7 charts of N-v-i-d-i-a technical logic.
November 9, 2026
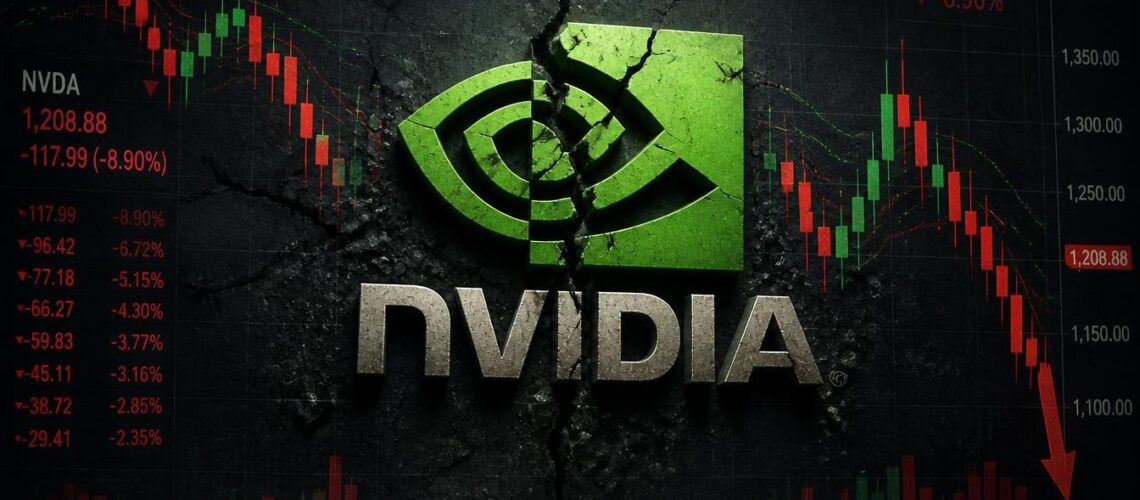
Don’t be shocked about NVIDIA. I wrote about it in my charts of the month 10/2026, but let’s keep it simple. I’ll show you charts which you can accept or you can deny. My rule says : Don’t argue with charts, they’re first. Confirmation events will arrive a bit later.
Nvidia is the hottest stock and once it’s done it’ll take the whole economy with them. There’re plenty of symptoms and in this dedicated topic I’m going to prove you it needs now a miracle.
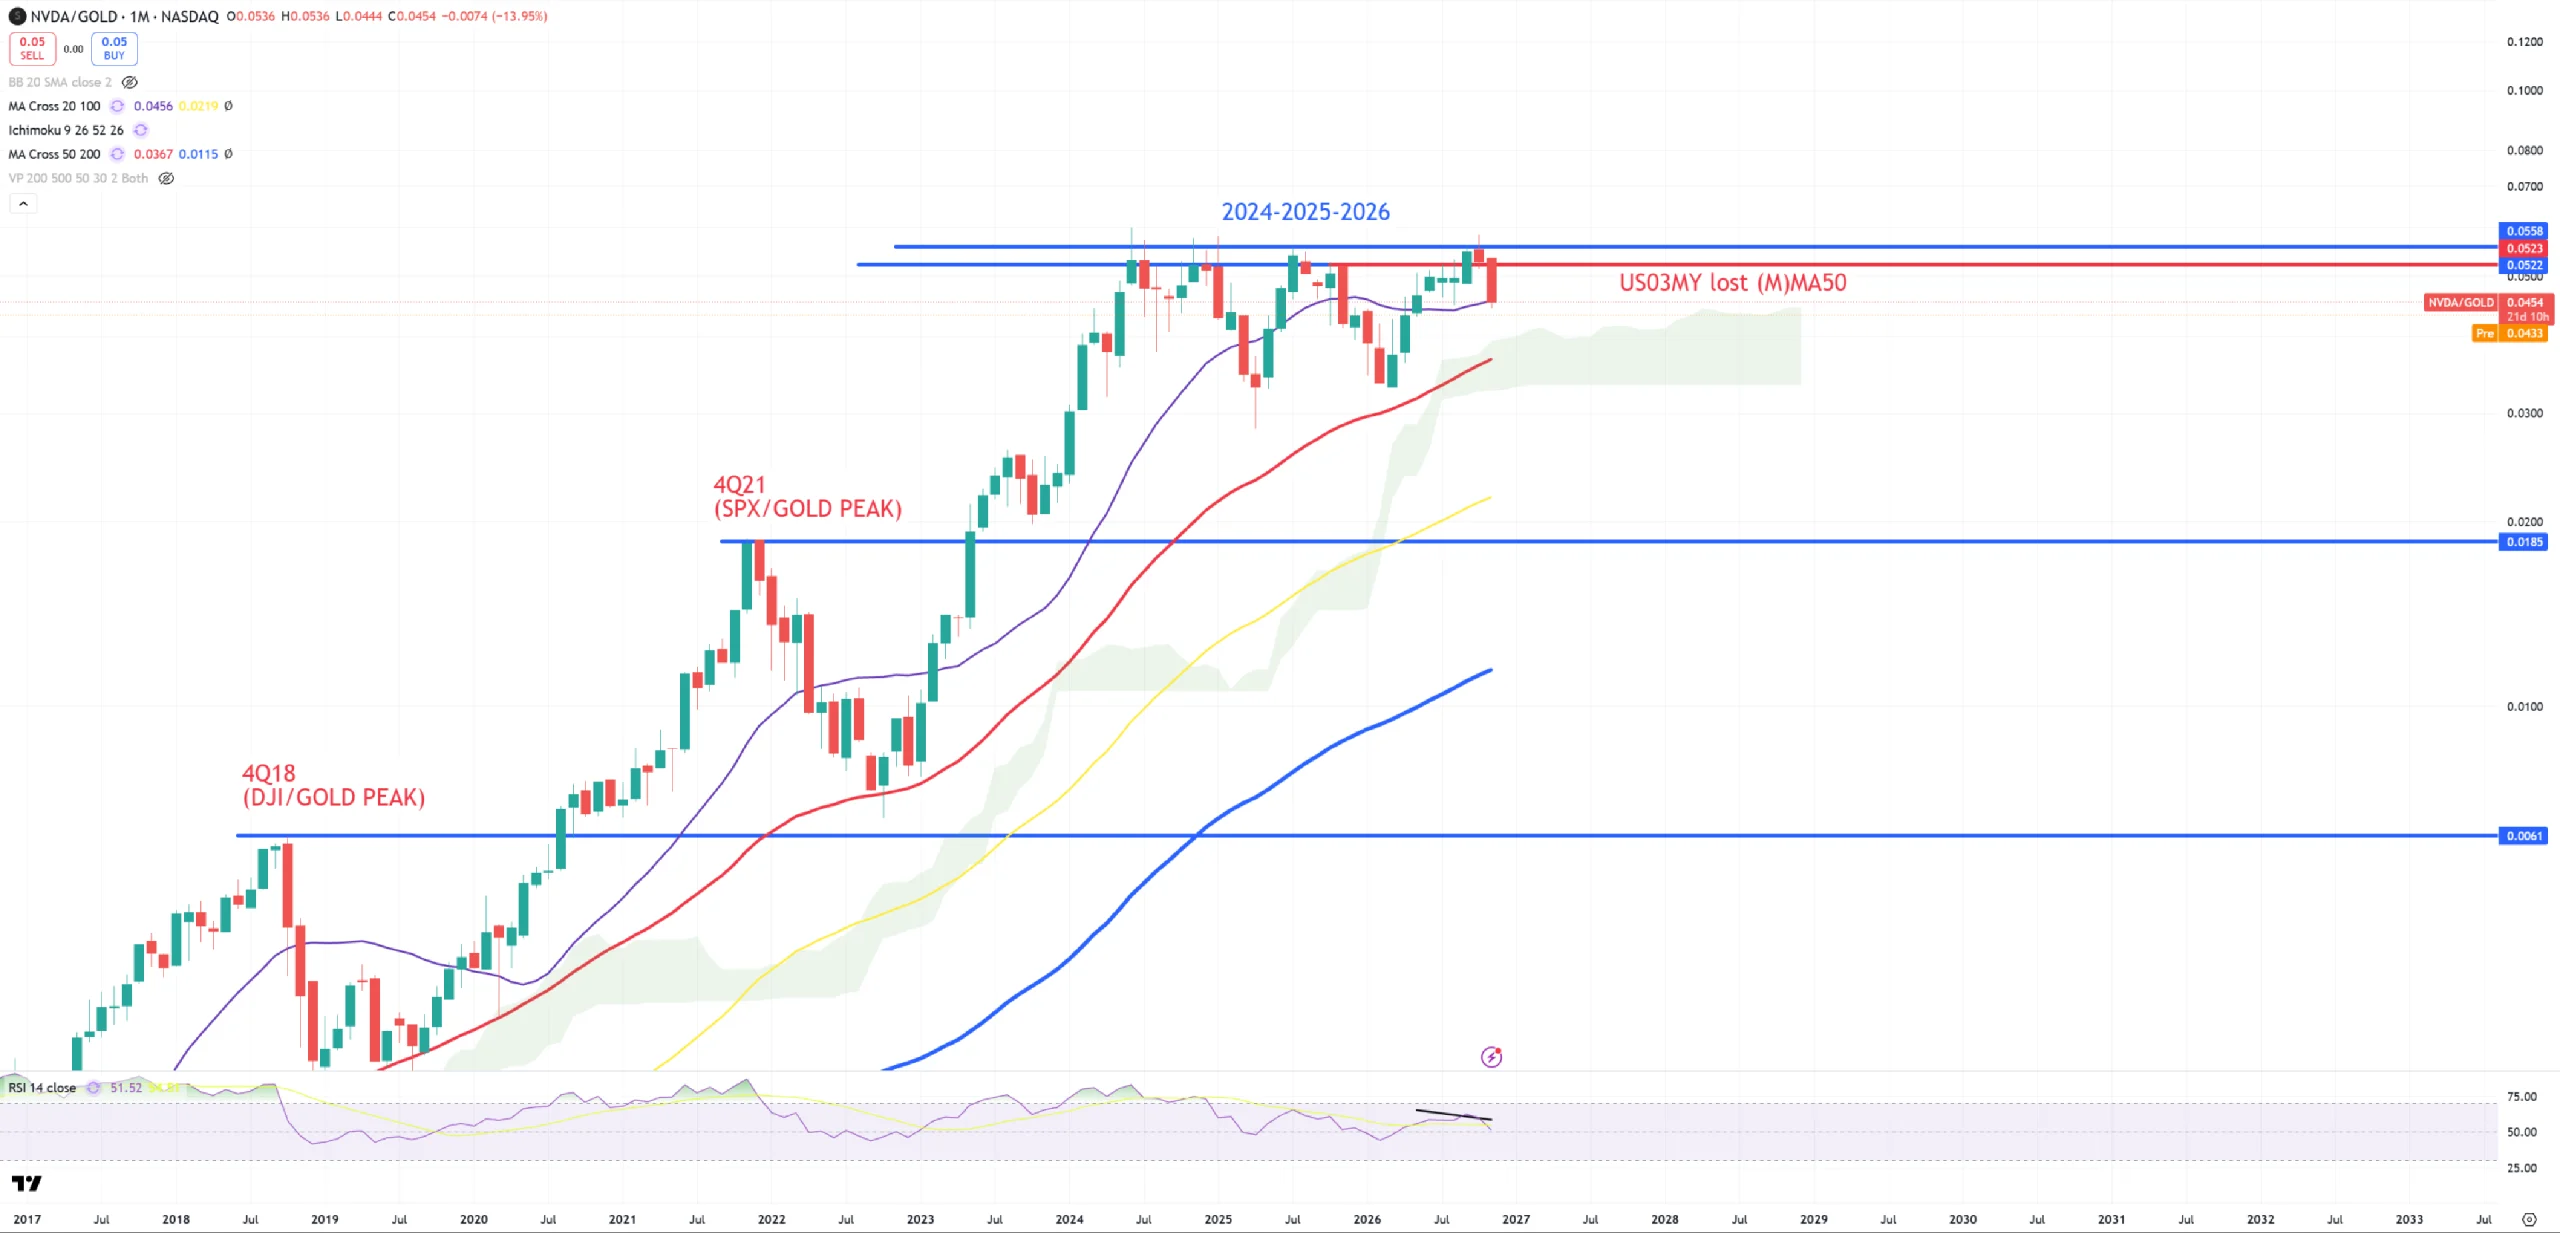
1. NVDA/GOLD ratio
Those golden ratios tell us about “the cycle” of NVIDIA. Without breaking last horizontal blue line it tells us – the cycle for NVIDIA keeps topping since July 2024. The moment red (M)MA50 will be broken it’s full game over.
Nvidia has 2 years of problems with this ratio.
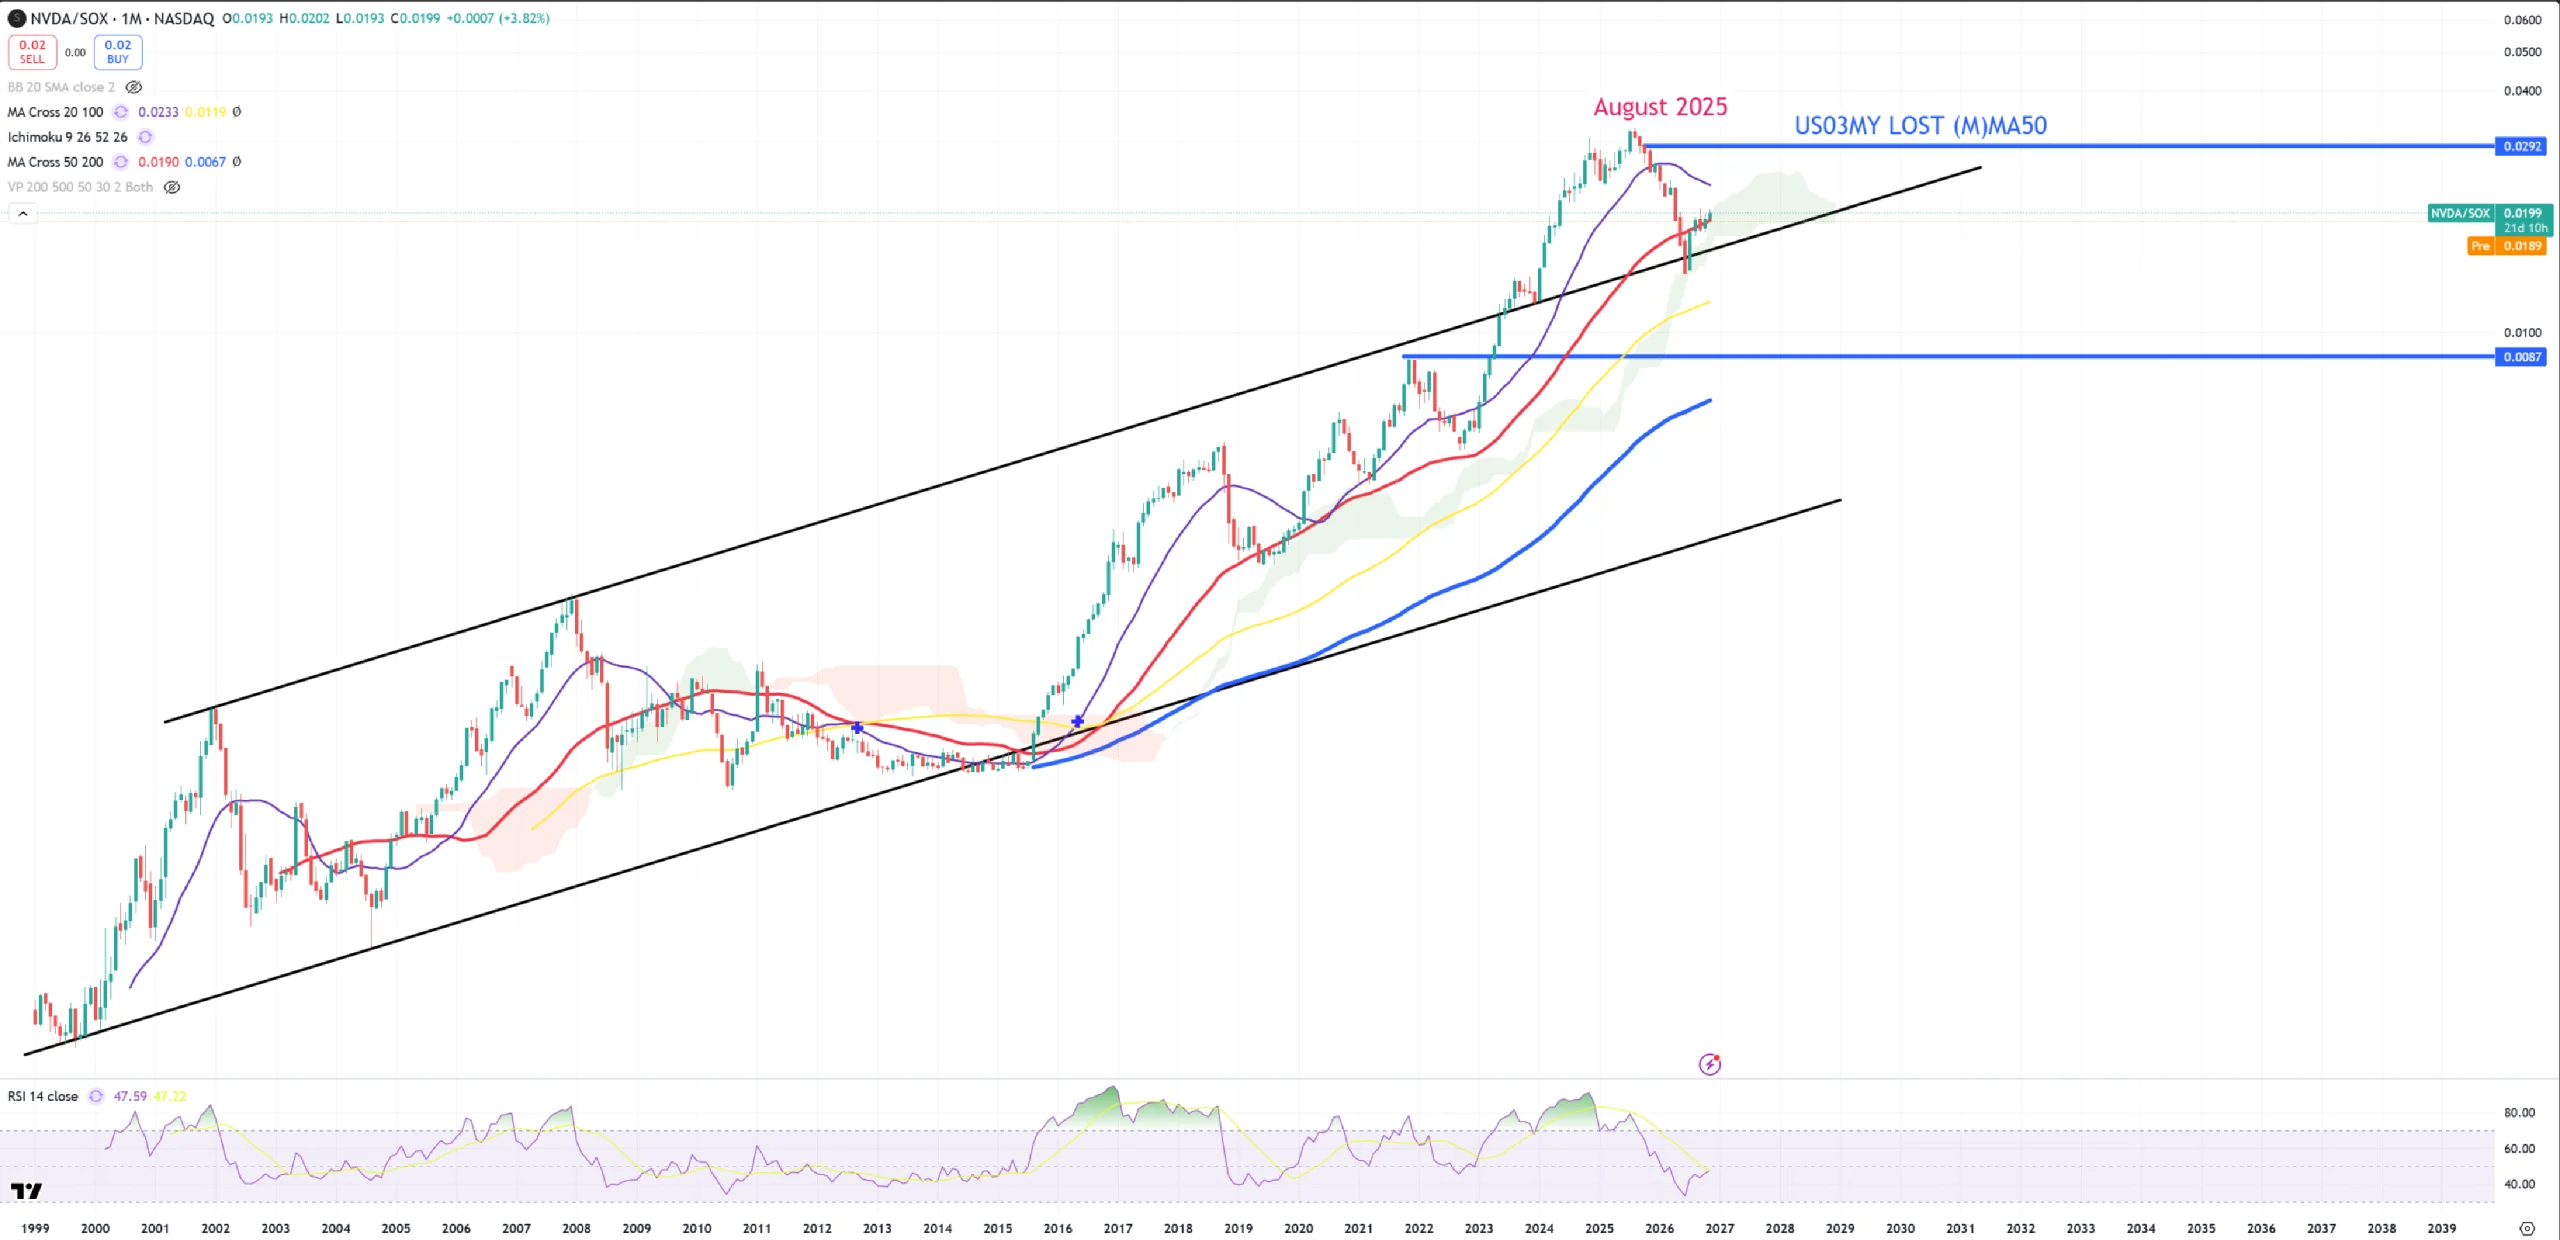
2. NVDA/SOX
This ratio shows us huge underperformance of Nvidia vs broad SOX index since its August 2025 peak. I’ve seen a lot of such charts and such breaks and lots of them turned out to be a bull-trap. Look how red (M)MA50 is being retested from the bottom. Nvidia losing steam vs SOX.
3. SOX/GOLD
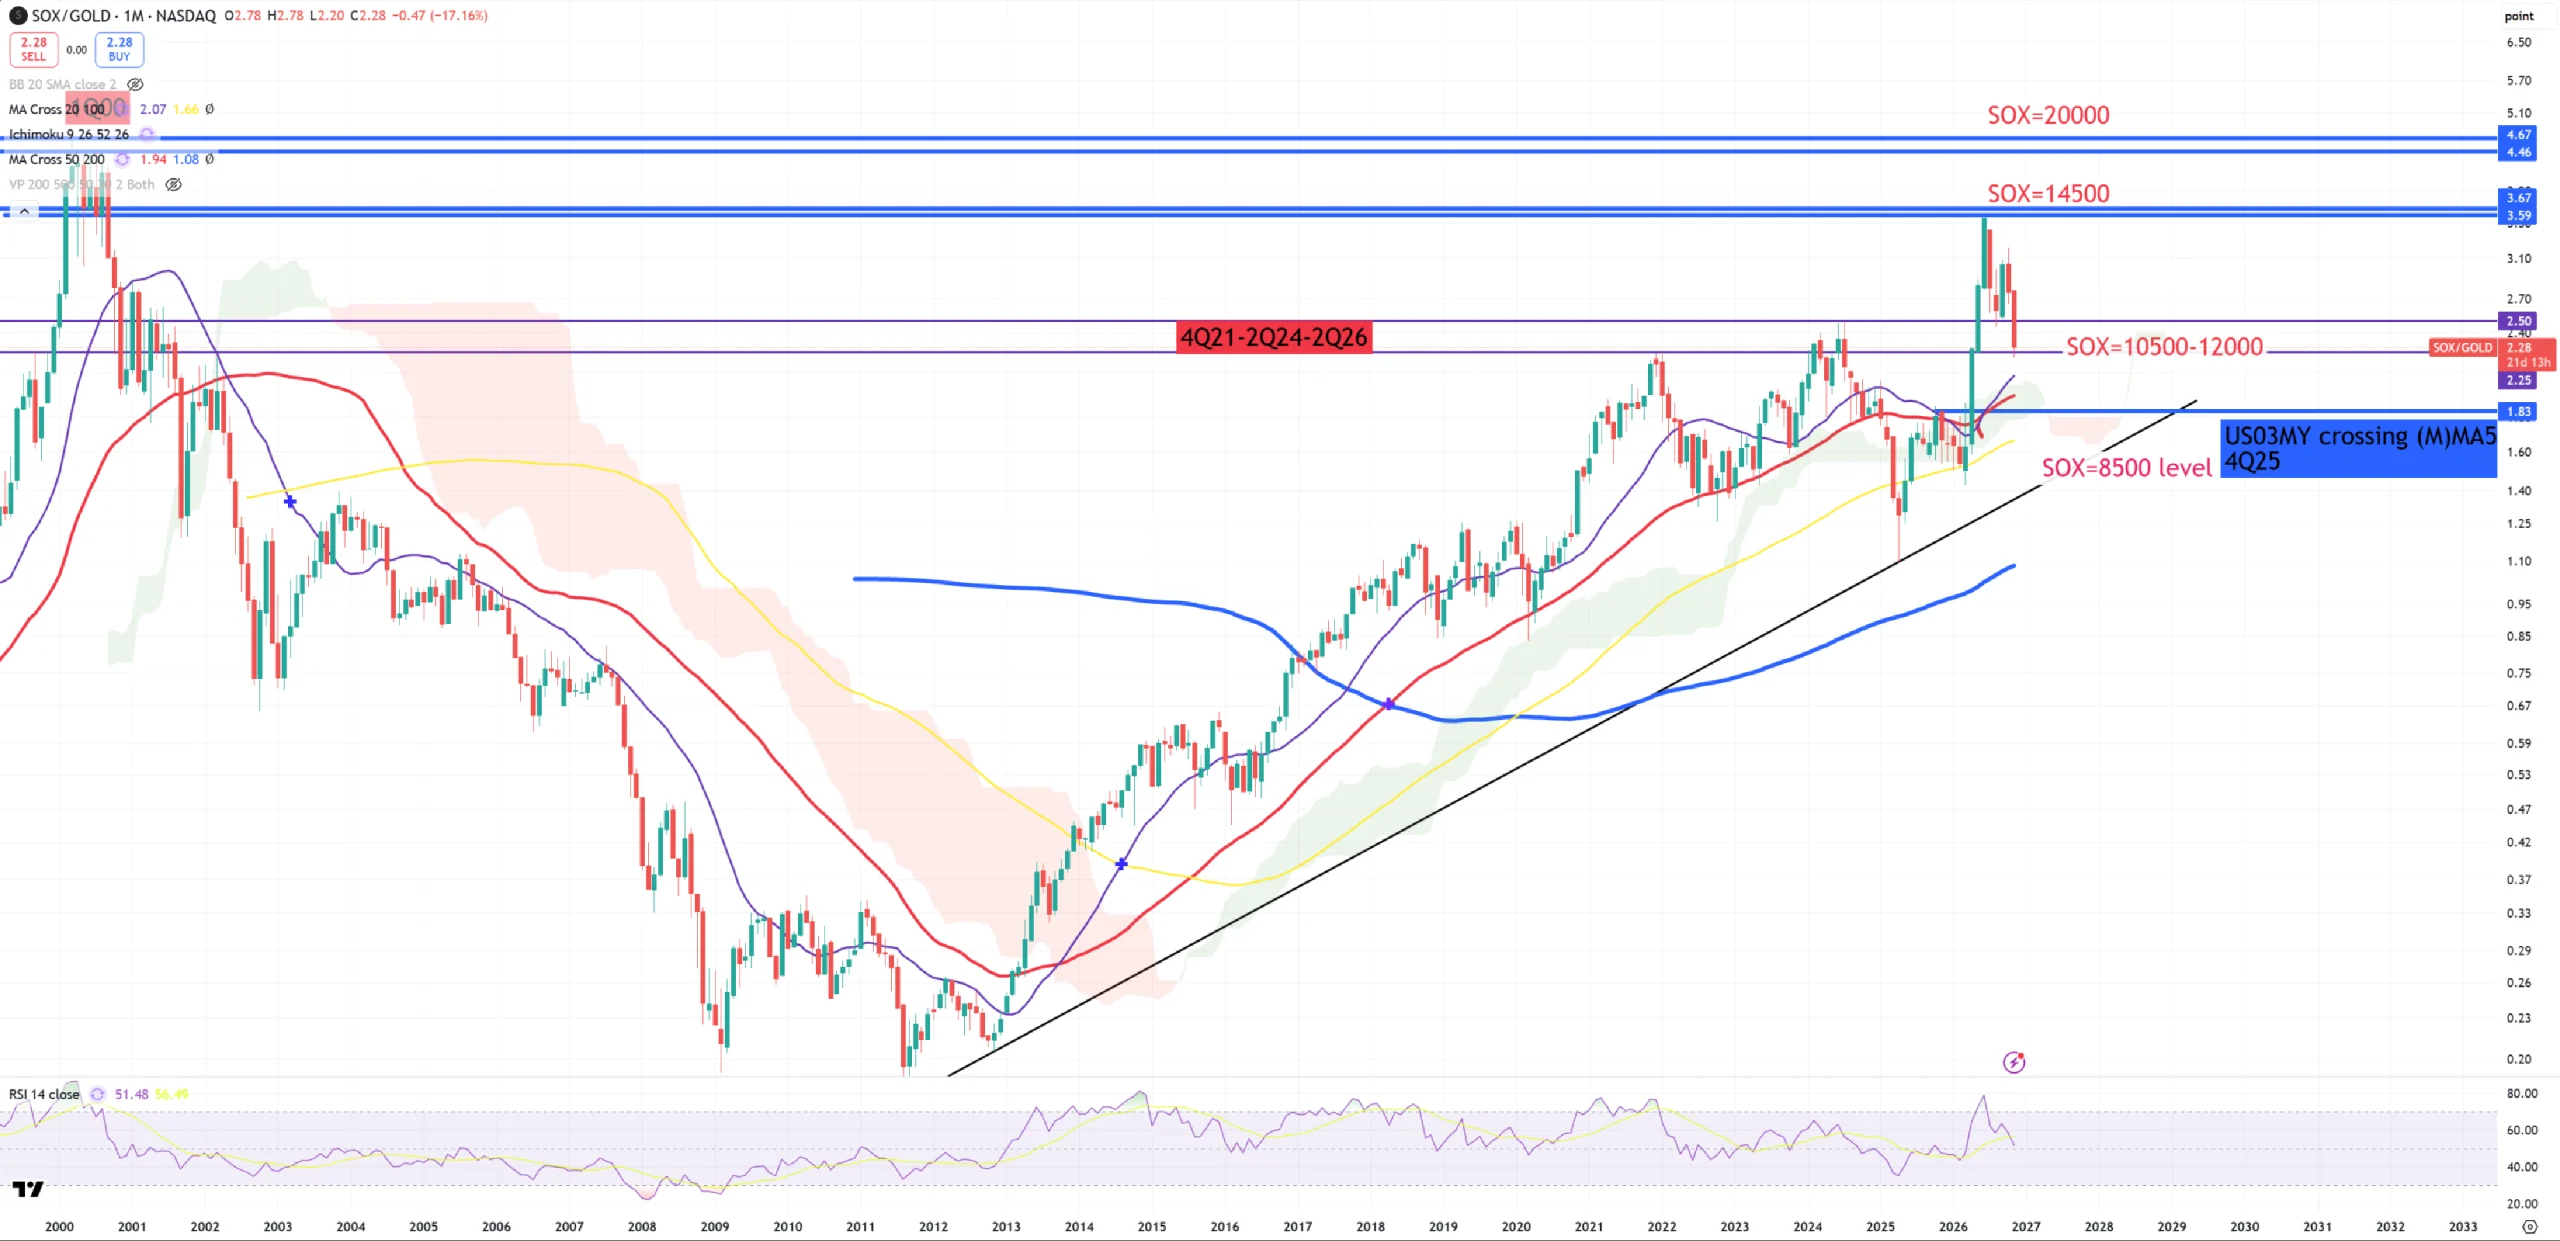
This ratio is a SOX cycle ratio with its June 2026 peak. Mostly wrote about this ratio HERE.
Let’s make the update. You see prefectly the key level around 4Q21-2Q24-2Q26. This chart does say nothing about Nvidia, but it says everything about SOX cycle. The highest point of SOX/GOLD ratio is the peak of the cycle. Is the last spike a bull-trap/blow-off top? It might if we close below this key level 4Q21-2Q24-2Q26.
4. 10Y/3M uninversion process
Never in a history when we managed to break > 60bps post long term inversion the market went without big damage. First spike to blue (M)MA200 was rejected. From this chart you can clearly see how we sit still in 2009+ cycle and all drops on the market were just bull market corrections. To get a true bear market you need to see this spread running towards red, crossed circle. Nvidia just like everything went through multiple corrections. Even 2020 was a bull market correction and even 2021-2022 was bull market correction.
Stock market bulls need 10y/3m to go heavily DOWN now like in 2022, but from the other side charts NVDA/GOLD, NVDA/SOX, SOX/GOLD must also align to 10Y/3M.
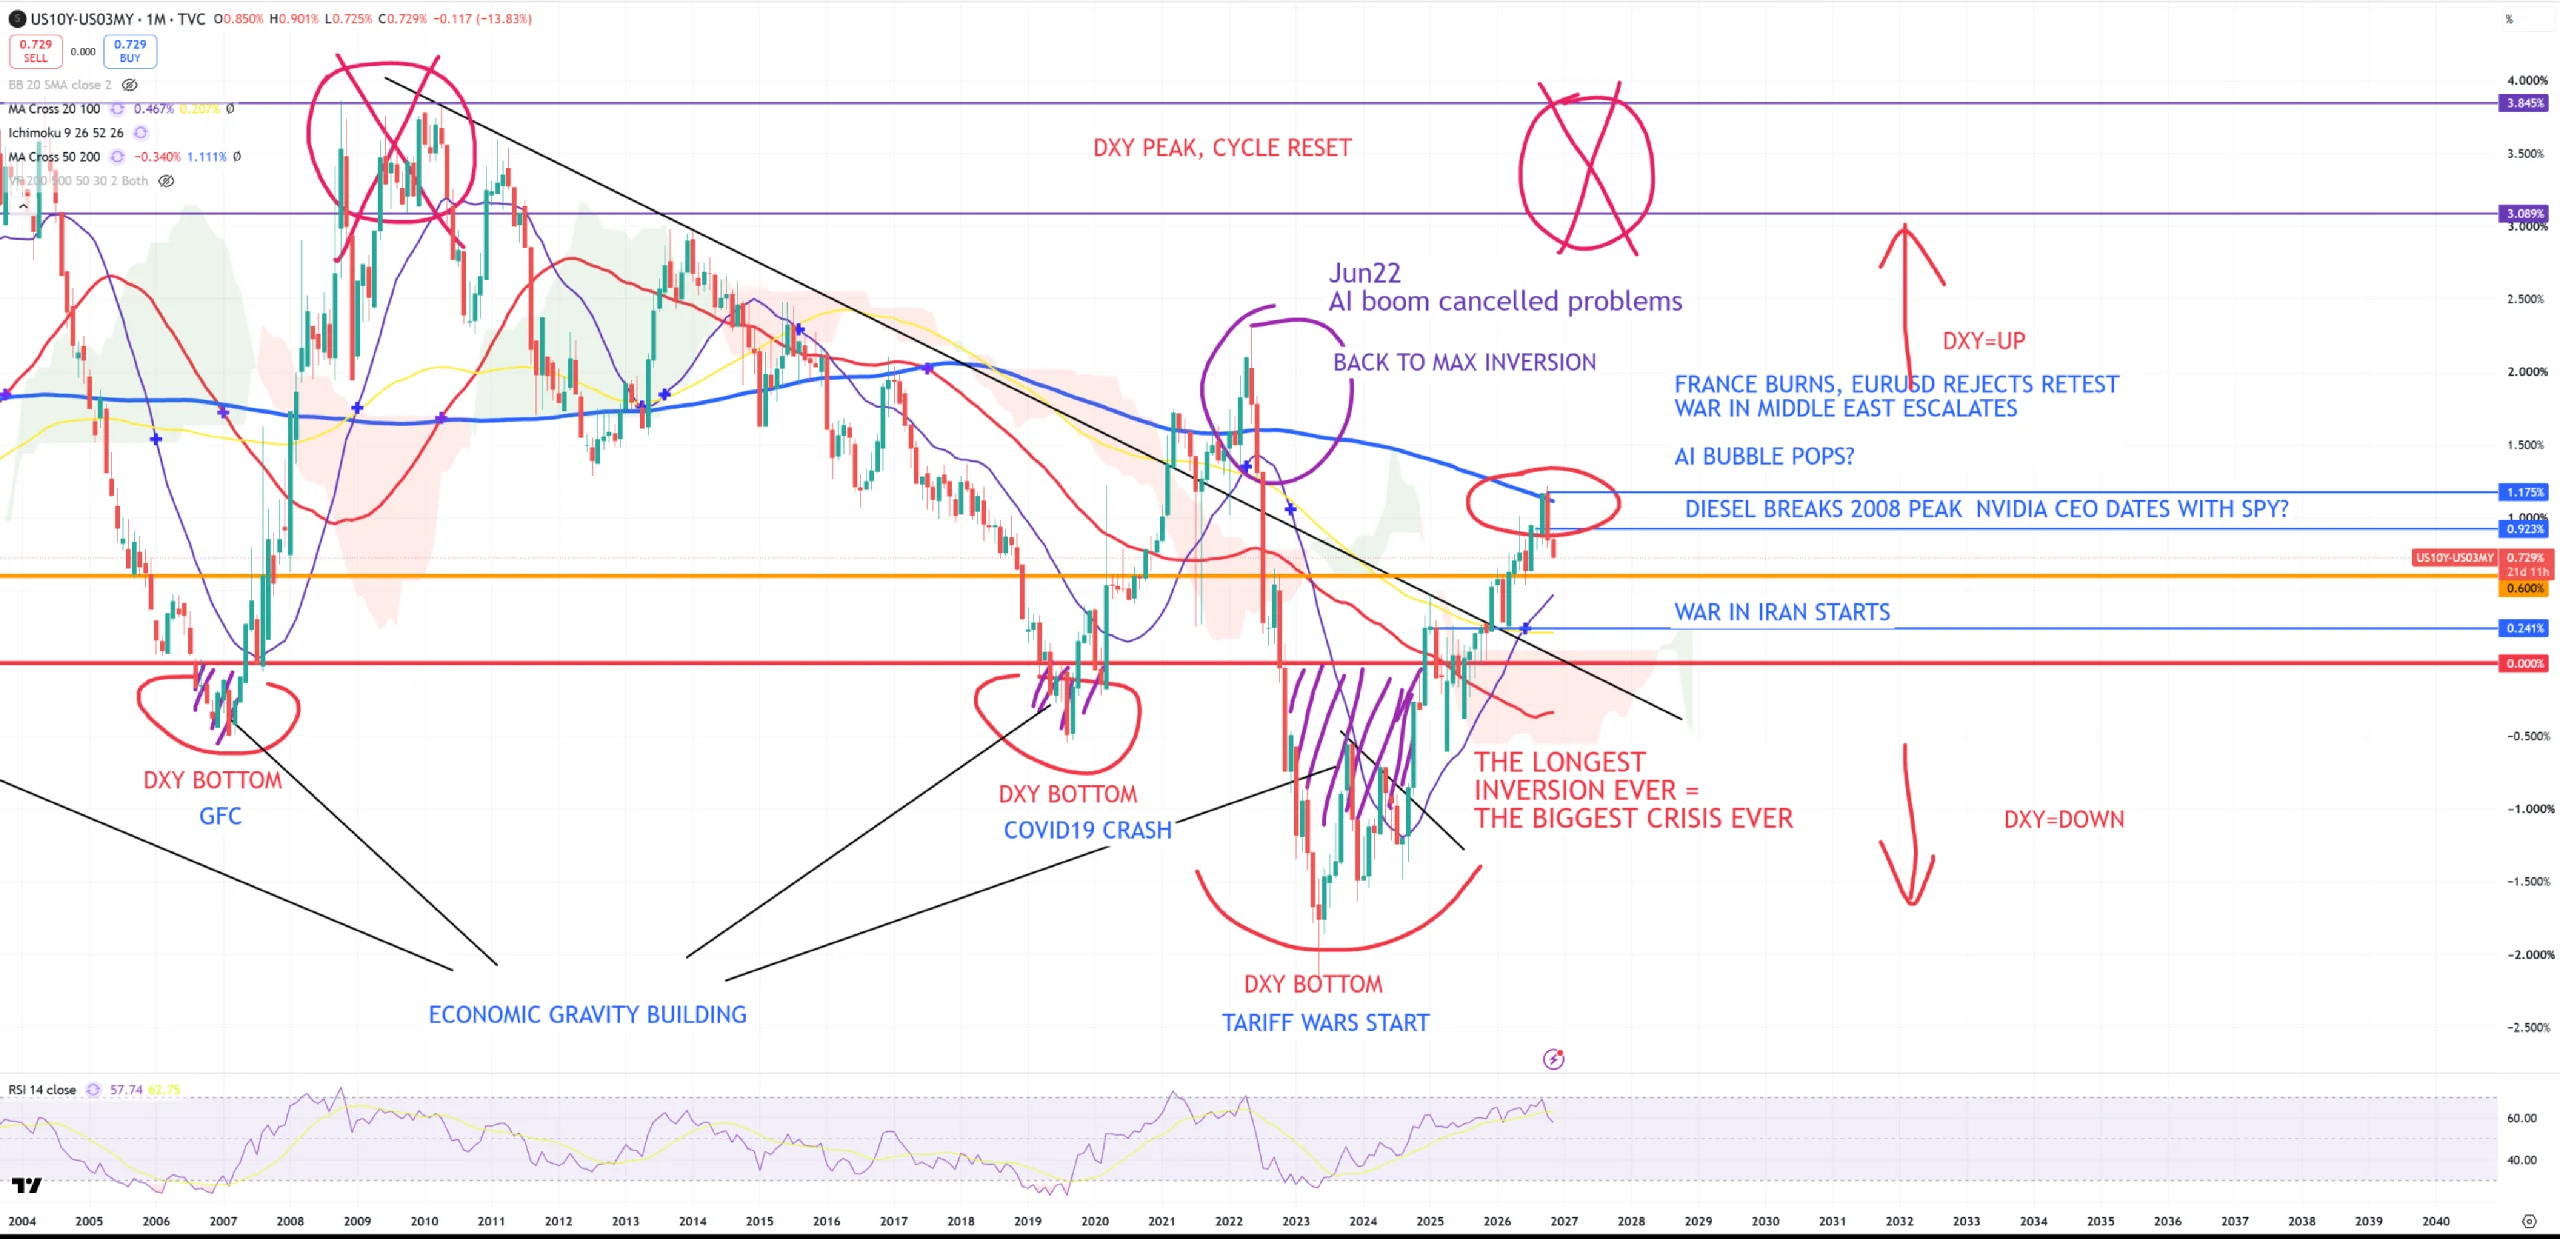
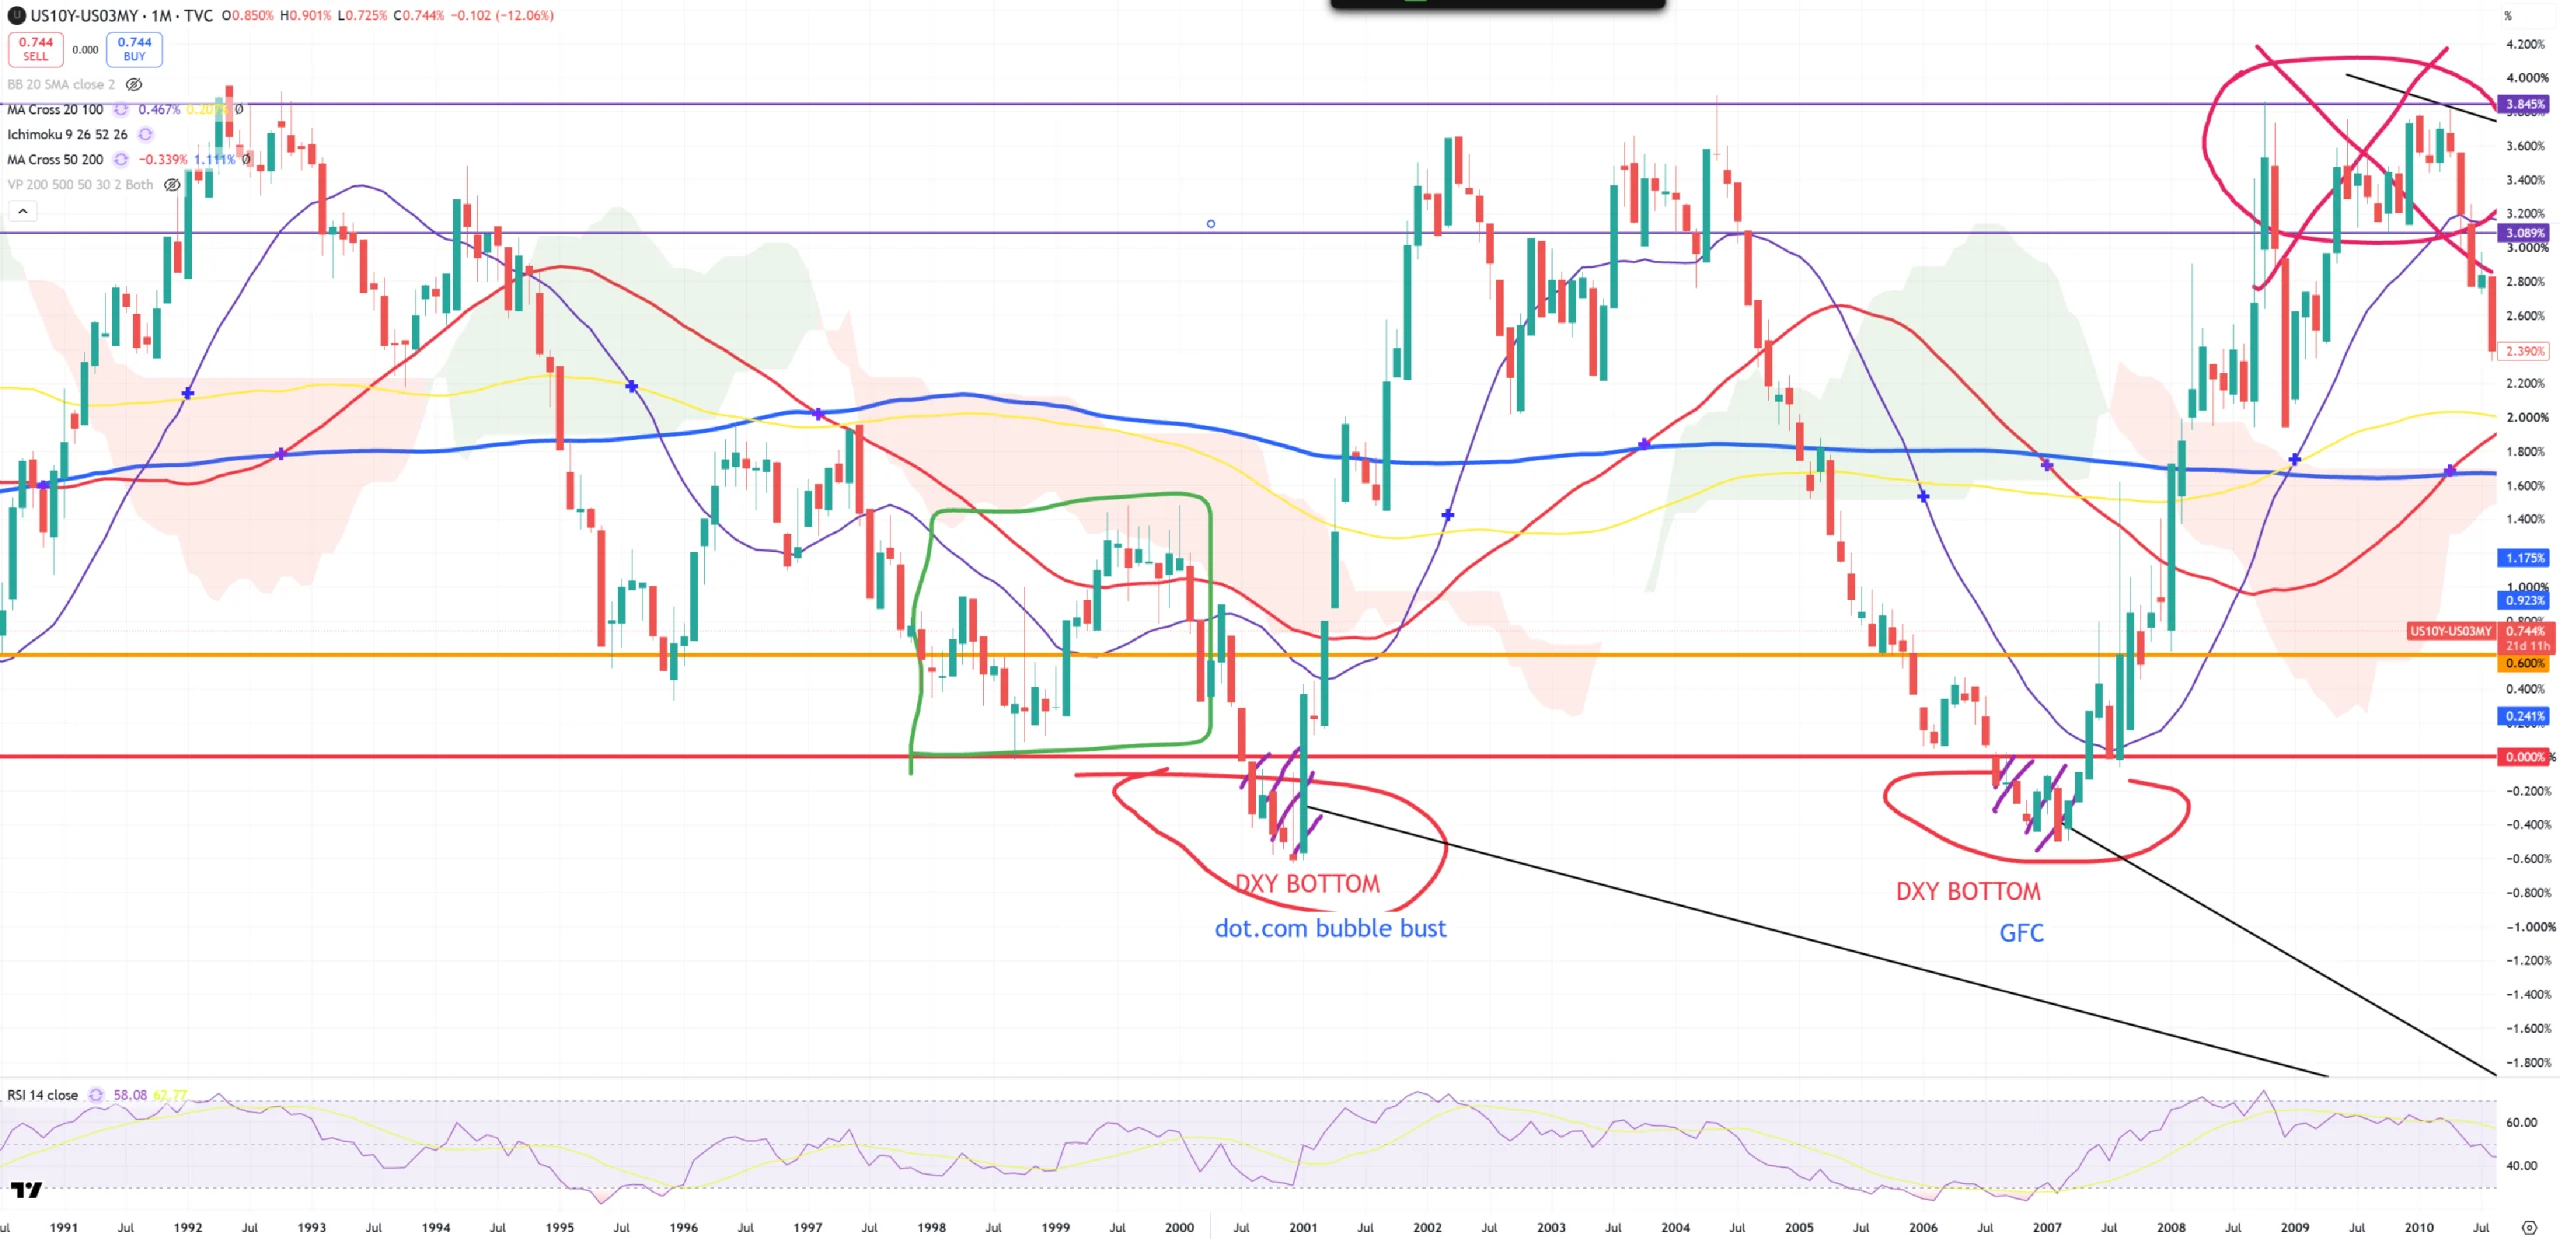
Because in a moment we’ll talk about 1999 moment let’s see how 1999 10y/3m looked like. You see it in a green rectangle. We didn’t even have inversion that moment, but yield-curve moved up and crashed again … inverted, market peaked and done. That’s the same scenario like 2022.
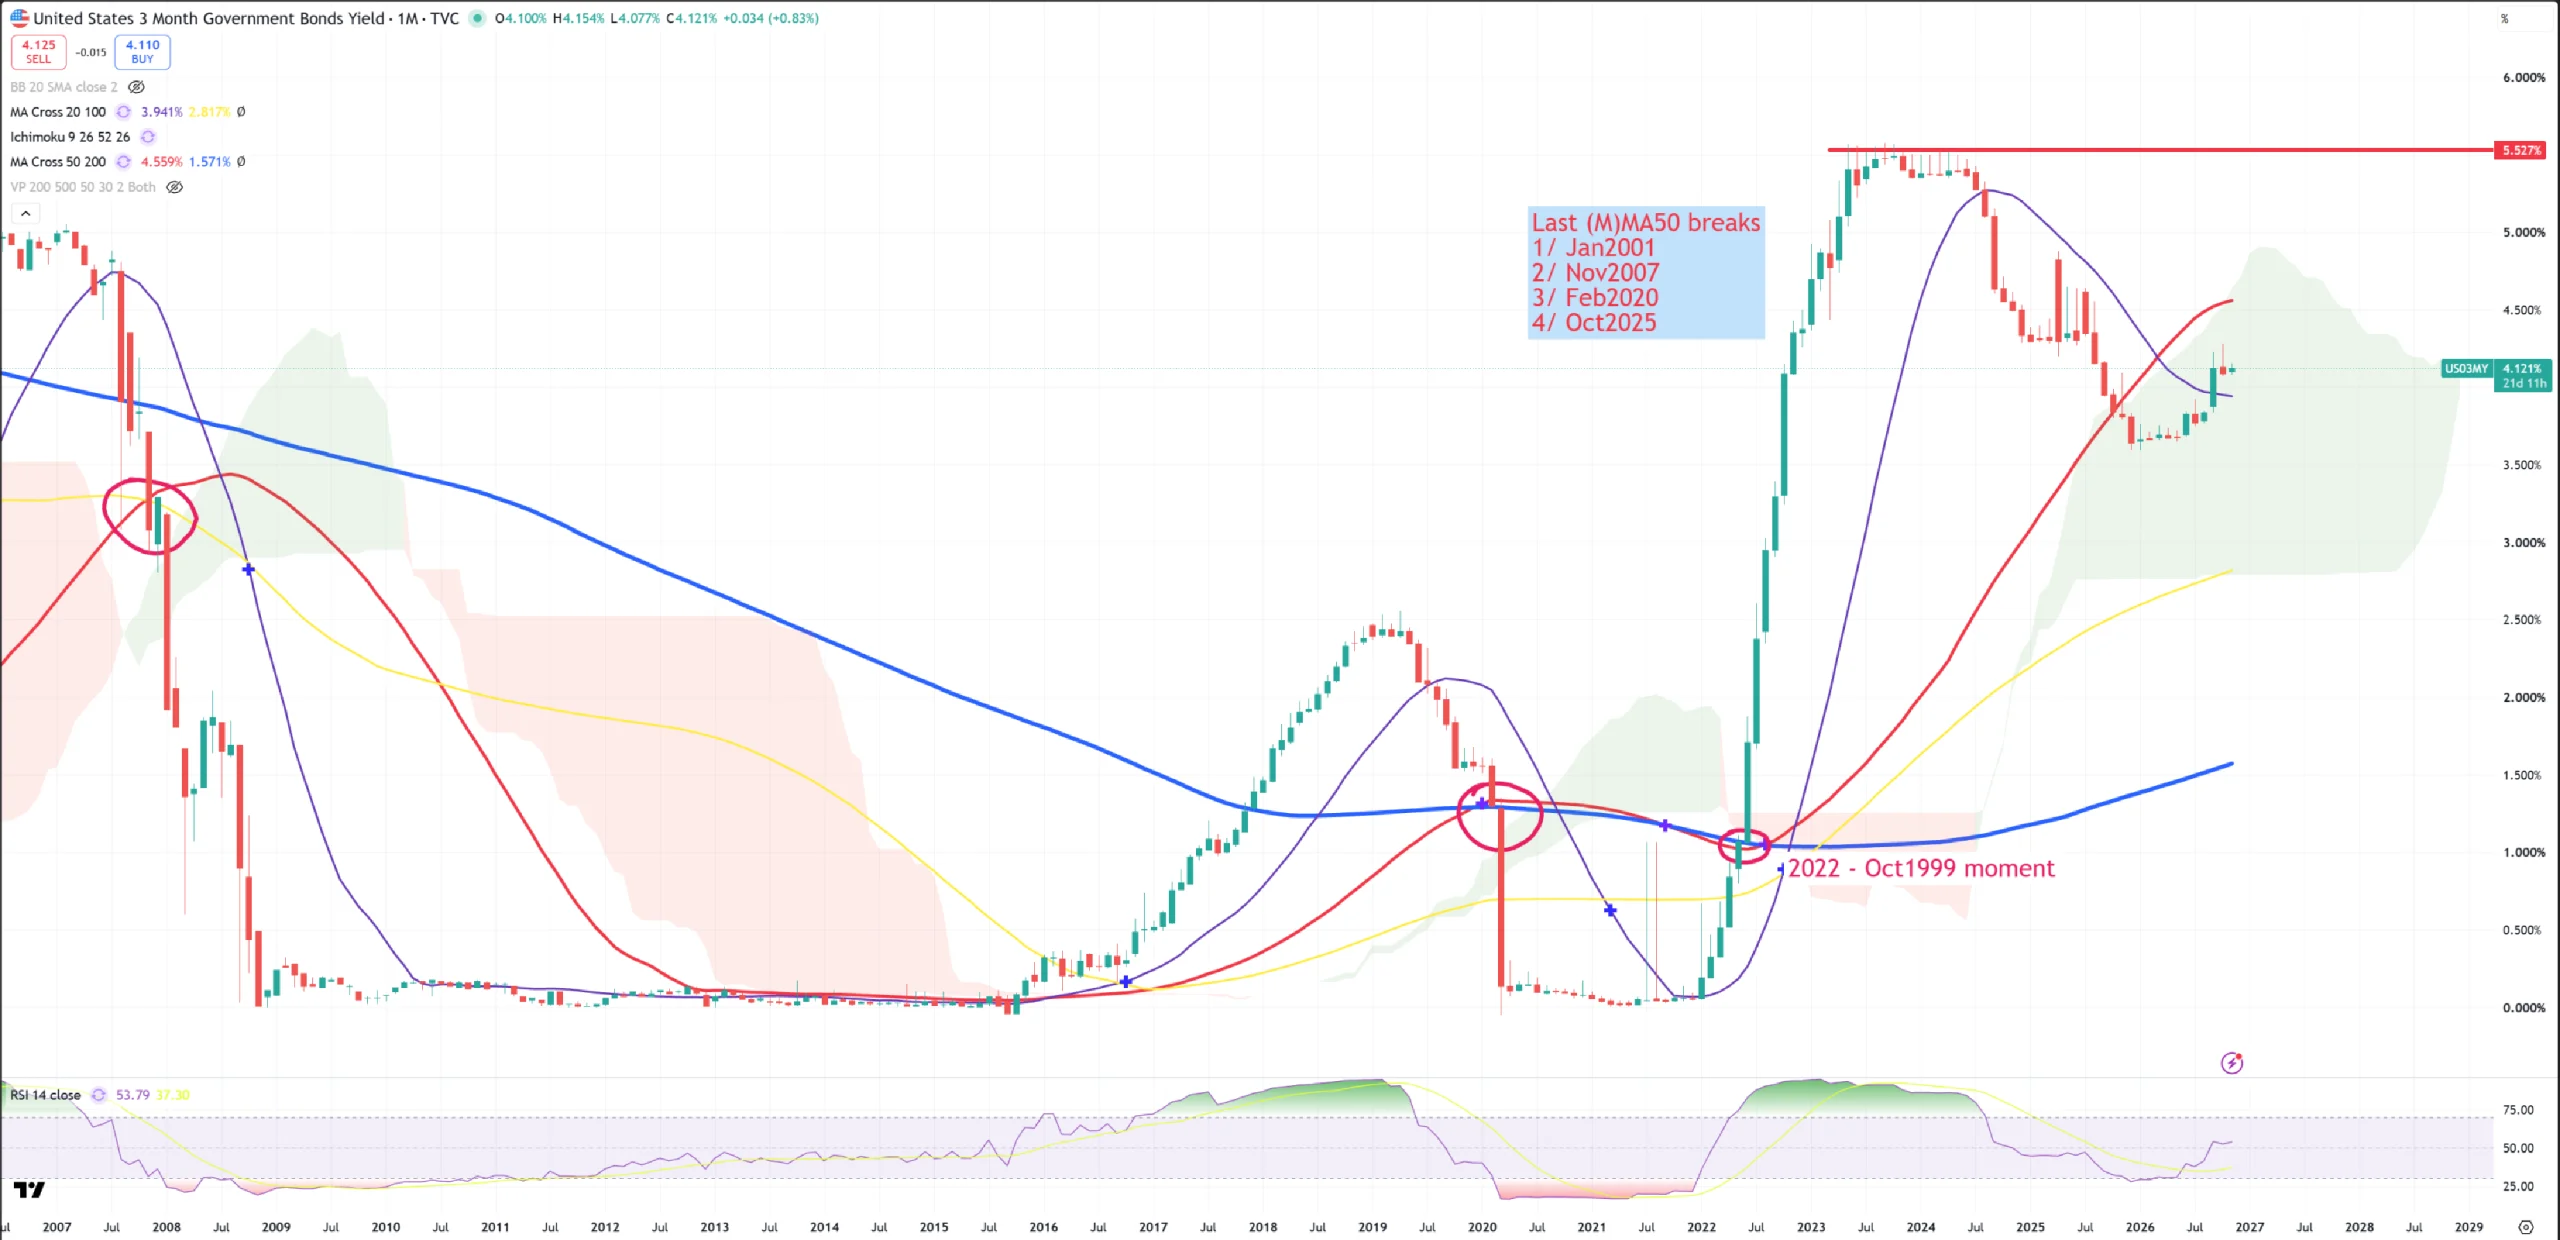
5. US03MY and 1999 moment
There’re plenty of 1999 comparisons, but … In 1999 you won’t see 10y/3m inversion. I wrote about 1999 moment here :
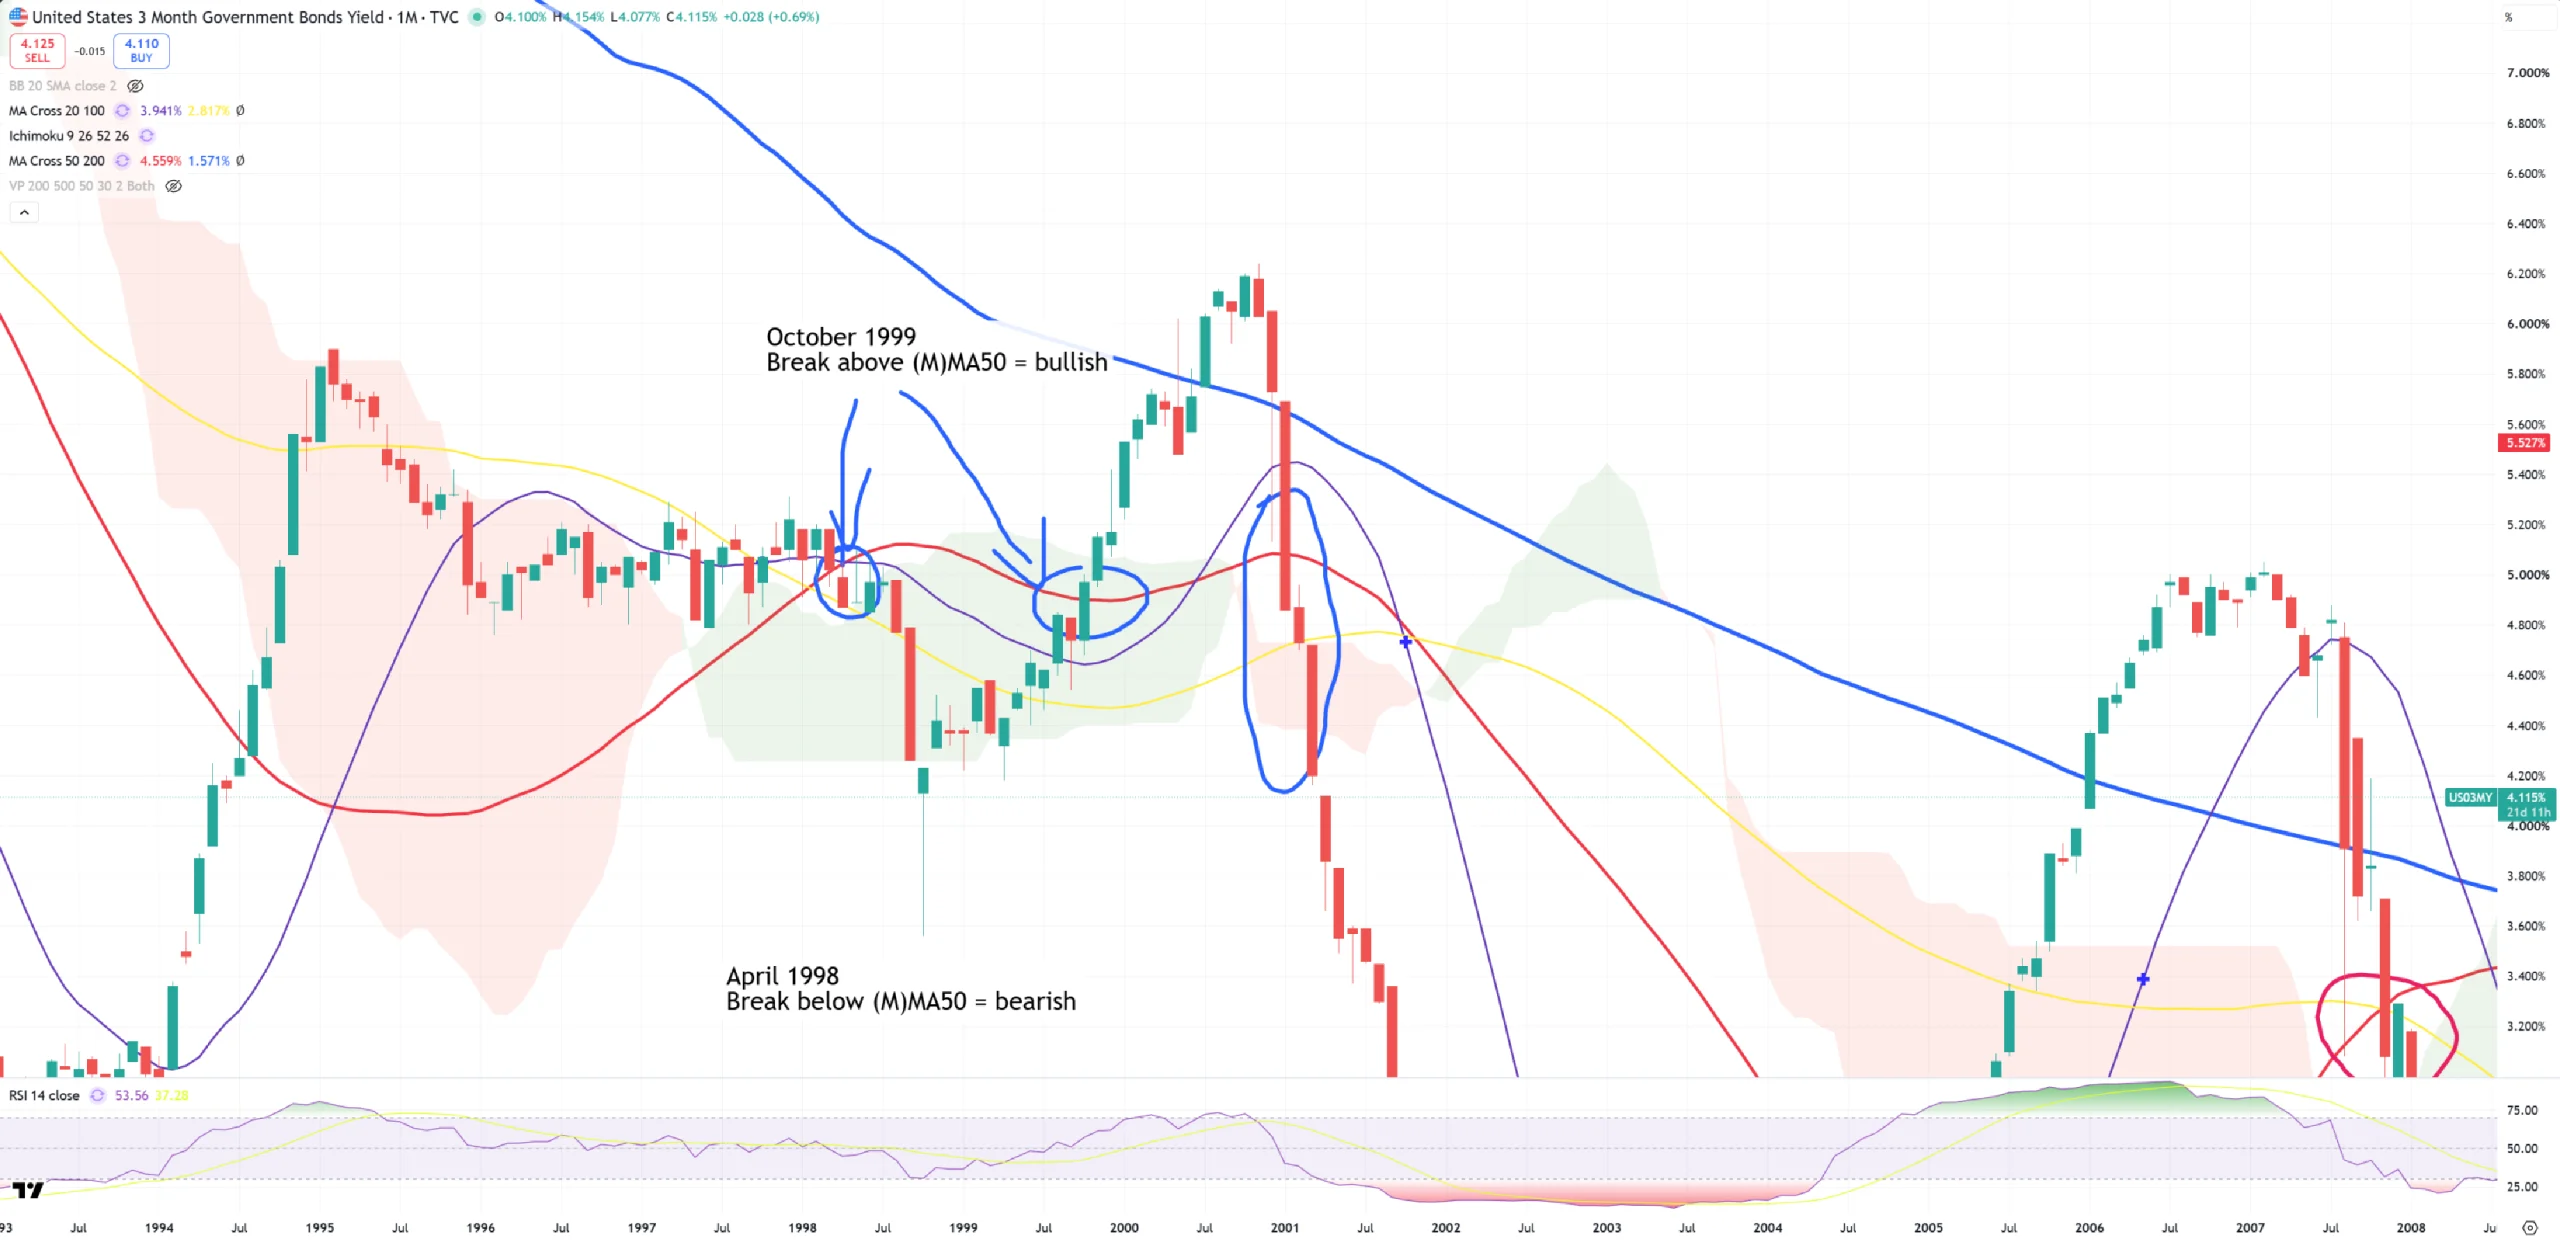
Conlusion sits on US03MY (M)MA50 break. So we need to break 4,50%+ on US03MY to get another 1999. You see 2022 moment (excellent equivalent of October 1999 moment). Go above and see what happened to 10y/3m after this (M)MA50 US03MY break up in 2022 => 10y/3m crashed = bull market.
Here you can see 1999 :
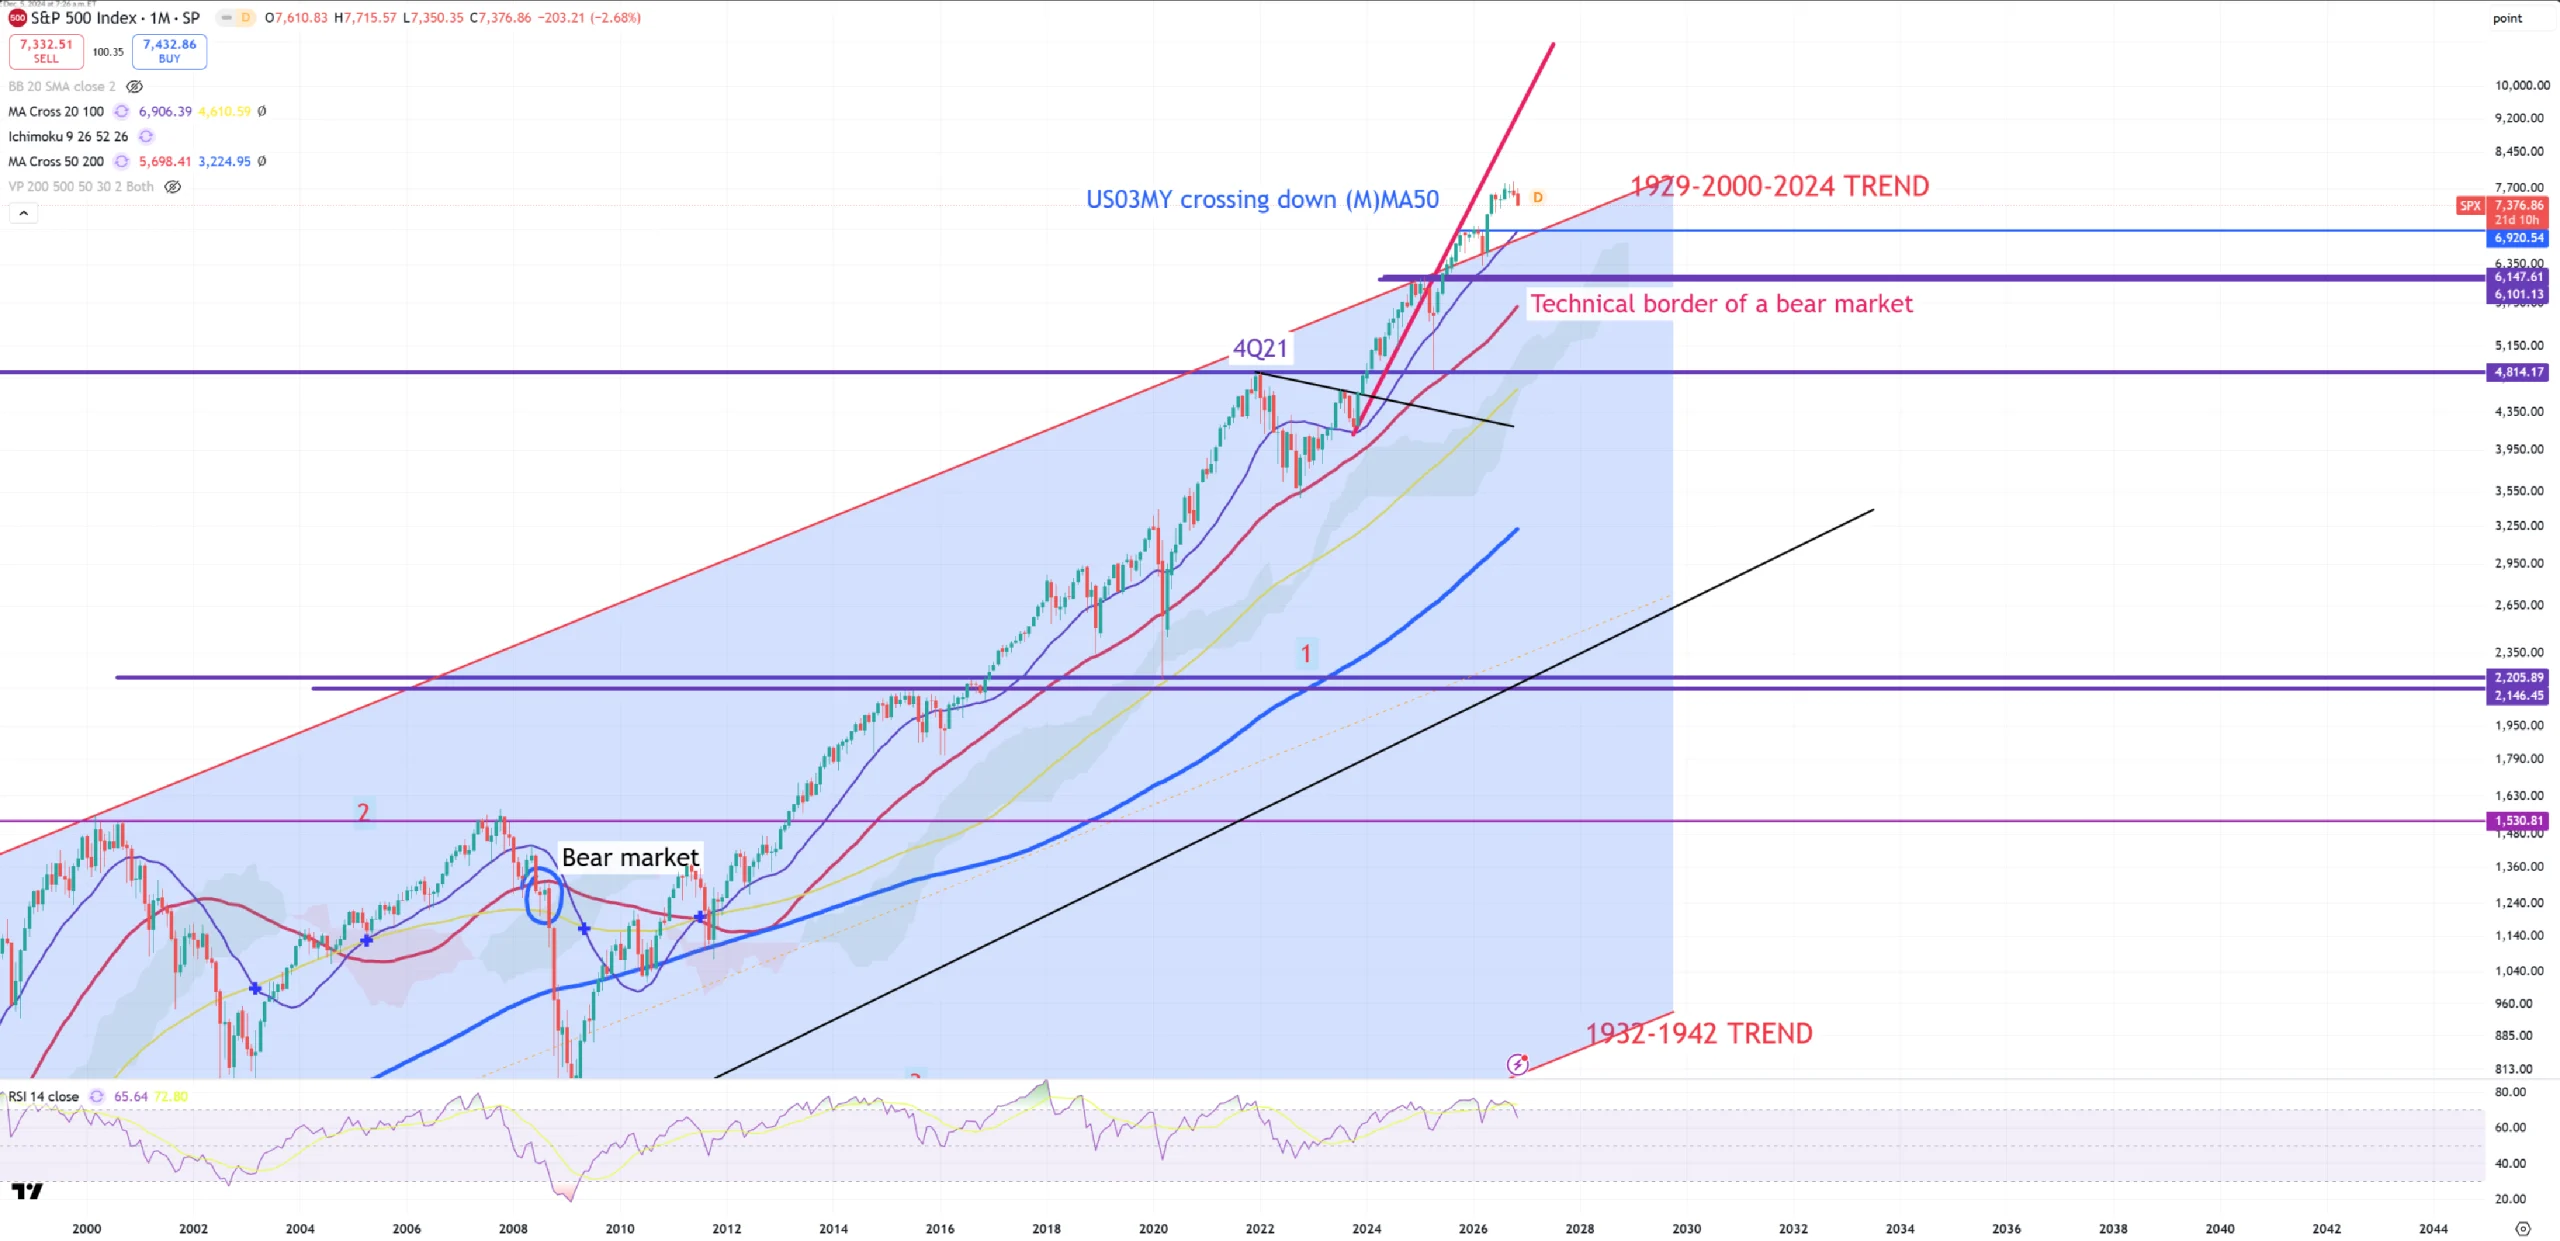
6. SPX and its 1929-2000 trend
This chart confirms 10Y/3M 2009+ cycle. Since 2009 we have never crossed red (M)MA50 – the natural border between technical bull/bear market. Because 10Y/3M has not fully uininverted – all market drops were caught by (M)MA50 border = bull market corrections.
As you know I don’t believe this 1929-2000 trend break will be sustained.
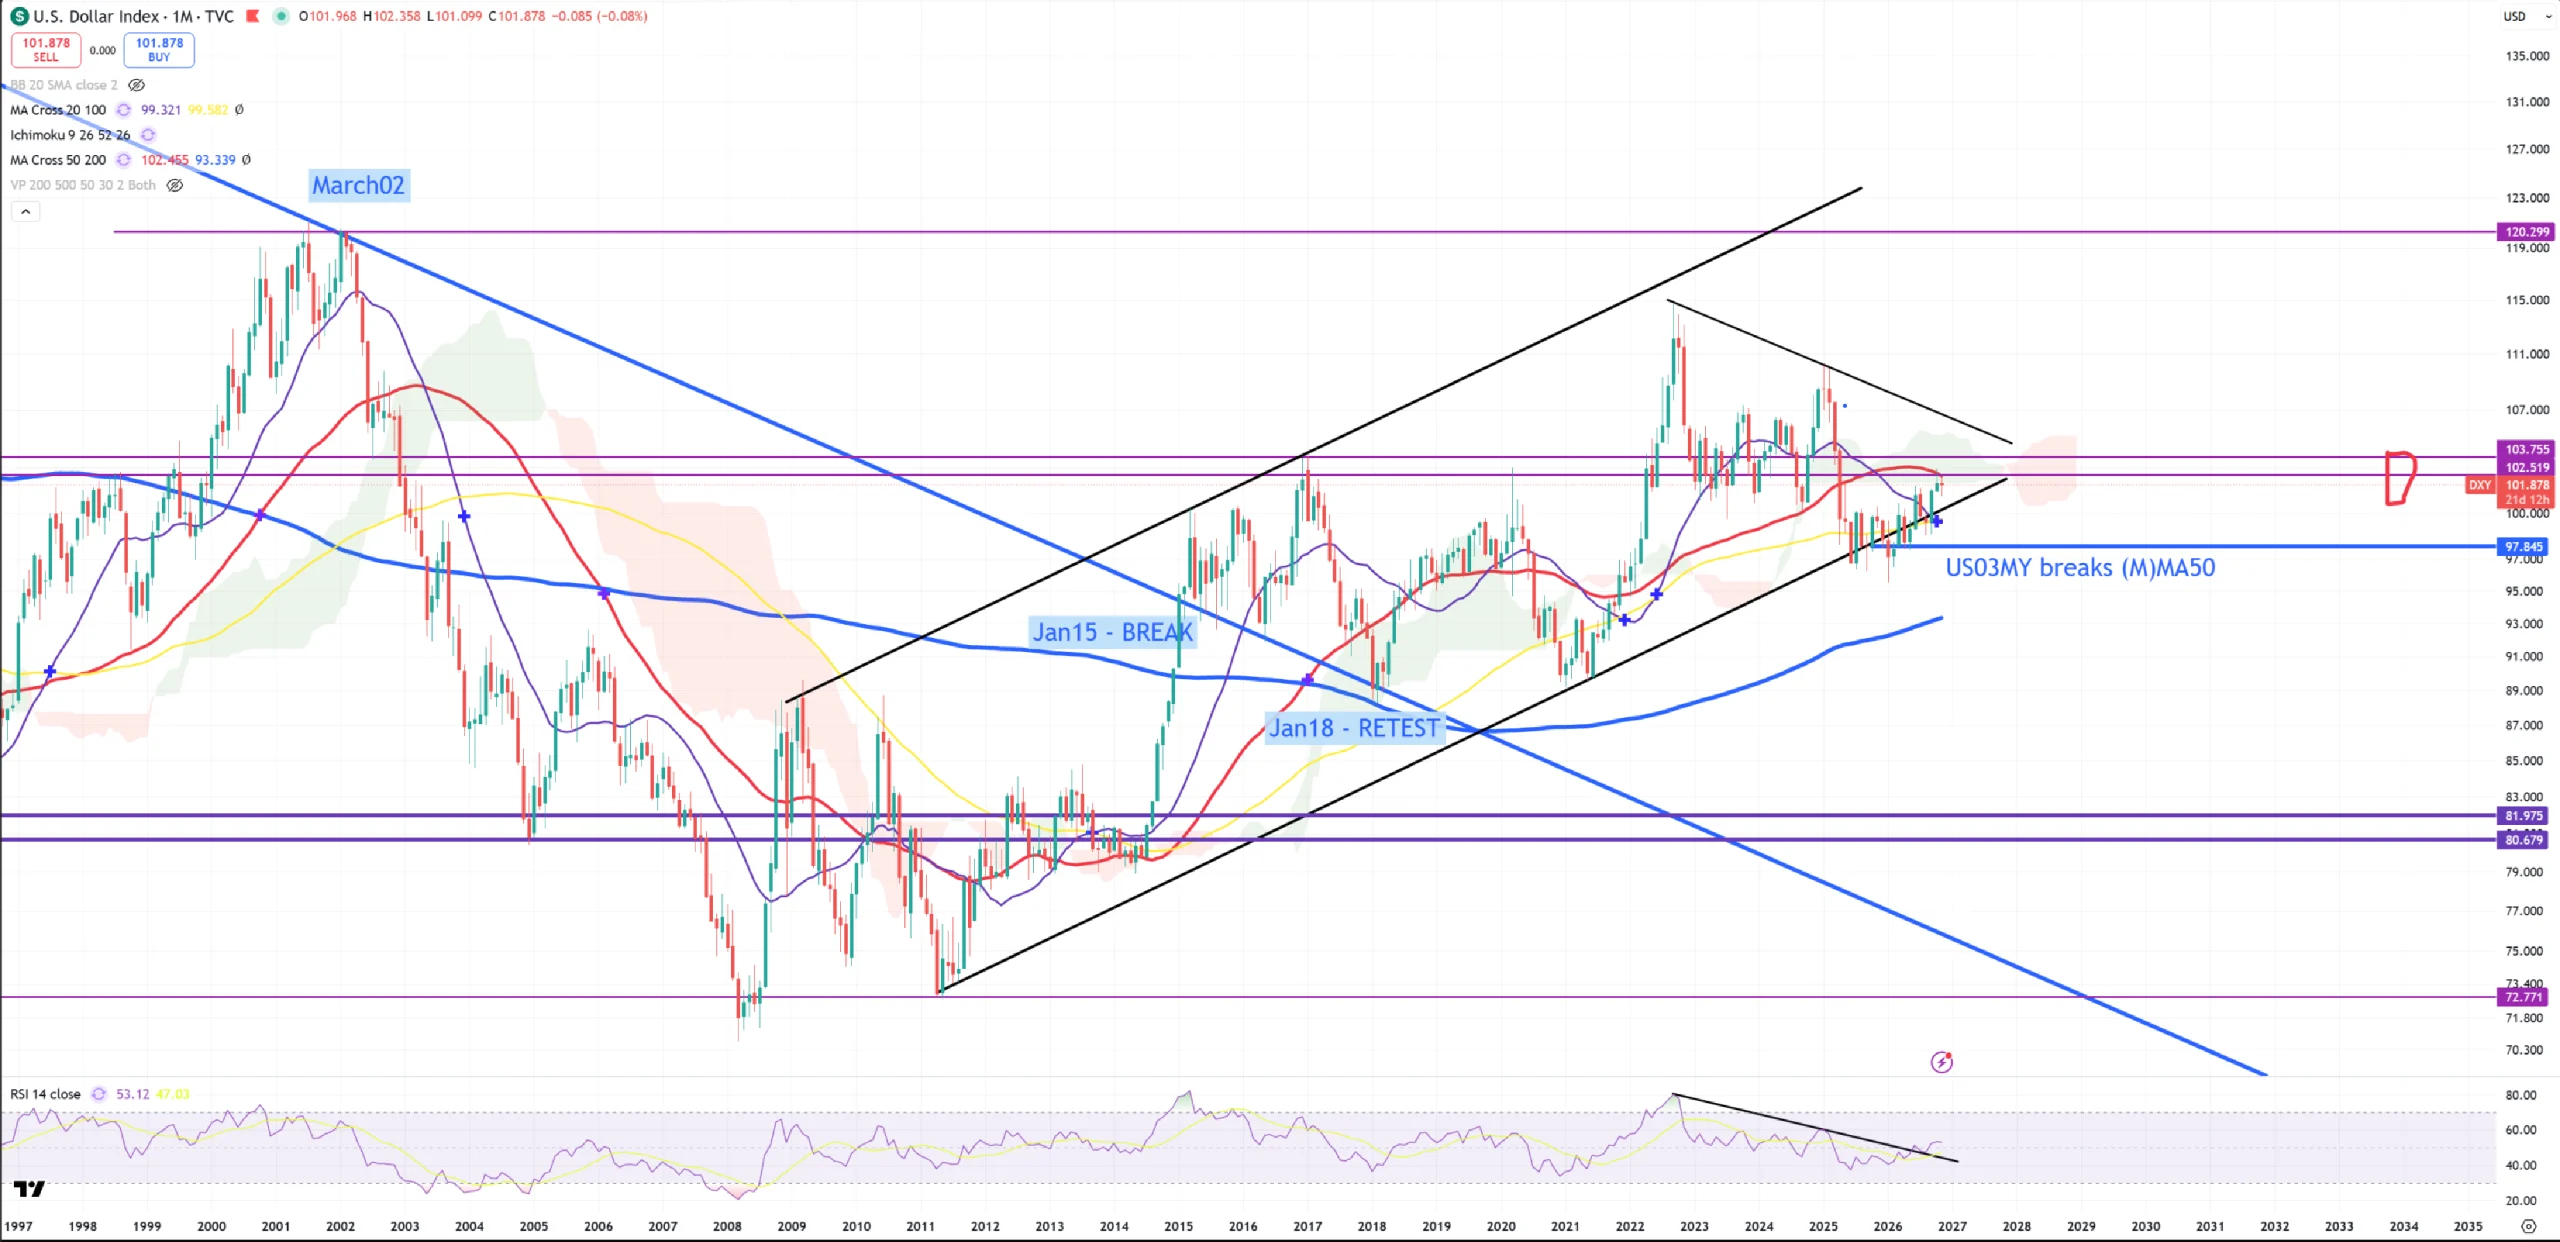
7. DXY
We hit red (M)MA50 and rejected it. Once we move above it + key resistance break = 102.5-104.0 it’s game over and probably that’ll be the moment 10y/3m will go parabolic UP. There’s also no big distance to lower trend which sits on 100-100.5. It’s not like in 2022 when you had 115 level with possibility to drop to lower trend around 96
Do whatever you want to do with those charts, but you see the logic behind my thinking about Nvidia.