09/2026
October 1, 2026

Month and a quarter came to an end. If you’re a bear you’ll be a bit dissapointed by quarterly charts mostly SPX/GOLD, but as expected montly charts are mostly bearish. Breadth is weak, stocks peaked mostly around 4Q21/1Q22. Really hard to get what to start from at the end of September. Not giving “a lot of charts”. You have to do your homework which stocks peaked in 4Q21/1Q22, and which now breaks (M)MA50 or (M)MA200.
Charts in this report (77)
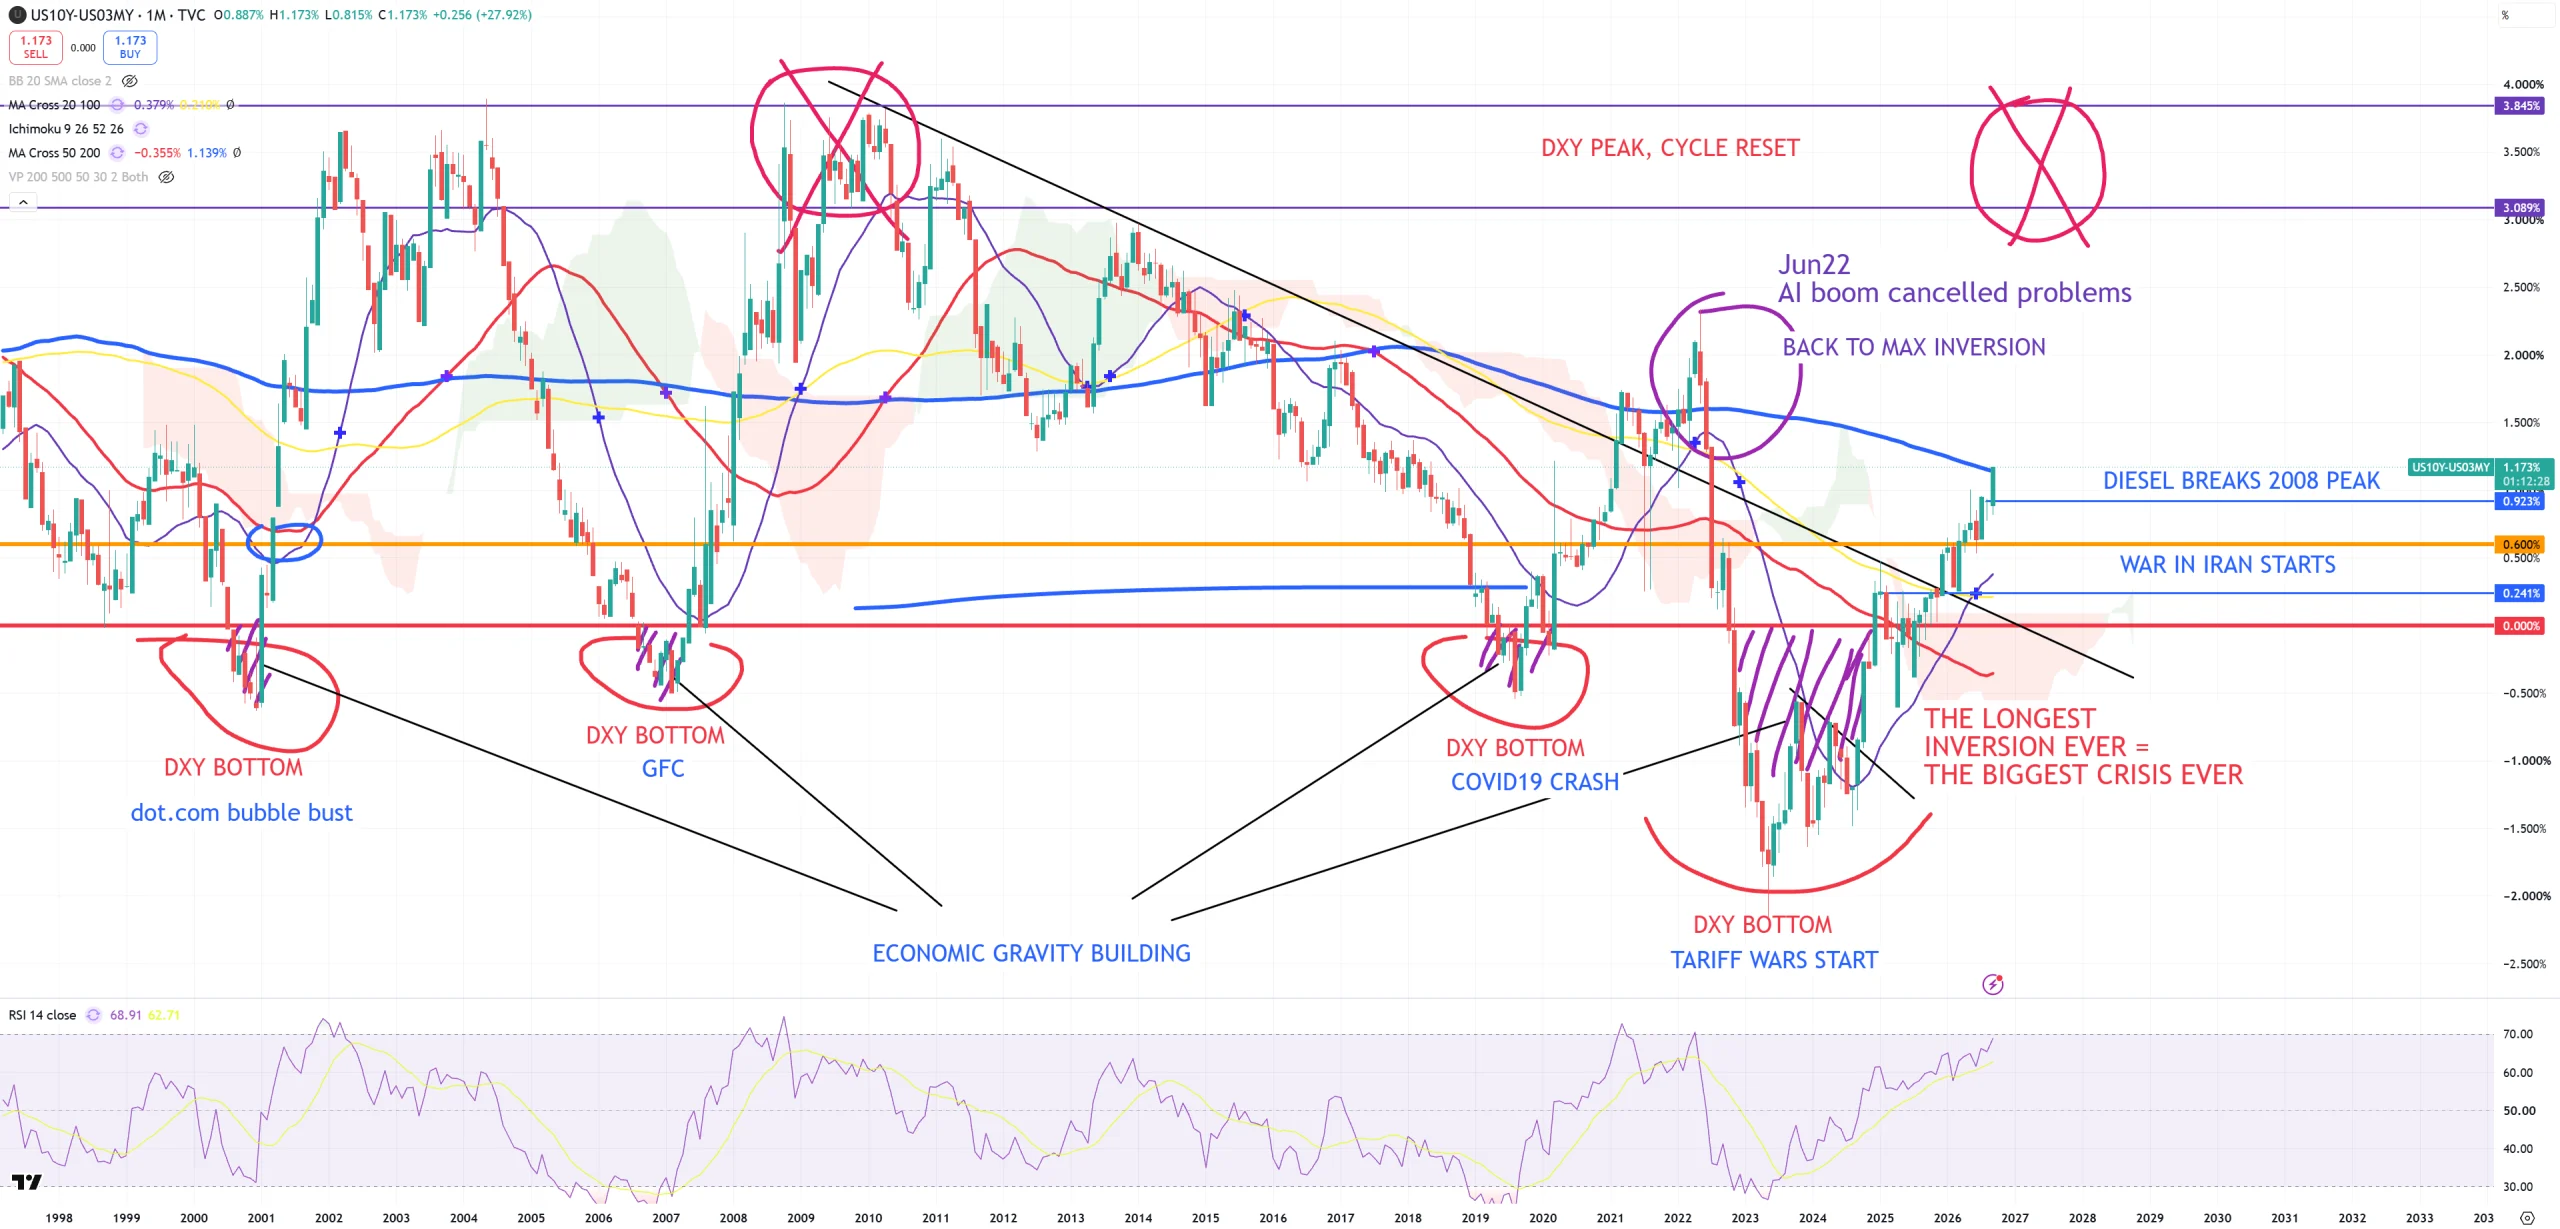
10y/3m – the economy heals and releases its massive gravity which has been accumulated during 2023-2025 inversion as blue (M)MA200 finally was broken again in September. Last spike above was a … false spike.
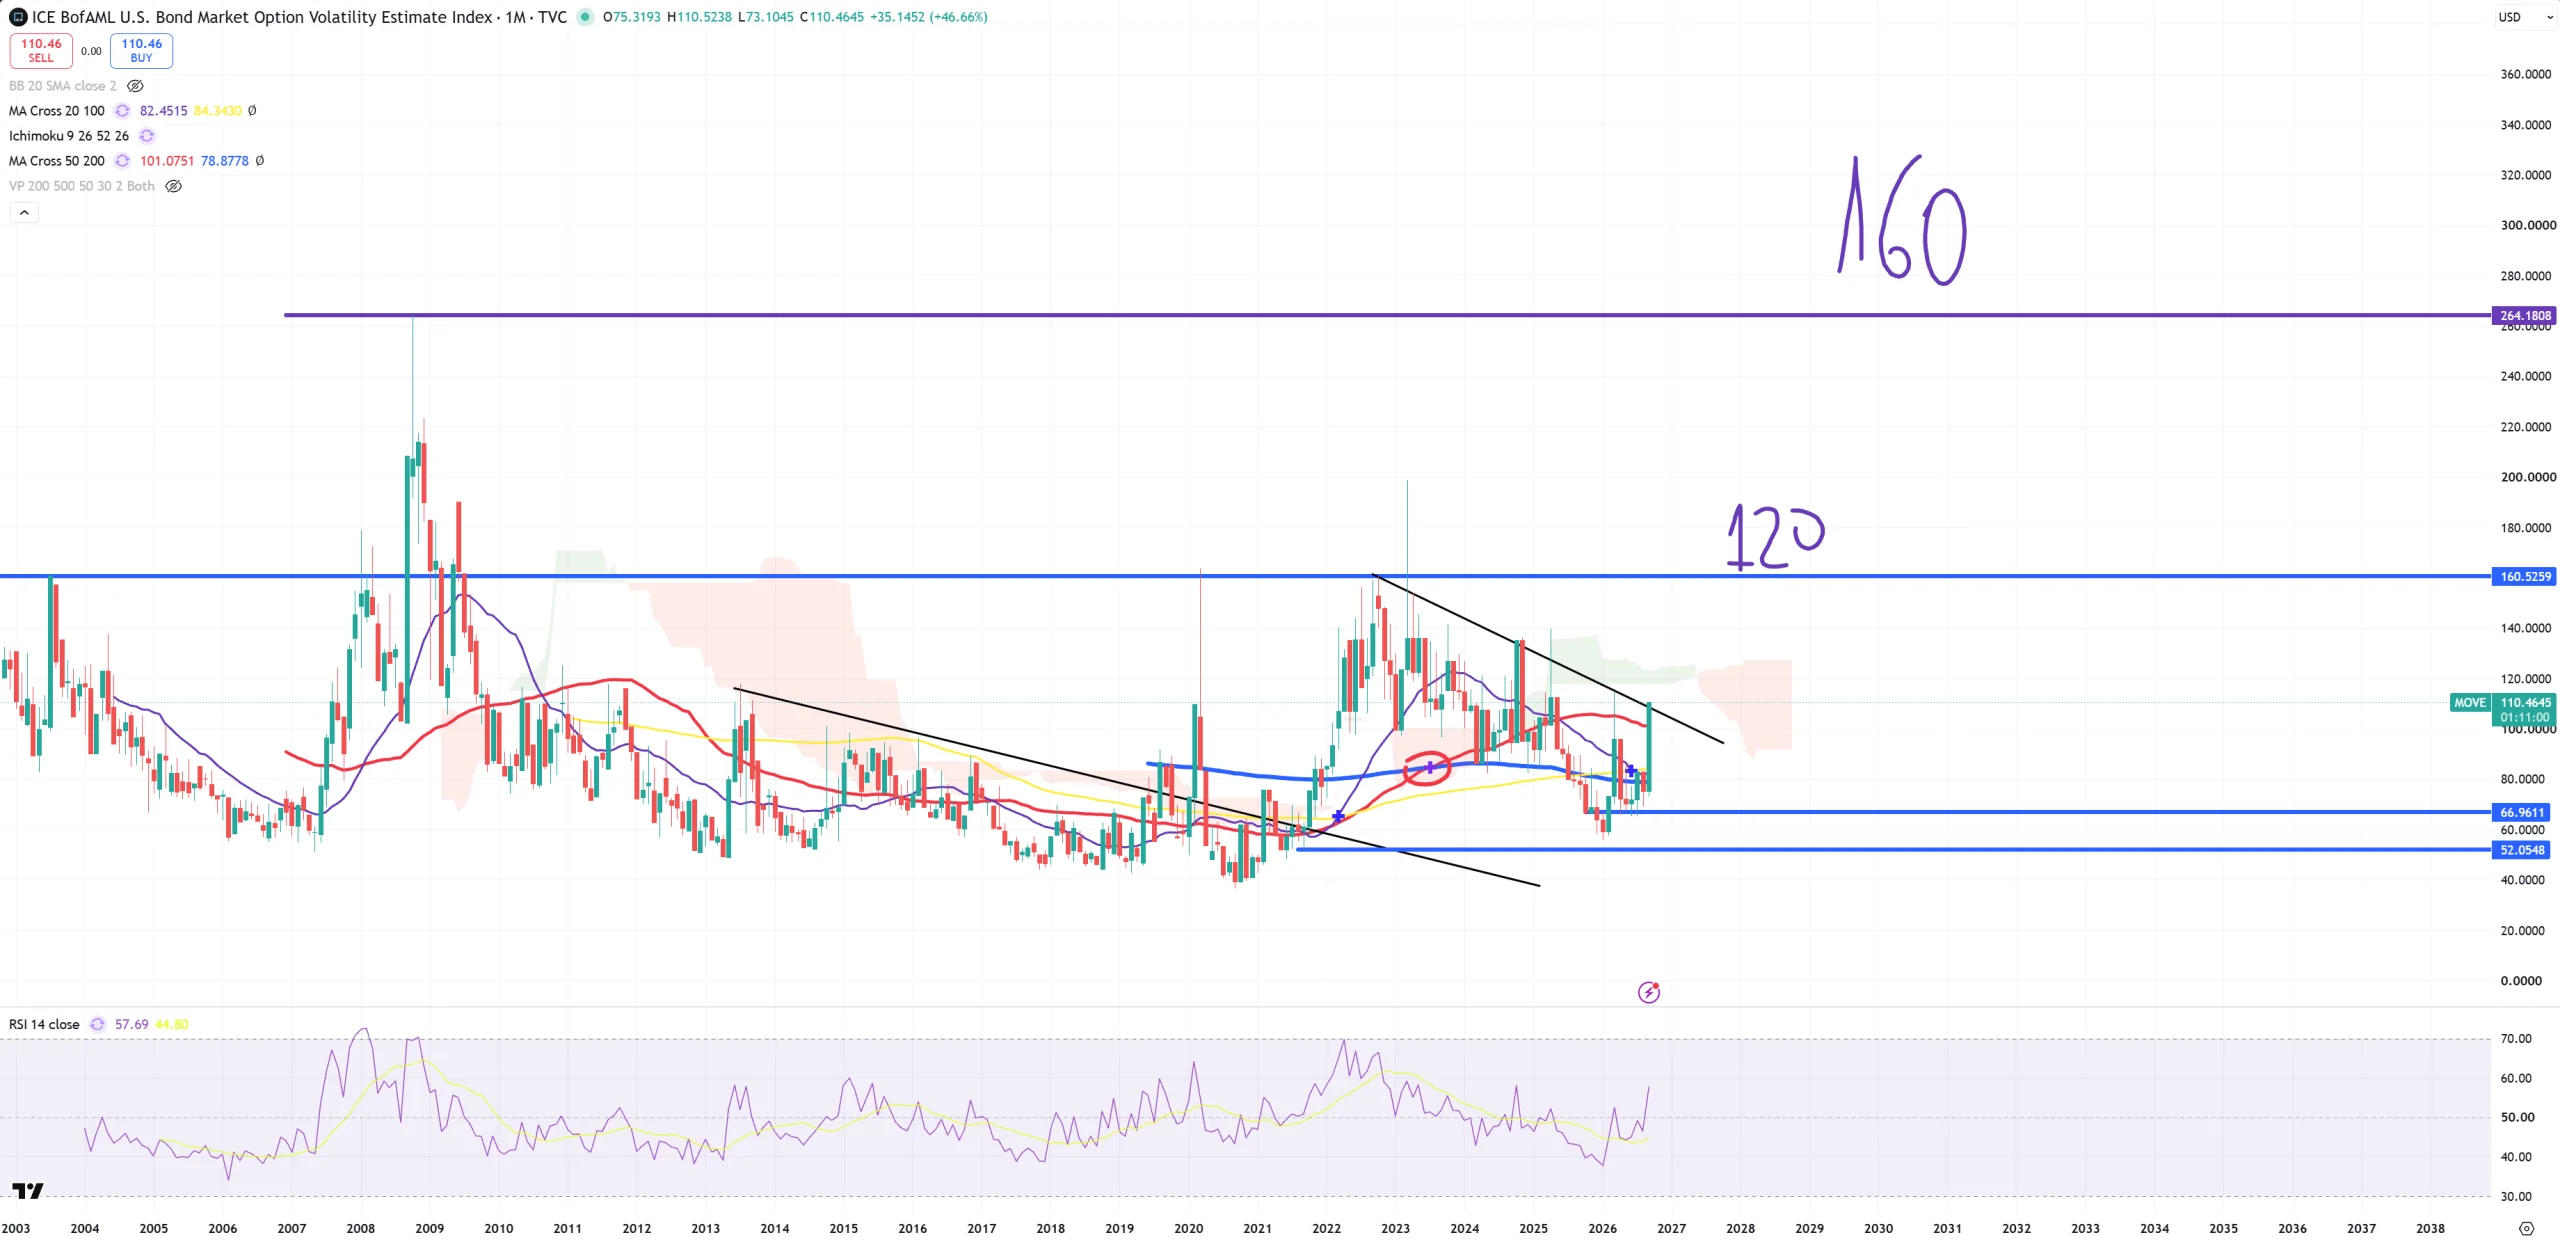
MOVE – Bond volatility as expected held its (M)MA200 and managed to break > red (M)MA50 and trend break? Those 120 and 160 levels are DXY levels expected.
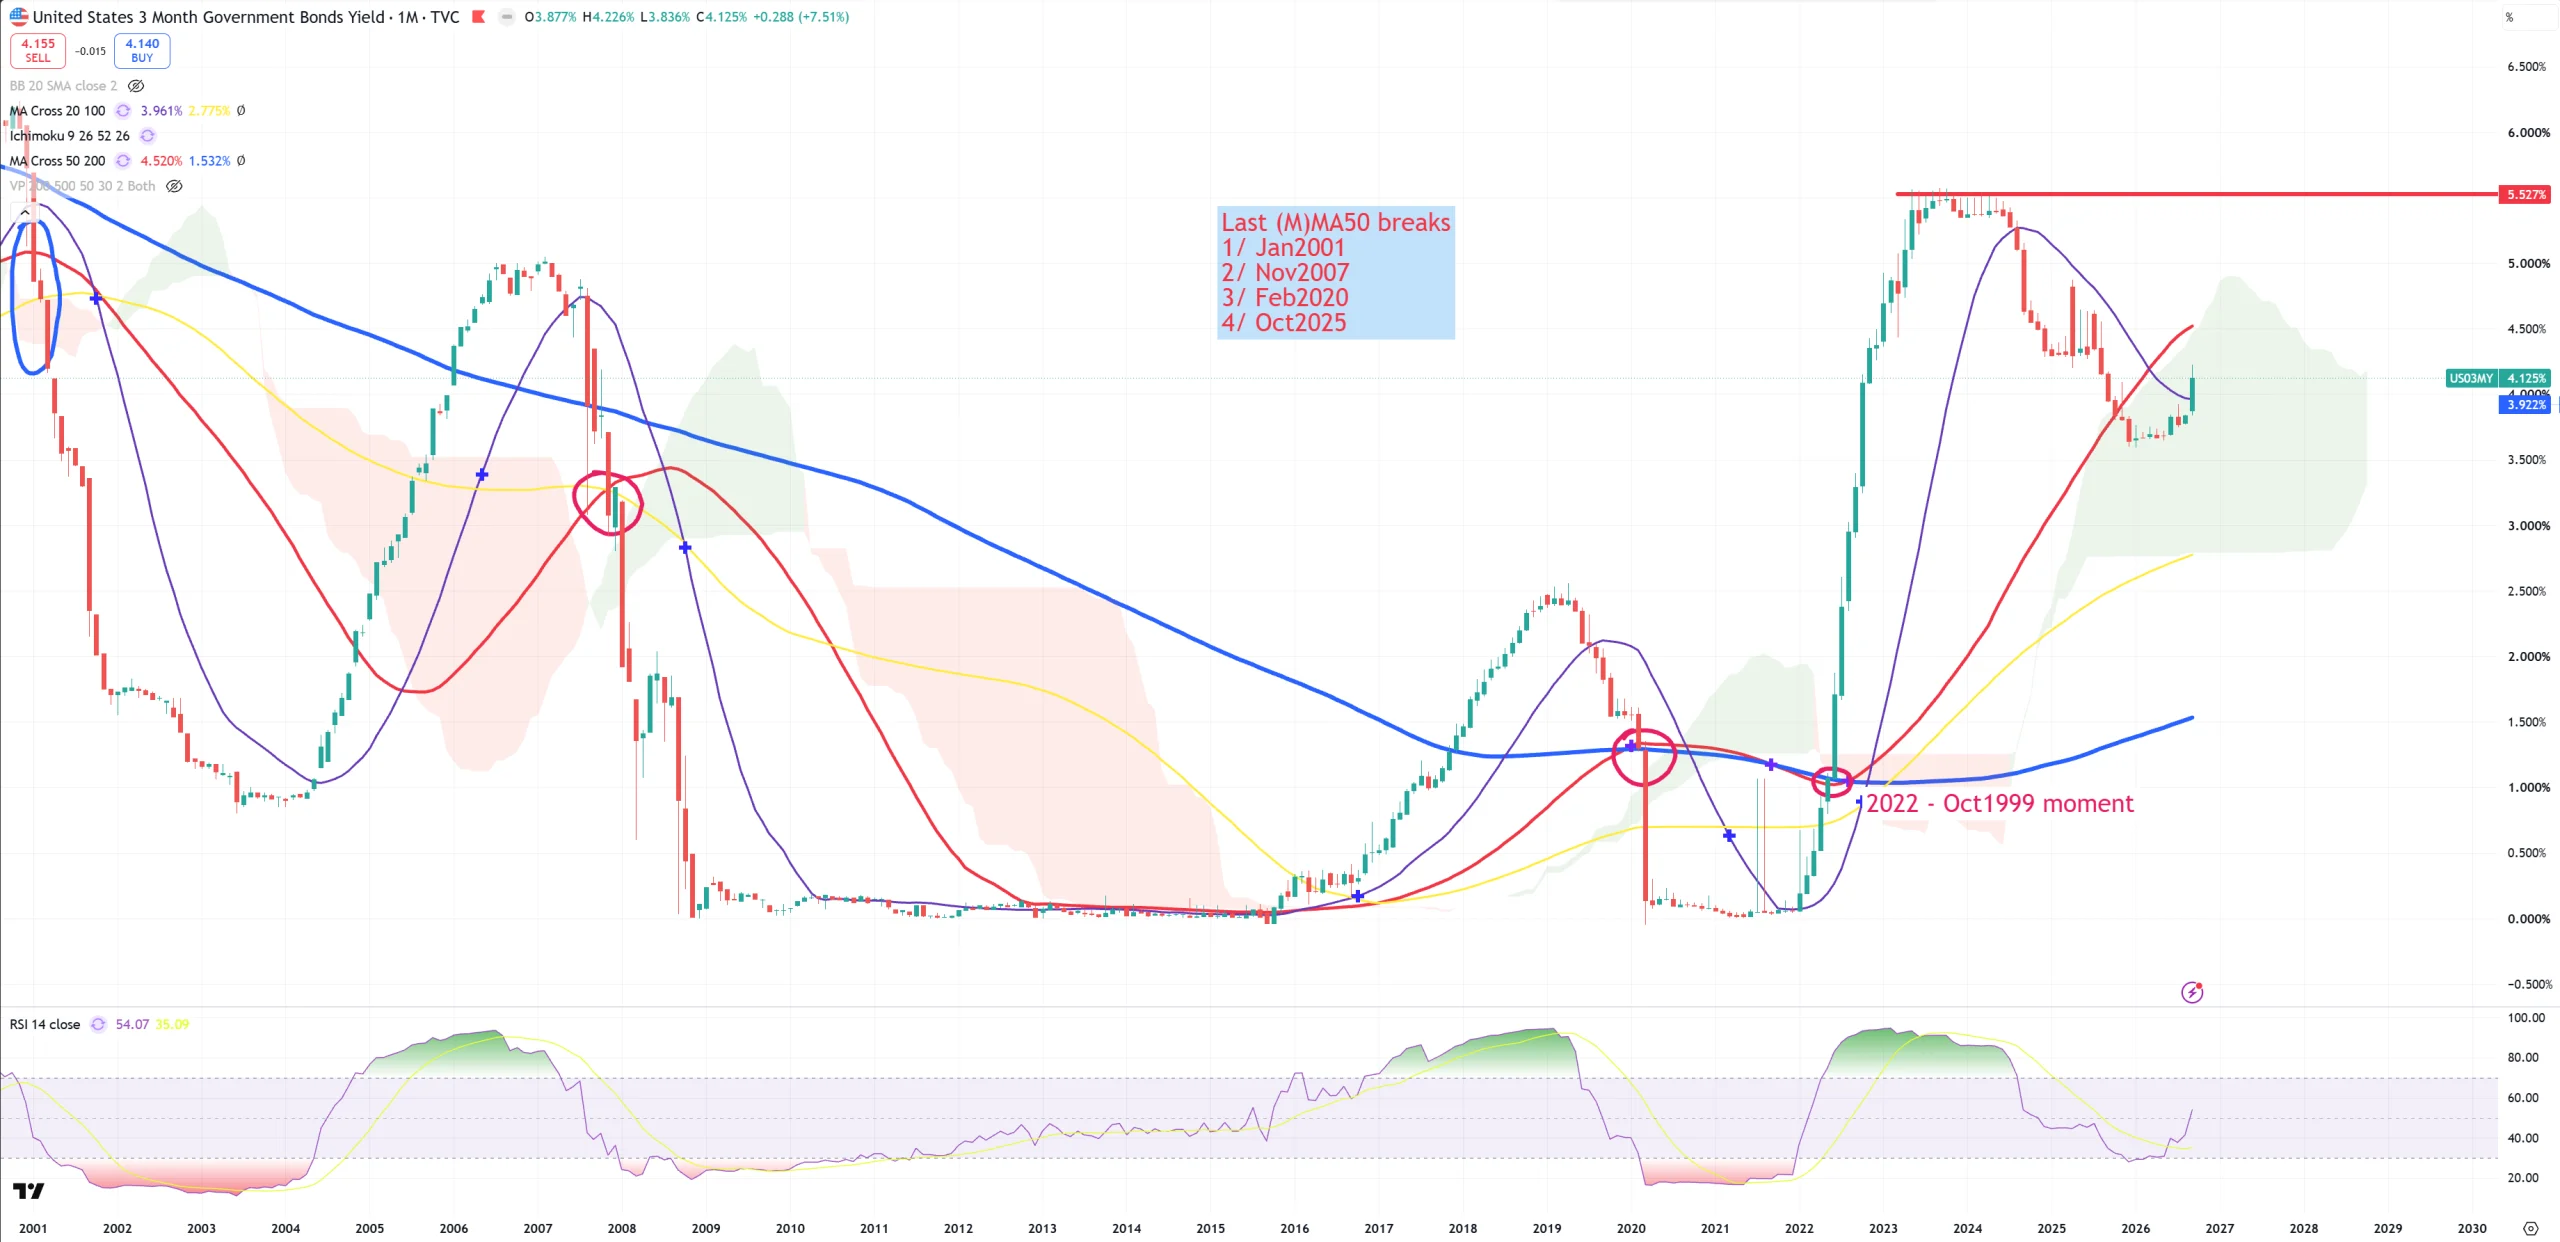
US03MY – red (M)MA50 is 4.50% – looks like now around 2x25bps hikes on the table after the first one, but it’s not guaranteed.
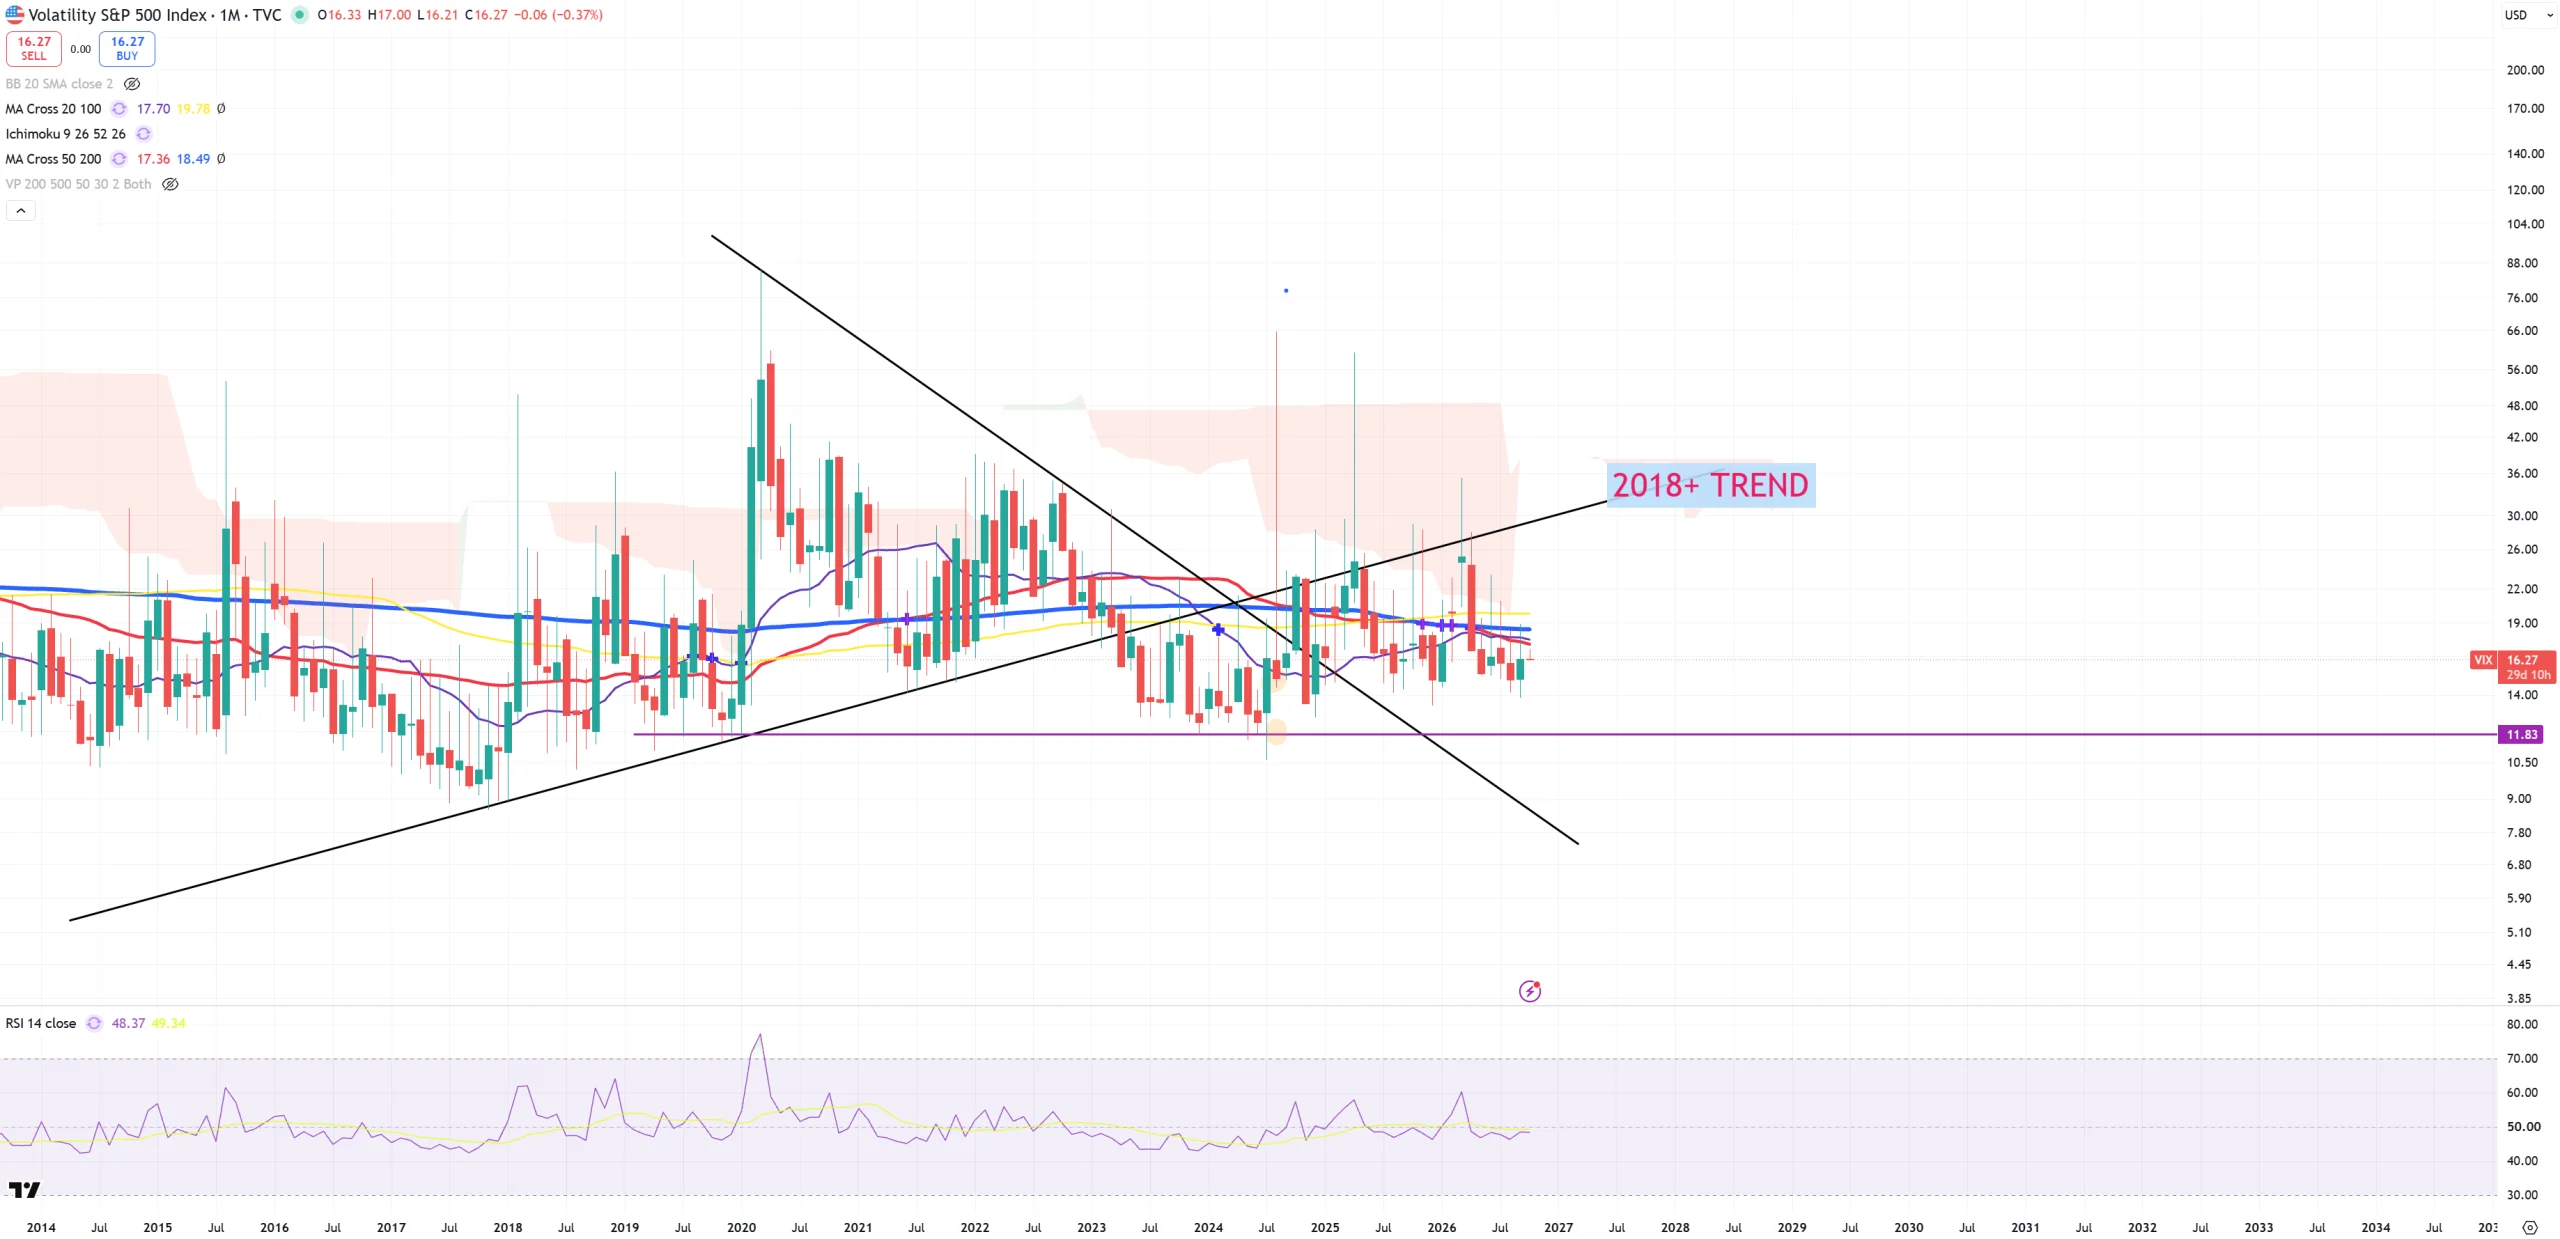
VIX – it’s like nothing happens. Full of oil, interest rates going down.
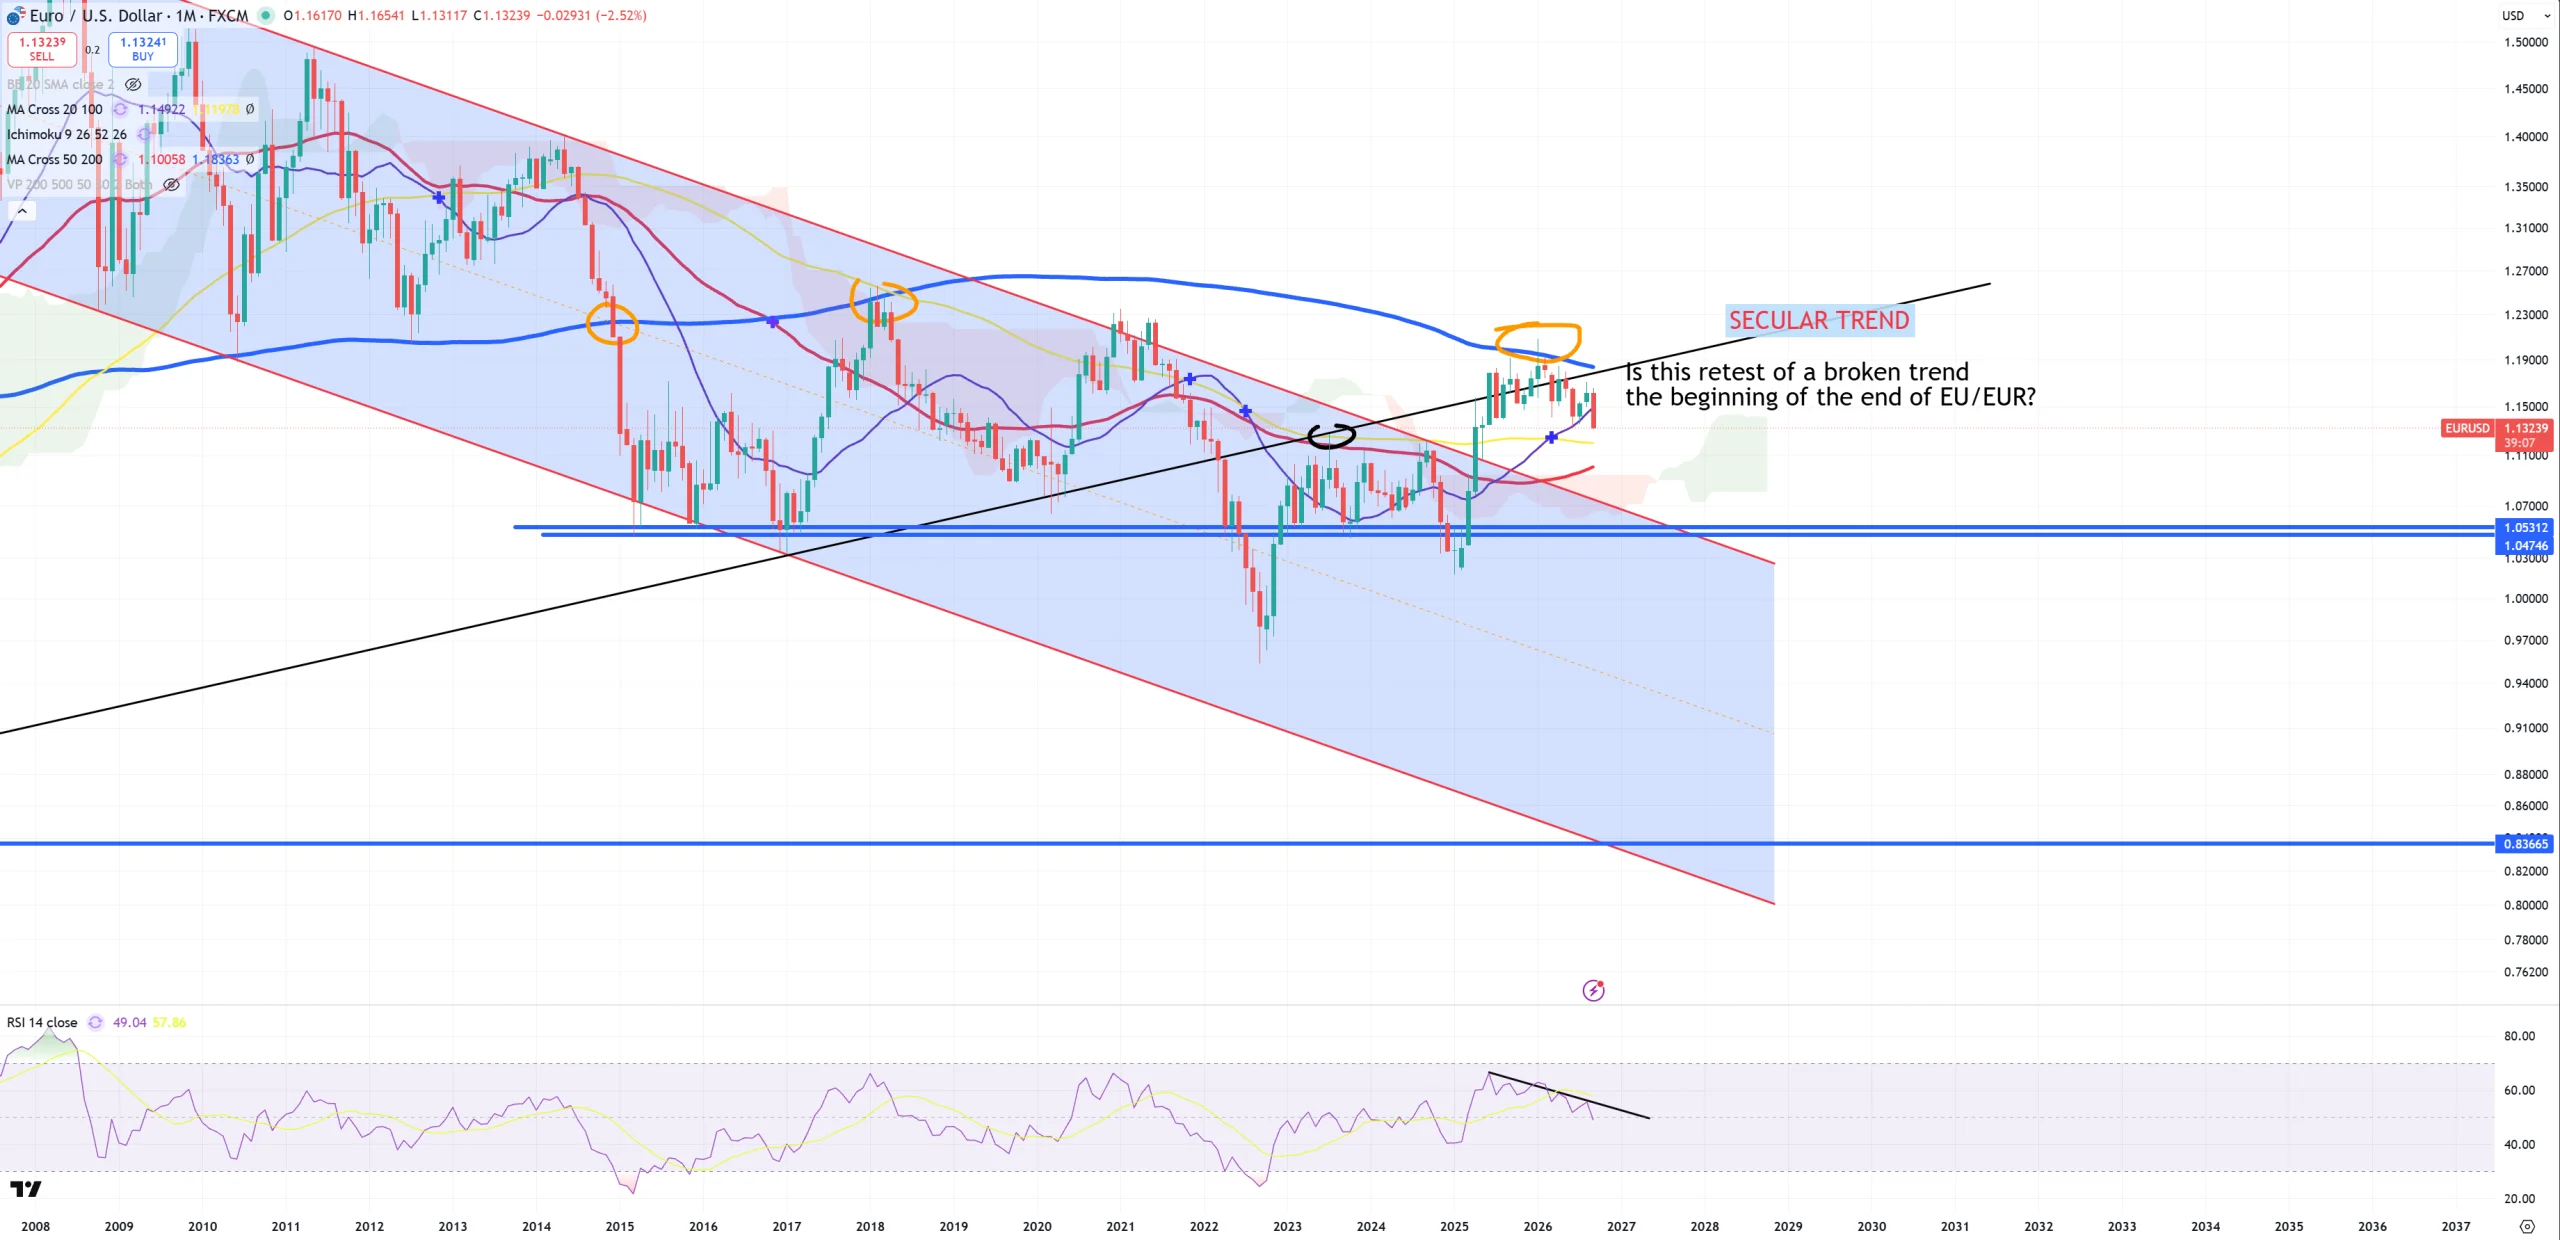
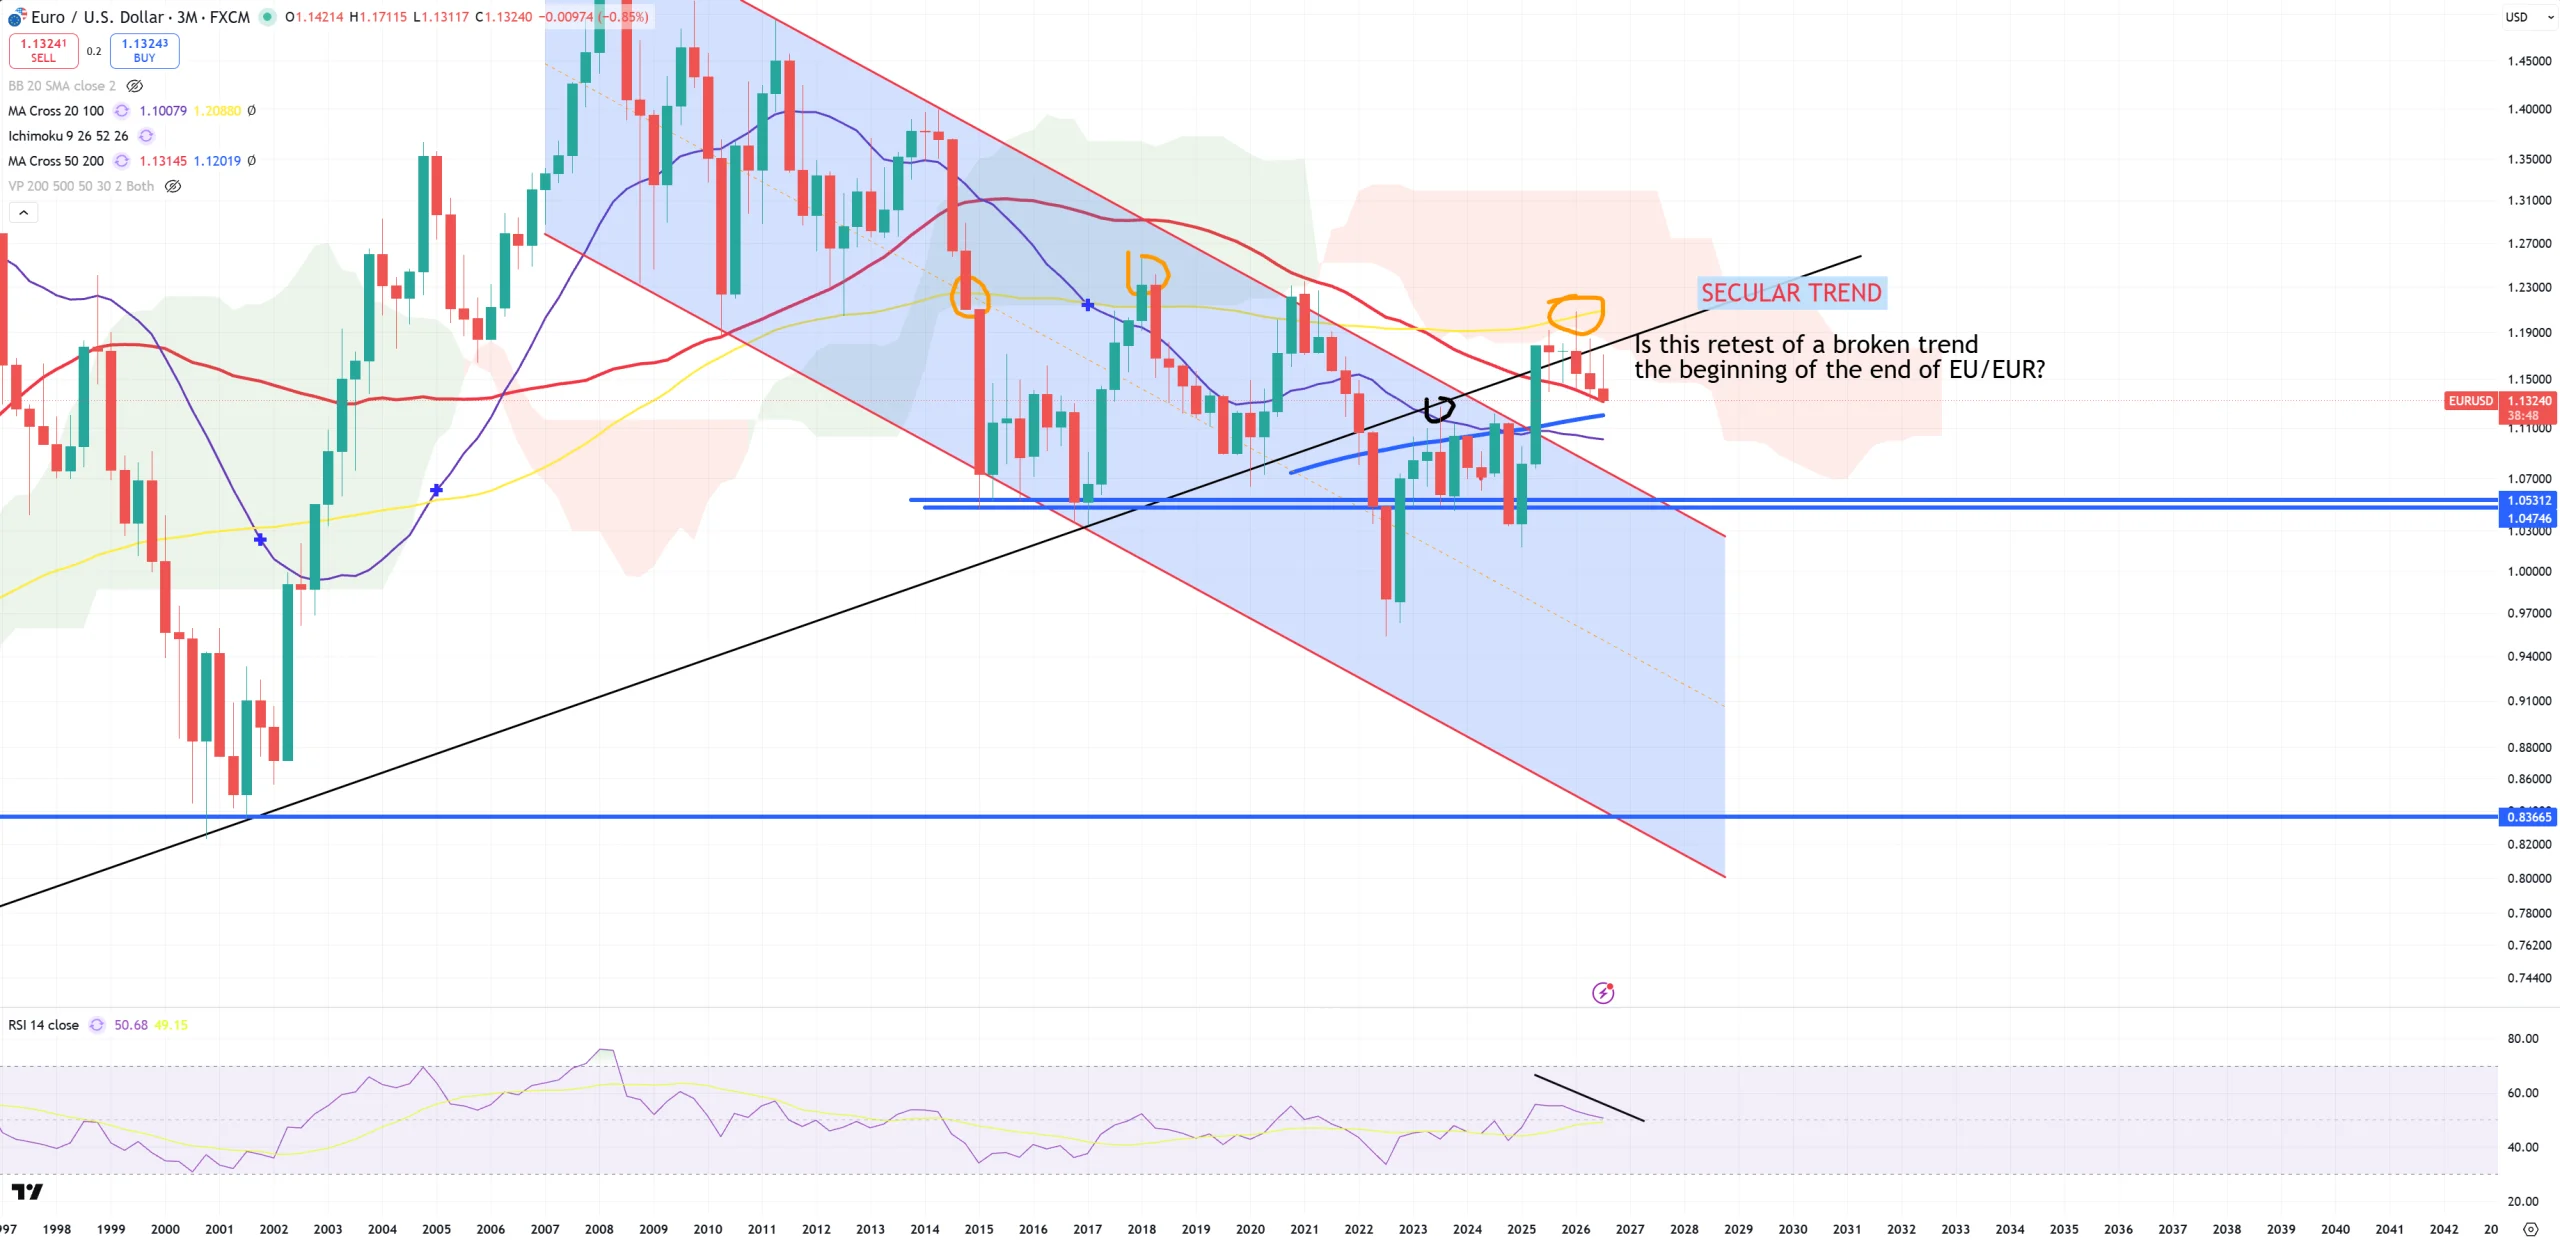
EURUSD – an entrance to DXY … As expected during yield-curve uninversion process EURUSD found its peak at the last possible border, blue (M)MA200 and 1.20. Ending quarter on red (3M)MA50. First chart (M) second (3M). If I have to tell you what part of the last 2009+ cycle I disagree the most I would say : move of EURUSD from 1.05 to 1.20 (DXY from 110 to 95).
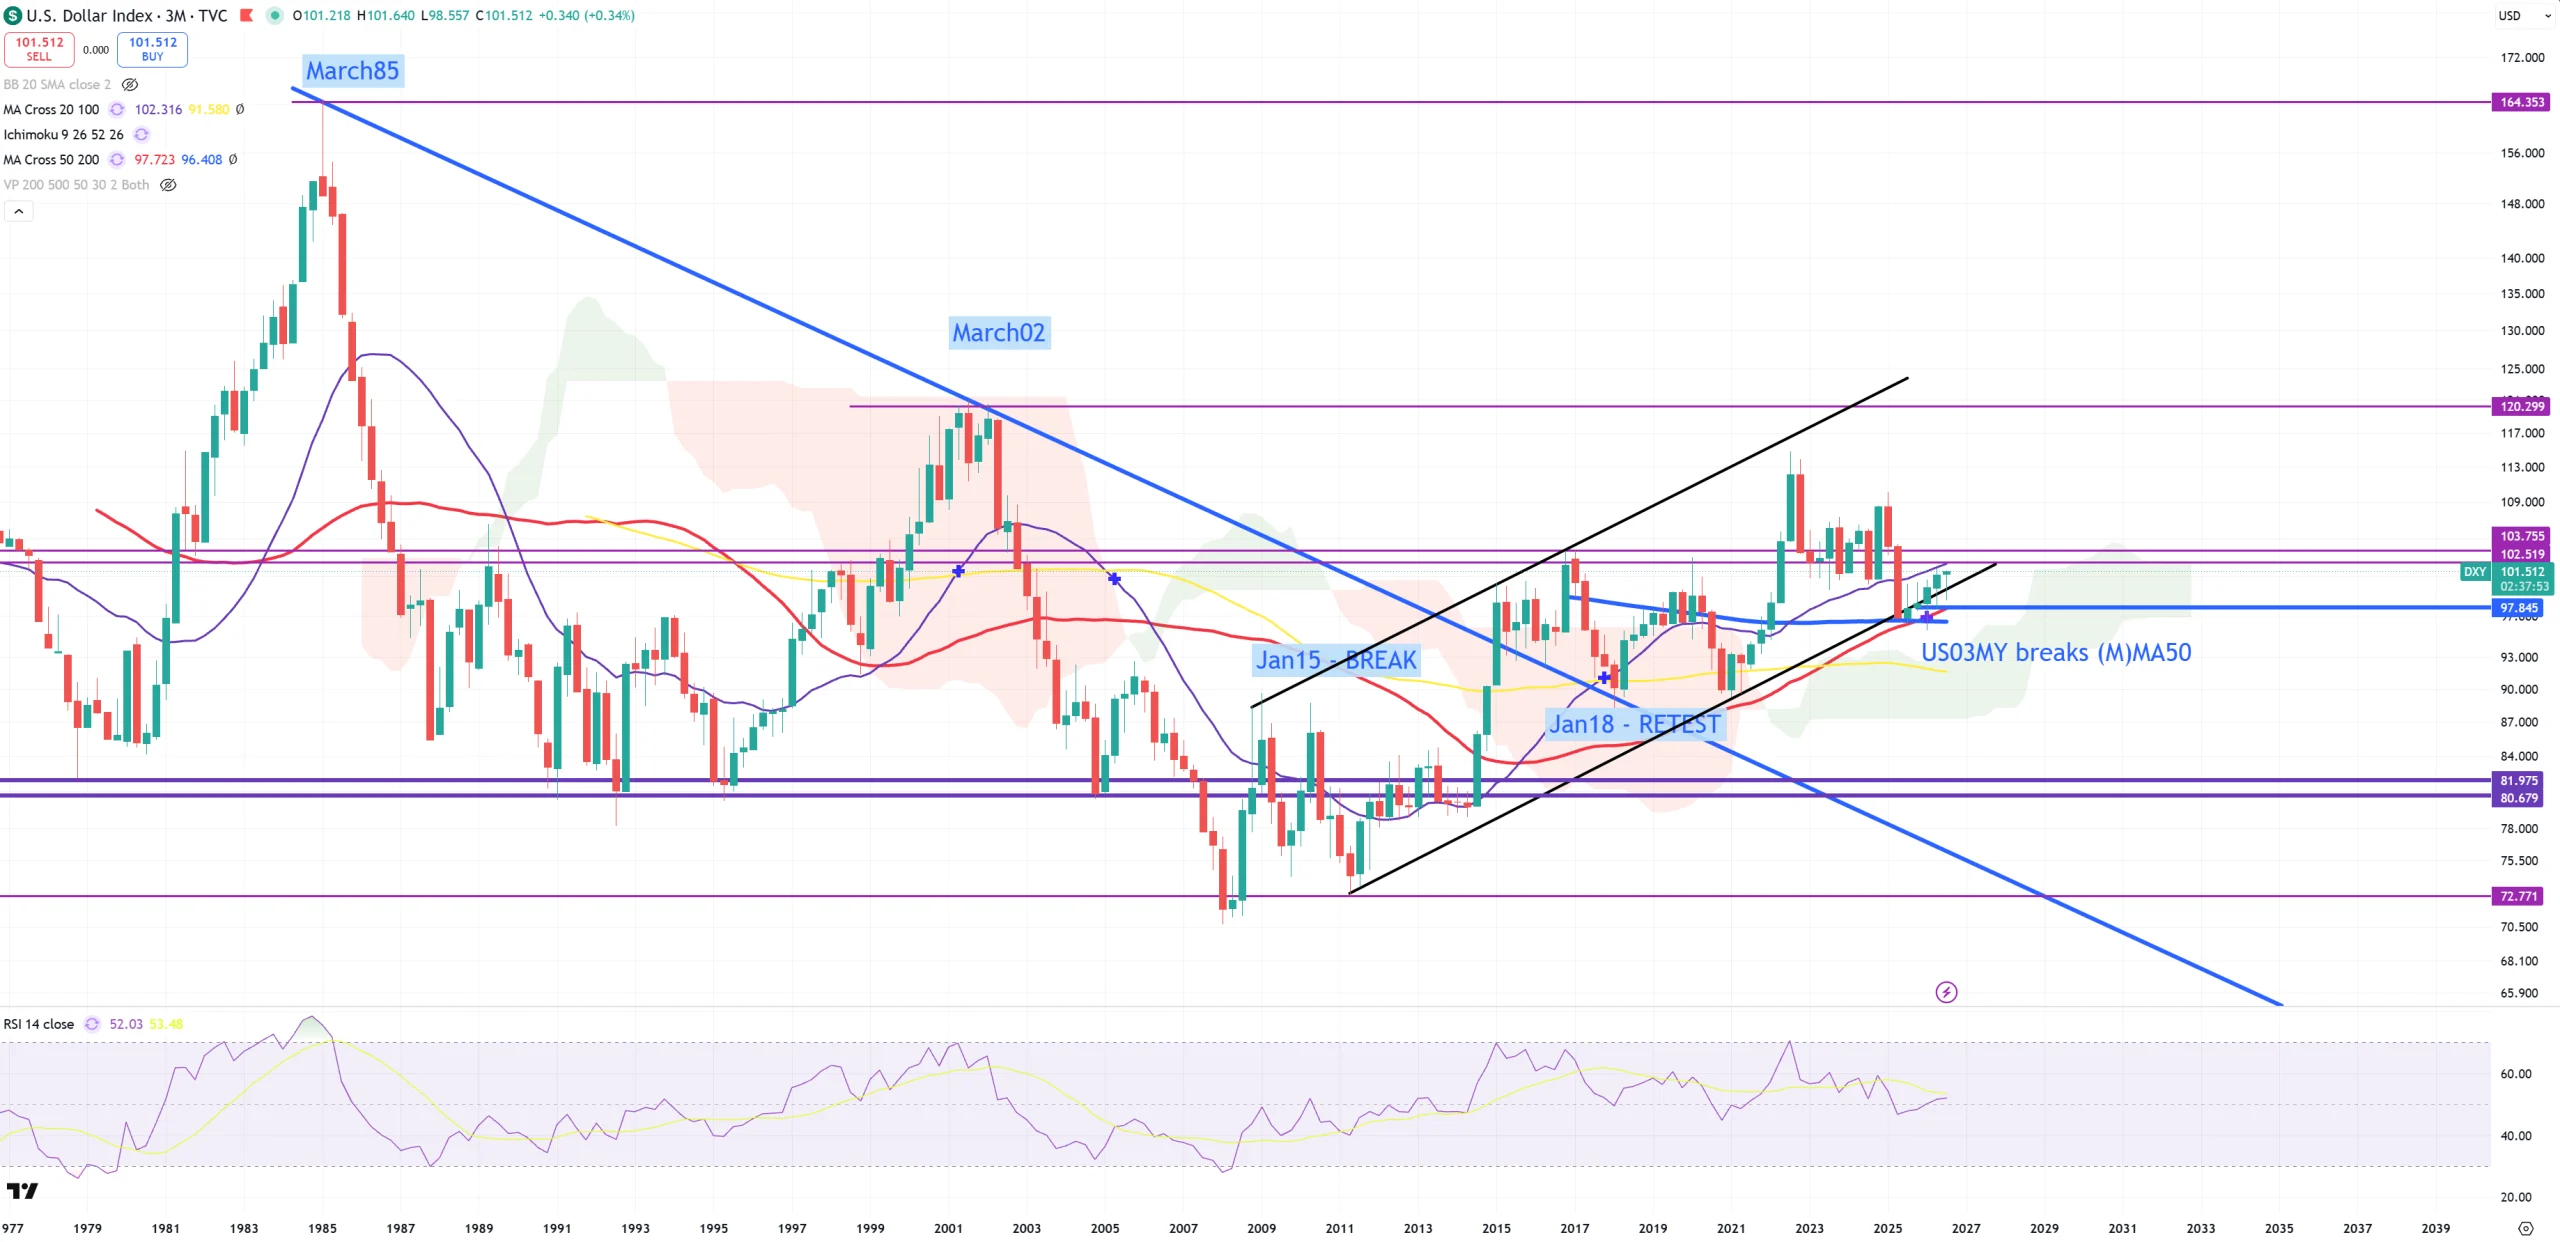
DXY – massive bullish 3M candles and super secular golden cross at 95.8 (red (3M)MA50 > blue (3M)MA200)
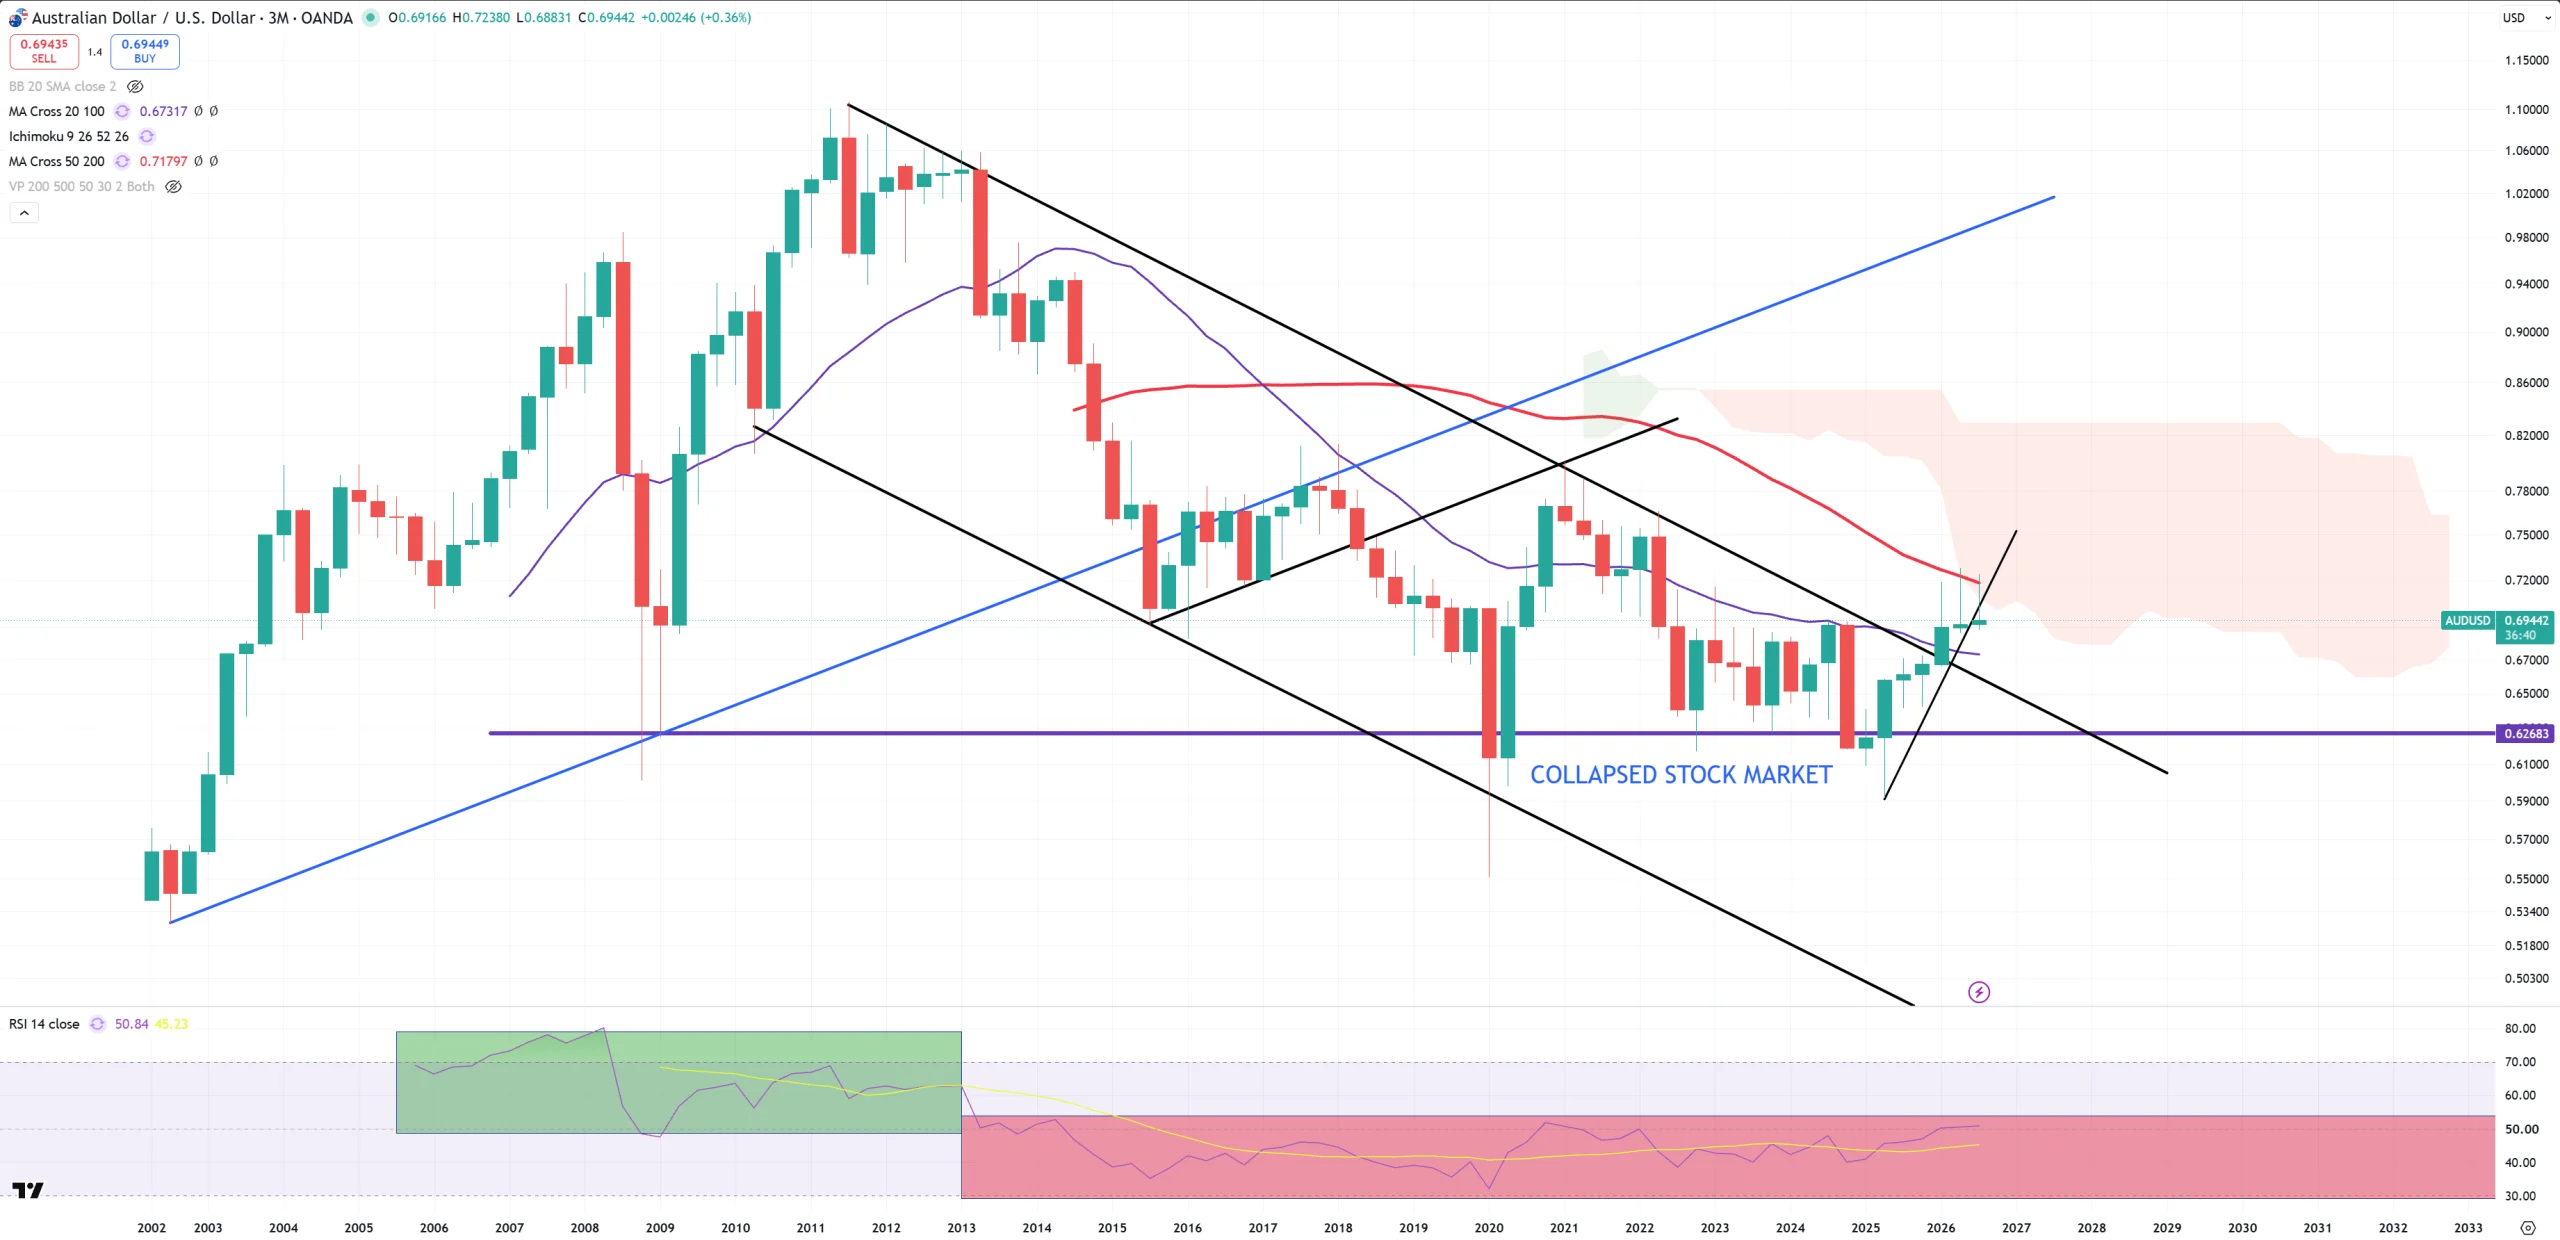
AUDUSD – and its (3M)MA50 last 0.725 level rejection
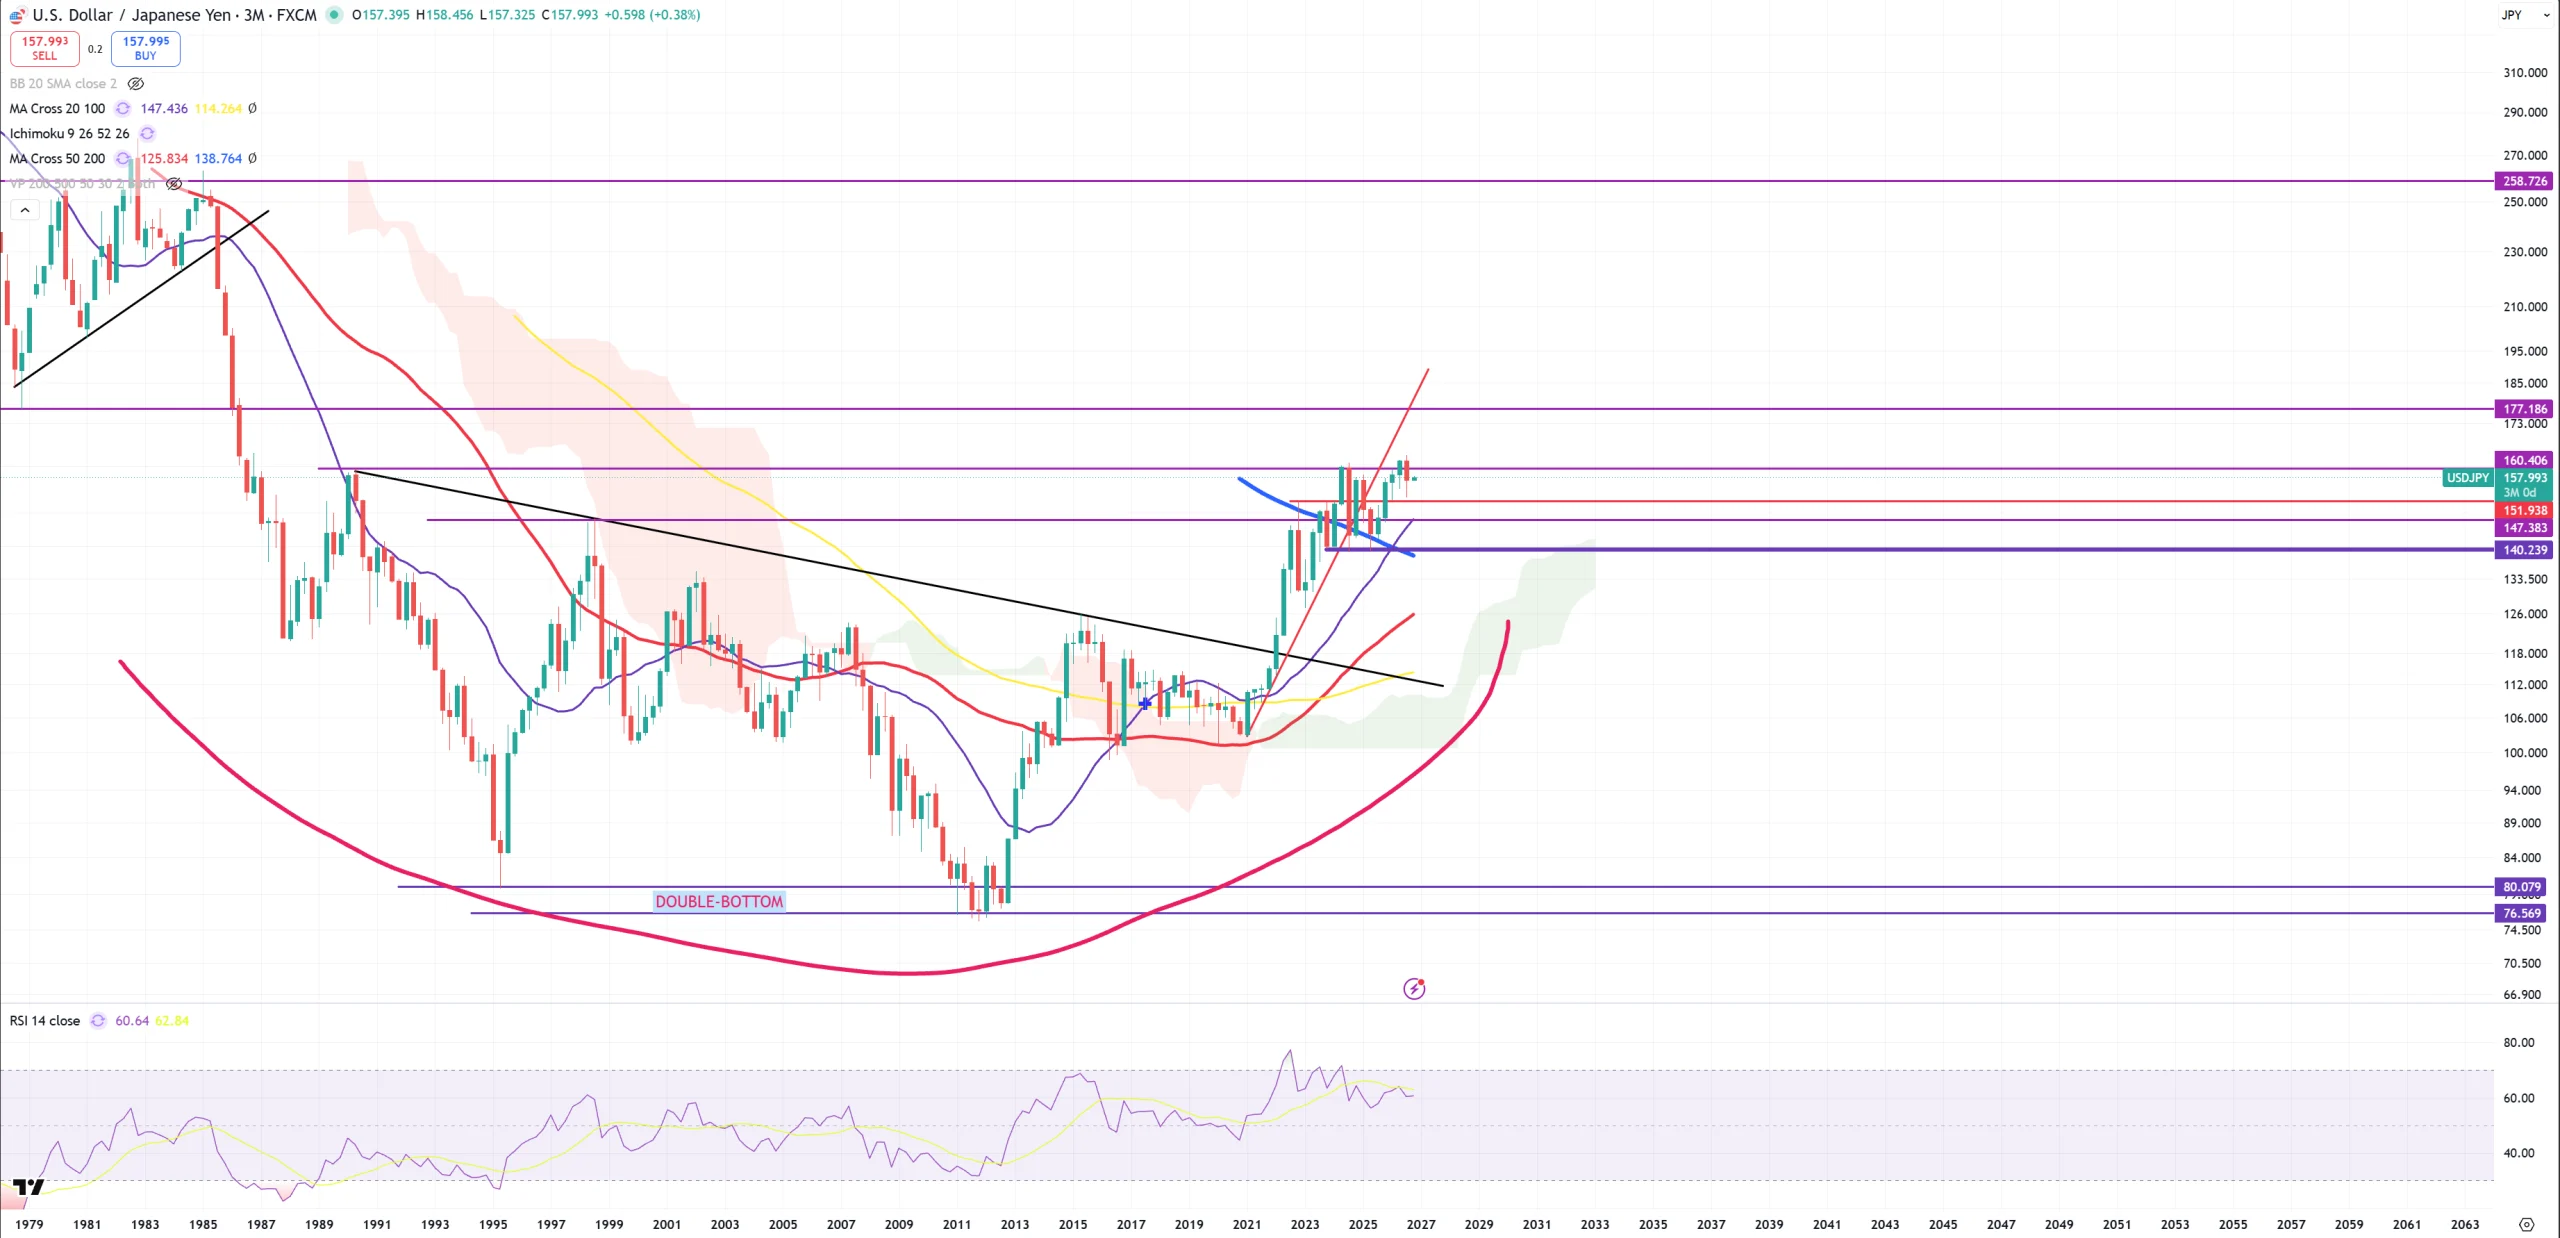
USDJPY – 3M view – not much to show until 160 breaks or 145 breaks.
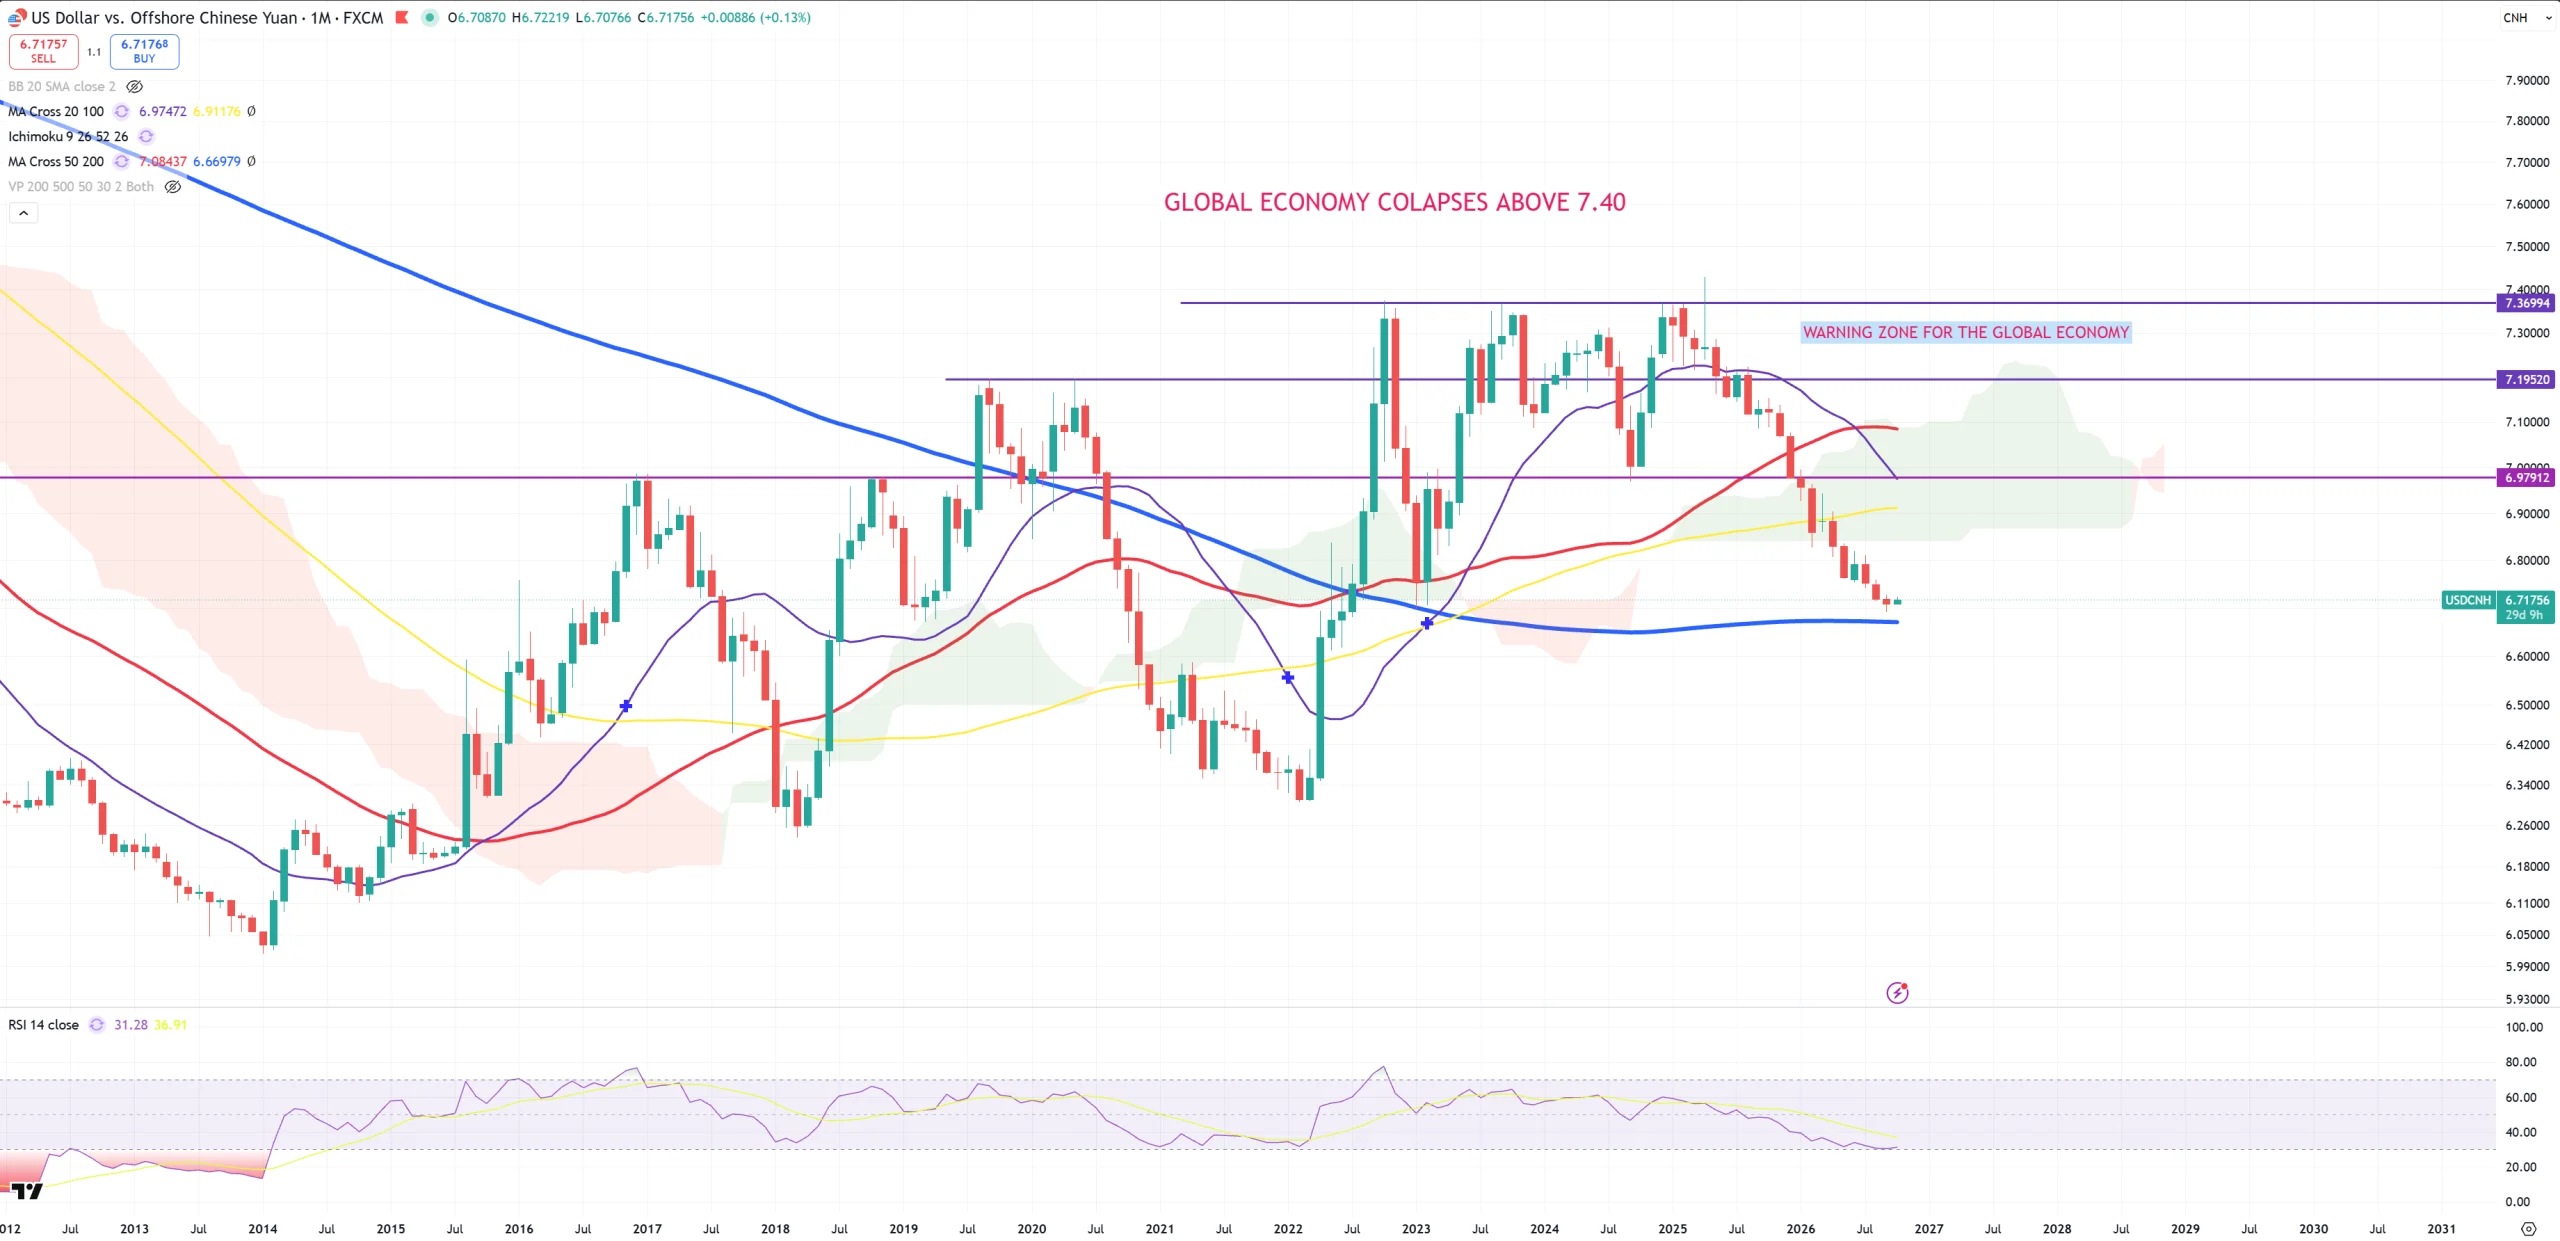
USDCNH – if DXY goes up, USDCNH goes up and AUDUSD goes down taking EURUSD with them. There’s no any other level lower than 6.66 and (M)MA200. USDCNH up = deflation exports to the world.
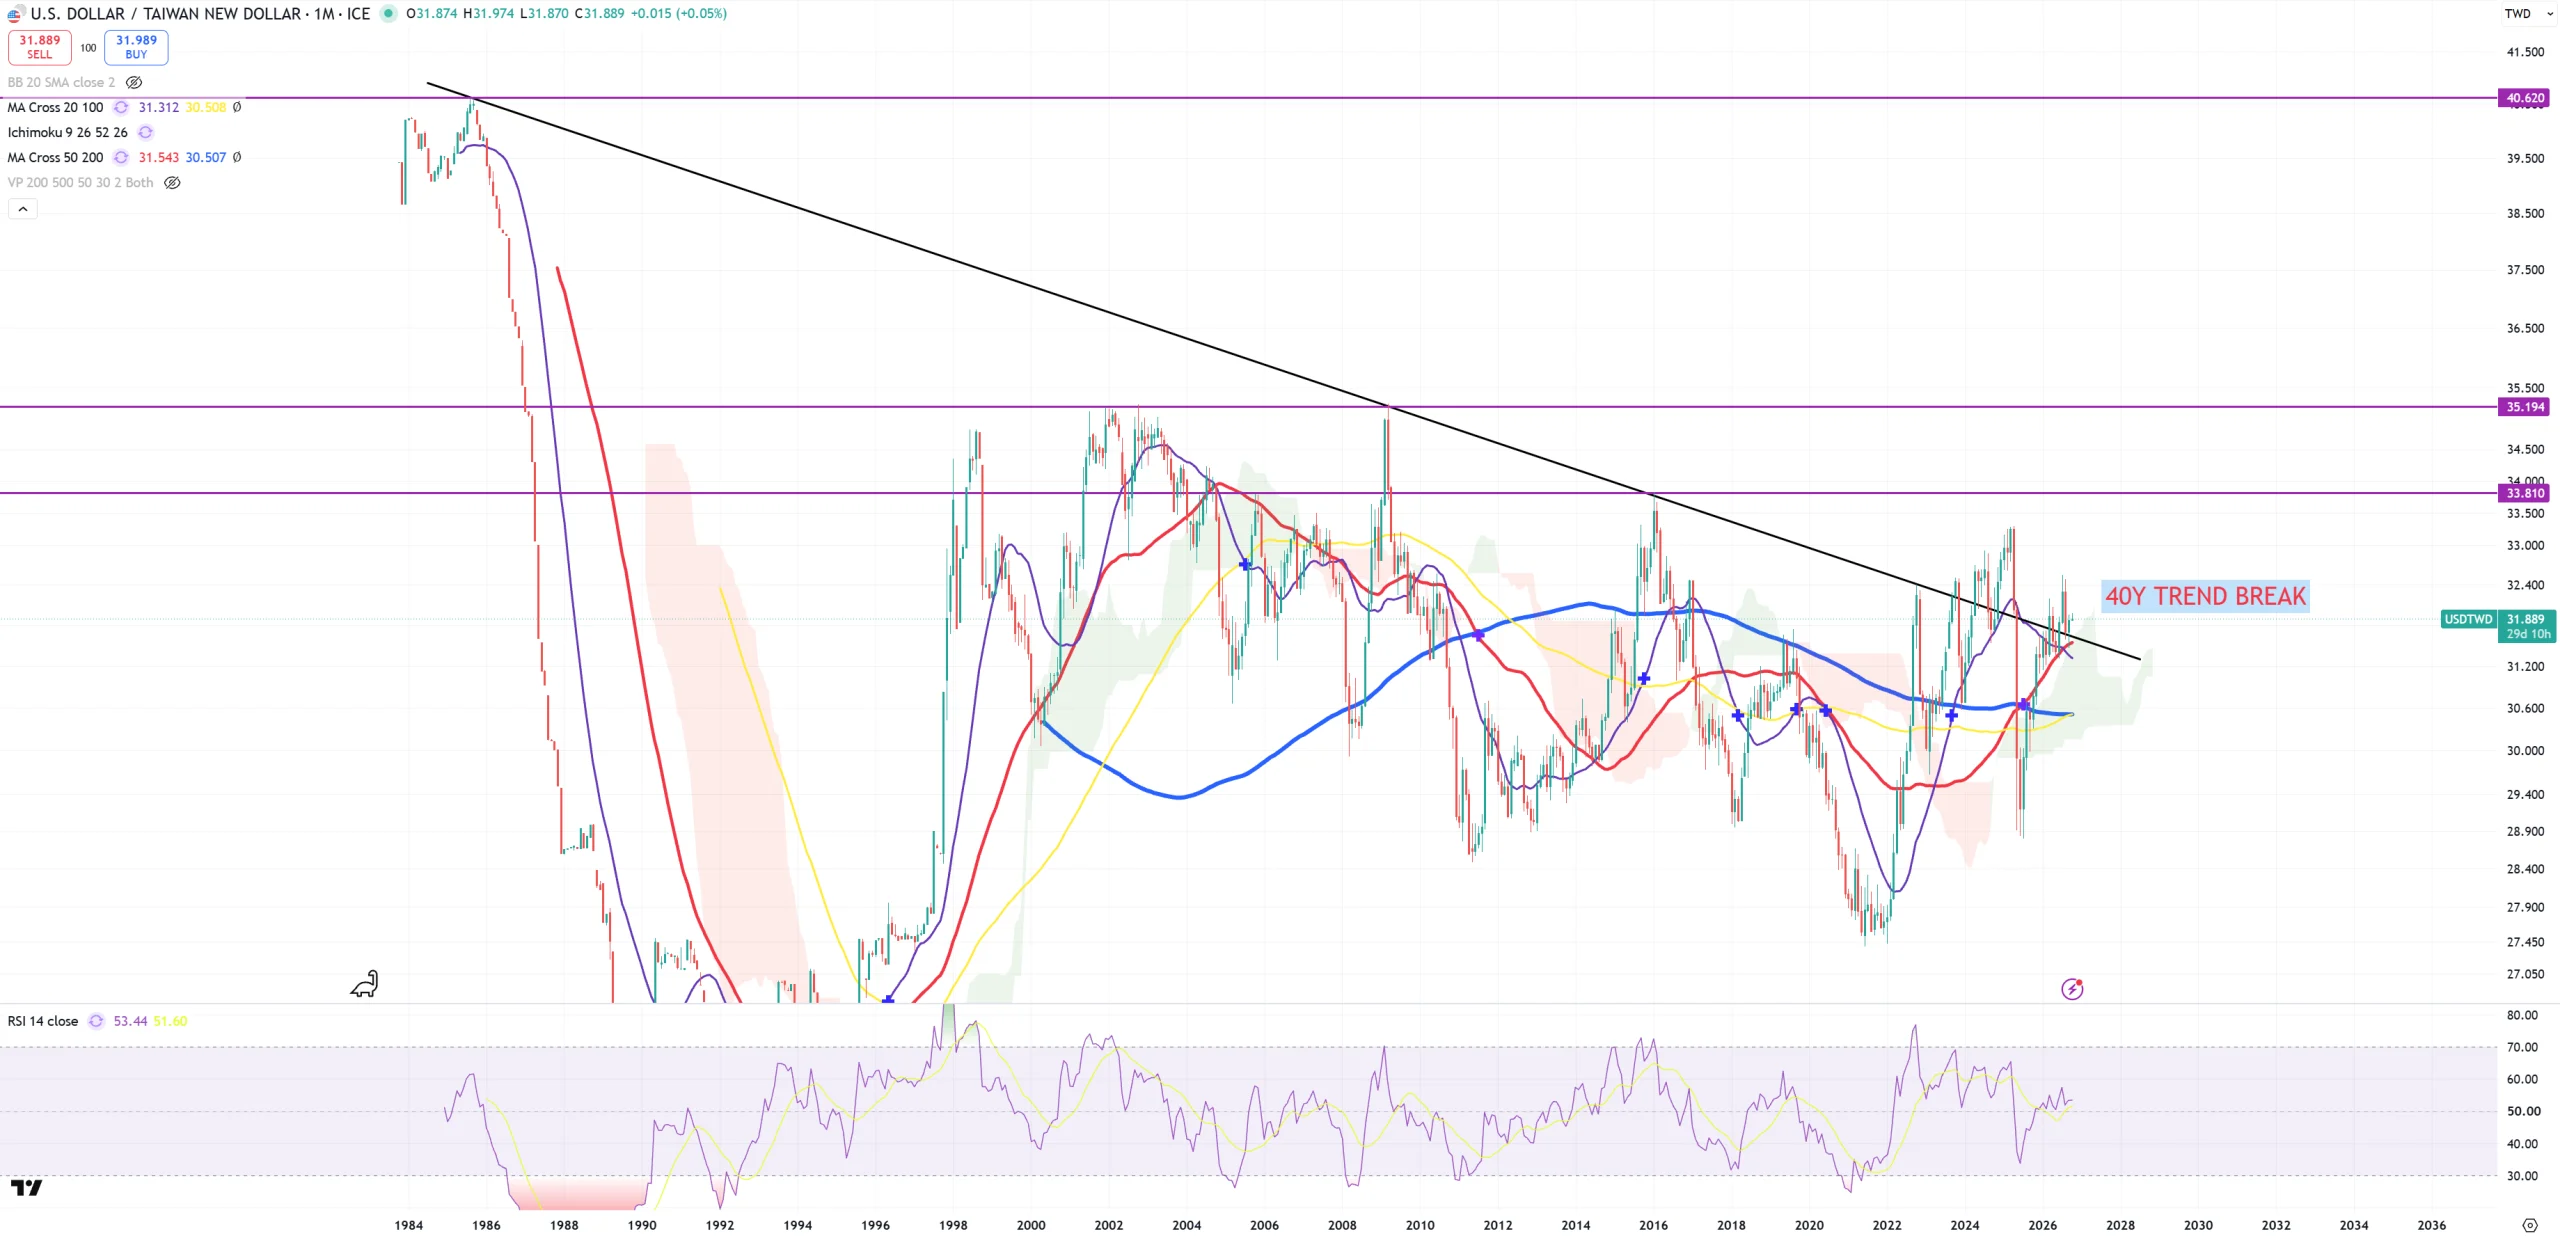
USDTWD – should be here so high on the list, unless something important happens like another attempt to break its 40Ys trend.
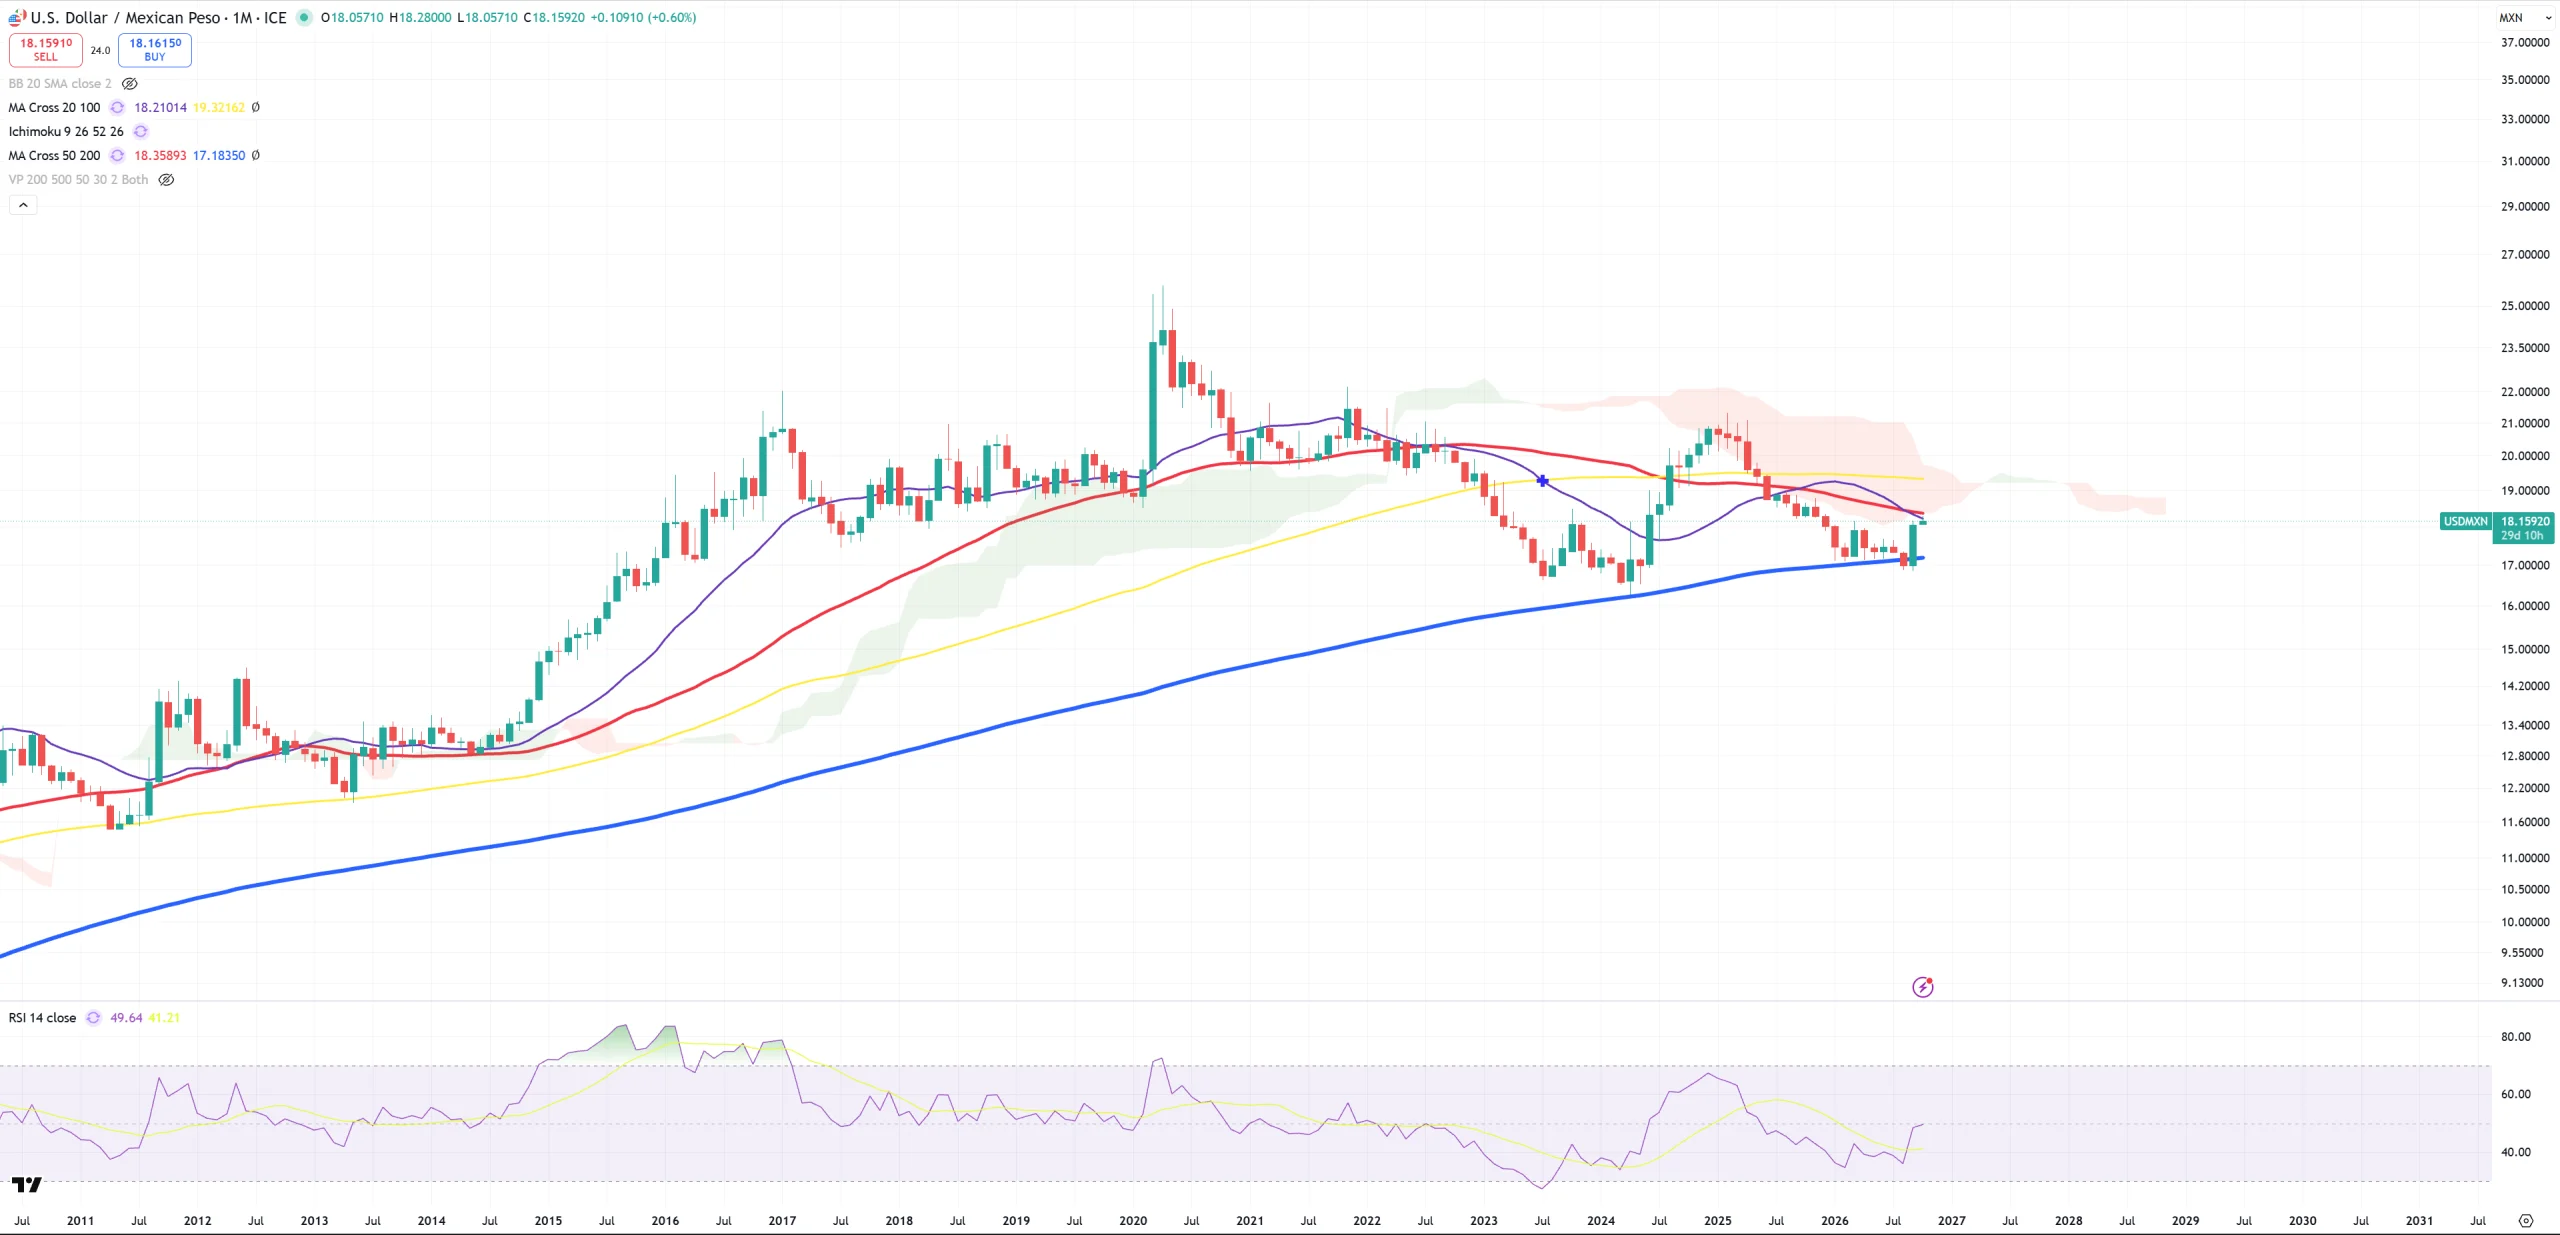
USDMXN – last level (M)MA200
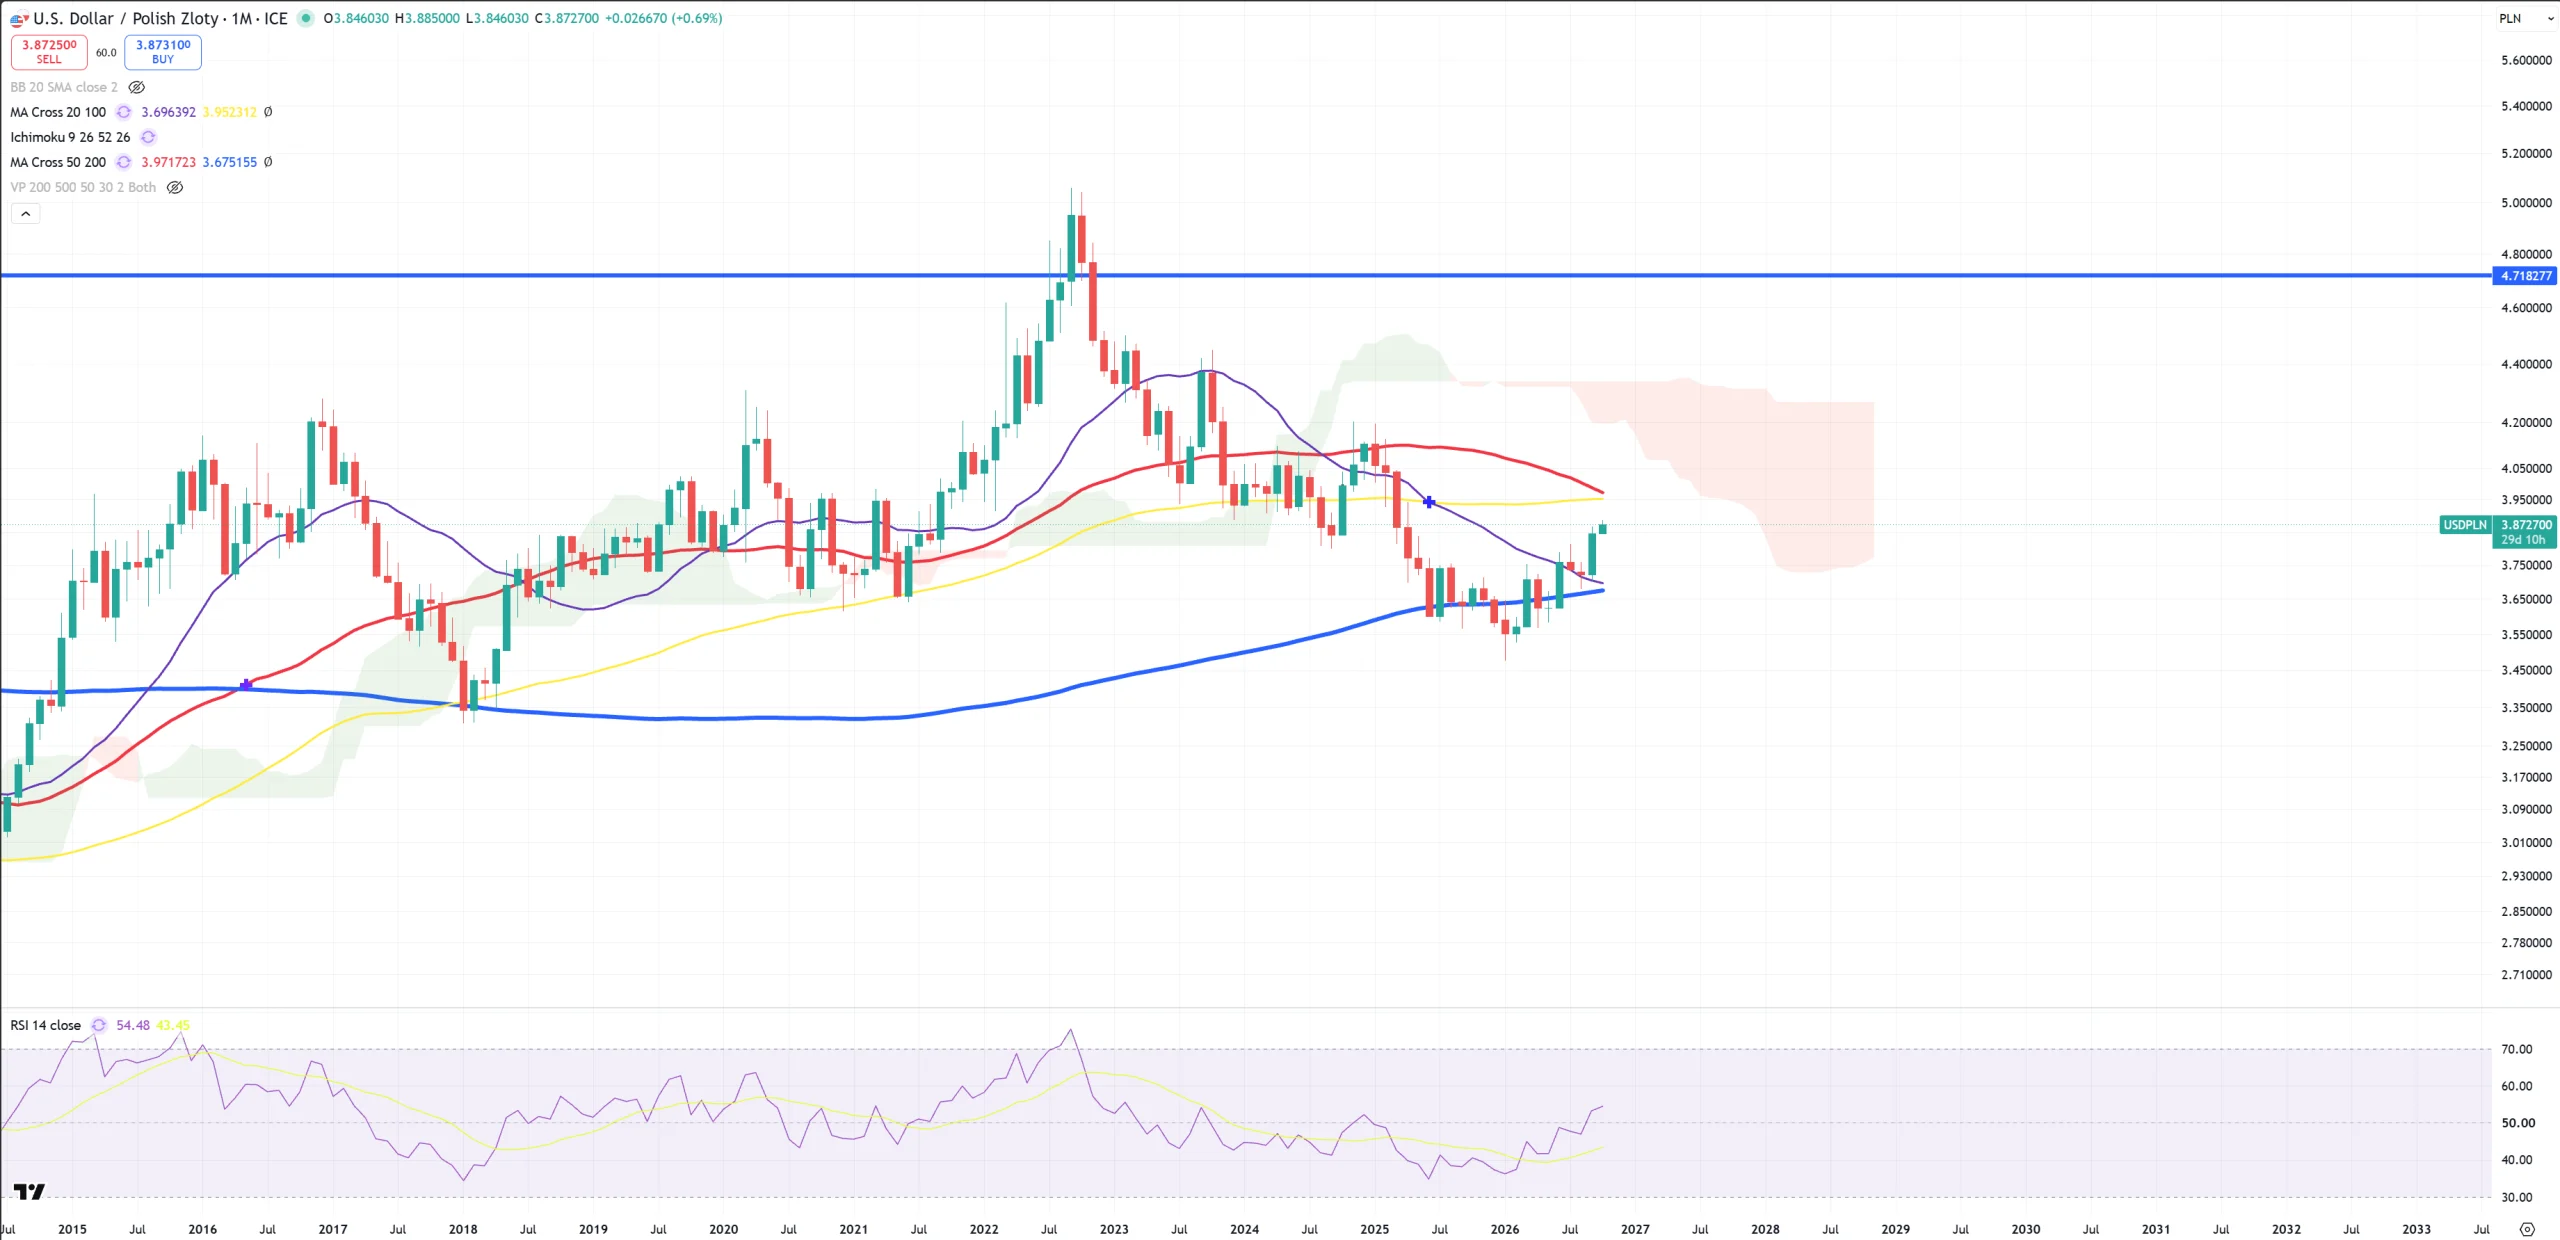
USDPLN – last level (M)MA200
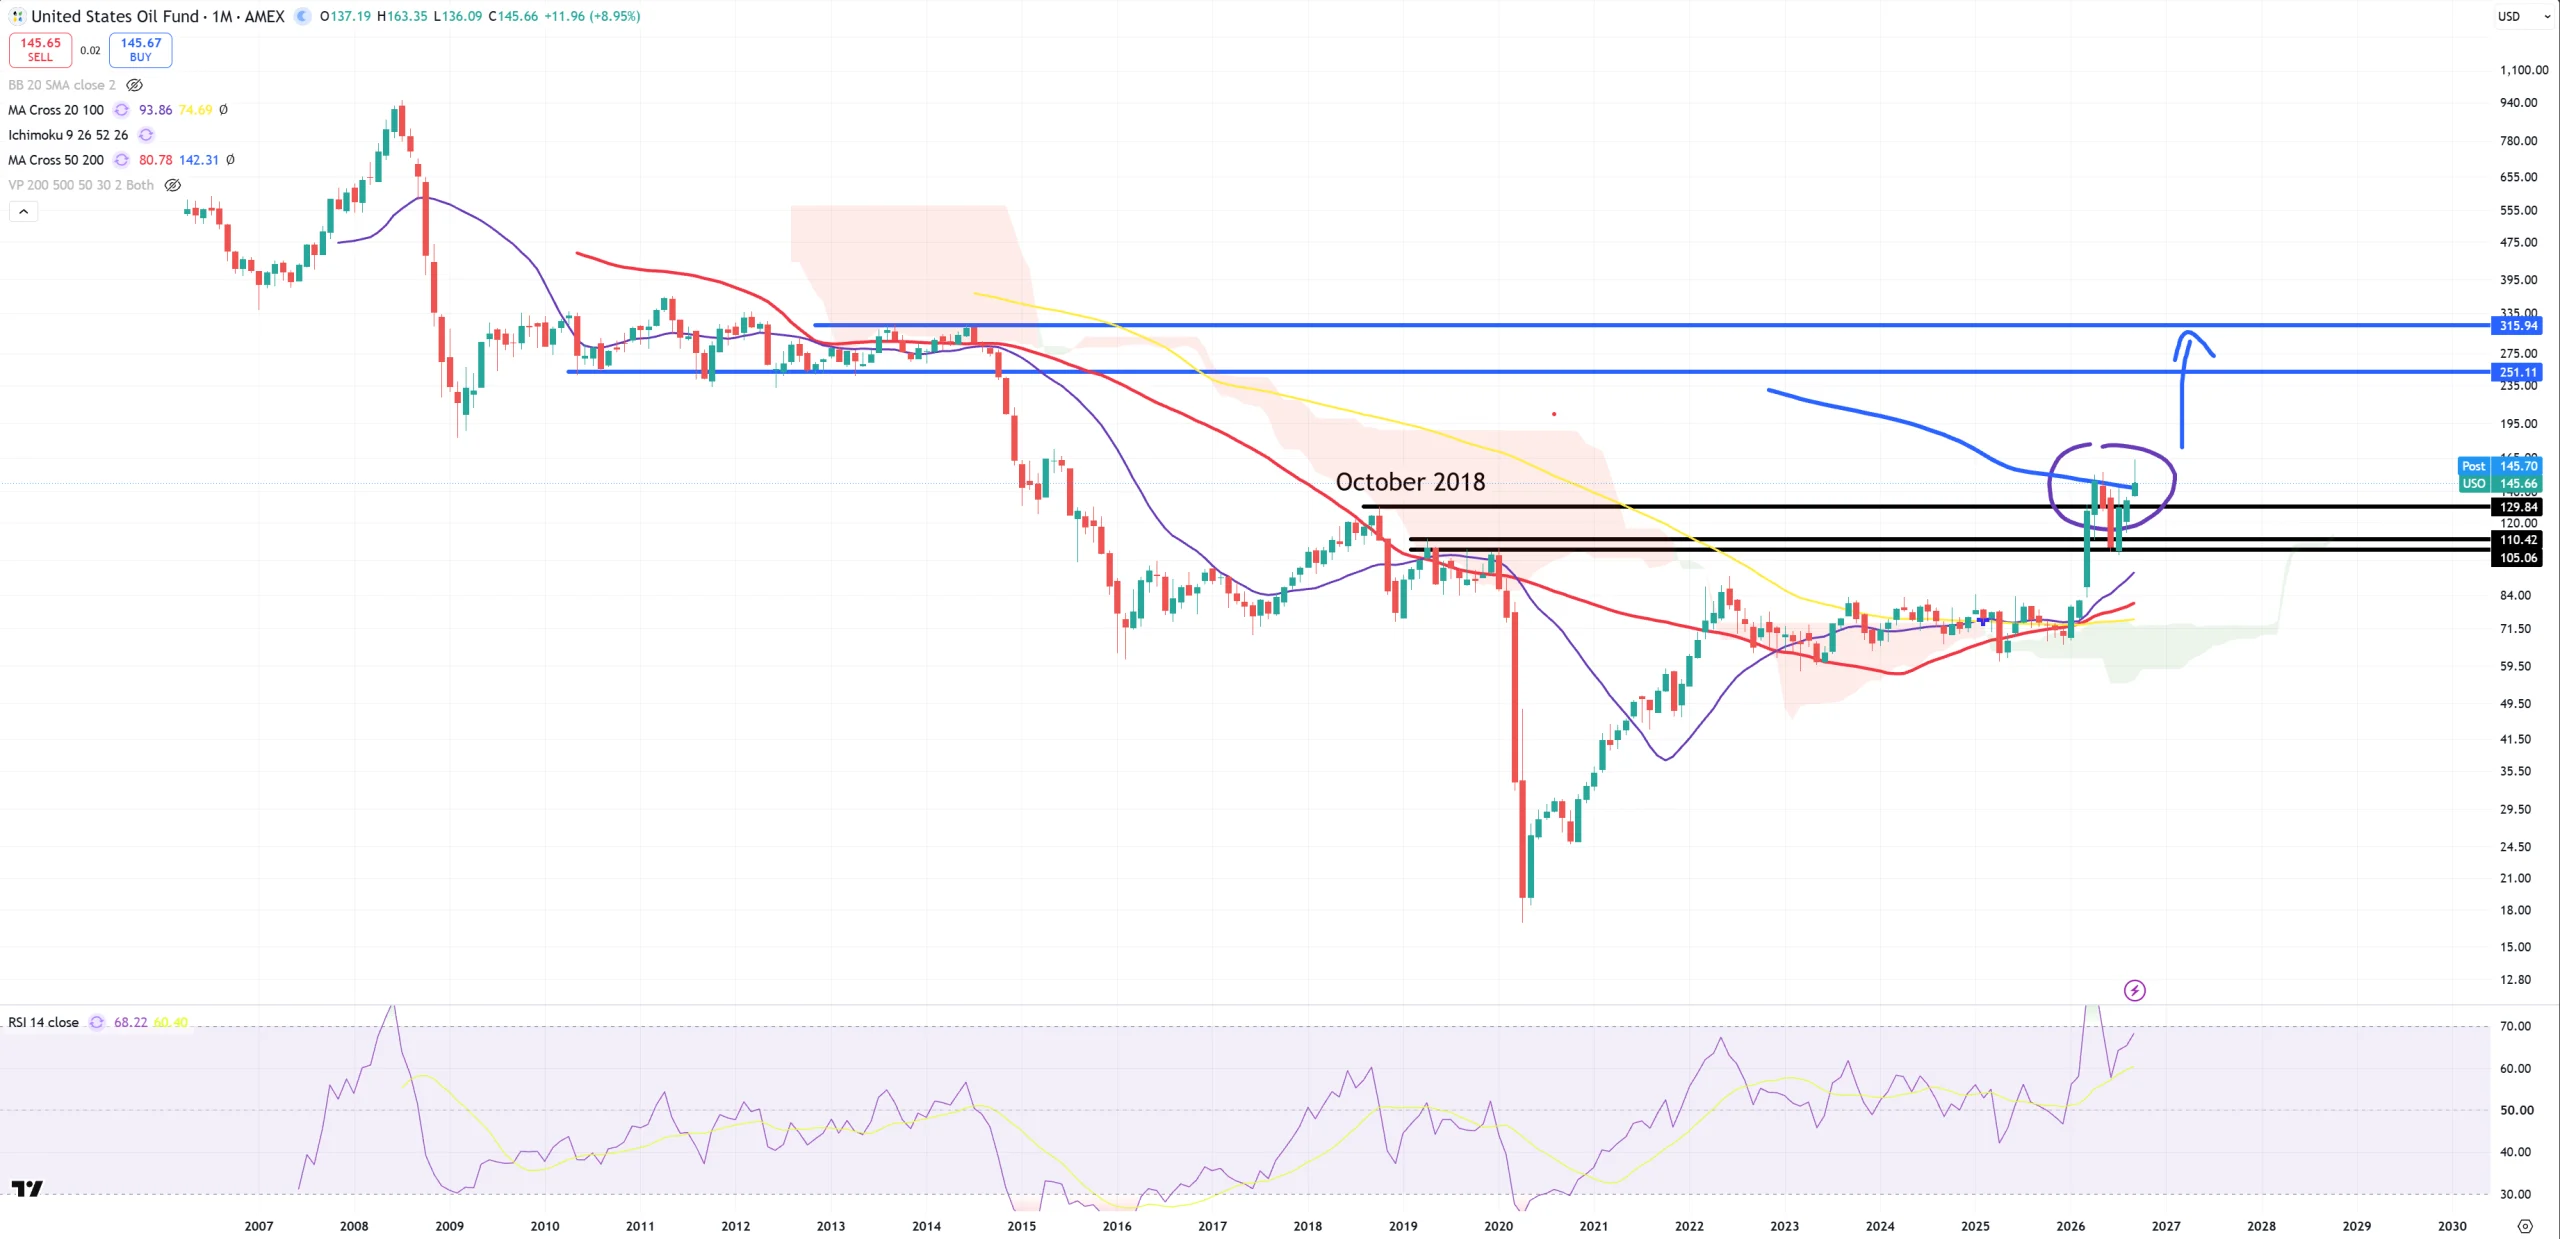
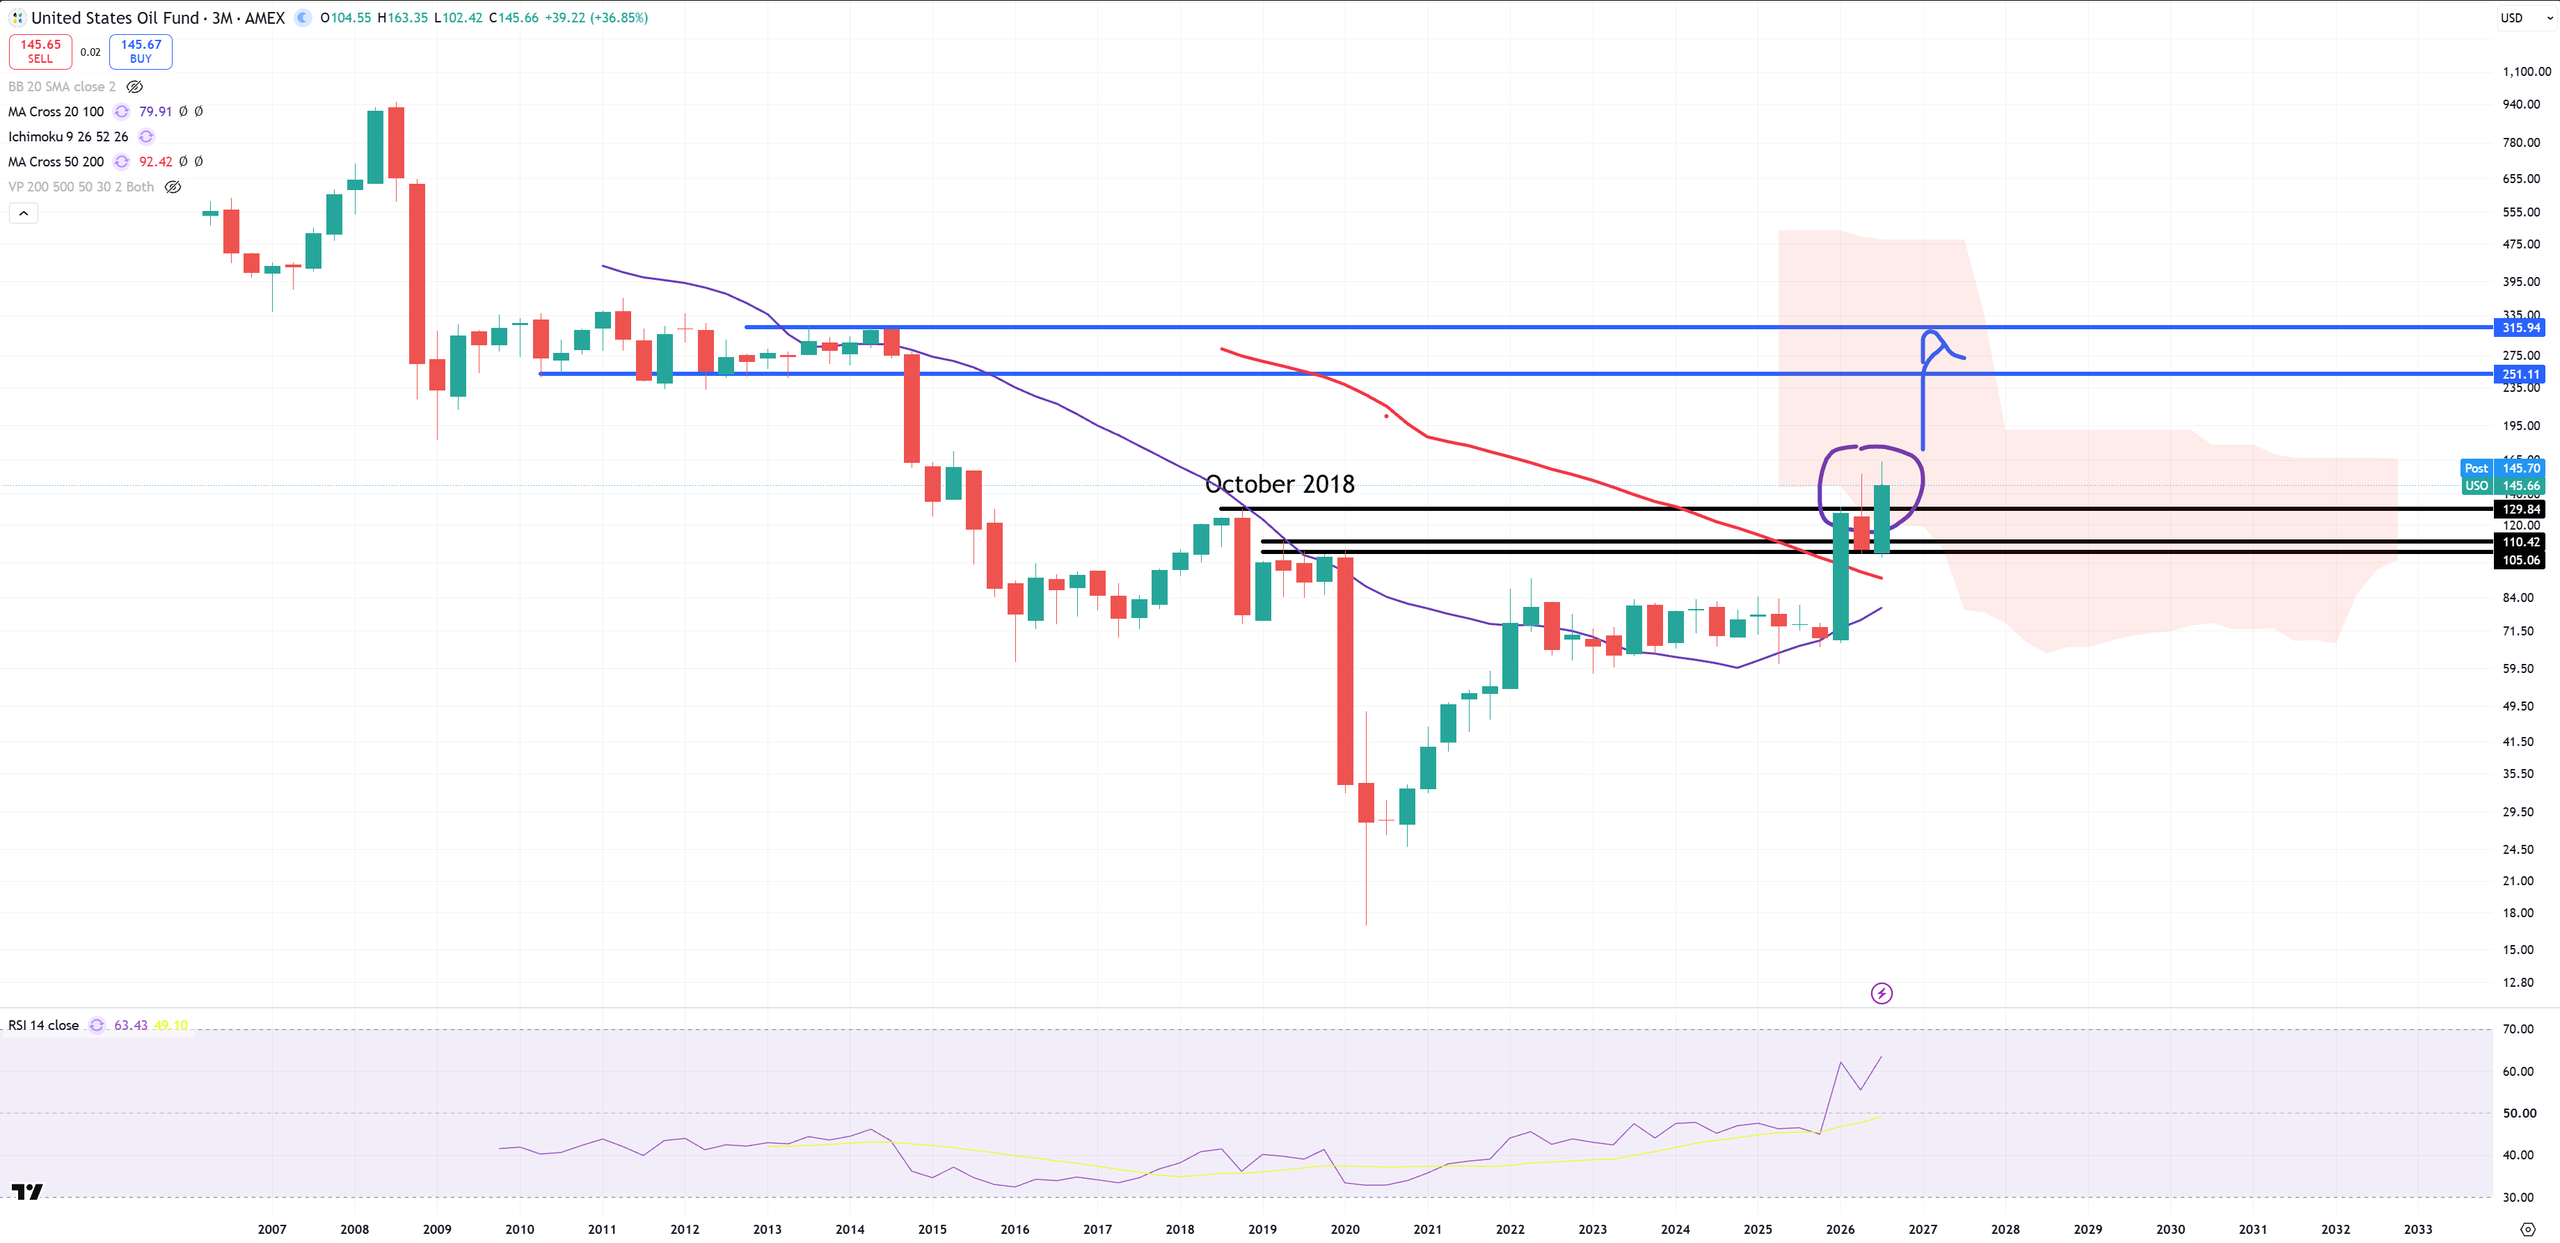
USO – managed to break (M)MA200, on (3M) it’s even more brutal : second chart. That’s super bullish if (M)MA200 acts as support = 142$. I was sceptical about oil prices until we break this (M)MA200. We did it in Sept2026.
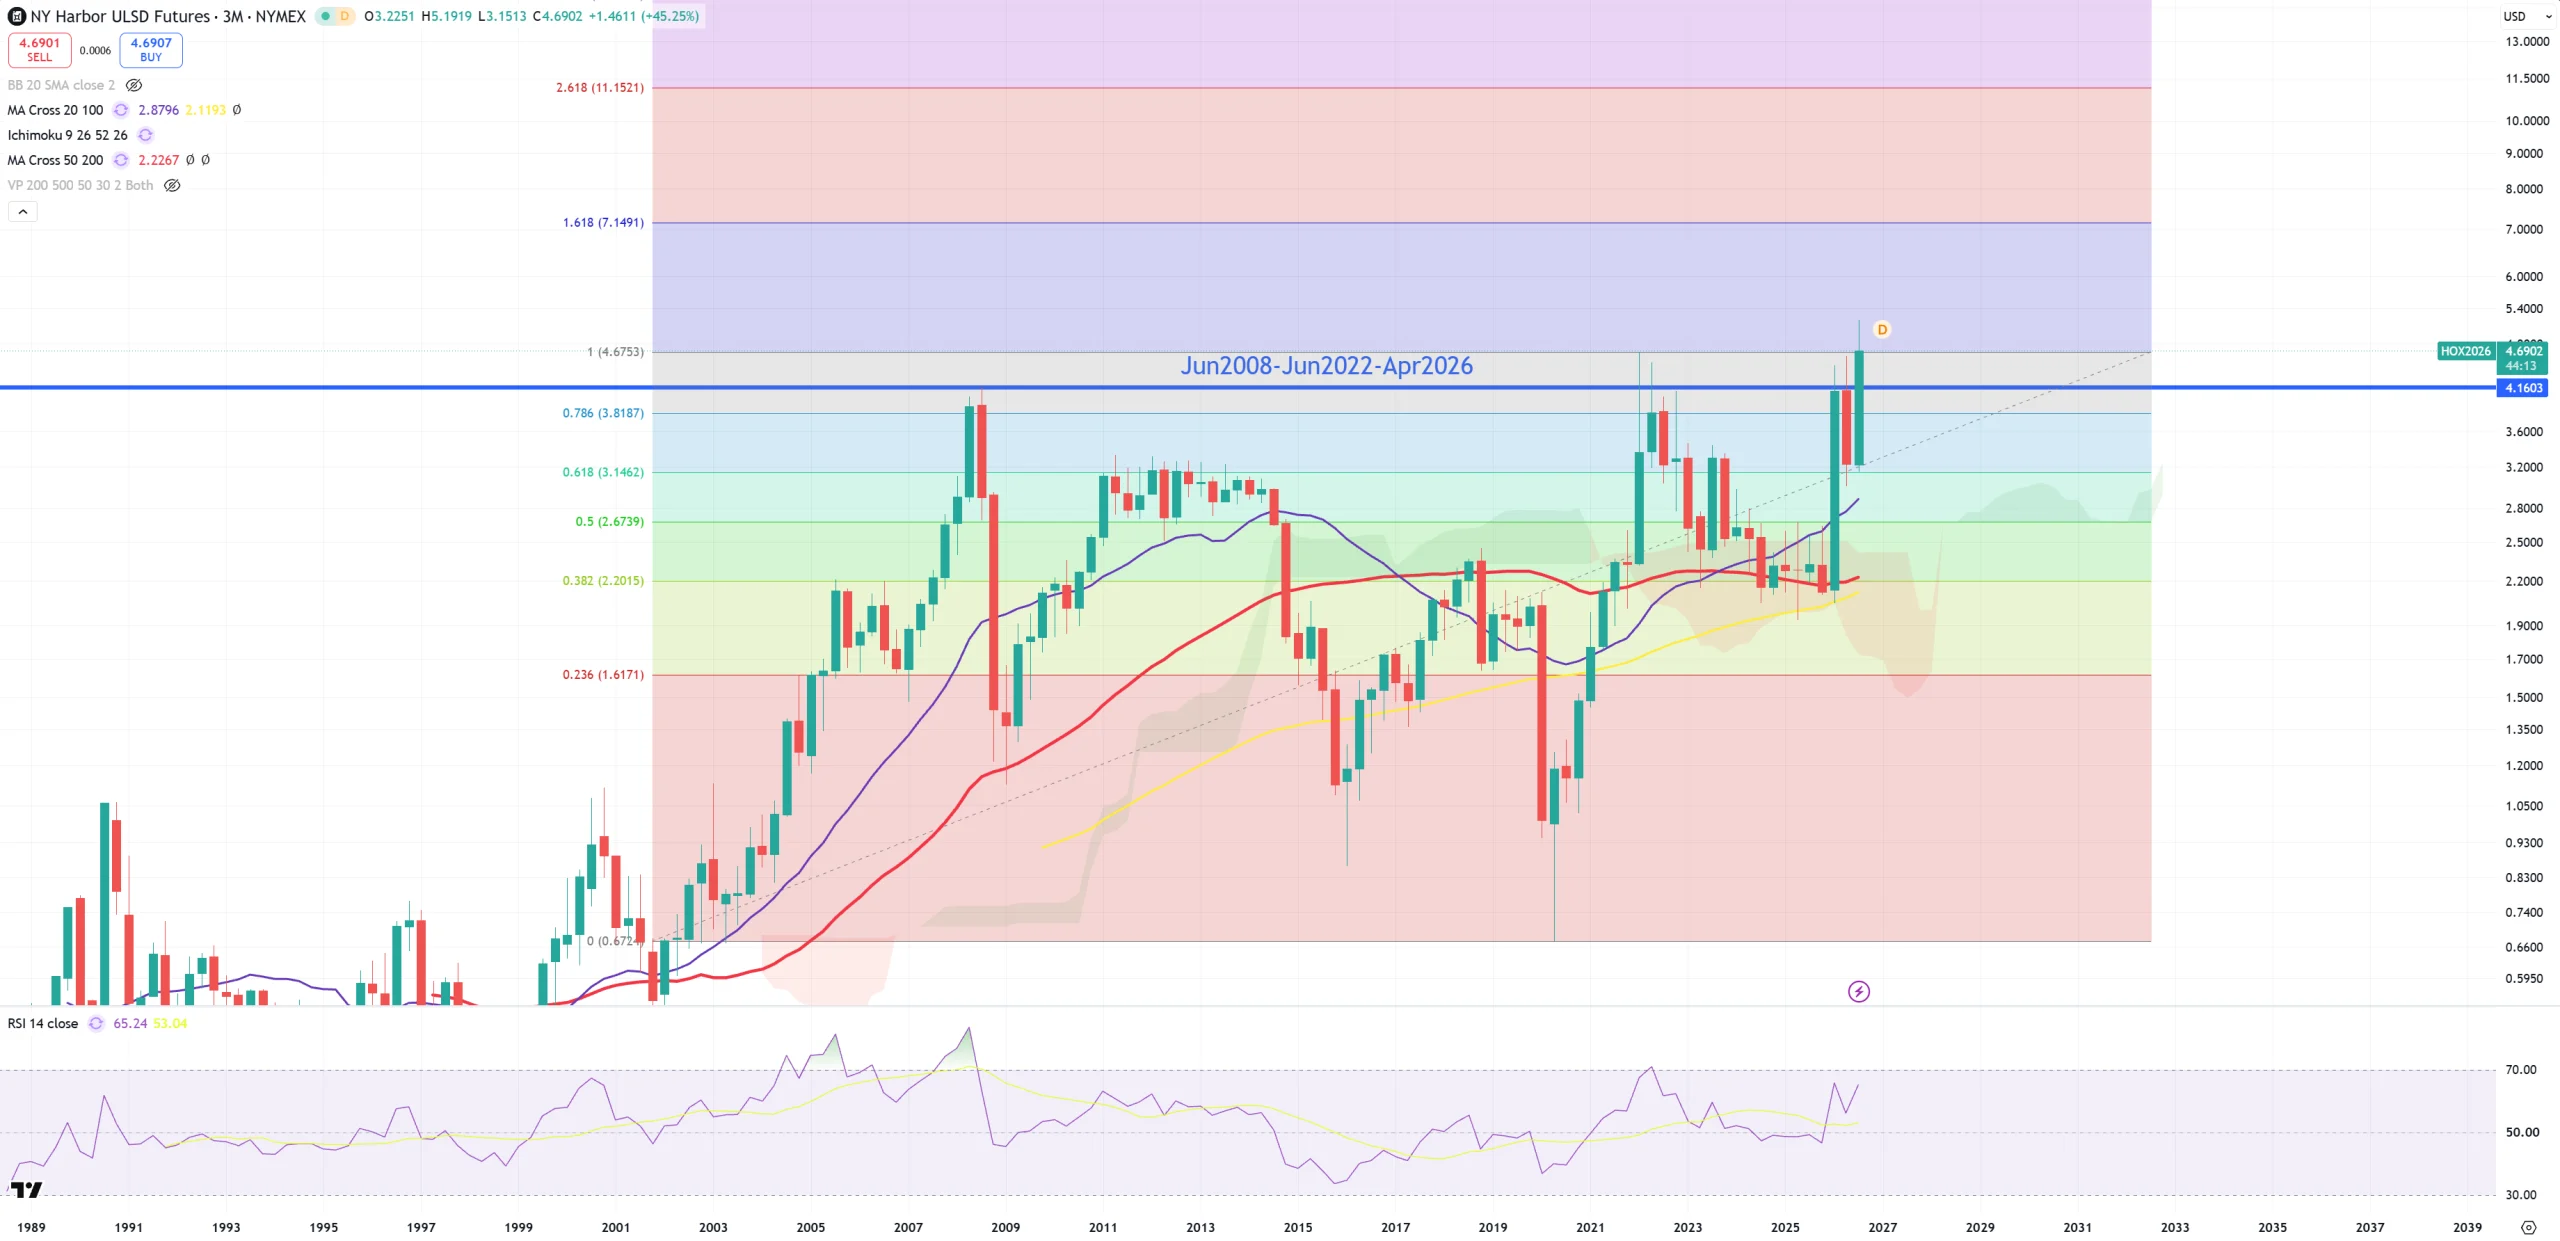
HO – Diesel – with no comment needed – super bullish. This is 3M view :
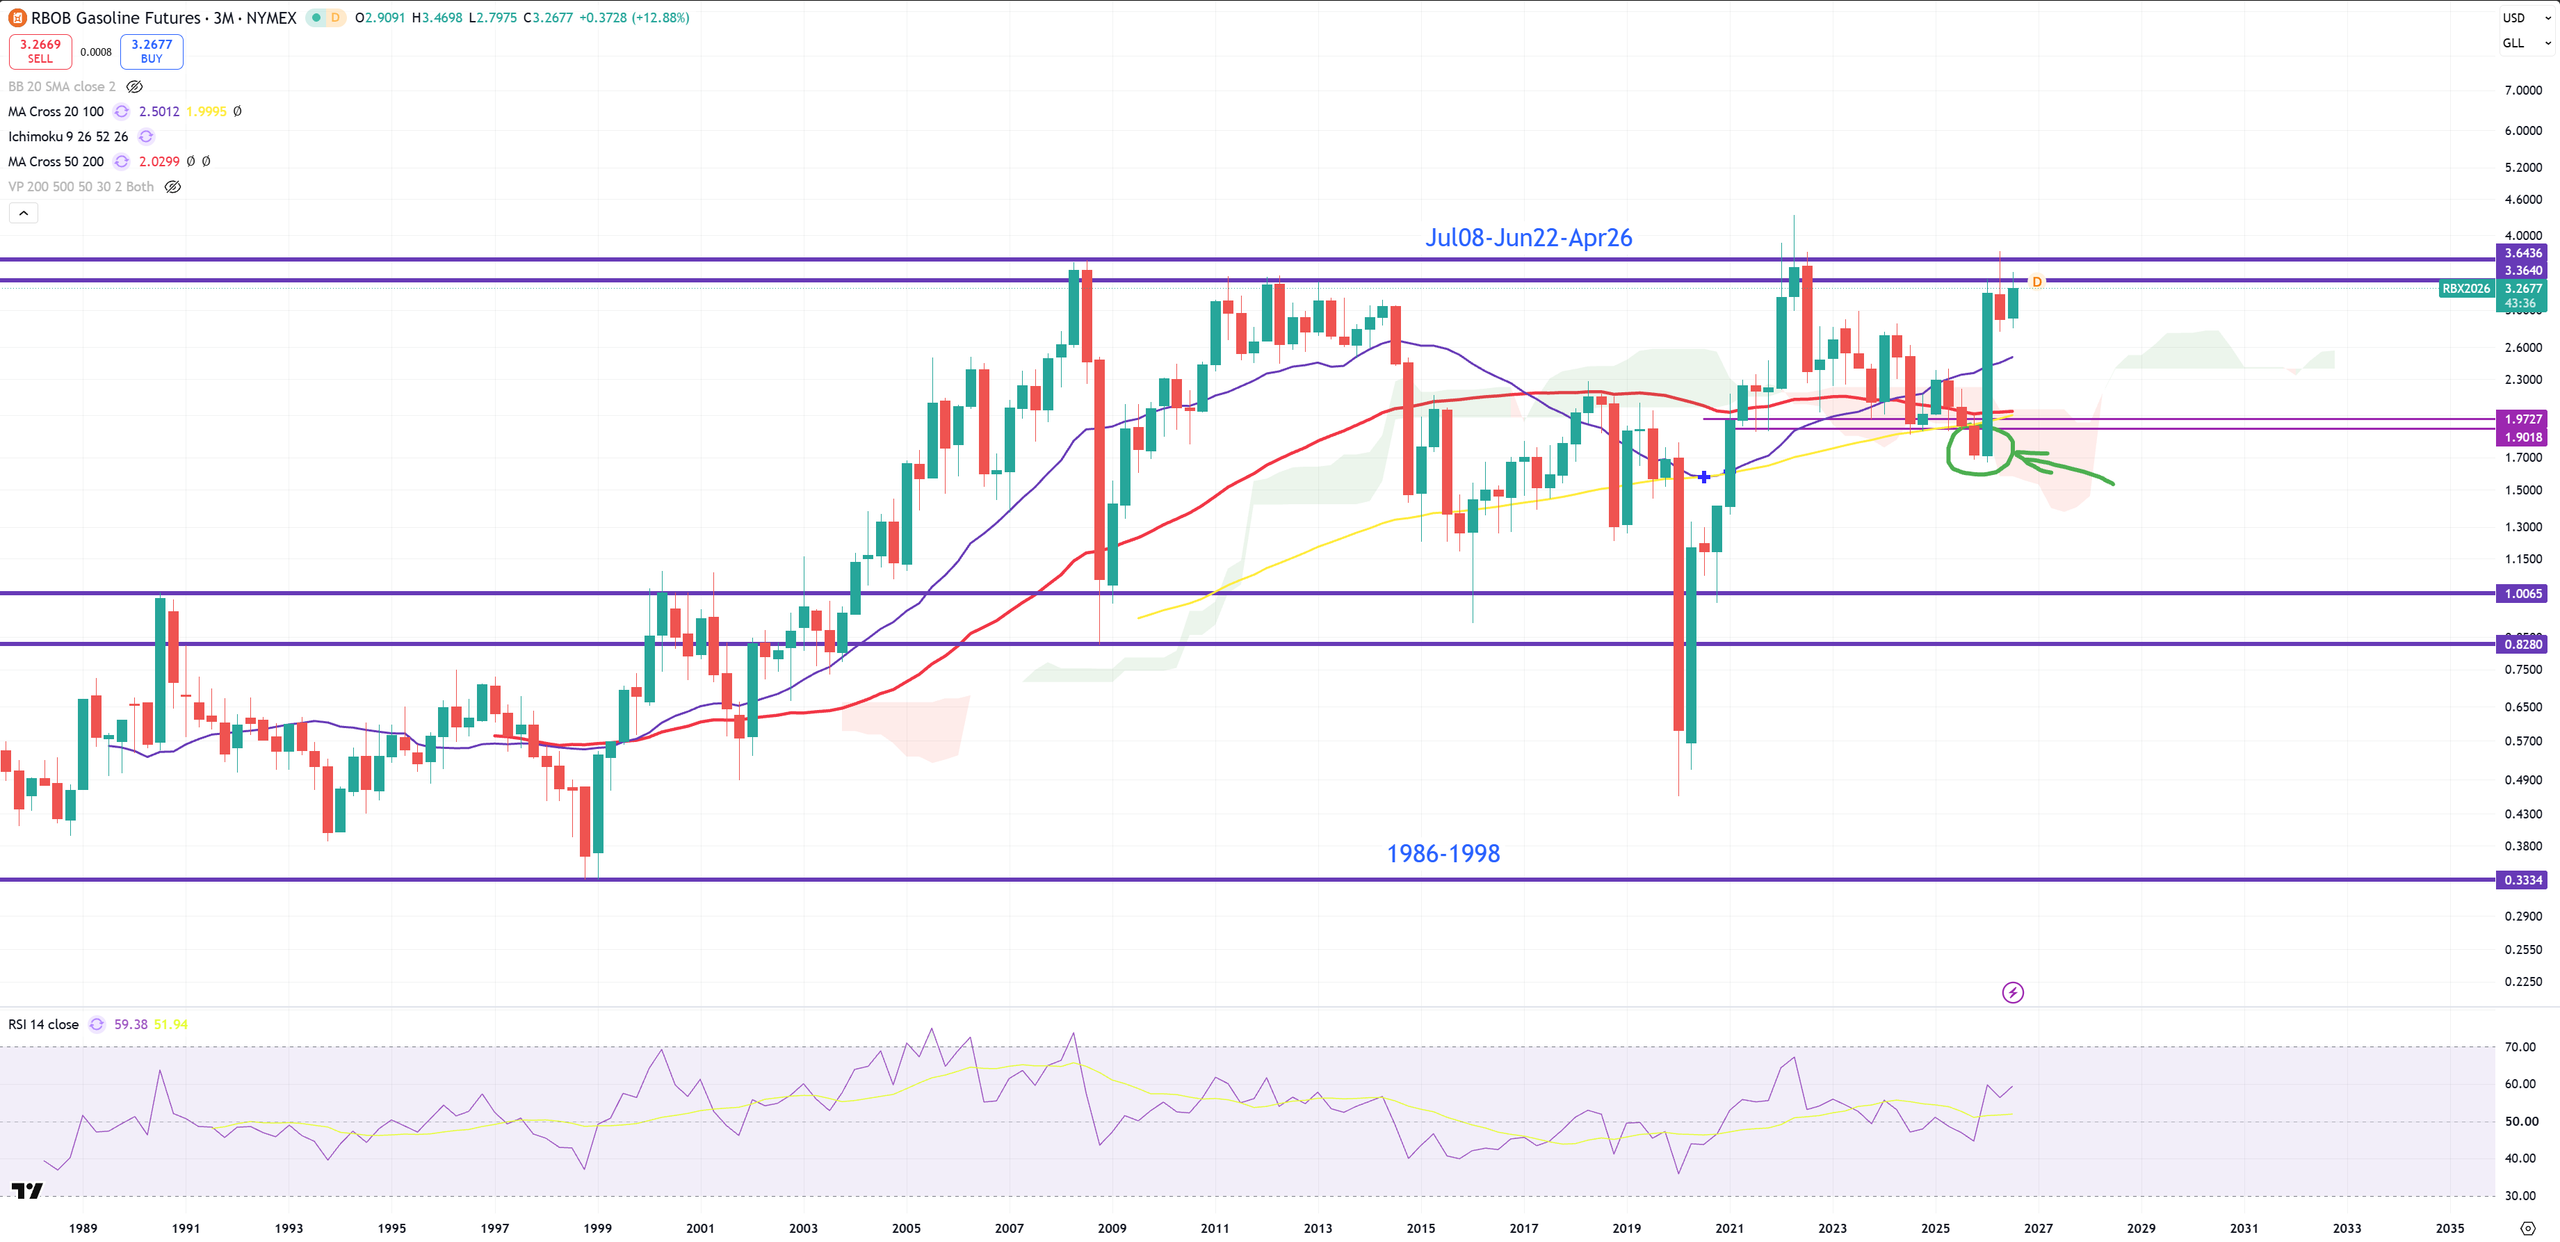
RBOB – Gasoline hits resistance on 3M
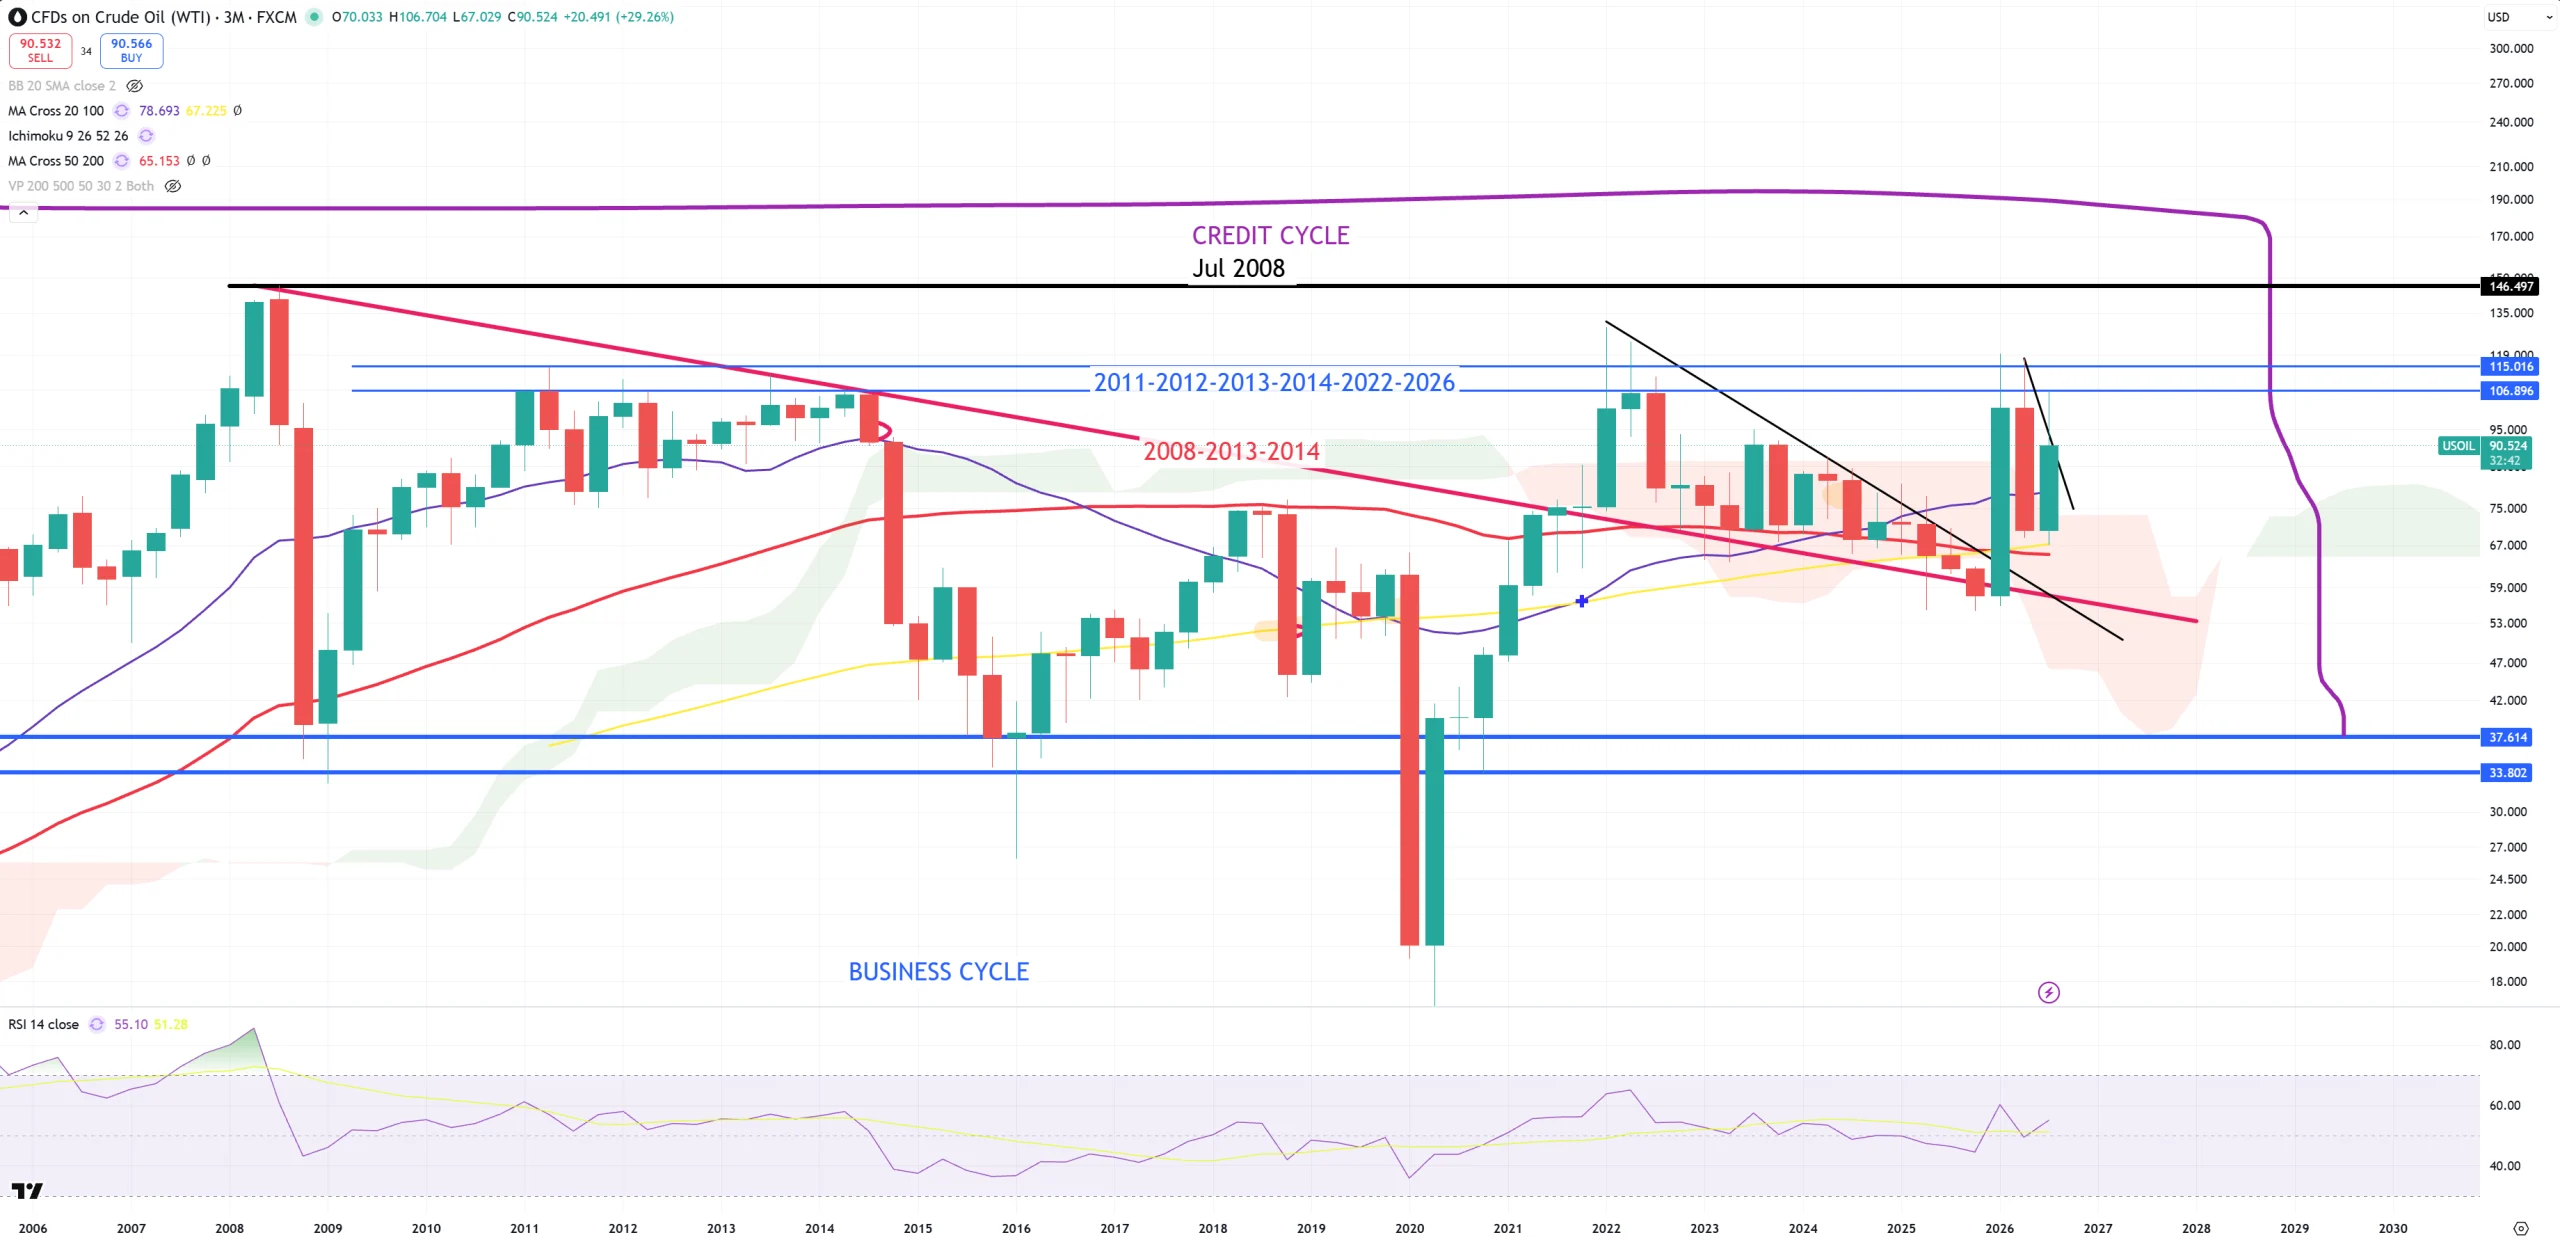
OIL – Just like RBOB on 3M knocking to key resistance.
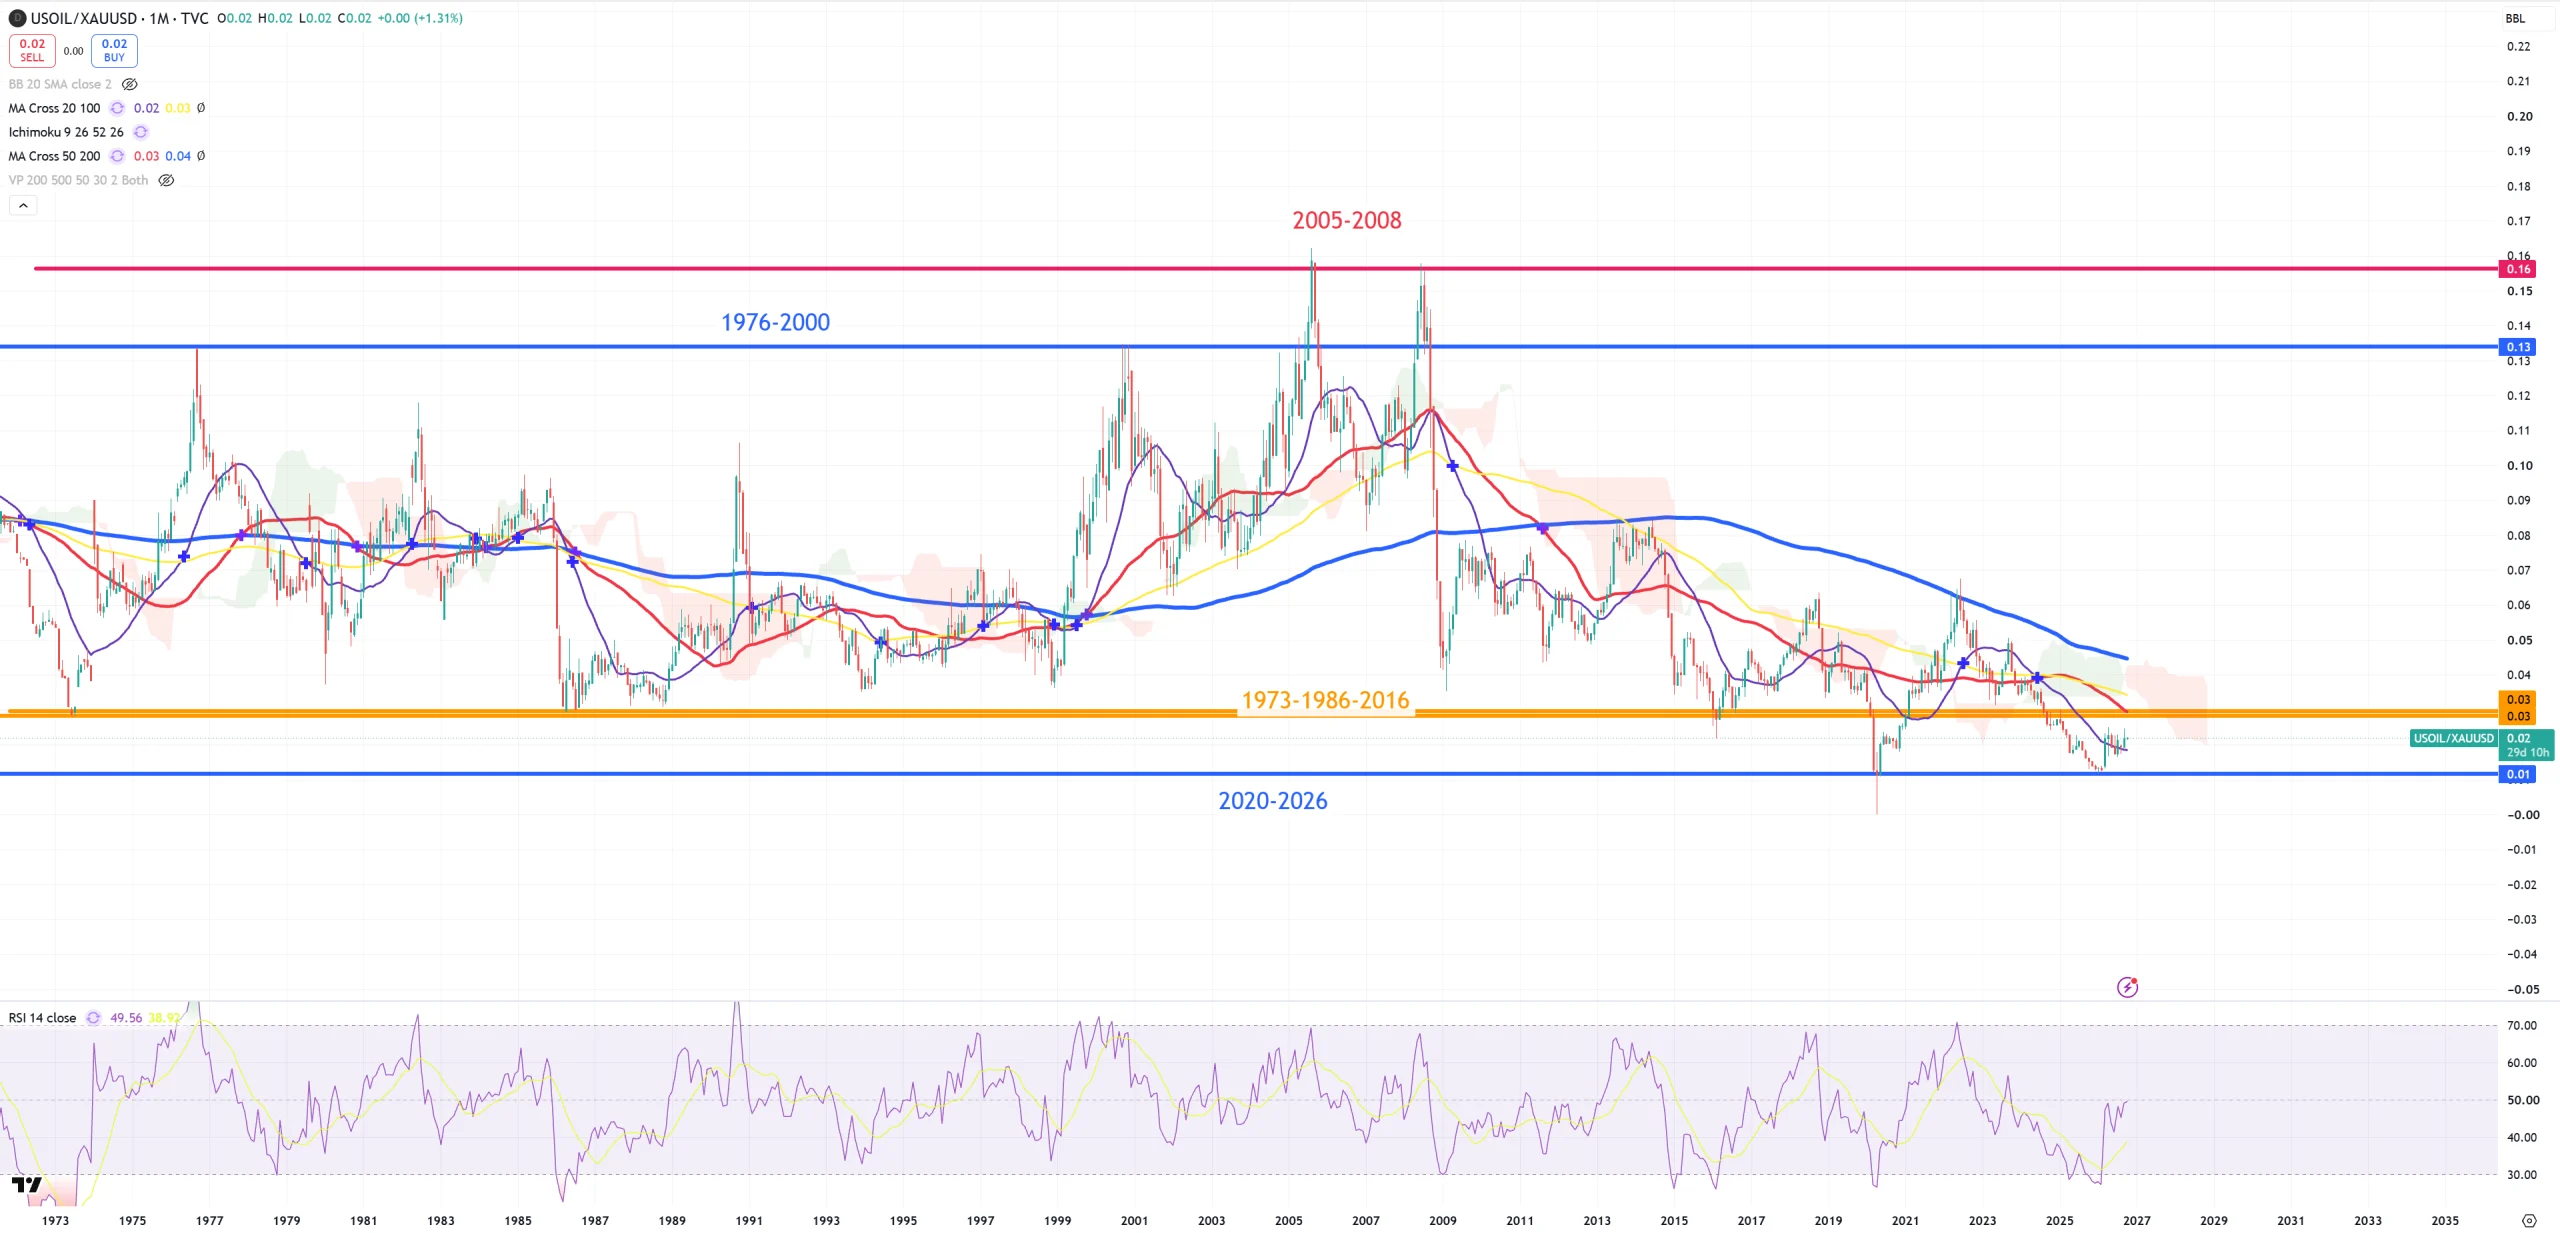
OIL/GOLD – since 70s yellow support was always support until 2020 hit and … 2026. We are now above violet (M)MA20, when 1973-1986-2016 level sits exactly on red (M)MA50. So just like a spike above blue 1976-2000 was a massive bull trap OIL > GOLD (2005-2008), do we have massive bear trap GOLD > OIL (2020-2026)?
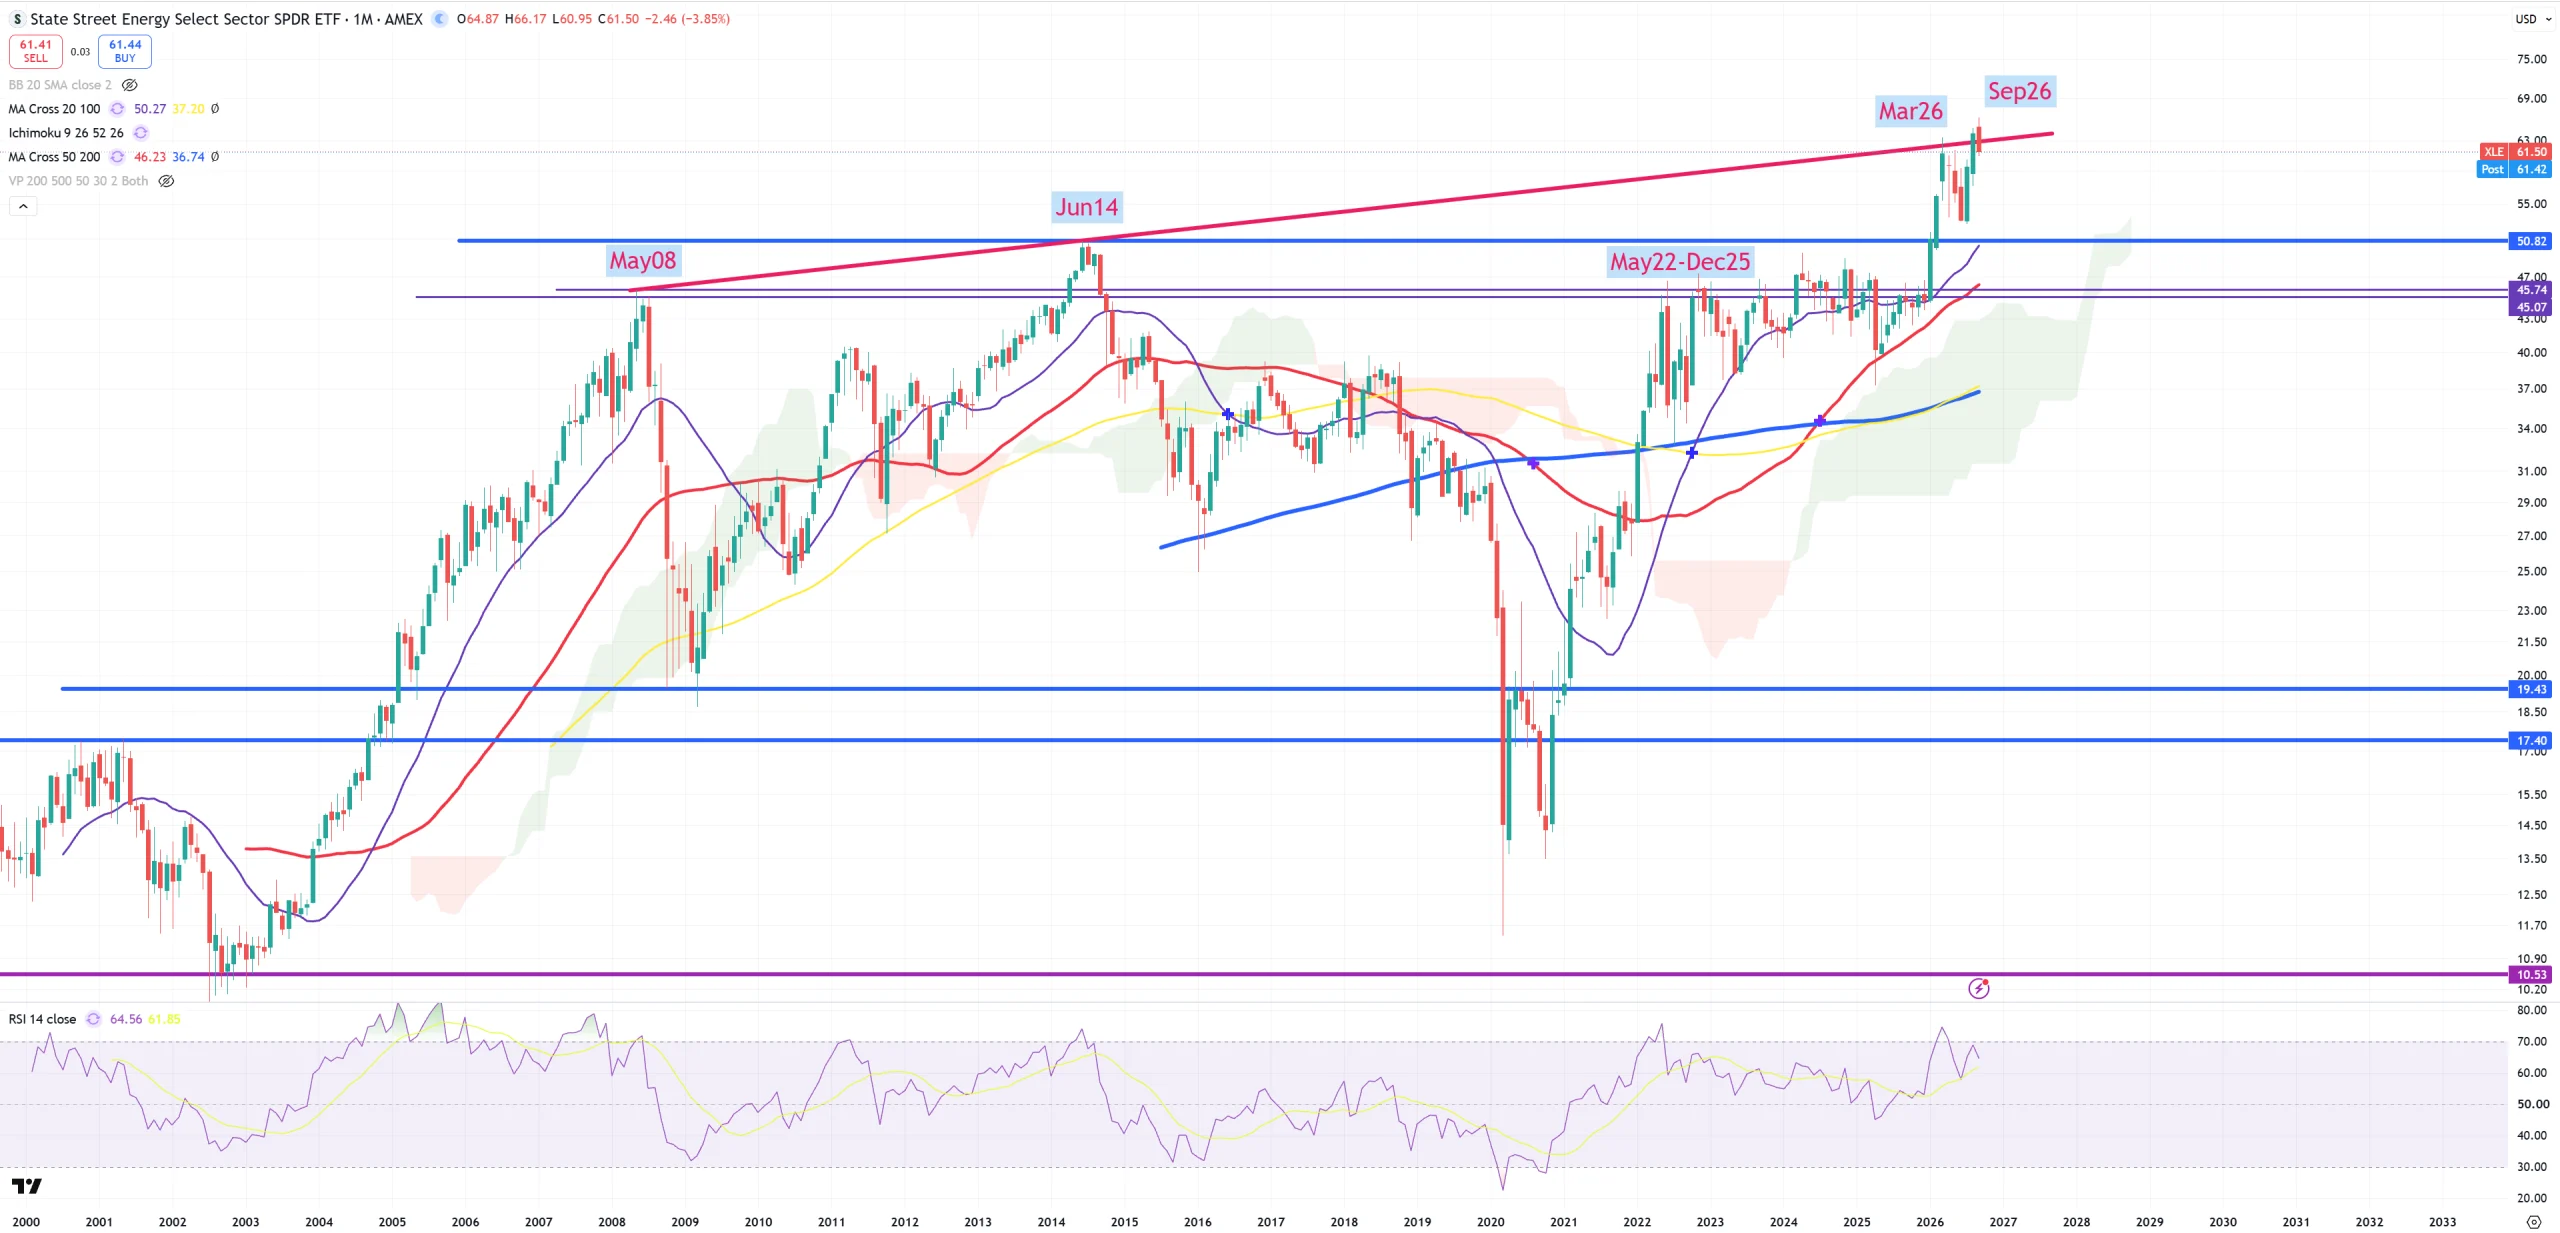
XLE – not sure what to think about that
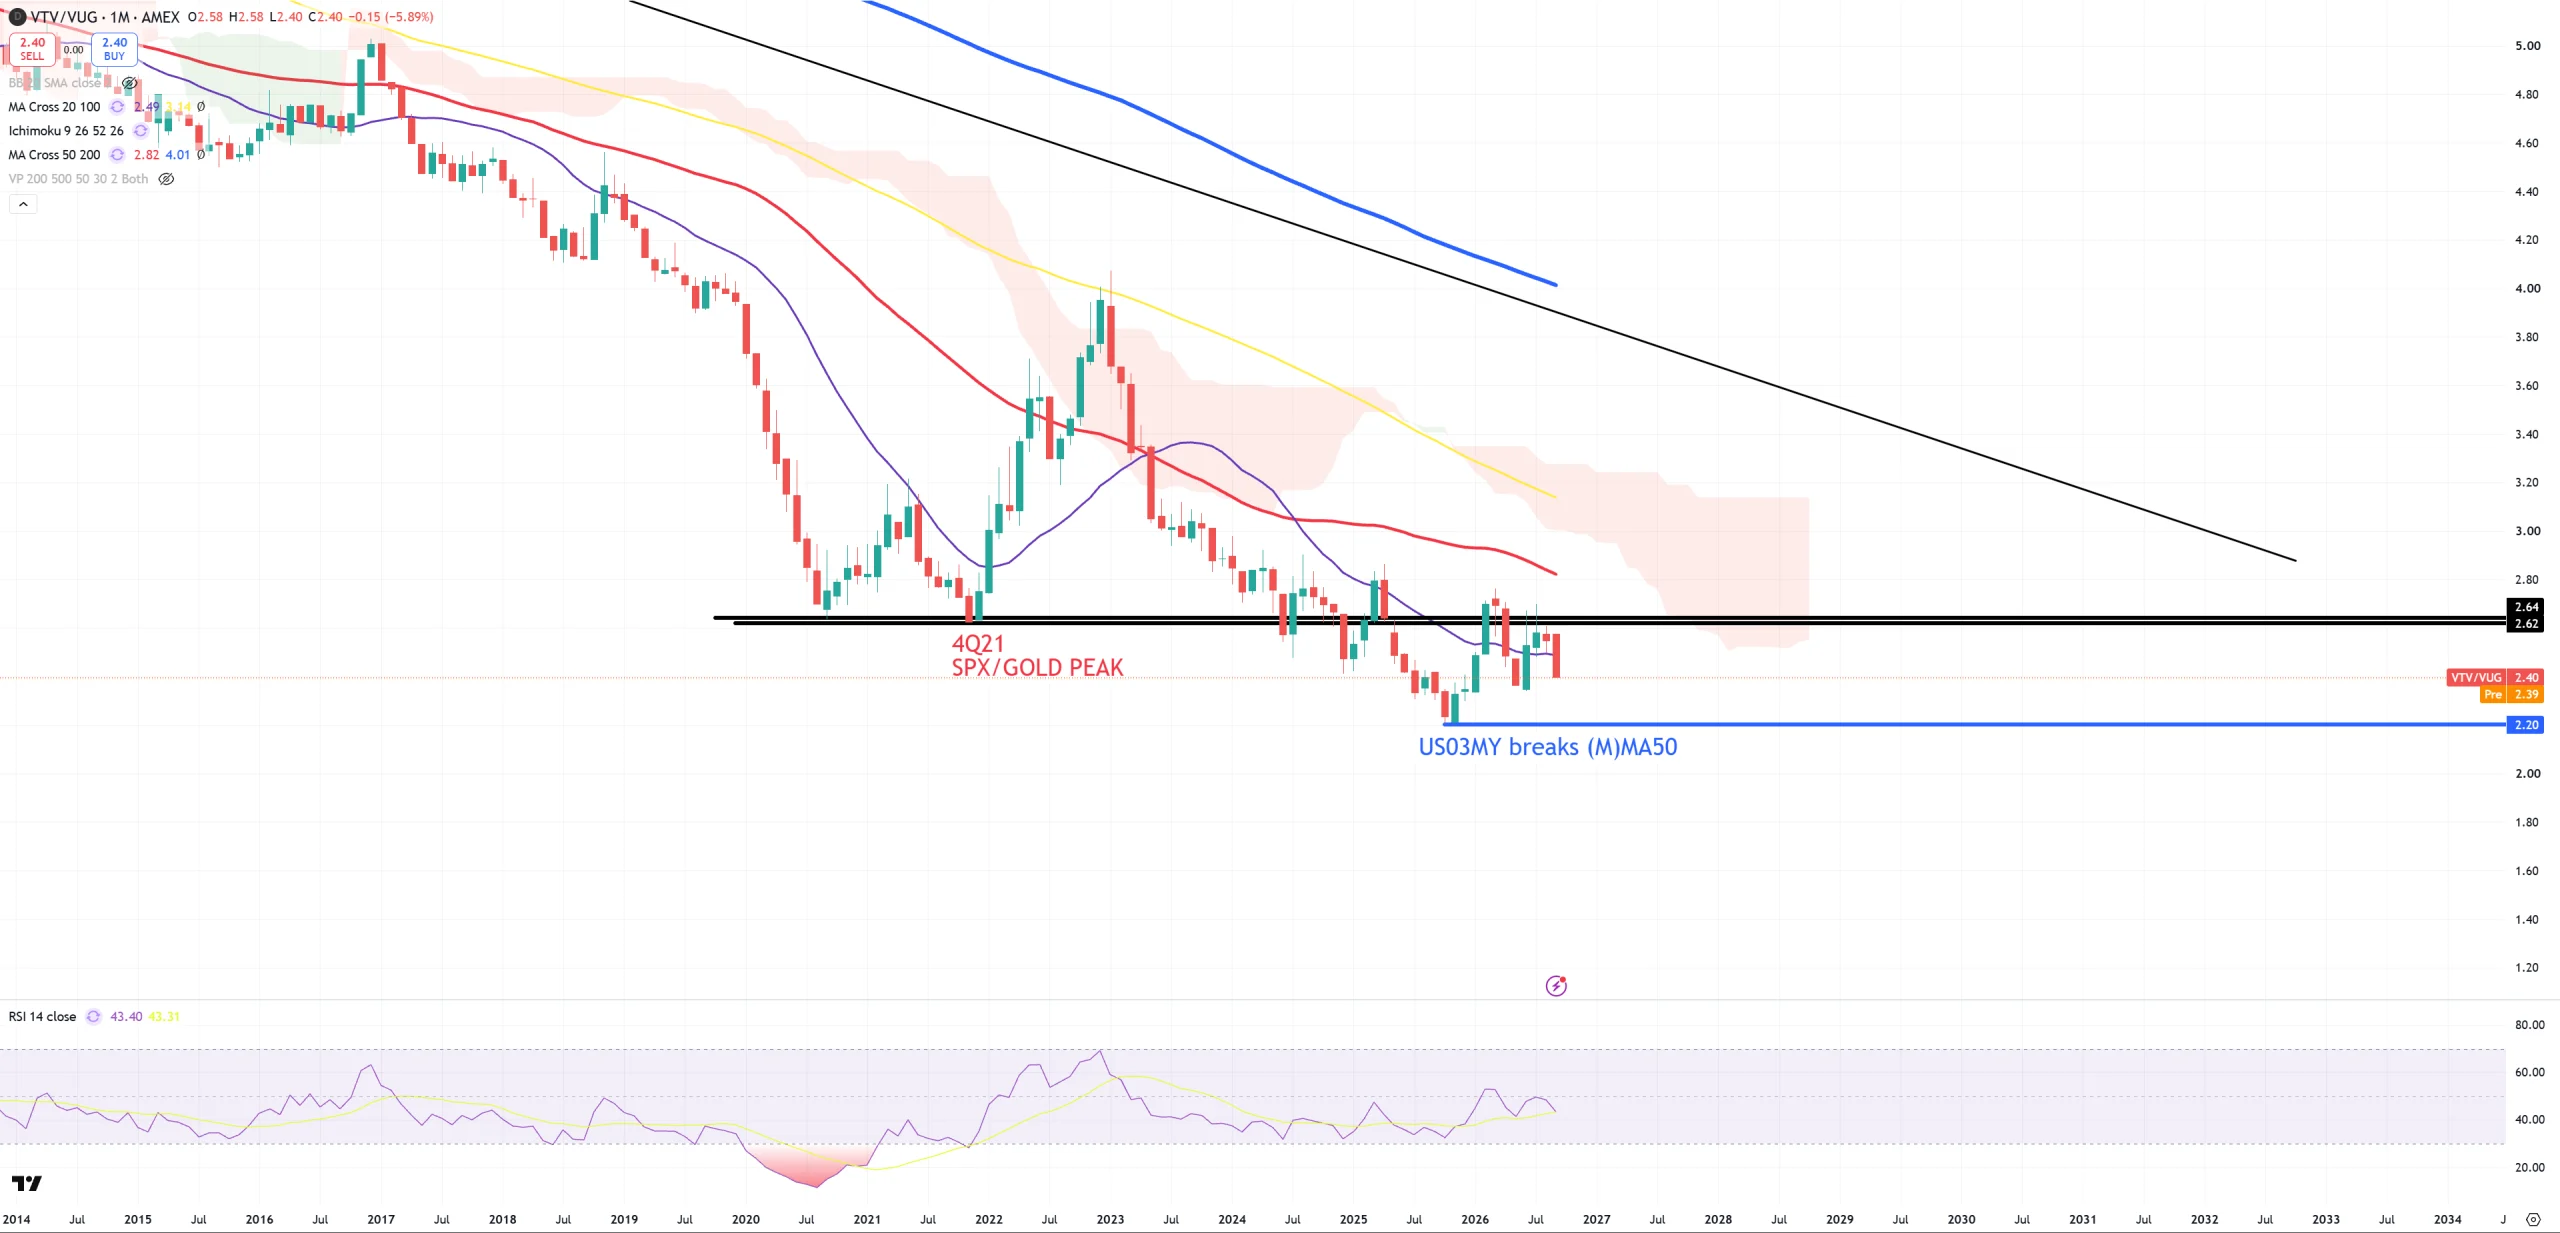
VALUE/GROWTH – still “no go” here
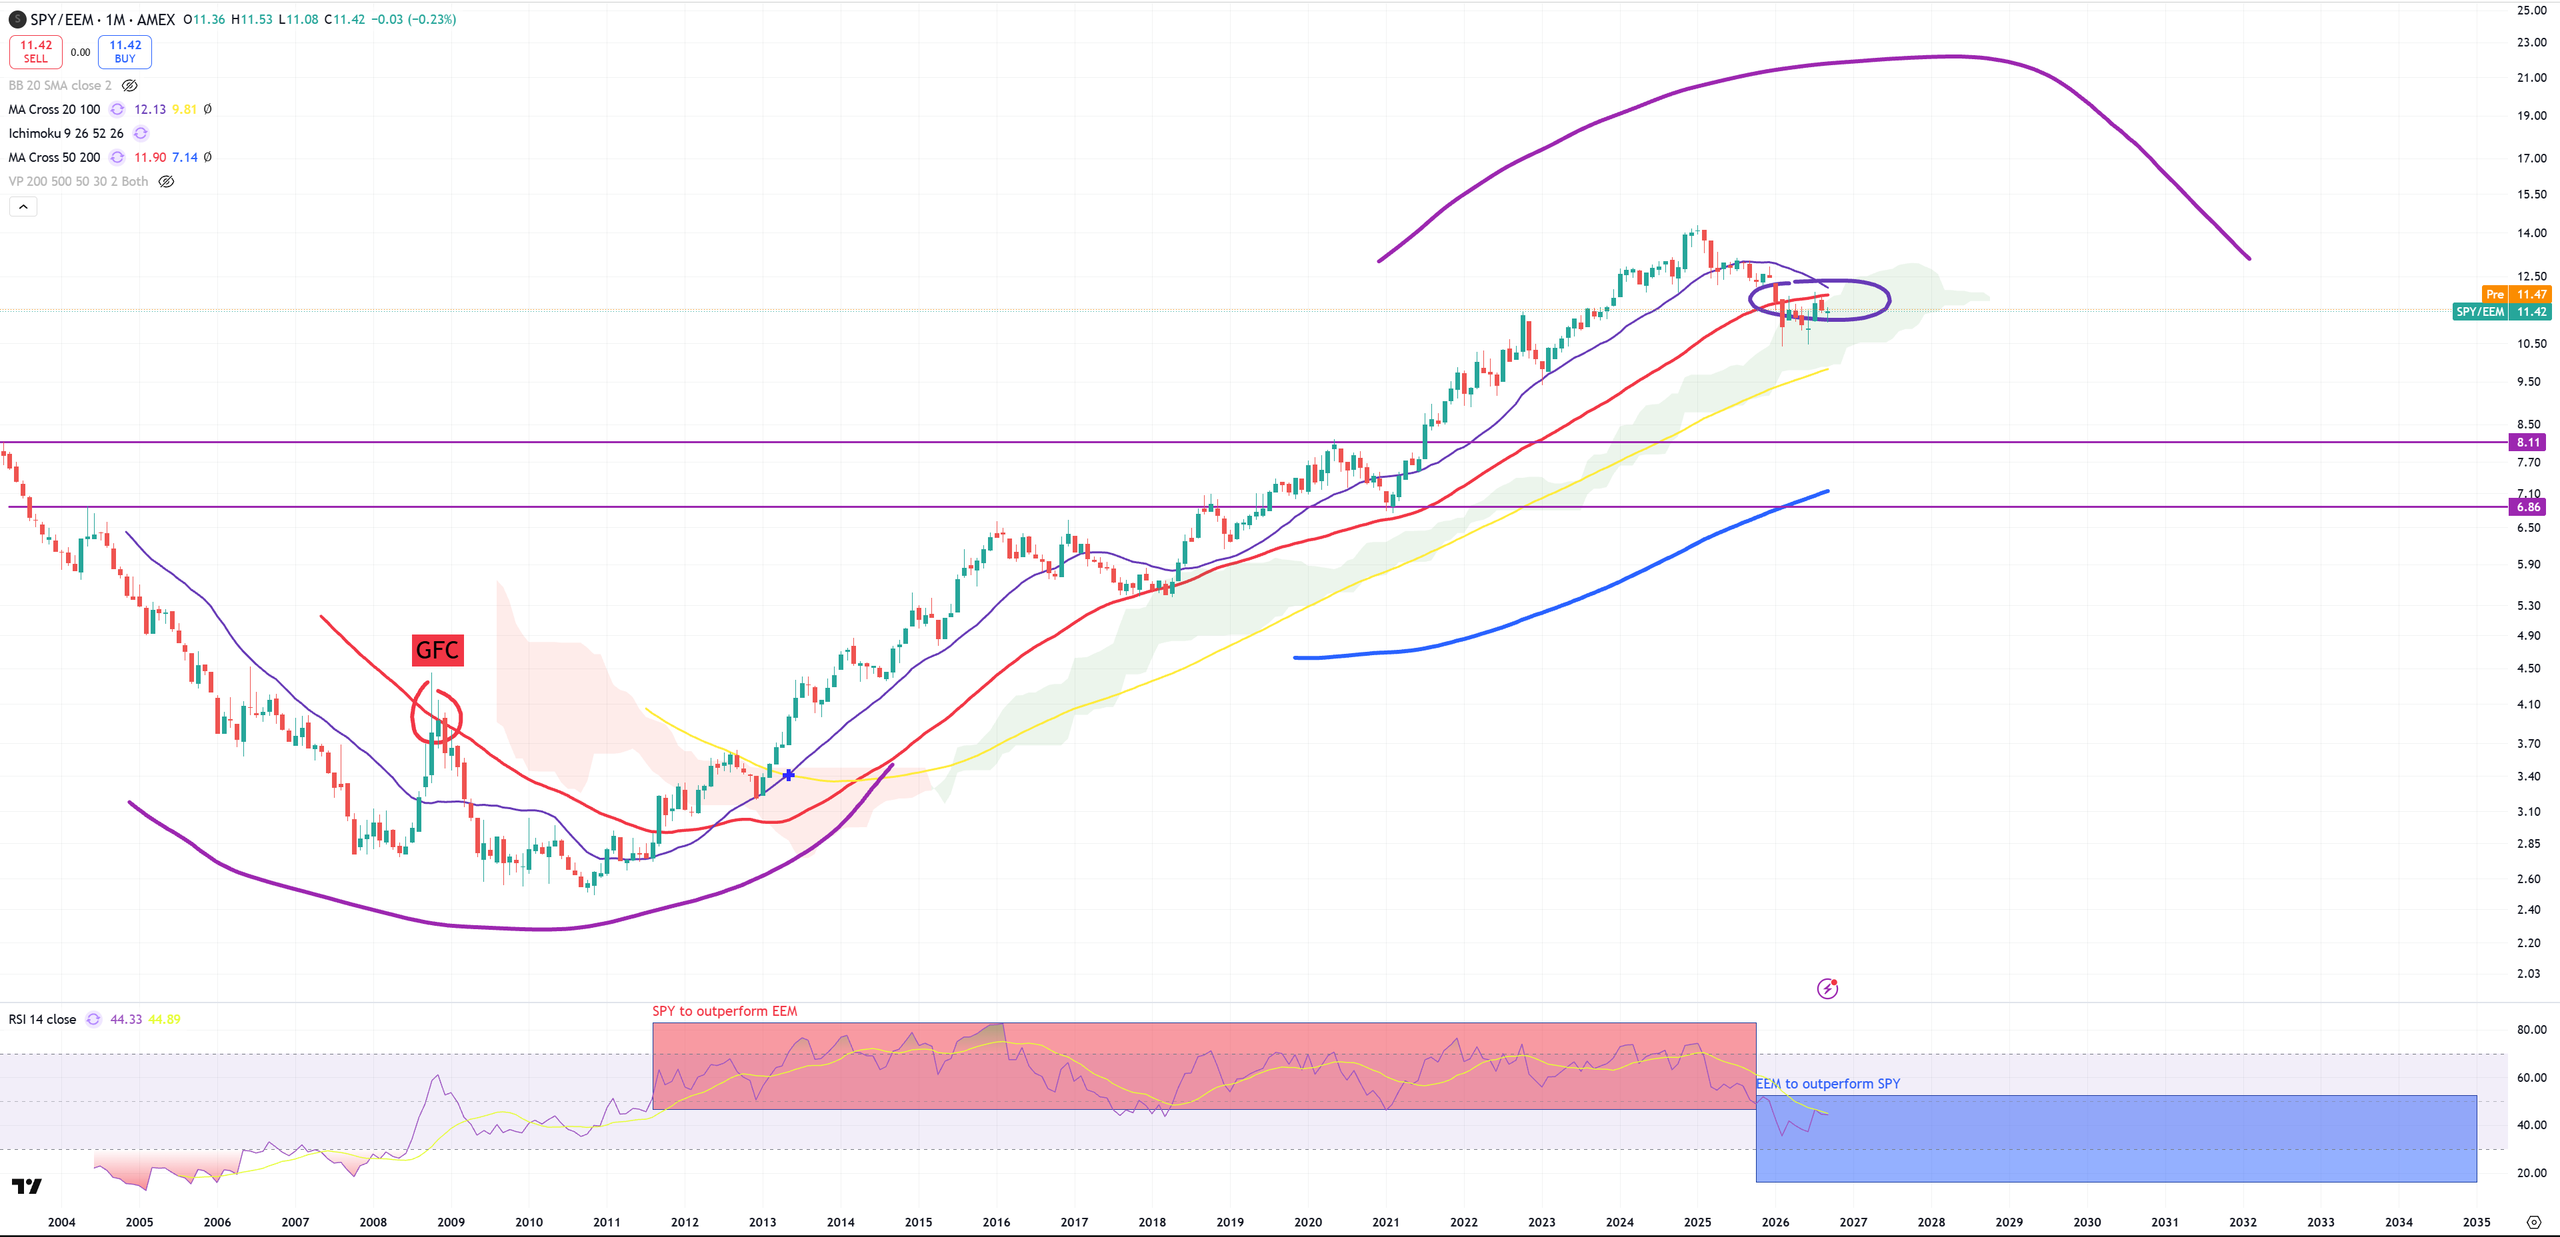
SPY/EEM – unchanged (M)MA50 retest from the bottom
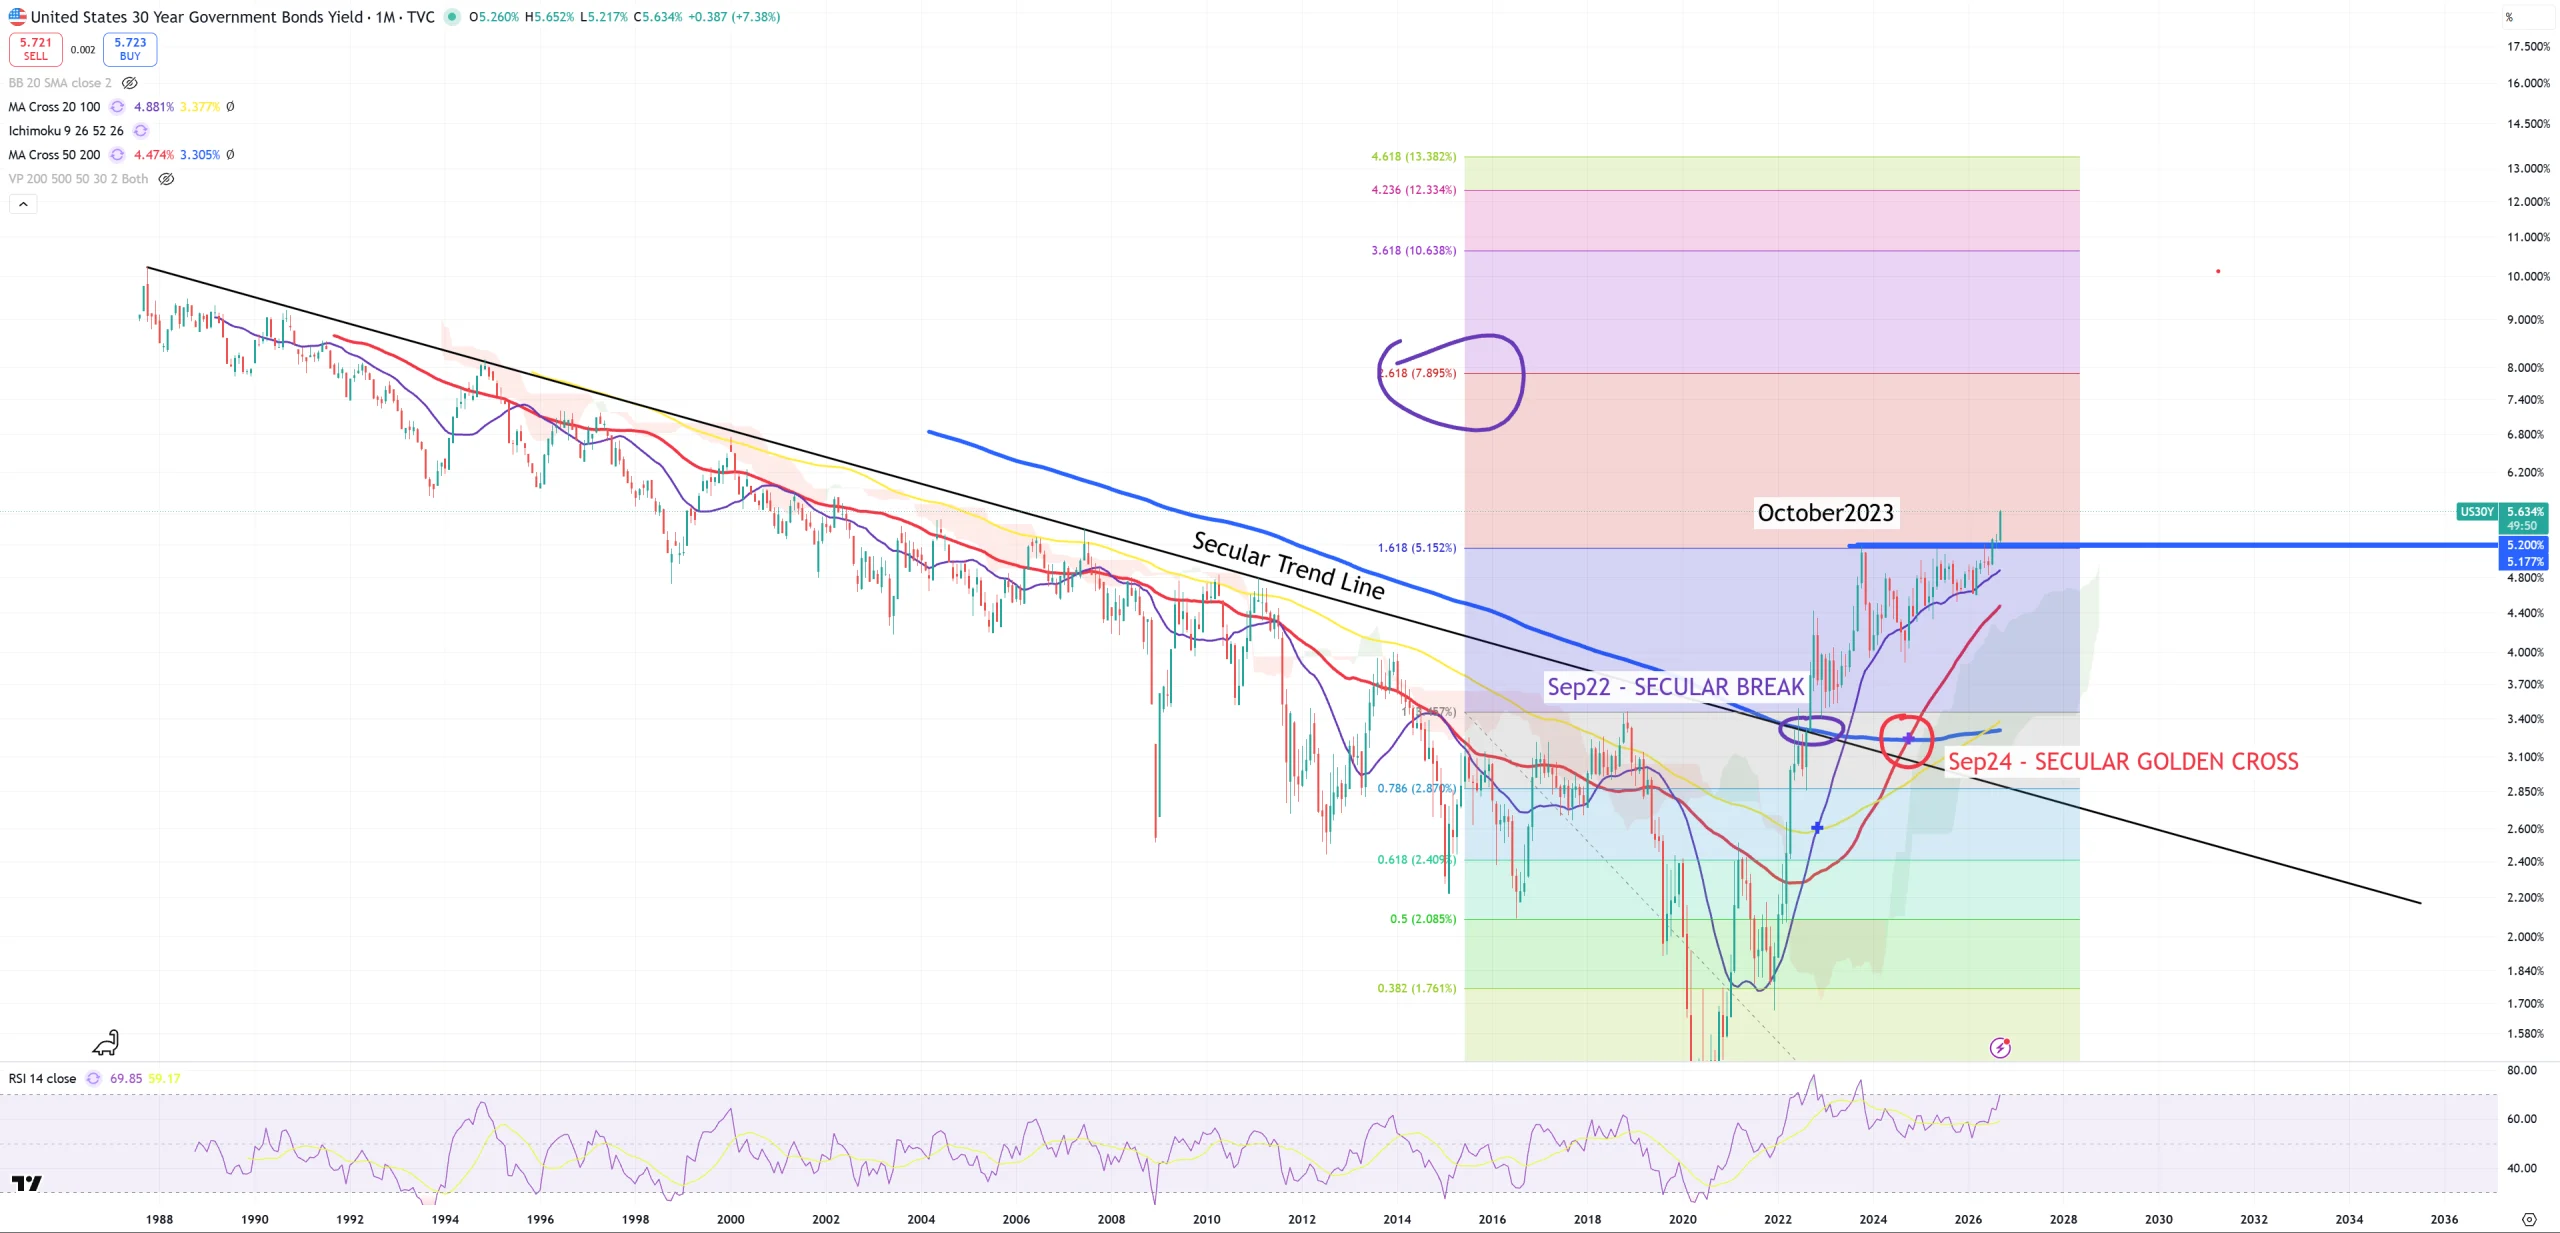
US30Y – doesn’t look so good. Just like other government bonds. Next FIBO is scarry almost 8.0%.
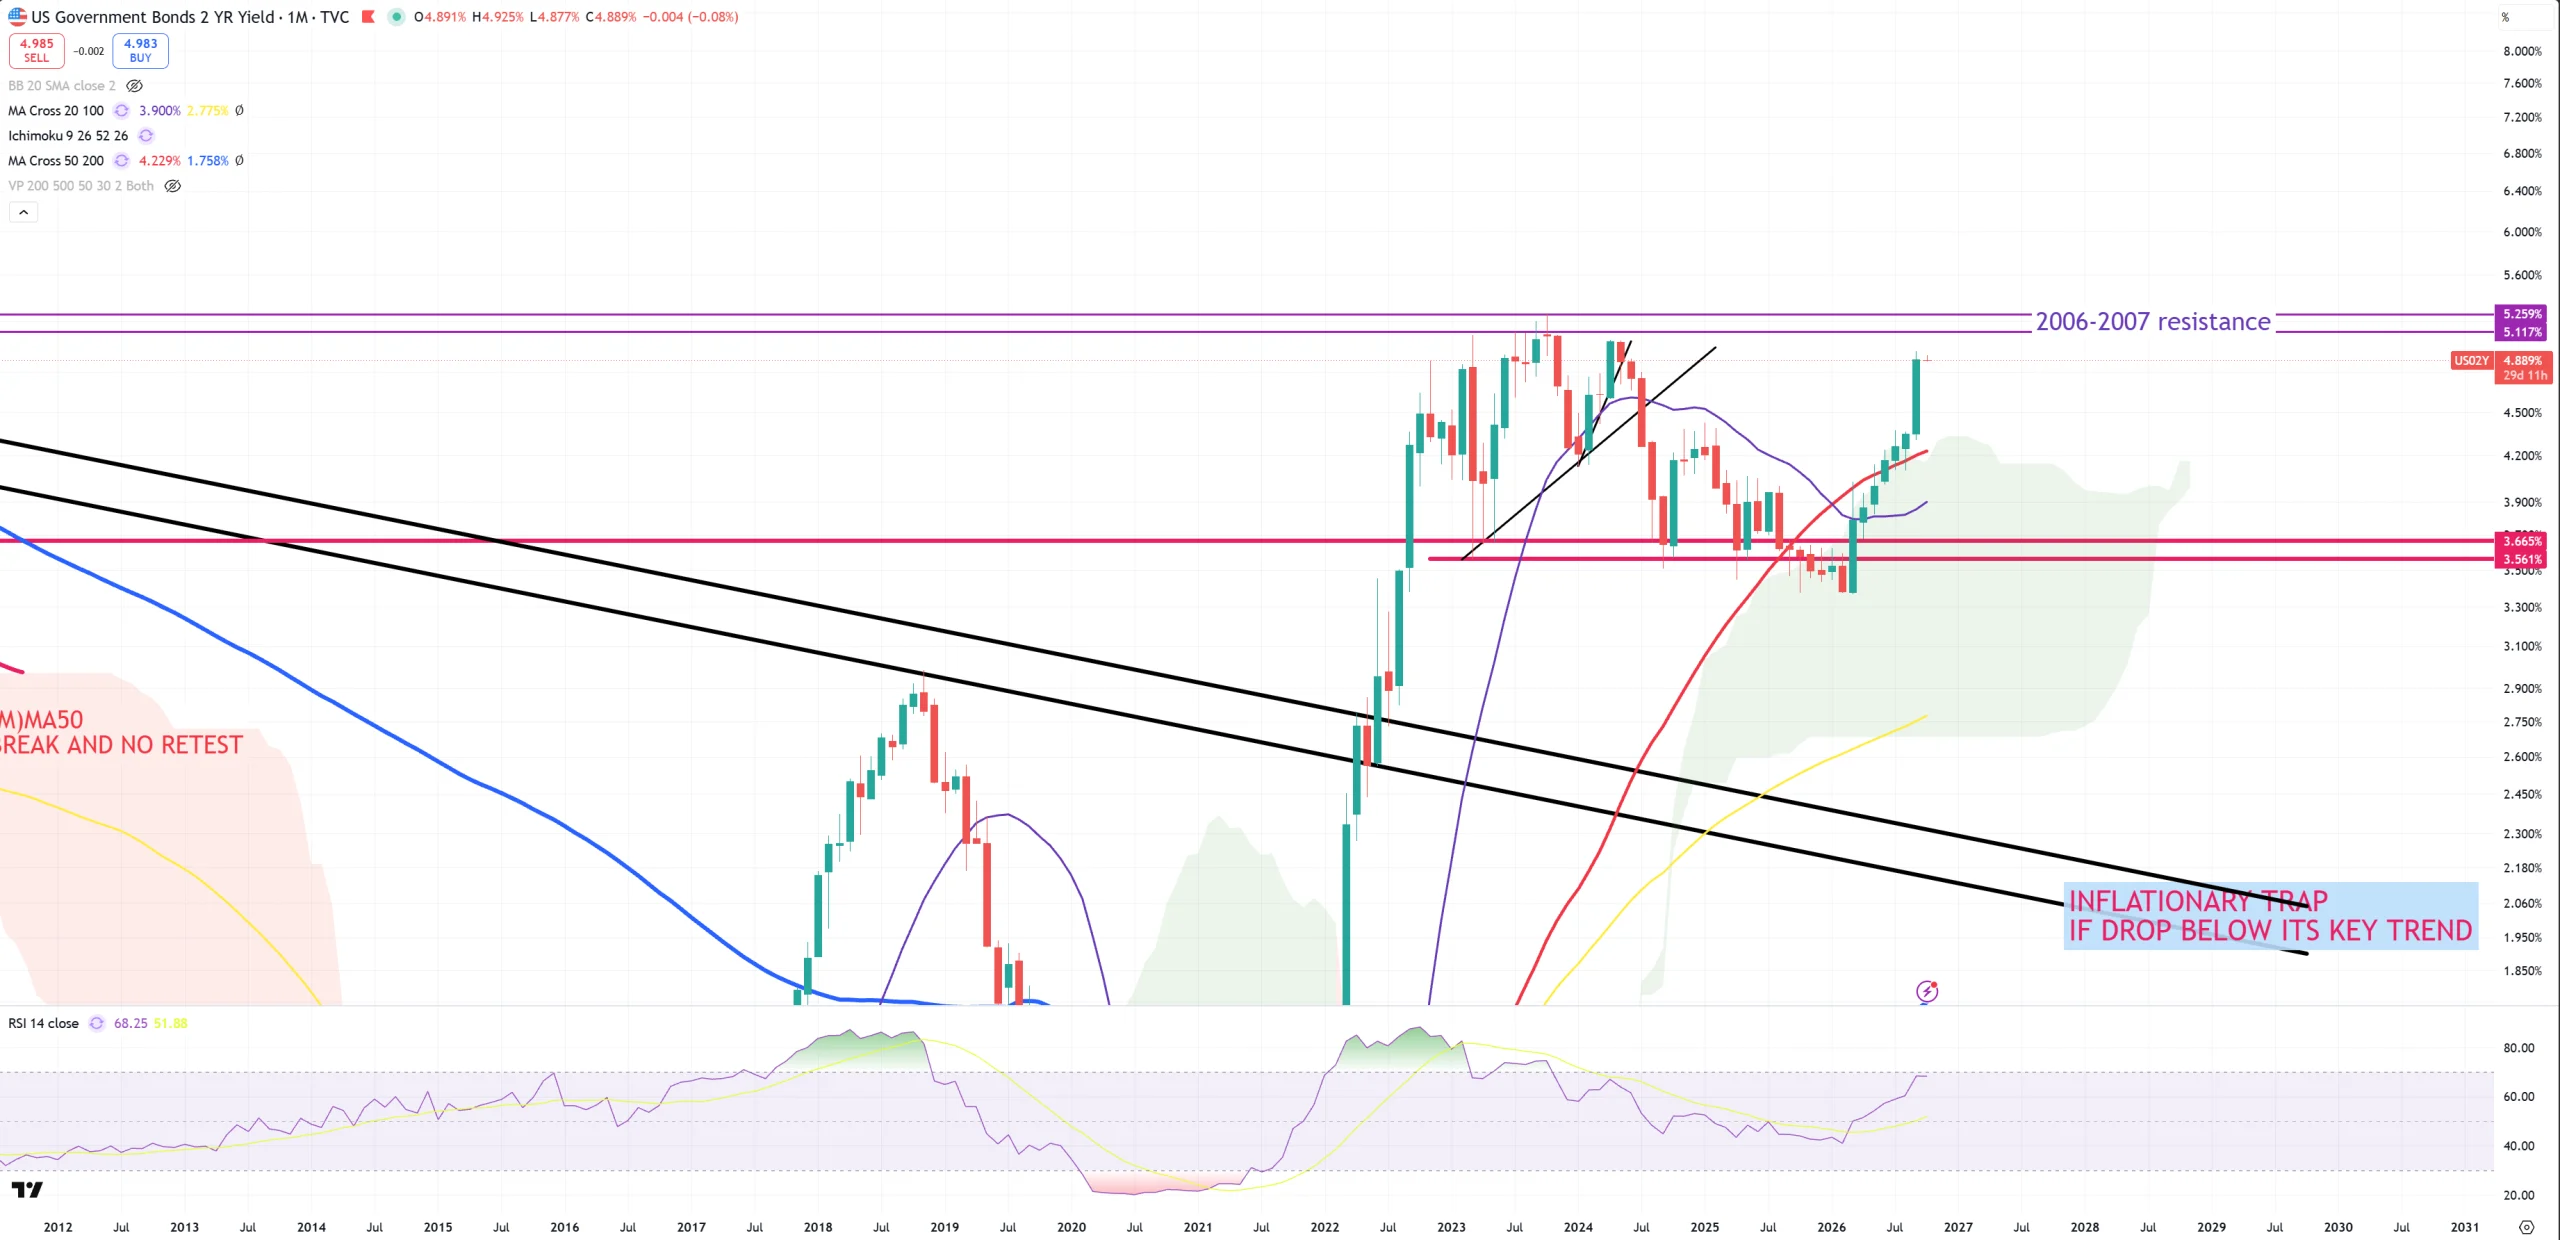
US02Y still wants to touch 5.20%
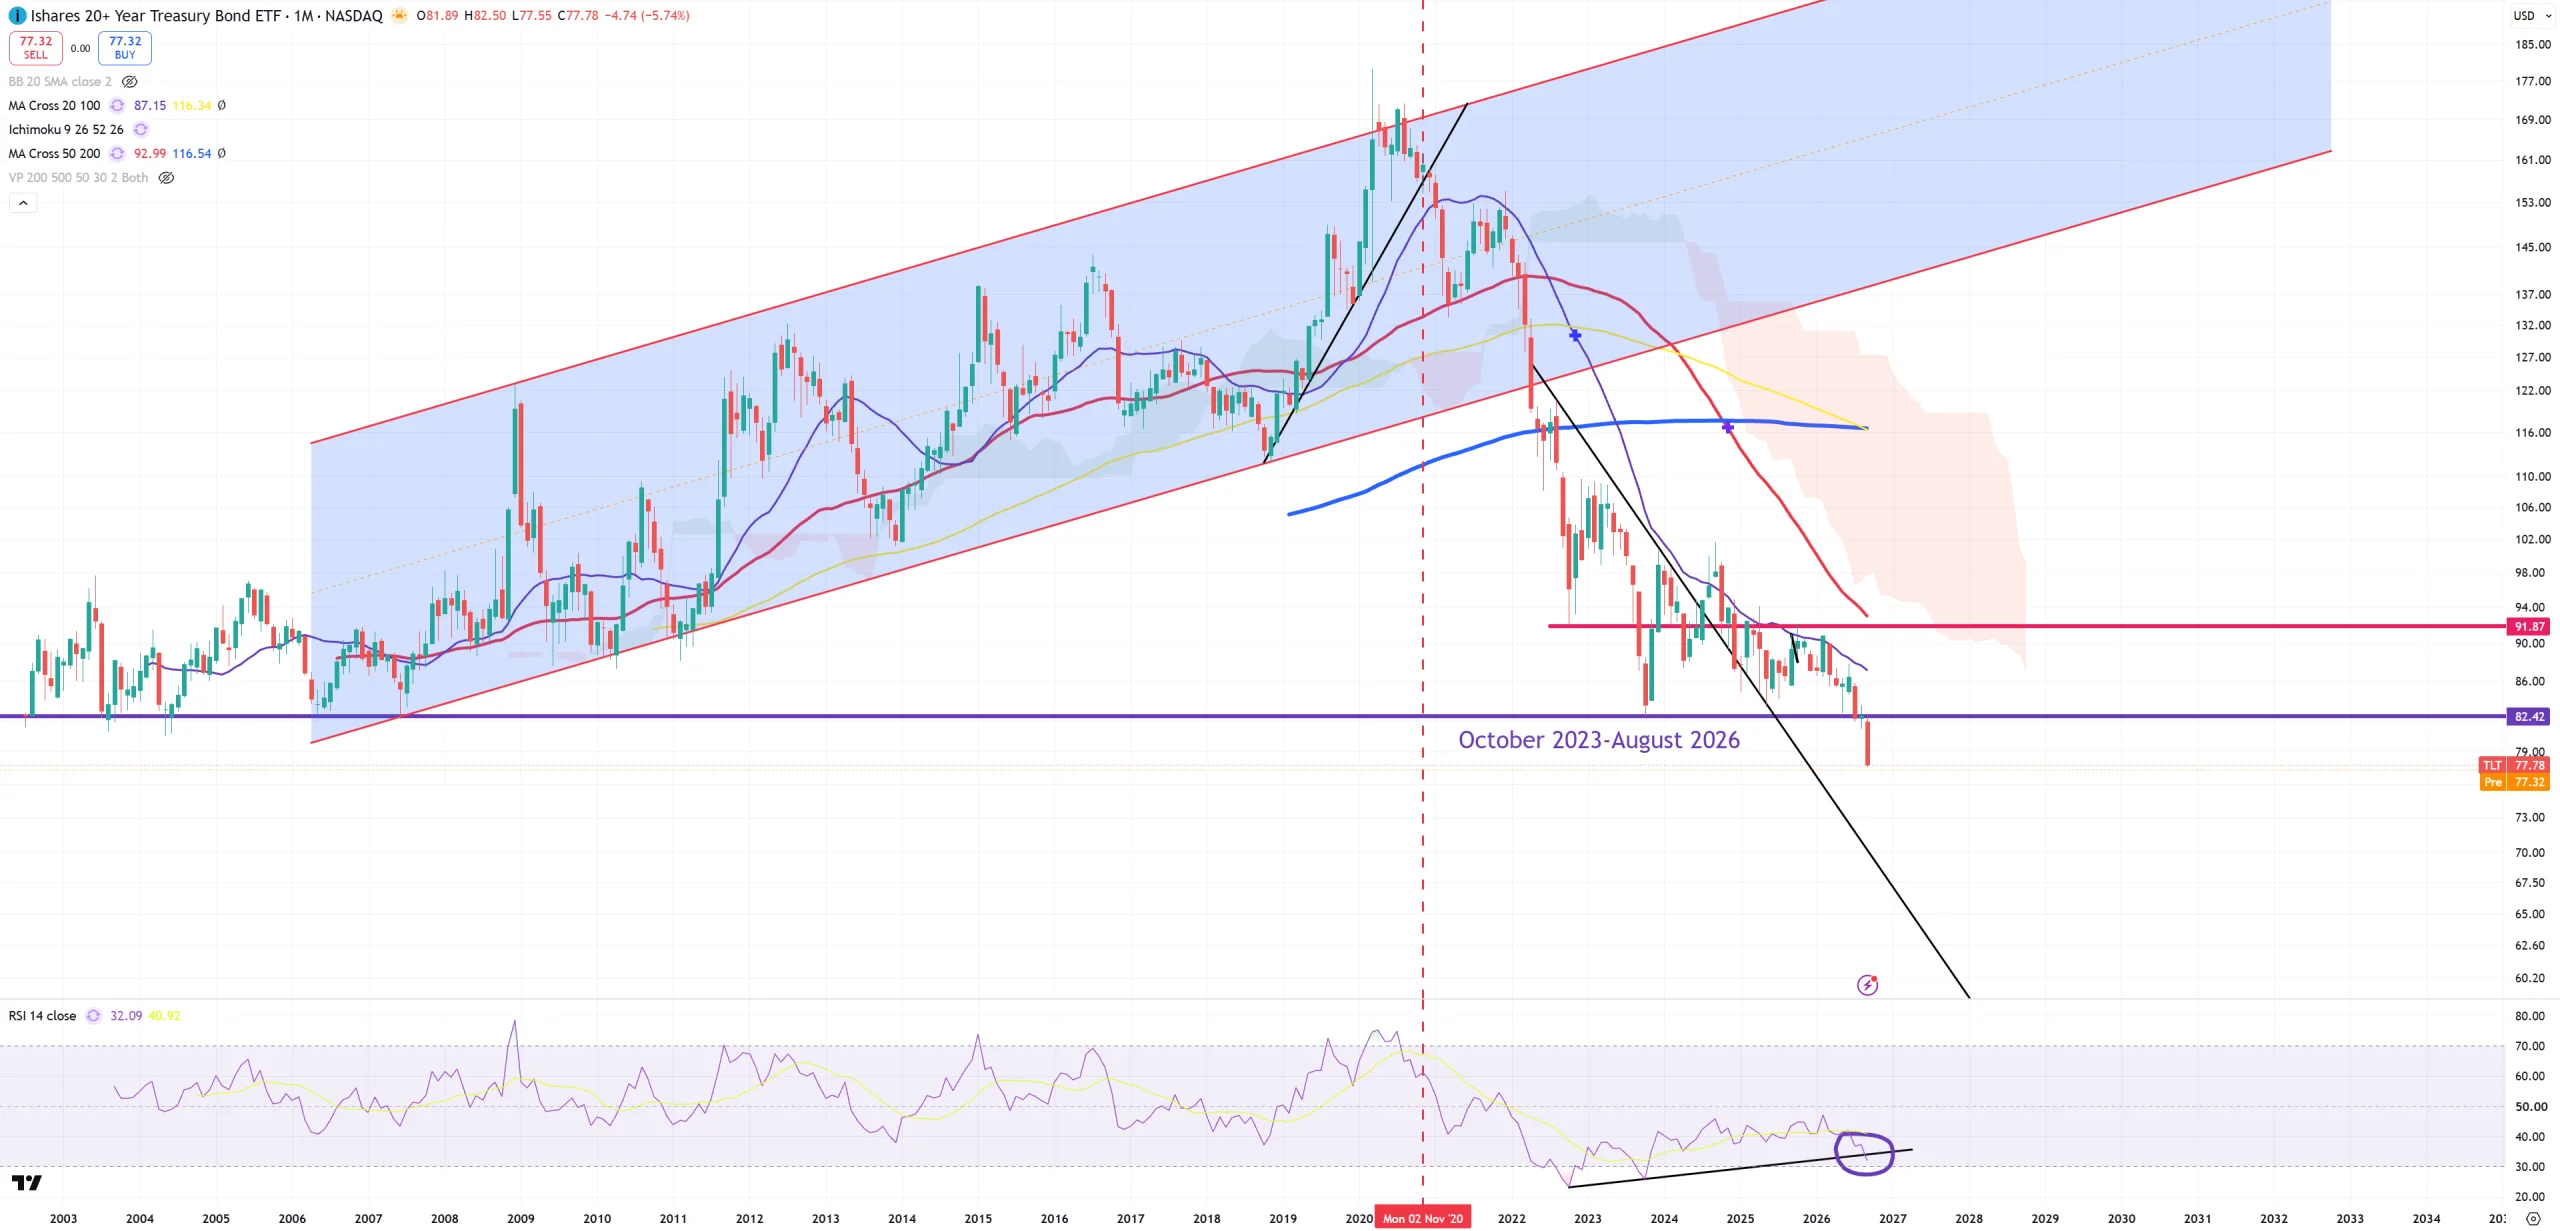
TLT – breaks 82$ and that’s a big RIP for the bond market. Really no need to show other bond markets because except Chinese one, all looking like this or worse.
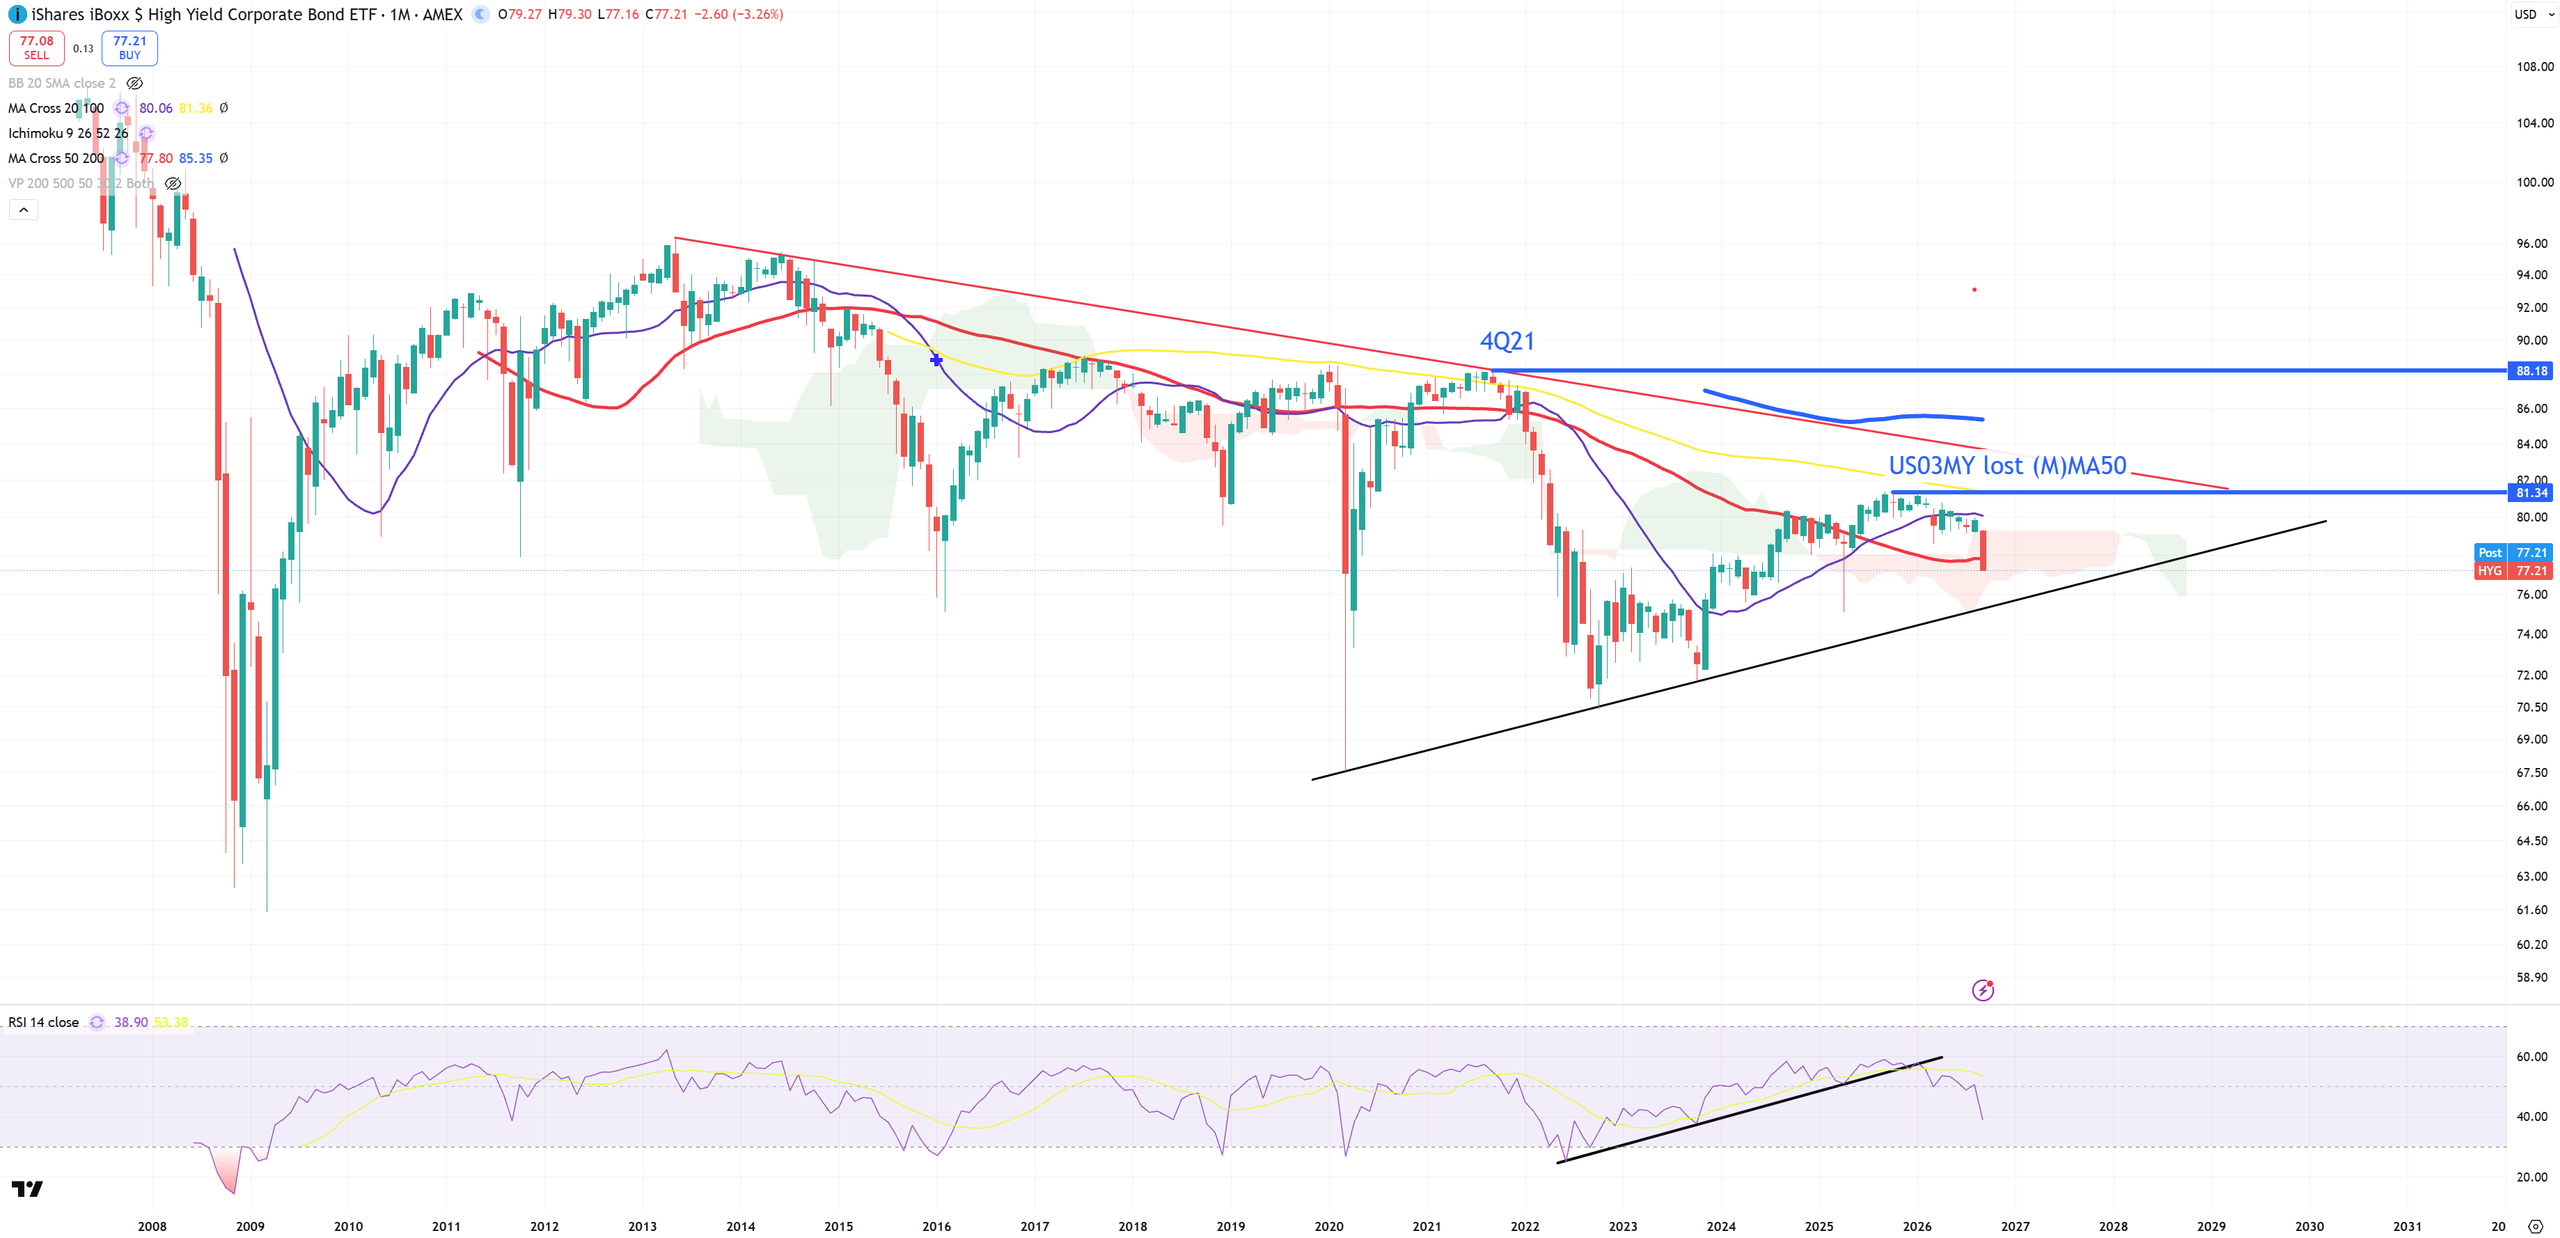
HYG – breaks (M)MA50
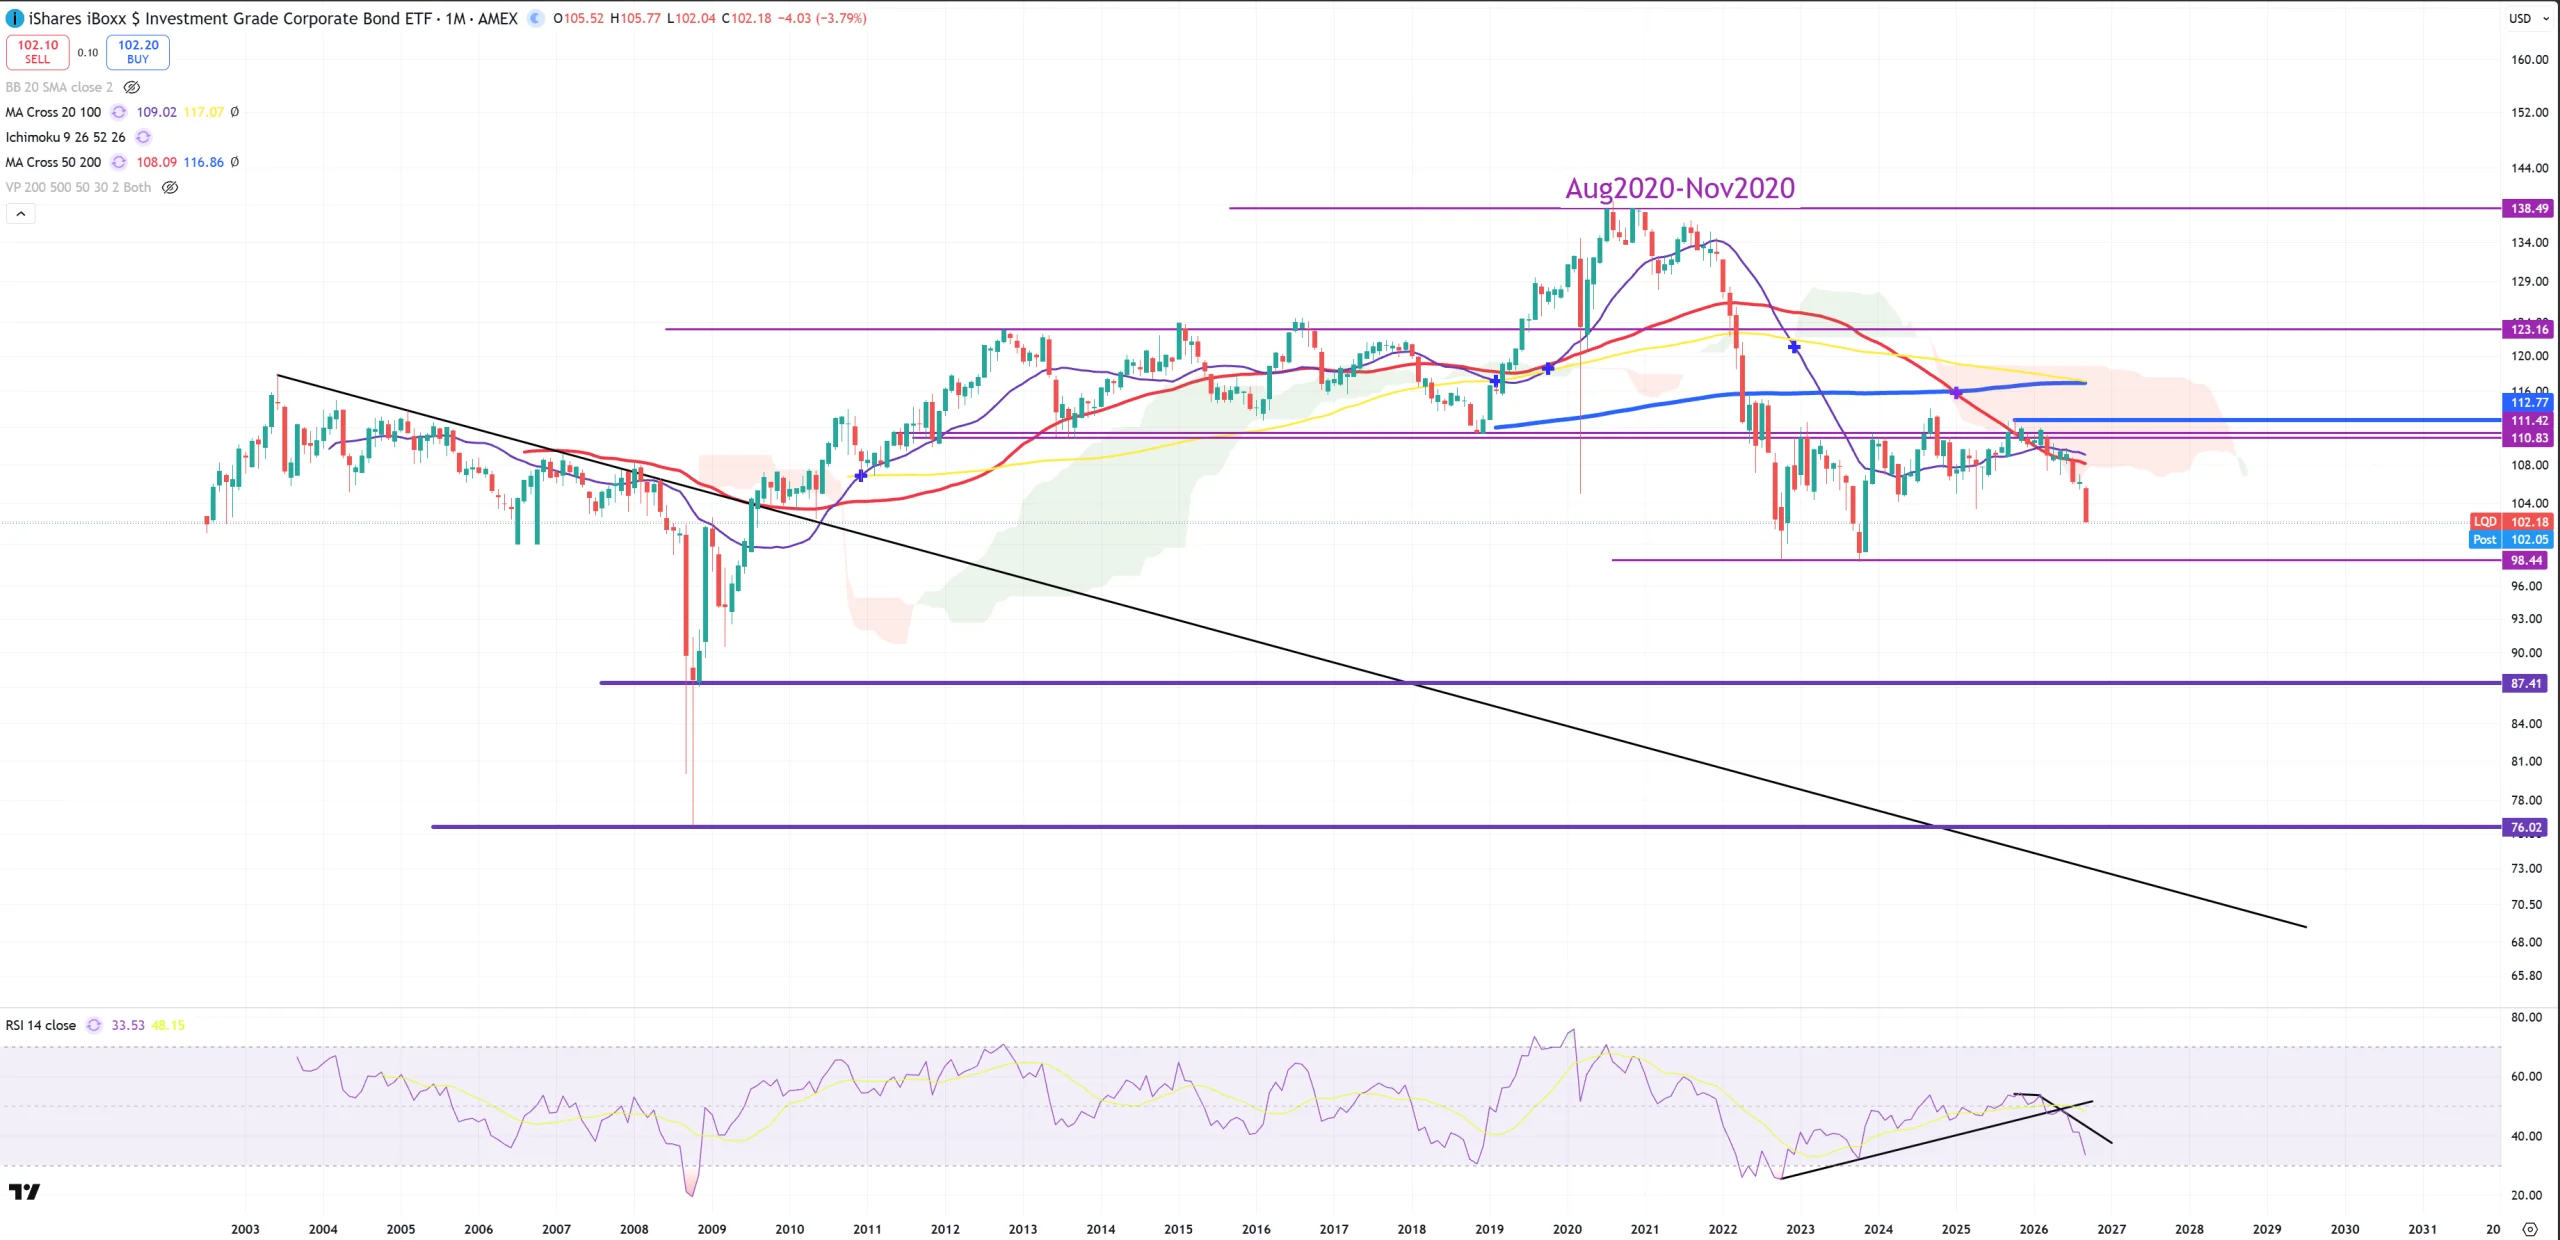
LQD – which is bigger junk than HYG after losing 98$ will land on 2008 lows
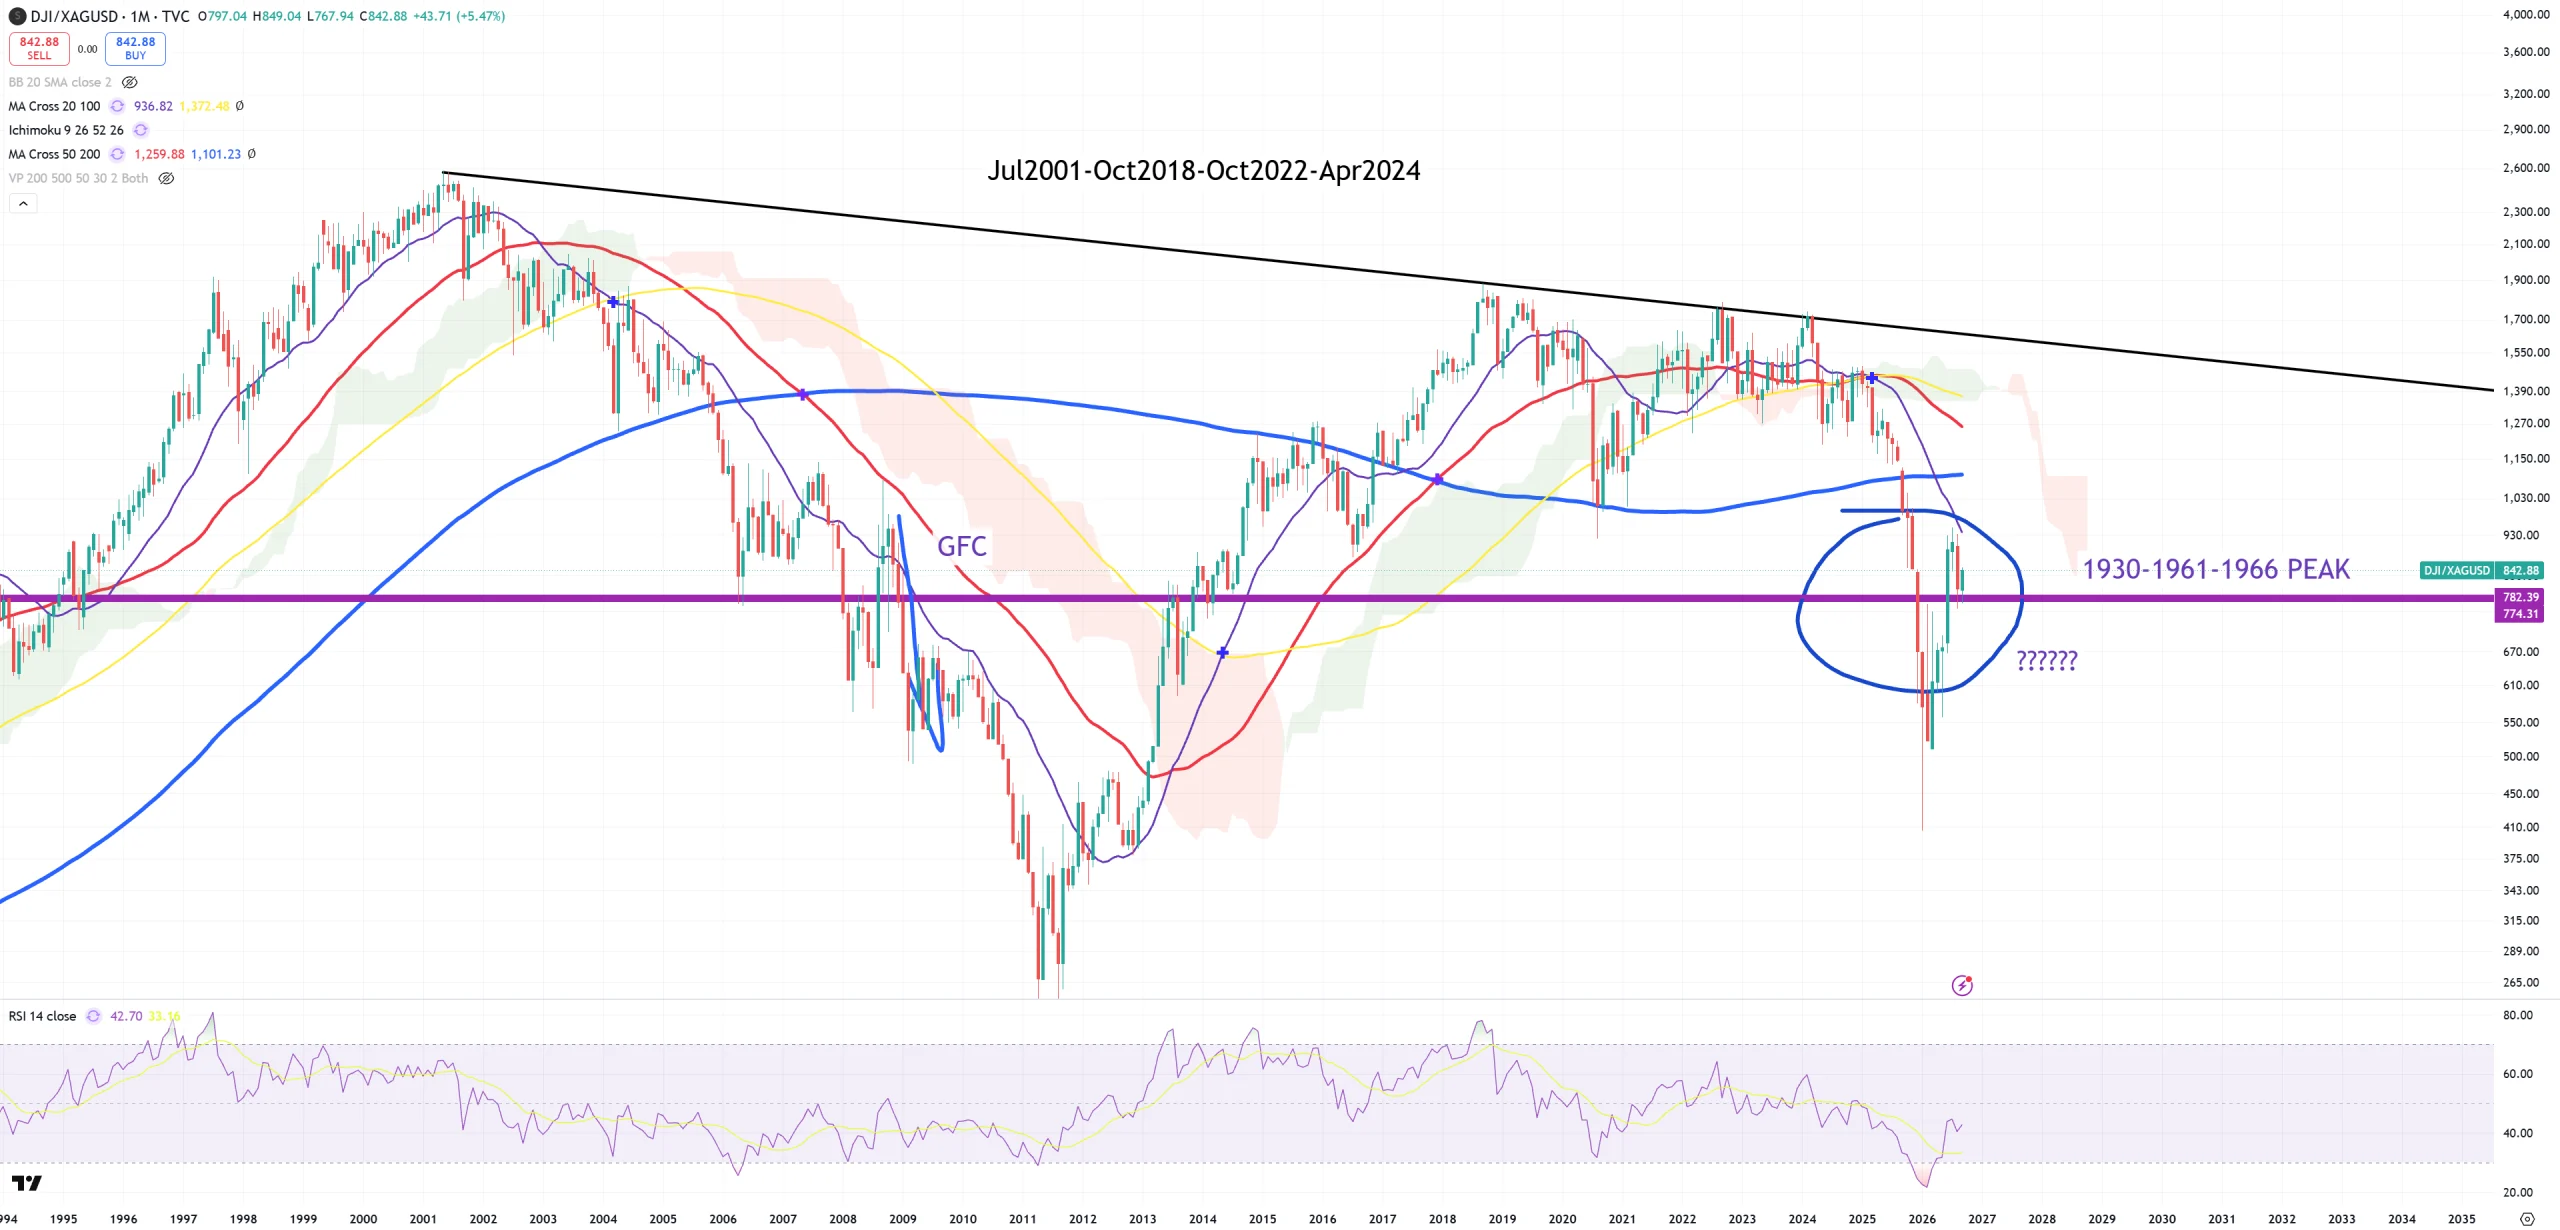
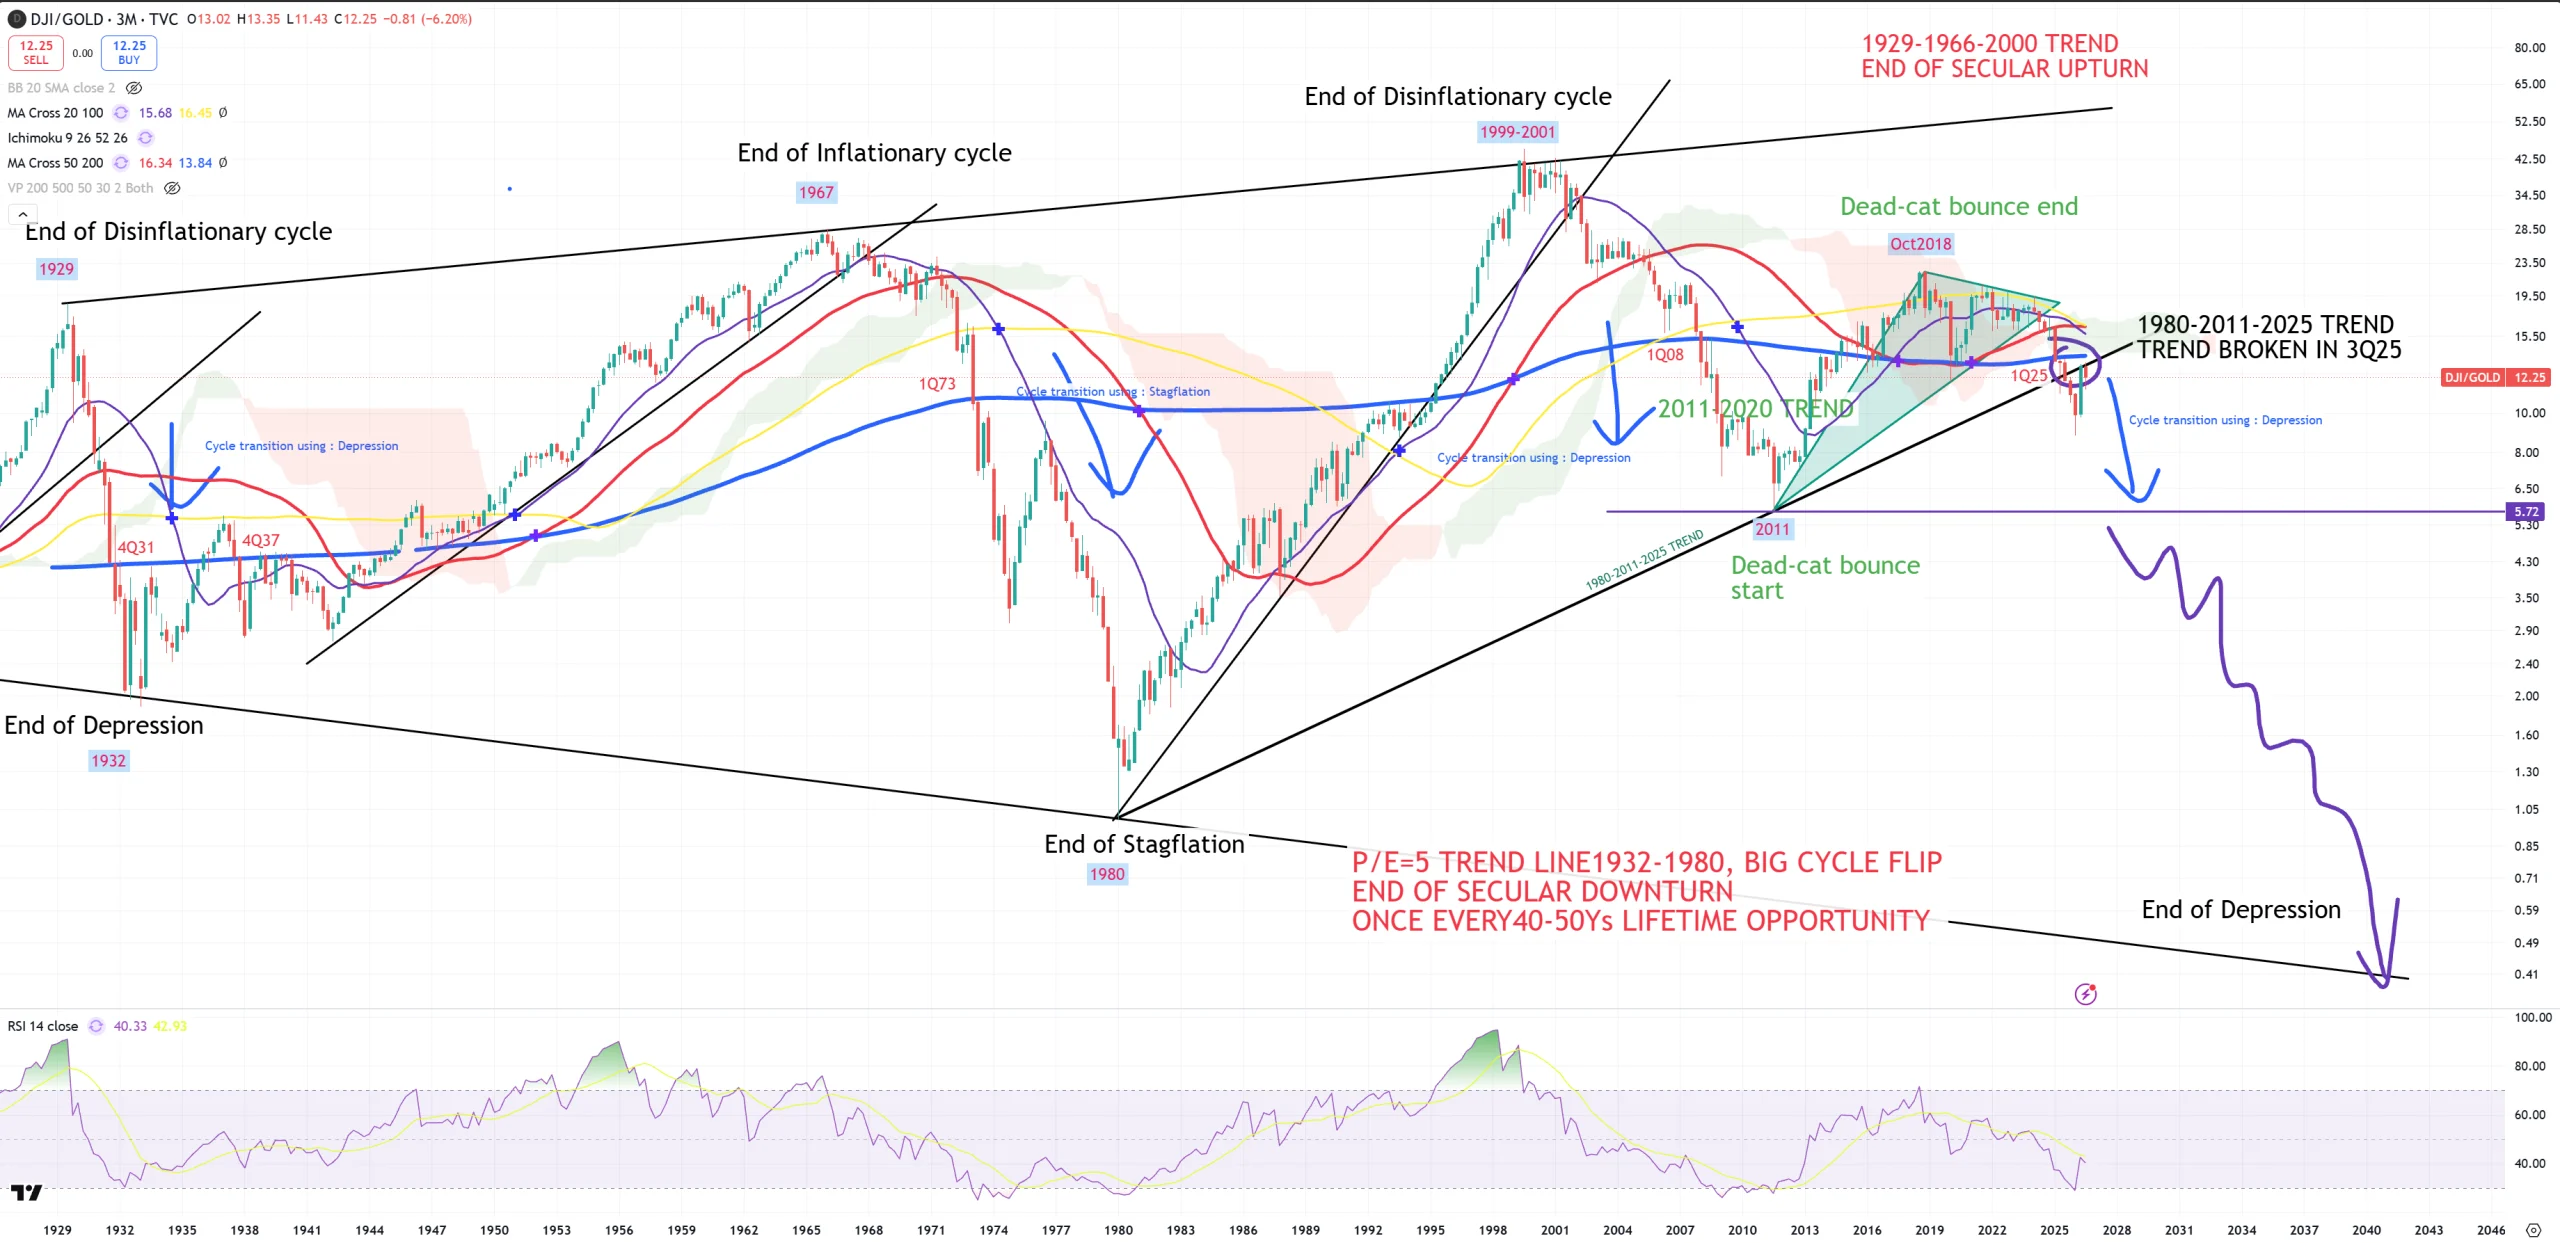
DJI/GOLD – cyclical indicator – keeps retesting its 1980-2011 trend rejection as blue (3M)MA200 was broken in 1Q2025 and never recovered. DJI is the weakest index ratio to GOLD vs SPX & NDQ.
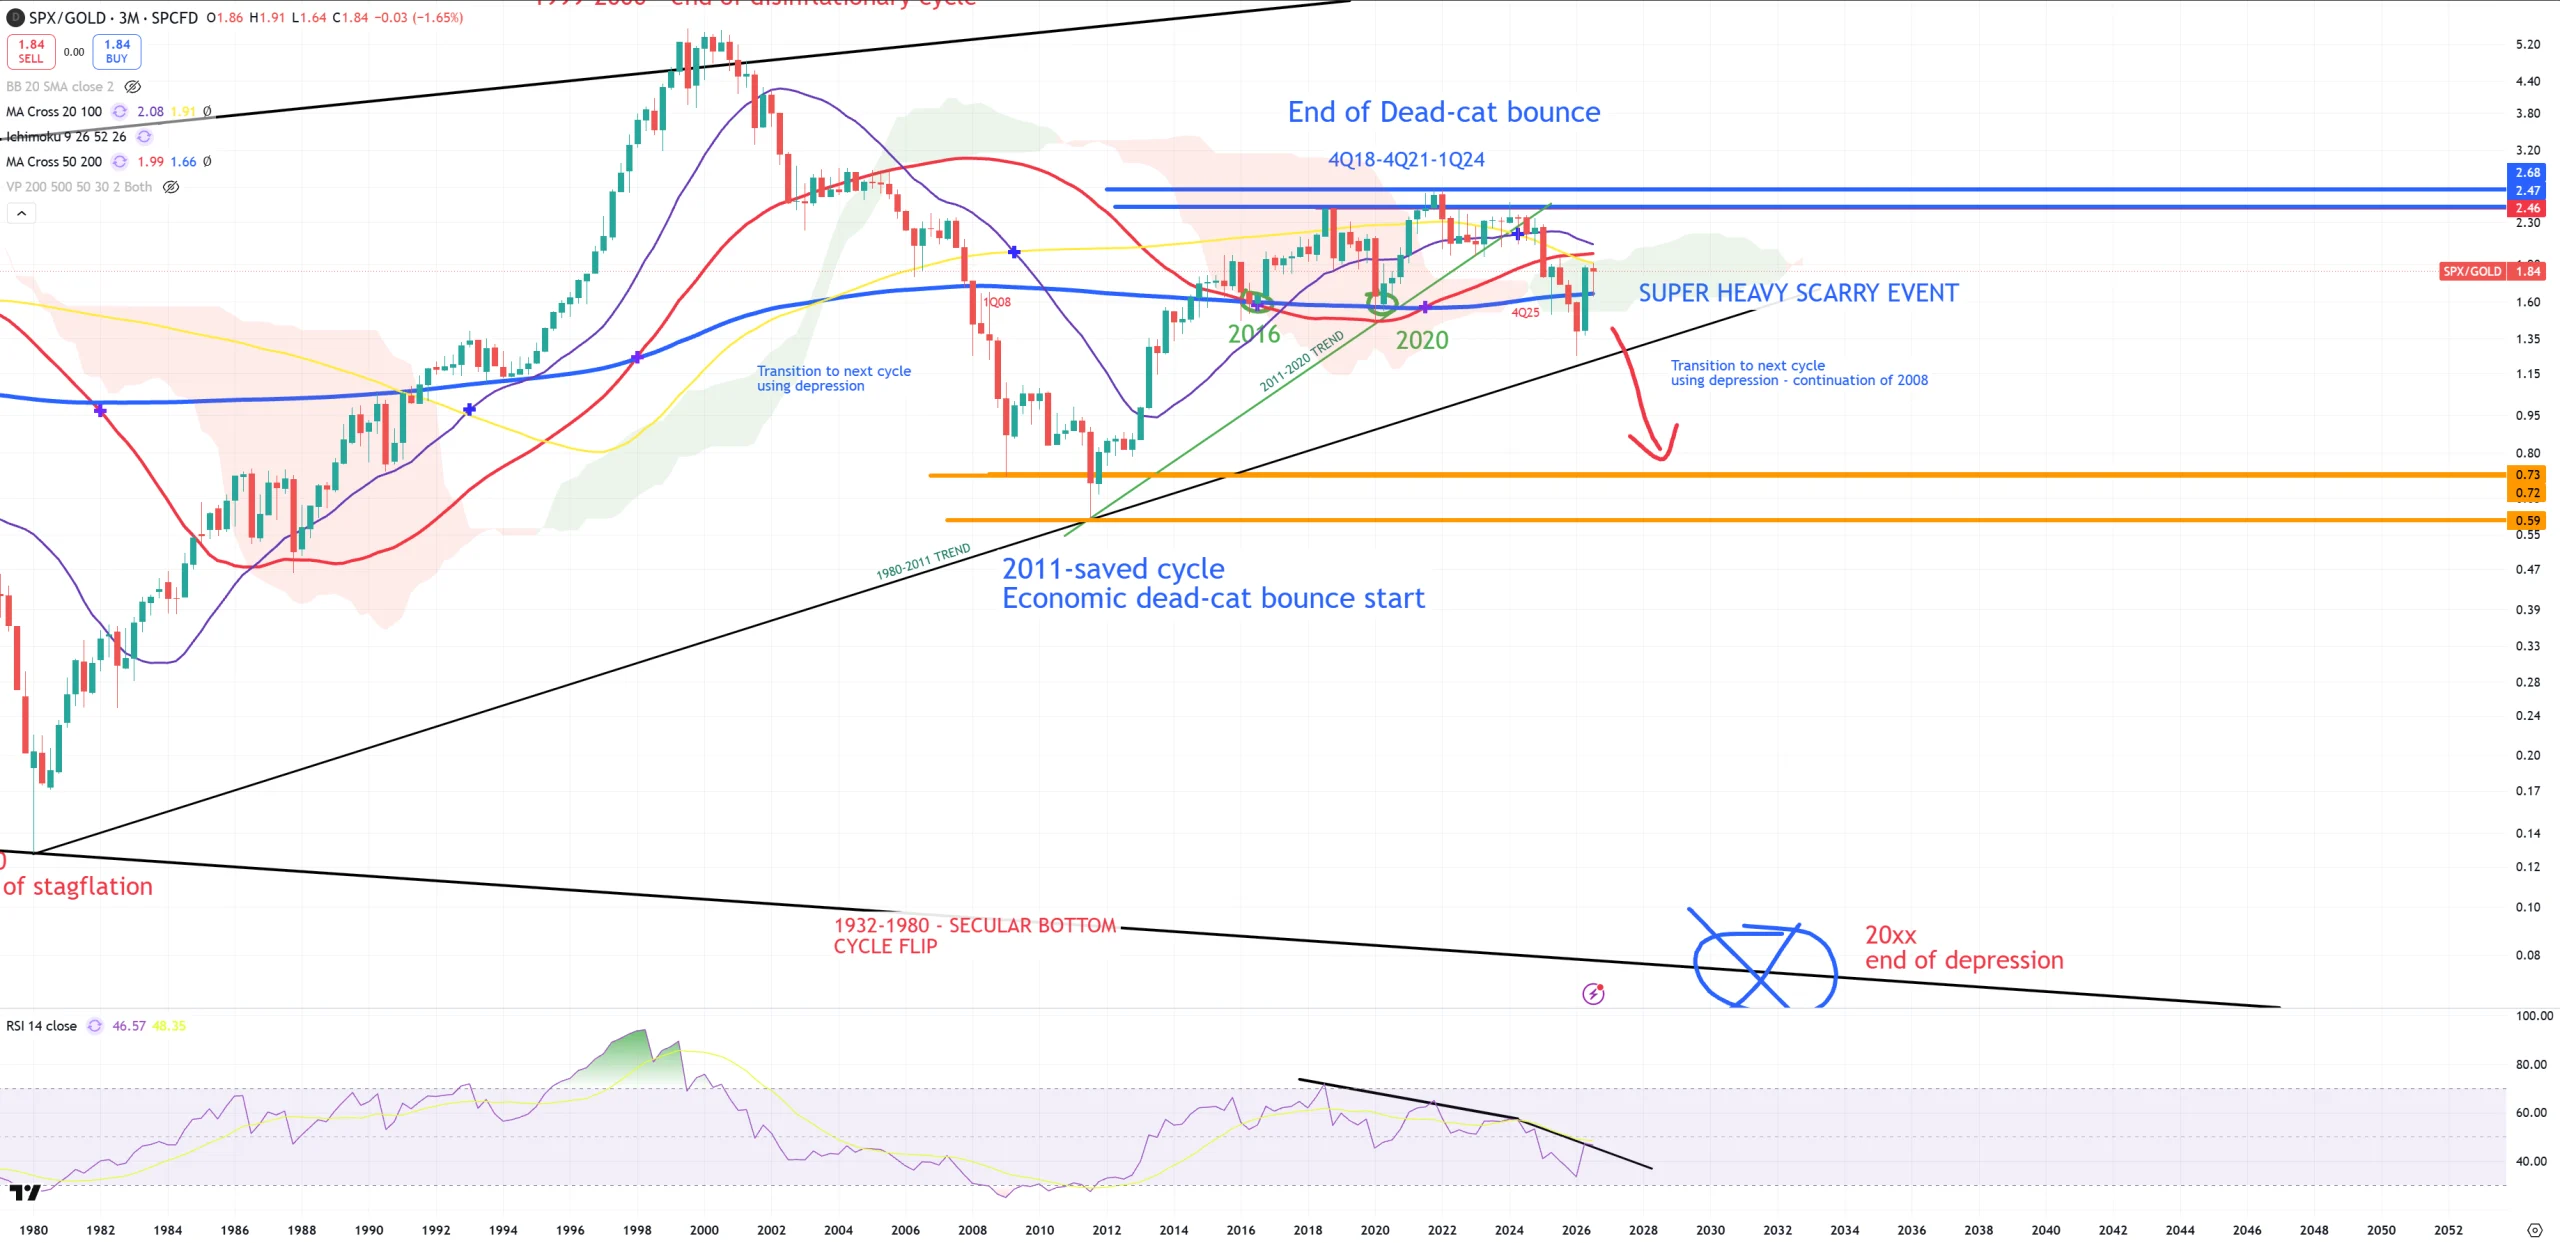
SPX/GOLD – saved its (3M)MA200 after losing it in 4Q2025.
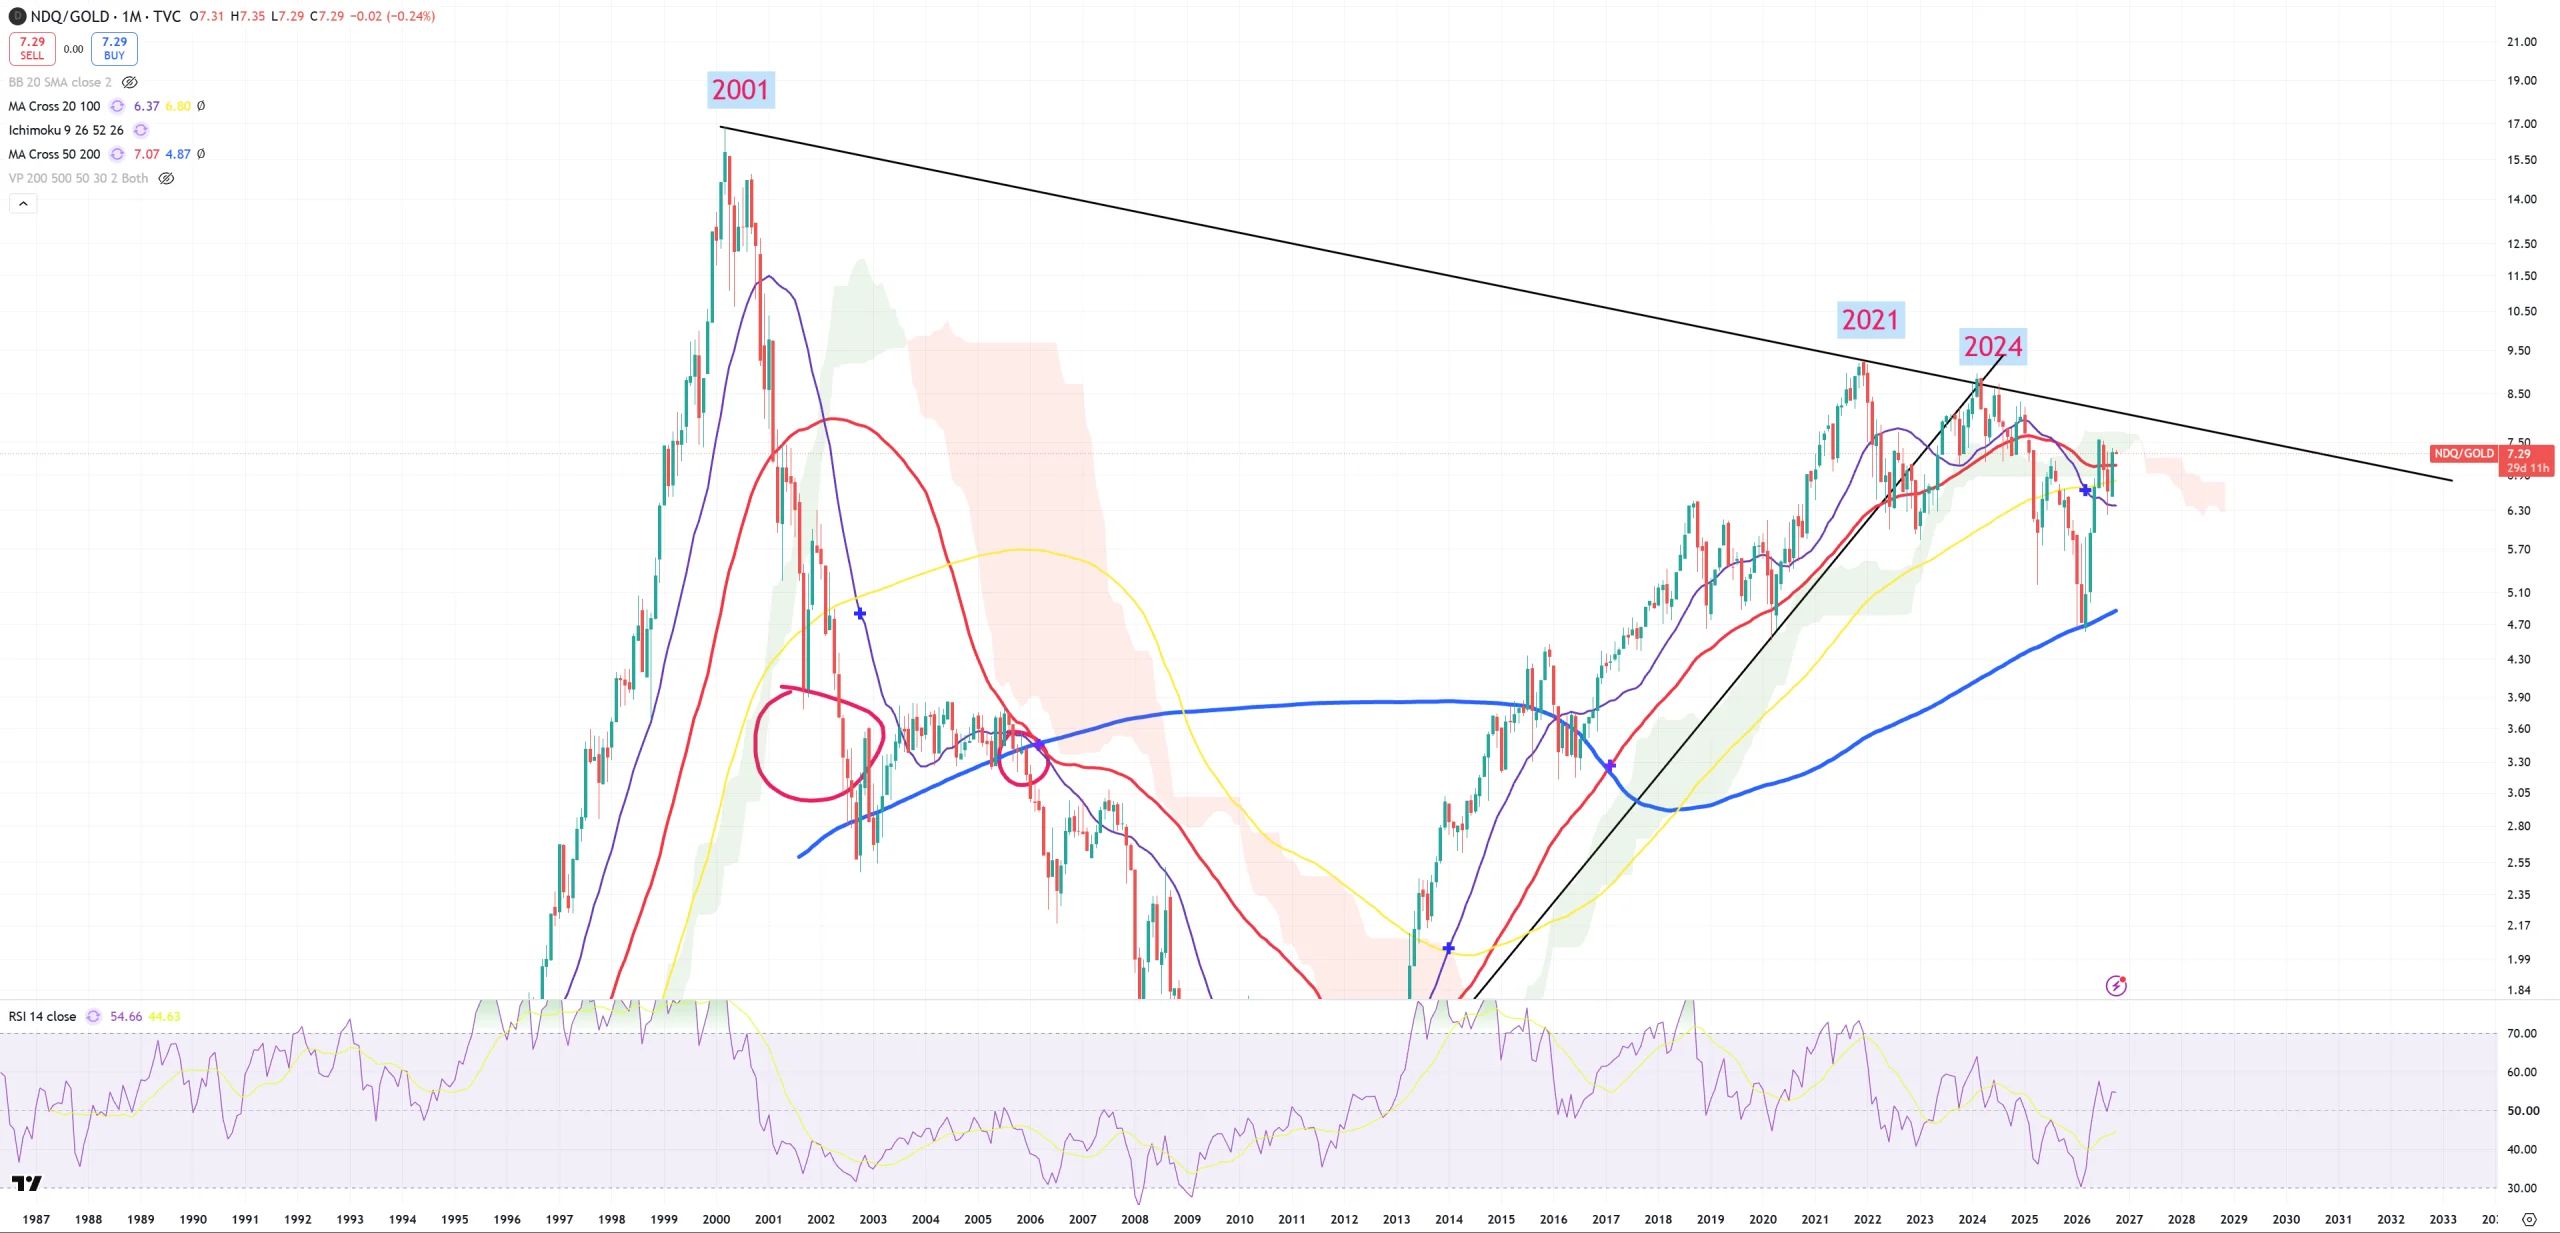
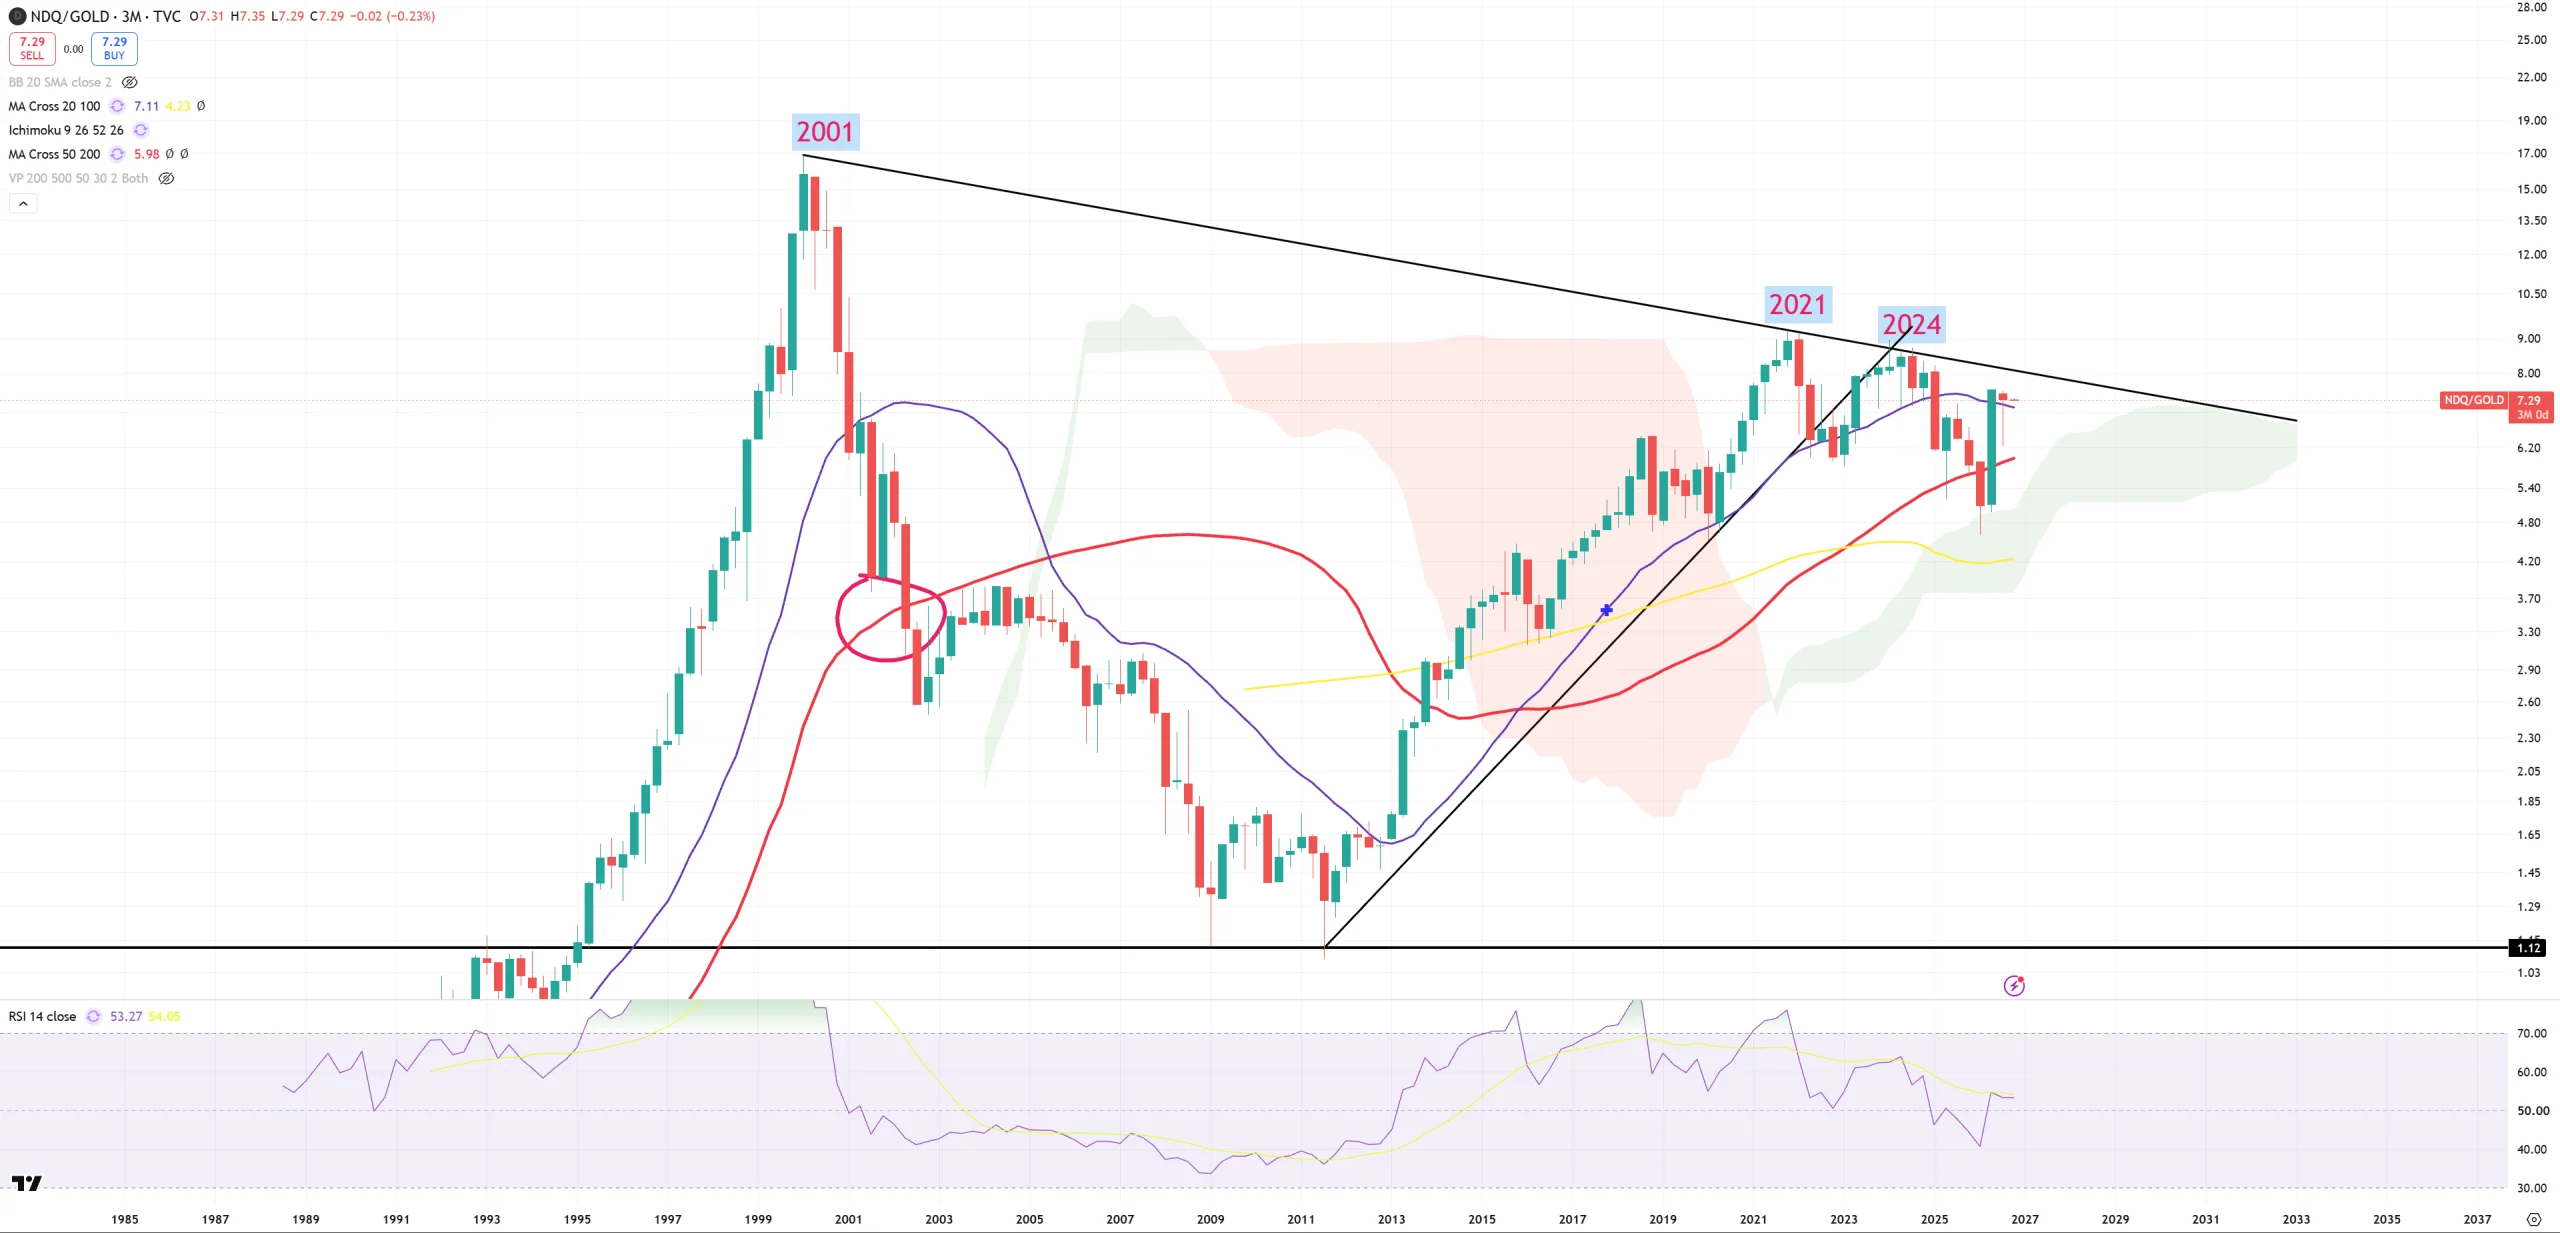
NDQ/GOLD – not really important cycle indicator, but Nasdaq 100 saved its (M)MA50 break and saved its (3M)MA20 break. Two charts, first (M) next (3M). NDQ still fights not to blow up at any cost.
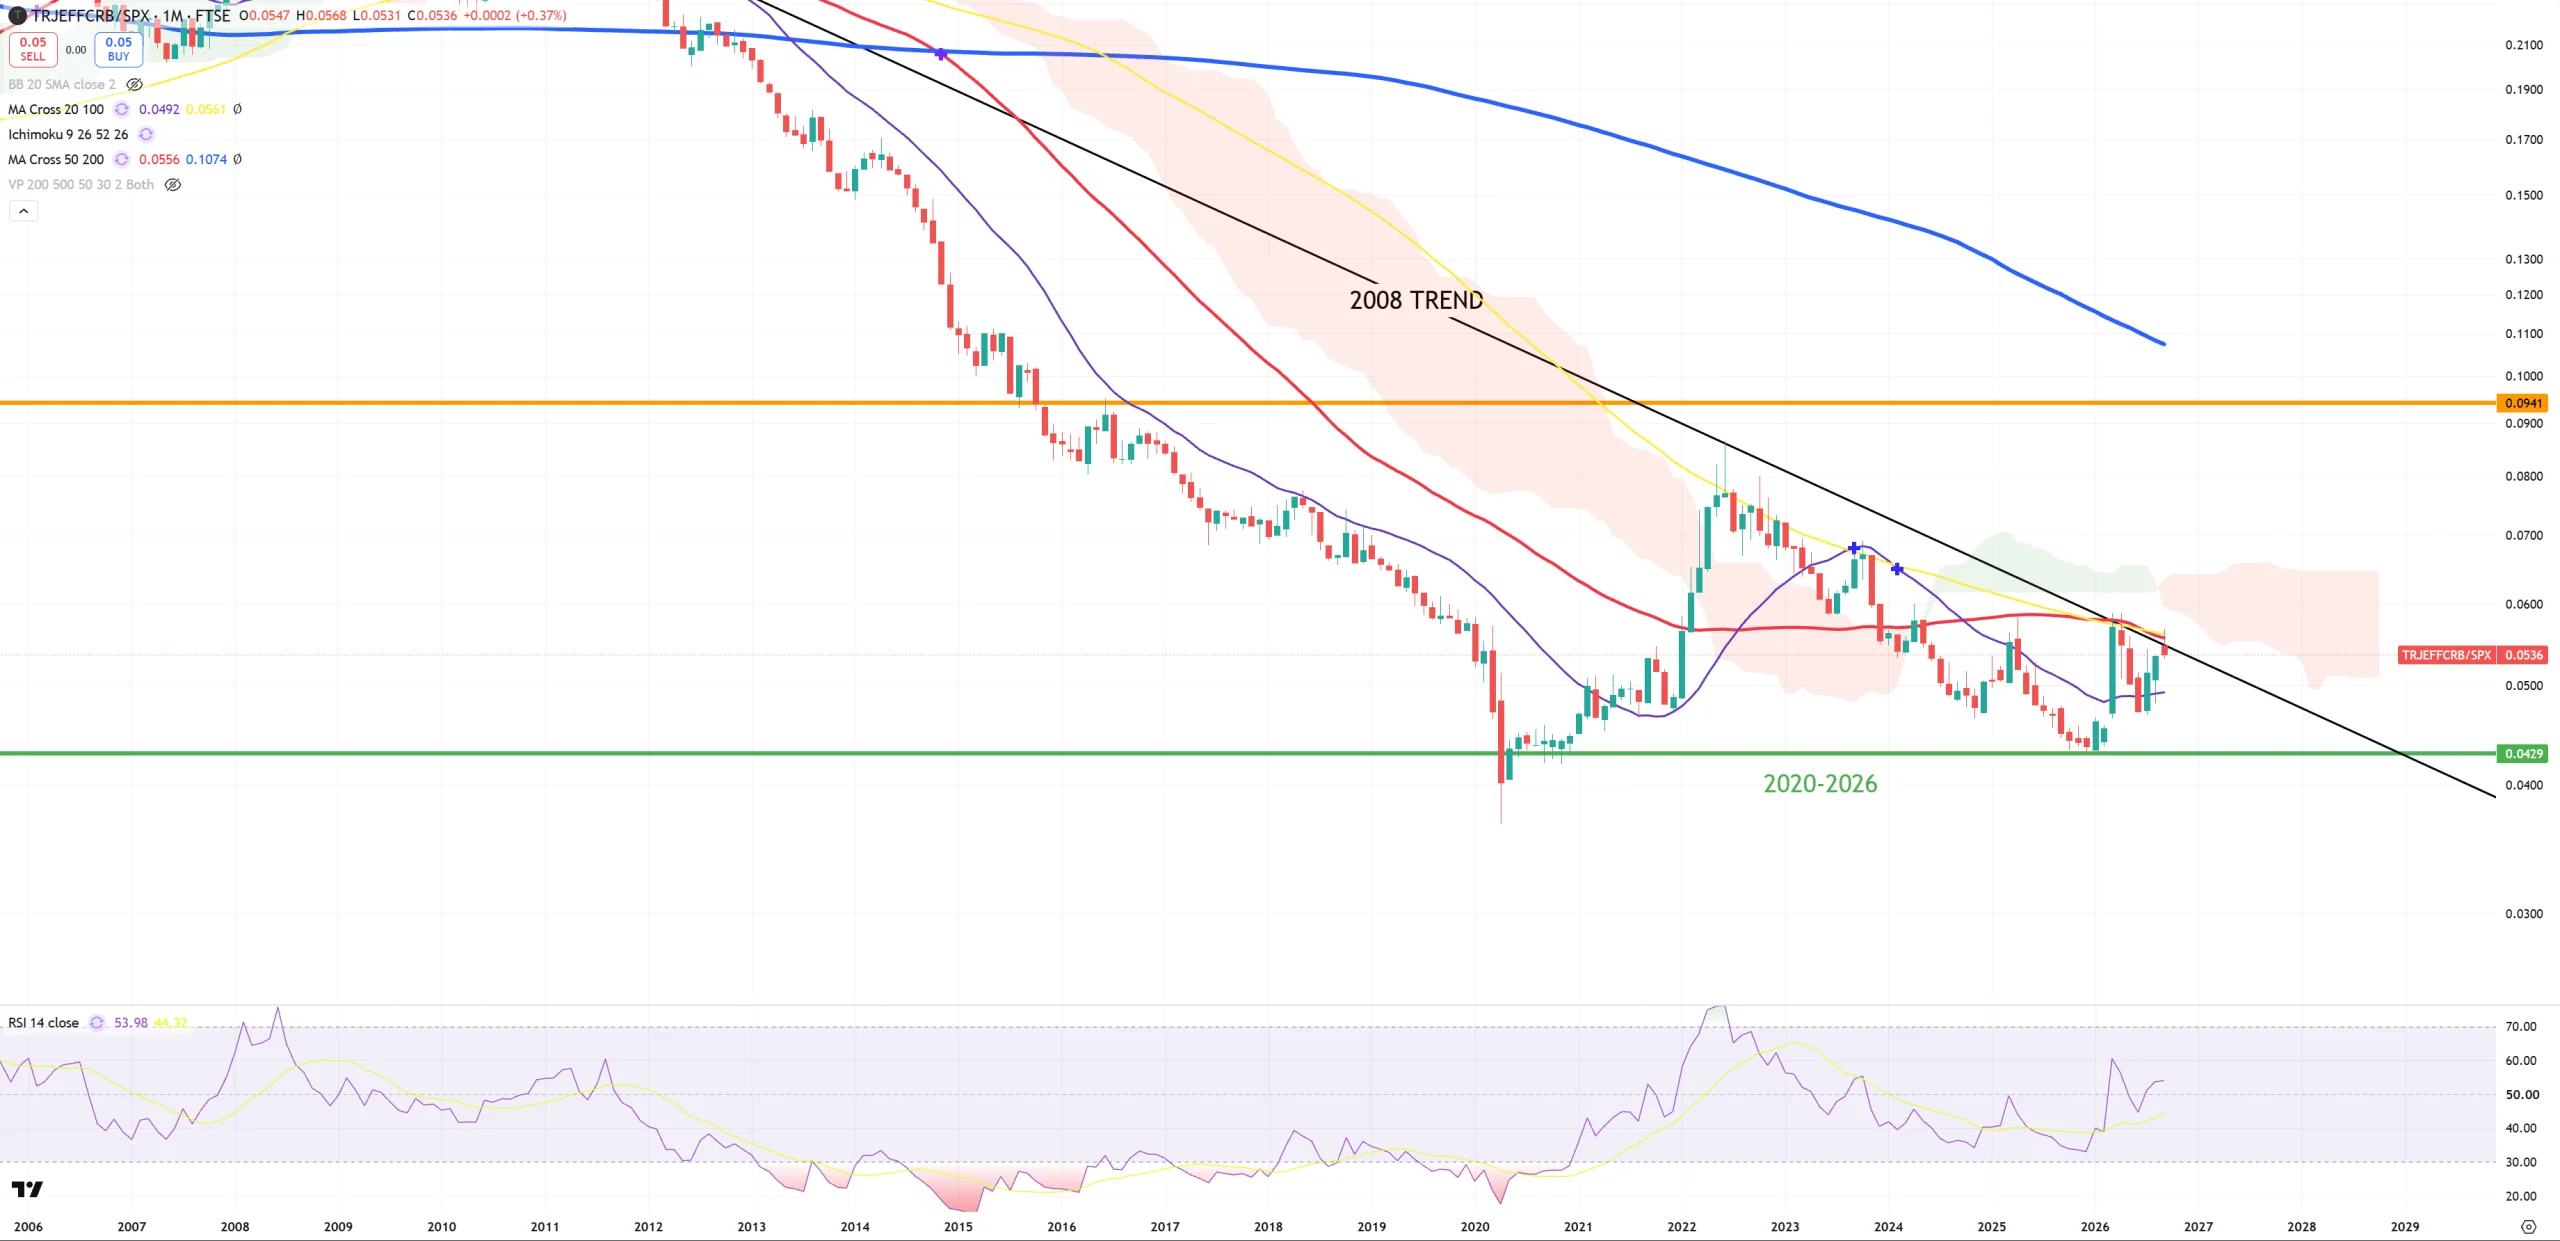
CRB/SPX – rejects red (M)MA50, still no commodities bull market vs SP500
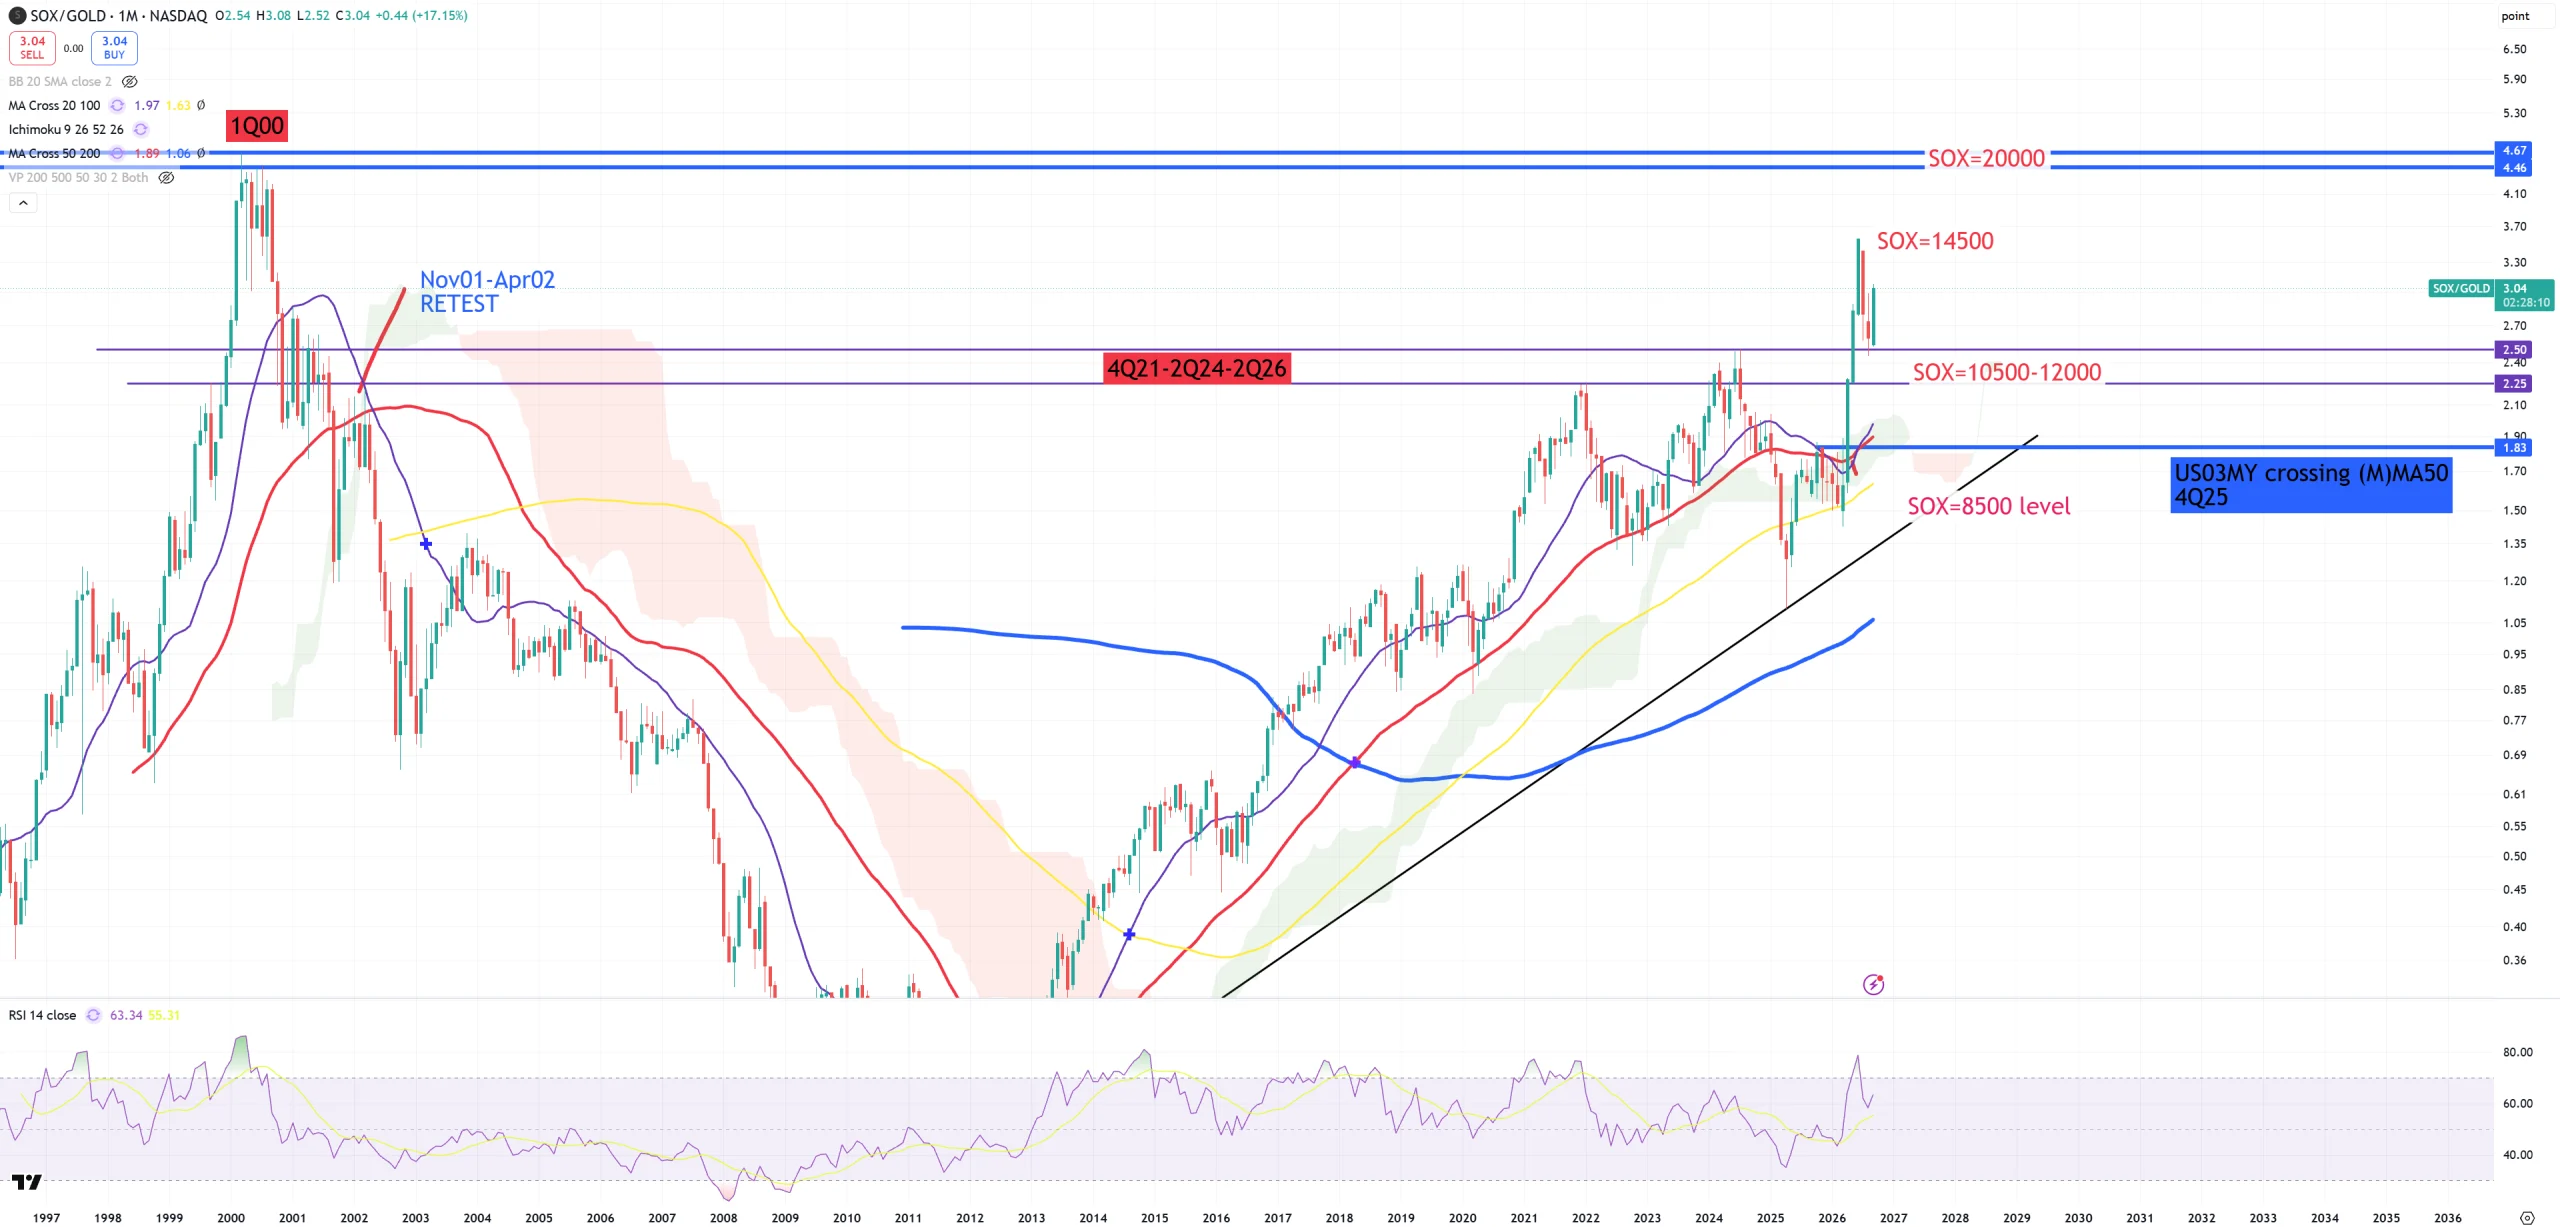
SOX/GOLD finds support where it should. The highest point for SOX/GOLD is June 2026 and (so far) we call it the peak of SOX cycle.
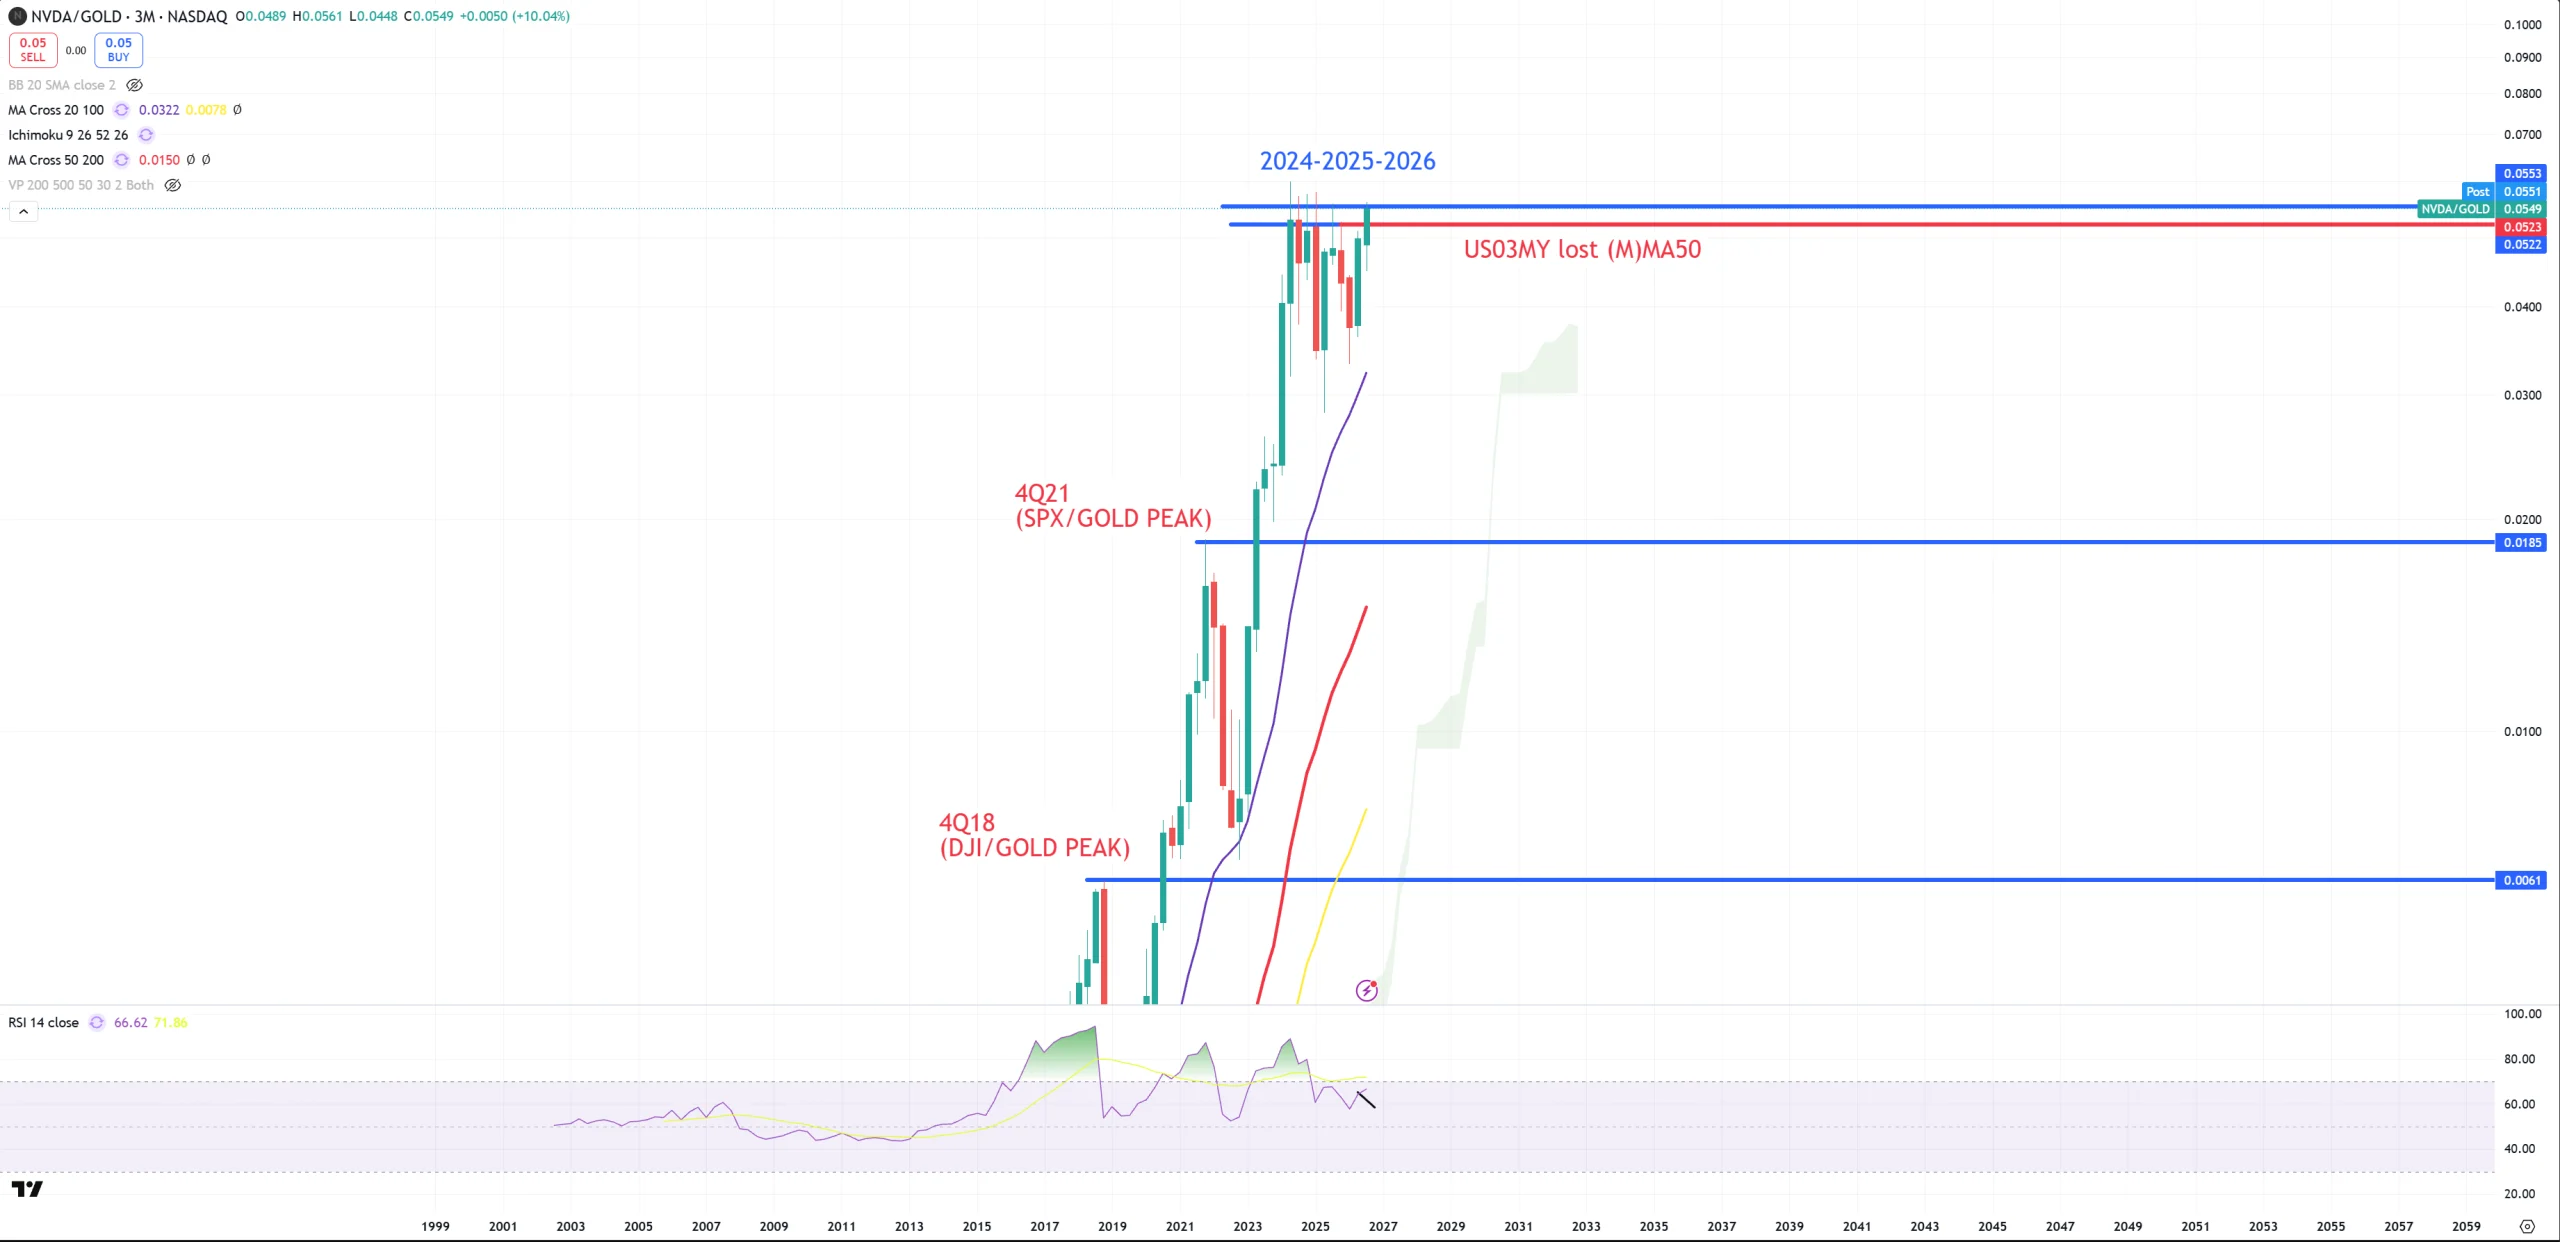
NVDA/GOLD – we’ll use almost 6T$ company as a key example – since April 2024 bangs to the same level reminding 1Q2000 from the chart above.
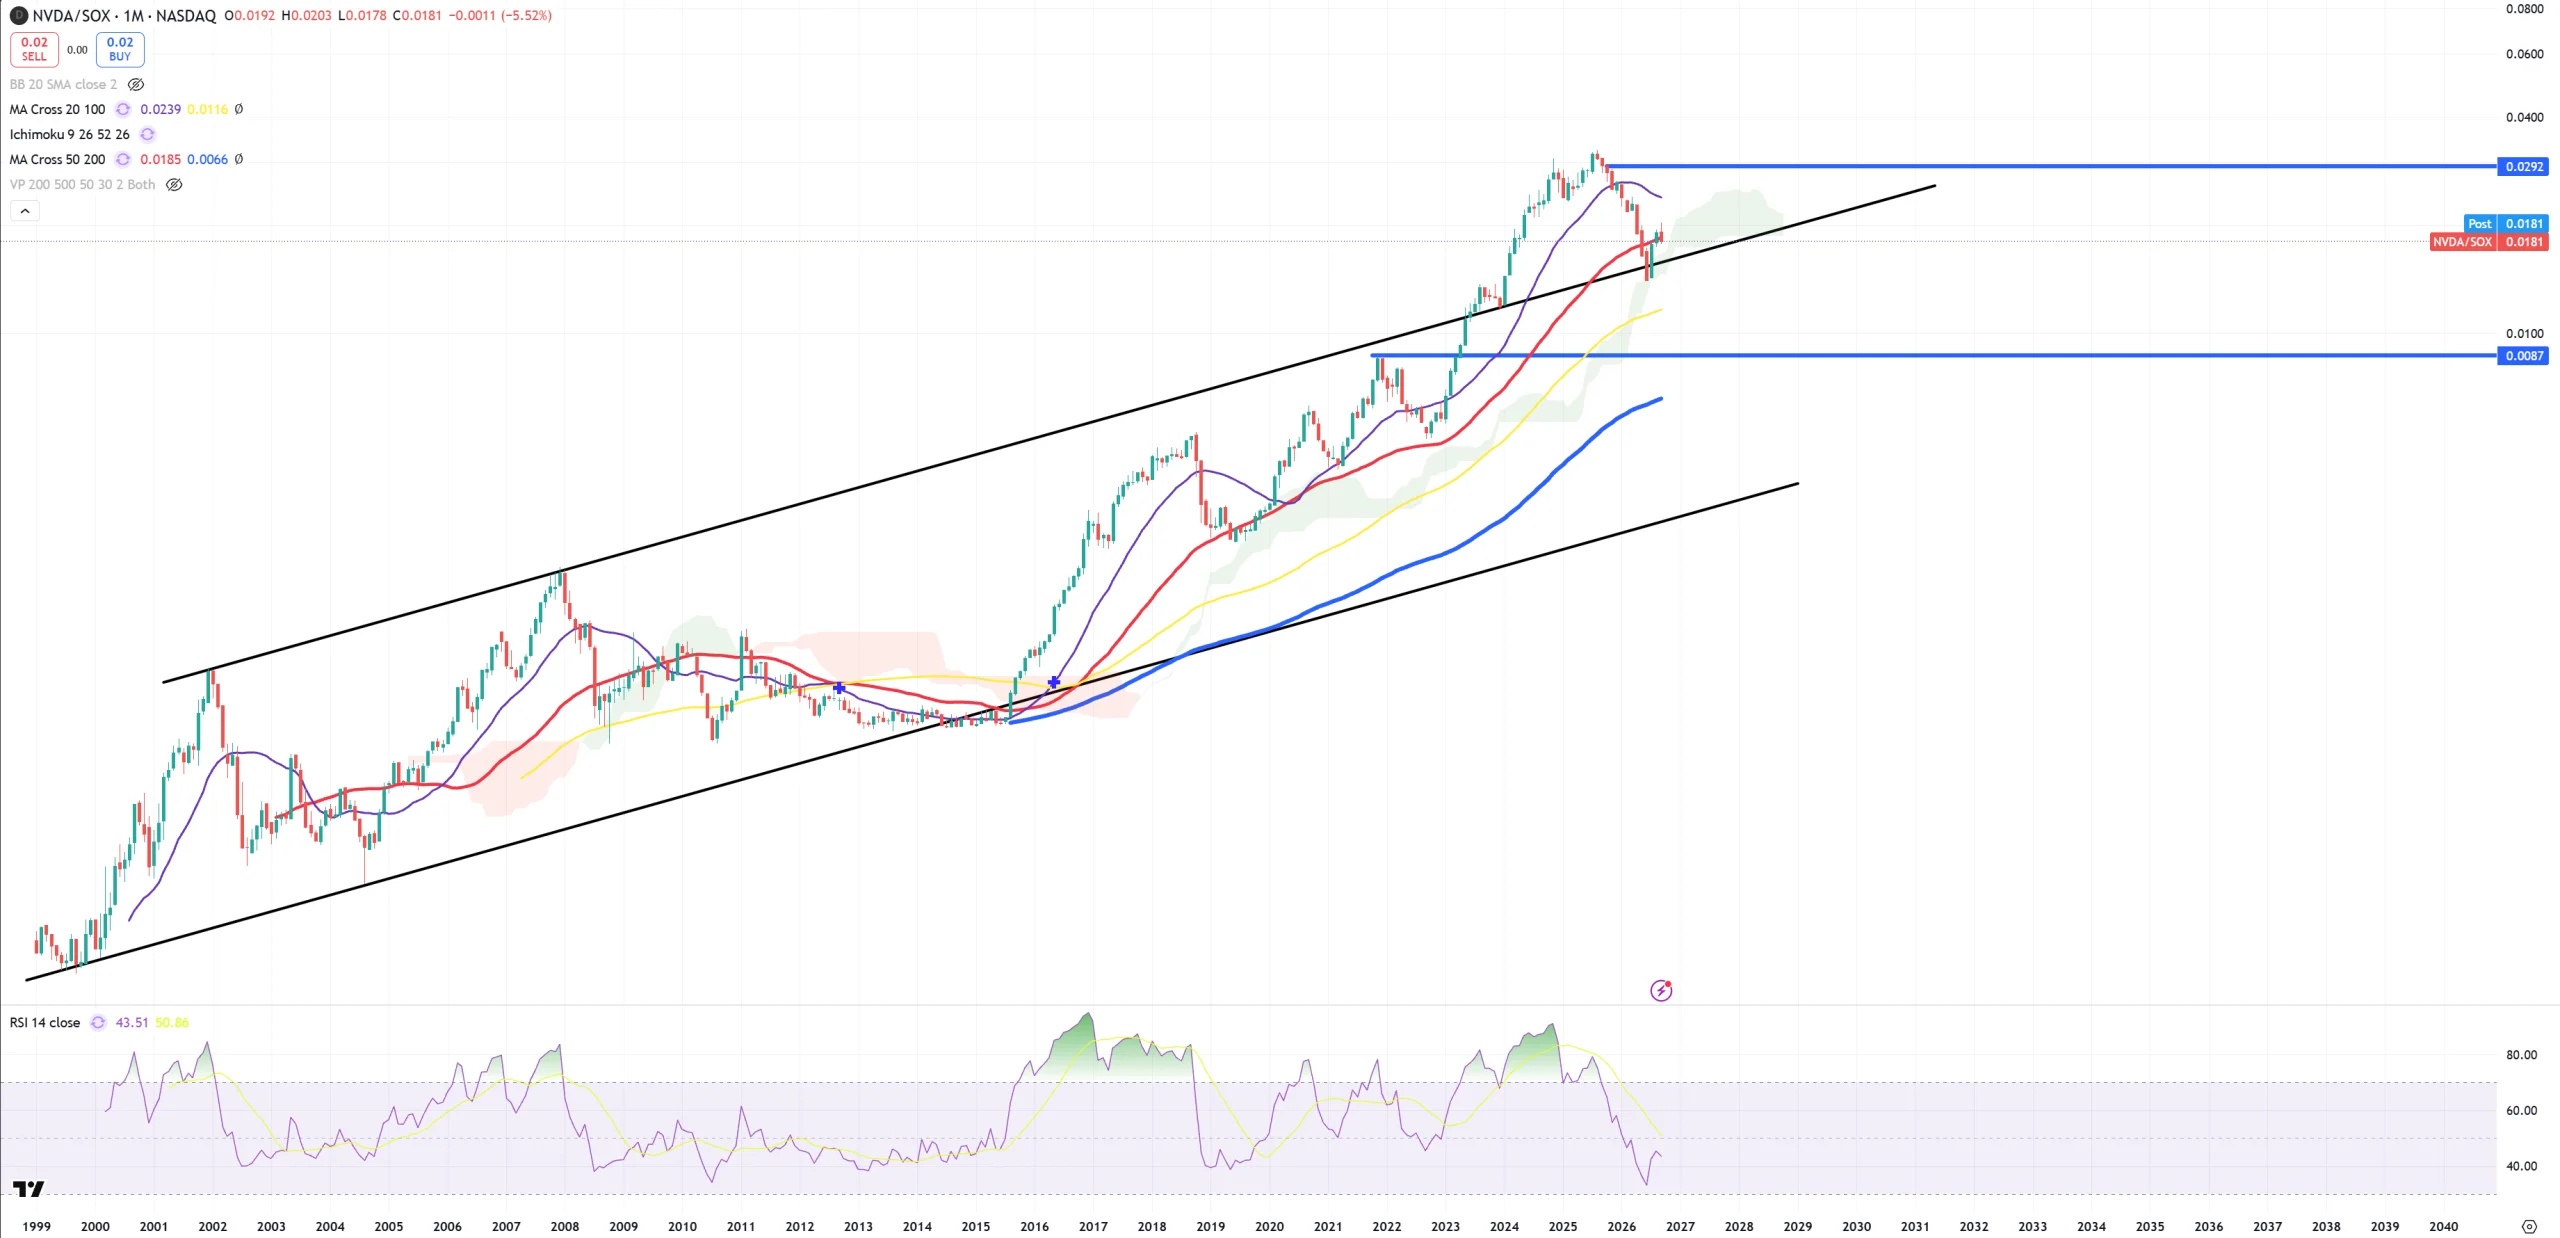
NVDA/SOX ends below (M)MA50 – entering bear market for NVDA vs SOX.
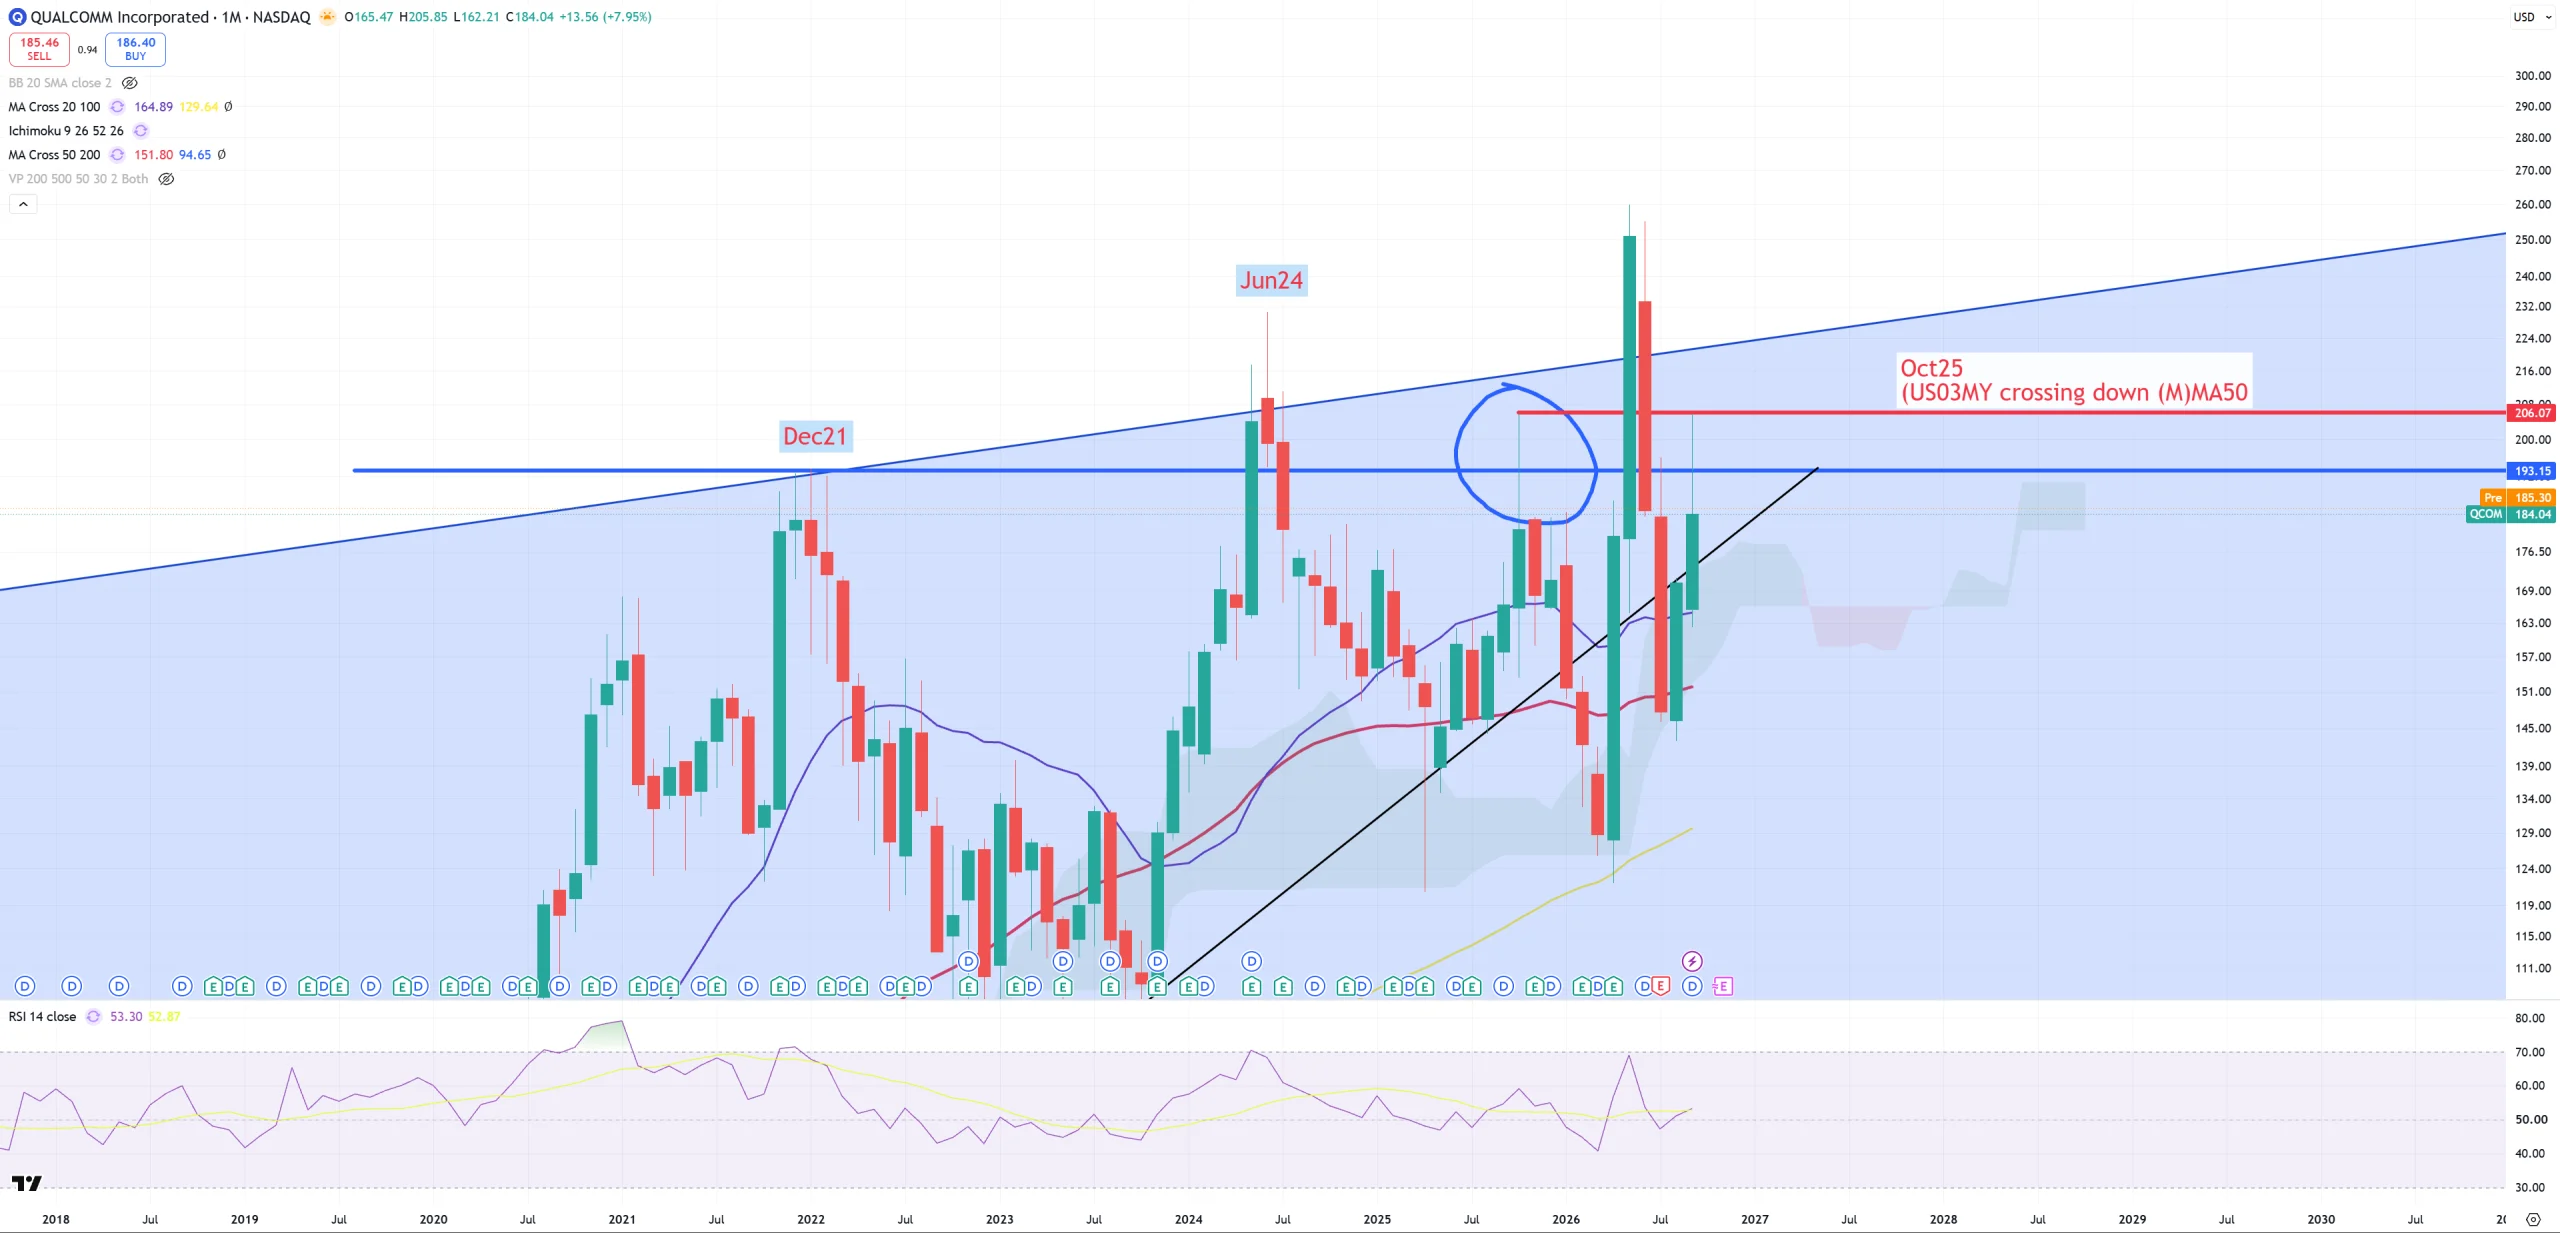
QCOM – not all SOX reaching new ATHs, some of the are below 4Q21 peak.
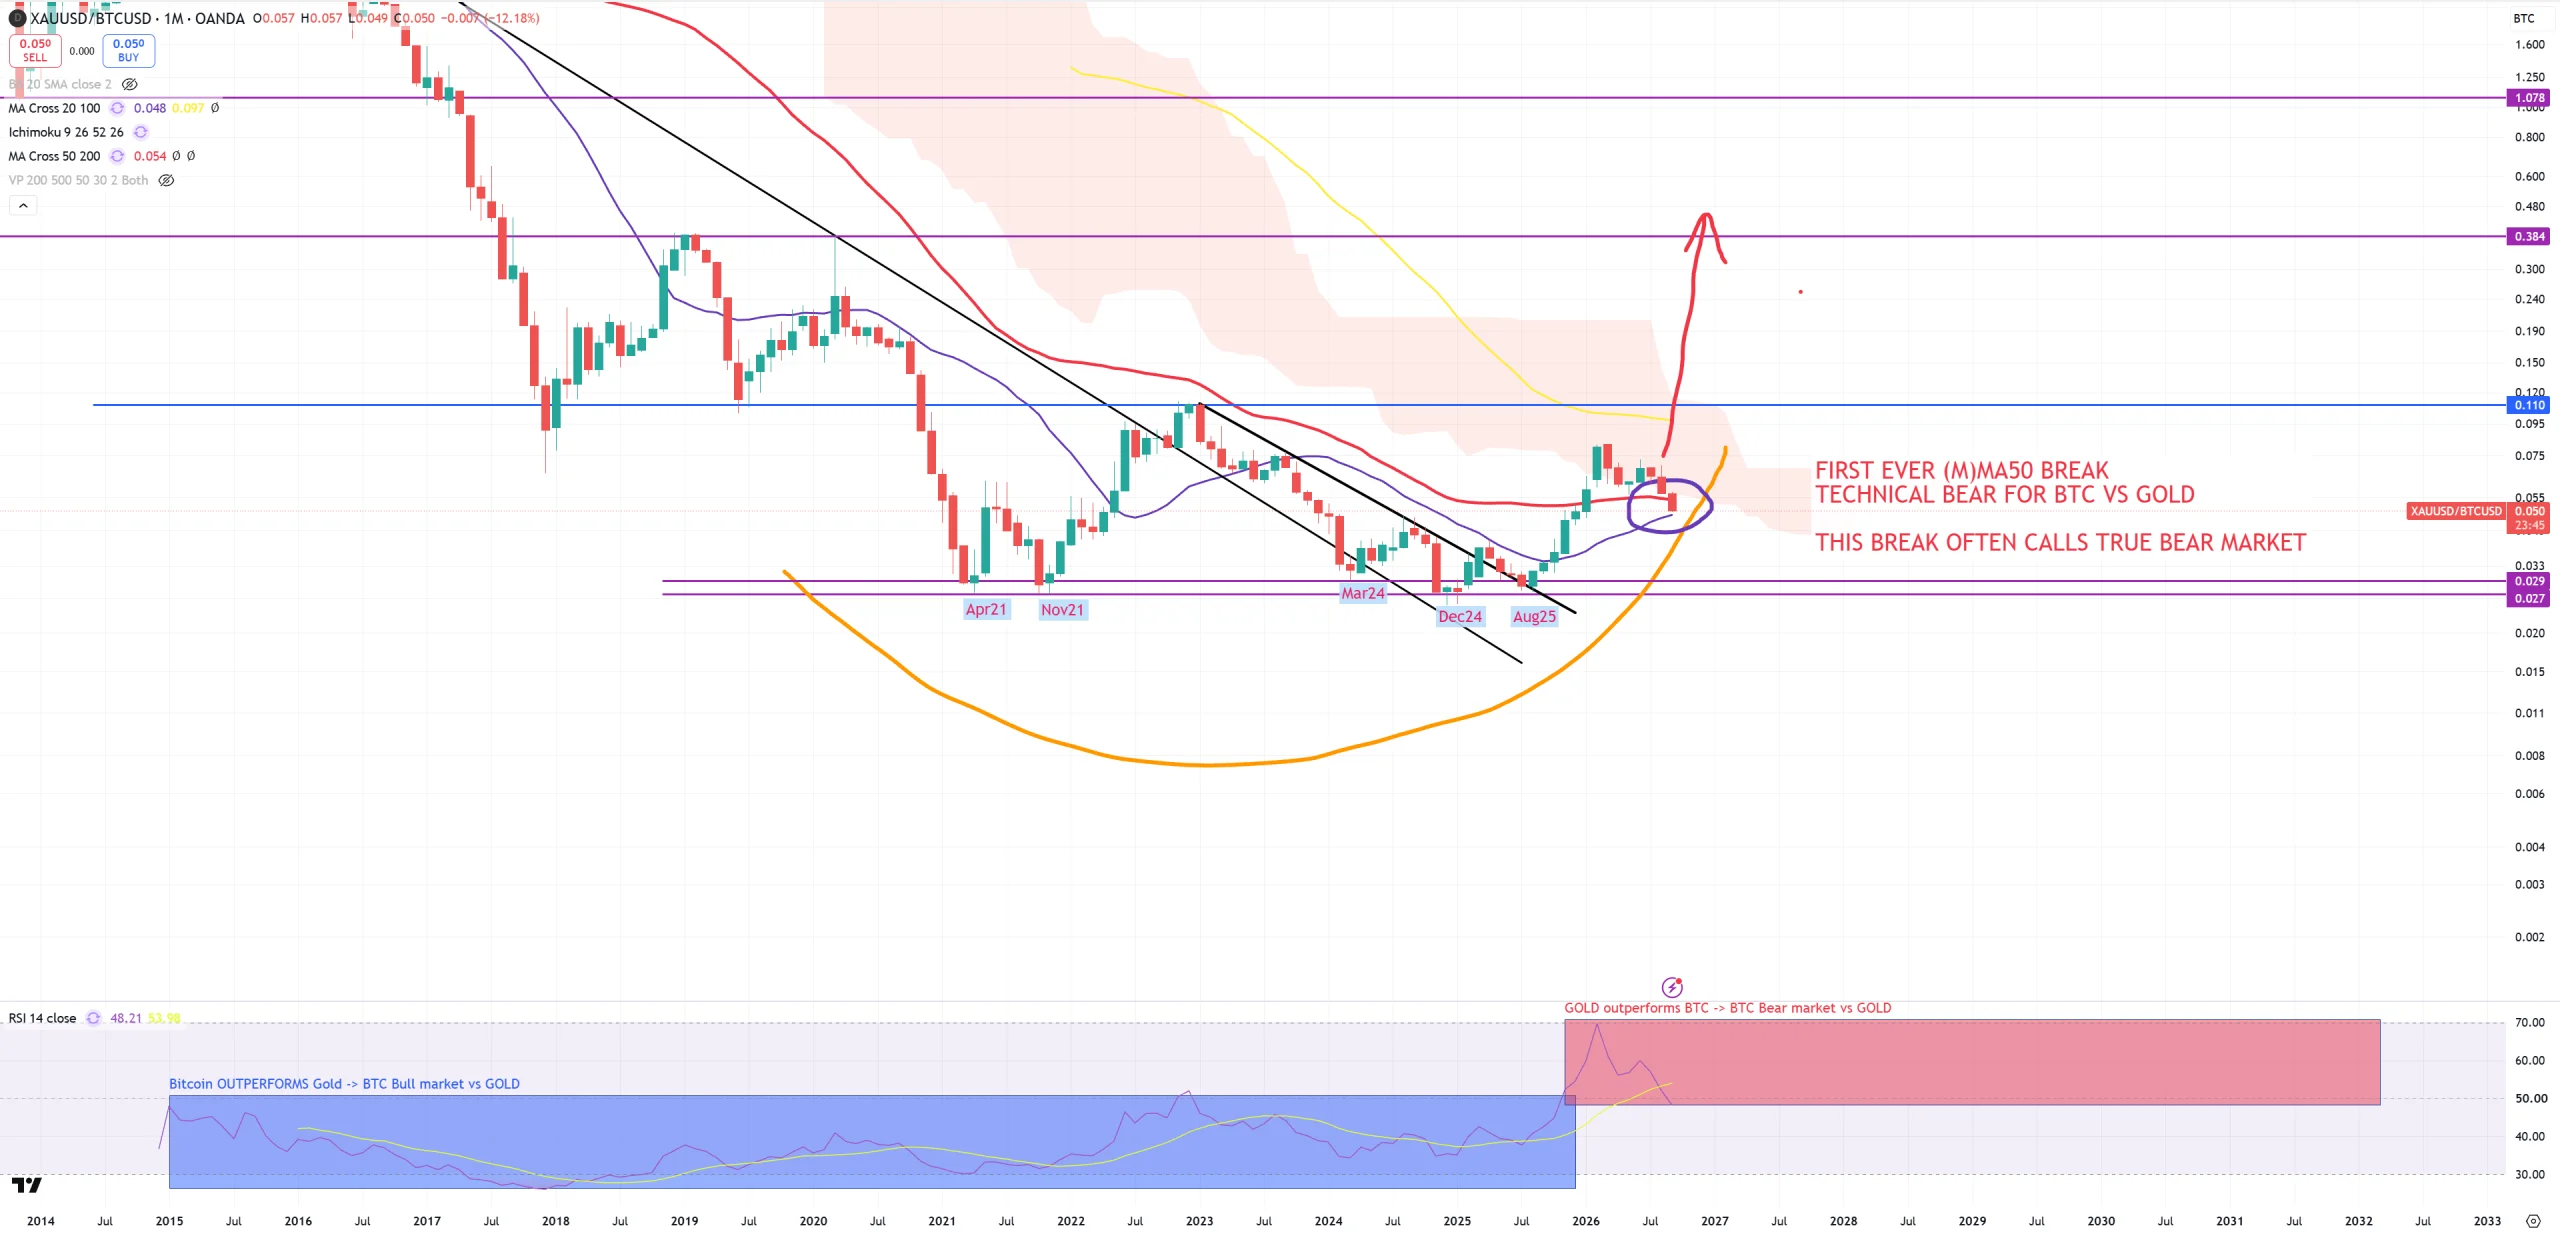
GOLD/BTC – did not hold its (M)MA50 but violet (M)MA20 ahead, once broken we’ll land again on 2021 level.
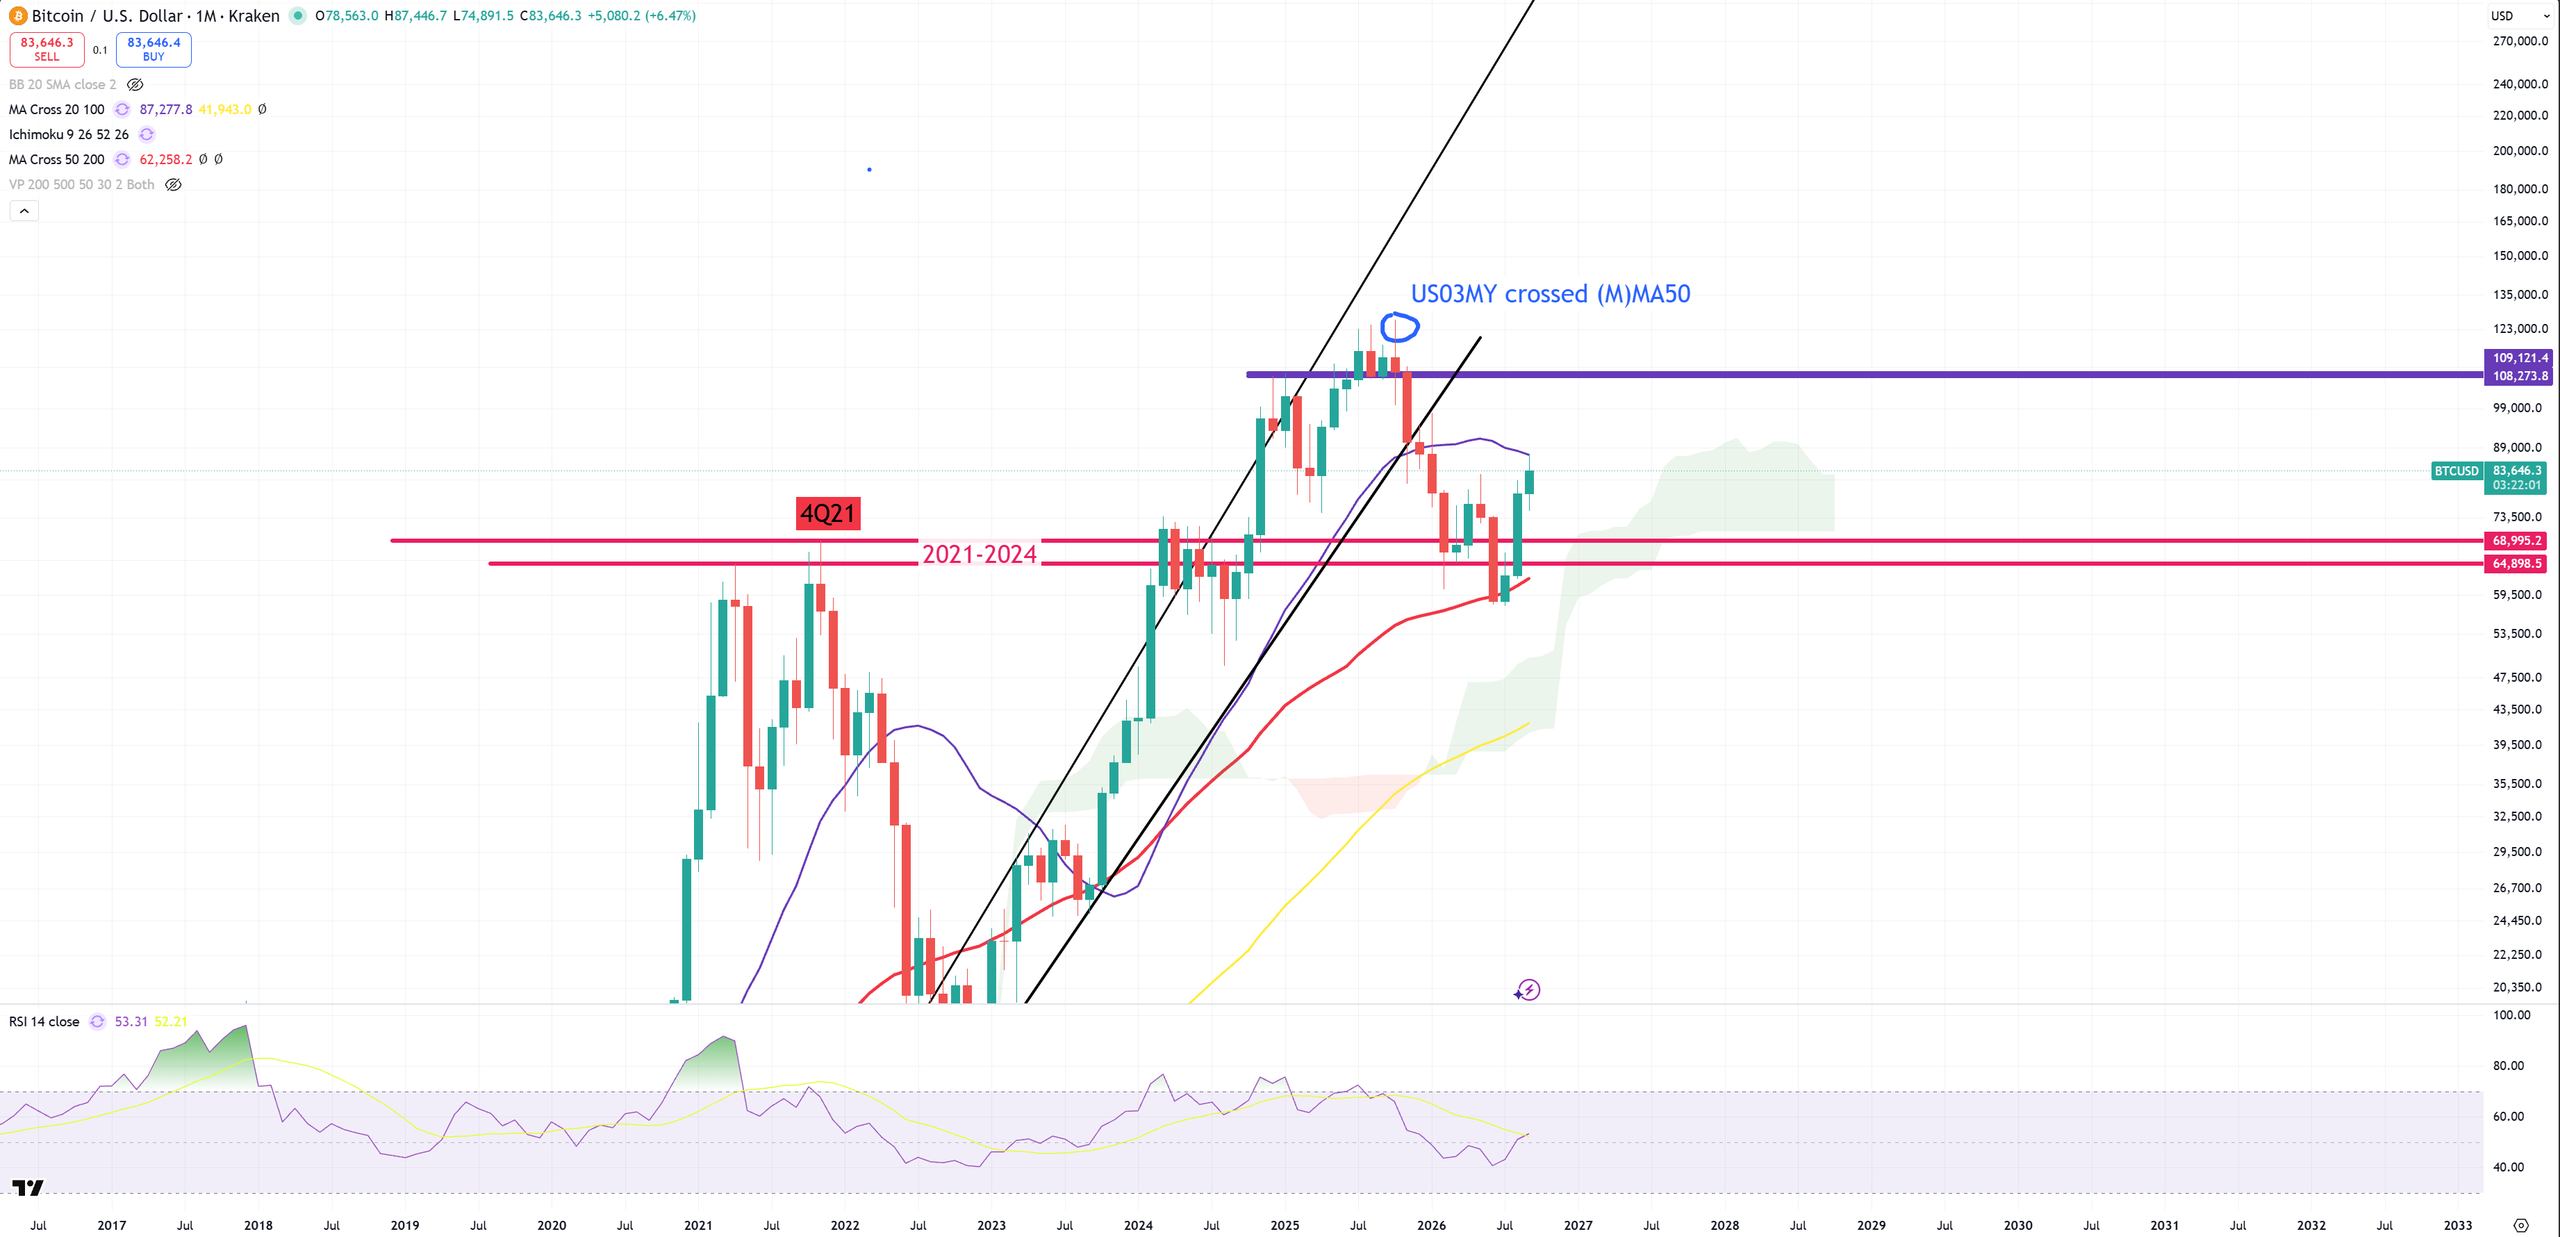
BTC – but BTC was rejected by (M)MA20 which sits on 87500$ after saving its (M)MA50 and once again breaking 4Q21 level.
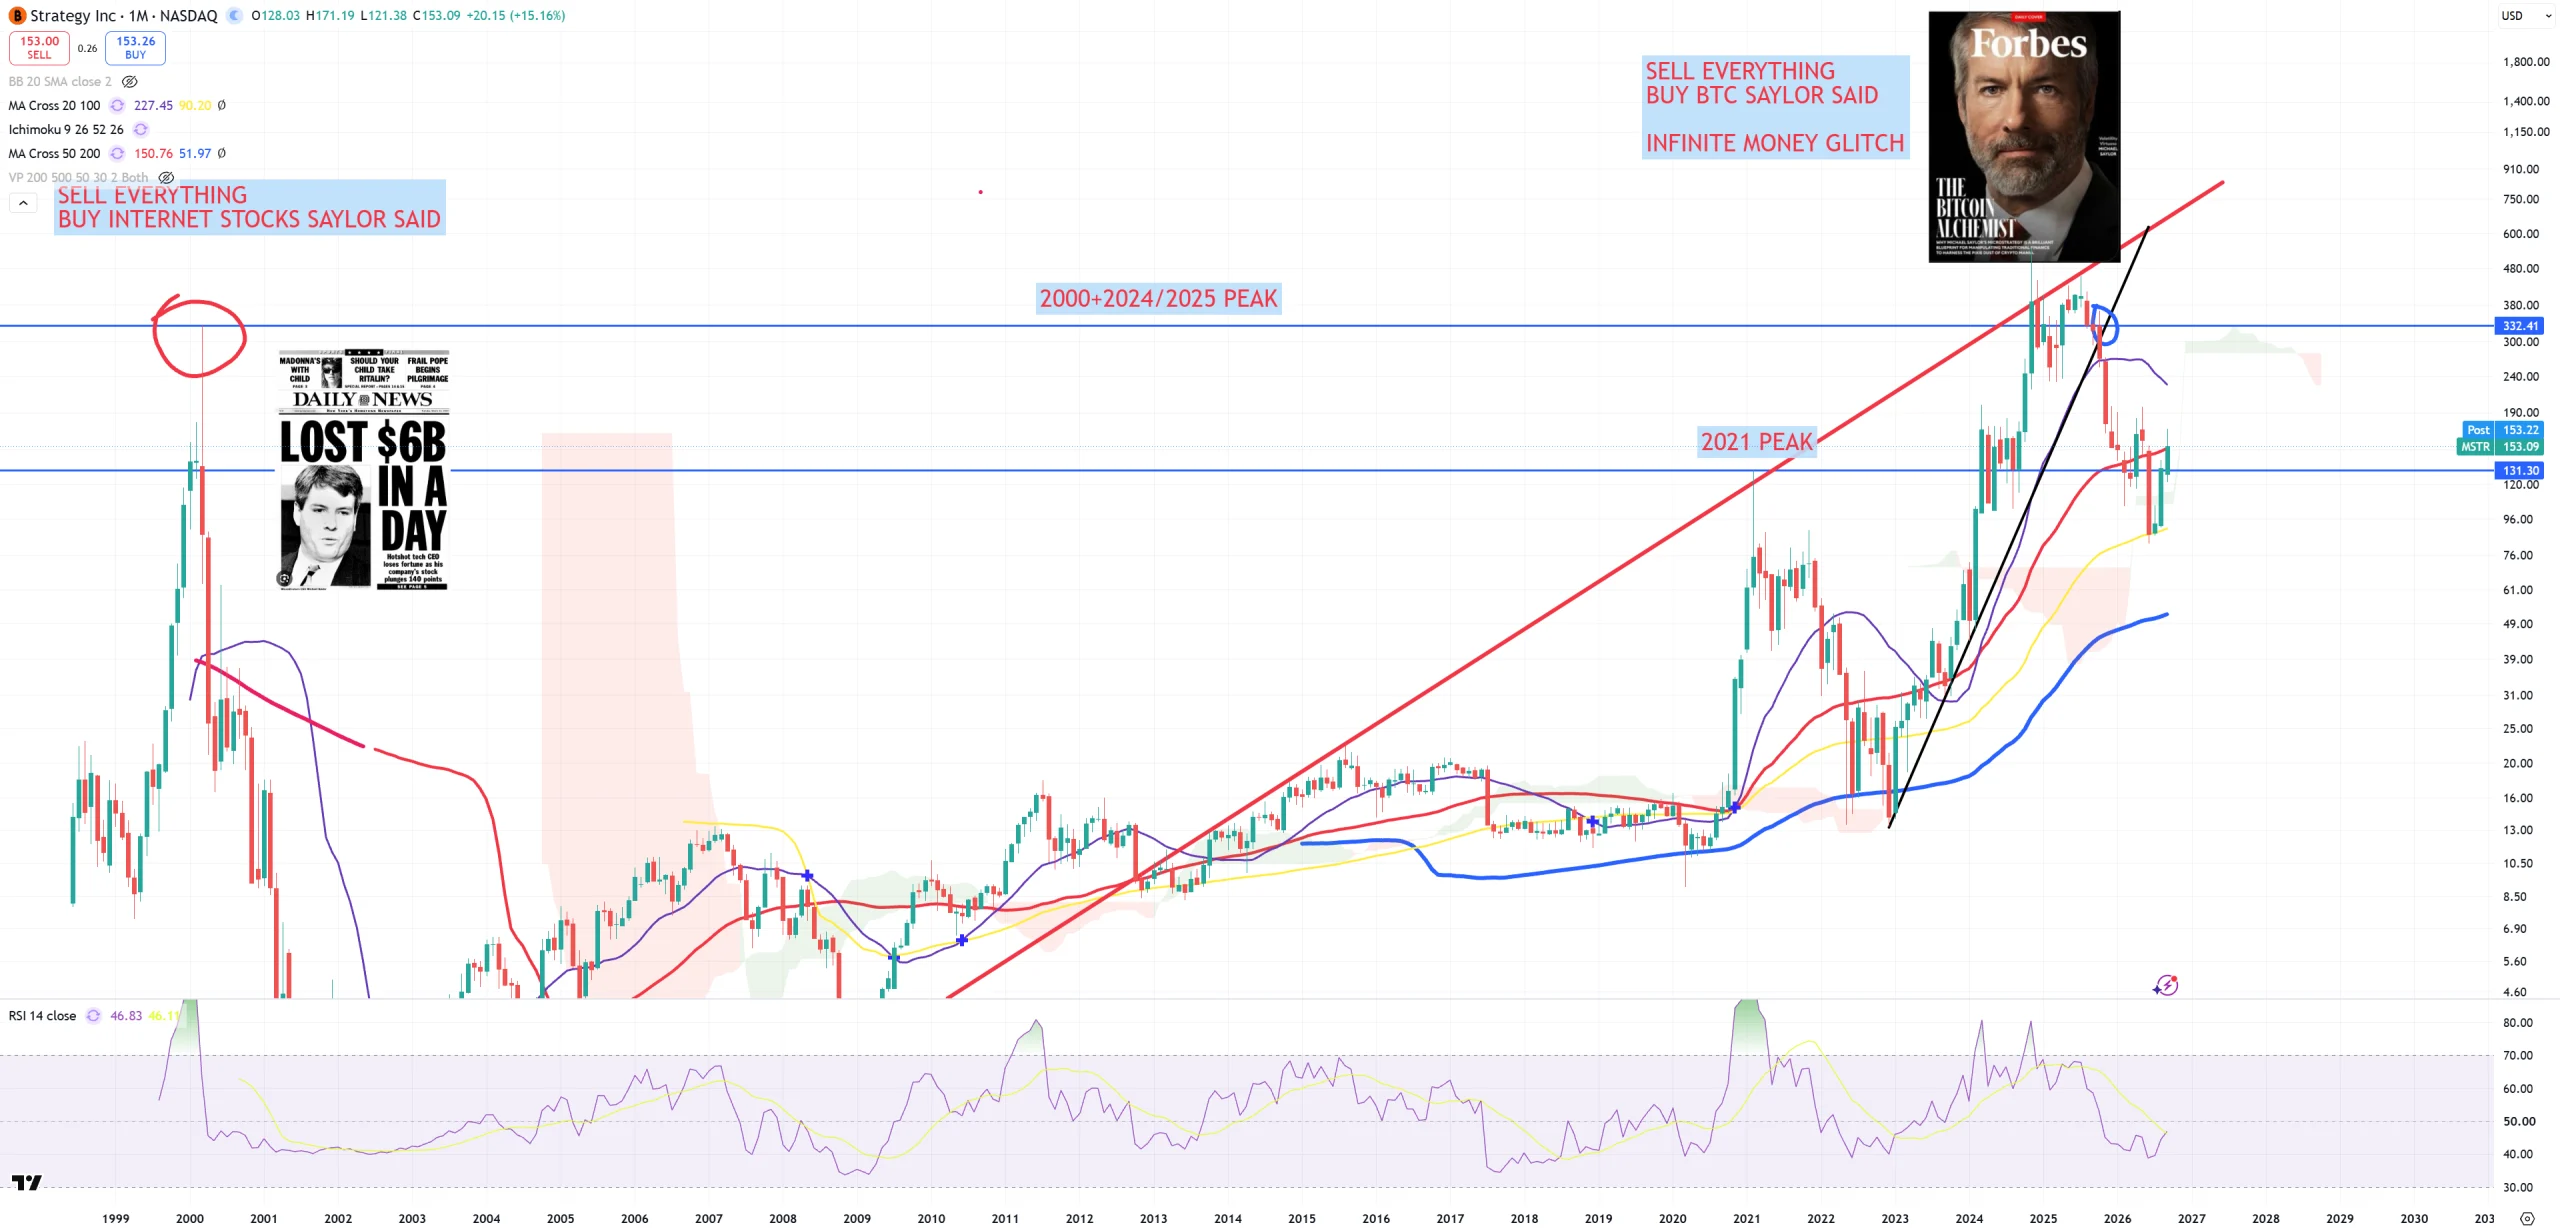
MSTR – retesting (M)MA50 from the bottom
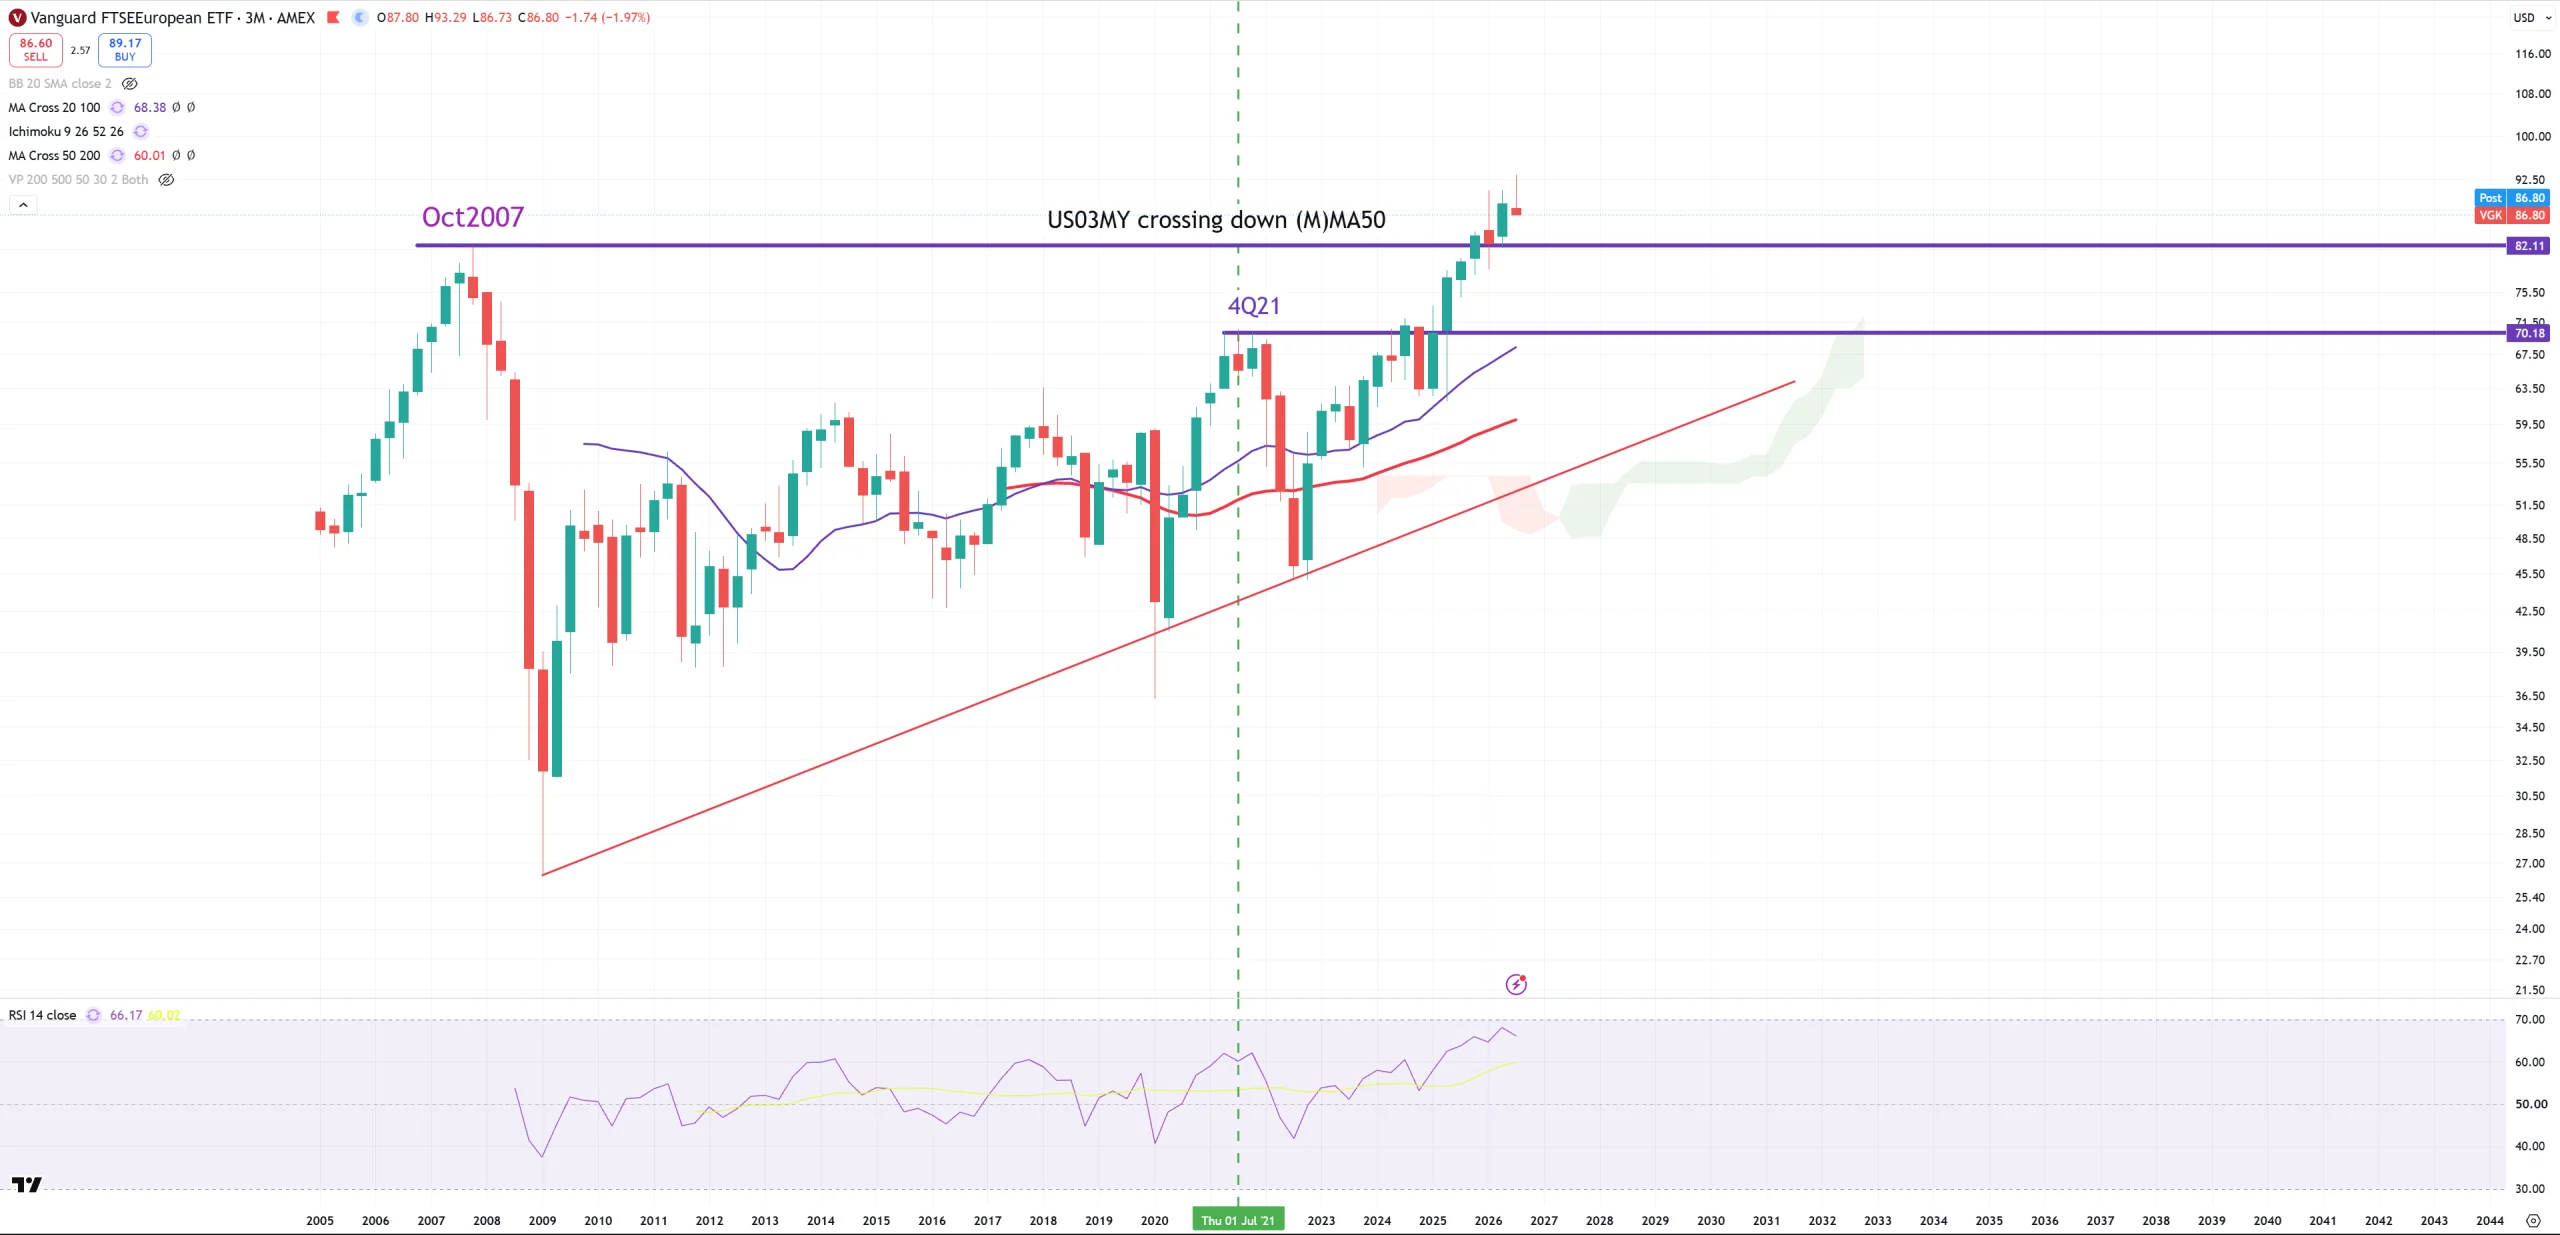
VGK – Europe – 4Q2007 happens when US03MY crossed (M)MA50 in Oct/Nov2025. I bet this spike above 4Q07 is a typical overshooting. (3M) view.
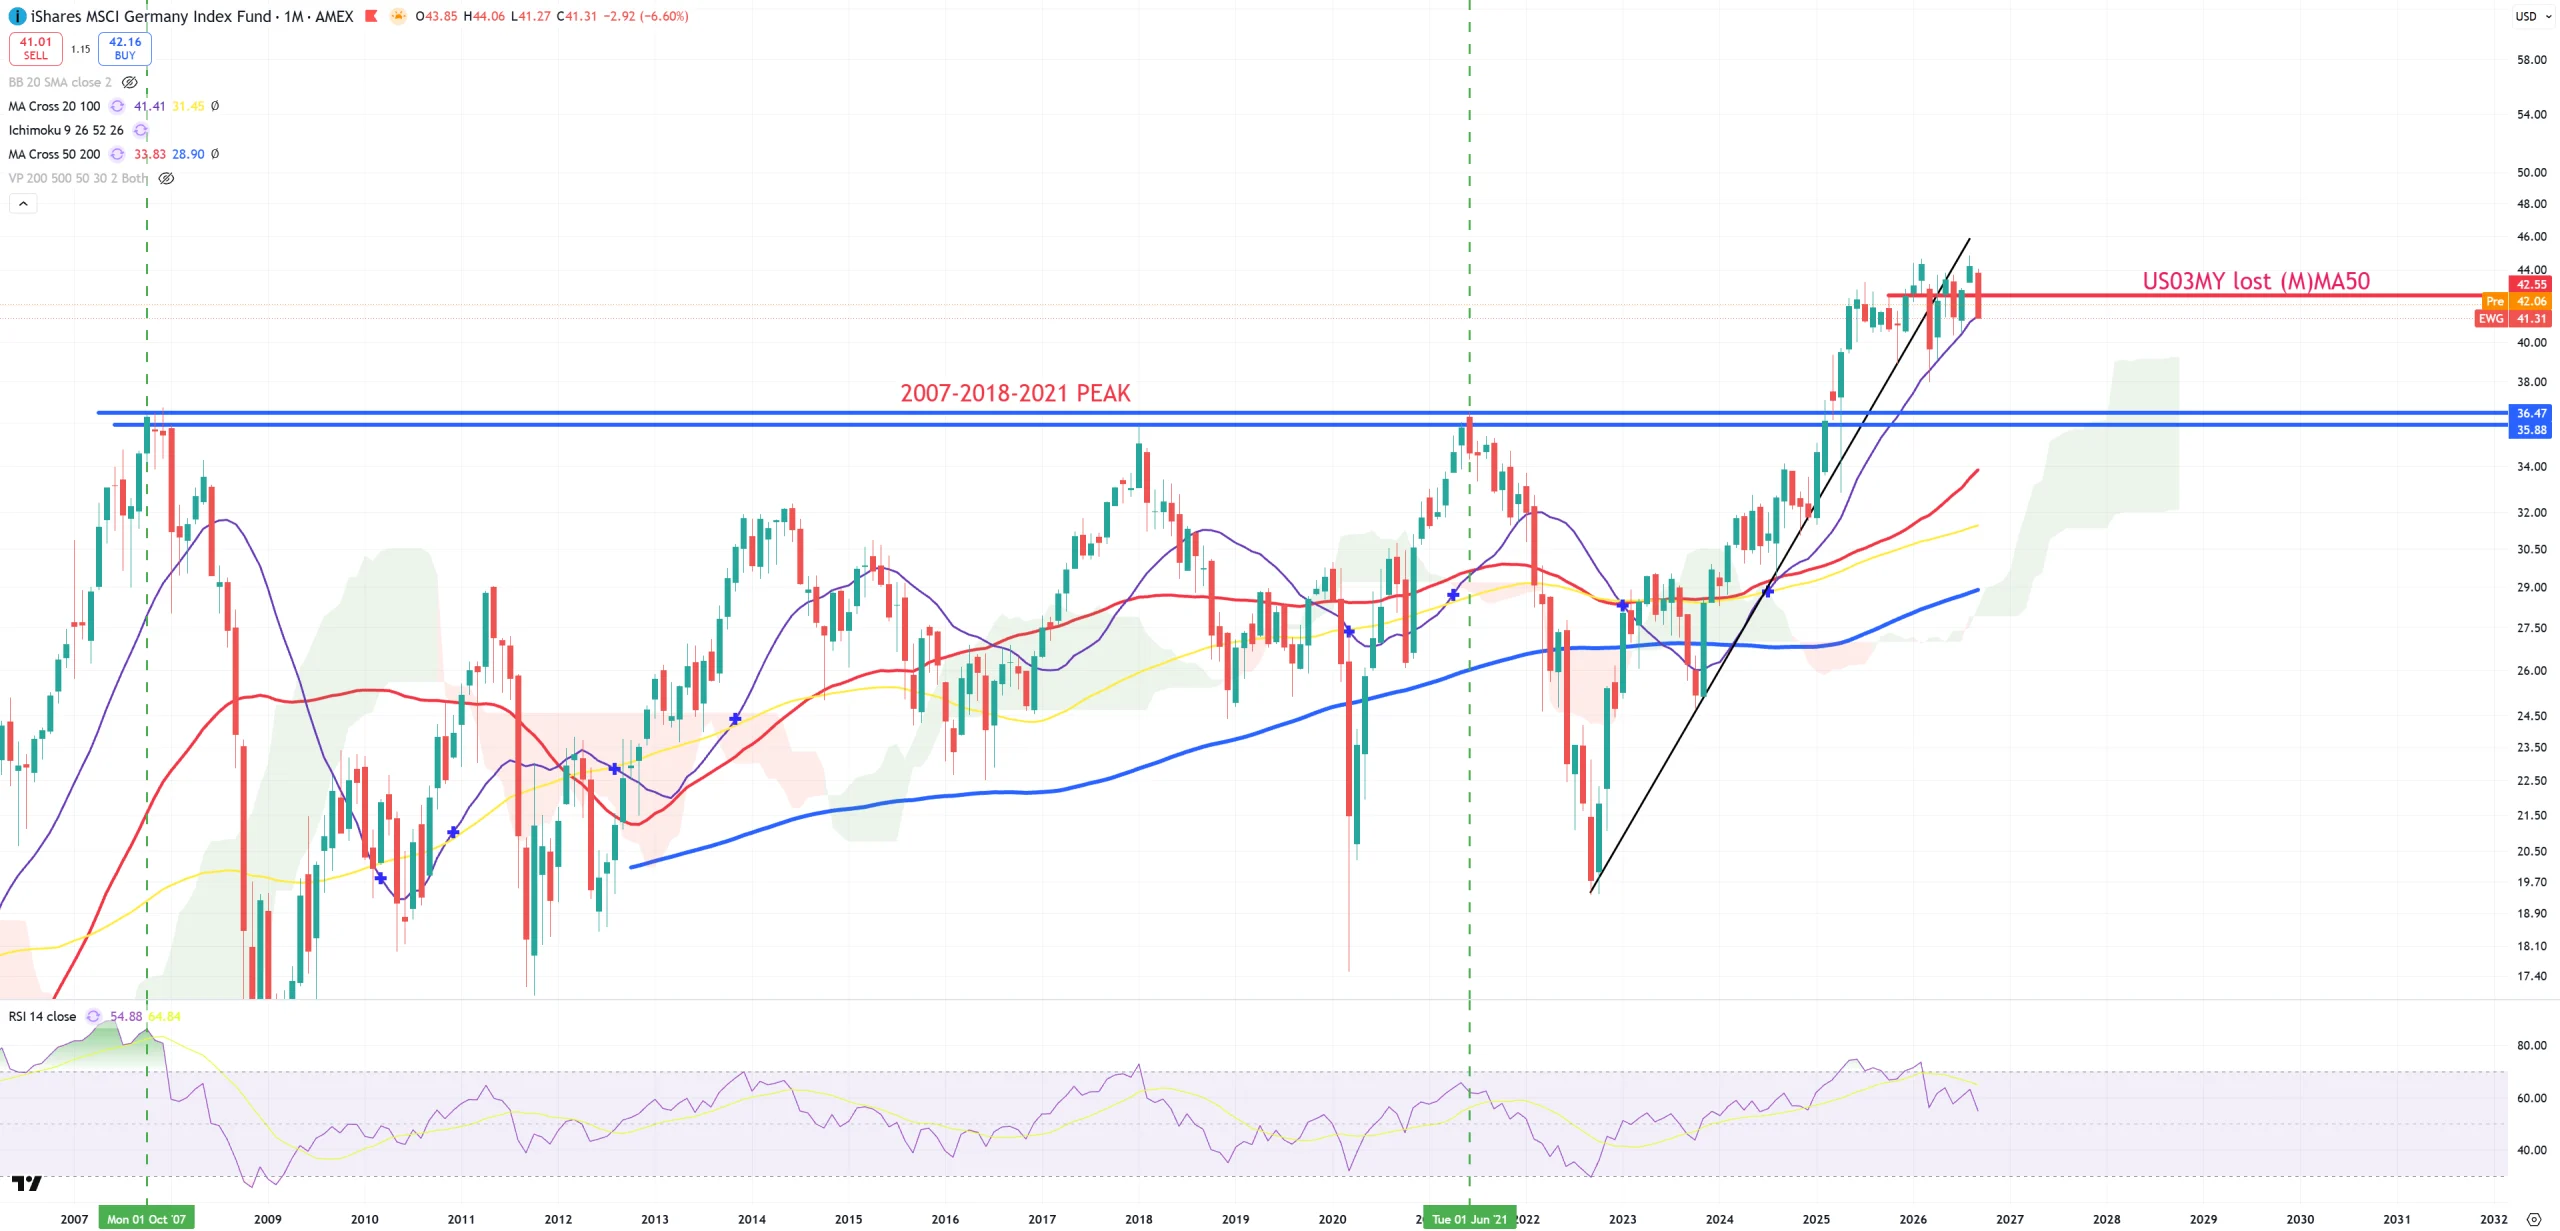
EWG – Germany – since May 2025 on the same level.
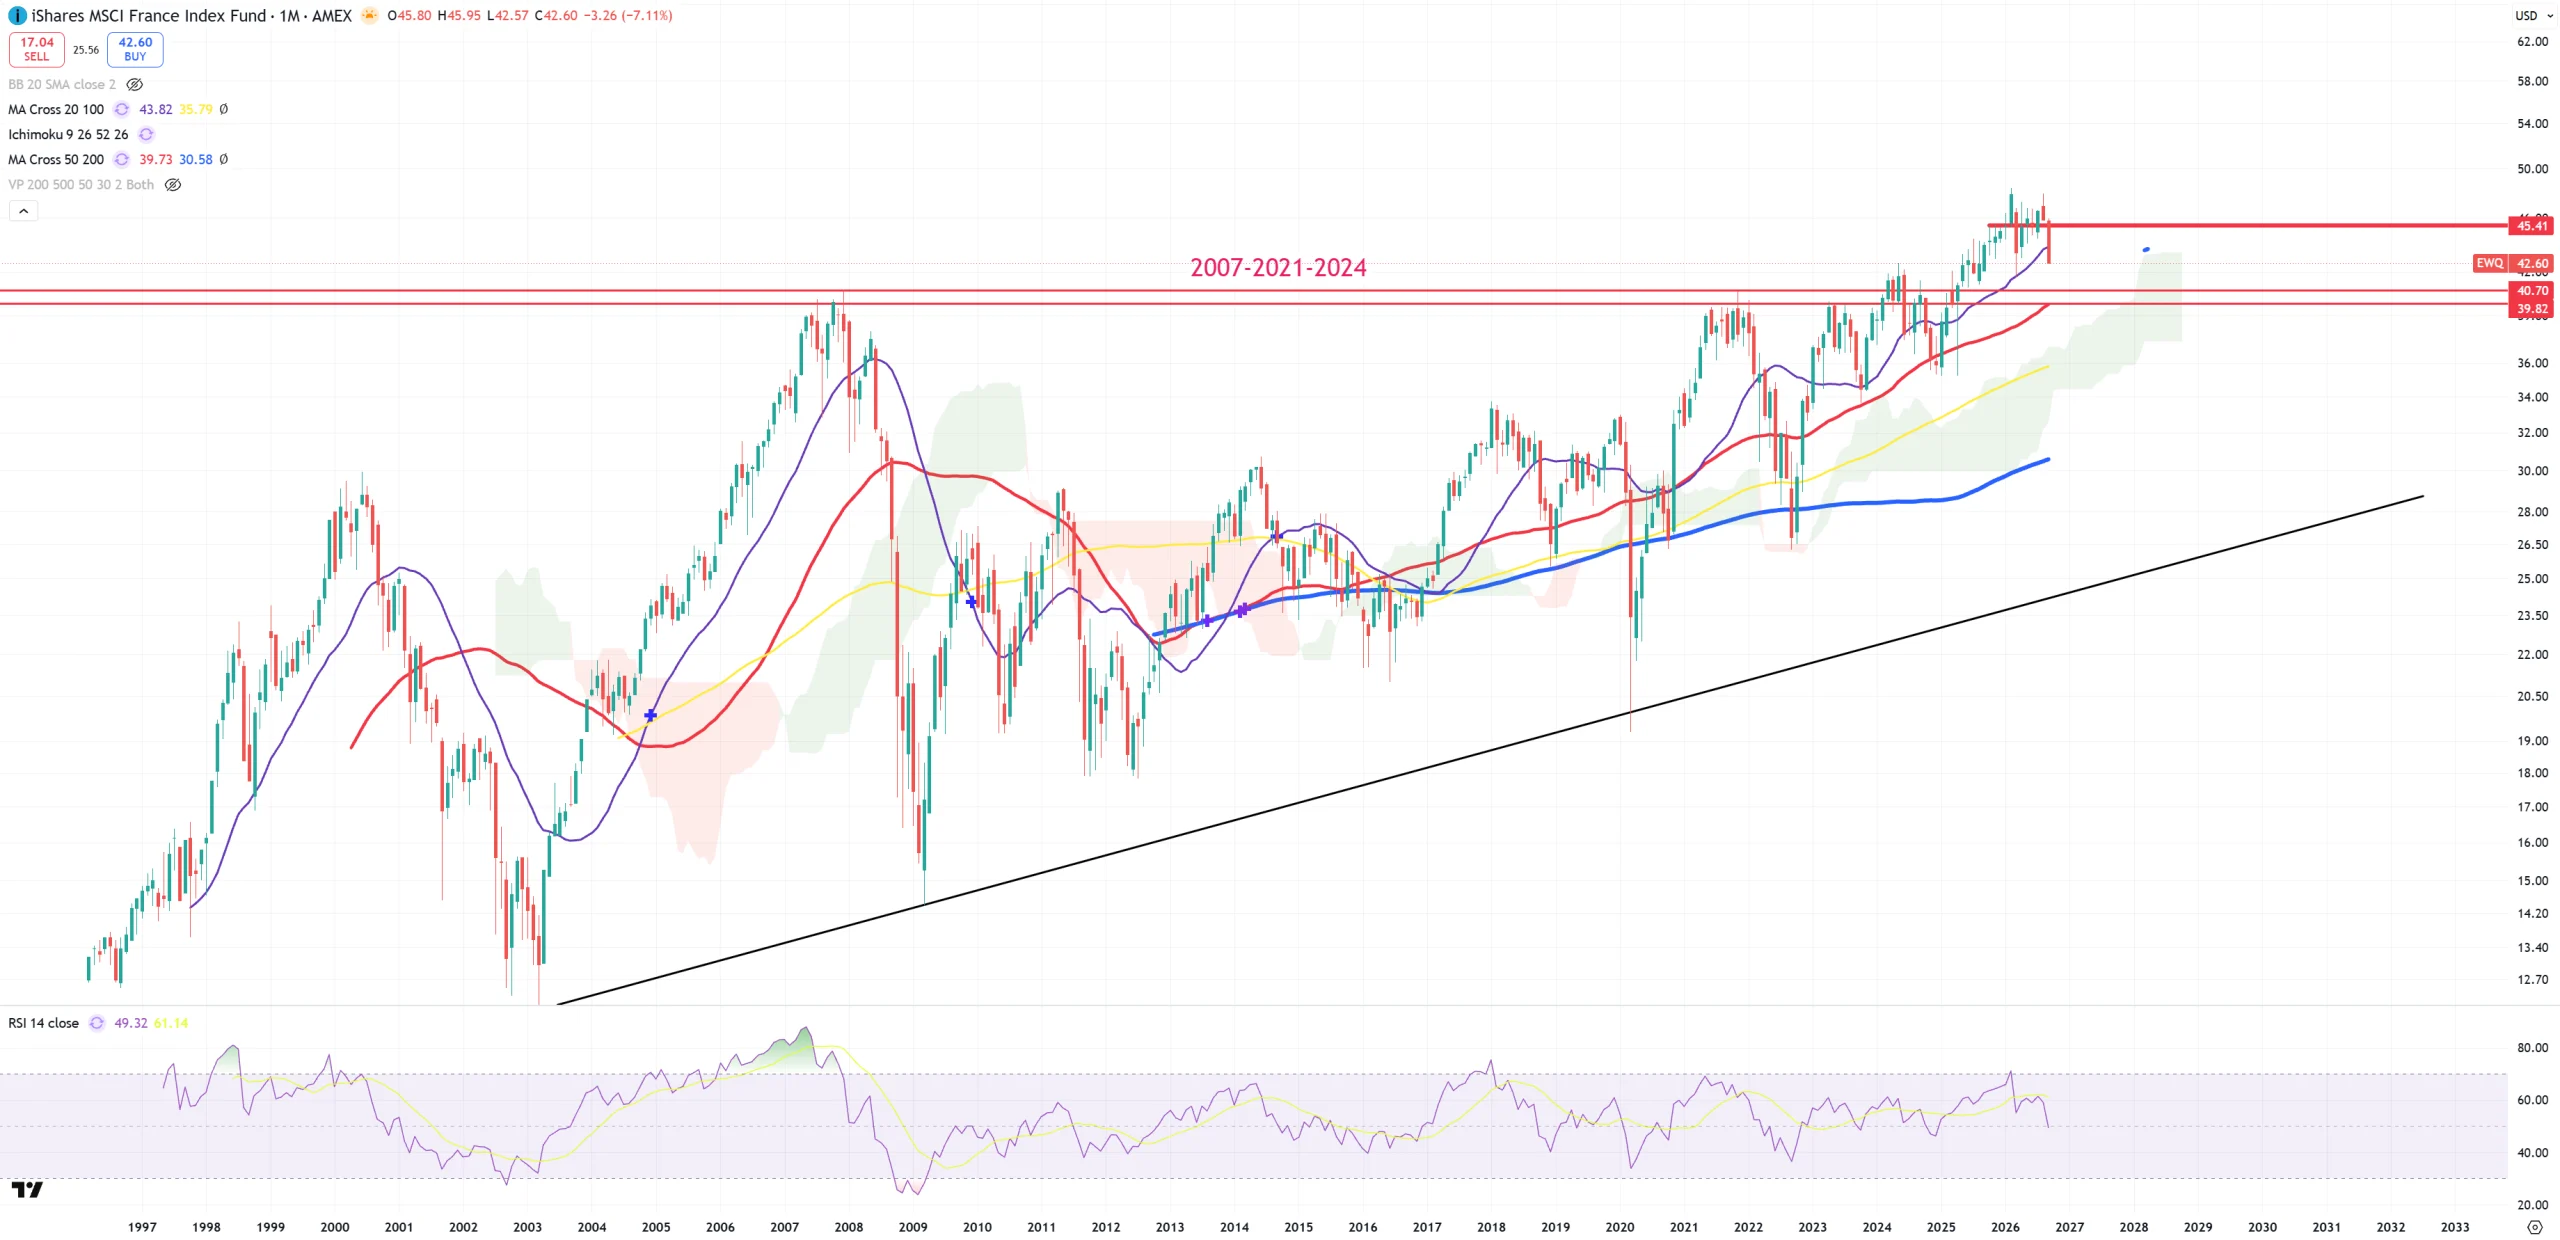
EWQ – France – like Germany. Big break or massive bull trap.
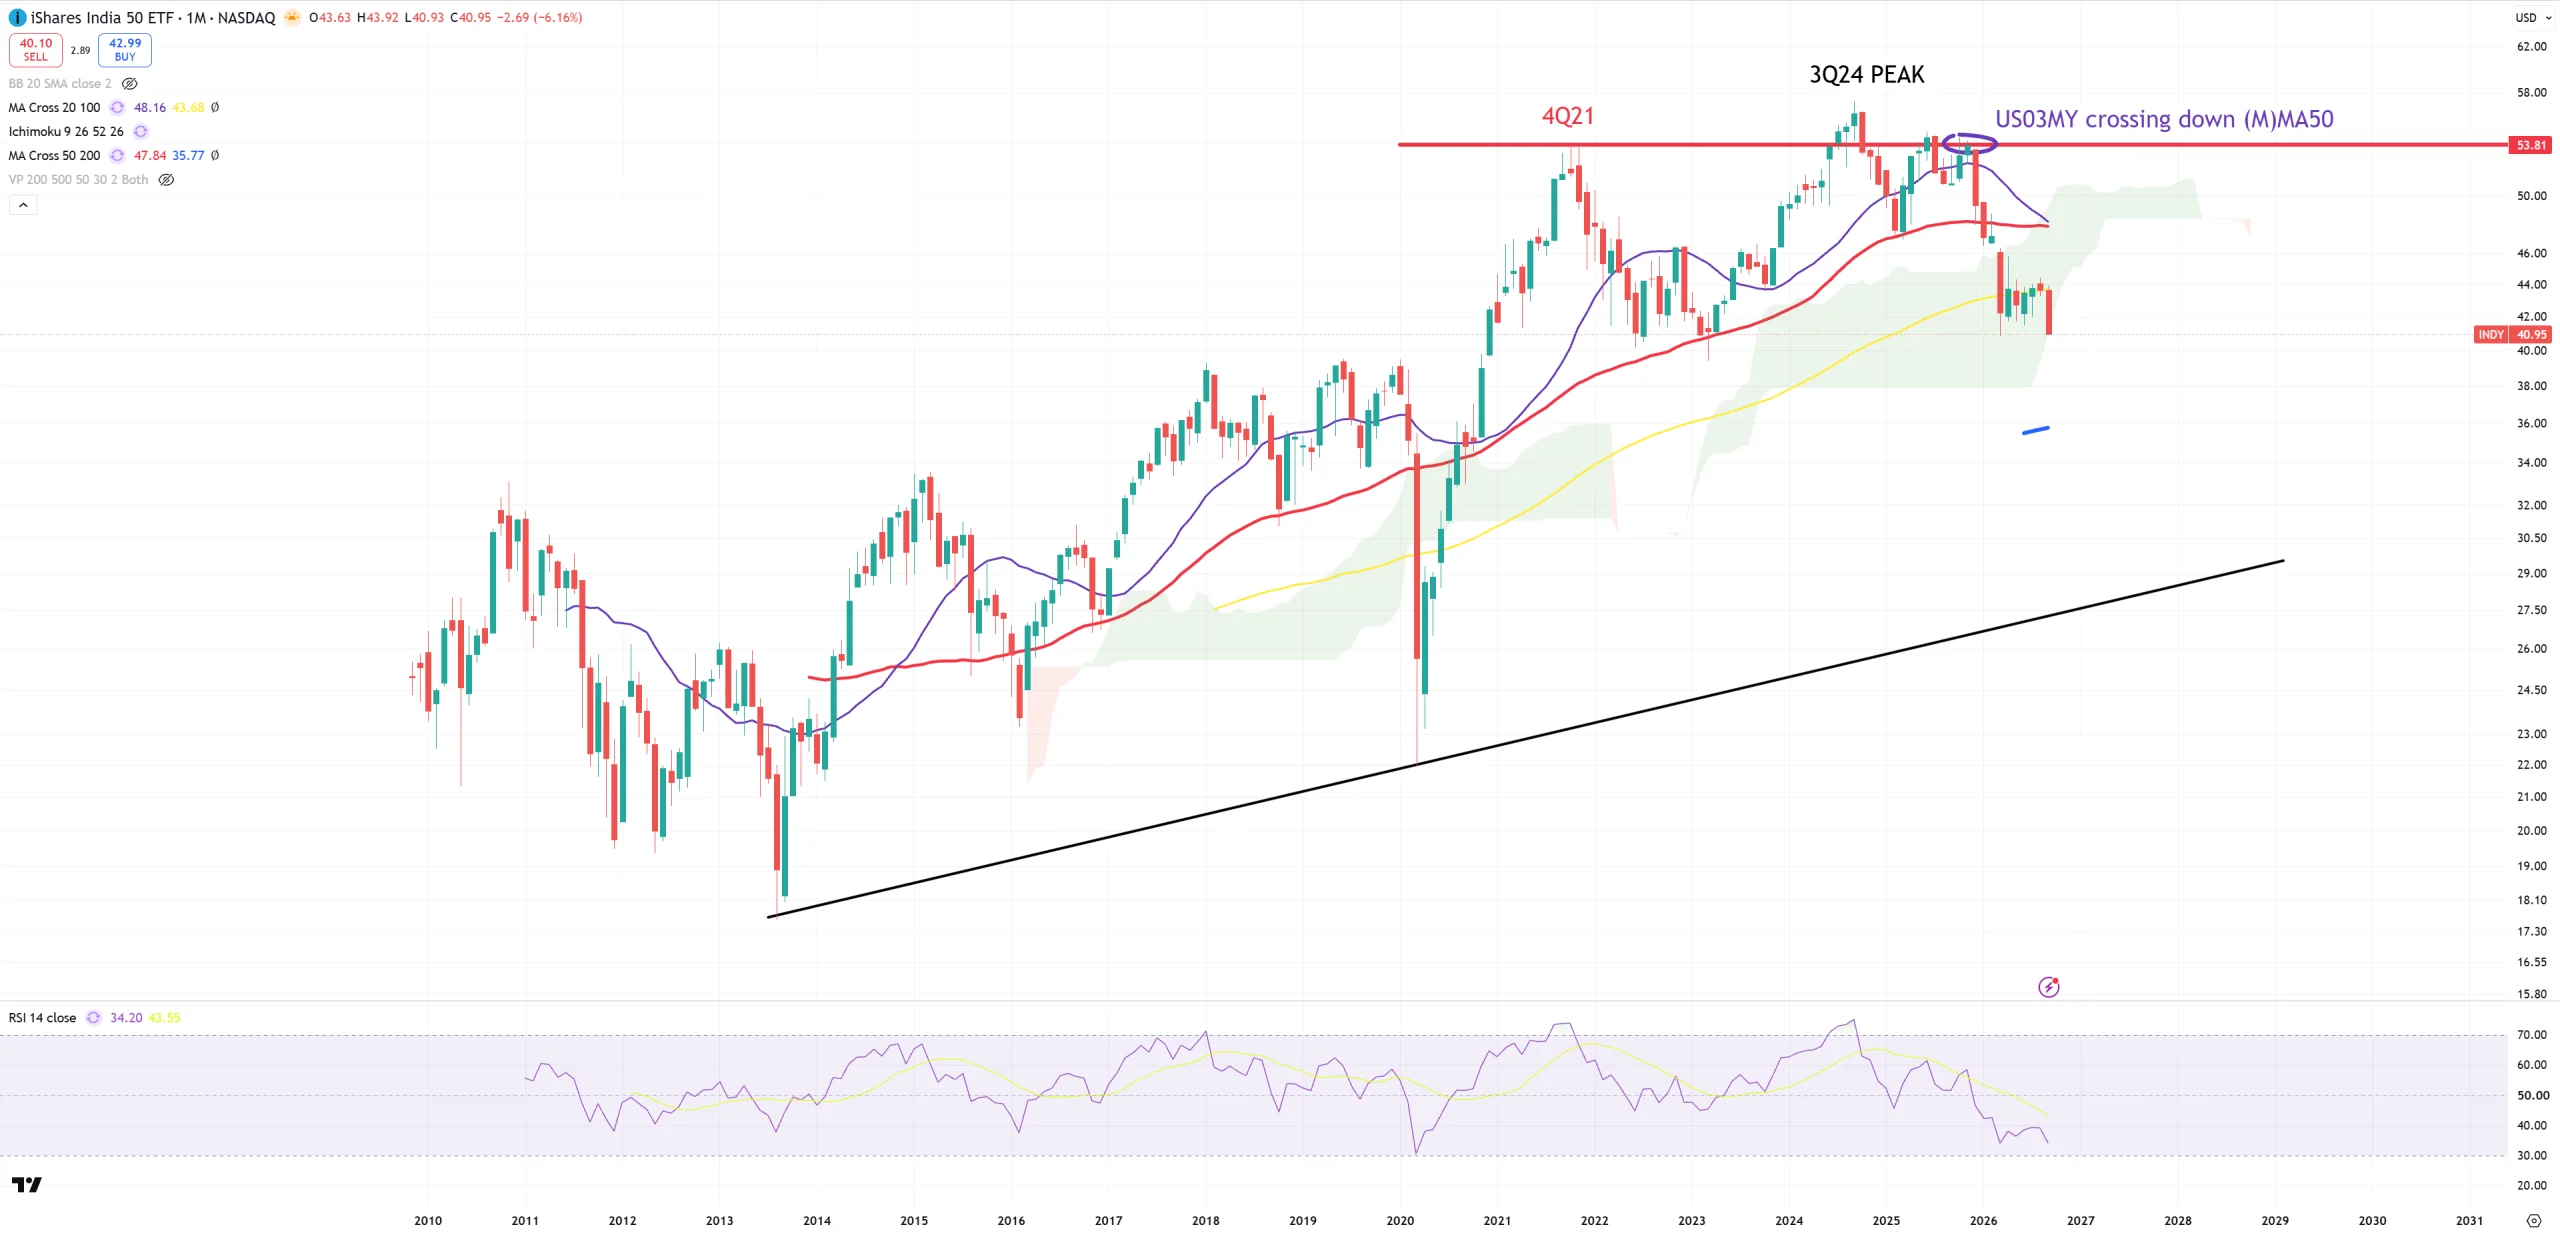
INDY – India – crash mode on as long as yellow (M)MA100 is resistance
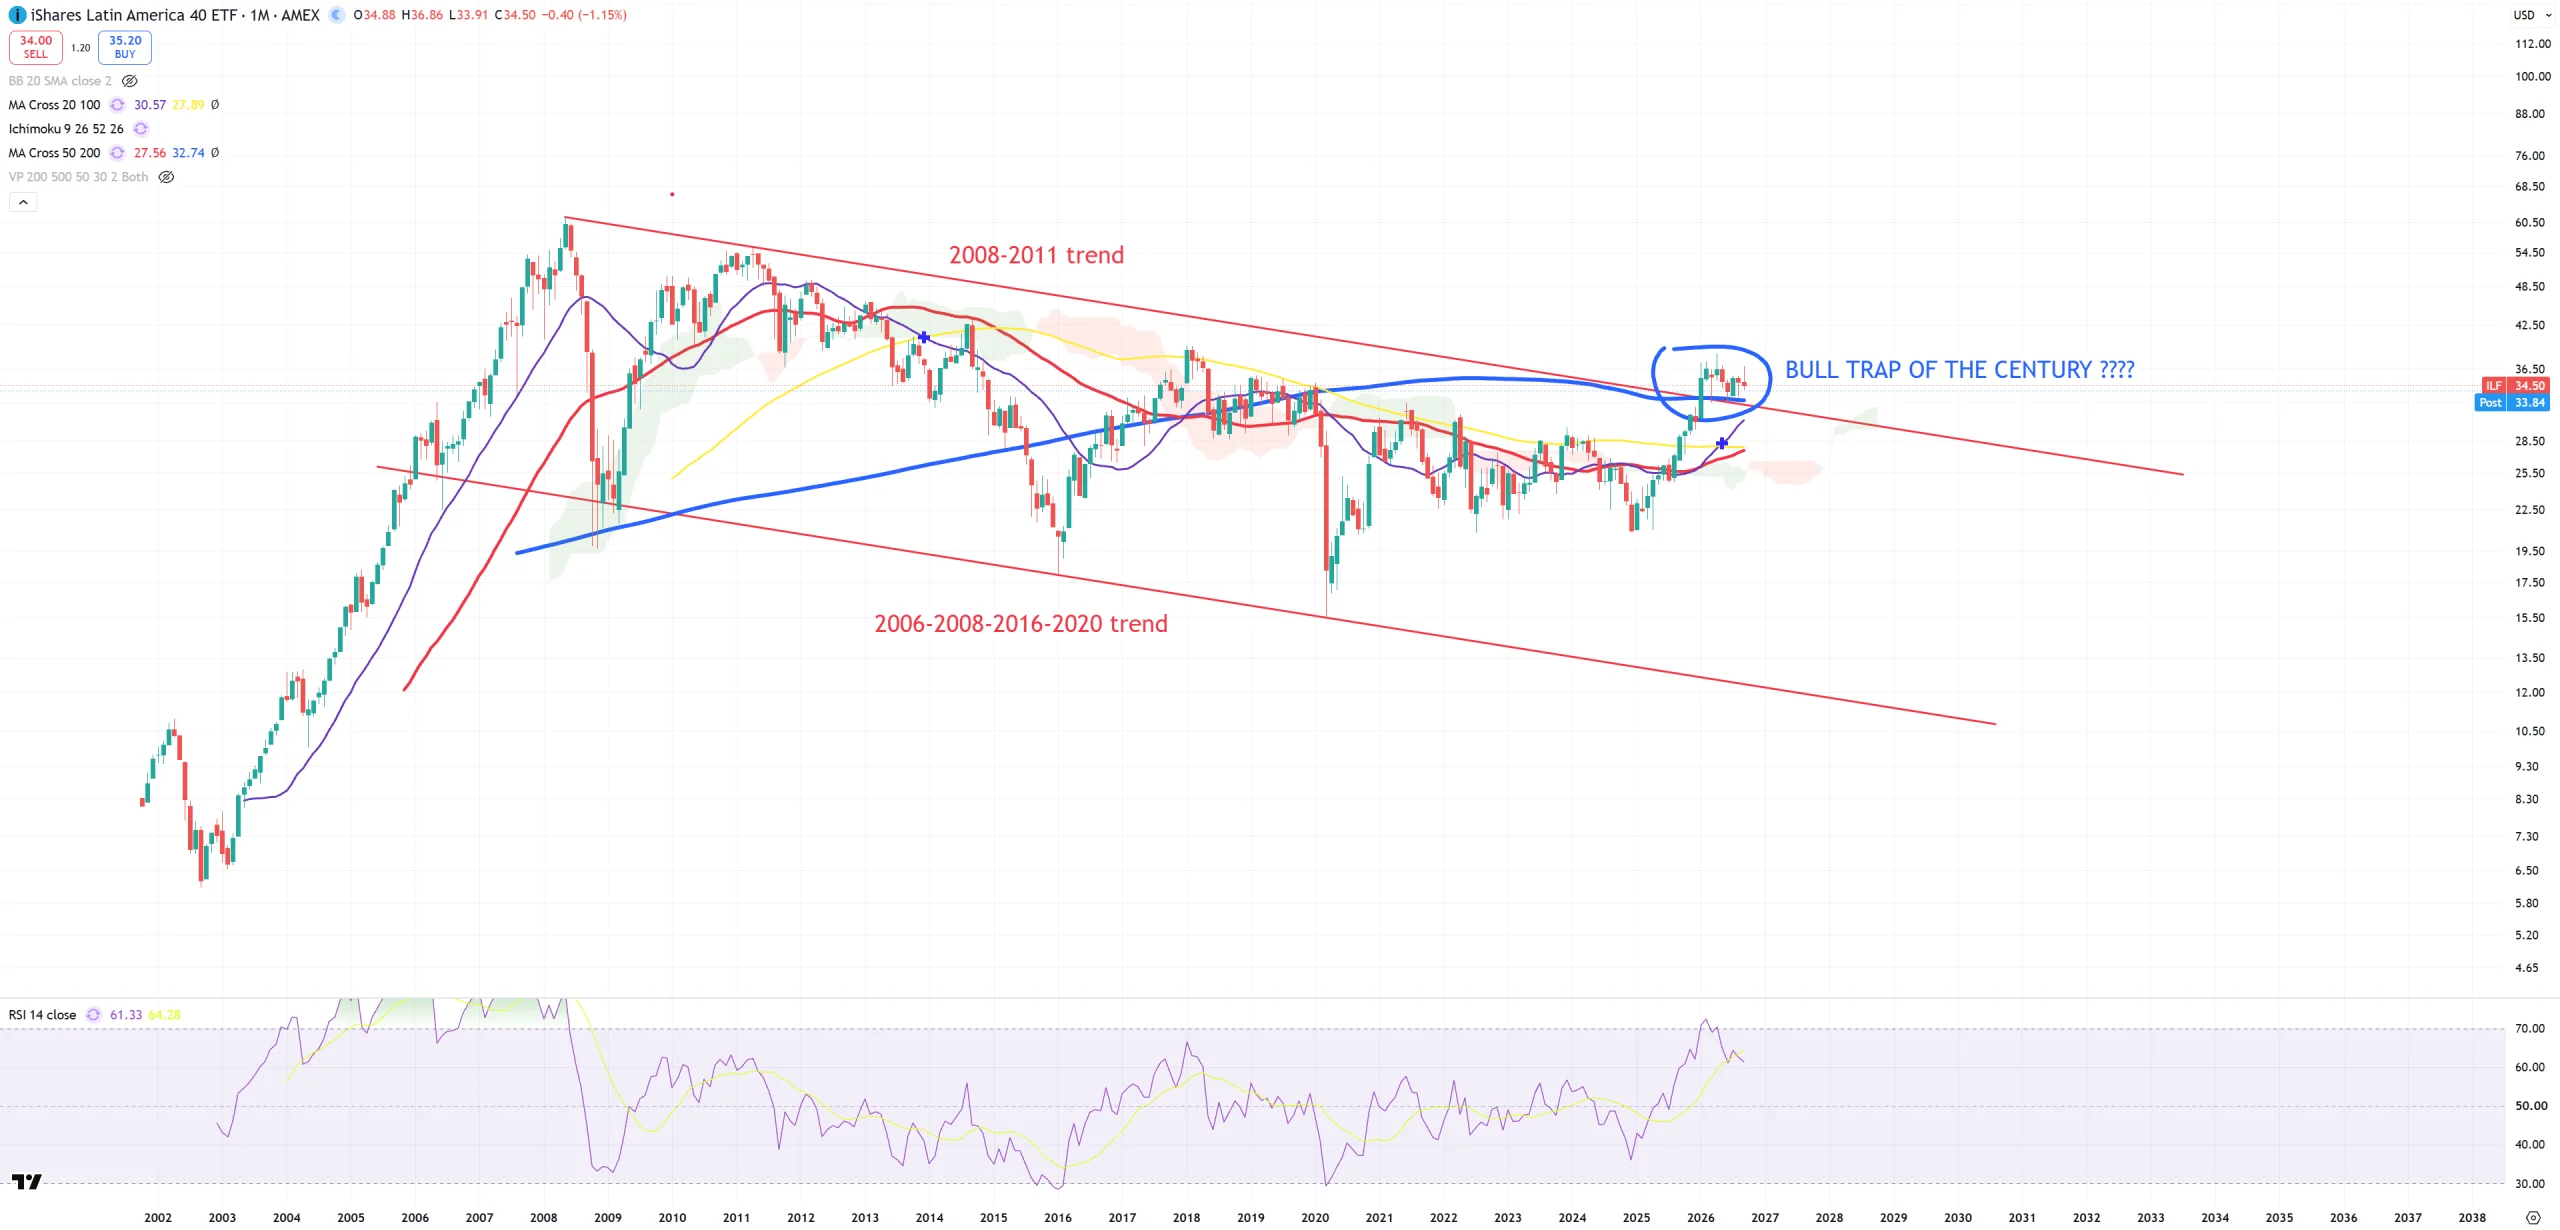
ILF – Latin America – massive break > (M)MA200 or massive bull trap once DXY goes up? Same setup like in 2018.
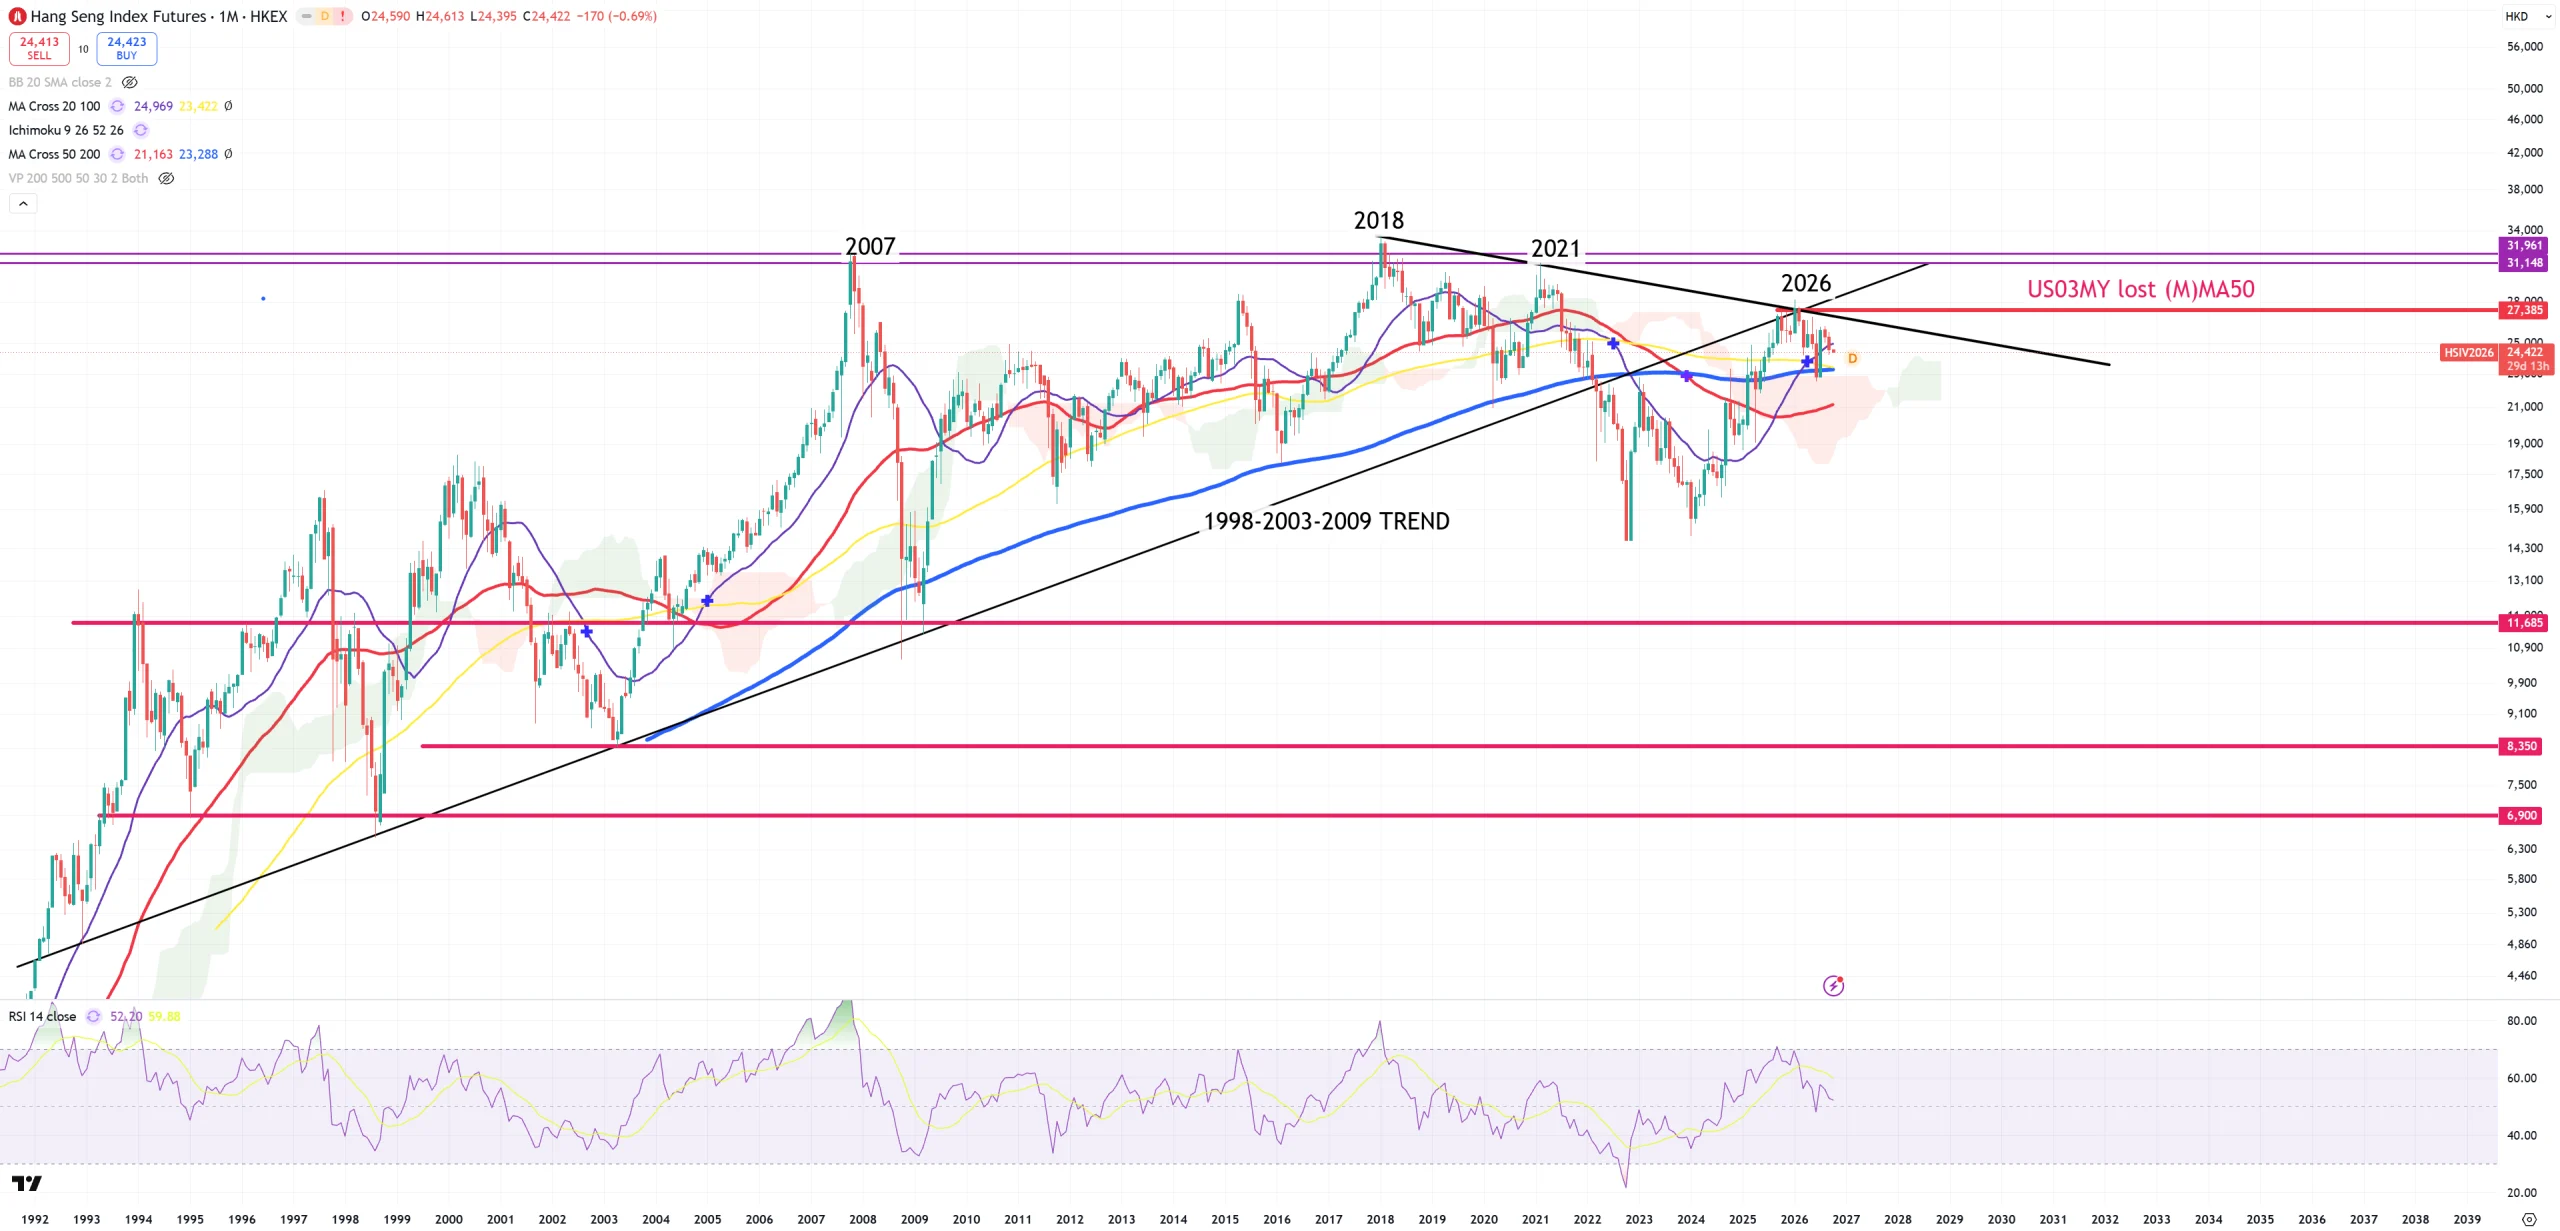
HSI – Hang-Seng – last possible level of retest was achieved.
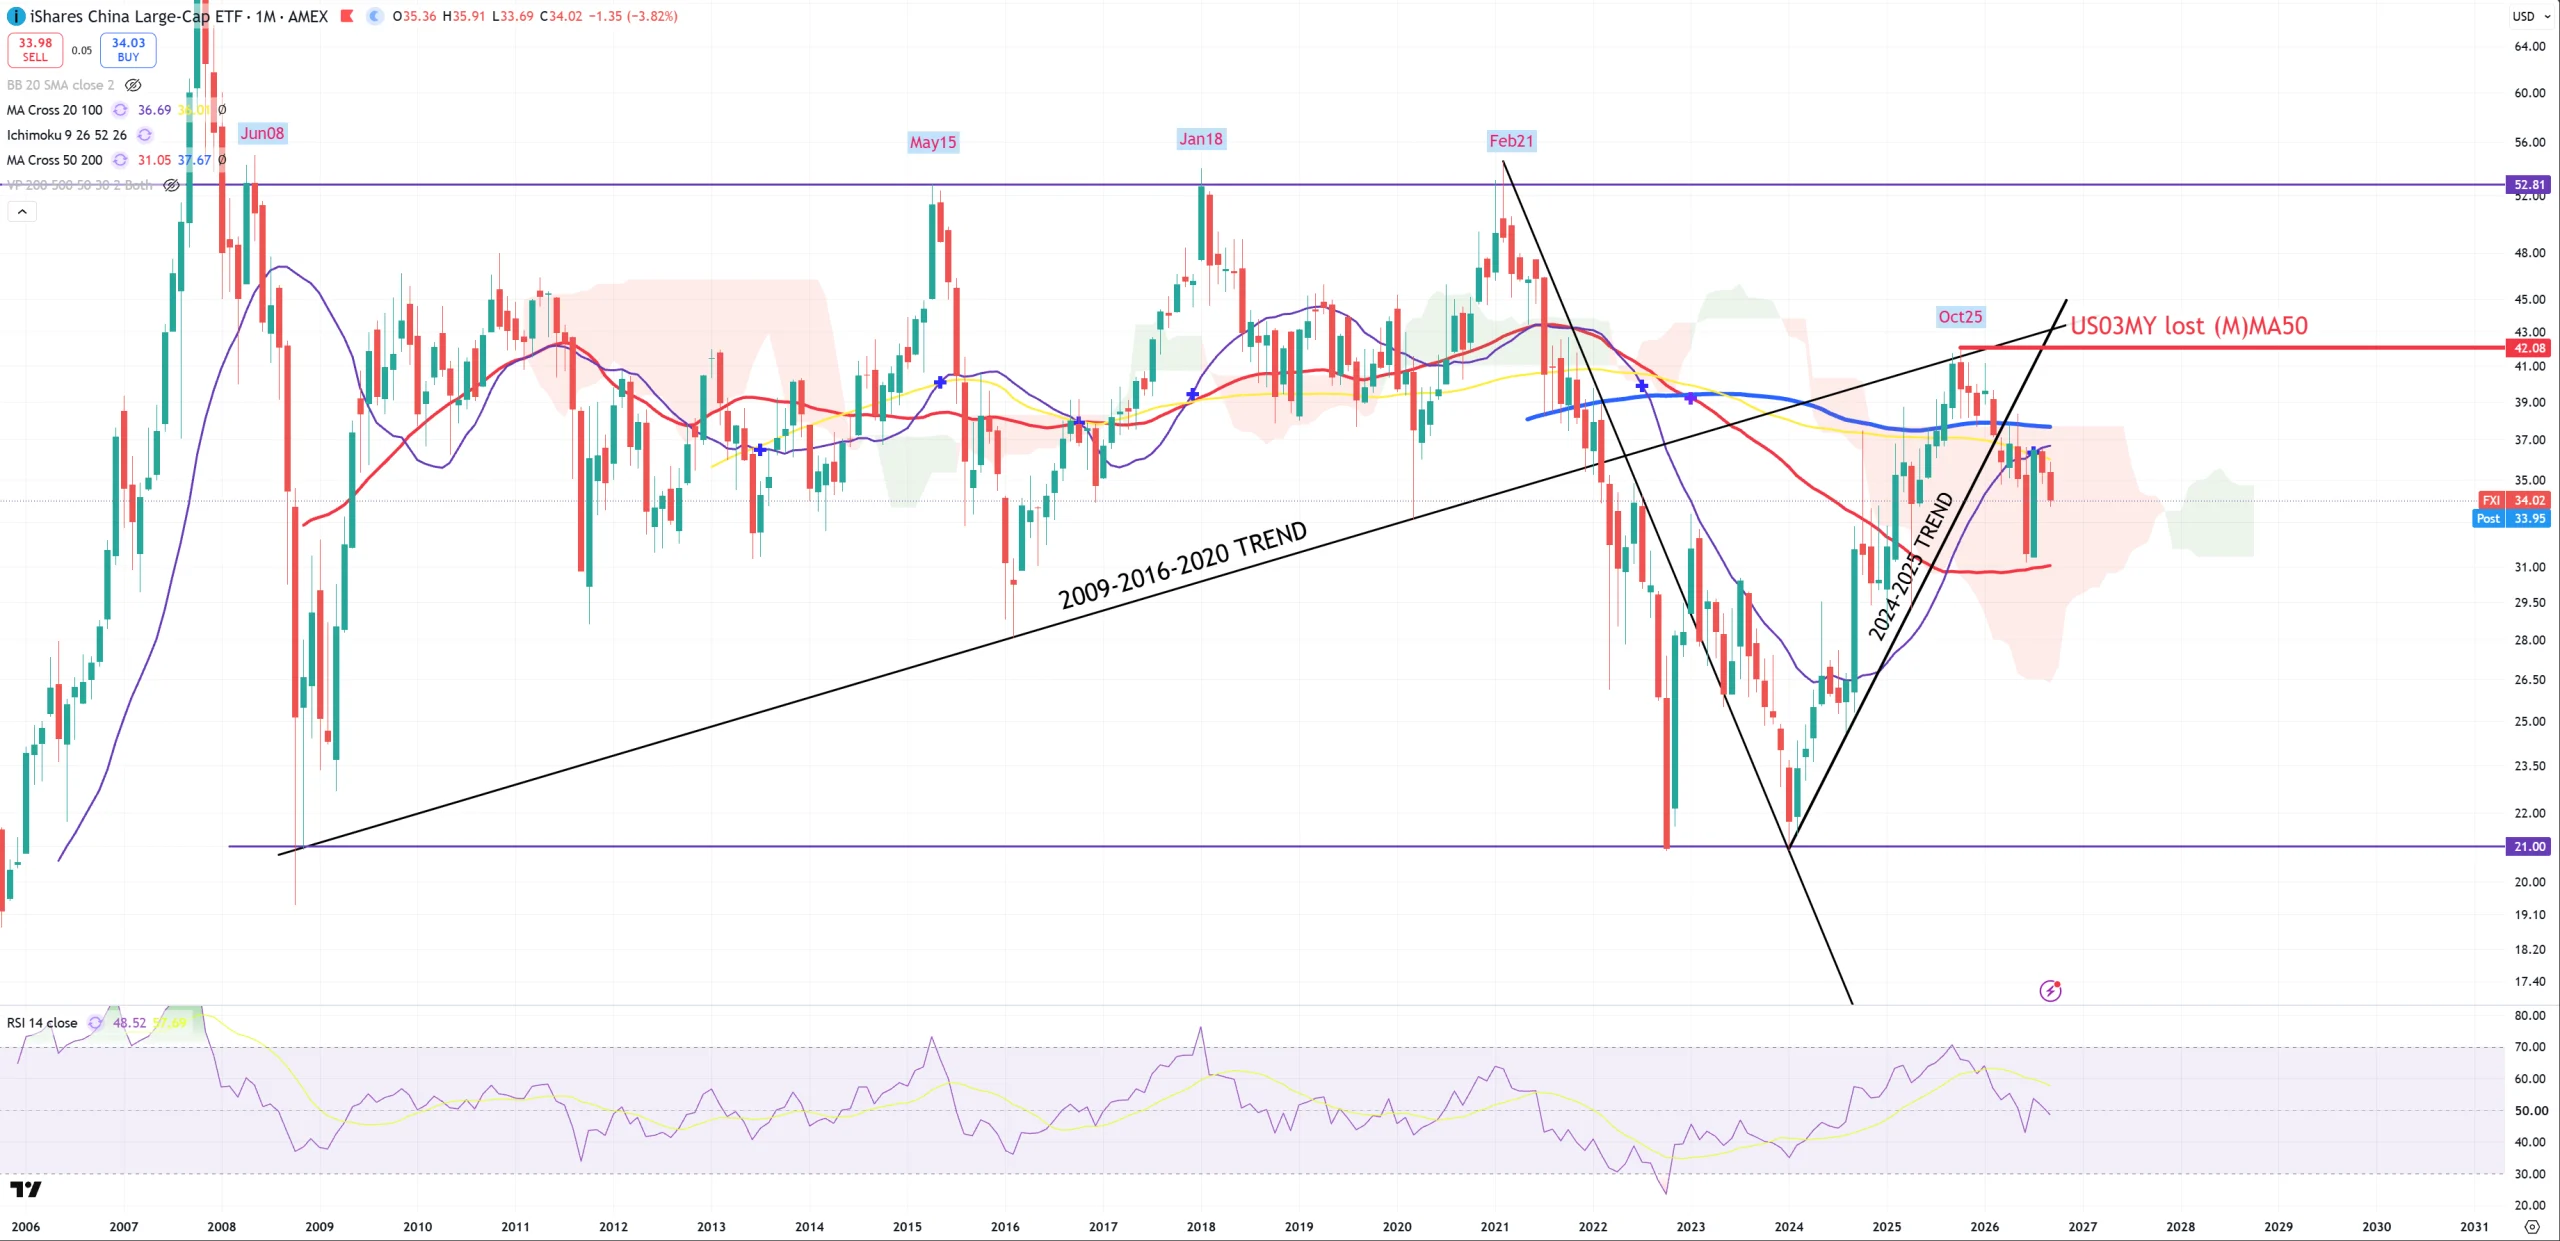
FXI – China
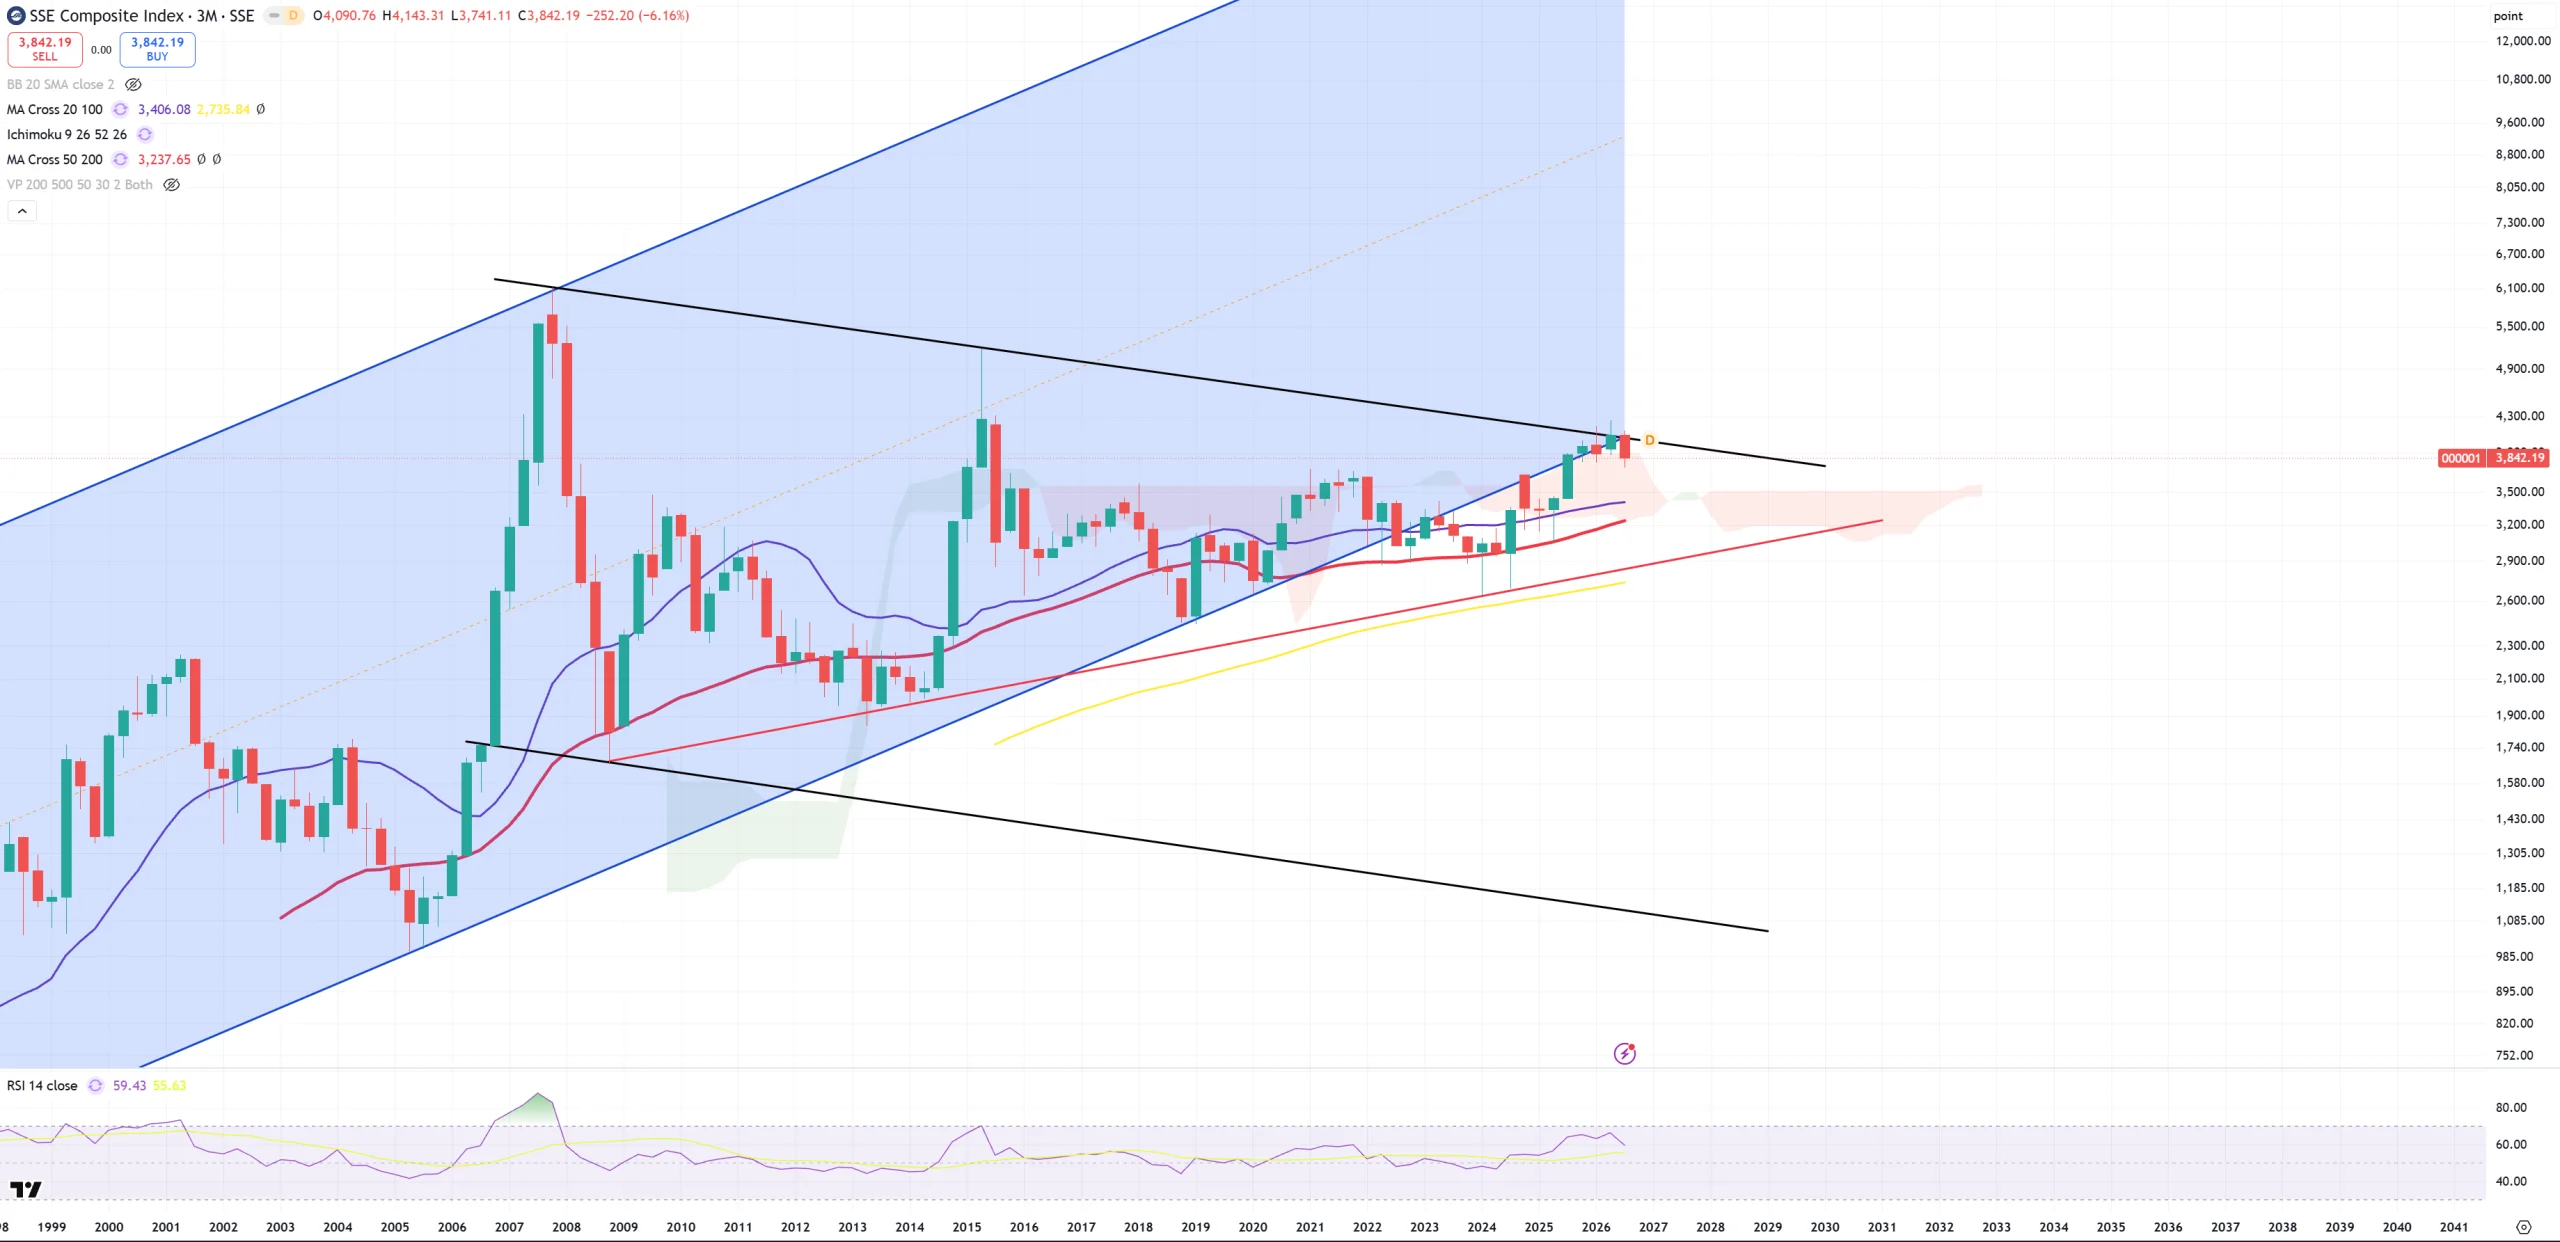
Shanghai Composite
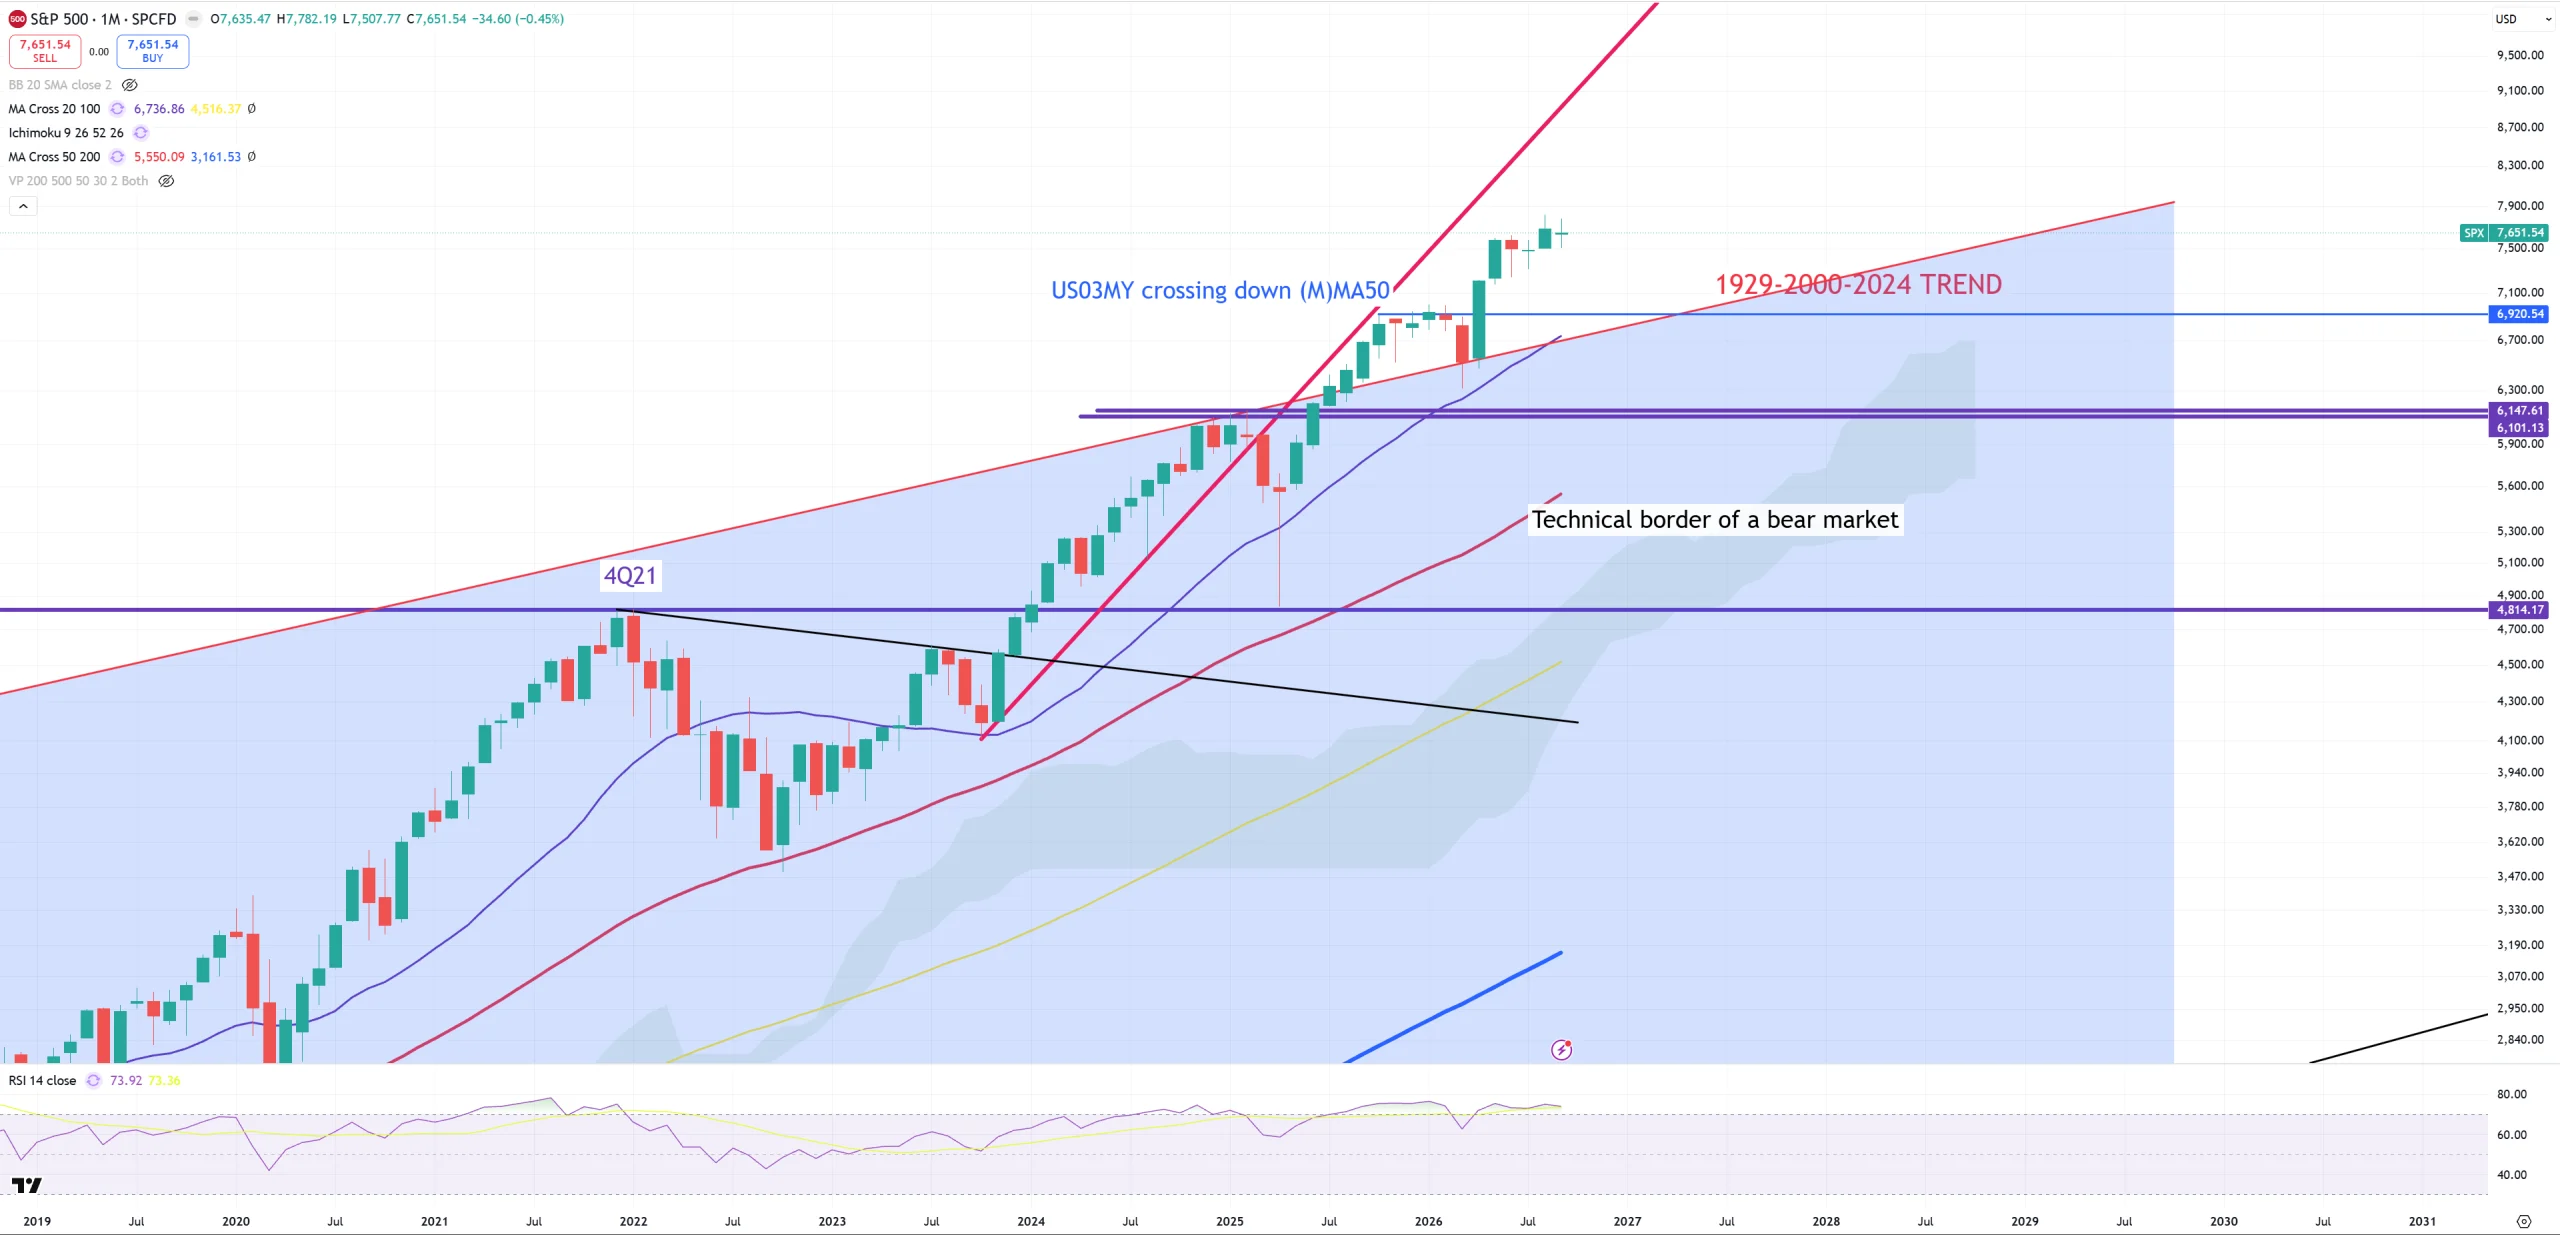
SPX – floats way above its 1929-2000 trend – nothing to watch here, but trend perfectly blends with (M)MA20.
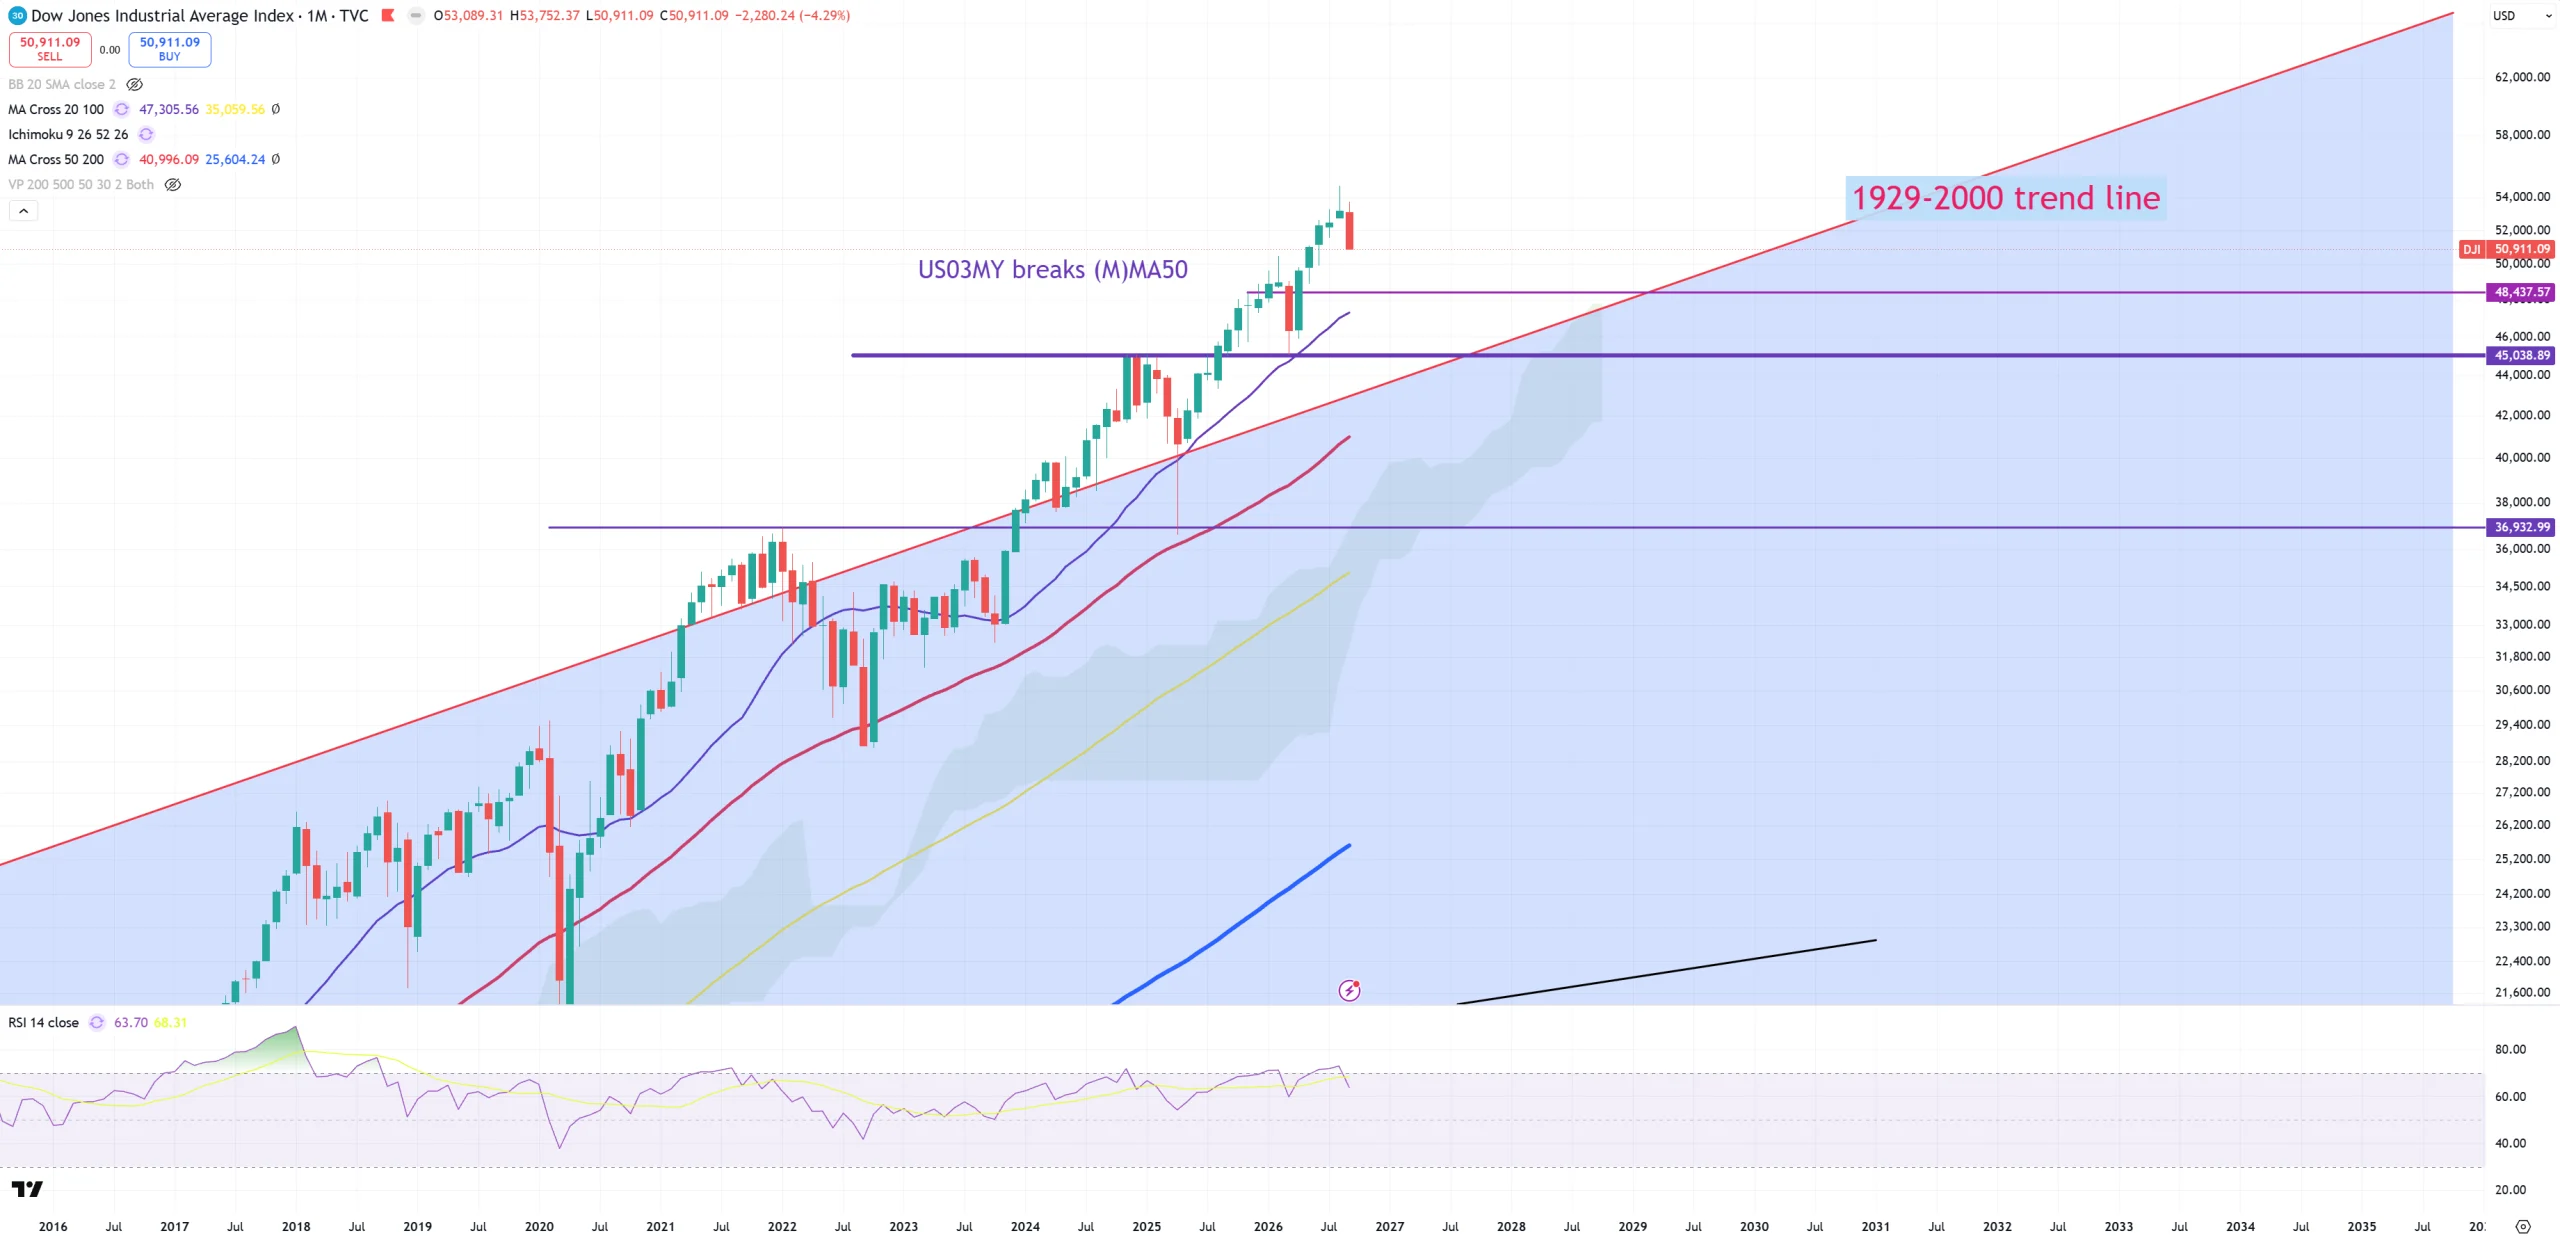
DJI – like SPX
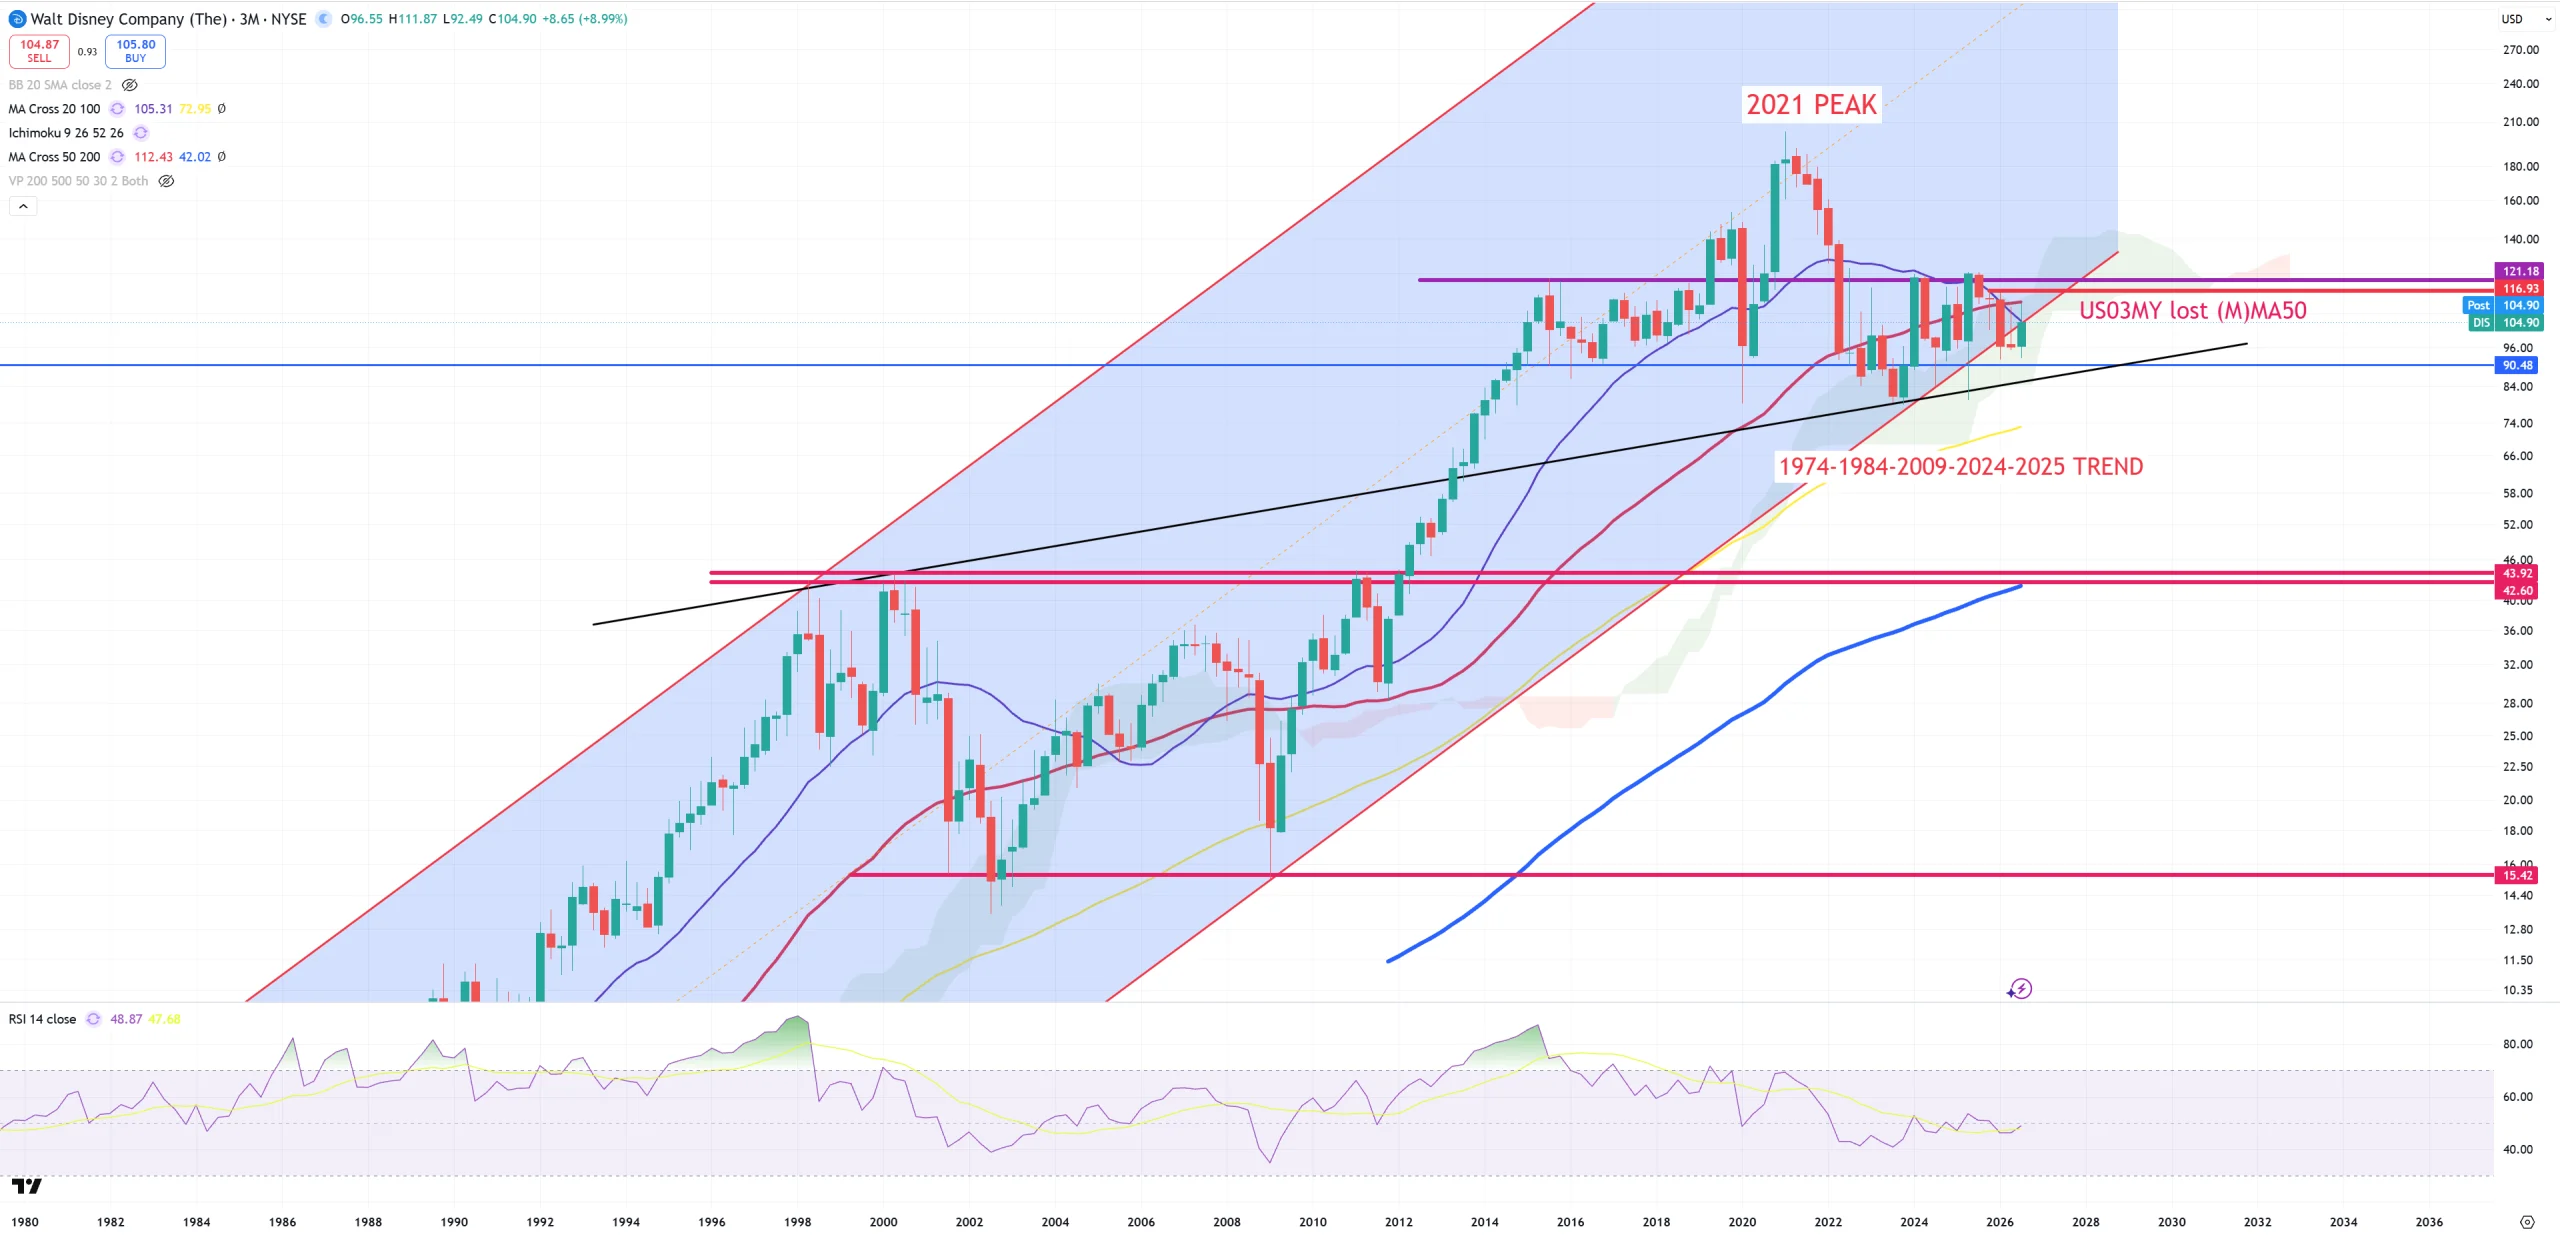
DIS – on (3M) it wants to get out of this 1974 trend
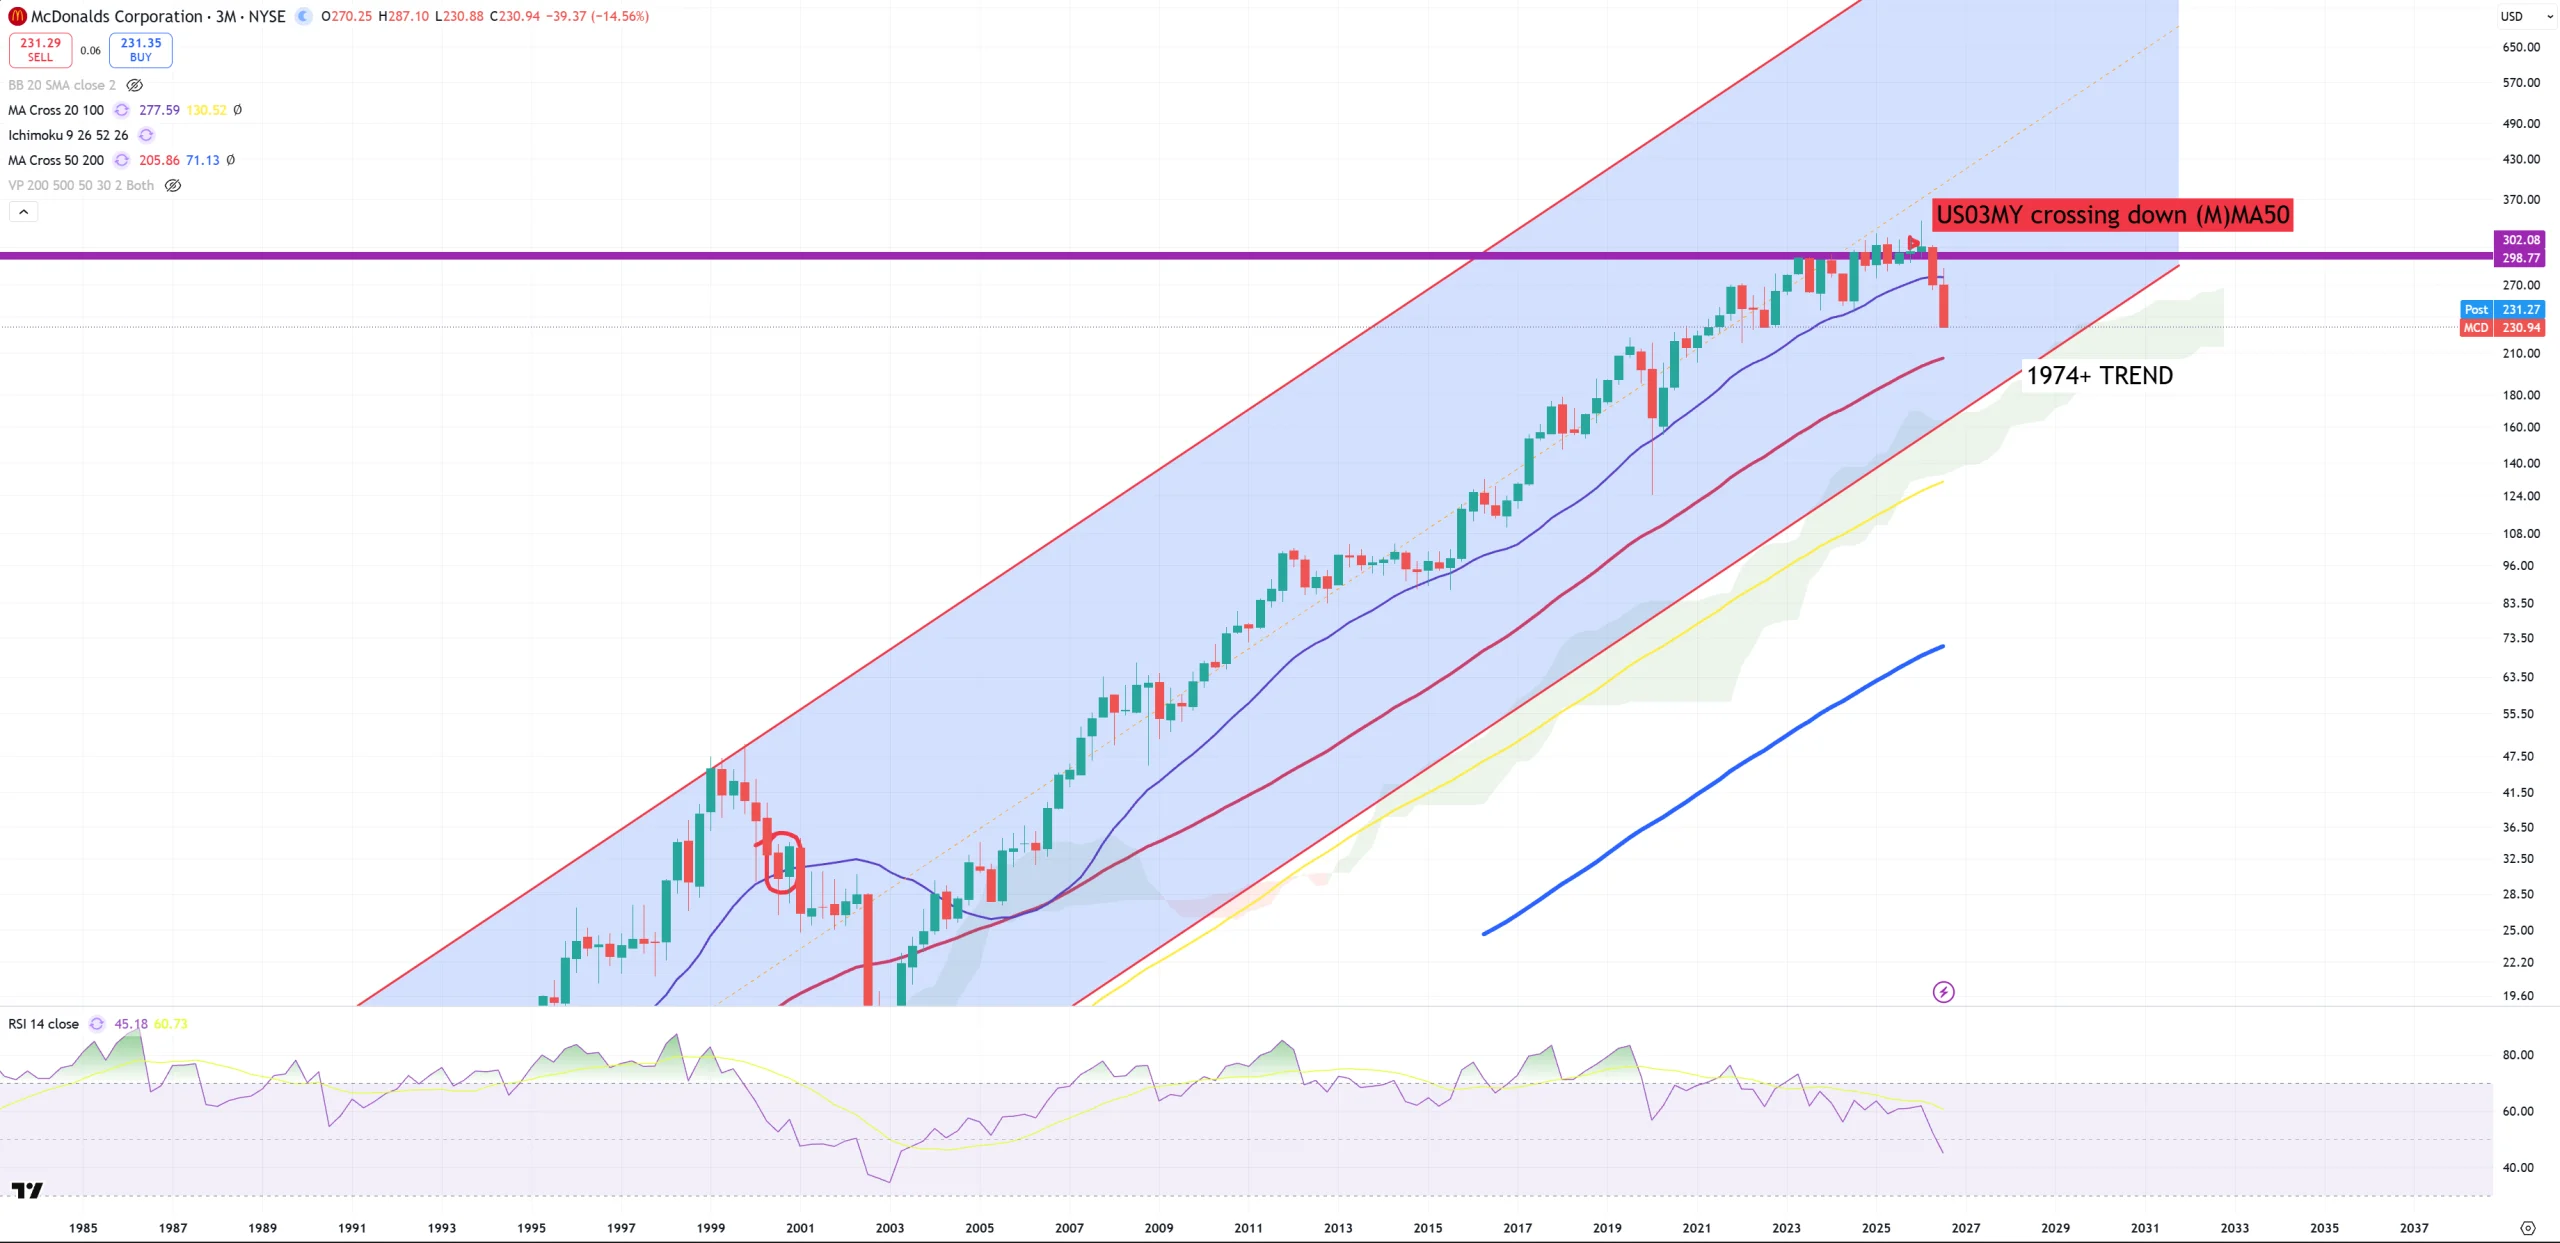
MCD – (3M) did what it did only during dotcom bust. 1974 trend waiting for it.
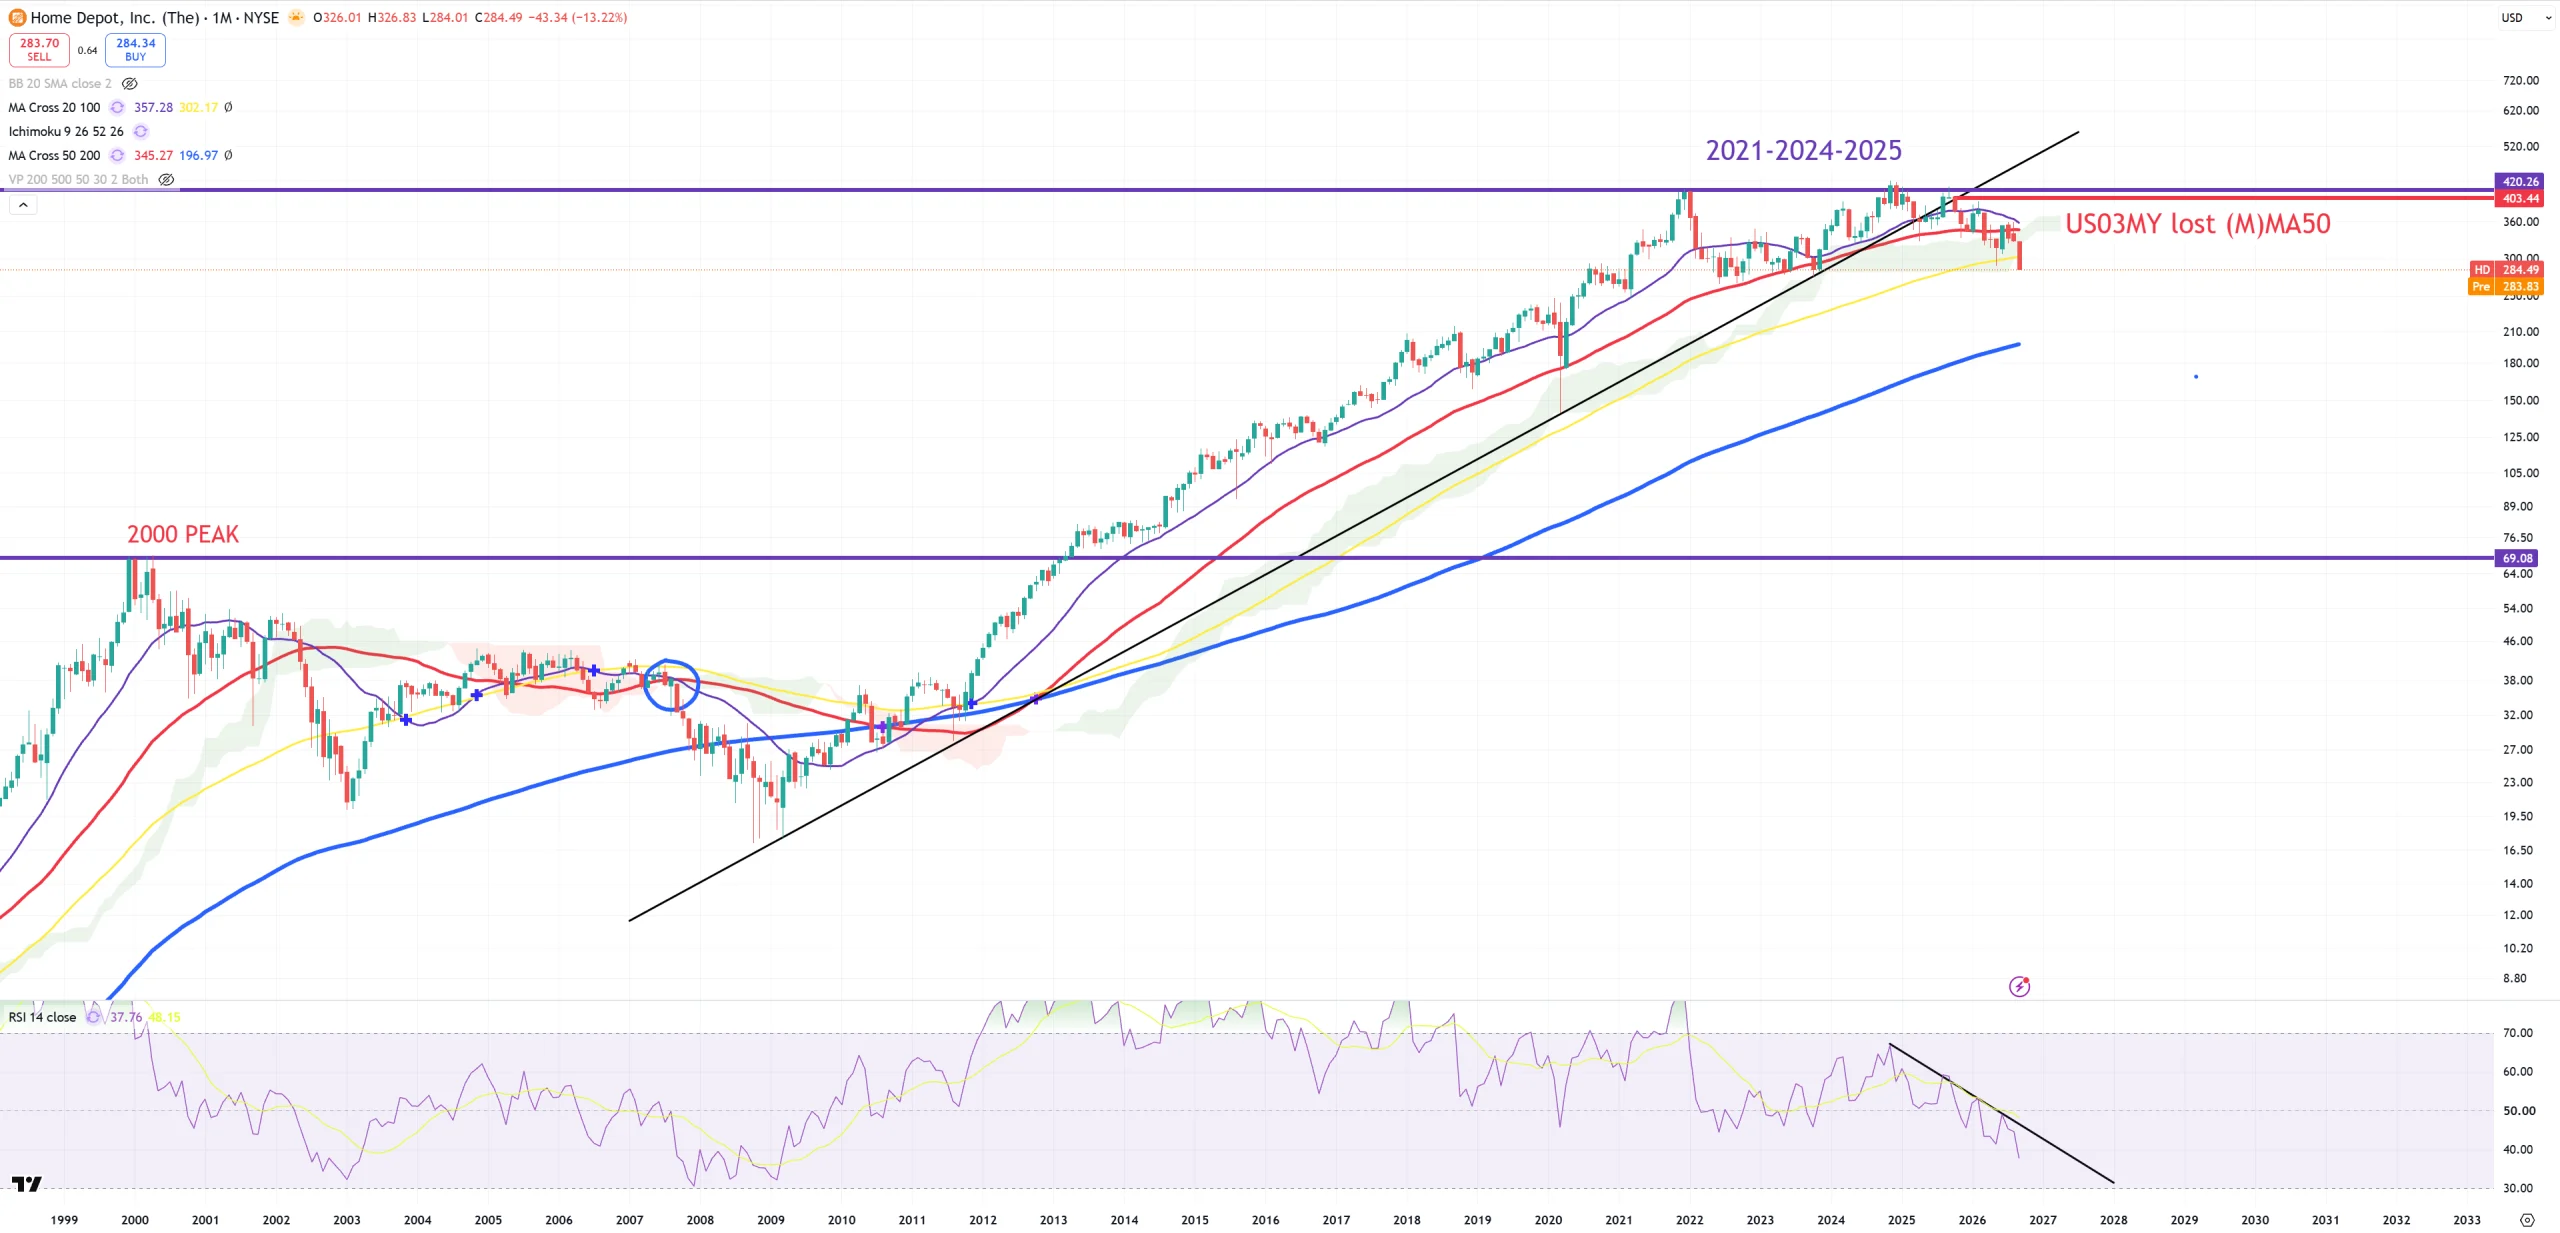
HD – massive bear market.
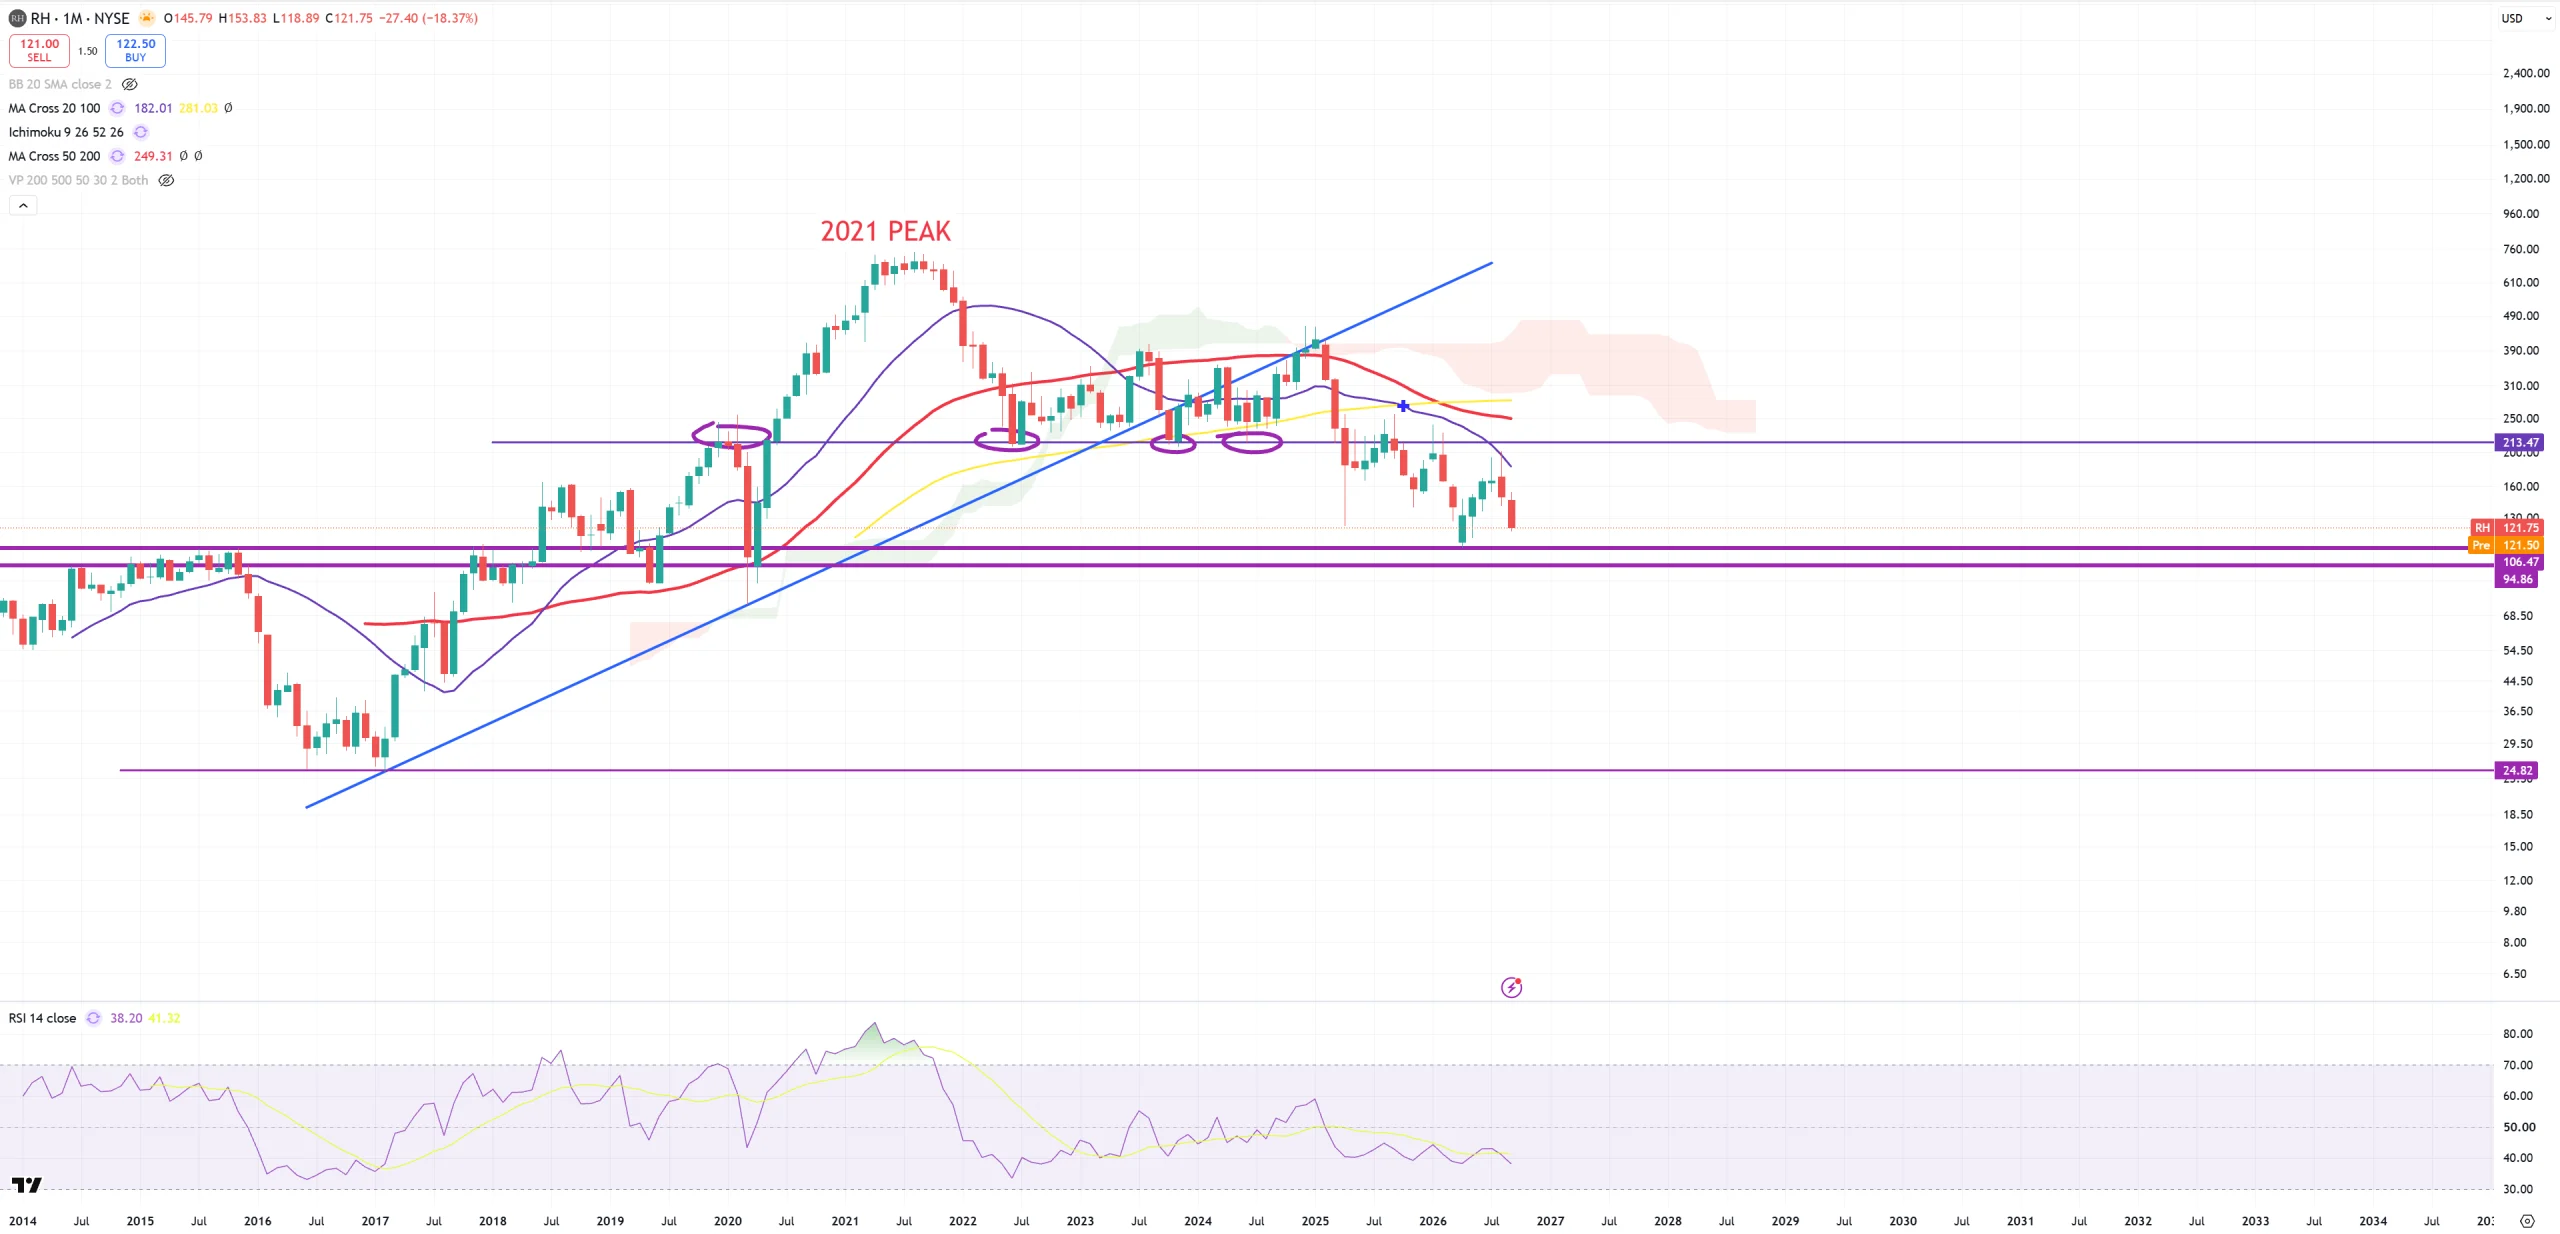
RH – losing 95$ to land on 25$
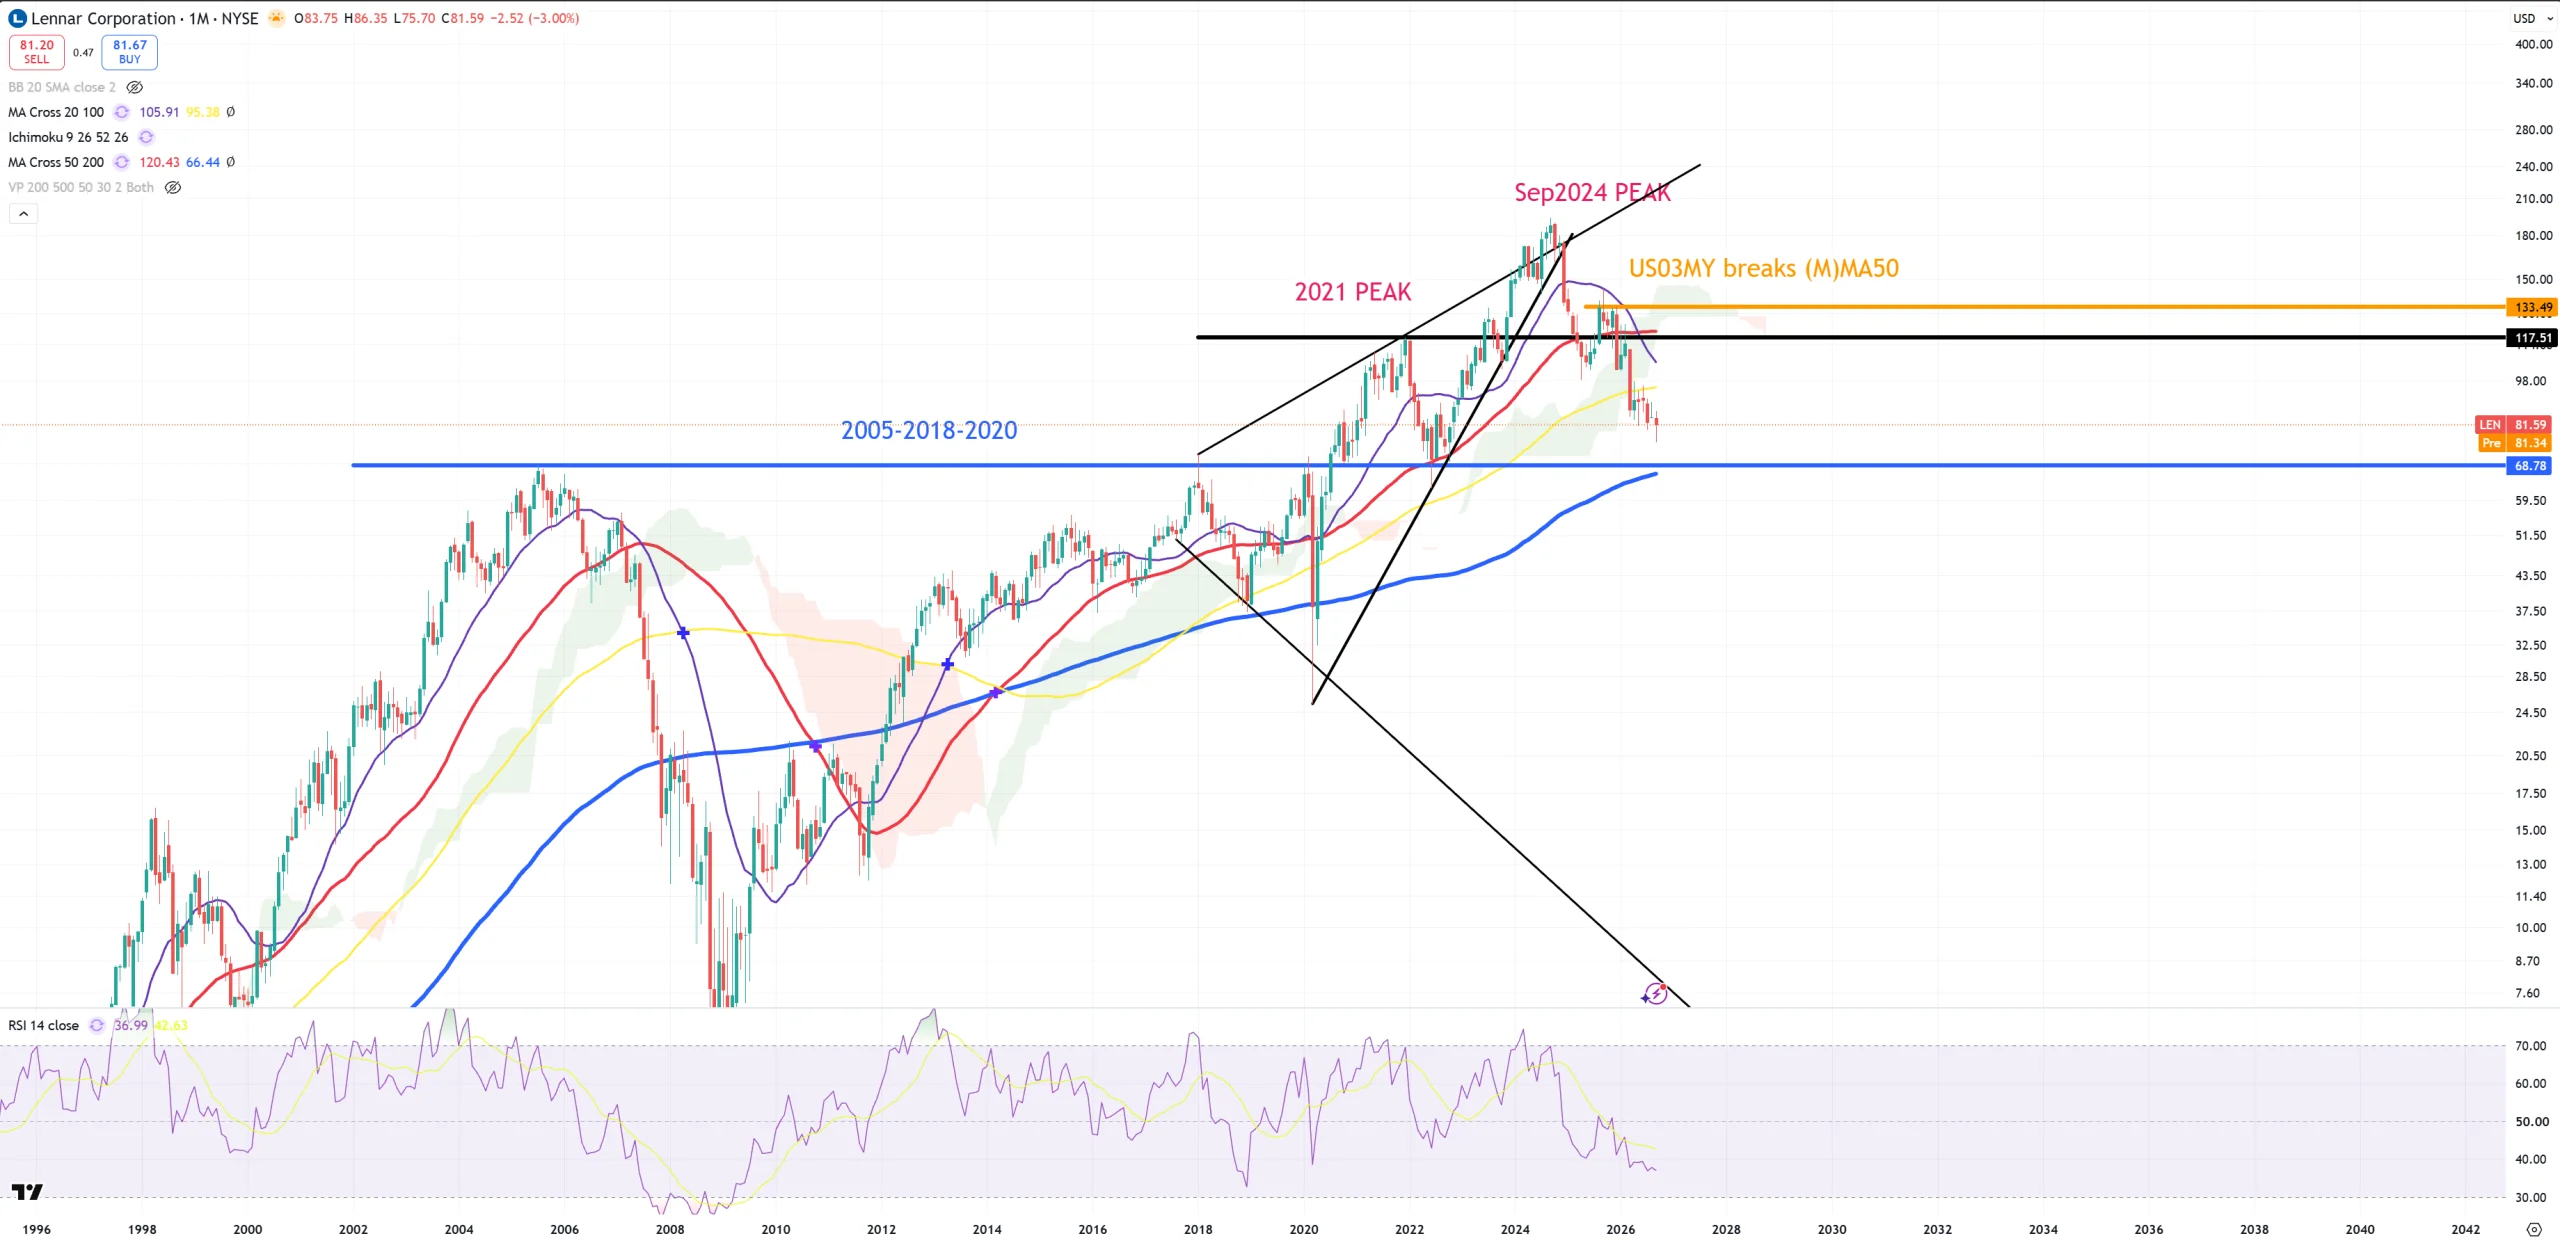
LEN – key level also sits on blue (M)MA200. Bear market like crazy, but things will speed up below 2005-2018-2020 support.
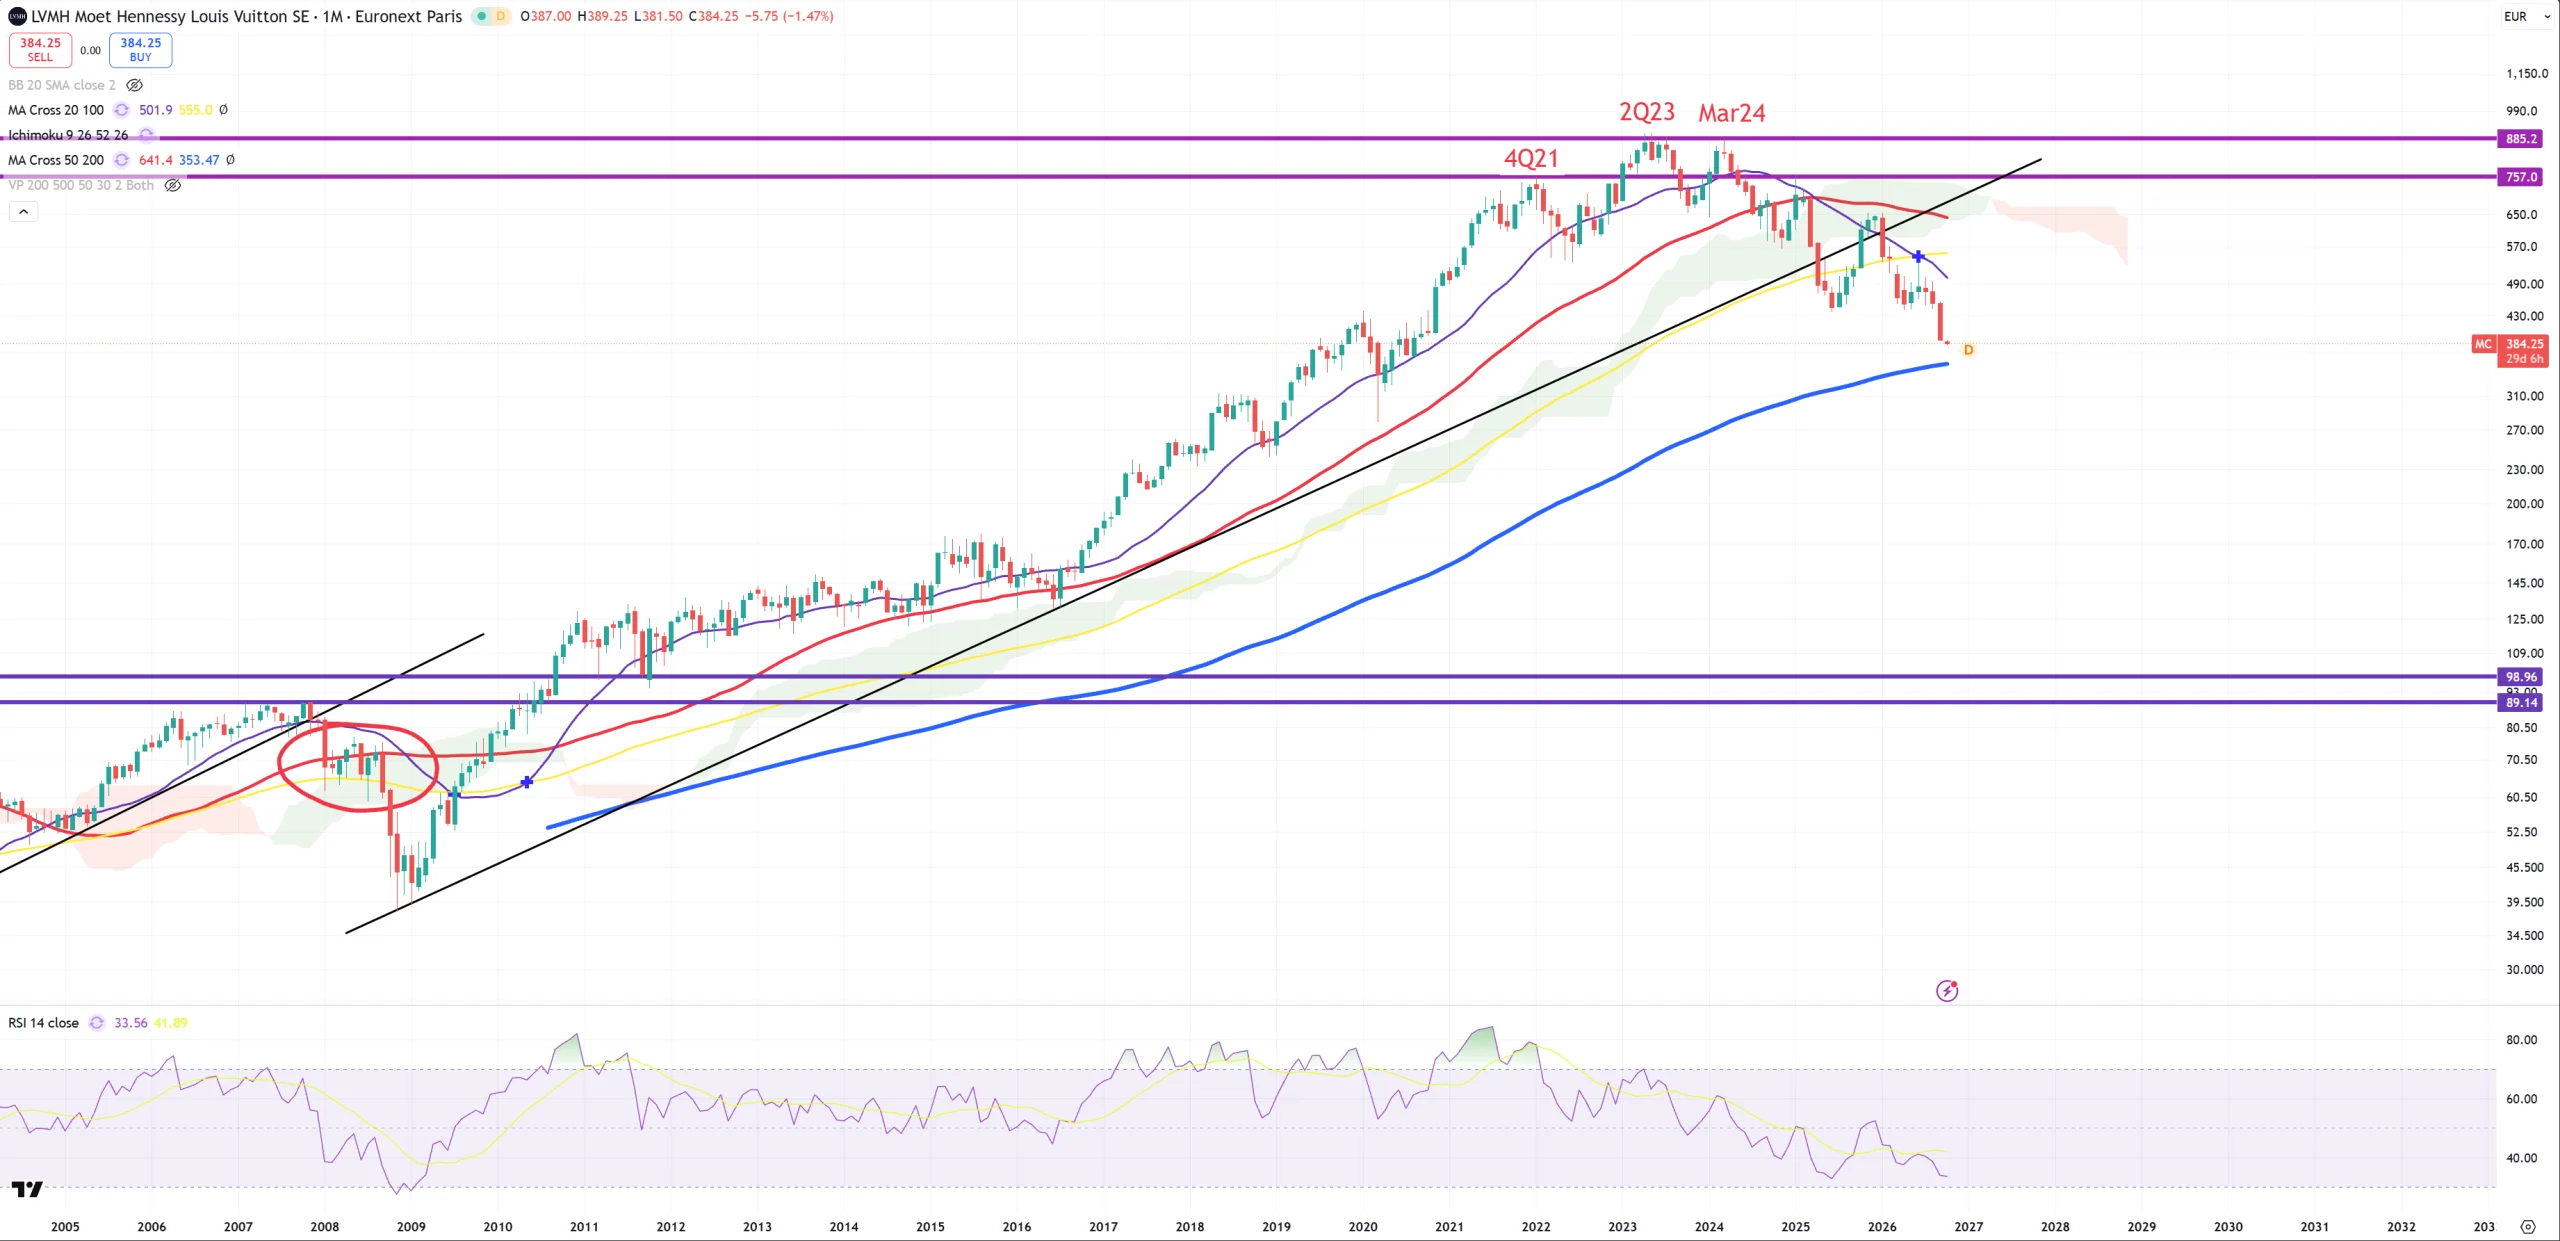
LVMH – looks ready again to touch (M)MA200
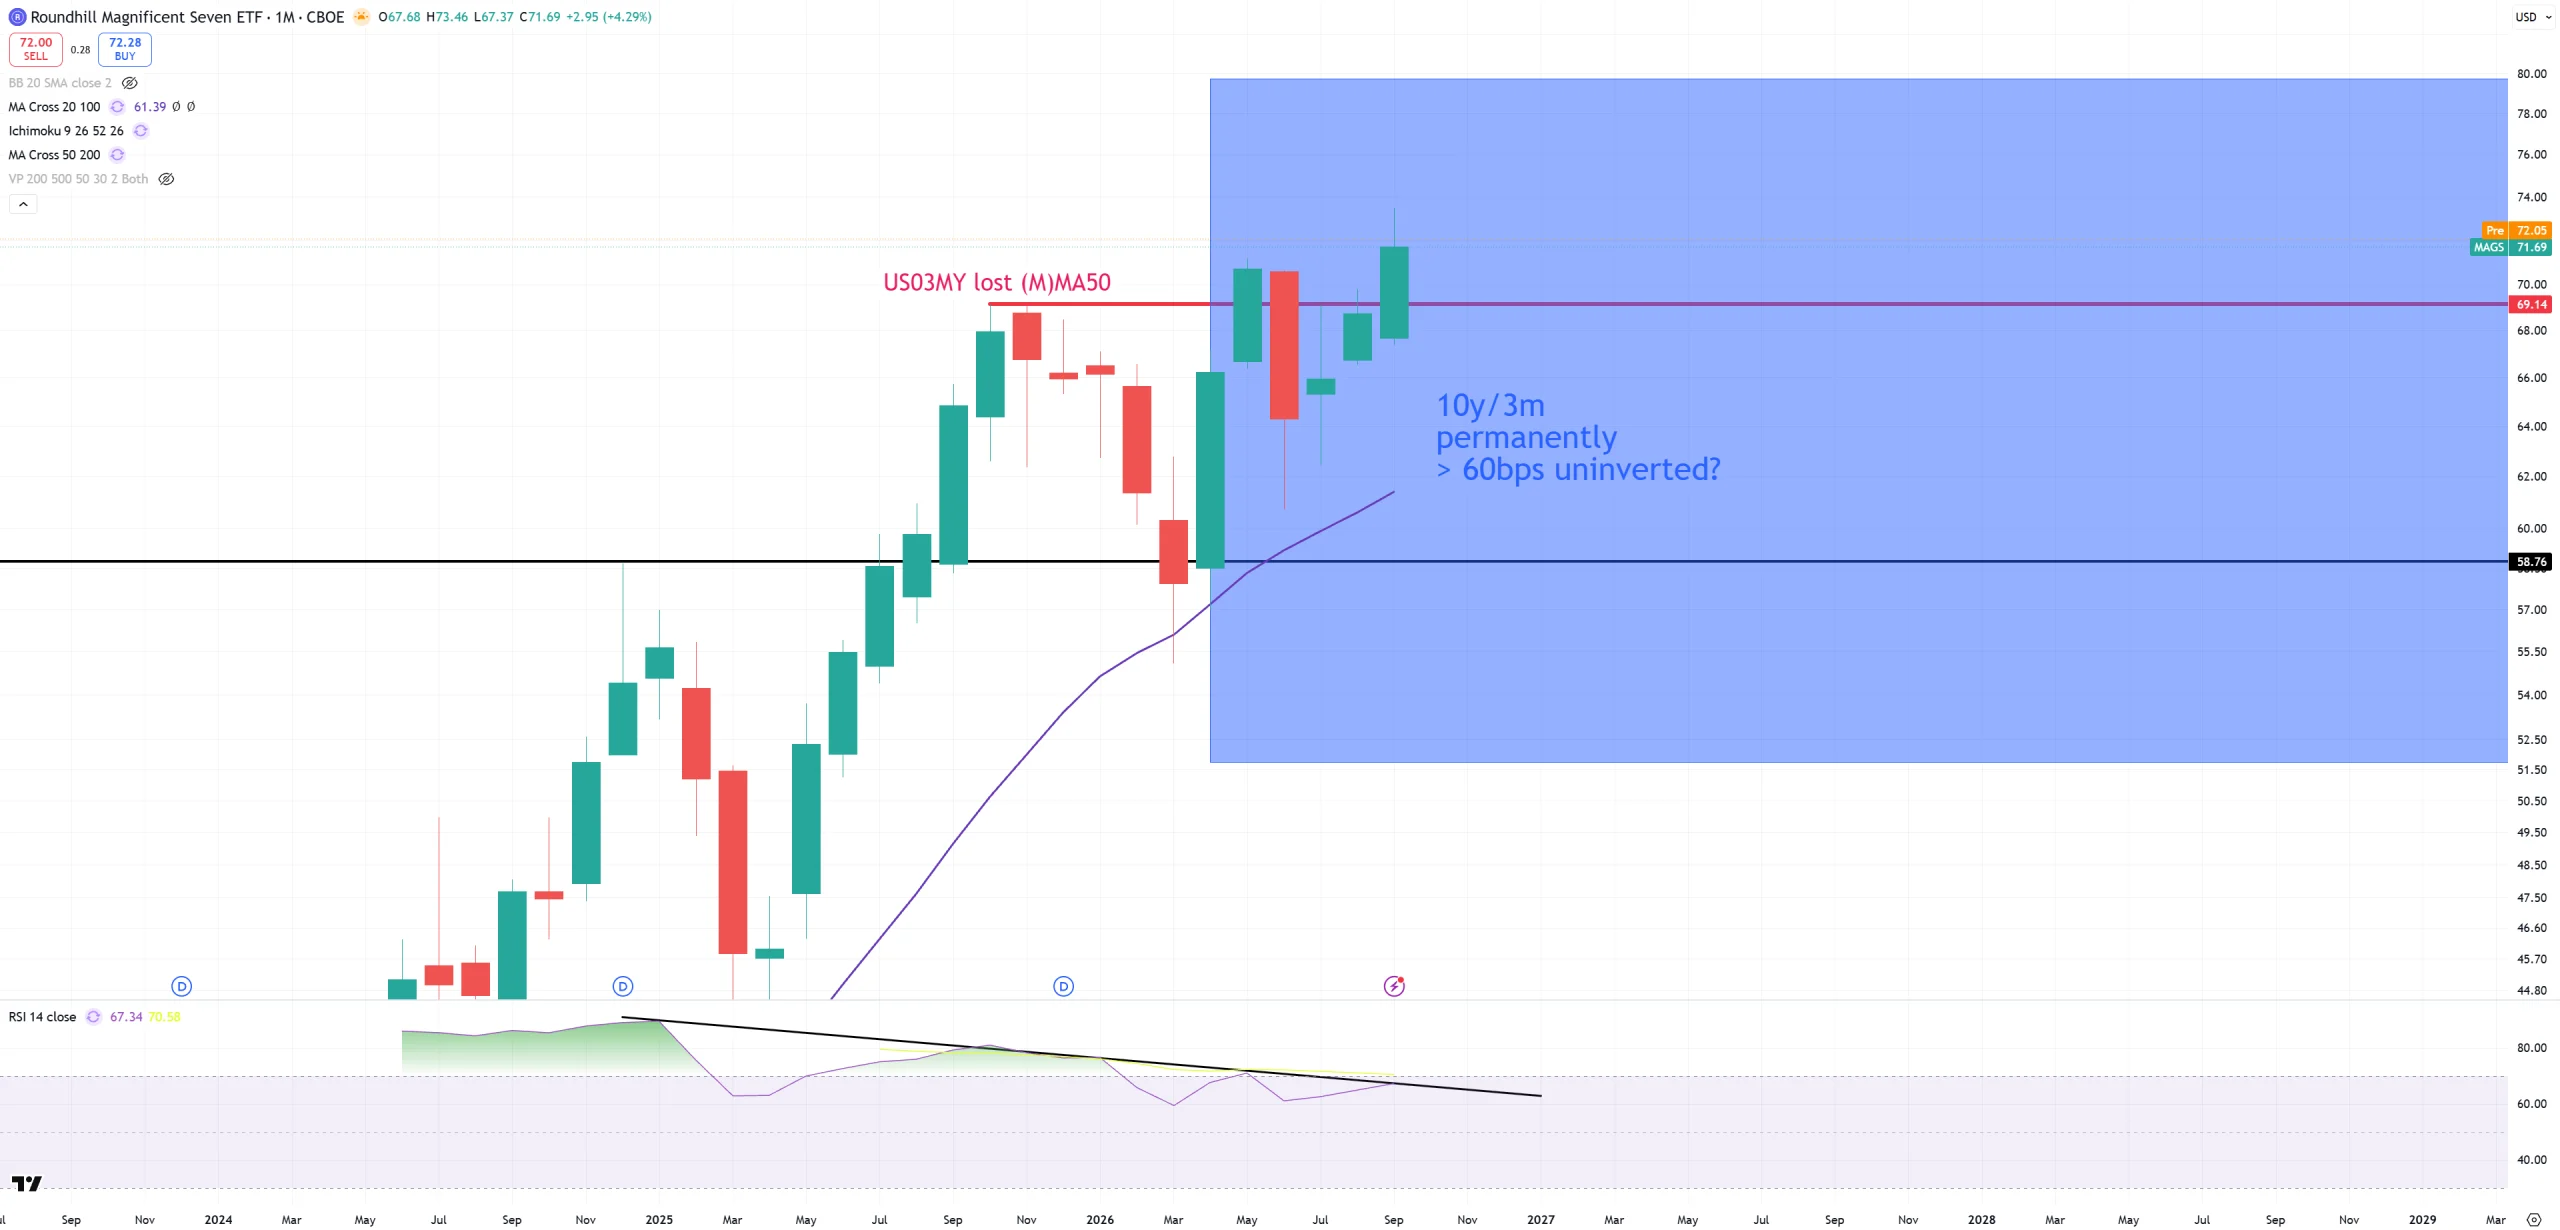
MAGS – Mag7 in general fights with key 69$ level but it’s broken. This thesis confirms NDQ/GOLD
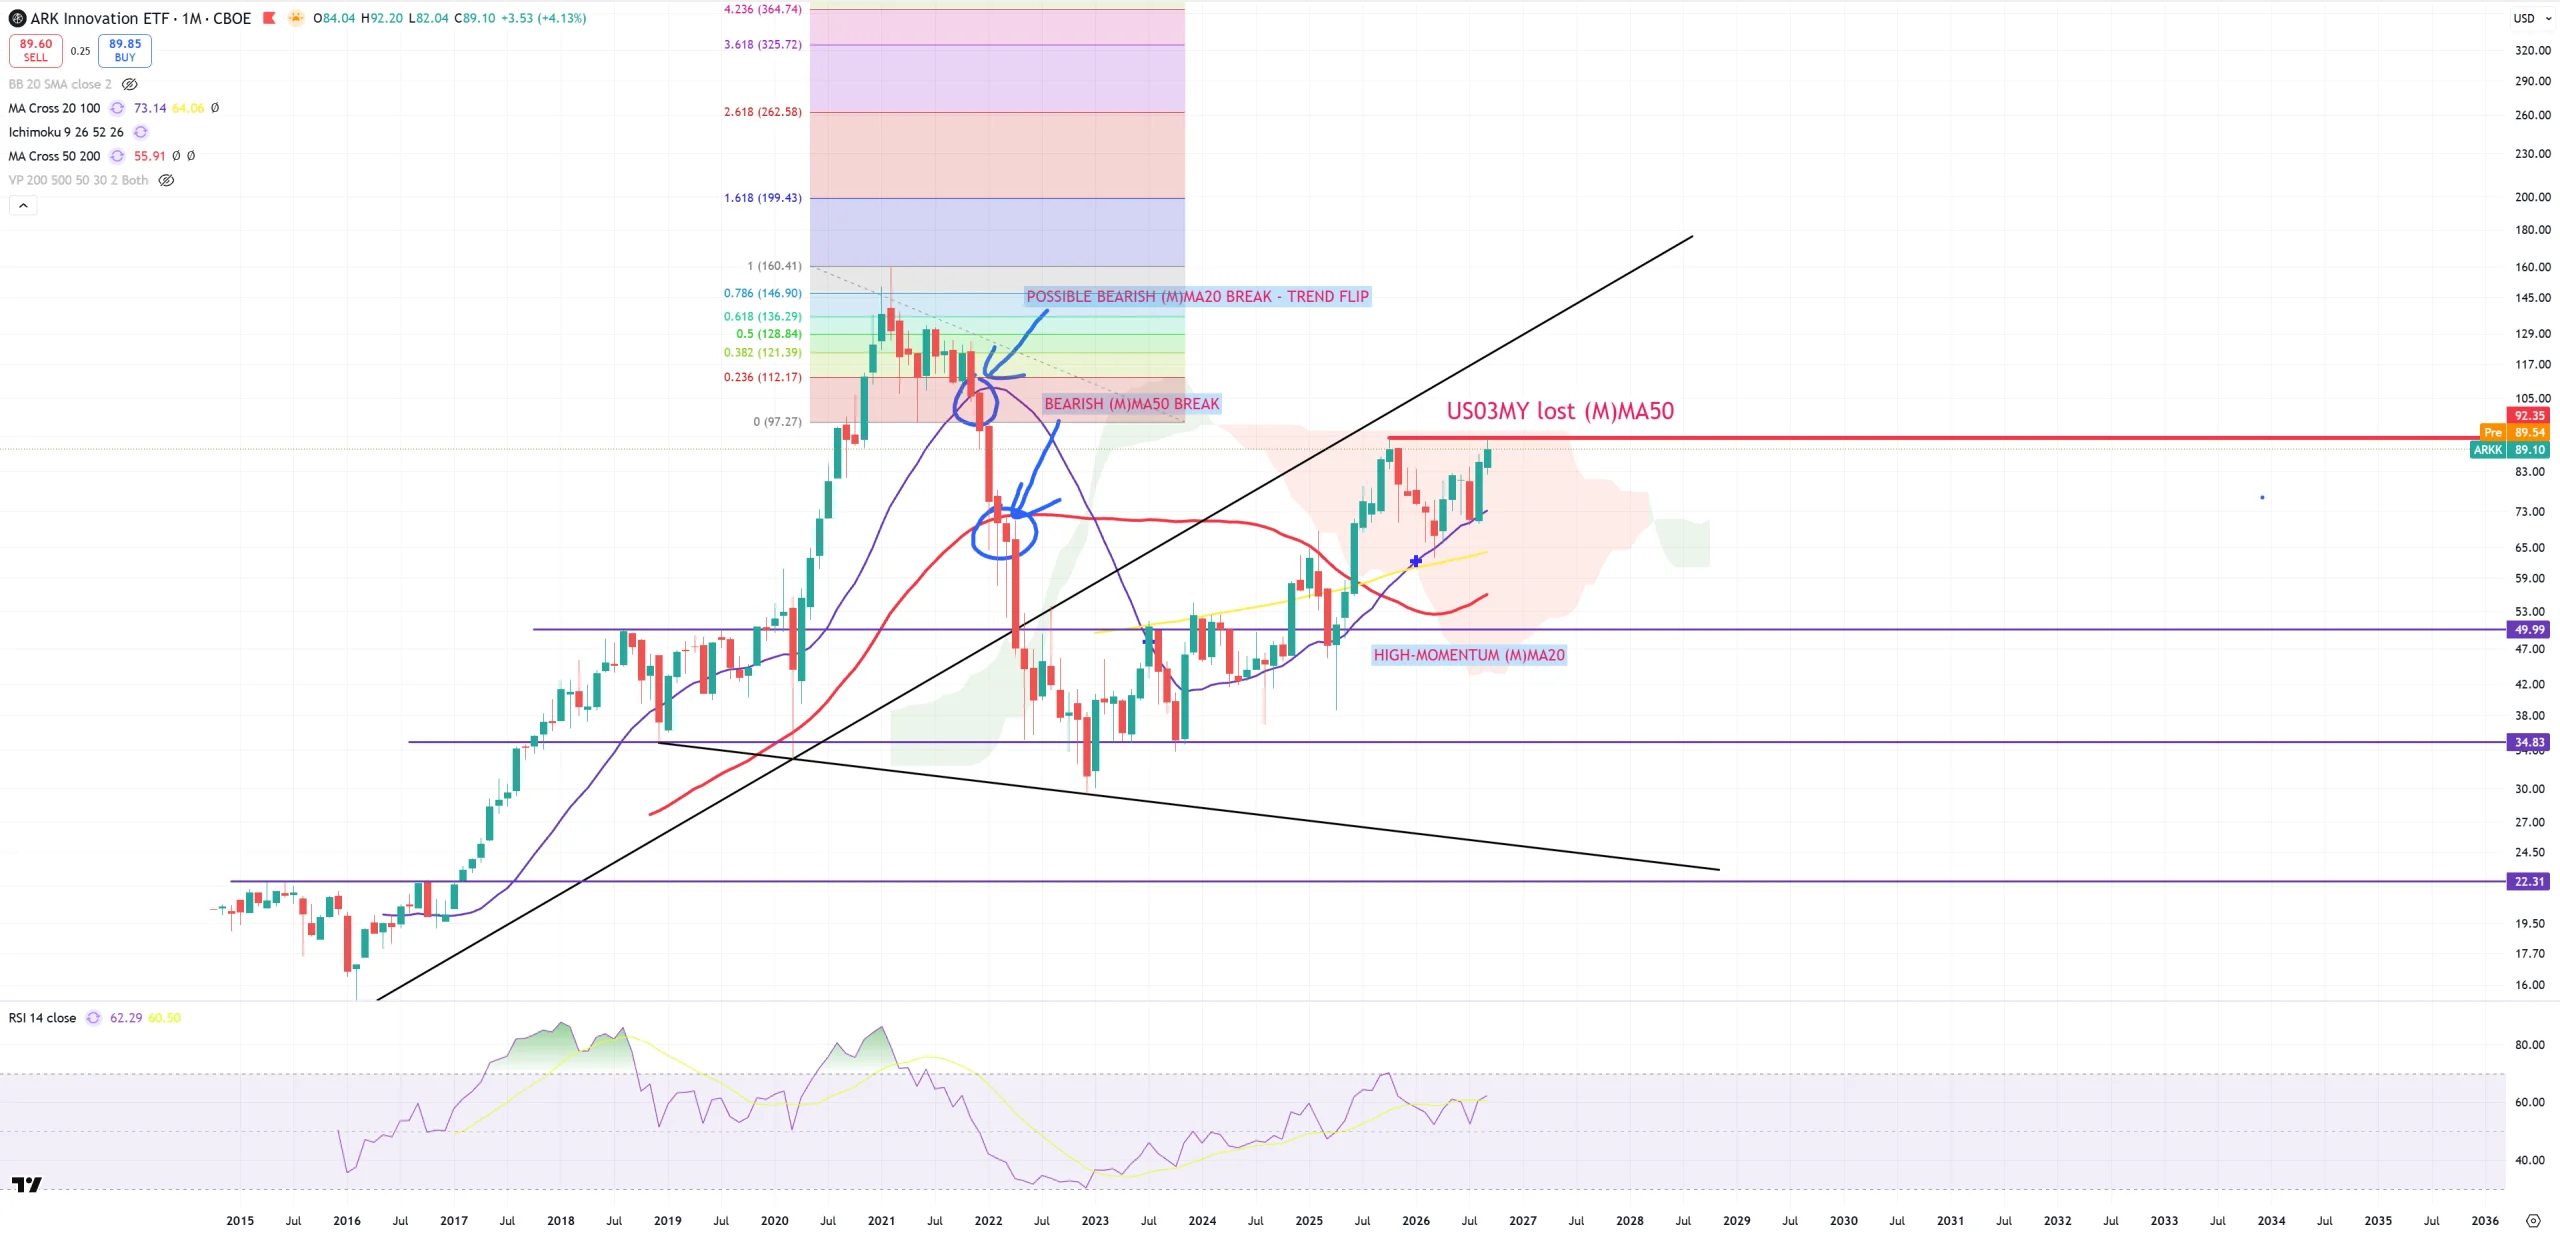
ARKK – key level.
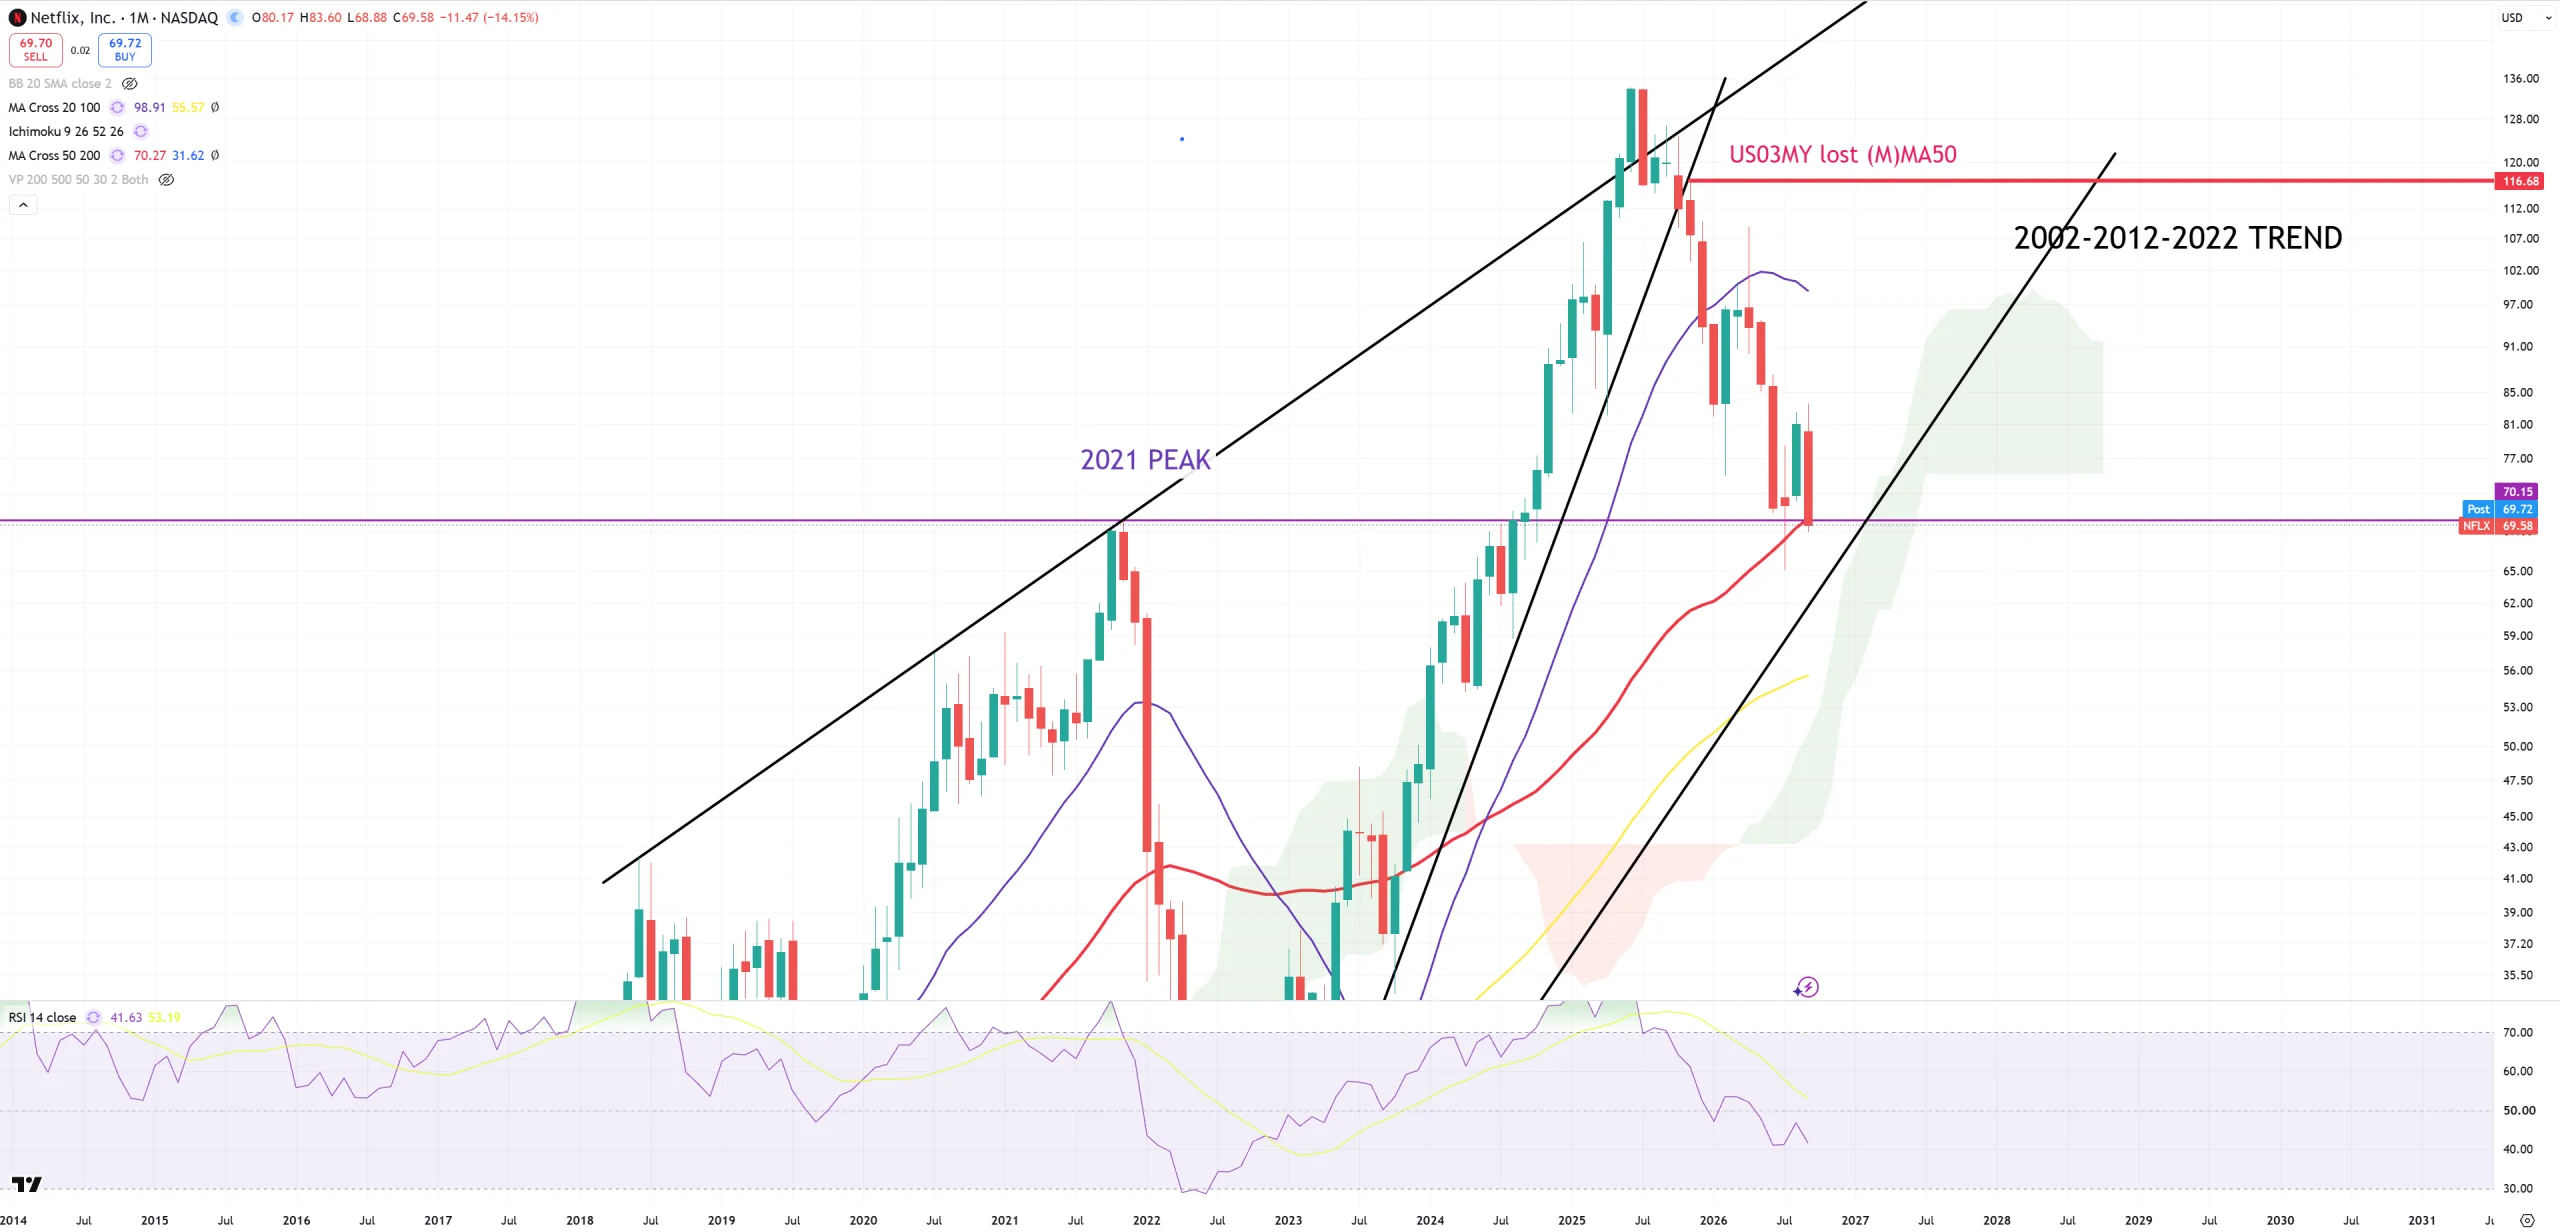
NFLX – huge junction of 4Q21 peak & red (M)MA50
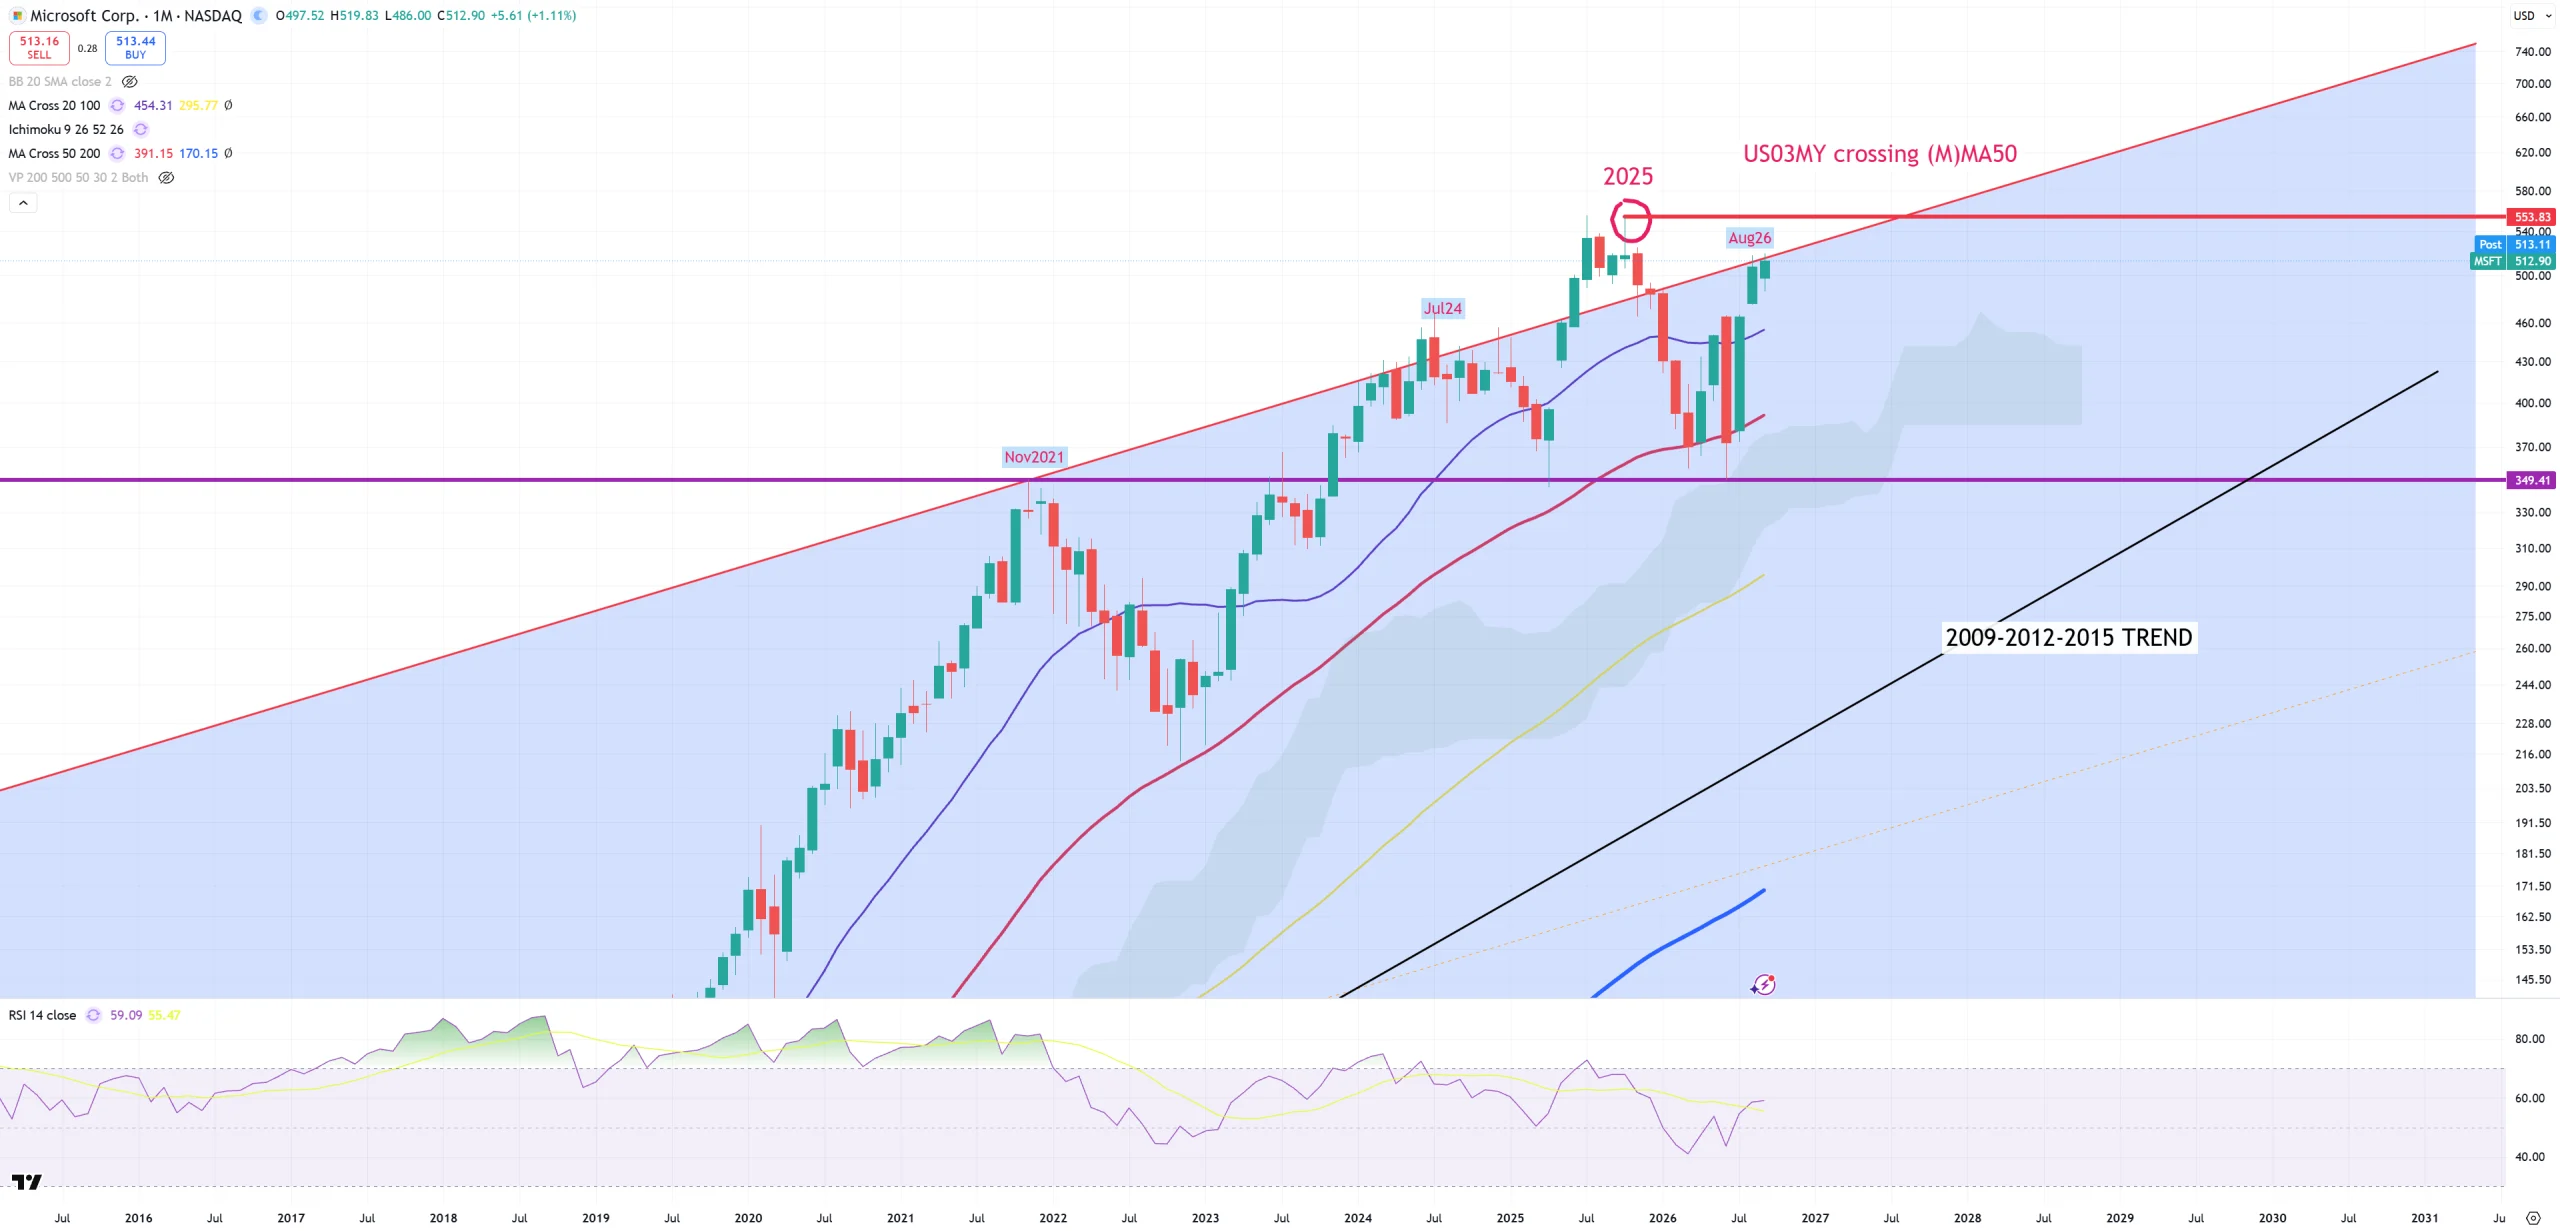
MSFT – and its key 2000-2021 trend
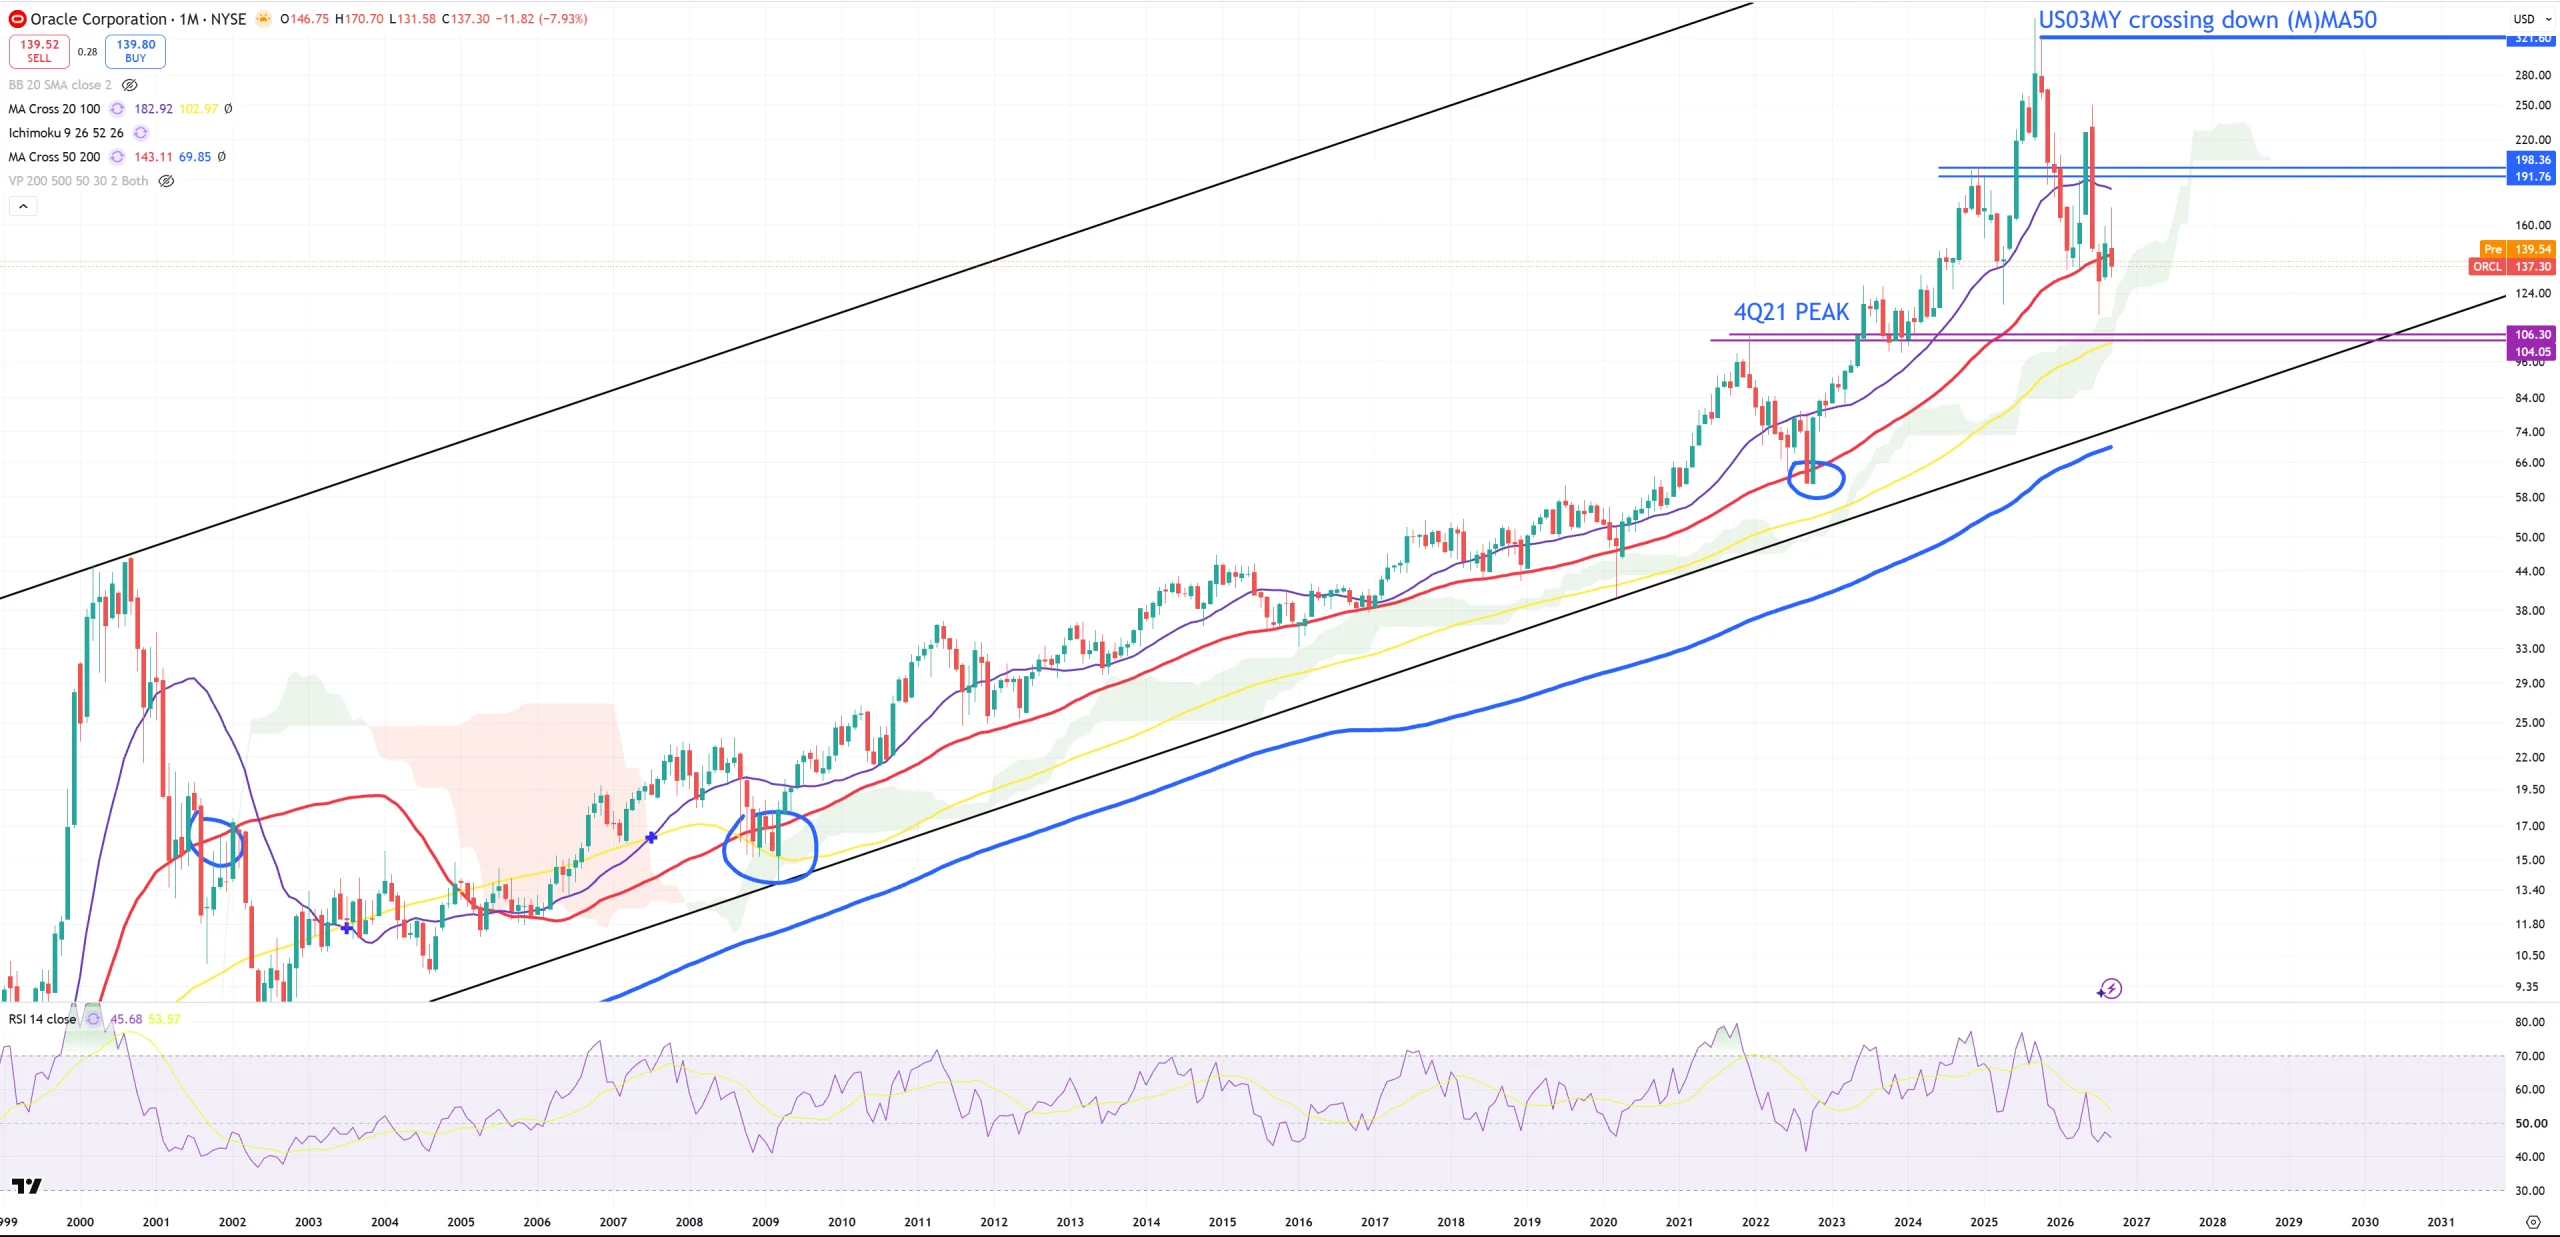
ORCL – do we have first since 2008 permanent break of red (M)MA50?
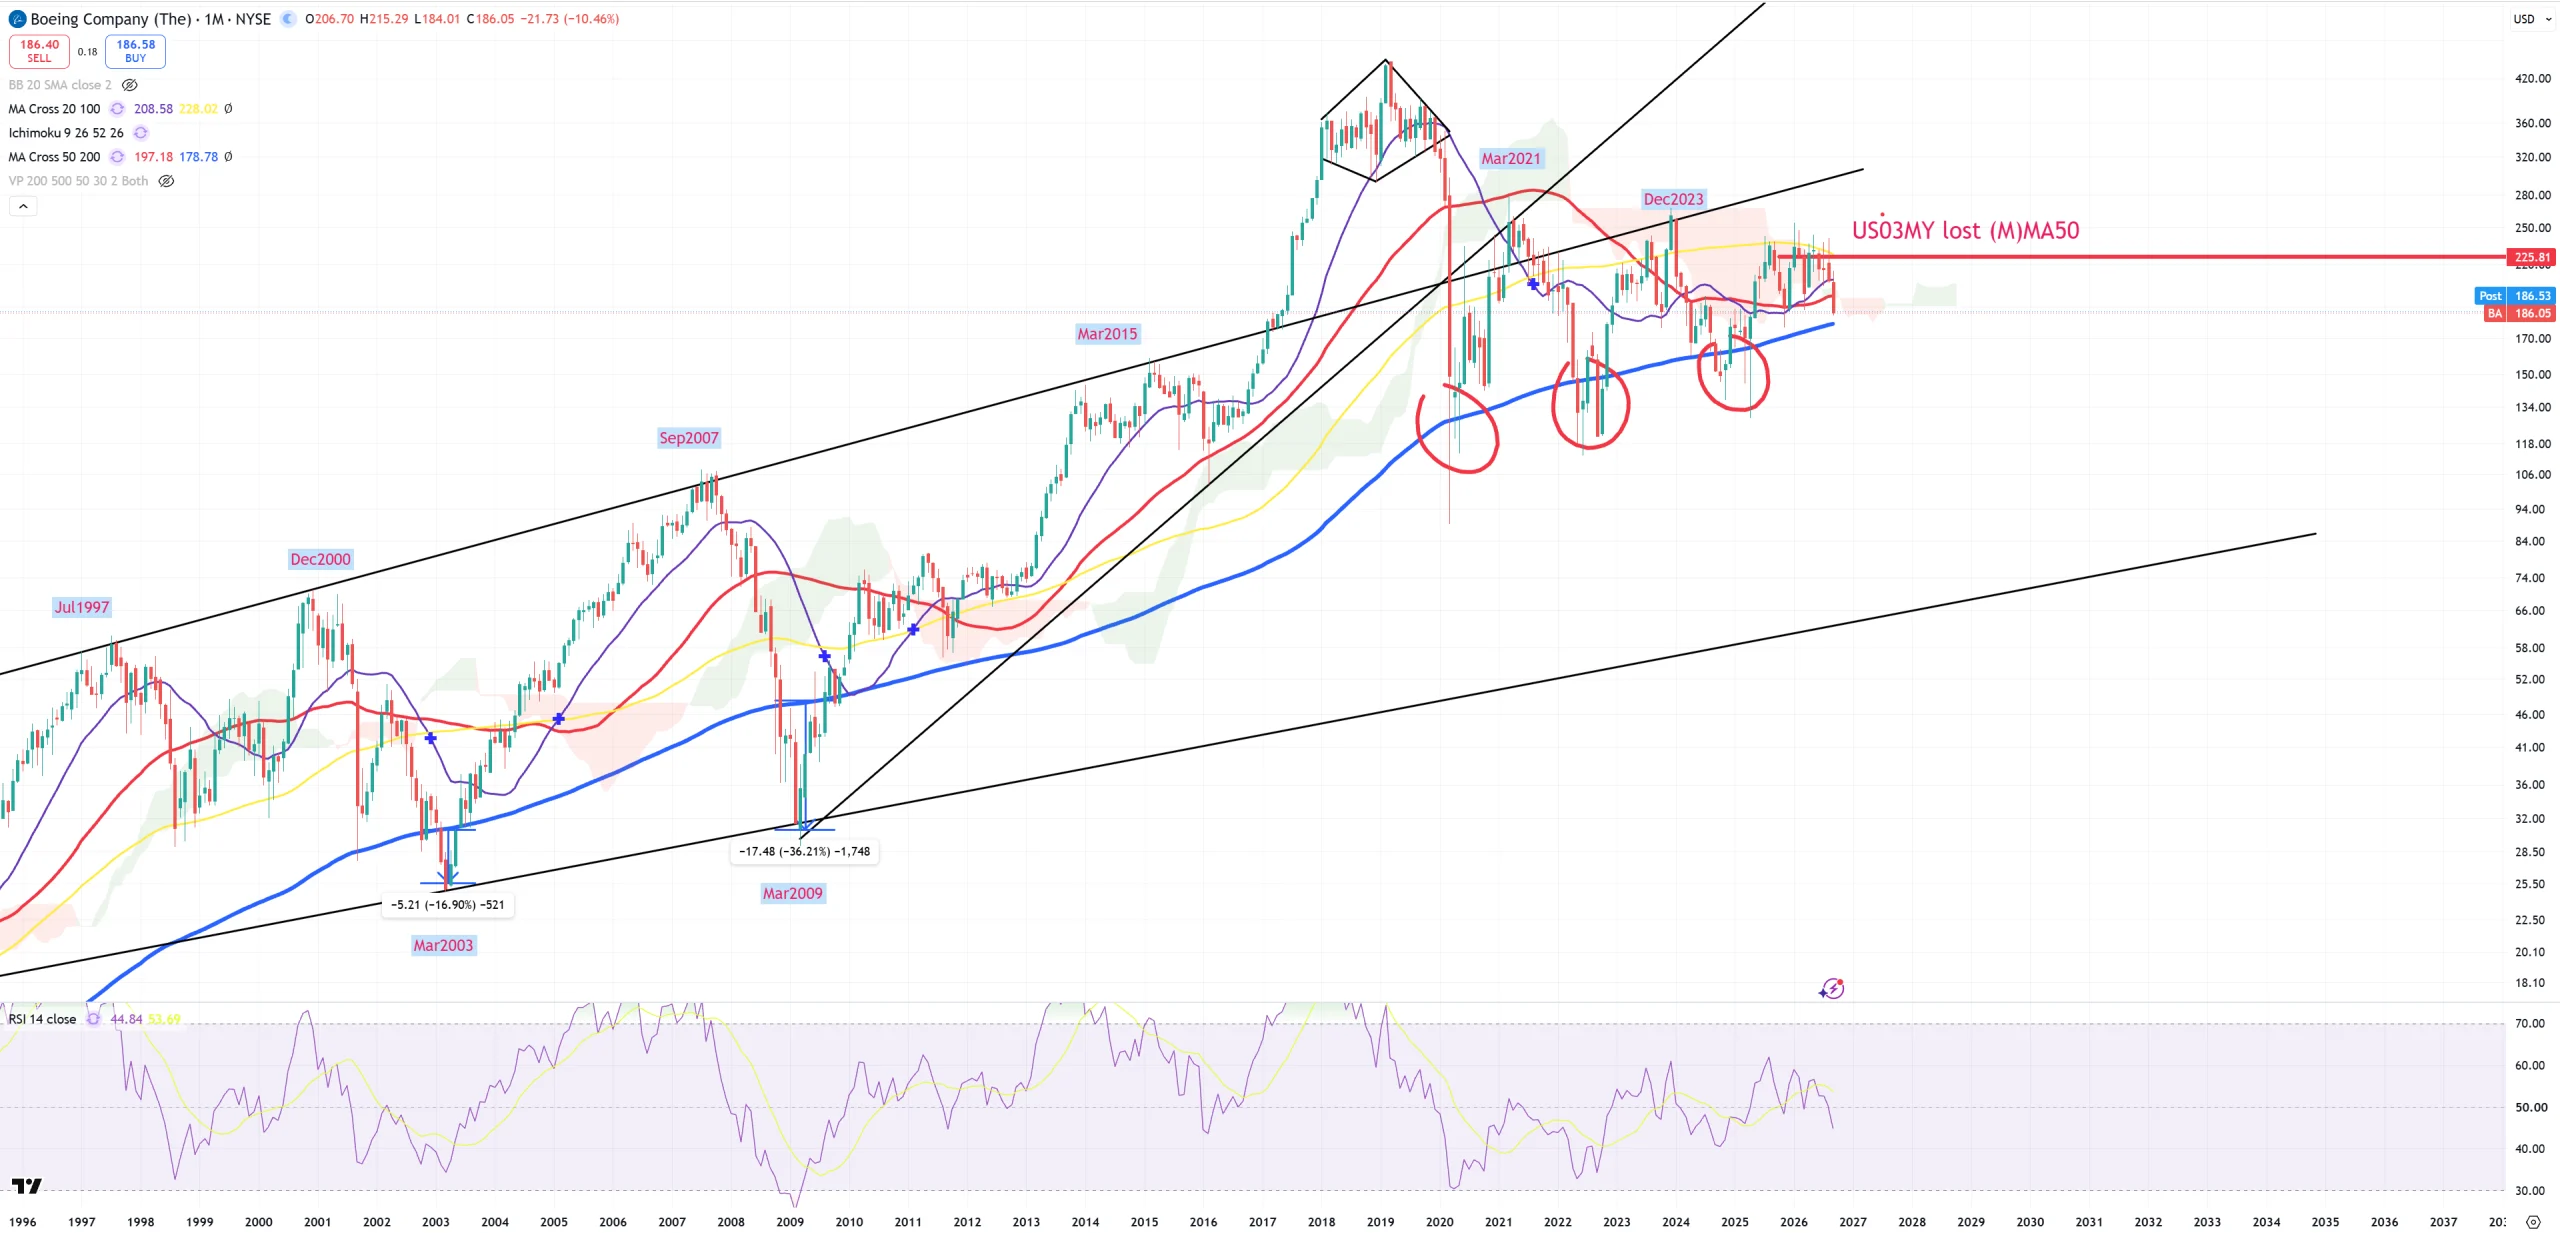
BA – Boeing – another attempt to break (M)MA200, this time it will be IMO successful because of 10y/3m level and US03MY lost (M)MA50
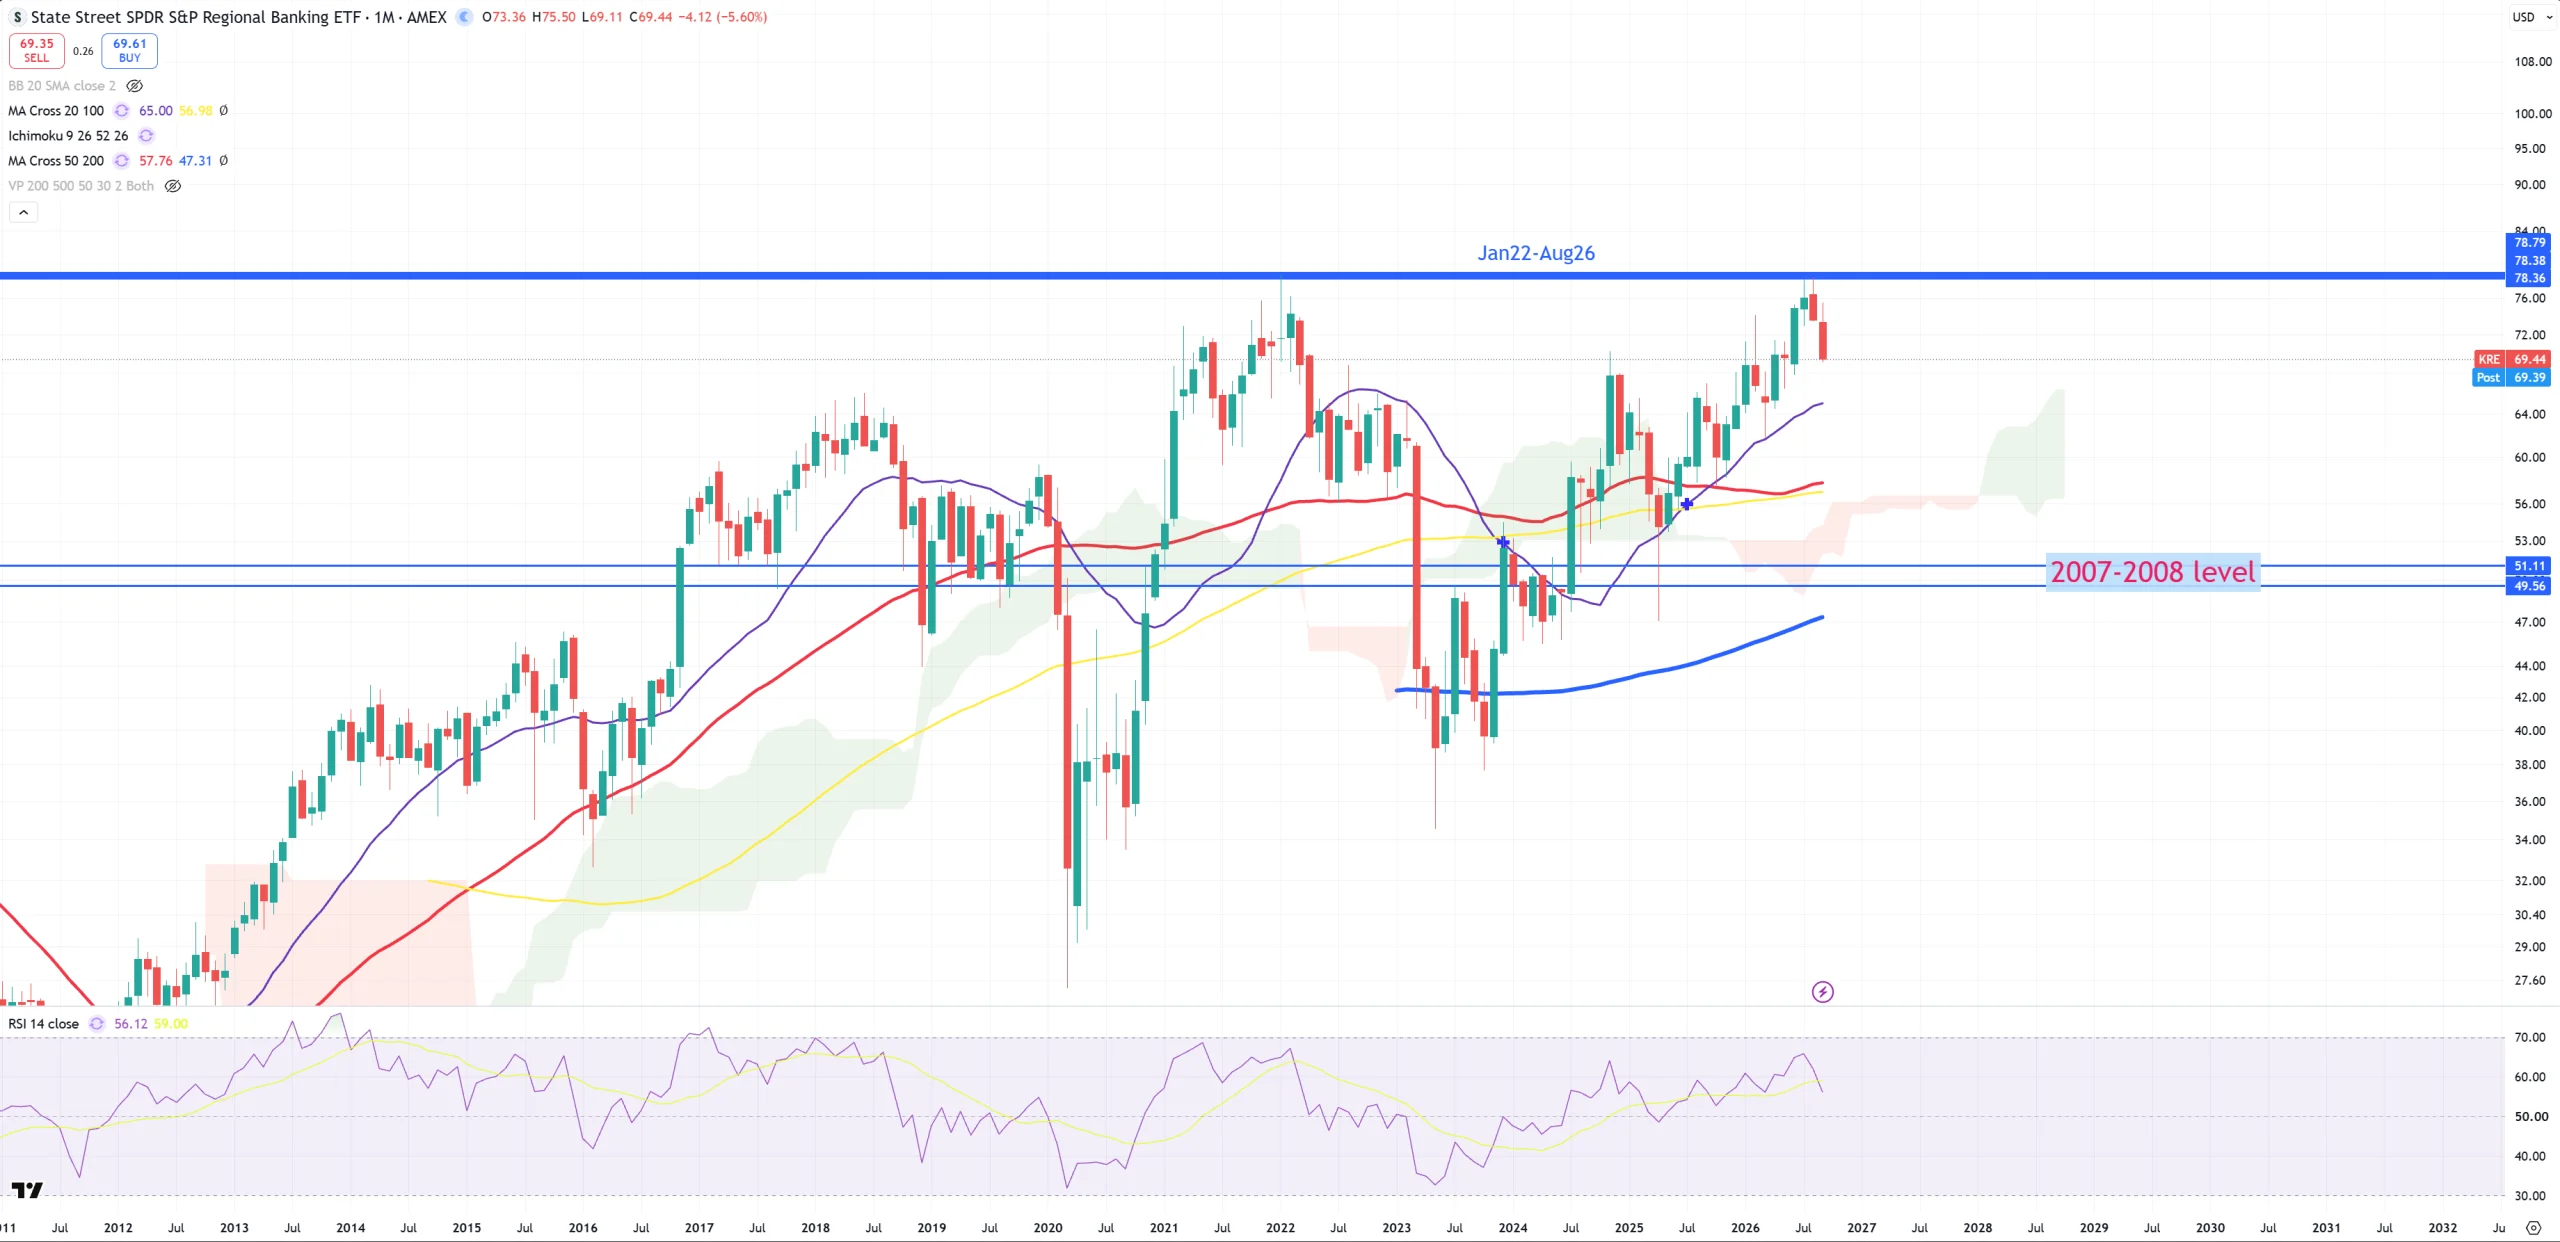
KRE – massive 2xTOP
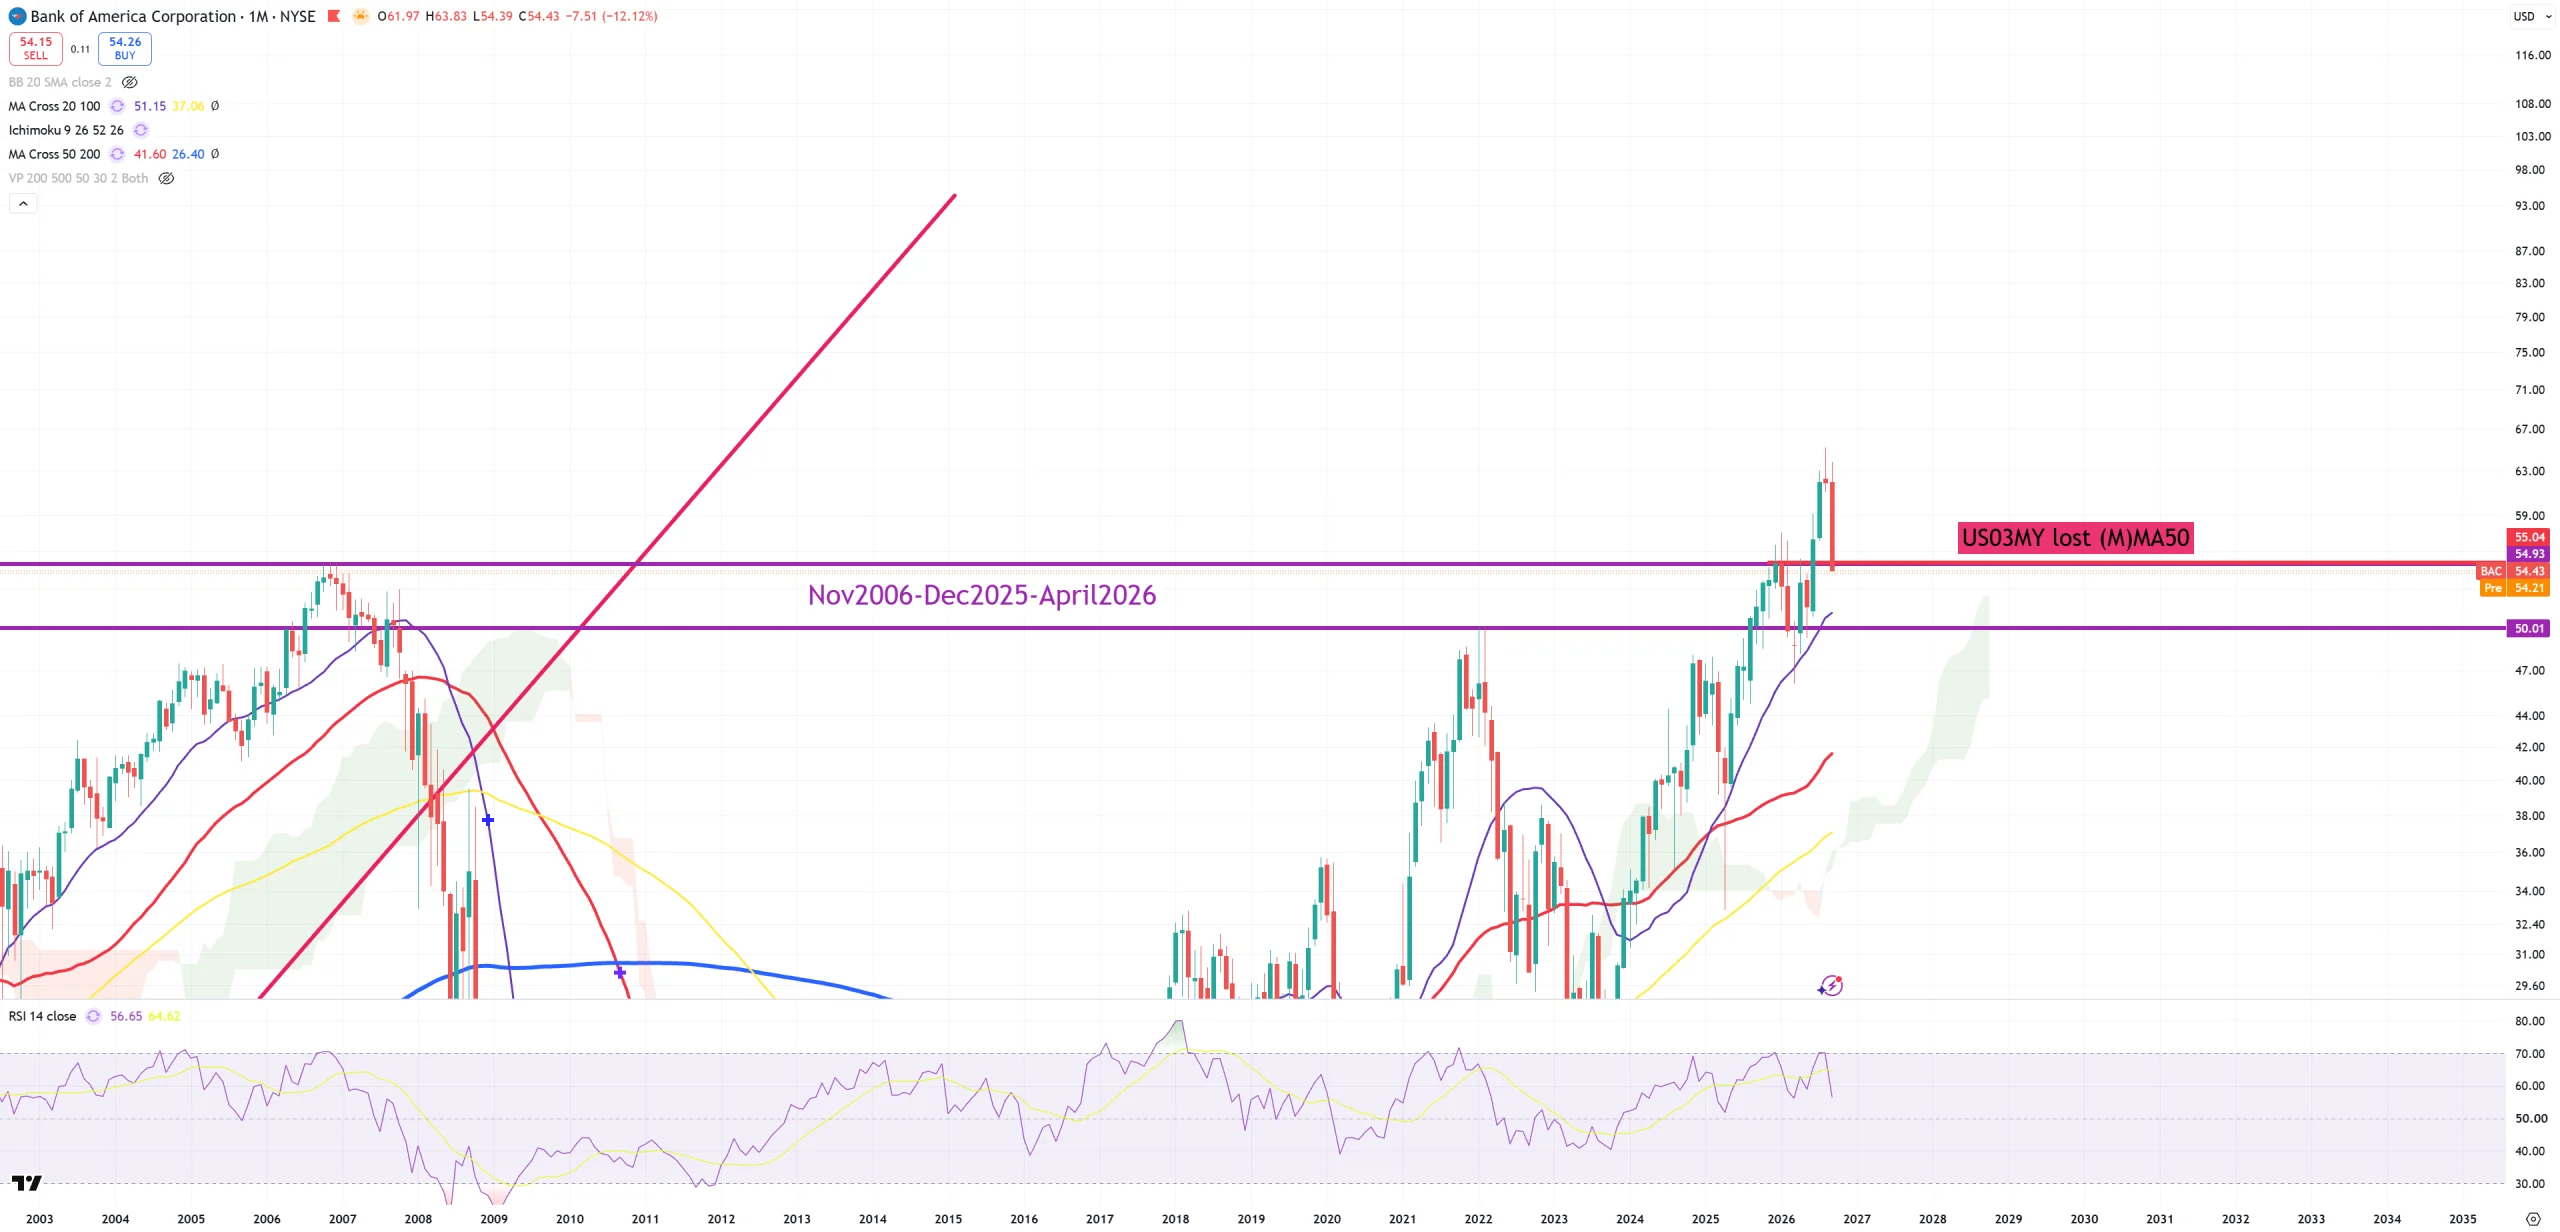
BAC – massive bull trap?
WFC – perfect rejection of a long term trend in Dec25.
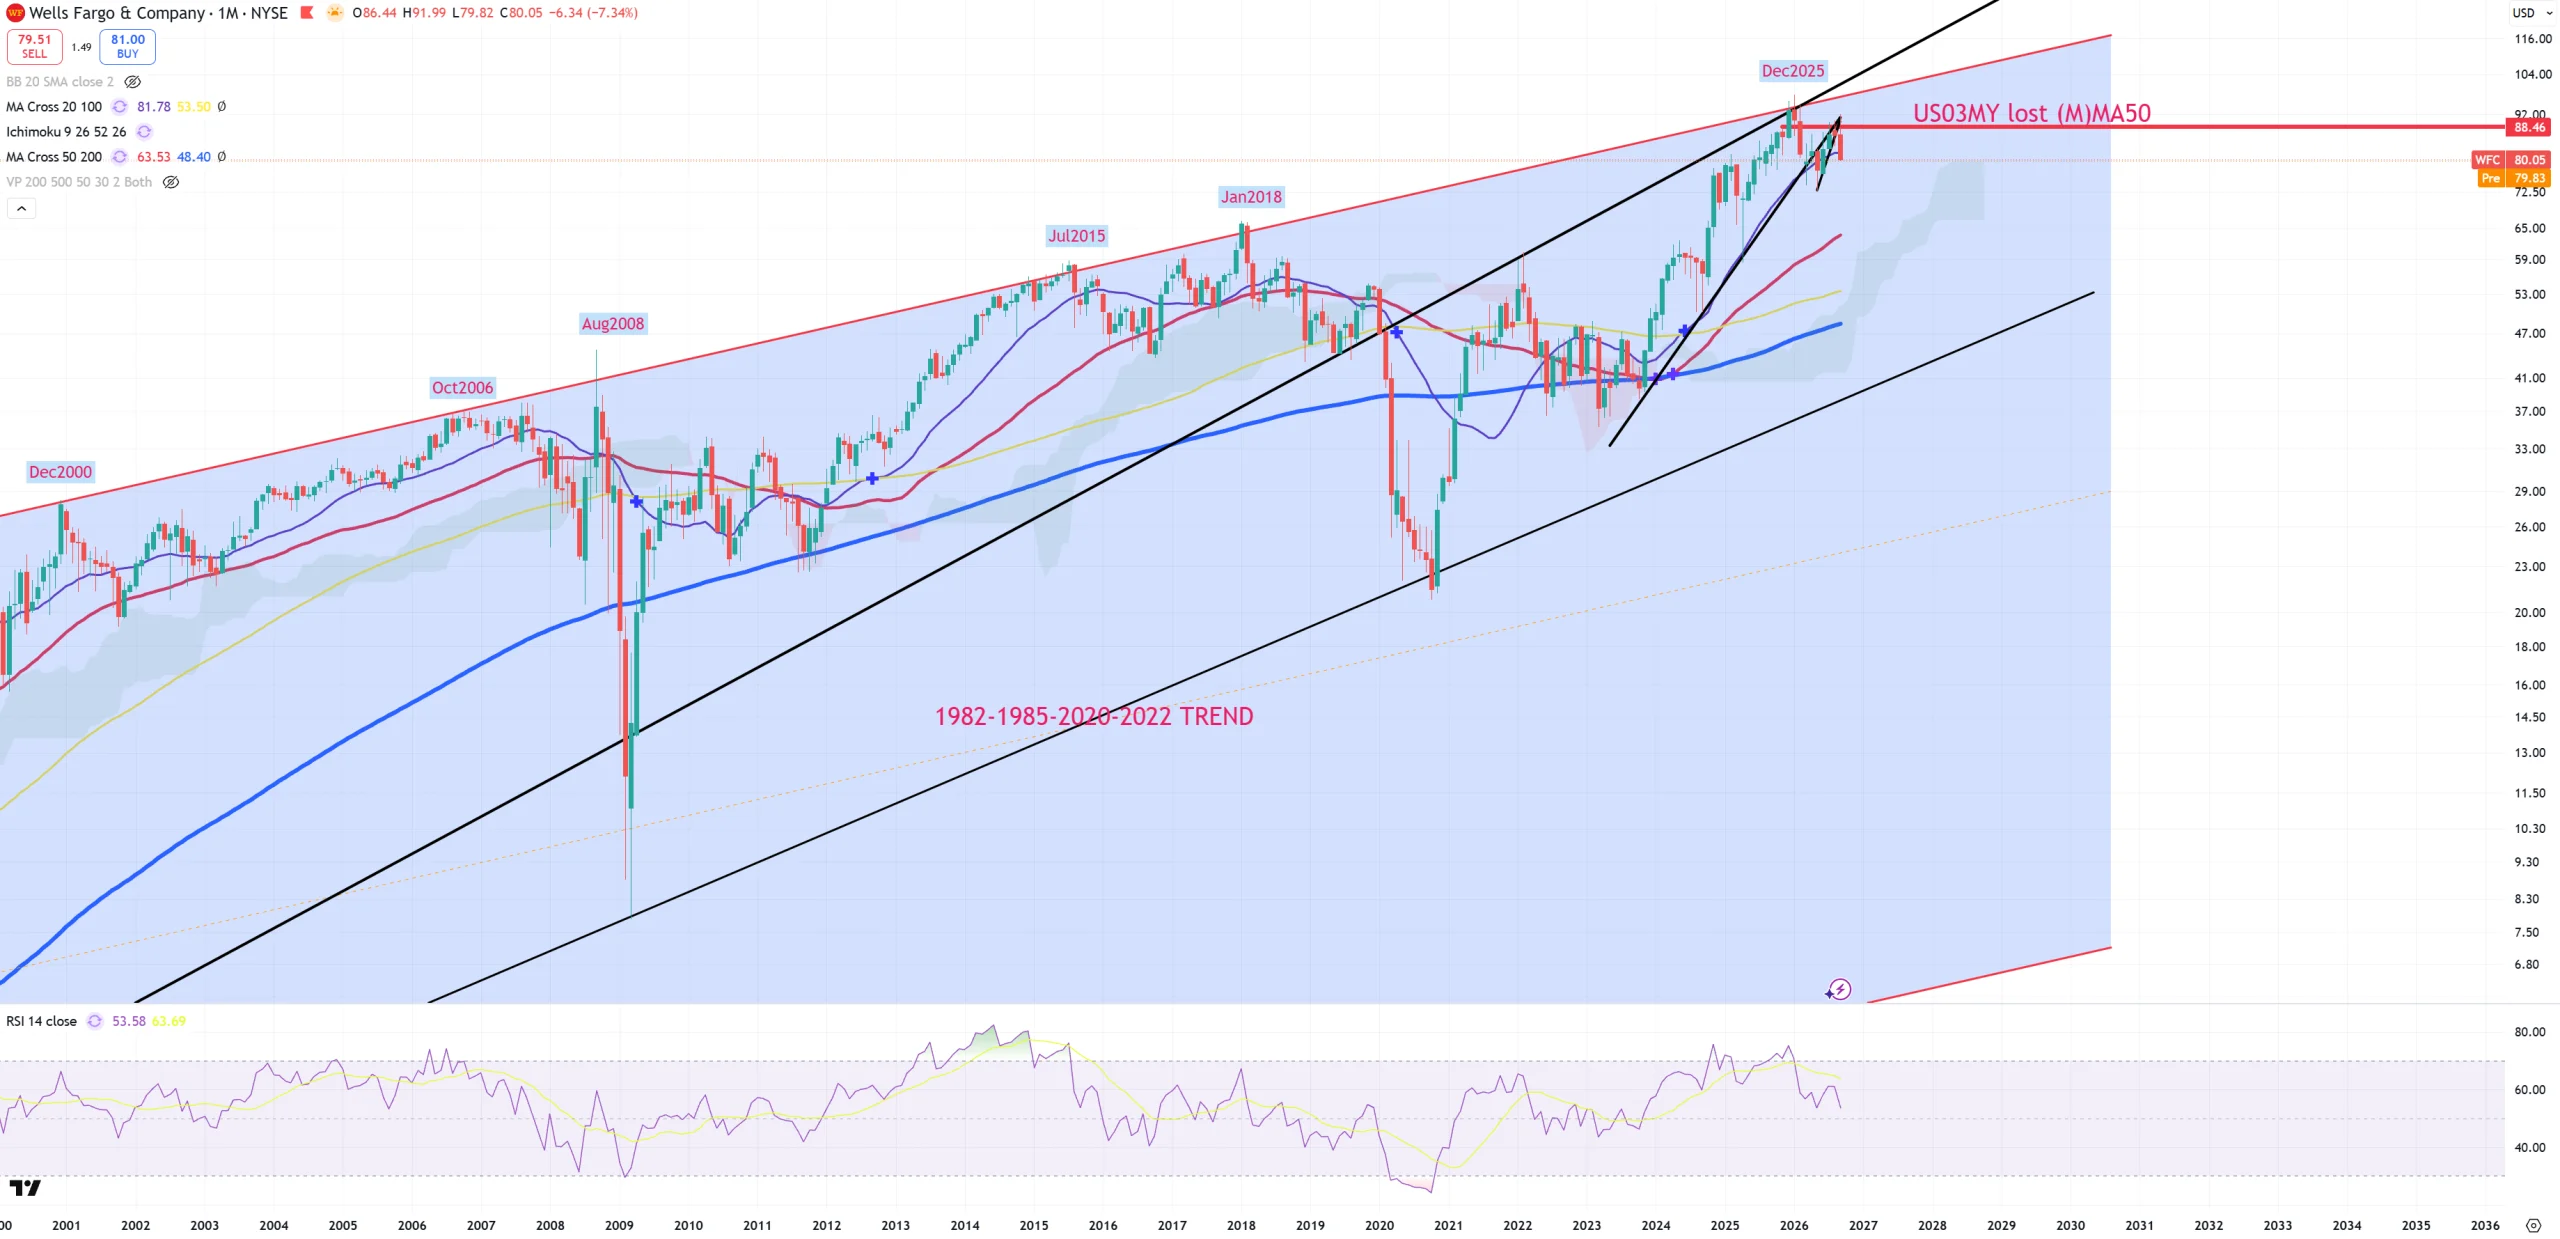
XLF – reverses its spike
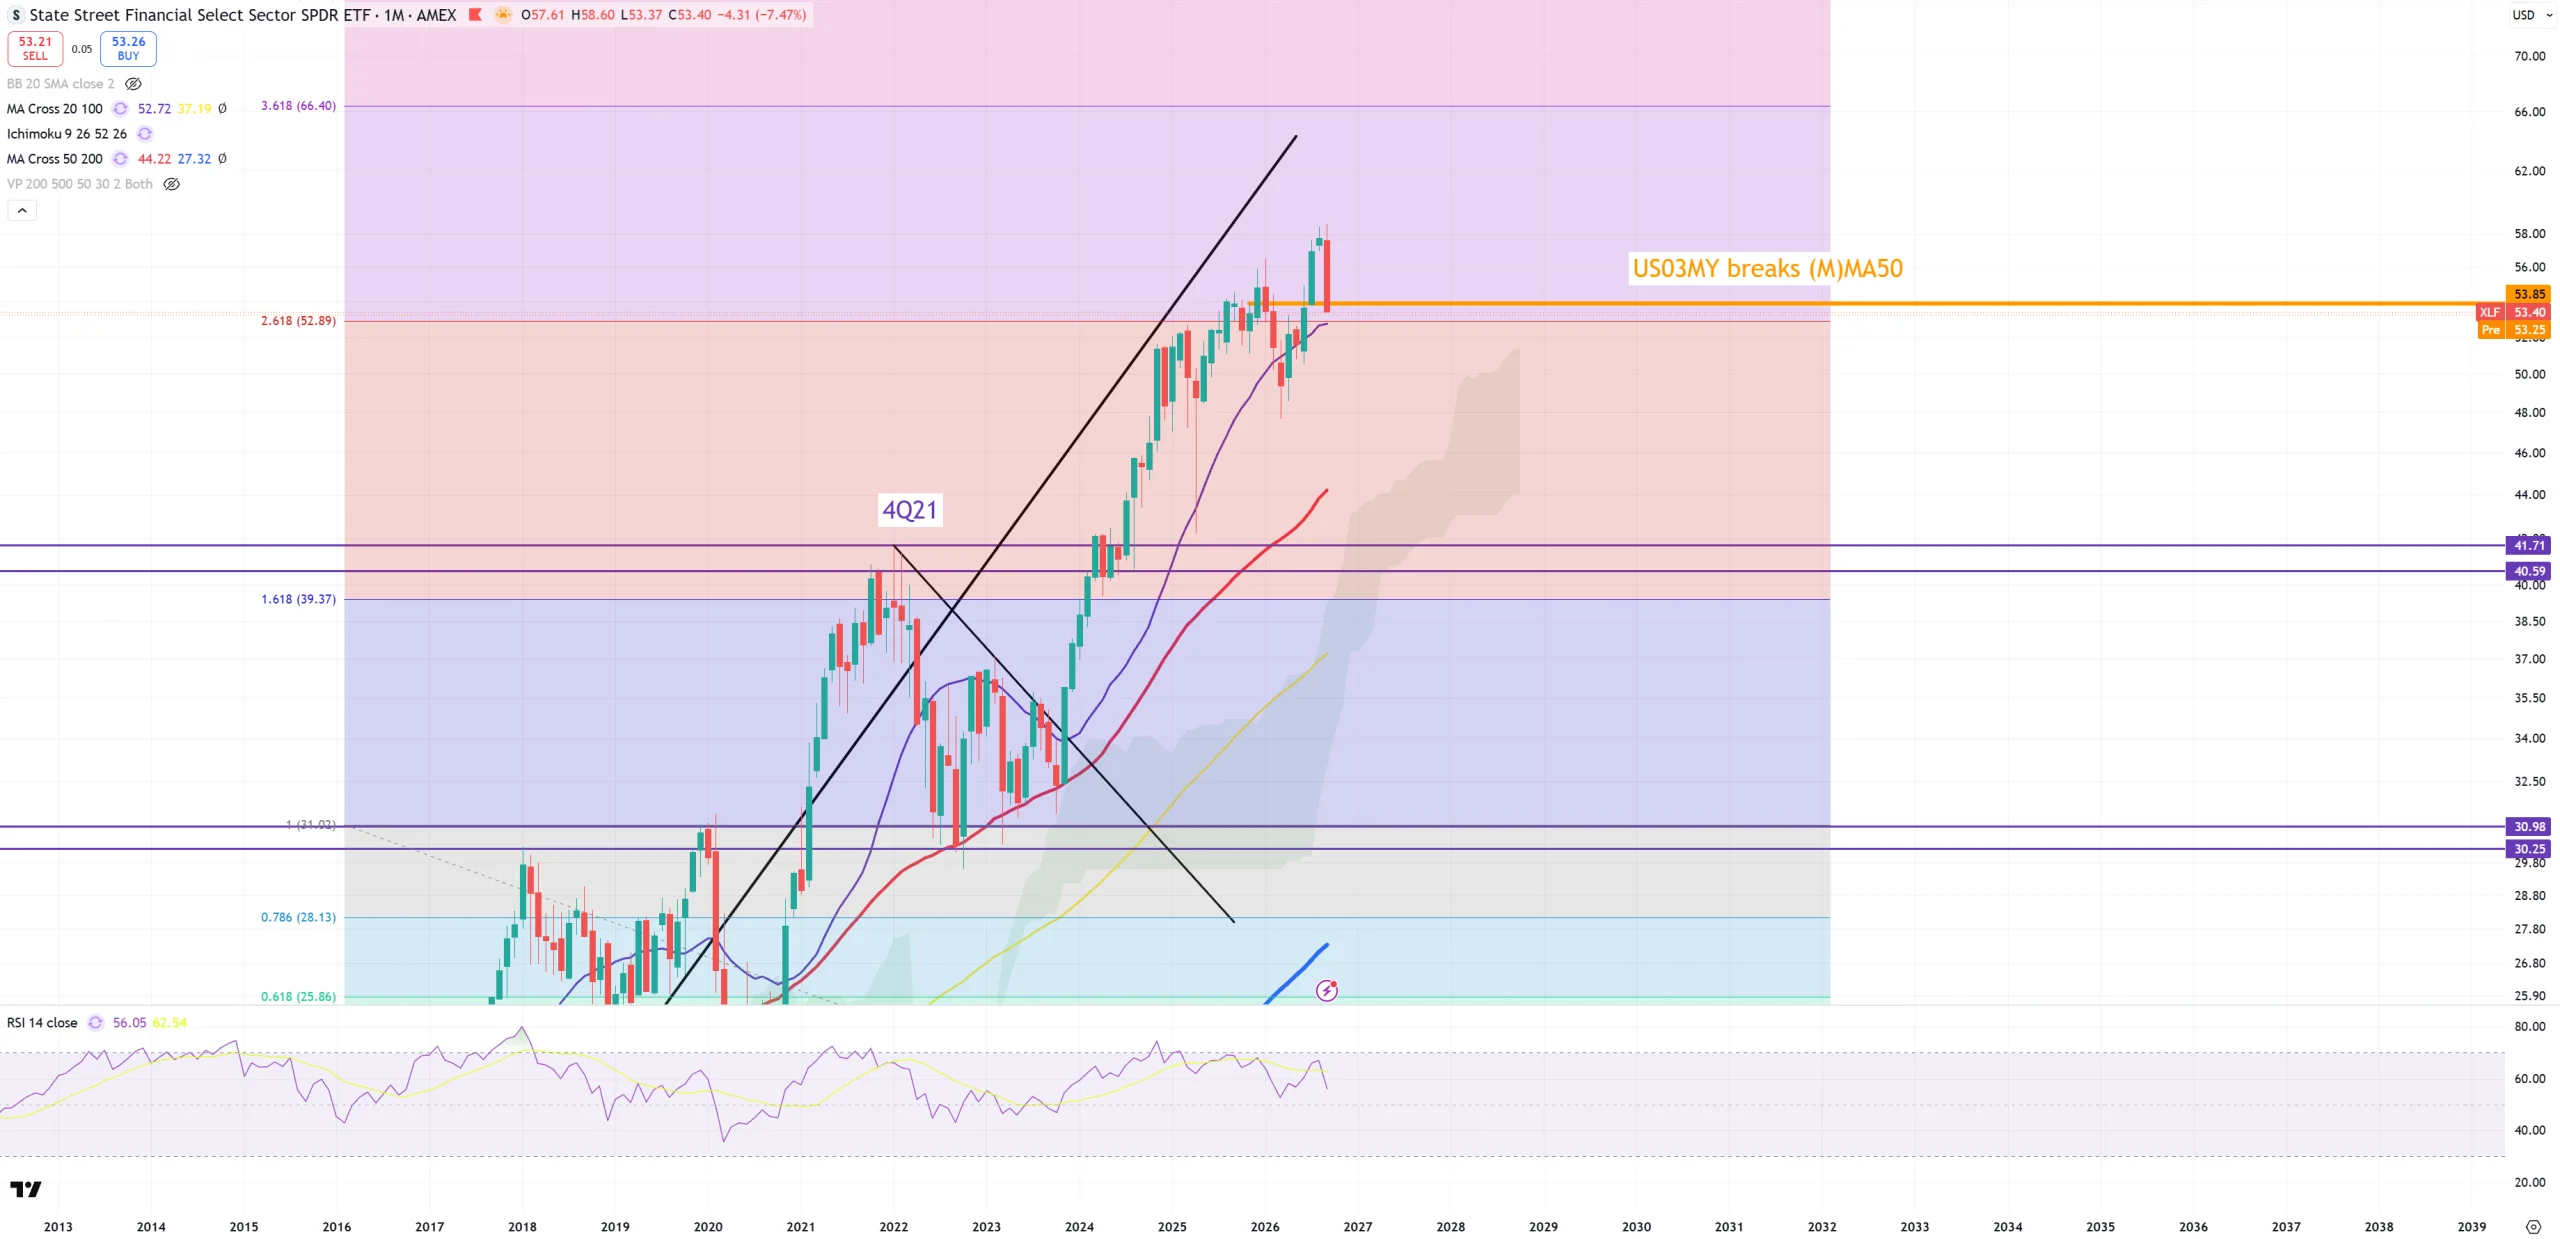
XLF/GOLD – managed to escape the retest to blue horizontal line to retest (M)MA20
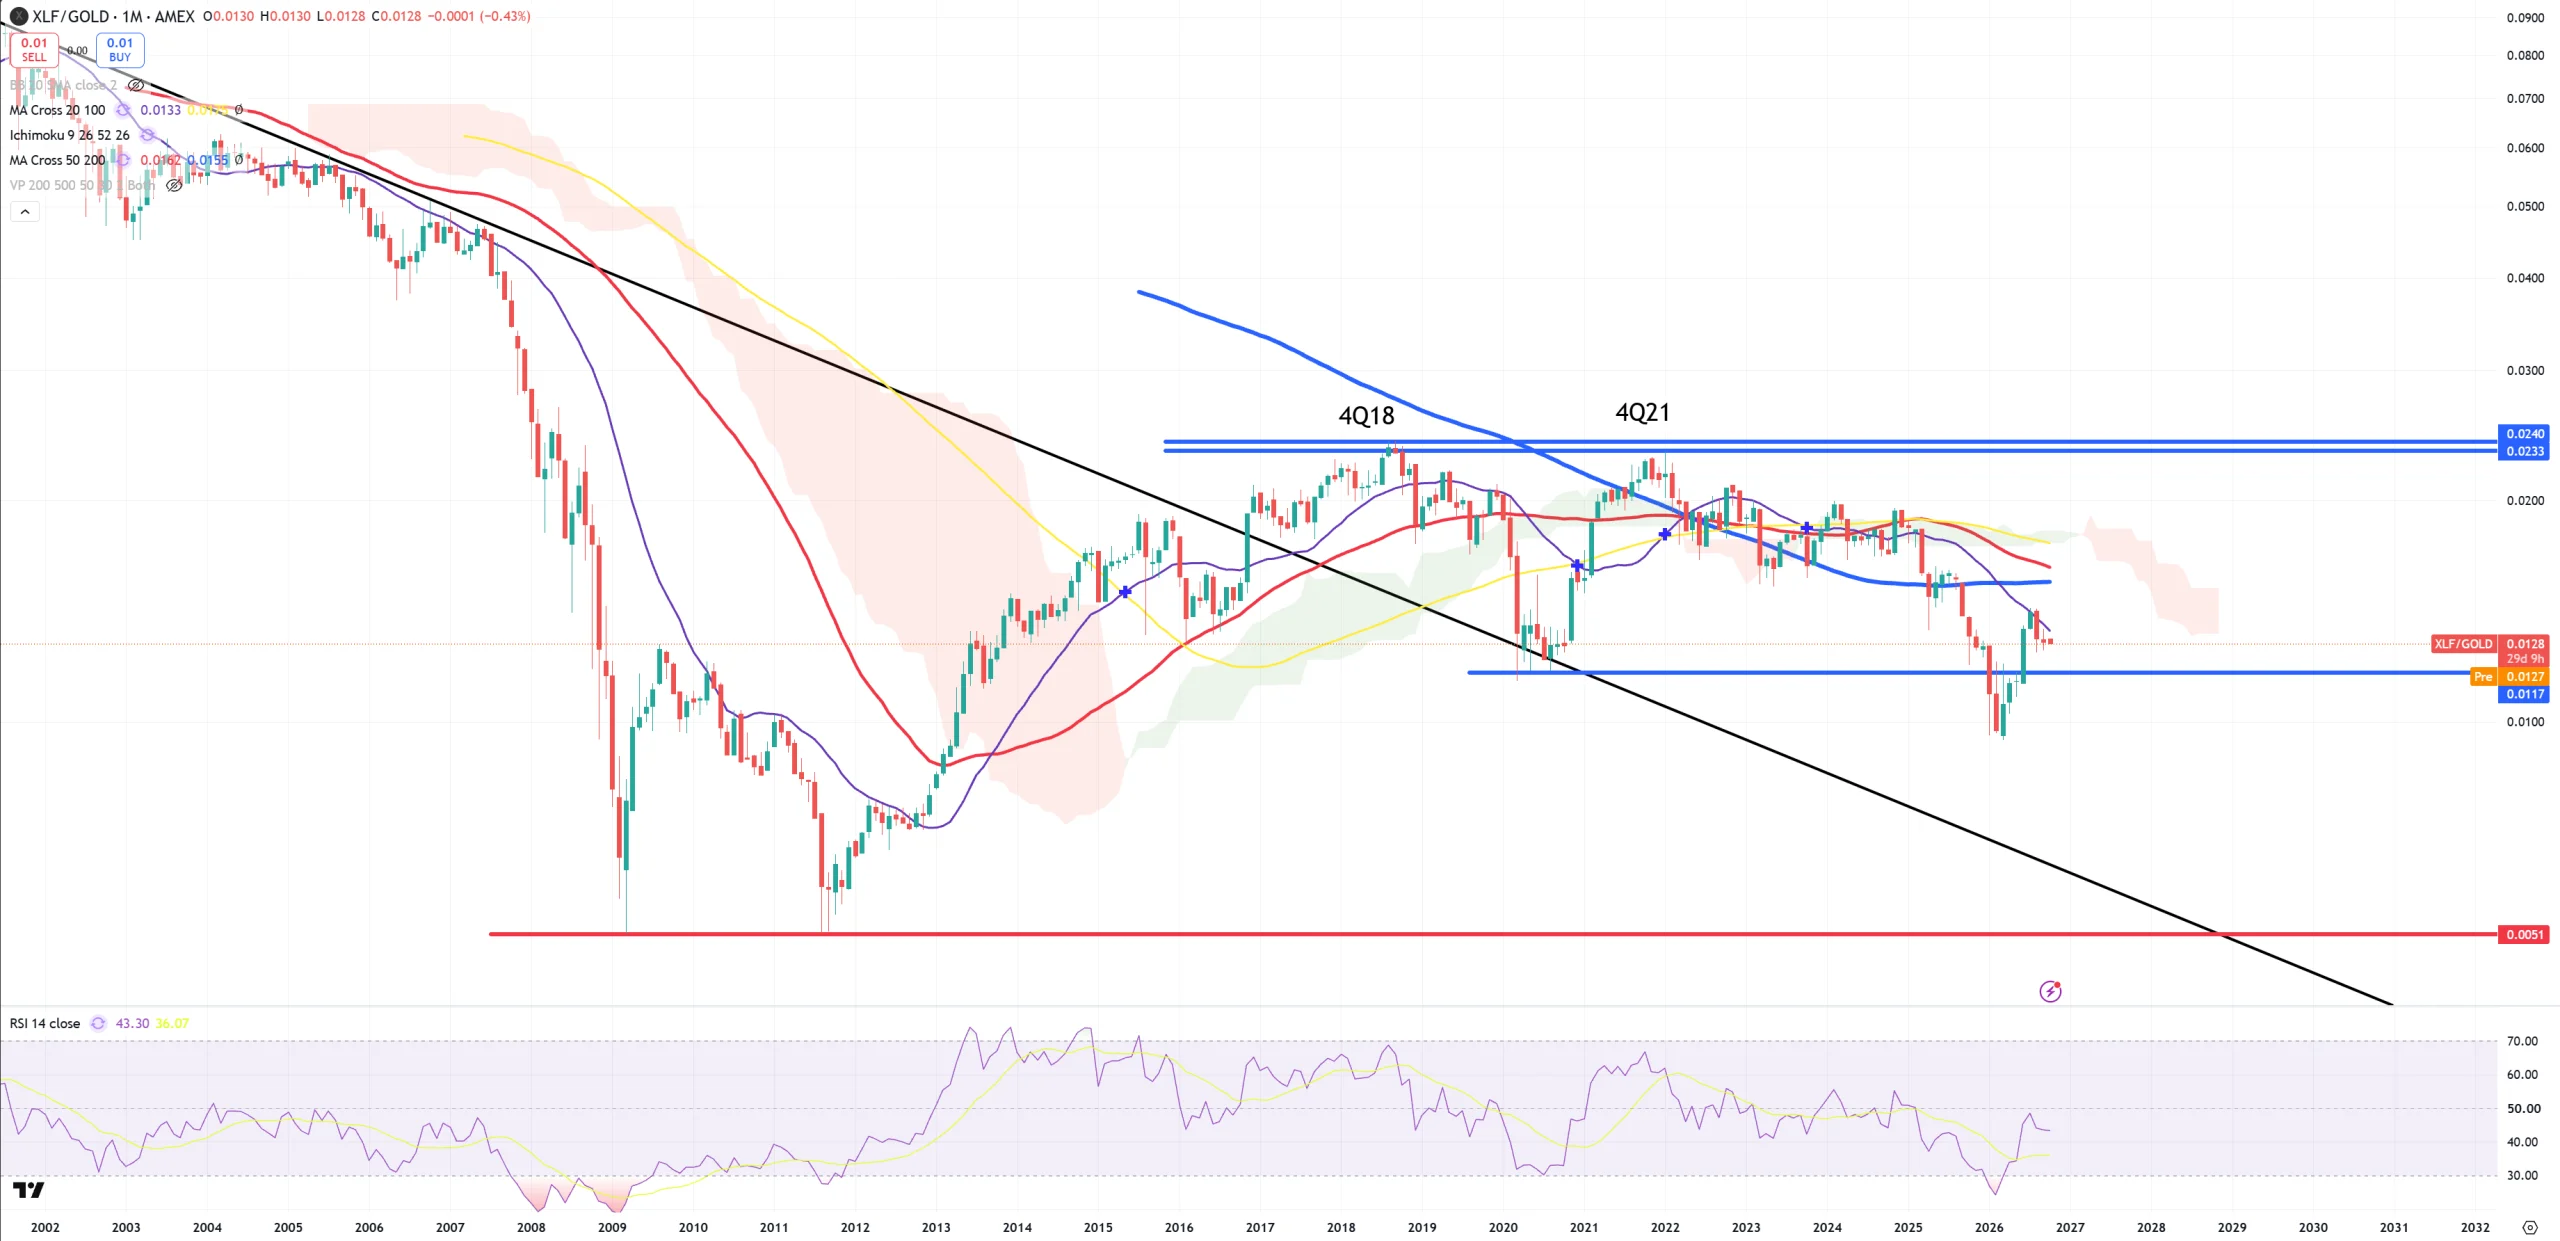
NOW – retesting (M)MA50 from the bottom. Textbook first big bear market really.
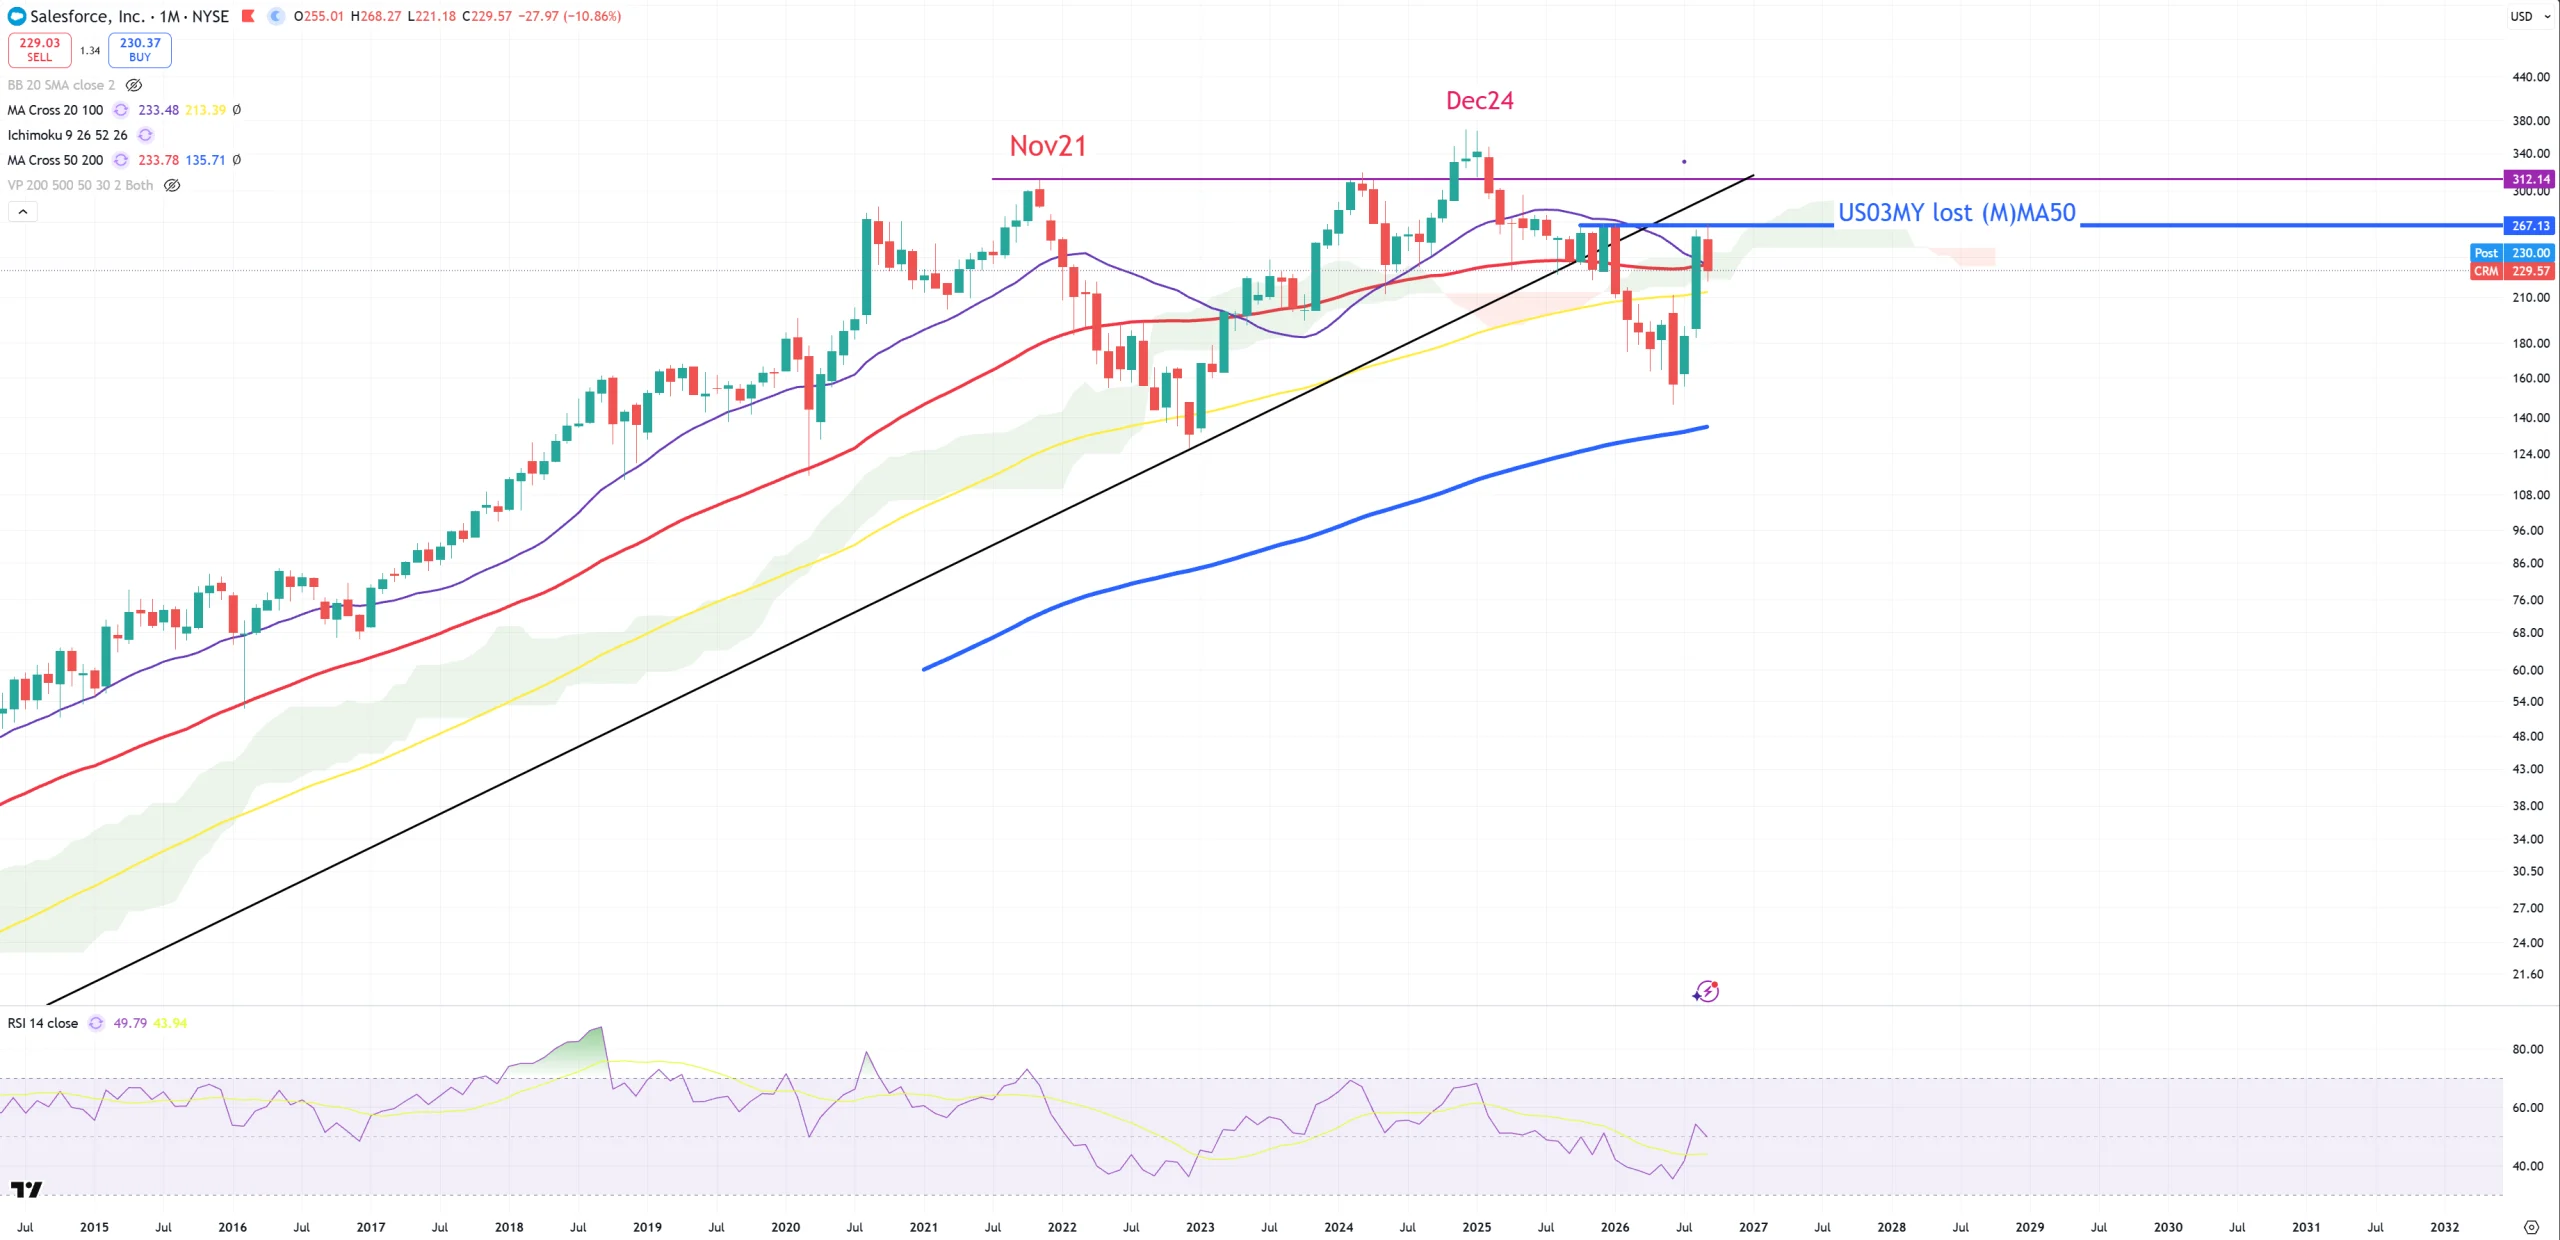
CRM – like NOW above.
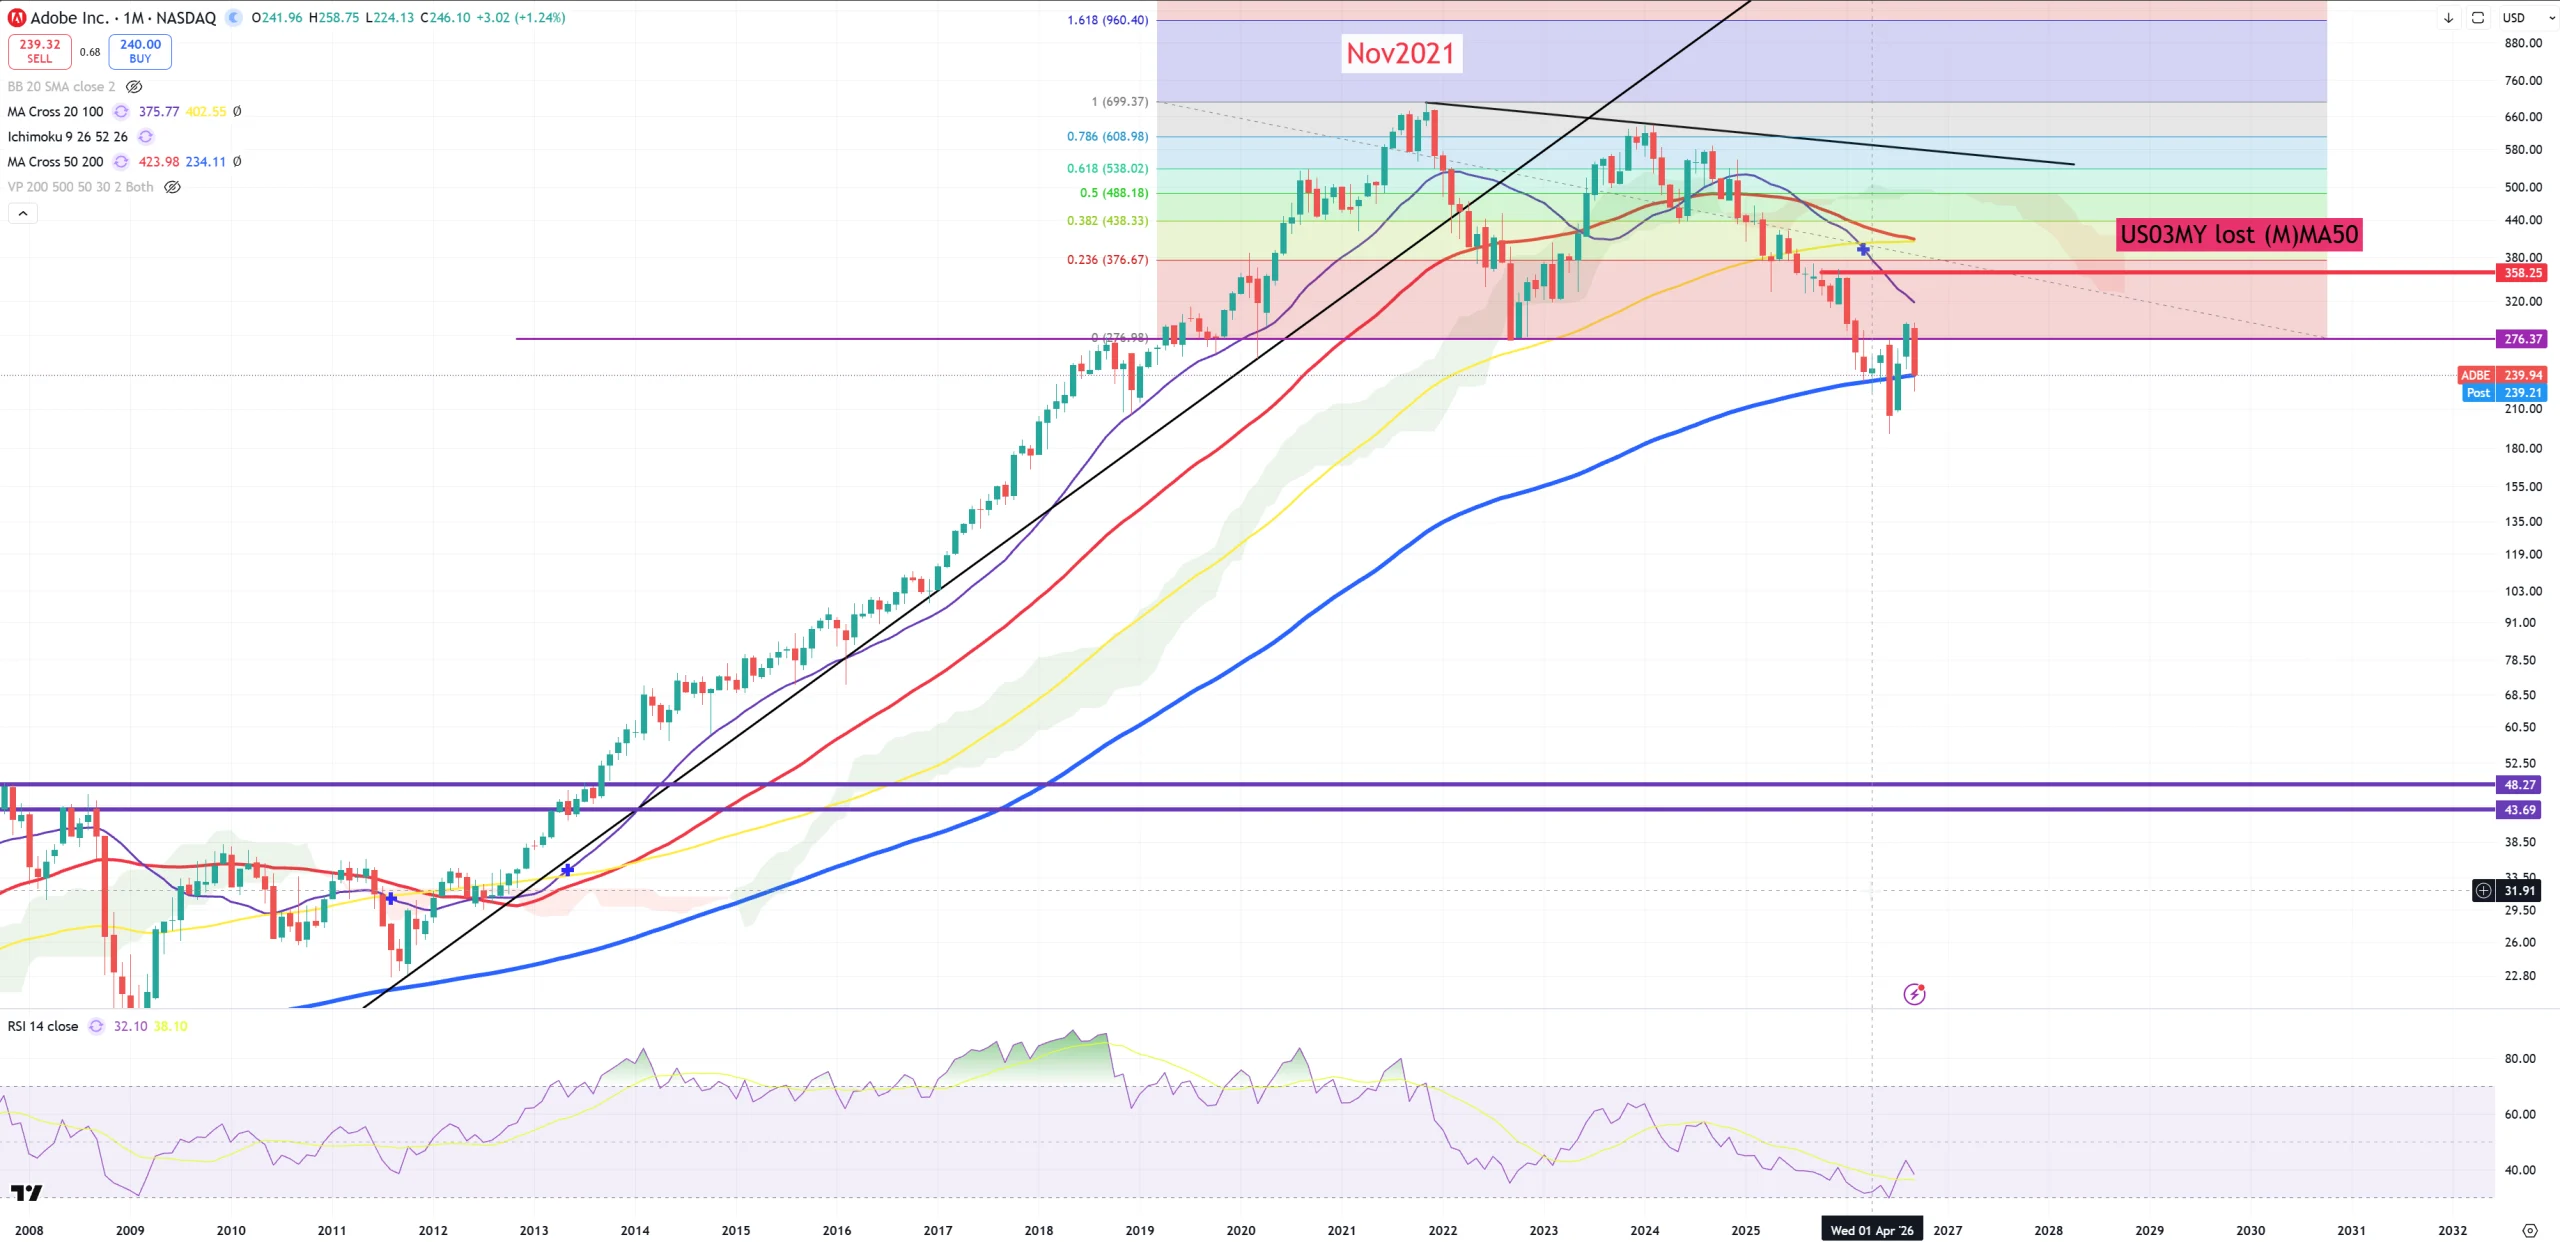
ADBE – dance around (M)MA200
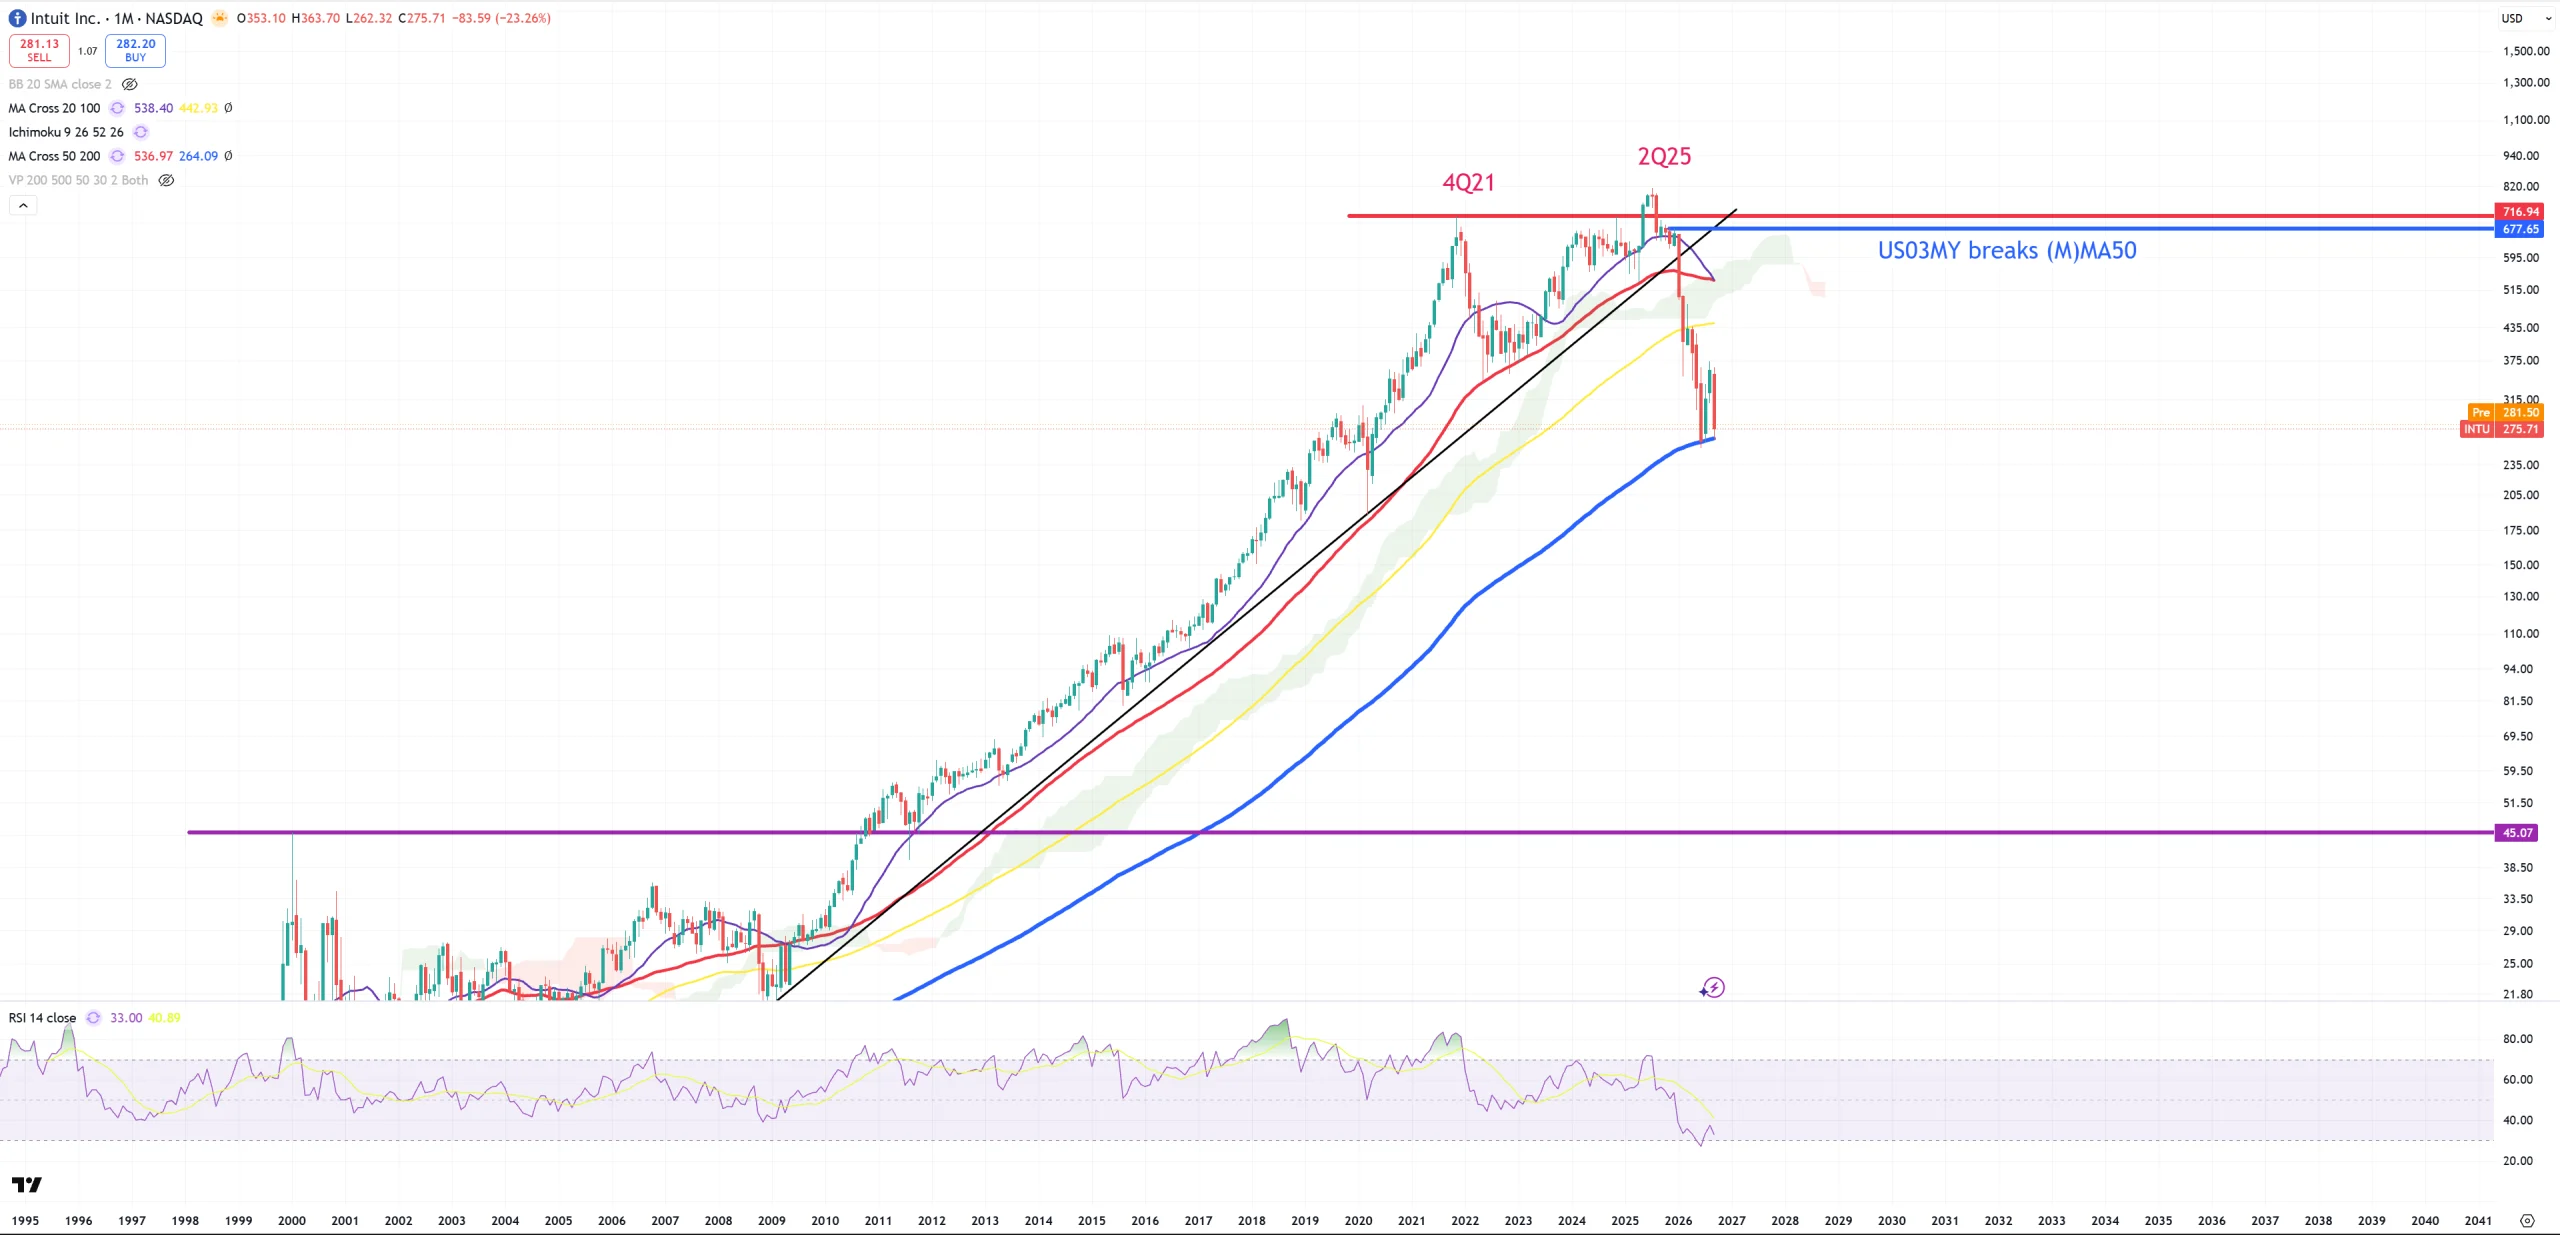
INTU – same as ADBE
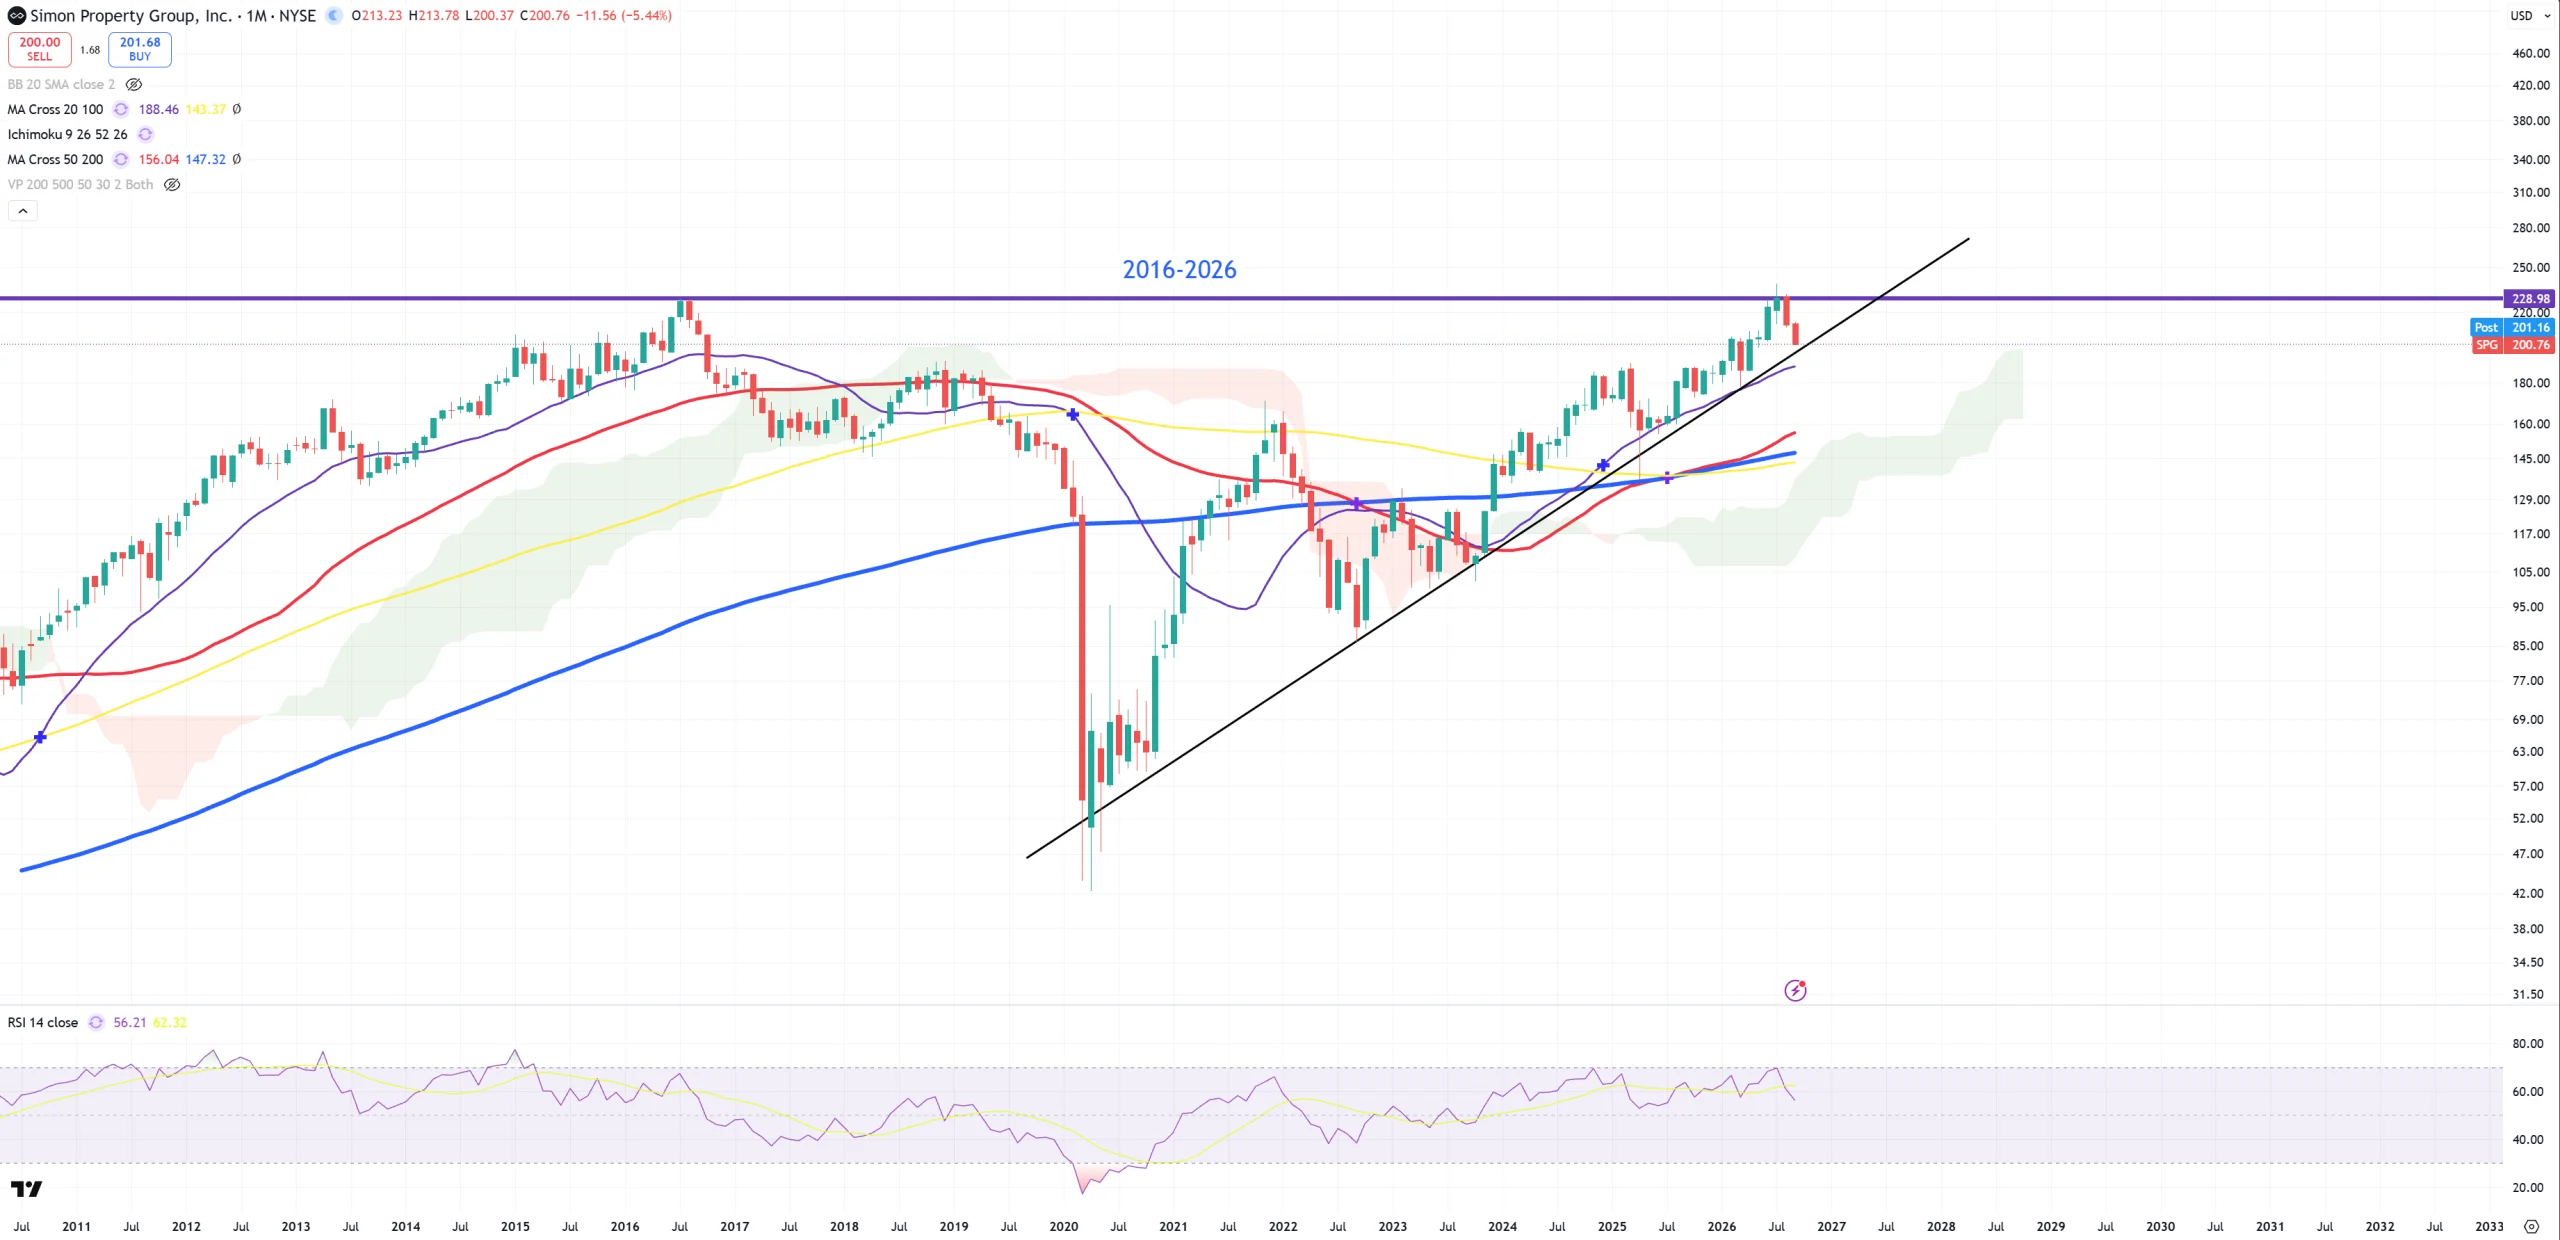
SPG – massive 2xTOP
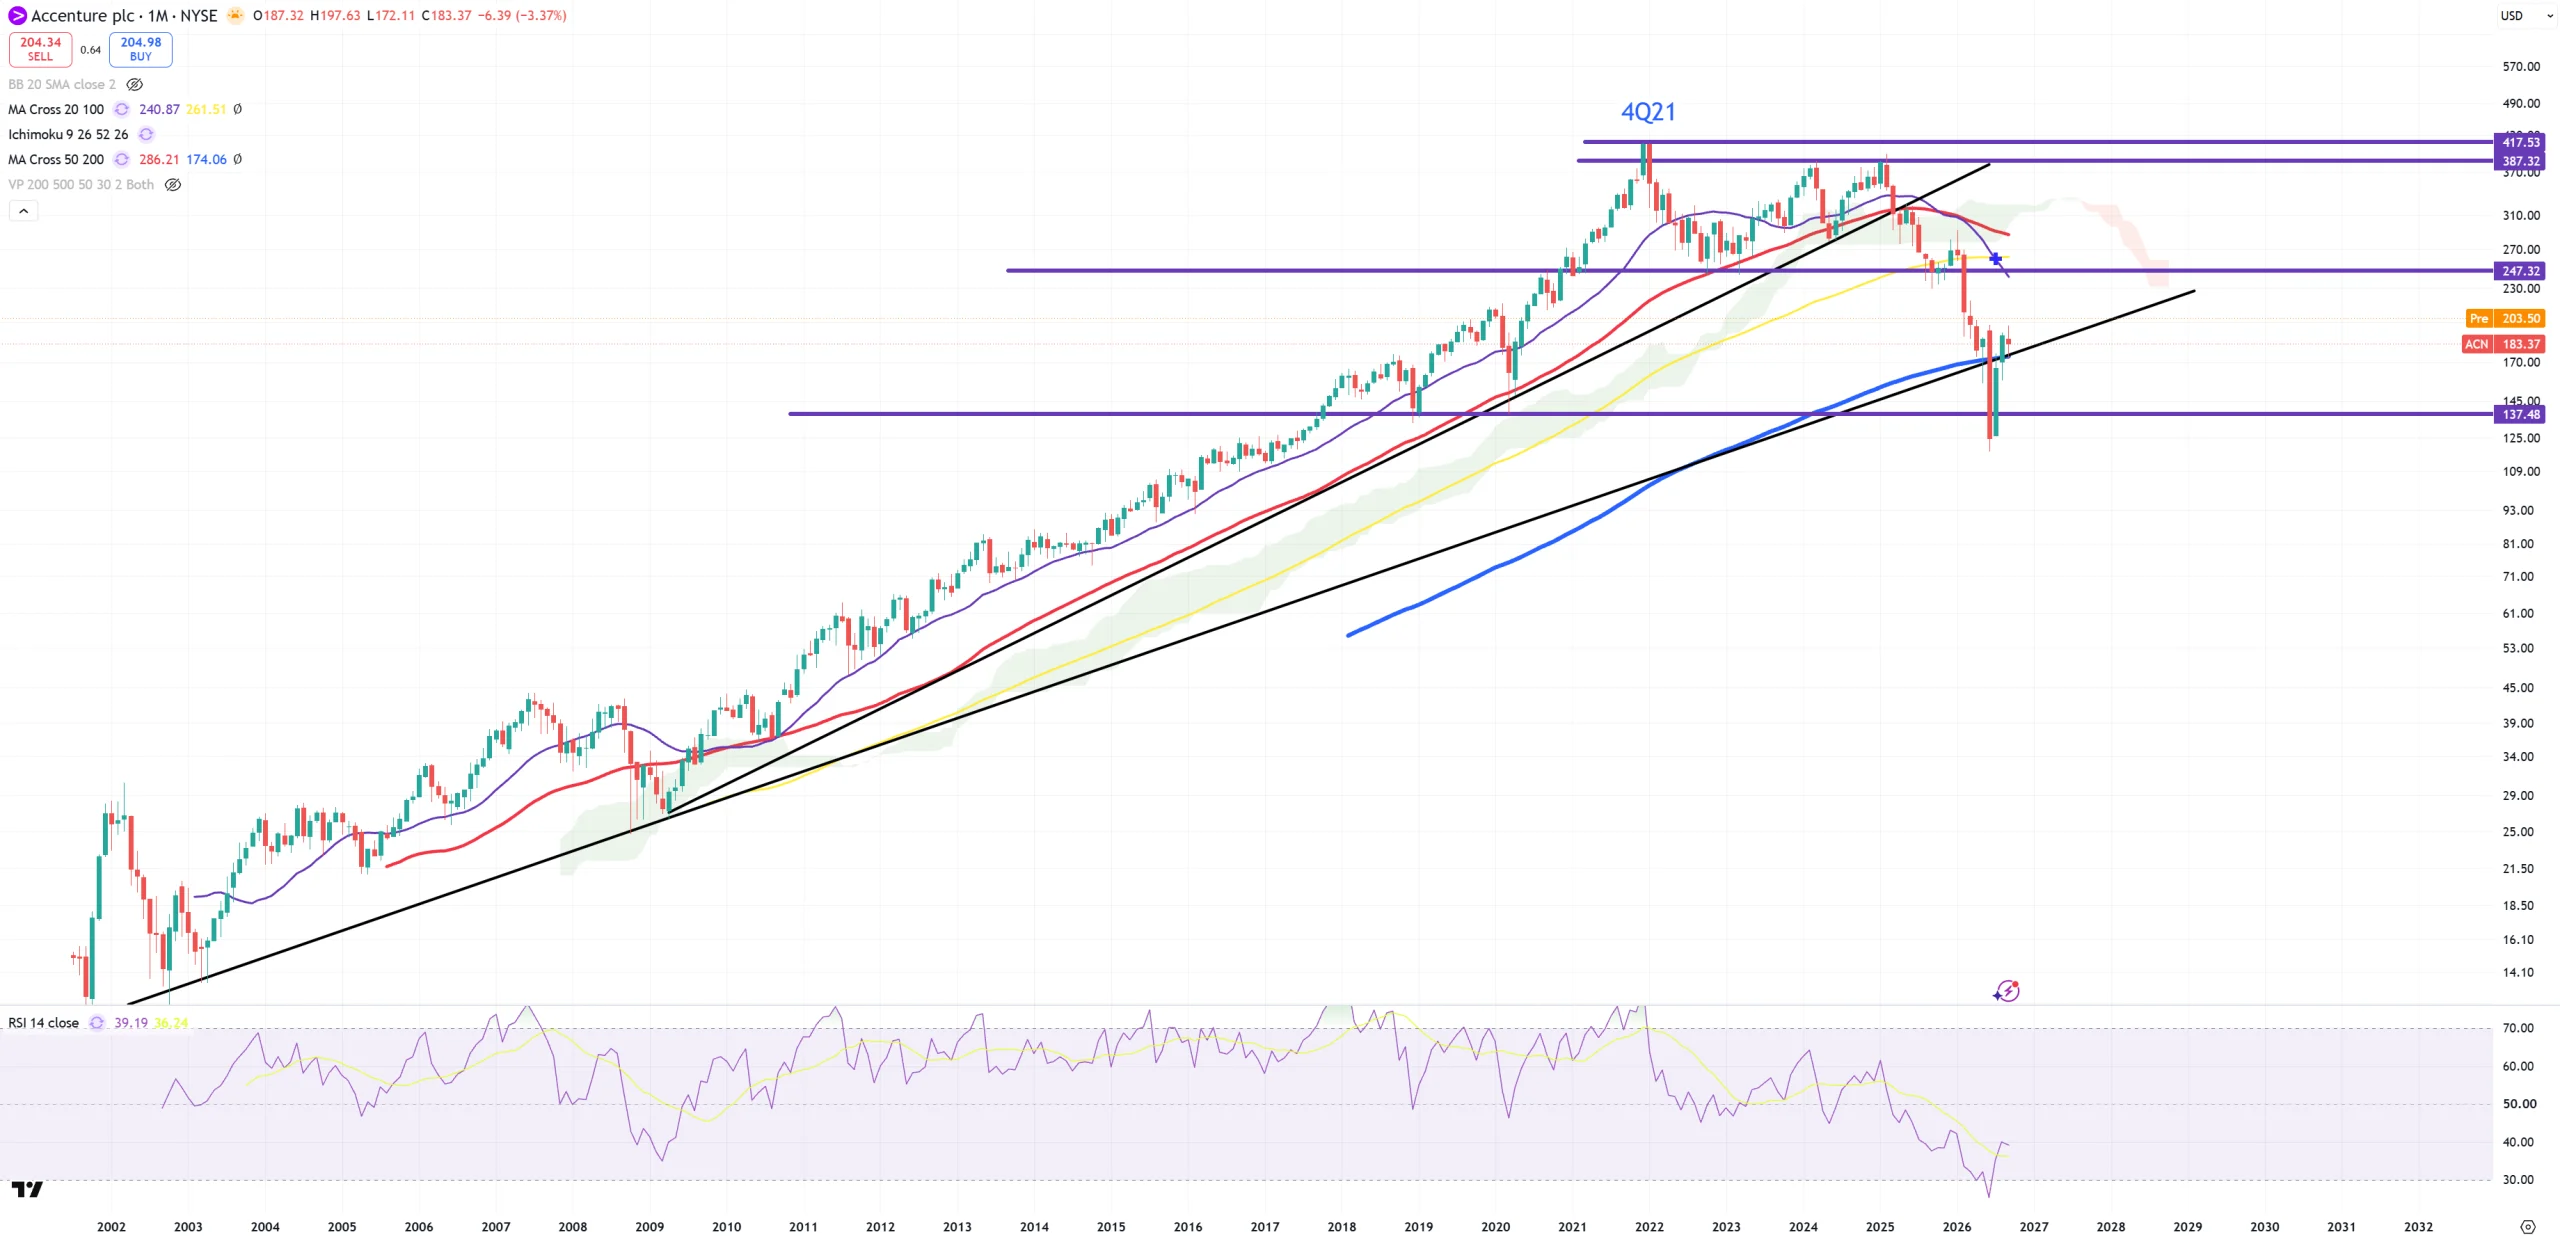
ACN – tries to stay around (M)MA200
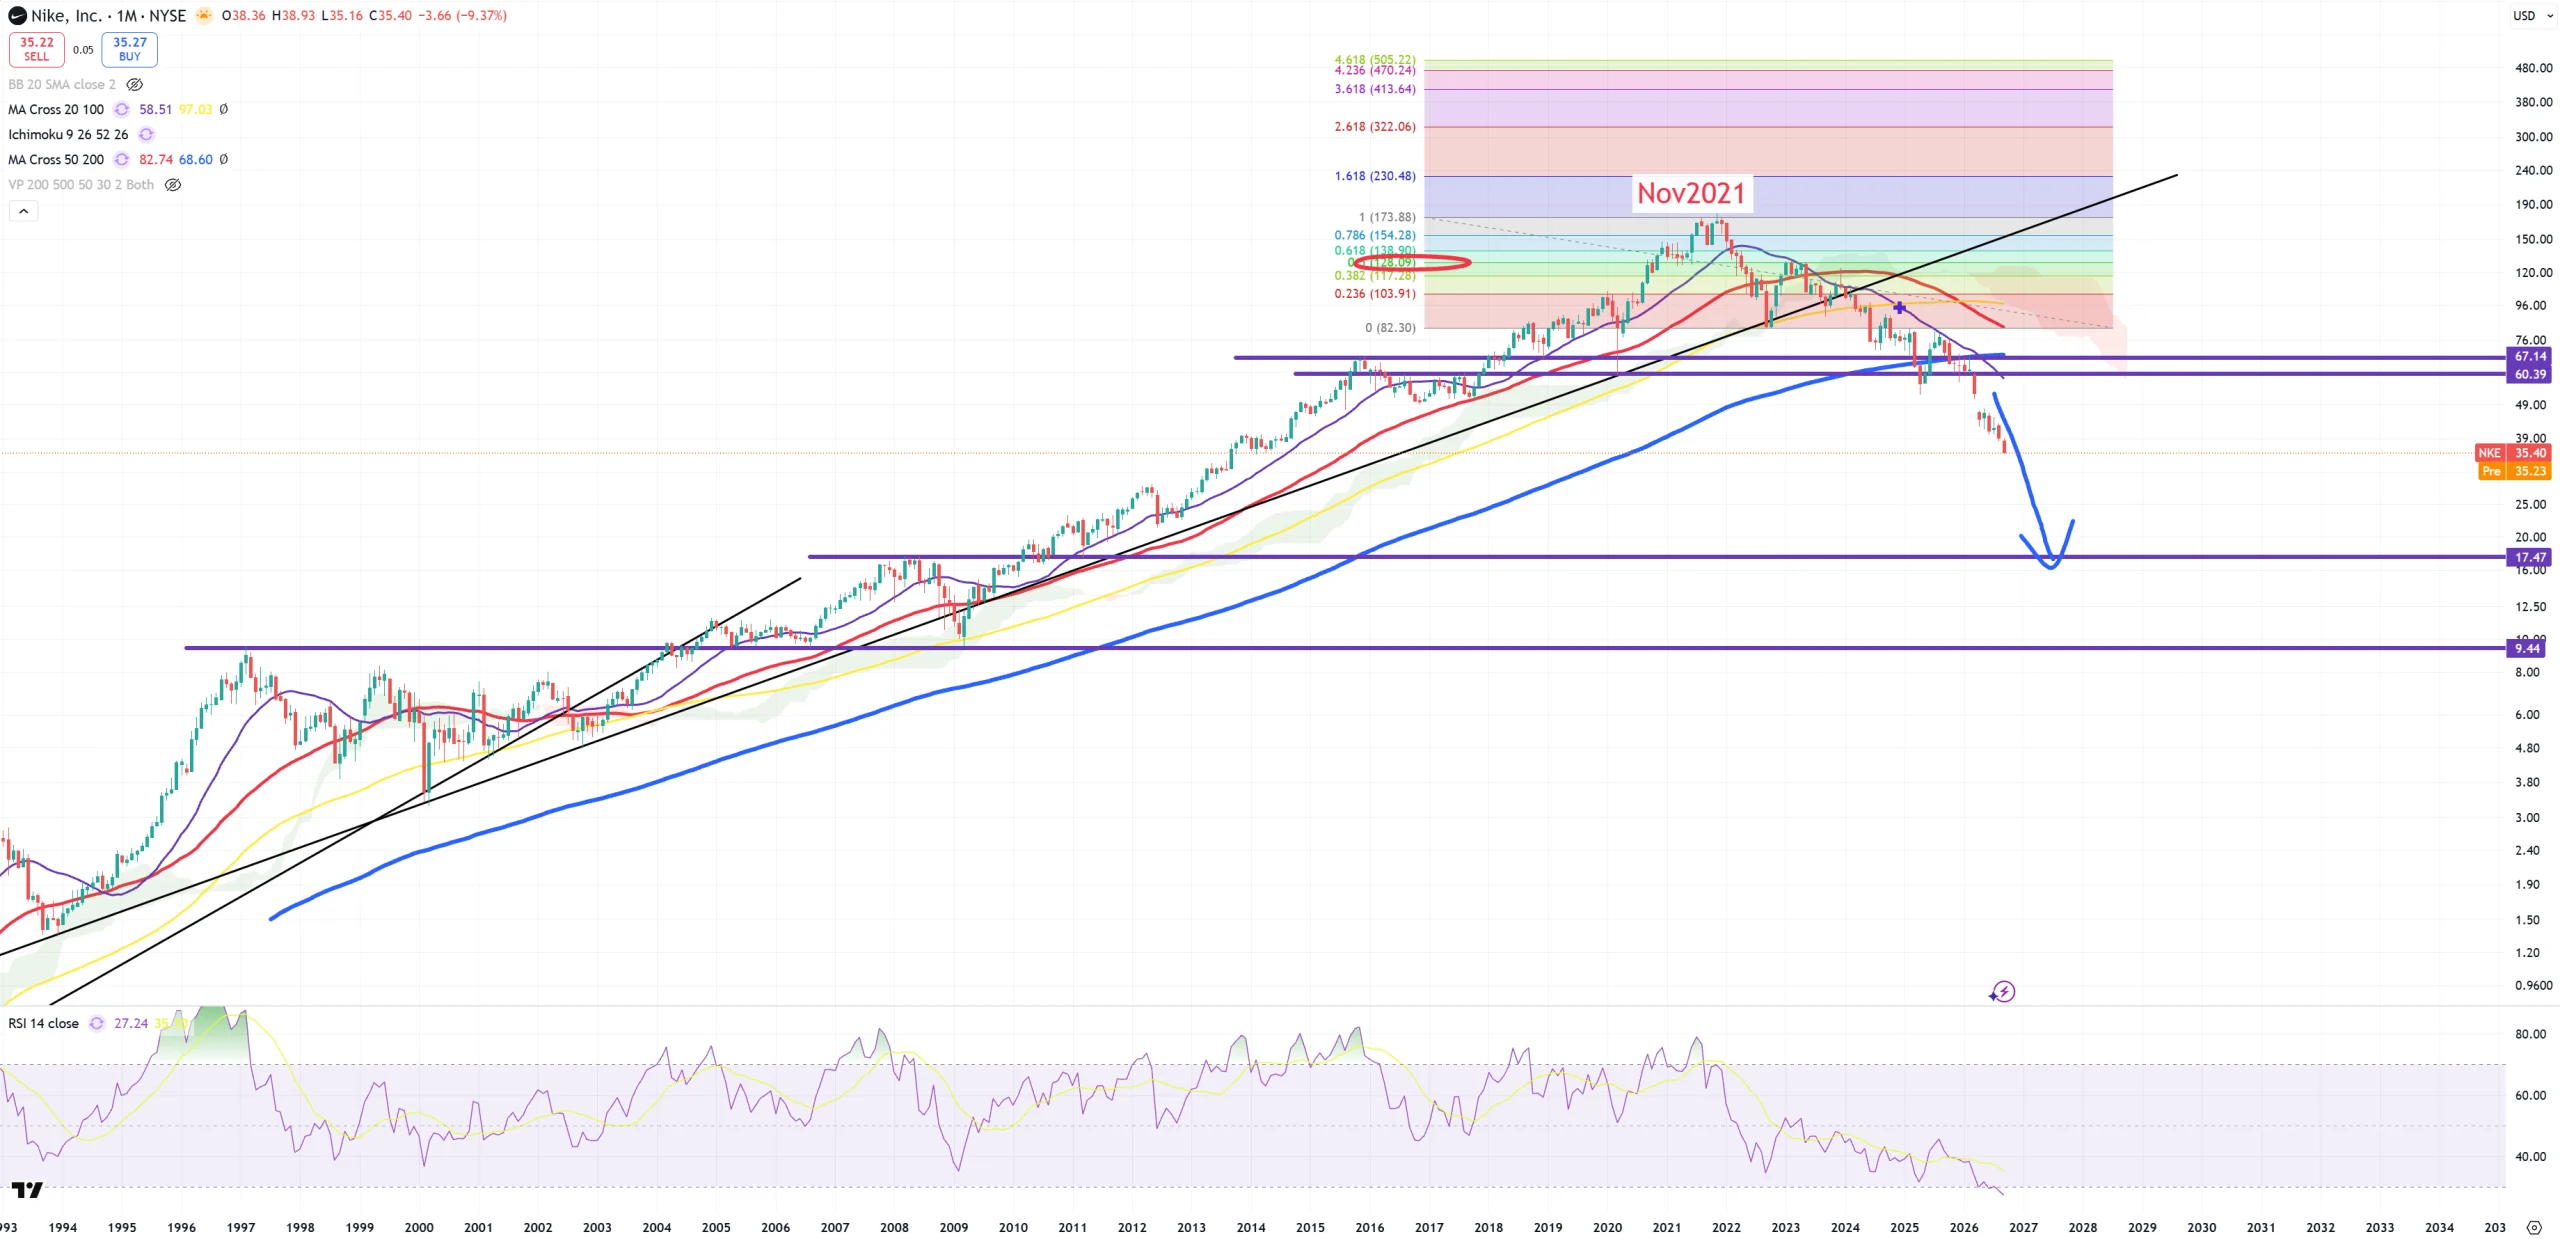
NKE – old dog … with 17$ target
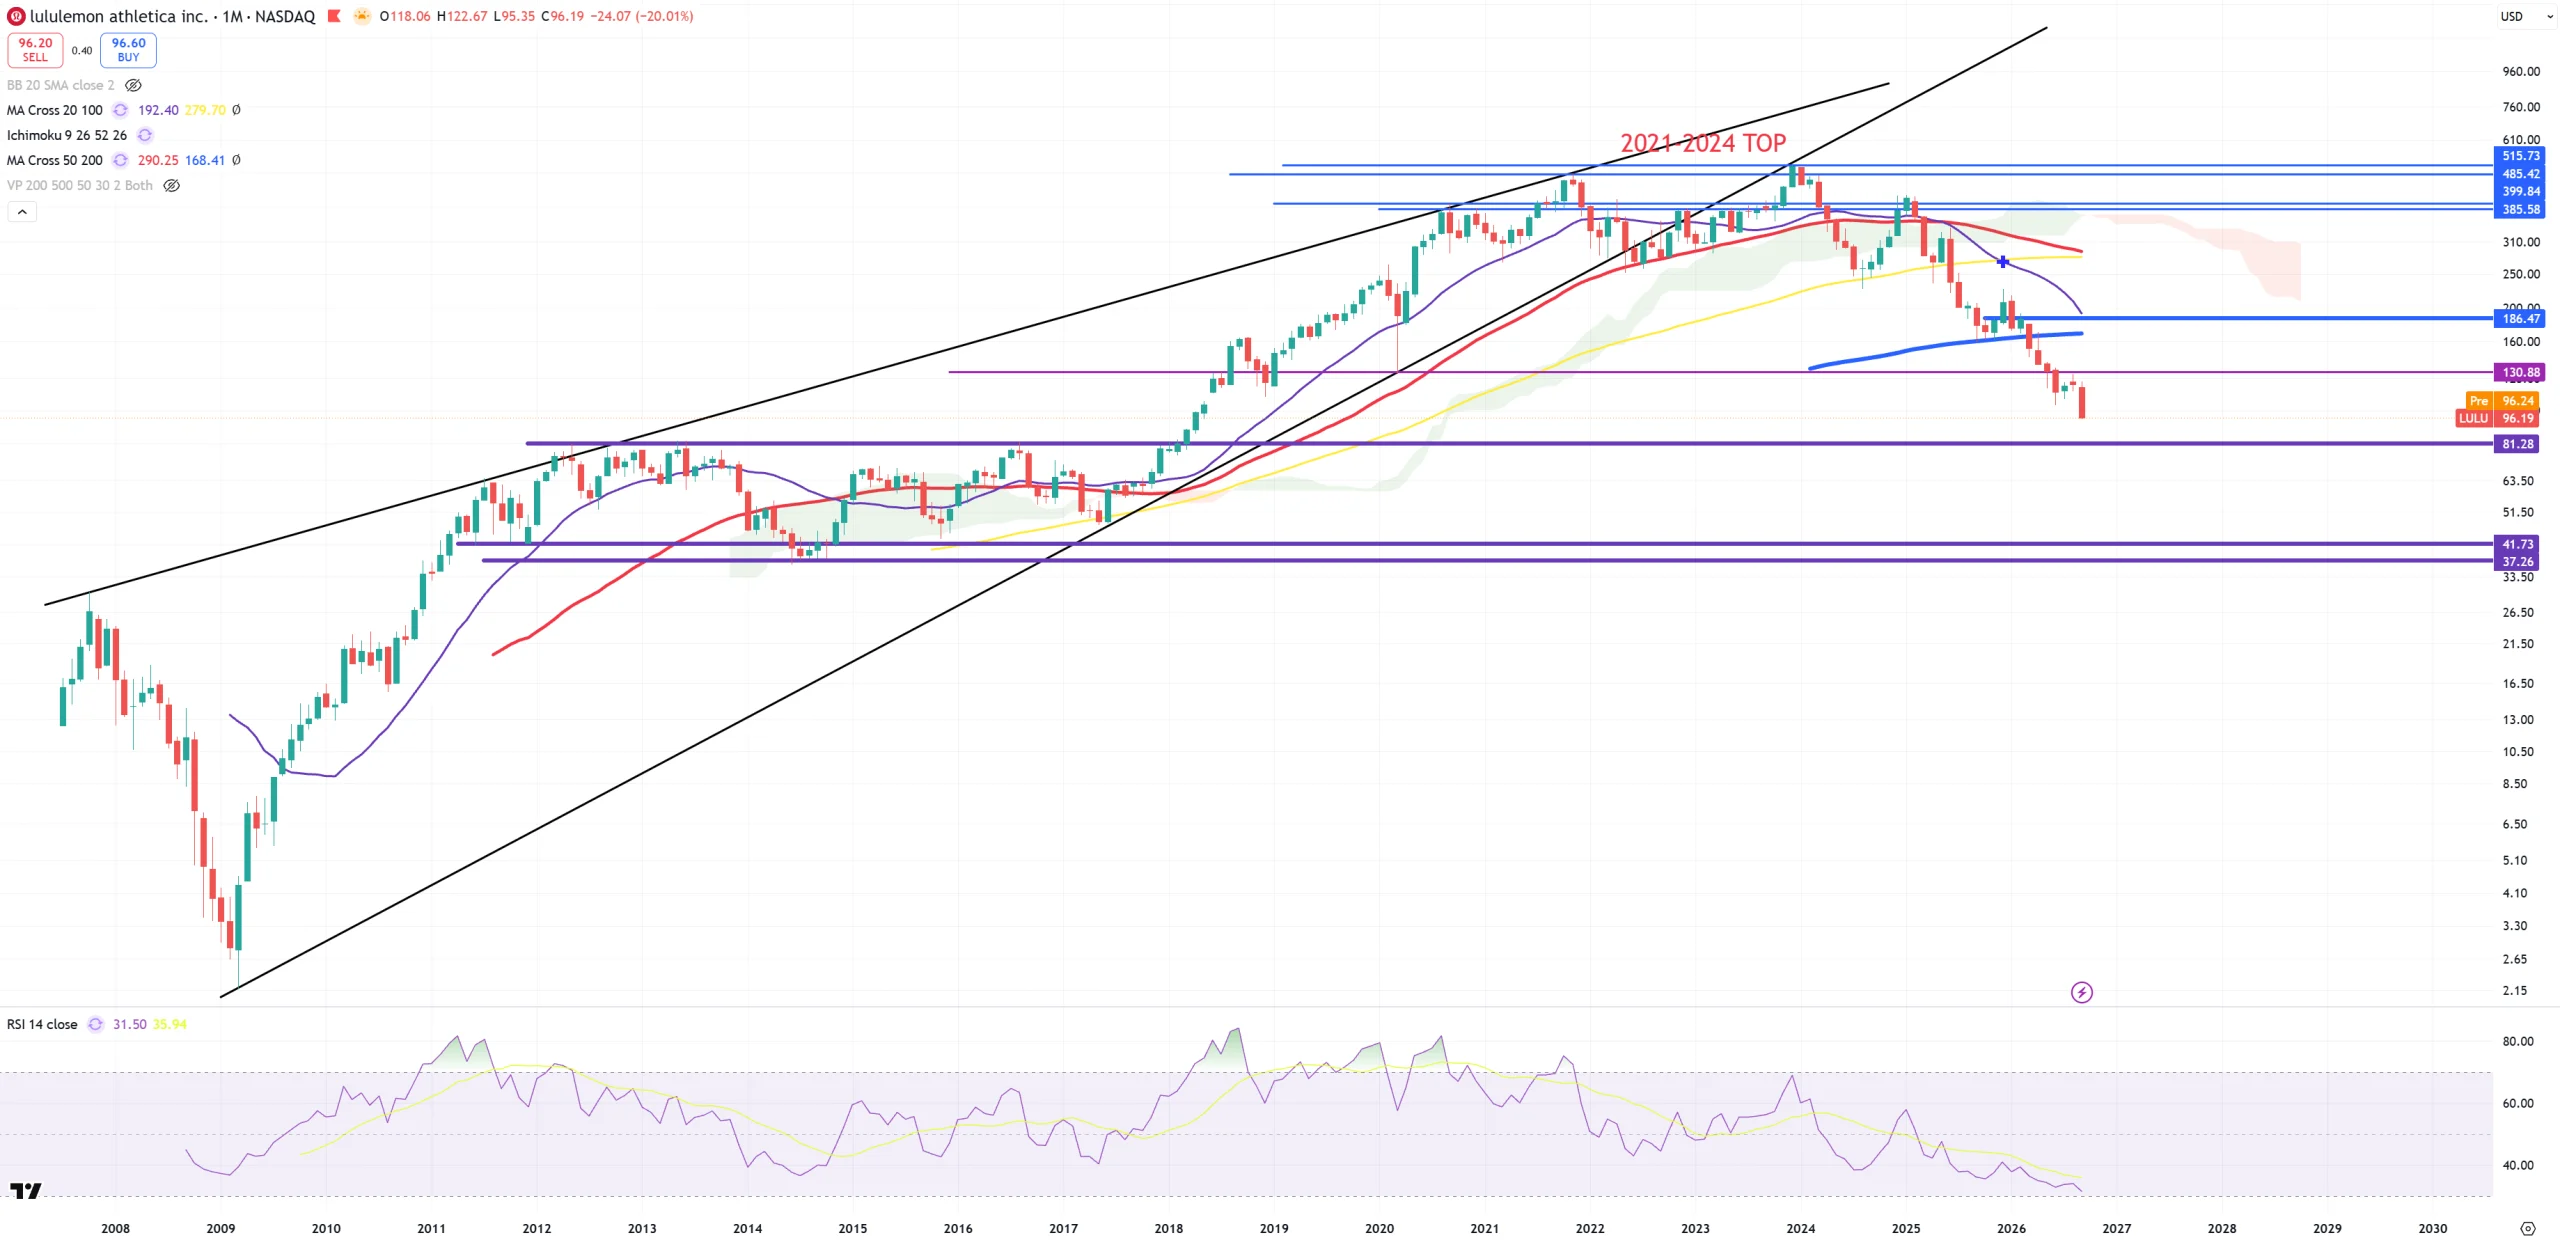
LULU – same as NKE
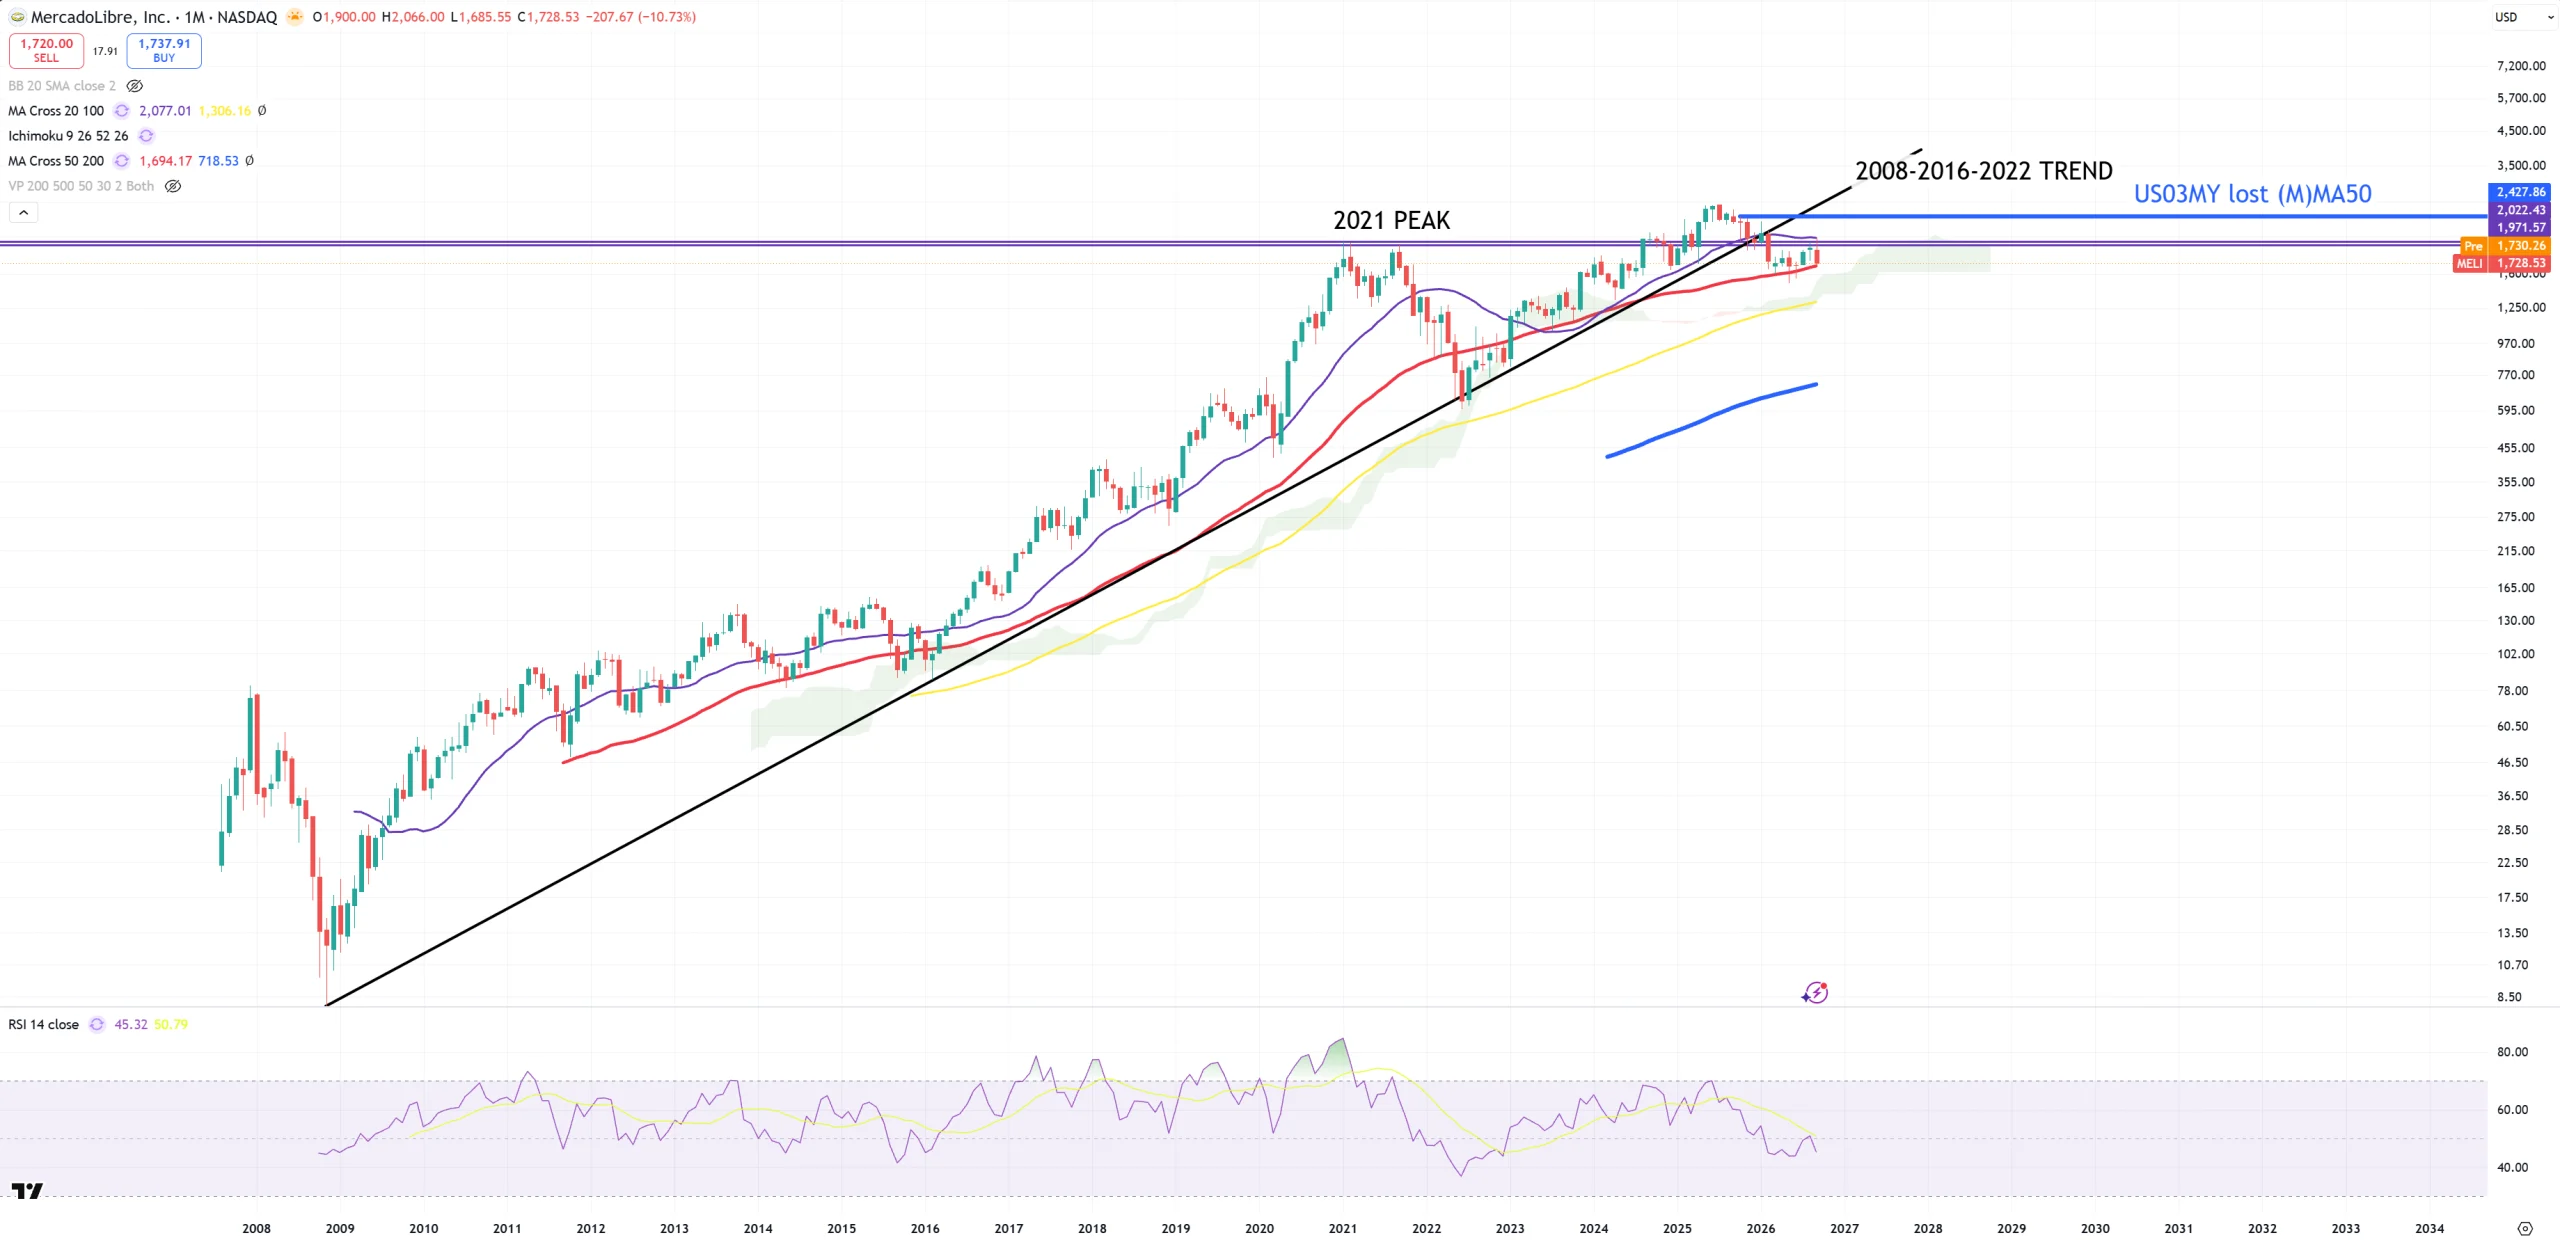
MELI – the Amazon of South America waits to break red (M)MA50
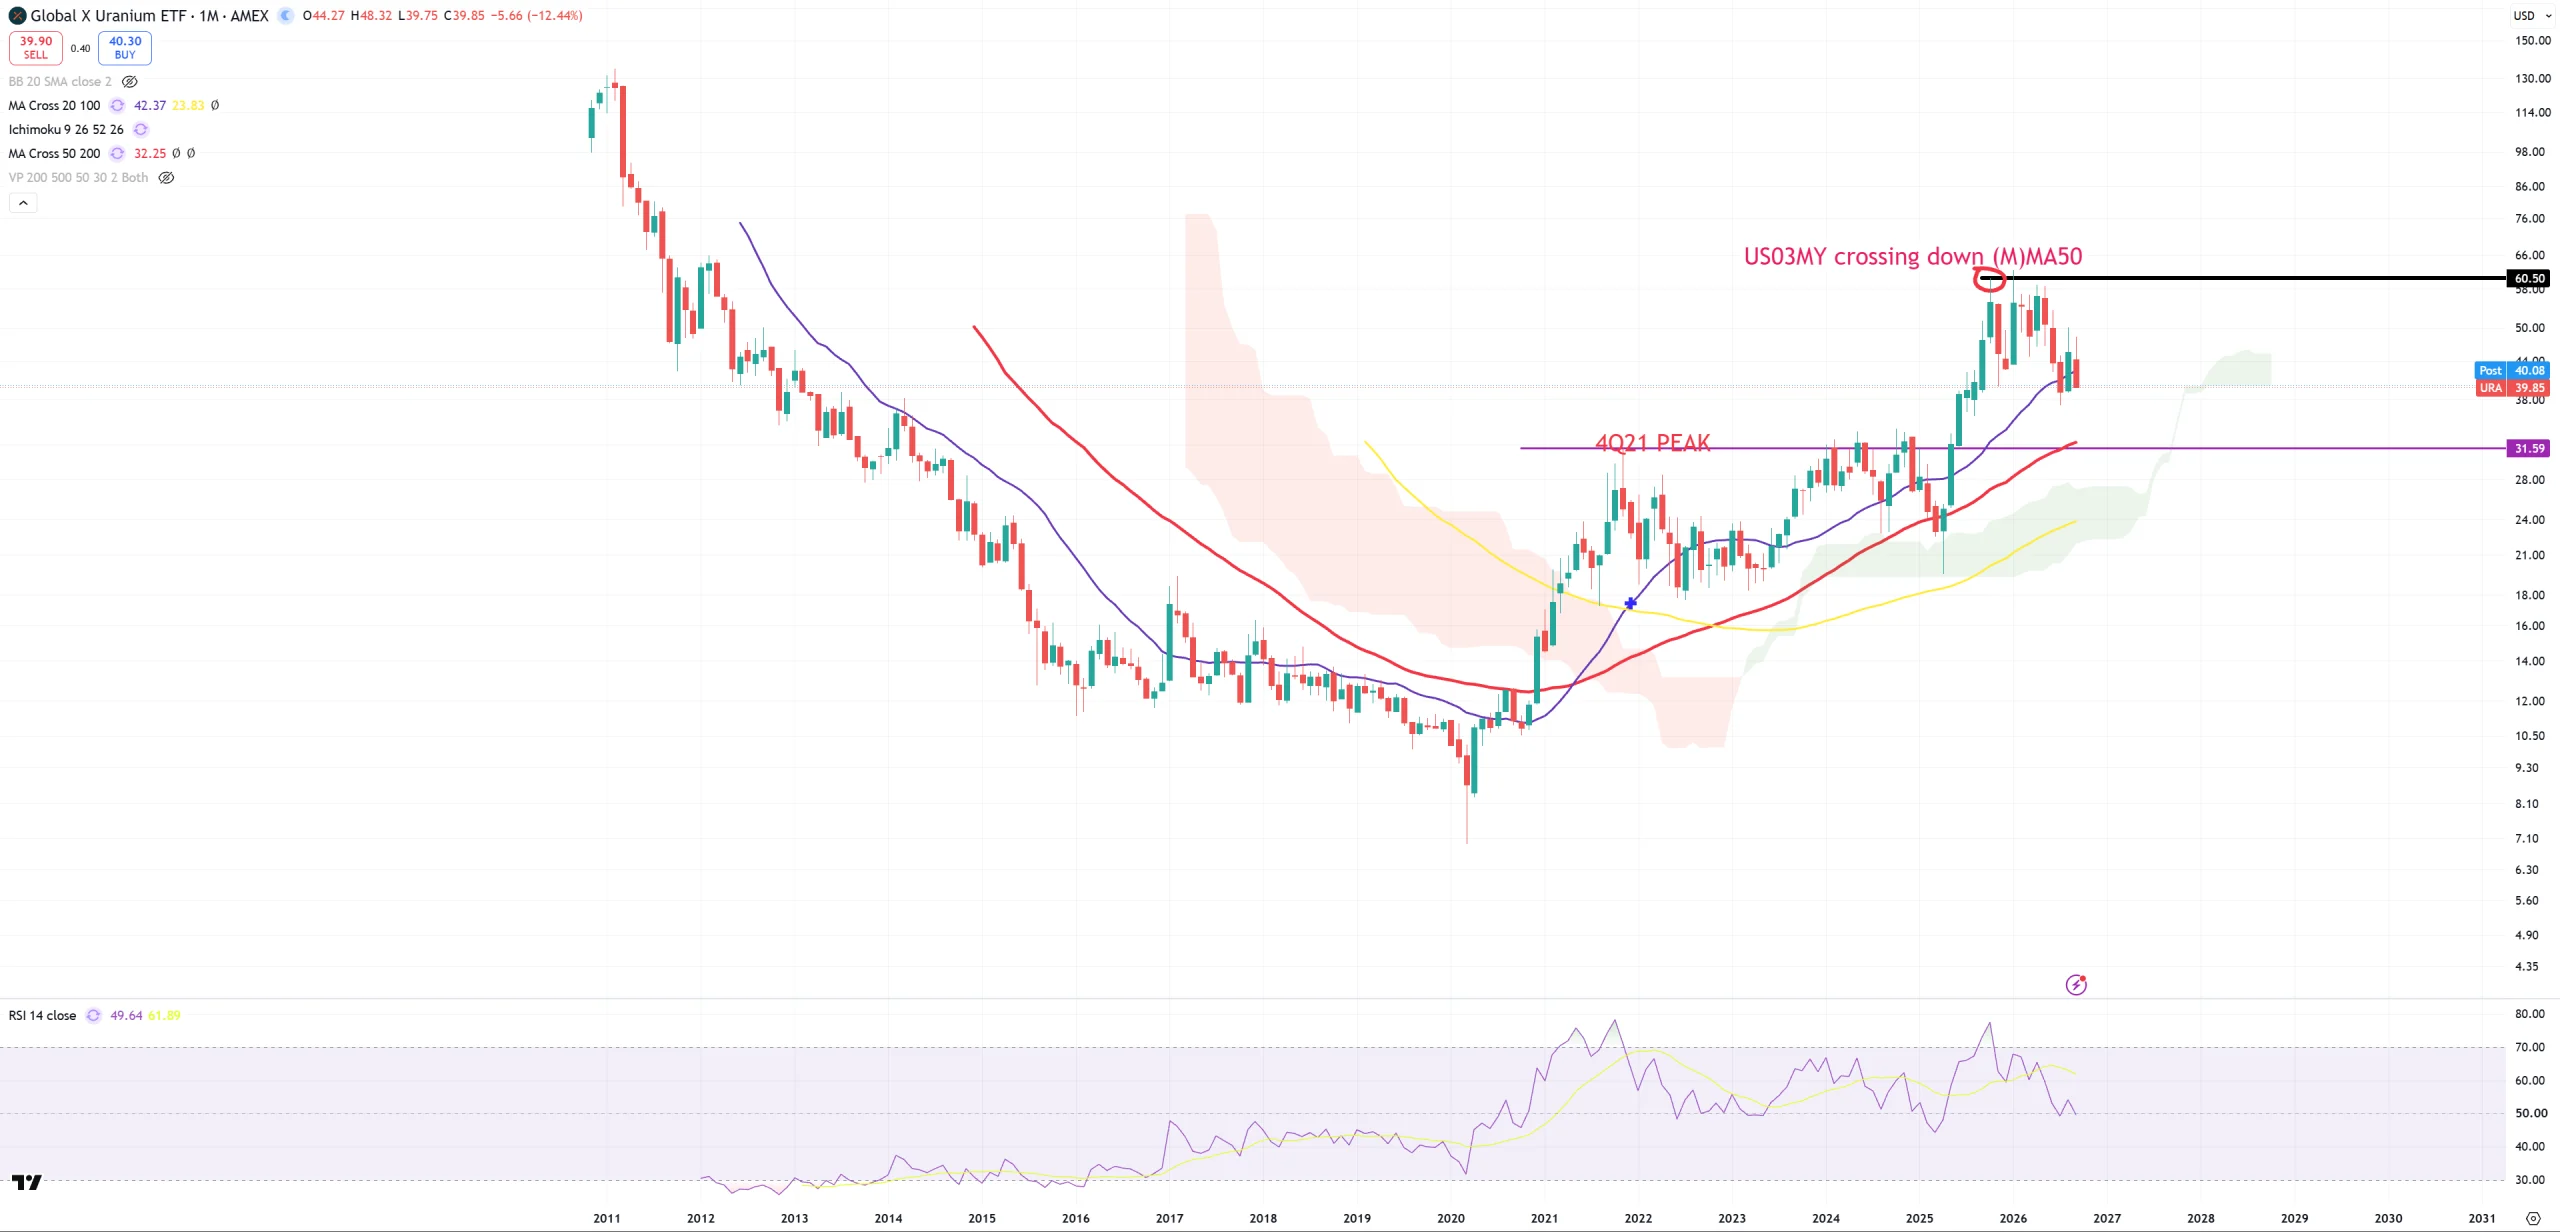
URA – Uranium ETF peaked and ready to retest 4Q21 level.
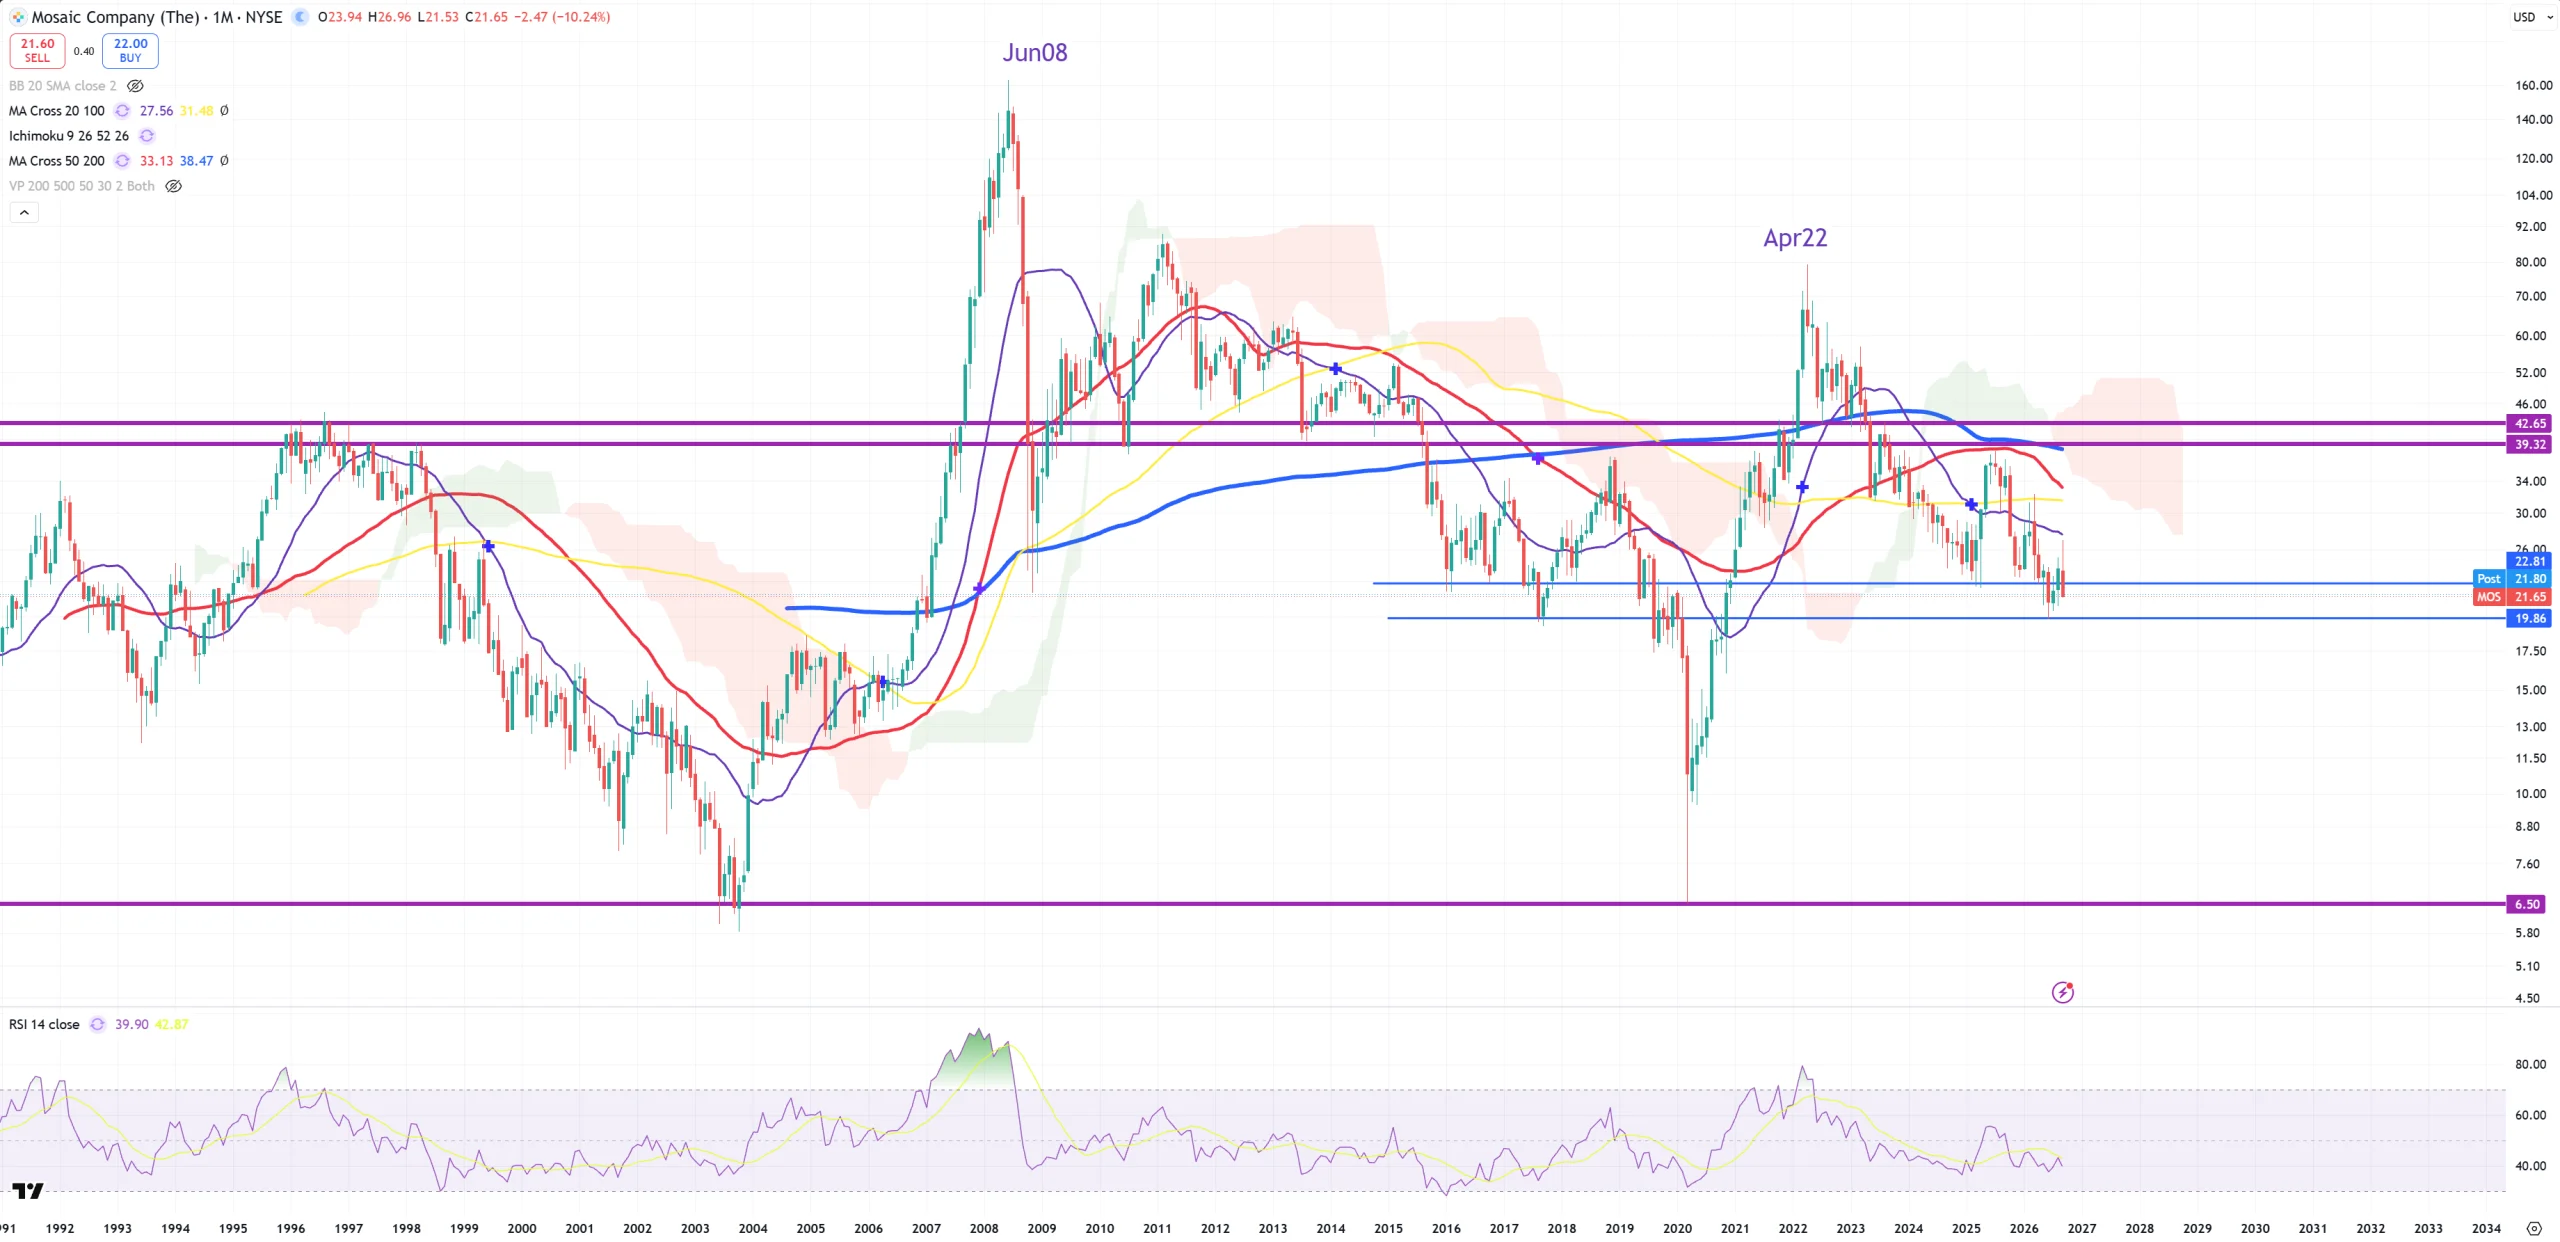
MOS – if we break this level we’ll land on 2020 lows.
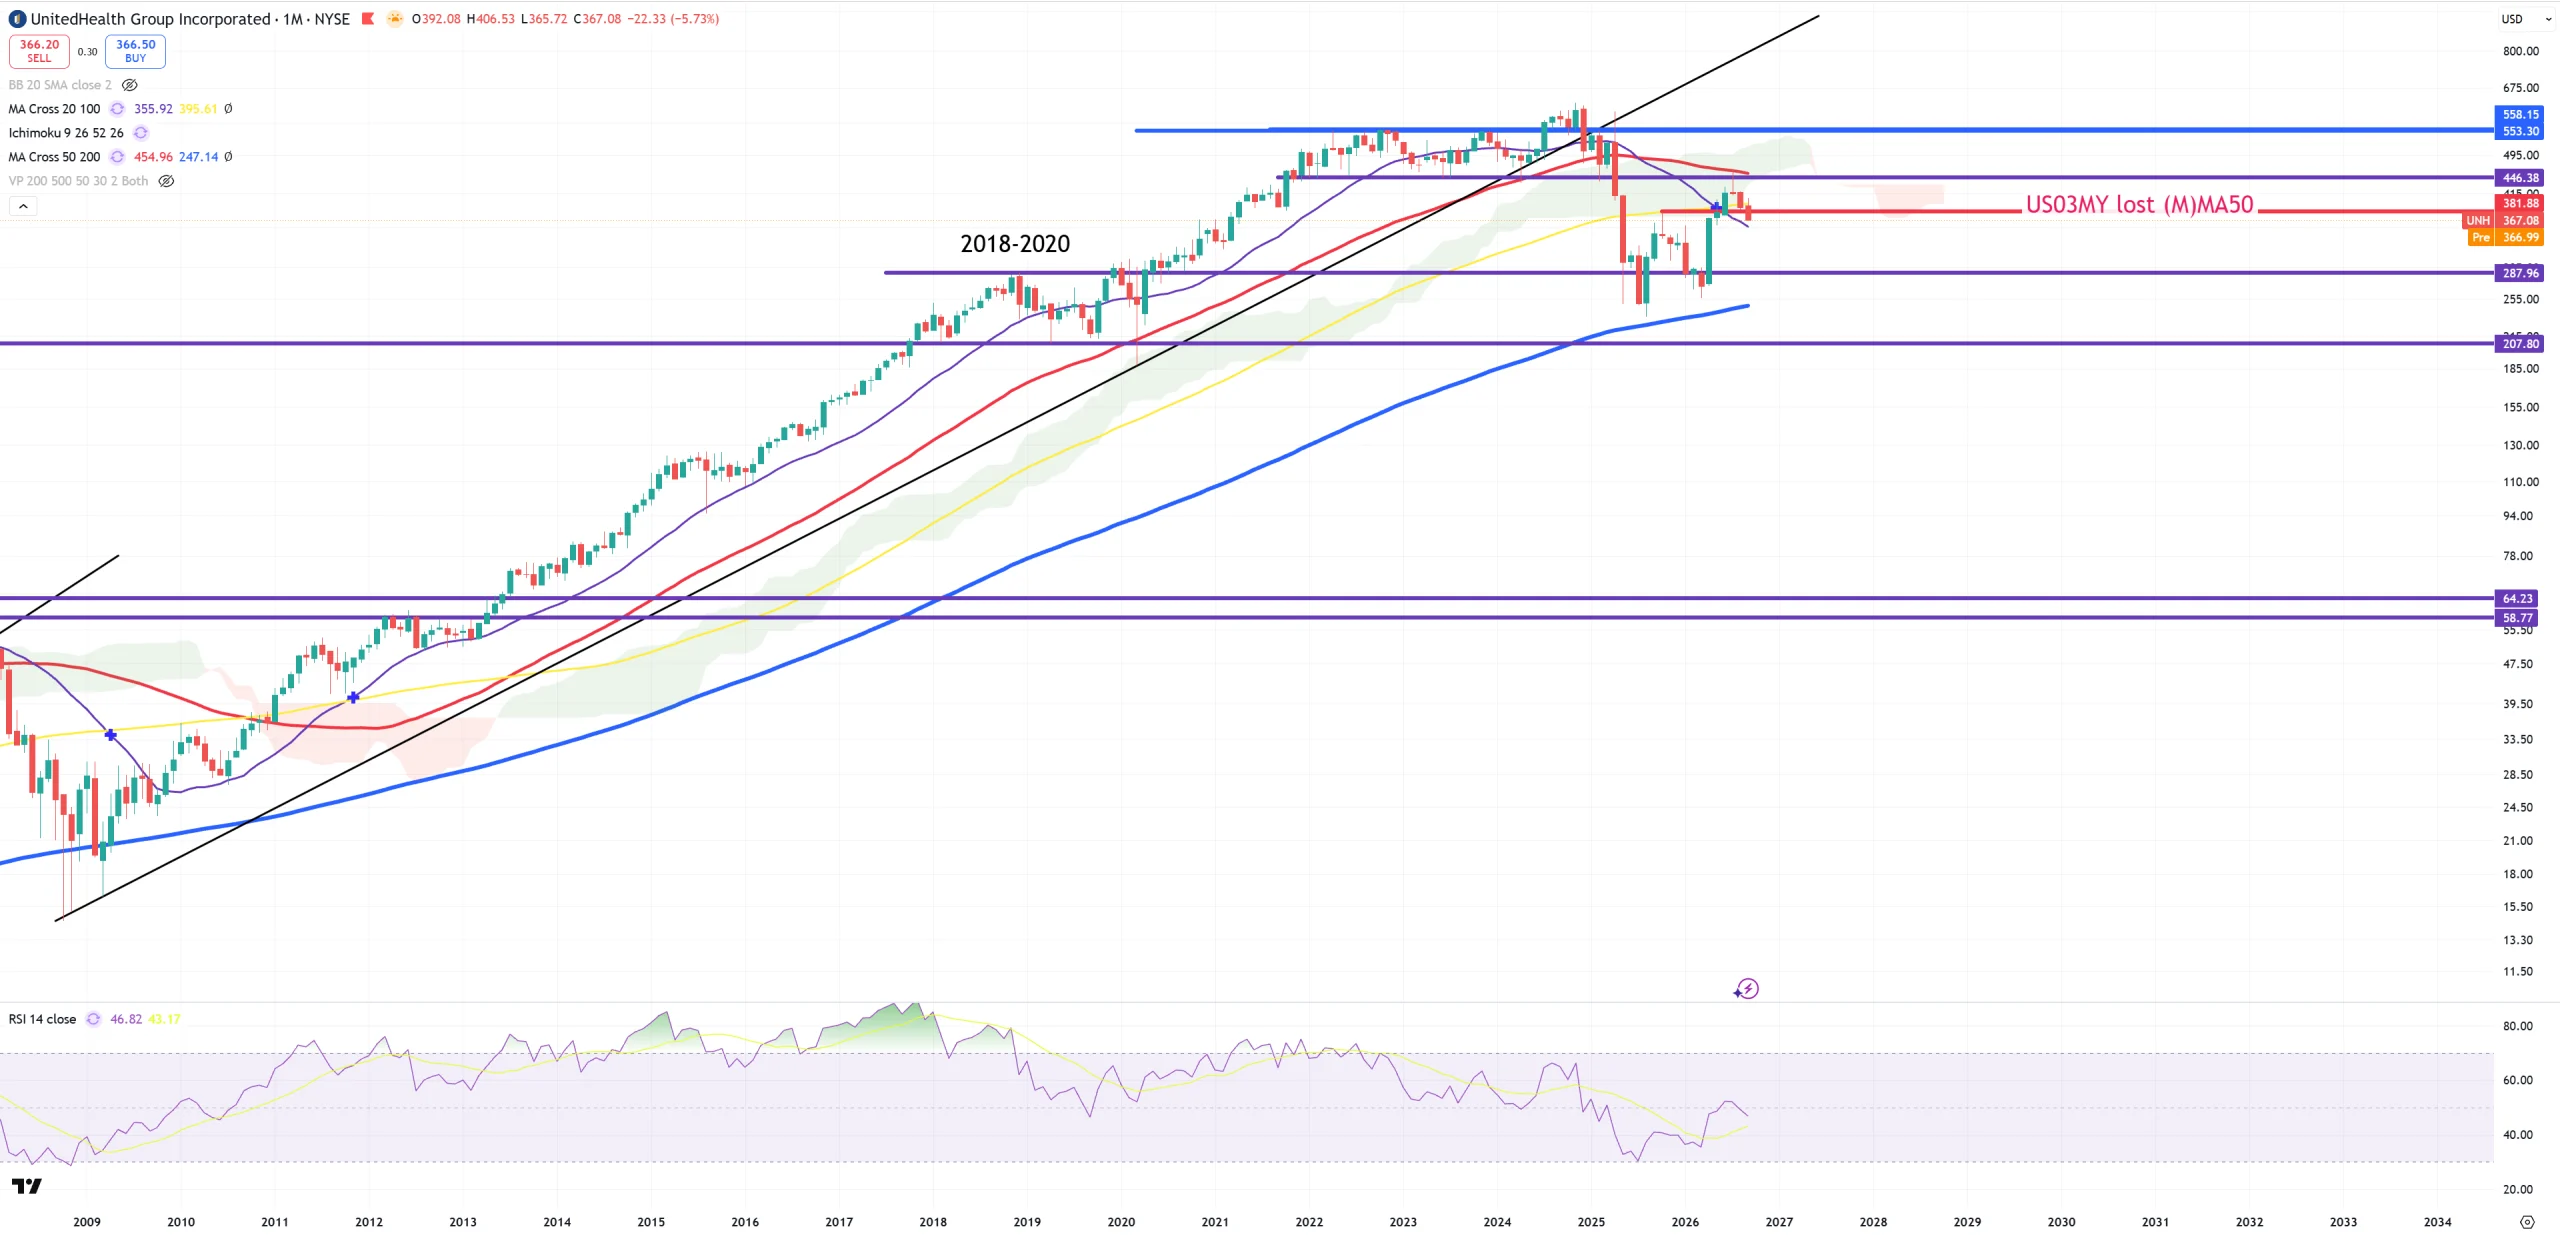
UNH – Break retest (M)MA50 – 460$ and failure. 2009+ trend was broken long time ago.
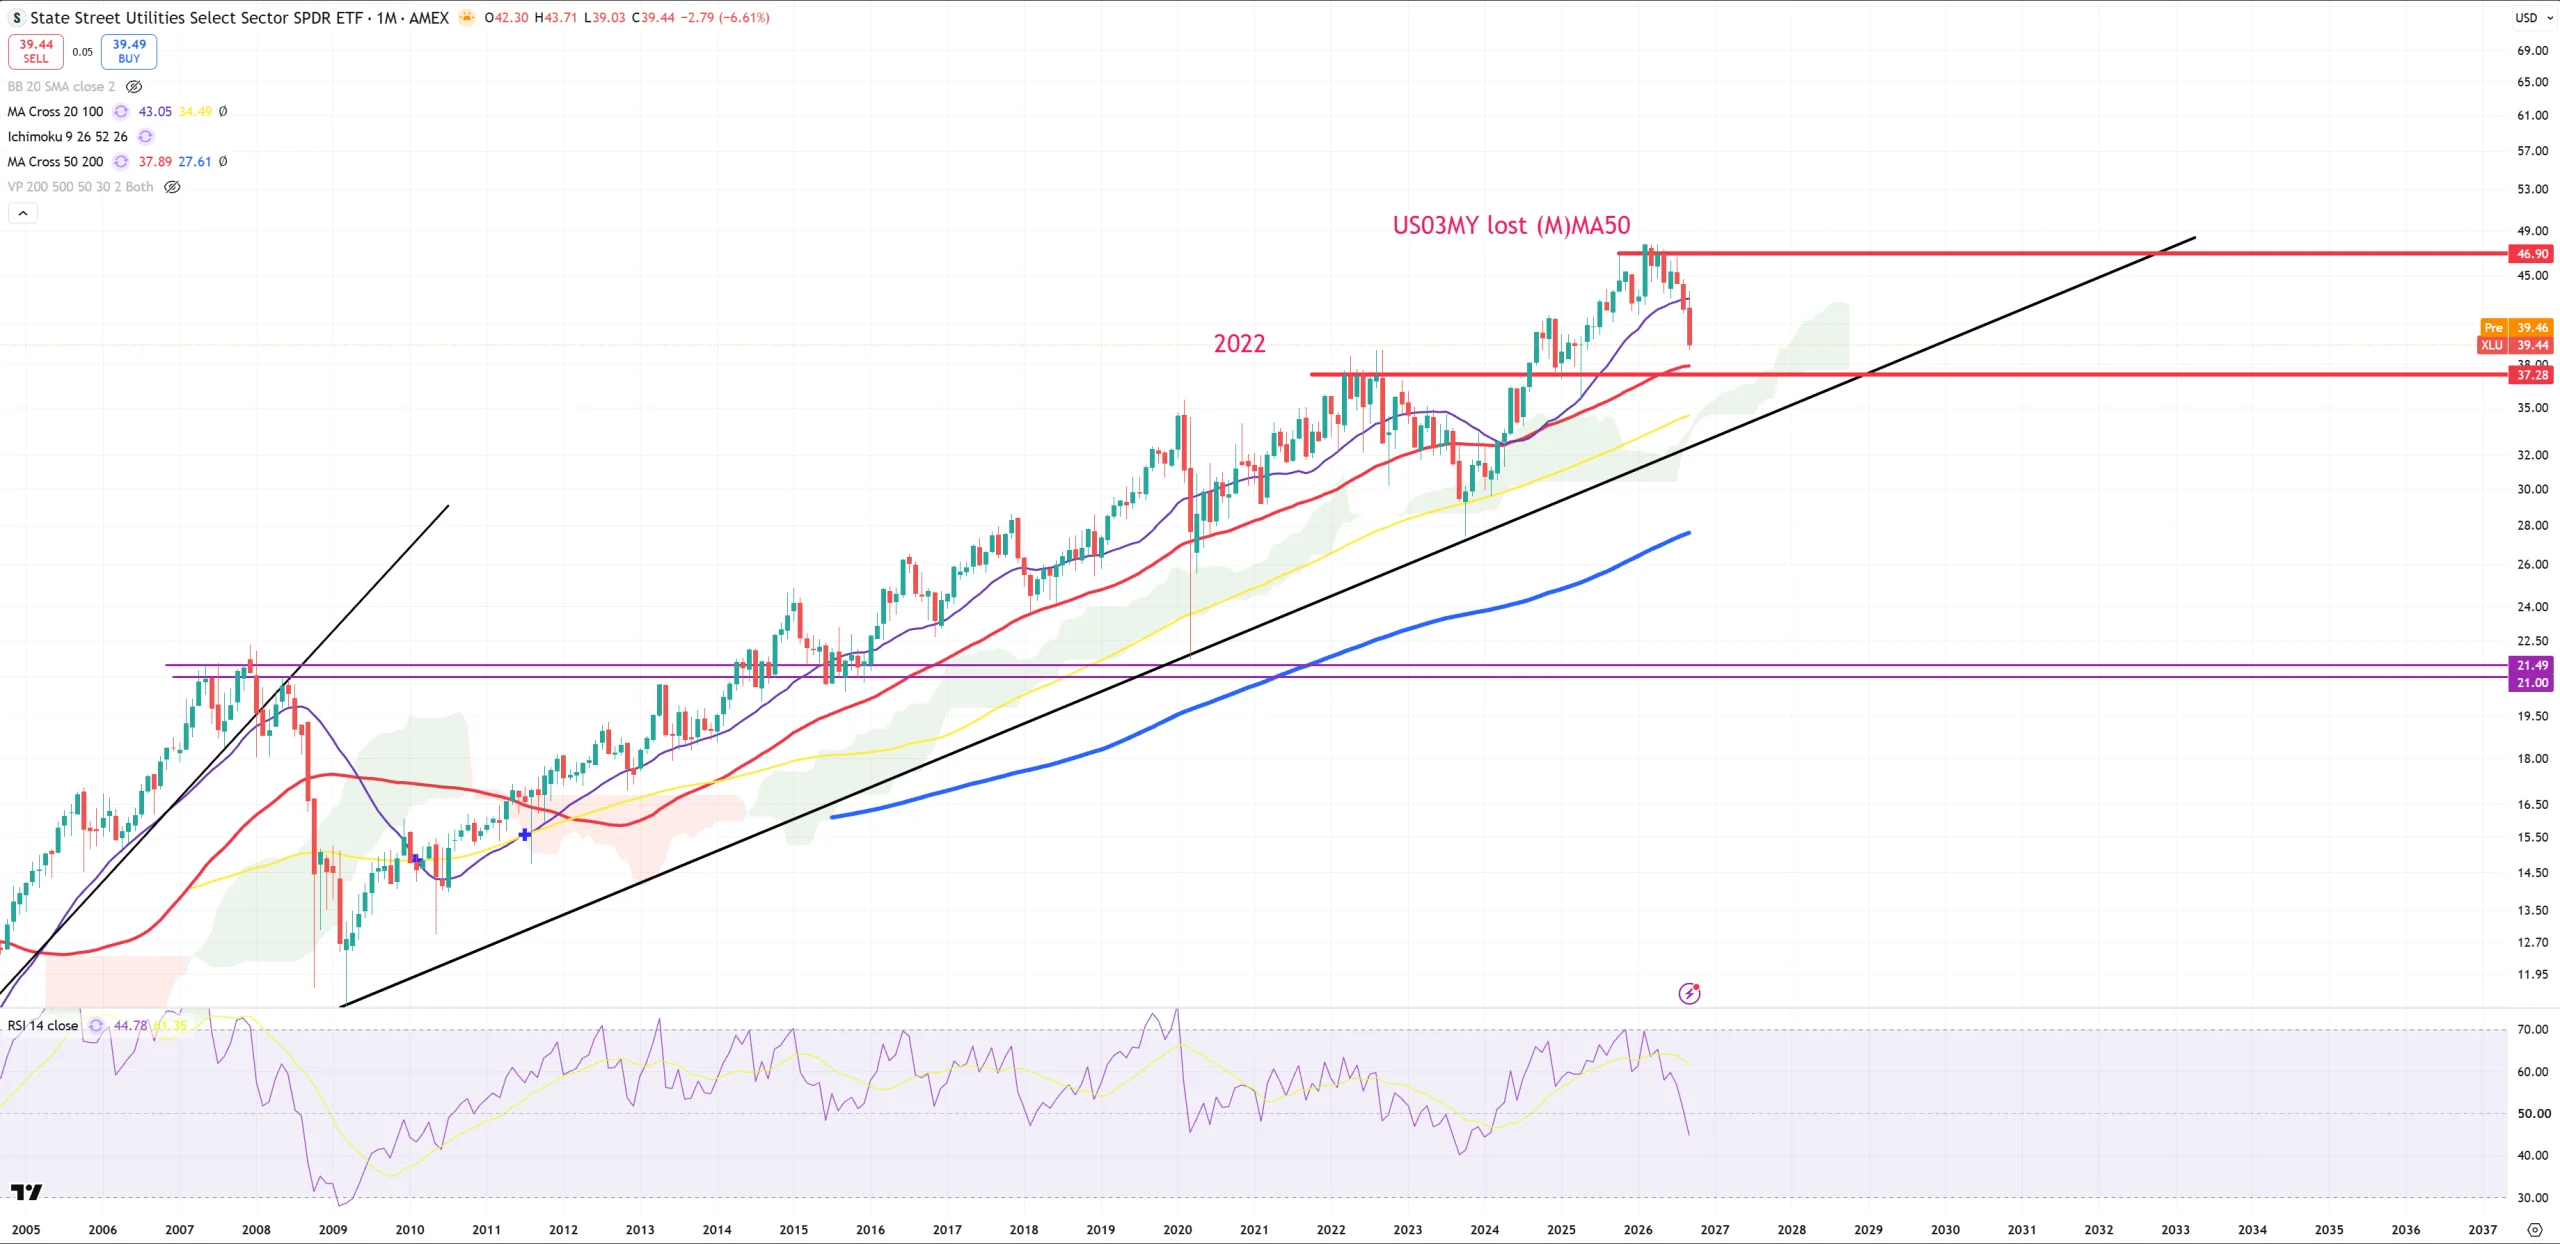
XLU – 1Q22 is red (M)MA50. Not yet broken.
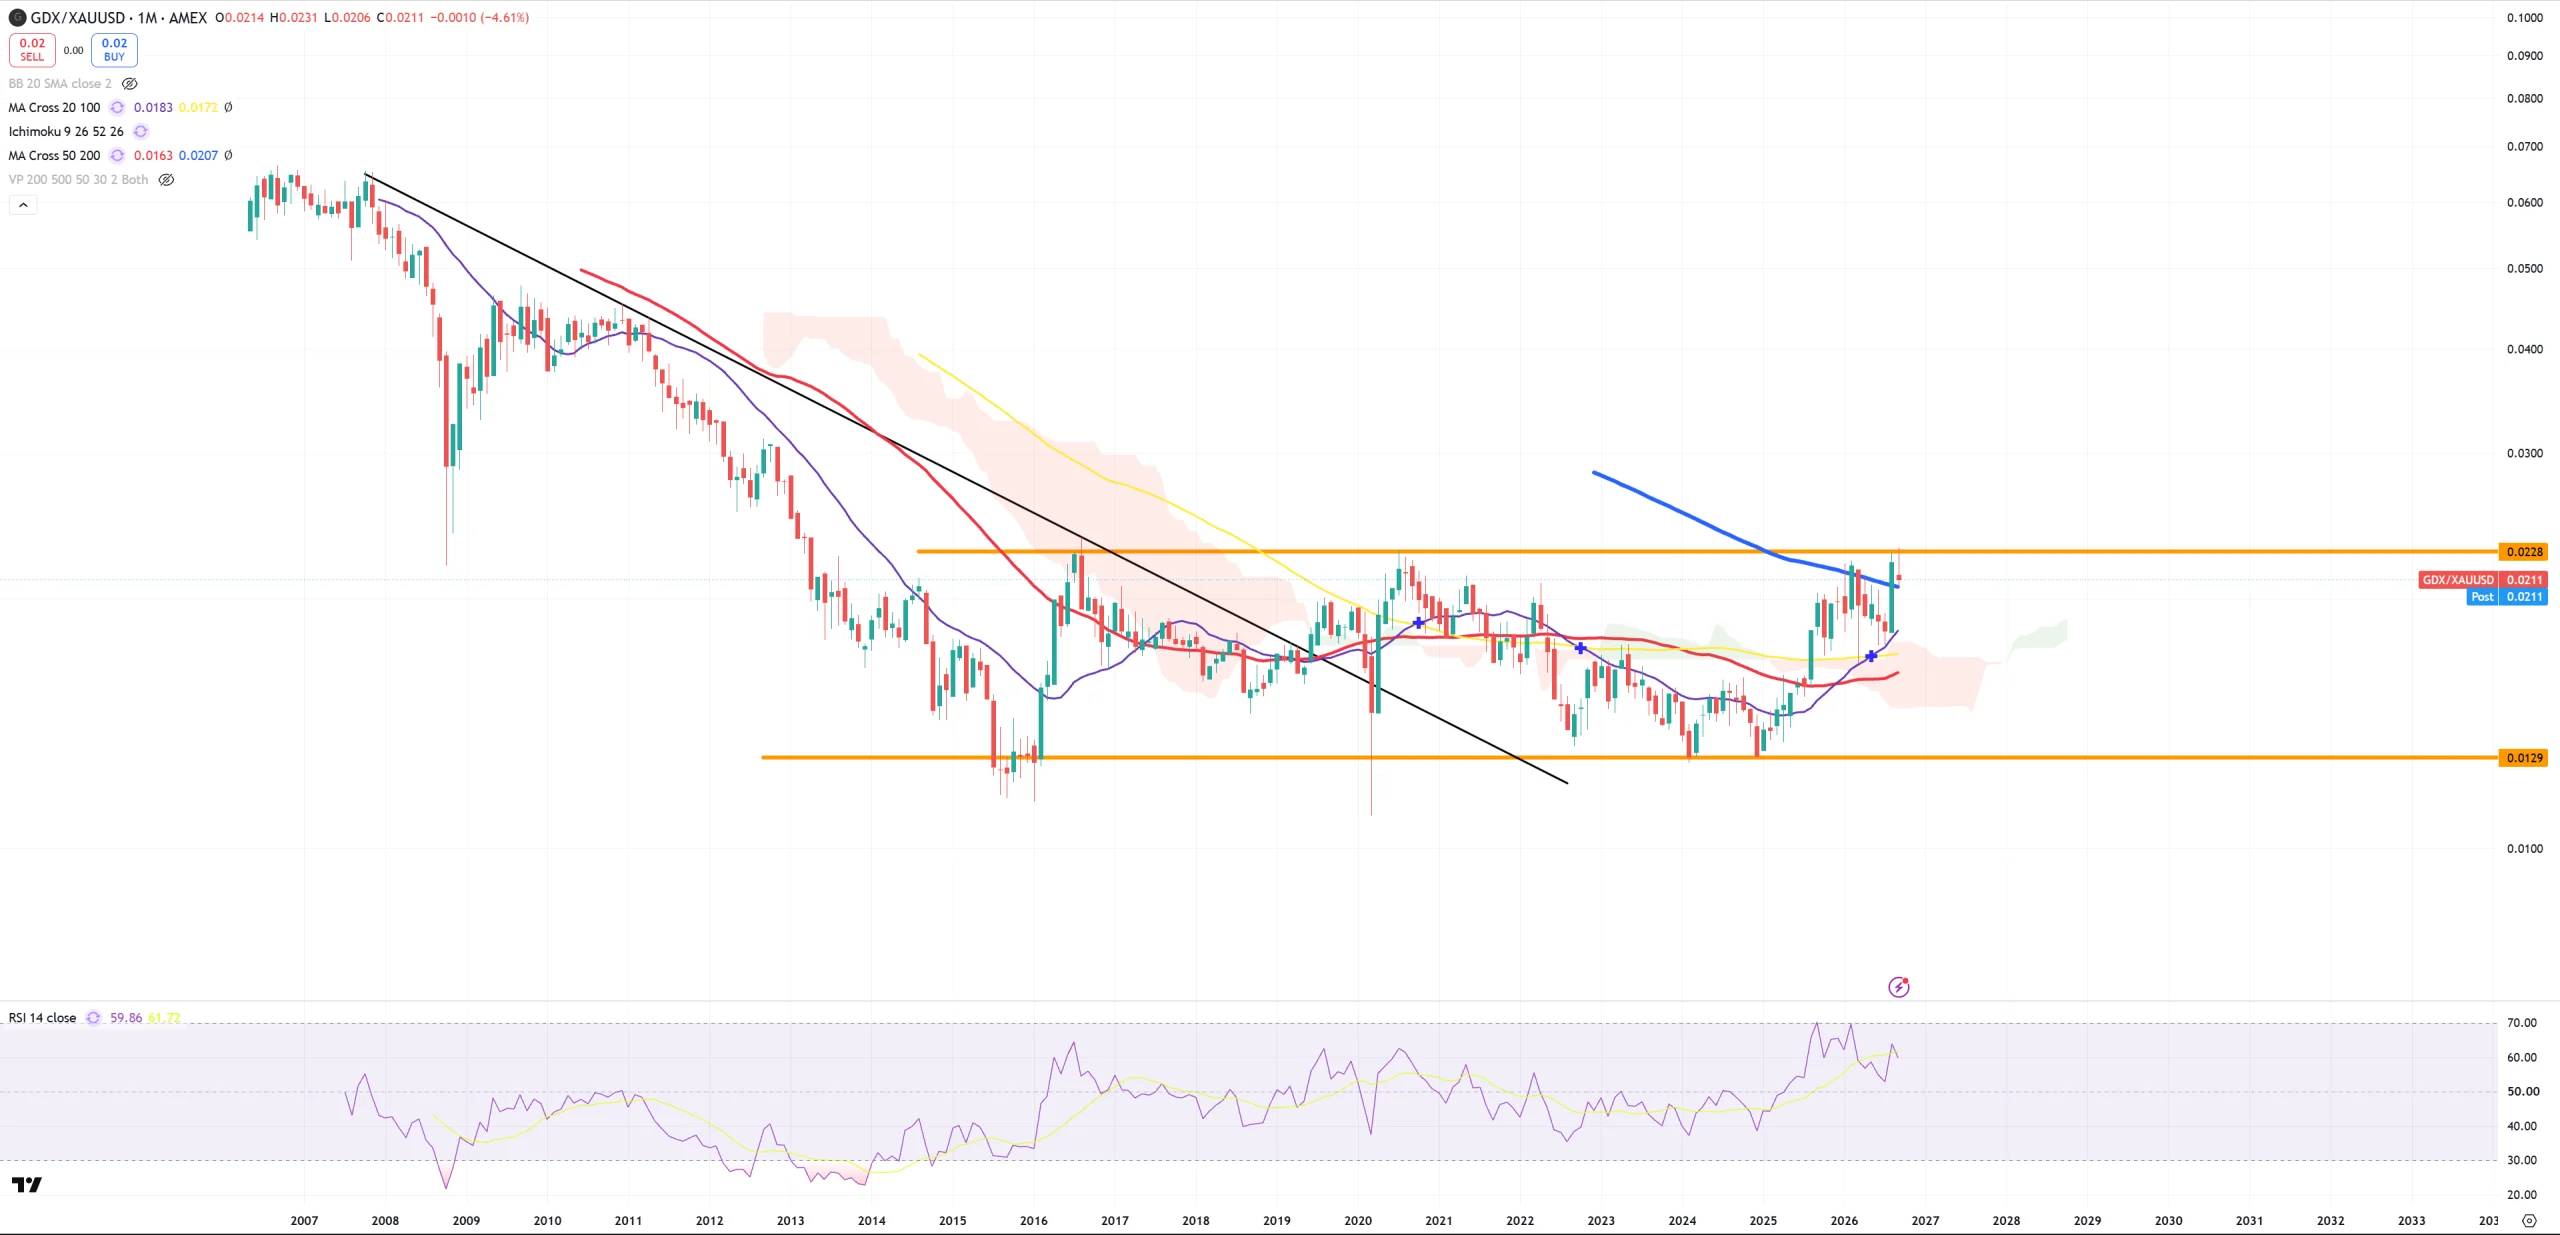
GDX/GOLD – do we have (M)MA200 now as support?
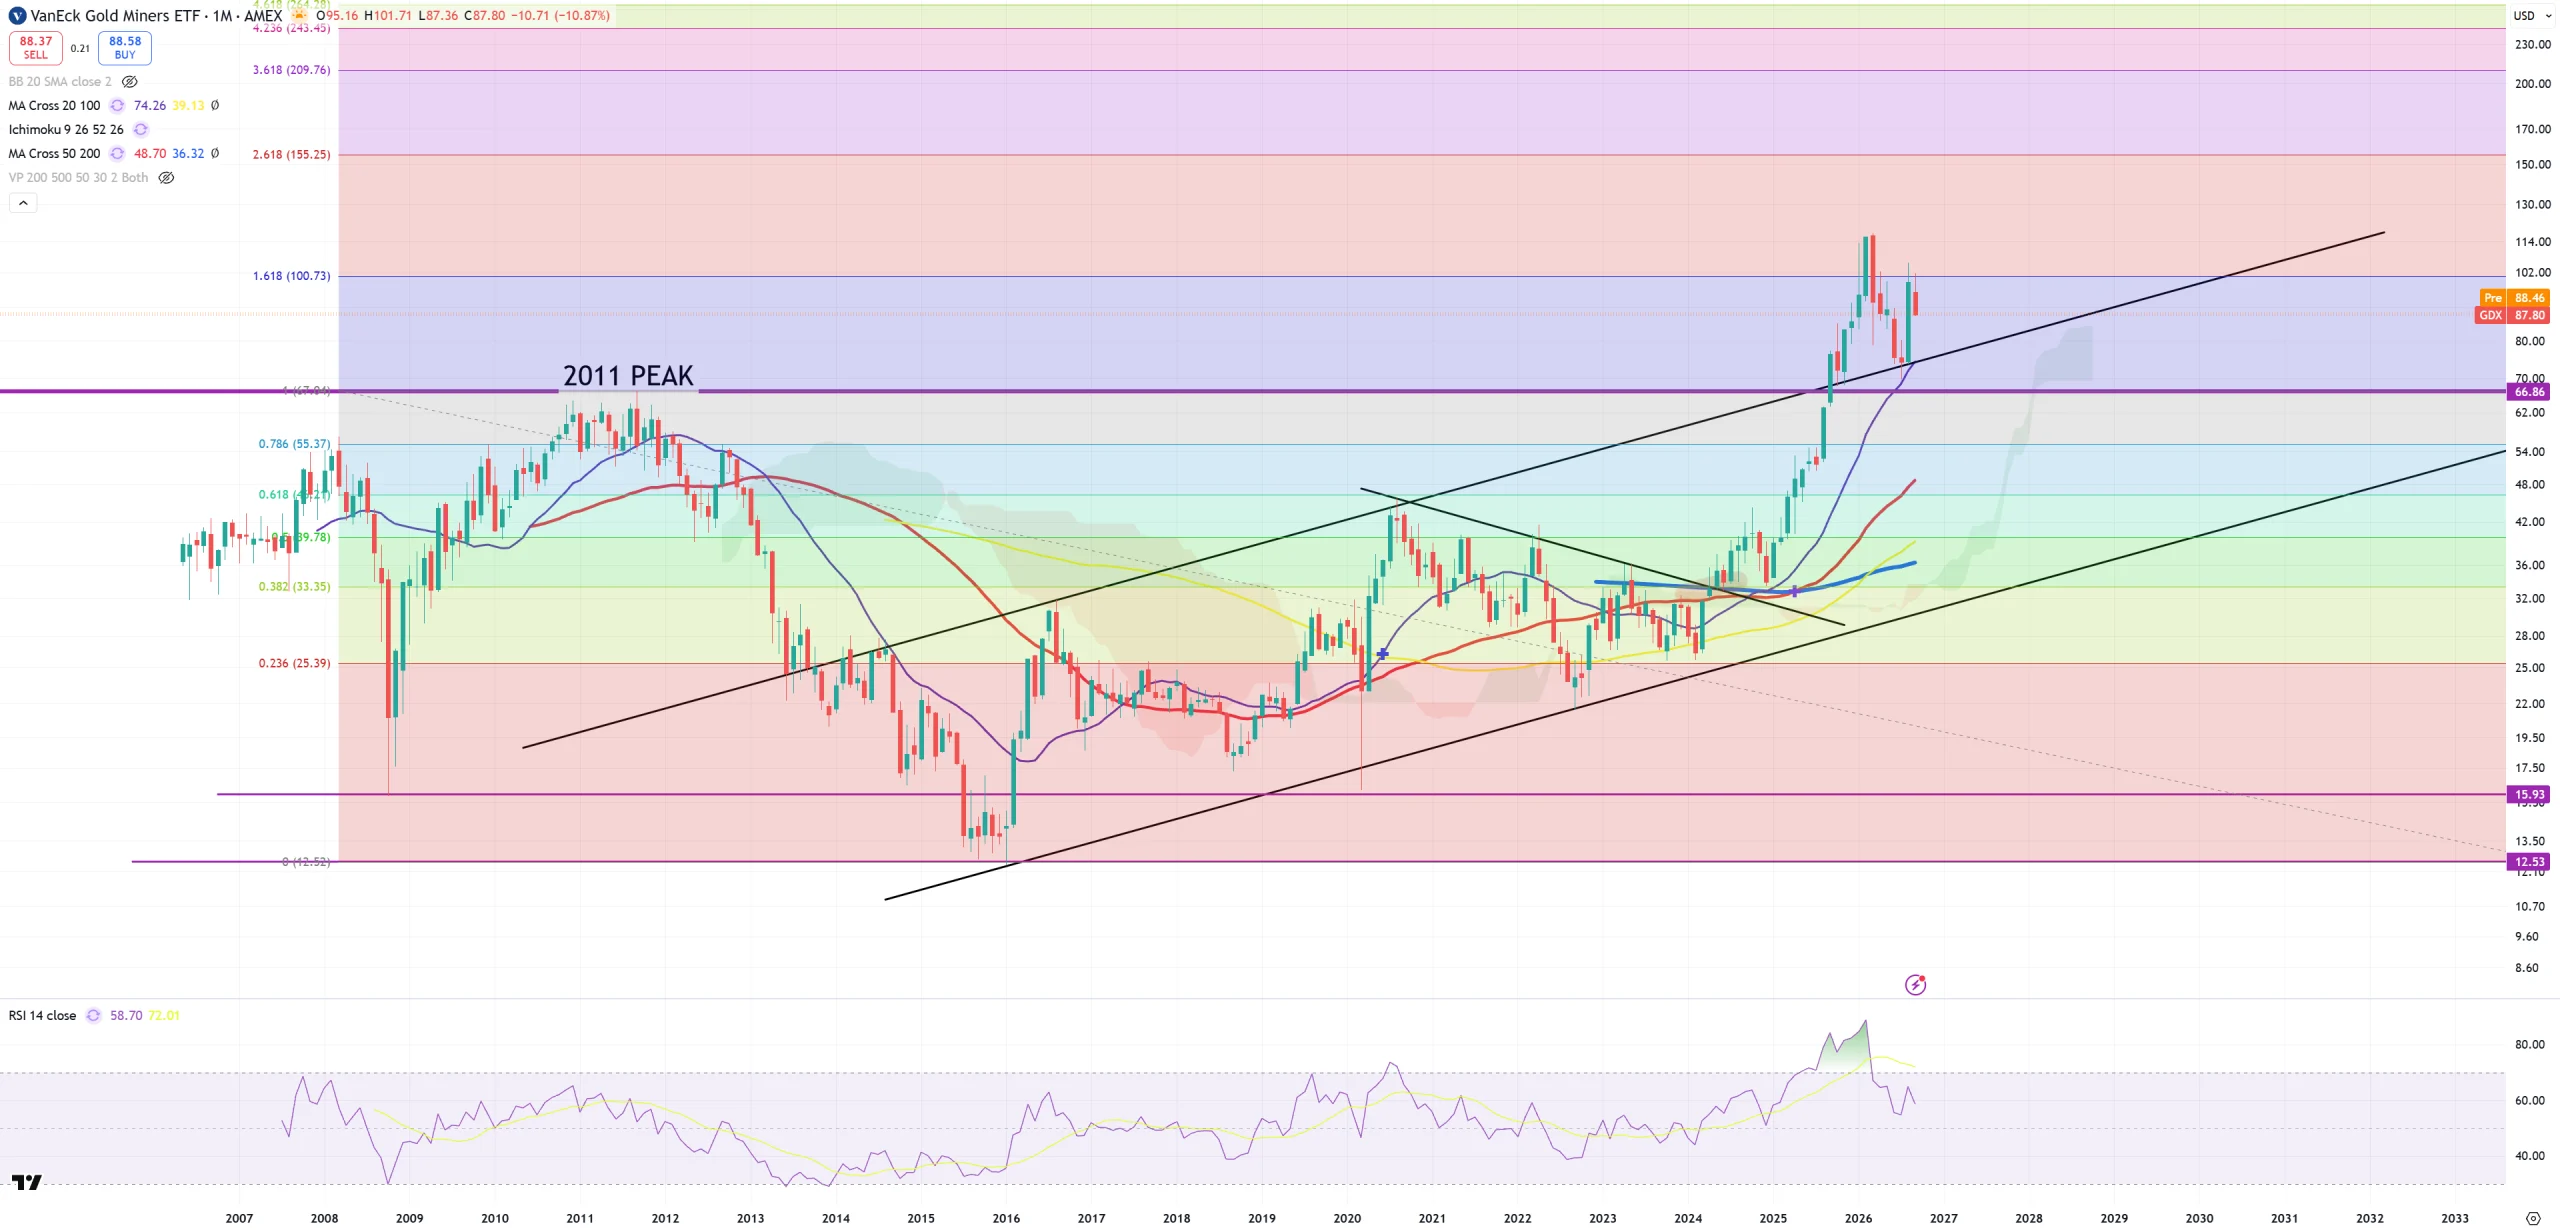
GDX – not much to see here.
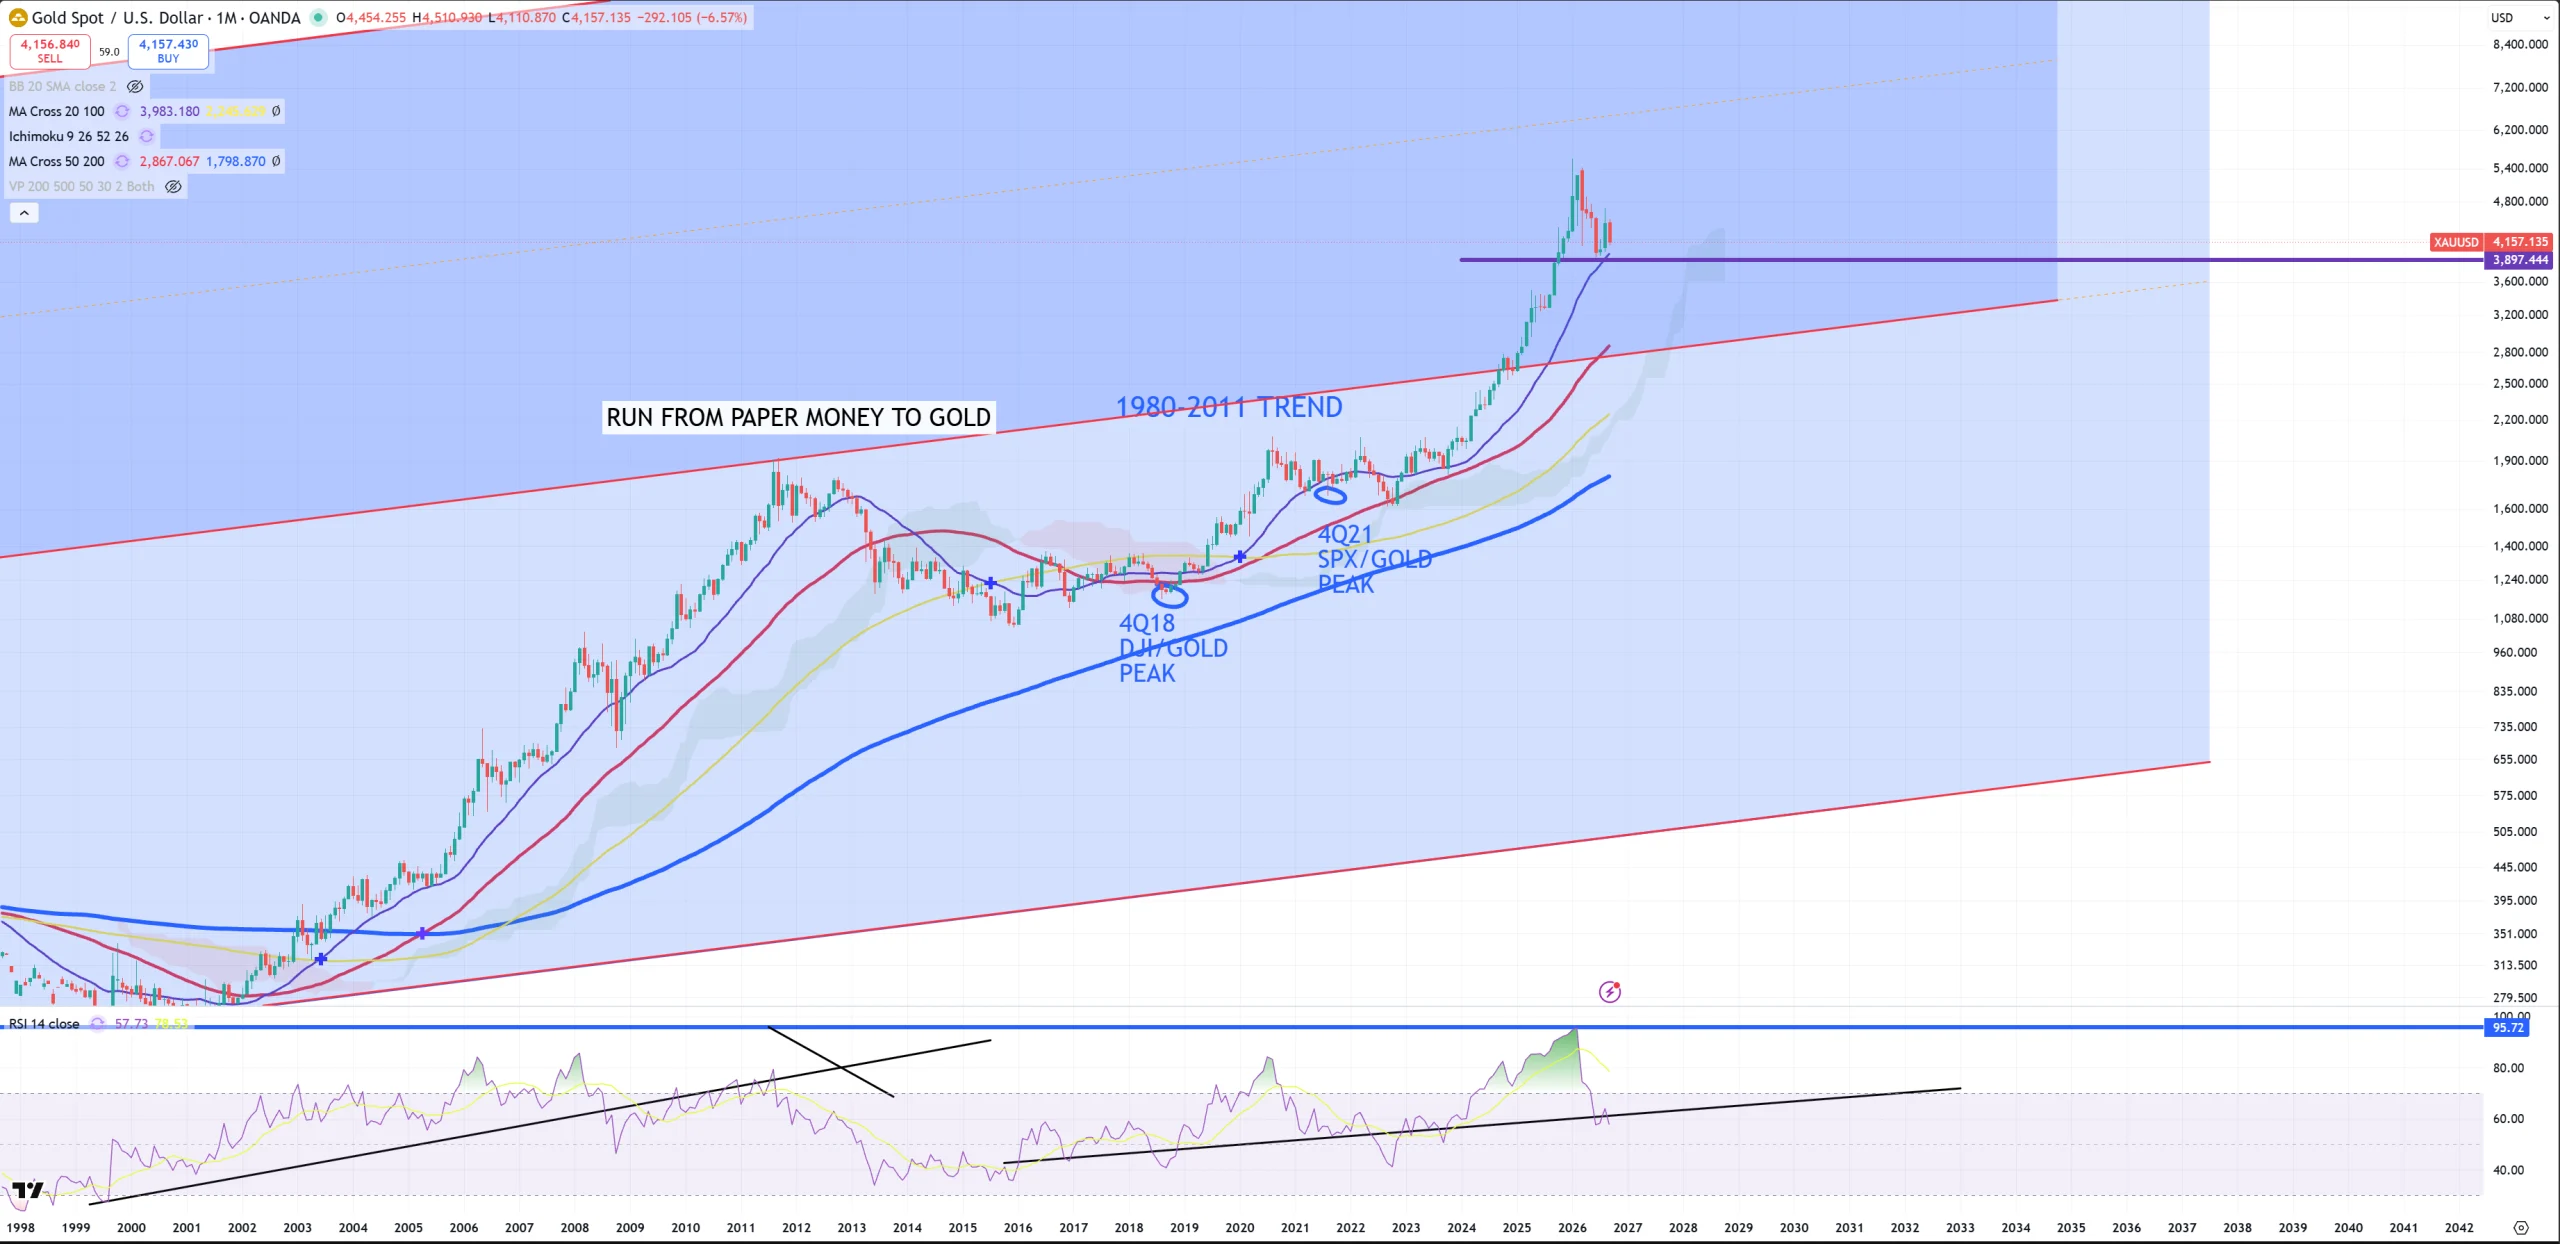
GOLD – violet (M)MA20 needs to hold = ~4000$
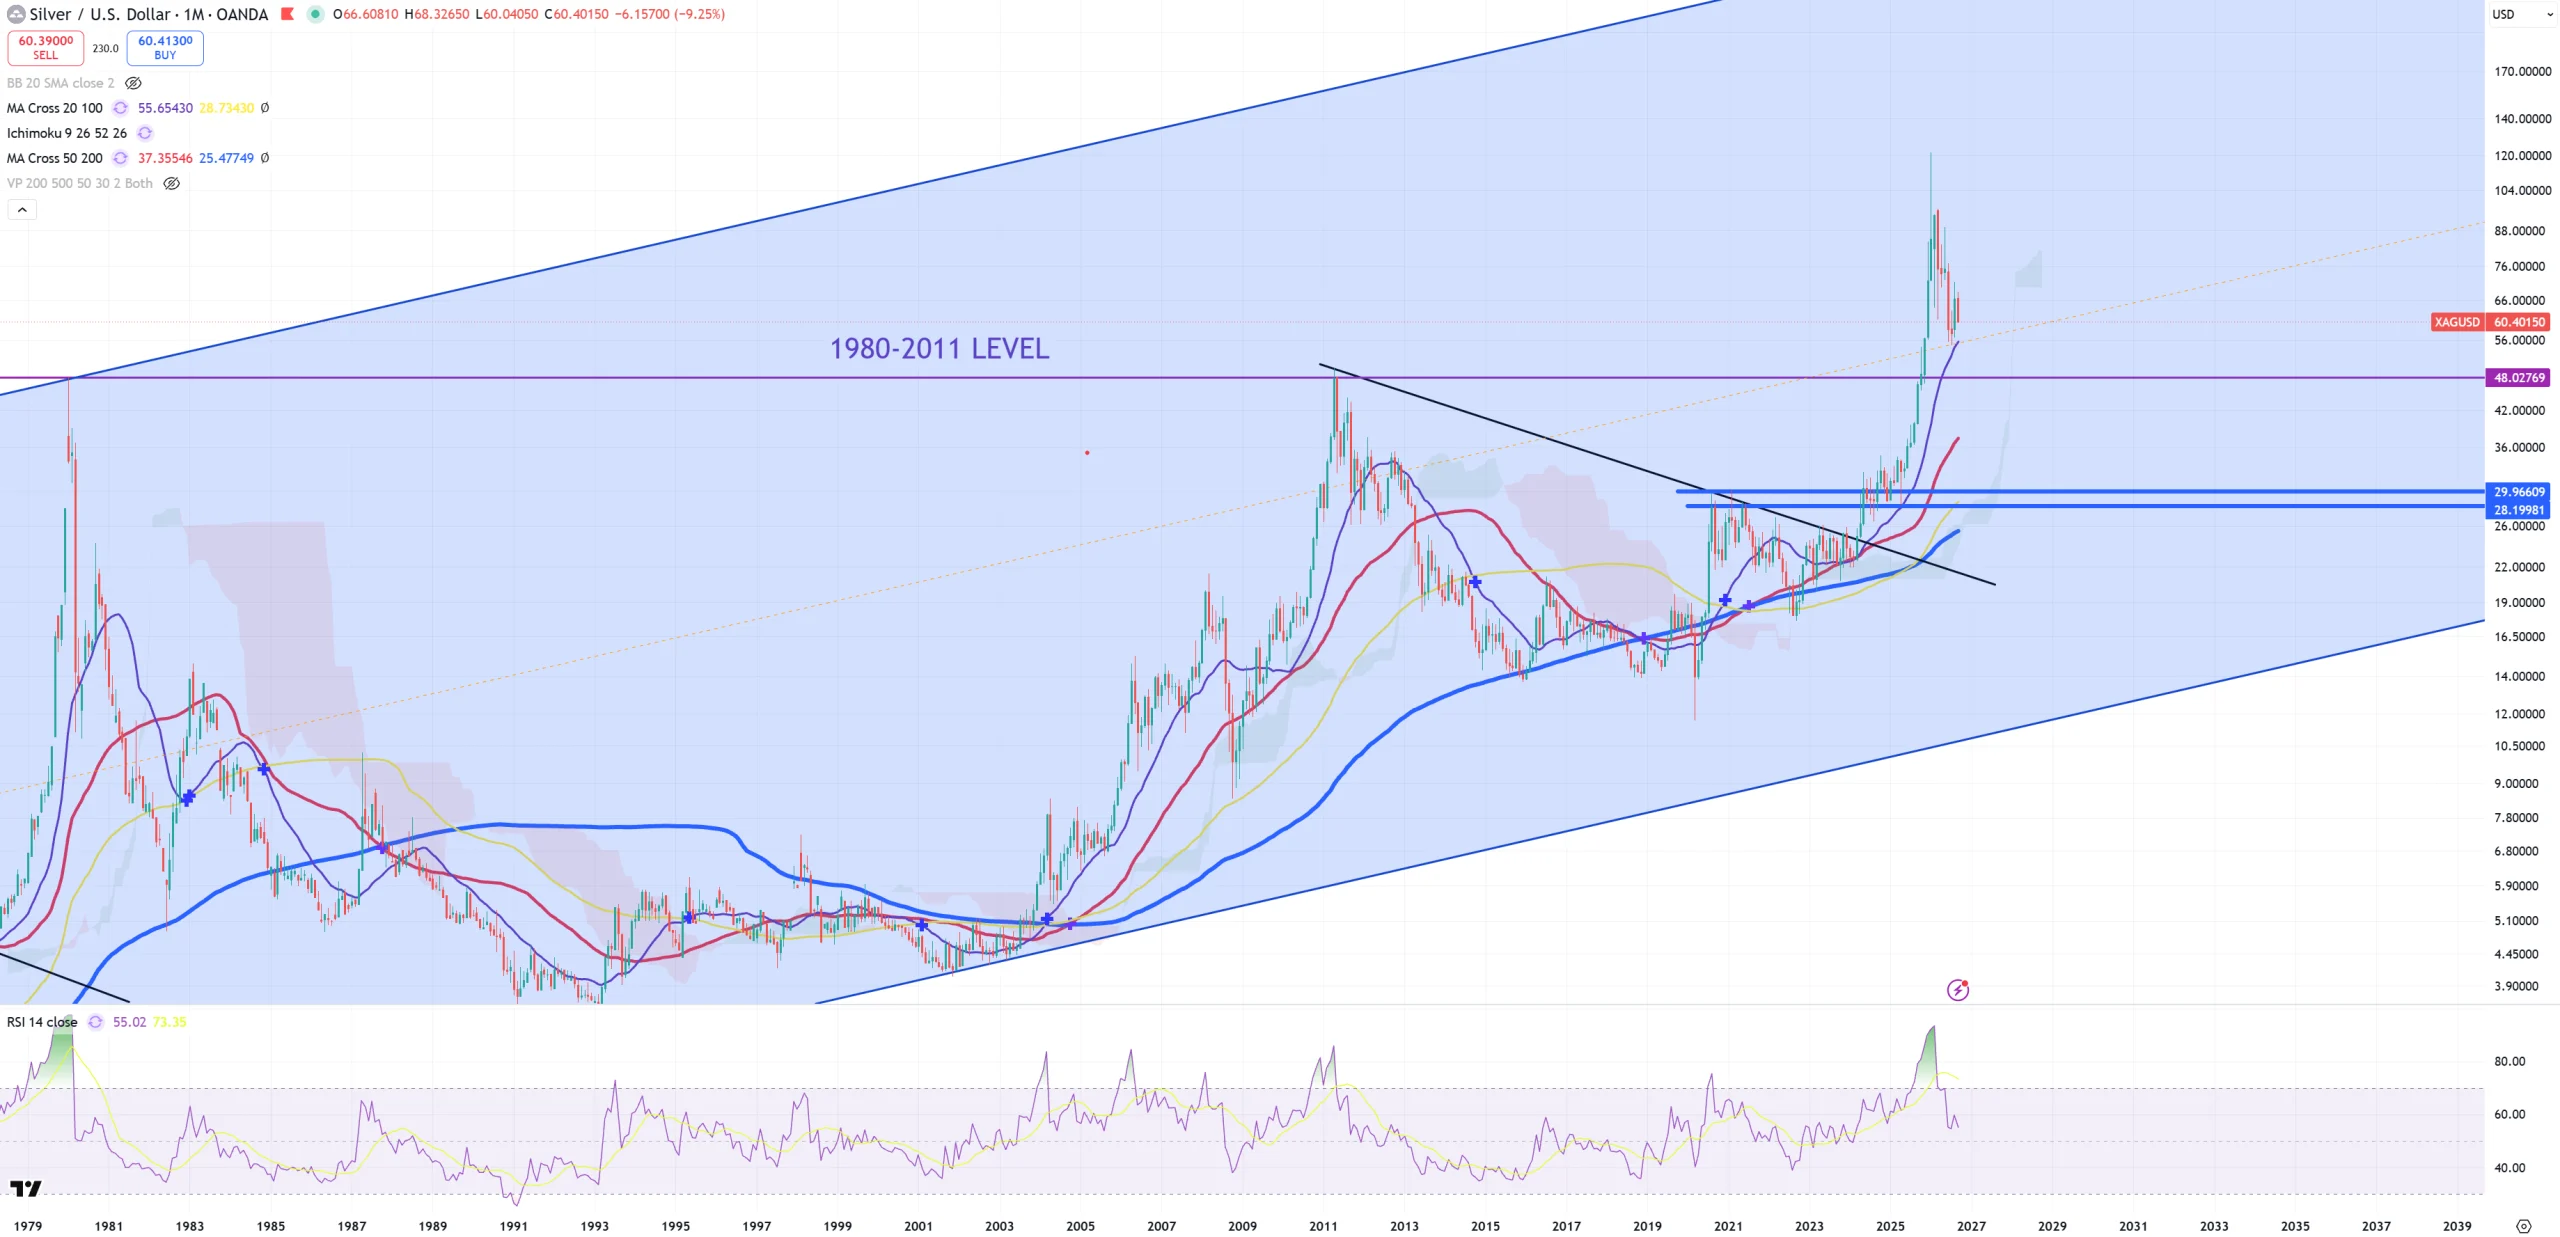
SILVER – same as GOLD = 57$ but lower support 1980-2011 sits on 48$.
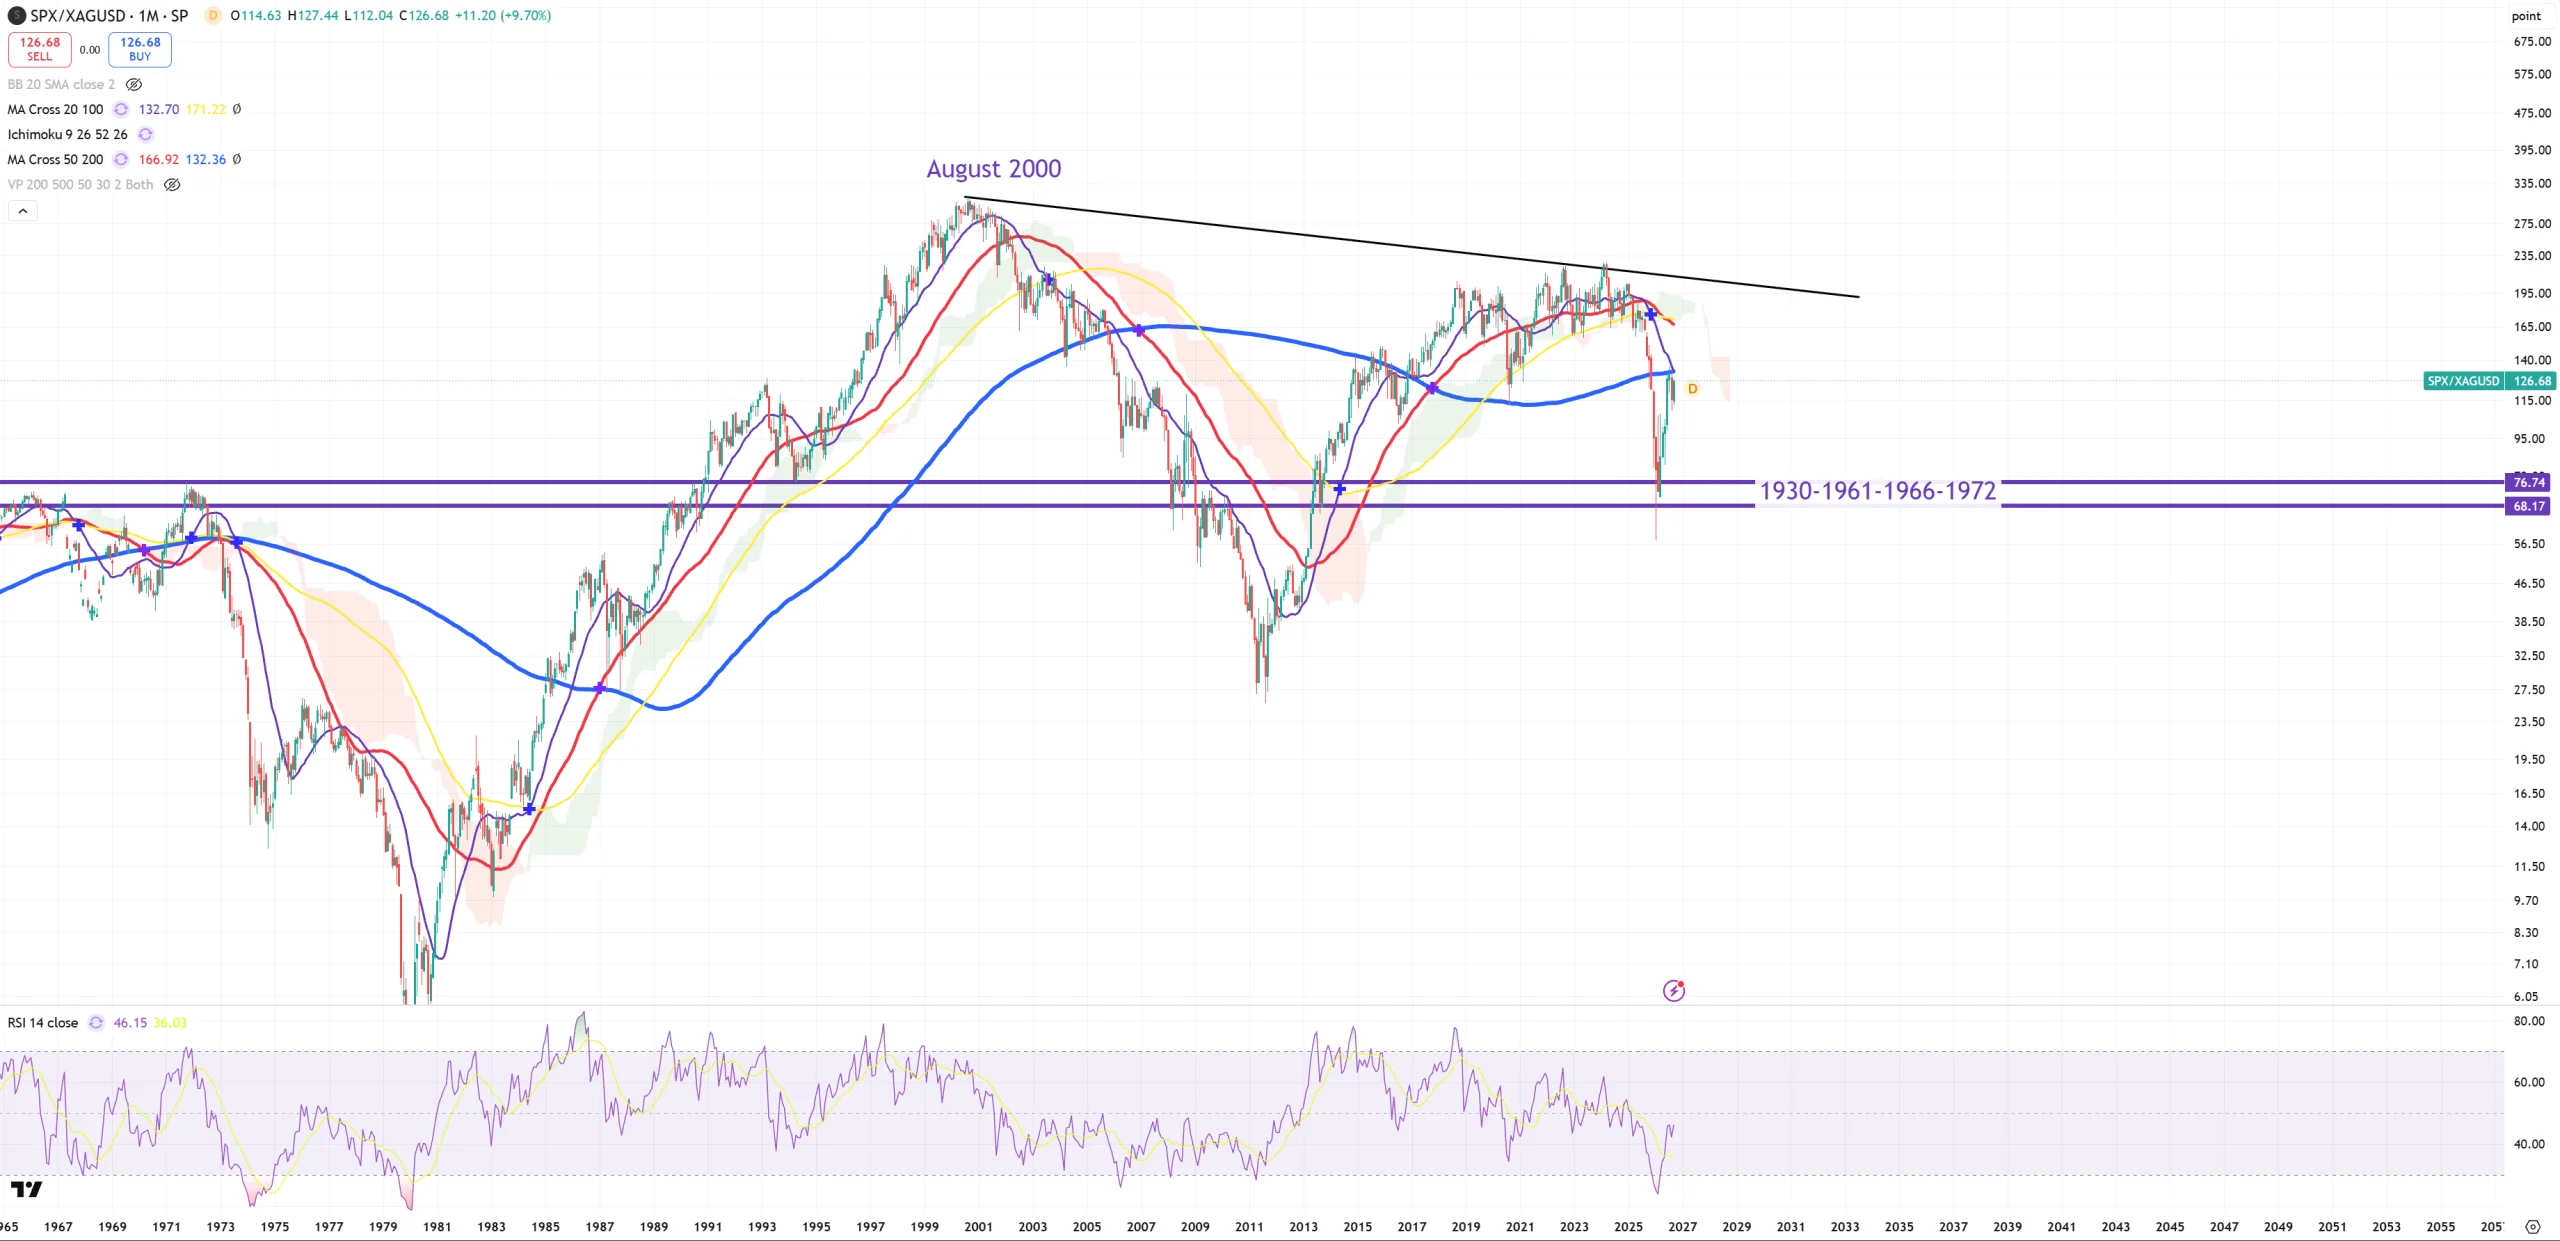
SPX/SILVER – 1930 support holds.
DJI/SILVER – also 1930 support holds.