Bull market correction or bear market? Here’s my thesis
November 13, 2026
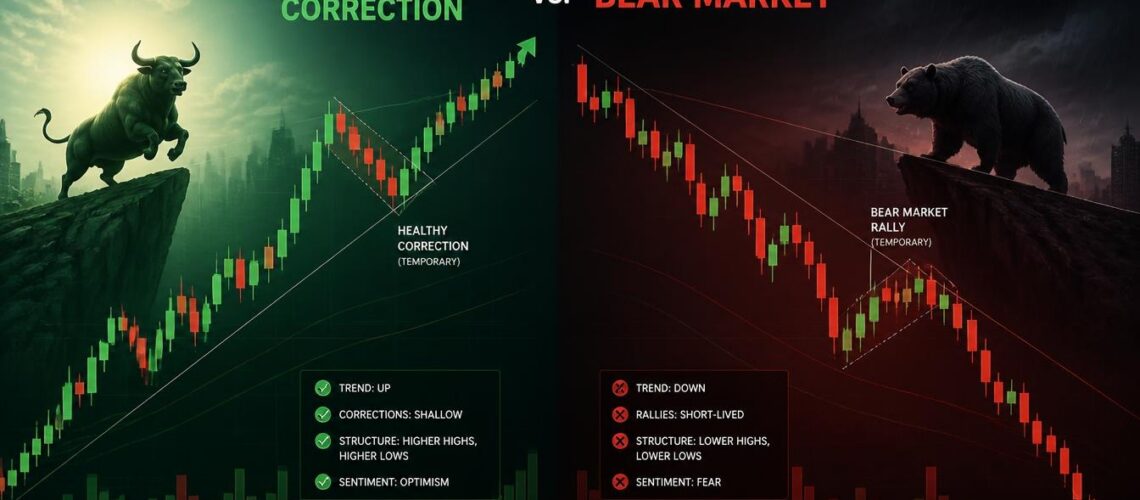
Since years we’ve been told that if -20% drops it’s bear market. I have a totally different view on this thesis and would like to show you, so we can once for good finish the difference between cyclical bull market correction and bear market. Bull market corrections also can have 70%+ drops, as % drop should not be considered as a primary key to identify if it’s bear market.
Here we go :
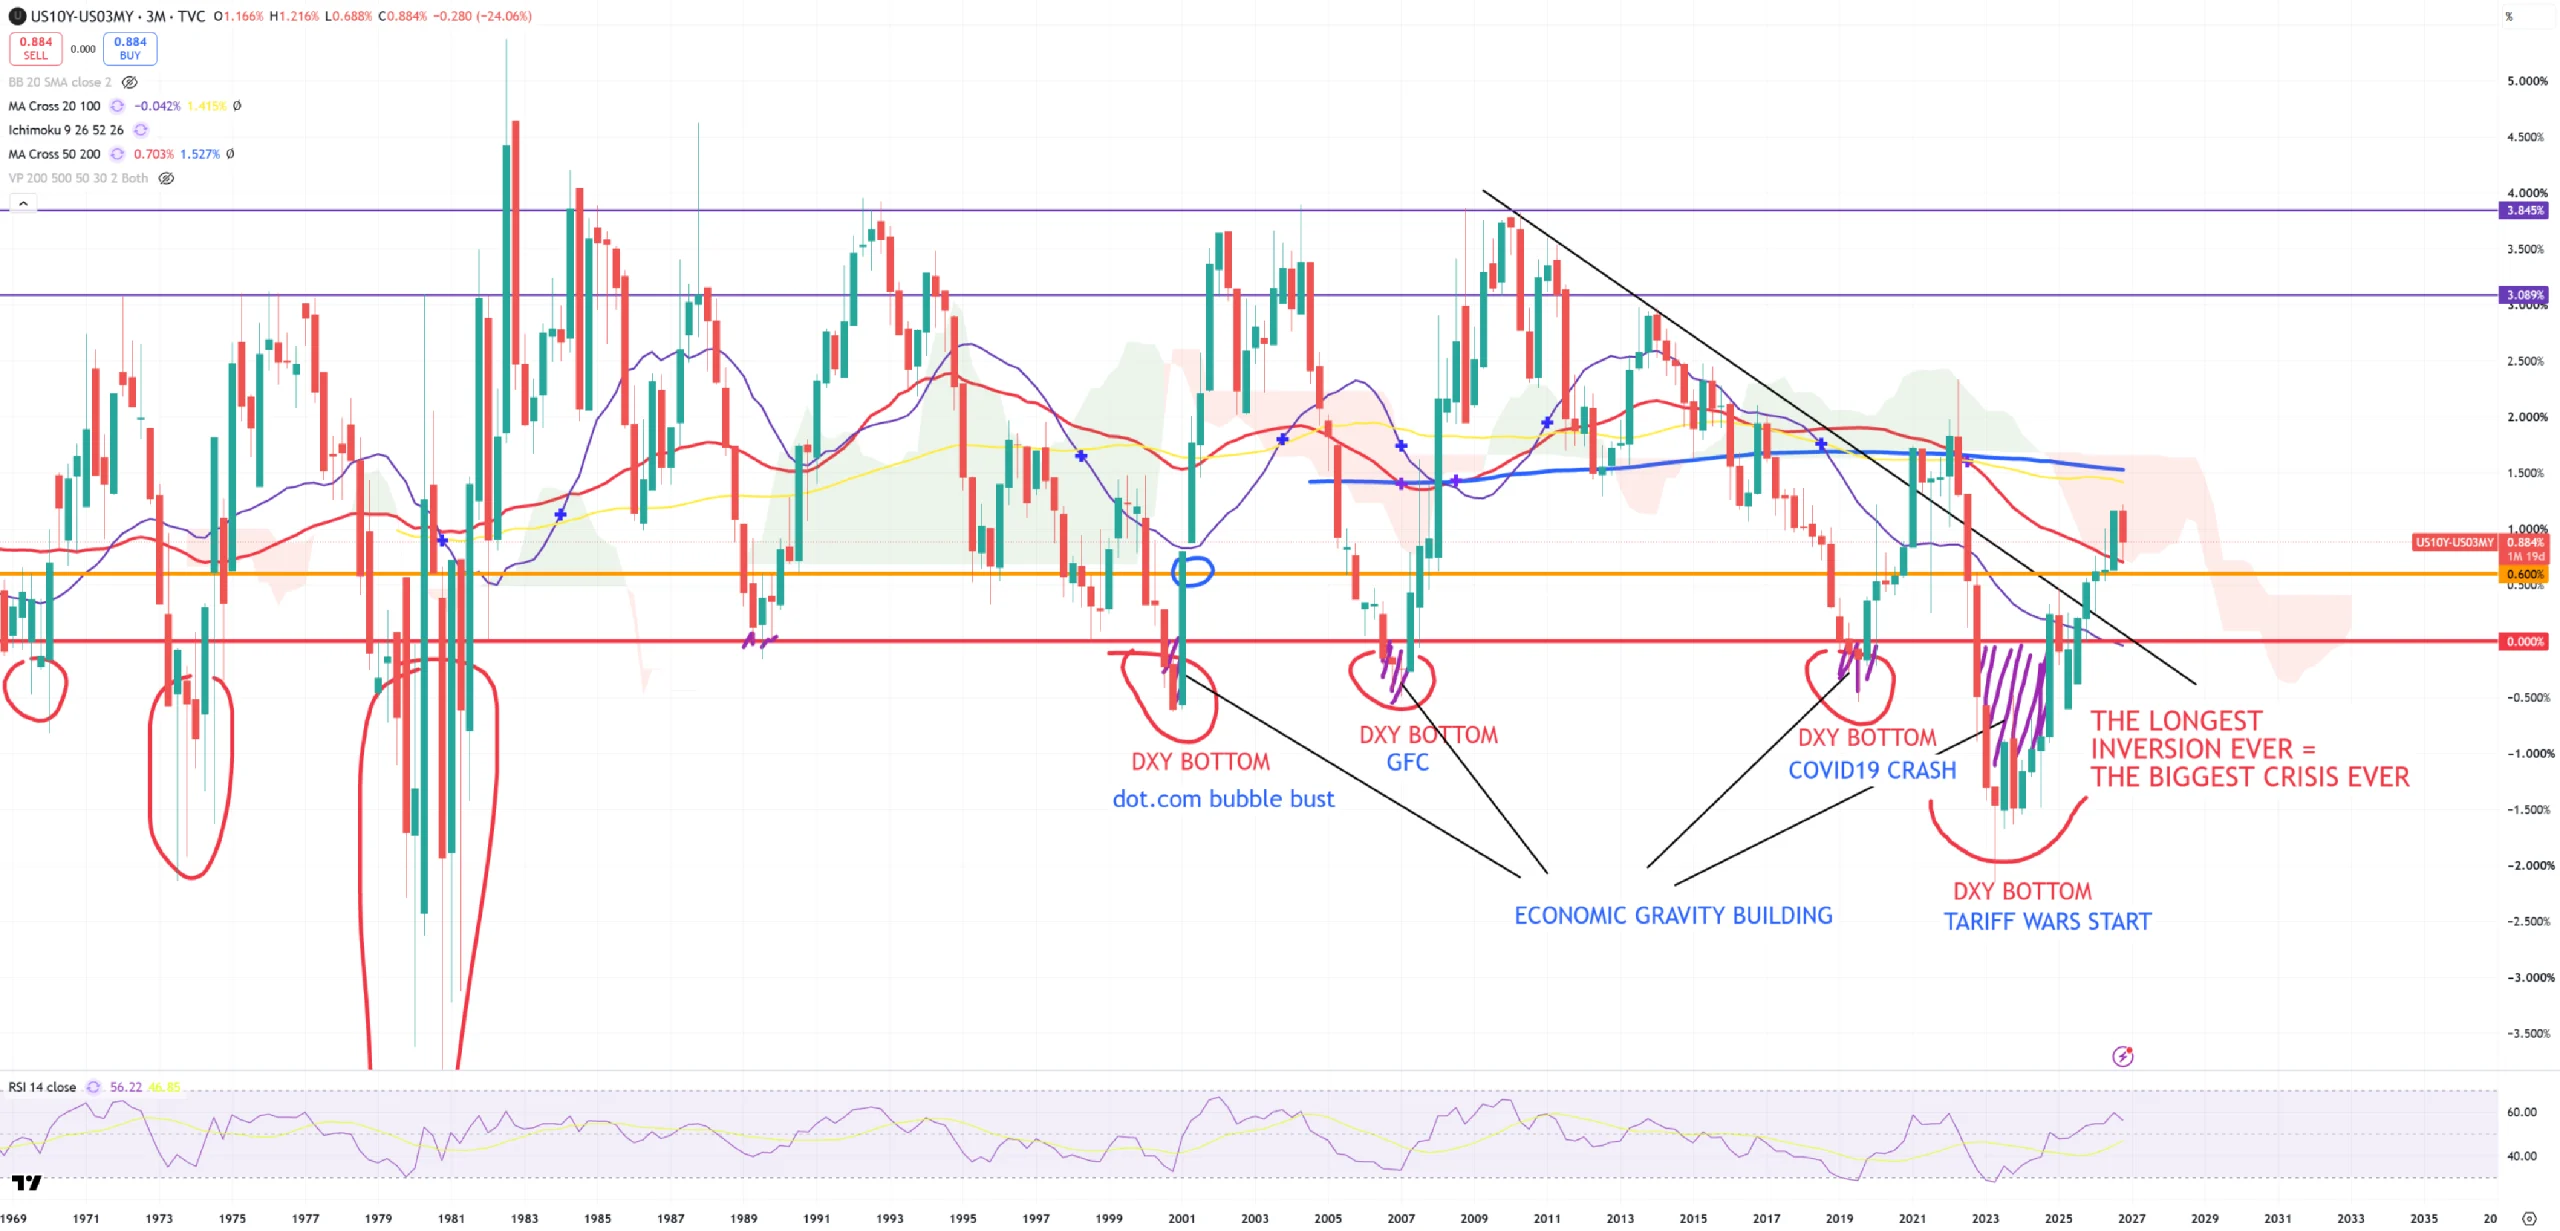
1/ Bear market strikes when 10y/3m uninverts to upper resistance.
This is very important. 10y/3m inversion/uniniversion is like a cycle for stocks. First confirmation of the end bear market comes once this spread comes to the upper resistance around +300-350bps from inversion. My theory says we still live in 2009+ stock market cycle and all drops are bull market corrections.
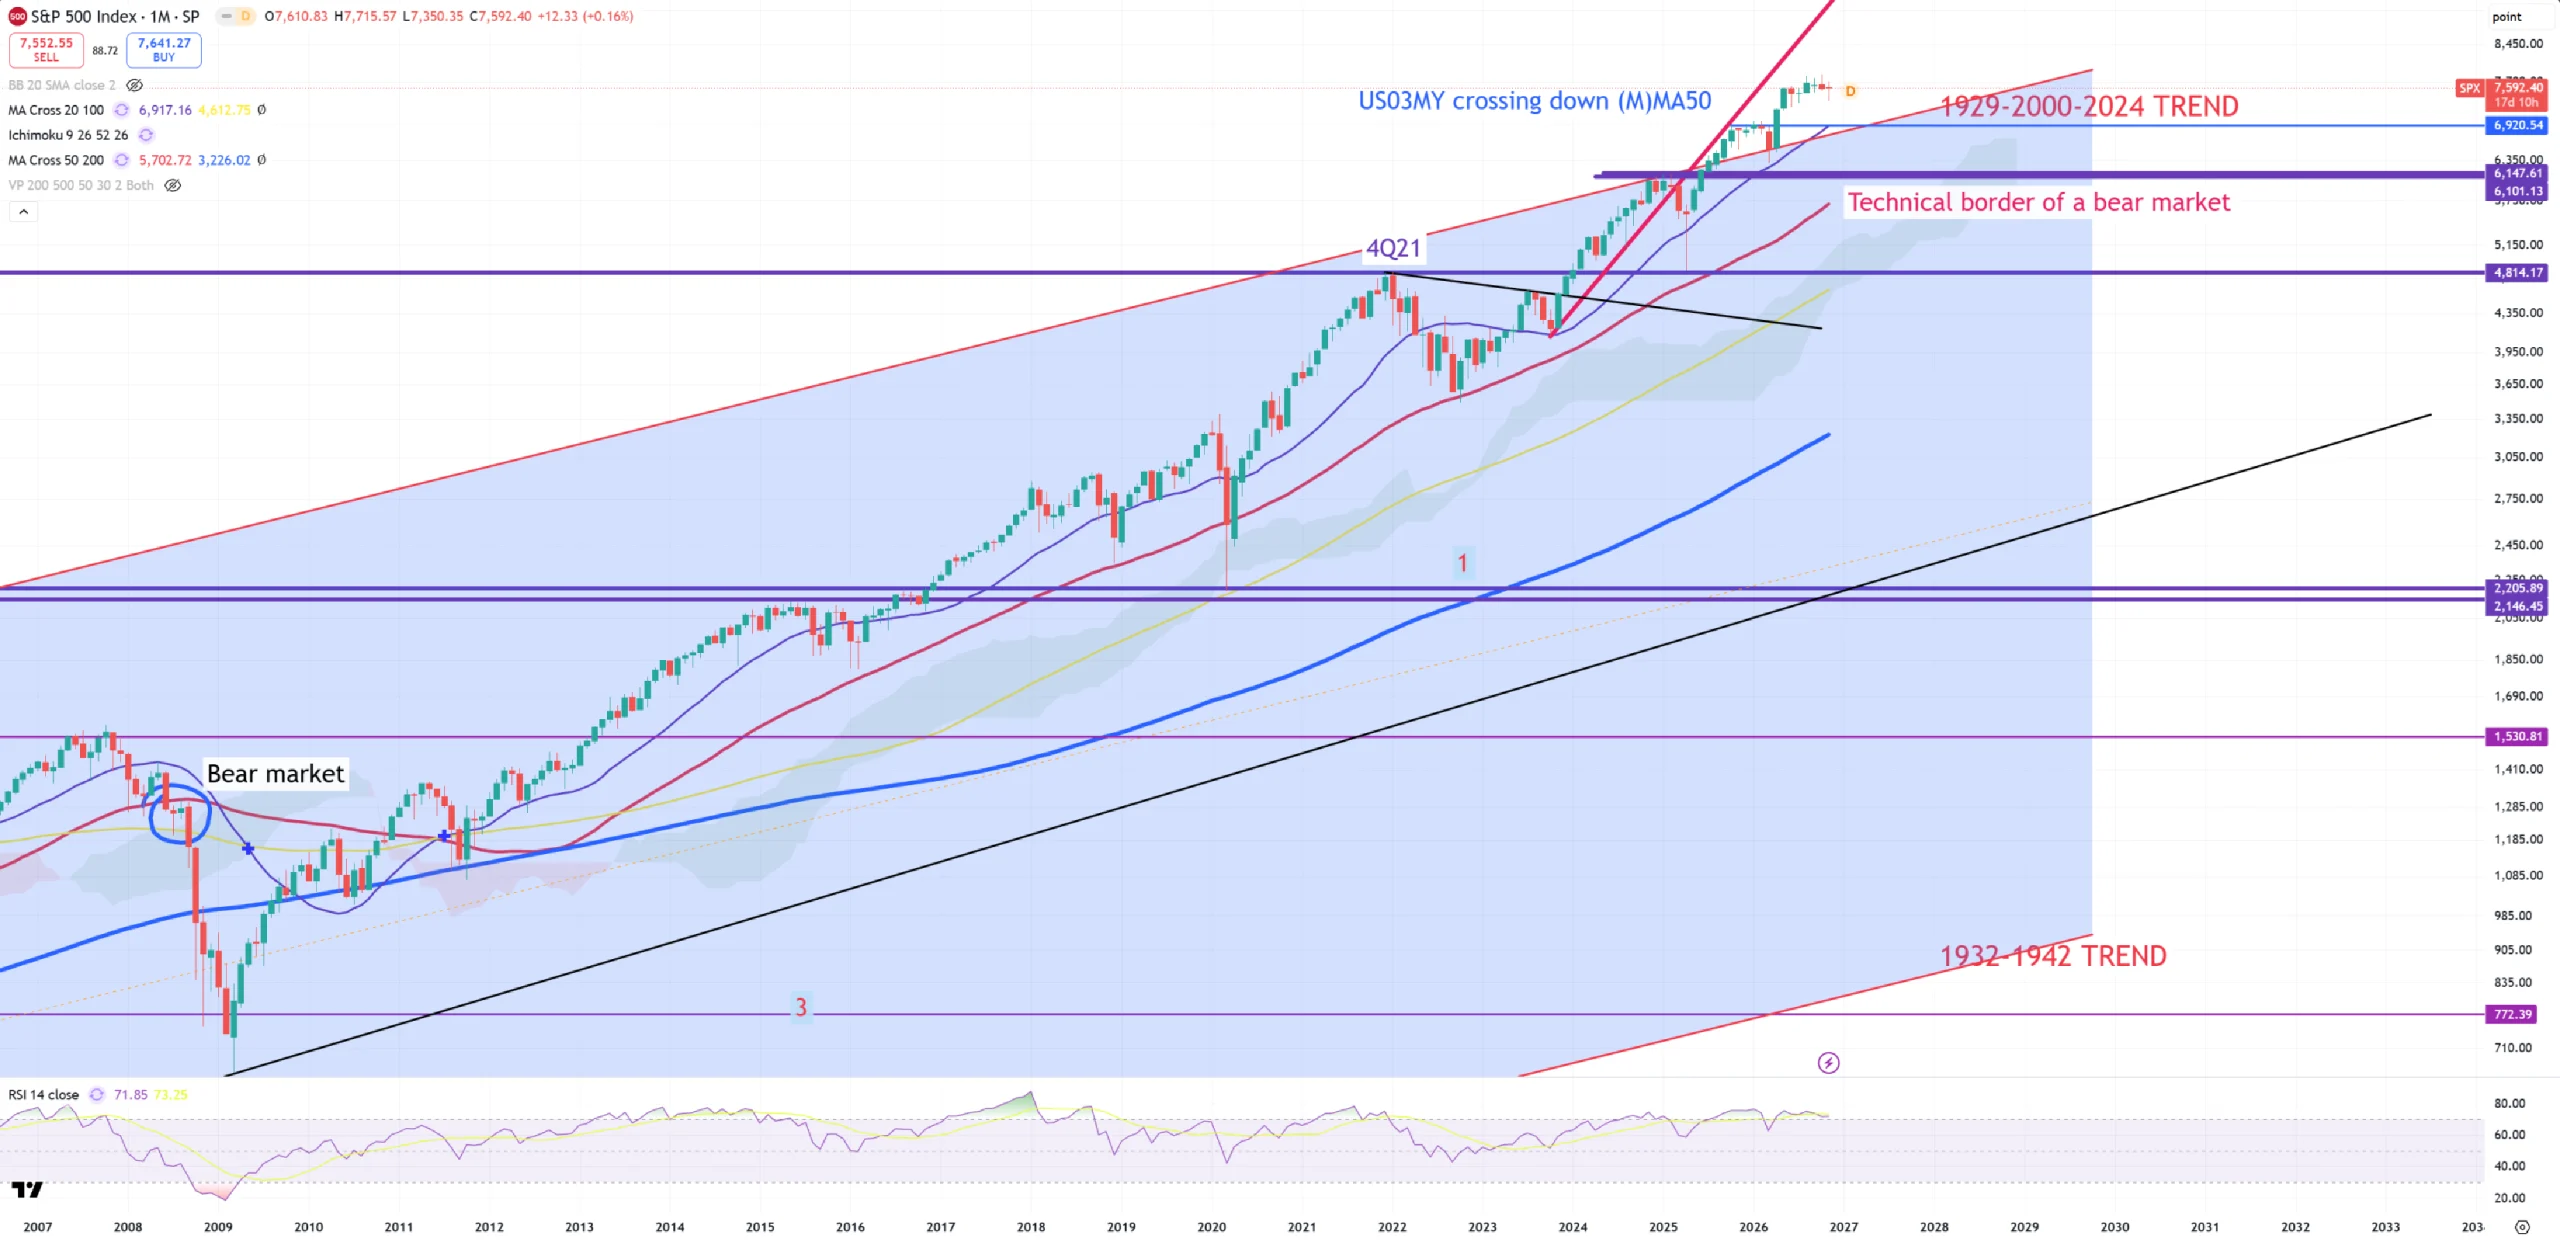
2/ Key indexes breaking (M)MA50 during 10y/3m uninversion process.
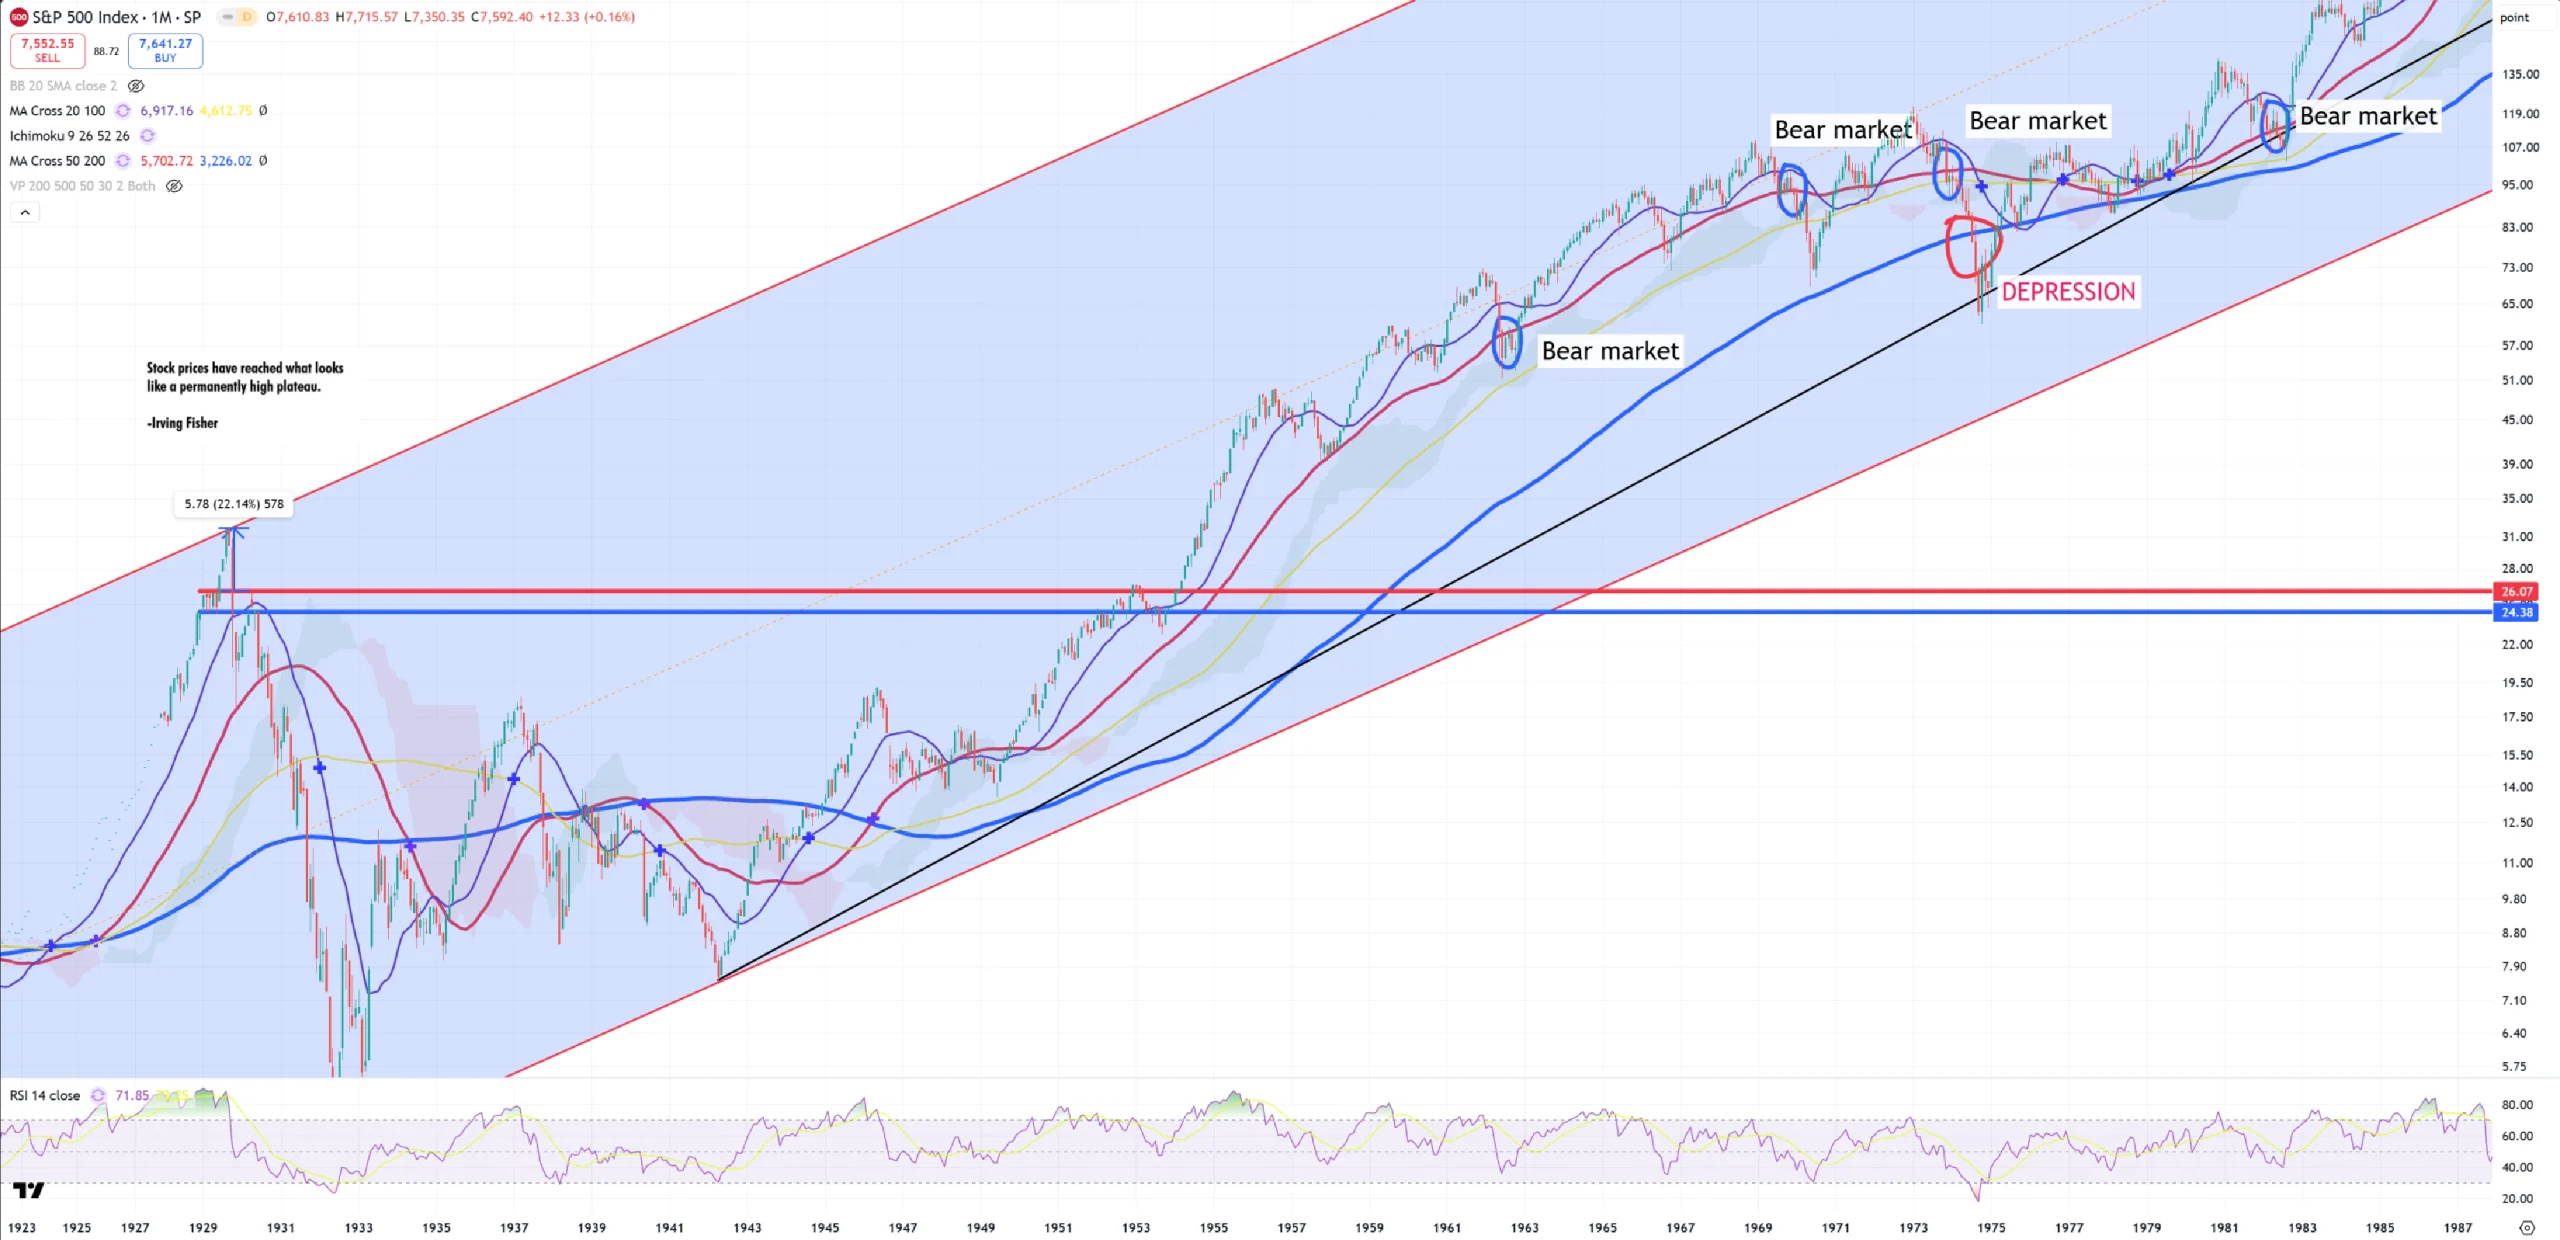
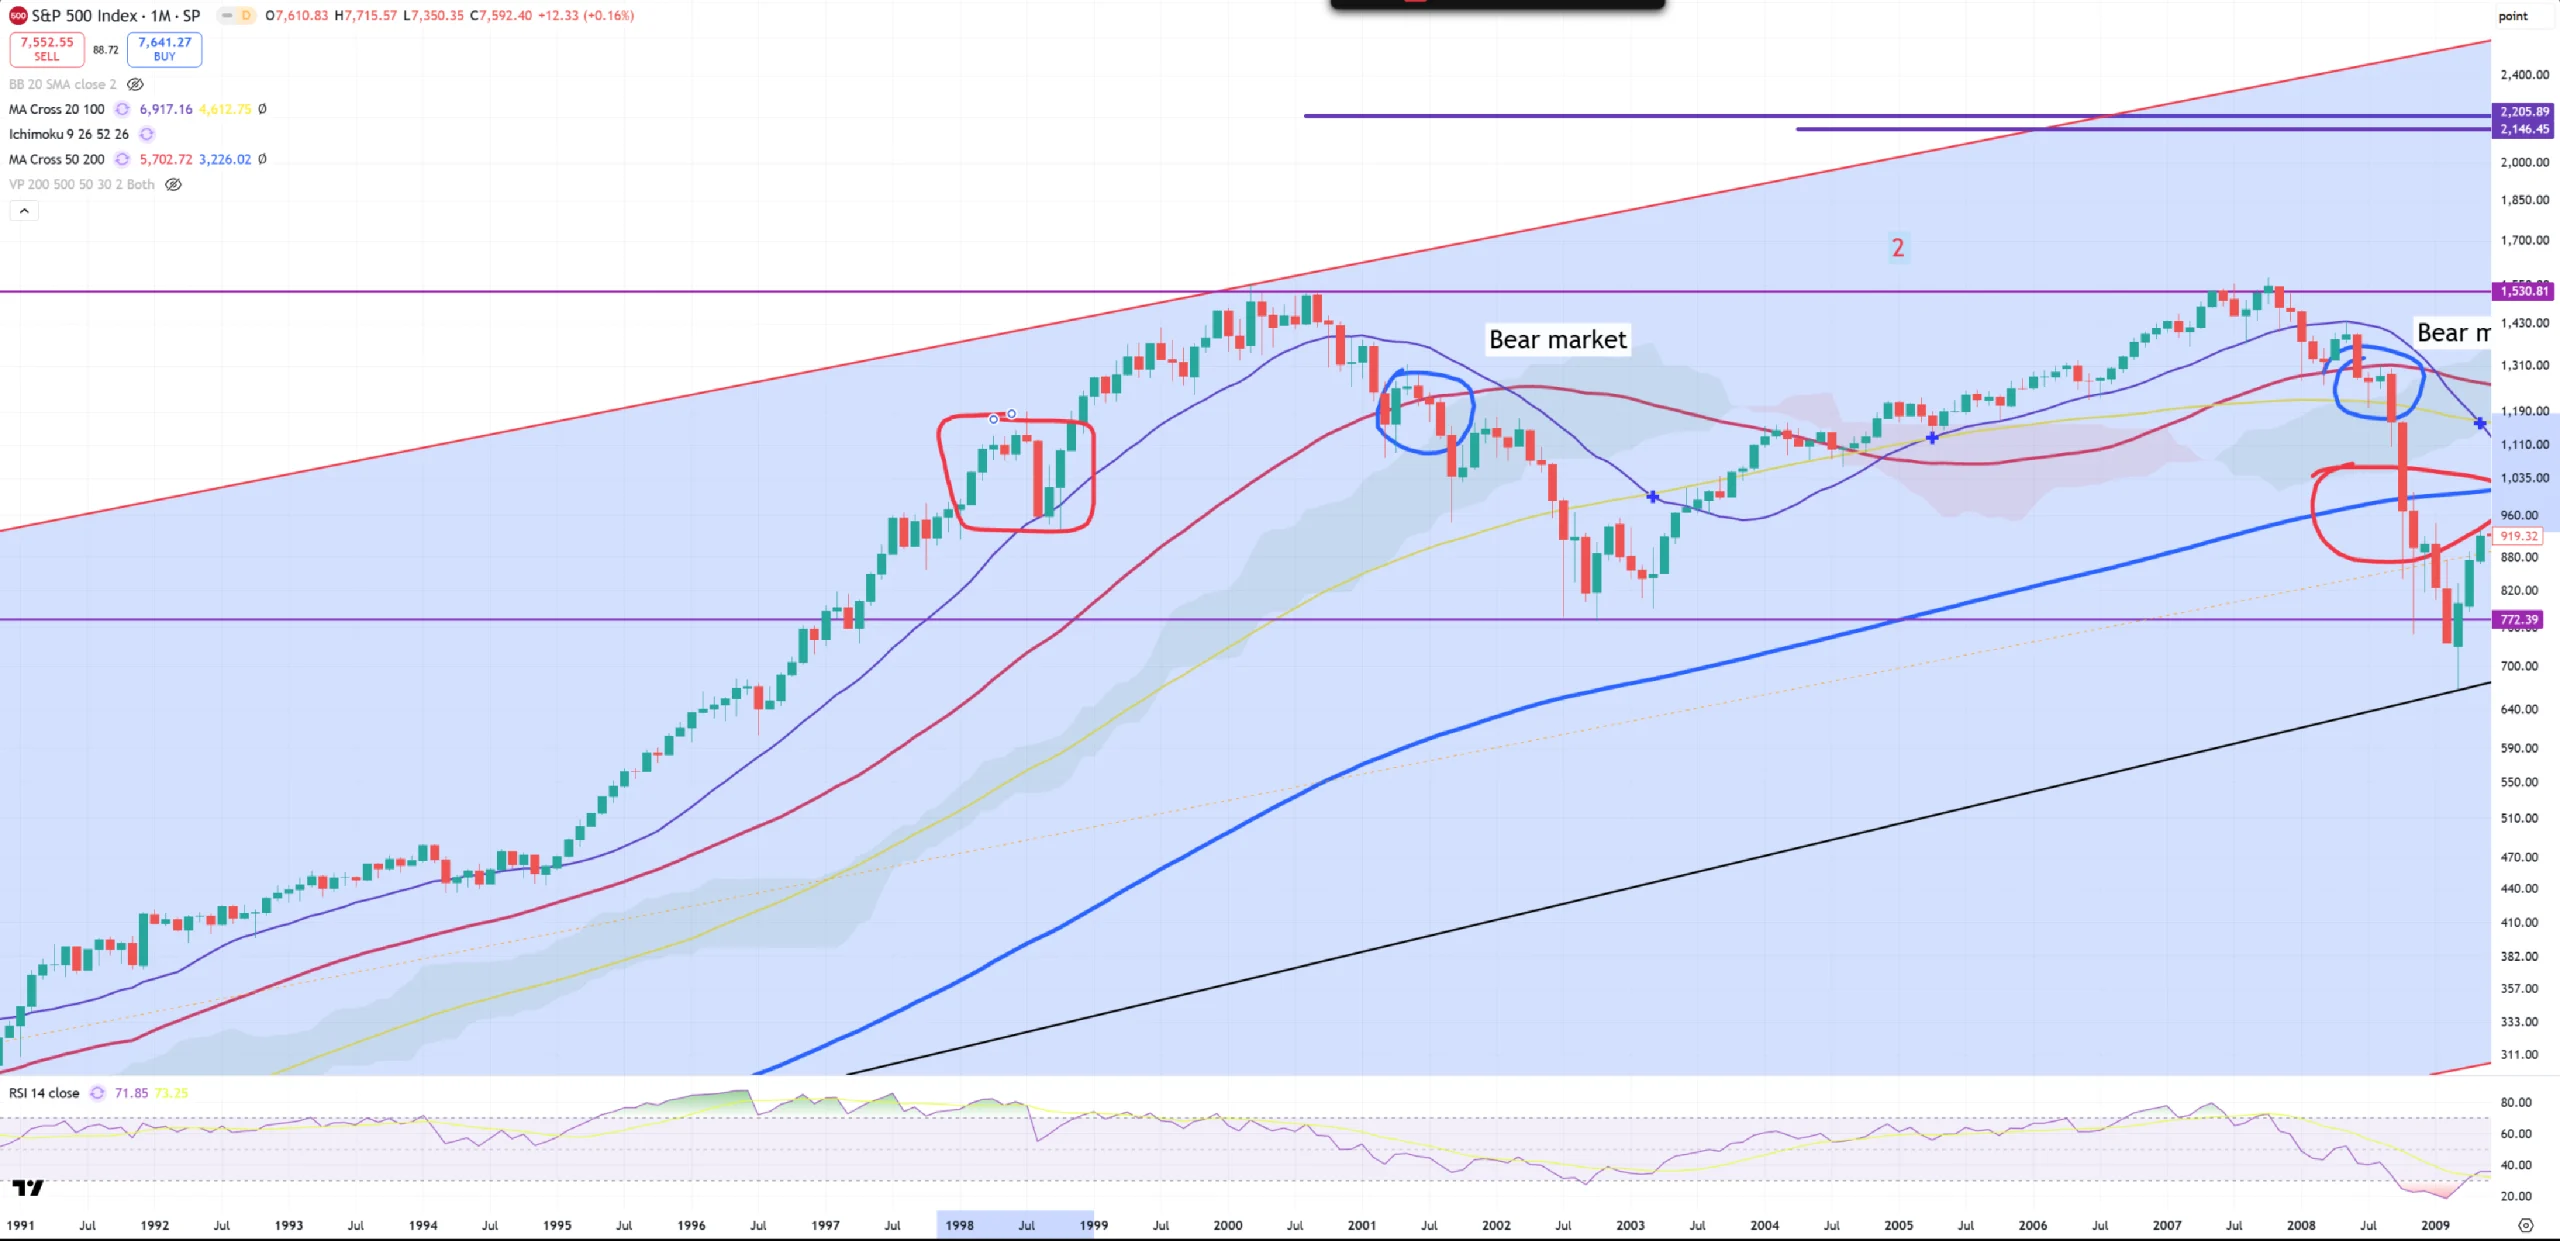
That’s our 2009+ run. Do you see any red (M)MA50 break? I don’t see any. We were really close in 2020 but it didn’t happen that time. 2020 was crash like 1987. Look on 10Y/3M – yield-curve was uninverting and around 2022 flattened back to inversion without reaching 300-350bps. That was another cyclical bull market correction. You can see 2008 break of (M)MA50 -> that was our last bear market.
3/ Bear markets vs Depressions
We know that 2008 was a bear market which hit rare definition of depression breaking blue (M)MA200 (2008, 1974, 1937, 1931) Yield-curve 10y/3m inverted and uninverted until 300-350bps+ where bottom hits of the stock market. Let’s see others. We see 2001 and earlier 1982, 1974 (depression), 1969.
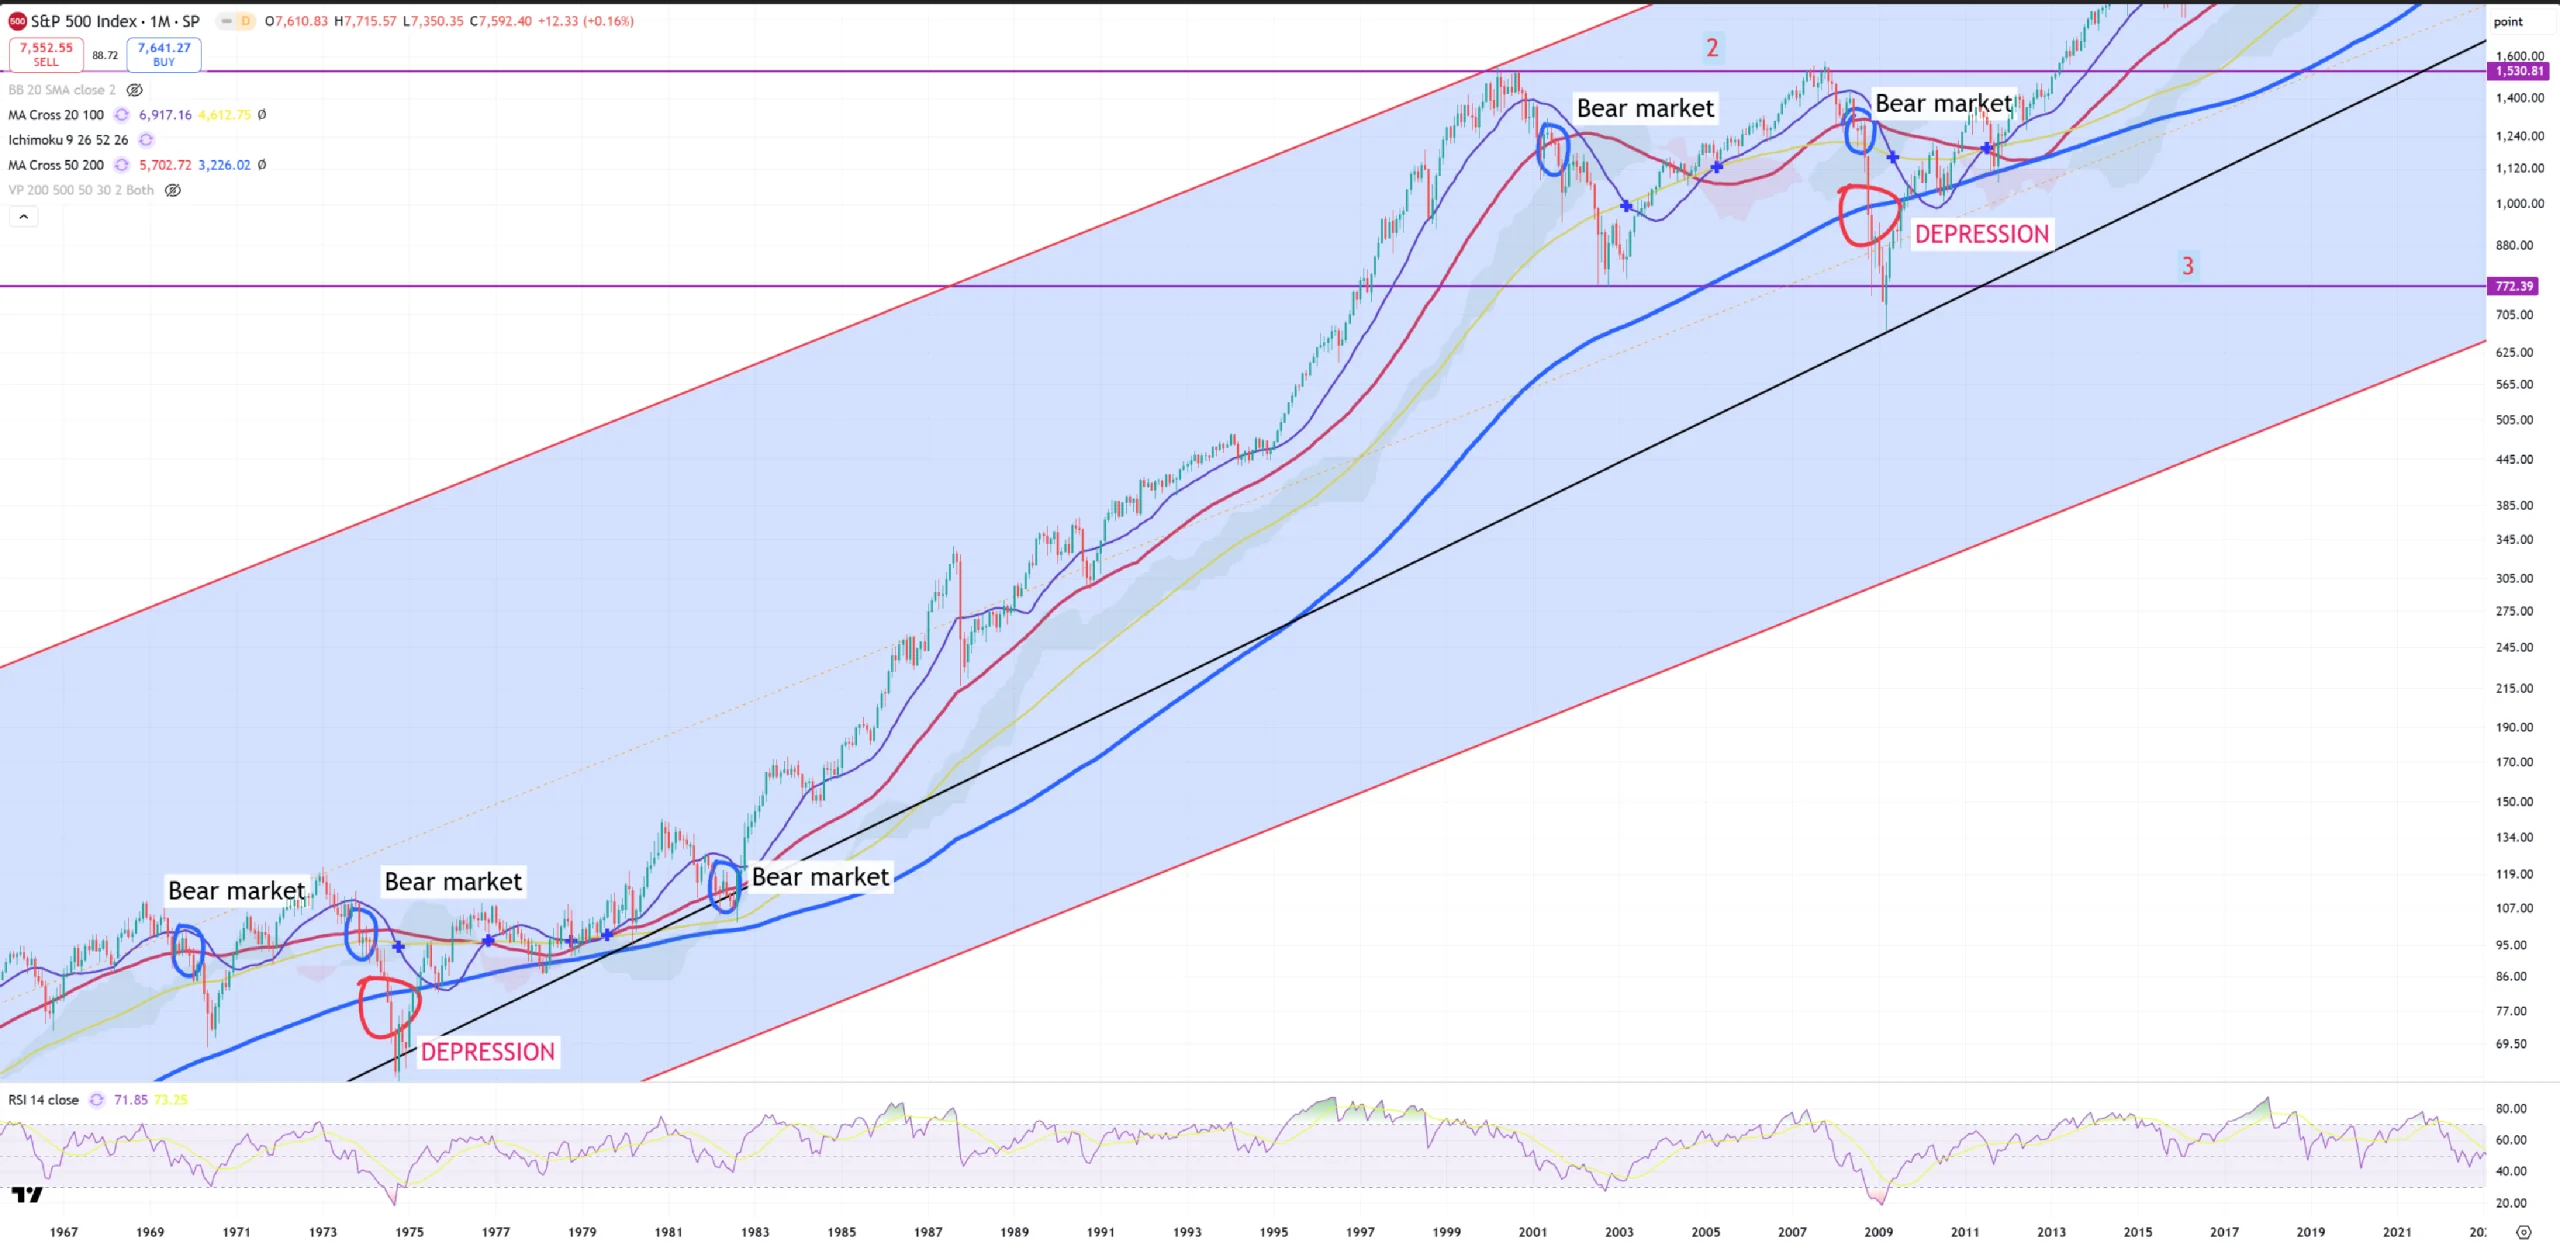
Earlier 1960. And we can stop here because since 1929-1931 crash we were living for a long period of time below blue (M)MA200.
4/ 1998, 1990, 2020, 2022 – were not bear markets
In analysis 1990 is an official recession, but 10y/3m was just around 0.00bps, but uninverted fully to +300-350bps, but market did not break (M)MA50. From technical point of view it was the same type of drop like 1987, but 10y/3m confirmed full reset of the stock market cycle reaching +300-350bps. That was very rare recession without (M)MA50 break.
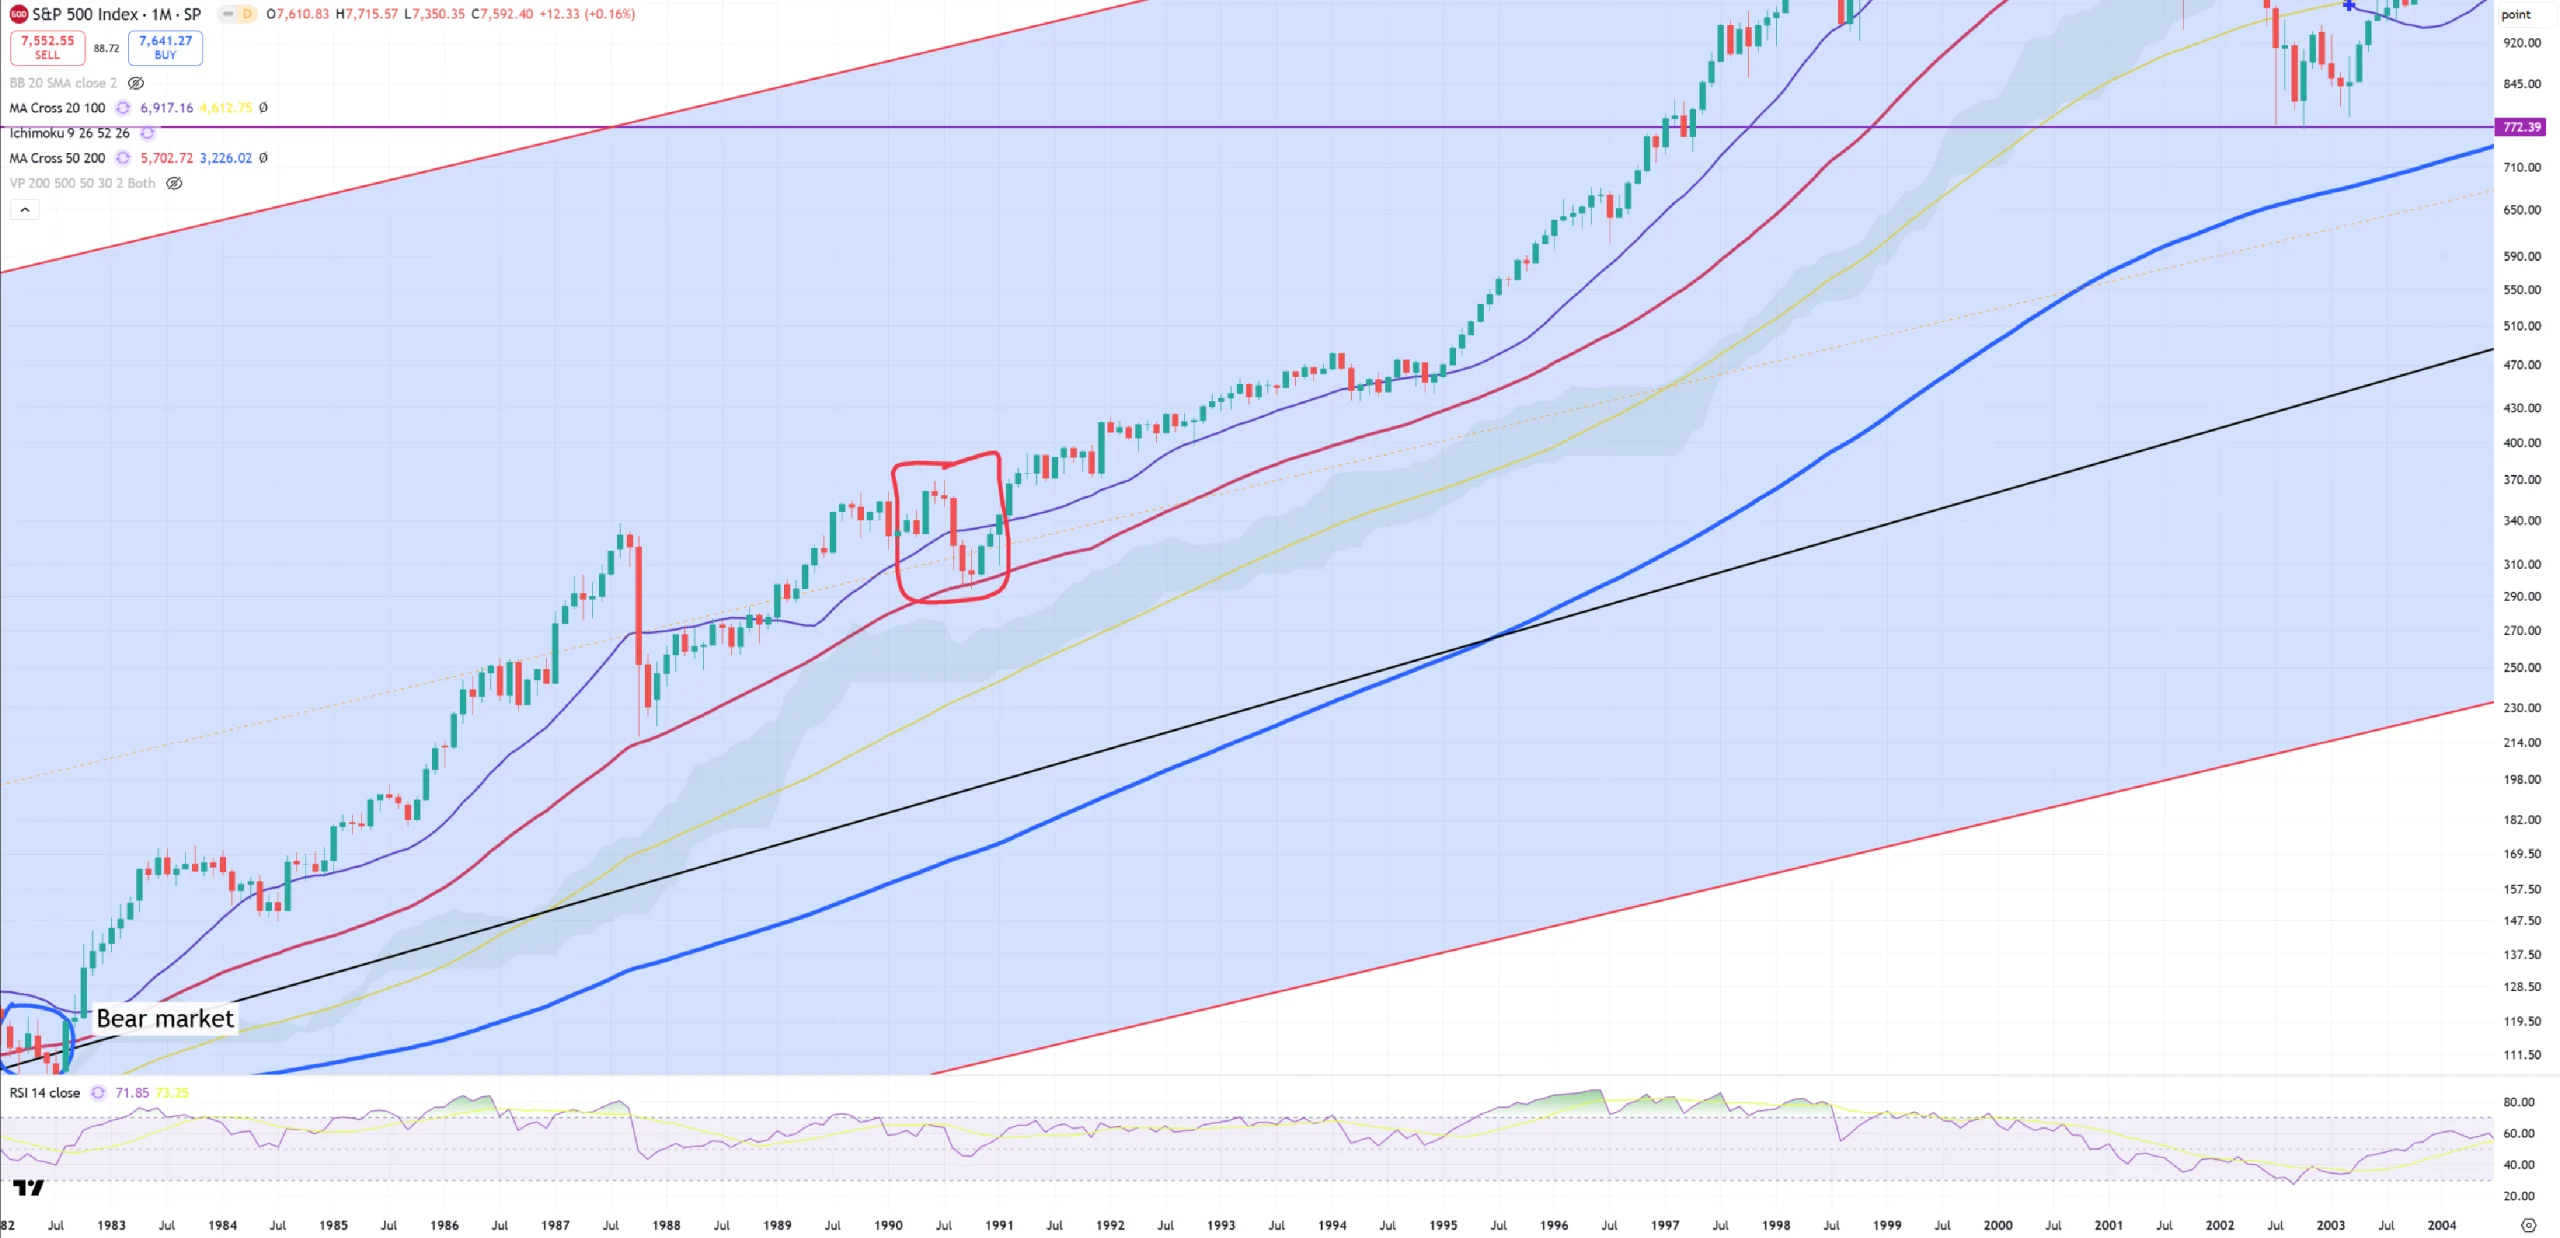
Famous 1998-1999. That was just a small correction to just violet (M)MA20 -> high momentum bull market border. Nothing extraordinary. During that time 10Y/3M was NOT even inverted.
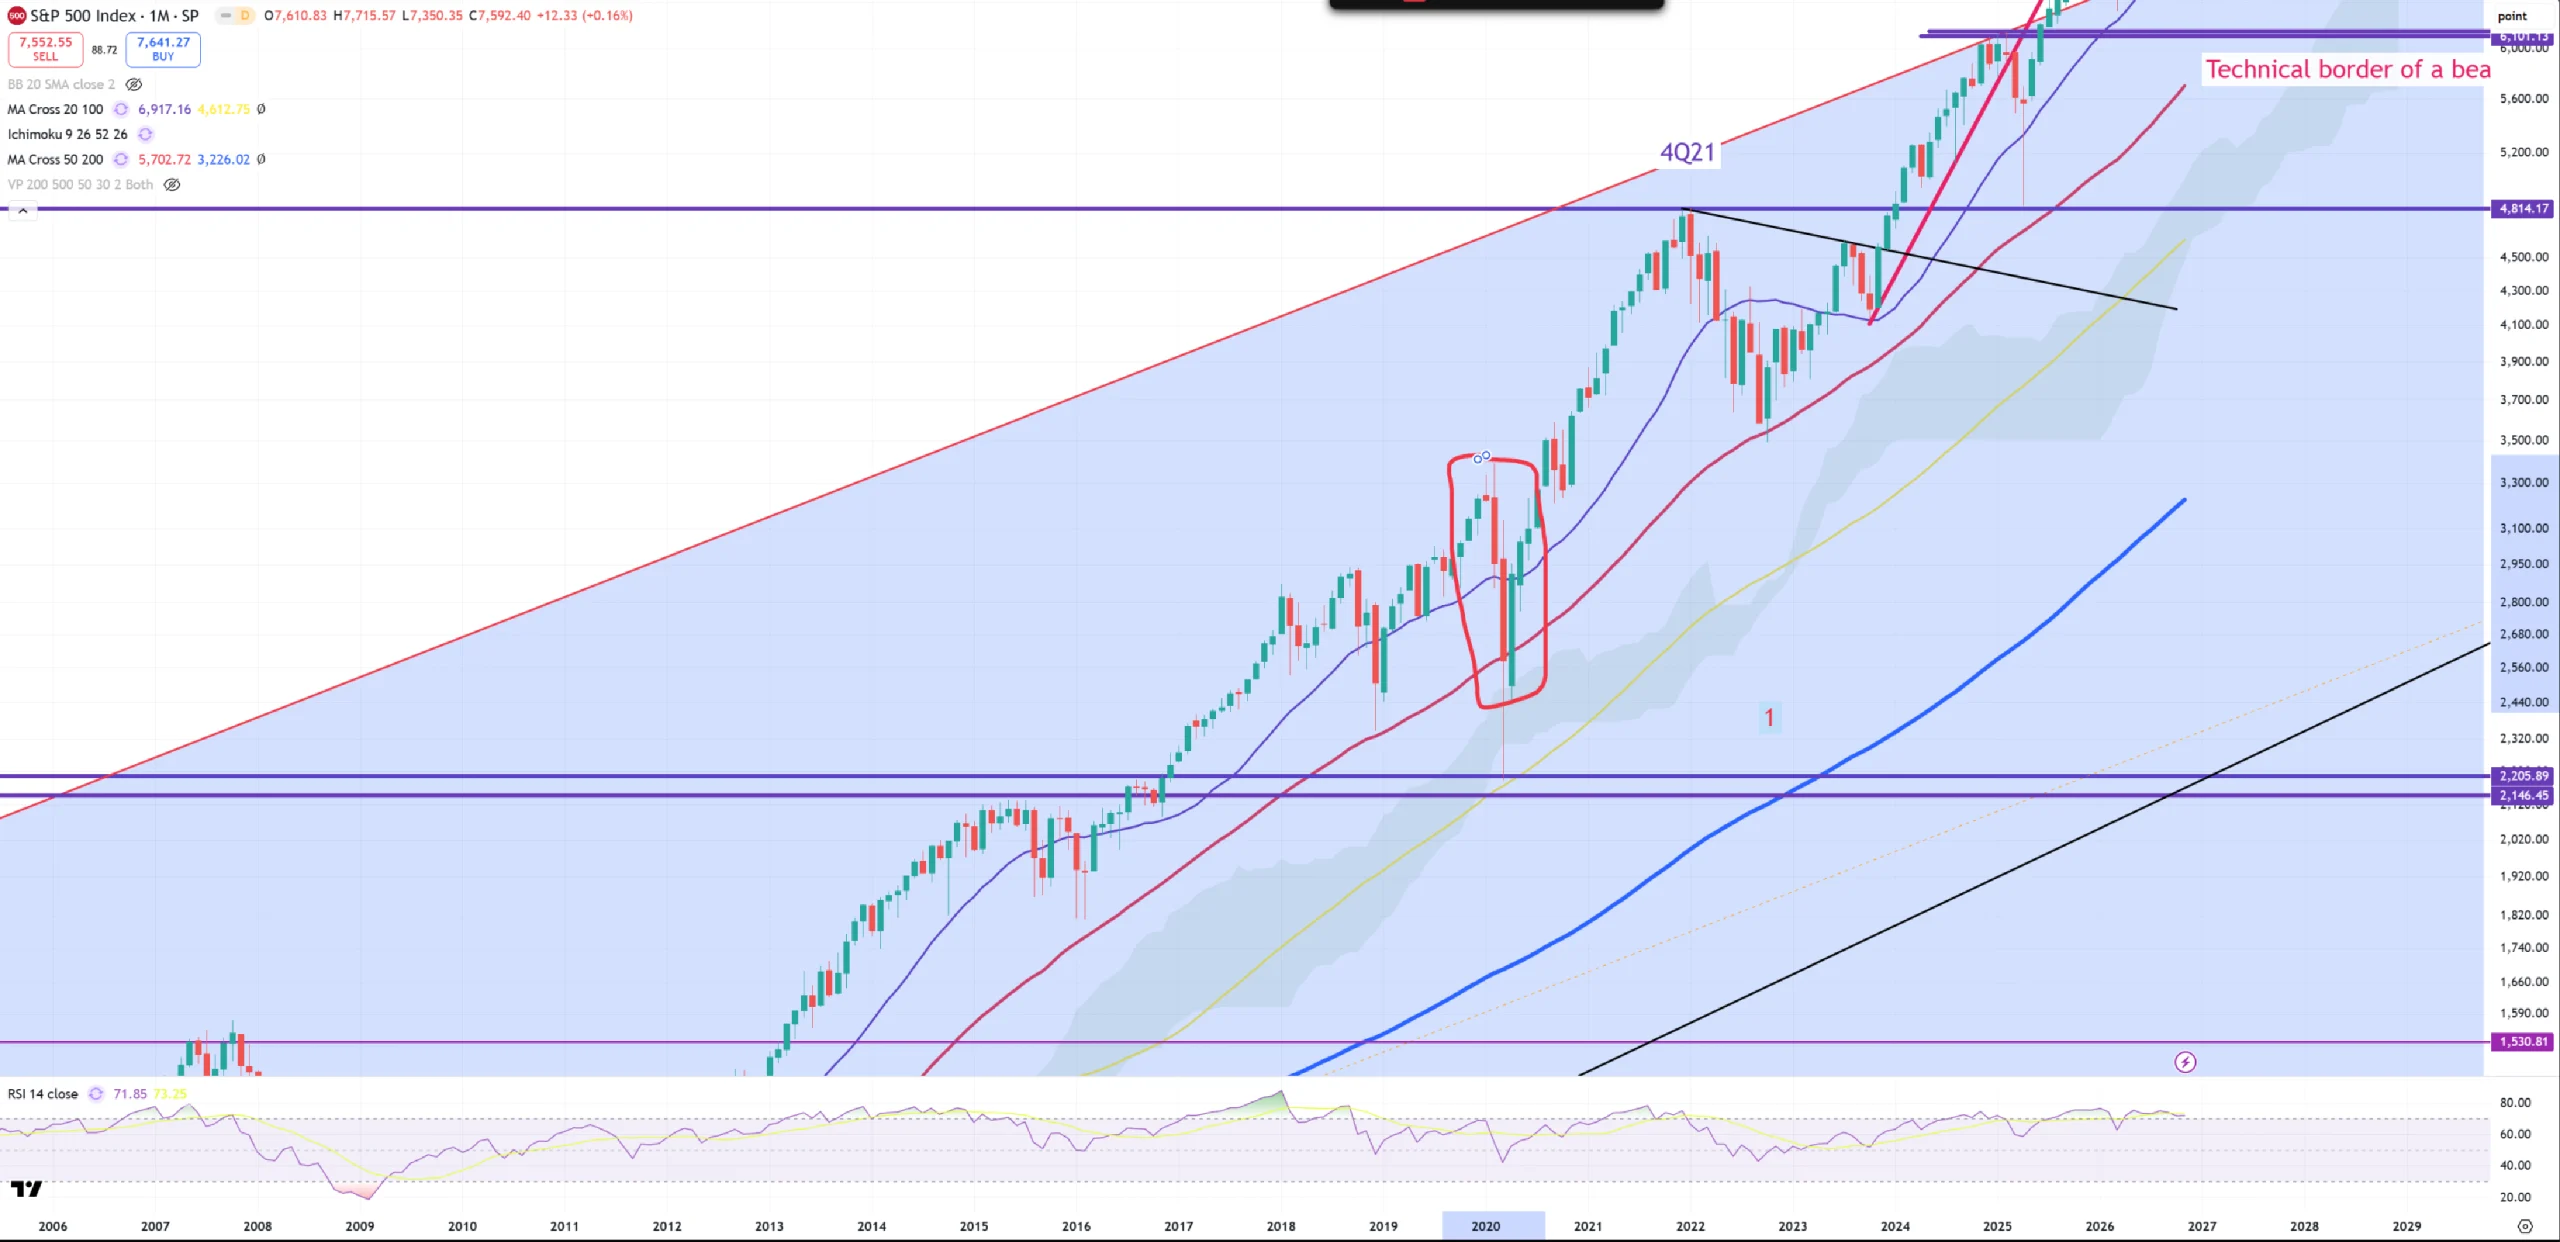
2020 COVID crash – had same effect as 1987. Just crash. True 10Y/3M WAS inverted but it didn’t uninvert to 300-350bps, a bit later you can see 2021-2022 correction also stopped on red (M)MA50. From that moment 10Y/3M crashed from +250bps to -200bps, while market moved higher.
6/ DEPRESSIONS are built on GOLD ratios charts
Depressions by definition are periods where the economy moves from secular disinflationary cycle to secular inflationary cycle or the opposite. You can see on the charts that since 1982 SPX did not break (M)MA50 until 2001.
Depressions are “SUMMER” (70s) and WINTER (30s). I expect (M)MA200 break is only reserved for depressionary periods.
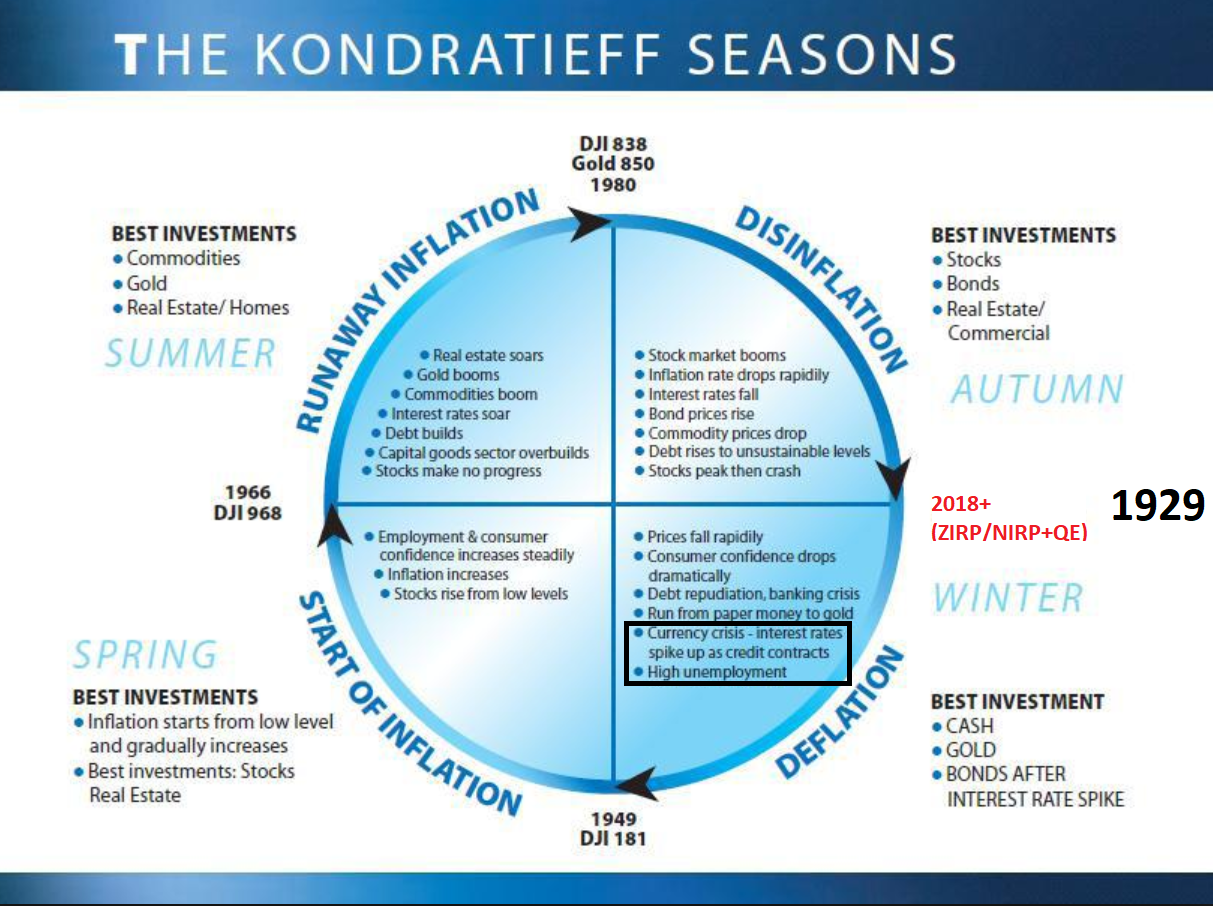
So why 2008 managed to break (M)MA200? The answer sits on GOLD ratios.
DJI/GOLD on (3M) view.
This is the equivalent of the wheel of cycles. SPRING, SUMMER (1974) , AUTUMN, WINTER (1930) and I love to say once blue (3M)MA200 breaks down, the big cycle is about to flip using depression (inflationary depression in SUMMER, or deflationary depression in WINTER).
You can see in 1Q2008 we managed to break blue (3M)MA200 opening path to depression, but instead of allowing the wheel of cycle to close moving down to 1932-1980 line, in 2011 using all programs we managed to reverse the path generating very weak “cyclical economic dead-cat bounce” which came to an end … in 4Q2018 based on DJI/GOLD.
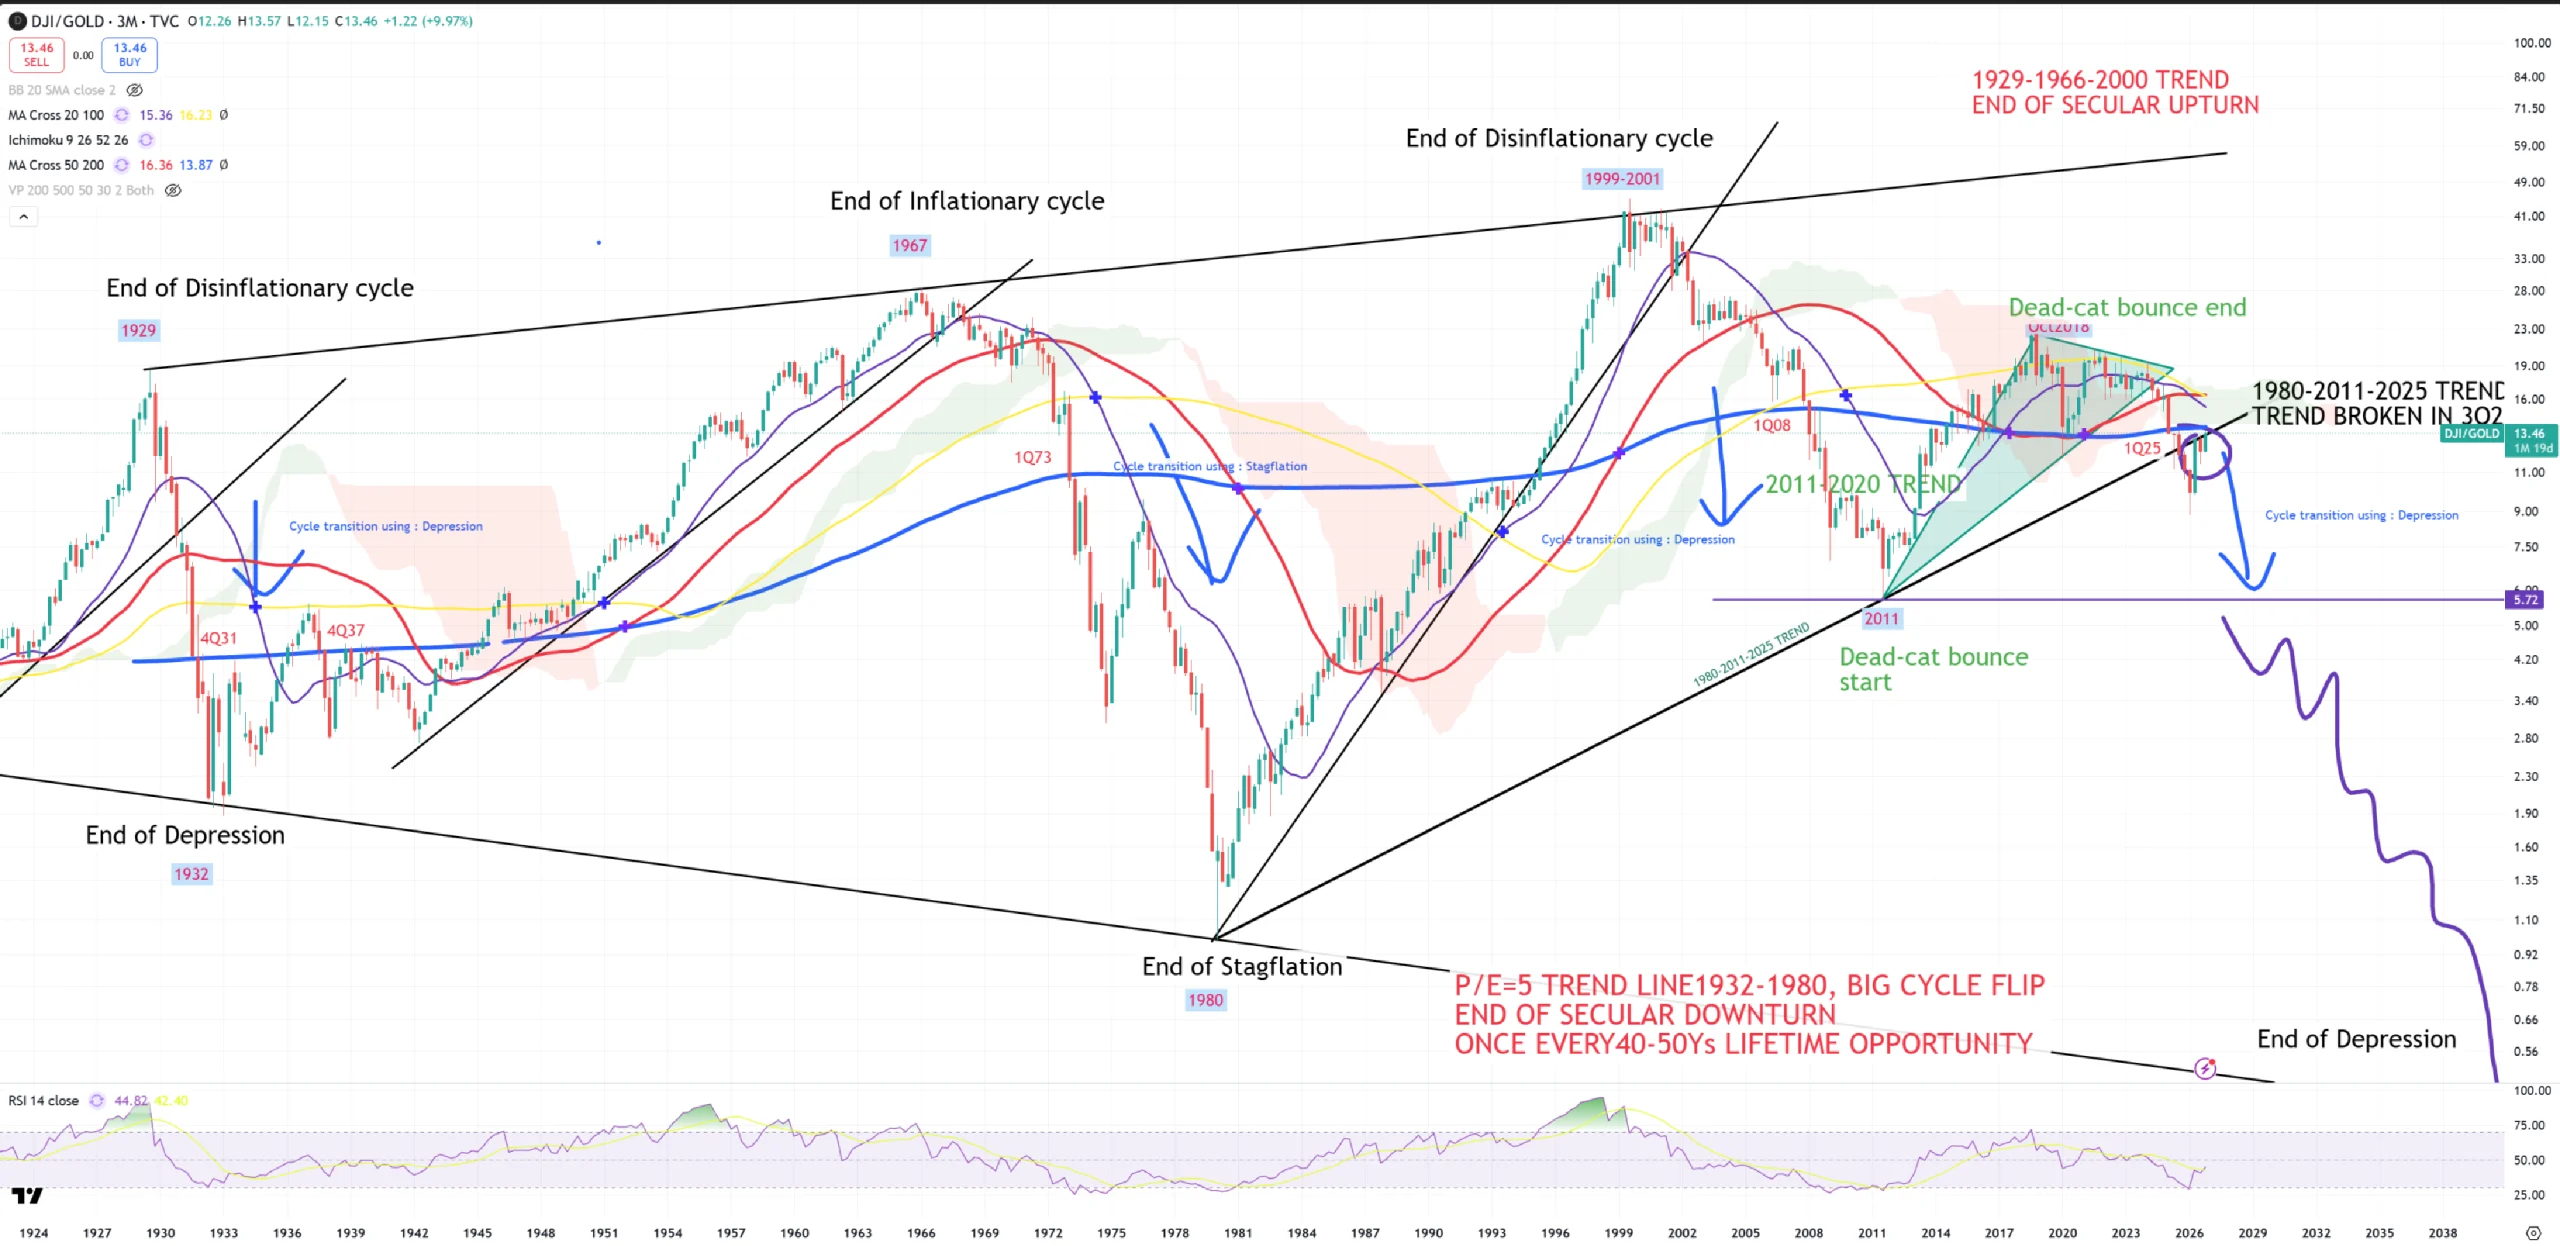
What this chart above tells you? That in 1Q2025 we managed to break (3M)MA200 (5th time in a history). I prefer to get a confirmation from SPX/GOLD too which so far managed to get rescued after initial (3M)MA200 break in 4Q25, but it now hits another couple key (3M)MAs.
SPX/GOLD contains a portion of mini-upturn-AI cycle in bigger downturn cycle, so that’s why SPX/GOLD gets a bit different behavior than DJI/GOLD. Once AI bubble gets full bust I bet it’ll reverse below blue (3M)MA200.
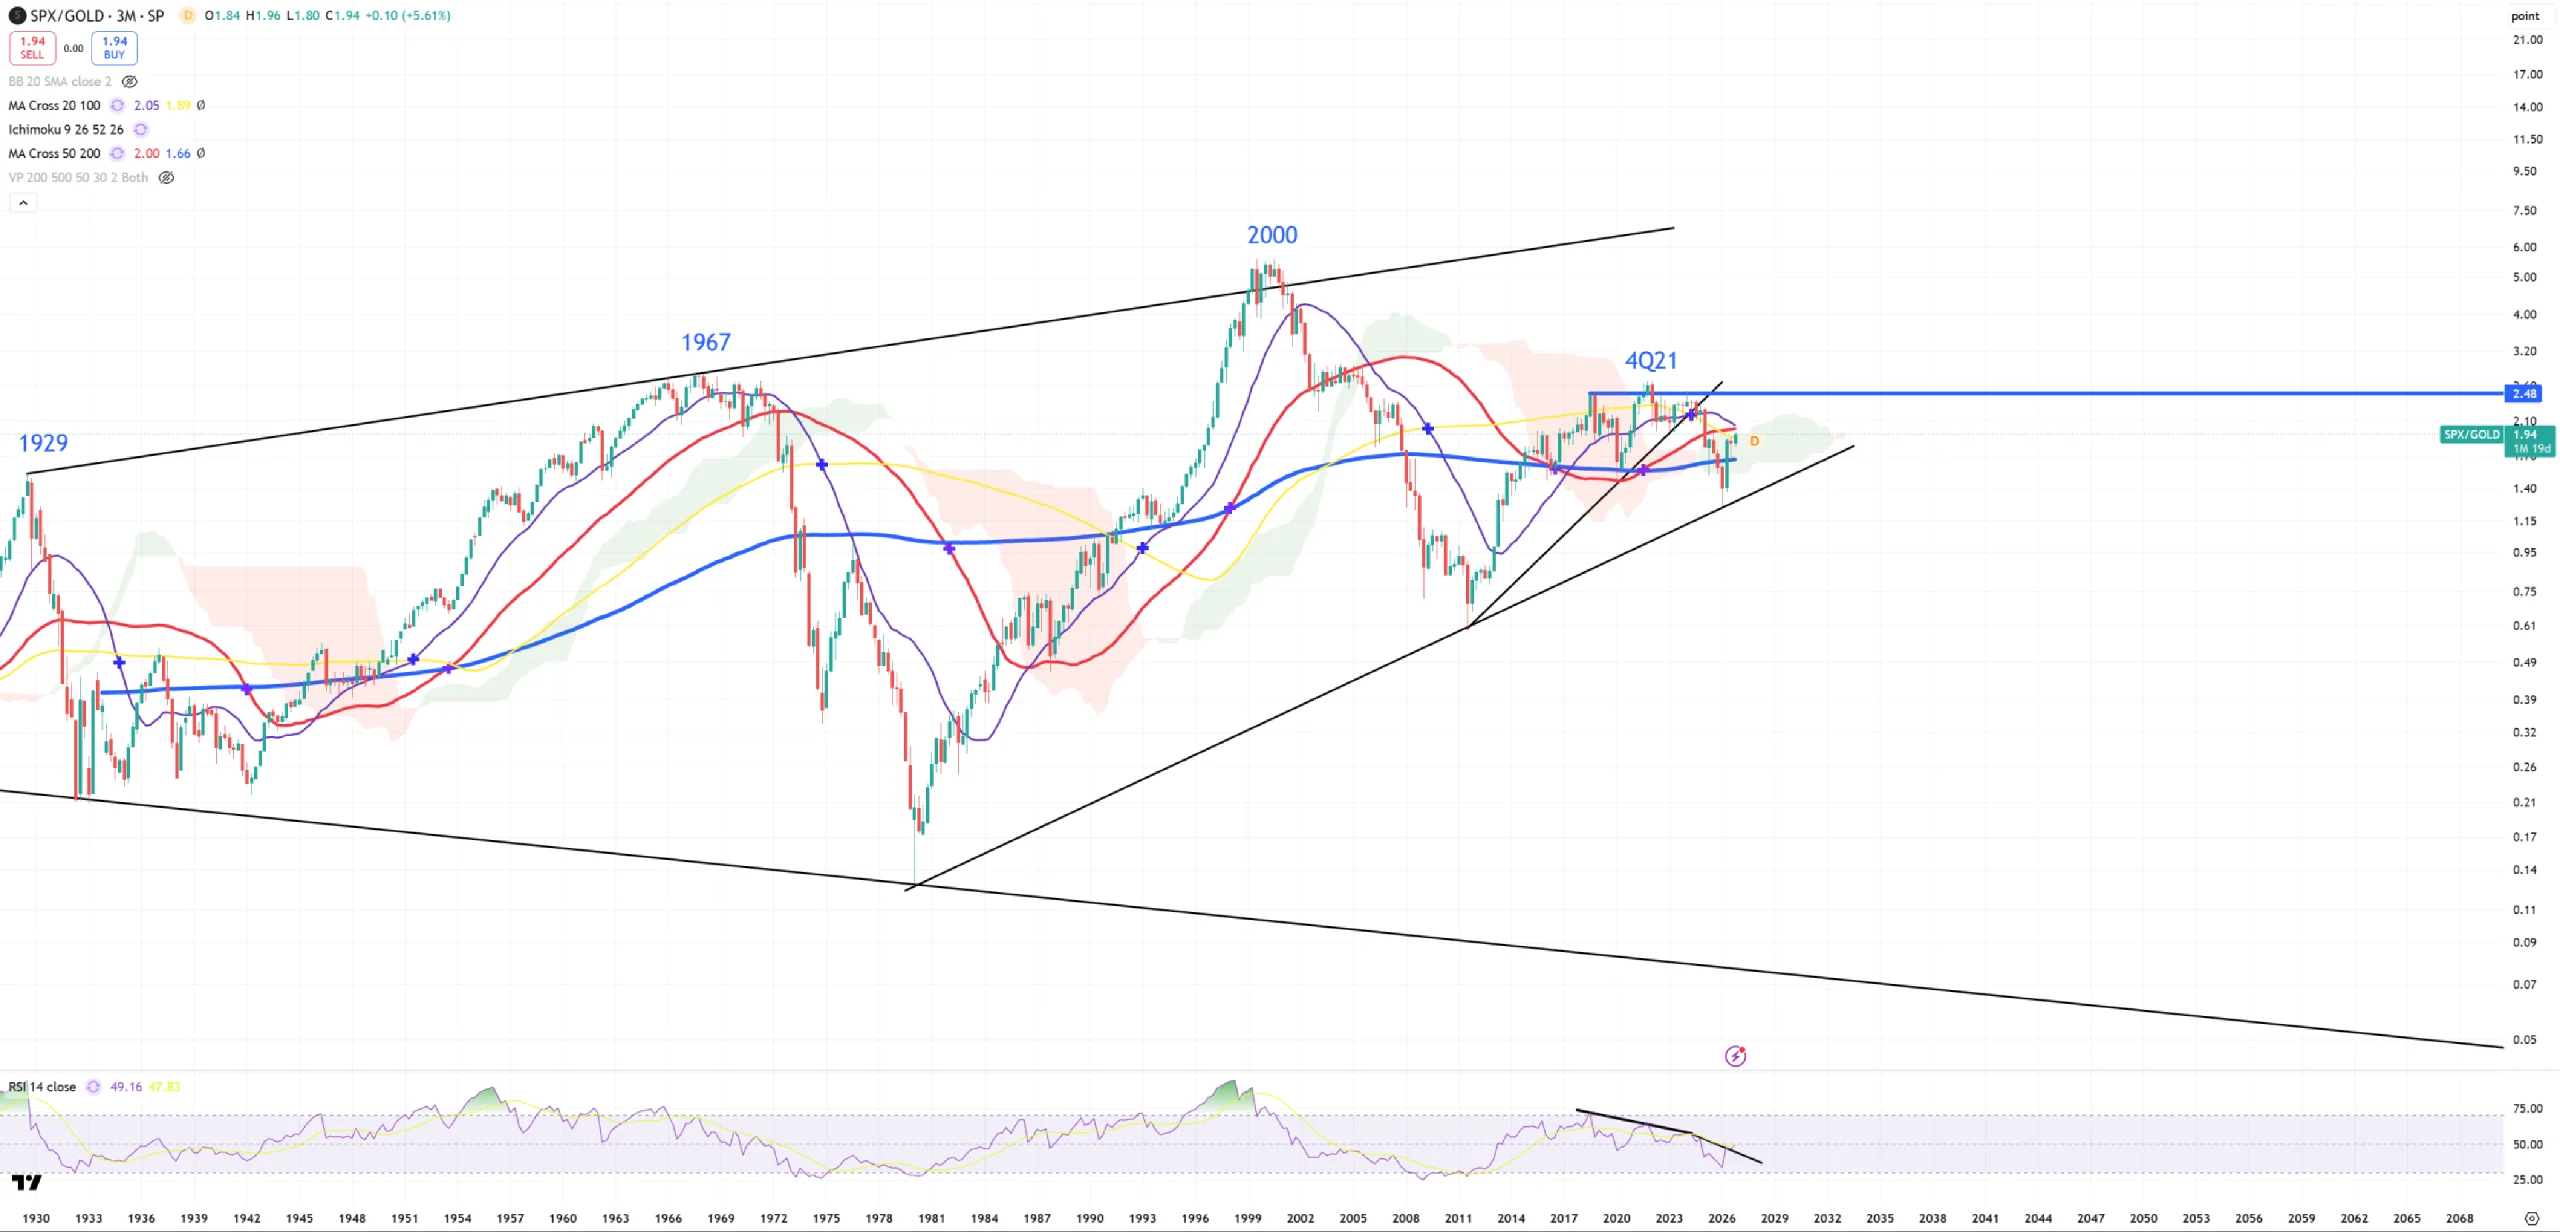
Summary is this : If we managed to break (3M)MA200 on both DJI/GOLD and SPX/GOLD it means we’re going to break blue (M)MA200 on SPX which sits on 3200.