10/2026
October 31, 2026
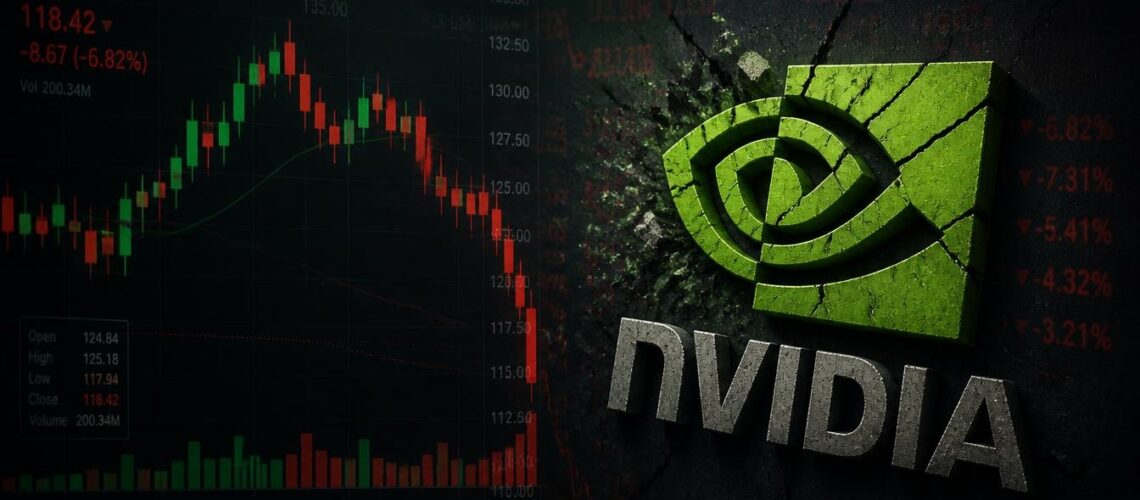
Holly shit whan an amazing last day of the month. Has the last puzzle of the bubble finally burst? Today I’ll make it quick and easy. No long list of breaks of (M)MA50, no breaks of (M)MA200 this time. Just key charts.
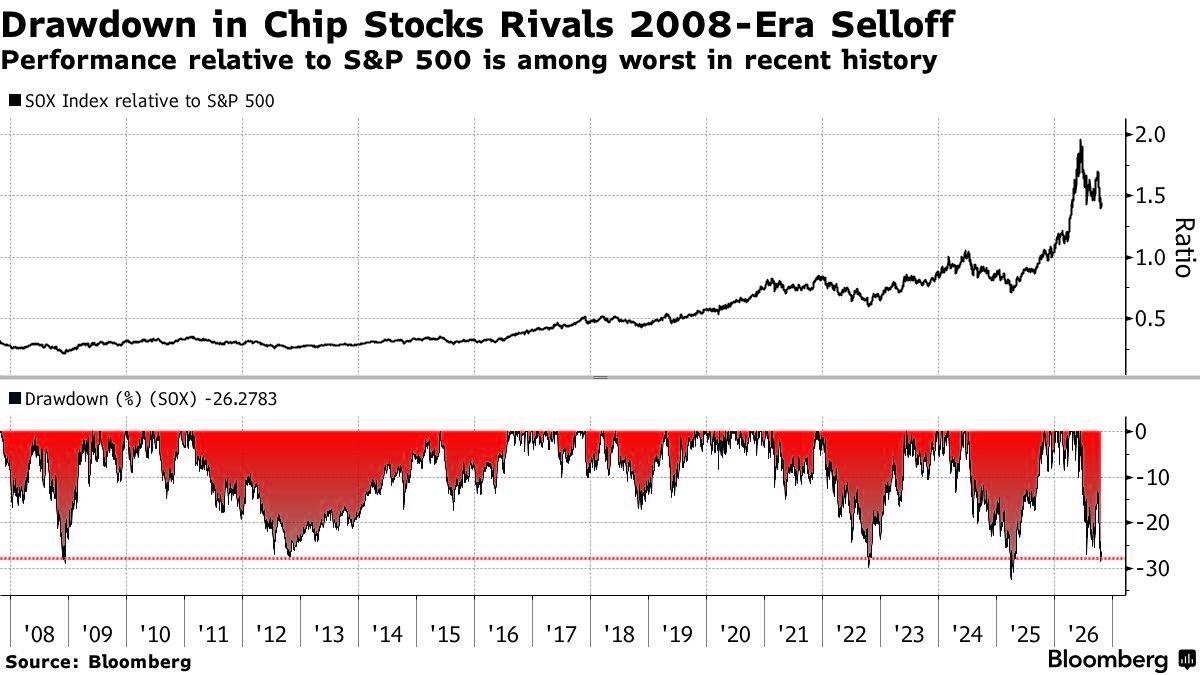
SOX & QQQ should be your number one after the end of October 2026.
Charts in this report (61)
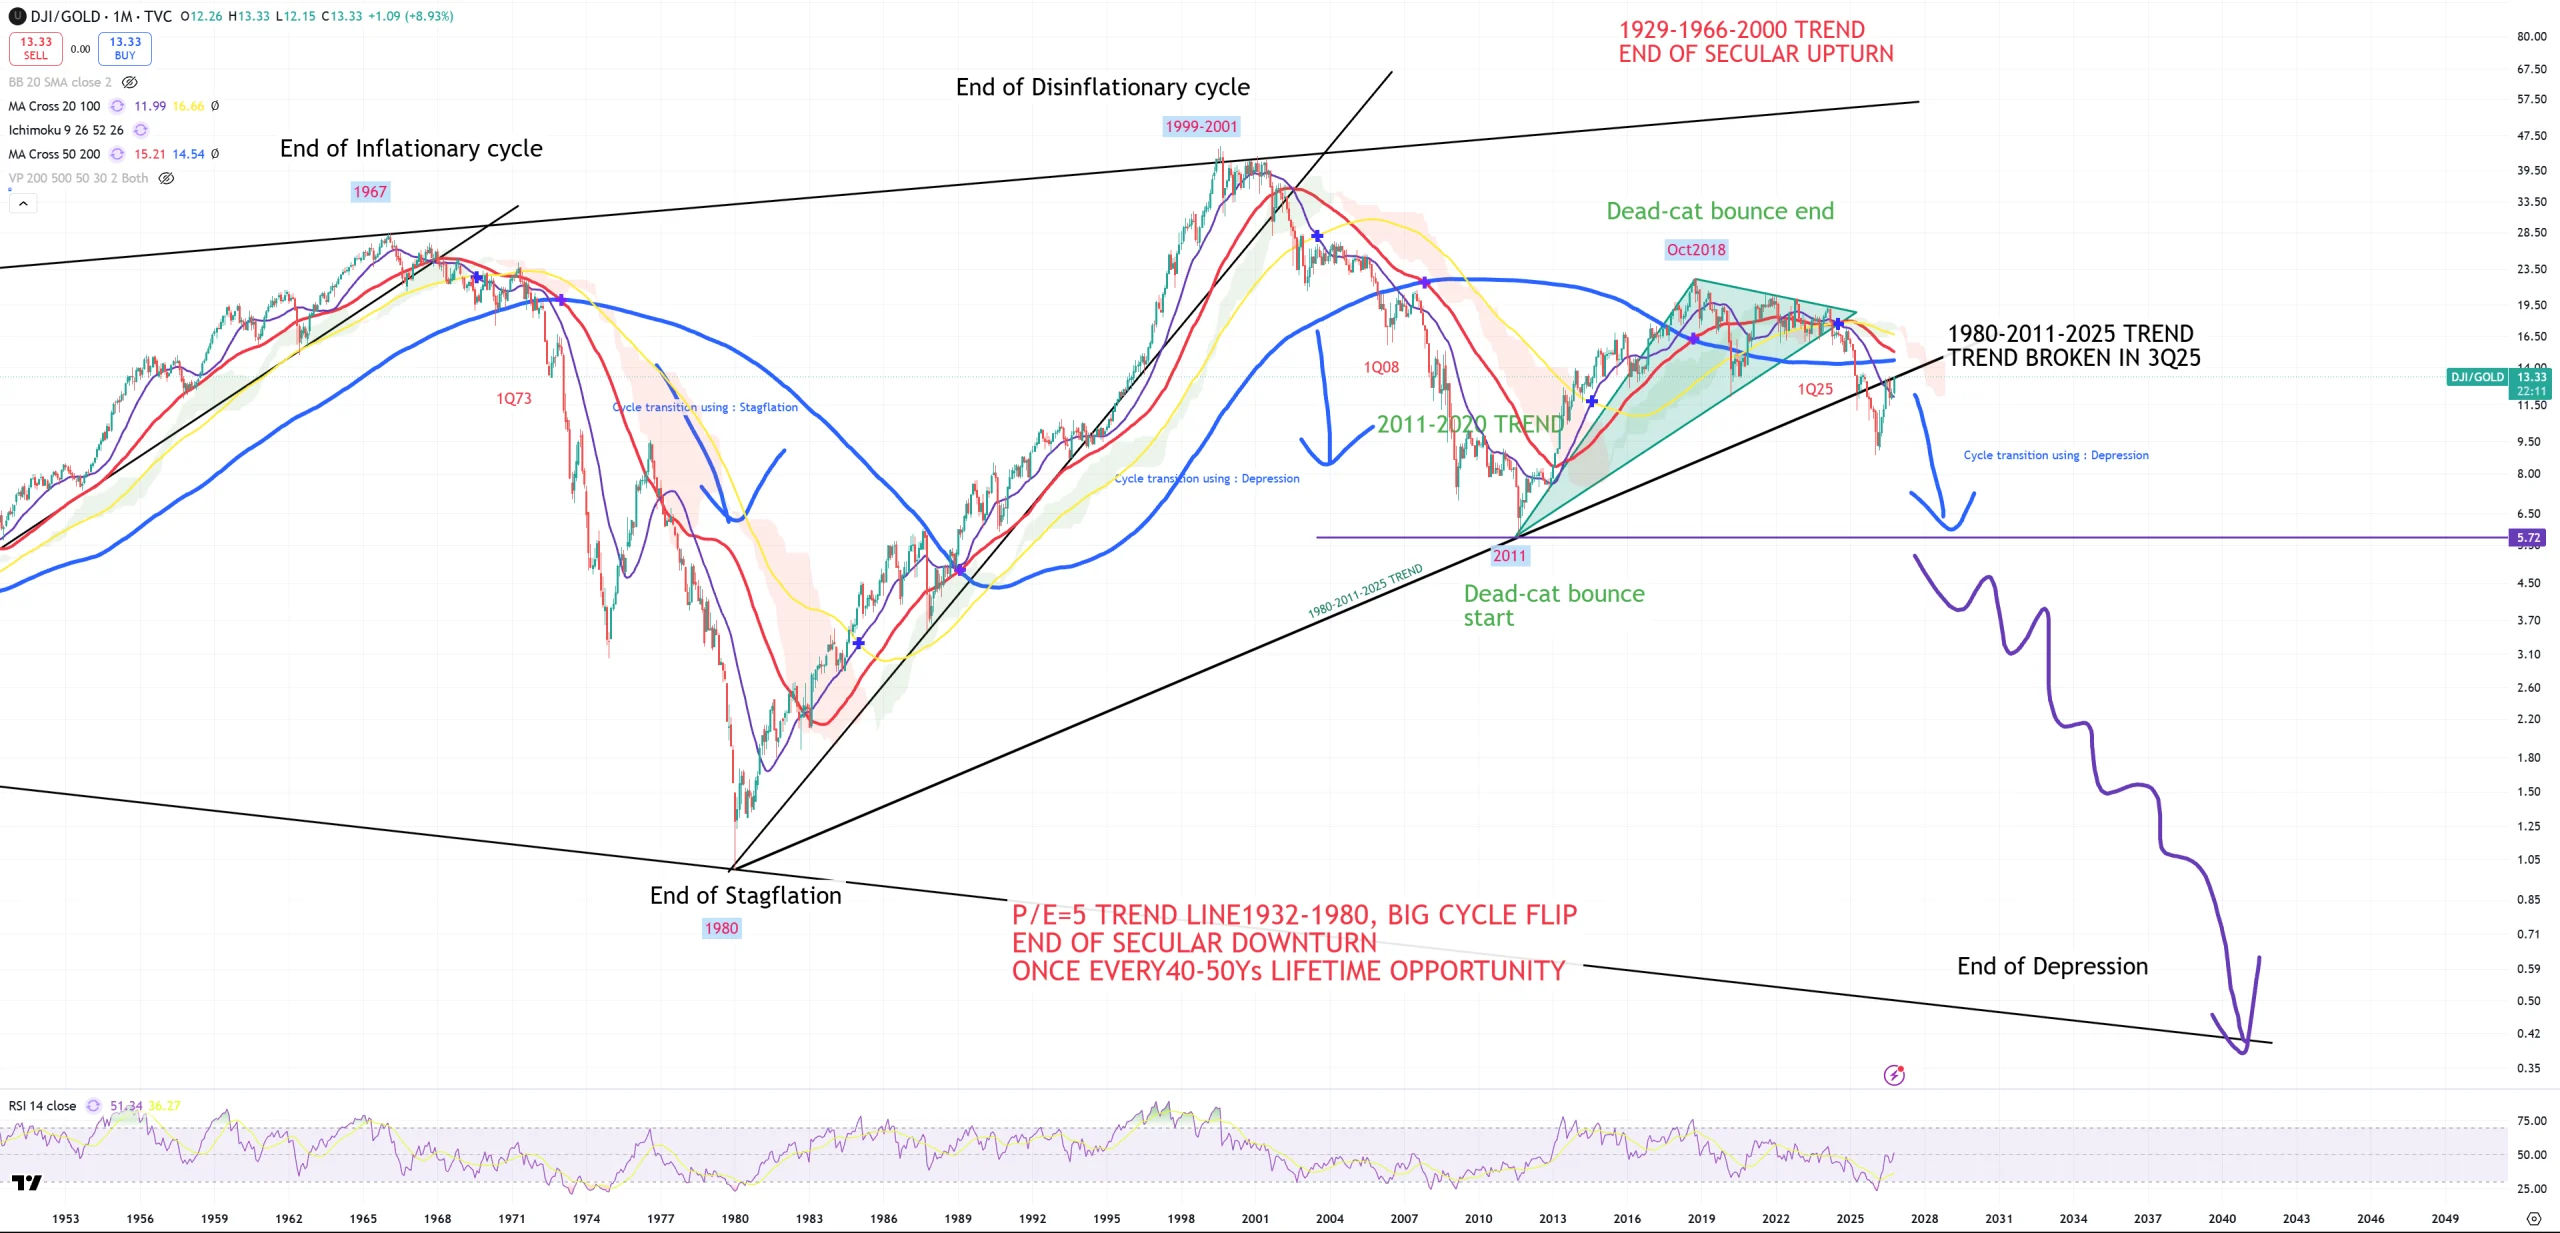
DJI/GOLD – we still have retest to broken 1980-2011 trend and its (3M)MA200 was broken long time ago and never recovered. Chart below is (M) and visible retest still ongoing. Cycle indicator still retesting 1980-2011 trend.
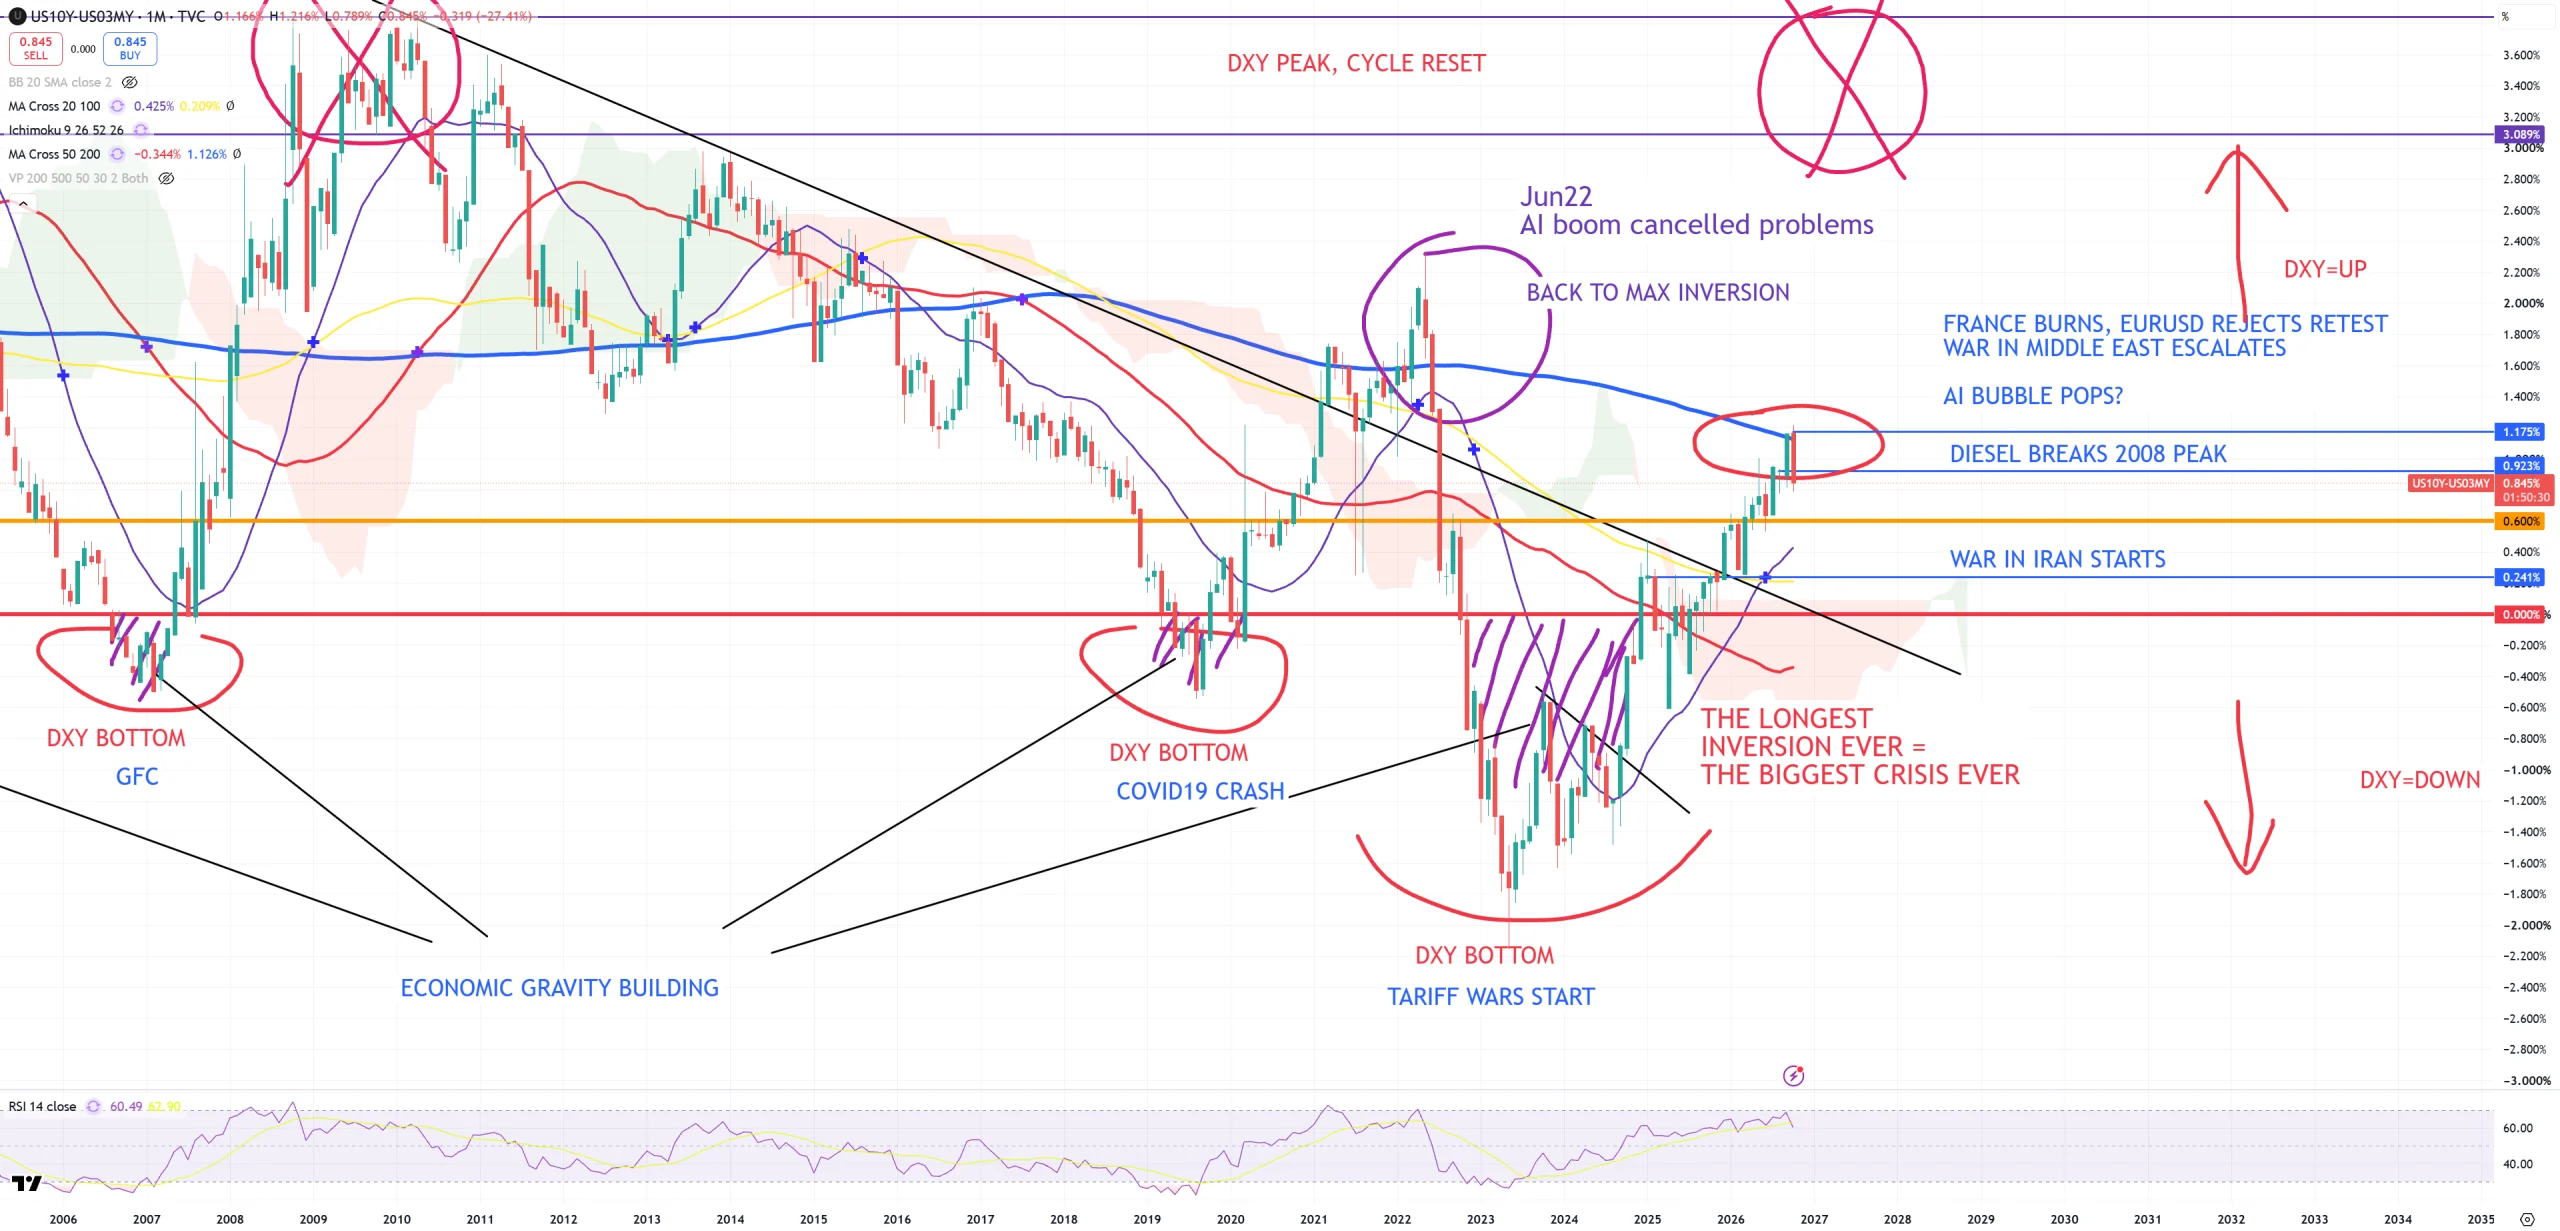
10Y/3M – (M)MA200 is never broken on the first attempt. Yellow horizontal line is +60bps. I put “events” during uninversion process.
US03MY – still below (M)MA50 since 4Q25, our October 1999 moment was 2022 in reality. Talked about that many times and put a separate topic about 2022 matching October 1999 moment :
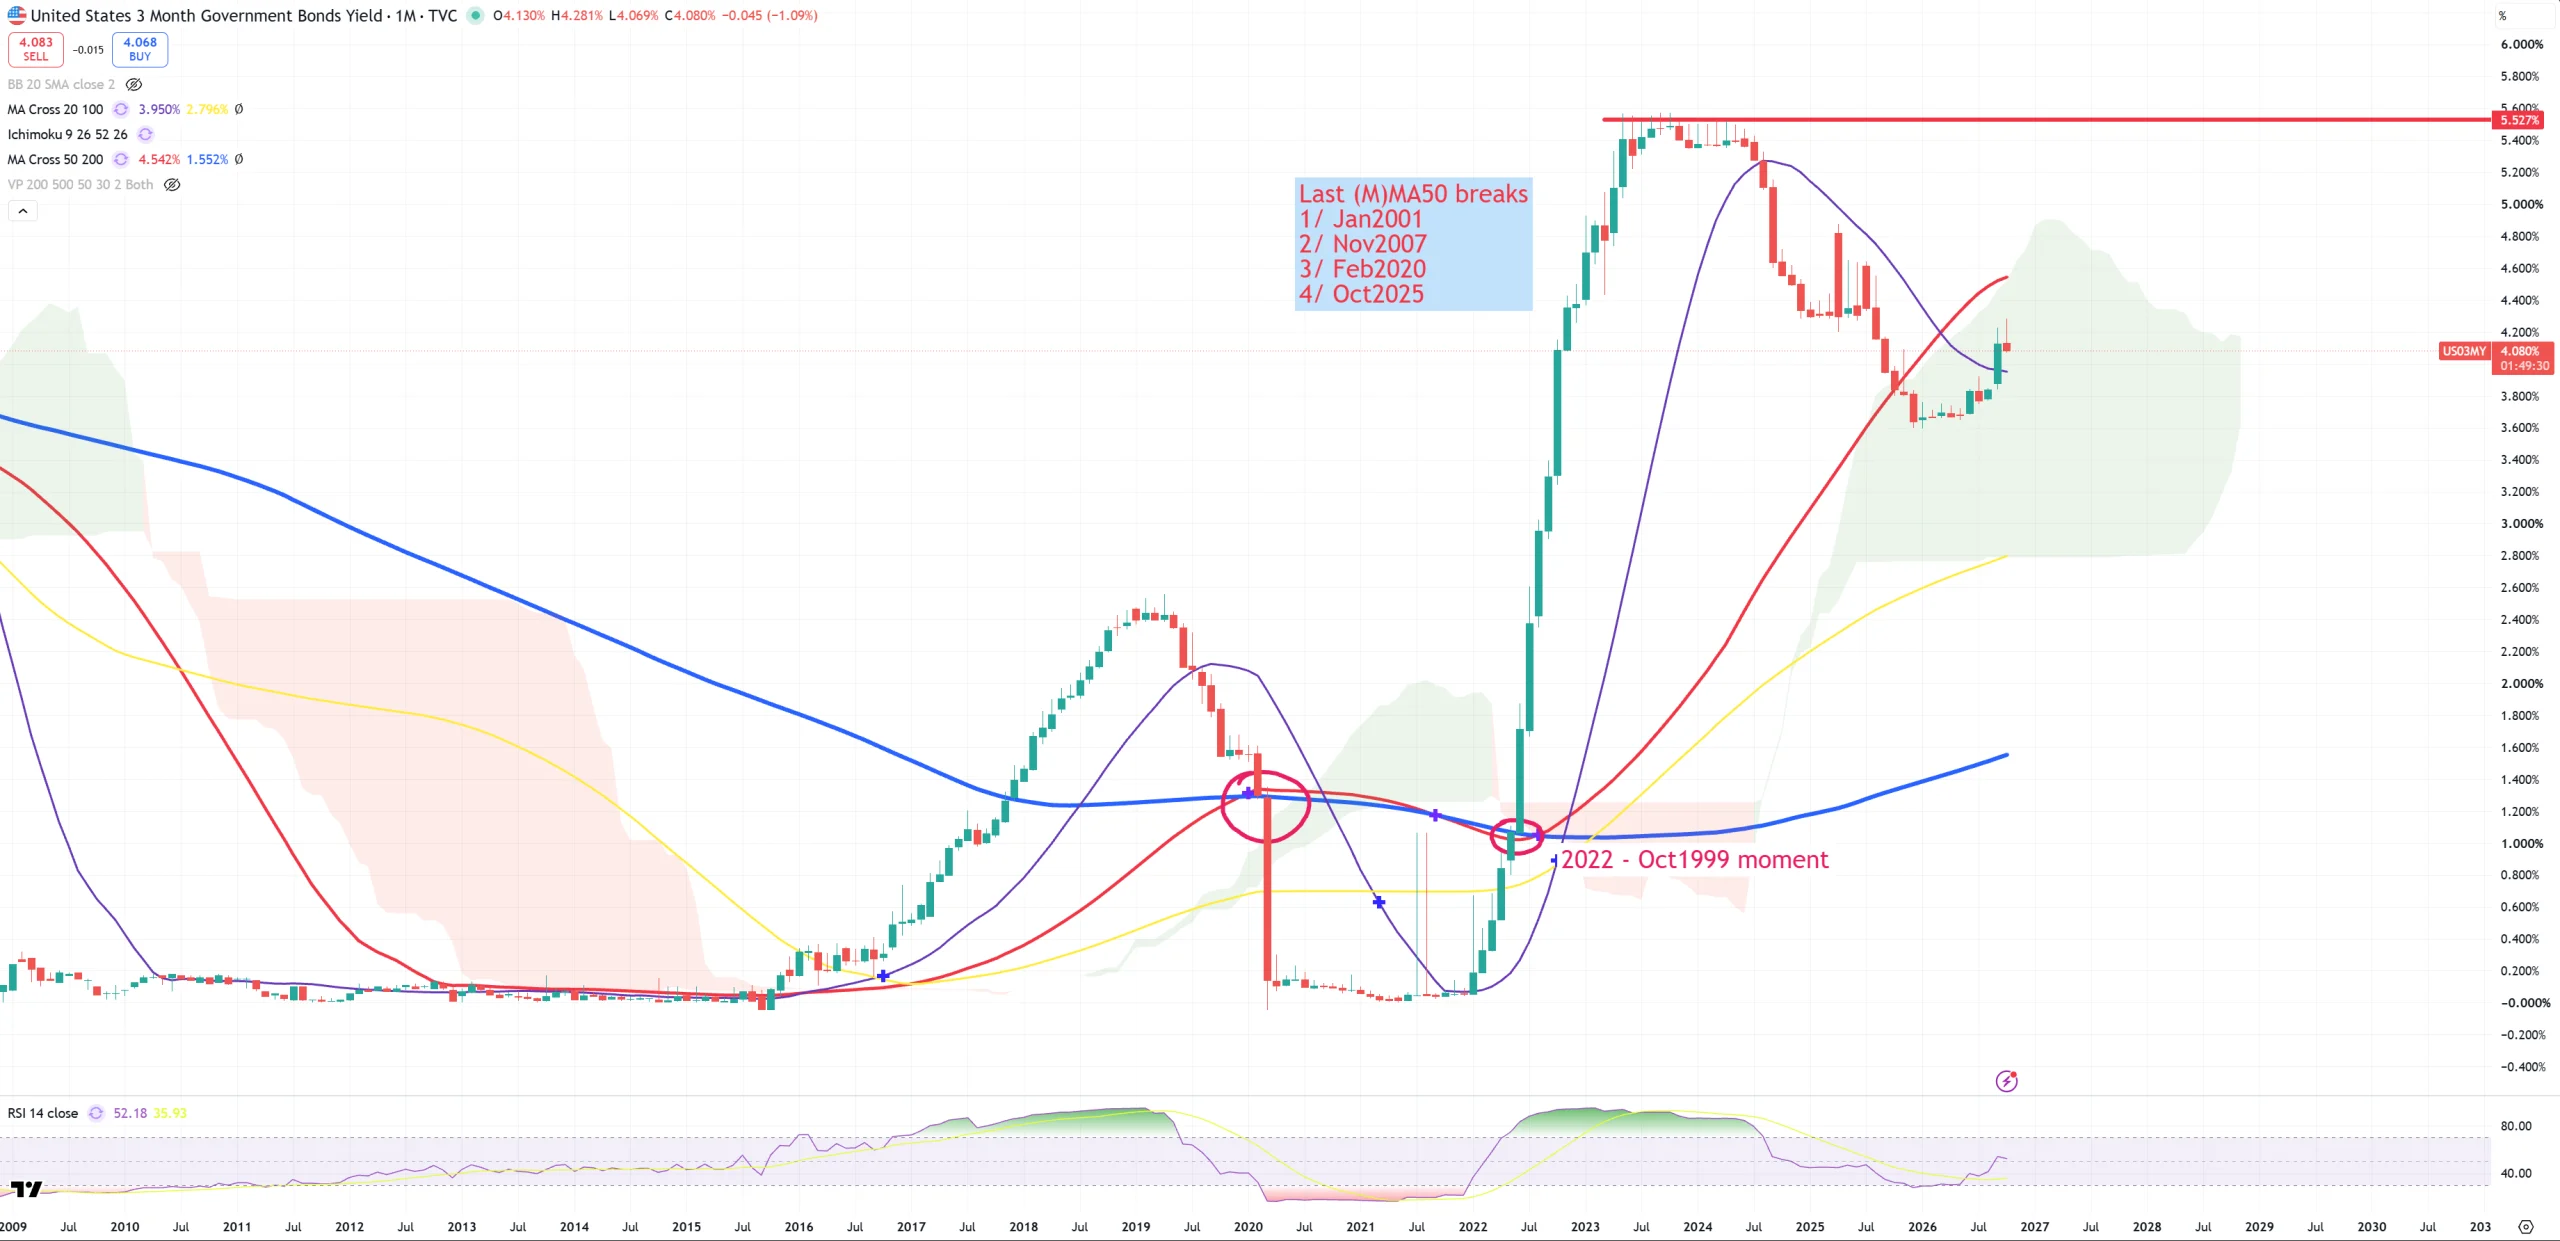
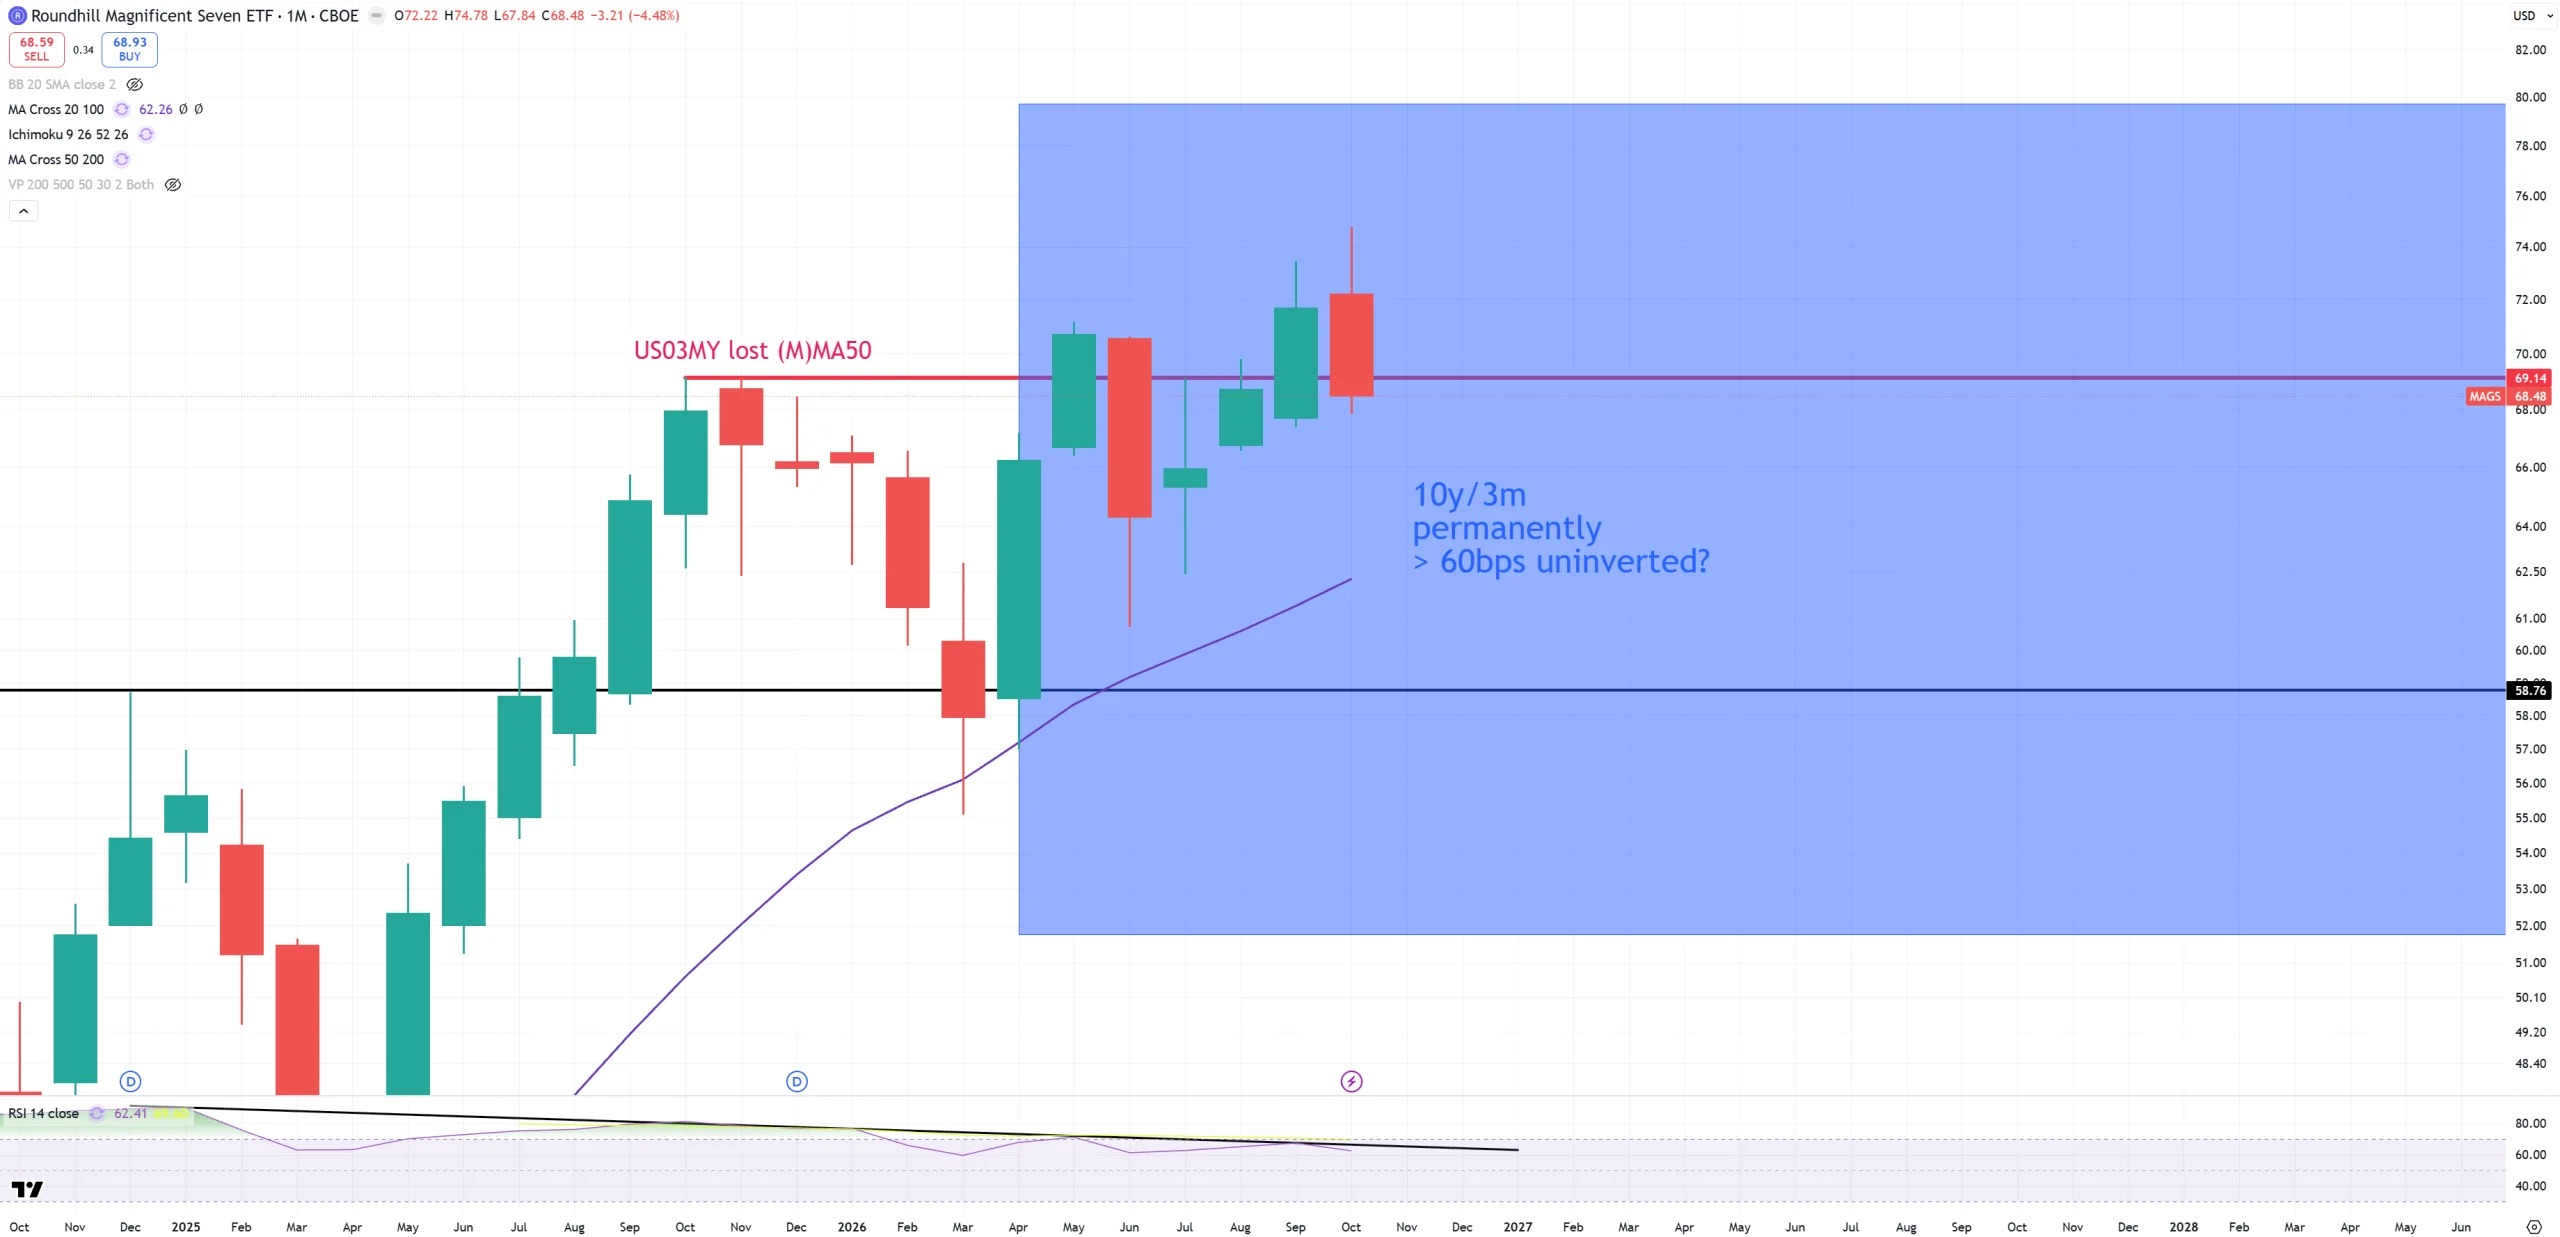
BROAD MARKET PEAKS ONCE US03MY BREAKS (M)MA50 (October/November 2025) AND 10Y/3M UNINVERTS PERMANENTLY > +60BPS (April/May 2026)
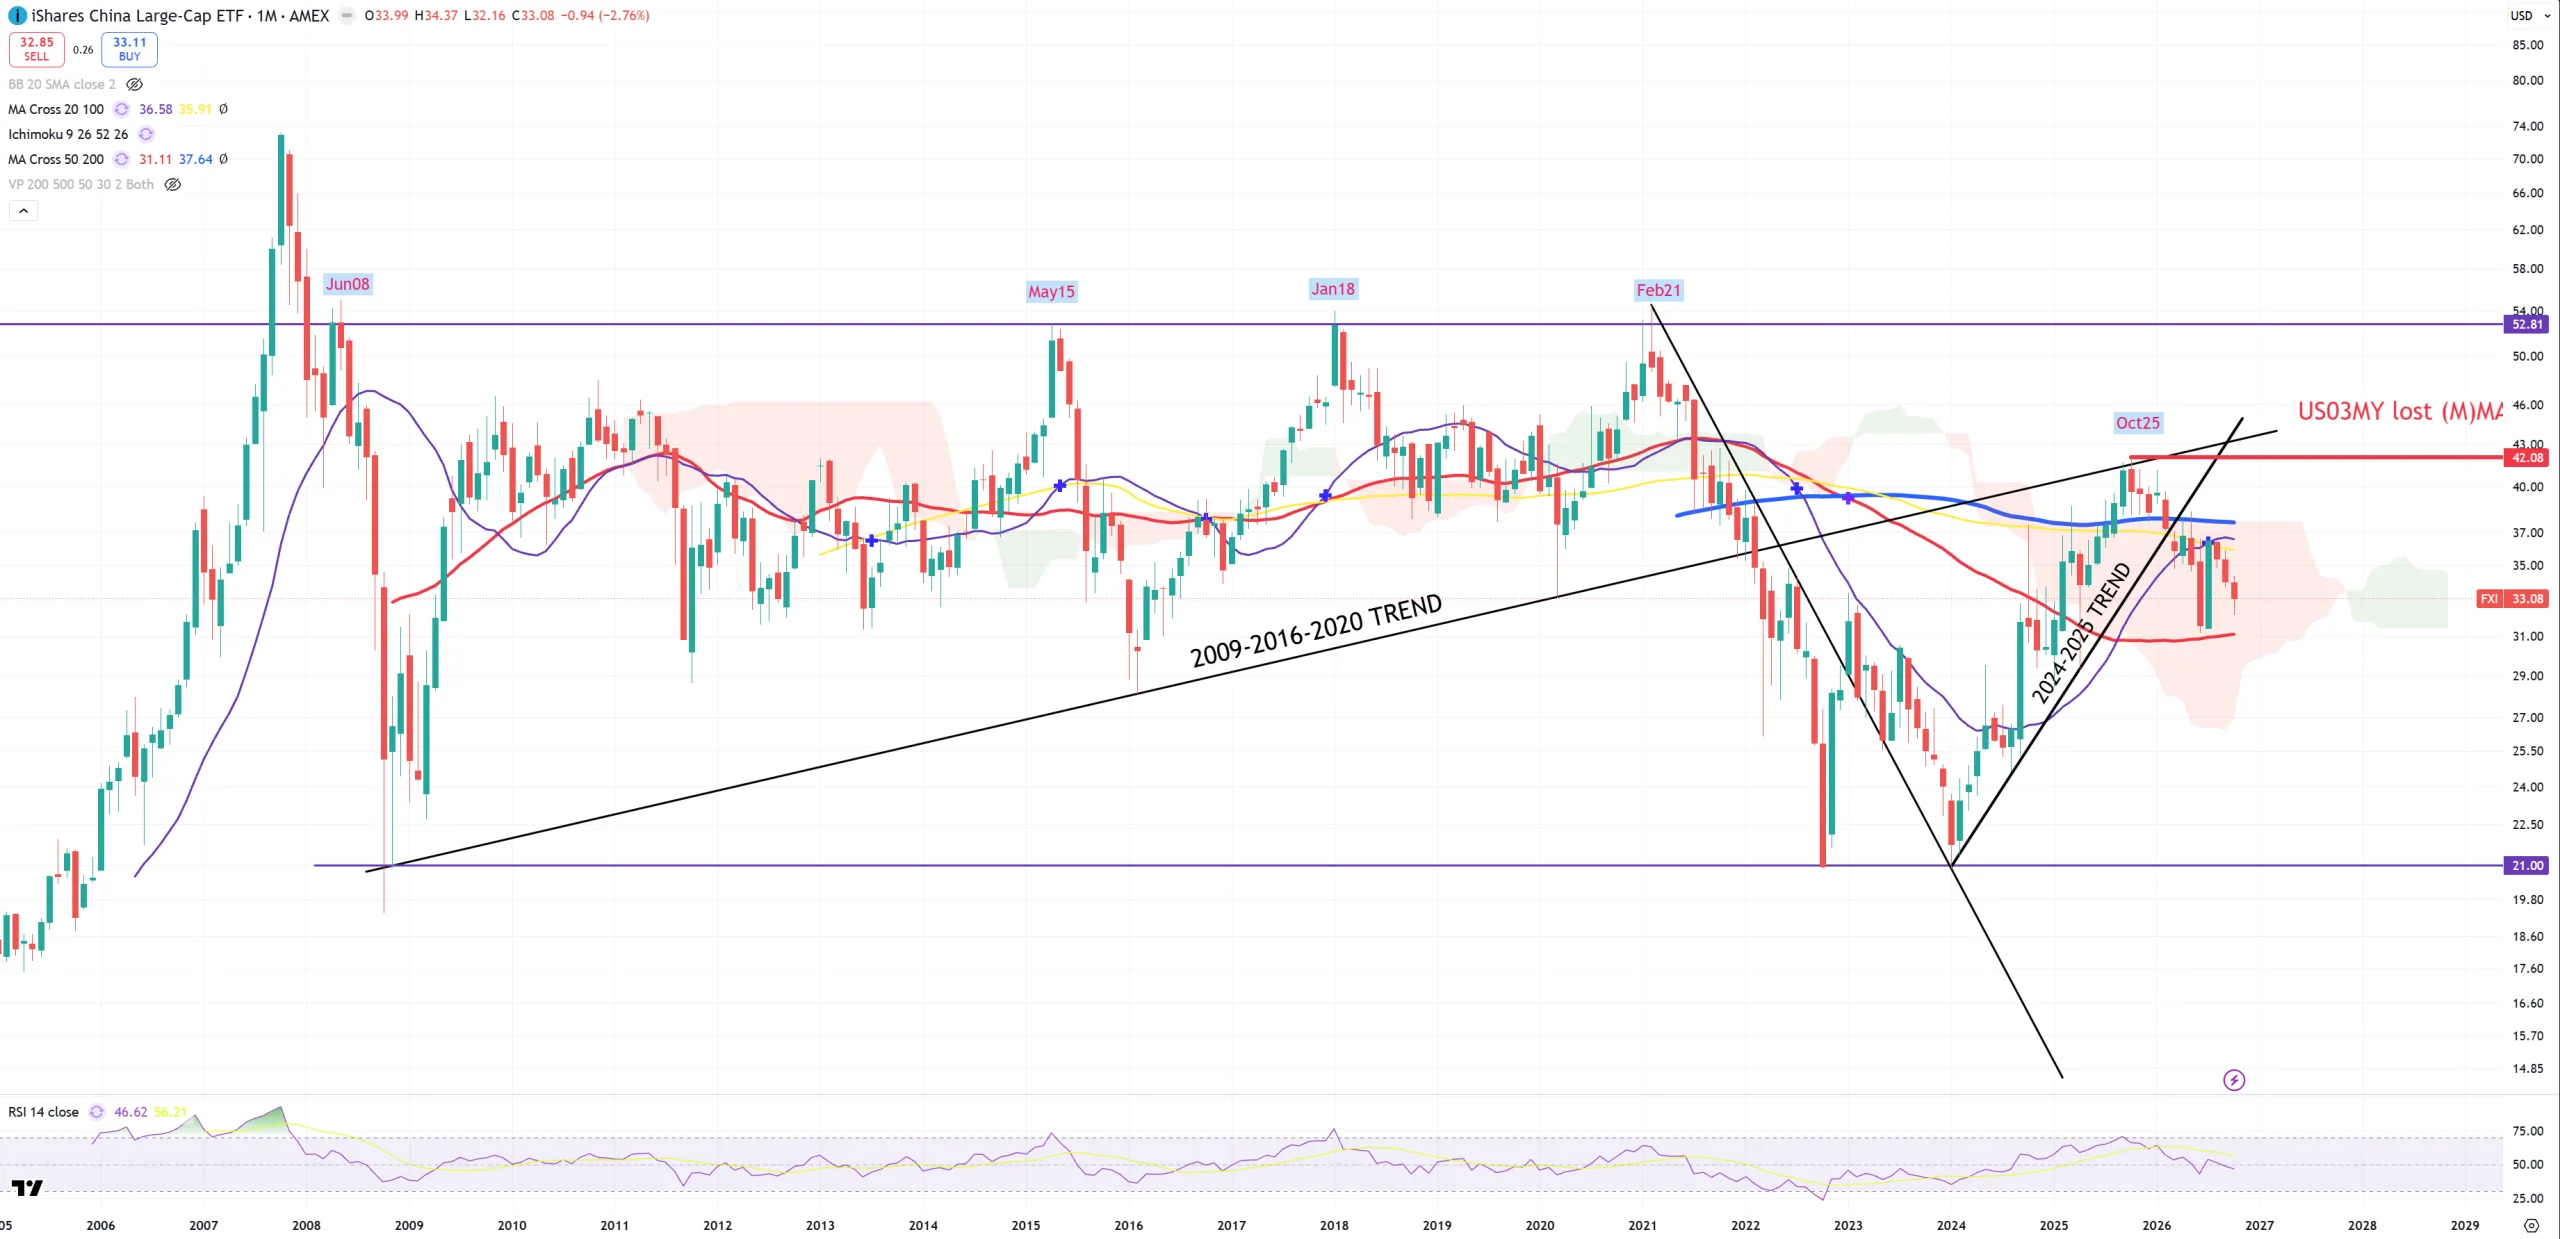
US Stock market mostly peaks ~3Qs behind Chinese FXI (the leader of the secular disinflationary cycle) which peaked in 4Q25 post 2024 bounce. That means ~2Q26 should be this level.
violet(M)MA20 = high momentum bull/bear market border, red(M)MA50 = techical bull/bear market border, yellow(M)MA100 = middle point often level of bull/bear trap, blue(M)MA200 = secular bull/bear market border
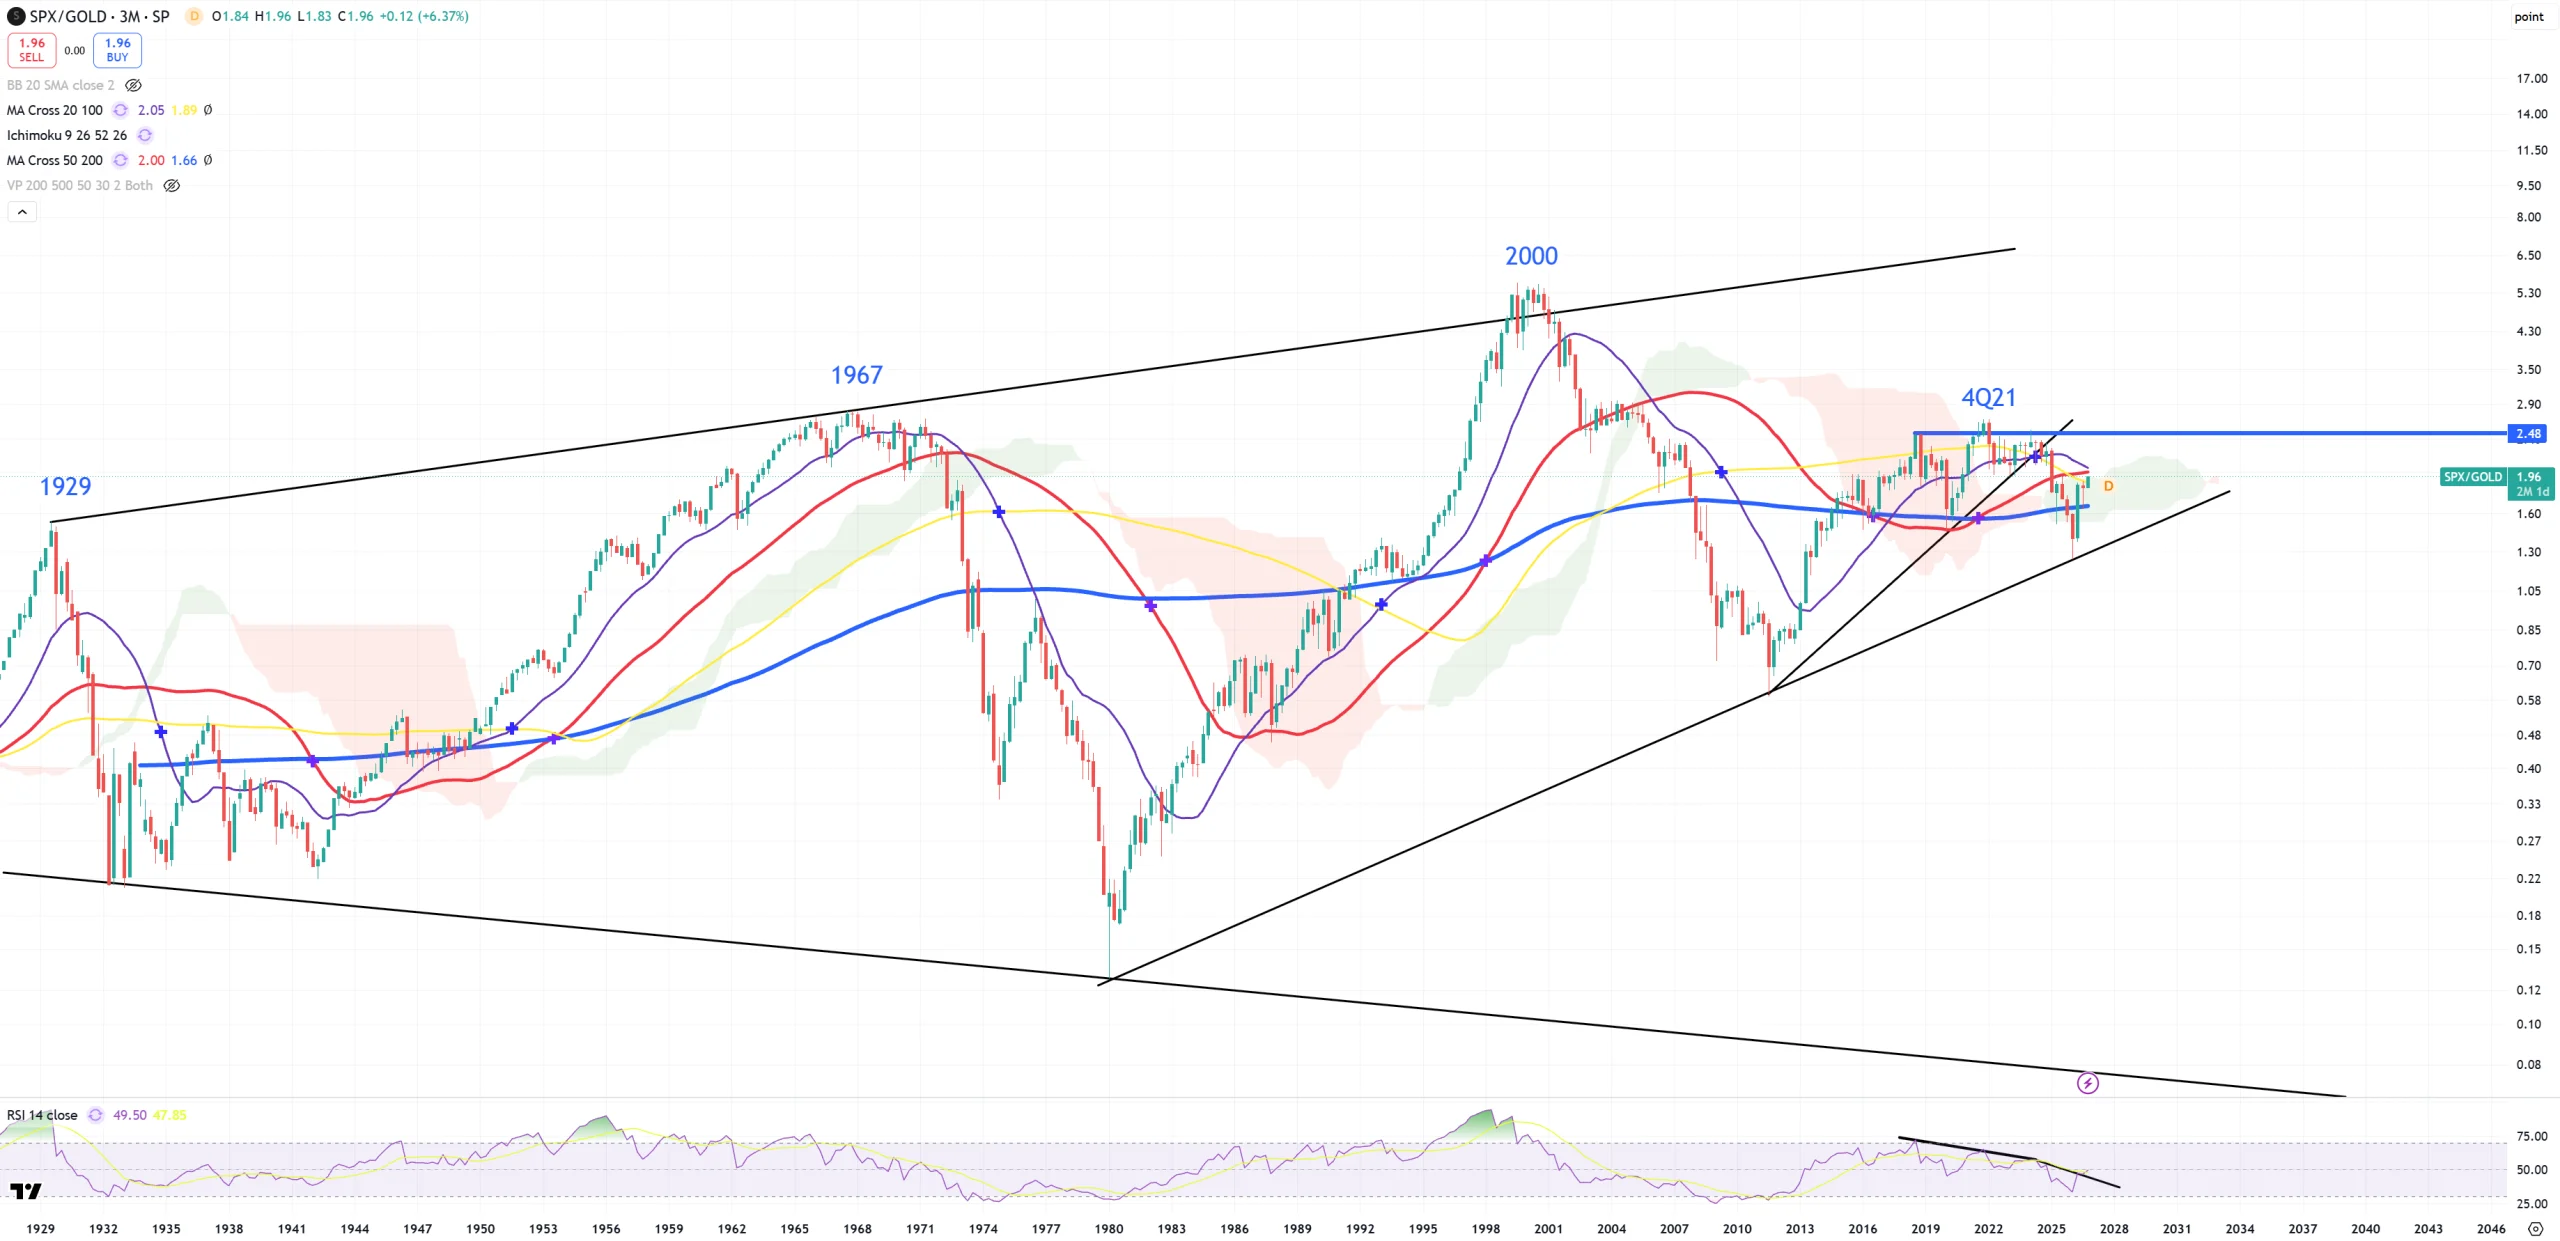
SPX/GOLD – key cycle indicator – this still looks different than all others so far. Don’t know why but very often TradingView does not show my saved comments on this chart. Sometimes it shows sometimes it does not show, but comments should be the same as DJI/GOLD. So. this is 3M view. blue (3M)MA200 was broken in 4Q25 the same moment US03MY managed to break its (M)MA50, but this chart rescued it with another massive level ahead including red (3M)MA50 and violet (3M)MA20. There’s also last level of ichmoku cloud around those 2 (3M)MAs, so we can treat it as the last possible level of a bounce, above we might call it recovery, but that’s also not 100% true statement. For recovery we need DJI/GOLD and also US03MY jump > (M)MA50 what we don’t have. Anyway we need to break 1980-2011 trend + kill blue (3M)MA200 again which last time was broken in 4Q25. Market has recovered SPX/GOLD but it has not recovered DJI/GOLD.
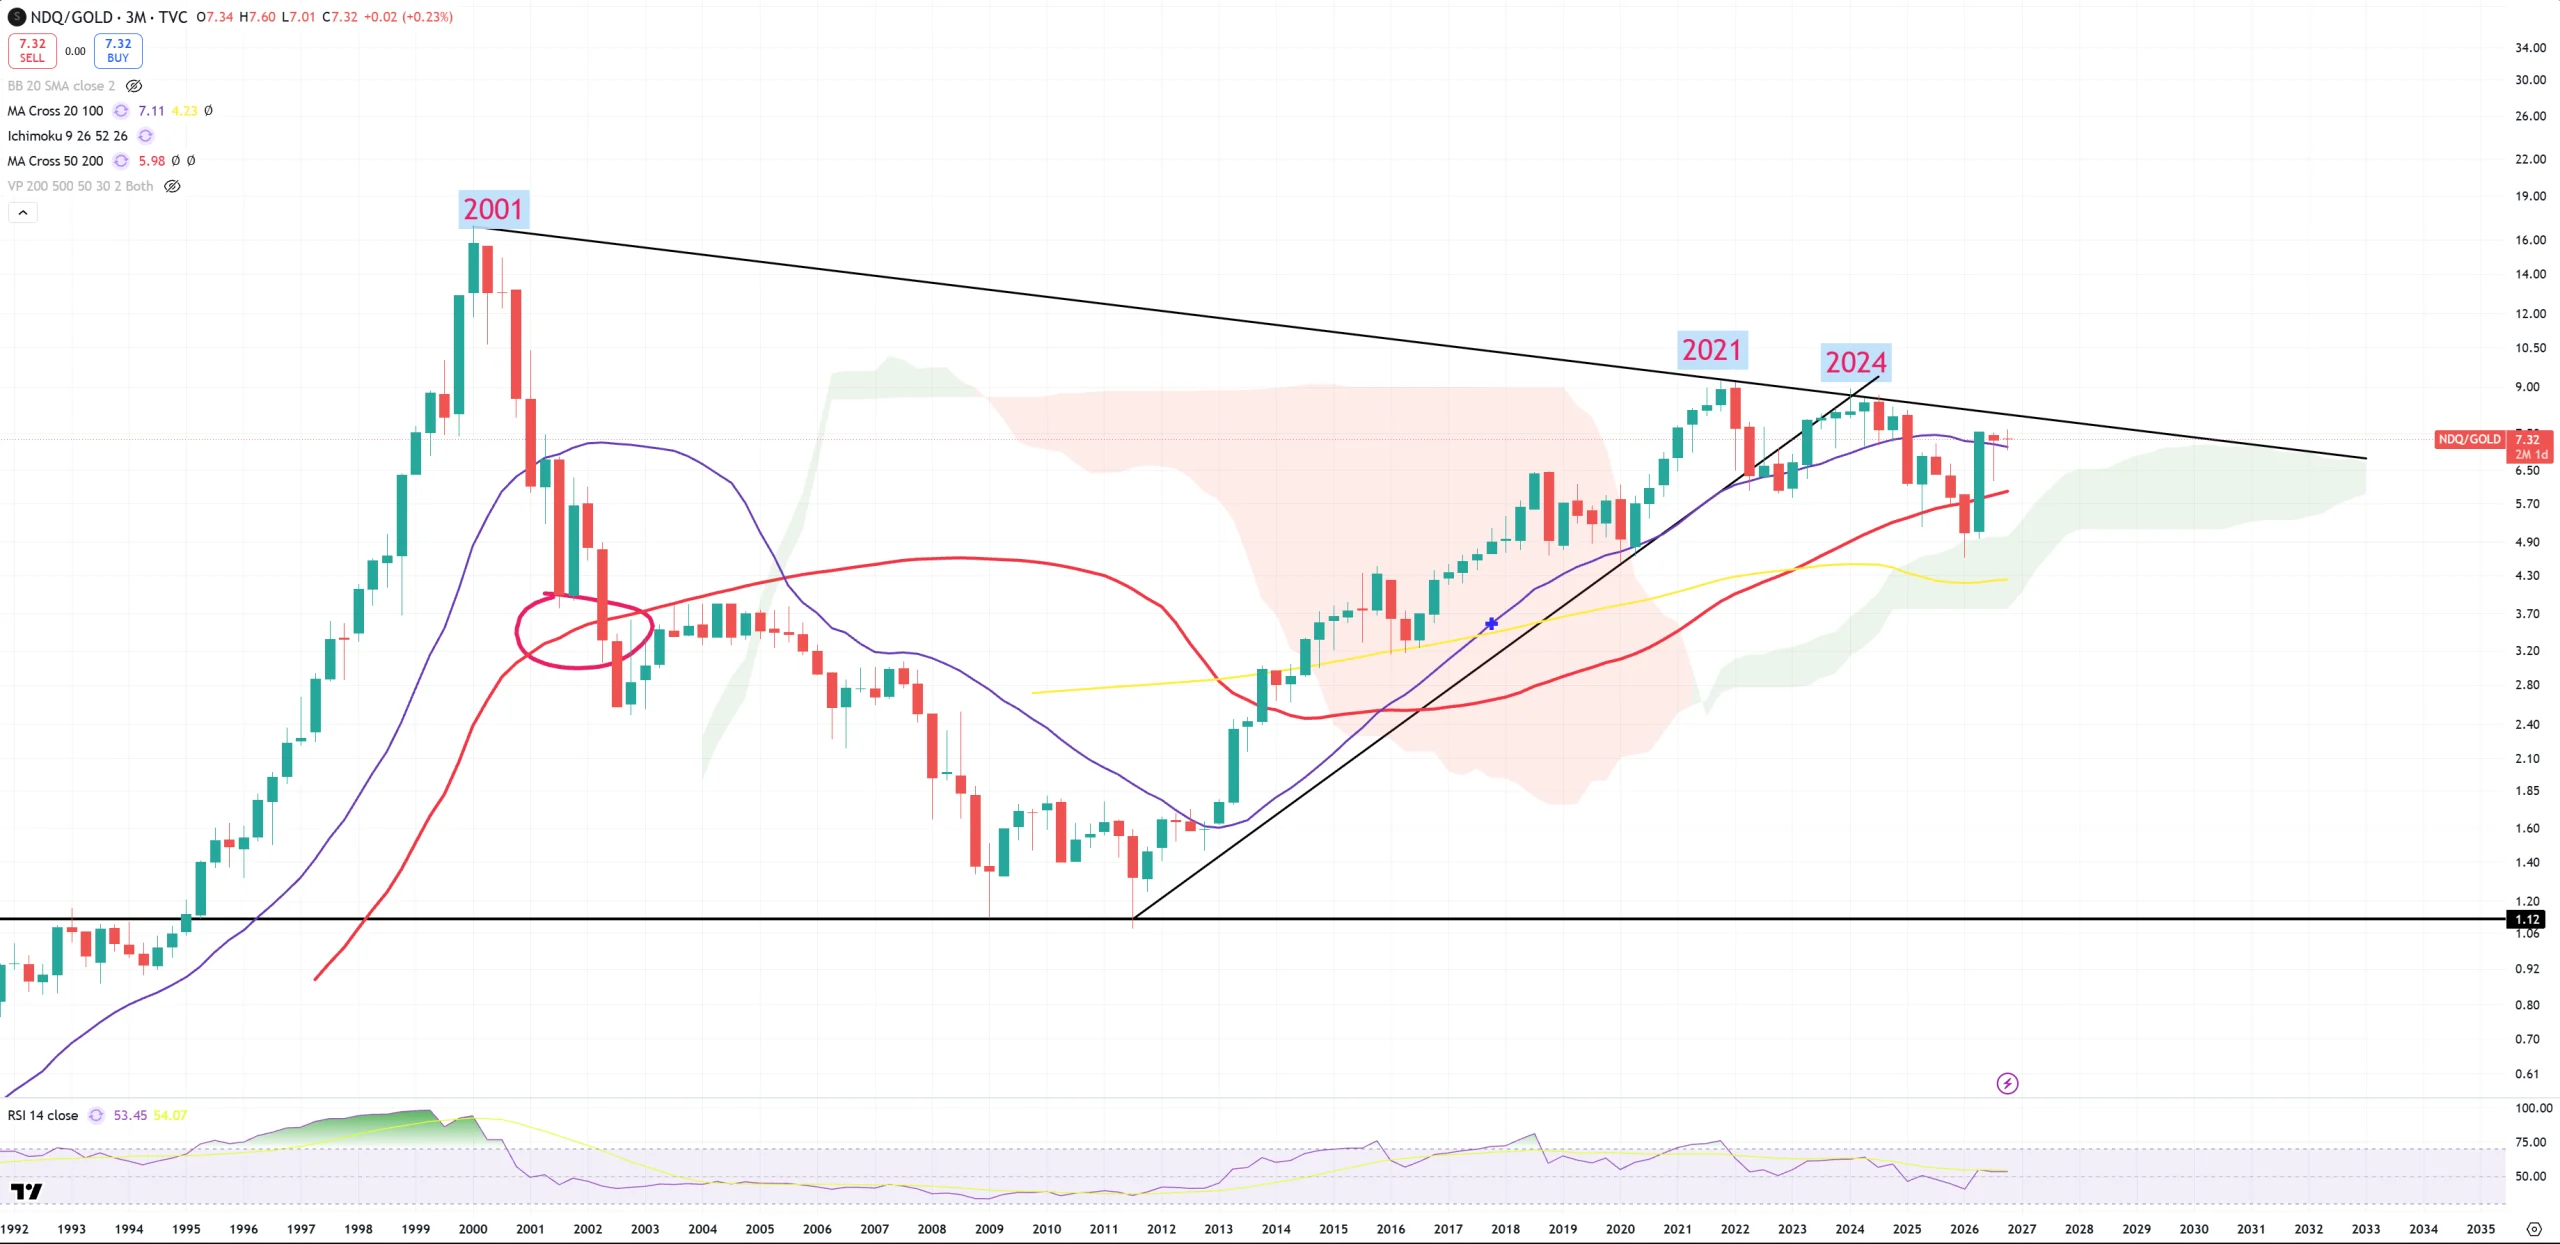
NDQ/GOLD – this indicator does not have value I admire, but let’s see its 3M view. We see it was sent from the hell (below red (3M)MA50 towards upper resistance 2001-2021-2024 level sitting on a big support of (3M)MA20 (~(M)MA50).
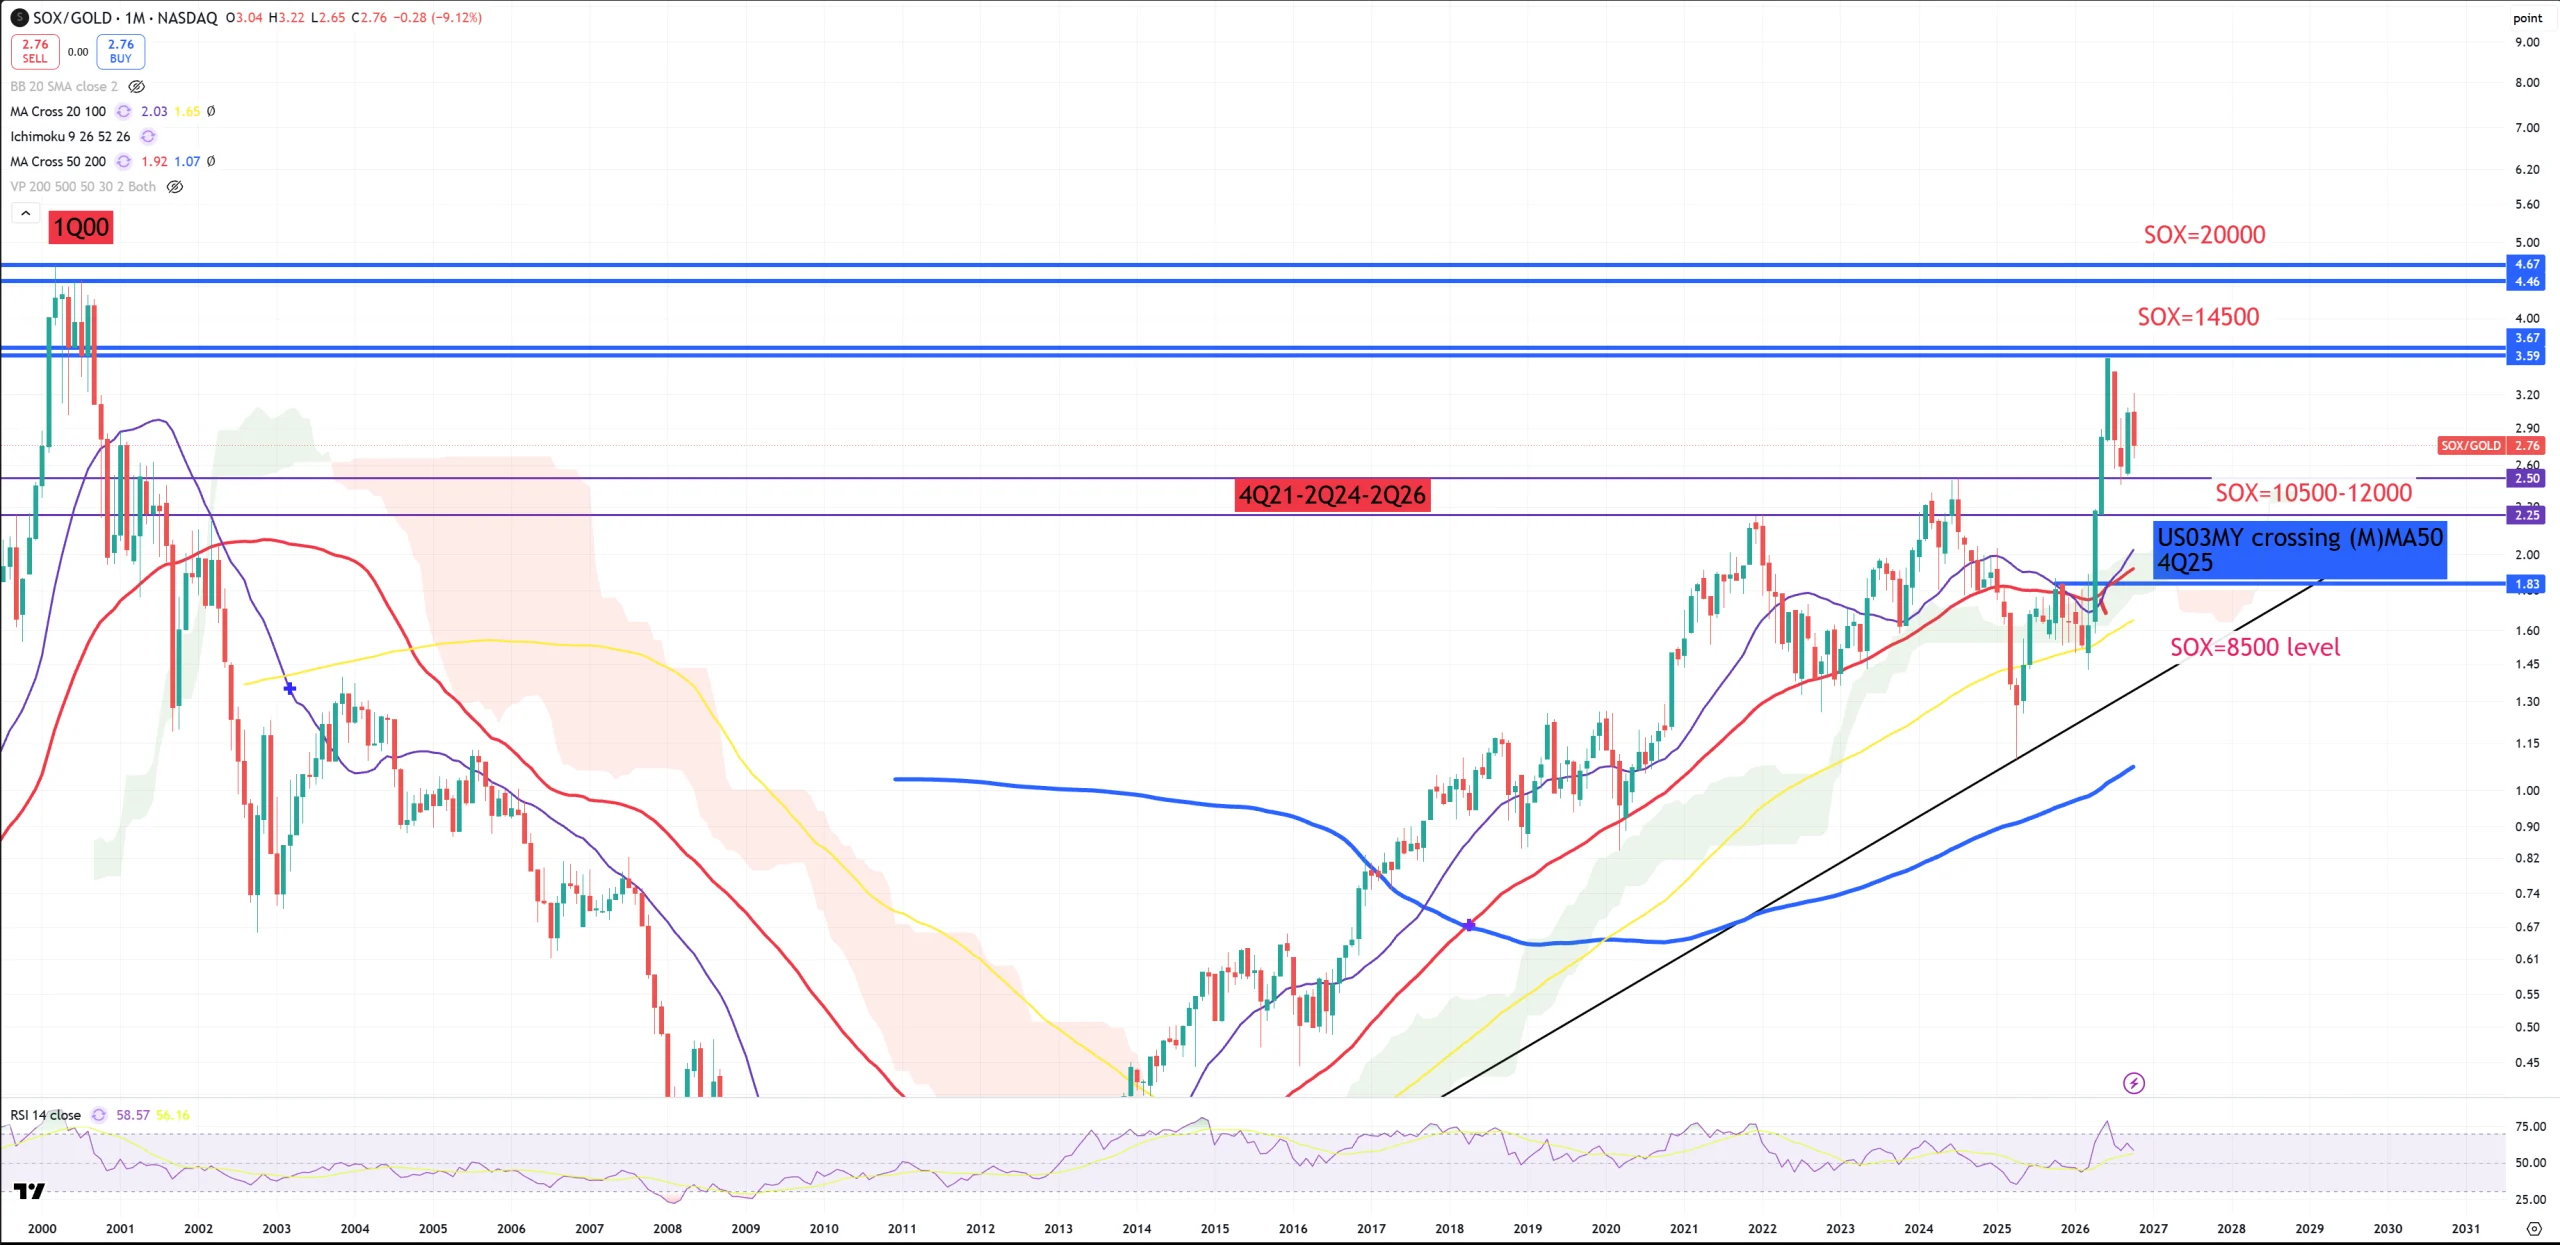
SOX/GOLD – you can see the “save-stick” which push all those gold ratios higher towards 1Q2000. That was something really unusal – amazing move post red (M)MA50 retest from the bottom around April 2026. Big retest to (M)MA50 was almost like game over (based on that was my topic about “The end of AI and Semiconductors bubble?”) and suddenly big spike above key resistance 4Q21-2Q24-2Q26. Peak June 2026 so far and we can call time time the “cyclical peak of semiconductors”. If we drop below this key resistance/support level (4Q21-2Q24-2Q26) there’s another chance to call the end of this bubble with cyclical peak June 2026. I was dead wrong on my idea about the end of the AI bubble in April 2026, but it looks like the market made one last Intel type of spike which you can see on the next chart.
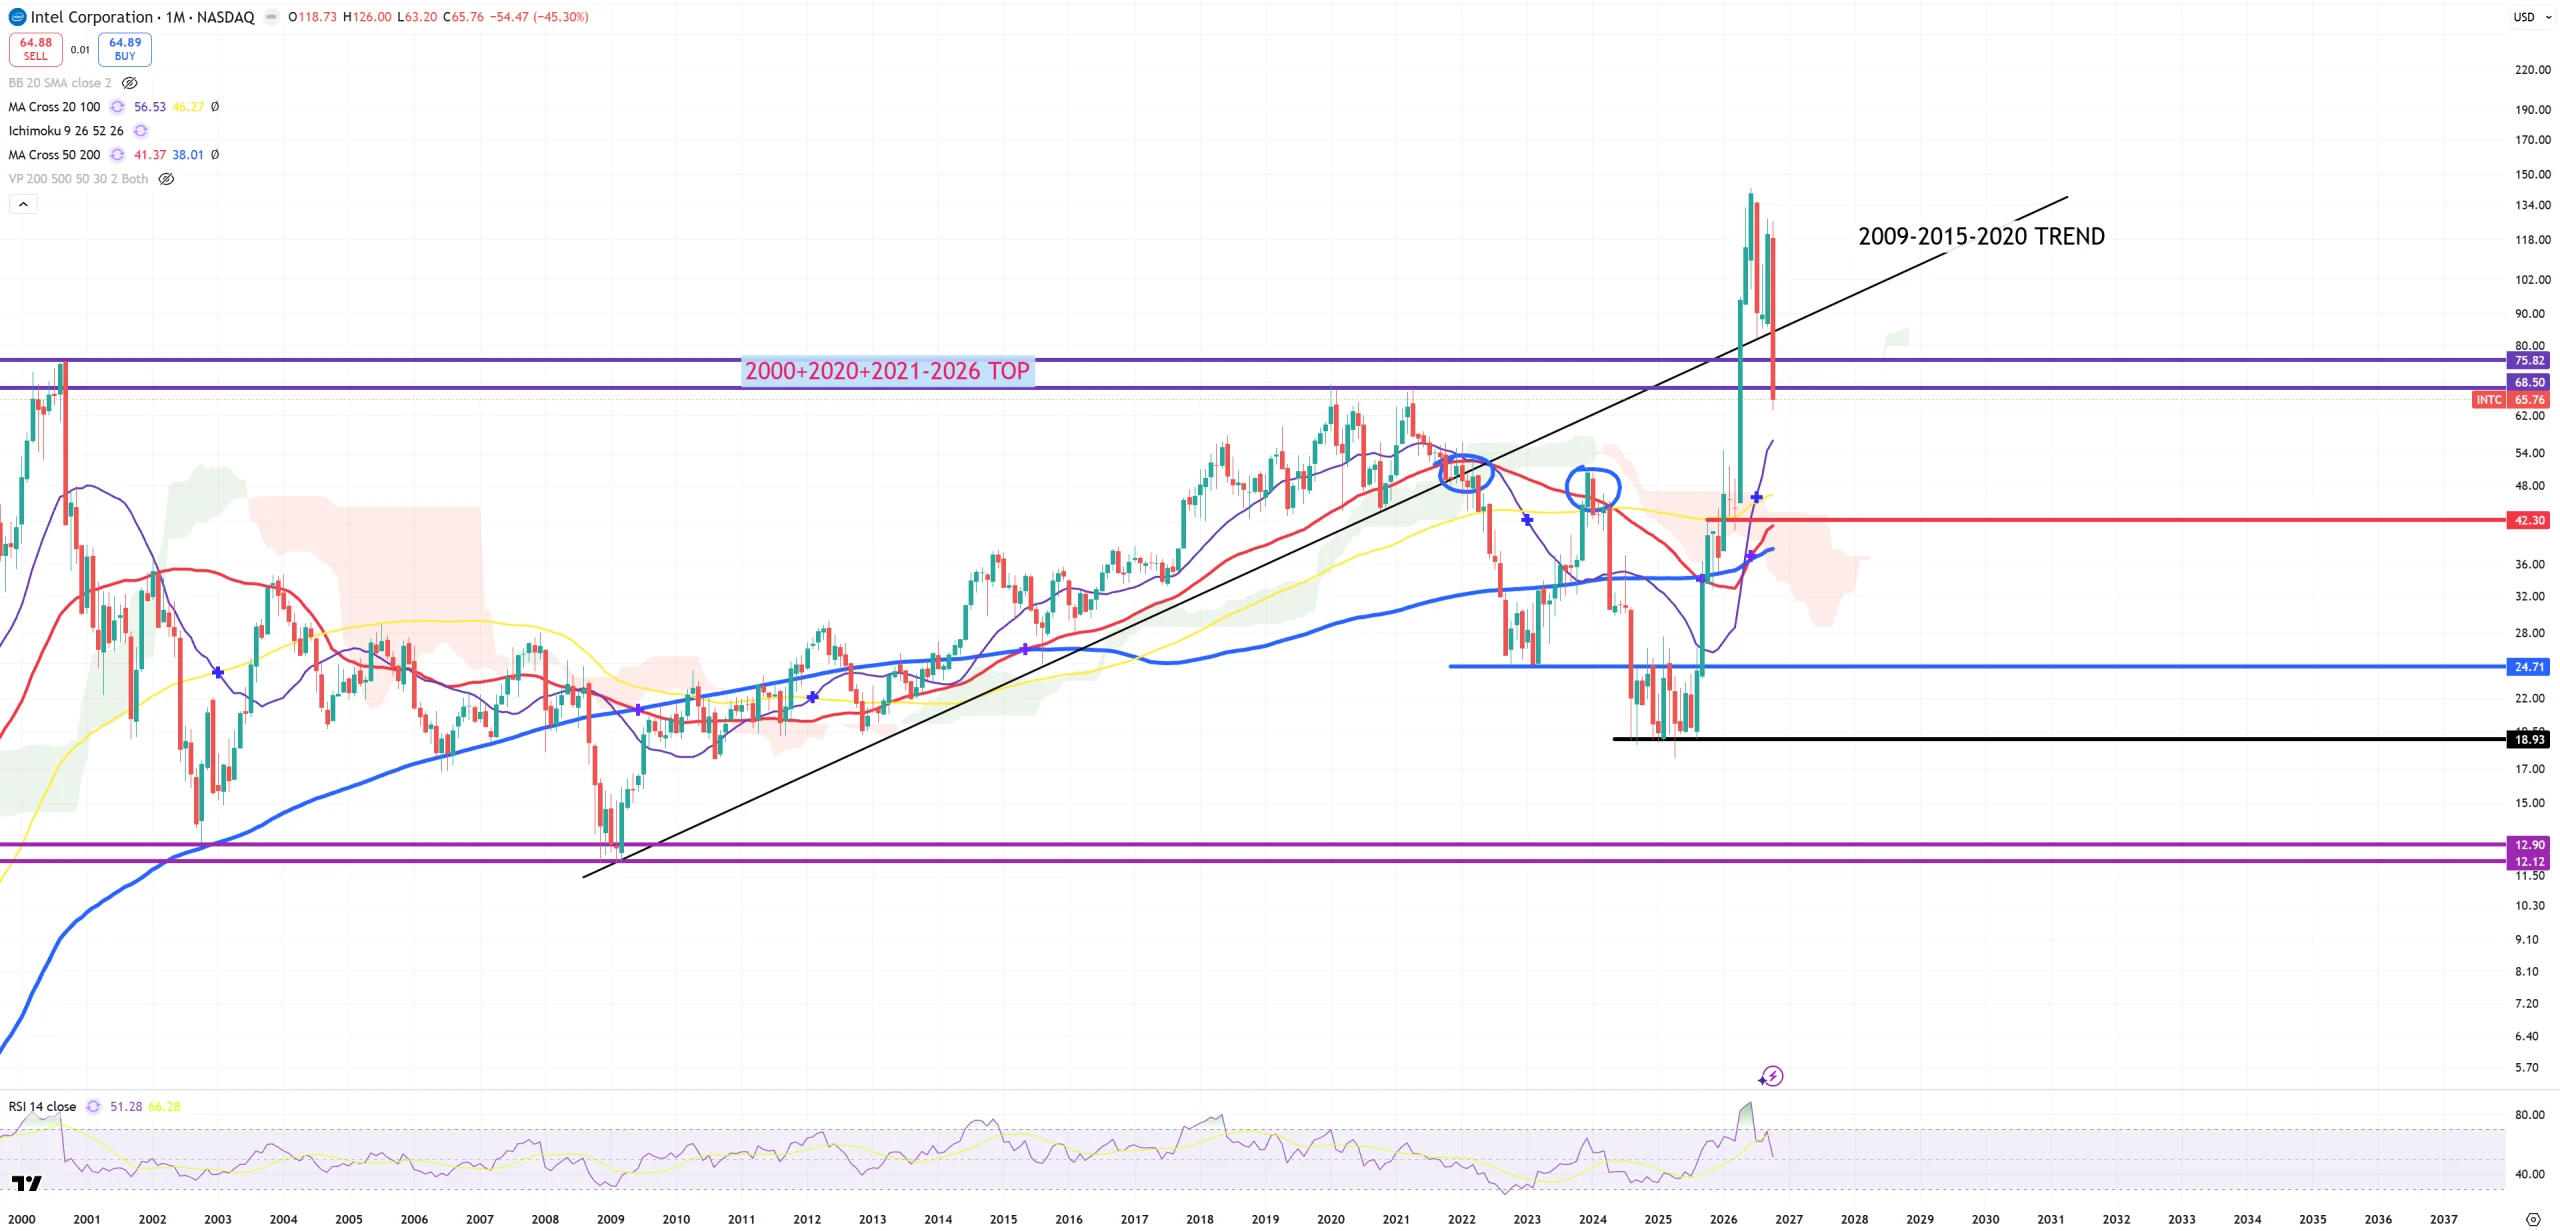
INTC – I must recall Intel here with June 2026 peak with massive bull trap > 2000 peak level. Intel literally was going towards 10$ until Trump started its communism against the stocks which in reality won’t change anything. Intel is dead and I wouldn’t really be surprised if in 2-3 months we’ll be back around 20$.
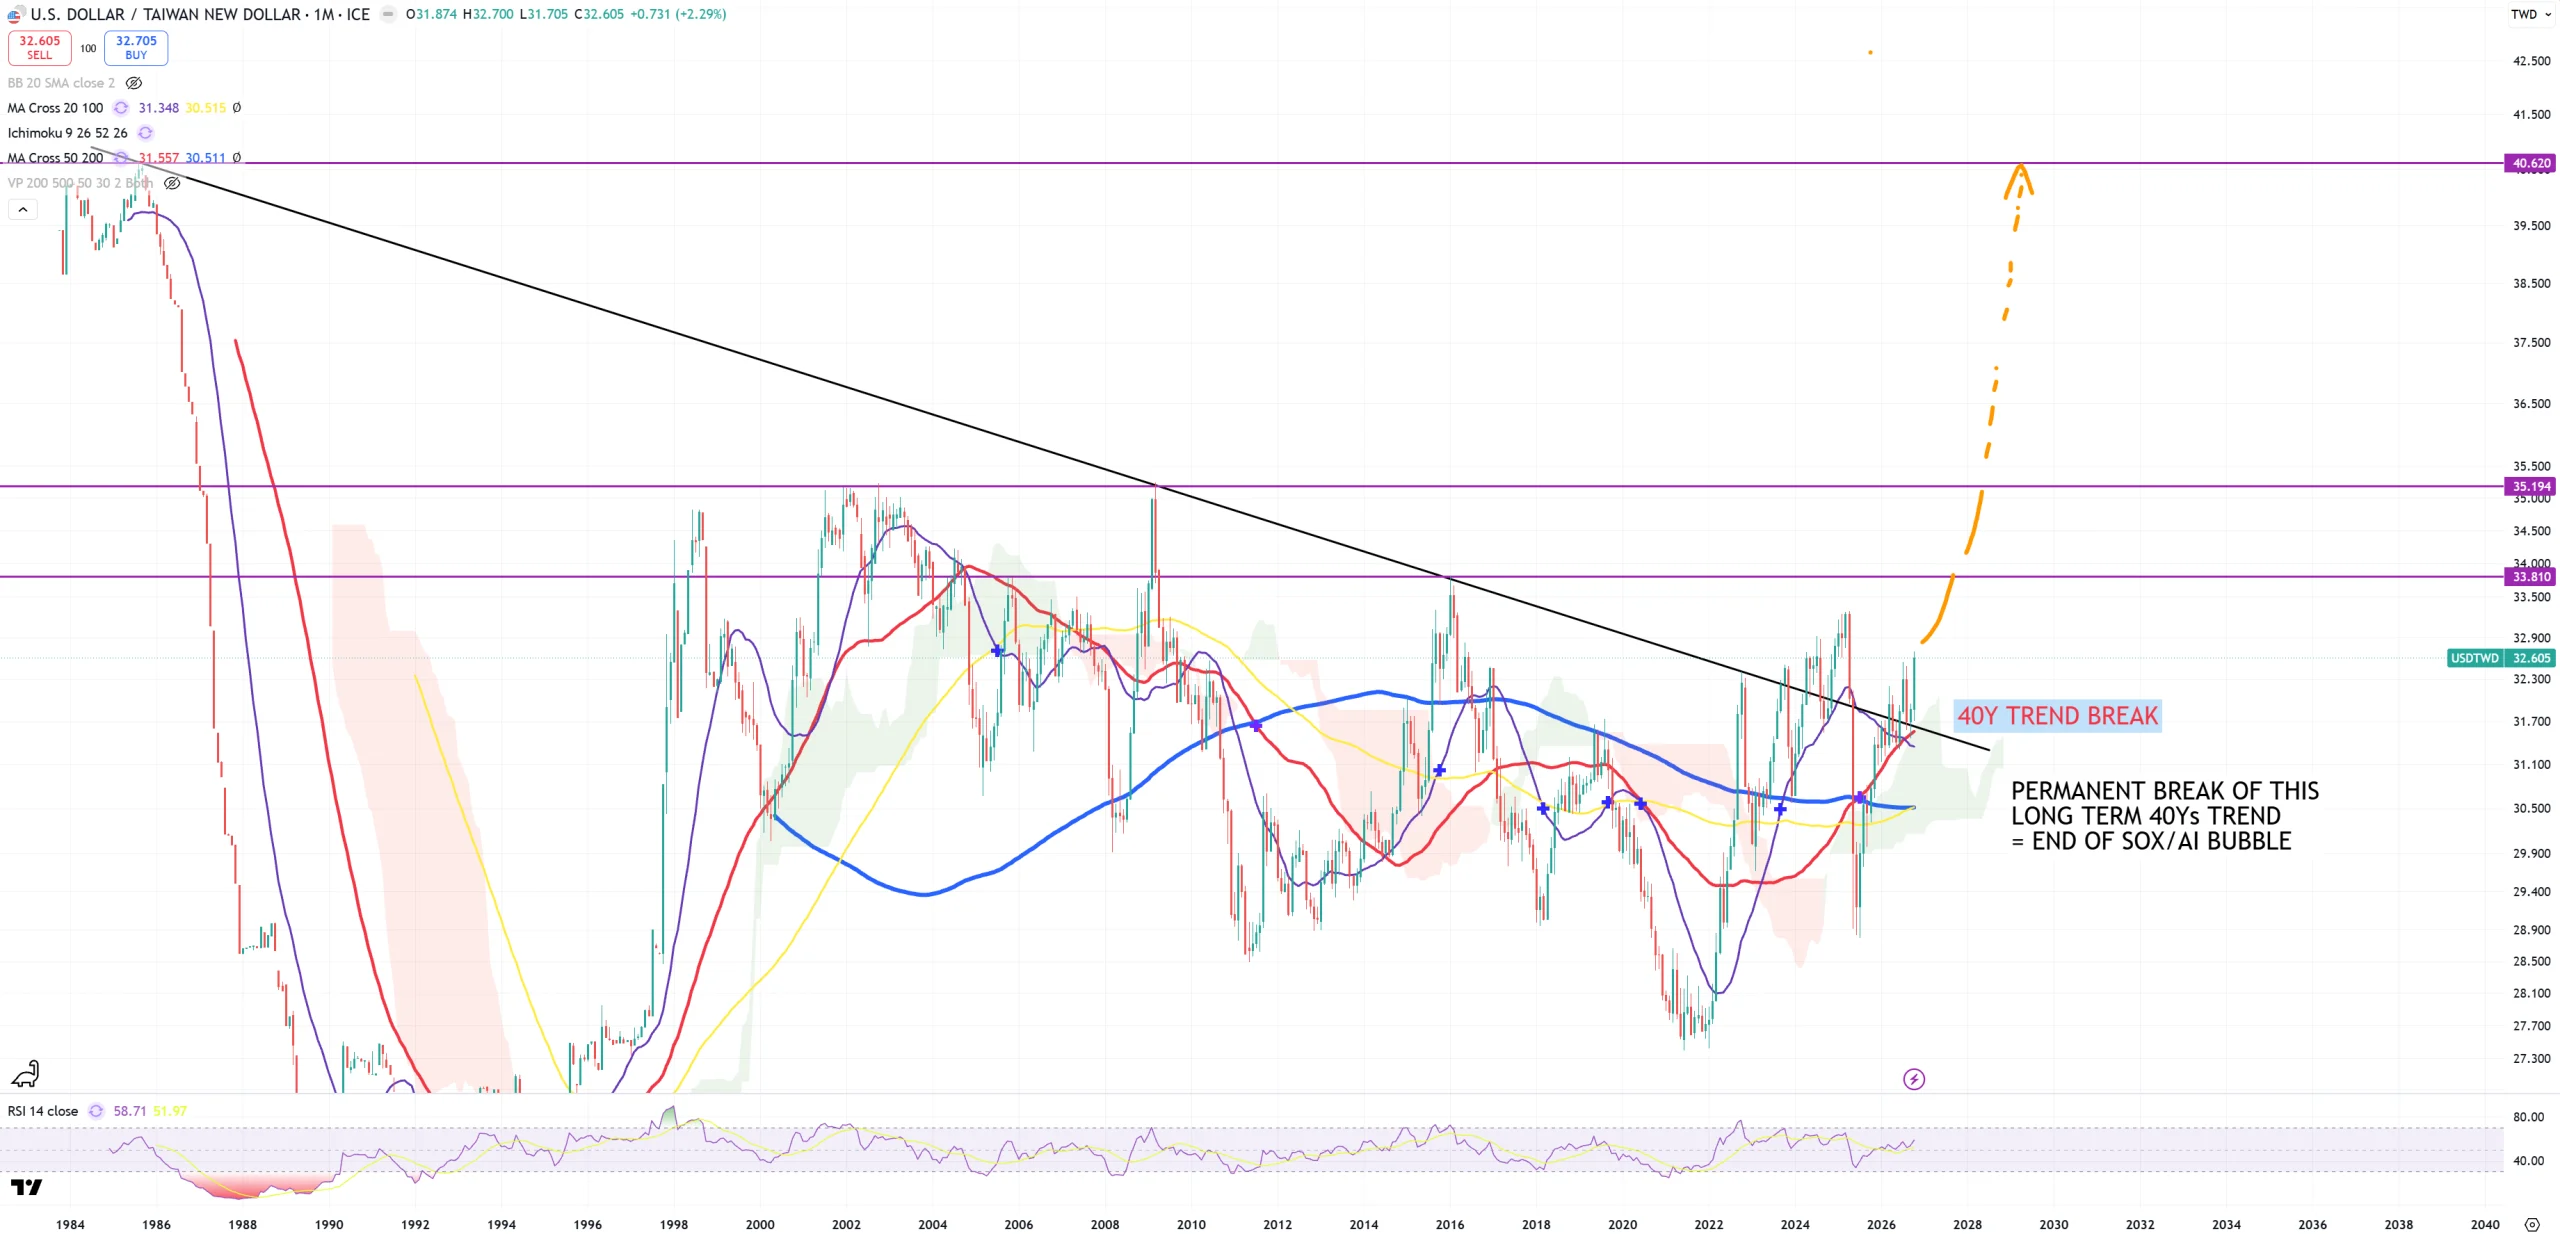
USDTWD – sorry to put this currency pair here, but it makes a lot of sense in reality putting it here. My old bet says once TWD 40Ys trend is broken = the end of SOX bubble
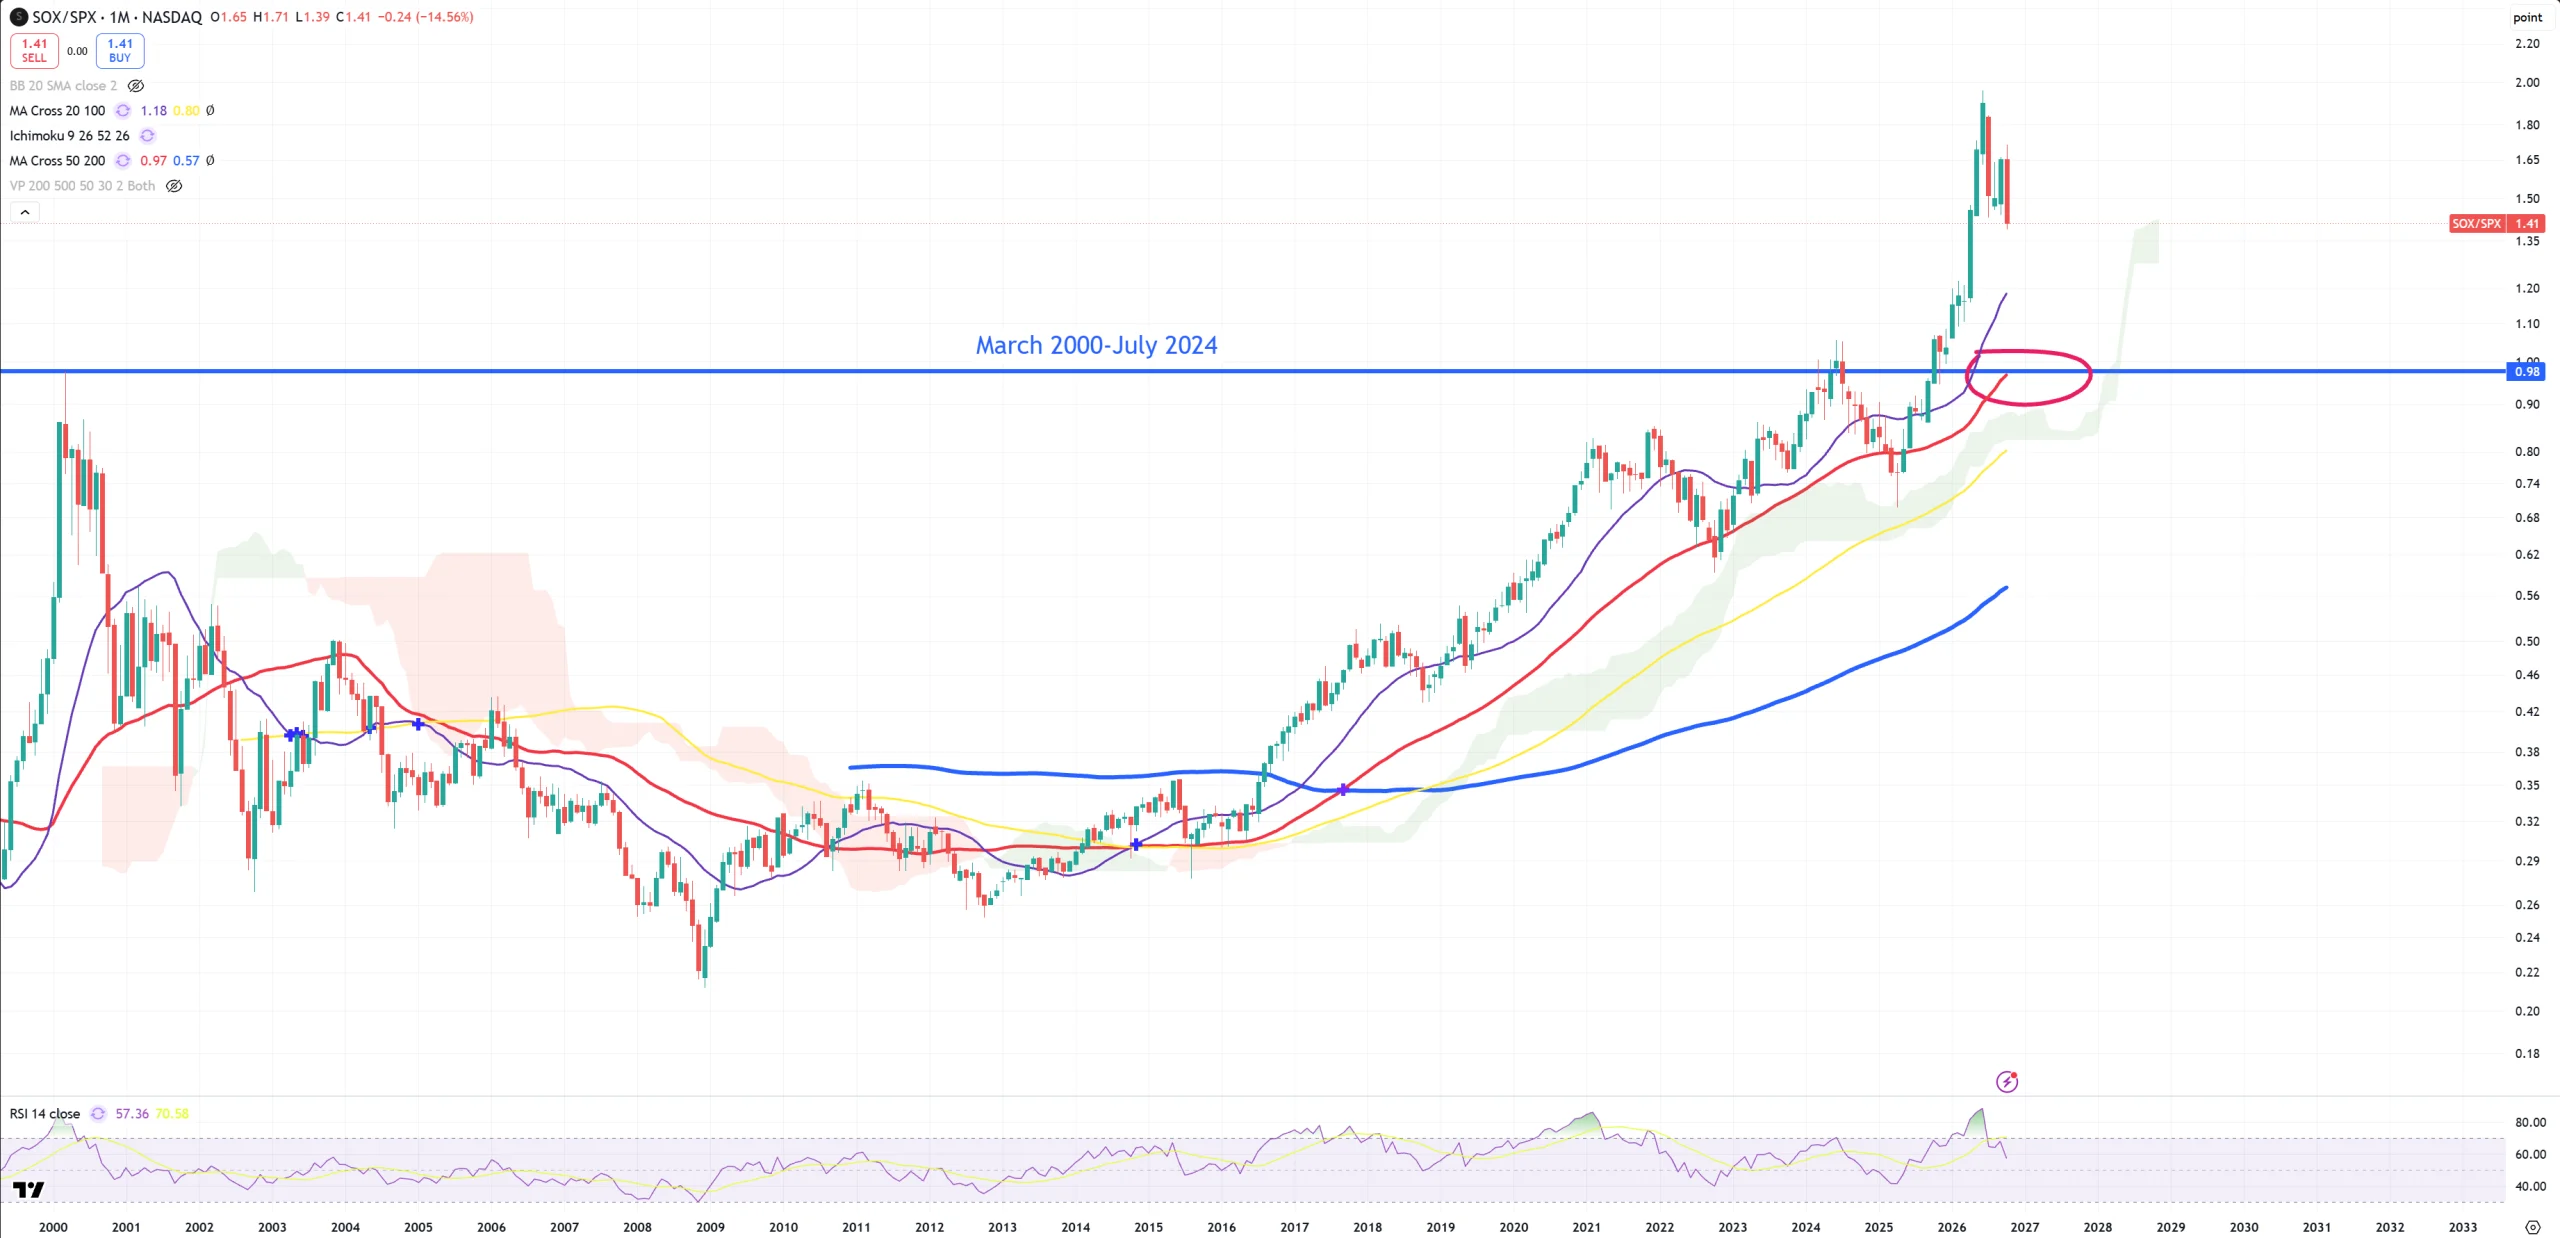
SOX/SPX – do we have a bull trap like Intel here? (M)MA50 matches March 2000 level.
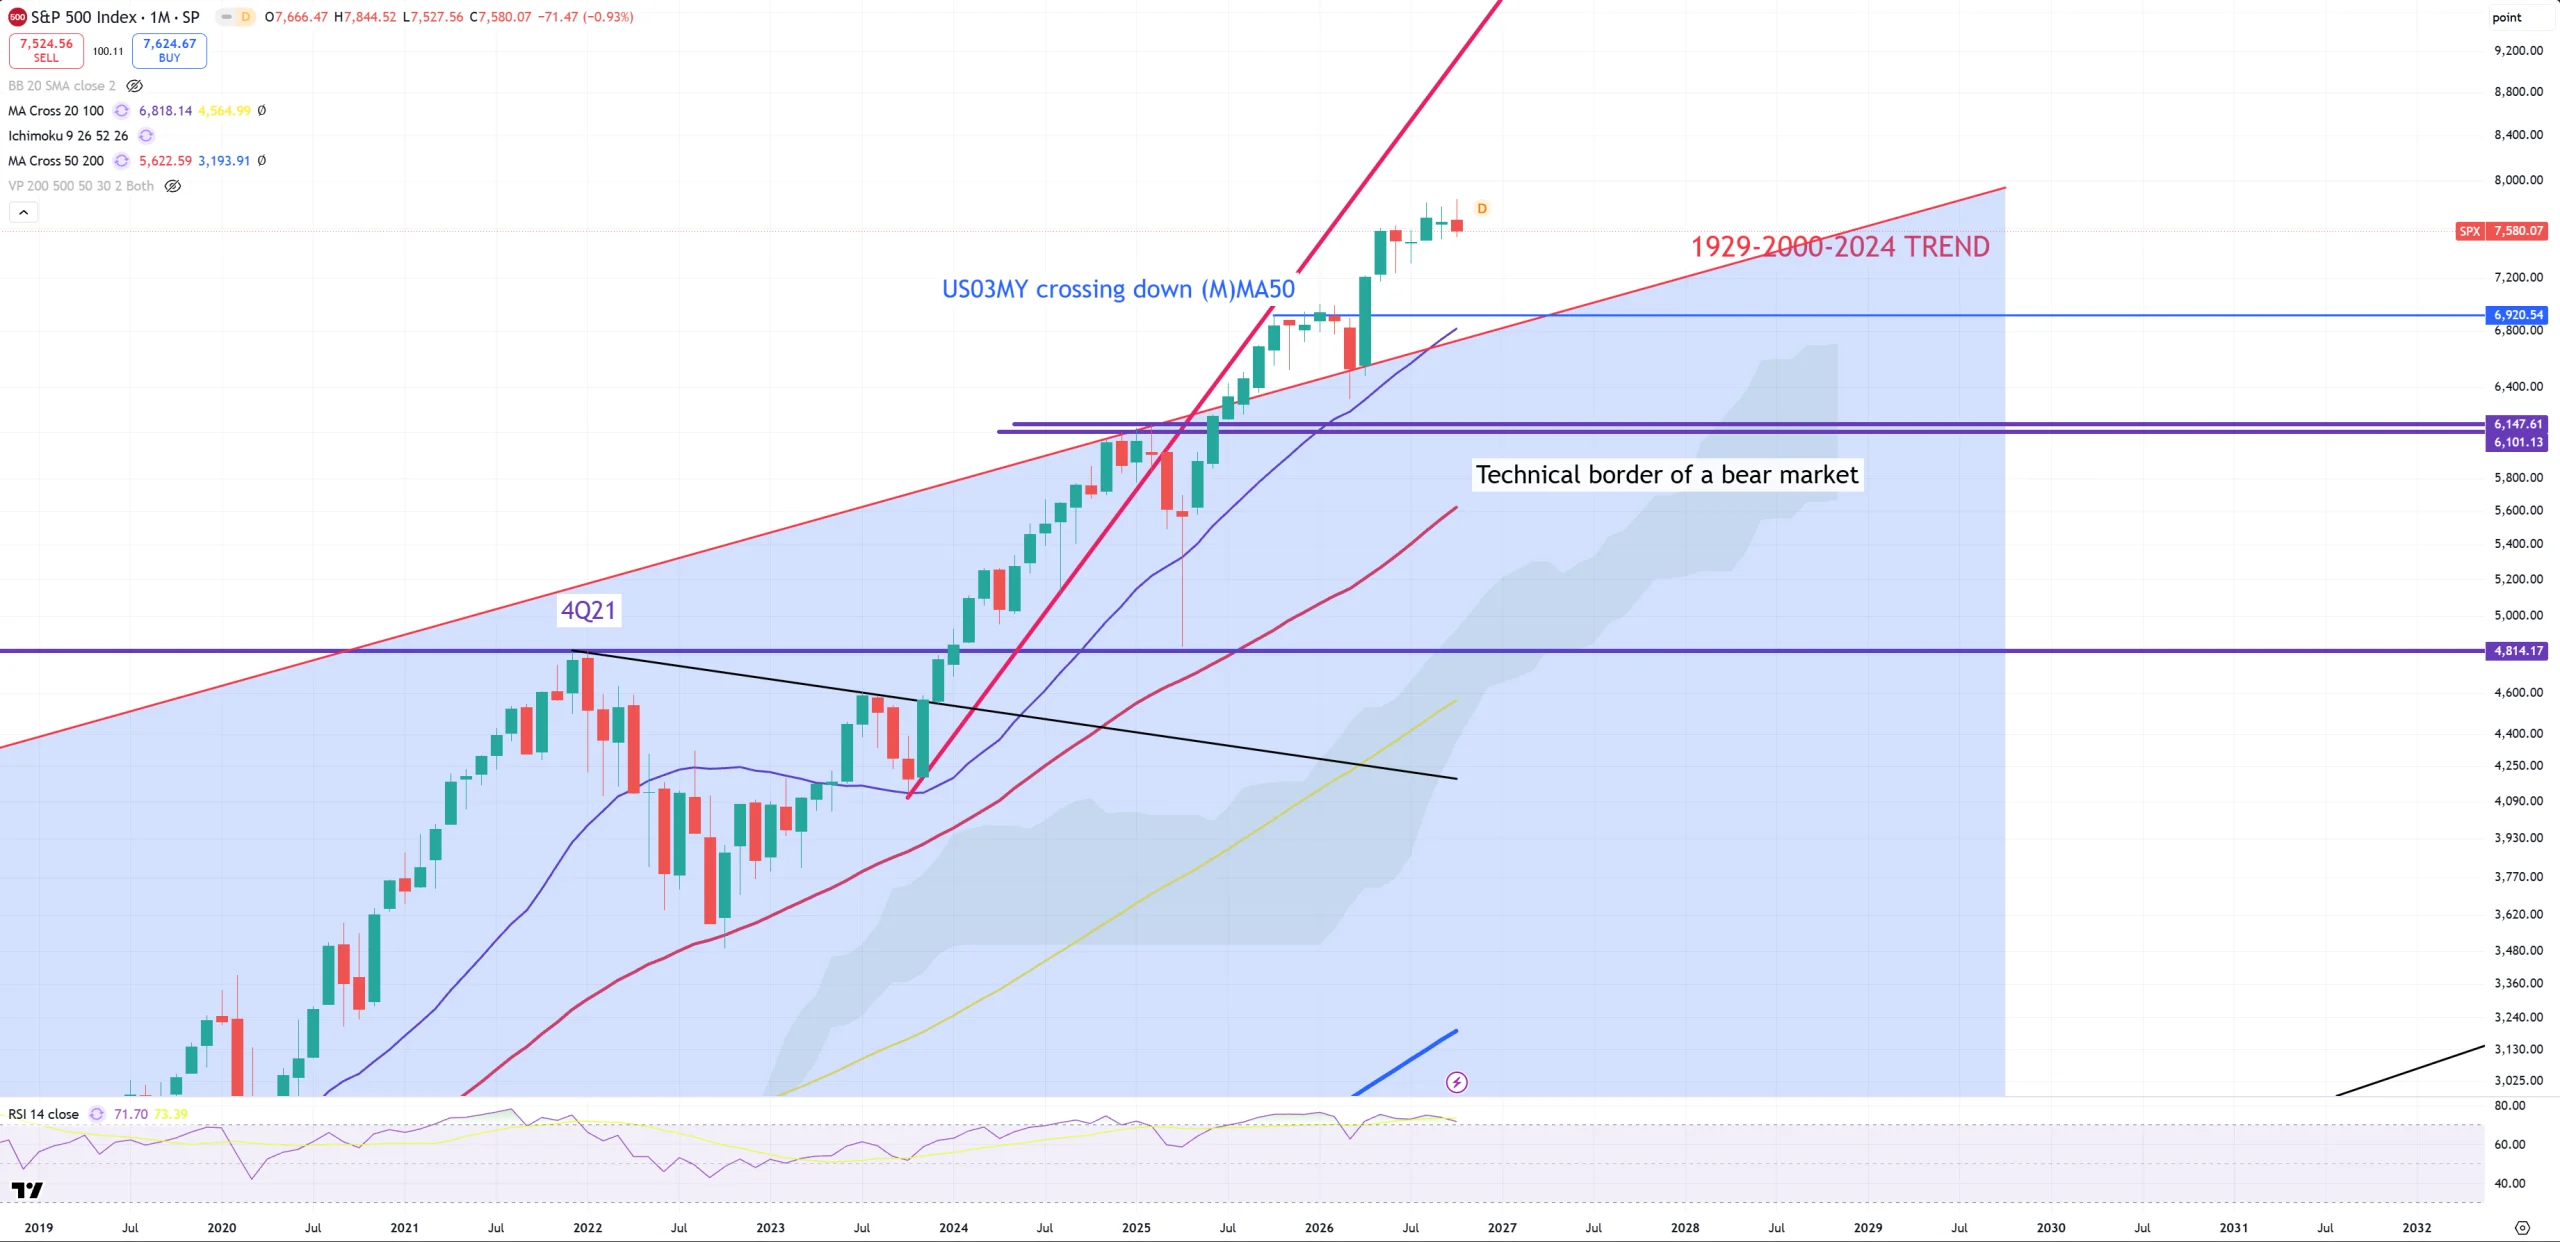
SPX – and that’s how SPX secular chart looks like … You know what I want to say looking on Intel chart above… (M)MA20 sits almost EXACTLY on 1929-2000 trend line. Red (M)MA50 is ~5630 key 1929-2000 trend is ~6780.
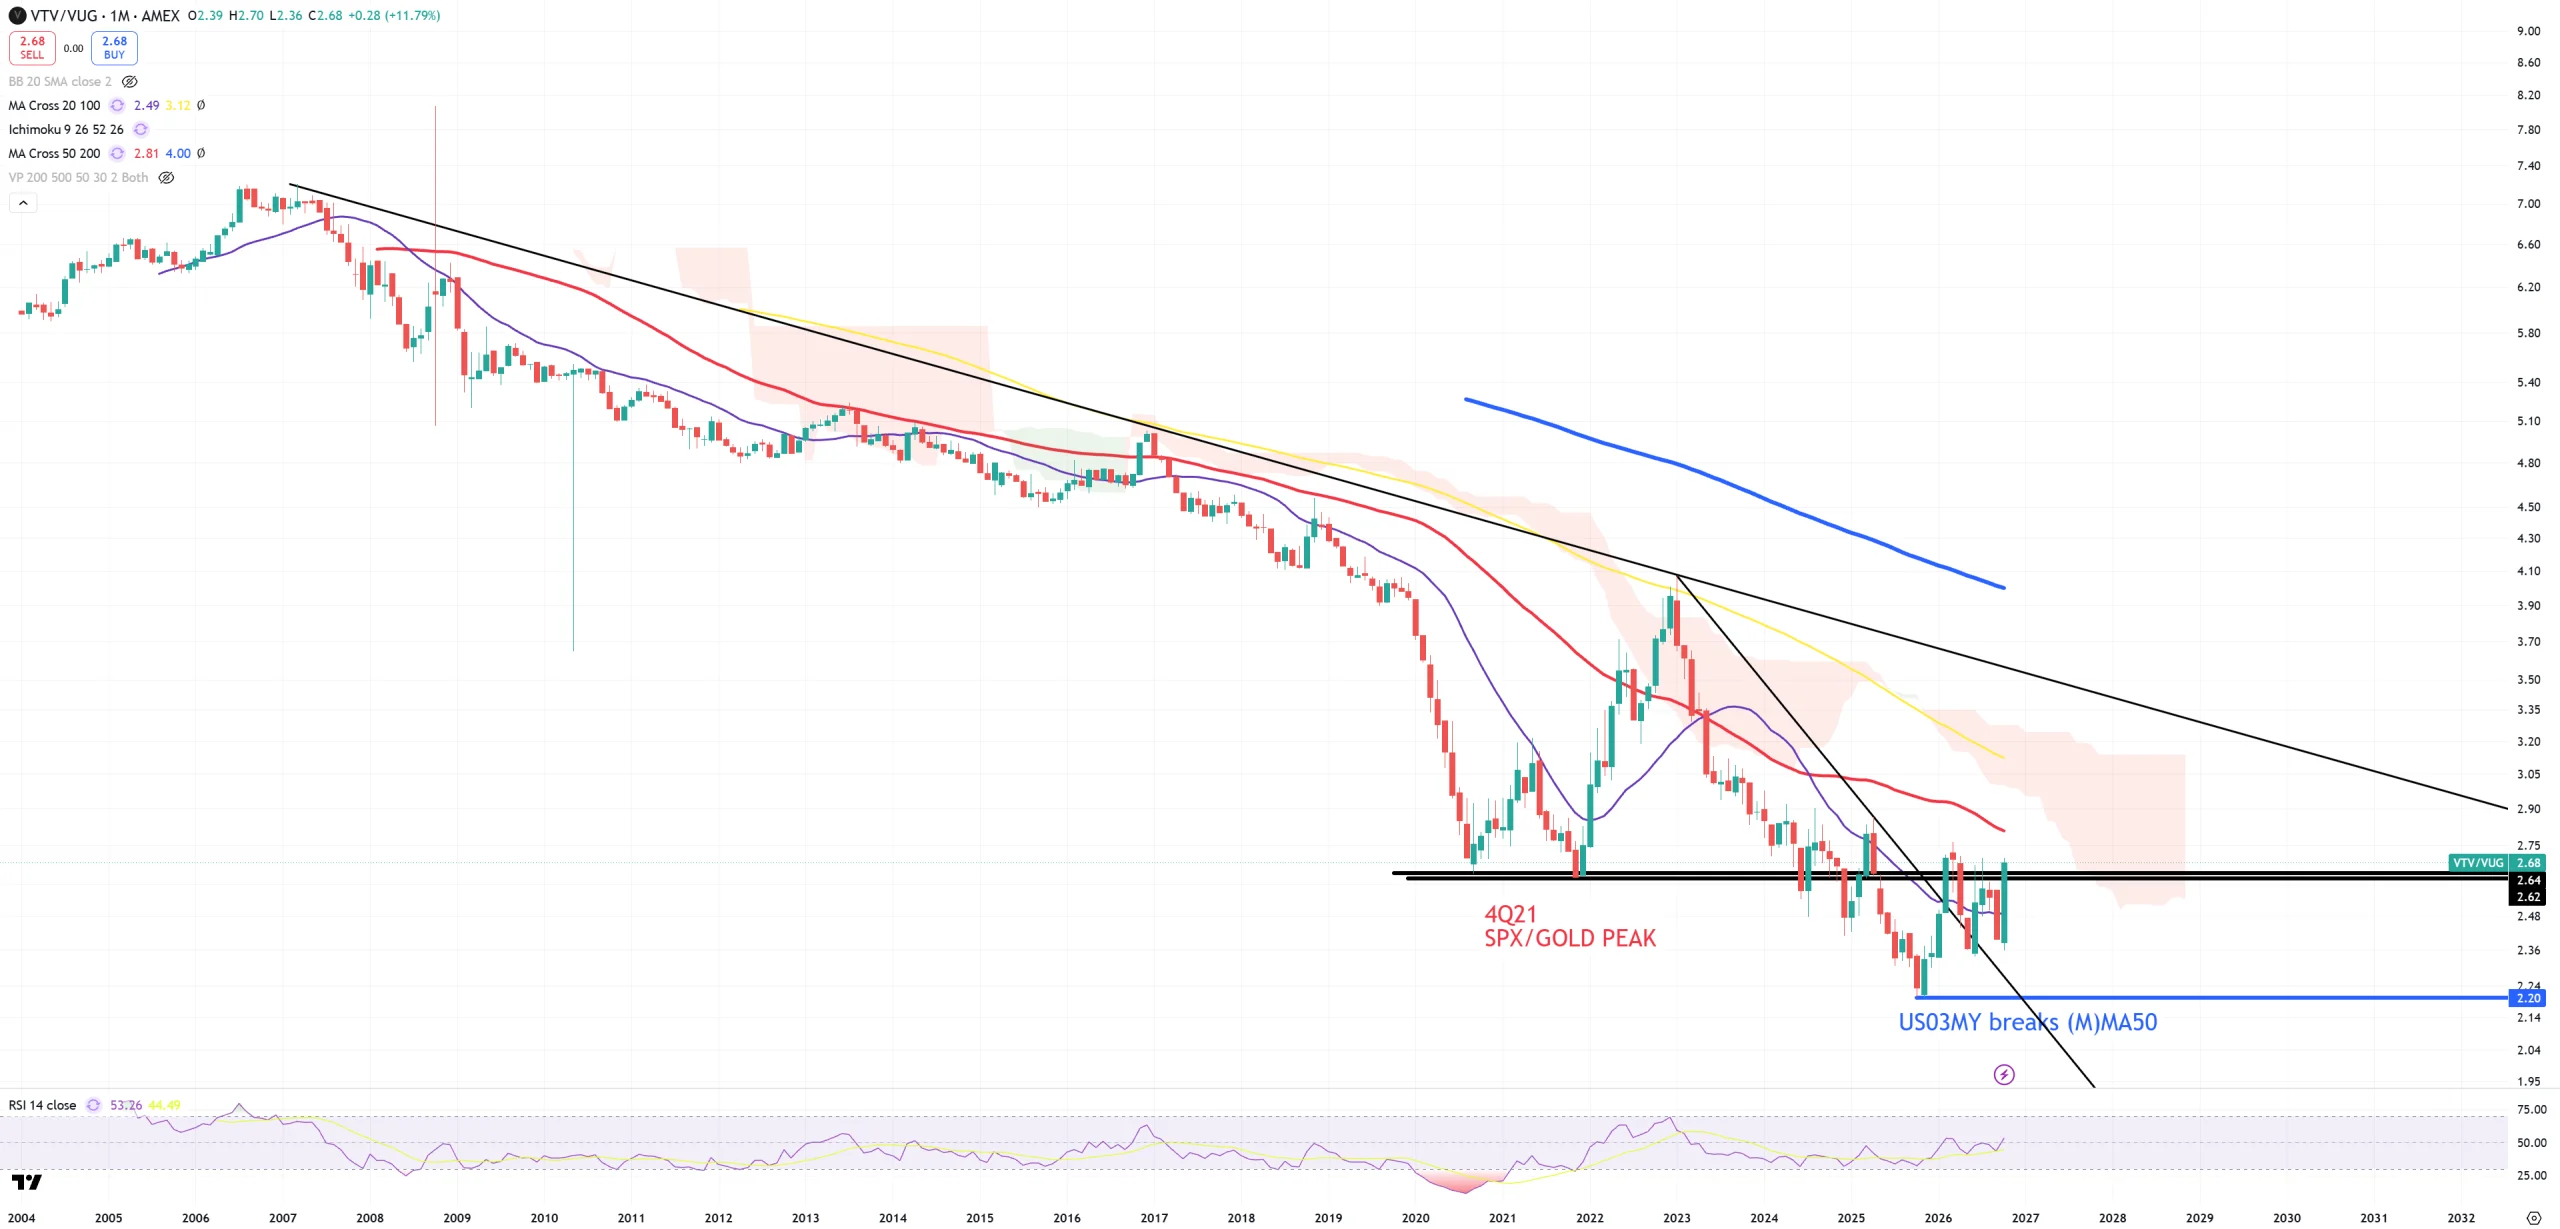
VALUE/GROWTH – key level 4Q21 and the moment it’ll become support we can call the end of TECH/AI/SOX bubble. You see how previously around this level market wanted from 4Q21 level : resistance. The moment 4Q21 level will be flipped as support = end of TECH/AI/SOX bubble.
MAGS – you see the moment when US03MY lost (M)MA50 and when 10Y/3M permanently uninverted > +60bps. My idea is that those two indicators combined have never made a mistake, unless US03MY jumps > (M)MA50 to invalidate the thesis and after it 10y/3m will plunge back lower (back to inversion).
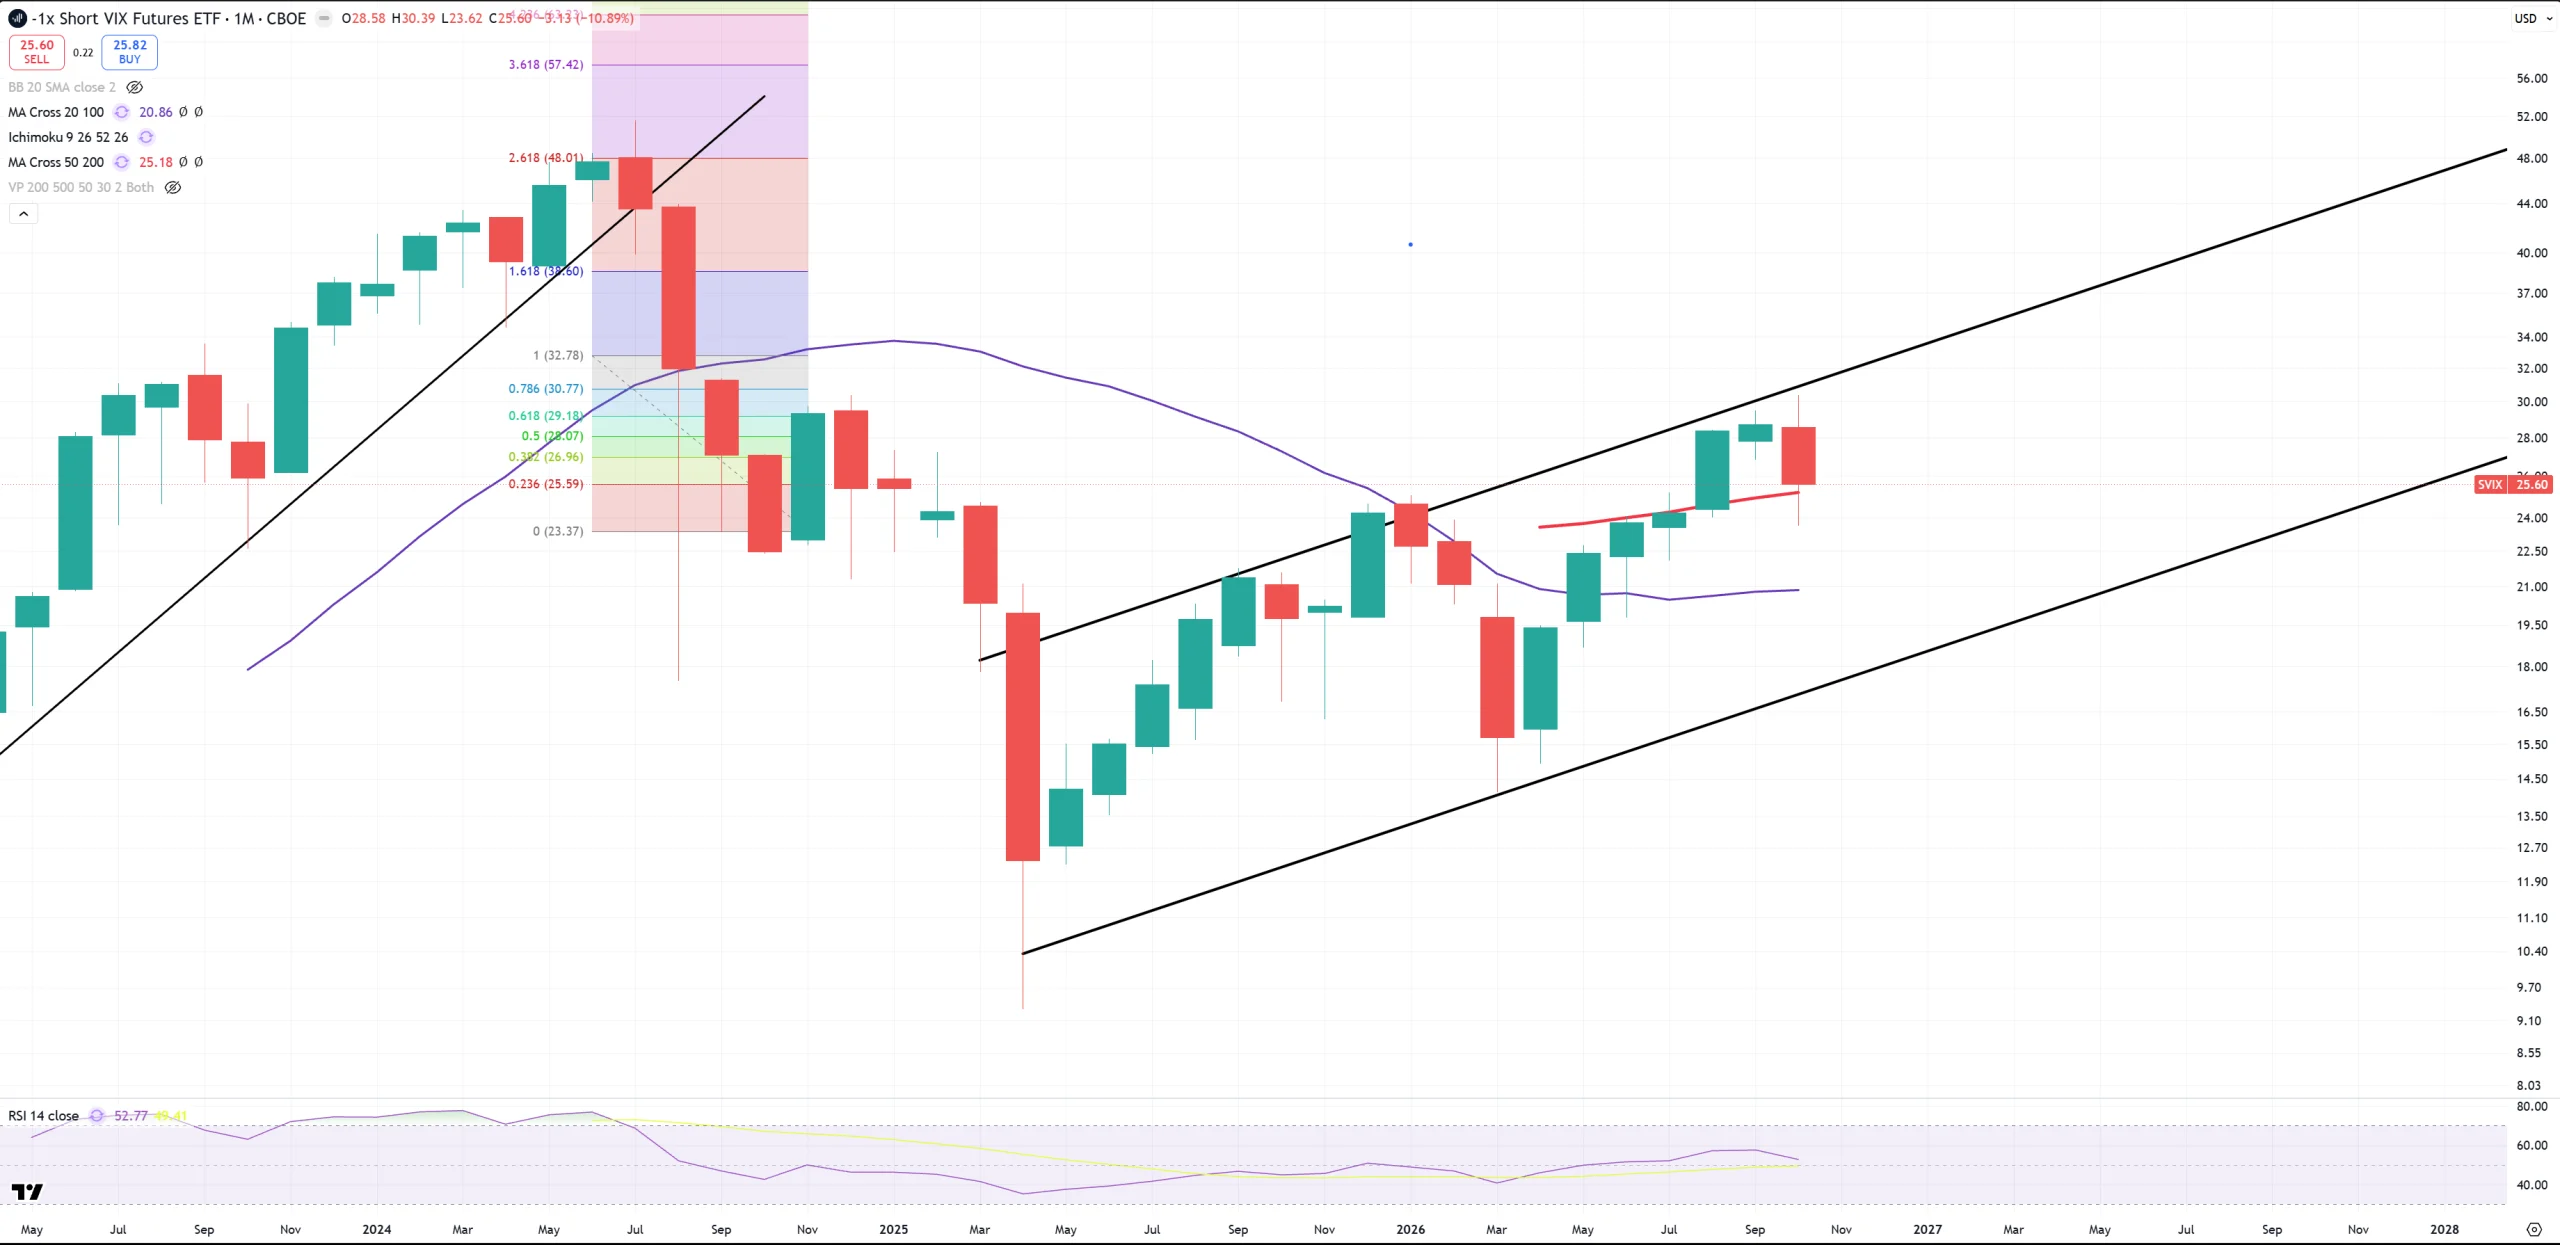
SVIX – and its (M)MA50
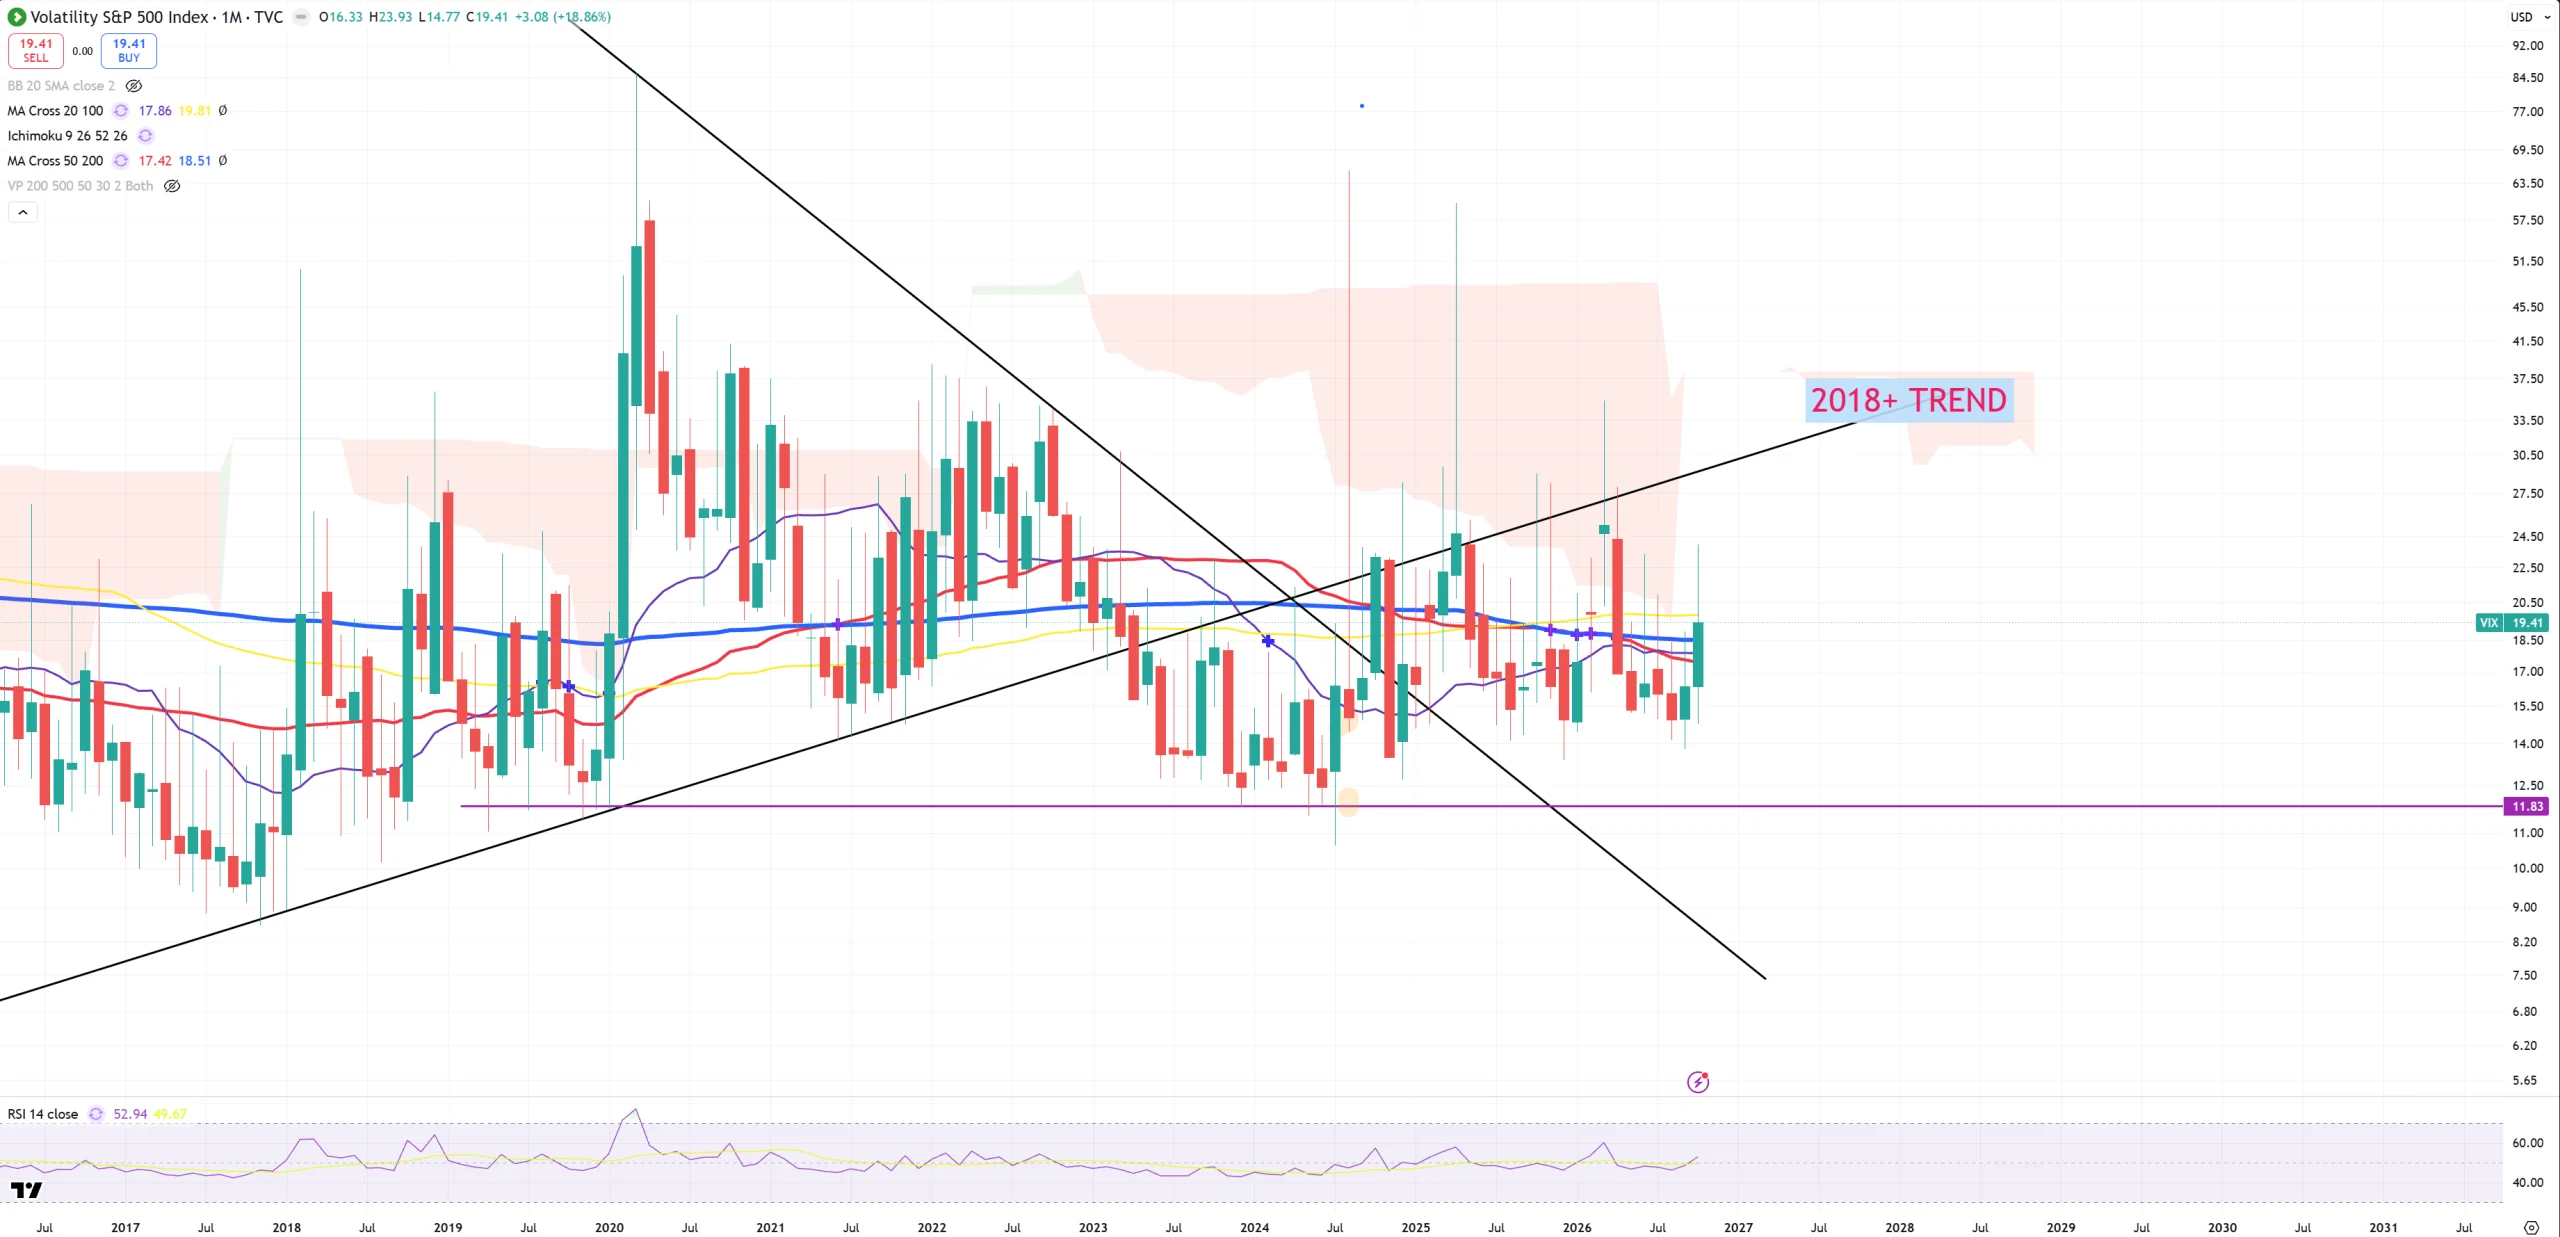
VIX and its close above (M)MA200/(M)MA50/(M)MA20, but below yellow (M)MA100. I watch more SVIX chart than this one in reality.
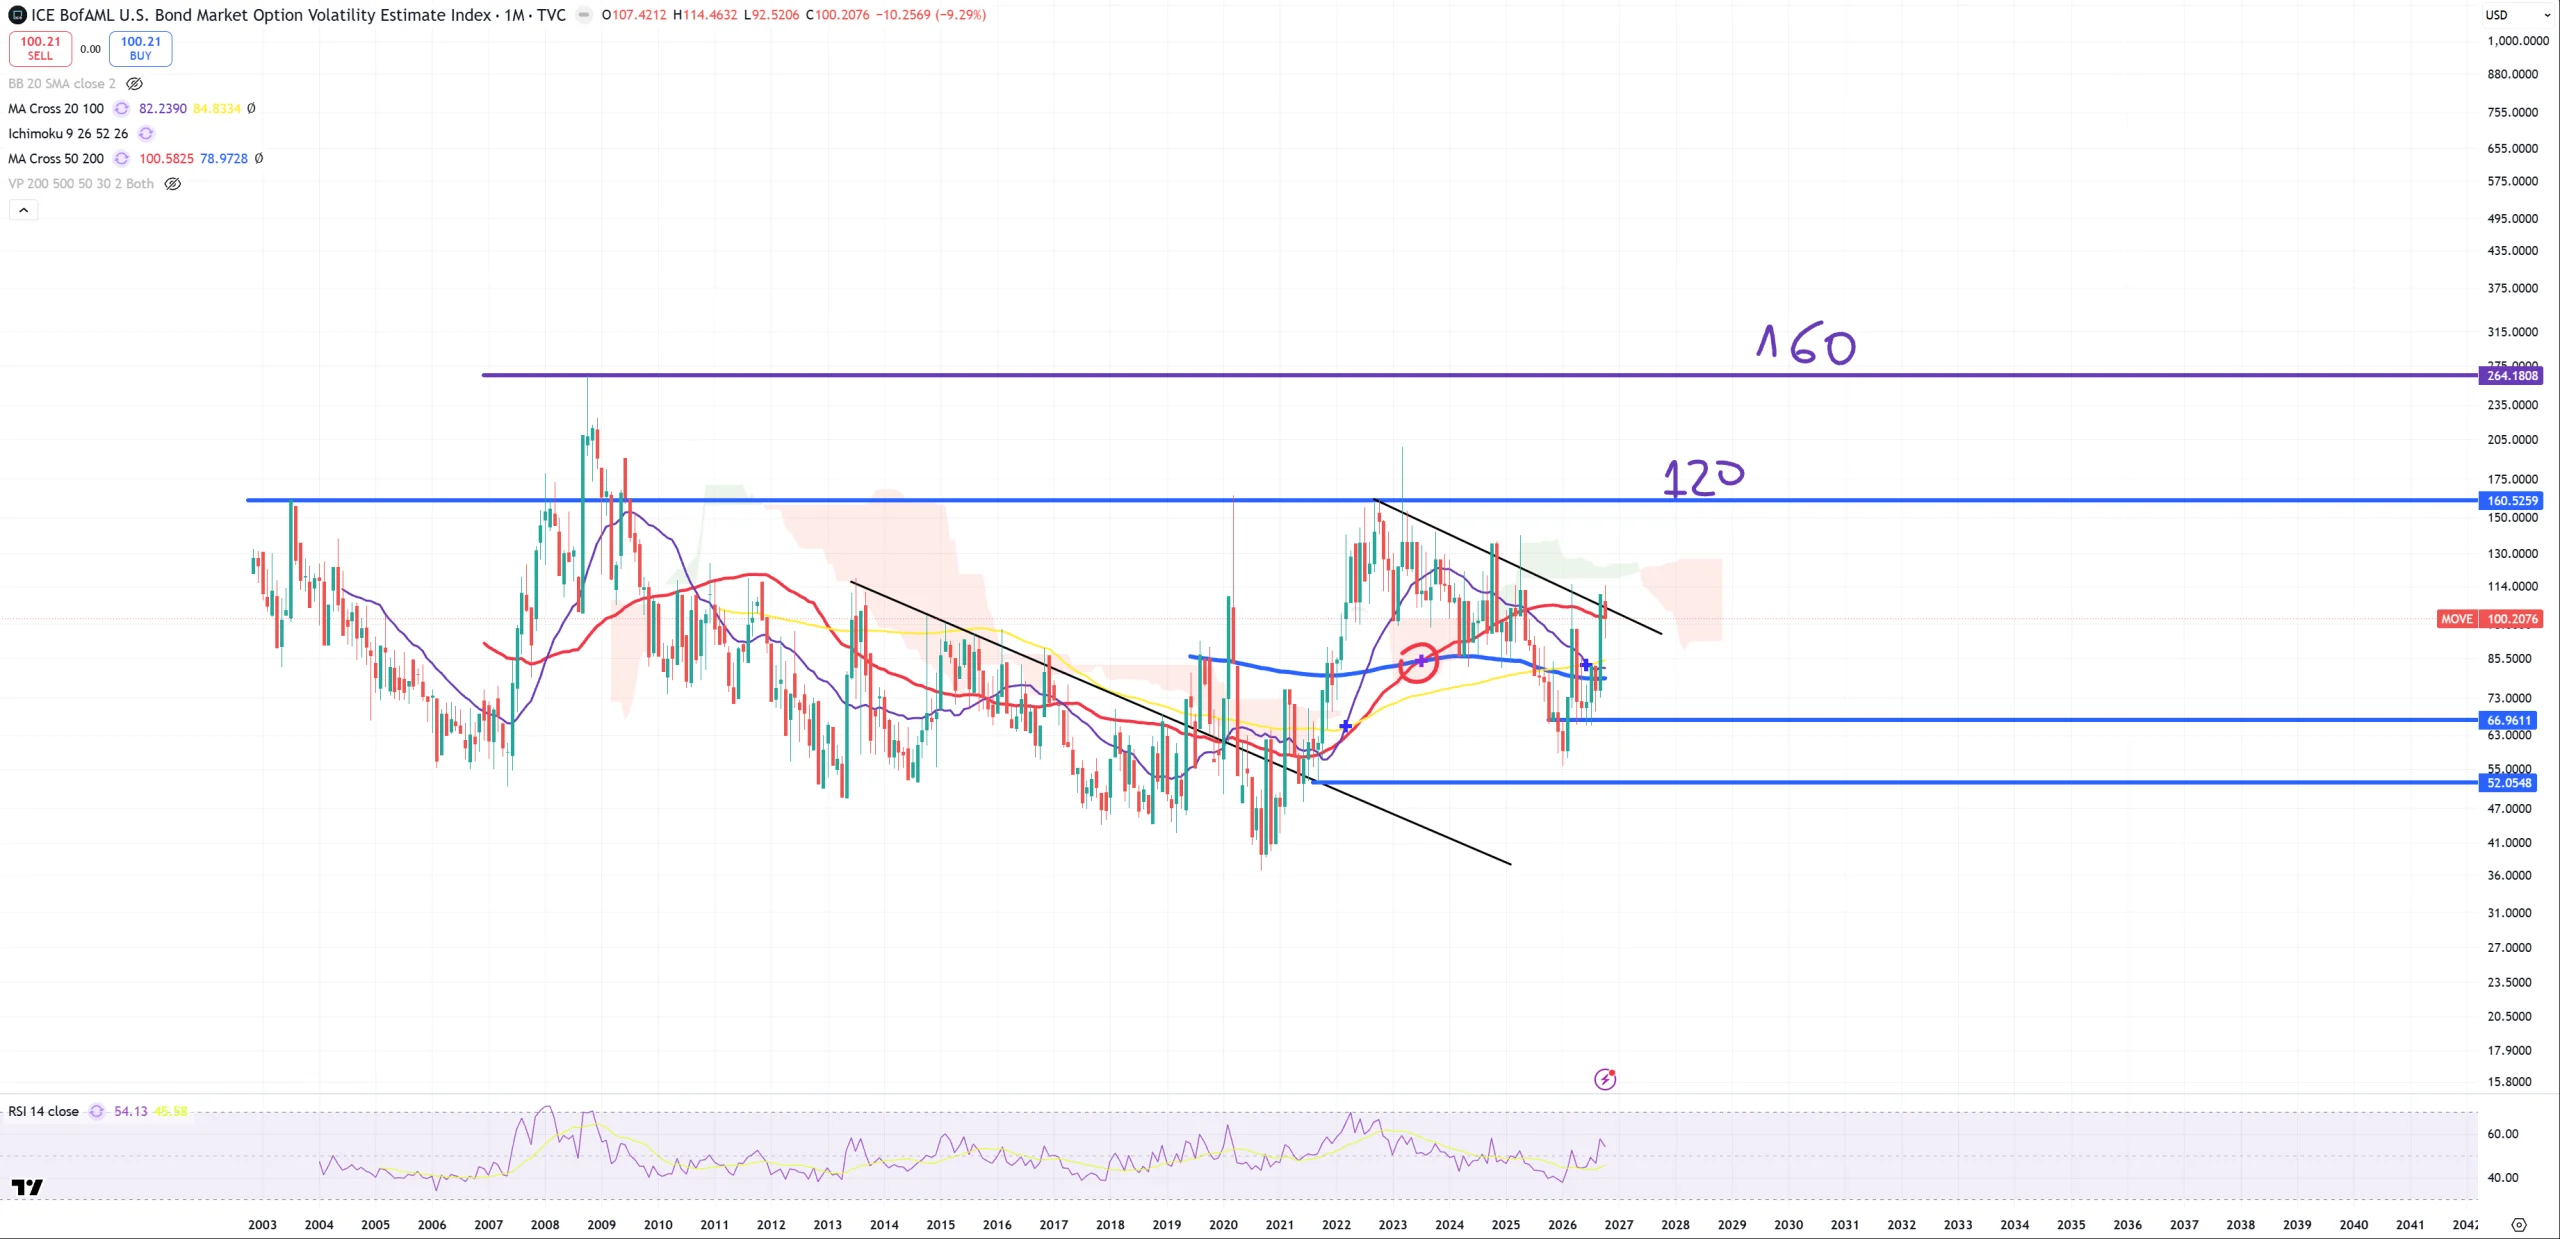
MOVE – and its (M)MA50
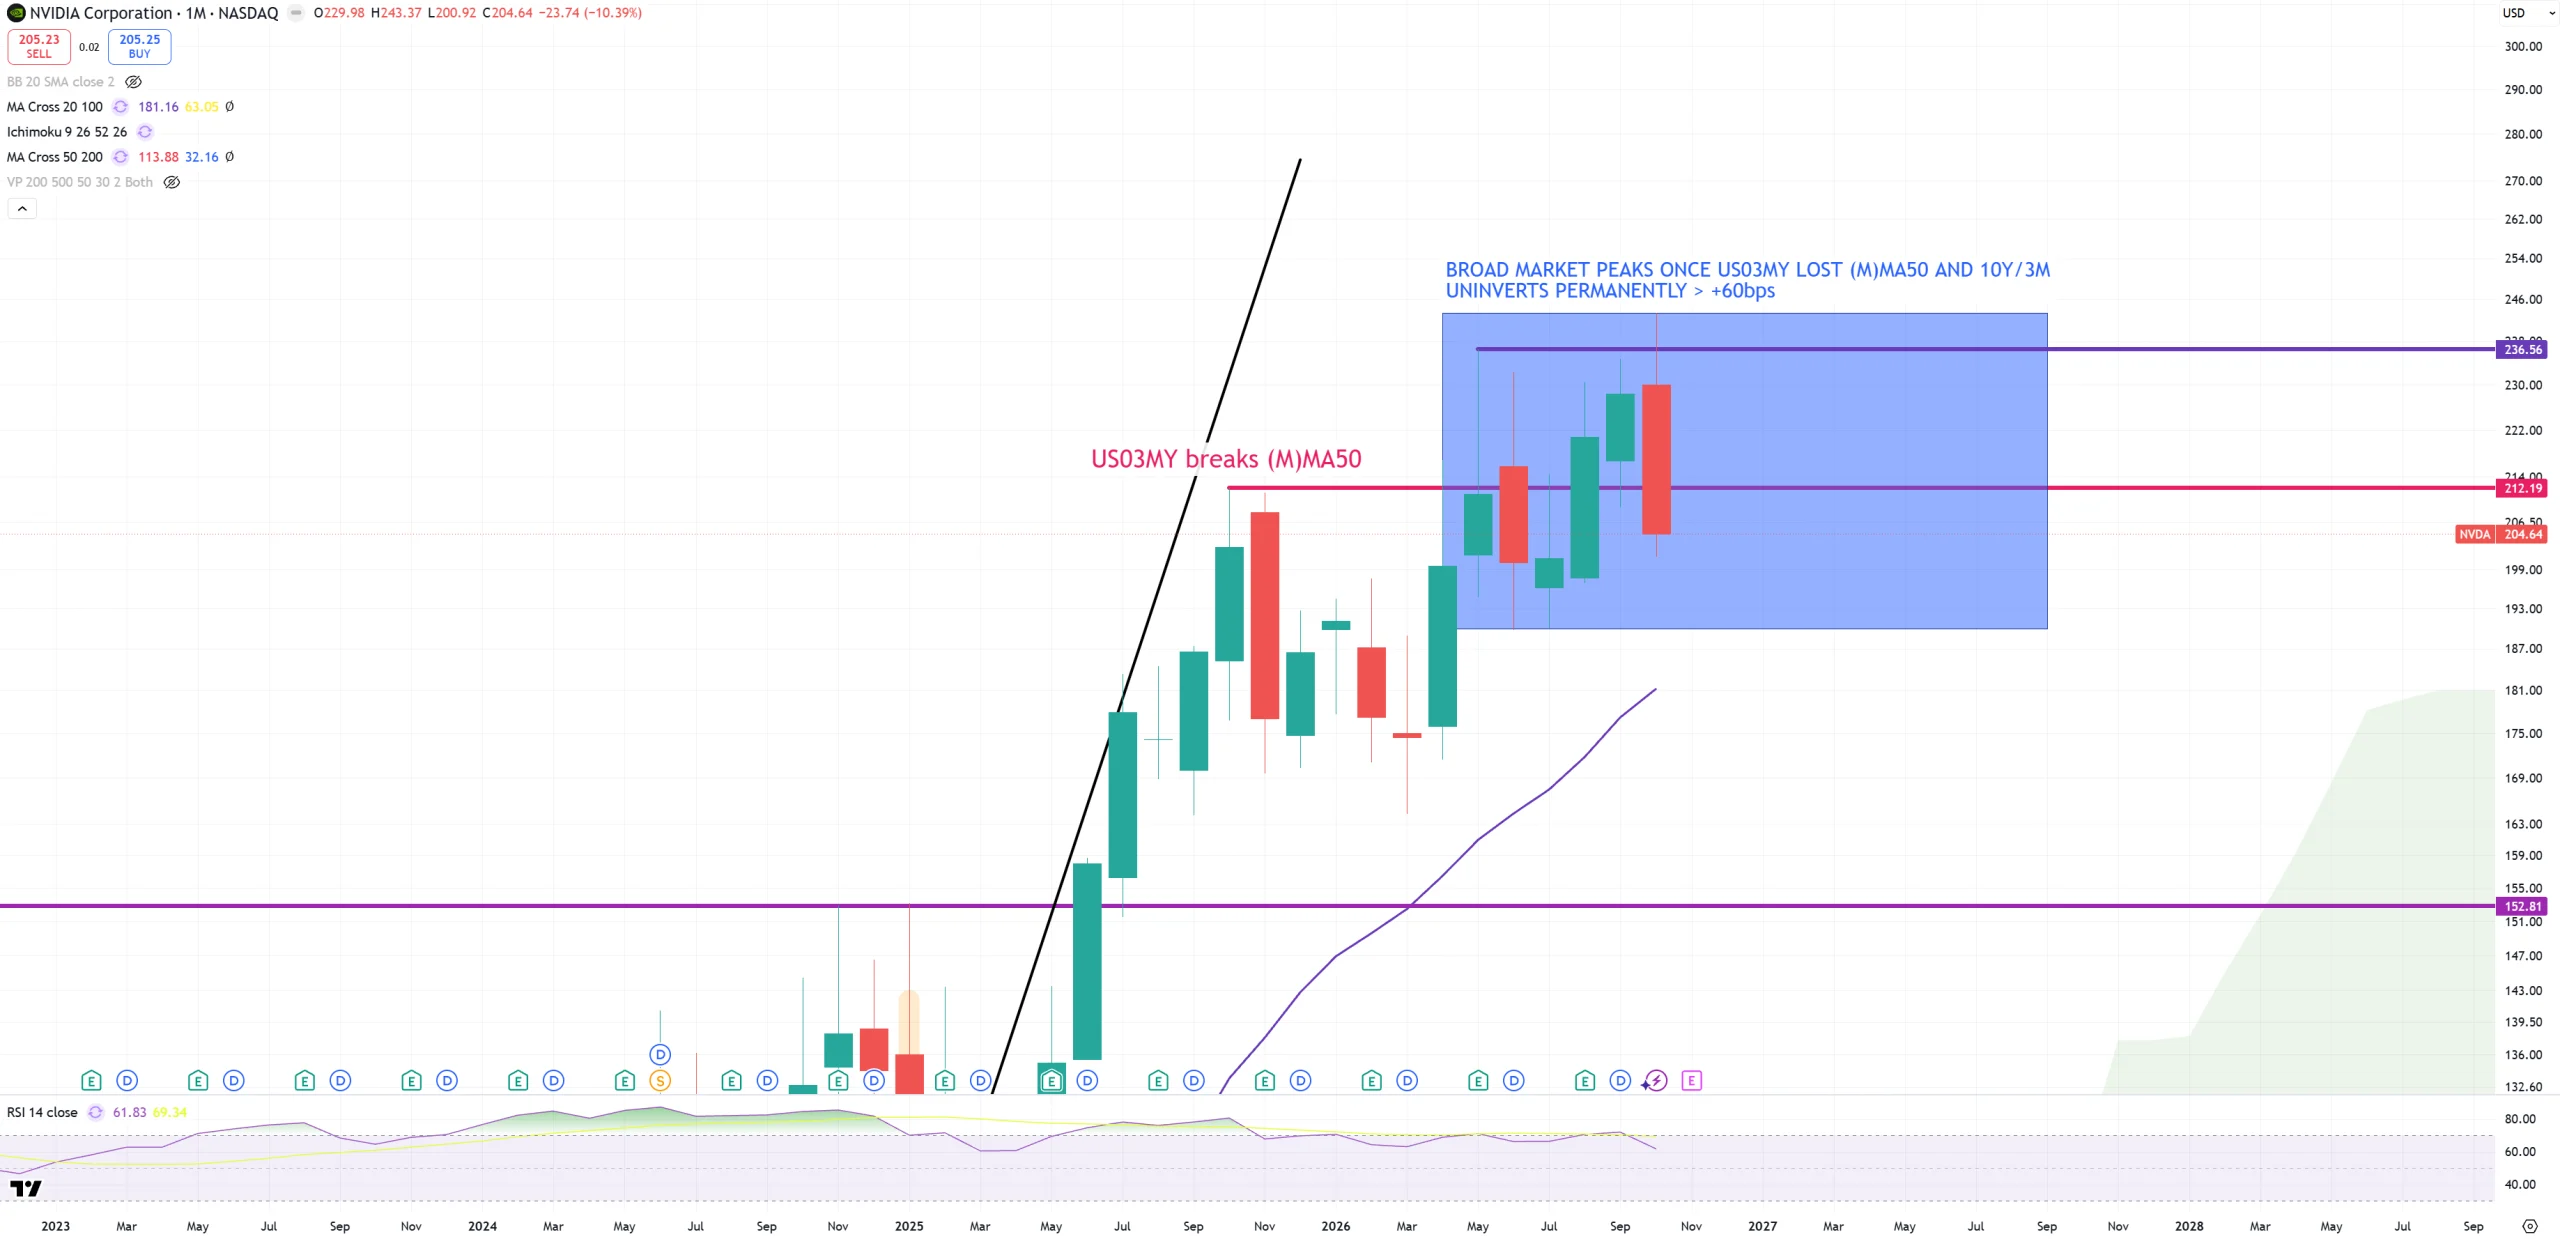
NVIDIA/TECH
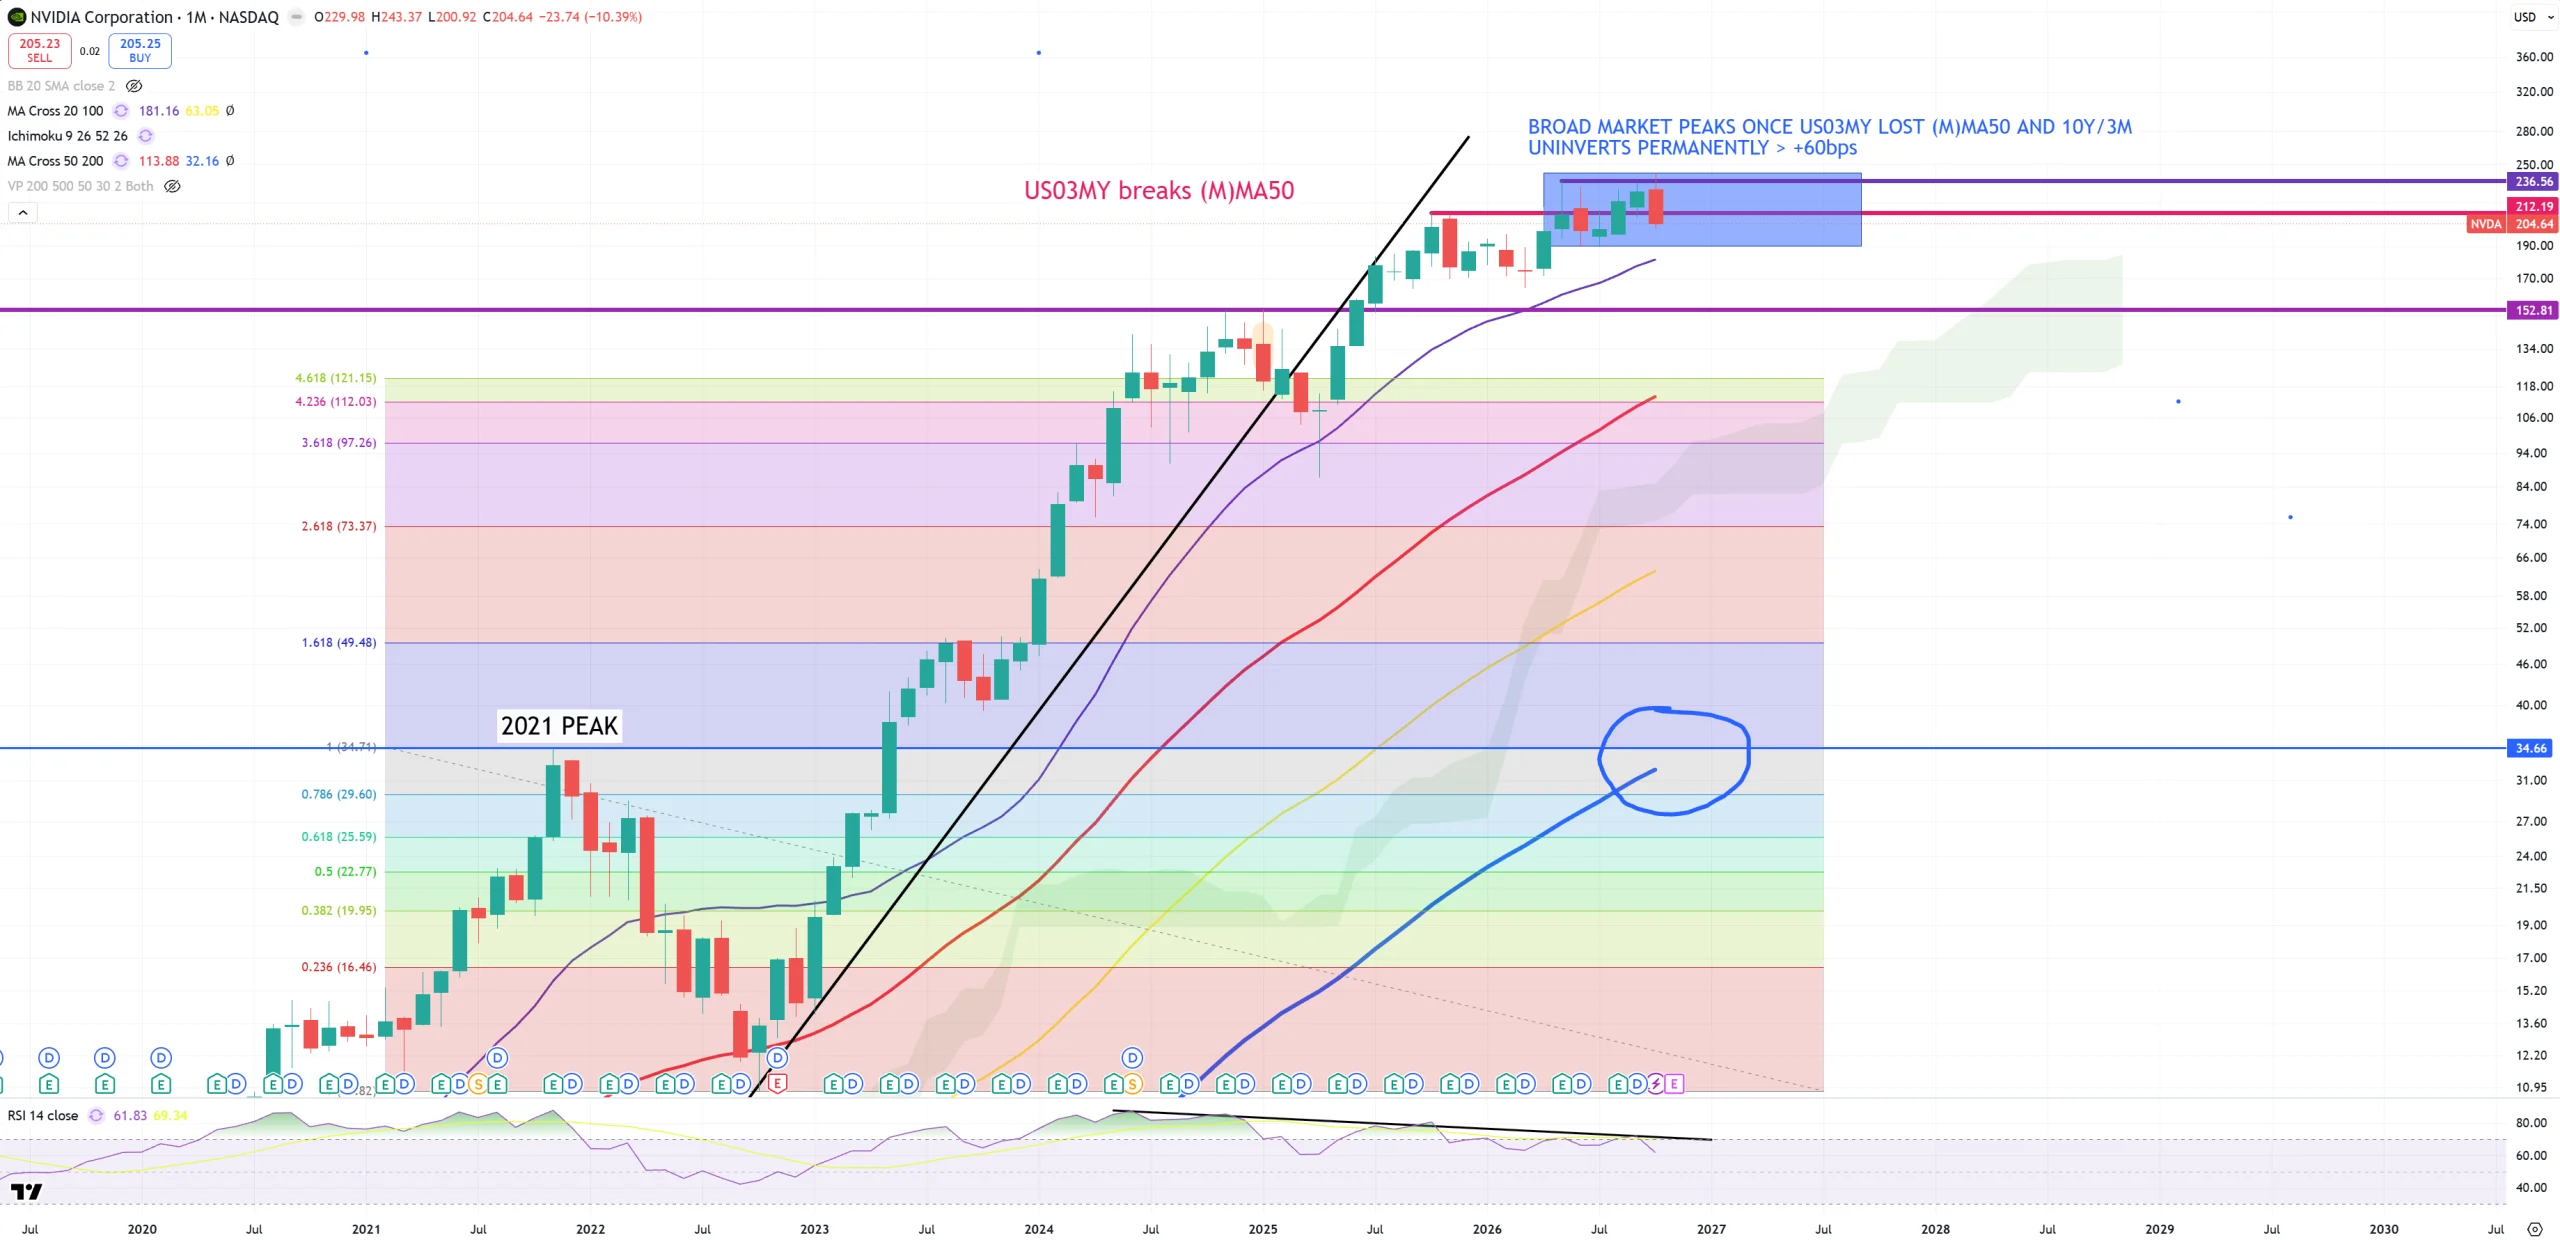
NVDA – just like MAGS we see that Nvidia keeps lagging since exactly a year. Since magical 4Q25. Deeper view shows you 35$ level as 4Q21 peak matched perfectly with blue (M)MA200 (second chart).
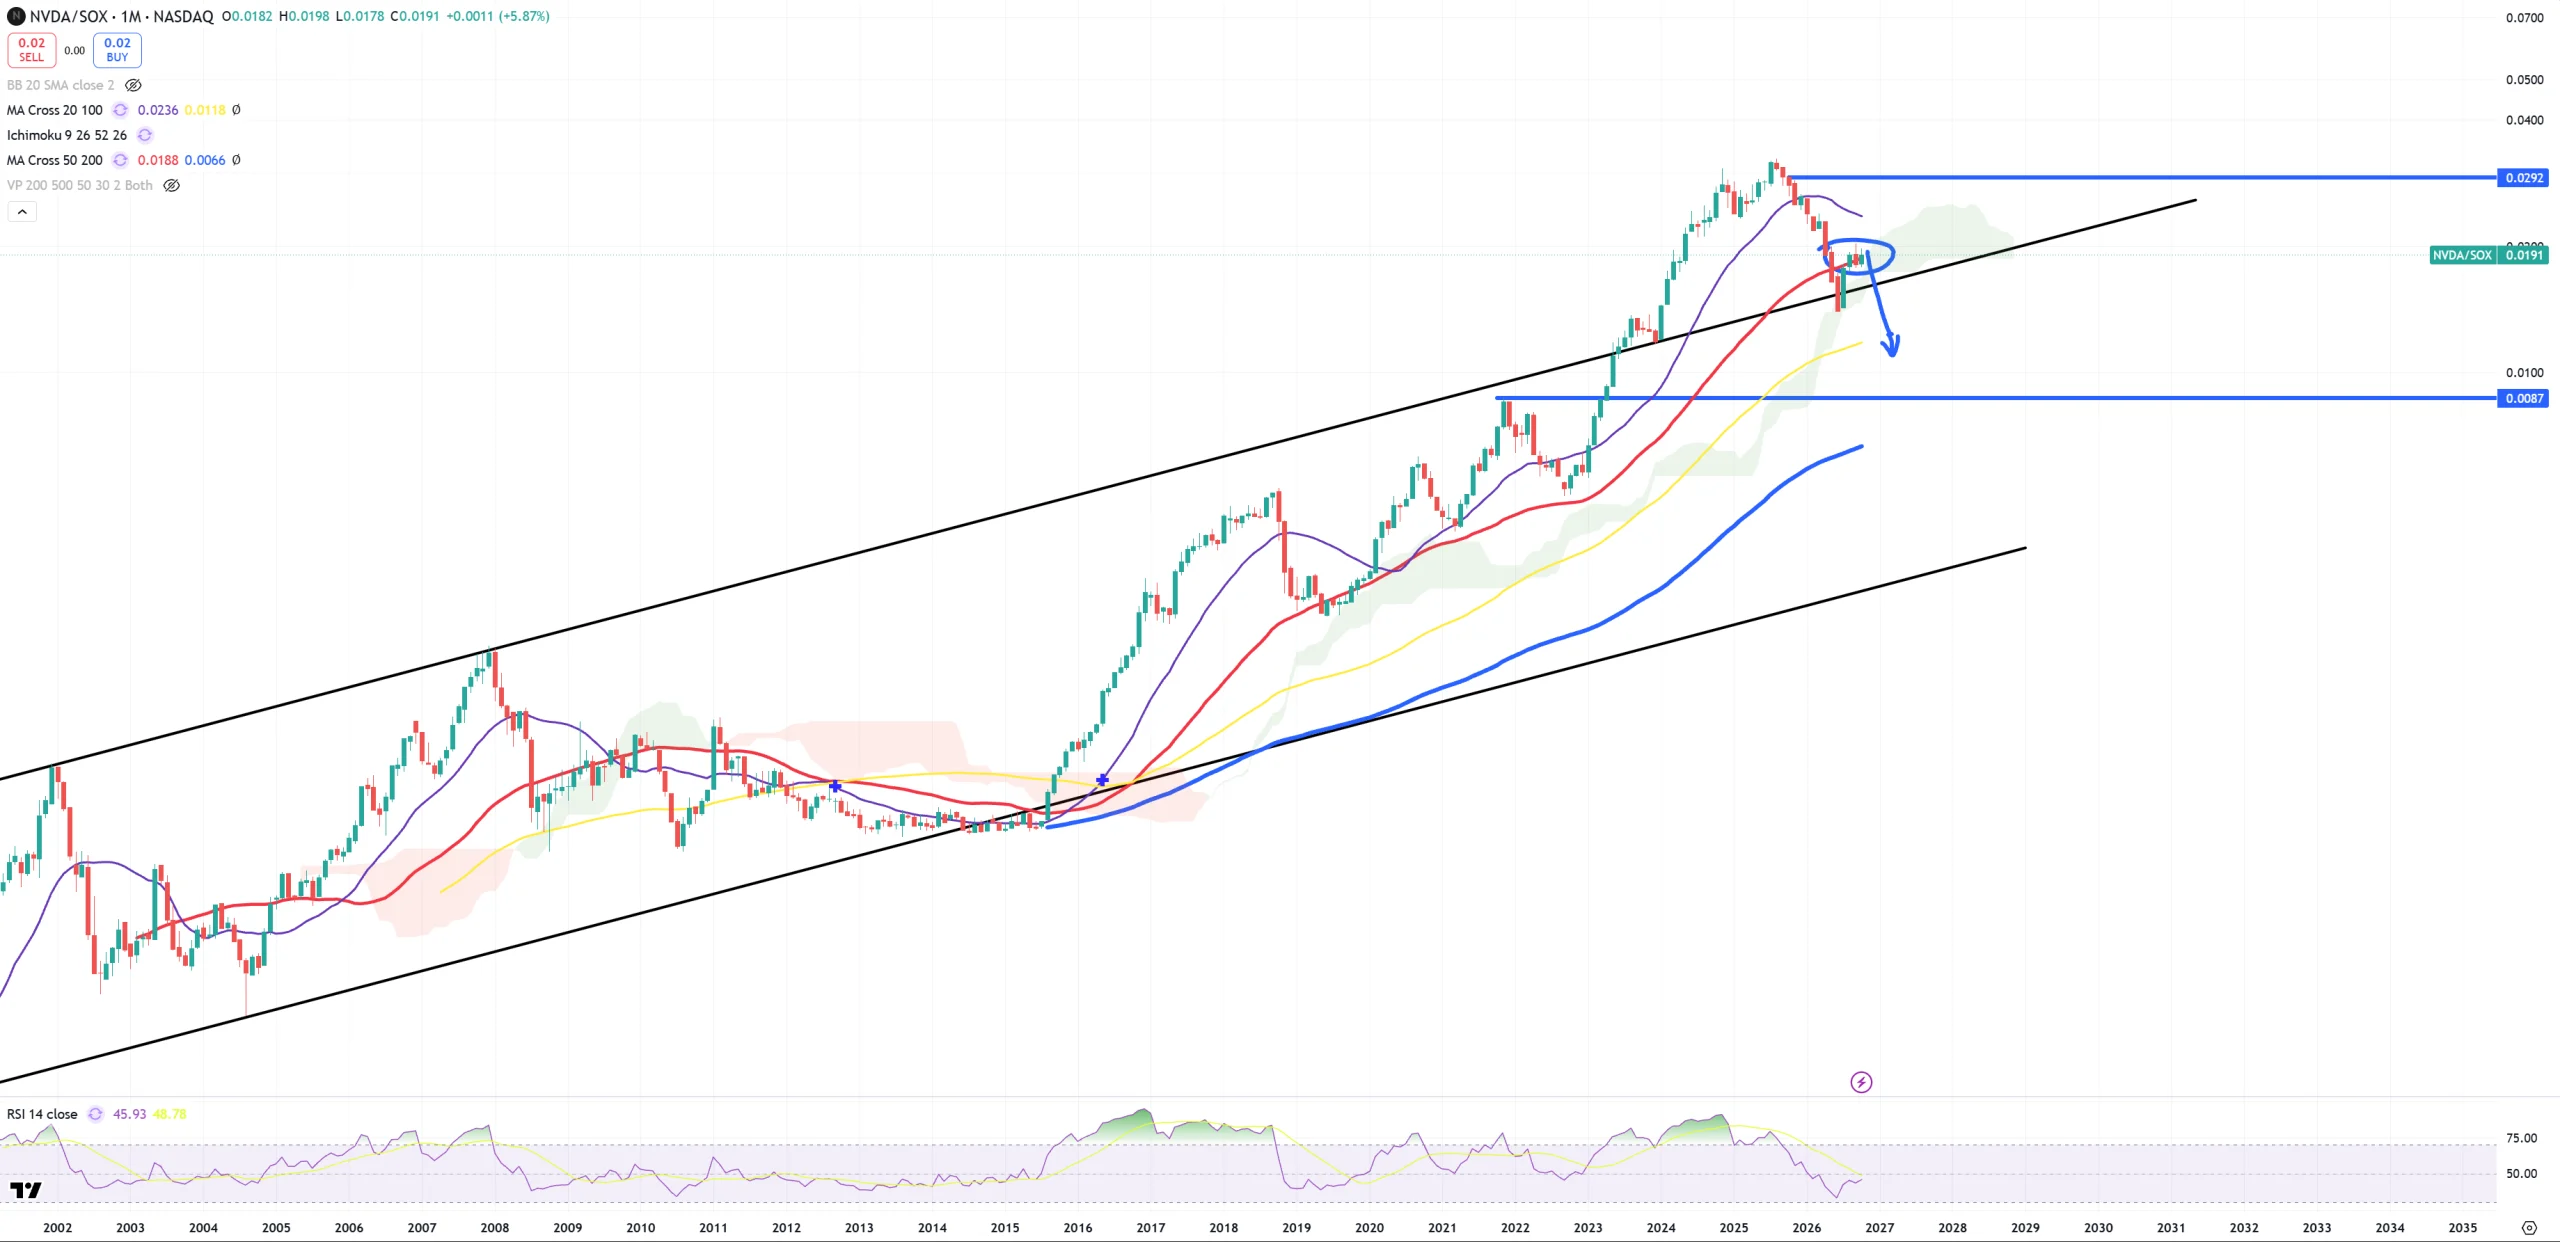
NVDA/SOX – still fights with red (M)MA50 as a retest.
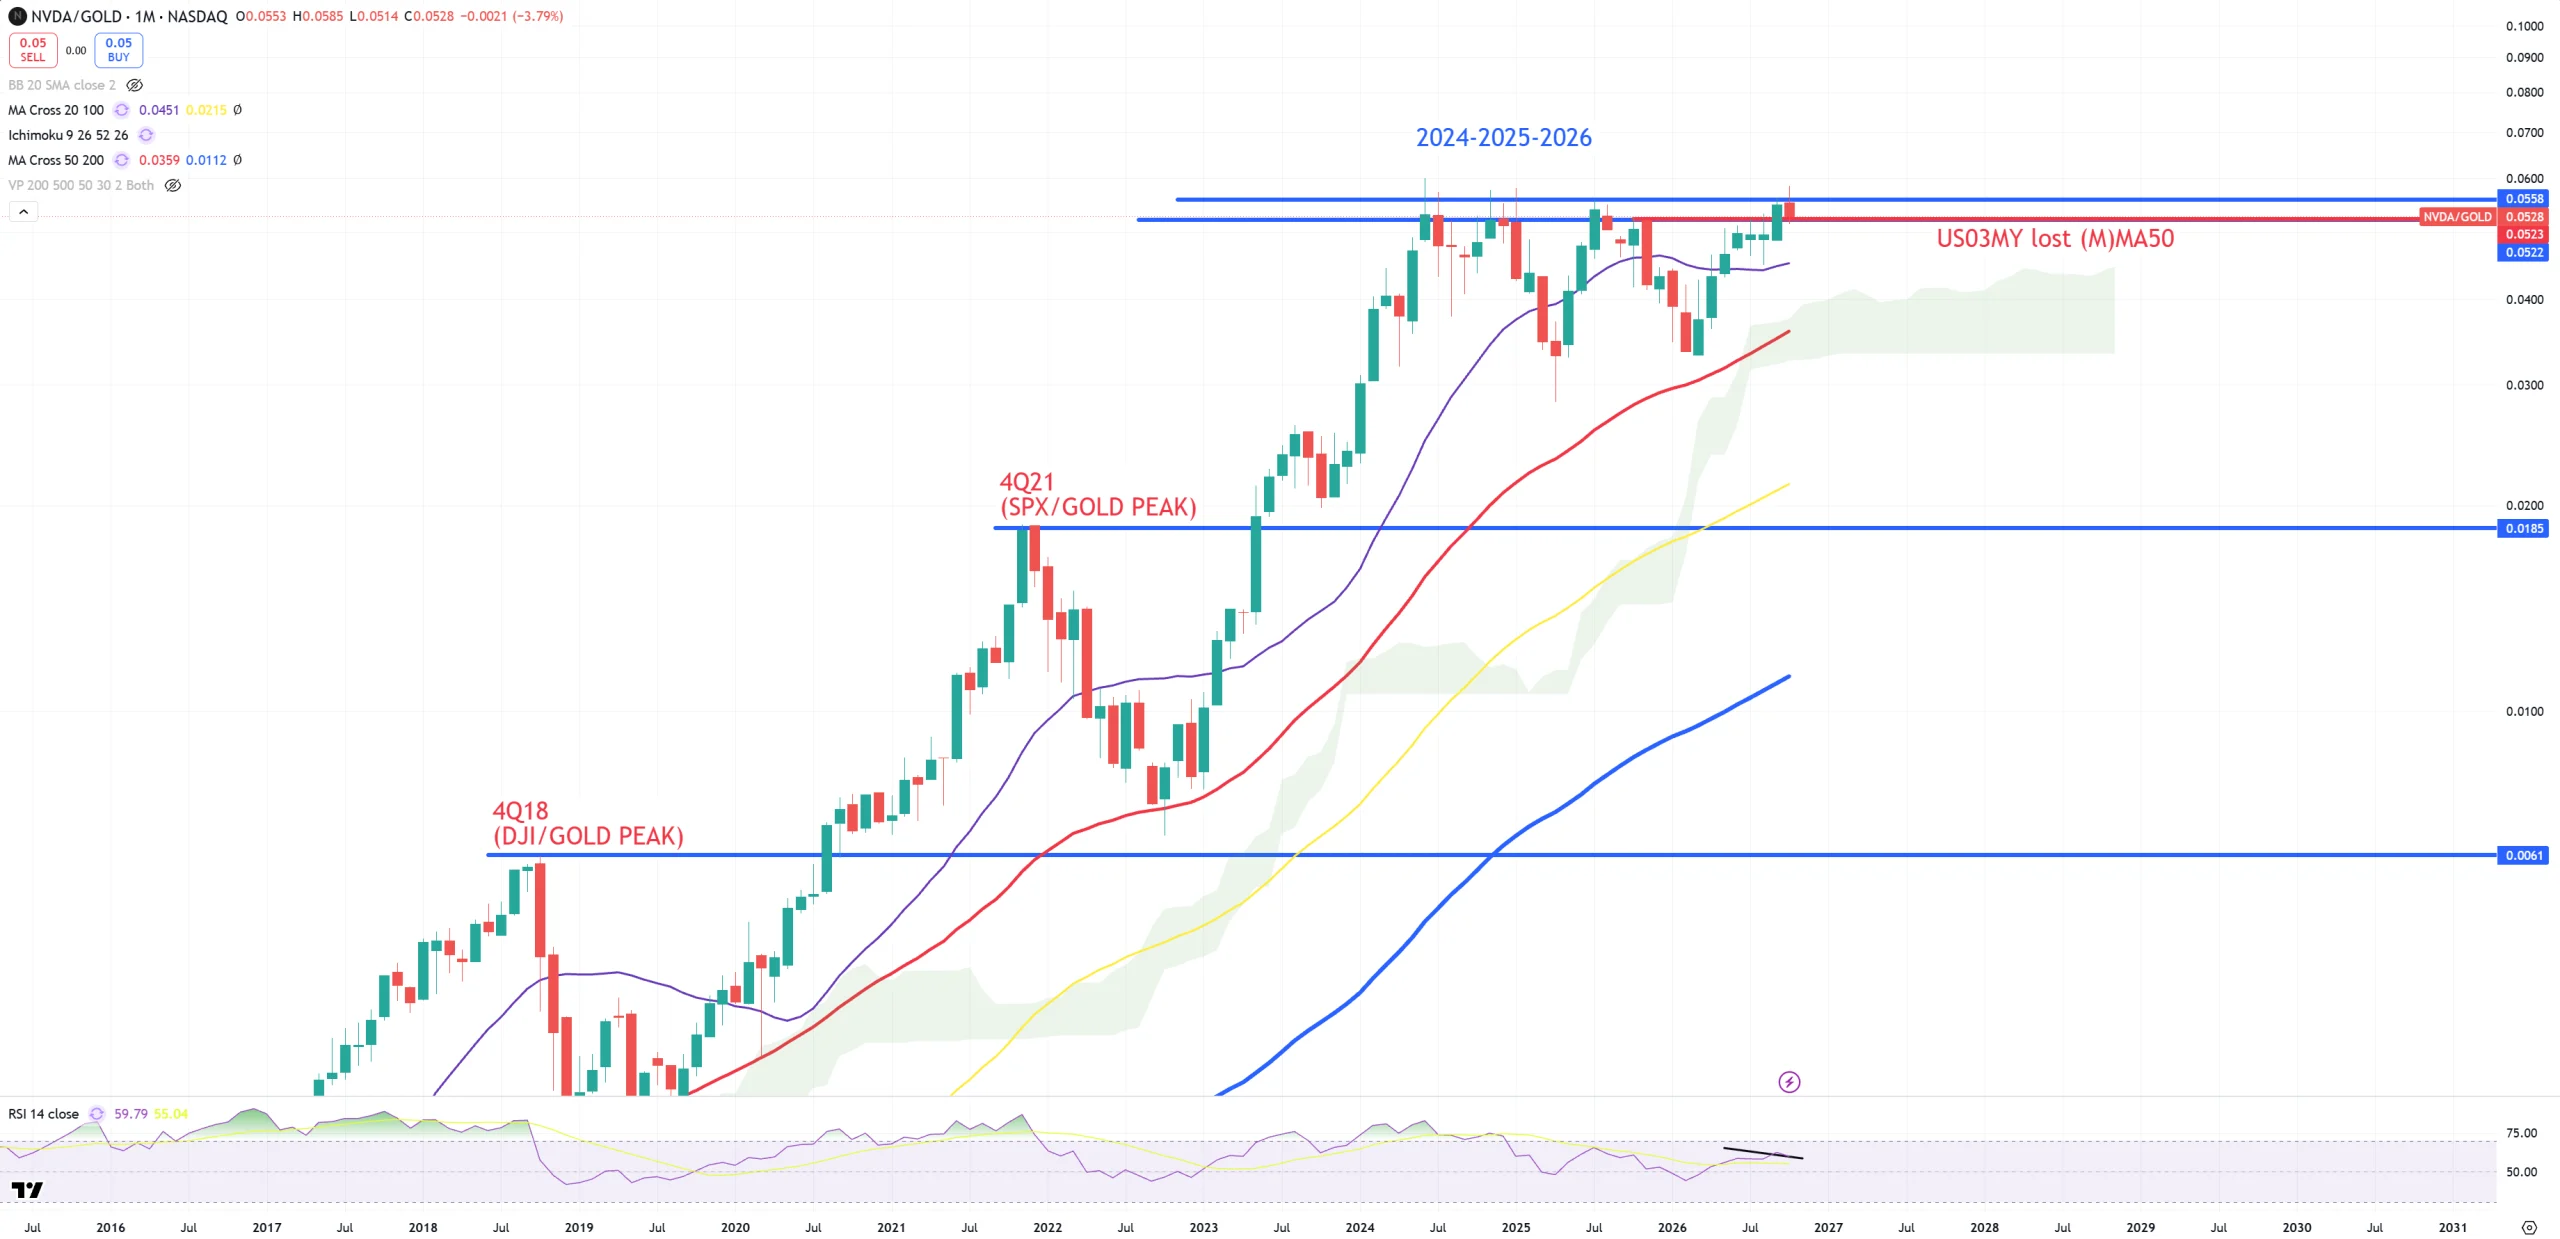
NVDA/GOLD – looks like the cyclical peak for NVDA is unchanged and in the same position since 2024. Nvidia keeps losing momentum vs GOLD and once it’ll drop below red (M)MA50 it’s THE END. Still some room, but to flip the momentum bullish you need US03MY to jump > (M)MA50 first. Otherwise I bet we observe the beginning of THE END of Nvidia circular financing scam and AI infinite demand – which is the same bullshit as infinite demand for CISCO switches in 2000. Do not please get the scam of low FORWARD P/E, because in current cycle the bubble sits on “E” not in “P” like in 2000.
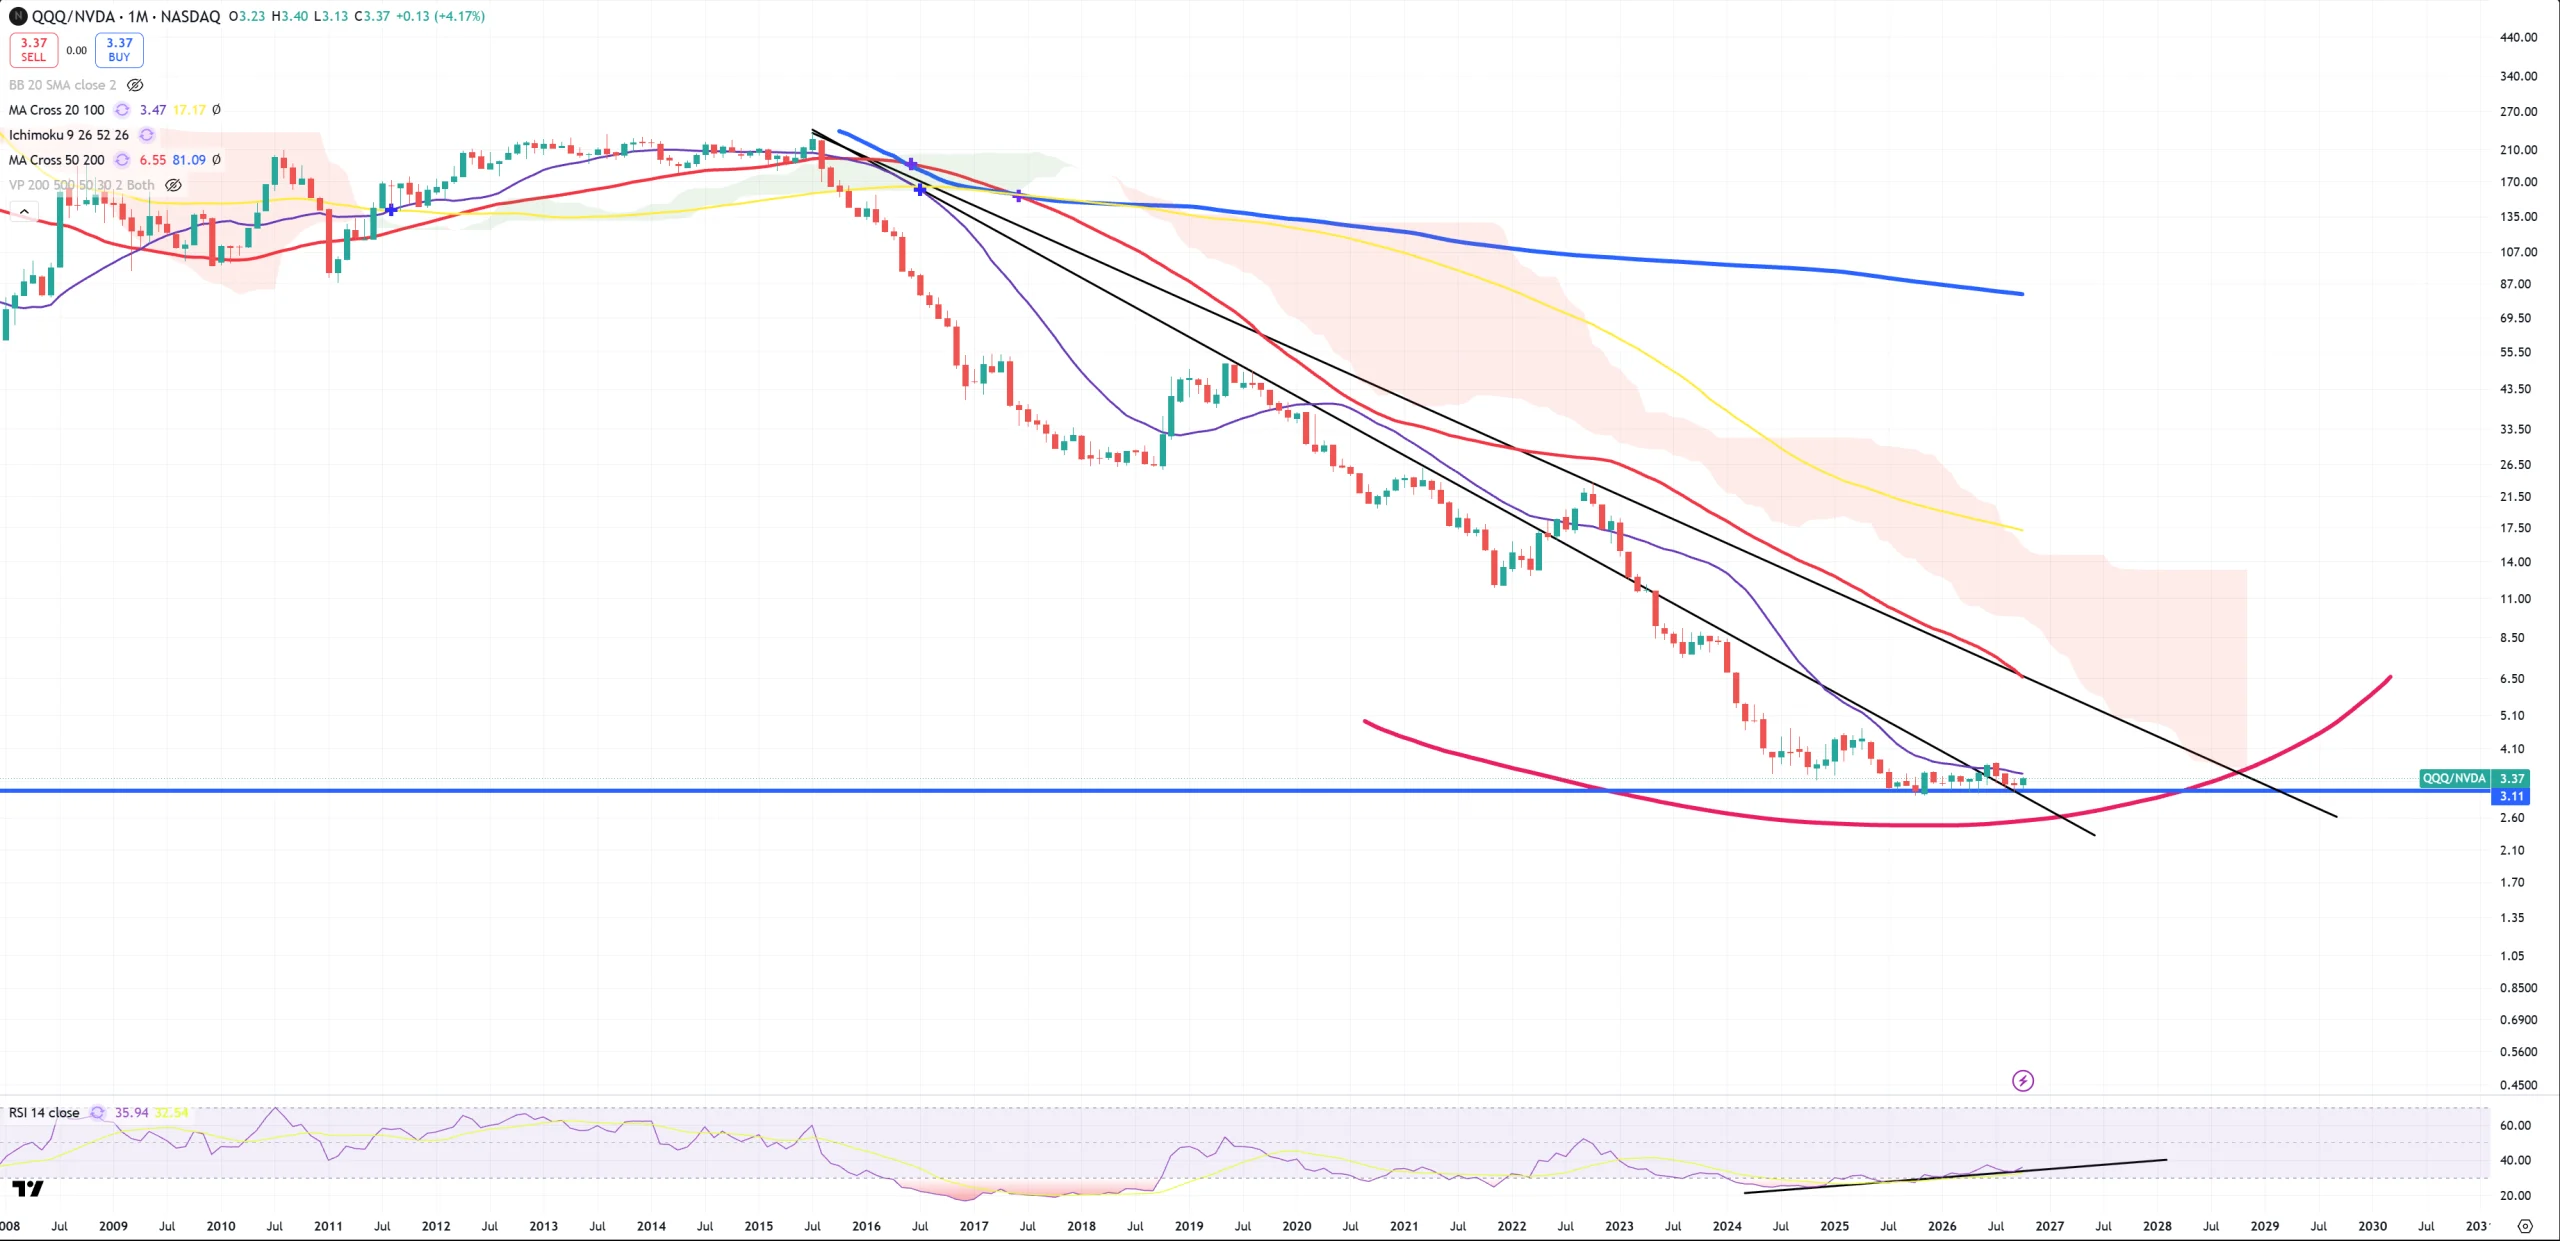
QQQ/NVDA – look how it tries to make a bottom here. Just like NVDA/GOLD tries to top, this ratio tries to bottom. It looks like we observe massive underperformance of Nvidia. In reality charts saying this. You have a rare opportunity to see NVIDIA peaking?
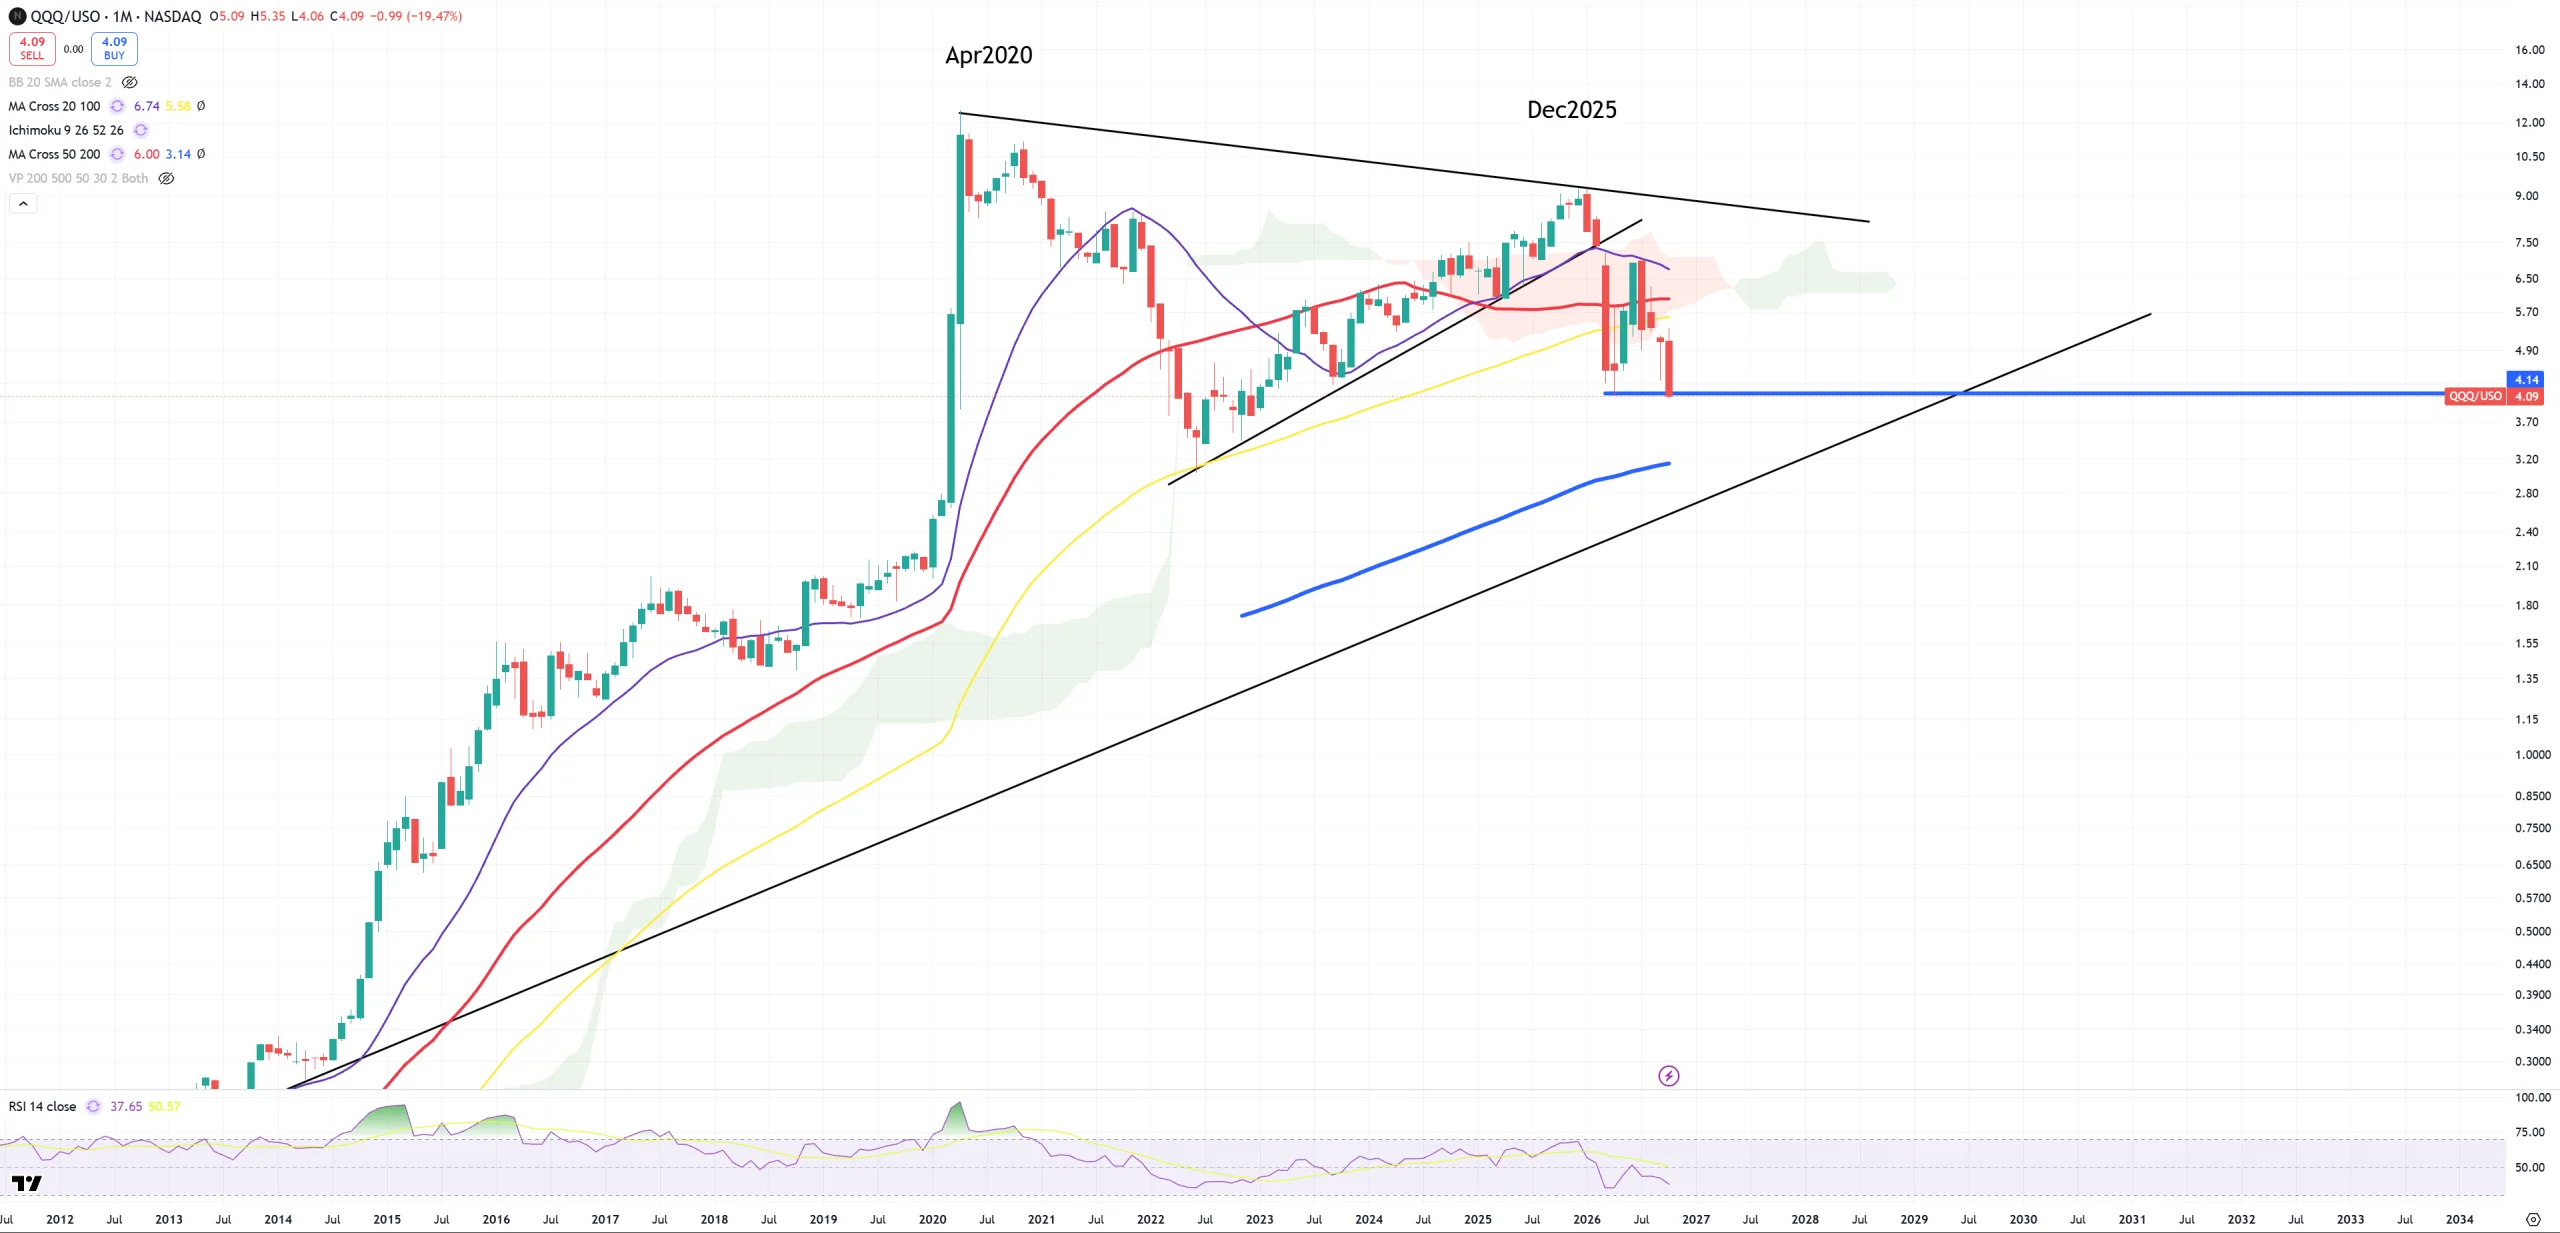
QQQ/USO – big bear market here. If you are not selling QQQ to buy more USO that’s your problem.
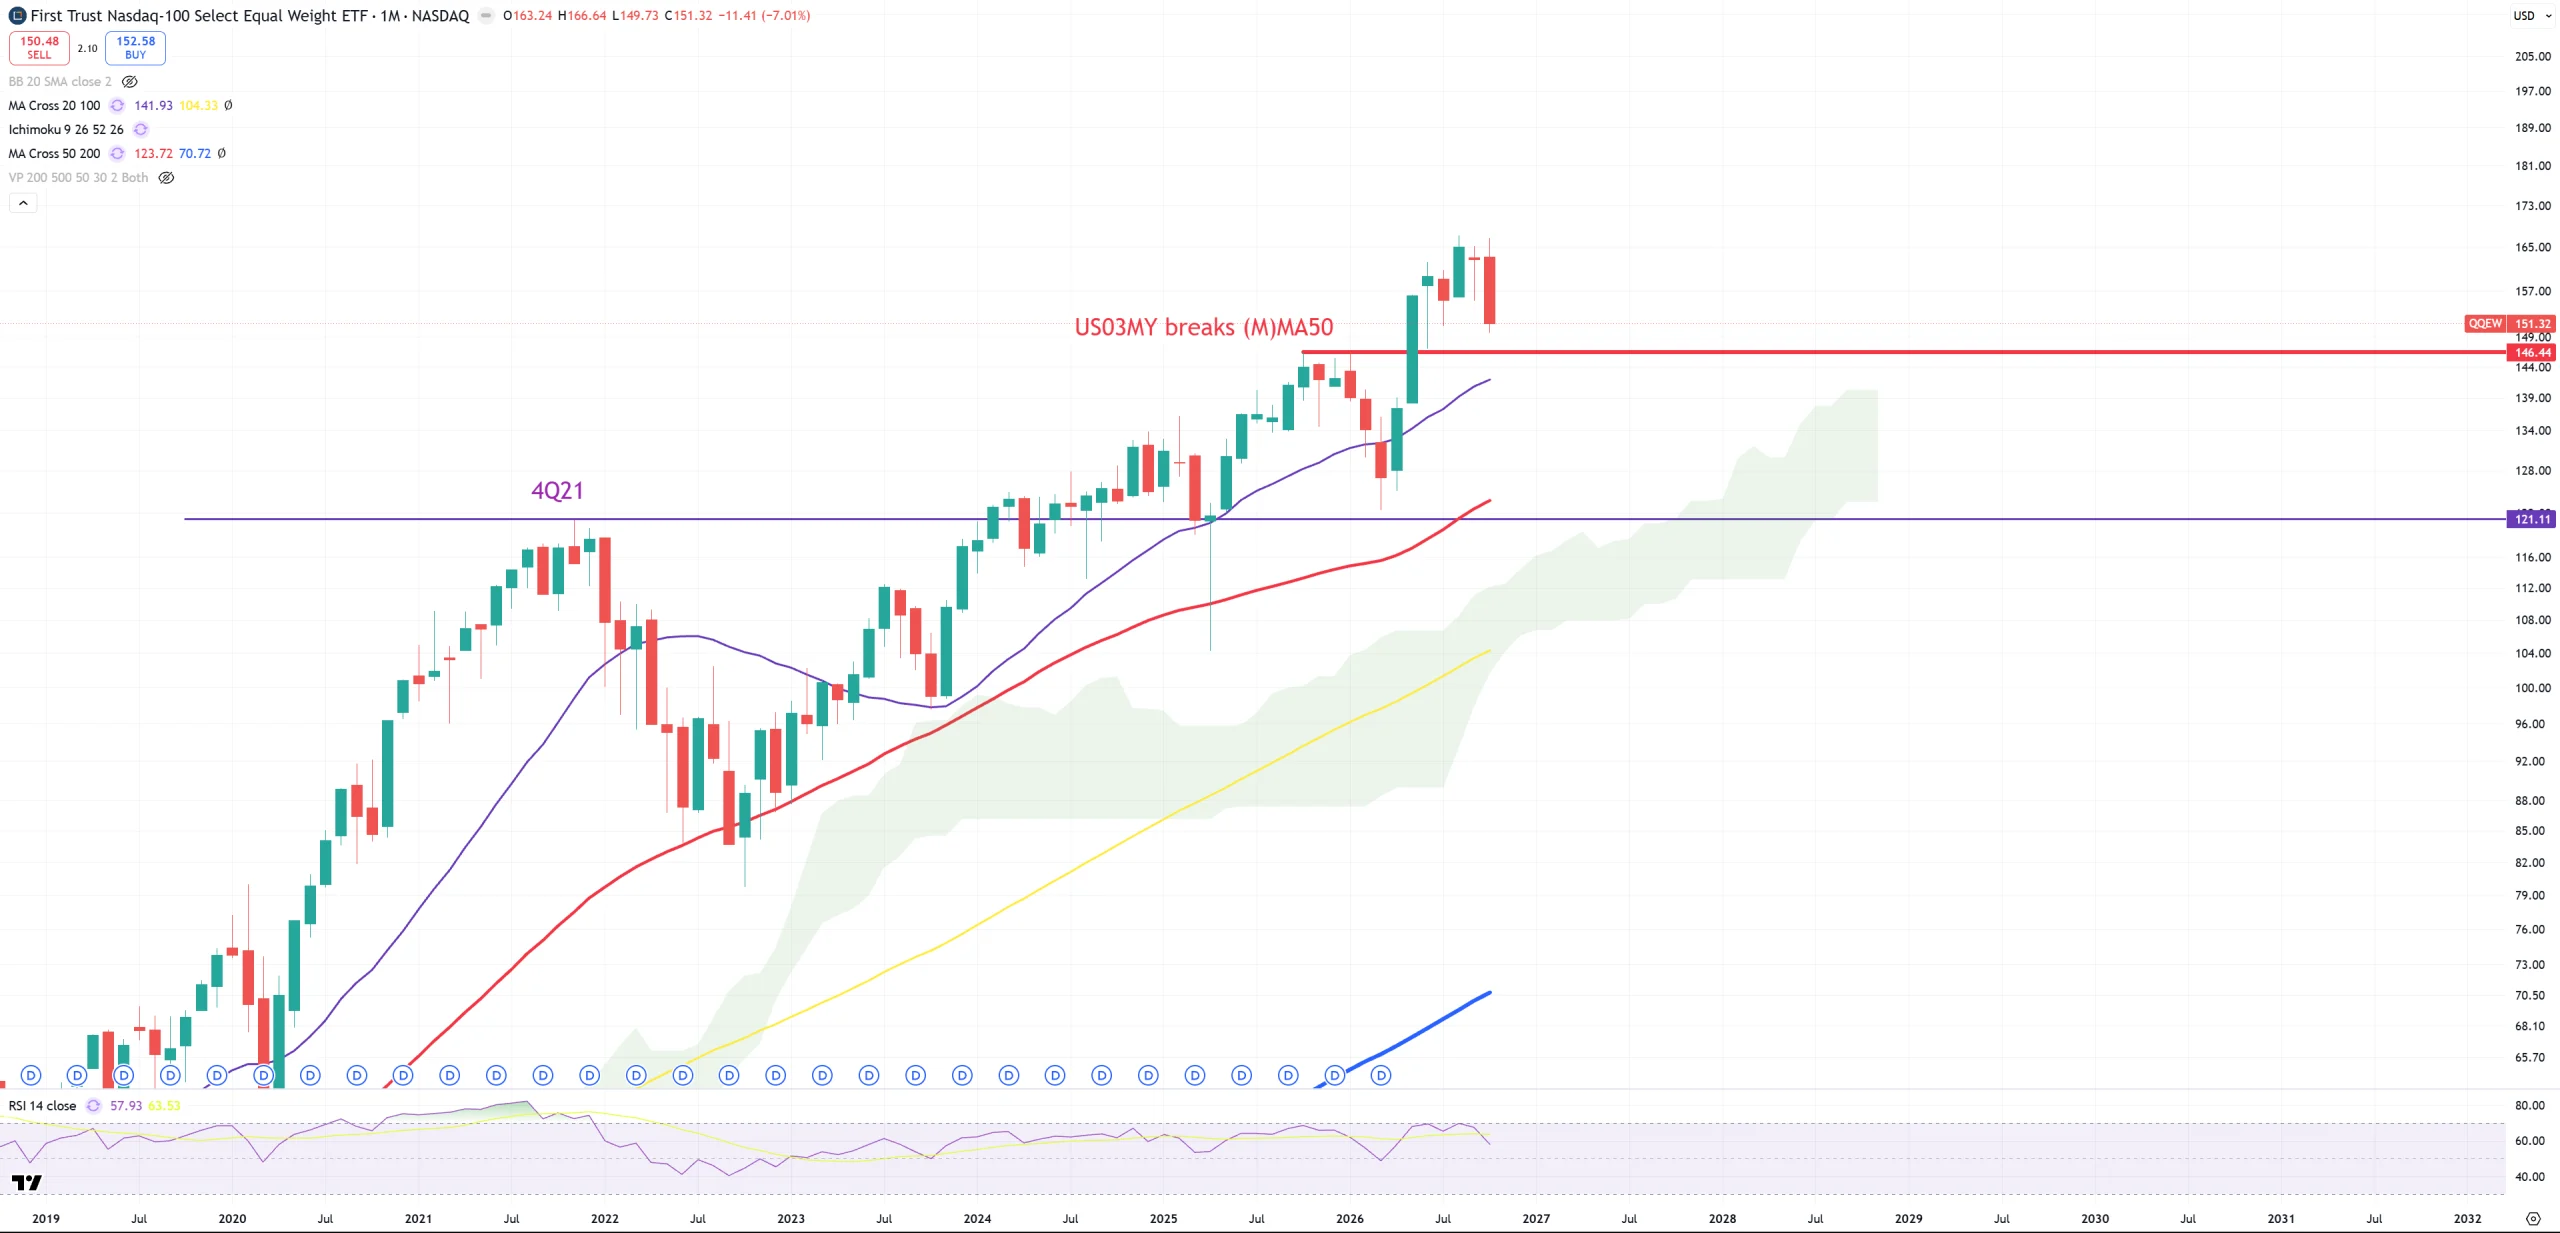
QQEW – Nasdaq 100 Equal Weight – nothing to see here, but dangerous game with 4Q25 level we play.
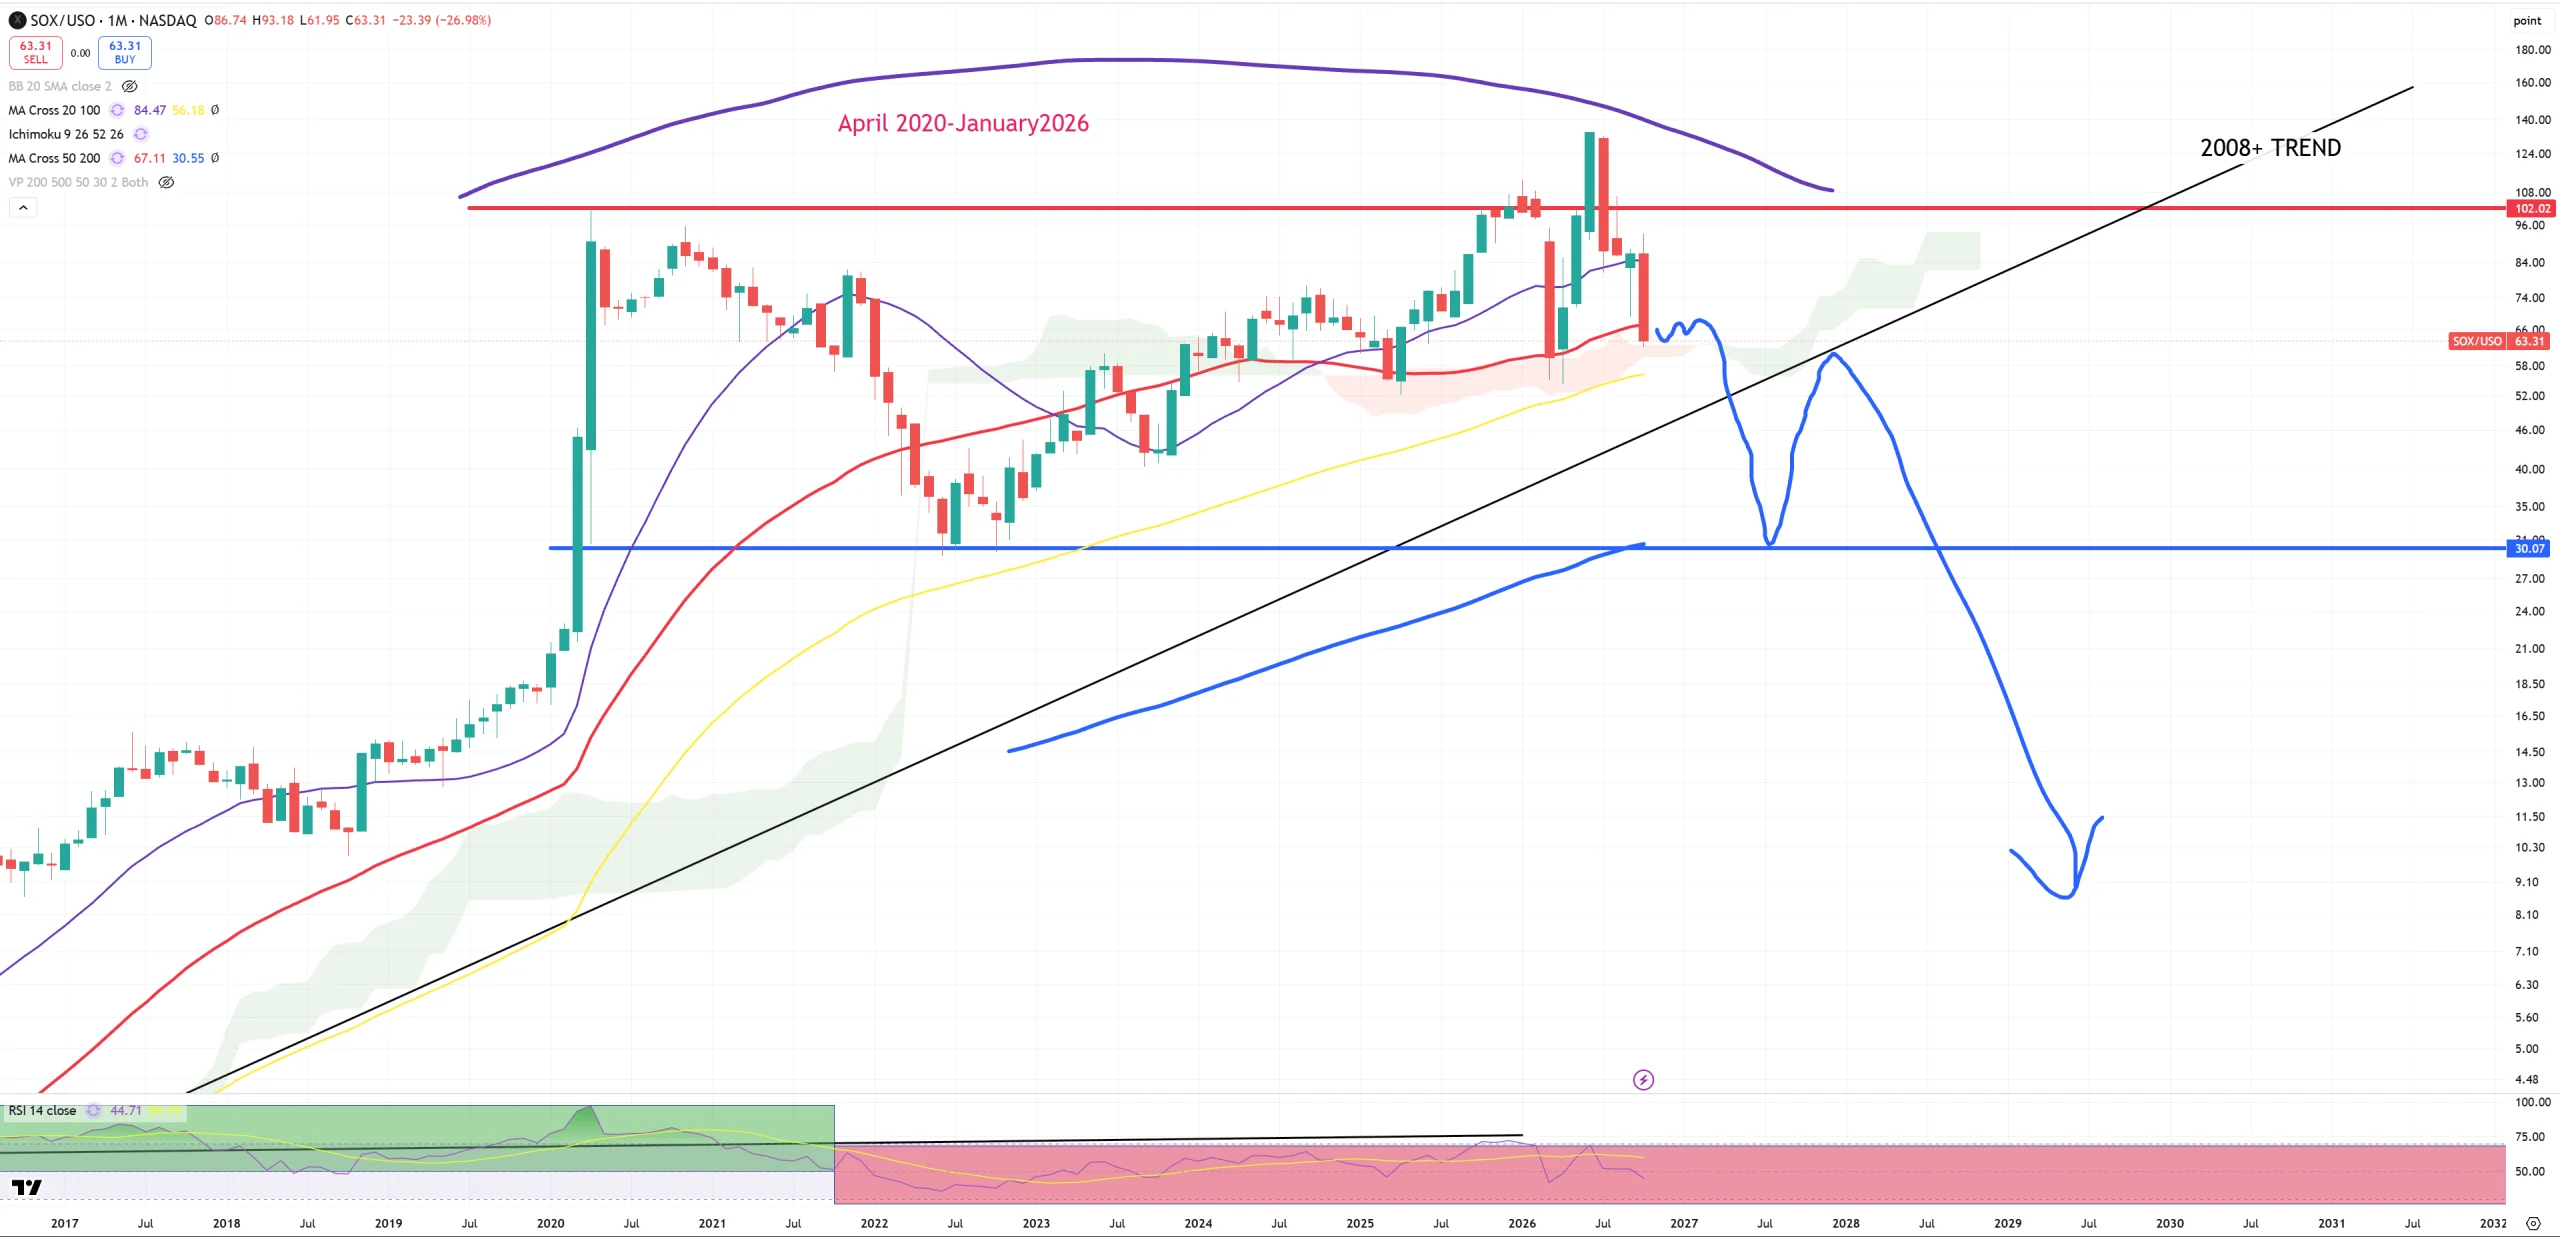
SOX/USO – we have (M)MA50 break here… What is not surprising as SOX follows QQQ with a lag and QQQ/USO is broken “long” time ago. Trade SELL SOX to BUY USO hit in June 2026.
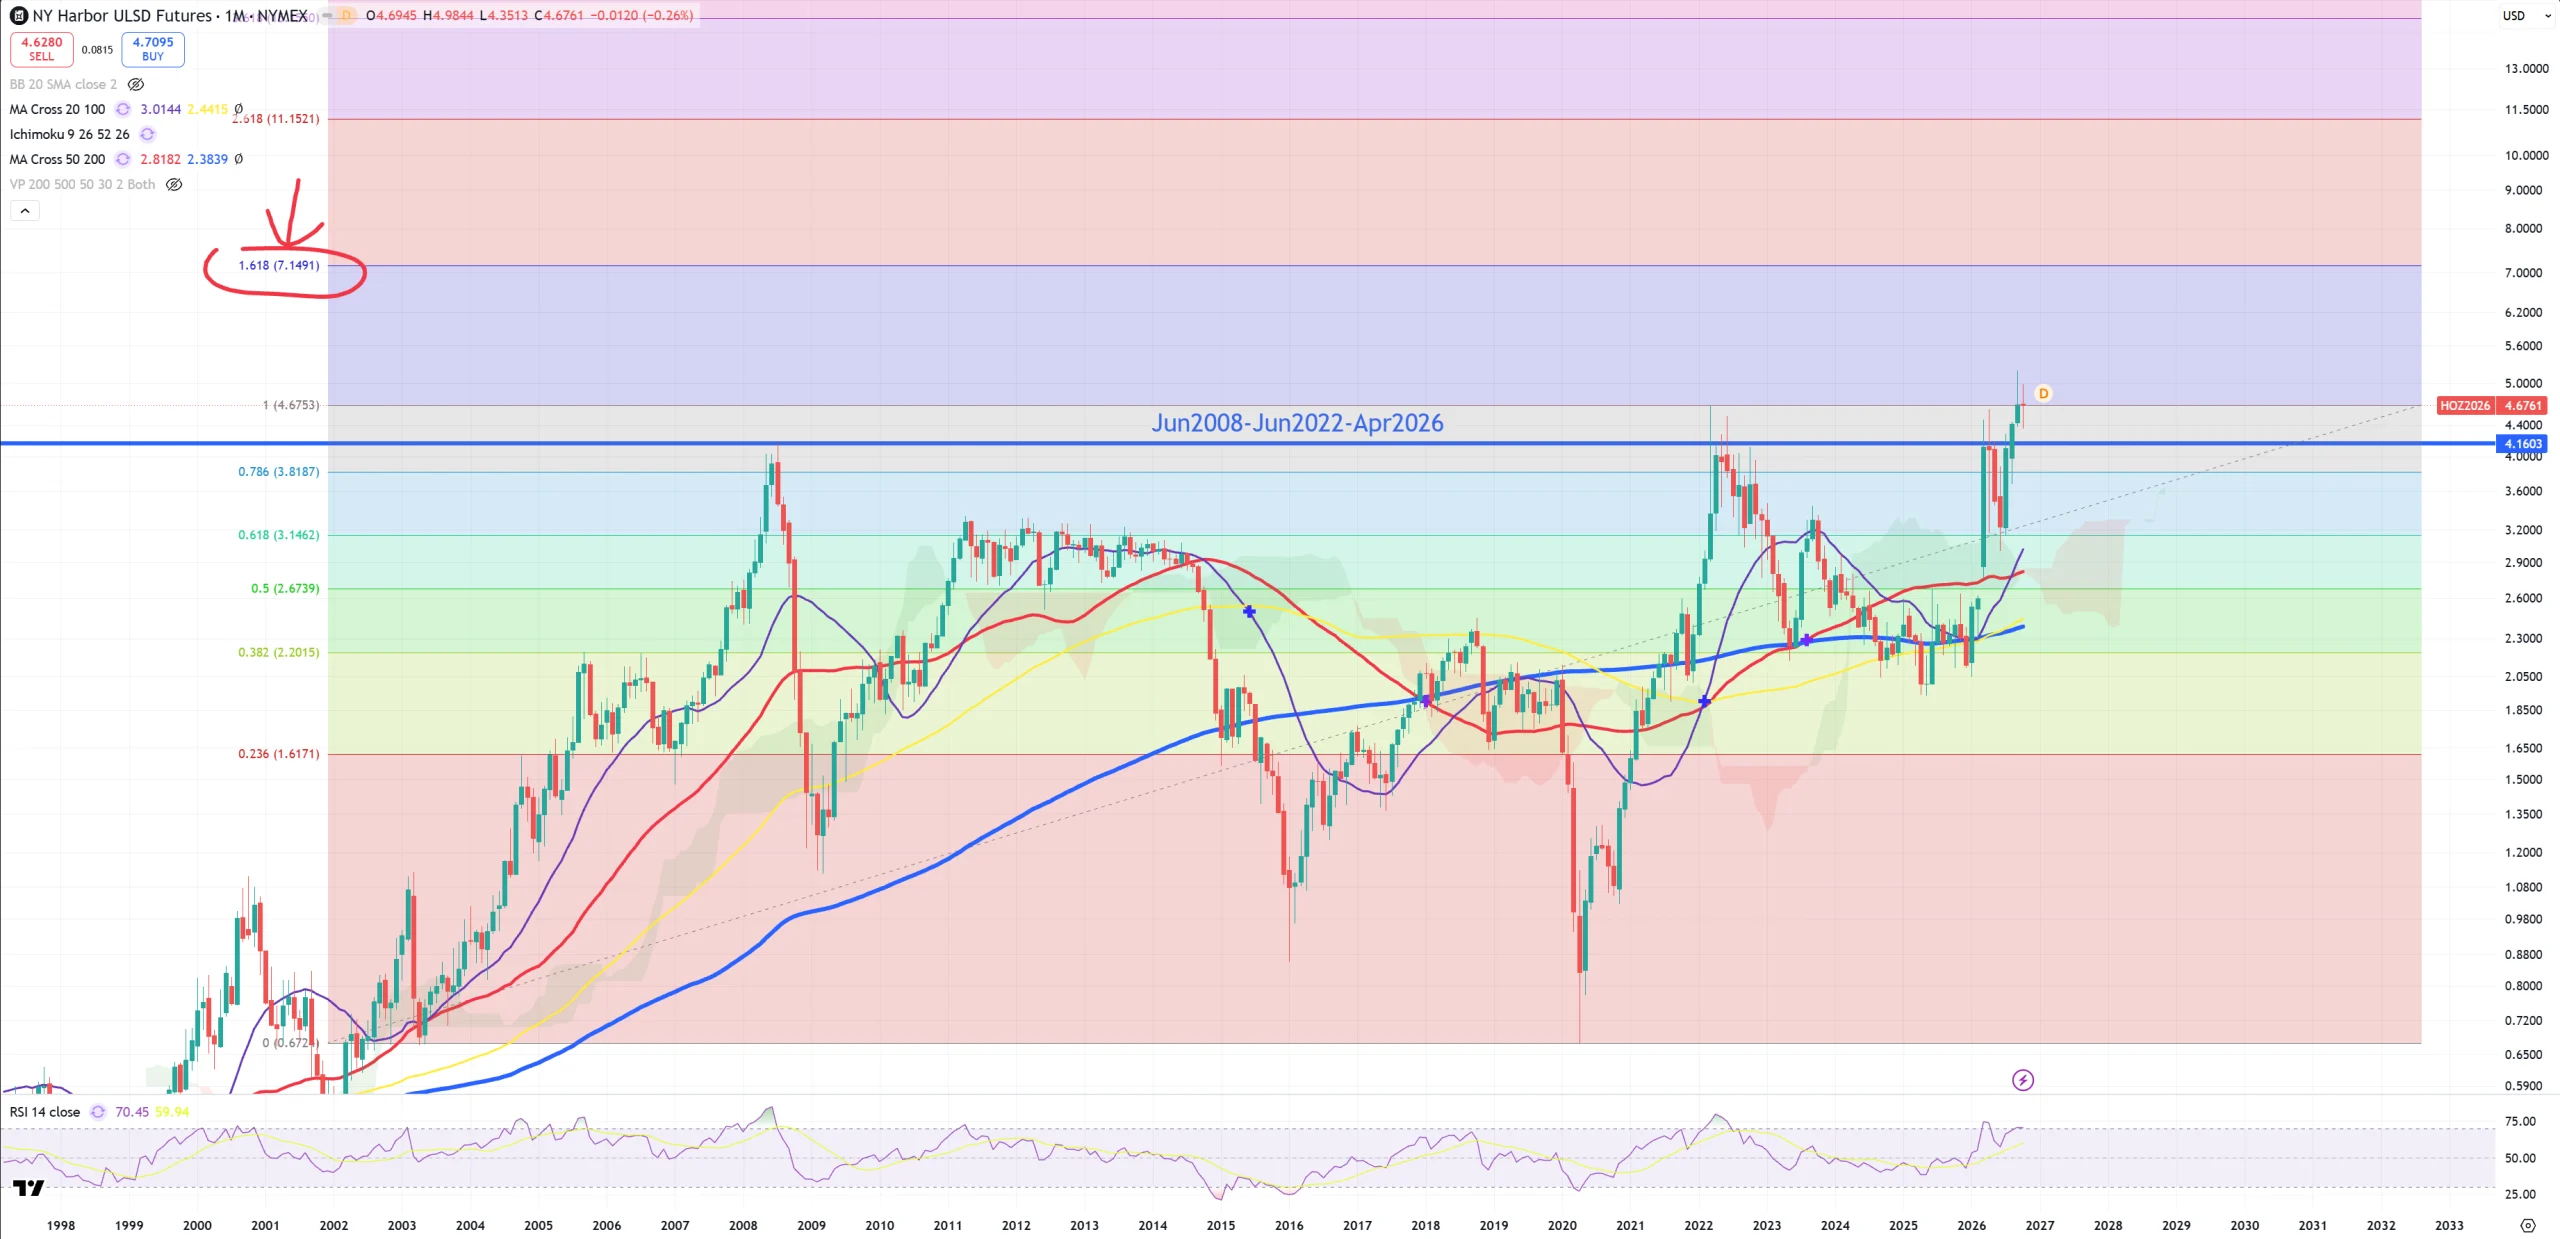
Diesel – break is break and diesel is about to double.
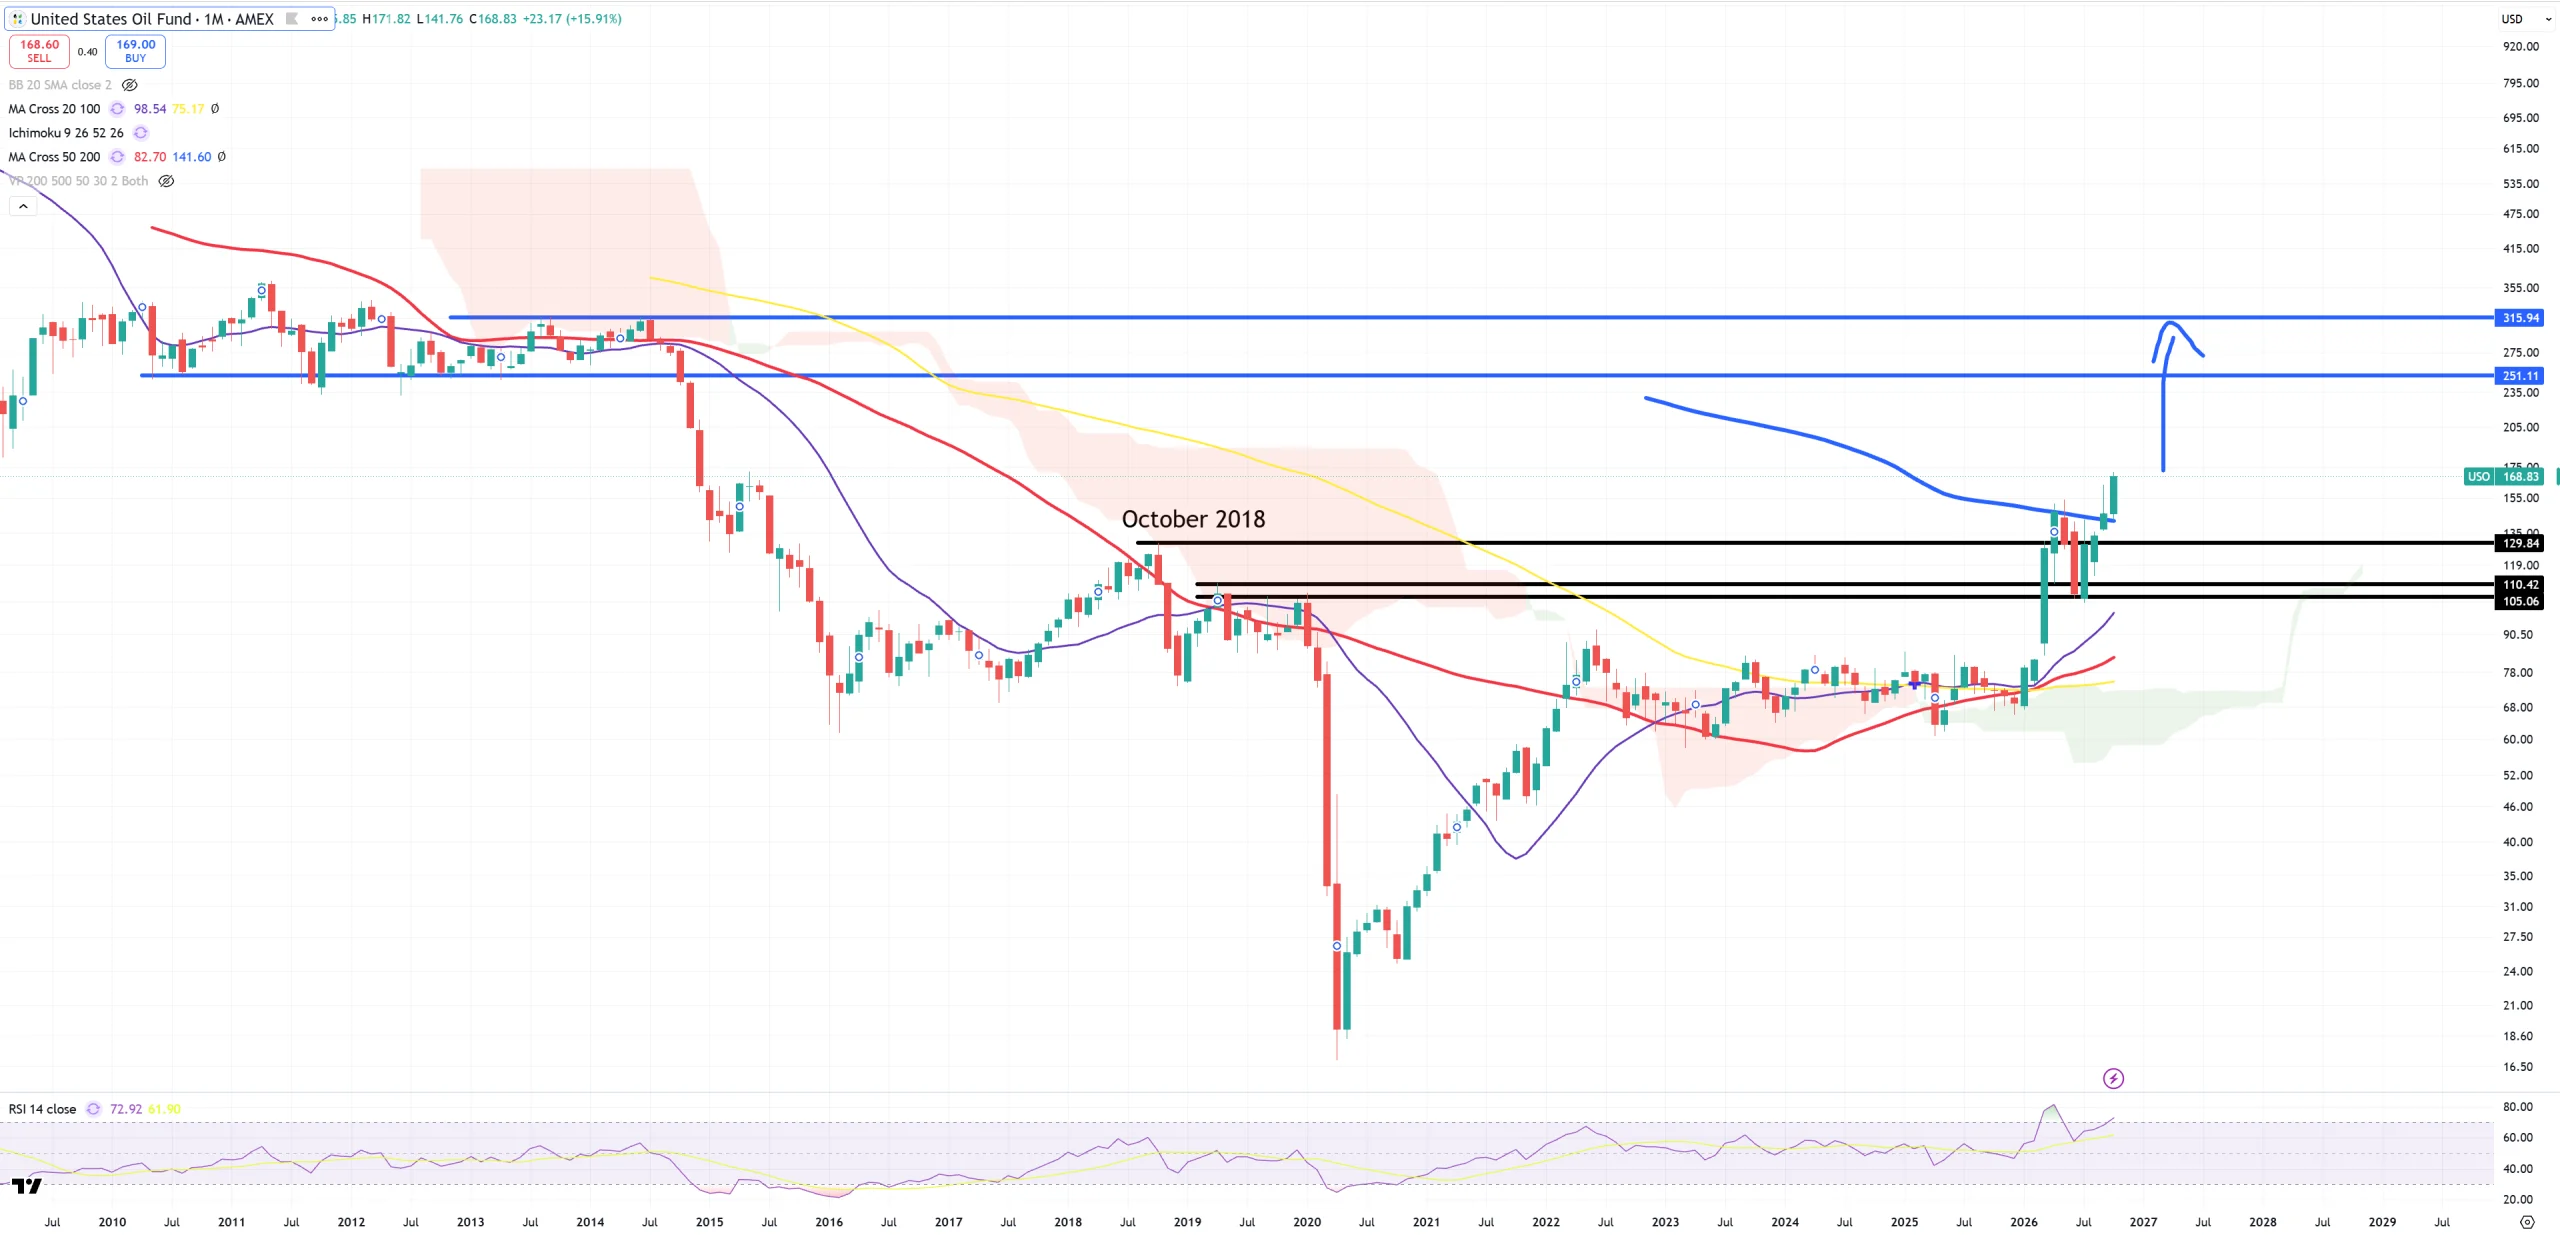
USO – as expected post blue (M)MA200 break oil is about to DOUBLE.
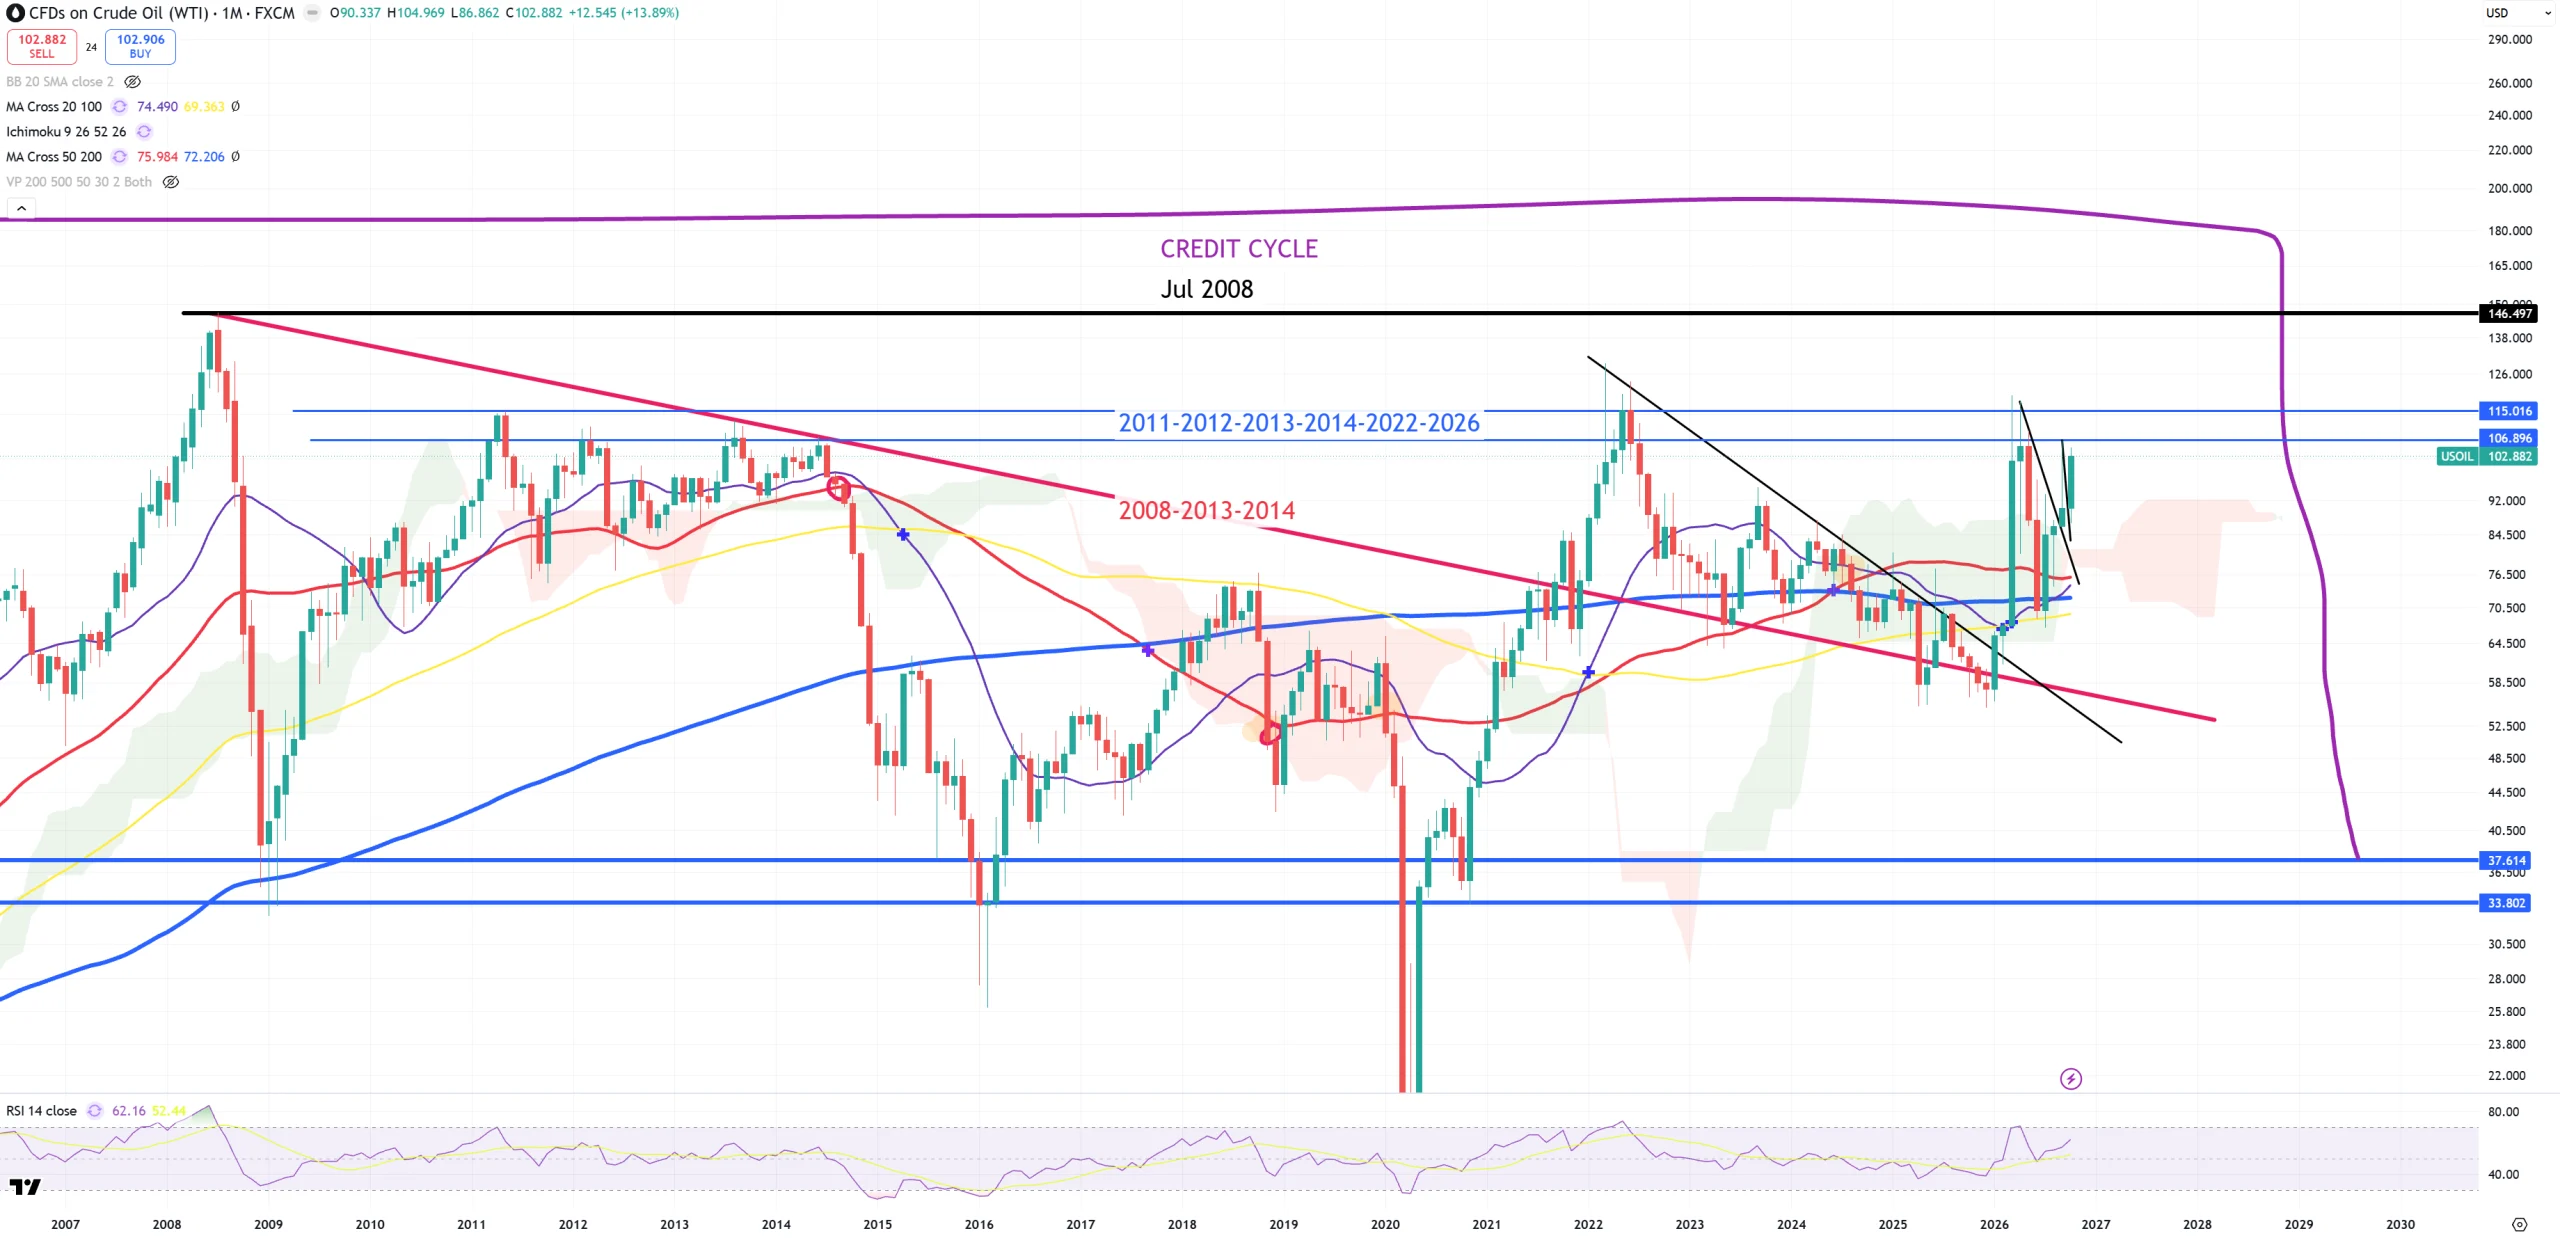
OIL – oil futures awaits to break 2026 level. Probability is high as USO is > (M)MA200. That was always my assumption. Once USO breaks (M)MA200, oil will revisit 147$ 2008 peak level.
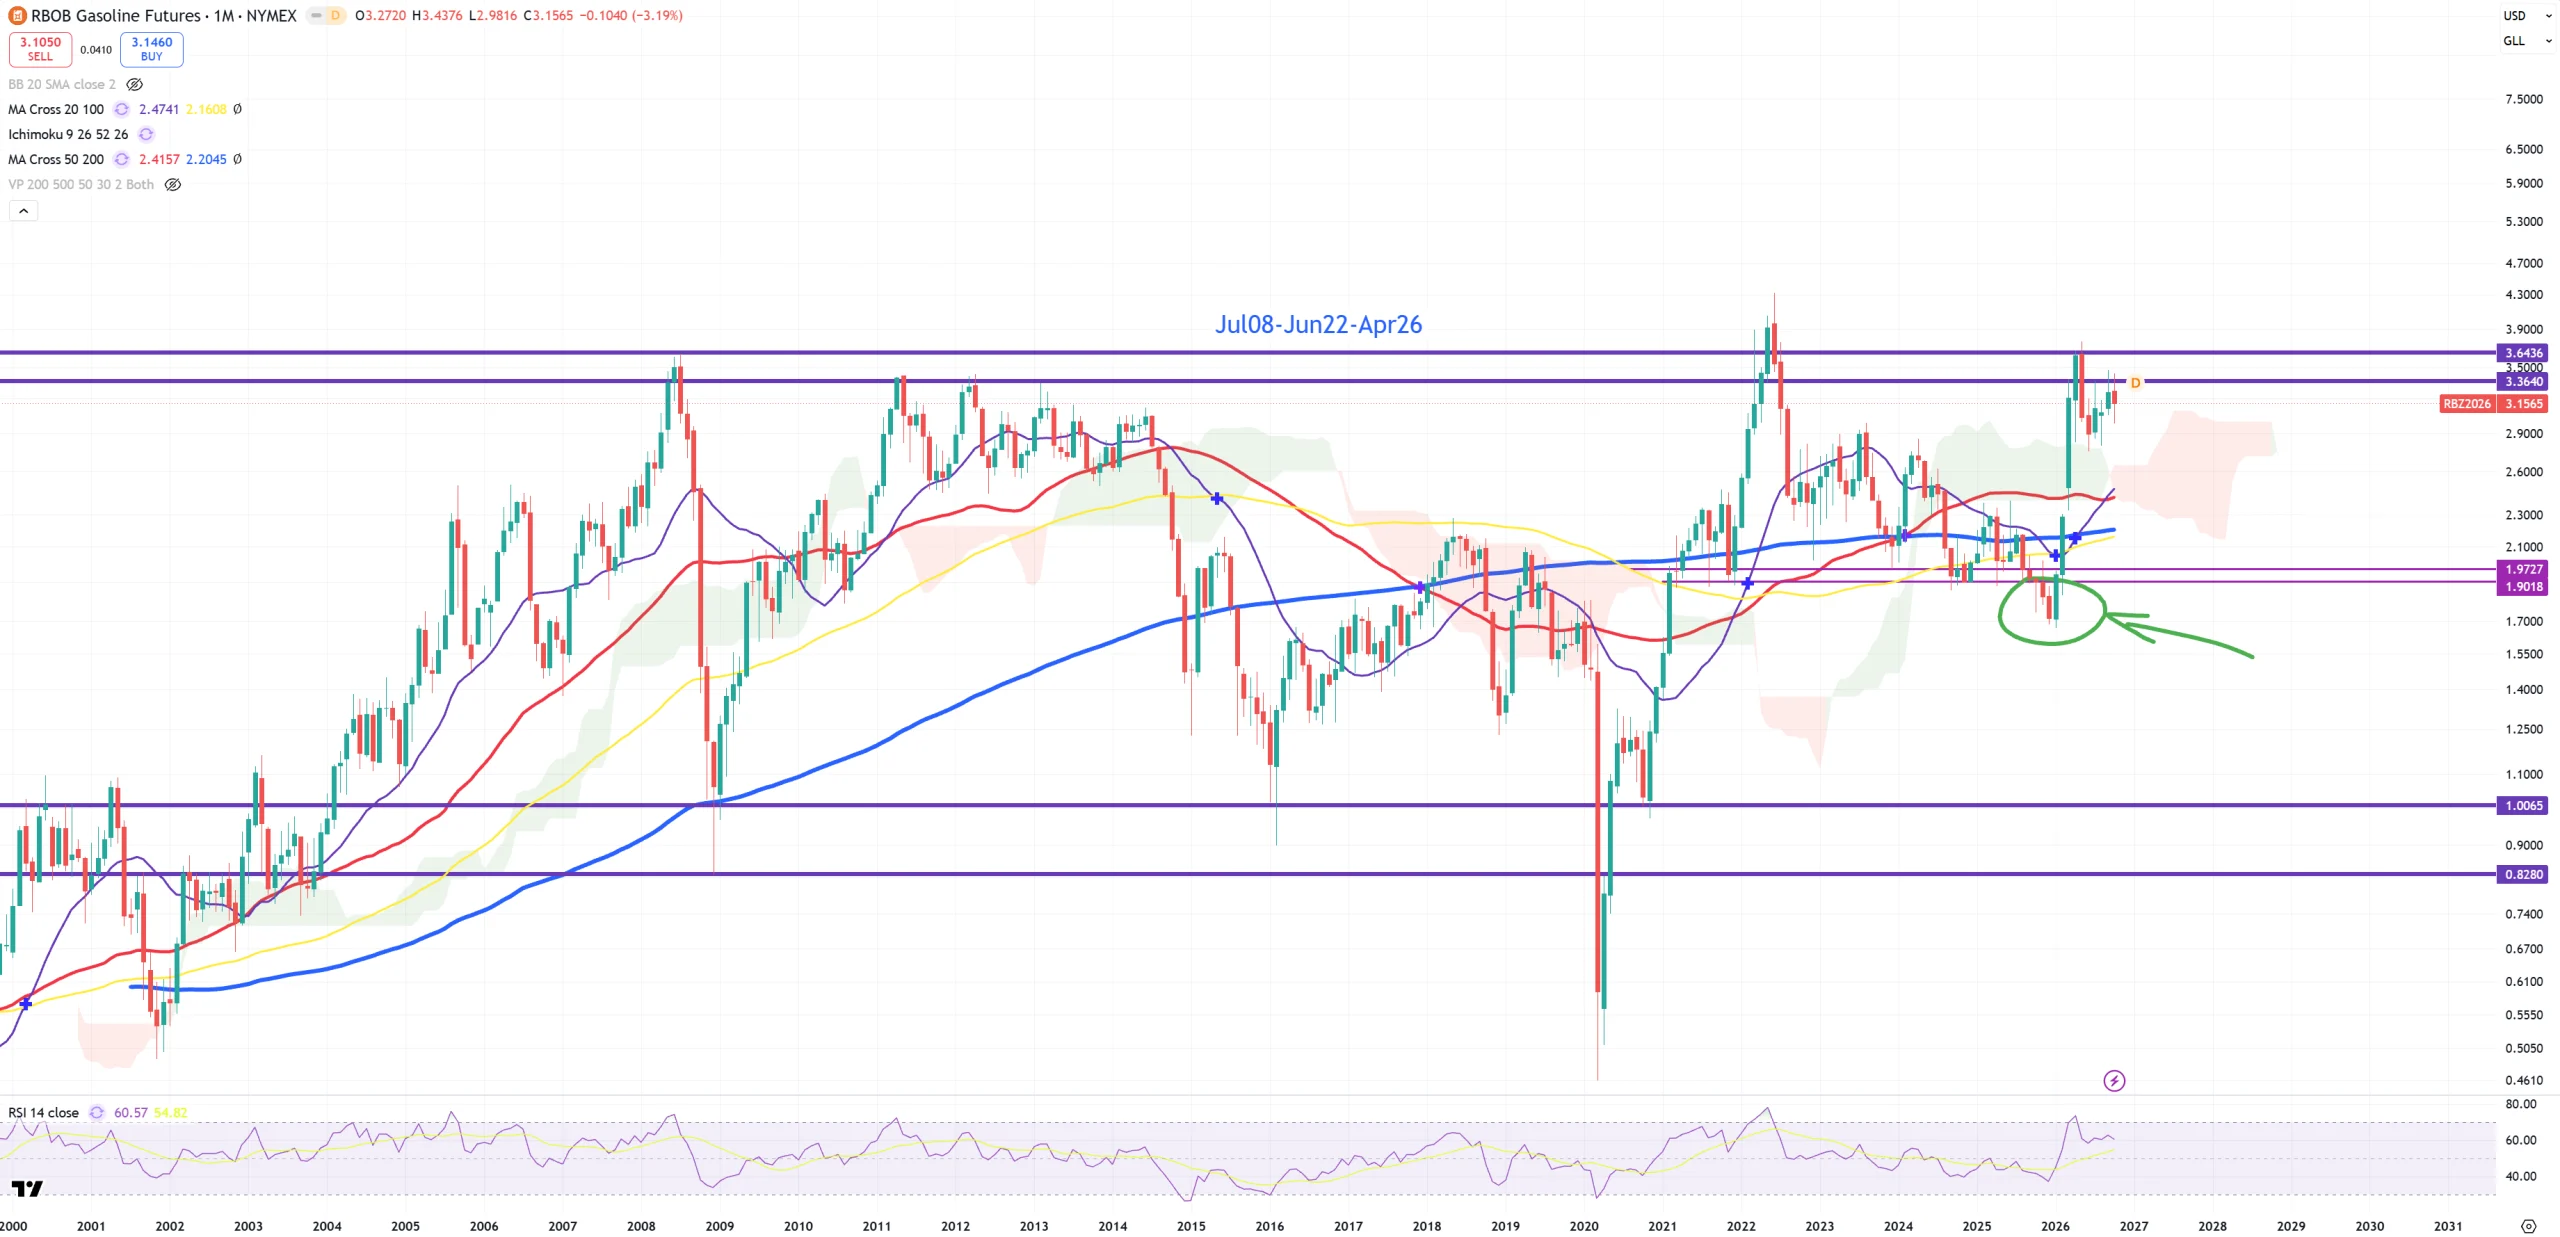
RBOB – Gasoline – there’s no break here like Diesel
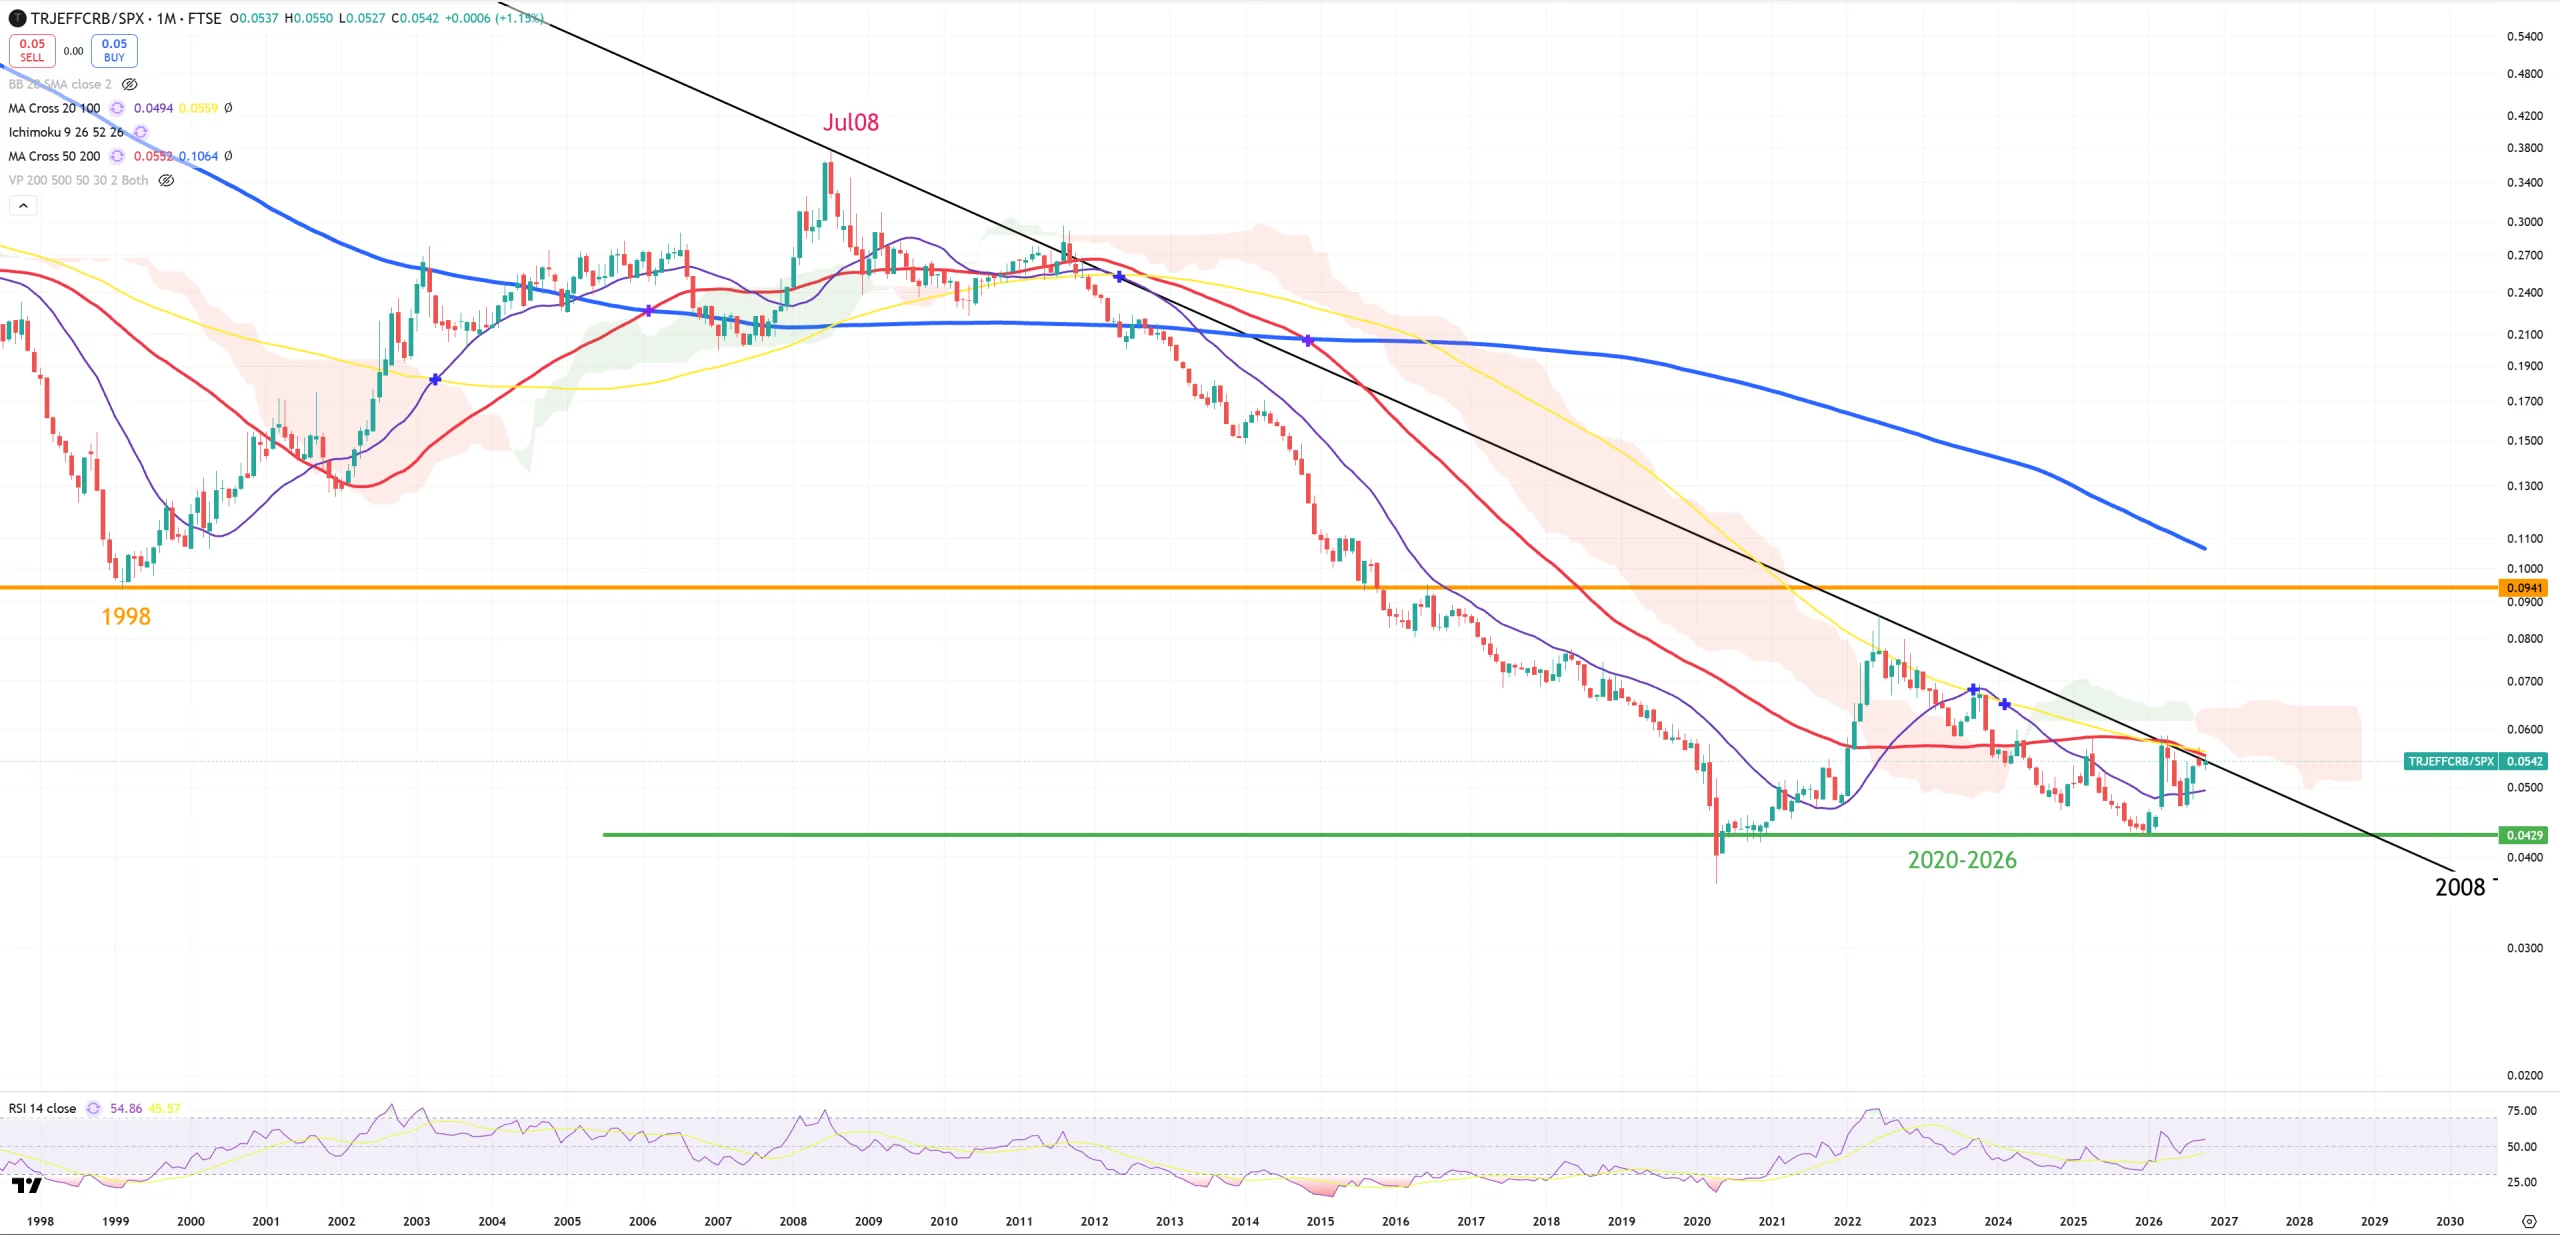
CRB/SPX – do we have a commodity bull market? This ratio still does not confirm it.
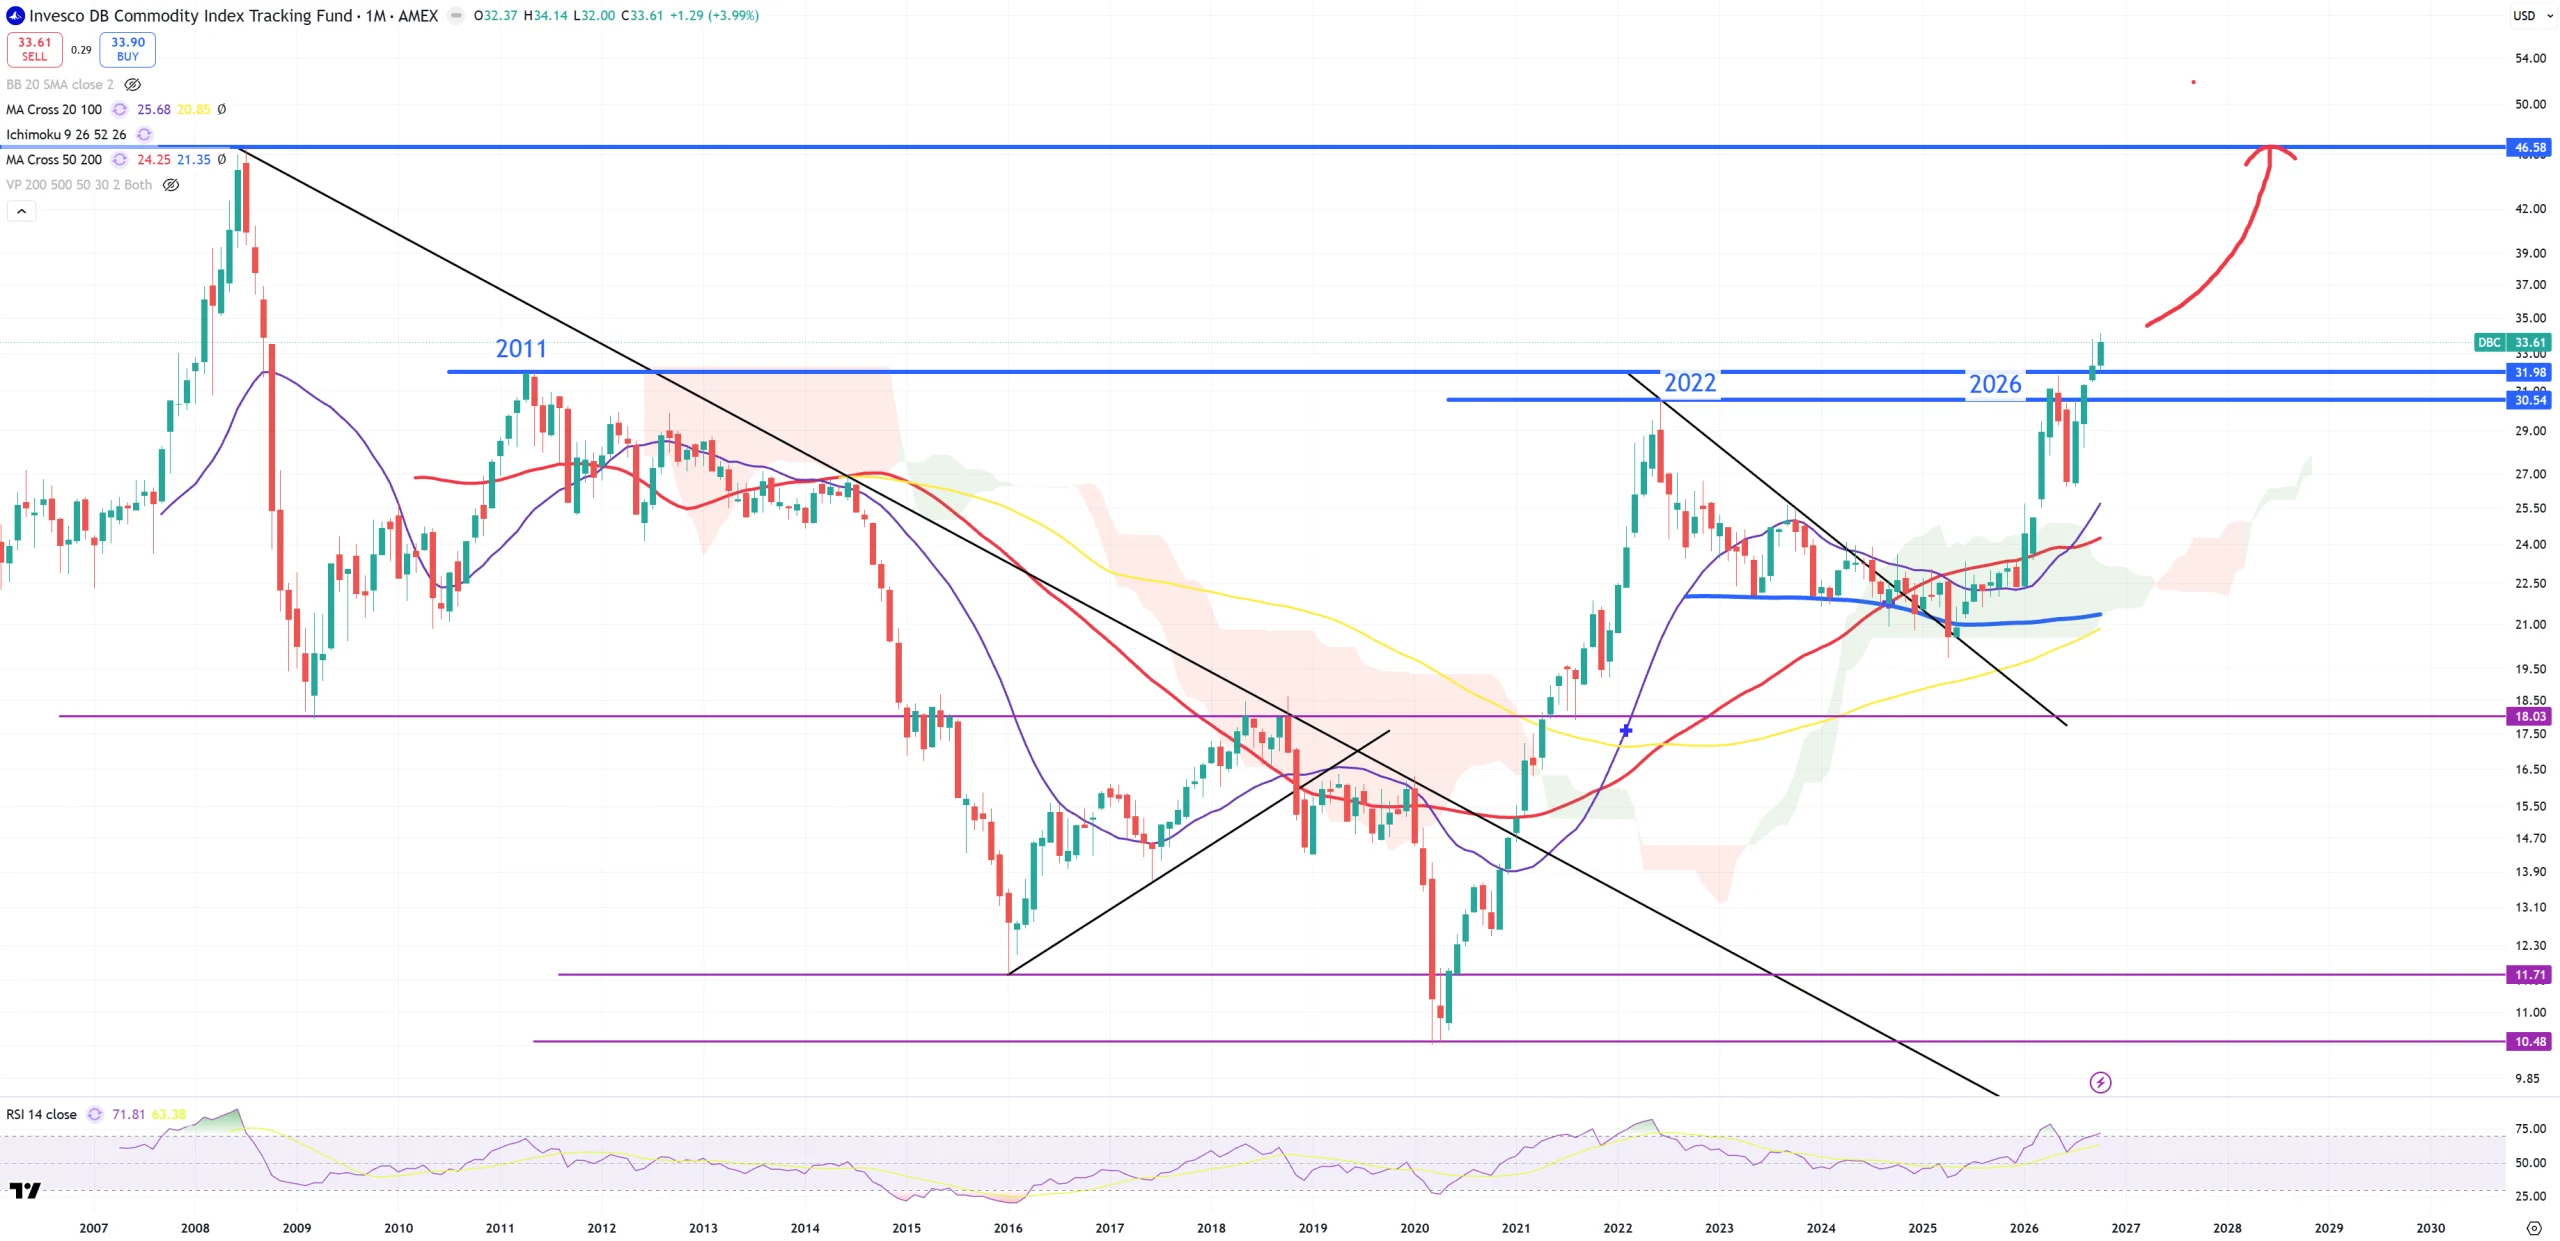
DBC – from the other hand DBC is bullish
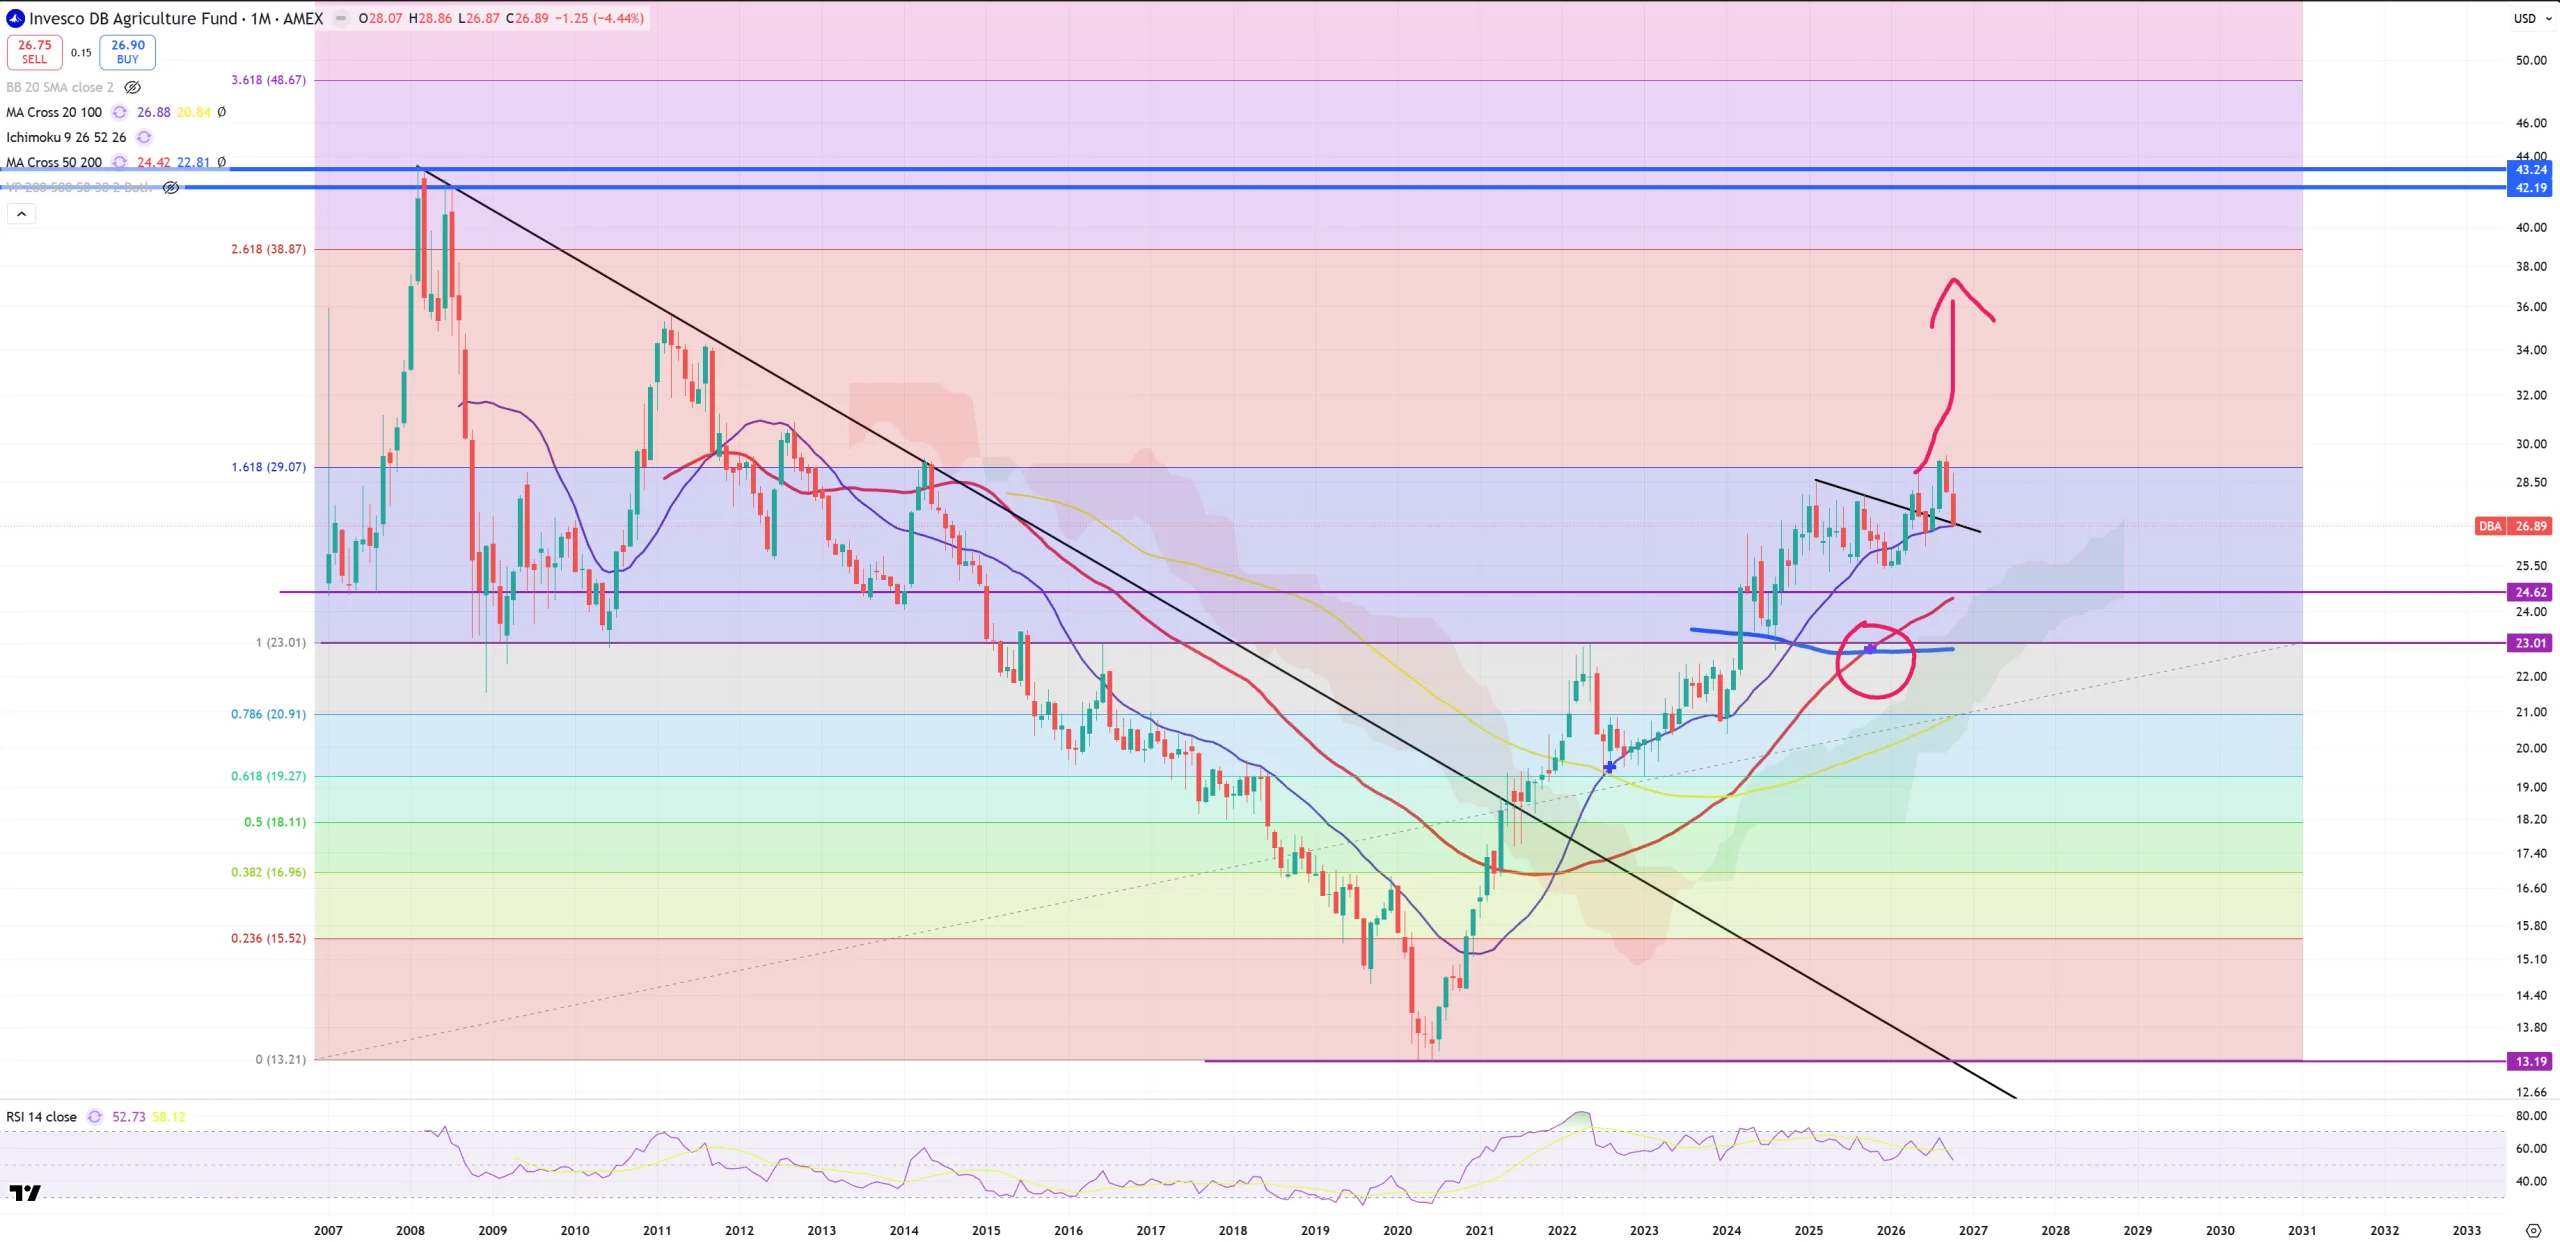
DBA – Agriculture made a retreat. Let’s see if violet (M)MA20 will be held.
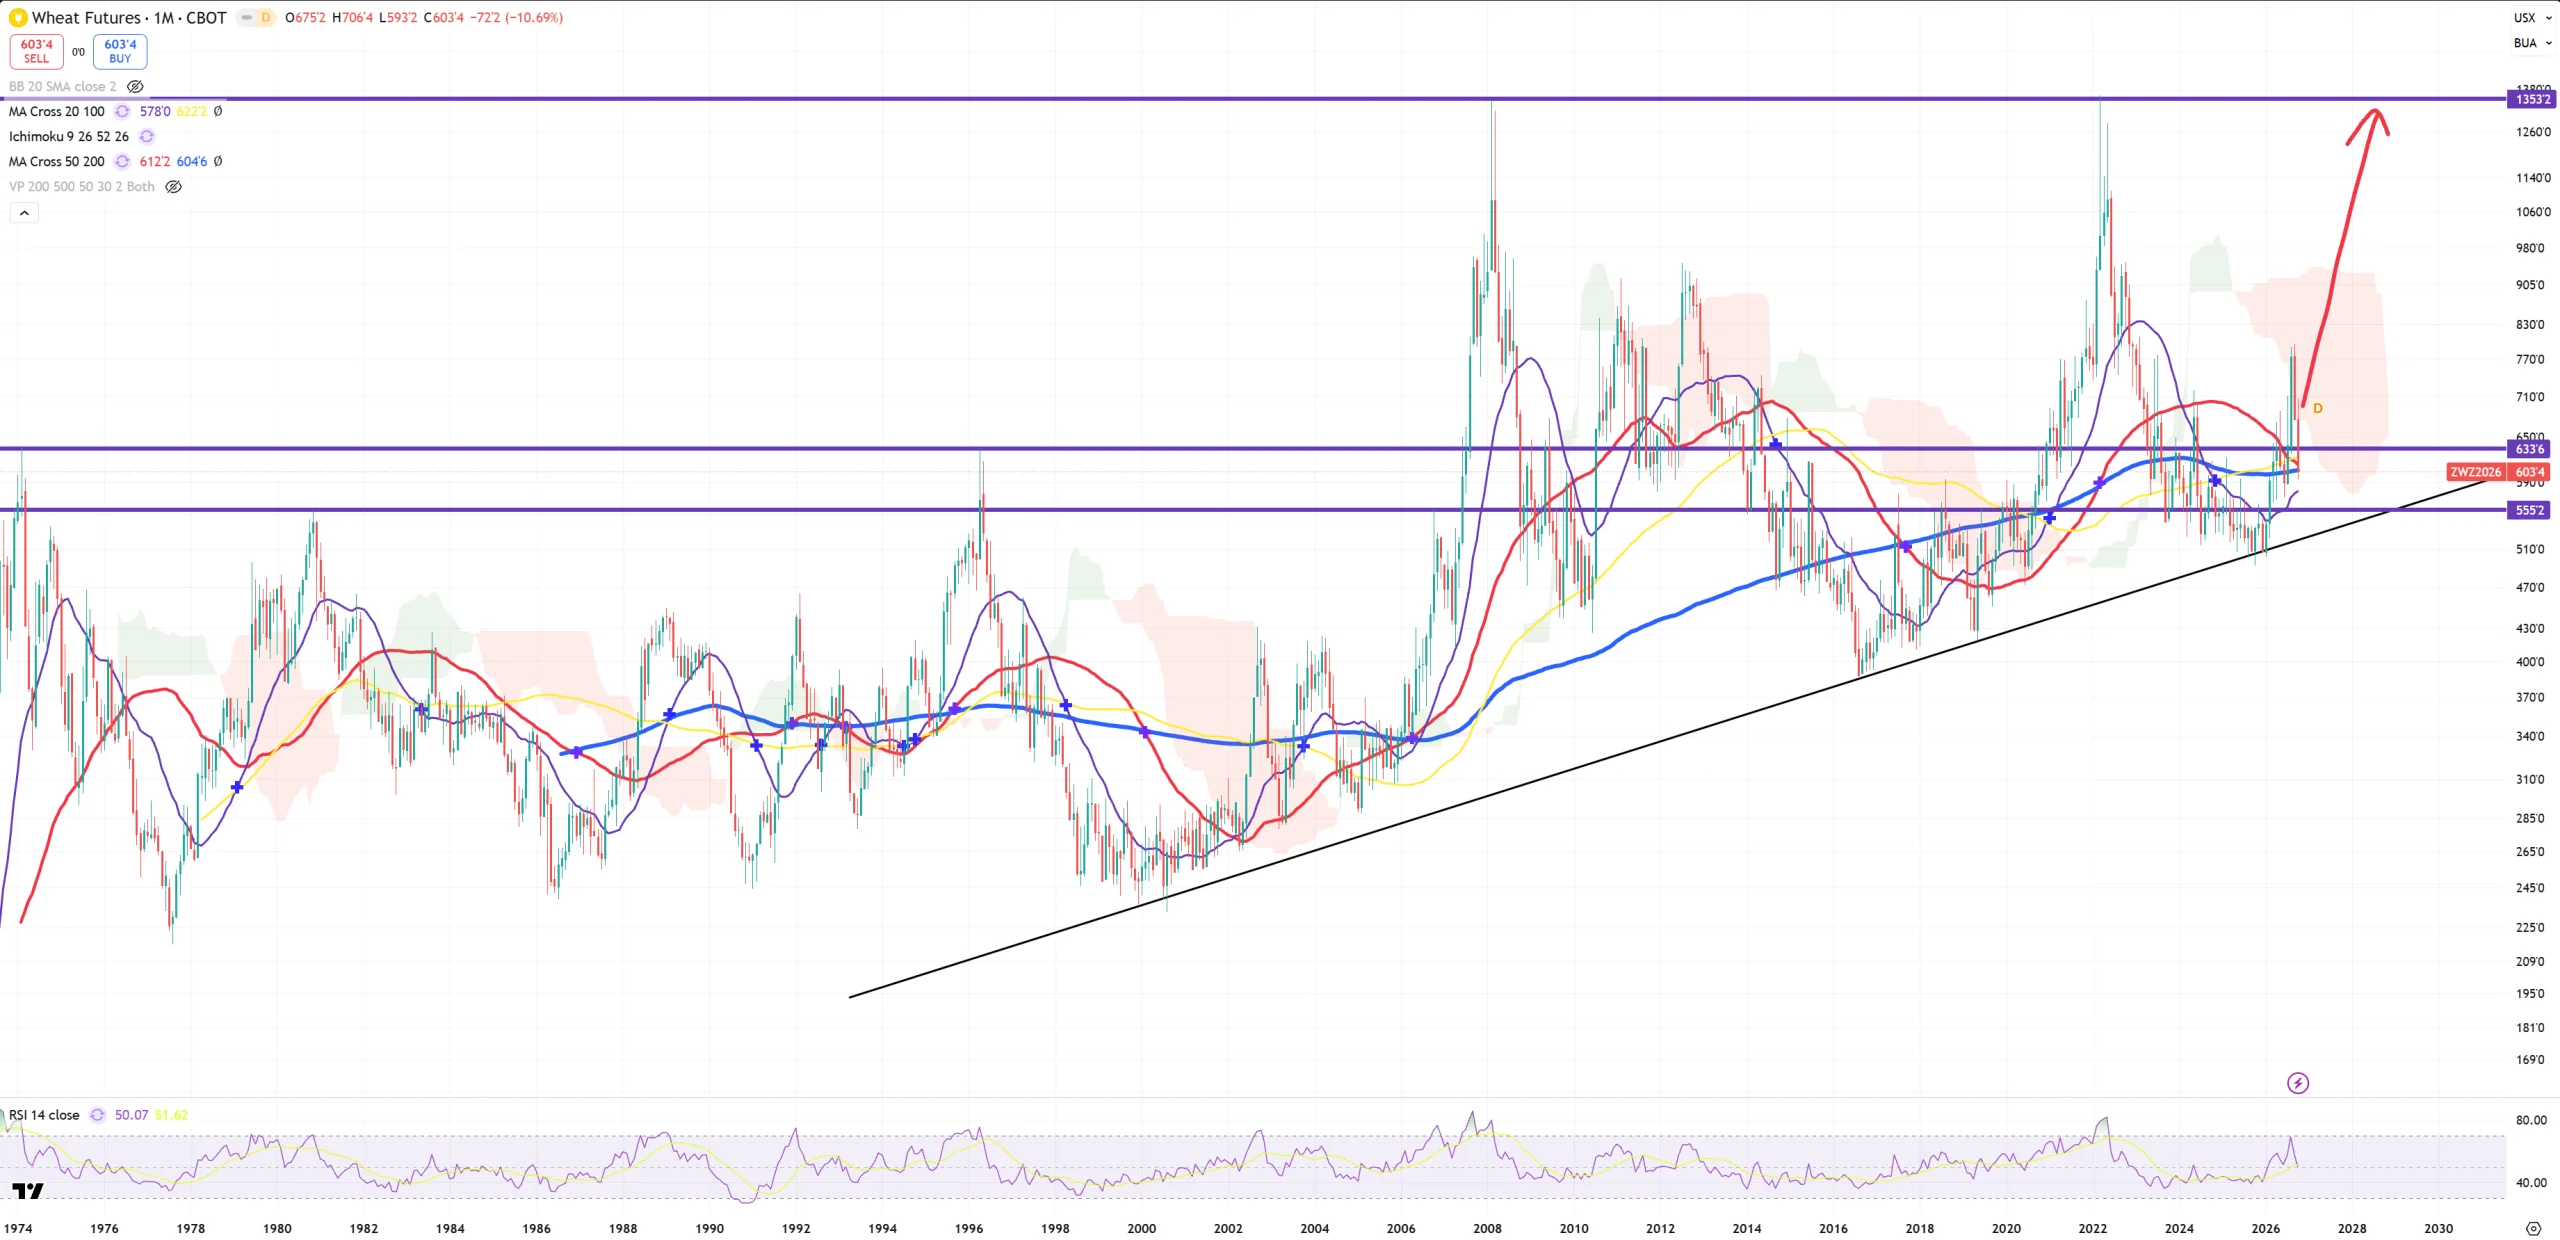
WHEAT – managed to break but now retesting blue (M)MA200. False spike or final retest?
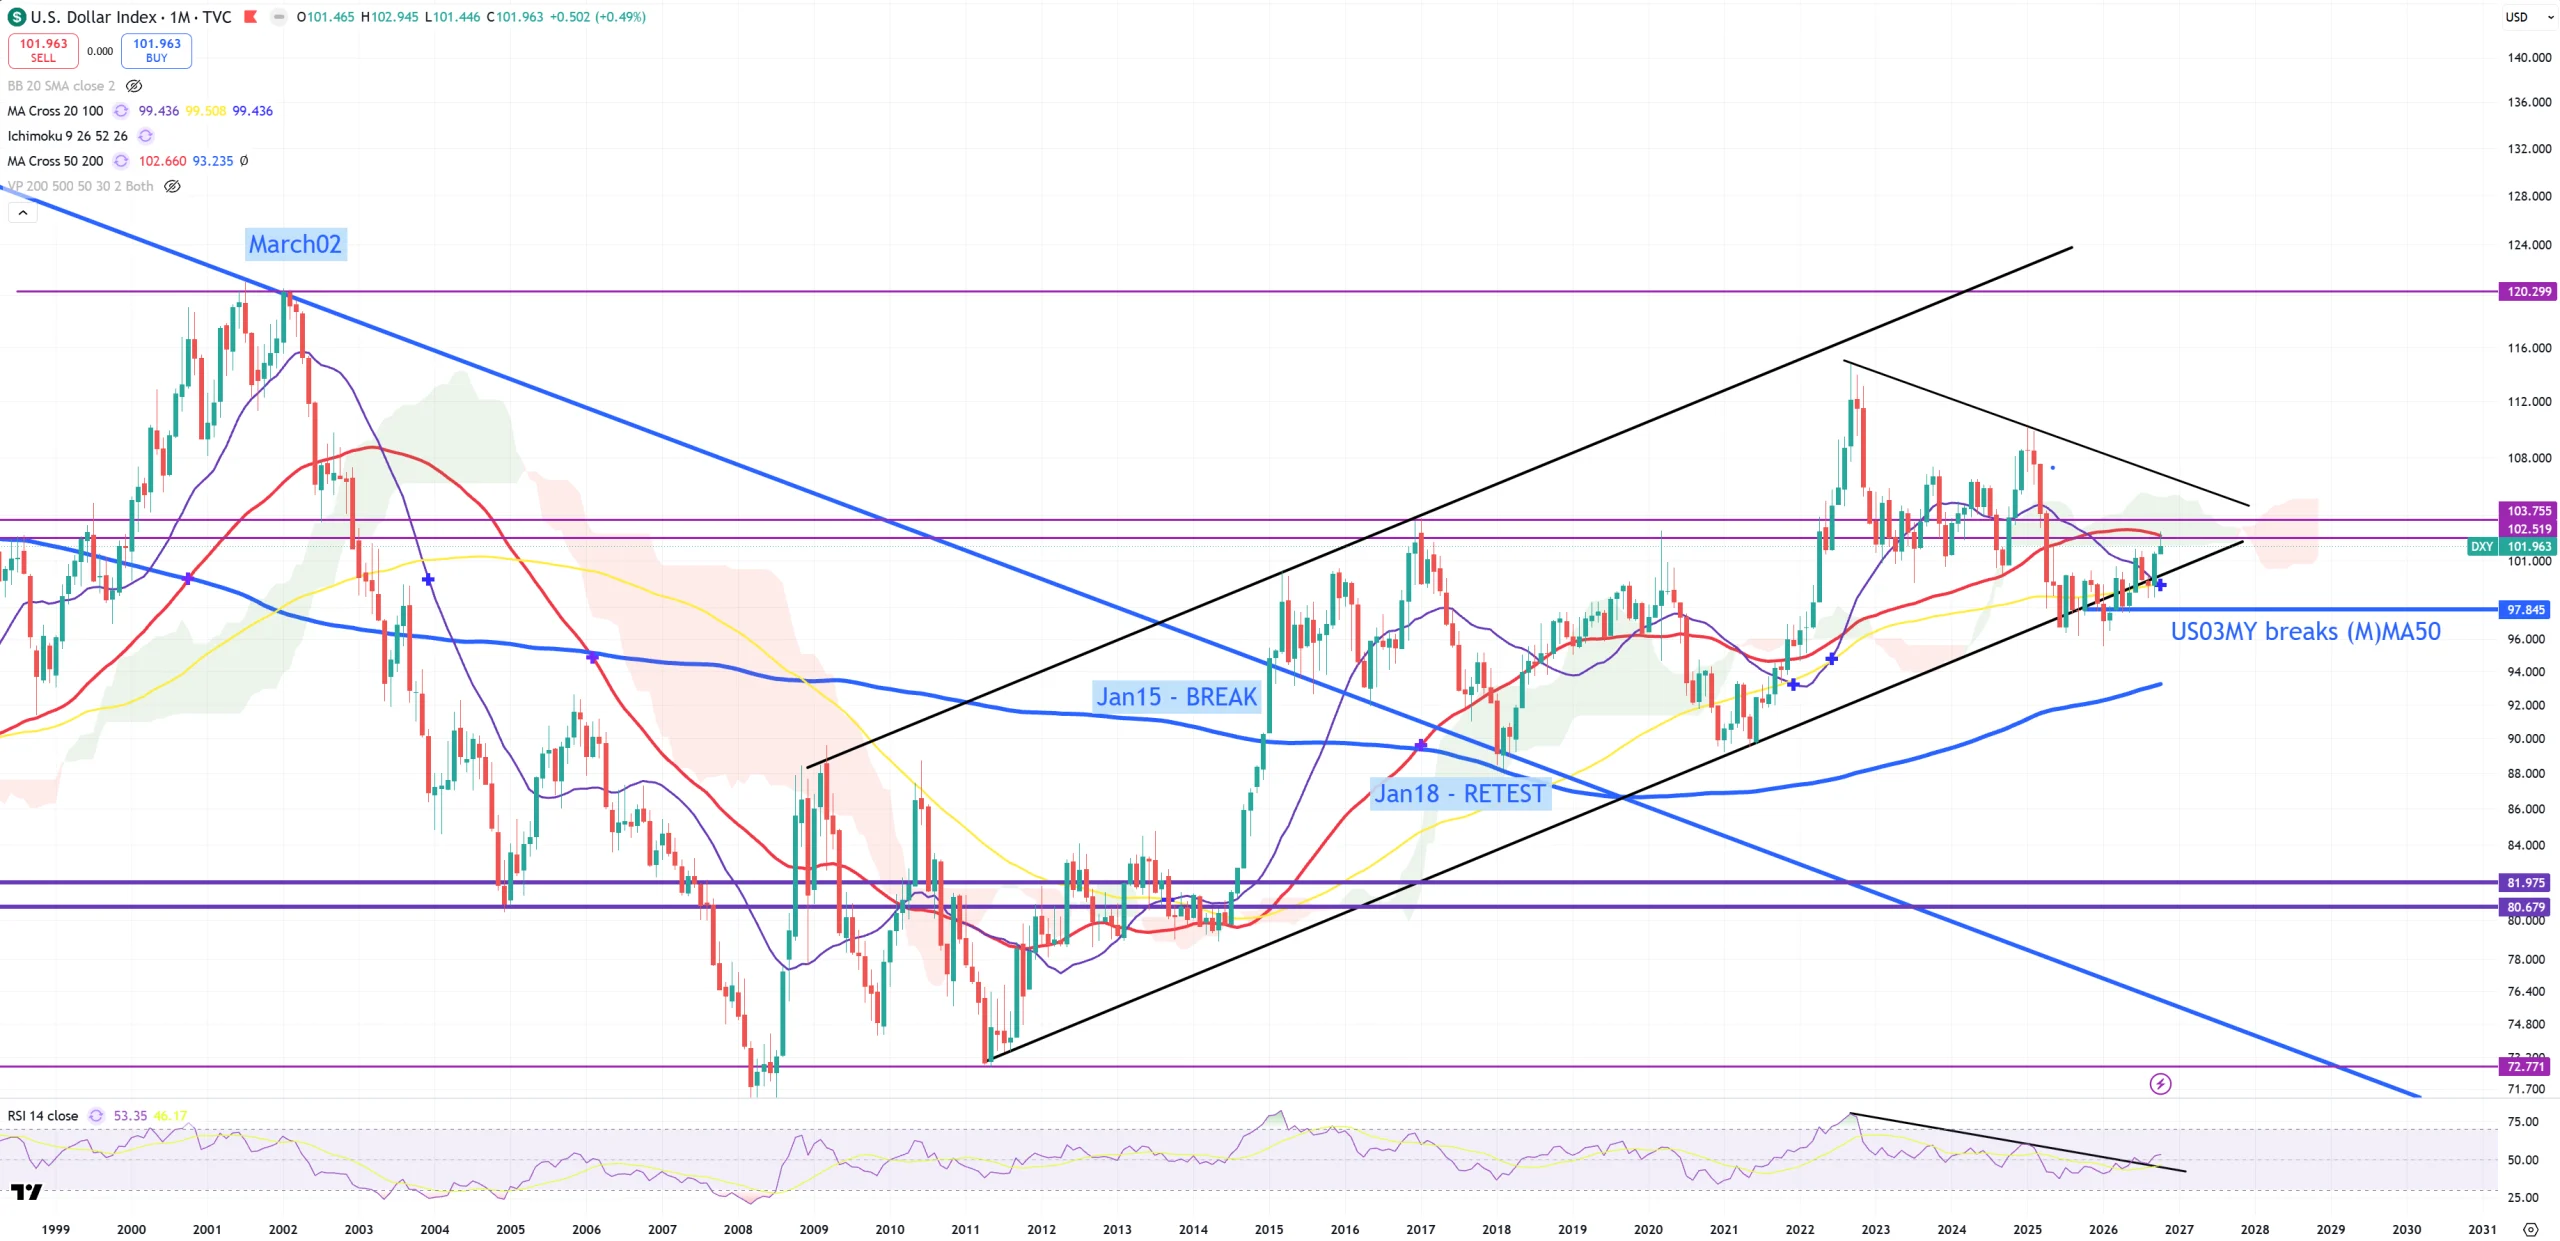
DXY – rejects (M)MA50 after first attempt. Level 102.5-104 will be big resistance but once broken 120 level is next.
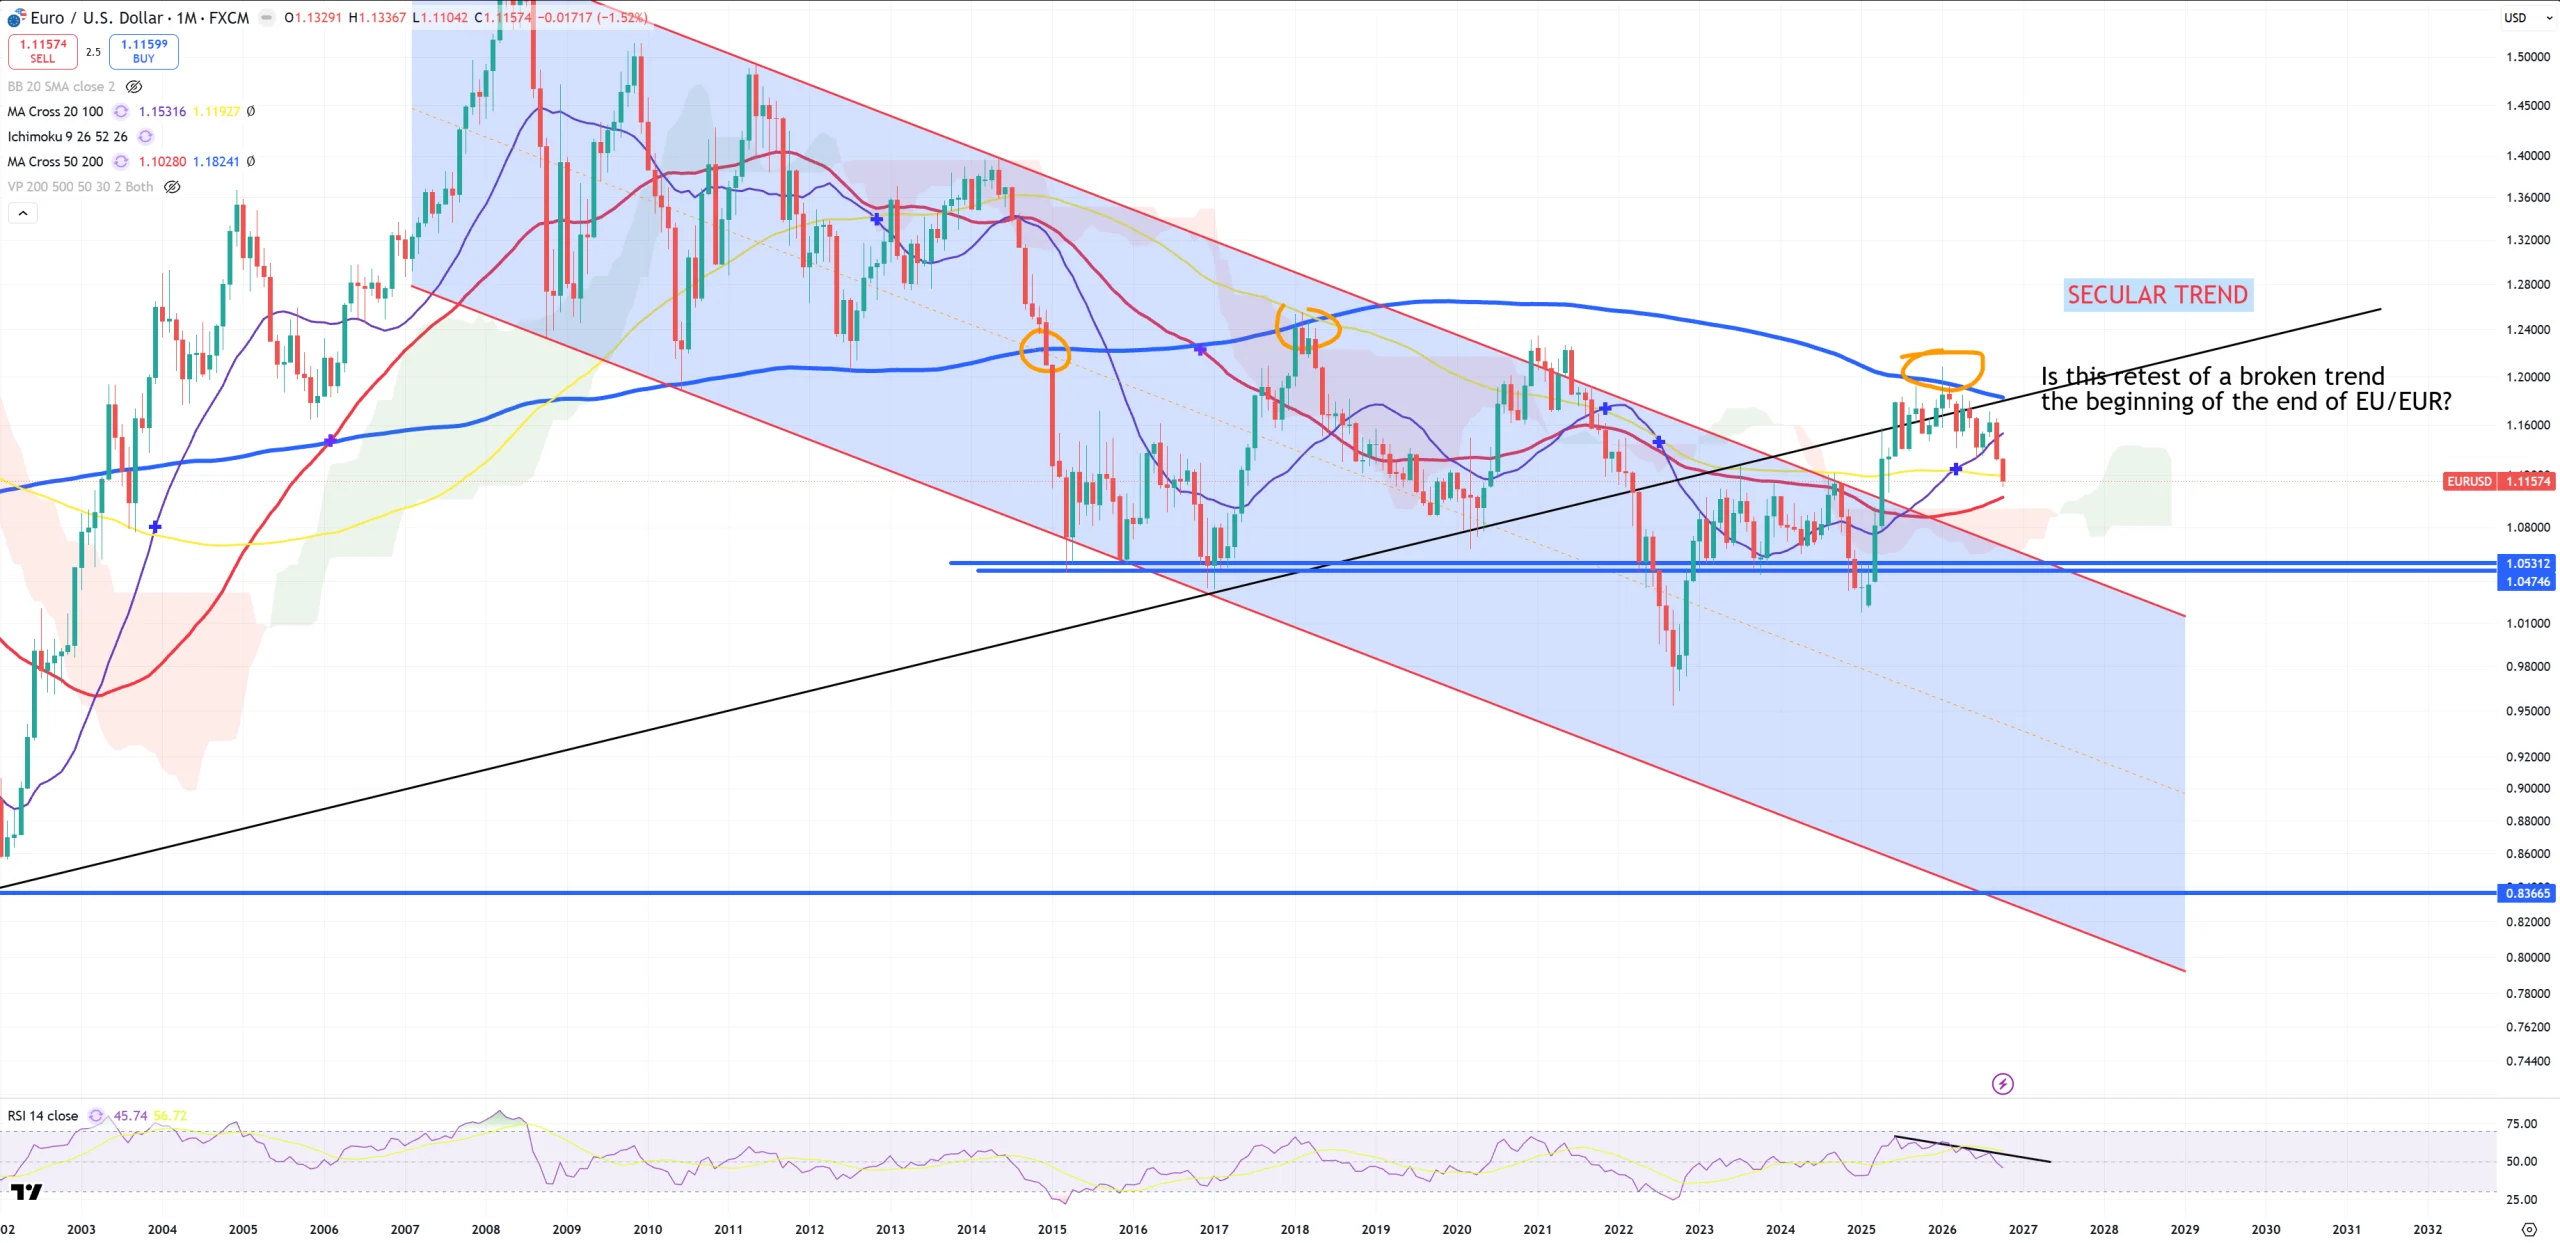
EURUSD – secular trend has been retested, completed and busted. You see “the last possible level” = 1.20 matched almost perfectly with secular trend. My “event” prediction post retest of the trend + (M)MA200 is intact. The beginning of the end of EU/EUR zone. EURUSD is 57% of DXY and its (M)MA50 is also a bit lower on 1.102. Normally I also show you 3M charts but on that scale 1.12 is the most important level, but still two full months to close 3M candles.
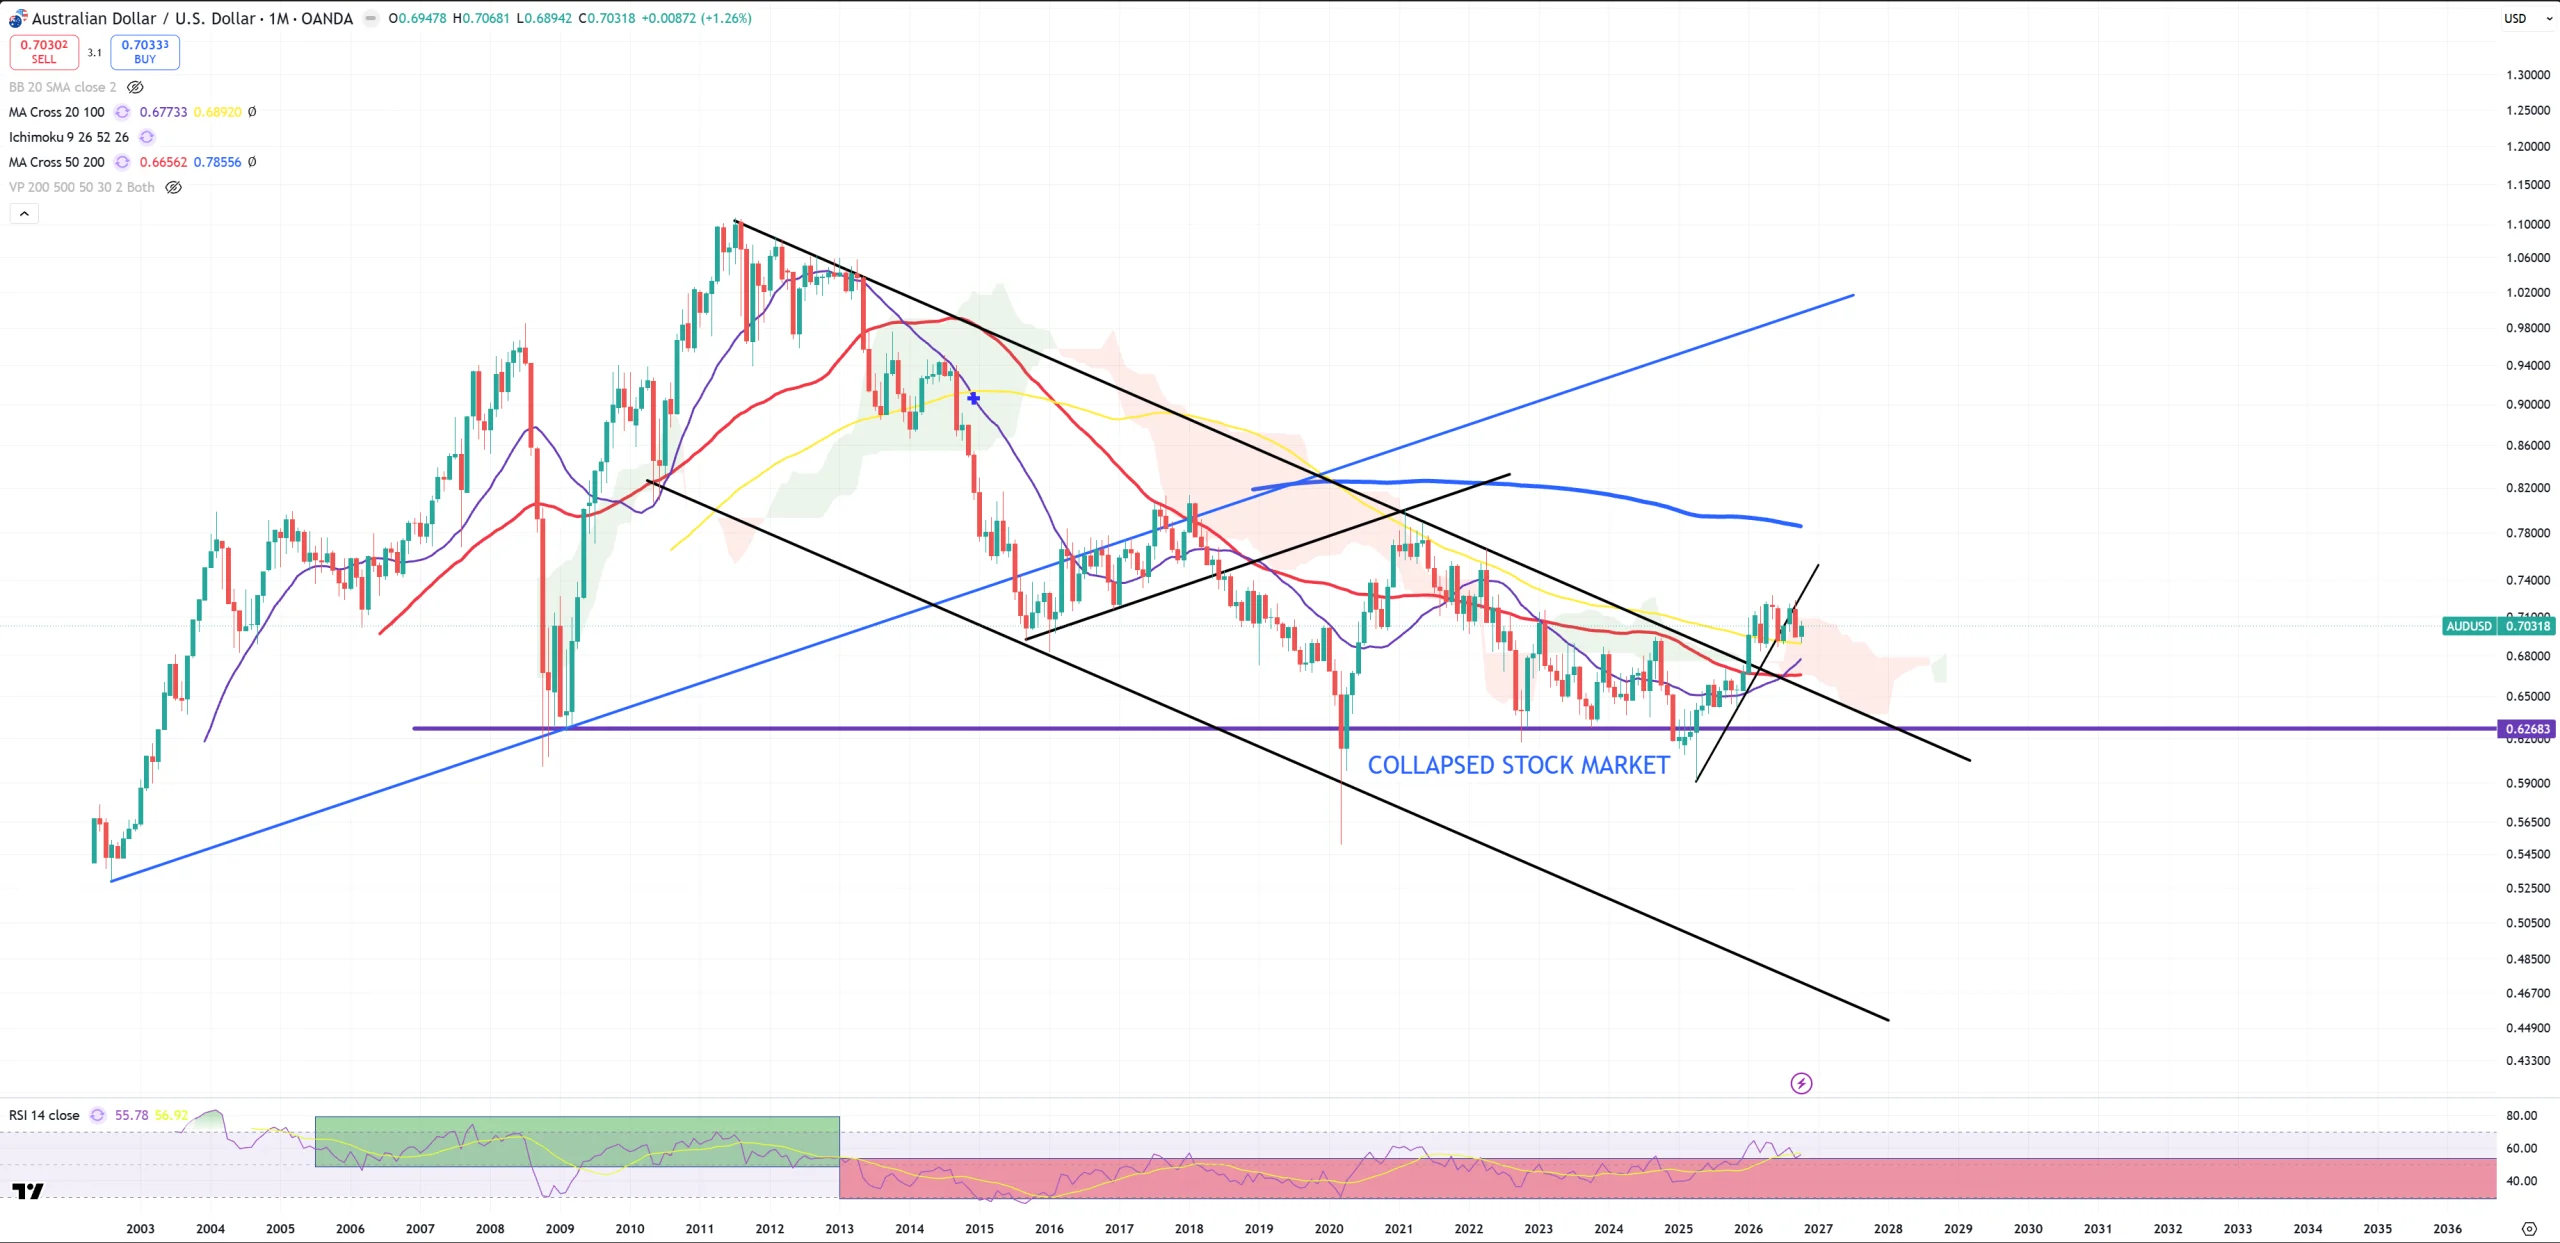
AUDUSD – it sits on yellow (M)MA100, on 3M it has massive level of rejection on 0.725. AUDUSD is the main risk on/off pair for US Stocks and it is a DERIVATIVE of USDCNH which is next on the list.
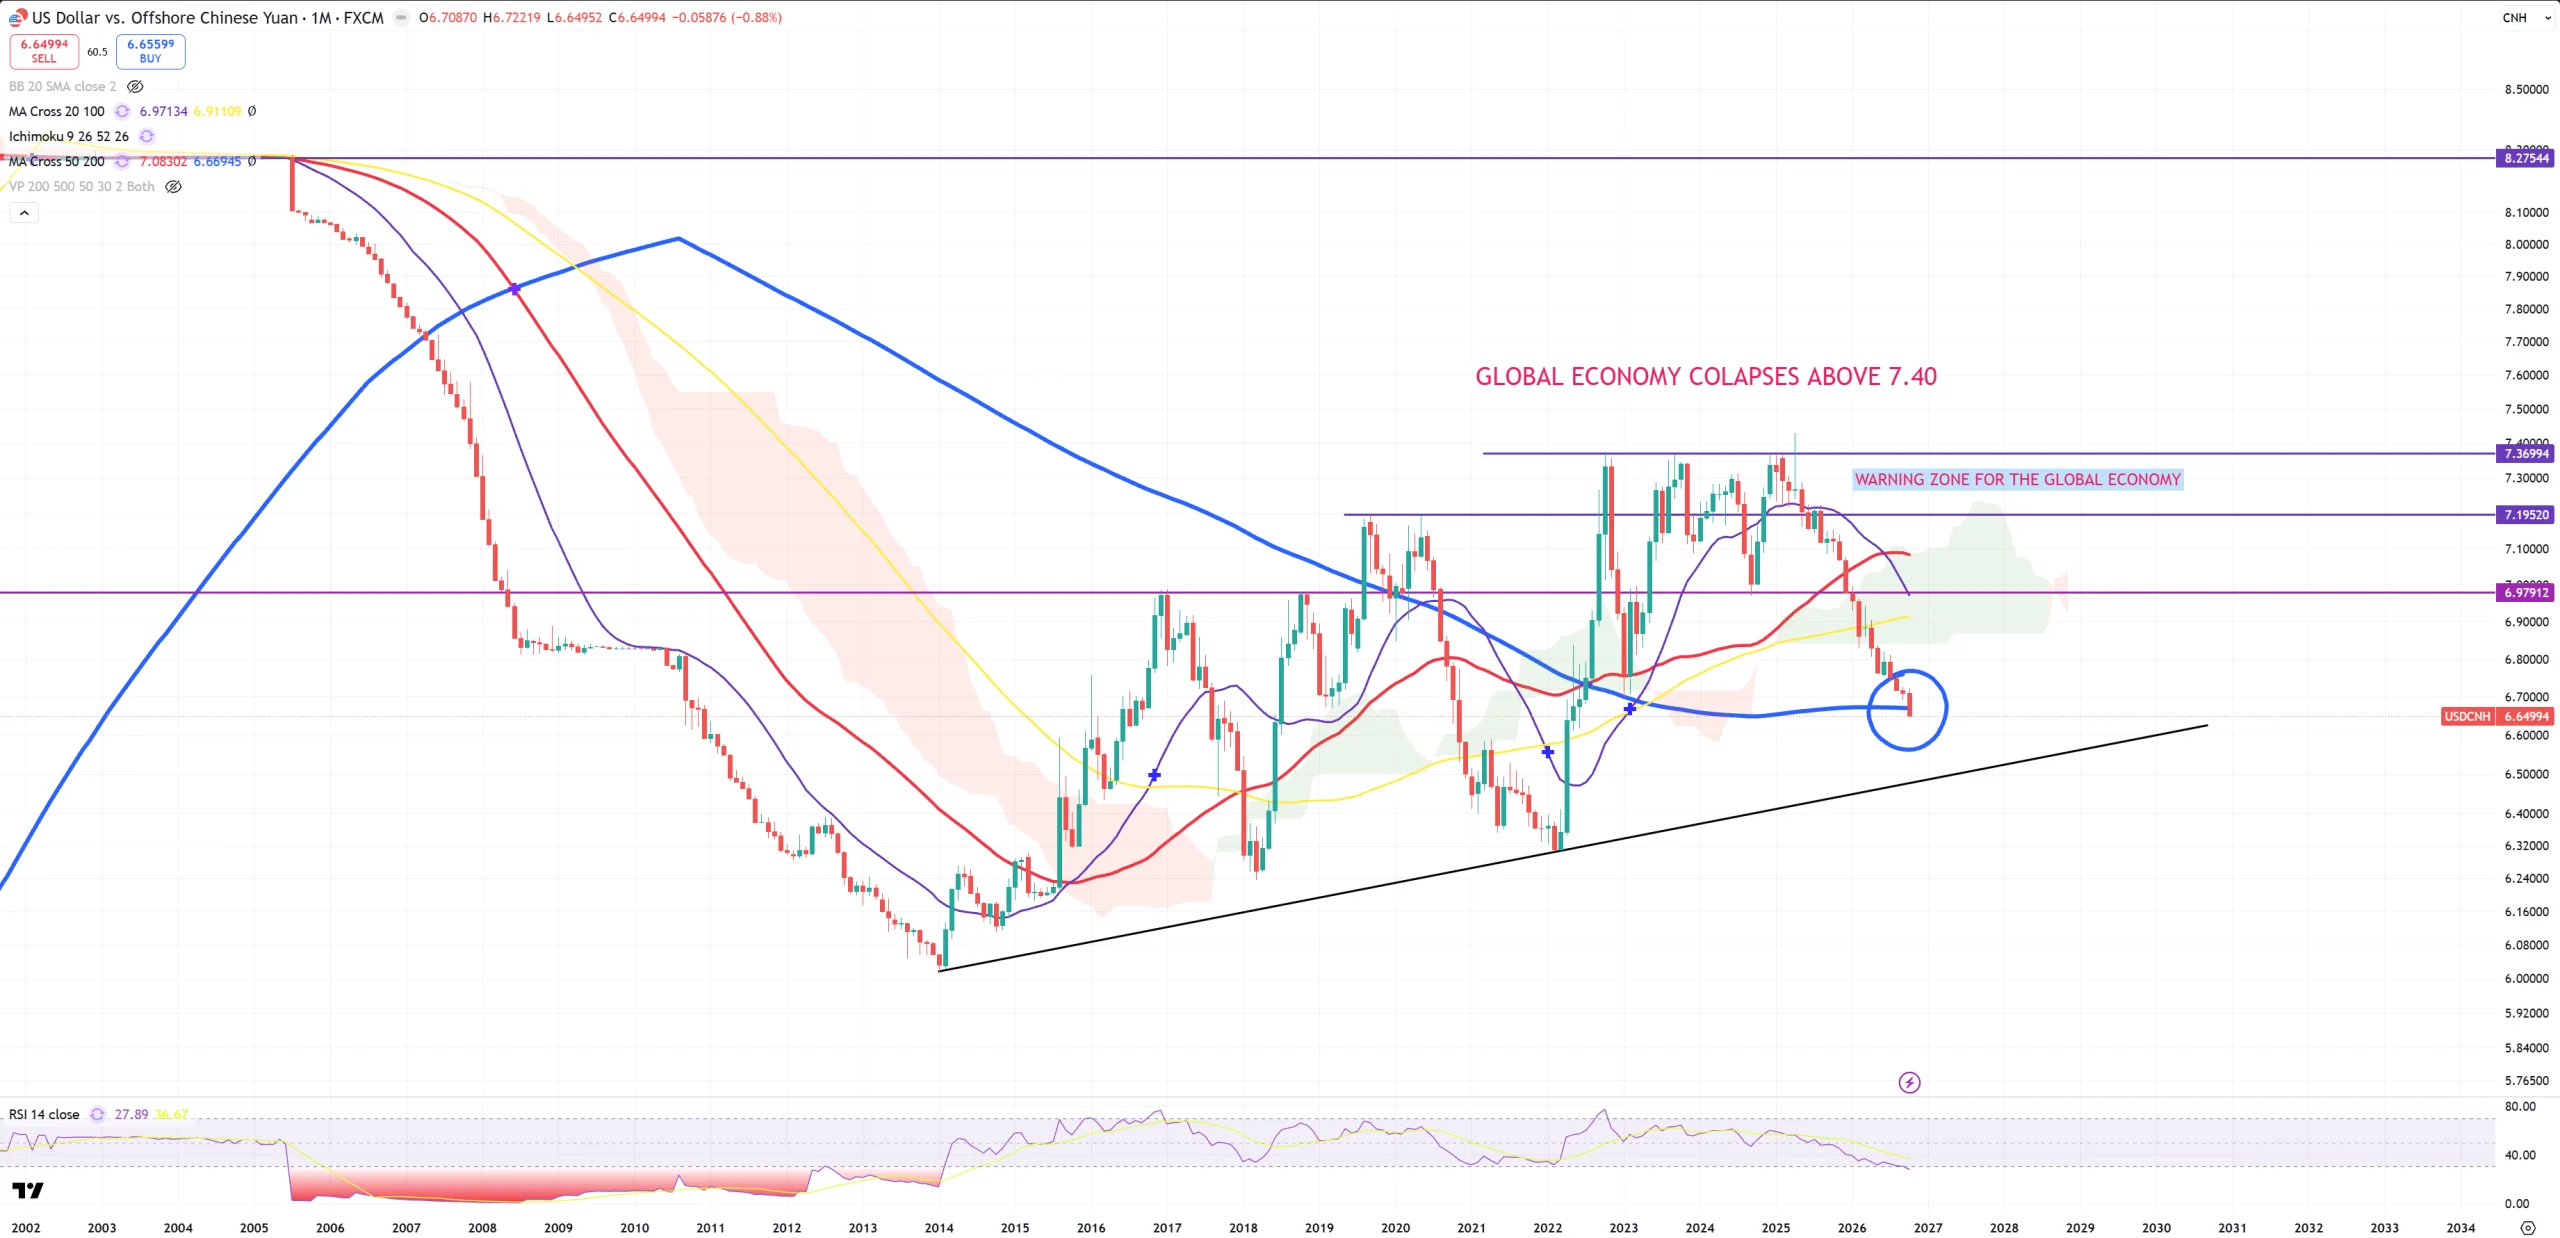
USDCNH – we are on the massive edge of (M)MA200 = 6.66. Market closed below (M)MA200, but it’s marginal break. AUDUSD not losing (M)MA100 needs USDCNH to go lower. Reversal on USDCNH up = China starts exporting DEFLATION to the WORLD. I know many says PBOC will not allow that, but BoJ told us that YCC will last forever and the market managed to break BoJ. I bet market will break PBOC too.
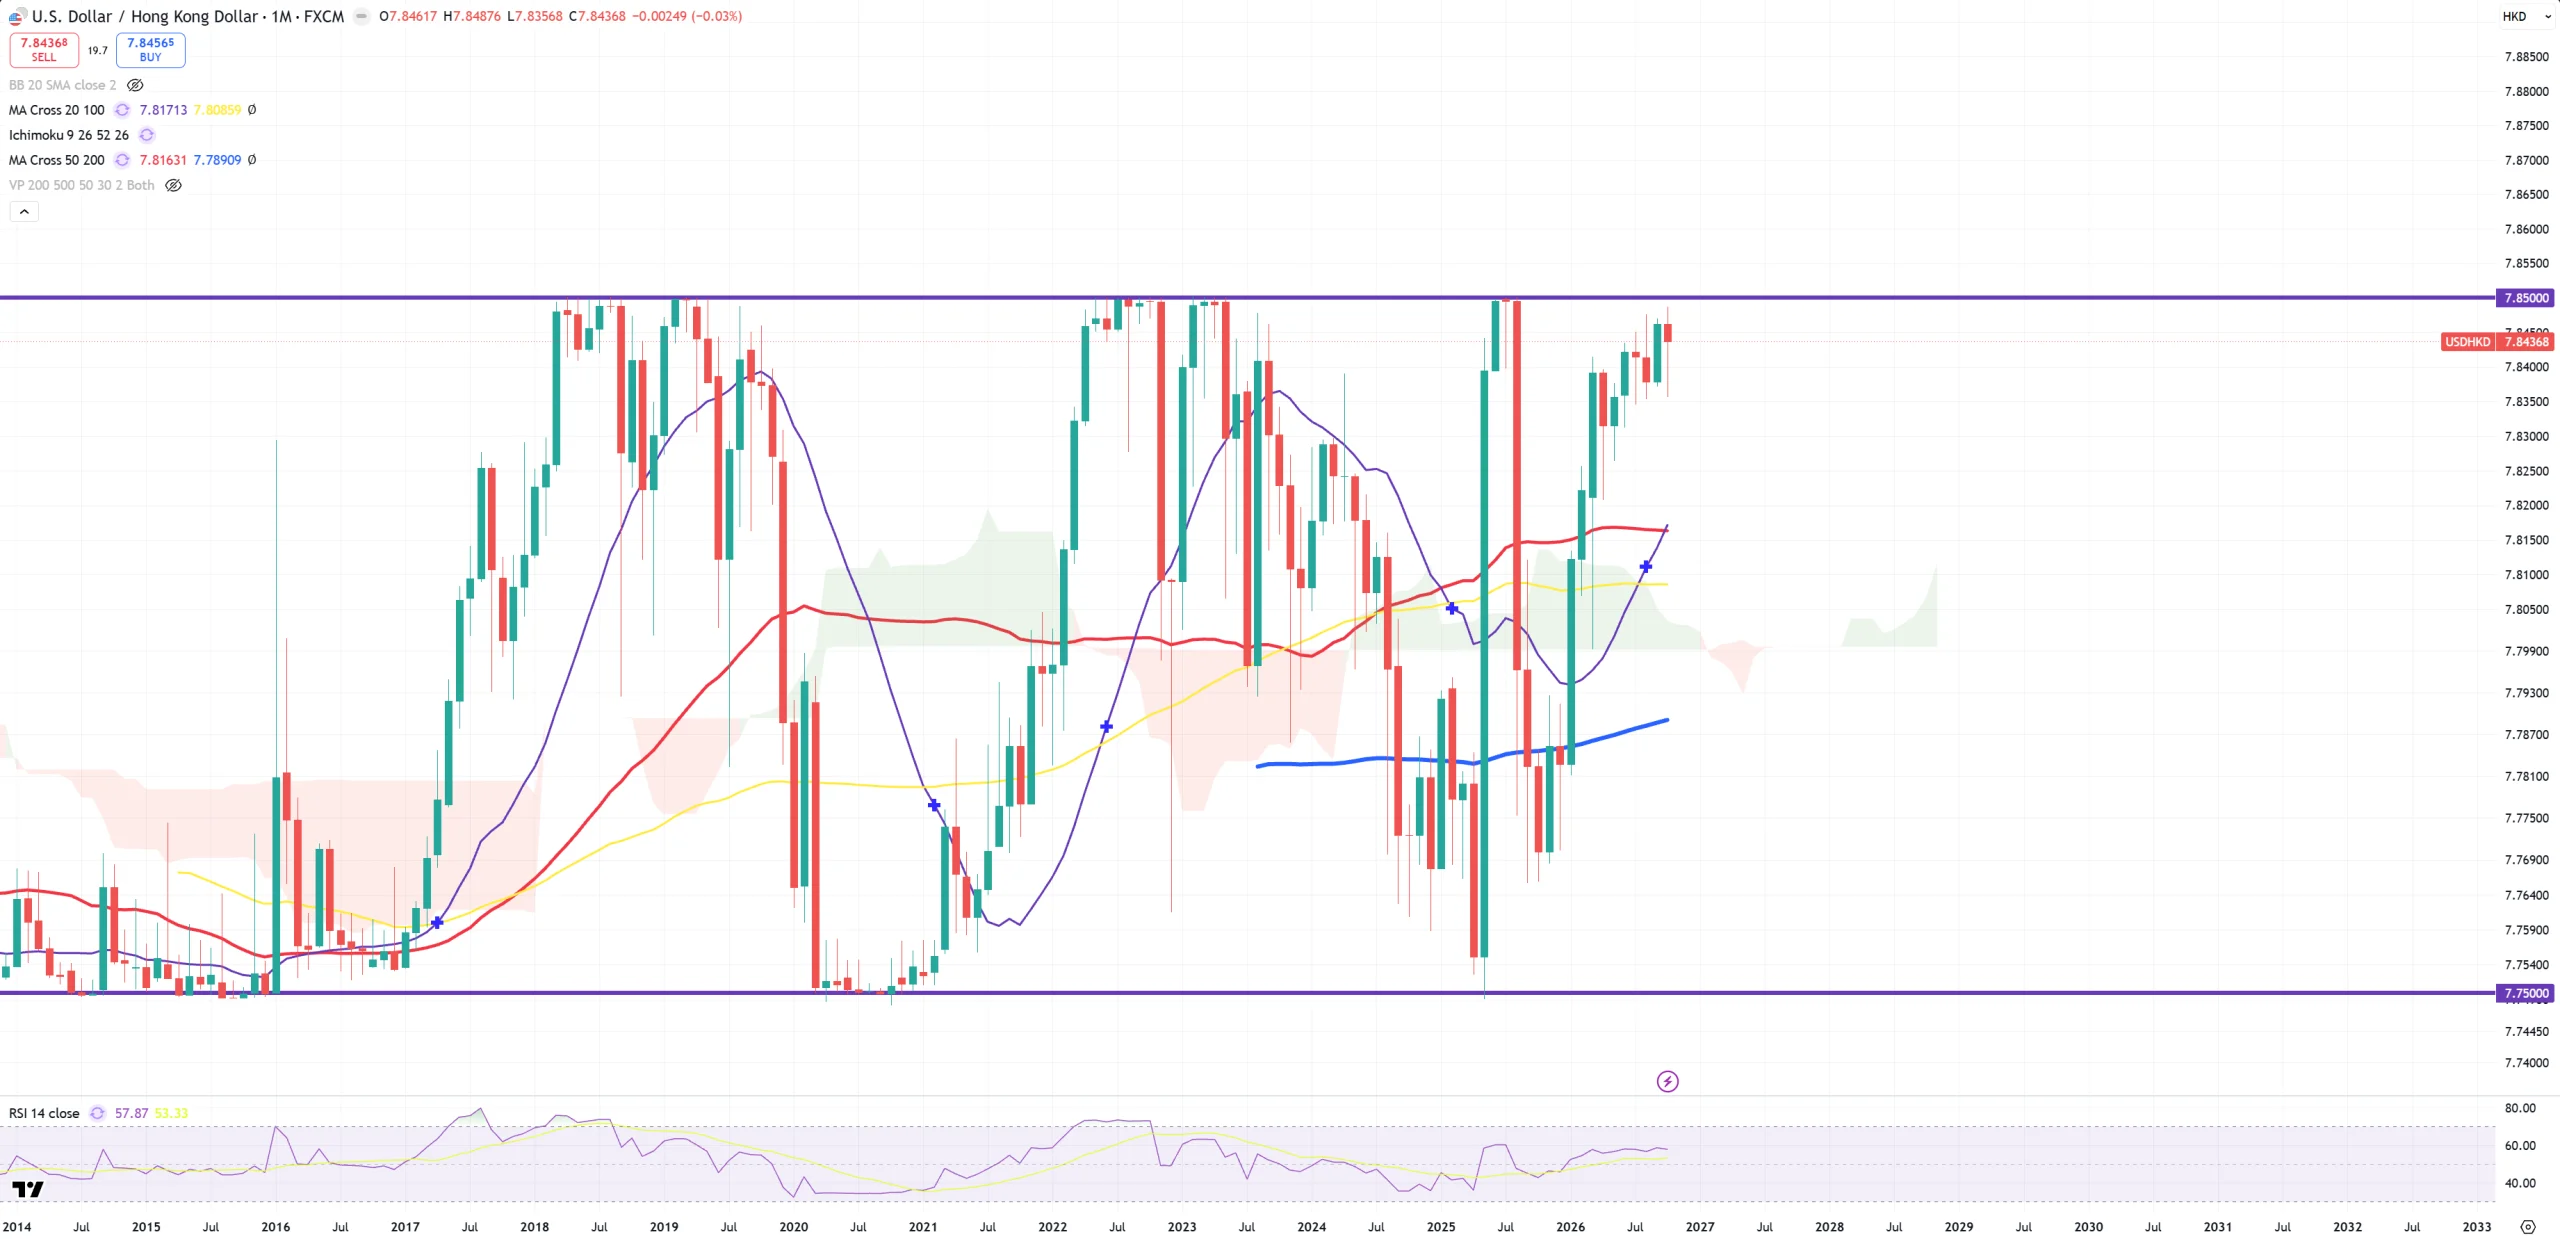
USDHKD – and that’s still my #1 where market will break PBOC. On this 7.85 level
FXI – getting dumped after massive bear market rally till 4Q25. US Stock market loves to be around 3Qs behind China and that’s 2Q26. Previously 1Q21 peak on FXI = 4Q21 for US Stocks = peak in SPX/GOLD = so many stocks breaking below 4Q21 level. Very easy to spot on. In reality US stocks should be in massive bear market since 4Q21 (most are), but AI/SOX made a mini recovery cycle inside big bear market (with big possibility to end around 2Q26). That’s the valid interpretation of the market so far.
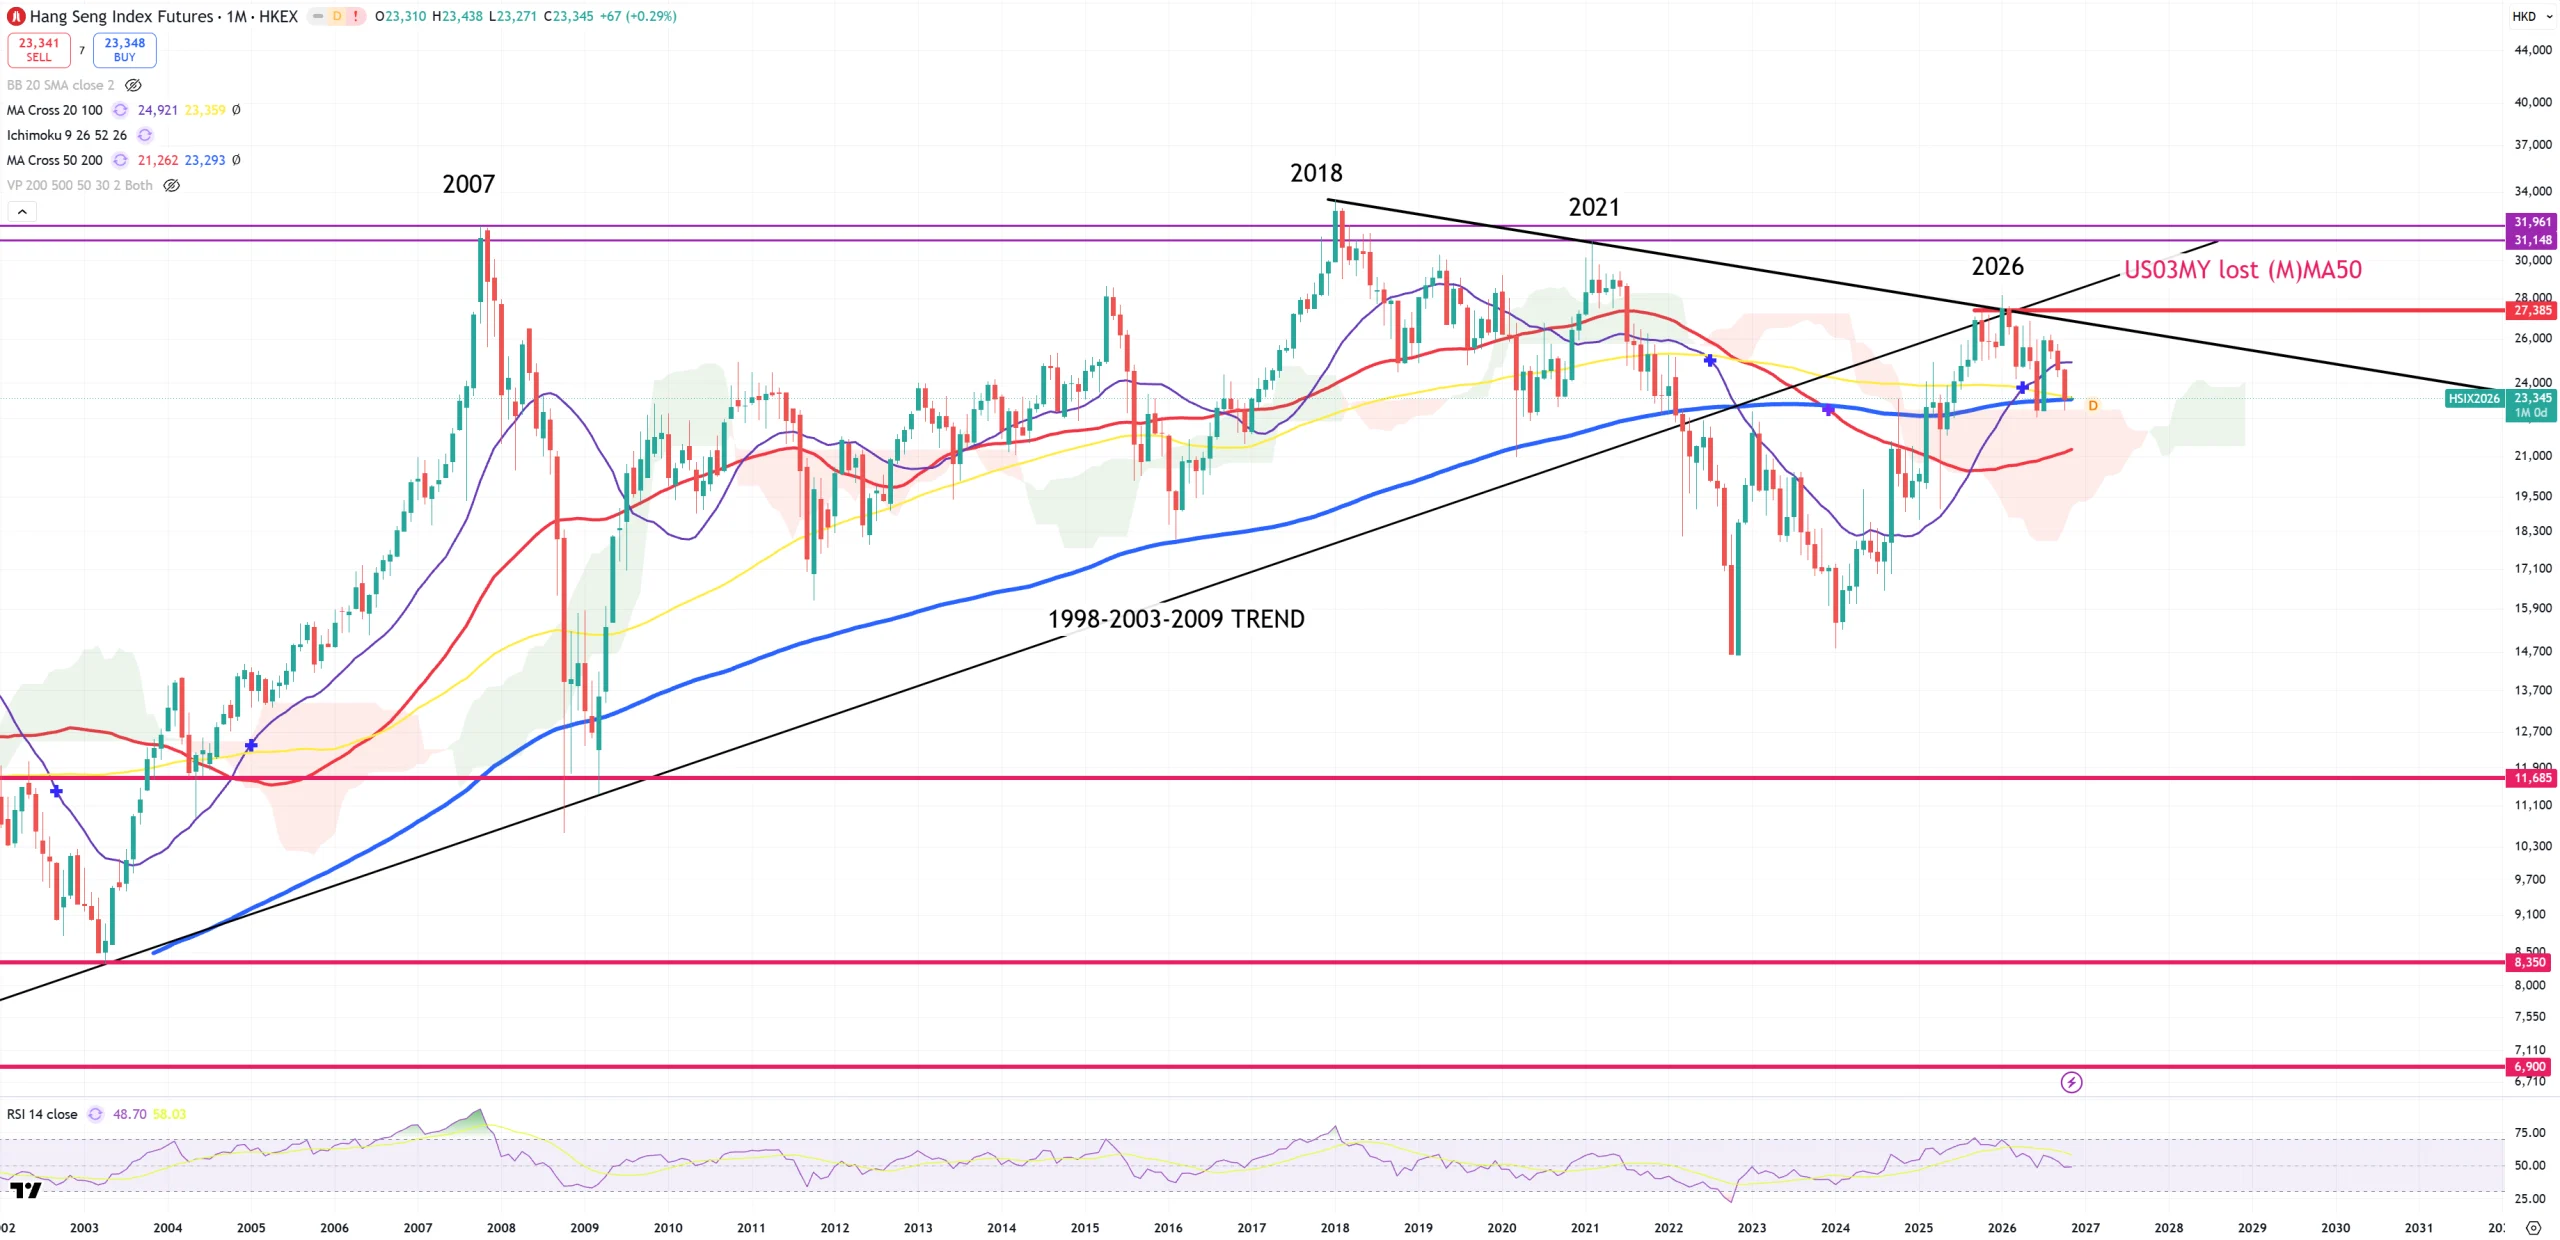
HSI – Hang Seng ends the month on (M)MA200. Again the edge of secular bear market after full retest to key 1998-2003-2009 trend and key retest to 2018-2021 trend. The highest point here is 2018.
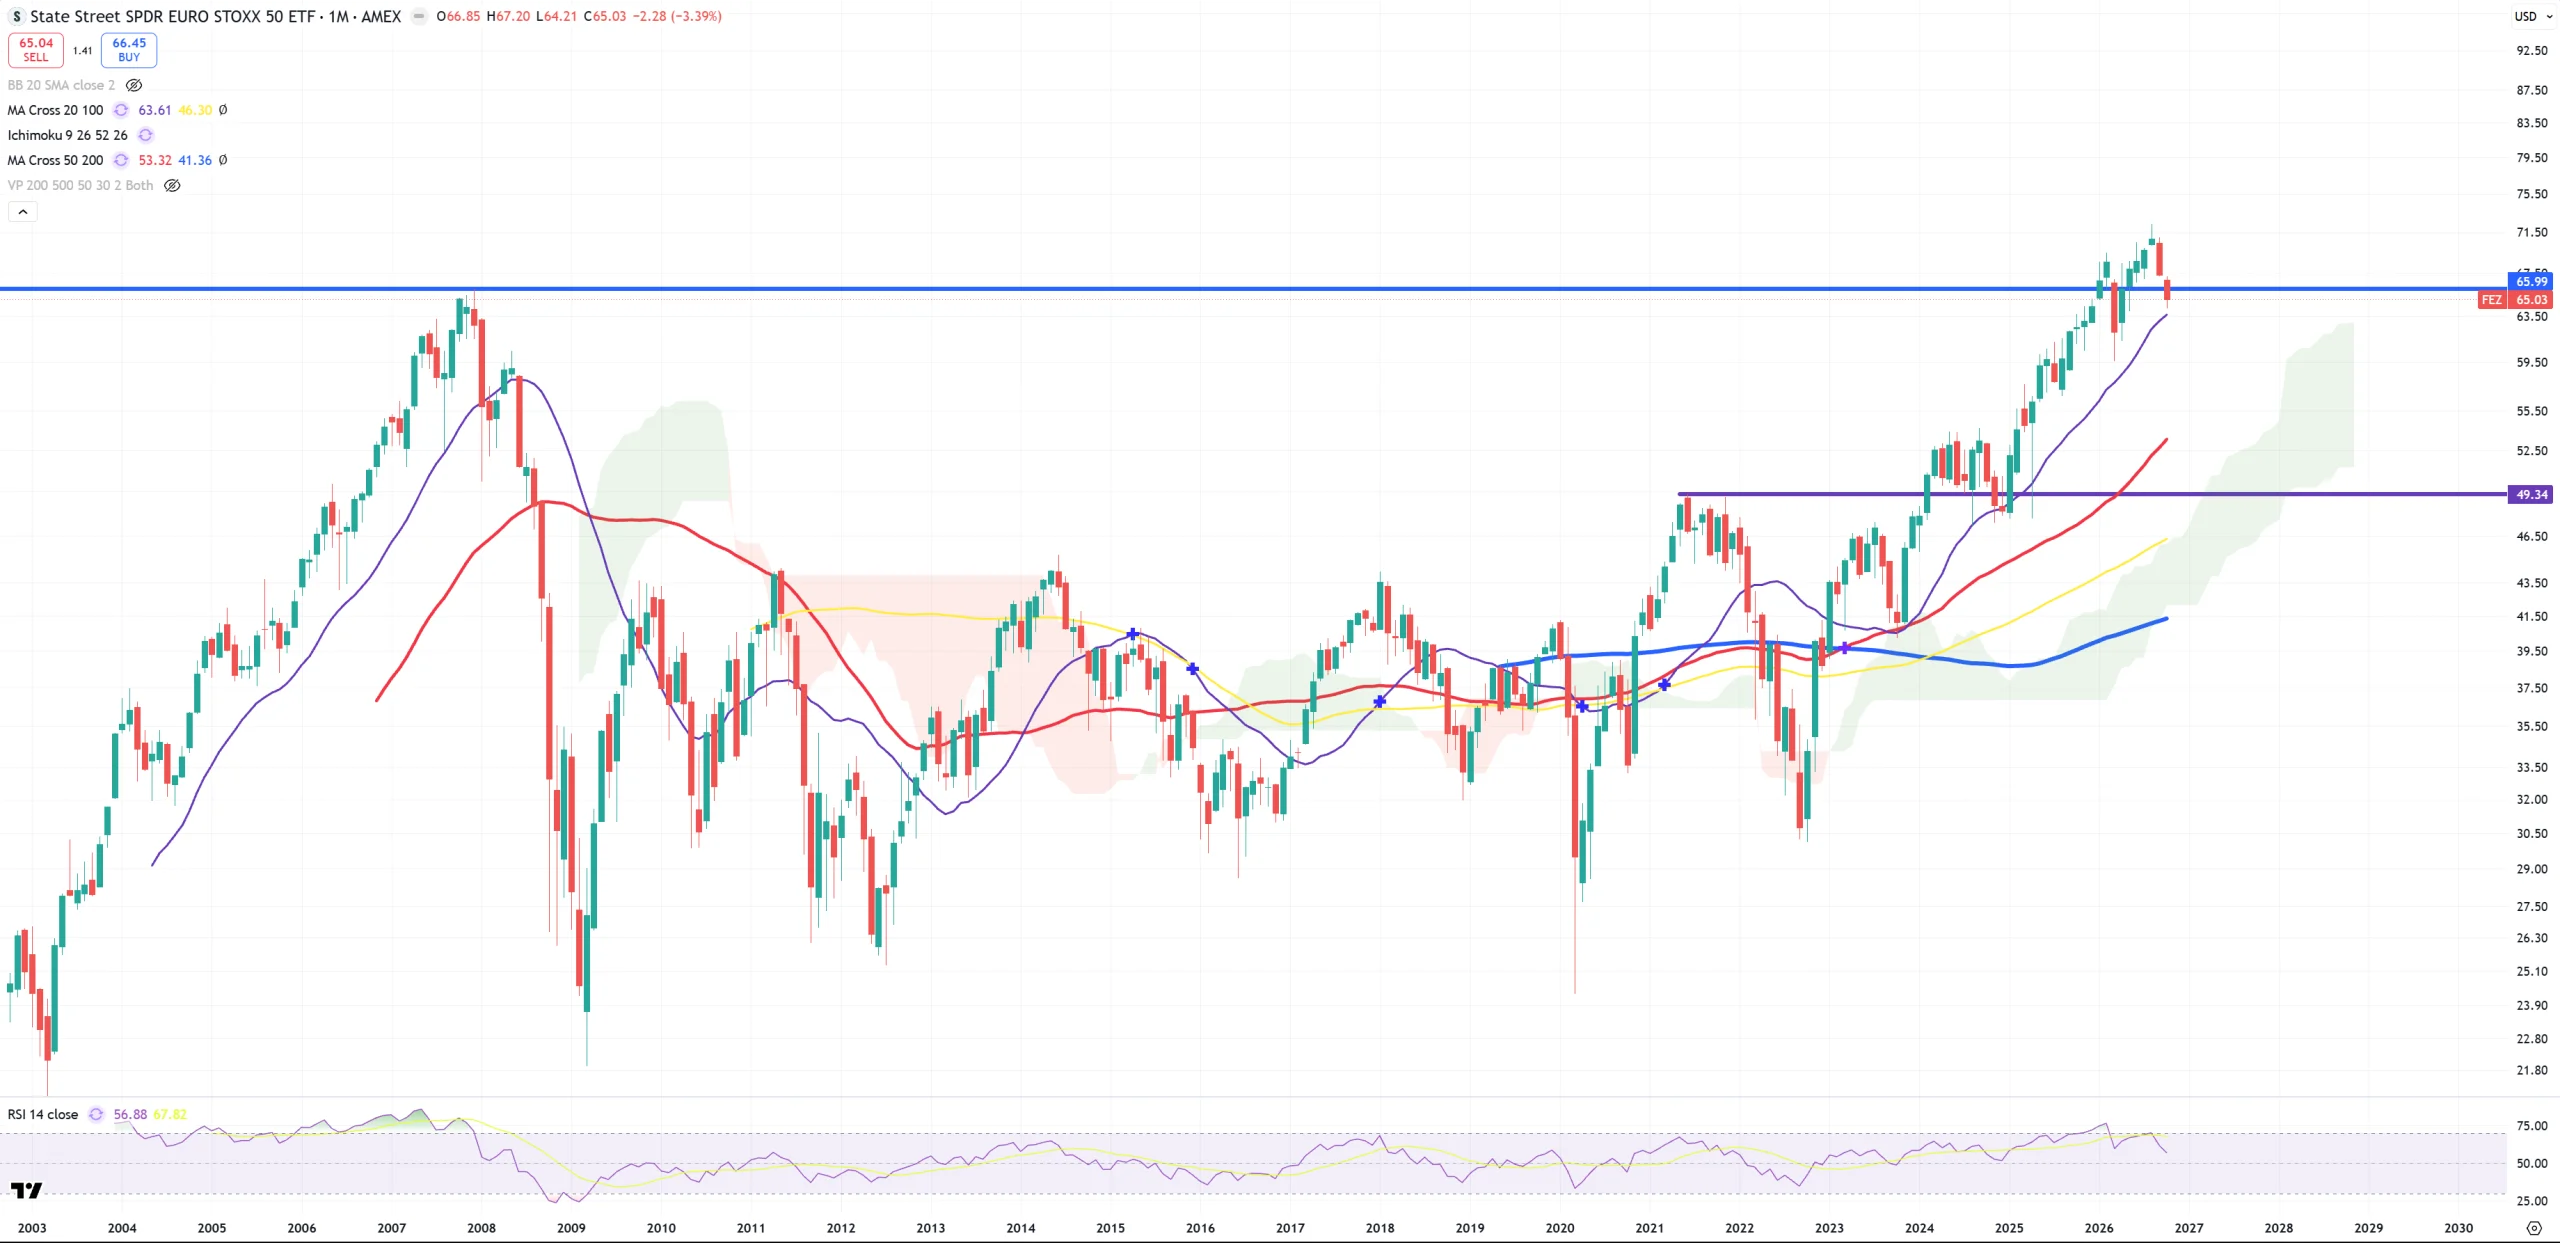
FEZ – Euro Stoxx 50 in $$$ – this chart doesn’t need any comment.
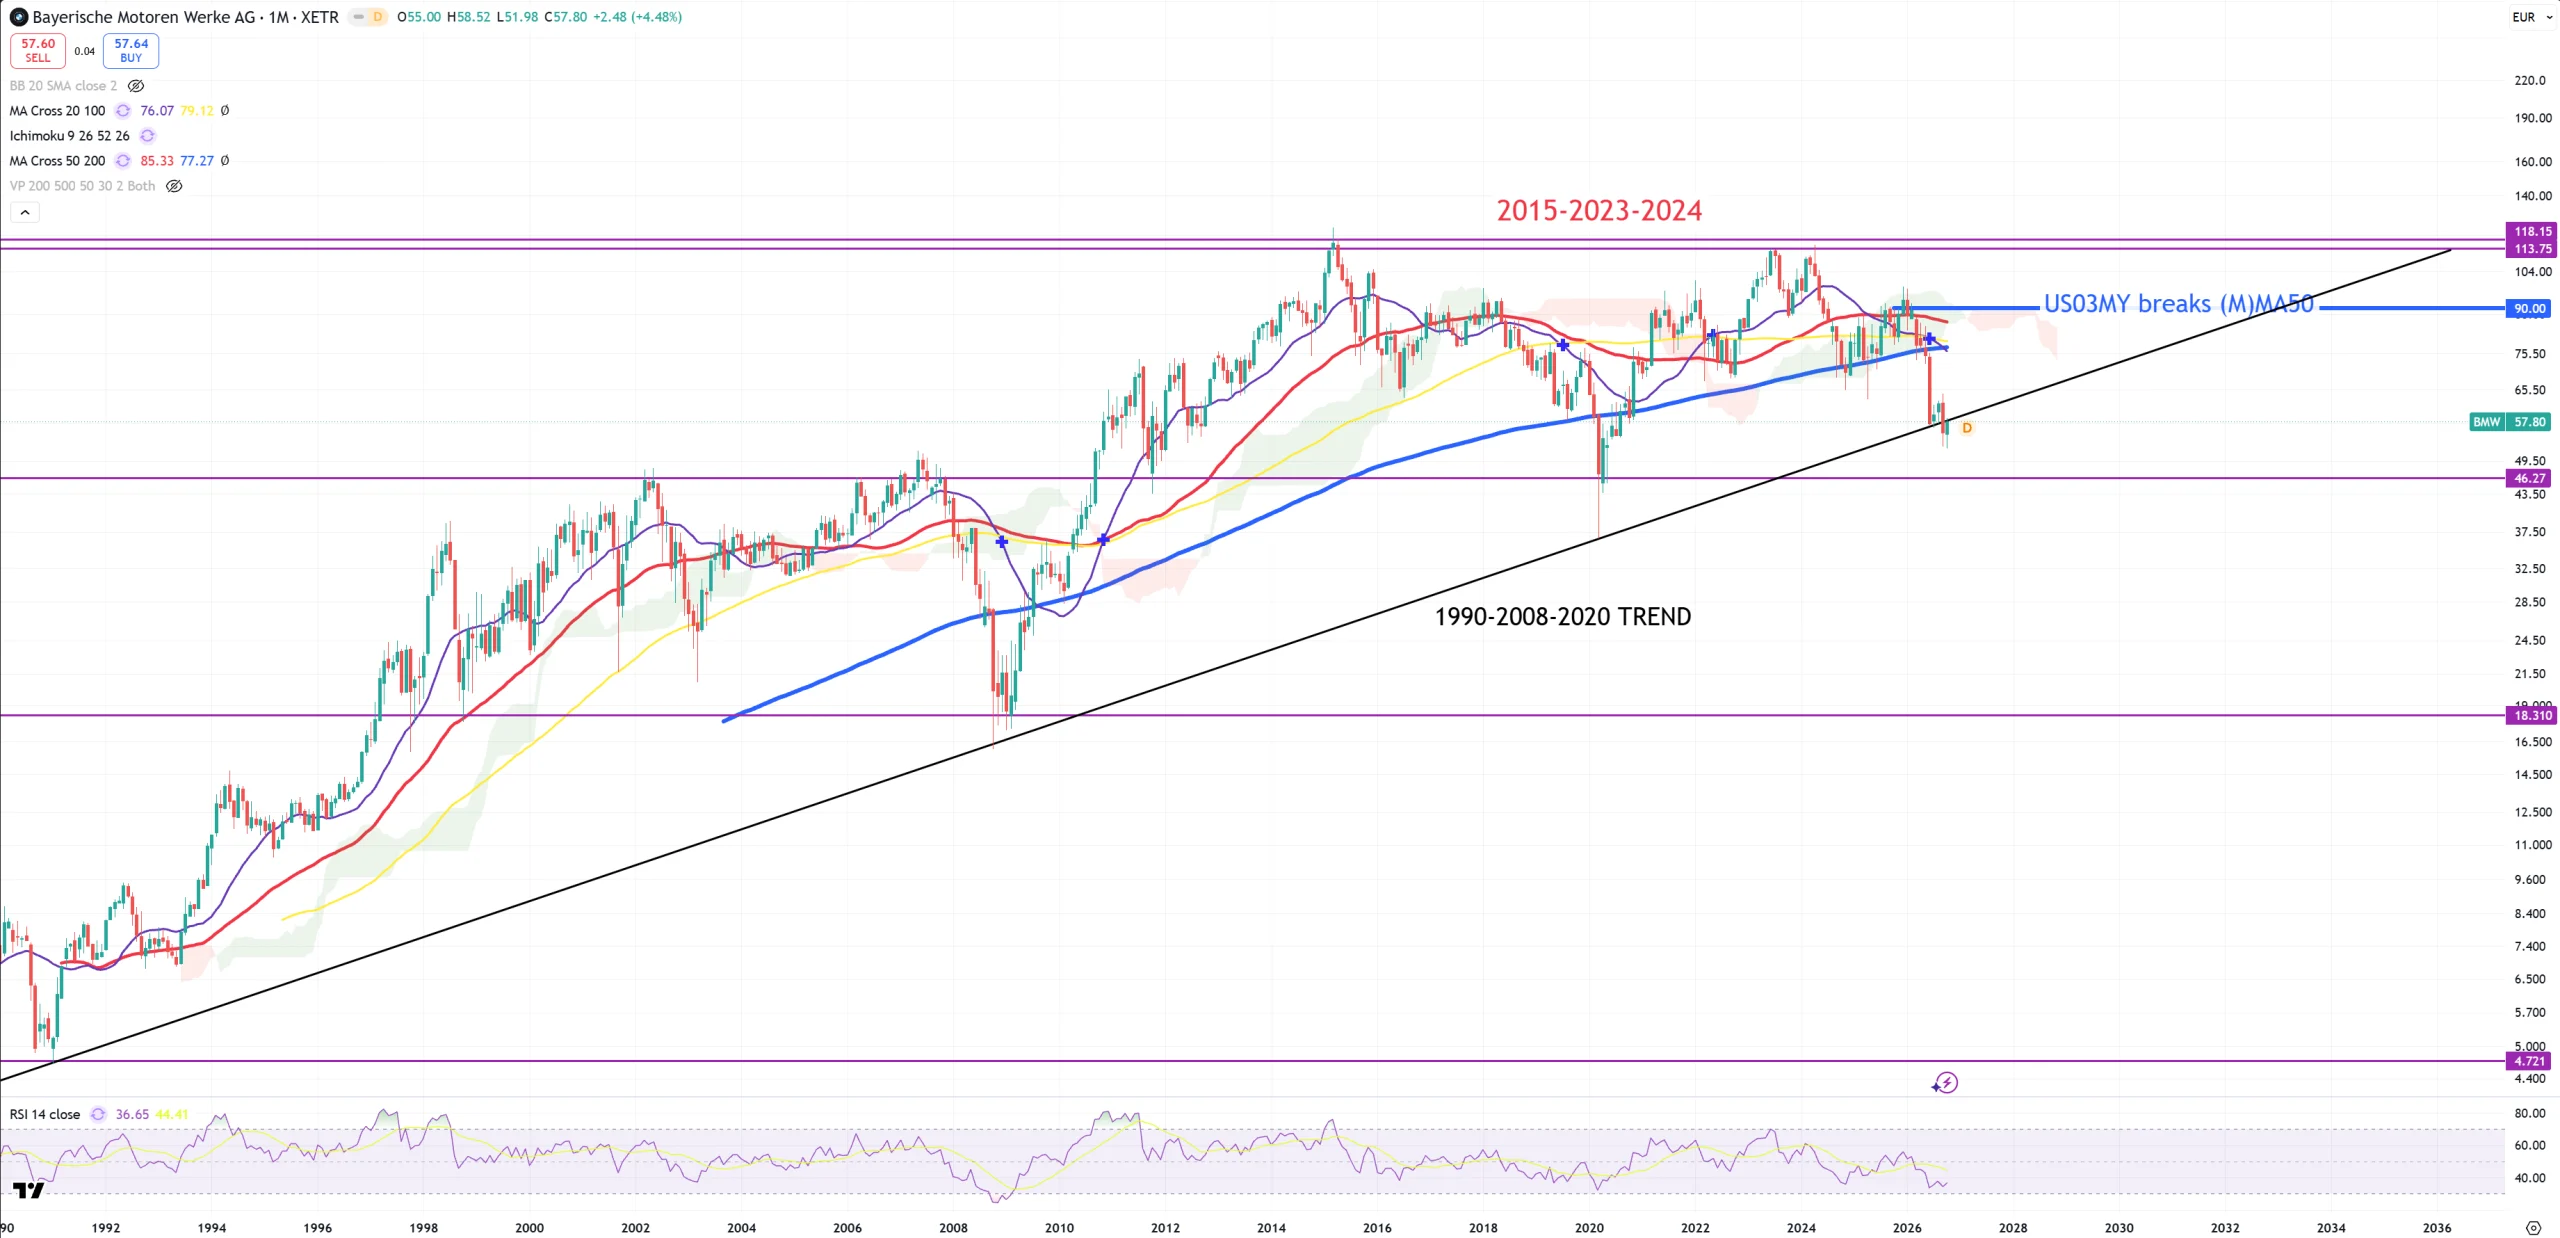
BMW – my favorite example from Germany – secular trend break retest and?
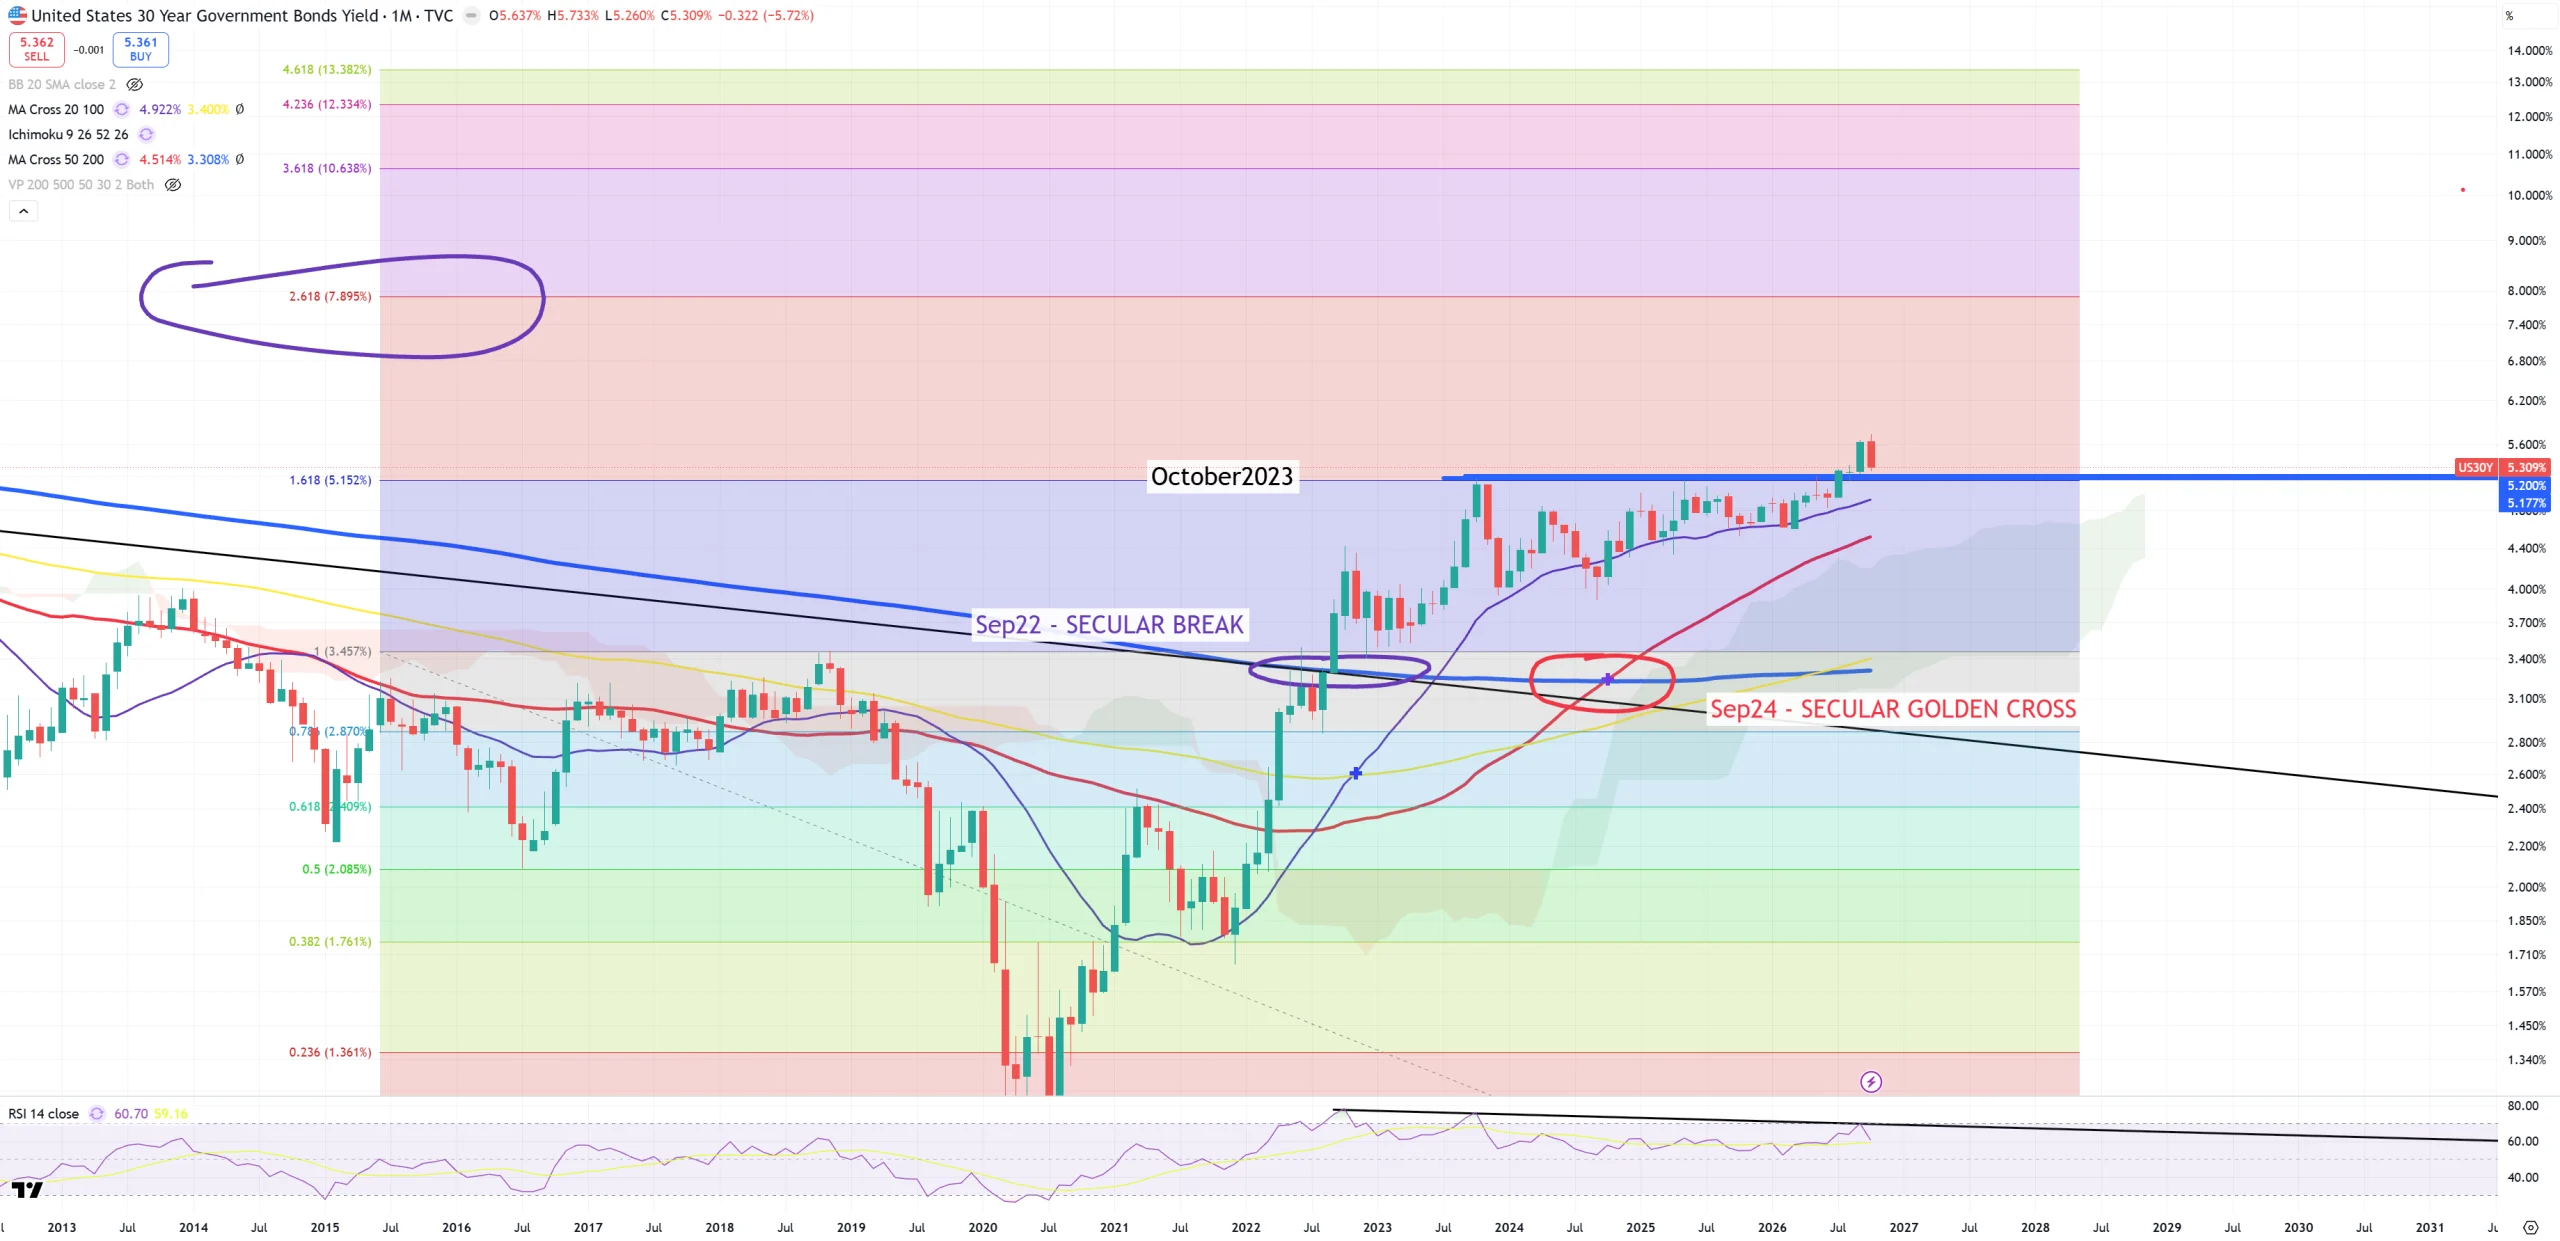
US30Y – nothing has been changed here. We need below 5.15% to consider it as a bull-trap (best on (M) candle).
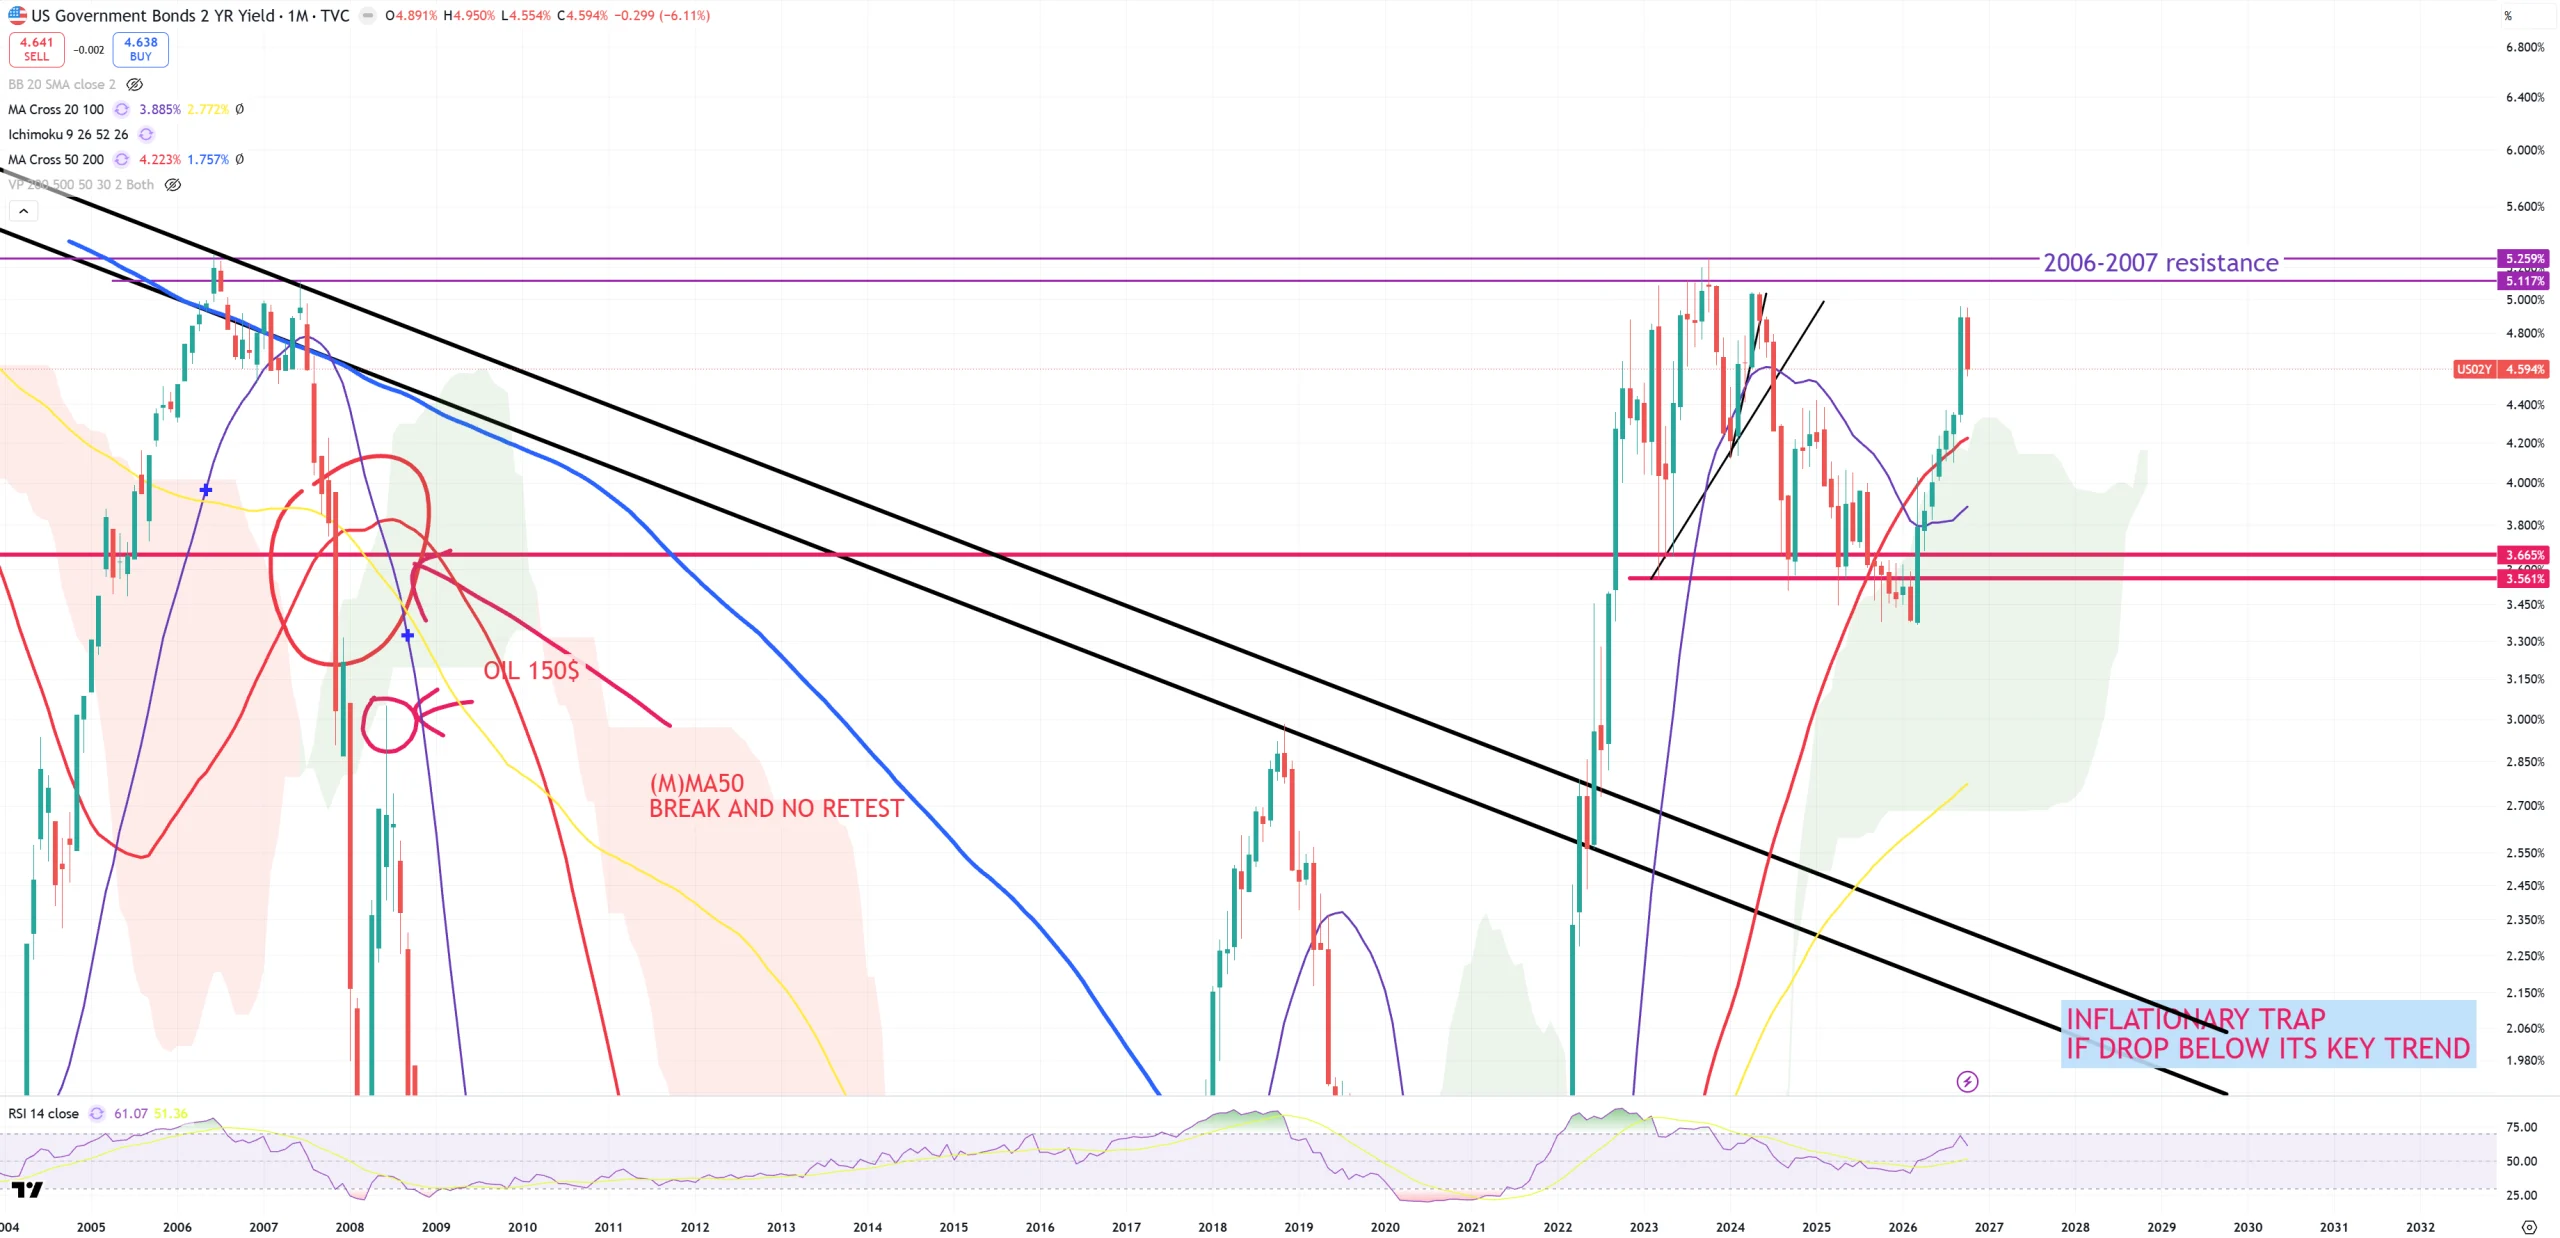
US02Y – I expect still retest to 2006-2027 trend so 2 more rate hike expecatations? Initial break of horizontal 2 red lines around 4Q25 was very bearish, but AI mini cycle managed to blow the bearish thesis into pieces.
LQD – Investment grade bonds look like junk.
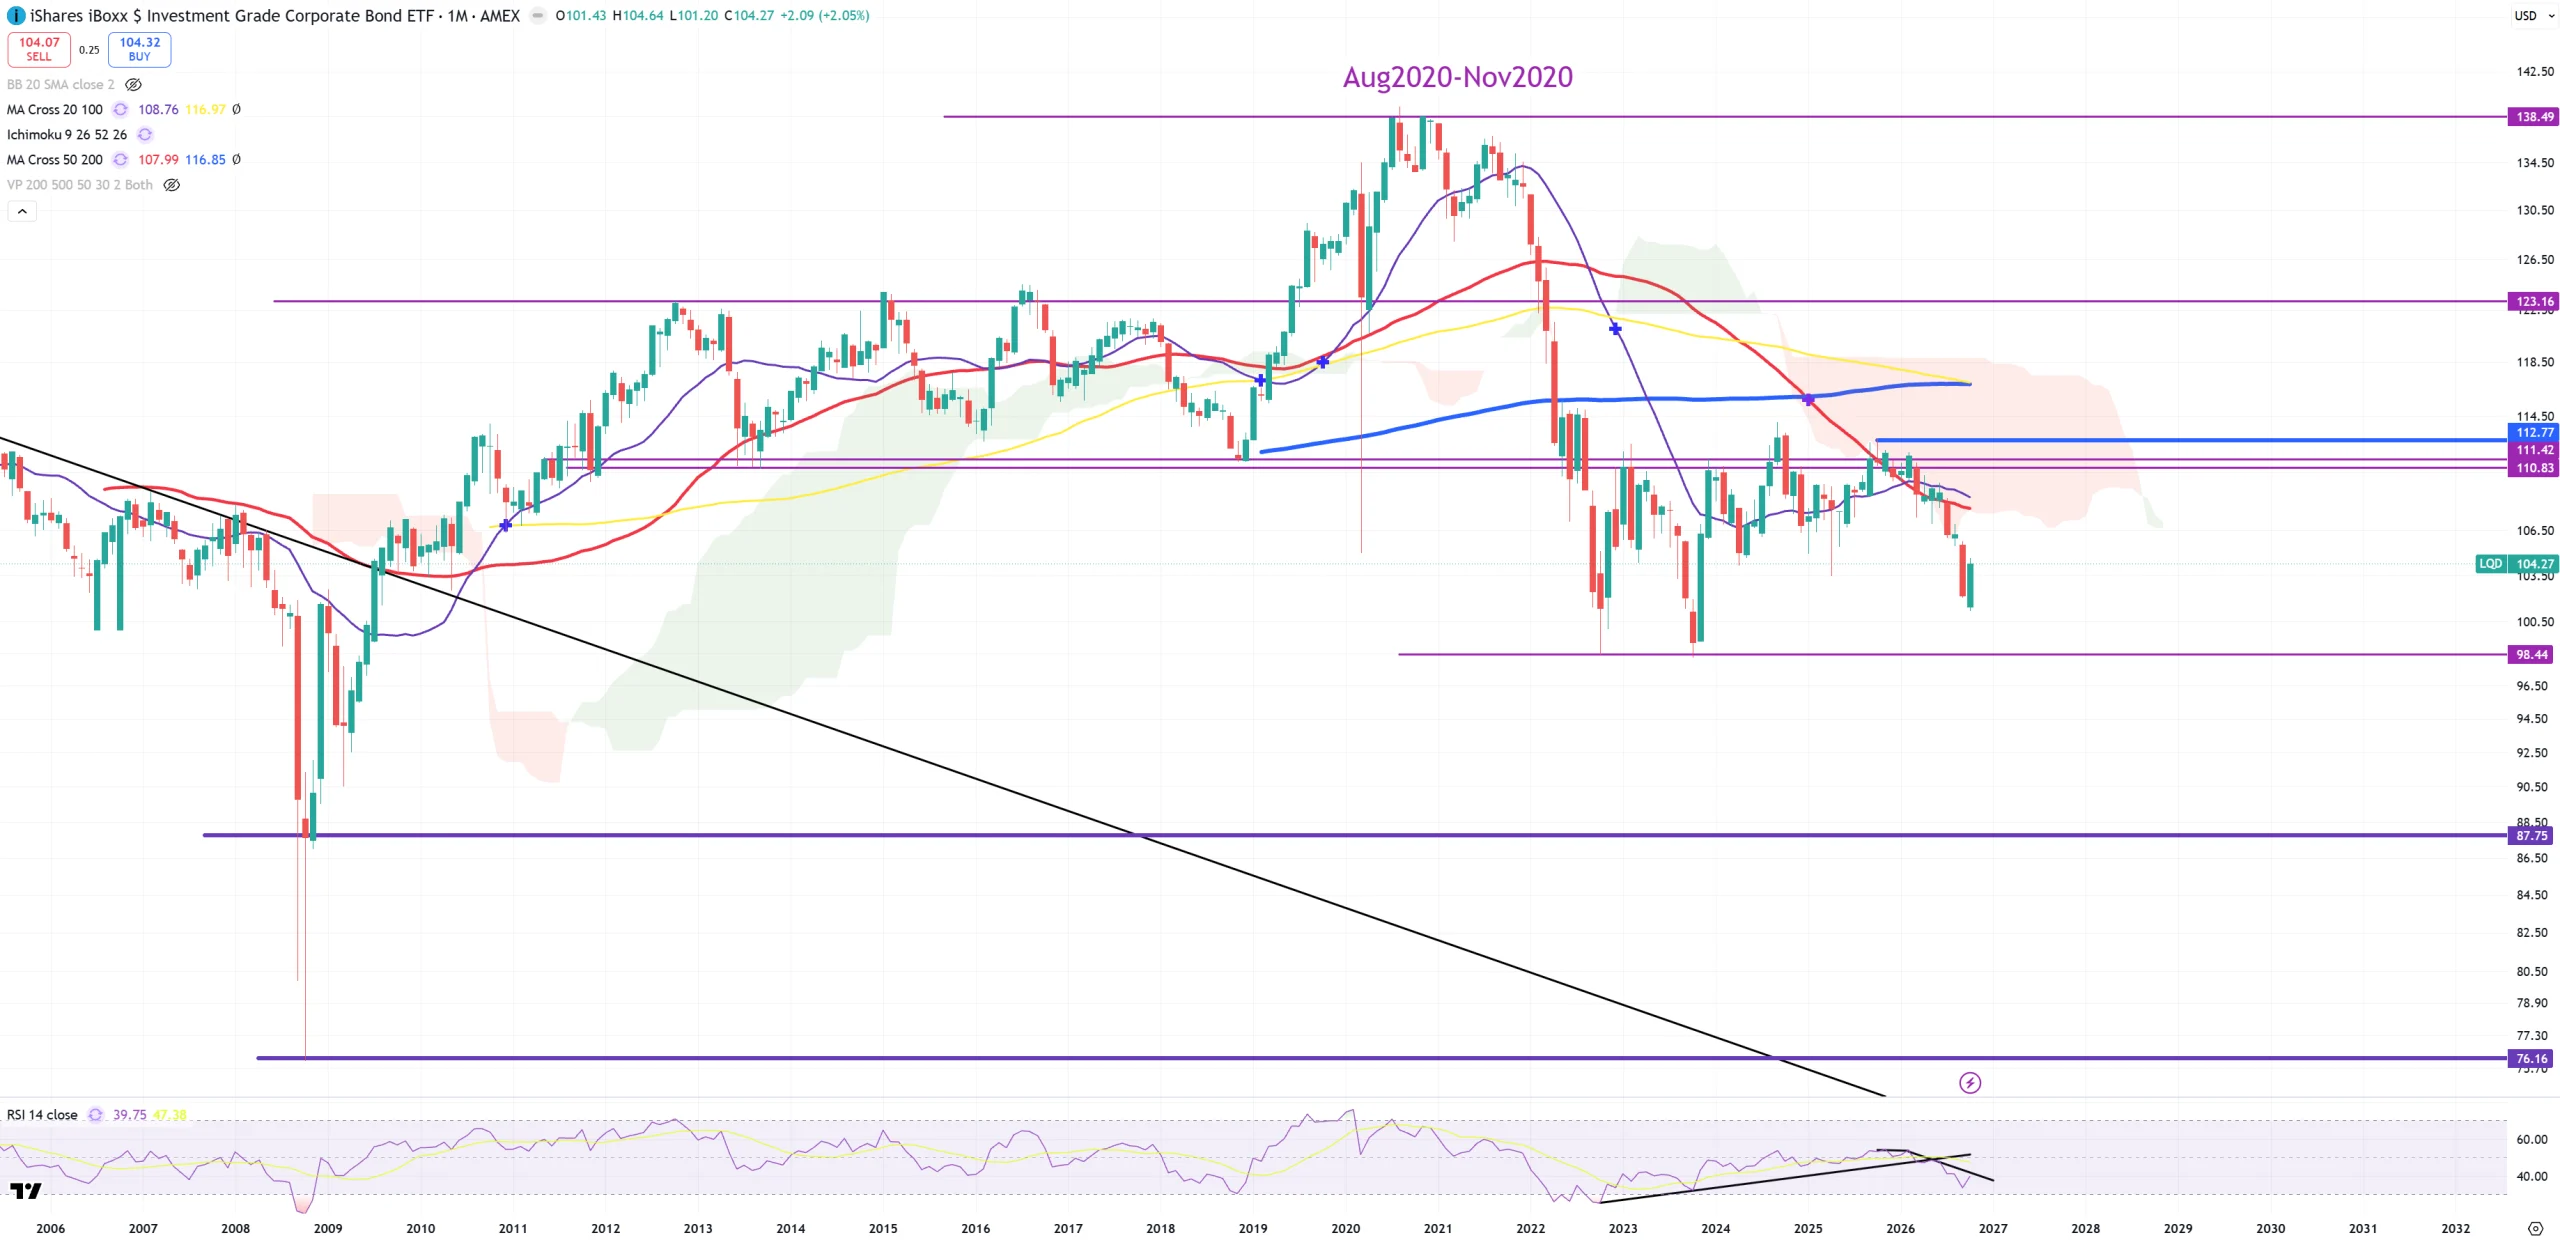
HYG – below (M)MA50. Junk looks better than LQD, but technically they are in the same position.
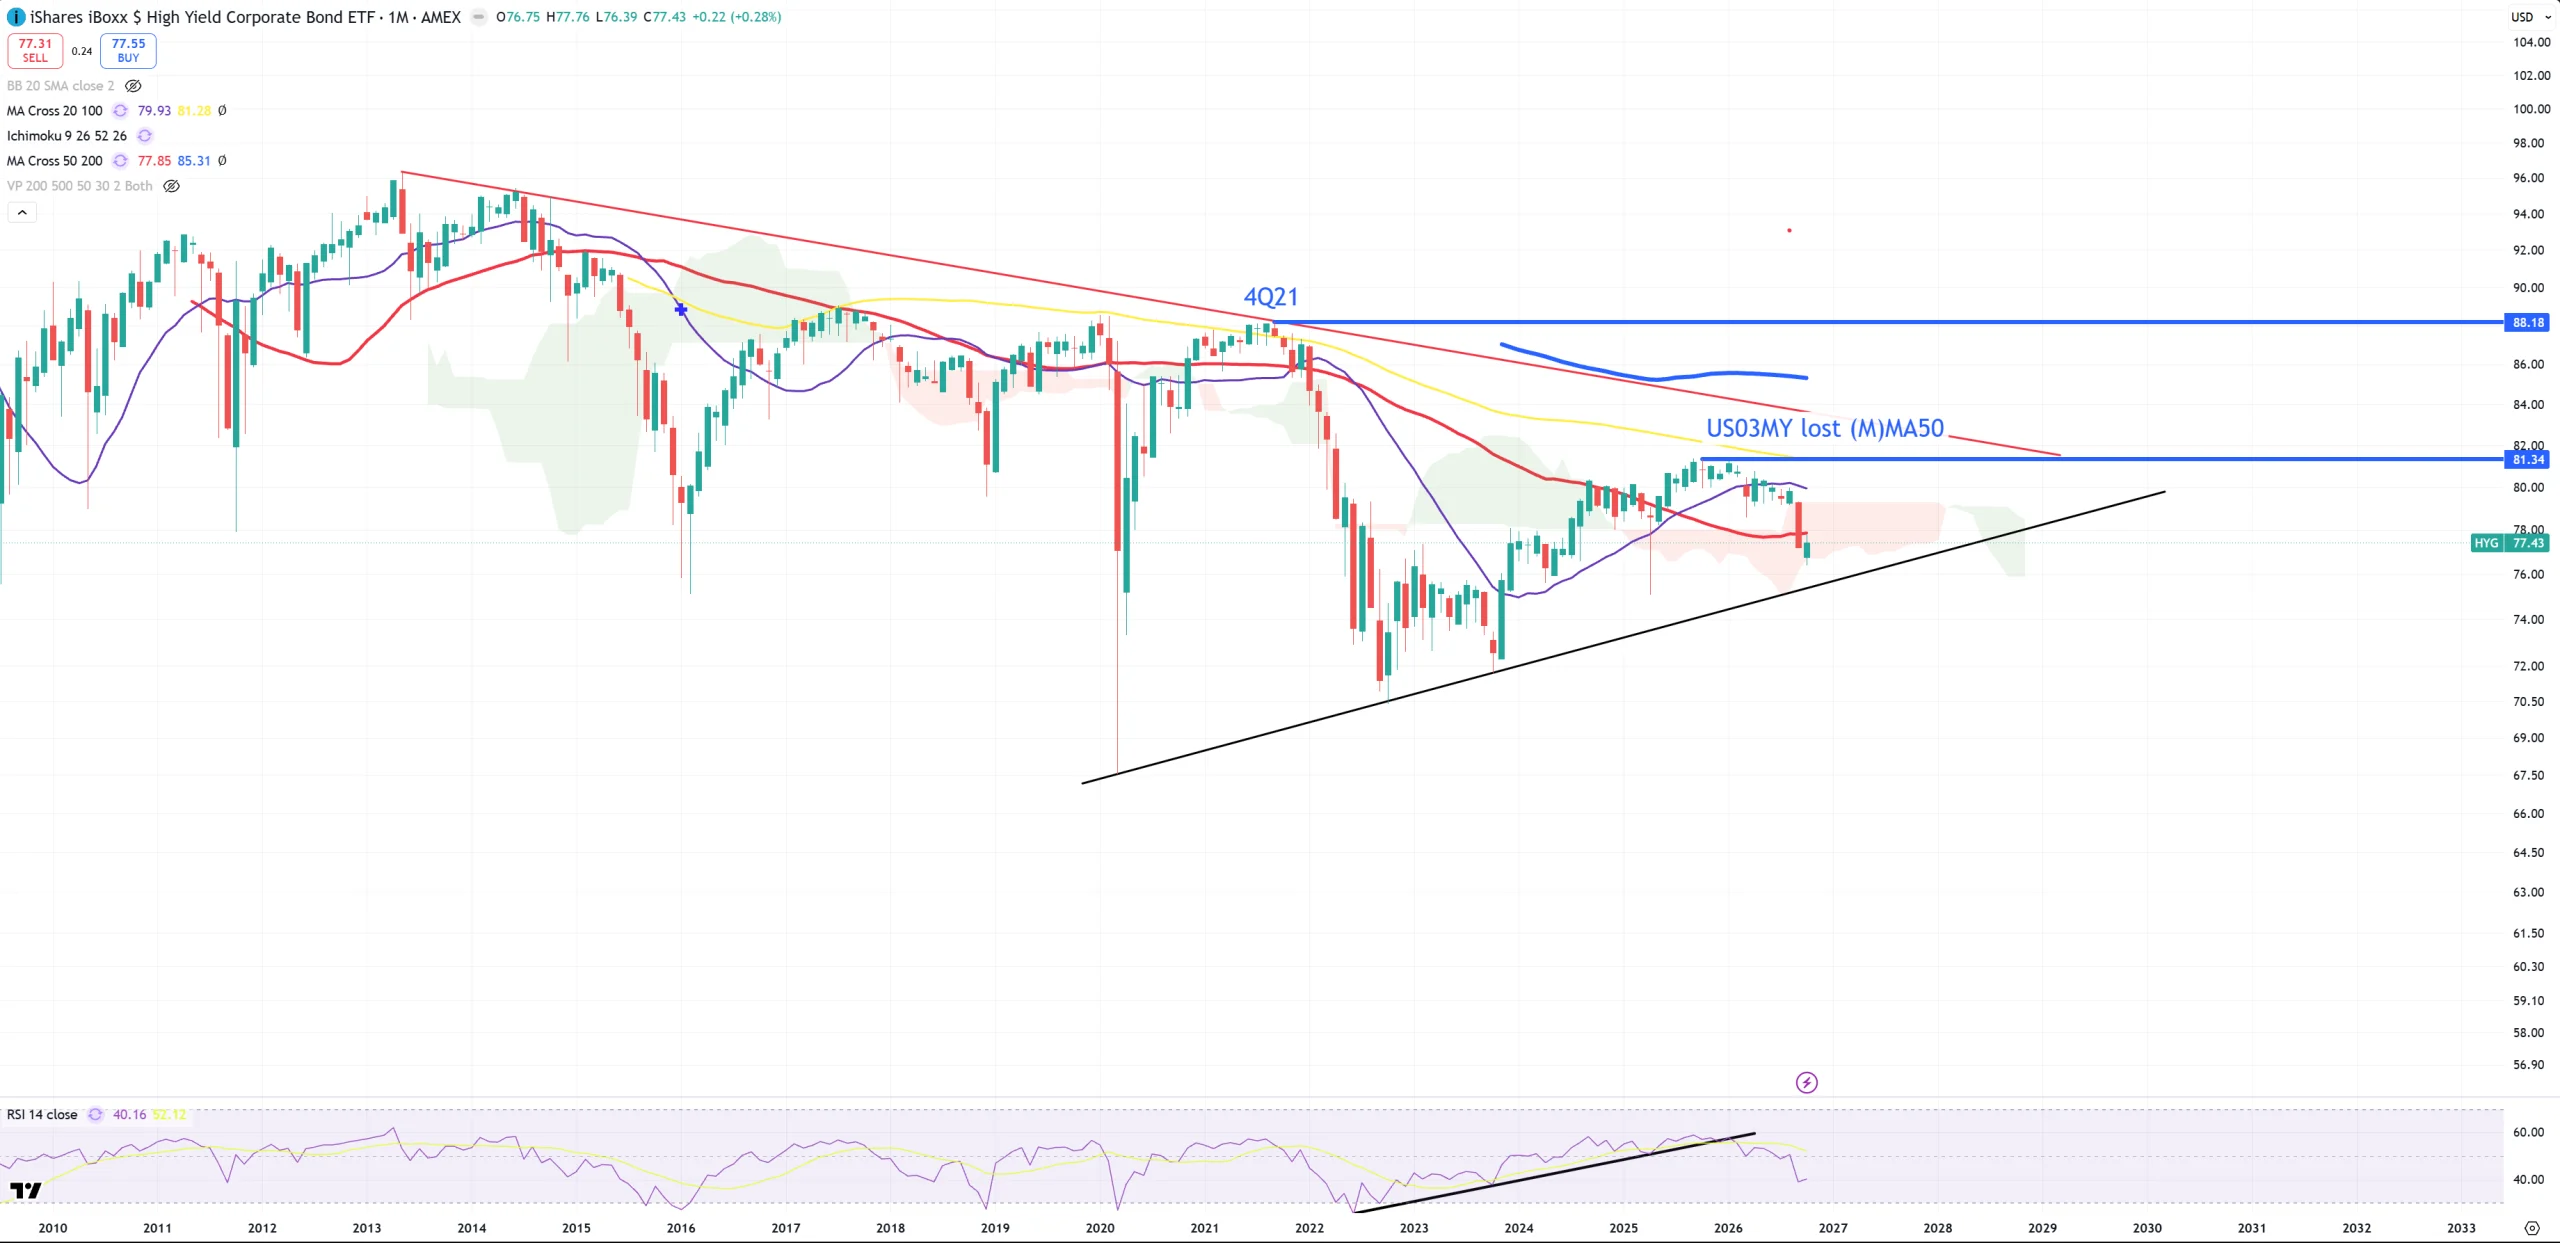
HYG/TLT – you see all possible levels of this ratio.
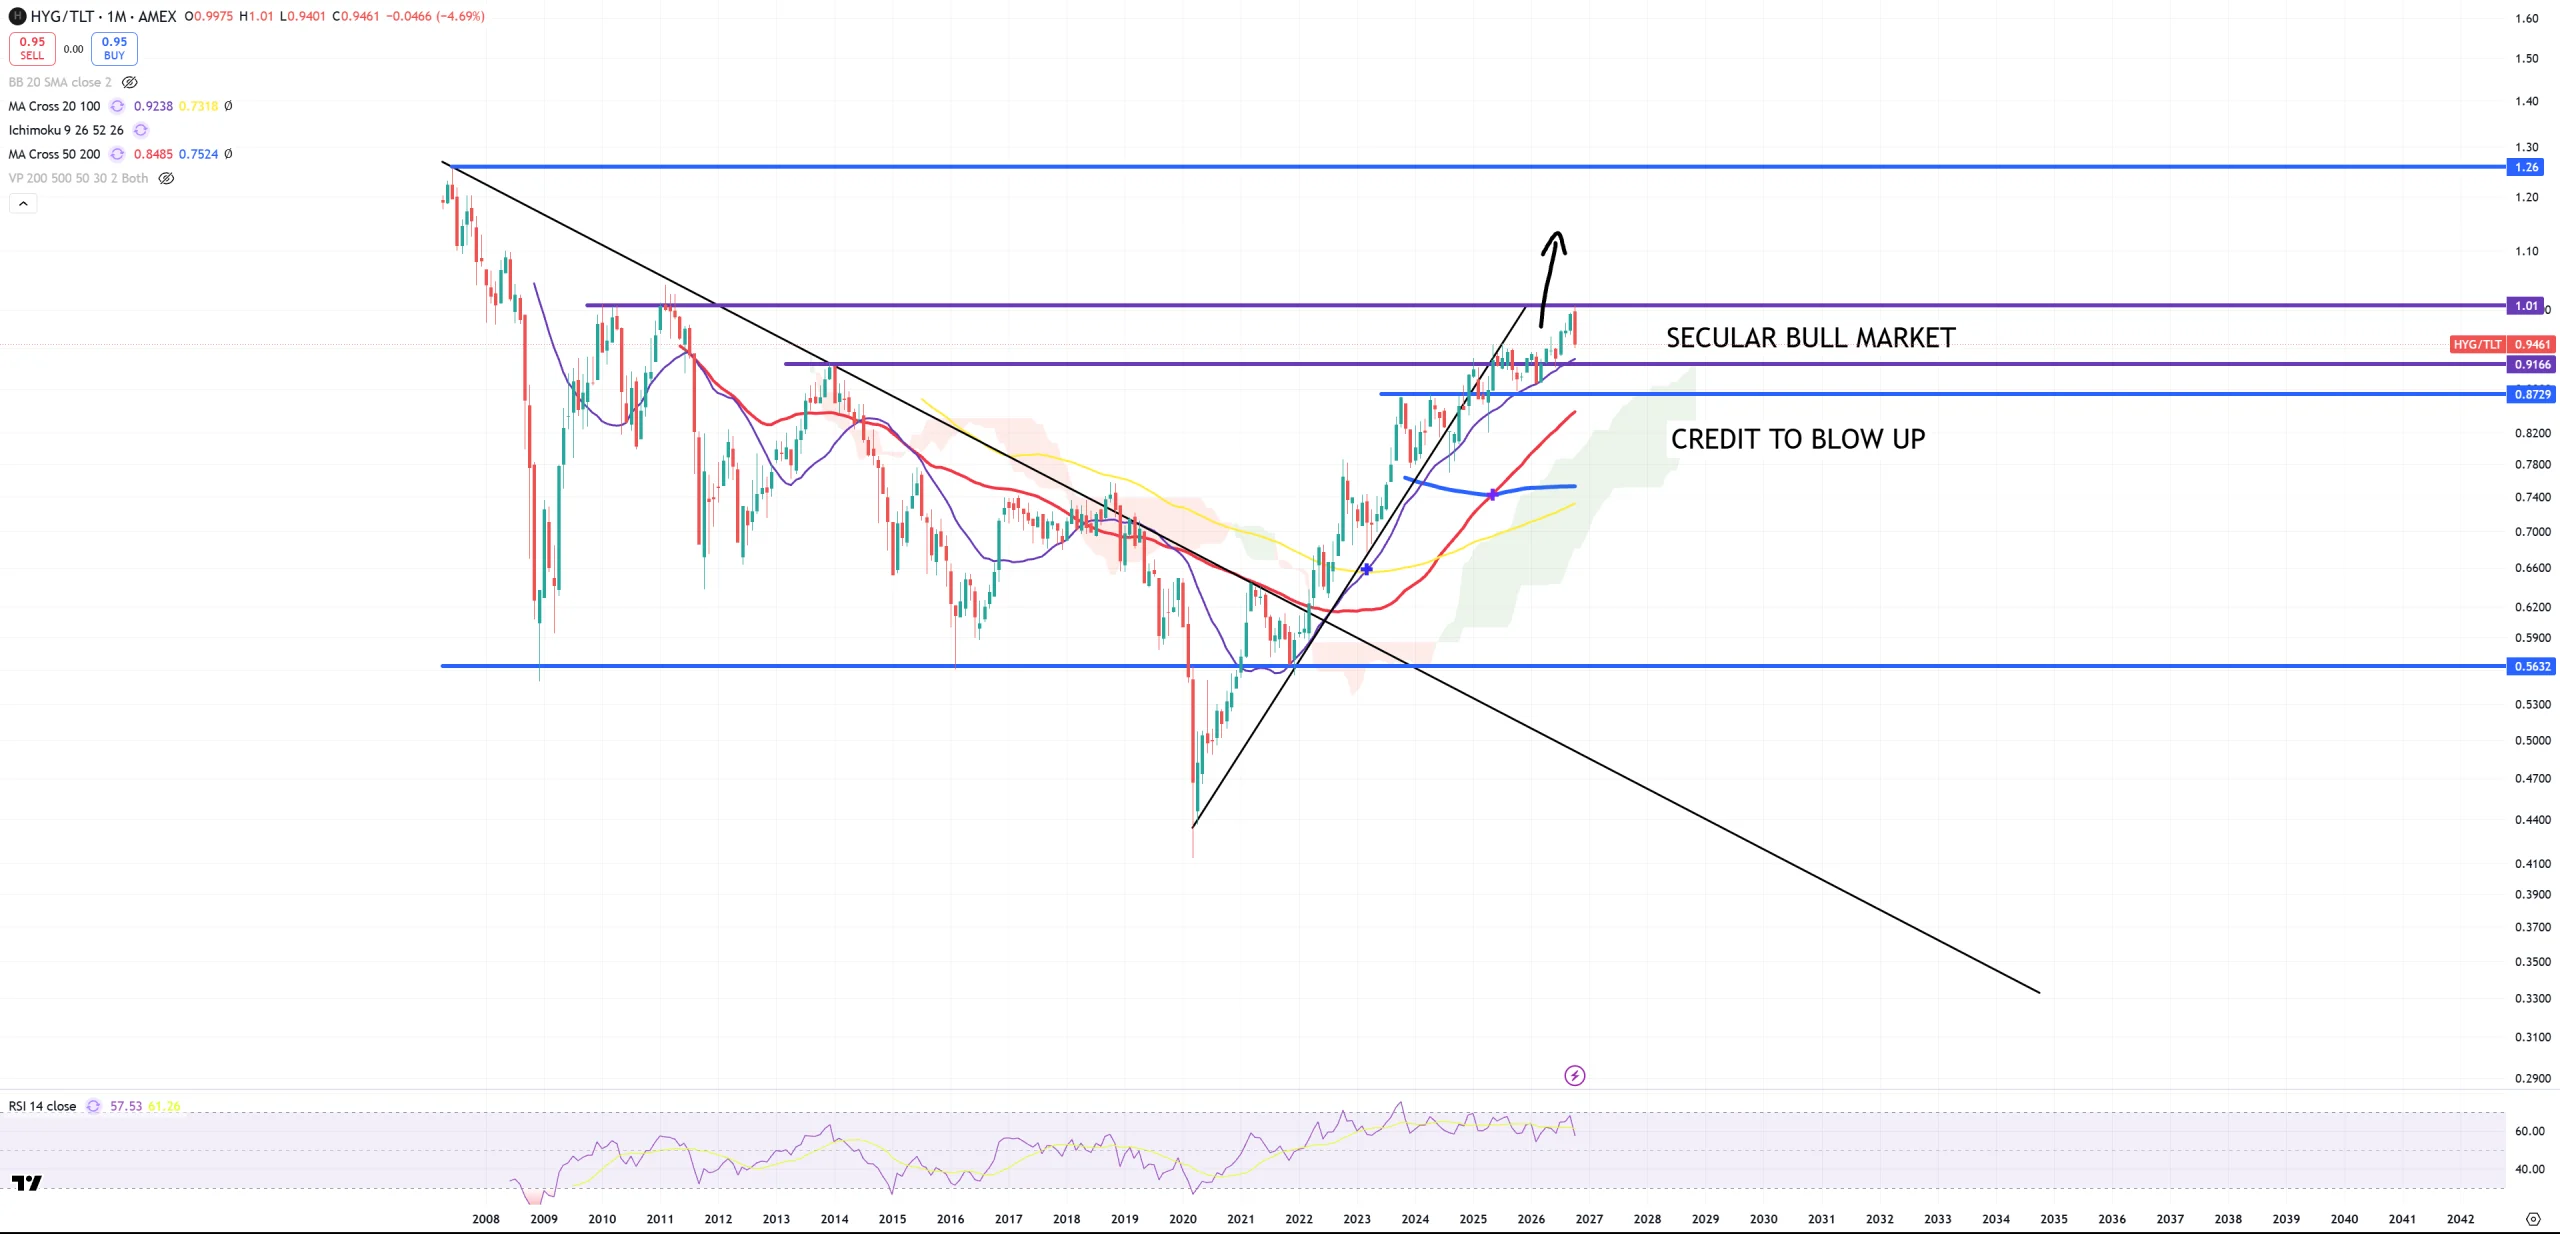
TLT – needs 82.5$ to consider this drop below Oct23 as a bear trap. So far it’s just a retest.
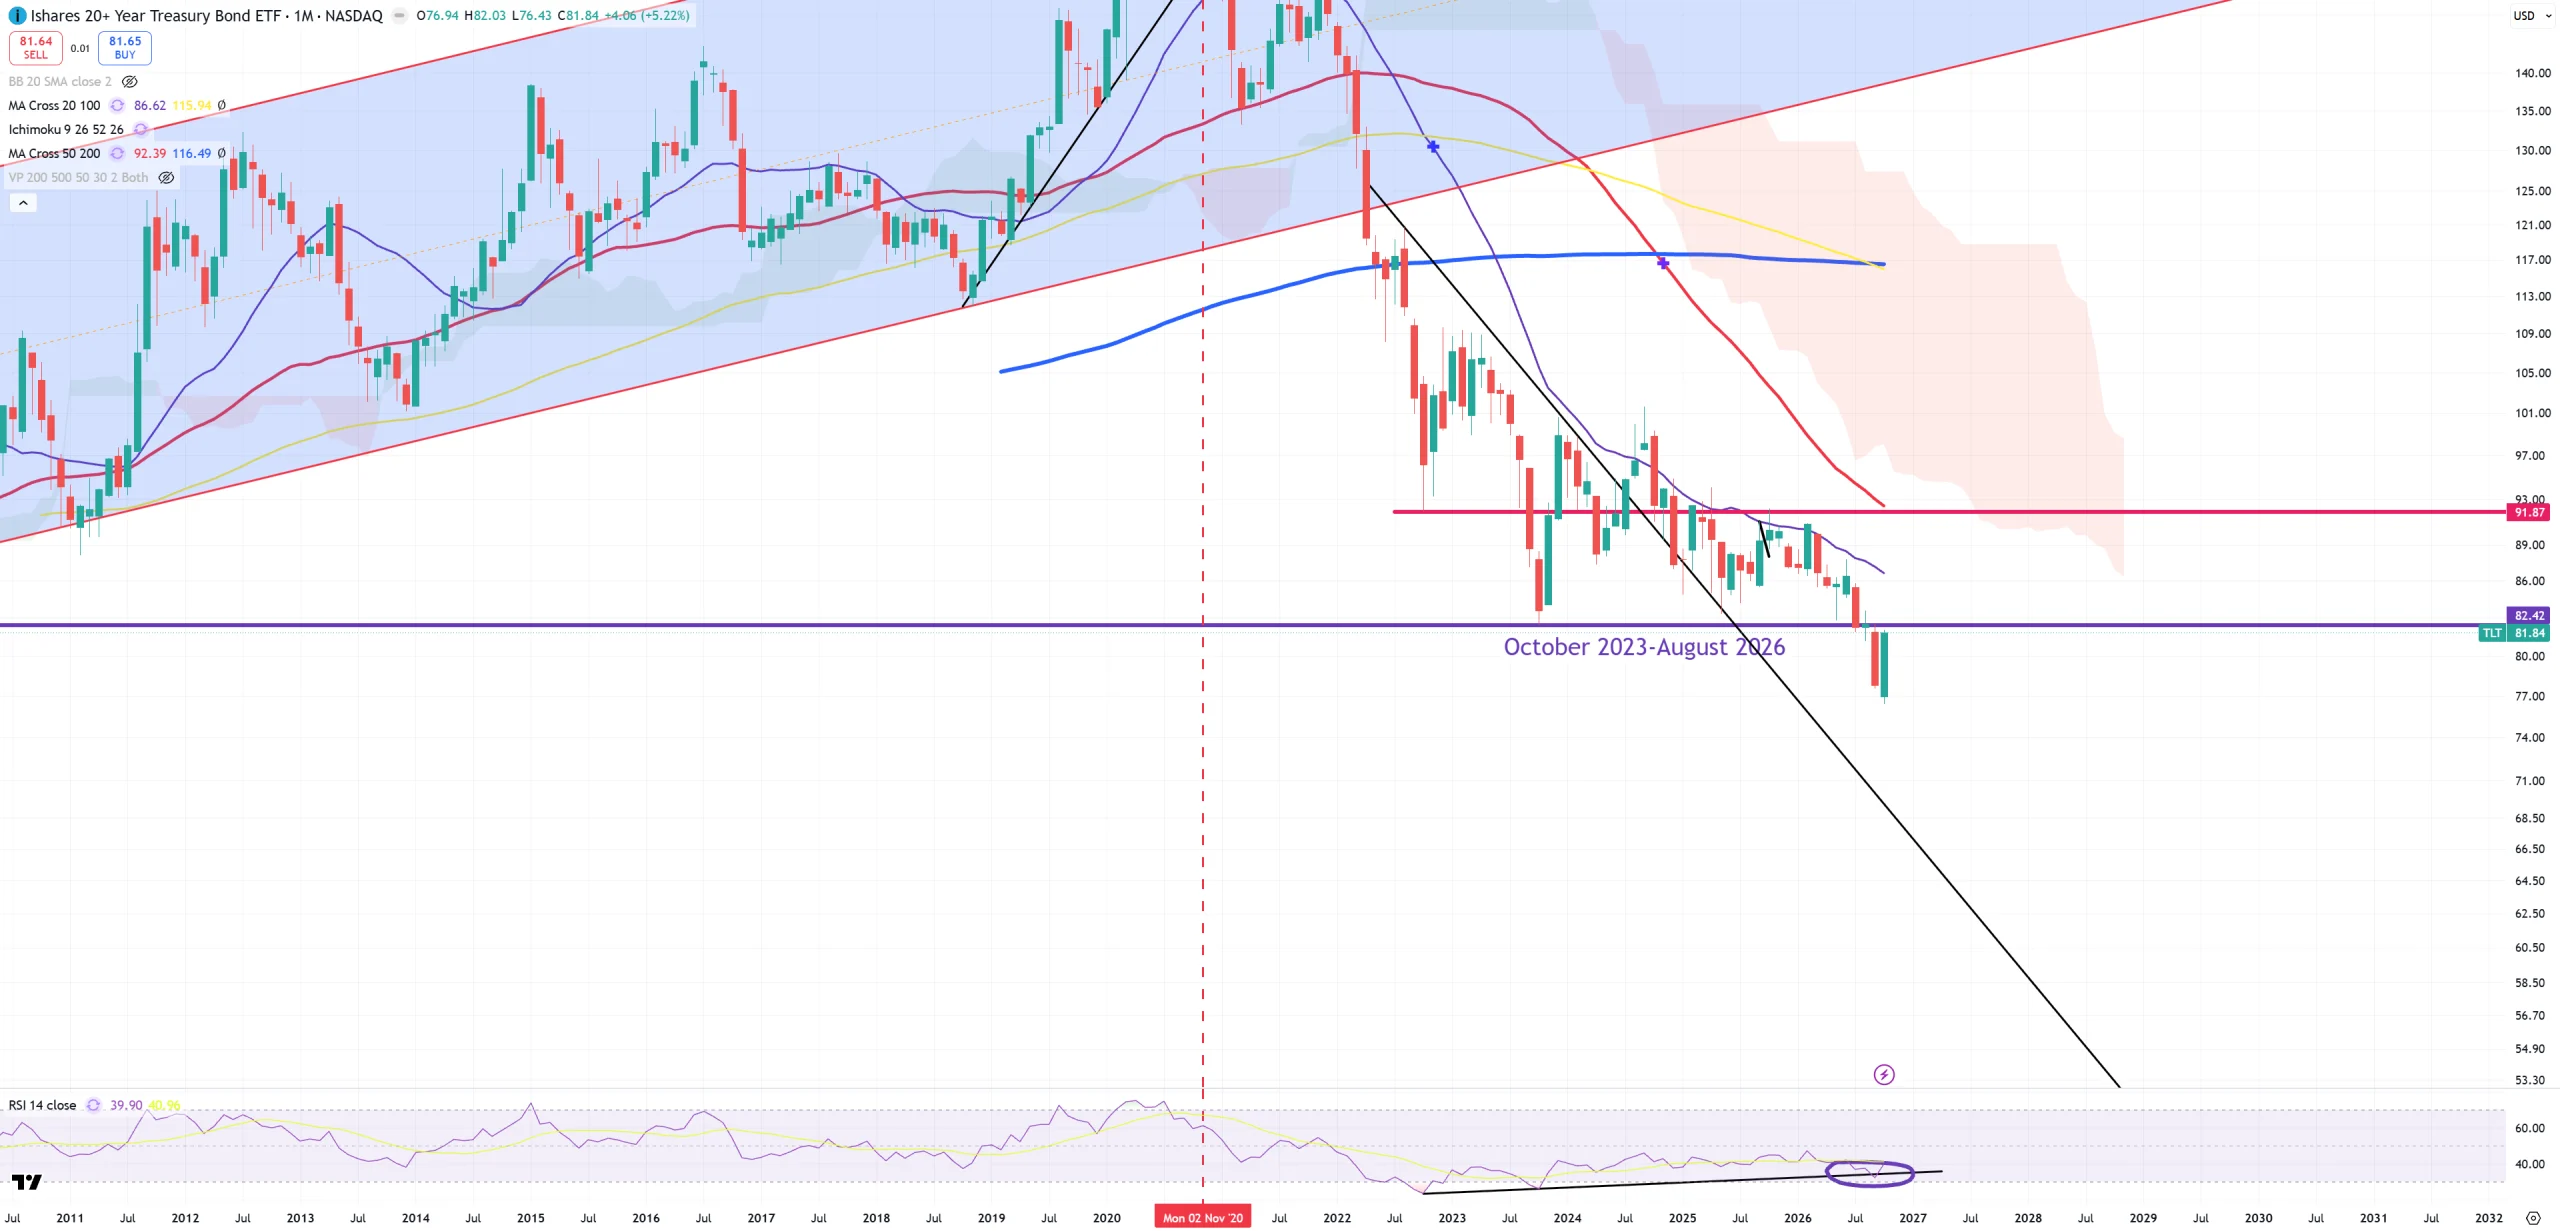
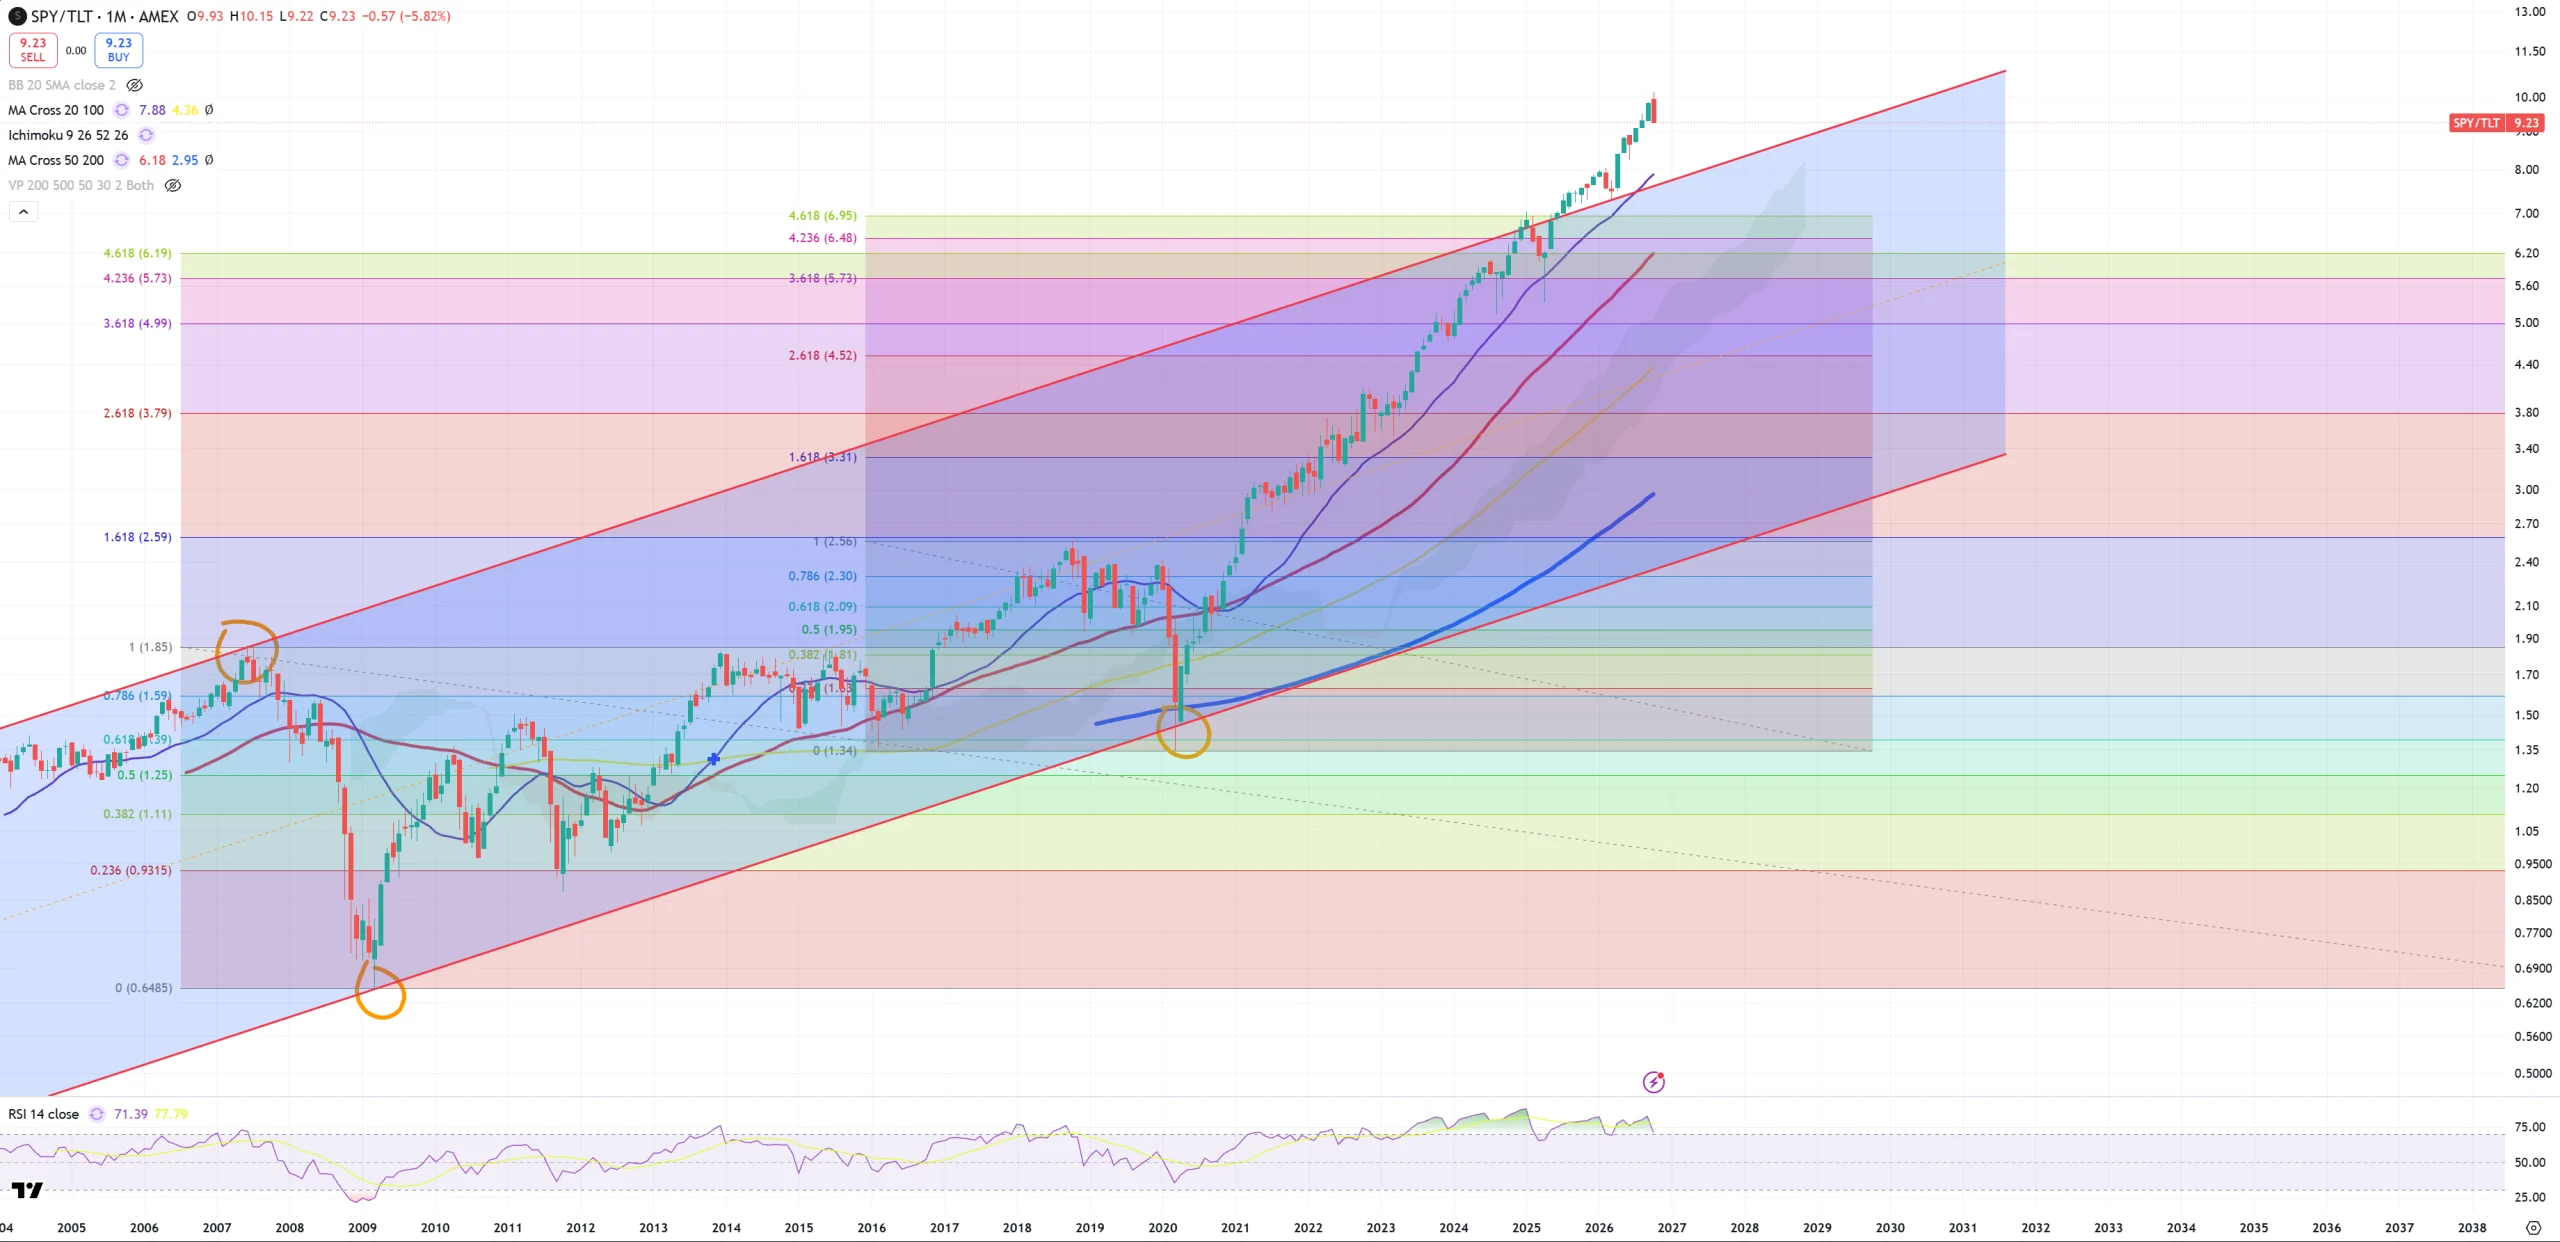
SPY/TLT – above key trend. (M)MA20 matches with the trend. Do we have a reversal here? I don’t know.
Financials
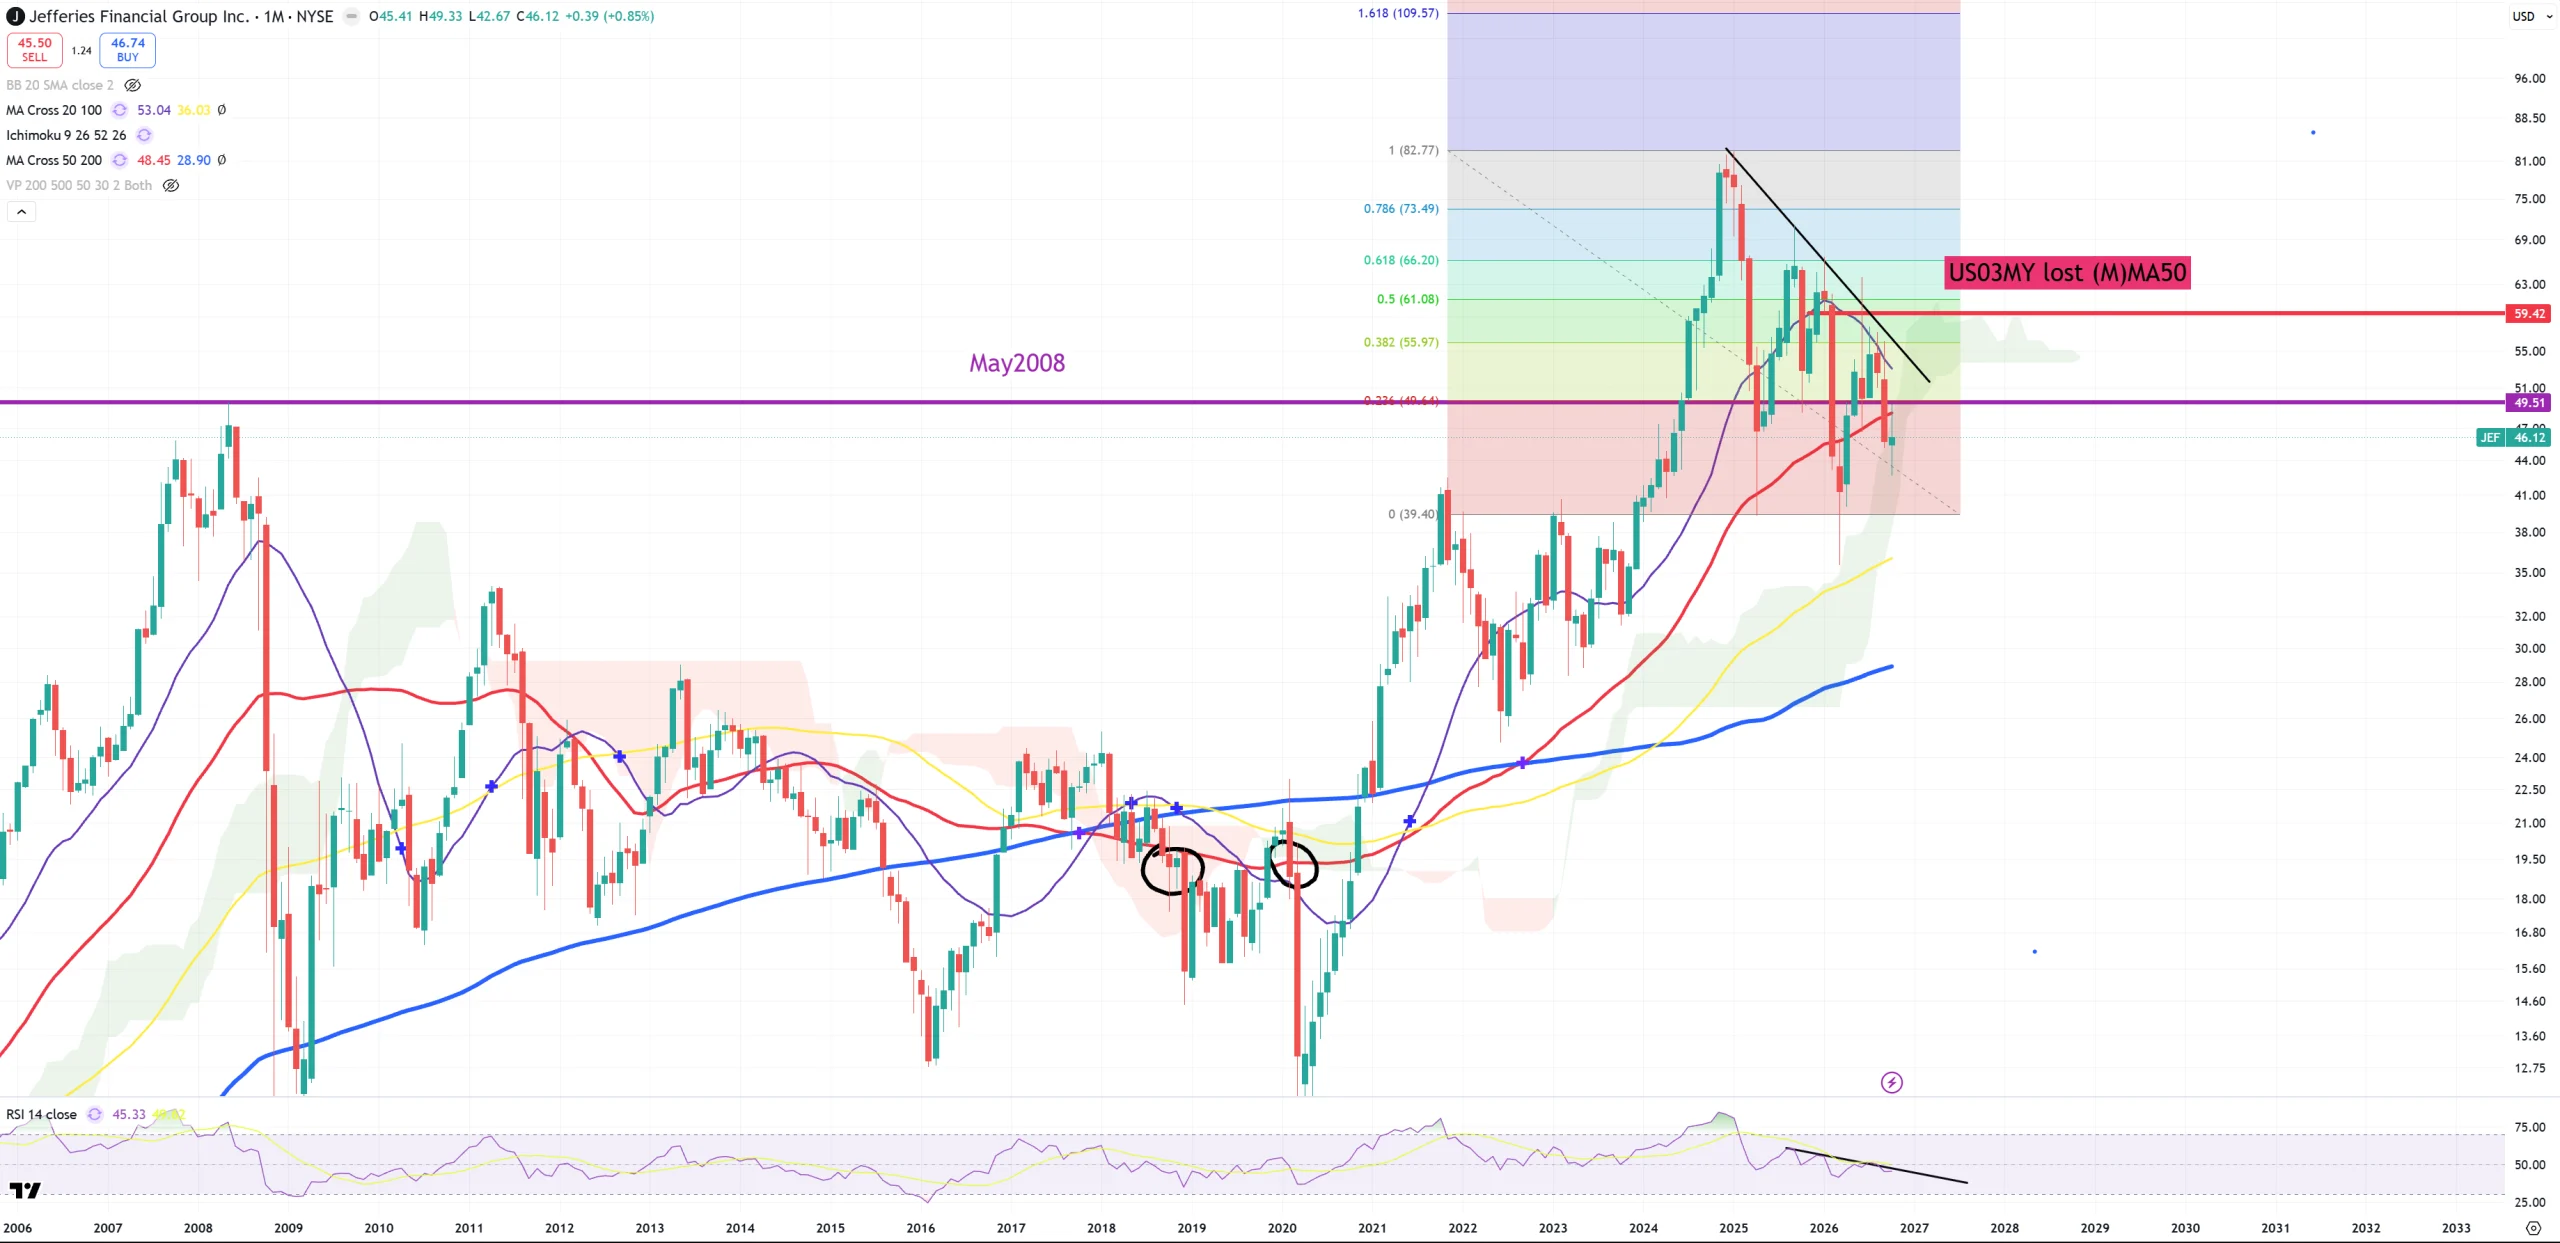
JEF – still crash mode on. Below May 2008 peak and below (M)MA50.
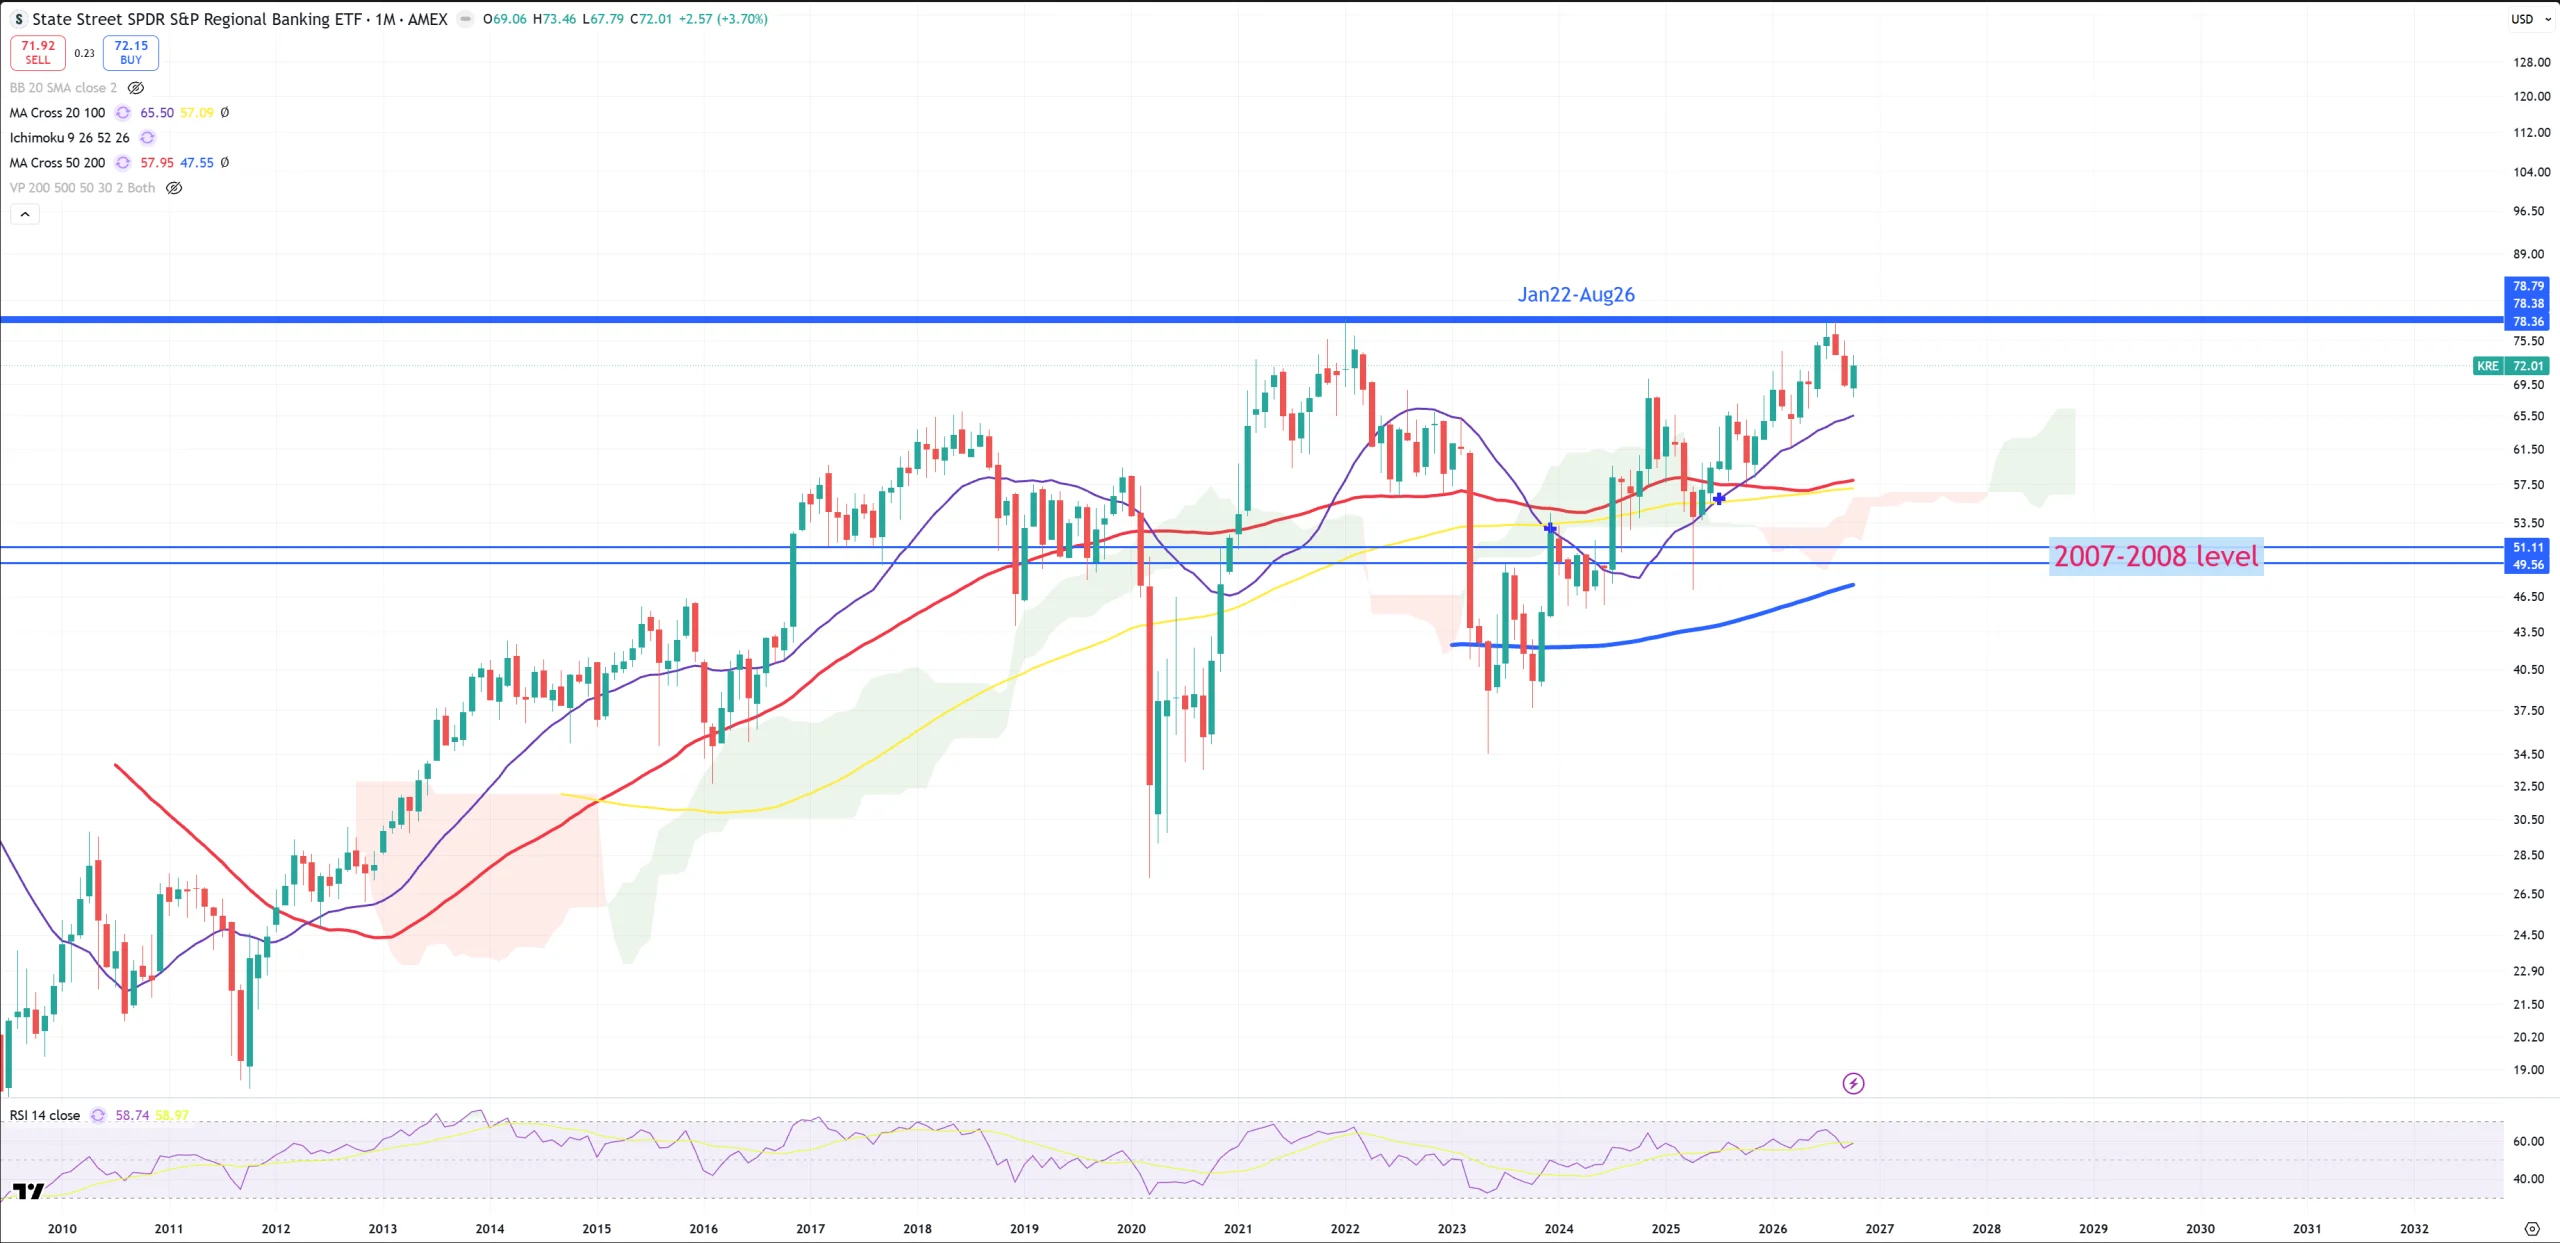
KRE – Double top
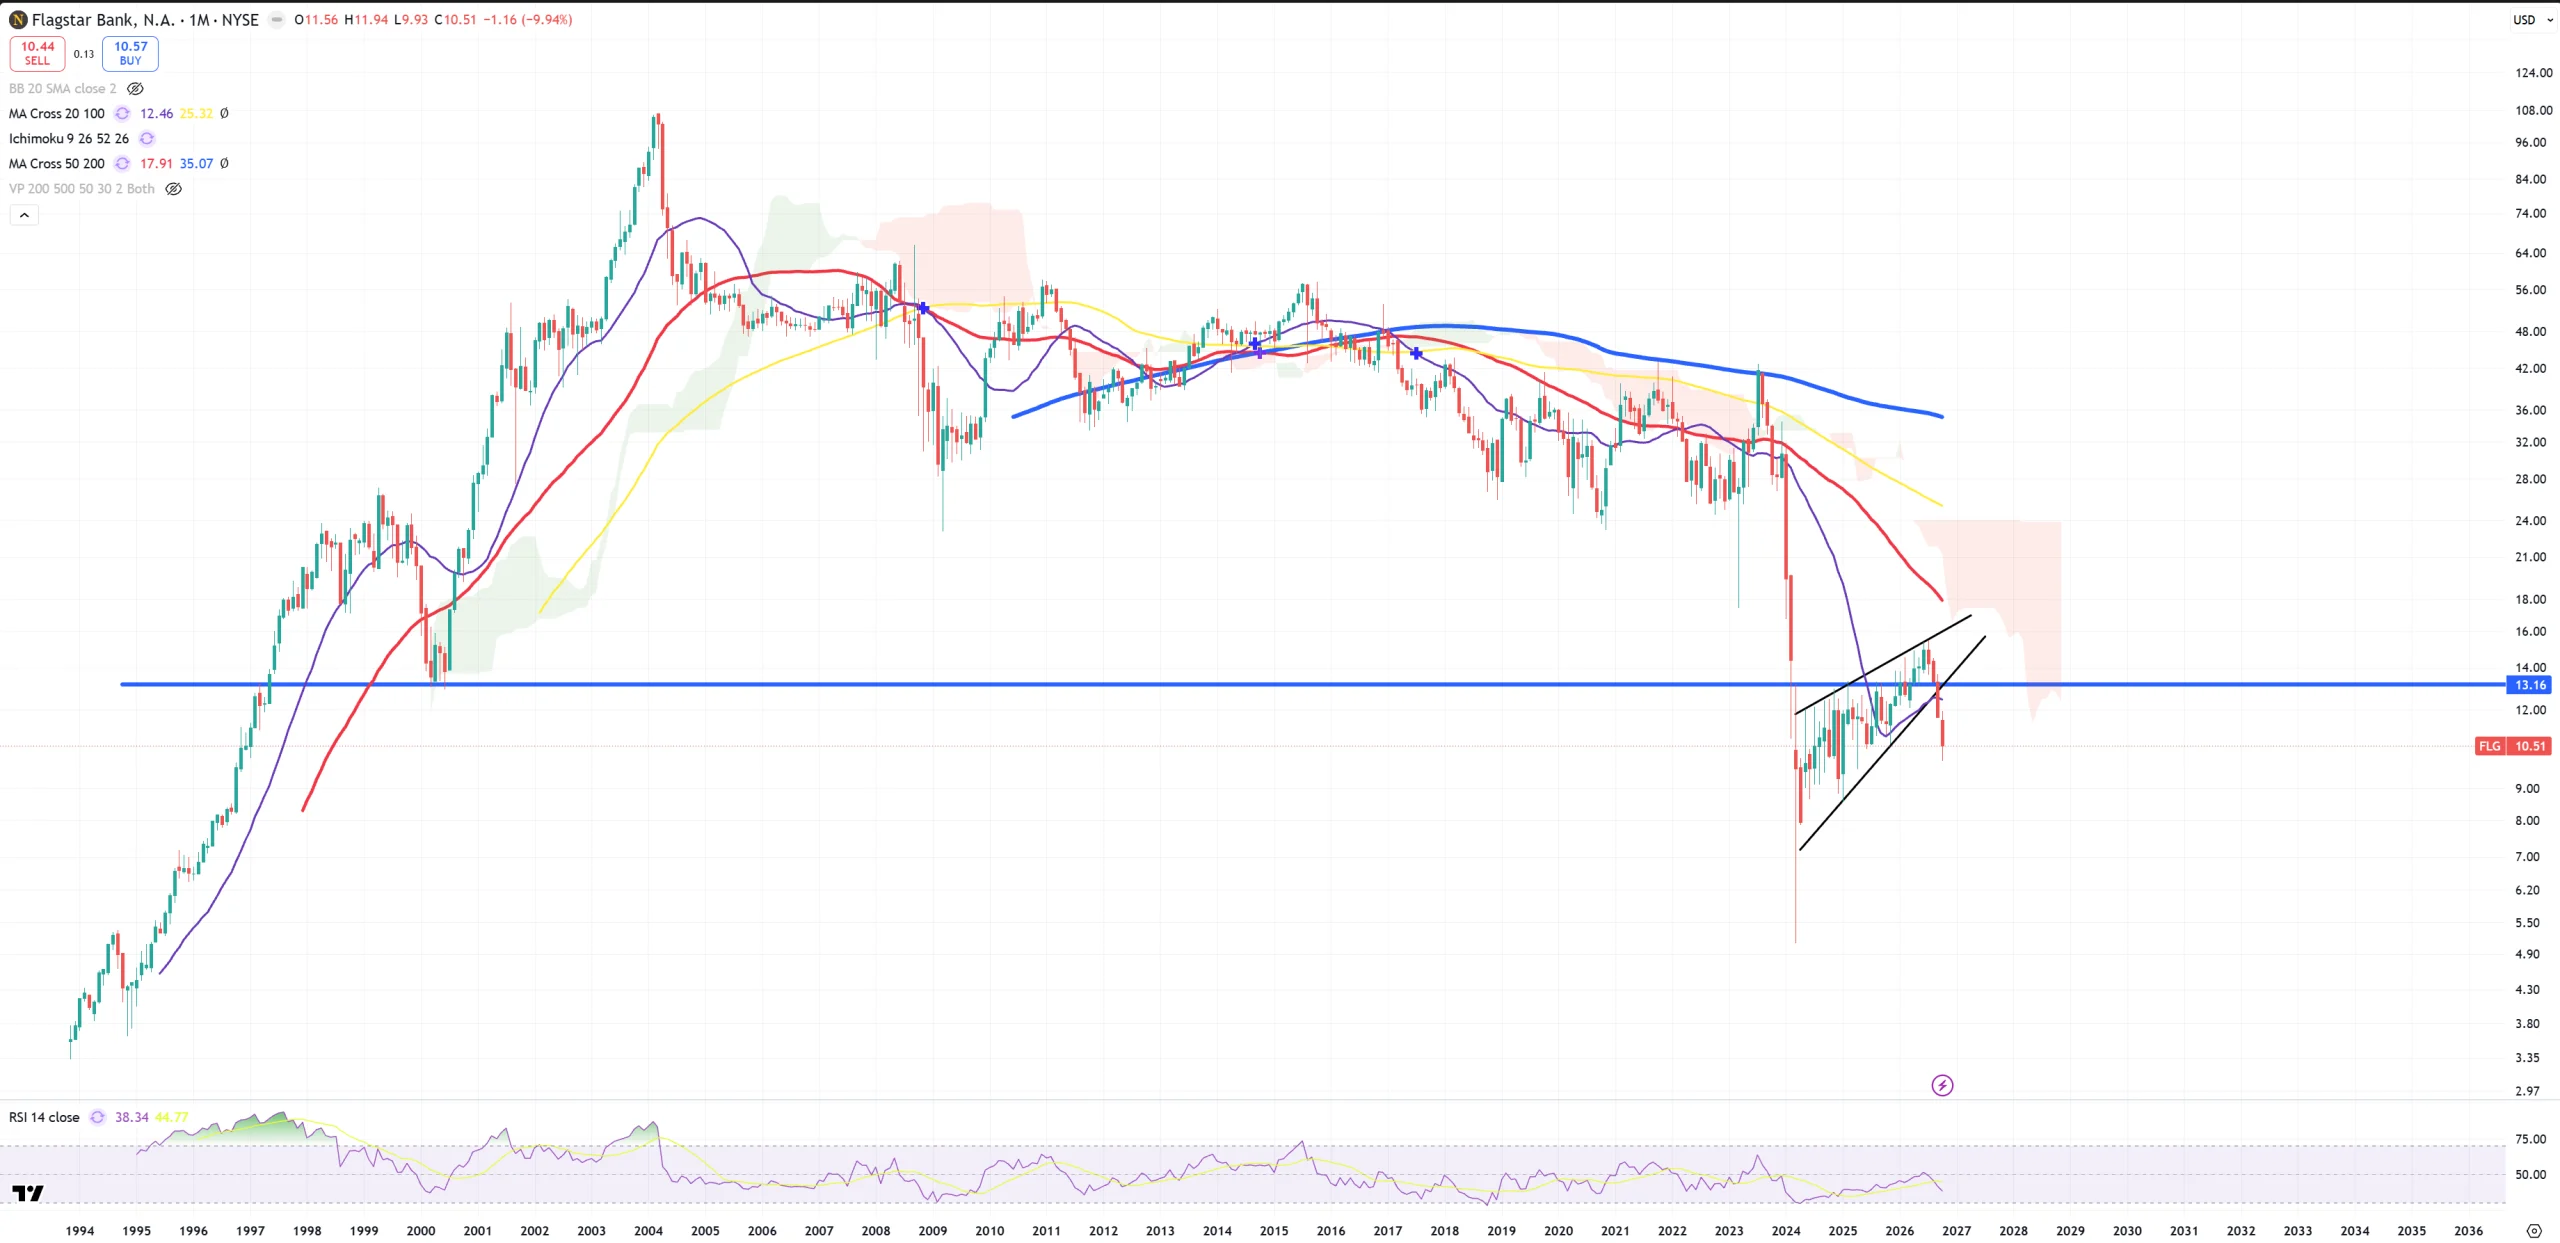
FLG – Flagstar bank looks like it’s already gone.
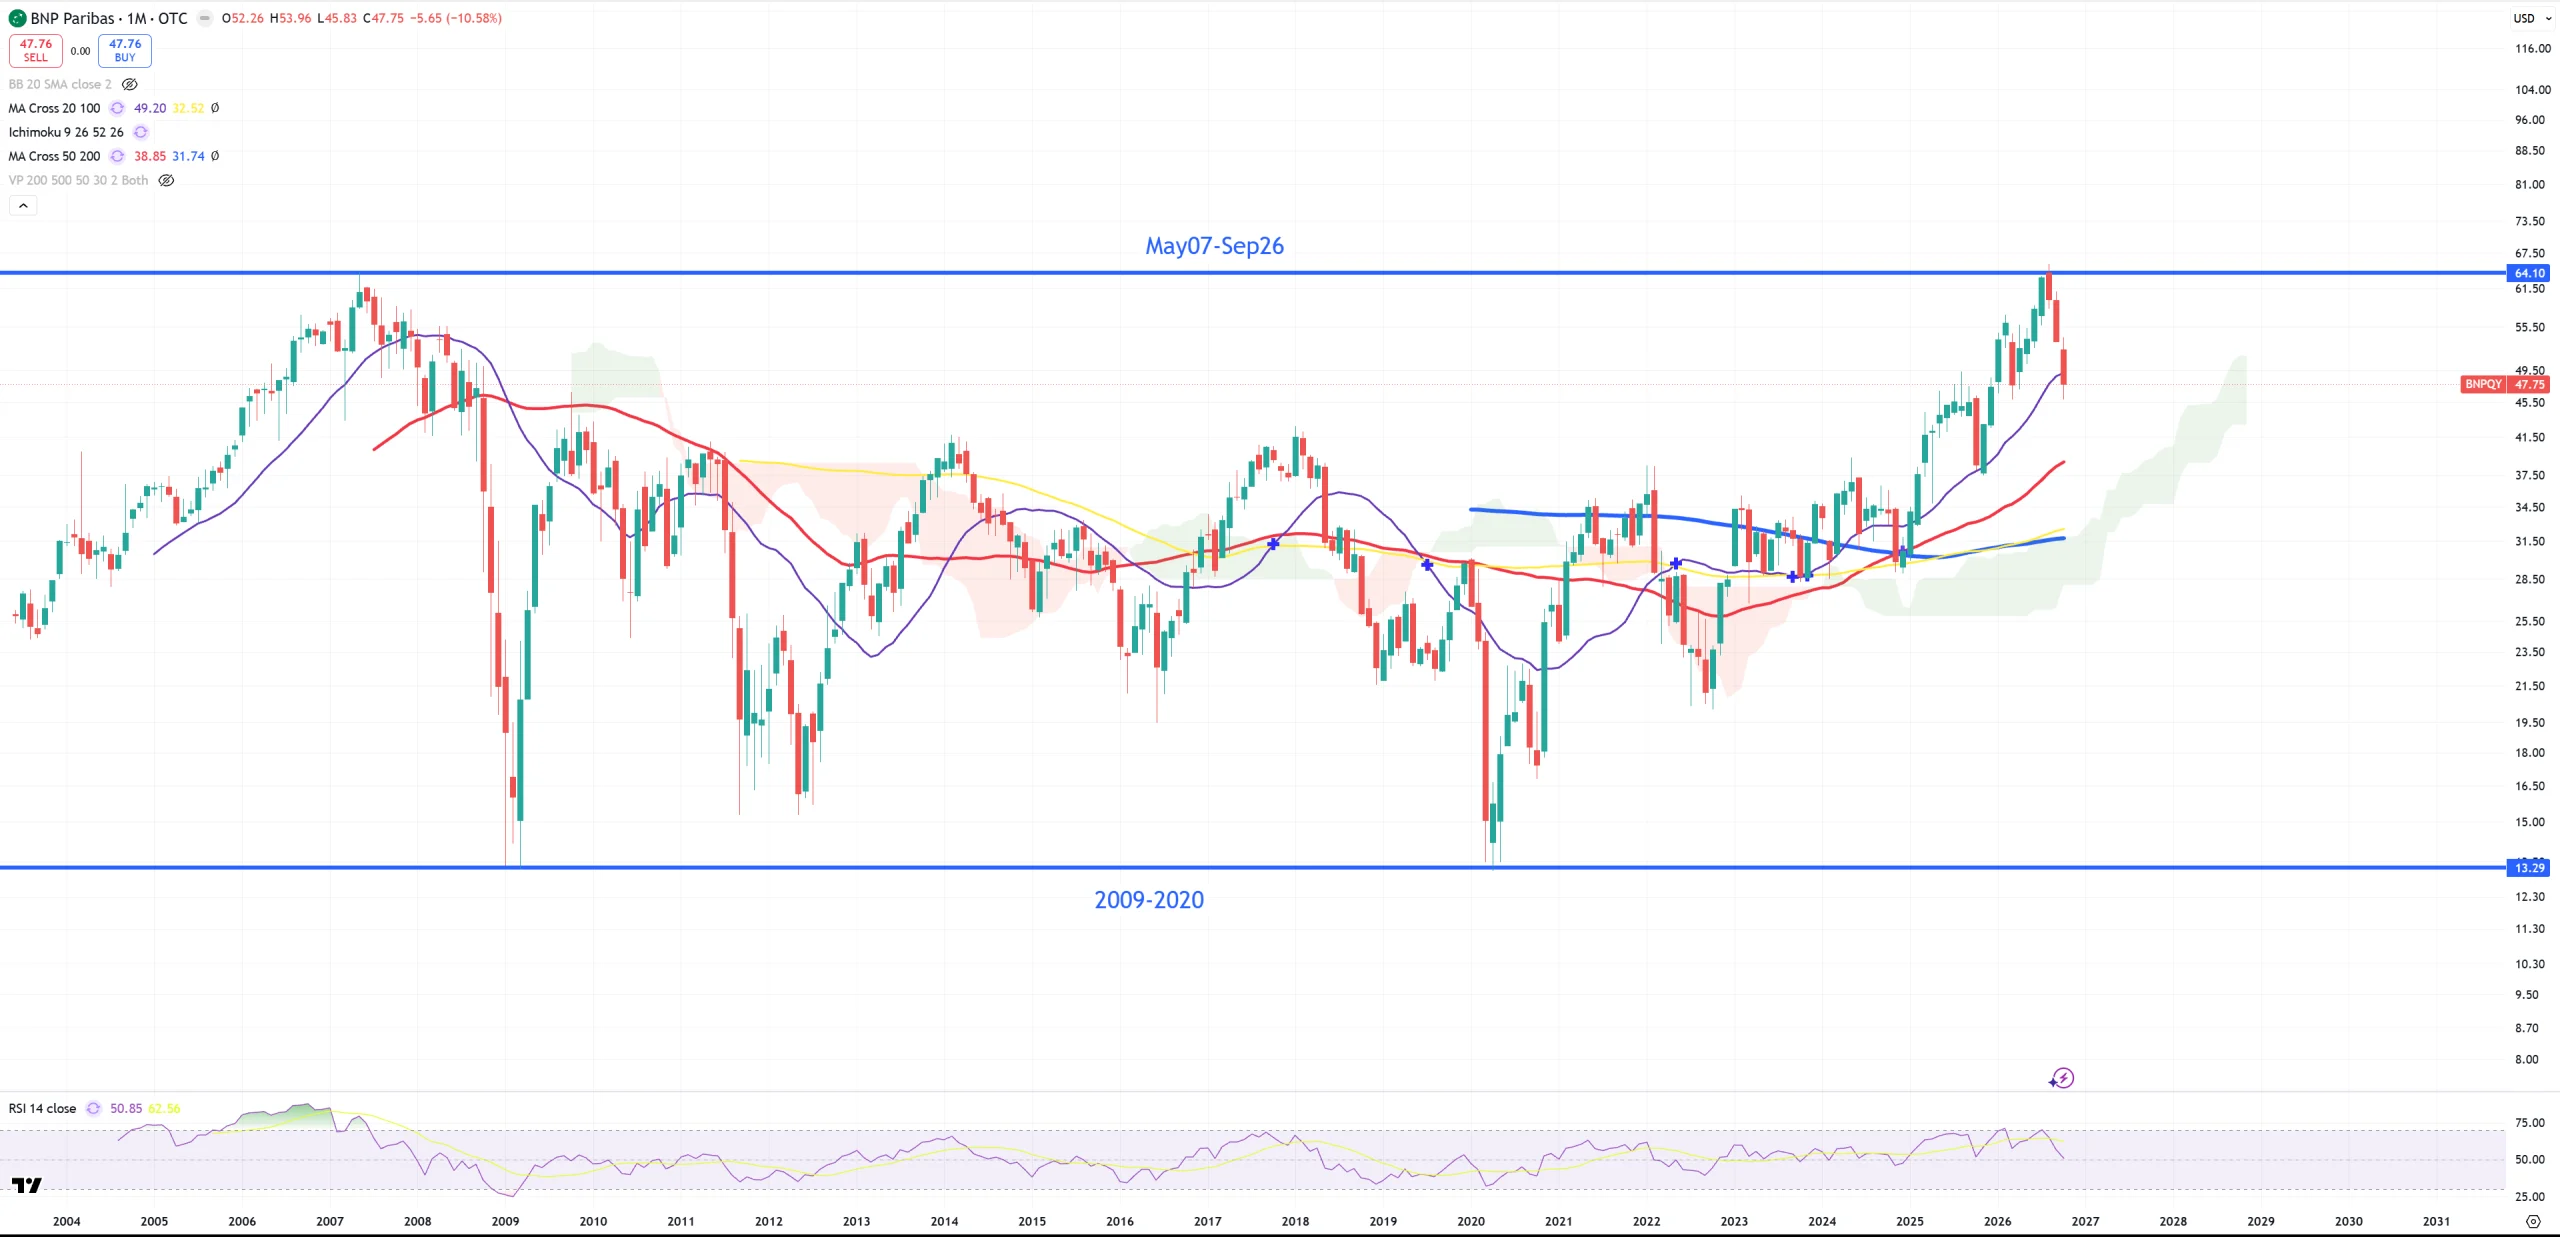
BNP – BNP Paribas – French bank on DOUBLE-TOP
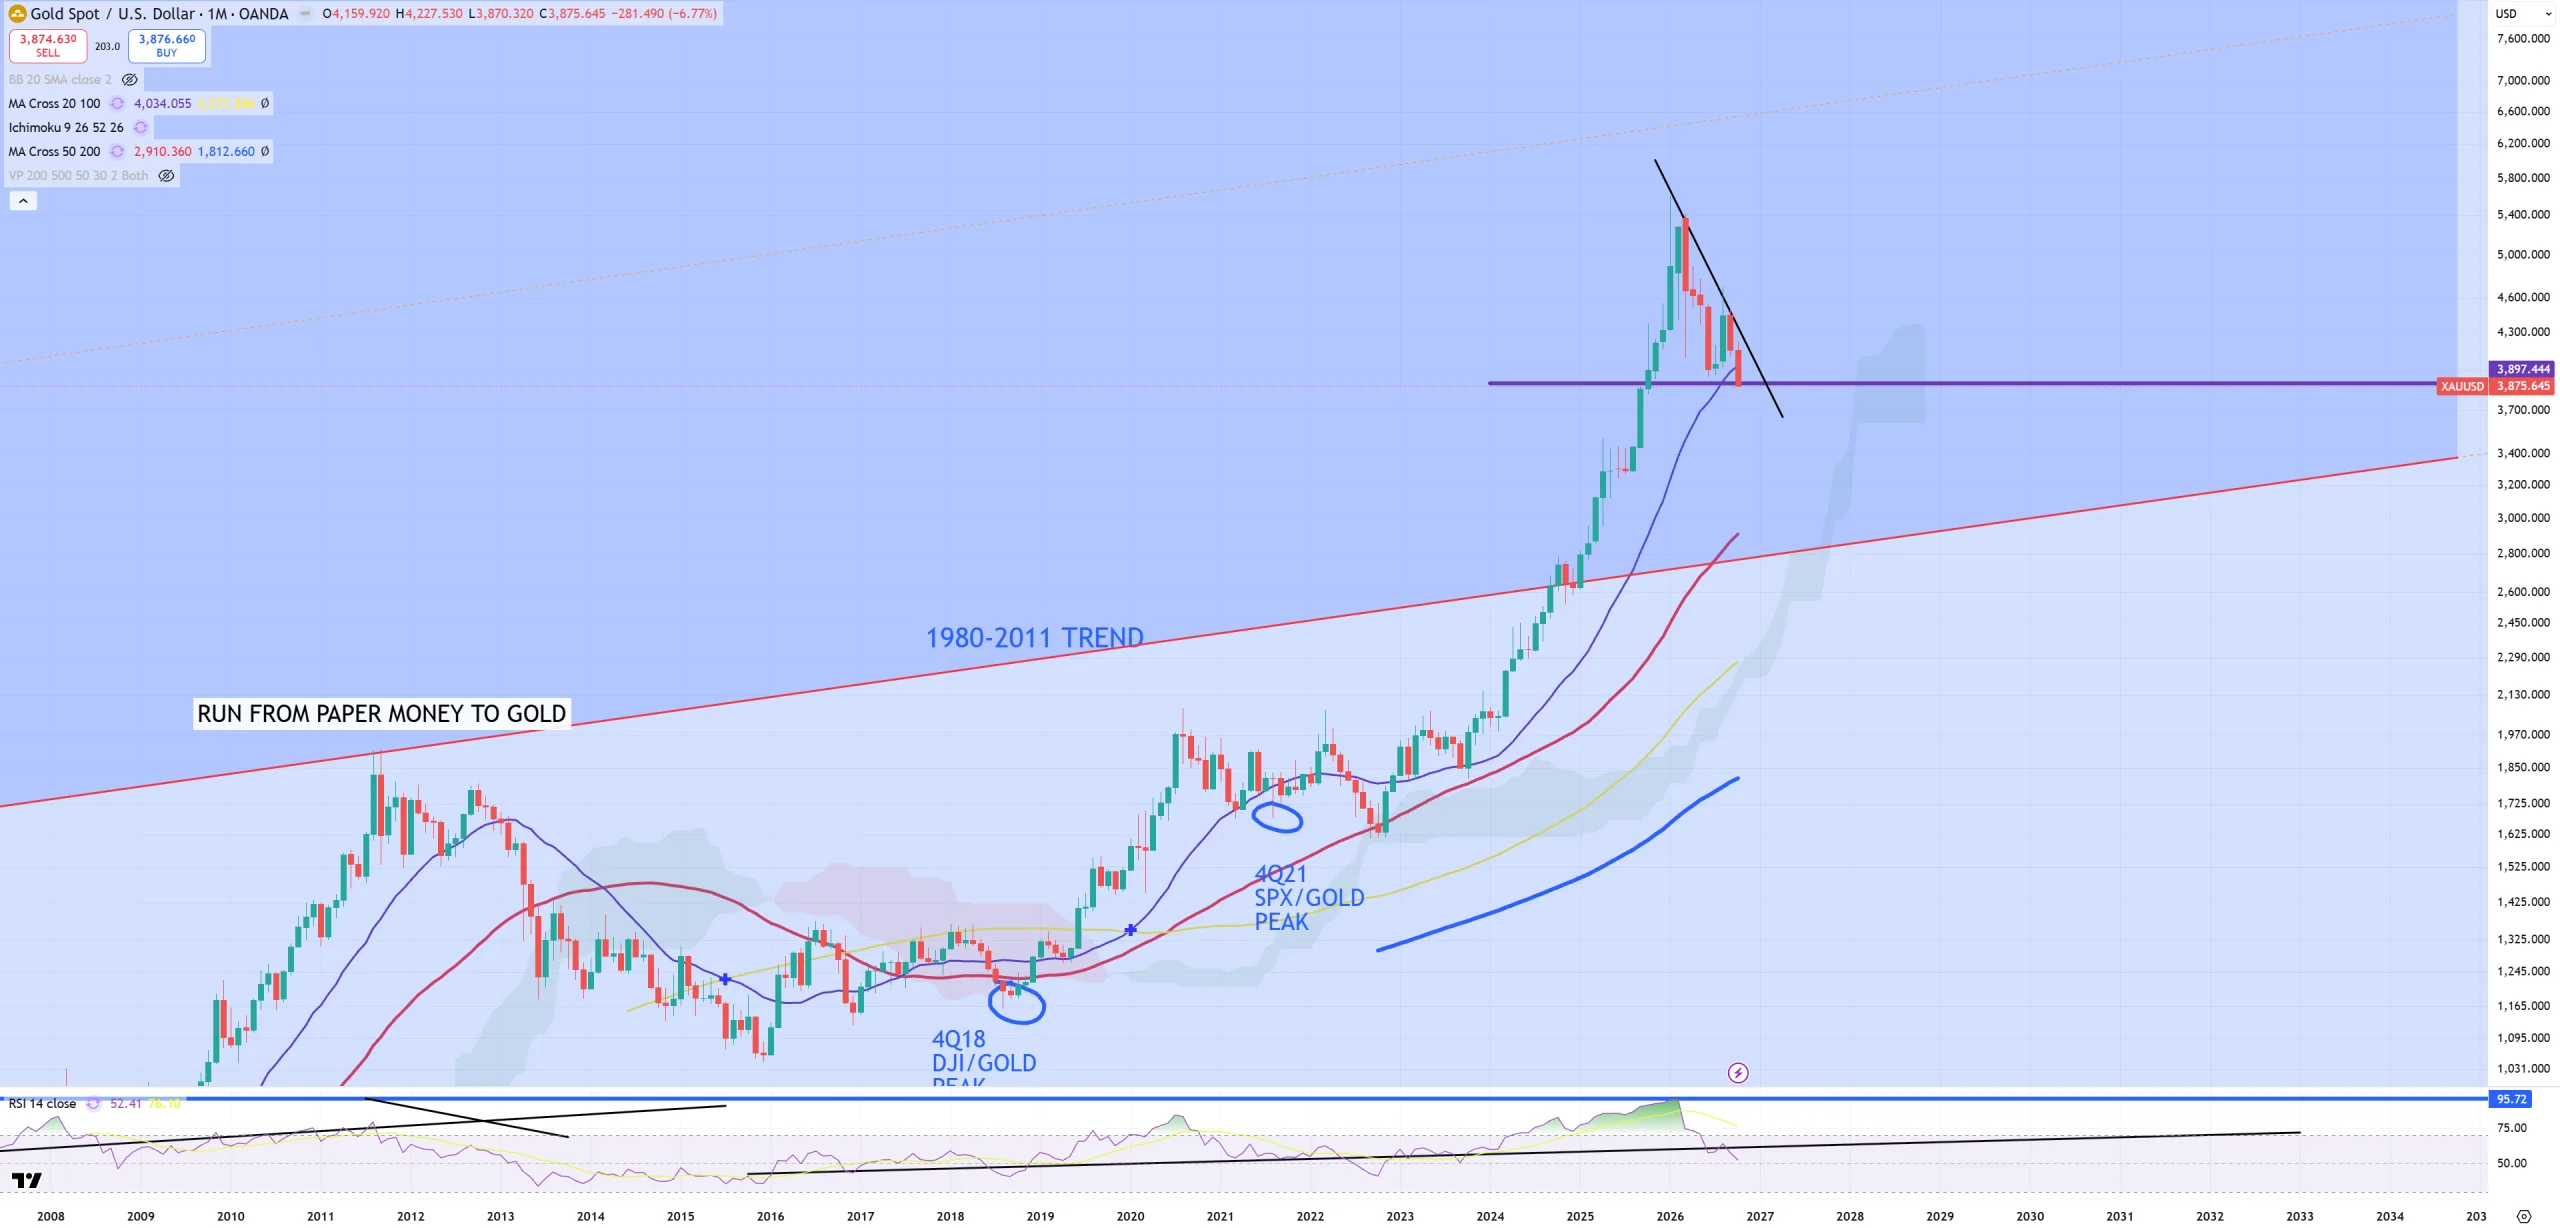
GOLD & “derivatives”
GOLD – (M)MA50 = 3000$ – this is deleveraging problem. As I expect oil to hit 147$, we can assume GOLD will hit 3000$, but the same time DXY will go IMO parabolic. While stacking gold doesn’t make a big sense when you earn $$$, I still think stacking gold in EM F/X makes sense, because big DXY spike will reduce GOLD’s prices drop in local currencies.
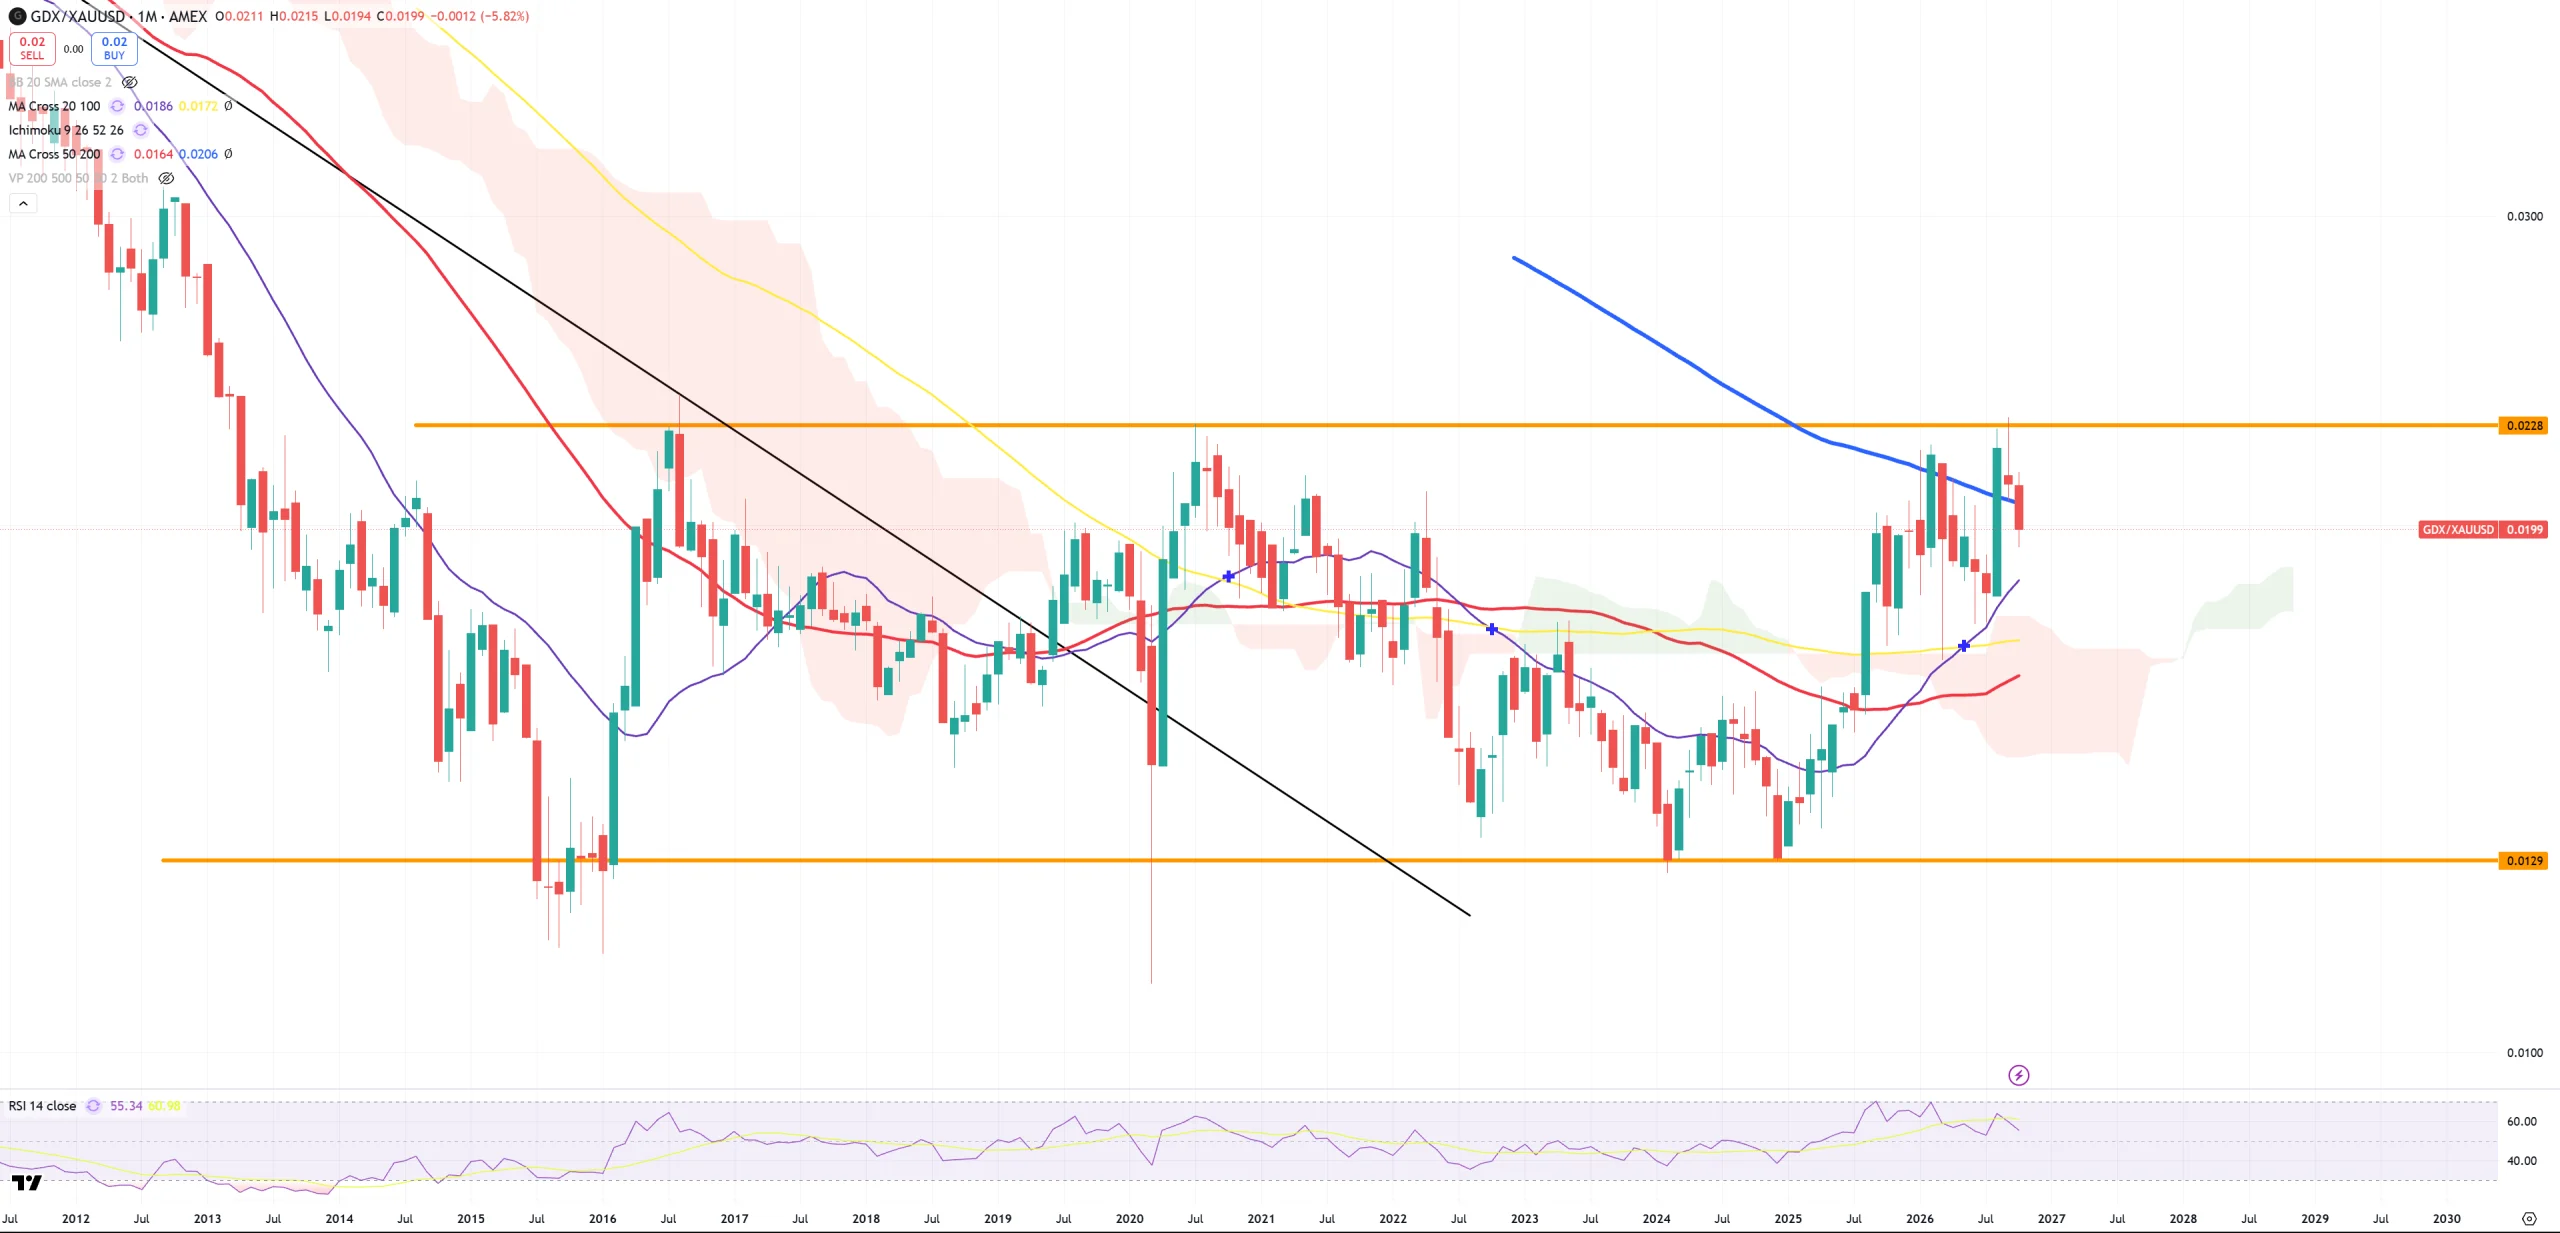
GDX/GOLD – was trying to break (M)MA200 but failed.
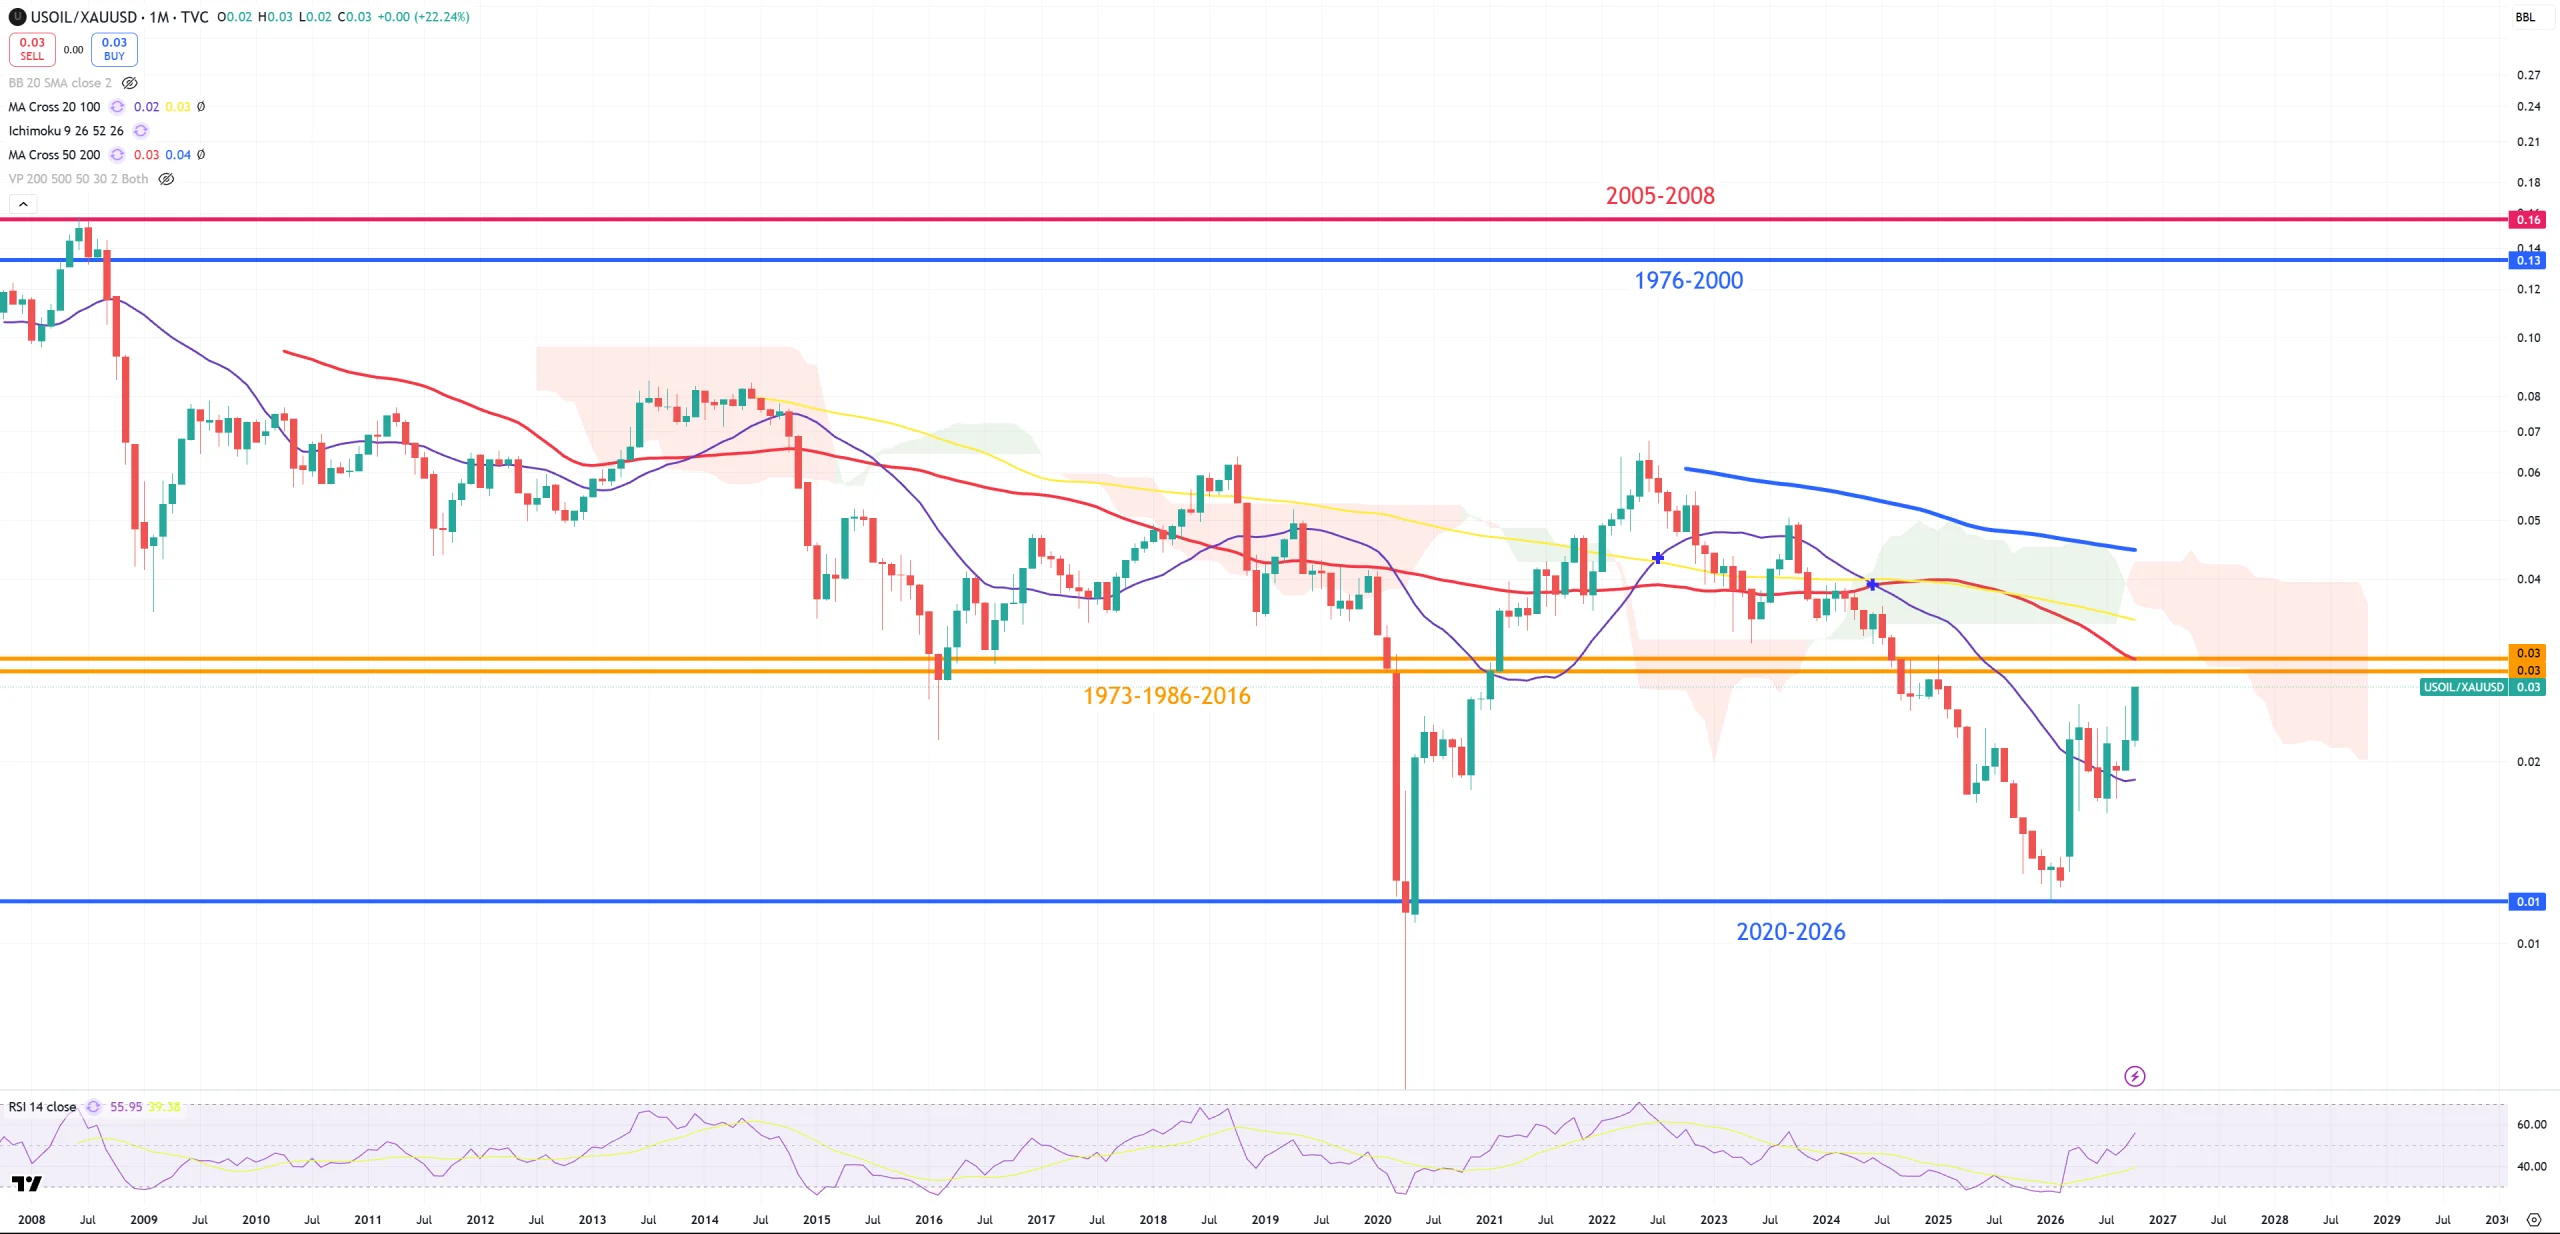
OIL/GOLD – we can assume that below 1973-1986-2016 level = massive OIL buy, above 1976-2000 level = massive OIL sell. (M)MA50 sits exacly on 1973-1986-2016 level. OIL is about to outperform GOLD in the nearing future ONCE (M)MA50 will be broken.
SILVER –
BTC and “derivatives”
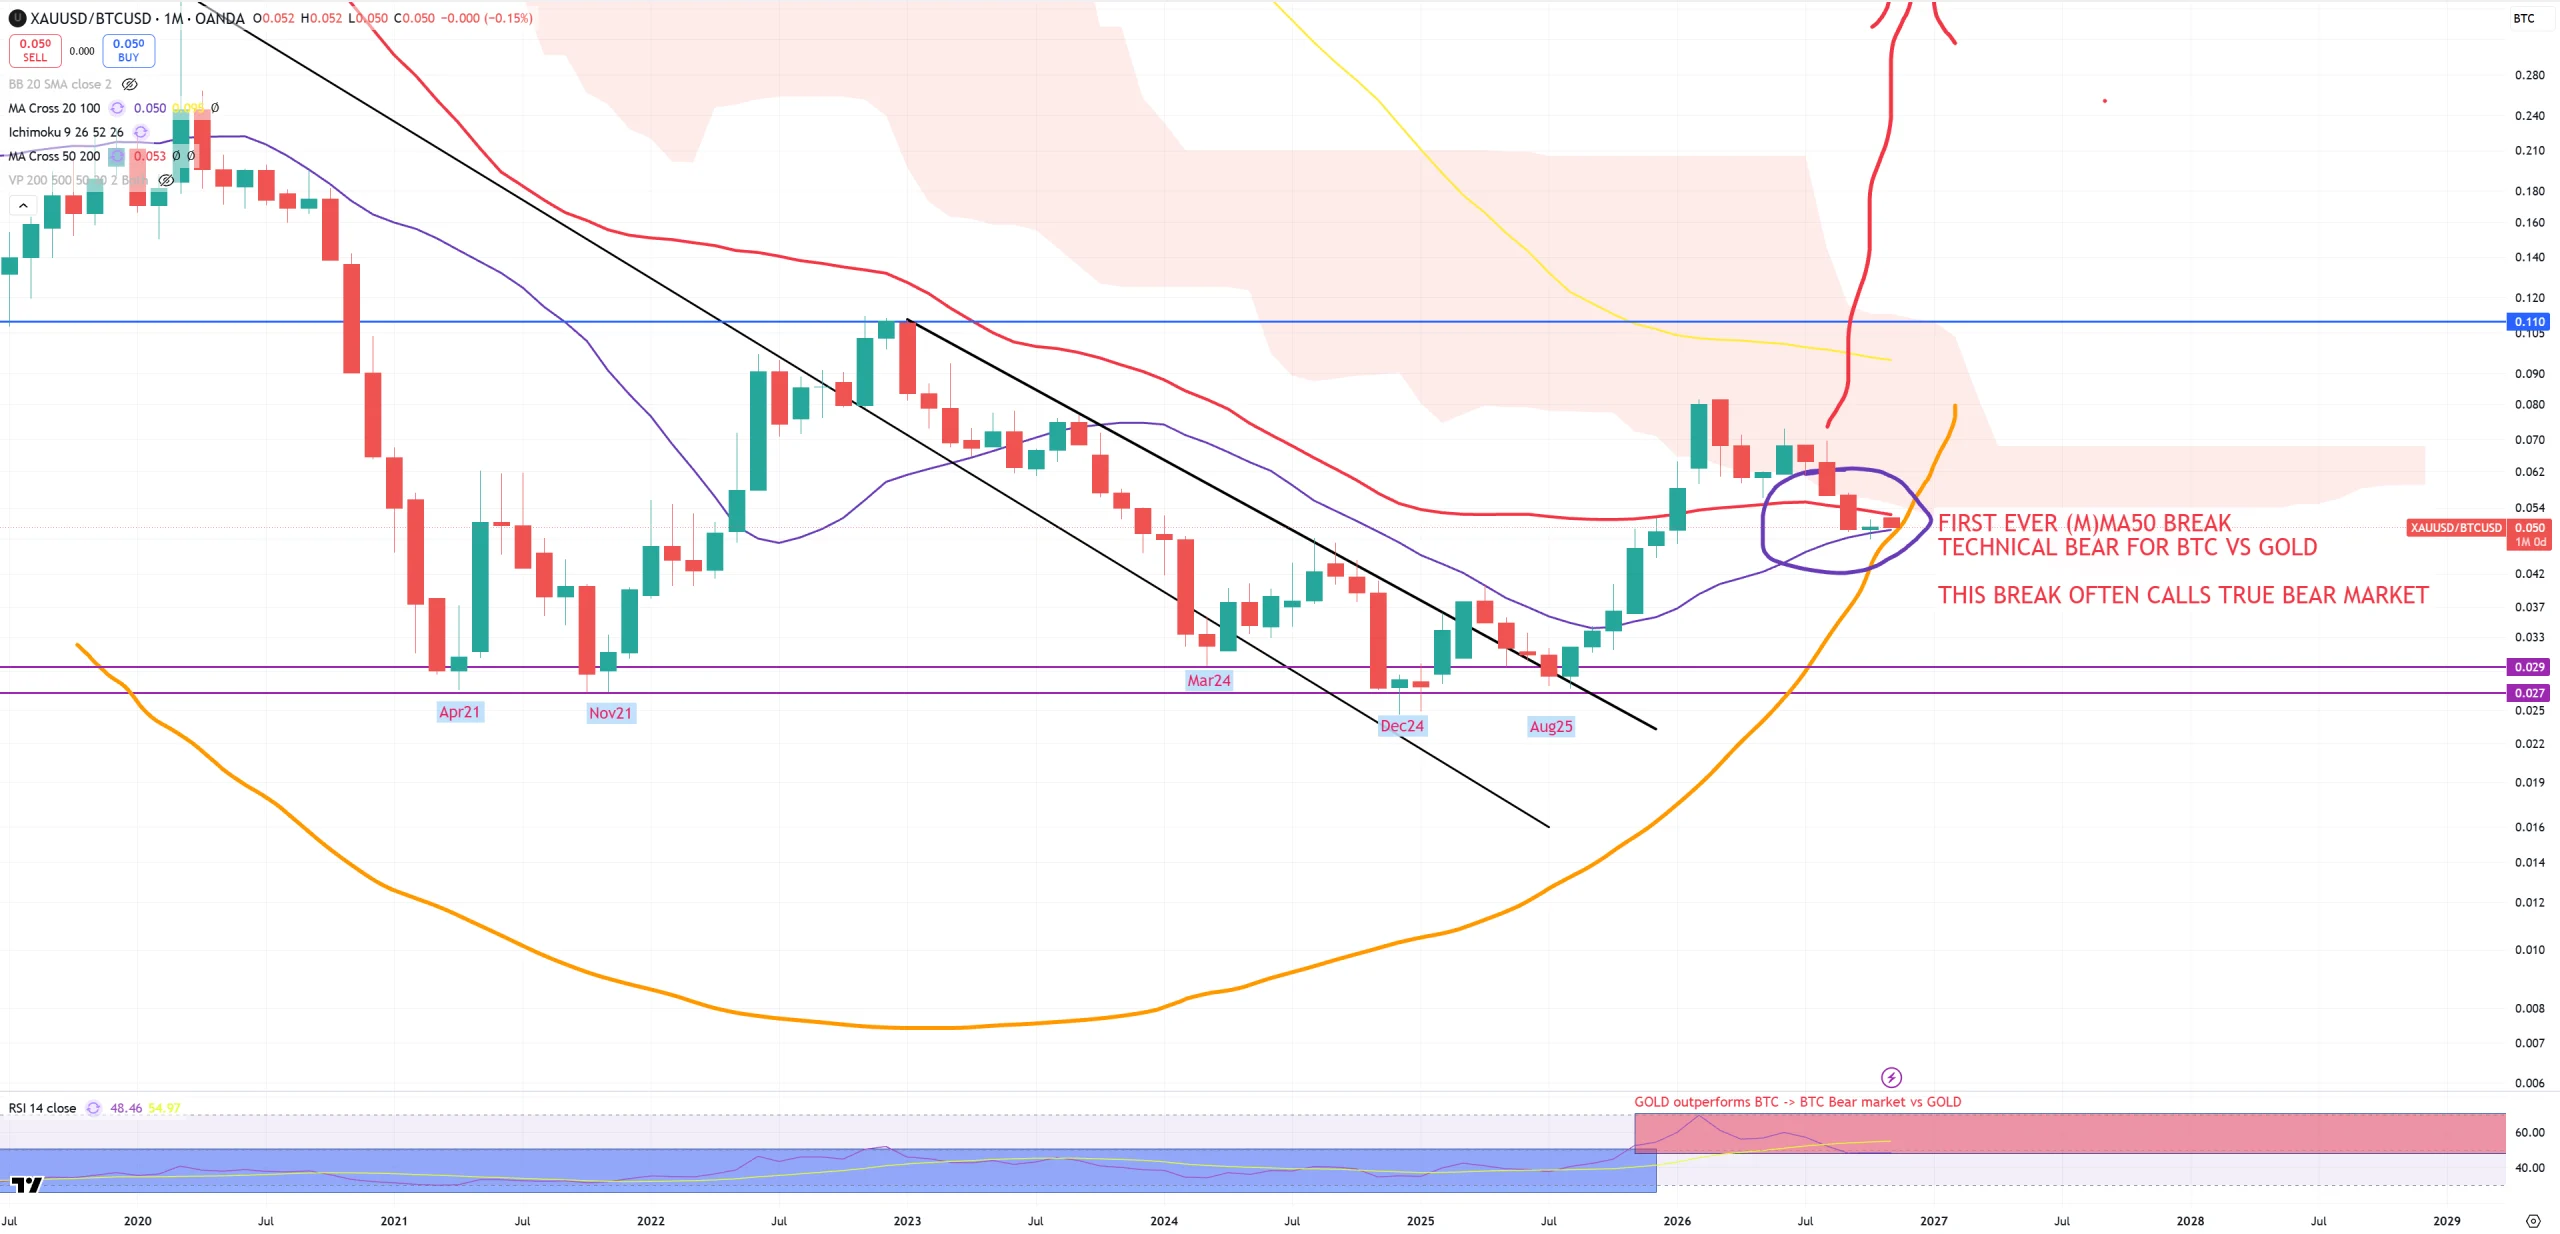
GOLD/BTC – main indicator is unchanged. (M)MA50 was broken, but last level of defence (M)MA20 stays as support.
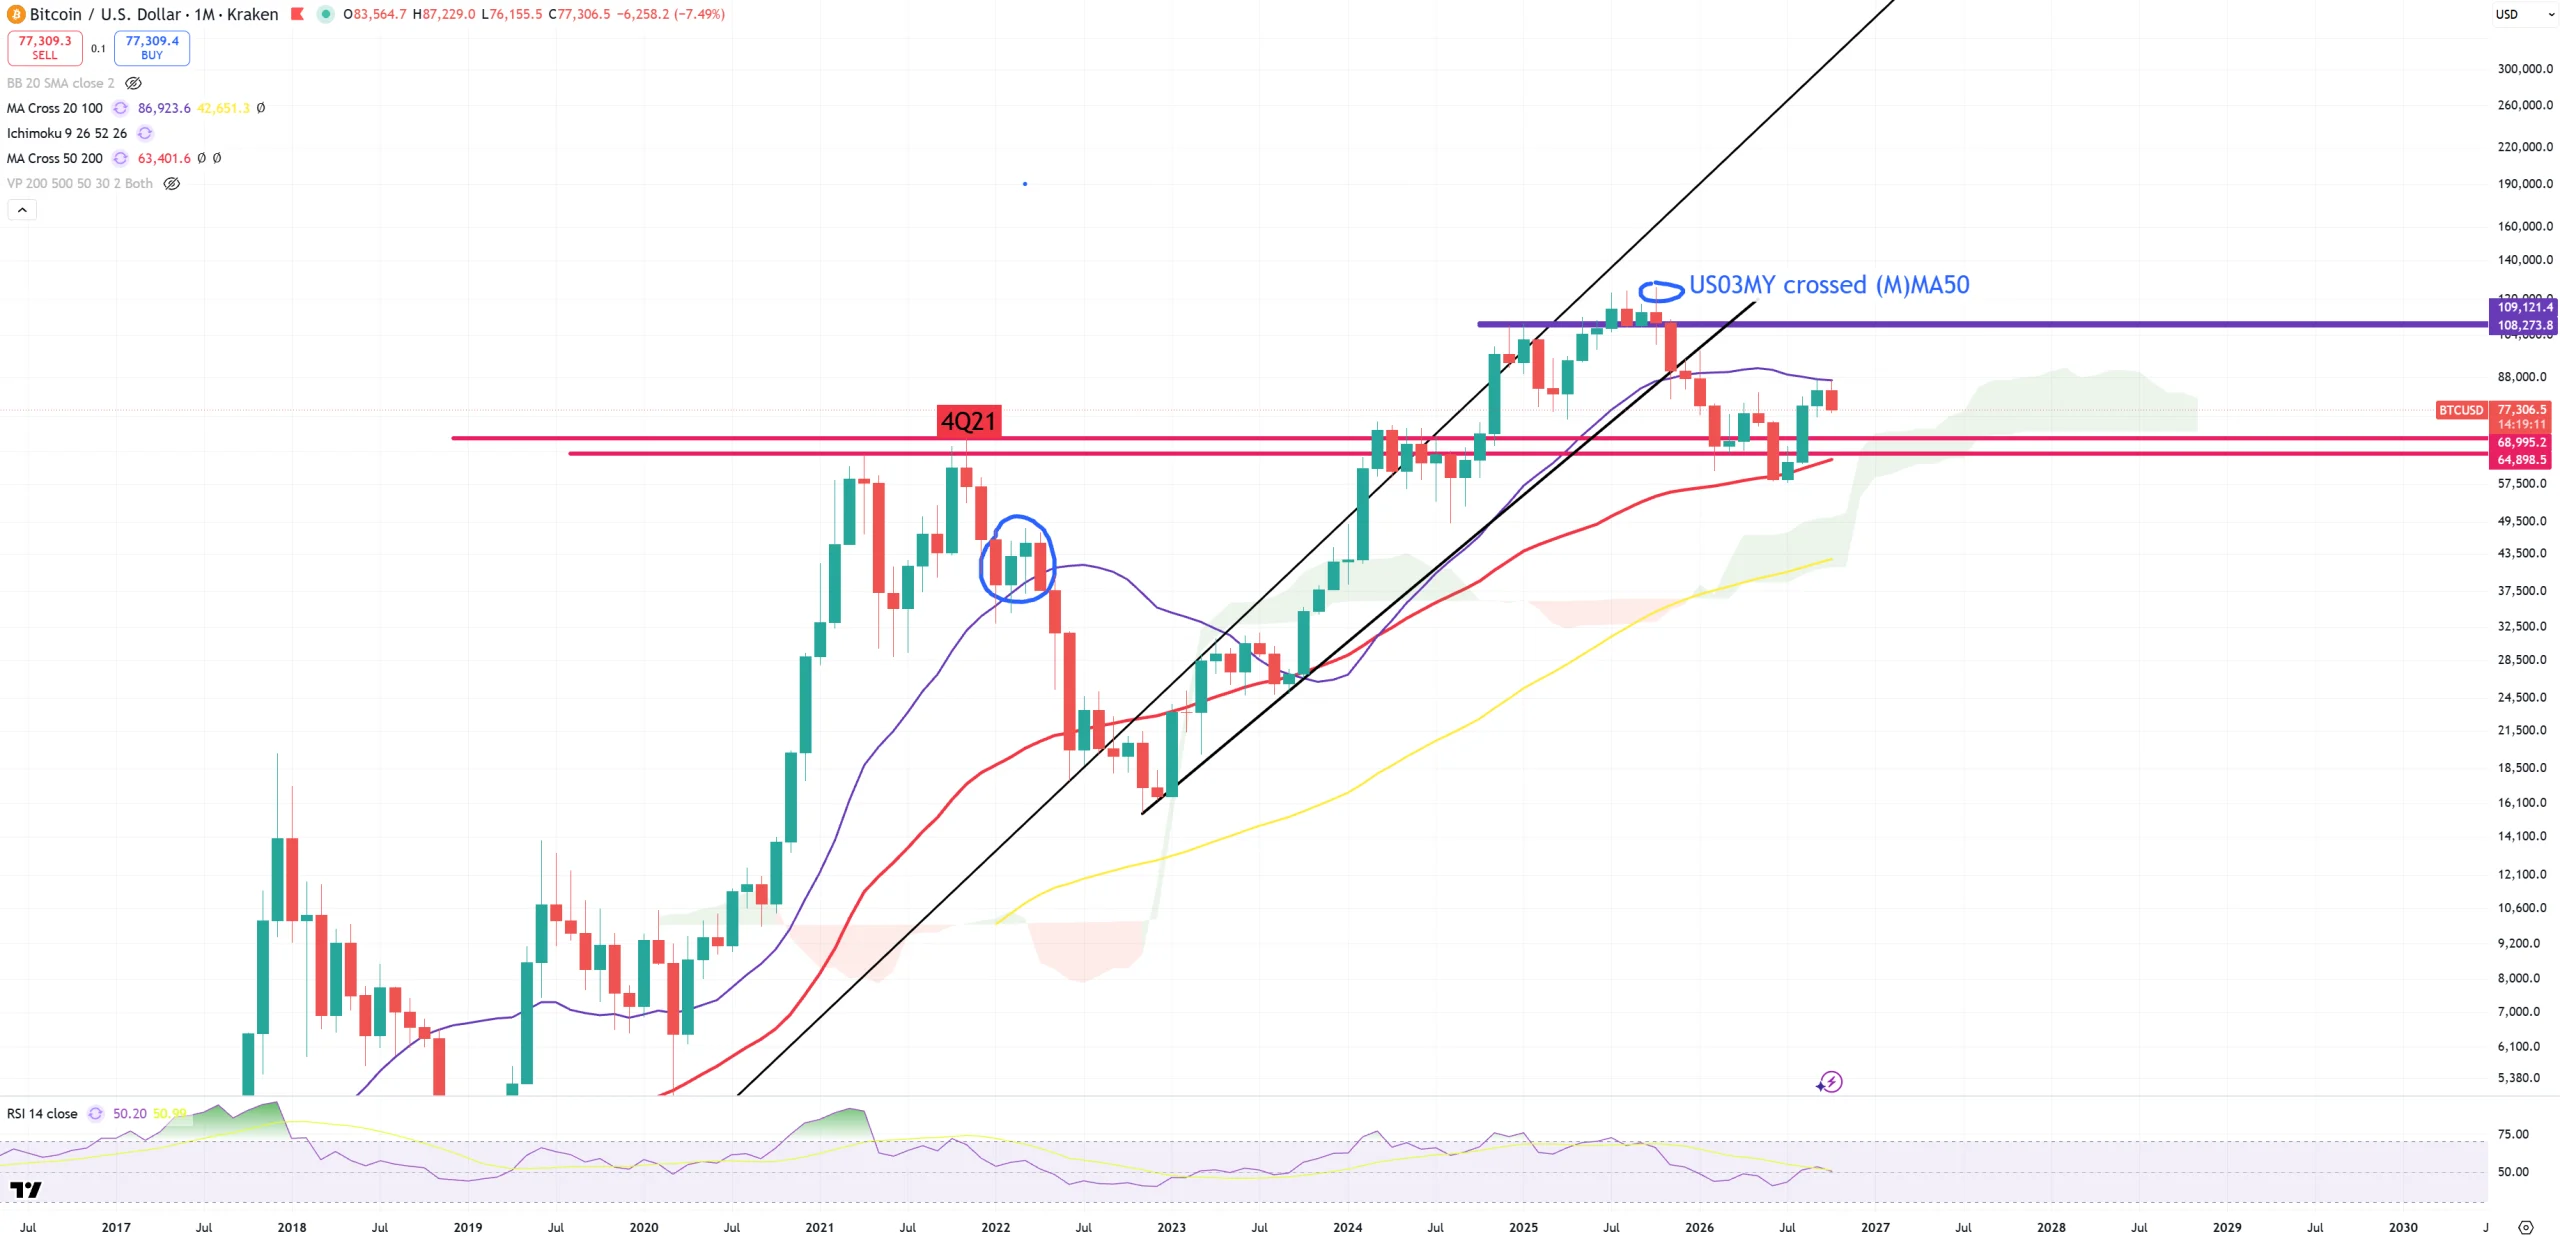
BTC – expecations is that (M)MA20 = 87500$ is the max of the bounce and we’ll get below 4Q21 just like everything else. (M)MA50 holds on 4Q21 peak too. Typical bear market bounce is (M)MA50 support till (M)MA20 and … next wave down to make a final break of (M)MA50 to match uninverting yield-curve.
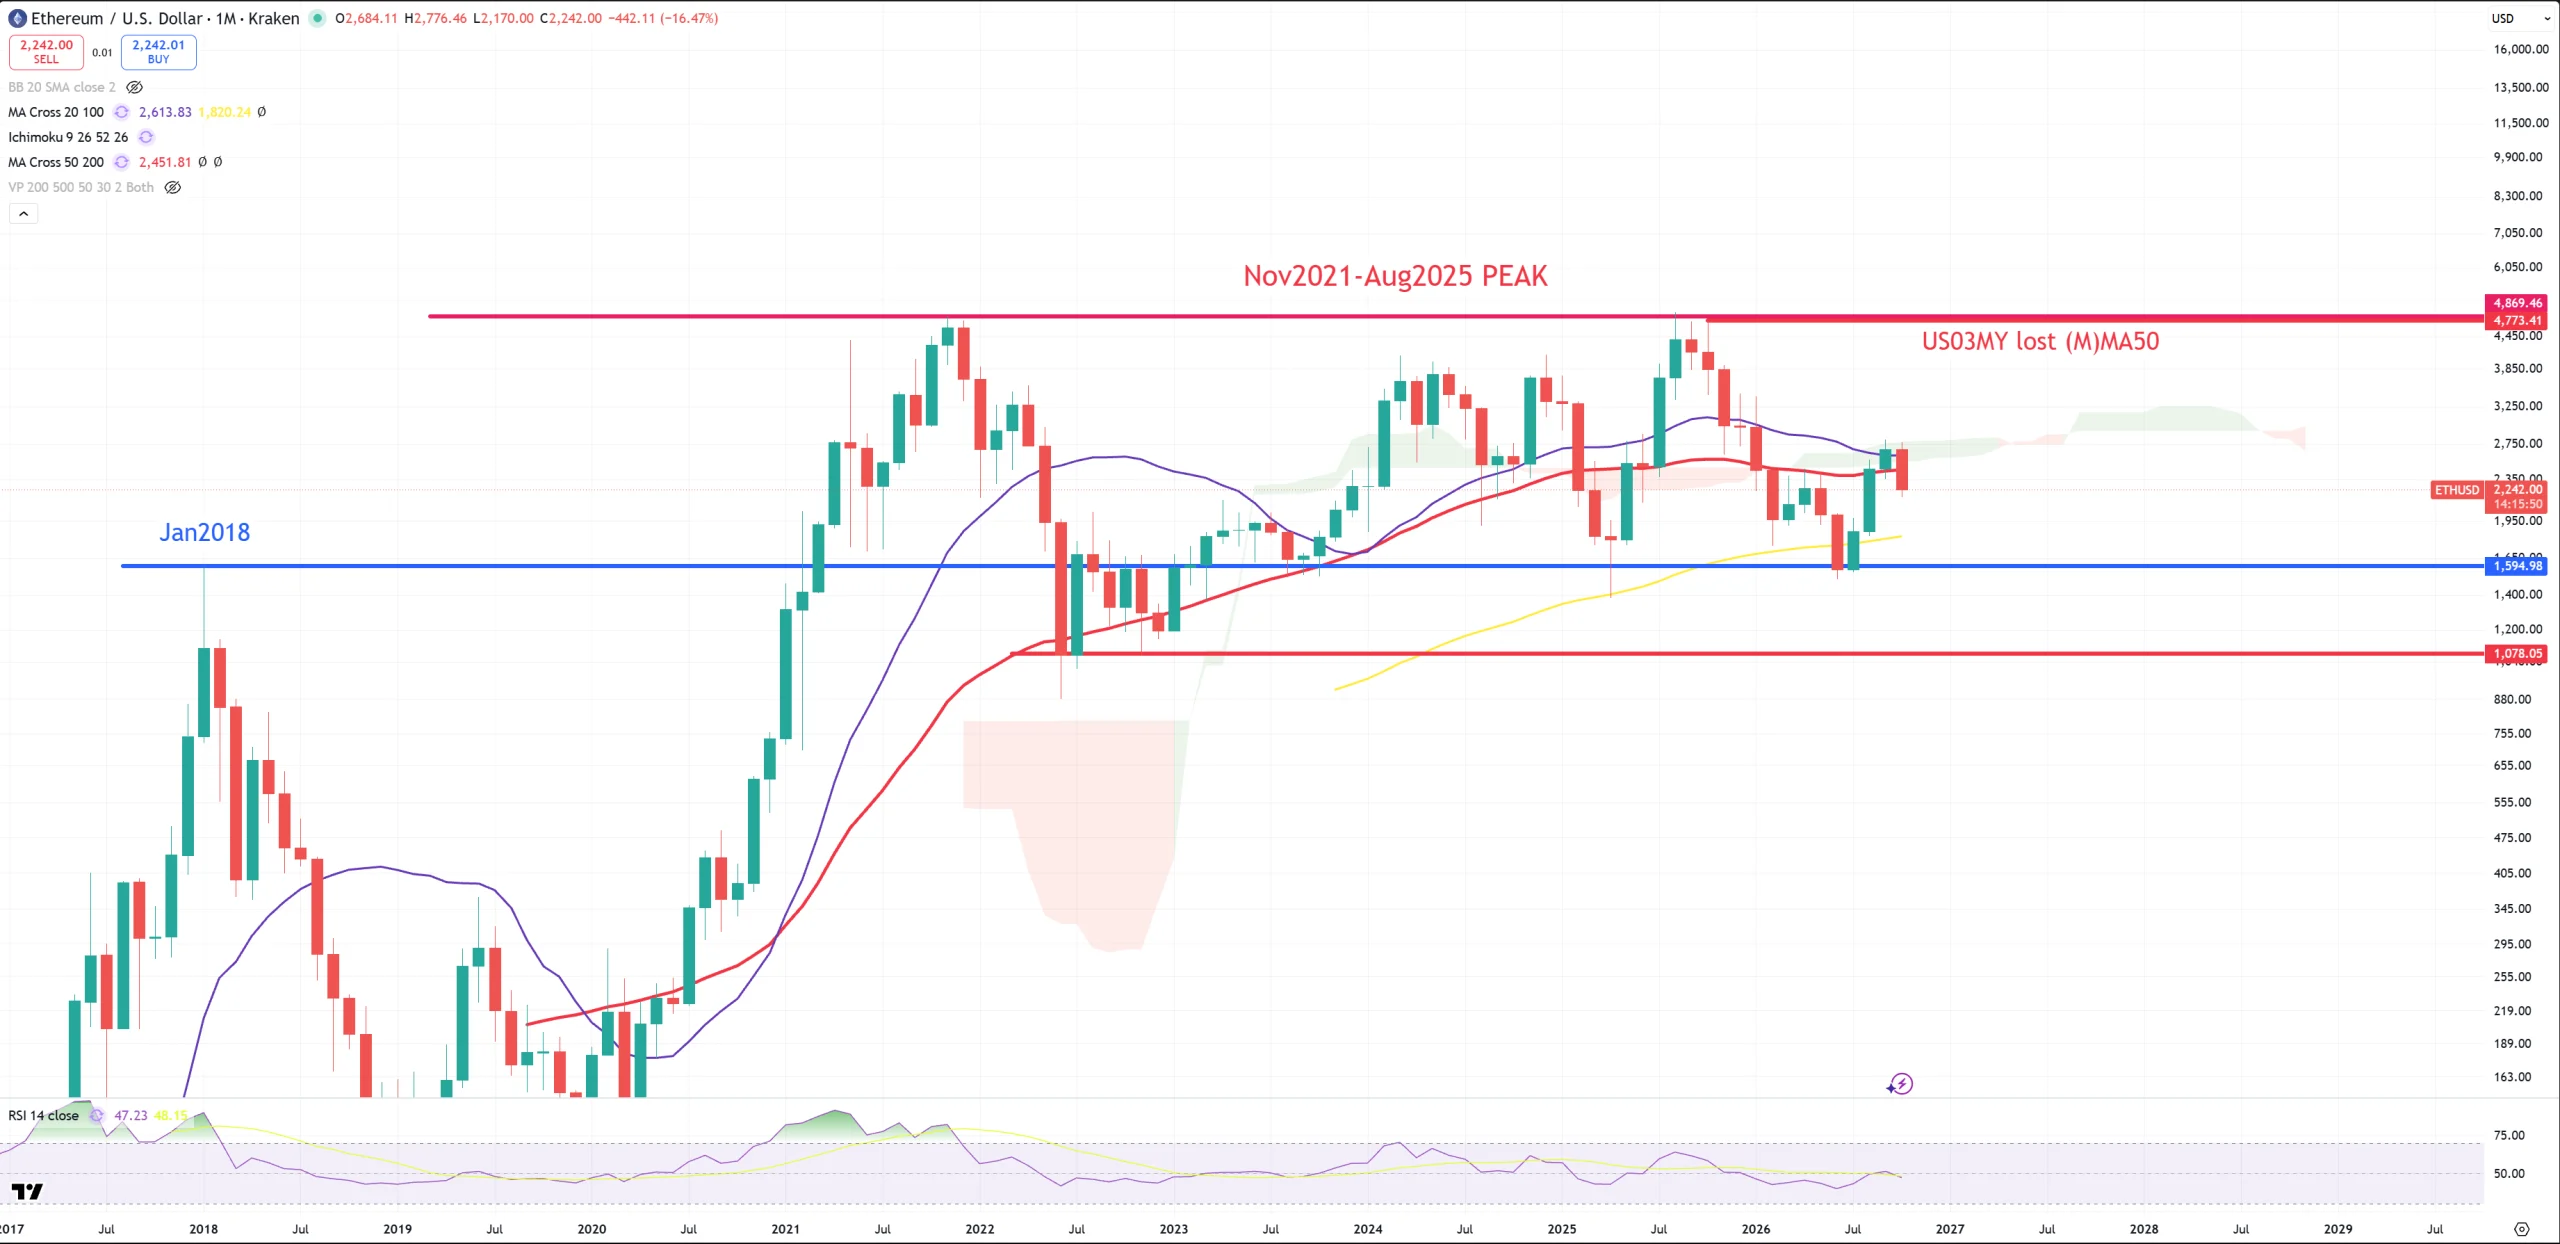
ETH – (M)MA20 i on the same level as (M)MA50.
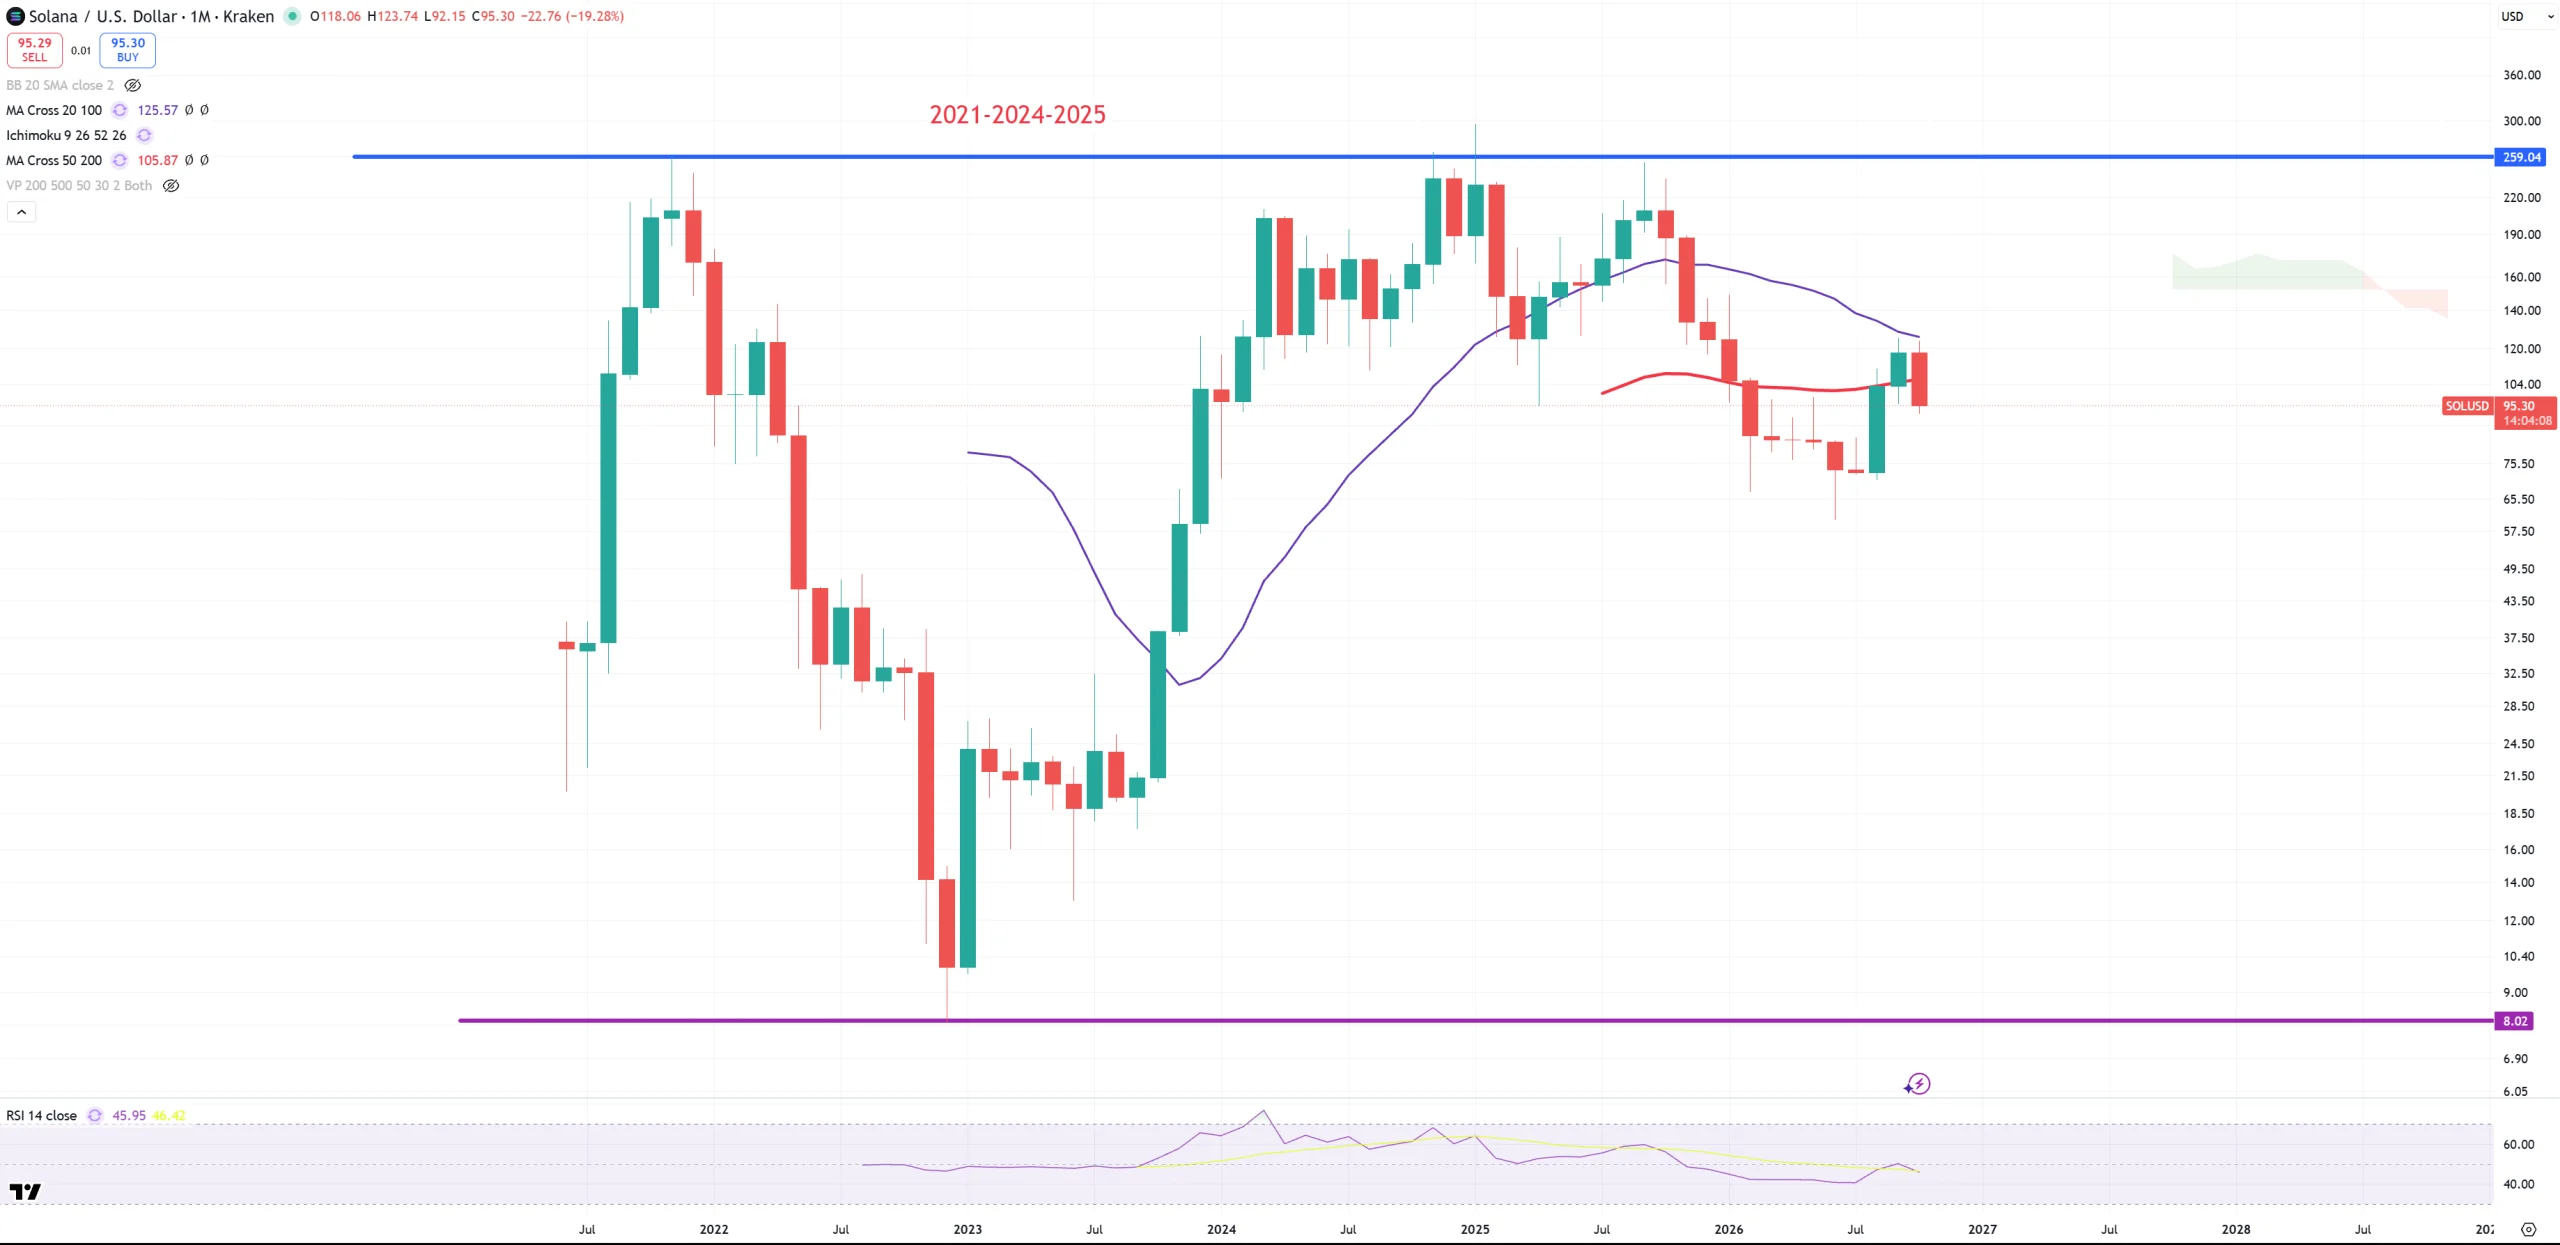
SOL – 1:1 as ETH
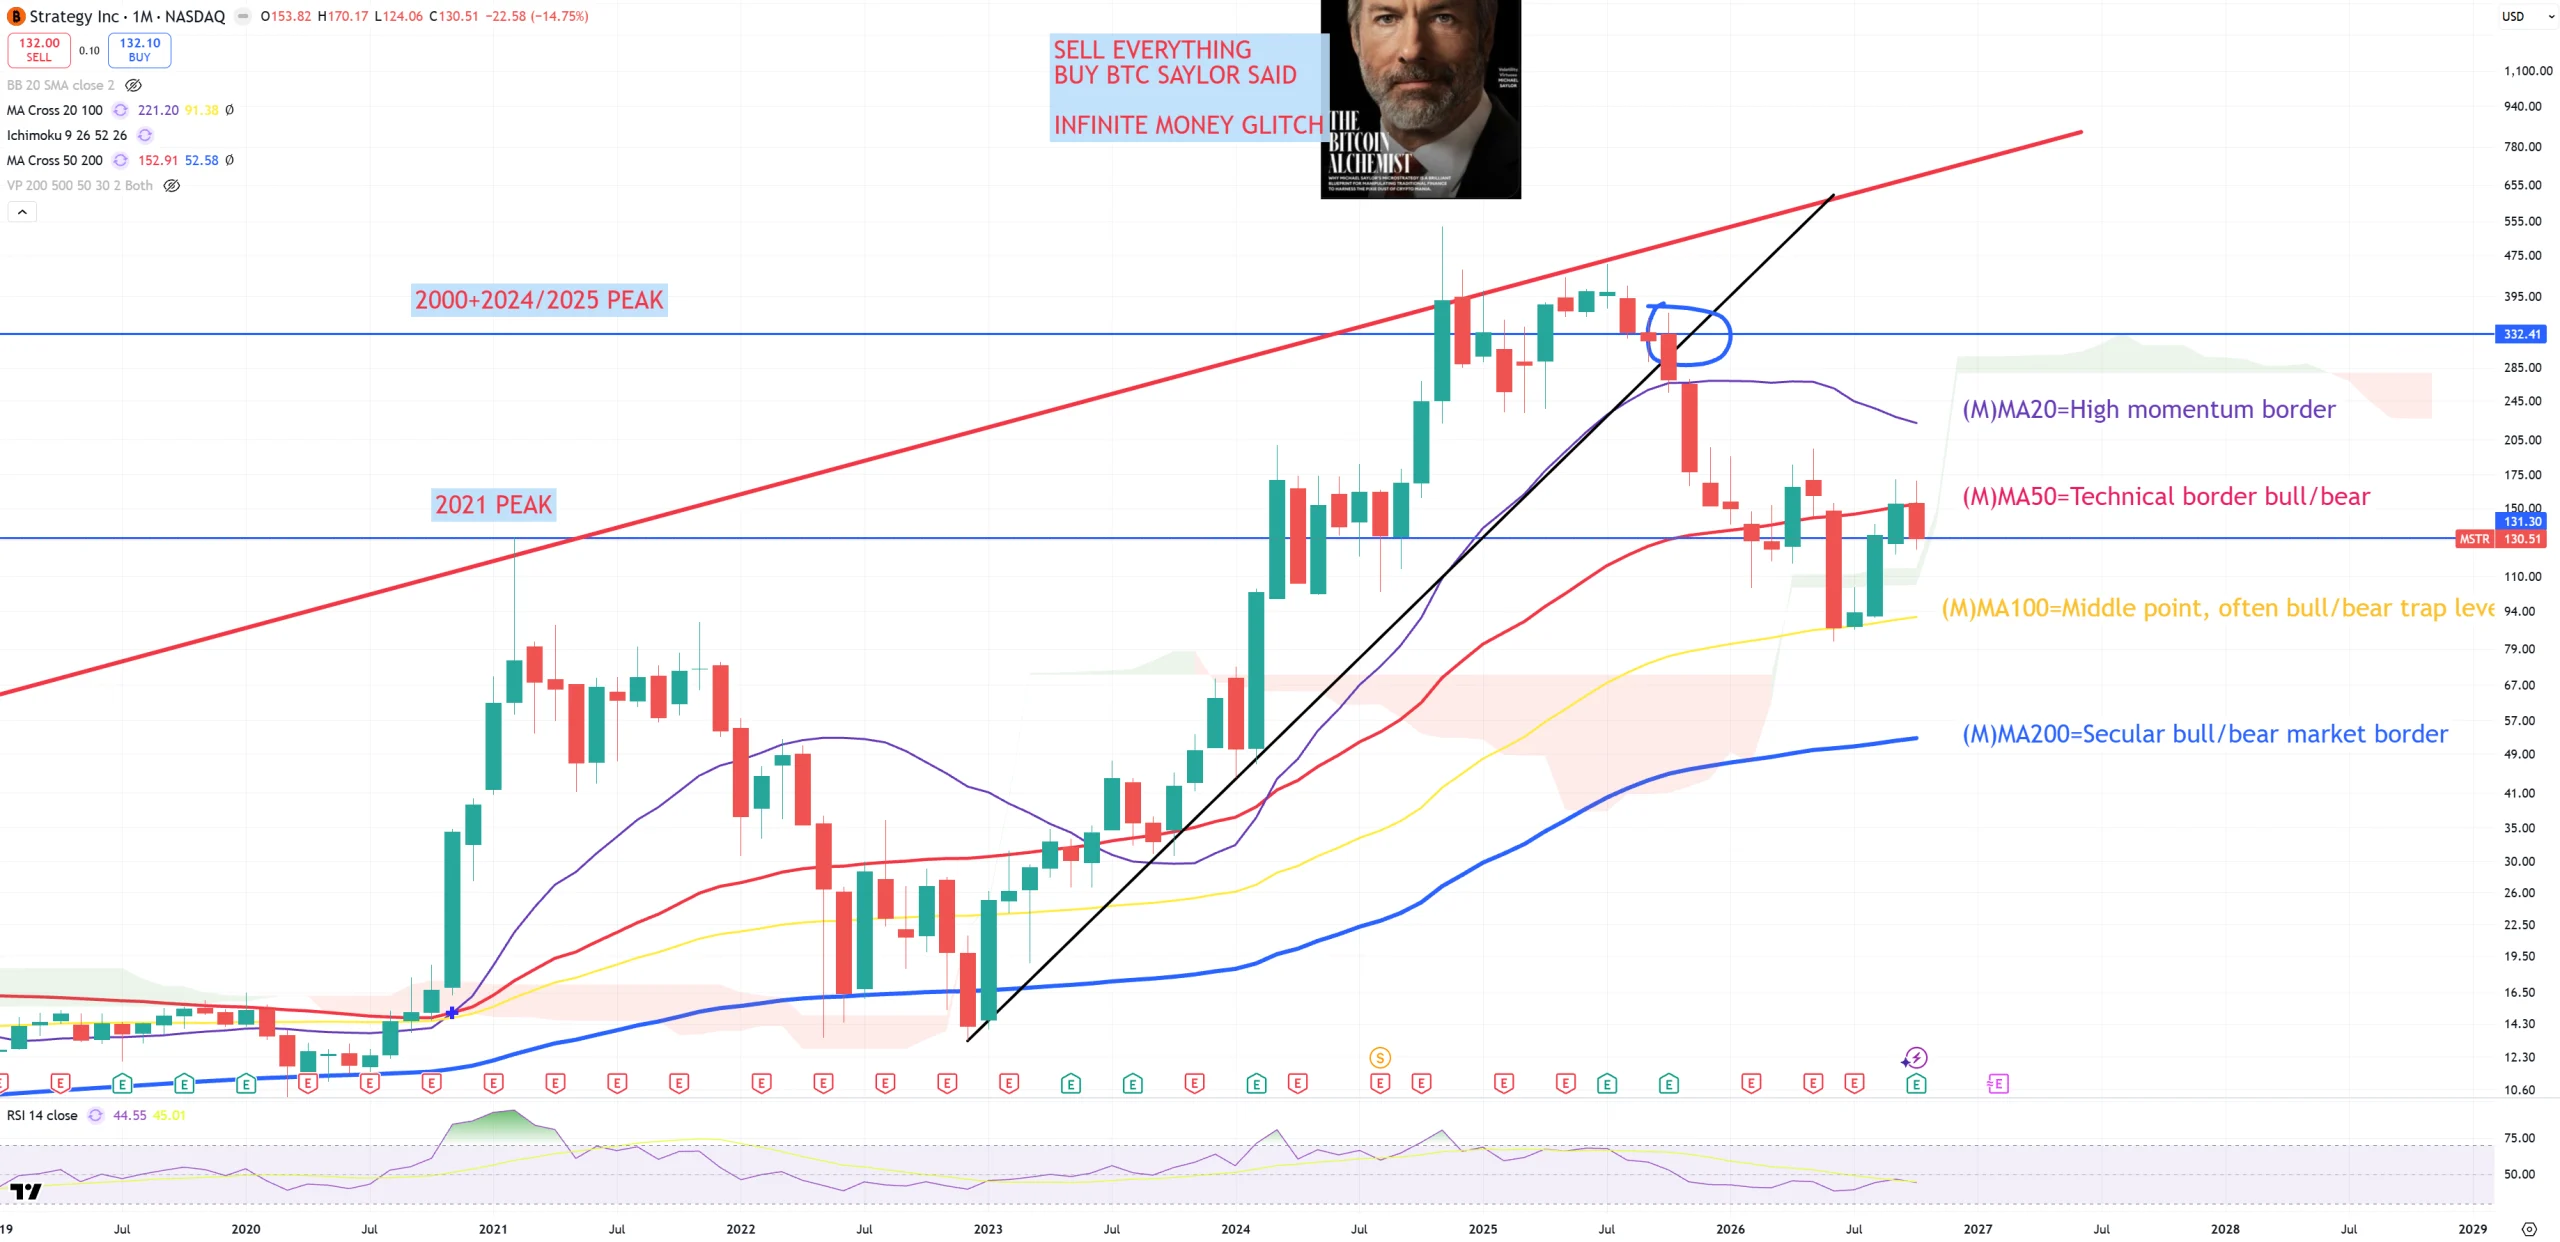
MSTR – you have everything on the chart you need. The most powerful crashes happen after (M)MA50 retest from the bottom (combined with uninvering 10y/3m). We managed to close below 2021 peak. We can assume (M)MA50 for MSTR is combined with (M)MA20 for BTC and (M)MA50 for ETH
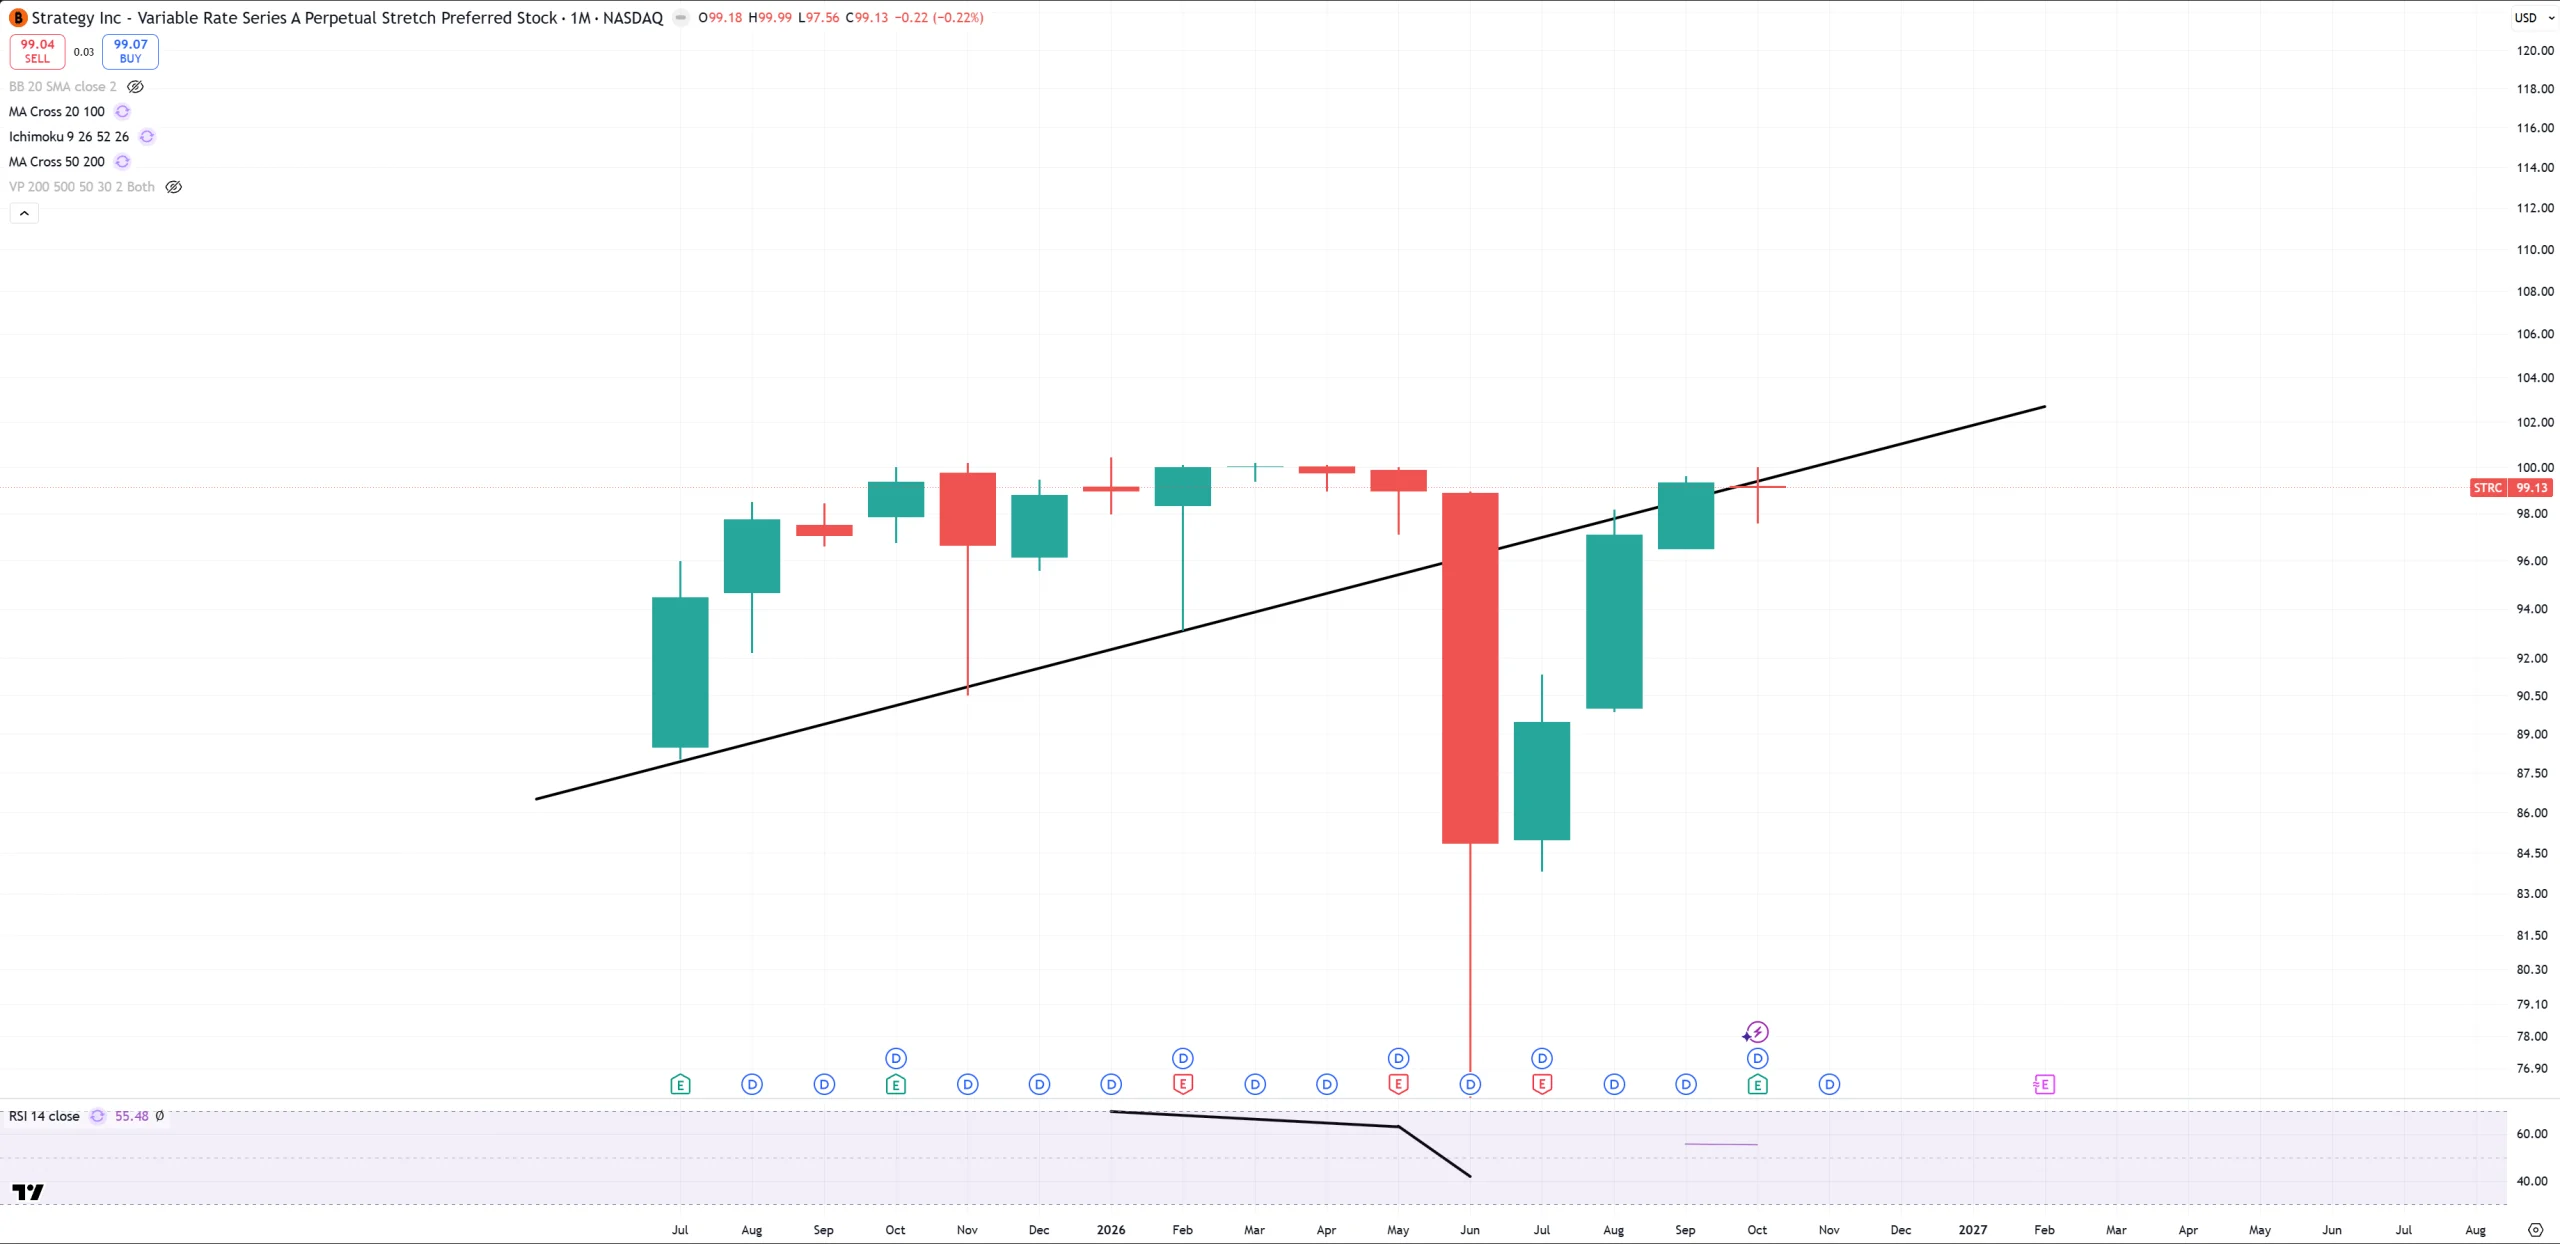
STRC – something what is called by MSTR as “digital credit”. So far pure retest to broken trend
Examples
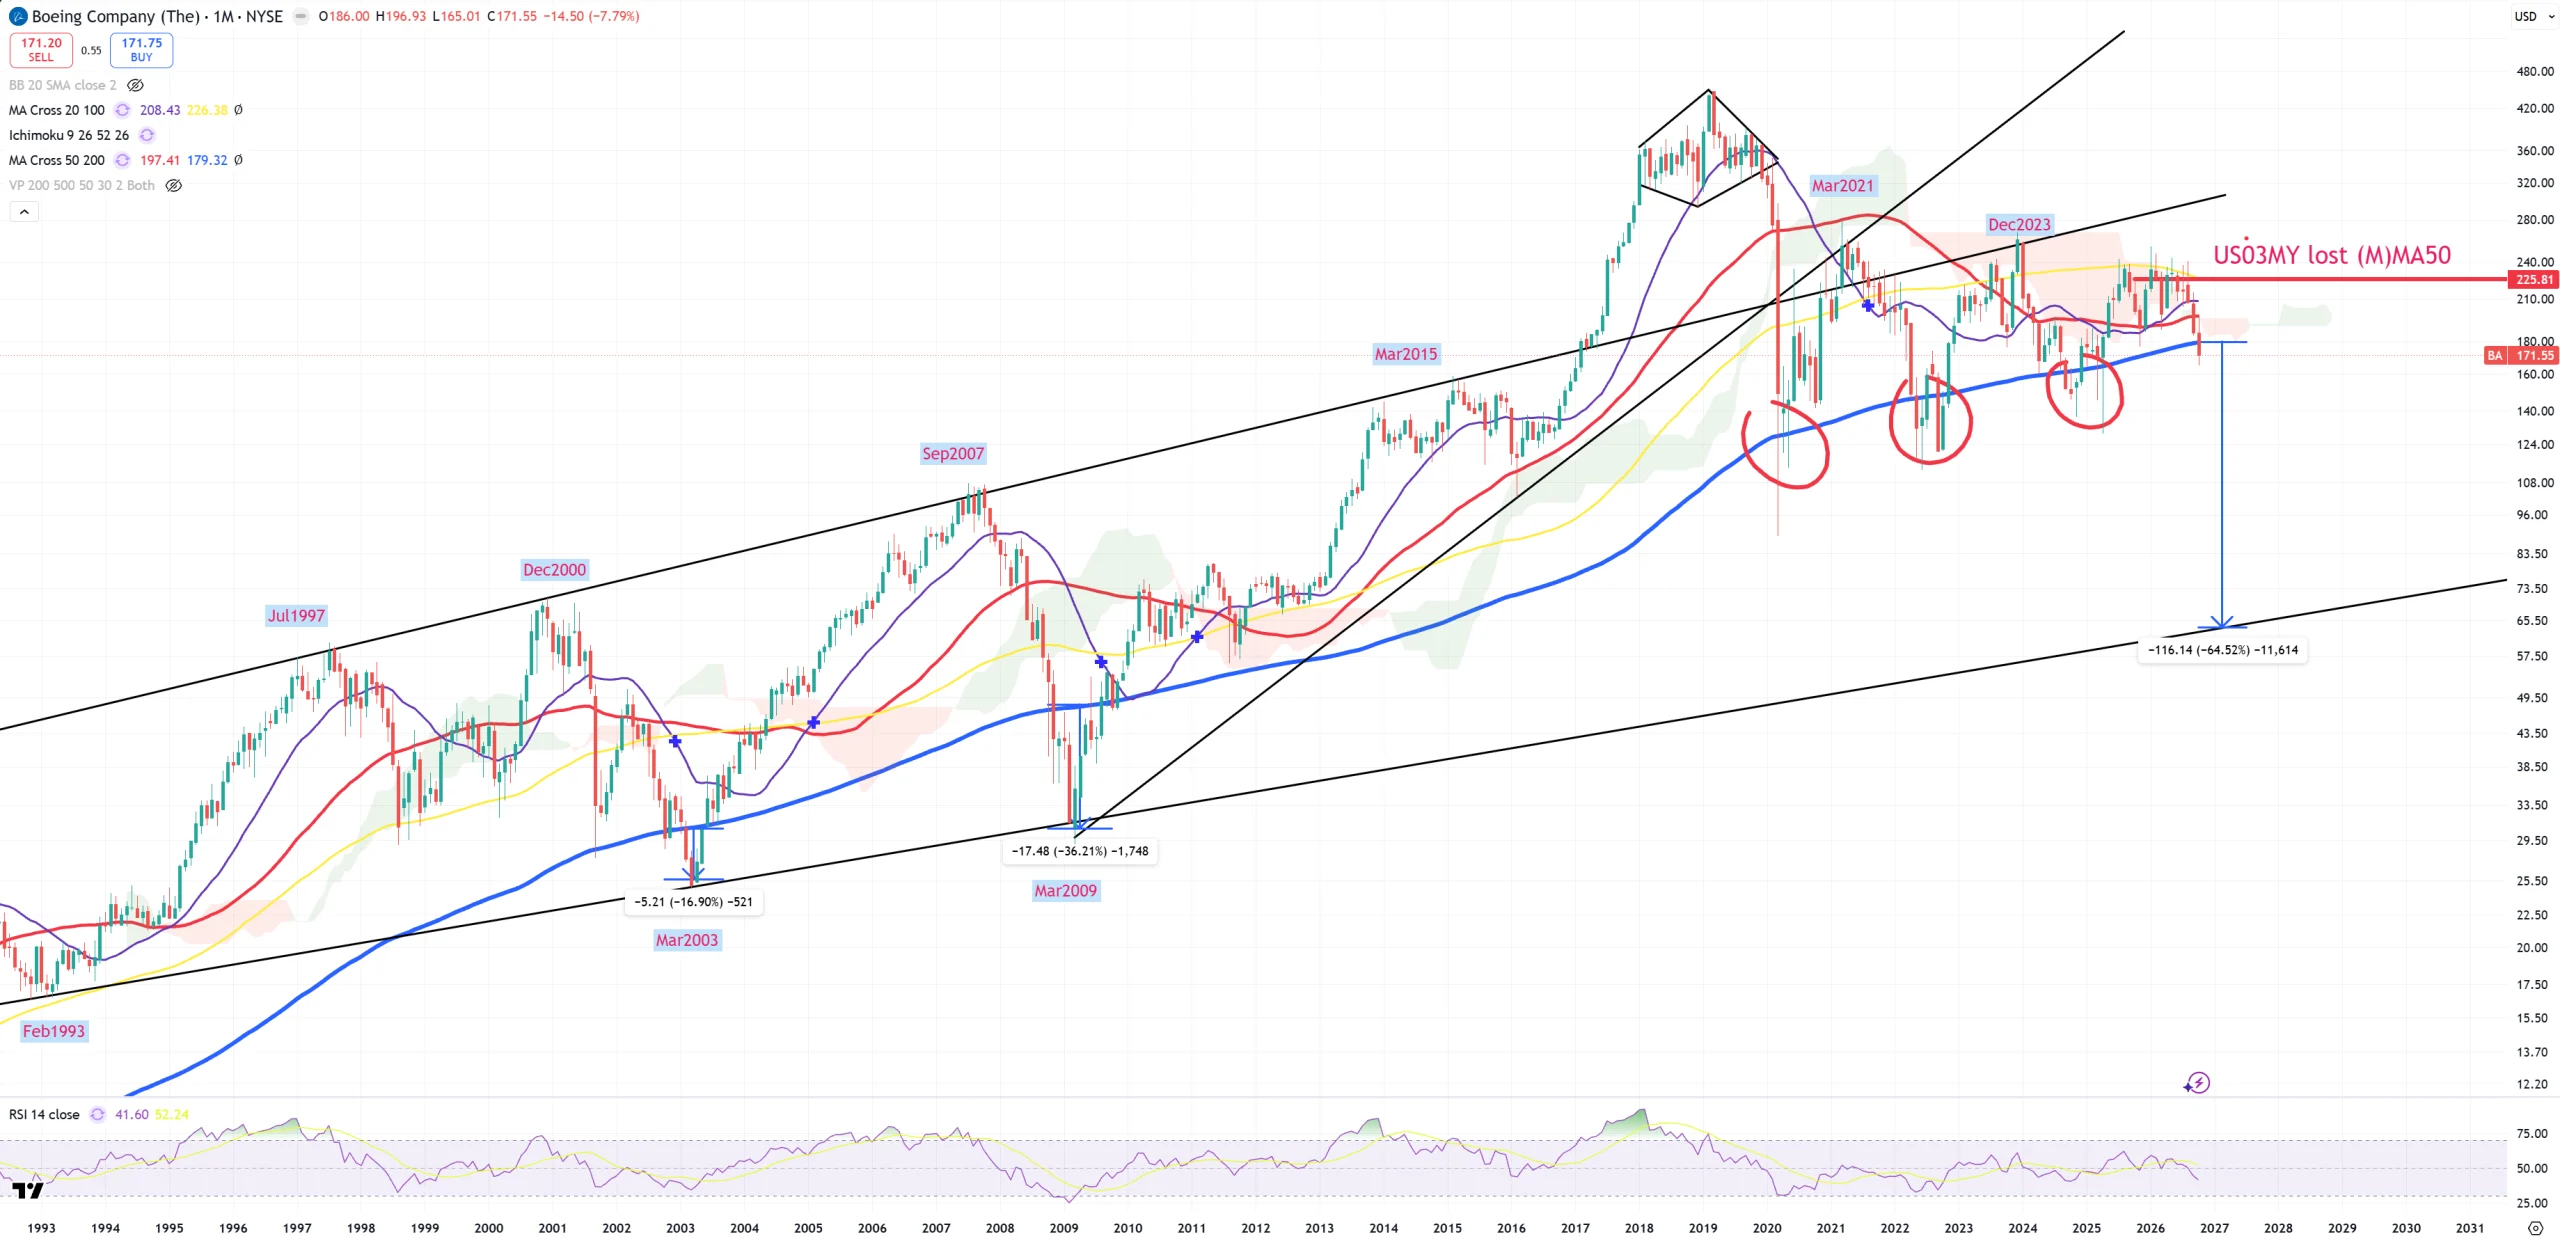
BA – Boeing – and 4th break of (M)MA200 opening another -65% drop to match lower trend line. I really LOVE Boeing’s chart, because its (M)MA200 permanent break was ALWAYS a confirmation bear market. We saved it 3 times so far and here comes the 4th. If the bear market hits and we won’t save this time (M)MA200 trend is 65$ what means -86% from its 446$ peak.
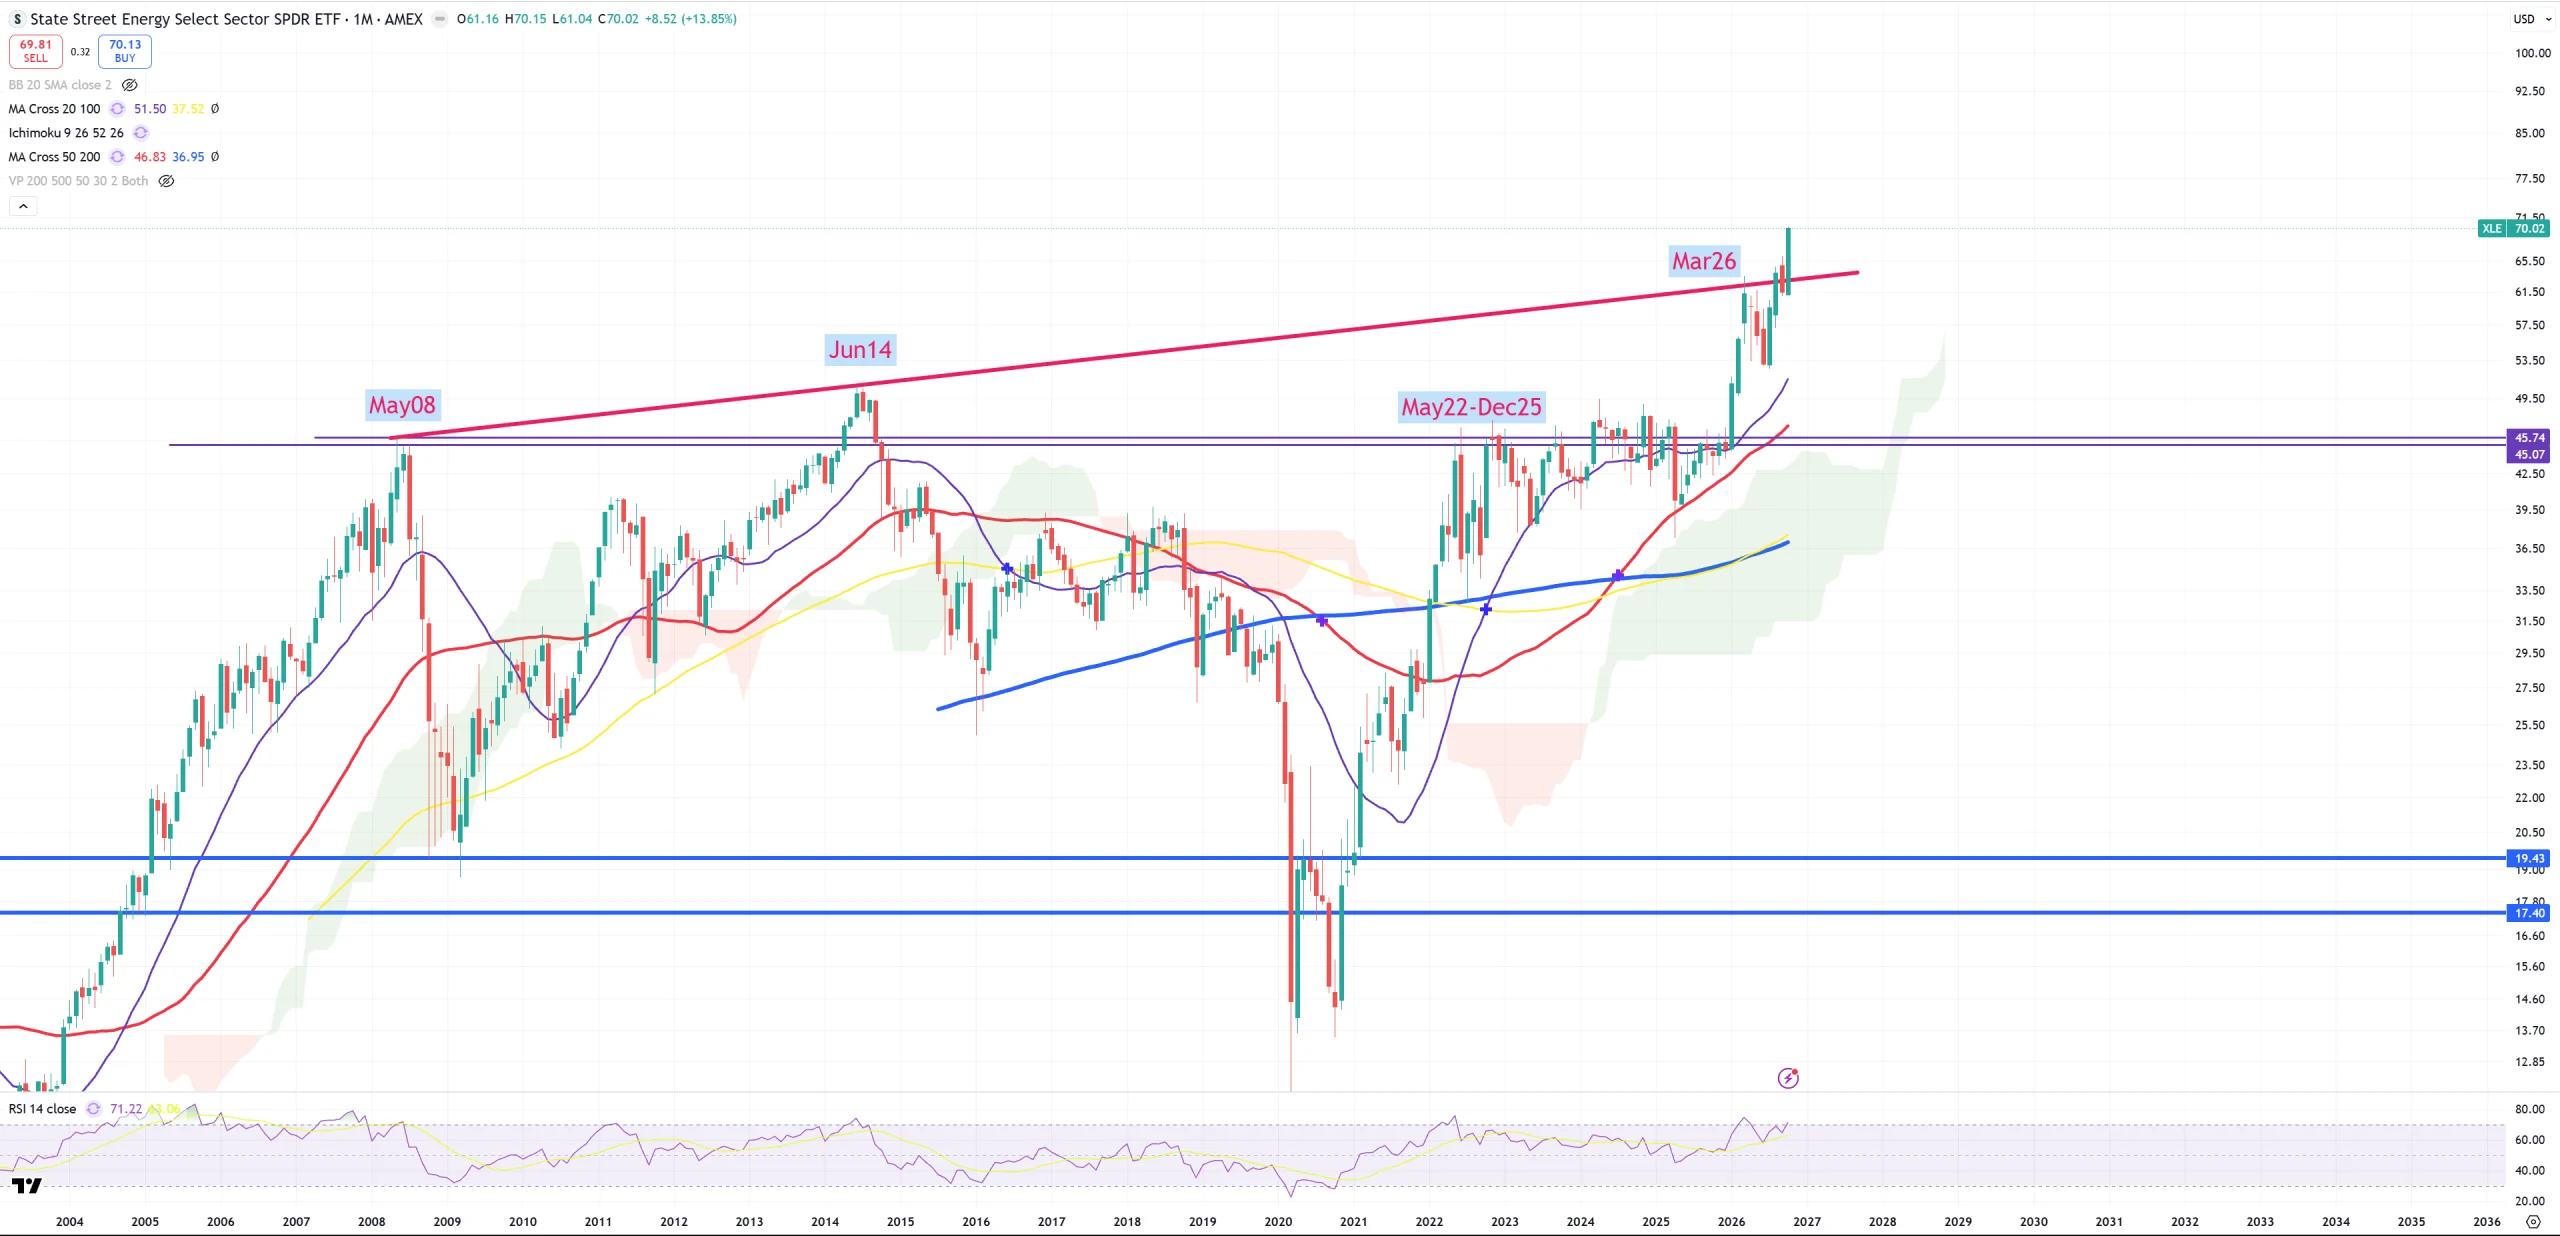
XLE – massive break of the key trend. In line with Value/Growth rotation
I don’t write summary of those charts in this month, you need to look on them and ask youself all the questions.