08/2026
September 1, 2026

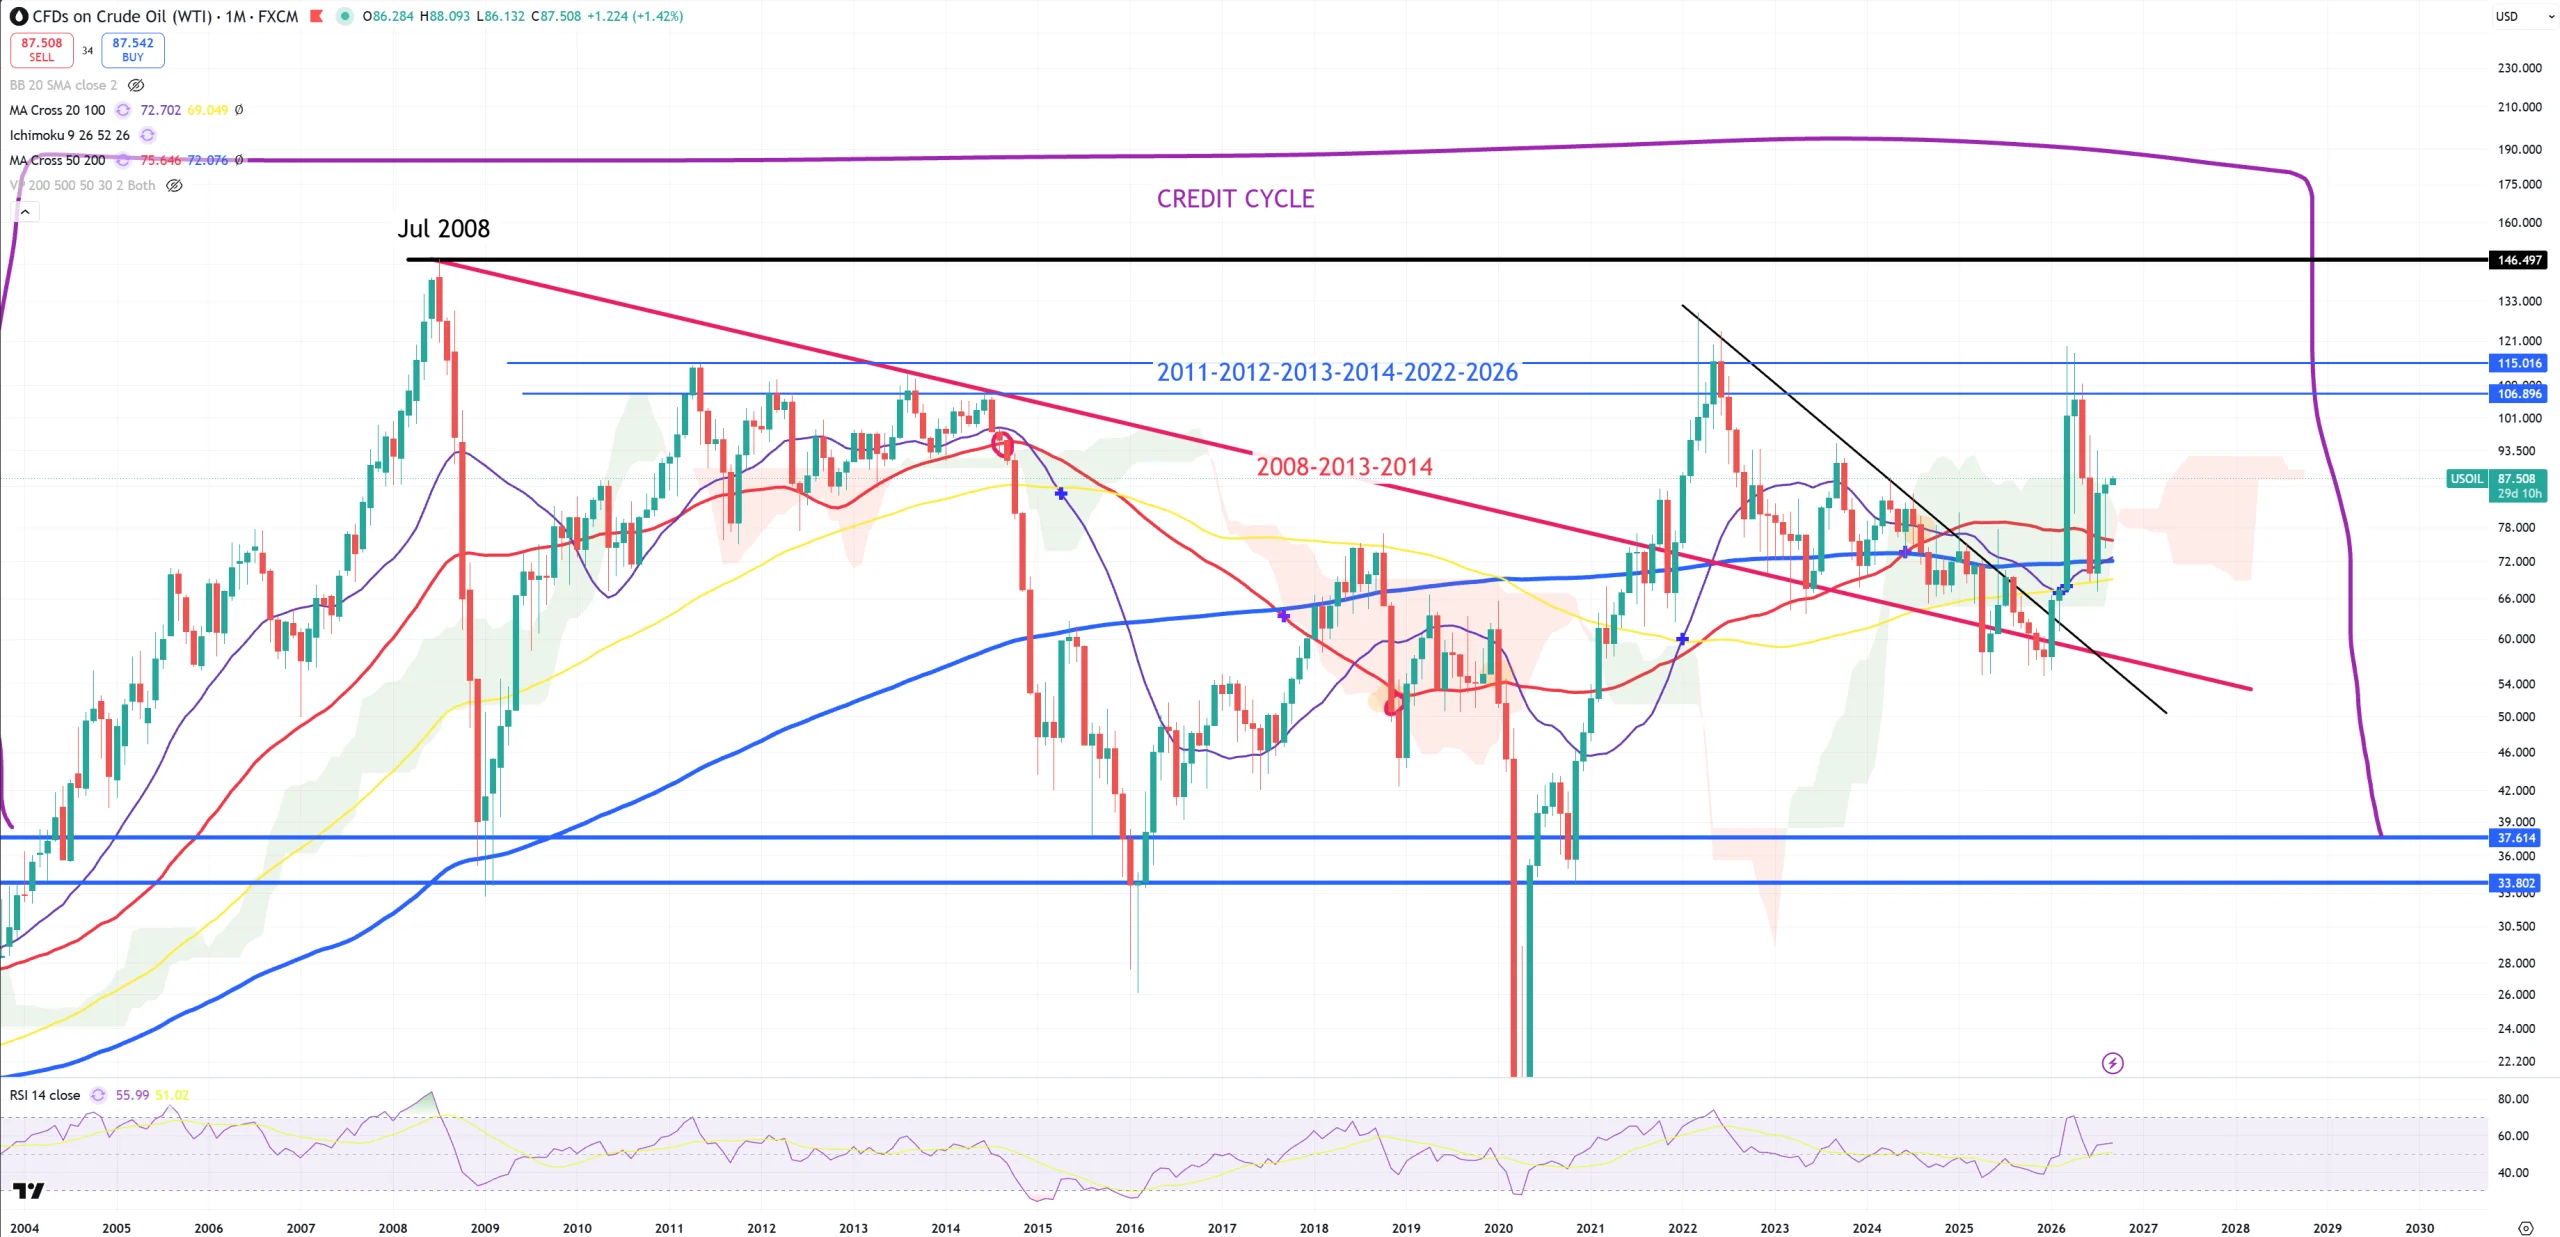
Another month passed and it looks like we finally backtested DJI/GOLD broken 1980-2011 trend and resumed down with gold bottom around 3900$. While SPX/GOLD another cycle indicator fights again with its (3M)MA200 but it needs September to close 3M candle. 10y/3m ends with +90bps. US30Y closed on broken support and Diesel broke 2008 resistance for the first time ever. While AI trade is in, SOX can’t really catch a sign of a life. Iran keeps winning what was written in DJI/GOLD & SPX/GOLD charts. Looks like we’re going to see massive OIL spike, as now some limiters which were capping oil on 110-115$ levels have gone and just like I was an oil bear around 110-115$, now I’m an oil bull and I think we can easily break this level this time. Let’s start with charts of the month.
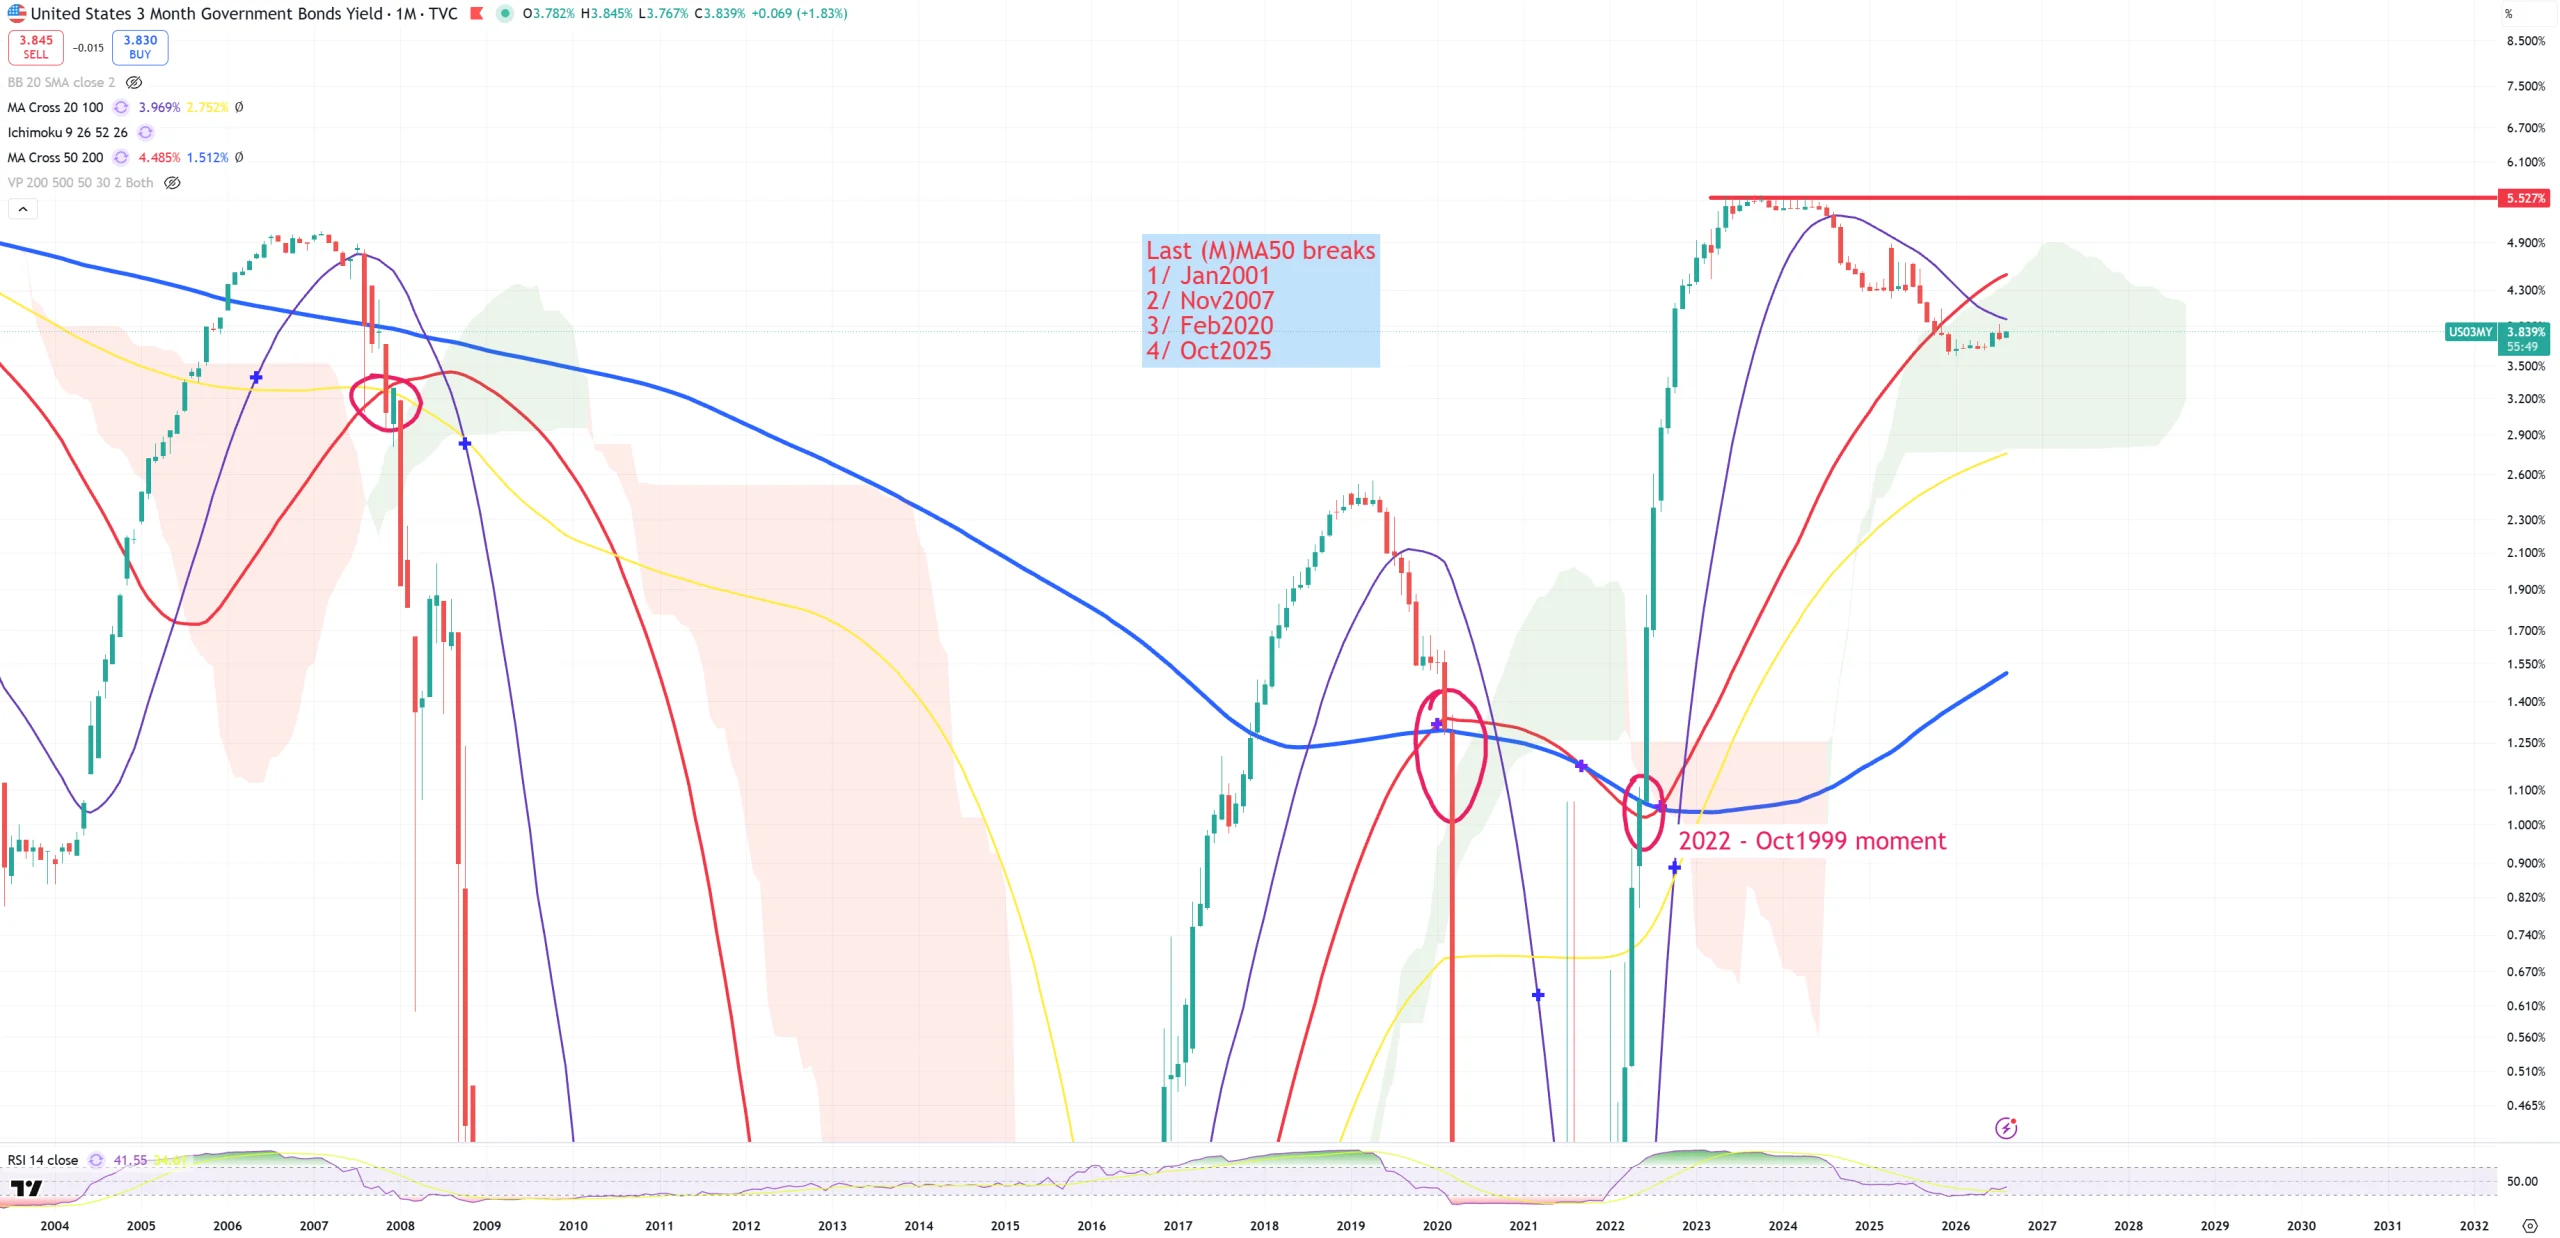
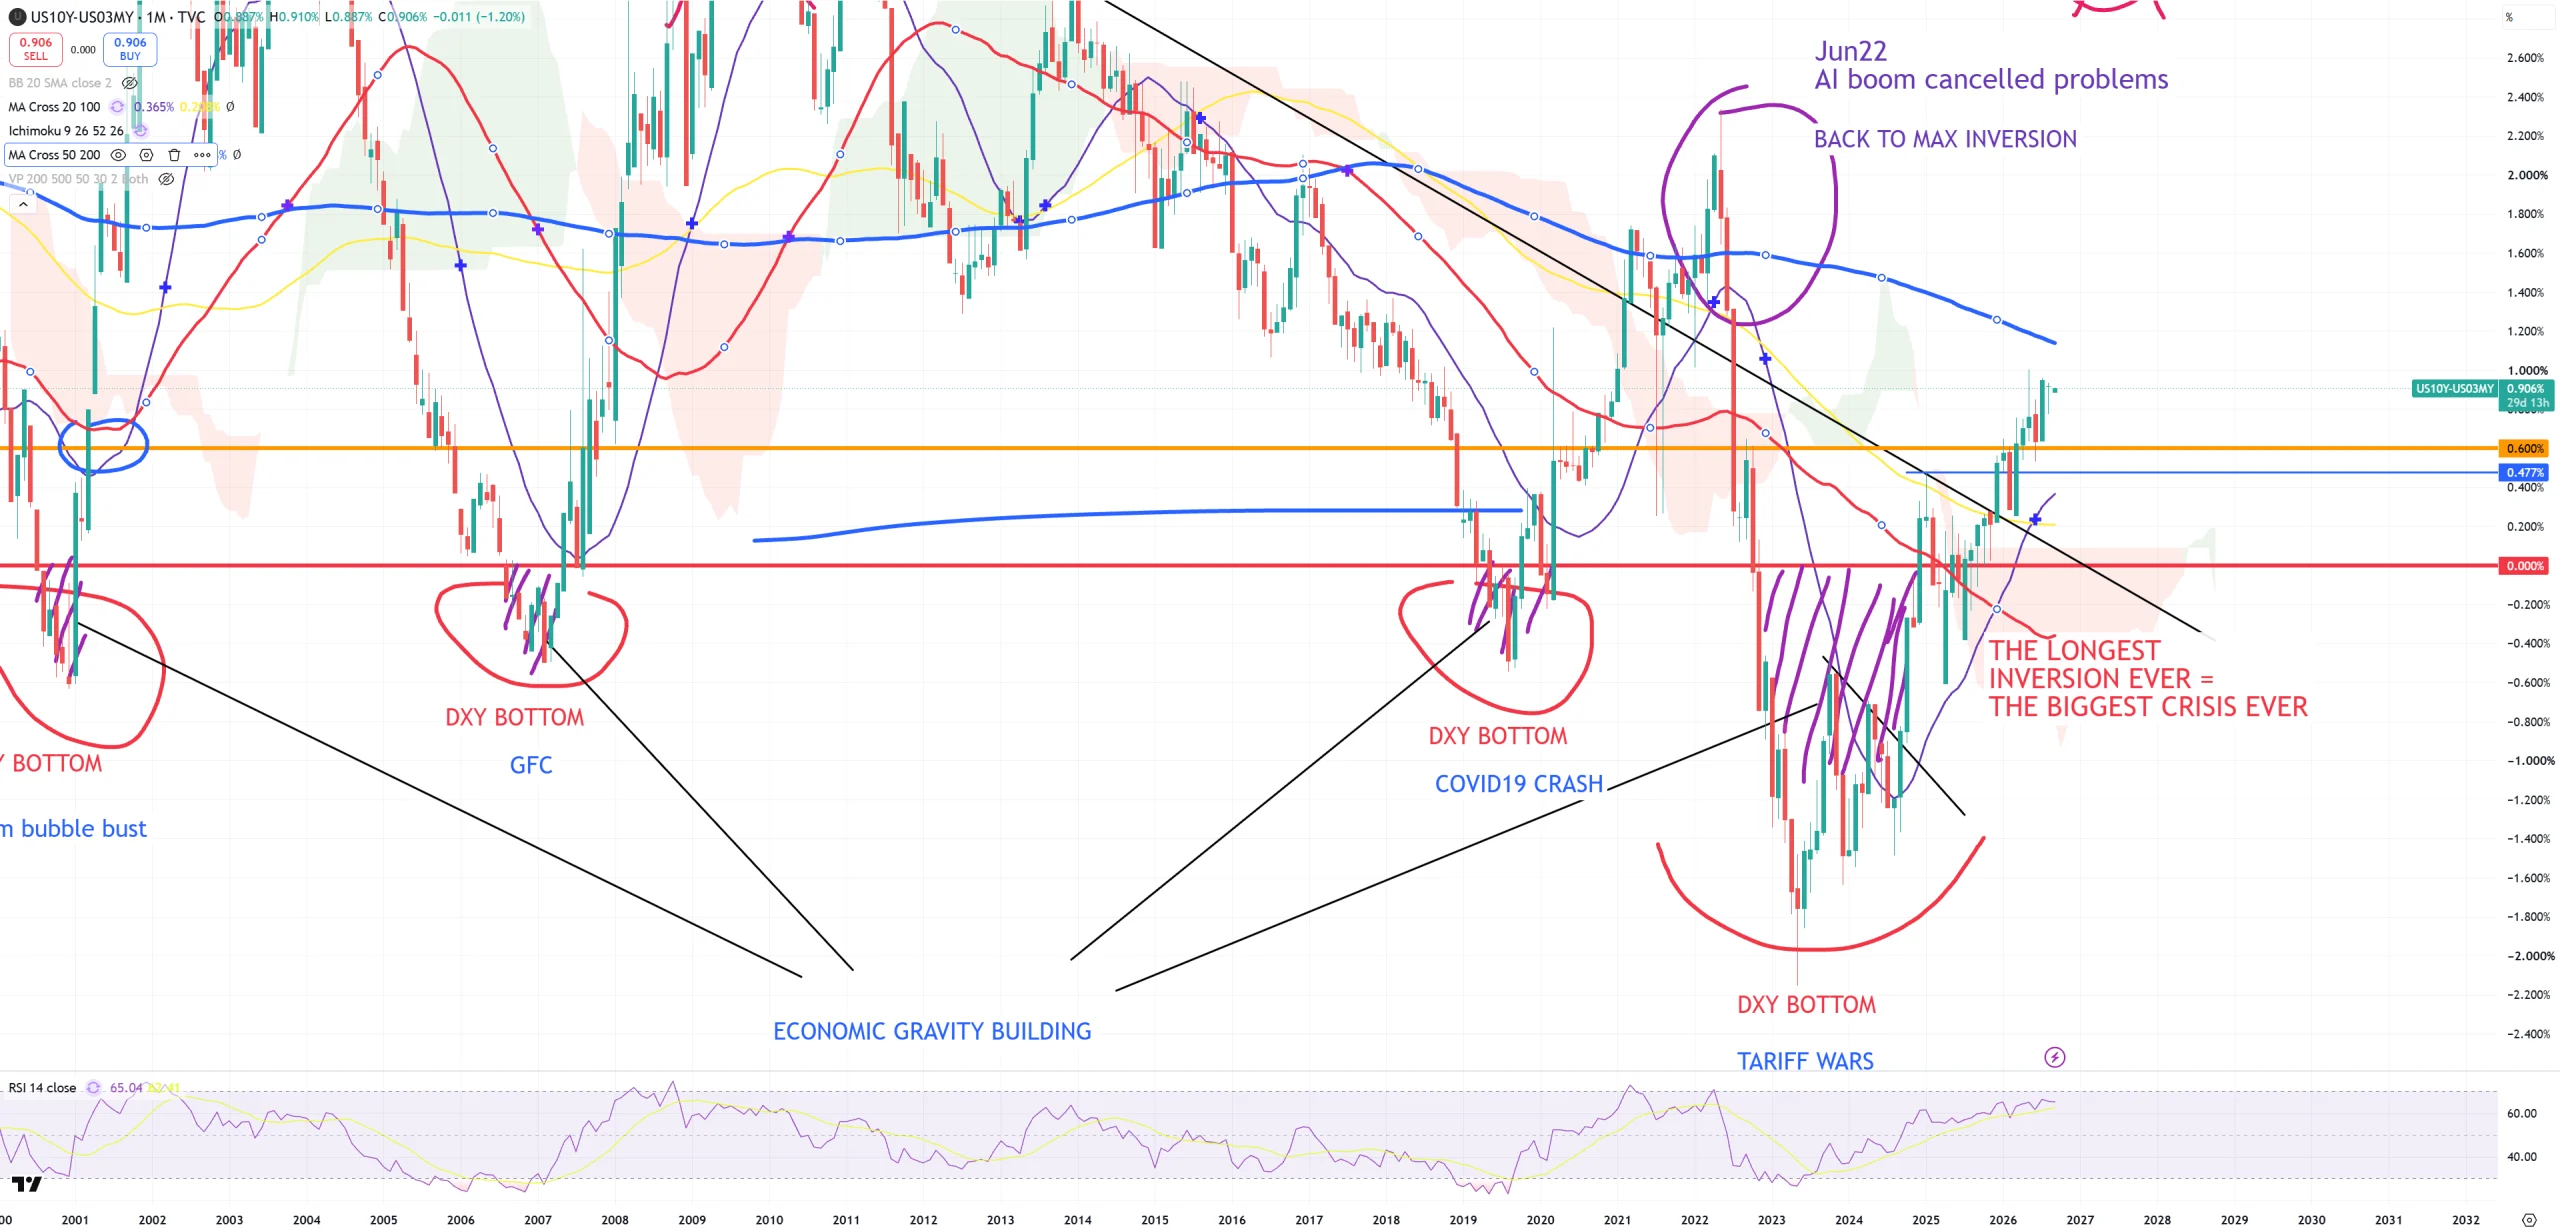
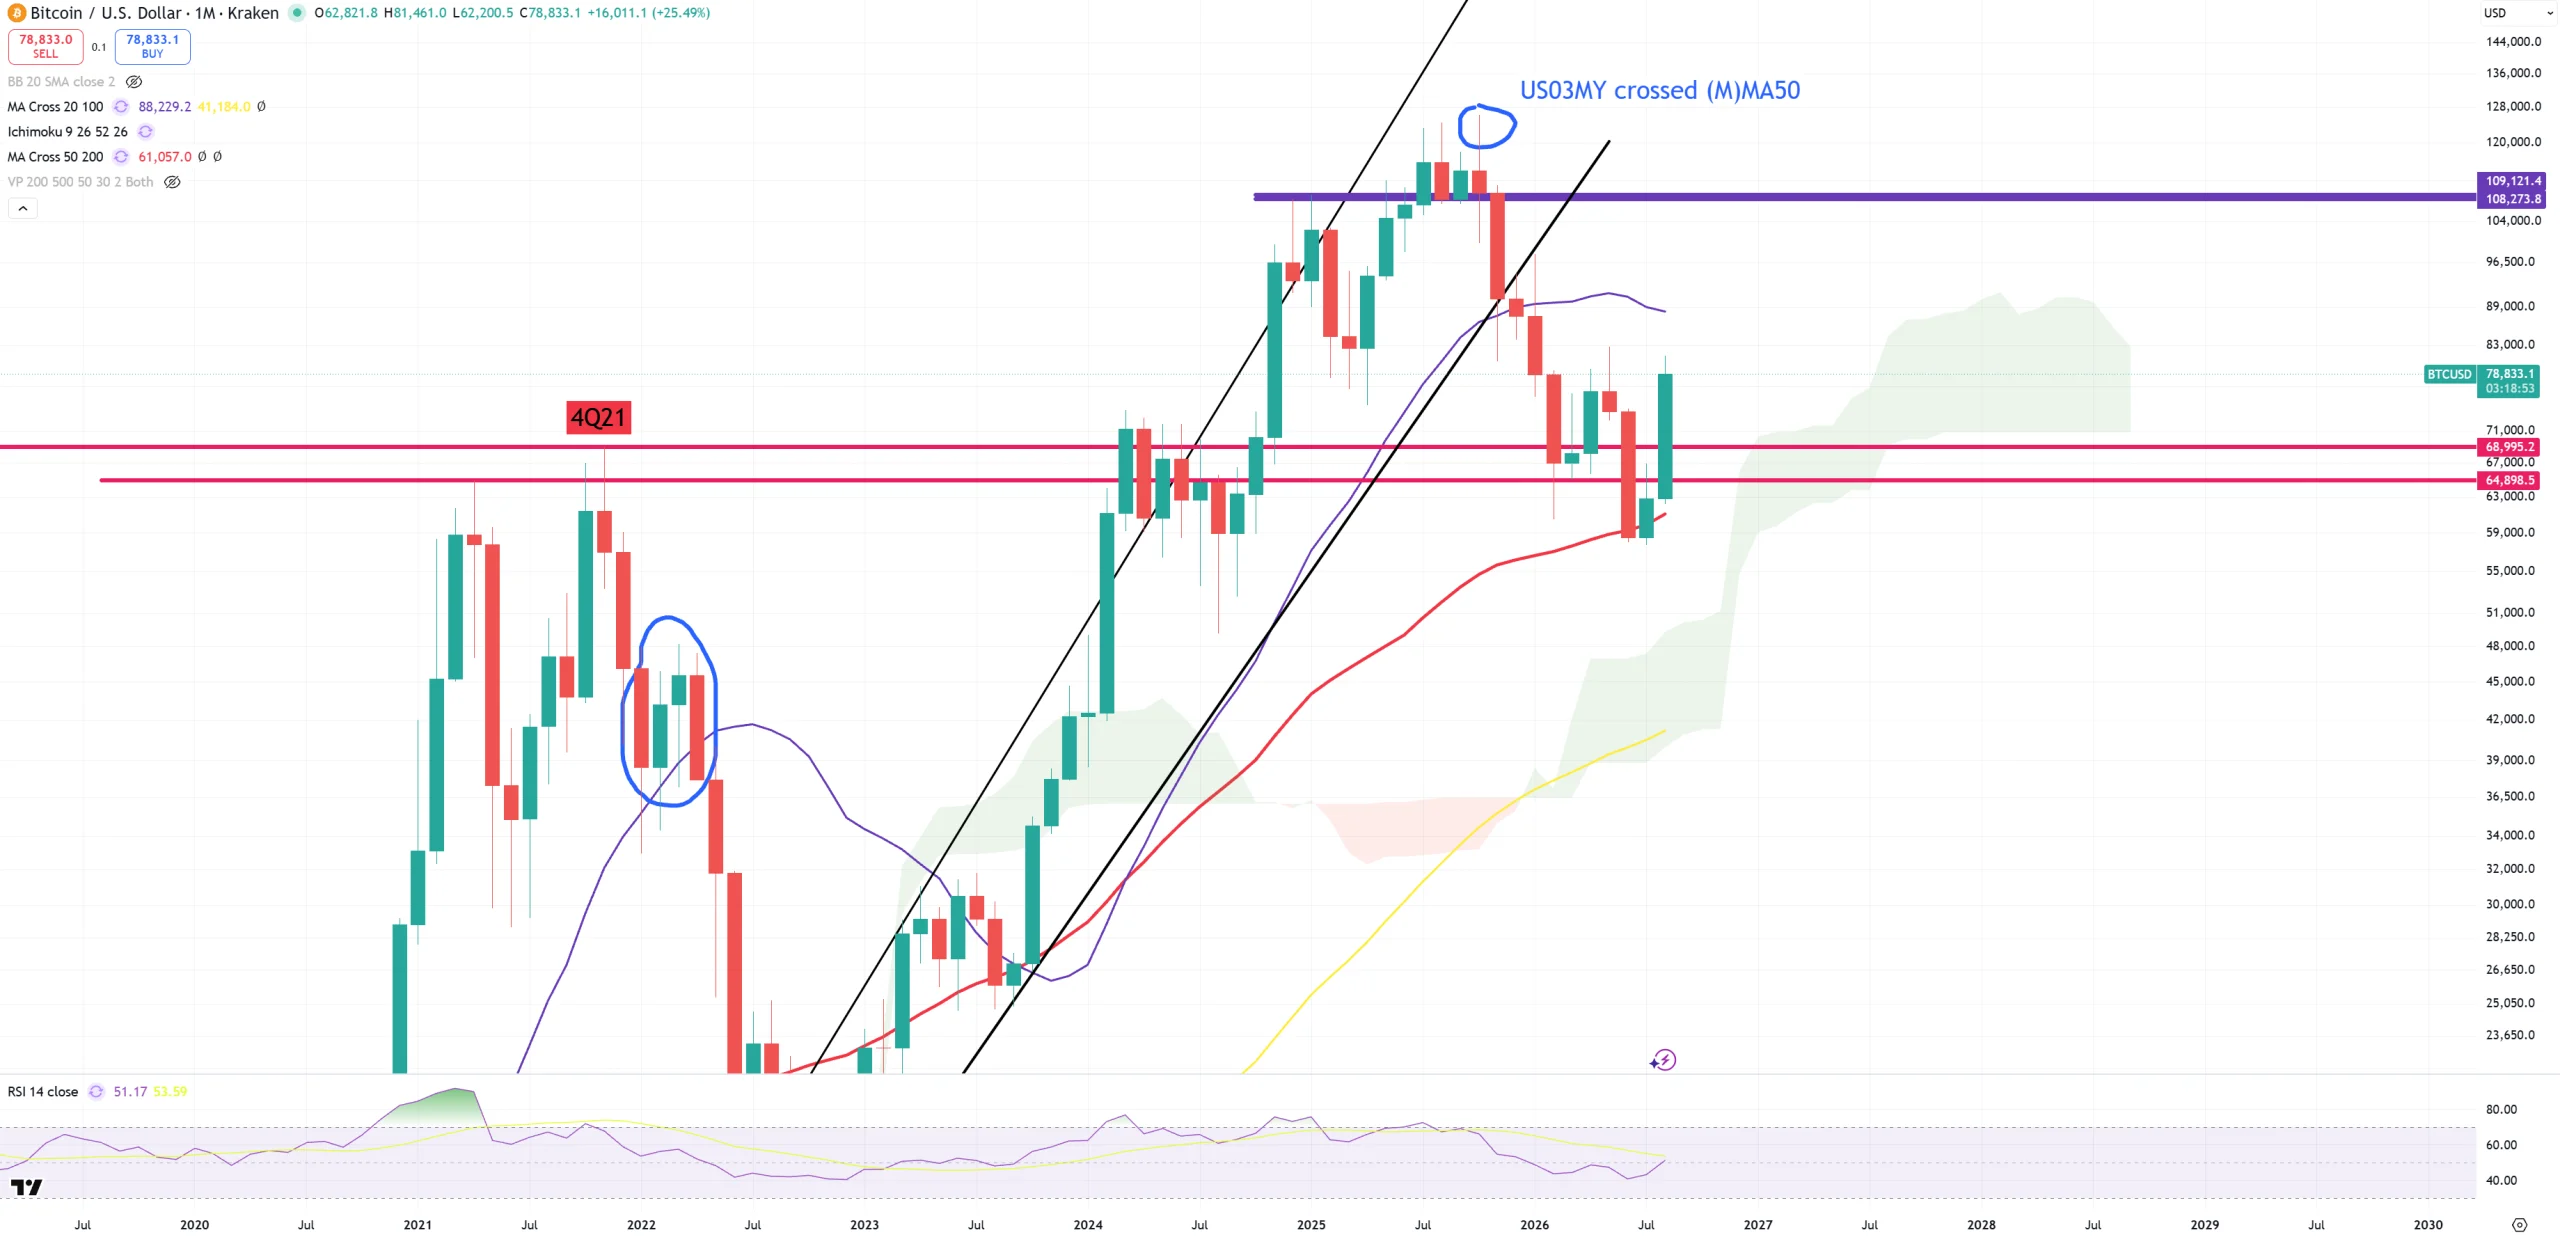
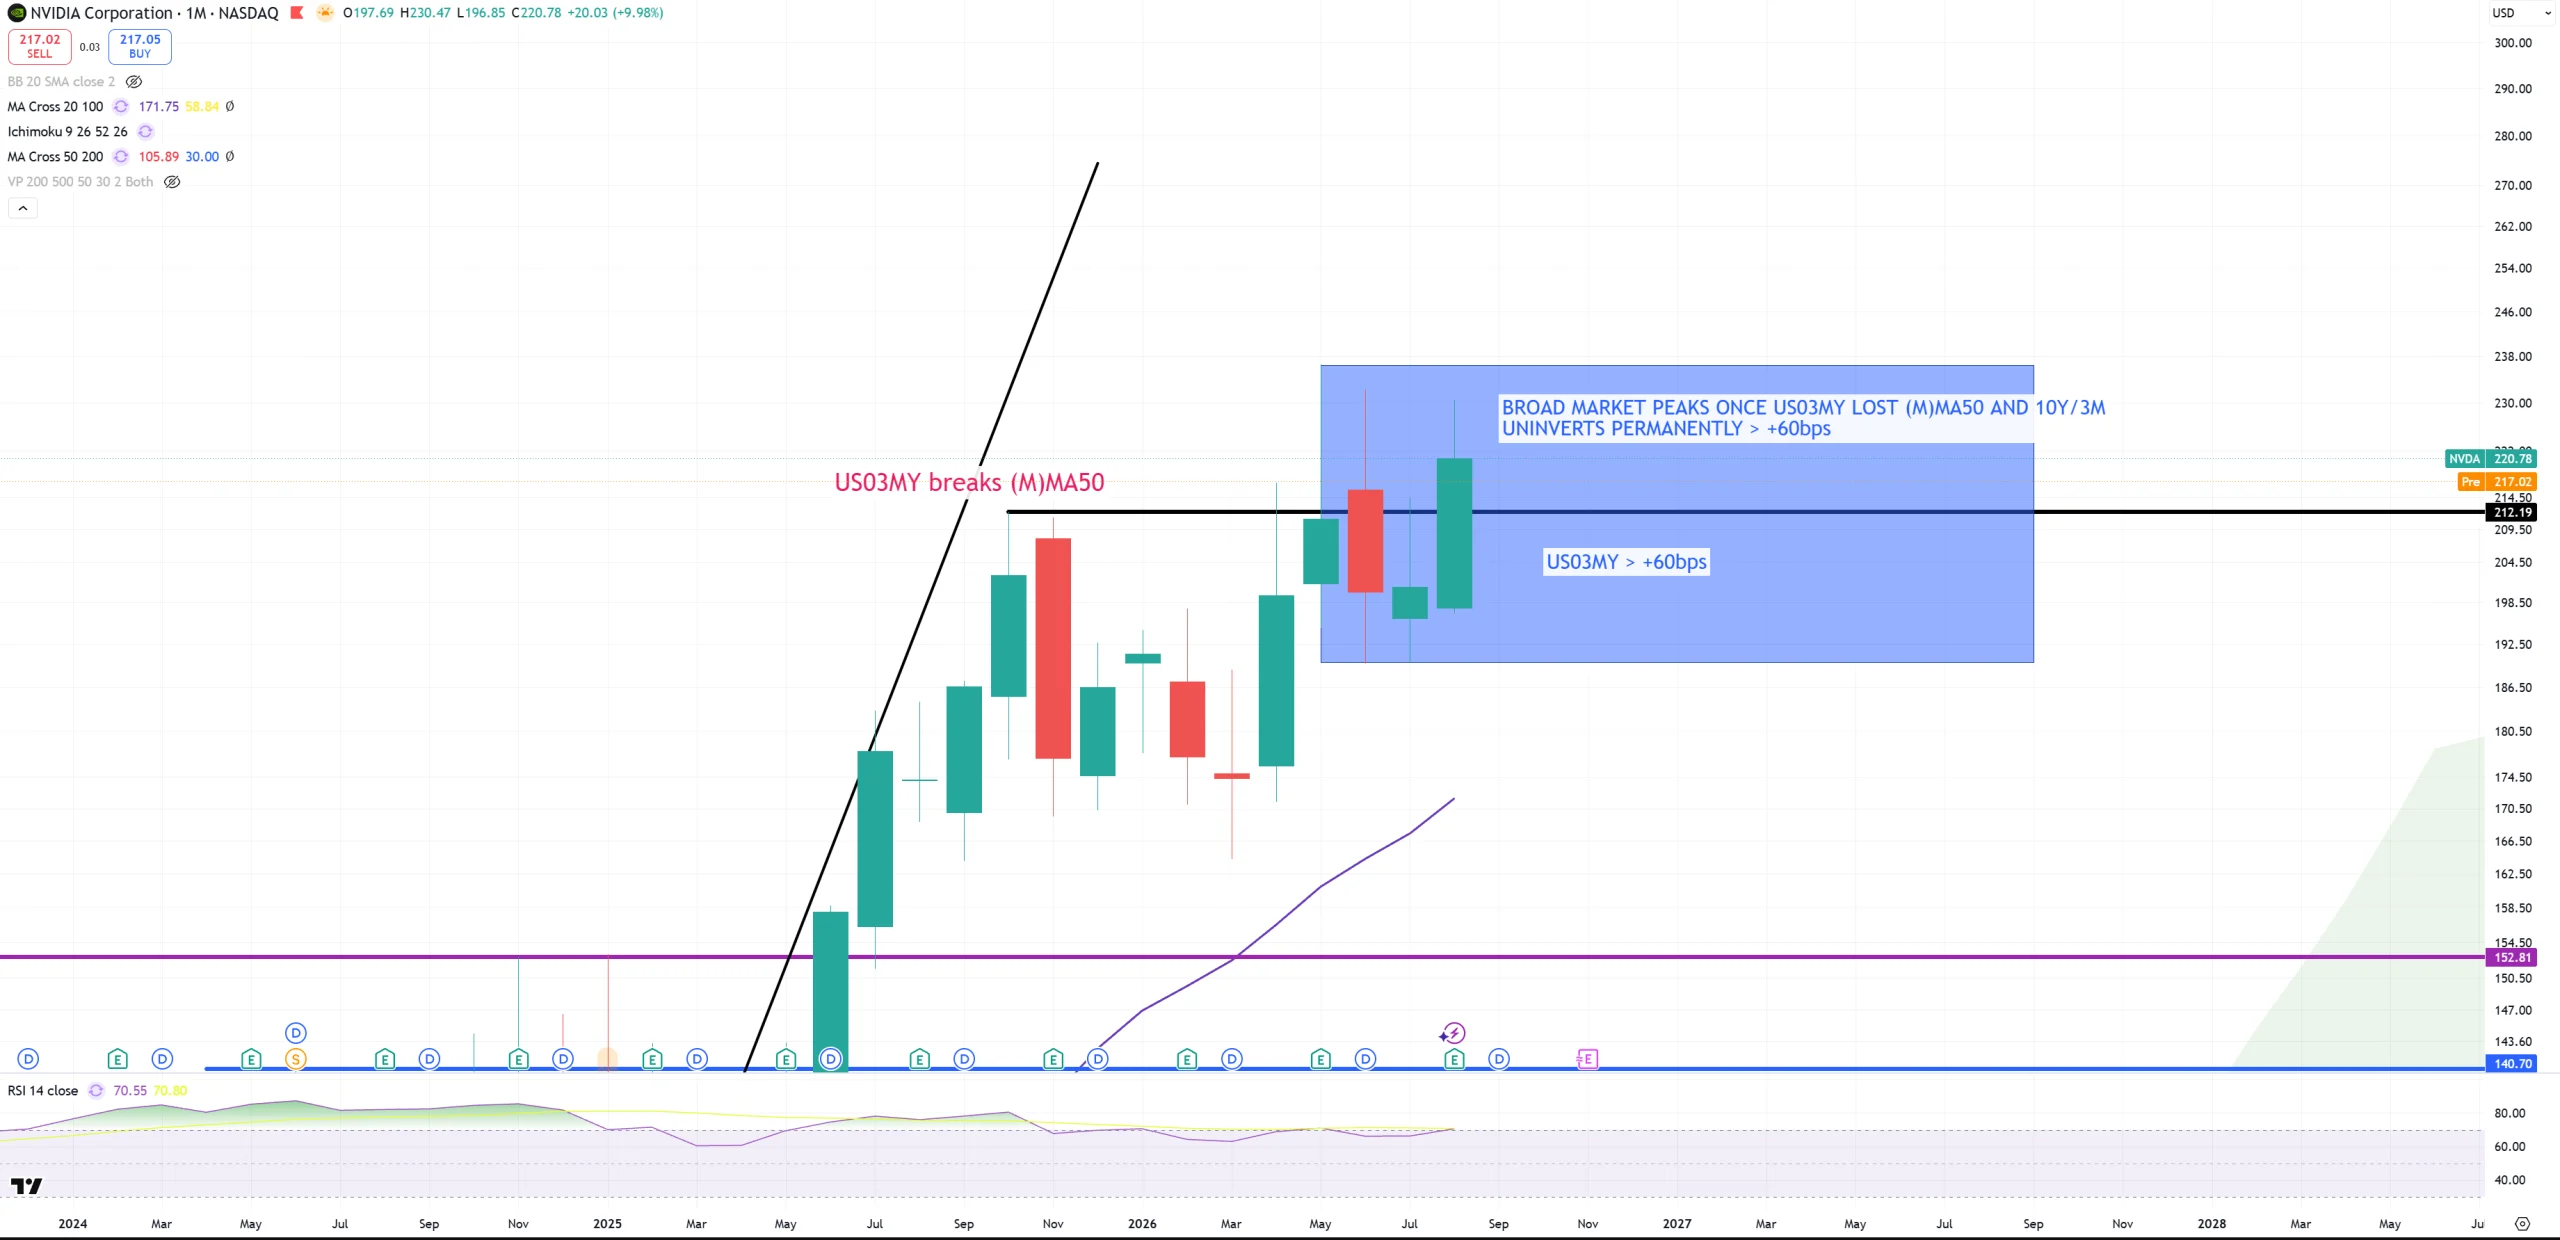
Broad market peaks once US03MY lost (M)MA50 and 10y/3m permanently uninverts > +60bps -> That’s my theory. In reality this theory was a bit enhanced with some 10y/2y mix to get my new tradingview indicator which is being tested. After lots of analysis with AI I wanted to eliminate based just on 10y/3m, 10y/2y and us03my move below (M)MA50 all periods where we had corrections (SPX holds (M)MA50). The signal turned ON around April/May 2026.

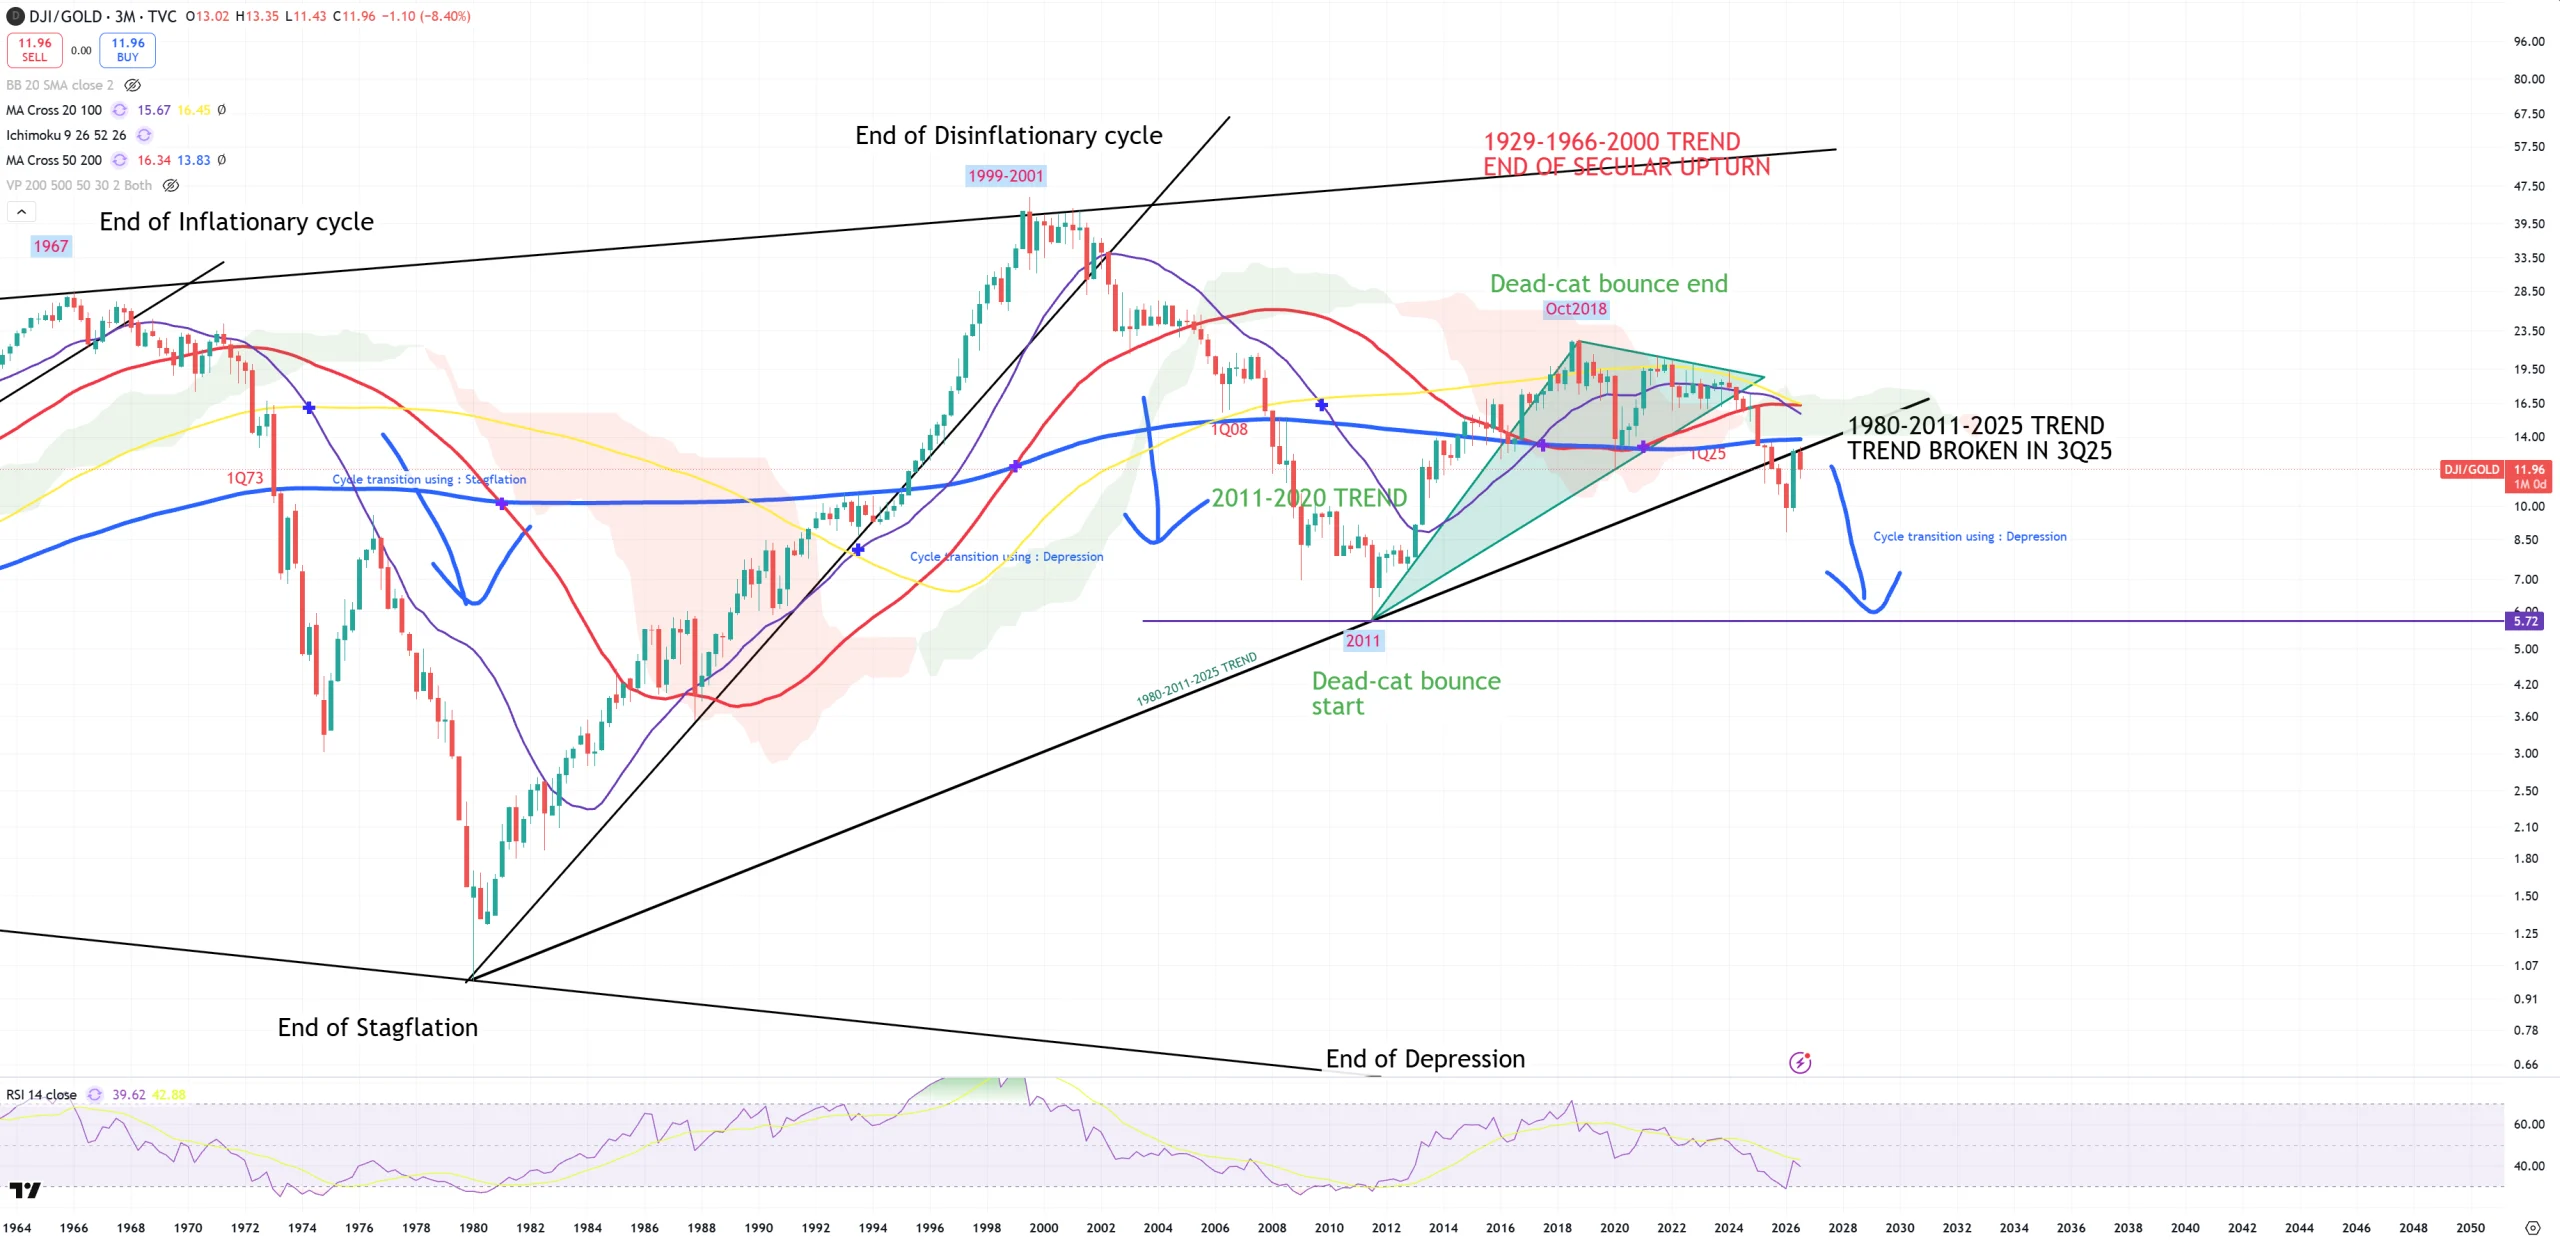
DJI/GOLD & SPX/GOLD are two cycle indicators. Once (3M)MA200 was broken down we had the worst possible economic crisies. 1931, 1937, 1973, 2008, 2025. Year 2025+ is weird because DJI/GOLD does not match SPX/GOLD 1:1 as it always does.
Charts in this report (89)
DJI/GOLD – not sure which chart I wanted to post first. This one or US30Y or Diesel, but because we talk about “cycles” DJI/GOLD should be posted first. We see perfect retest to 1980-2011 trend line and rejection, so gold outperforms stocks again. Retest came in once gold was around 3950$. This is 3M view.
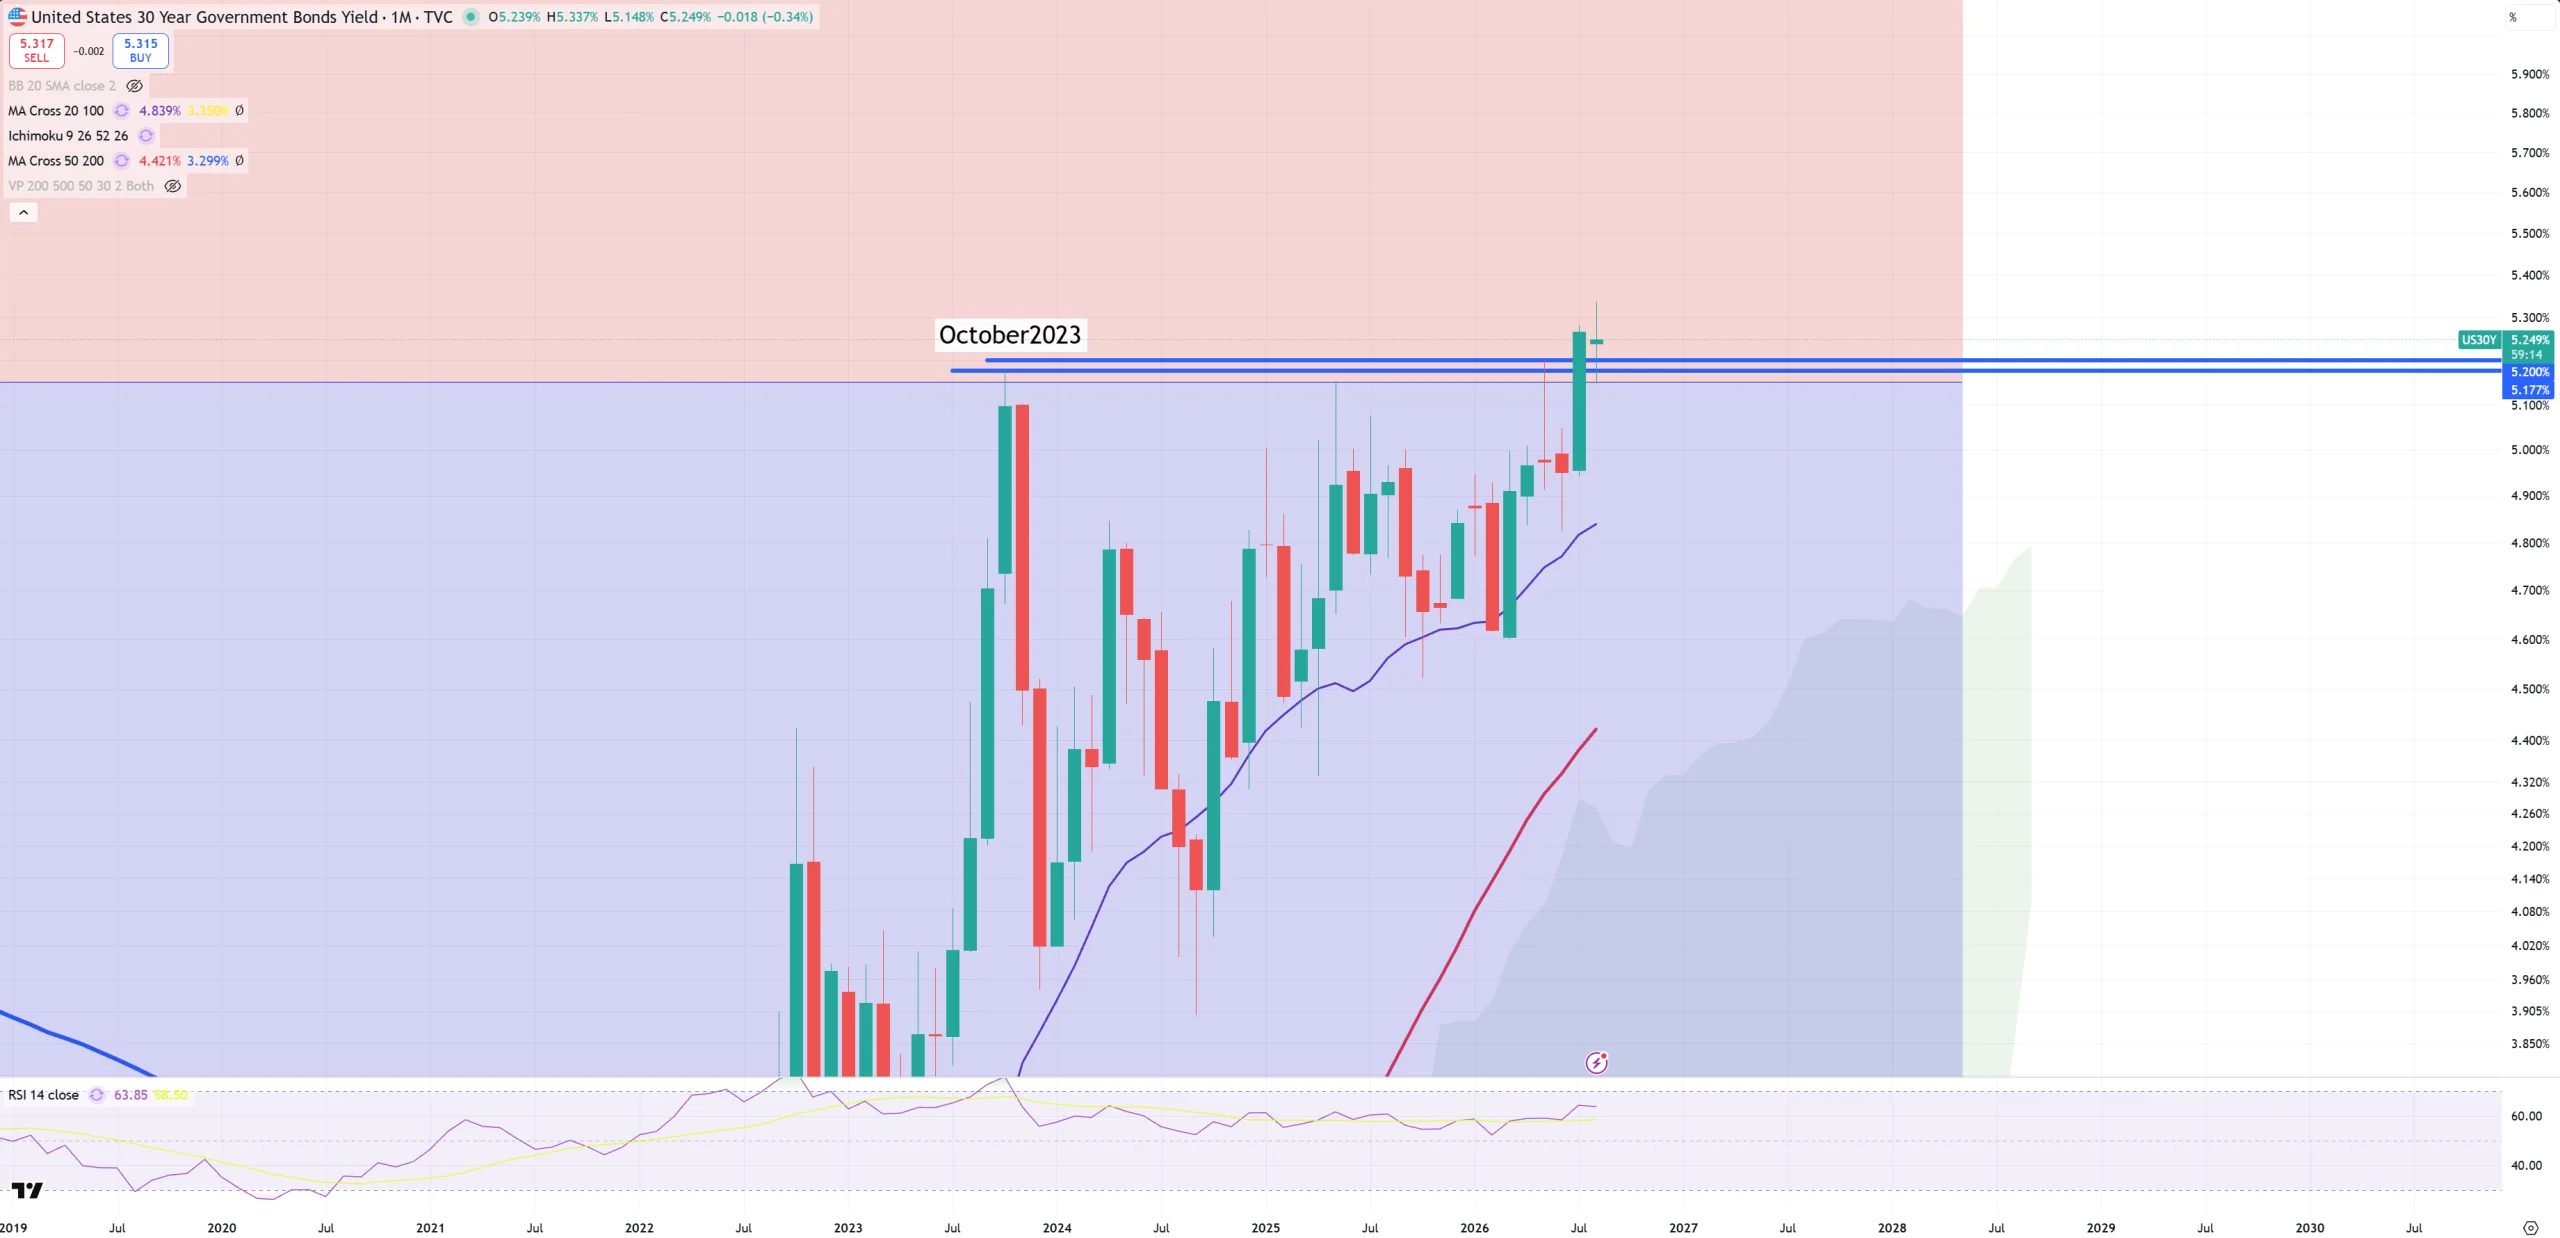
US30Y – long end bonds managed to break key October 2023 level and it looks like yields want to go … higher
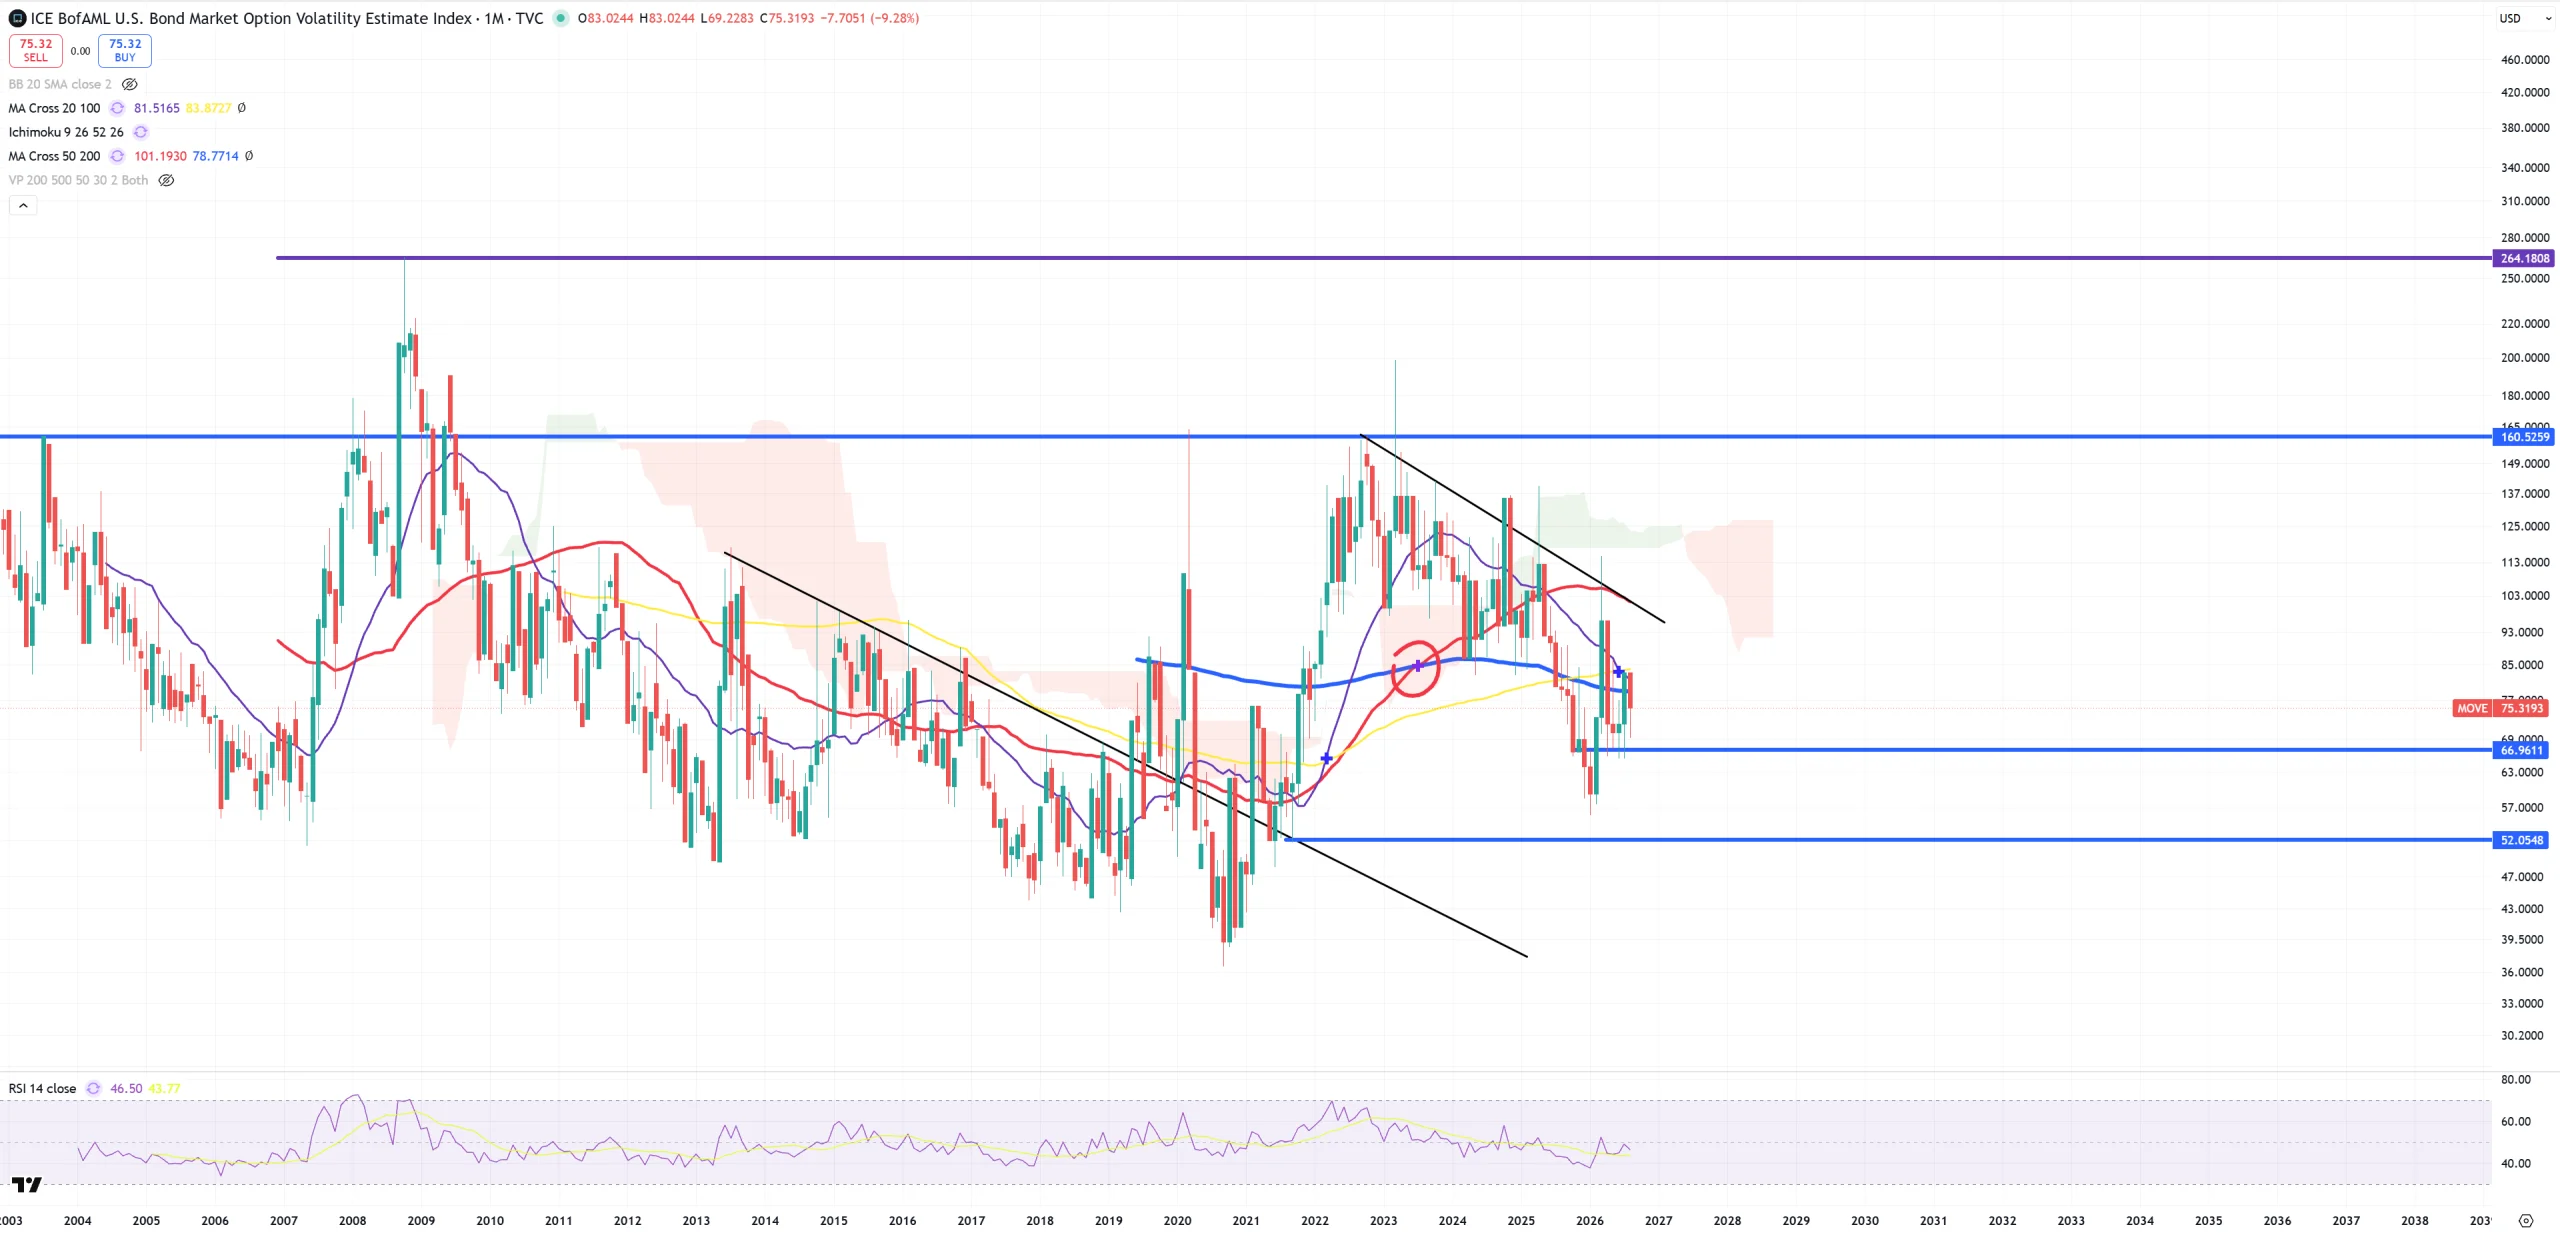
MOVE – index is upside down vs US30Y, but I expect this blue (M)MA200 will be held.
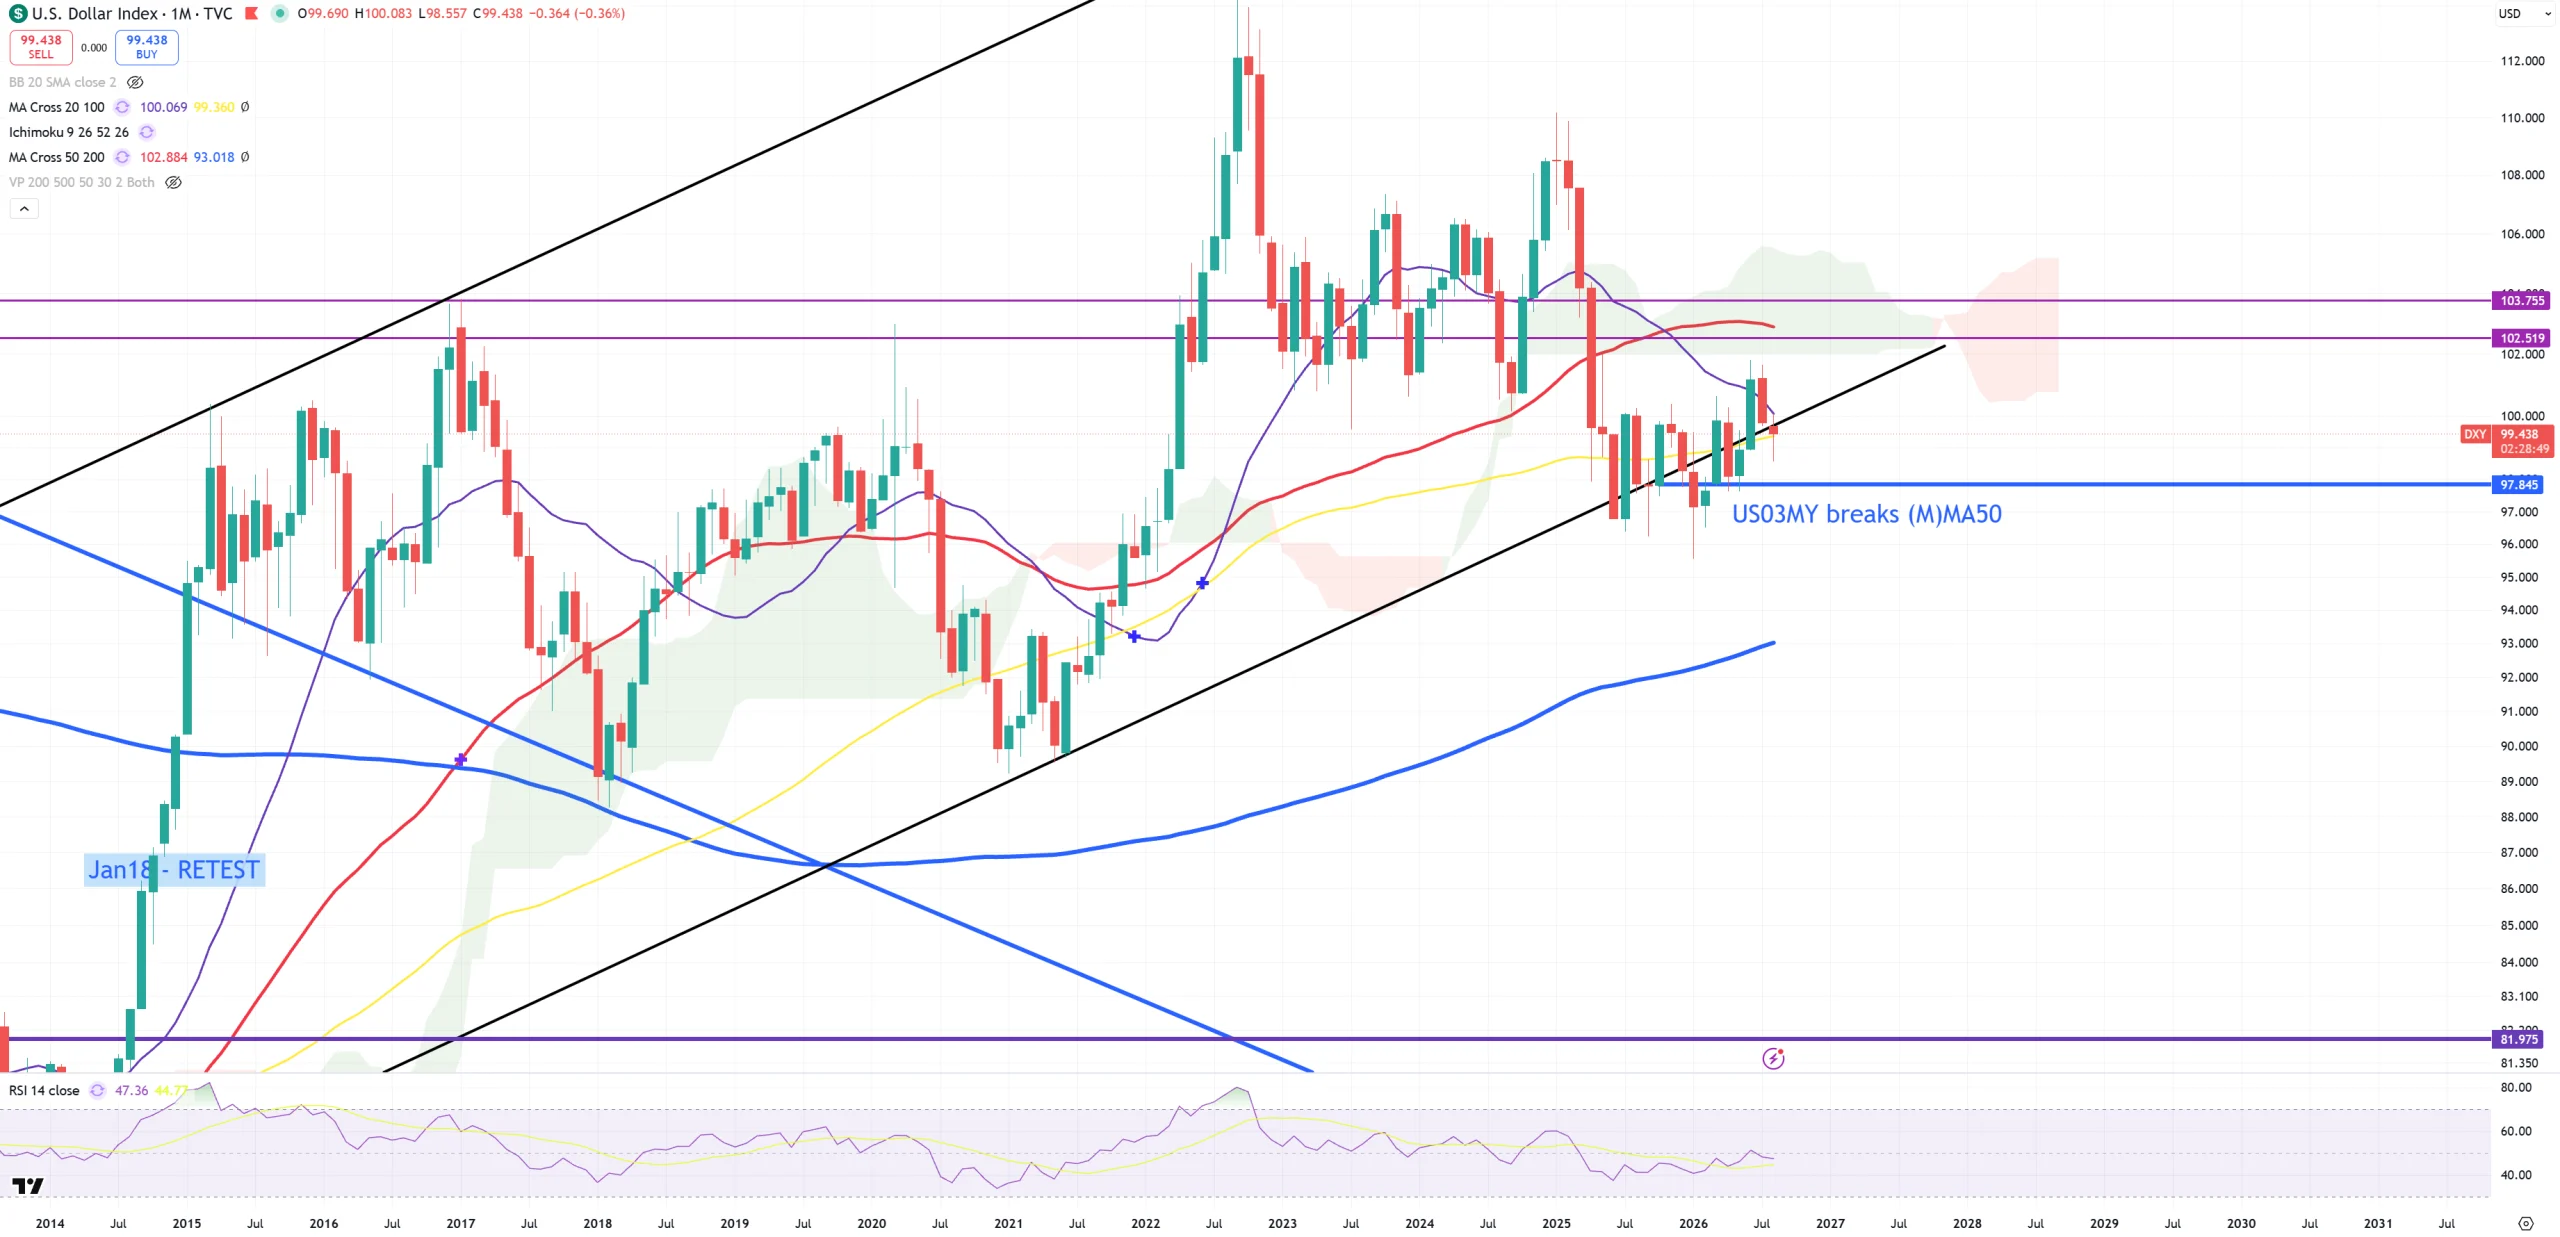
DXY – holds above yellow (M)MA100 sliding on the trend like never before
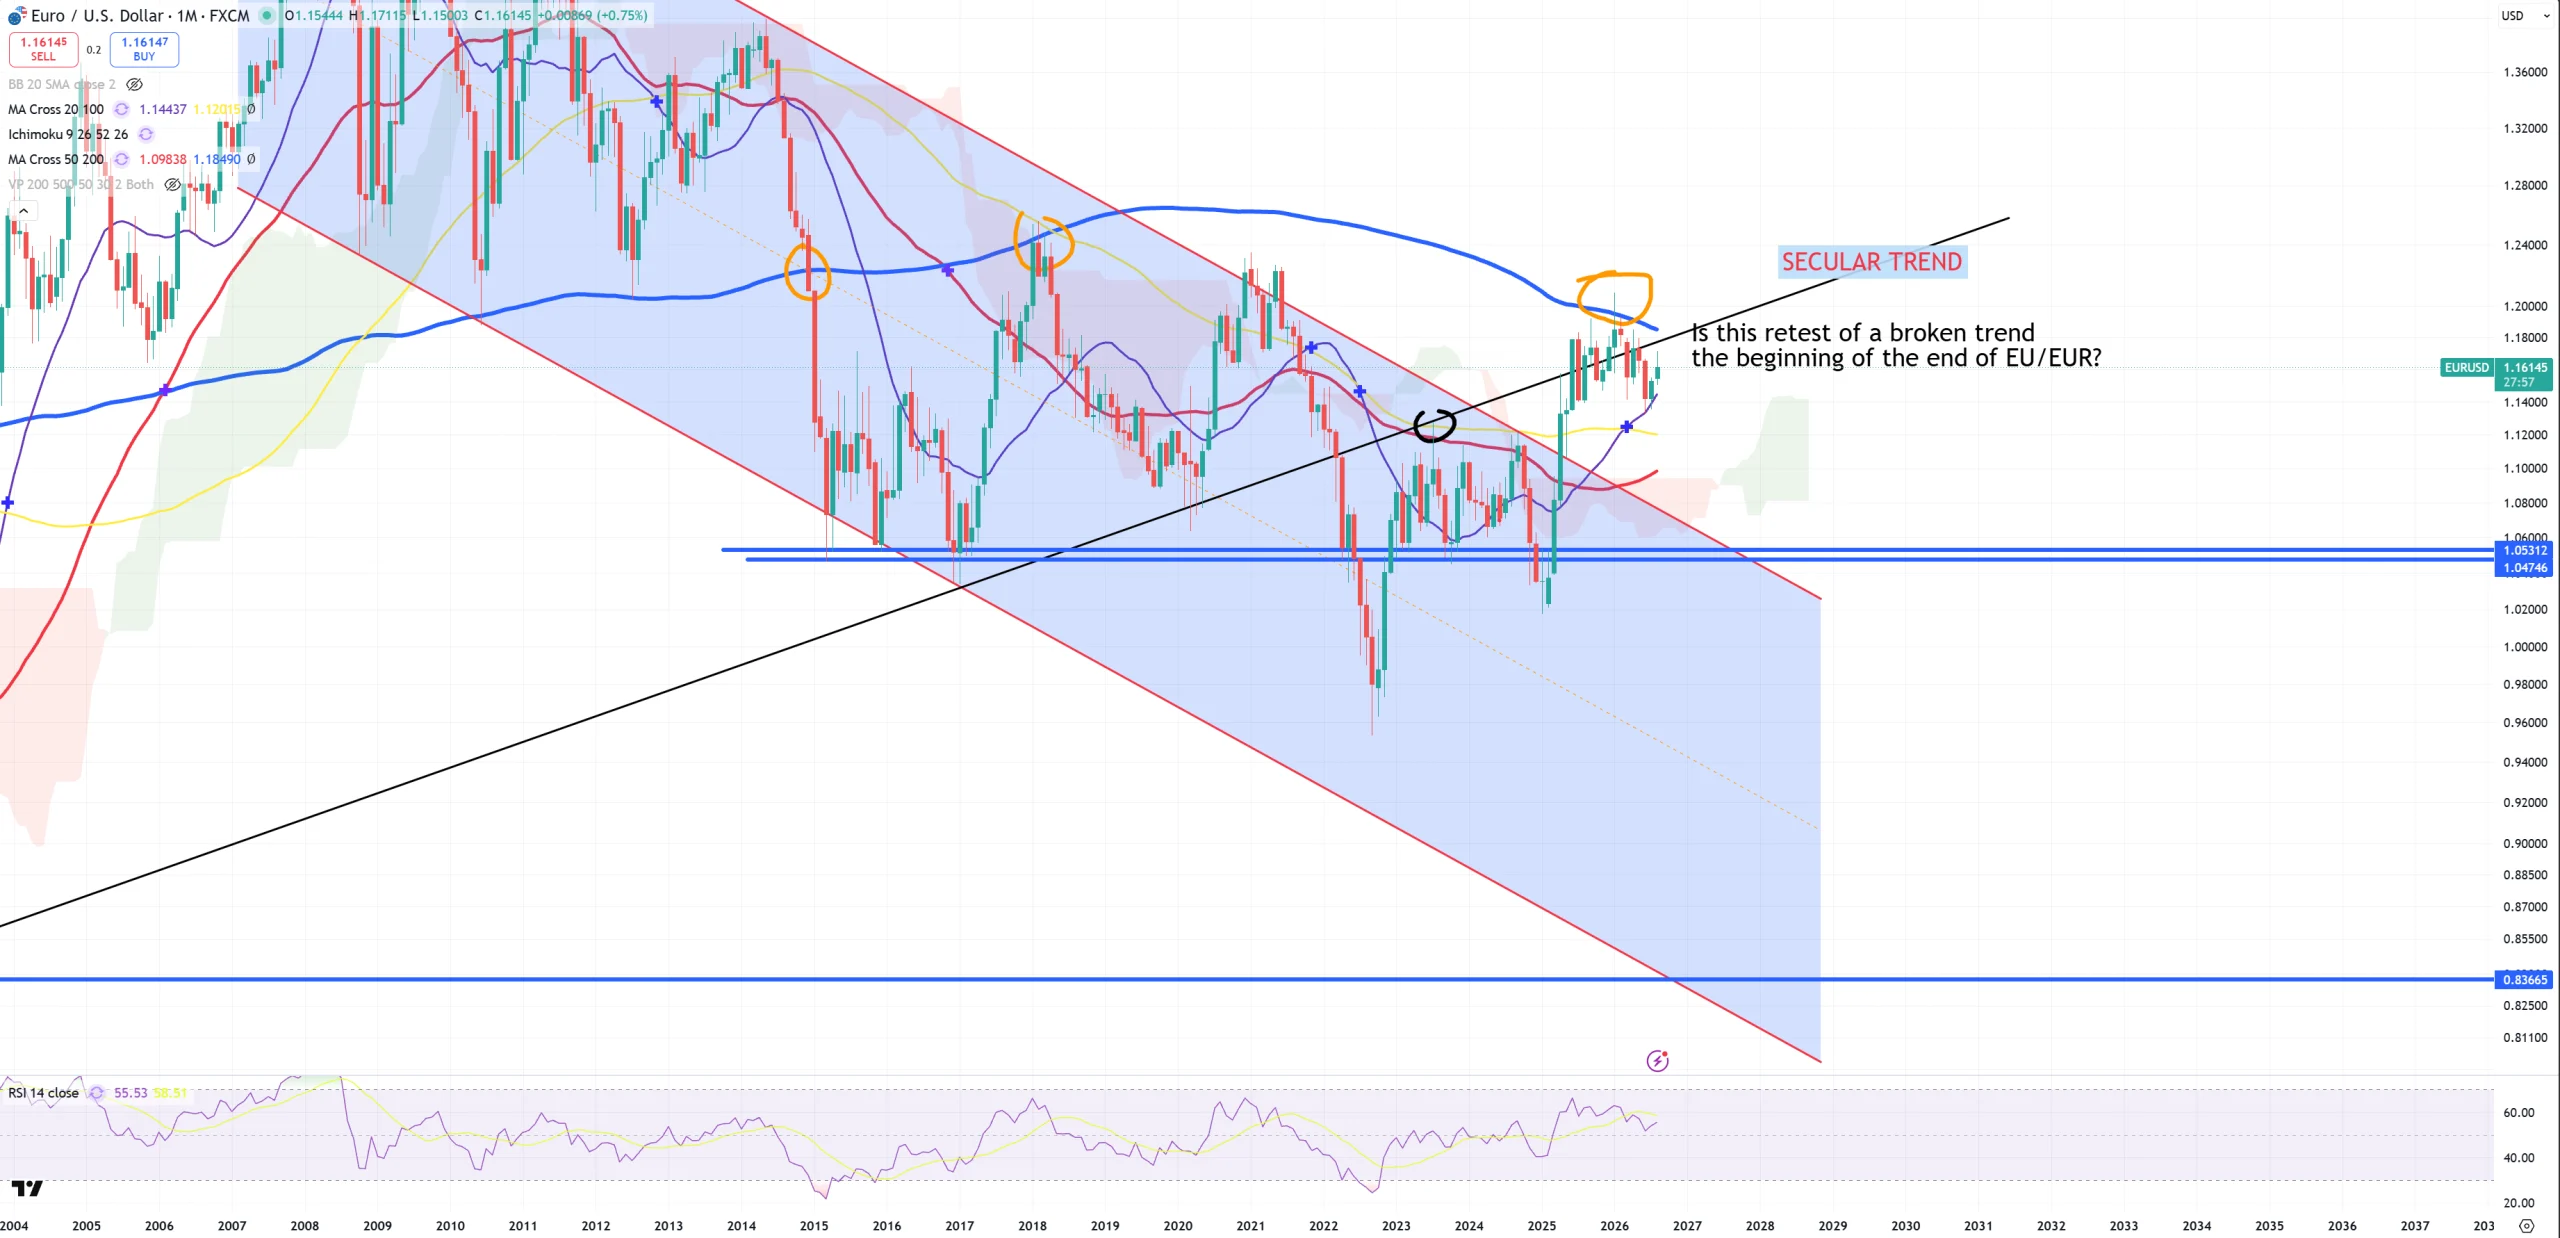
EURUSD – situation unchanged. Retest to key trend.
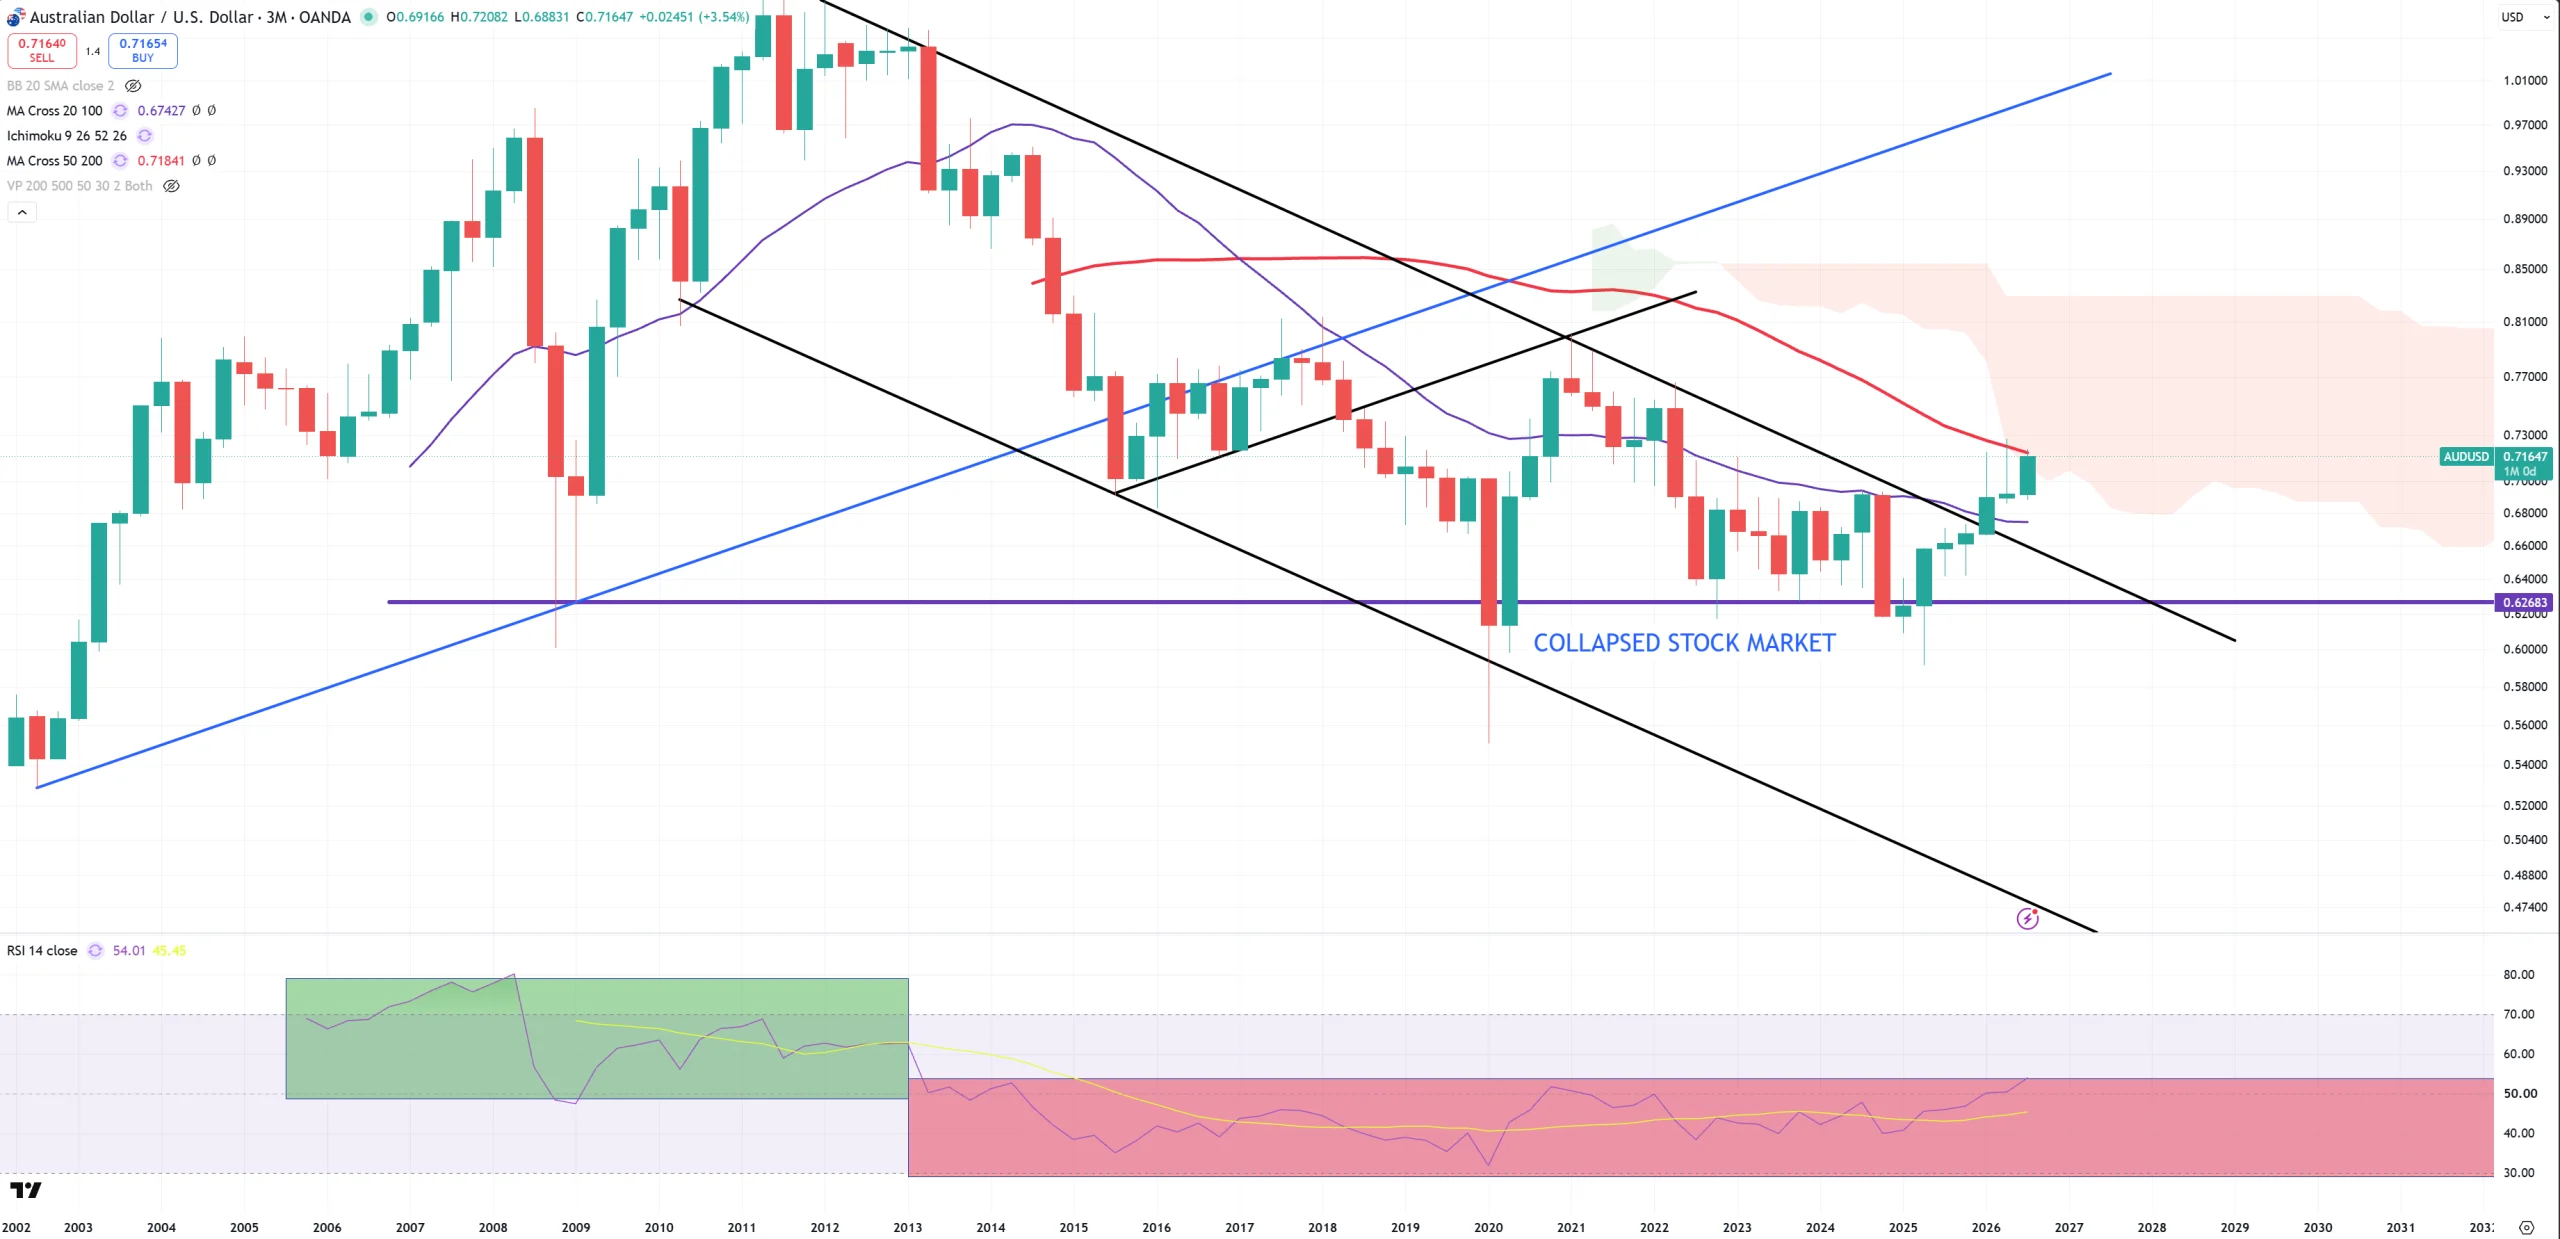
AUDUSD – on (M) you won’t see anything. On (3M) it’s here again. My main risk ON/OFF pair now.
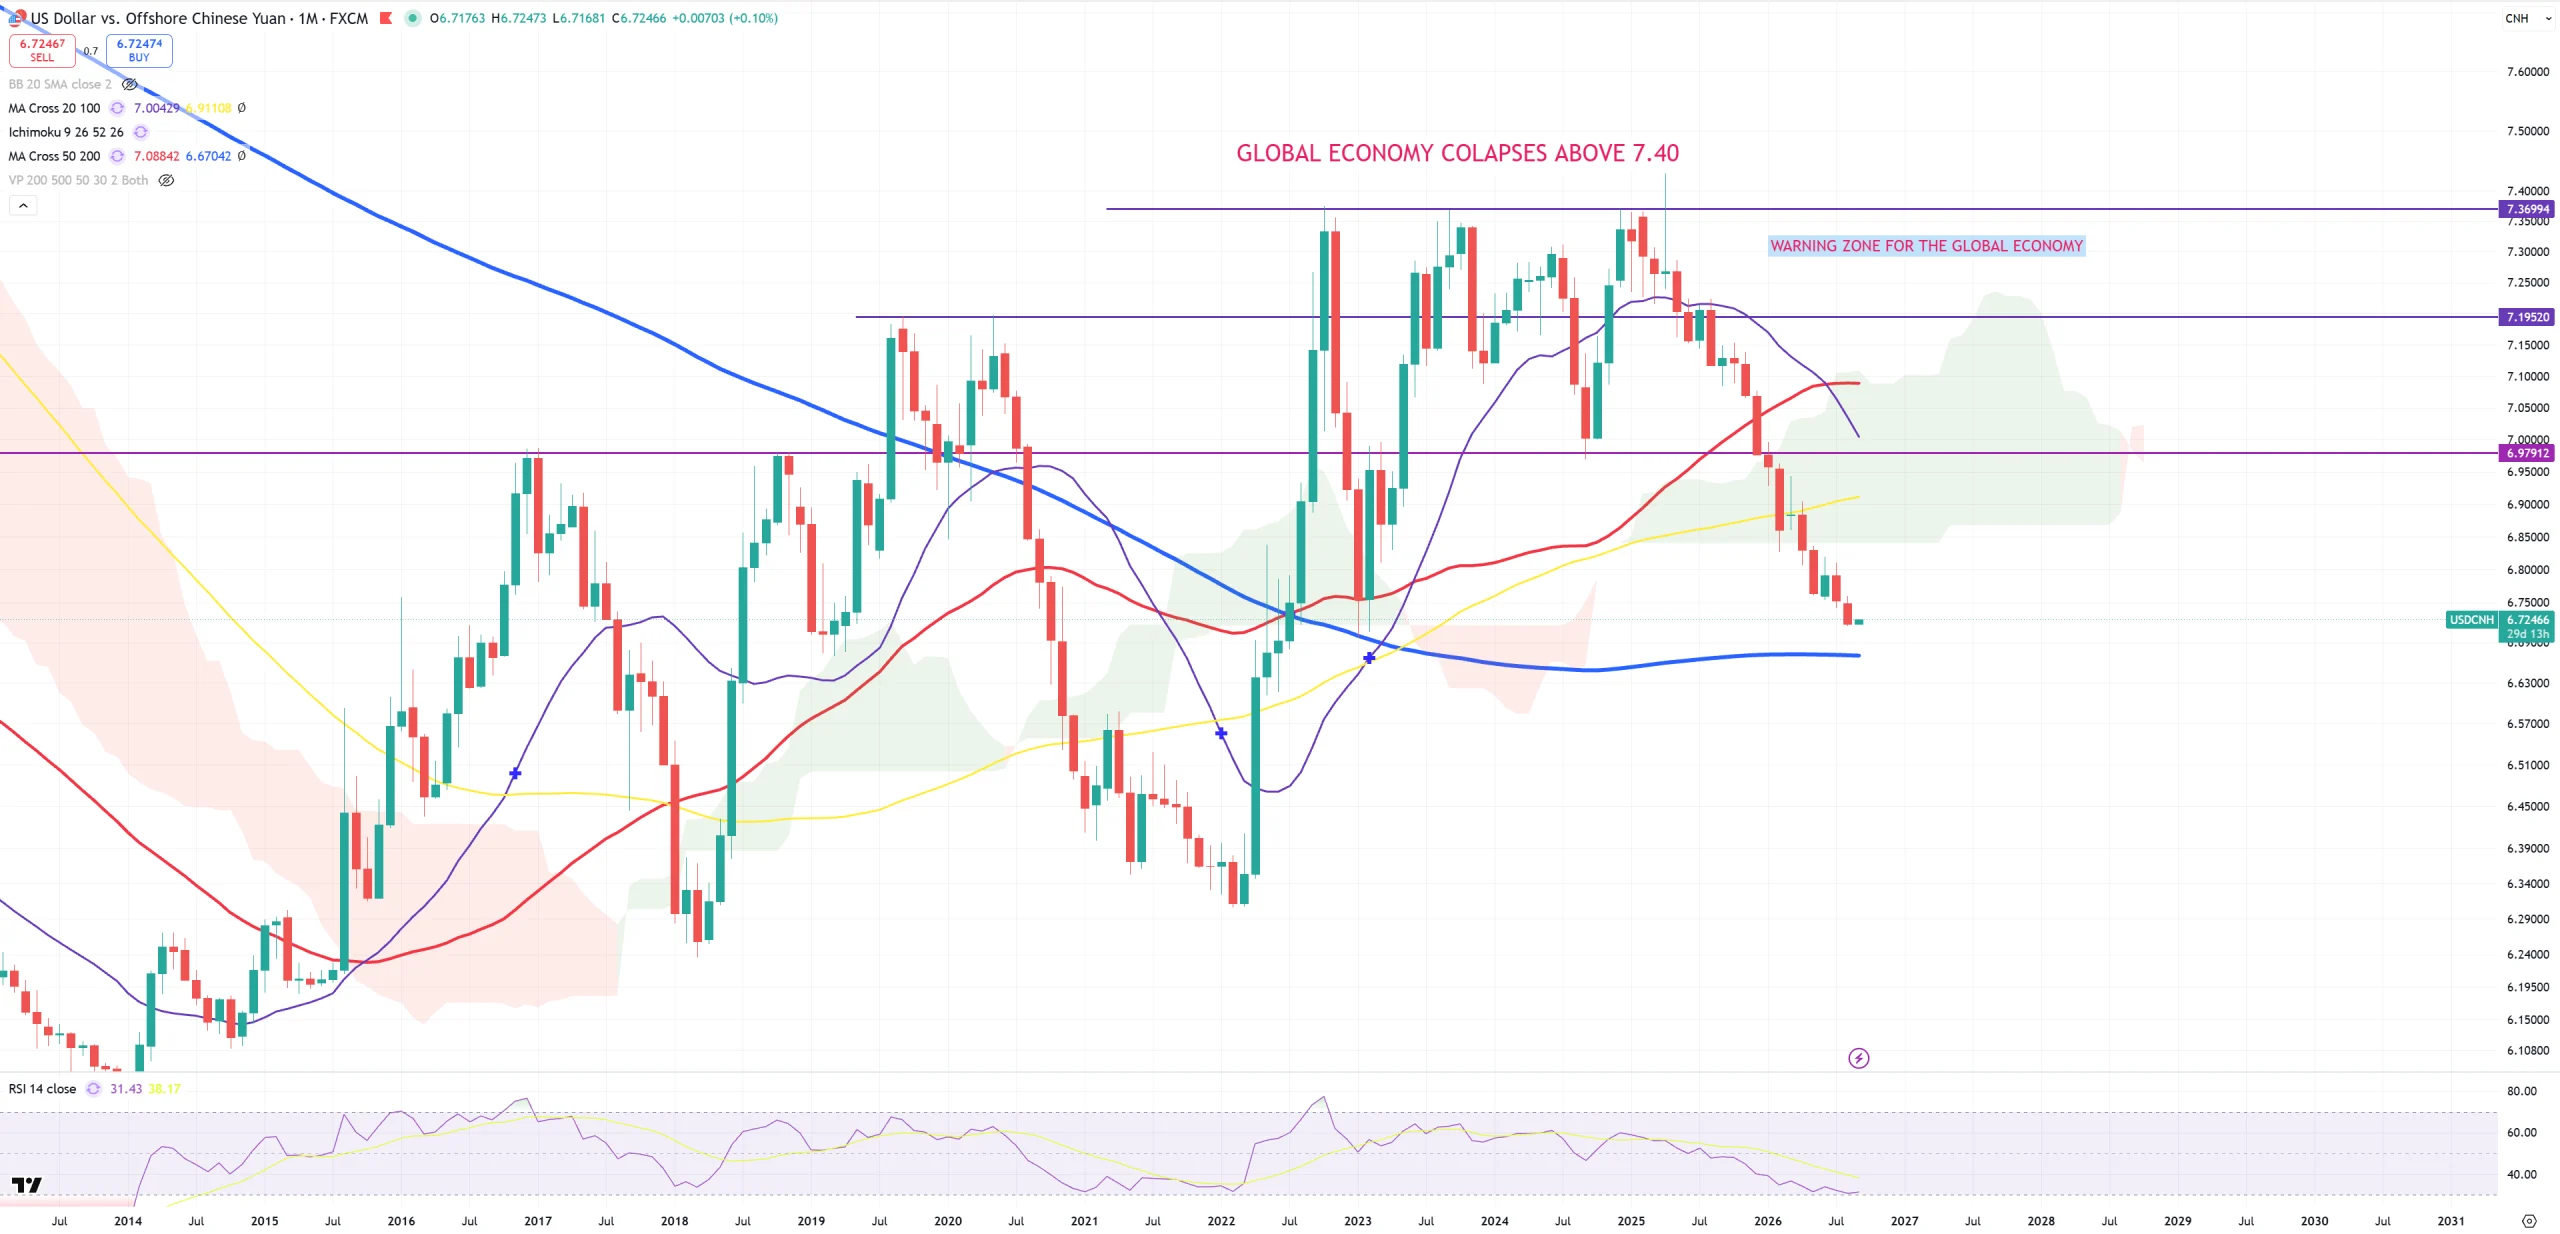
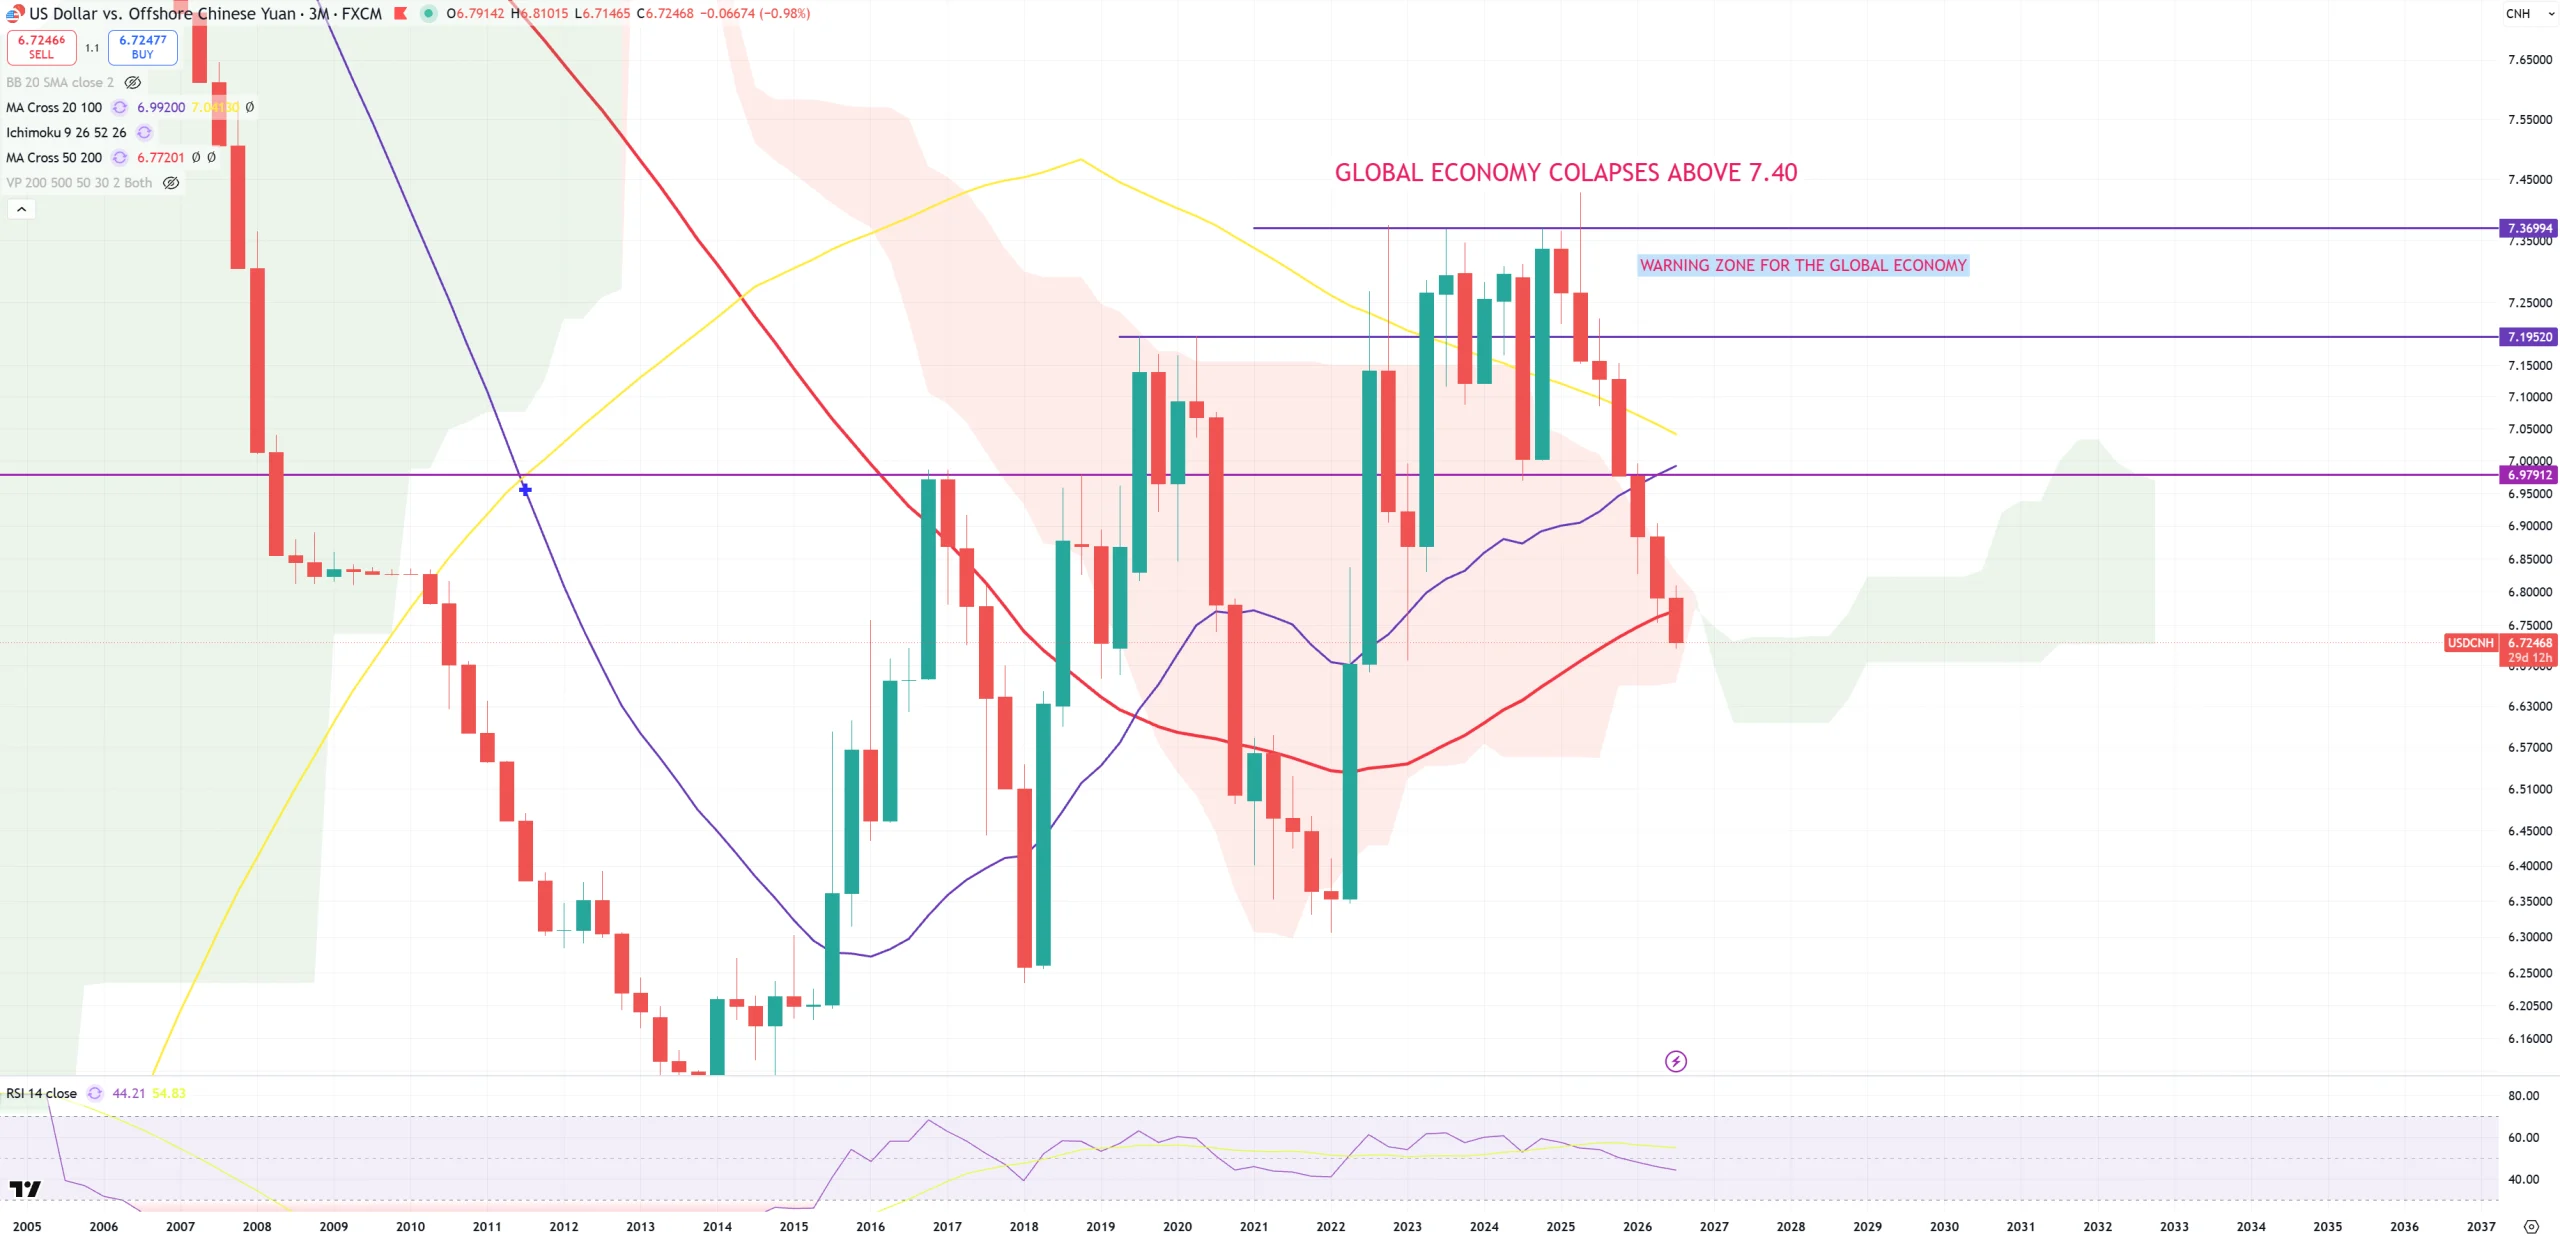
USDCNH – last possible targets : (M)MA200 = 6.67 and (3M)MA50 = 6.77
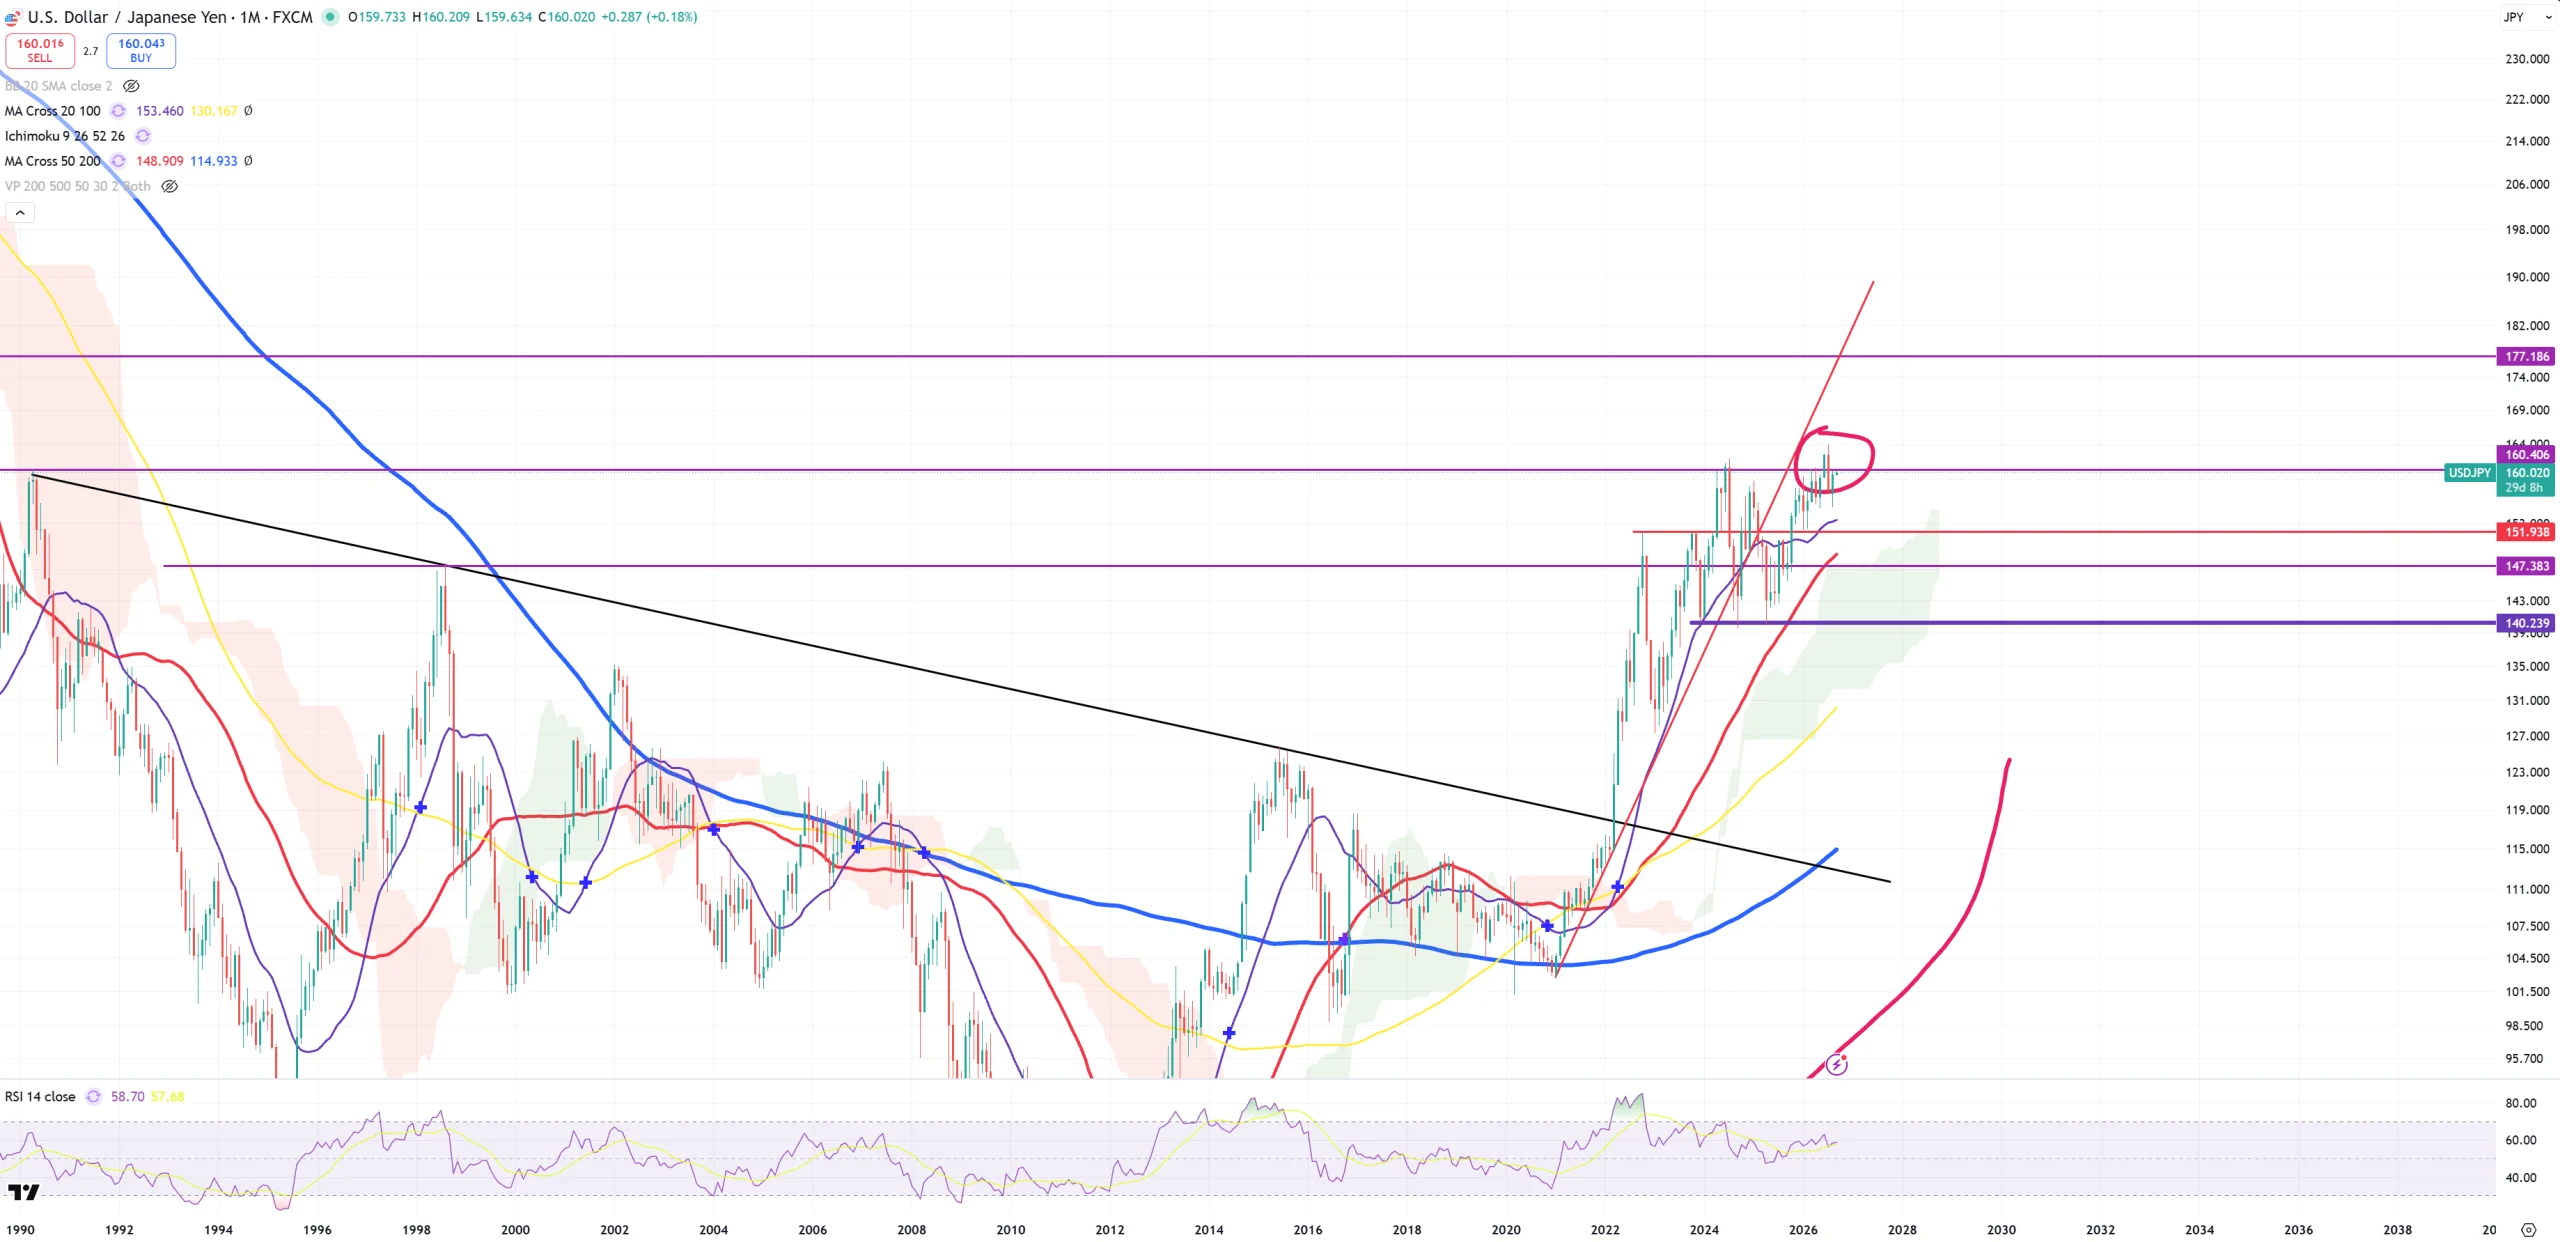
USDJPY – 160+ break is coming sooner or later. Currency crisis is going to kill Japan which will kill the world?
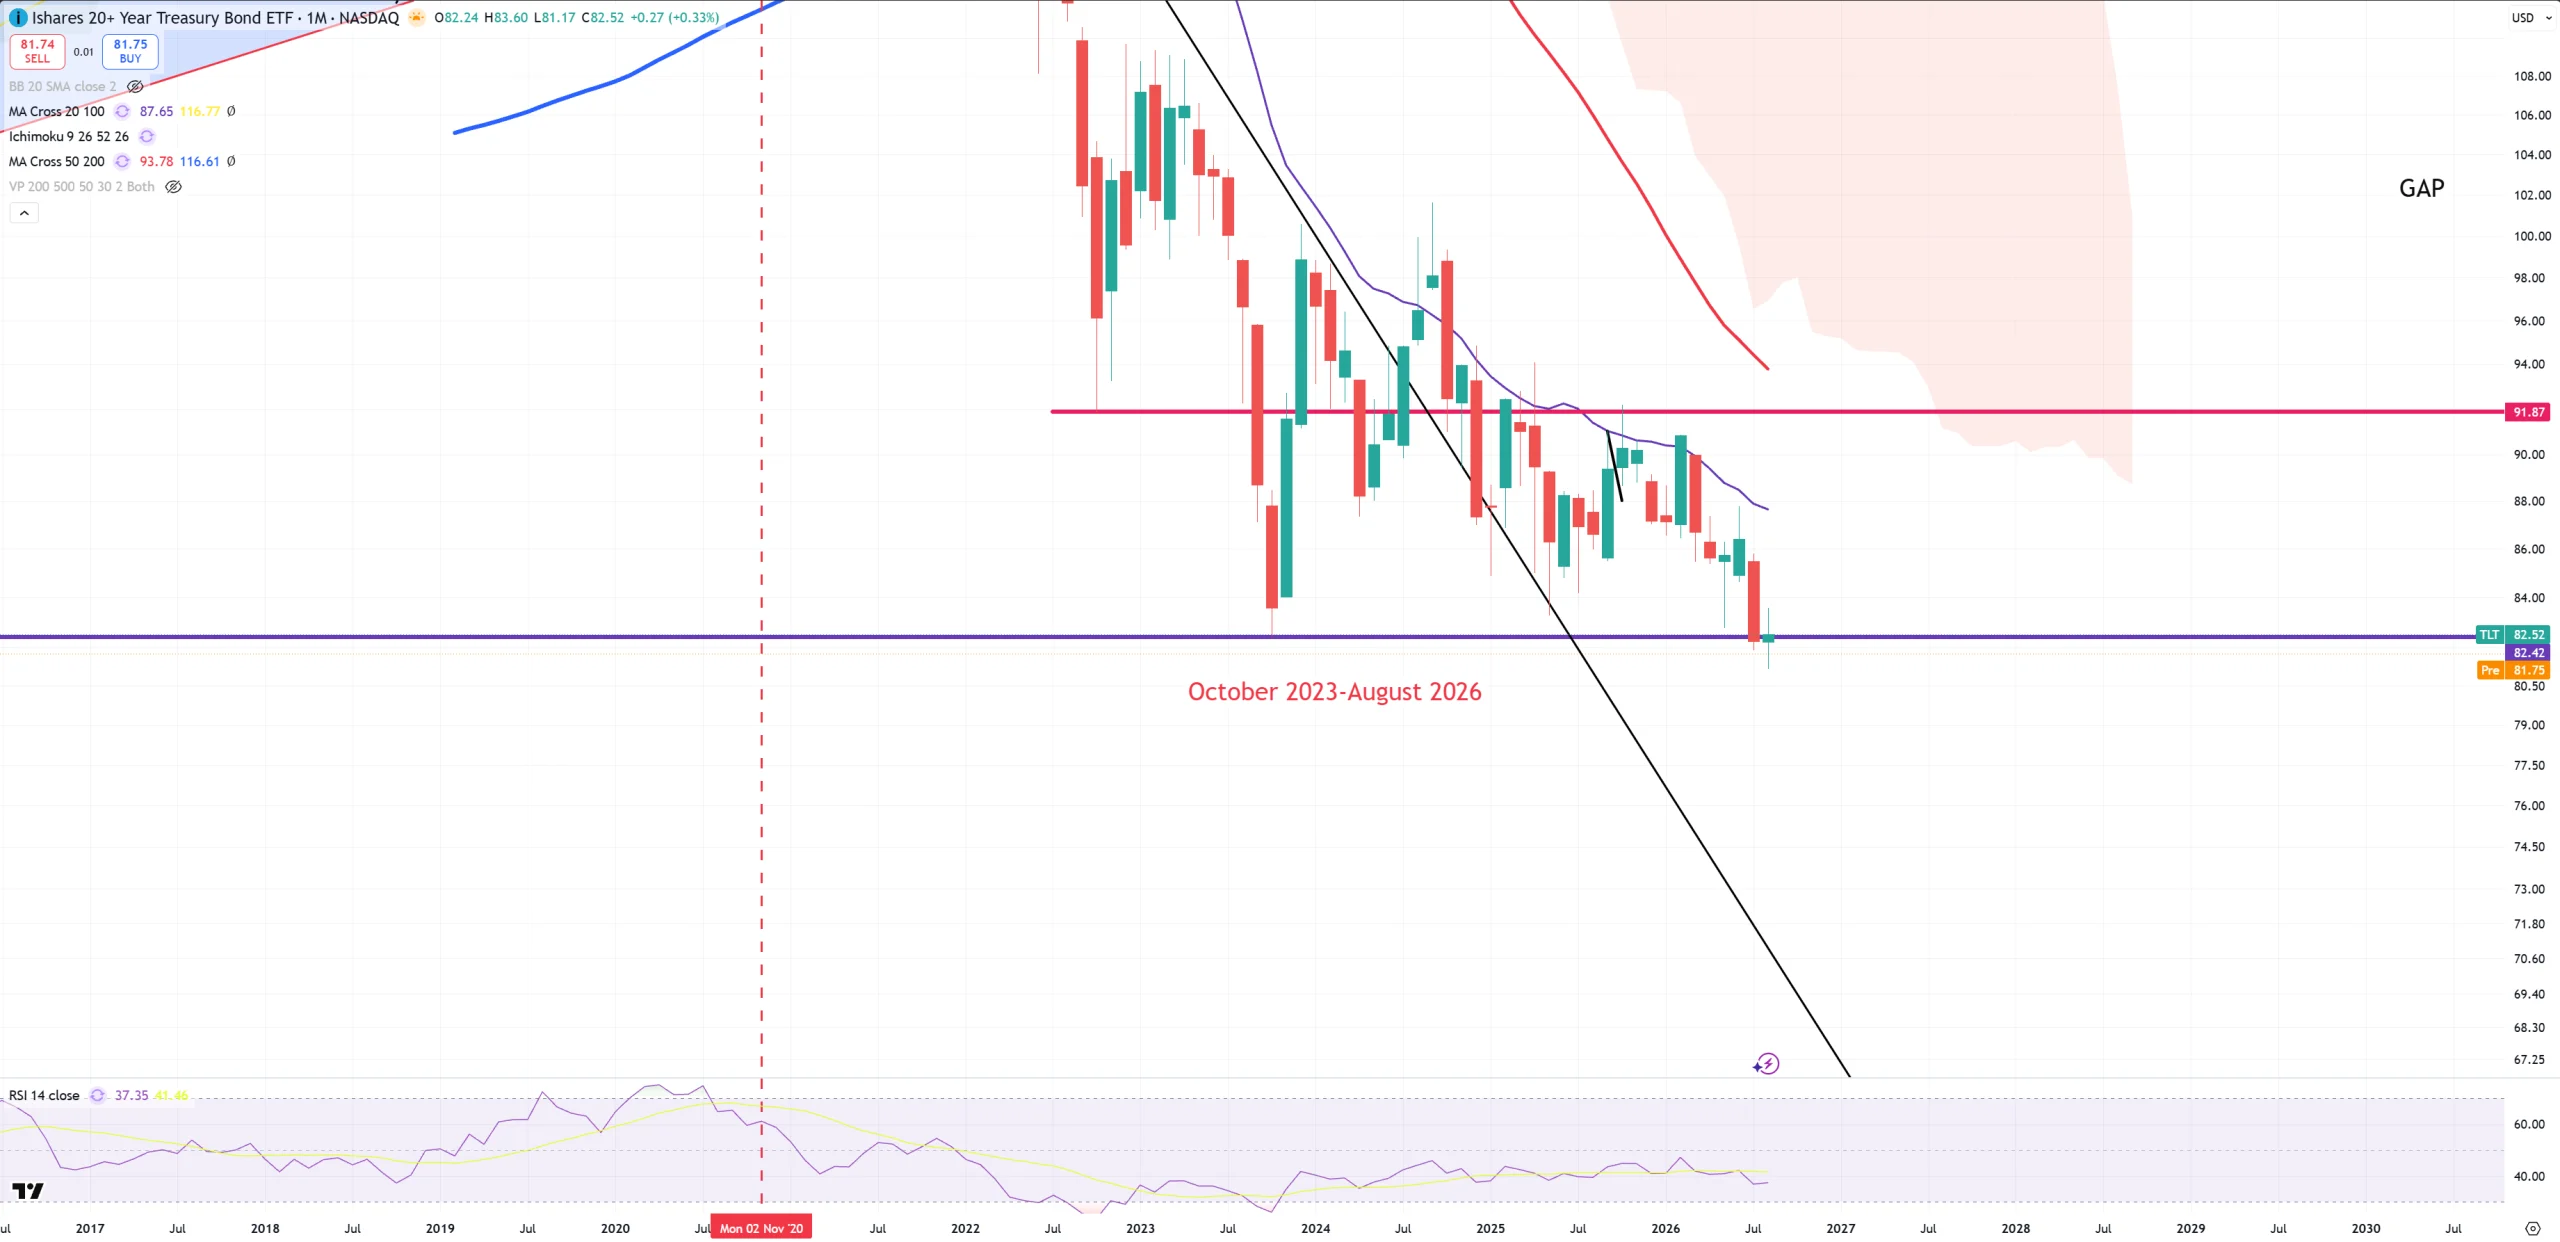
TLT – 82.50$ is the key level but it’s broken like US30Y yields. My idea about October 2023 bottom/double-bottom has just collapsed.
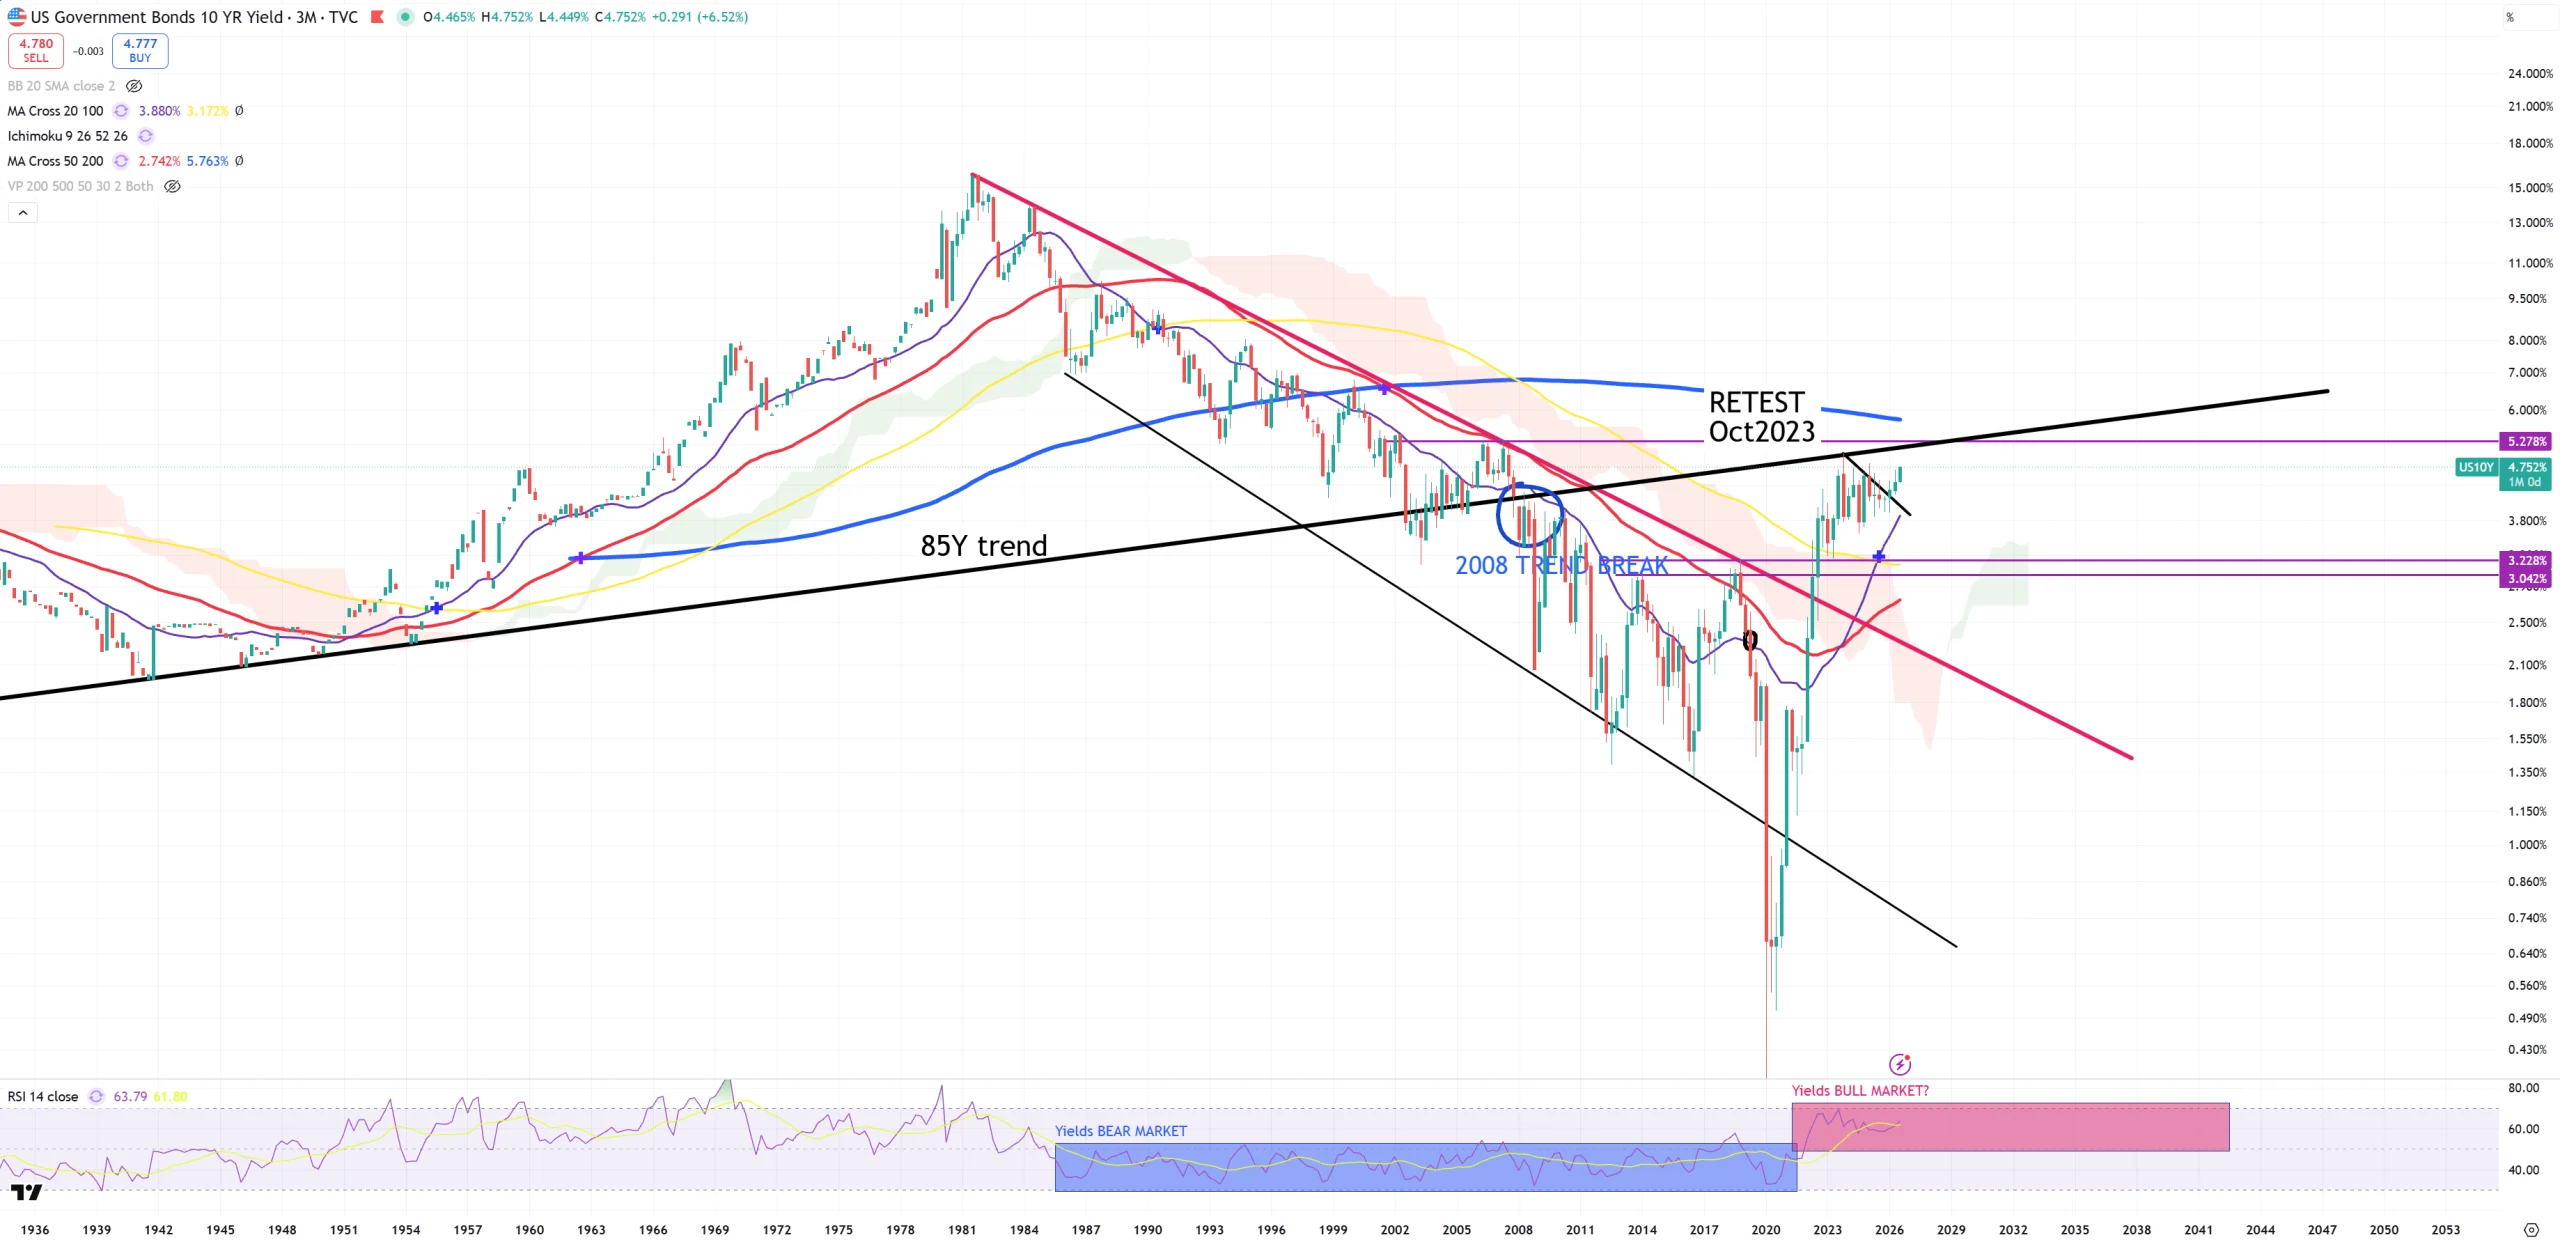
US10Y – 85Ys trend sits around 5.15%-5.20%, but take a deeper look on this chart. What if trend in bond market was up and around 2008 QE managed to ignite the biggest bull market for the bonds and now everything makes a reversal?
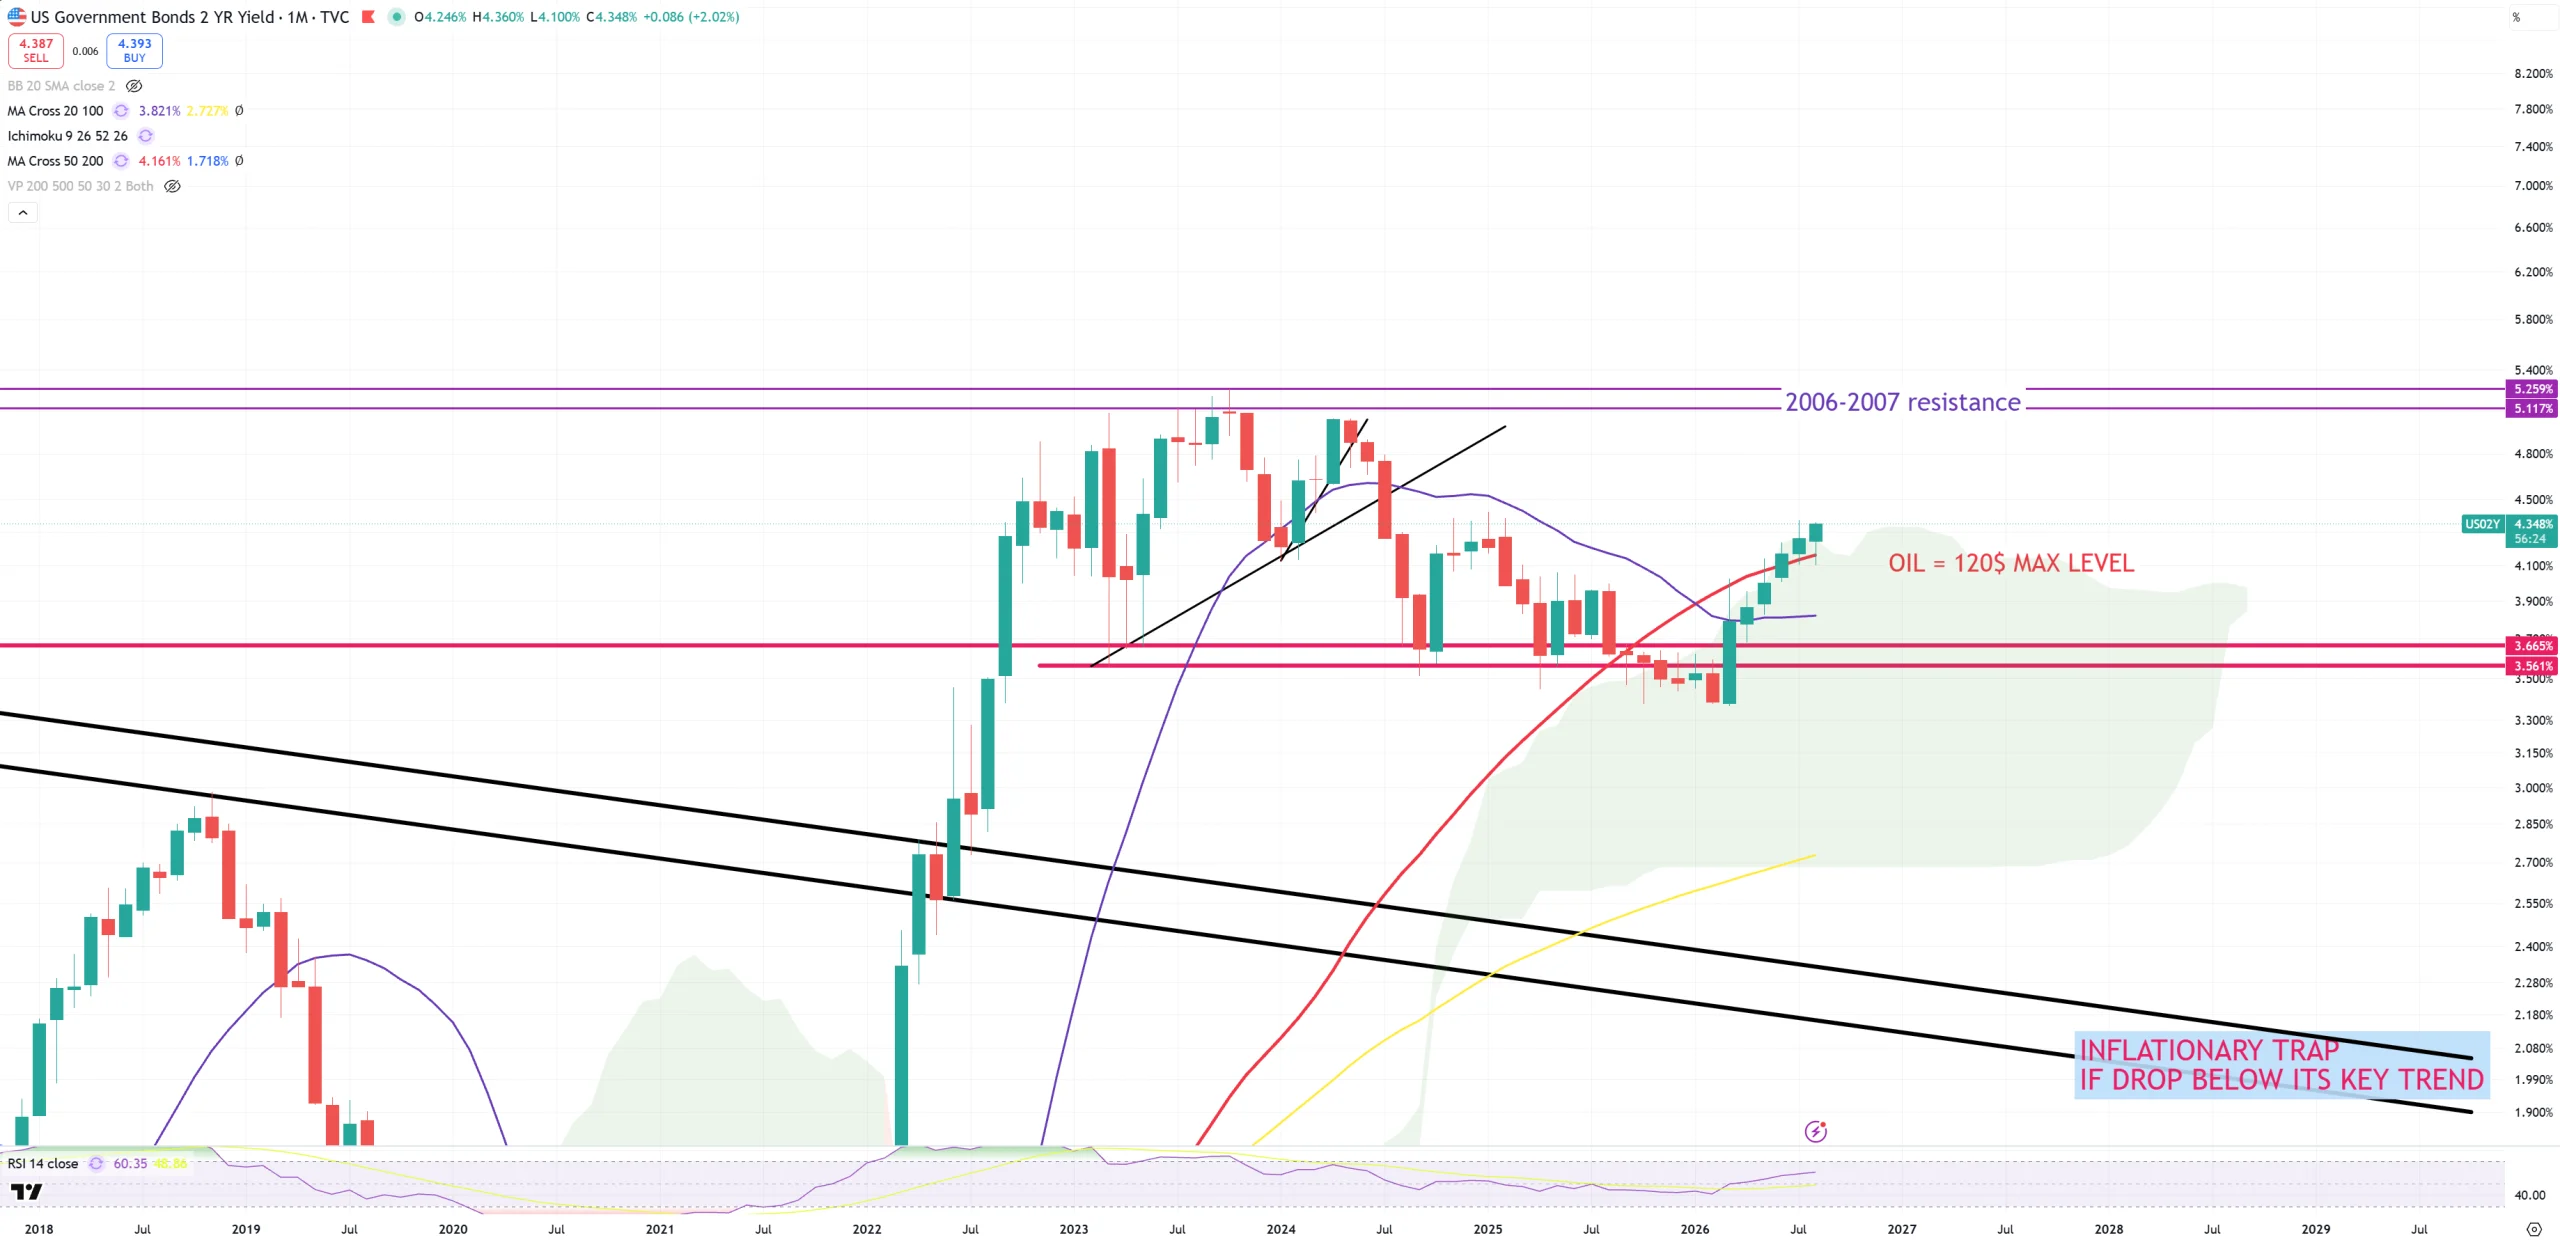
US02Y – (M)MA50 is now support and it looks like bull market here has been resumed with 5.20% level as a final target
US03MY – it is still way below (M)MA50. This needs real rate hikes by +100bps to get over (M)MA50
US10Y-US03MY and we are +90bps. Market has never survived a permanent break > +60bps. The question what’ll happen after. Post 2020 we managed to reverse the course, but look how long and deep 10y/3m was inverted. MMT worked fine, if we add to that AI/datacenter boom it works even more fine, but under the surface we see record ever inversion surpassing previous record : 1929.
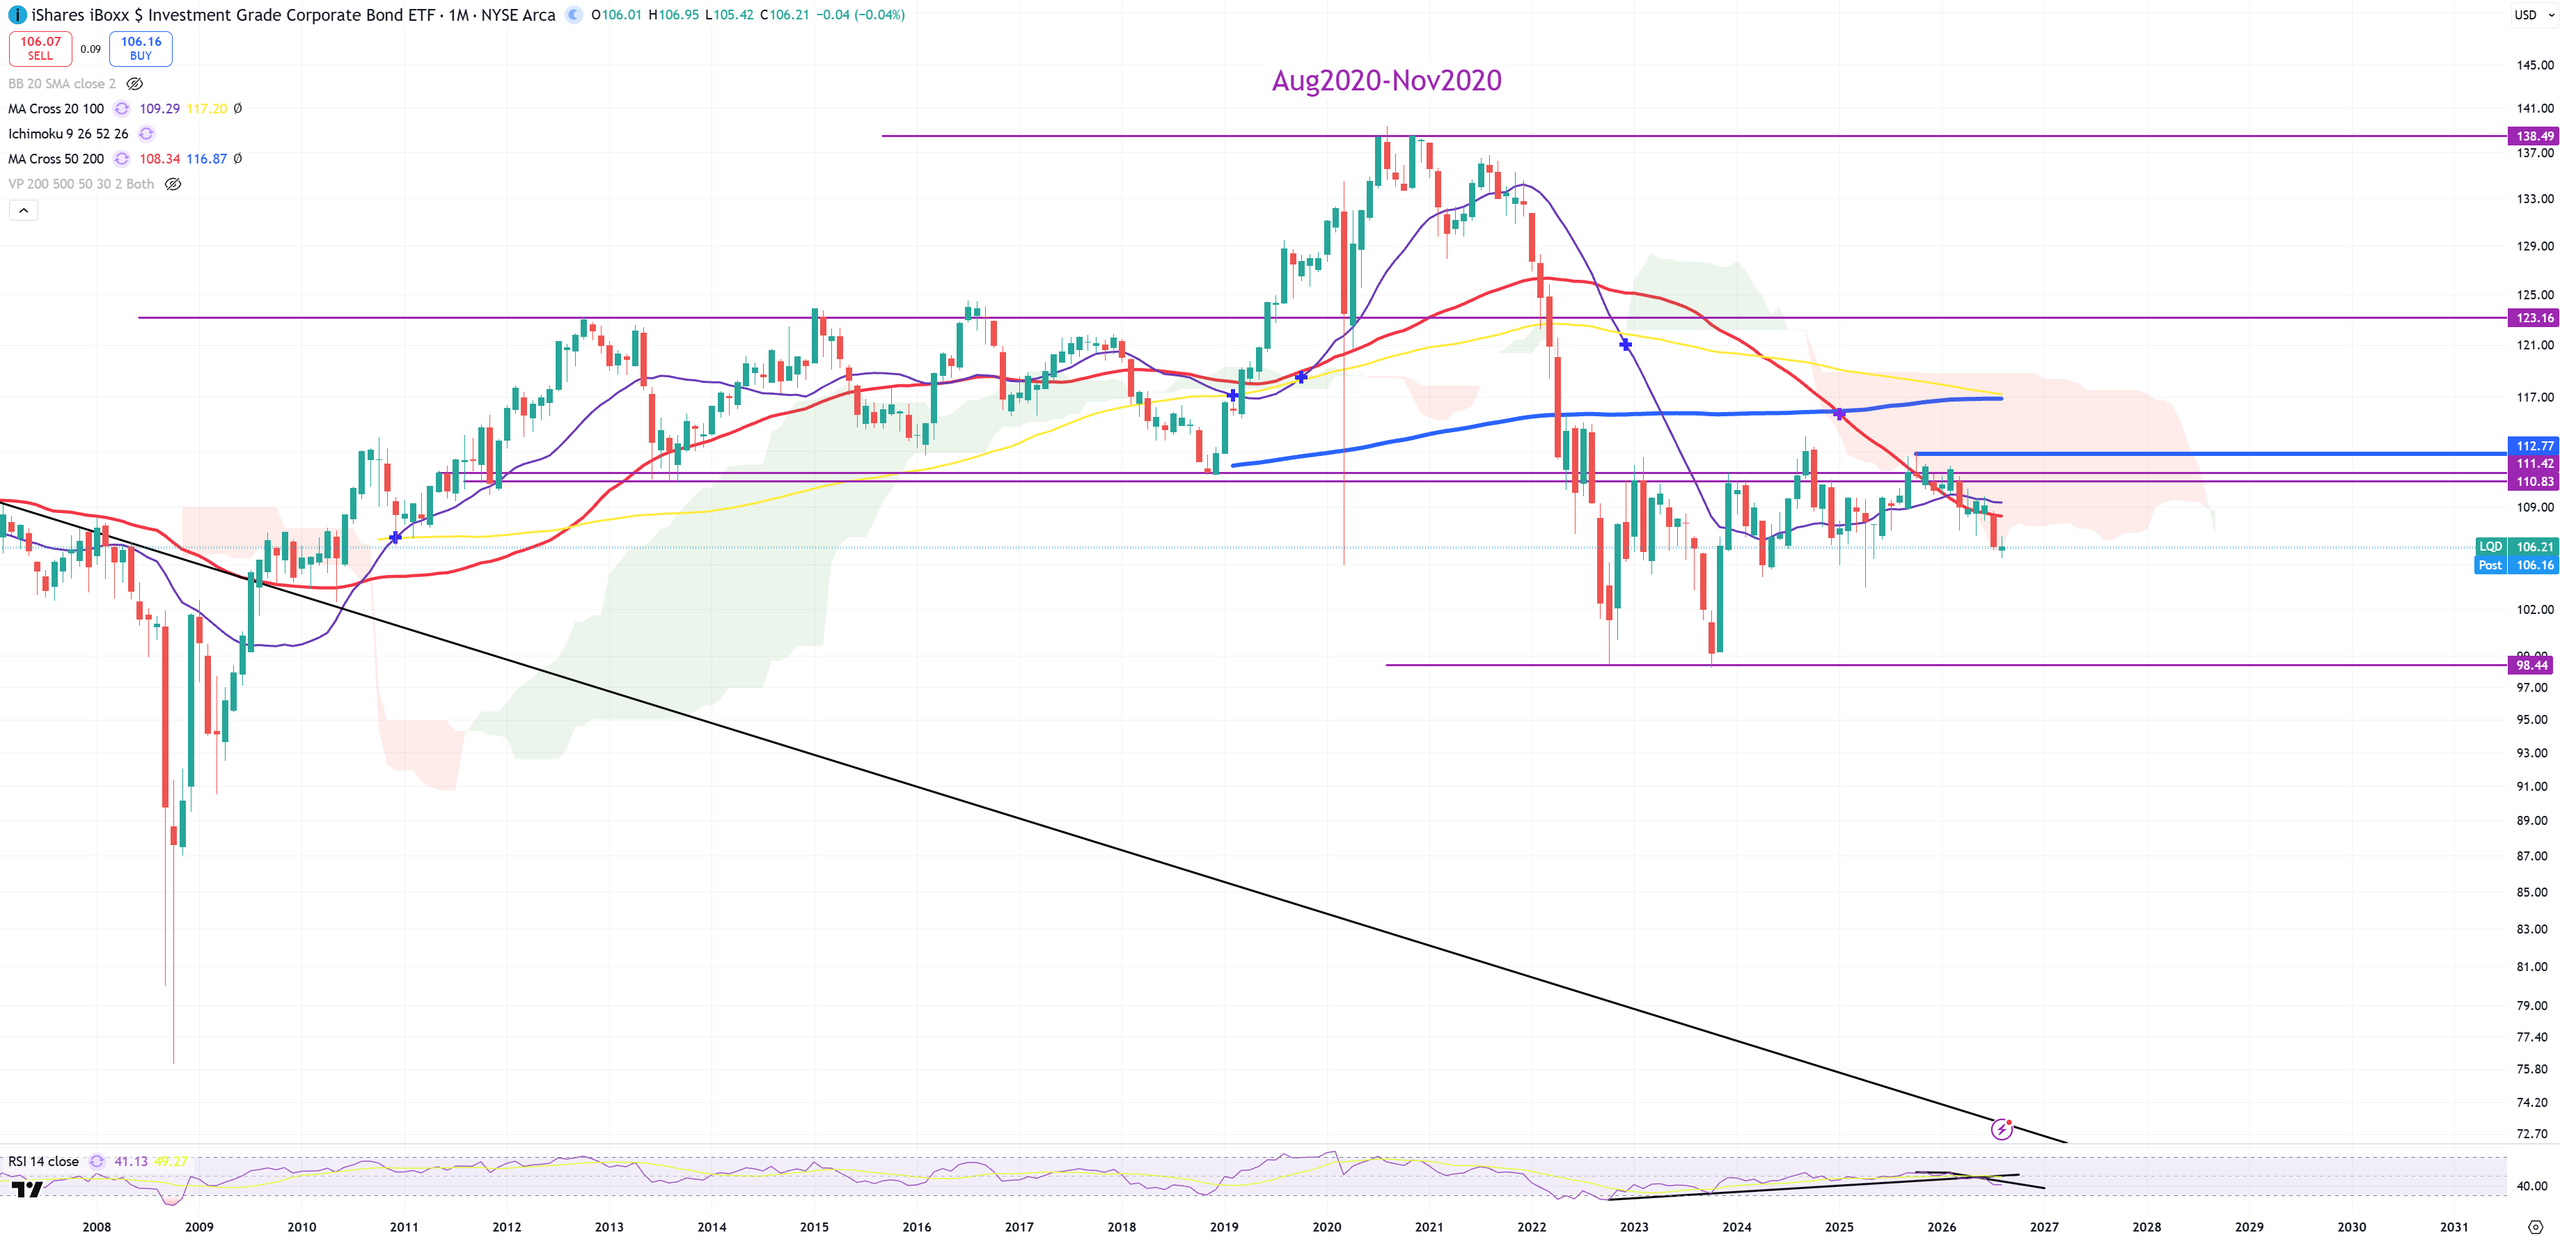
LQD – Investment Grade looks like bigger junk than junk. We have managed to flip the term Investment Grade.
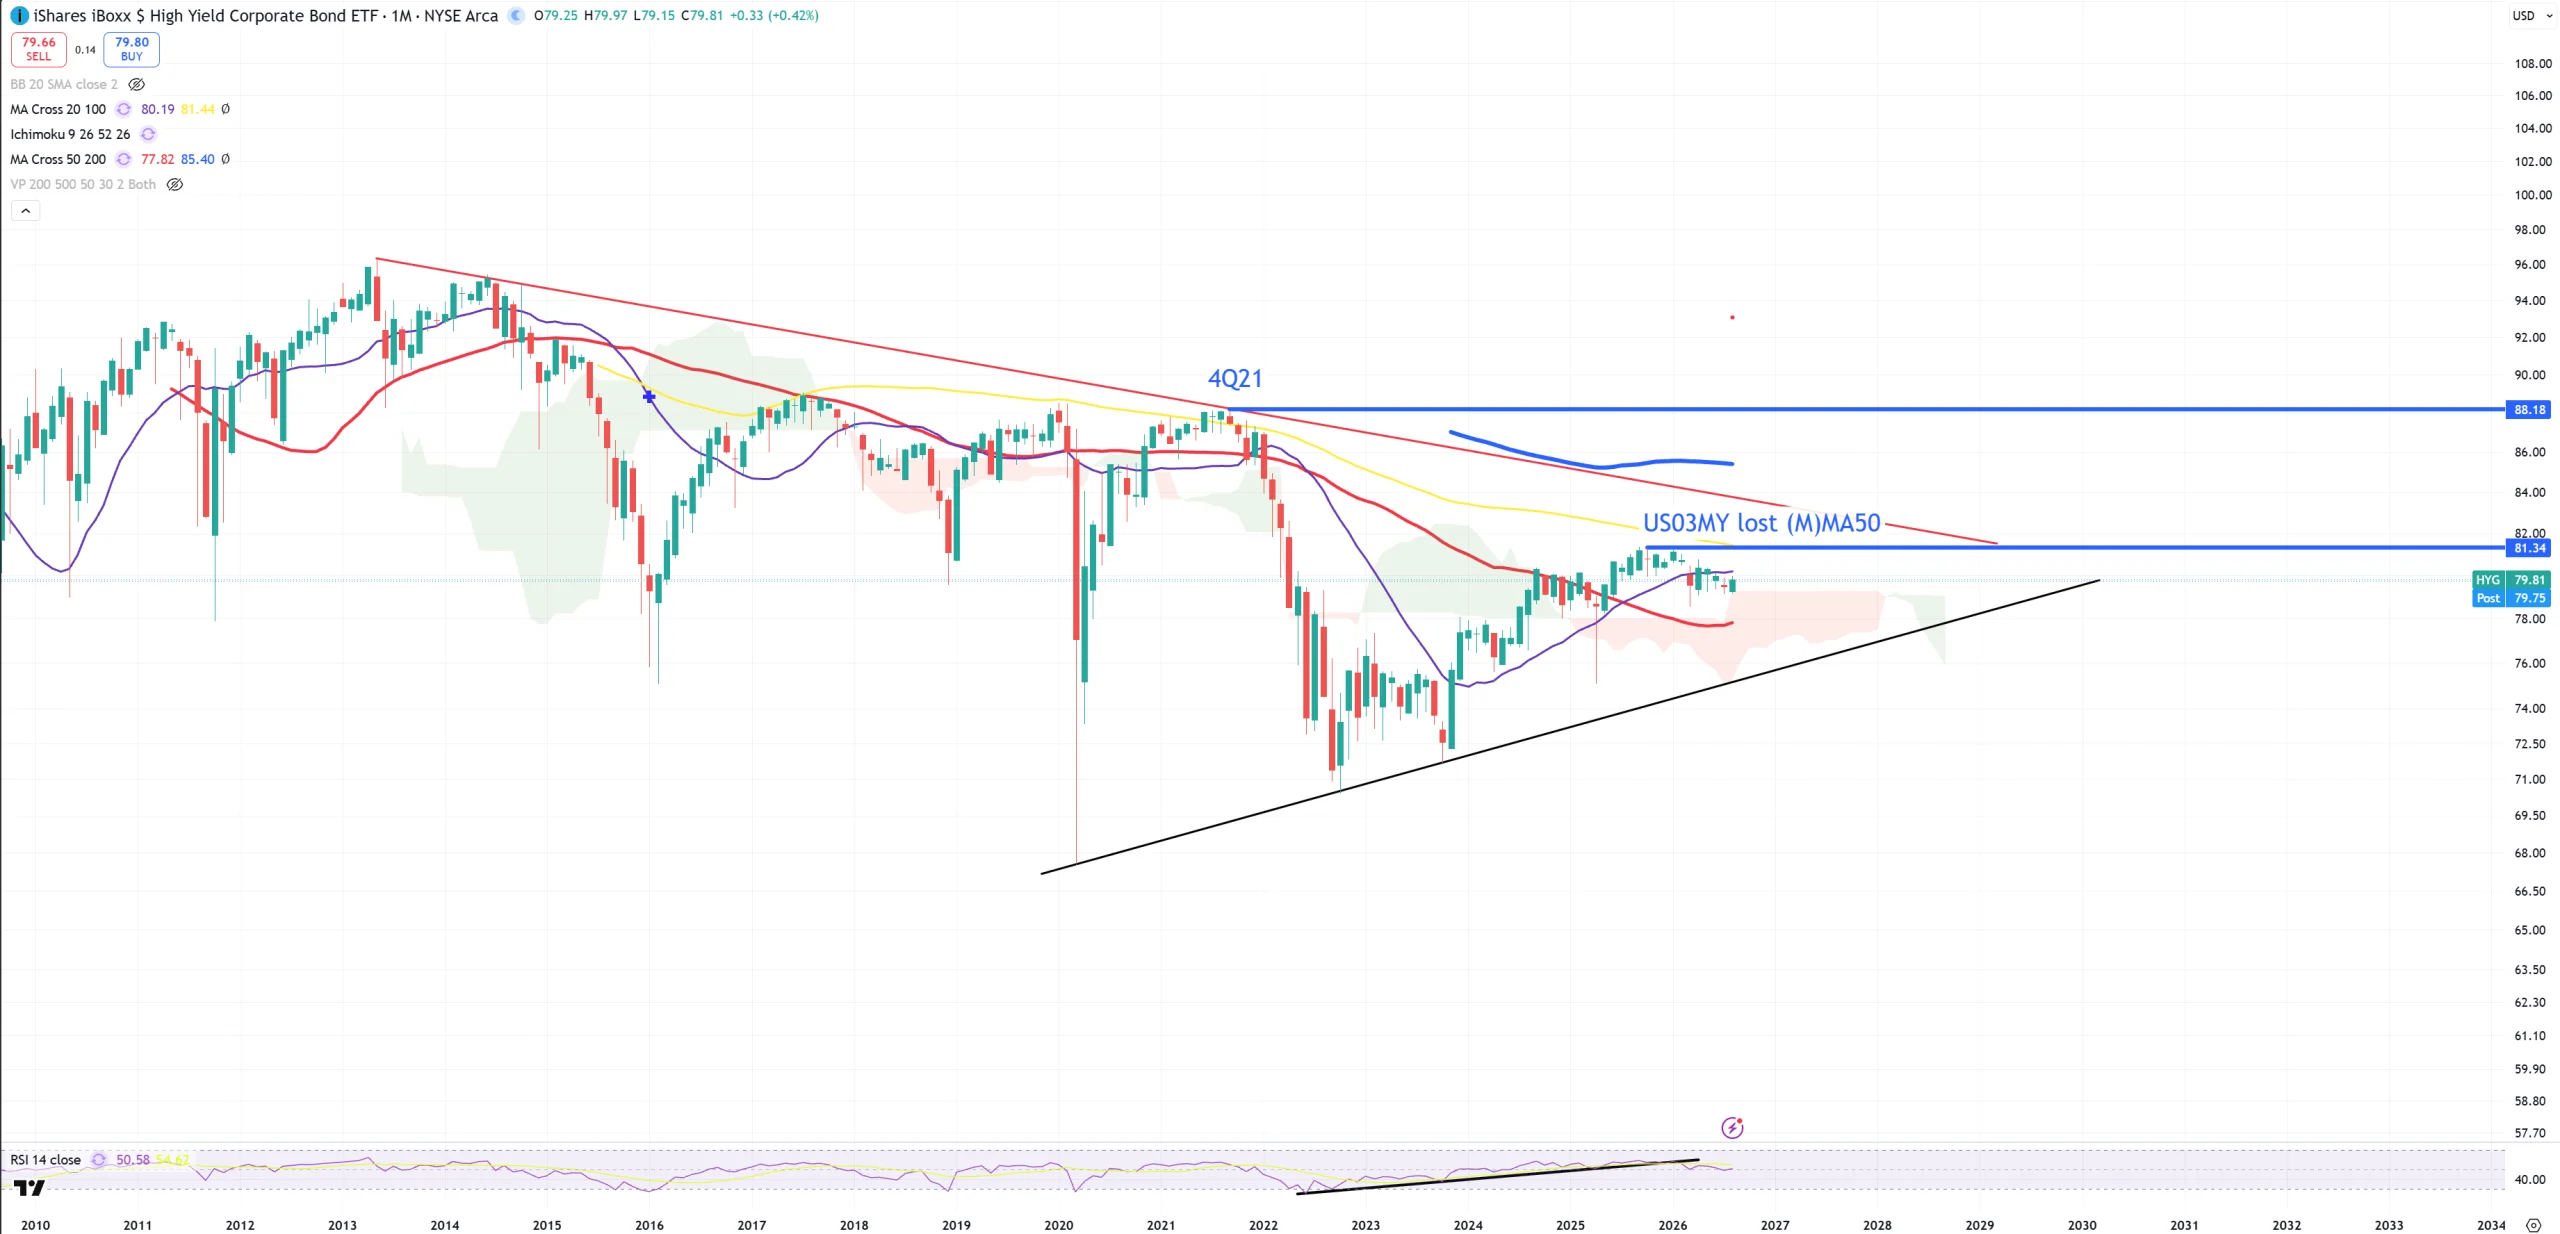
HYG – junk doesn’t look as bad as Investment Grade LQD. It’s > (M)MA50 and < (M)MA20. Compression.
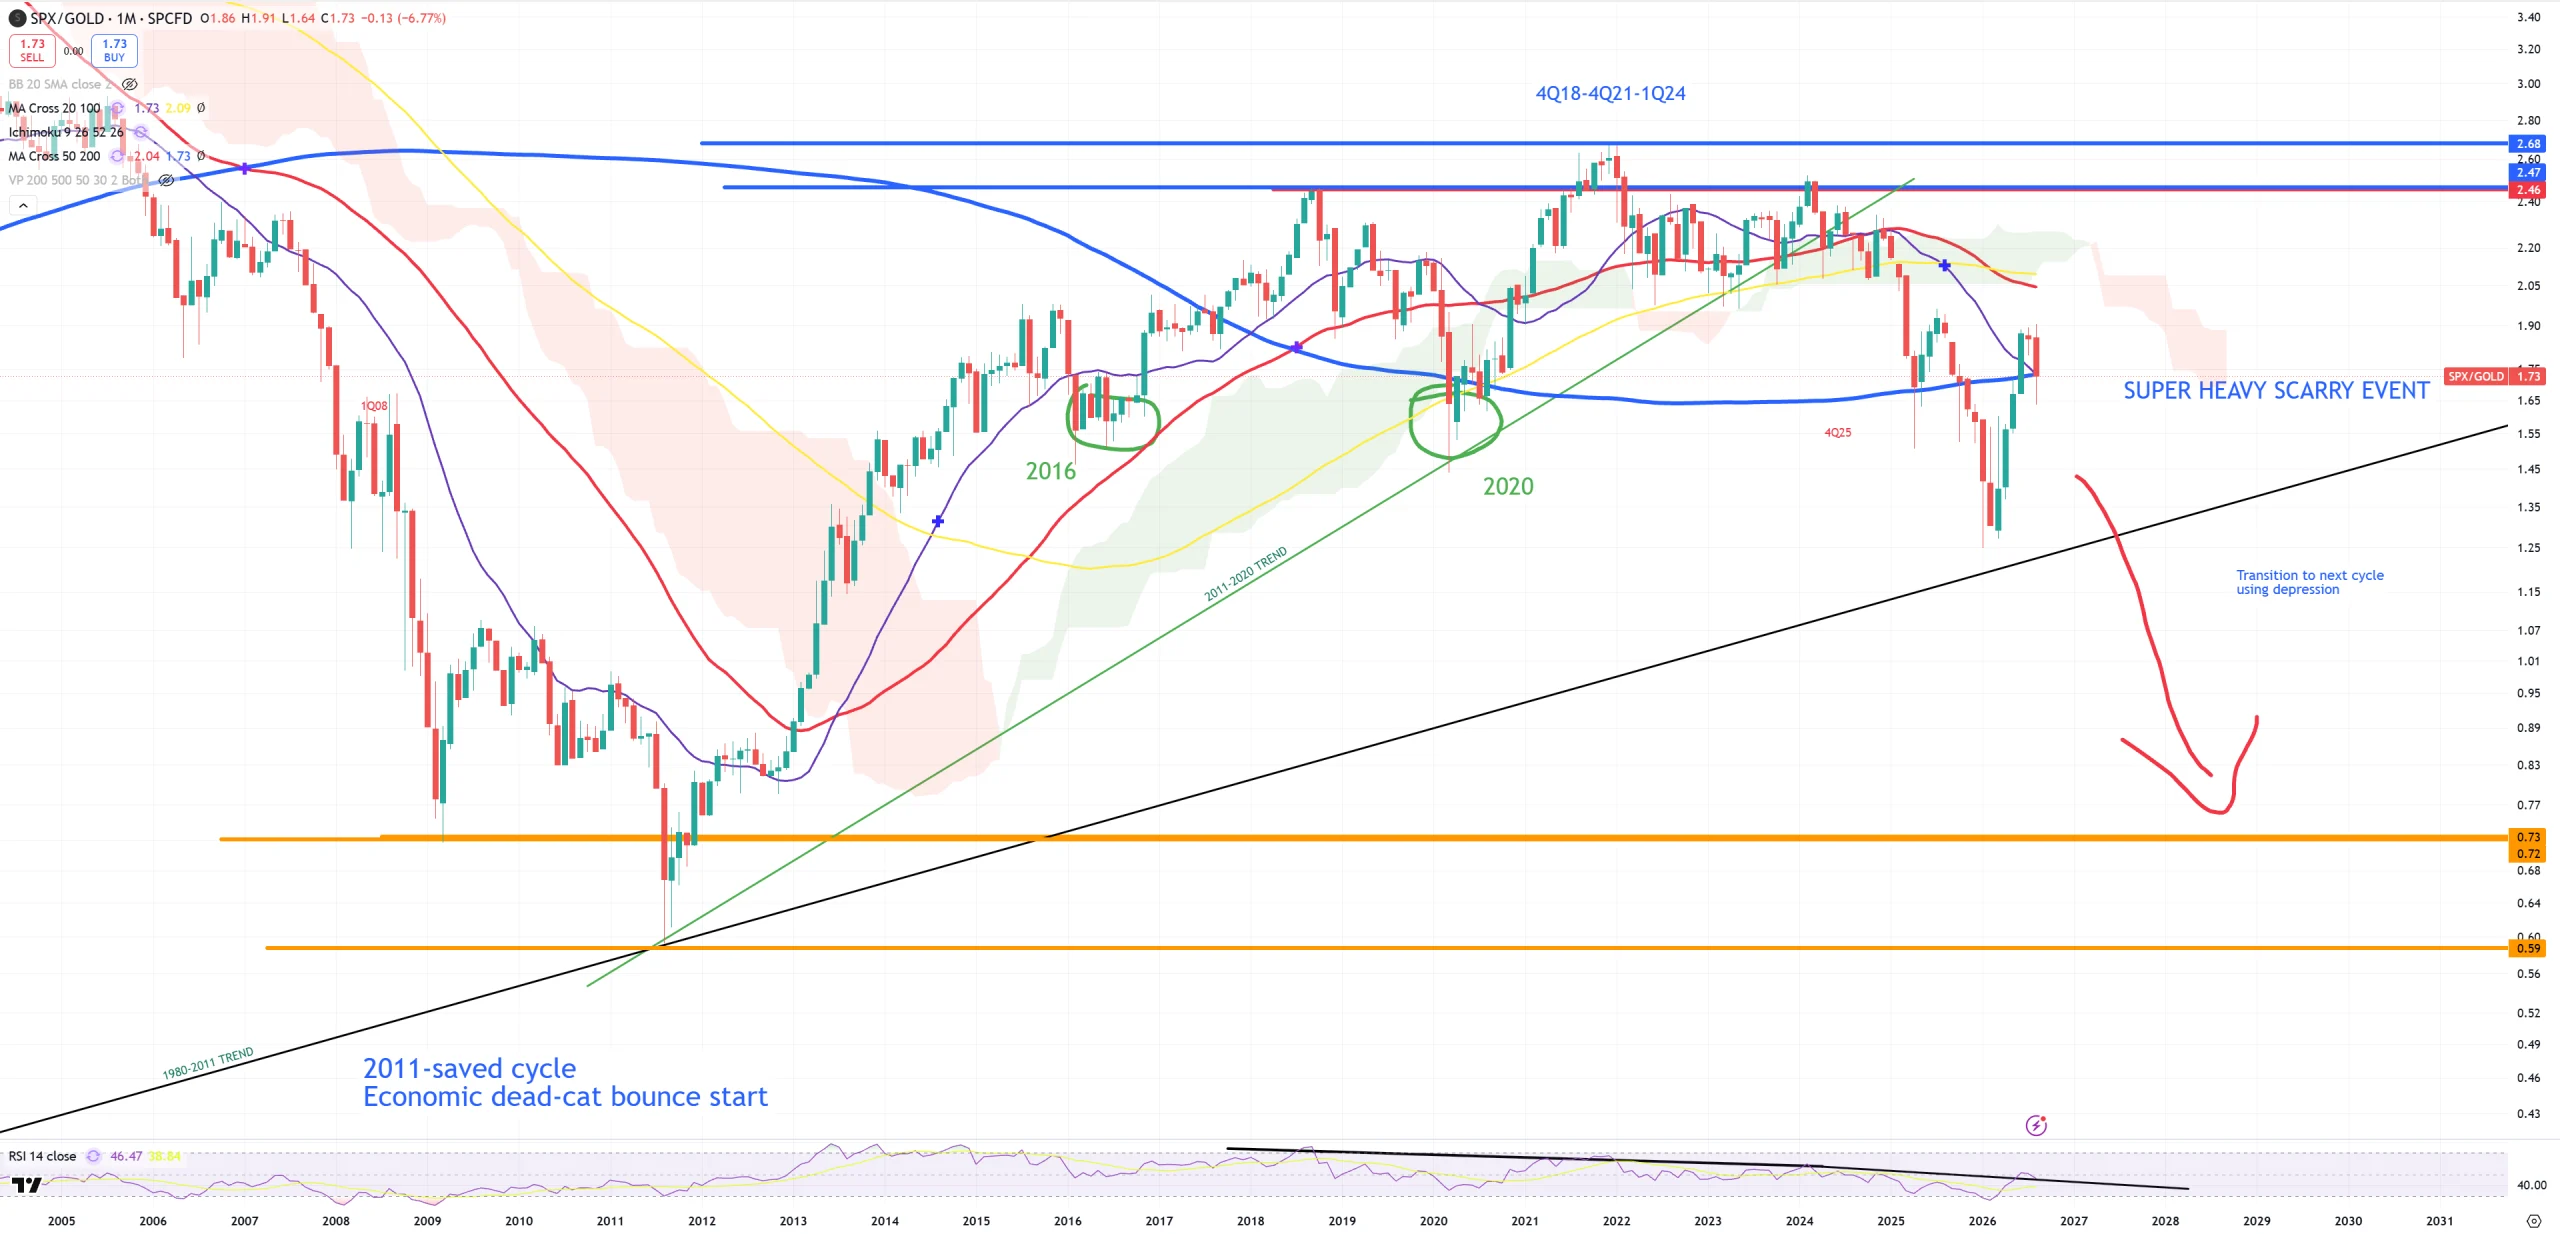
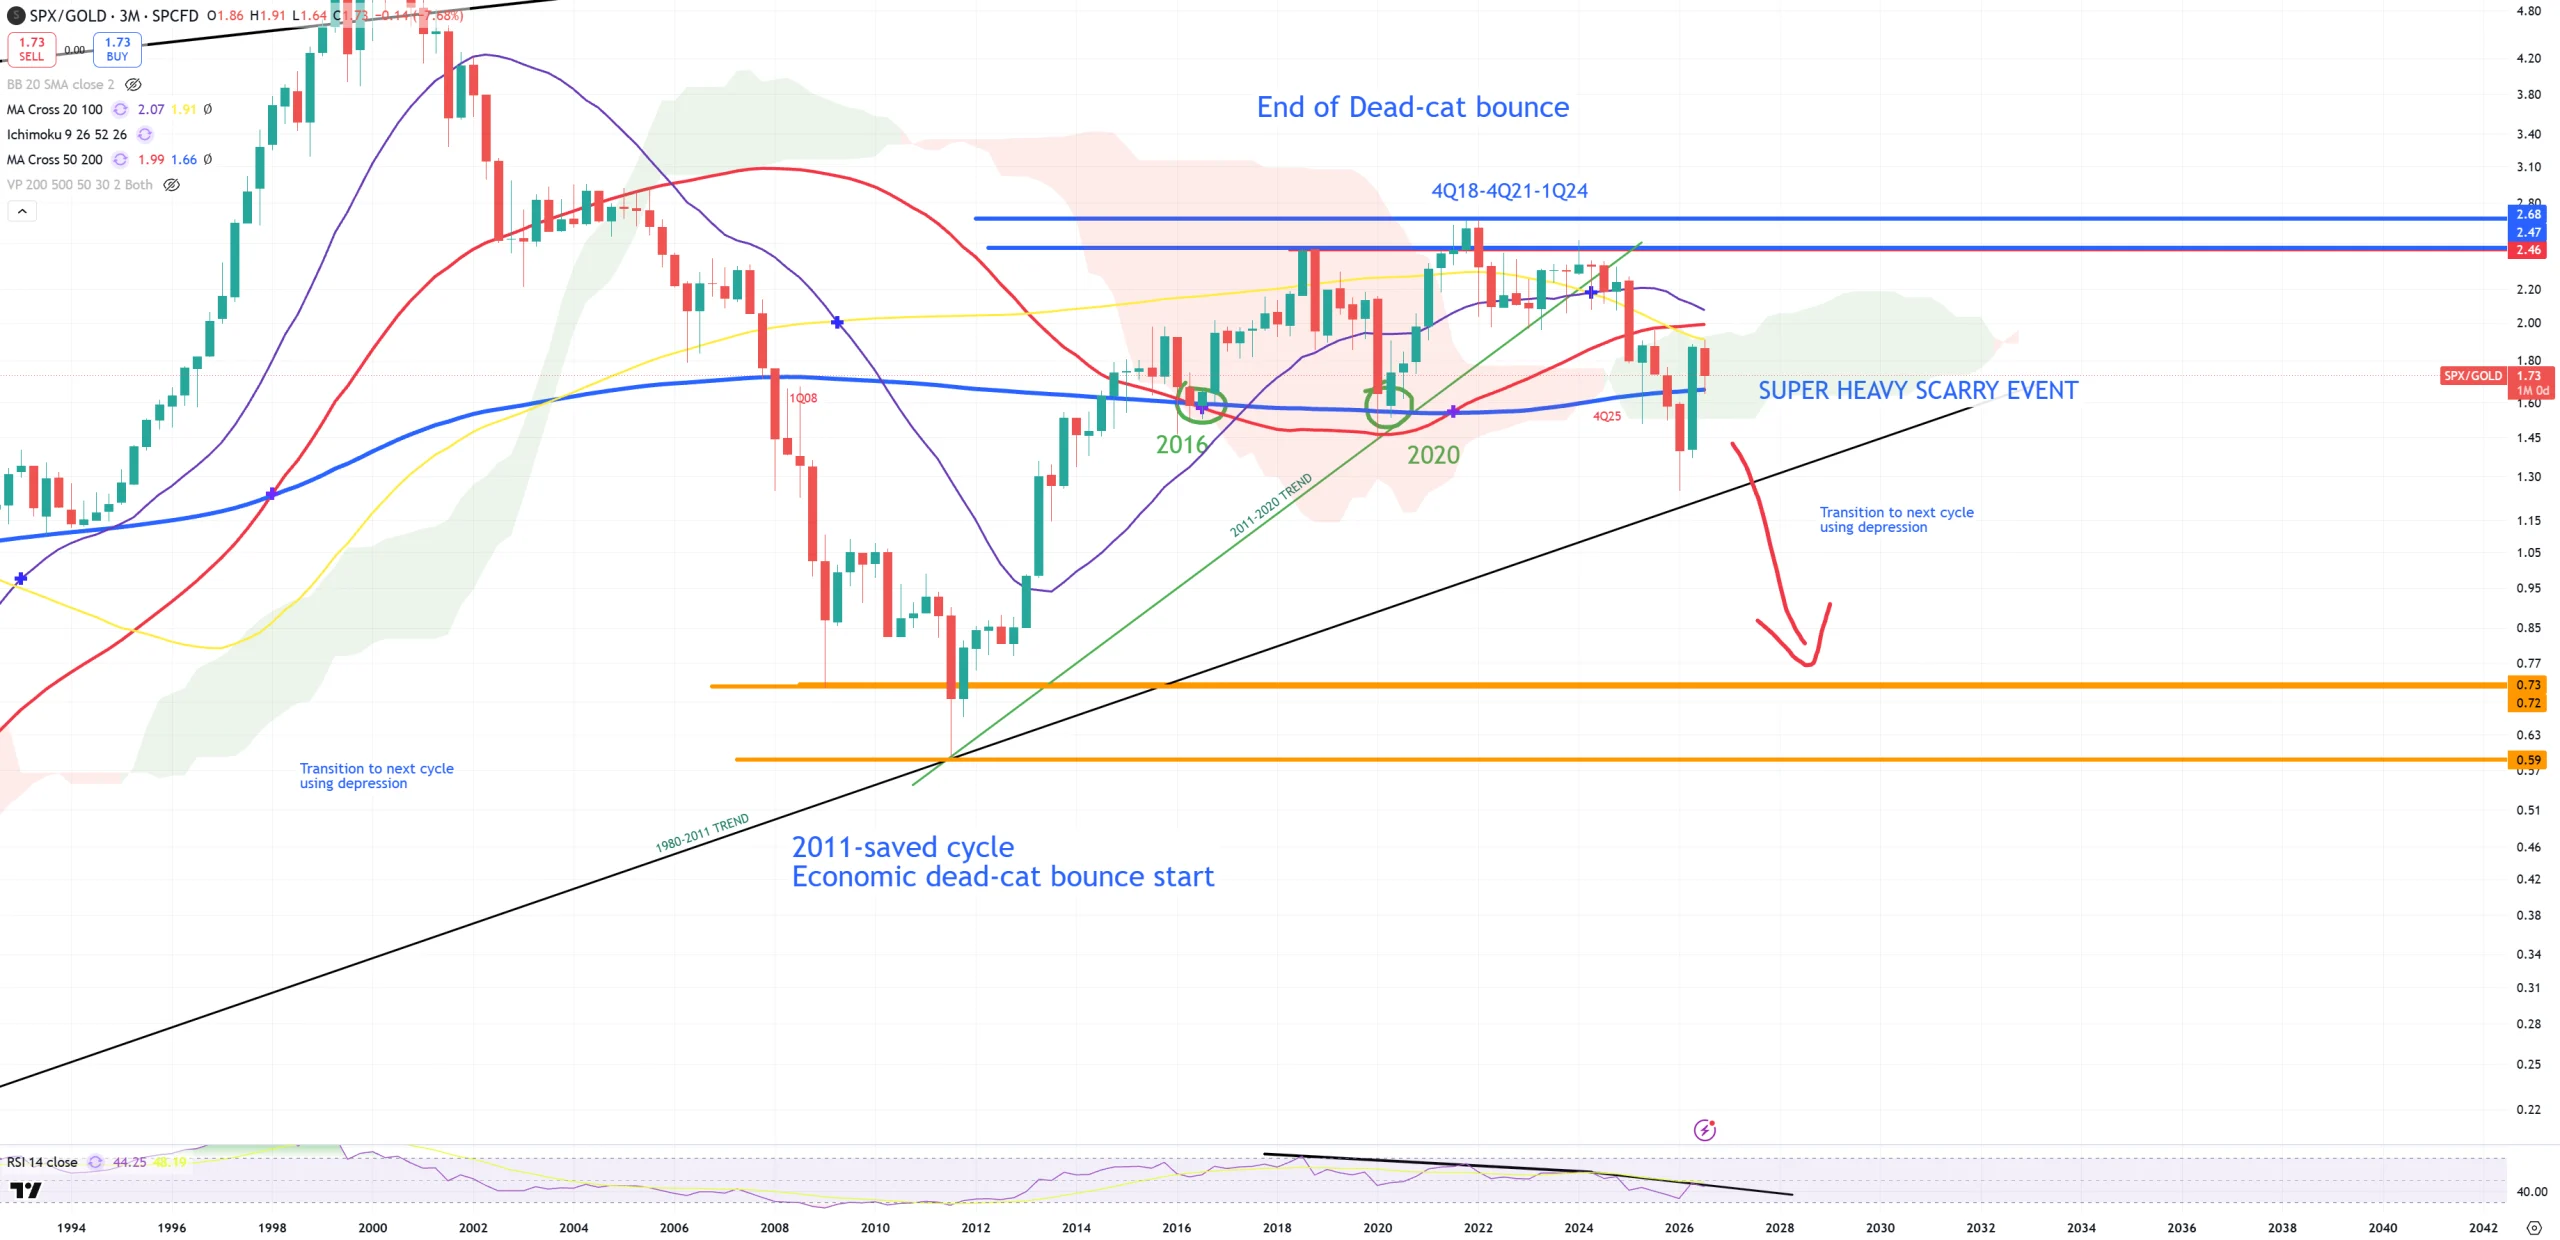
SPX/GOLD – big cycle indicator. 2xviews. First on (M) second on (3M). (M)MA200 = almost (3M)MA200 and my expectation that “big scarry event” will kick in once we leave this level of (M)MA200 & (3M)MA200.
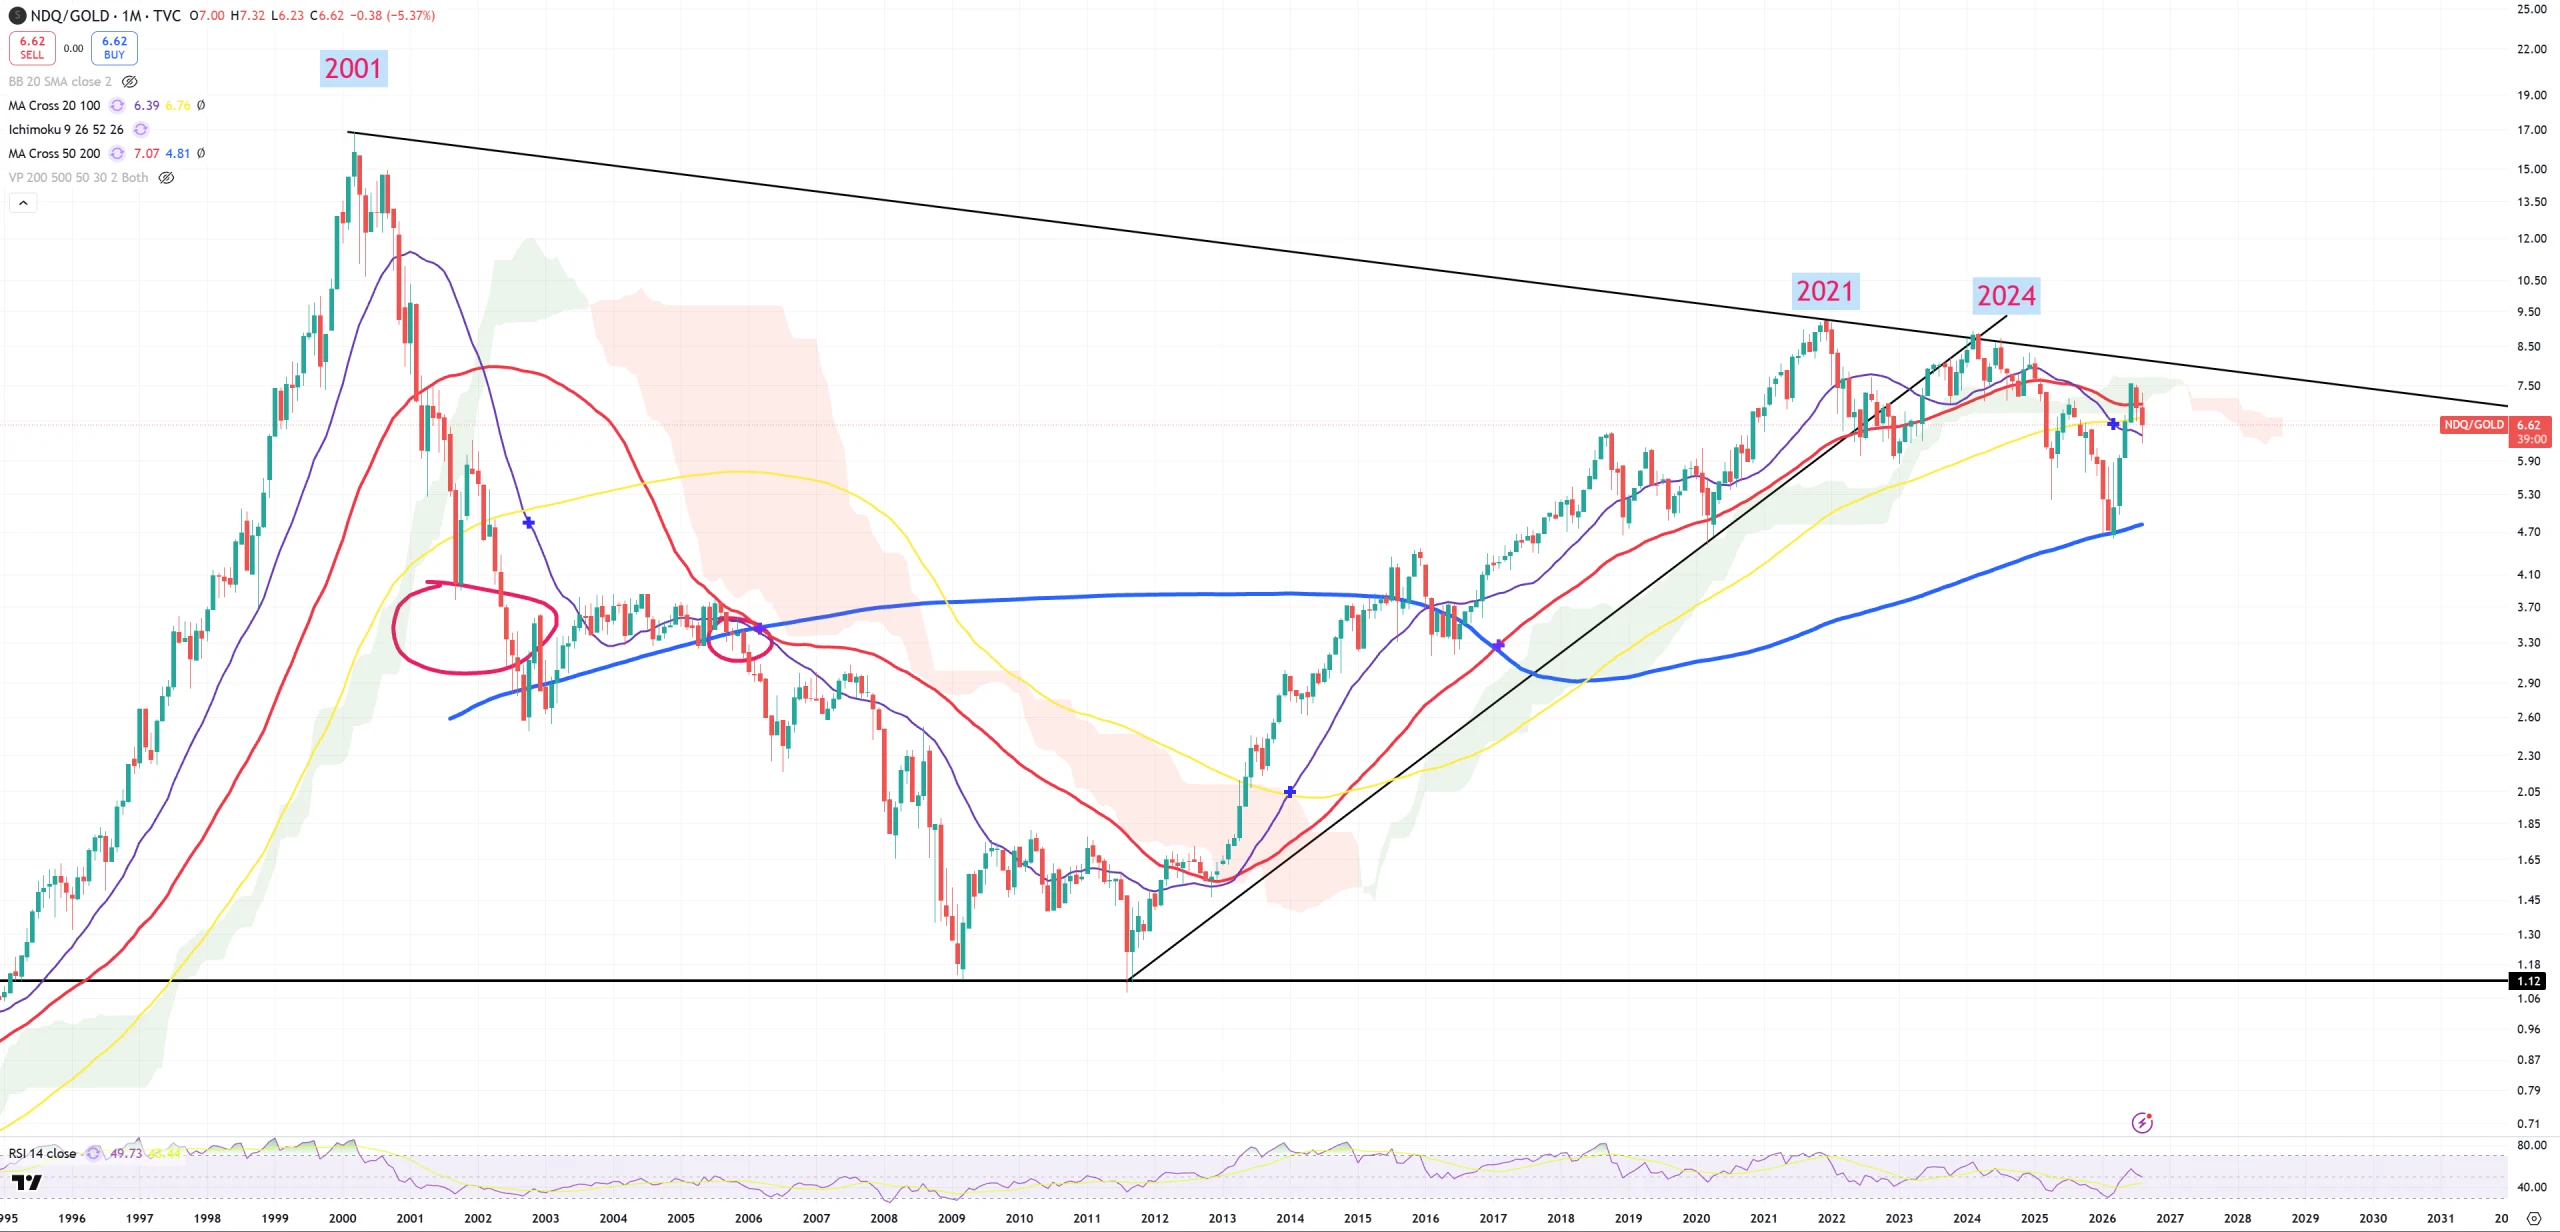
NDQ/GOLD – we see that NDQ cycle peaked in 2021 and 2024 – almost perfect double top here. Now after (M)MA200 bounce we ended below (M)MA50 & (M)MA100.
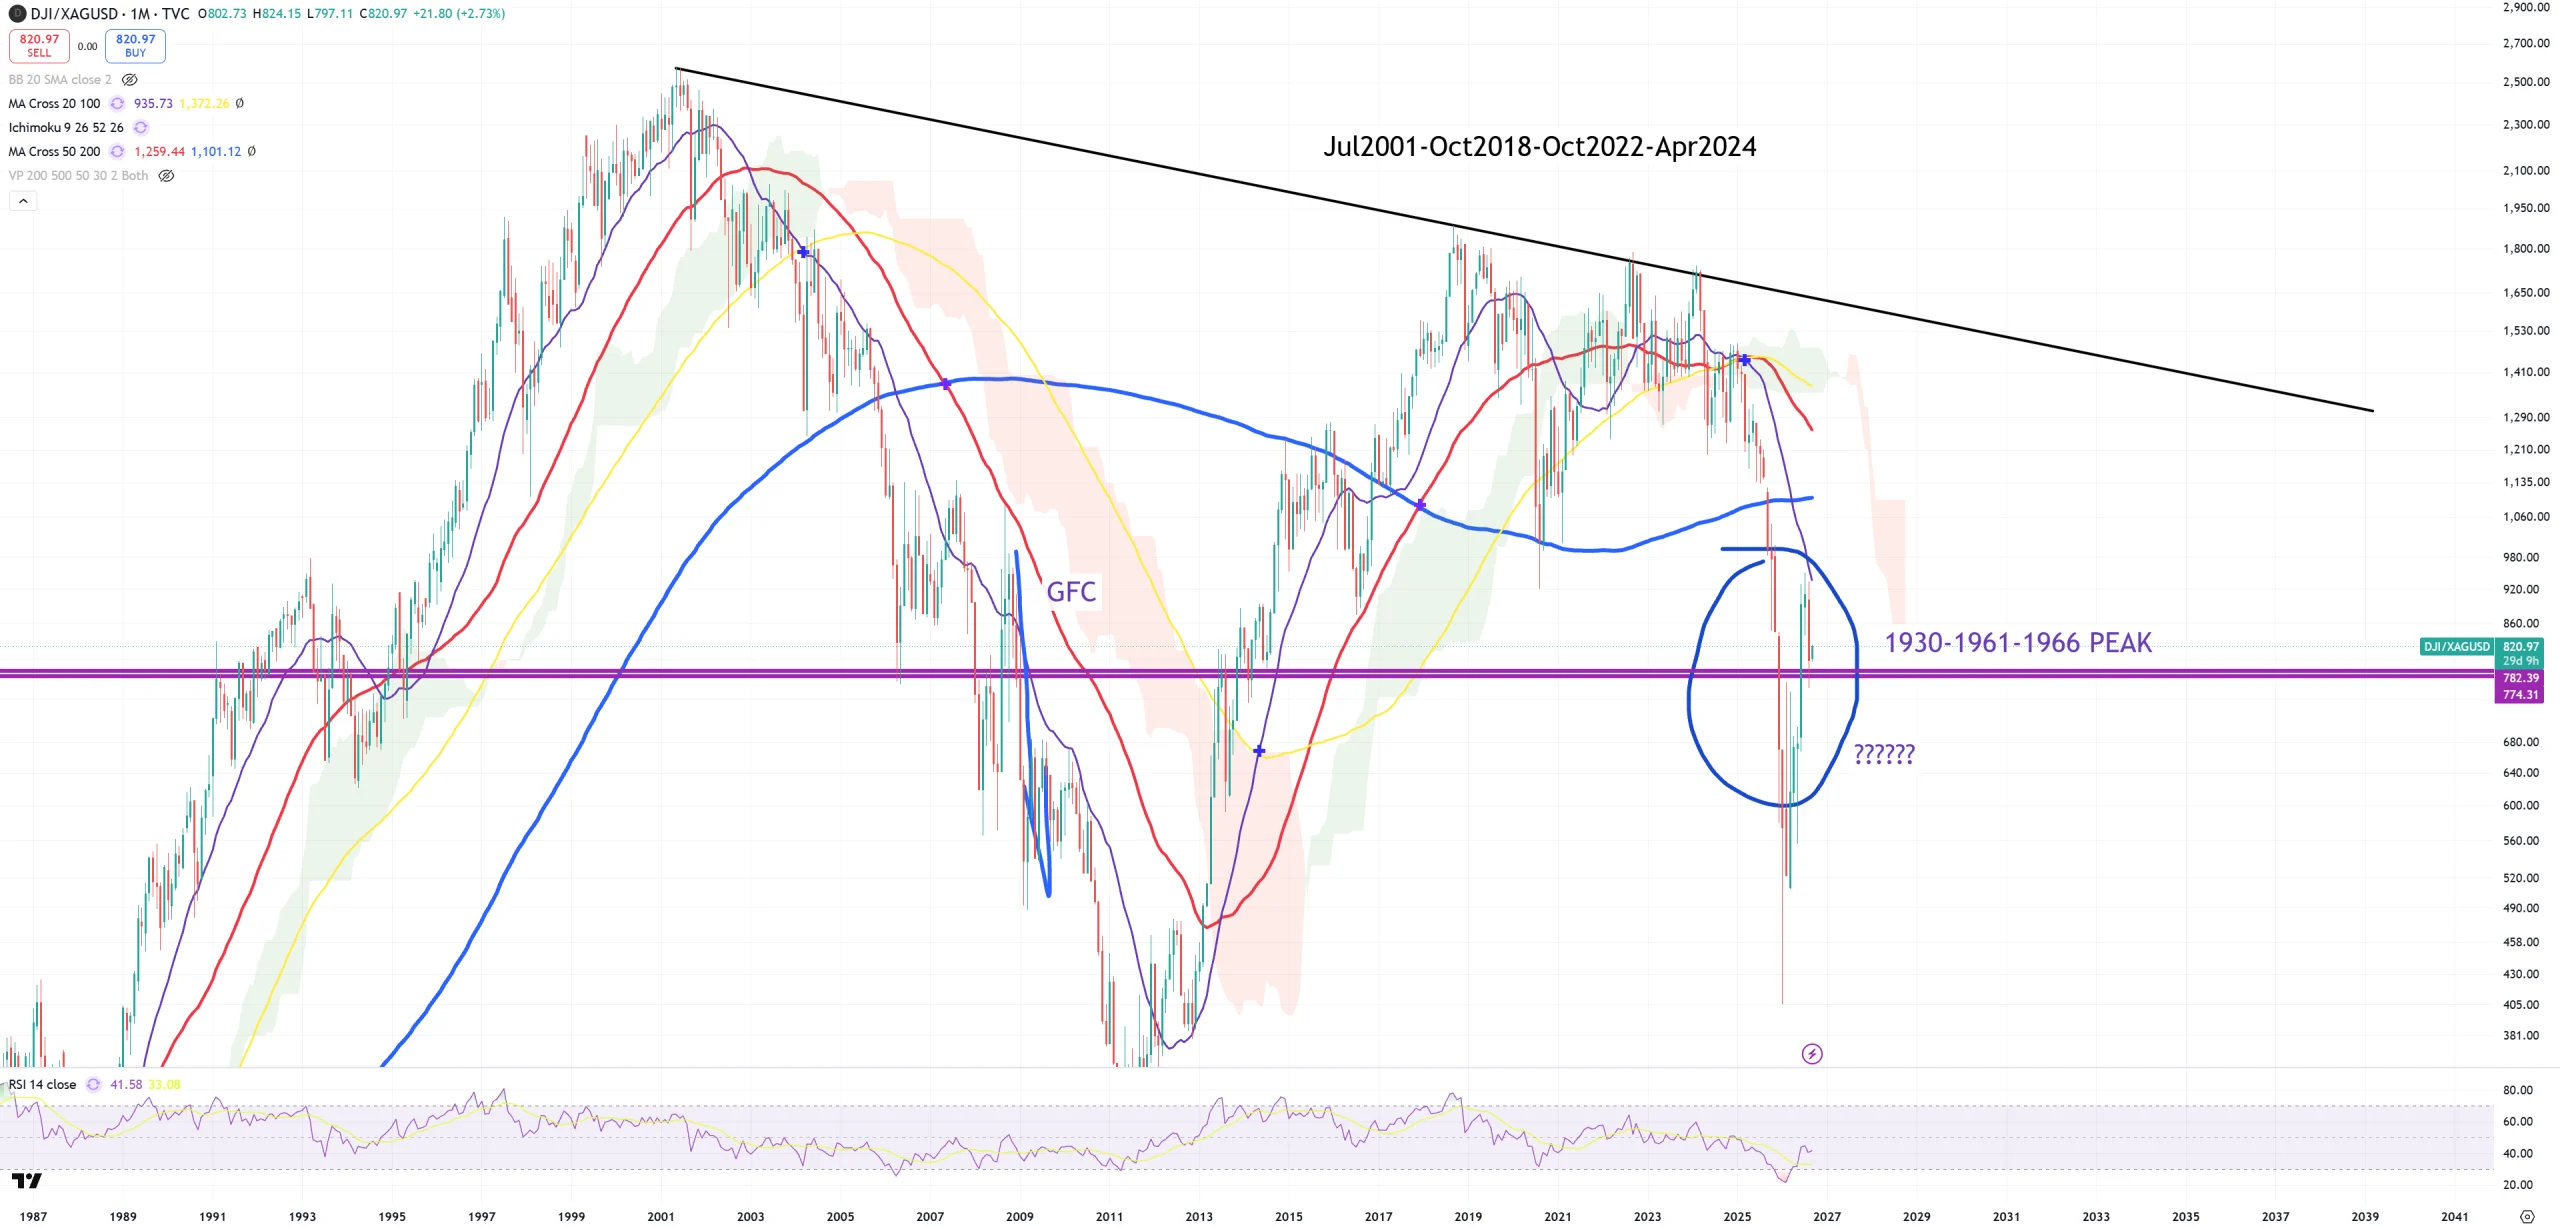
DJI/SILVER – it’ll be a fight on this level. Last break = GFC.
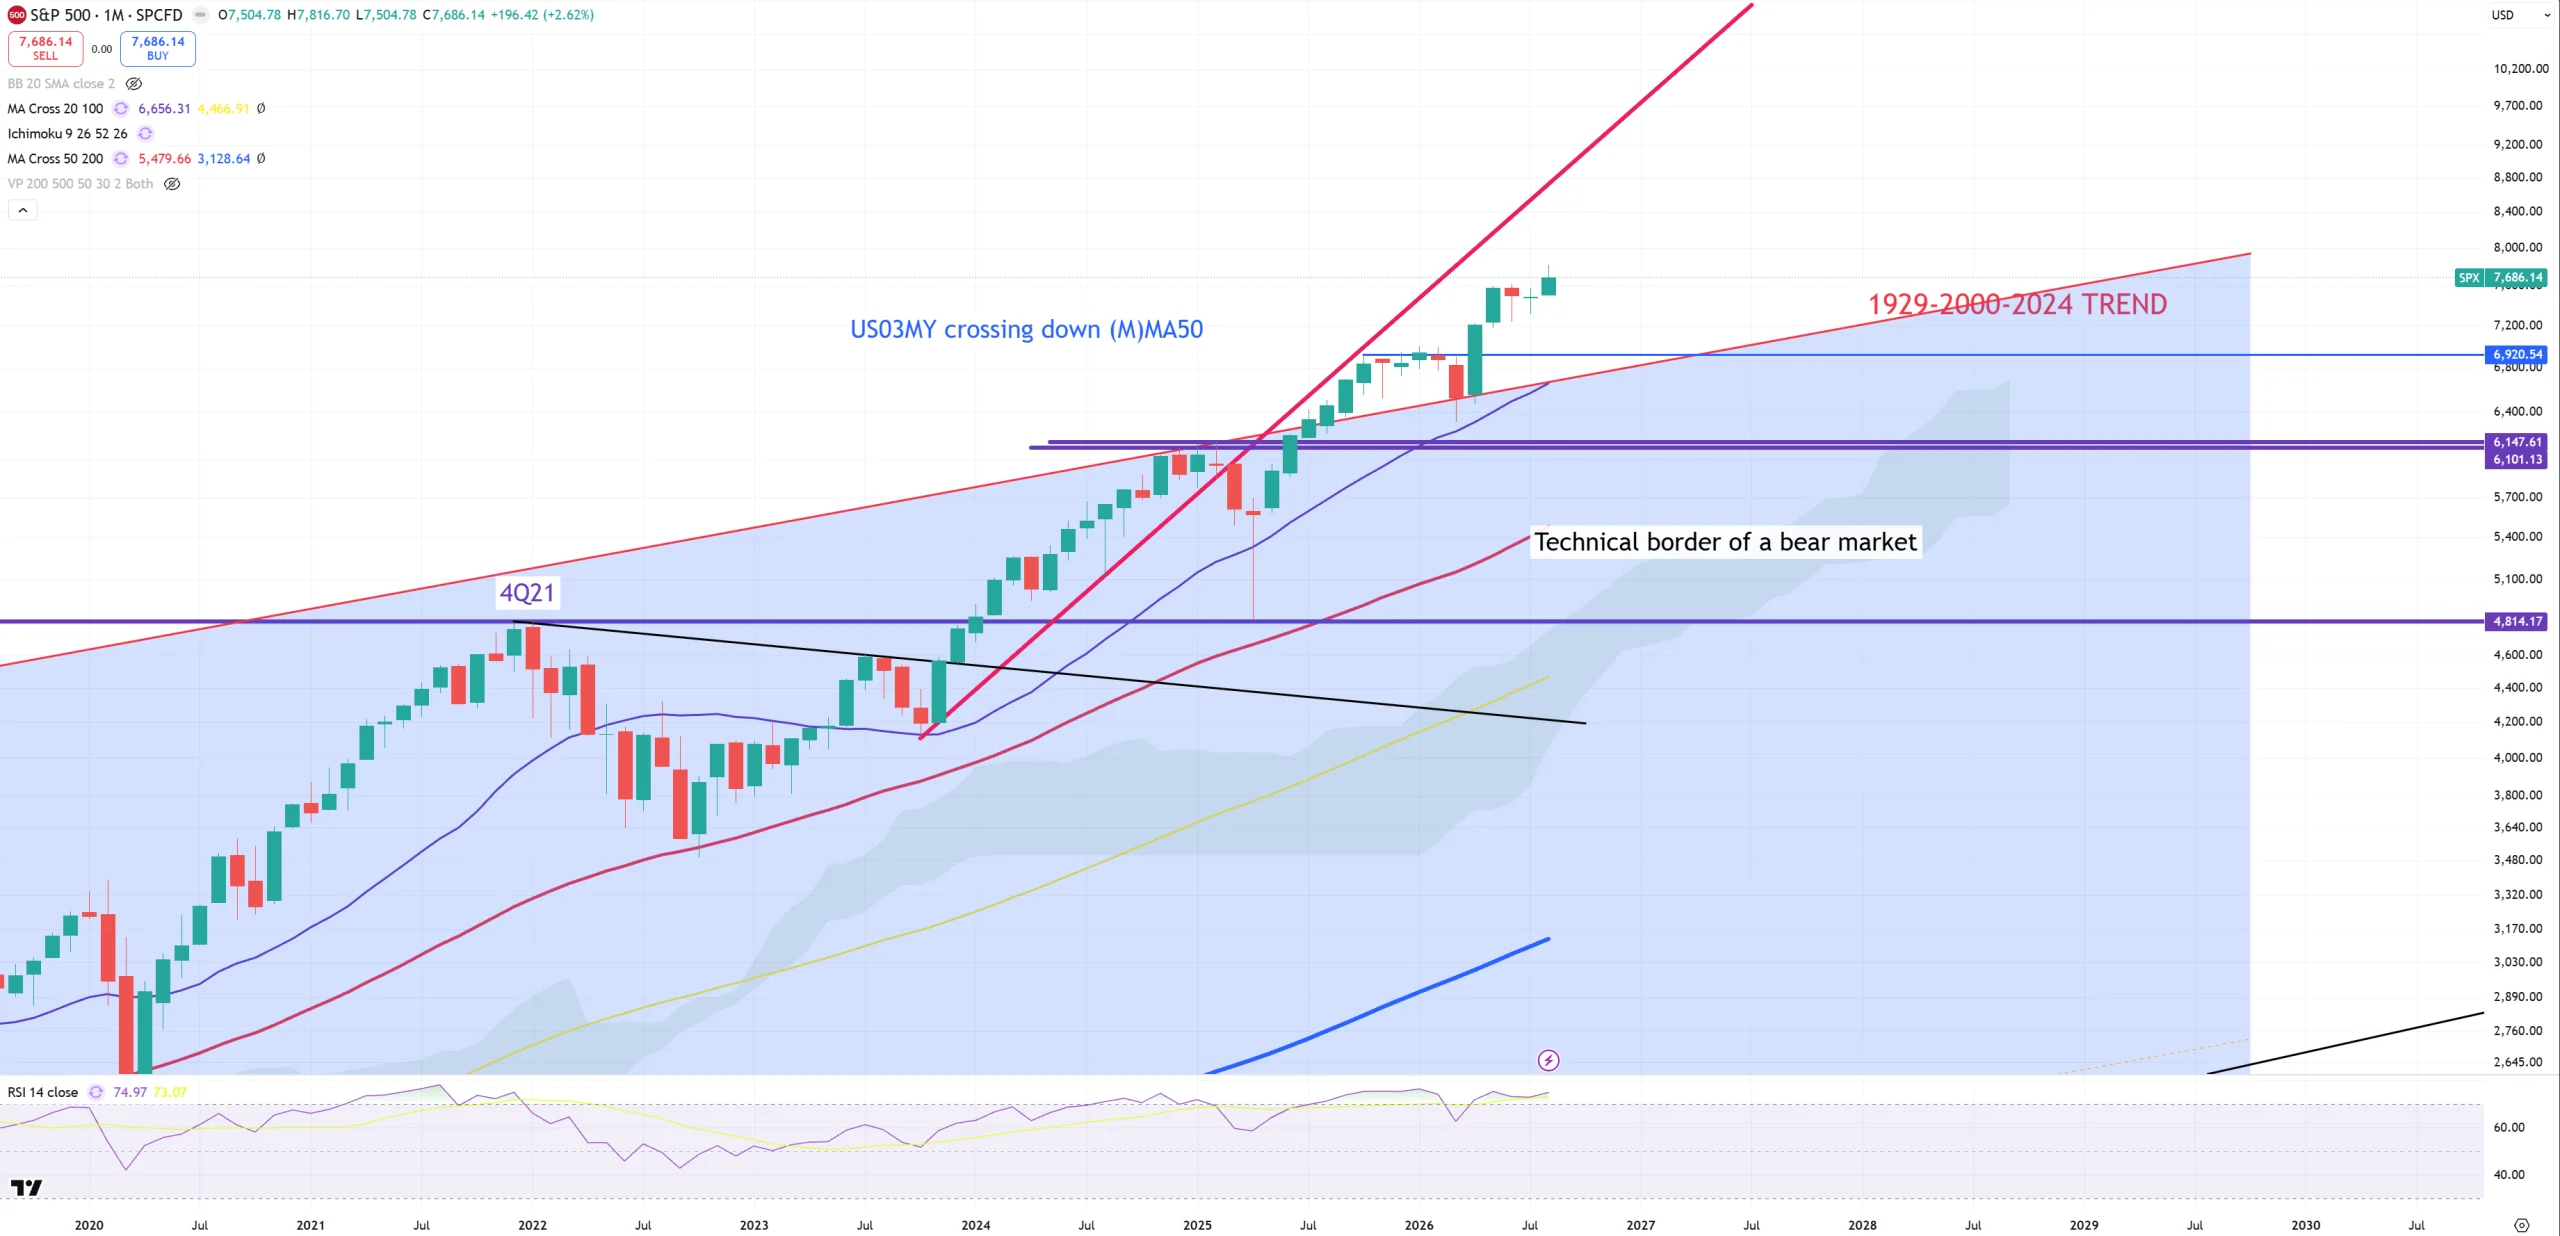
SPX – not much changed here until we go back below 1929-2000 trend which matches perfectly with violet (M)MA20. This level sits on 6700 for September 2026.
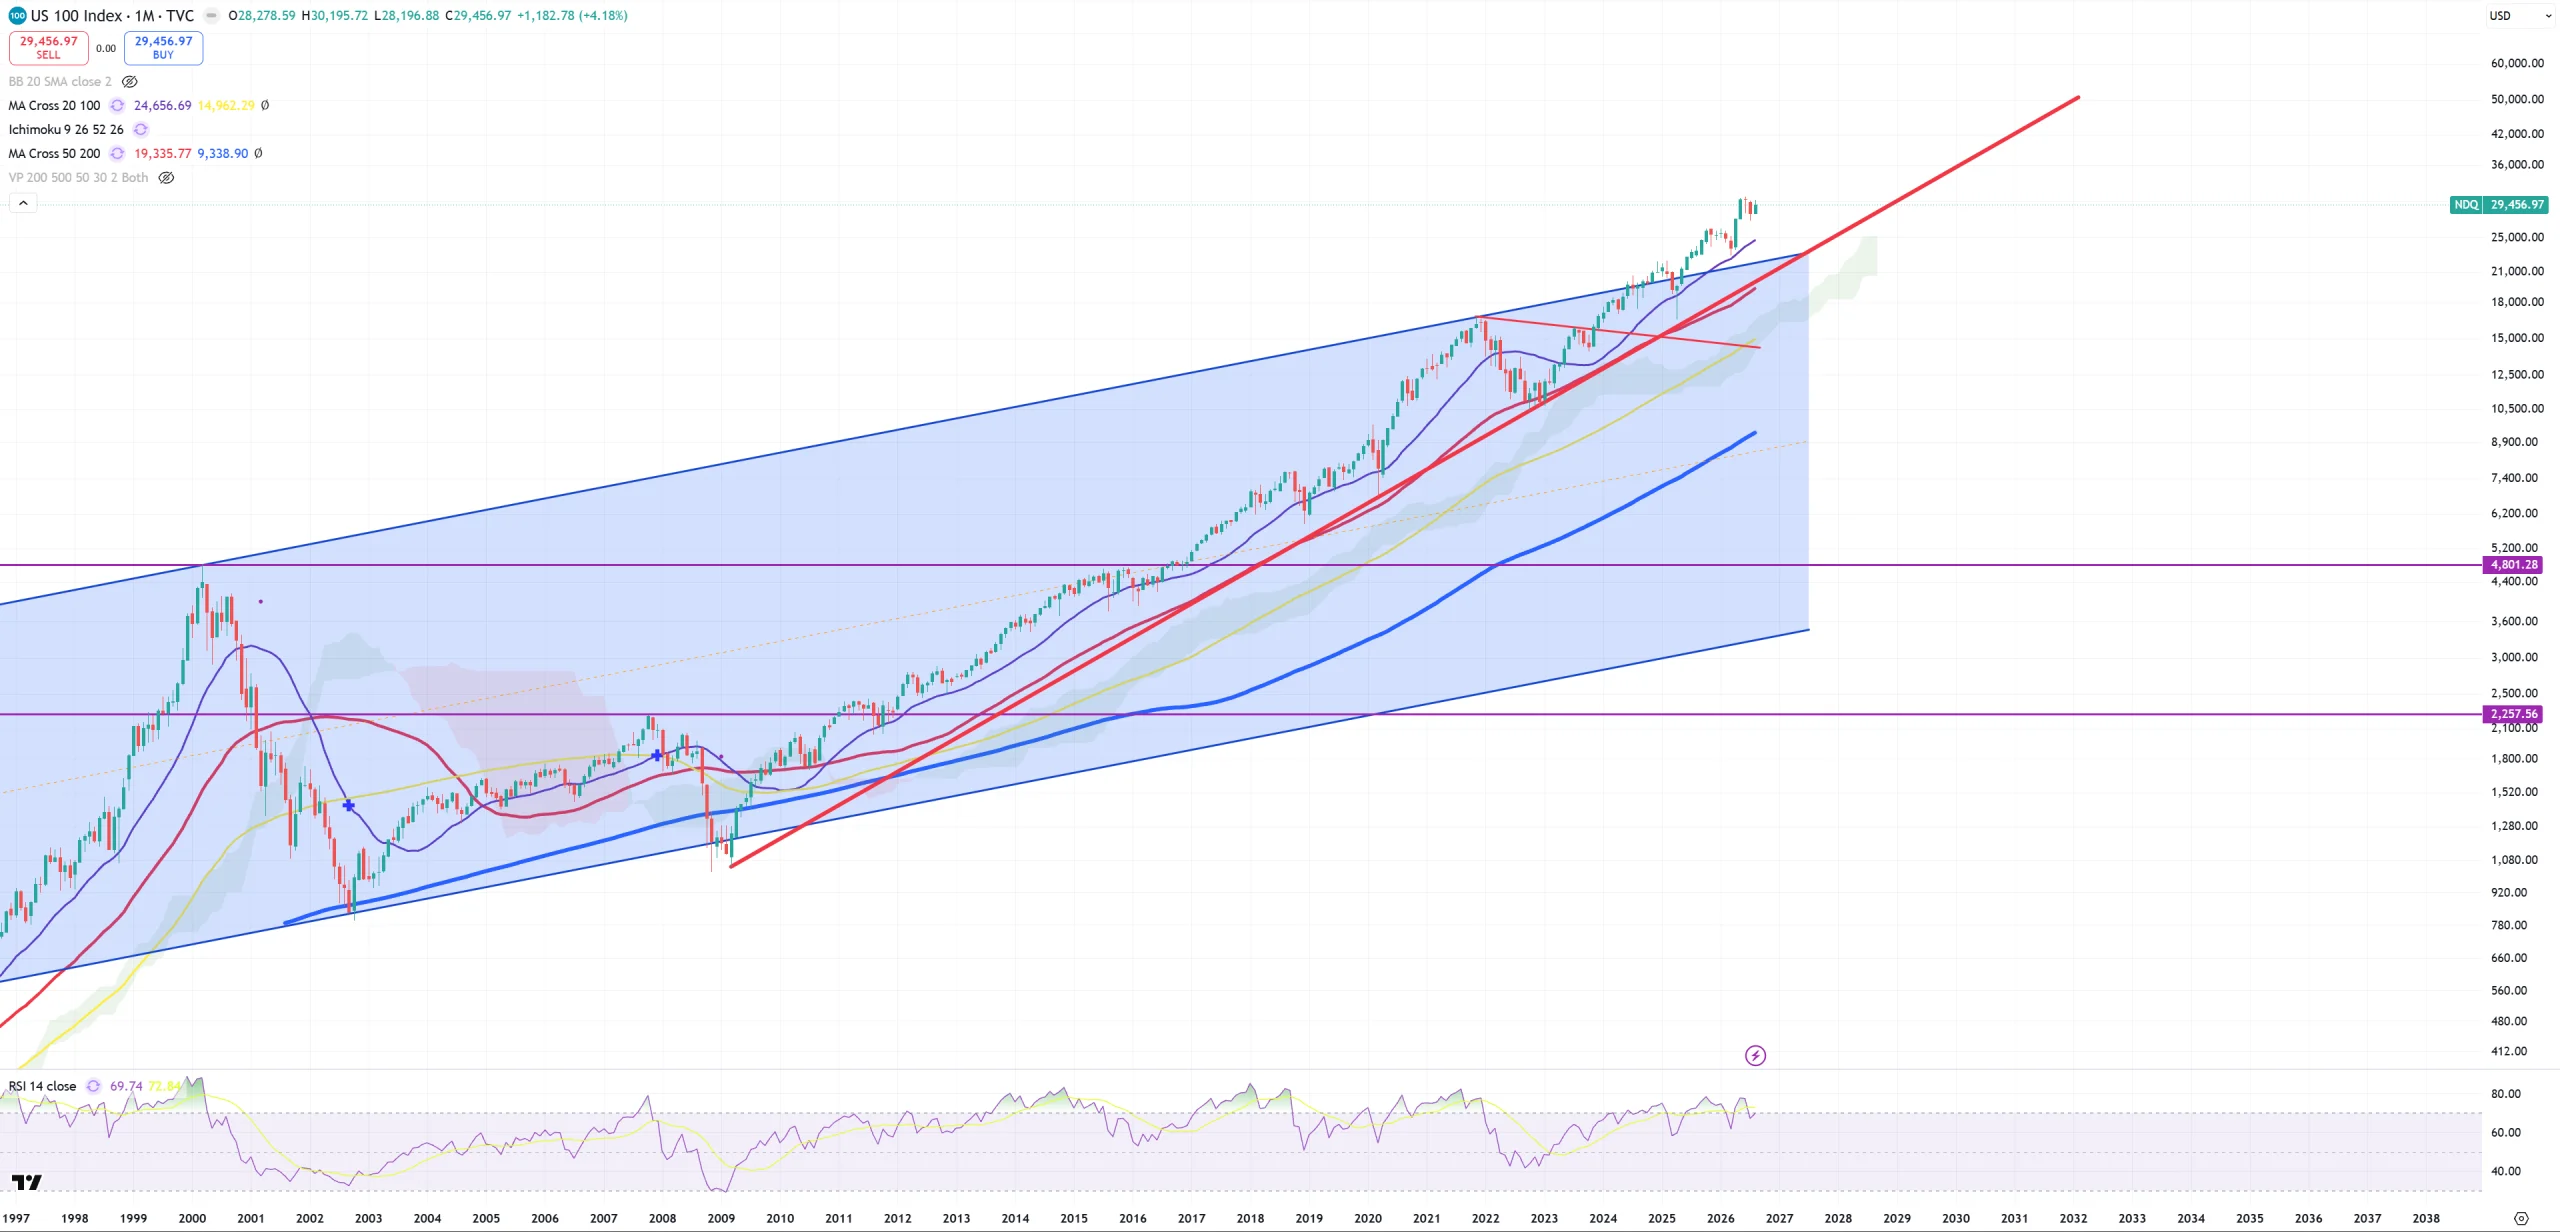
NDQ – Nasdaq 100 – nothing to see here. violet (M)MA20 holds = high momentum bull market intact.
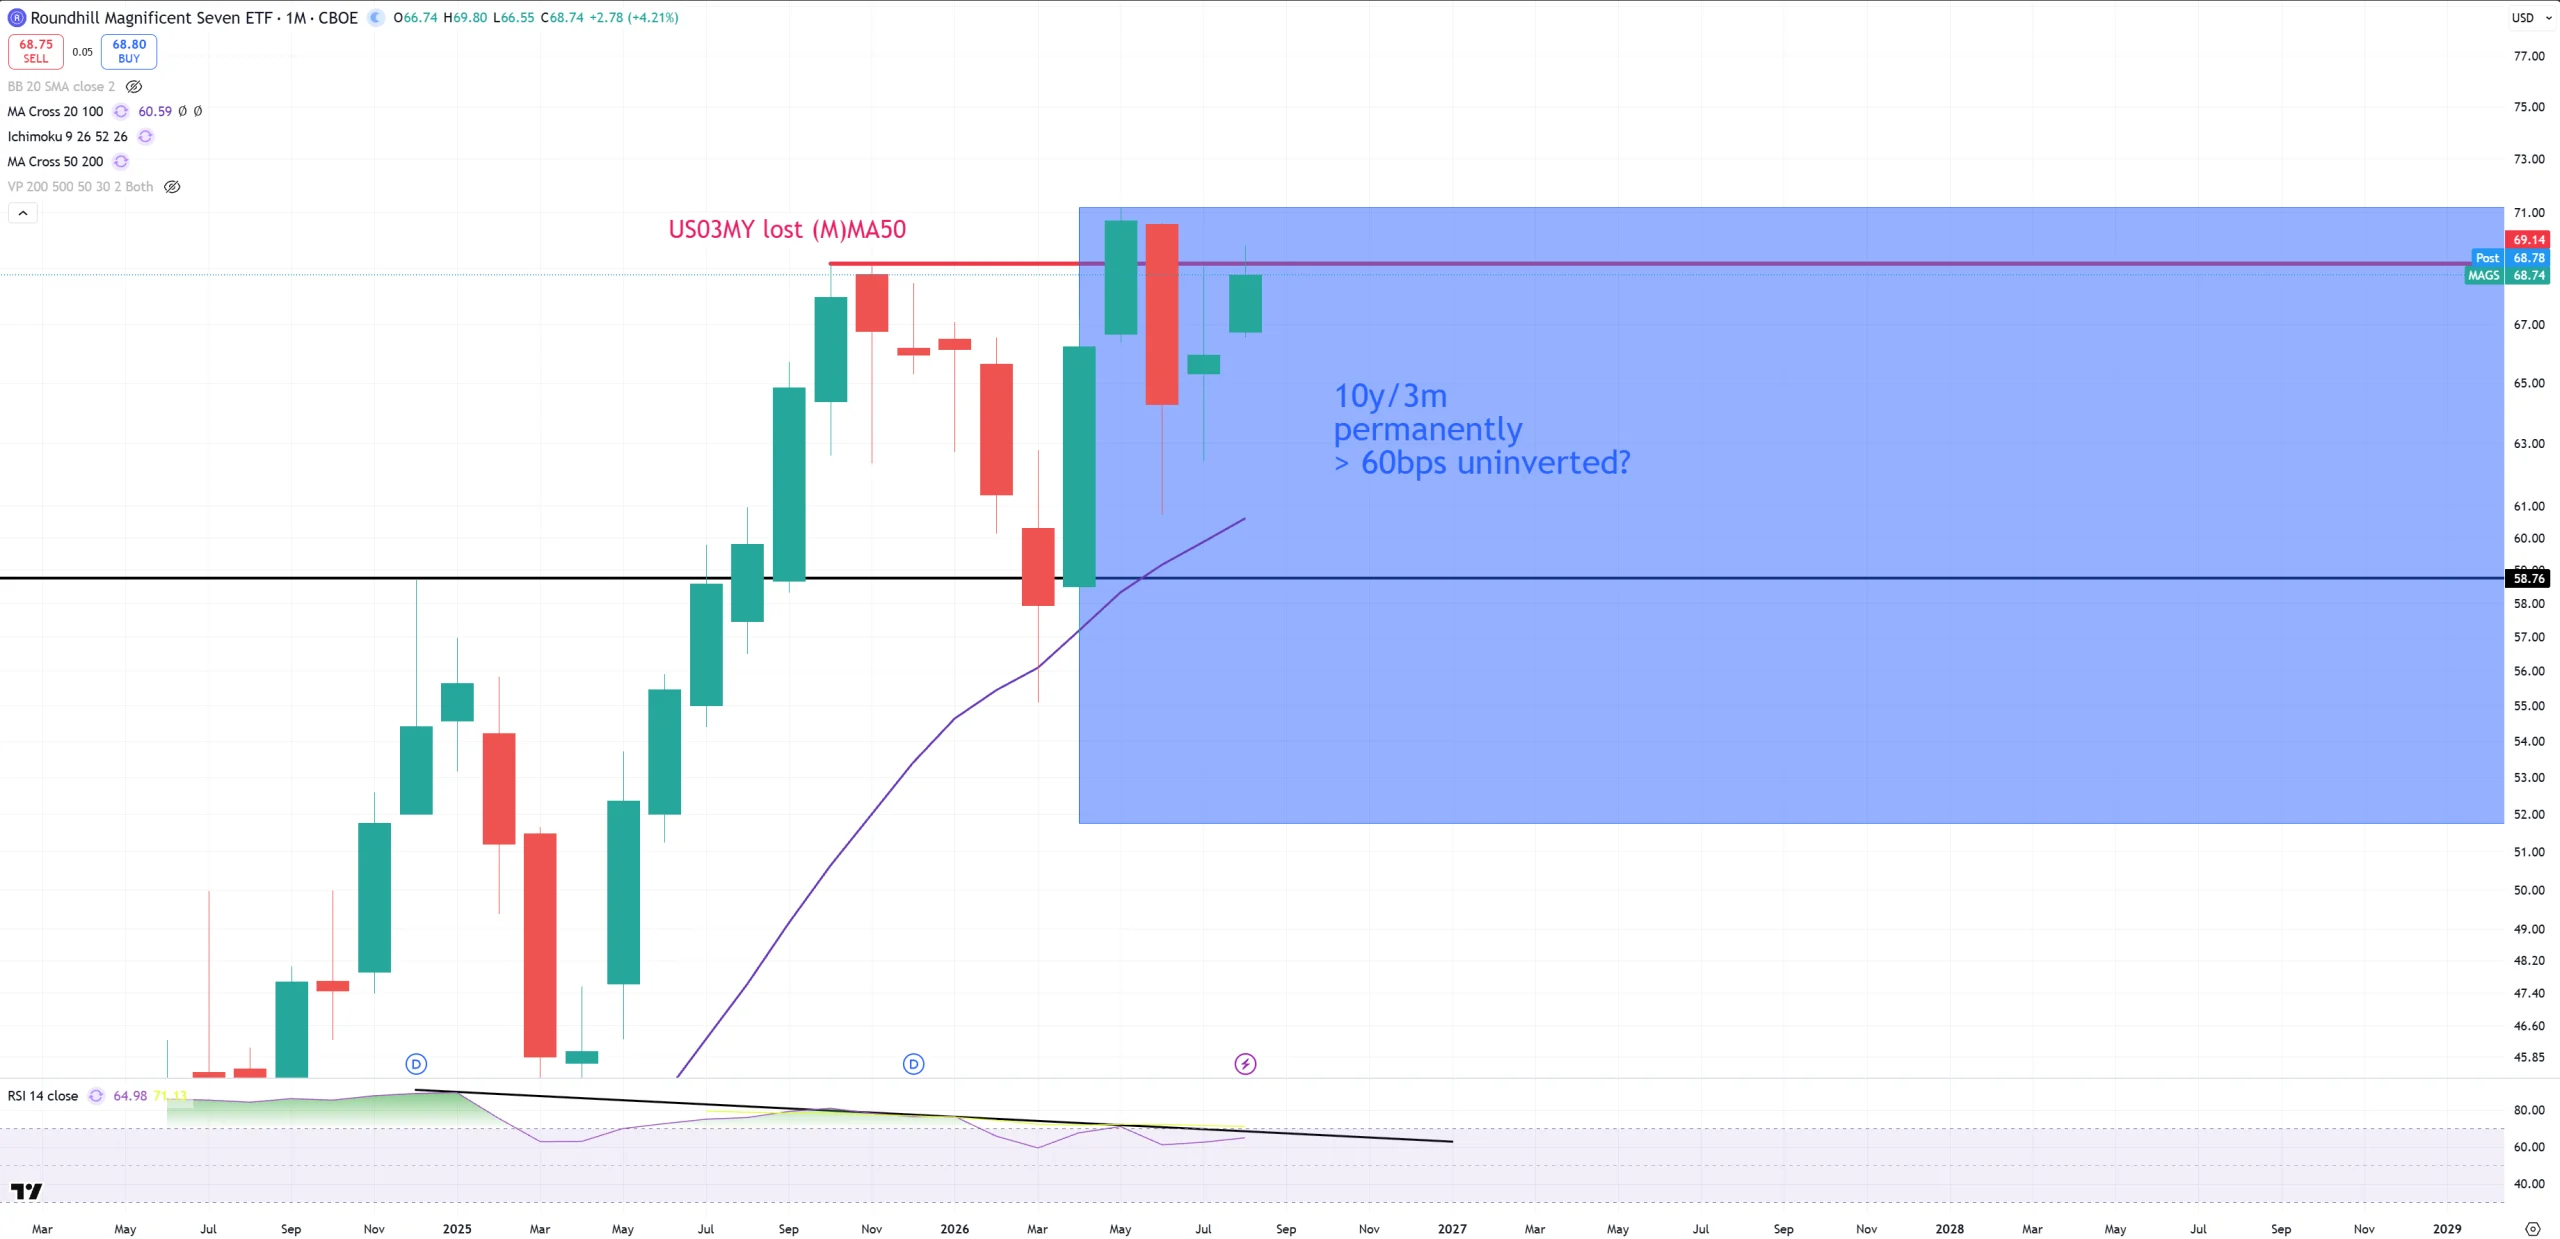
MAGS – since almost a year it can’t break this 70$ level
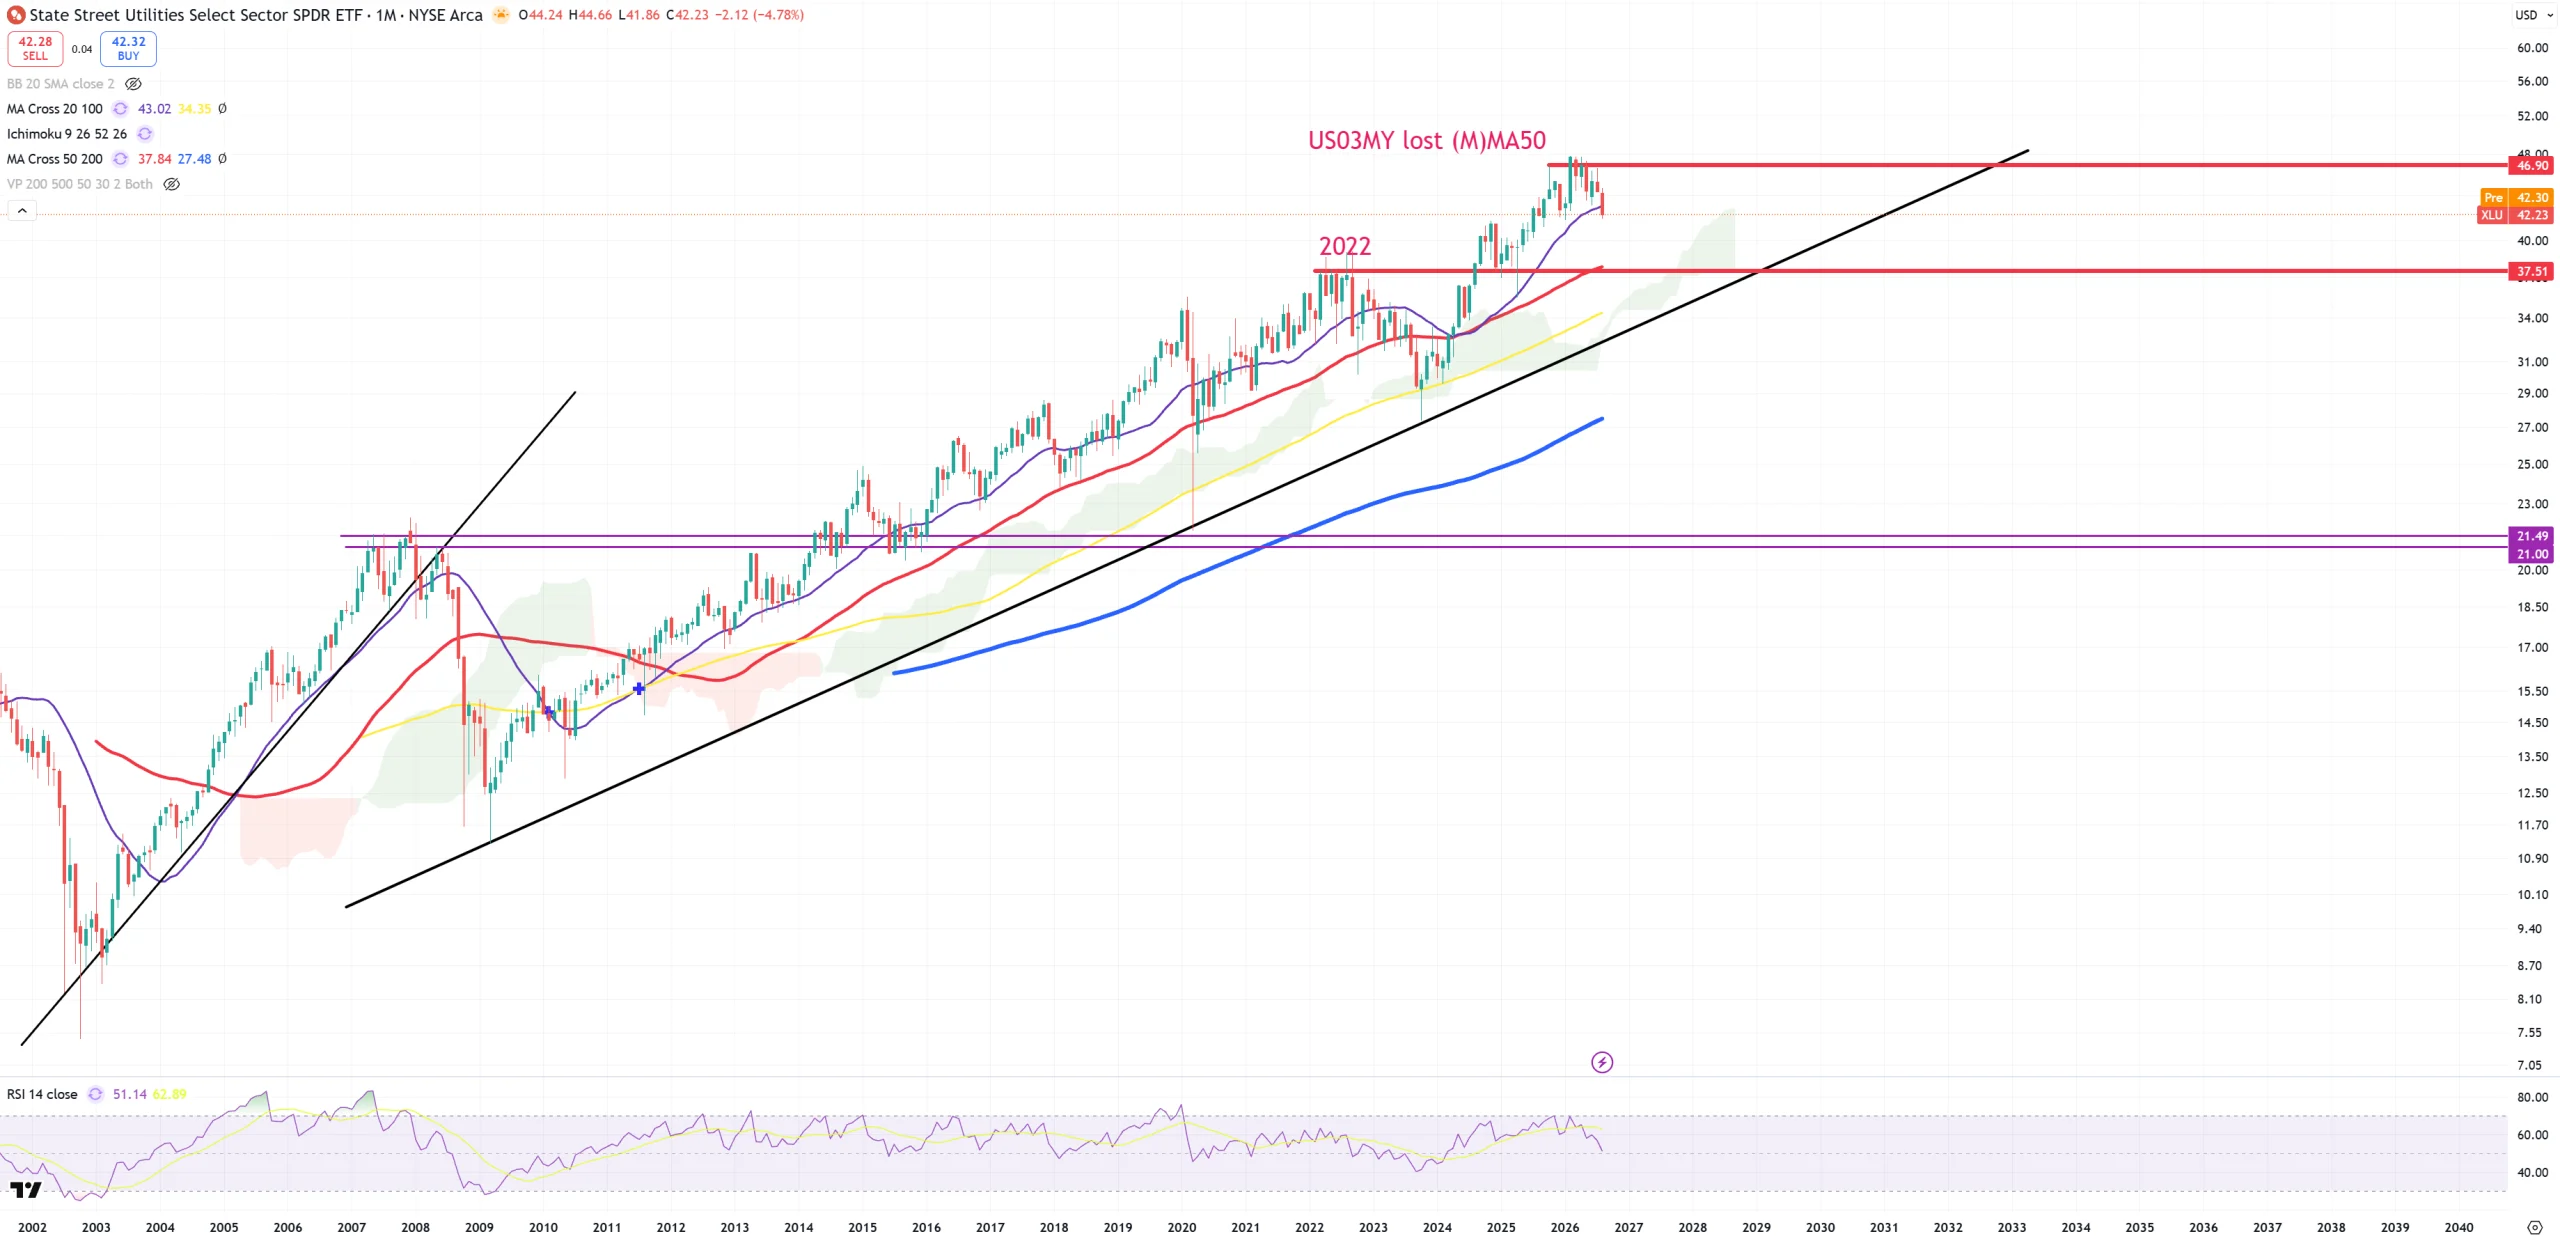
XLU – Utilities are always last
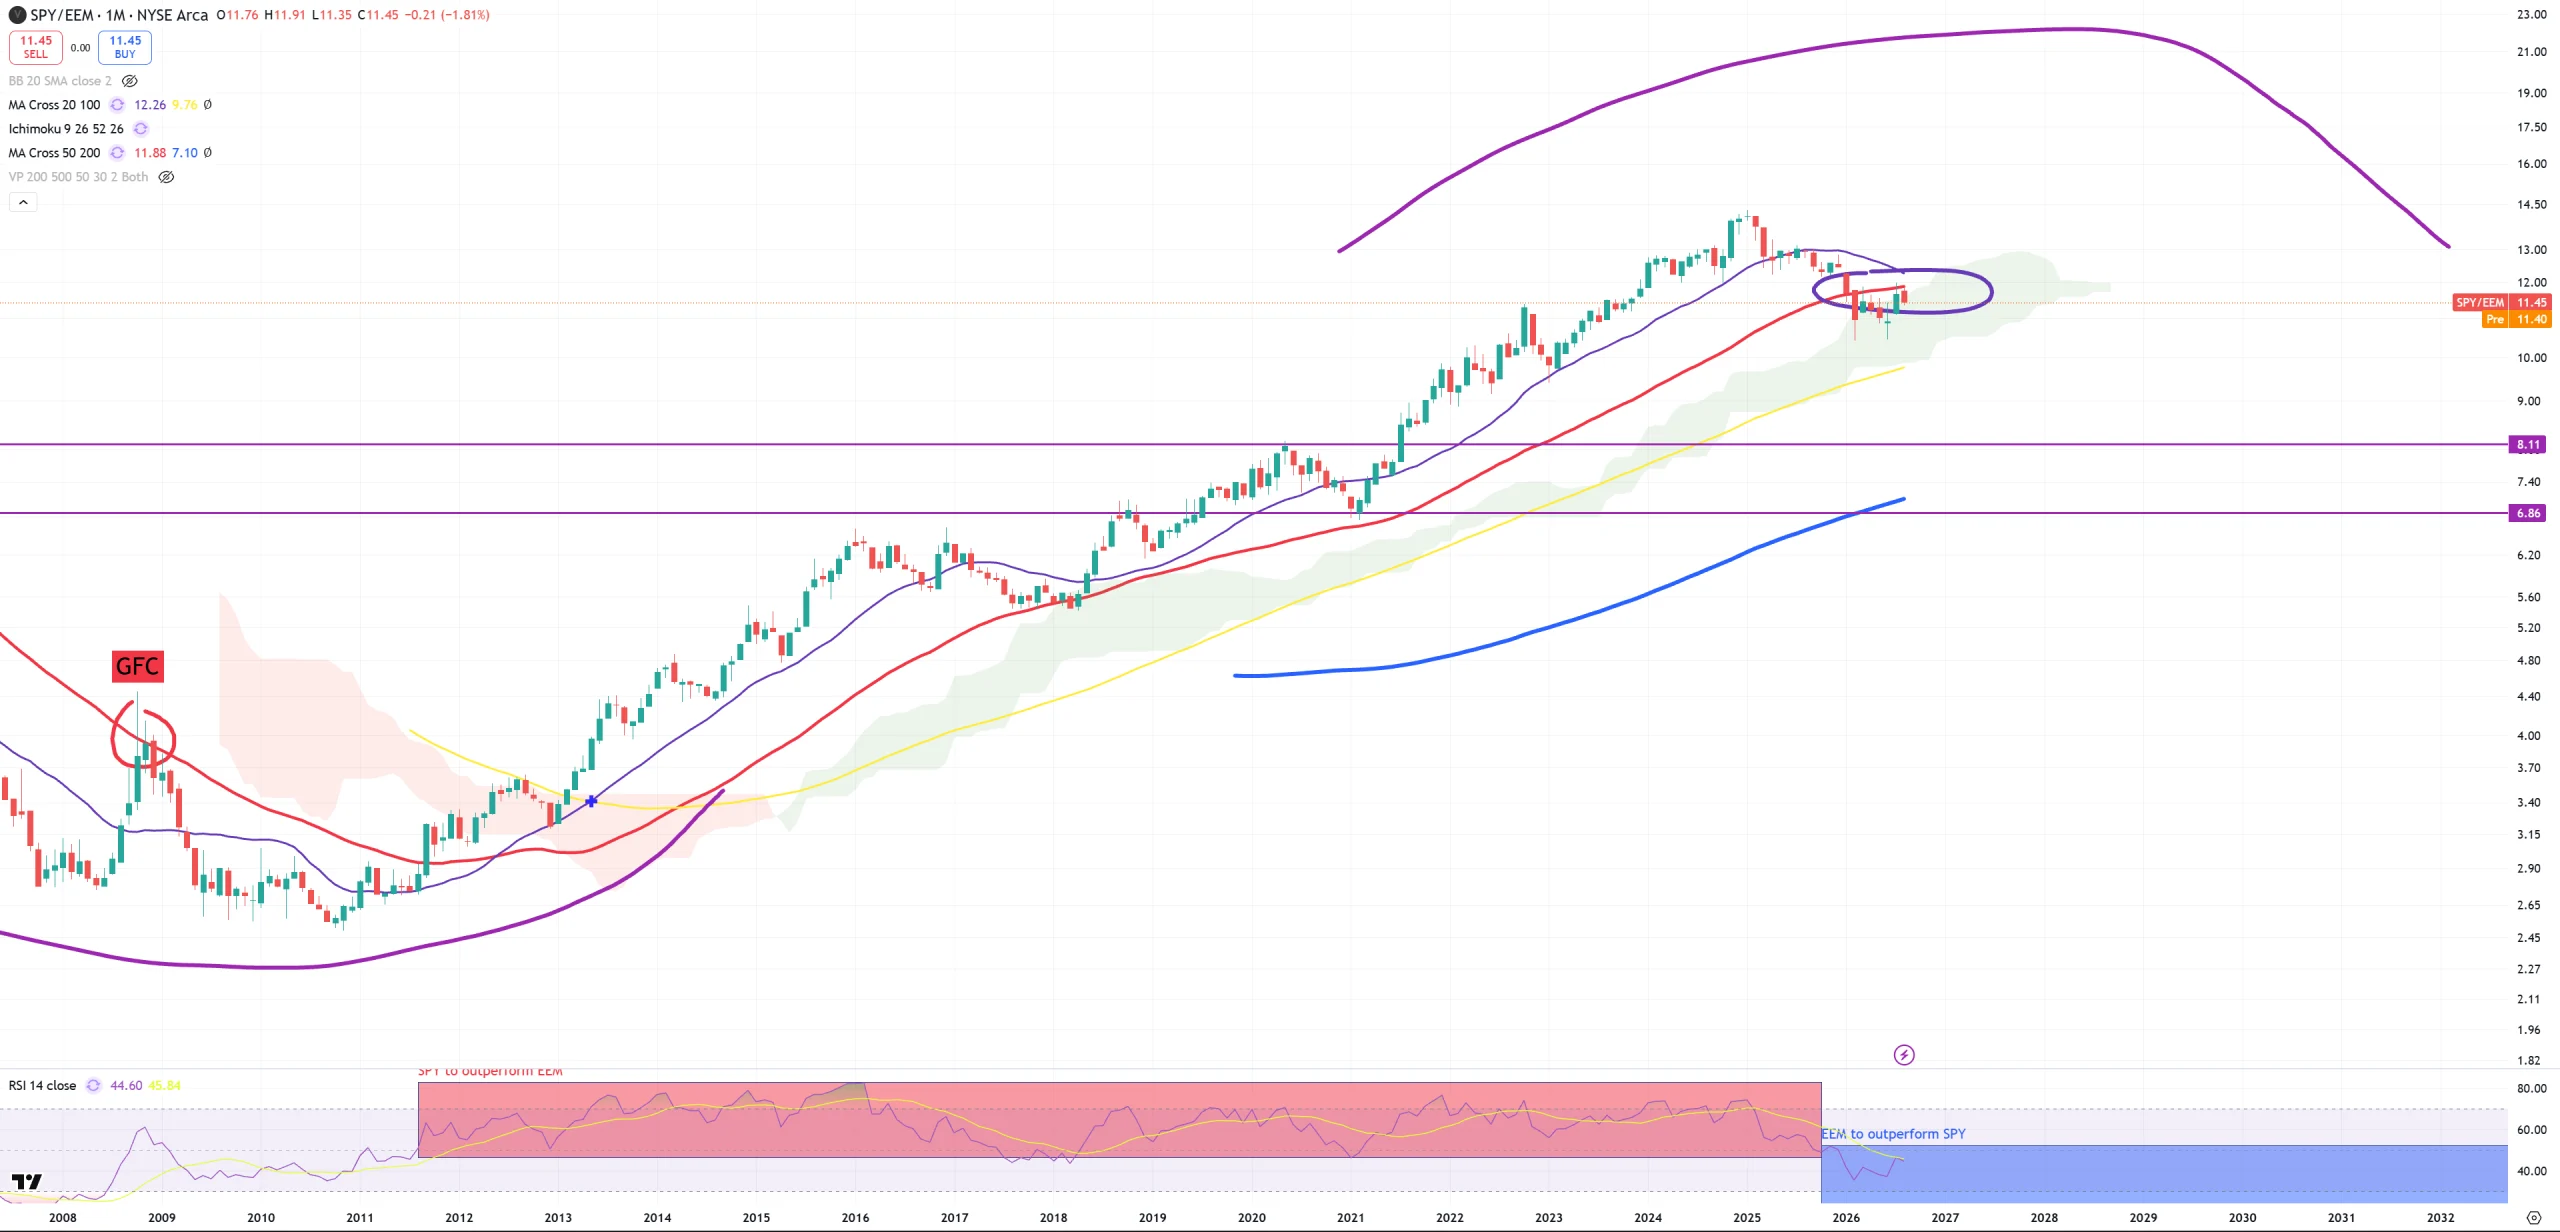
SPY/EEM – retest to (M)MA50 from the bottom pointing for cycle rotation
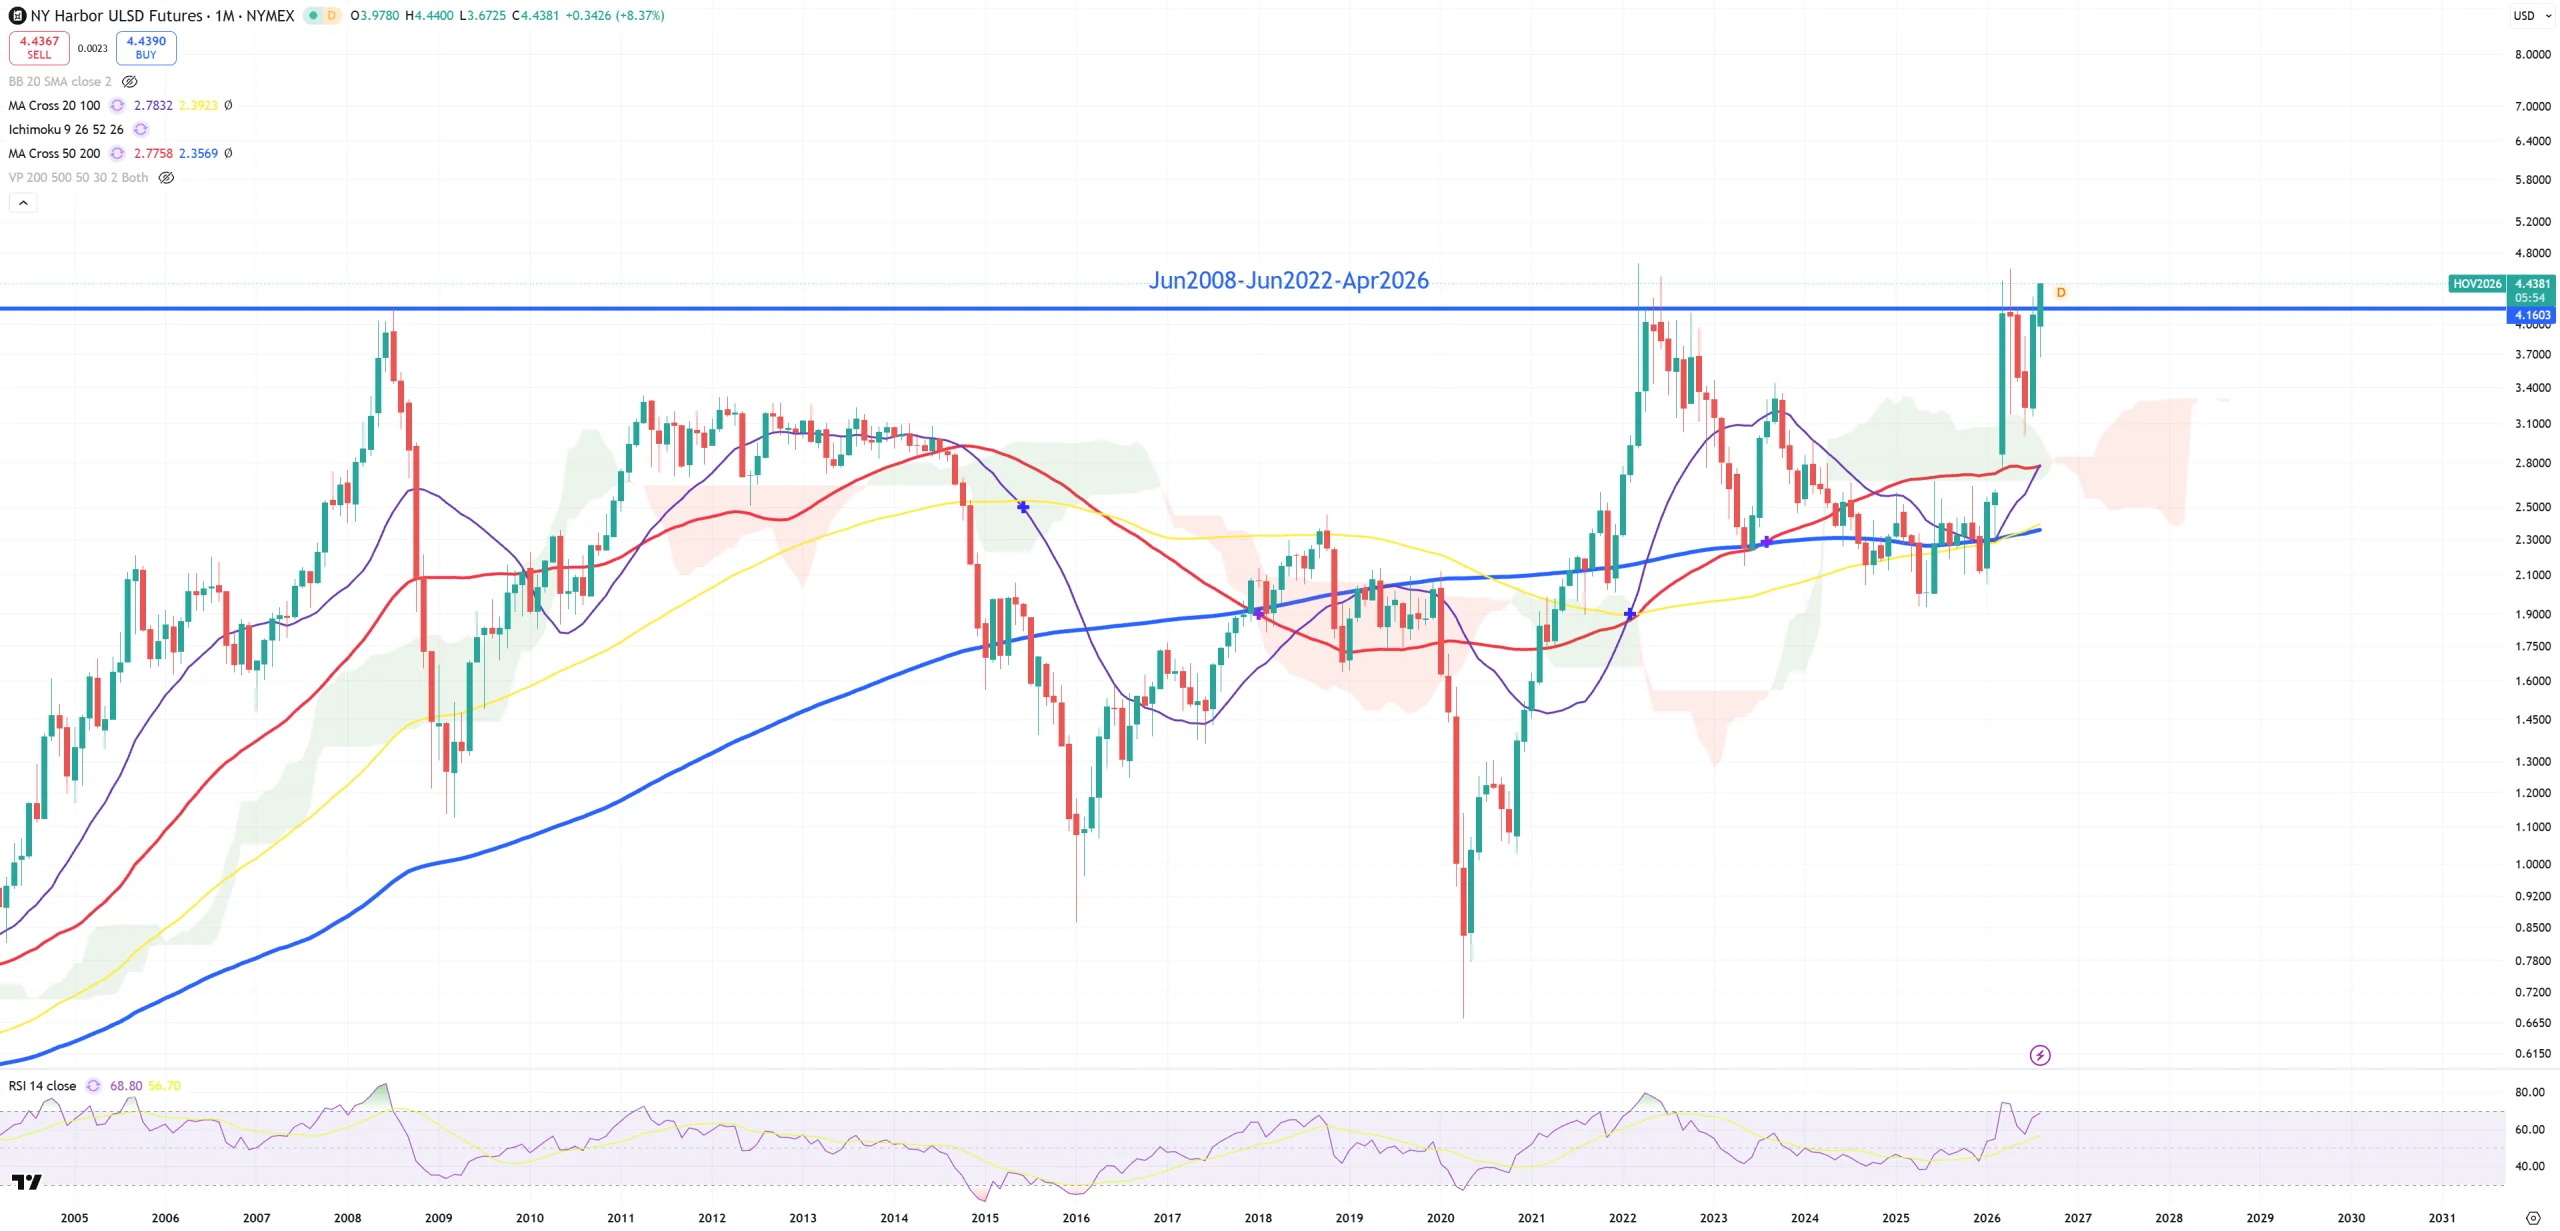
DIESEL – first (M) break ever …
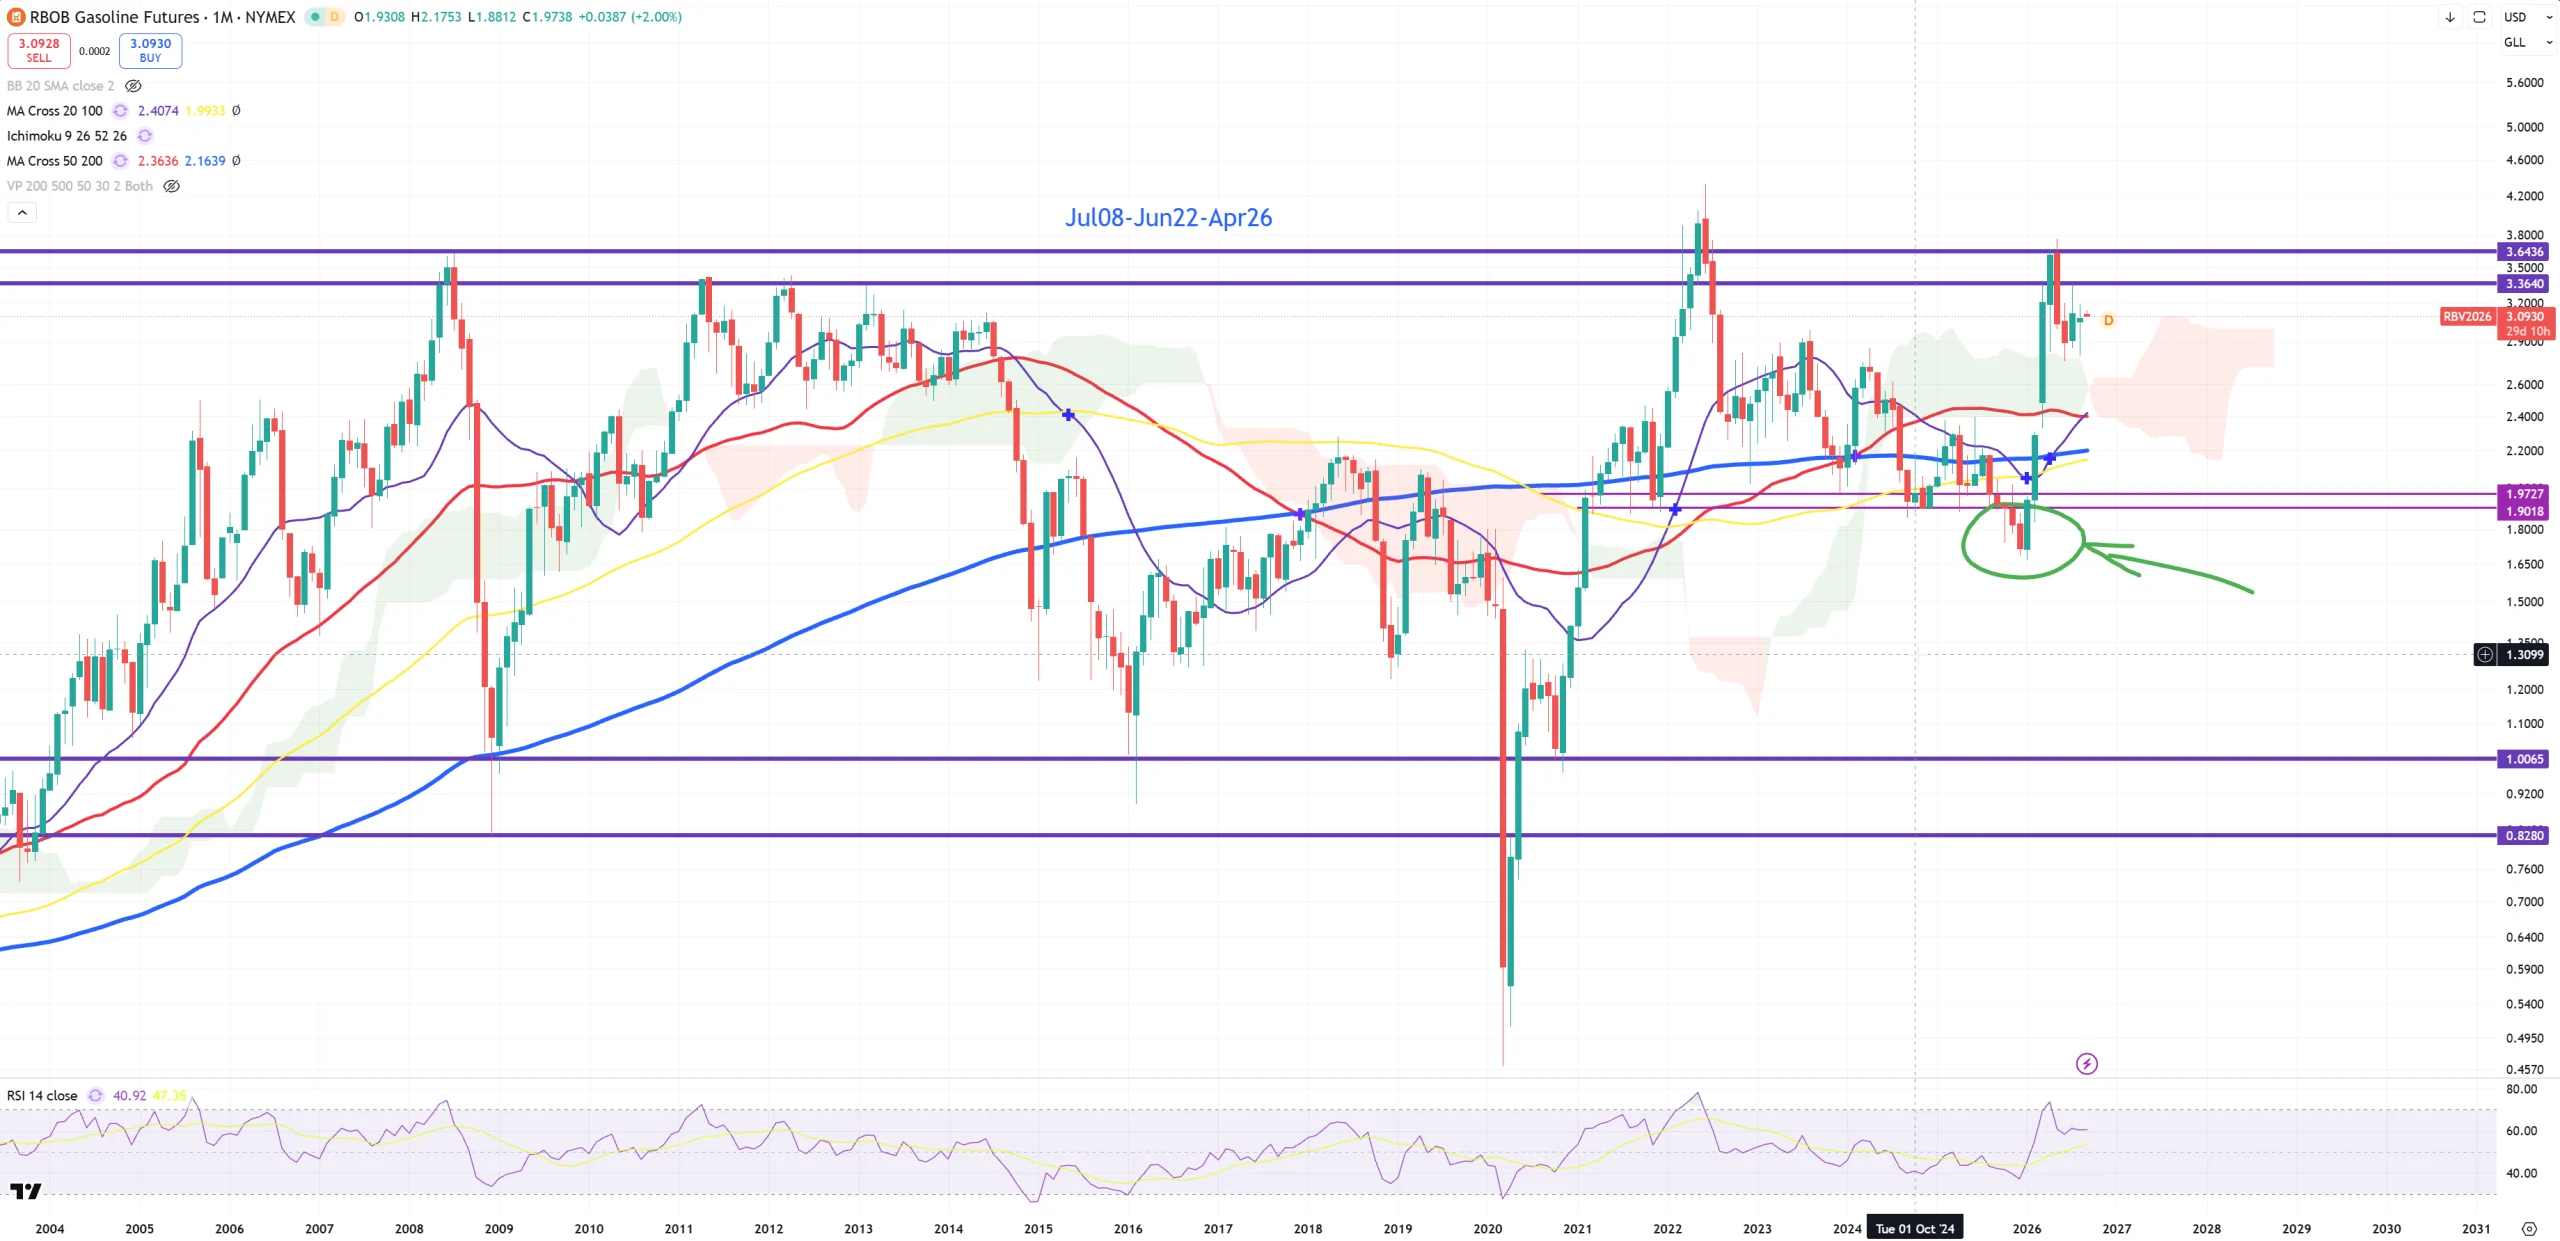
GASOLINE – not as bad as Diesel, but awaits for its possibility to break
OIL – (M)MA50 holds, (M)MA200 holds – bull market intact with again 110-120$ target, once broken => 147$.
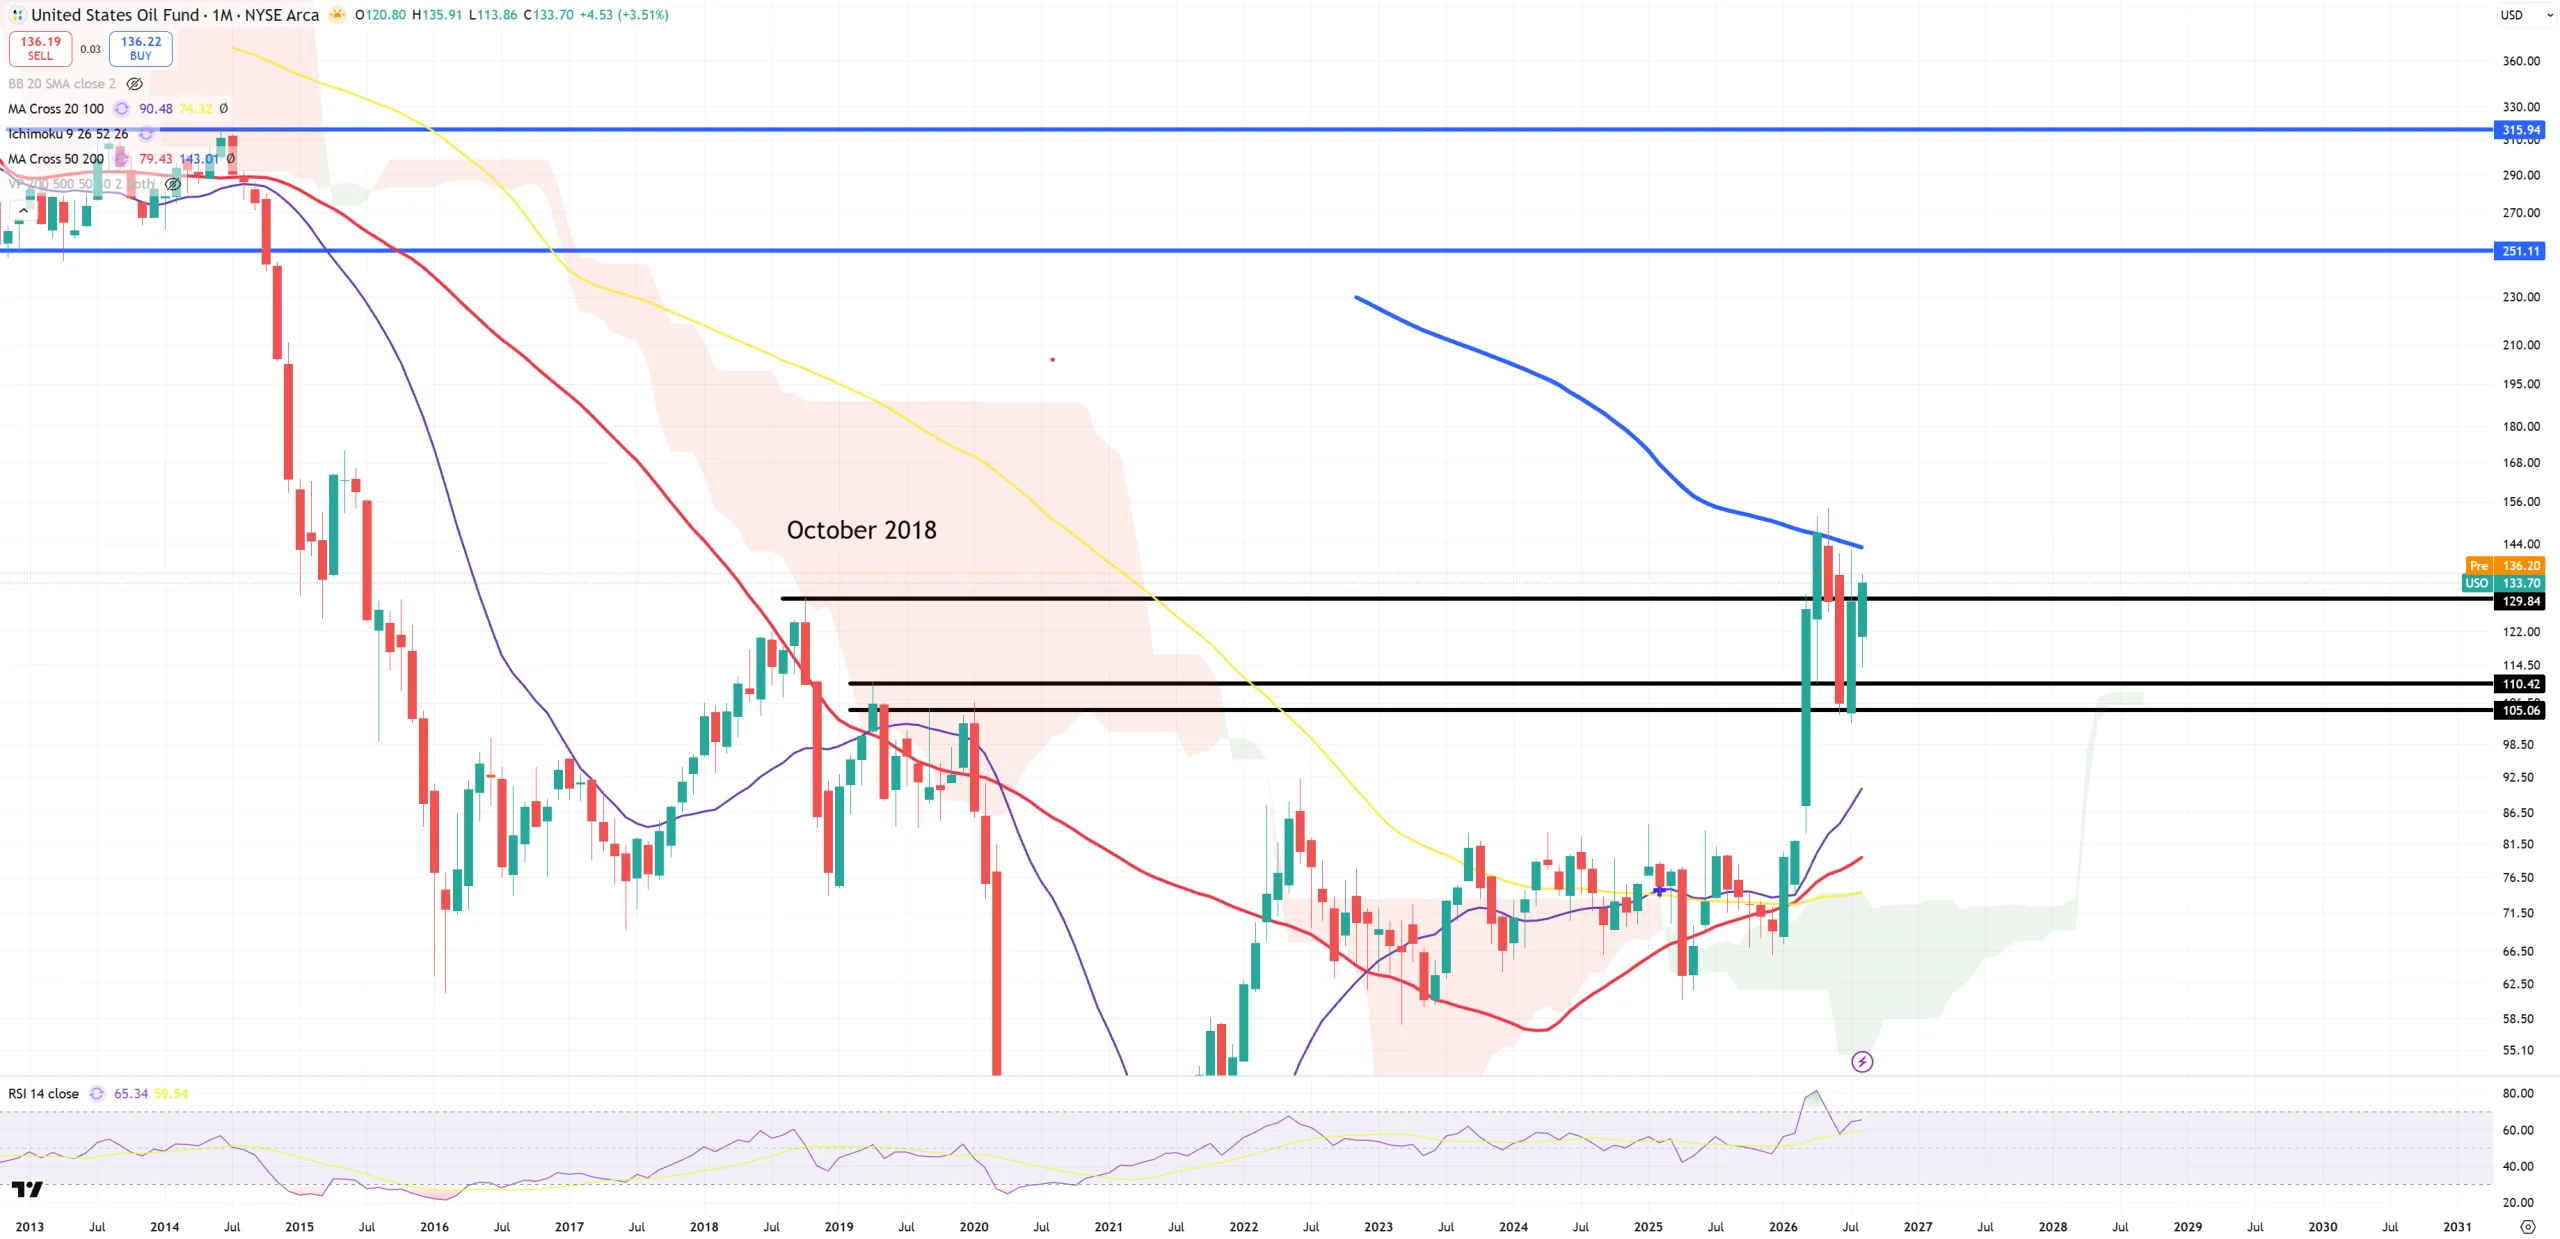
USO – ends above Oct2018 level but below blue (M)MA200. Once blue (M)MA200 will be broken I bet we’ll get towards new ATHs in oil.
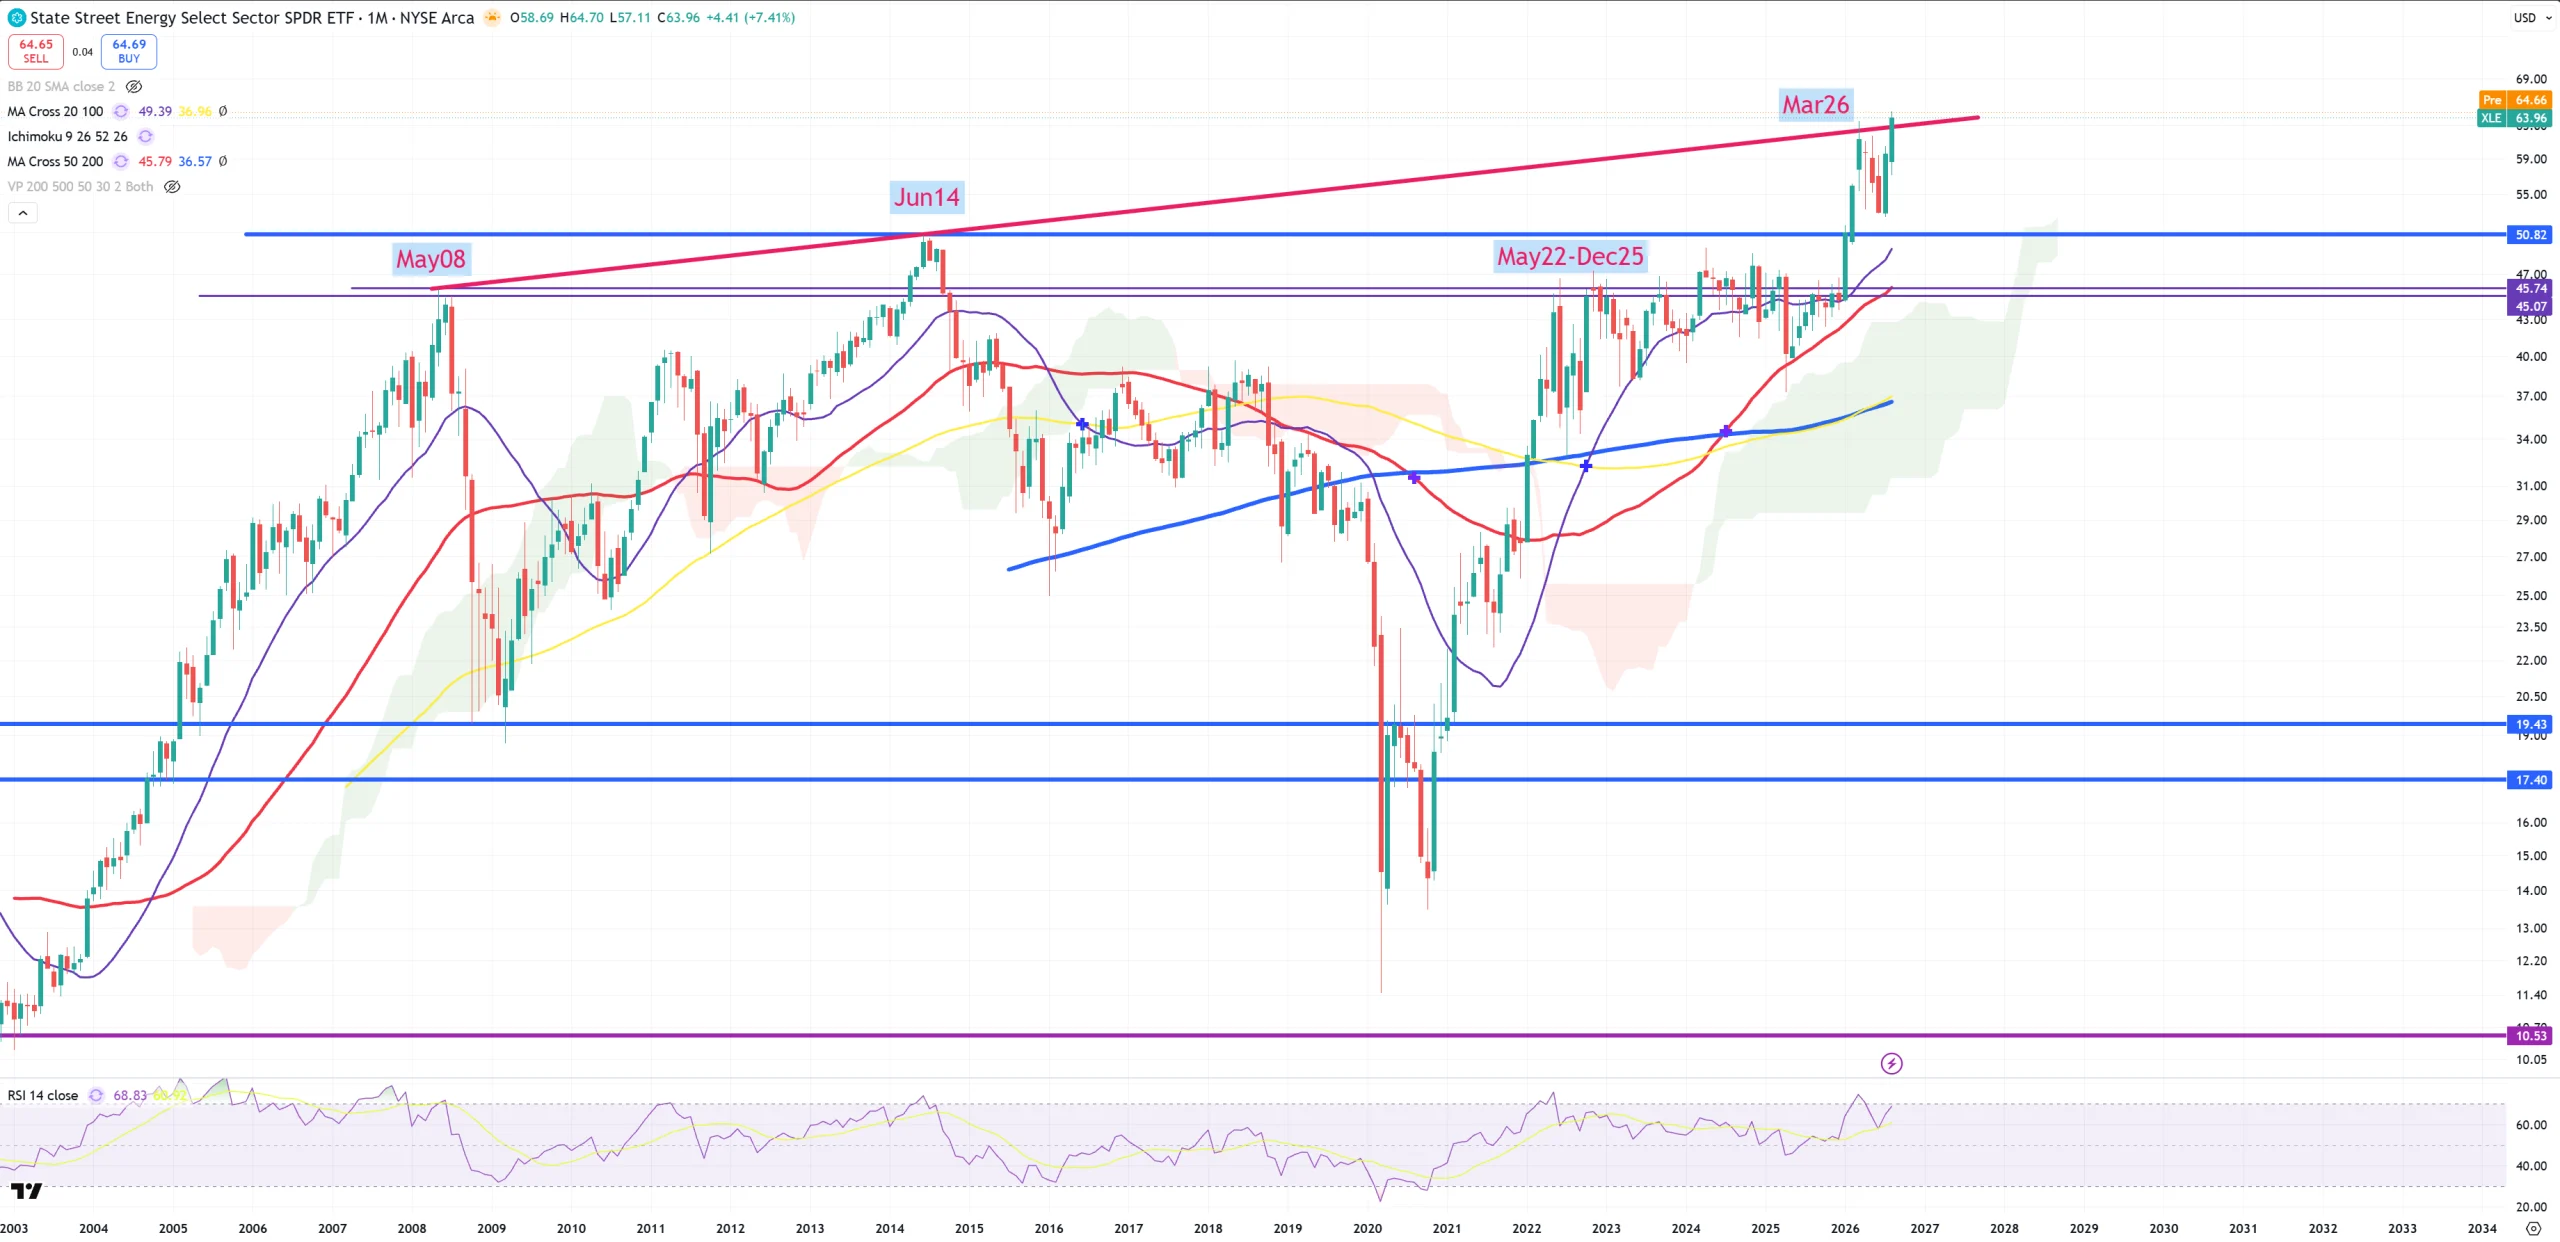
XLE – GDX for OIL – no comment needed. My assumption was we’ll break down under own gravity around May2008 but this was invalidated.
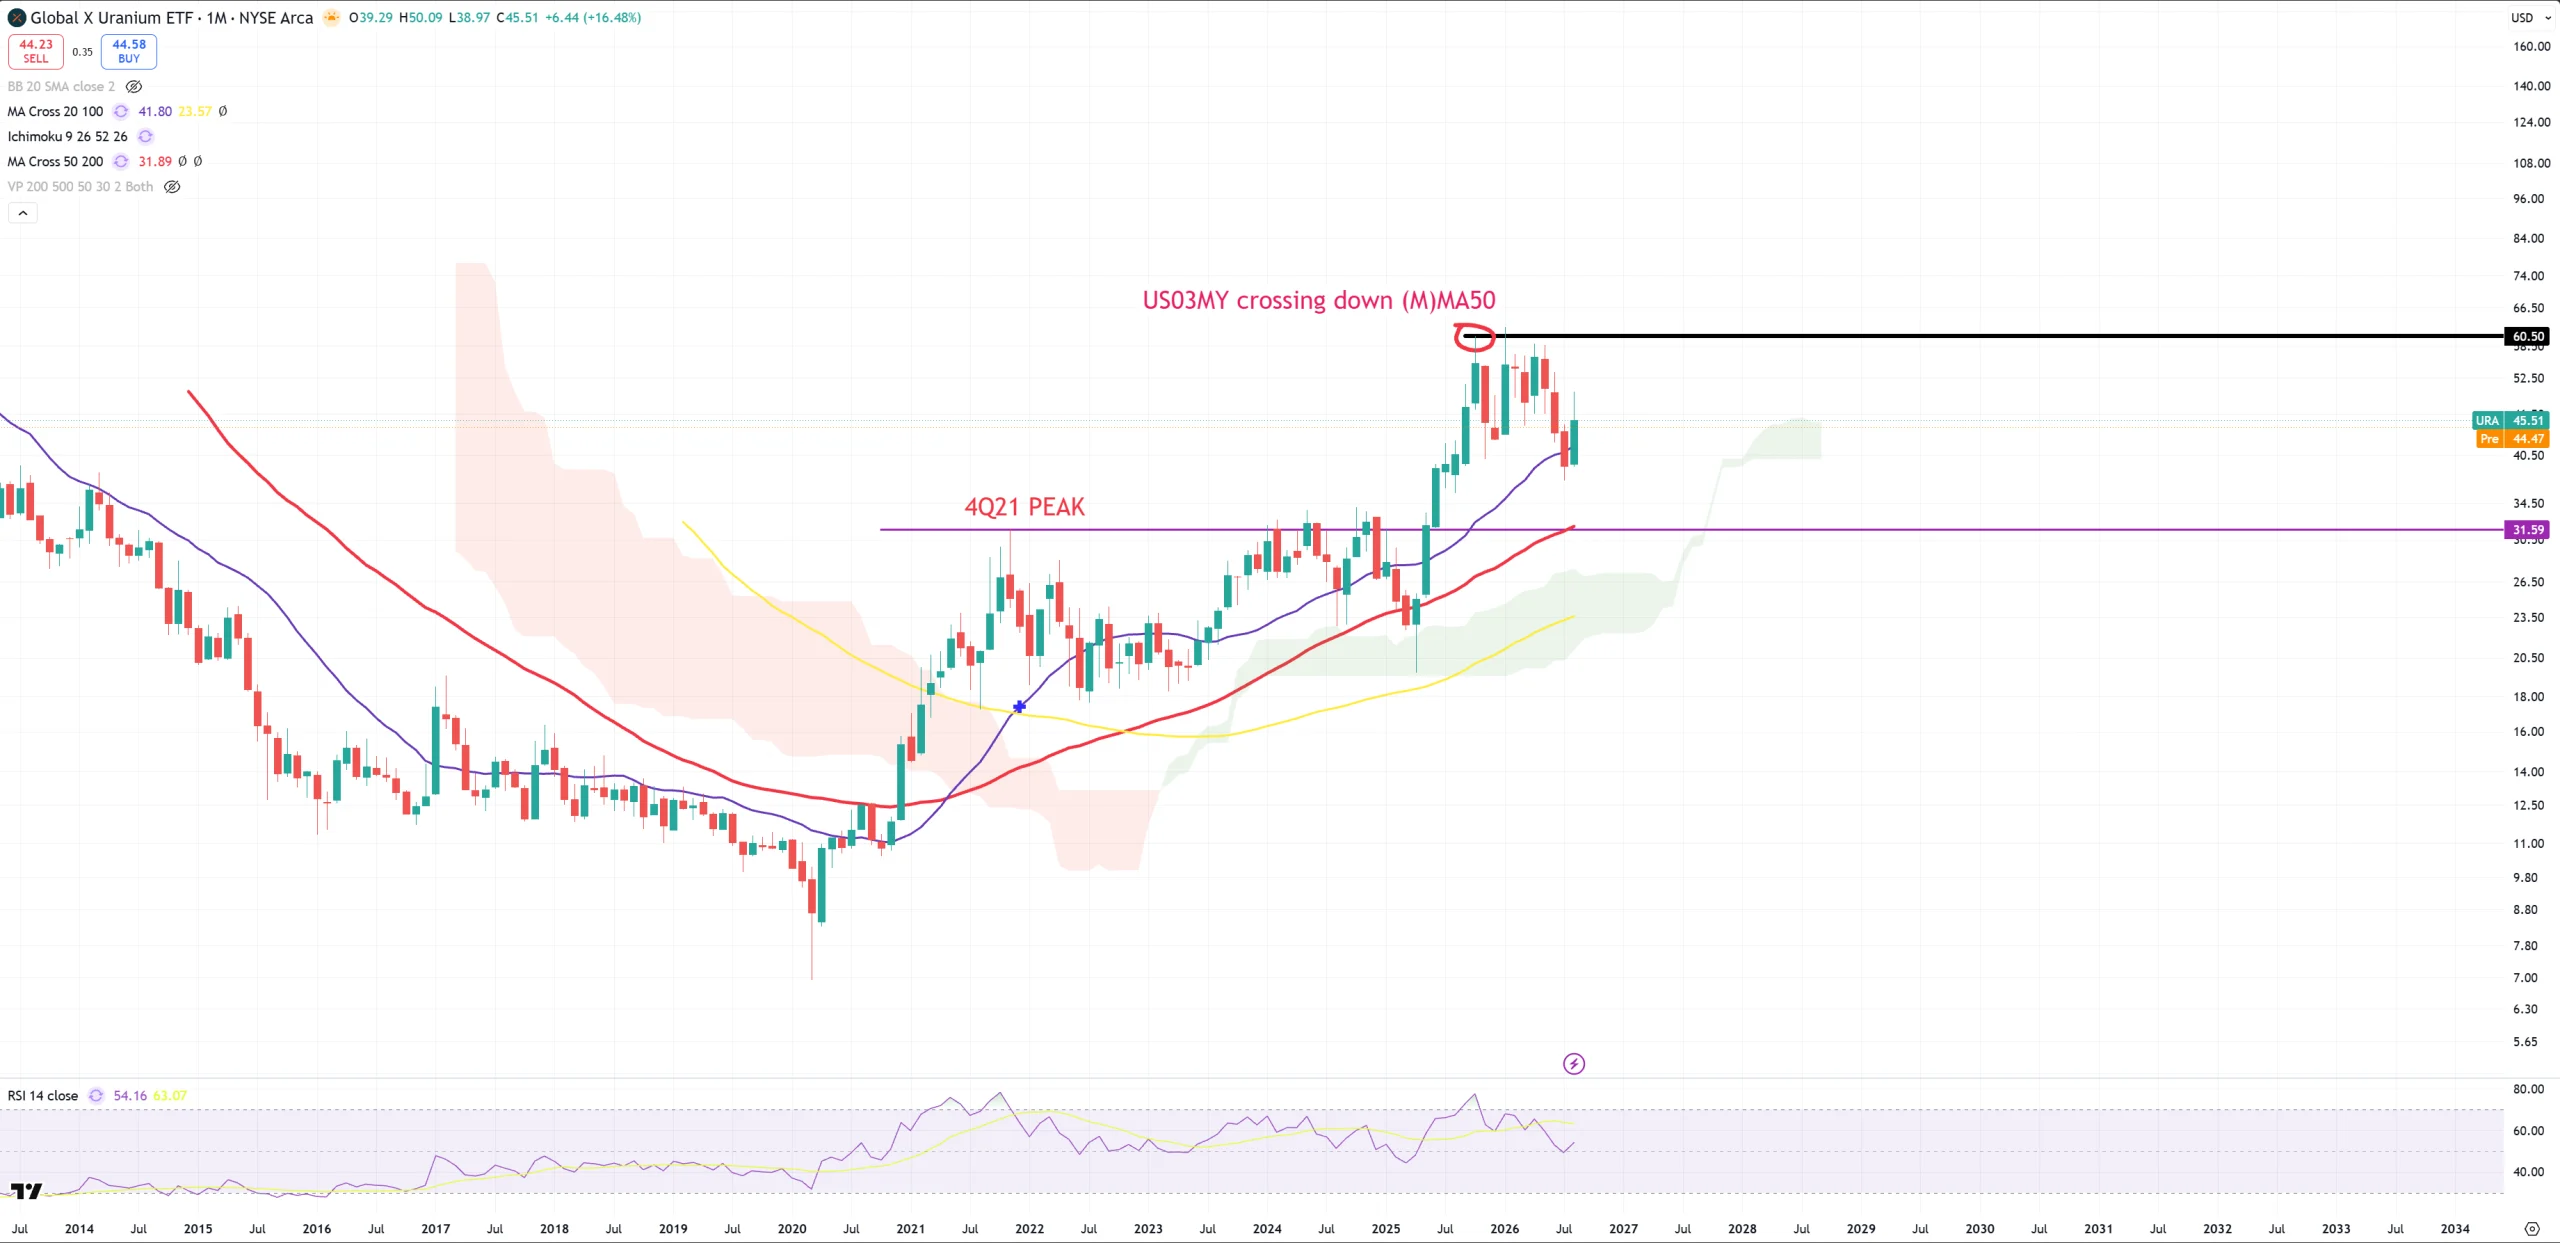
URA – not much to say. (M)MA20 holds.
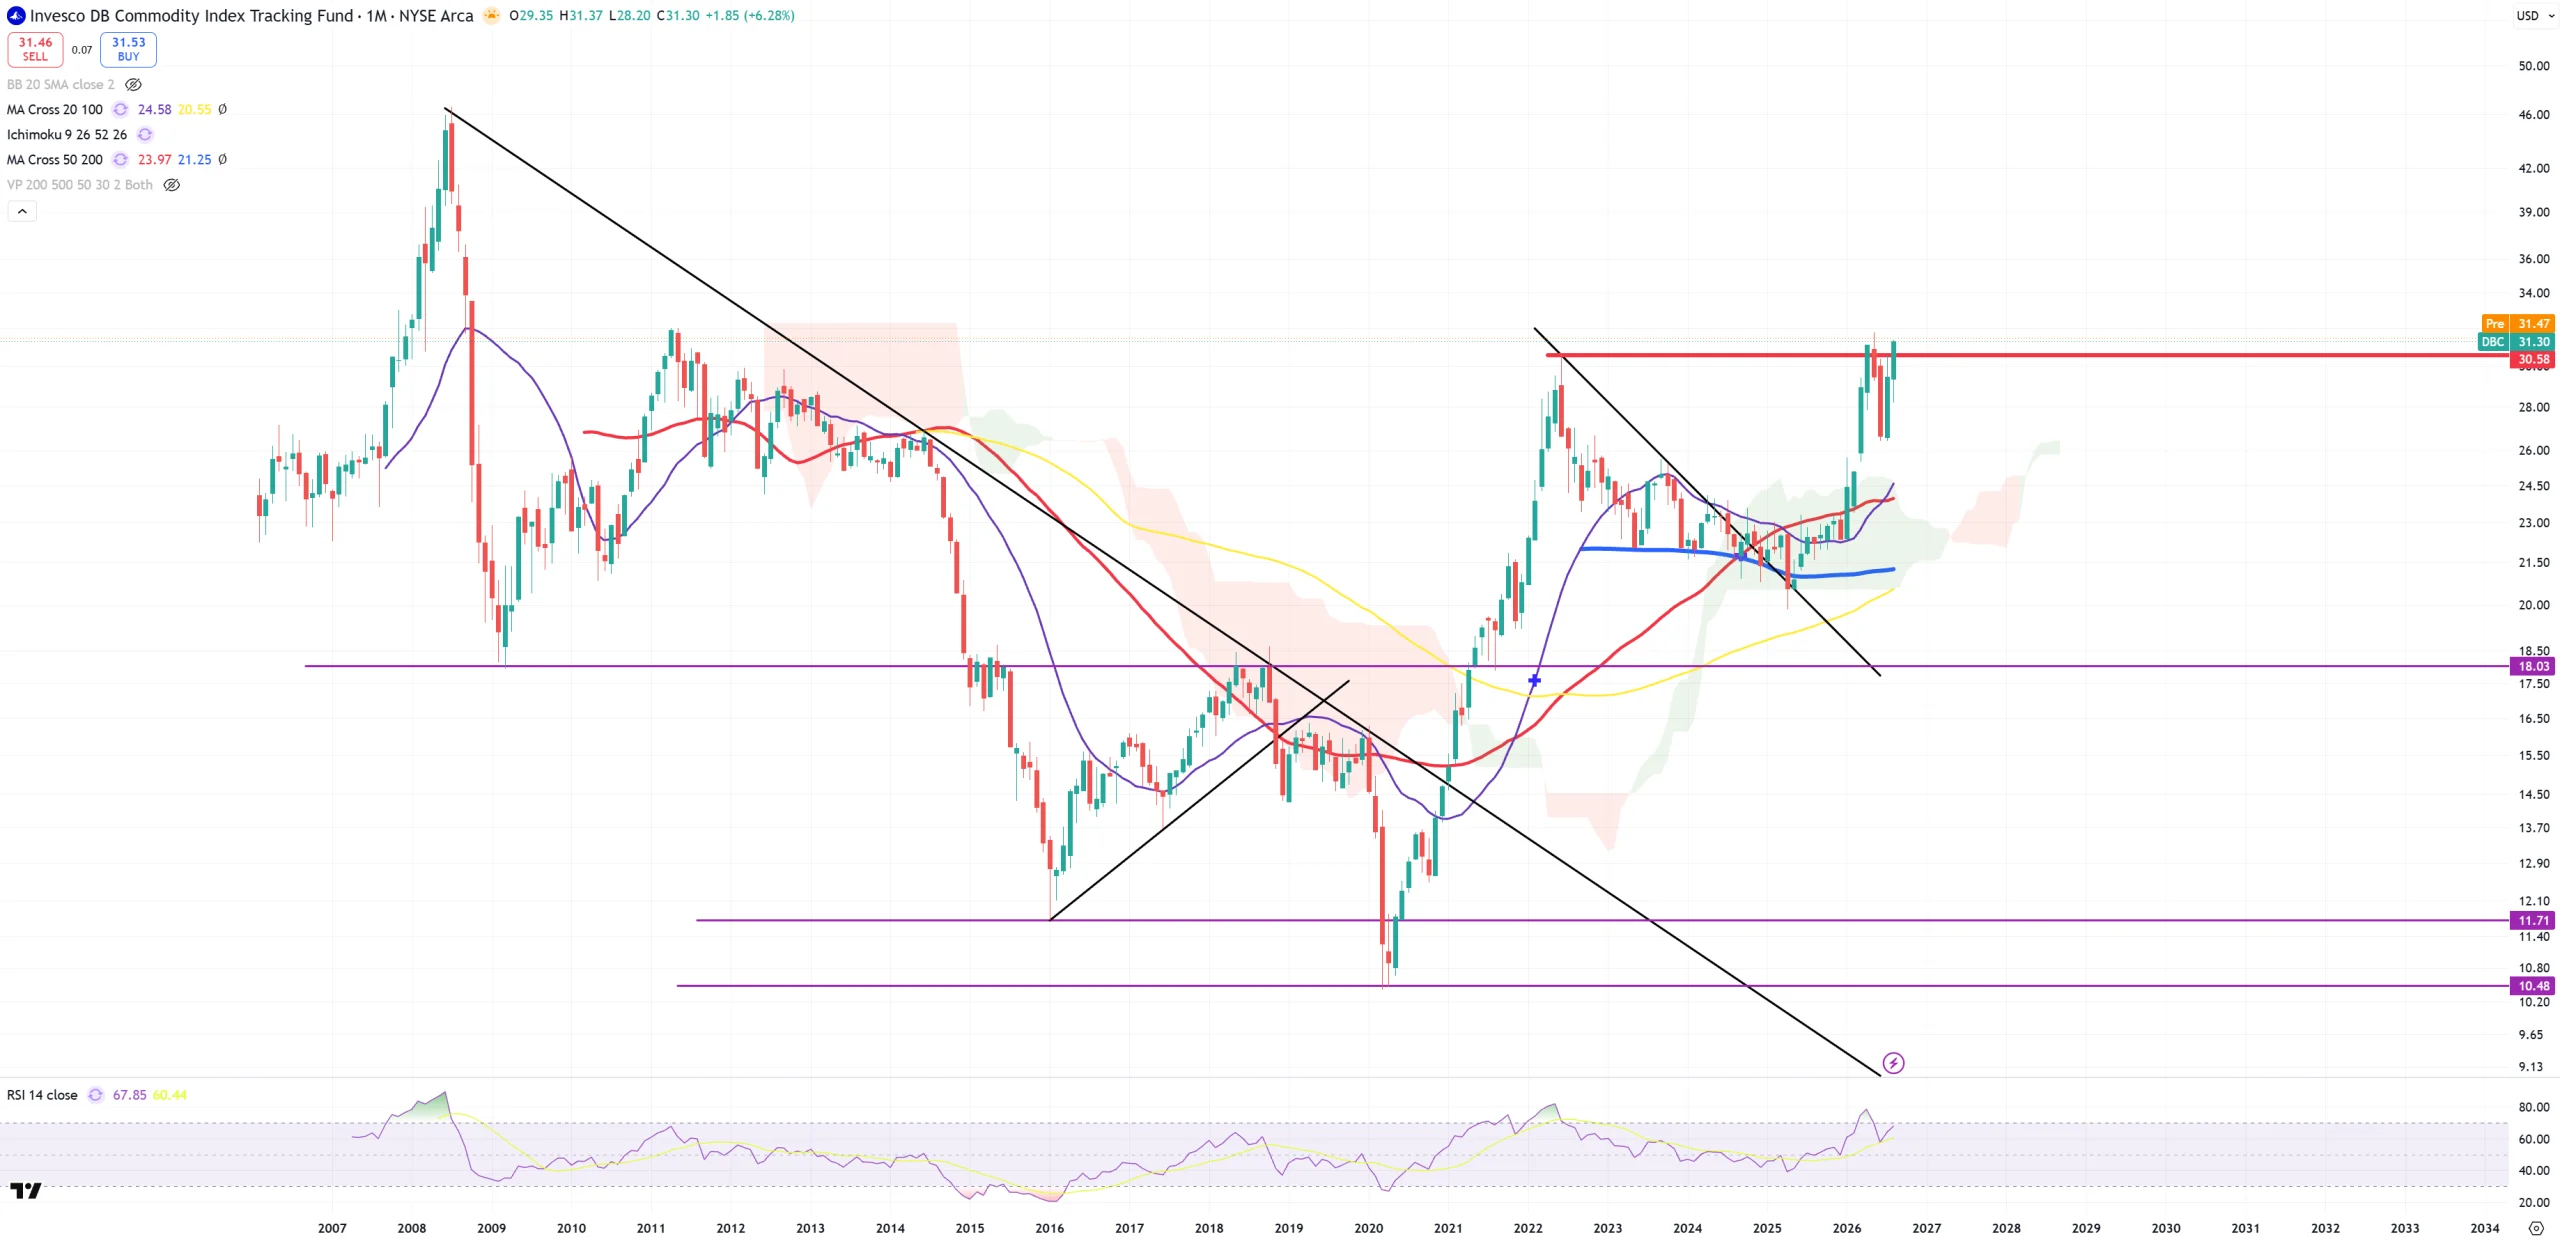
DBC – June 2022 level is now broken again. Look how DBC found support on blue (M)MA200 -> the secular bull/bear market border once permanently broken.
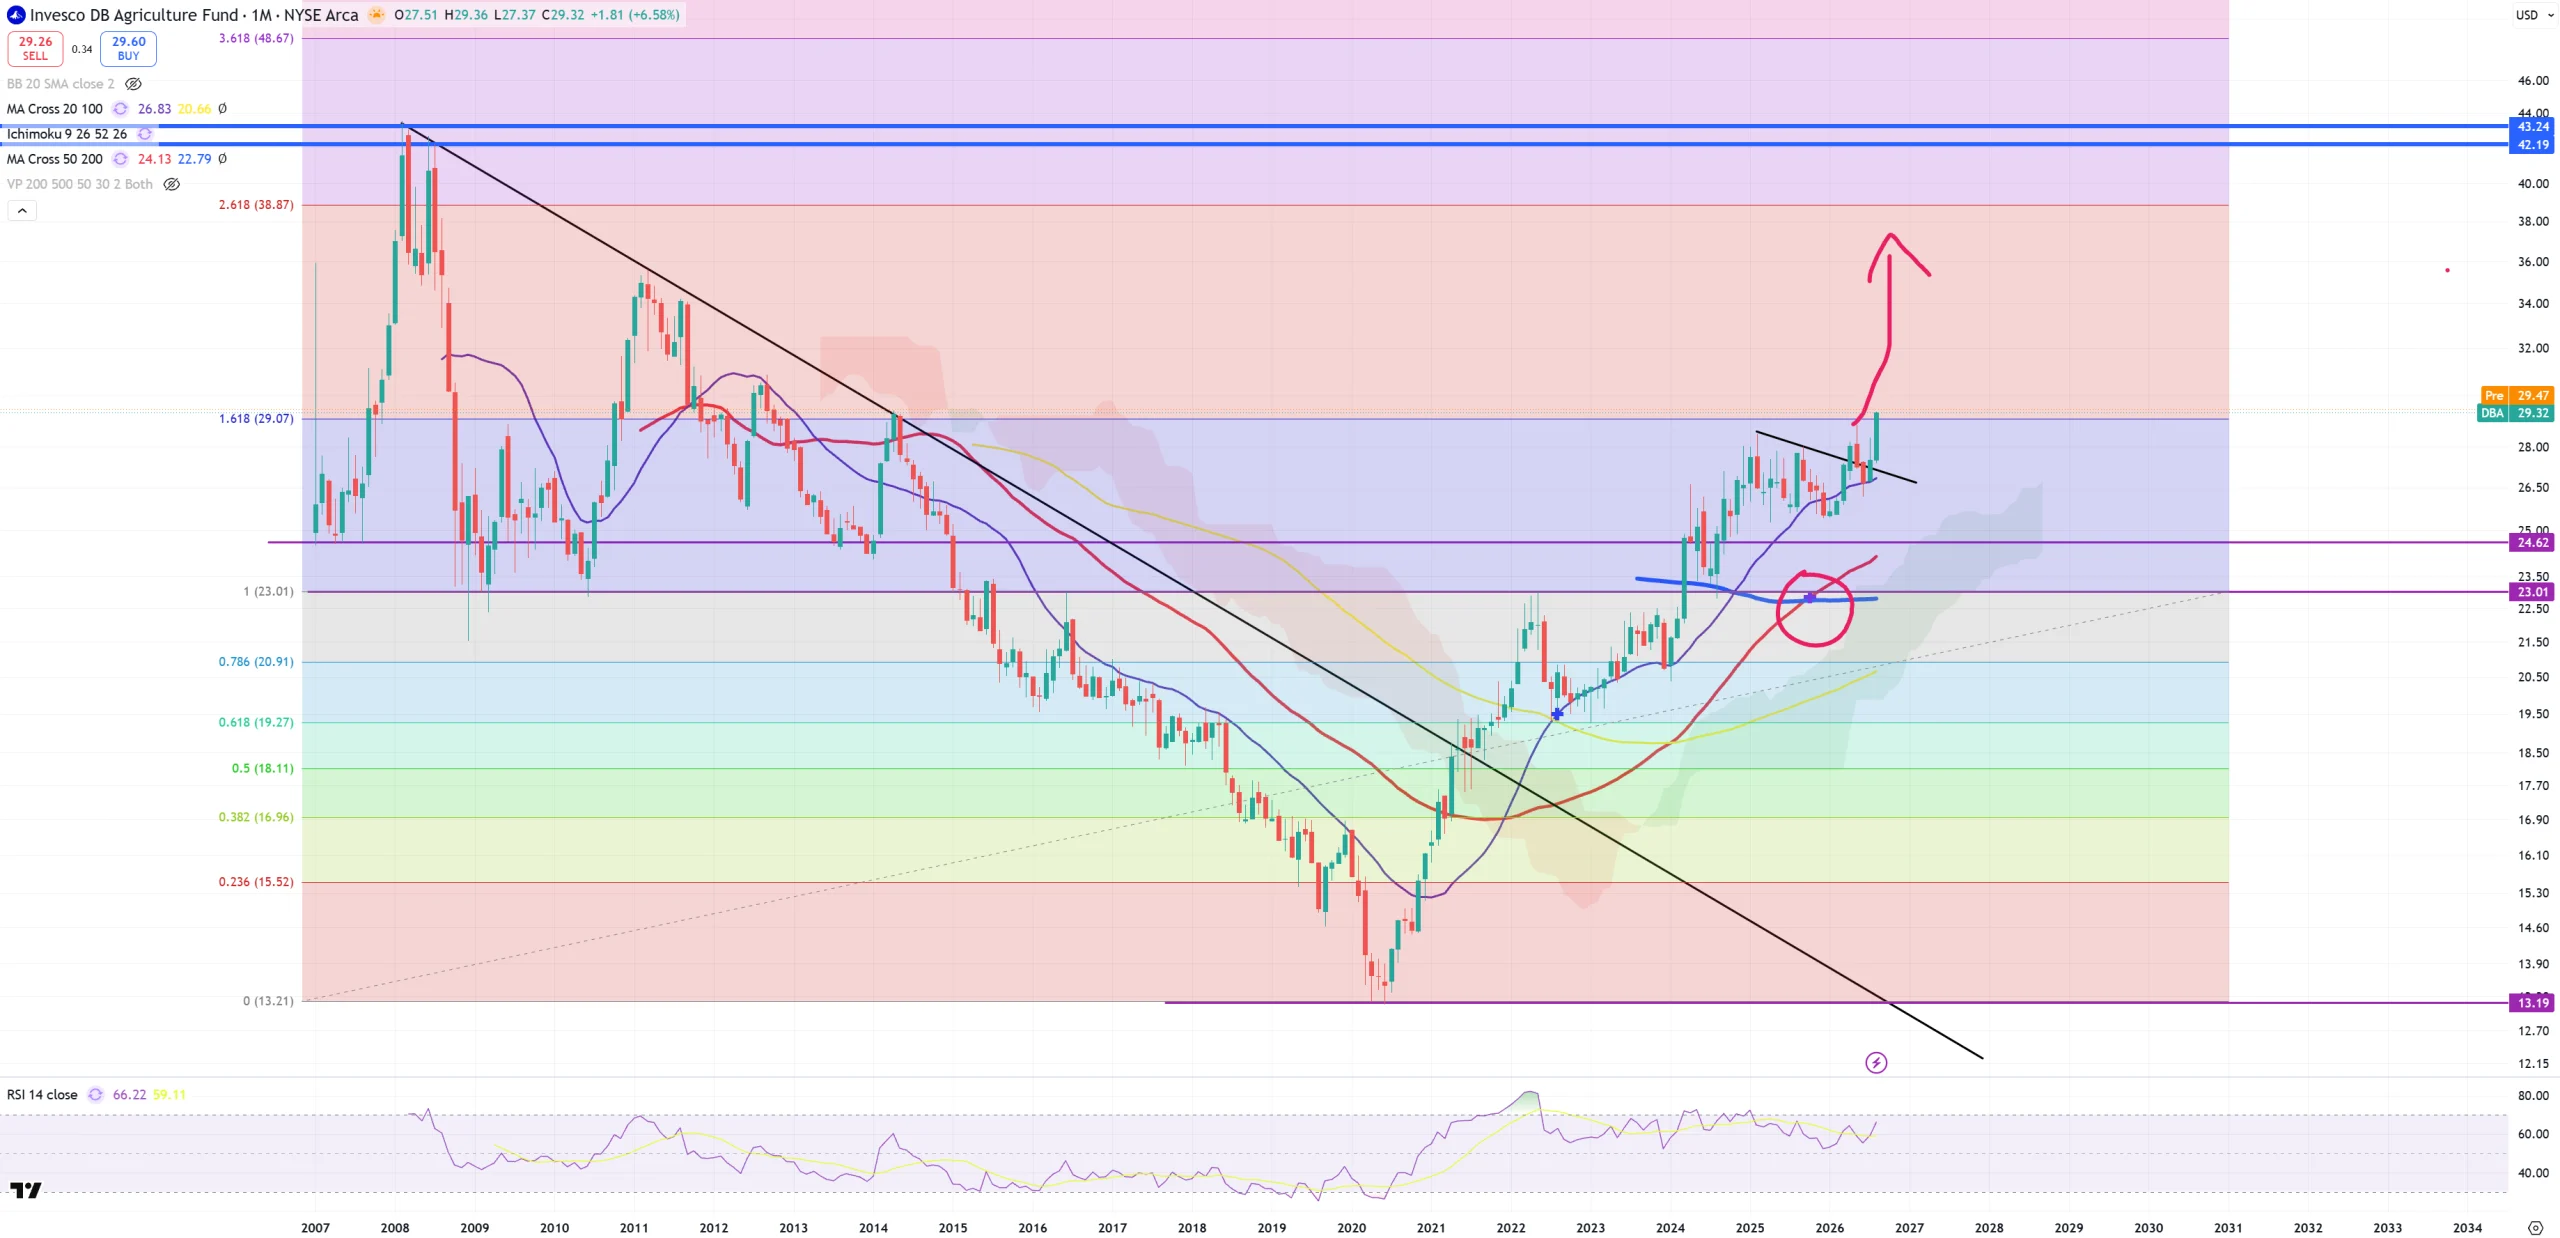
DBA – Agriculture – this might double to March2008 peak. Food inflation & diesel breaking to new highs. Consumer sentiment is going to crash to new ATLs again.
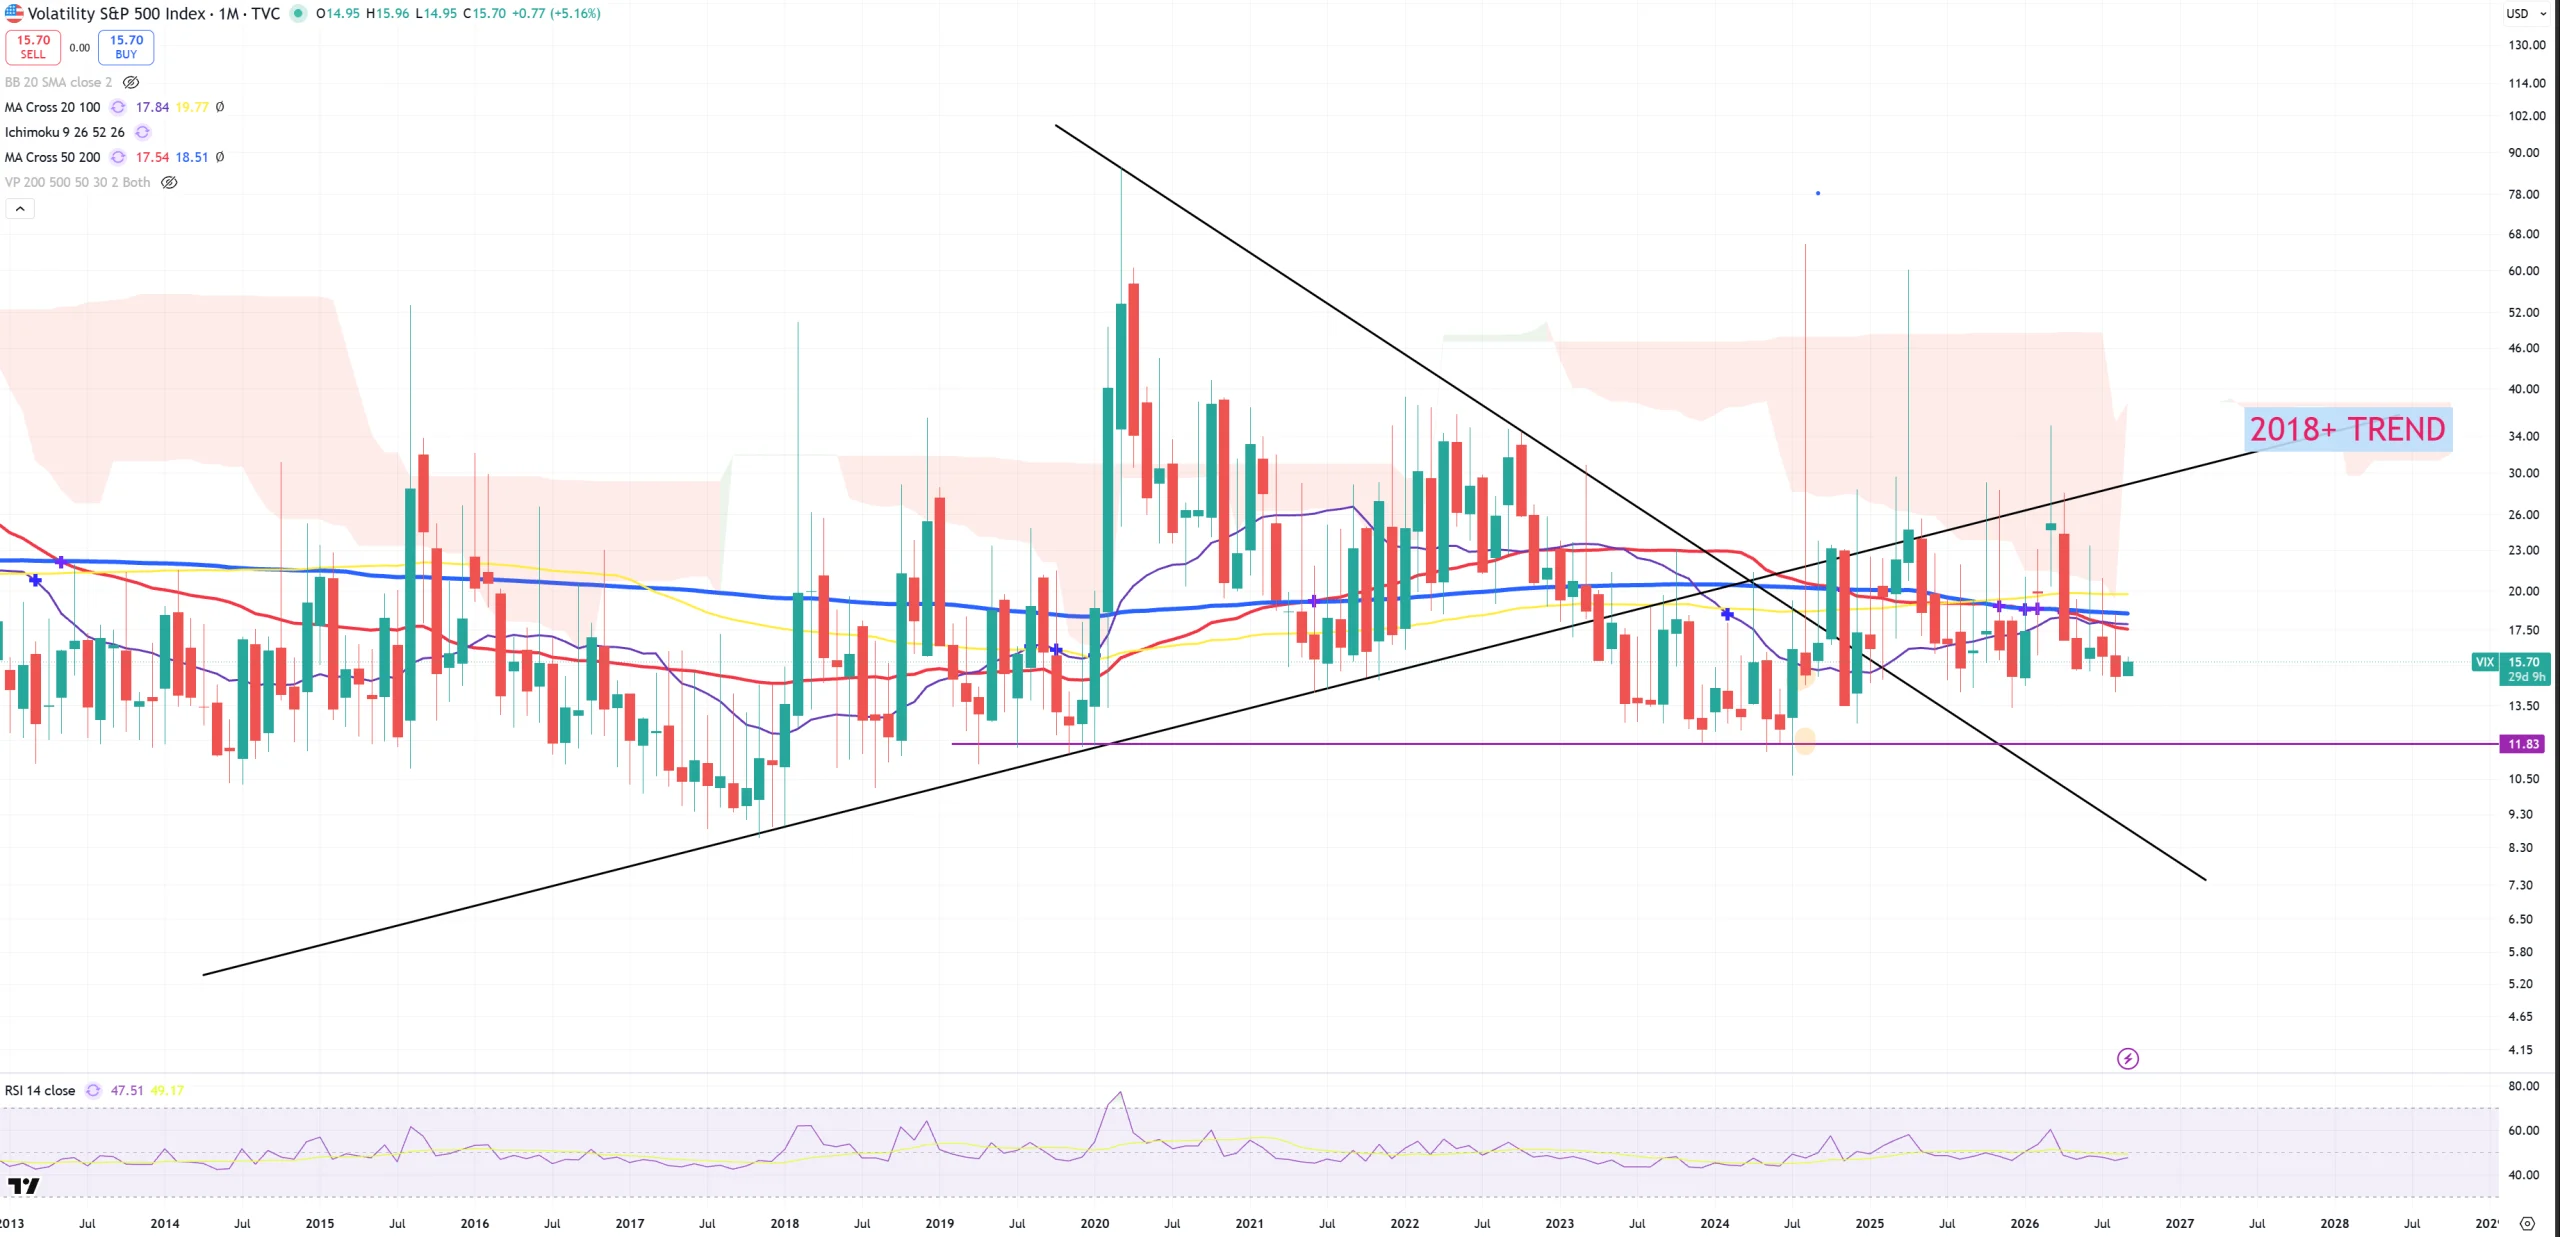
VIX – not much to talk, market loves everything. Below all key (M)MAs.
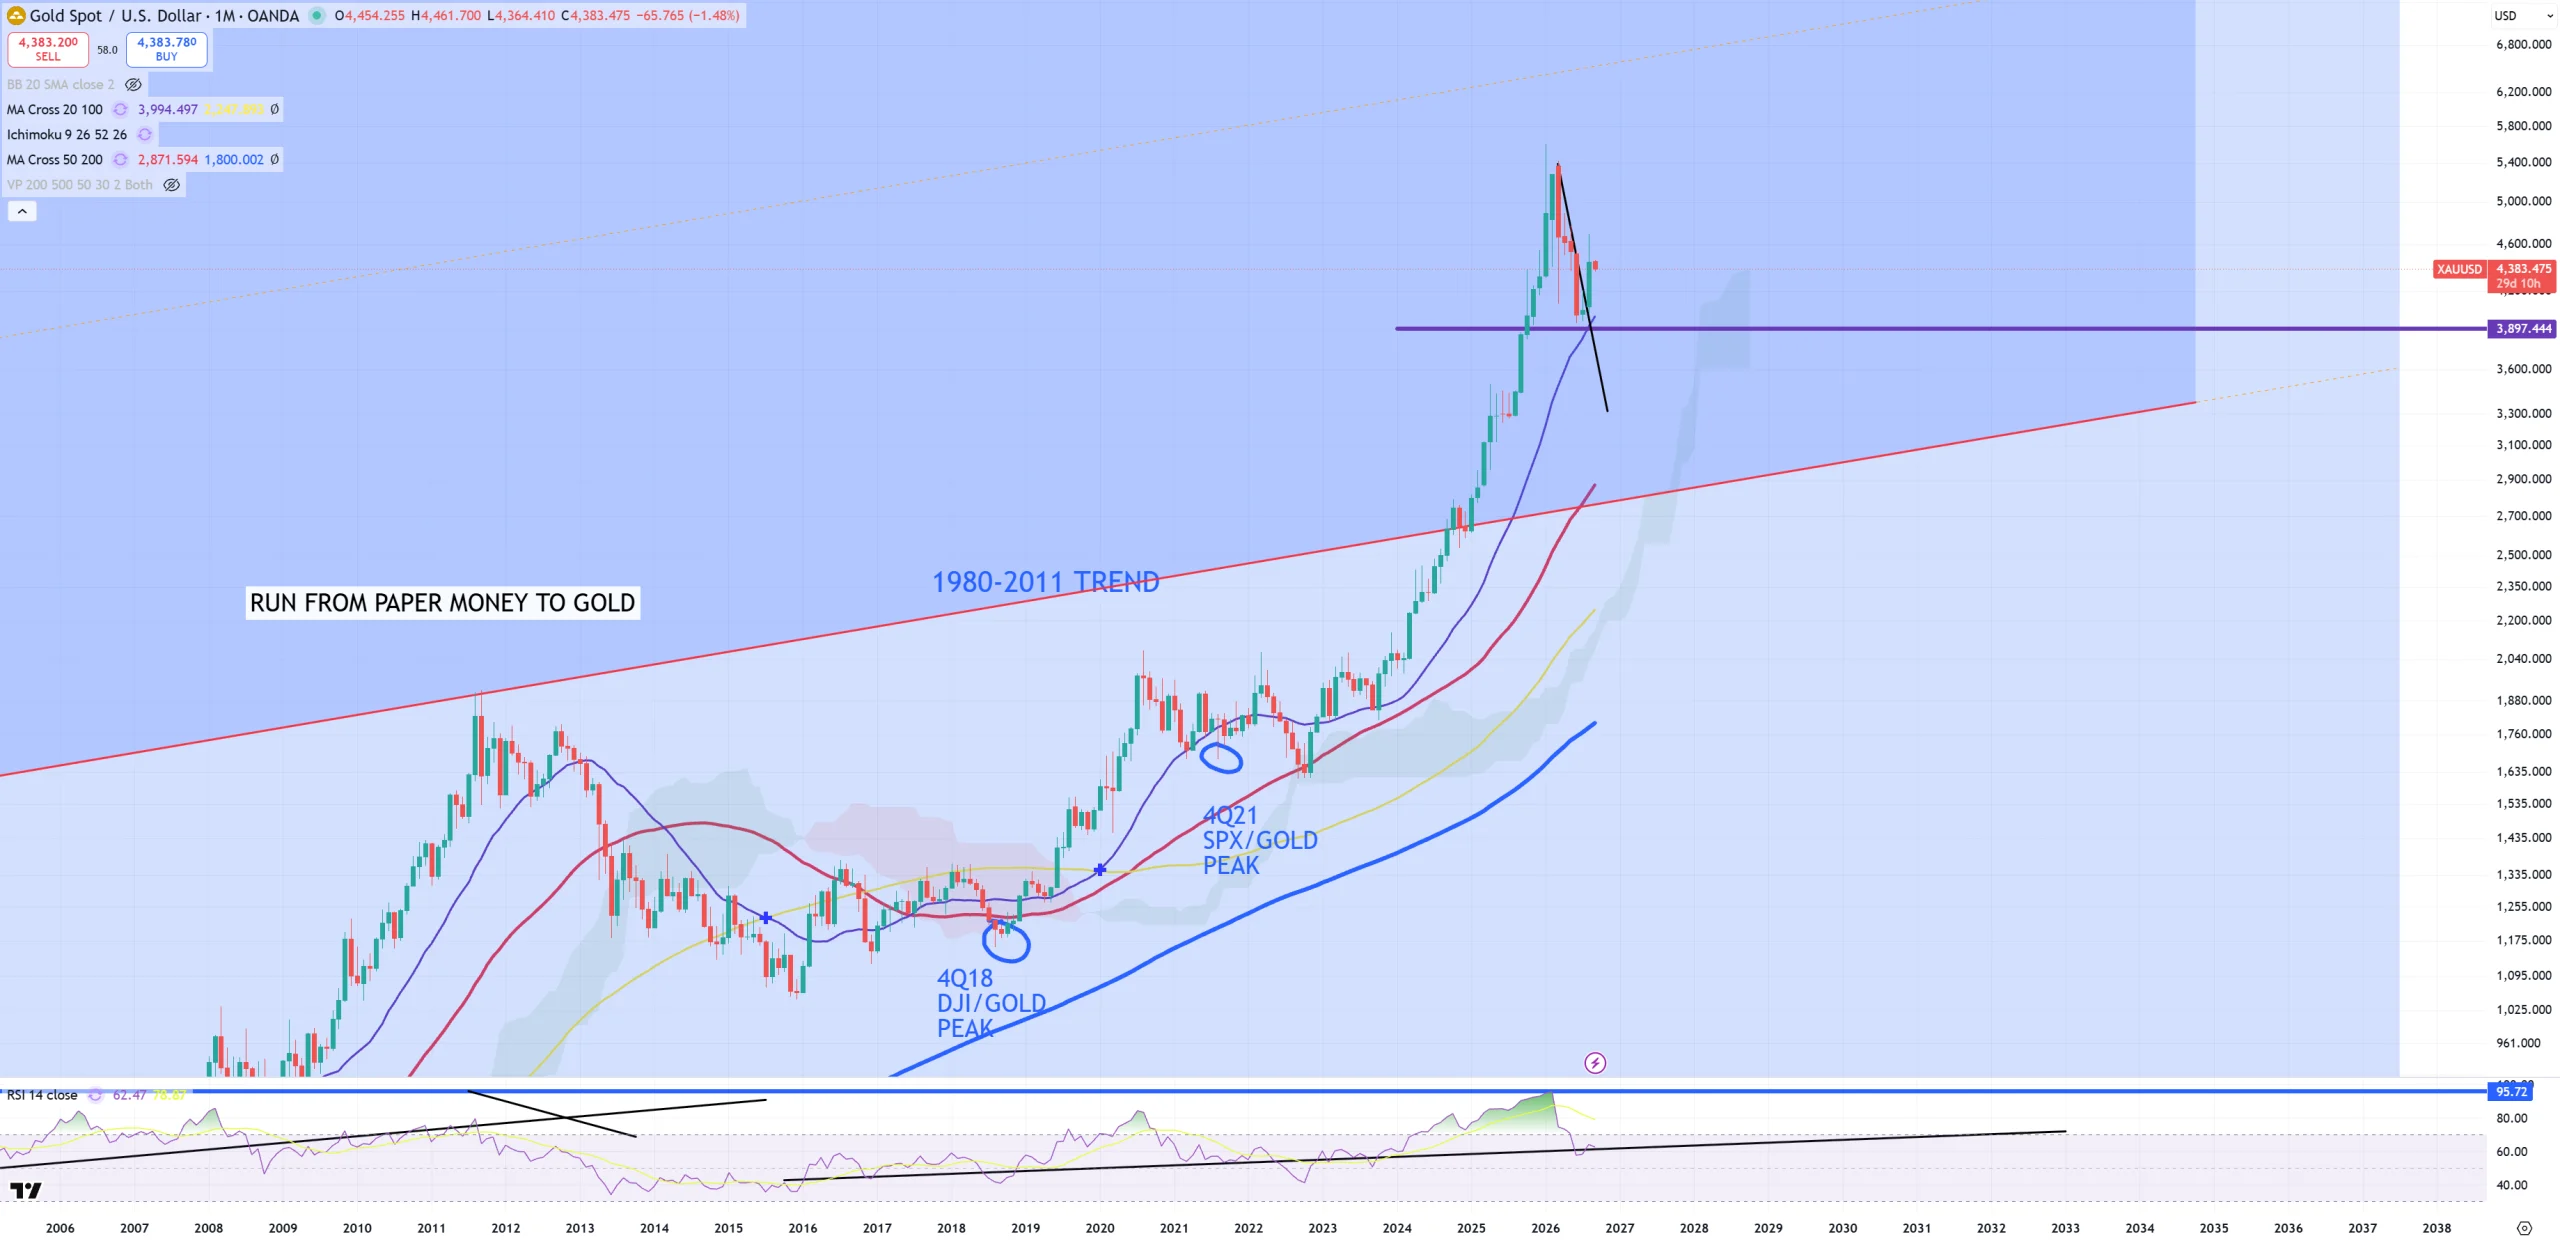
GOLD – don’t know what to say here. (M)MA20 holds (~3900$), DJI/GOLD retests the trend. Raising oil makes pressure on GOLD but IMO later once this pressure will be released it’ll be a rocket here.
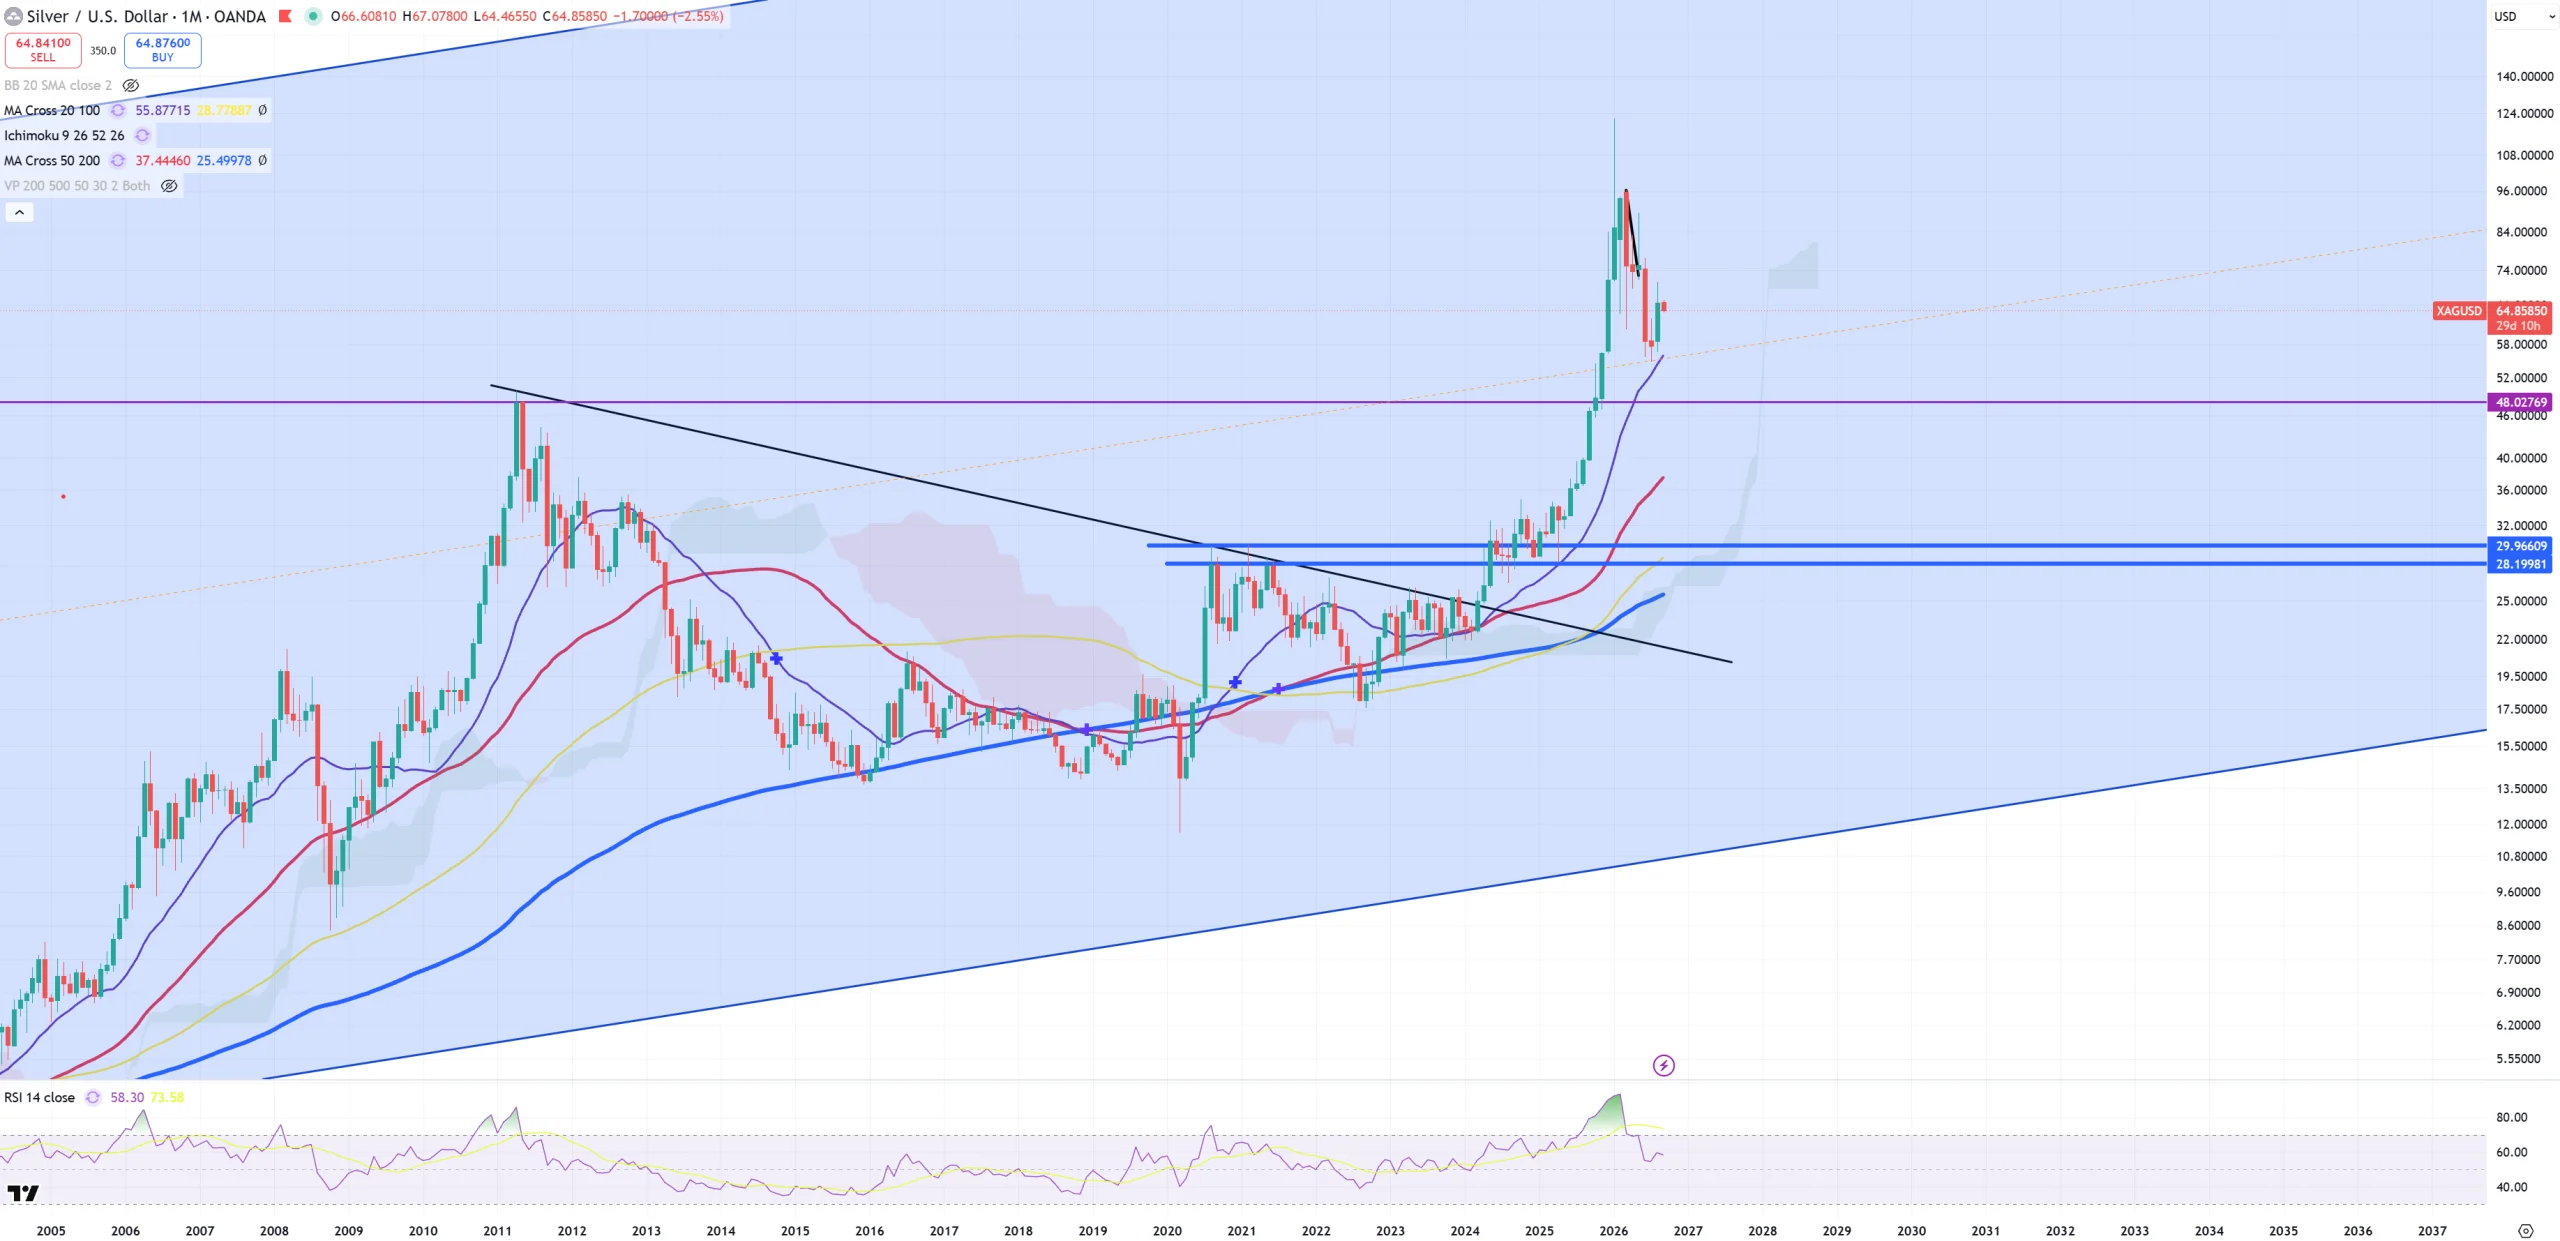
SILVER – same as GOLD
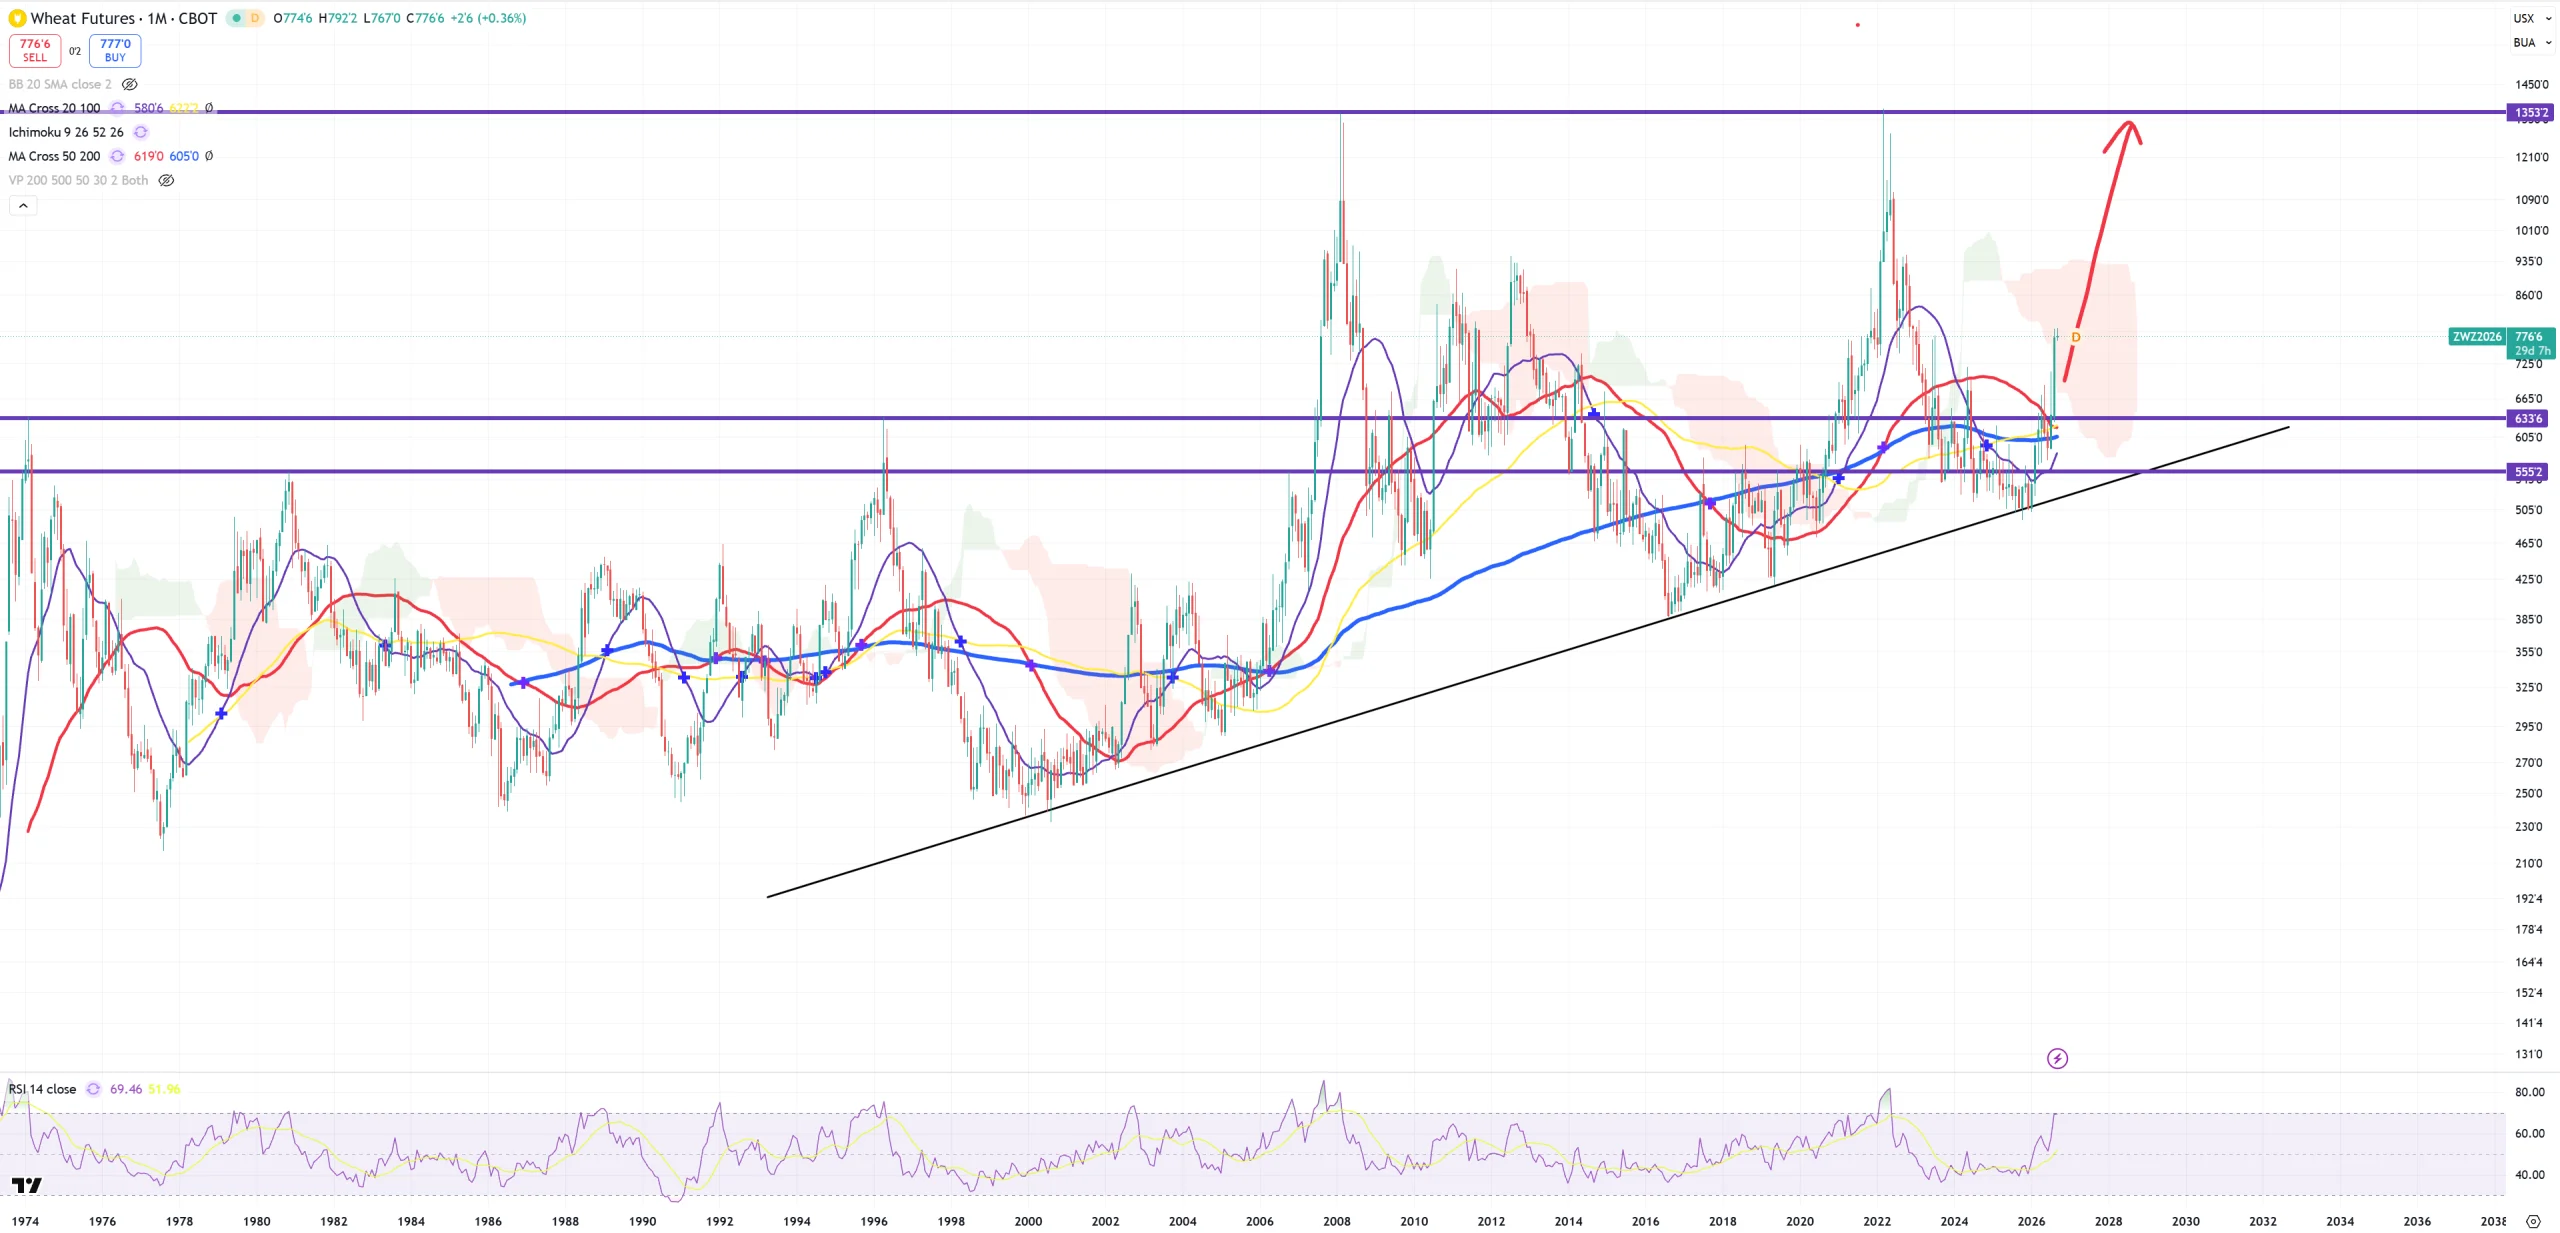
WHEAT – looks like 1300$ coming
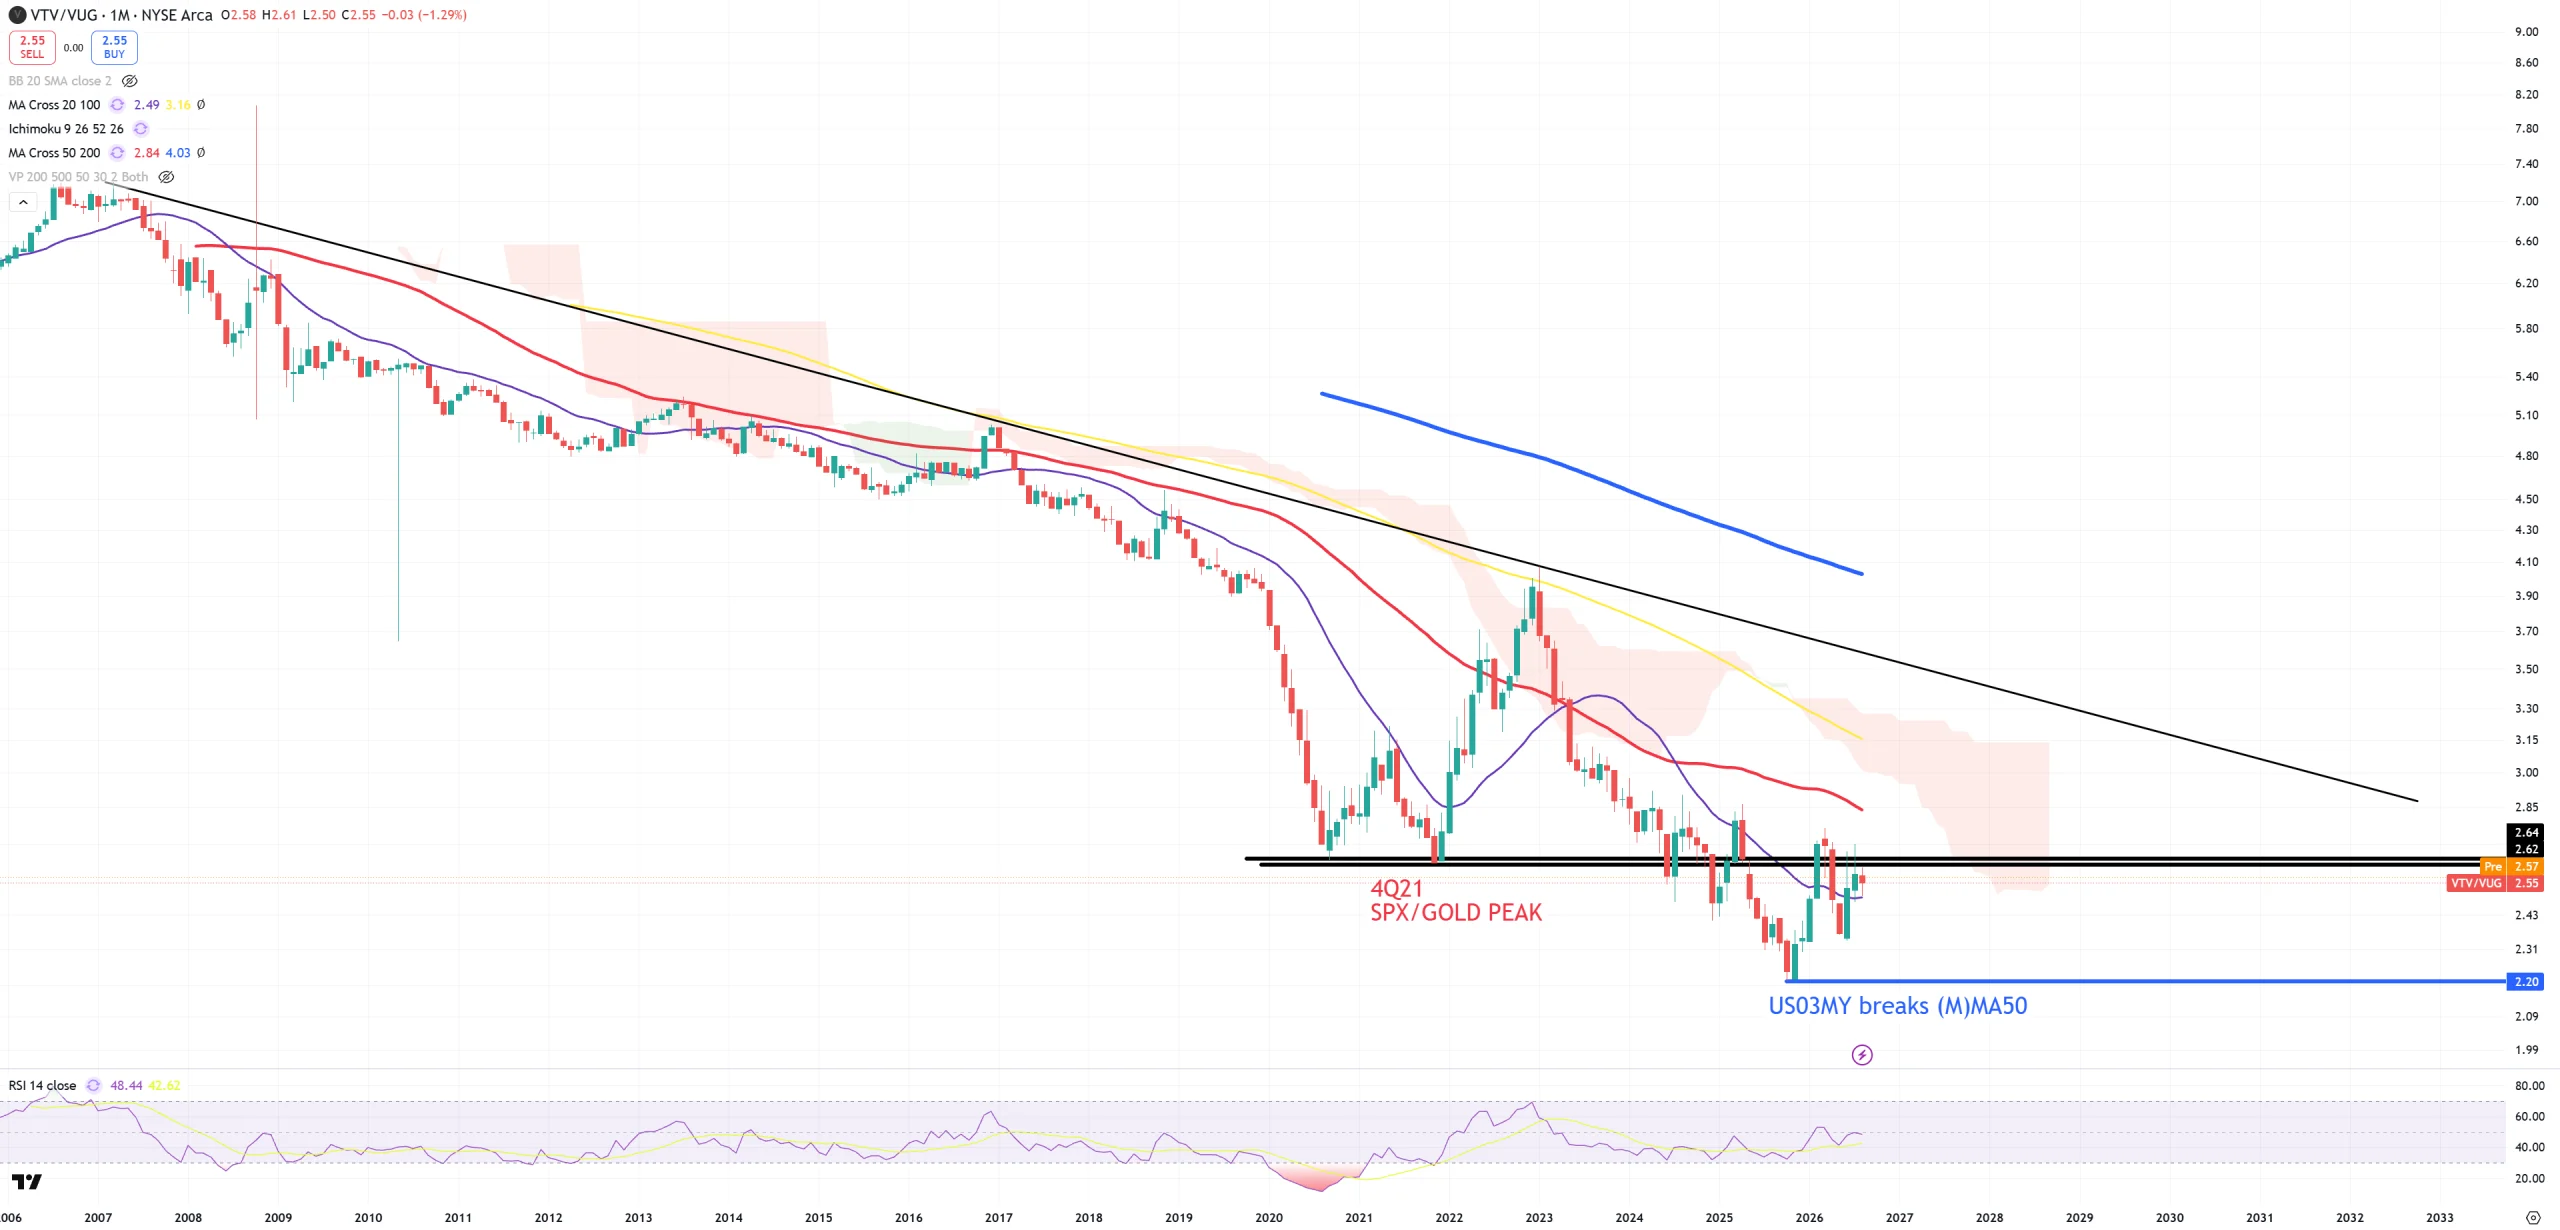
VALUE/GROWTH – can we finally get above this 4Q21 level? I don’t need to tell you the moment it’ll run higher to break finally this black trend line we’ll get the end of SOX/AI Bubble. (M)MA20 holds so far.
GOLD/BTC – there’s still some minor room for (M)MA50 retest.
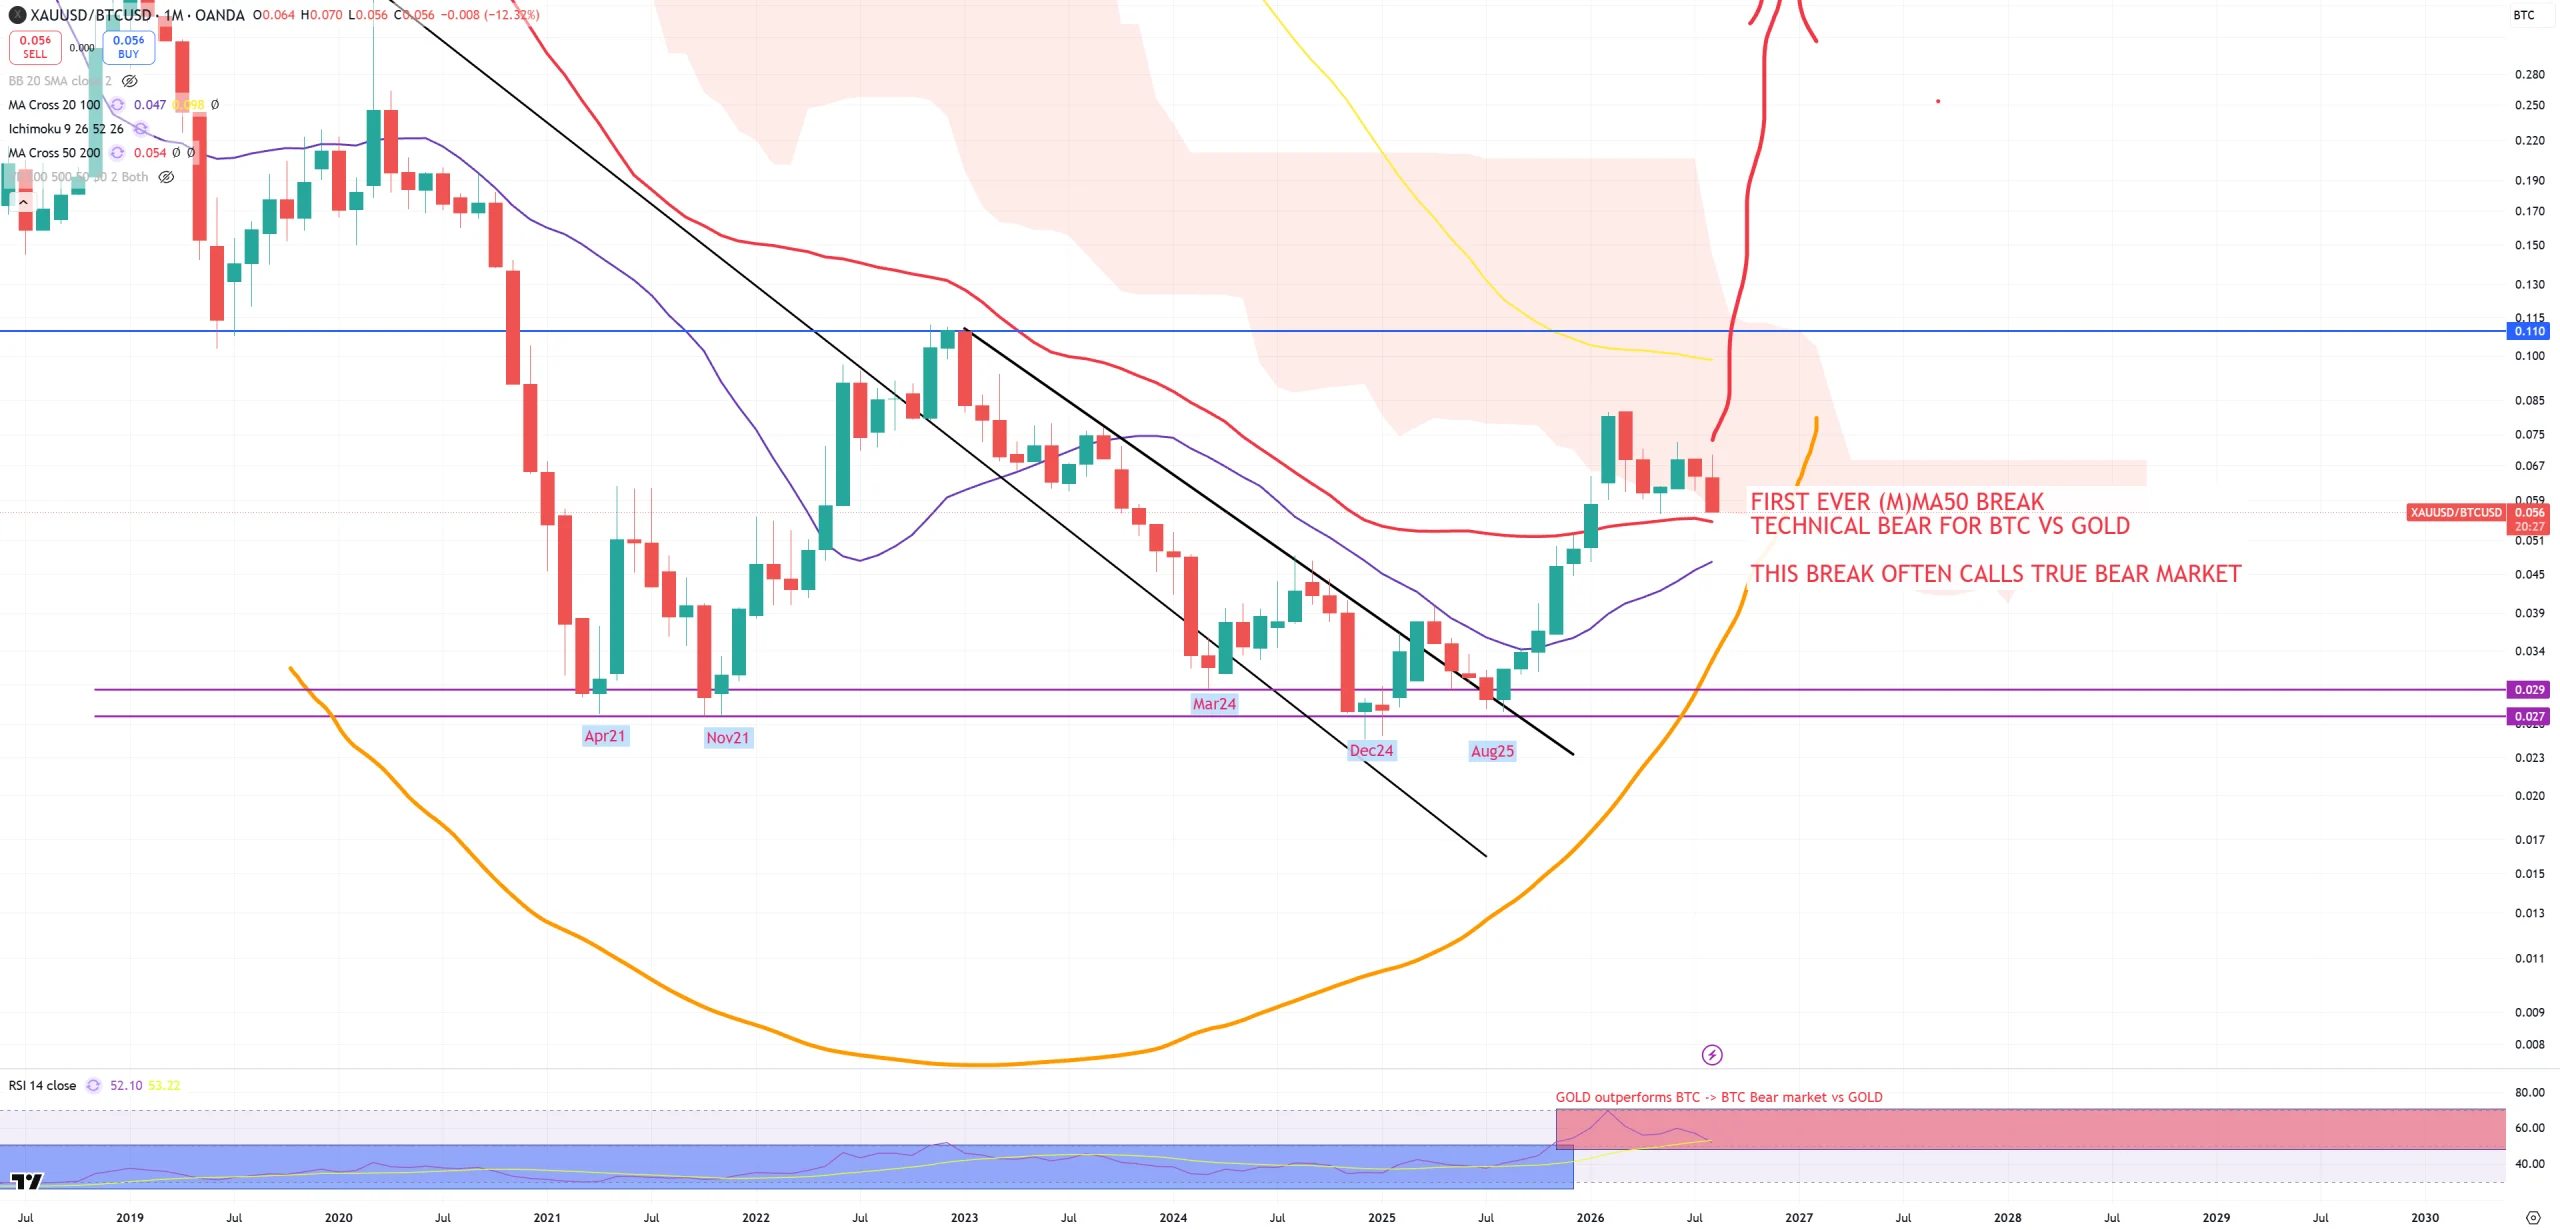
BTC – support of (M)MA50 holds, but resistance of 4Q21 did not hold, from the other hand GOLD/BTC ratio still has some room to retest (M)MA50.
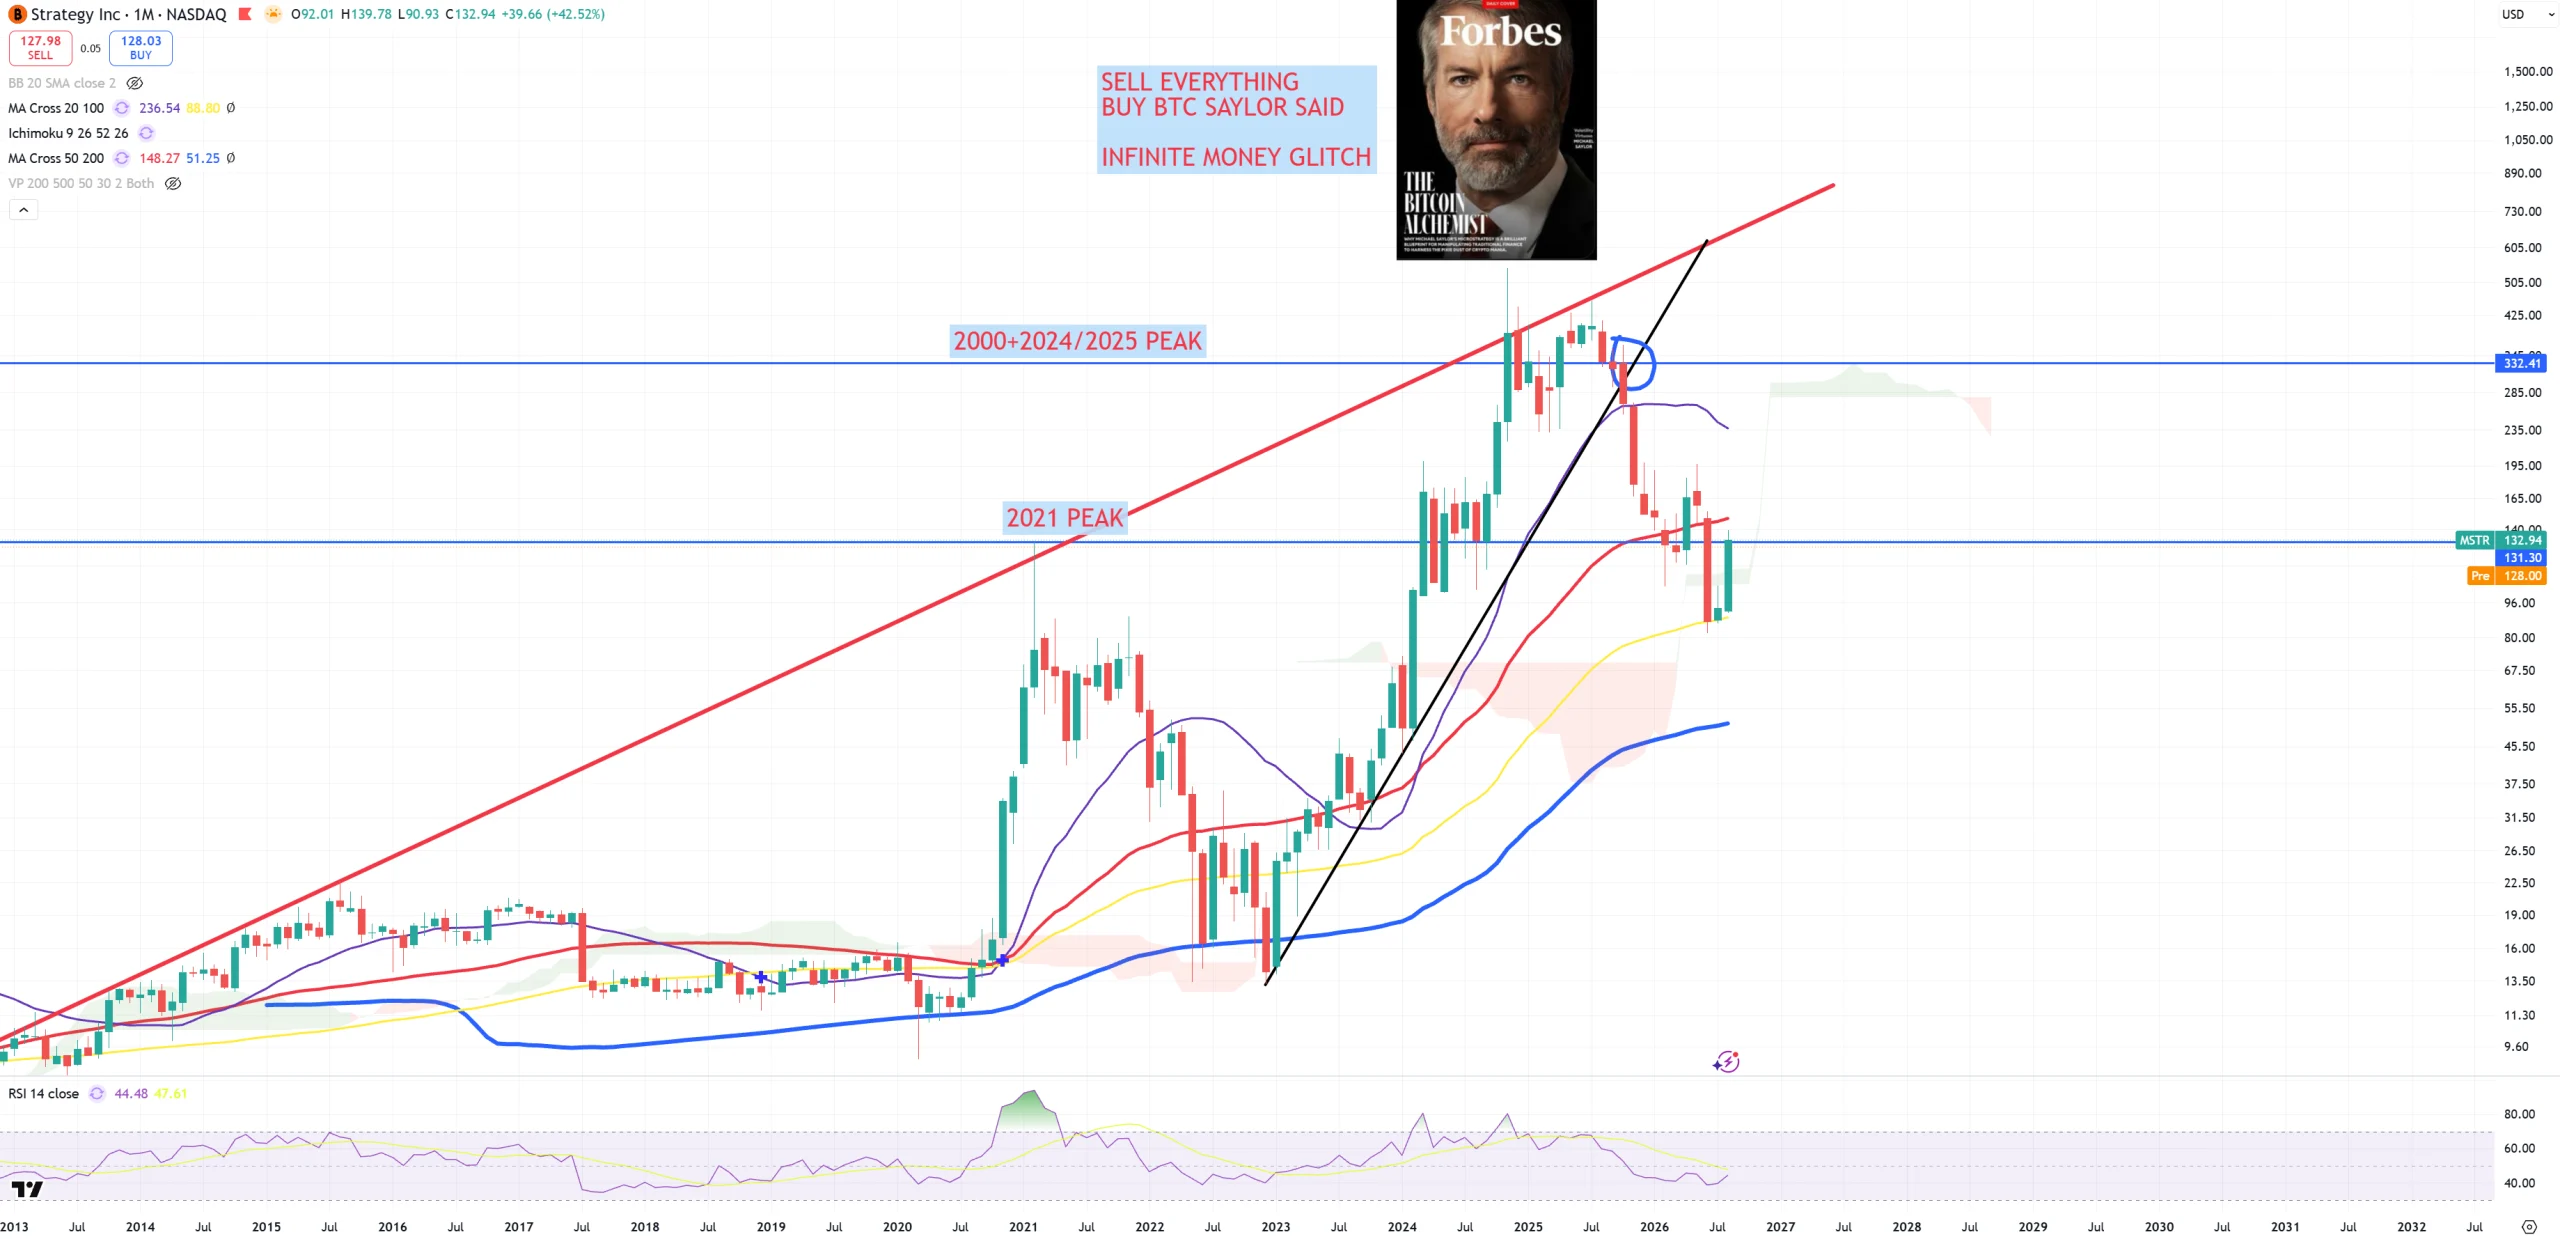
MSTR – Saylor comes to the game and bought some BTCs on > 80200$+ level on its 131$ resistance and (M)MA100 support.
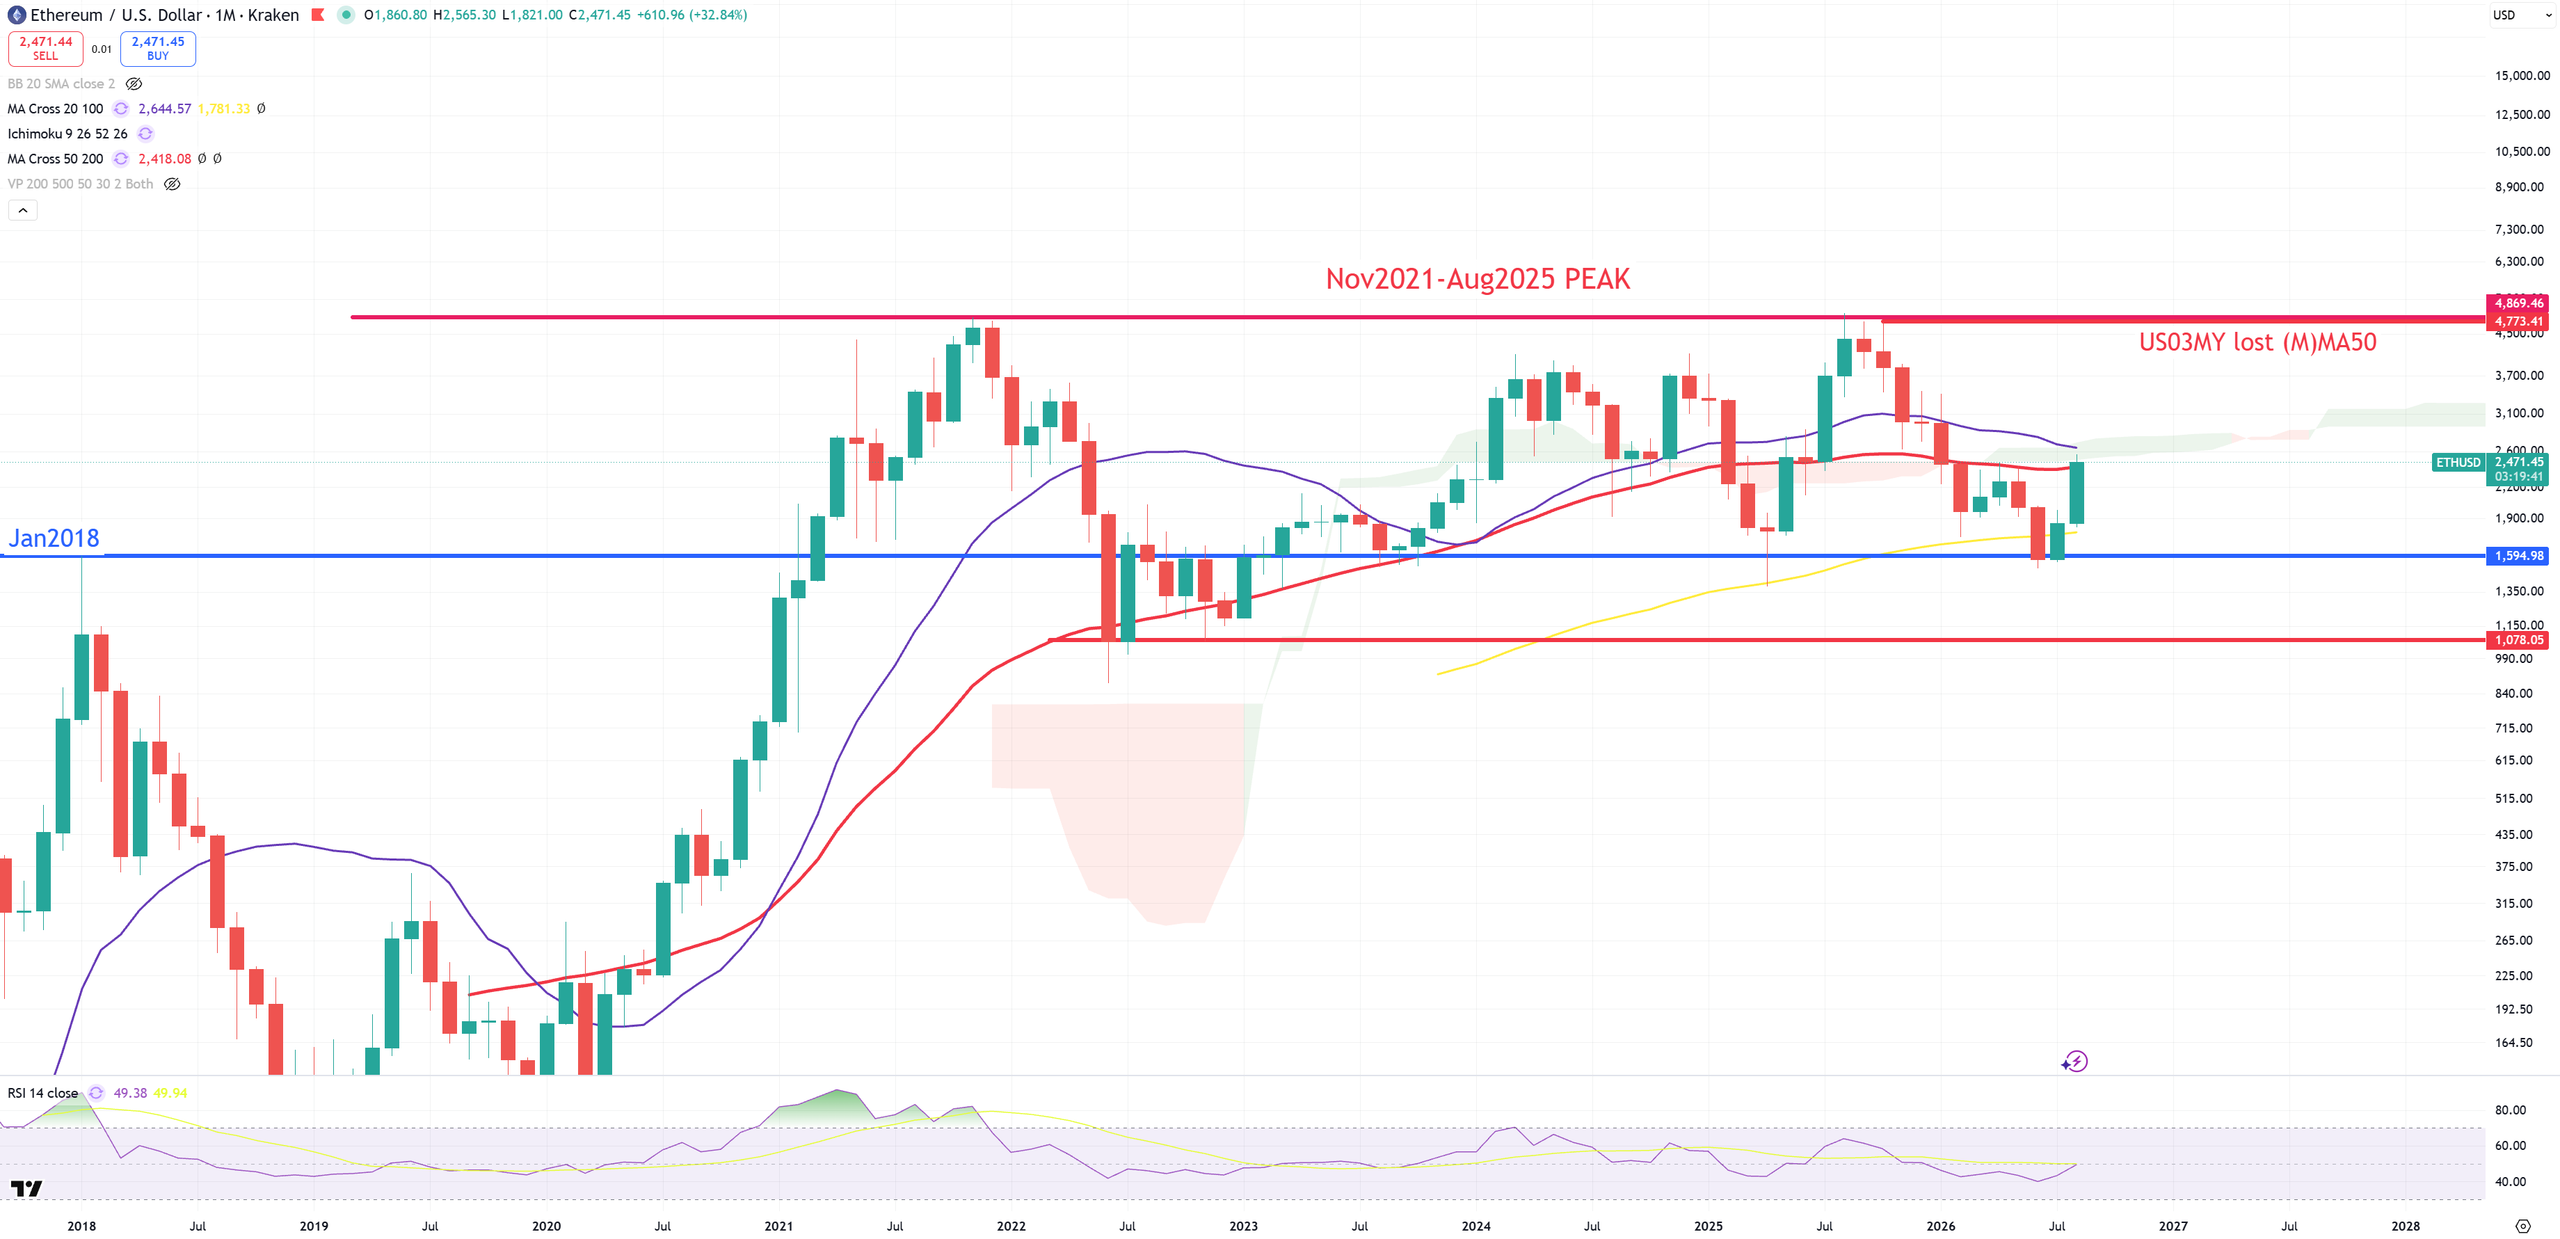
ETH – trying this (M)MA50 from the bottom
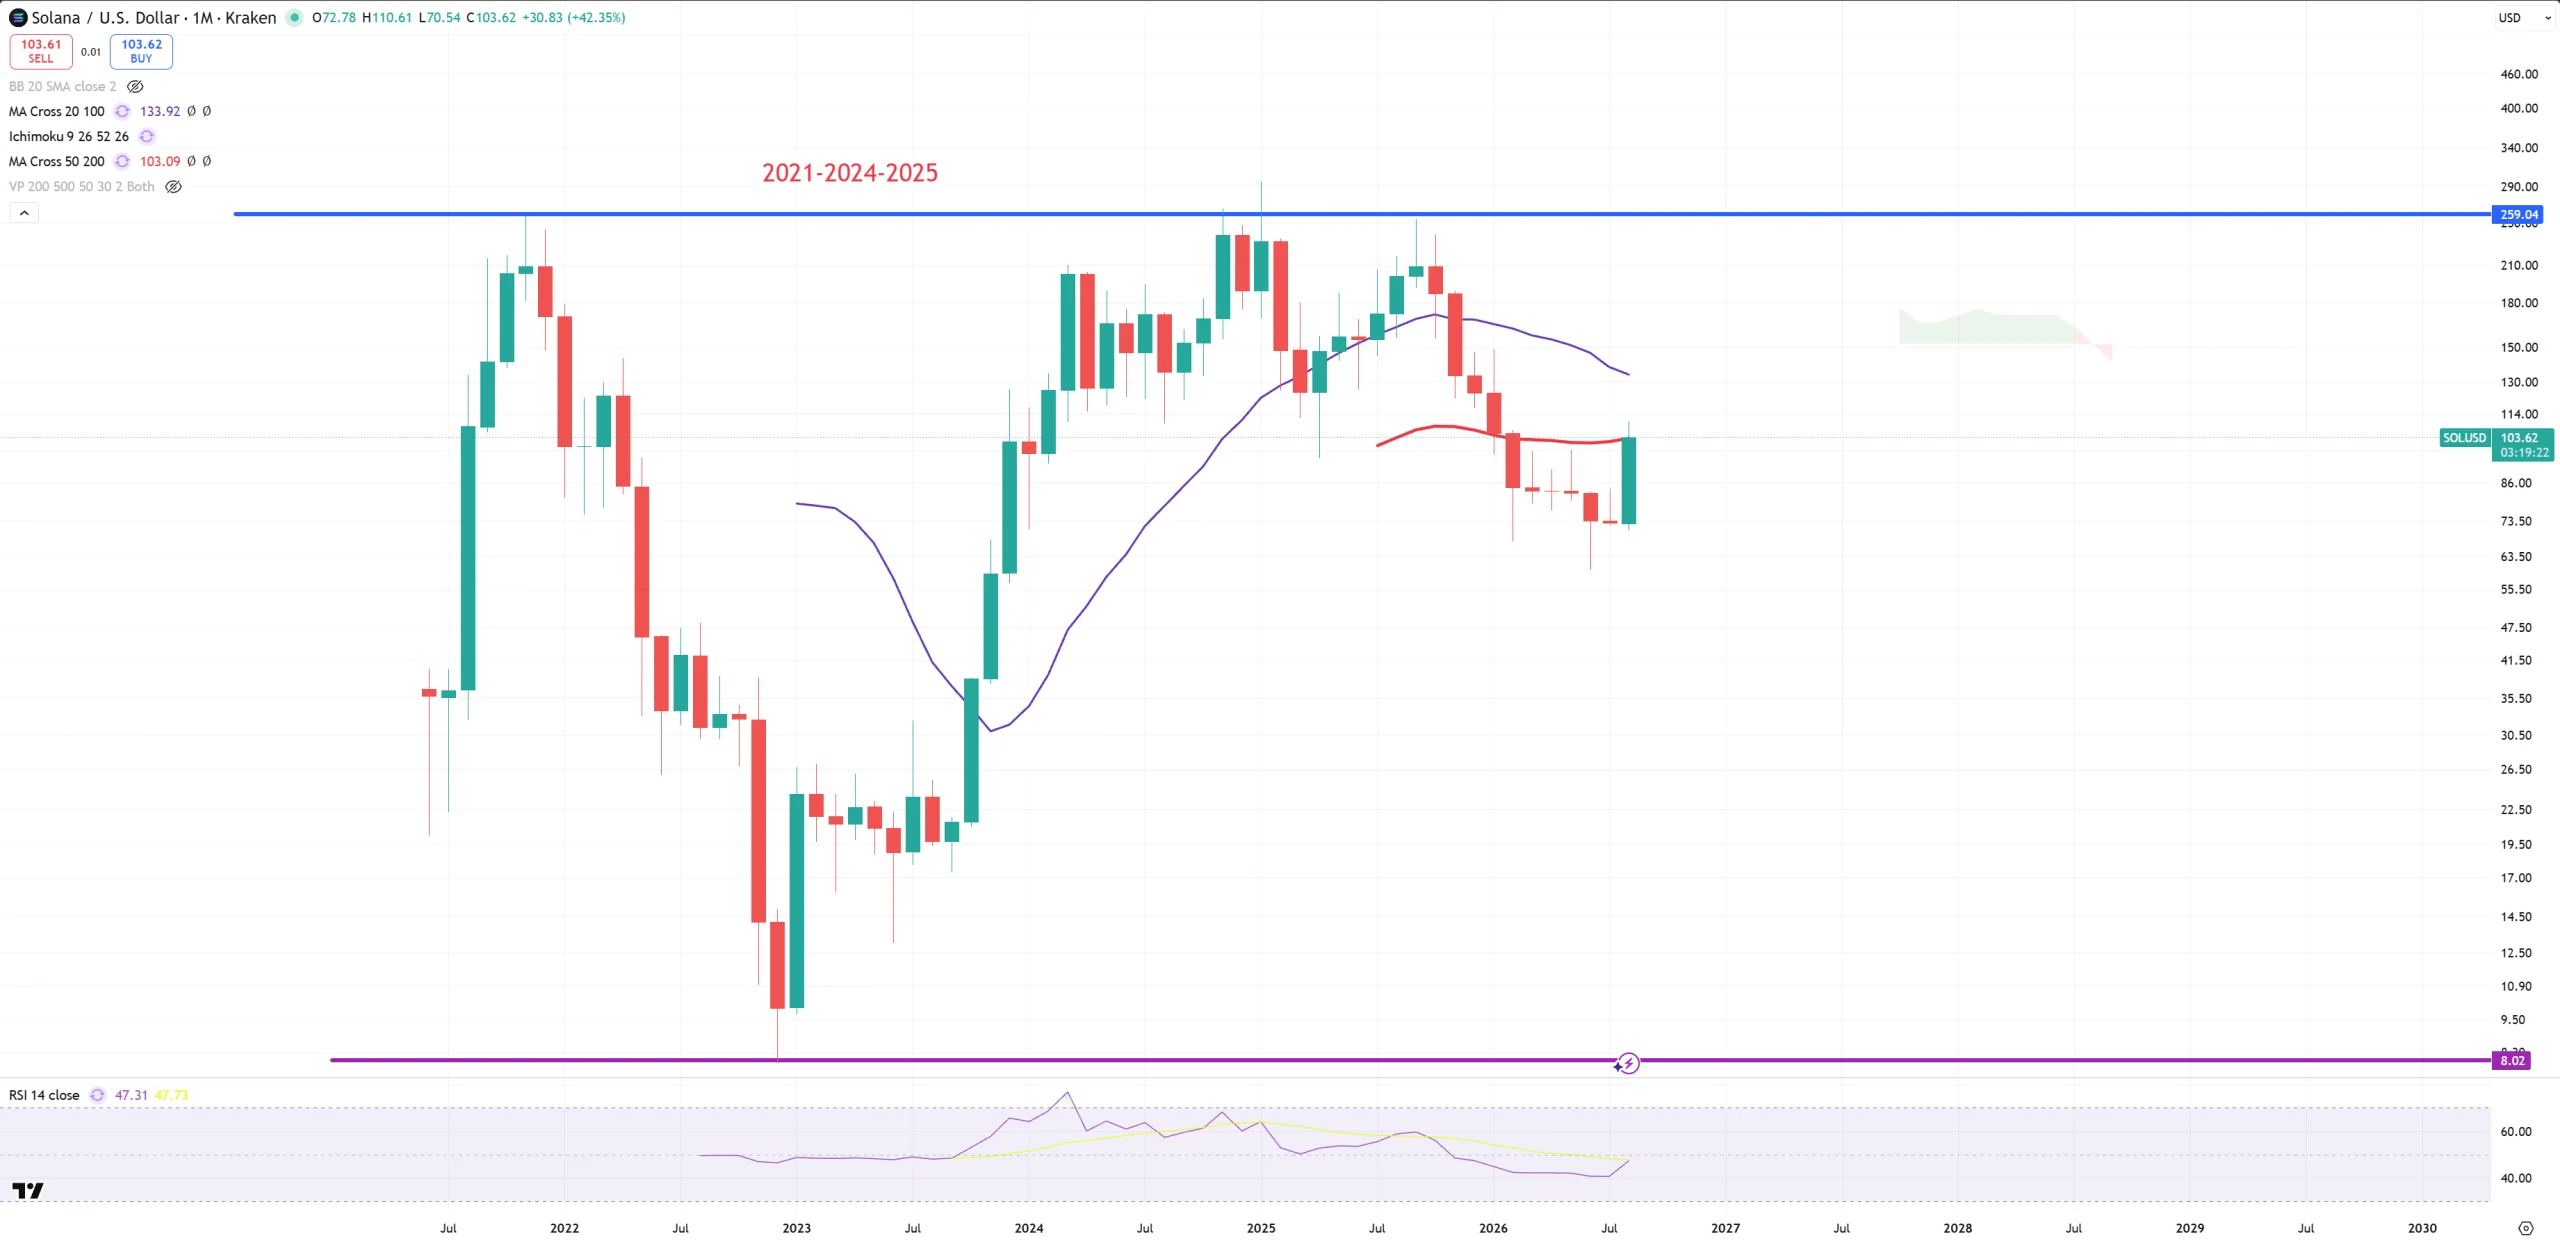
SOL – just like ETH.
AI + SOX
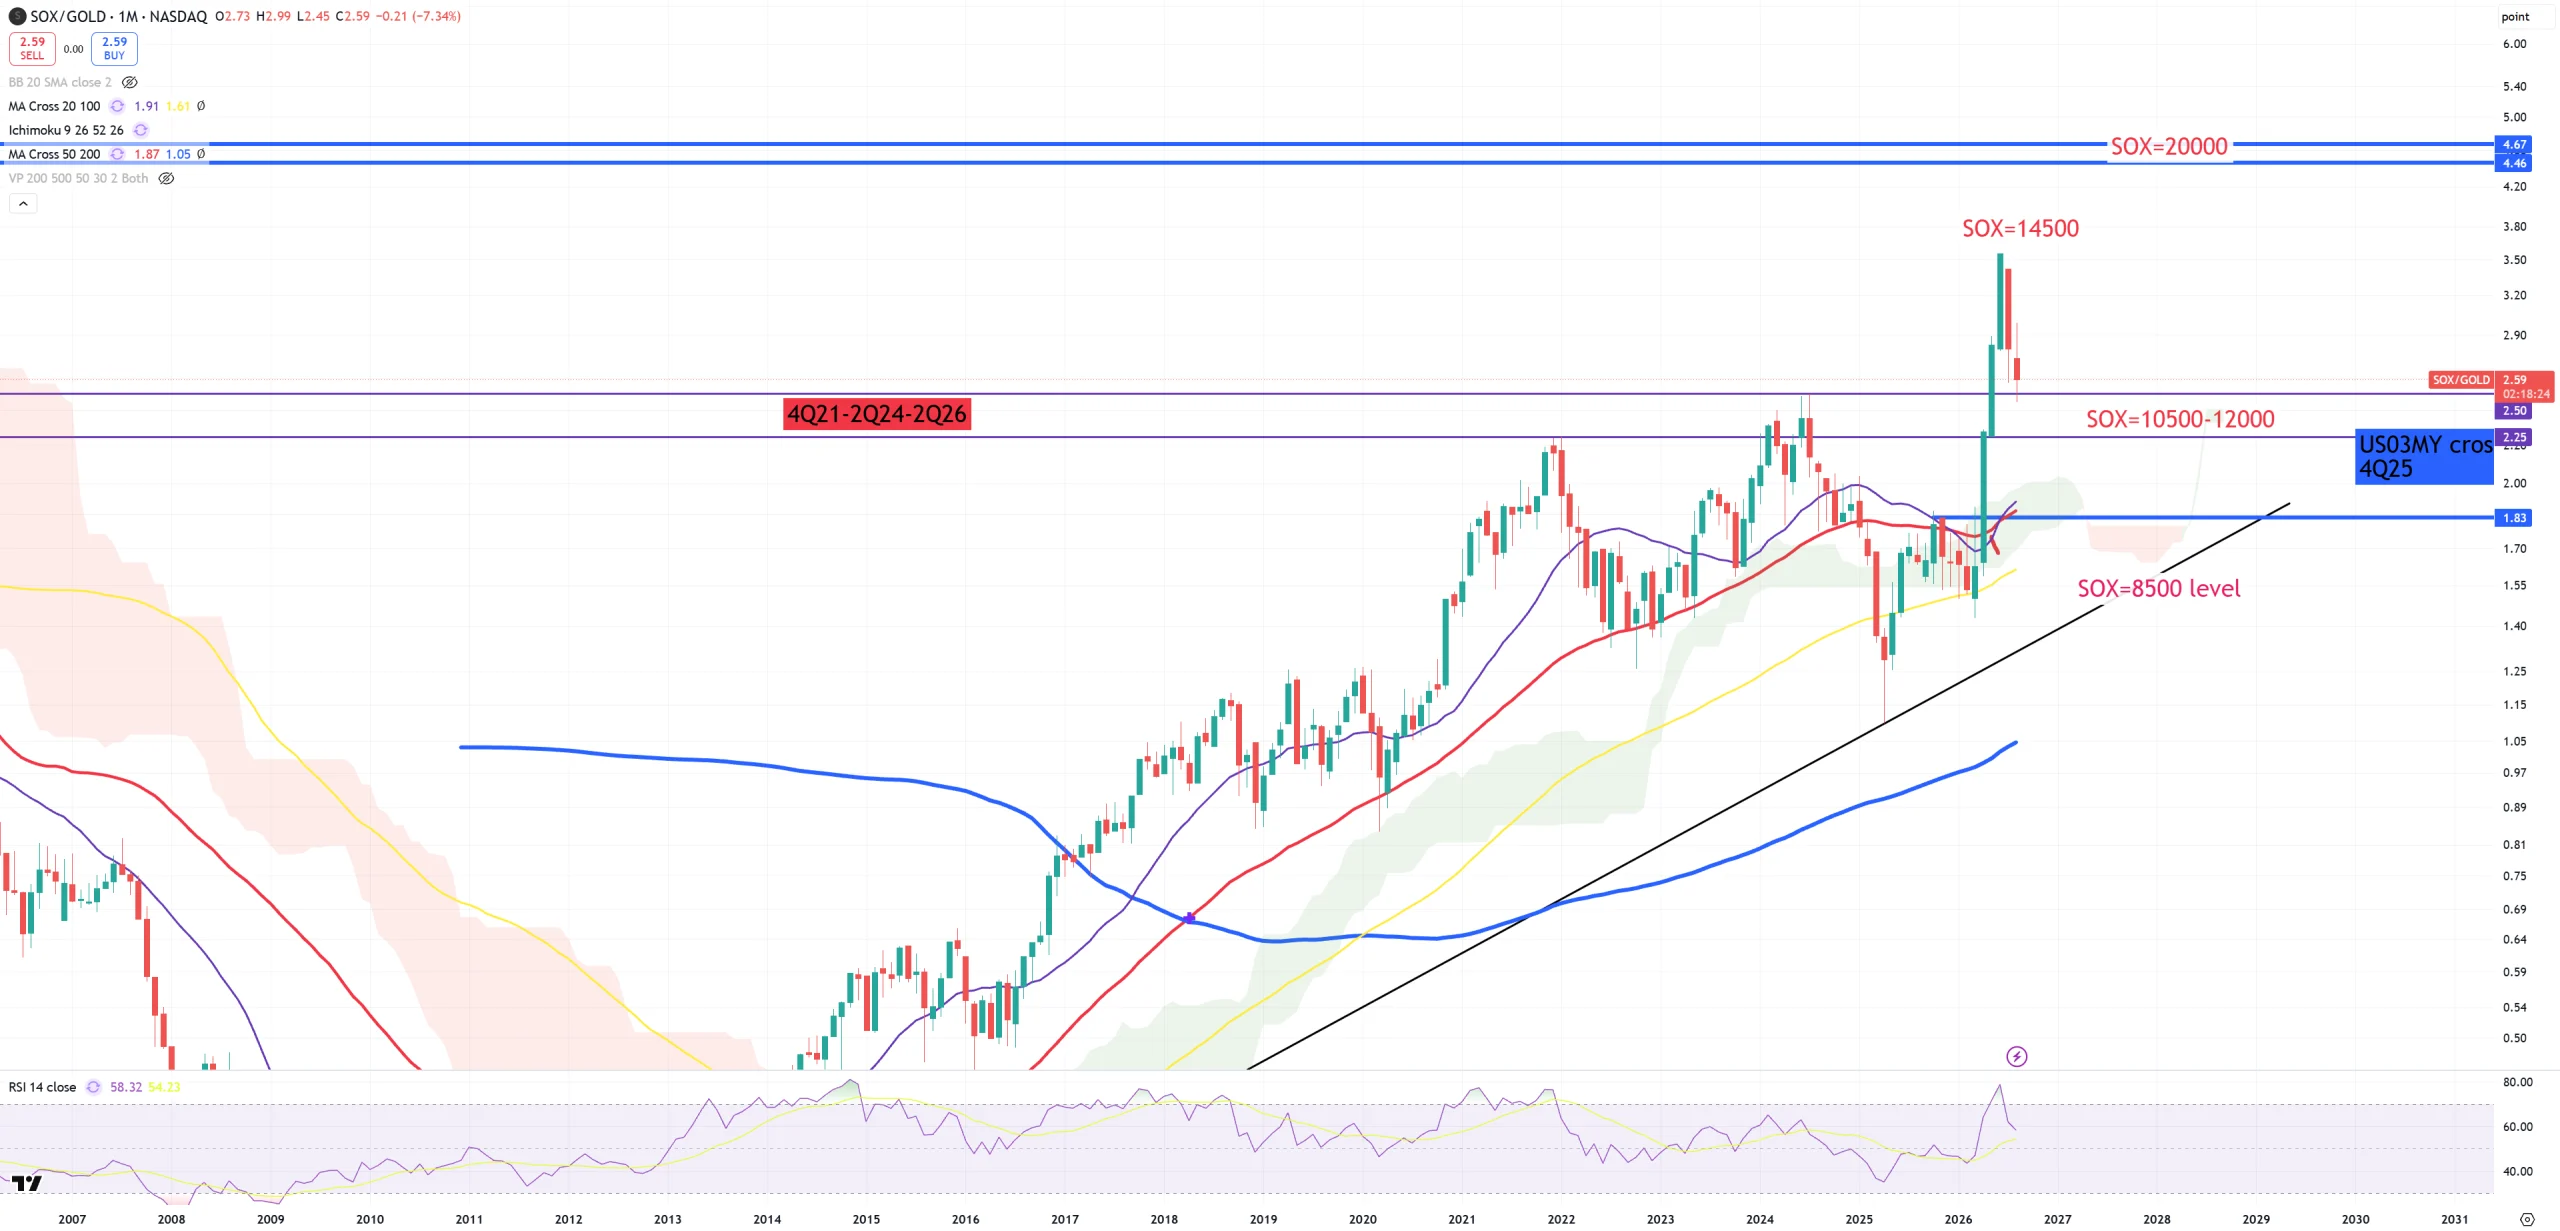
SOX/GOLD – ended up on key support level
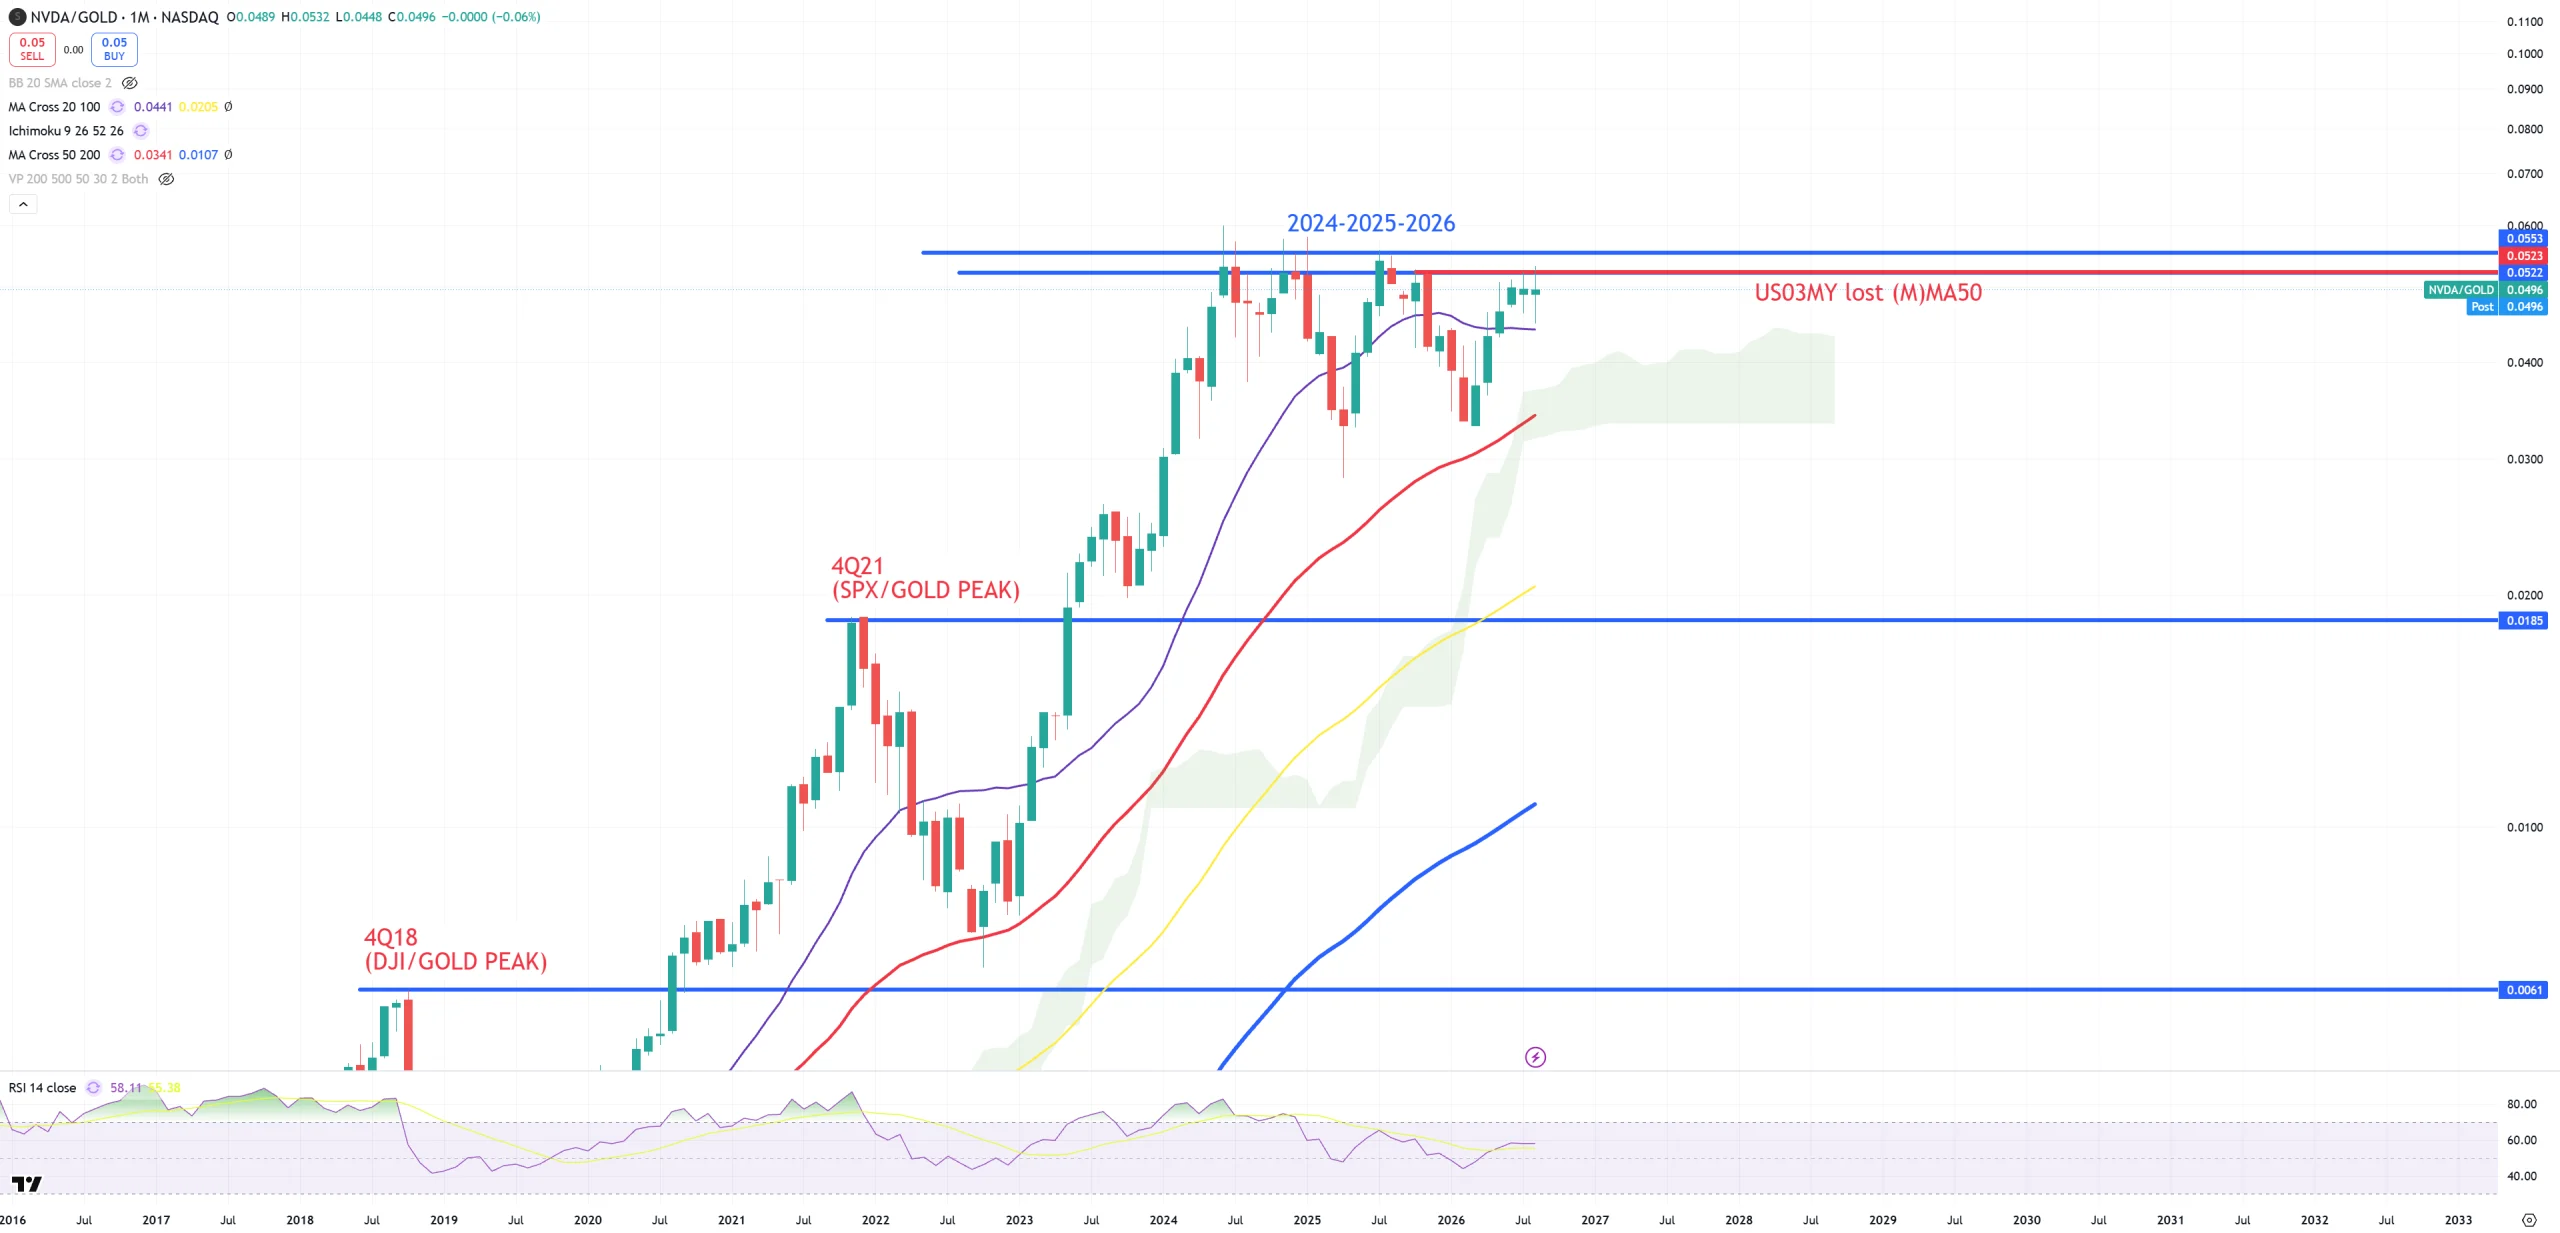
NVDA/GOLD – since 2024 it looks like “the cycle” for NVDIA keeps rotating
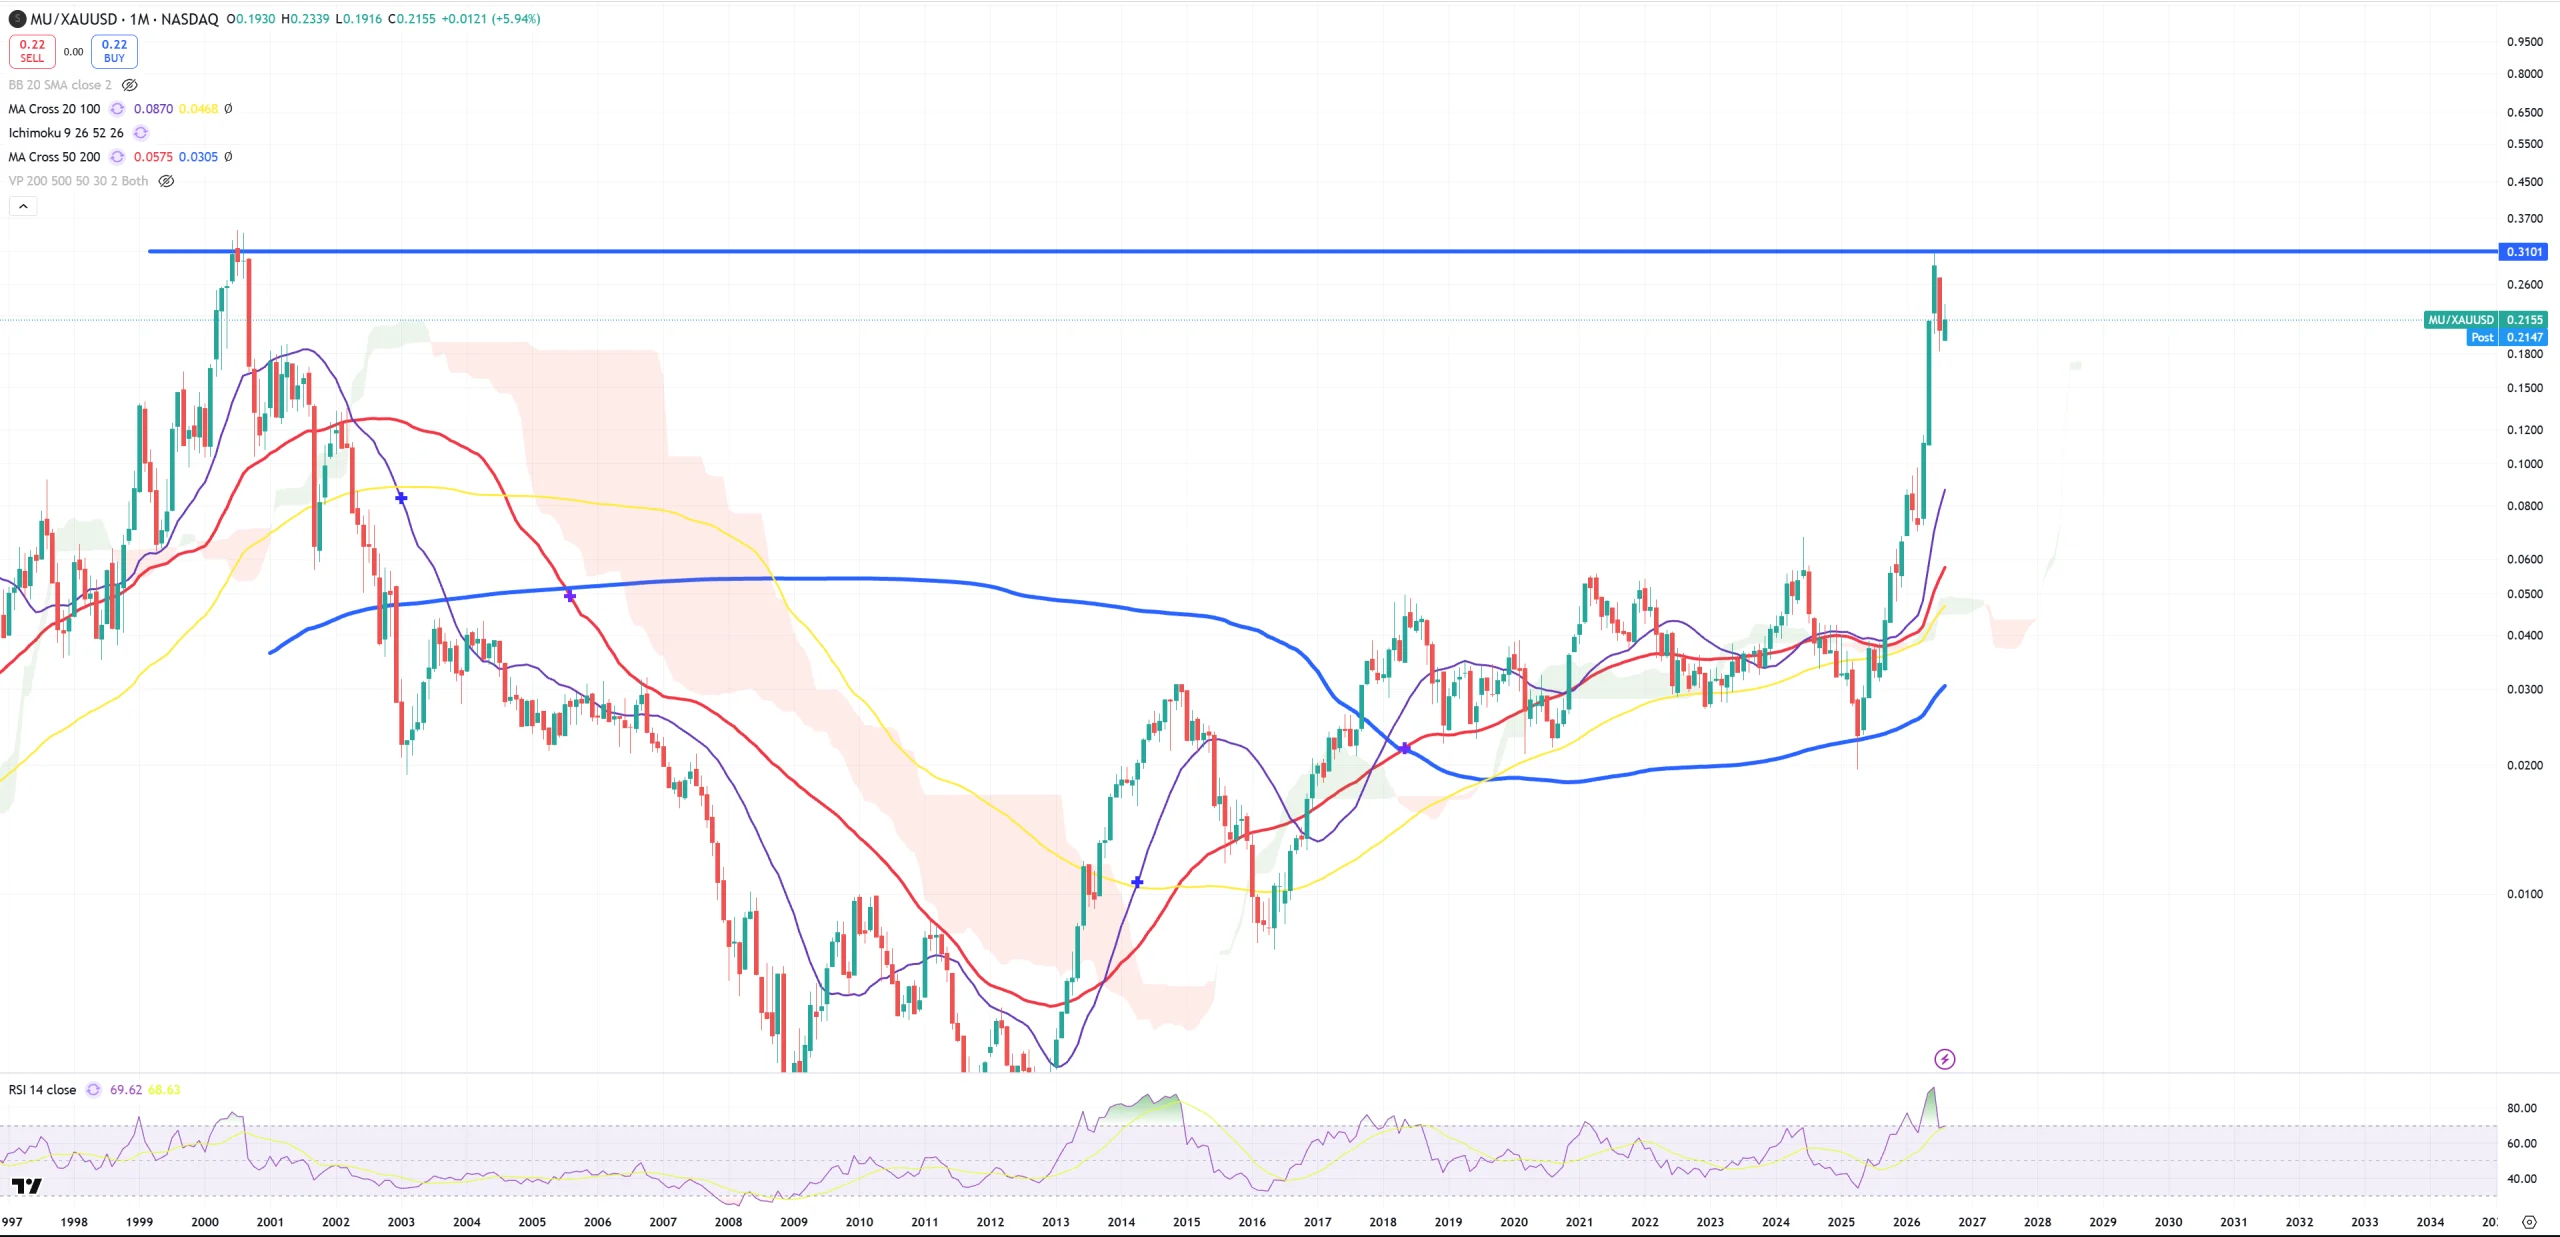
MU/GOLD – placed almost perfect 2000 peak.
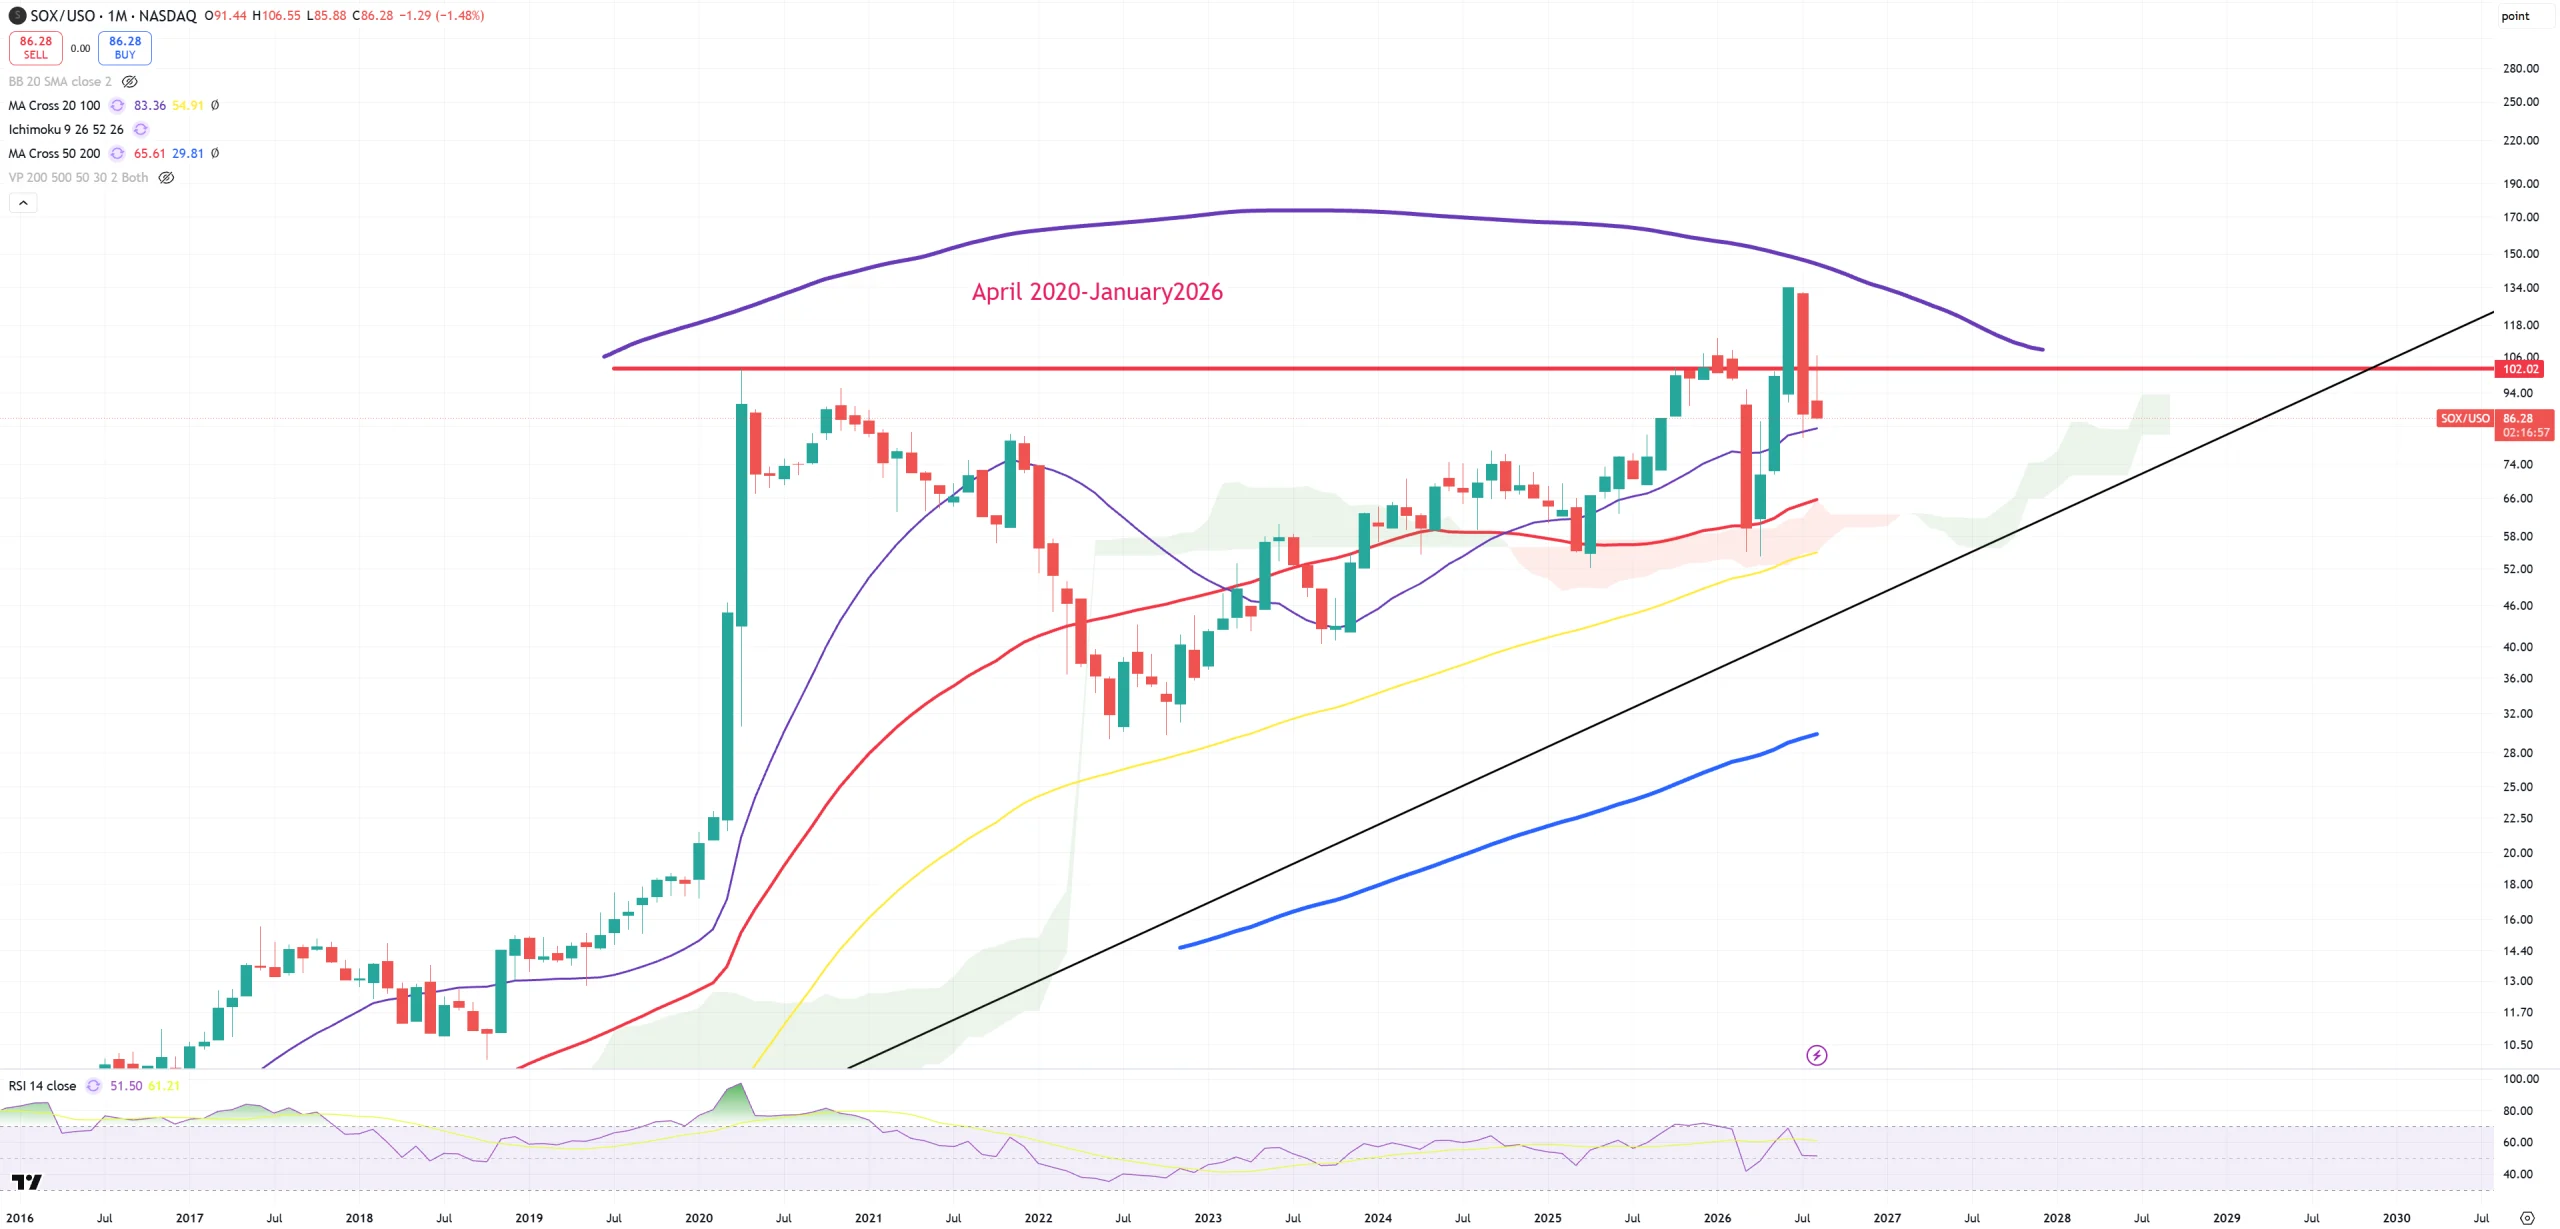
SOX/USO – 6 years of reversal? OIL > SOX has just started?
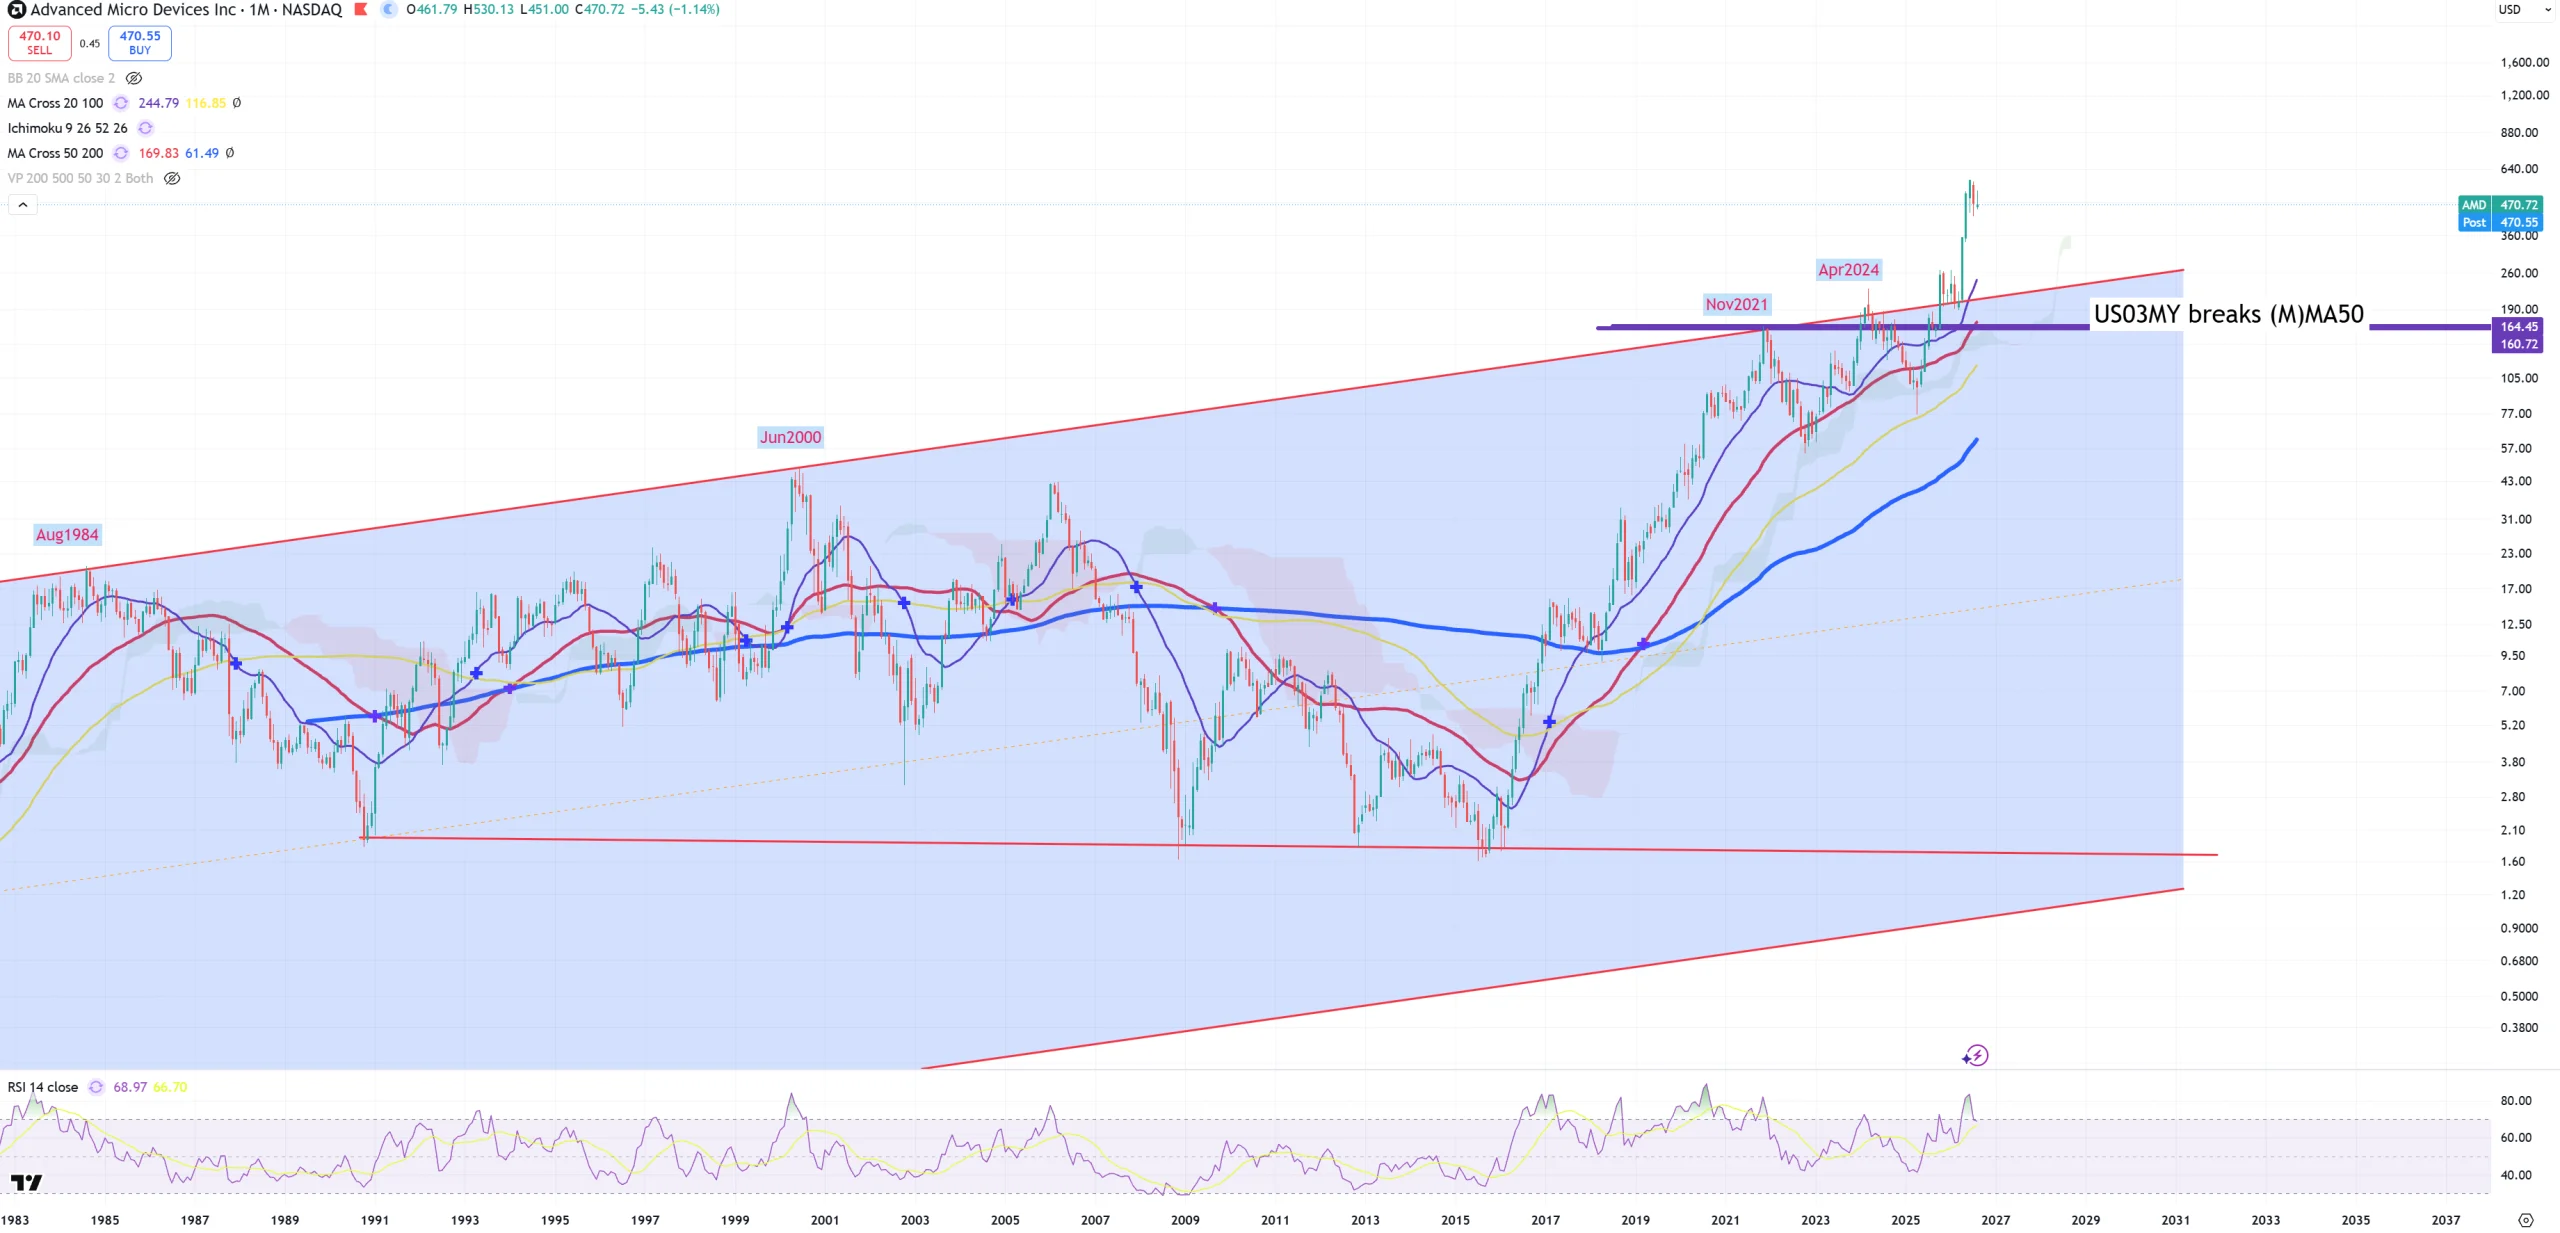
AMD – I don’t believe in super long trends break (1984-2000) when 10Y/3M uninverts and is now > 90bps.
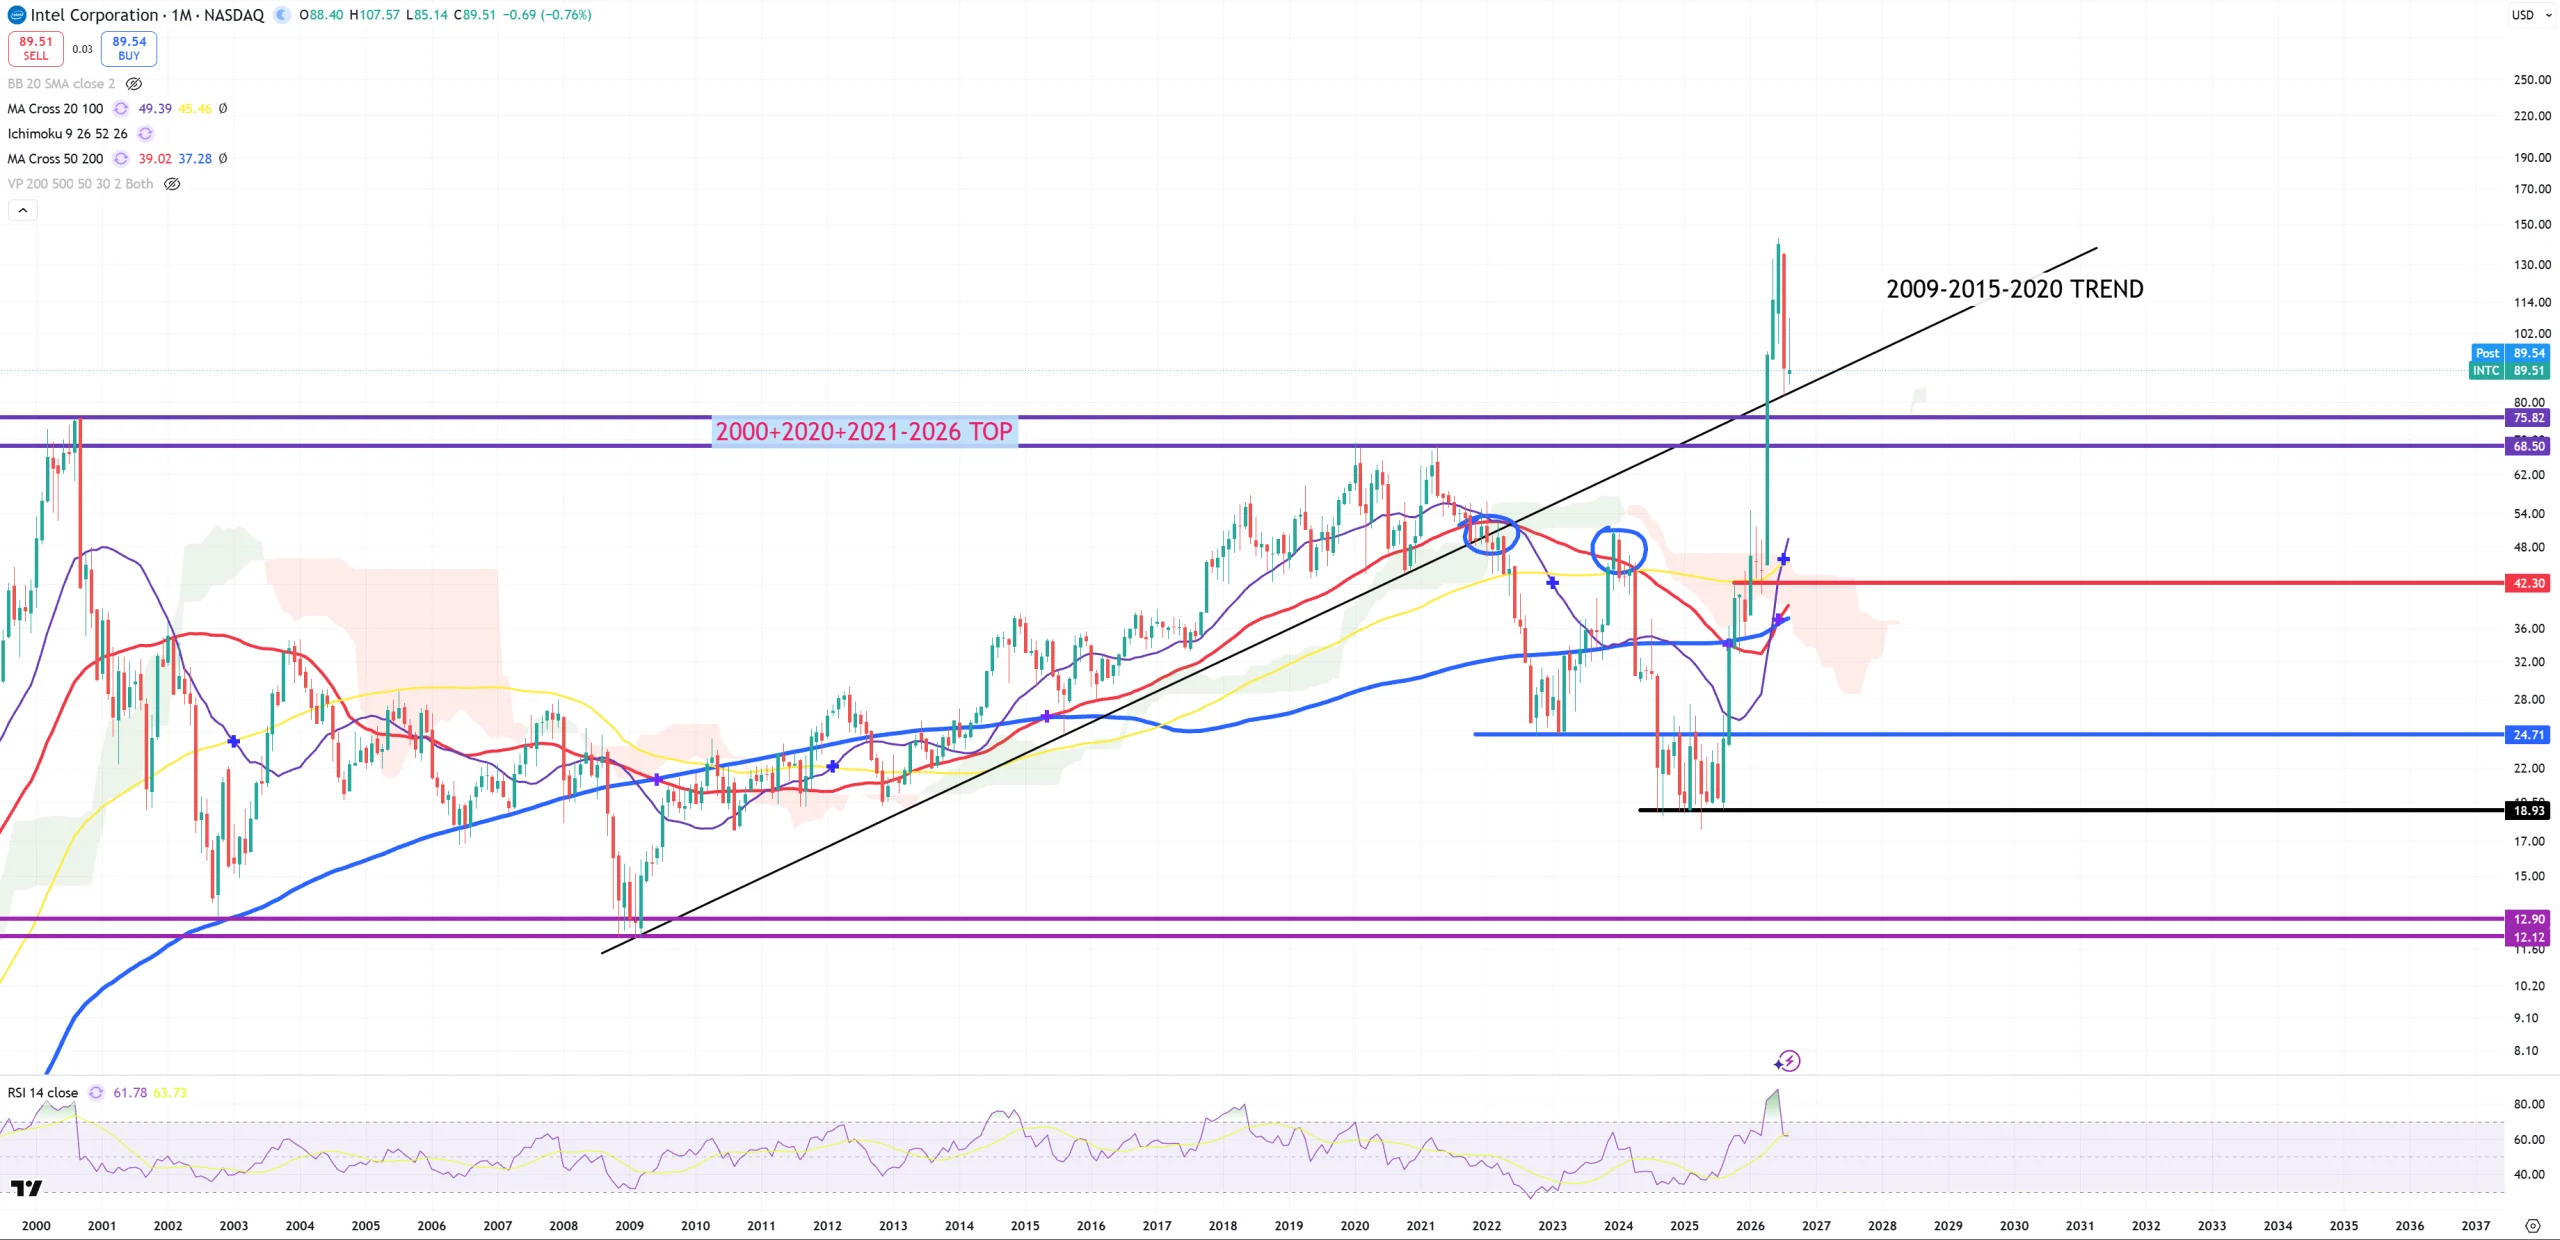
INTC – Intel was taken out from the grave. One of the biggest surprise I’ve ever seen.
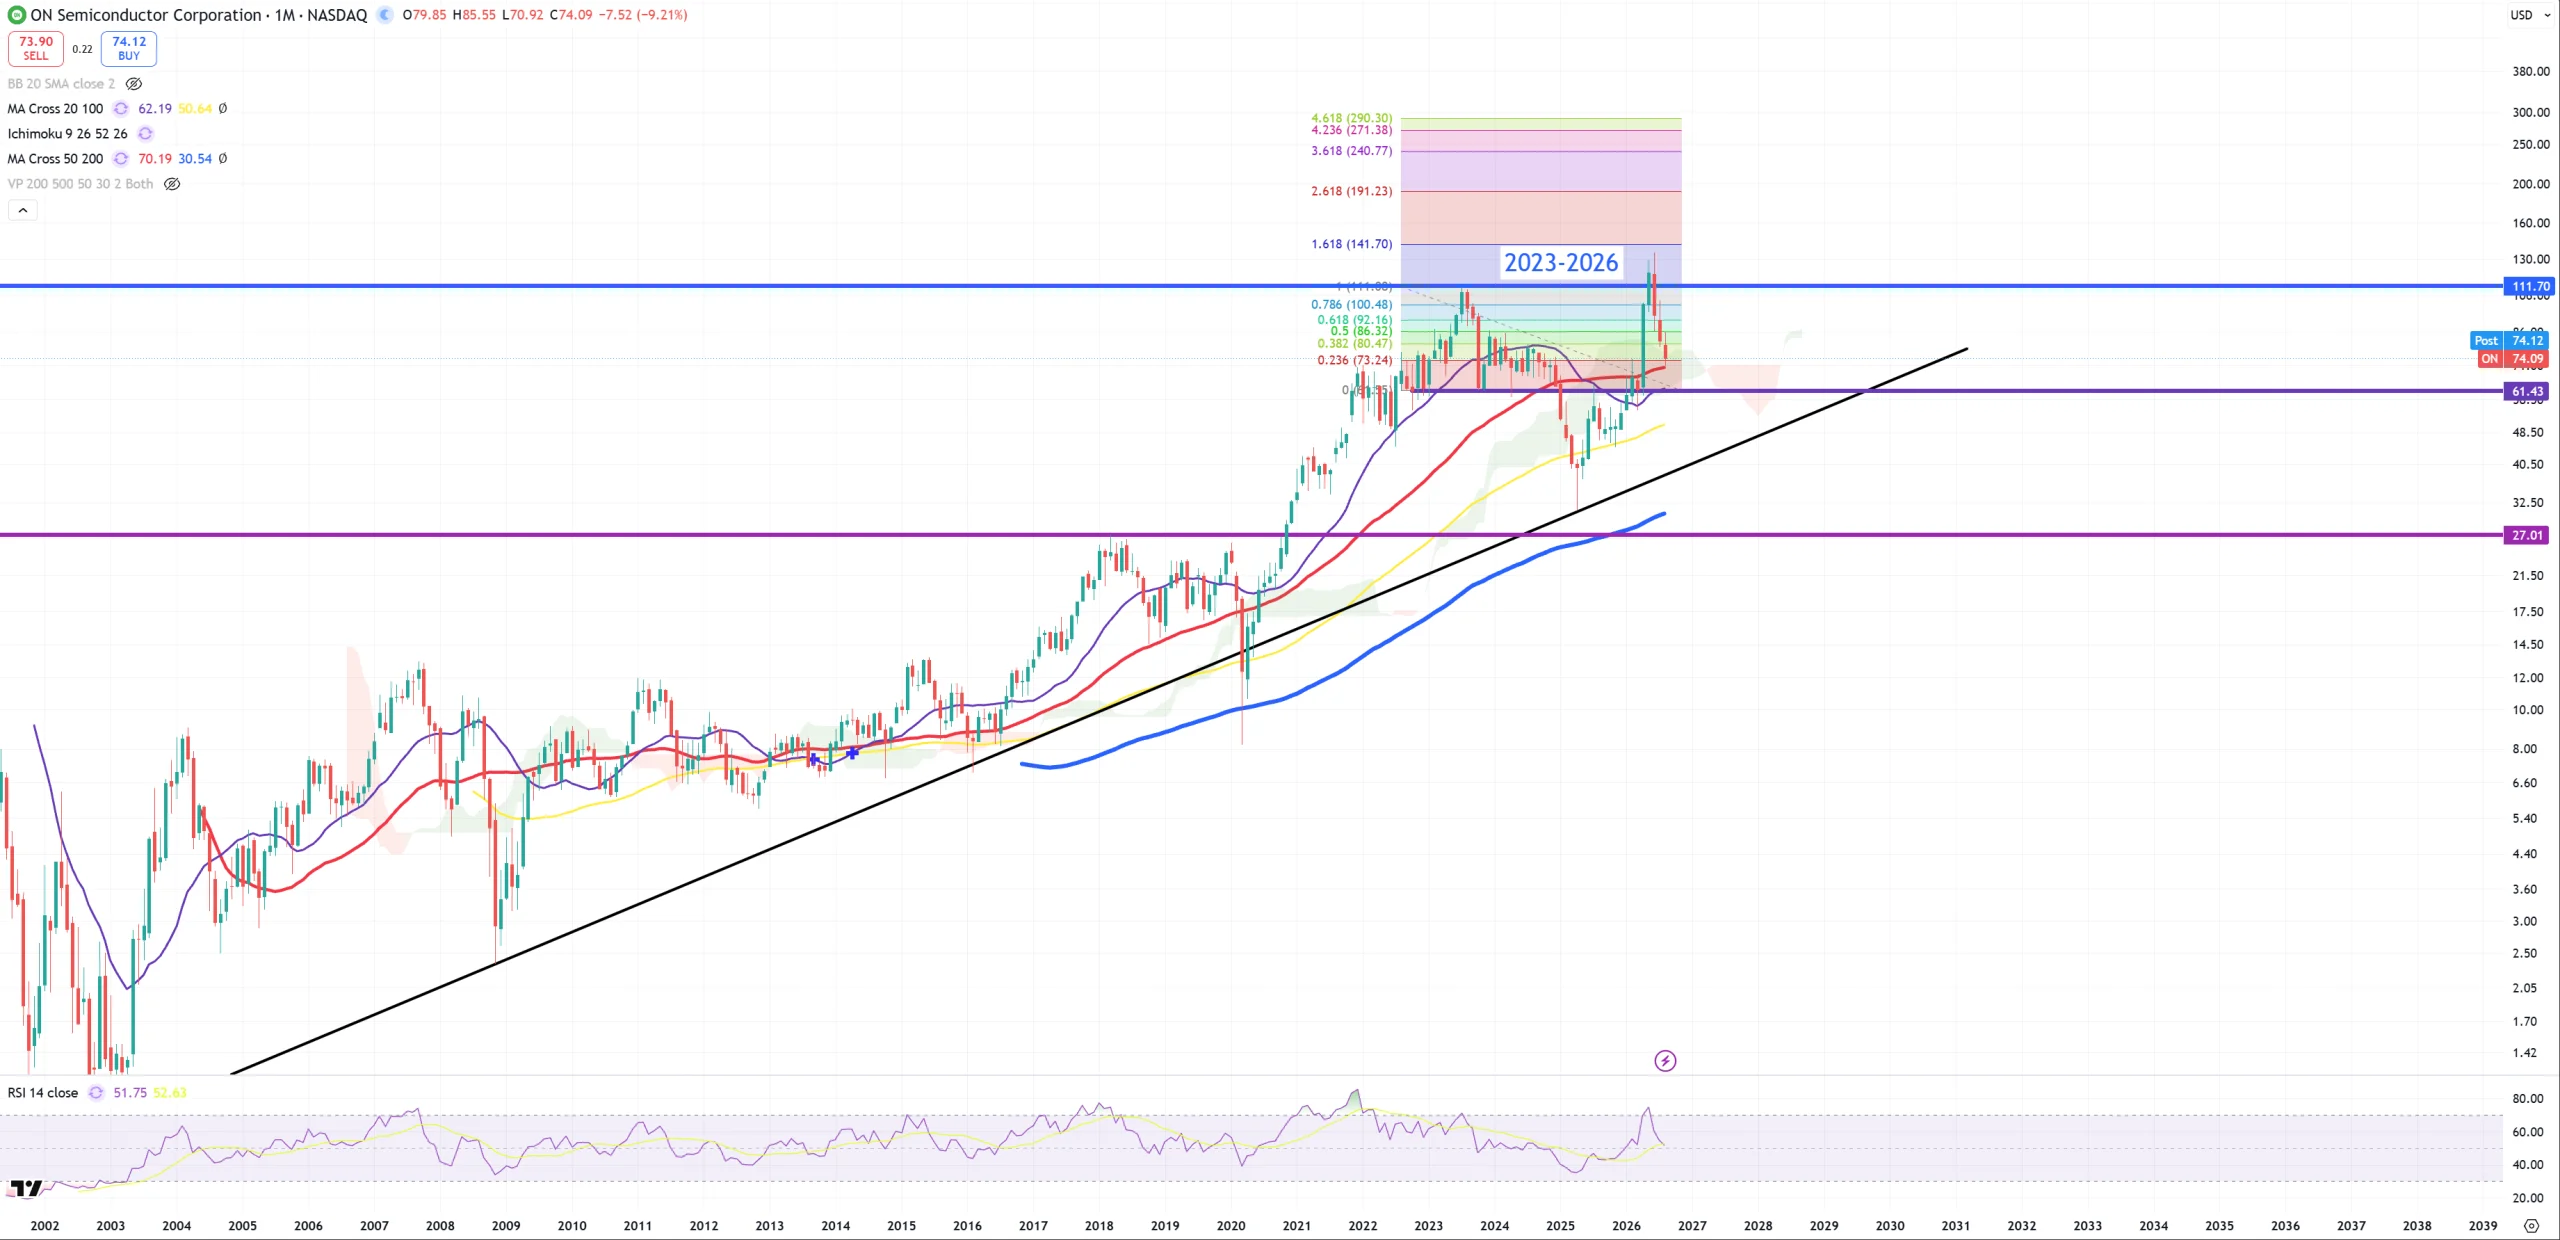
ON – possible double-top
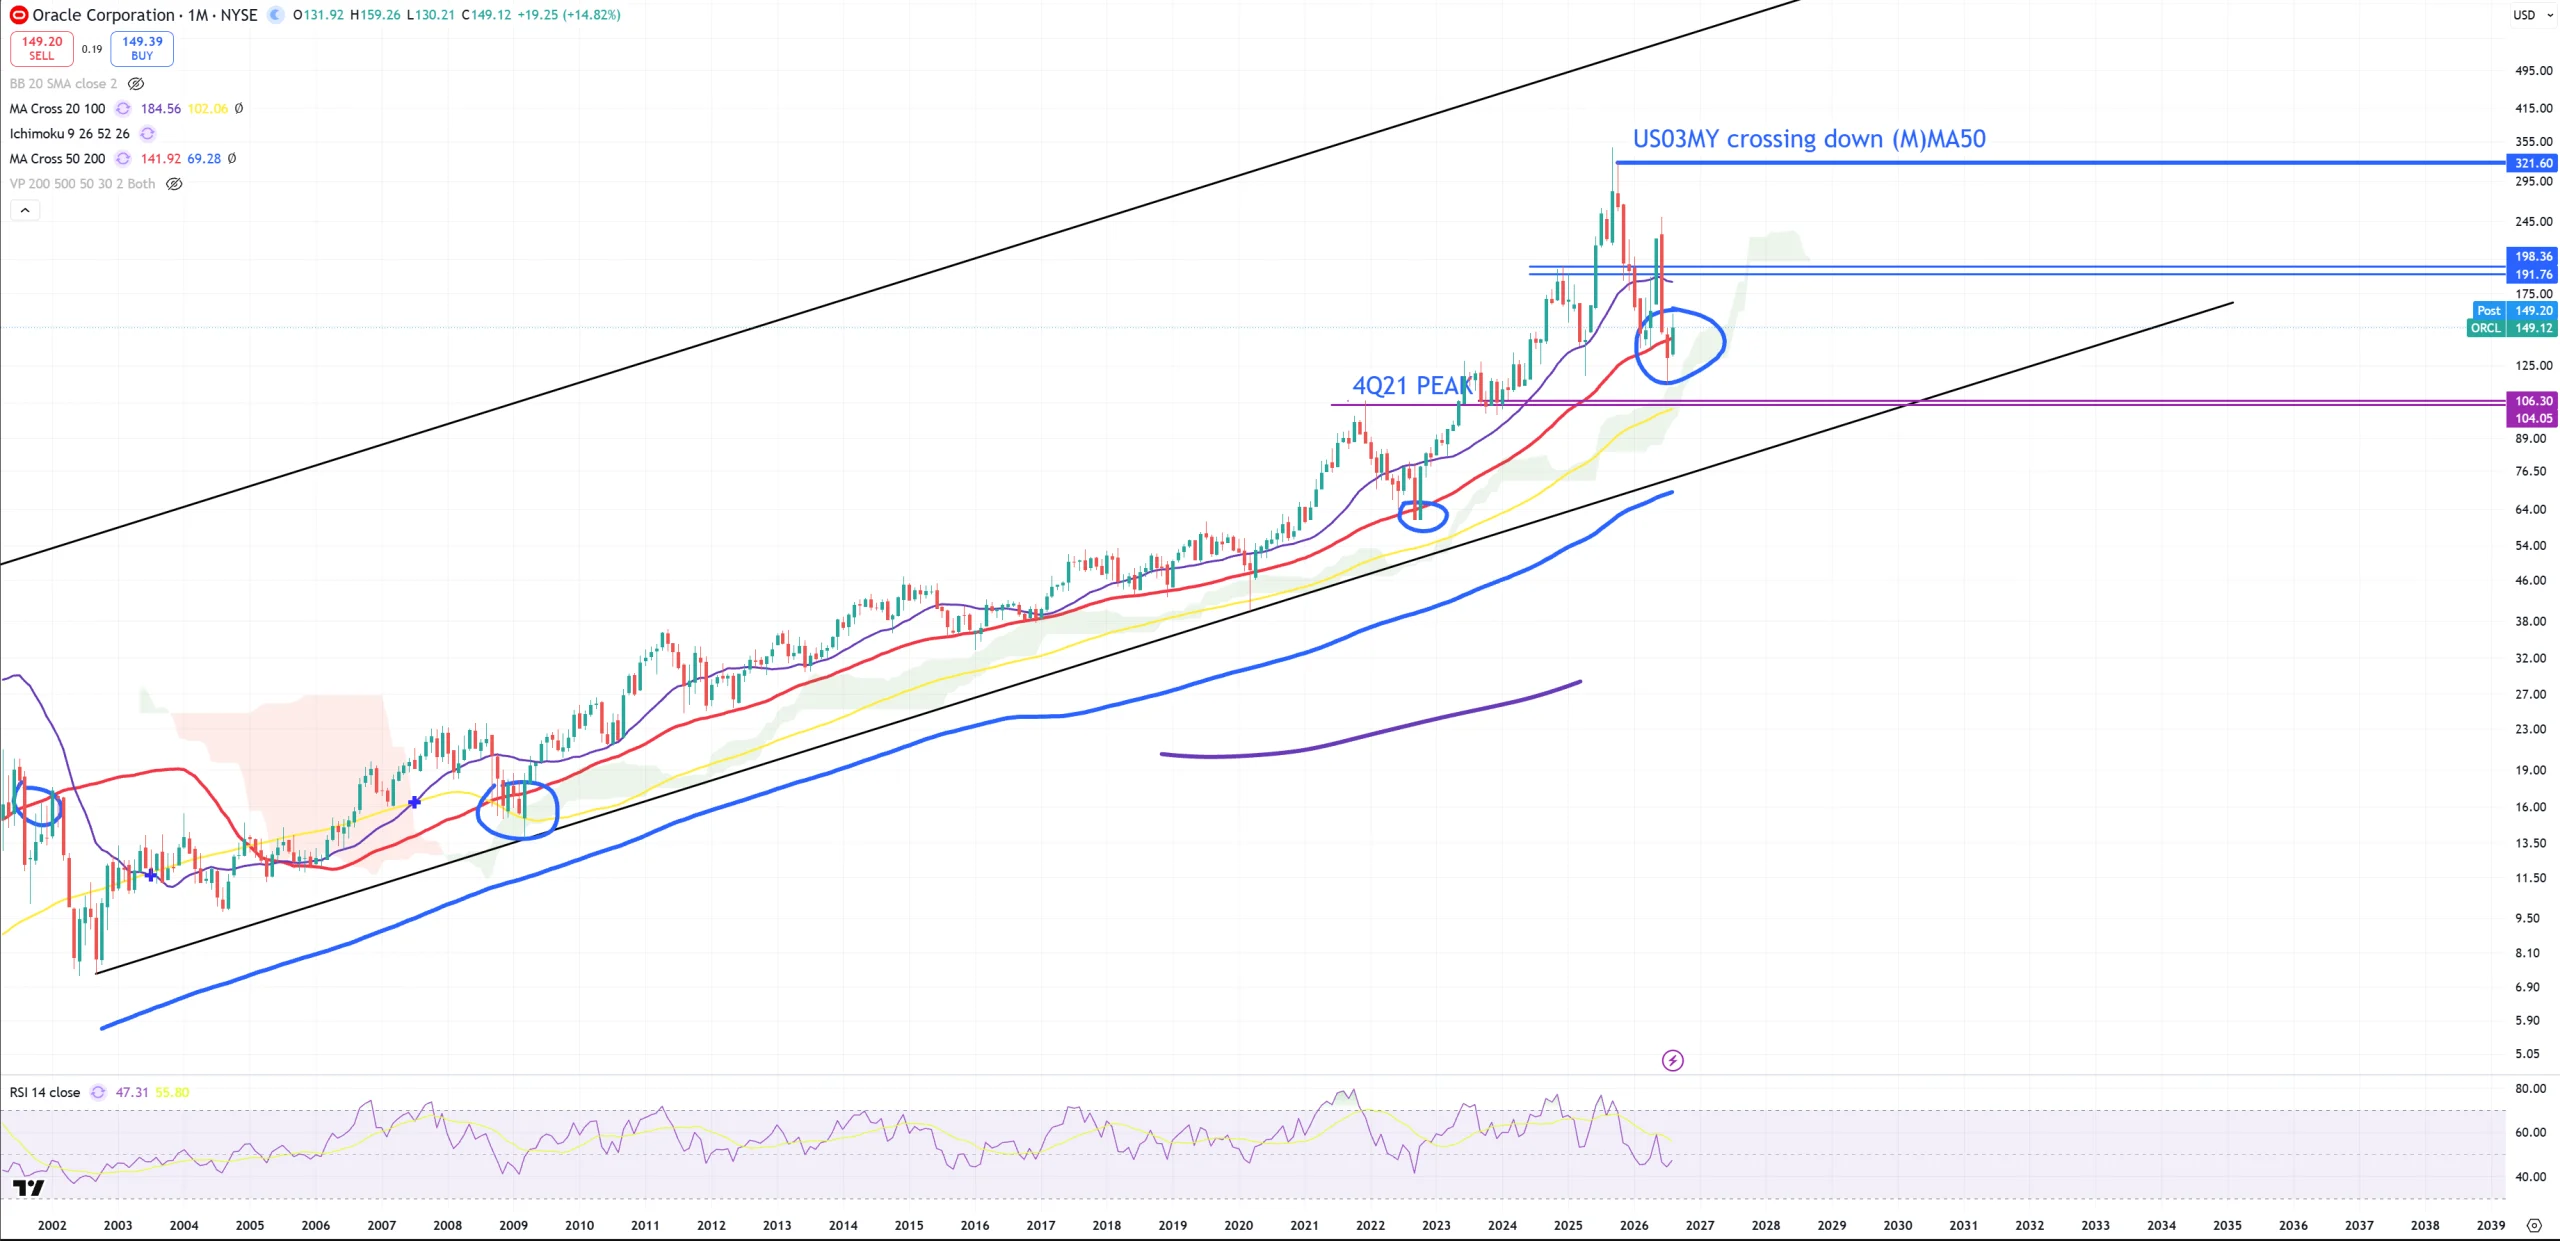
ORCL fights with (M)MA50 – this company leads CAPEX AI spending with massive debt and 5YCDS > 2008 peak.
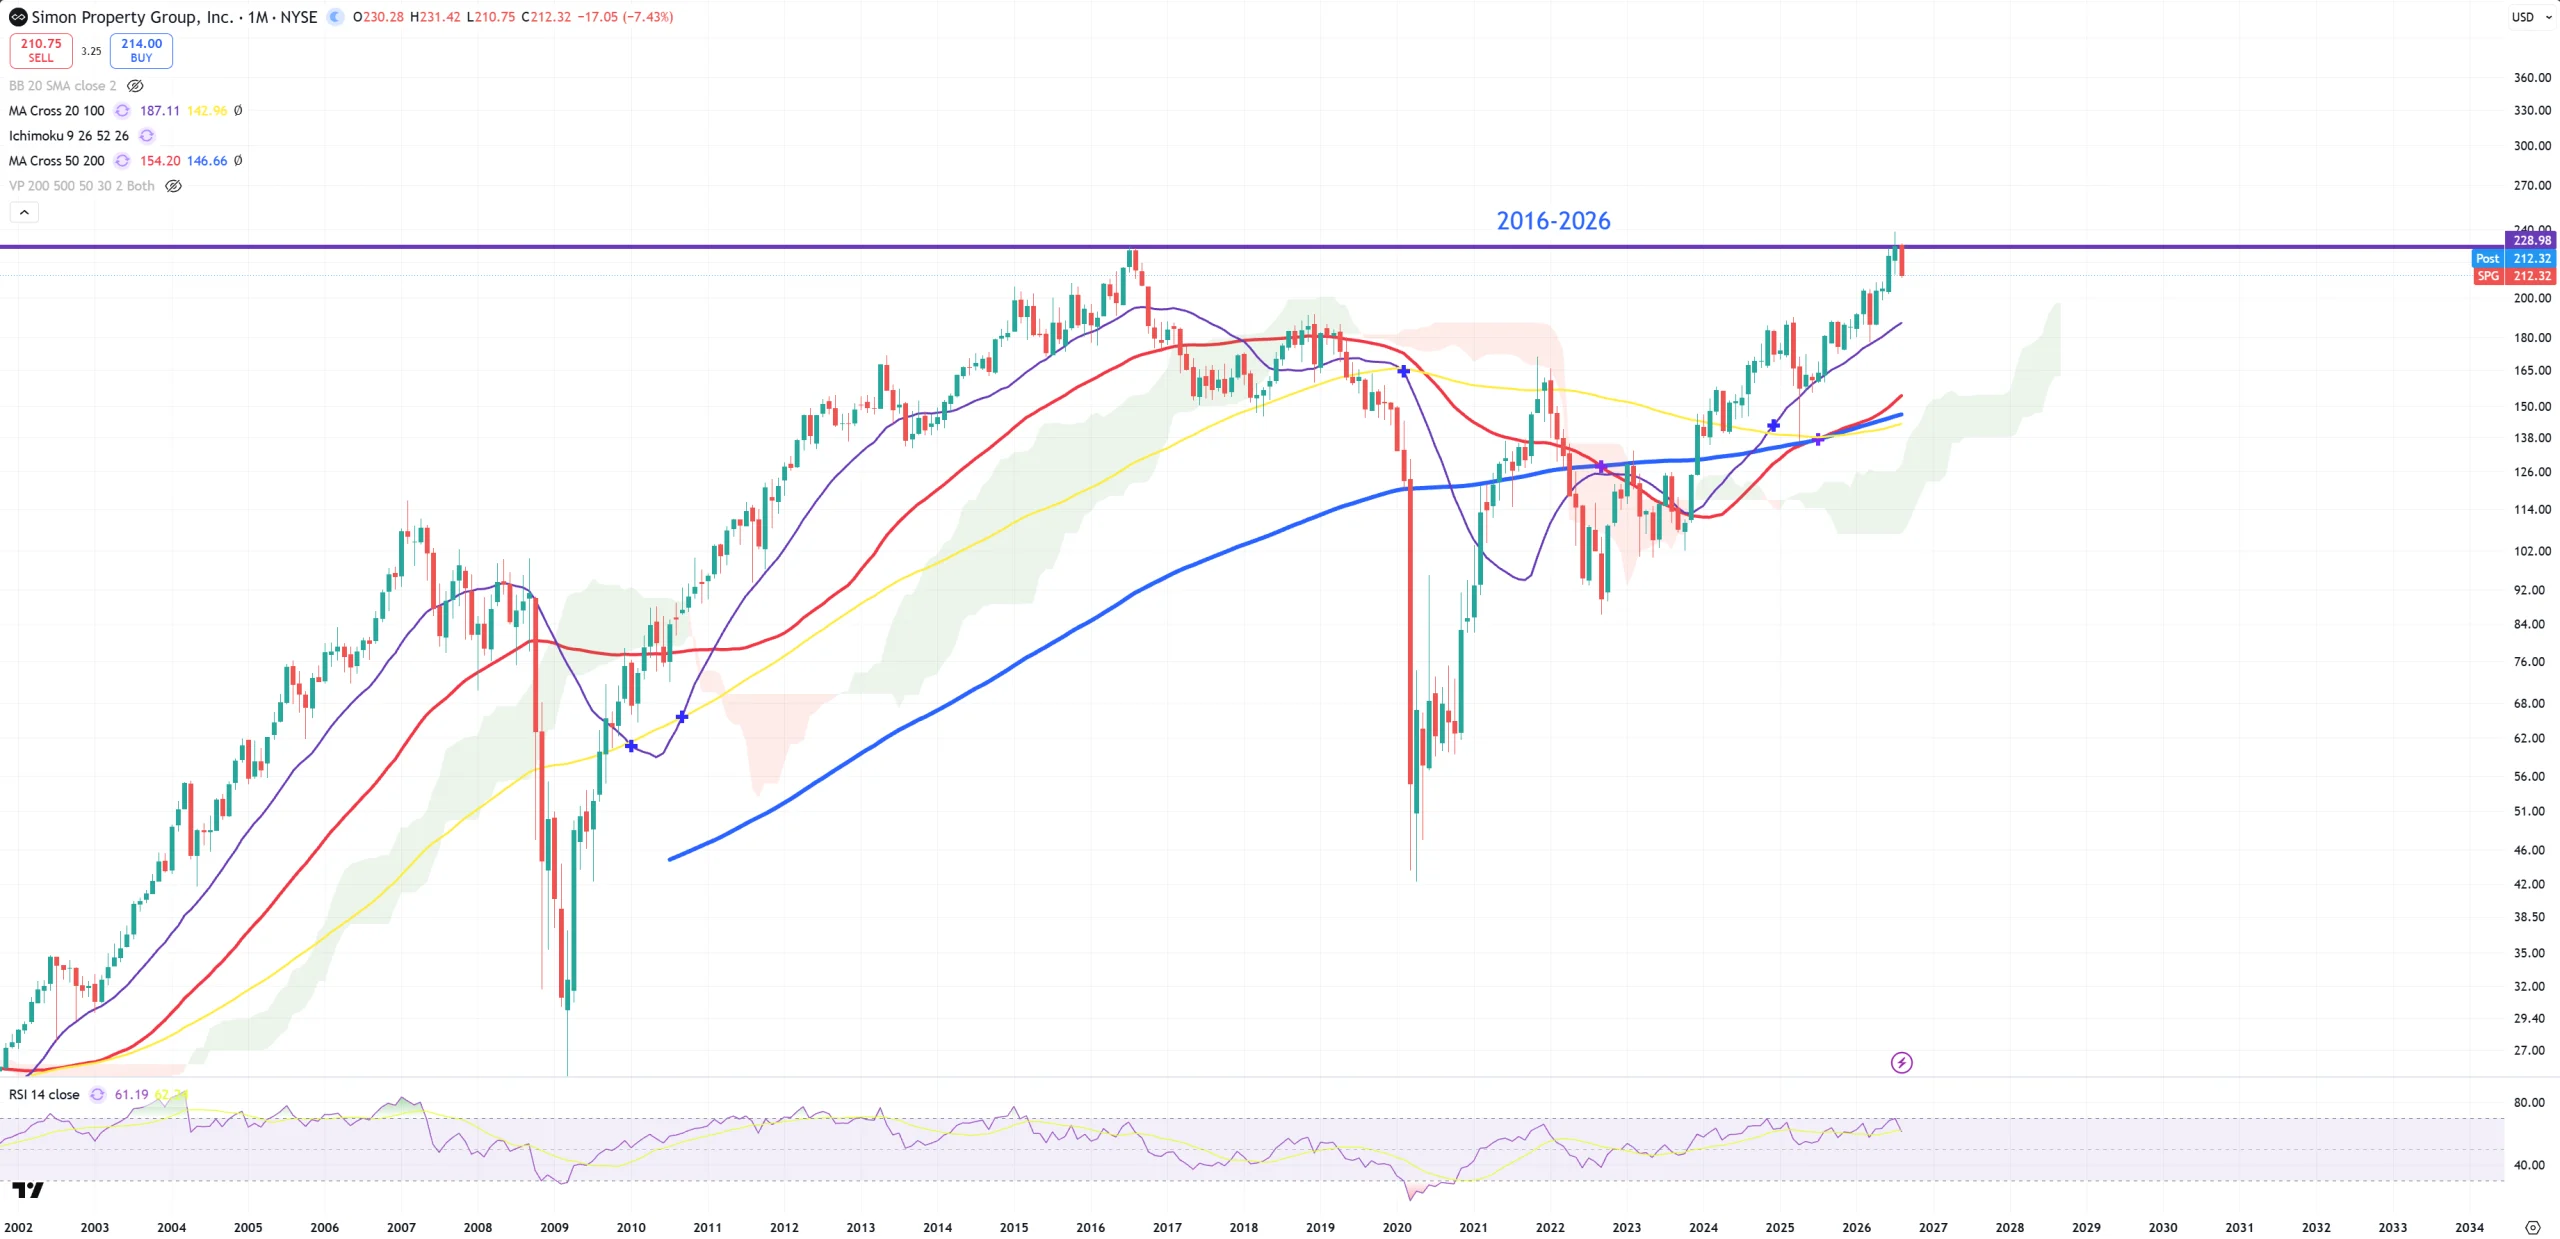
SPG – Simon Property Ground and its 2016 TOP.
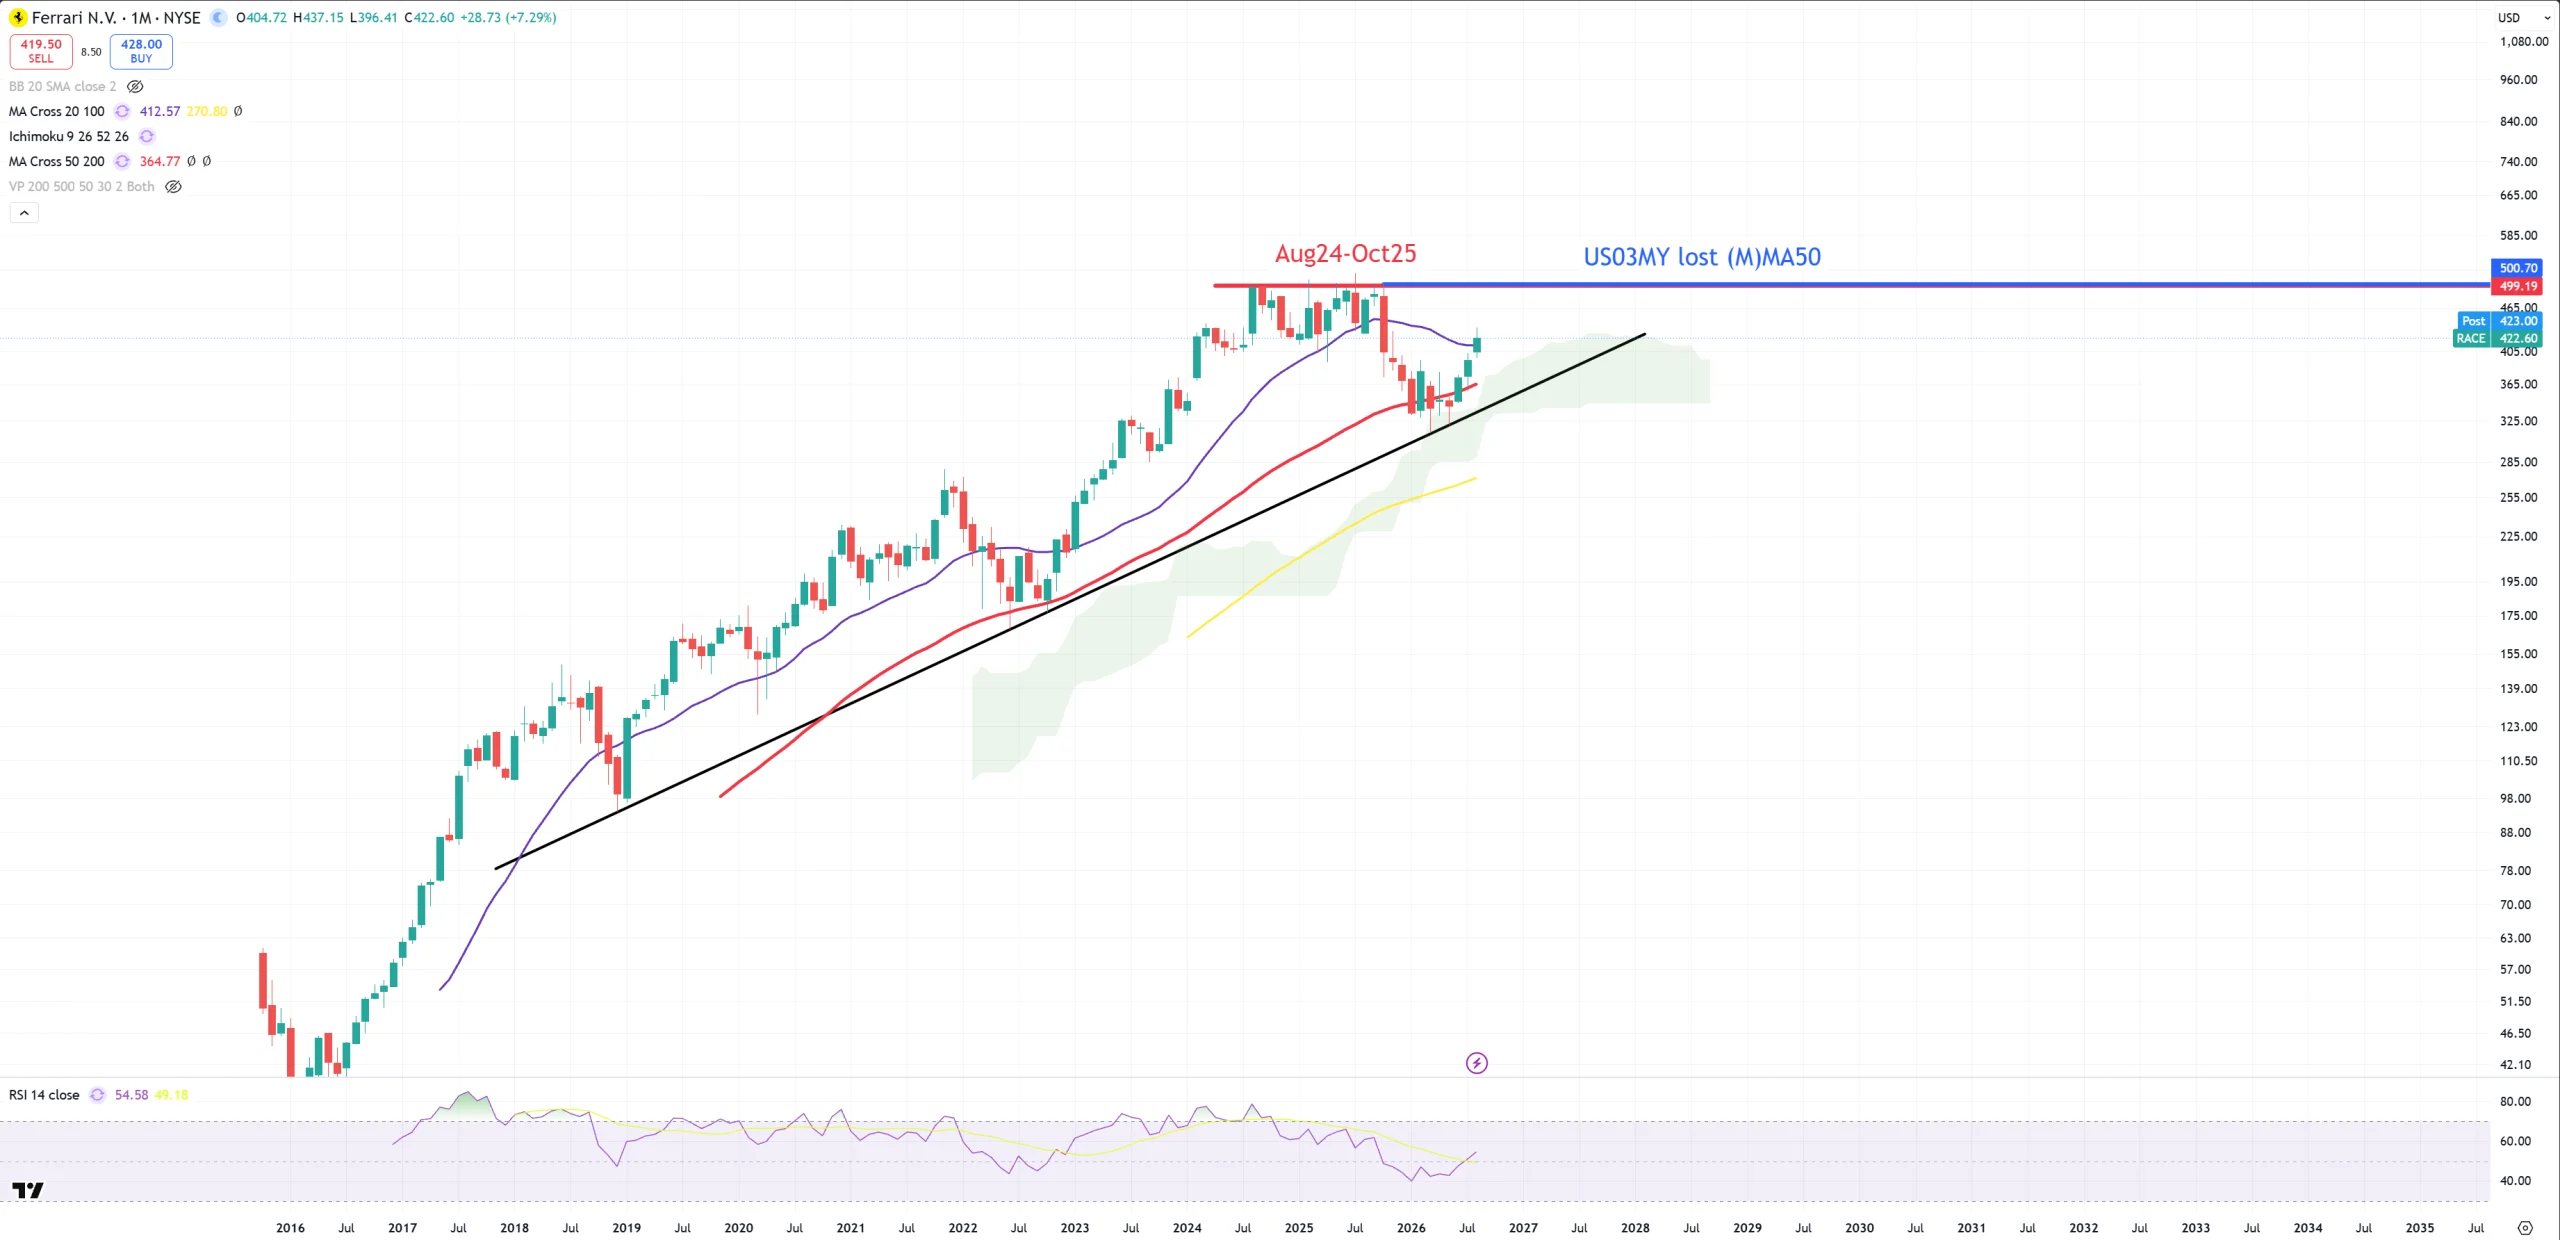
RACE – Ferrari tries to save (M)MA50 to retest (M)MA20.
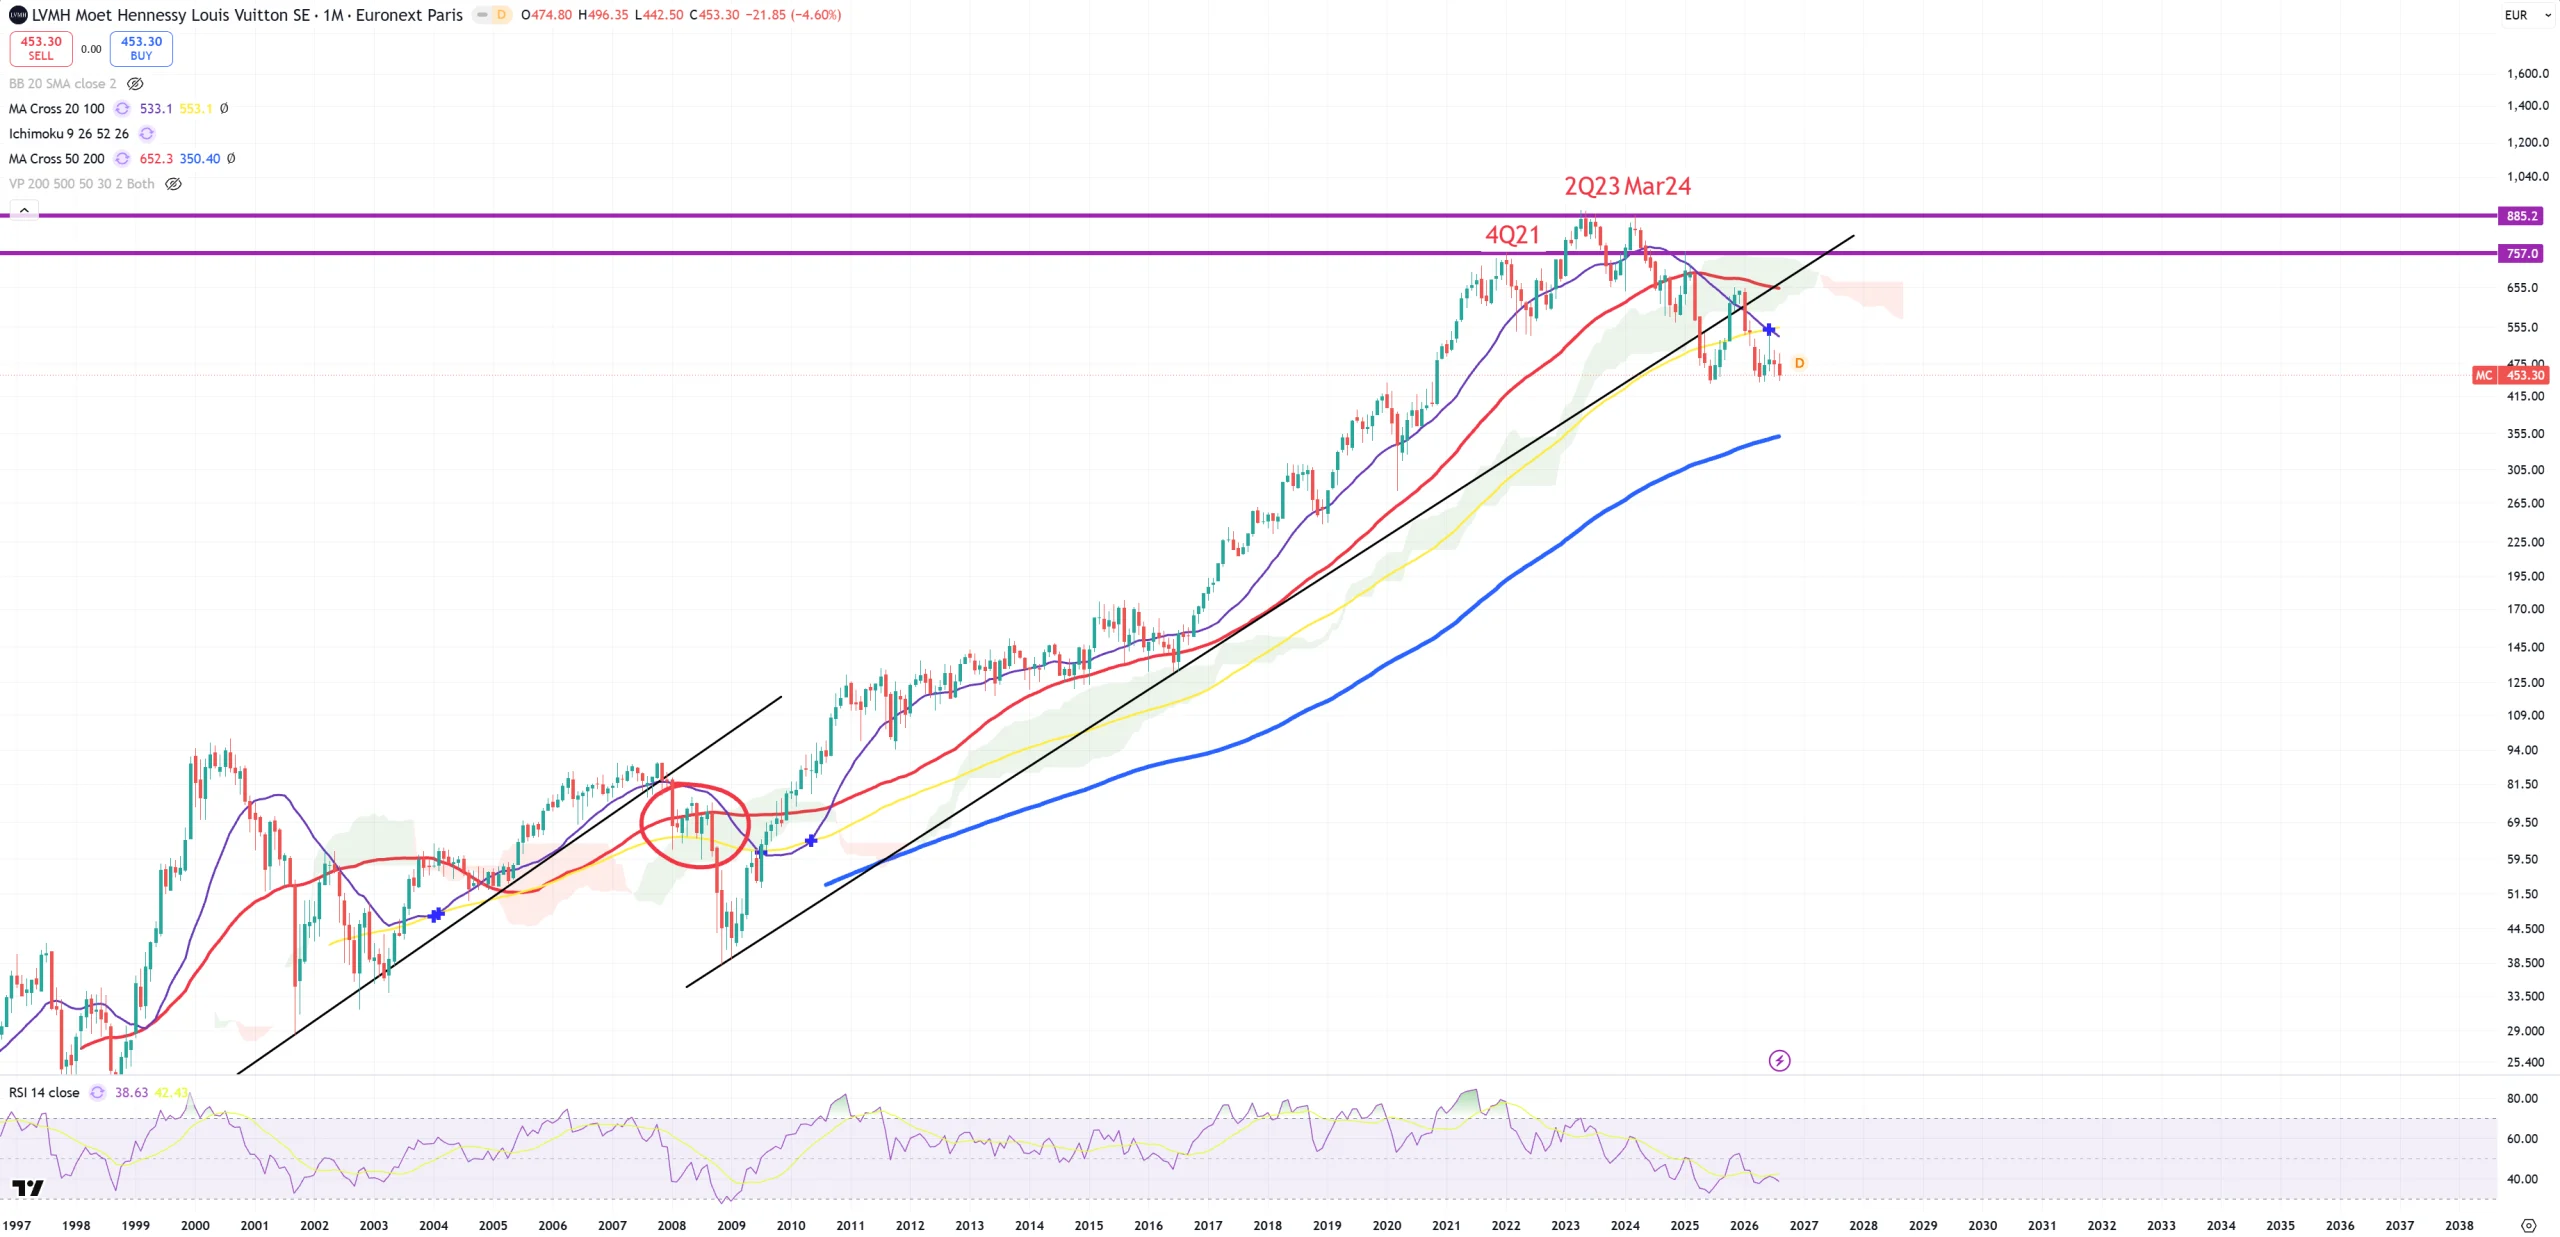
LVMH – Louis Vuitton … it’s busted.
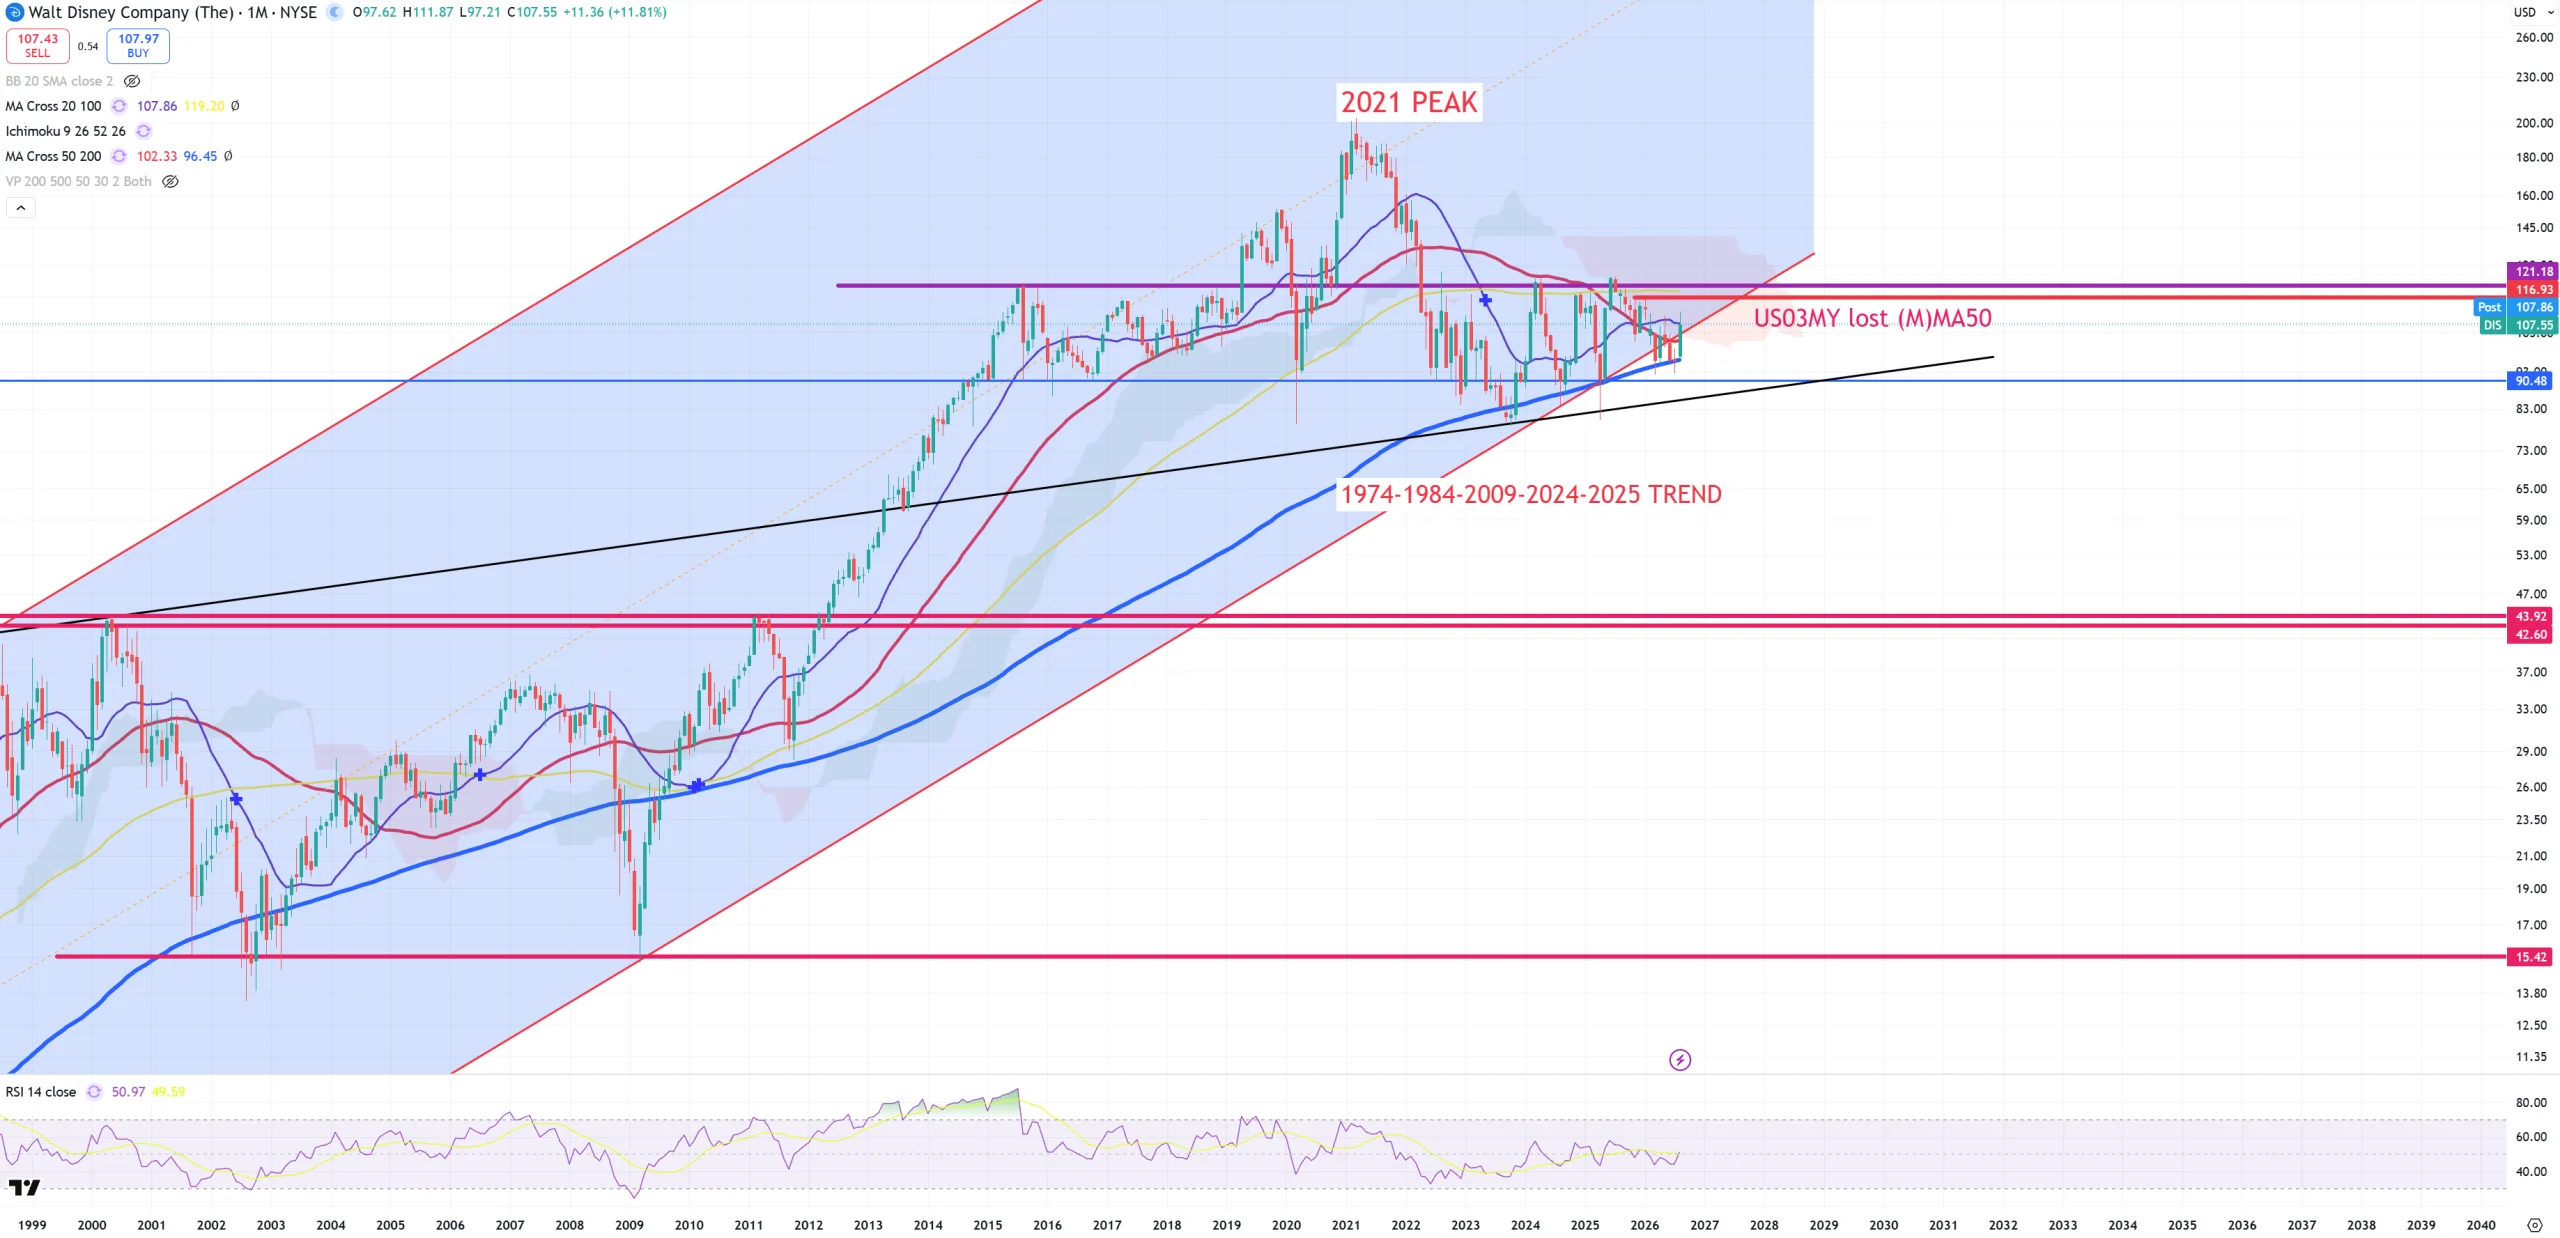
DIS – Disney and (M)MA20 rejection. Tries at any cost to stay > its 1974+ trend and blue (M)MA200. (So far it holds).
NKE – busted with 17$ target.
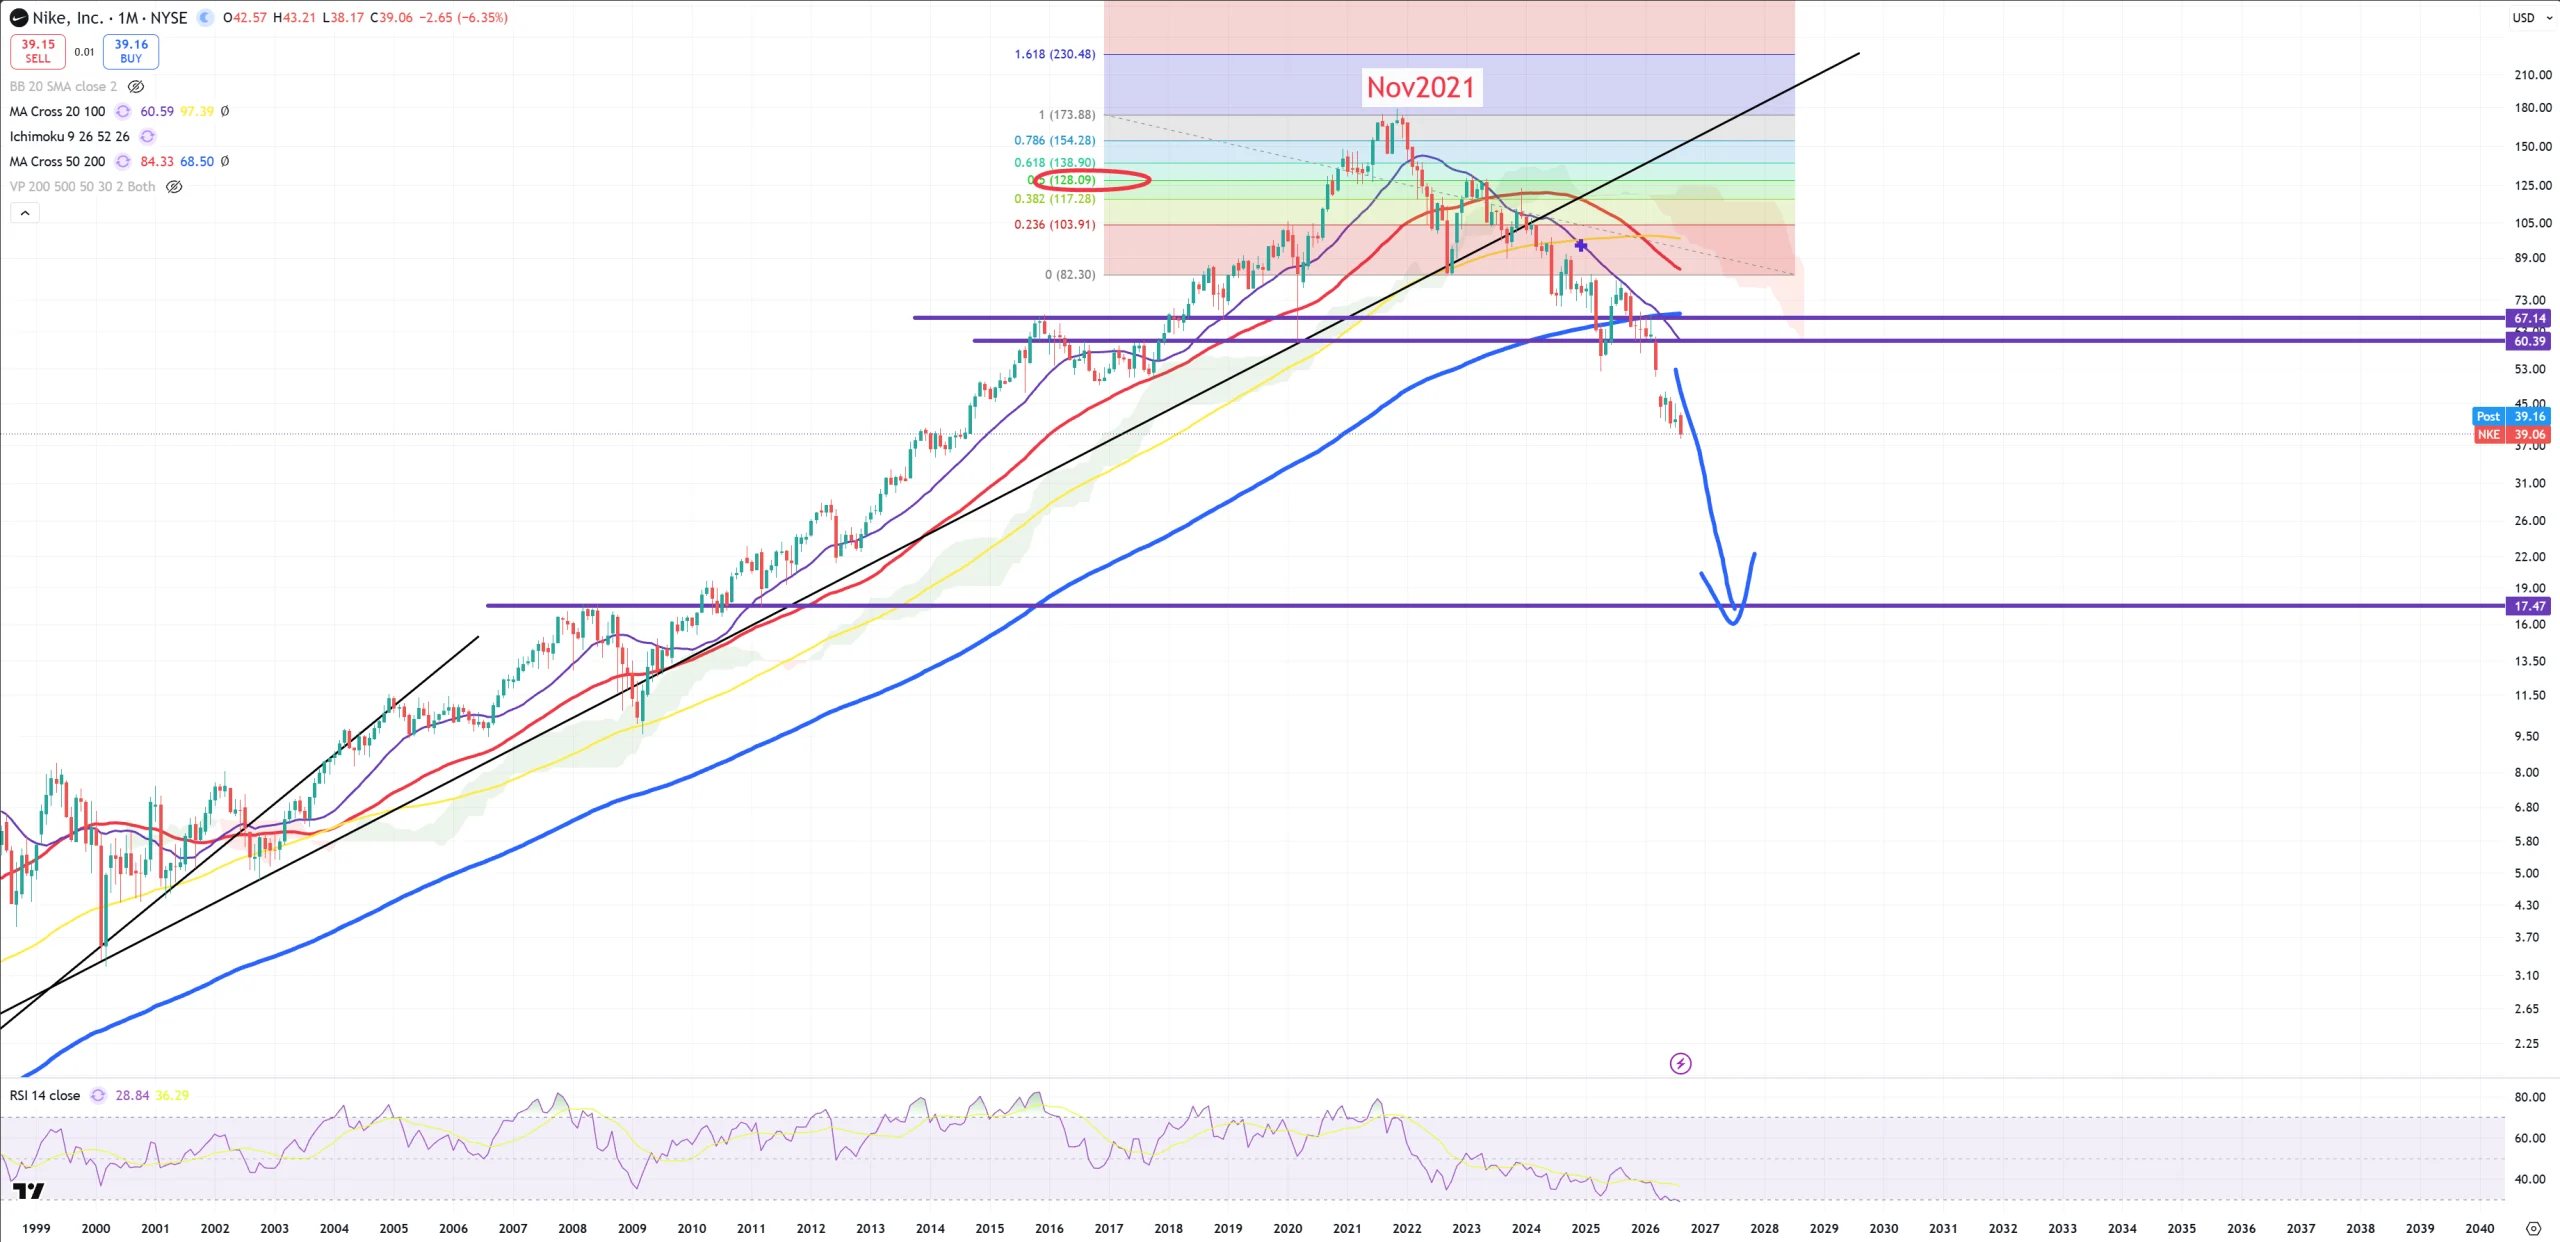
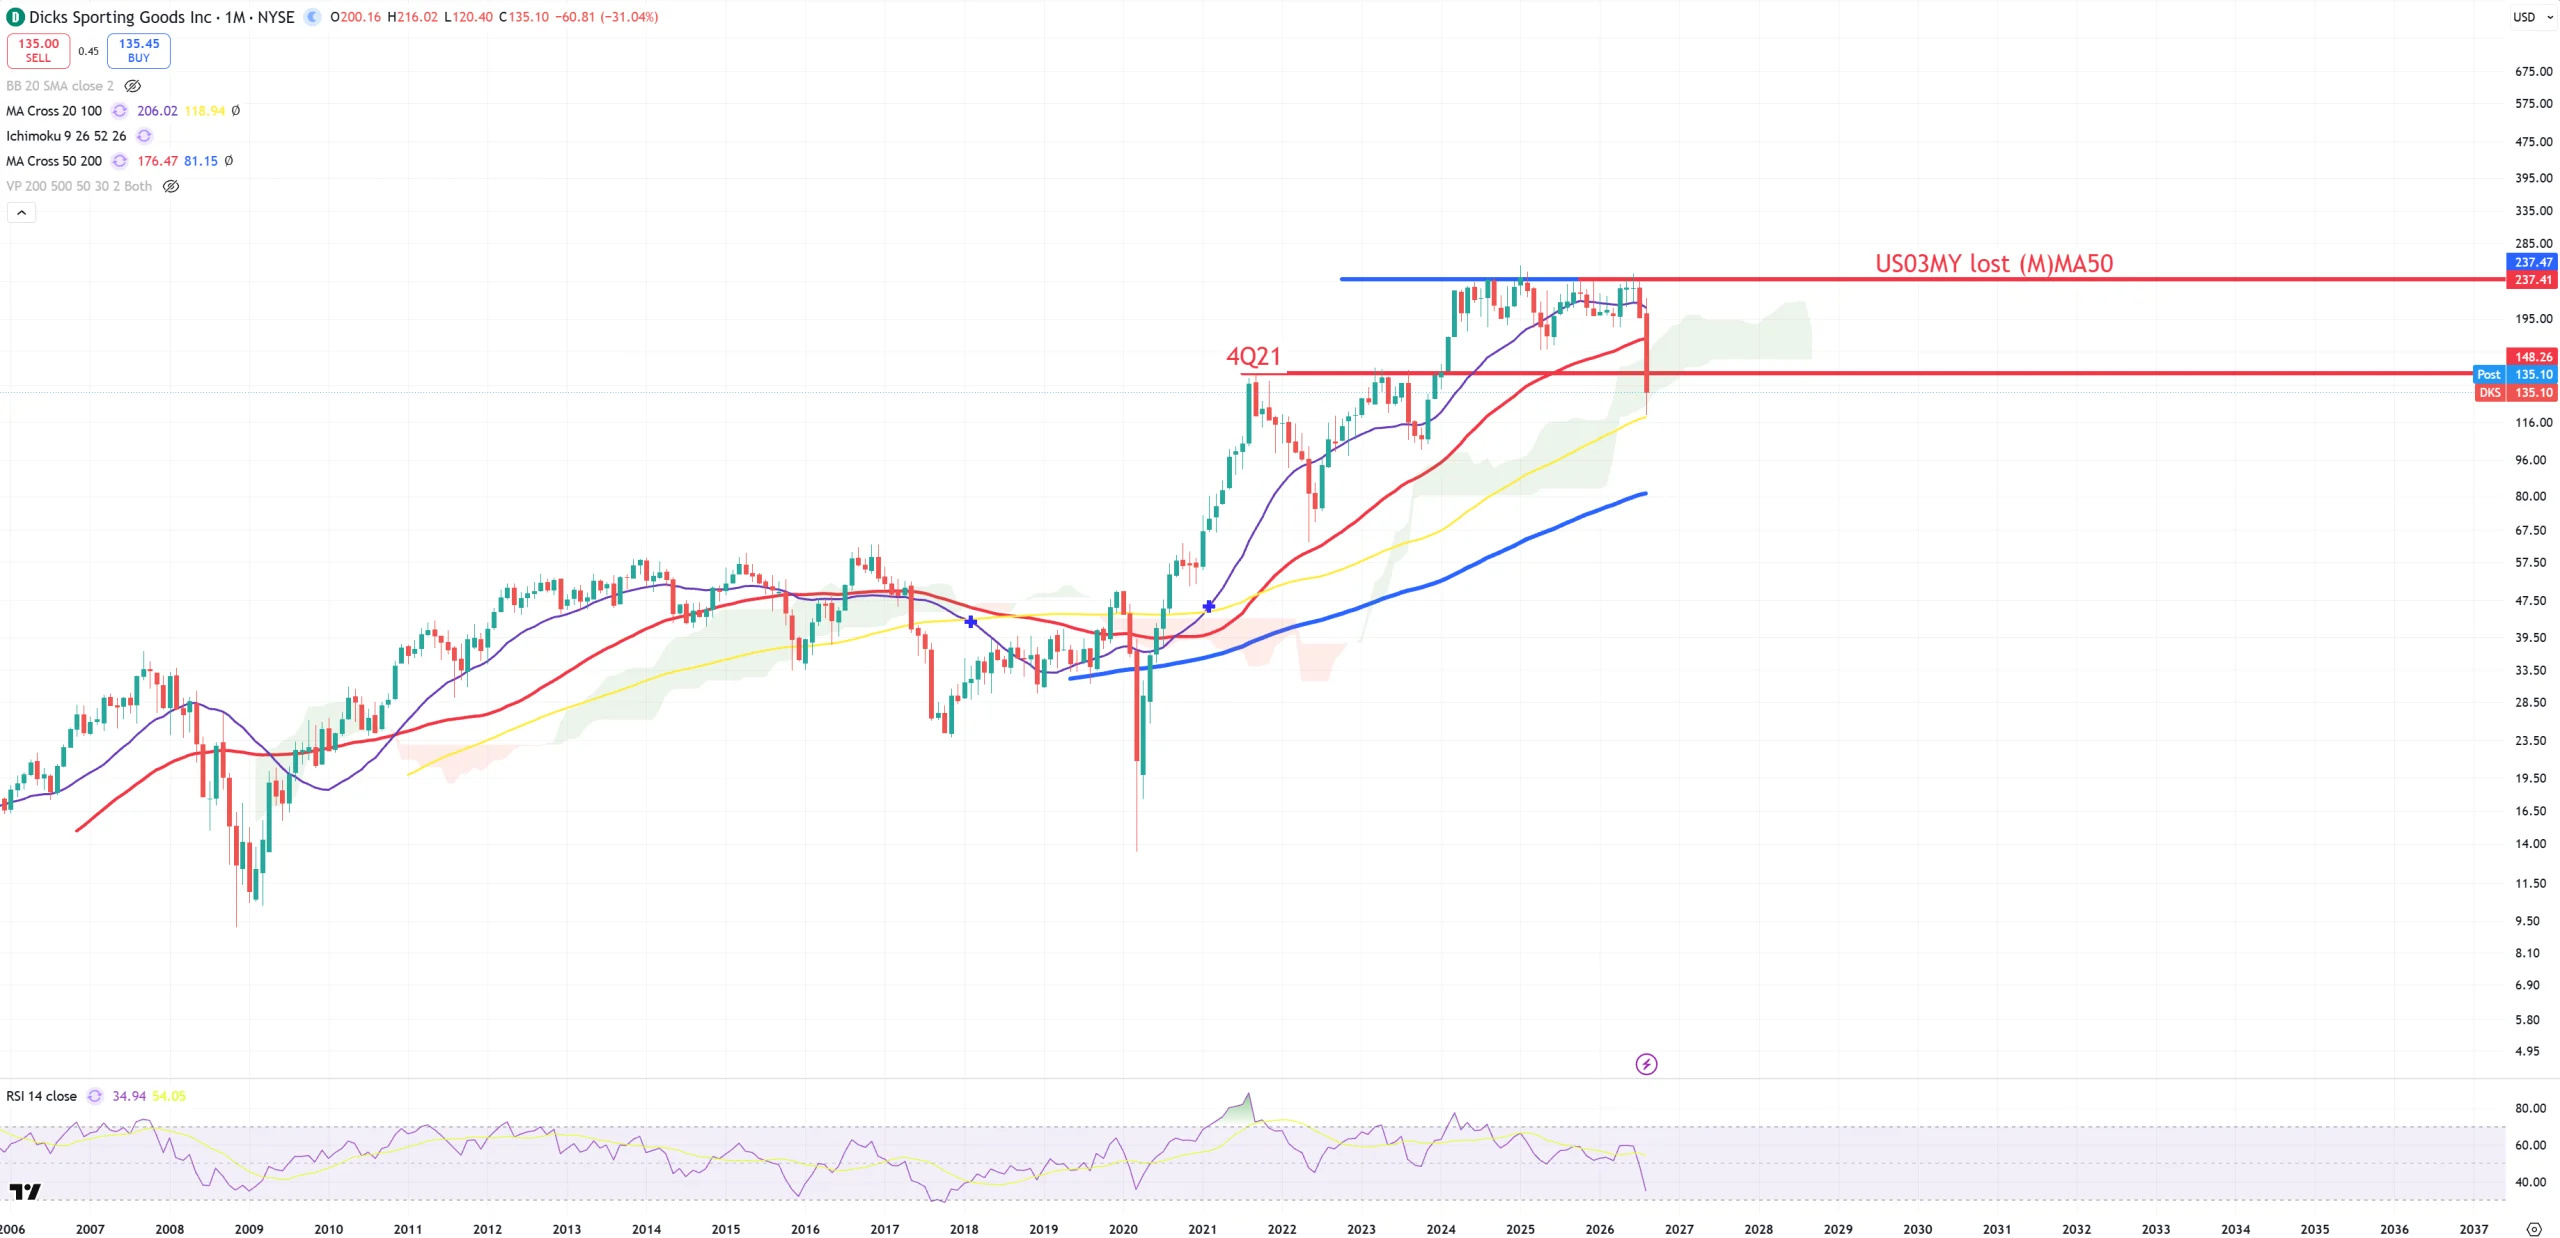
DKS – Same as Nike – big distribution and crash below 4Q21.
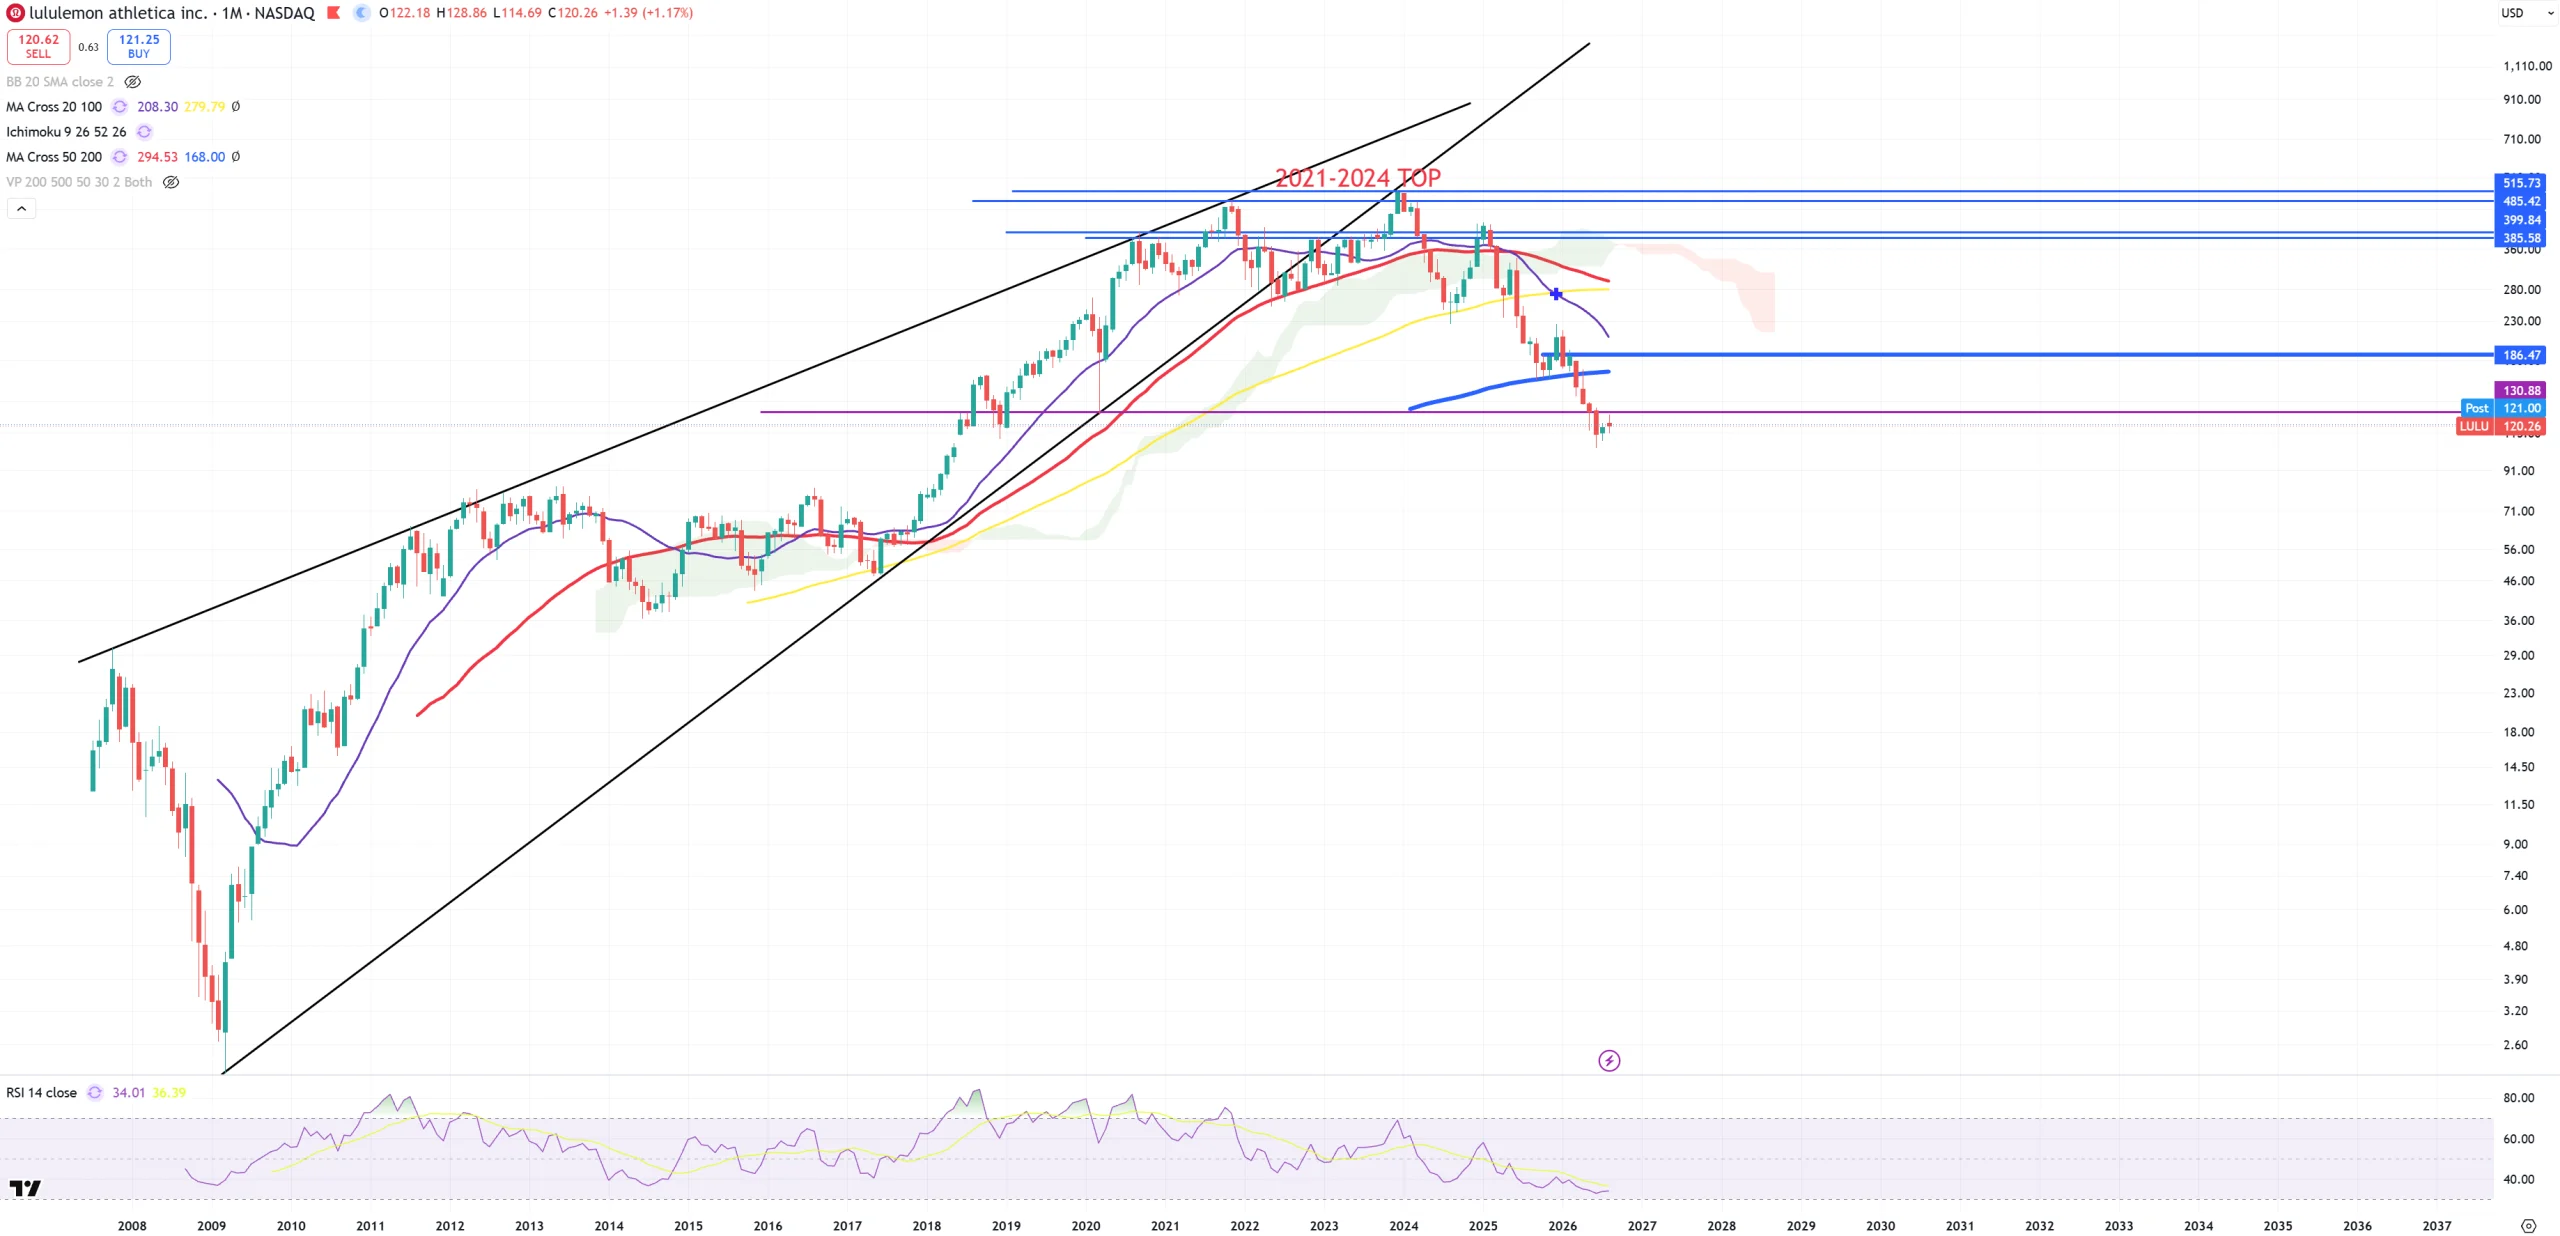
LULU – Like NKE and DKS – it’s busted.
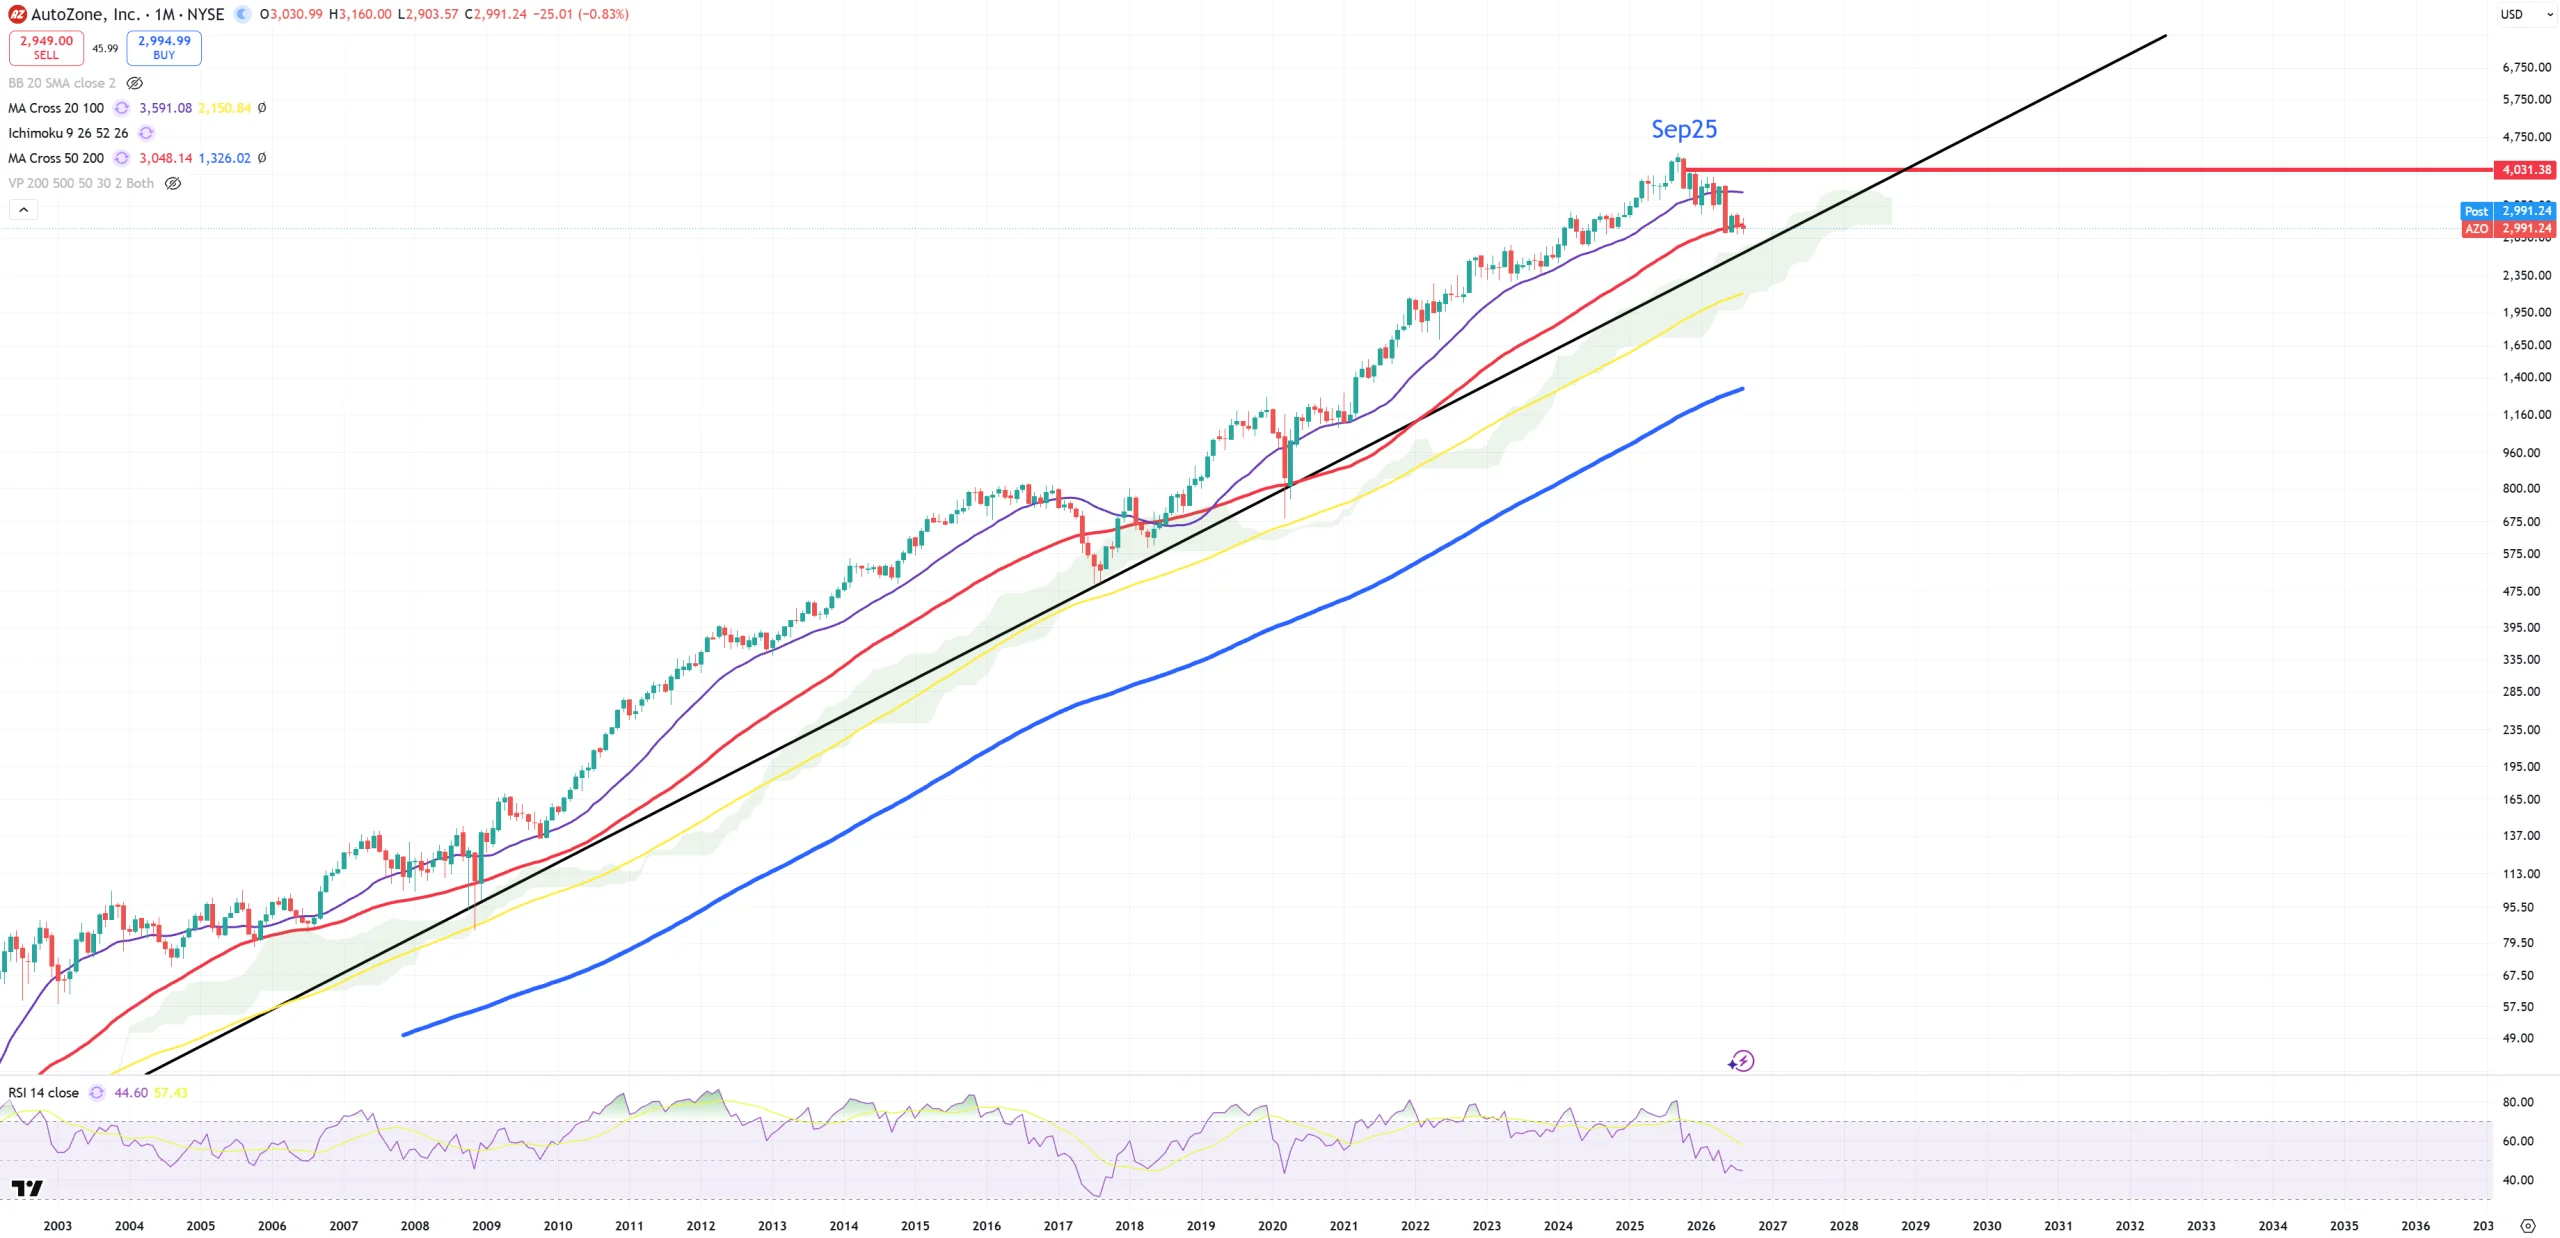
AZO – AutoZone managed to break below (M)MA50
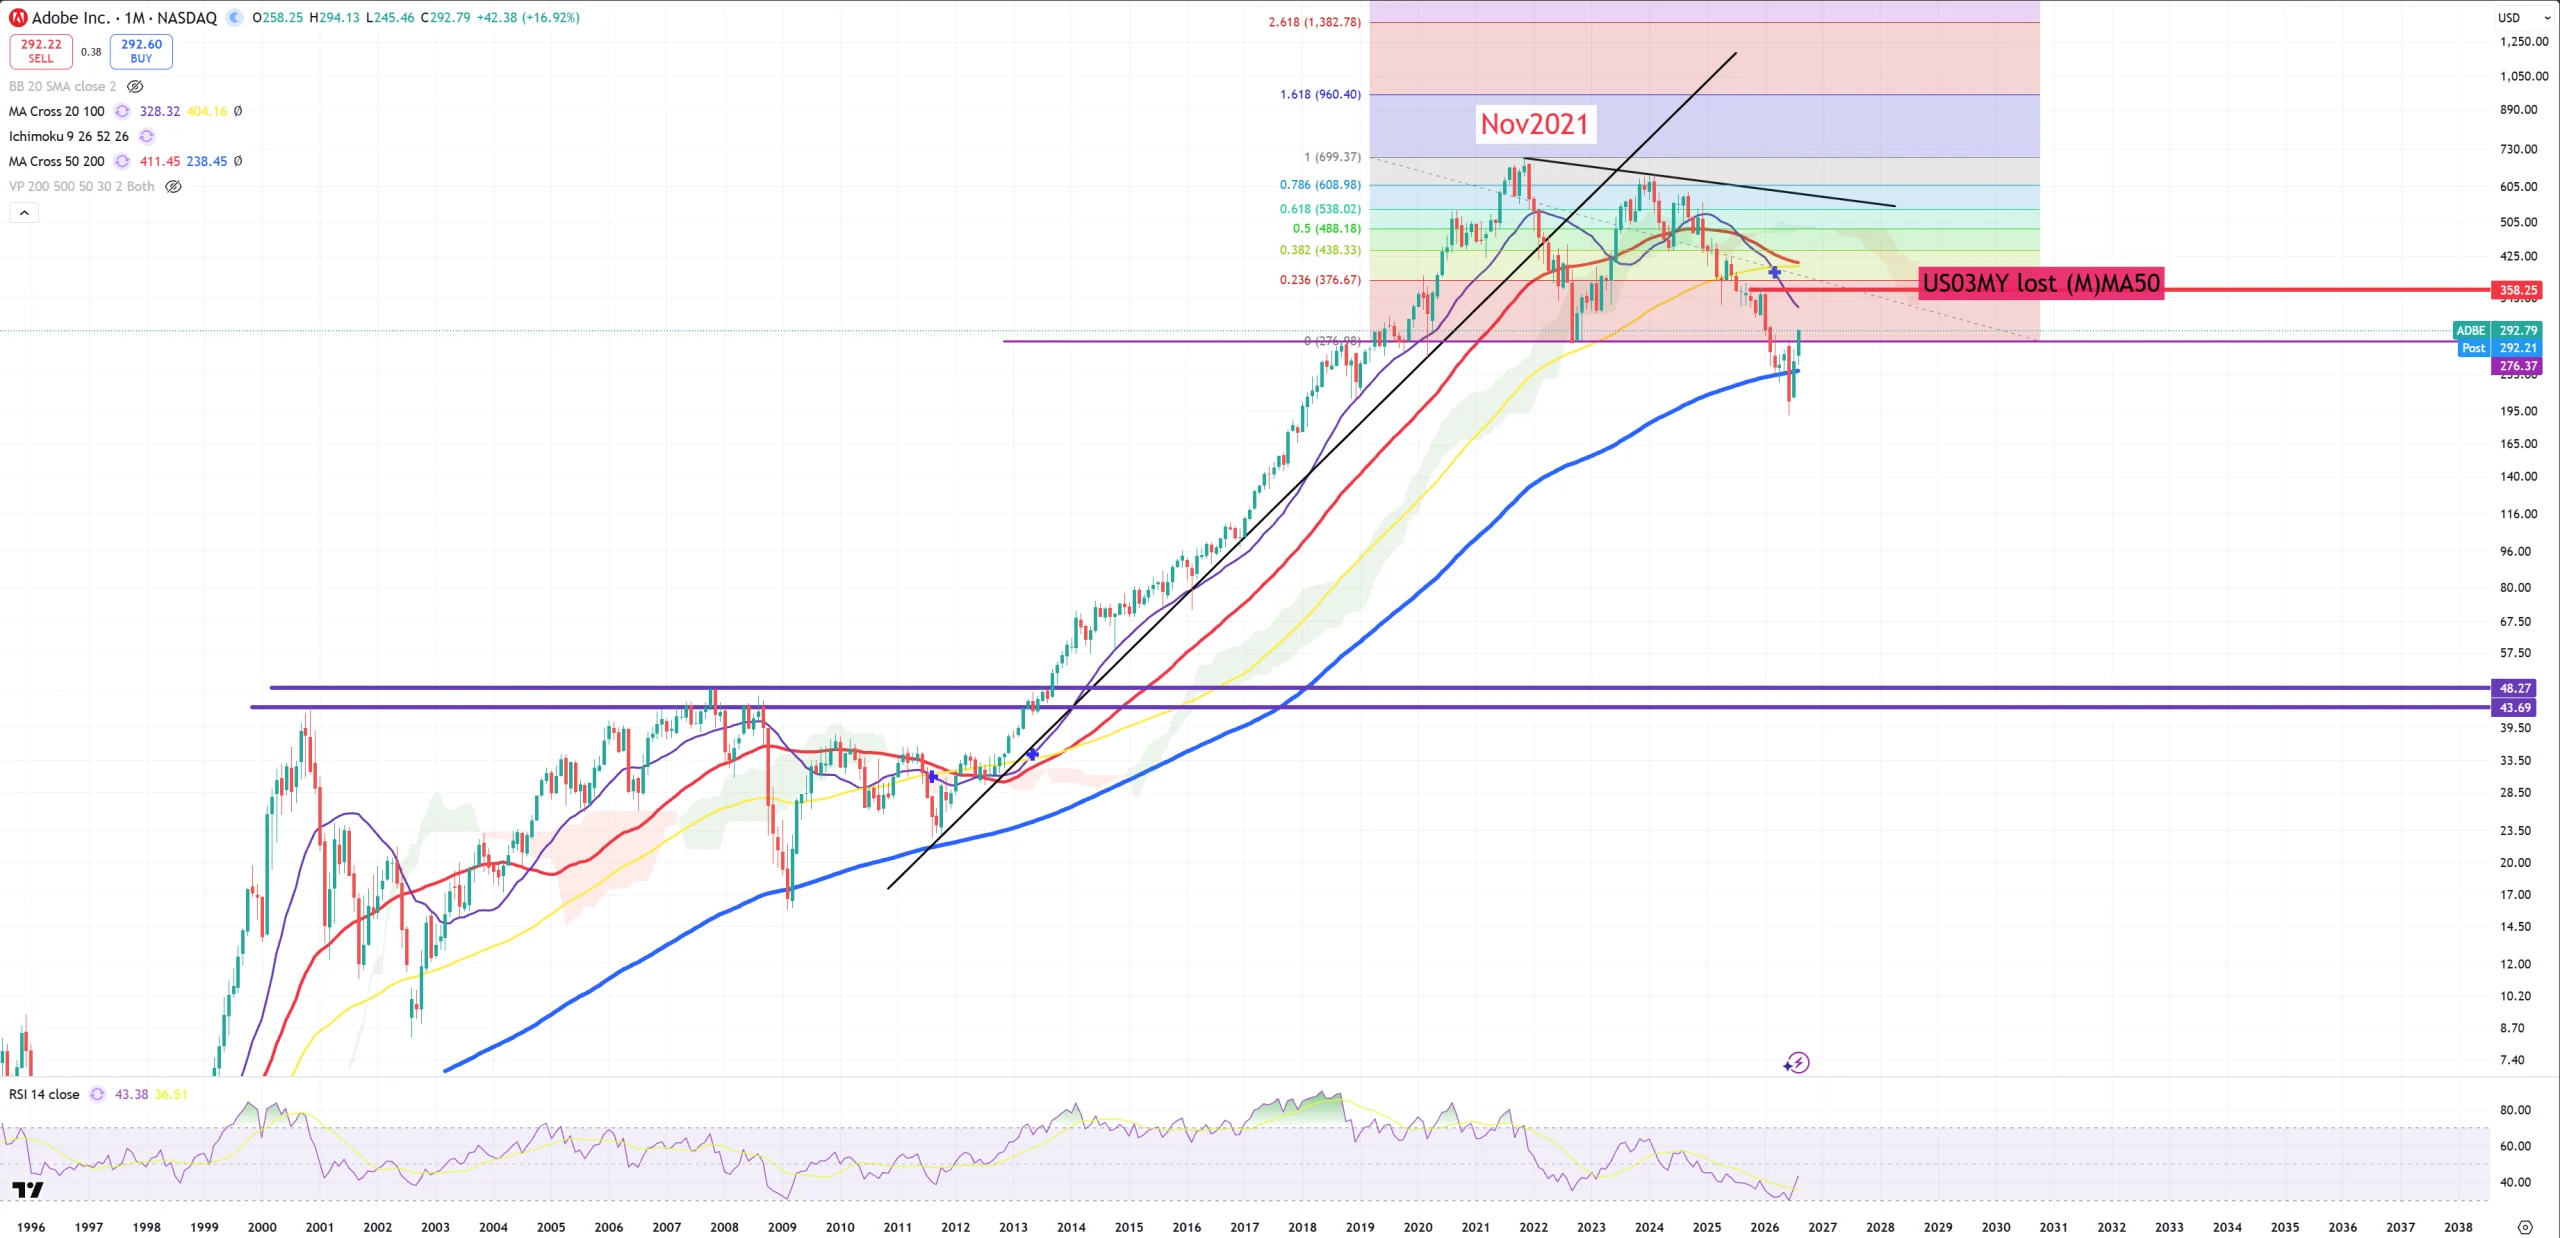
ADBE – Adobe – as expected there’ll be a dance on blue (M)MA200
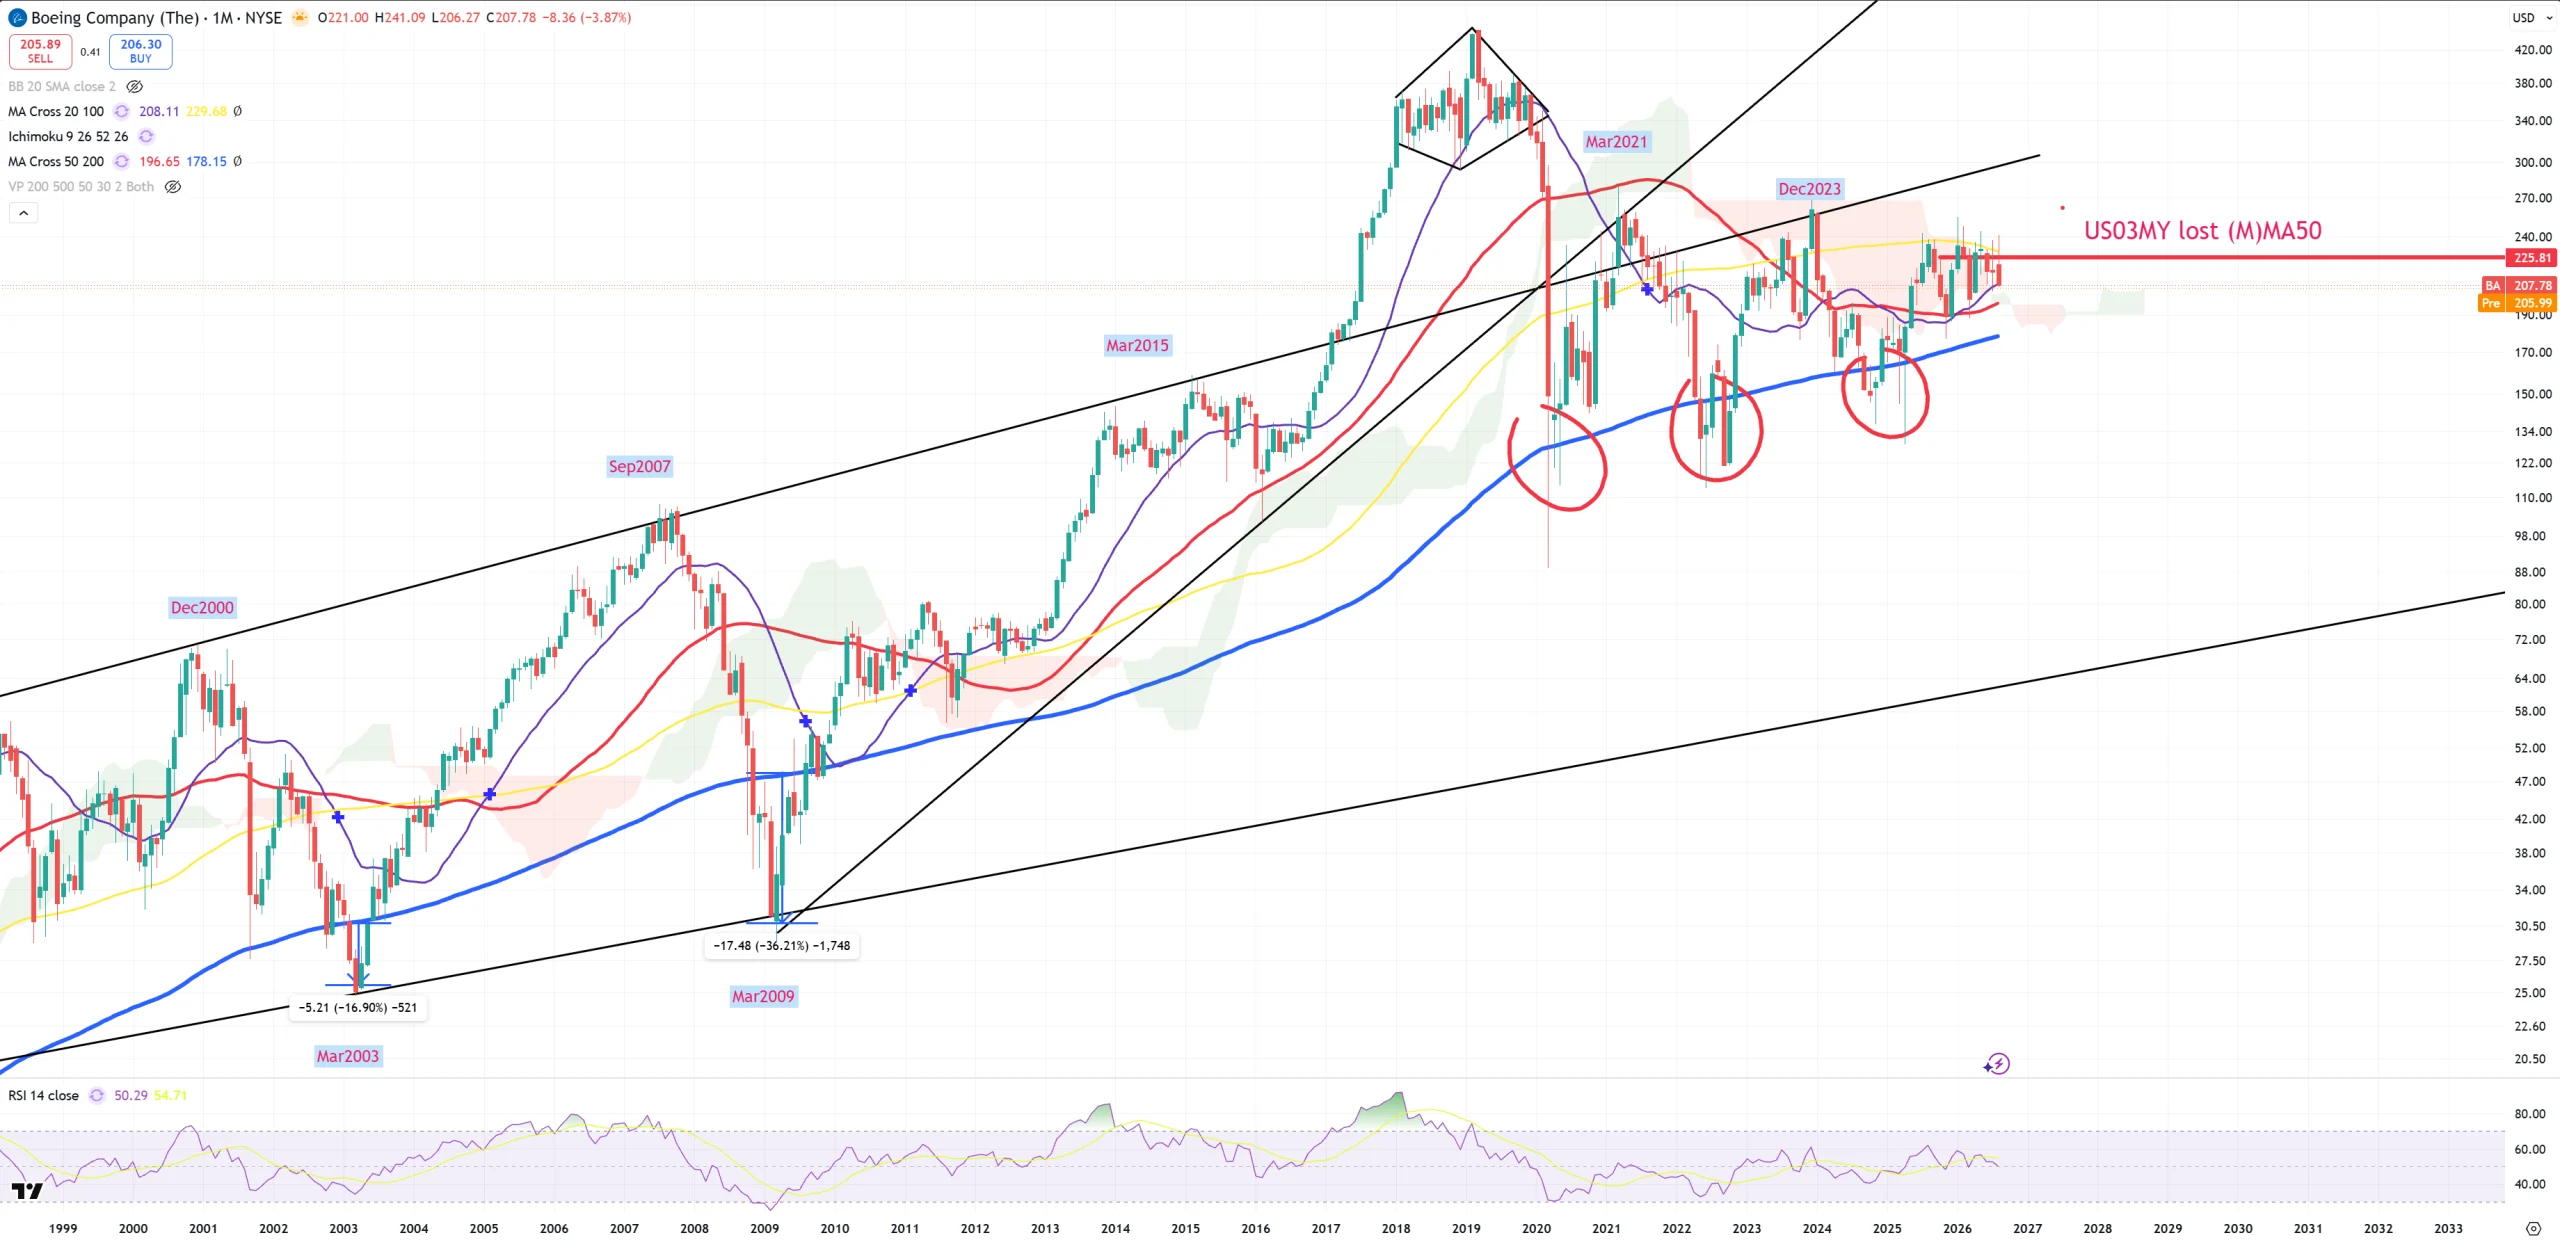
BA – Boeing – I love this chart so much – we had 3 lives in this cycle. #4 soon will be tested (blue (M)MA200 break). Once (M)MA200 breaks it’ll go to 60$.
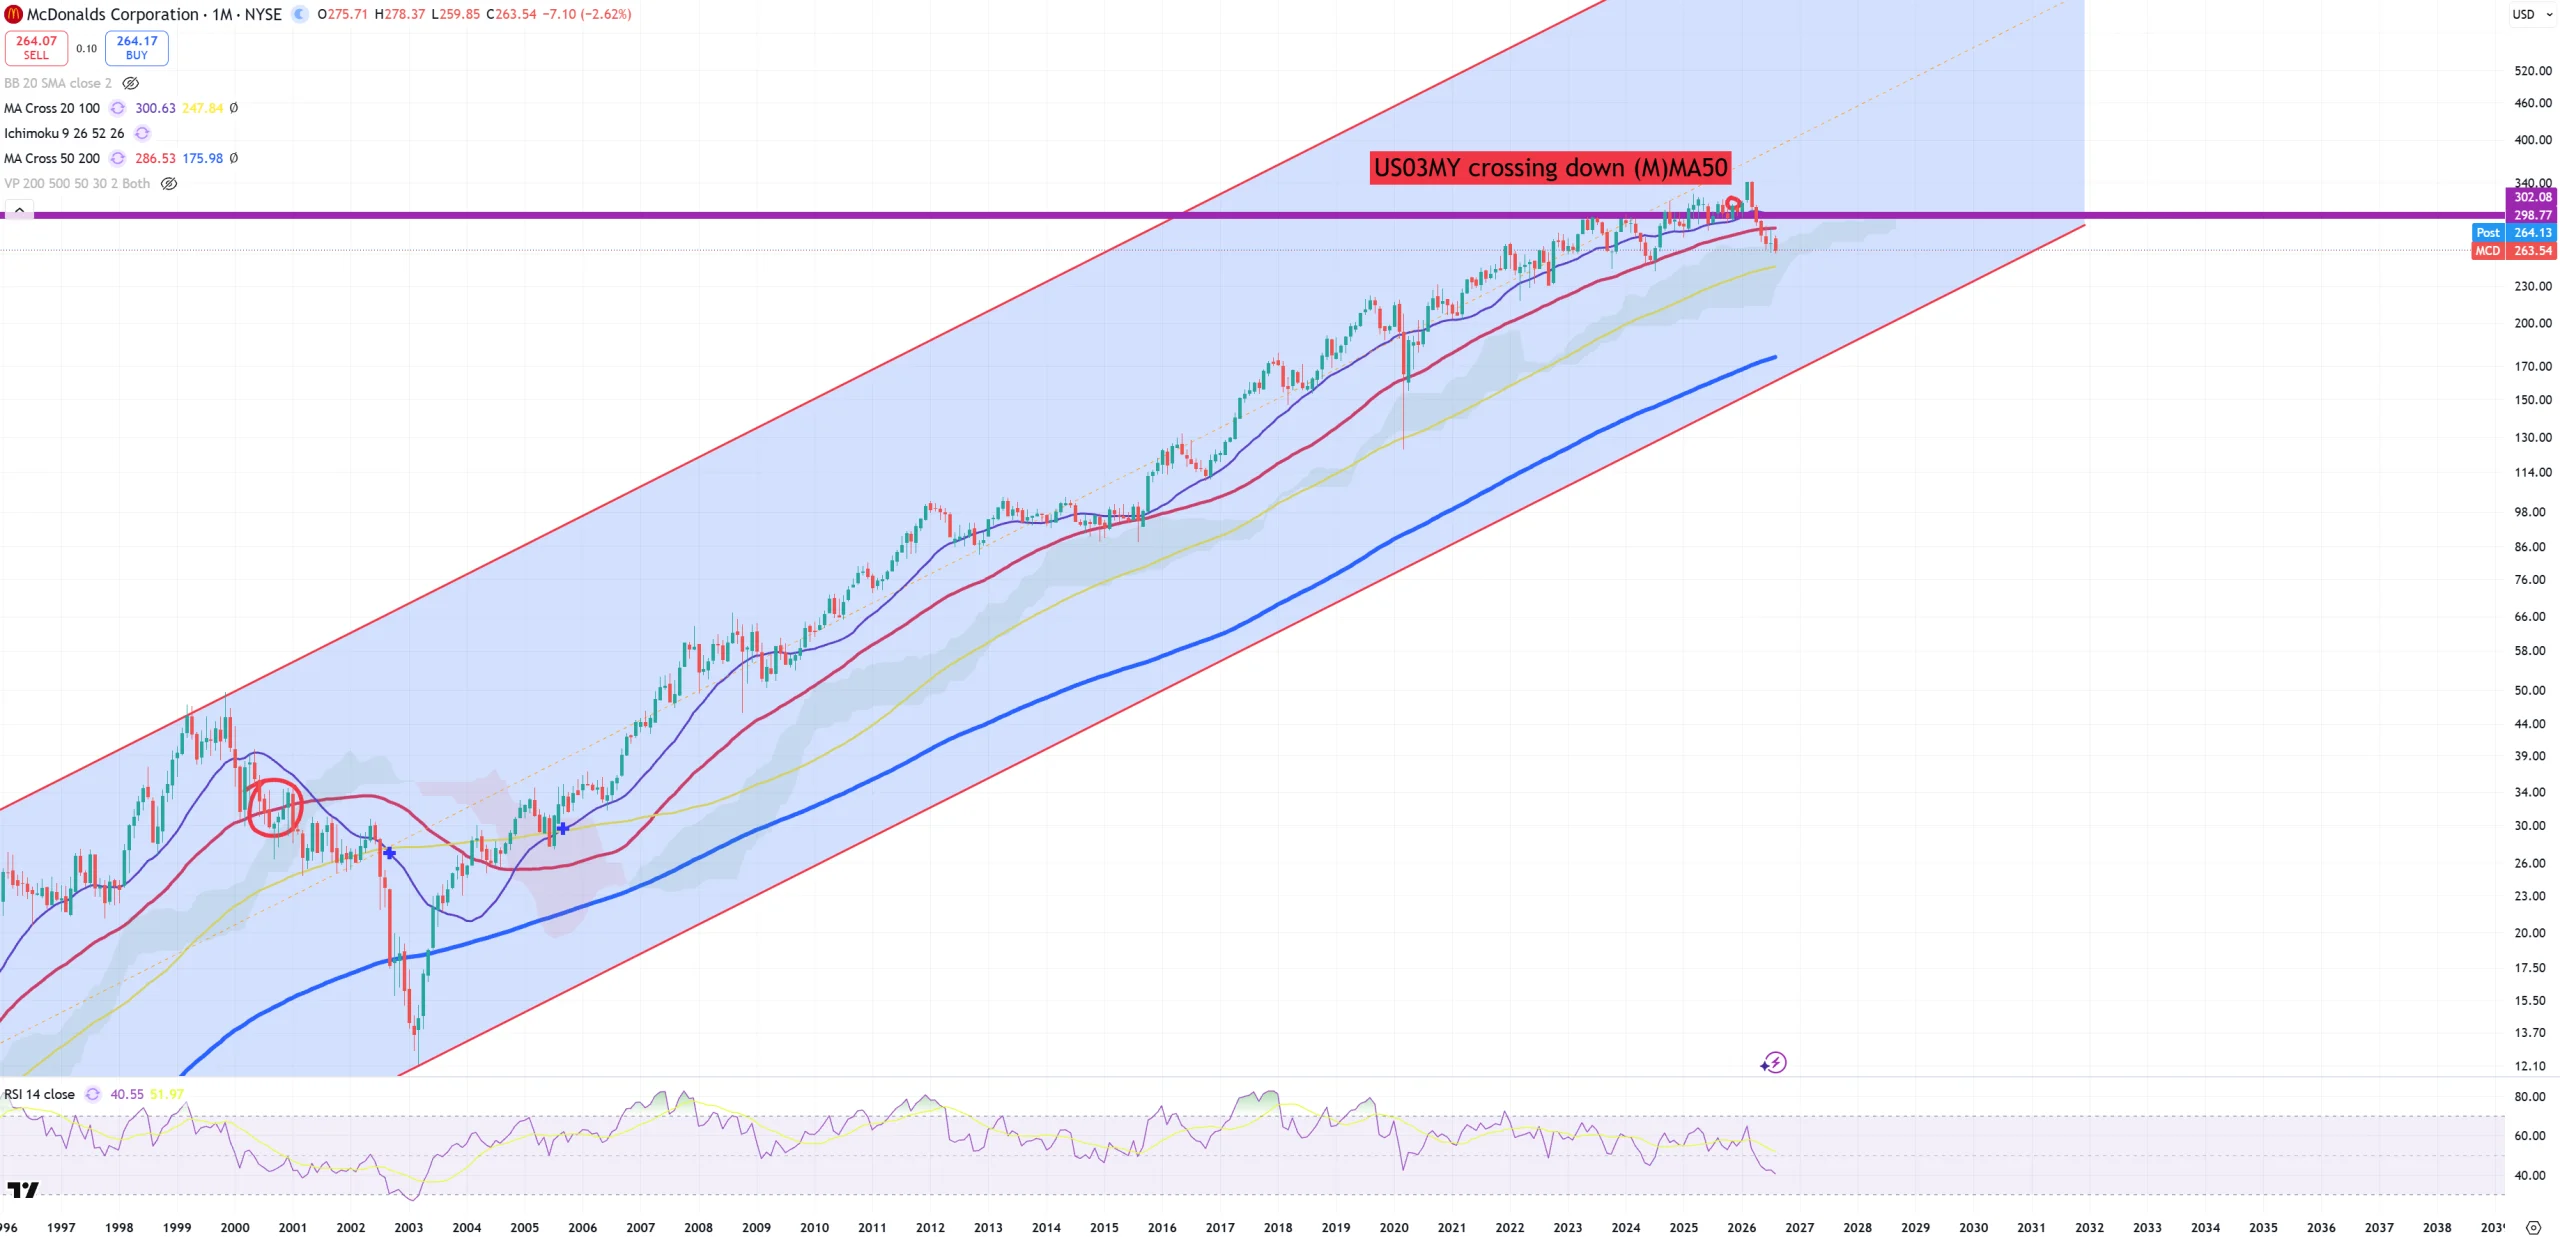
MCD – Long term consolidation and break of (M)MA50 – previously during dotcom bubble collapse.
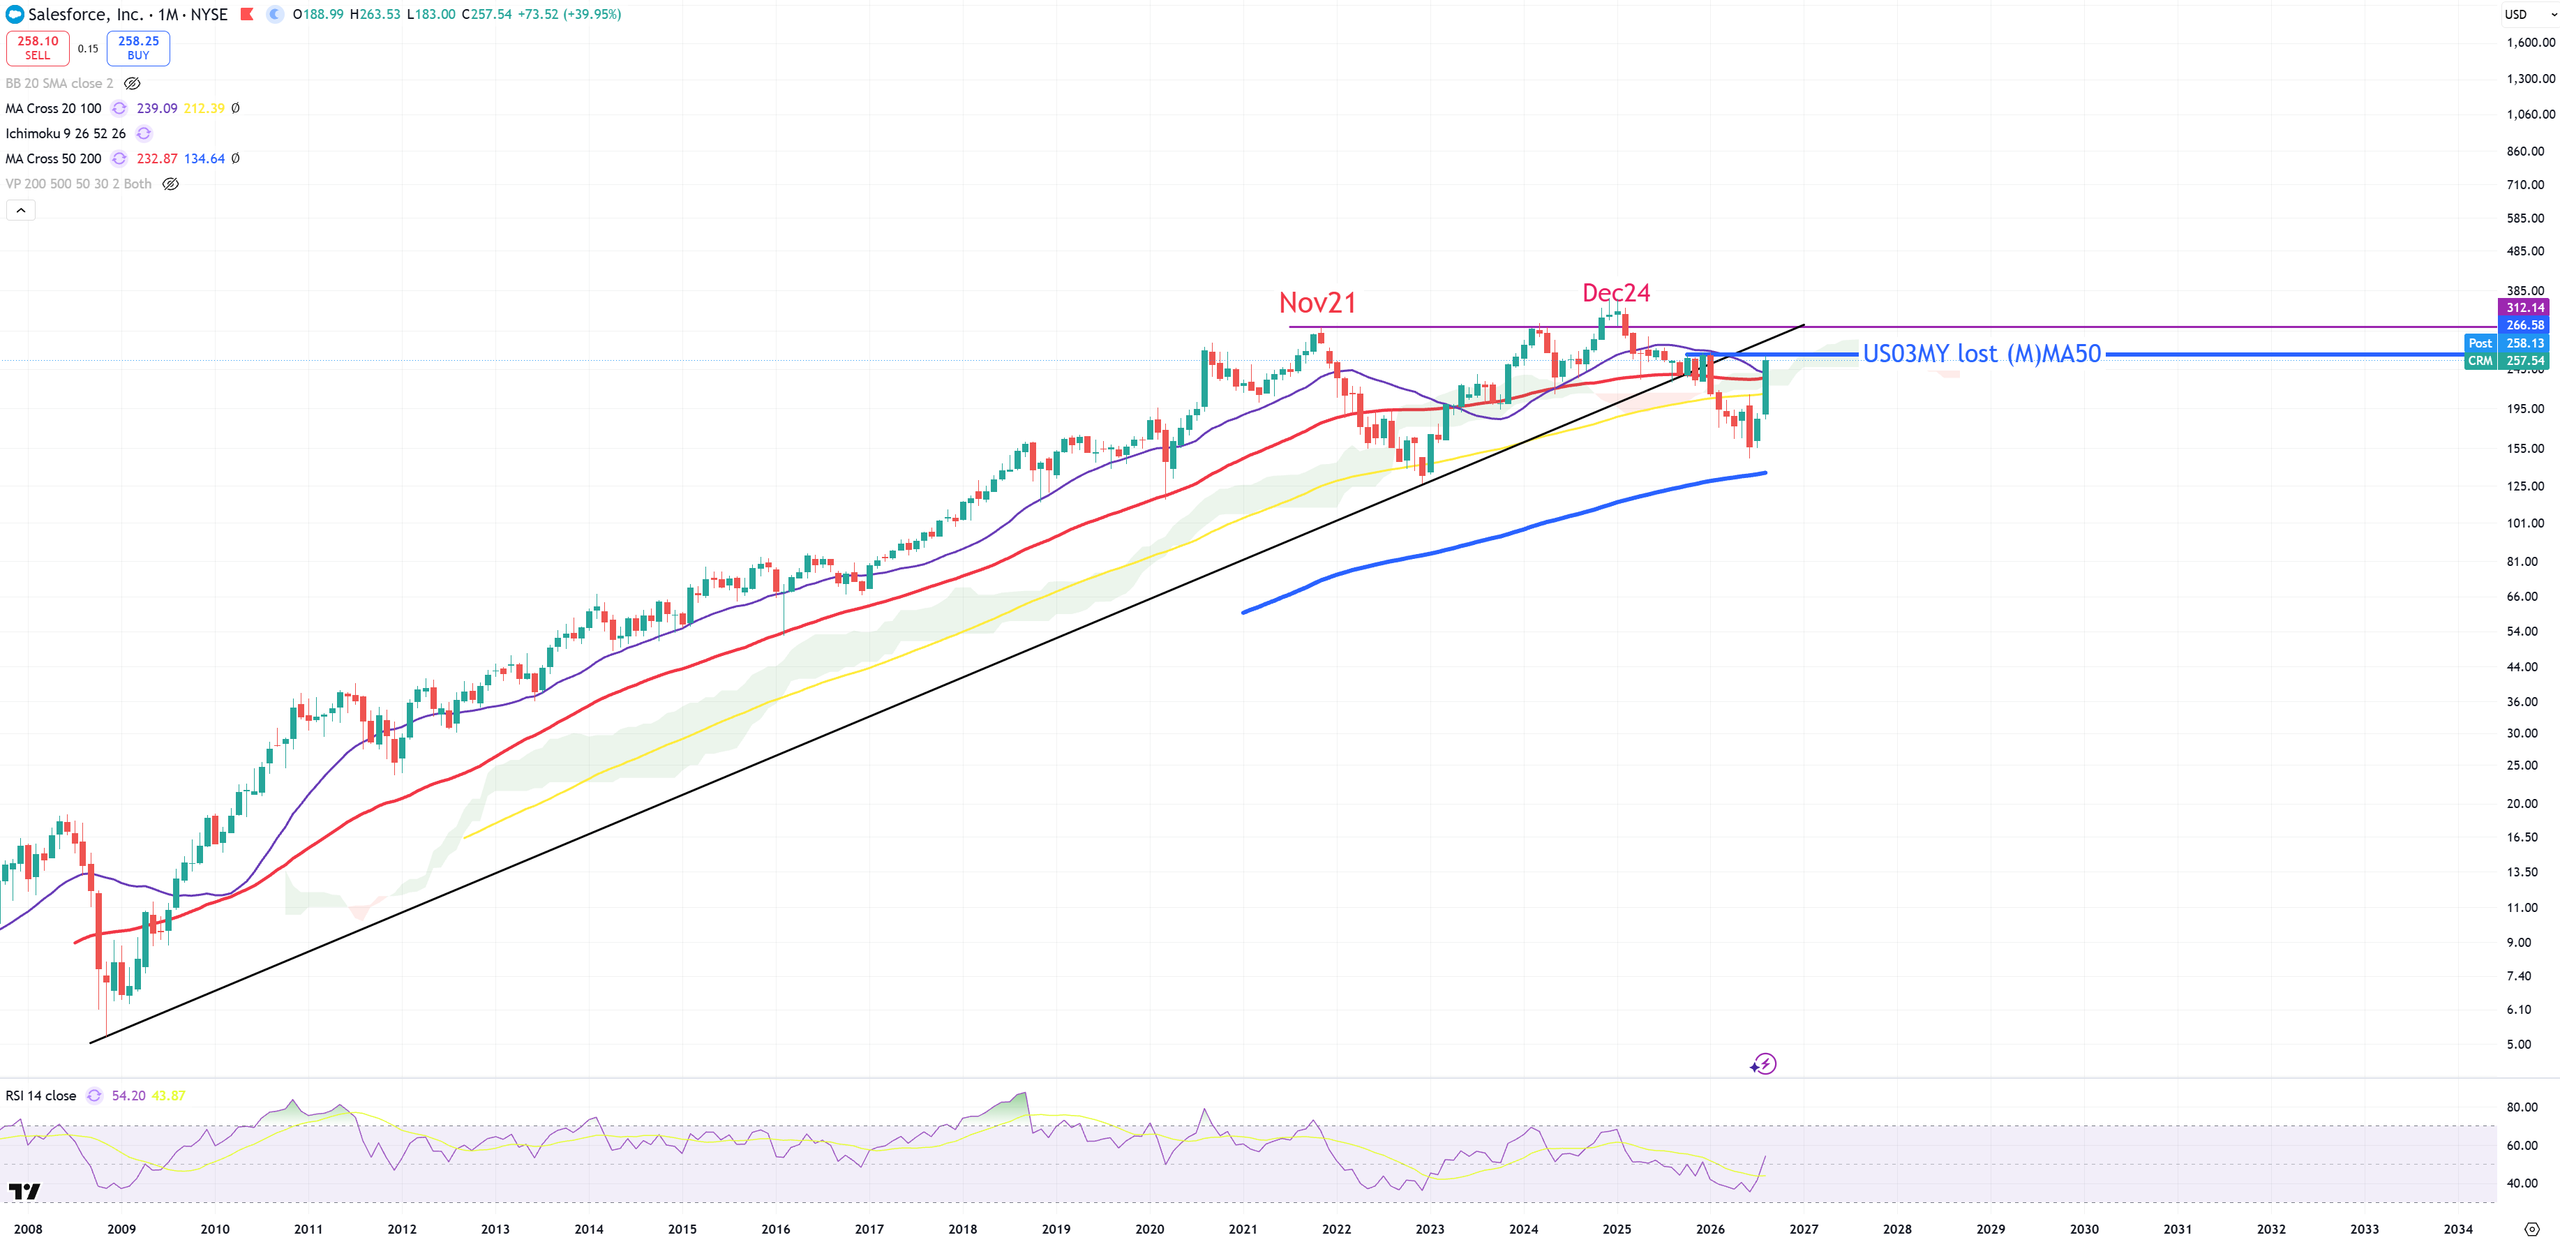
CRM – like Sandisk – hit -60% and bounce. Bounce till nowhere. Above key (M)MAs below broken trend. September will give us an answer as 3M candles will close.
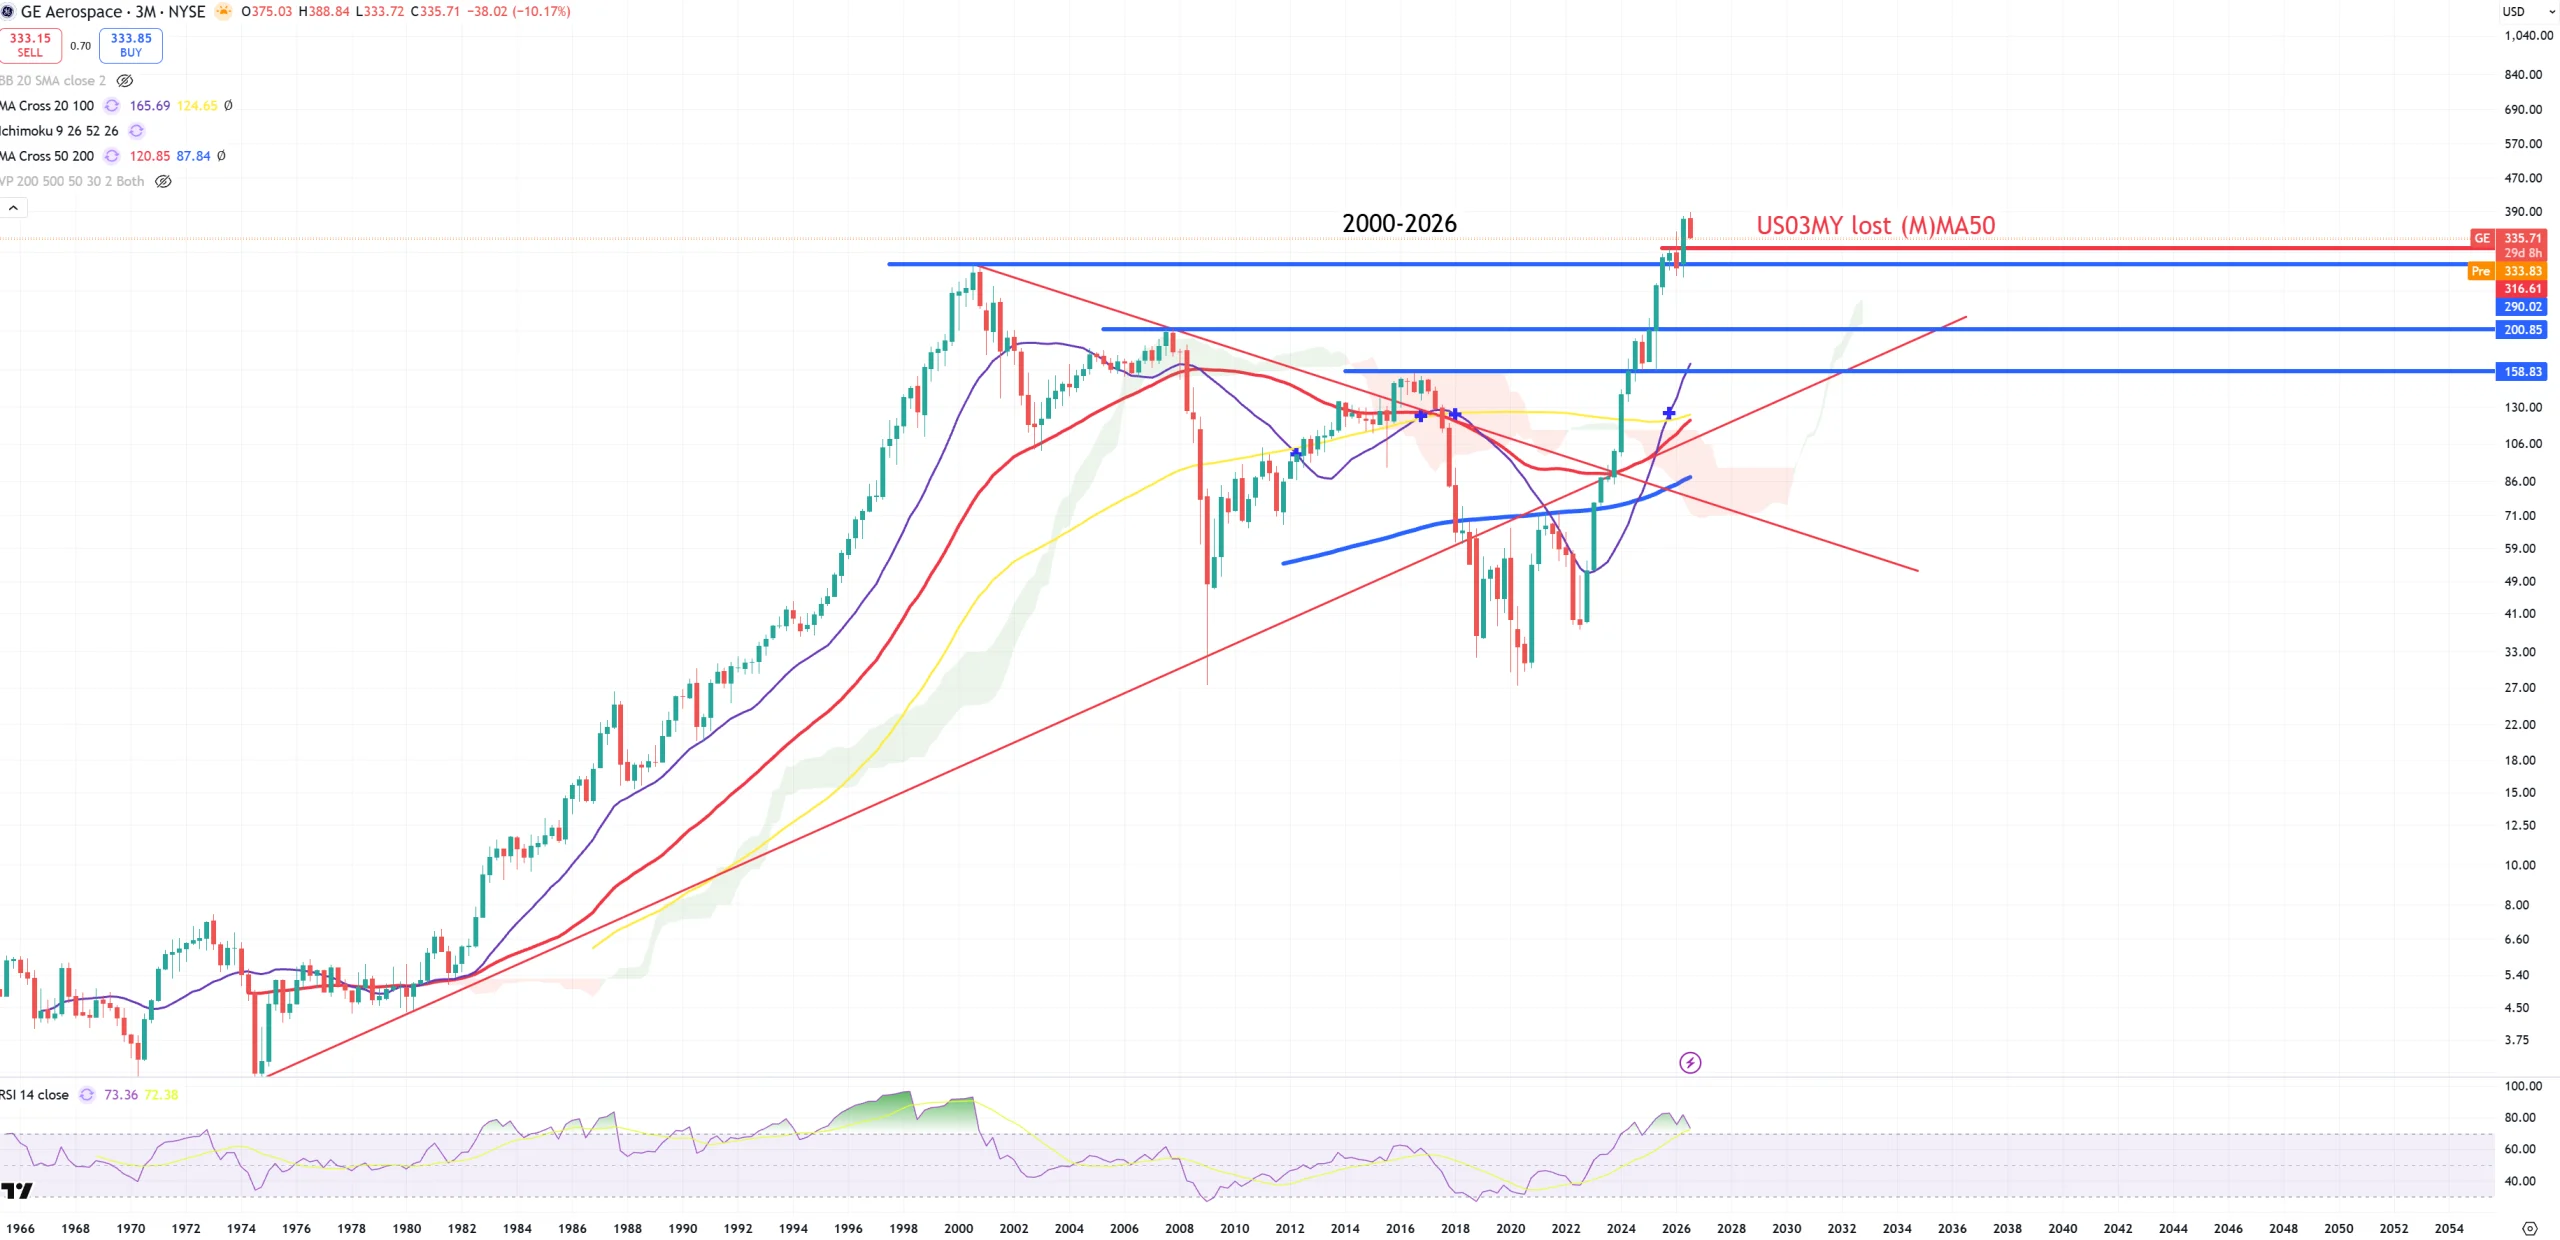
GE – I don’t believe this break
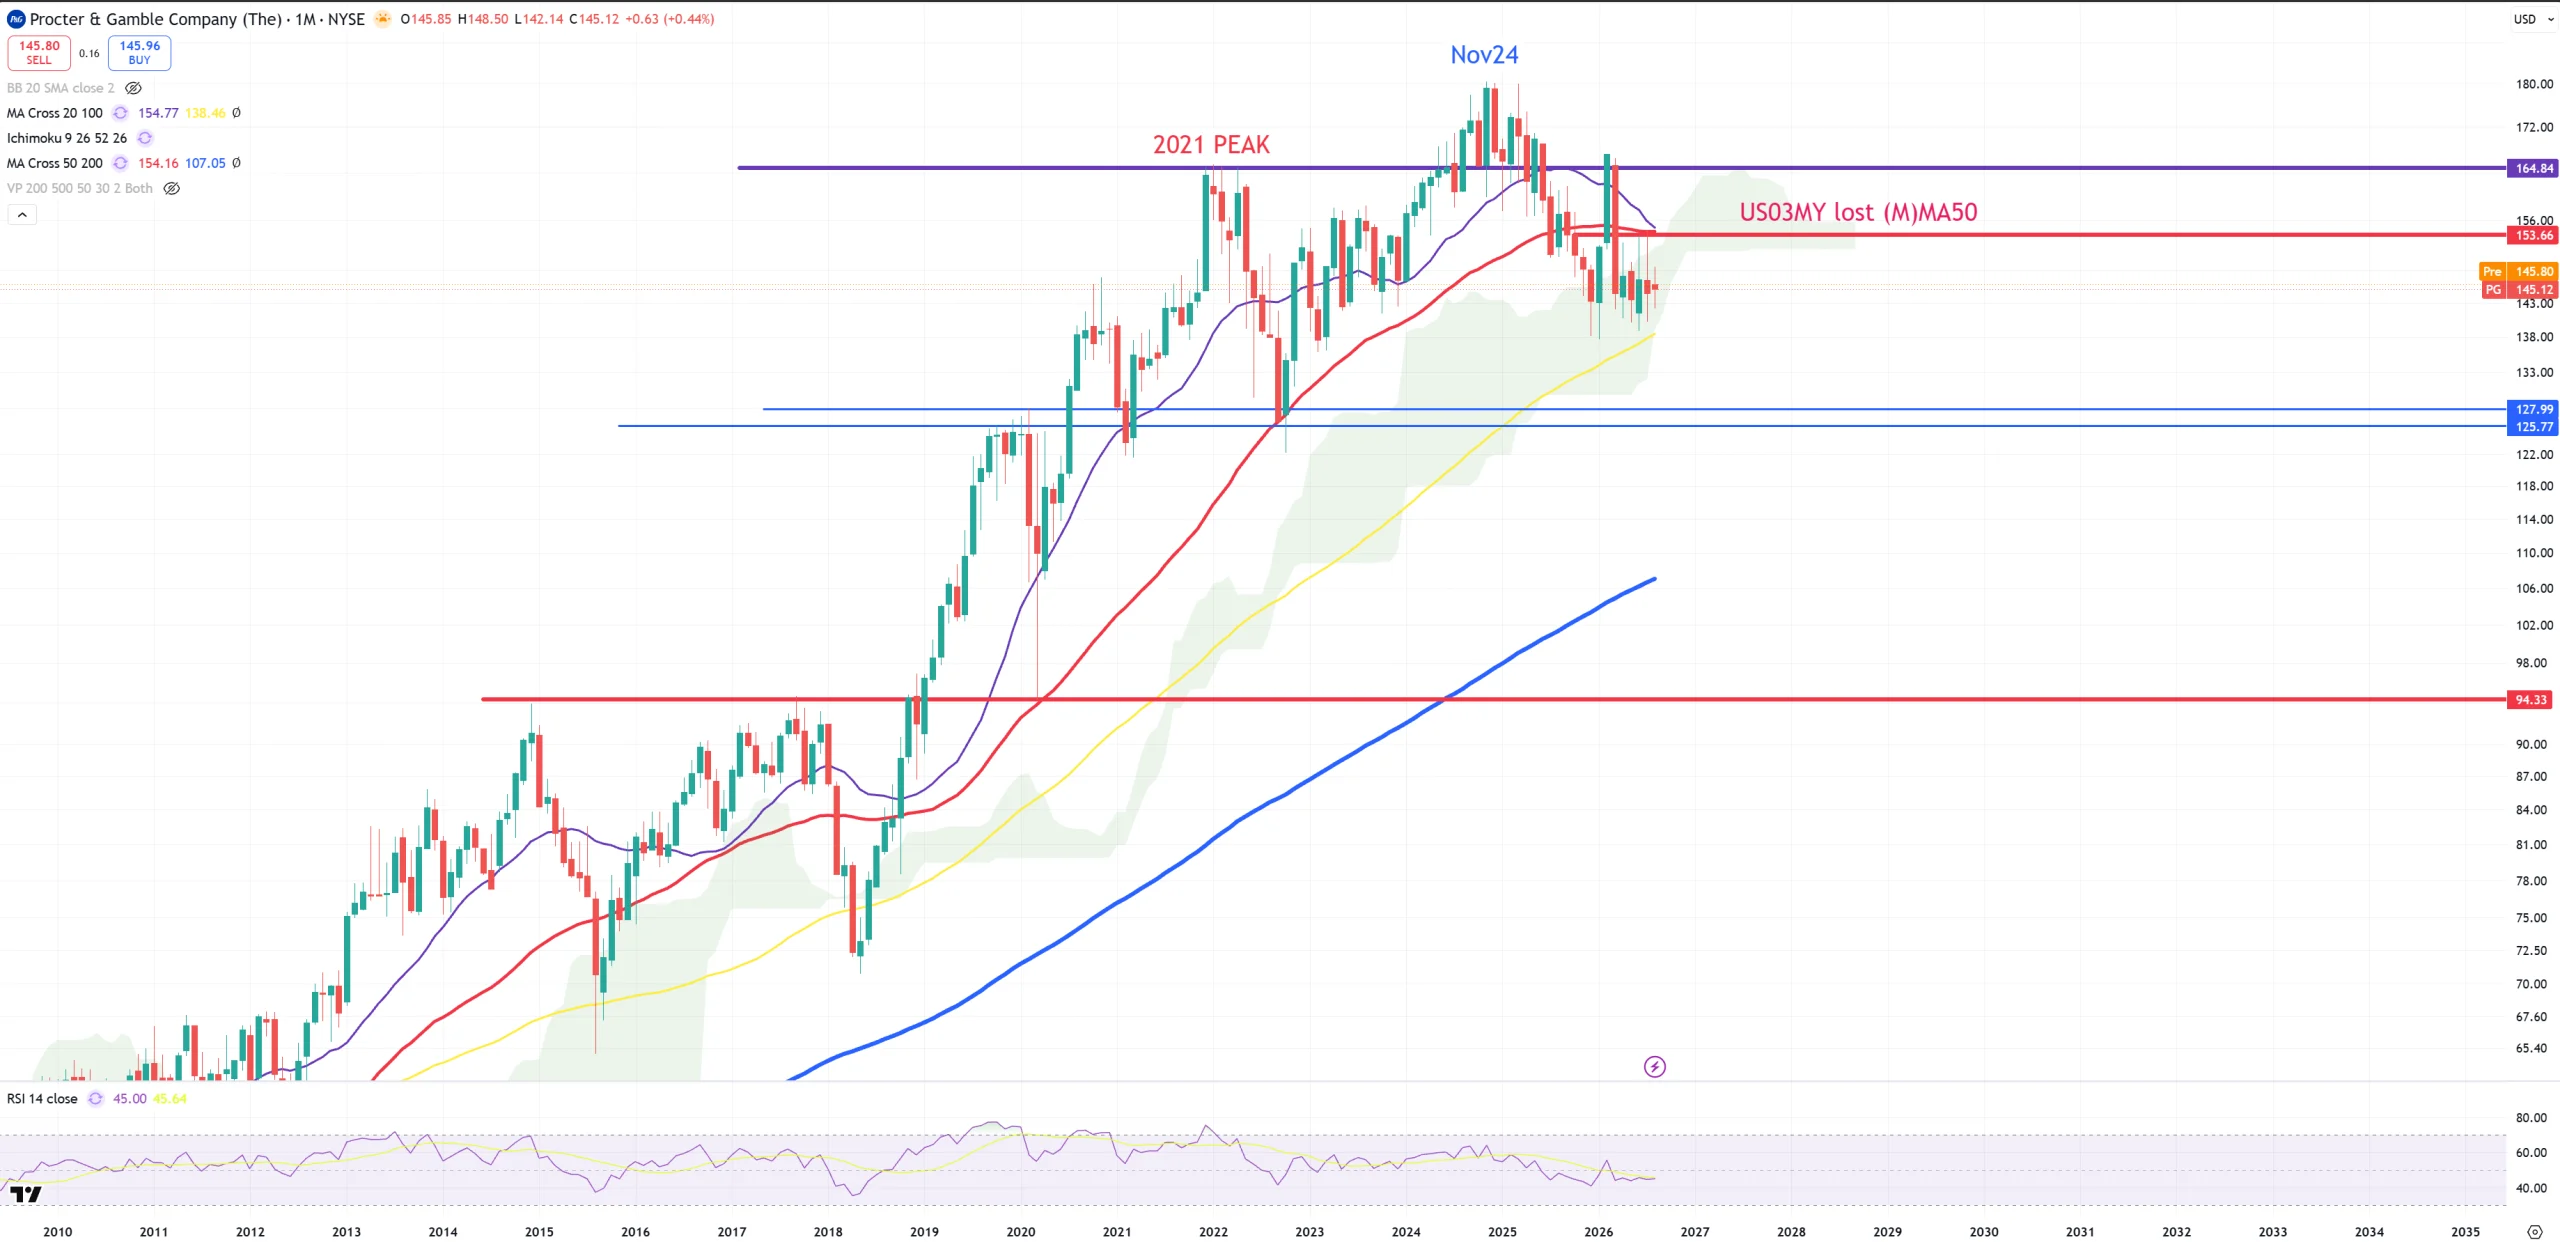
PG – Procter & Gamble, 9 months with no real move.
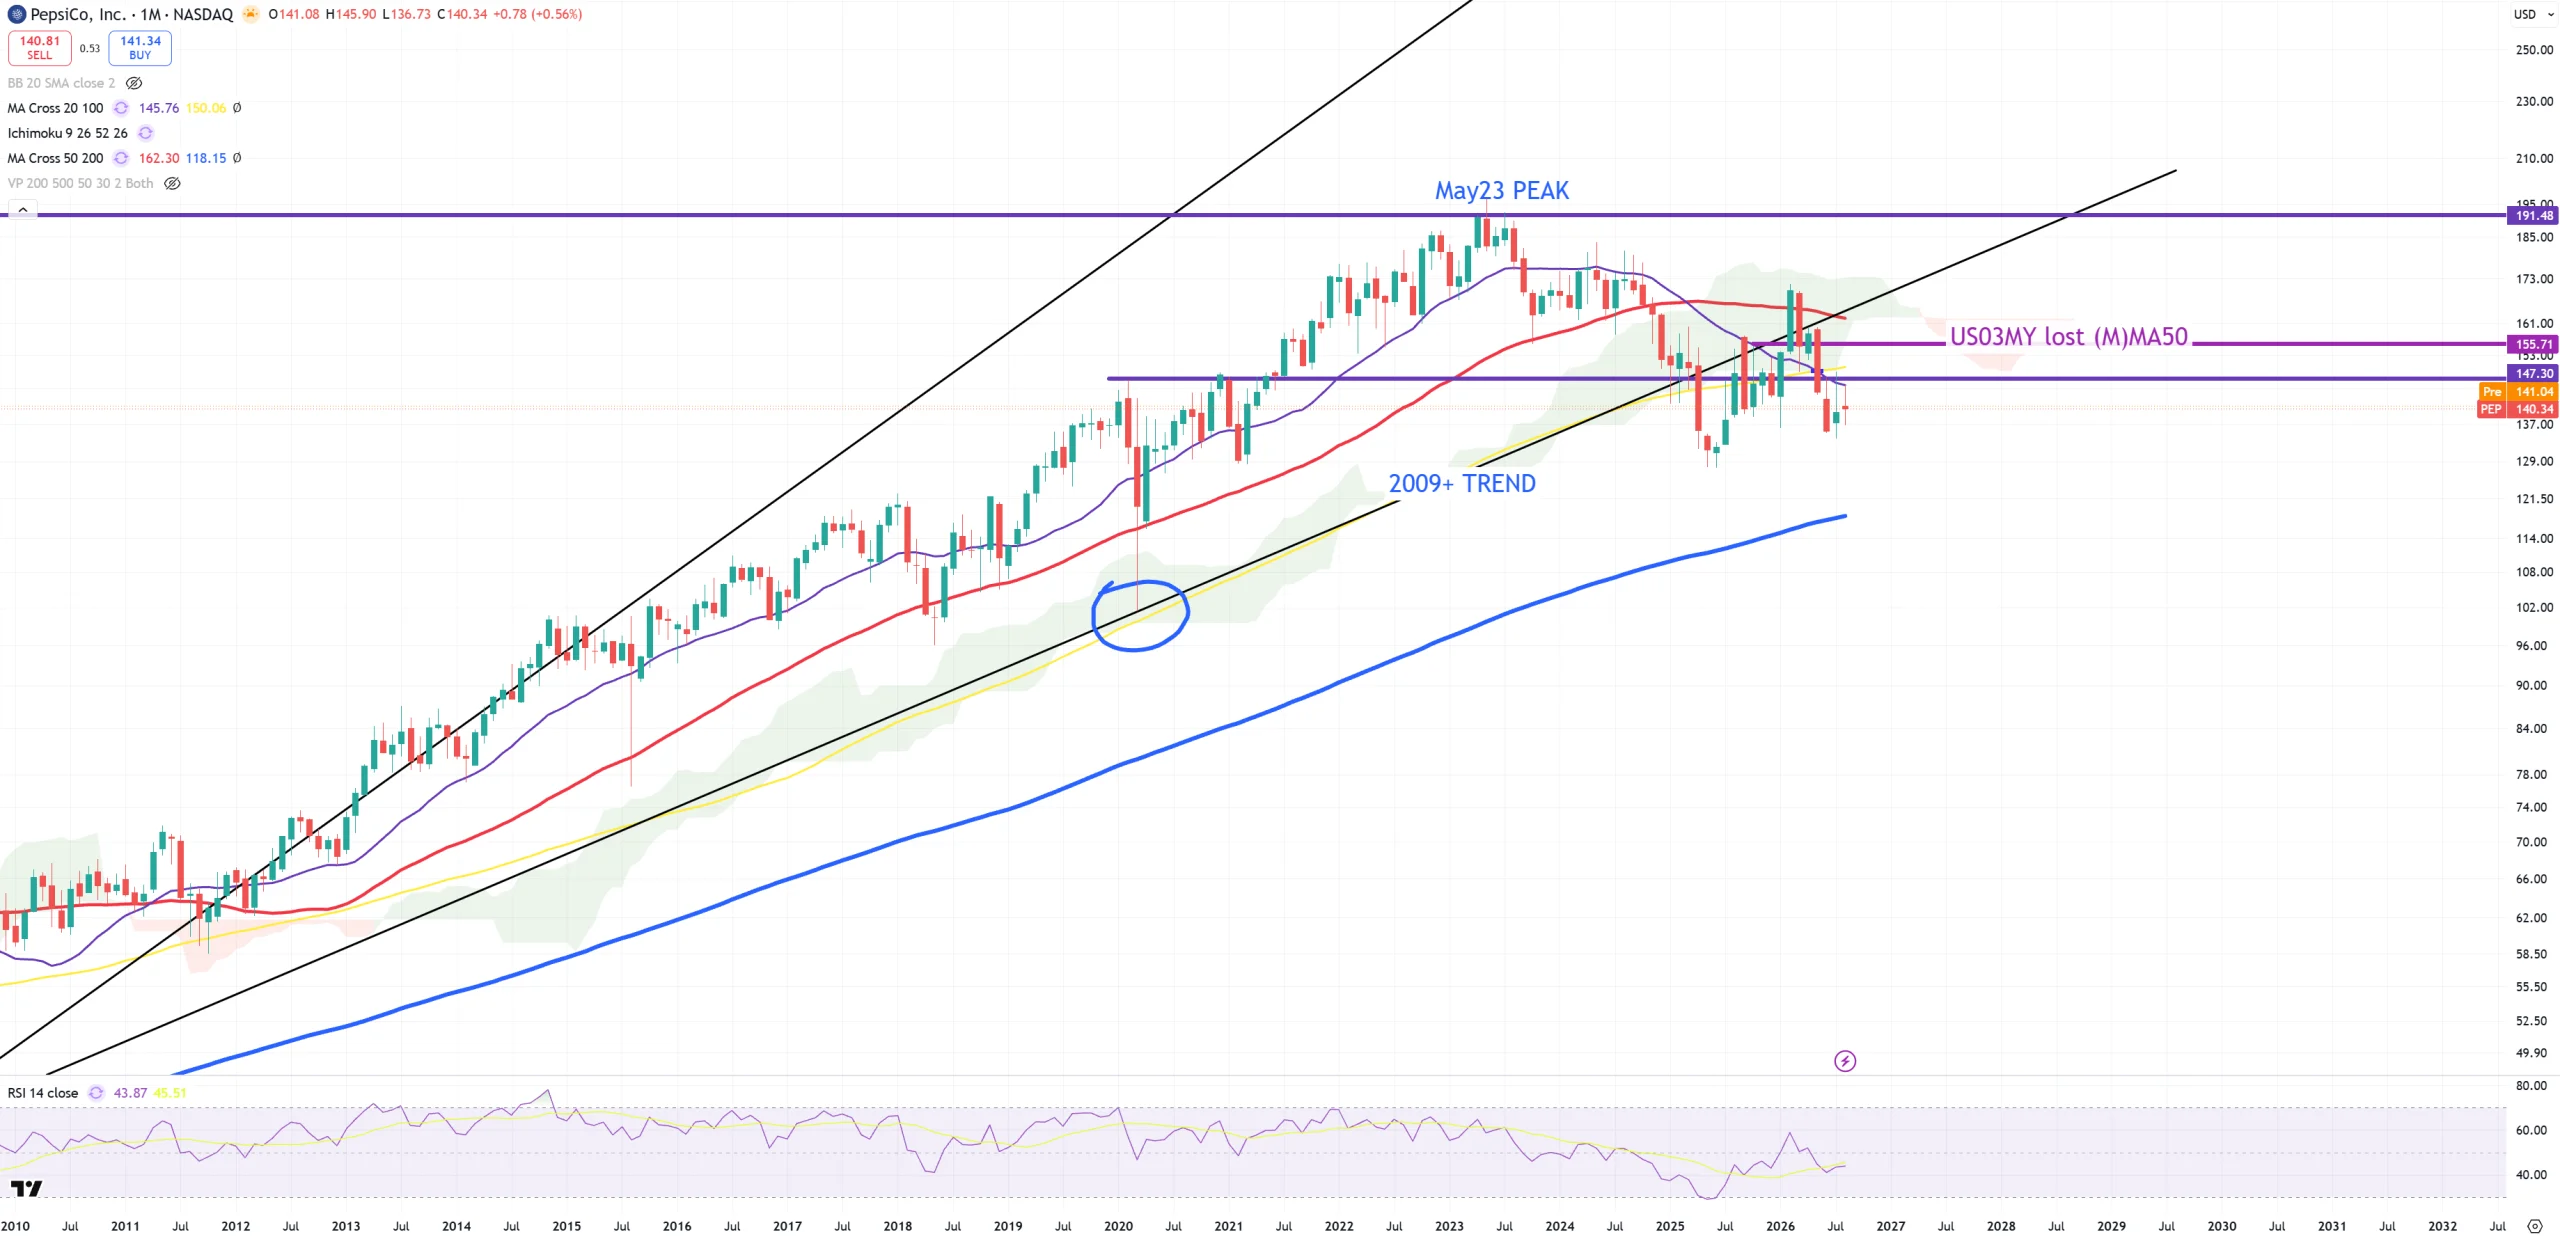
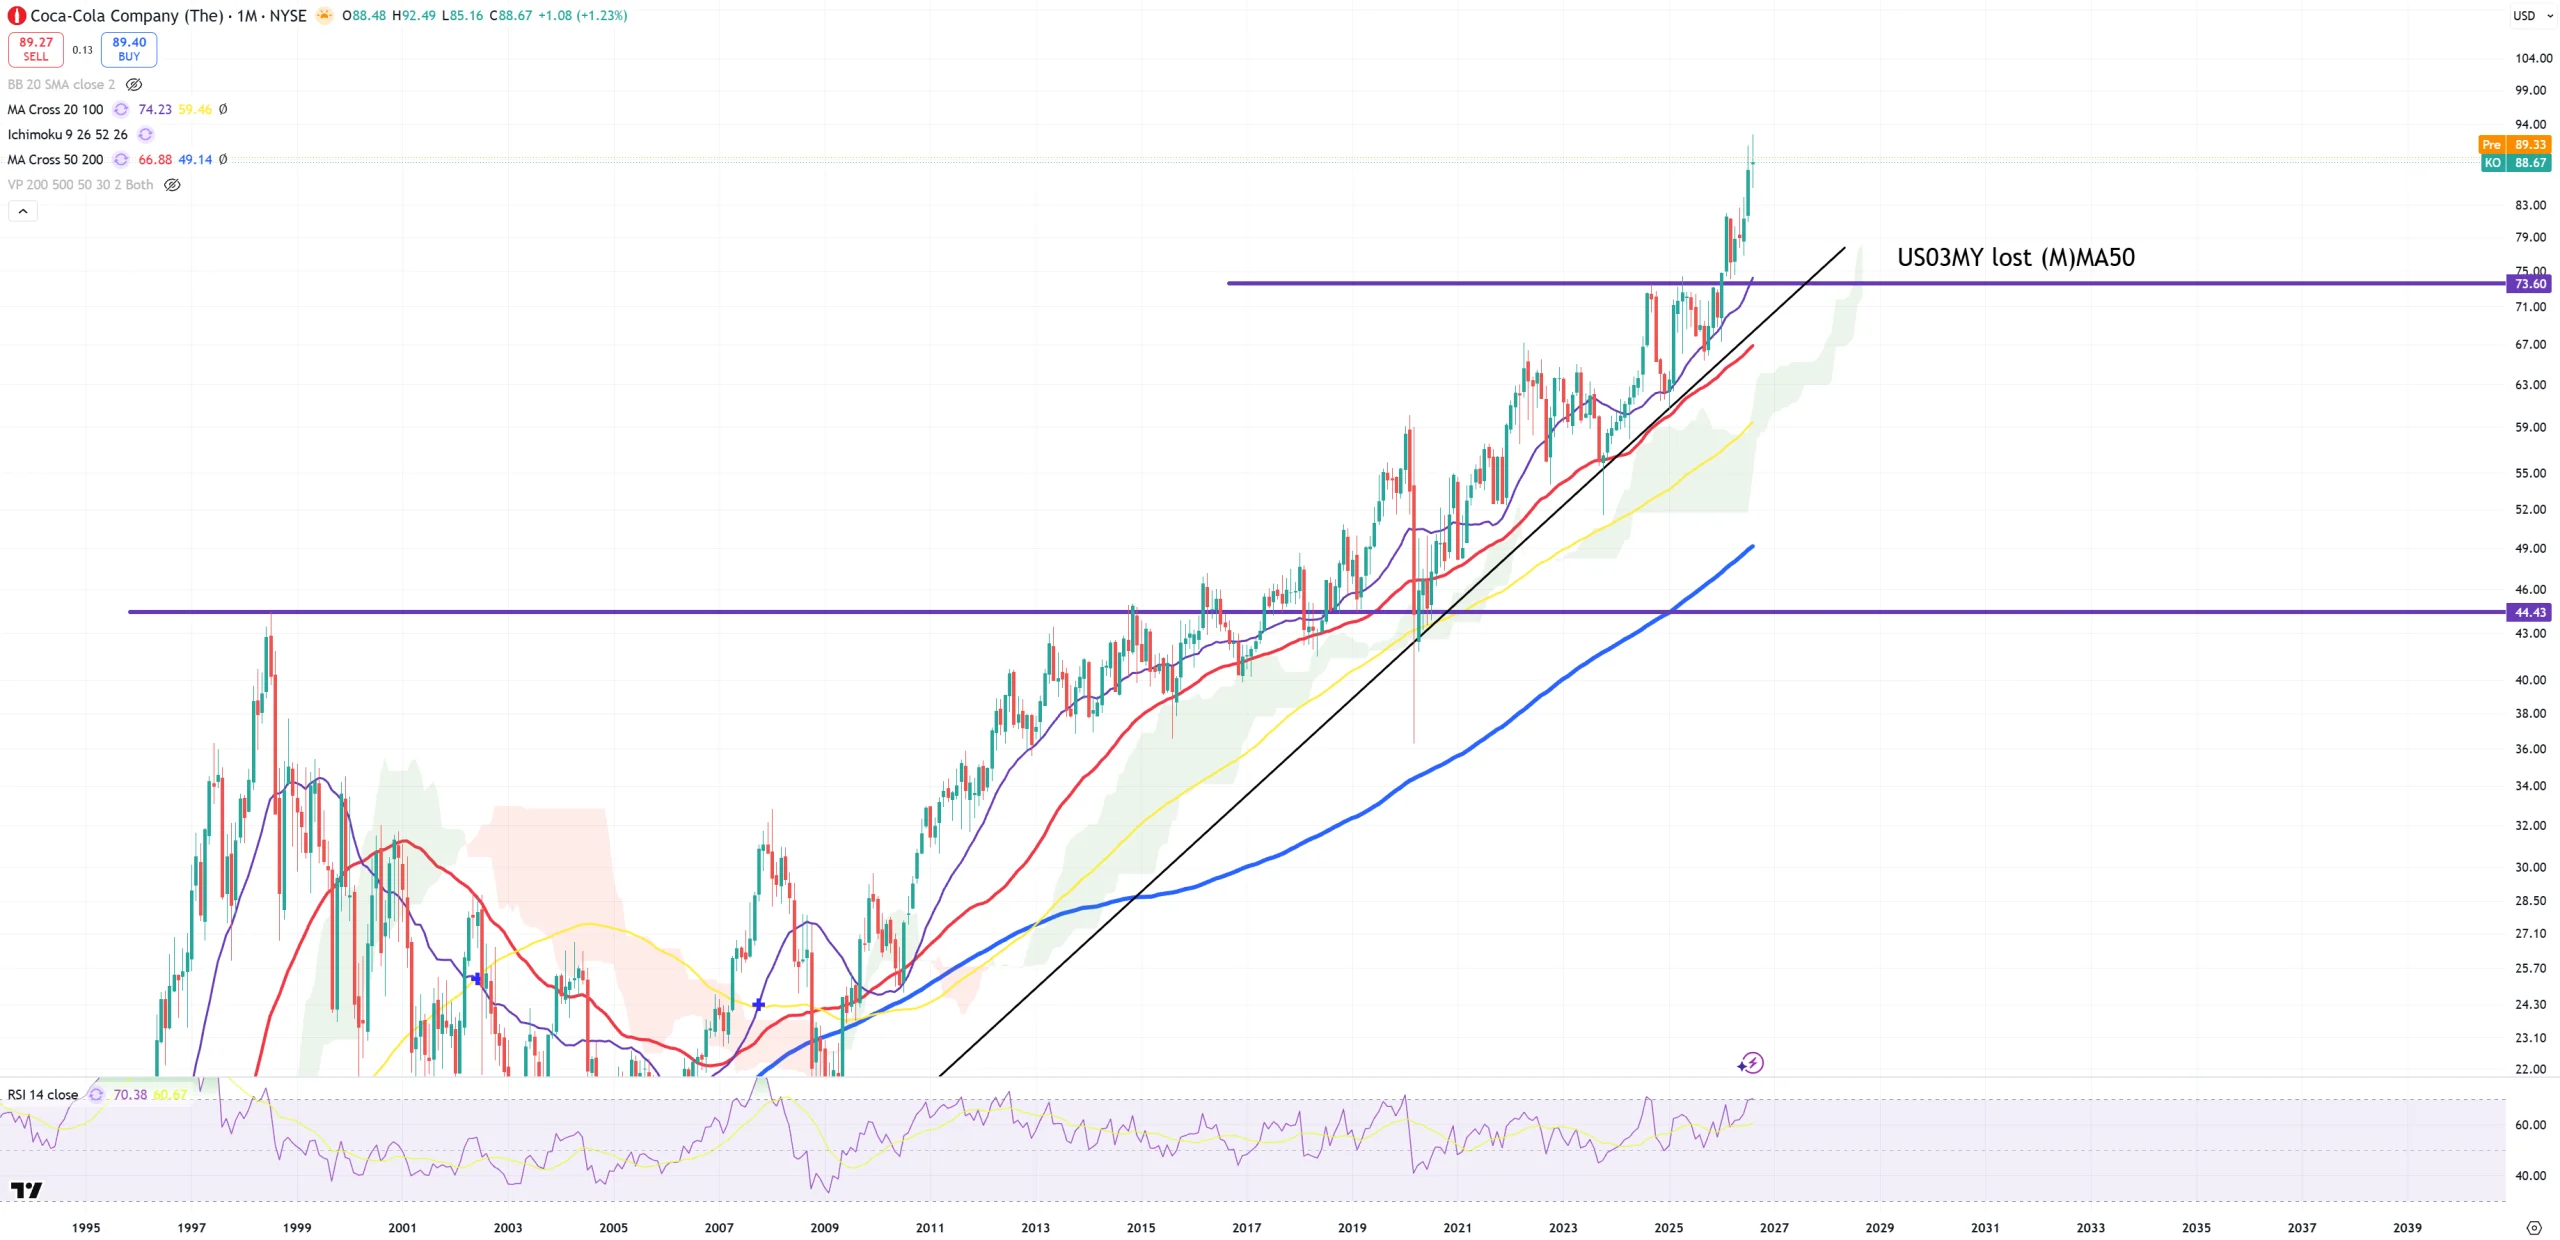
PEP – Pepsico is the same as KO but it looks way different. Either KO is wrong or PEP is wrong.
KO – Looks way different than PEP
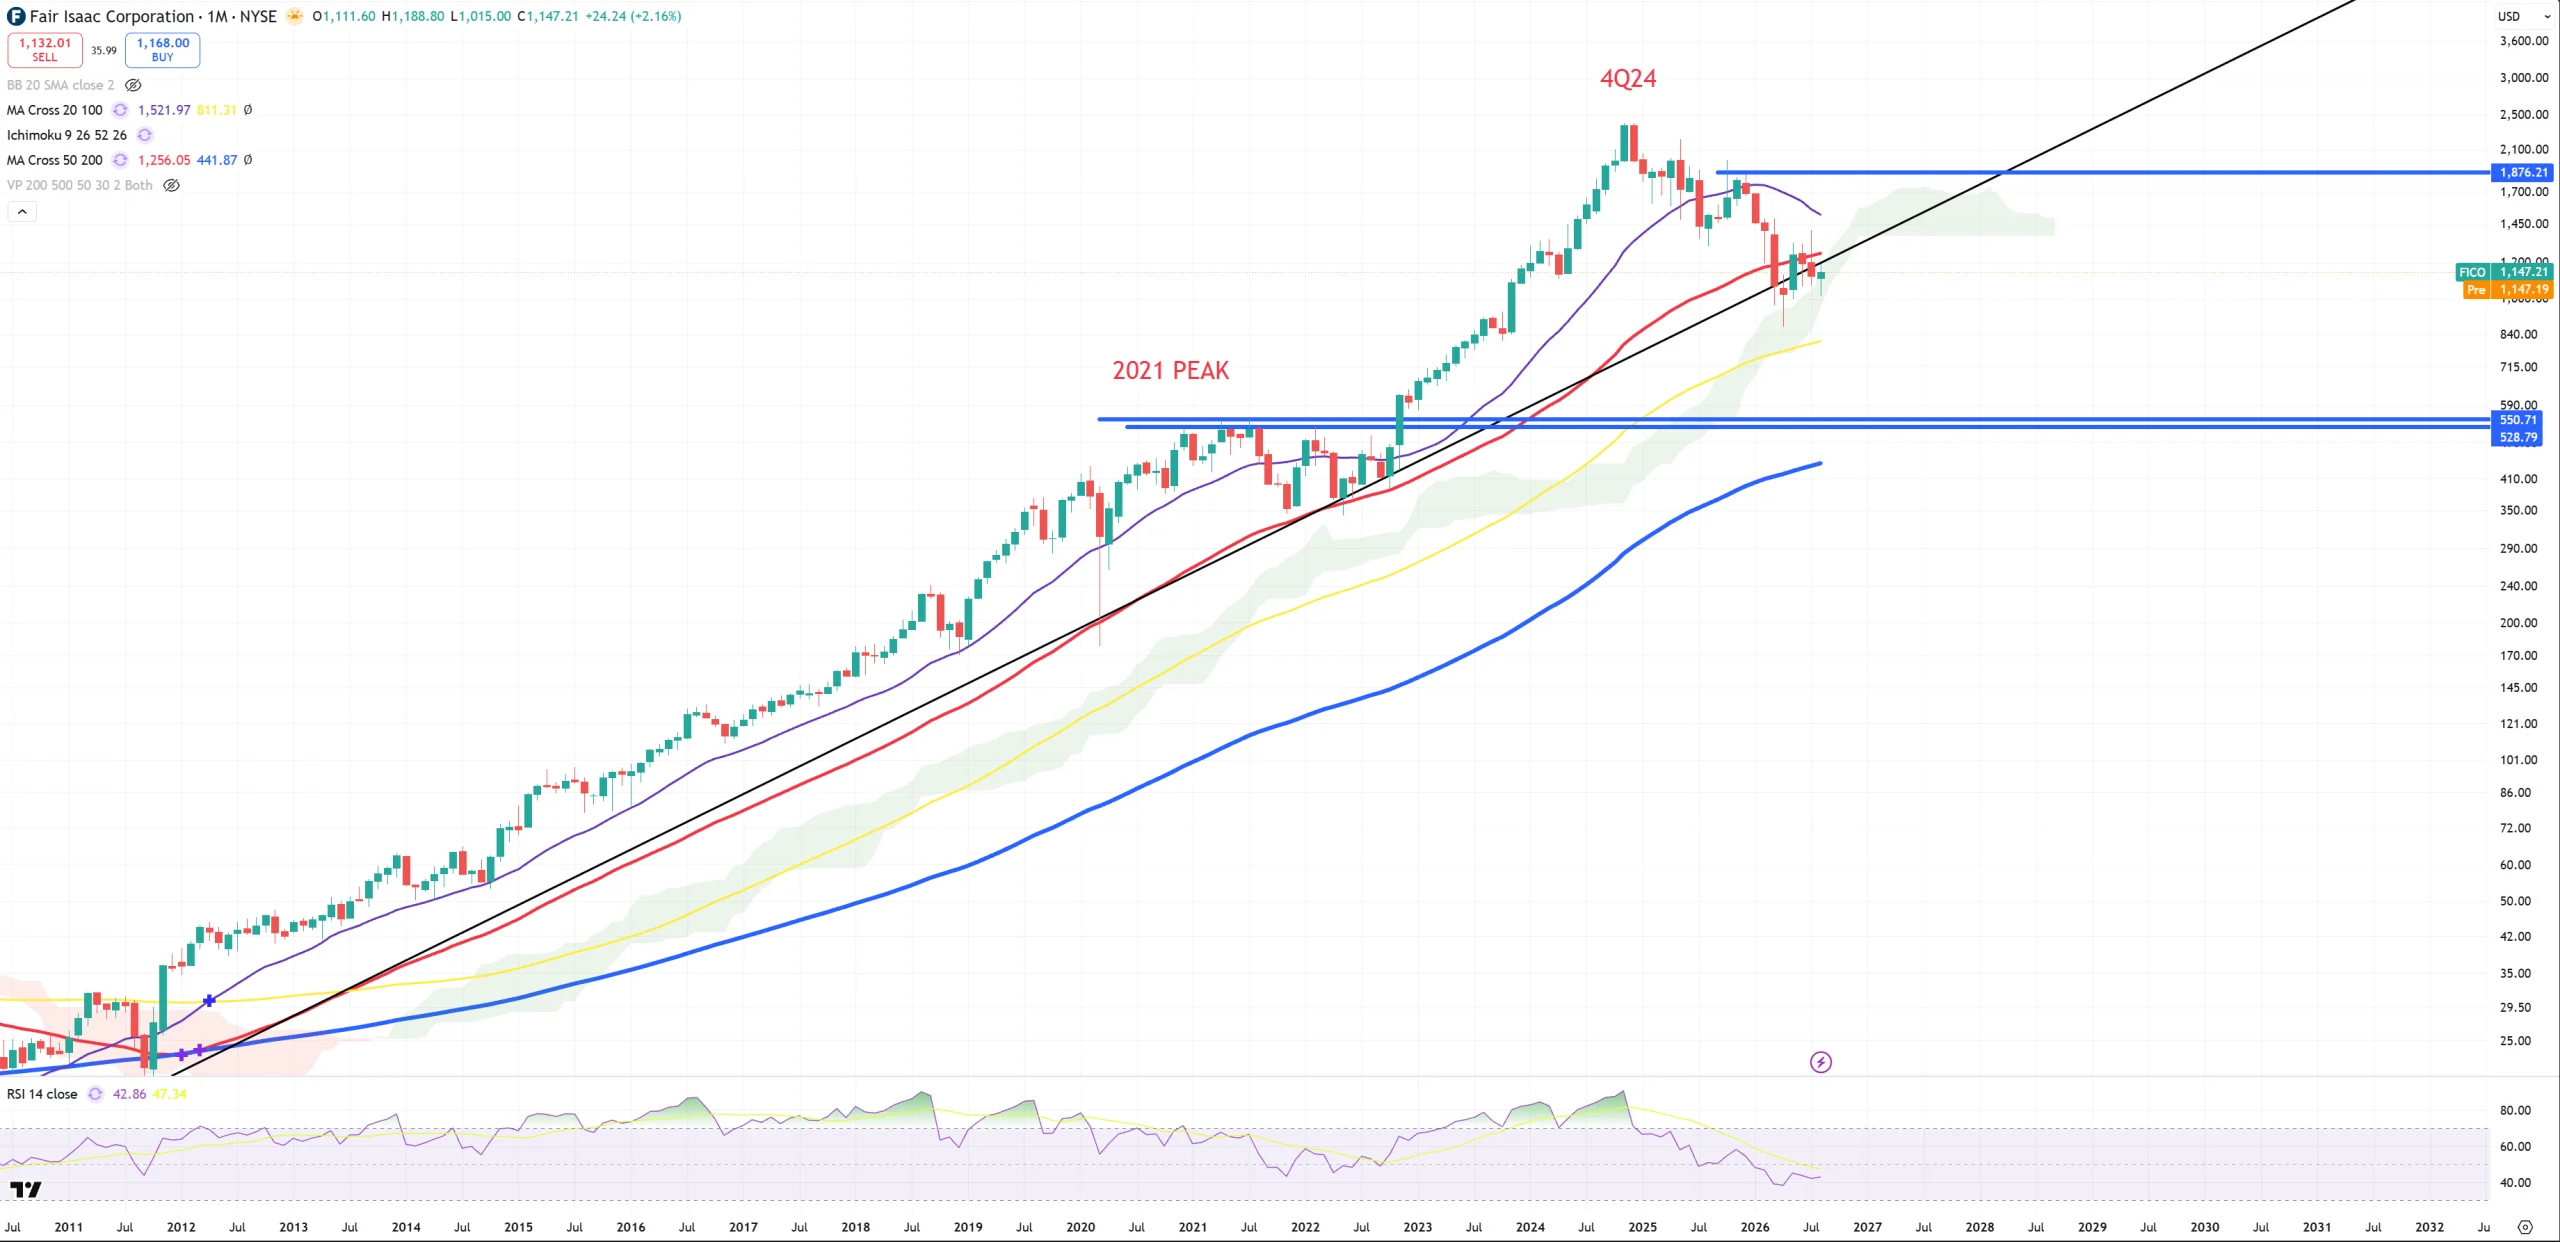
FICO – below (M)MA50 if it won’t break it it’s going to crash
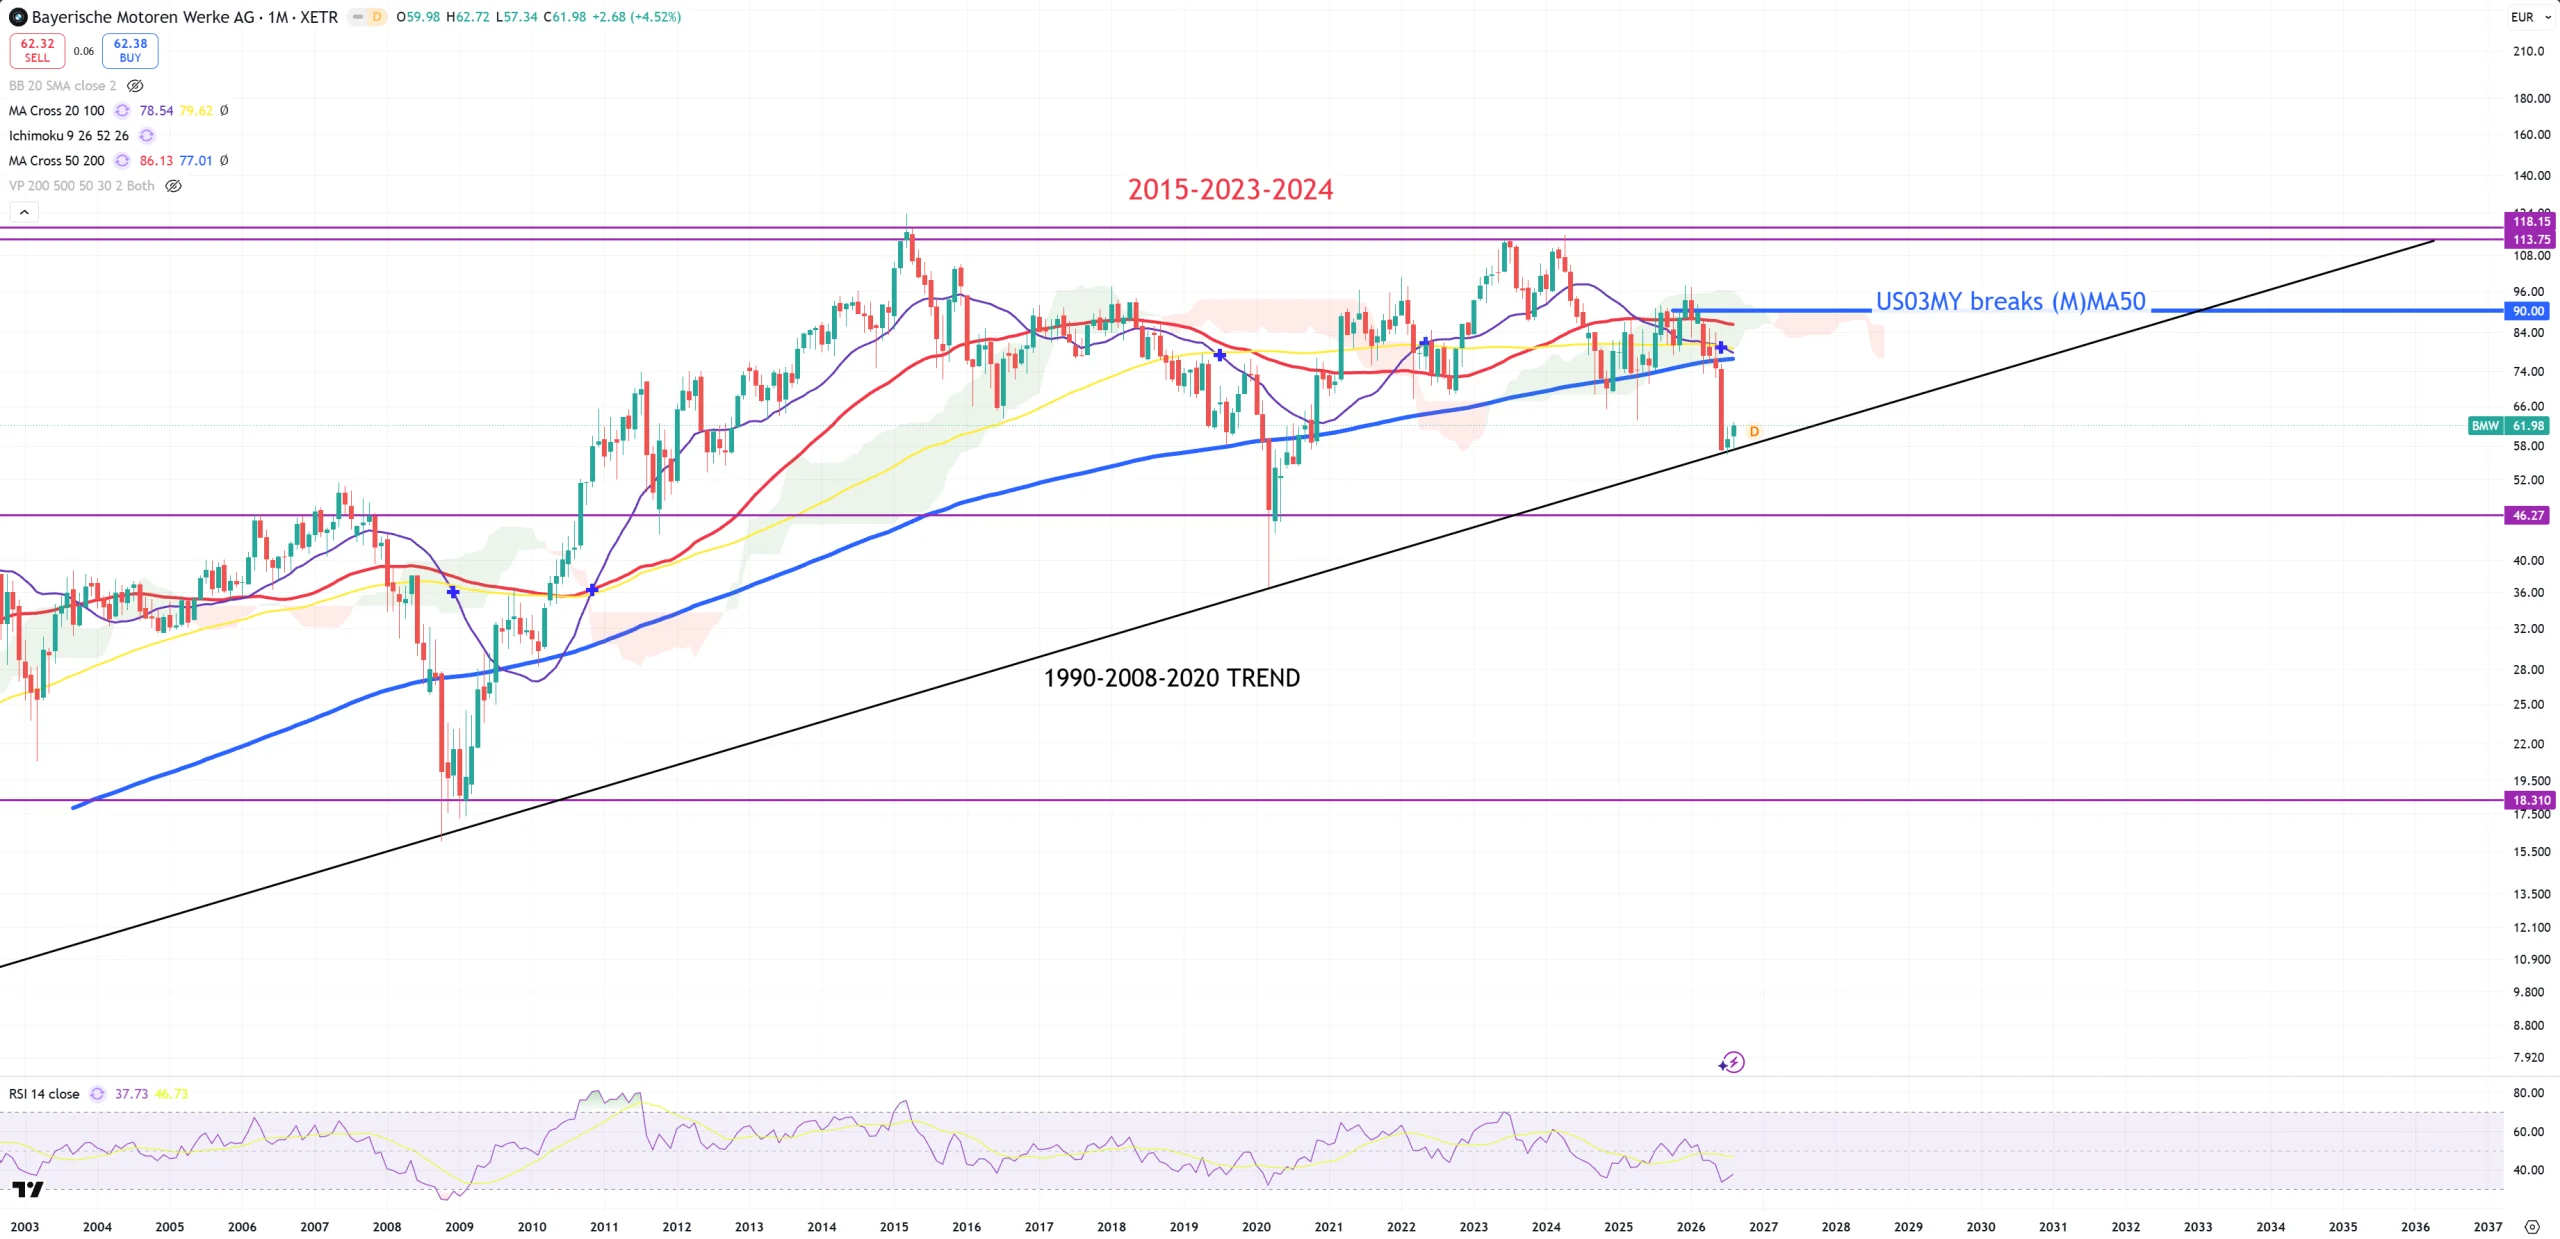
BMW – once this long term trend will be broken BMW is going to vanish … Of course it’s a joke, but the brand will be finished. (Chinese automotive to finish BMW?)
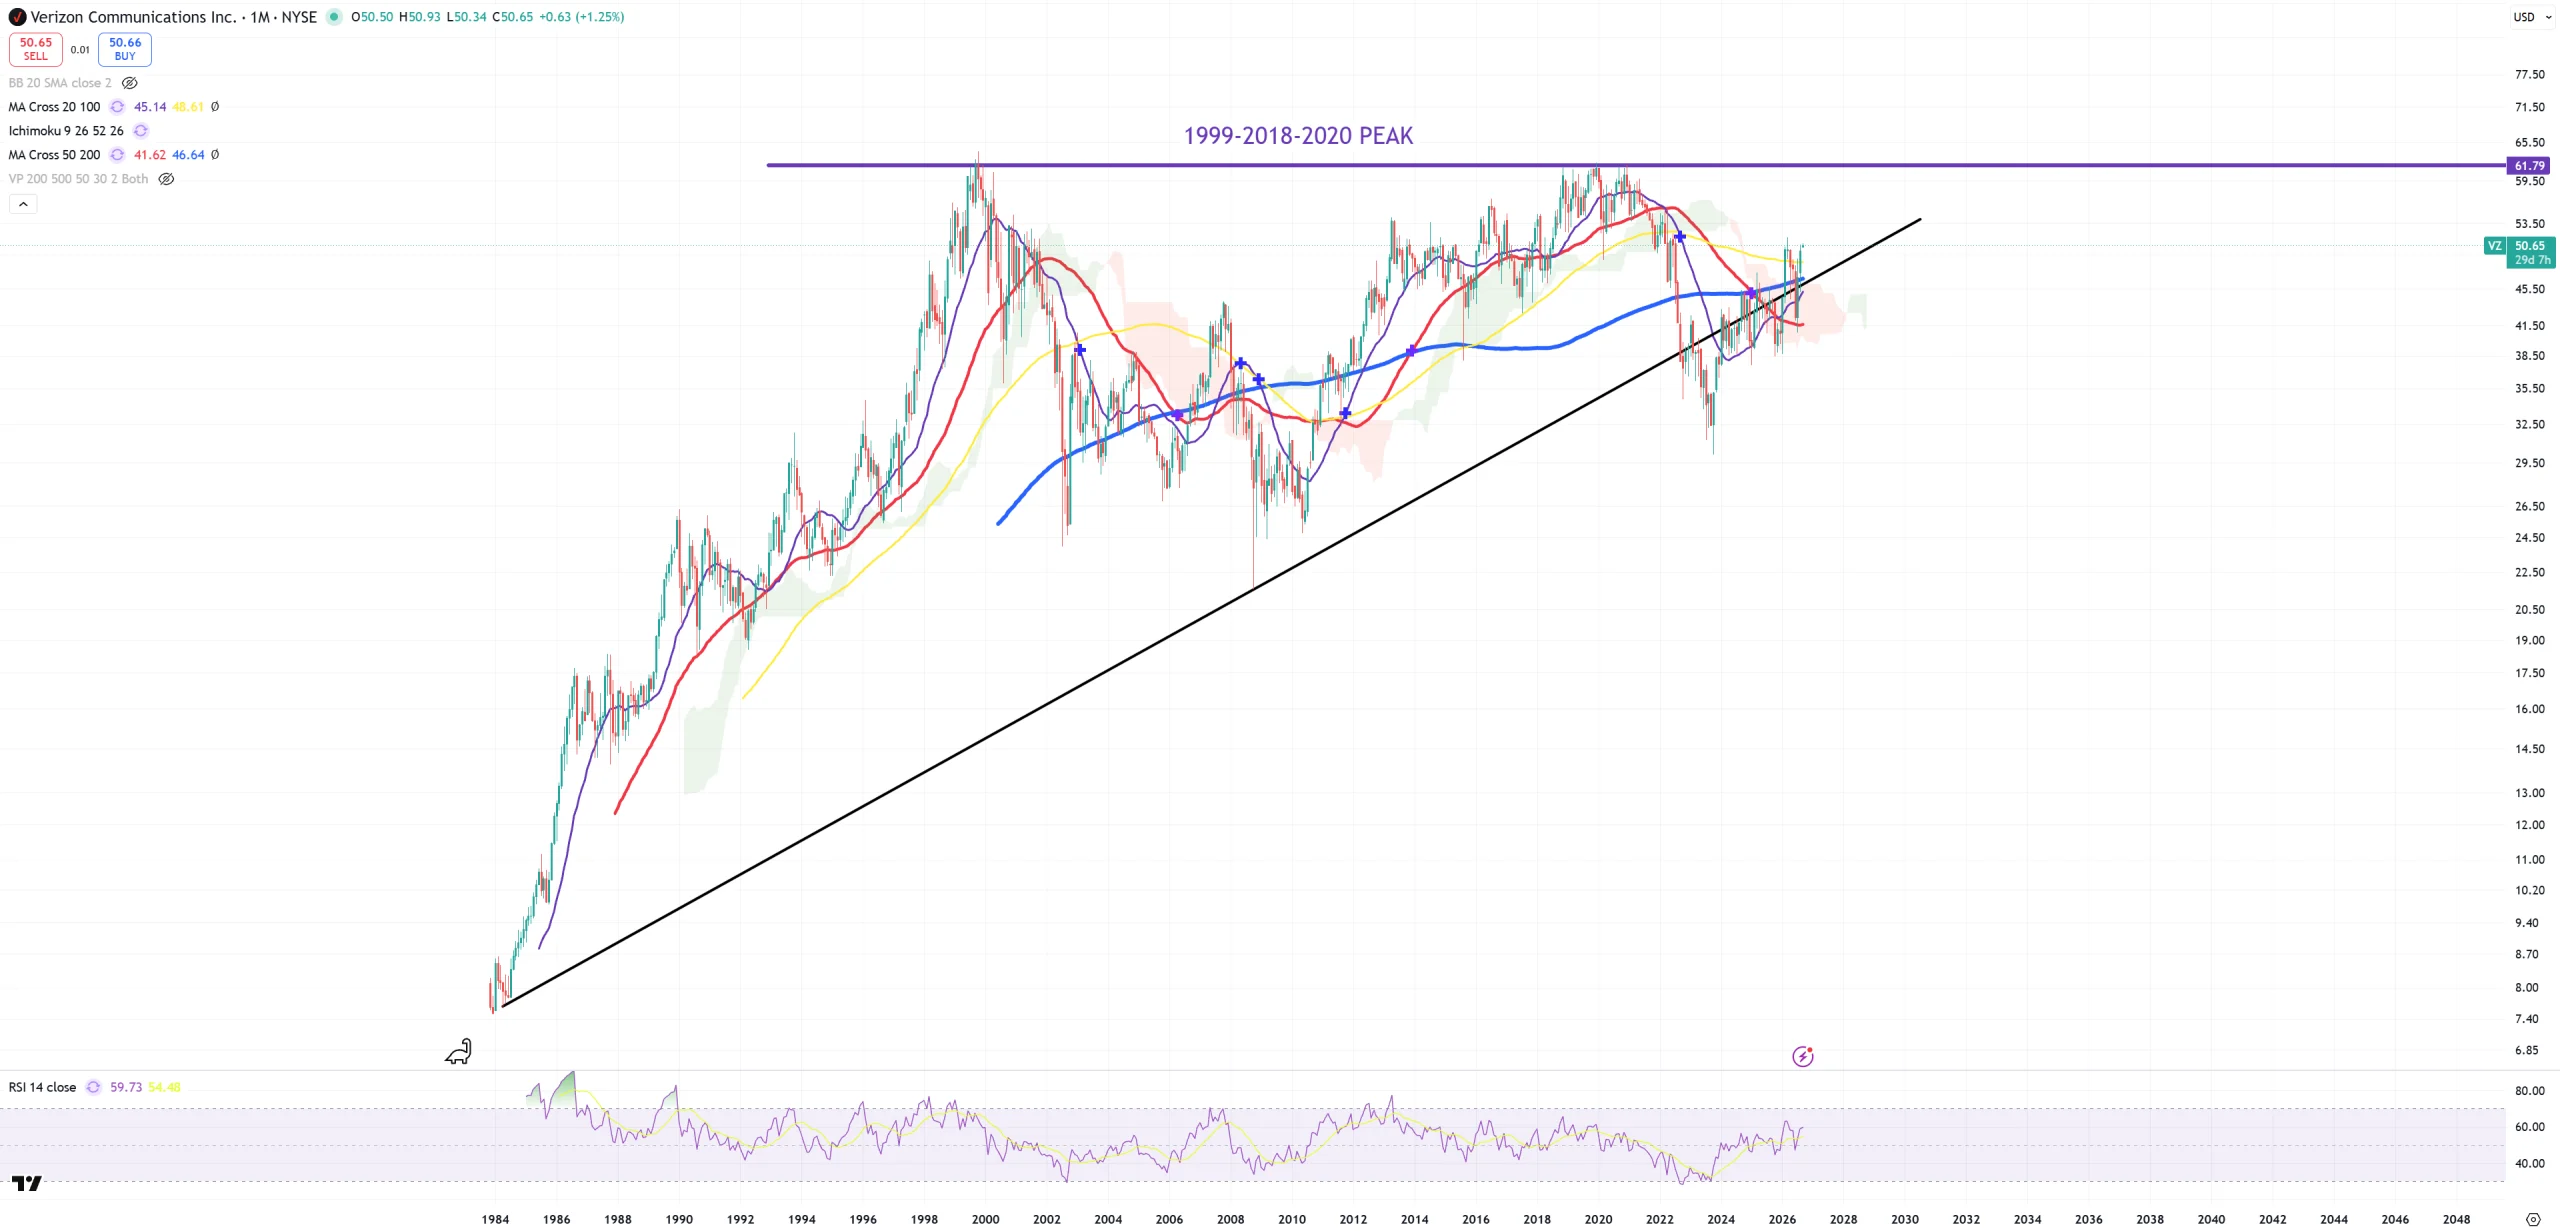
VZ – Verizon – I call this chart – fighting at ANY cost.
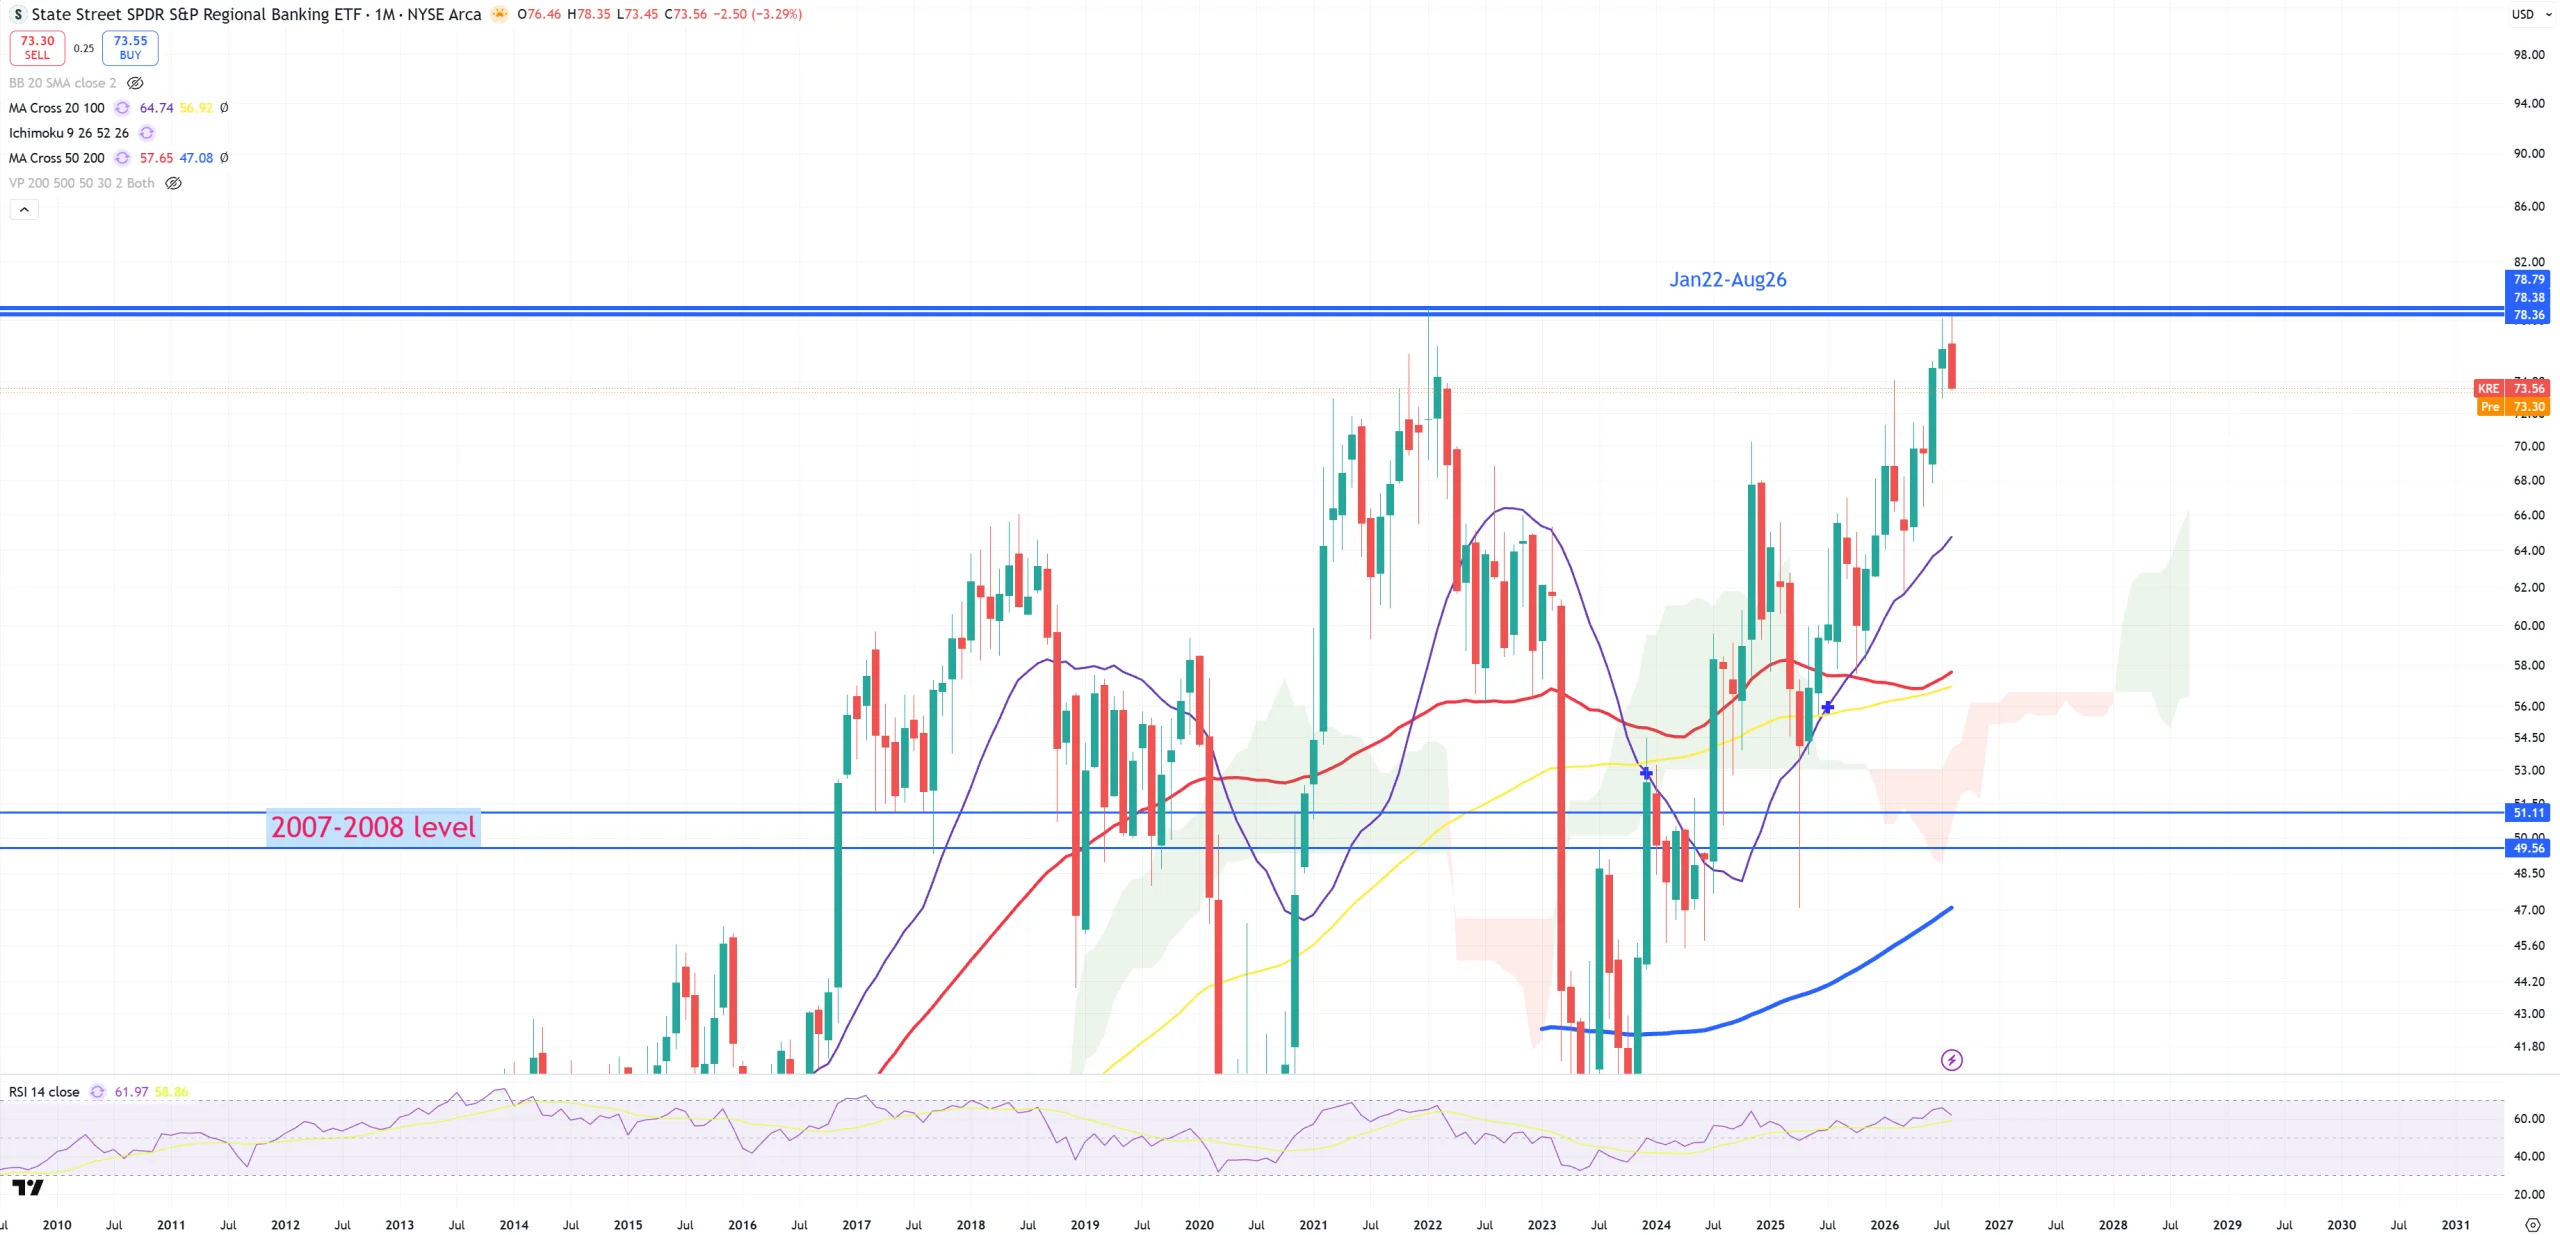
KRE – double top. Never ever I though KRE will go so high with yields going so high…
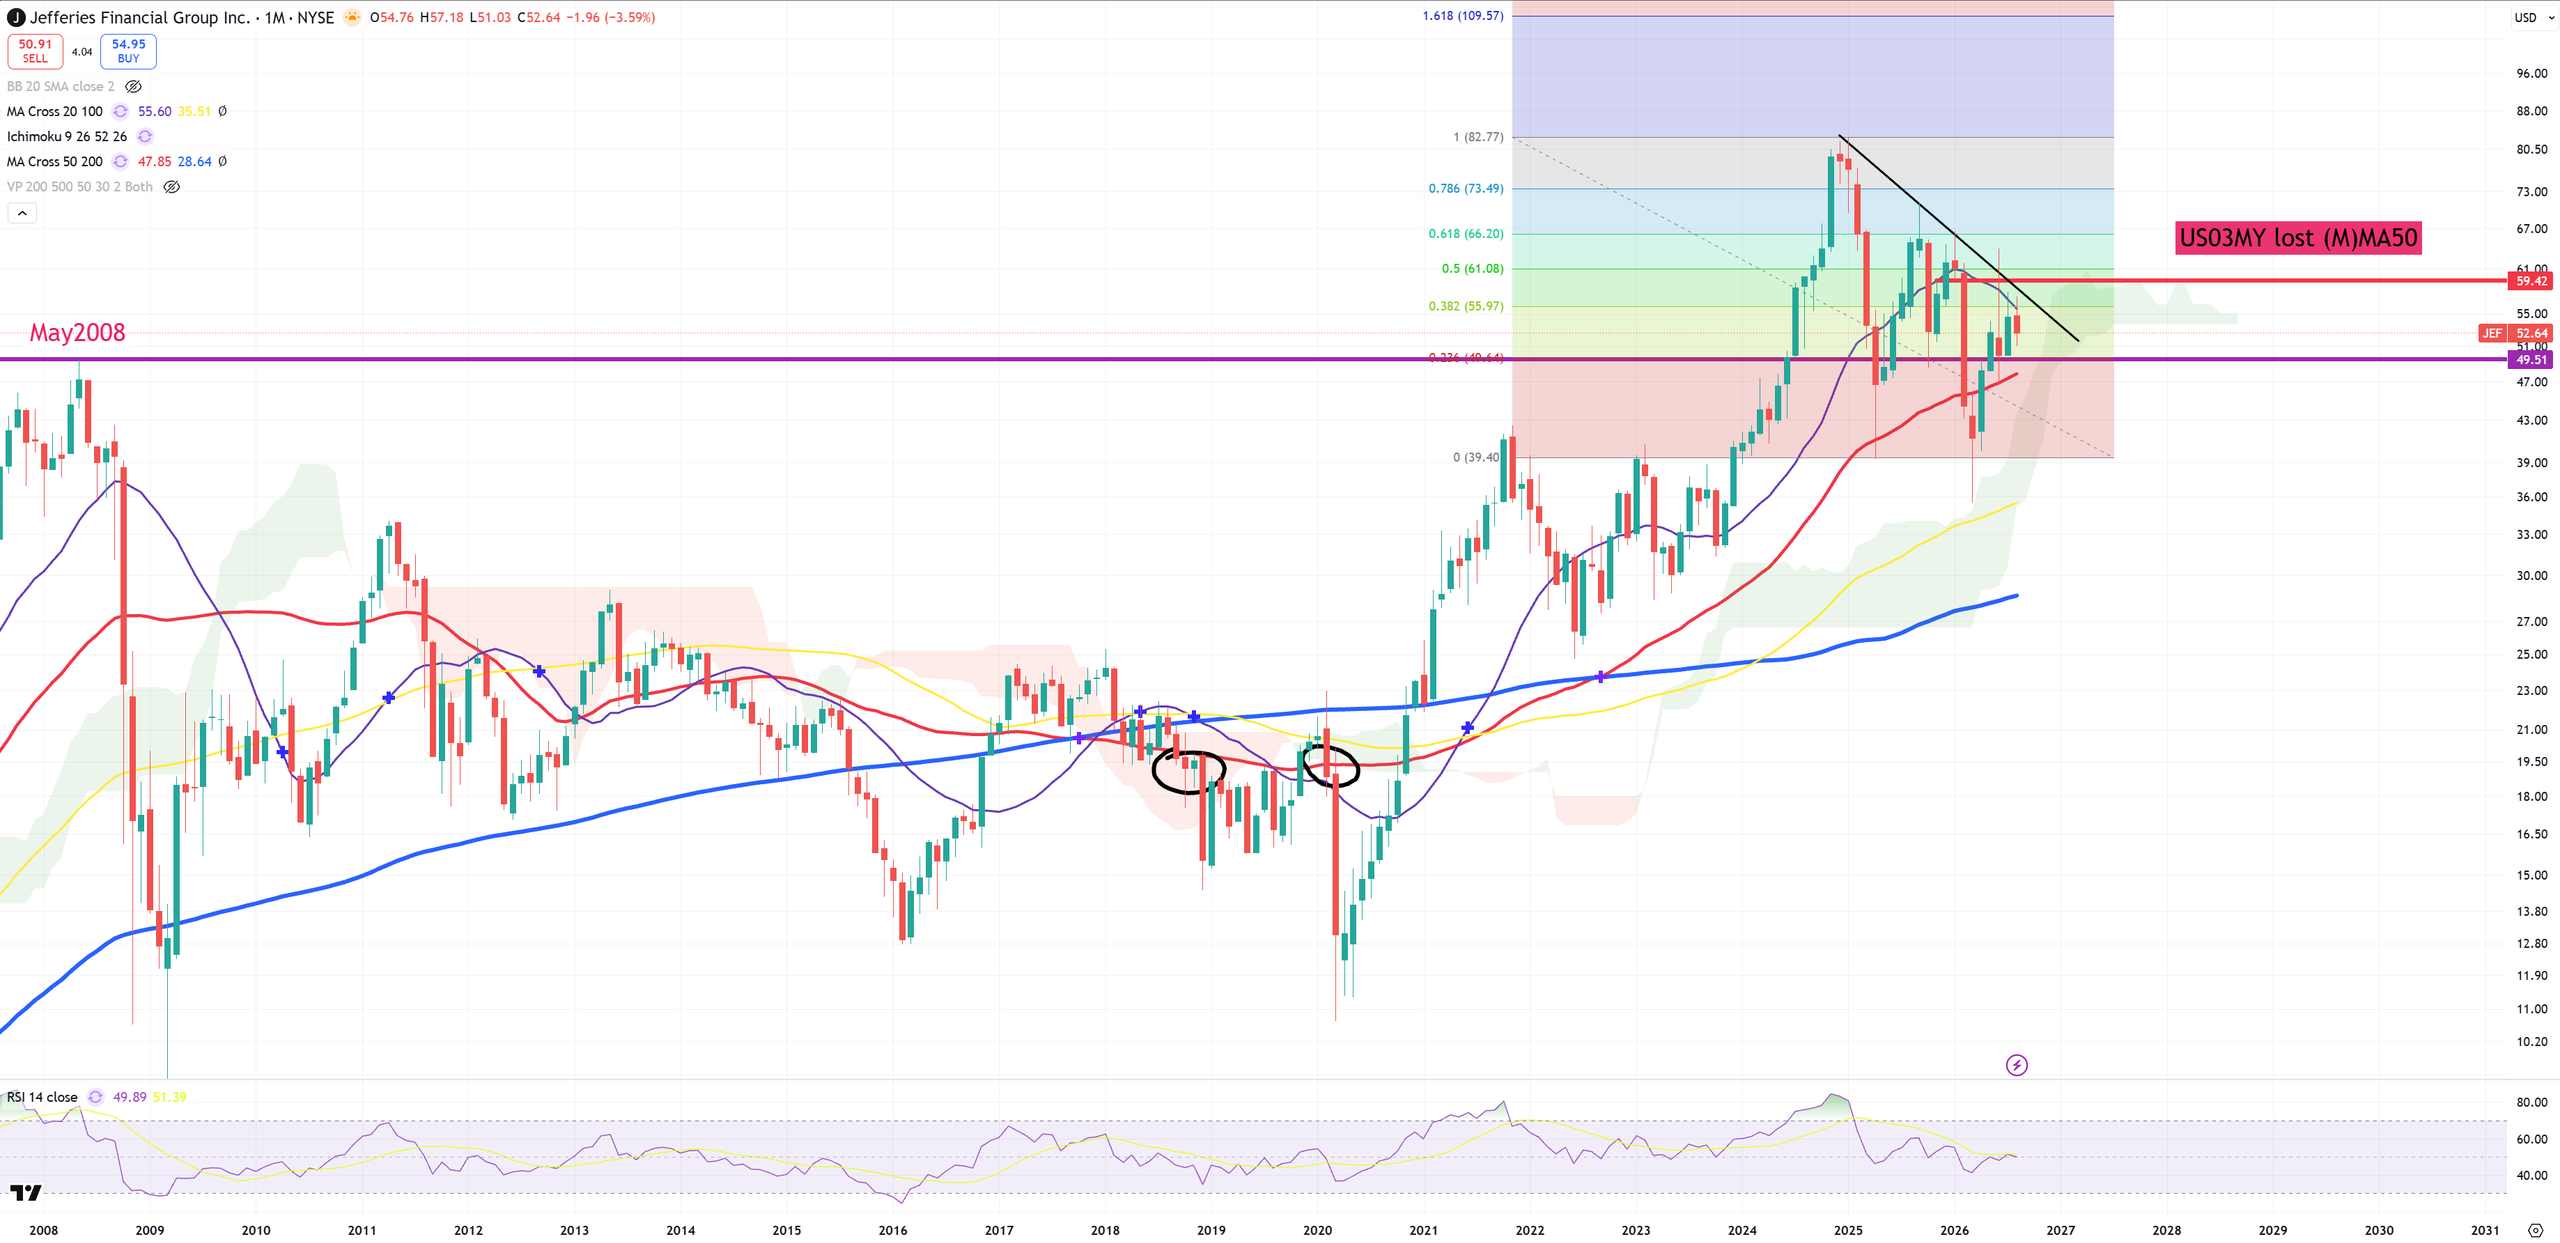
JEF – Jefferies, first plunge below 2008 peak saved. Now we’ll try again with some Iran’s help.
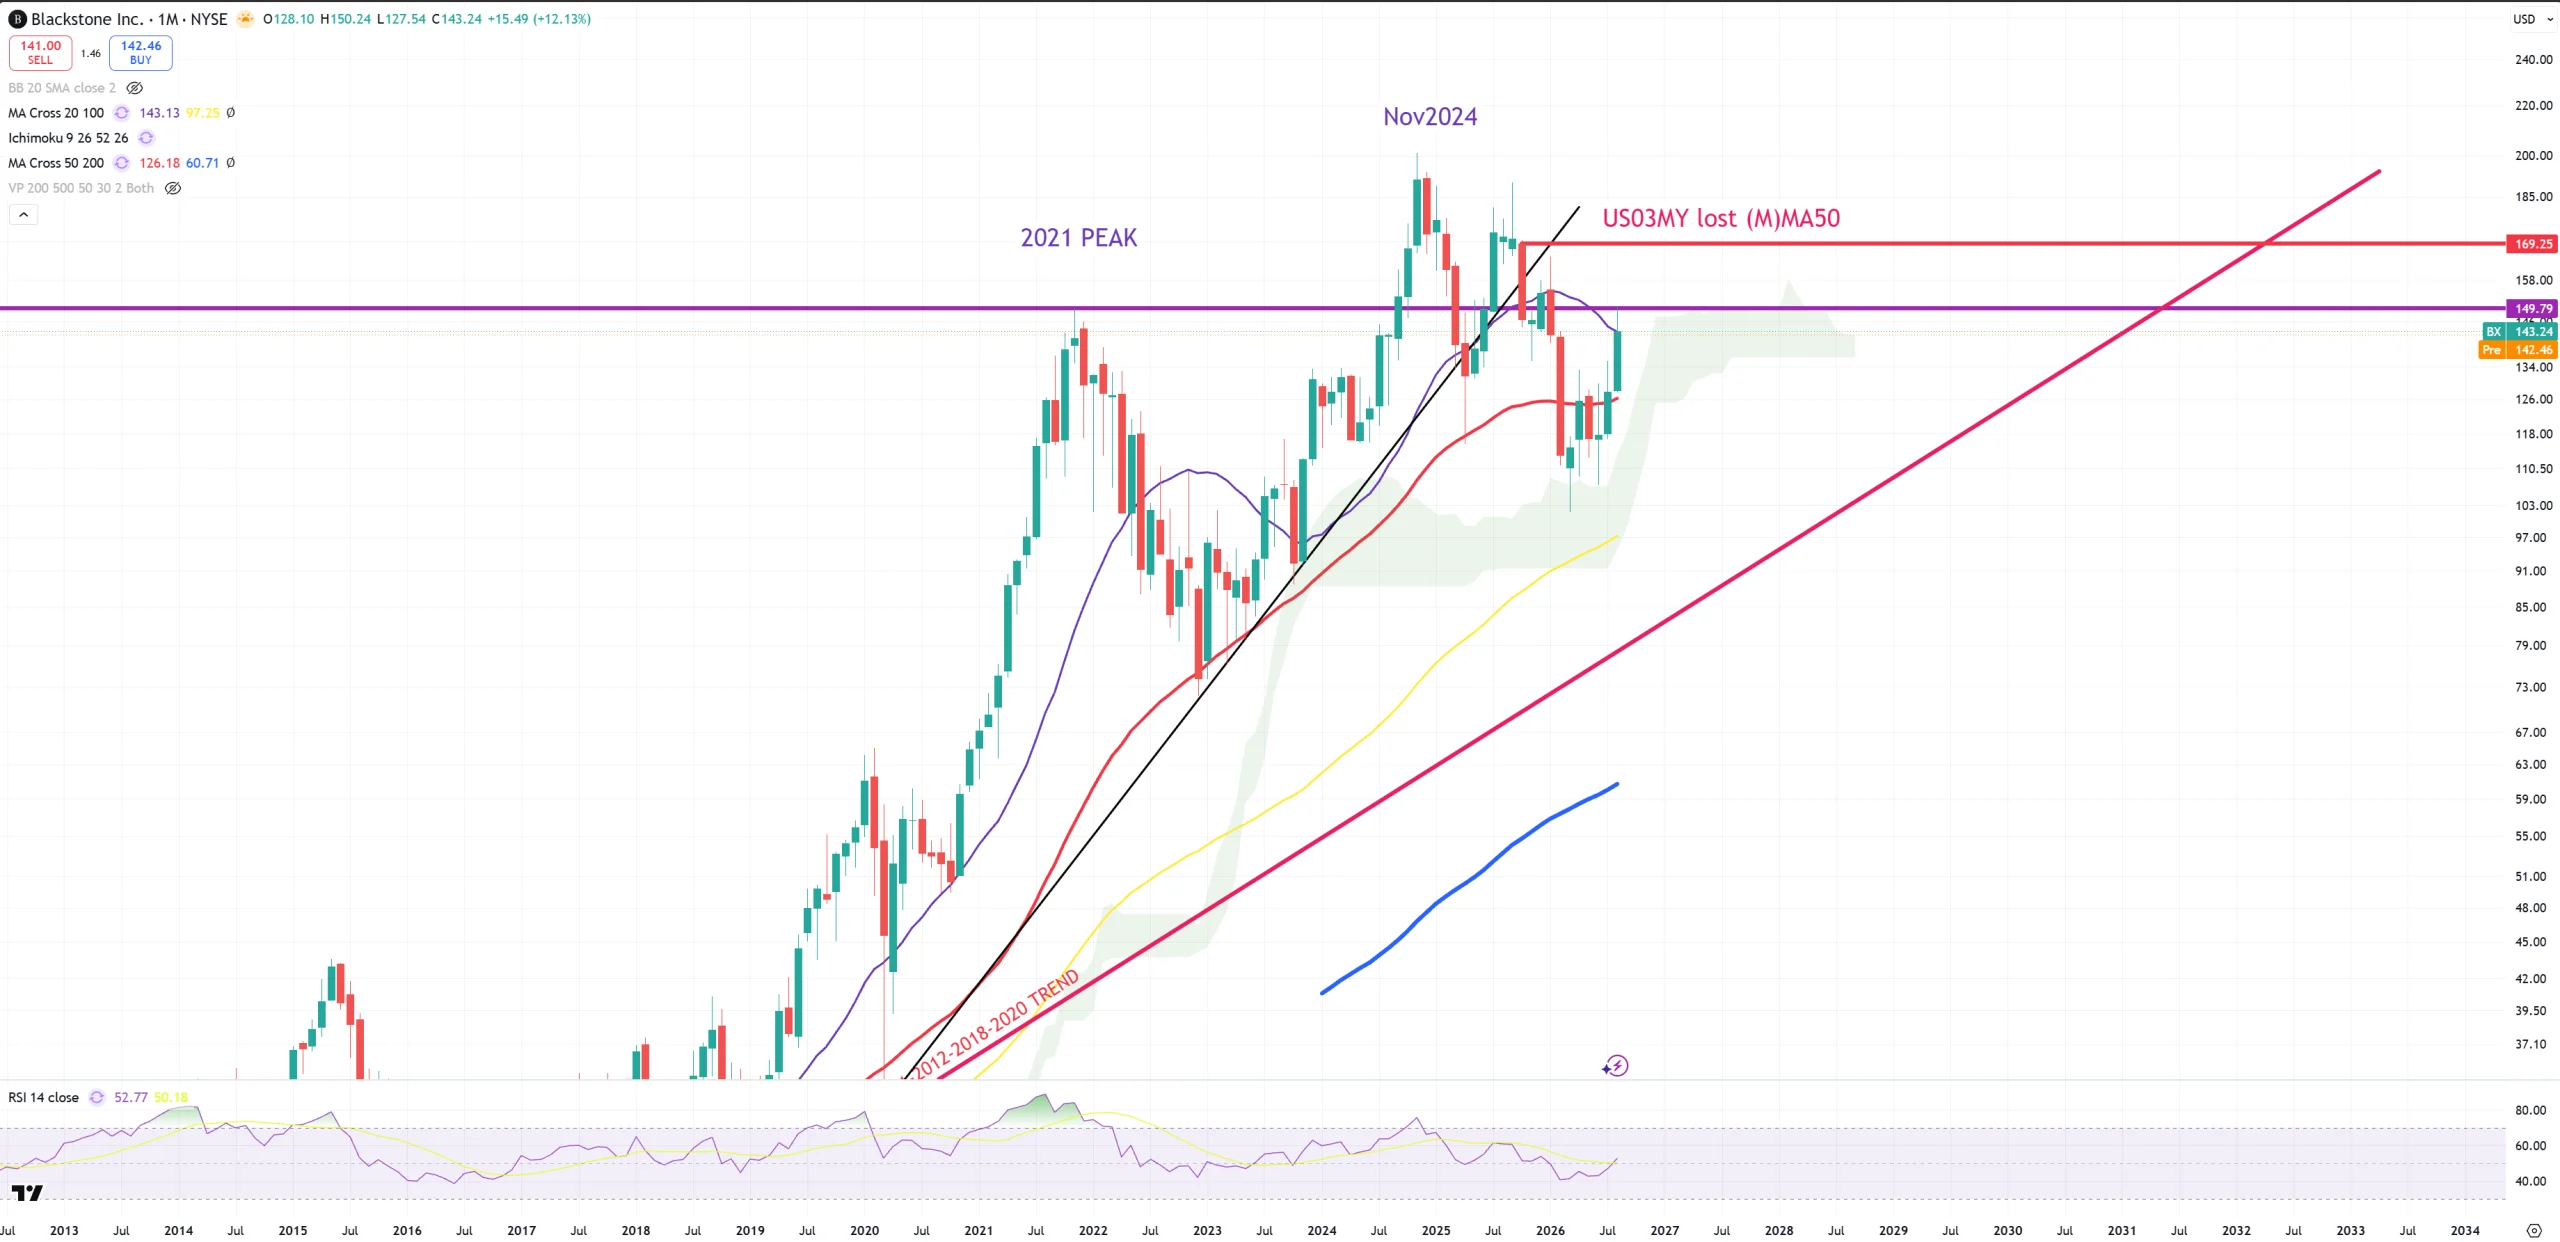
BX – looks like BlackStone loves yields going higher and higher or the market is so stupid. 2021 level is resistance.
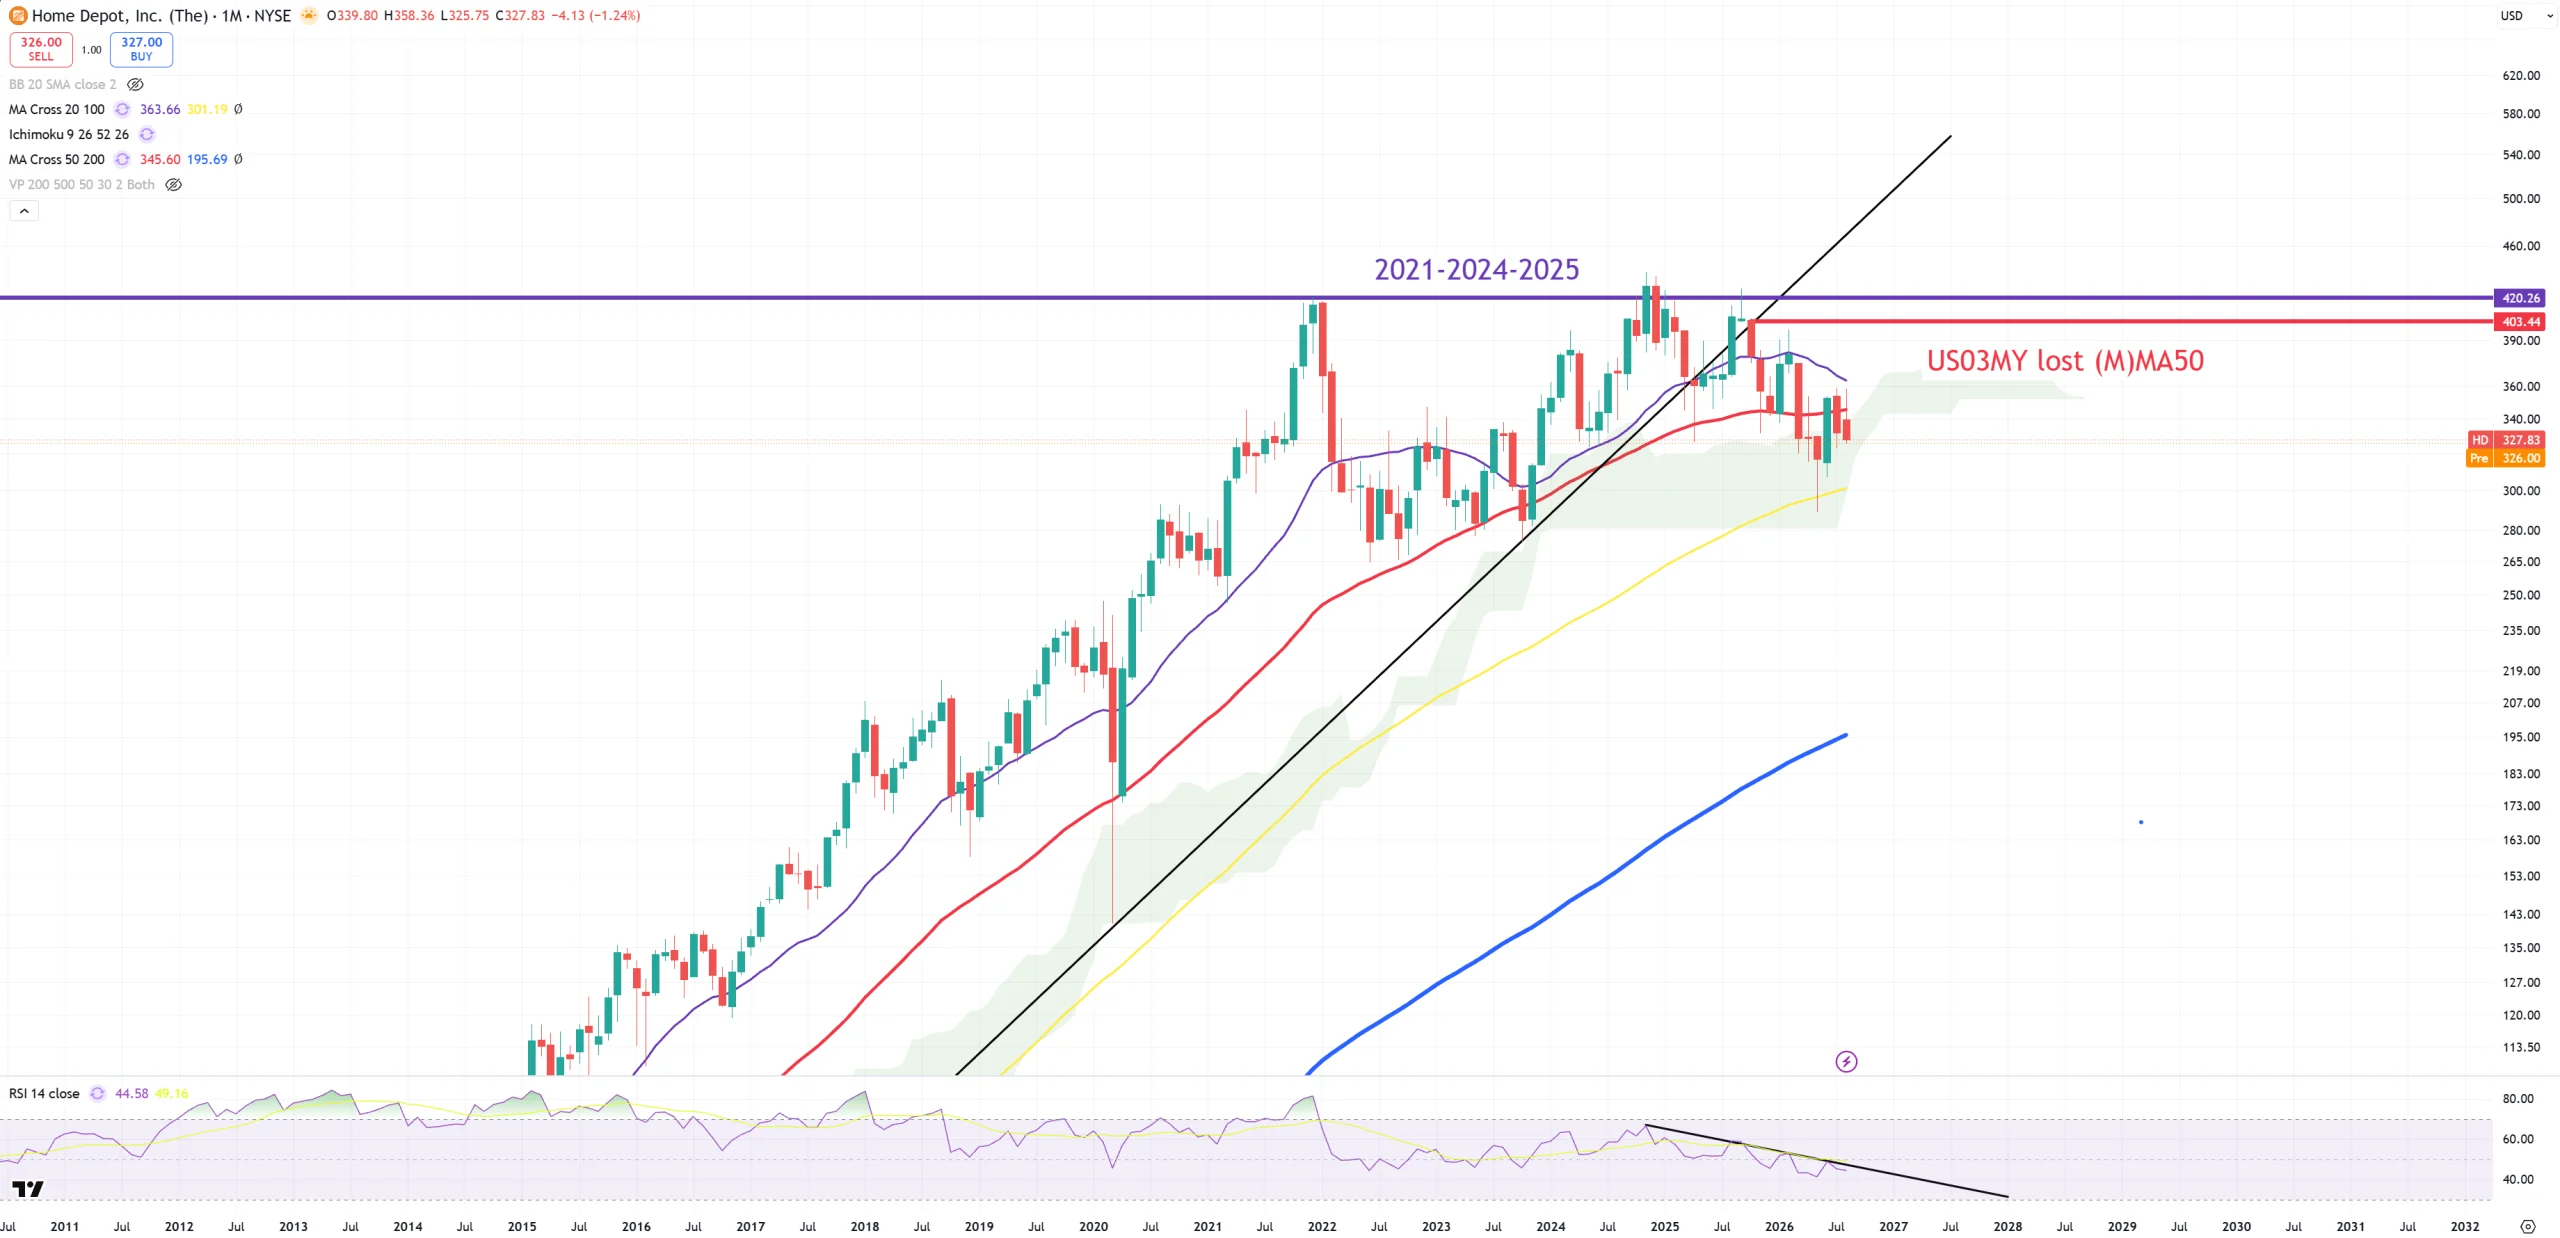
HD – HomeDepot is busted
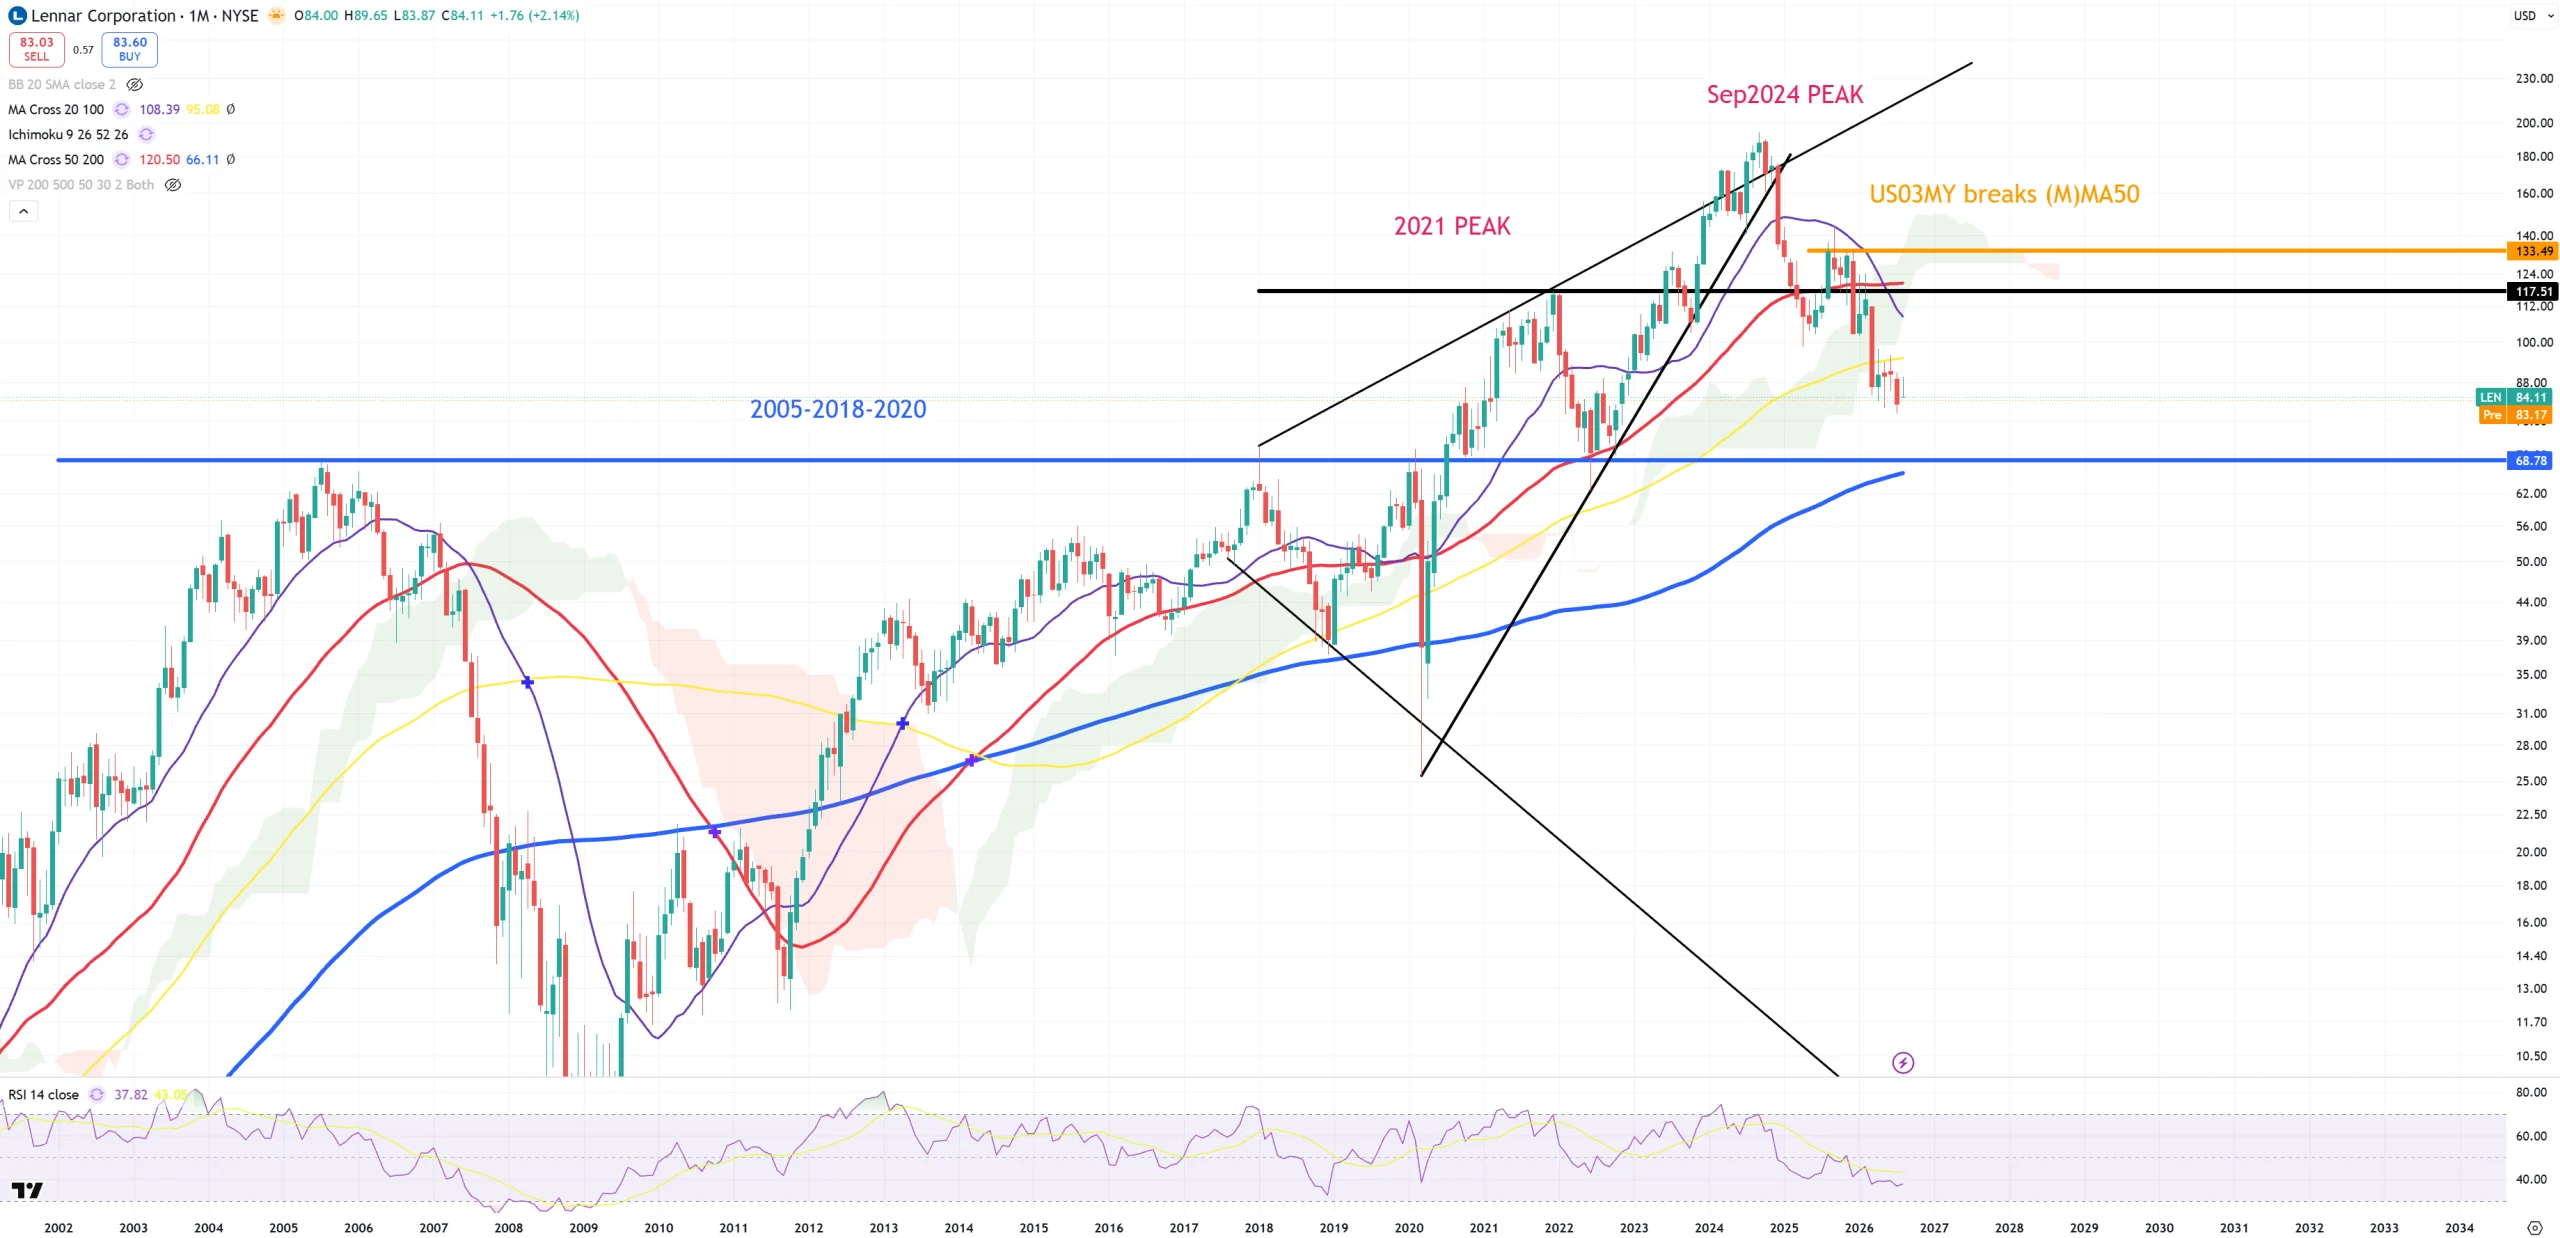
LEN – just like Lennar
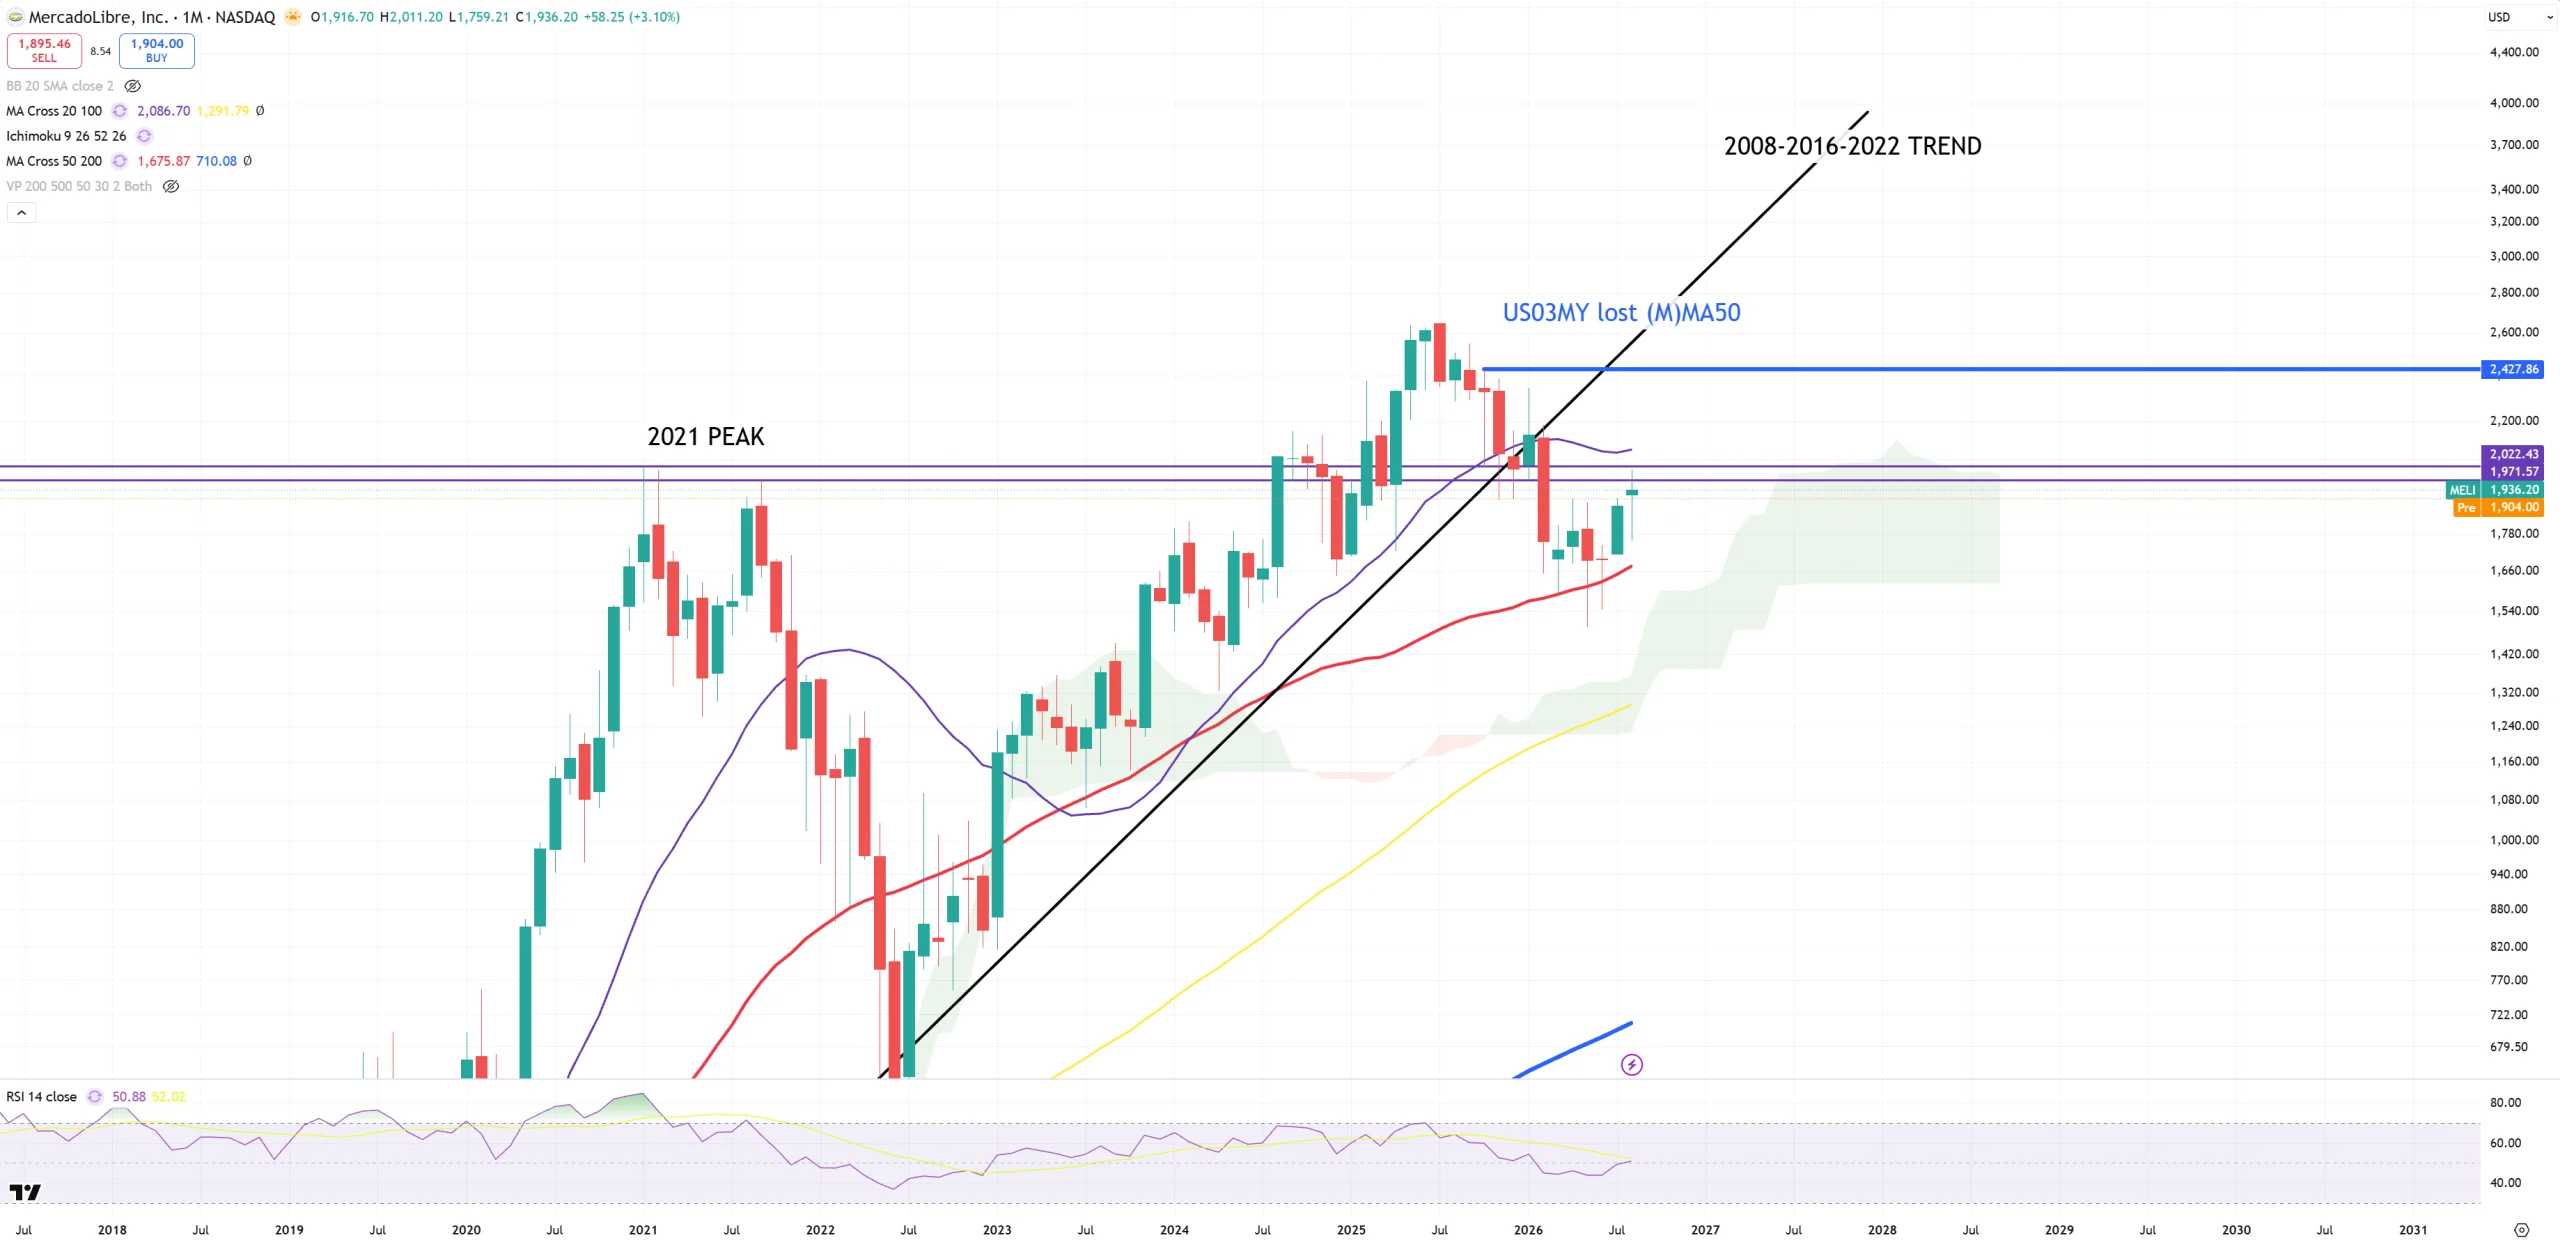
MELI – South America’s Amazon
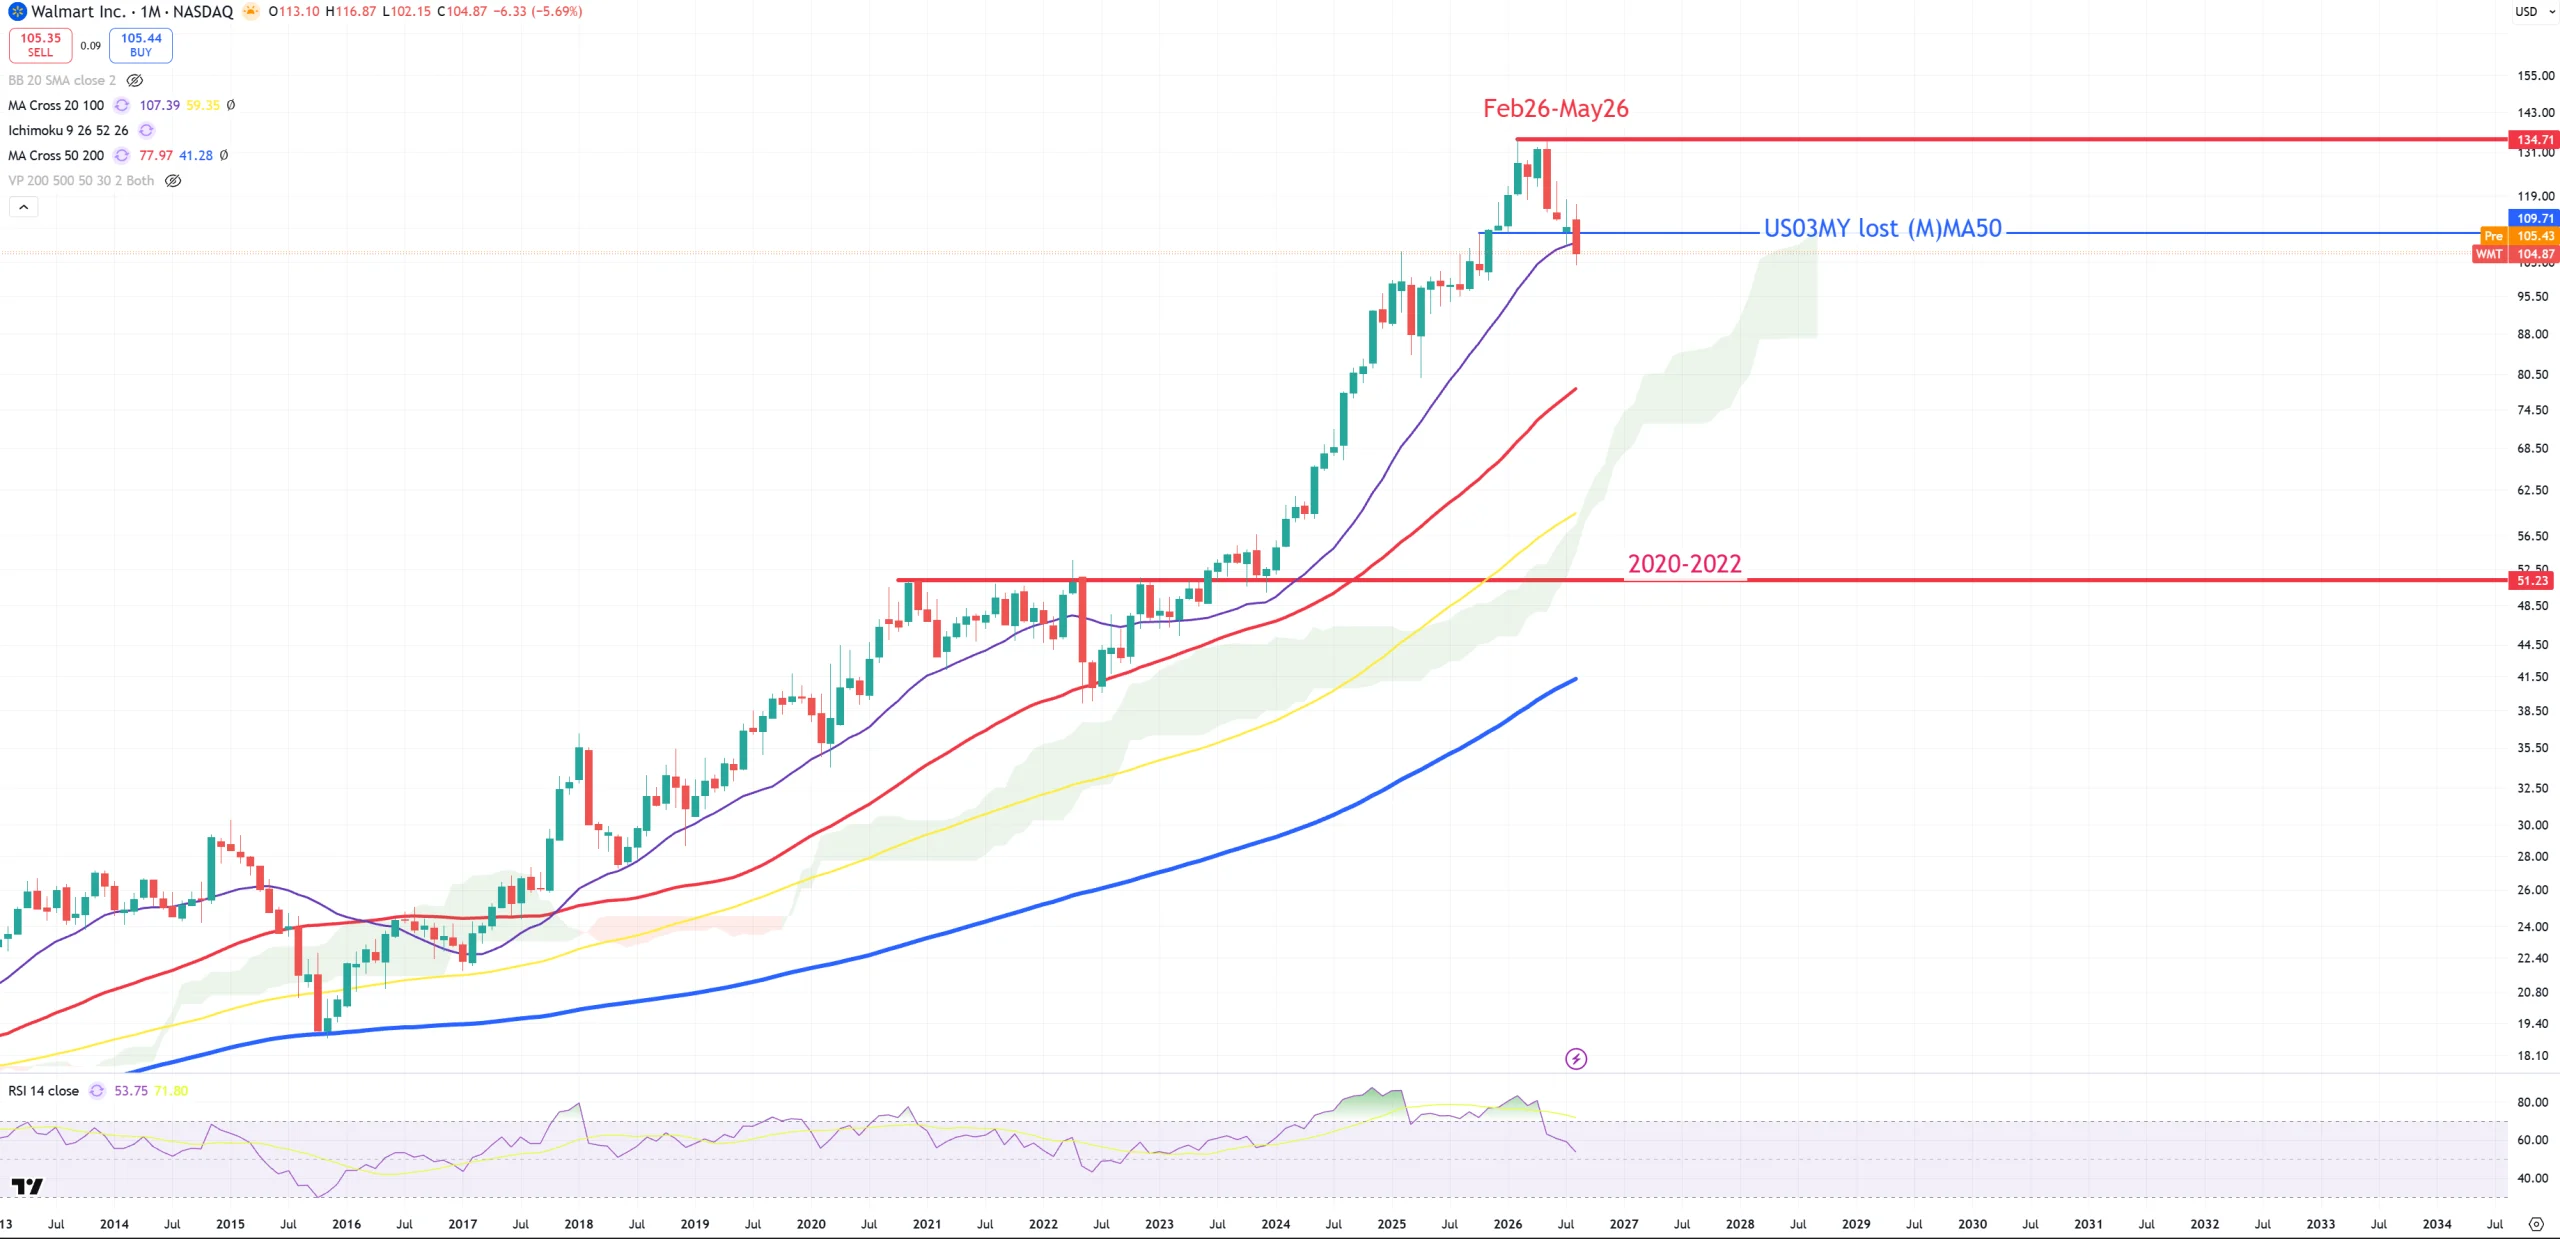
WMT – Walmart – and (M)MA20 break.
BOND MARKET IN GENERAL
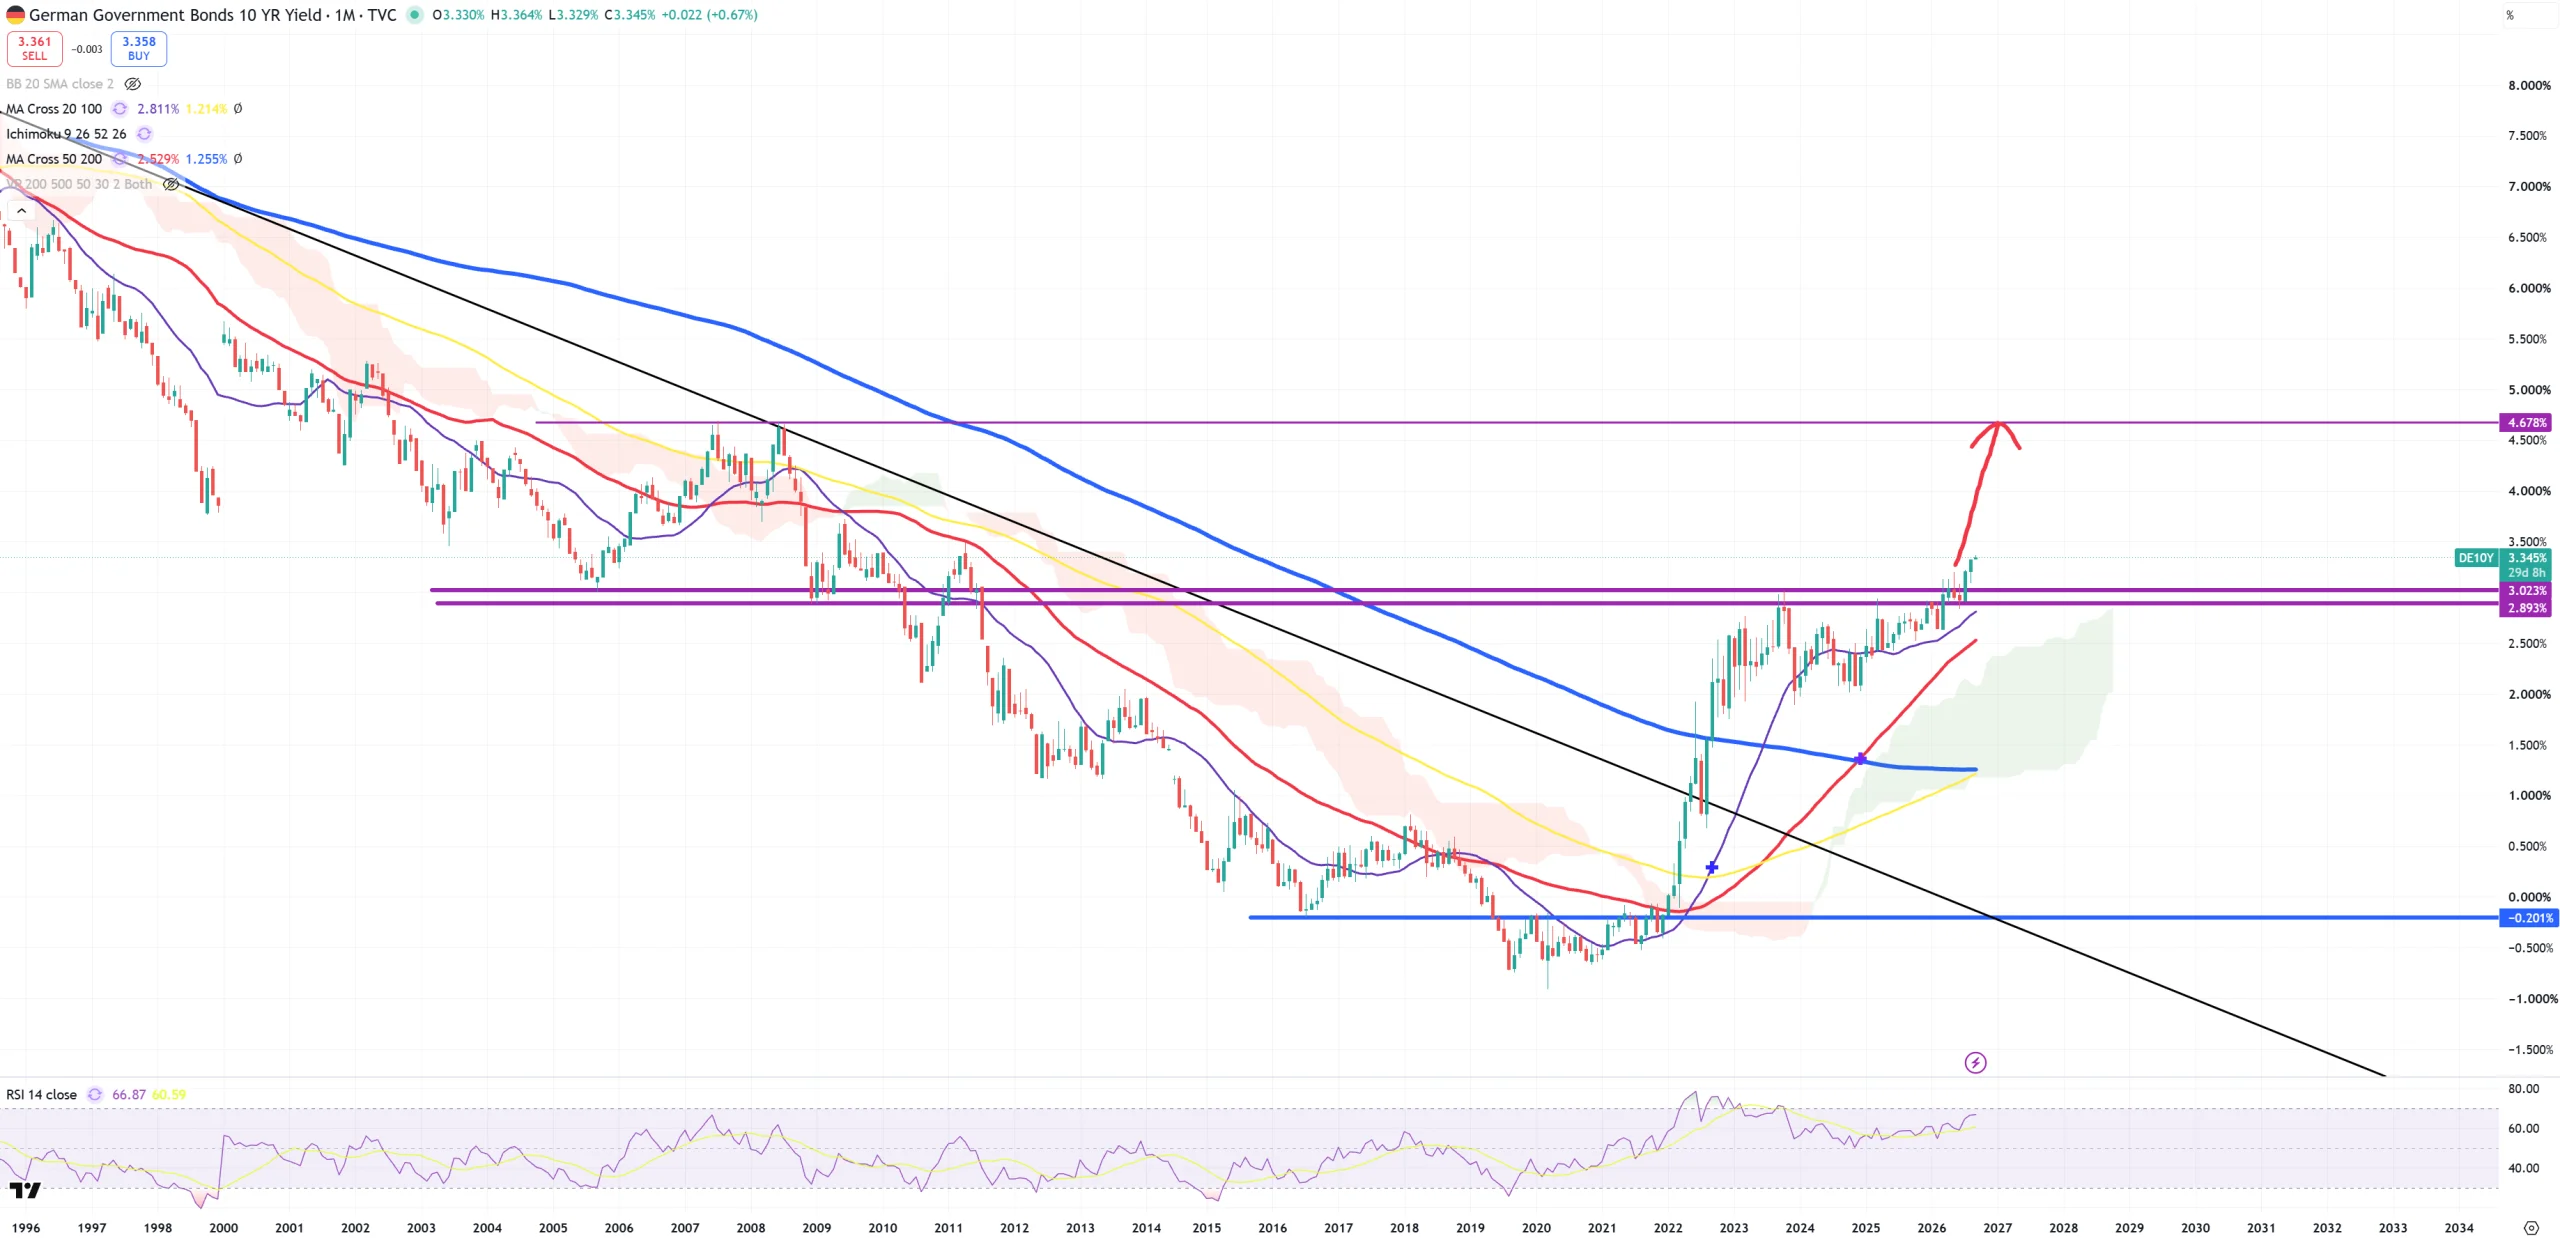
DE10Y – 4.8% coming.
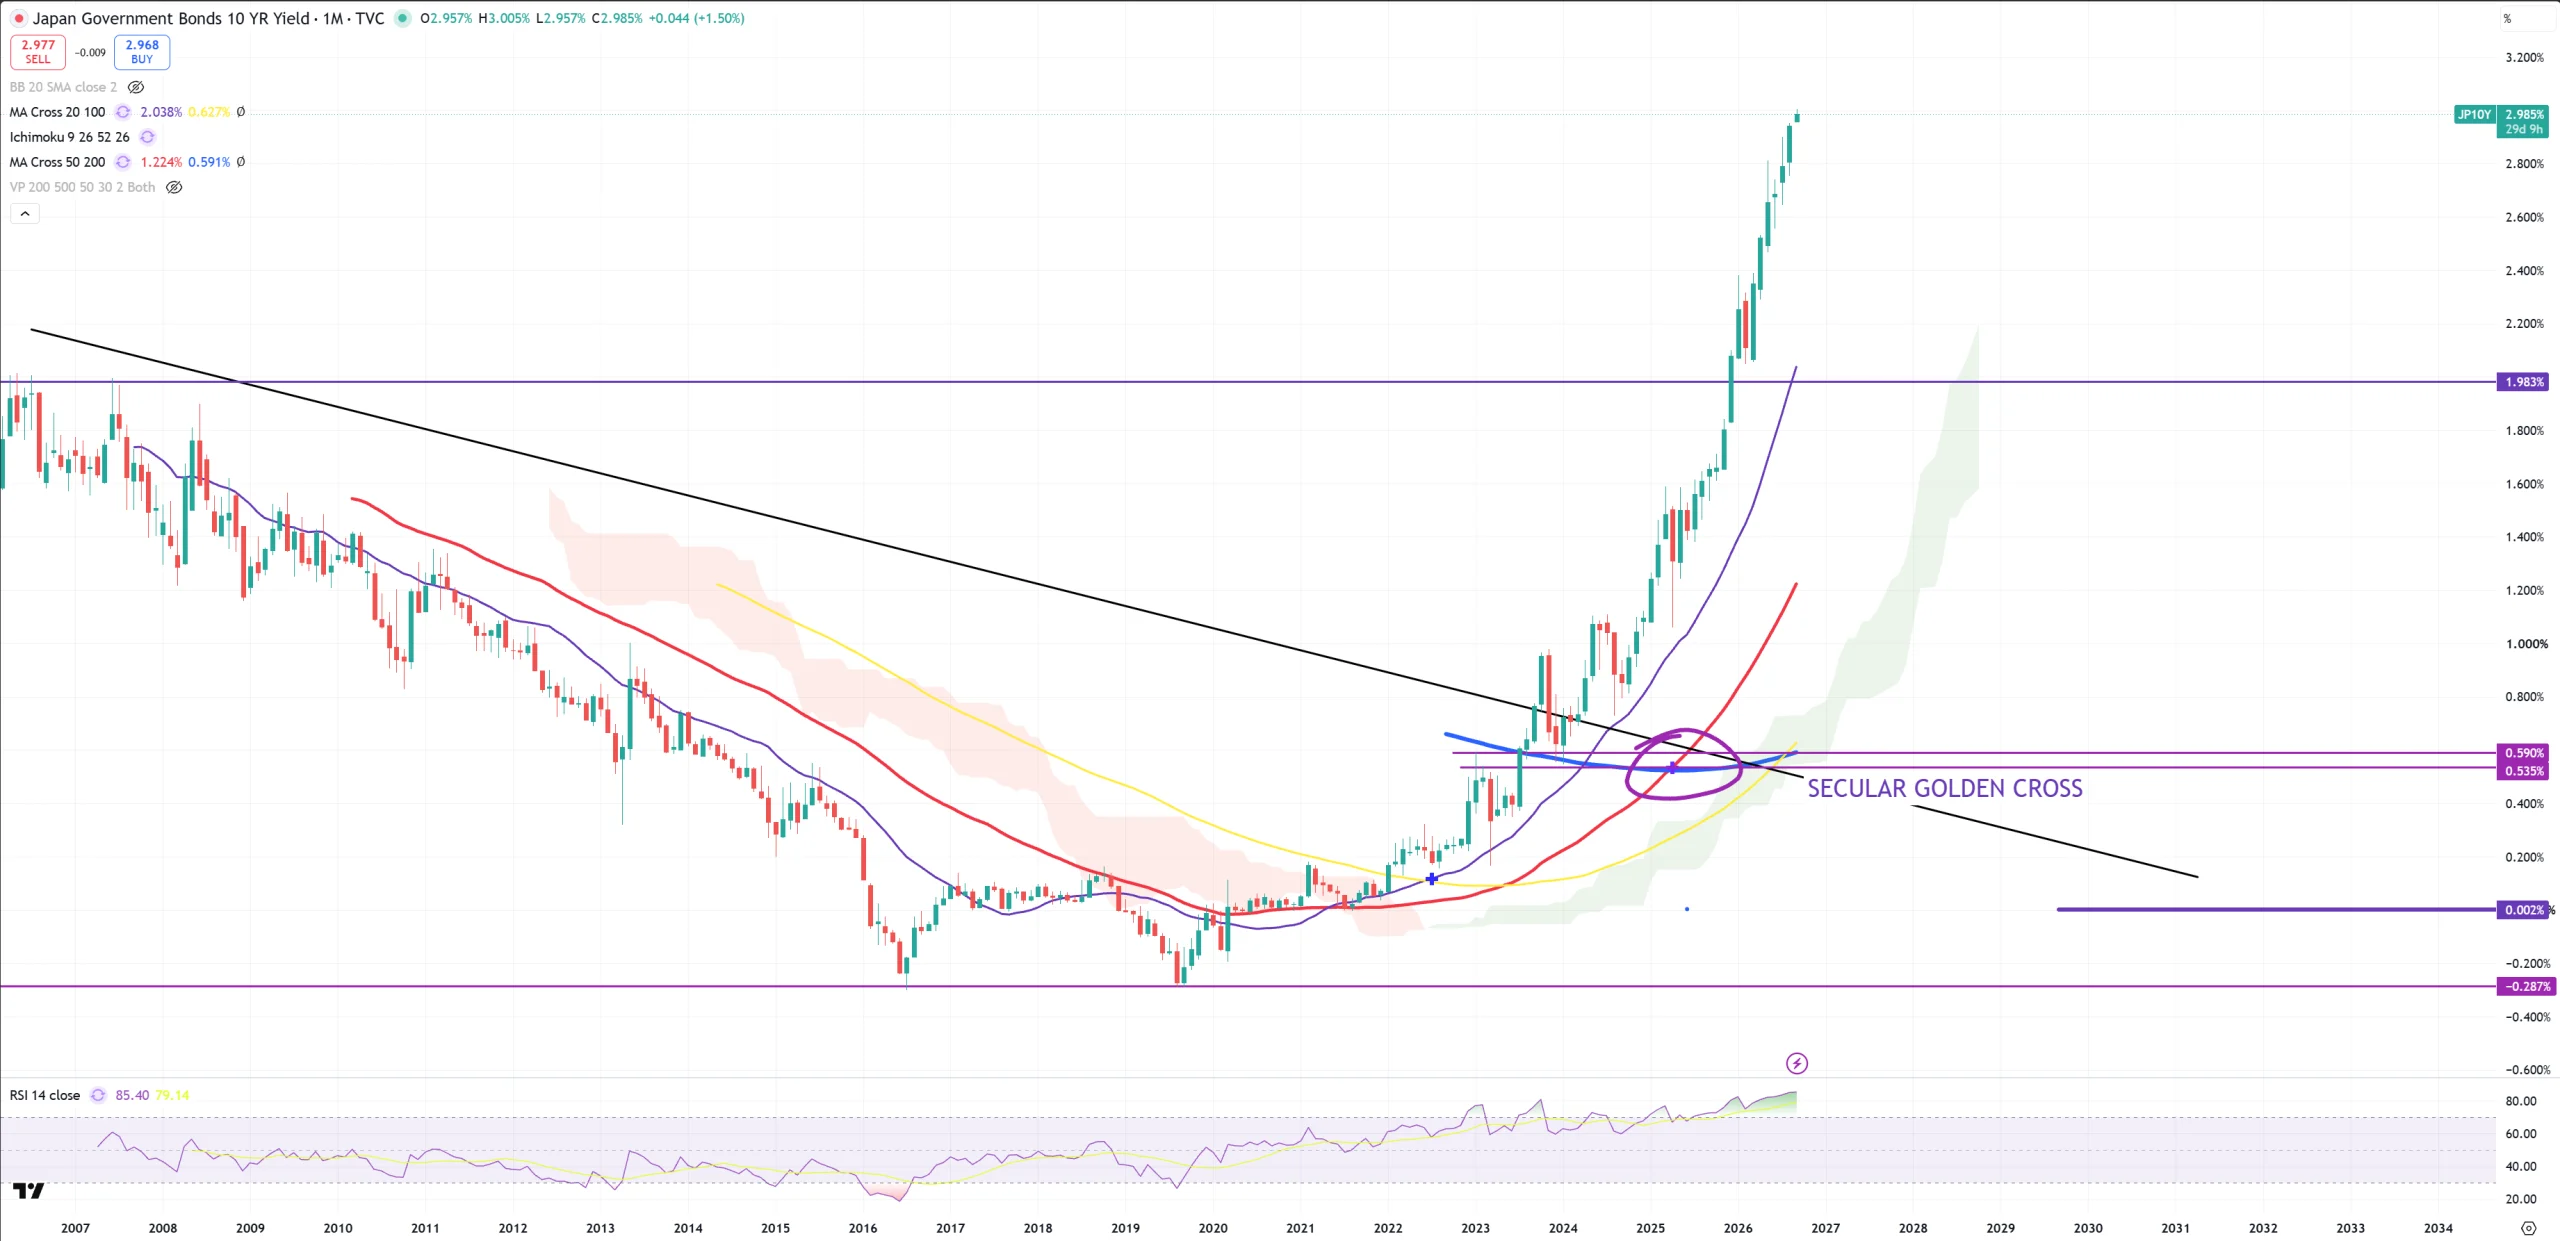
JP10Y – sky is the limit
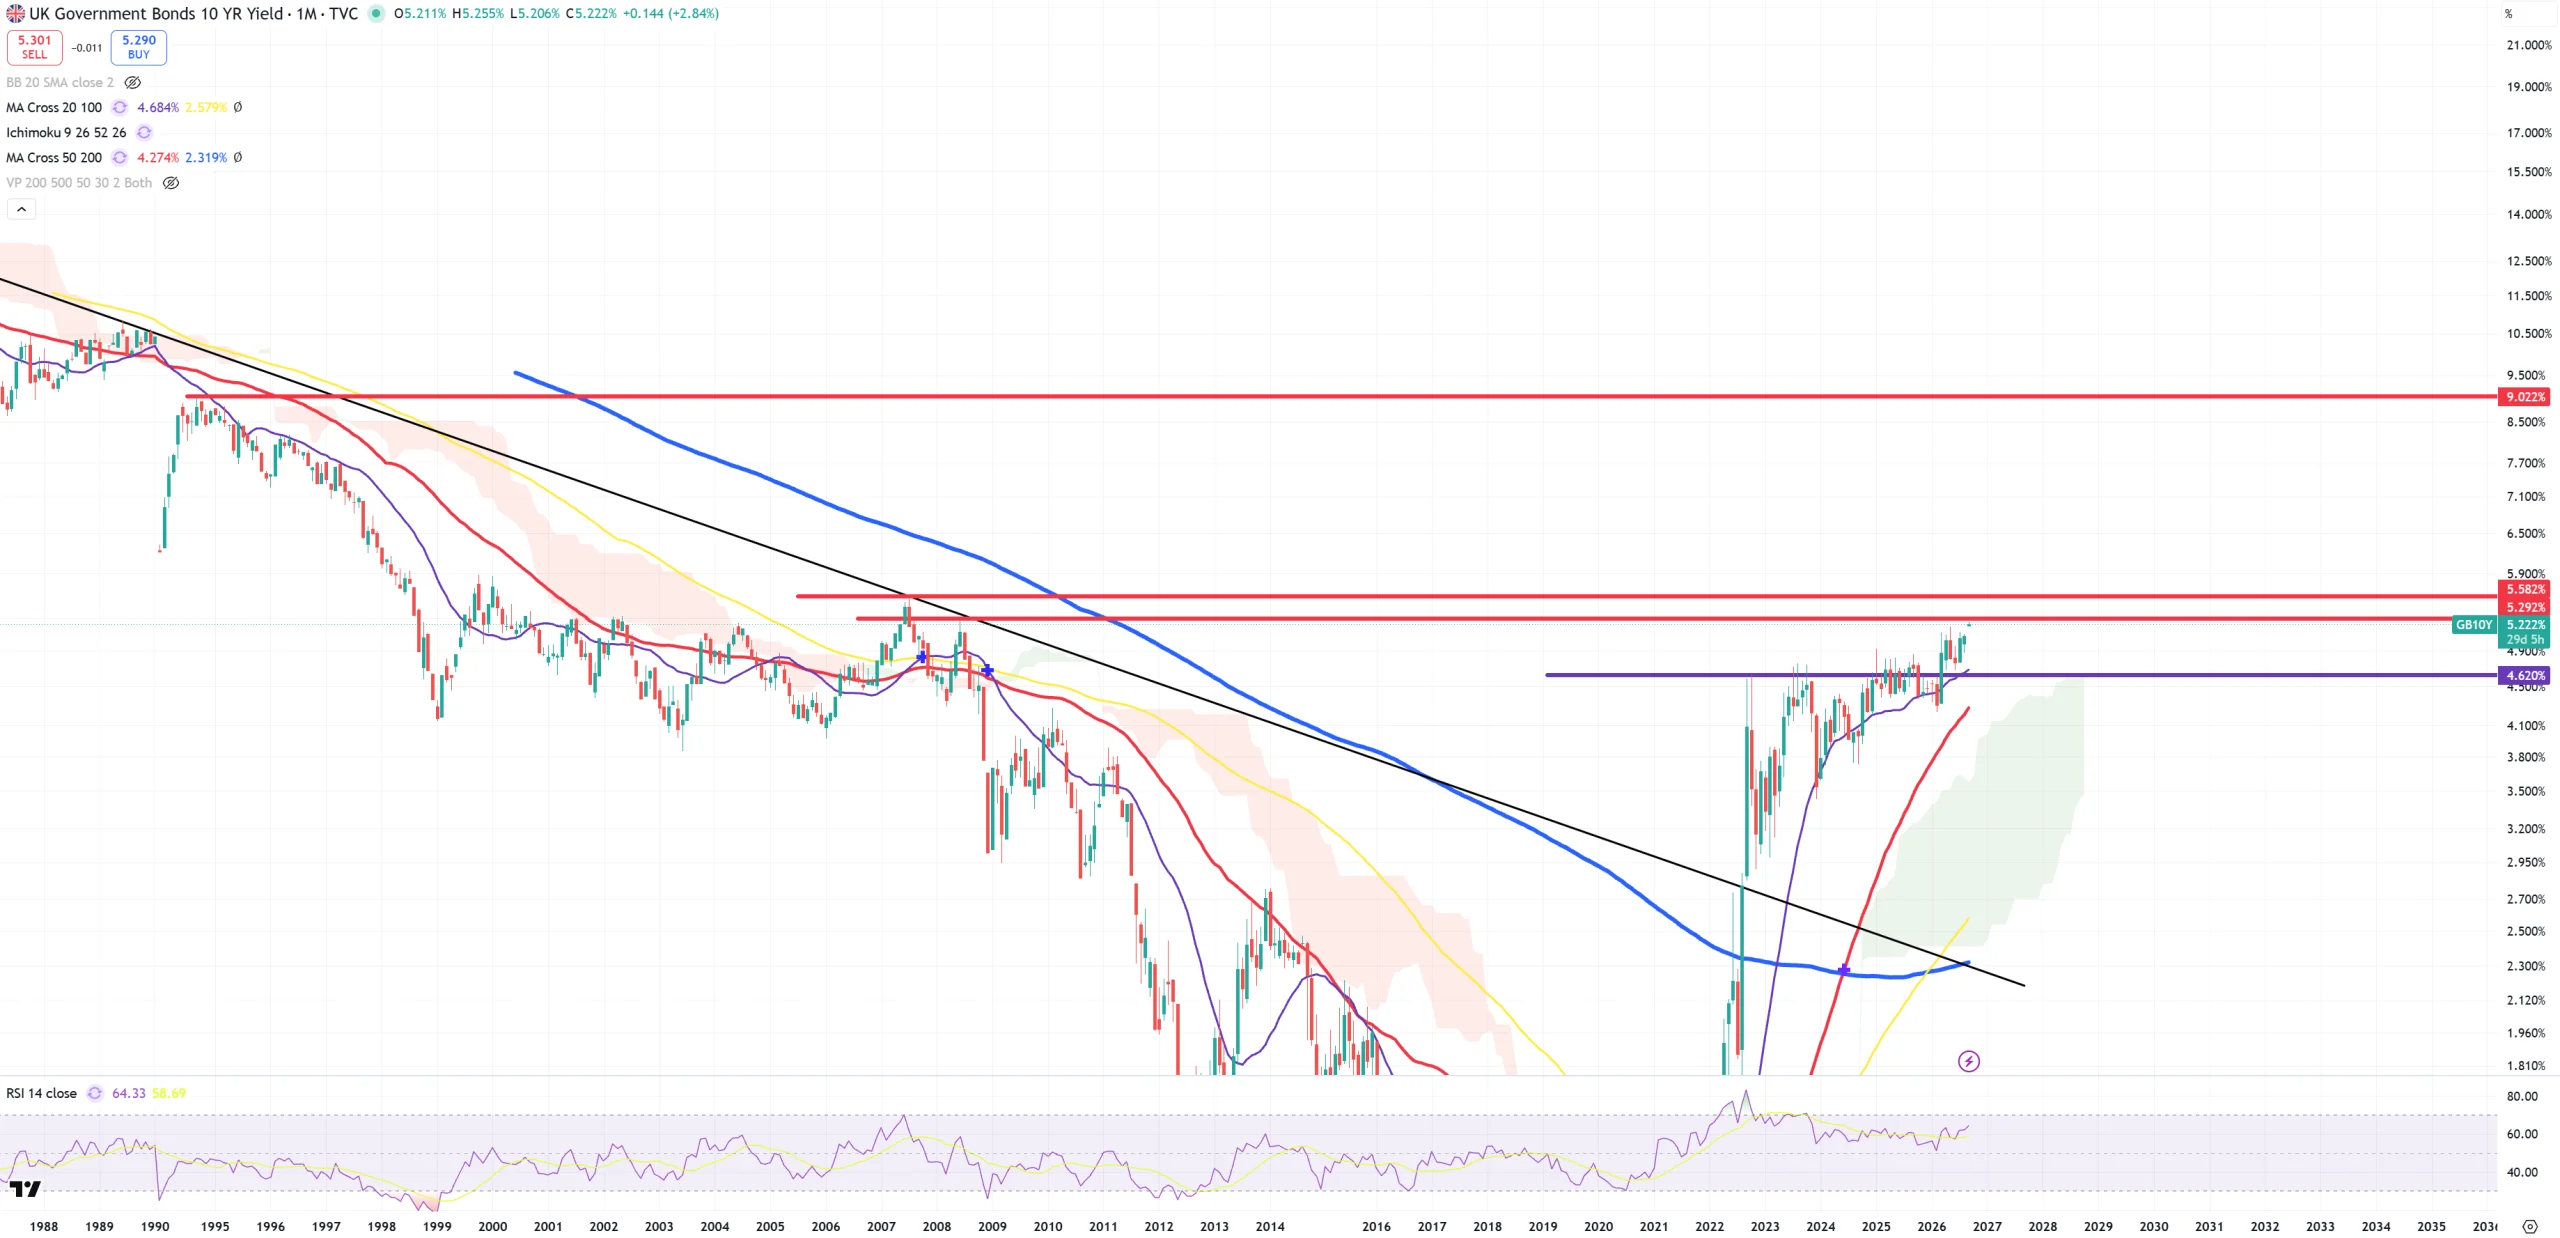
GB10Y – once we break 5.6% it’ll be 9.0%
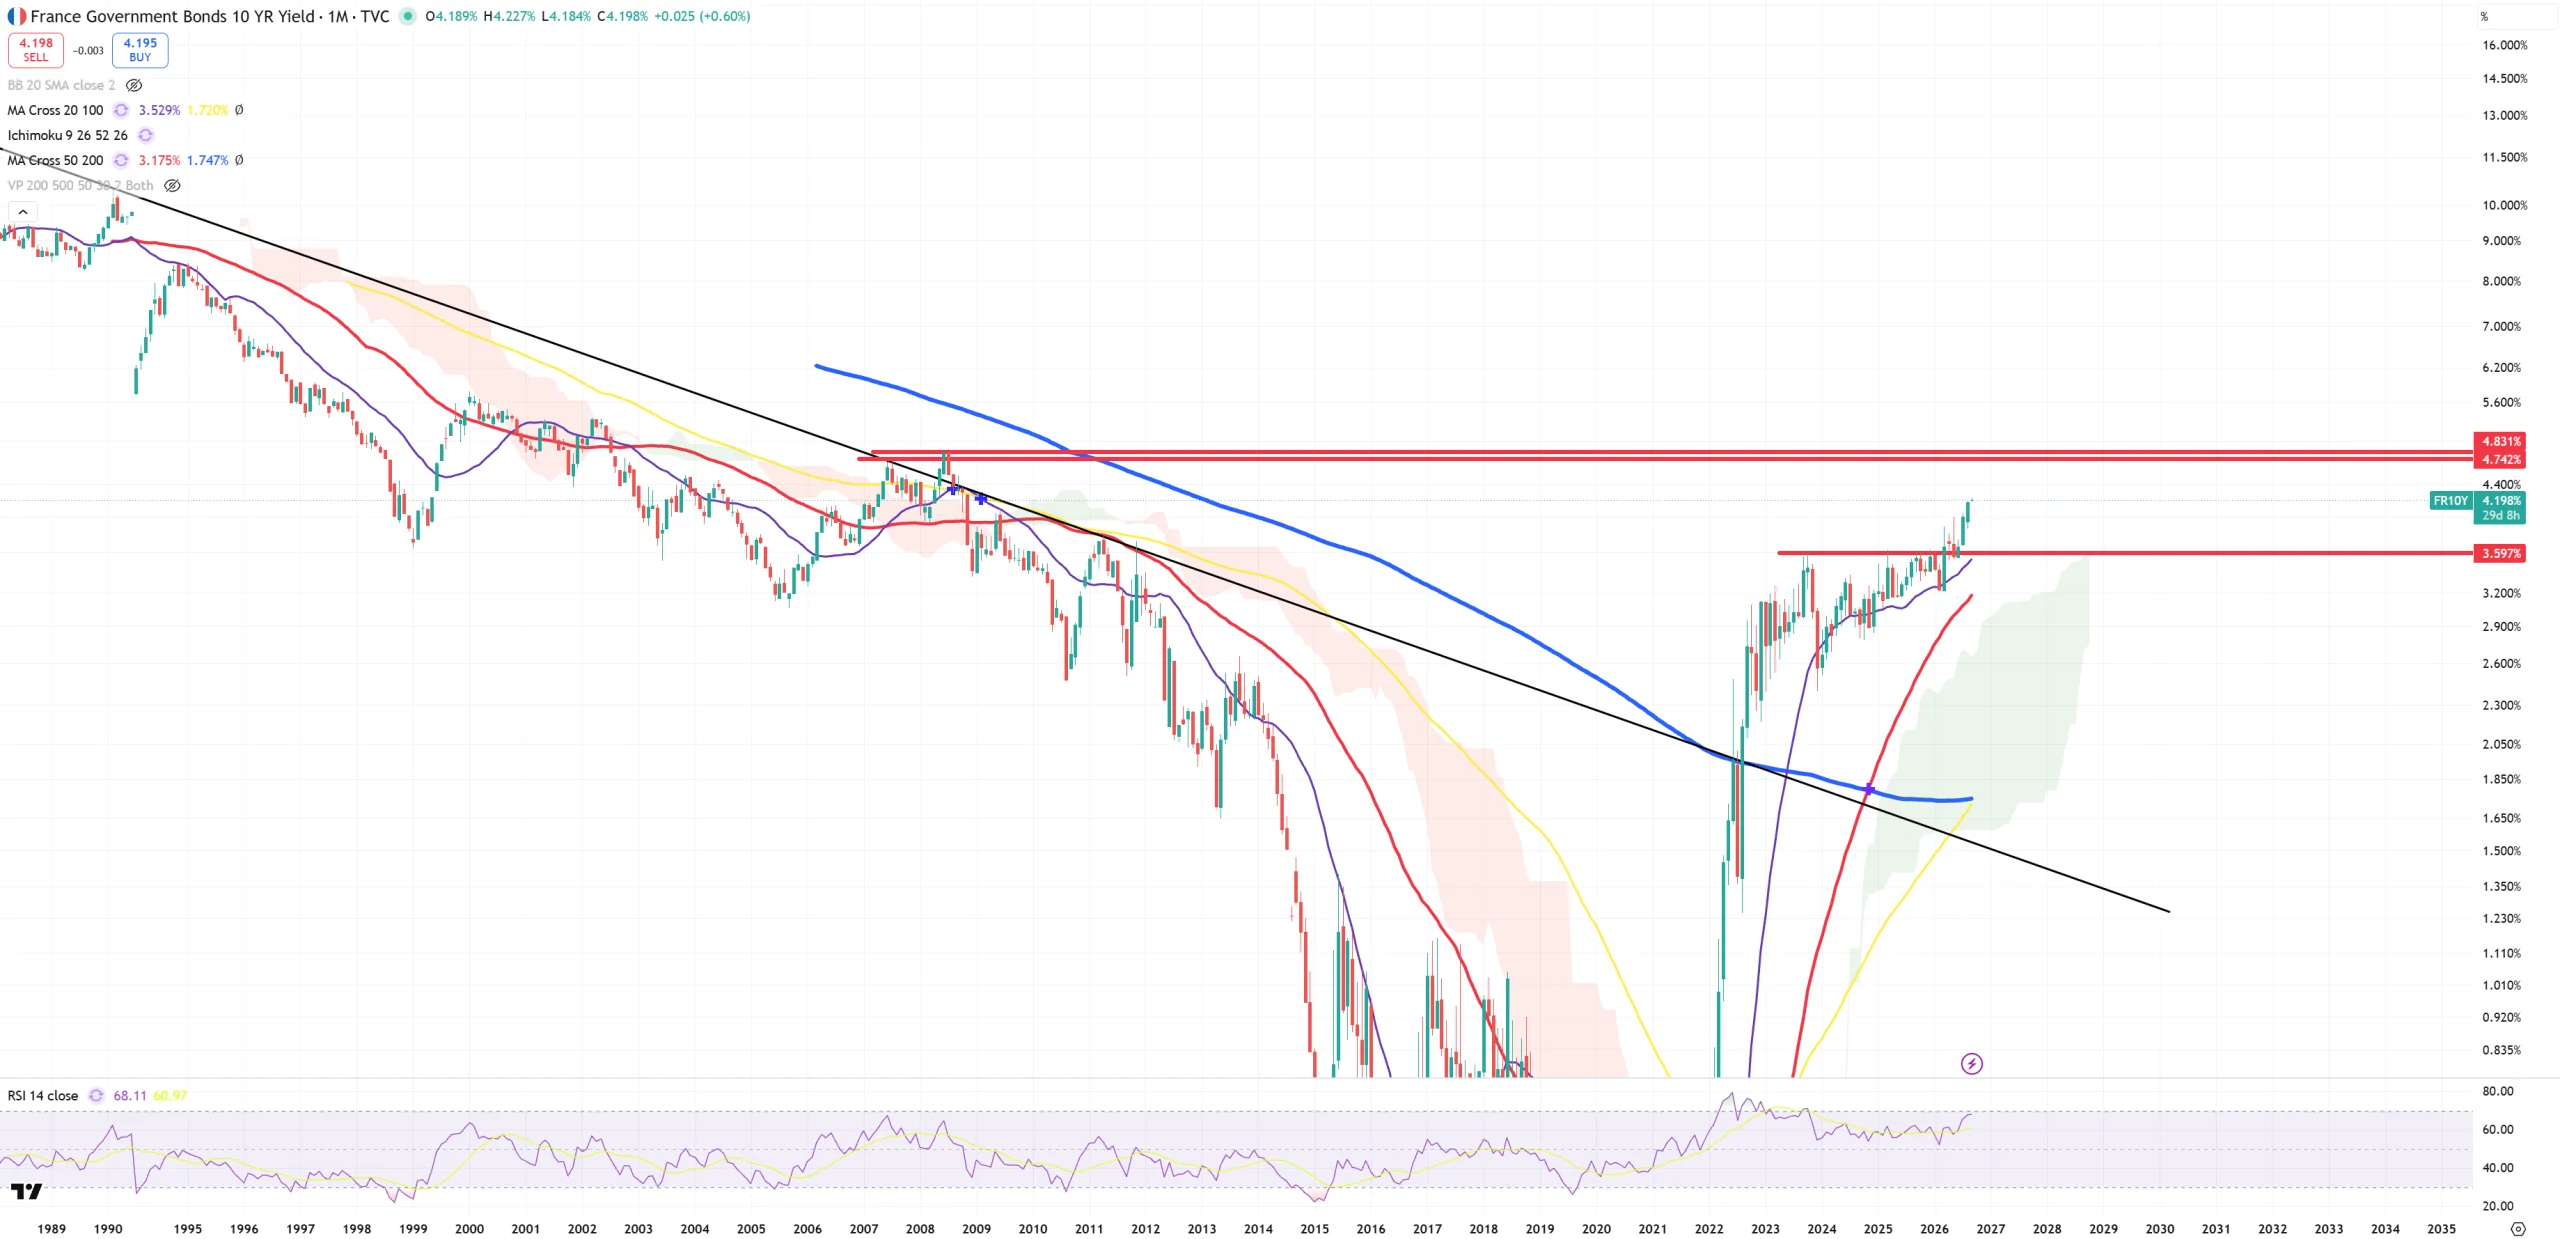
FR10Y – 4.8% coming
COUNTRIES
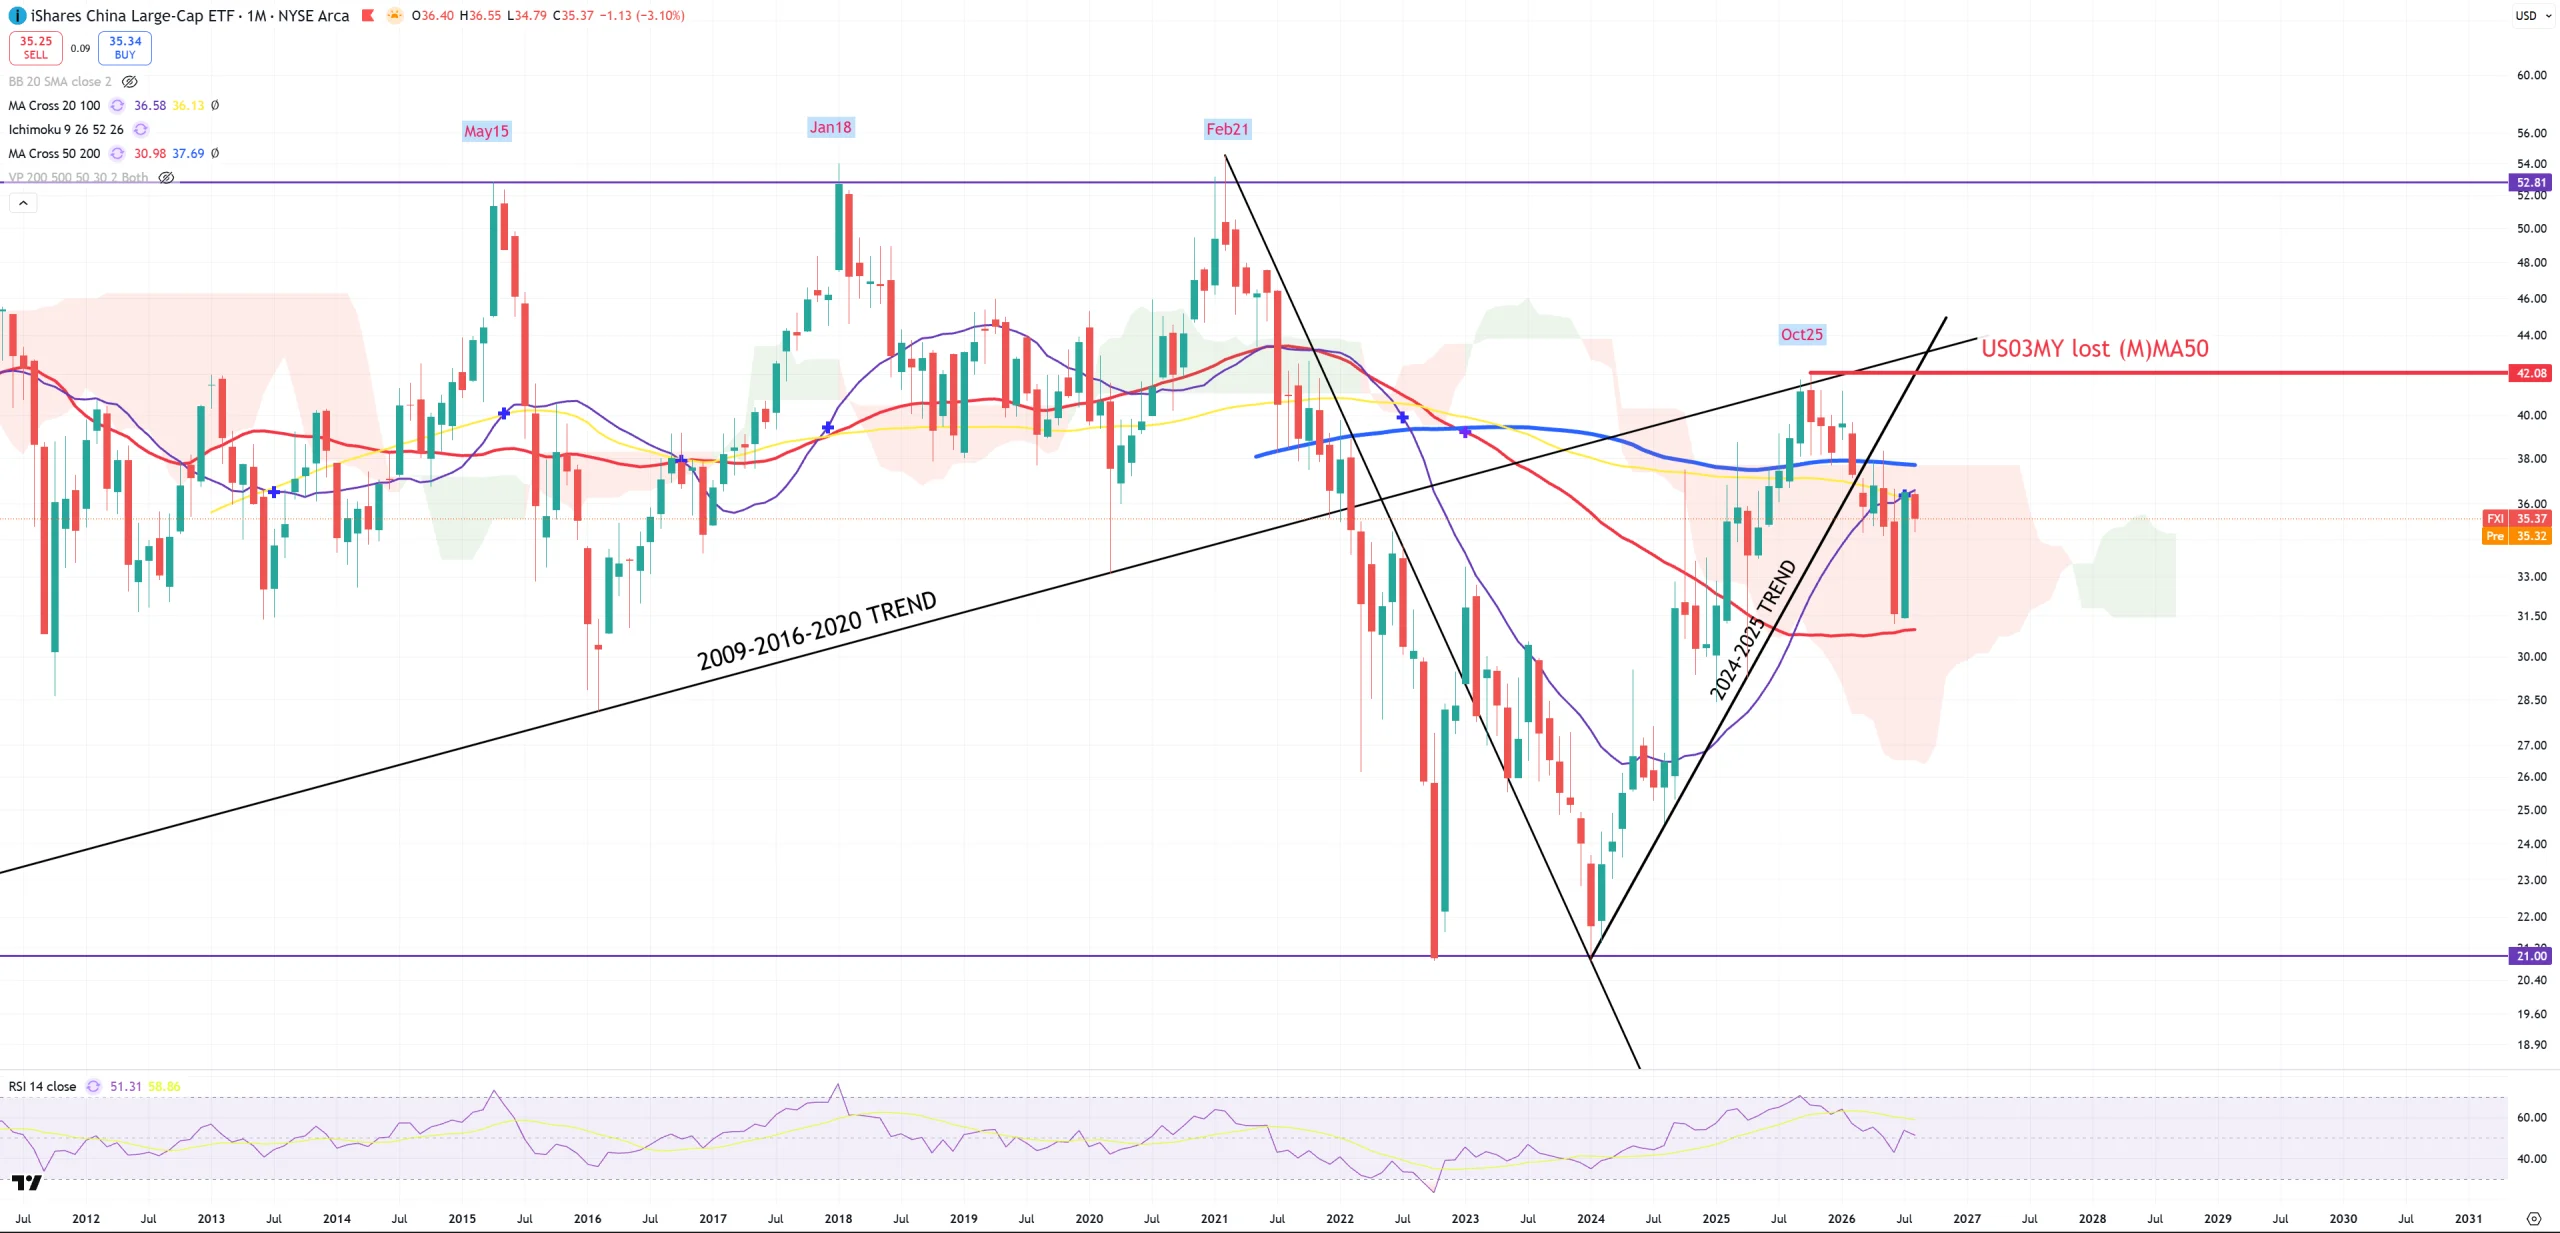
FXI – China is nowhere. Below (M)MA200, 100 and 20. Red (M)MA50 ahead.
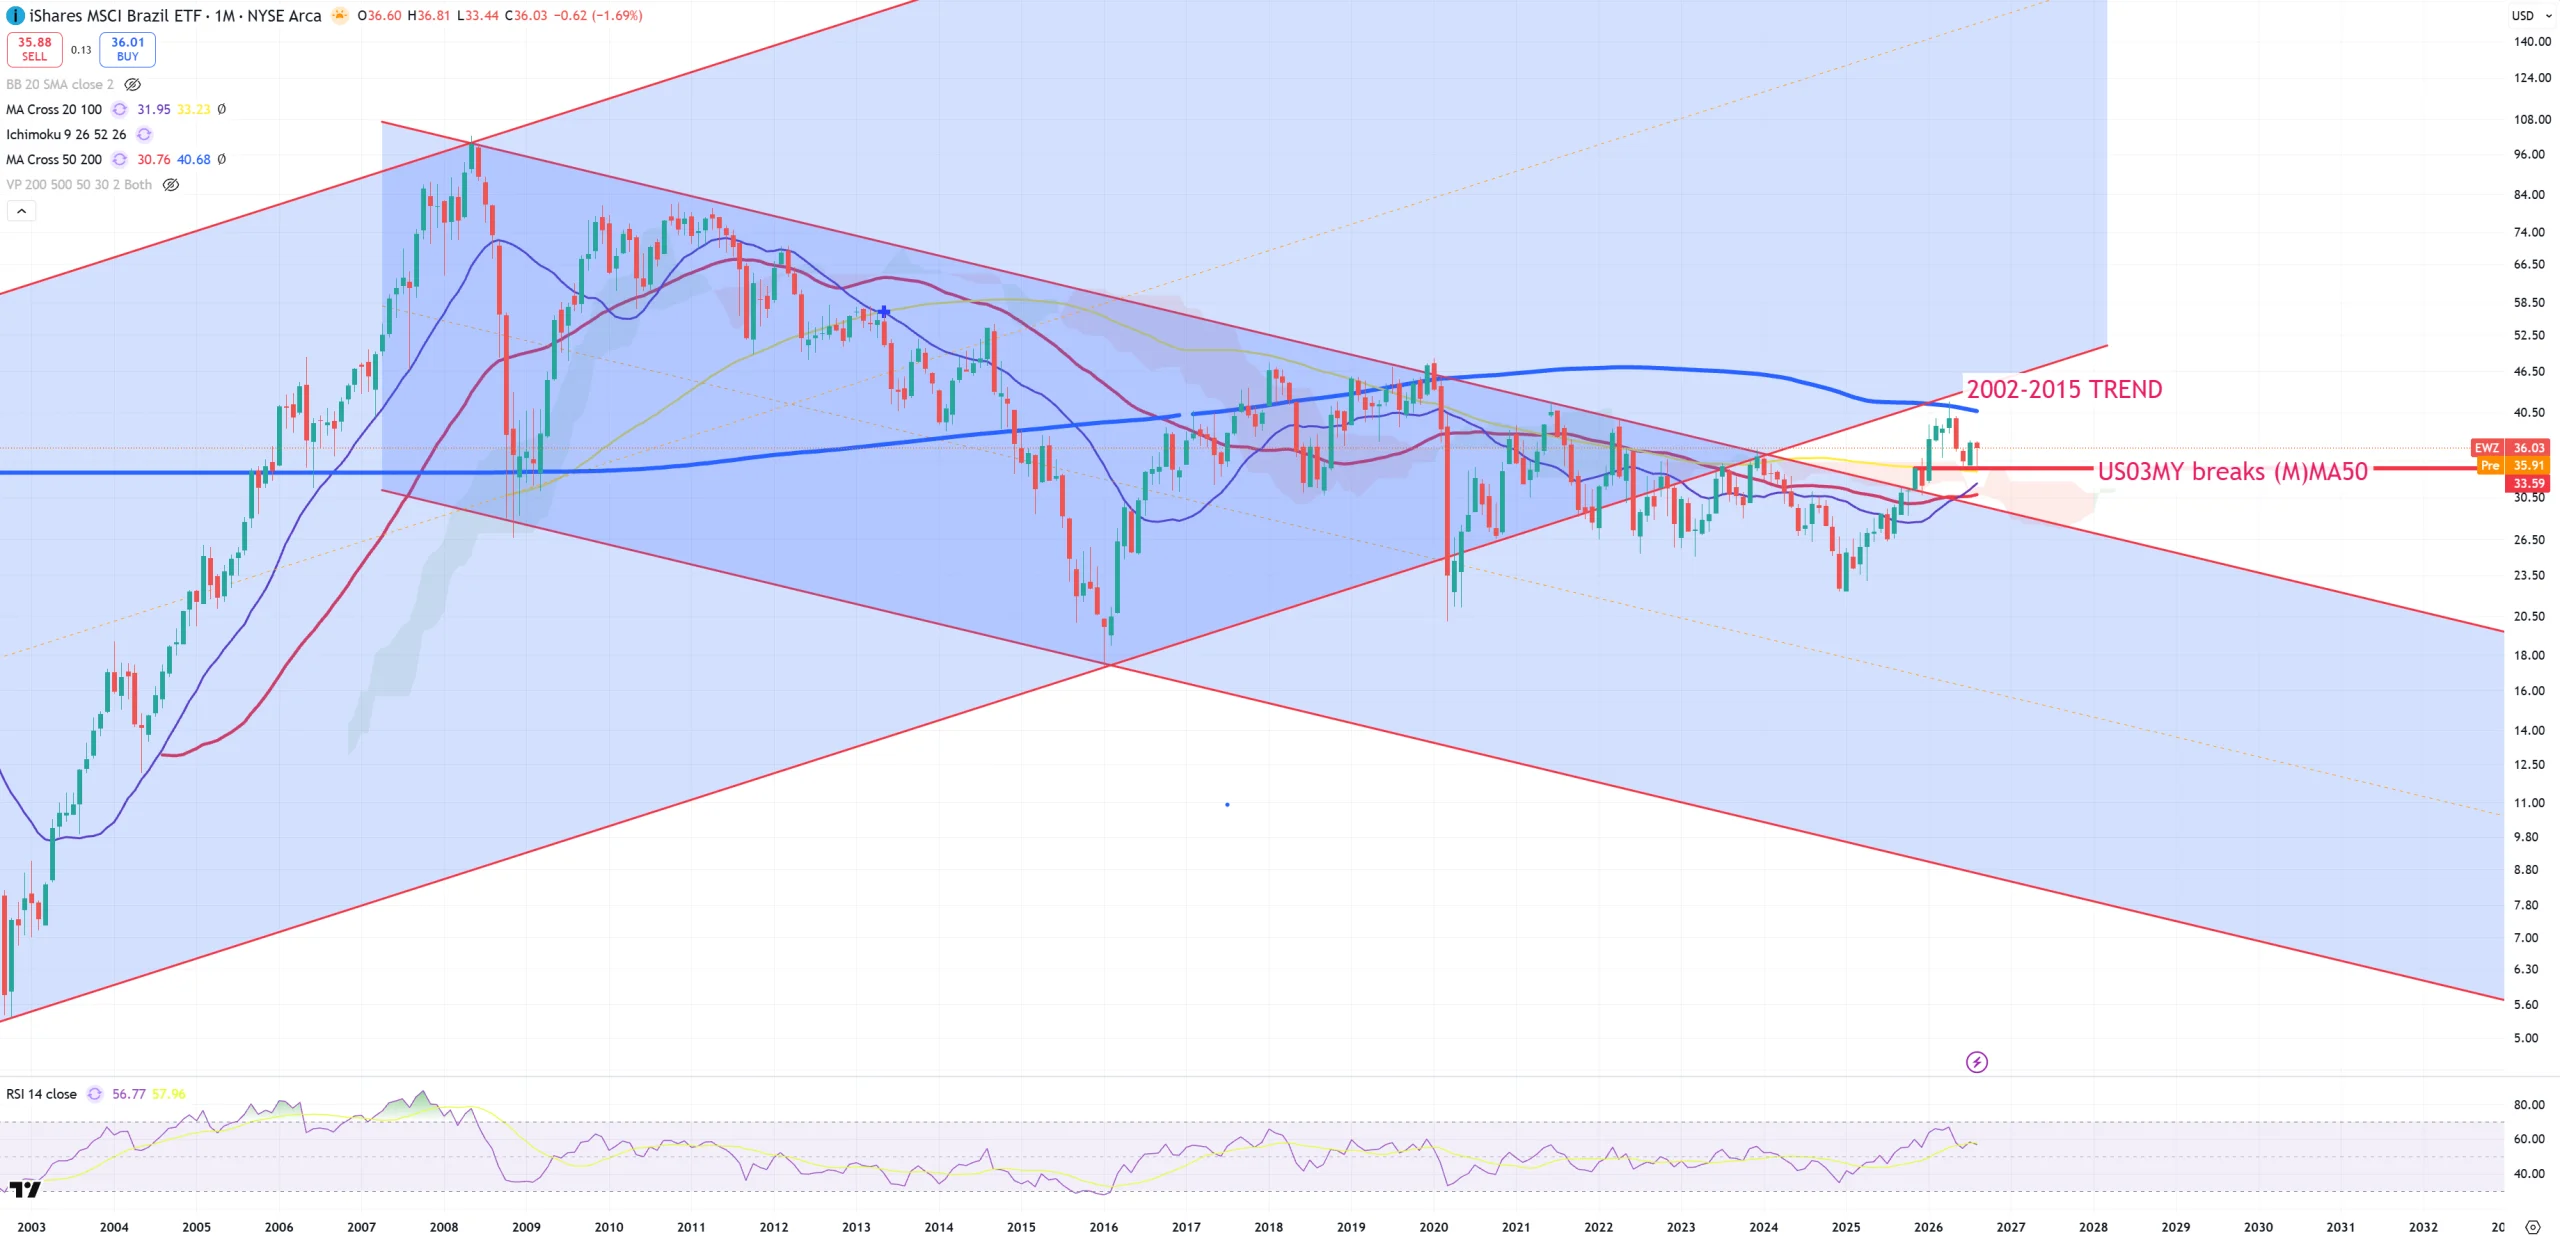
EWZ – Brazil awaits for a bounce? or move down back into old channel.
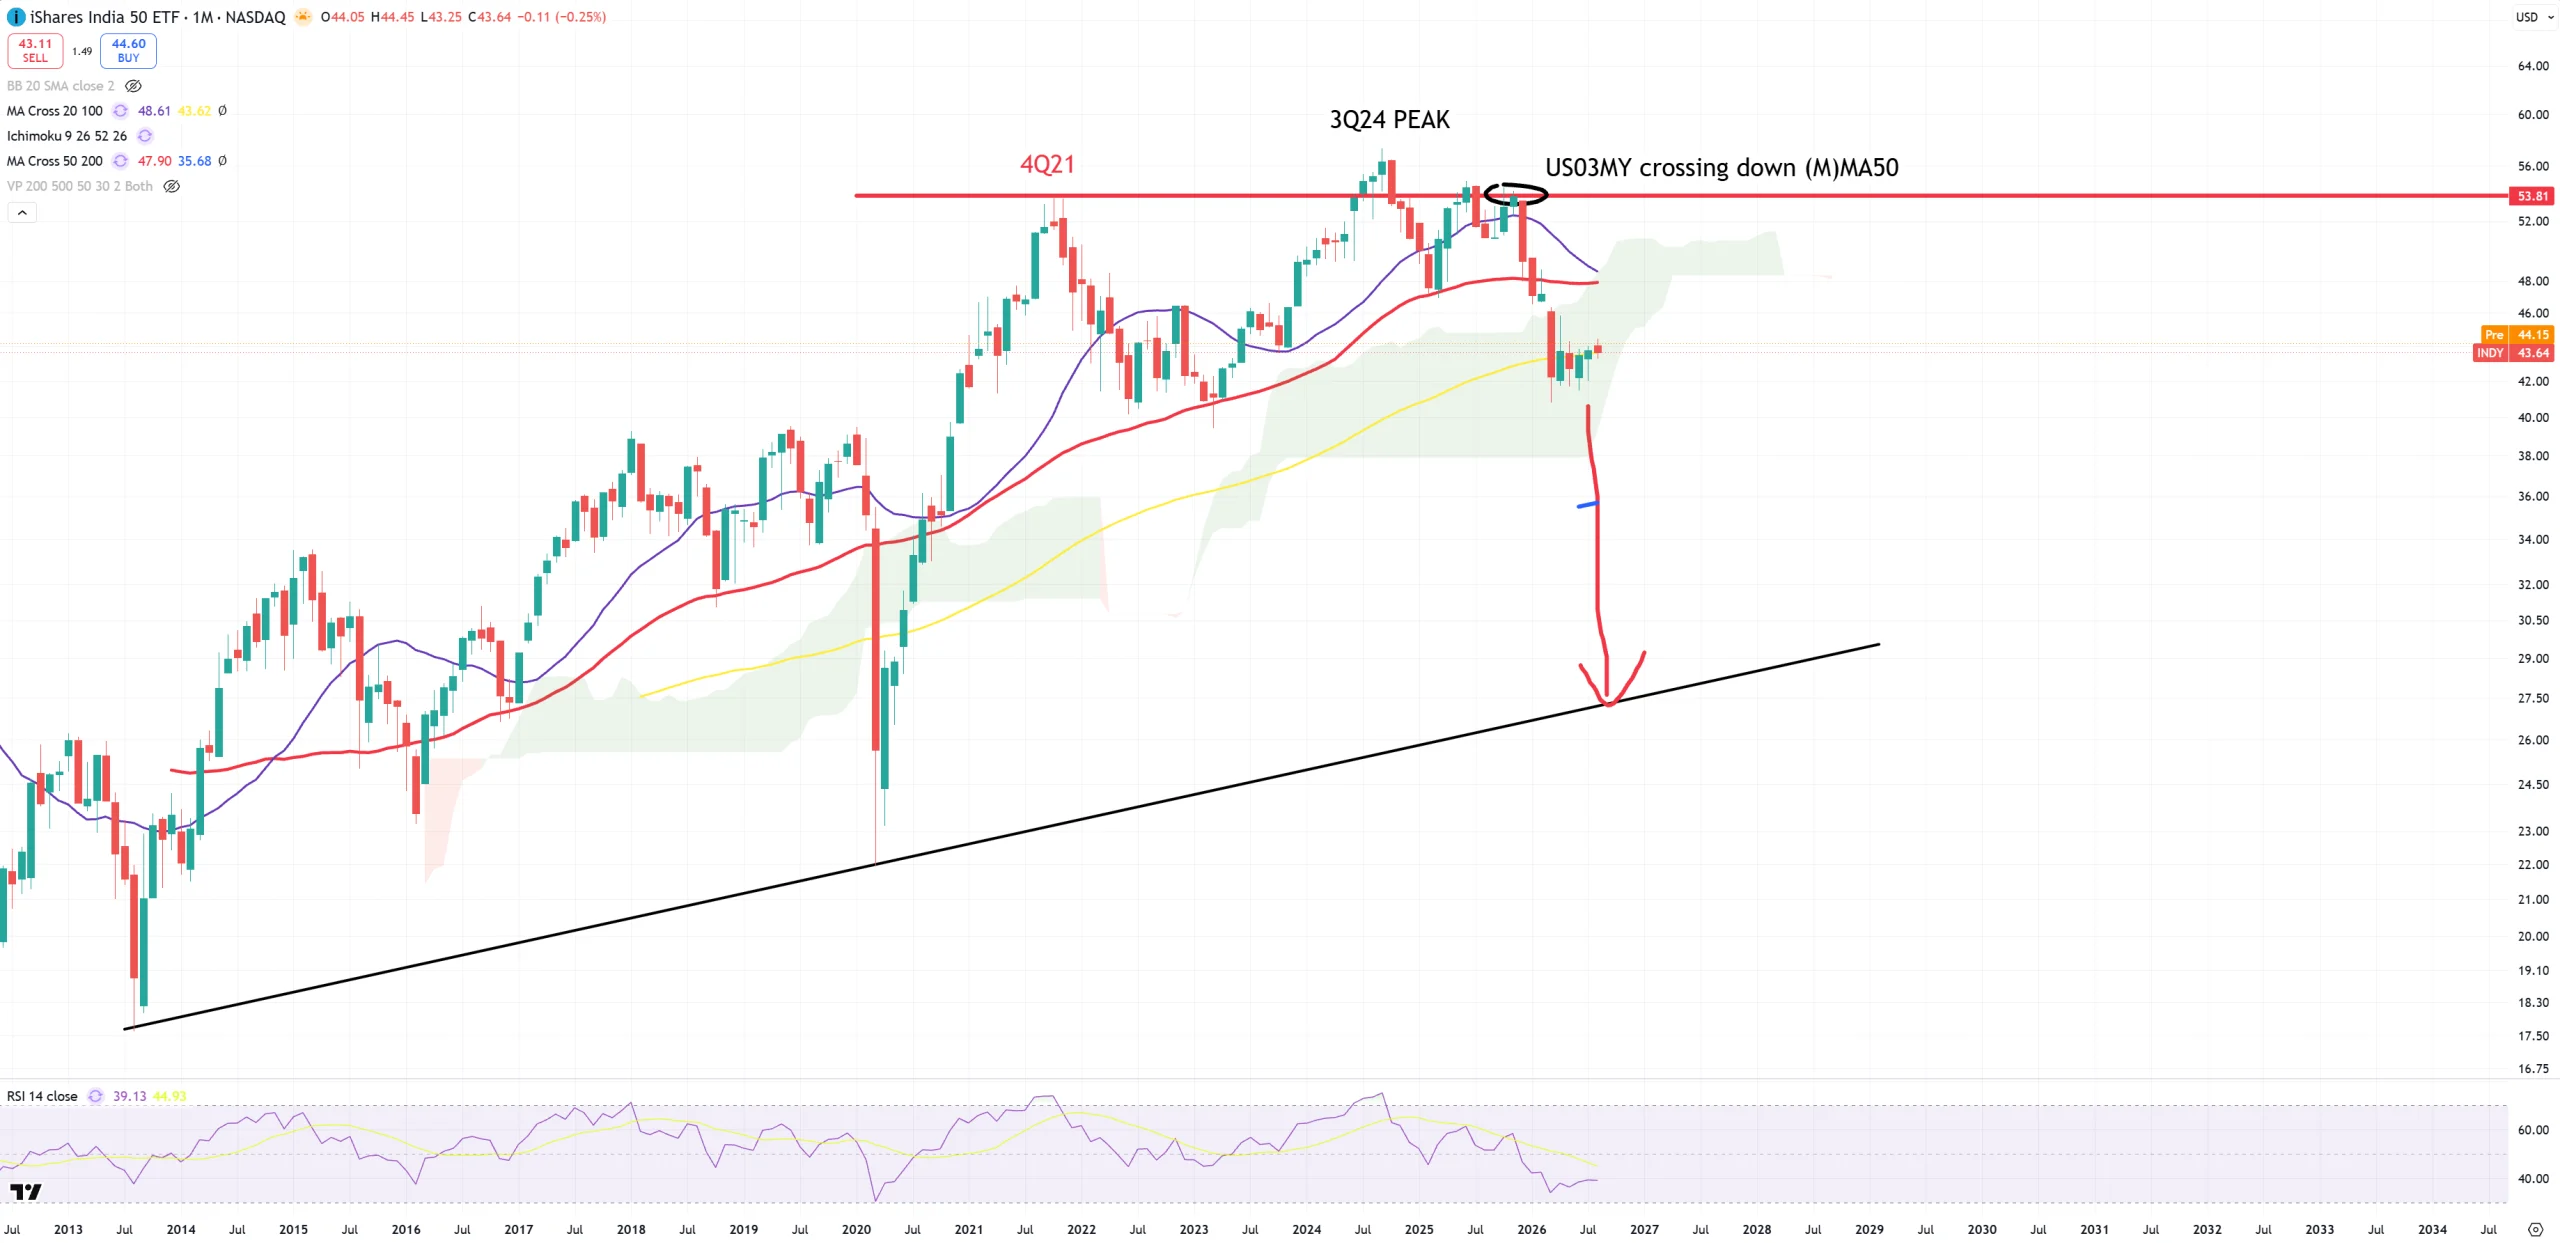
INDY – India 50 – unchanged since months prediction once this yellow (M)MA100 will become resistance. It’ll crash and take USDINR towards 100+.
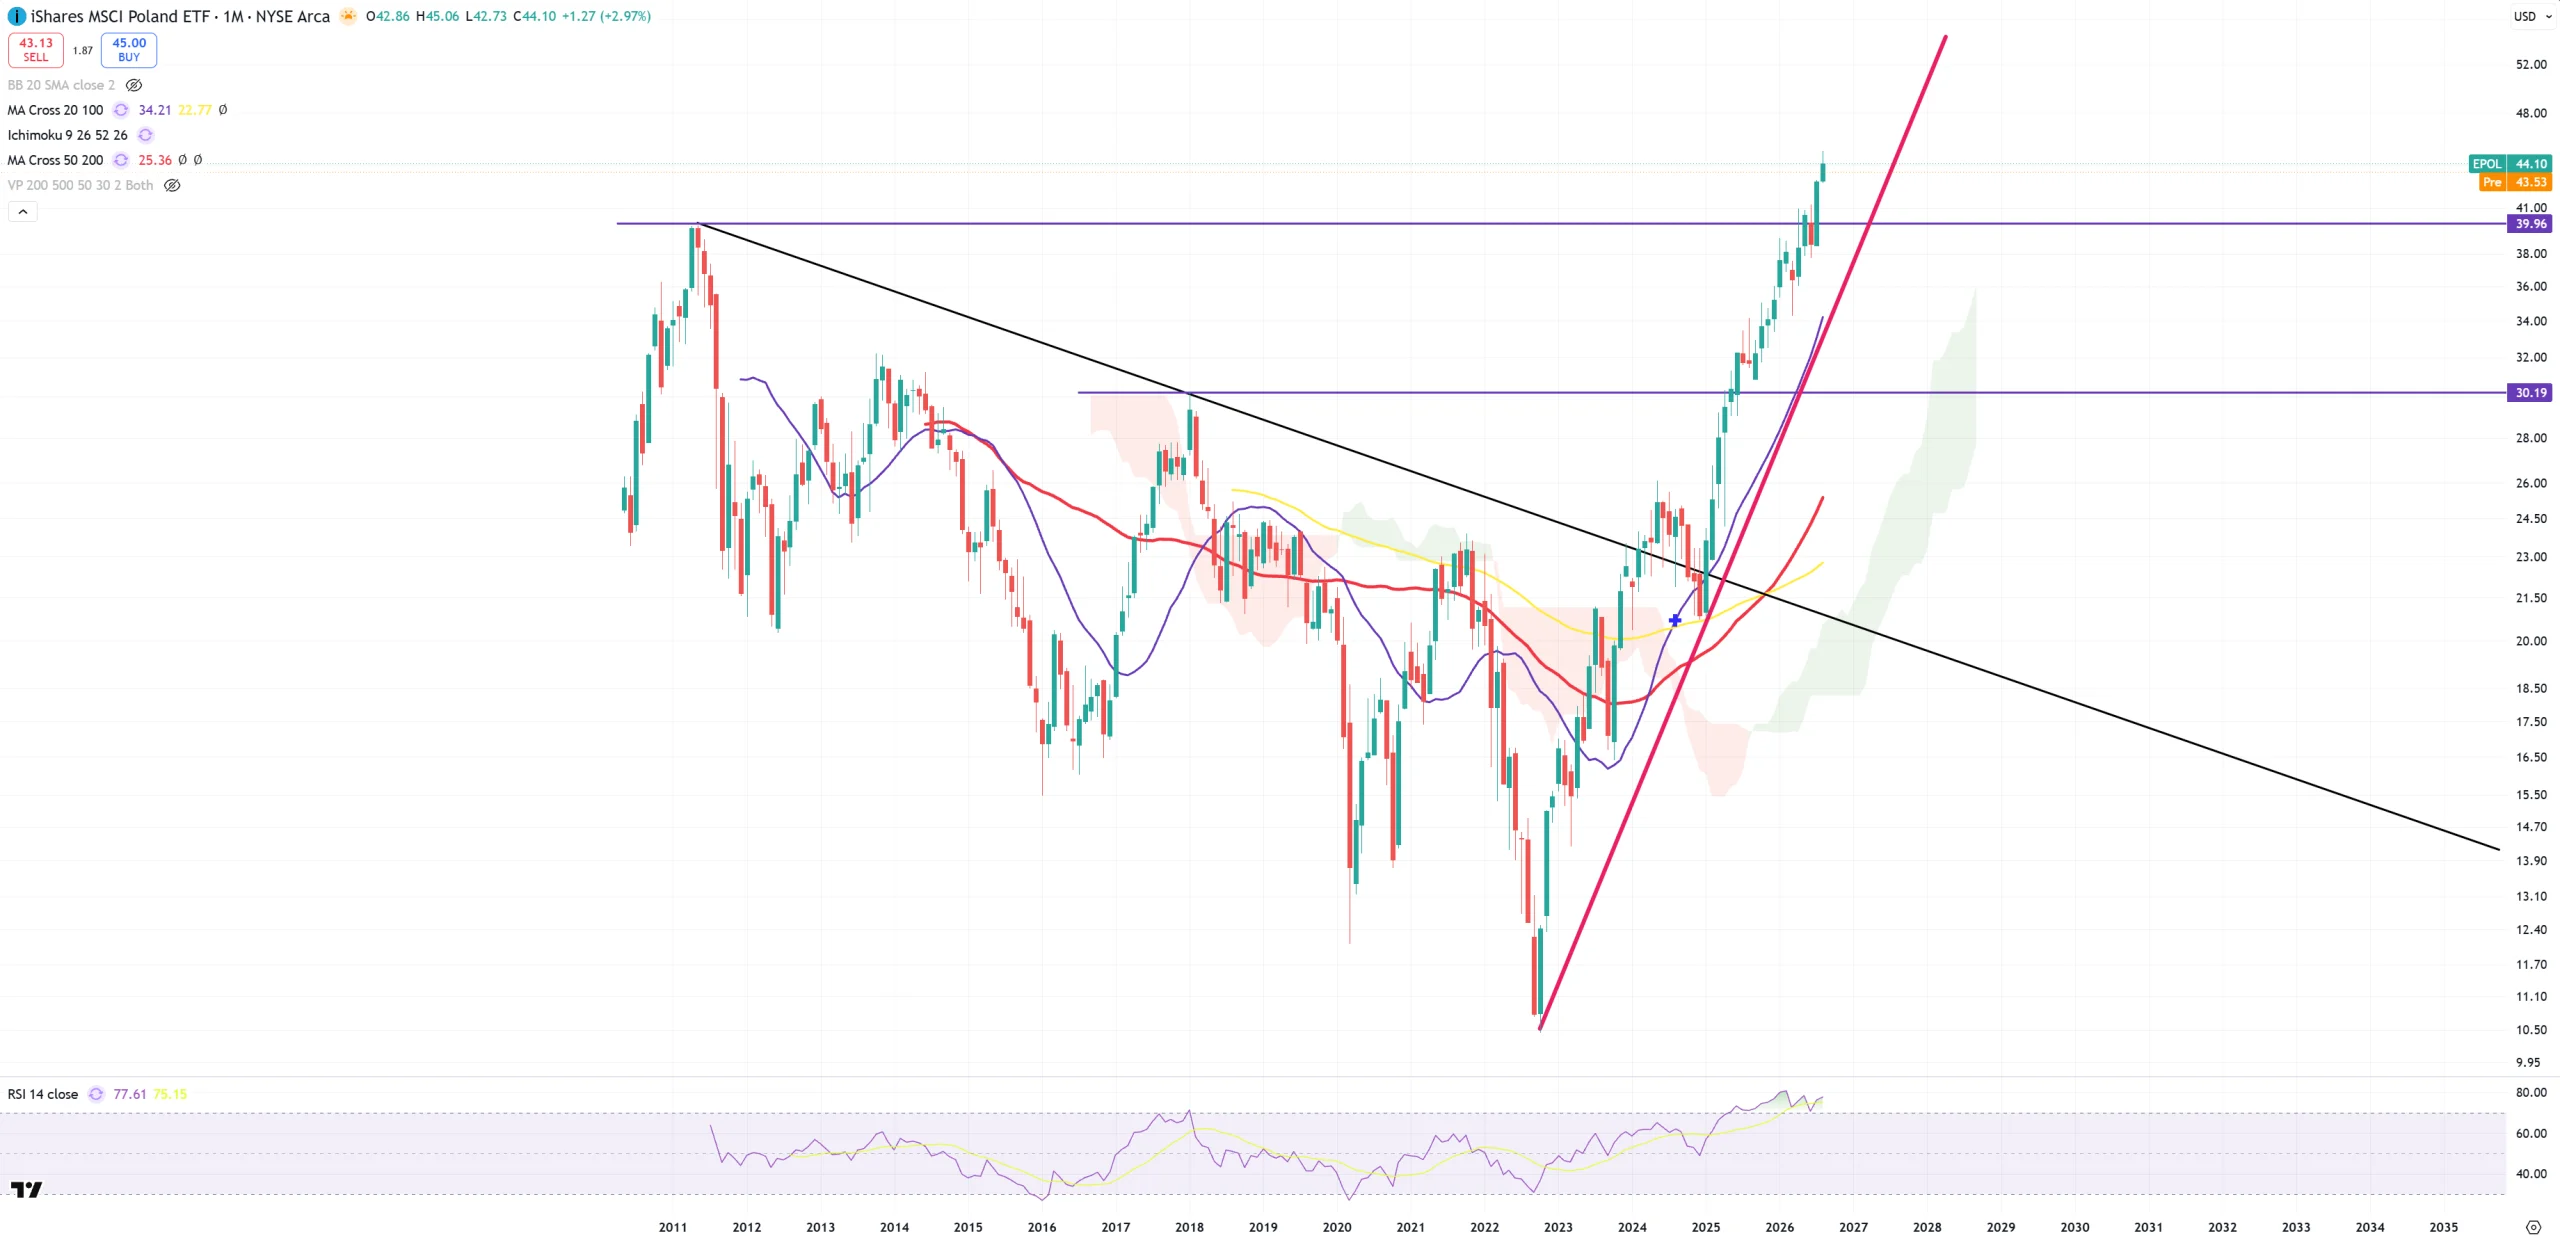
EPOL – Poland with DOUBLE-TOP possibility?
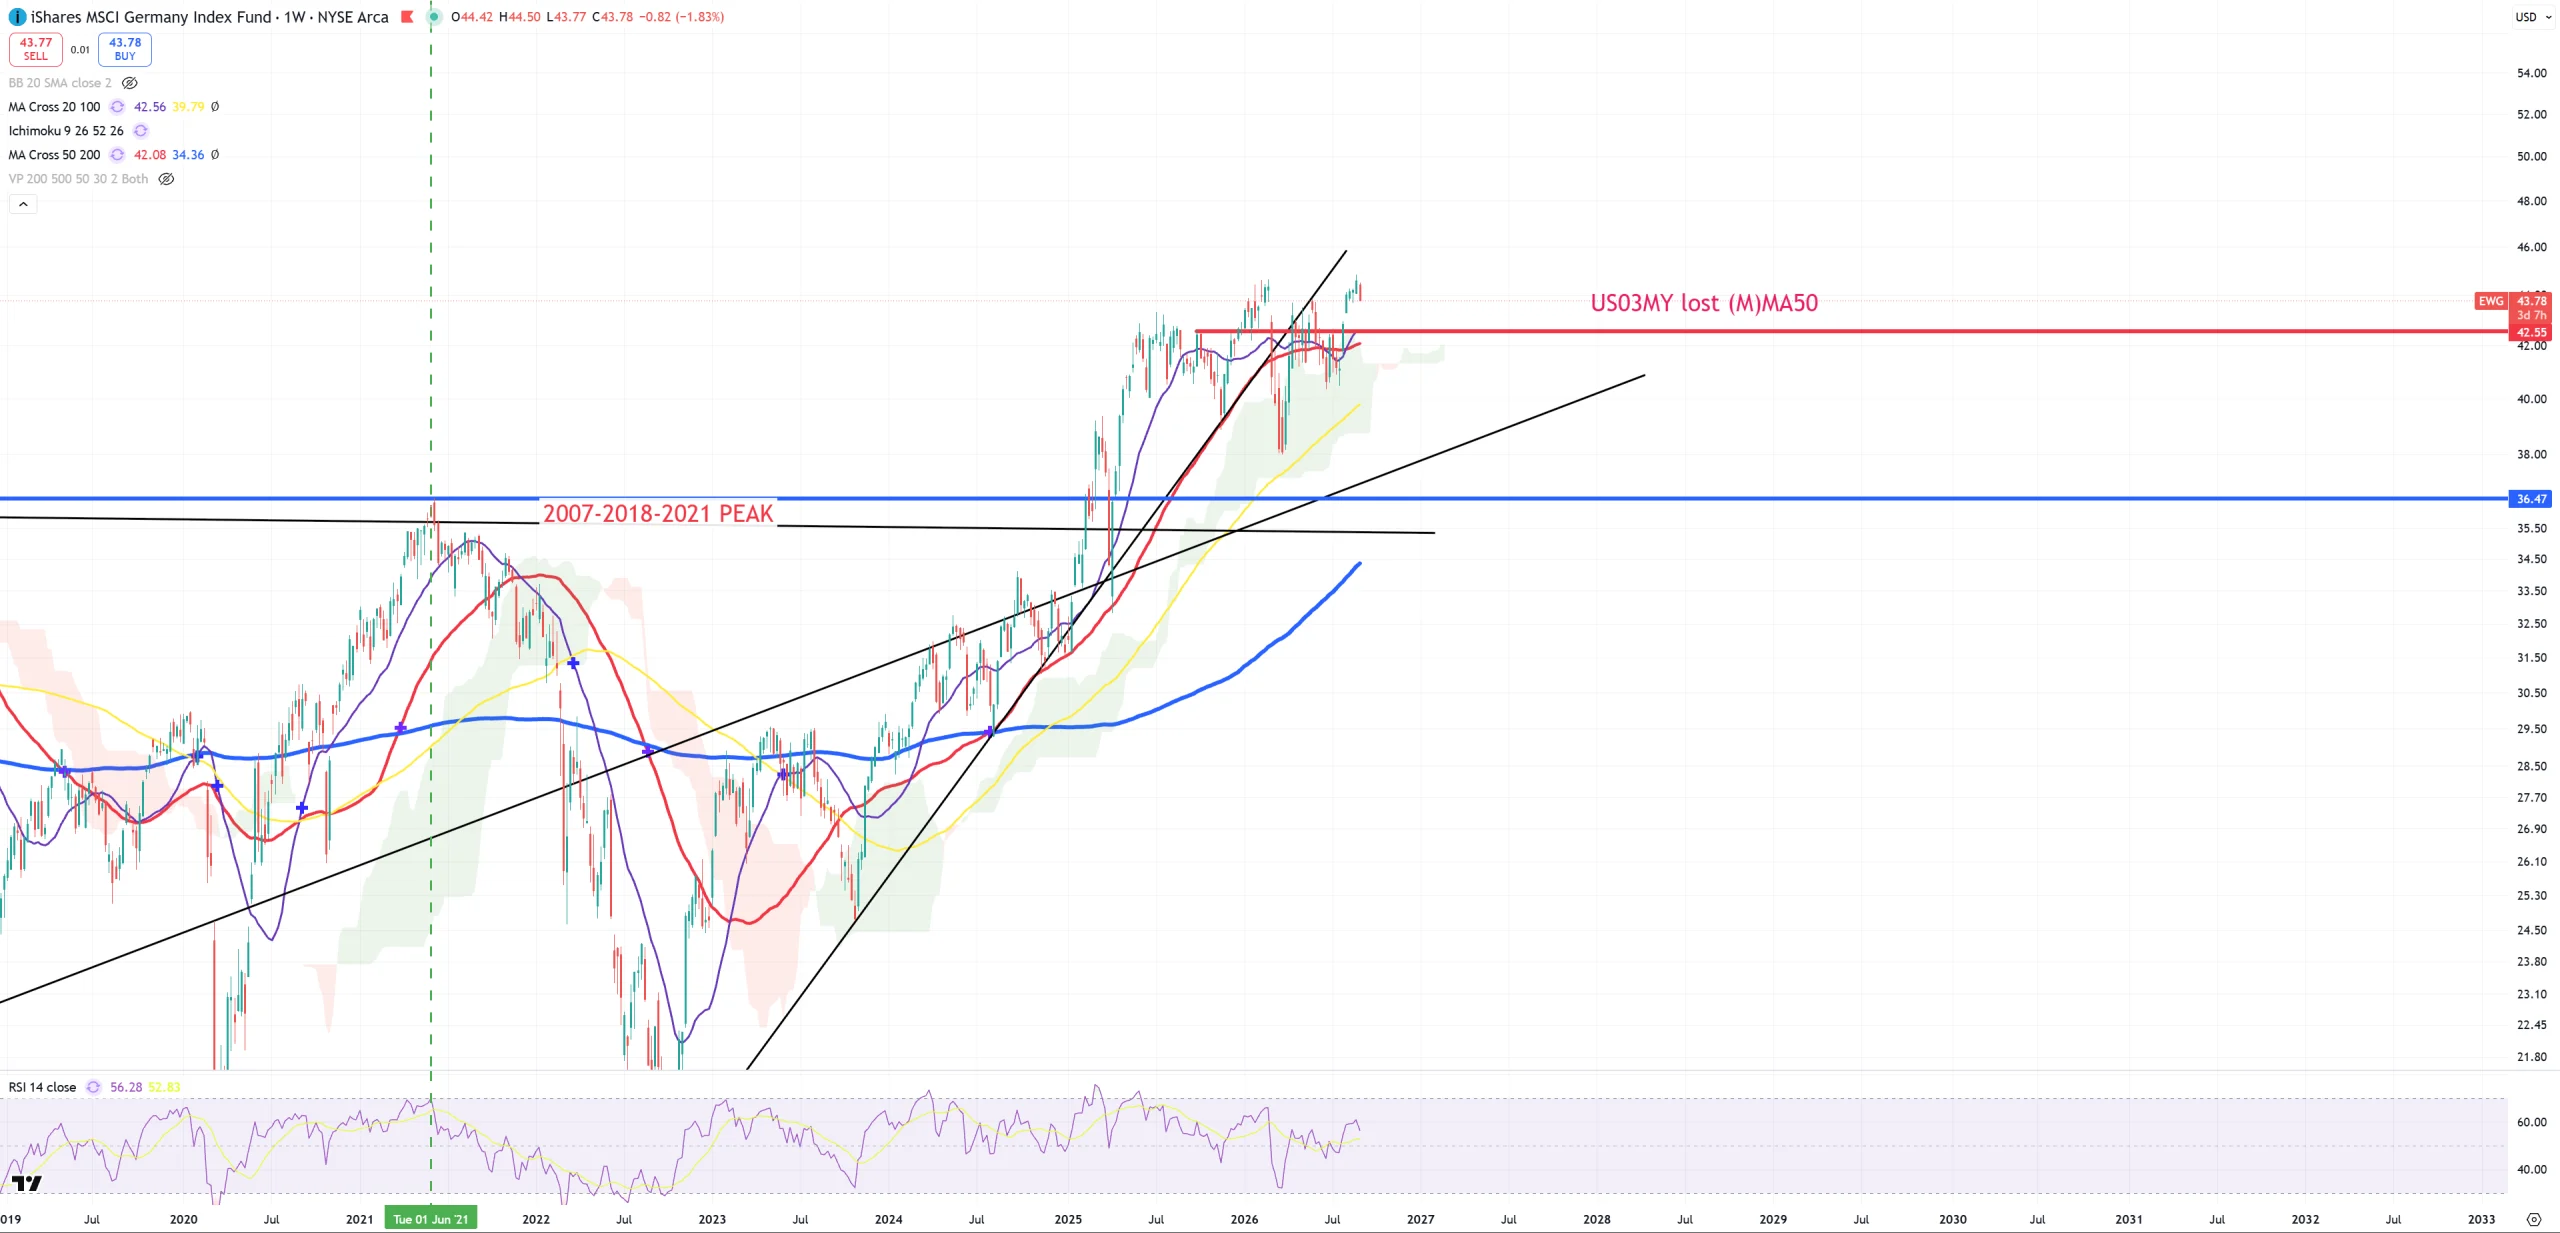
EWG – Germany – probably turning around its key 42-43$ level
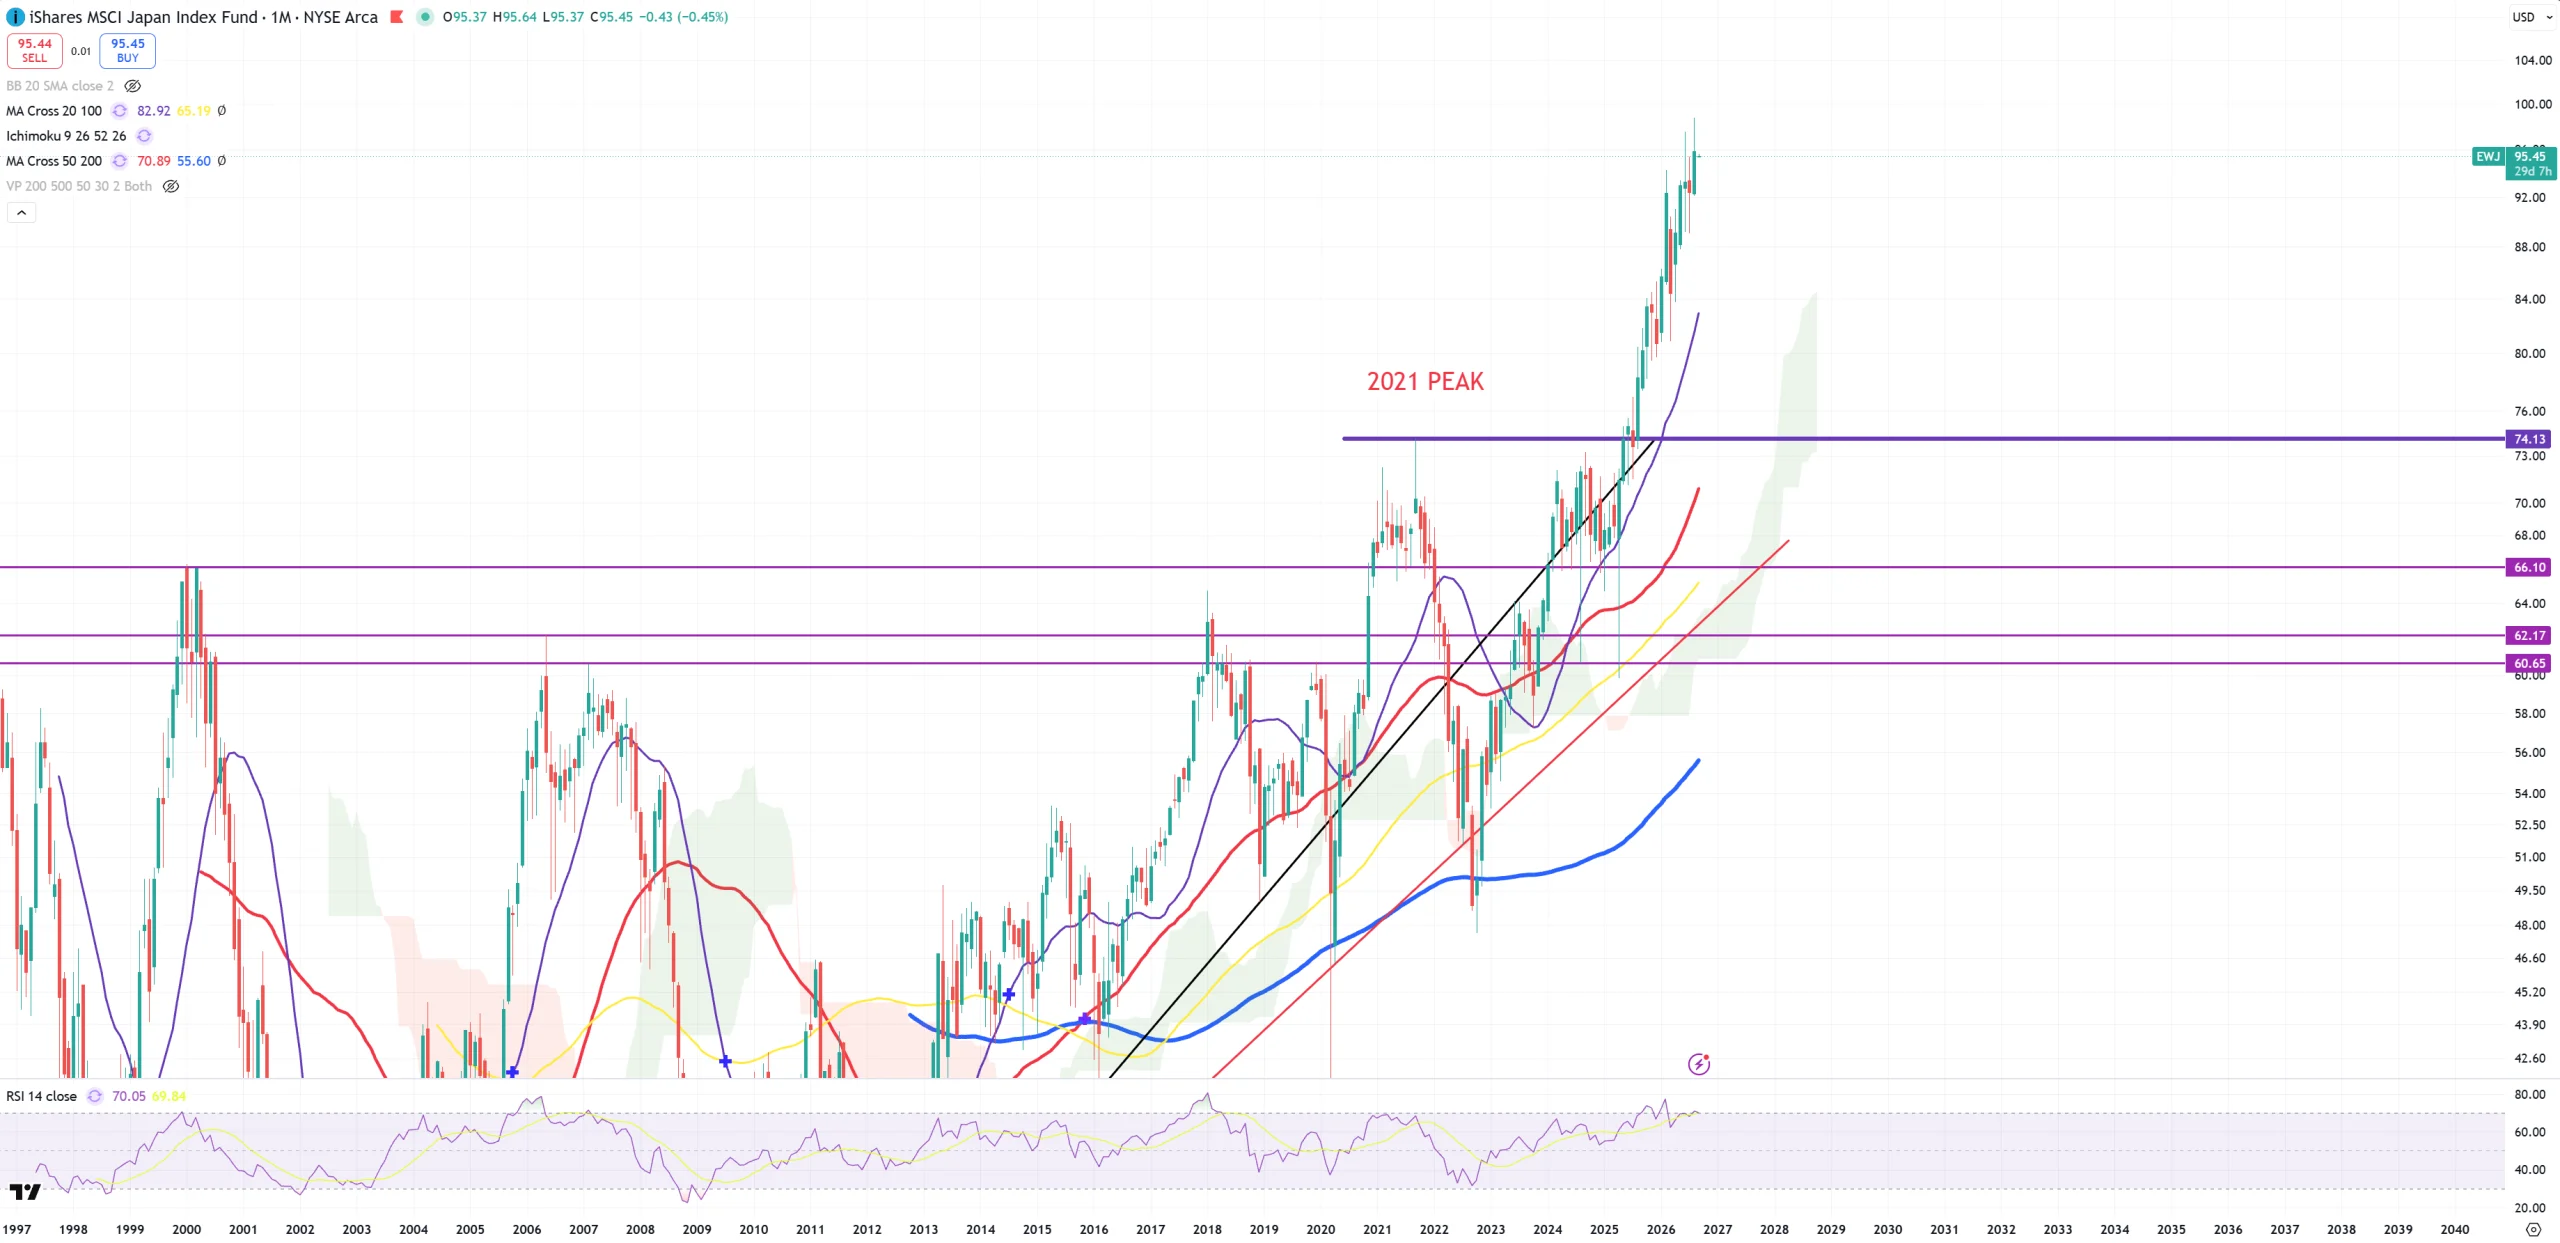
EWJ – Japan – nothing so far to see here. Going more parabolic.
MAGS stocks
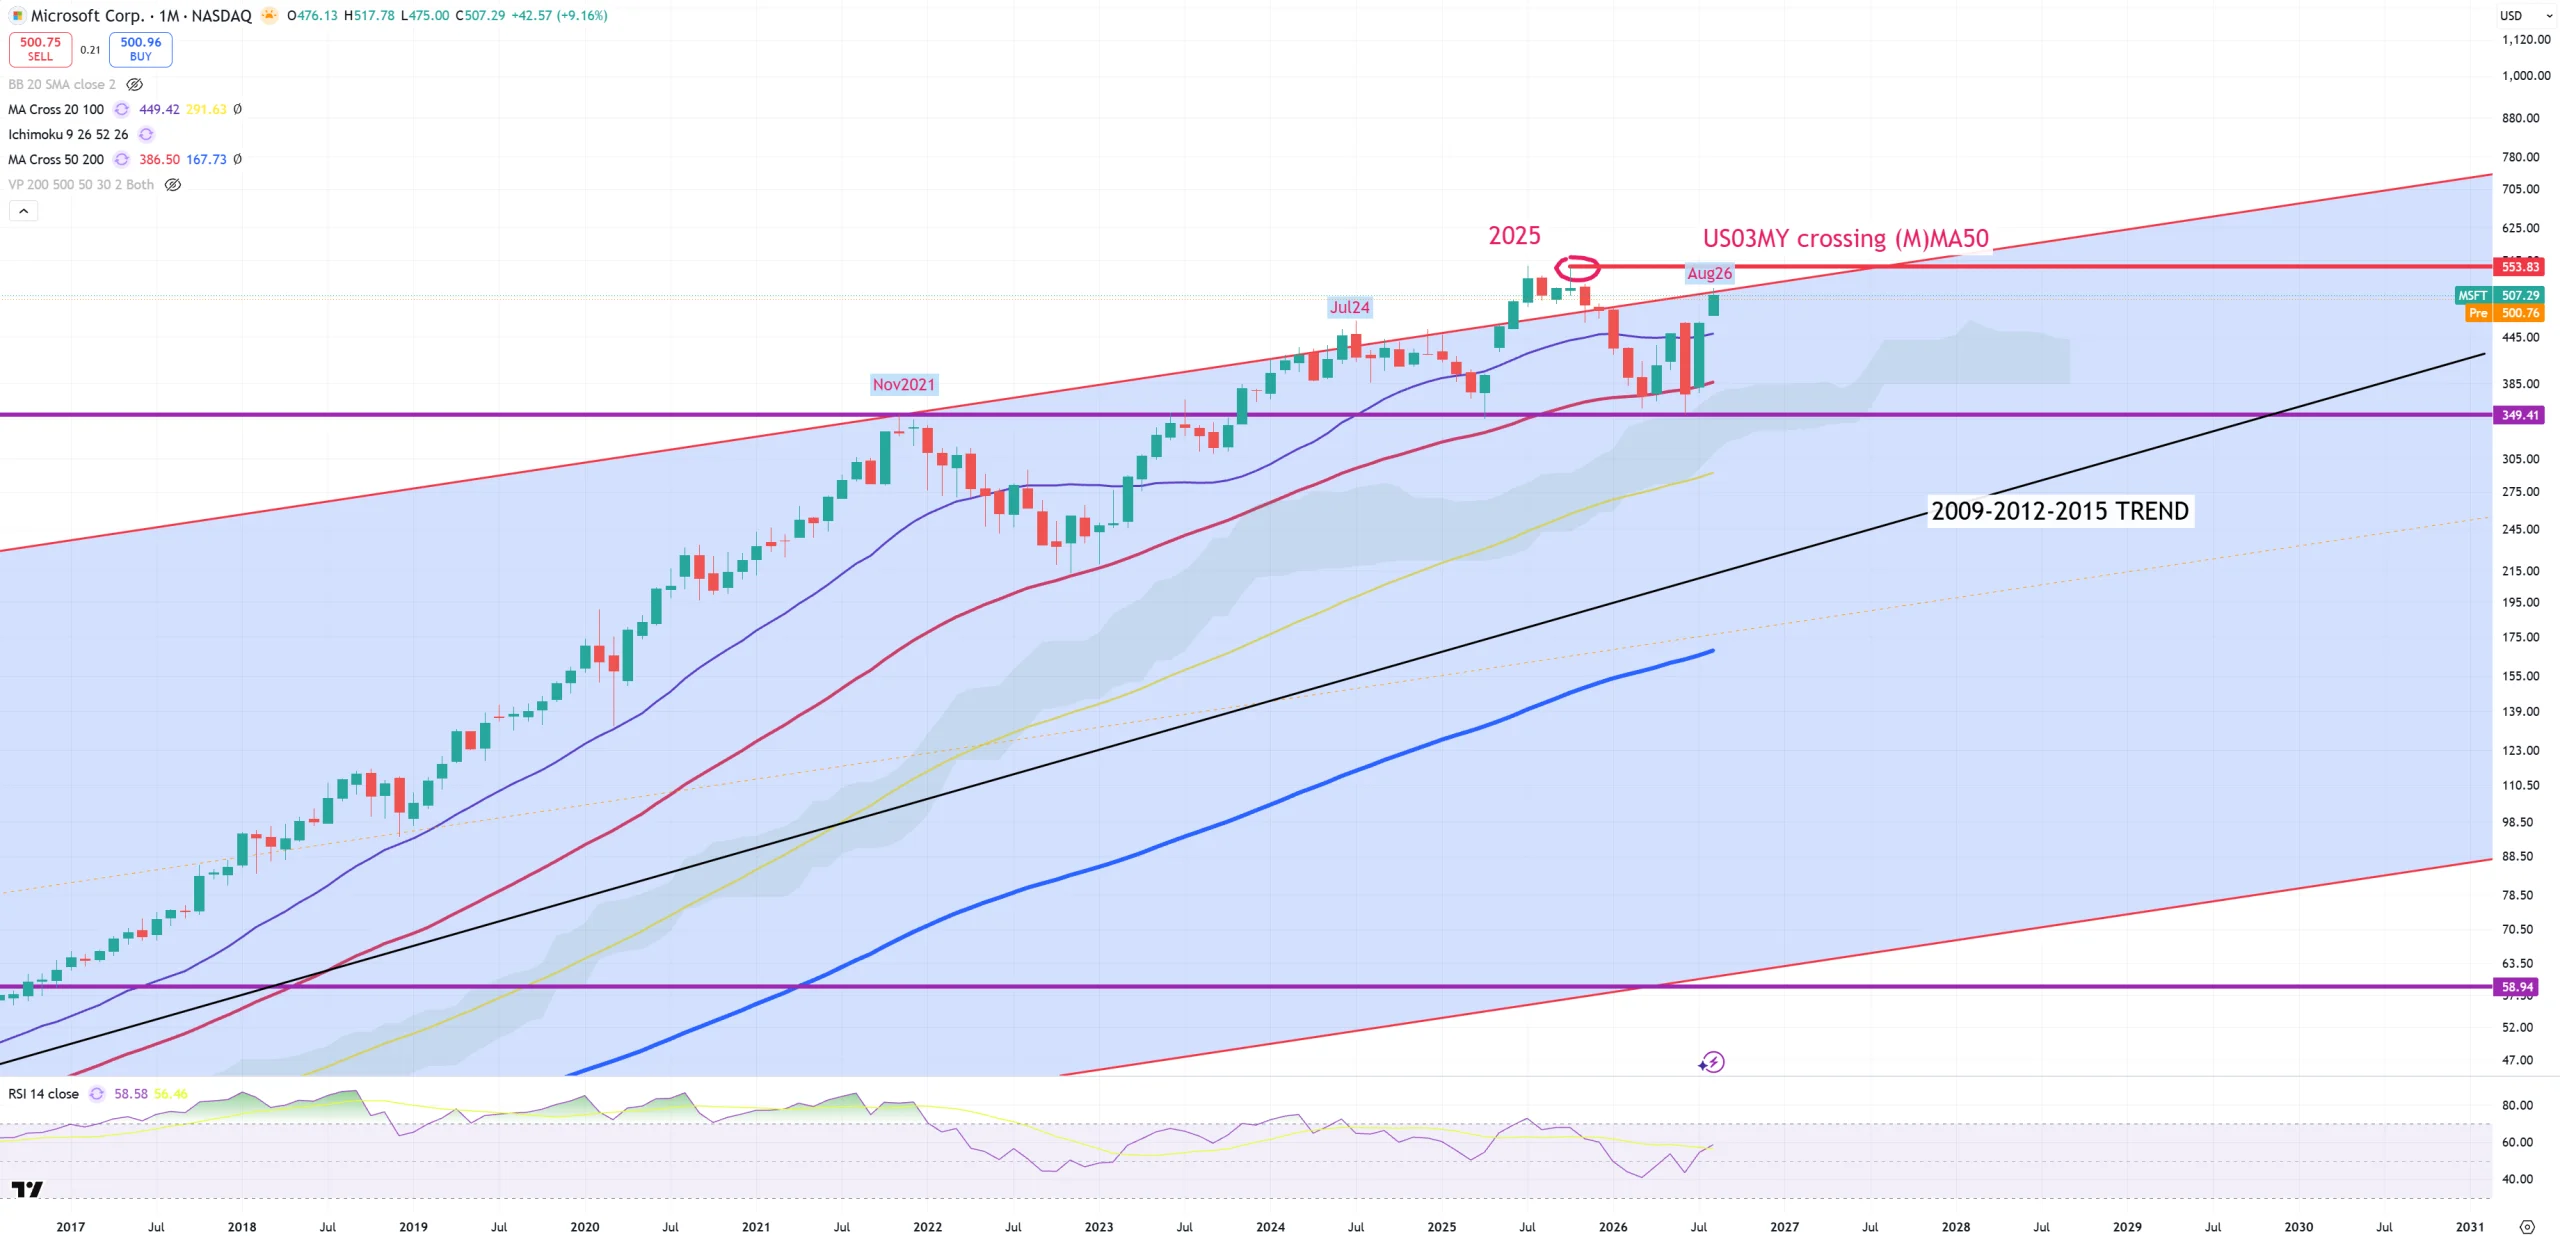
MSFT – and 2000-2021 trend hit again. (M)MA50 was saved
NVDA – earlier I posted in SOX/AI section NVDA/GOLD ratio. This 212$ level is the key level.
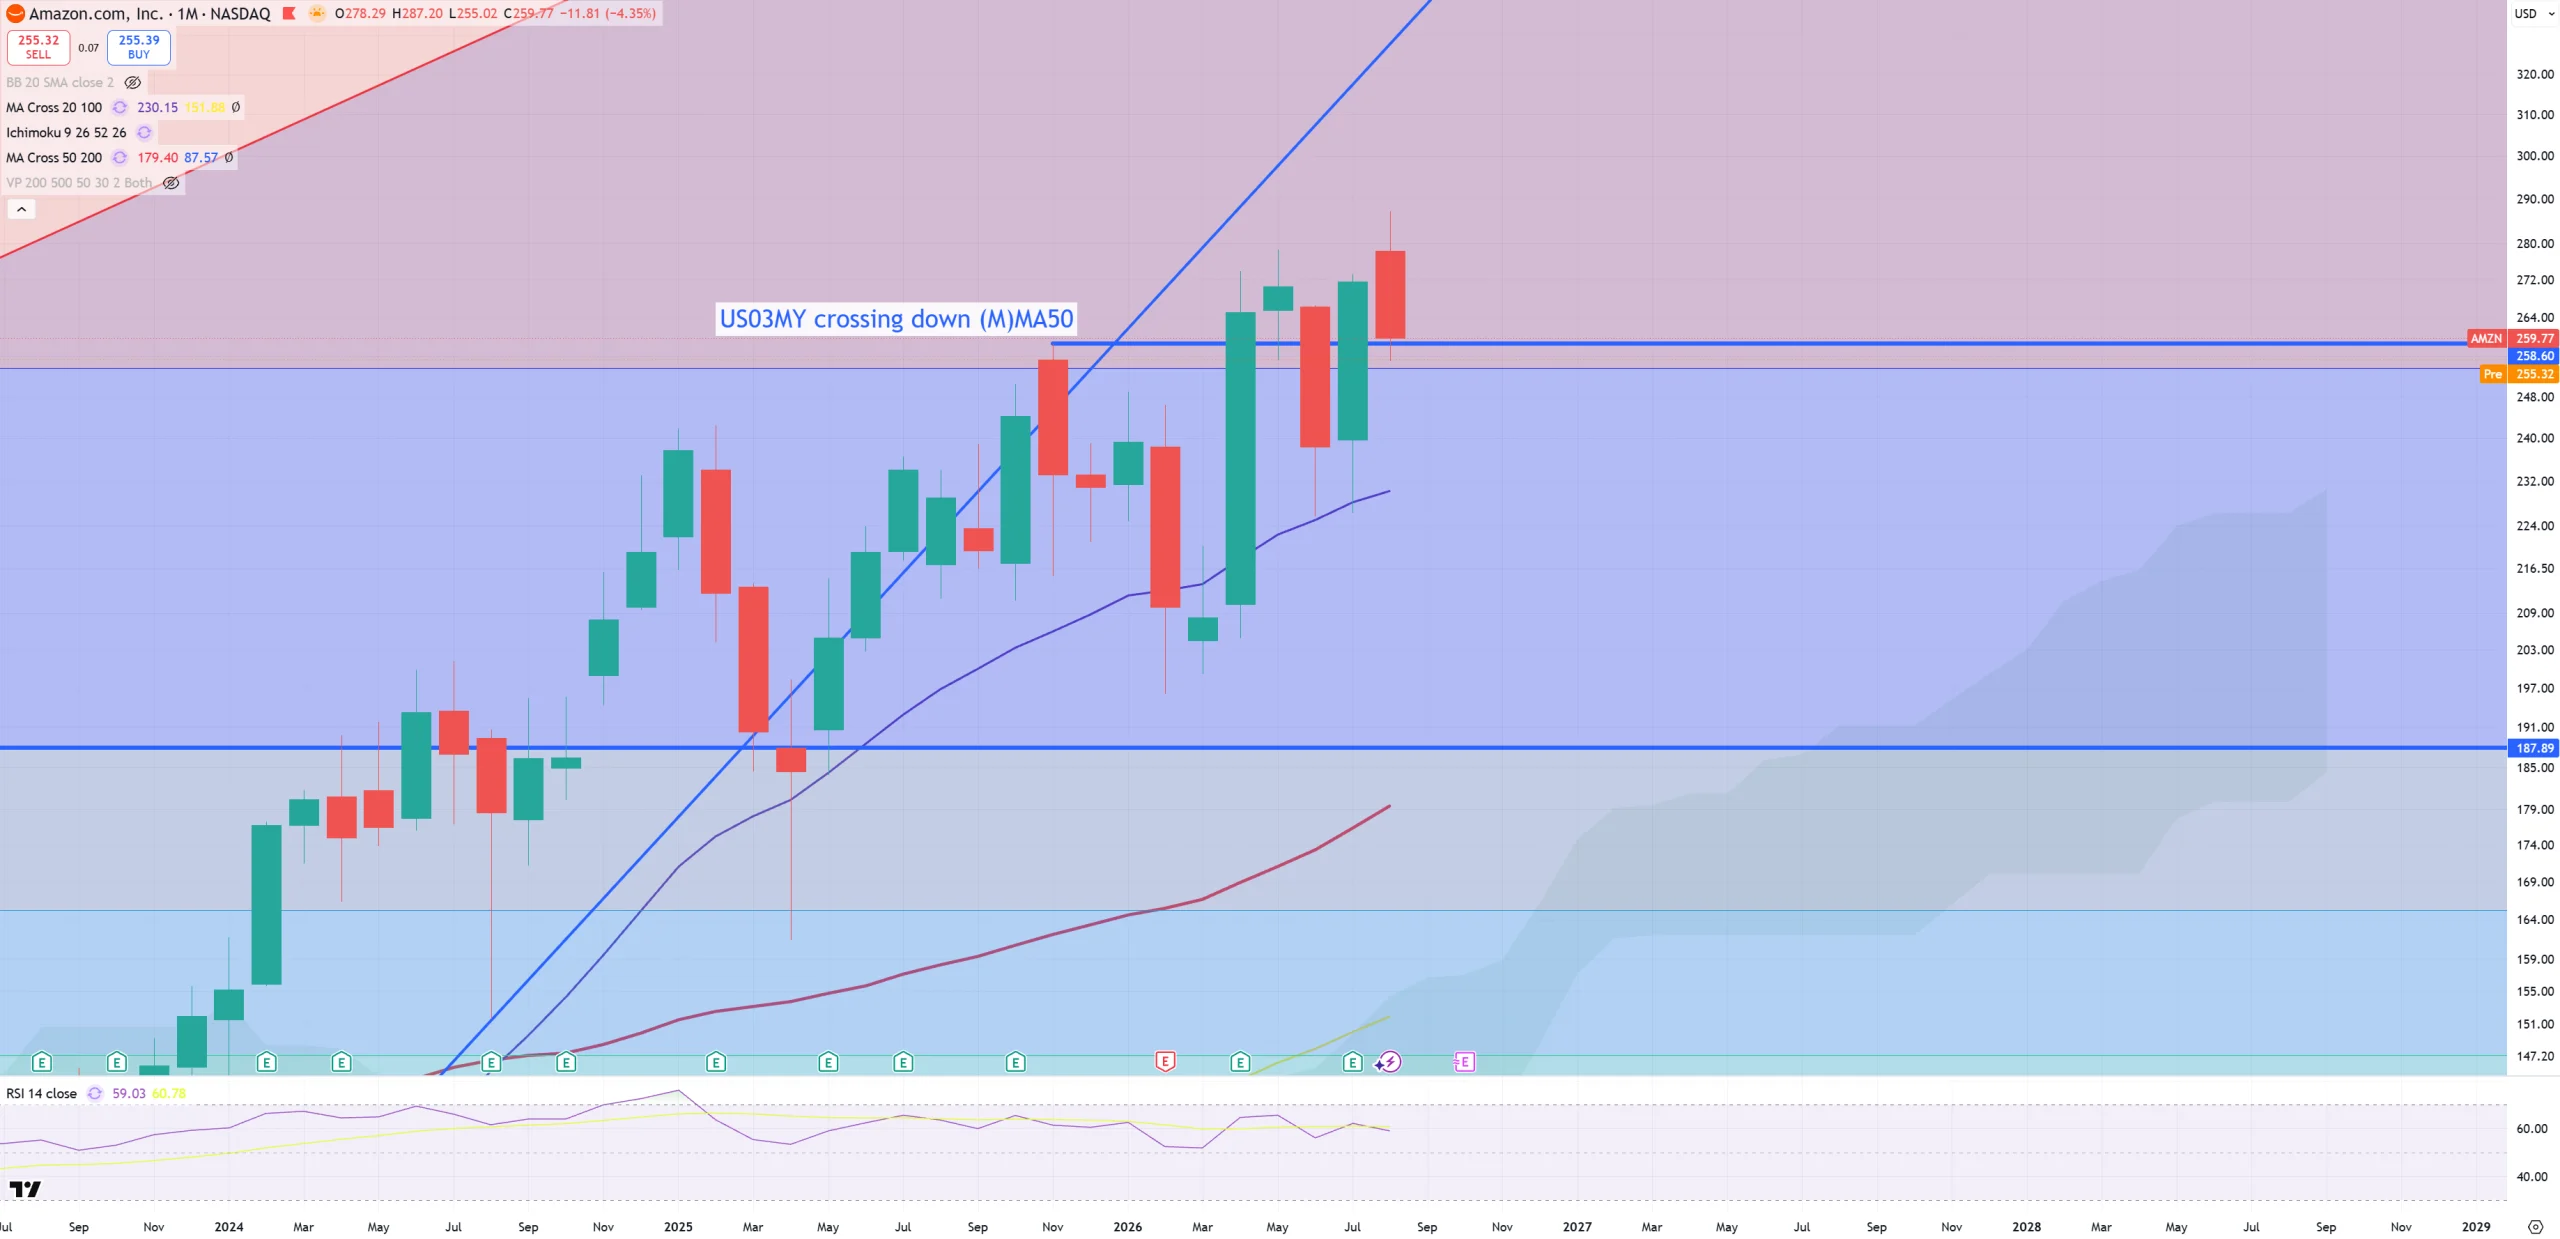
AMZN – same as NVIDIA
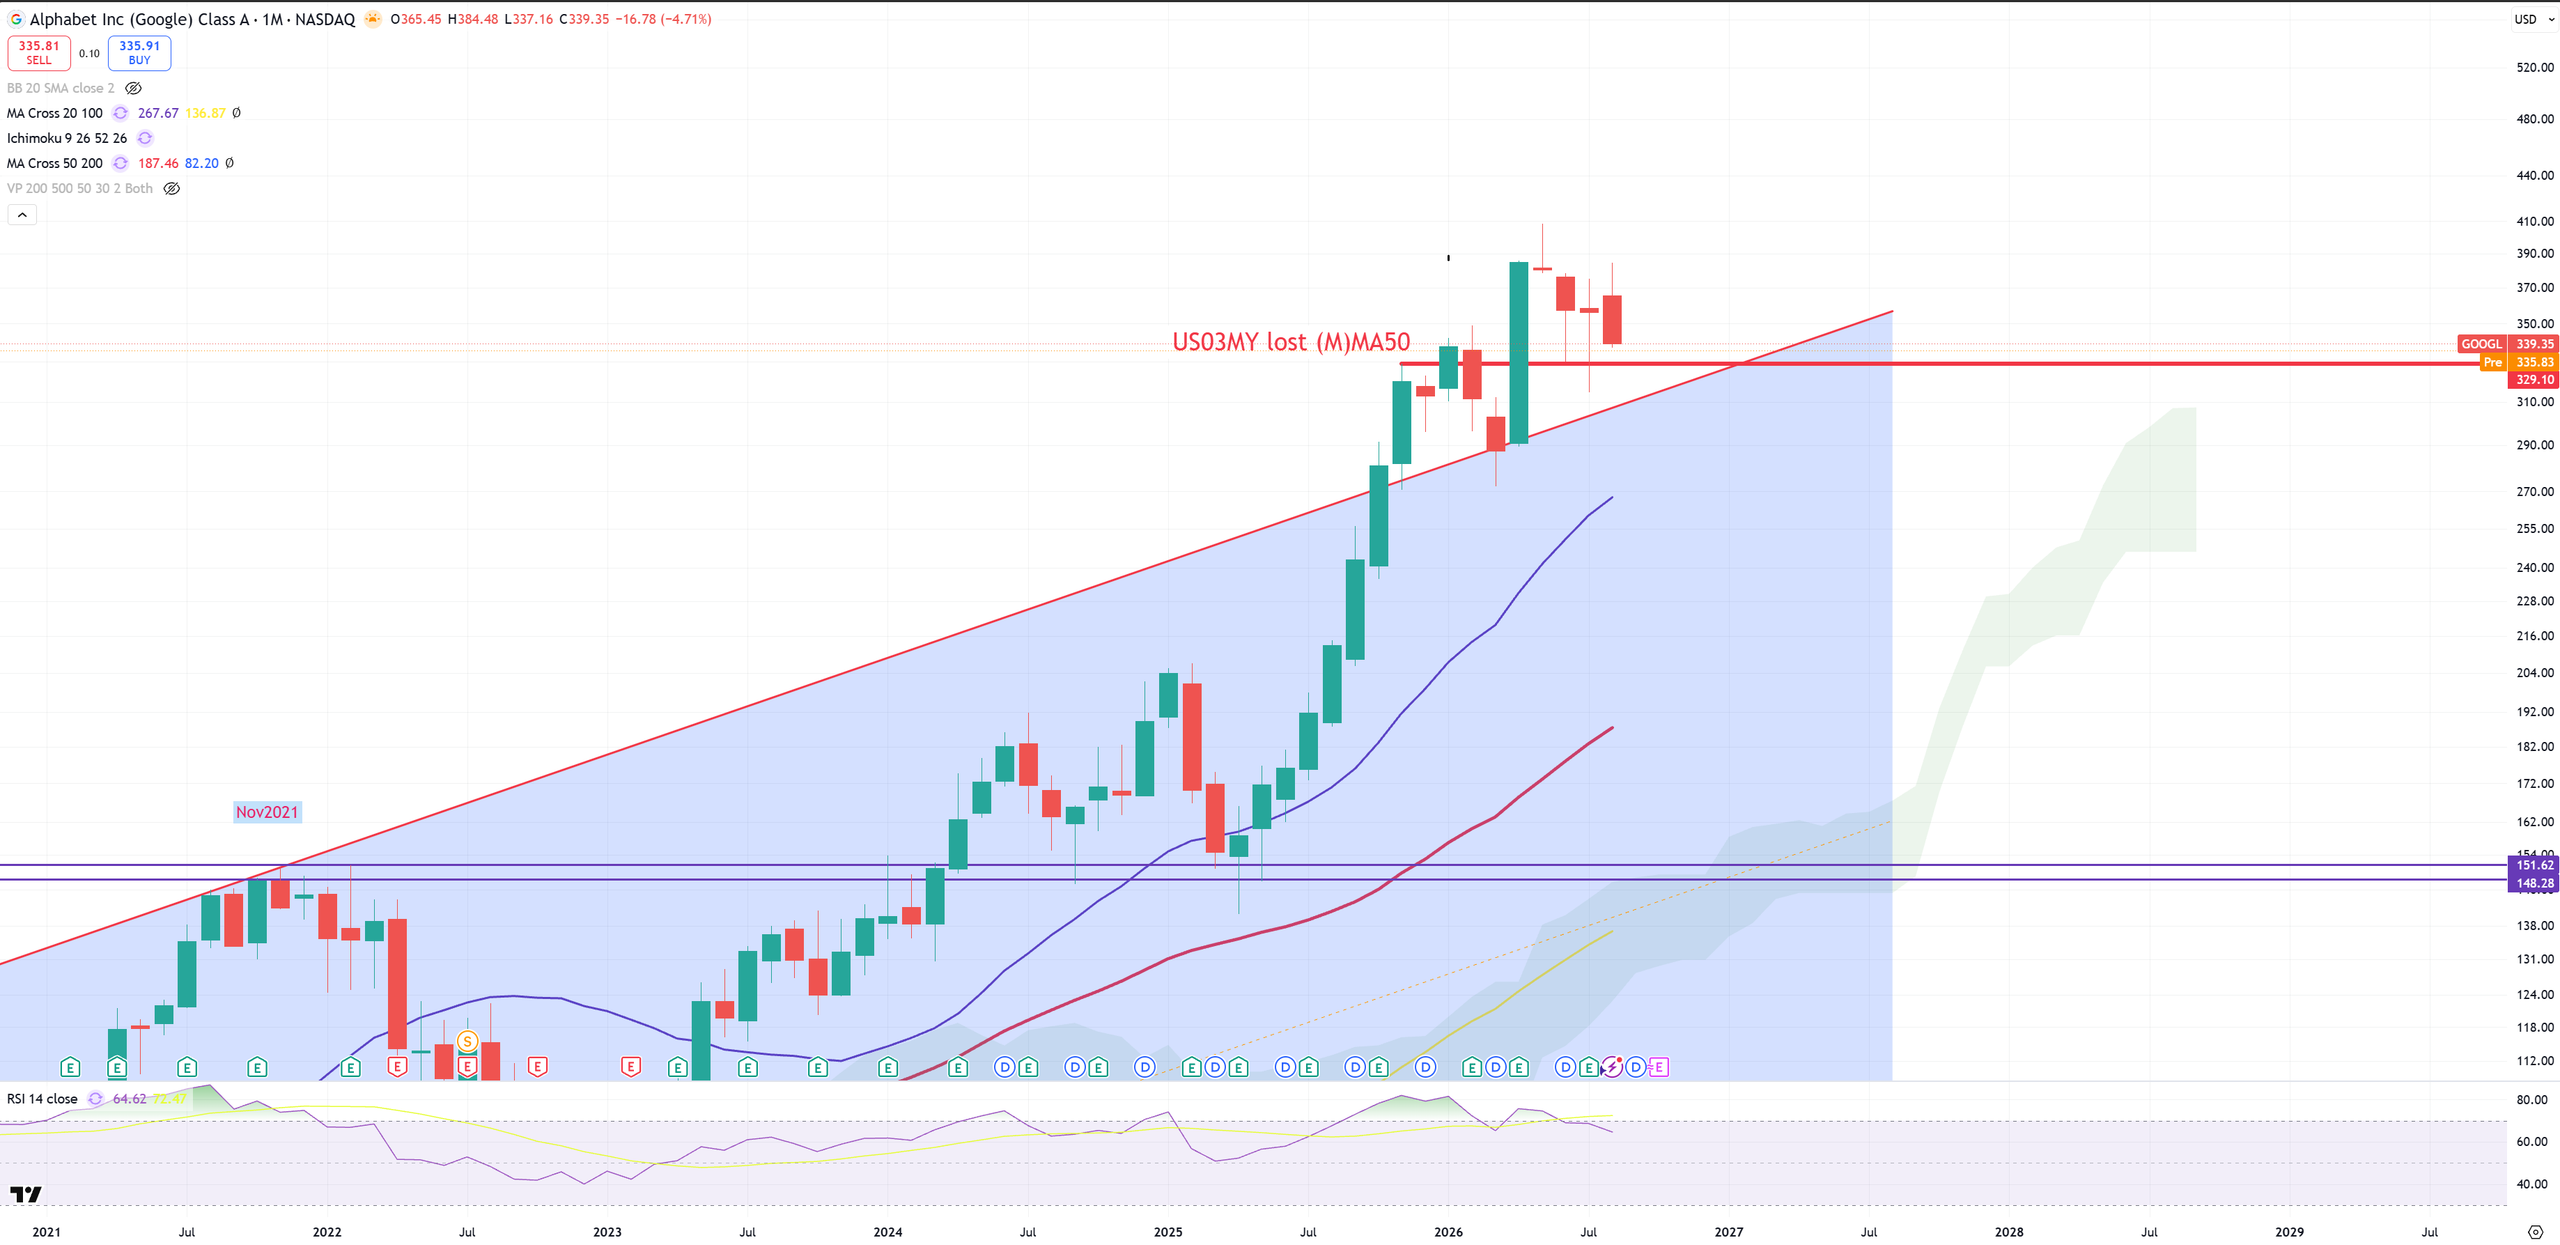
GOOGL – very similar to AMZN & NVDA
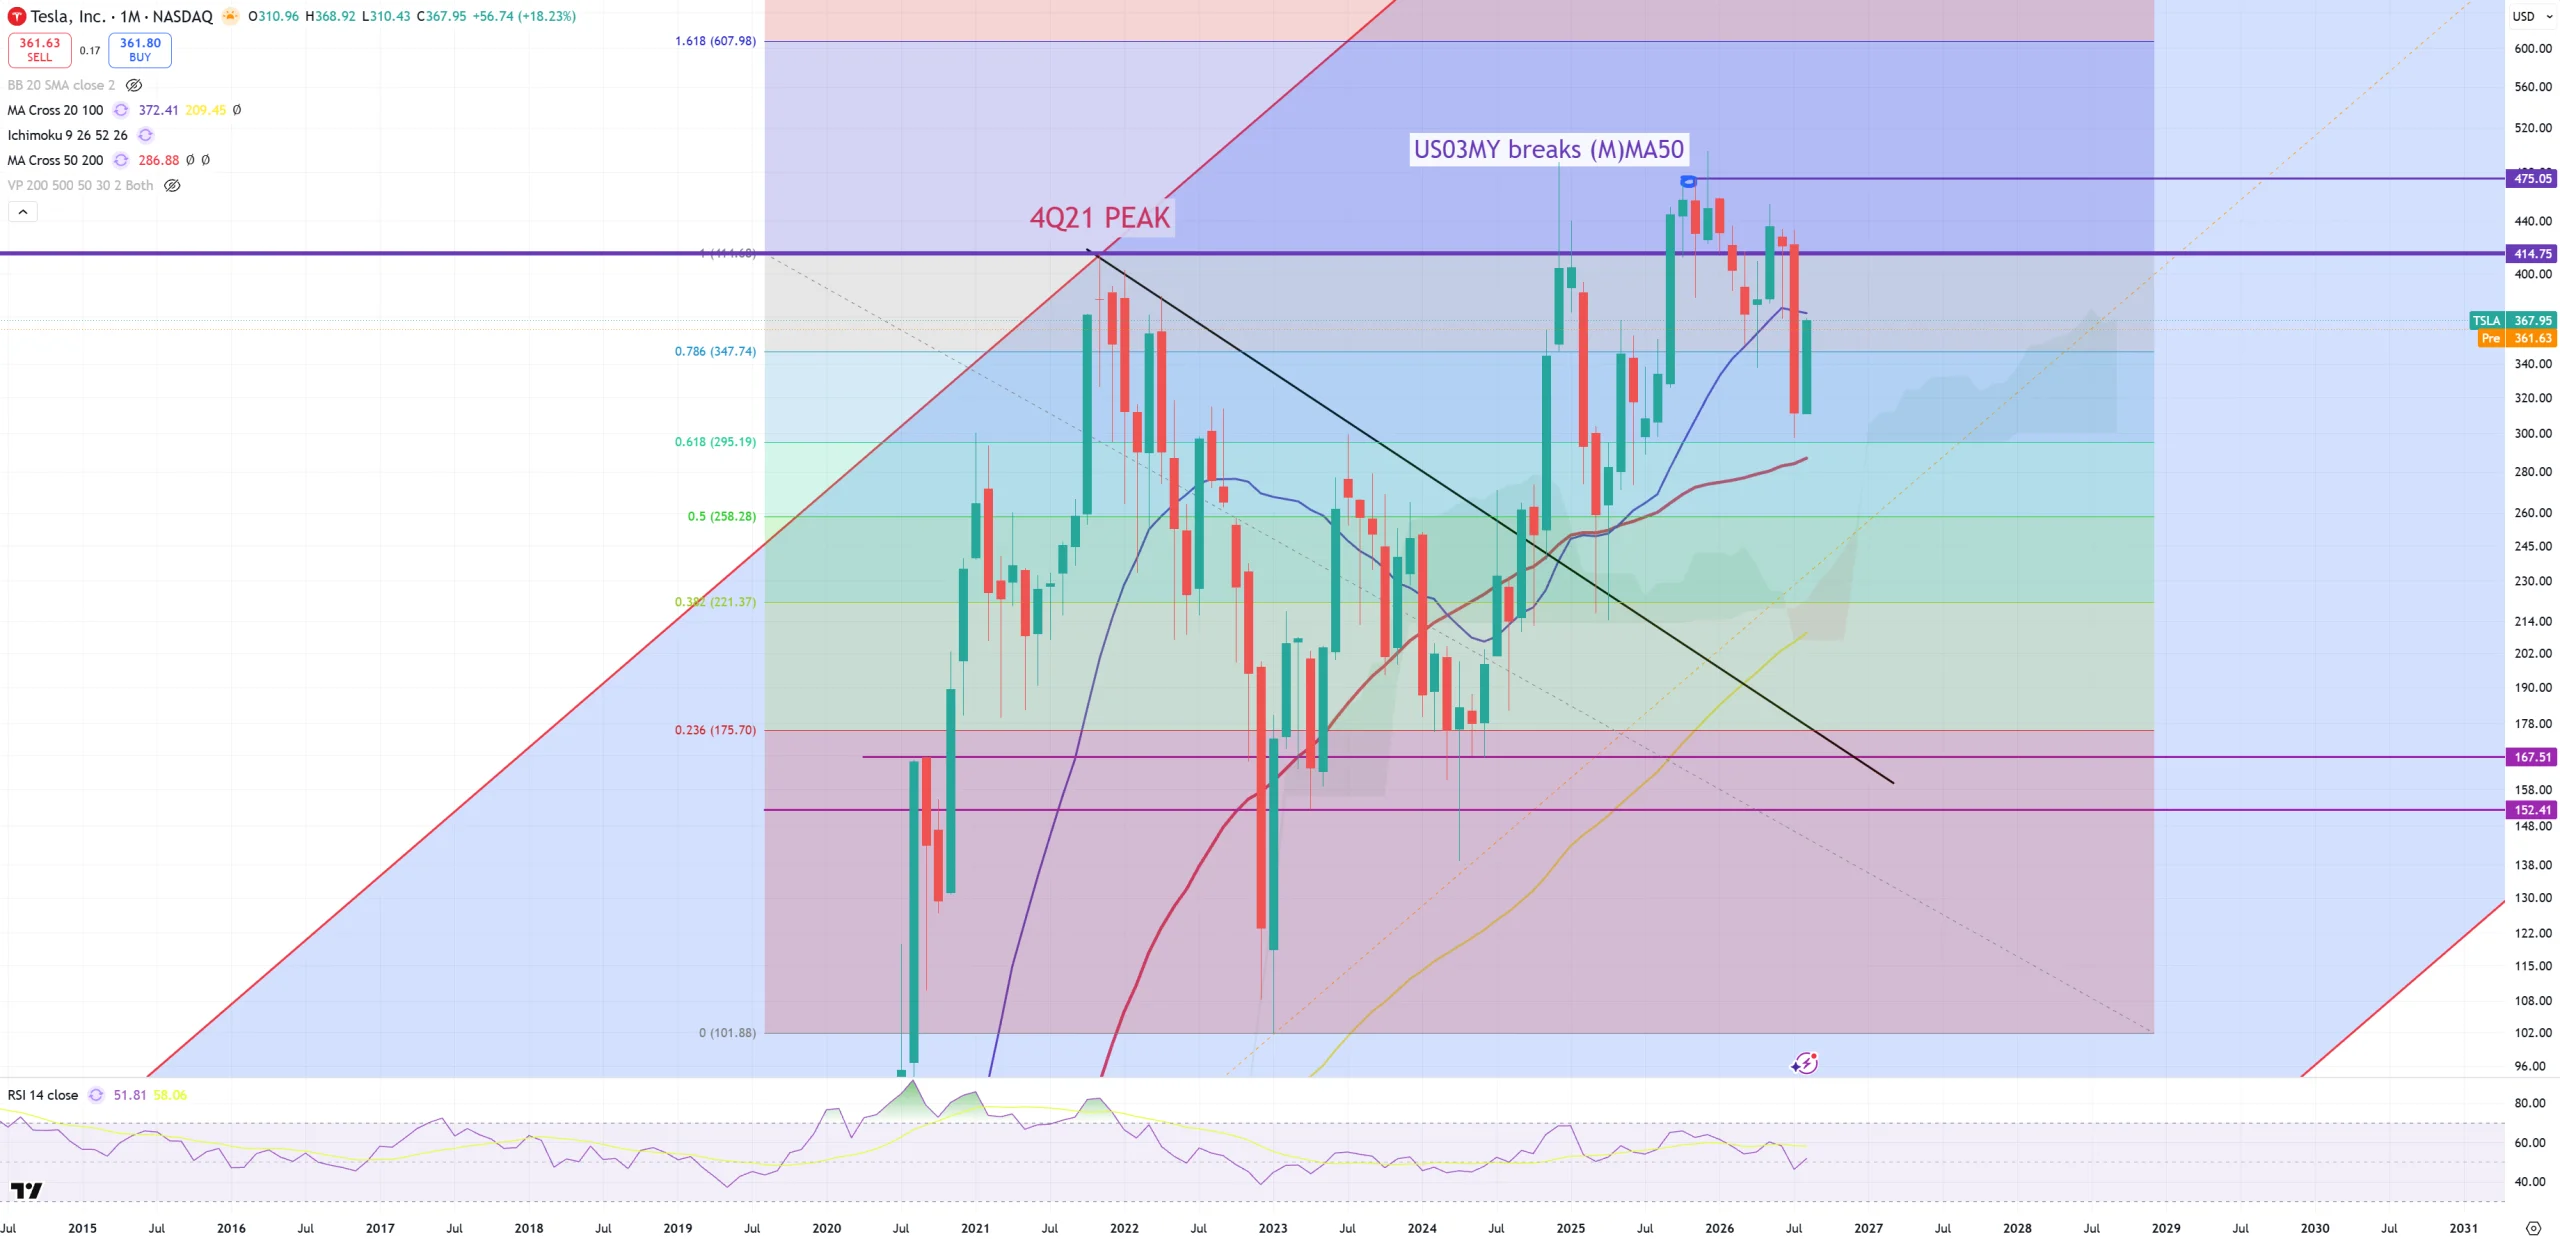
TSLA – is broken. violet (M)MA20 retest and red (M)MA50 ahead
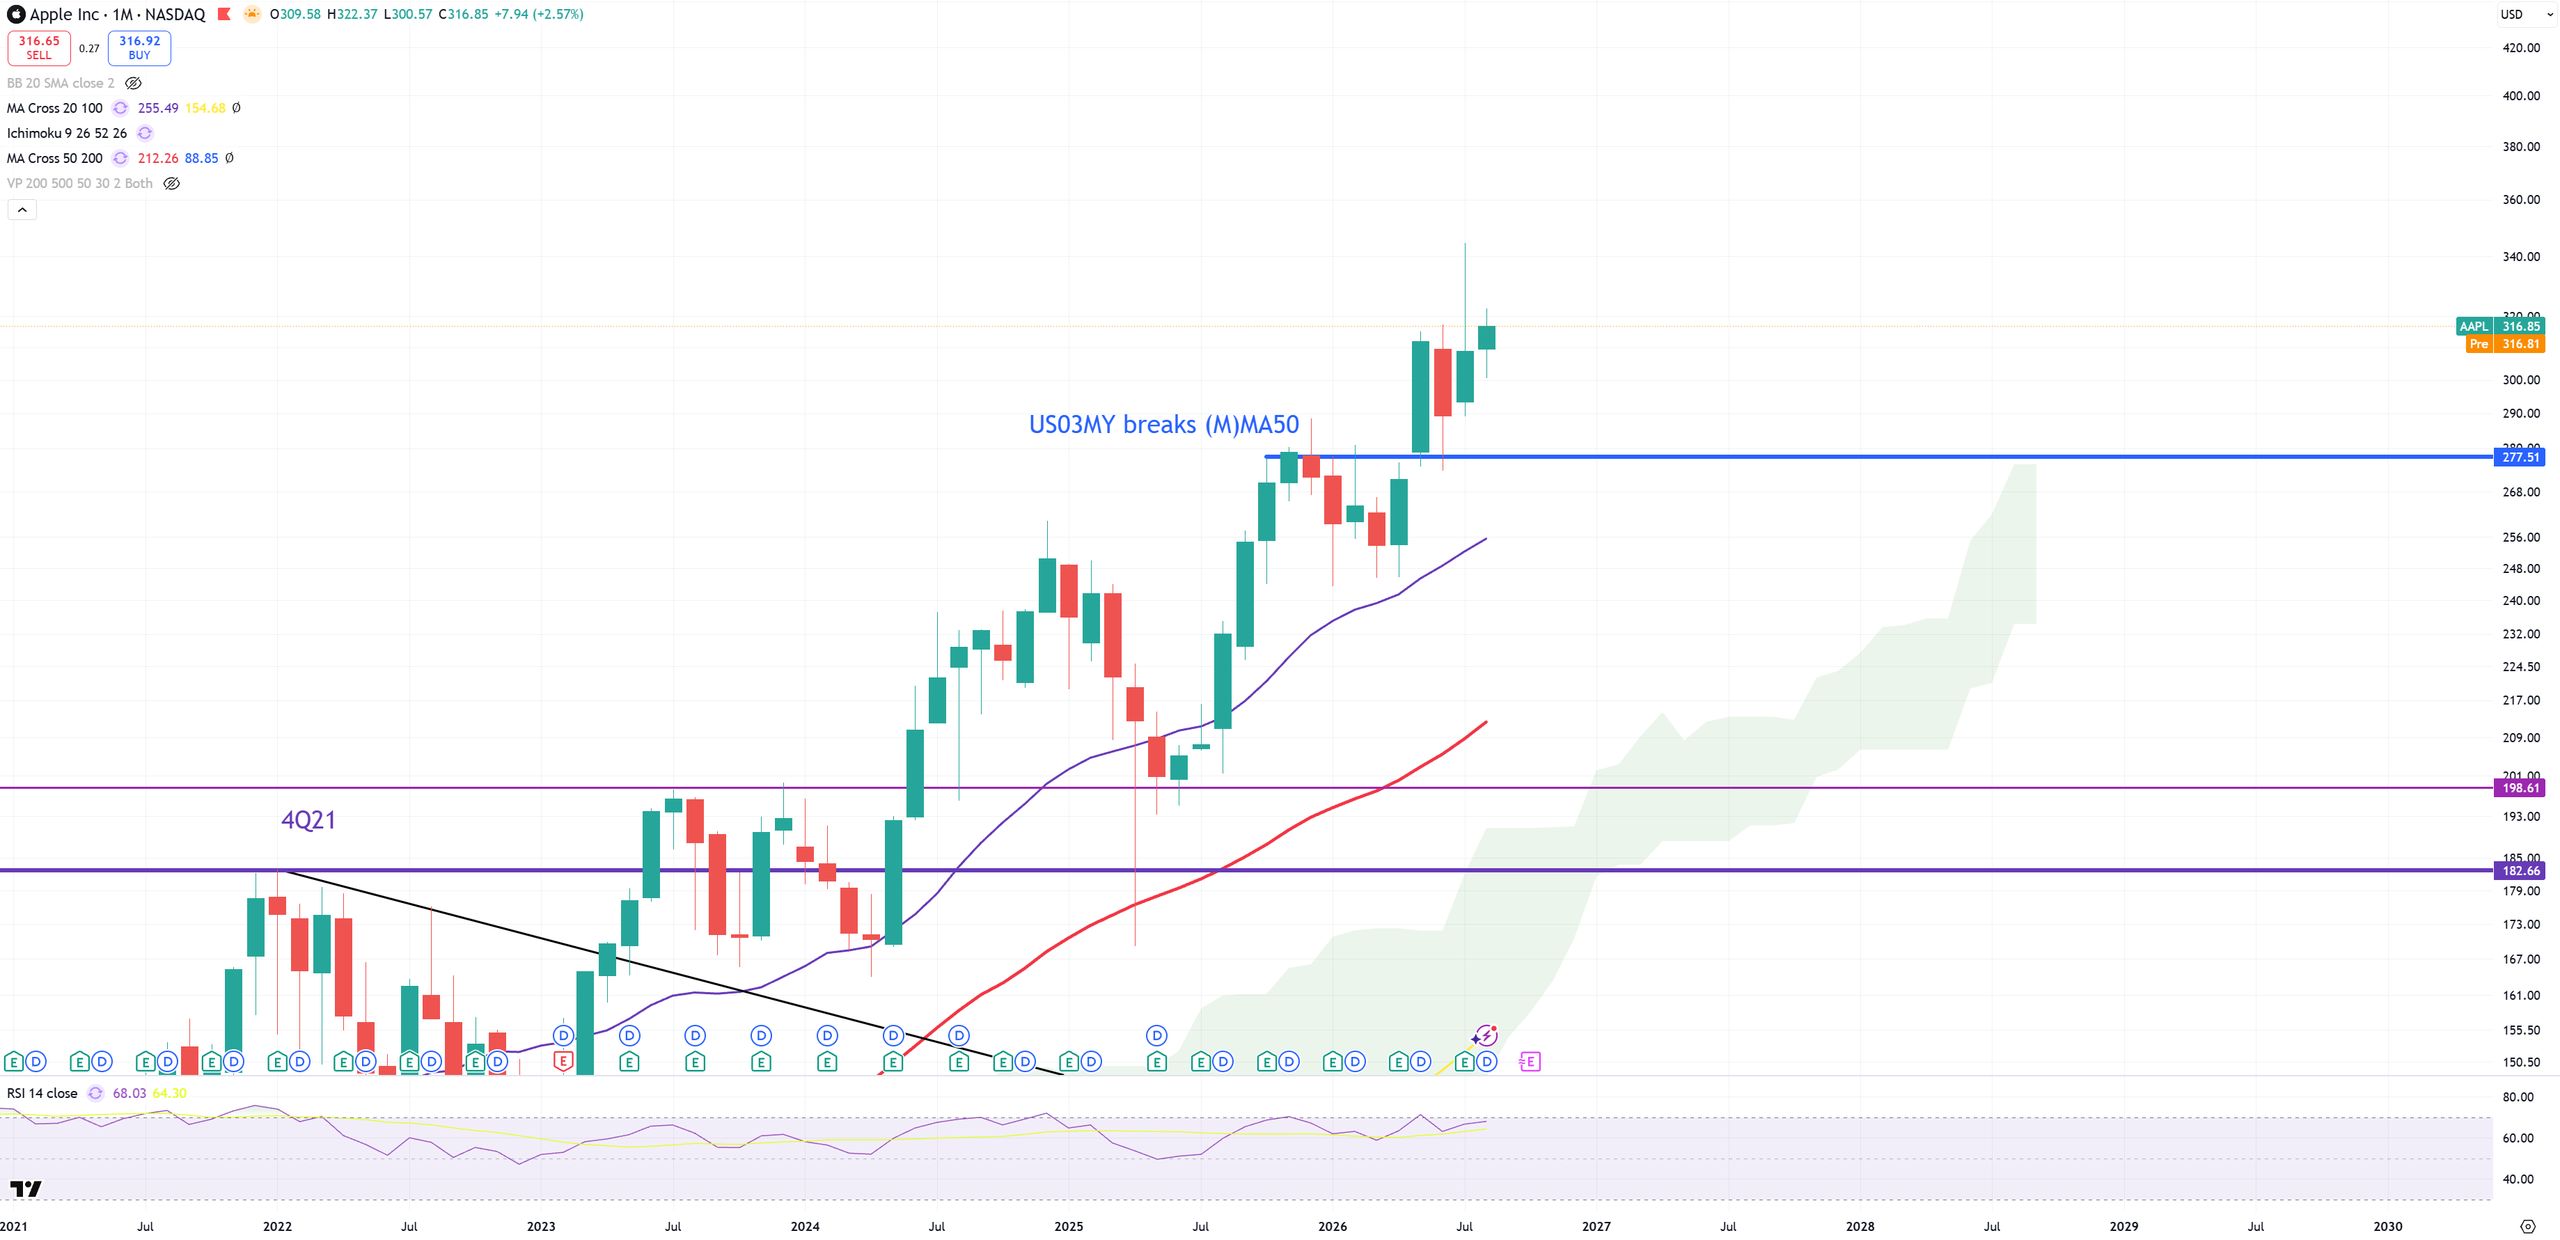
AAPL – looking the best from all of them. AAPL is TLT of the market so far.
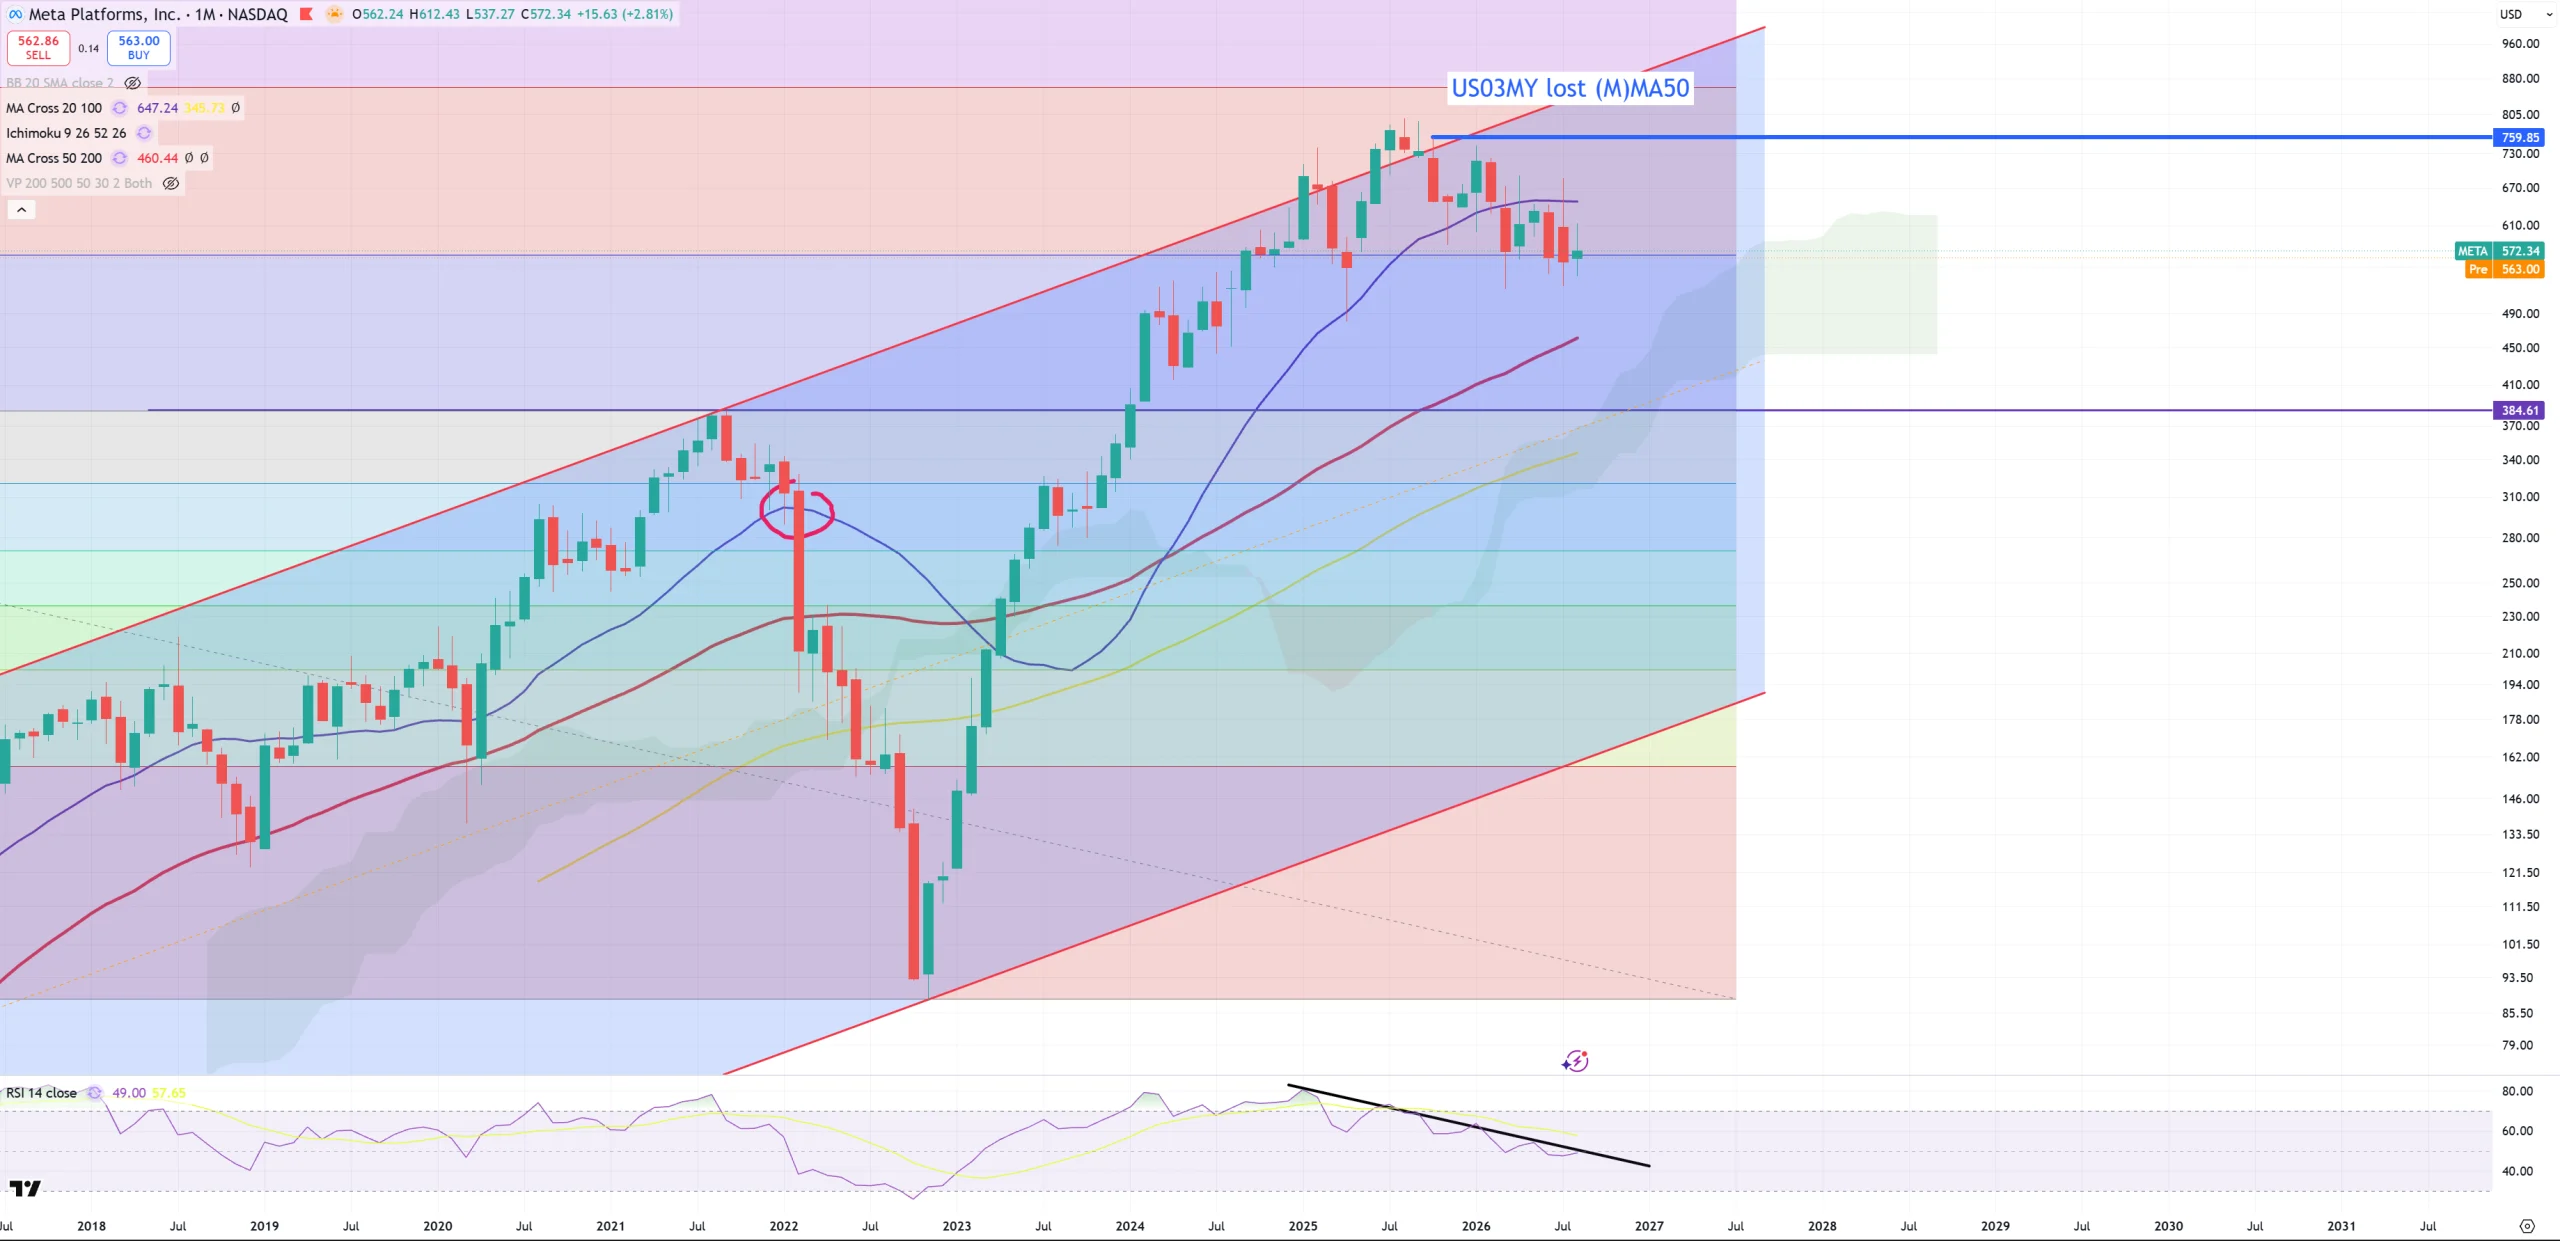
META – the biggest dogshit from all MAGS