Crypto market is on the edge of its first technical bear market ever. Something crypto bulls have never experienced.
August 15, 2026

Since a long time I was talking about GOLD/BTC ratio as a key indicator about long term market flip out of crypto. All those GOLD ratios I love the most, because they’re very reliable indicators about cycles. BTC has cycle just like stock market has cycles and my idea is that I’ve never called a bear market unless couple indicators follow up behind a market drop. The main technical indicator is (M)MA50 – my natural border between technical bull/bear. We need to follow BTC and GOLD/BTC ratio to get an idea how “cycle” for BTC works – just like the same for DJI/GOLD, or SPX/GOLD. Peaks for GOLD ratios don’t mean peak in those assets, but I assume, the longer the GOLD ratio reversing while current asset goes higher, the more powerful will be “the rejoin”. Have in mind that stocks followed till 2000 perfectly GOLD ratios. Situation has been changed post 2008.
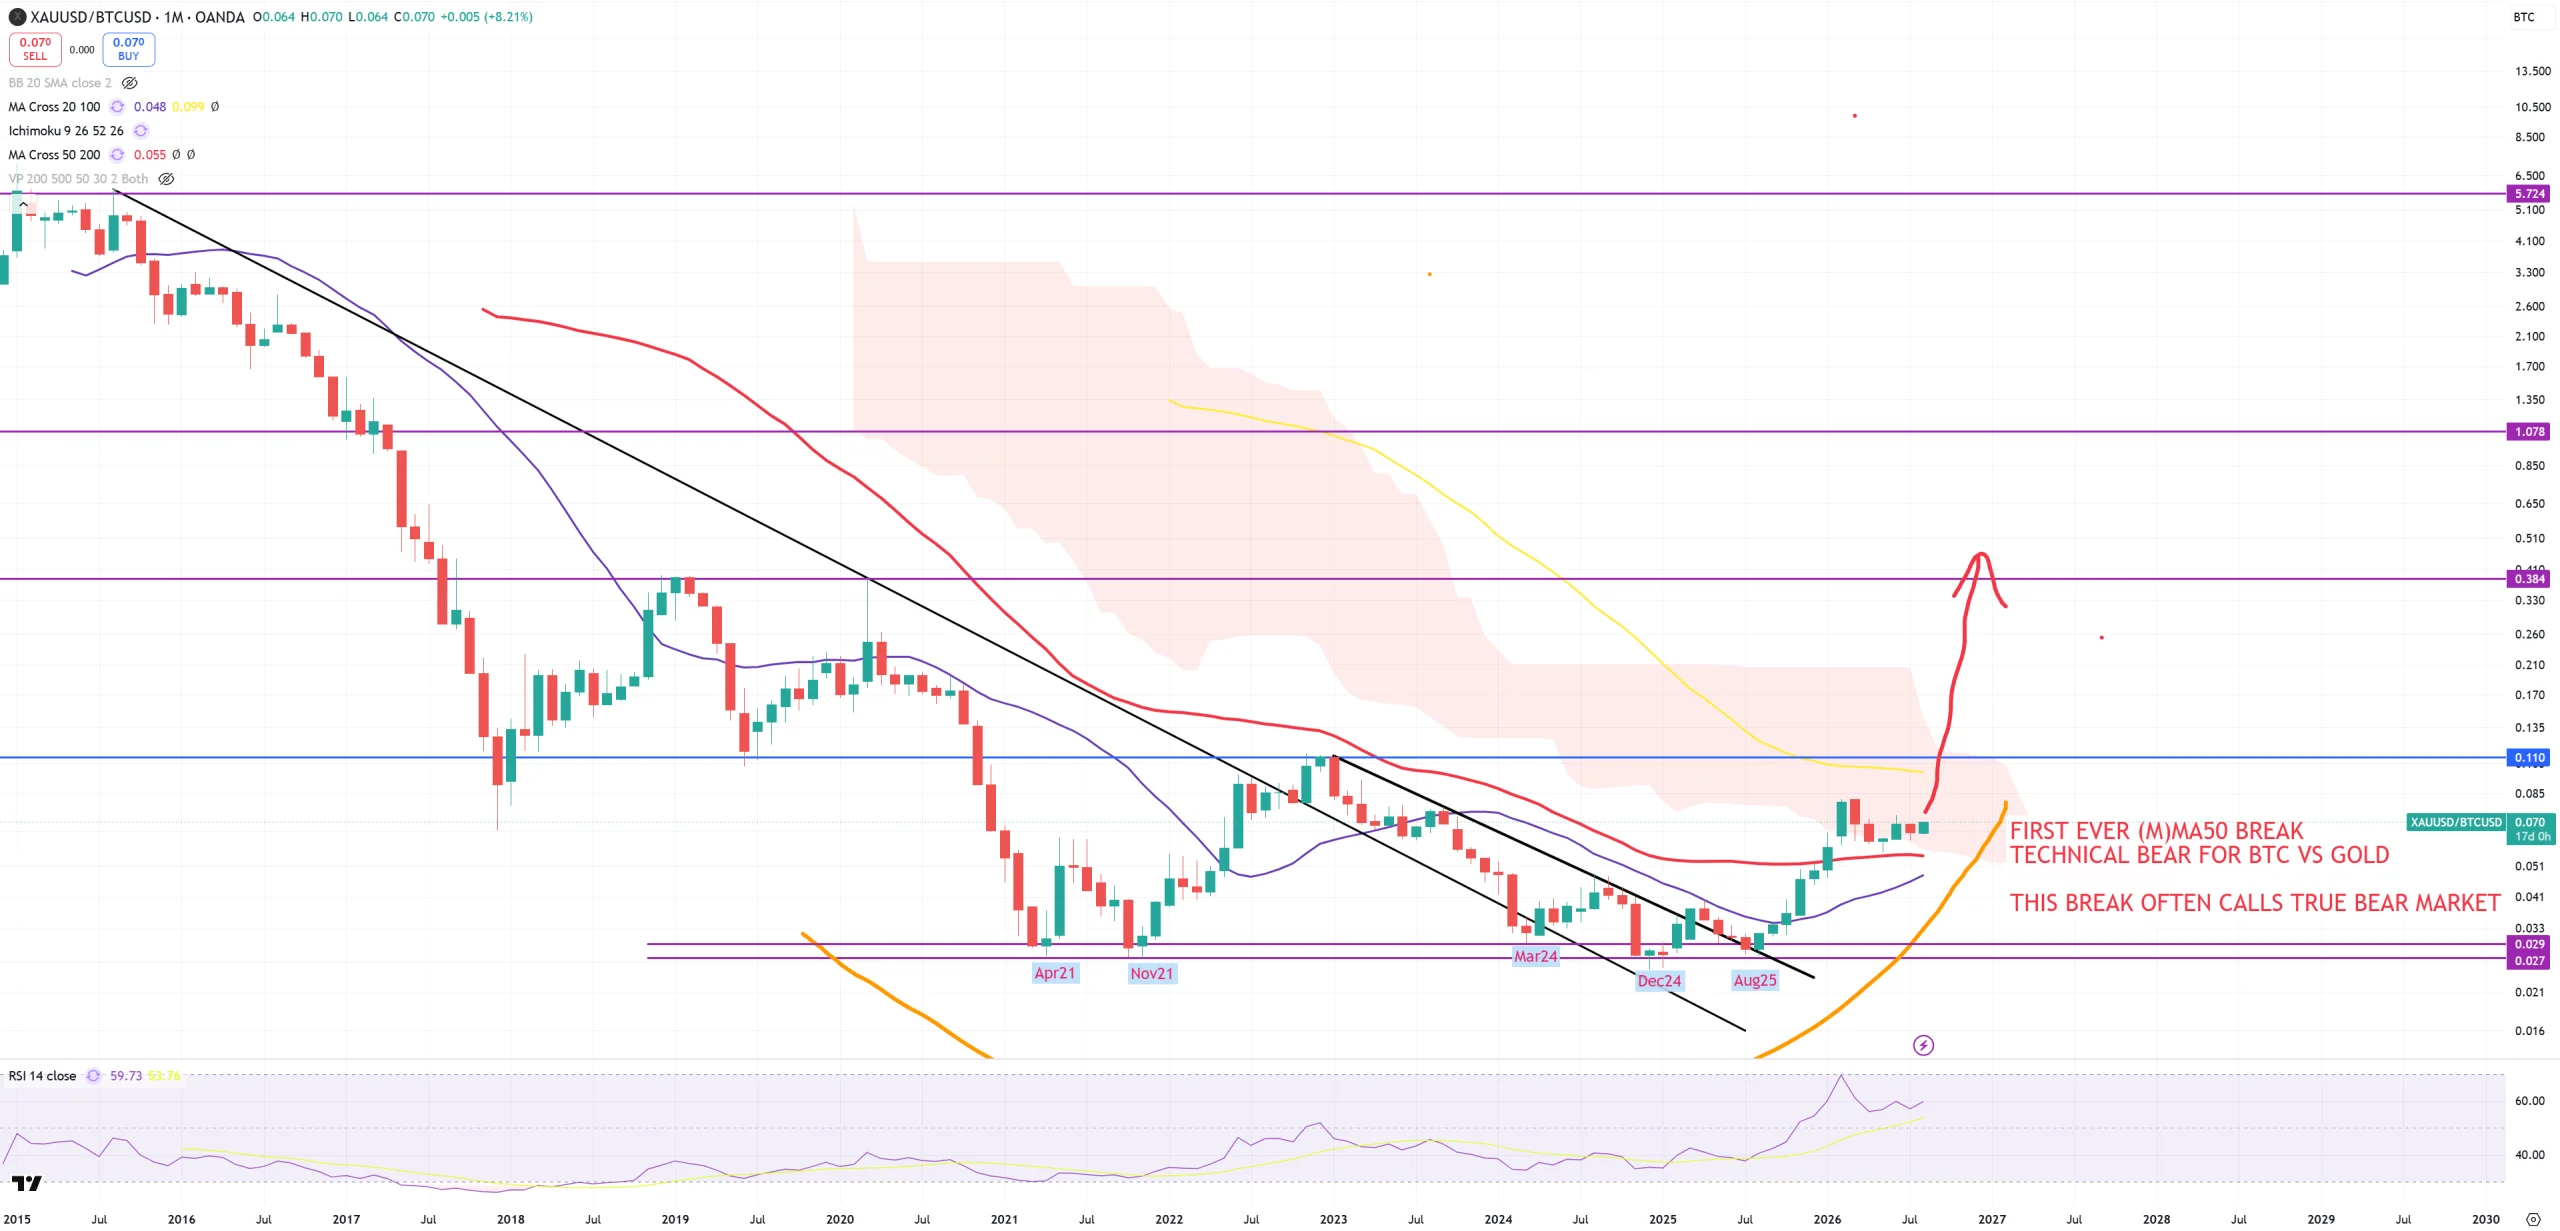
GOLD/BTC ratio – look how this ratio was reversing since 2021. Huge support and super long term bull market cycle for BTC. Despite -80% drops – it was all about correction in the same cyclical bull market. Now you can see that level of drop doesn’t determine a cyclical bear market. Situation was rotating since 2021 and it took almost 4 years till 3Q25 till we had last bottom on this 0.027-0.029 support. In January 2026 GOLD/BTC ratio did something it has not done before. It managed to break a border of technical bull/bear cycle indicator. The problem is I don’t have here longer (M)MAs like (M)MA200, so we can assume this break as a first valid indicator that BTC cycle has come to an end. First solid resistance around 0,38 while 2021 bottom was 0.027 – it’ll be a big move of GOLD vs BTC. The biggest one. Now imagine even higher level and 1.00 ratio.
BTC – BTC as an asset managed to break 2021 peak – but because GOLD/BTC had this 2021 support it was automatically a red flag that this break over 70000$ was a bull-trap and … it was :
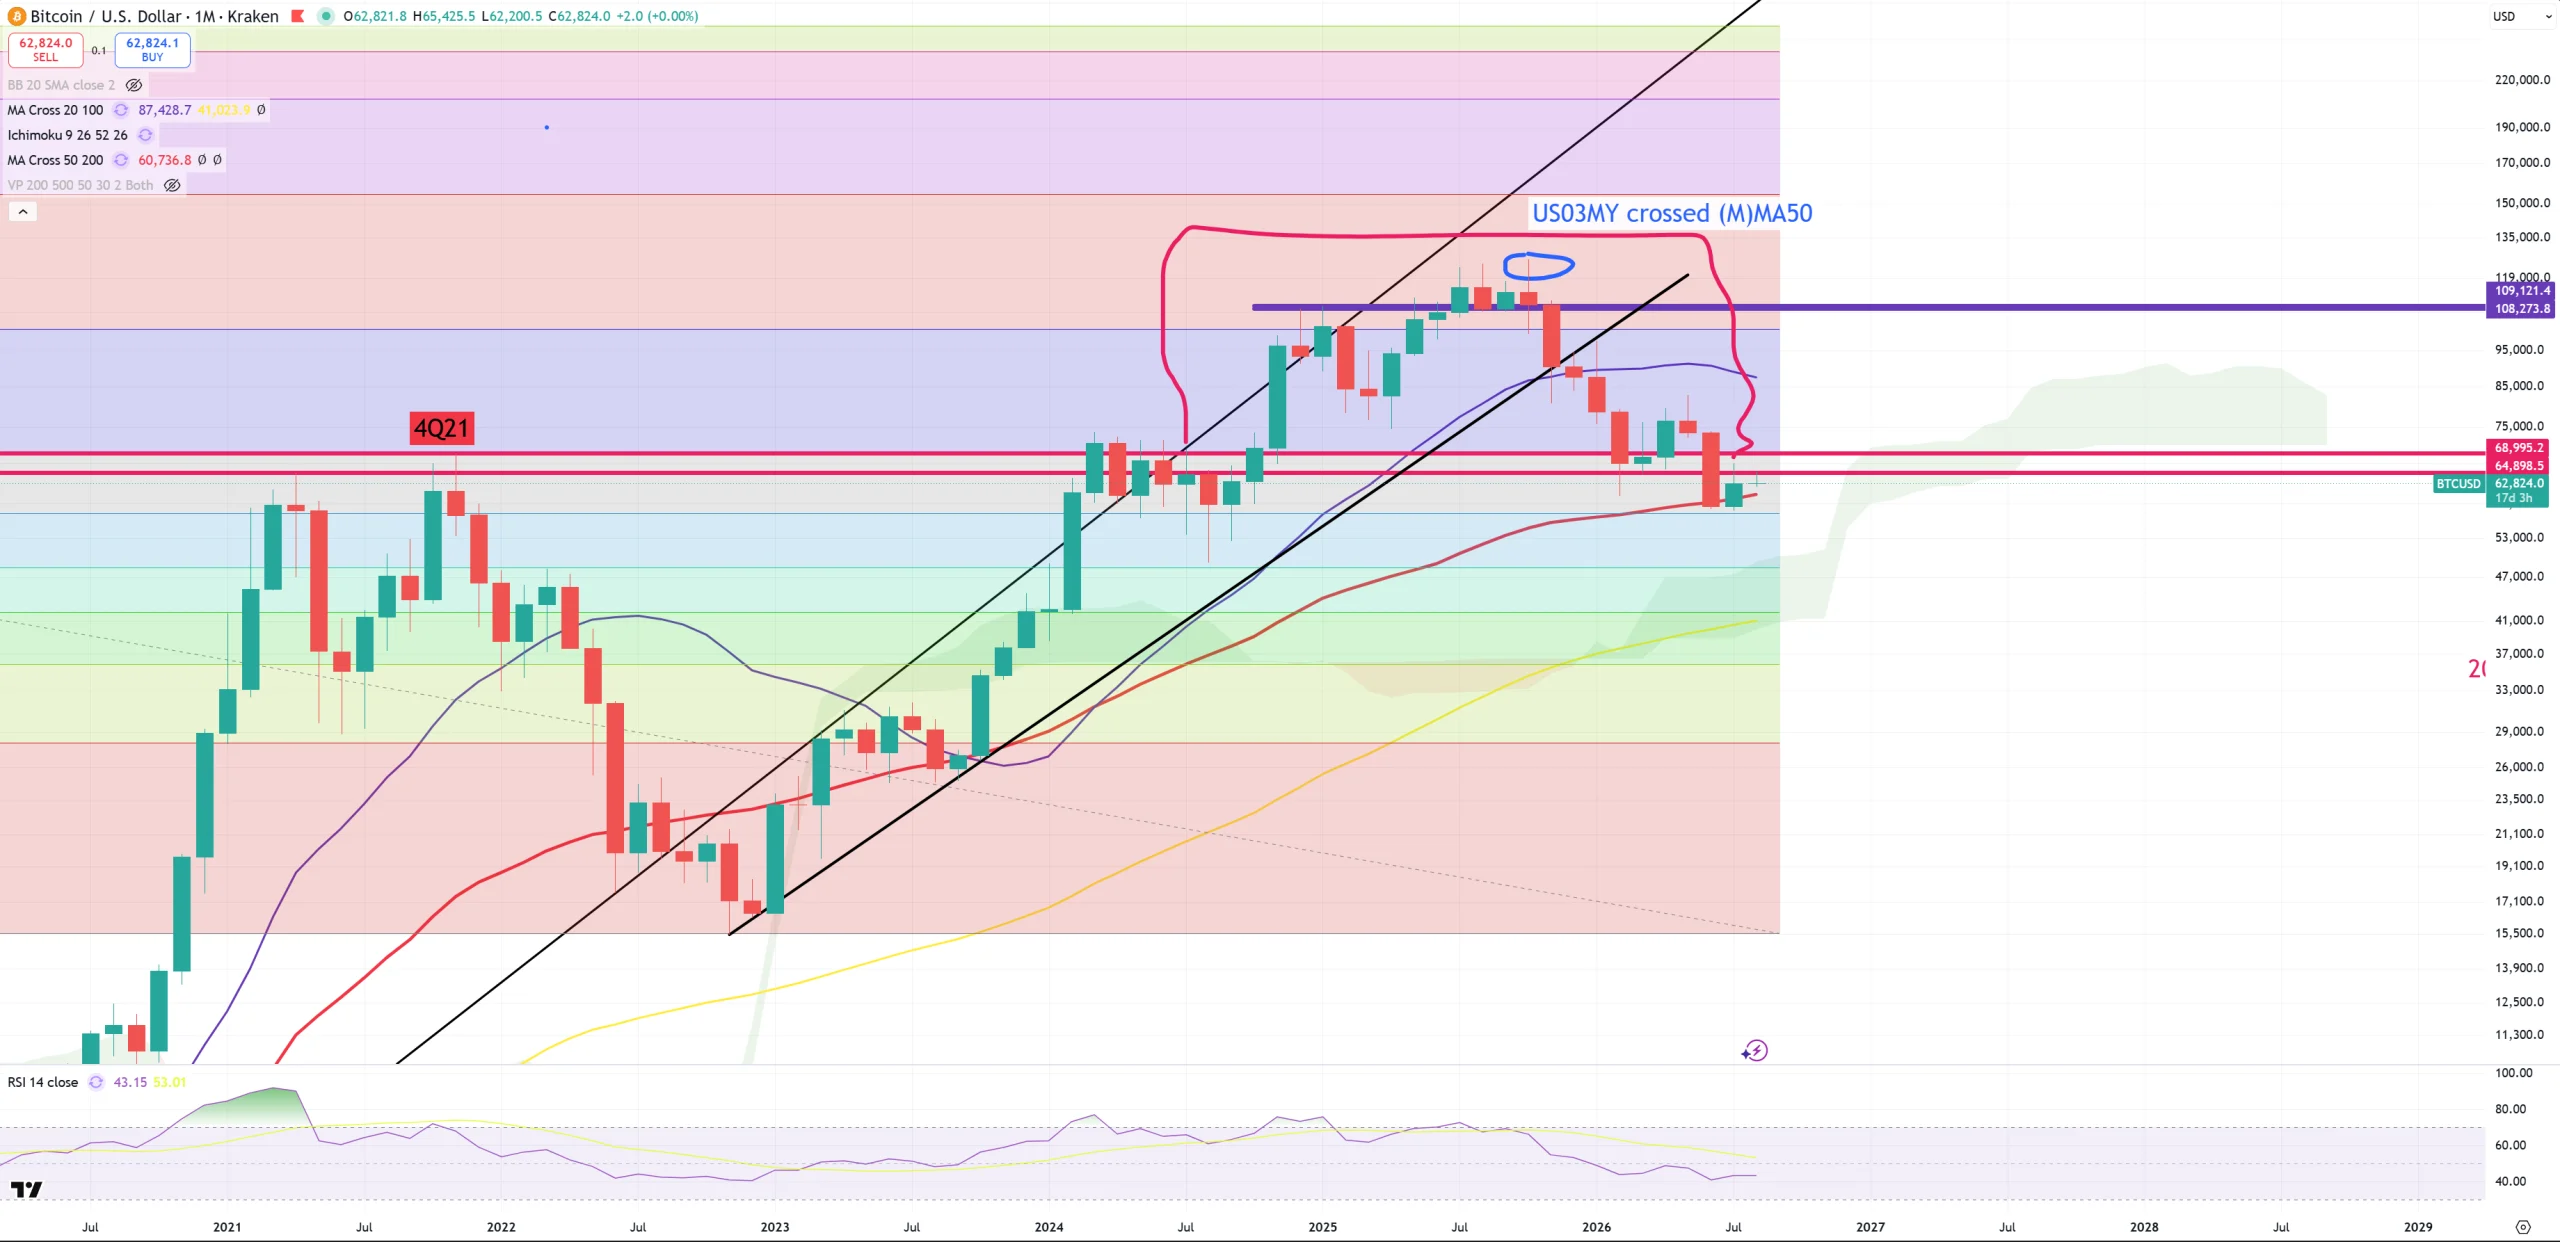
Of course we can see another red (M)MA50 break around 2022 – which was short lived and it was a bear trap, but around 2021-2022 we had a massive correction everywhere (in the same cyclical bull market). Now situation is way different because GOLD/BTC broken ratio is a gravity. Its (M)MA50 level is very low, so there’s no really room for BTC to move.
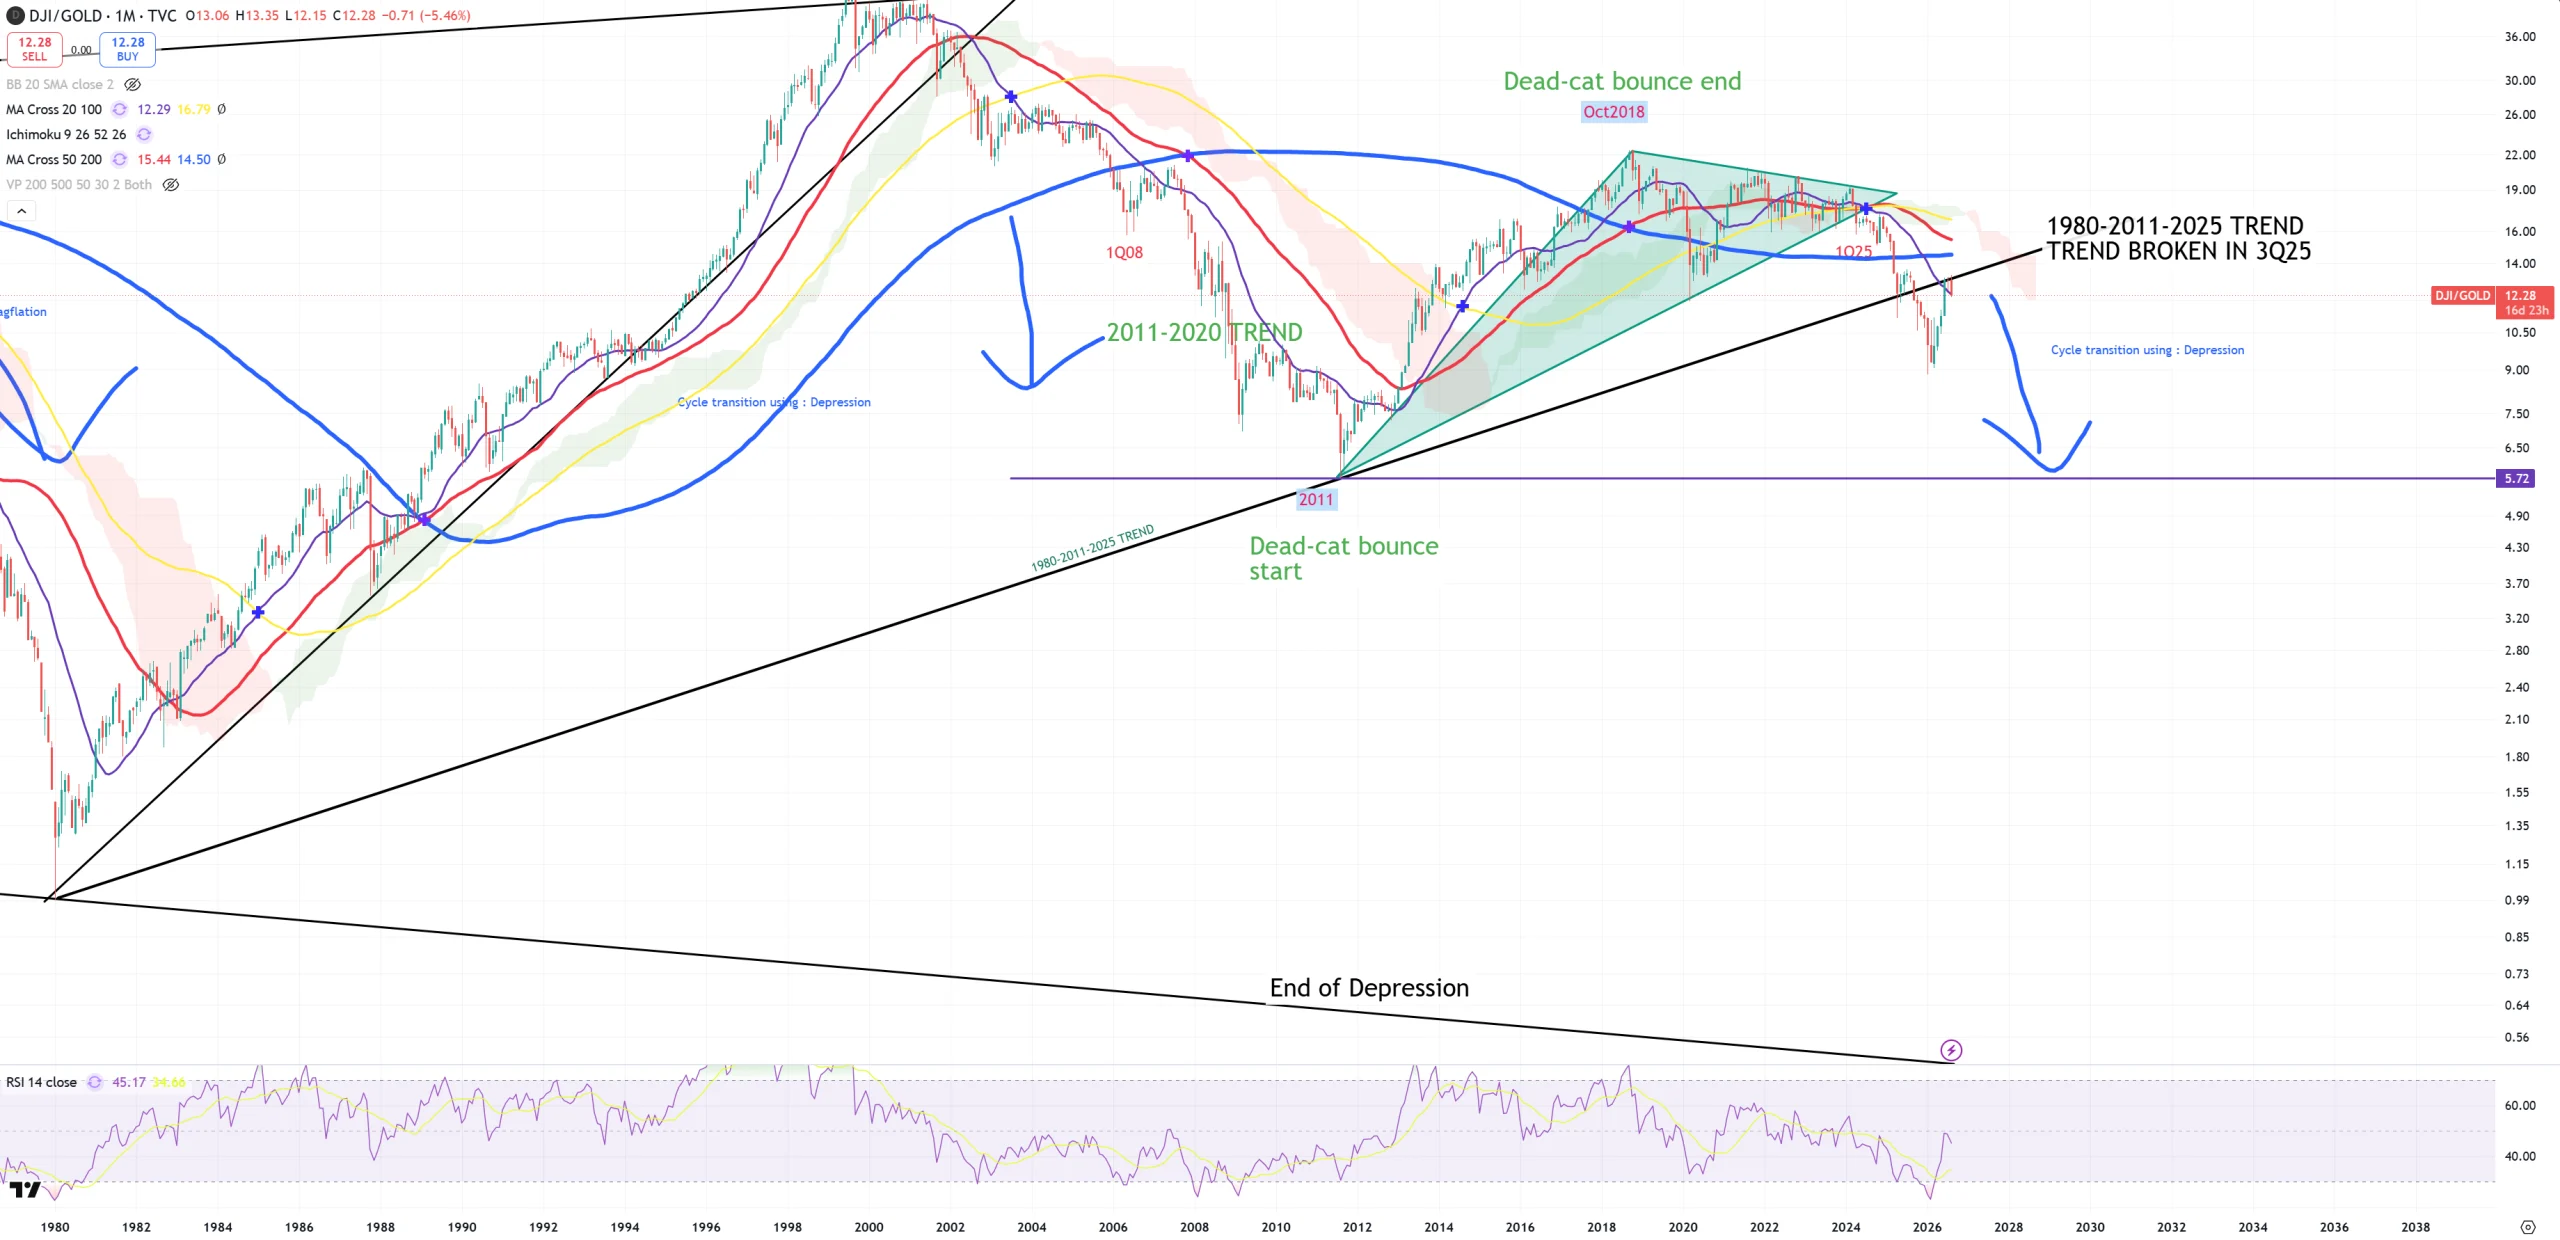
DJI/GOLD – the most dangerous setup is here. I say DJI/GOLD leads SPX/GOLD and SPX/GOLD takes stocks with them. When GOLD hit 5600$ with (M)RSI=96 it was really obvious correction is coming, but all GOLD ratios still pointing for secular bull market cycle for GOLD vs STOCKS.
Technically DJI/GOLD plays way better than SPX/GOLD – it is always as perfect as possible on trend lines, key MAs.
We can’t talk about long term cycle without looking on 3M view on DJI/GOLD
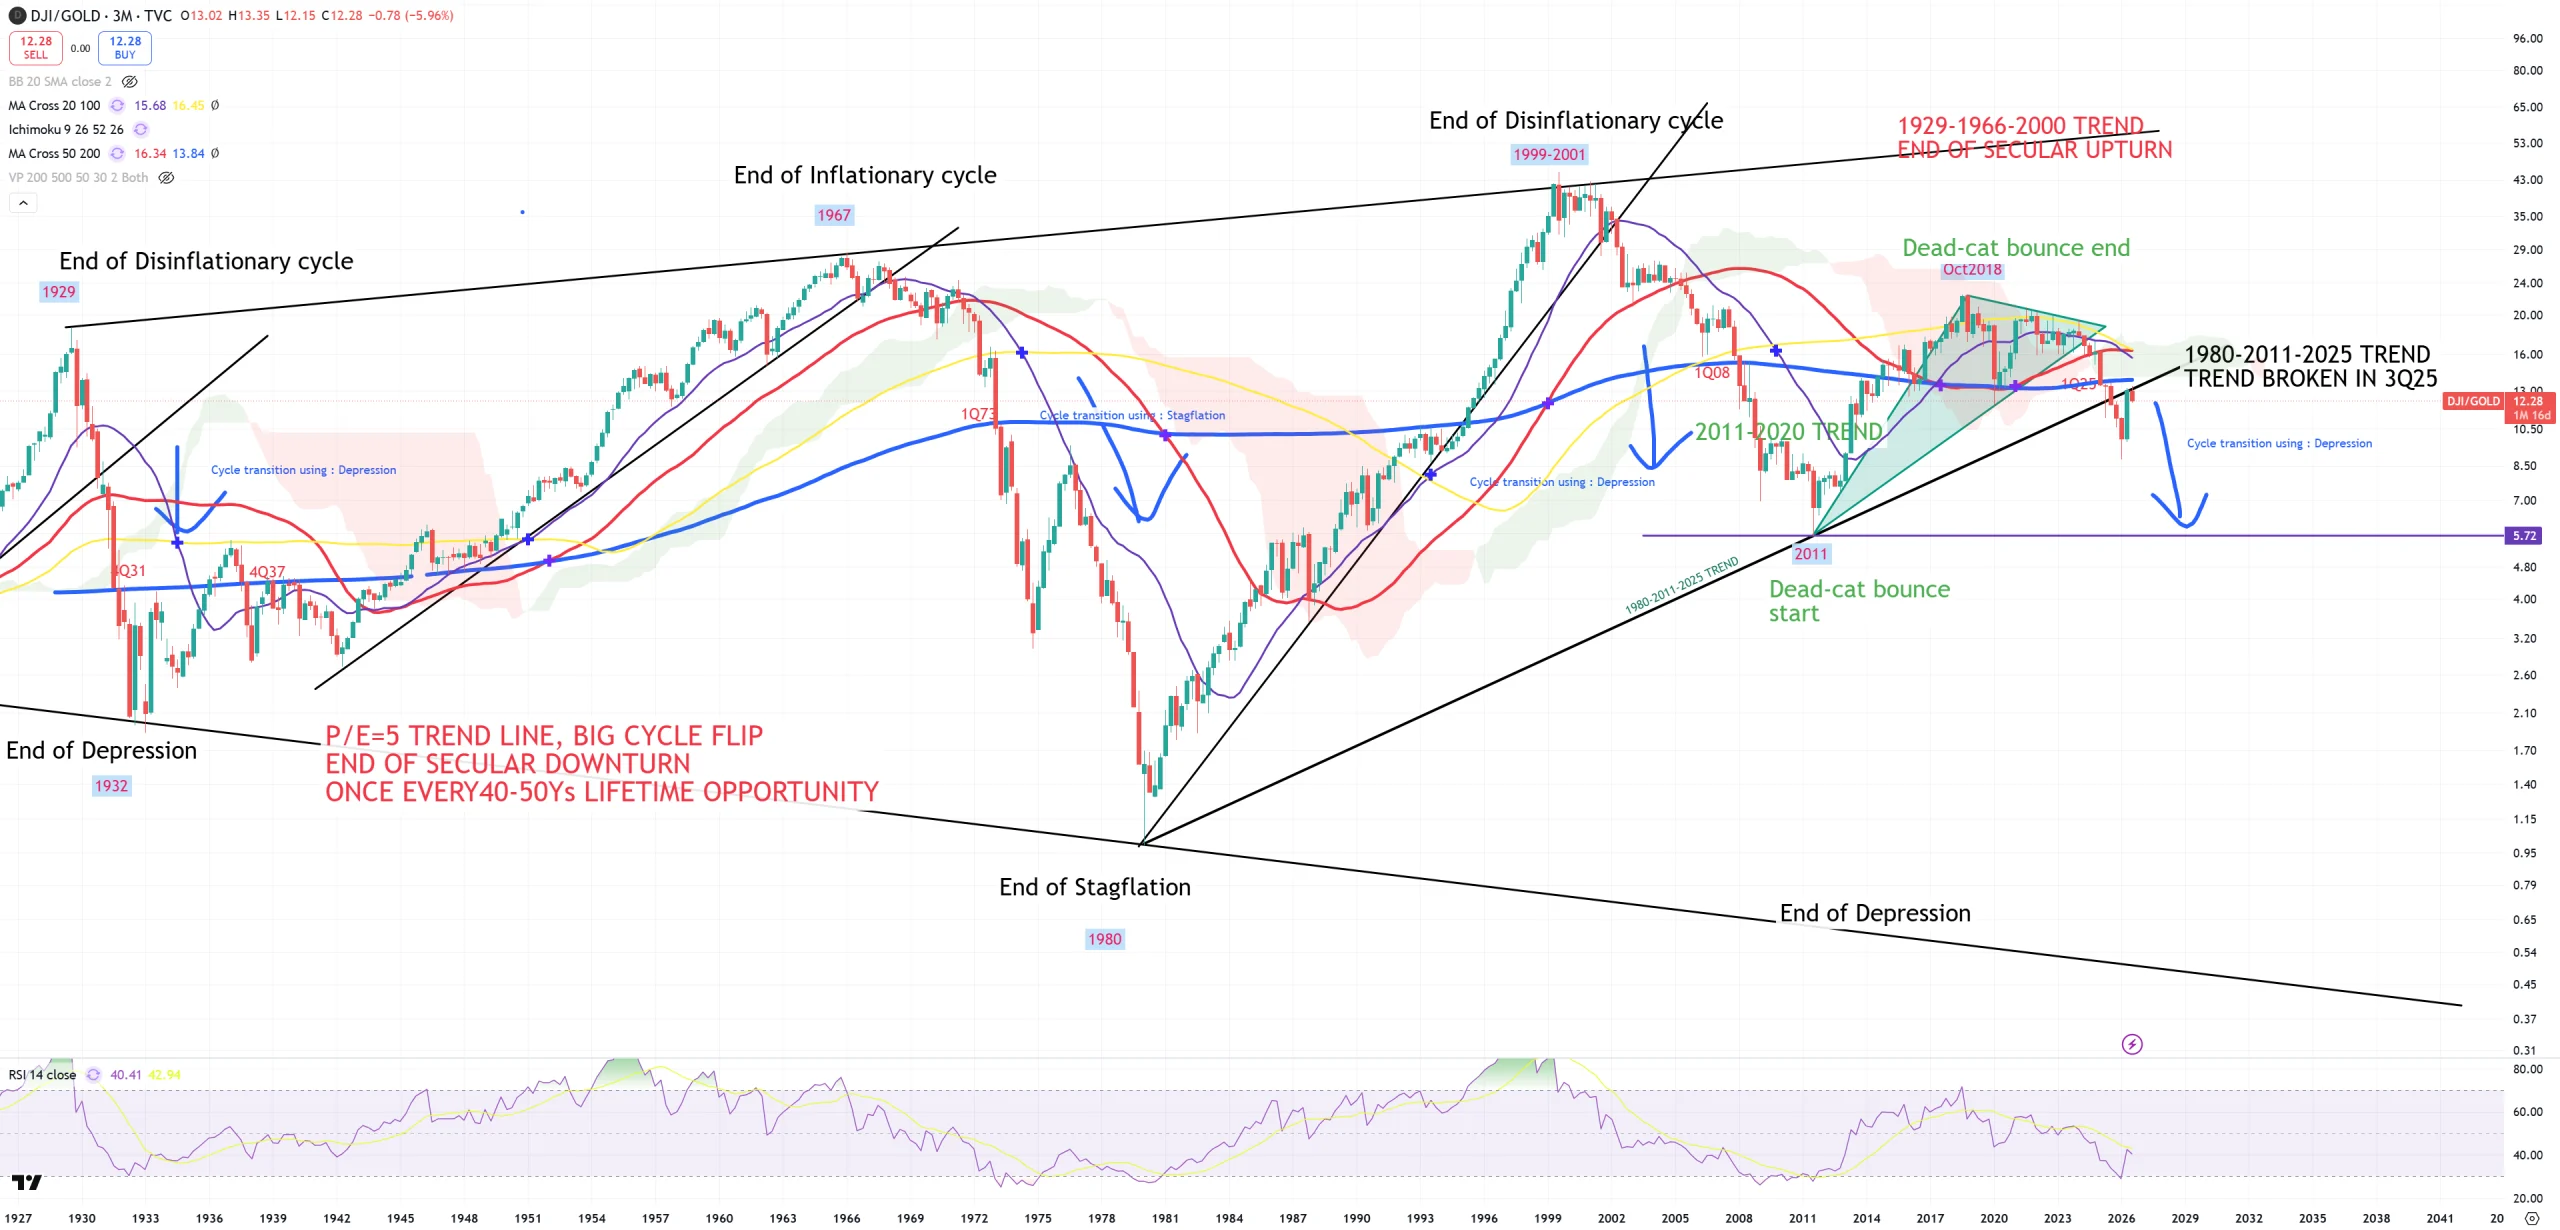
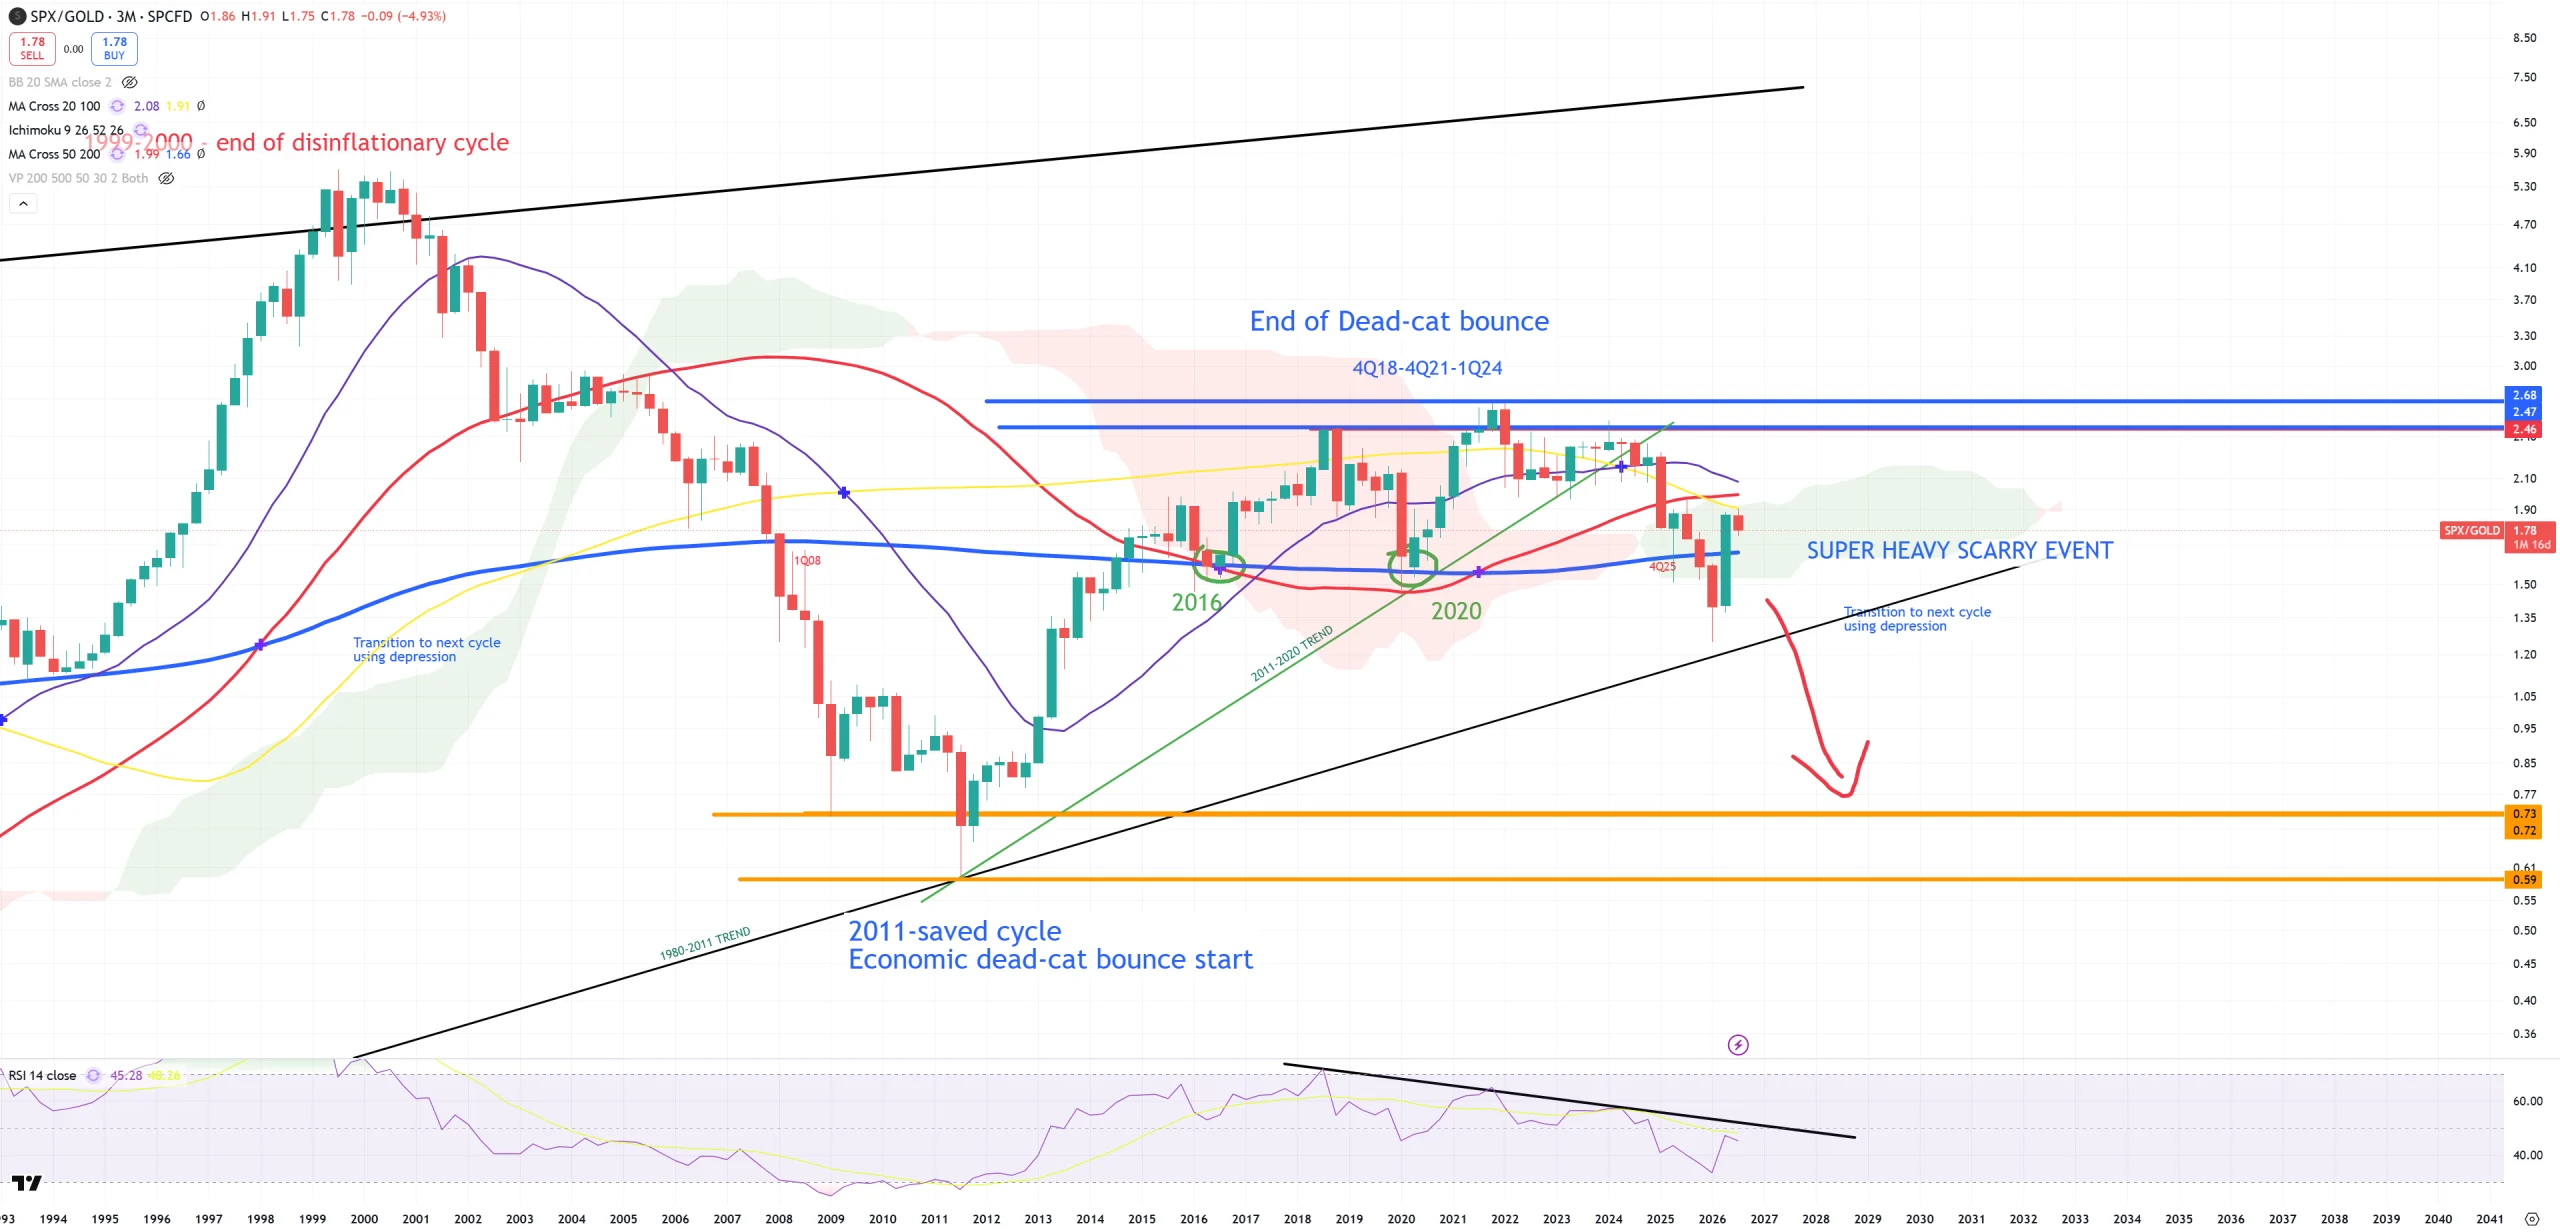
SPX/GOLD – better correlated with stocks cycle indicator with the most important peak 4Q21. To close (3M) candle we need September – that’s a lot of time. SPX/GOLD managed to get in touch with (3M)MA100 here and once this ratio start going down, pressure on stocks will increase especially post blue (3M)MA200 break which was broken down 5 times in history : 1931, 1937, 1973, 1Q2008 and 4Q2025. While DJI/GOLD is still below (3M)MA200, SPX/GOLD manage to jump above it. Will DJI/GOLD lead SPX/GOLD like always? We’re going to see that at the end of quarter.
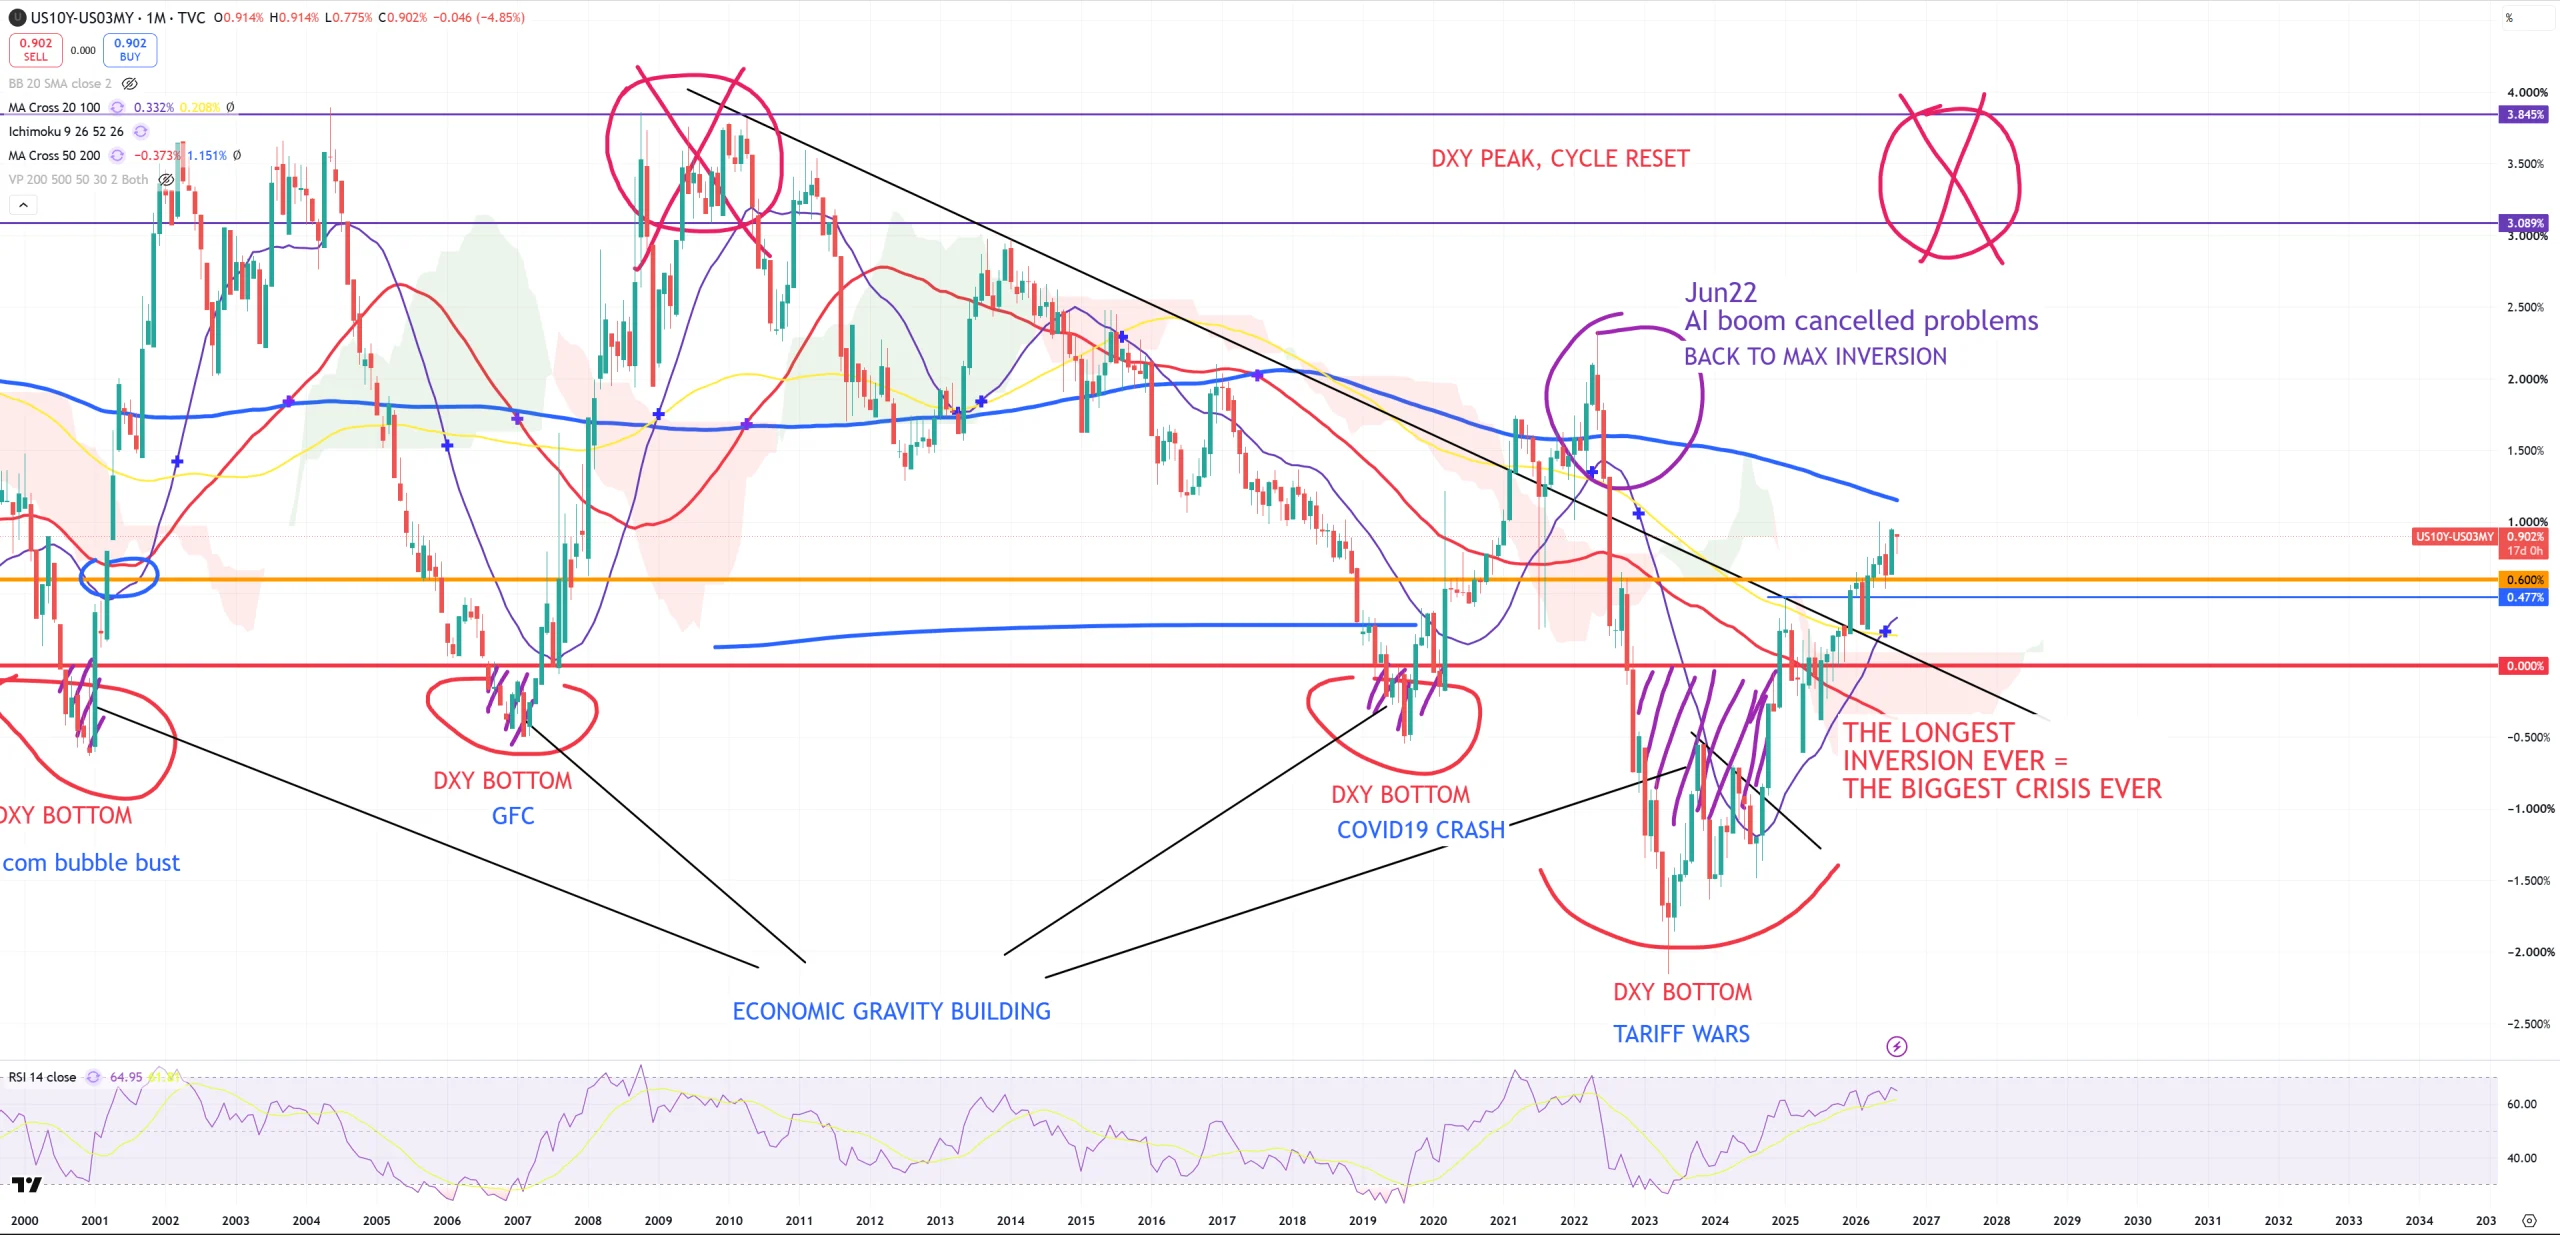
10Y/3M – gravity indicator is now +90bps – look how around 2022 10y/3m crashed saving the 2009 economic bull market cycle. Now we are on way lower level and we’re getting into even bigger troubles.
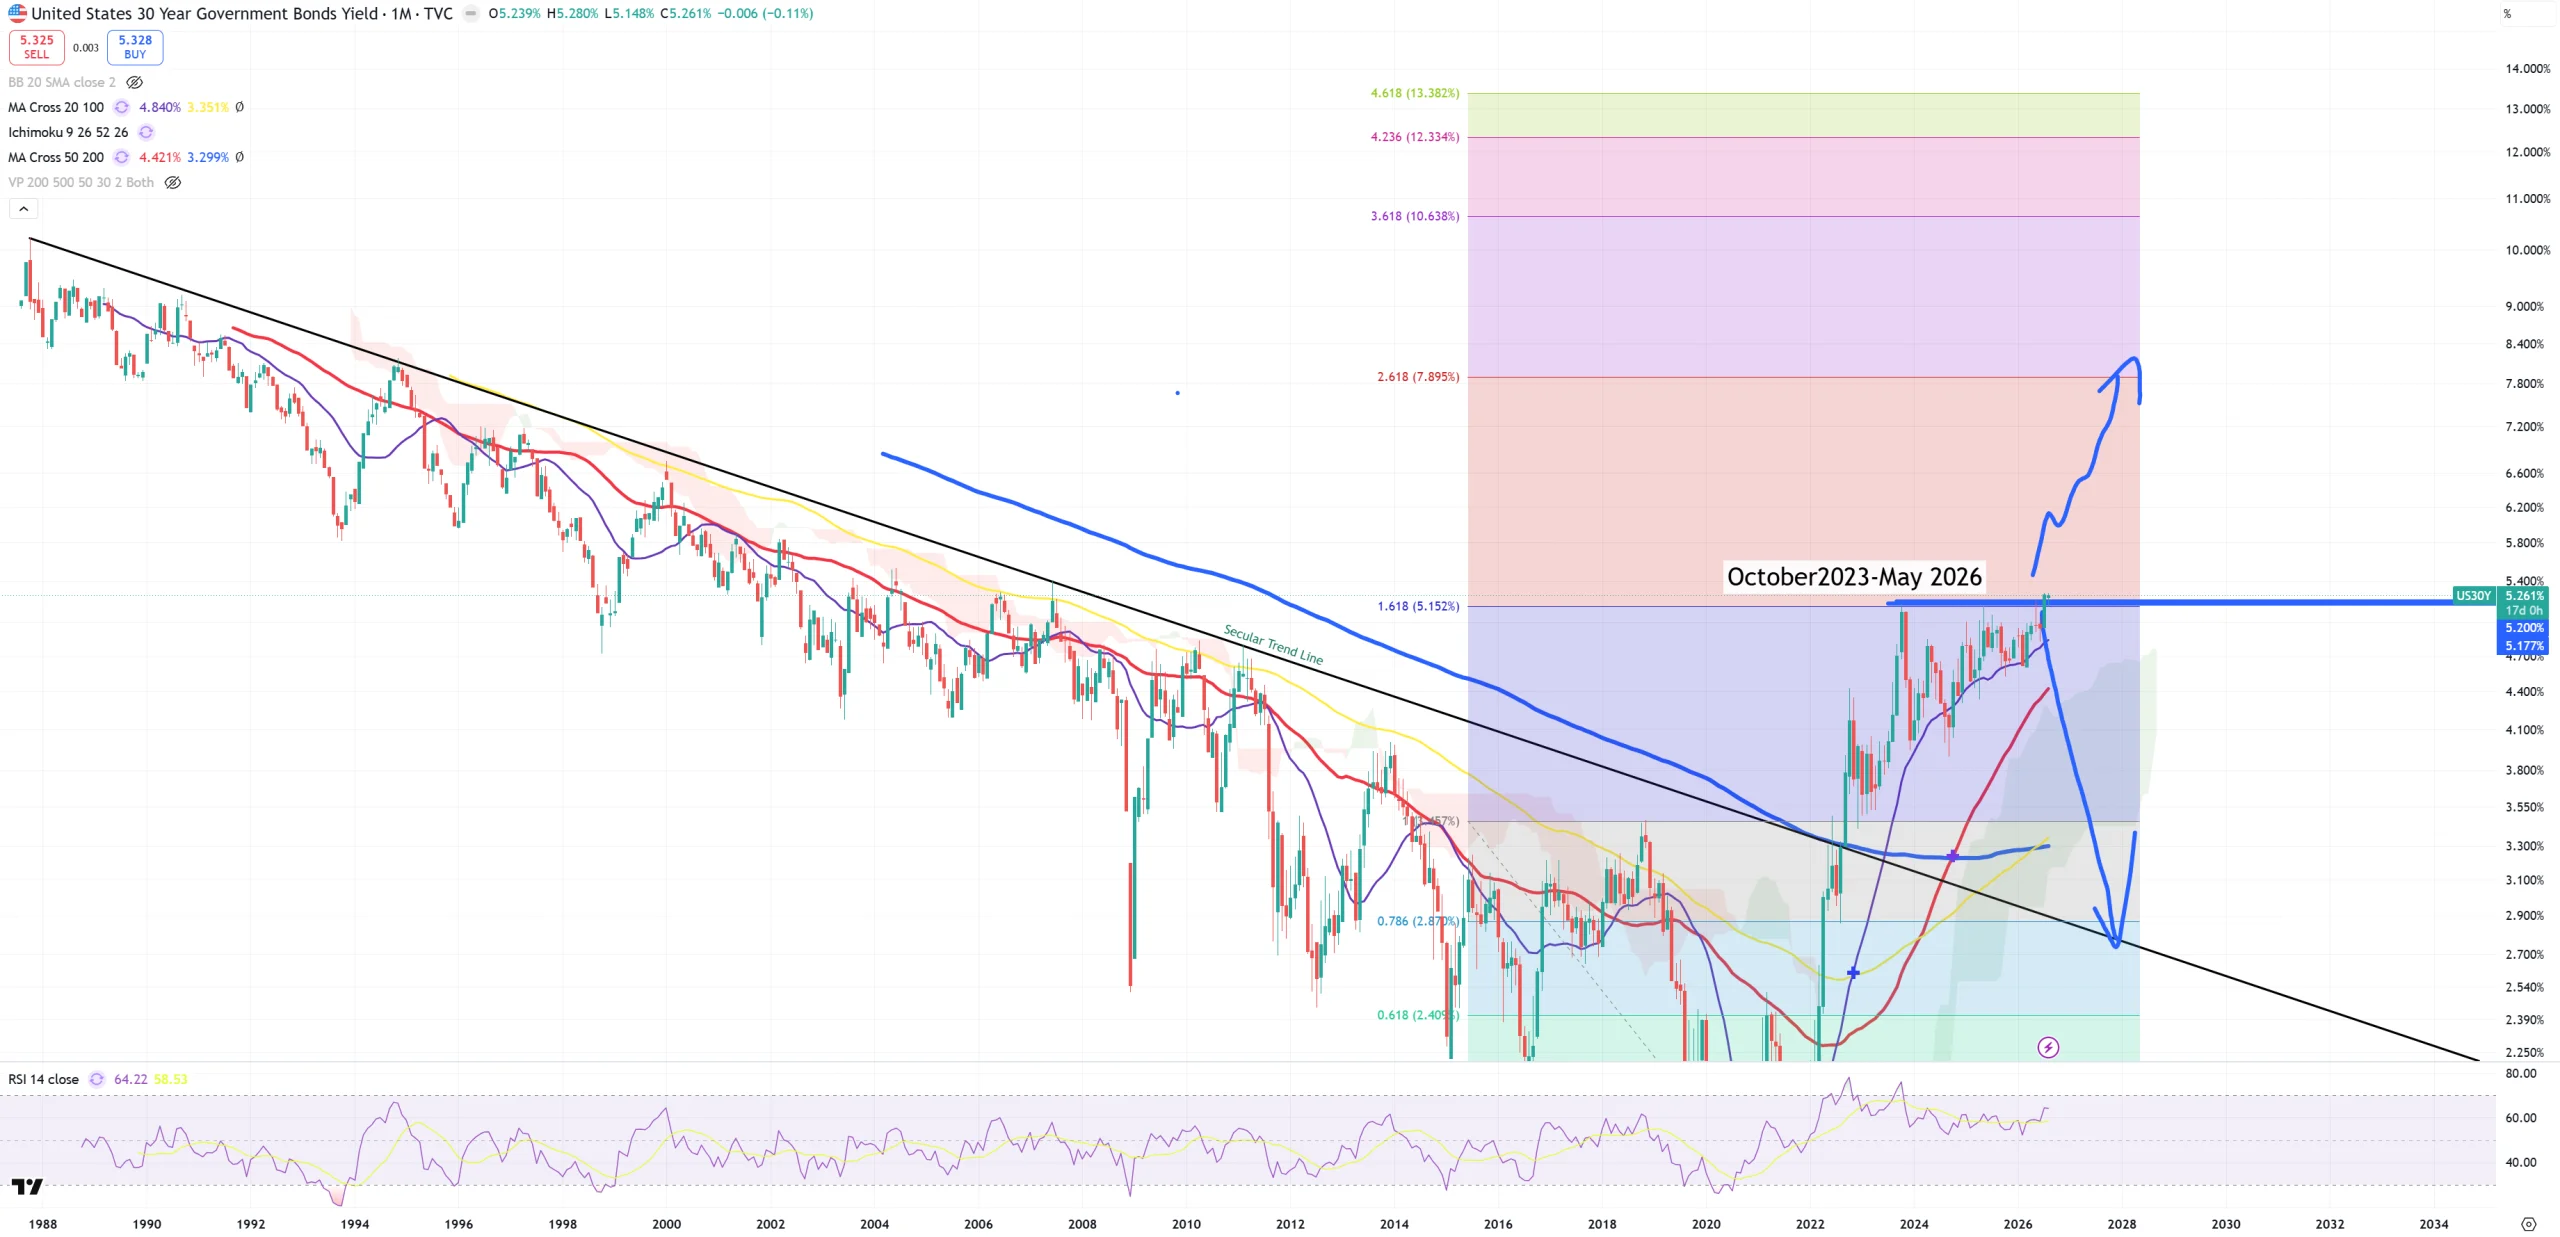
US30Y – trouble comes from long end bond market. This is way different market than in 2022.
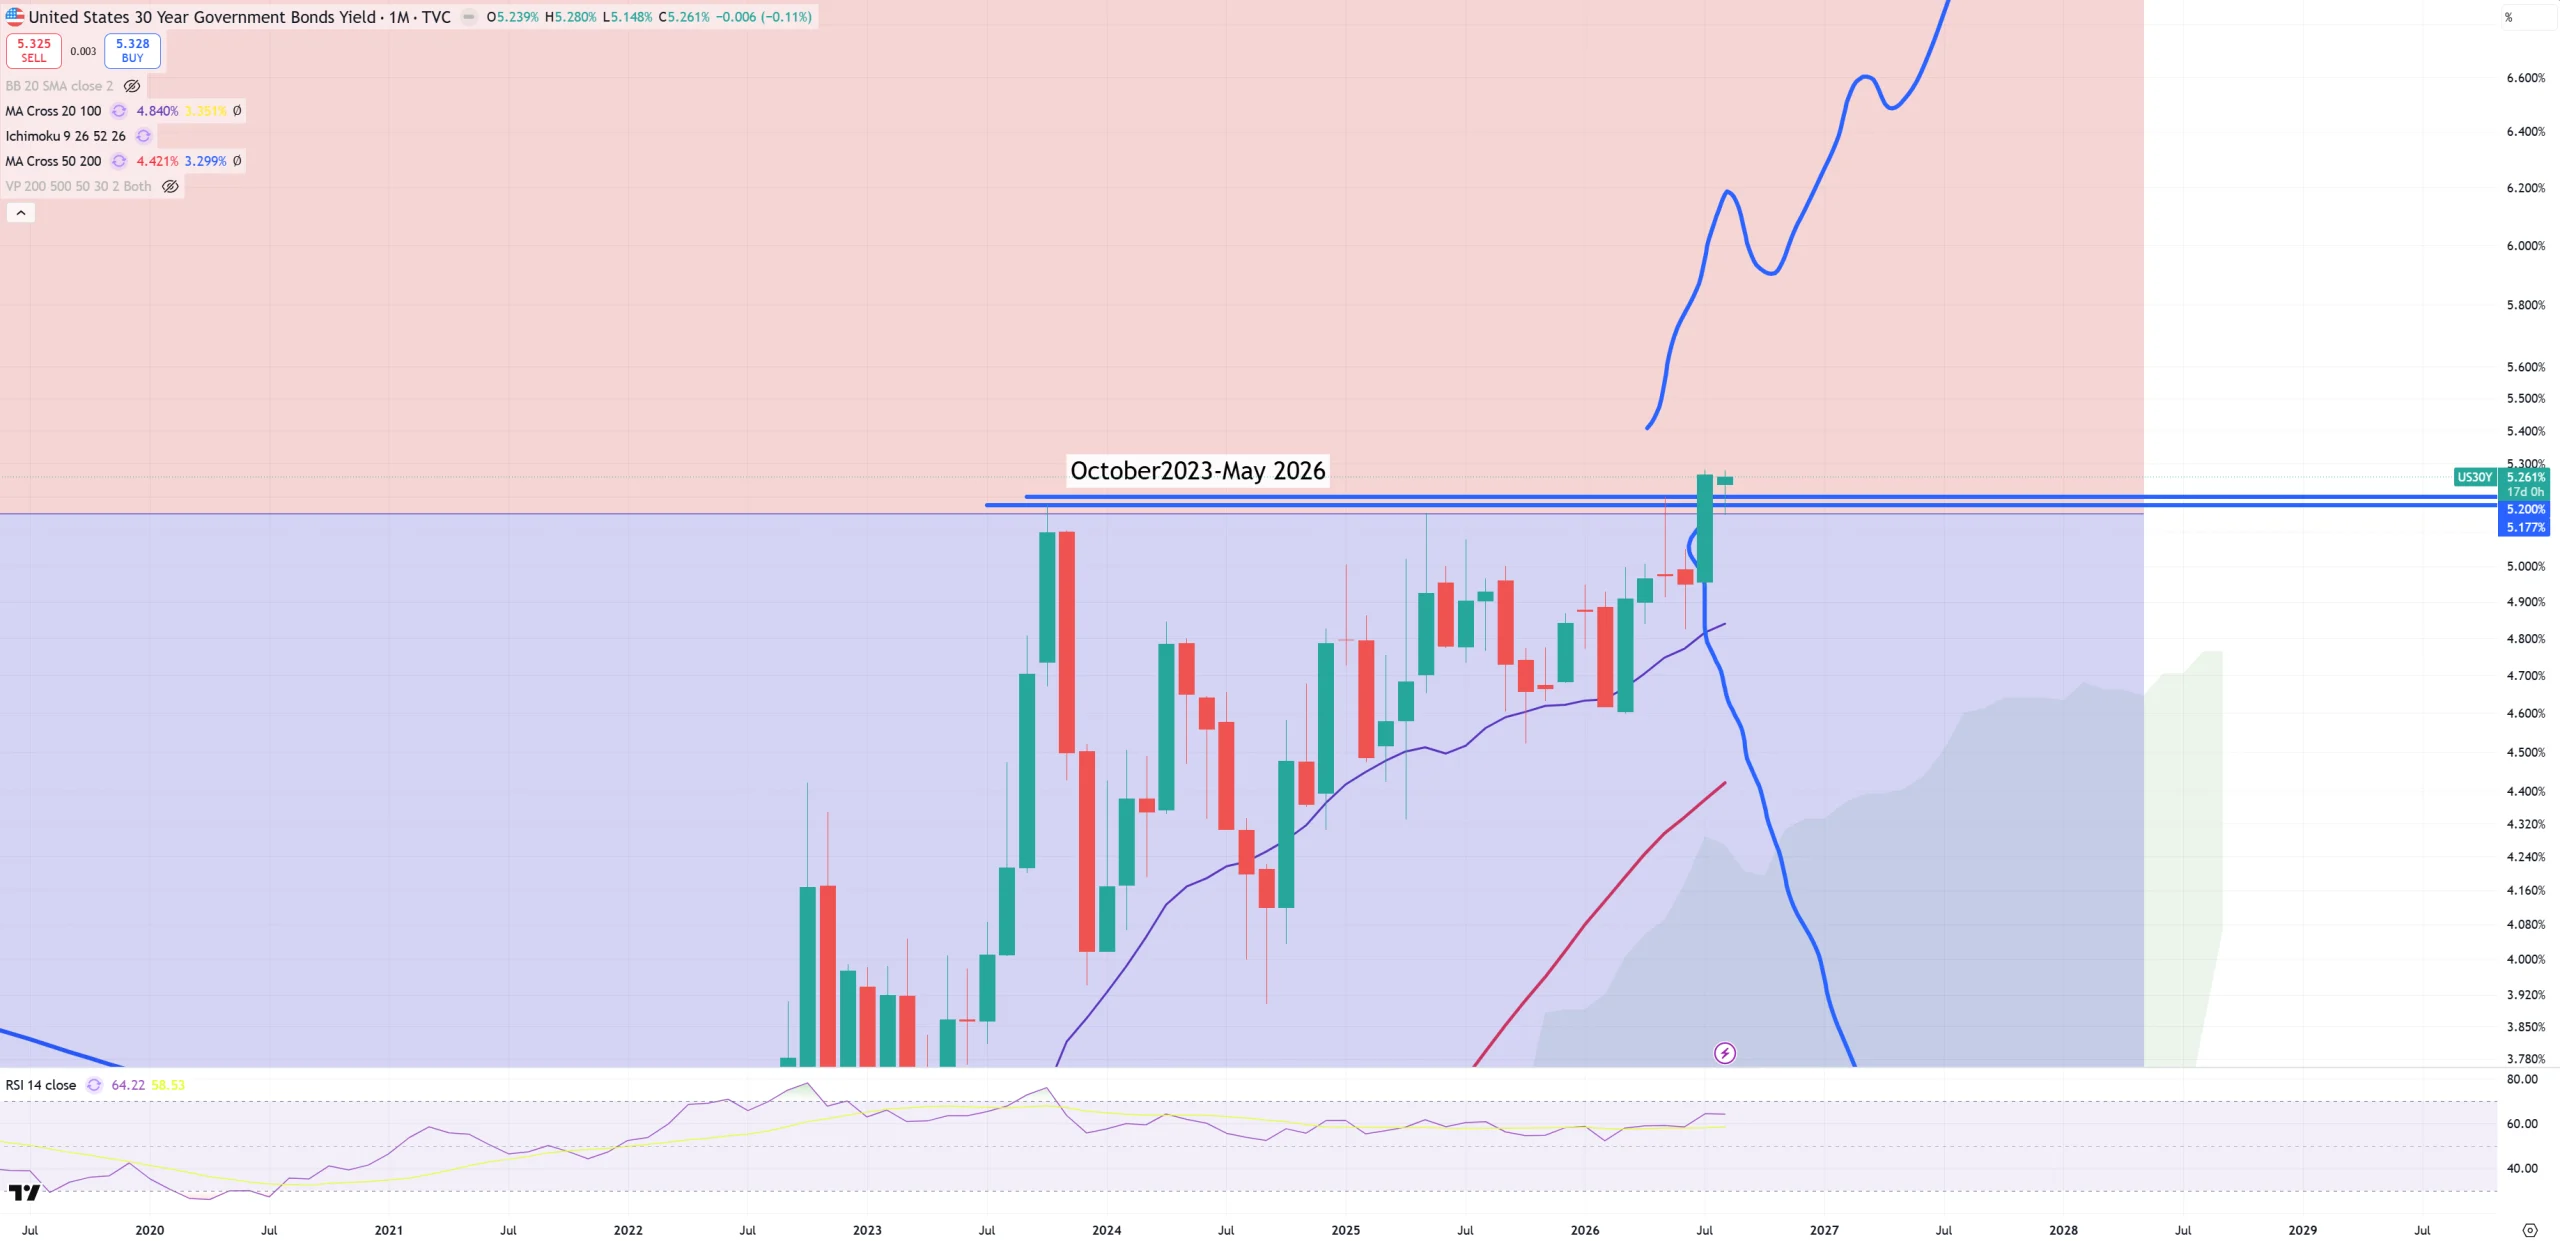
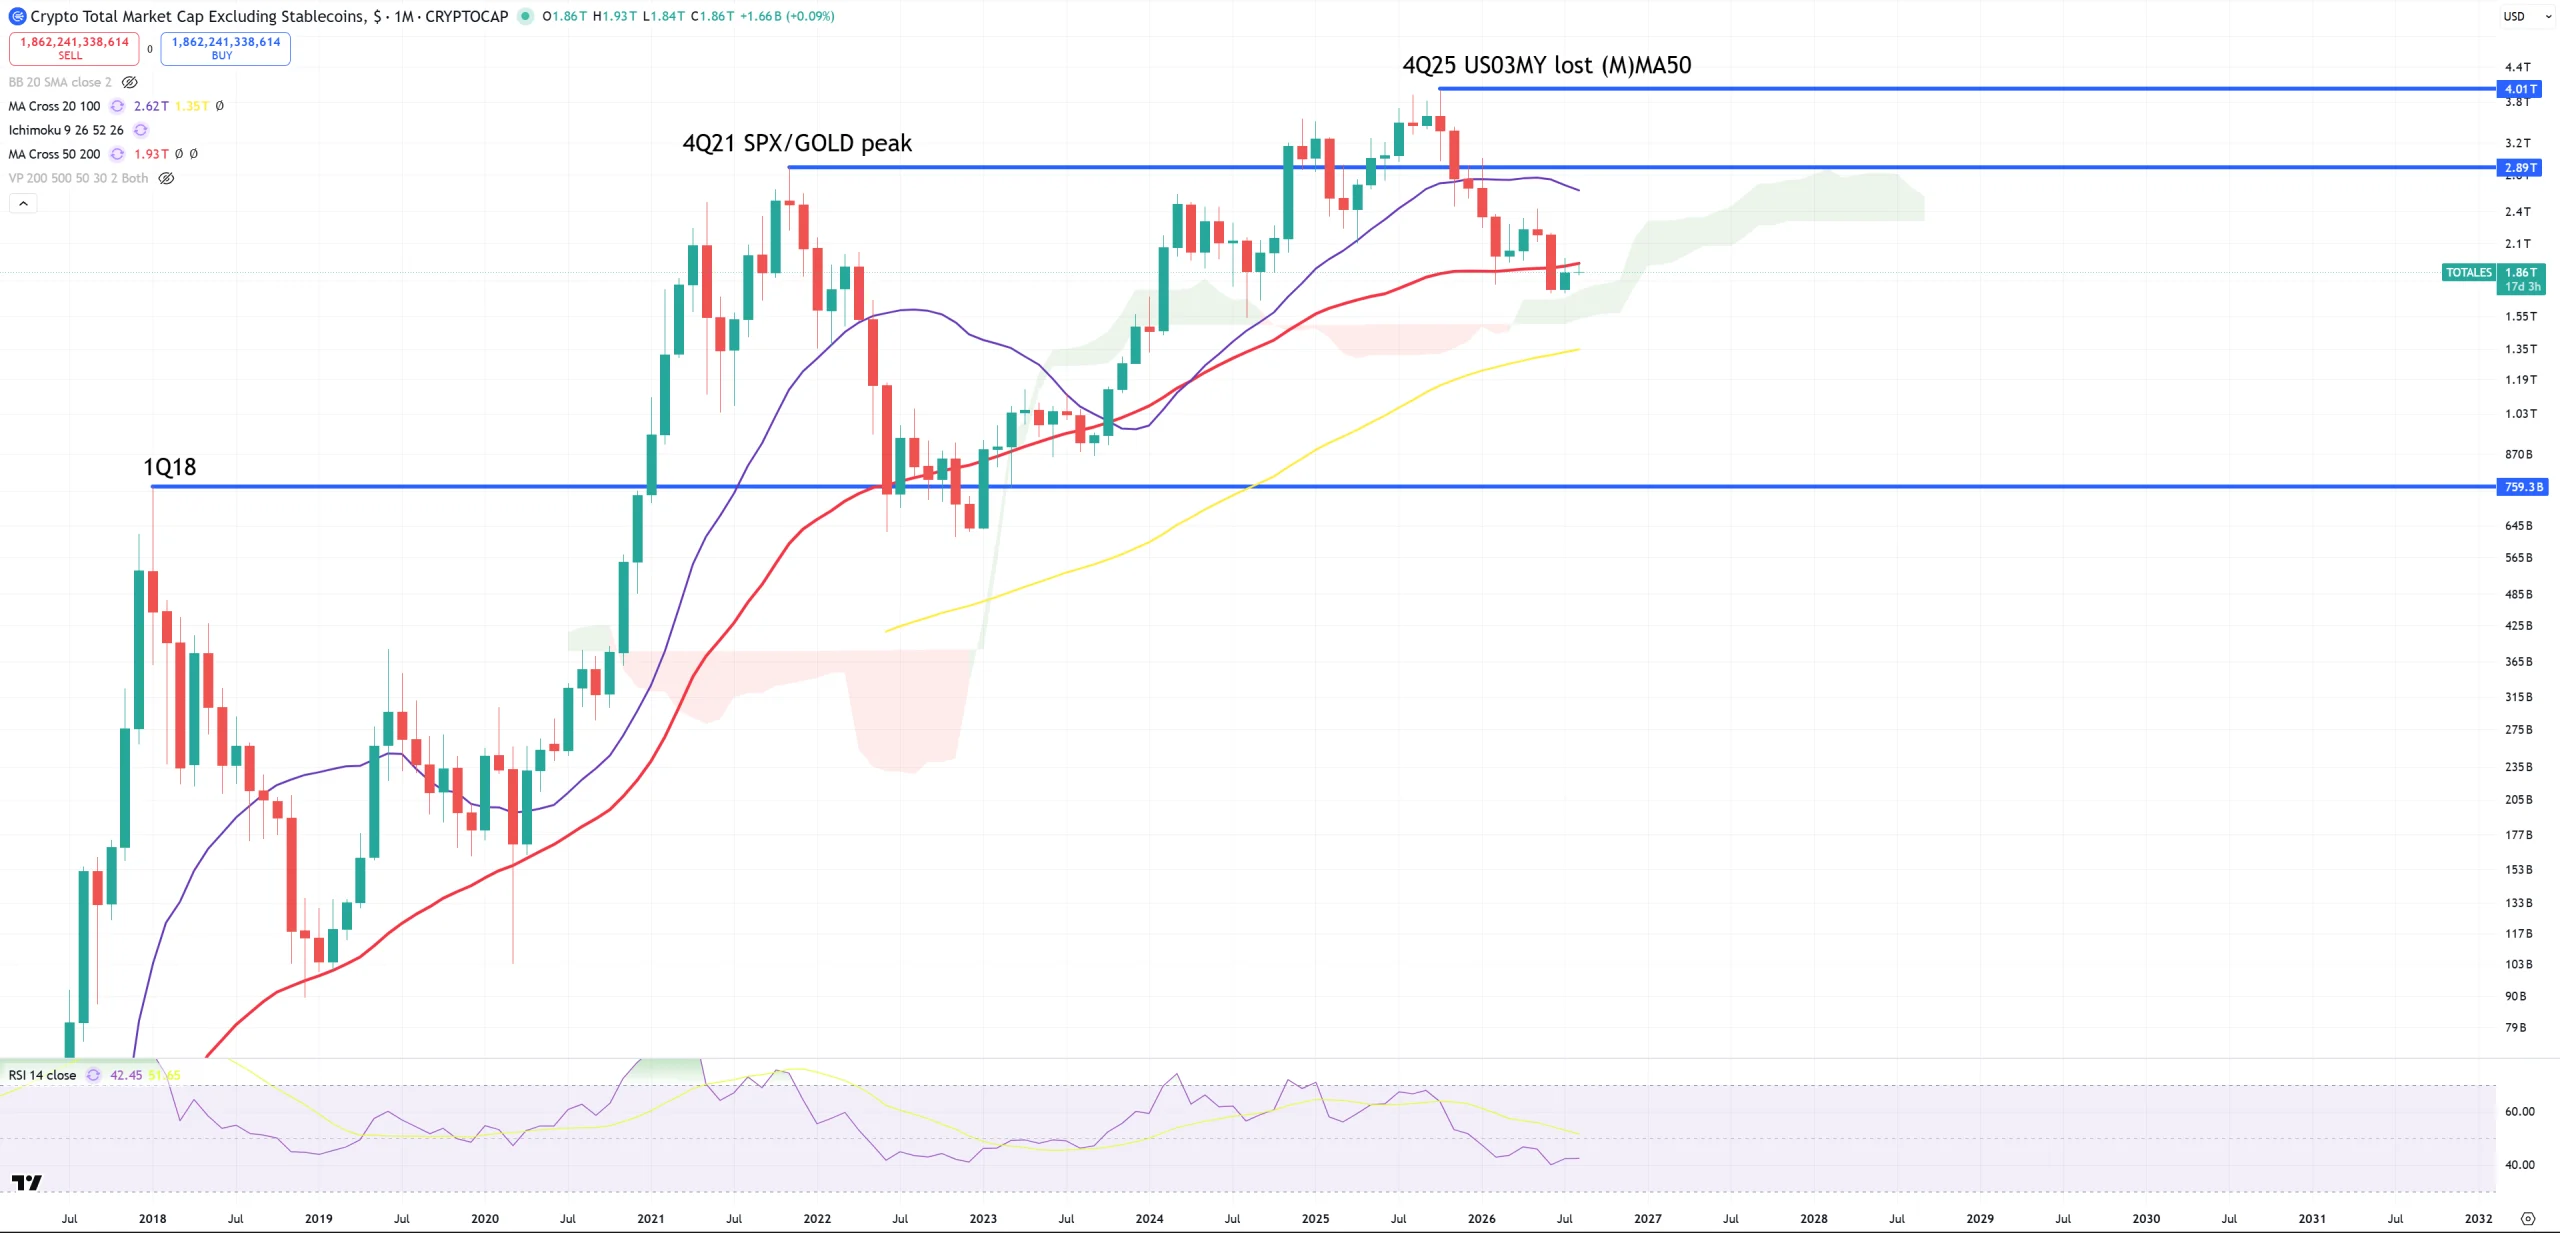
CRYPTO TOTAL MARKET CAP excluding STABLE COINS – and here the situation looks brutal. (M)MA50 retest from the bottom – which is THE WORST possible outcome and crash predictor. Yes in 2022 we had this false move down but that was a … bear trap. Now situation is way different. Look how this (M)MA50 retest is aligned by US30Y break + DJI/GOLD retest to 1980-2011 trend.
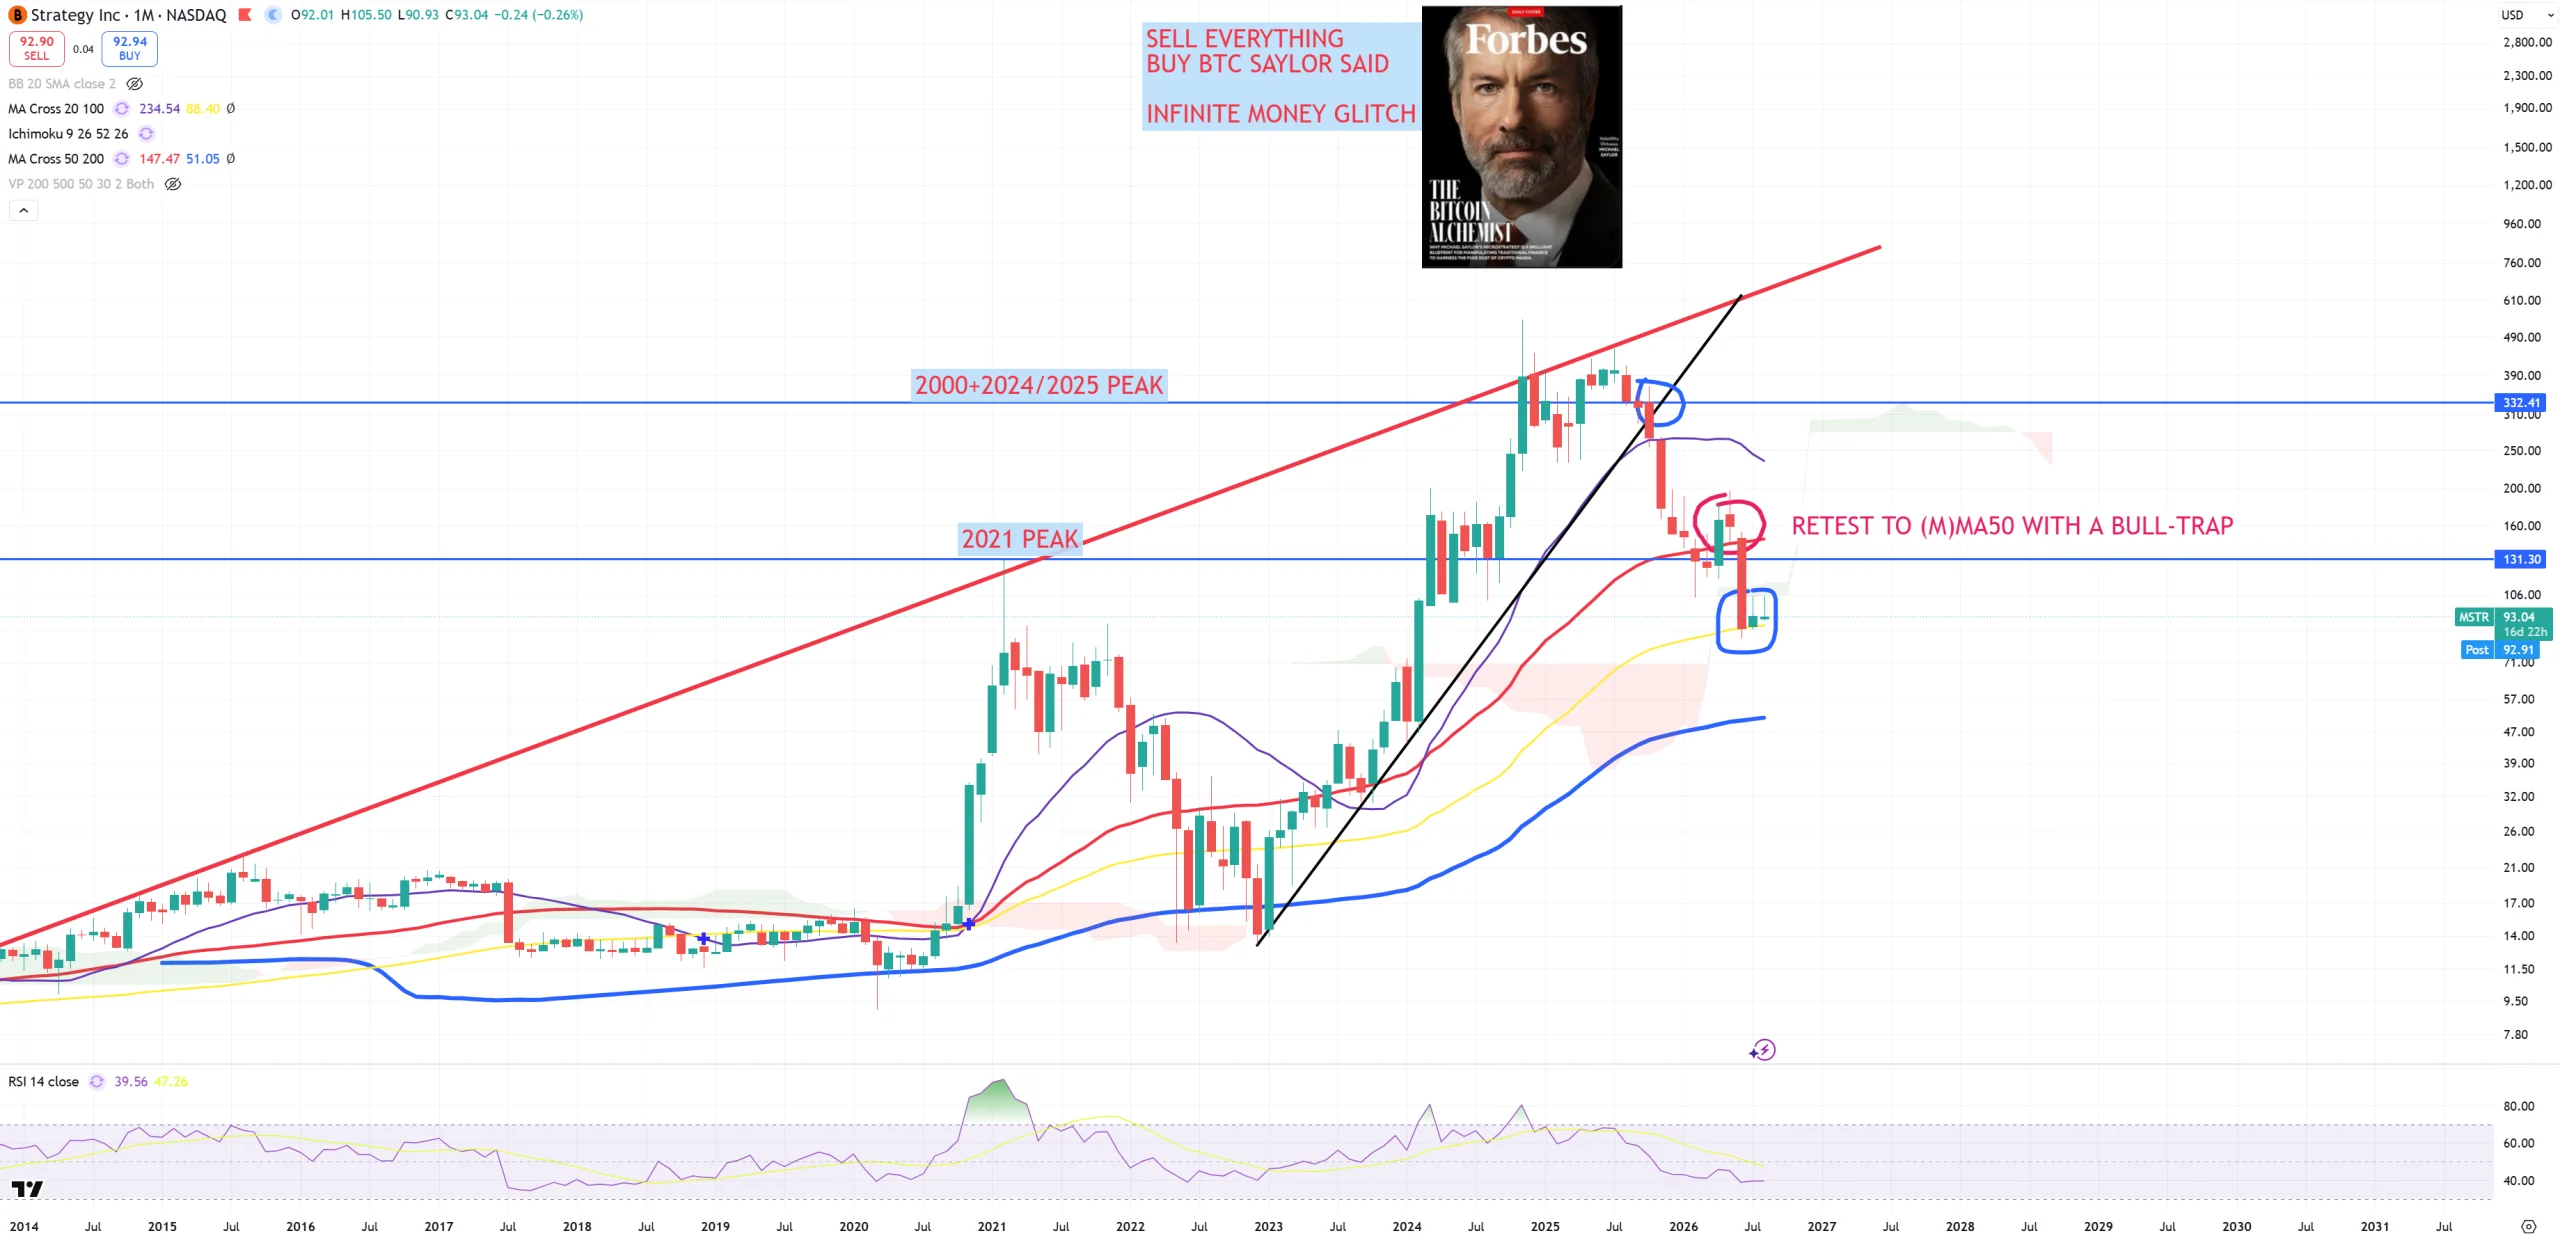
MSTR – we can’t talk about BTC without MSTR which now holds between 105$ (cloud resistance) and 88$ (M)MA100 support. Once broken down -> 50$ is next level.
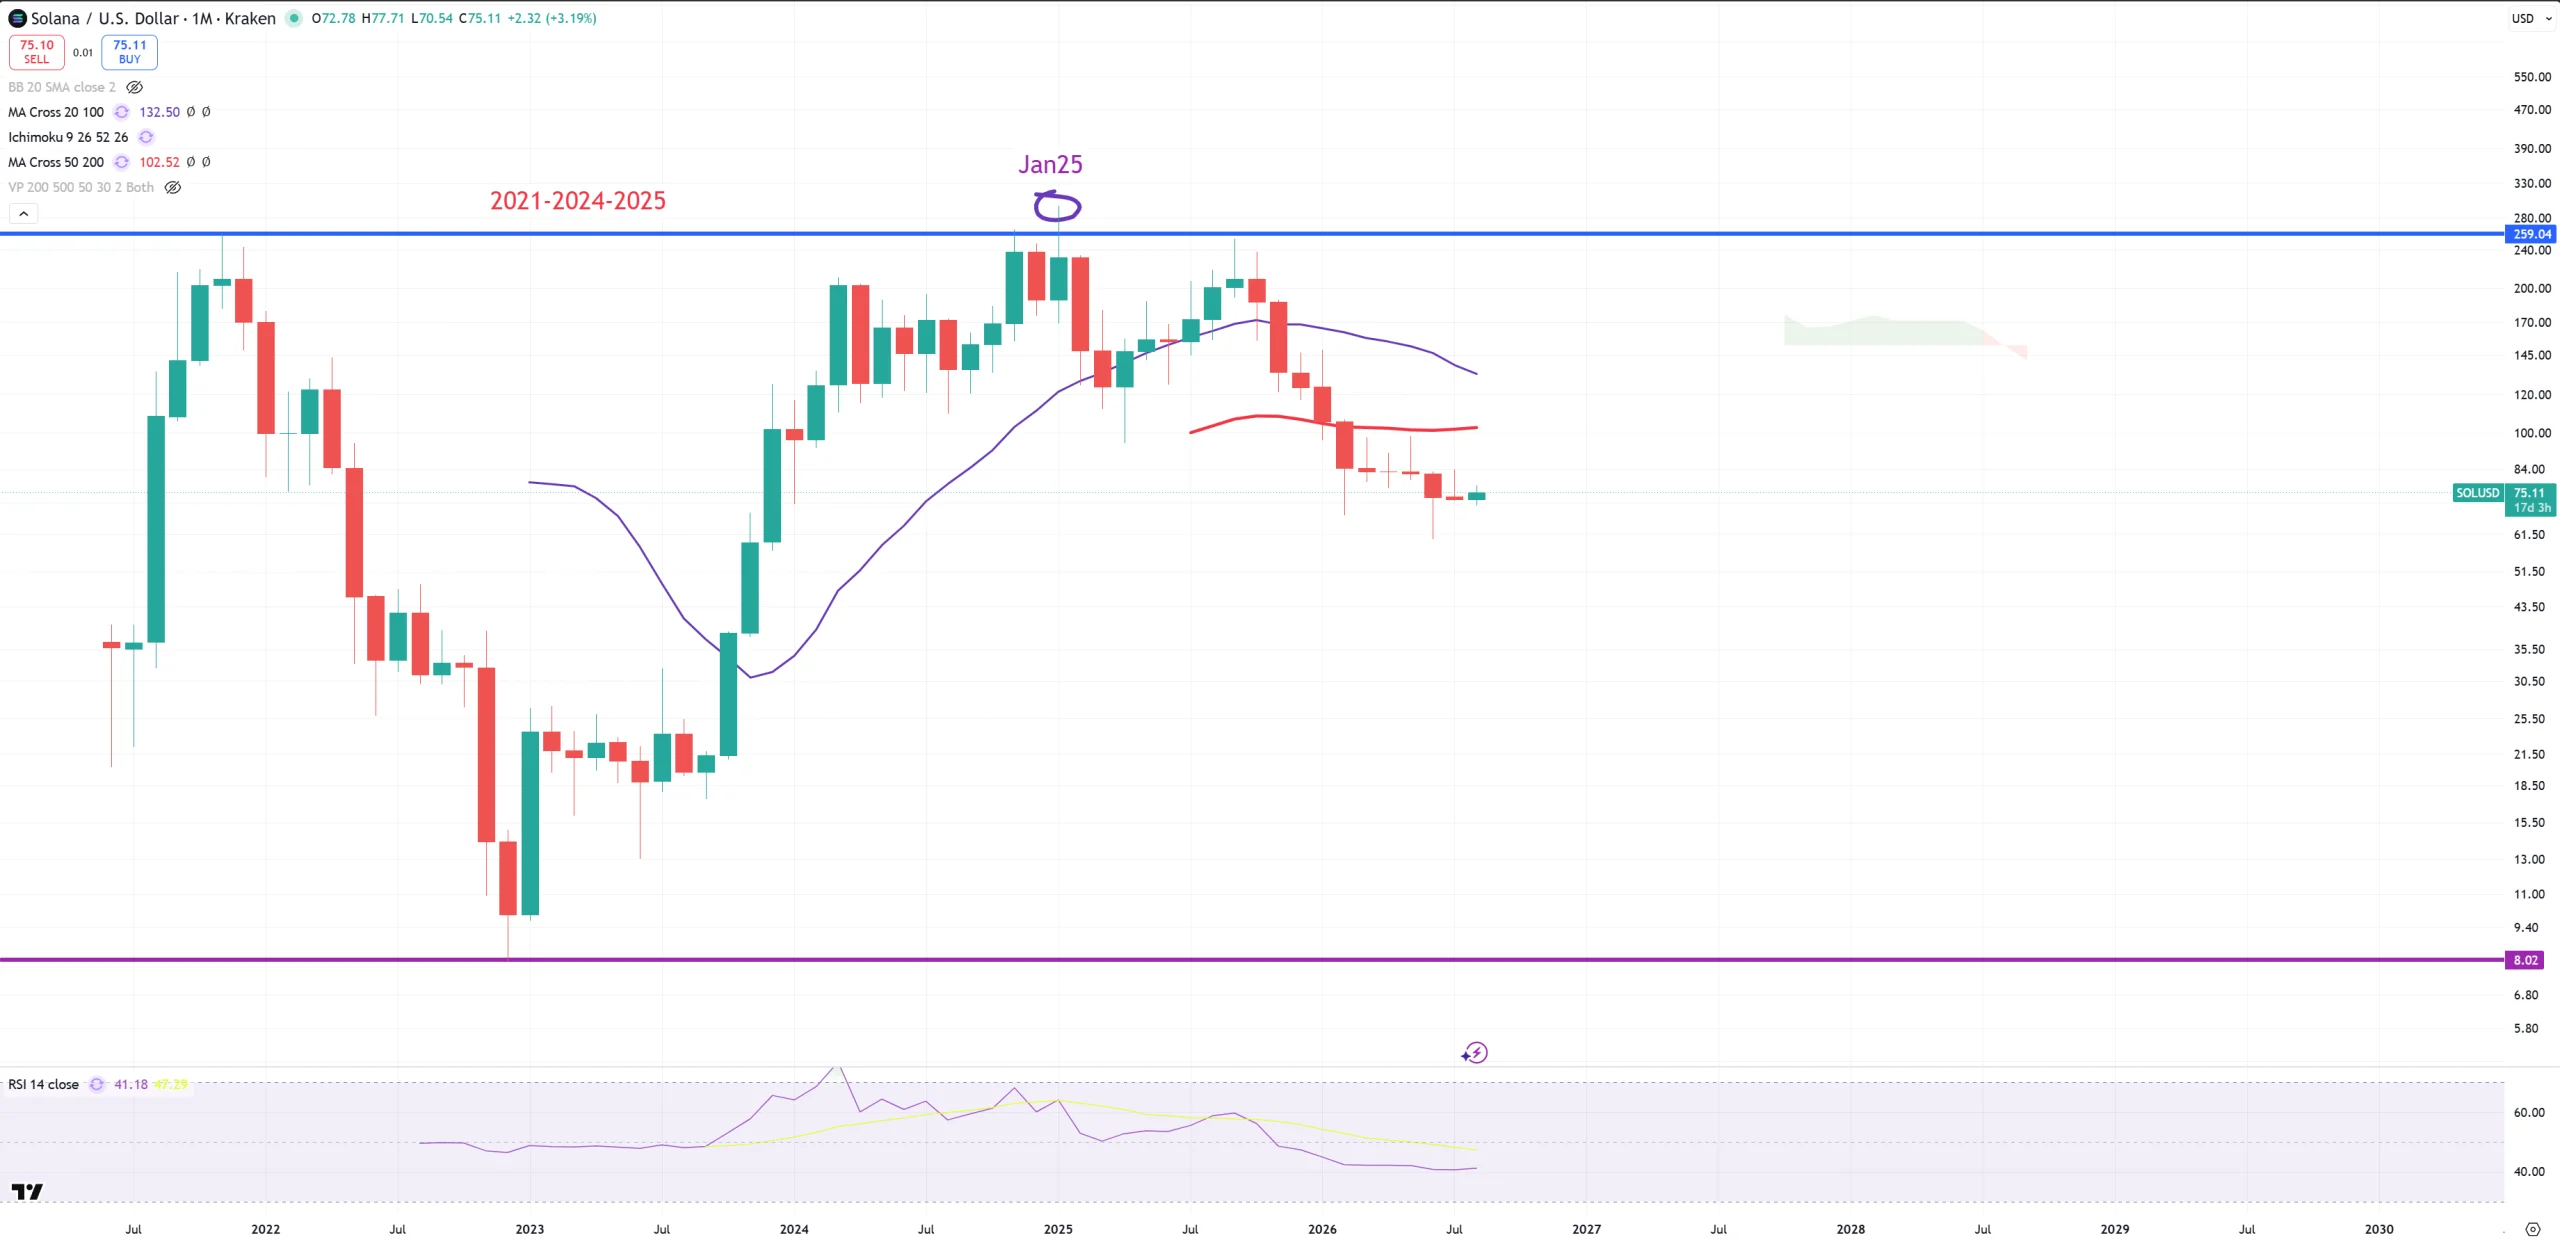
SOLUSD – looks like it’s coming down towards 8$
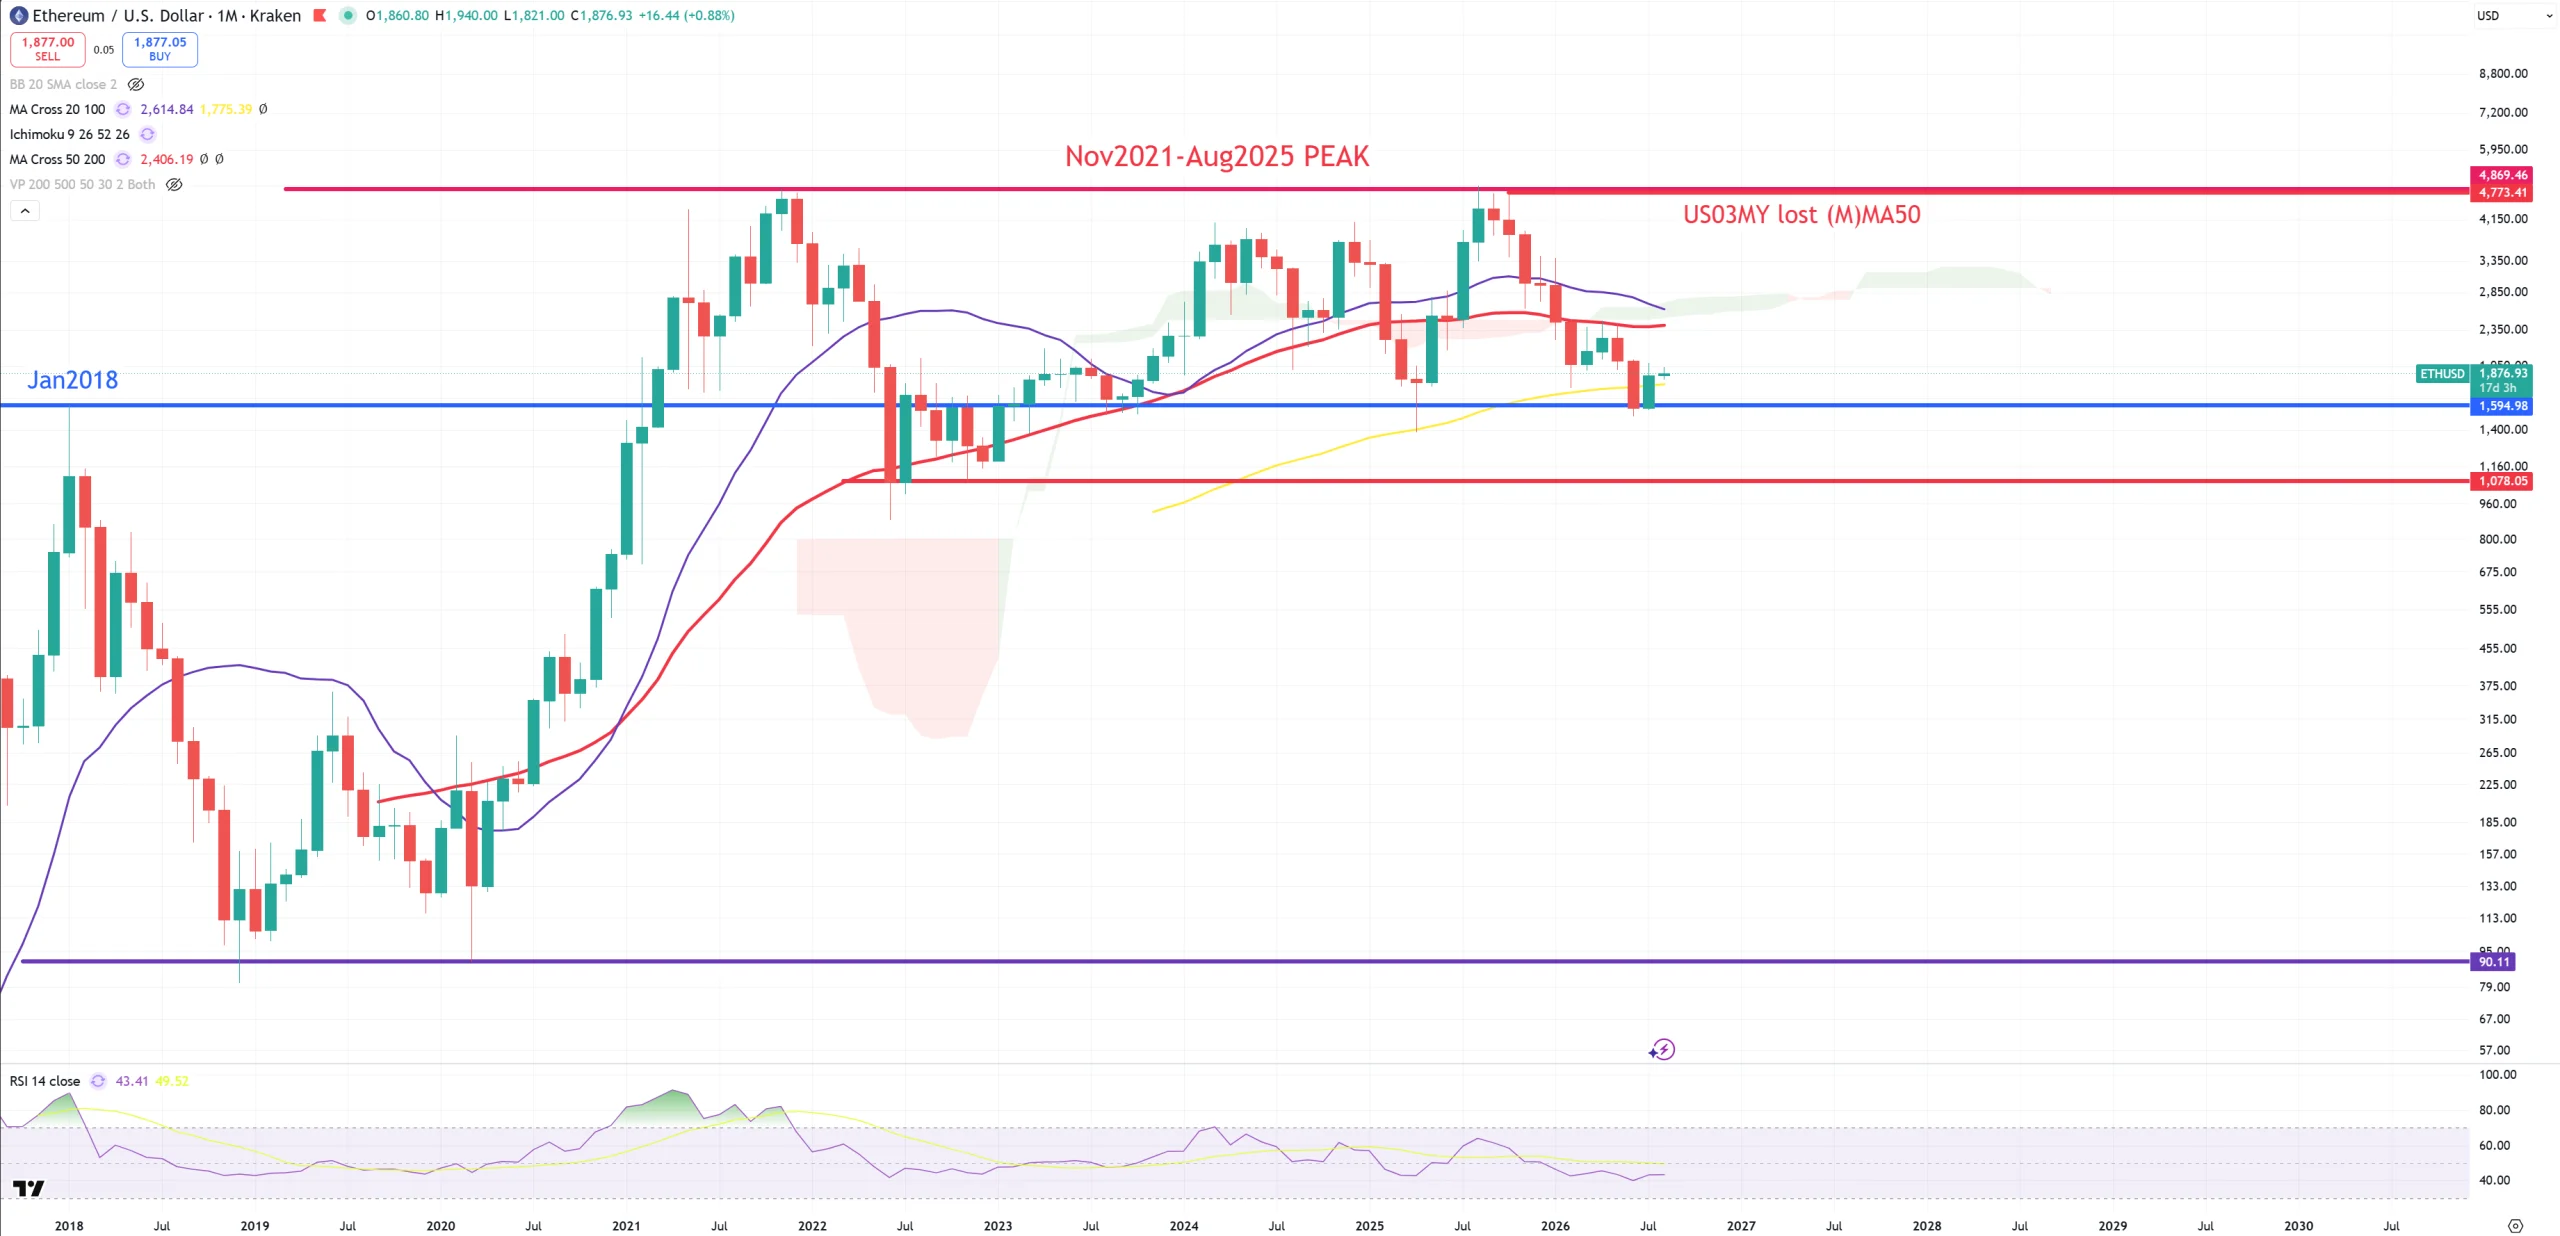
ETHUSD – it said BYE BYE to (M)MA50 long time ago. Now yellow (M)MA100 + Jan2018 support. If we take down Jan2018 peak = ~1600$ it’ll be game over for ETH for long, especially if 10Y/3M will uninvert even more. Level 1000$ is critical, because later there’s almost zero support until 90$.
Summary : Crypto is another asset that probably has been eliminated behind the scene by economic cycle rotation. 2021 SPX/GOLD cycle peak is almost everywhere and that’s how pre 2008 everything worked. It also worked great in ETH and SOL as this peak was never in reality broken. GOLD is now set as outperformer looking on GOLD/BTC ratio. This setup I’ve introduced you have never happened for crypto and it’ll have to deal with it for the first time ever. What will be the outcome? I have no idea, but if you are a crypto lover, you have some analysis pointing for big troubles.
At the end I wanted to show you GOLD – if this is a correction in a big bull market, (M)MA20 should hold (~3850$). Worst case is (M)MA50 = ~2850$. (M)RSI has been cooled from 96 to 55 and in high momentum bull markets (M)RSI=50 is really big bottom. Are we going to double gold price in upcoming 2 years+? Very high possibility.
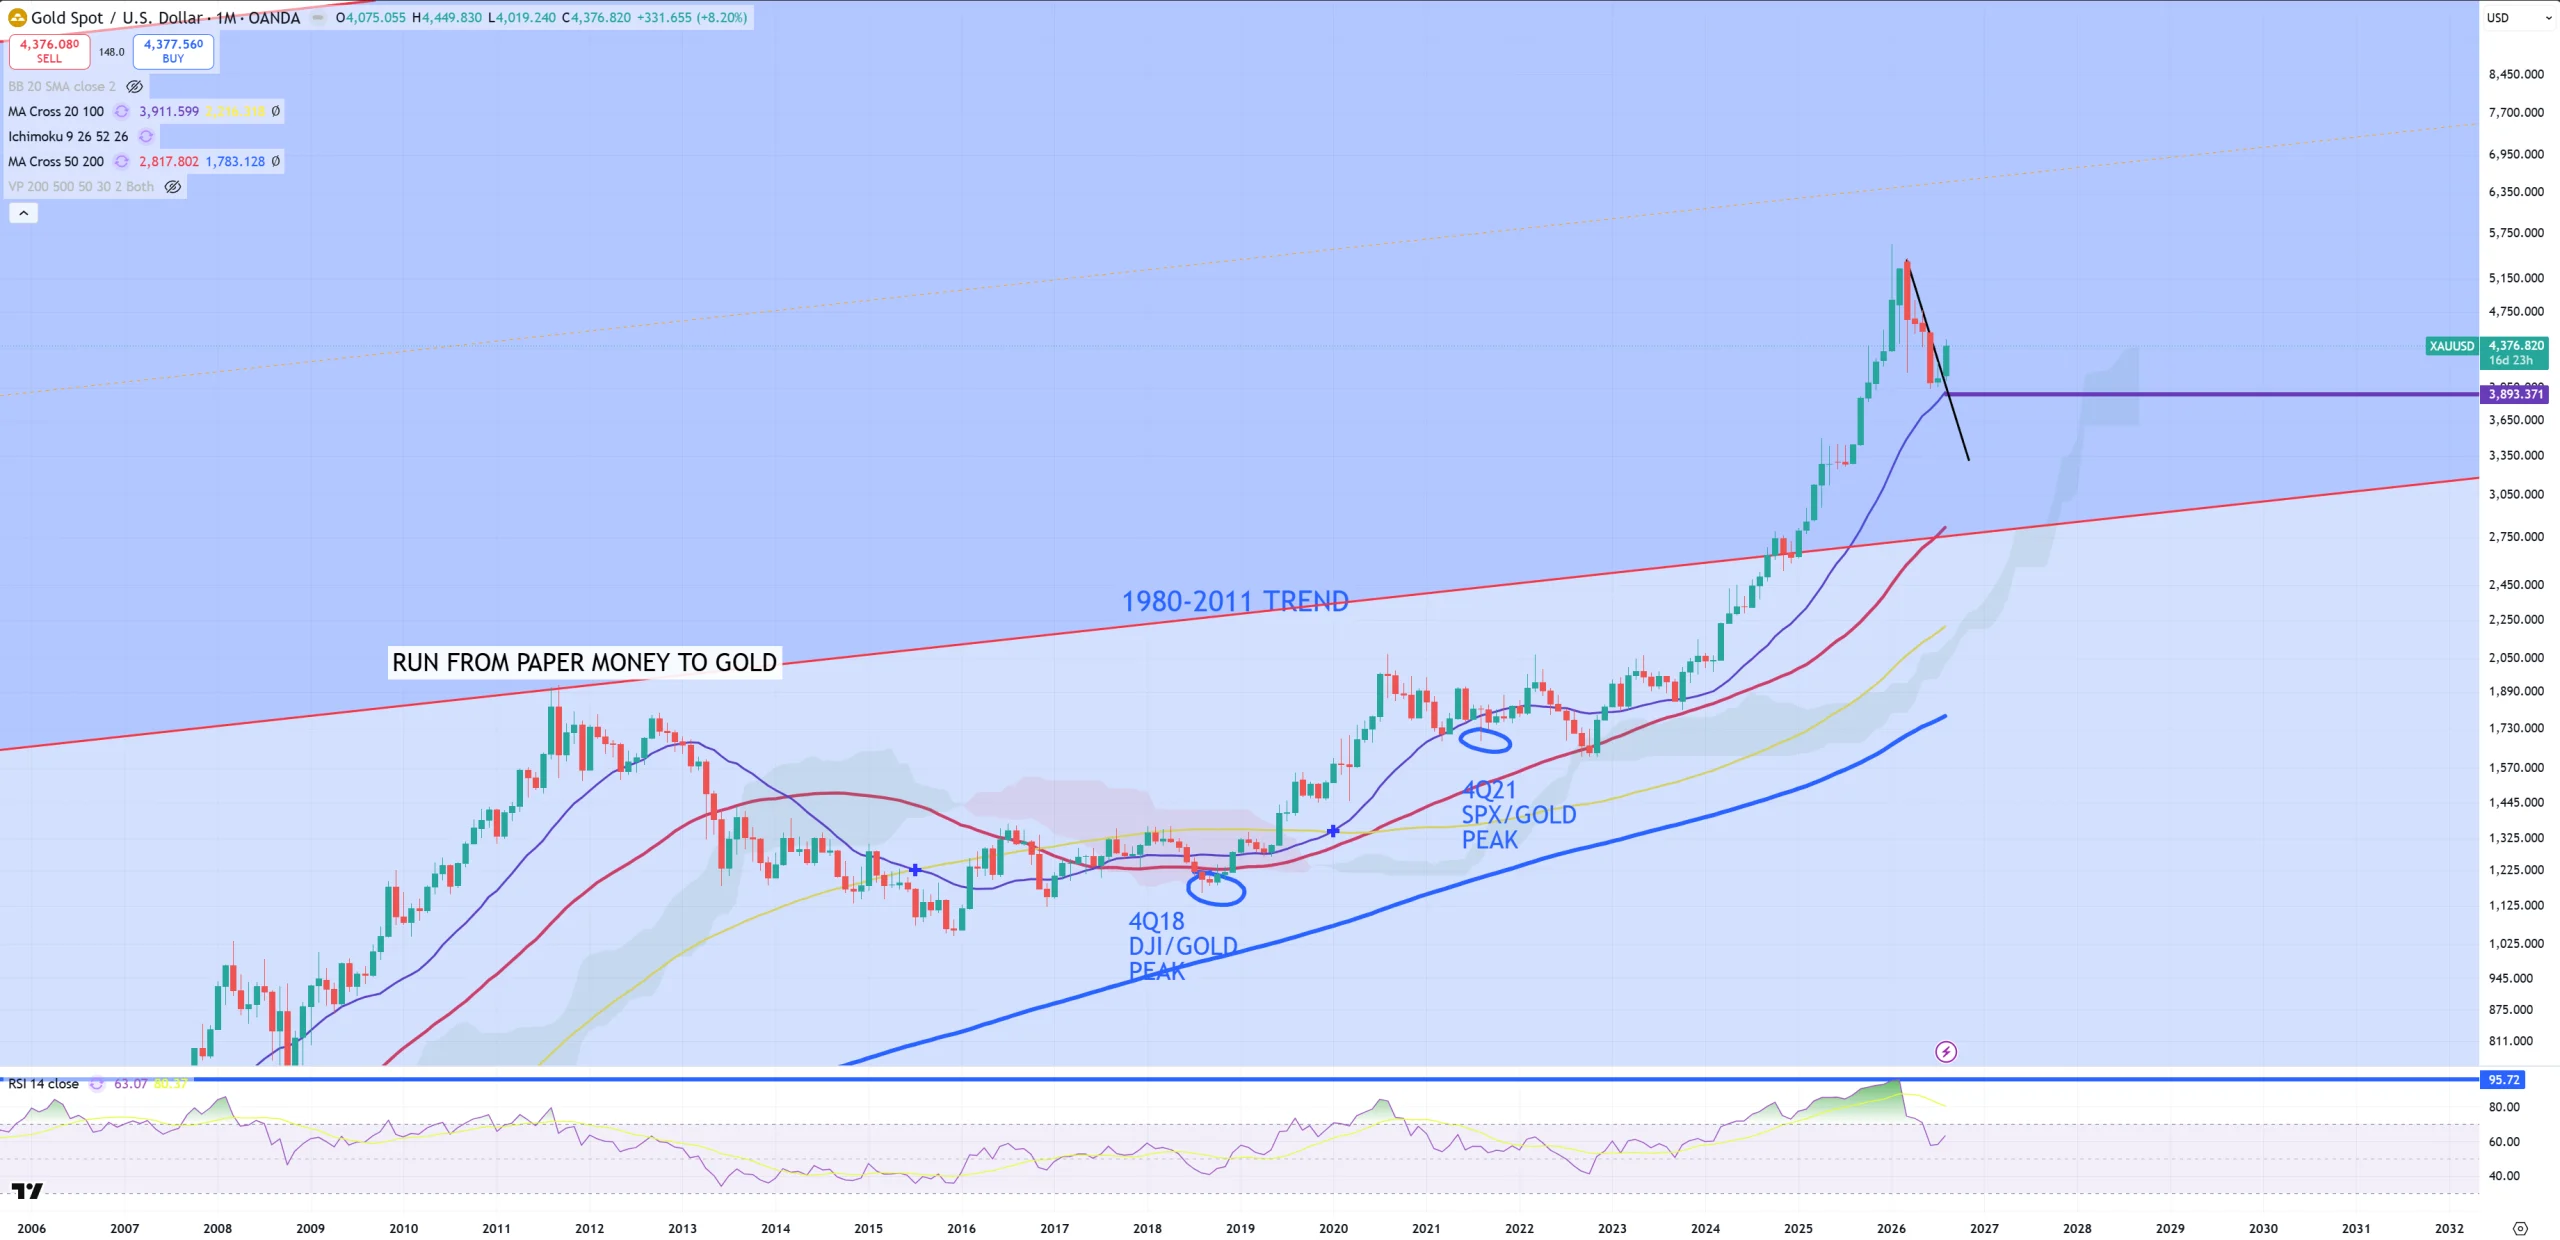
There was a time for crypto, there is a time for gold, just take a look on charts and ask yourself which outcome has higher probability.