My idea about peaking indicators is getting checked right now
July 27, 2026

Some time ago I wrote about Mastering technical turn :
In reality it’s a mix of very simple indicators and for stock market we just need in reality two.
Broad market peaks once US03MY breaks (M)MA50 AND 10Y/3M uninverts PERMANENTLY > +60bps
So let’s take a look on that in details
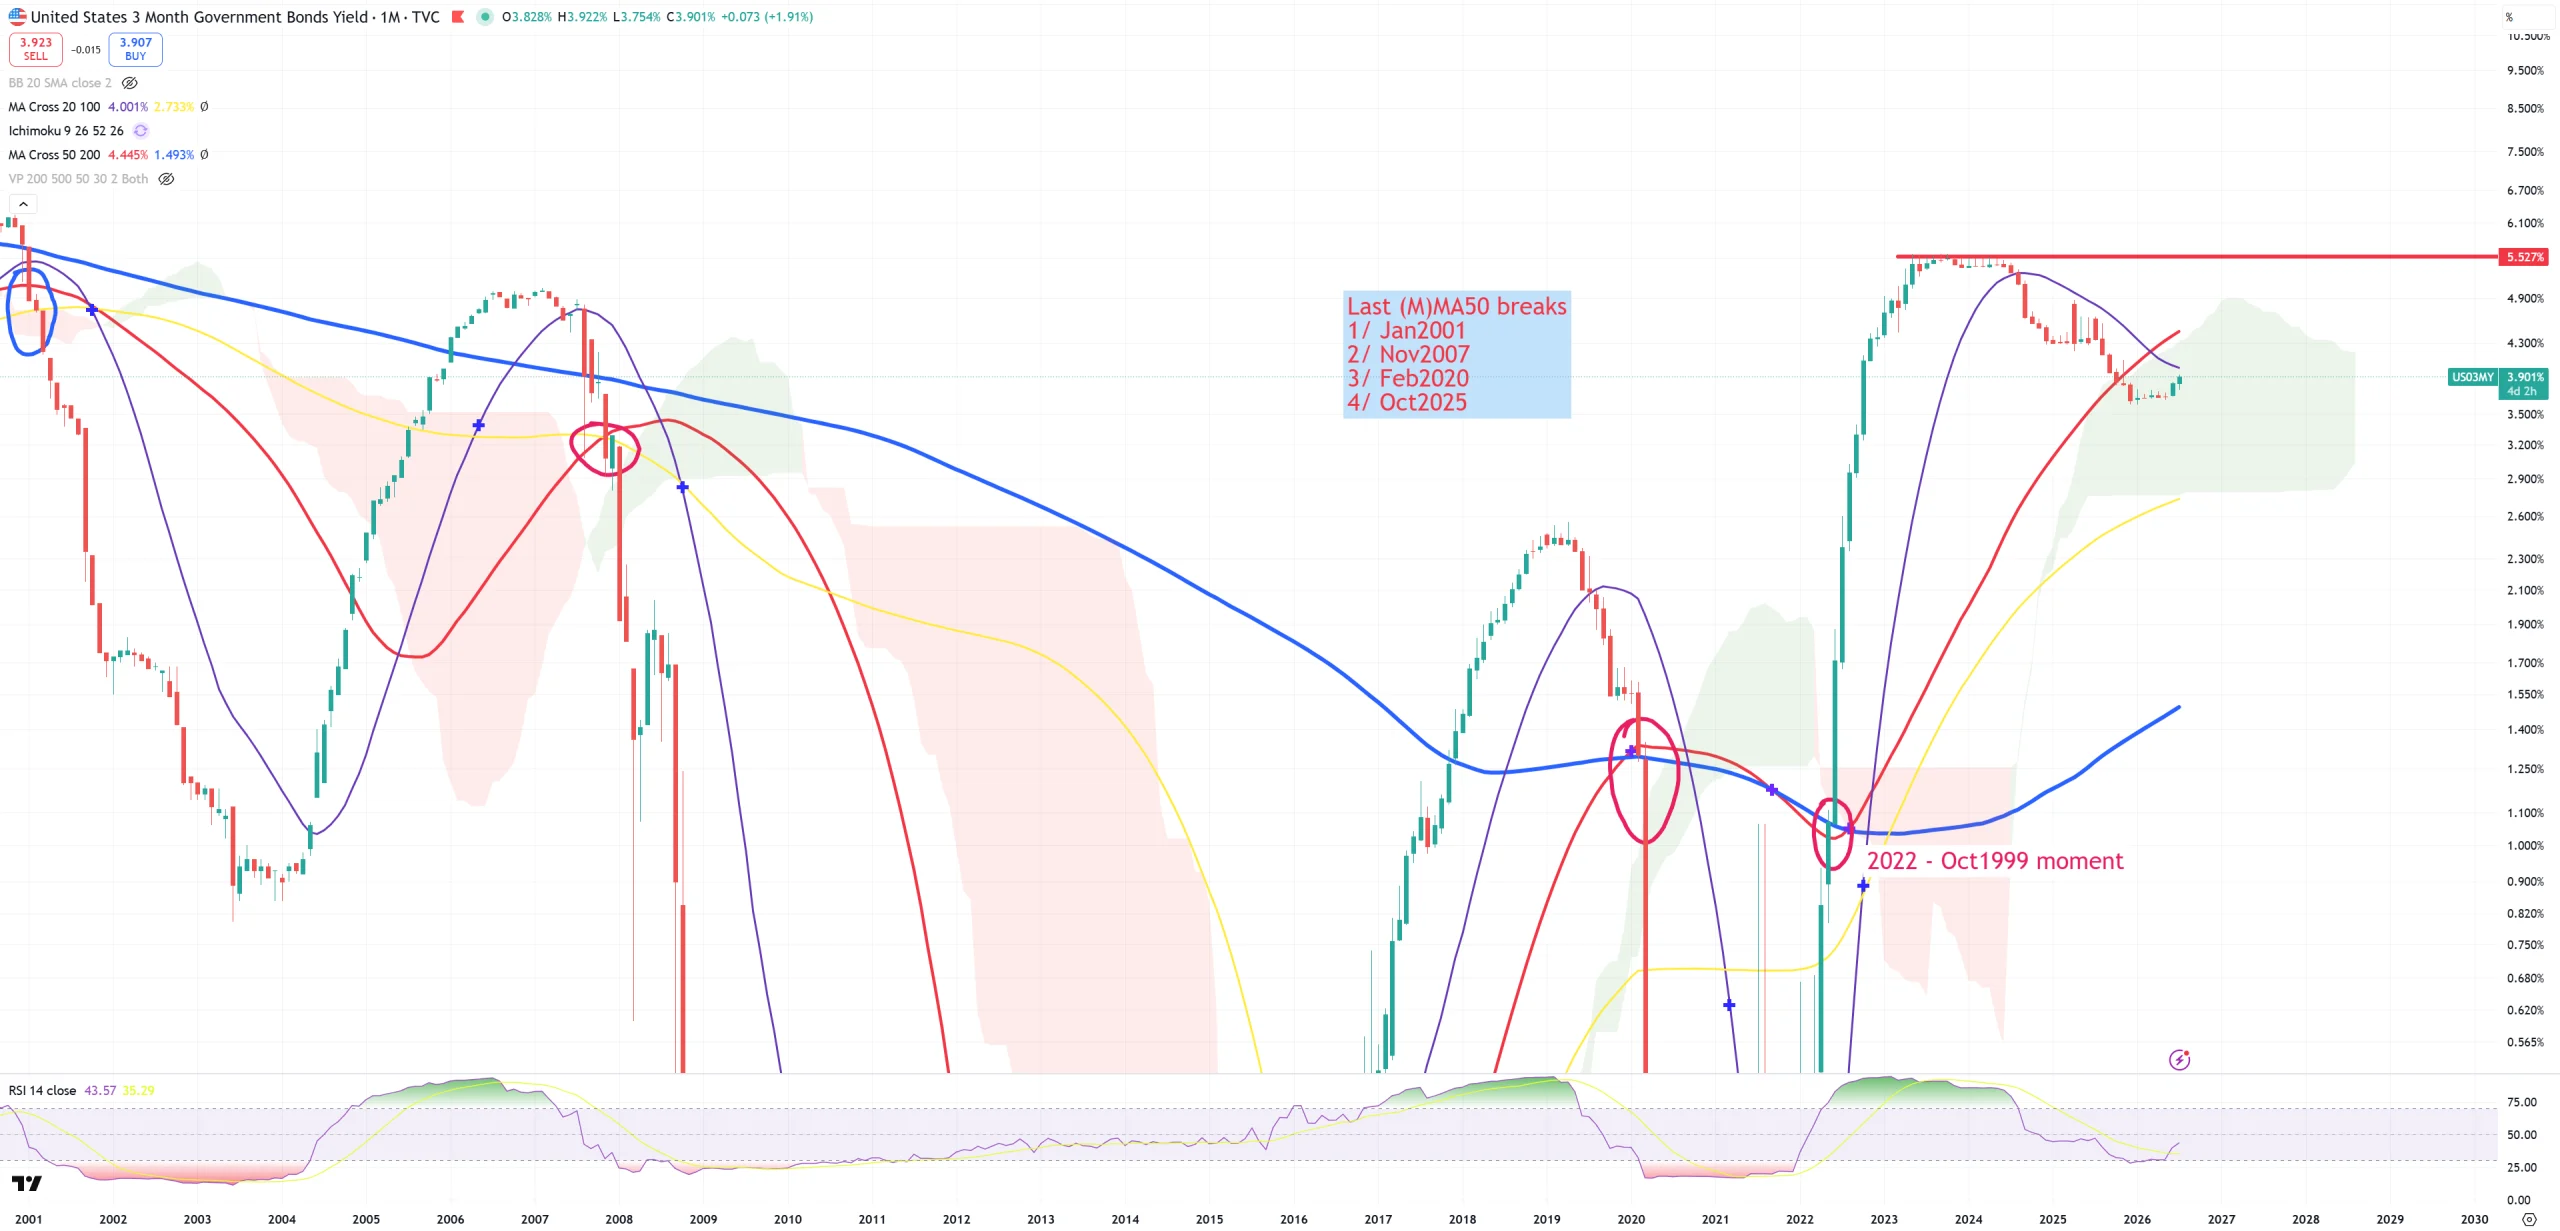
1/ US03MY lost (M)MA50 in Oct/Nov 2025
There’s still a long move to (M)MA50 which sits on ~4.50% level. Break is break and it happened in 4Q25.
2/ 10Y/3M uninverts PERMANENTLY > +60bps
Everything what is above horizontal yellow line is > +60bps. This cycle is super complicated. Because post-COVID crash it was expected post 4Q21/1Q22 to finally blow the market into pieces, but you can clearly see how it was saved. AI boom overextended the stock market cycle inverting 10Y/3M to levels not seen since 1929. How we can describe it?
I’d say AI boom is a very very very narrow boom, which caused way more troubles behind the scene. Look how post AI boom 10Y/3M inverted. The longer and deeper inversion = the bigger the crisis to arrive and the higher the $$$ will go.
Cycle will restart once we reach > +300-350bps. Once it’s done SPX will for sure lose (M)MA50 the main border between technical bull/bear market which was not broken since 2009, and you can see on 10Y/3M exactly why. So far all drops were corrections in bull market INCLUDING … 2020 COVID crash, because 10Y/3M has not closed over 300-350bps to confirm cycle restart.
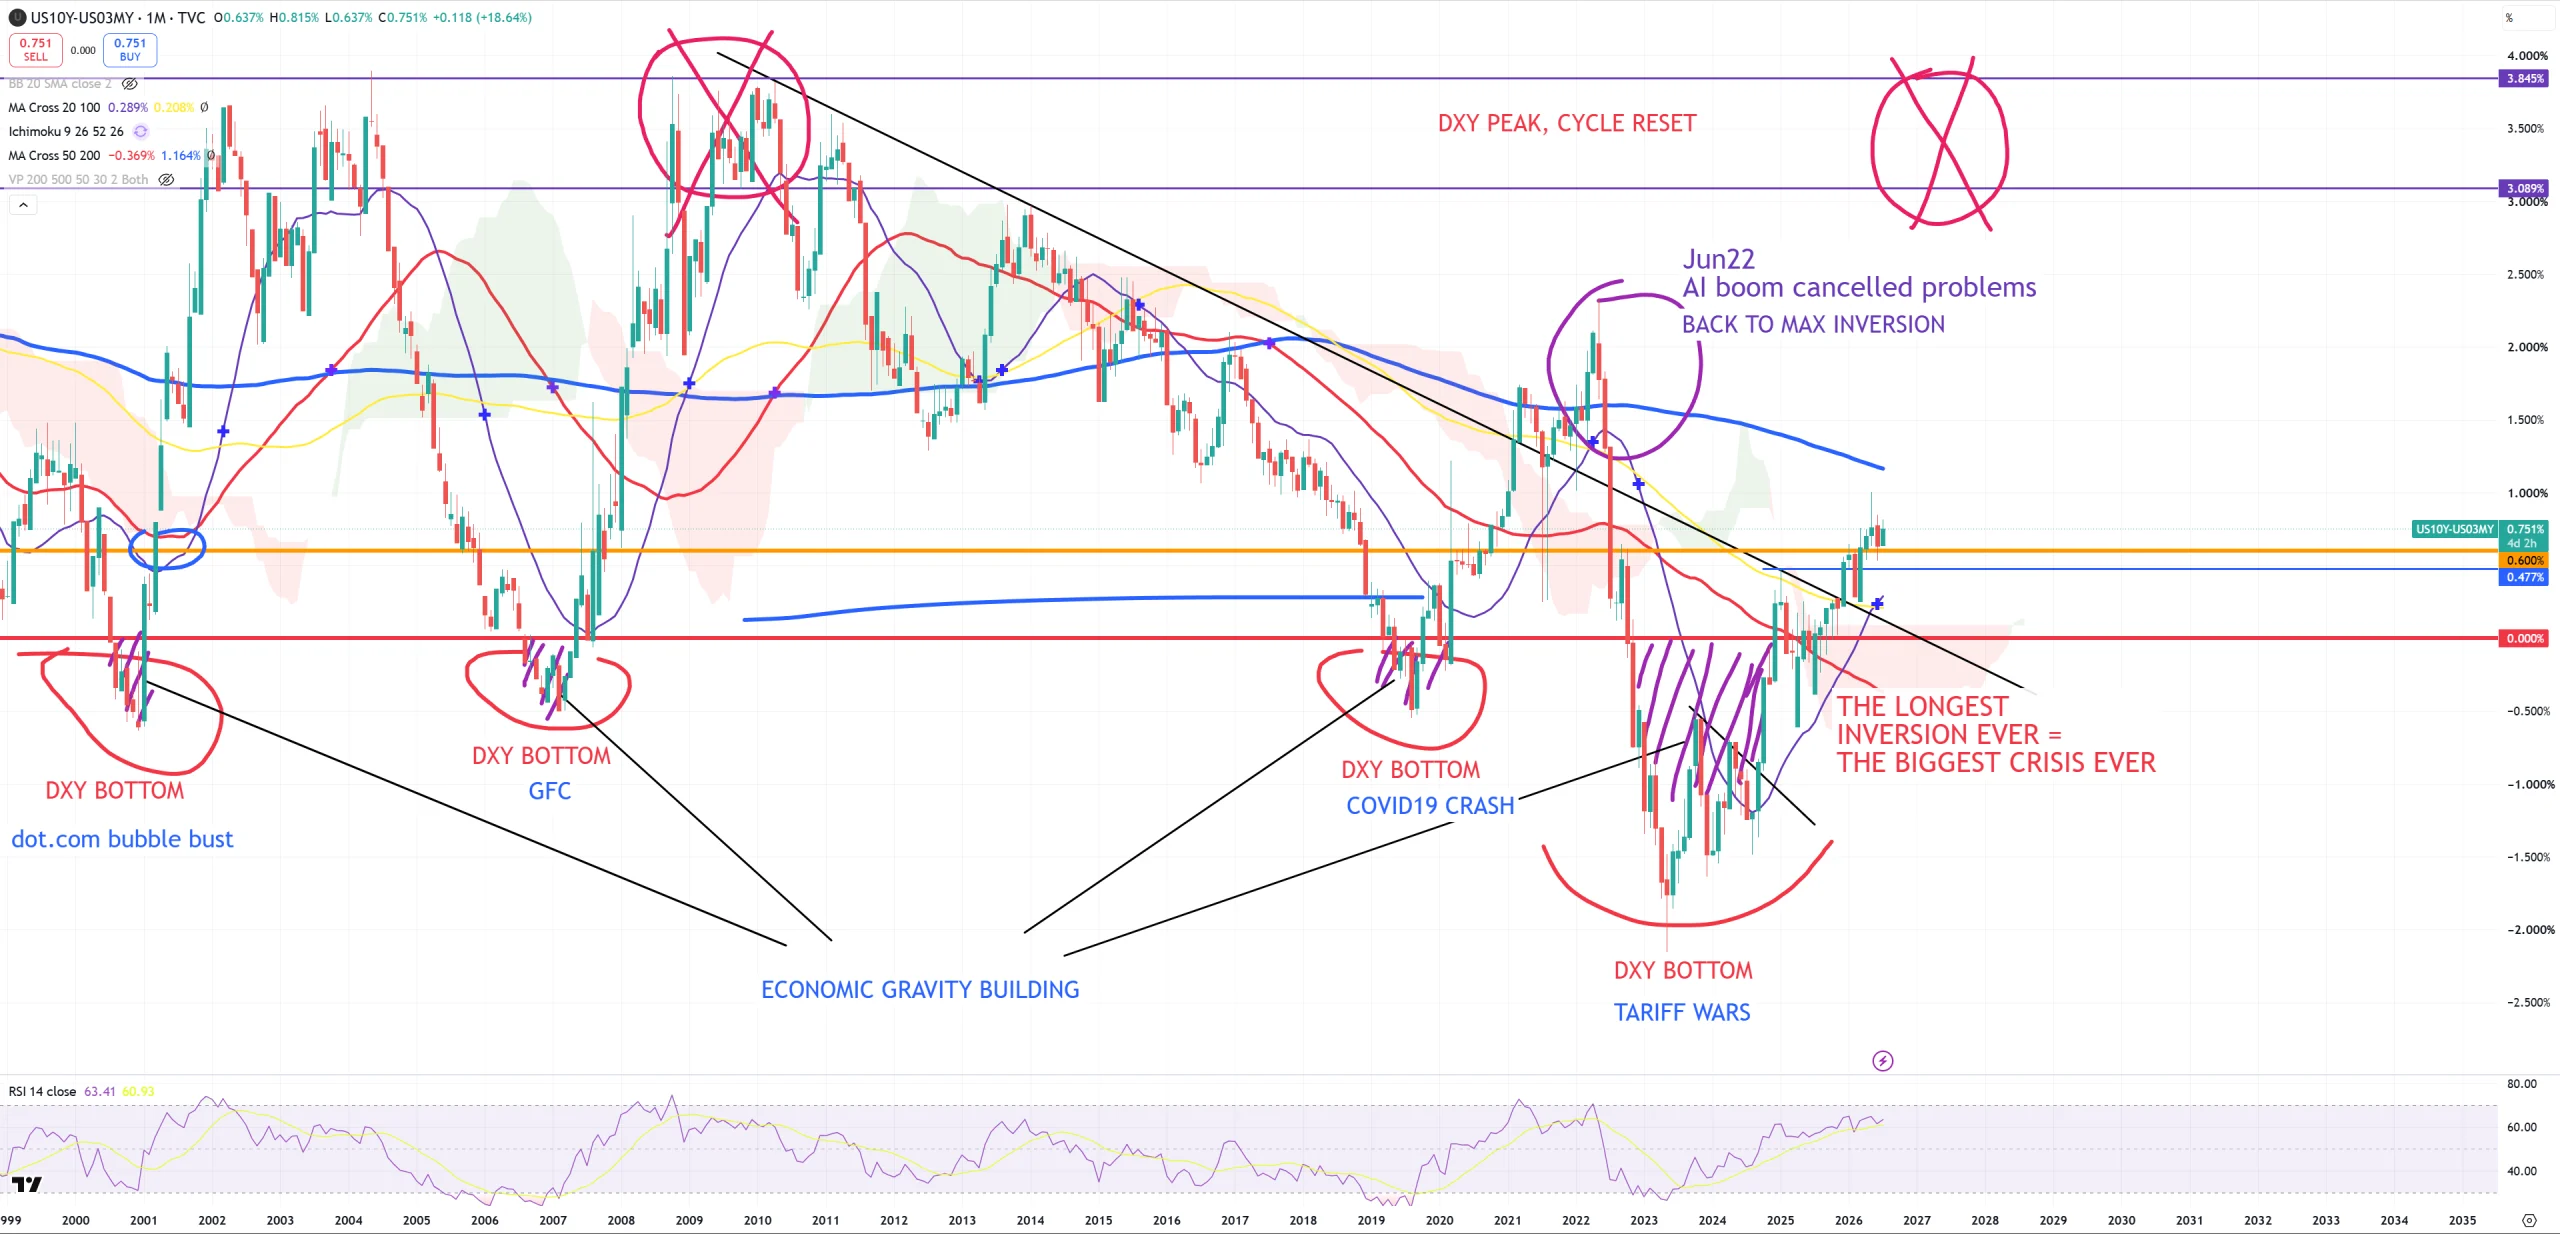
Now we clearly stand > +60bps since let’s say April/May 2026. This is normally, using my analysis, the moment where markets have never recovered and peaked. If we flip the view into (W) or (D) we’re going to see PLENTY of false spikes above +60bps and returns. These fake moves combined with US03MY (M)MA50 break forced me to risk a thesis about AI bubble peak, which was a total blow, because at the end not only SOX/GOLD broke the key level (automatically invalidating the thesis), but it turned out 10Y/3M did not permanently uninvert. The whole topic automatically should go to trash, but I’m not doing that.
3/ SPY – broad market indicator
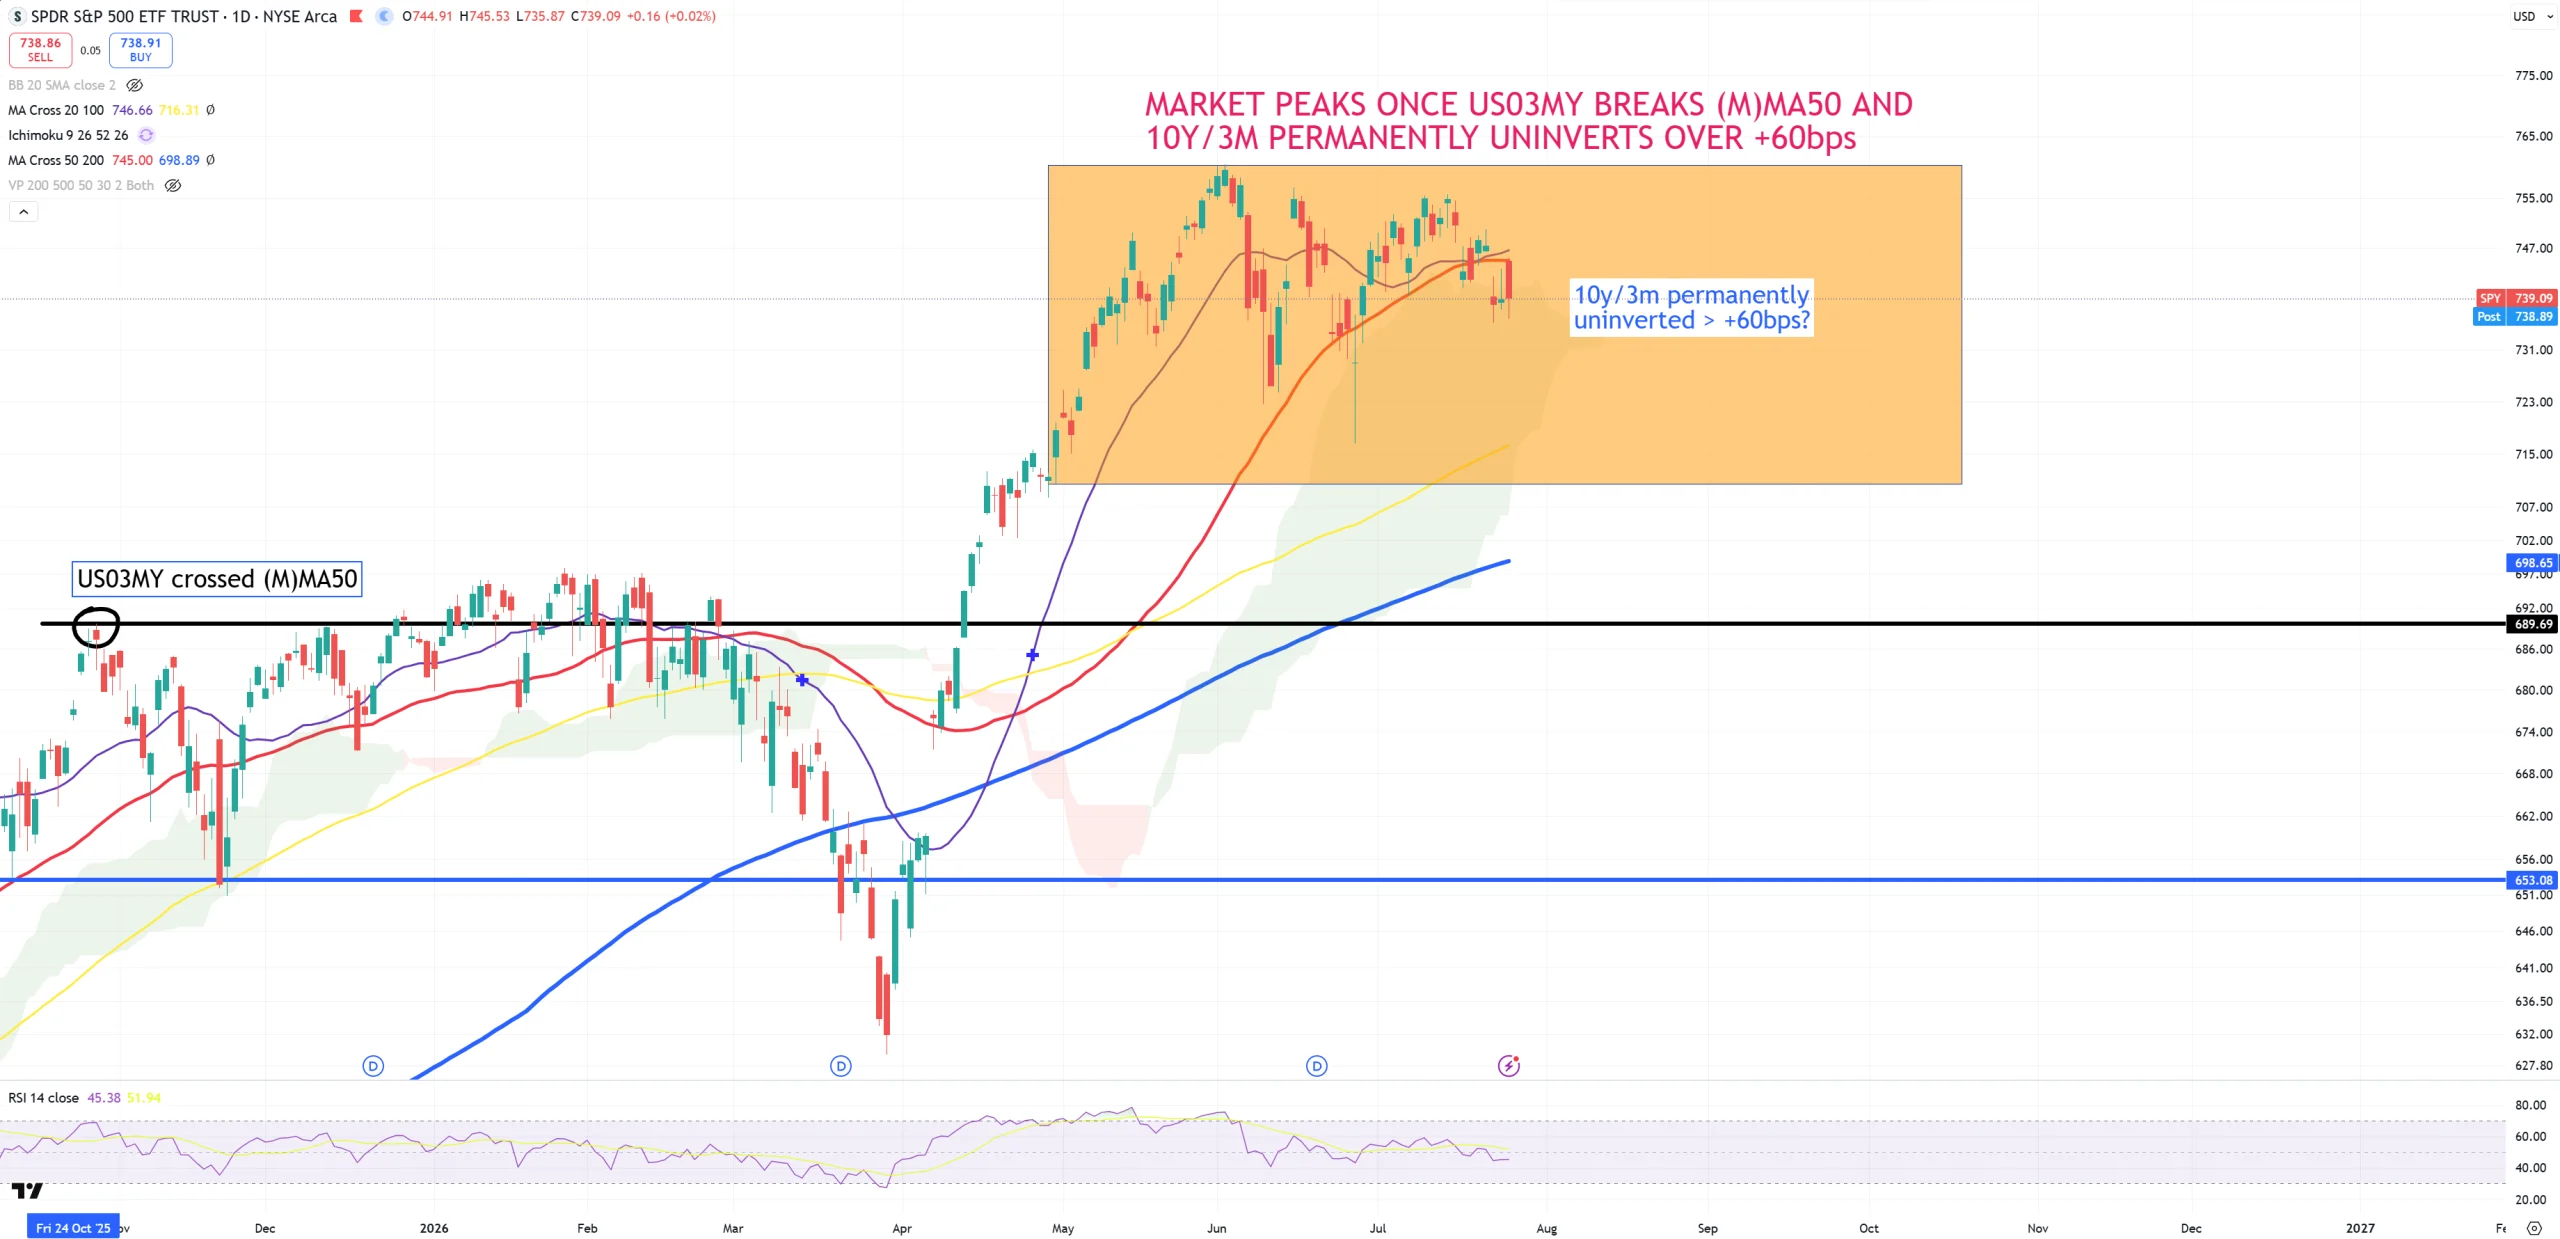
No idea what’s going to happen, but without a doubt that’s where the mix of my two indicators has arrived. I recognize permanent uninvertion > +60bps since late April, beginning of May 2026. 2Q26.
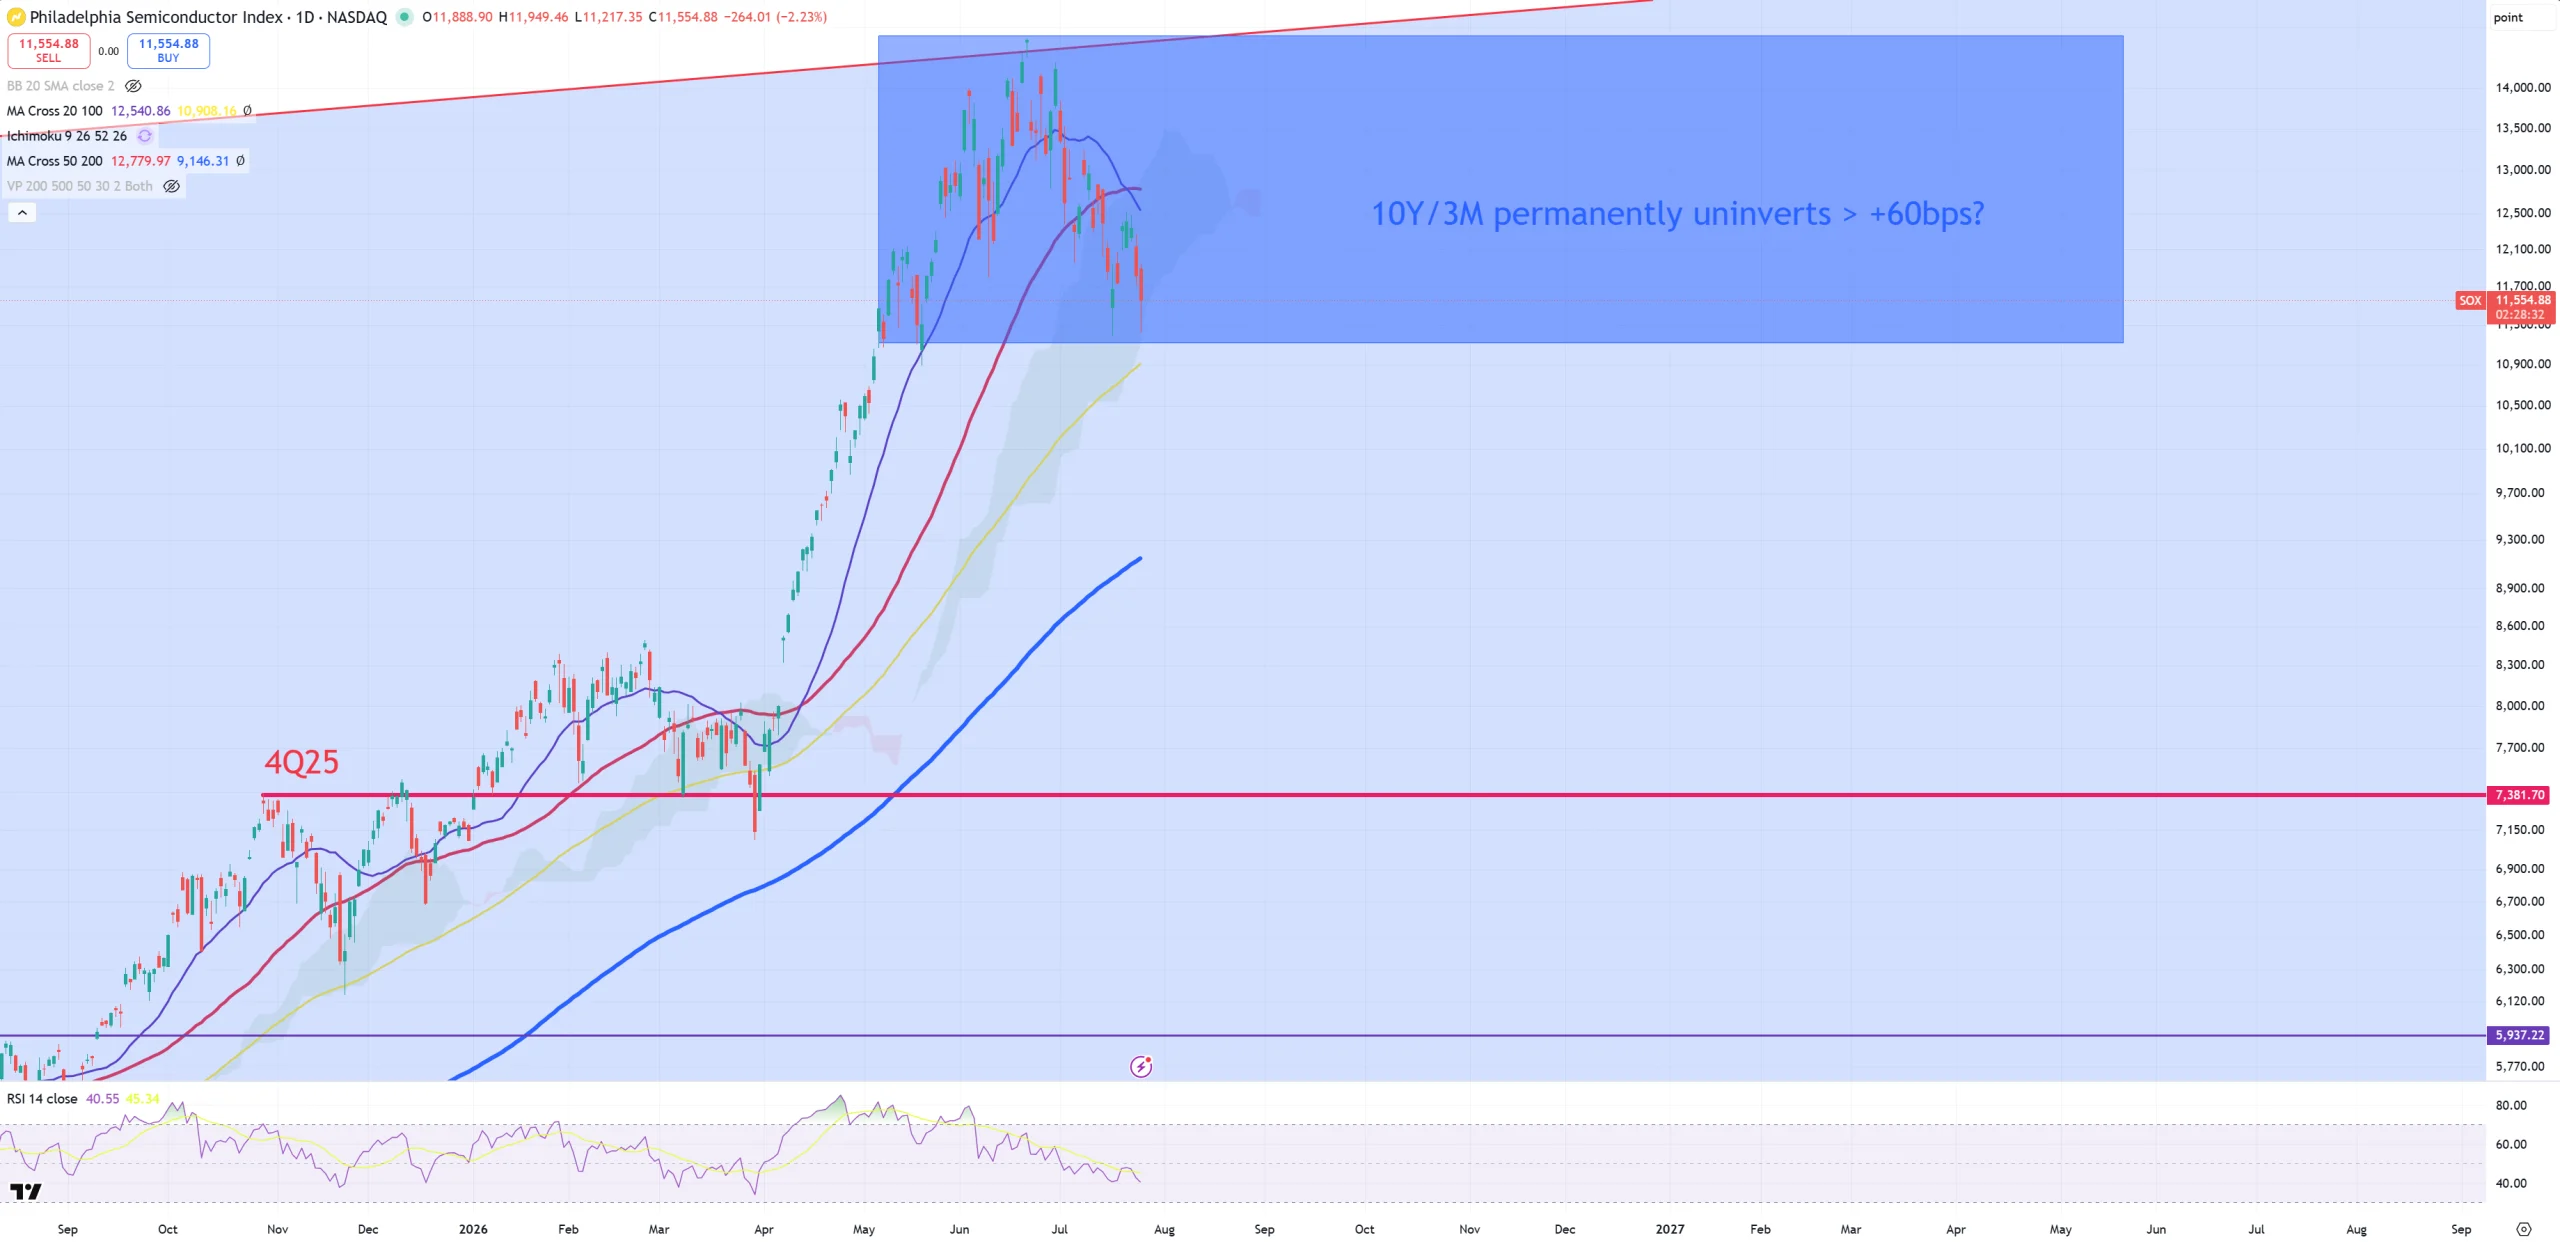
4/ SOX once again
With those two dates : 4Q25 and 2Q26 we can see the same areas like on SPY above.
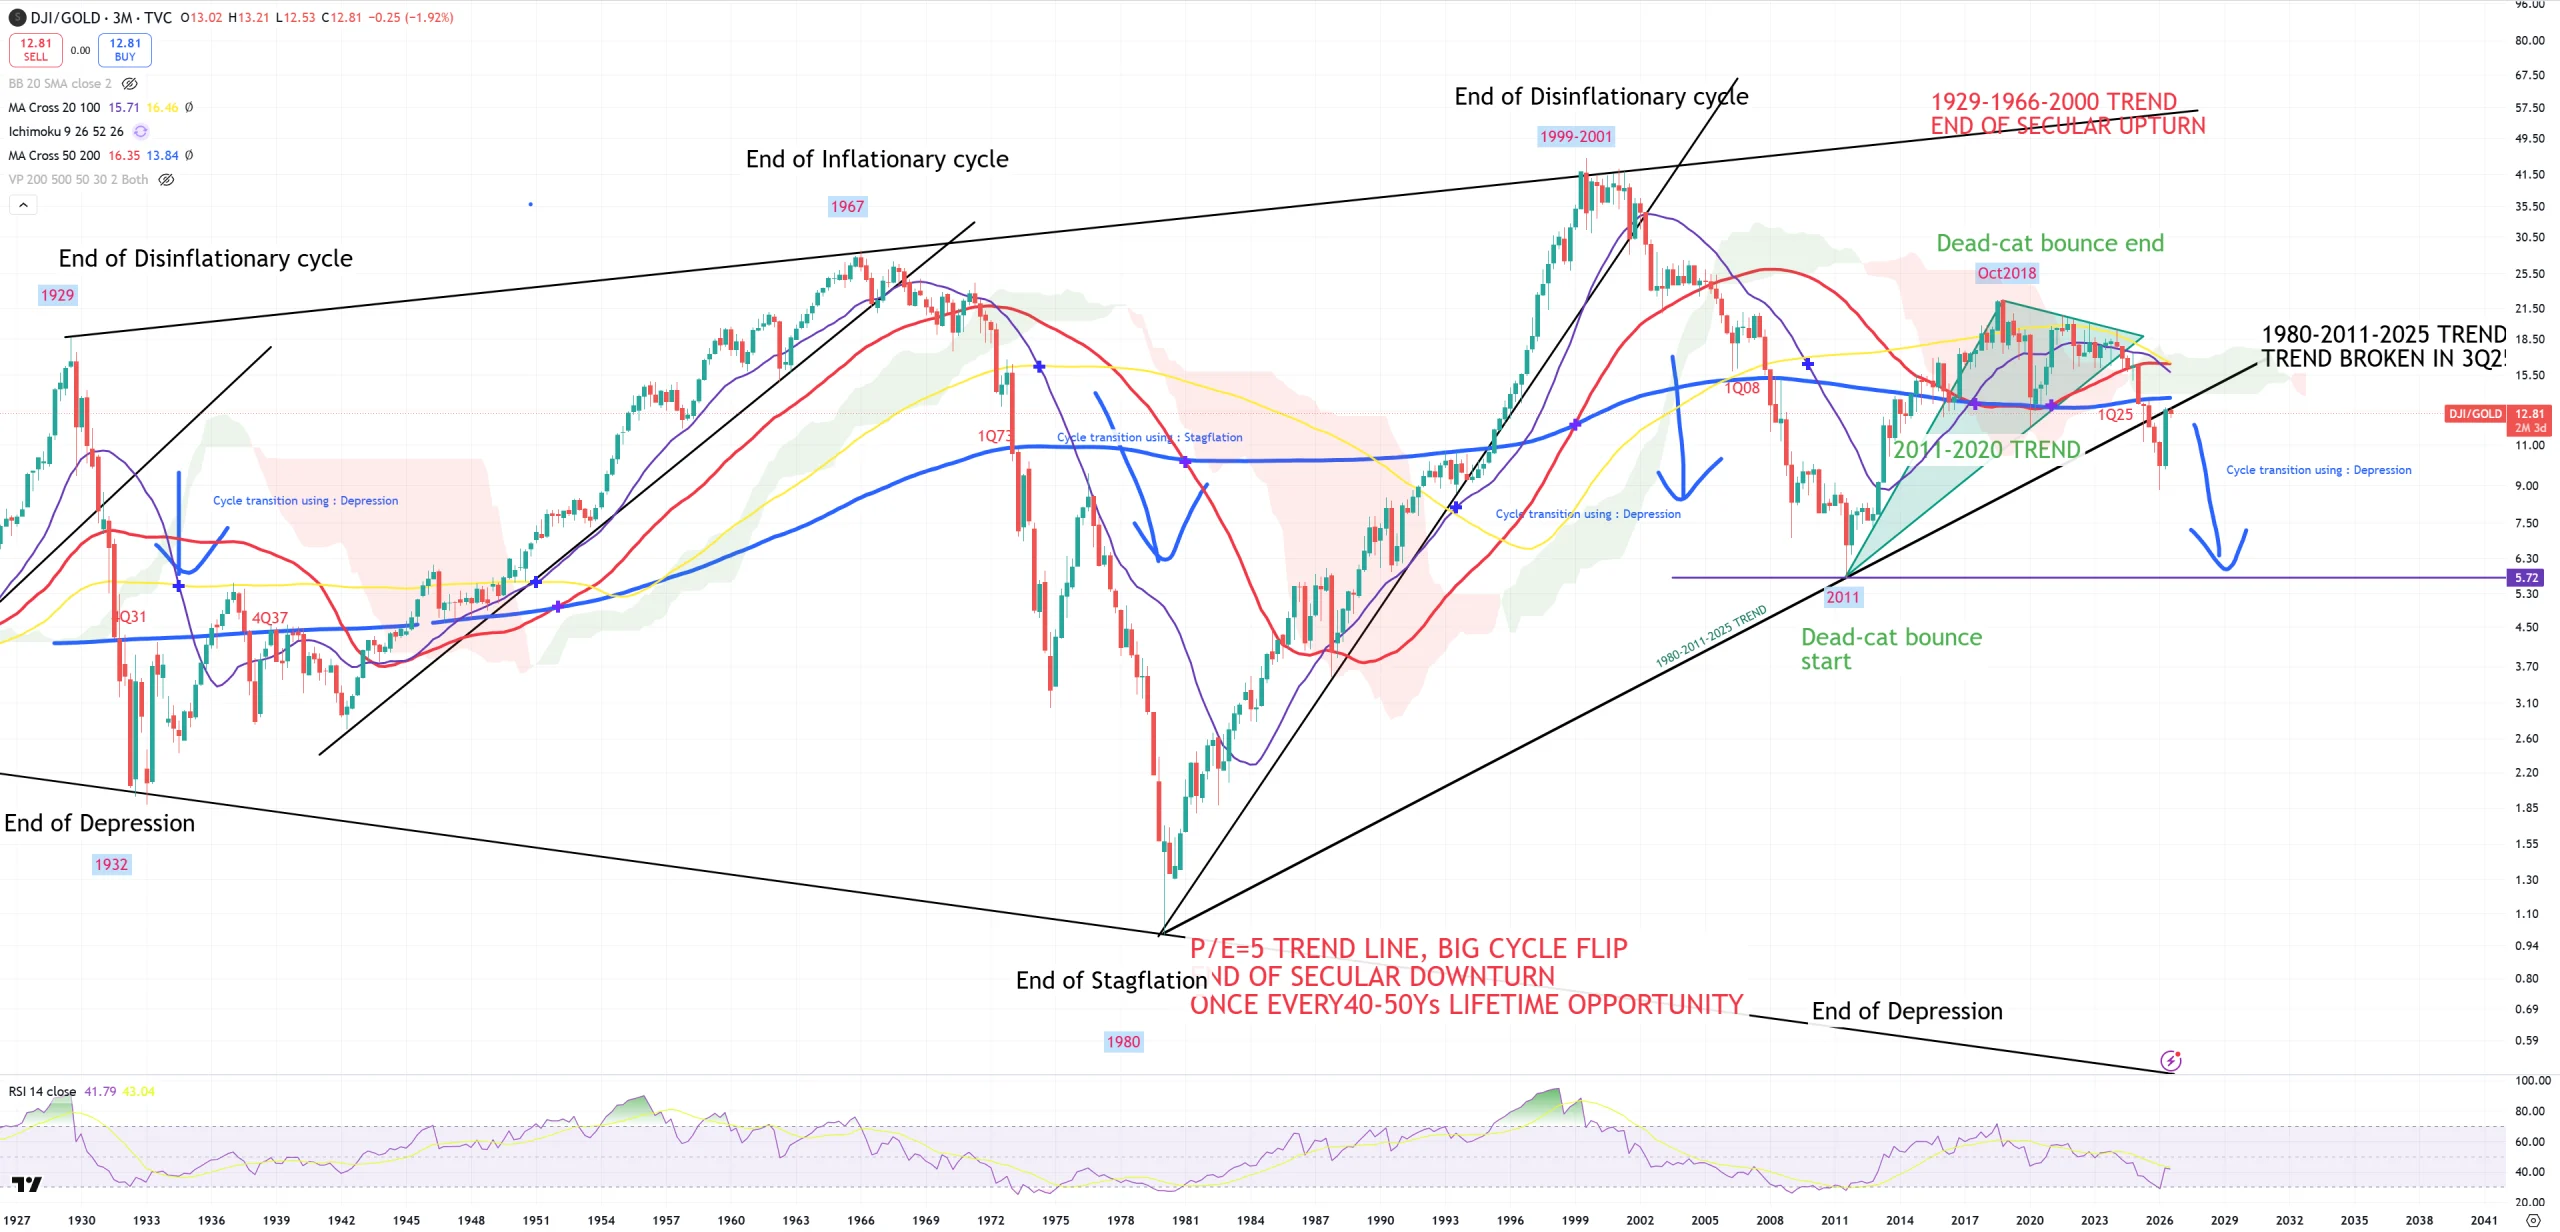
5/ SPX/GOLD & DJI/GOLD – key cycle indicators
I bet SPX/GOLD keeps retesting its own (3M)MA200 still with some false spikes and around this retest we’ll have a very powerful event, but nobody knows how many quarters it’ll take. This time we MUST start from DJI/GOLD and its perfect so far retest to 1980-2011 TREND. (3M)MA200 was broken in 1Q25.
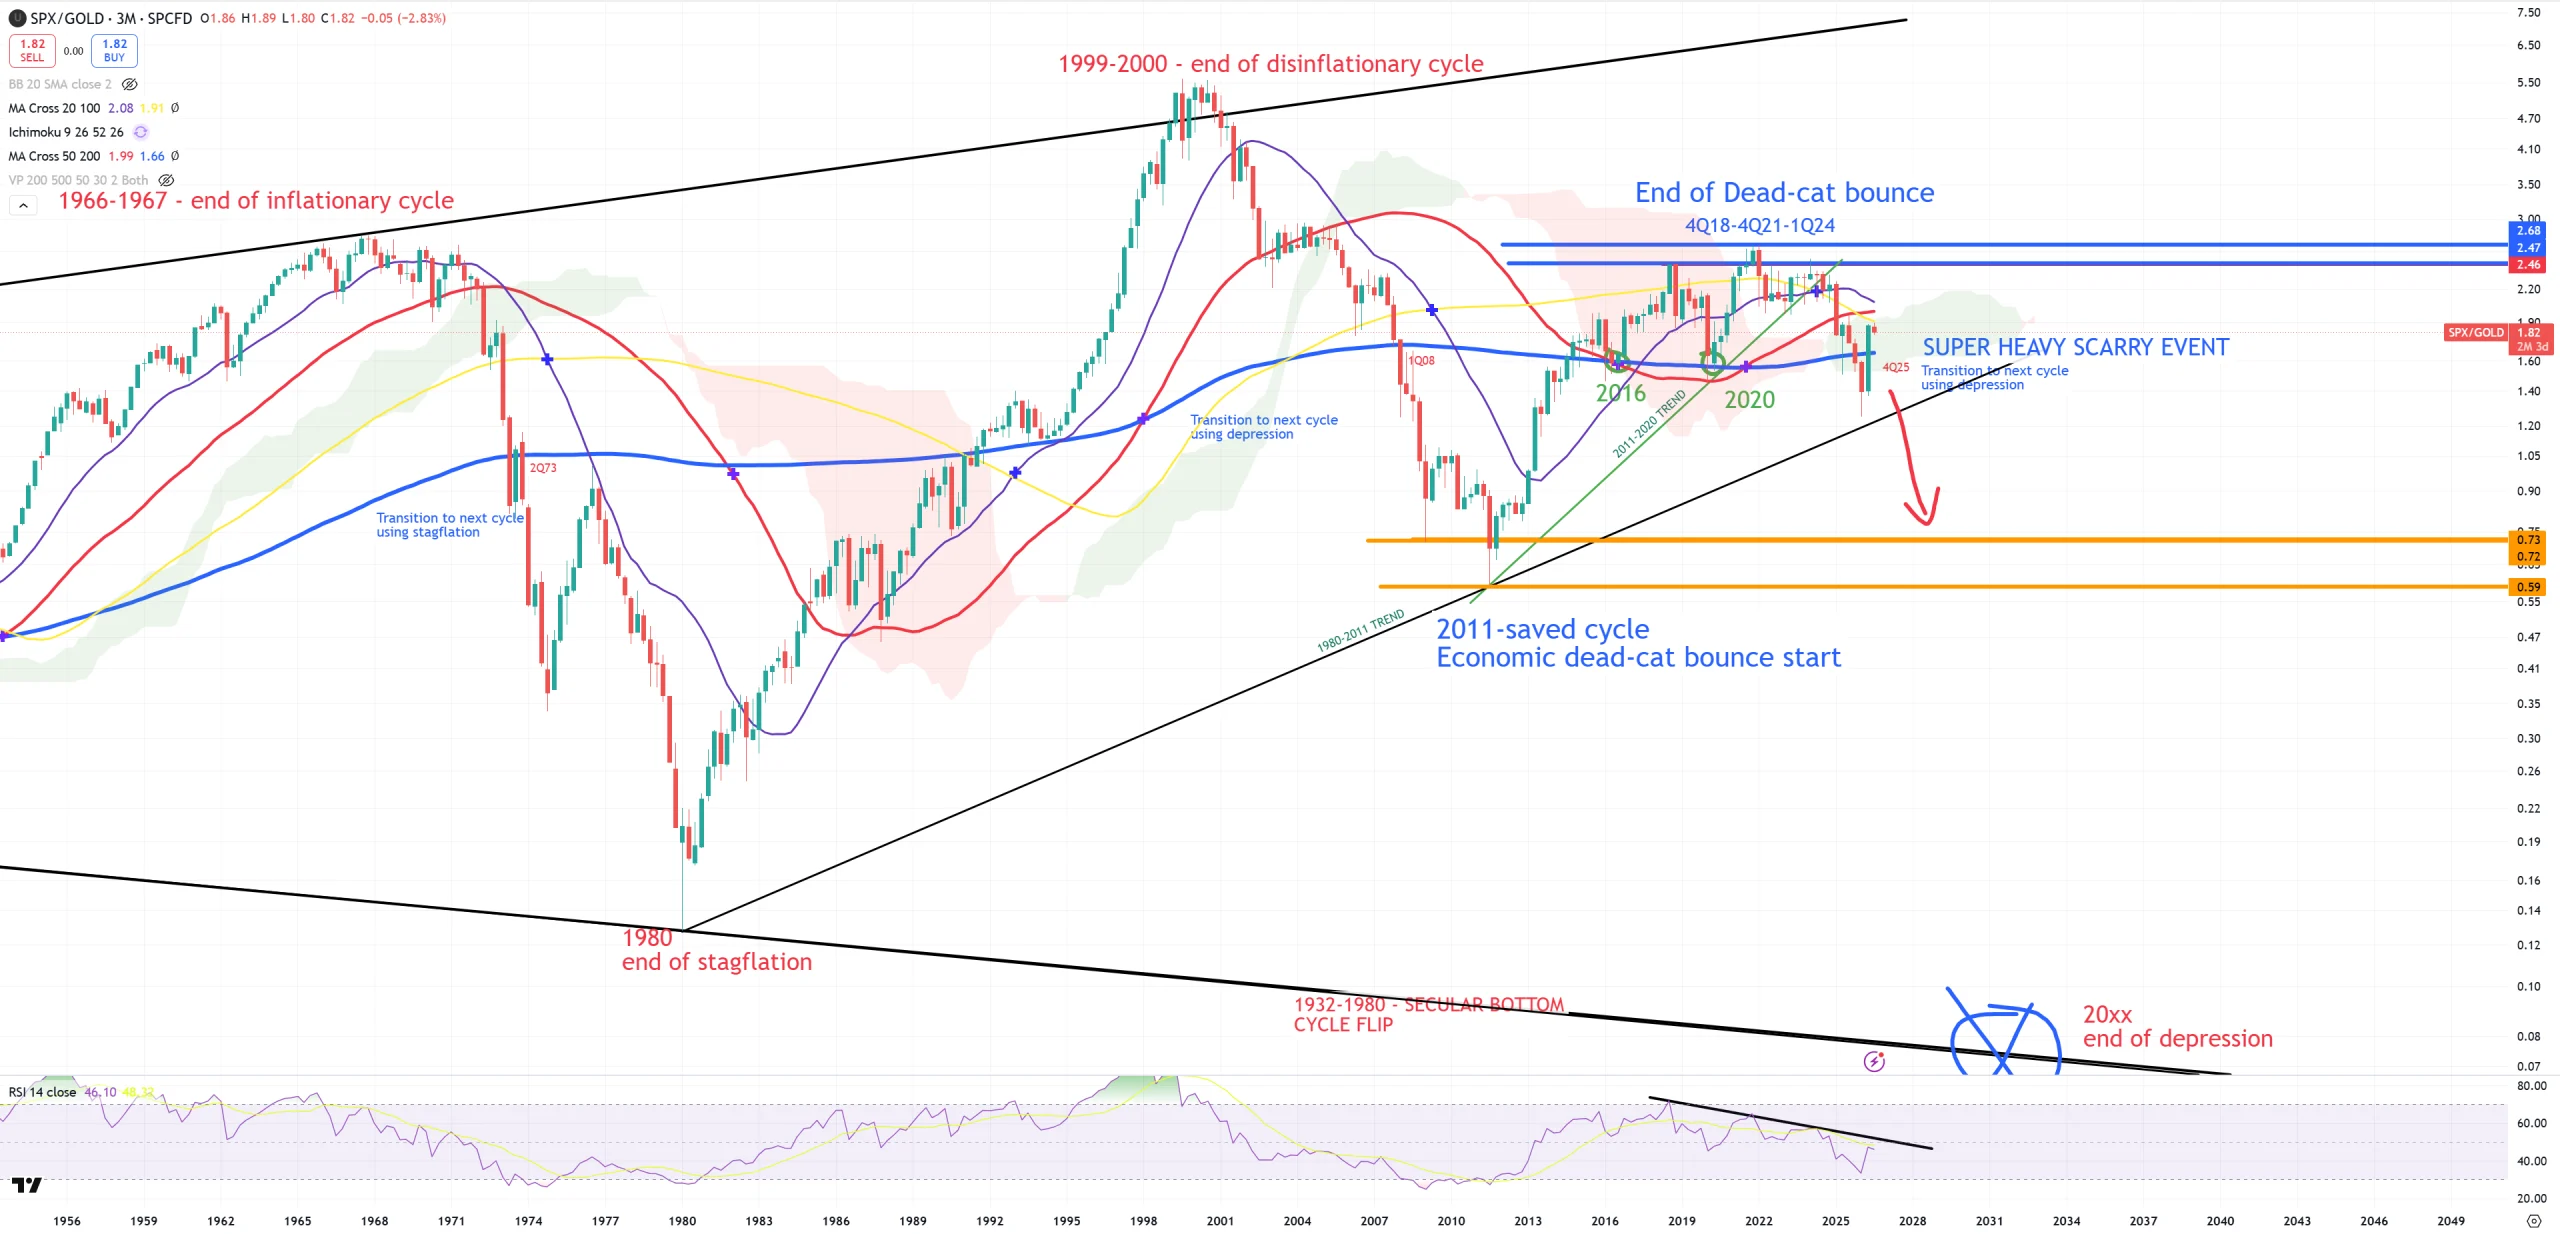
SPX/GOLD holds so far. 1980-2011 TREND has not been broken. (3M)MA200 is trying to regain, but it’ll FAIL once 10Y/3M will go higher and will keep +60bps as a support. 3rd quarter will end in September.
6/ The $$$
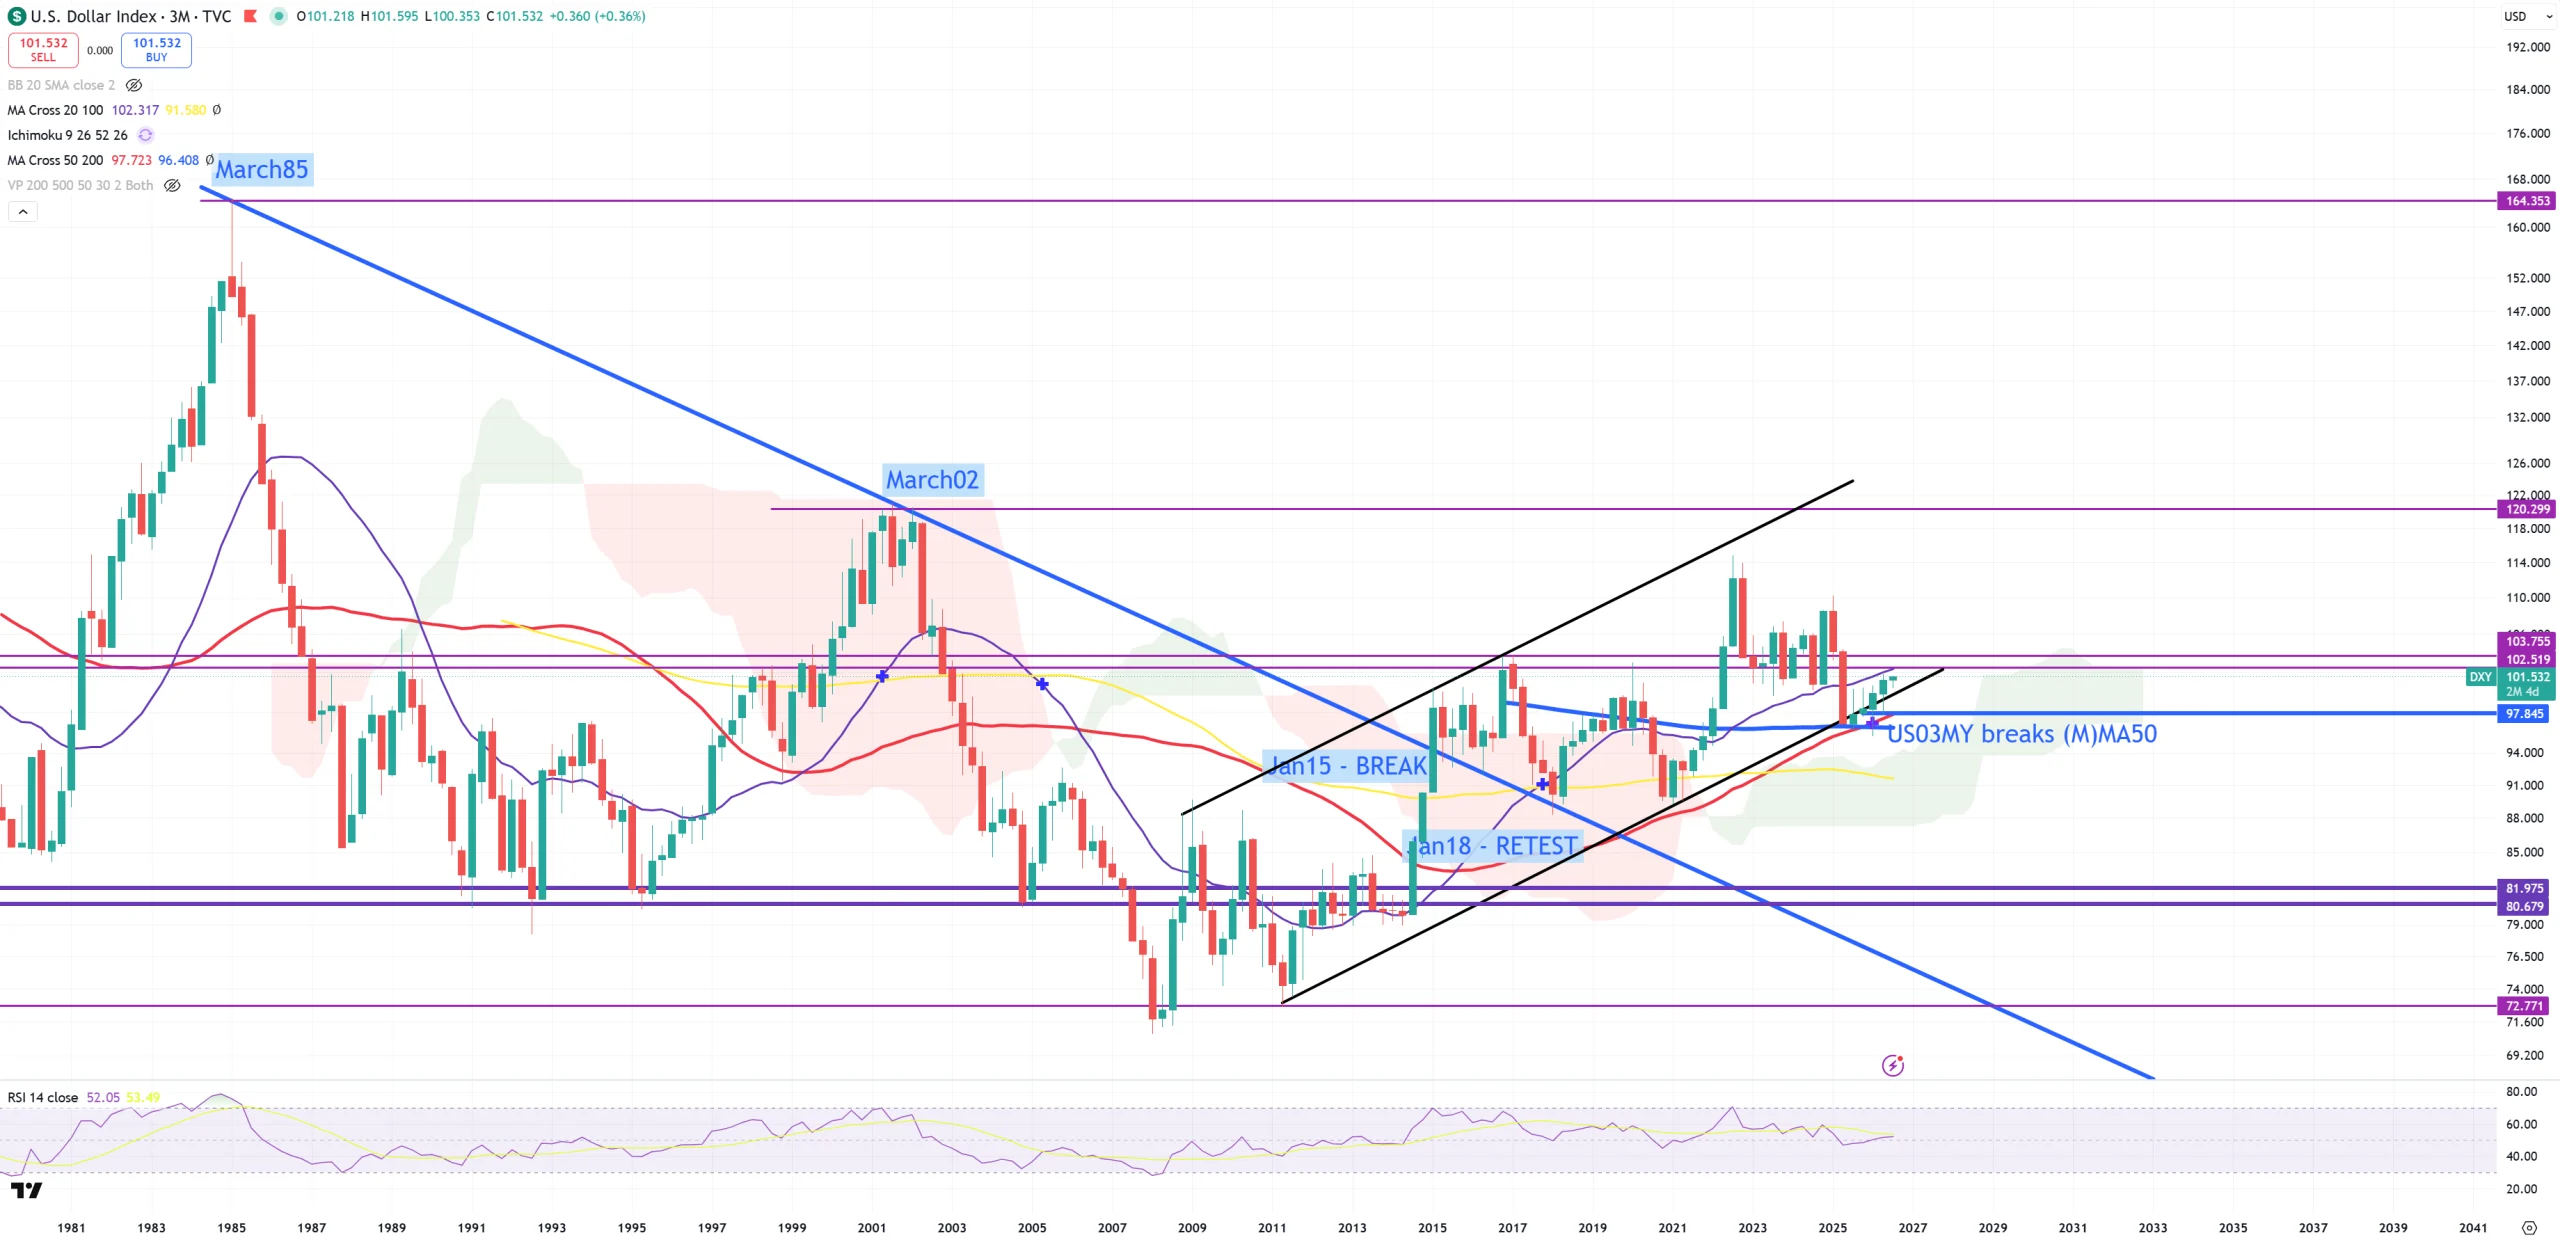
The is 3M view on DXY. I’ll become the big $$$ bear once this red (3M)MA50 & blue (3M)MA200 cross will be taken down for a longer period of time. That’s DXY=96 level. So far it’s 101 and it’s running towards key 103 level. Soon we’ll know if this move from 110 to 96 was a massive trap, and I bet it is. Now DXY is 101 and 10Y/3M is just +75bps, watch where DXY will be around +100bps or +200bps or > +300bps to restart the cycle.
Because 10Y/3M was inverted in a way more powerful than previous 1929 record, that still forces me to keep my old thesis about 160 level and March 1985 double-top.