The end of AI+Semiconductors bubble?
March 28, 2026
Lots of things happening that forces me to drop more articles here. AI+SOX setup forces to me to place an official post on my blog
In the example above I put $SOXX ETF value, but considering SOX we’re talking about 8500 value.
I’ll try to give you more detailed explanation why I think AI+SOX is finished for good as cycle has changed in the background.
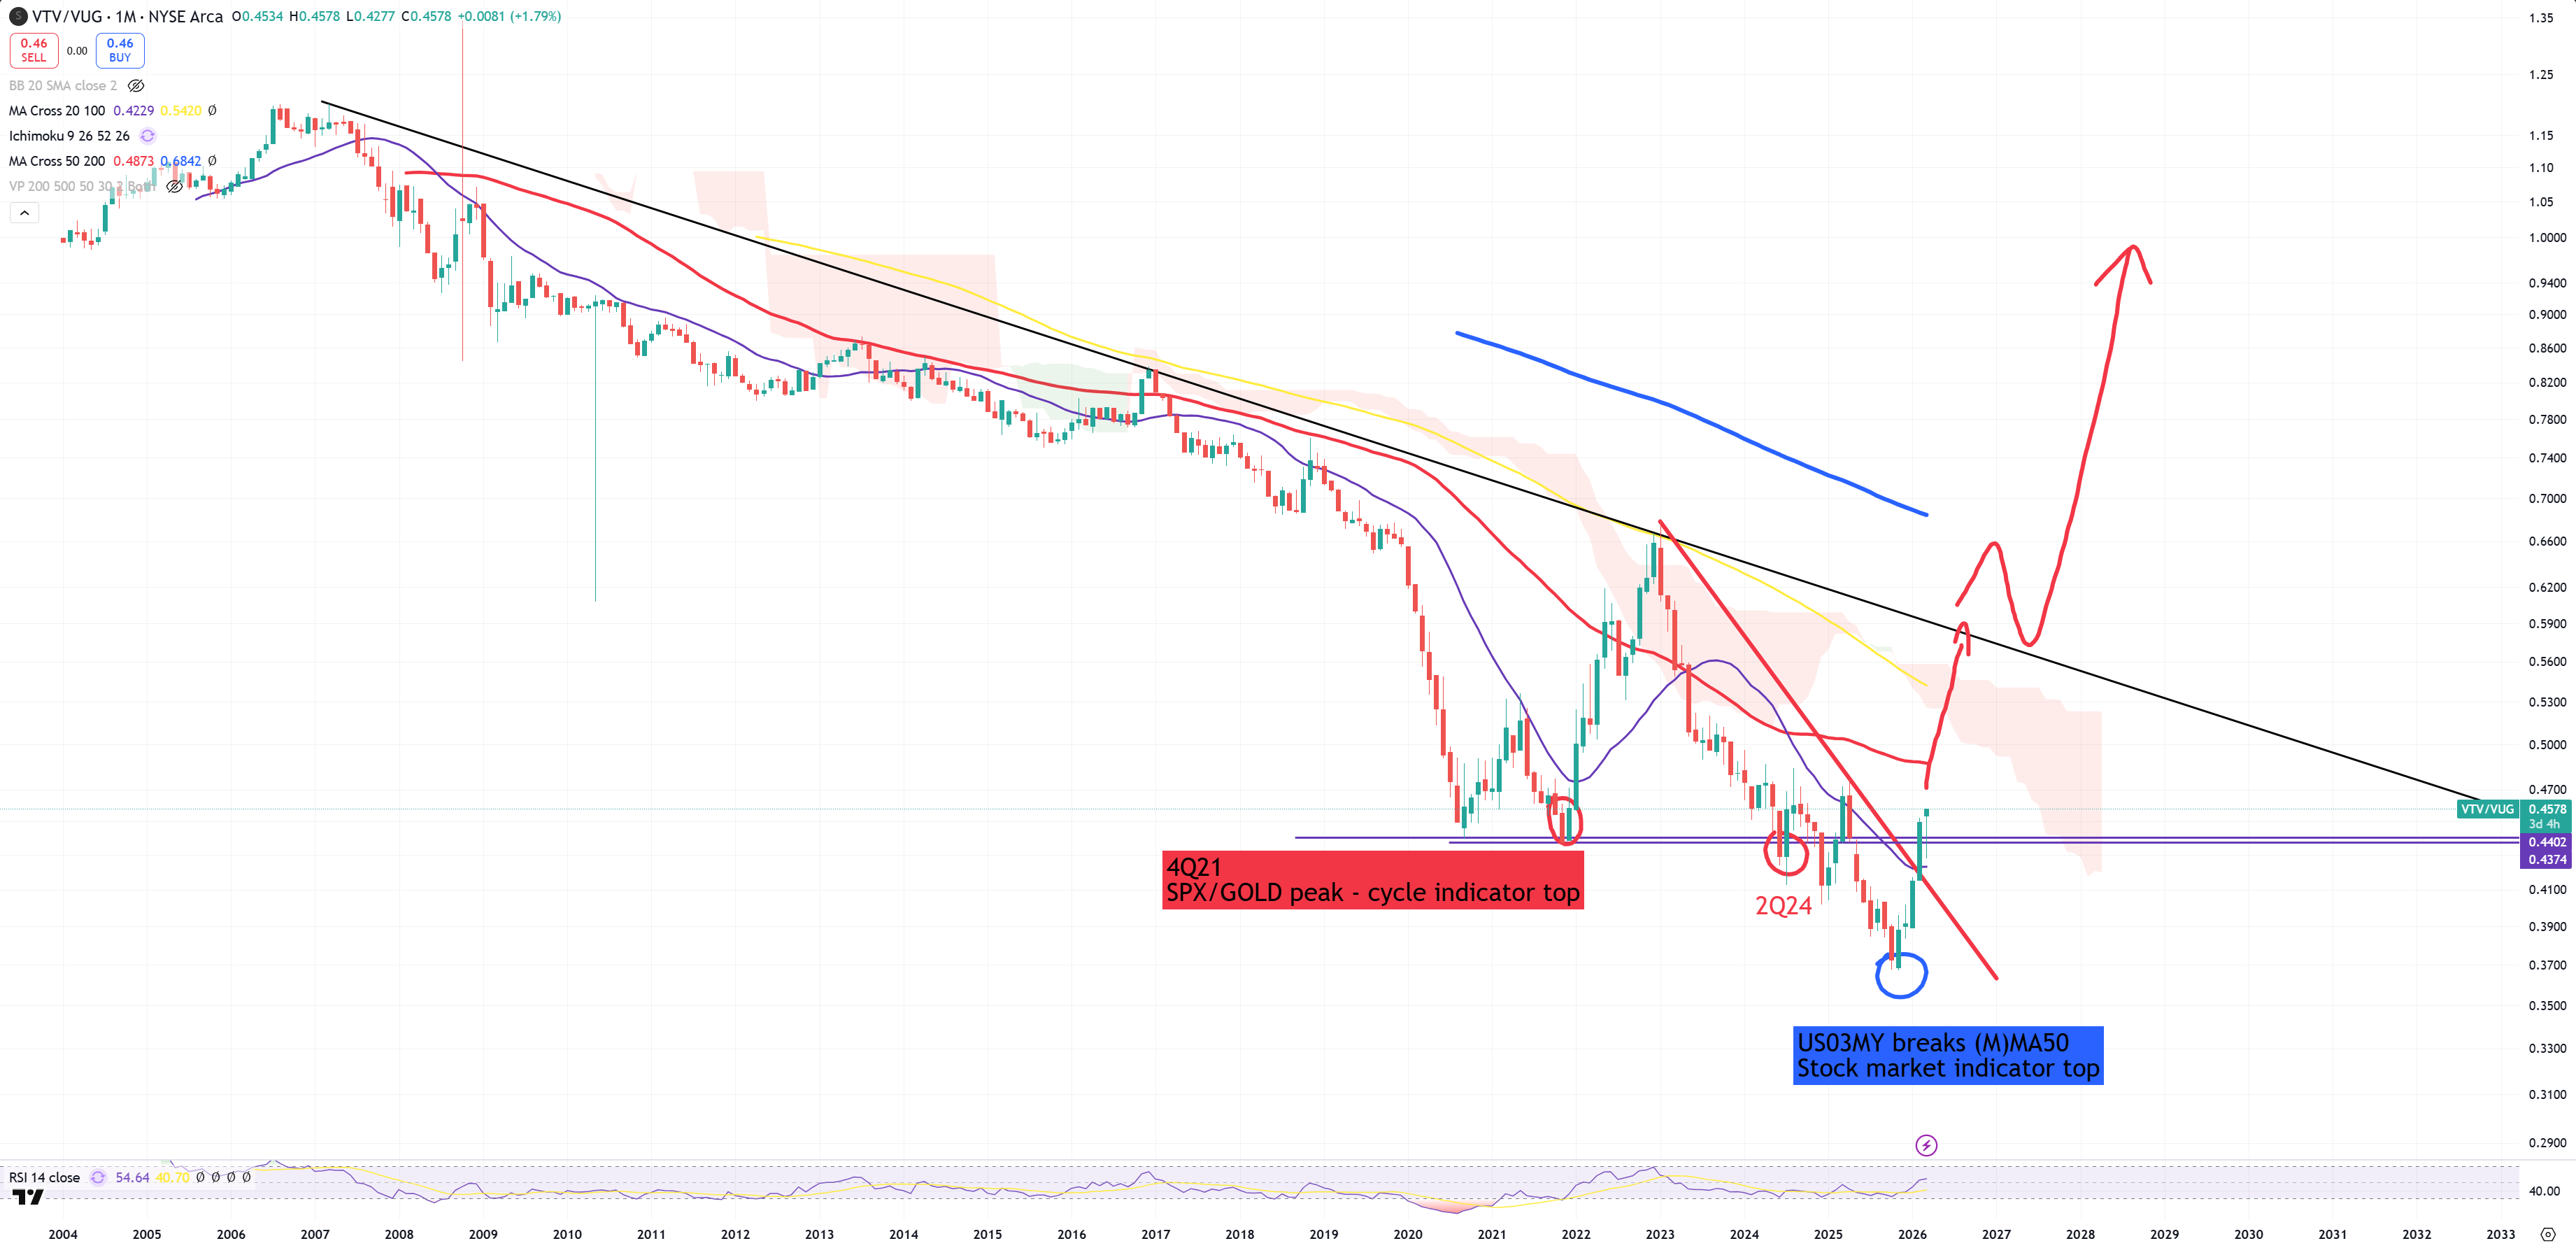
4Q21, 2Q24, 4Q25 – key dates
I won’t be once again putting the same charts over and over again. 4Q21 is SPX/GOLD cycle peak – that’s the MOST IMPORTANT DATE for you now. 4Q25 is the date when US03MY crossed down (M)MA50 and SPX/GOLD broke its super secular (3M)MA200 level – to simplify that we will call this date just a stock market peak indicator.
Have in mind SPX/GOLD cycle peak vs US03MY stock market peak difference is … 4Ys. During this period of time you can easily call “Stock market is not the economy”, but this is not true statement anymore, as I think now stock market is going to chase SPX/GOLD massive drop since 4Q25 or beginning of 2026.
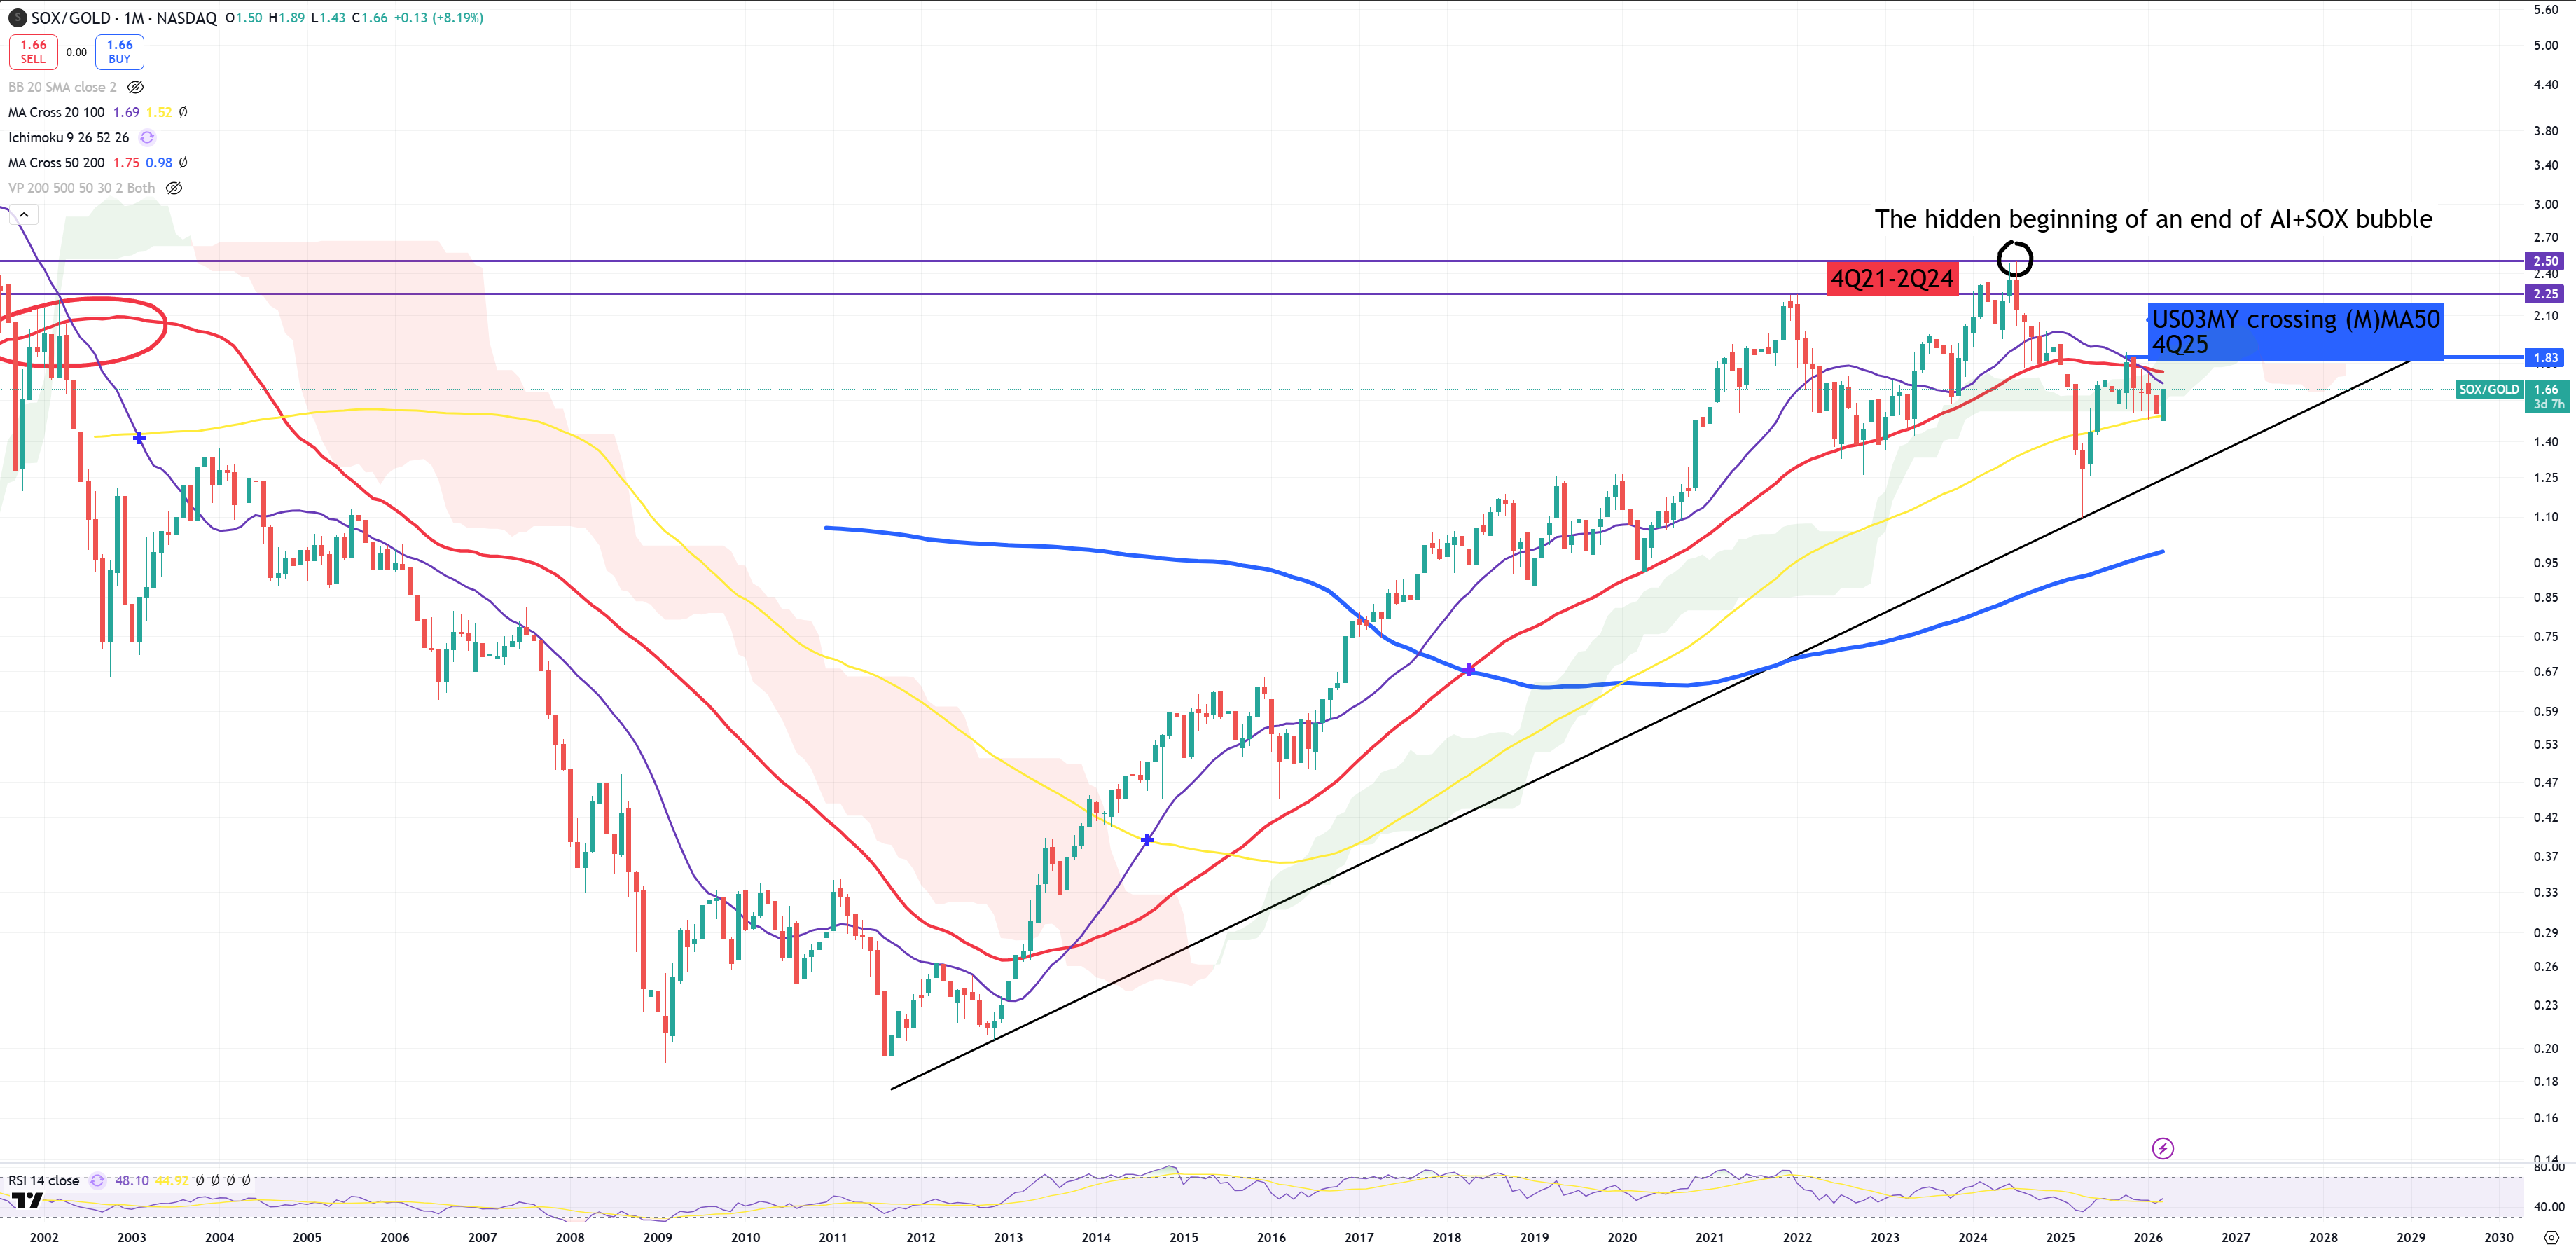
2Q24 is another important level from SOX perspective. While SPX/GOLD told us about cycle peak in 4Q21 – and lots of stocks made peak during that level, SOX is different. SOX/GOLD peaked 2Q24 – that can be called the hidden beginning of an end of AI+SOX.
Cyclical peak doesn’t mean stock market peak, what is important is the fact that 4Q21 was not a peak for SOX/GOLD what will be important later when I give you couple examples about SOX stocks
We see now a typical retest towards (M)MA50 which last time blew up dotcom bubble and ended TECH dominance for 20Ys. This is also a perfect 0.5 FIBO bounce (0.5 and 0.618 are typical dead cat bounce levels).
Another fun fact is : SOX/GOLD (M)MA50 retest happens exactly the same moment when US03MY broke (M)MA50. Another fun fact is : When in 2002 SOX/GOLD retested (M)MA50, SOX failed -67% after it.
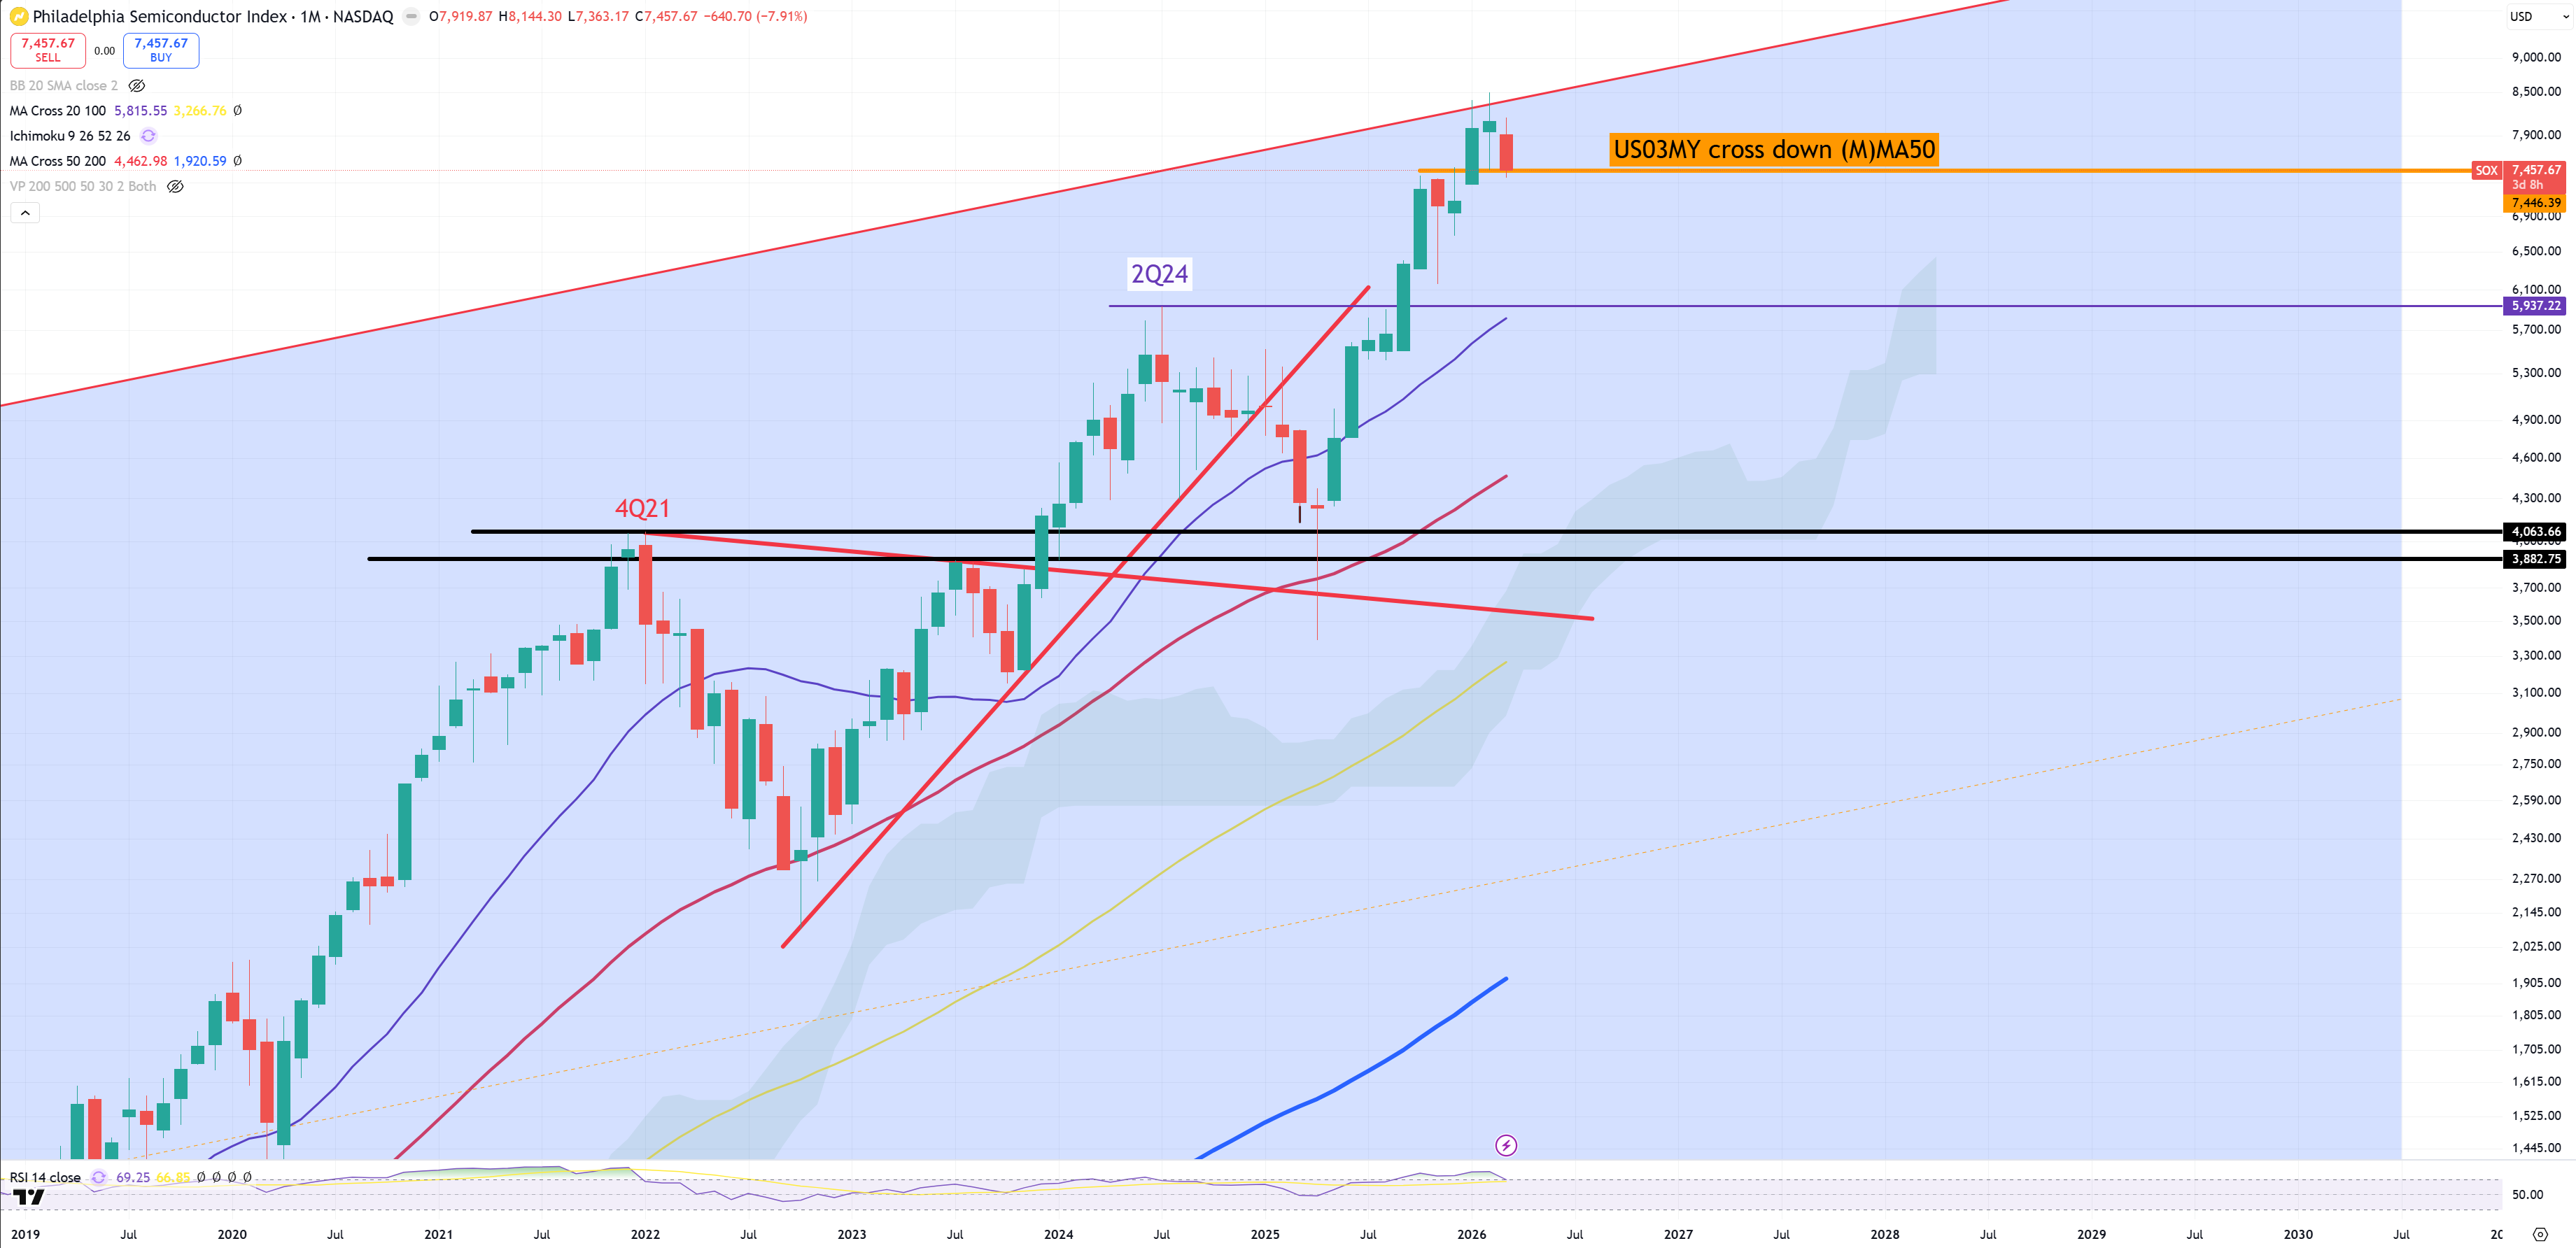
SOX index
All dates you can see on the chart. Once yield-curve finally uninverts it gives us another important hint about the end of current biggest bubble :
What to expect?
Once it’ll jump below 4Q25 level when US03MY crossed down (M)MA50 it’ll be a first sign it’s over. Still the chance is very high, once SOX/GOLD can’t jump above (M)MA50. Later it should be quick drop below 2Q24 (SOX/GOLD peak), to finally break 4Q21 (cycle peak) – maybe with a bounce from here. Remember that all cycle indicators DJI/GOLD and SPX/GOLD broke their super secular (3M)MA200 telling us – there’s no way out.
If you ask what will blow this bubble I’ll answer : I have no idea and I don’t care as I won’t even guess. This event will arrive for sure.
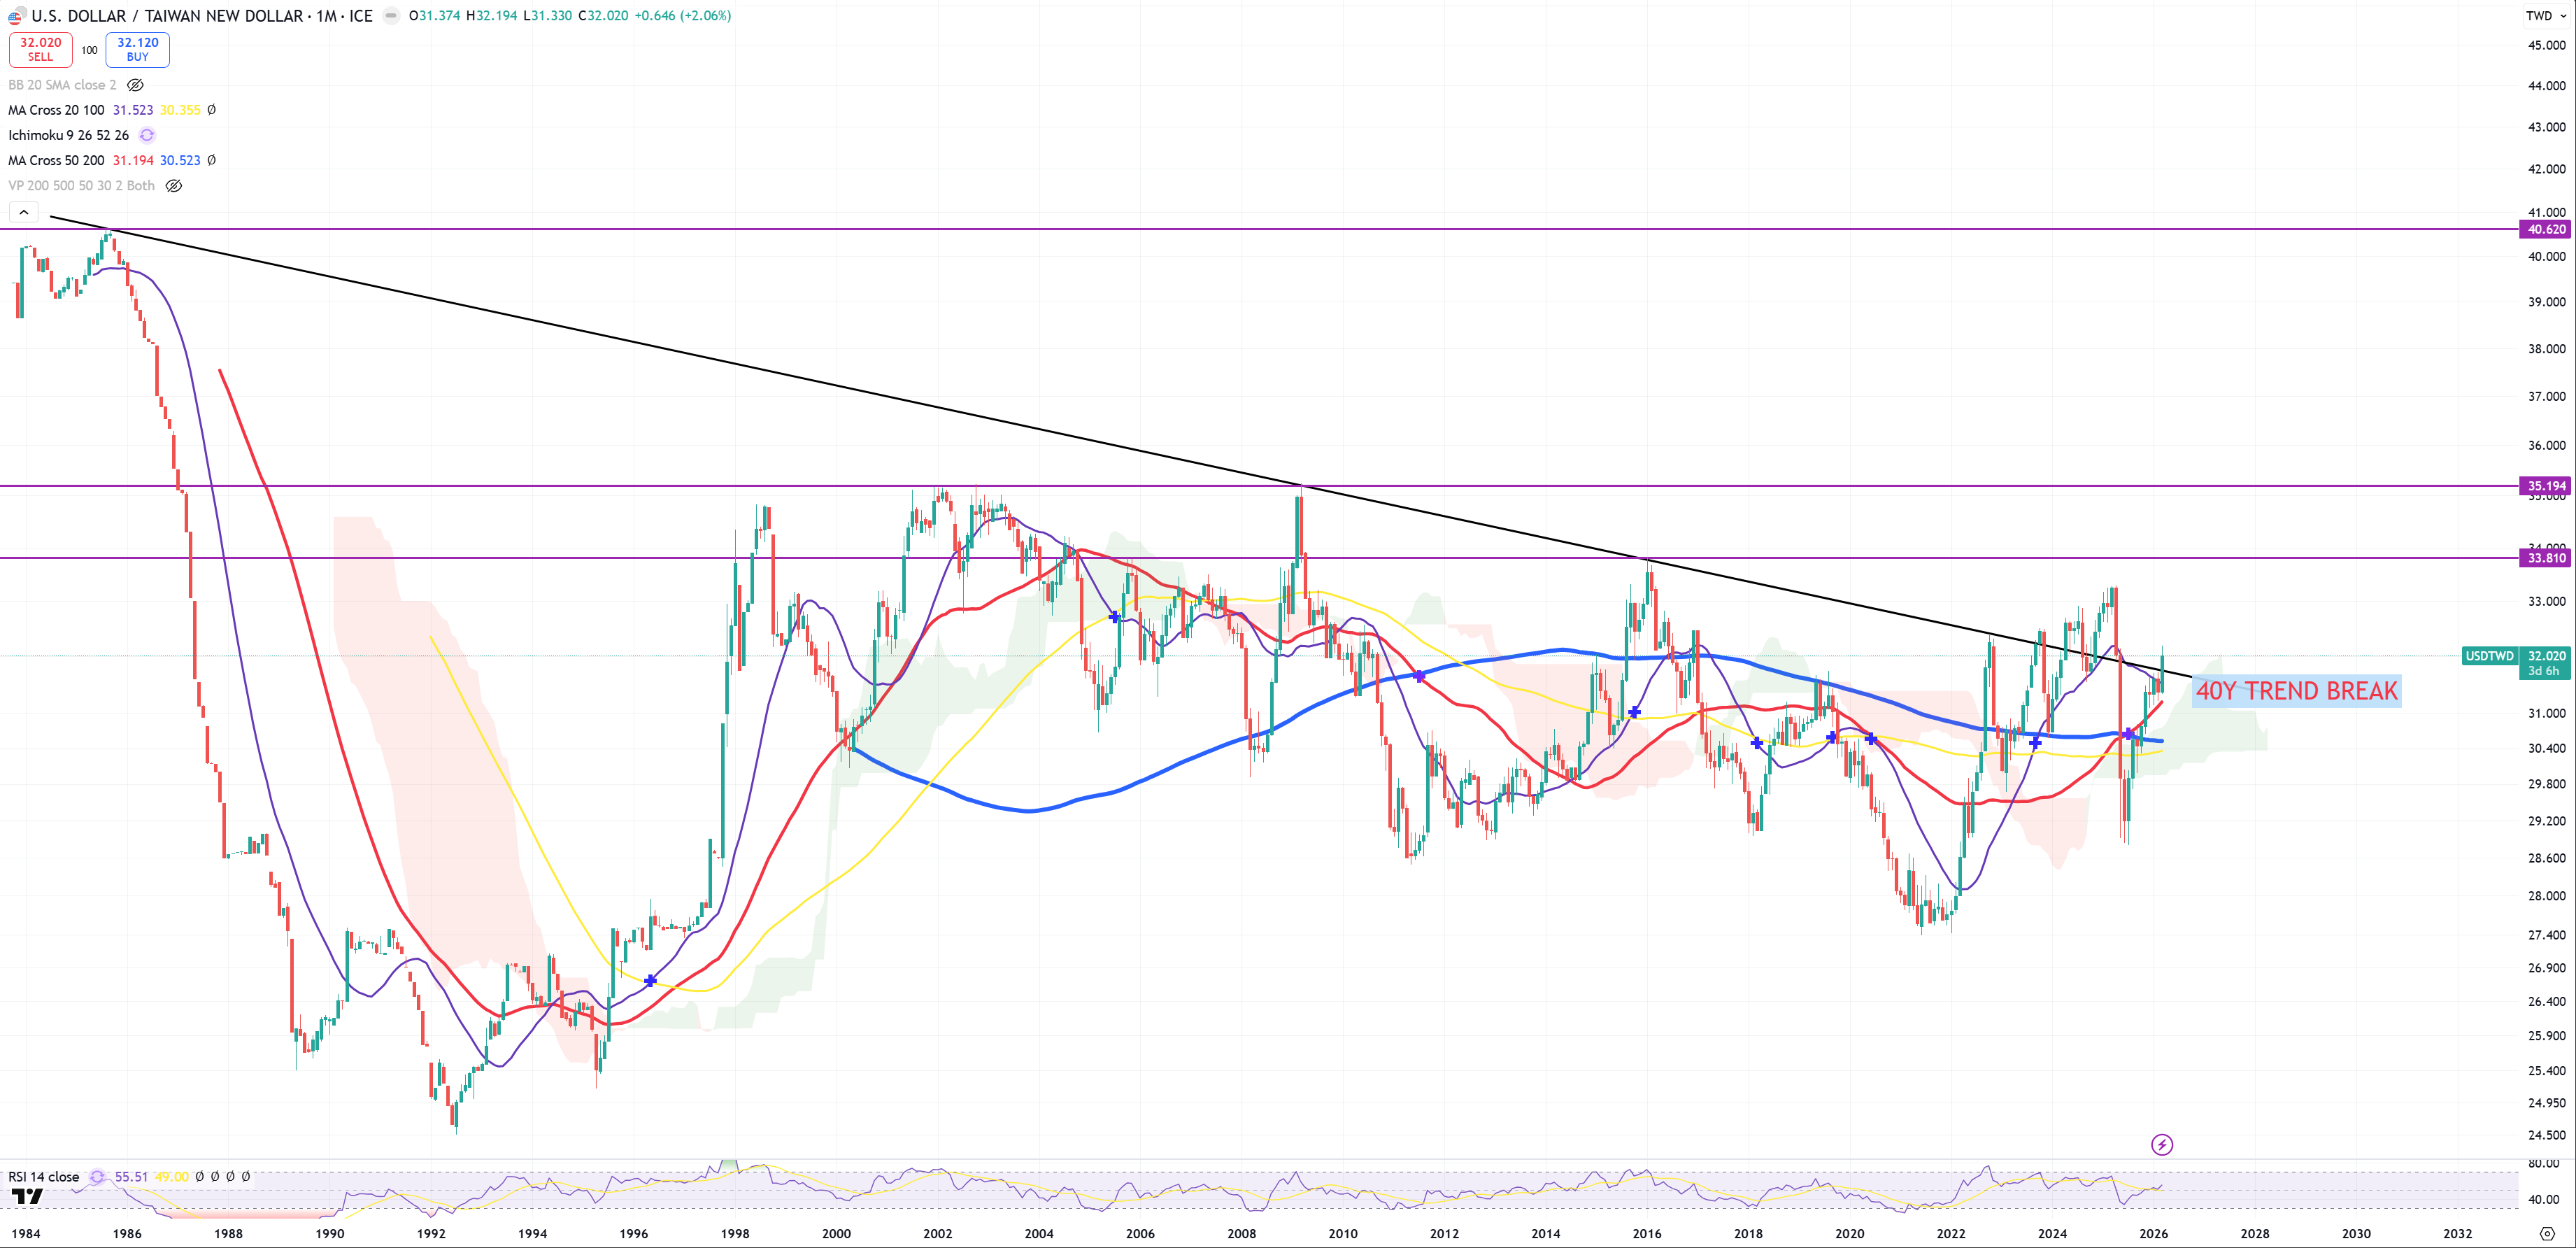
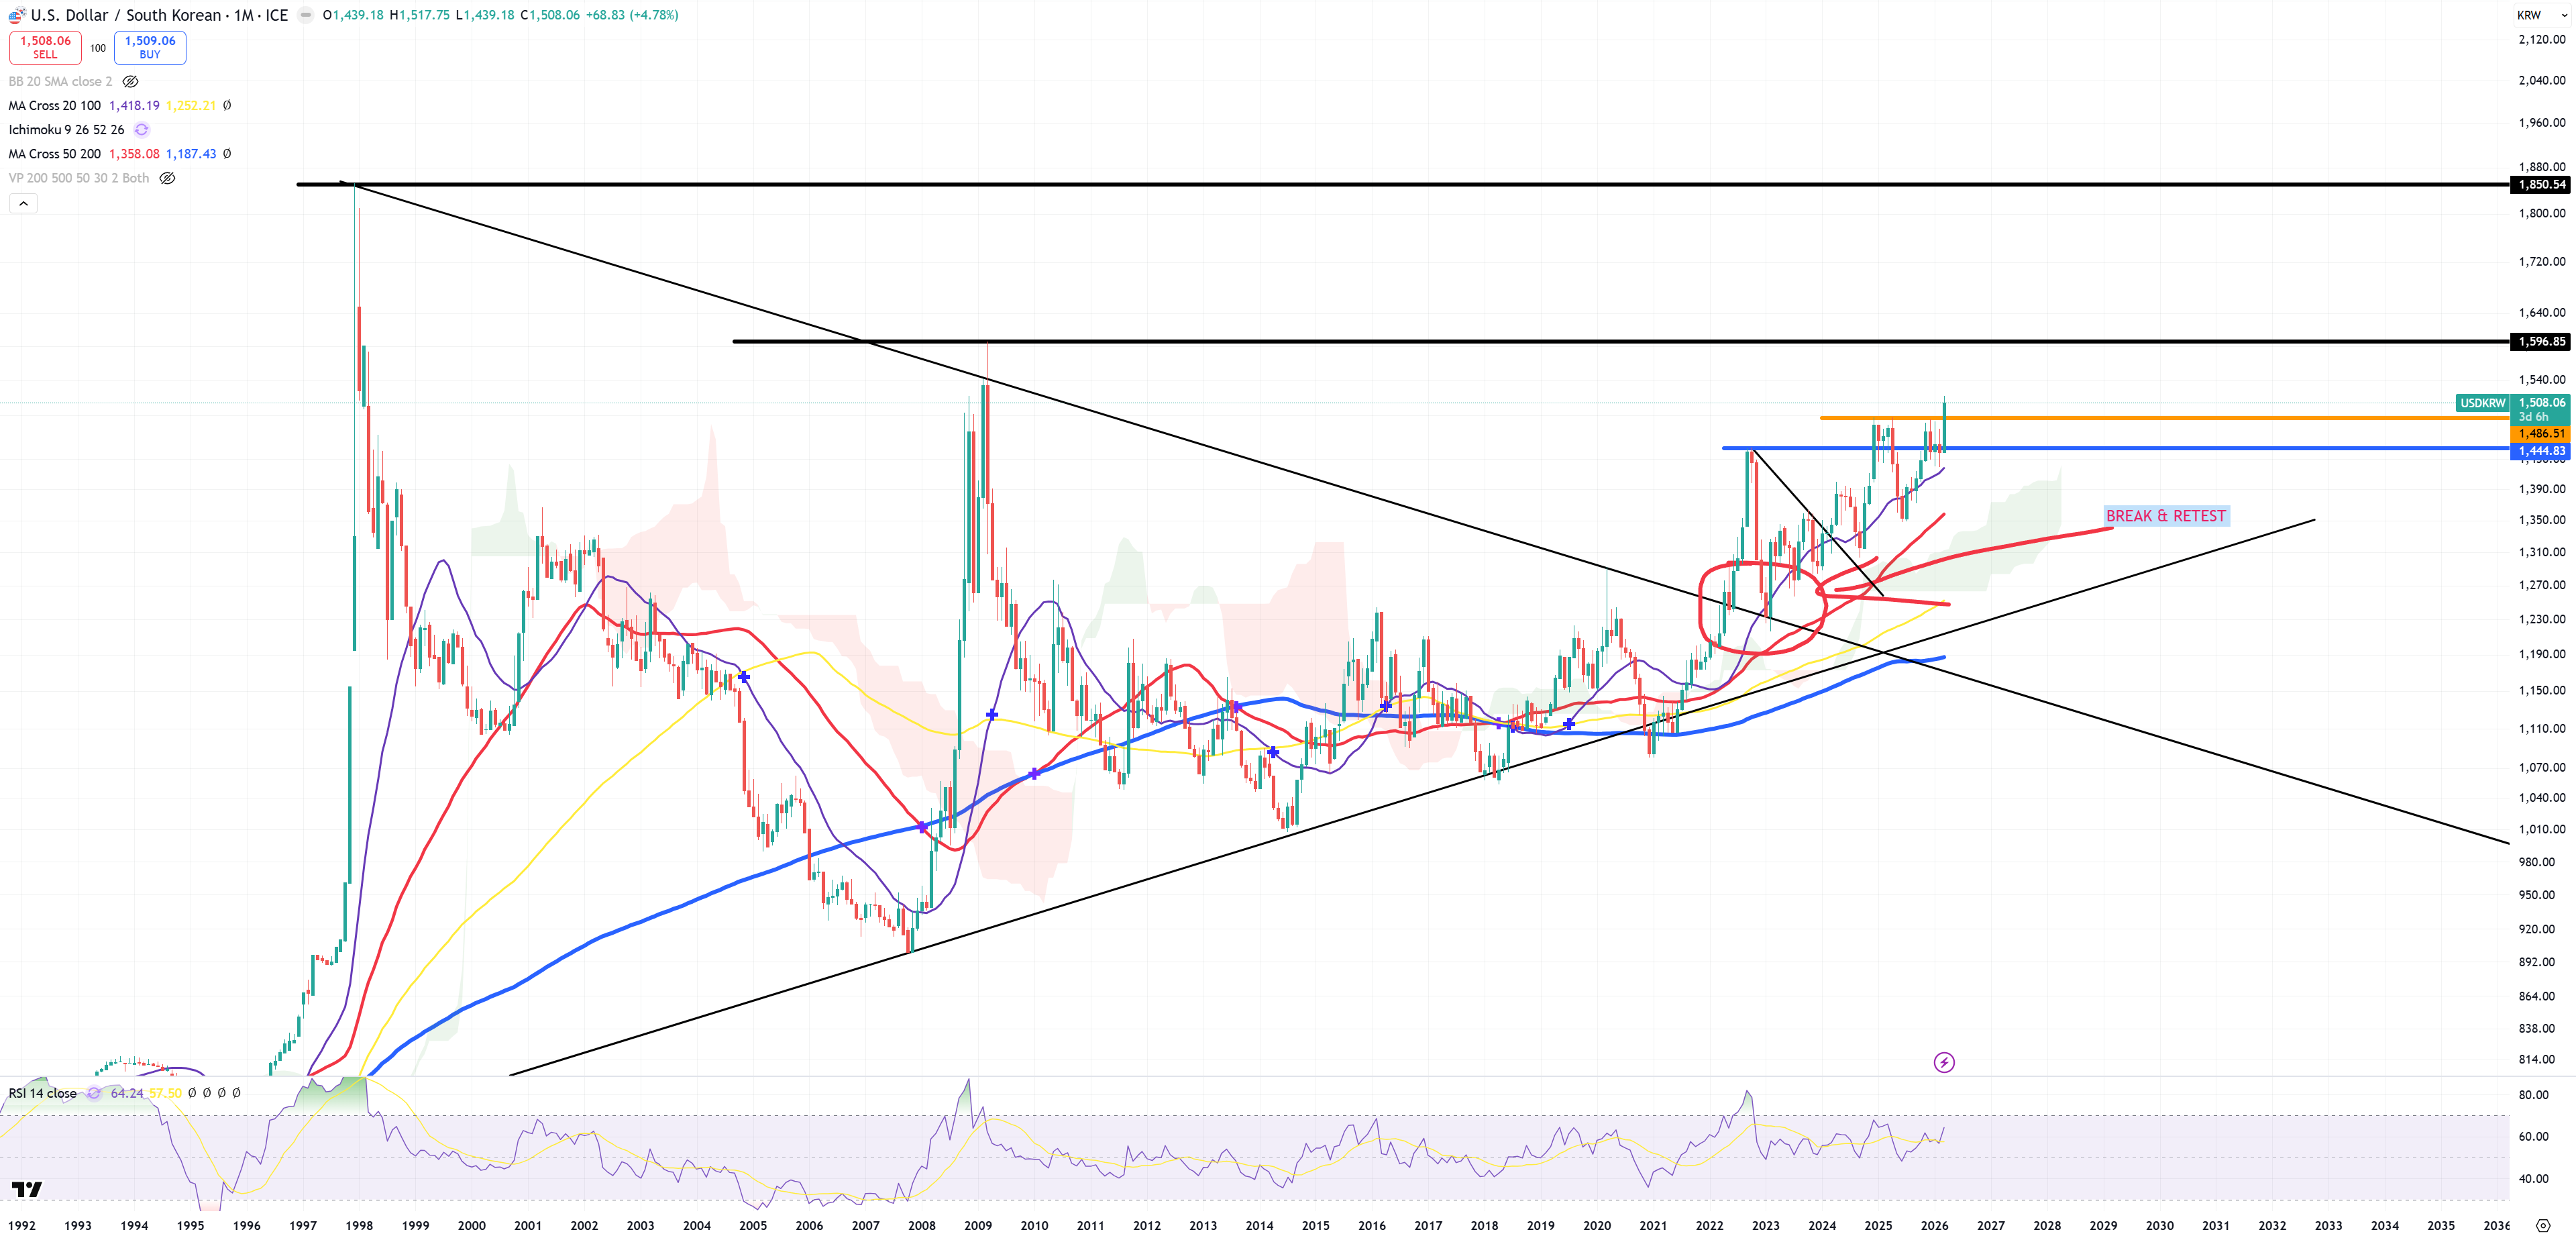
USDTWD breaks 40Ys trend, USDKRW > 1500.
USDTWD trend break is a supplementary indicator of SOX peak – that’s how I think. Last time it was saved, but it’s breaking again. You all know this break will affect TSM. How? I have no idea and I won’t guess. Quick 3 points out of my head.
1/ Taiwan lost LNG supplies and run out of power
2/ Taiwan lost hellium supplies
3/ China enters Taiwan
Korean Won doesn’t look too good : HYNIX & SAMSUNG got some troubles. Considering the fact 10Y/3M is just +73bps level 2000 from Asian Crisis might not even be the top especially if SOX bubble implodes.
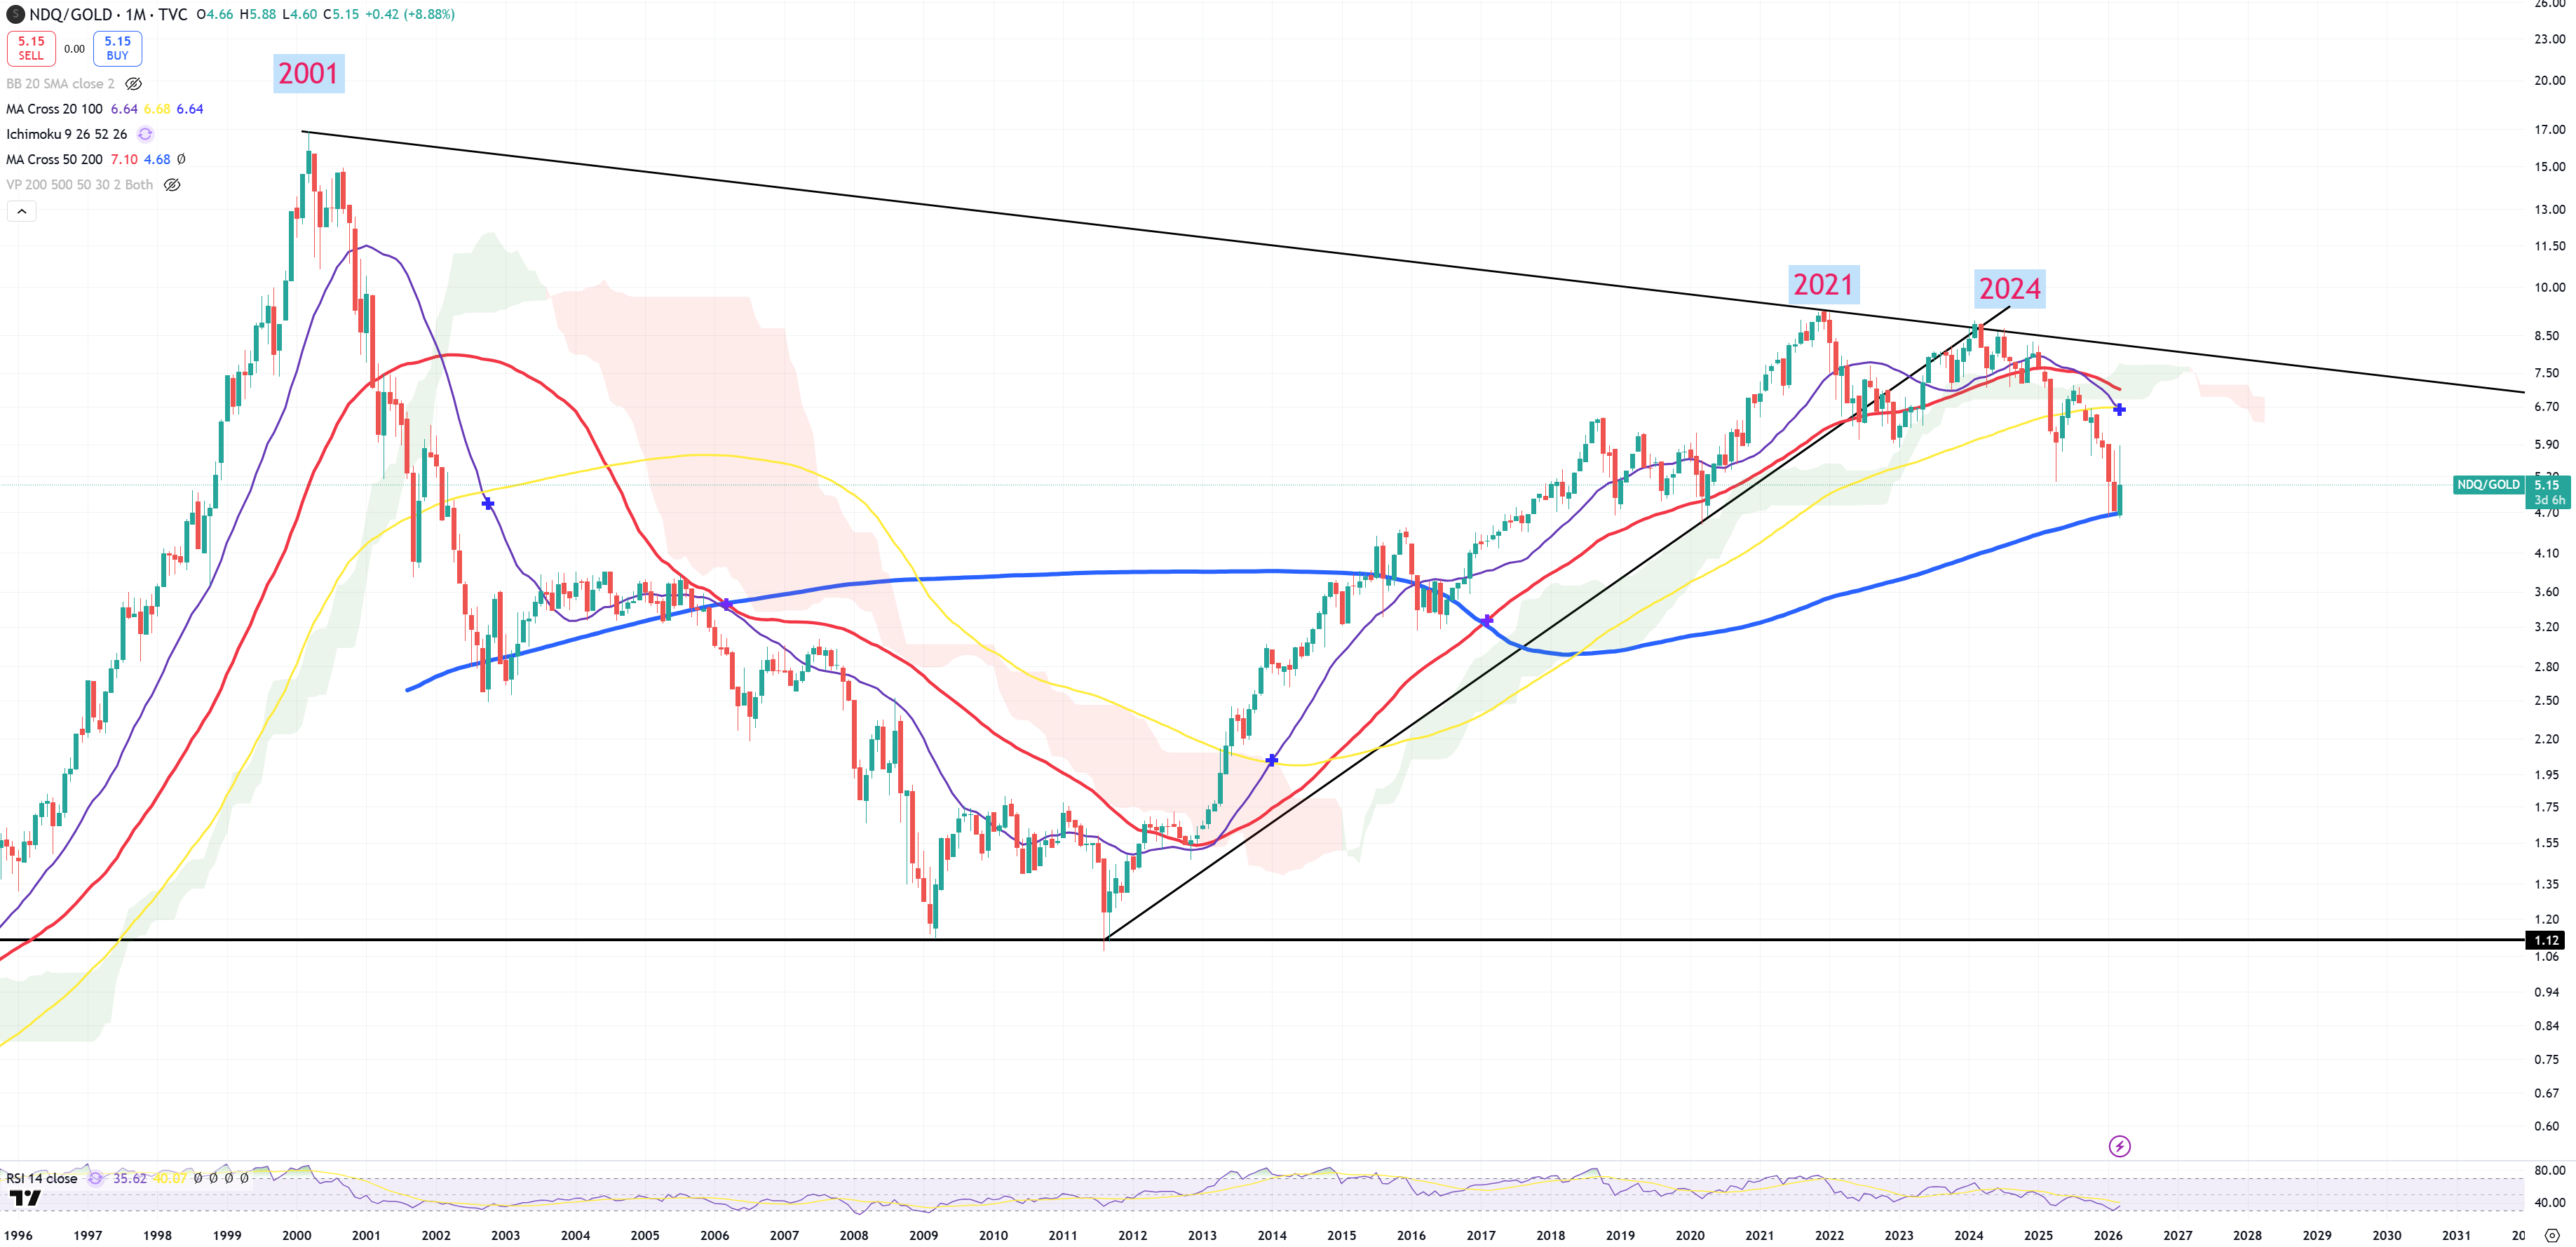
NDQ/GOLD
But if you even take NDQ/GOLD analysis you’ll see another super important cross junction. NDQ/GOLD peaked in 2021, with a bit lower peak around this 2Q24. But from 2Q24 it was just a massive meltdown. Will we see 1 NDQ = 1 GOLD to get to 3xBOTTOM? That’s my bet. NDQ is > 23000 today.
If you bet this (M)MA200 is support, I will tell you there’re high chances it won’t because more powerful indicators like DJI/GOLD, SPX/GOLD and US03MY (M)MA50 break and 10Y/3M uninverting flashing red after big breaks.
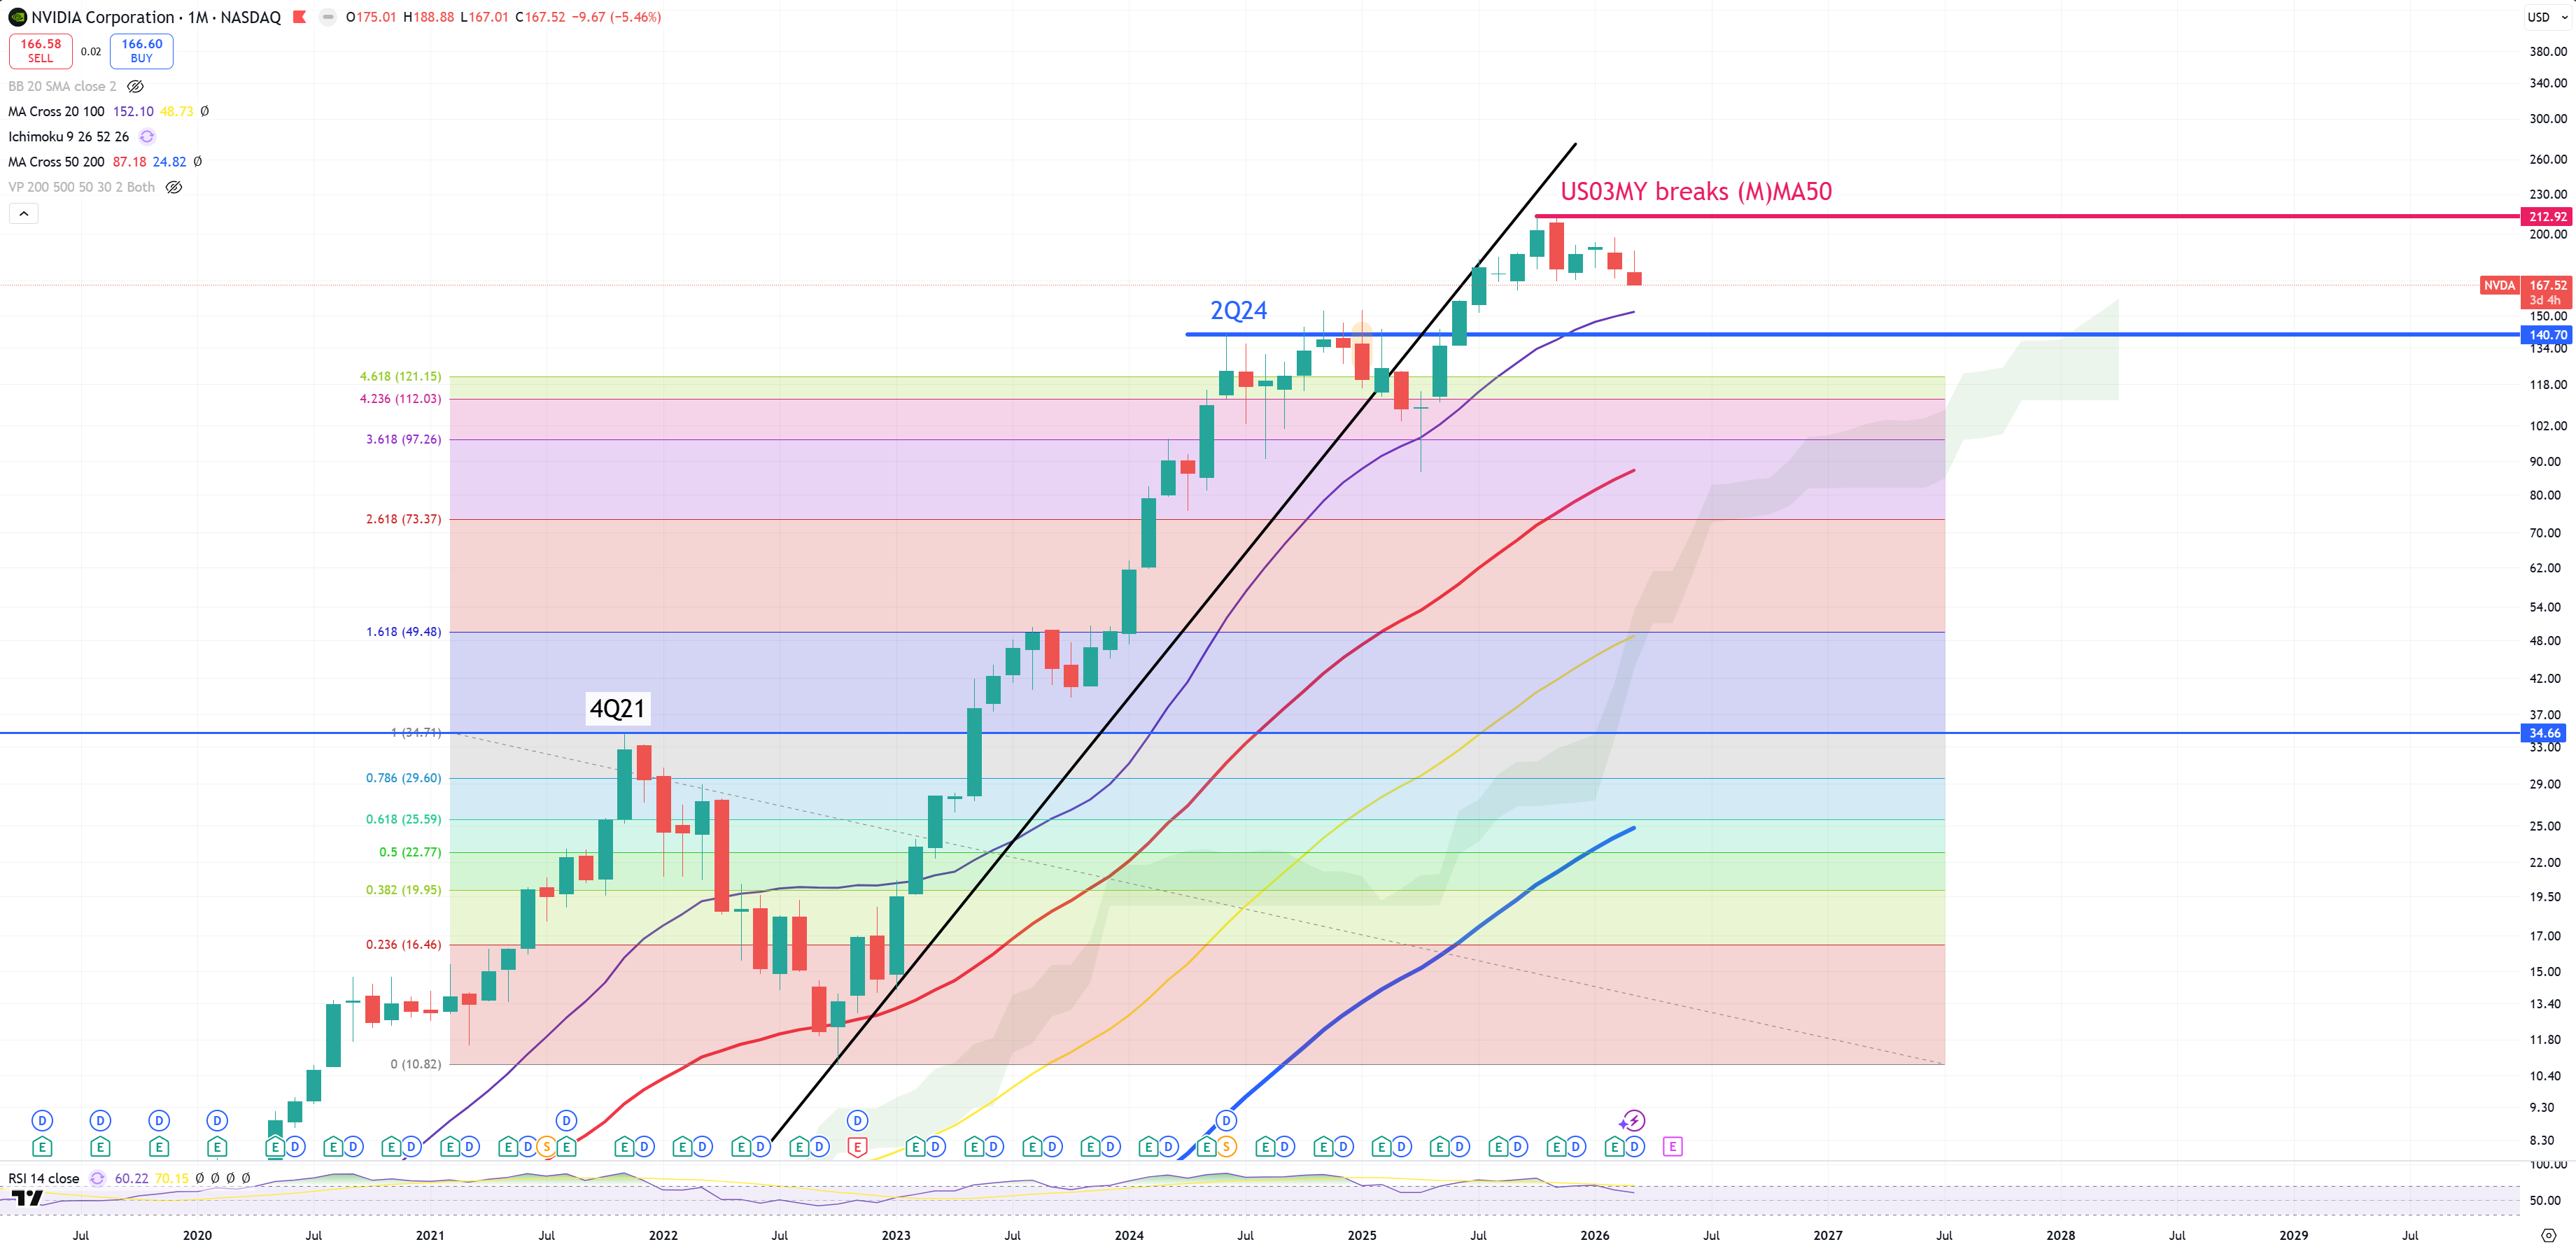
NVIDIA
Nvidia is this company that reflects perfectly stock market peak indicator. The moment US03MY broke (M)MA50 NVDA placed 212$ level.
2Q24 (SOX/GOLD) peak places around (M)MA20 = losing high momentum bull market indicator, 4Q21 places around blue (M)MA200 = 35$ = secular bull/bear market indicator
Initially I thought this 2Q24 peak will be hold, but … Nope it moved up more. What is more scarry is 4Q21 stays on … 35$ level.
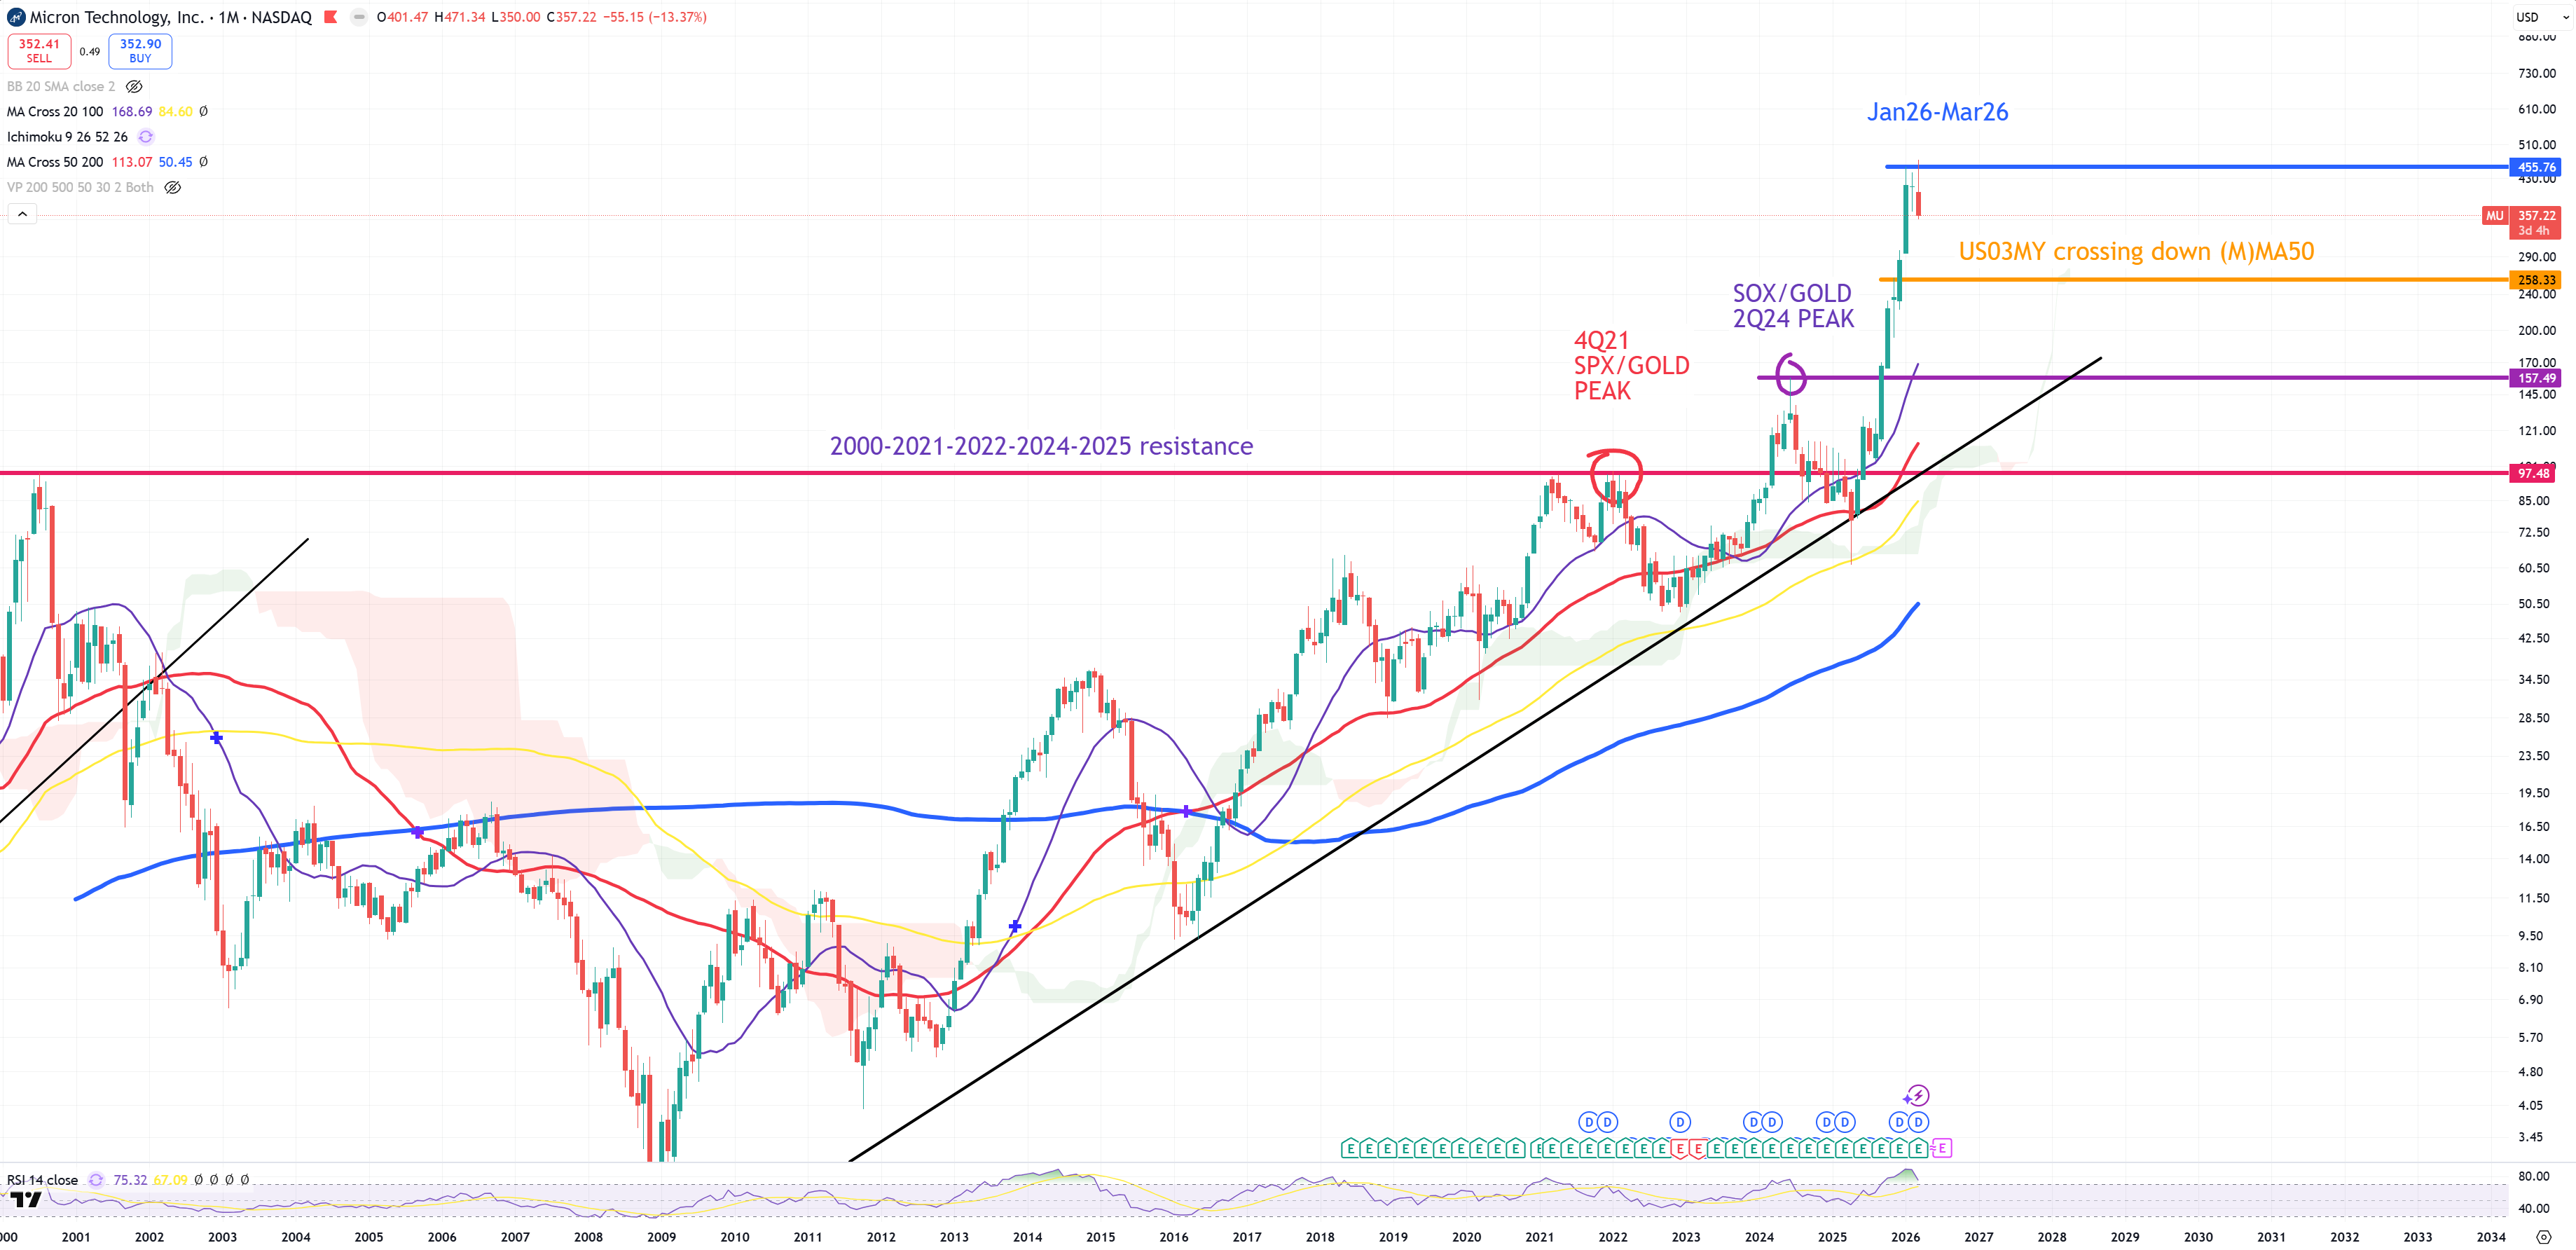
Micron
I’ve never thought it’ll be Micron which will outplay NVIDA in the move up. You see all levels. No idea what’s going to happen, but Micron needs to jump below yellow level first to finally align with cycle inicators. The fact is that’s not Nvidia that needs to be observed to track the bubble bursting, but it’s Micron.
Micron also initially placed a tempting setup post 2Q24 drop below 4Q21 resistance giving an impression of keeping dotcom bubble peak as a resistance, but that all failed.
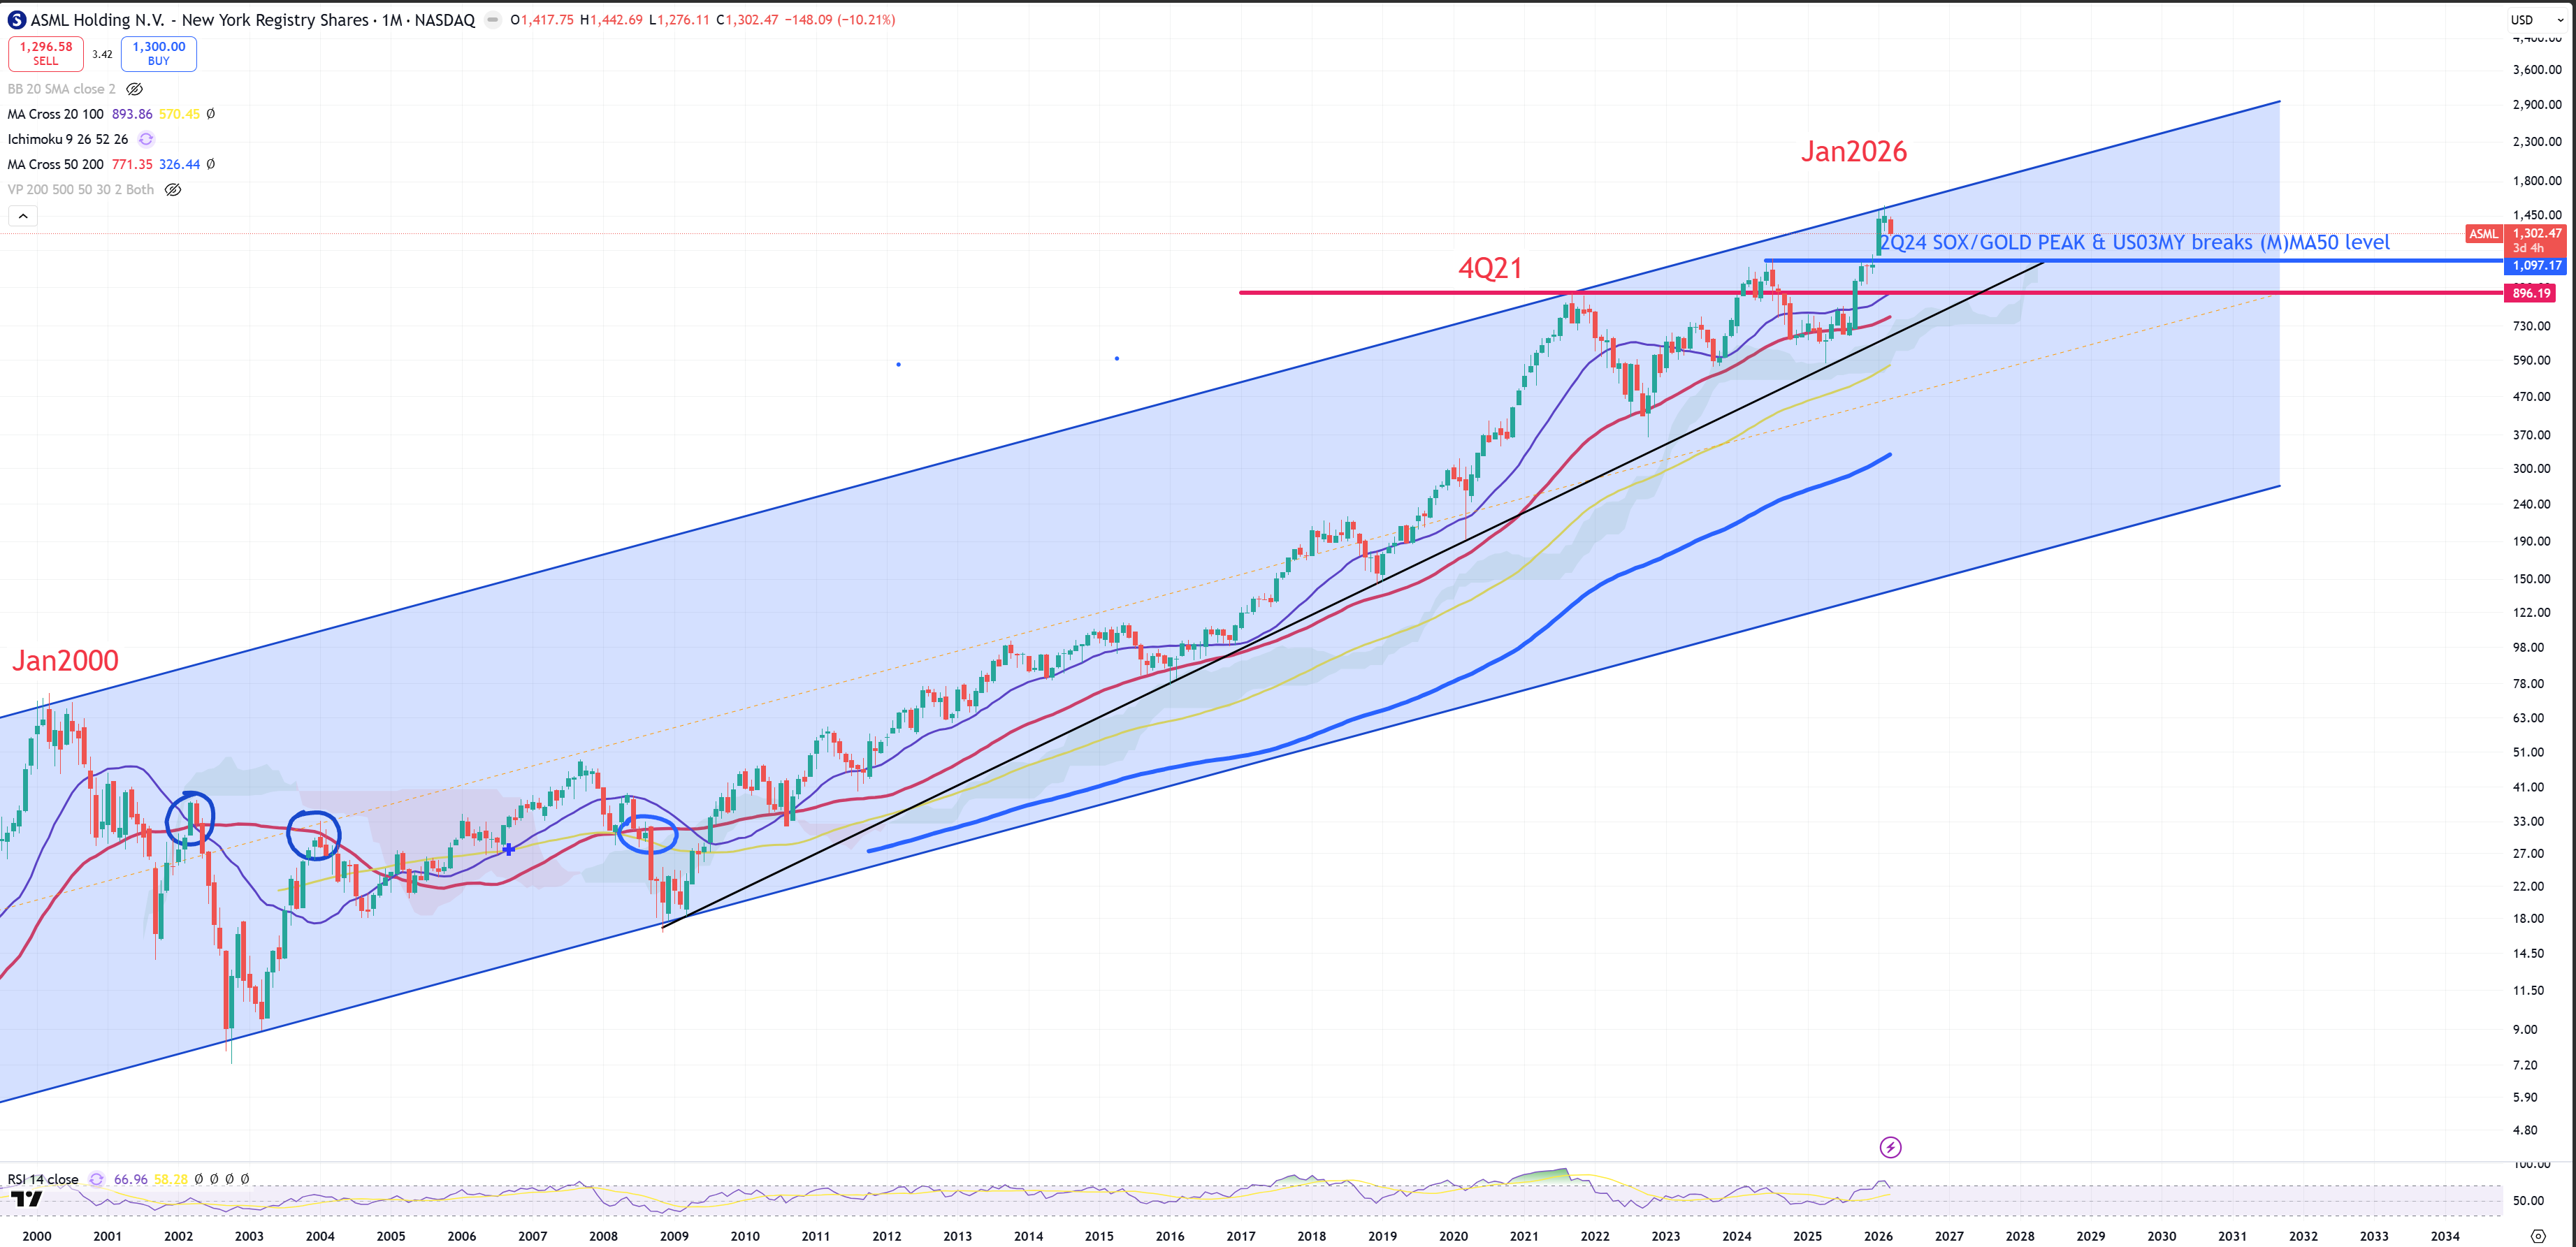
ASML
ASML so far perfectly follows 2000-2021 trend, placing 3rd point on January 2026. 2Q24 peak is placed exactly on the same level as 4Q25 level (US03MY breaking (M)MA50).
VALUE/GROWTH rotation
Another confirmation comes from Value/Growth ratio. As everything breaks we should observe this kind of move. Value/Growth is now above 4Q21 bottom, placing perfect bottom when US03MY broke (M)MA50. It’s another confirmation of GAME OVER.
SUMMARY
It looks like SOX/GOLD is going to reject (M)MA50 and crash. Last time it was a main indicator of a flush during dot.com bubble. On this SOX/GOLD (M)MA50 retest wave SOX lost -67%.
While Nvidia seems to be already busted, the game is about Micron. Of course there’re lots of other companies like SanDisk etc. but I decided to select 3 different examples. Nvidia as the biggest one, ASML as main producer of equipment, Micron as the main RAM producer.