03/2026
March 31, 2026

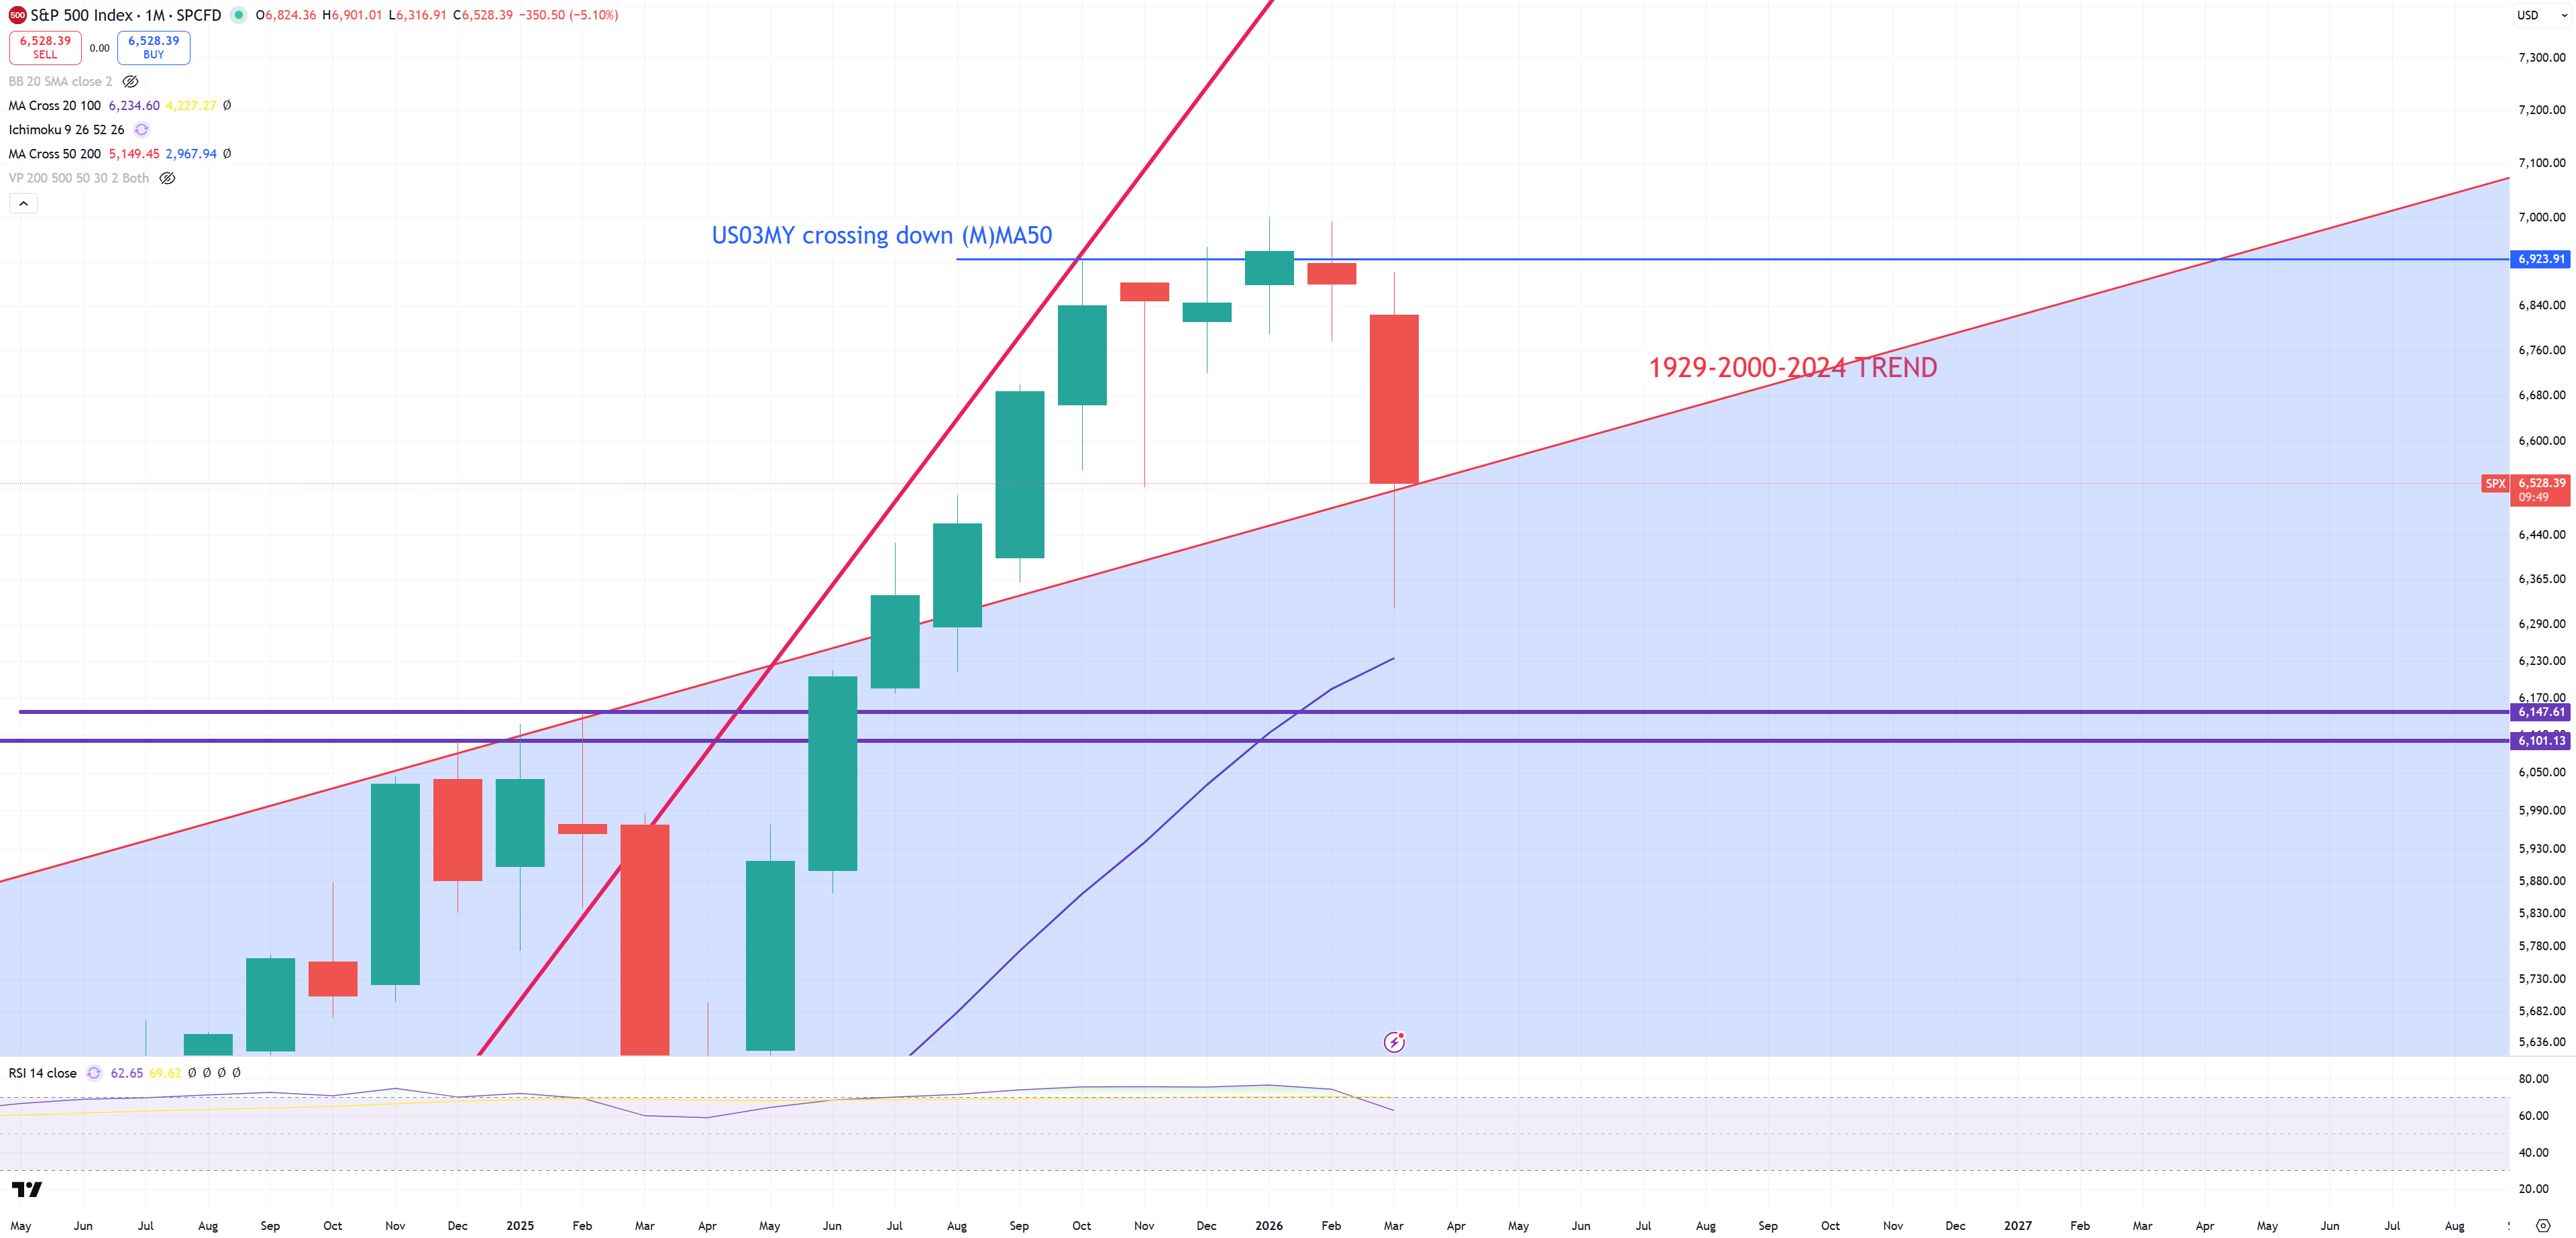
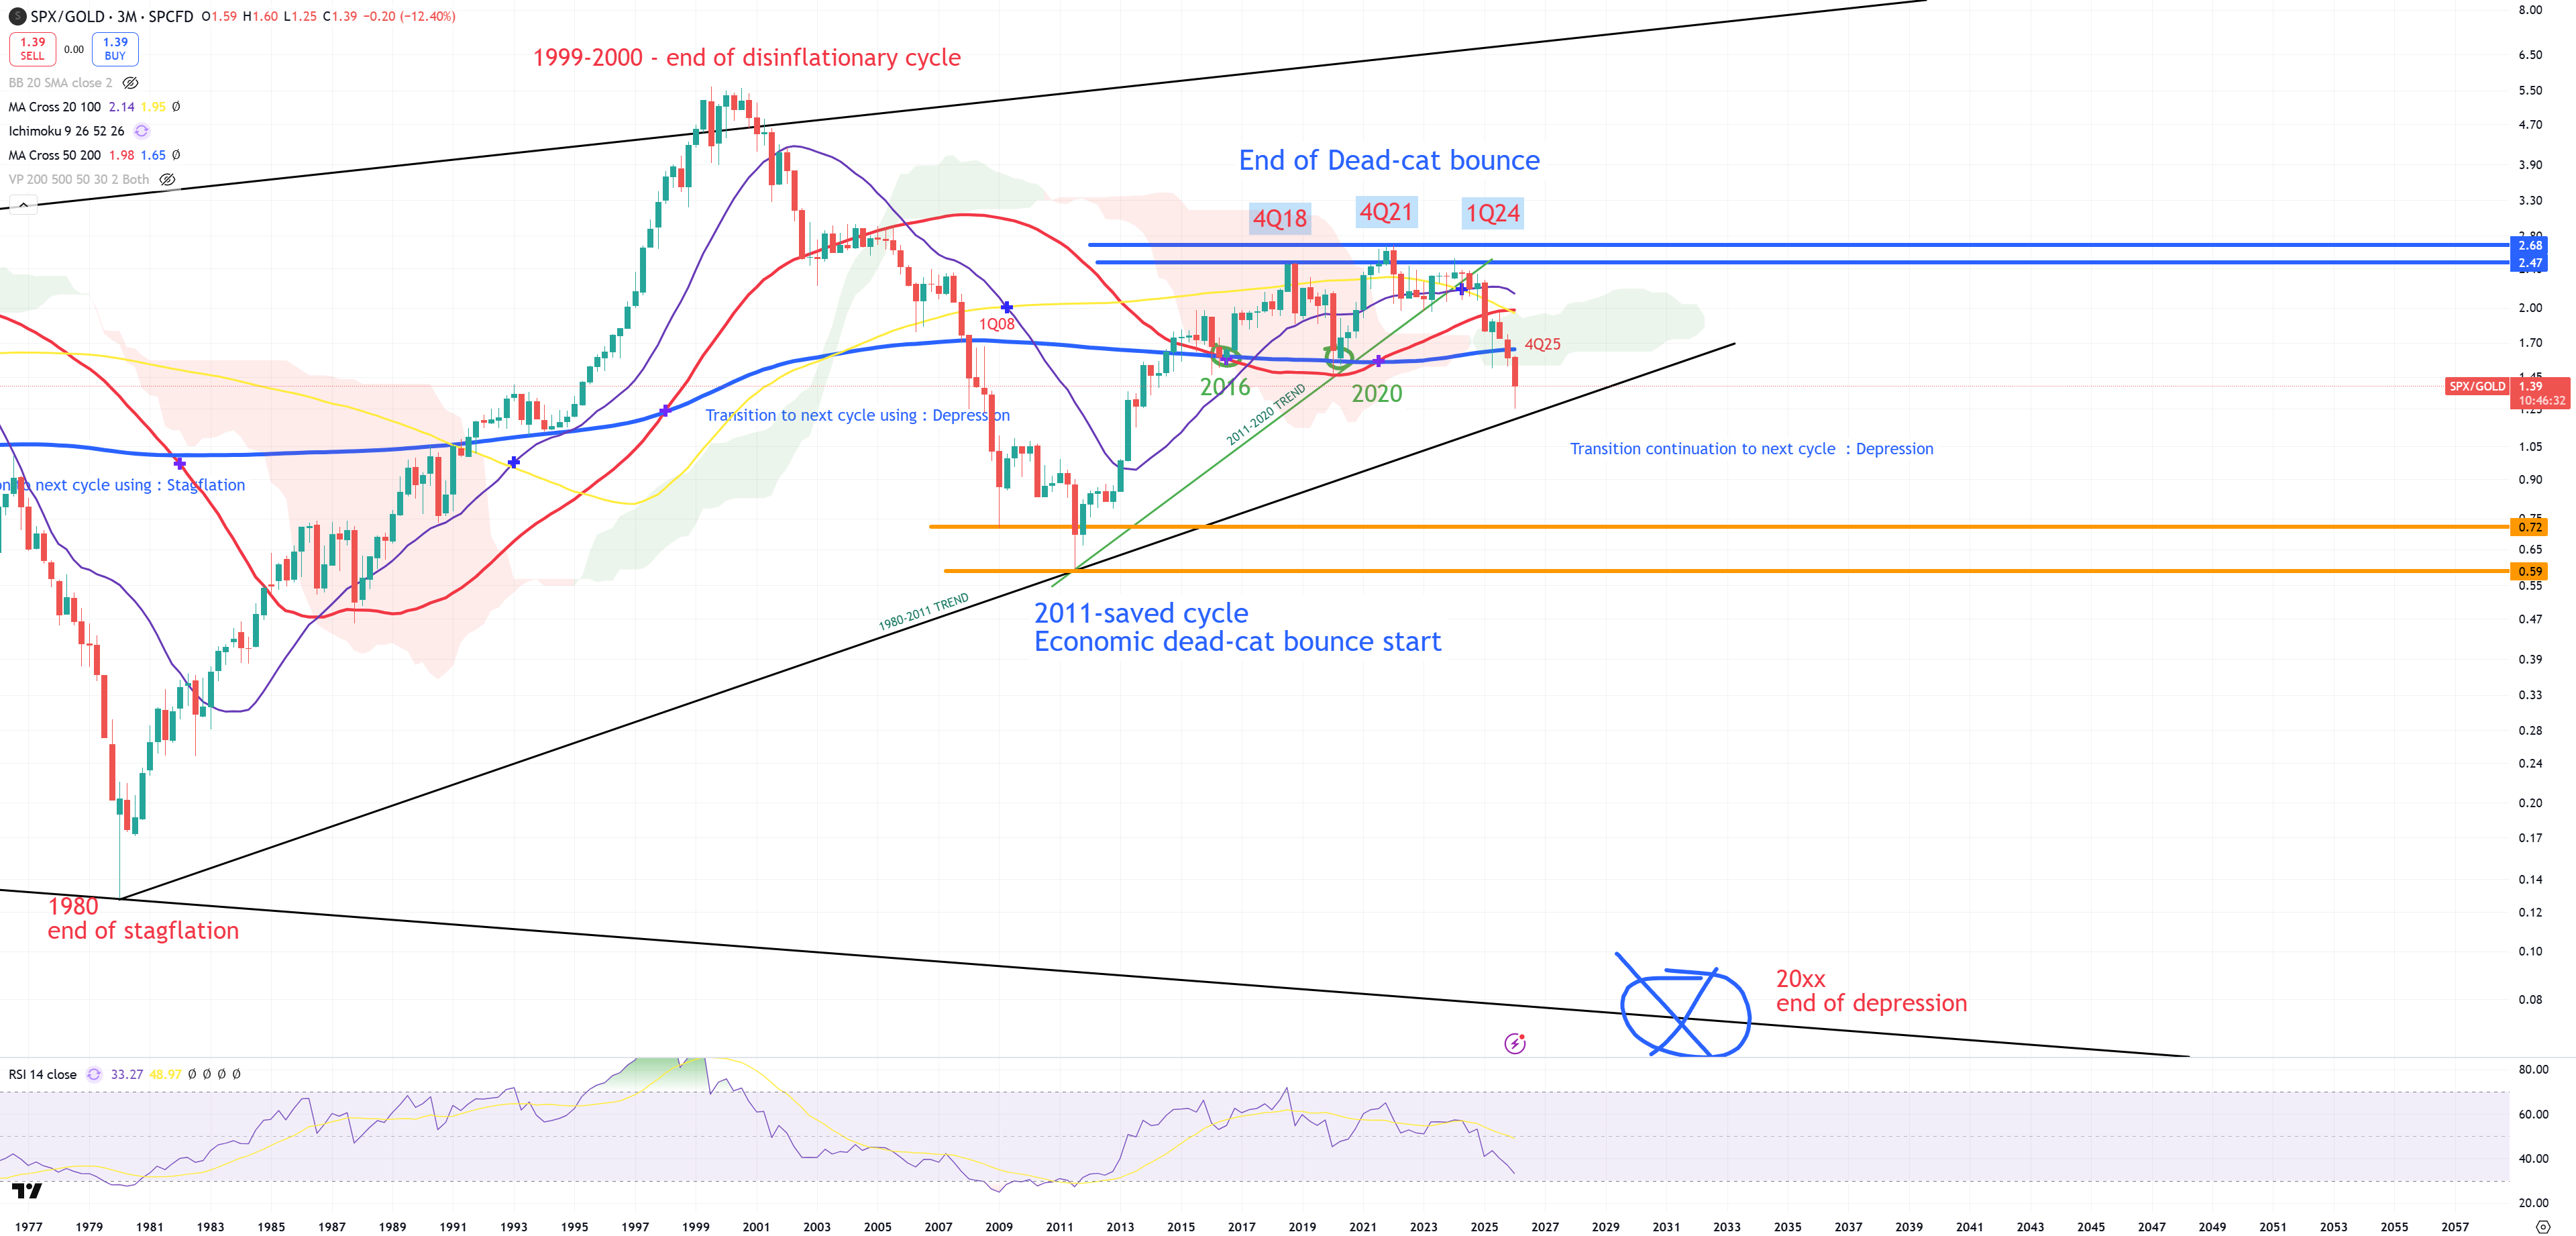
Another month/quarter passed. Like in the whole 2025 I was waiting for a moment when SPX/GOLD will break (3M)MA200 (Had to wait till the end of the year). 2026 is the year I’m waiting the most WHEN SPX is going to close below 1929-2000 trend. Market really wanted to get this 1929-2000 trend to hold, but April 2026 is now moving this trend higher to 6540.
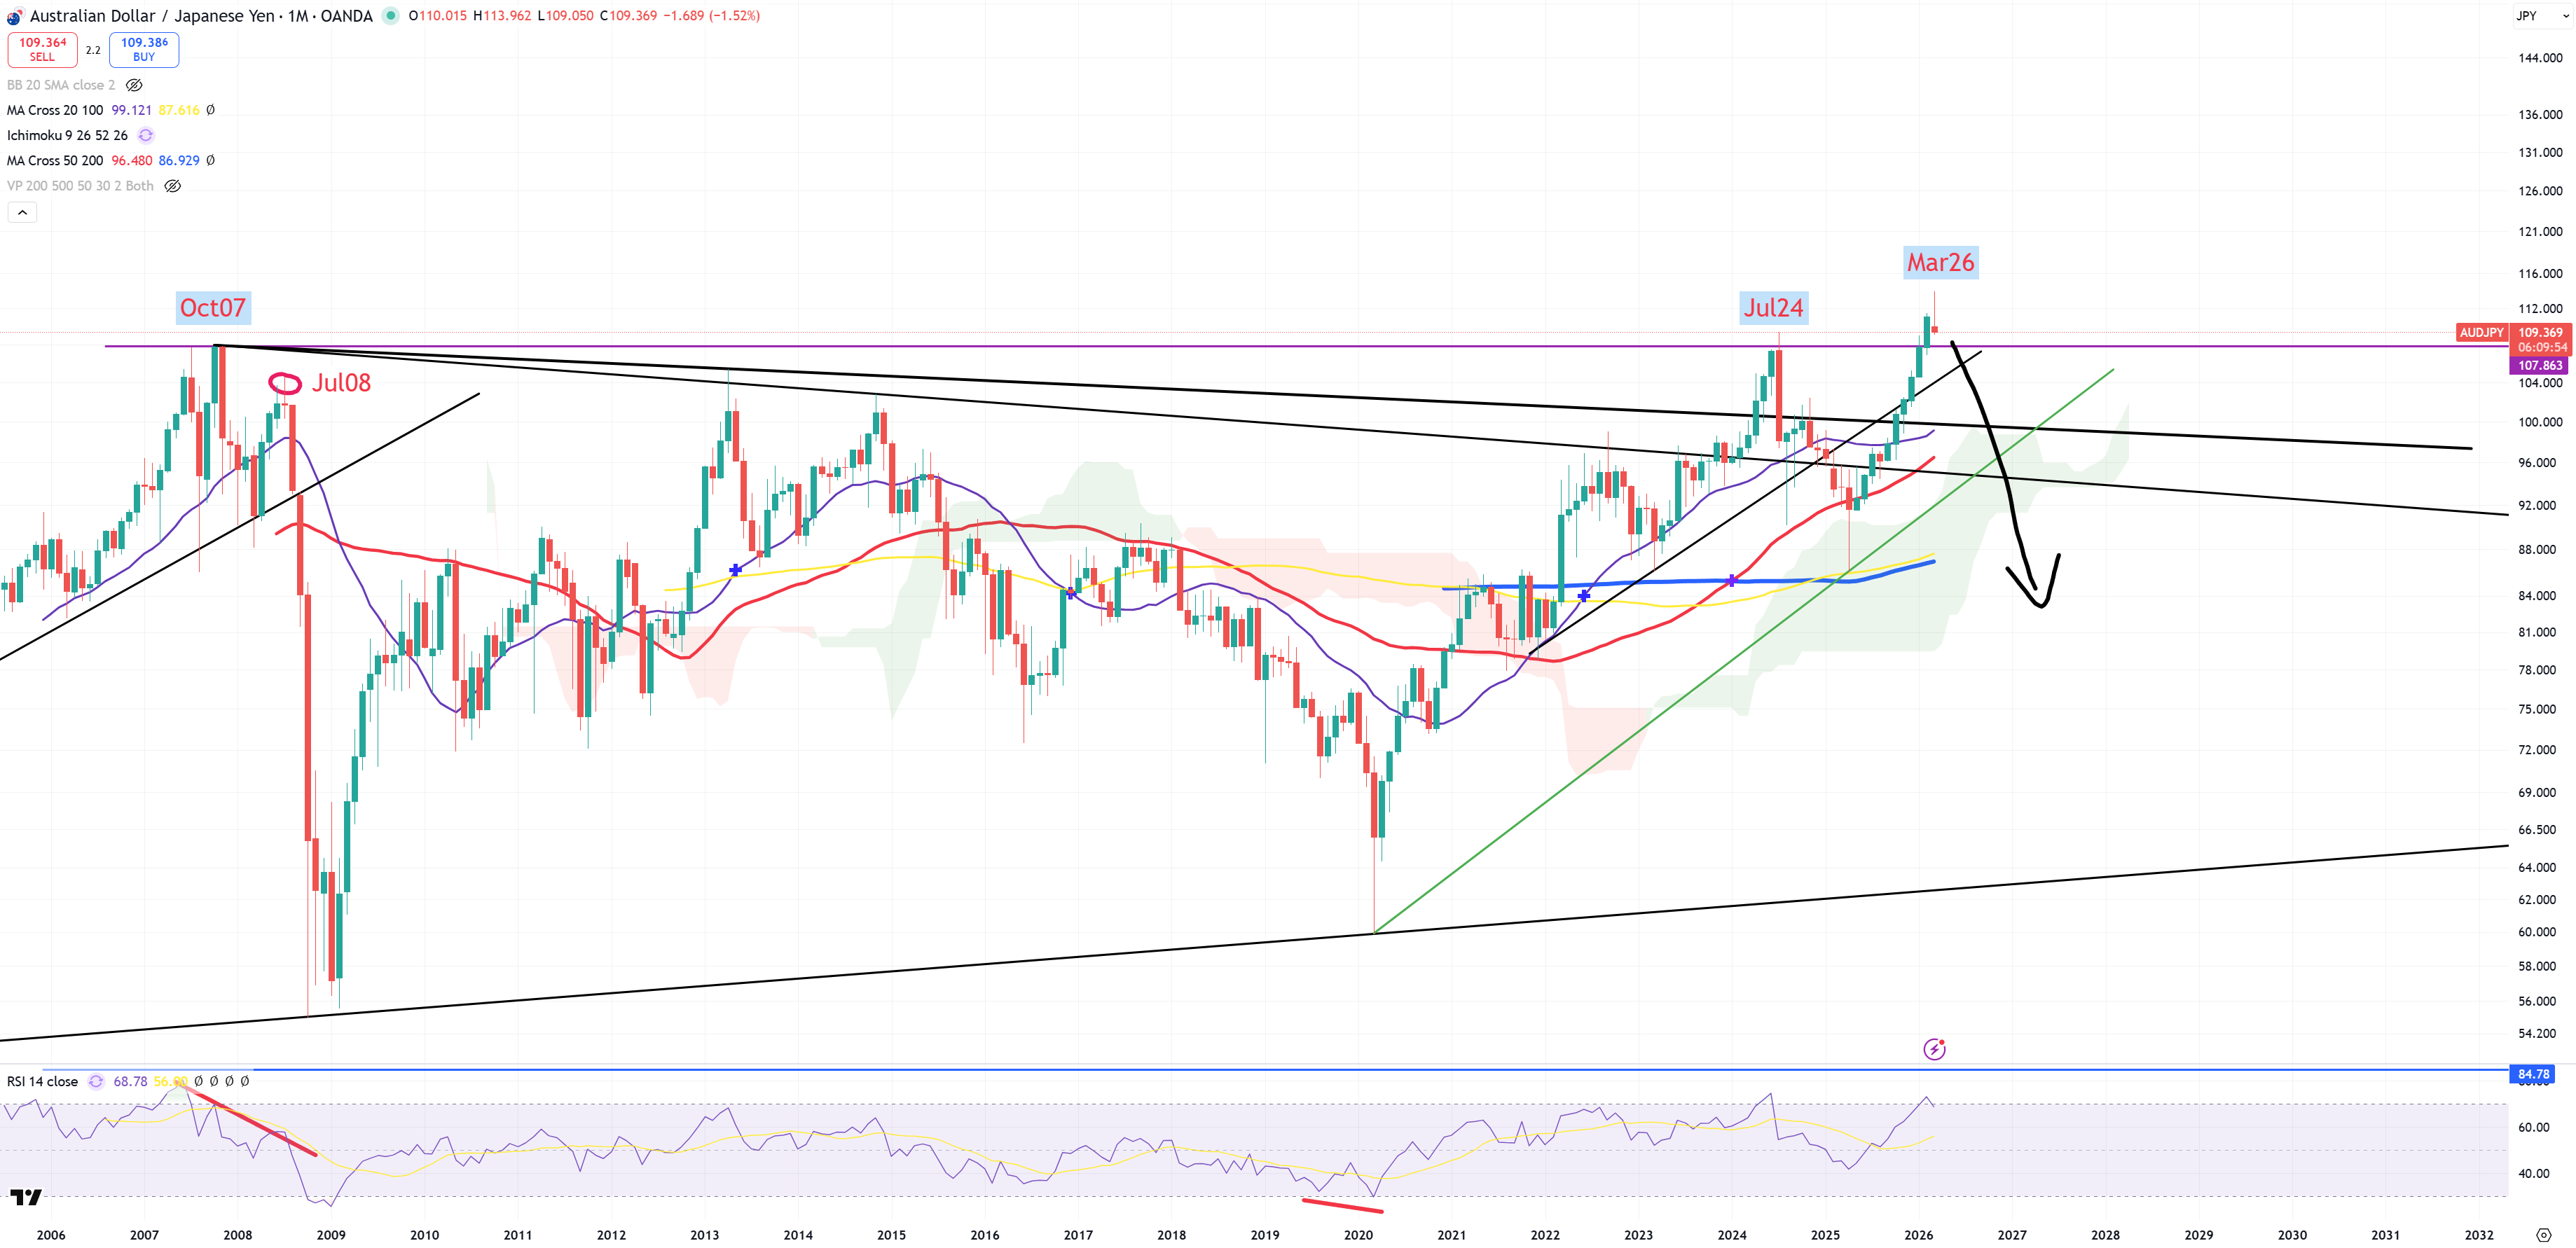
End of the month is an exceptional day which I’ll remember for good, seeing AUDJPY main risk on/off pair 0.0% while SPY jumping +3.0%.
SPX – finally after couple months floating over 1929-2000 trend line we have returned to the key point. Opening new month will be very important. If SPX=6540 will be now resistance it’ll become a problem. This is exactly how US03MY crossed down (M)MA50. It ended up in late October 2025 on the edge of (M)MA50, but above it to open below (M)MA50 in November 2025. Can SPX play the same game starting April? We will find out very soon. So far all indicators confirm we’ll go back below 1929-2000 trend including US03MY, SPX/GOLD.
Have you ever thought how people felt on 1929 peak and 2000 peak? You have another chance to feel it. Right now. Previous 1929-2000 trend retest : late 2024 beginning 2025 that wasn’t it. Now you can feel again those emotions!
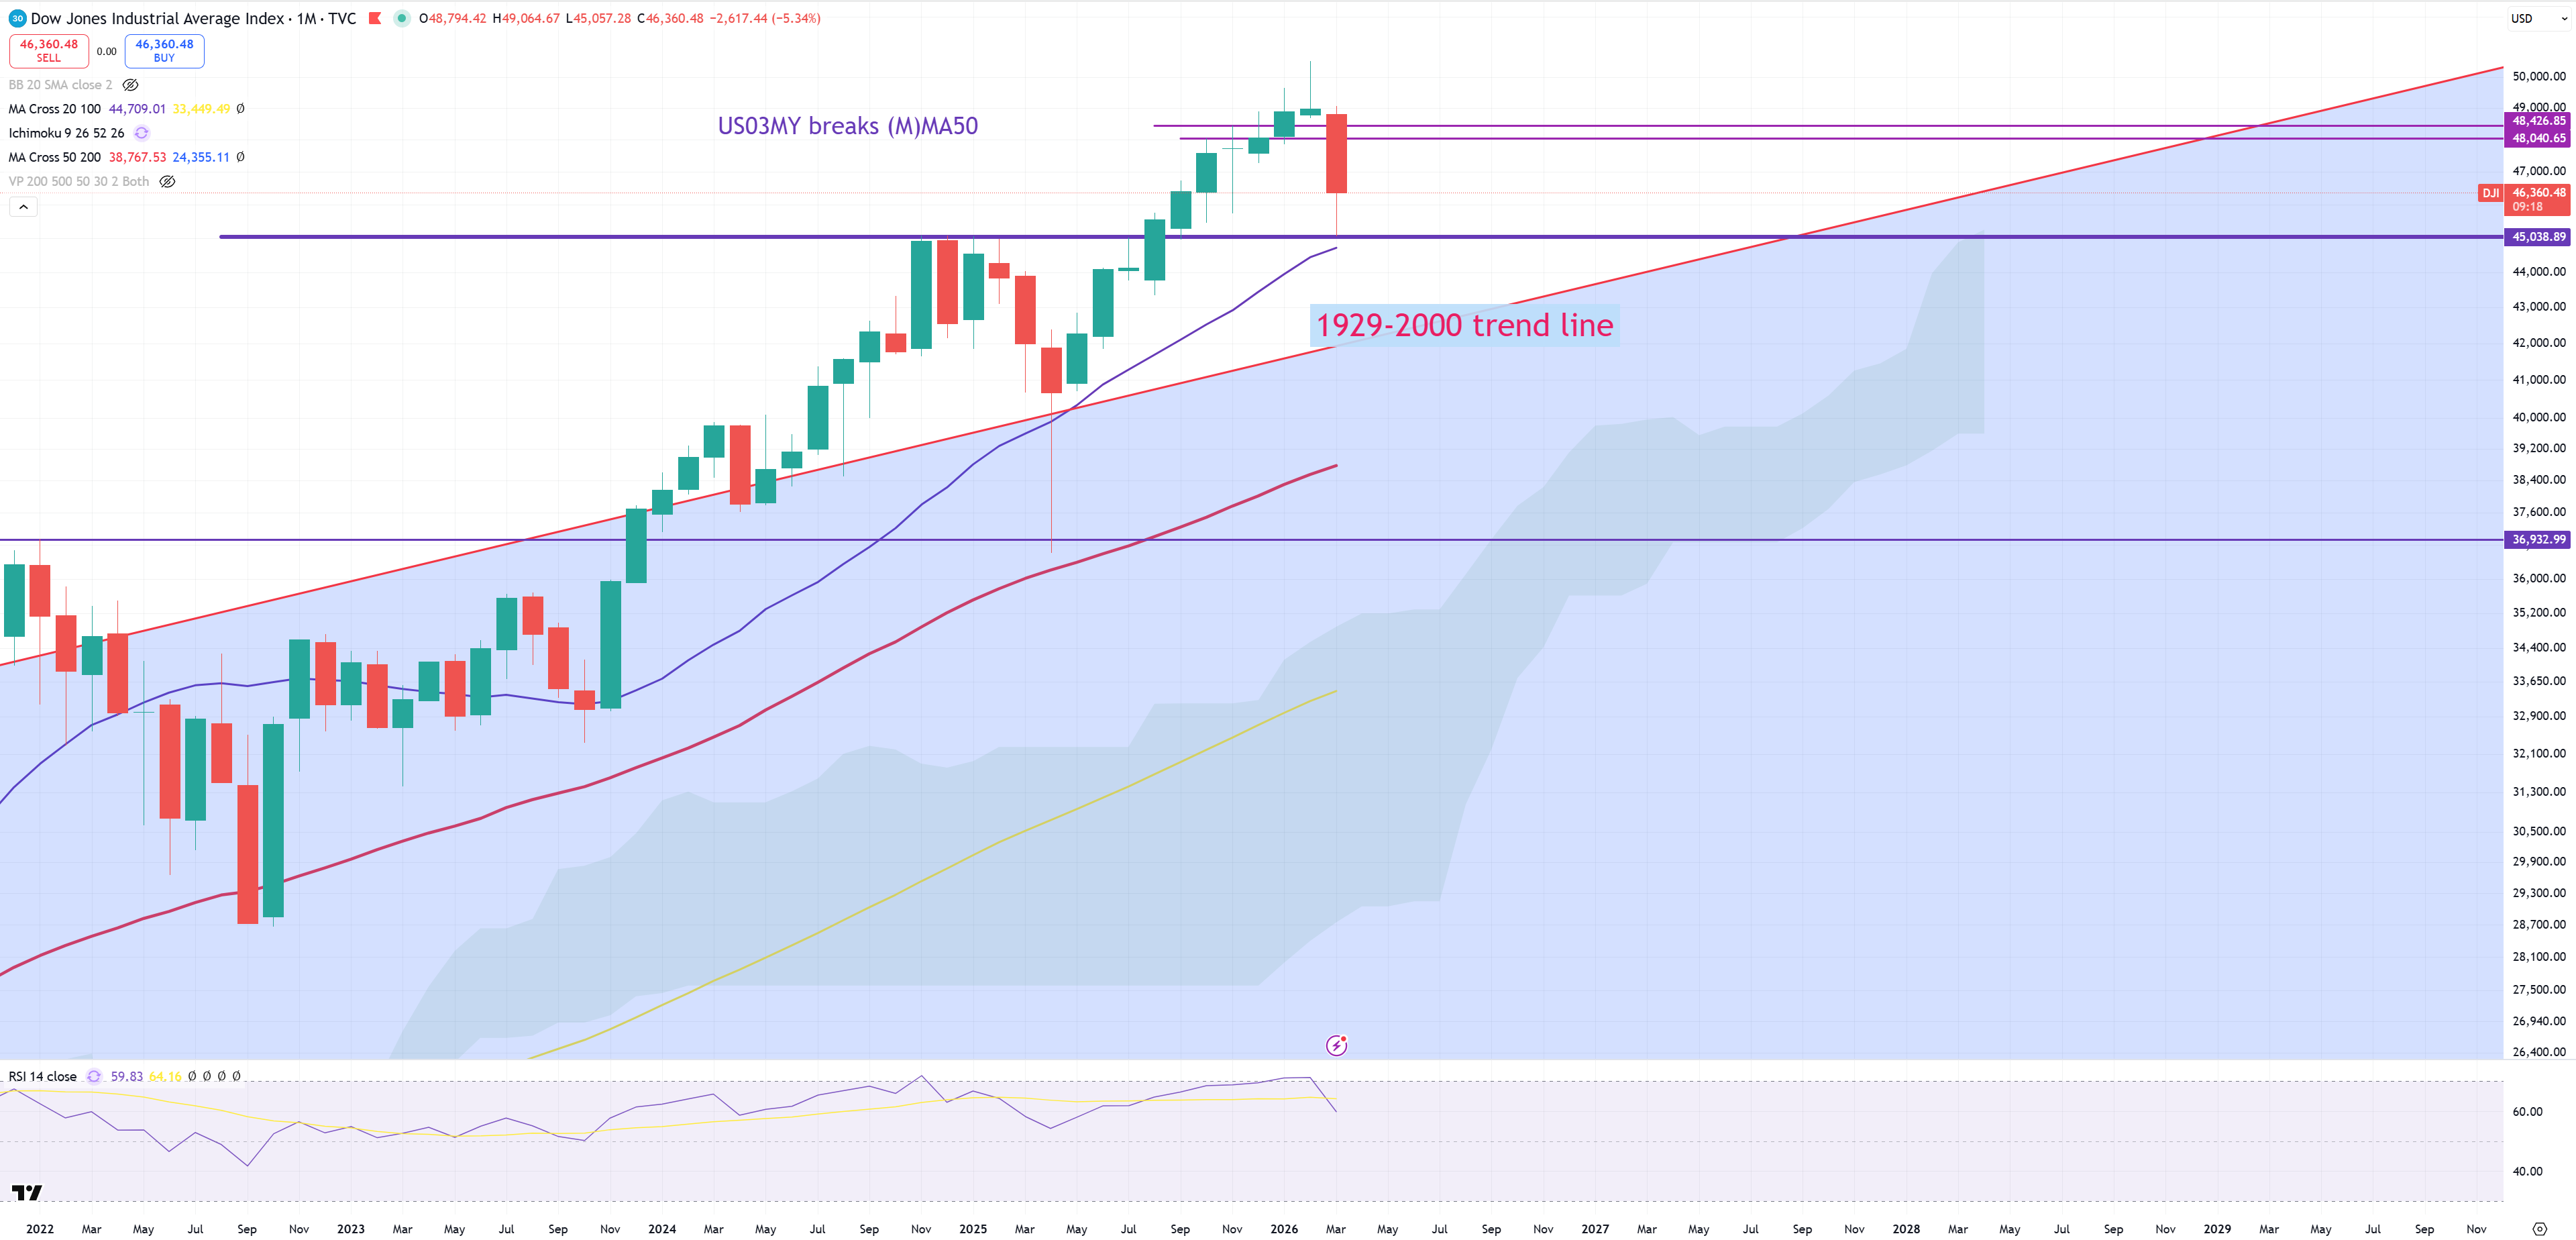
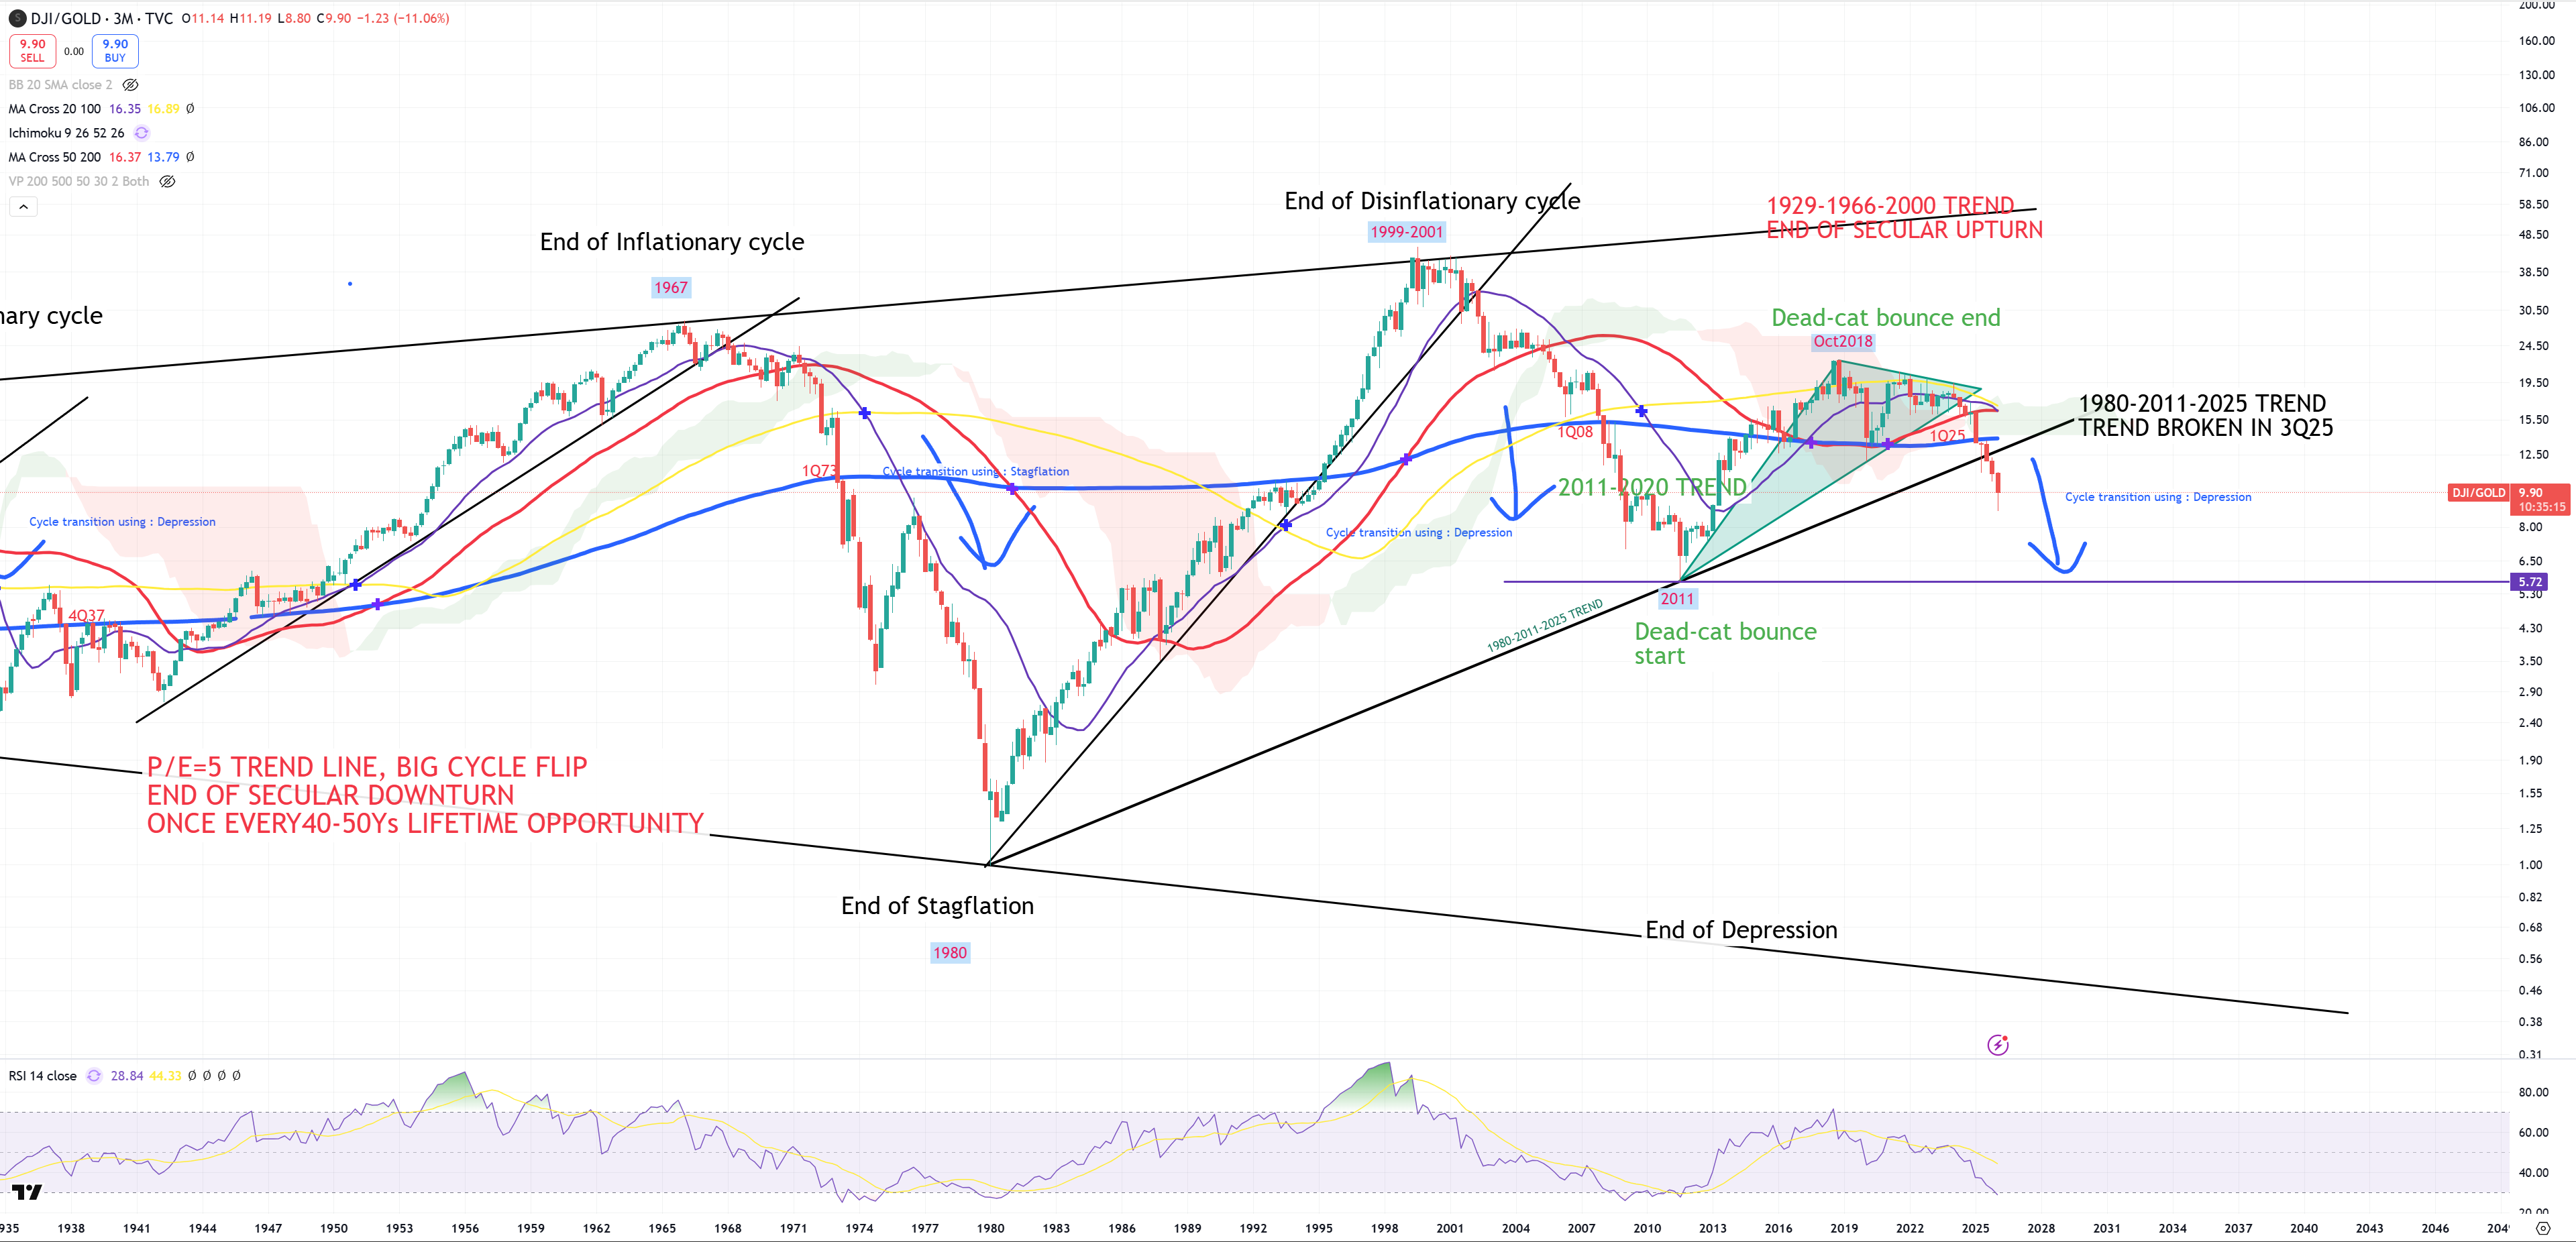
DJI – here is still another story. 42000 is 1929-2000 trend, but I’d say it again. 2000 wasn’t even a bubble for DJI, so this chart I treat more about “curiosity”, while SPX is the most important one. DJI finds support where it should.
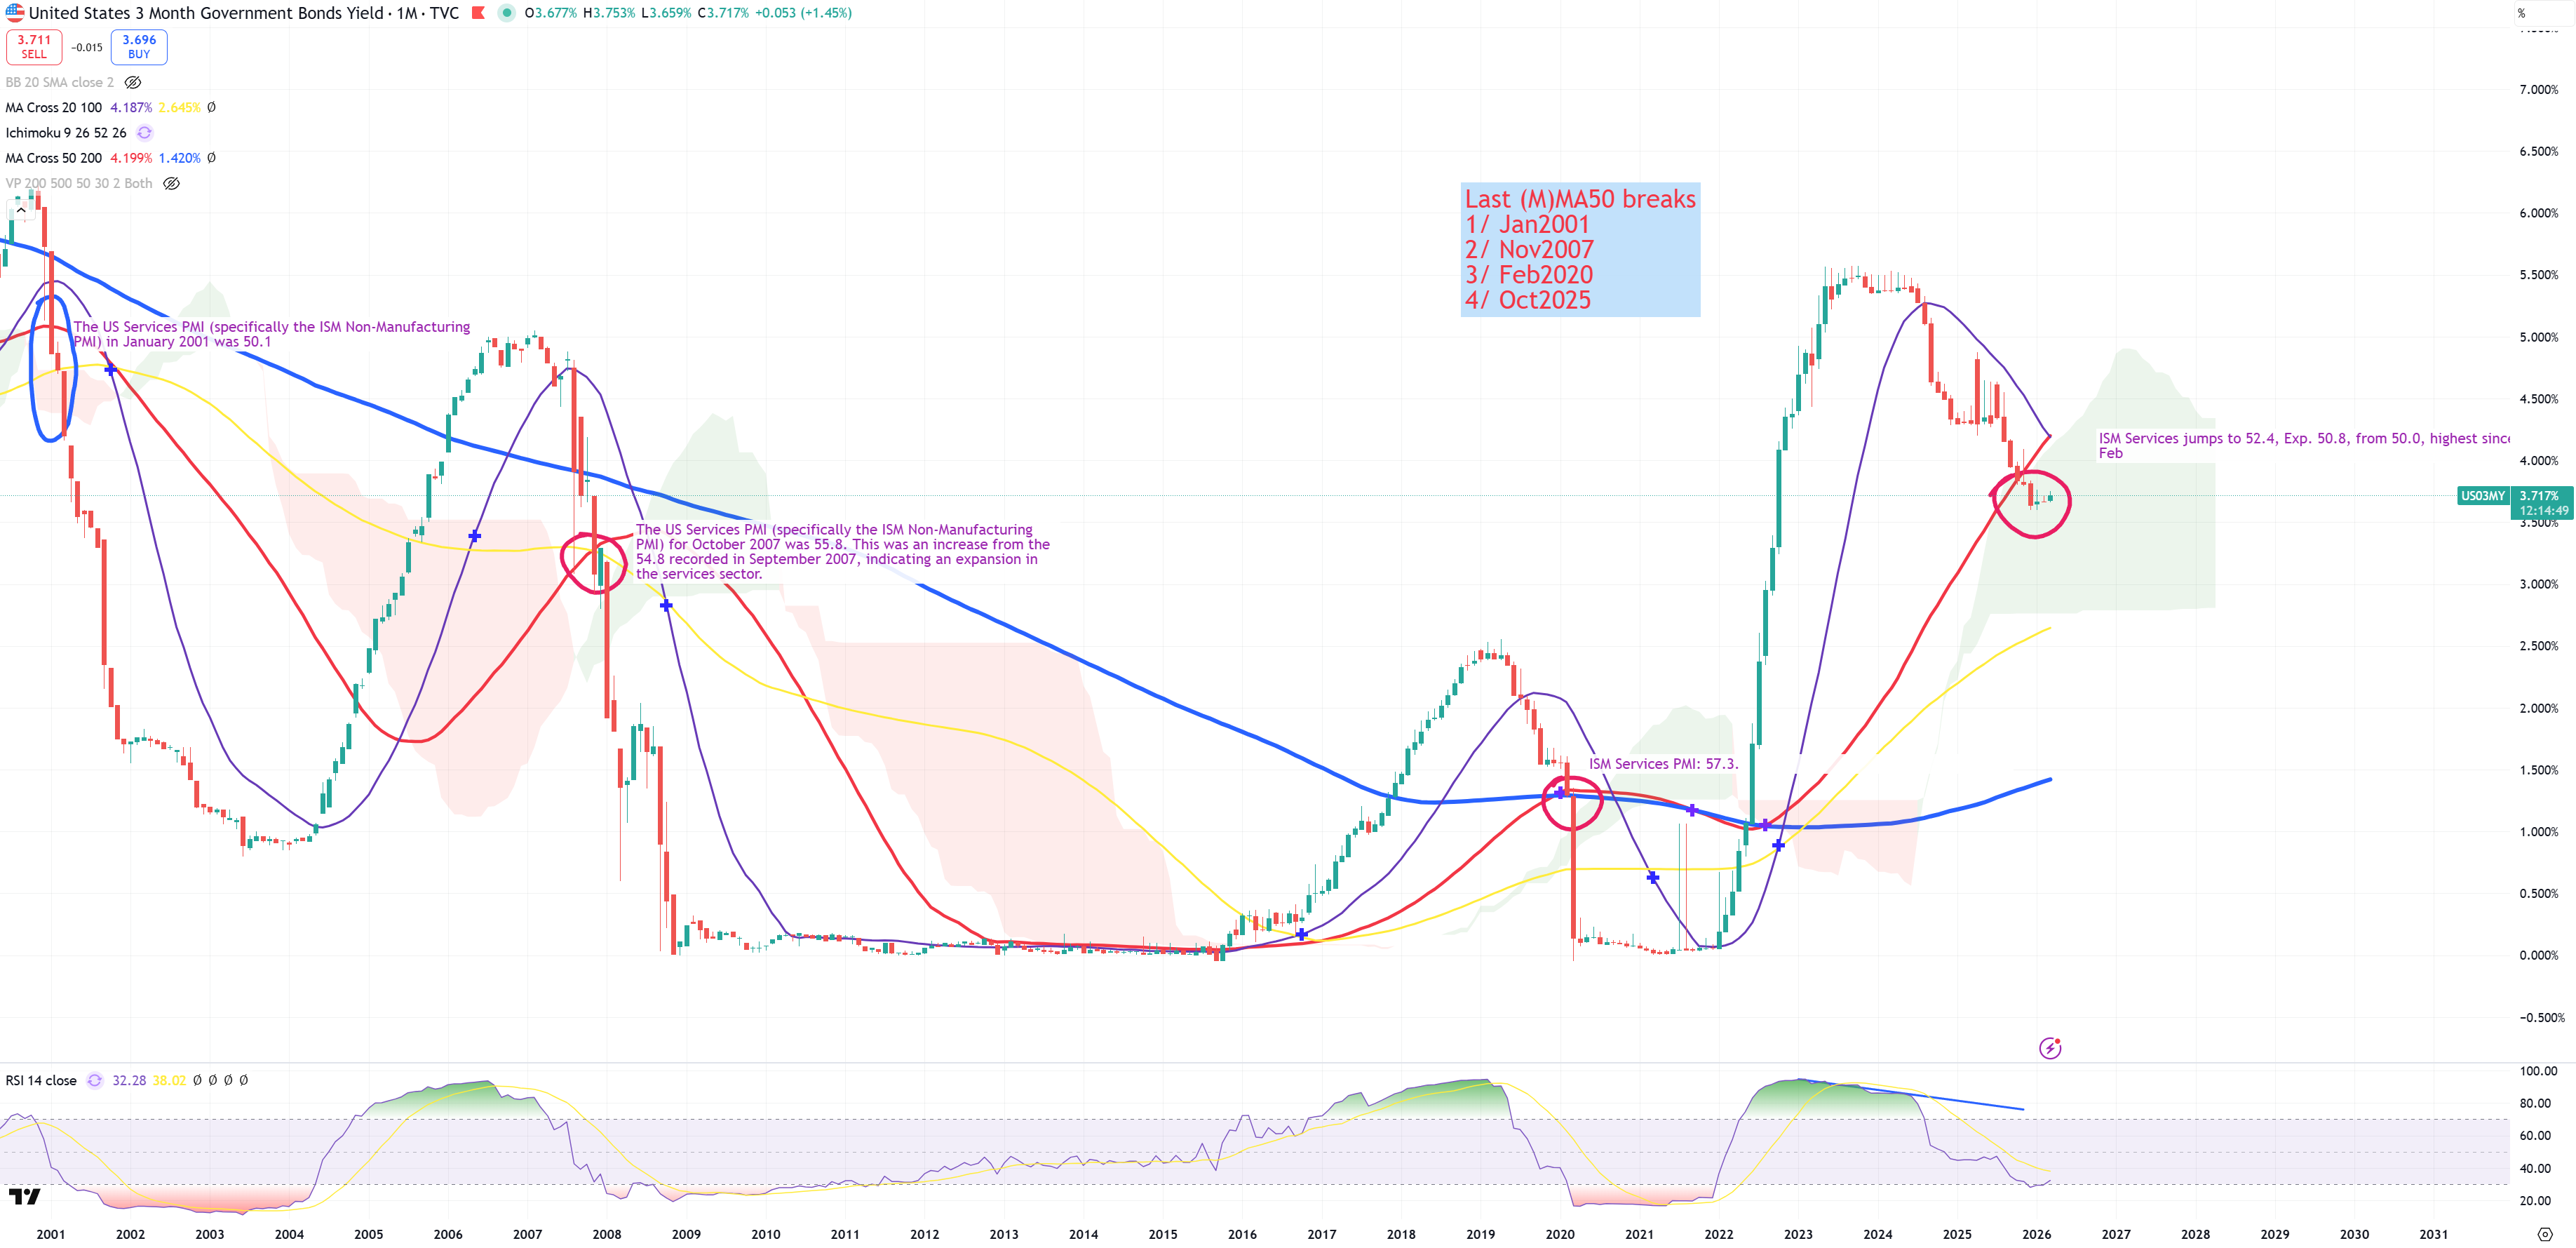
US03MY – all last (M)MA50 breaks moments. Breaks first, events to confirm them will arrive a bit later.
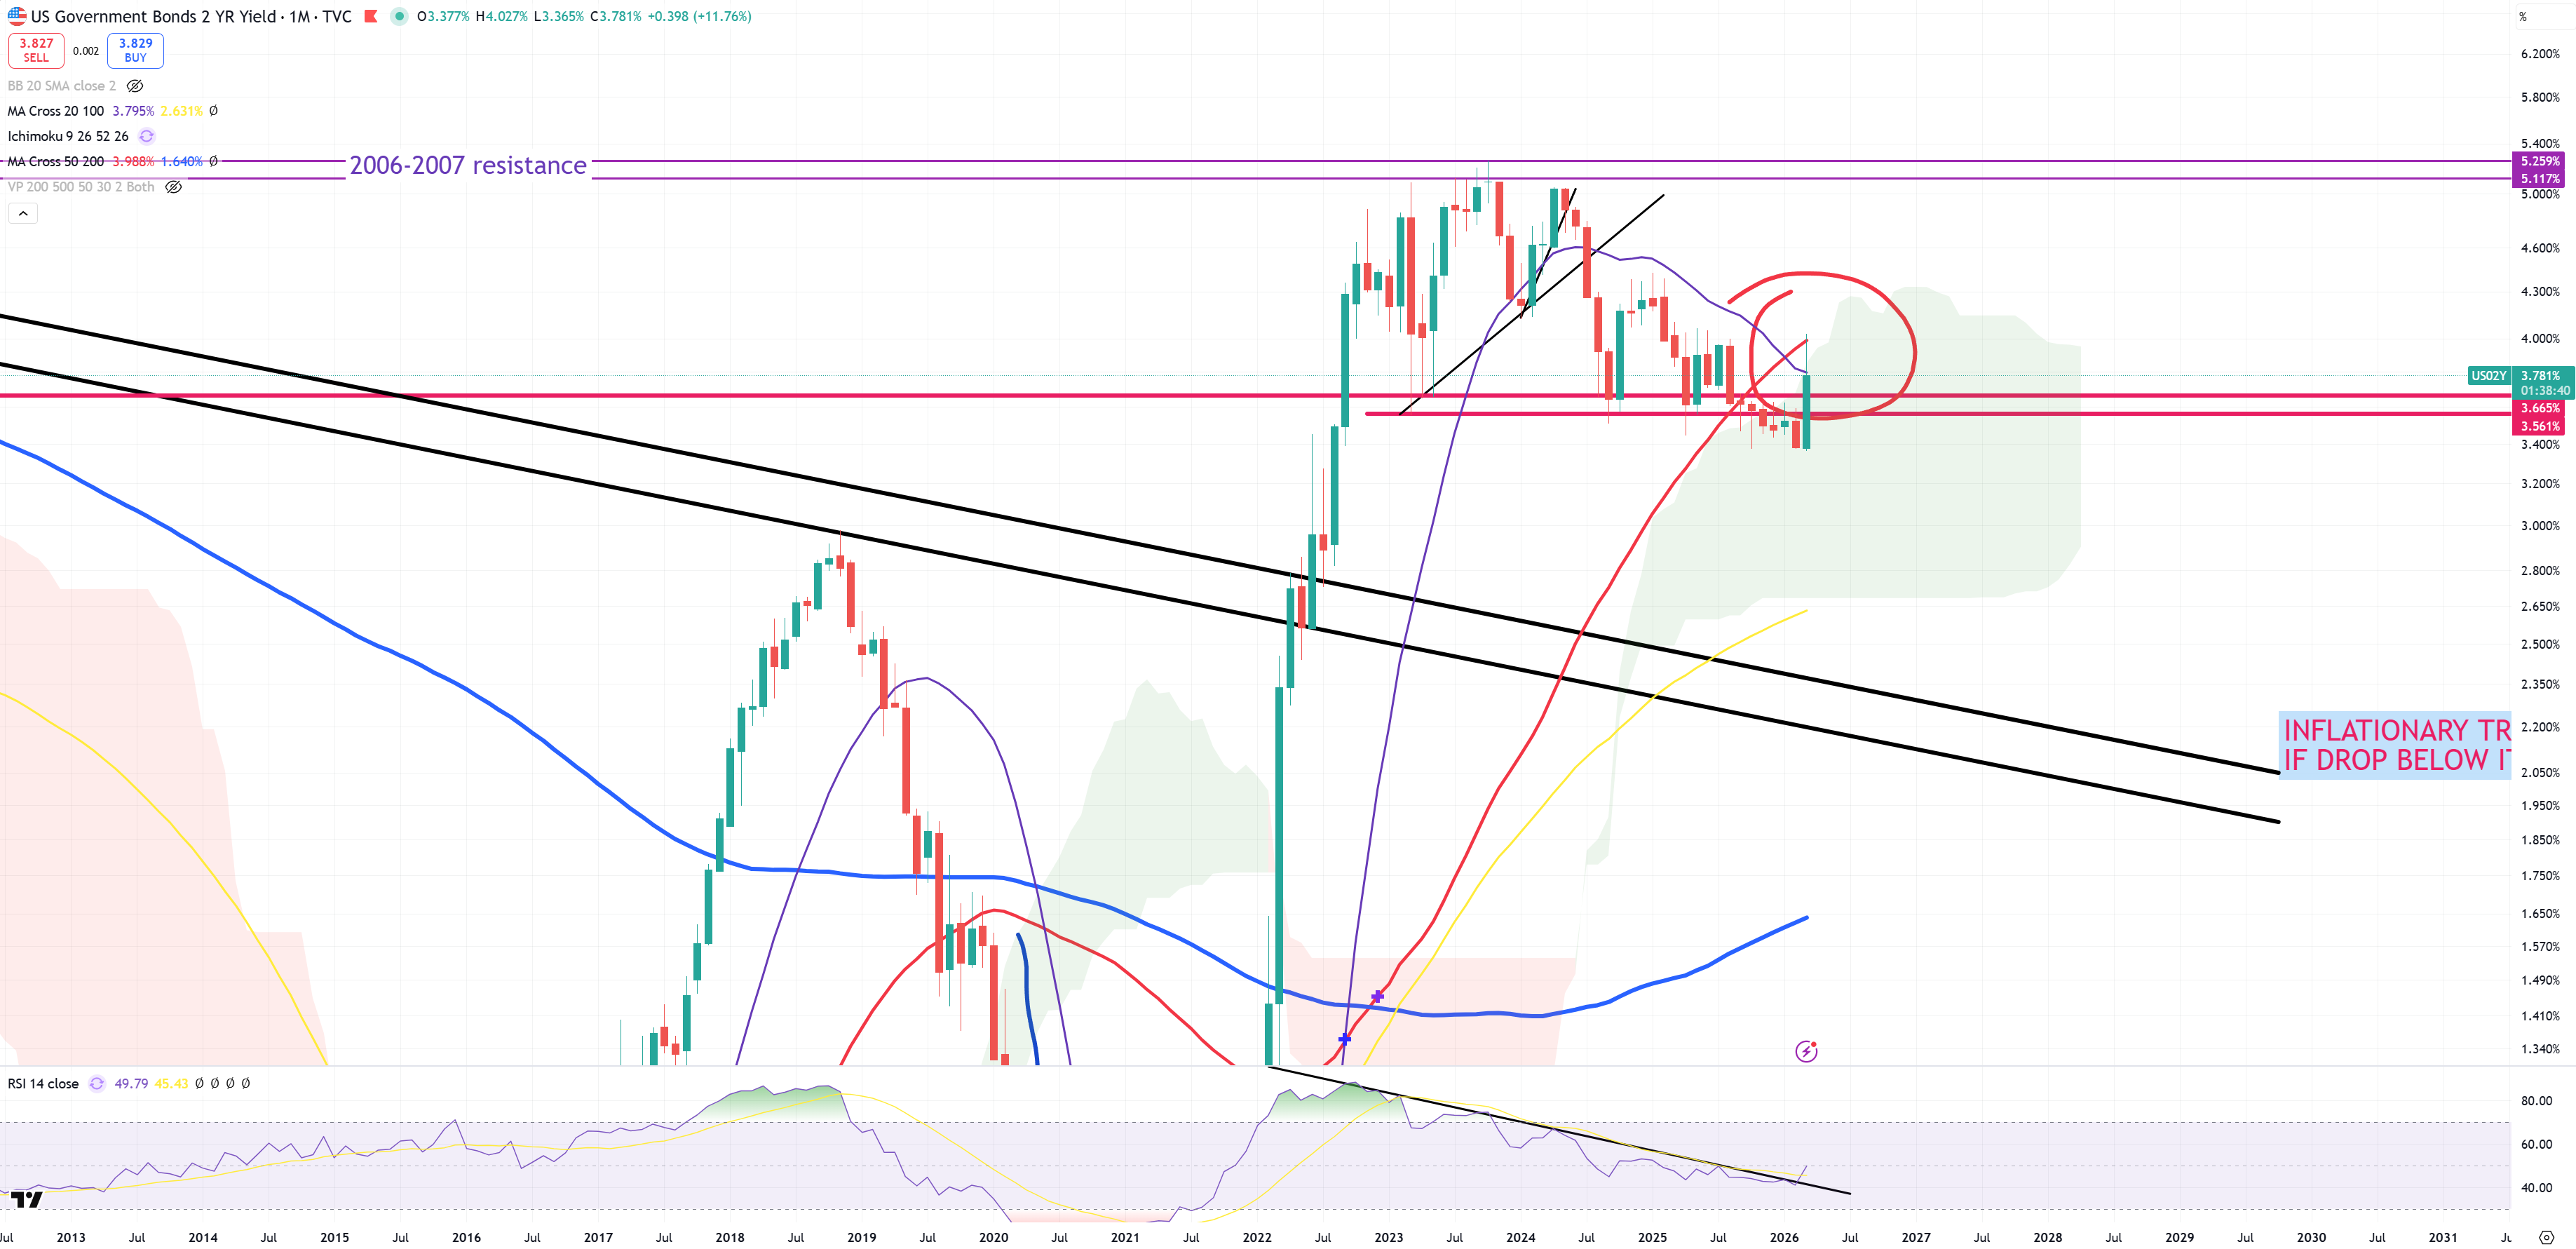
US02Y – Short term yields jumped to their last possible level = 4.0% (M)MA50, I bet this level won’t be broken.Both (M)MA20 and (M)MA50 rejected = still high momentum bear market for short term yields with last level to confirm 4.0%.
SPX/GOLD – closed below (3M)MA200 – cycle has closed all the doors, locked the out and running time is cutting the oxygen from the economy. We are approaching towards 1980-2011 trend level which later opens path to 2011 lows :
DJI/GOLD – this is a chart that shows the path for SPX/GOLD – based on that chart I assume SPX/GOLD will break its 1980-2011 trend. There’s nothing on this chart to stop it from getting 2011 lows = 5.72. While all the time (3M)MA200 breaks were 1:1 between DJI/GOLD and SPX/GOLD, in 2025 we had to wait 3Qs more after DJI/GOLD 1Q25 break for SPX/GOLD.
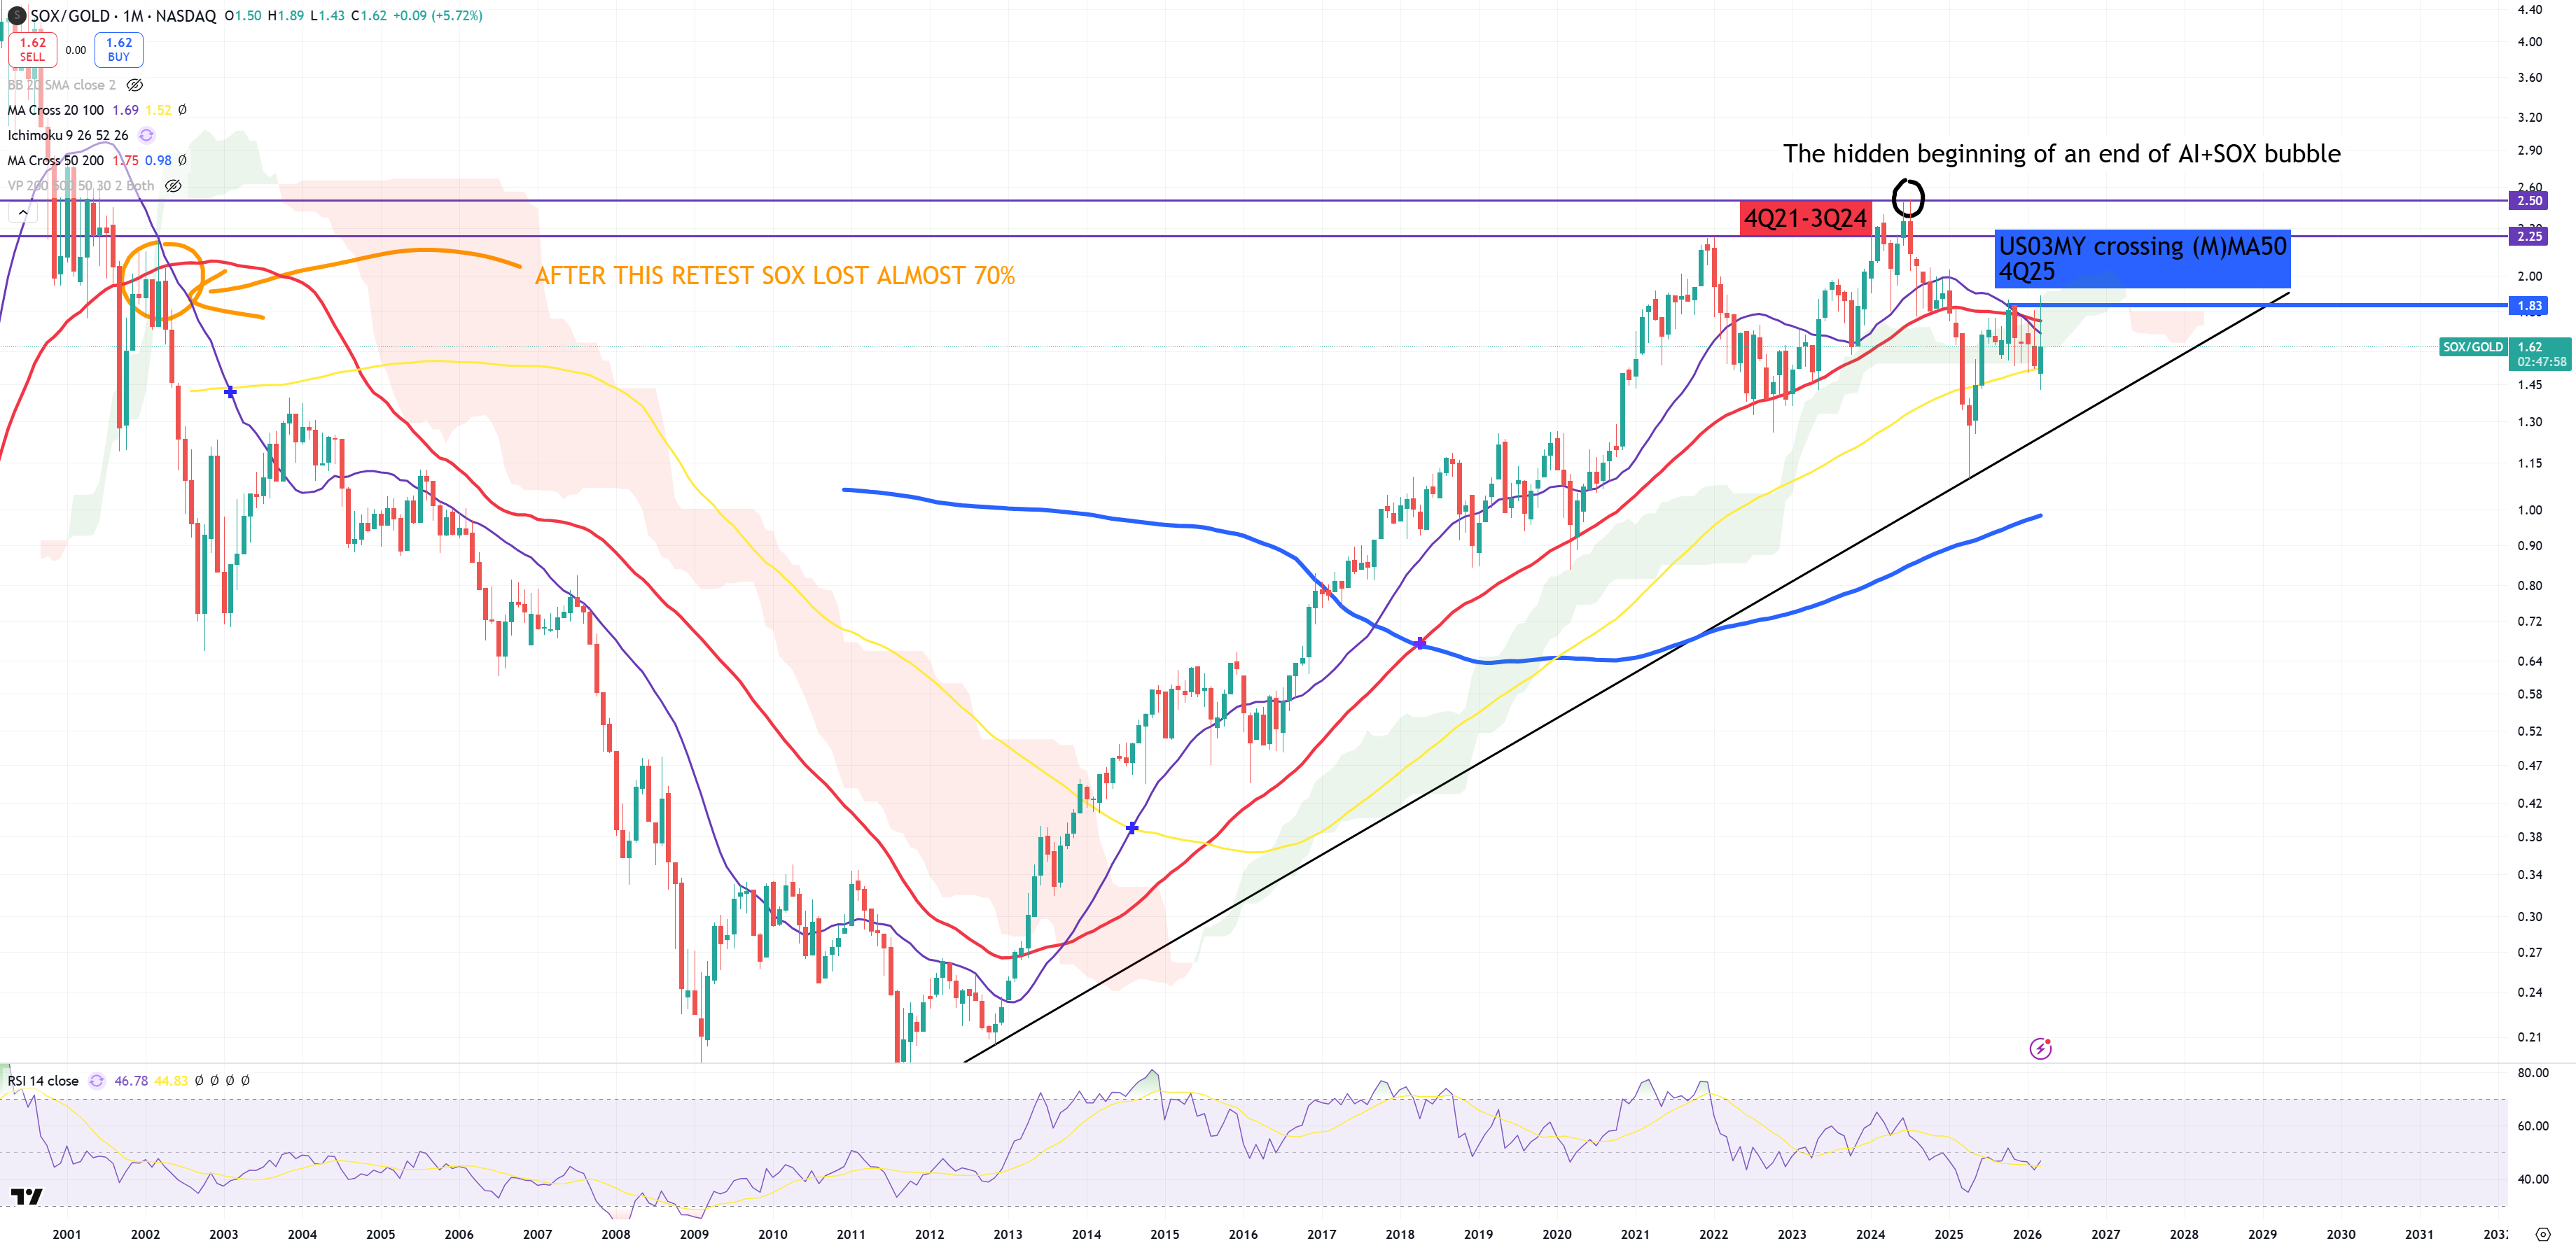
SOX/GOLD – some kind of SOX cycle indicator. (M)MA50 still rejected. Still similar technical position to dotcom bubble blow up from 2002 :
US20Y – so many asks about TLT that’s the same. My bet : October 2023 was the ultimate bottom for the bonds. While I keep my thesis about US Bond market to rally, I wouldn’t touch any other bond markets (like Japanese, German etc..). So far this 5.0% is not possible to break
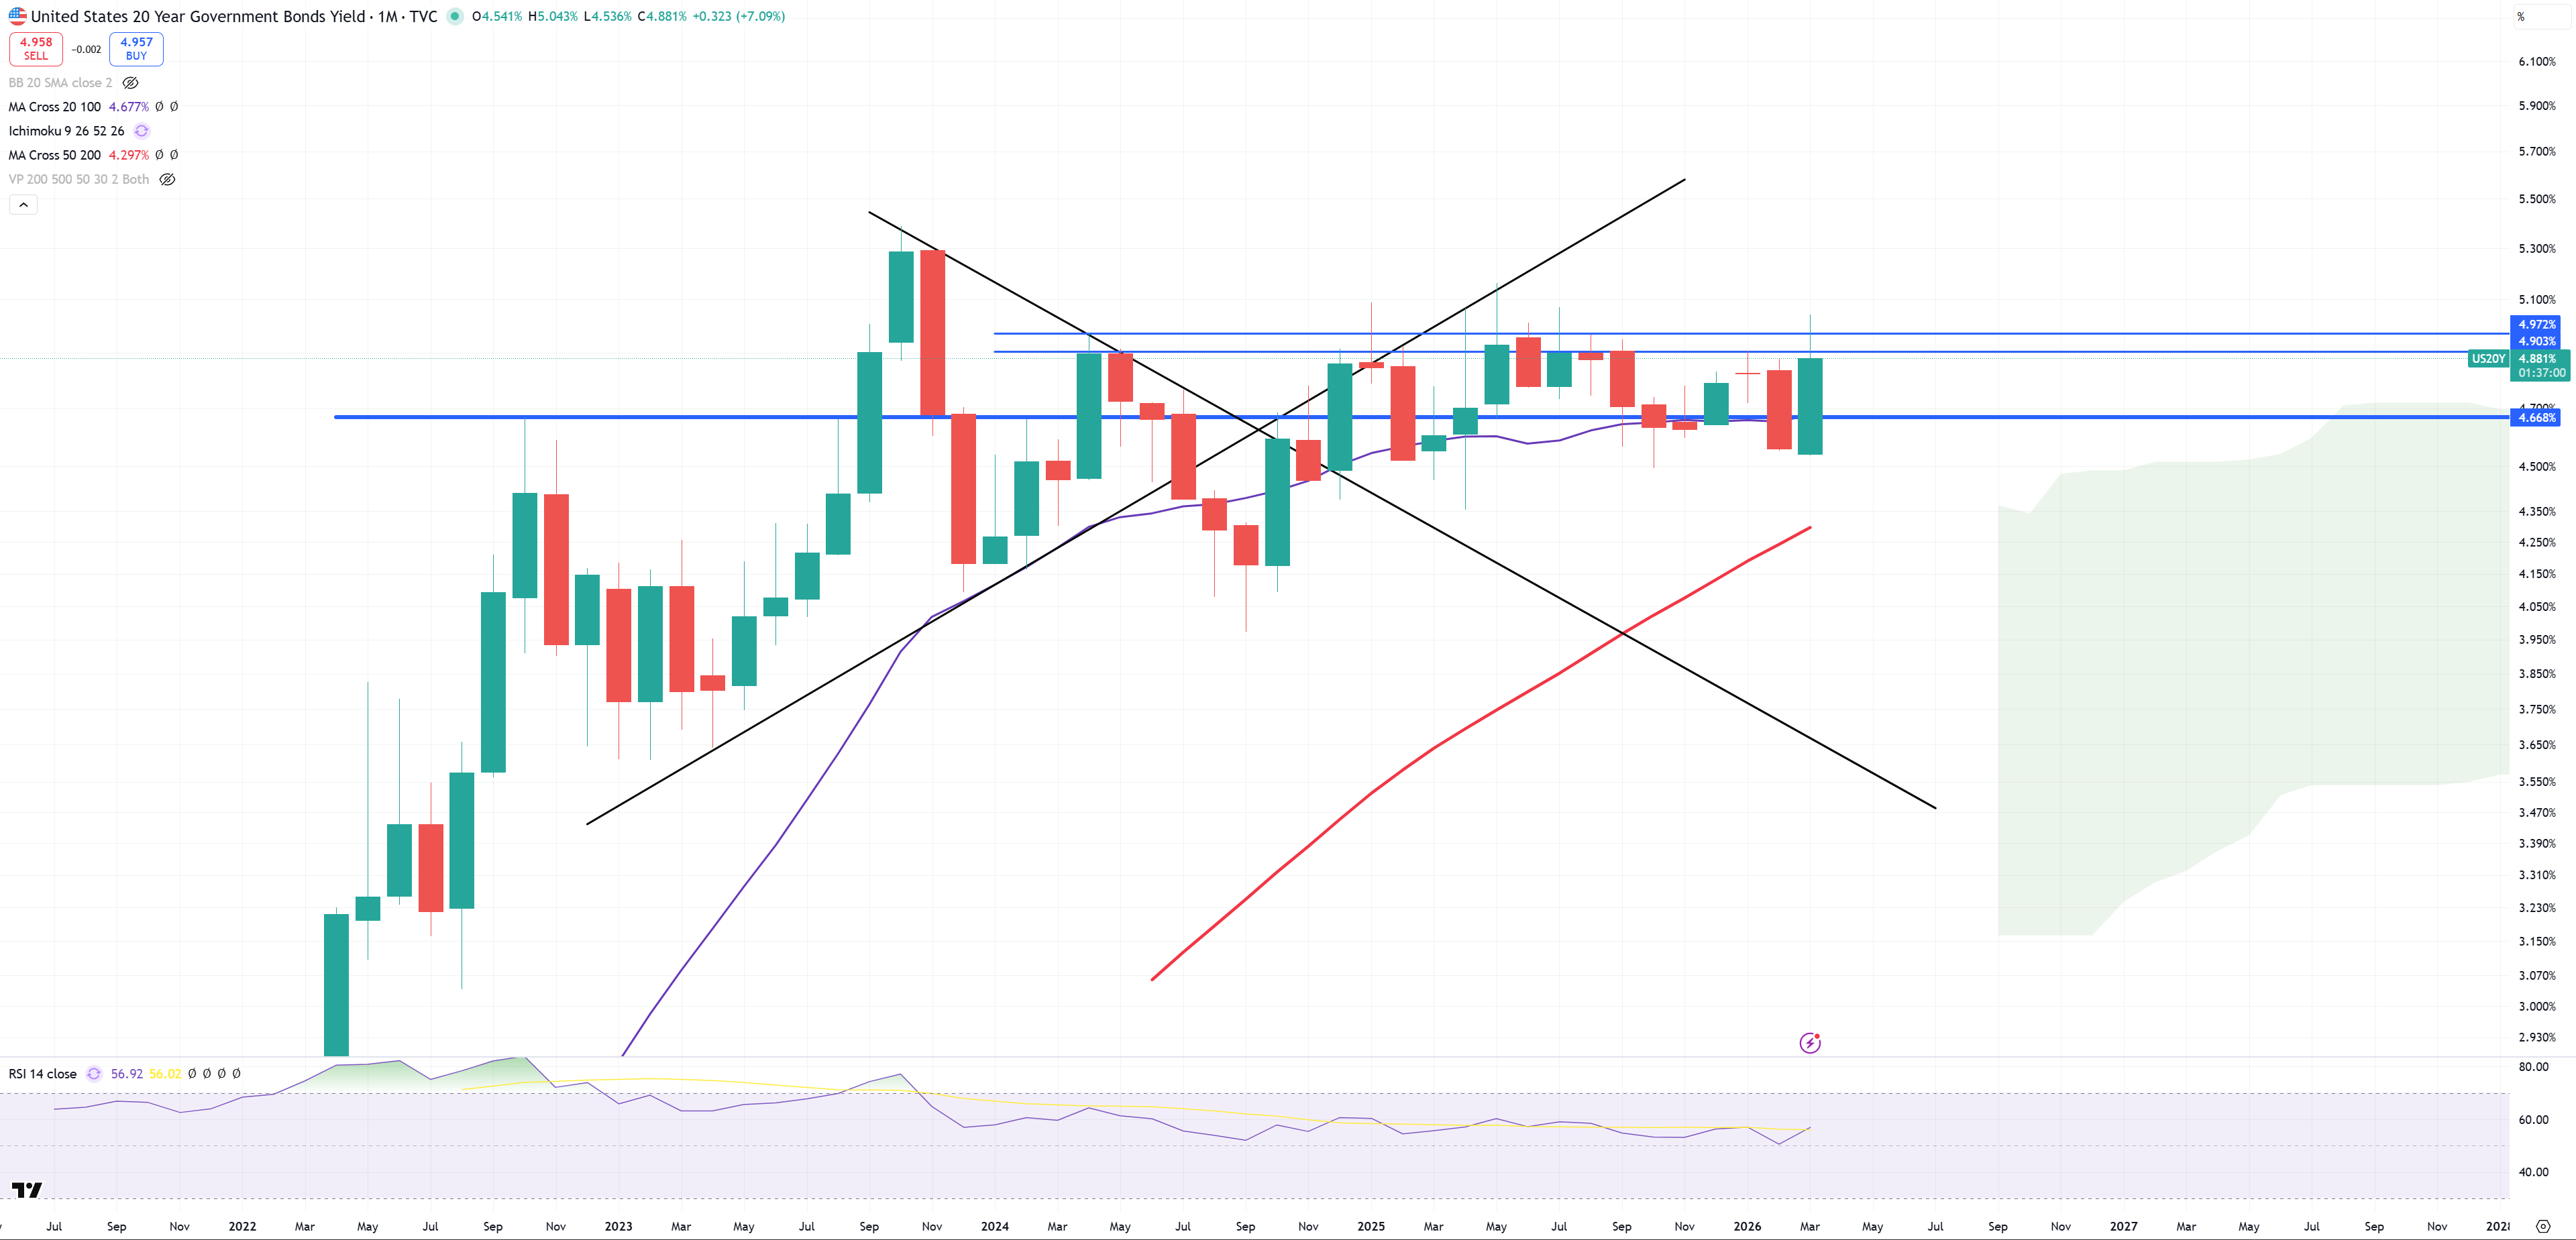
WTI OIL – now what if US20Y hits 5.0% and that’s max and US02Y hits 4.0% and it’s max? It means that this resistance will be … max. While I don’t give my head on this thesis this equation tells us that credit event is just days/weeks away?
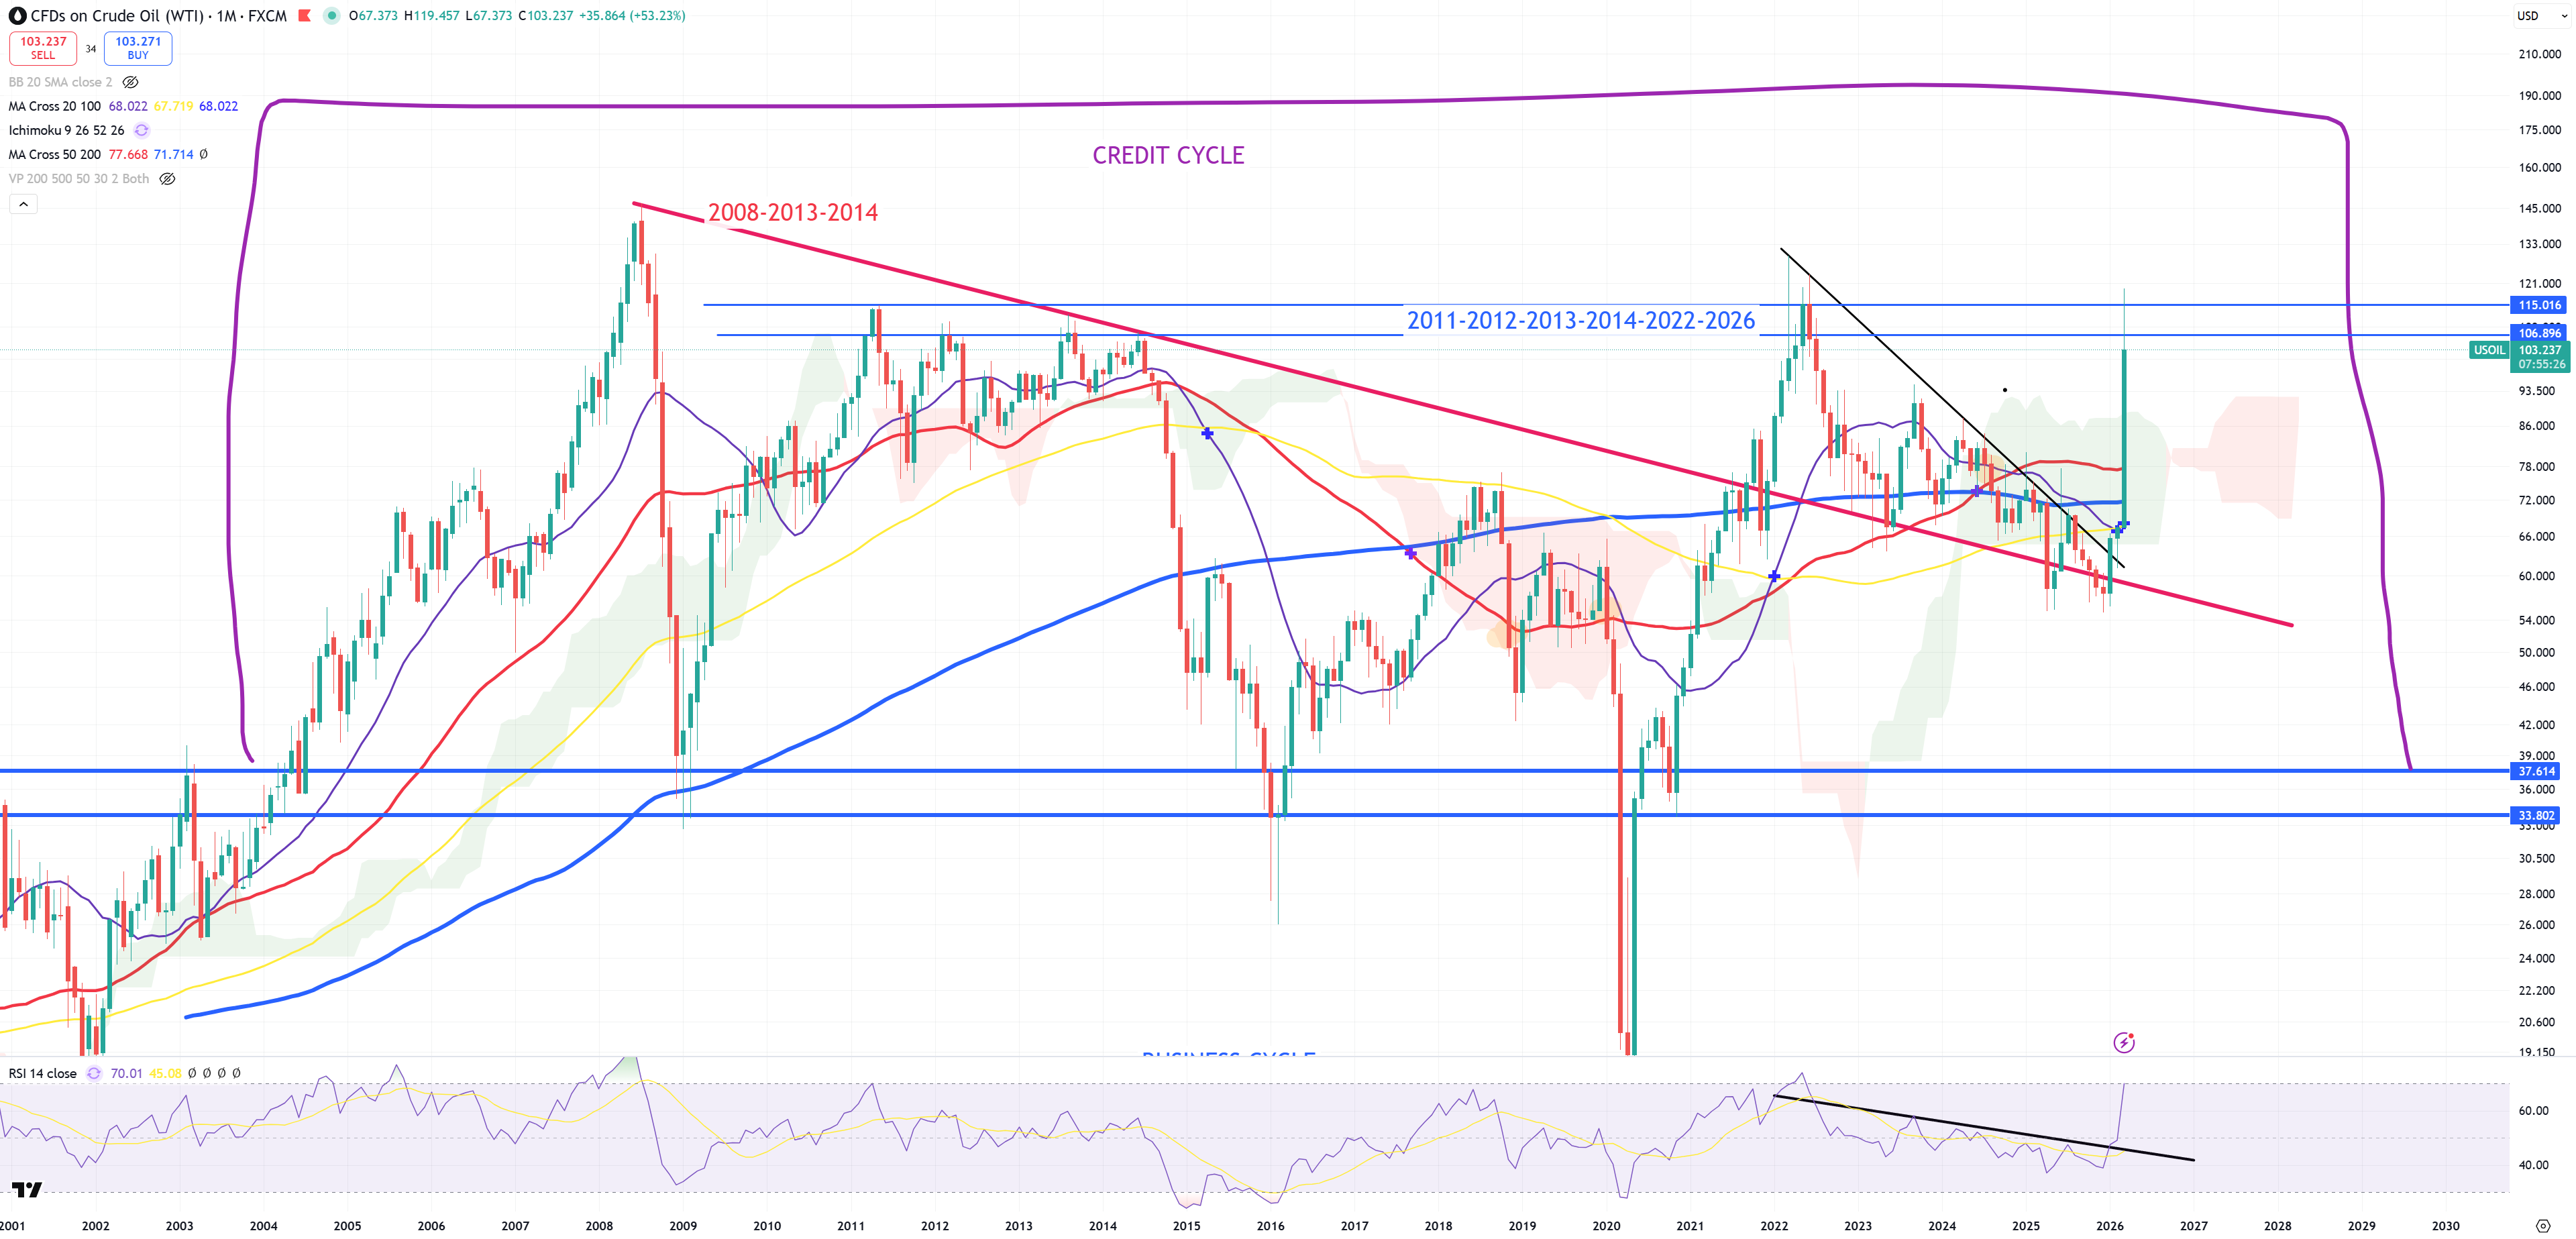
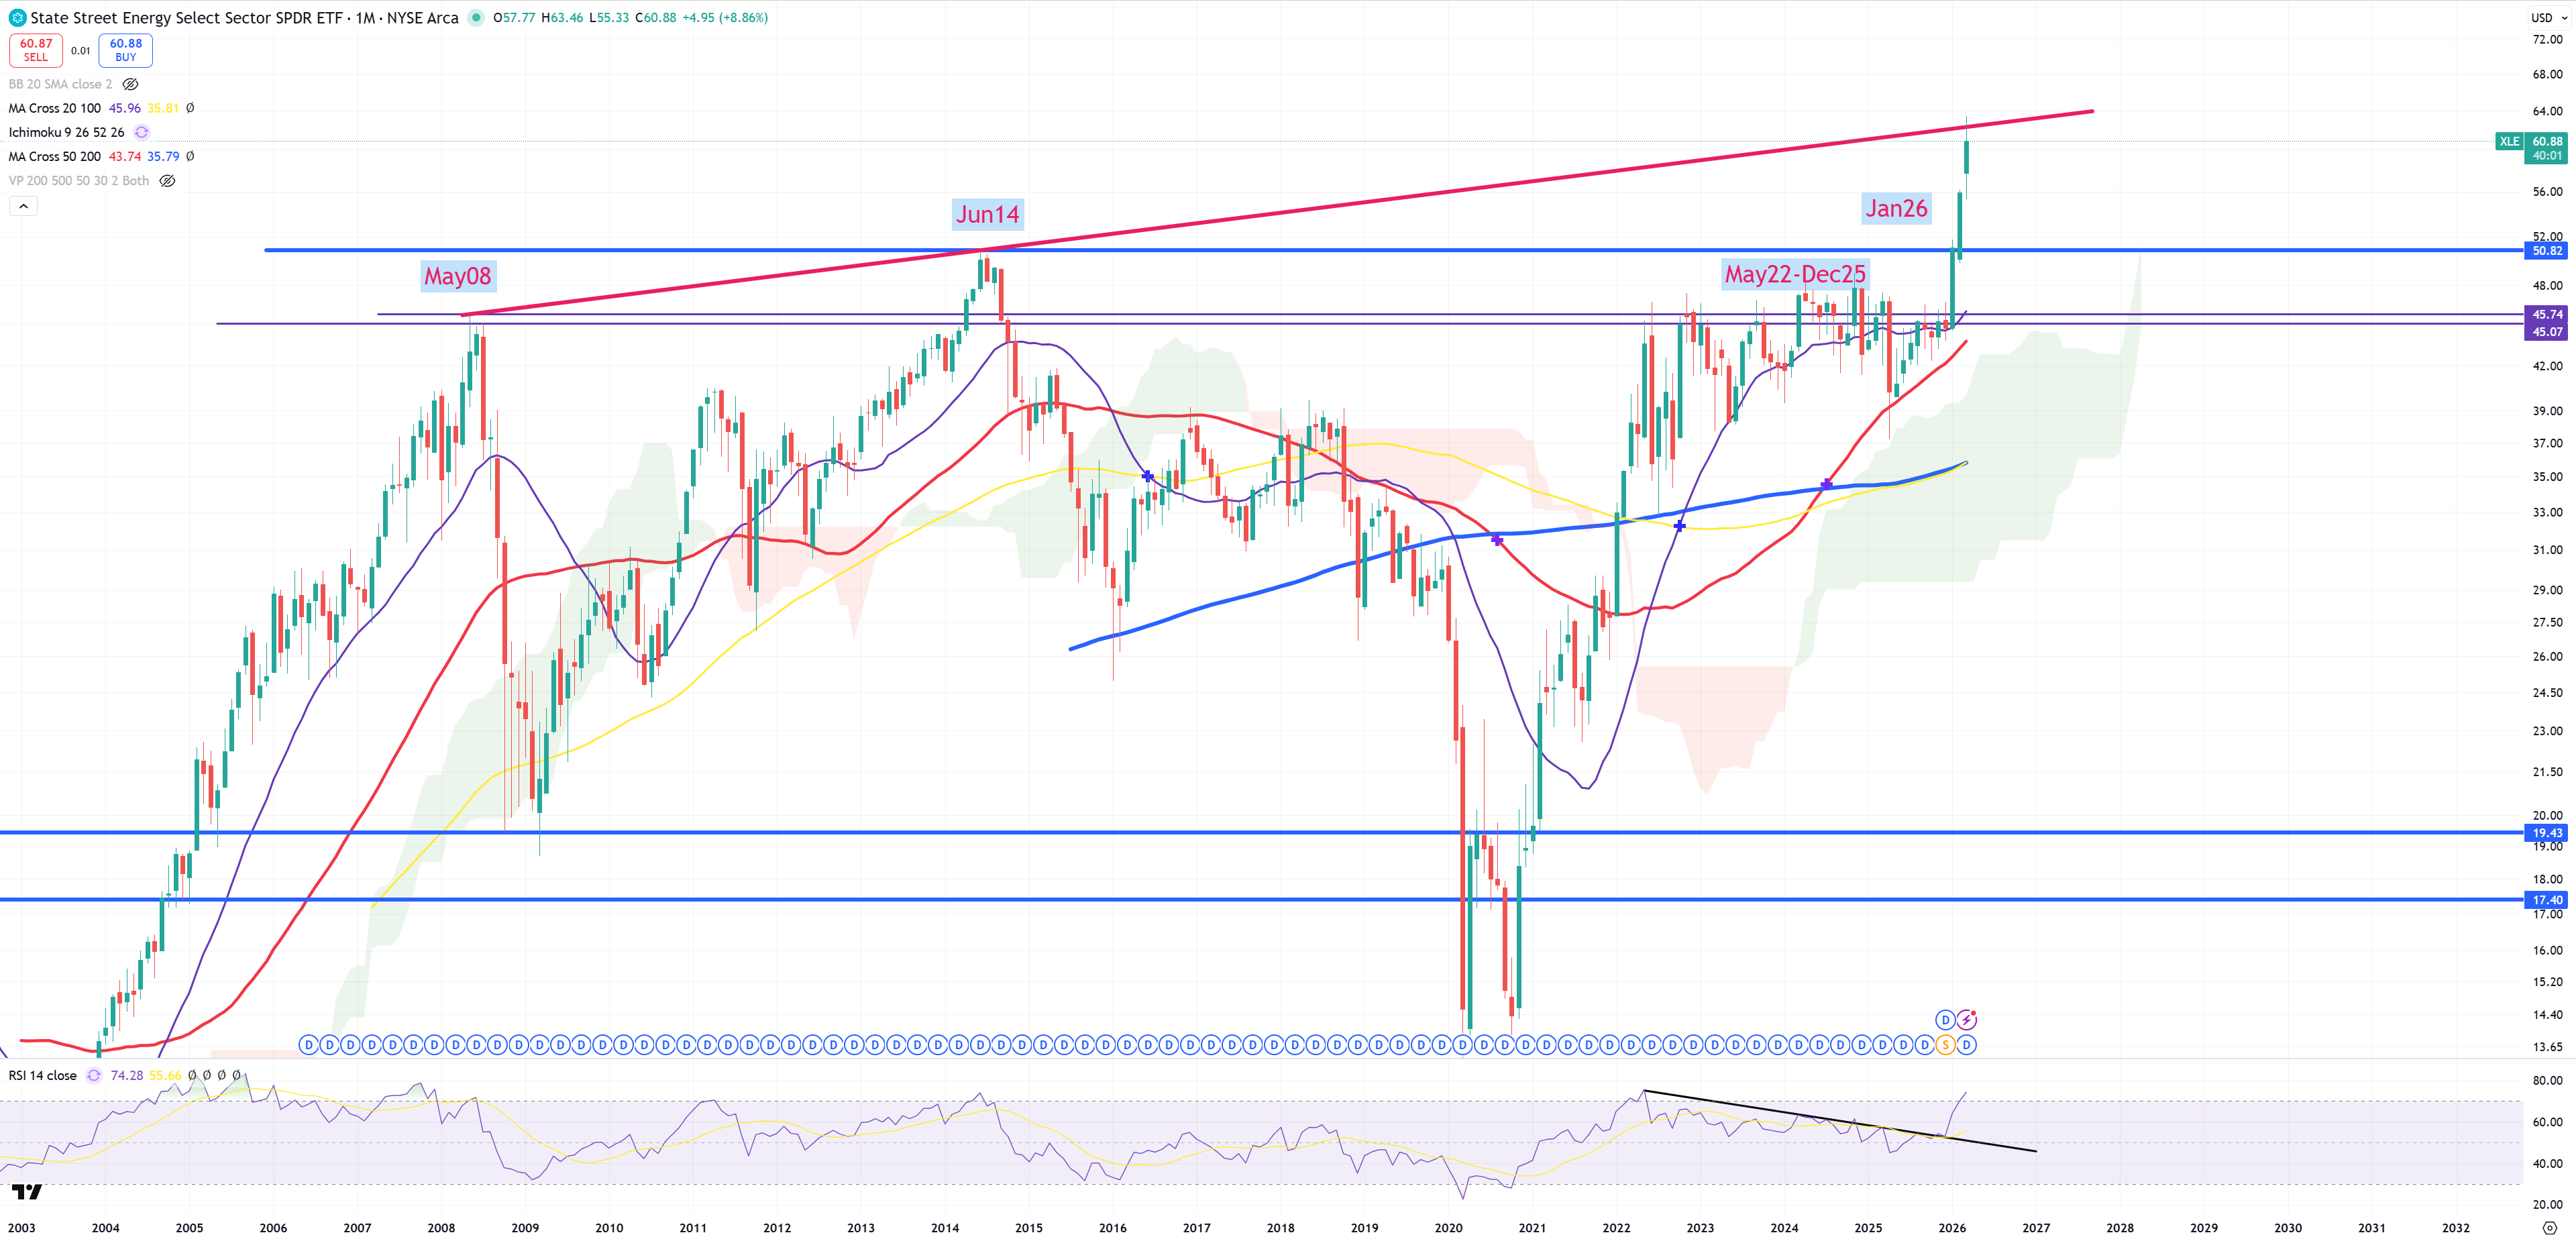
XLE – initially I placed 2 levels of support/resistance. May 2008 and Jun 2014, now I had also to put another trend o those peaks. It’s really hard to believe about this break so far and XLE theory can be matched to OIL theory
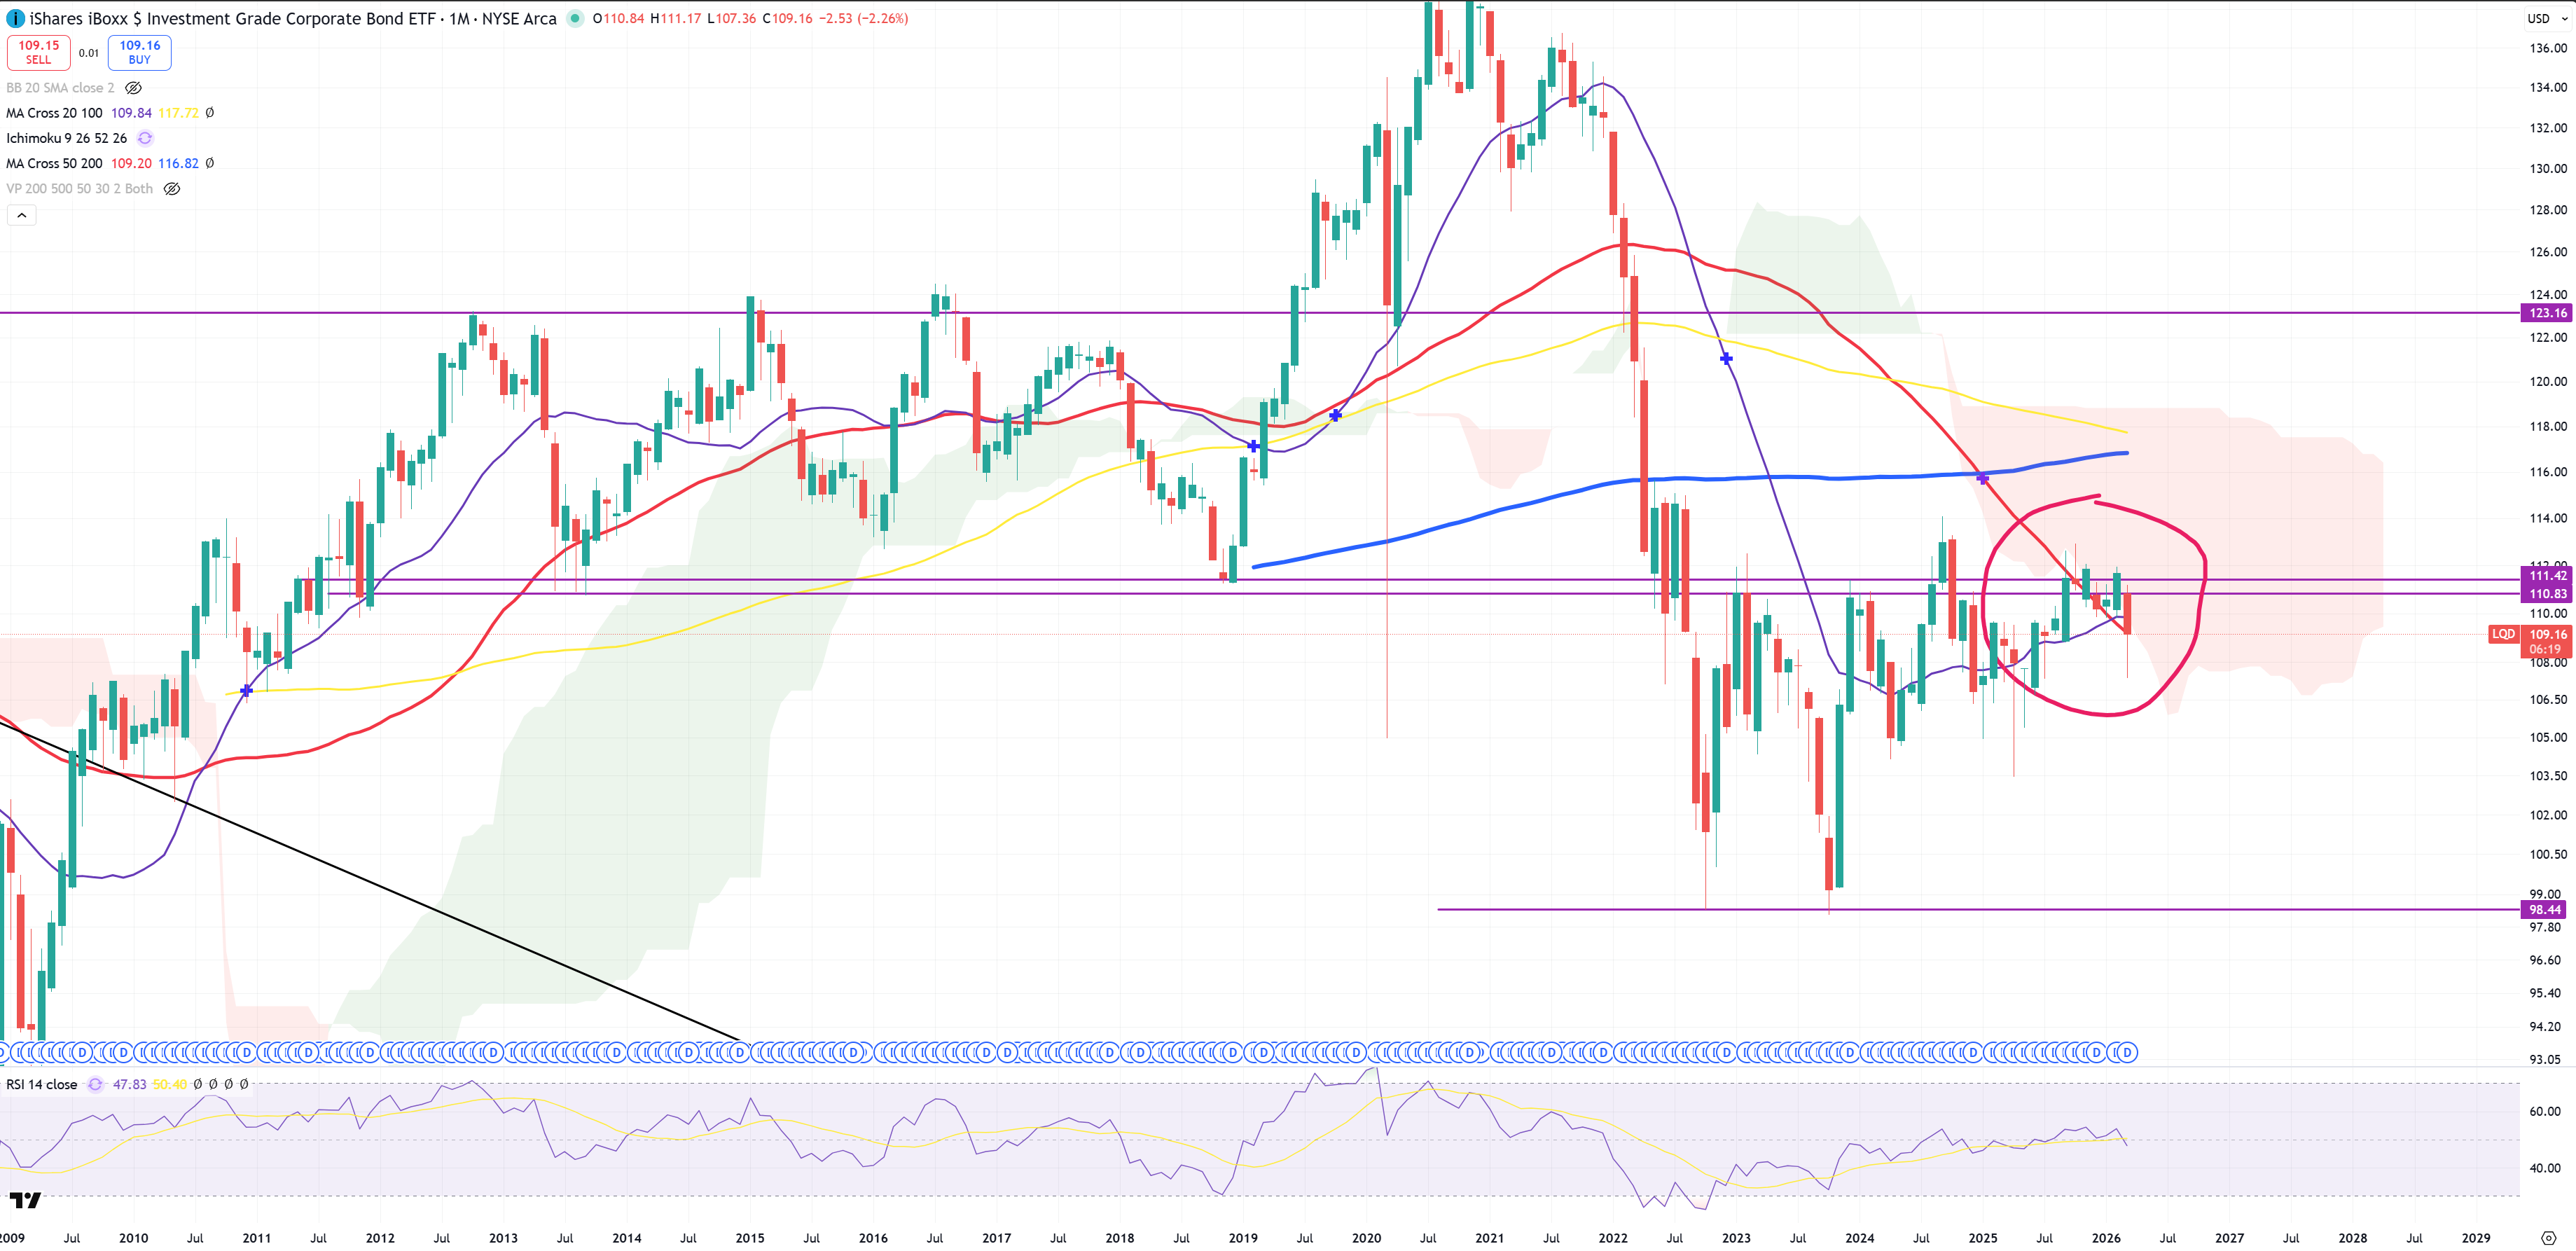
LQD – investment grade bonds. No need to comment.
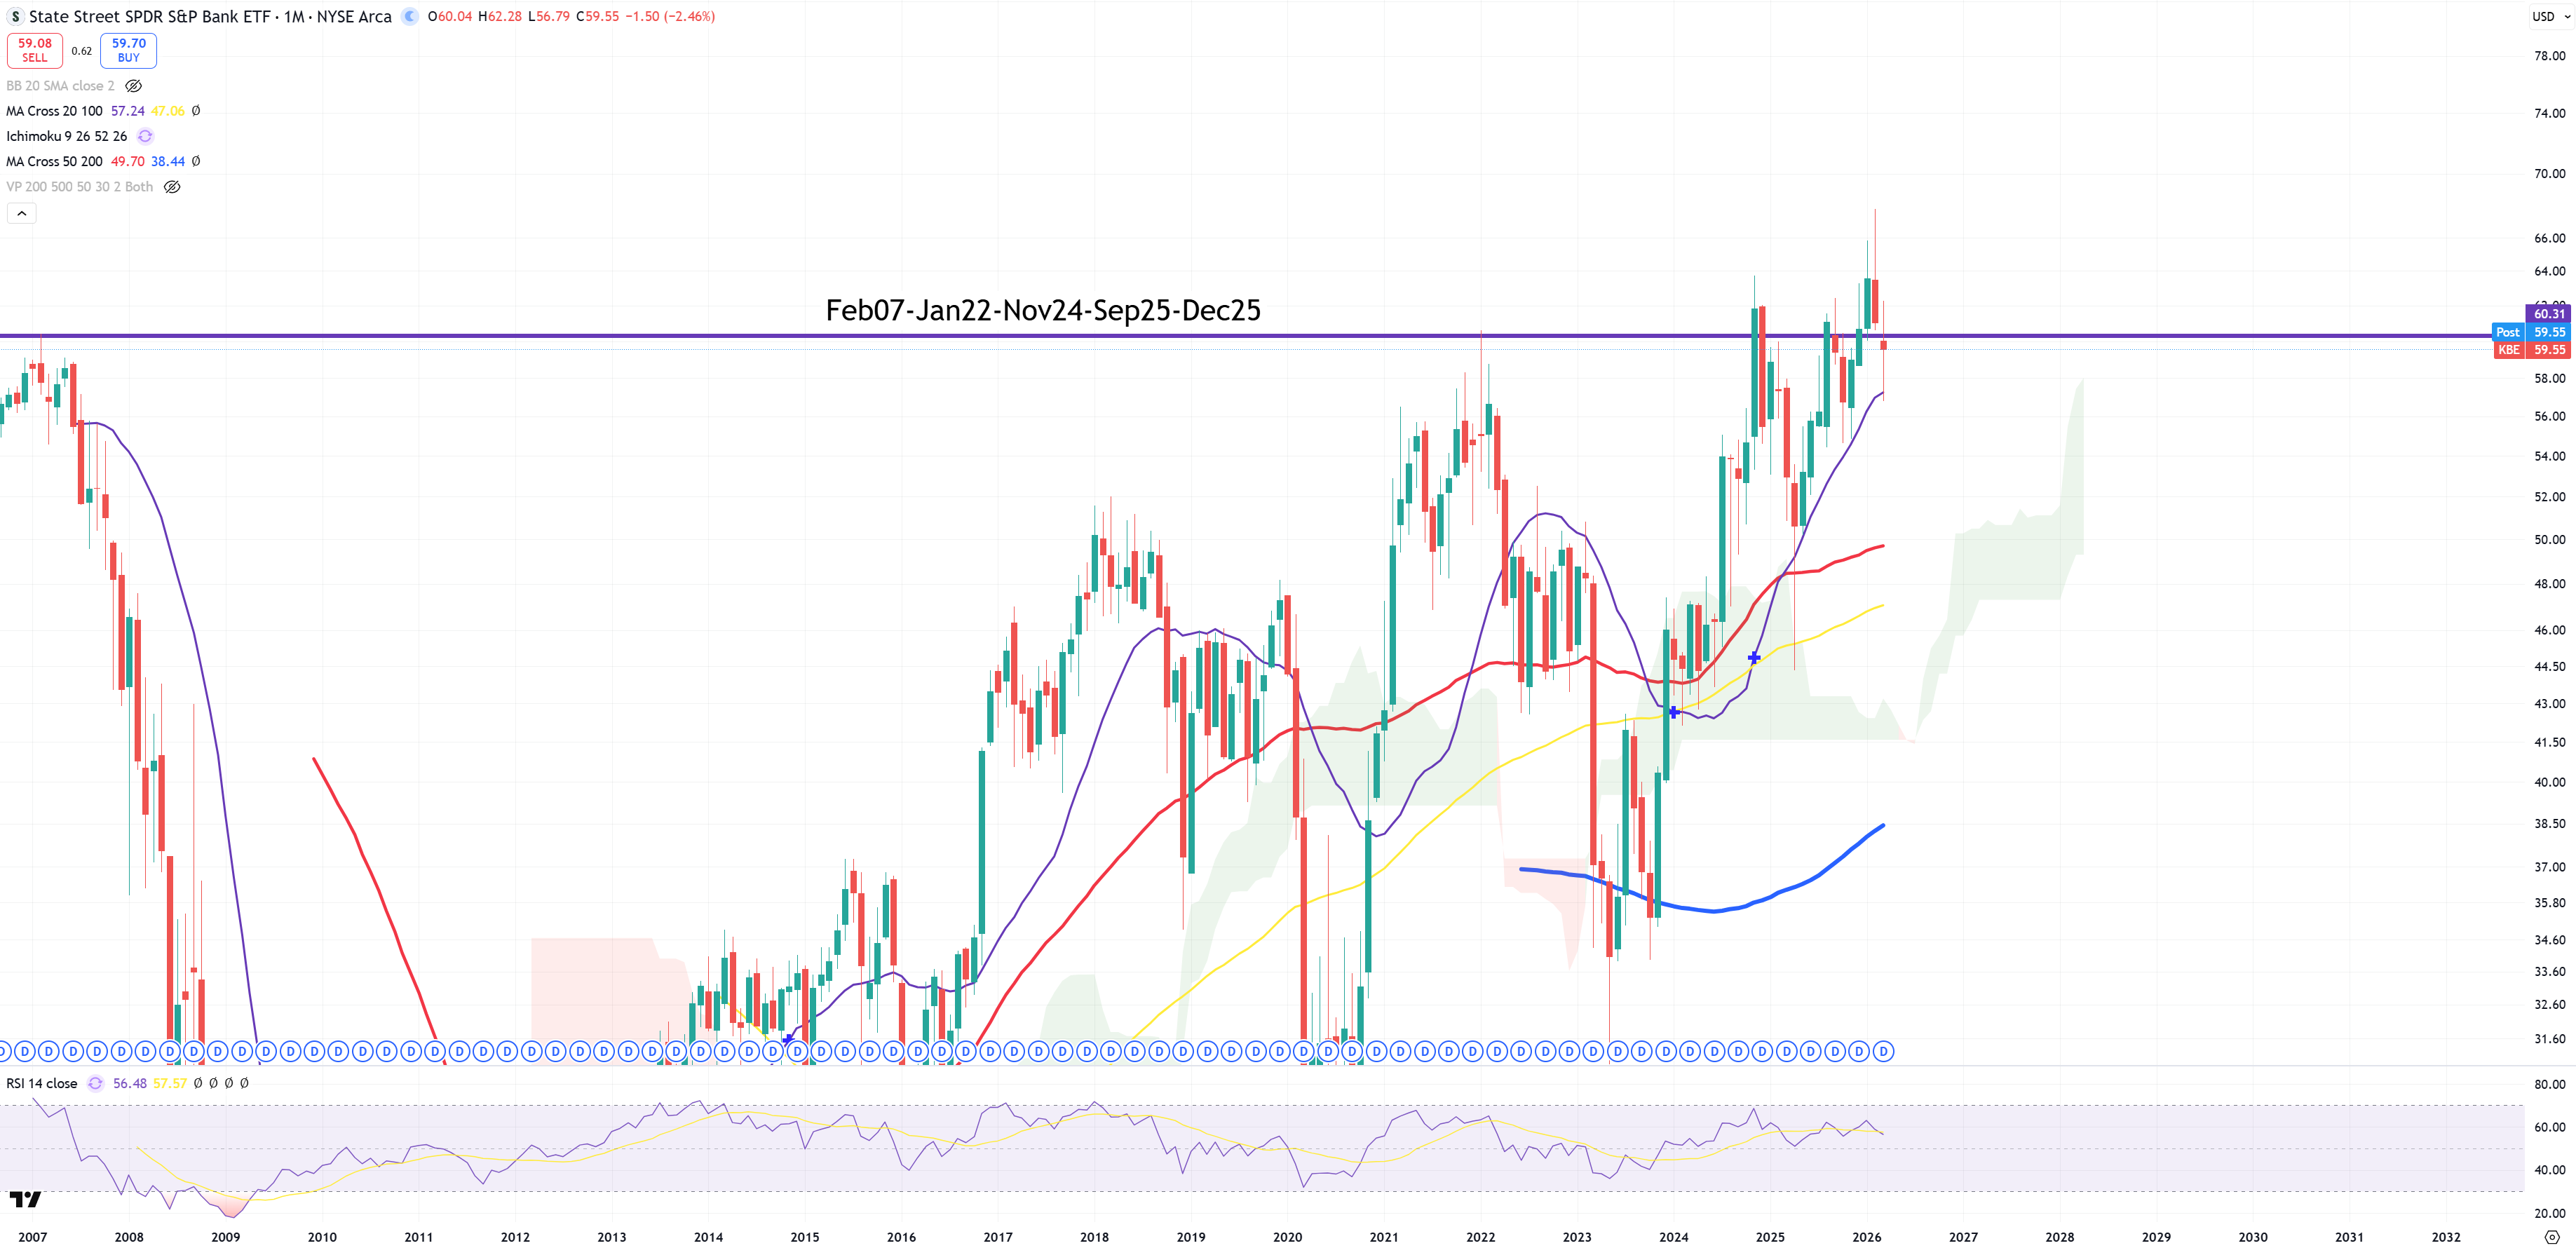
KBE – Banking sector.
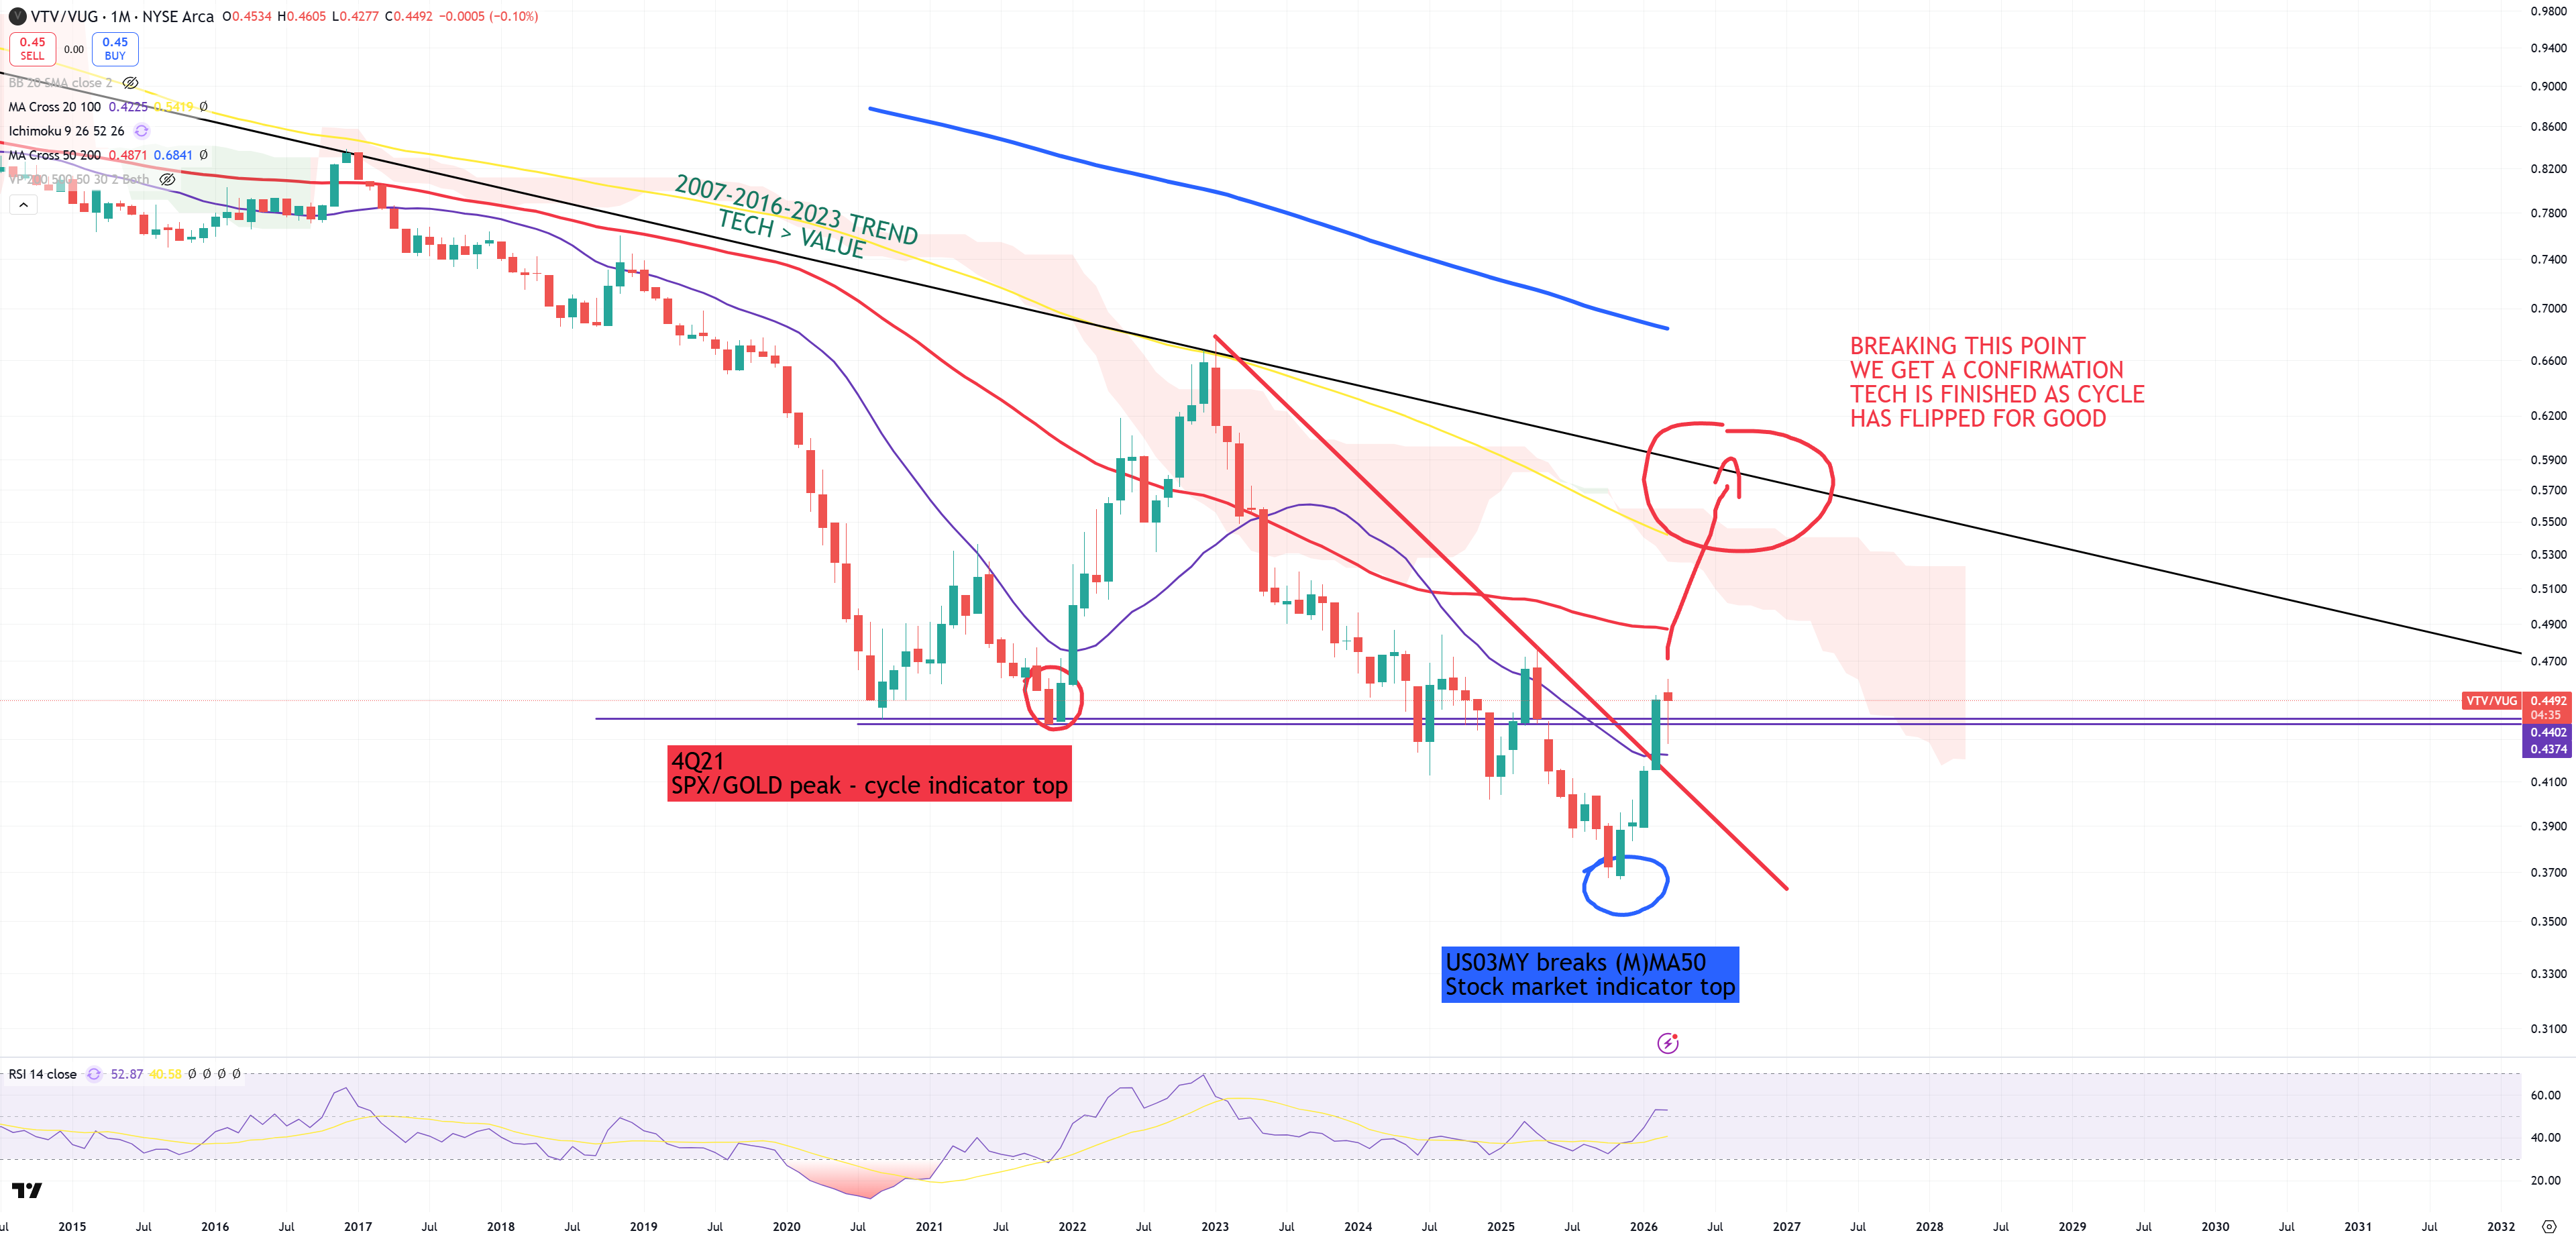
Value/Growth – because we have jumped > 4Q21 bottom the path is clear now. I bet the moment SPX breaks (M)MA50 finally this Value/Growth will break above 2007-2016-2023 trend.
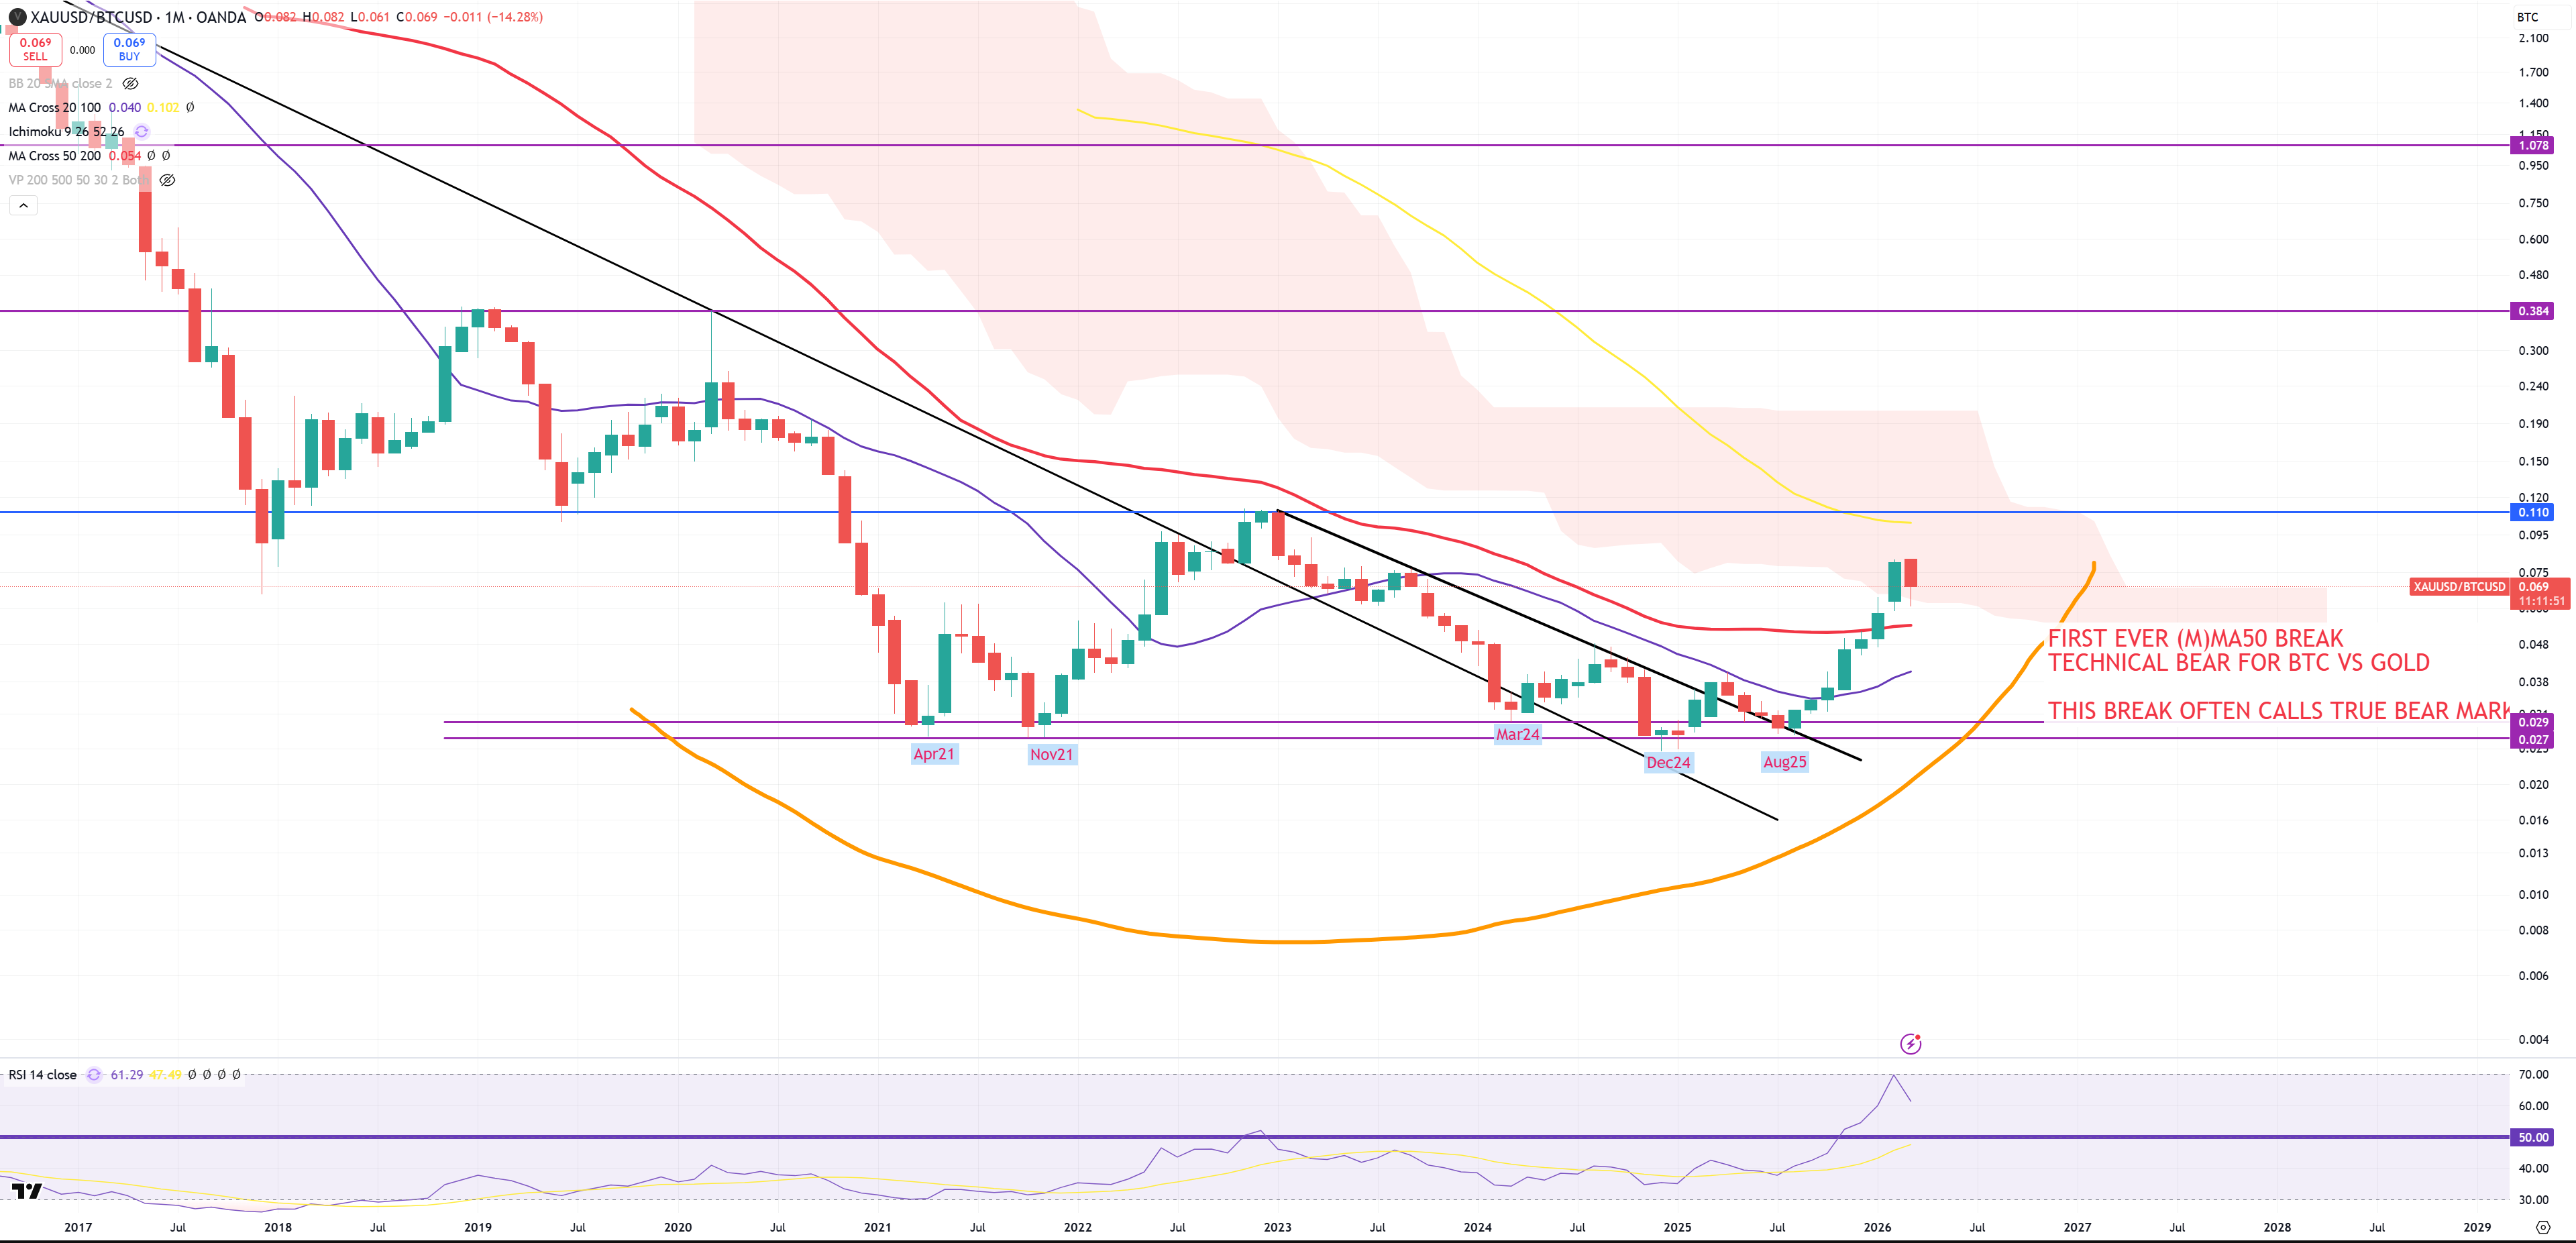
GOLD/BTC – another indicator that broke (M)MA50. GOLD dropped from 5600$ after hitting (M)RSI=96 and this ratio automatically dropped, but that’s not the end of fun for BTC bears.
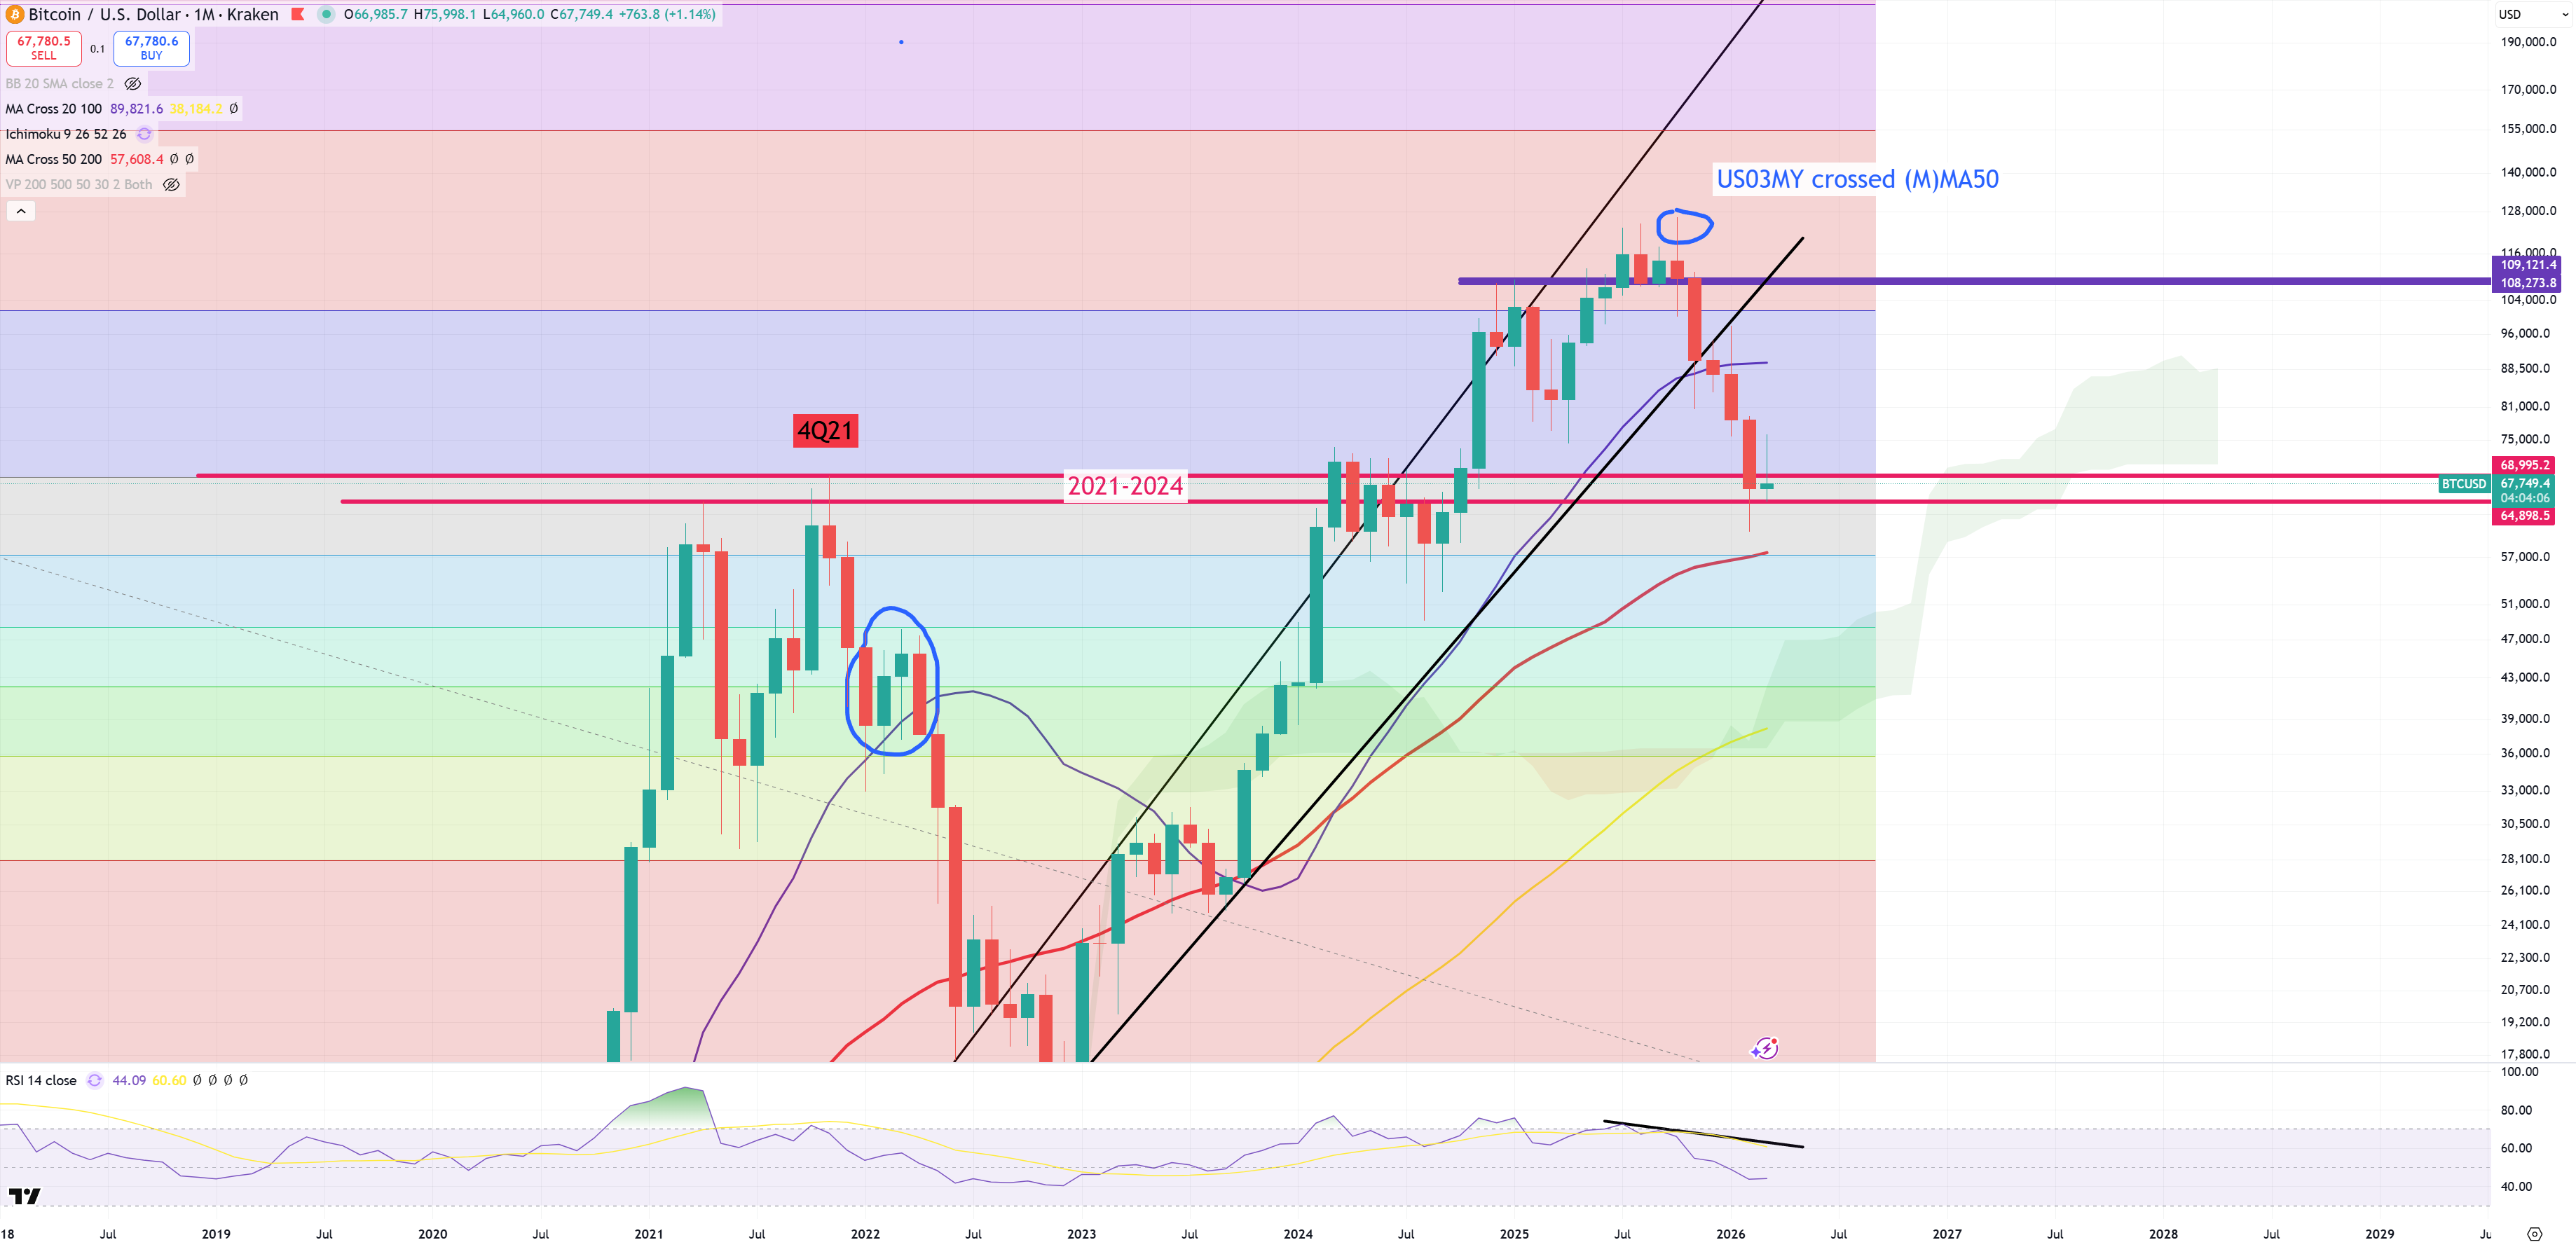
BTC – closing below 4Q21 opens path to break (M)MA50 and (M)MA100 move. So we talk about 57k$ and 38k$. If that happens bigger support is 2022 lows = 15k$.
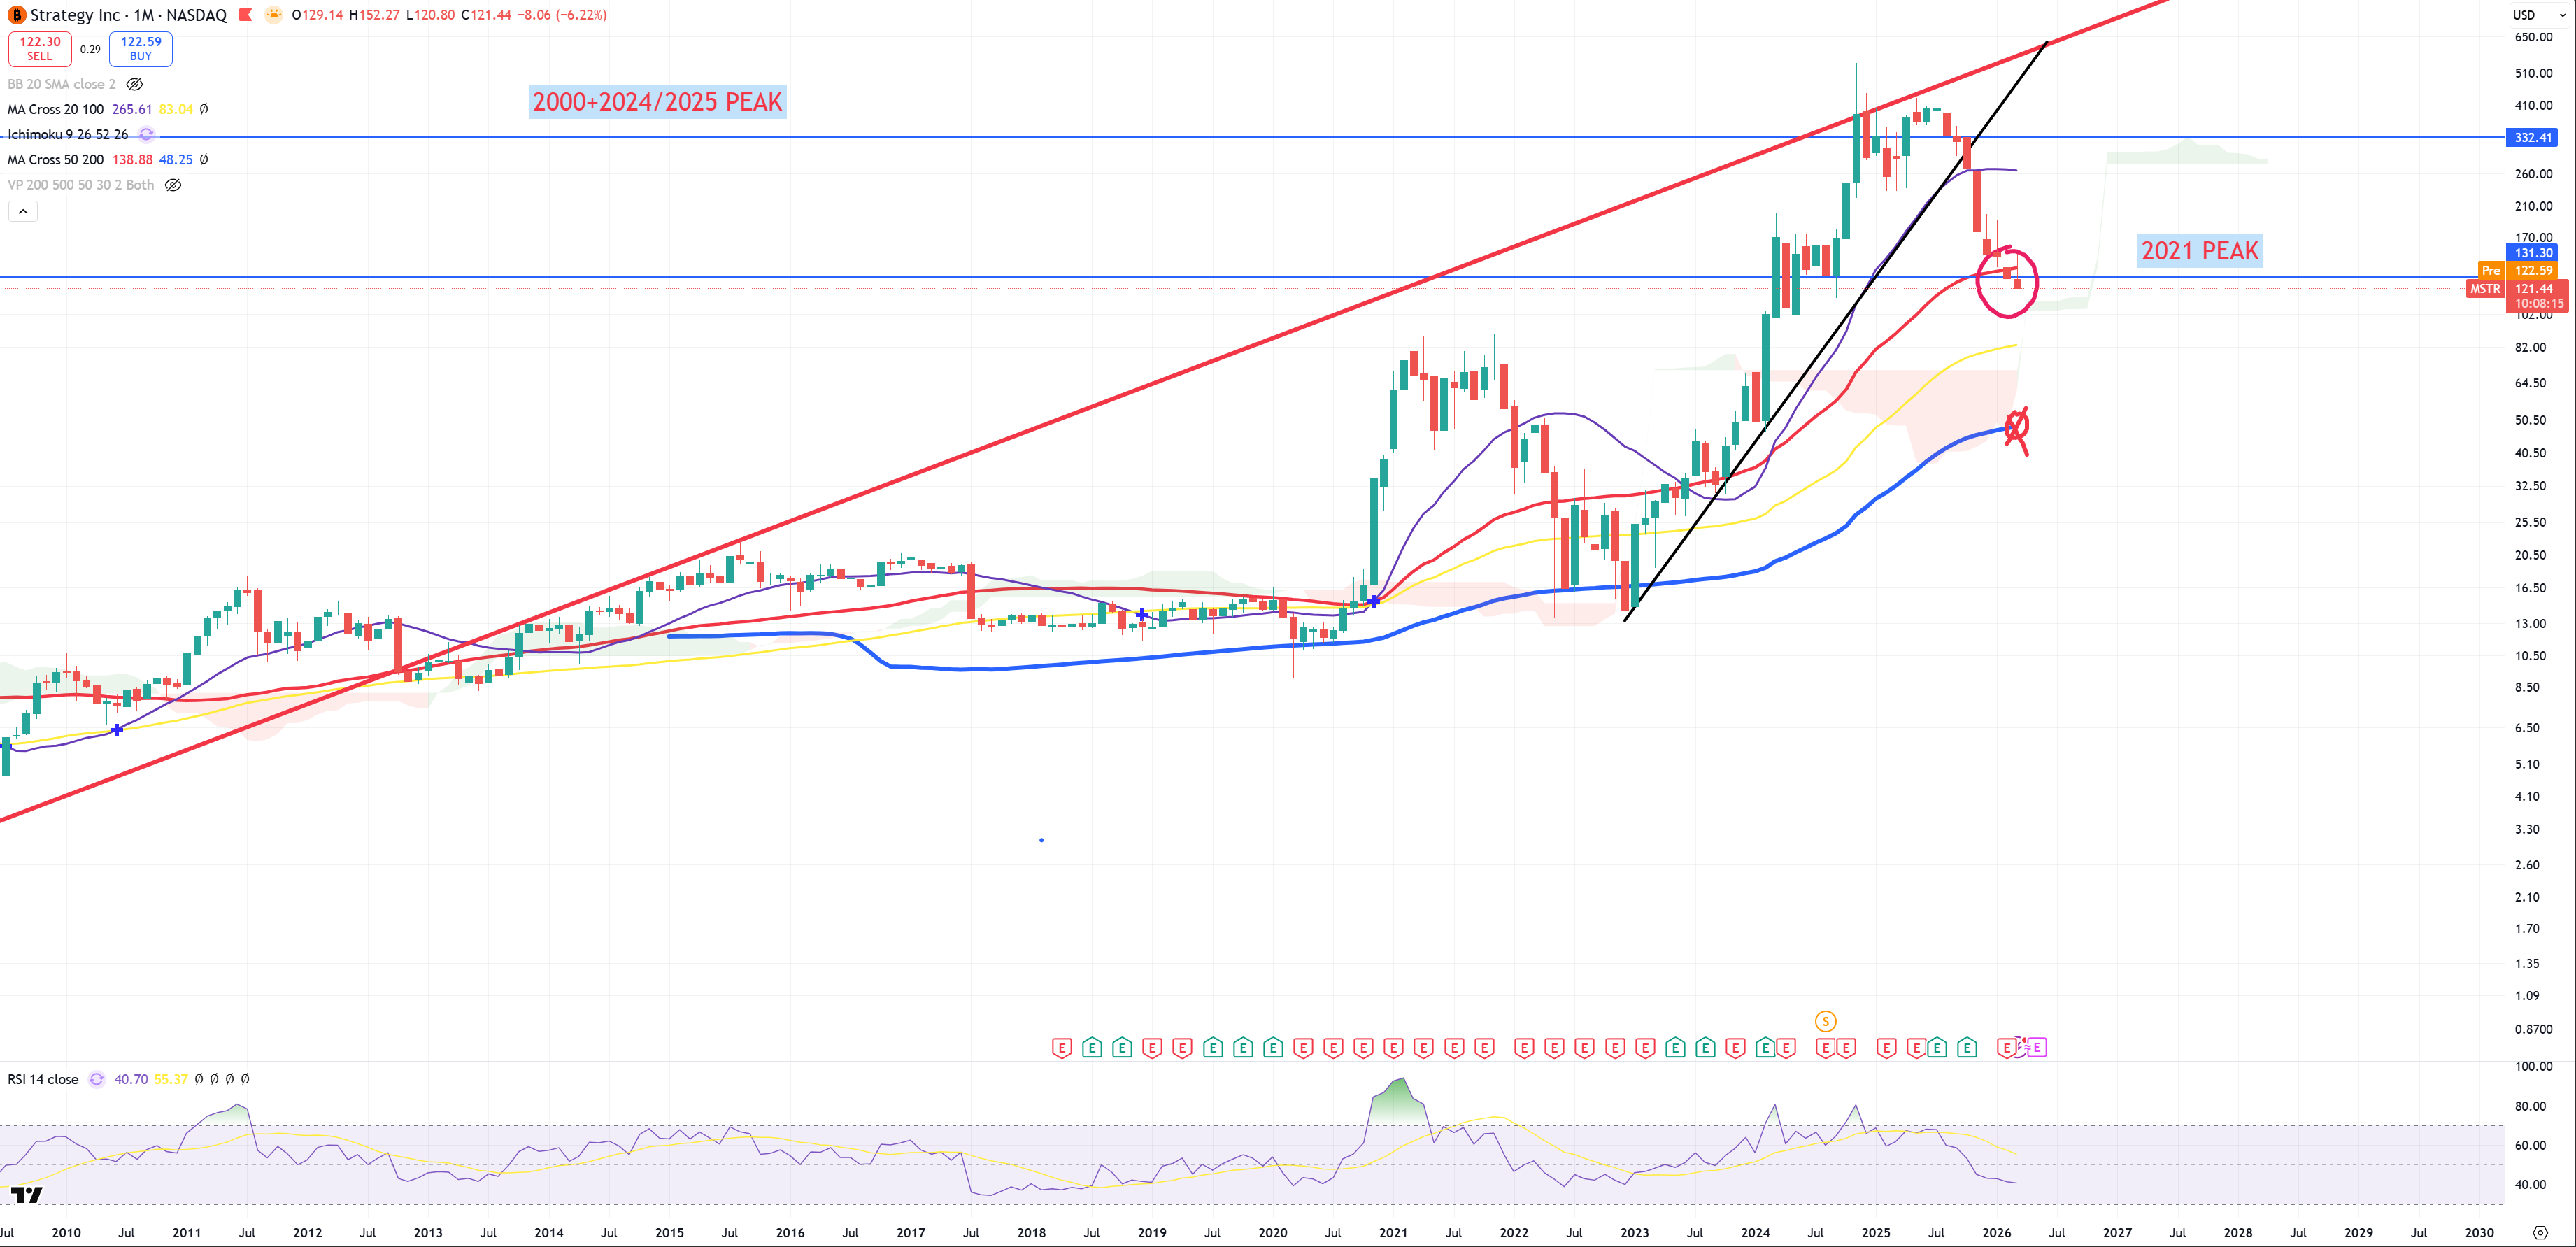
MSTR – the biggest crashes happen when market breaks (W)MA200 & (M)MA50 retest it from the bottom and fail. (M)MA50 retested, below 2021 peak, (M)MA200 is a natural path = 48$, breaking it will drop MSTR towards 12$.
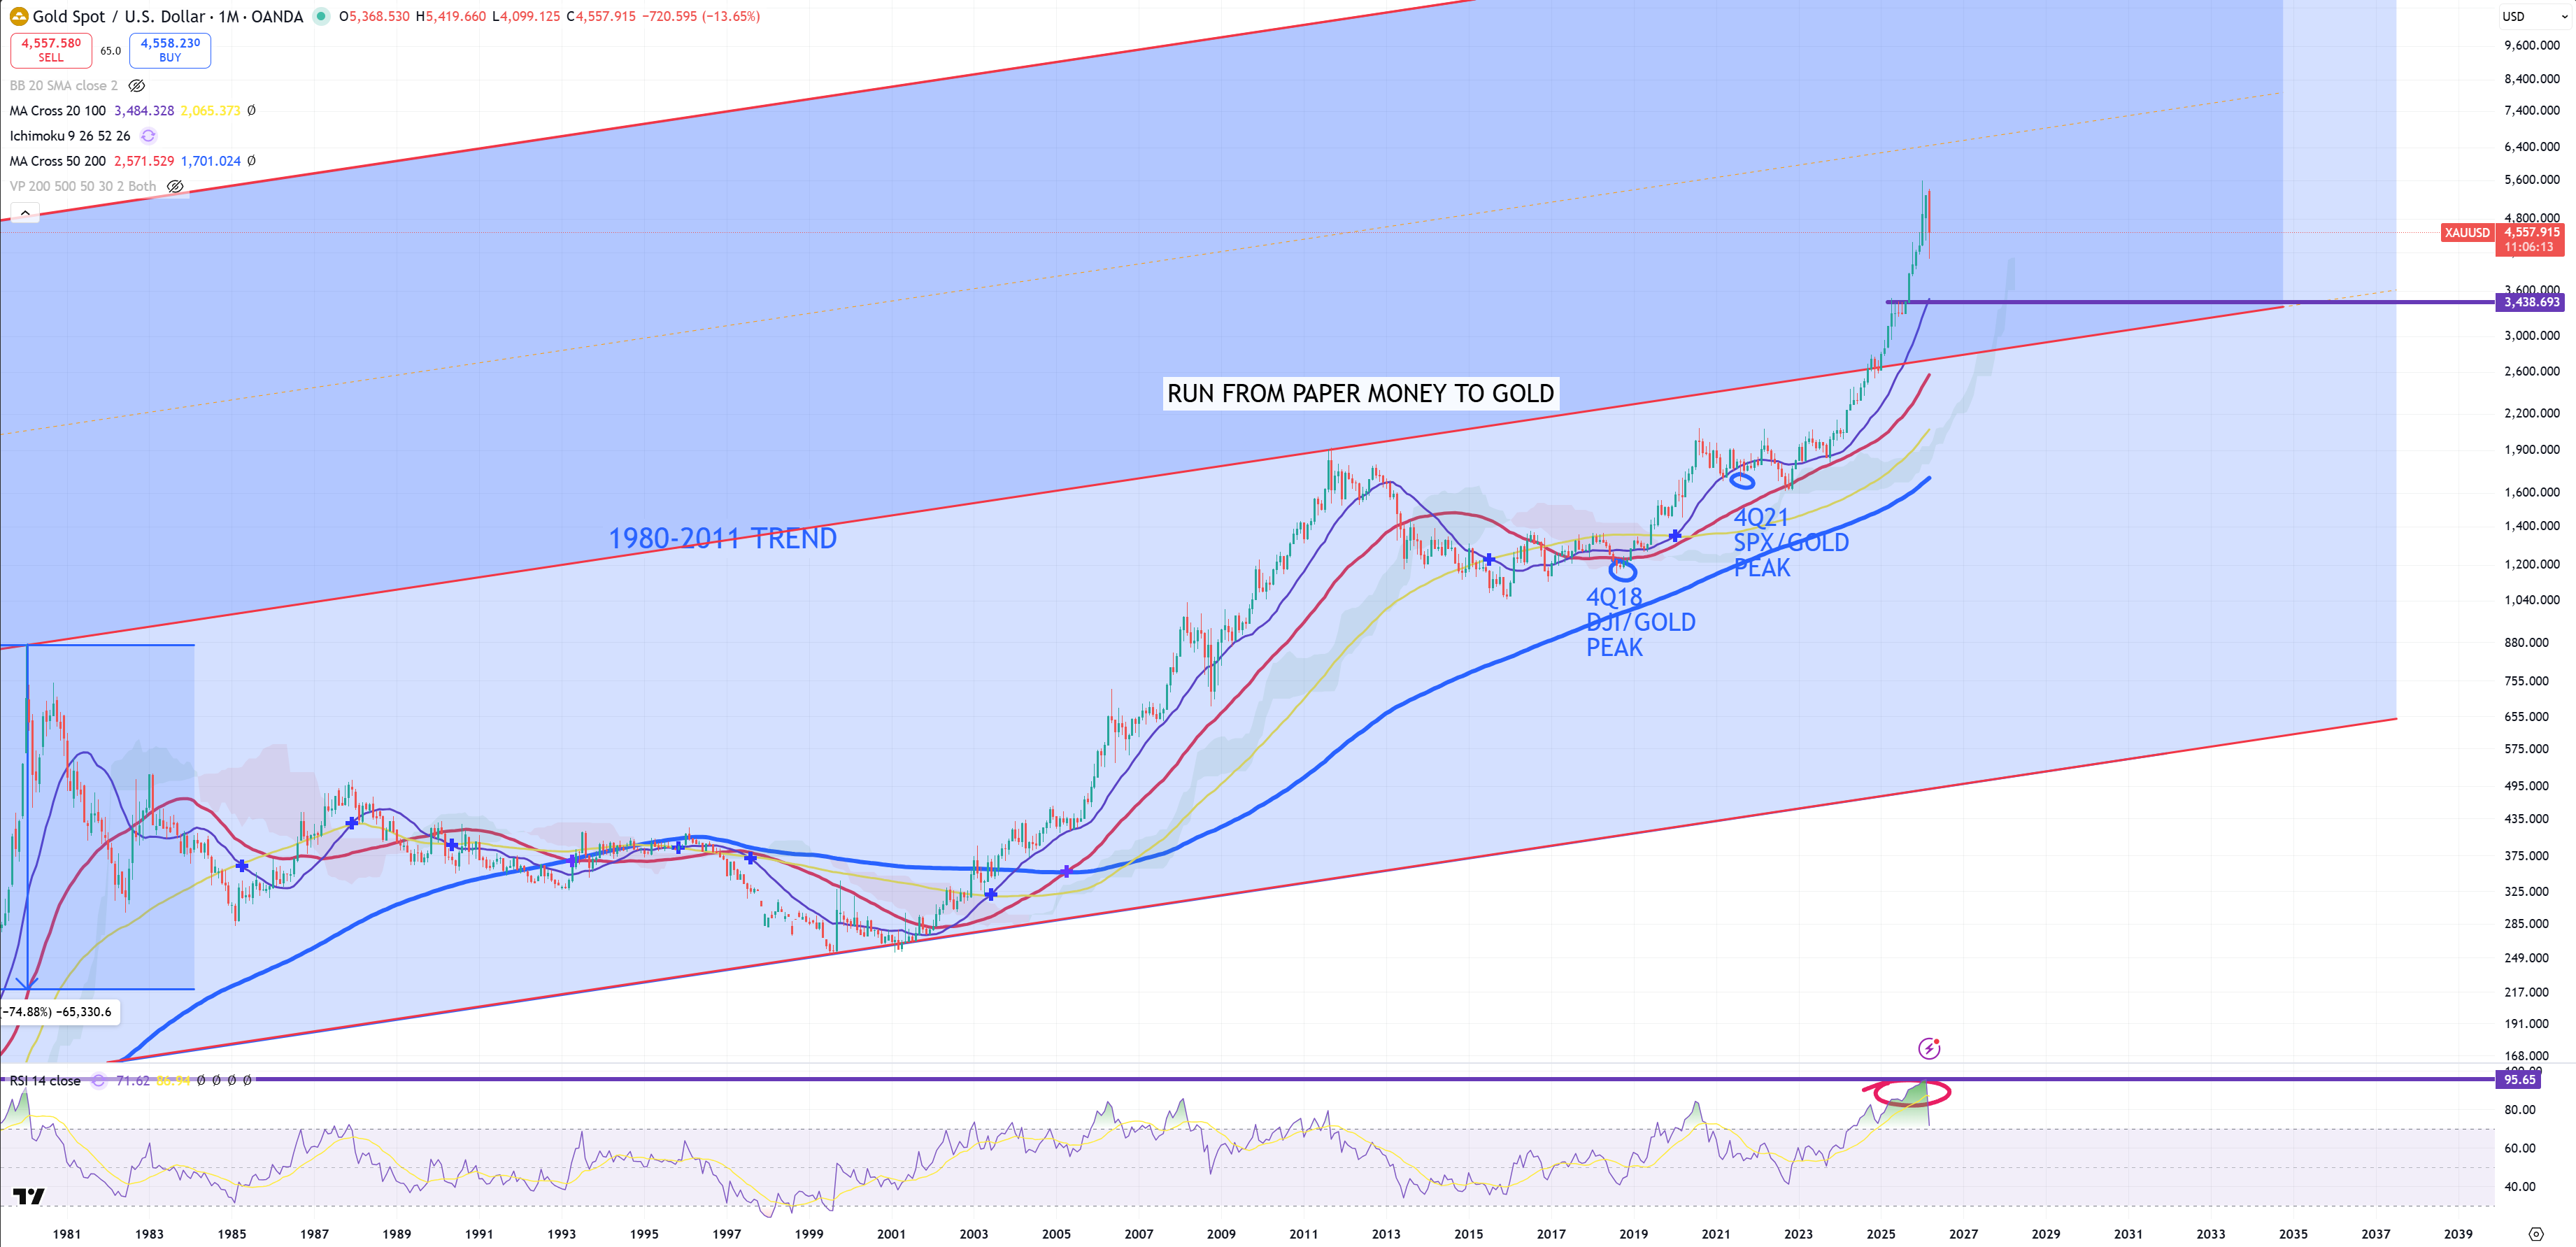
GOLD – support is around 3500$, but I believe this level ~4500$ will be now support – why? Just go back to US02Y and its last possible resistance = 4.0%, or US20Y and last level 5.0%. Once US02Y will be going down, GOLD will be going up. At some point when stock market will go limit down, gold will drop too, even to this 3500$, but I believe this level ~4500$ is for now a bottom due to US02Y/US20Y thesis. Path is still opened towards 10000$ – it’s also confirmed by DJI/GOLD and SPX/GOLD trend. (M)RSI dropped from 96 to 71. In a super strong parabolic bull markets we see moves between (M)RSI : 70-95.
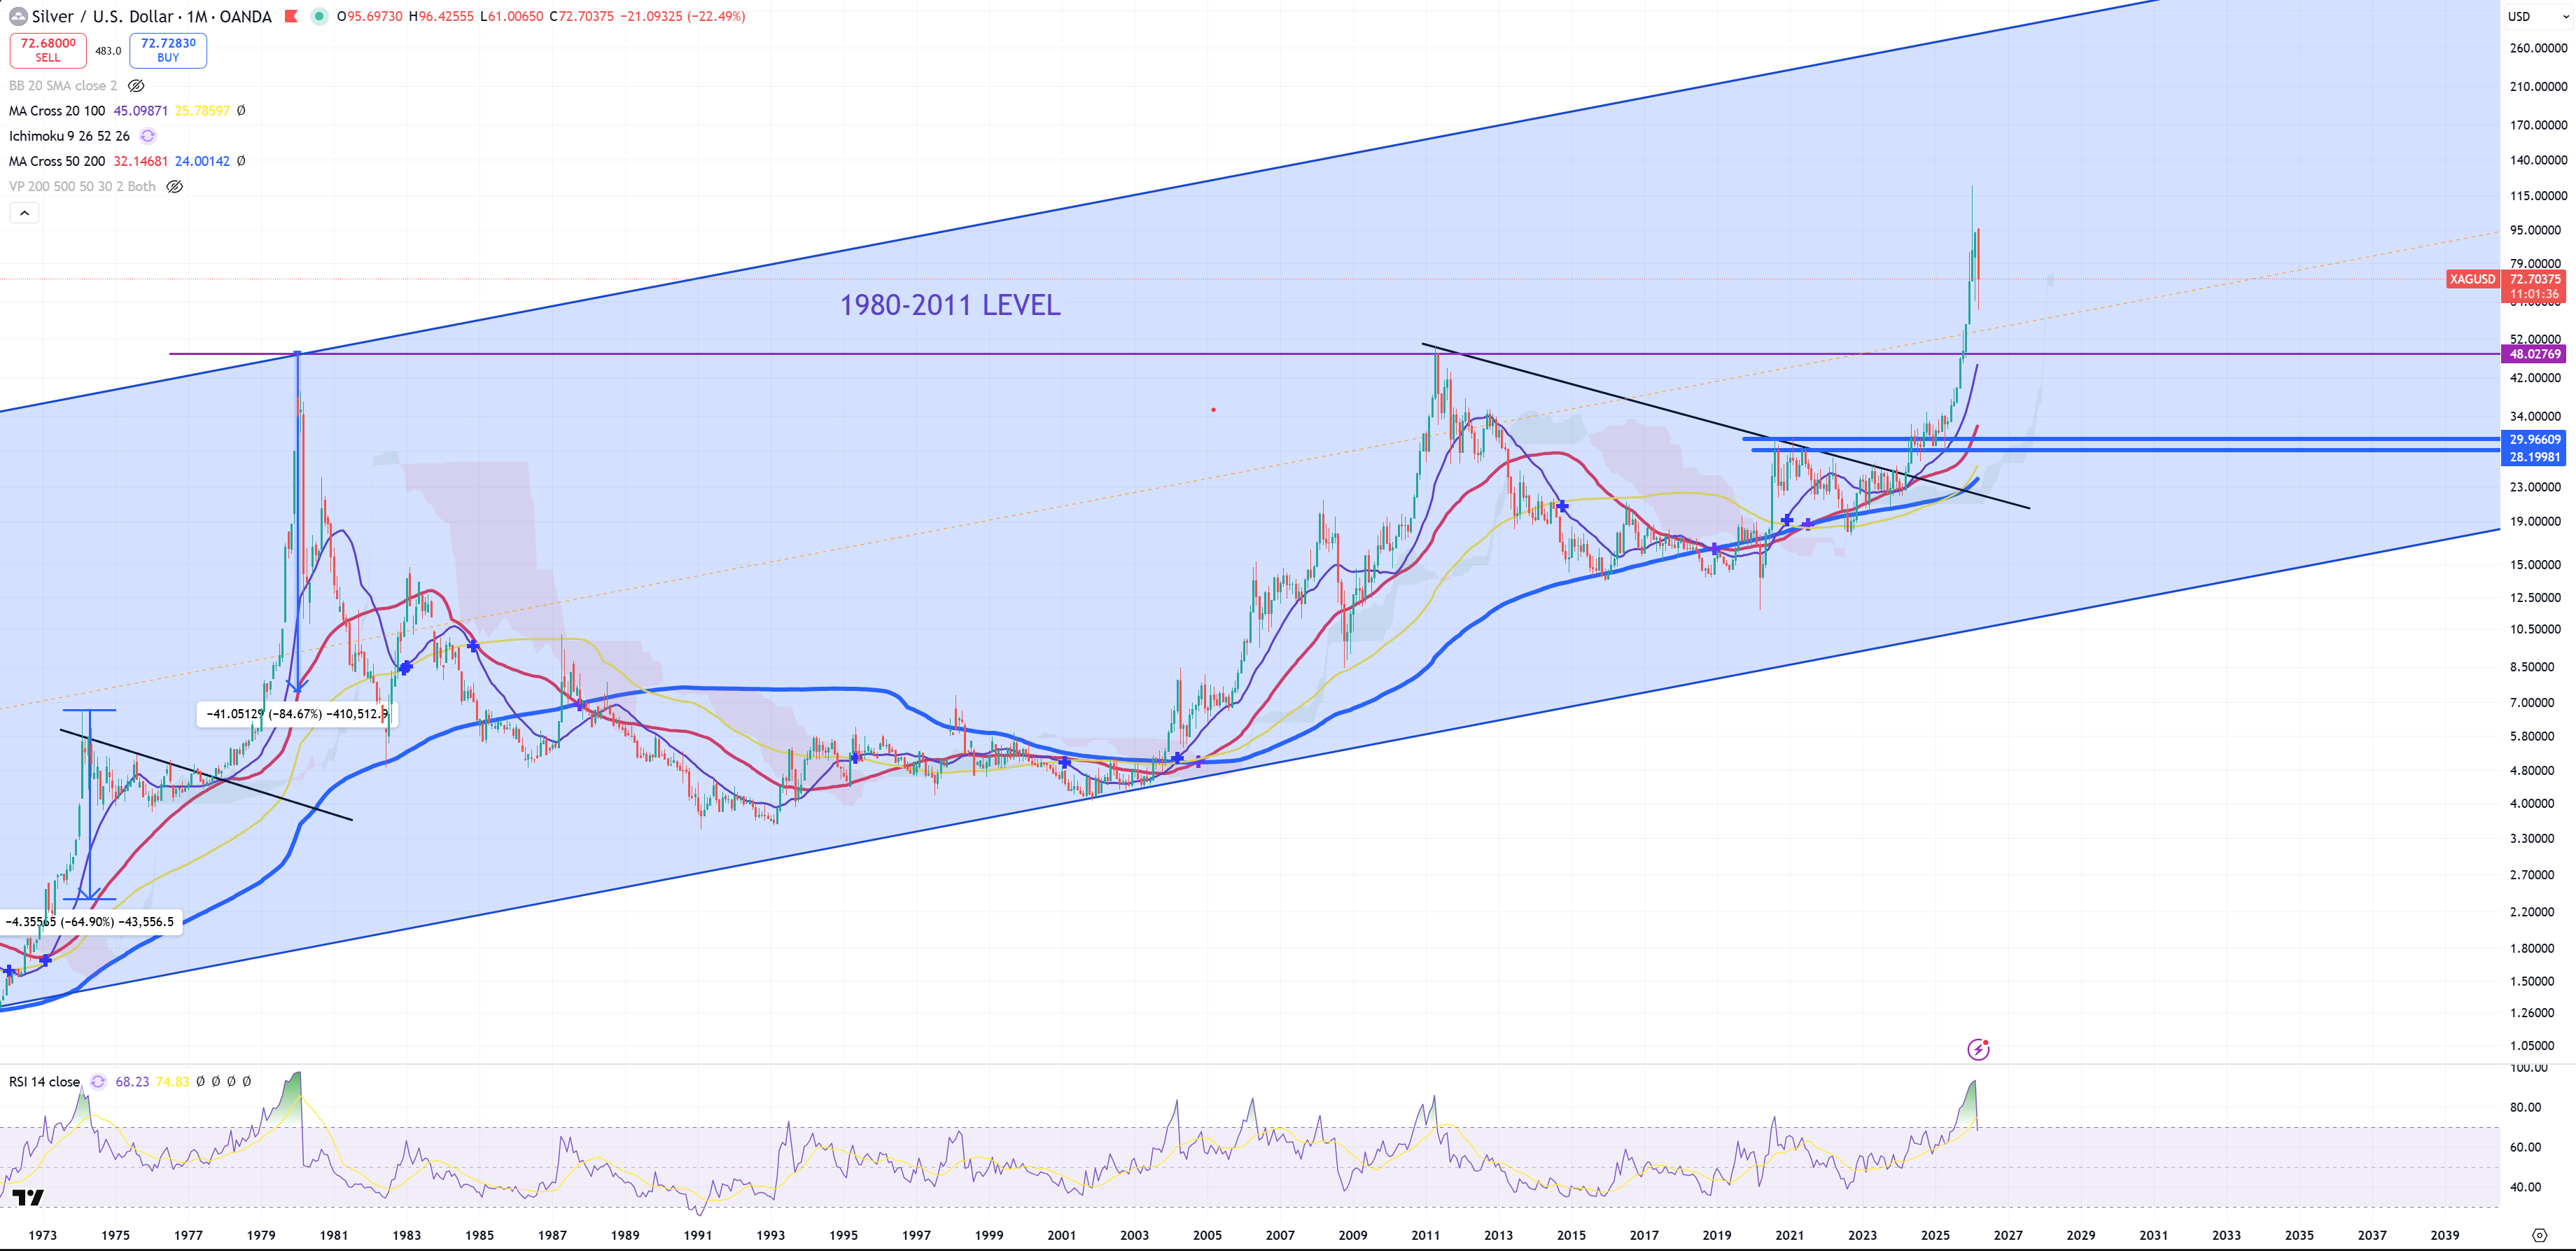
SILVER – same thesis as GOLD. This chart is in the middle of nowhere. I assume it’ll start going up from here, but once first limit down hits it’ll drop to 1980-2011 support level ~50$.
10Y/3M – key gravity indicator. What is important is : passing 60bps after inversion leads to bull steepening because of recession fears. Once again market tries not to break 60bps, but SPX/GOLD (3M)MA200 & US03MY (M)MA50 break keep telling me this time it’ll blow up the the upside quick (aka emergency rate cuts). Rule is simple : uninverting 10y/3m = DXY up. It’s not 1:1 of course but a general rule of thumb.
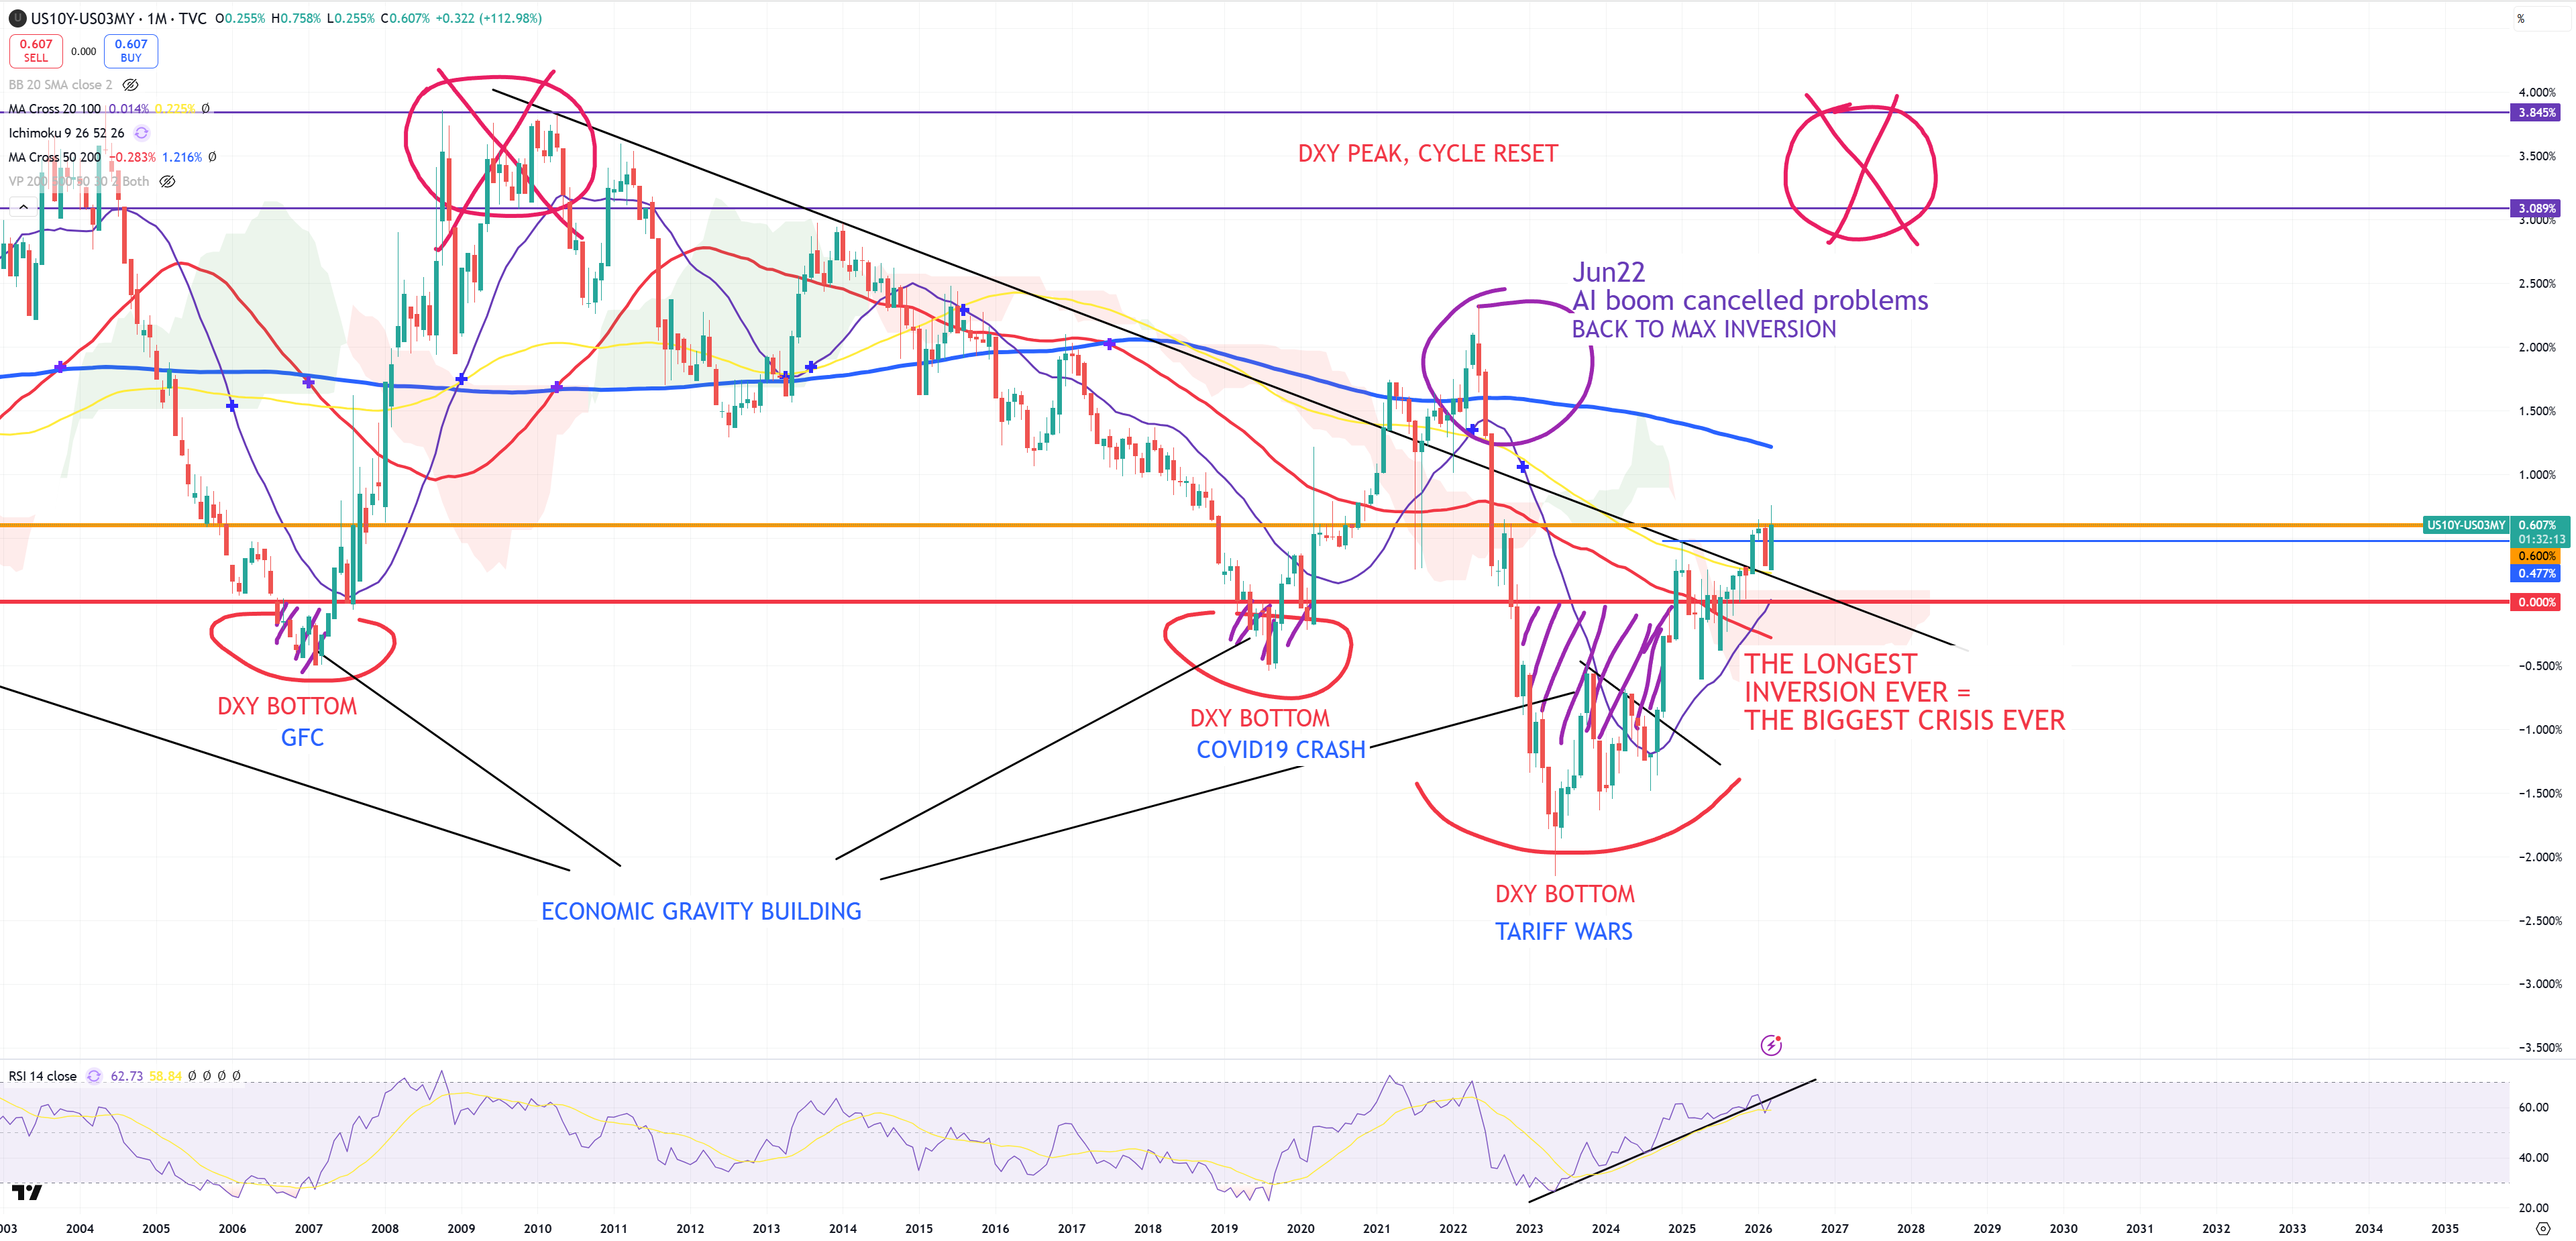
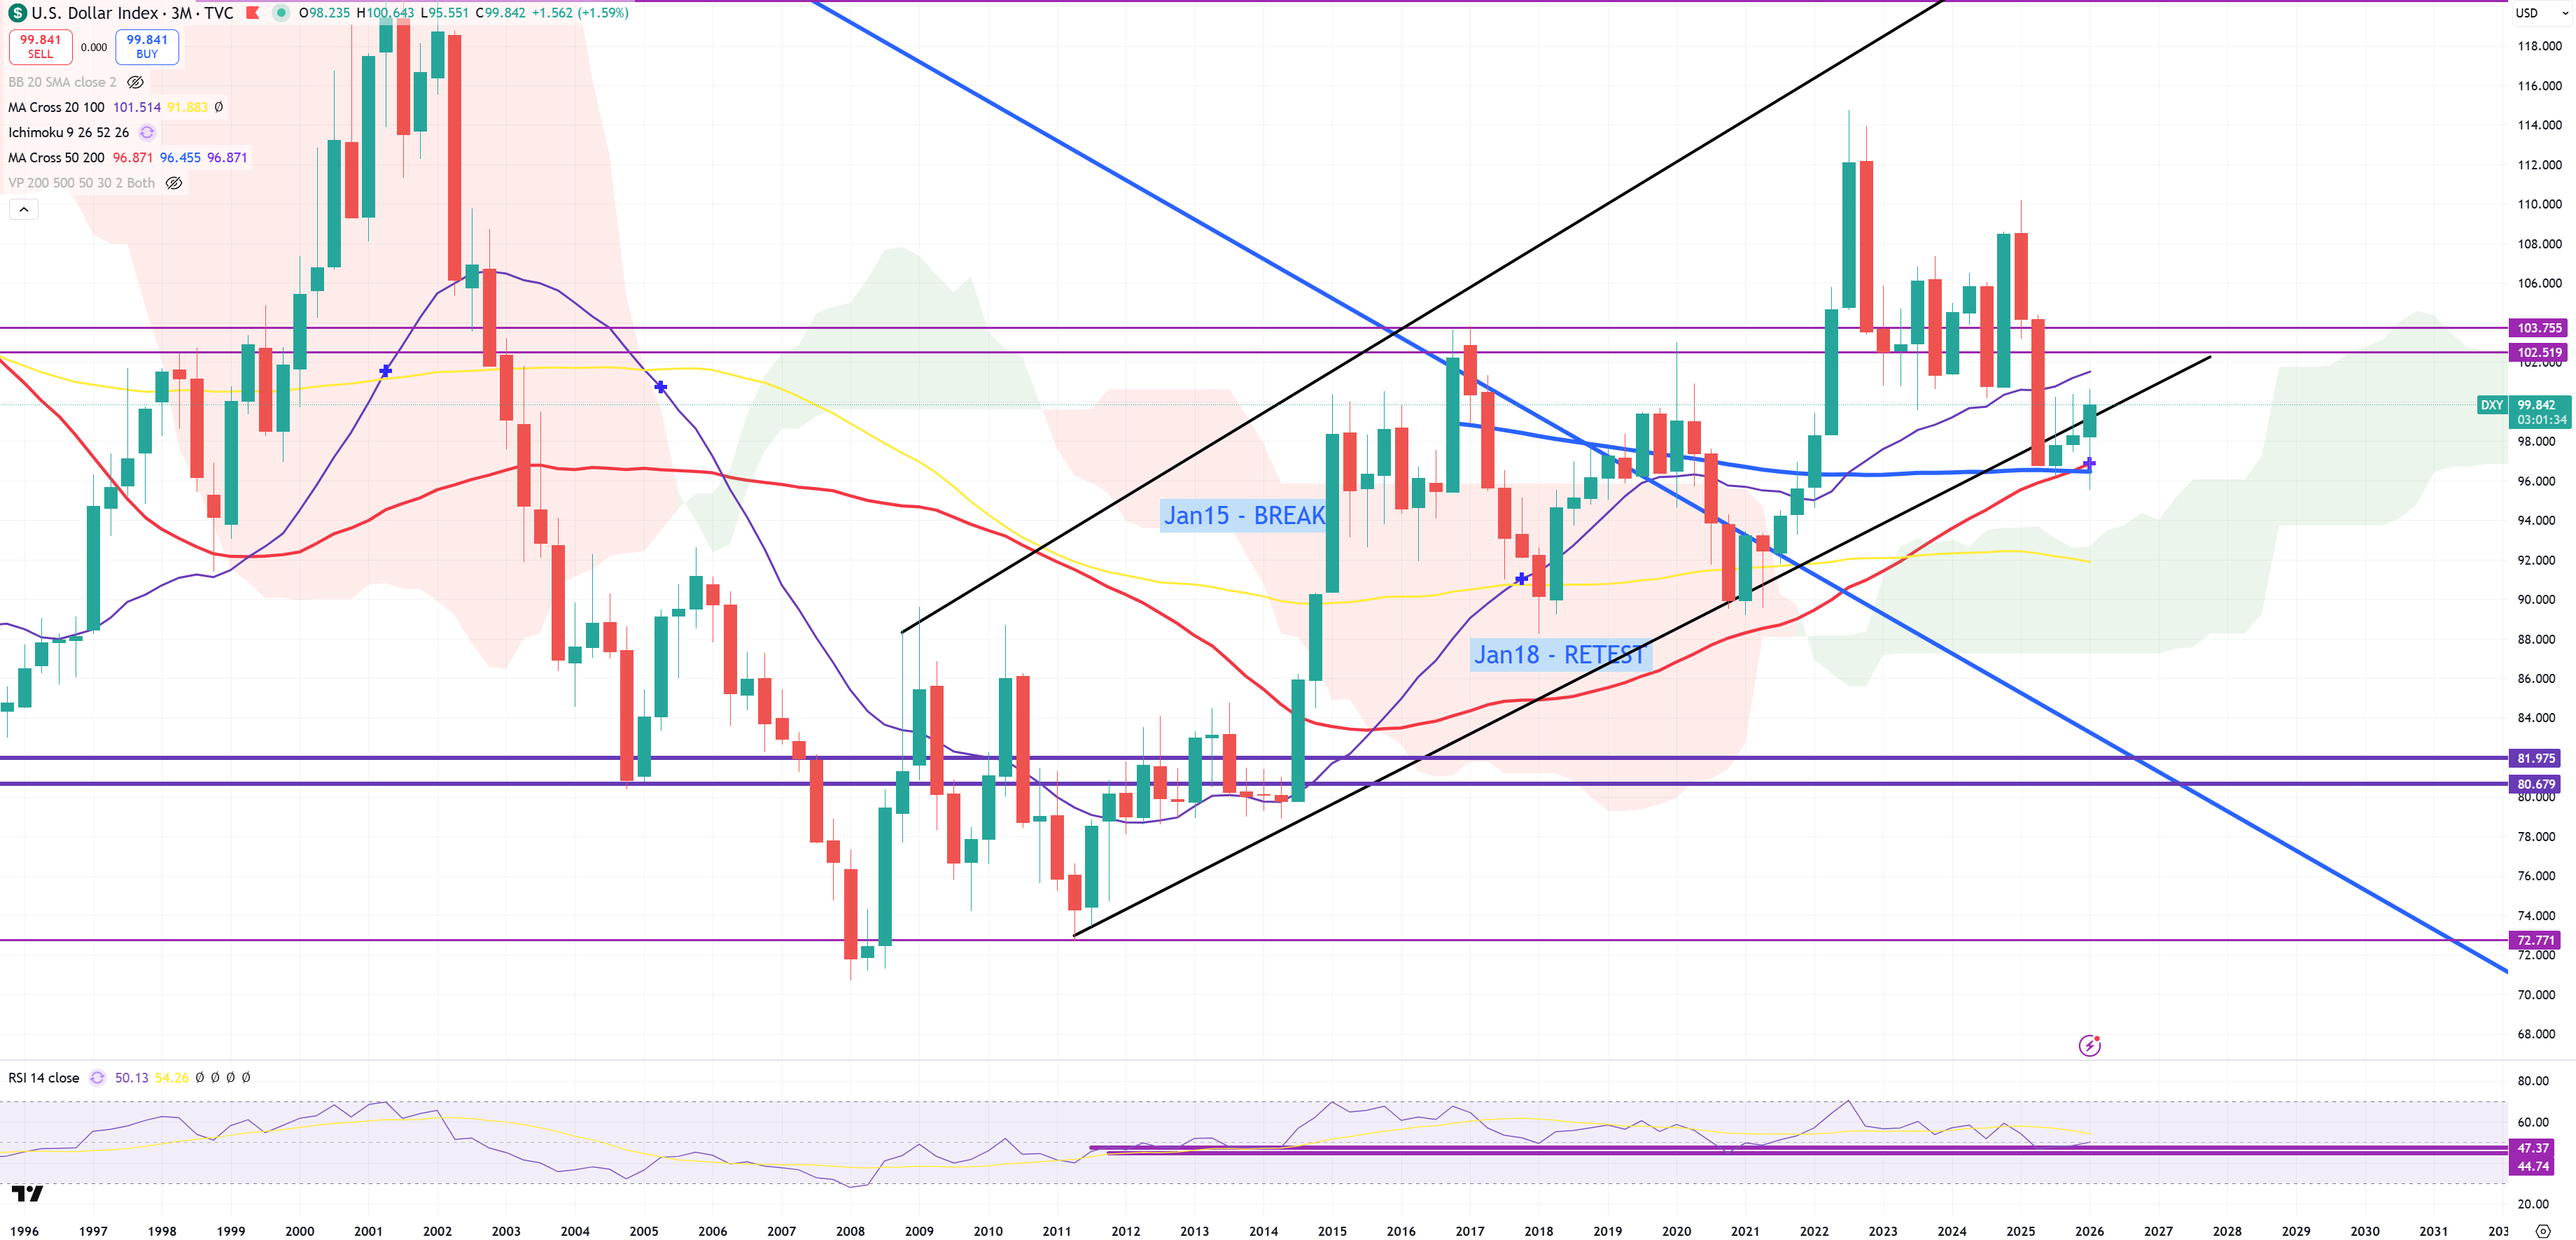
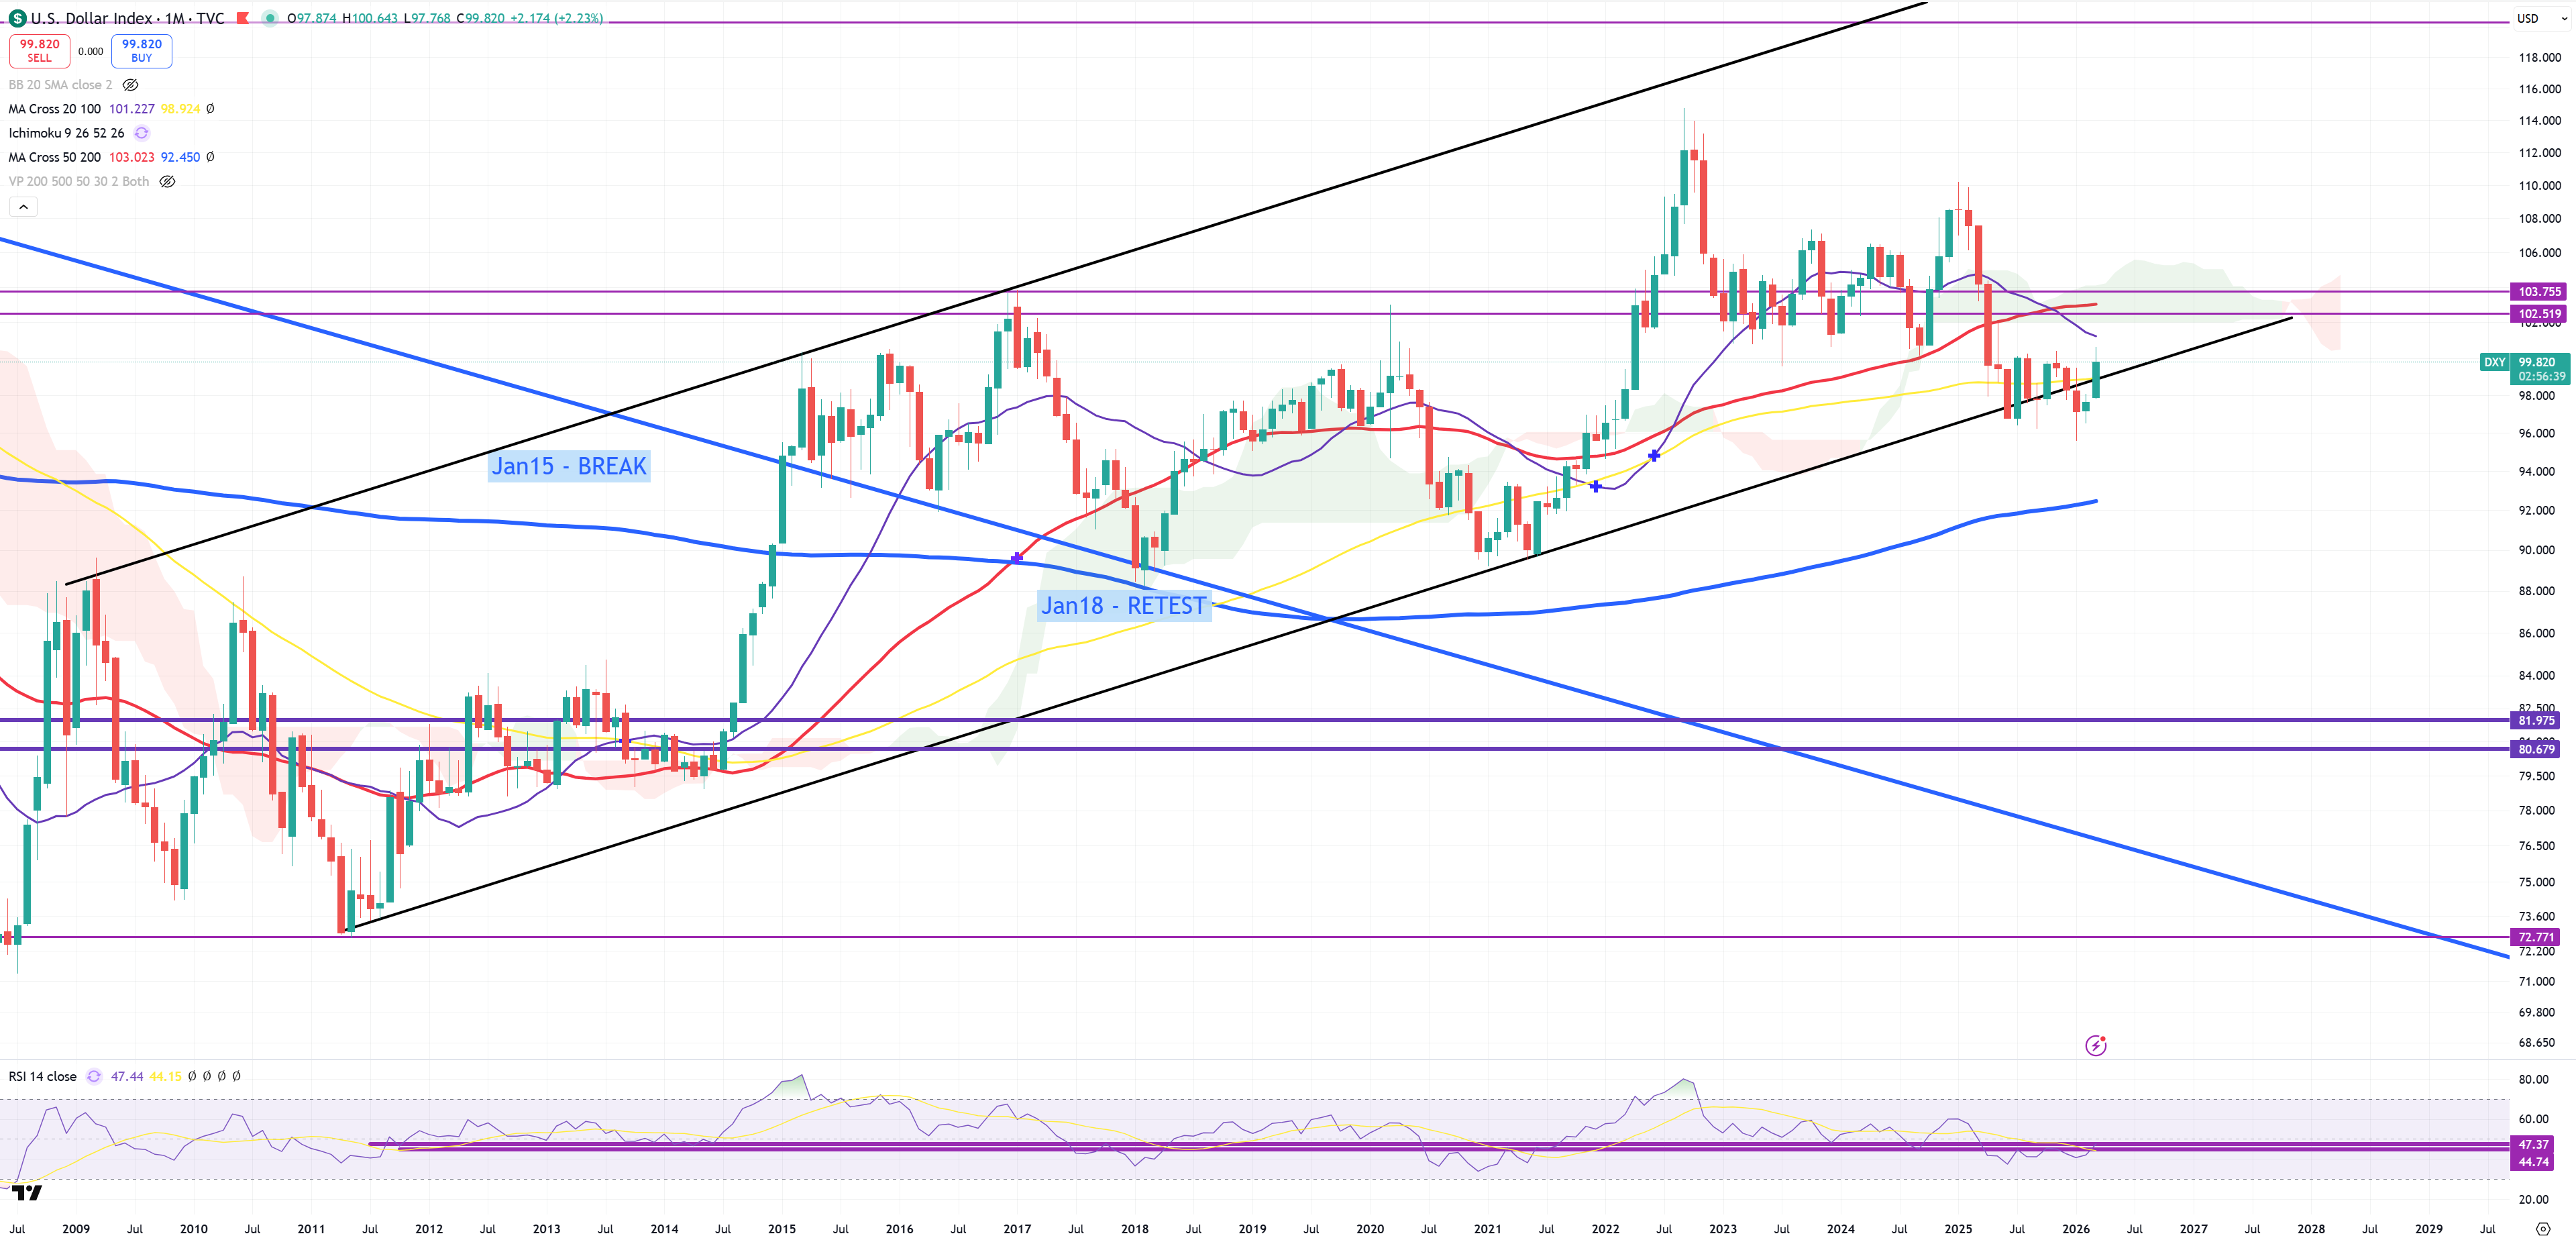
DXY – we have SUPER SECULAR GOLDEN CROSS, when red (3M)MA50 crossing up blue (3M)MA200, the same moment (3M)RSI finds support telling us it’s a bottom in a super secular bull market with last possible retest 96-96.5. Still 2 levels opened 120 or 160. The longer 10y/3m was inverted the higher the chances 160 will be a final target. Even if you take a look on the chart above. During Jun 2022 10y/3m peak DXY passed 110-115 level. There were still plenty of room to get 10y/3m to 300bps cyclical peak, but it failed. That’s another fact pushing me to get 160 level as the final one, as even today with just +60bps we have DXY=100. First view 3M, second M. On M we see yellow (M)MA100 broken
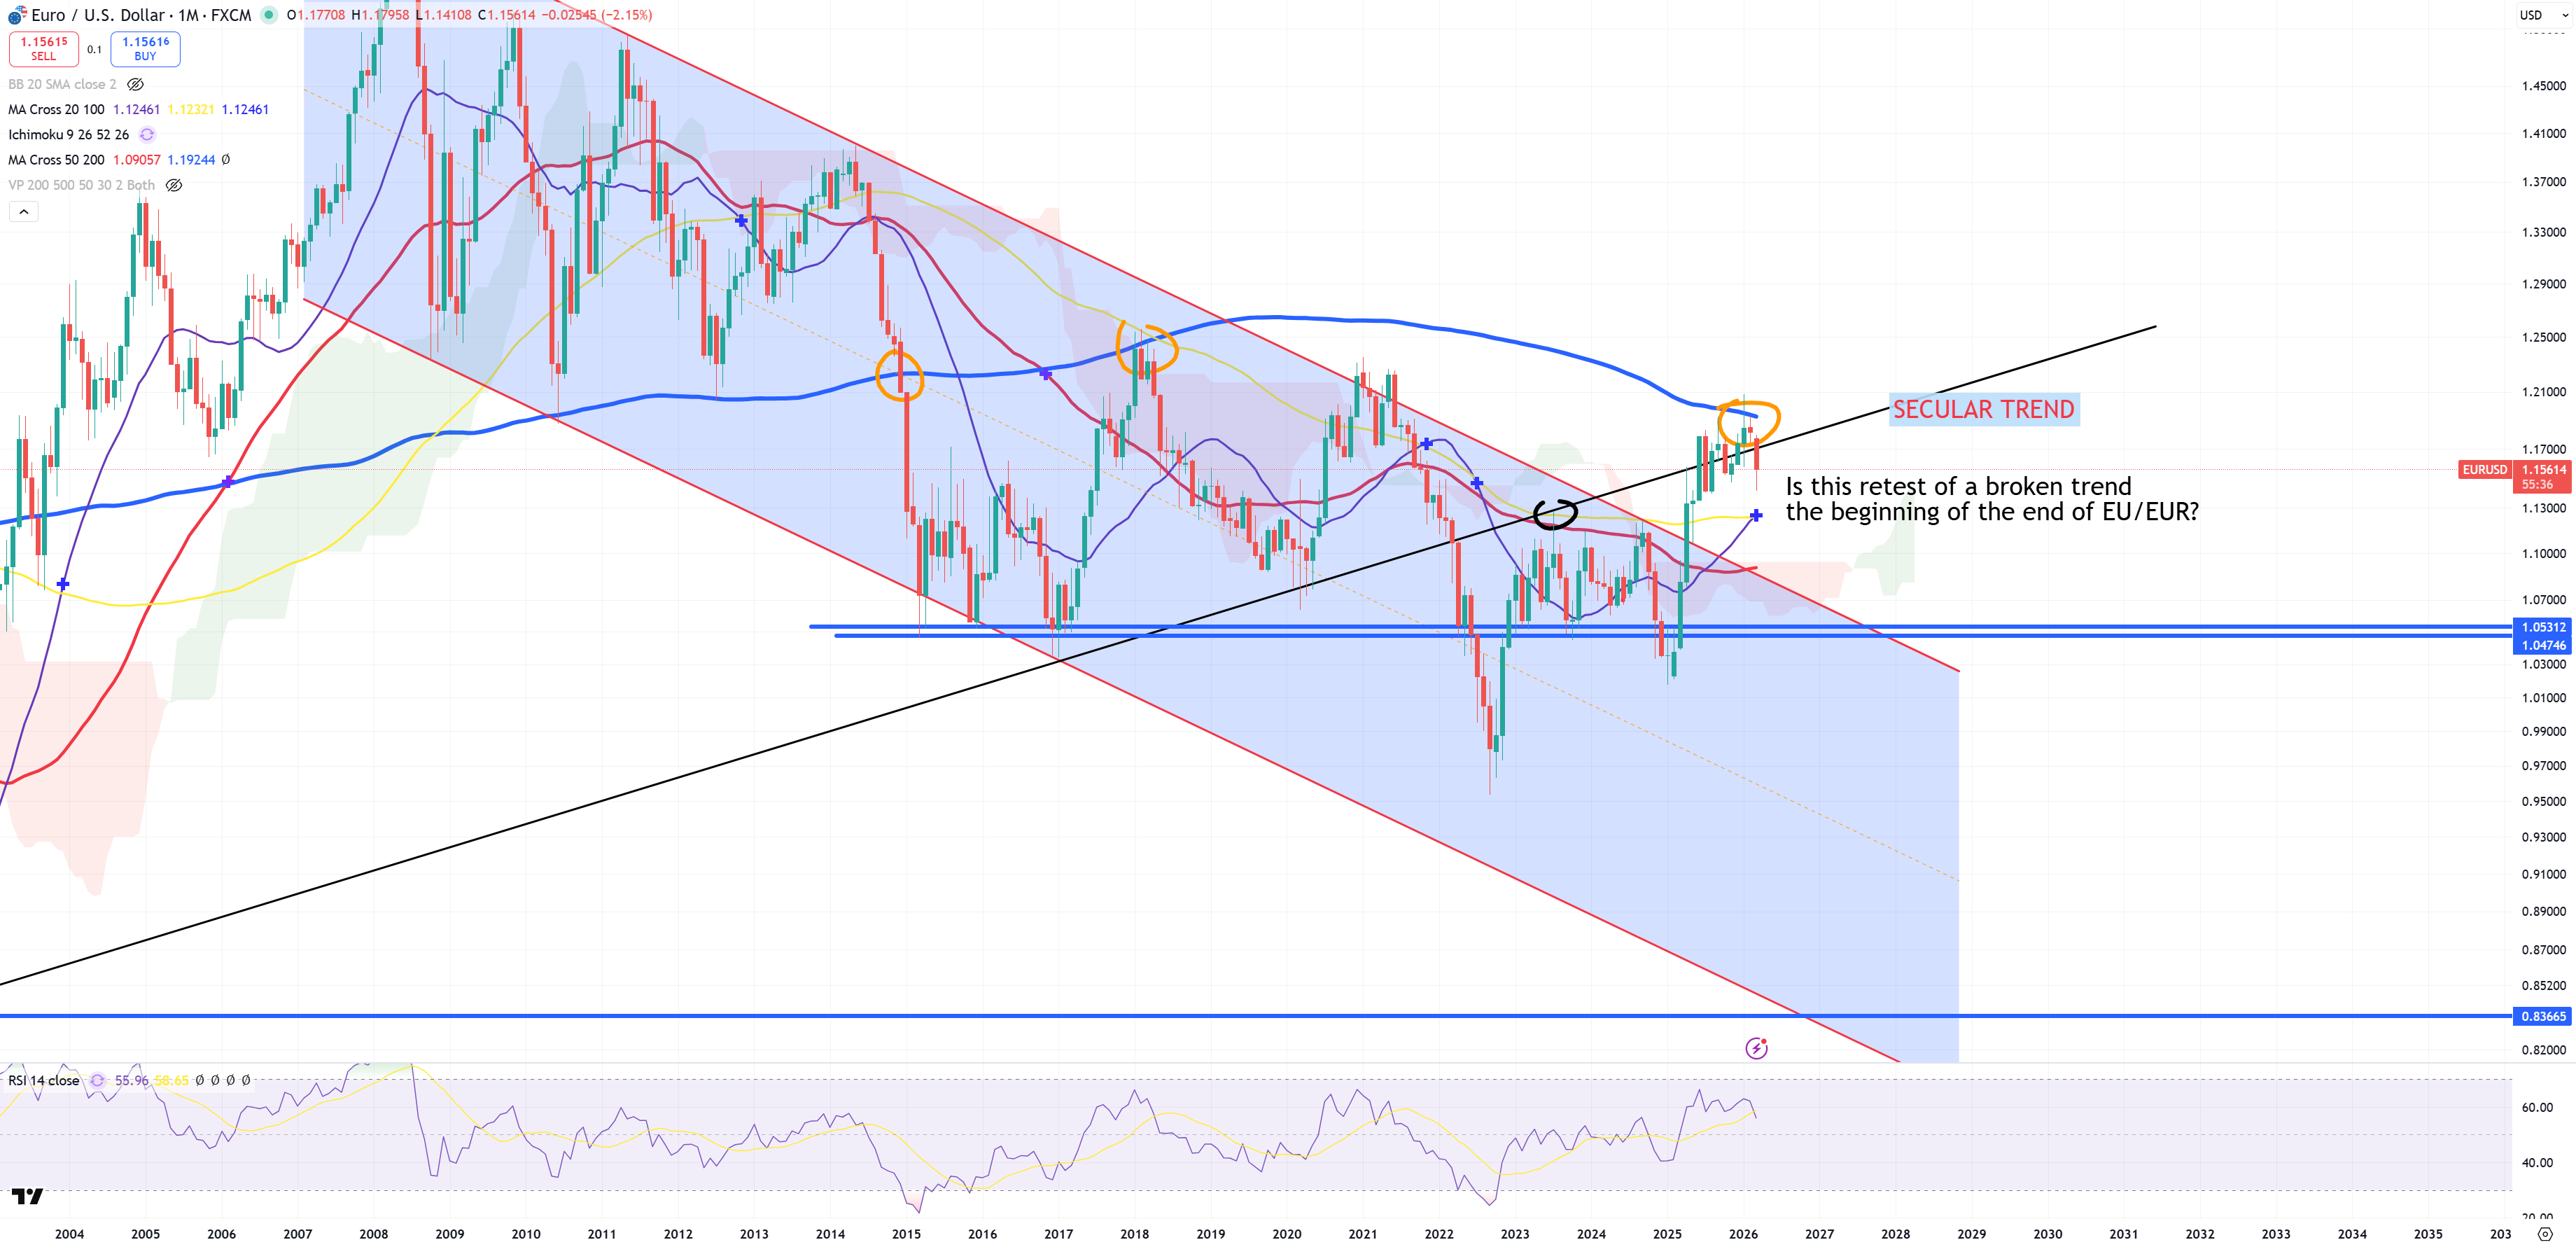
EURUSD – and this DXY comes also from EURUSD confirmation with last possible 1.20 level of retest which hits (M)MA200. I still call it a retest to secular trend :
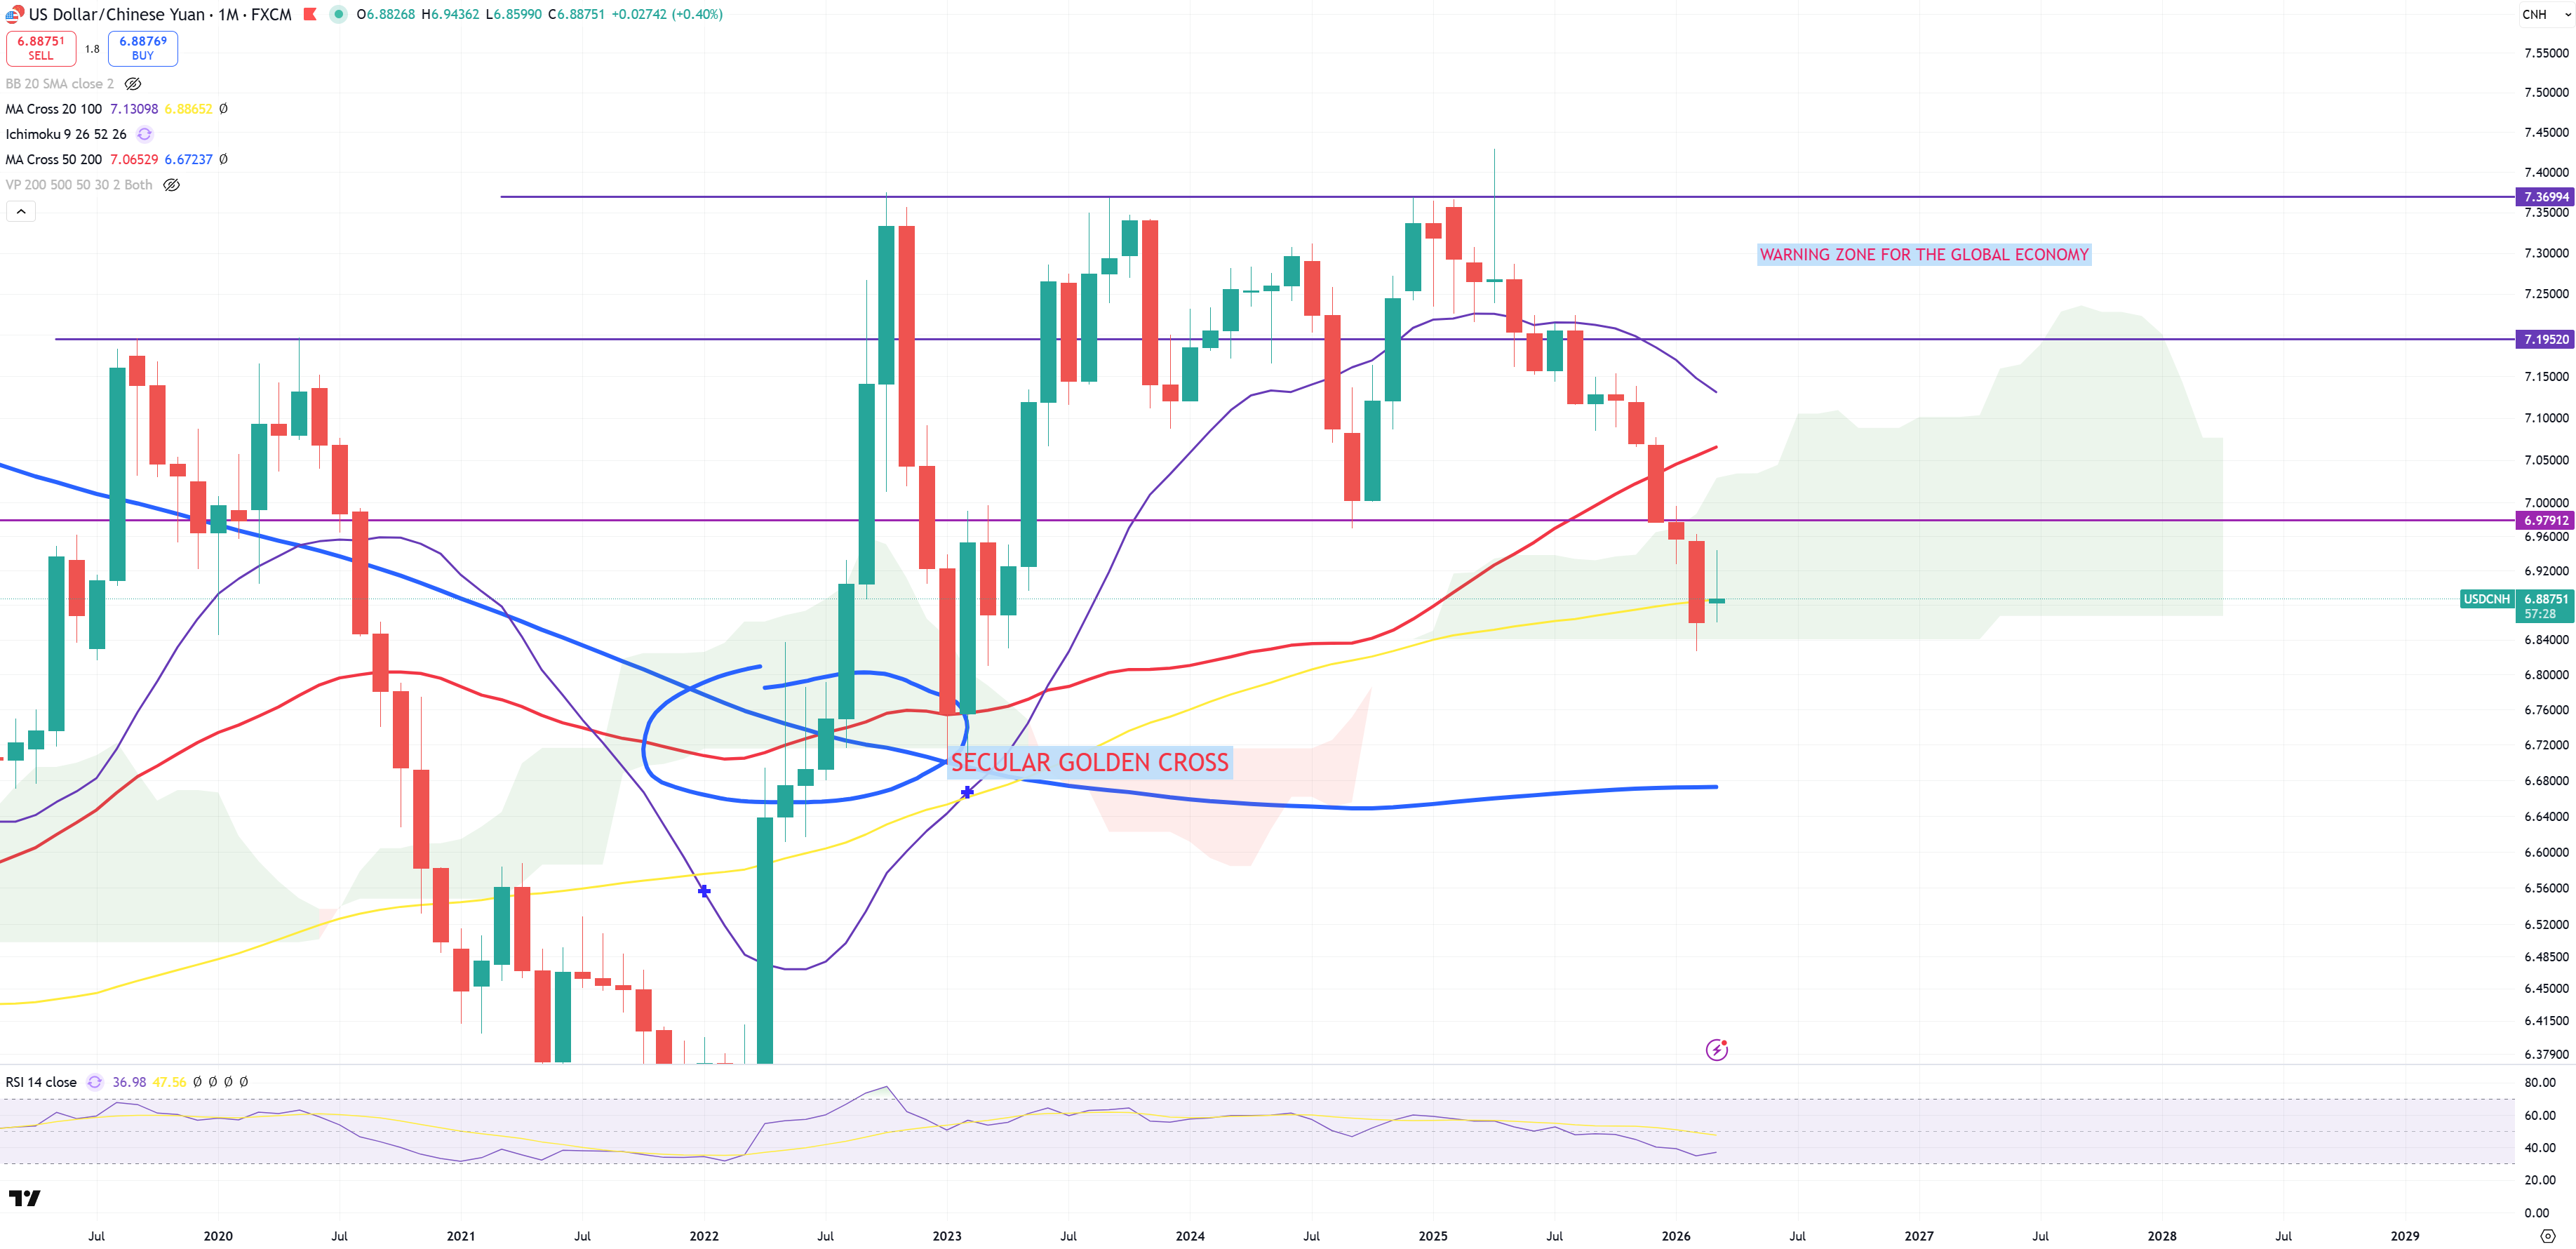
USDCNH – we are not even allowed to talk about $$$ without talking about Yuan, if $$$ starts raising it means Yuan starts going down (= USDCNH going UP). Actually it hits lowest level of the cloud + yellow (M)MA100 = typical bull/bear trap level. So without a doubt we can say that if DXY=~96 bottom it means USDCNH = ~6.90 bottom. This yellow (M)MA100 needs to be now support to get DXY up.
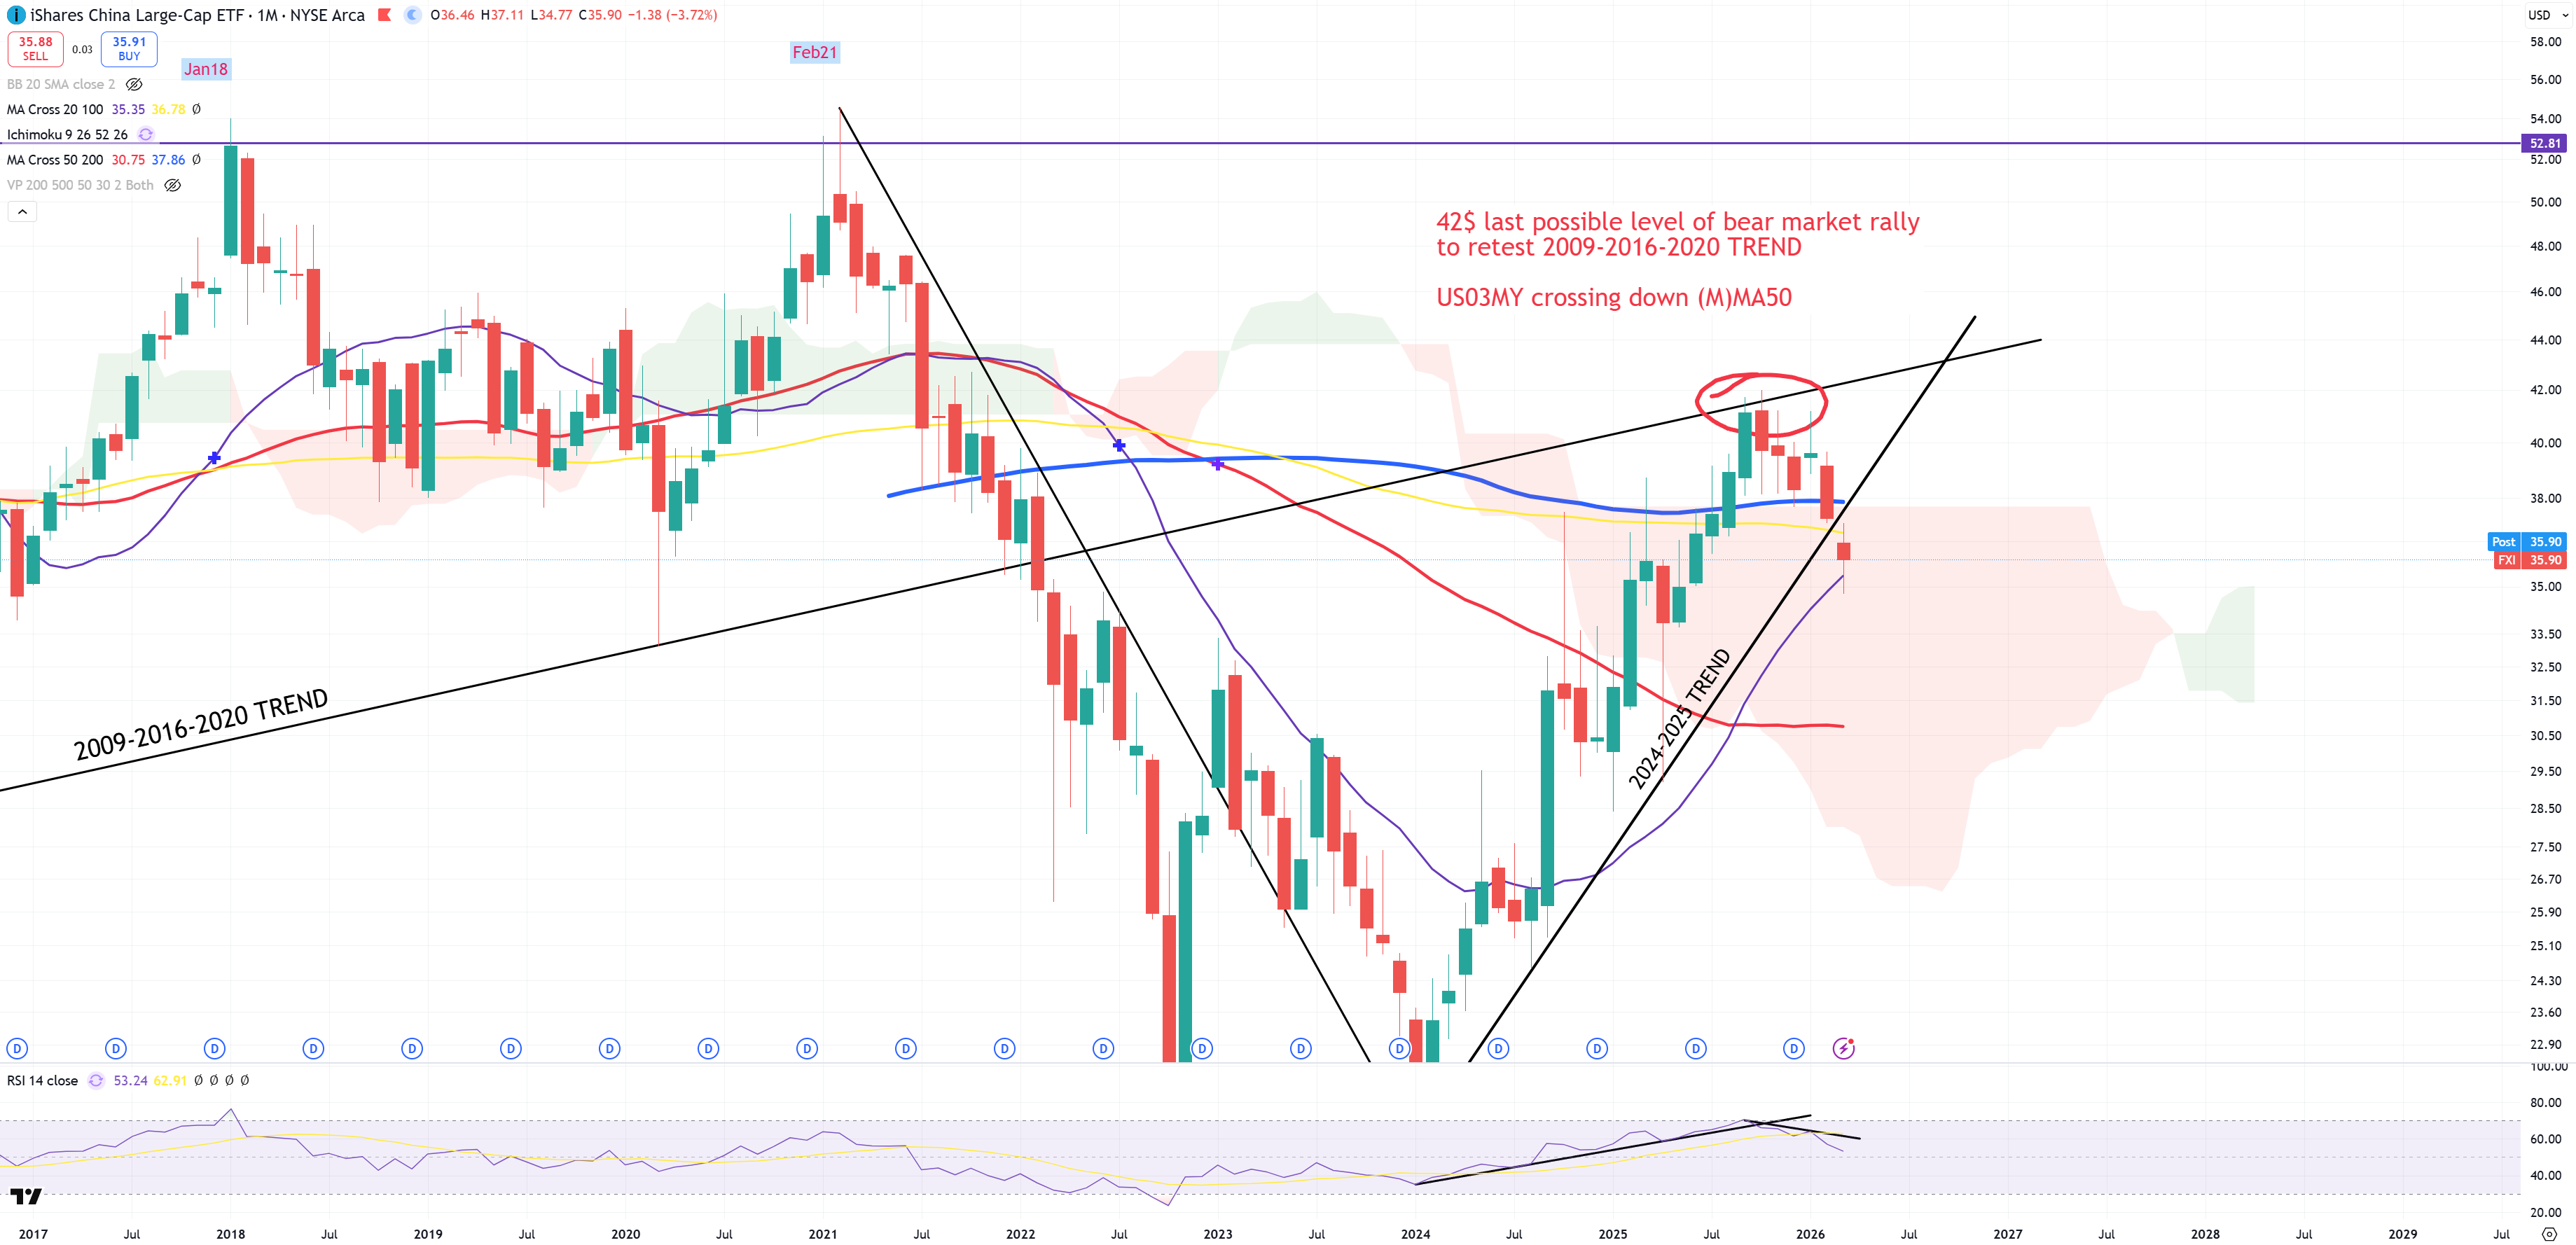
FXI – even Chinese stock market works as it should to align. While SPX was trying to retest 1929-2000 trend but failed. FXI tried to retest 2009-2016-2022 and failed too, while DXY found its bottom. It’s really hard to find any excuse about China than typical bear market rally when SPX/GOLD peaked in 4Q21 and around 2024 it started to crash. That move from January 2024 till October 2025 was a bear market rally. Now it holds (M)MA20 after trend break – high momentum bull/bear market indicator.
AUDJPY – main risk on/off pair. I bet this spike above October 2007 is a massive bull trap. Reversal below 2007-2024 will be very brutal for stocks.
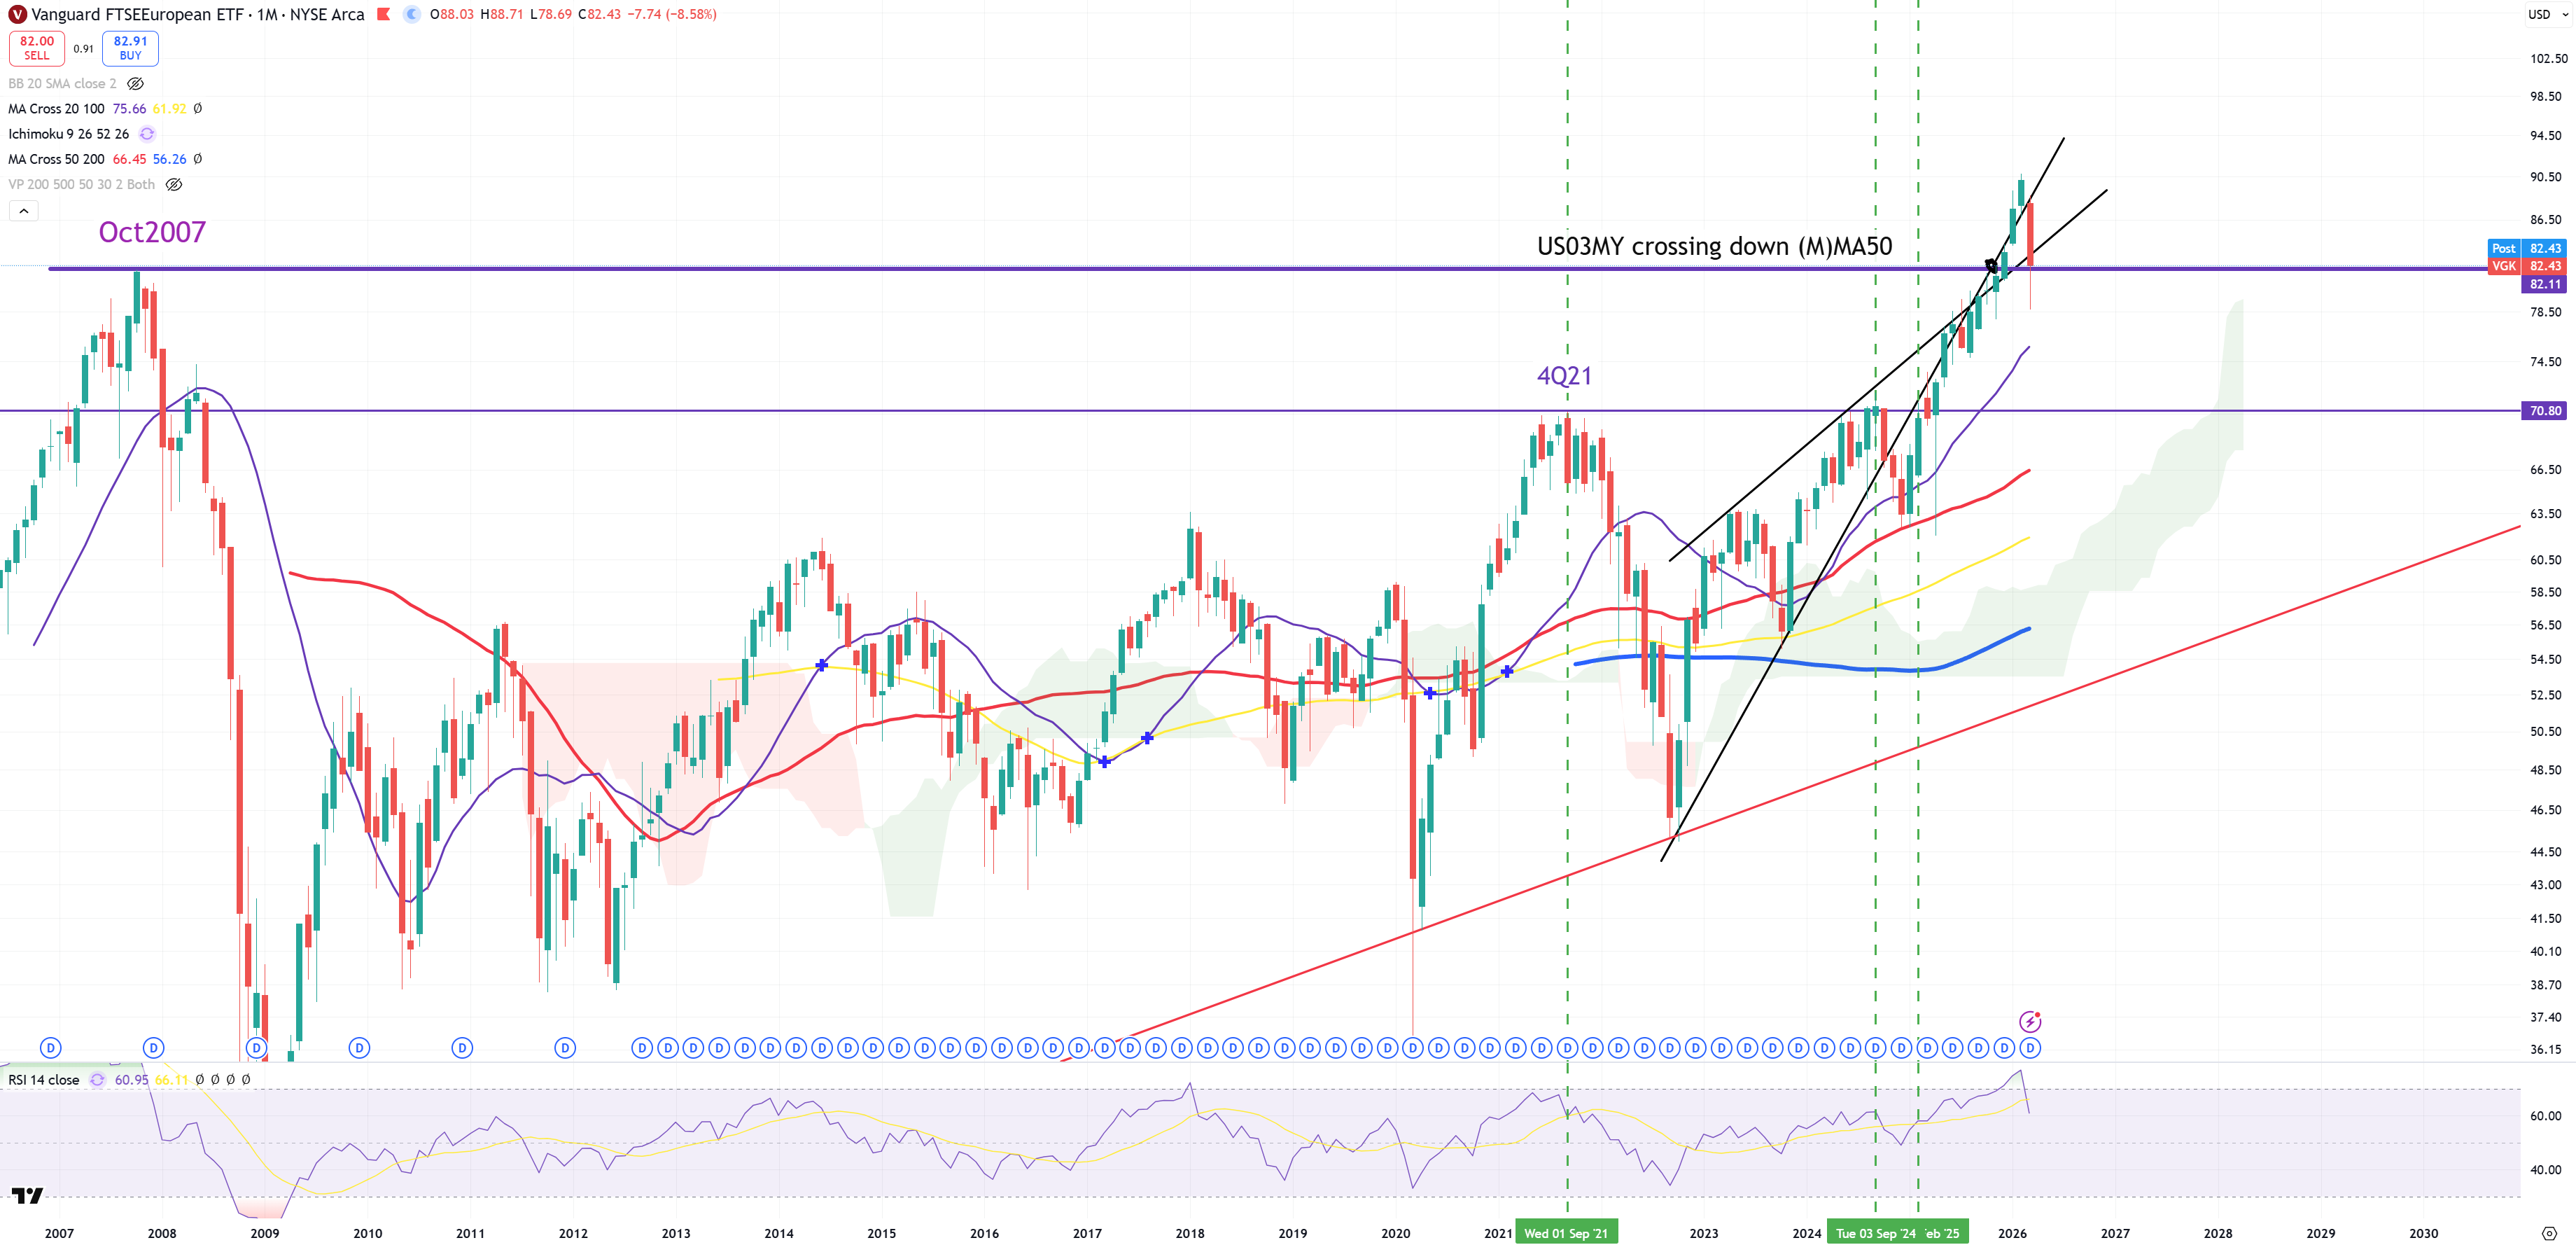
VGK – Europe – same as SPX from first chart. Very good comparison with chart above AUDJPY and VGK :
While most stocks peaked around 4Q21, some managed to get another top on 4Q21 level and finally depart. Quick couple examples, because this time we’ll concentrate on Mag7 later.
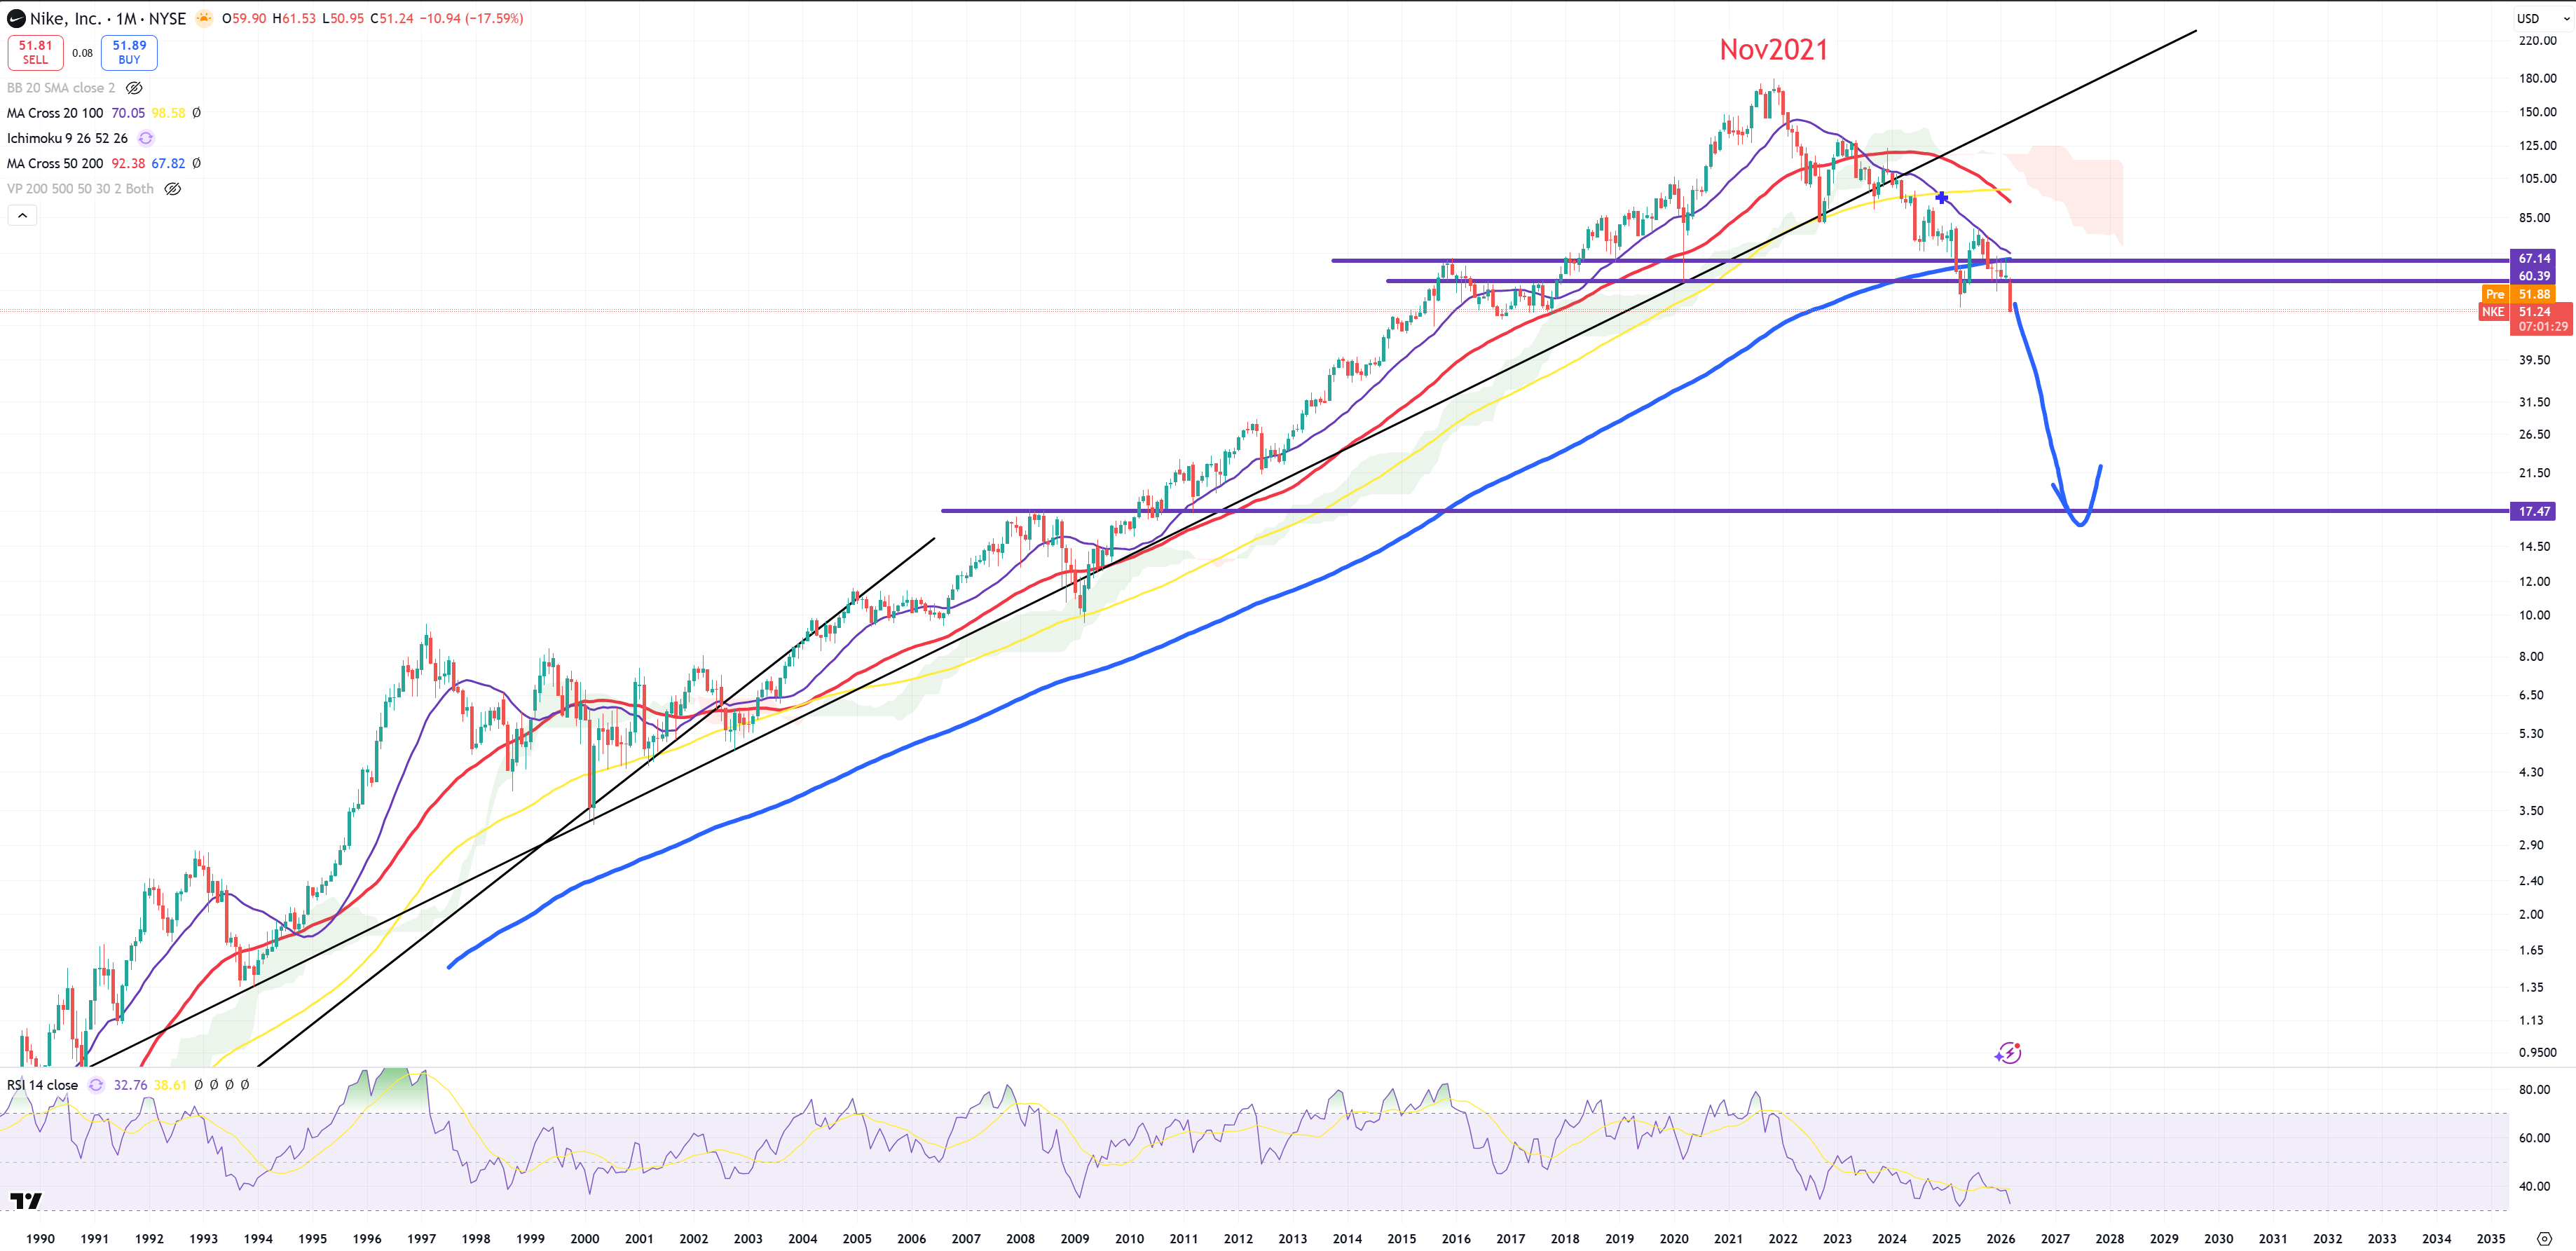
NKE – My favorite company. 17$ is the final target.
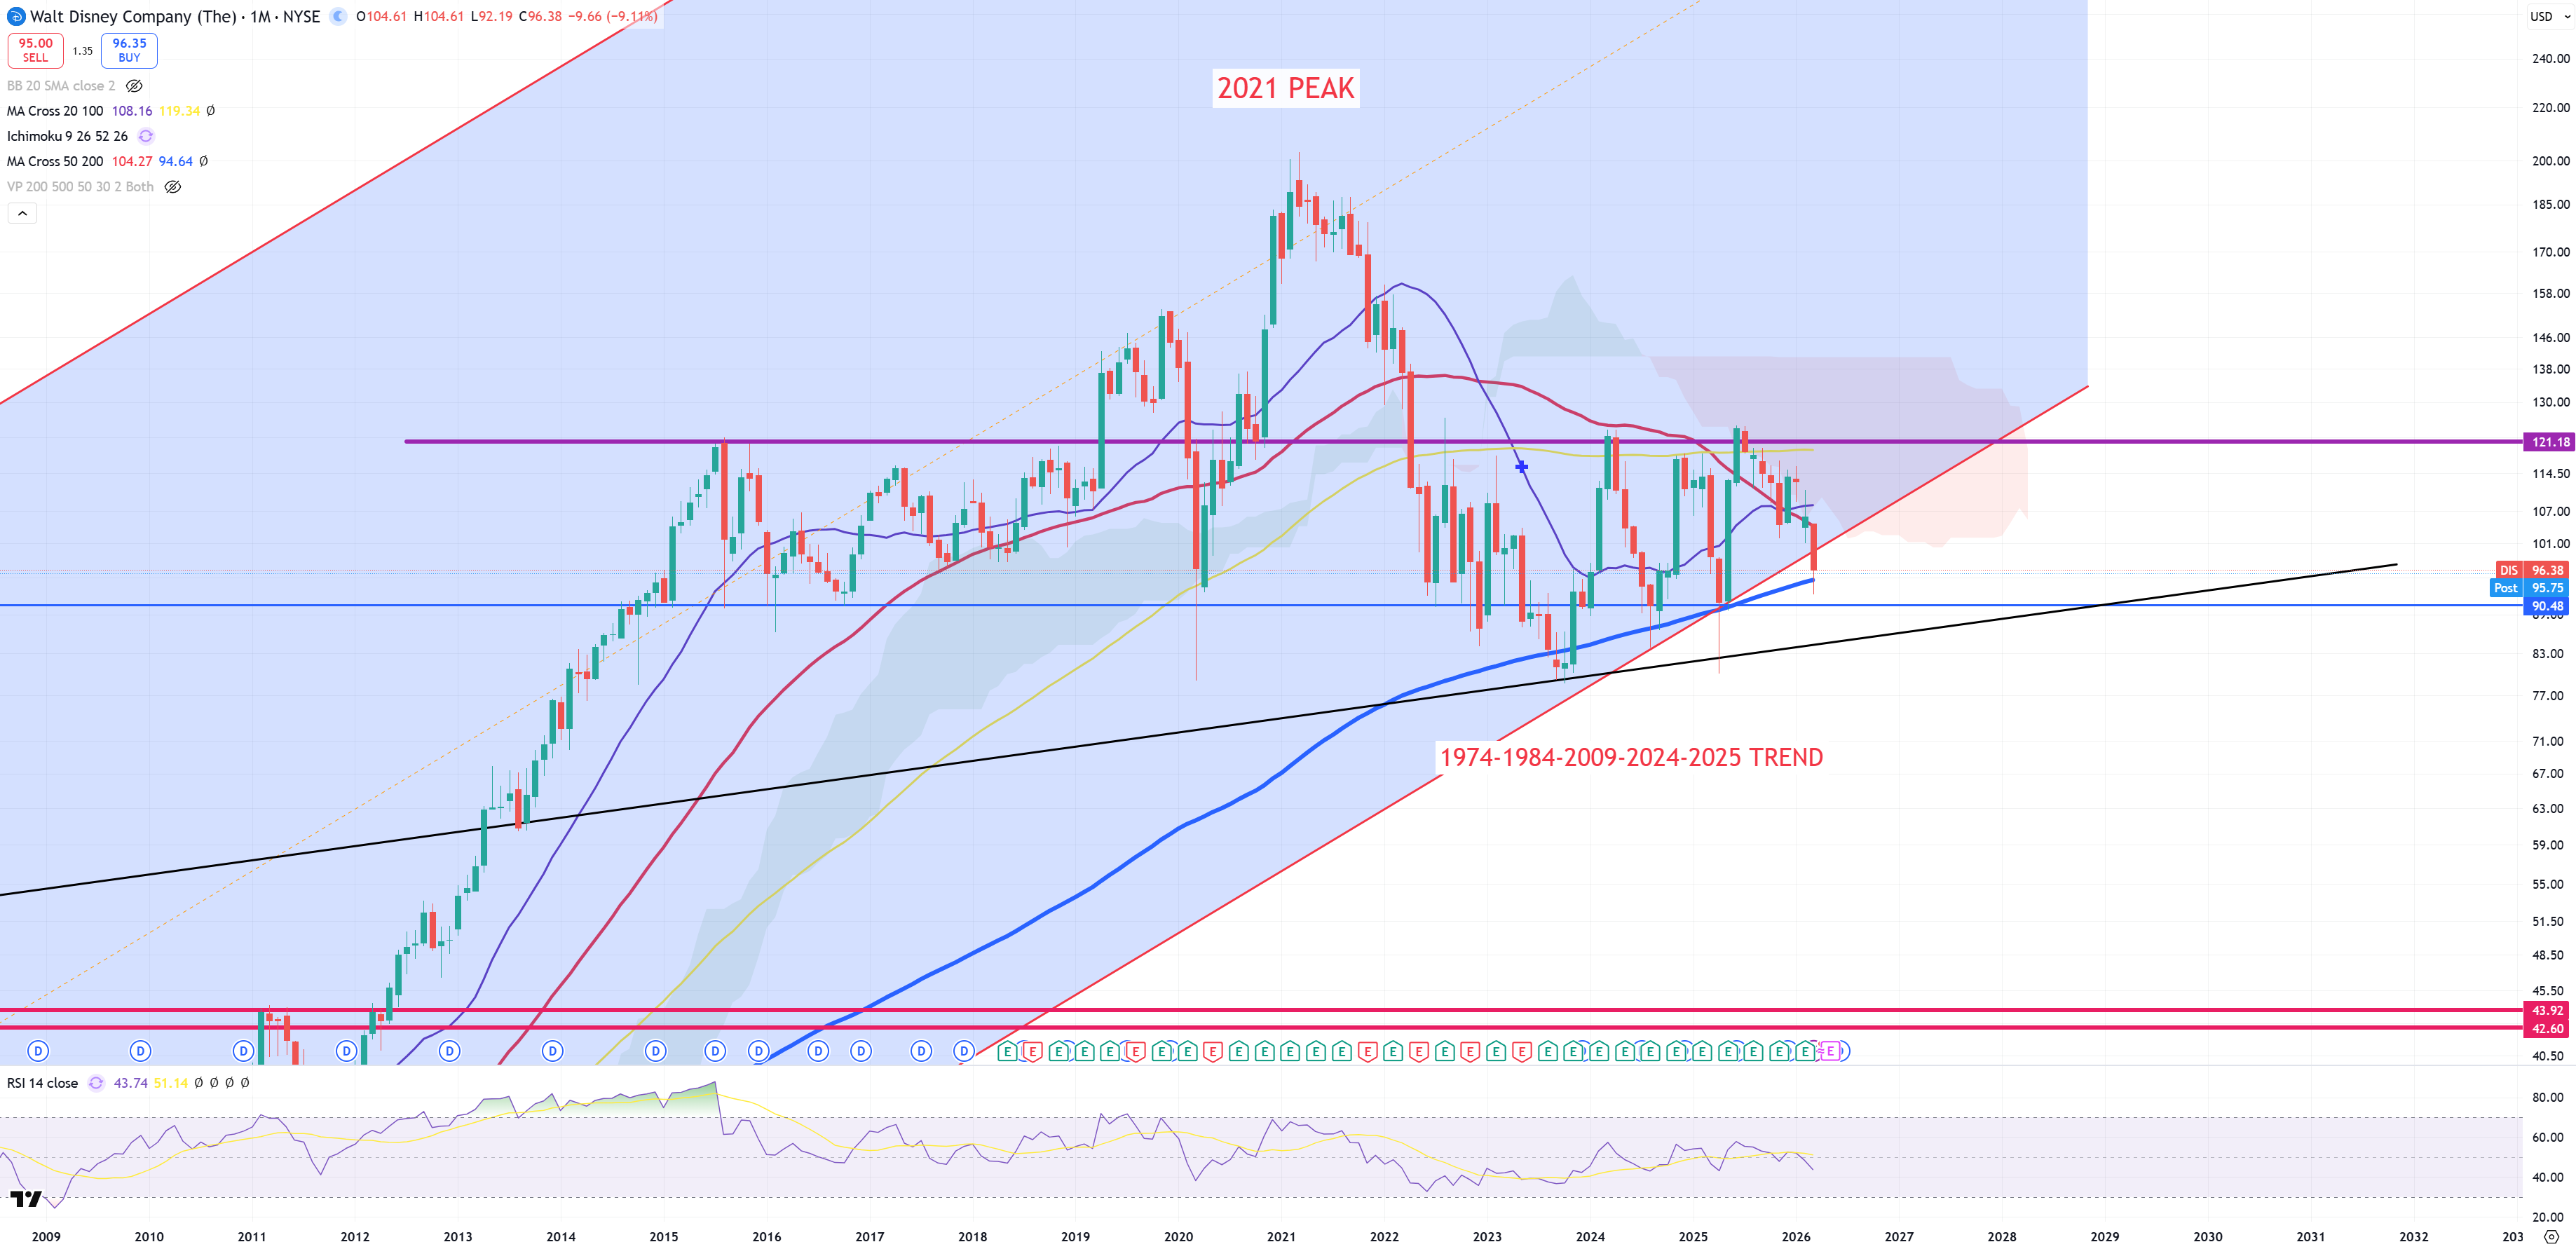
DIS – This 1974+ trend has finally broken. I really love to say : Once super long term trends/channels breaks it often leads to collapse of the company. Will Disney go bankrupt? We’ll find out. (M)MA200 support holds but trend has gone.
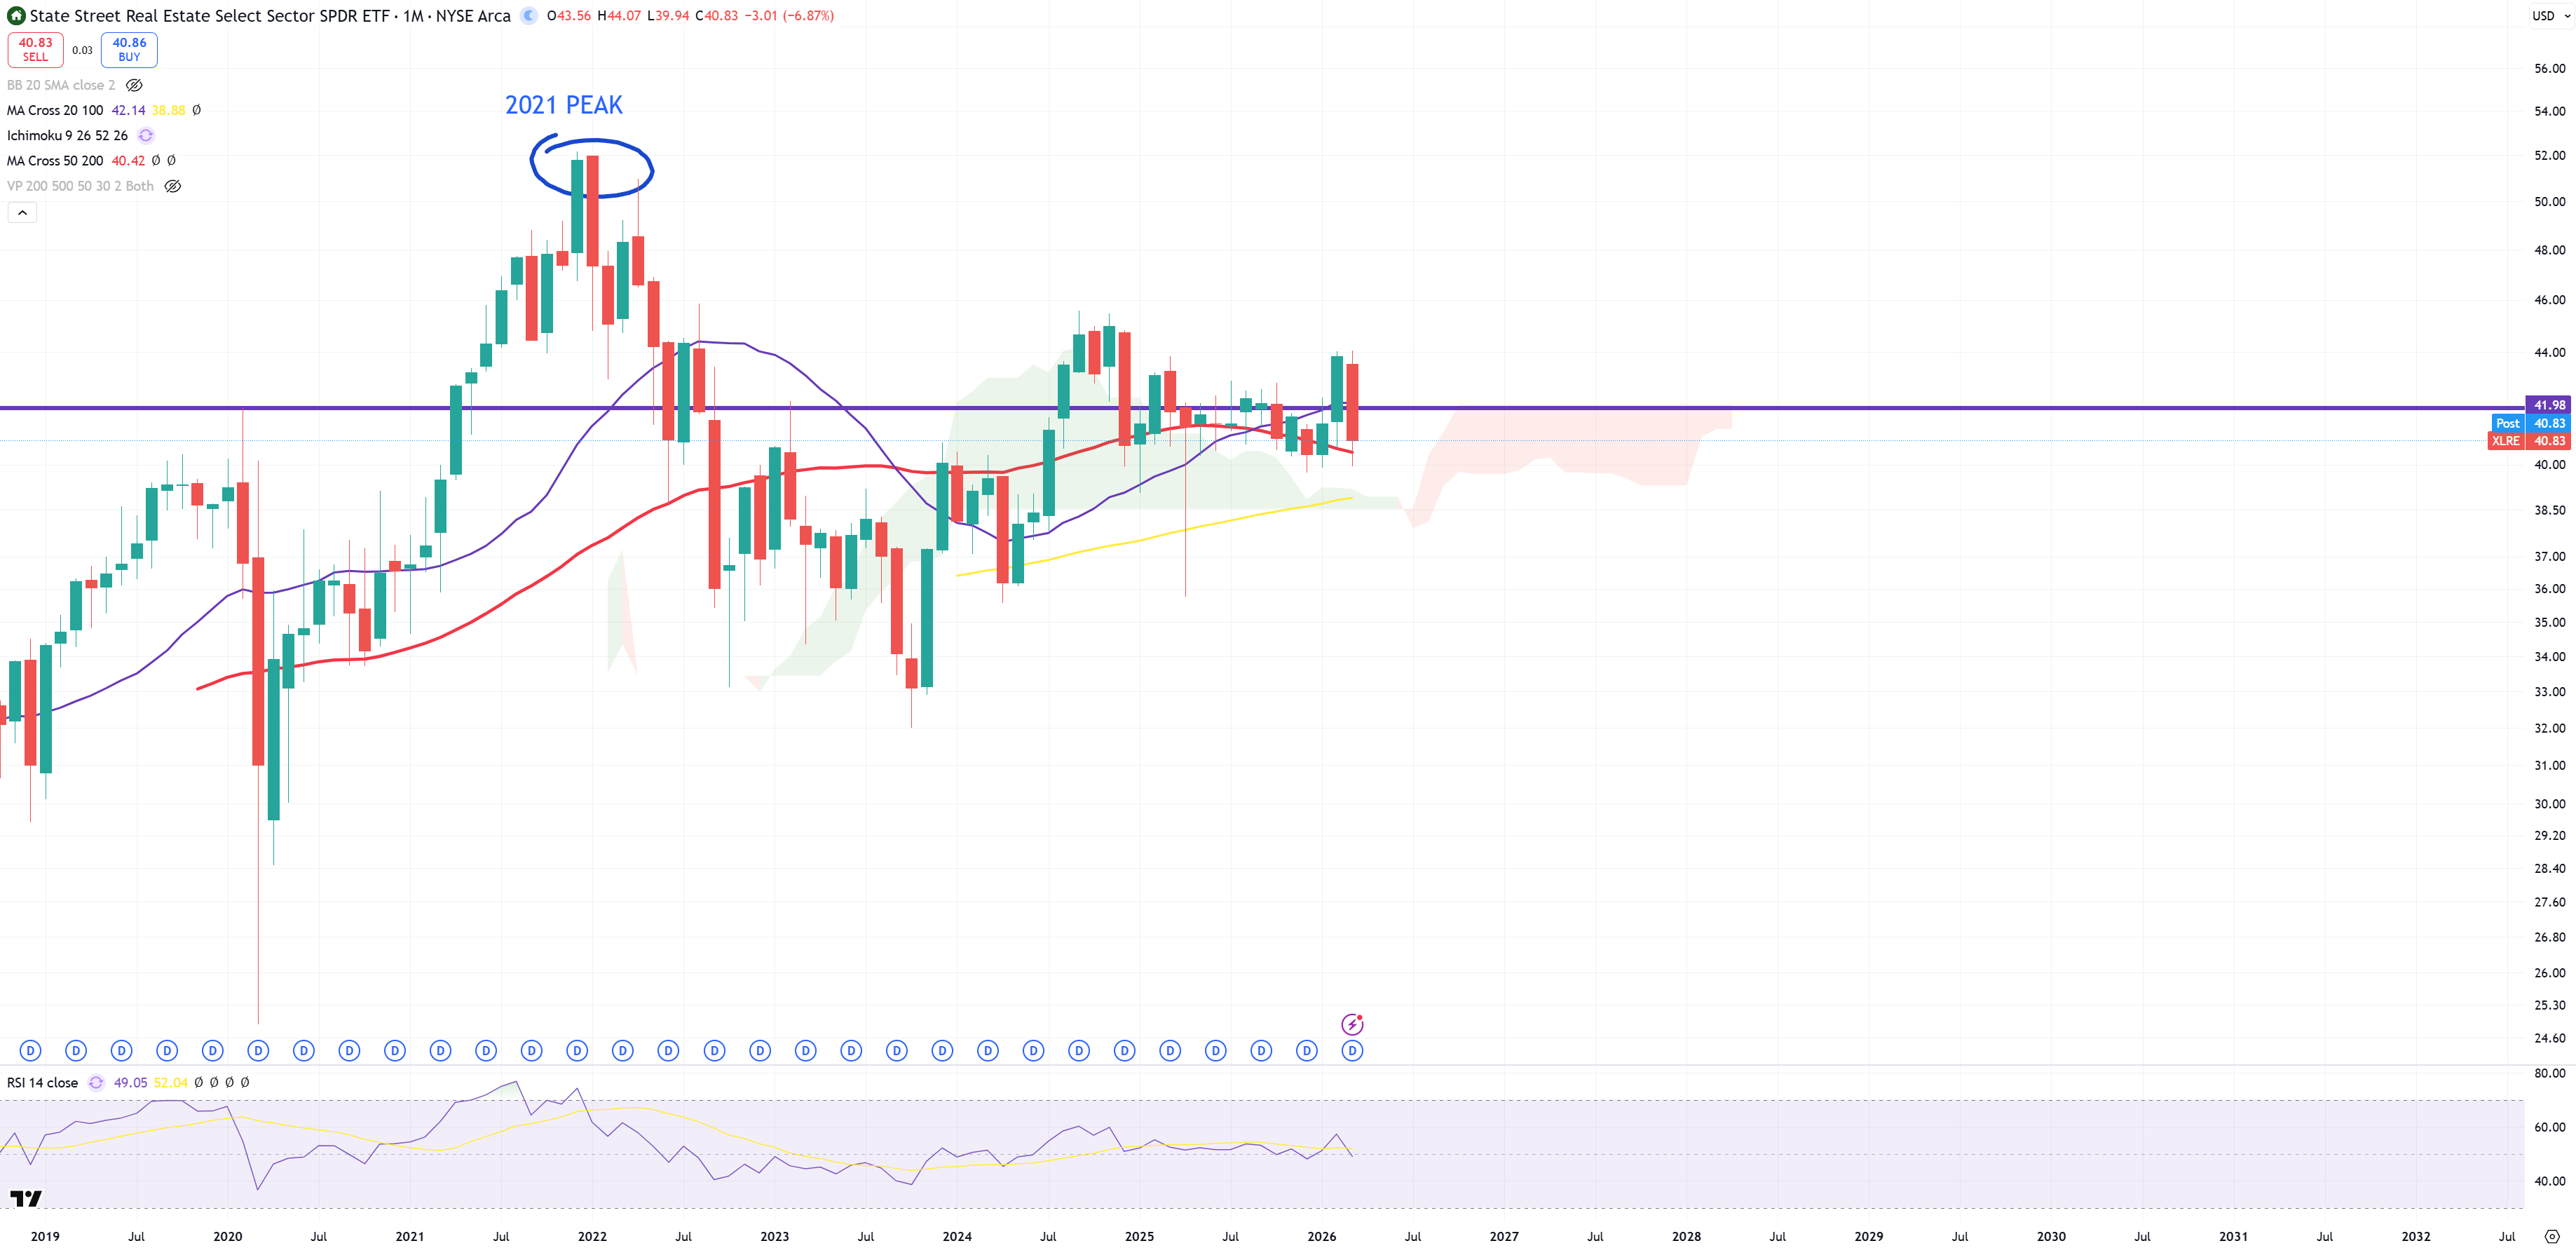
XLRE – Real Estate sector
Mag7
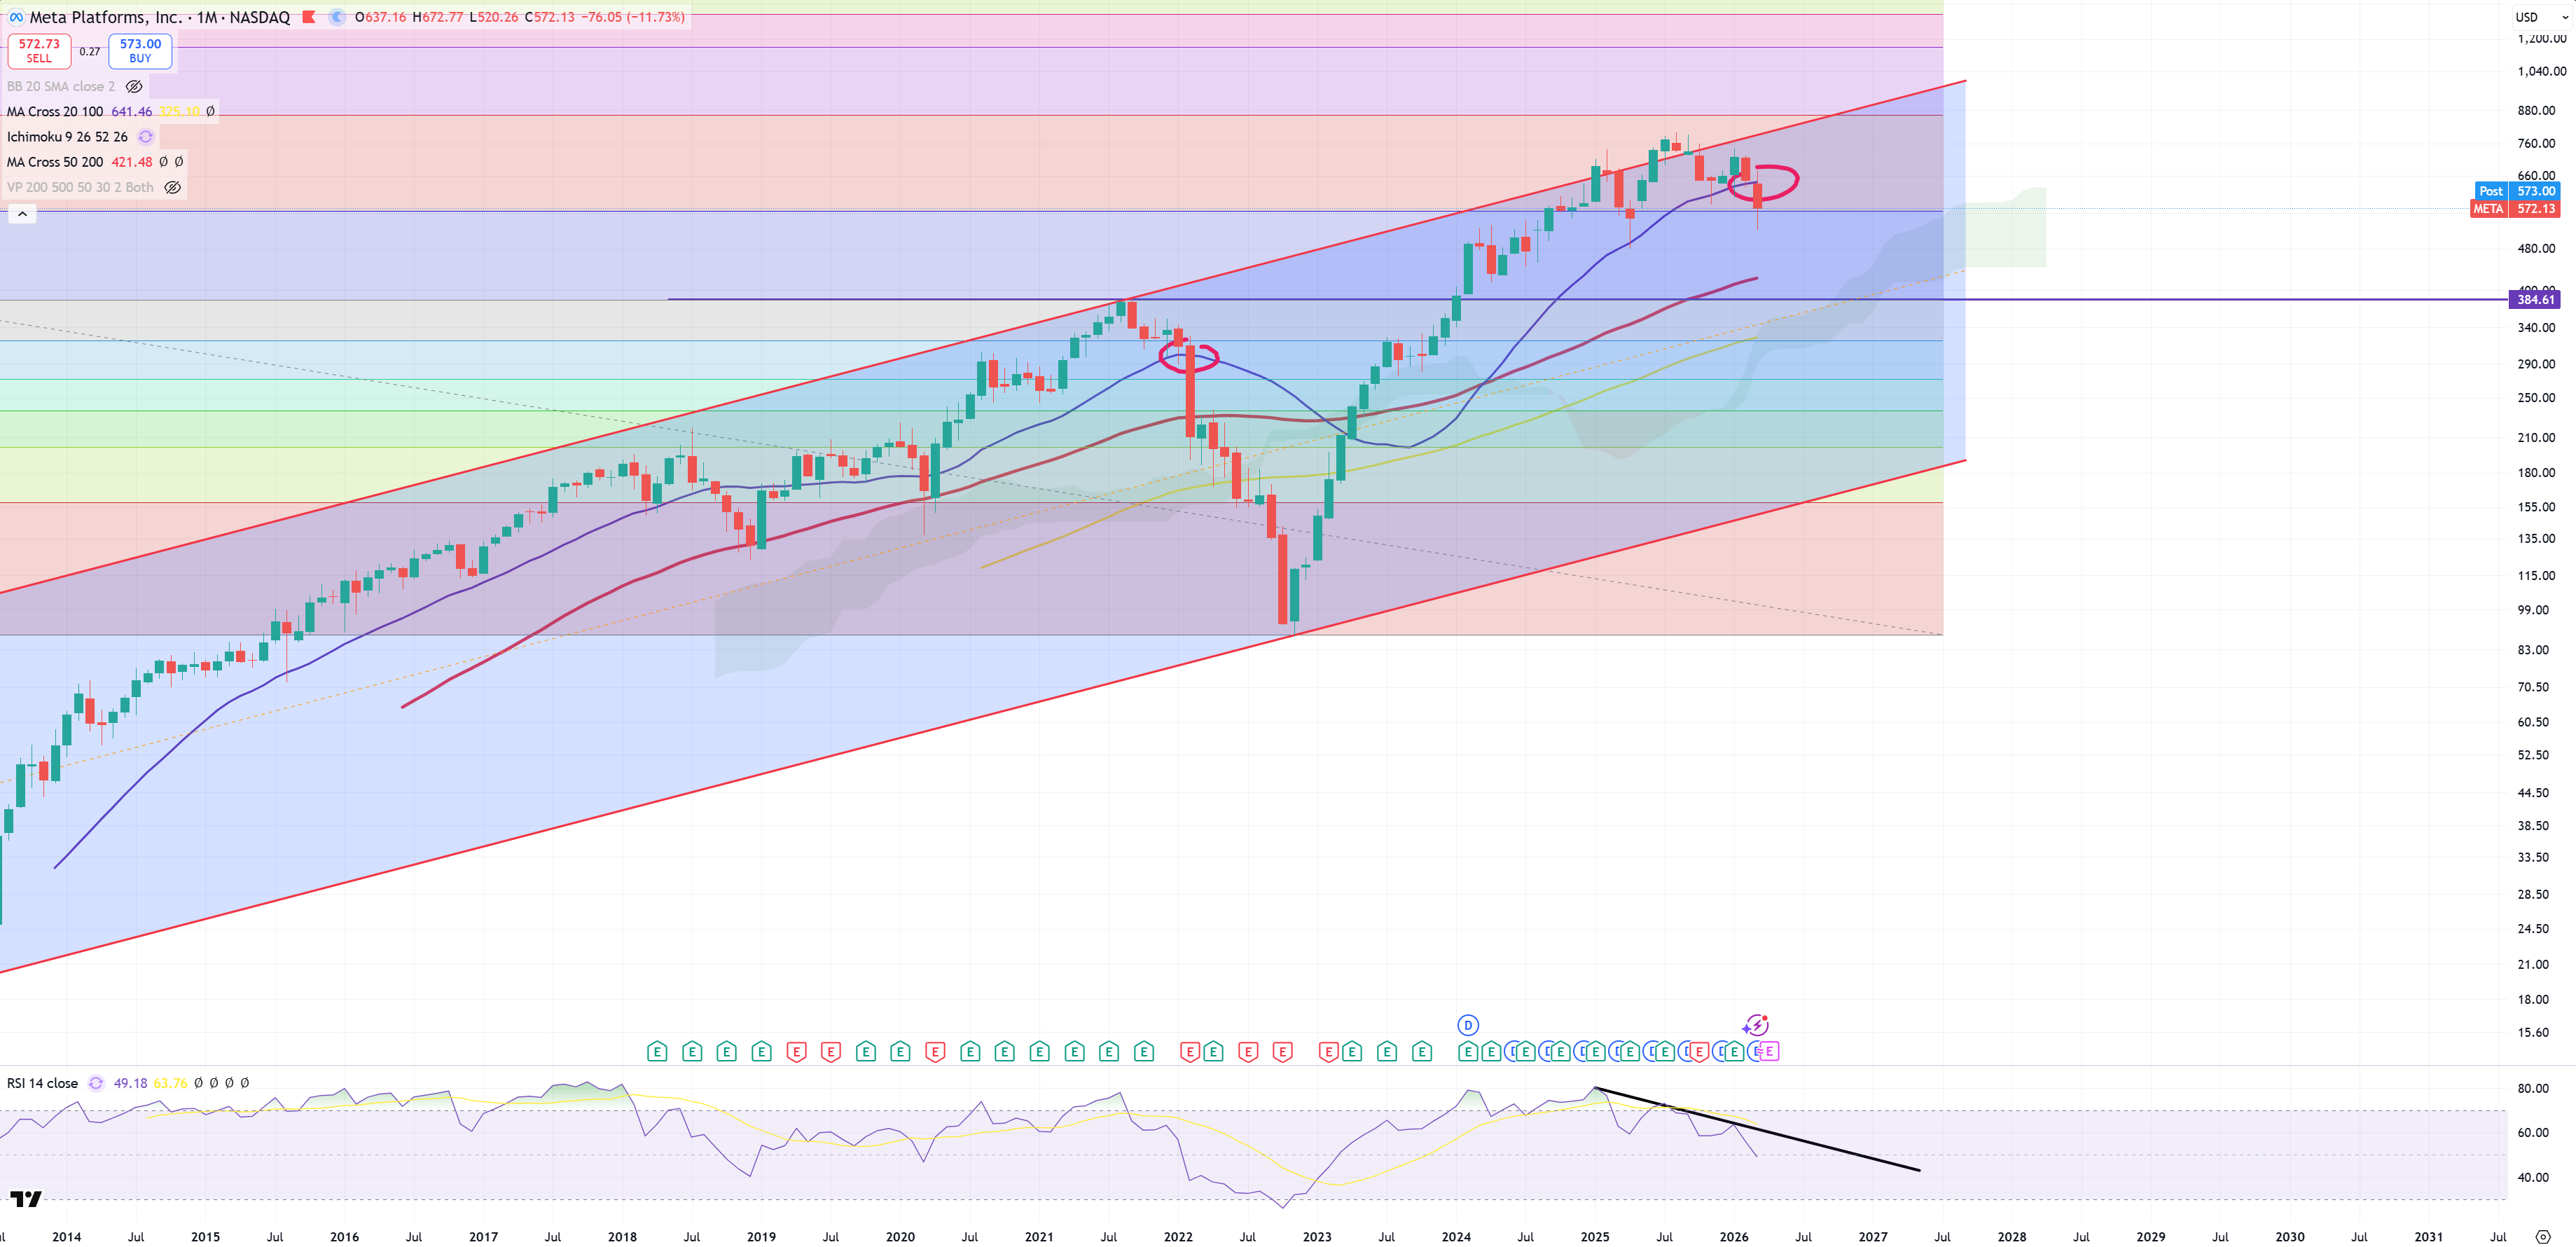
META – below (M)MA20
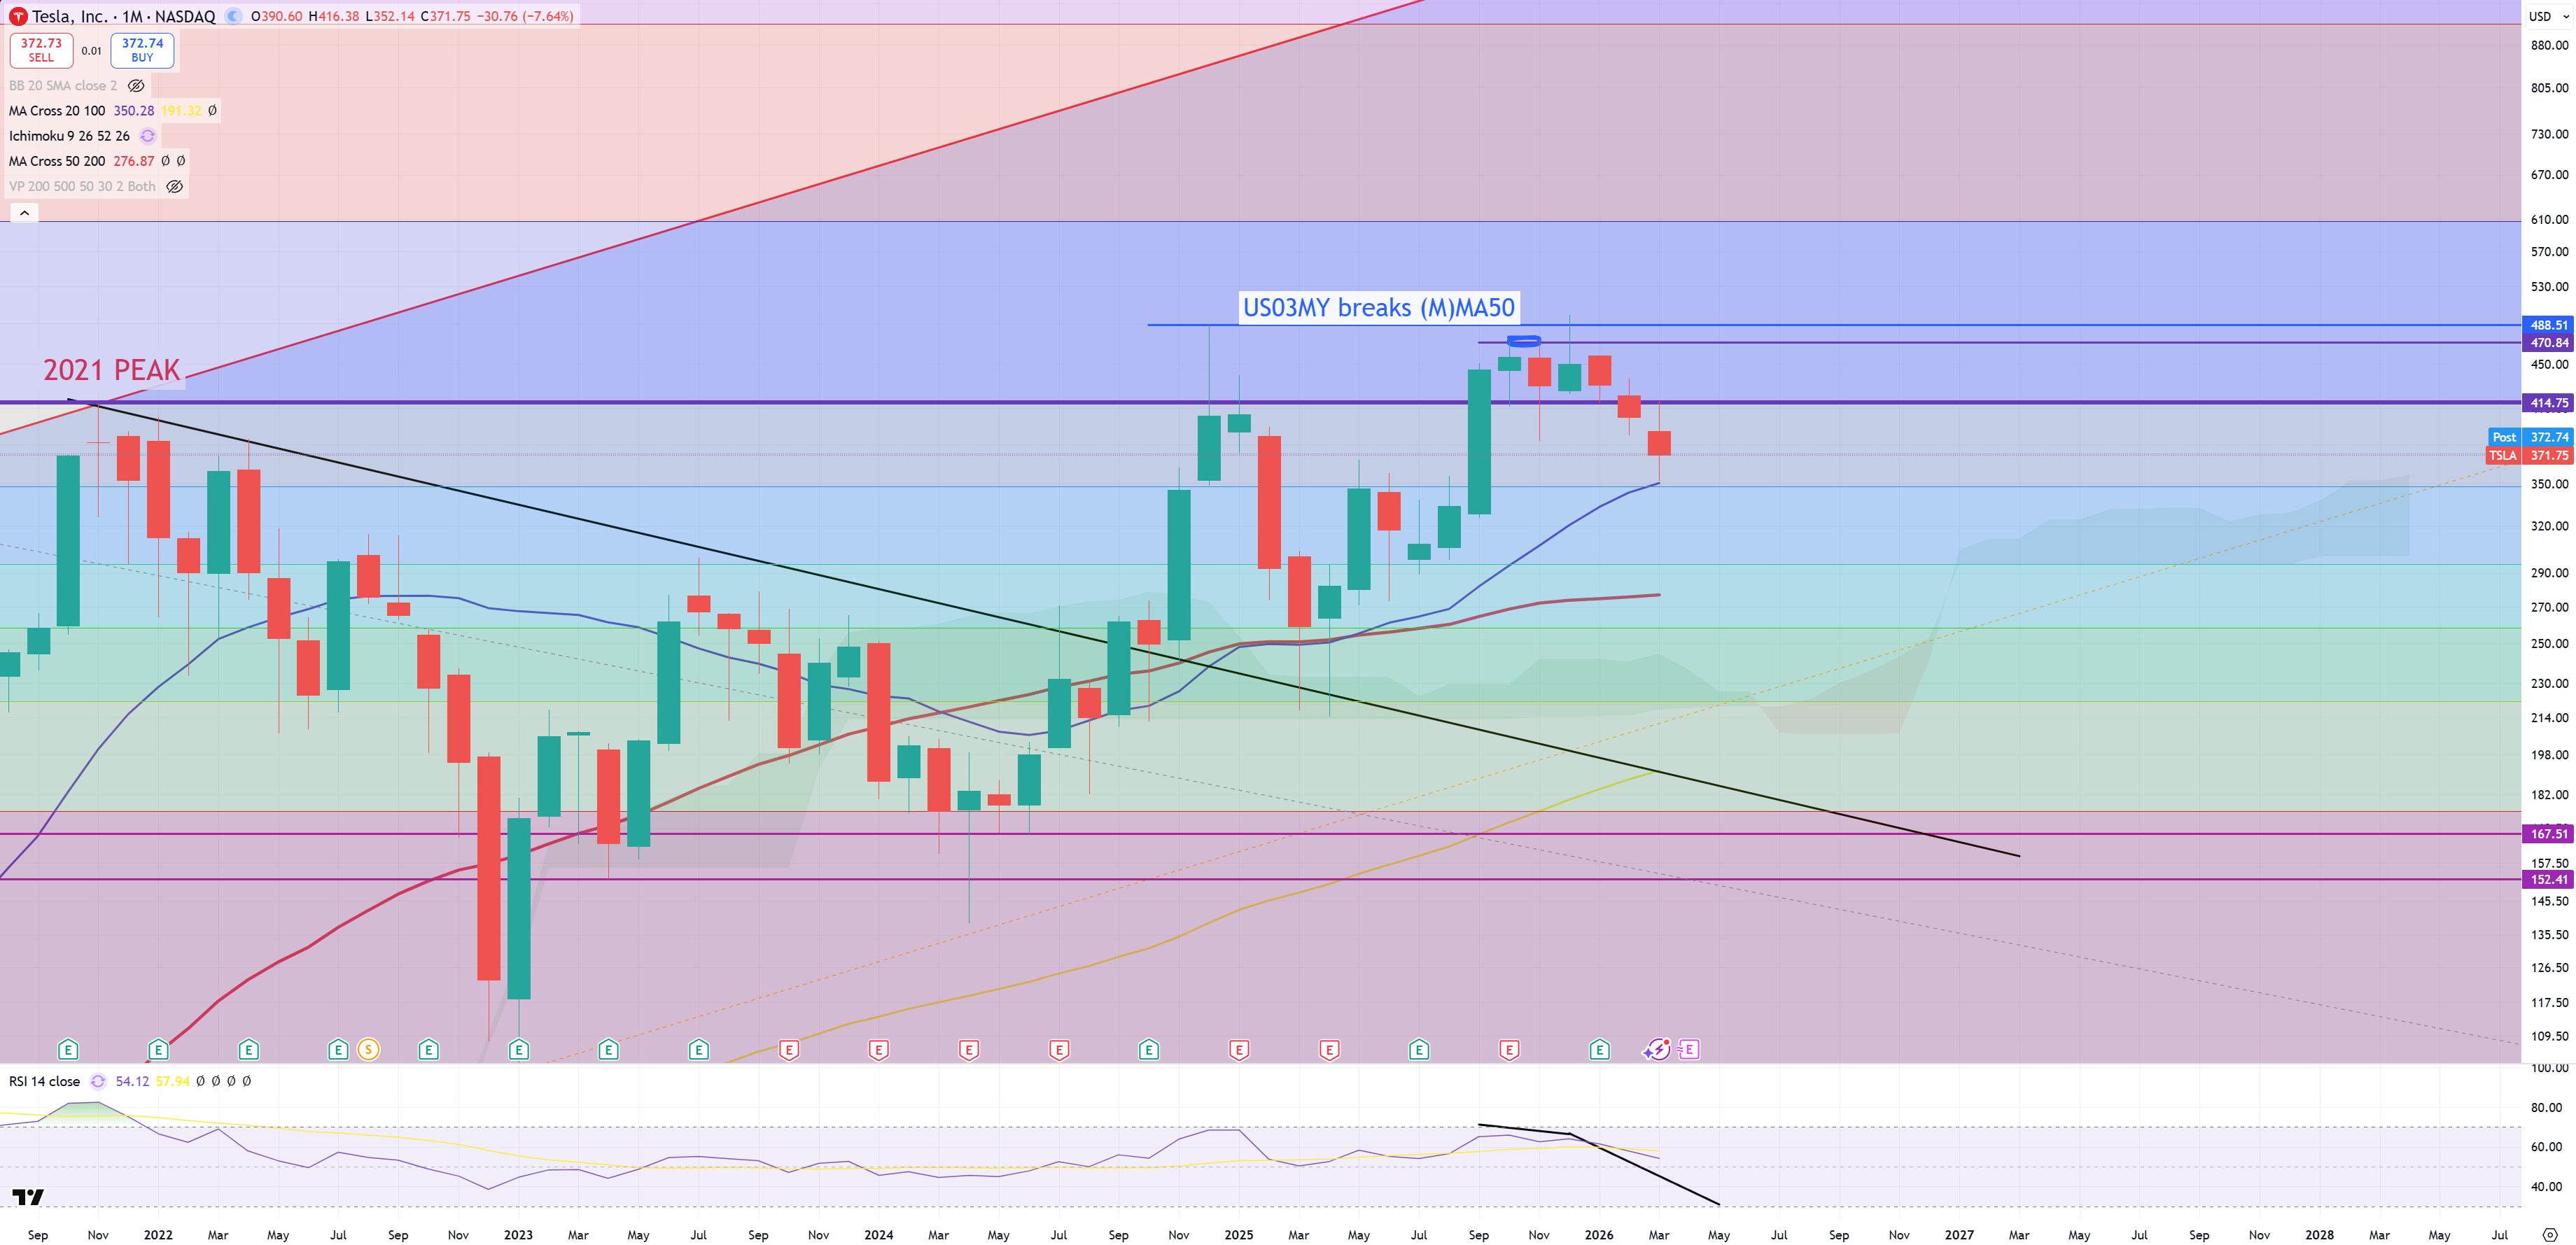
TSLA – below 2021 peak holds (M)MA20
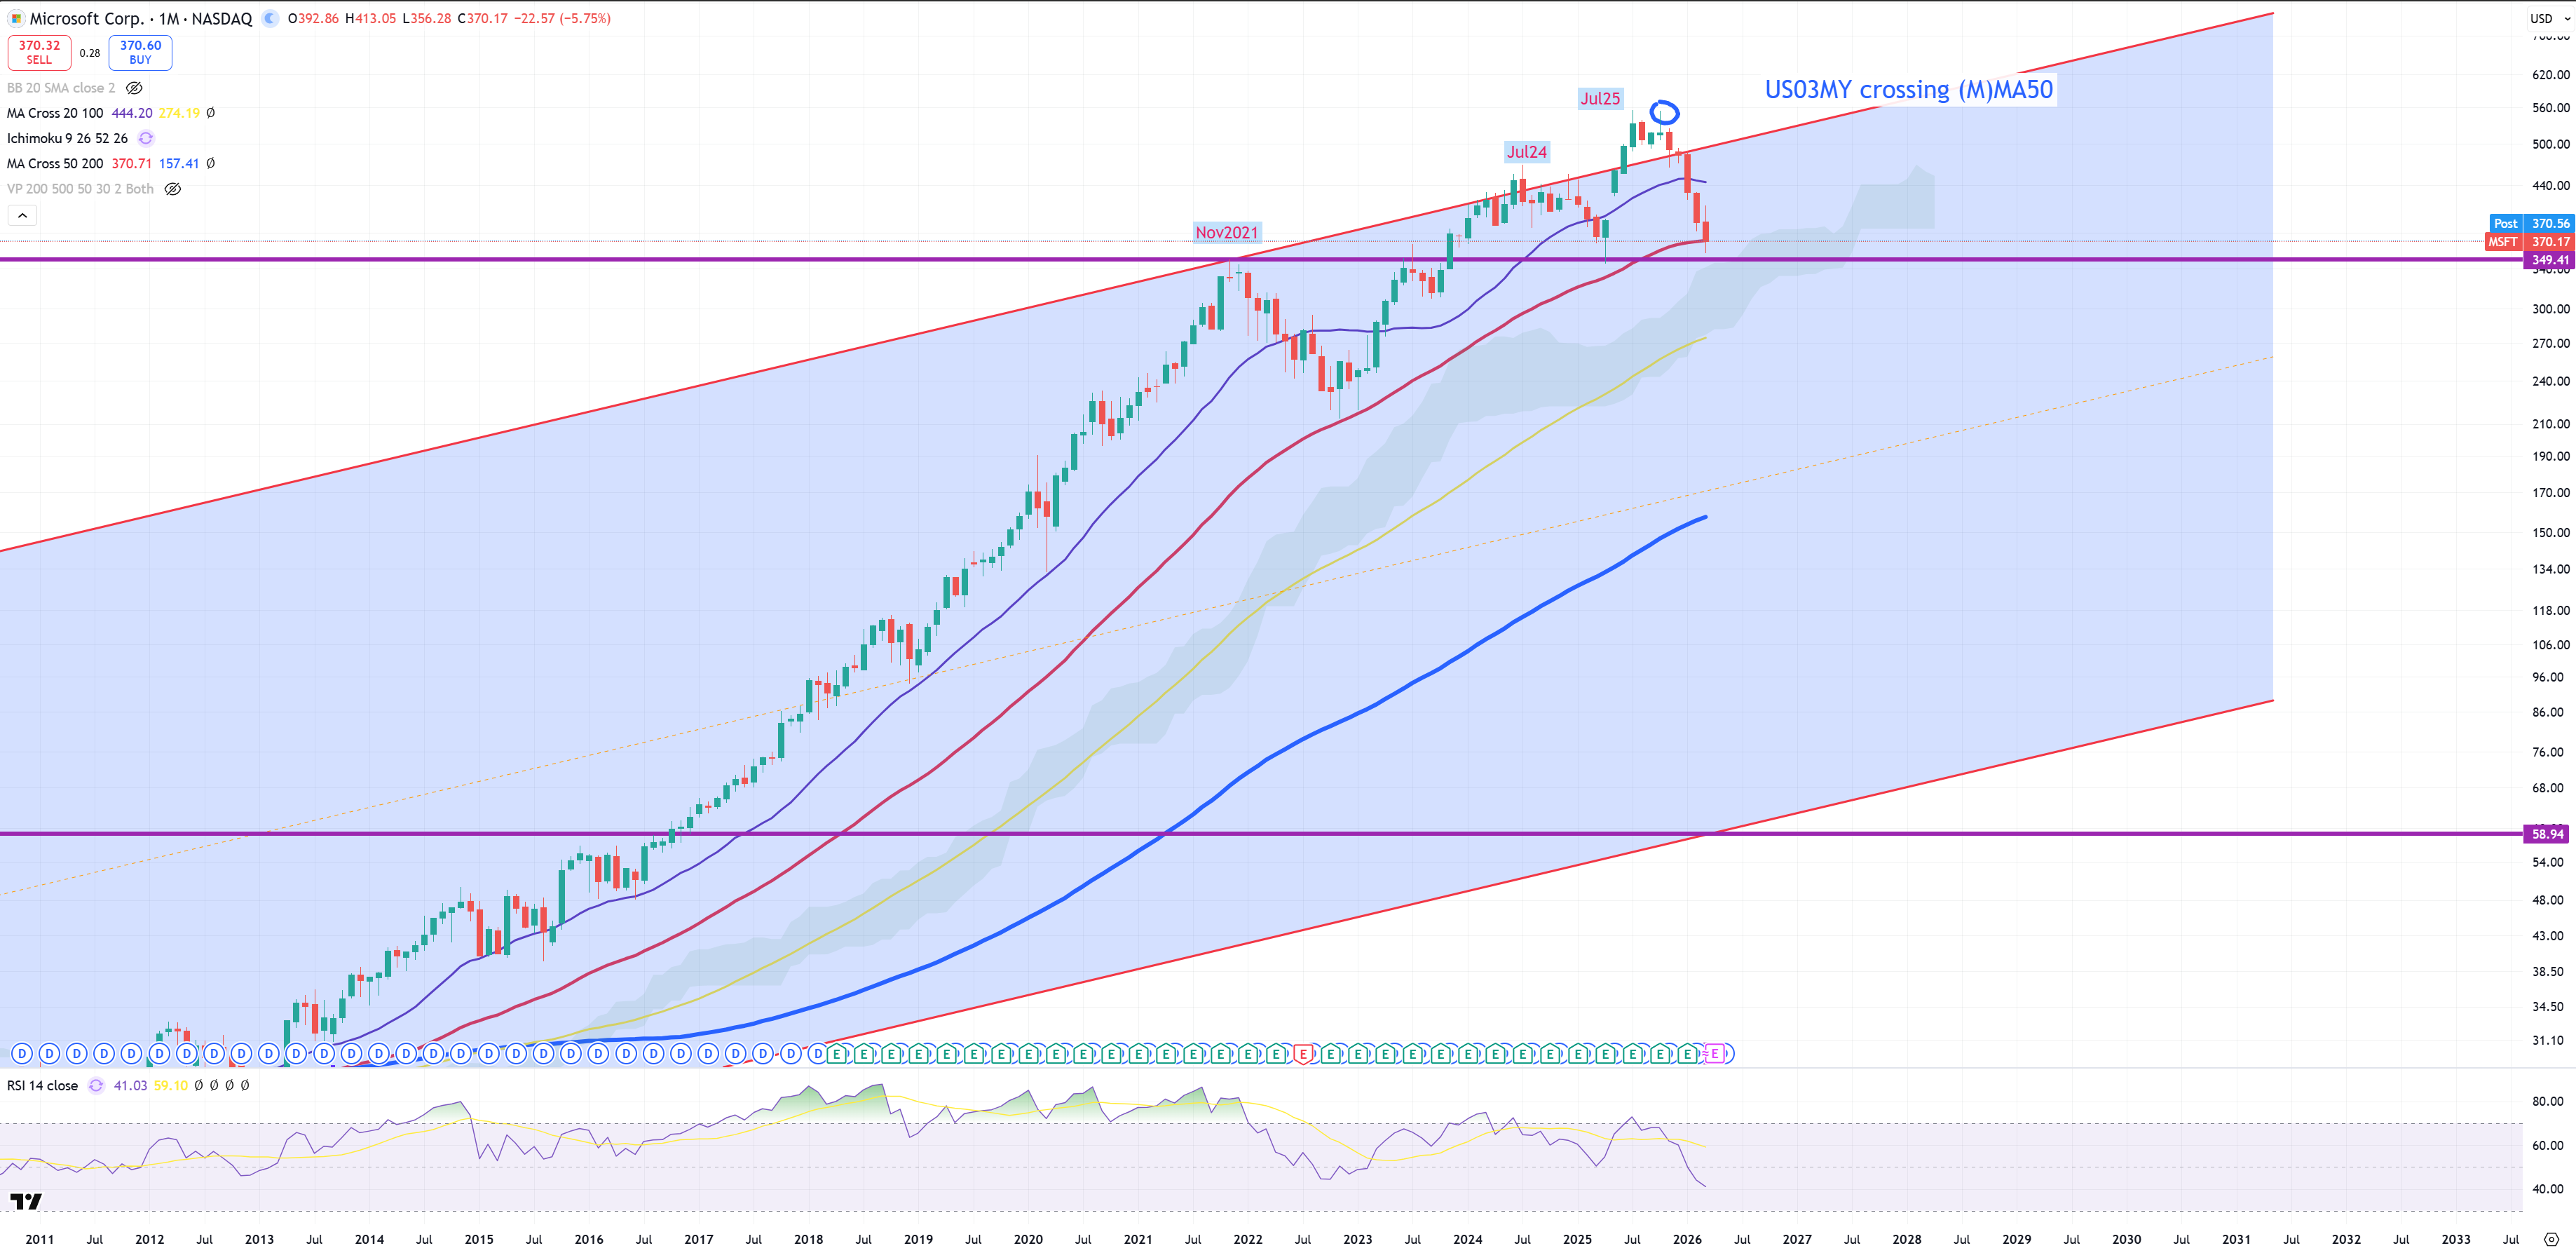
MSFT – on the edge of breaking (M)MA50 – so technical bear market. Very dangerous to 4Q21.
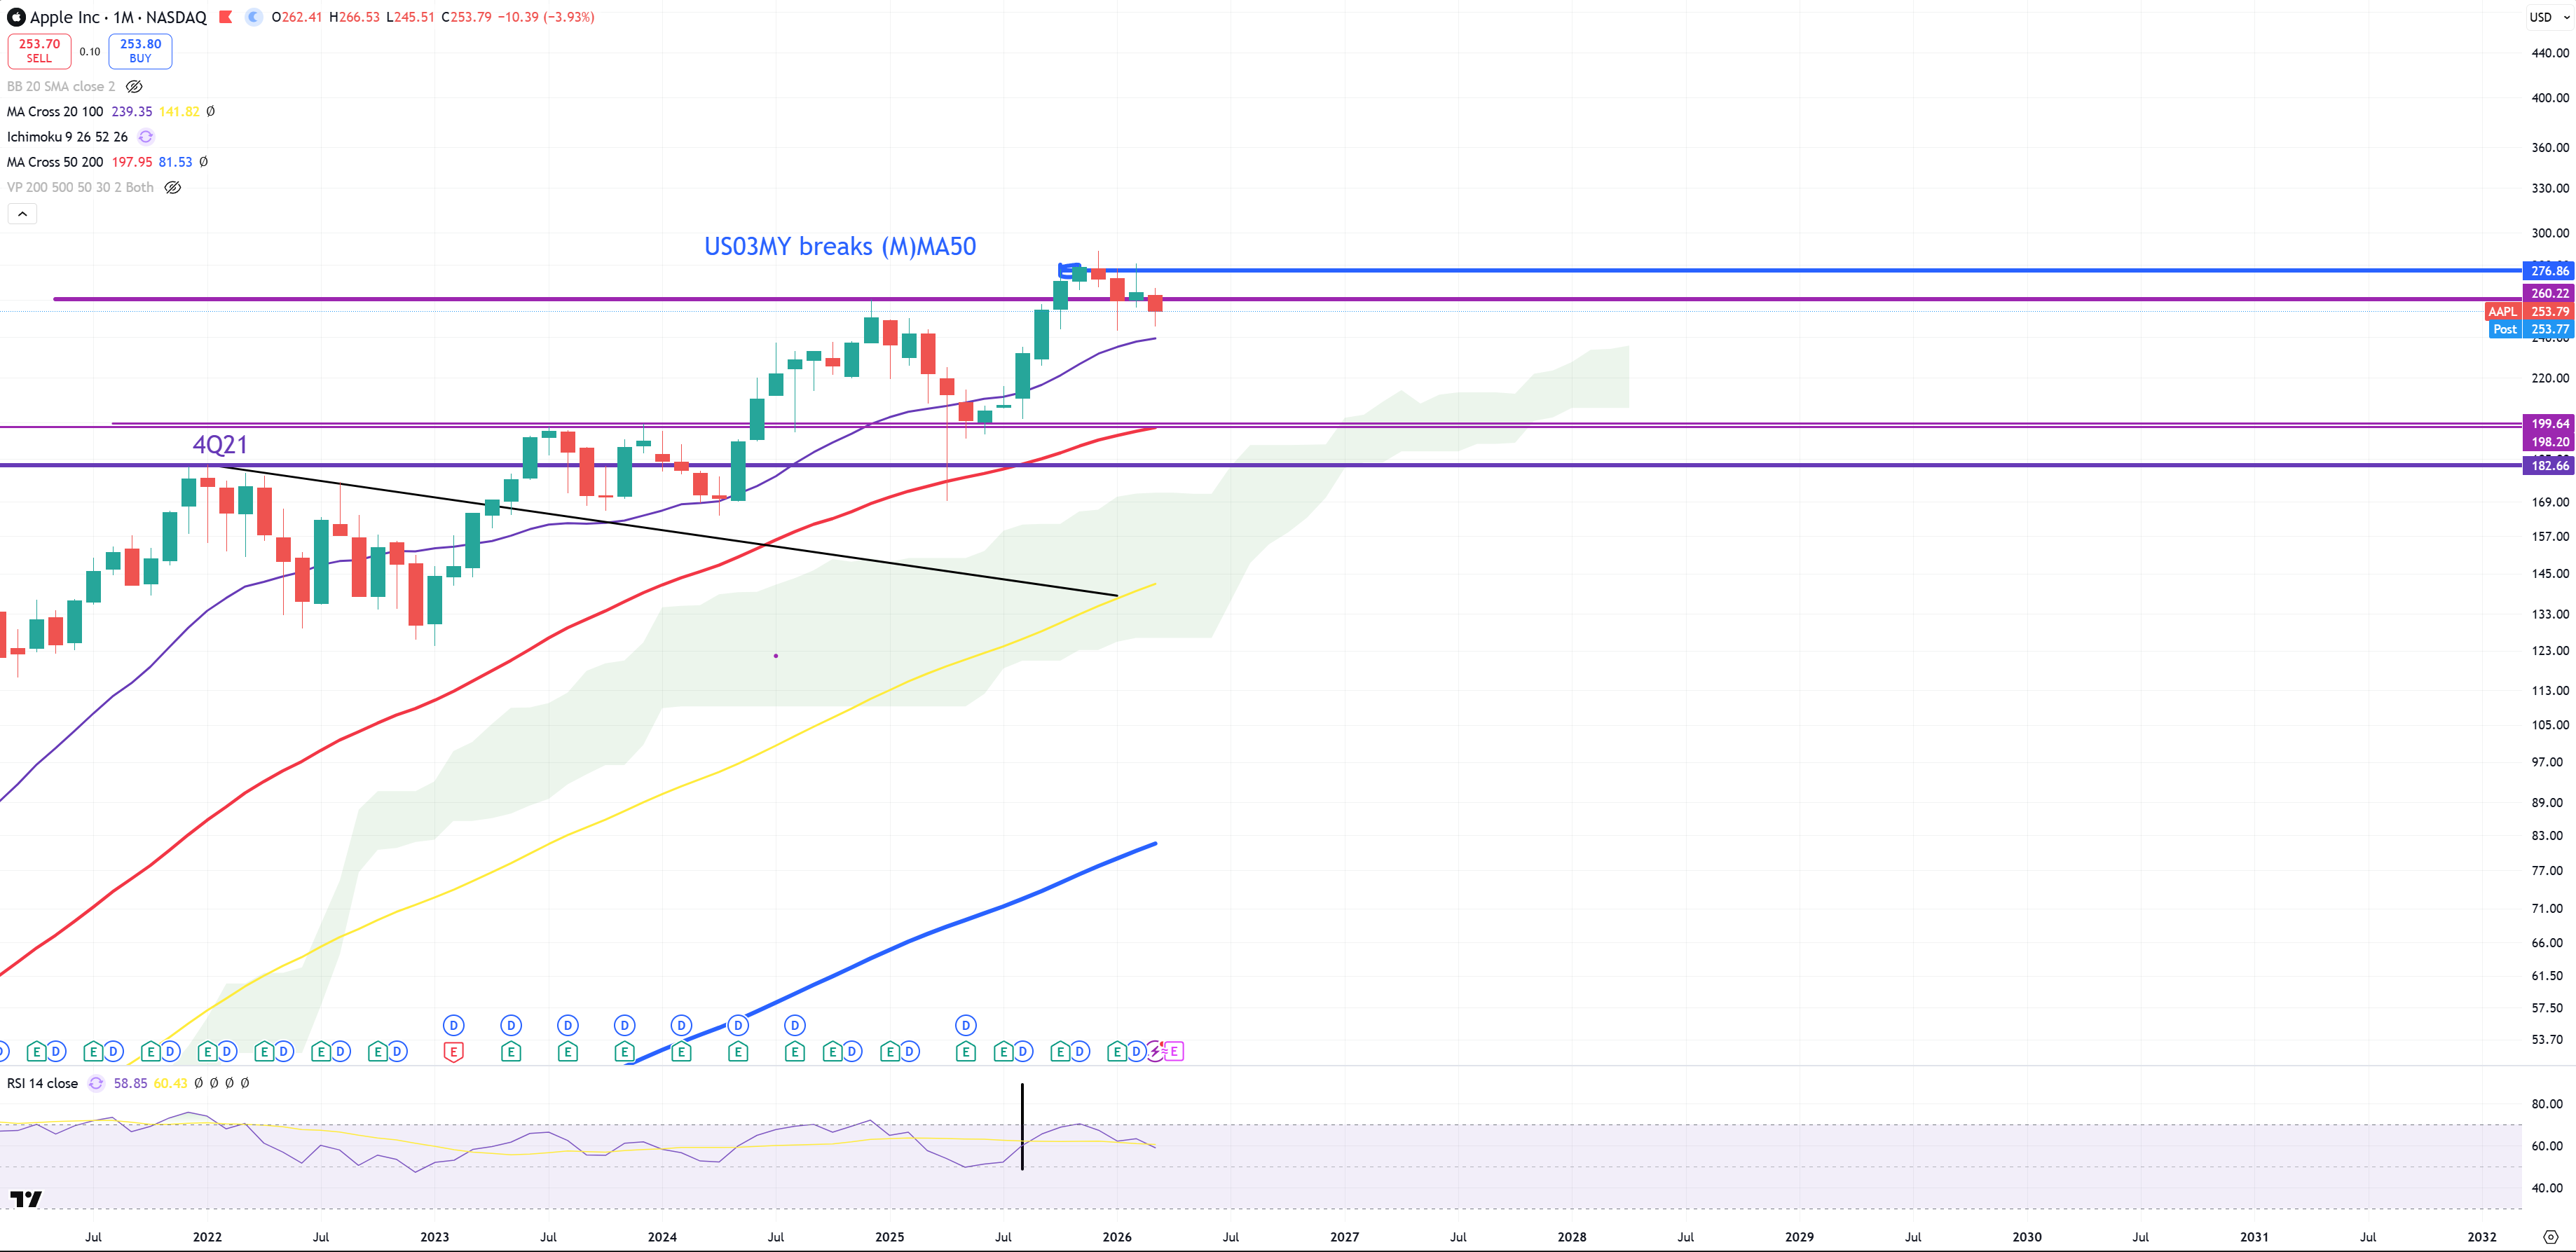
AAPL – not much to see here, except it managed to close below previous 2024 support which is now resistance.
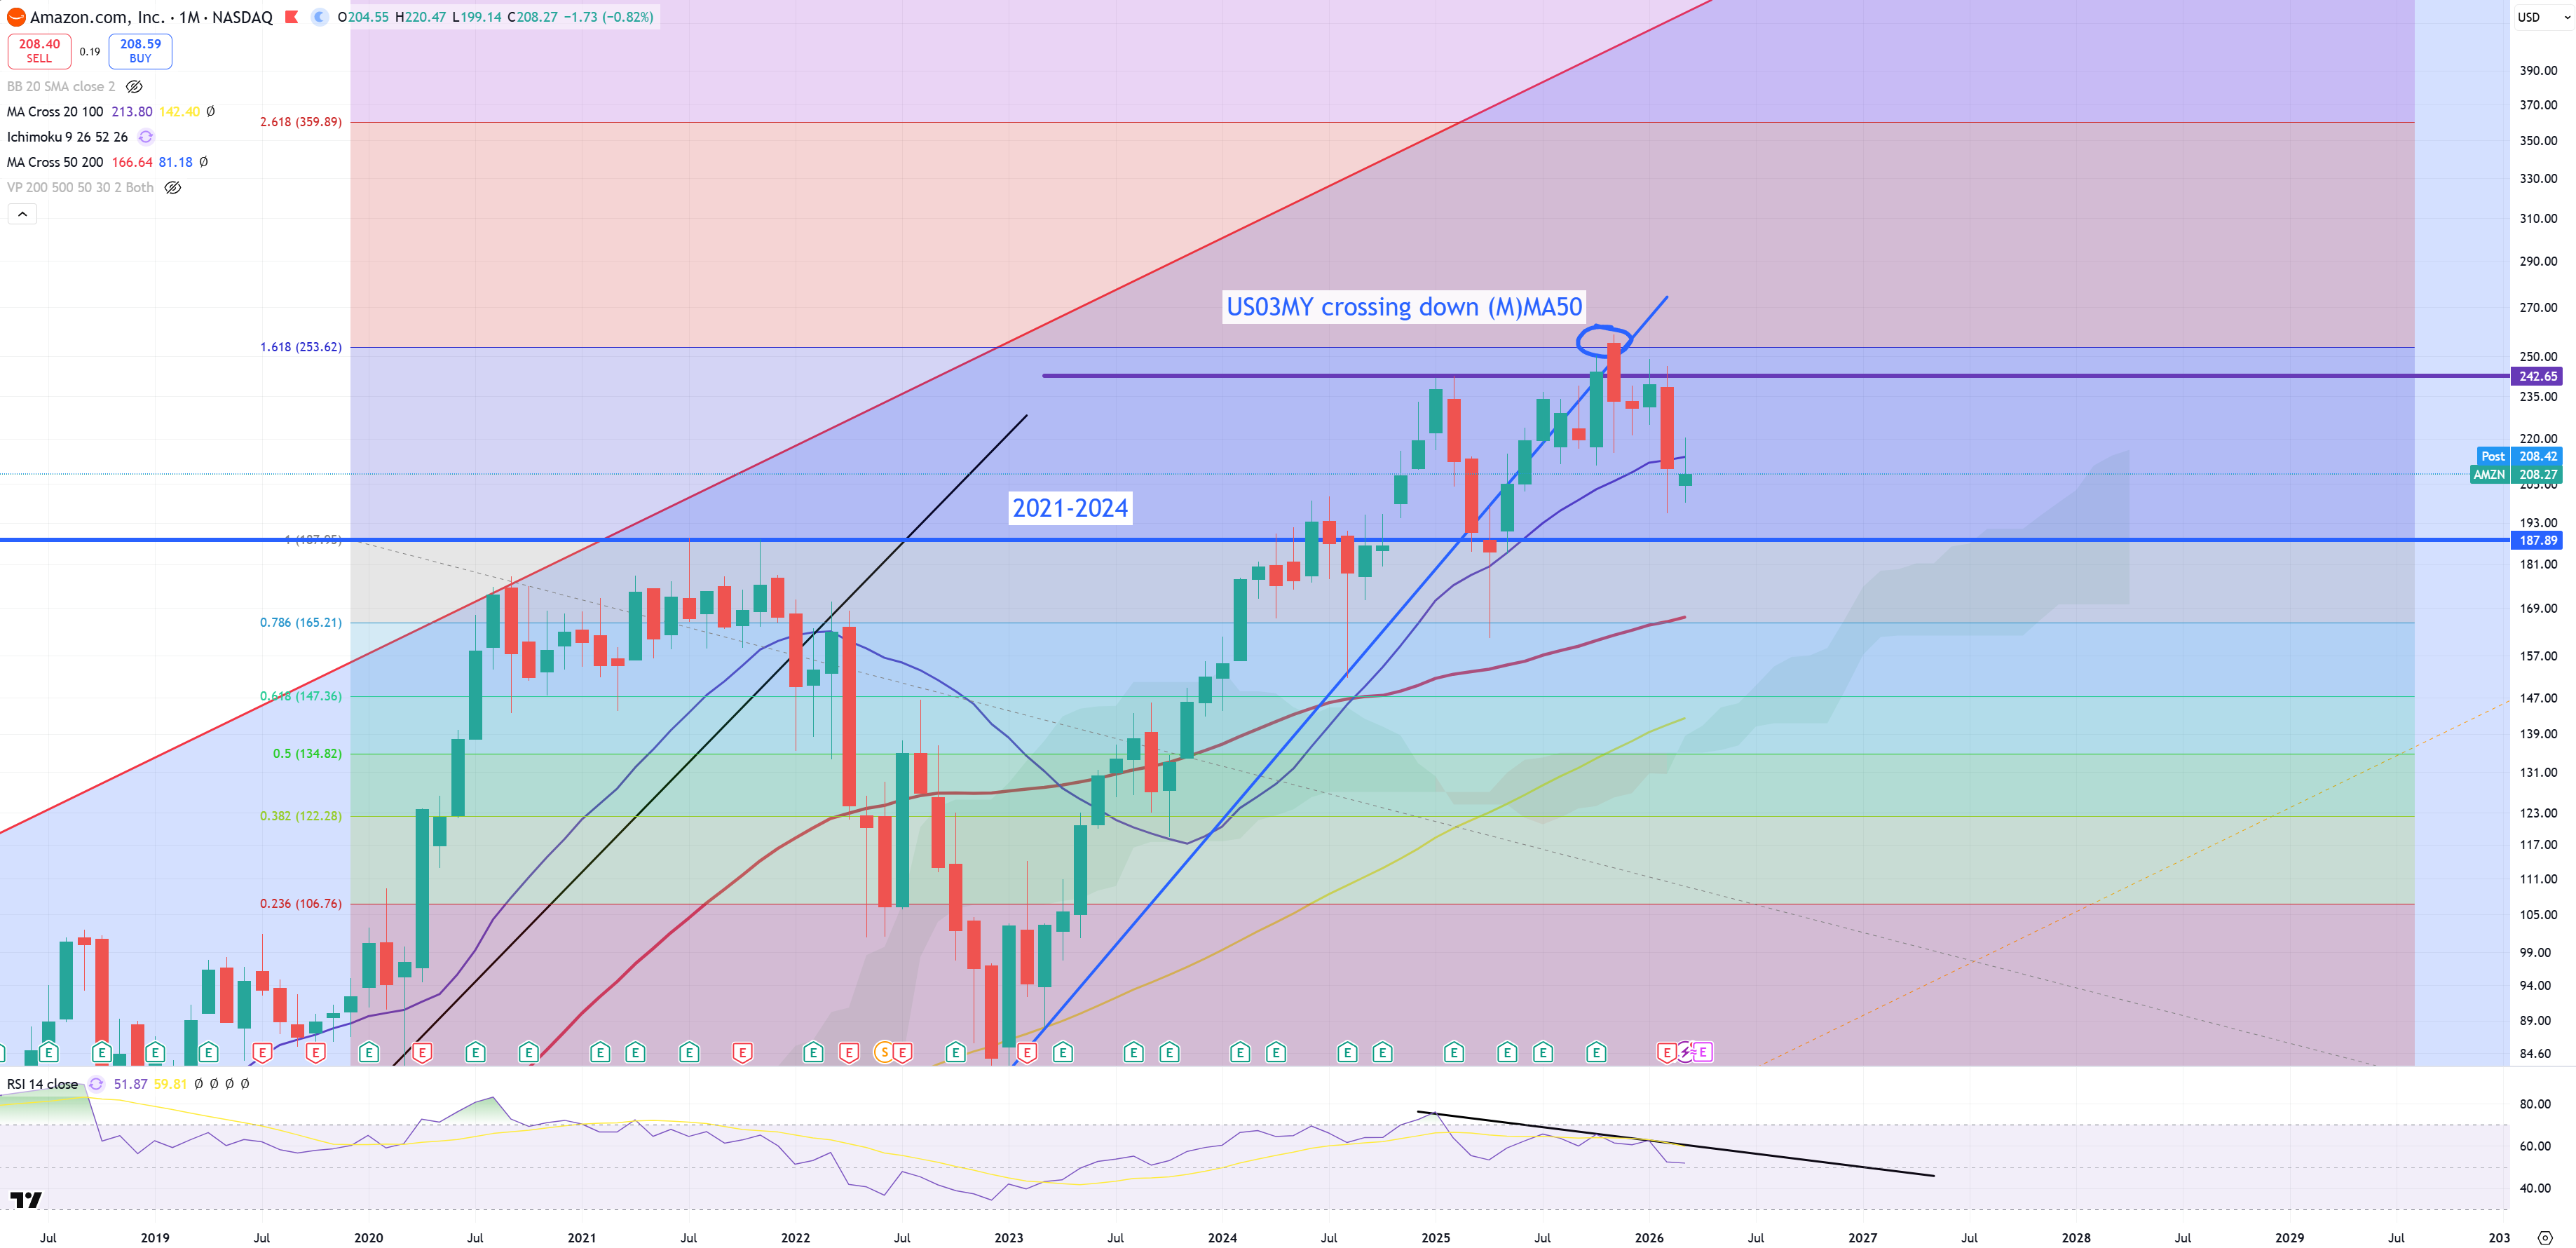
AMZN – just like MSFT – very close to 4Q21 peak, so far below (M)MA20
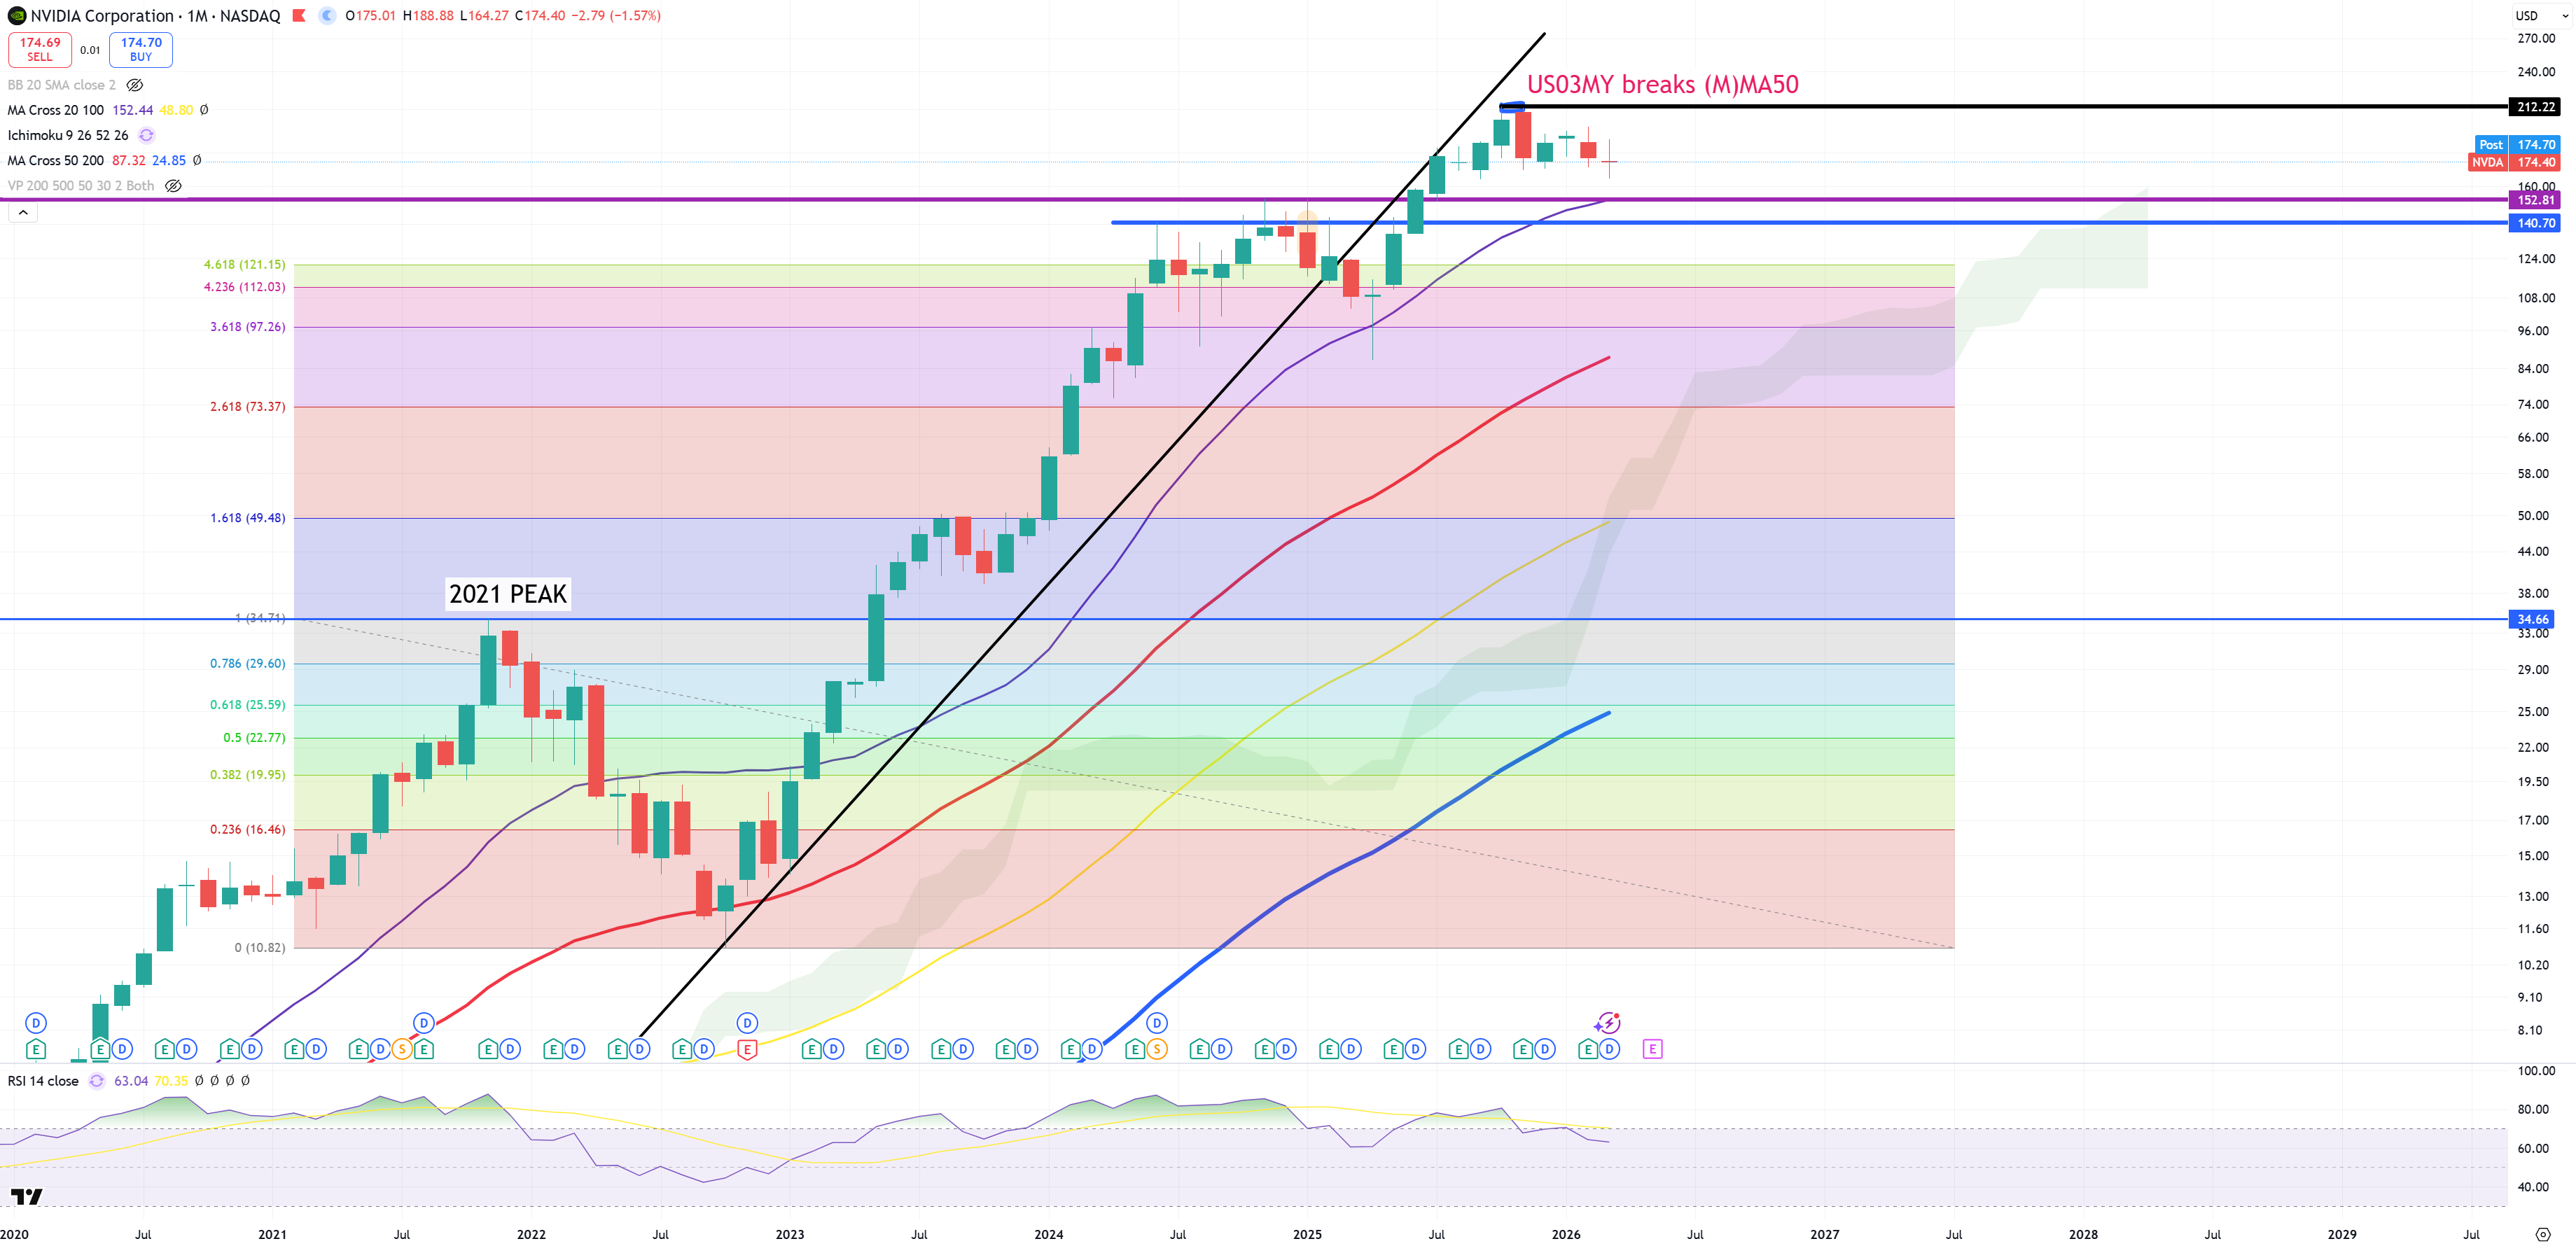
NVDA – 140-150$ level is waiting. This level is also (M)MA20
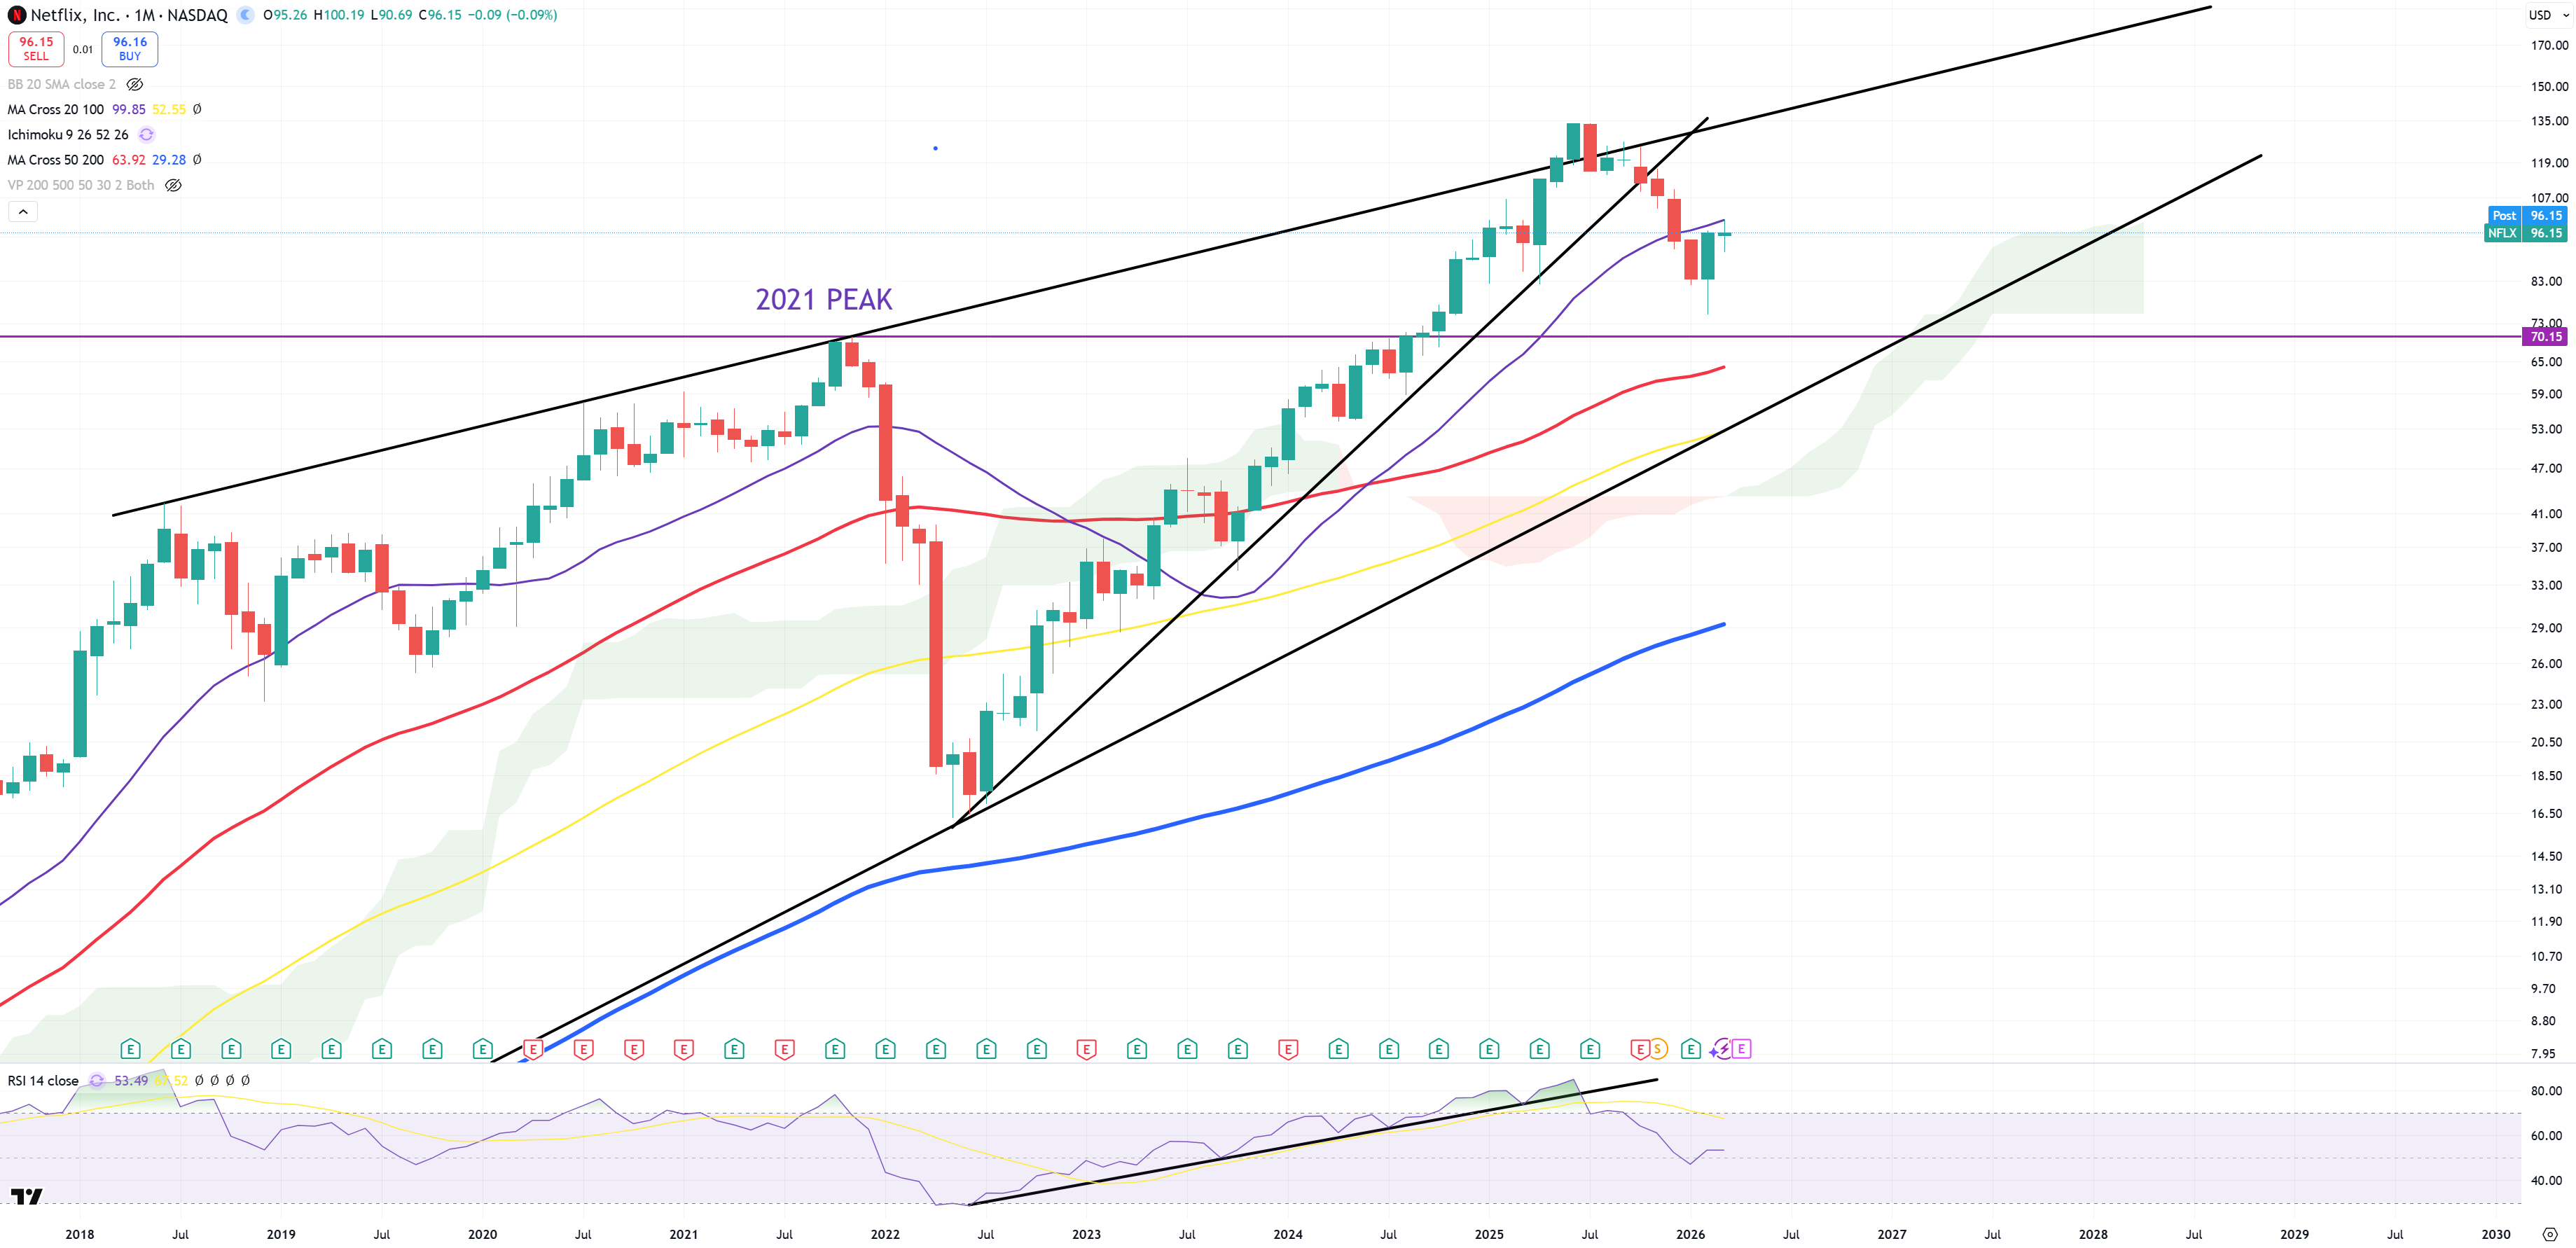
NFLX also retest to (M)MA20, also very close to 4Q21.
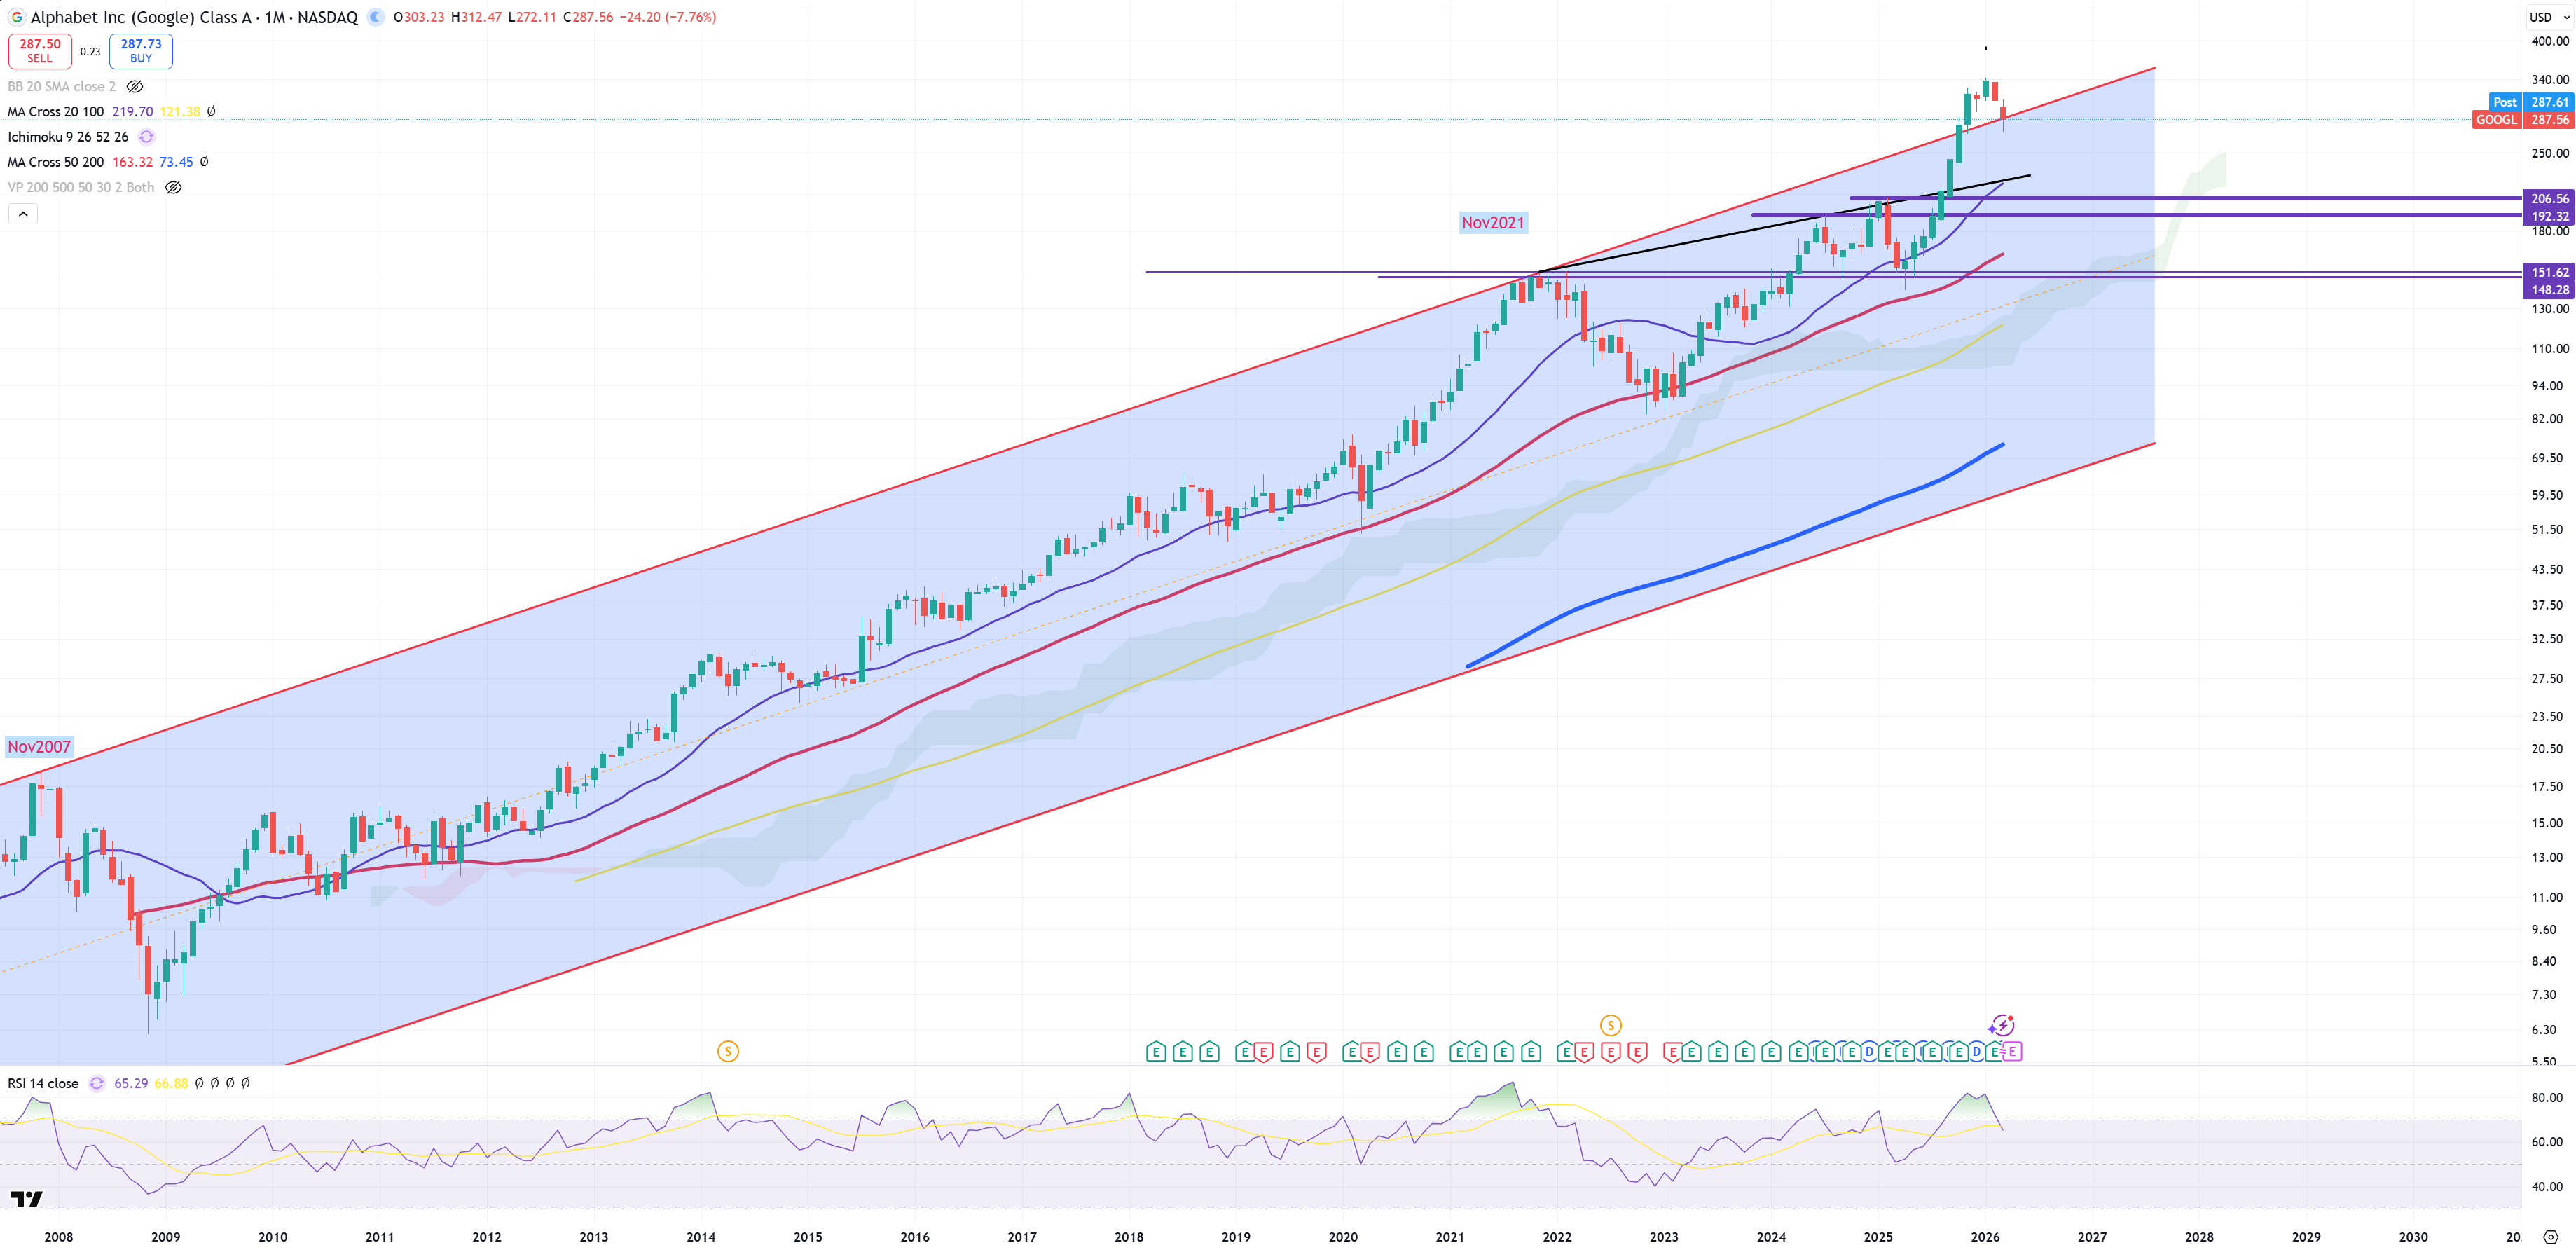
GOOGL – trend 2007-2021. Are we coming back?