04/2026
May 2, 2026

April 2026 has gone, breadth is terrible and SOX made +50% in just couple weeks, while other sectors in reality collapsing. I was looking on multiple stocks, ETFs if they will be able to close below important (M)MA50 level, but that has not happened.
To remind you, we’ll be watching multiple levels and the most important one 4Q25 – due to SPX/GOLD super secular (3M)MA200 break combined with my stock market indicator US03MY which lost (M)MA50 level the same time -> Mostly October/November 2025. I watch cycle chart SPX/GOLD, DJI/GOLD on 3M view. Summary at the end.
violet (M)MA20 = high momentum border – possible trend flip, red (M)MA50 = technical bull/bear market border (the most important MA), yellow (M)MA100 = typical bull/bear trap level, blue (M)MA200 = secular border between bull/bear market.
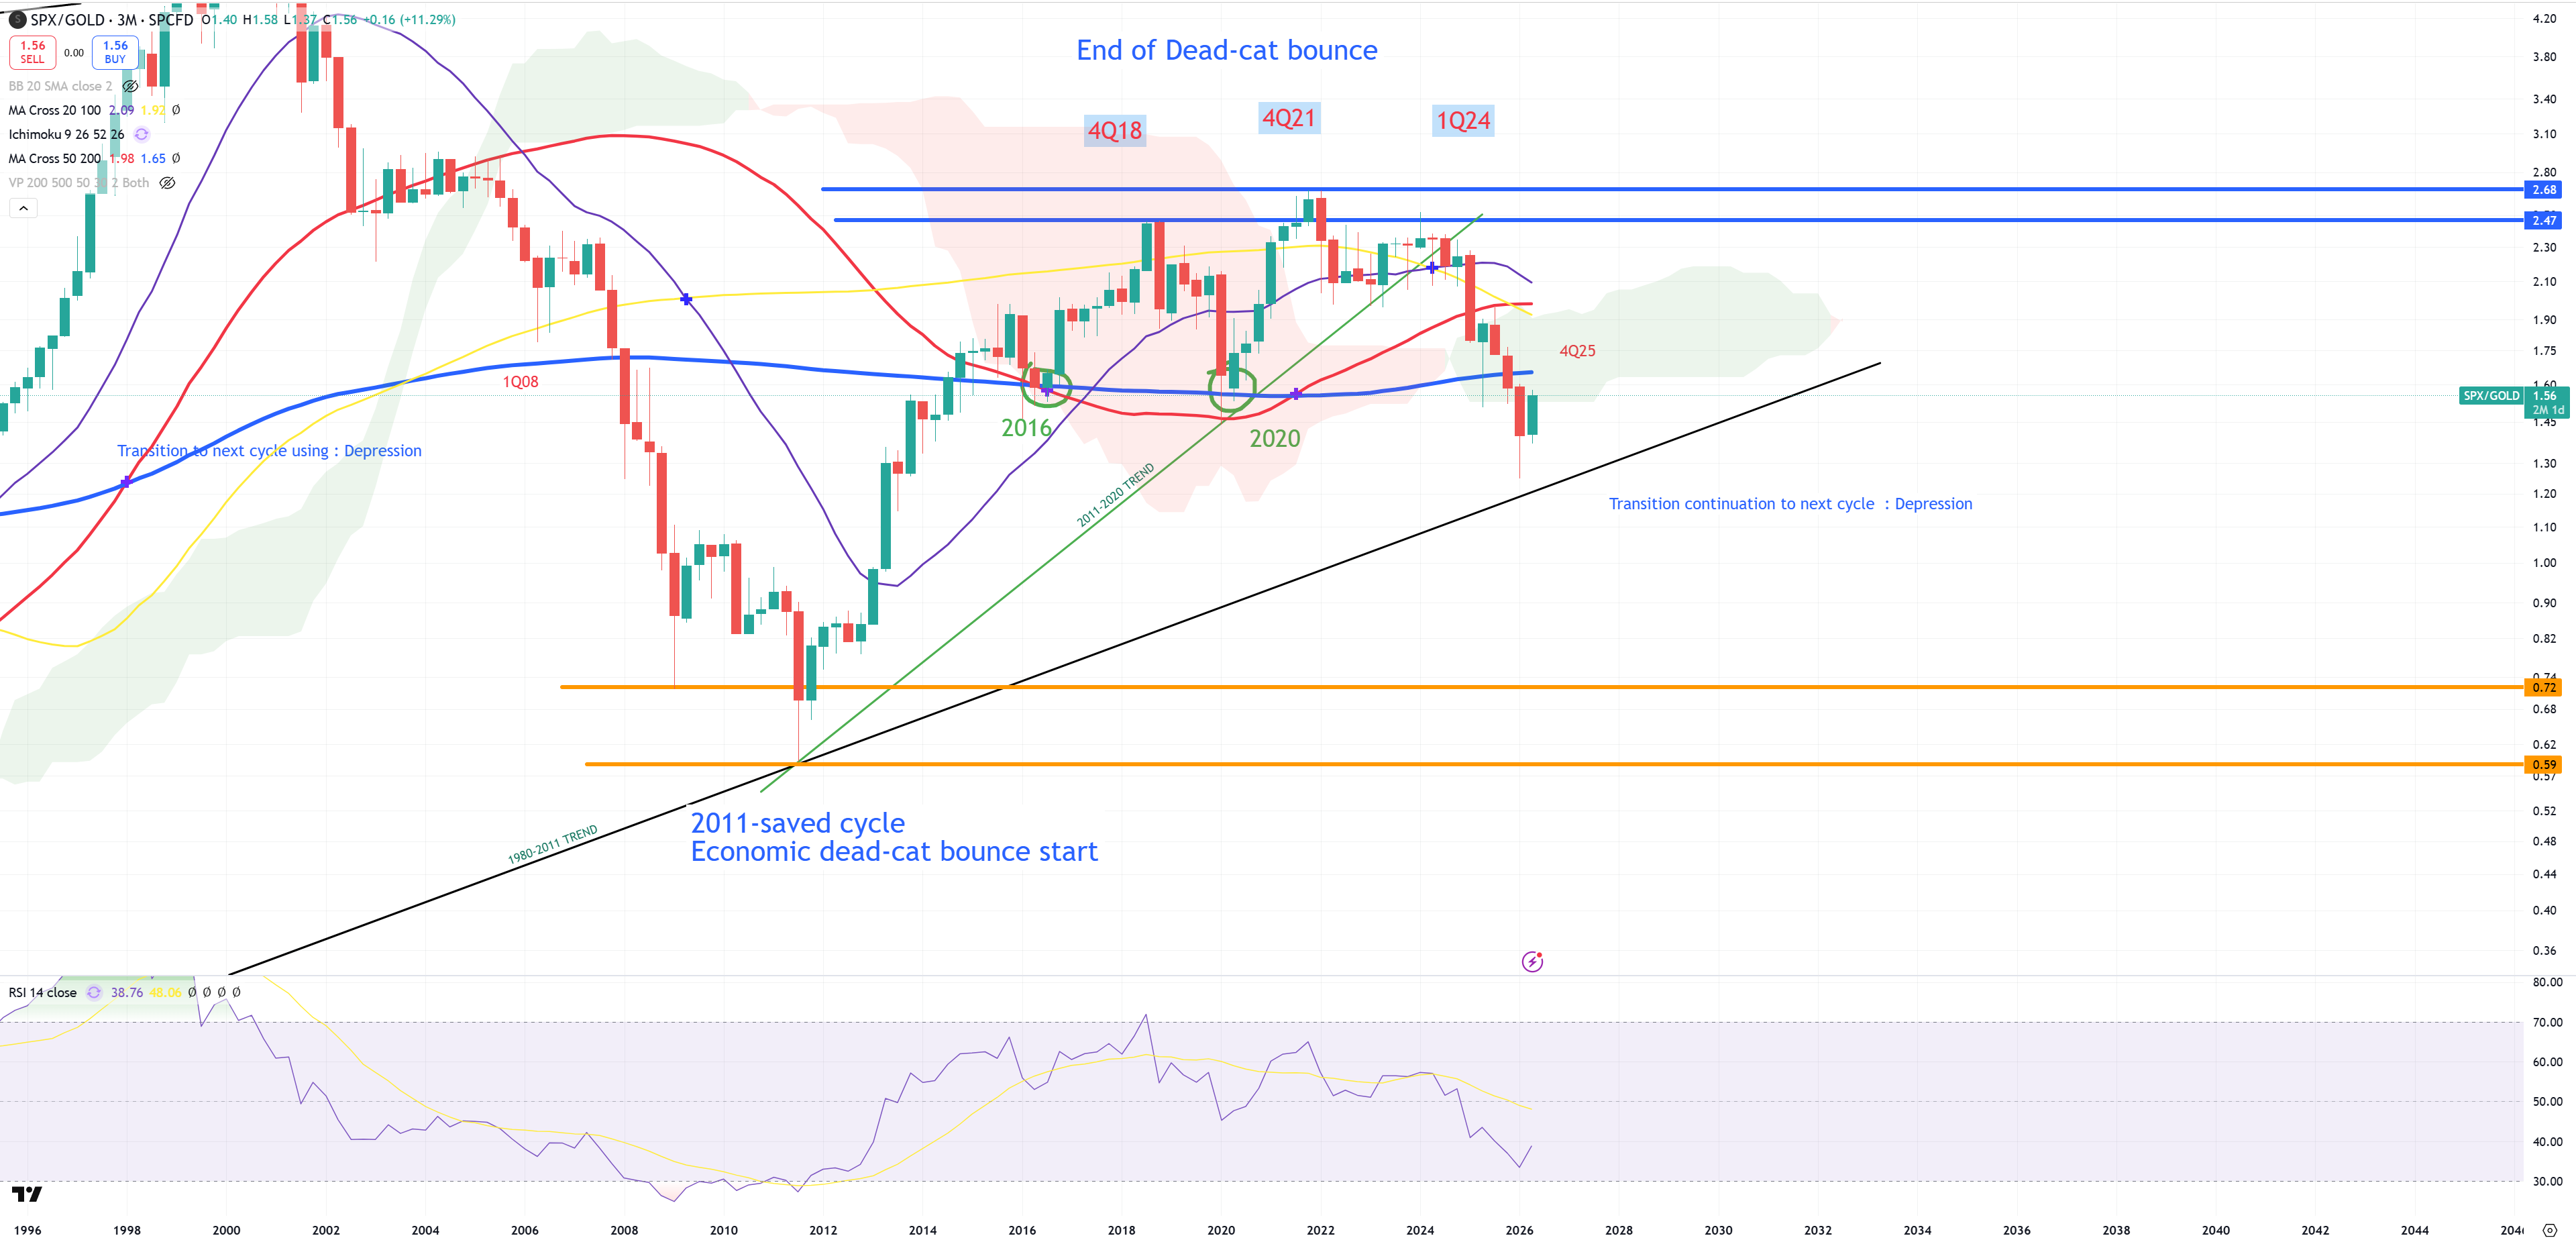
SPX/GOLD – key cycle indicator broken in 4Q25, in previous 1Q08 moment it needed 9 months to finally crash, natural retest level 0.6-0.7 level. Considering GOLD = 4000$ = 2400-2800 level. I know I know sounds crazy, but we’re just interpreting technical level. 4Q21 is the most important level due to SPX/GOLD cyclical peak. Till 2000 moment stocks were 1:1 matched with SPX/GOLD peaks. Situation has changed from around 2005-2006, where SPX/GOLD was just a prediction for broad indexes. 3M view and we see big green candle. Gold is in correction vs Stocks. During 2008 it took 3 quarters below blue (3M)MA200. Remember 4Q21 because it’s a base point for plenty of stocks/ETFs, also remember this 4Q25.
As long as SPX/GOLD is below (3M)MA200 I’m in a position market cycle will be killing stocks after stocks, ETFs after ETFs, maybe to leave breadth in 1% level (from 2.4% now), while everything will be dropping until this breadth will be so bad it’ll take AI+SOX with it. The free gap towards (3M)MA200 can be considered as a possible juice for a stock market but ONLY under an assumption of weaker breadth. For example in 1Q08 there was no even power to retest this MA and we’re on the edge right now, tons of stocks/ETFs should be either below 4Q21 peak or way way way lower.
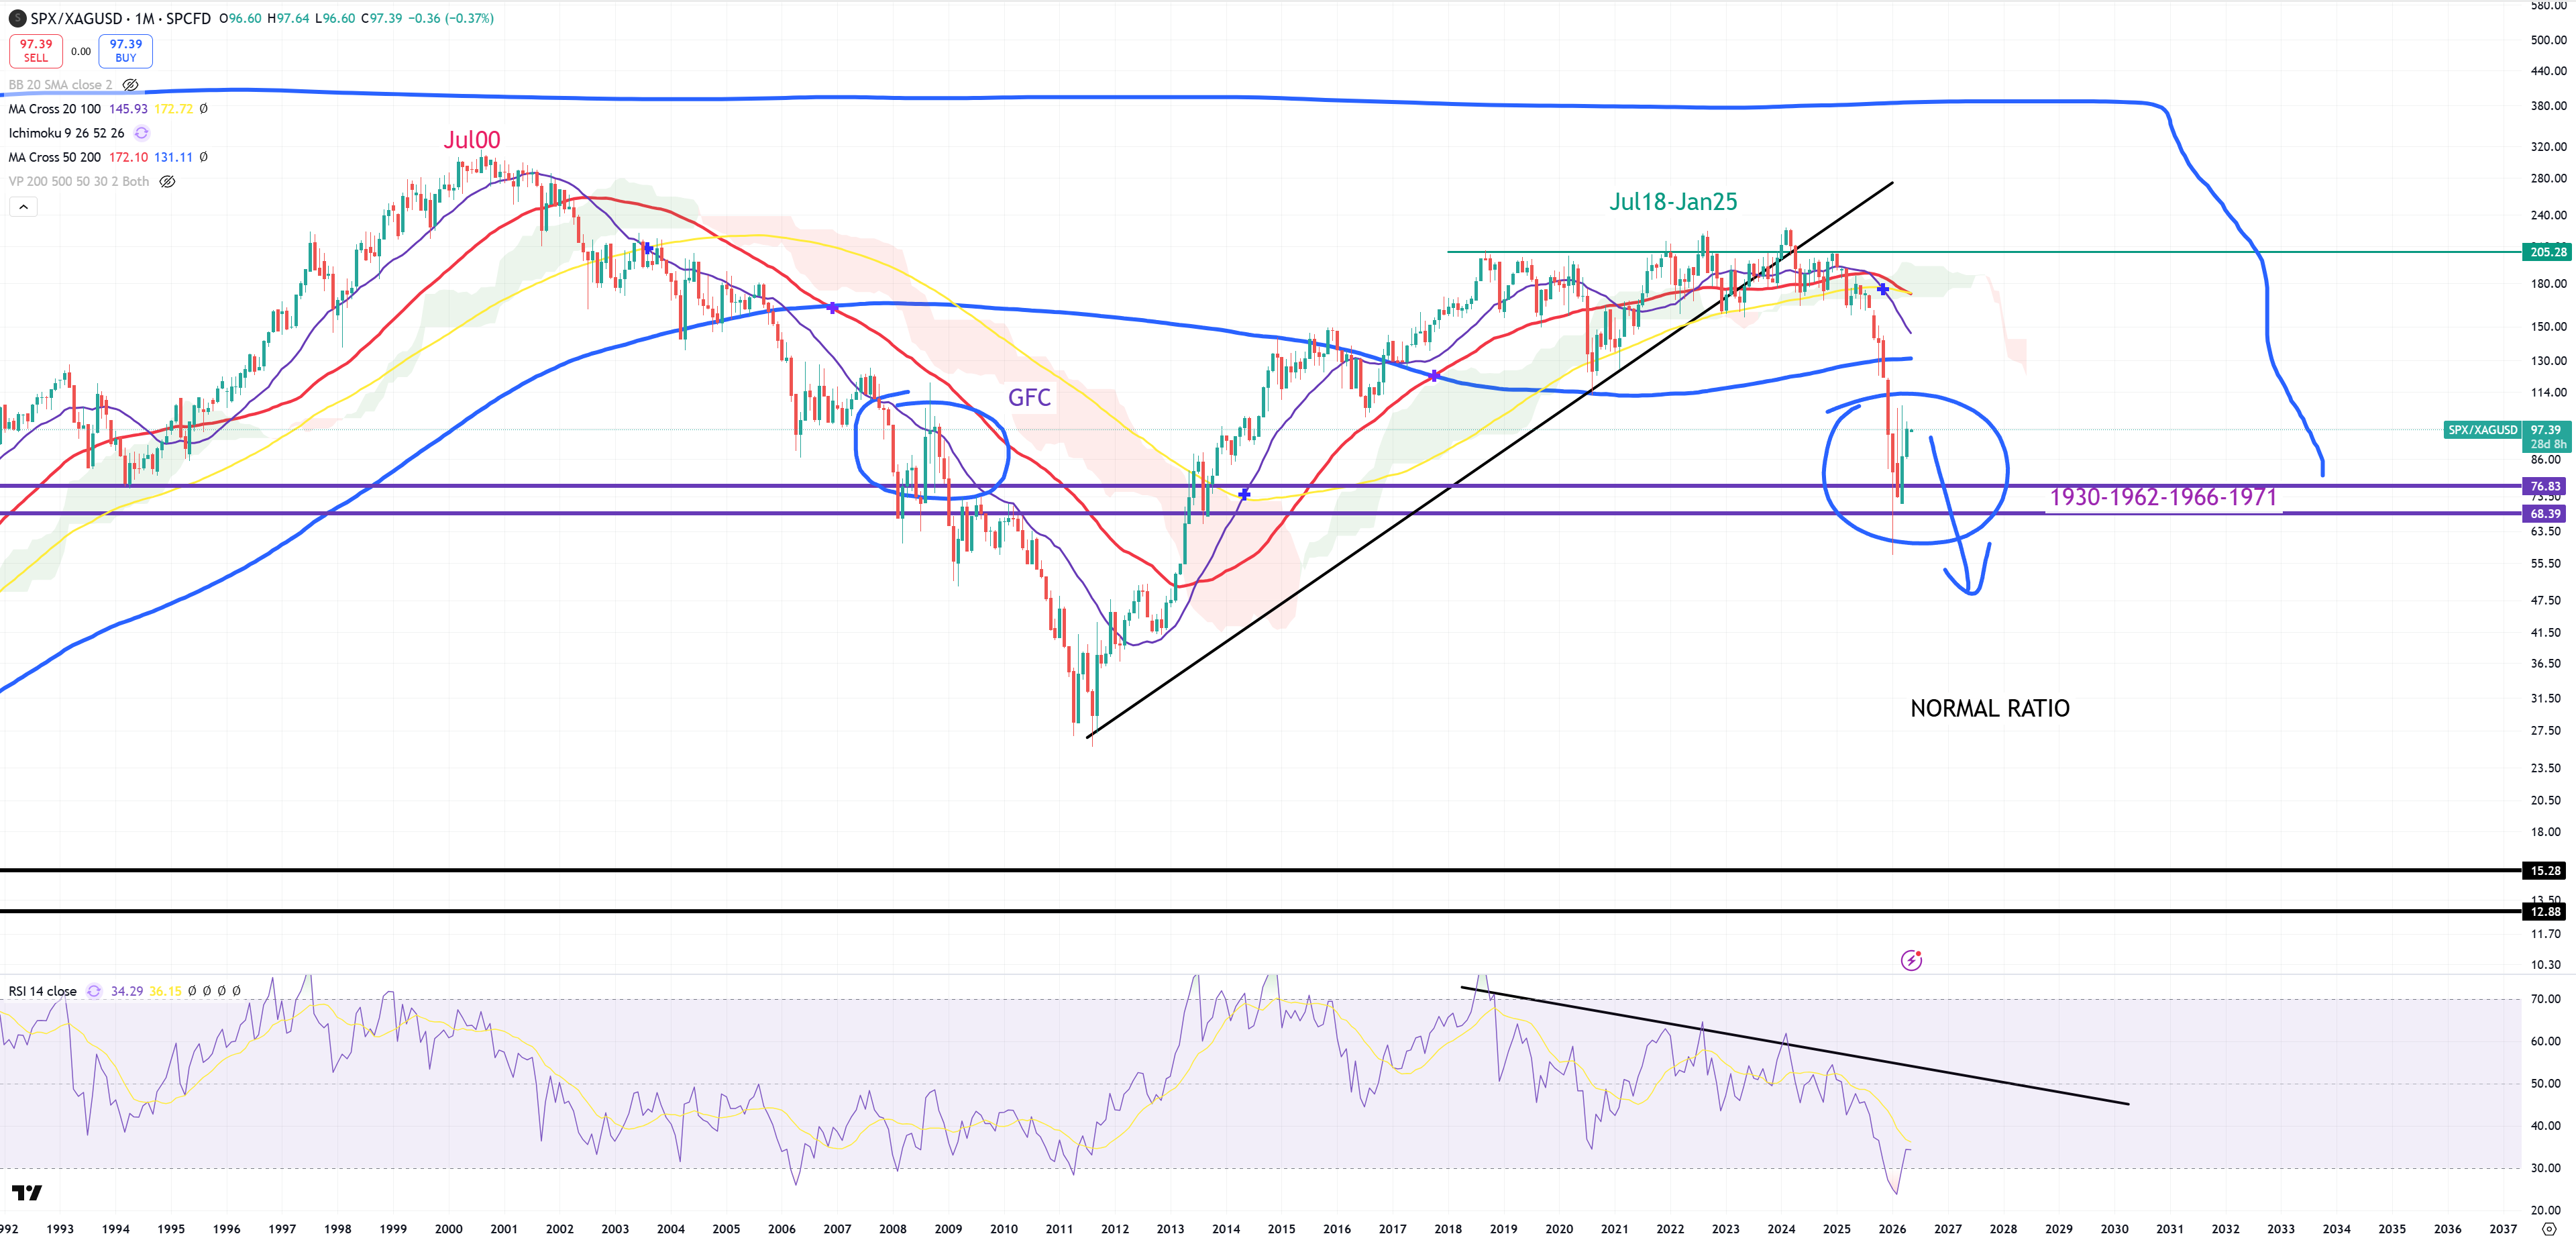
SPX/SILVER – another kind of cycle indicator, but it’s now dancing on almost 100Ys support which last time was broken during 2008. If we match SPX/GOLD 1Q08 (3M)MA200 break and we add to that 4Q25 (3M)MA200 break let’s find out how this setup will be played. Silver is still super cheap vs stocks.
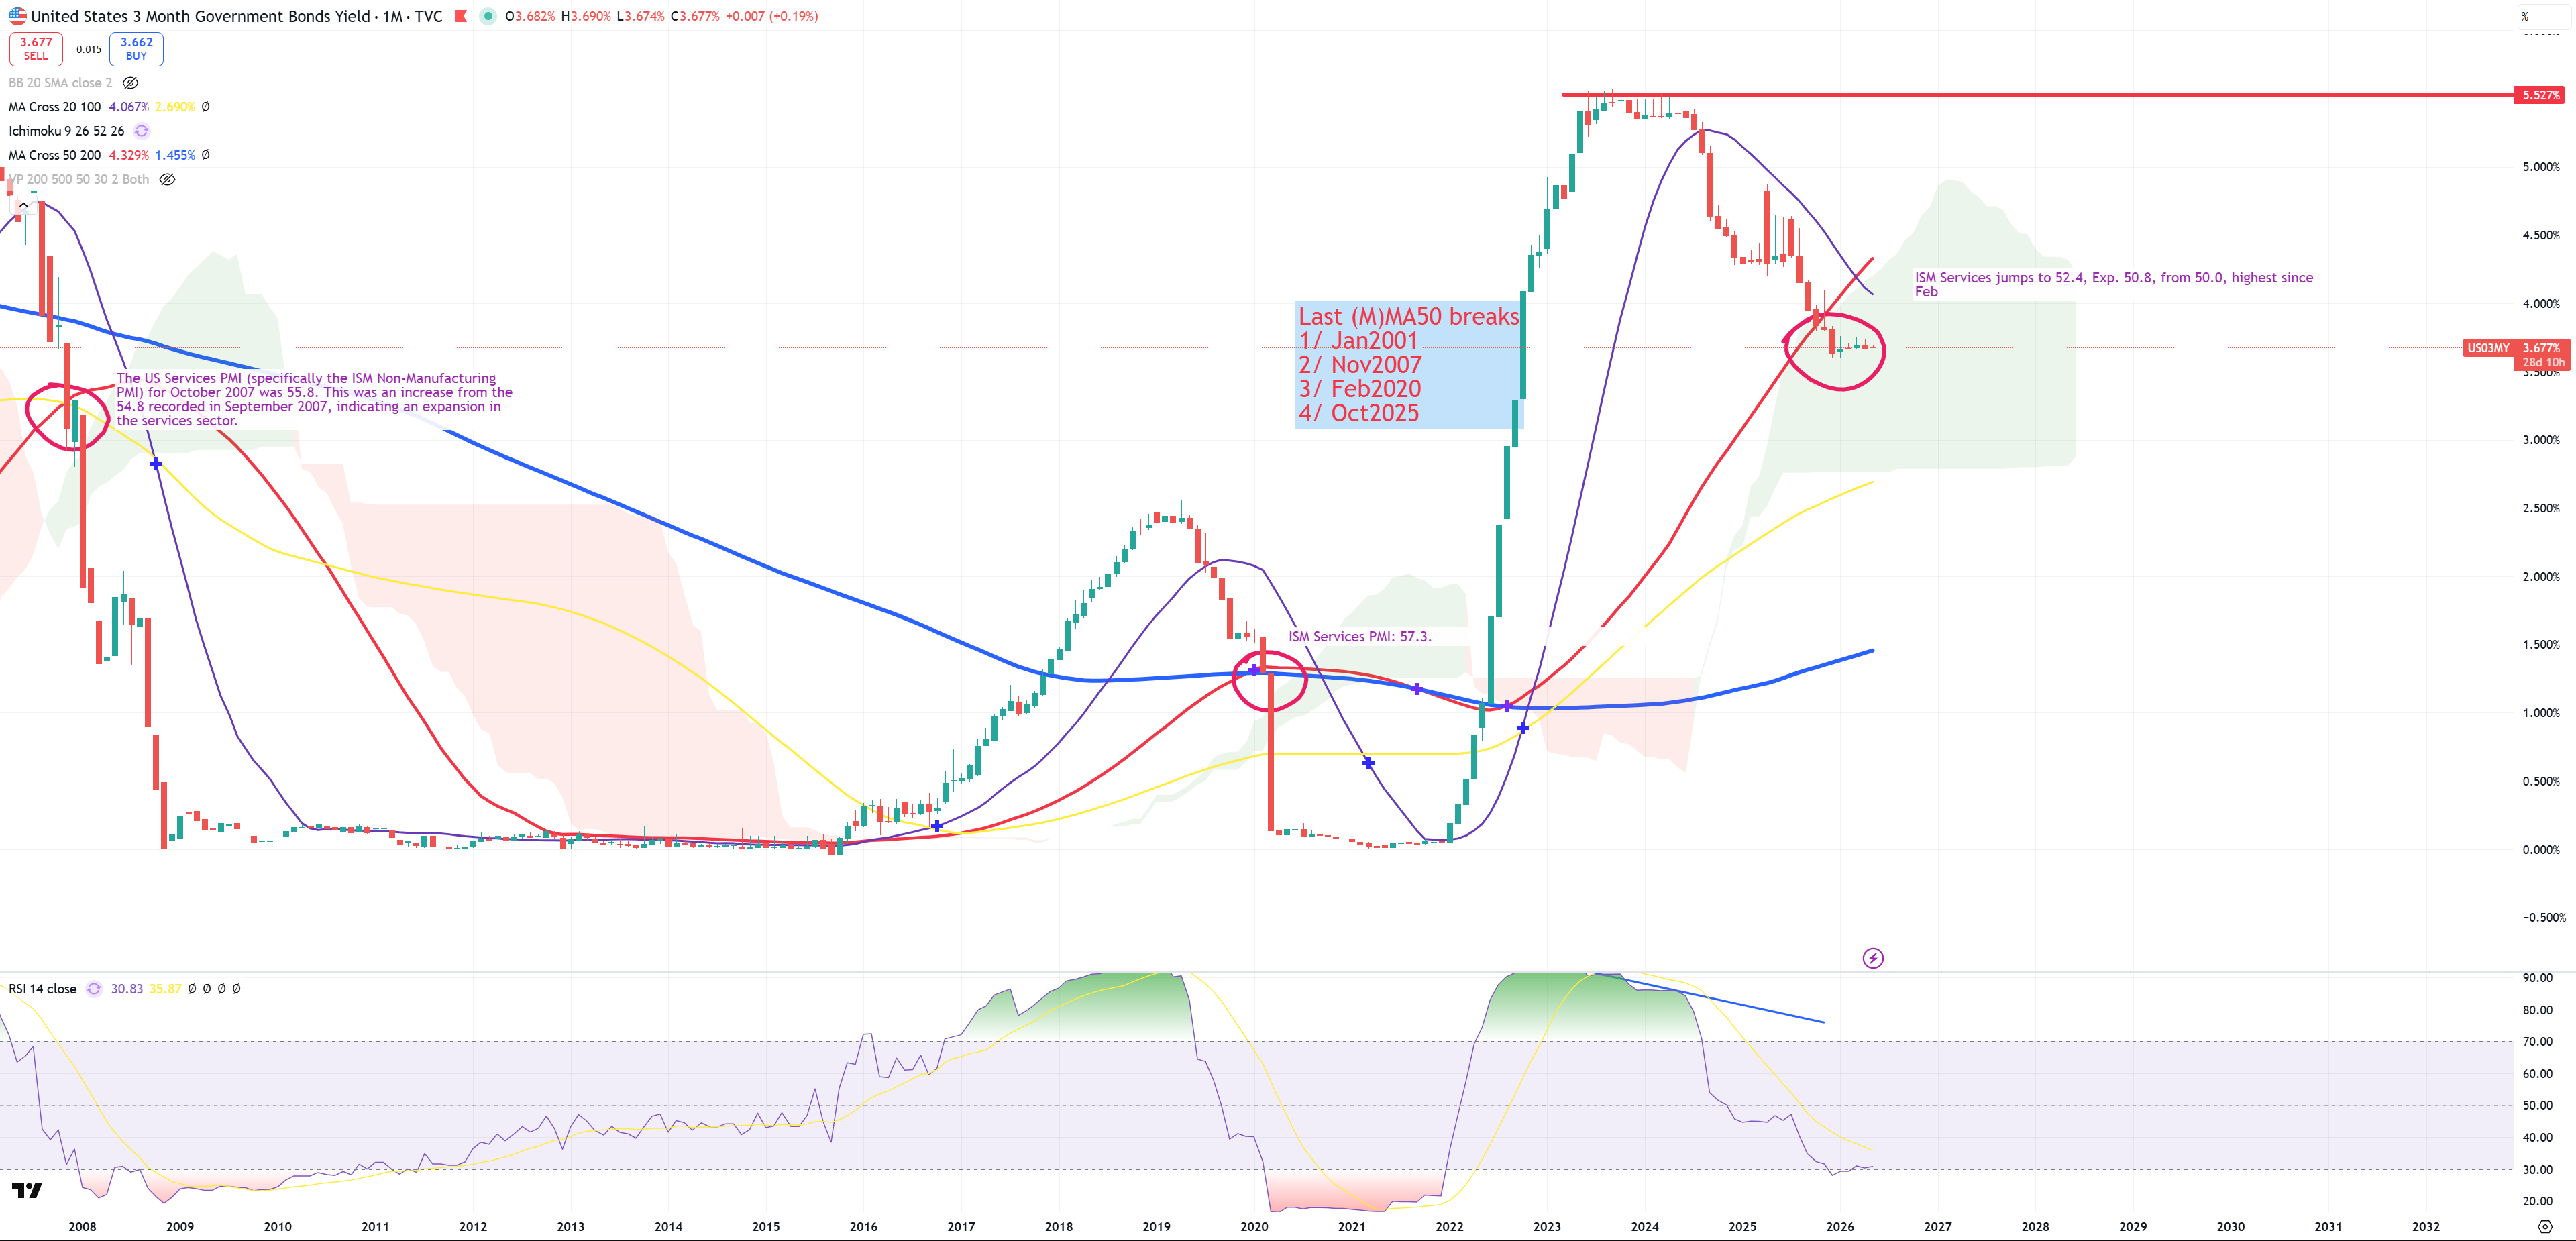
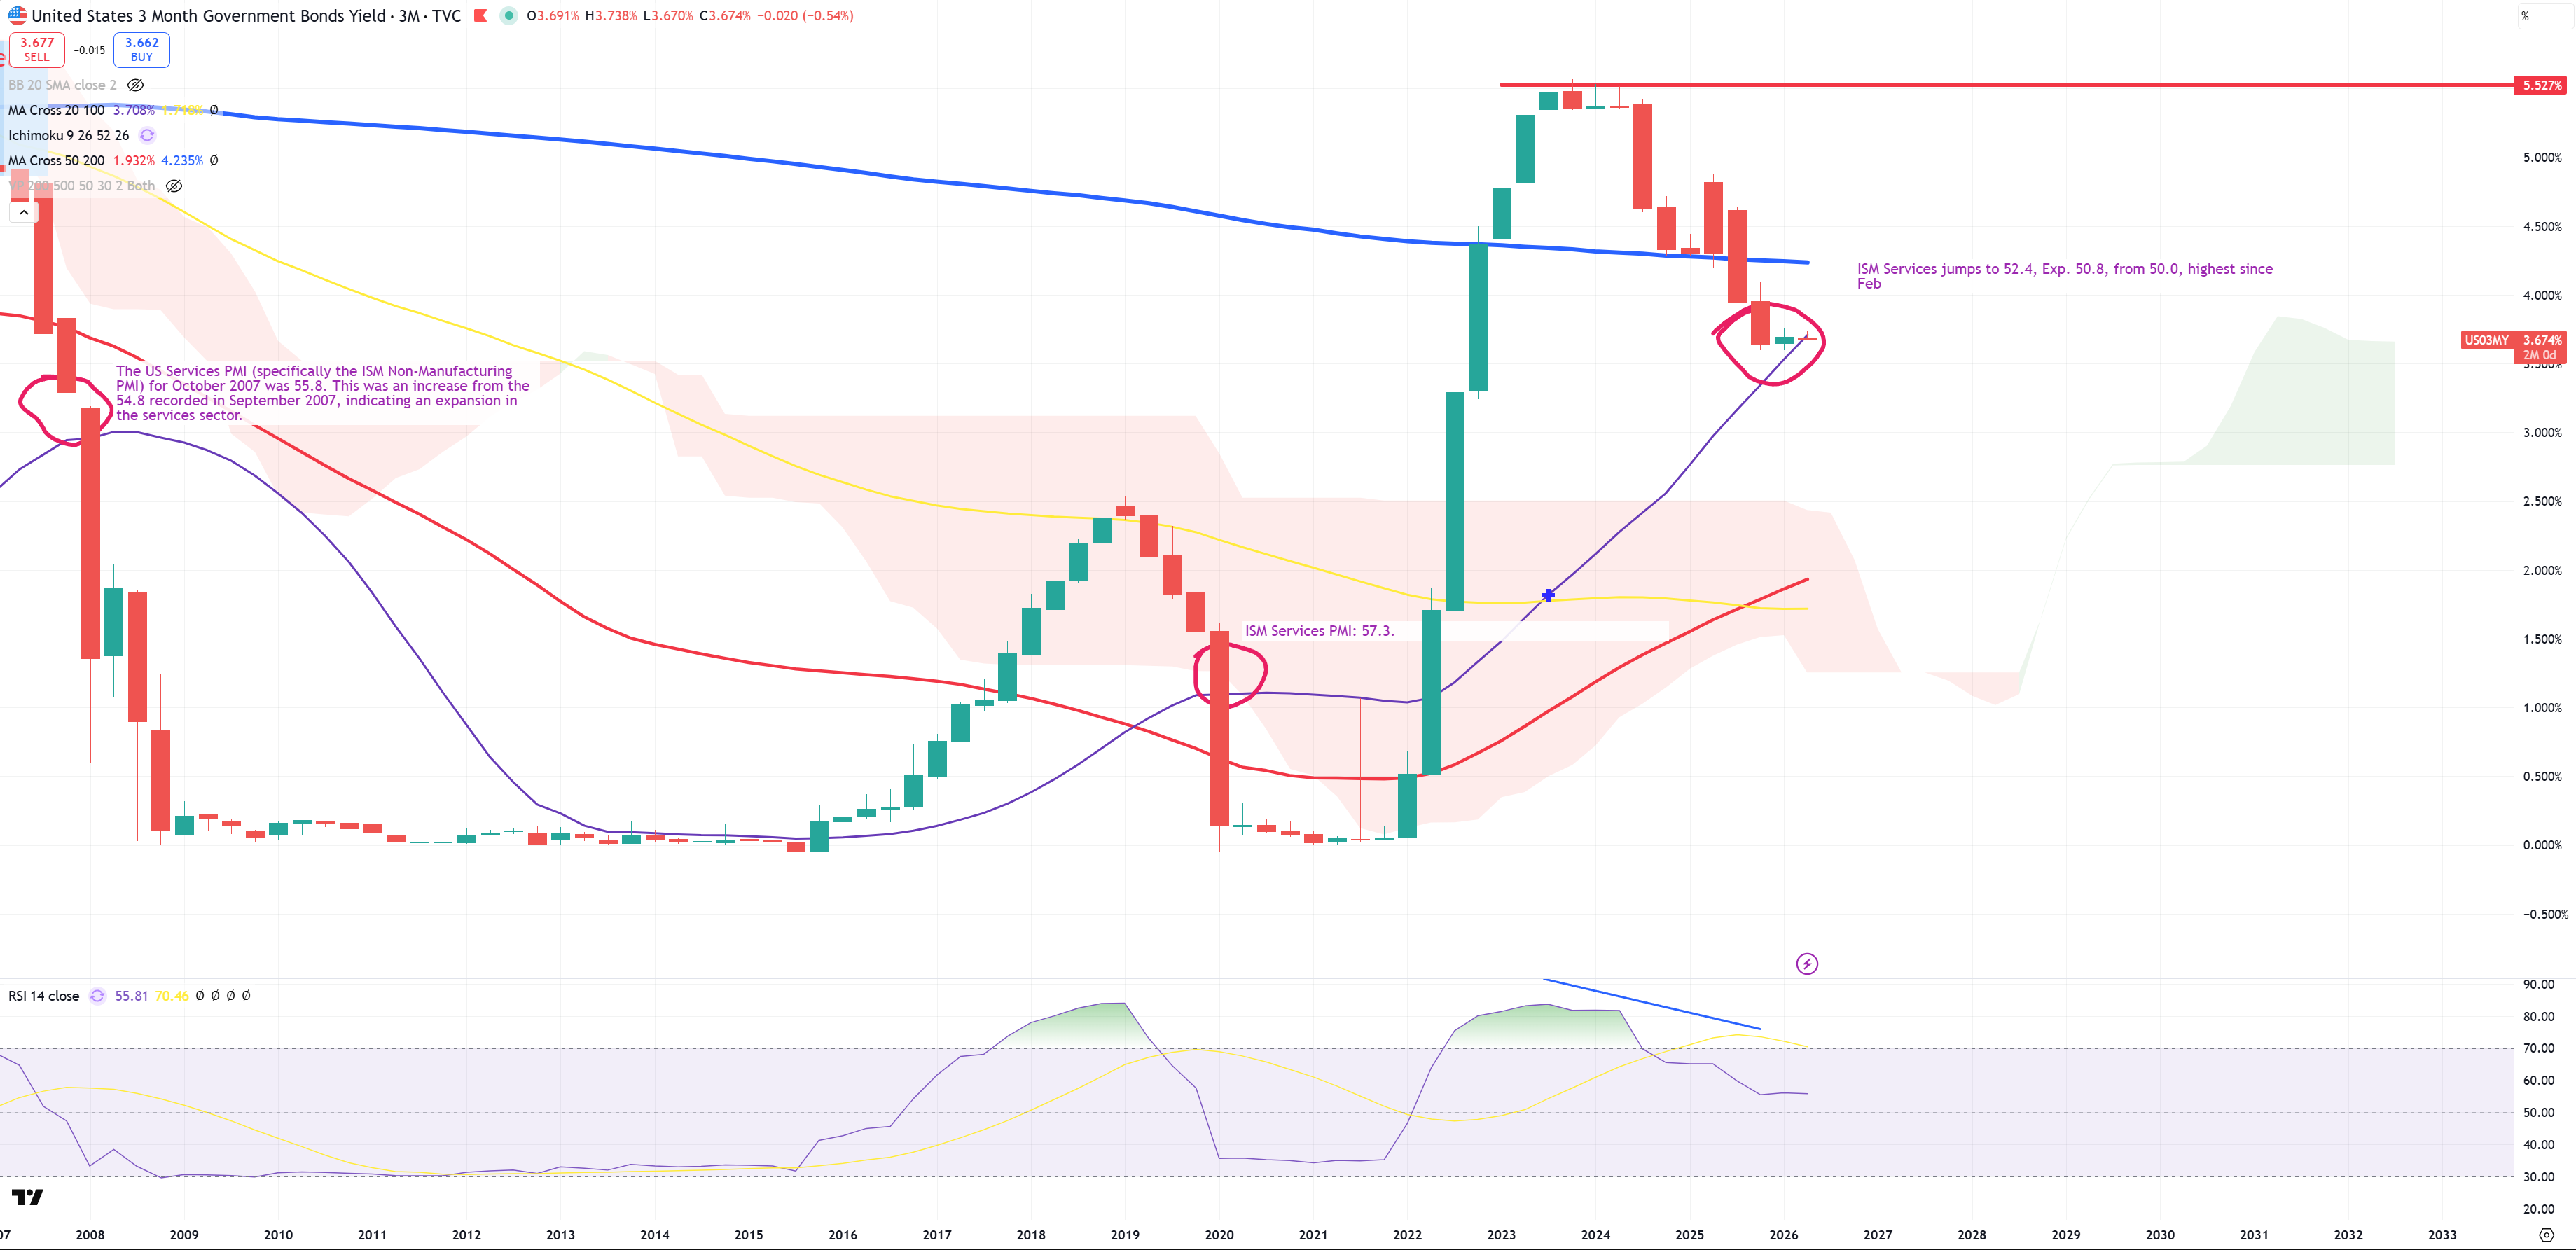
US03MY – key topping indicator matched exactly SPX/GOLD in 4Q25 moment. You’ll see on every chart here when it happened. I was watching this indicator for years and wasn’t sure about it but it pefectly matched all previous downturns in stocks. This is a kind of a connection gap between stocks & cycle I assume and this level in 4Q25 (October/November 2025) and moment of US03MY break will be represented on each stock/ETF chart to show you how it probably works. US03MY doesn’t say the top of broad market is already behind us, but it says so far it’s very near. Also adding (3M) view as even on a longer term we see (3M)MA20 break. First (M) second (3M) :
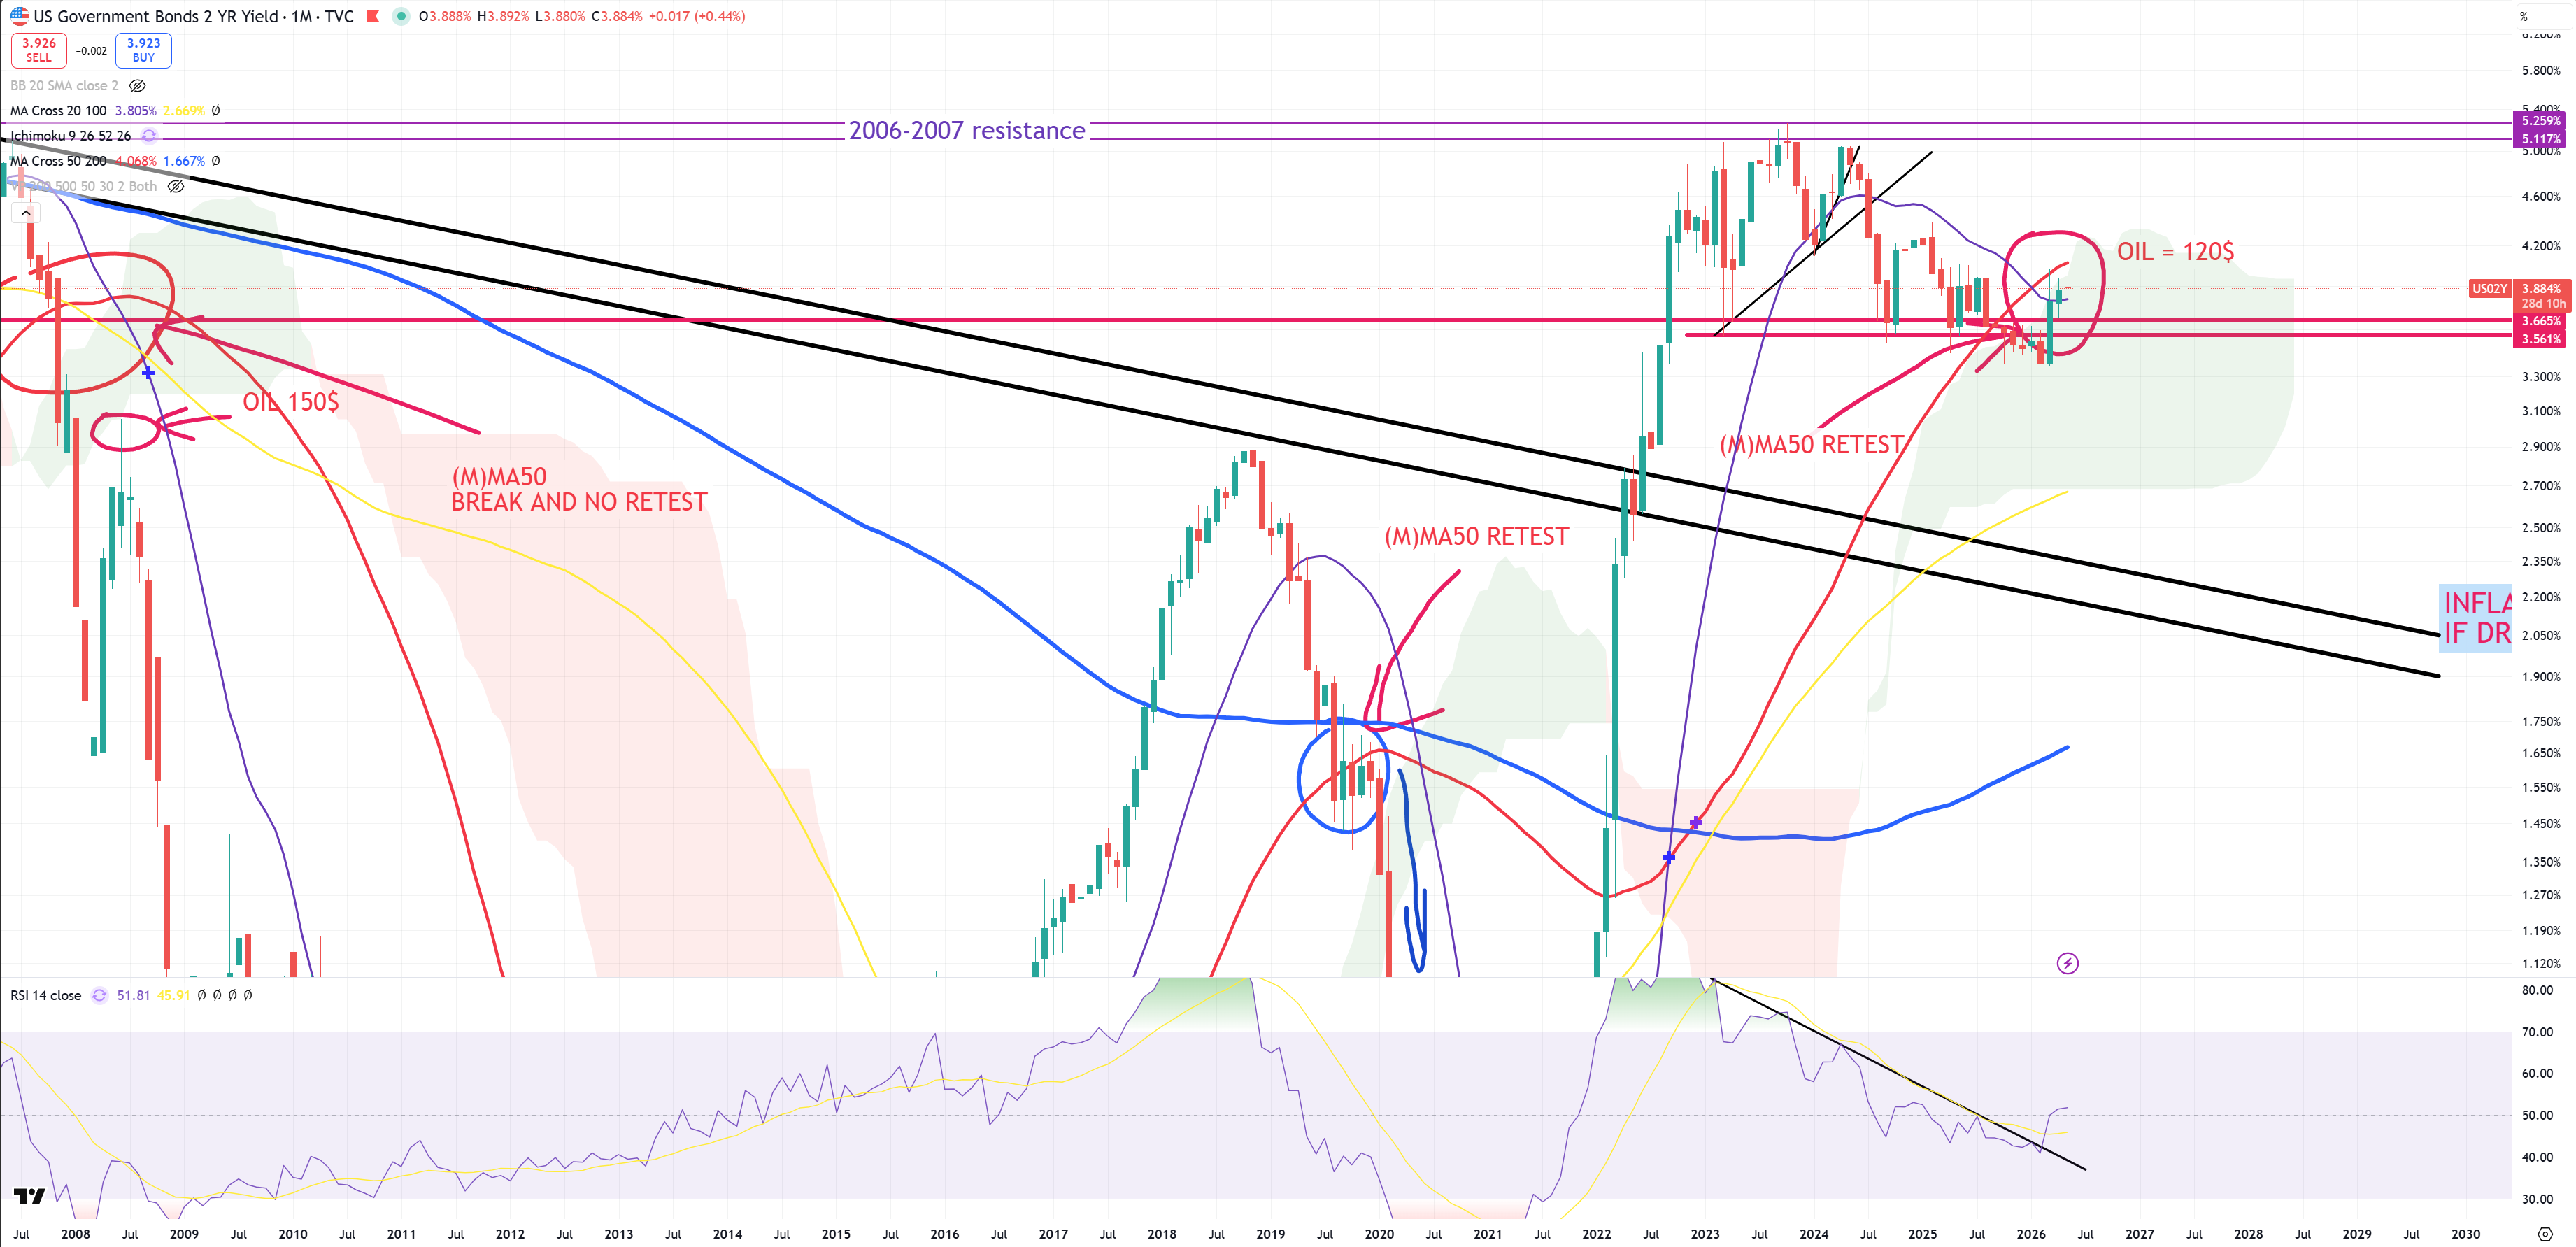
US02Y – so (M)MA50 has been eliminated and OIL = 120$ is the level of this retest. 4.07% is (M)MA50 and equivalent of OIL = 120$
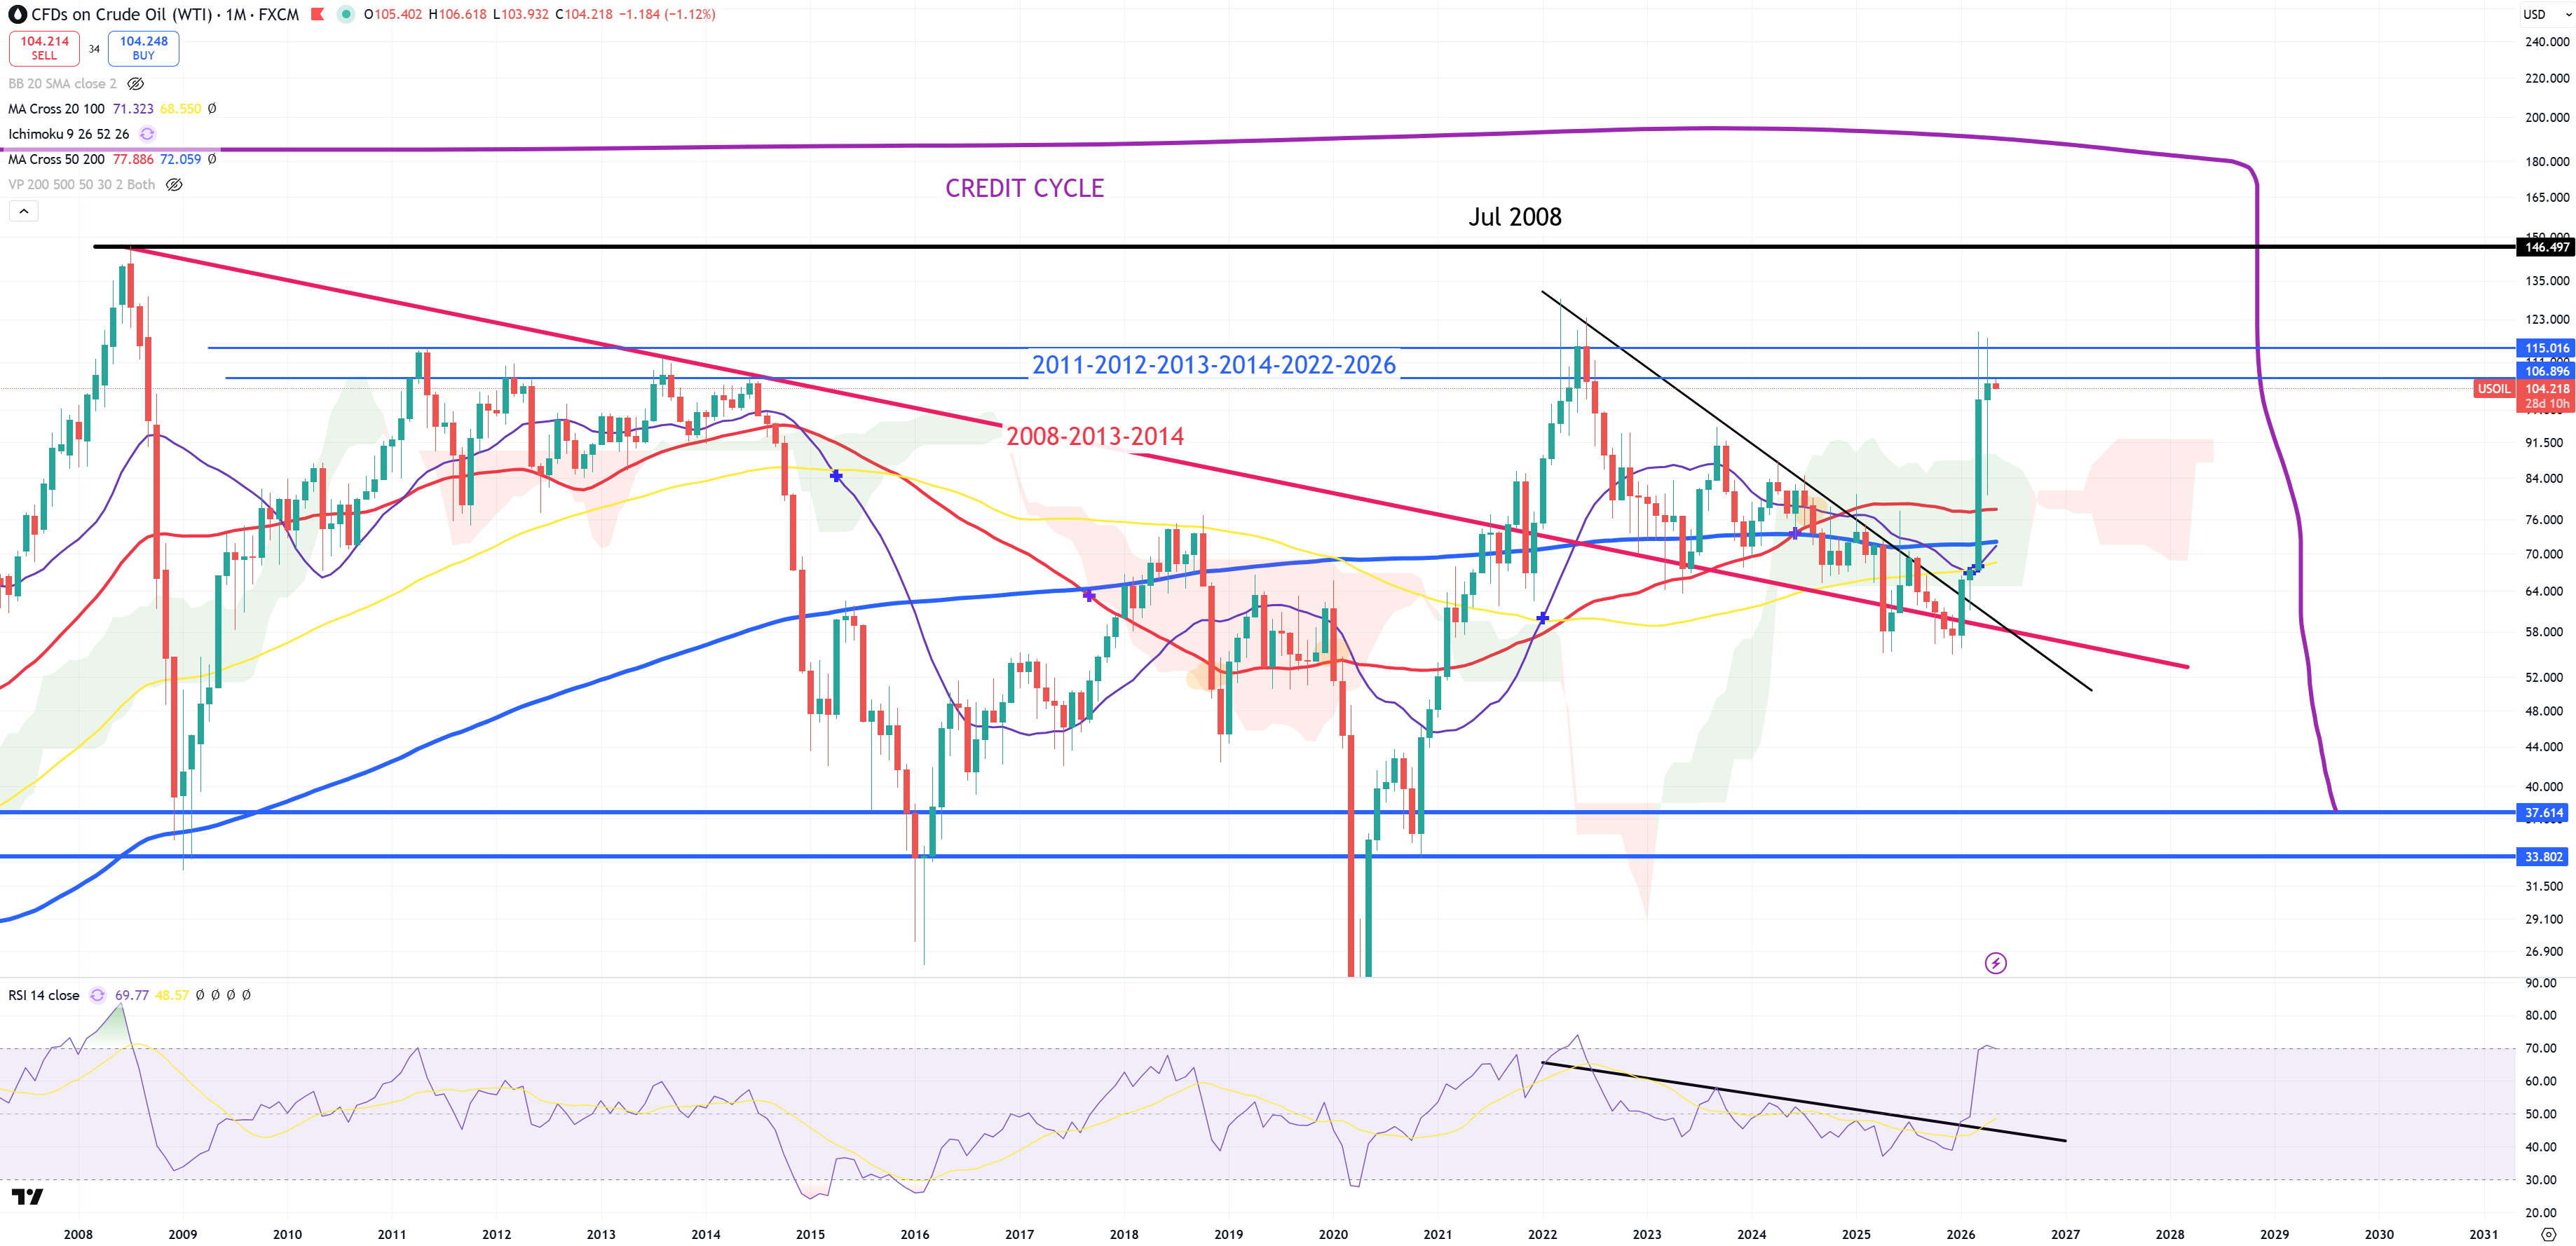
OIL – 120$ is a massive resistance
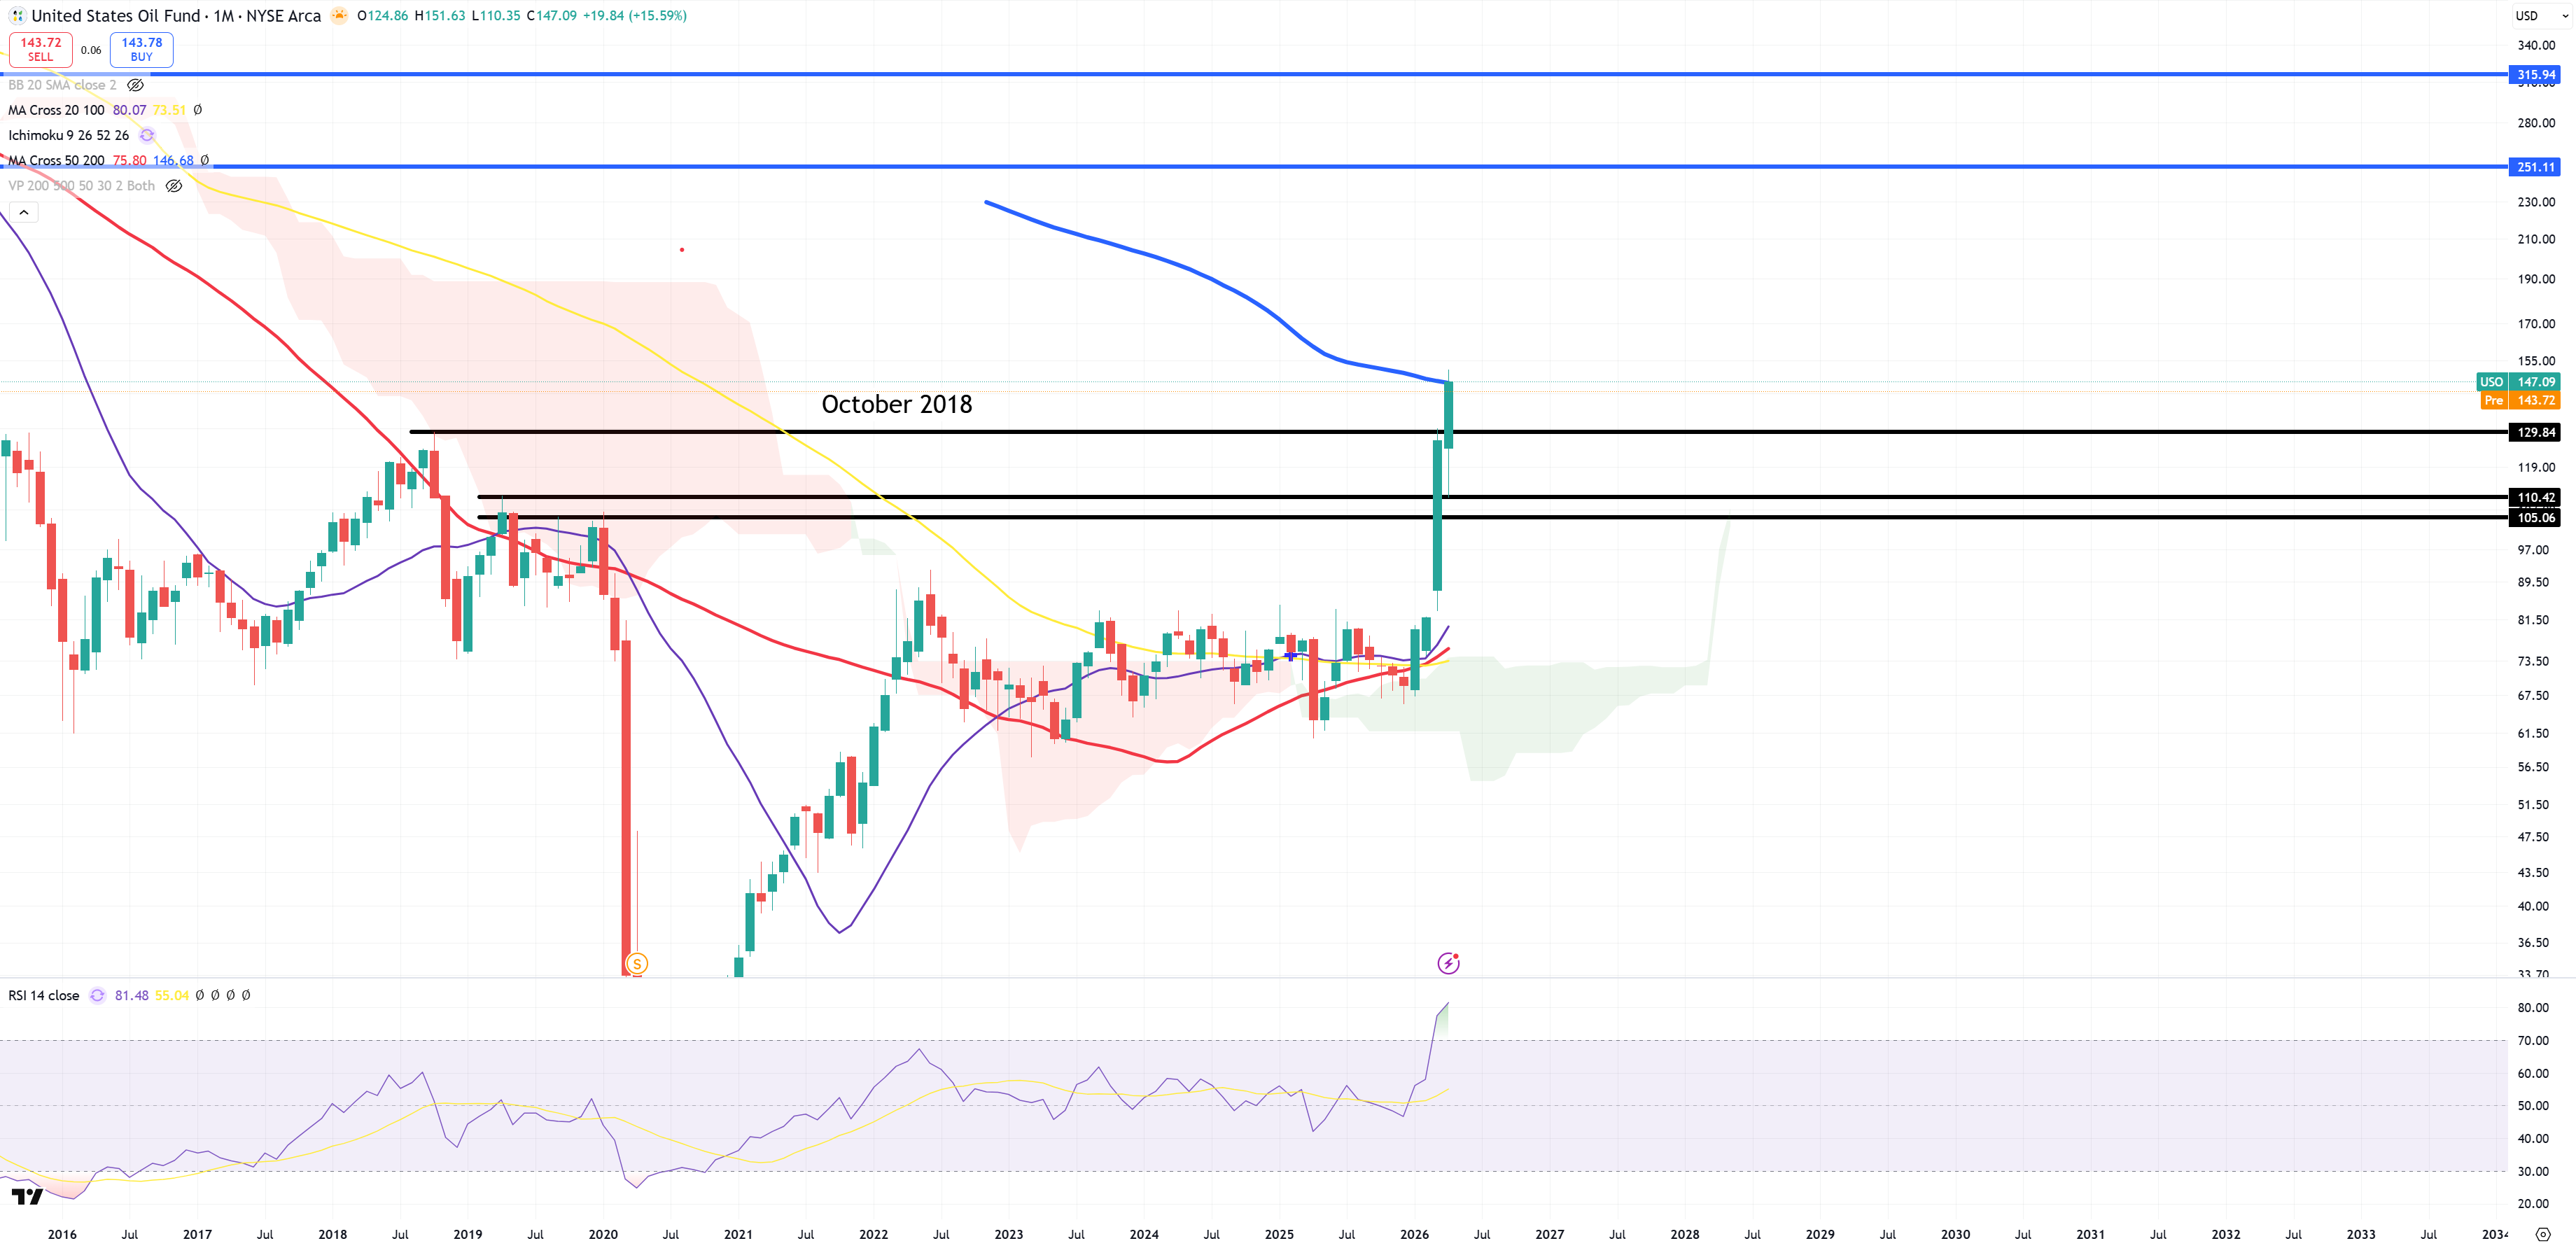
USO – hits (M)MA200 from the bottom. Massive resistance which was rejected so far.
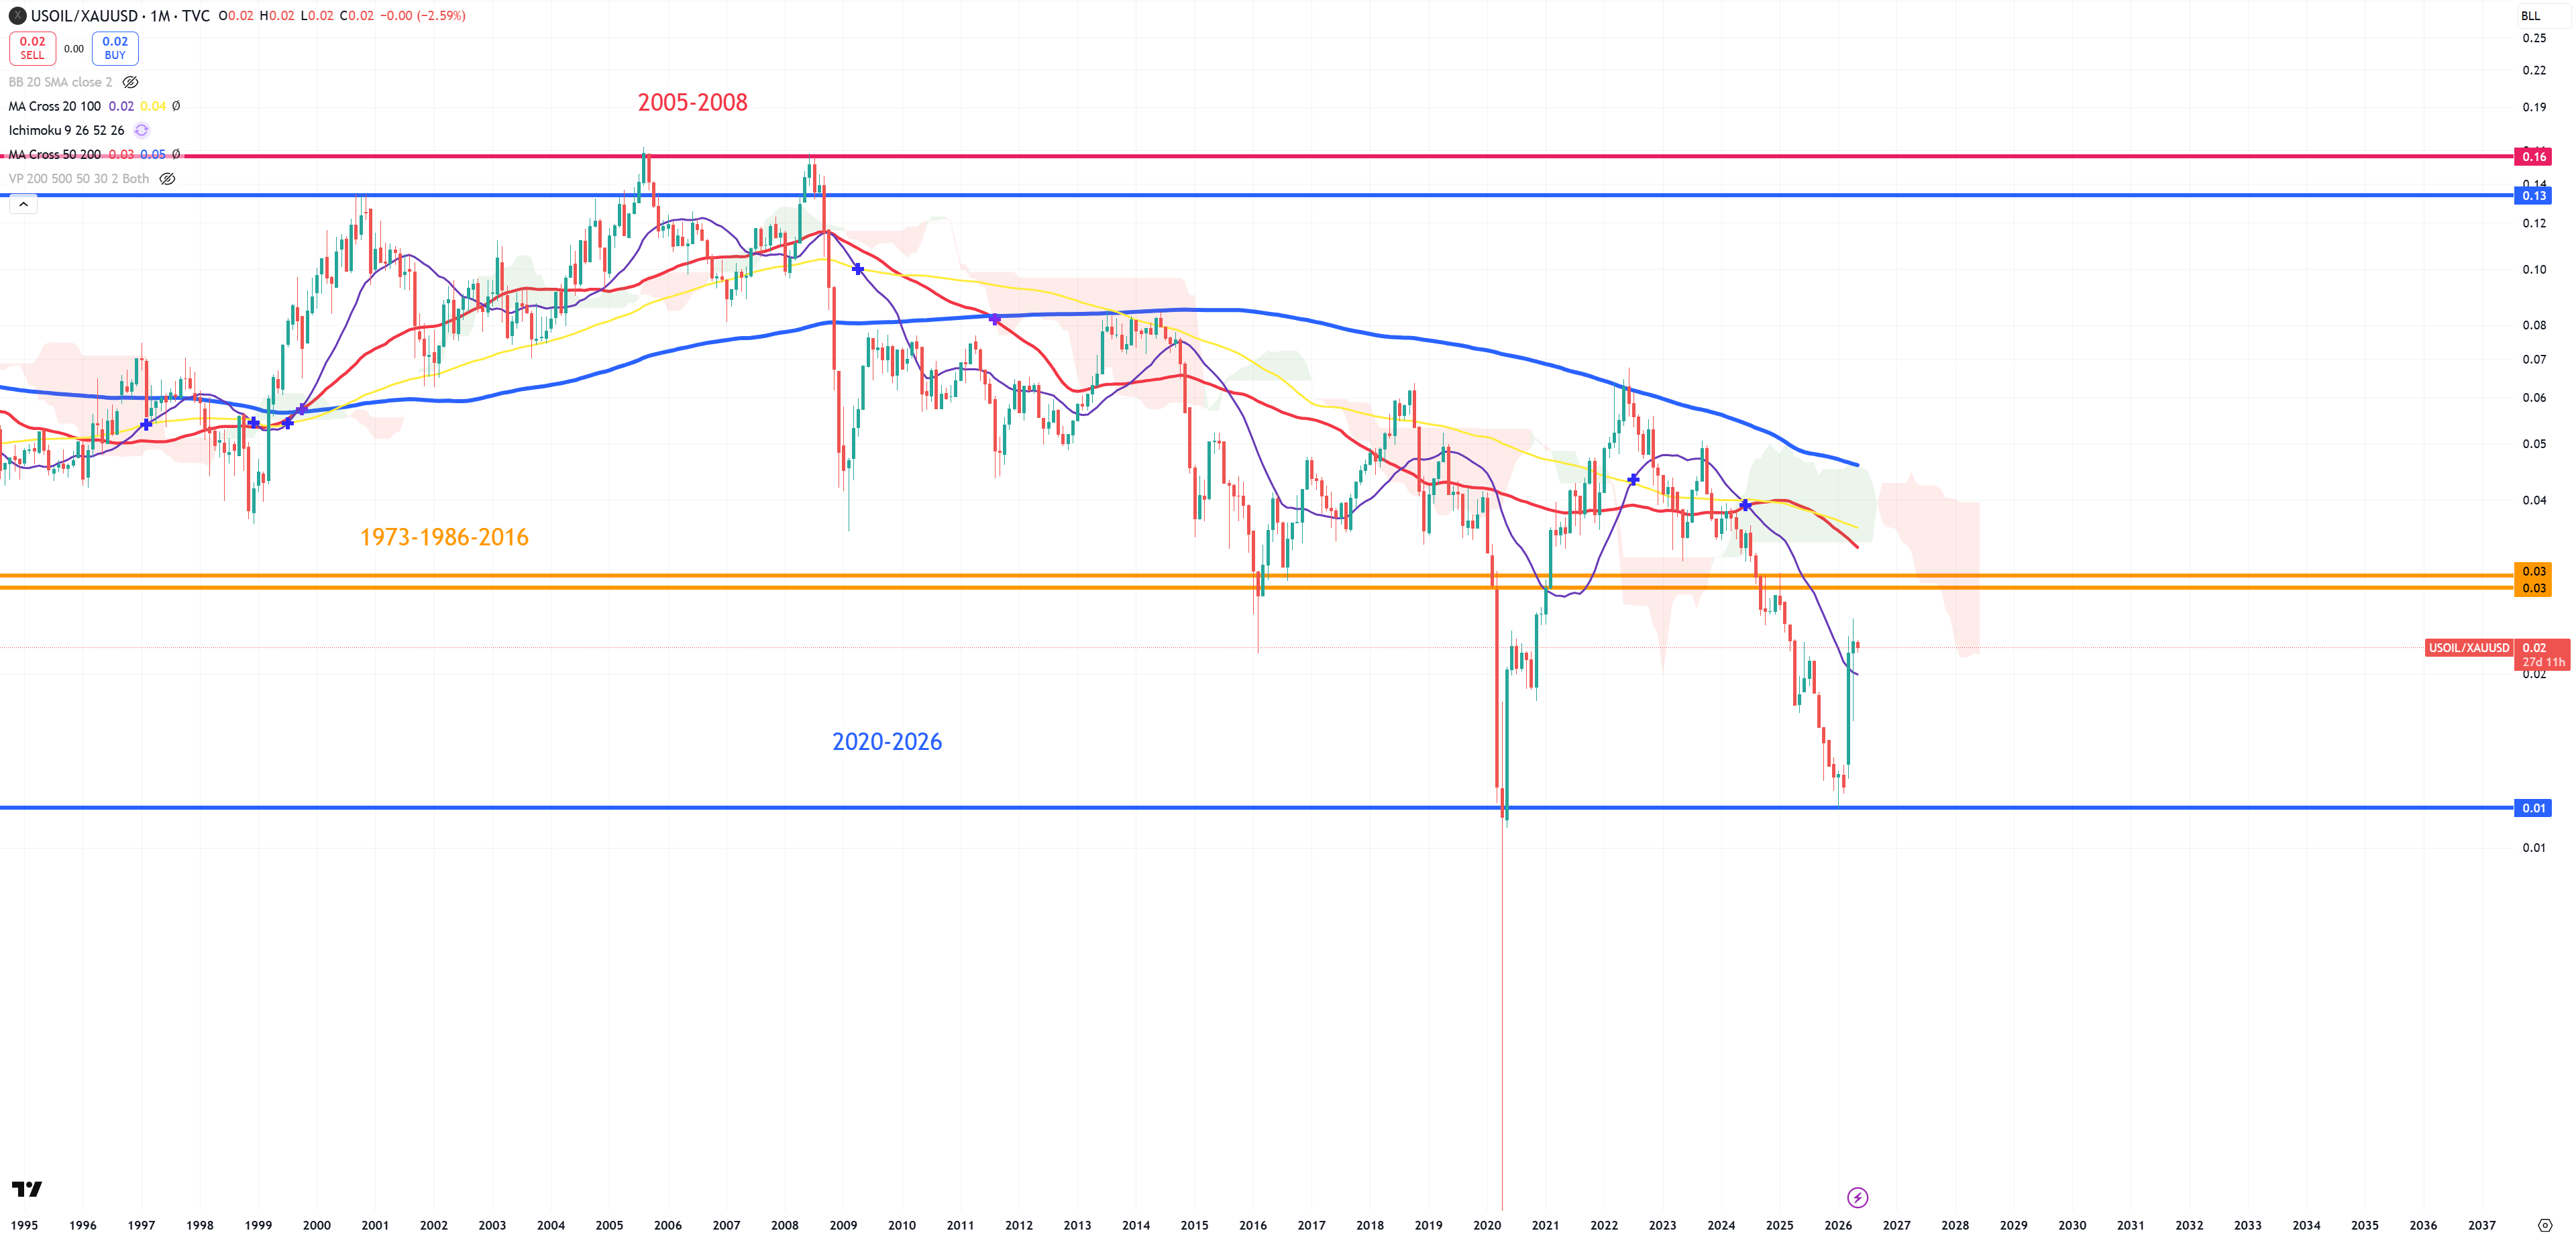
OIL/GOLD is super low, but above (M)MA20
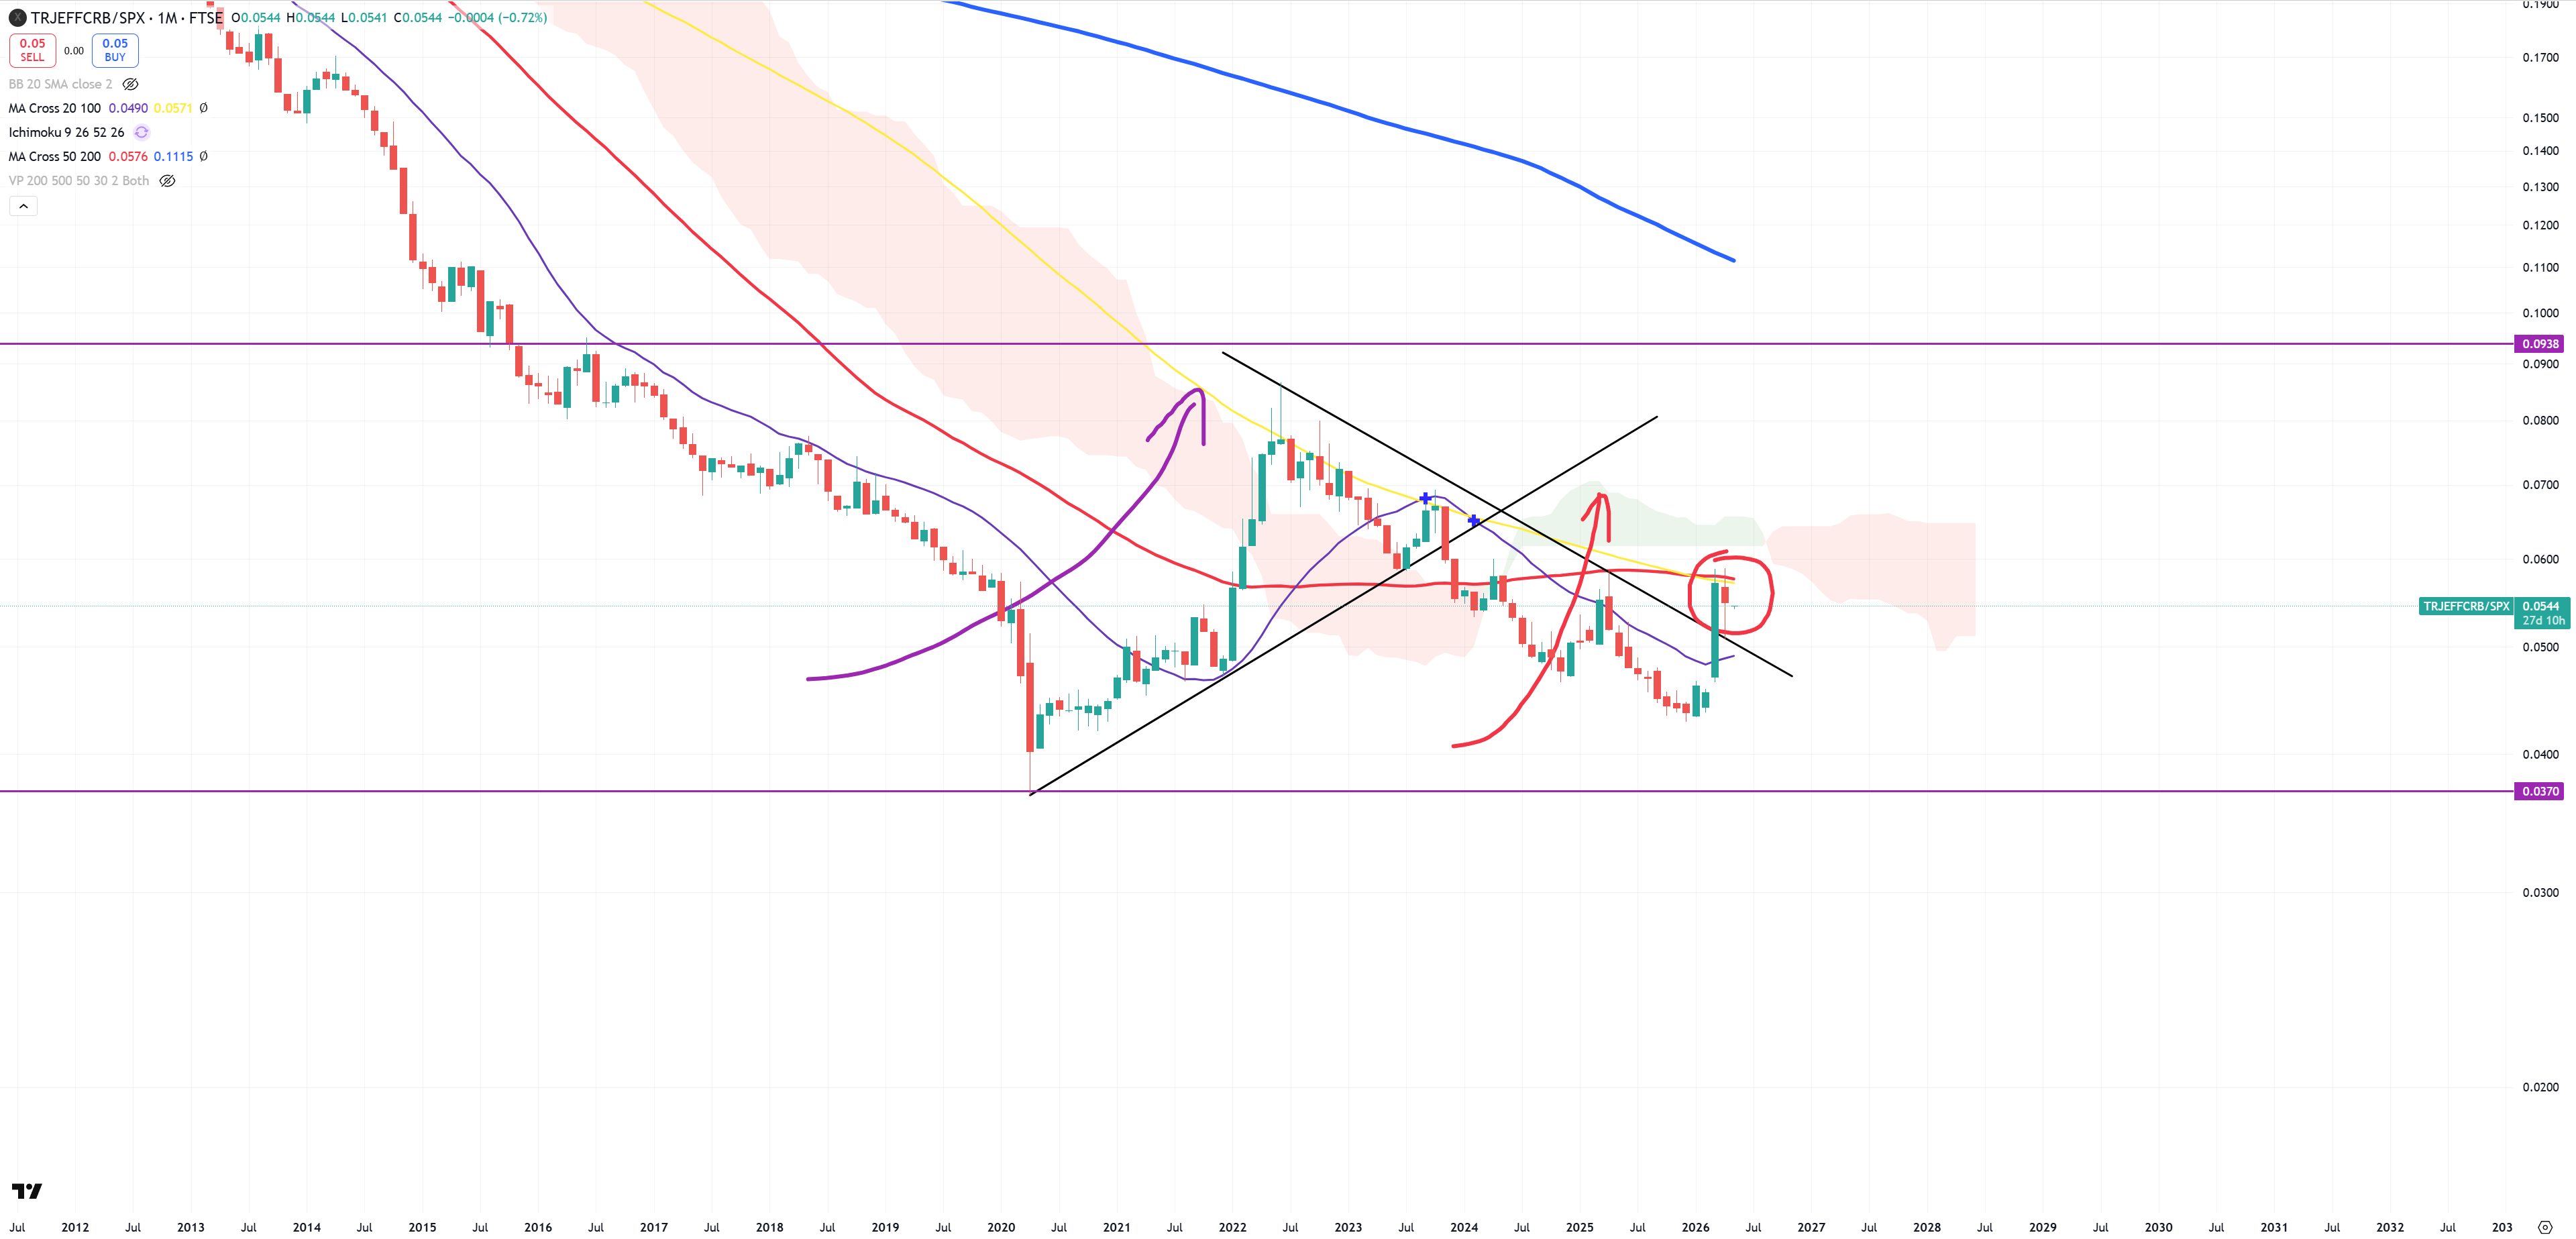
CRB/SPX is also above (M)MA20 => inflationary spike ahead, but (M)MA50 is now a limiter :
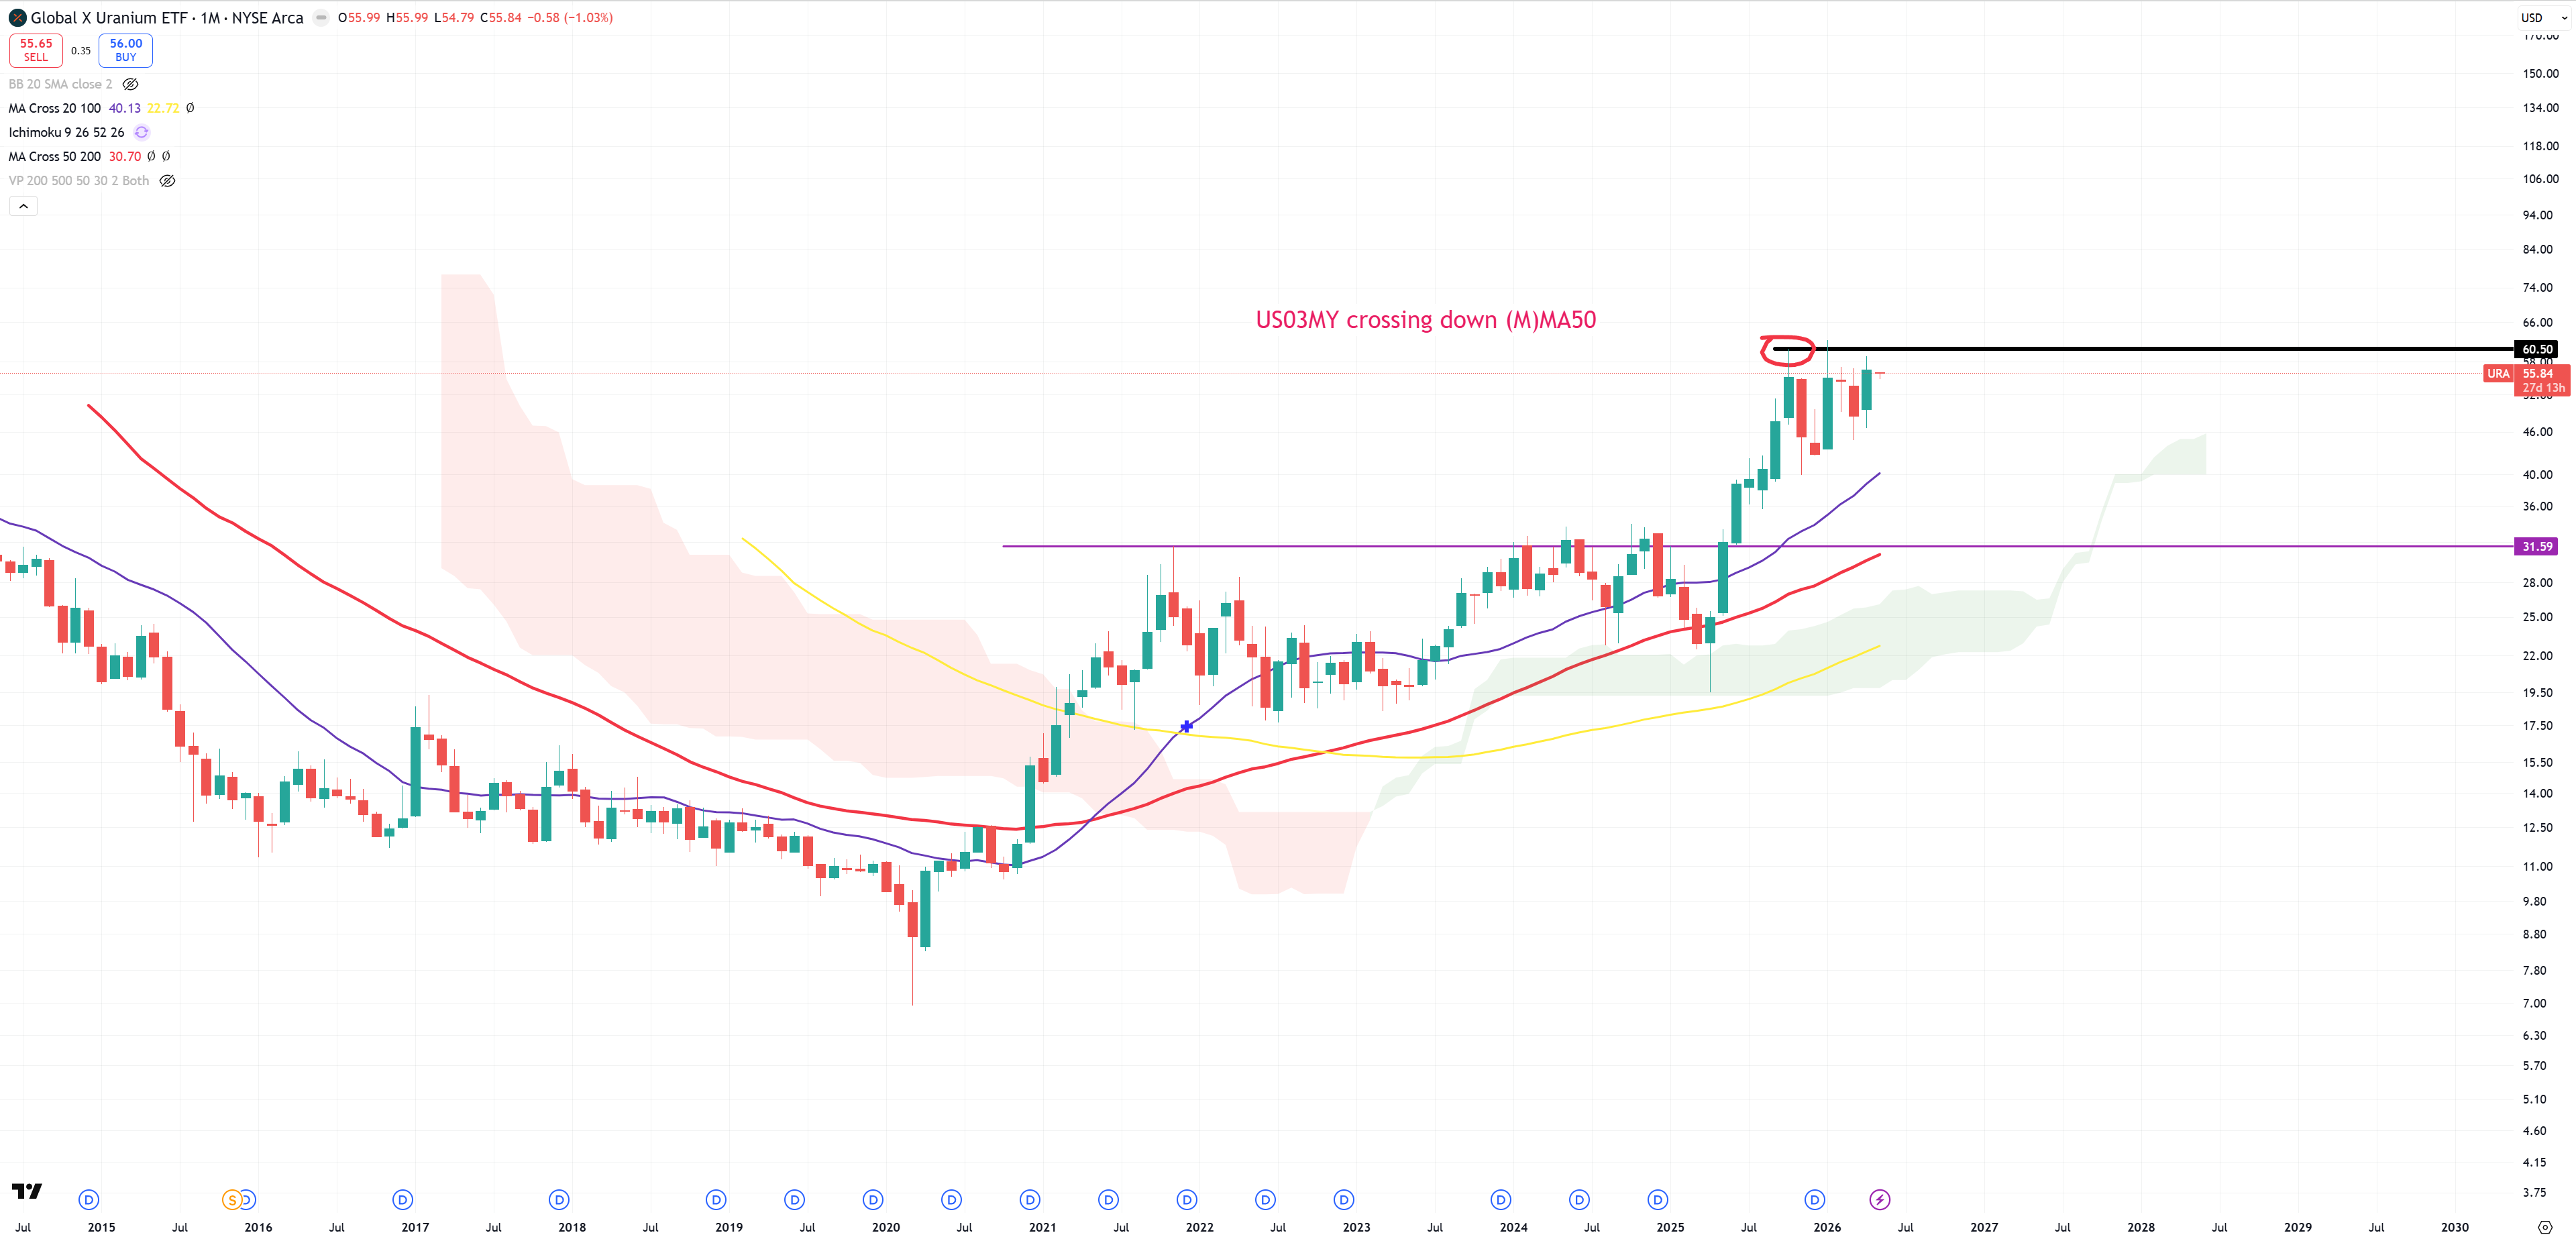
URA – The most important ETF for most of people I assume but nothing has been changed. I assume if OIL won’t be able to break 120$, URA won’t be able to break this 60$ too, the same time US02Y won’t be able to jump over (M)MA50 = ~4.05%. Remember this is all about putting the puzzles from technical analysis.
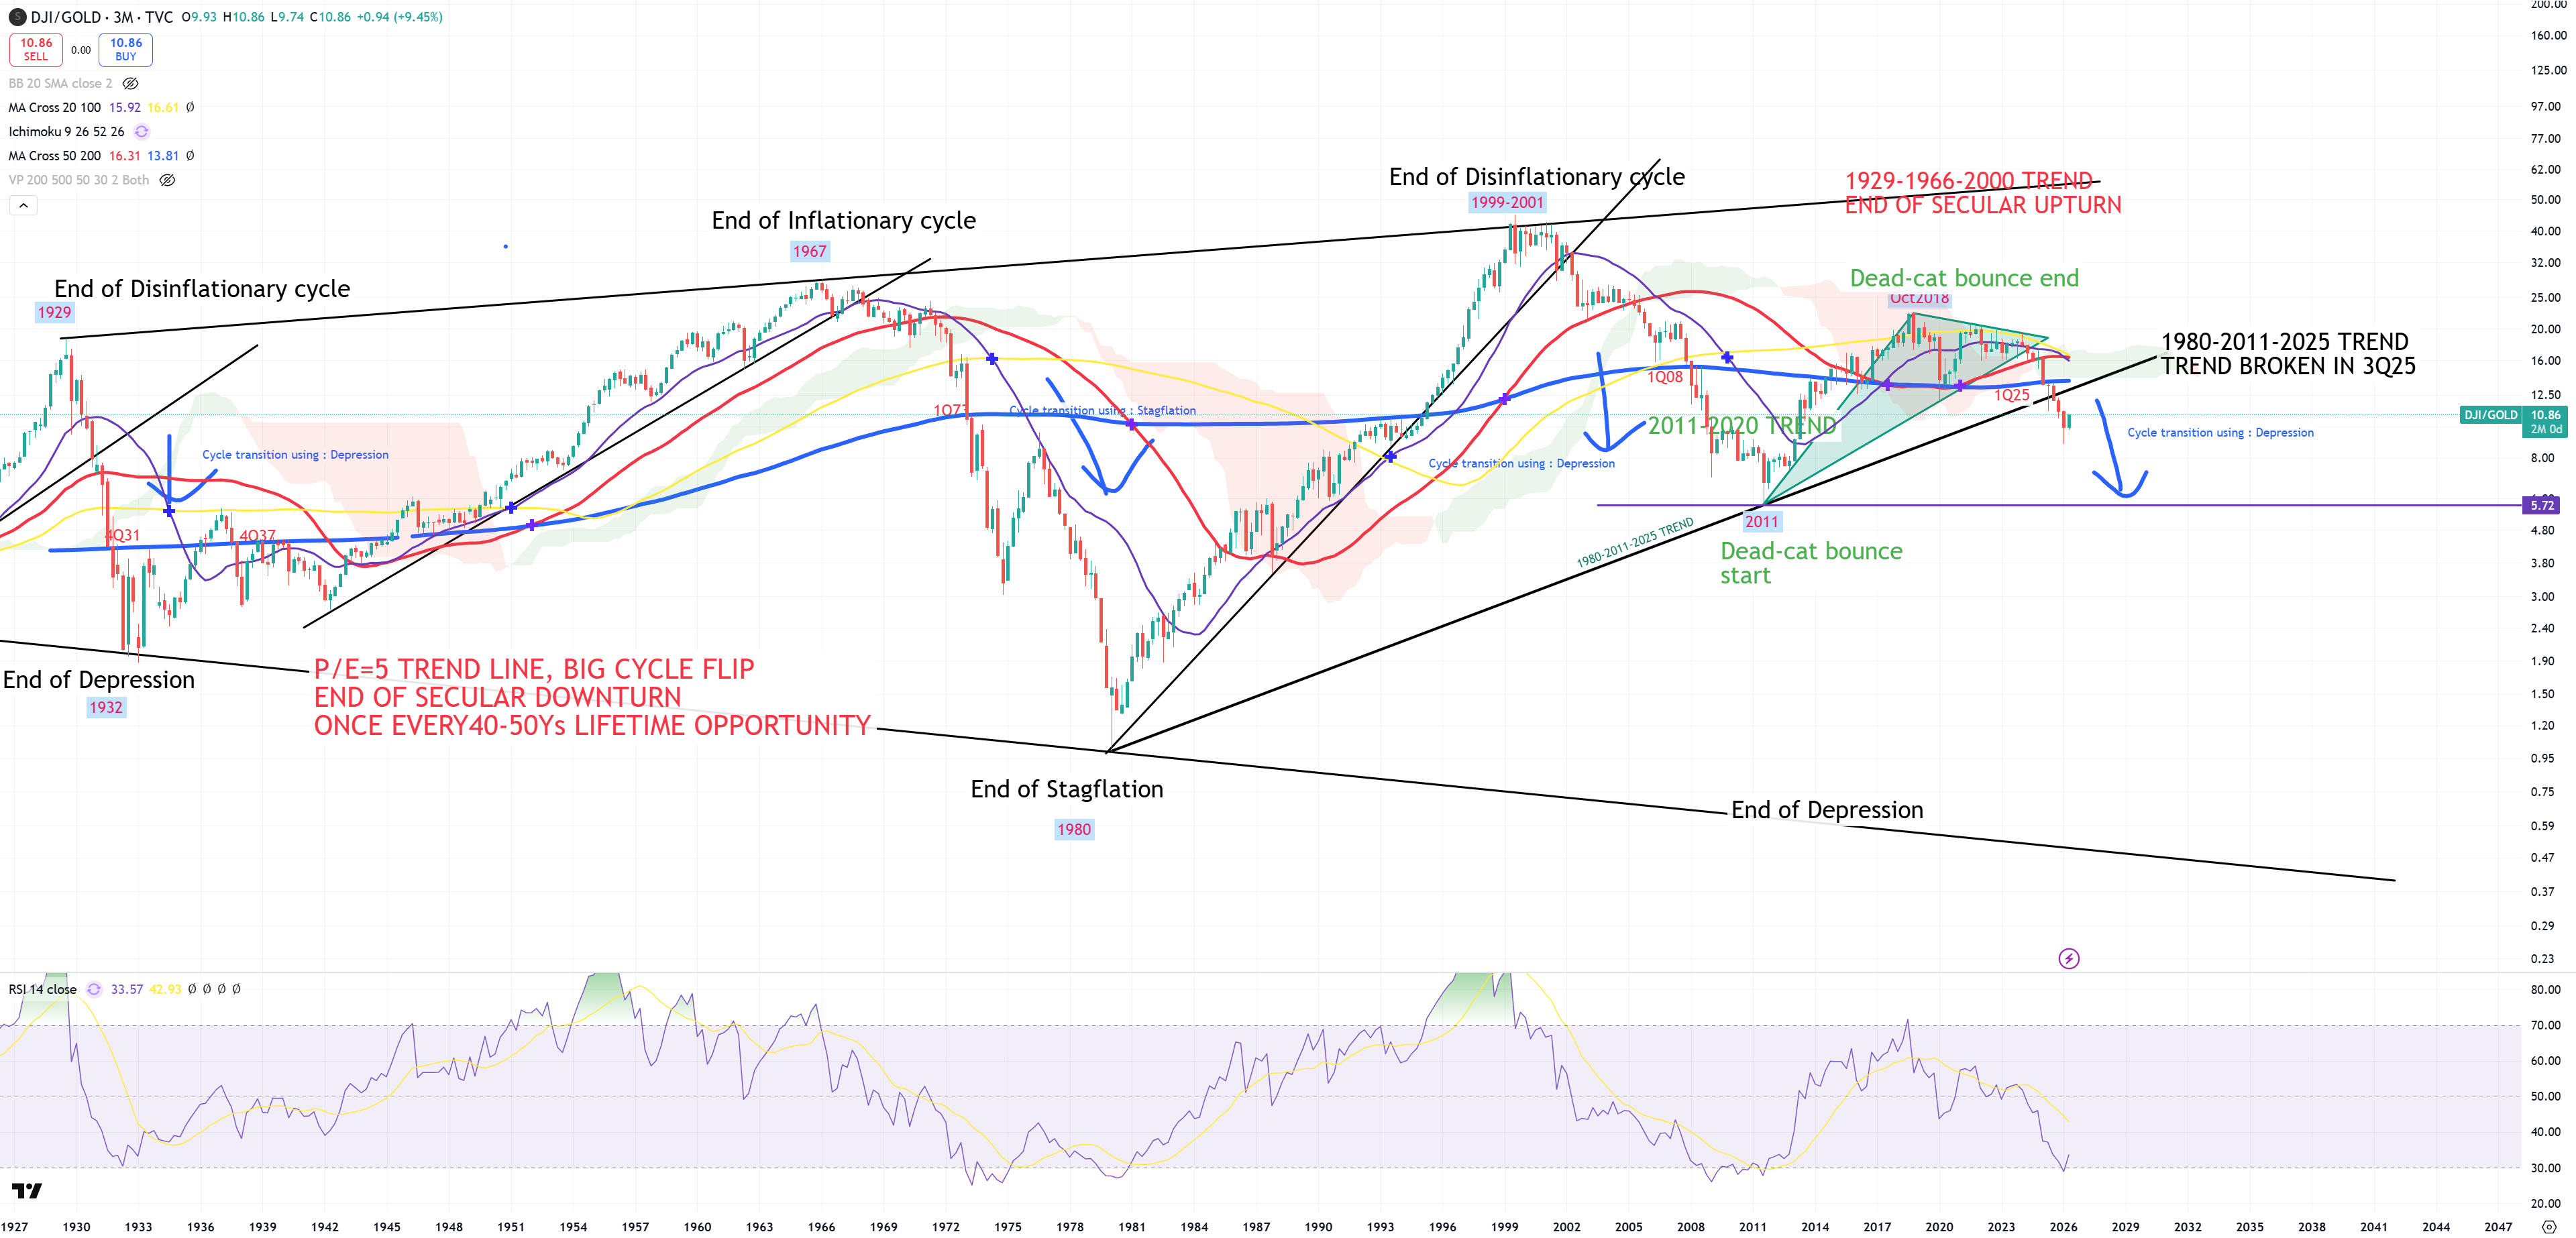
DJI/GOLD – Combined with SPX/GOLD they were running together, but since some time it looks like DJI/GOLD shows the future path for SPX/GOLD. DJI/GOLD has broken even 1980-2011 trend line. This small green 1Q26 candle seems to be a peanut over the long run of gold’s secular bull market which started based on this chart in 2018.
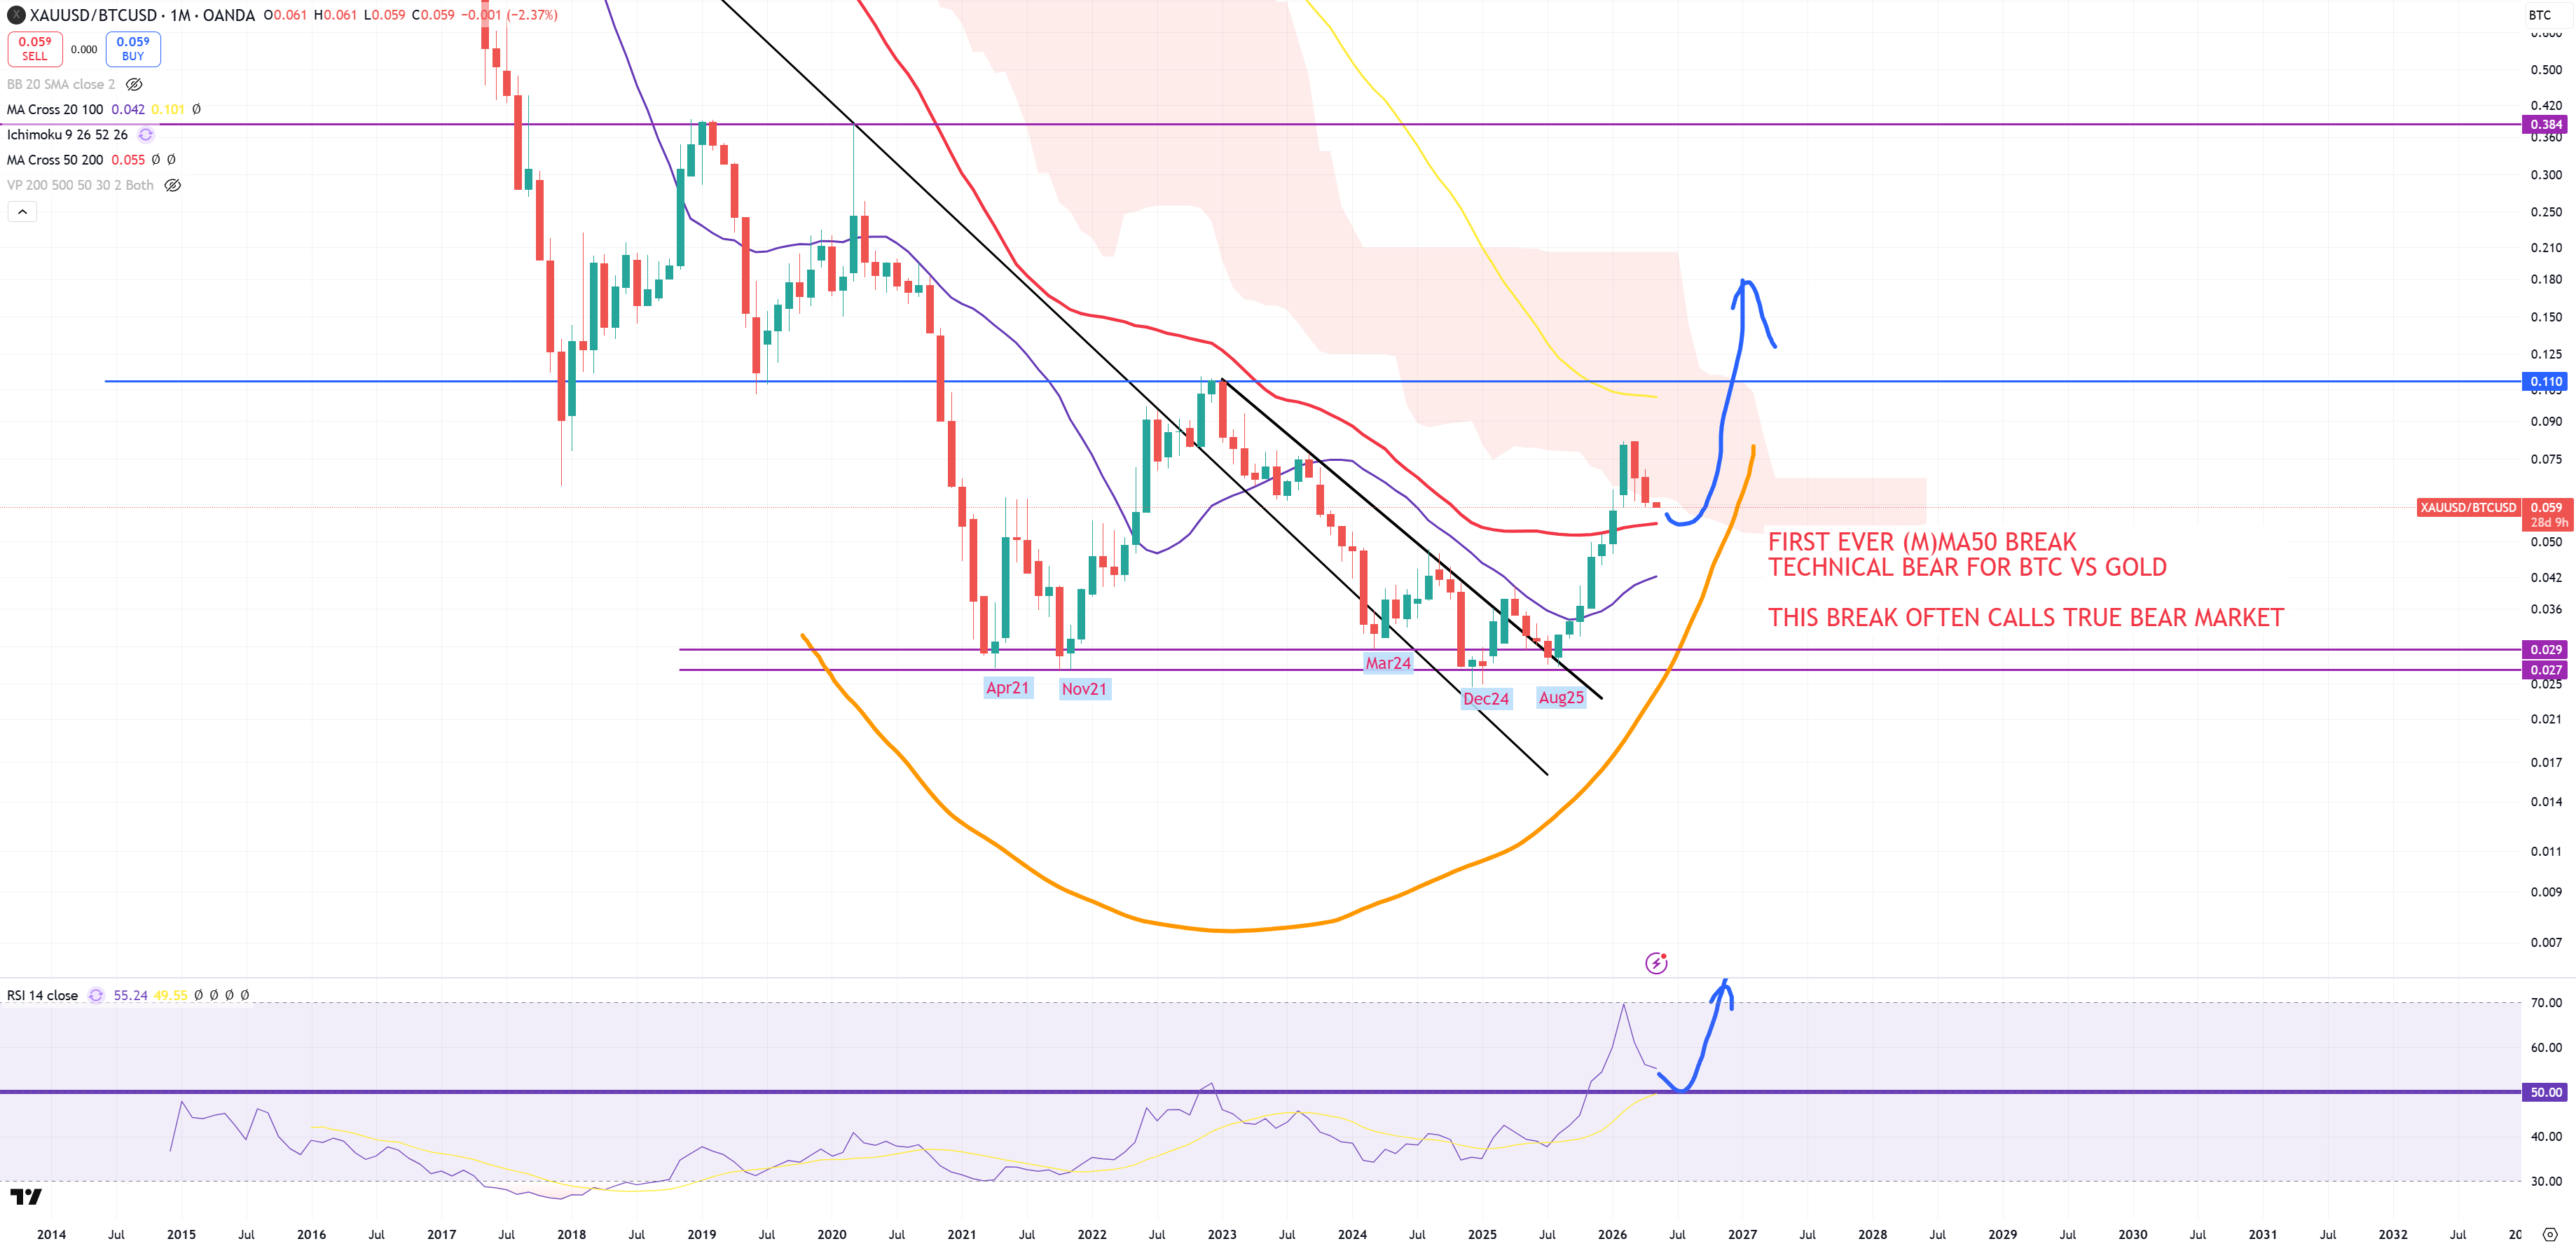
GOLD/BTC – still has some room to retest (M)MA50 for the first time ever. I this room is exactly the same as SPX/GOLD distance to (3M)MA200. If you ever thing about shorting BTC just wait for (M)MA50 touch.
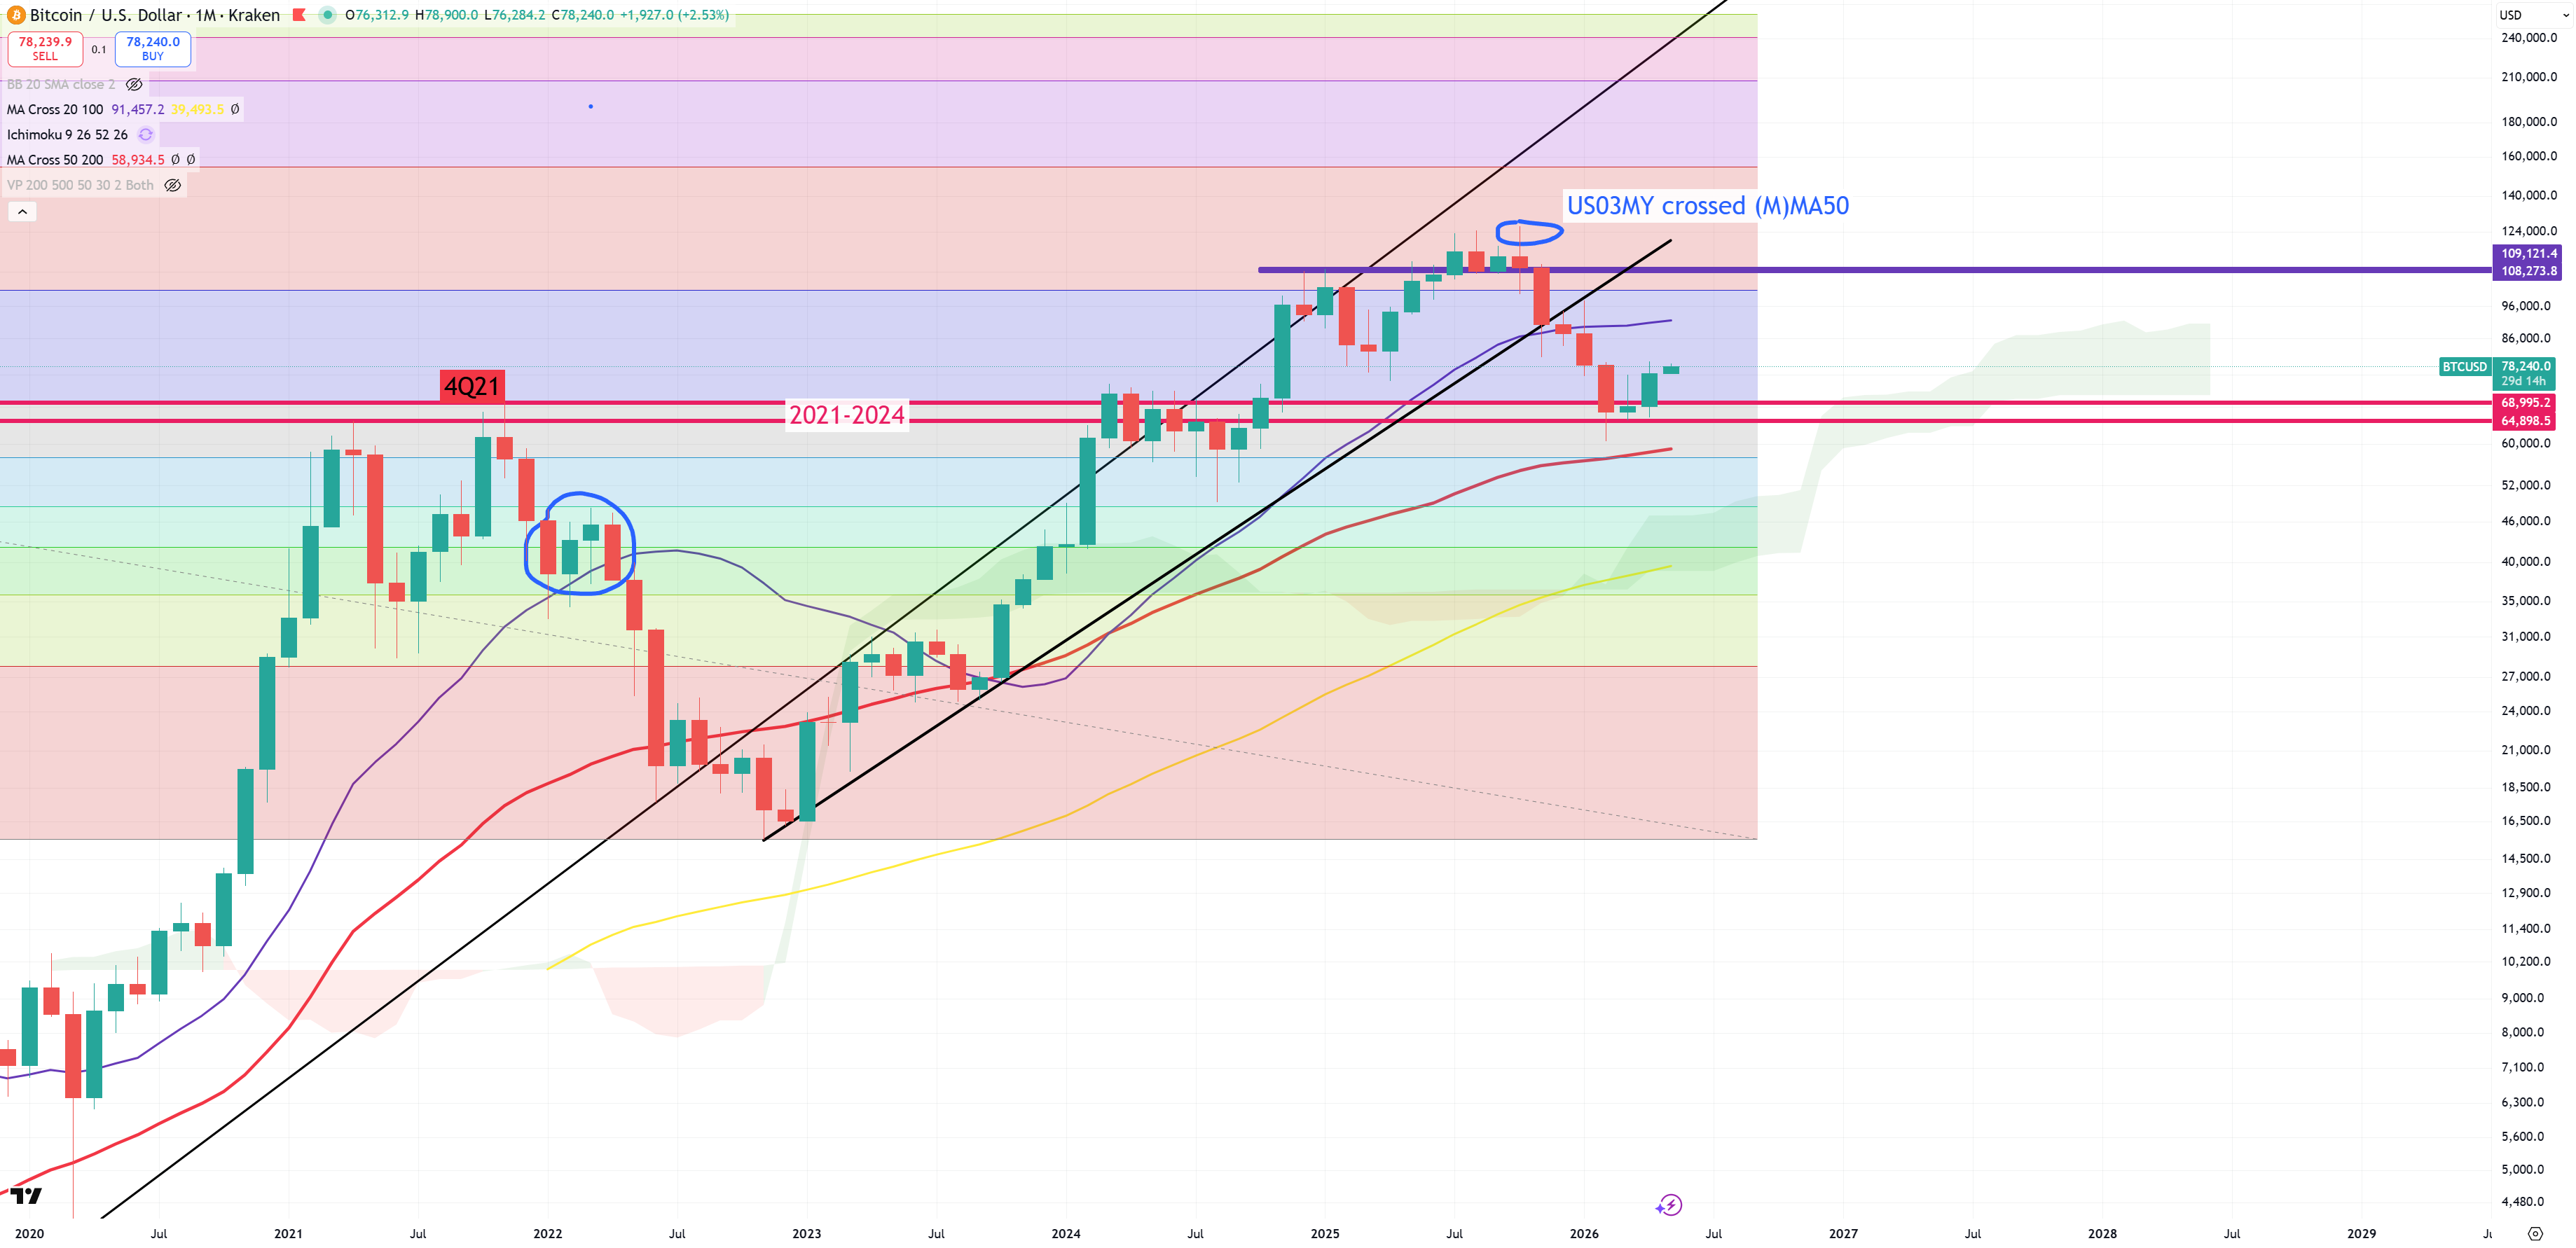
BTC – while BTC keeps defending its 2021 peak
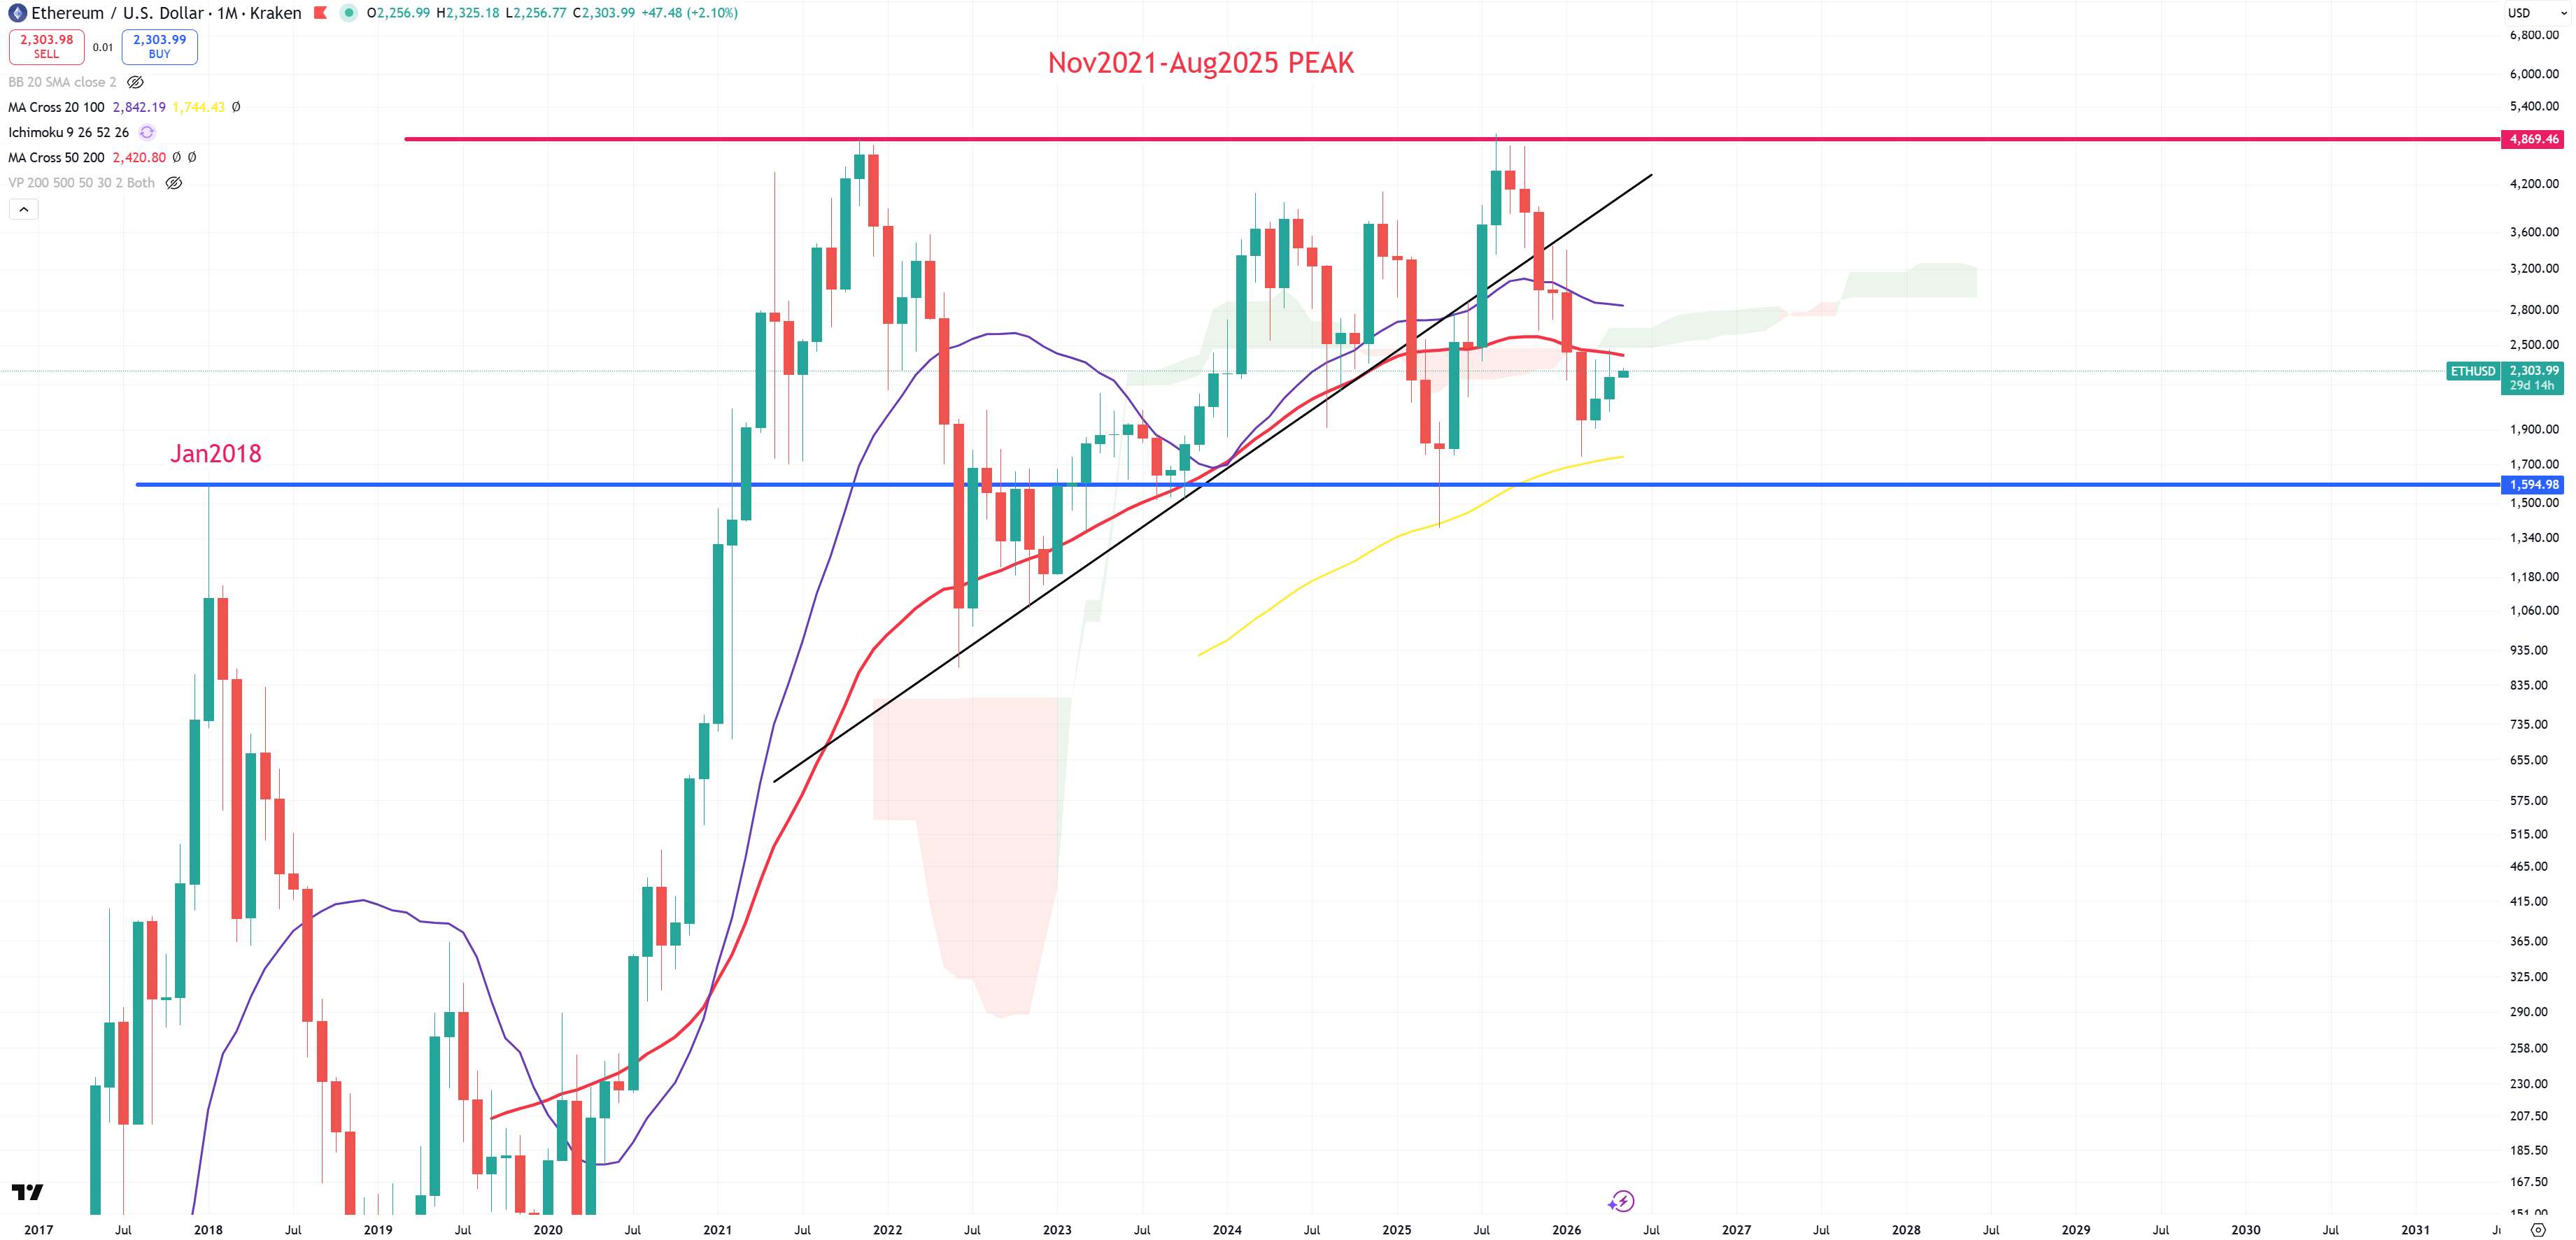
ETH retesting (M)MA50 from the bottom
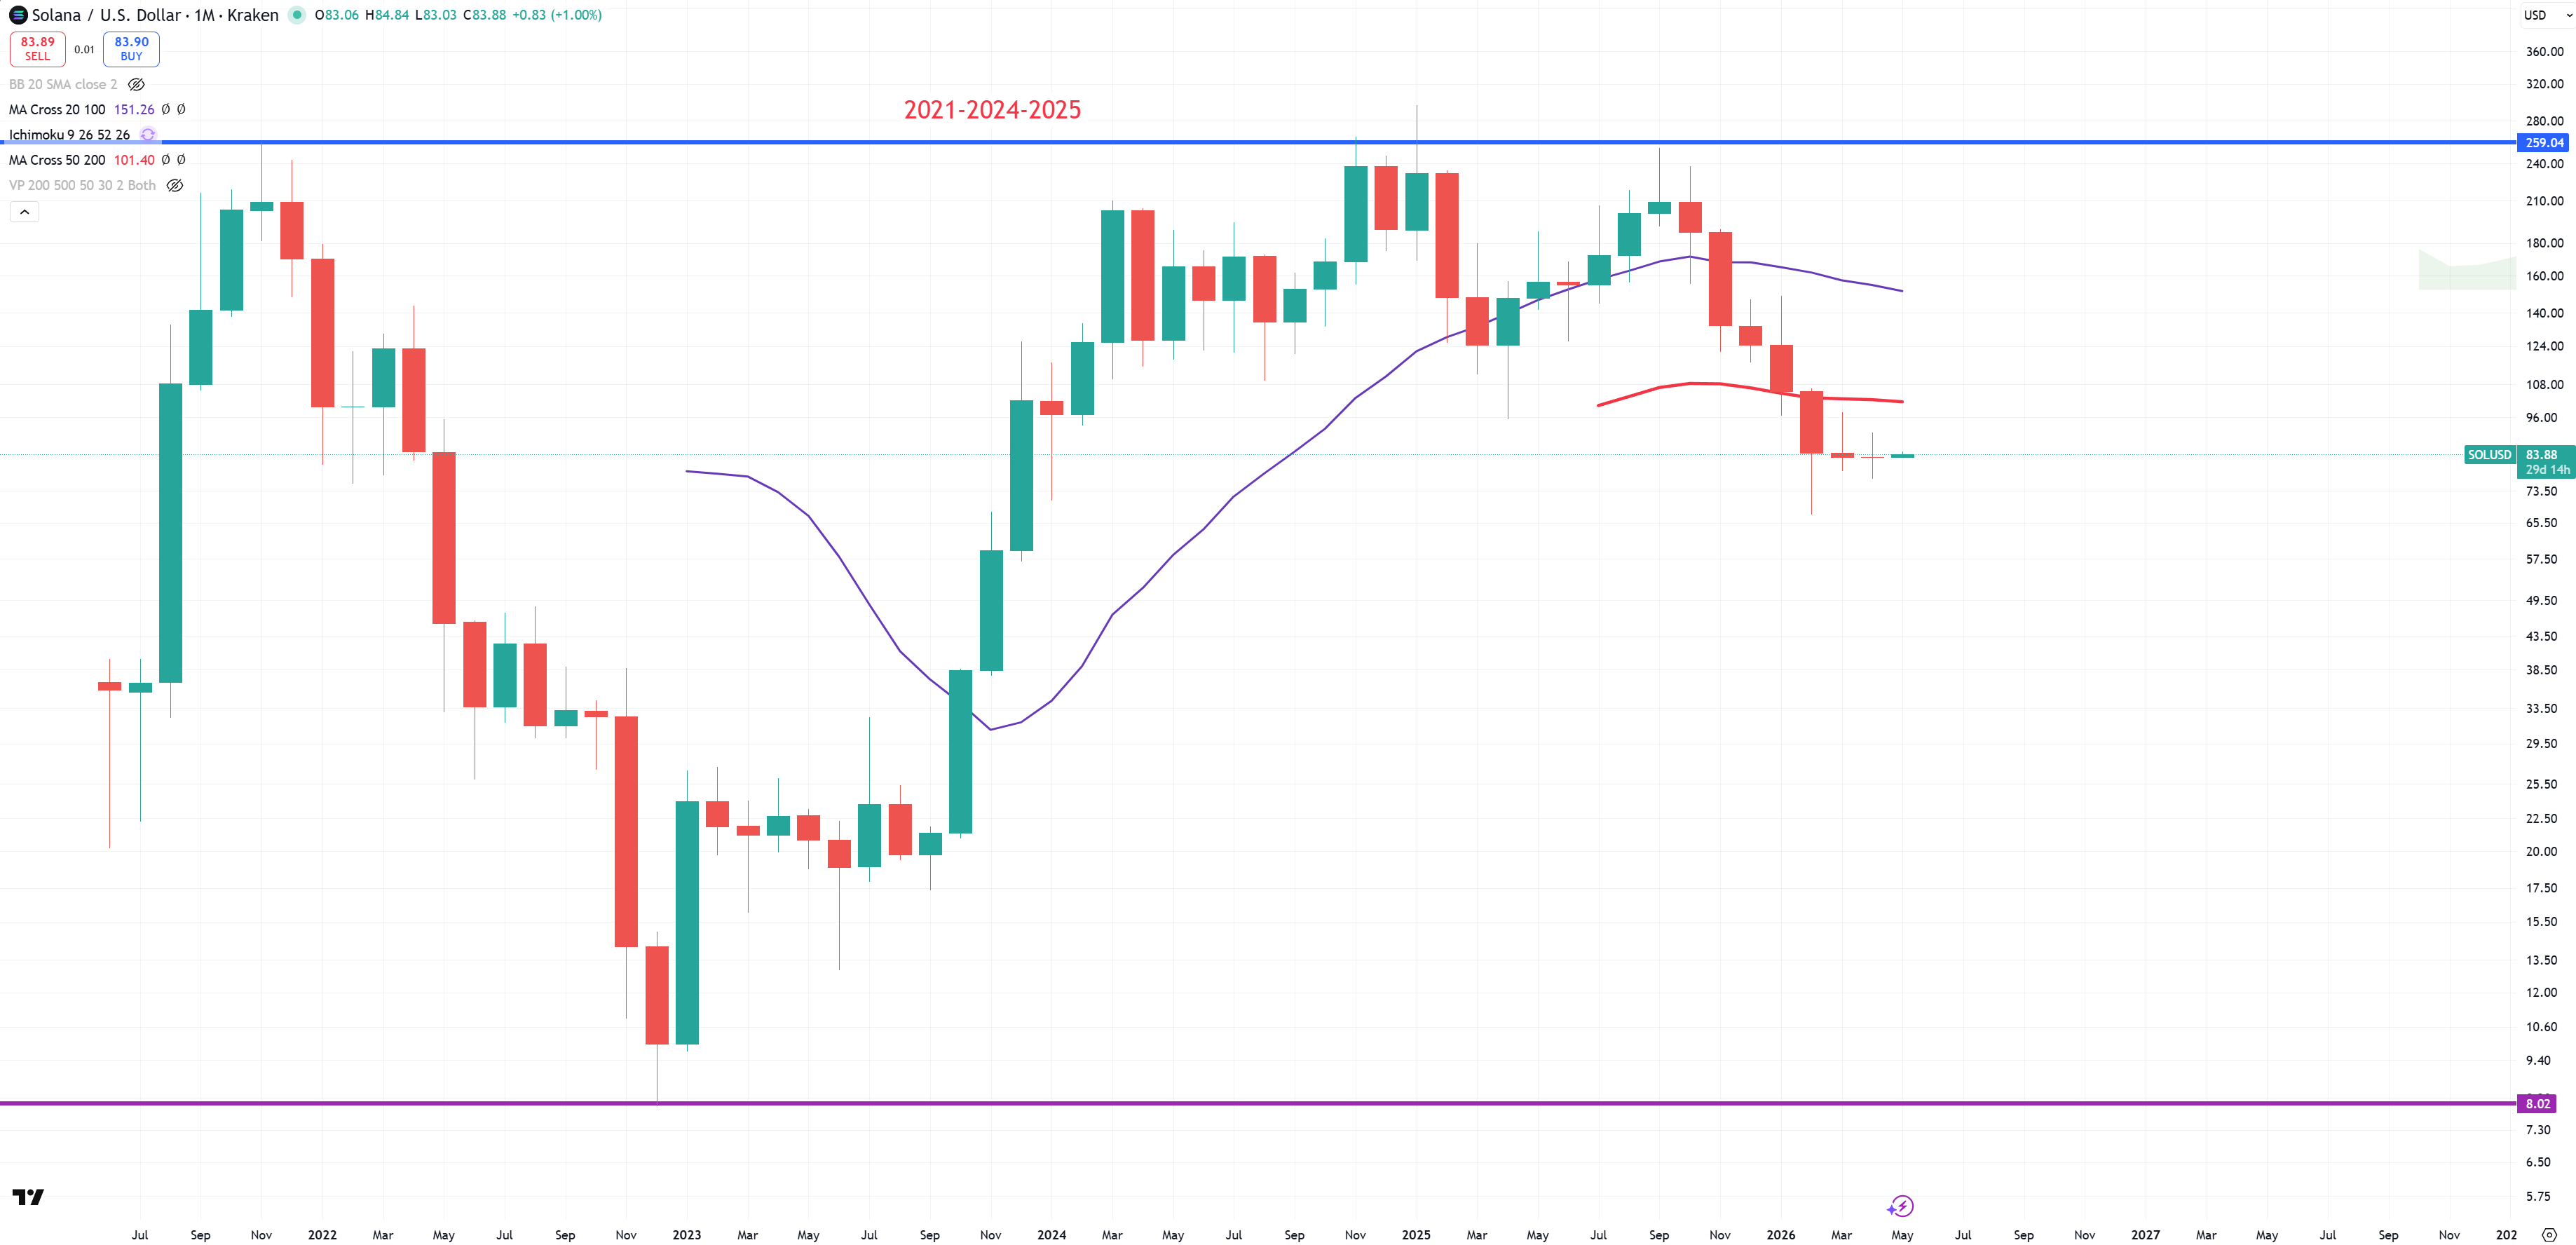
SOL – this looks even worse
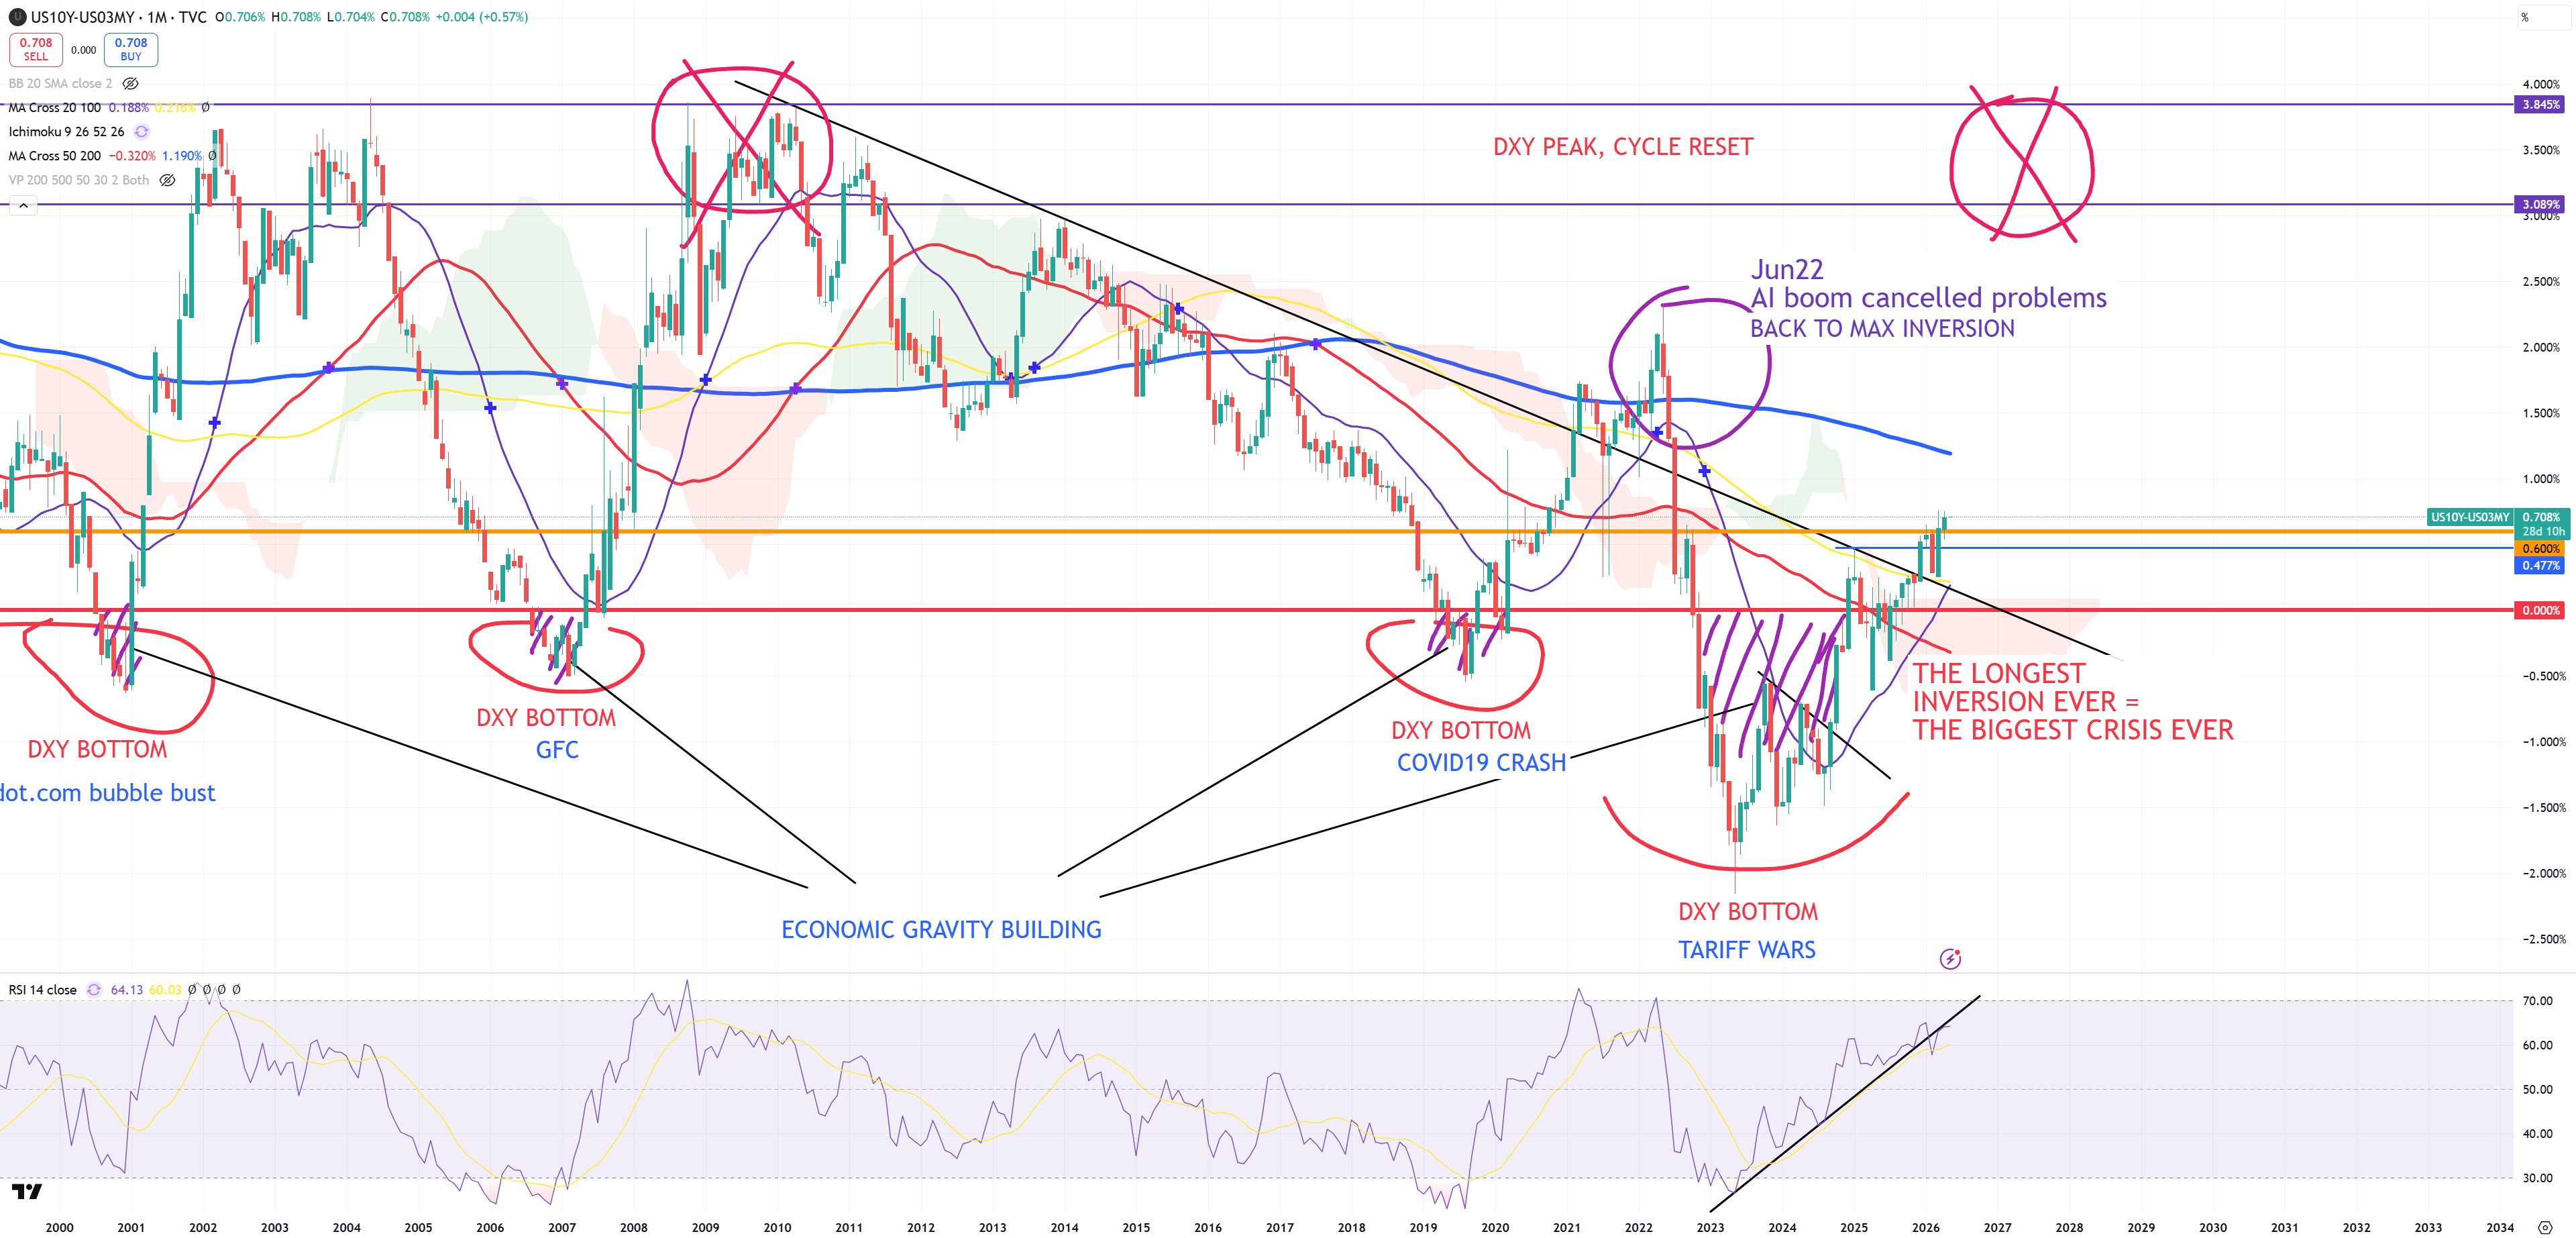
10Y/3M – gravity indicator is > +70bps – market has never survived if 10y/3m uninverted PERMANENTLY > 60bps post inversion
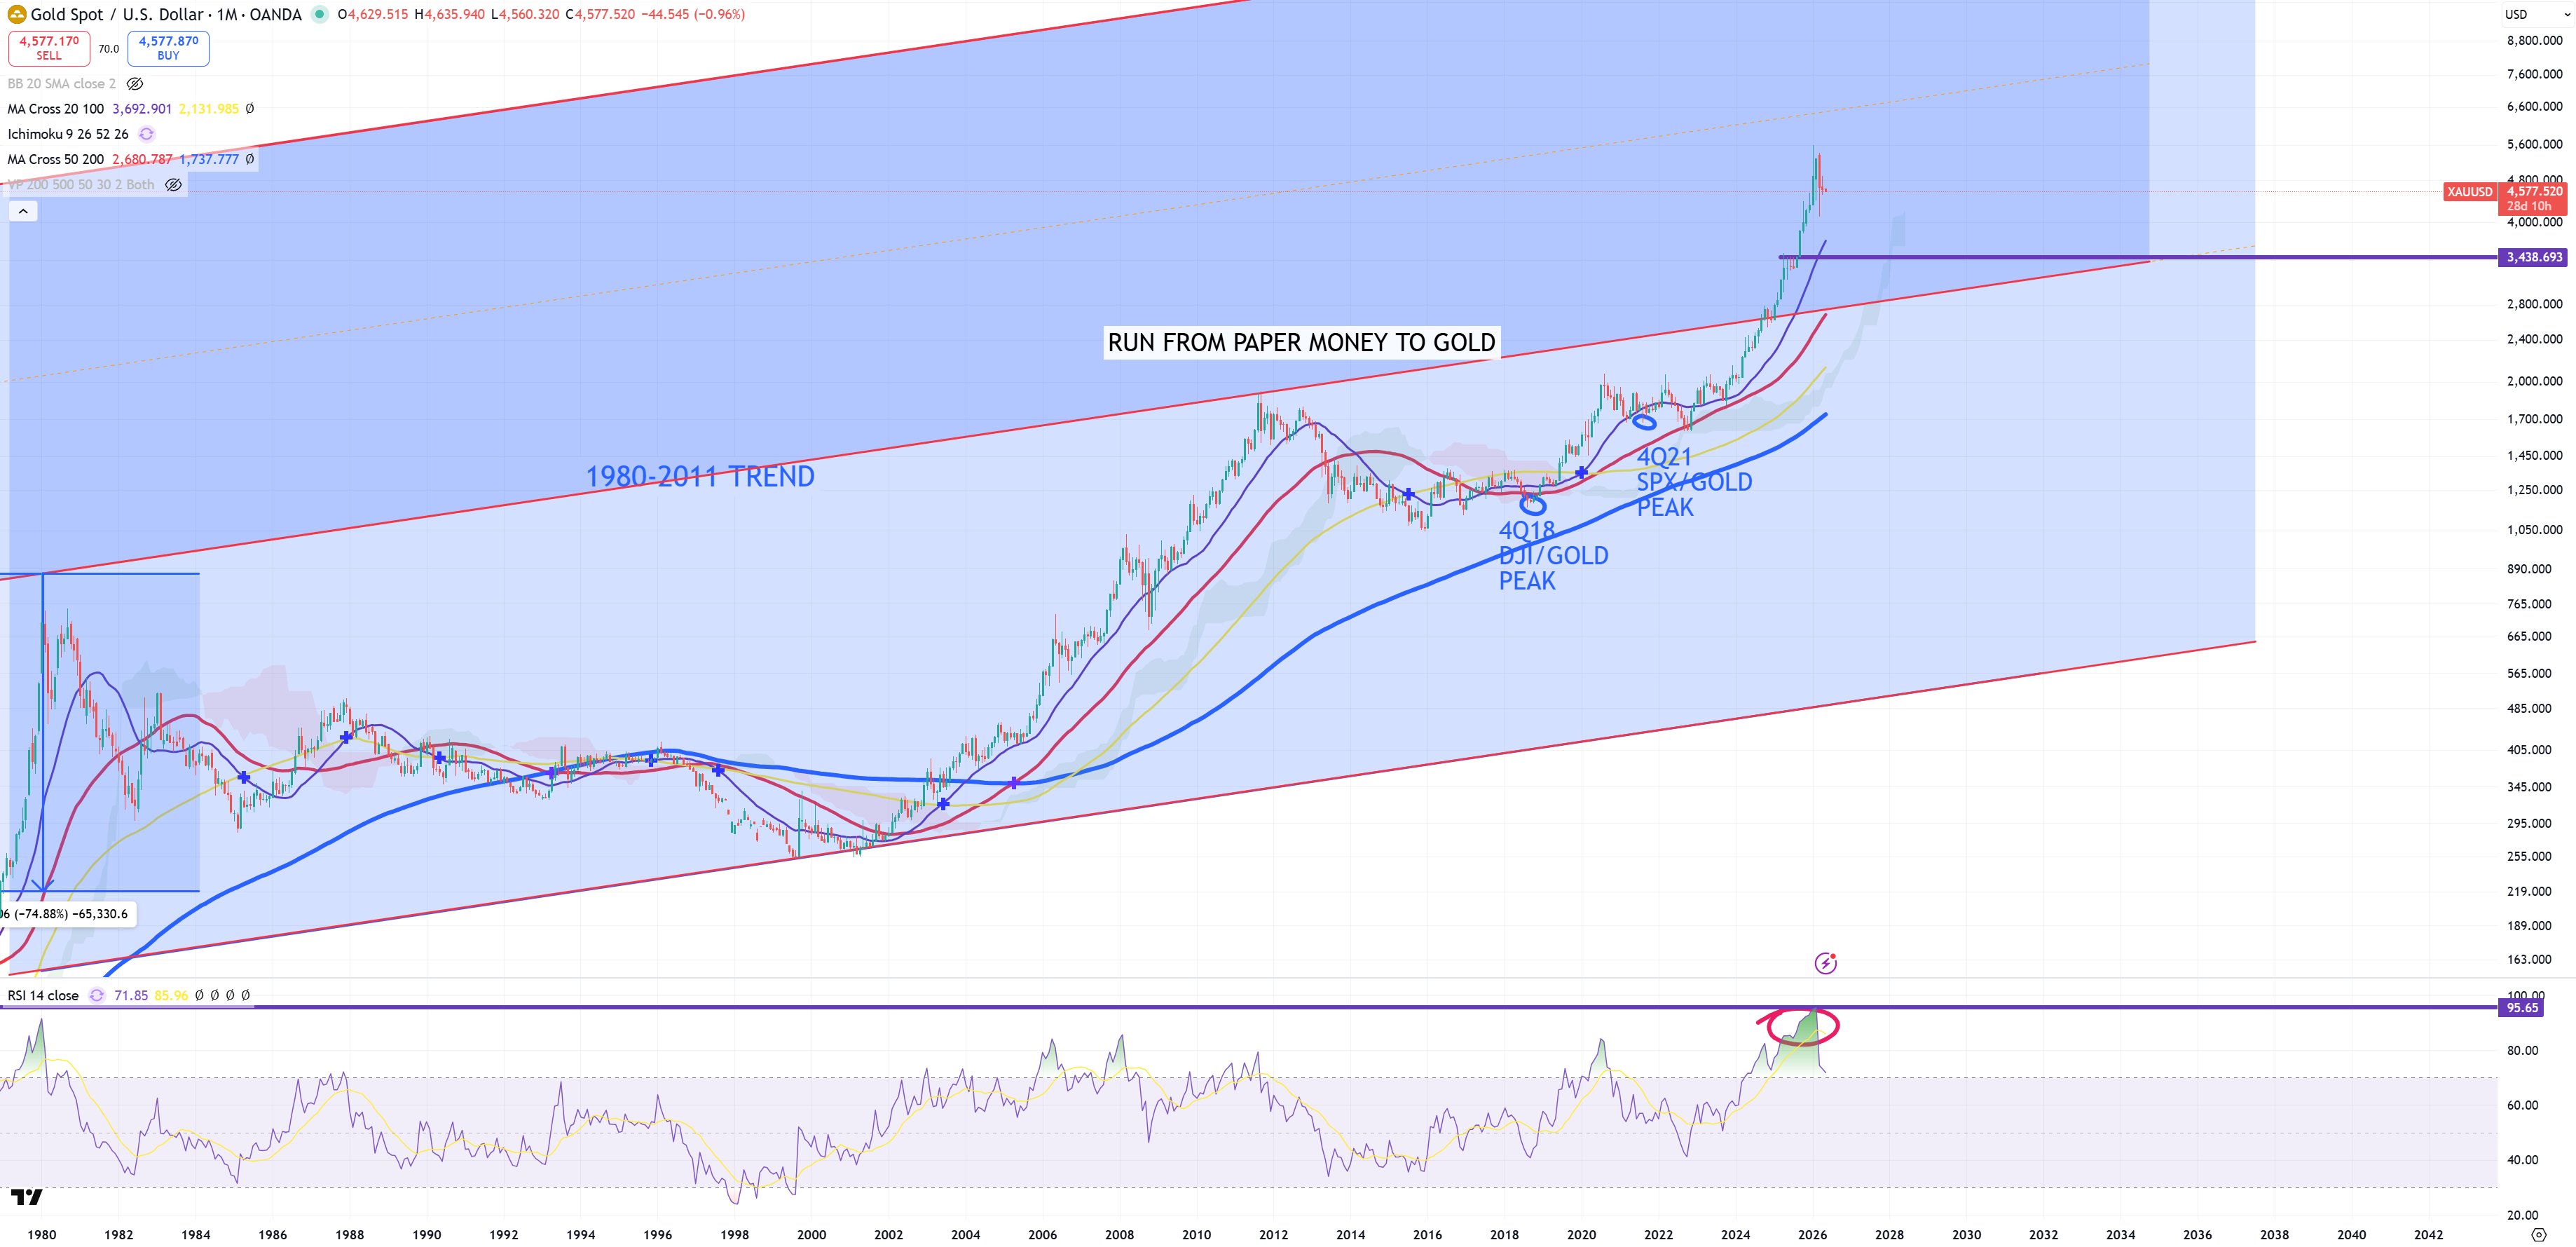
XAUUSD – Gold – no doubts after (M)RSI approaching to 96 we have a move down. That was the highest (M)RSI since 1968. (M)MA20 = 3500$, (M)MA50 = 2800$. Look above where in 1980 was DJI/GOLD (=1) and where it is now (=~11). Those targets like 3500 or even lower will arrive ONLY when DXY will hit ultra high levels.
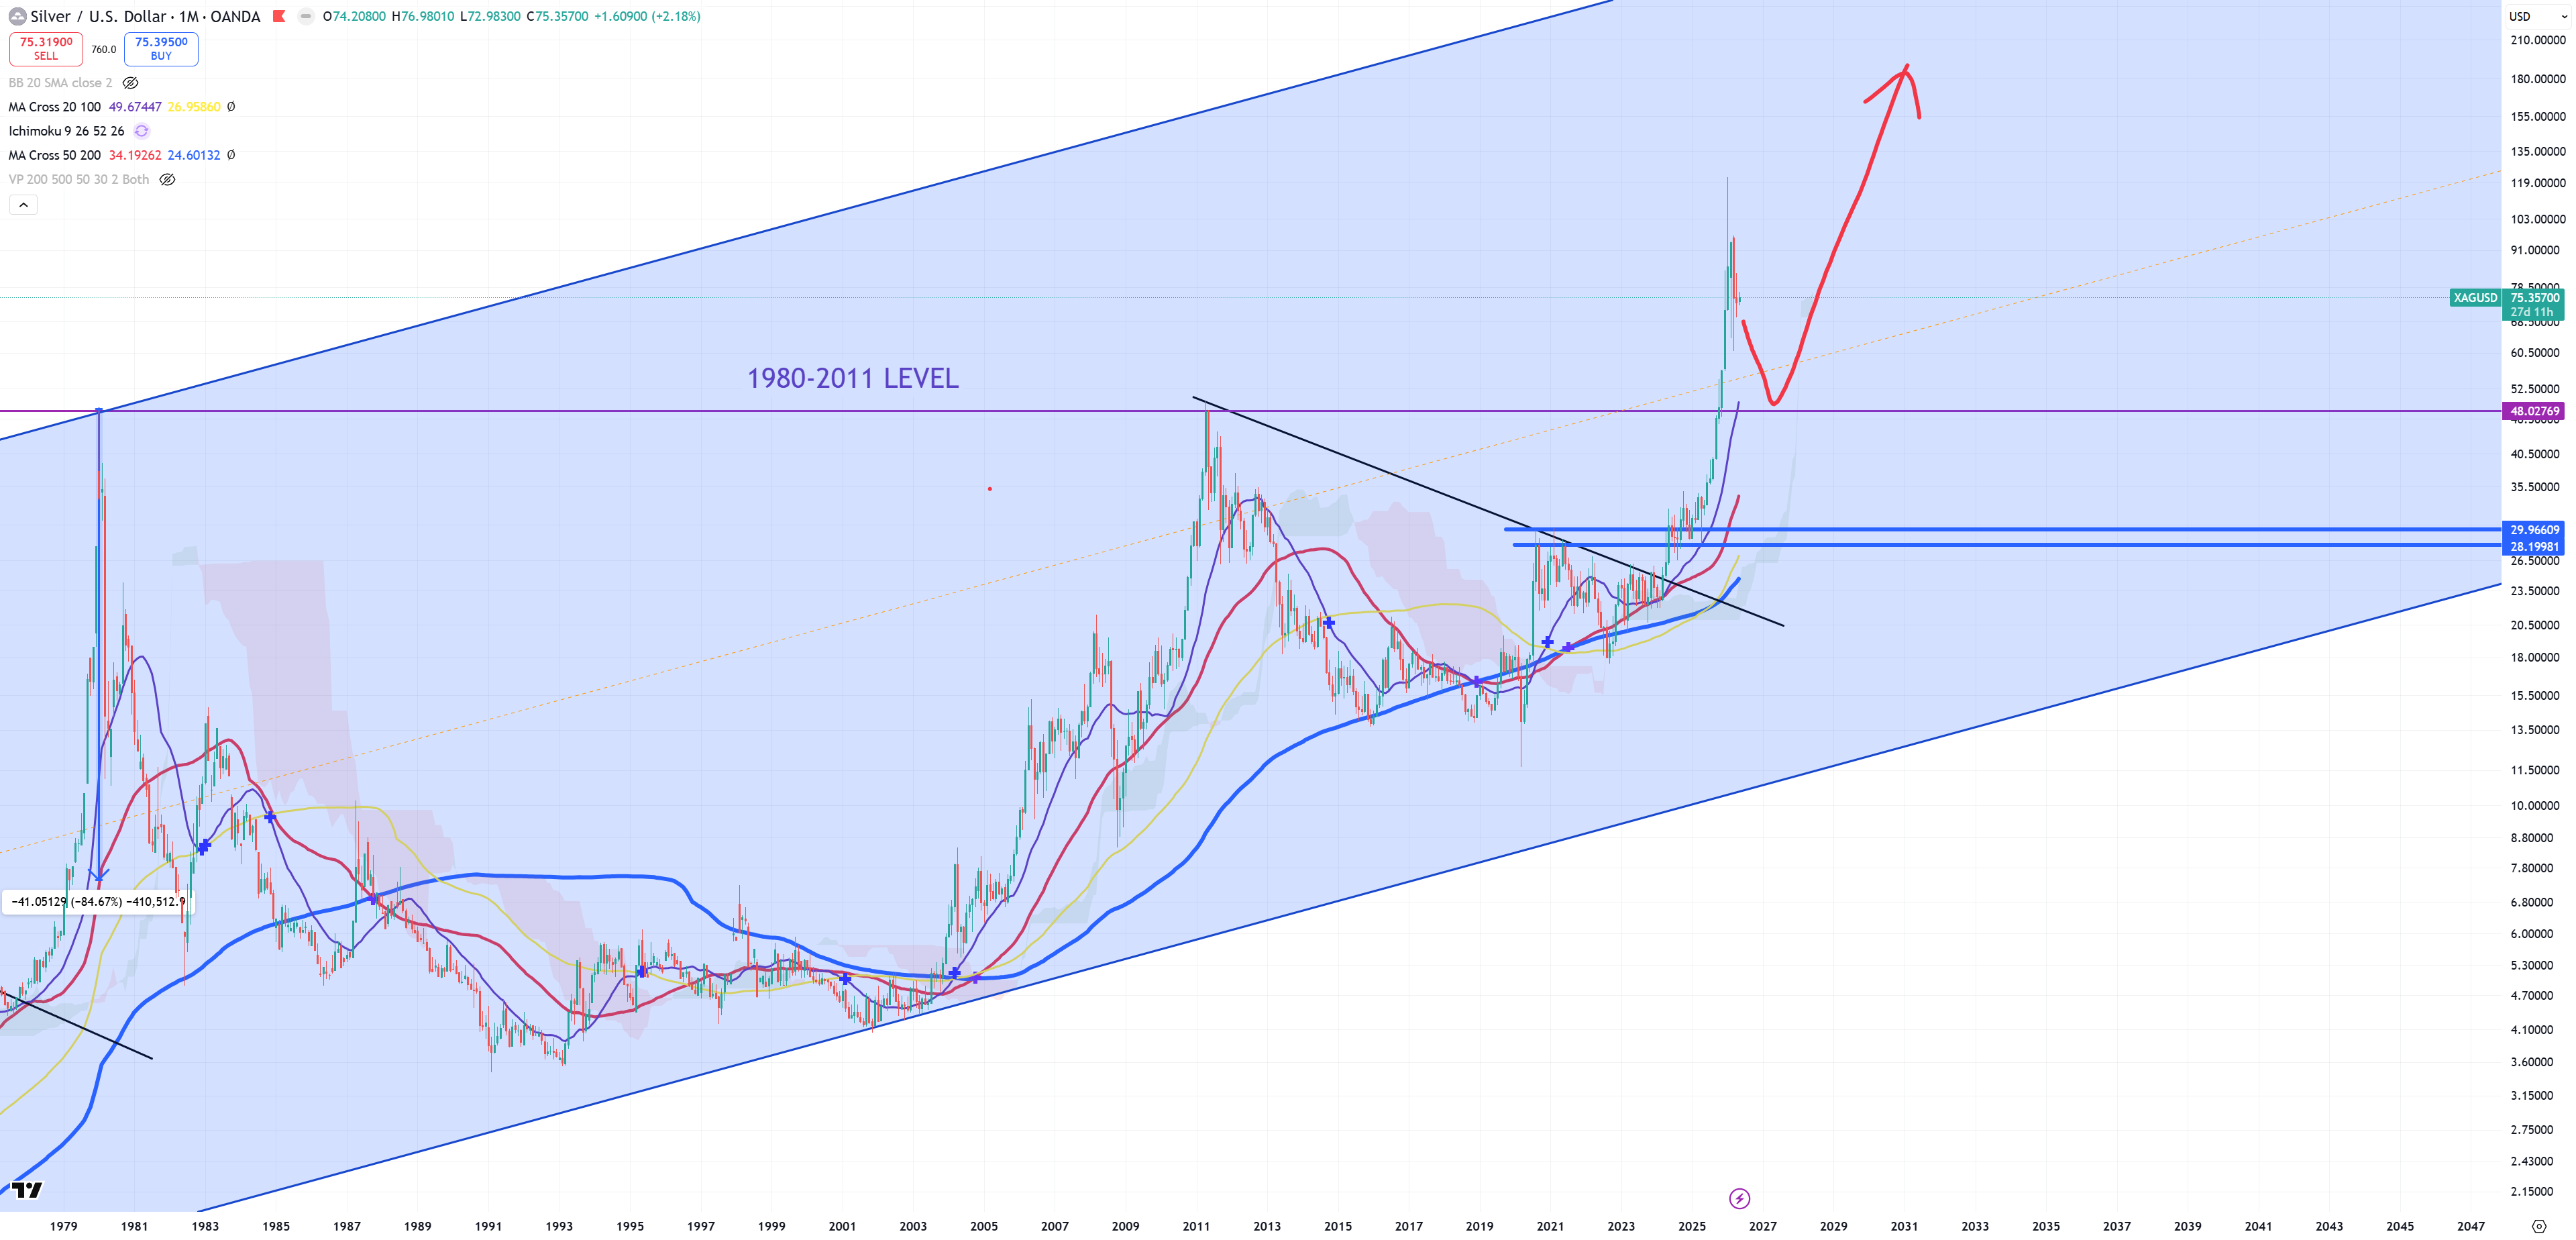
XAGUSD – Silver. I still think we’re in correction territory till (M)MA20 which is exactly on 1980-2011 level. Hard to say it’s a bubble, where SPX/SILVER is still so so so ultra high.
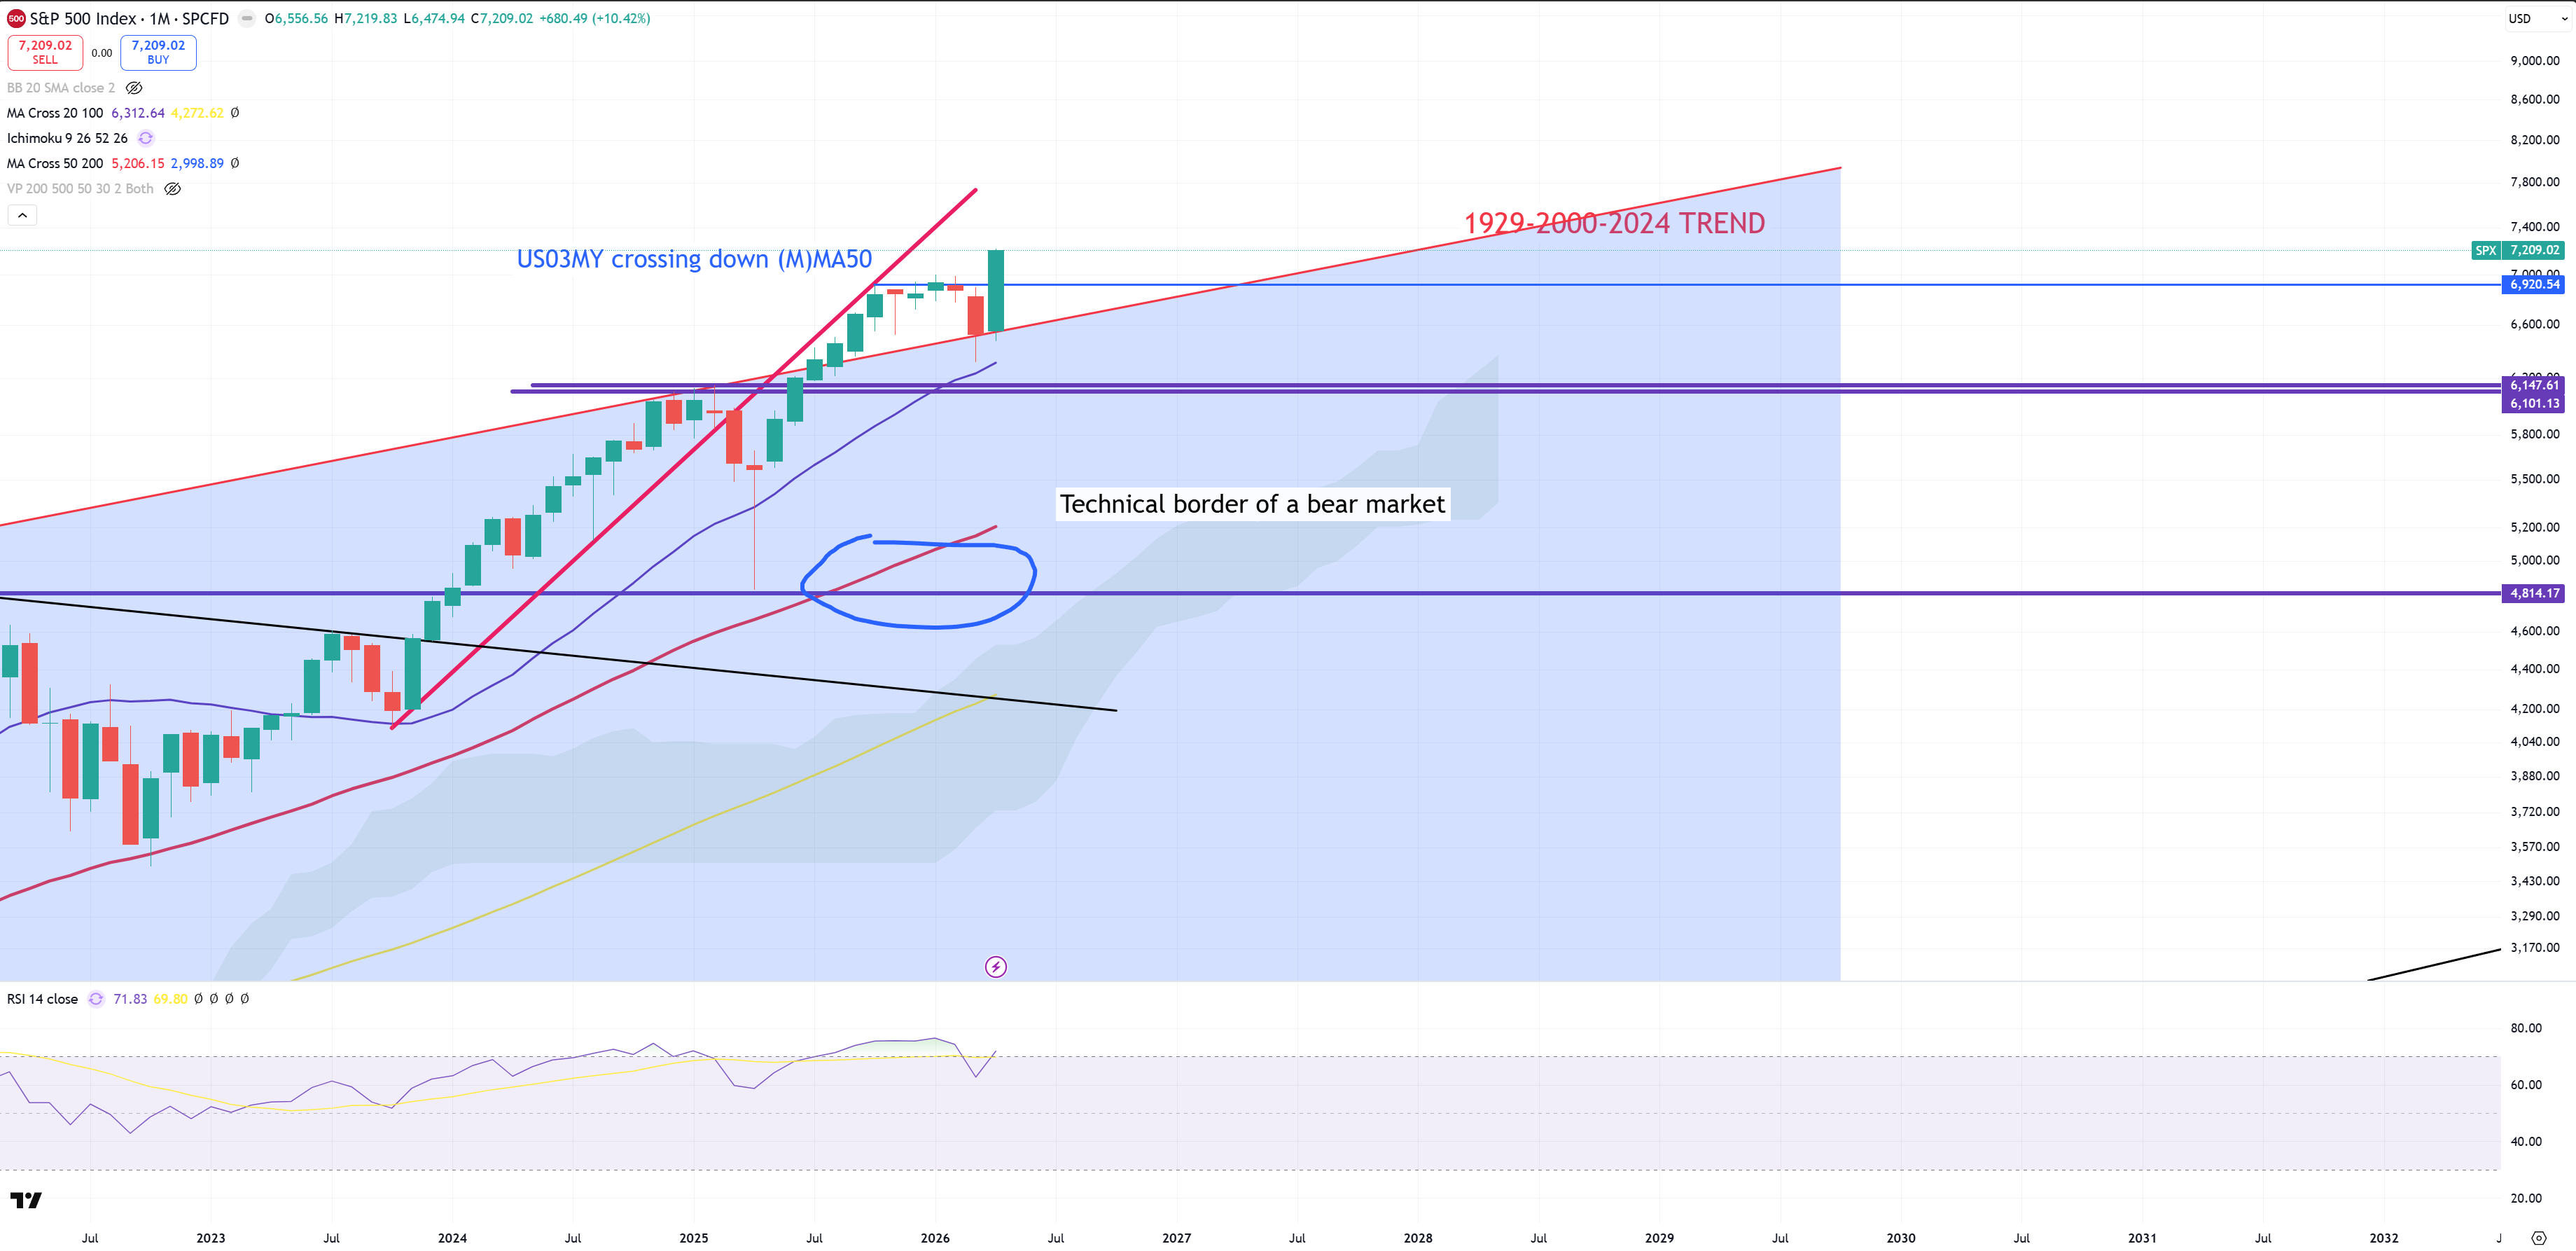
SPX – trend 1929-2000 is being kept as a support and we’re +4% above key level. Trend for May 2026 is 6580. Once we lose this 1929-2000 trend it’s game over. 6580 is this line for May 2026. Once again US03MY losing (M)MA50 doesn’t mean the top is behind us (It could be) or it’s the top (it could be) or a kind of a “marginal” one will be placed. That’s from my experience. The base is built around 6920 and we’ll find out soon about this last green candle.
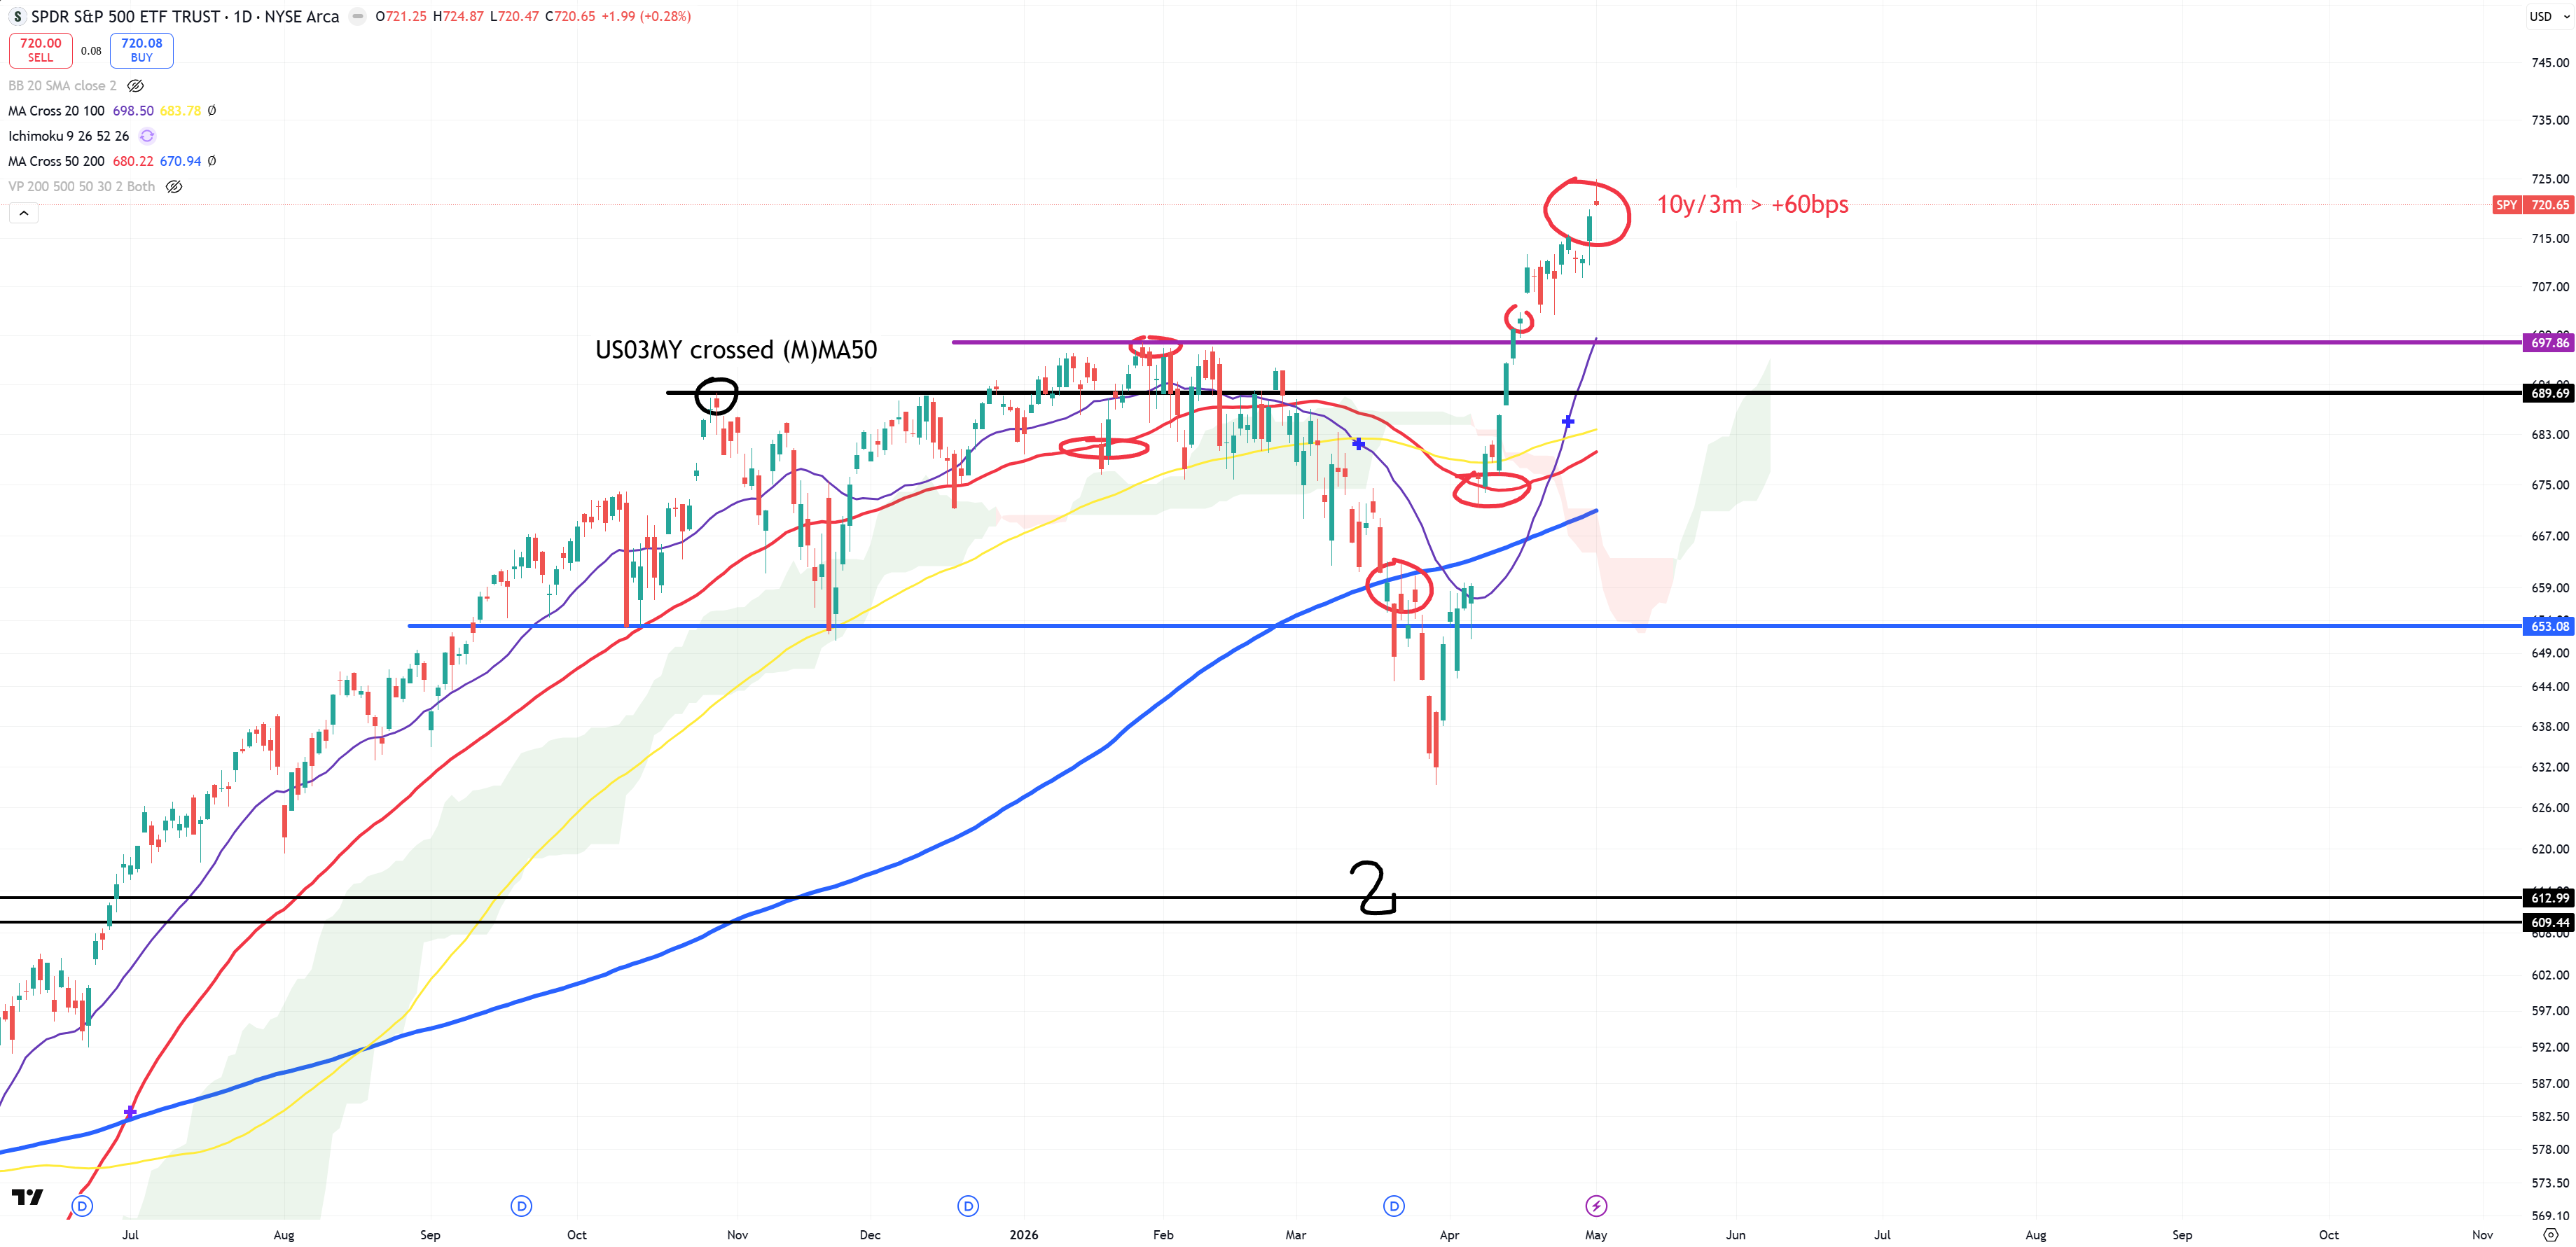
SPY – short term pattern. Red circles mark when 10y/3m started going > 60bps. Once the market moved below 6500 there was a period of longer term > +60bps uninversion but that failed pushing again SPY higher.
My idea says : The broad market peaks once US03MY lost its (M)MA50 and 10y/3m permanently breaks +60bps post inversion. As US03MY lost (M)MA50 in 4Q25, 10y/3m has not yet can be considered as a “permanent break” over +60bps.
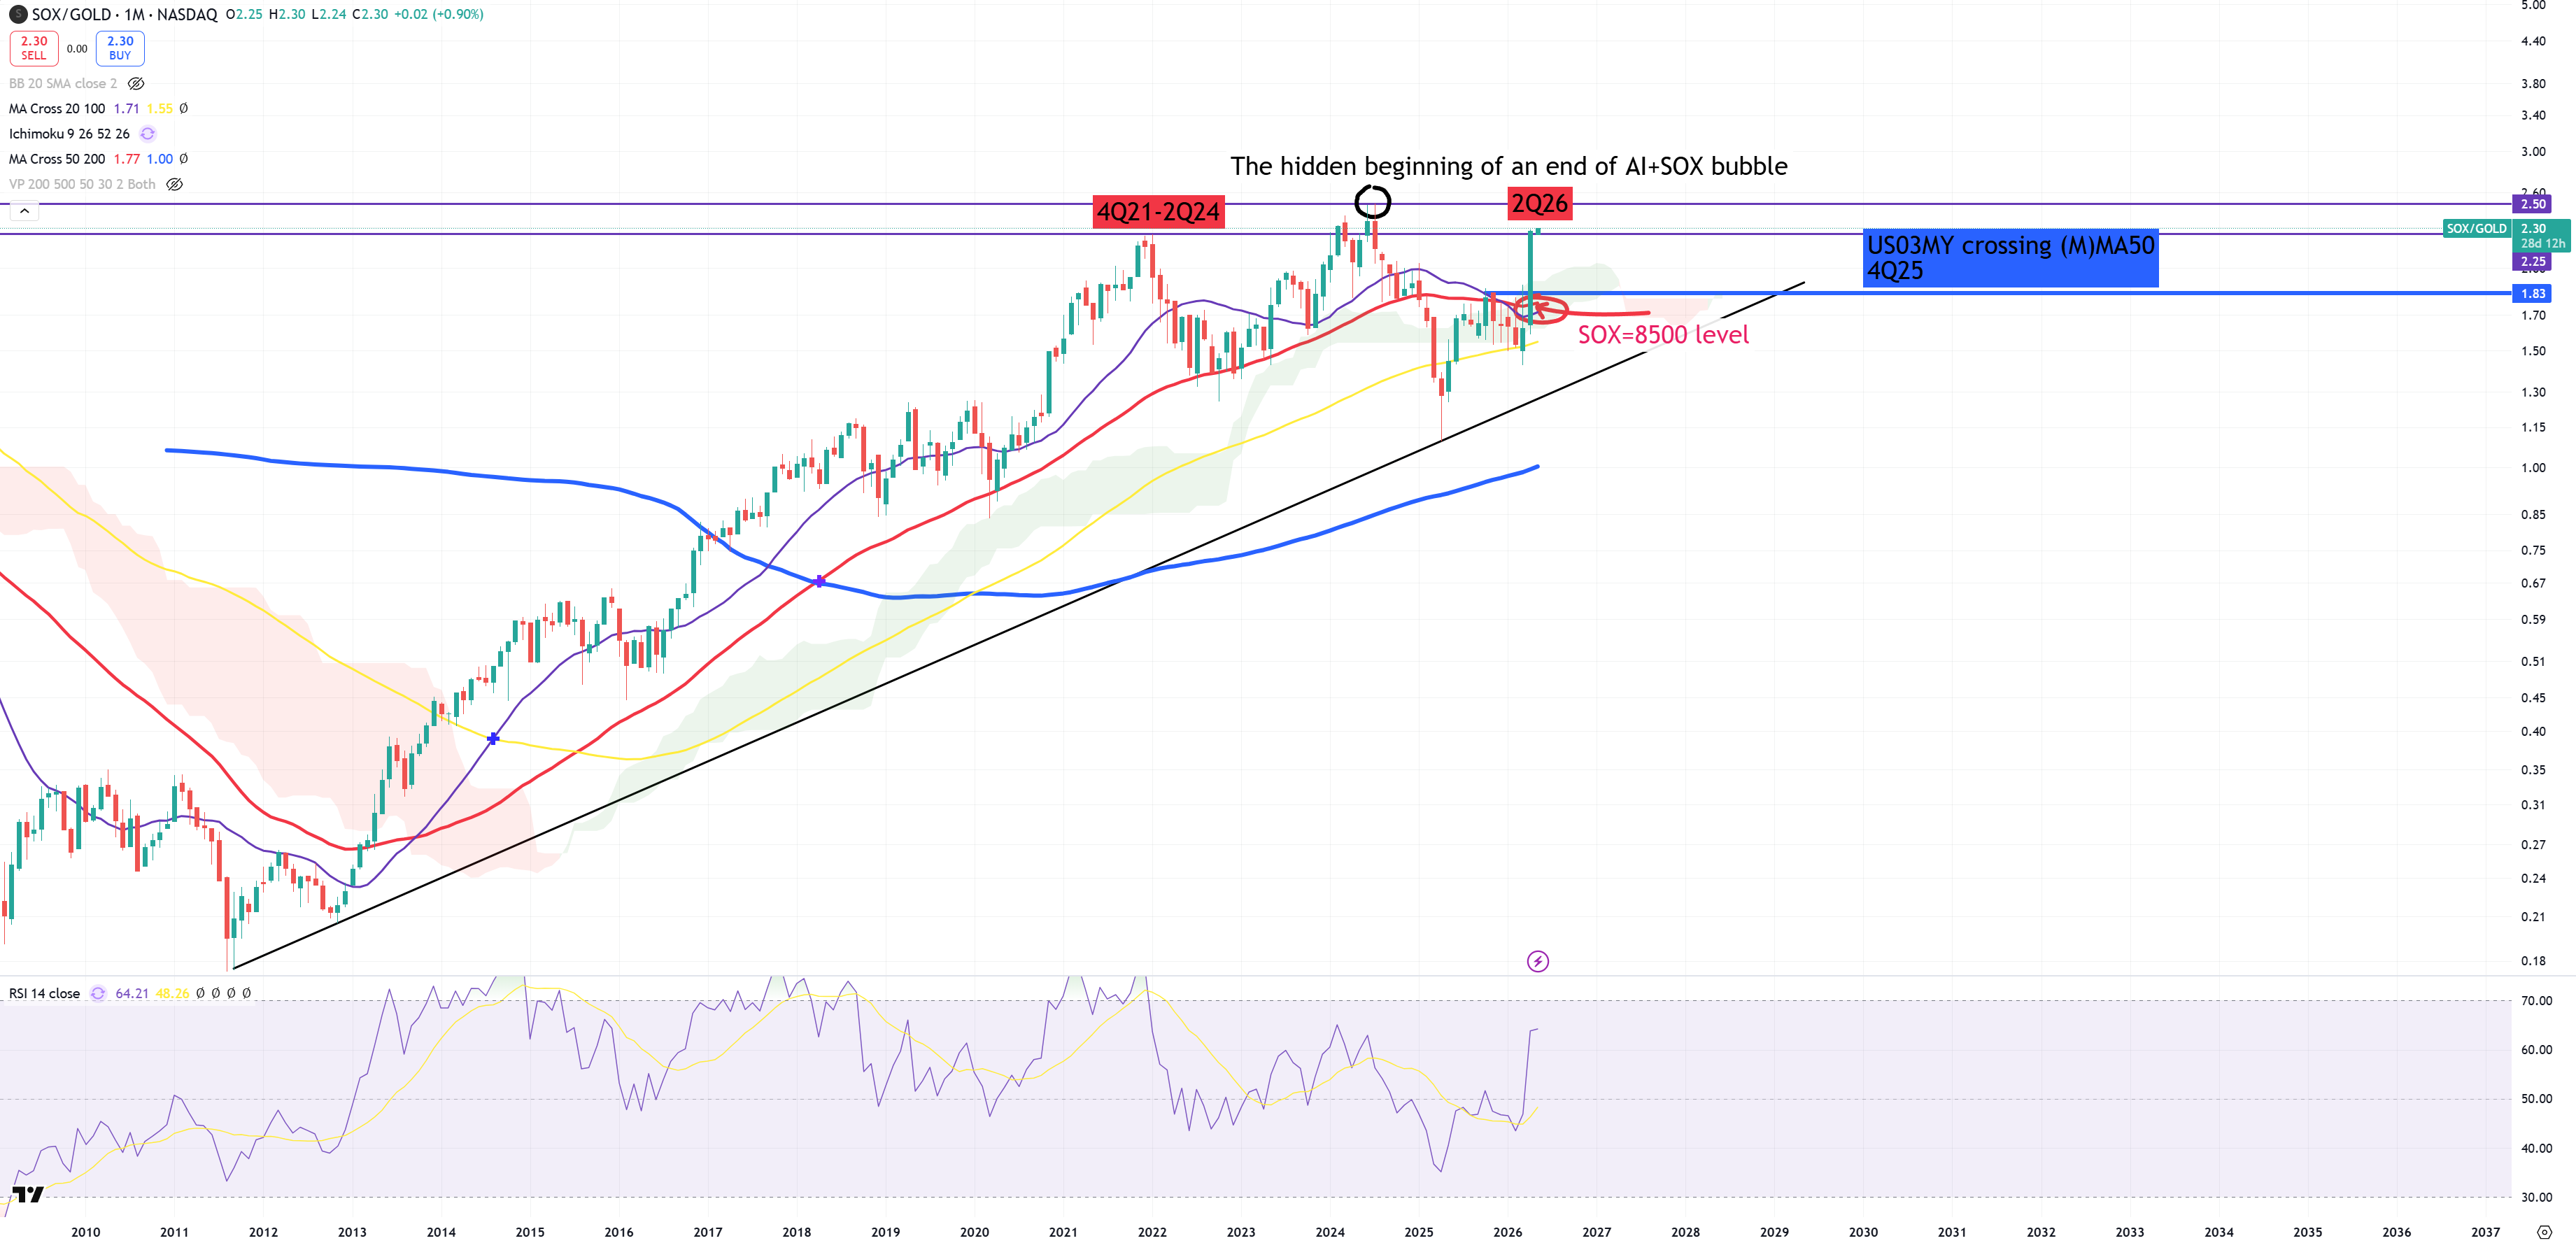
SOX/GOLD – the most important level made a total failure, what was the equivalent probably of keeping SPX trend 1929-2000 as a support. We are getting once again towards upper resistance level. This rotation below (M)MA50 like during dot.com bubble failed. That means my prediction about SOX reversal based on assumption of (M)MA50 rejection here (and putting SPX below 1929-2000) failed. There’s no need to put SOX chart because it’s so parabolic without any realistic targets, but we can assume floting around this resistance will push SOX to 10500-12000 level on ultra low breadth in general. This move also could be allowed as 10y/3m has not fully uninverted based on my theory.
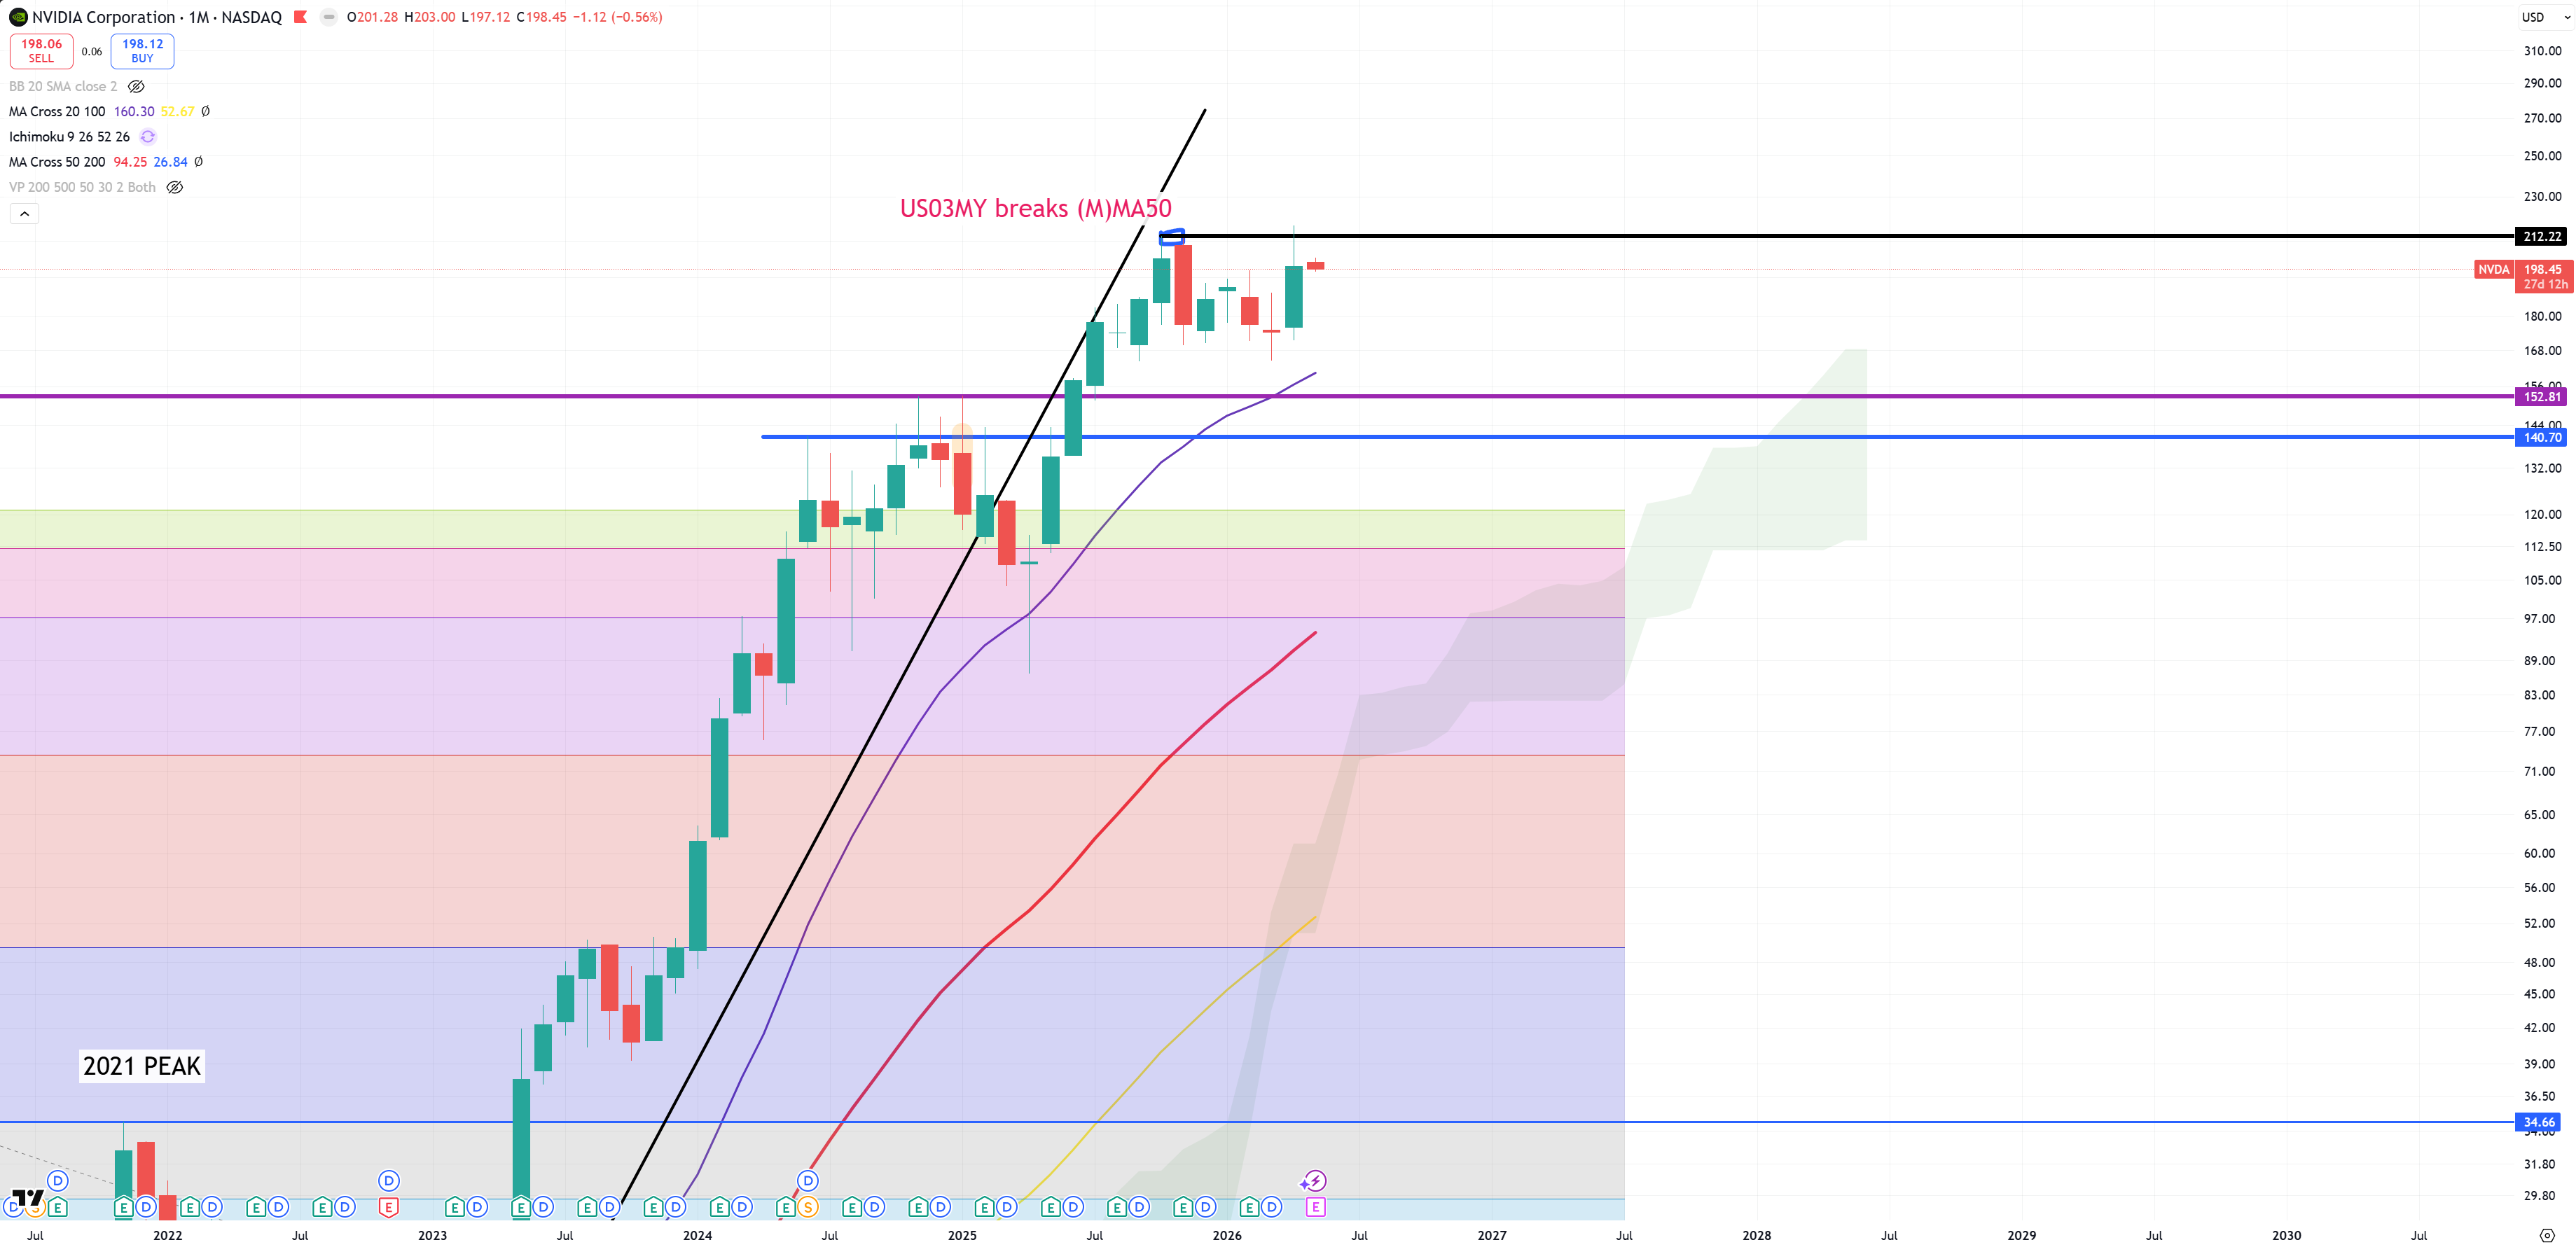
NVDA and moment of truth :
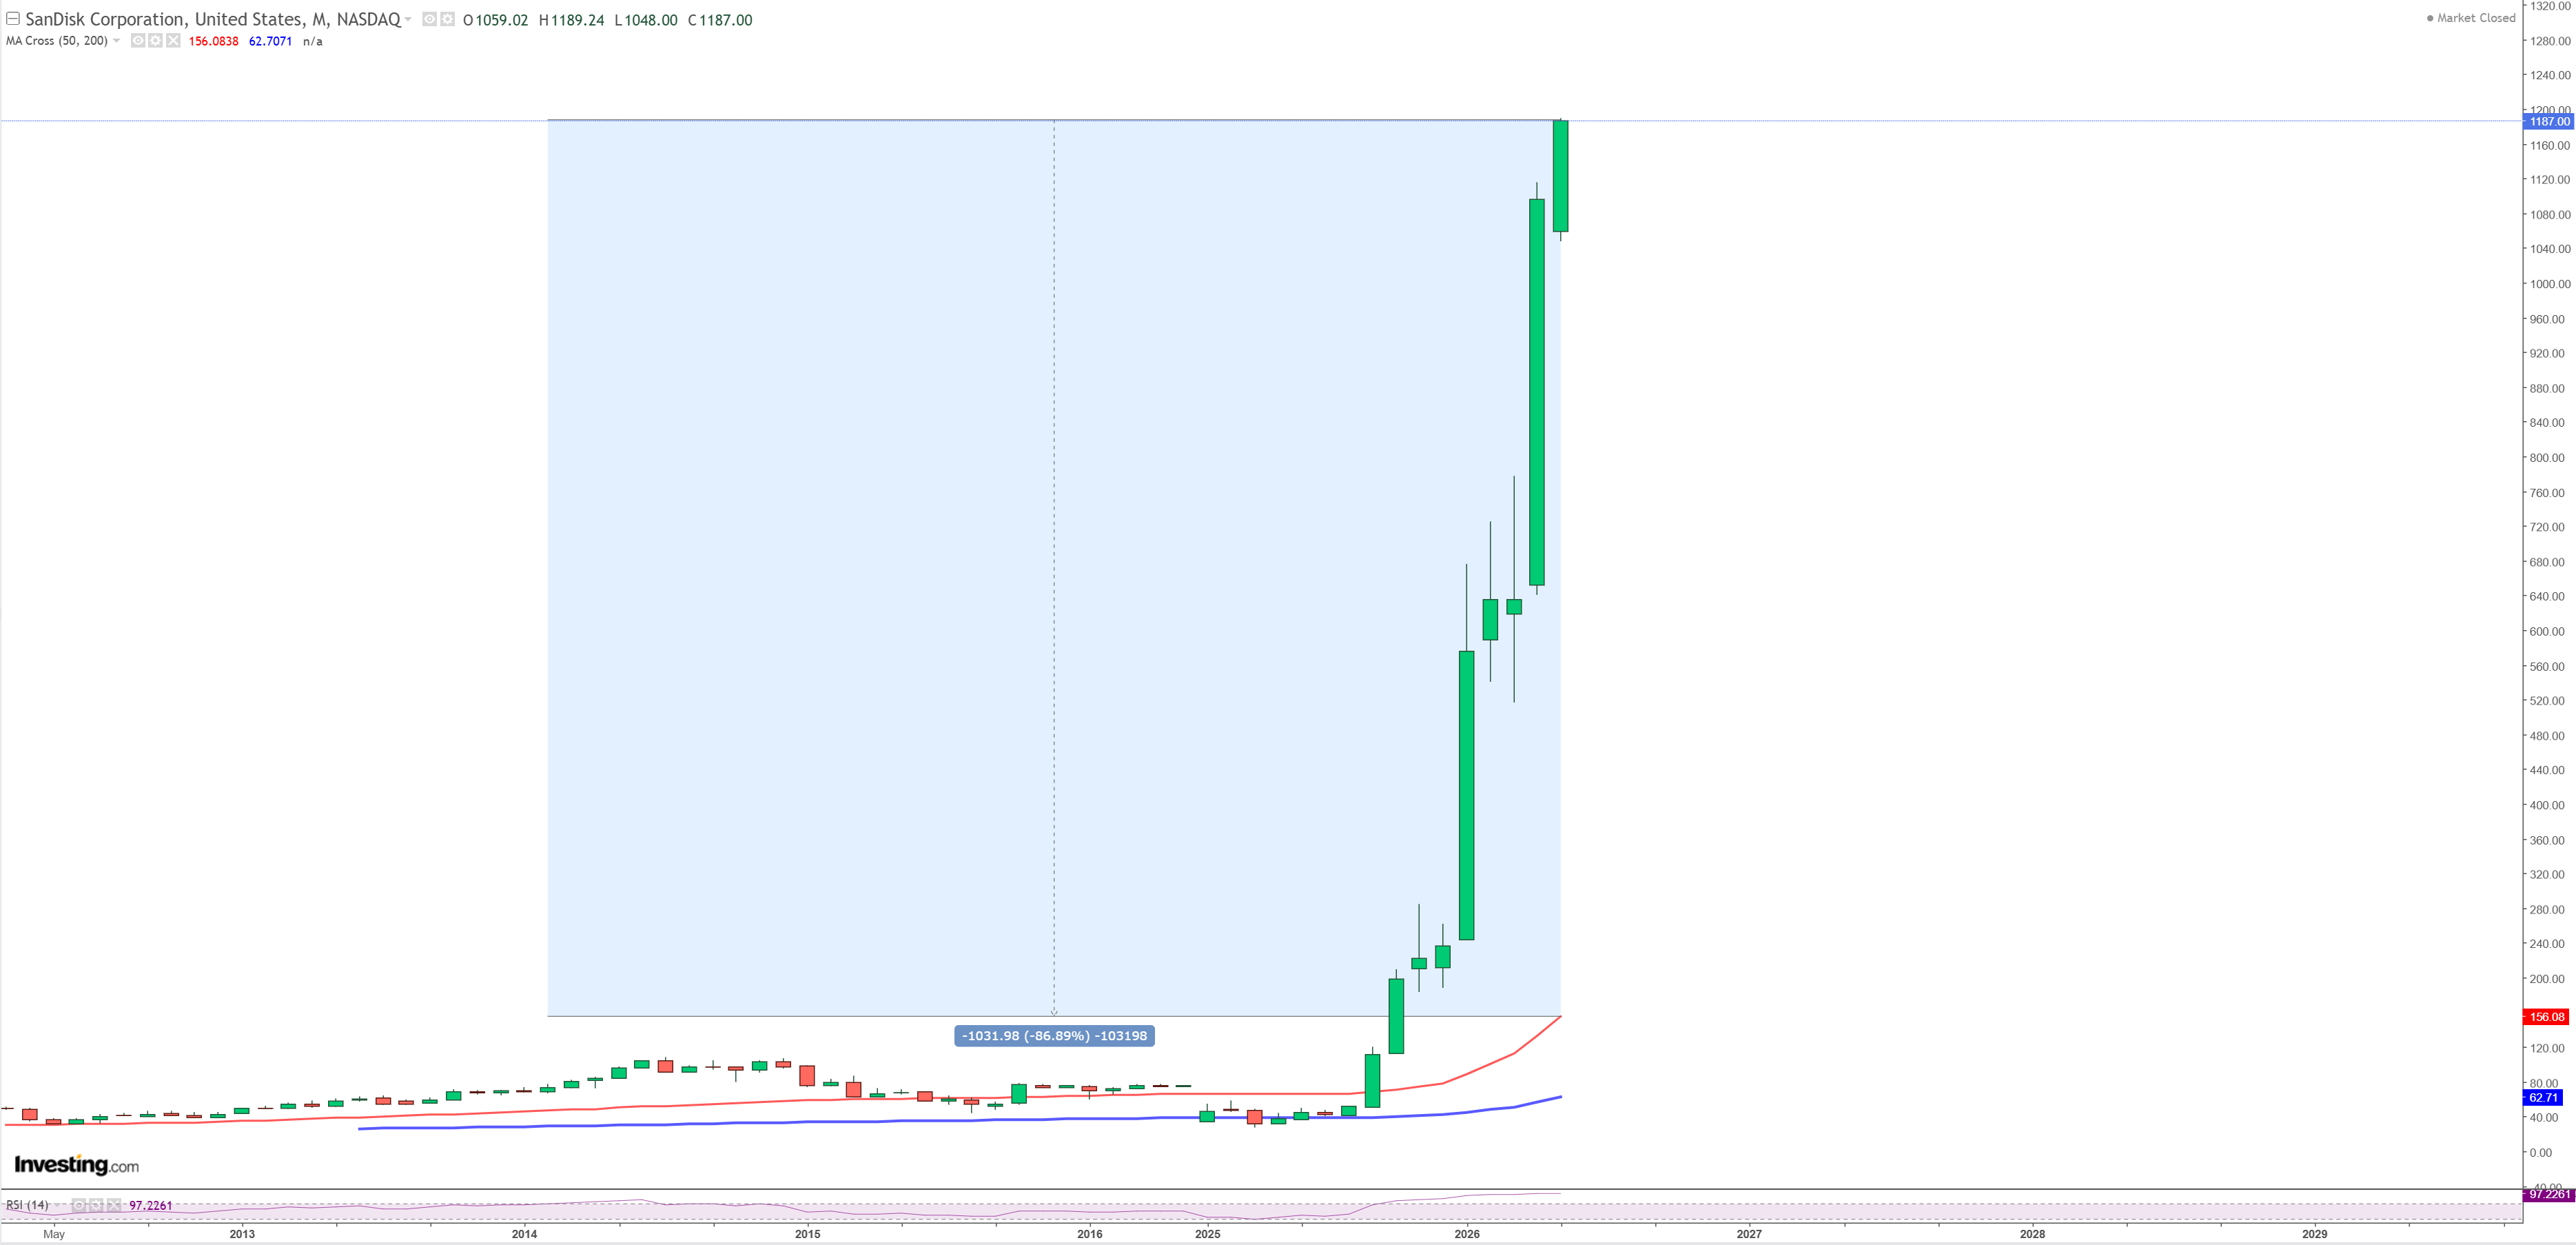
SNDK – as SOX/GOLD blew up (M)MA50 to the upside, SNDK (and others) continue to go parabolic achieving -87% distance to (M)MA50. Really hard to find another examples of such an extreme distance to this MA. Even last CAR move managed to achieve just -82%. Everything what is > -80% I call “GET THE F… OUT OF HERE”, because it’s even higher value I categorize as “tulip bubble” (-70% to -80%). This is all with > (M)RSI = 97. Even last GOLD move has not achieved such (M)RSI (ended by 95).
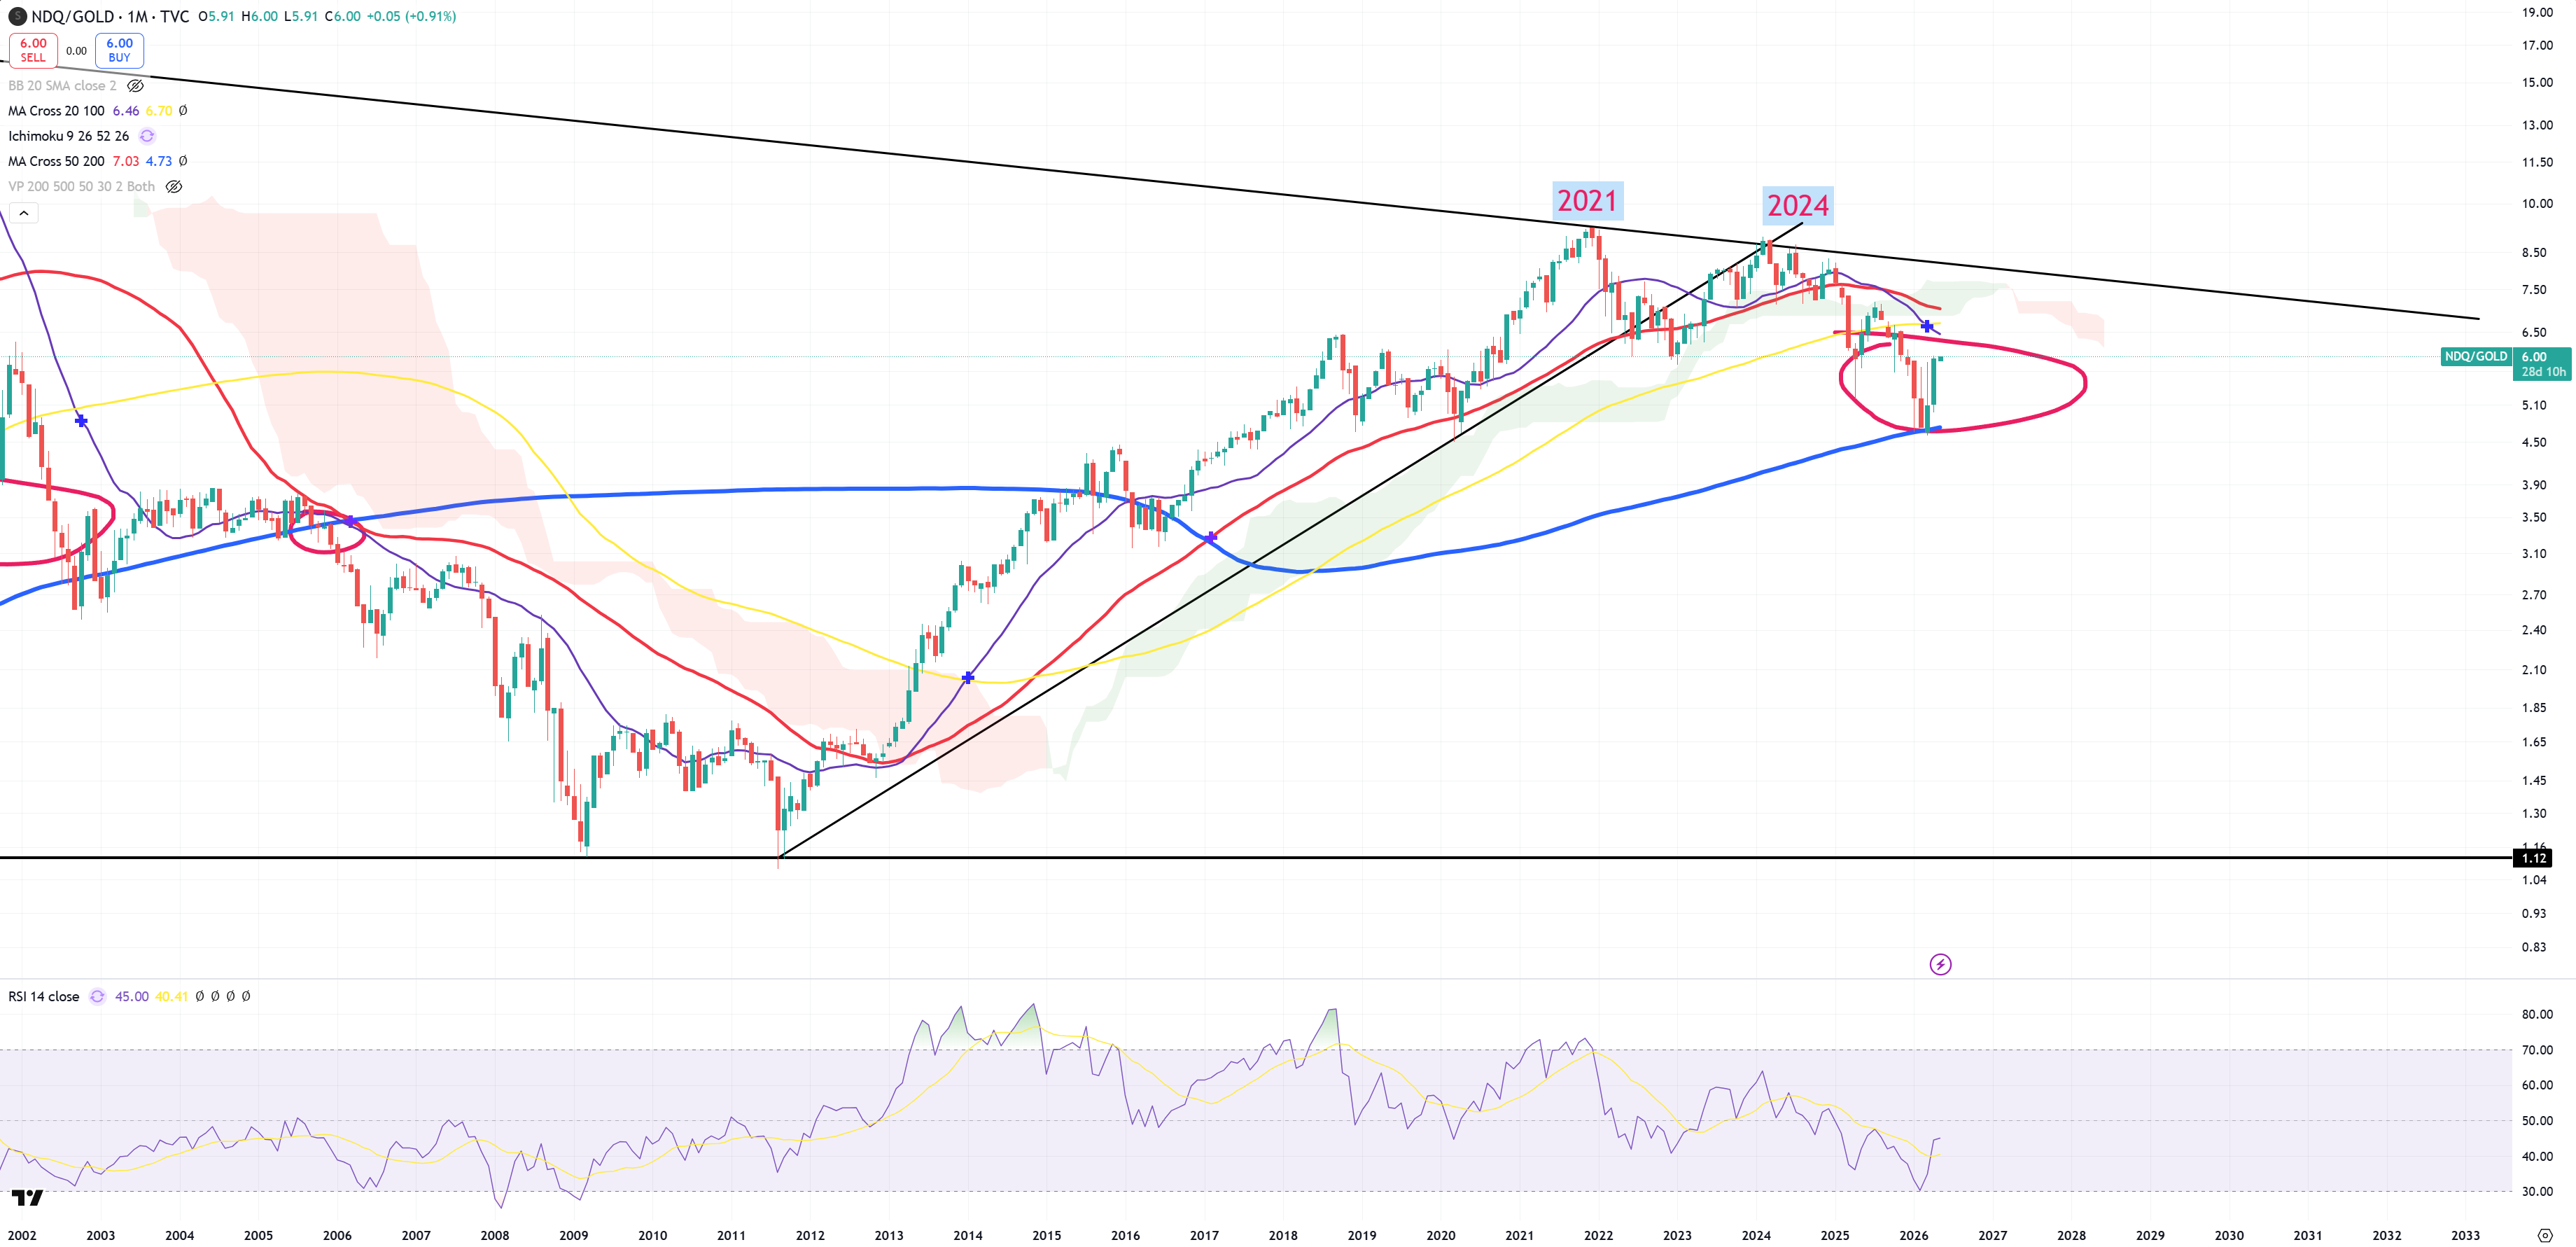
NDQ/GOLD – due to the same reasons (SPX holding 1929-2000 trend) NDQ/GOLD was not able to break (M)MA200 (from time perspective it’s really hard to break it in its first hit)
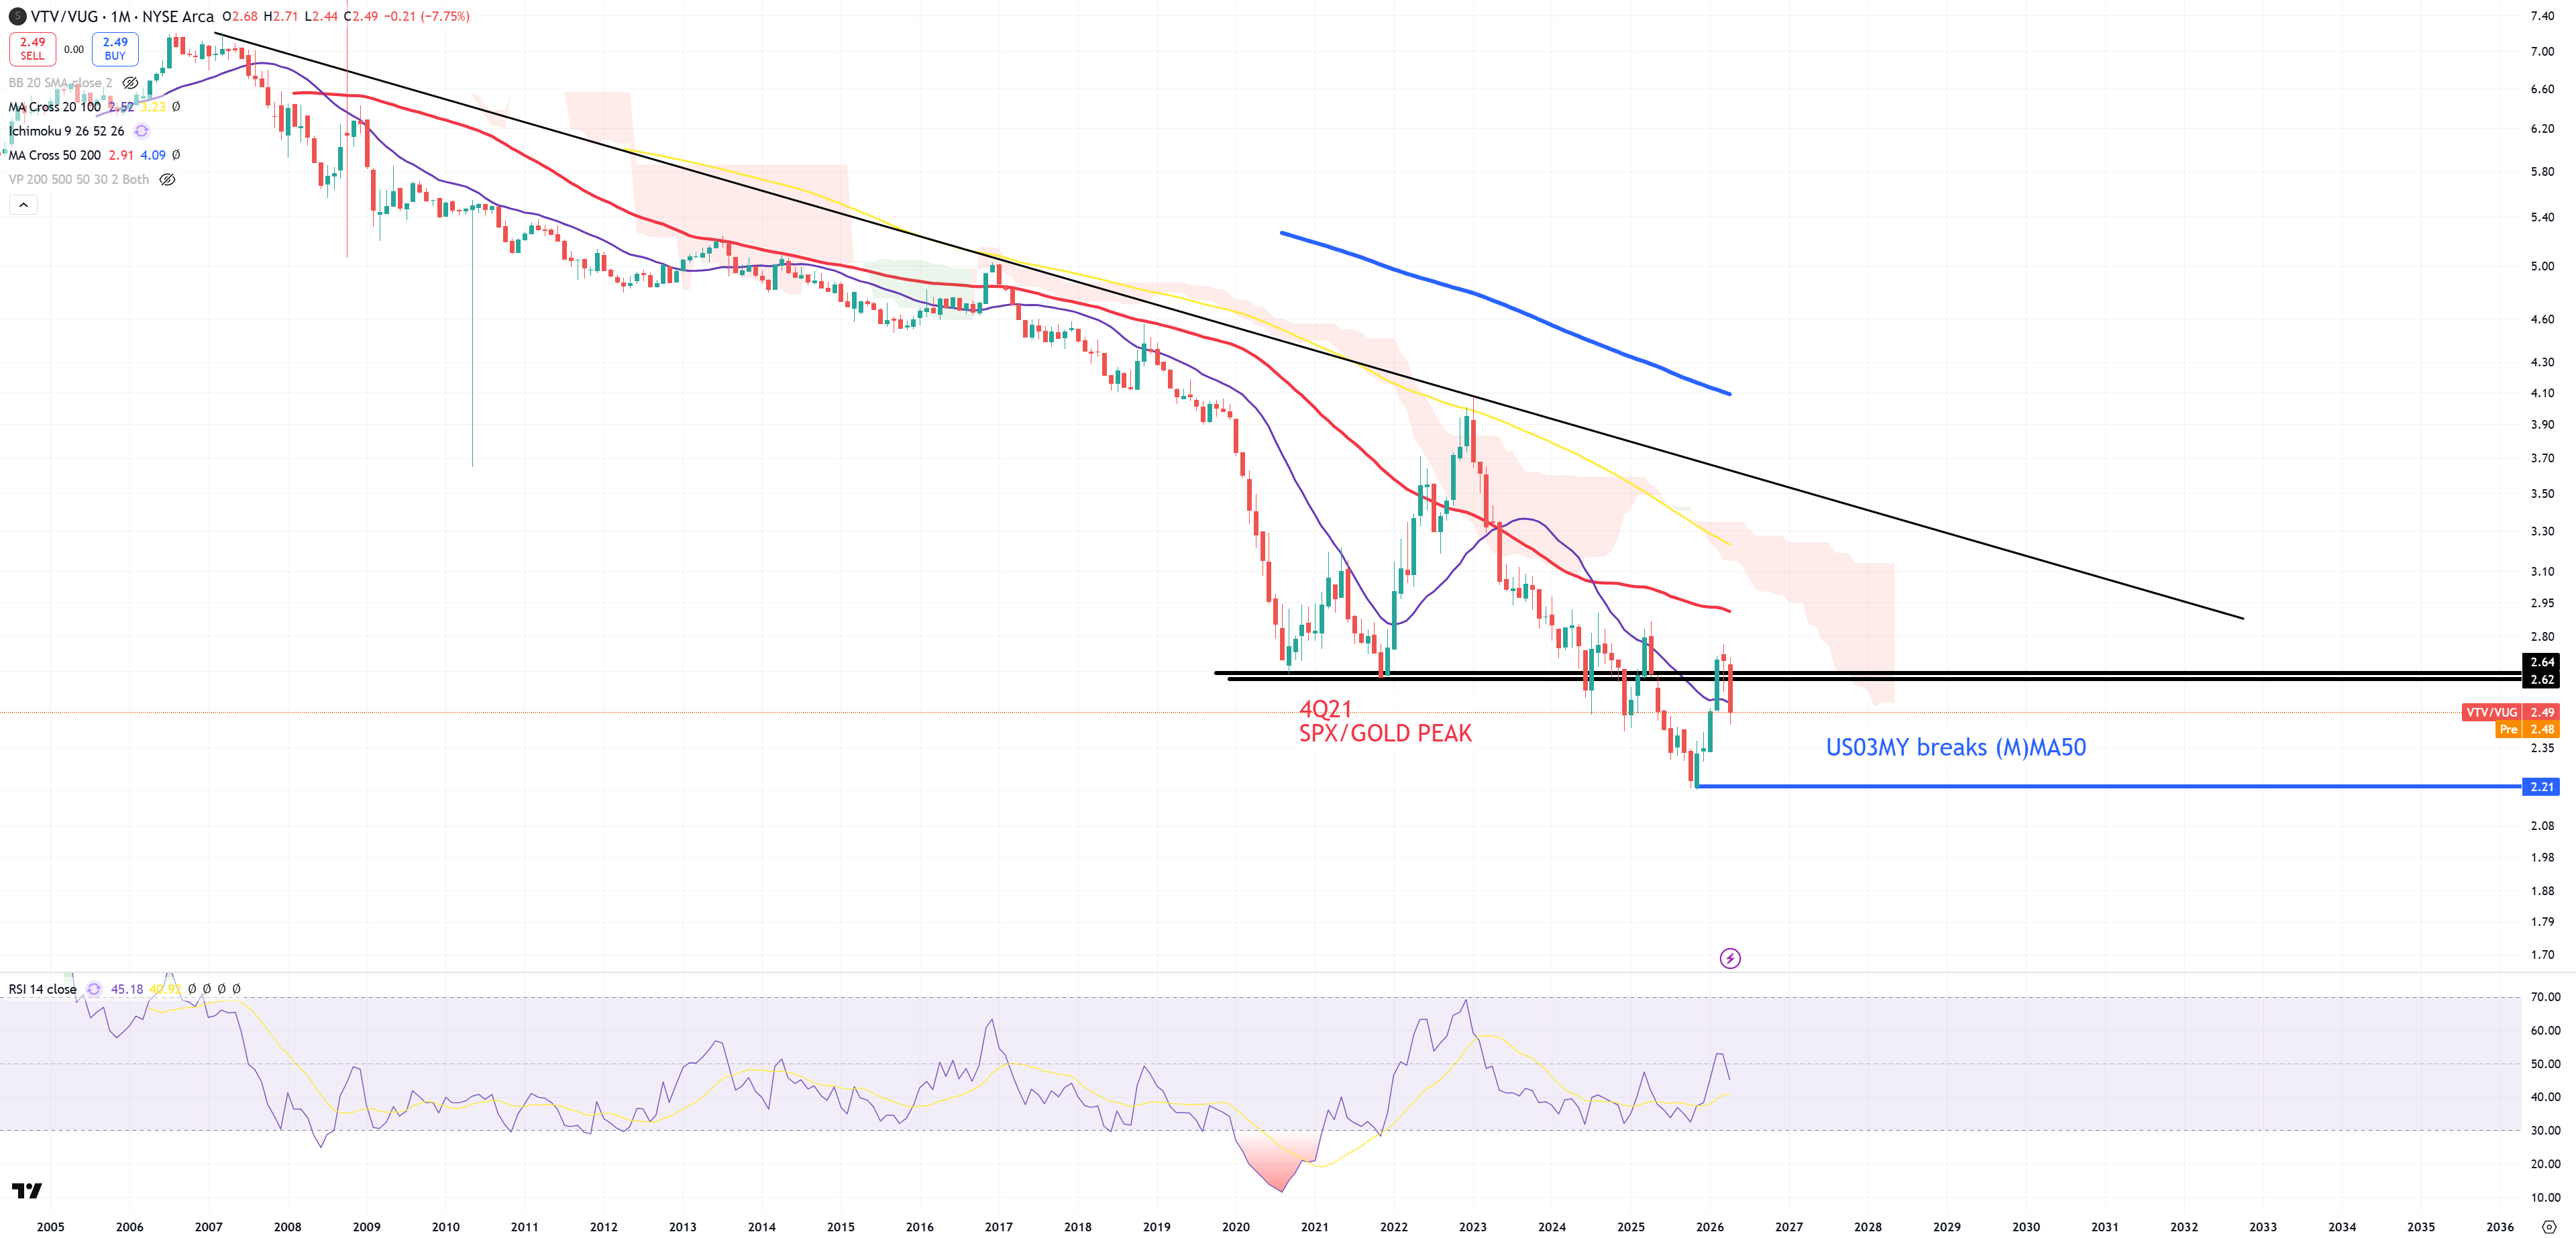
Value/Growth – and also due to the same reason (fact that SPX managed to jump above 1929-2000 trend), Value/Growth wasn’t able to keep the support above 4Q21 level :
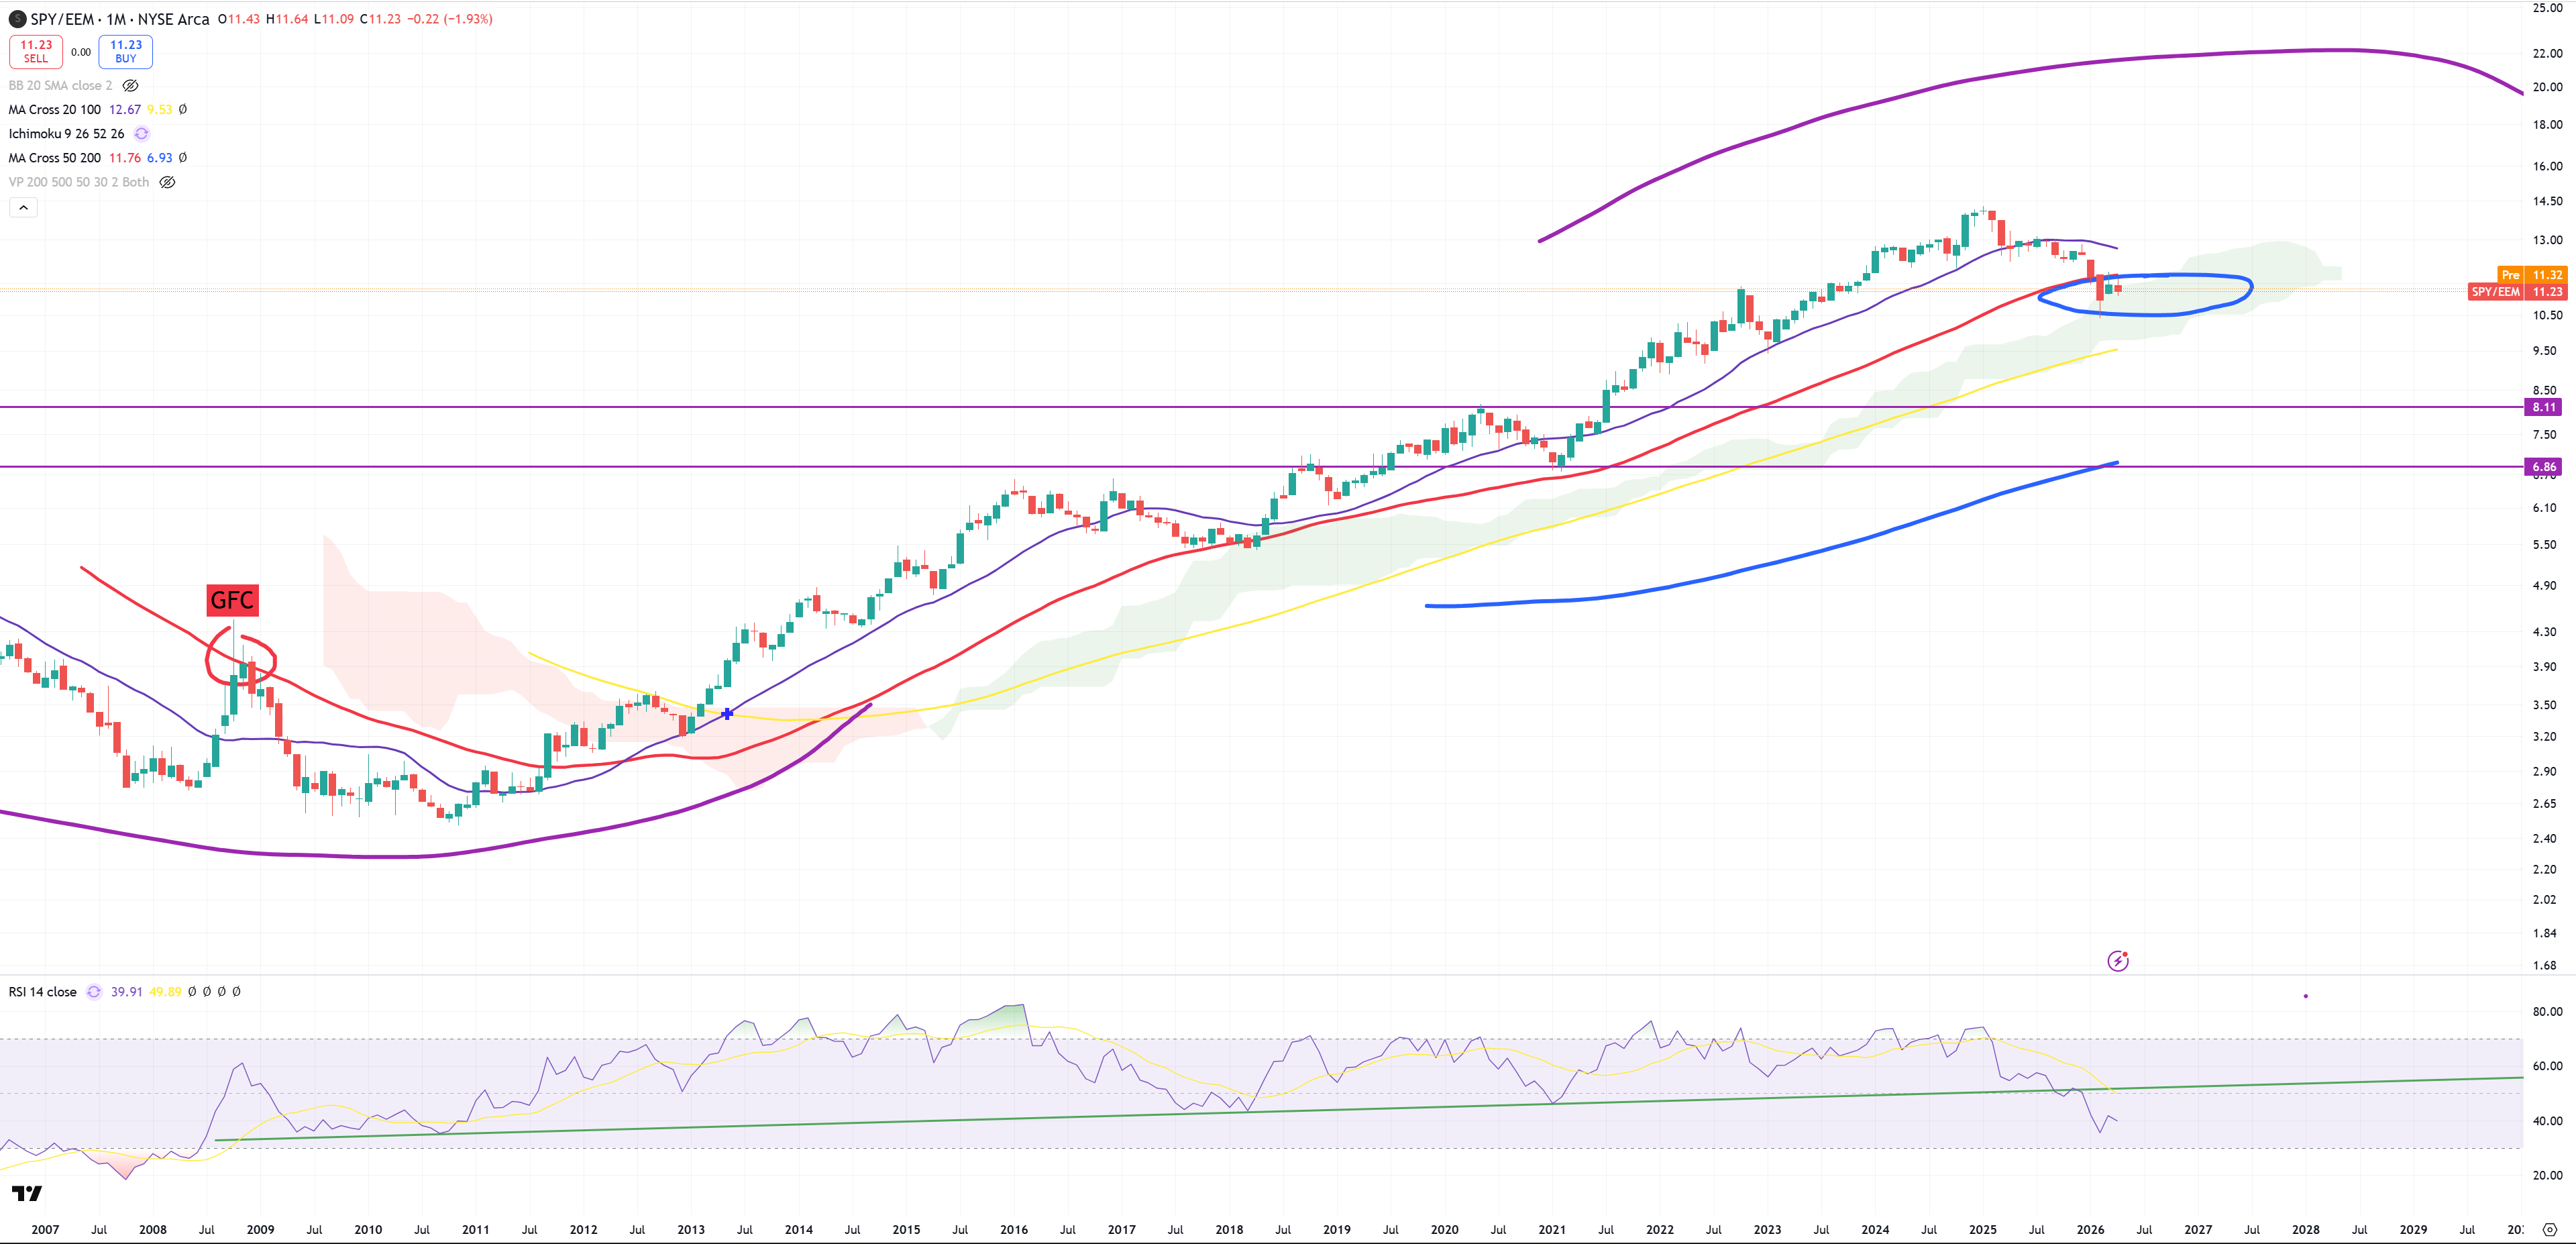
SPY/EEM – this is now a serious break of (M)MA50 – we see a cycle rotation here without a doubt.
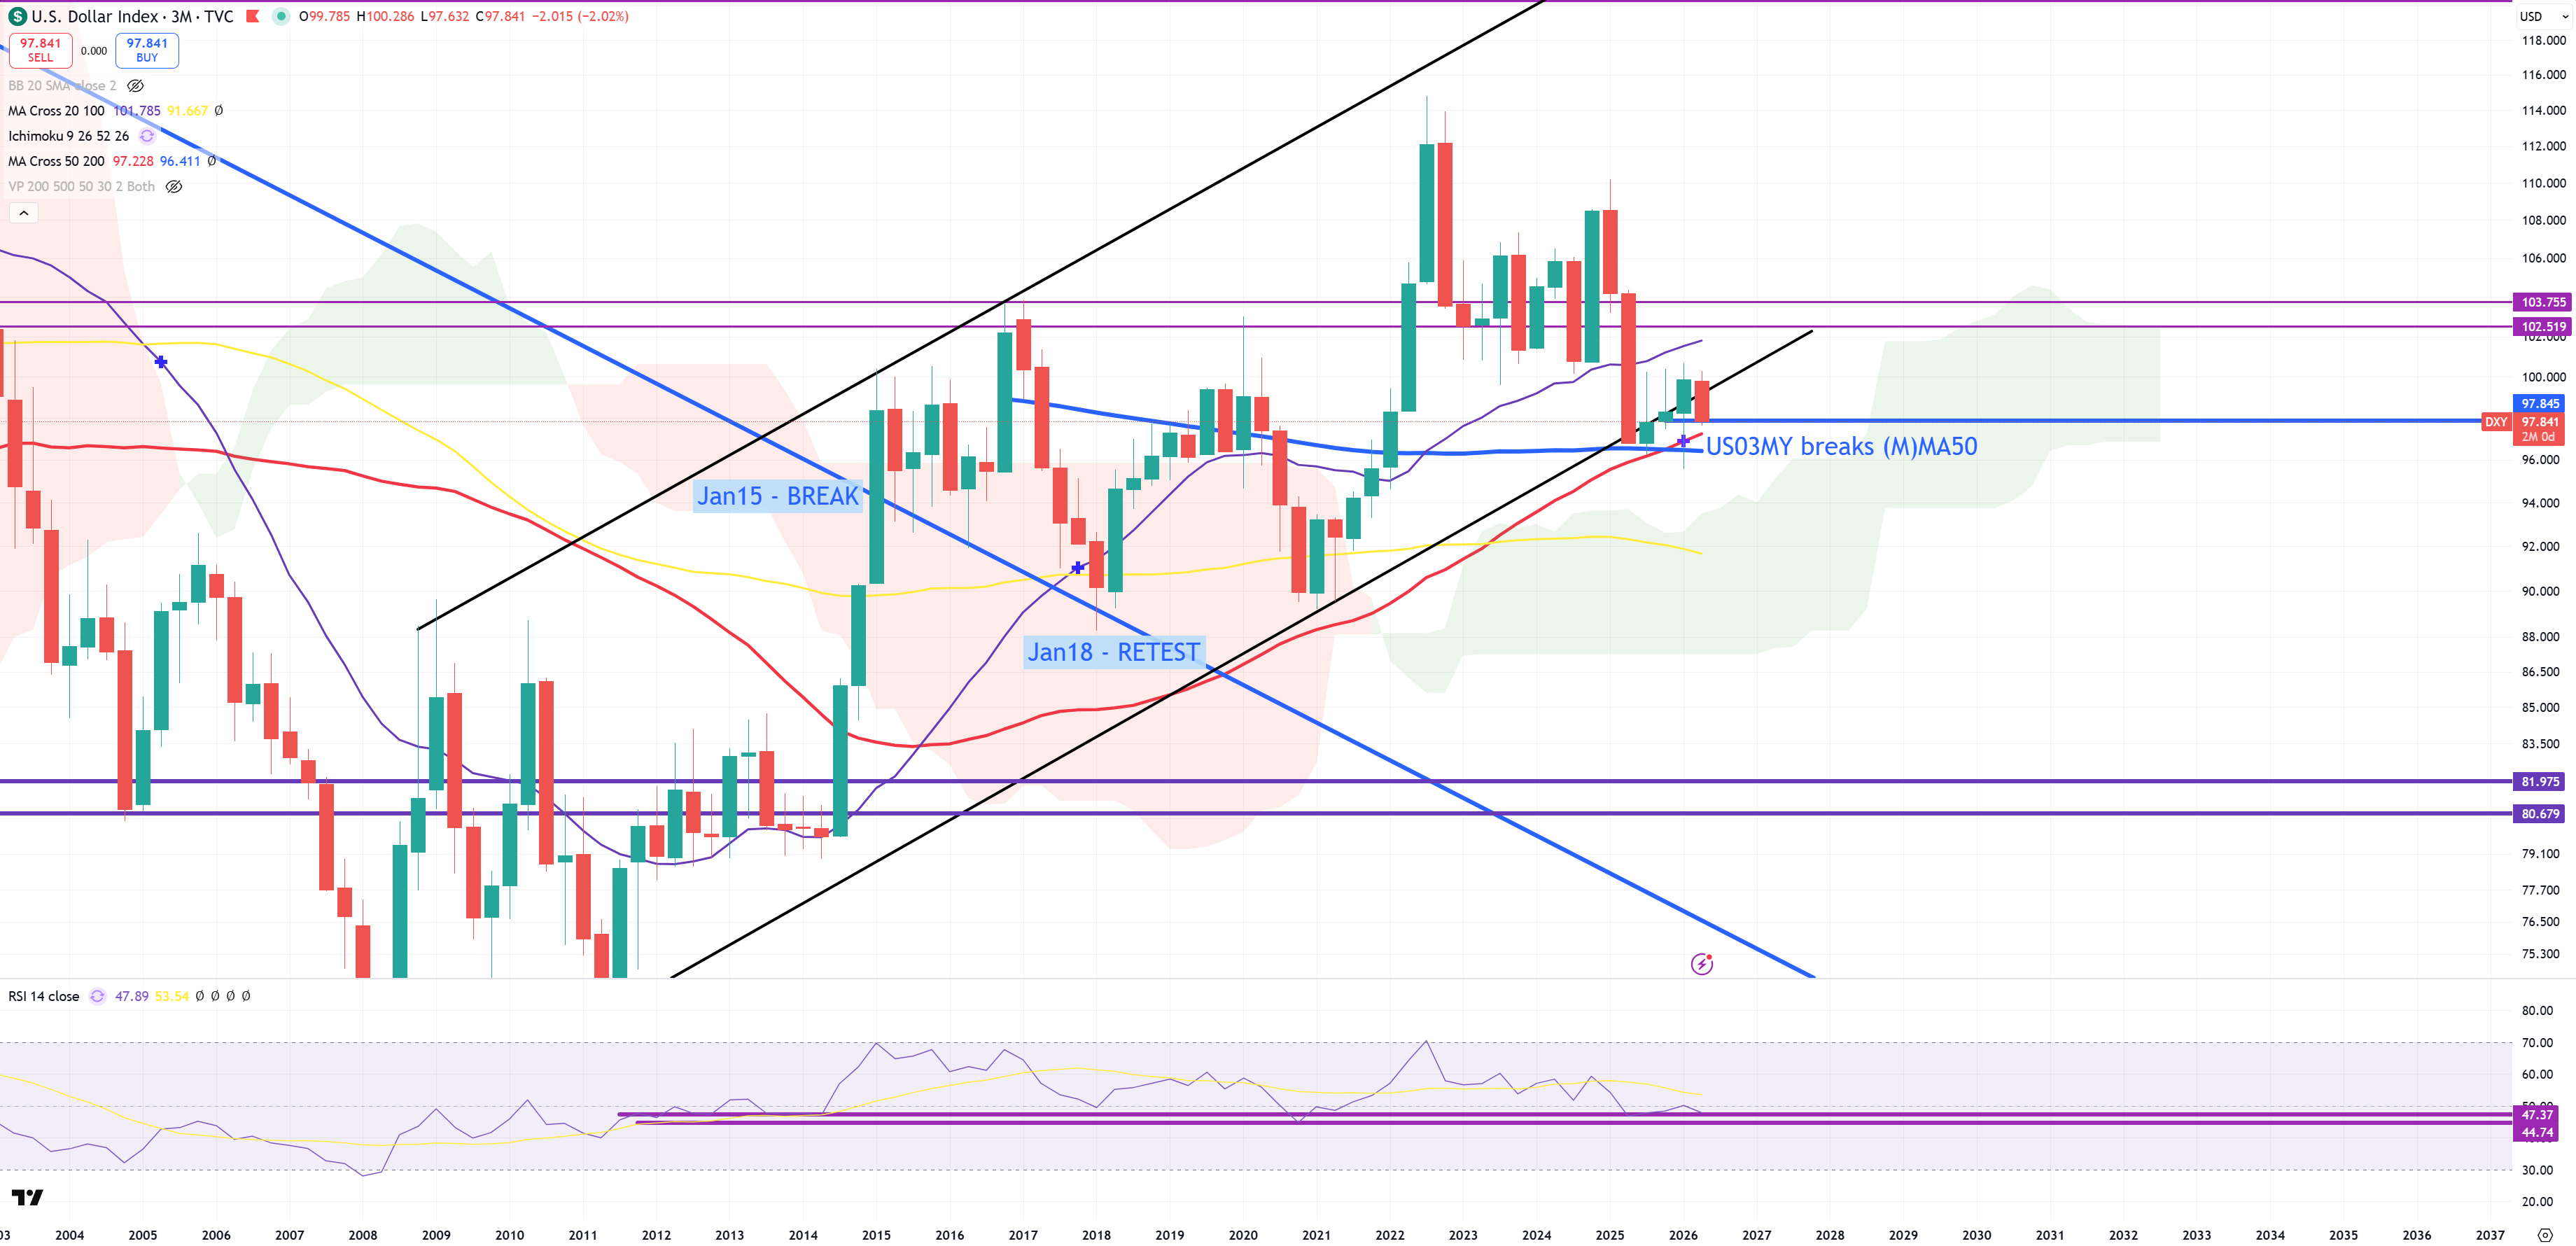
DXY – $$$ index is kept between key trend and multiple MAs : (M)MA100, (3M)MA50 and (3M)MA200. There’s a dead zone between 99 (TREND) and 96.5 (lowest possible support on (3M)MA200) :
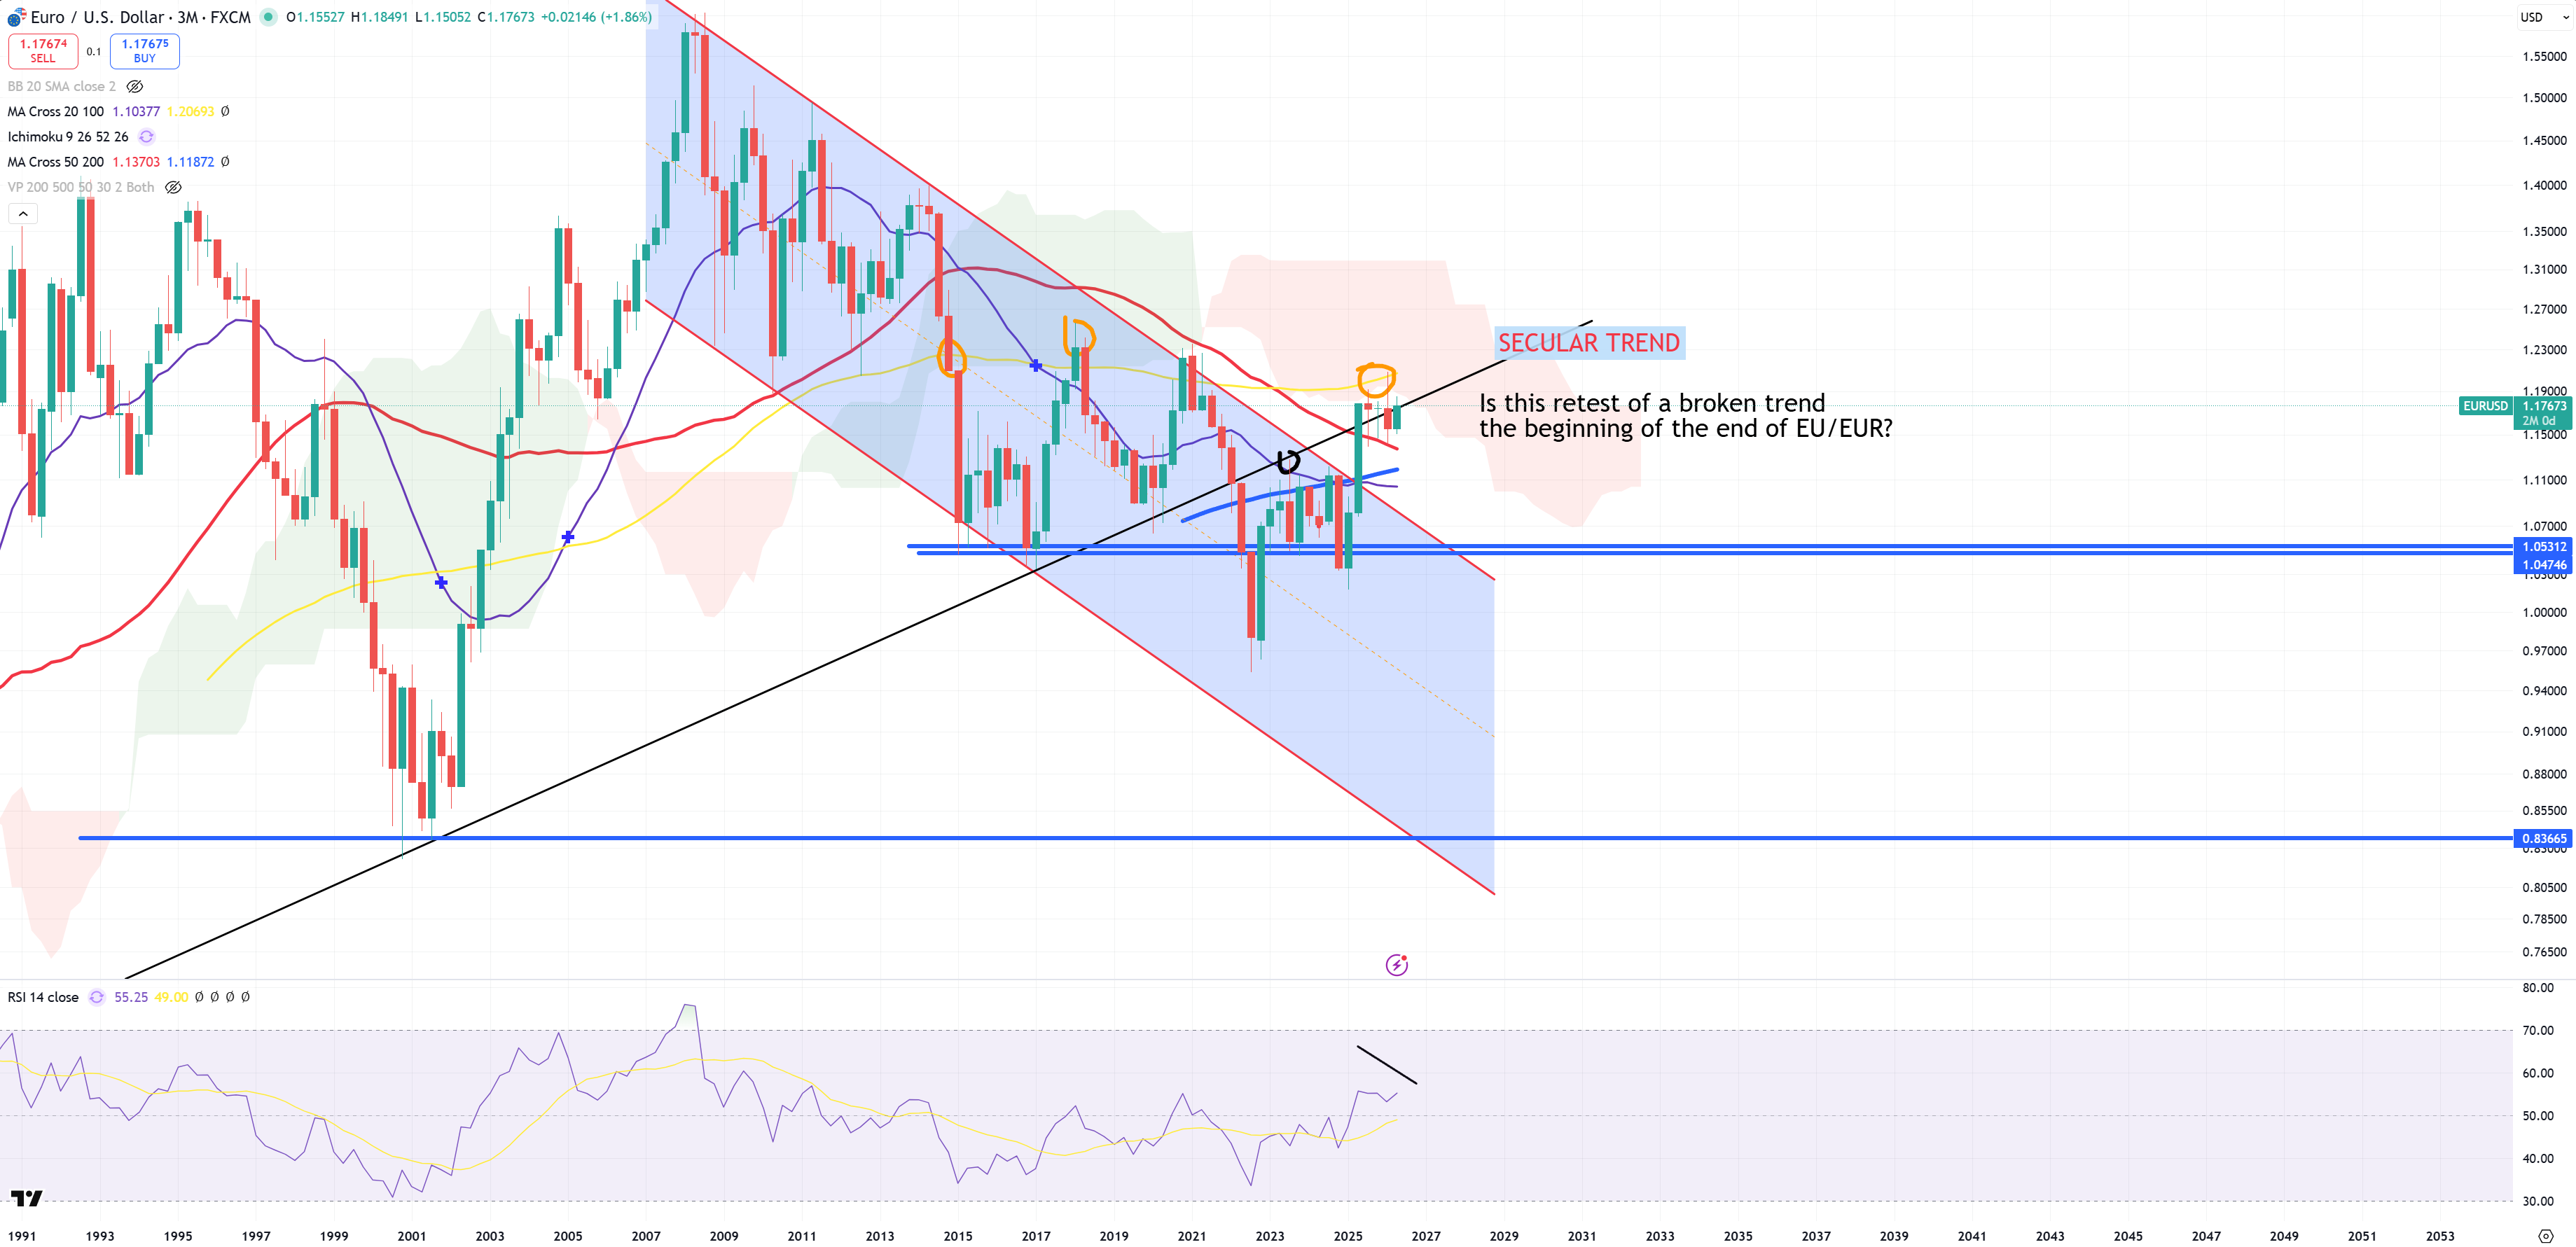
EURUSD – the same time key asset of DXY places big retest with maximum possible target = 1.20.
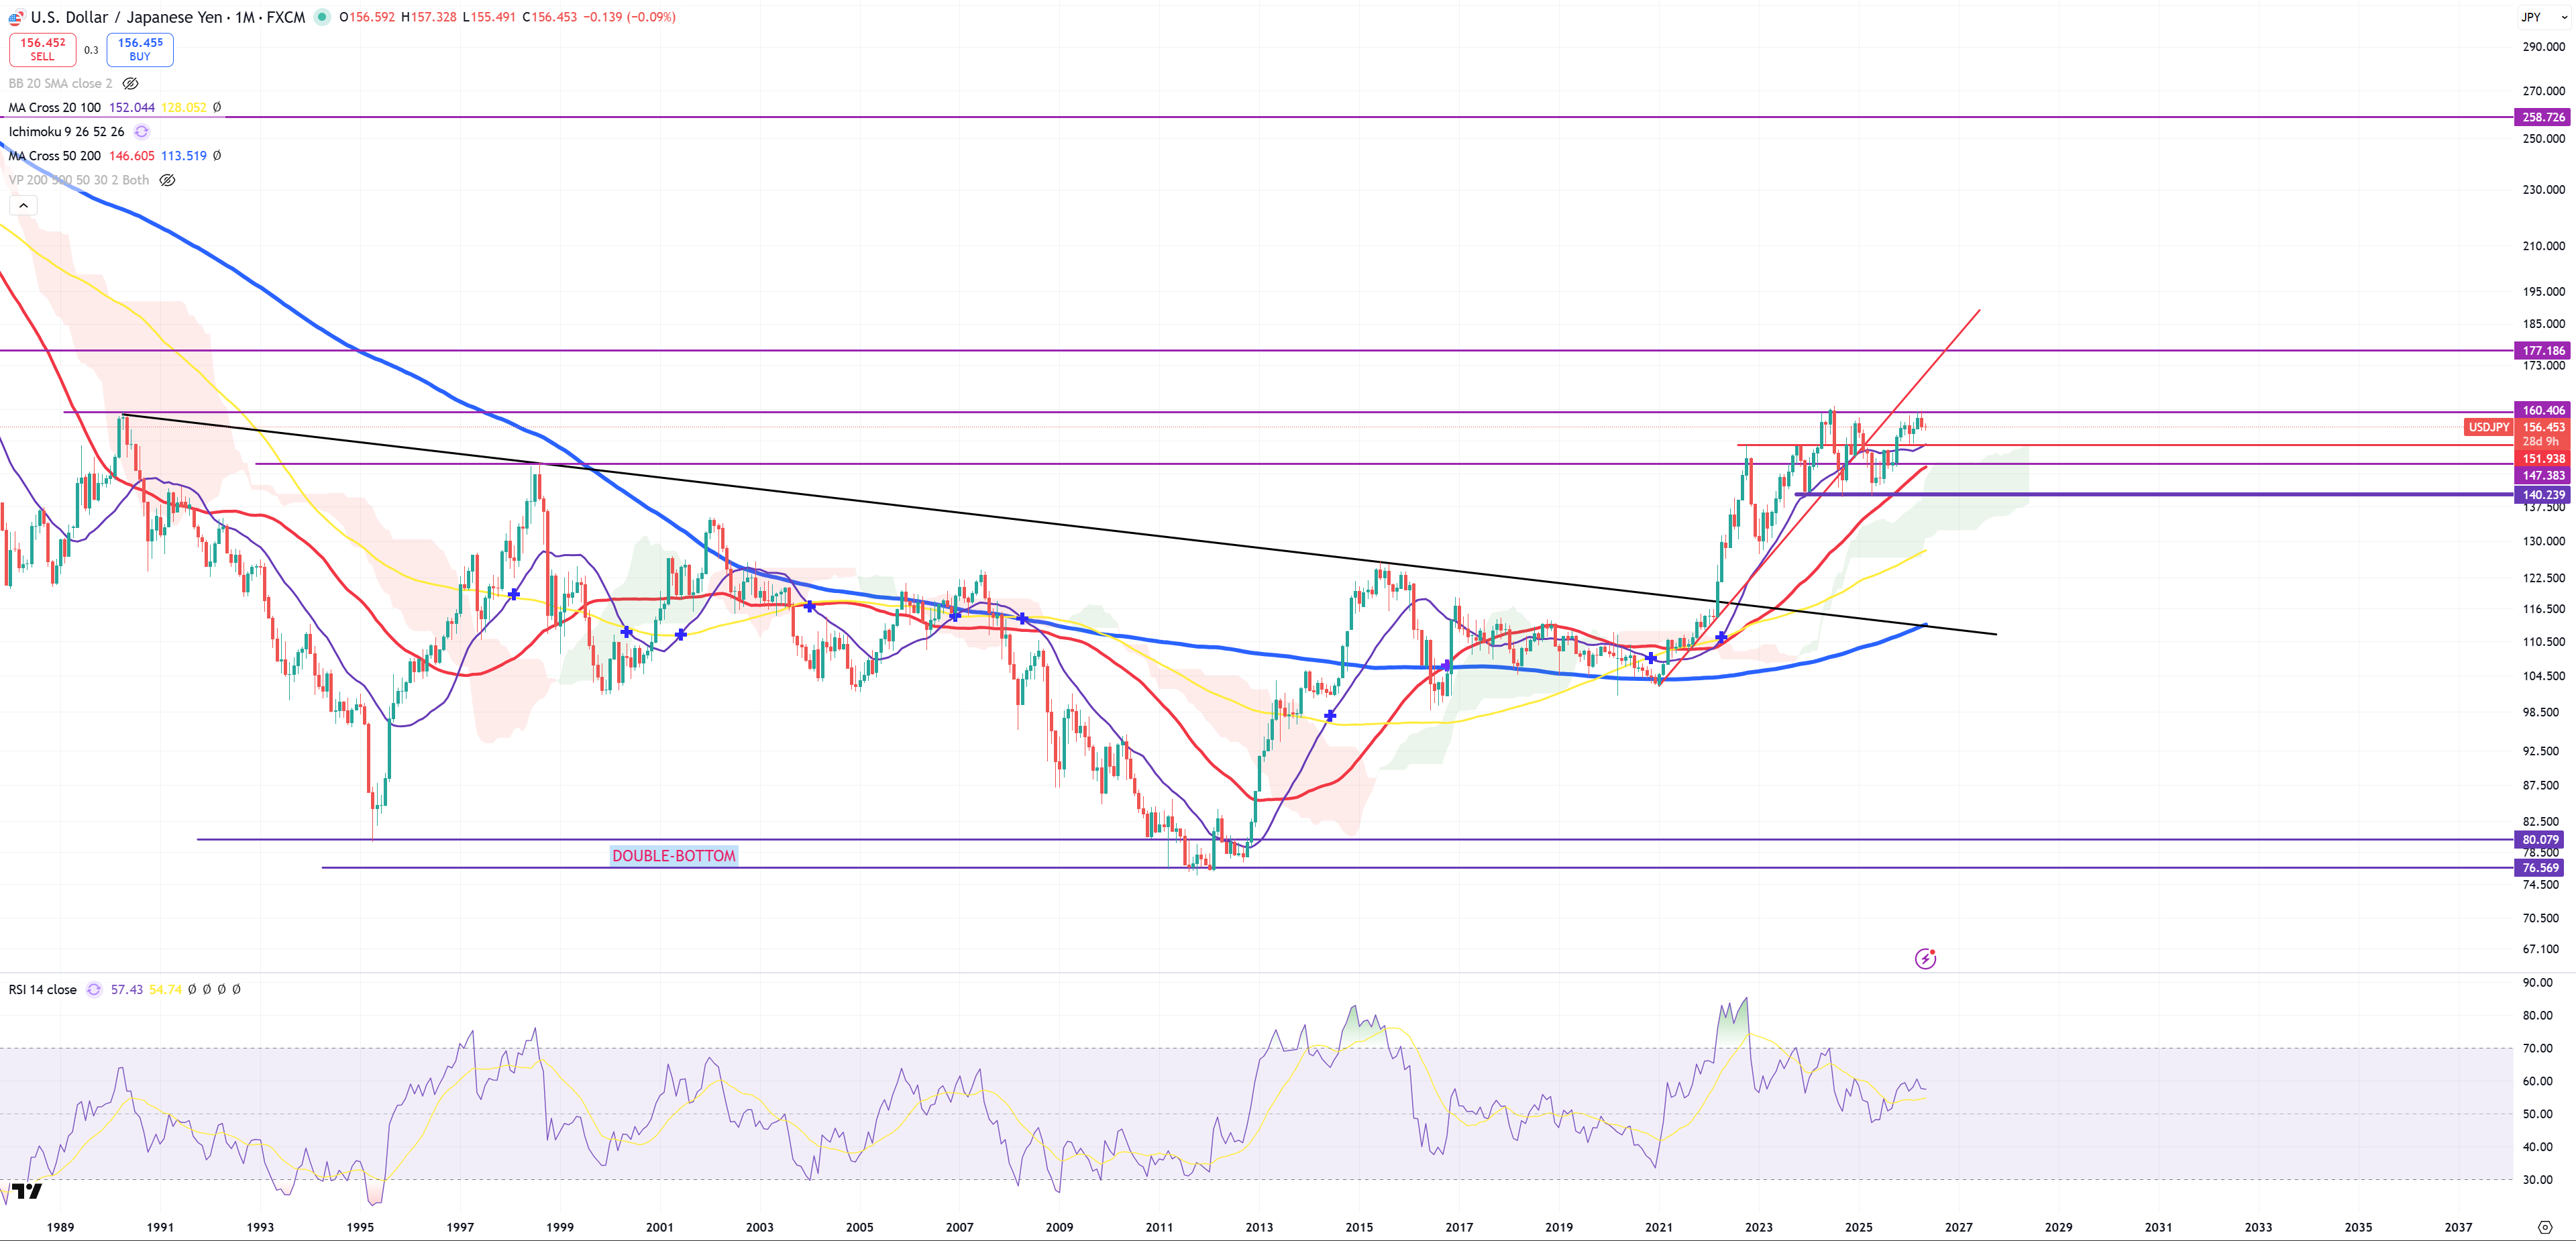
USDJPY and its 160 level. The longer the game goes the more I think we’re going to see a break of this level. The more I look on JPY the less I think it’s important at all.
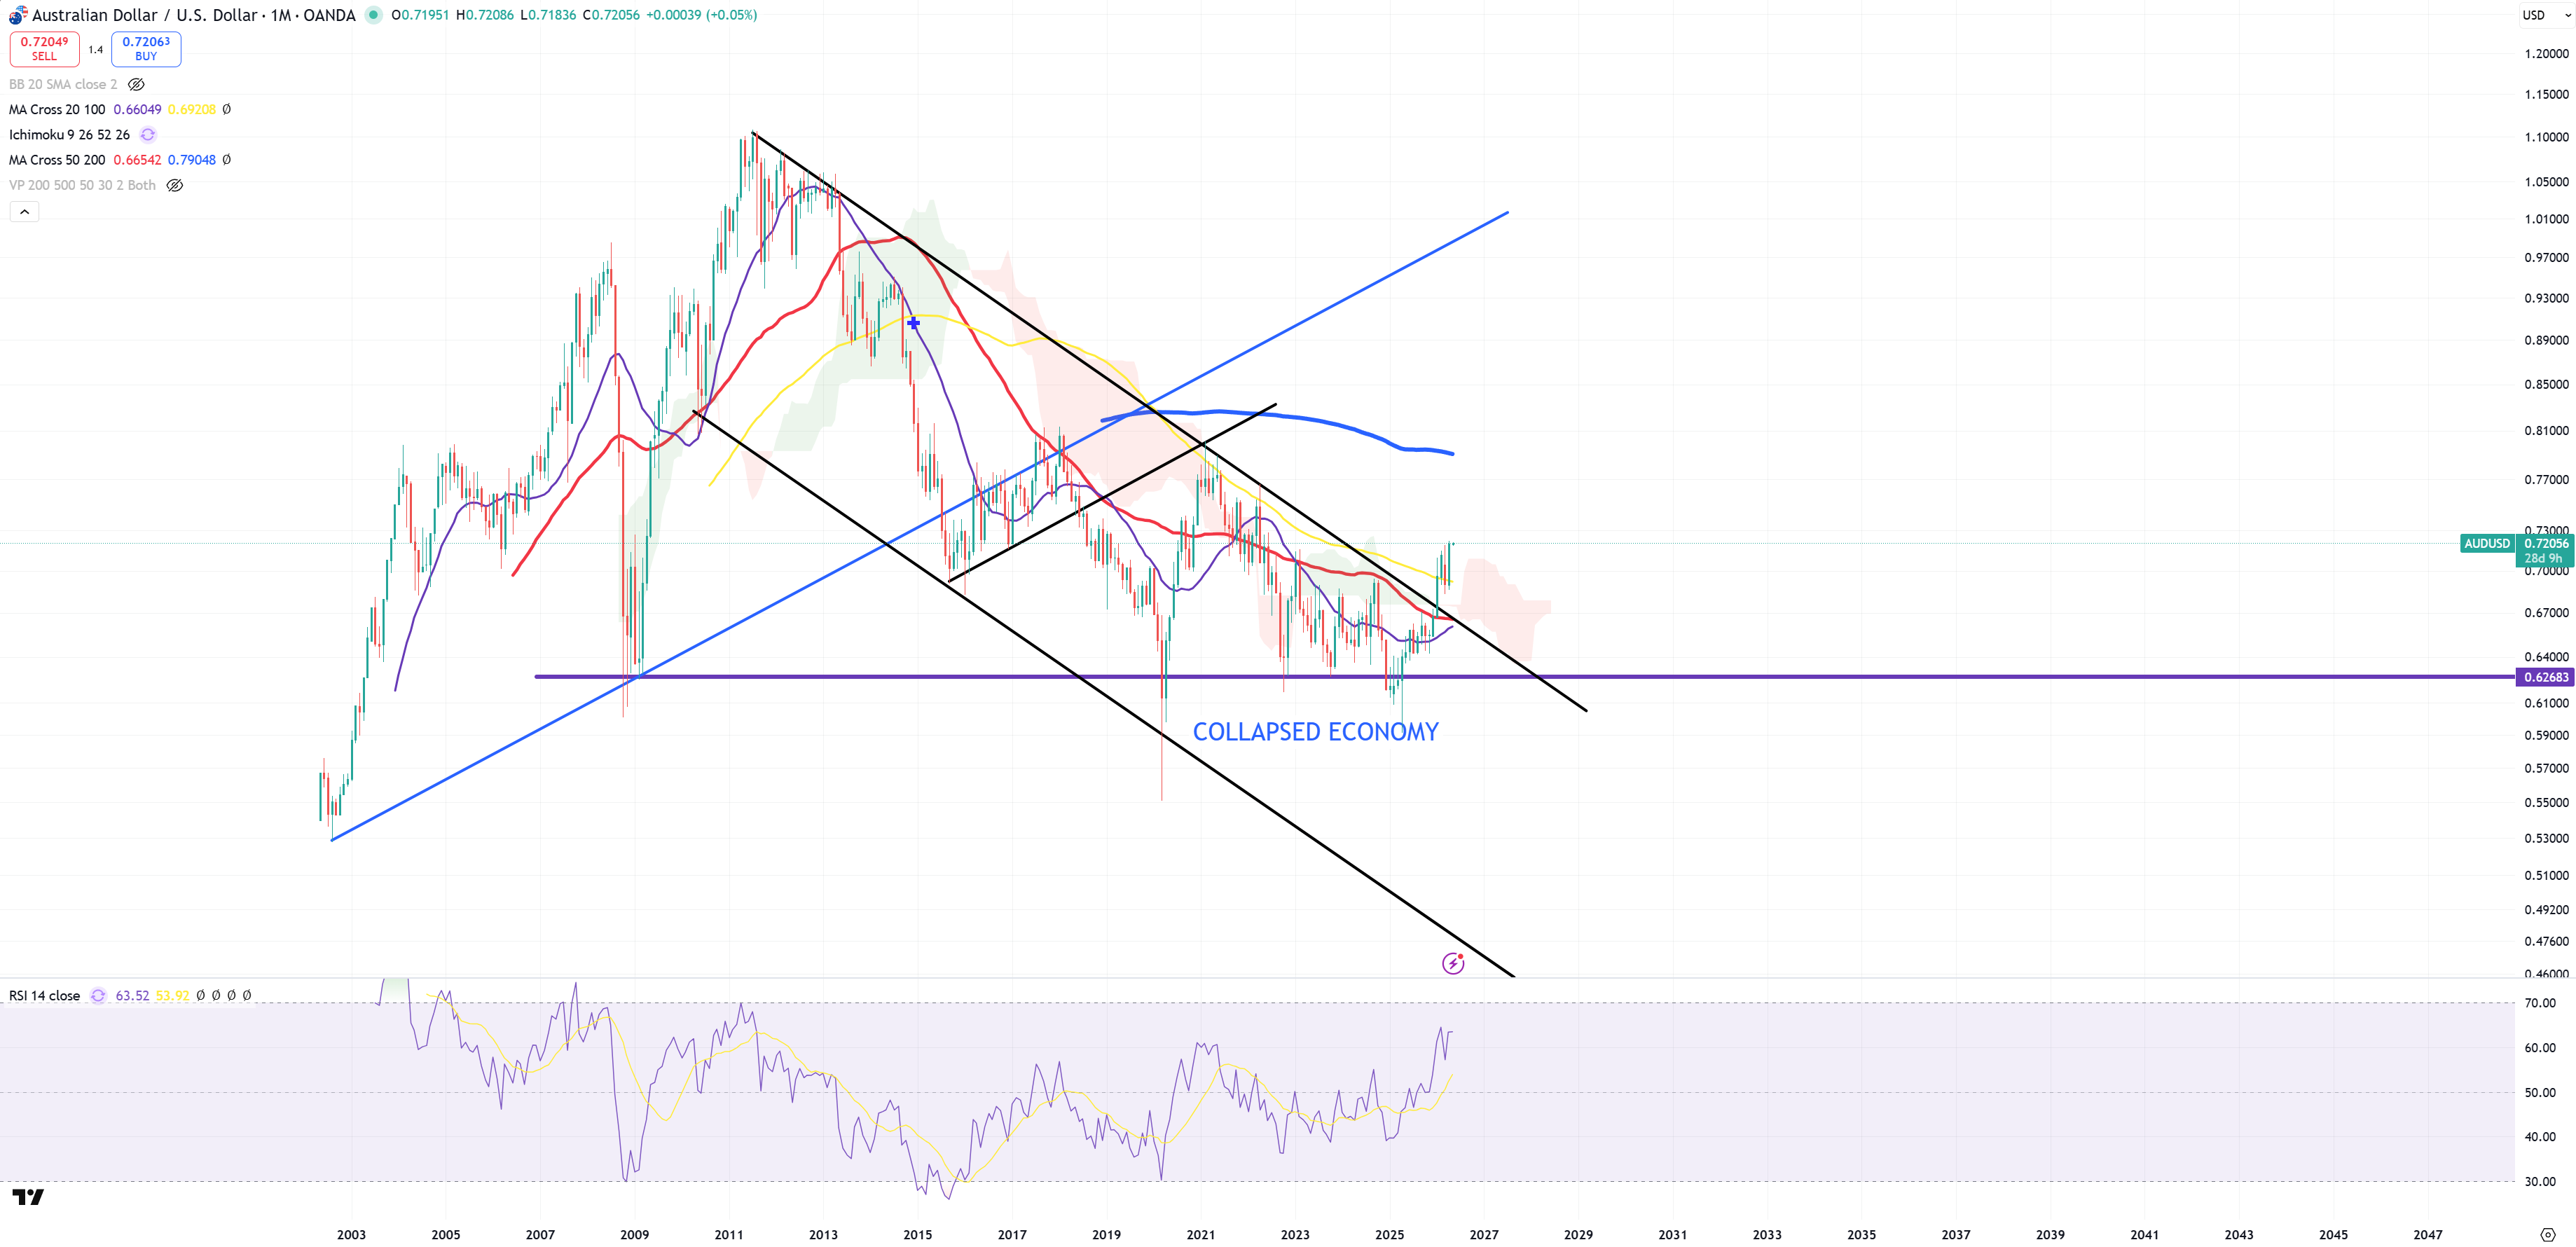
AUDUSD – this pair is now way more important. Below 0.60 I placed a support below I call “COLLAPSED ECONOMY” – maybe this term is wrong and should be “STOCK MARKET COLLAPSE”. AUDUSD tells you a pressure on inflation and pressure on DEFLATION. The break is the break : there’s a pressure on INFLATION right now = pressure to lift up long end yields.
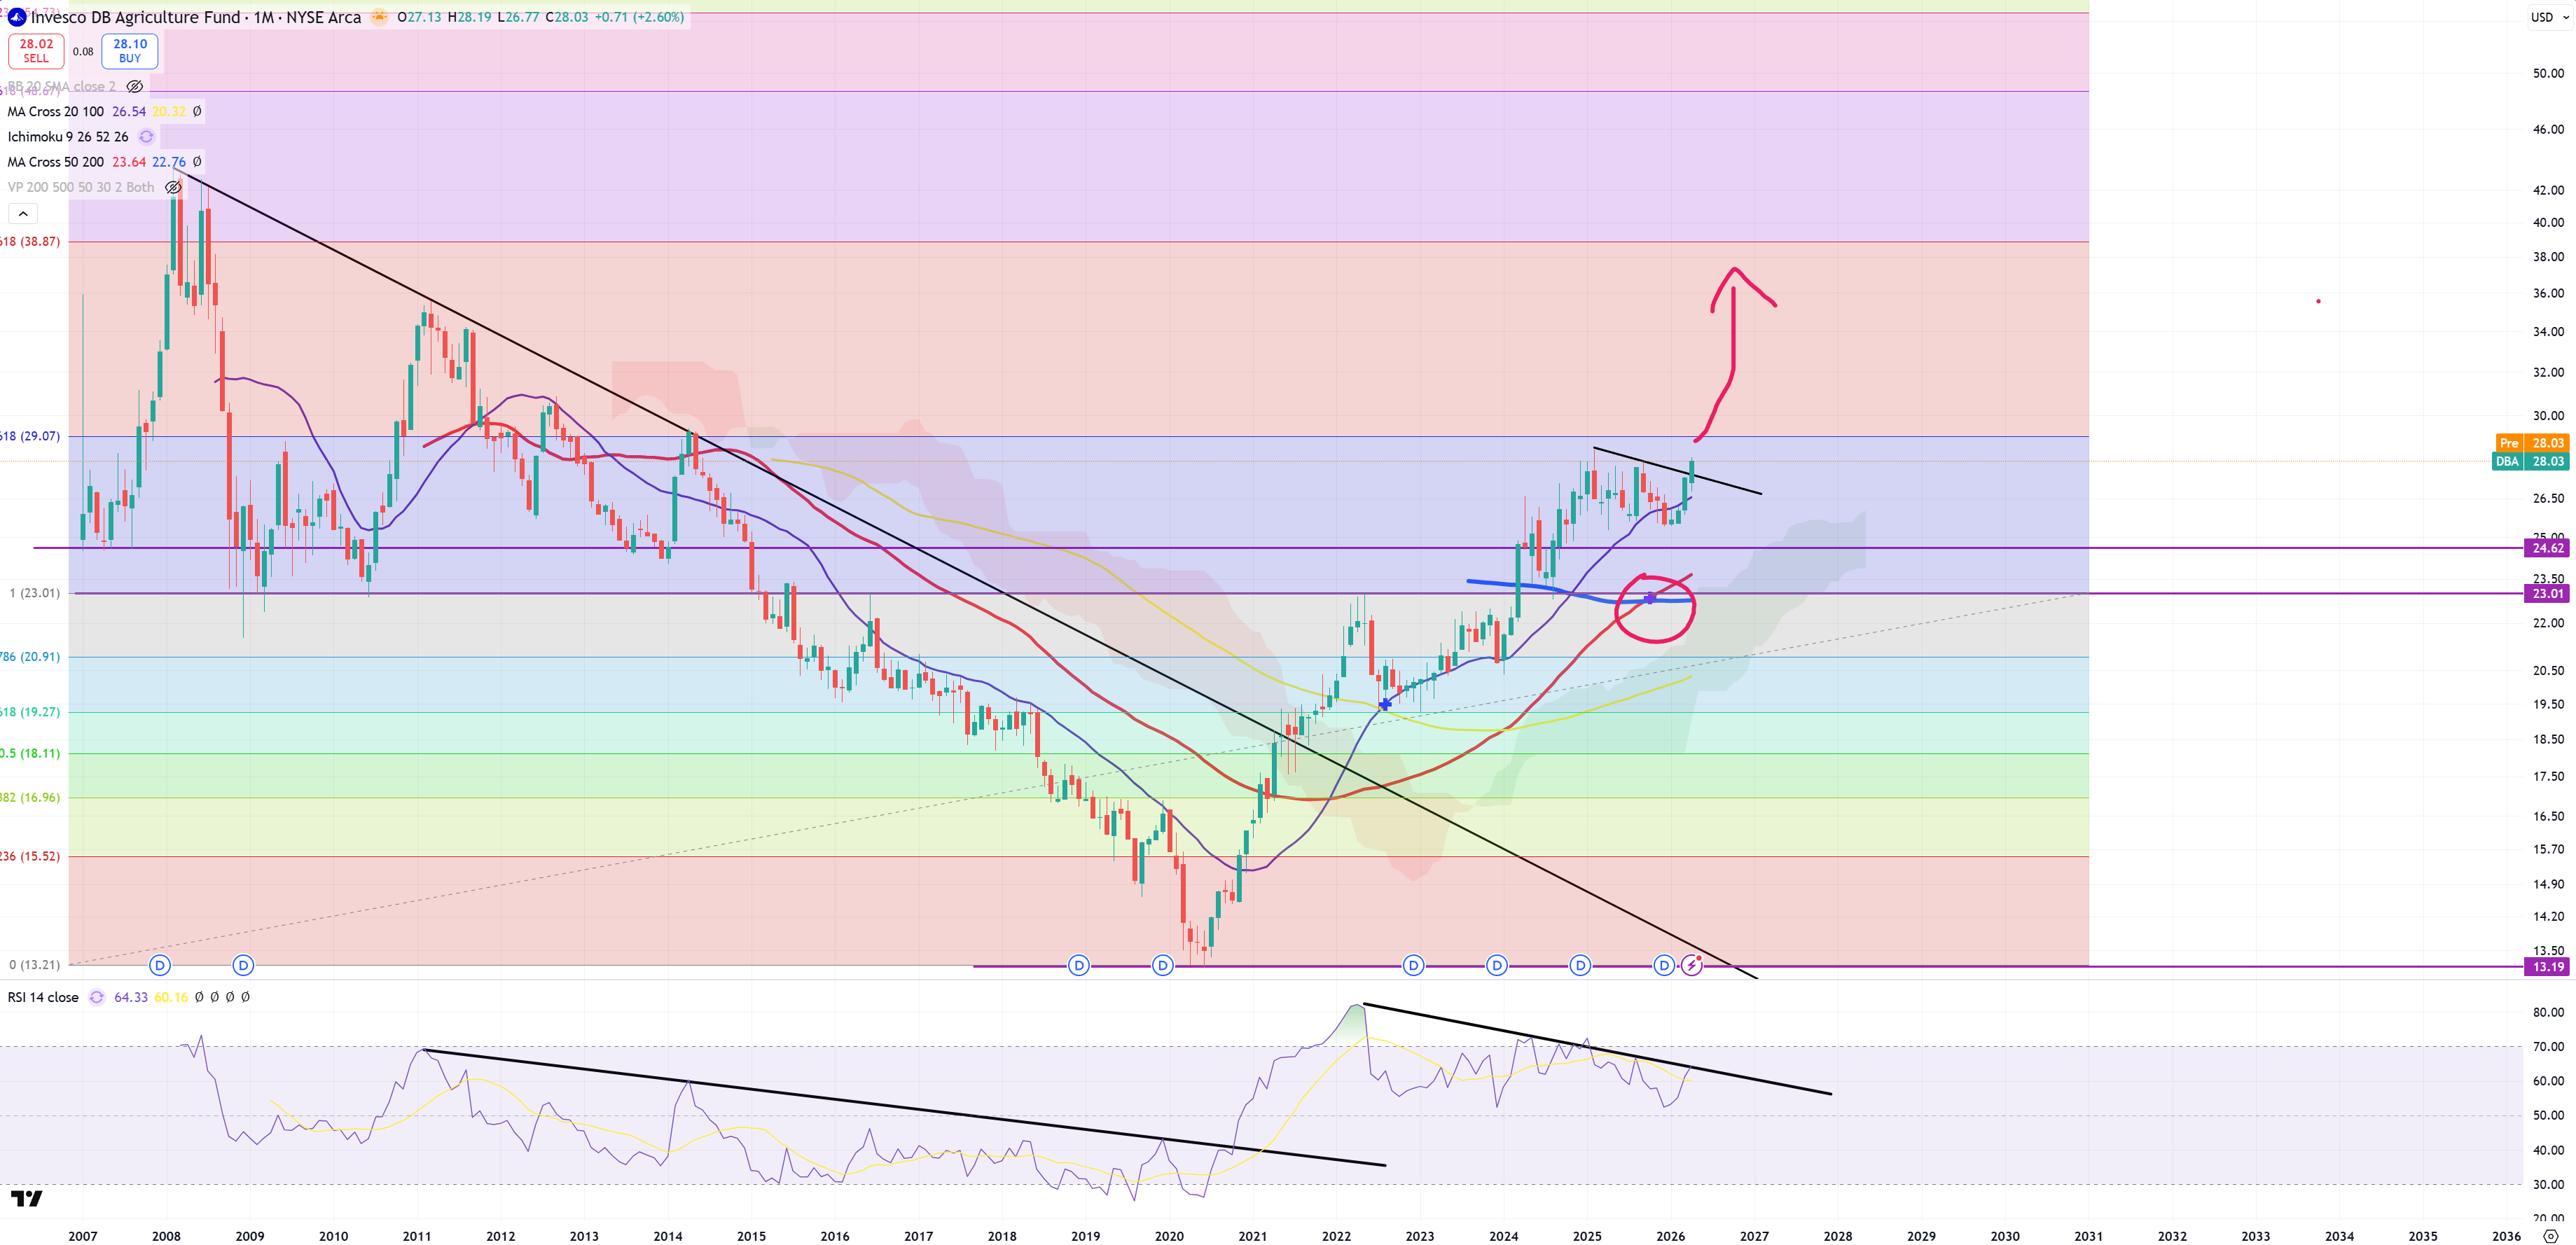
DBA – and you can see that on Agriculture. Wheat, Corn all looks the same, like next wave of food inflation is about to hit us.
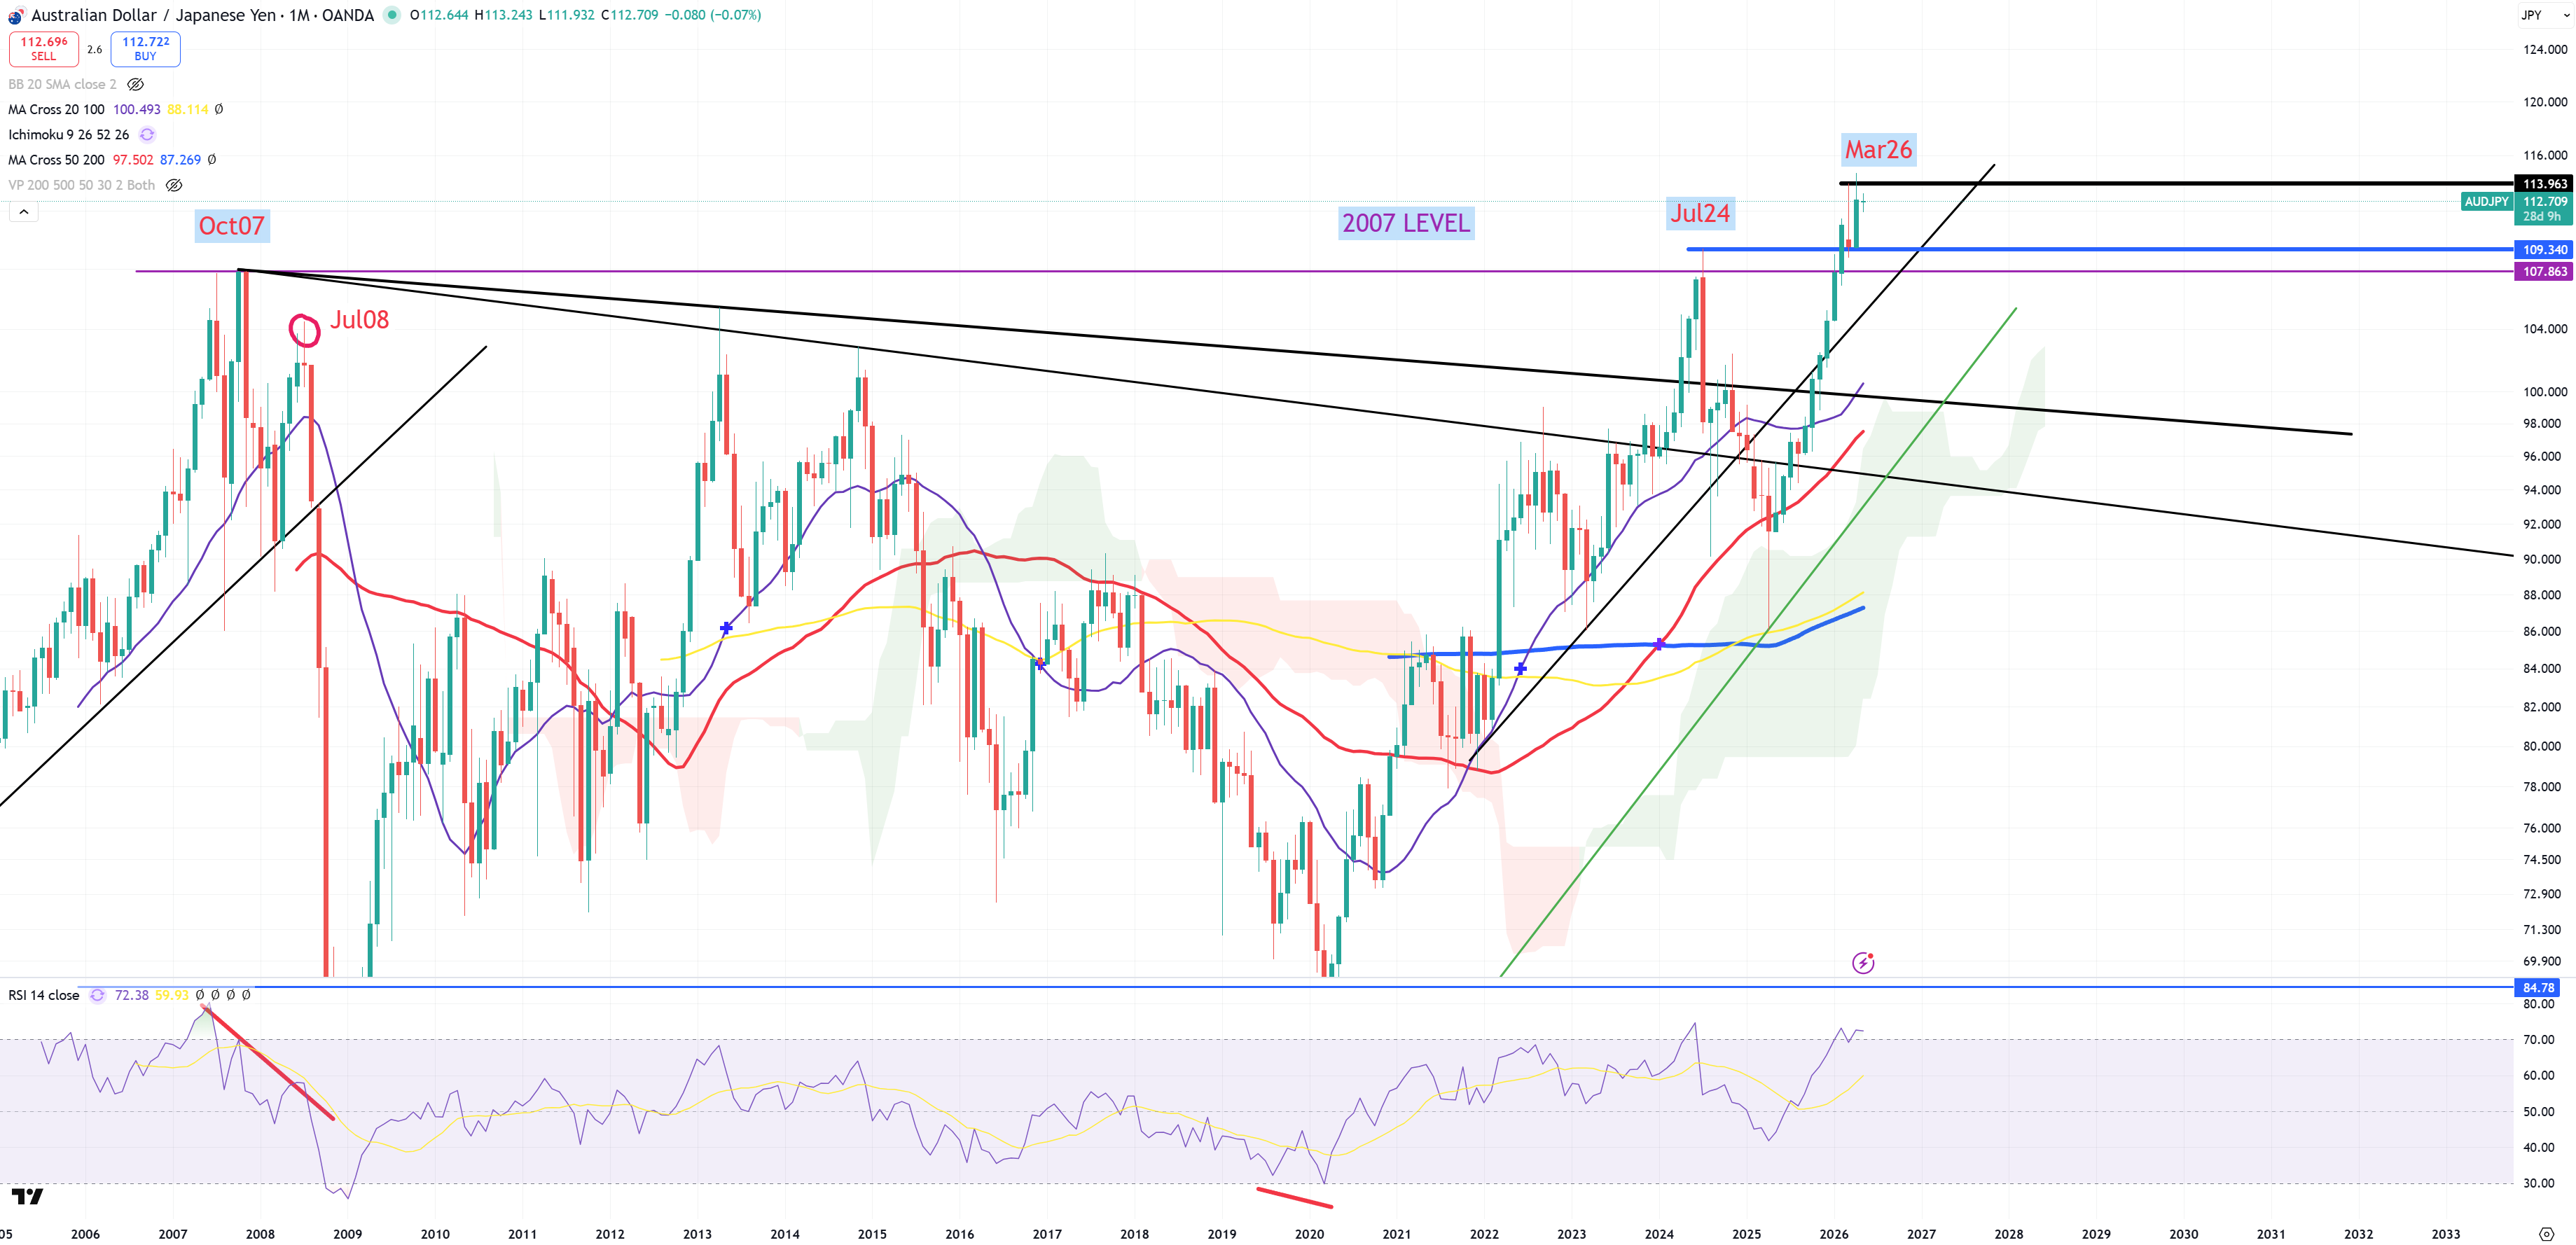
AUDJPY – main risk on/off indicator, but I came to conclusion it doesn’t work as it used to work and I started to ignore it after some longer term observation mostly because USDJPY is not a reliable indicator anymore. It’s all about AUDUSD move down to take down stock market.
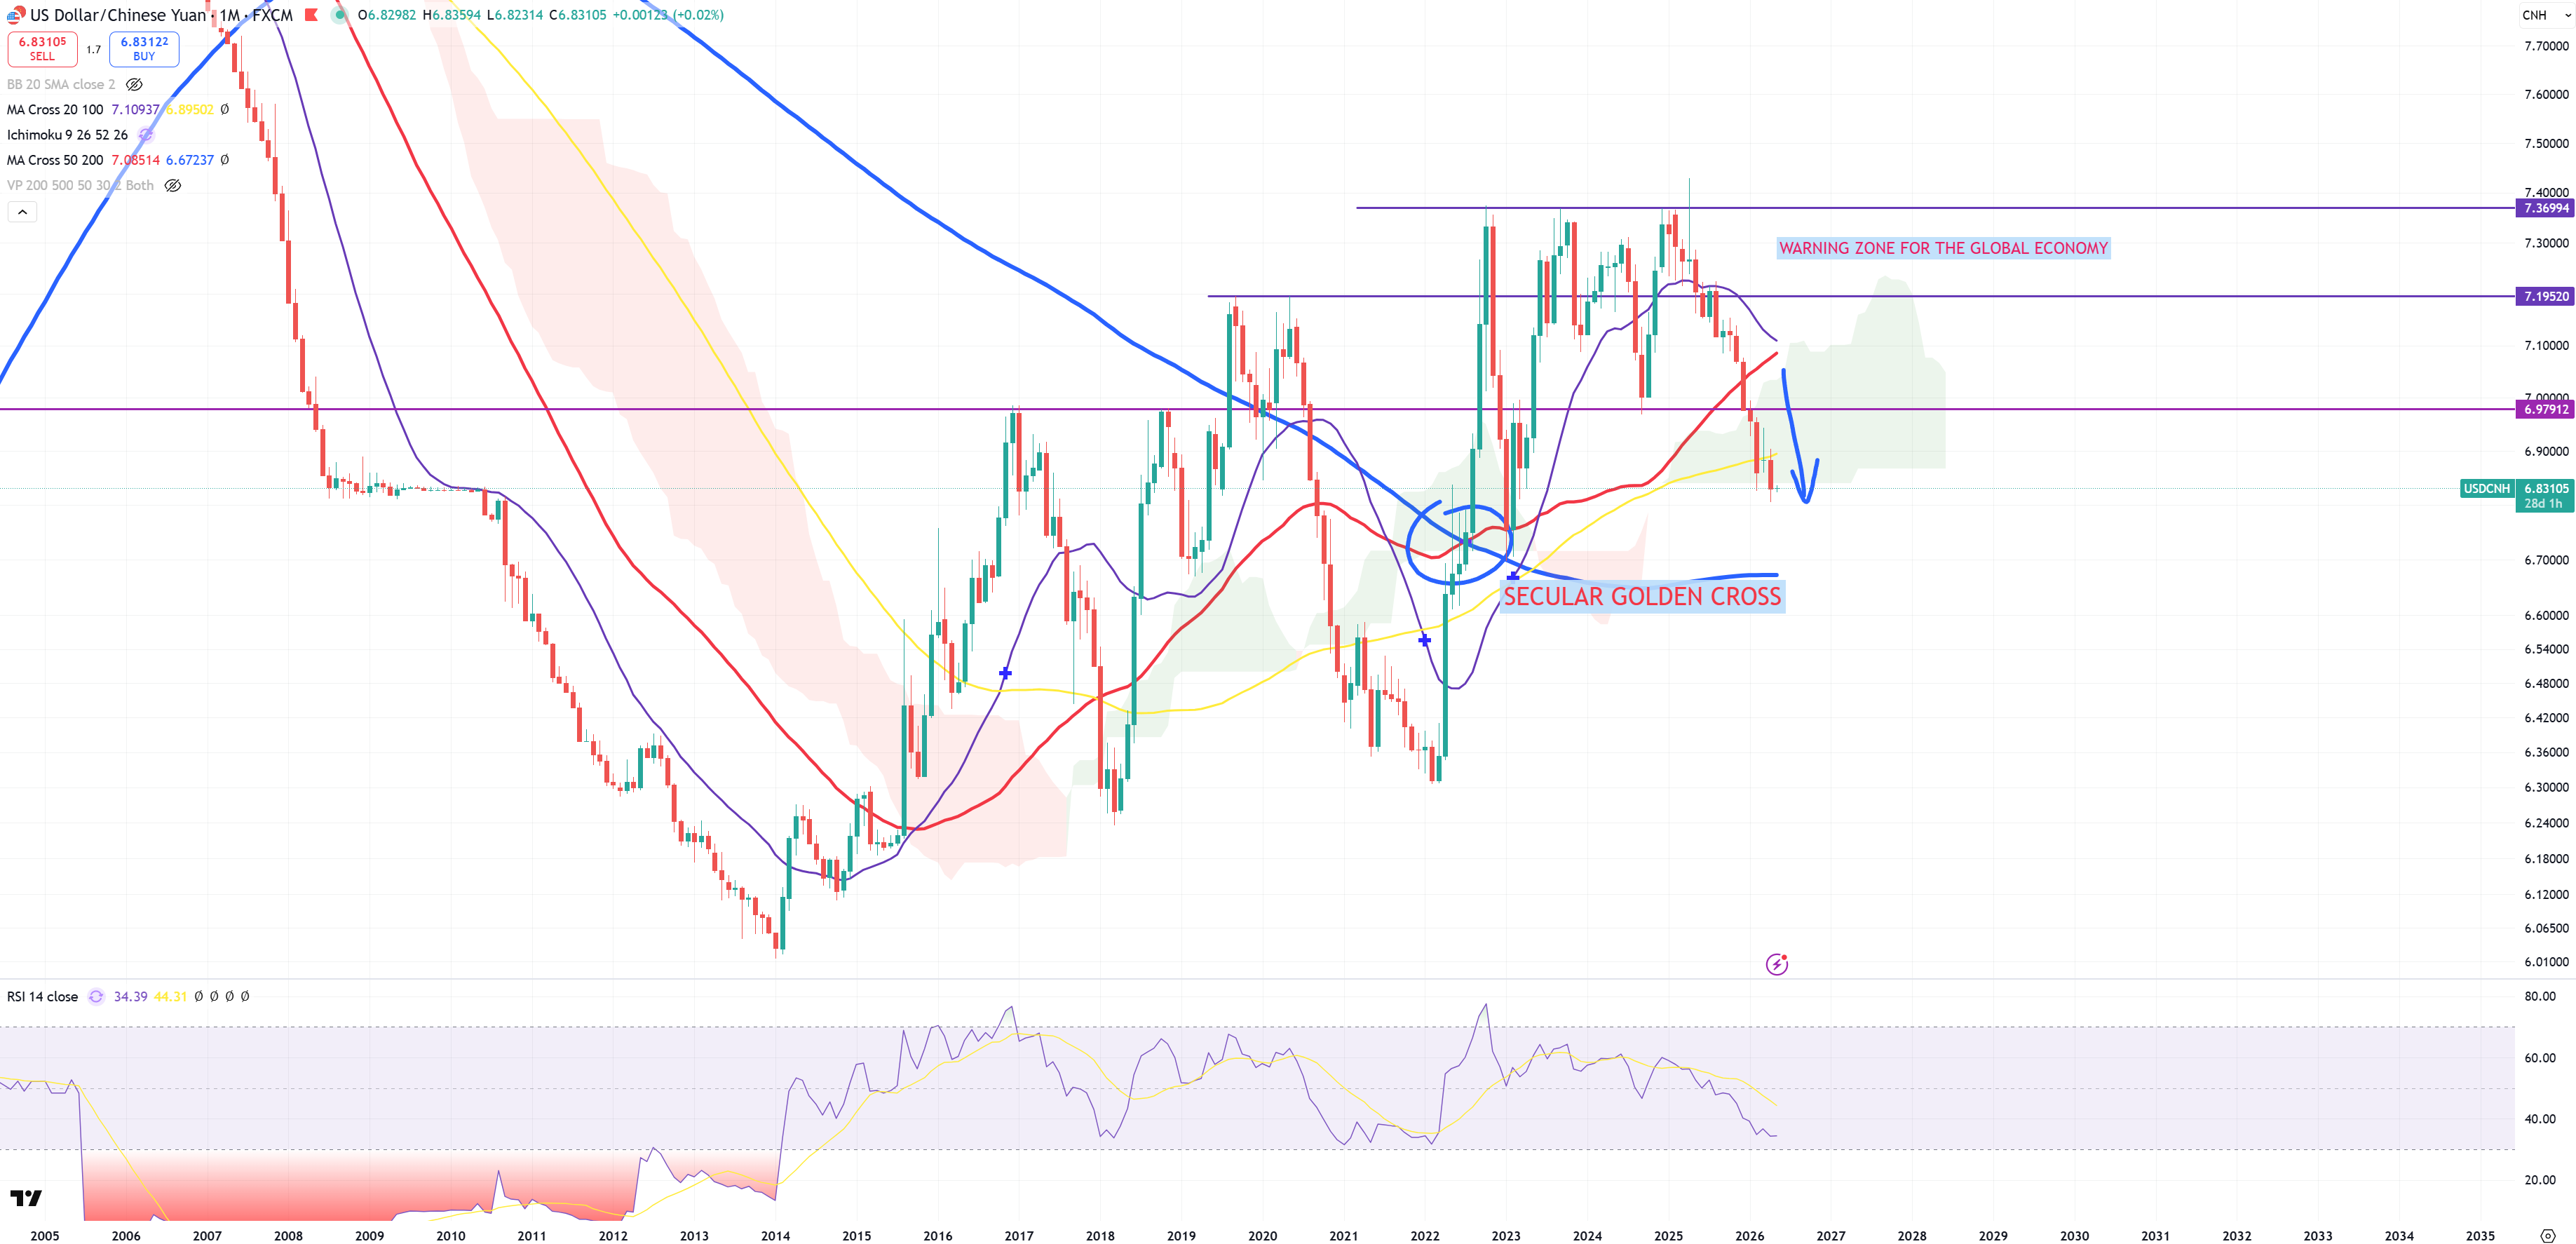
USDCNH – really hard to tell you anything about Yuan. My old mantra says : The power of the $$$ is the weakness of the Yuan (USDCNH up). It does not match to … DXY levels, EURUSD levels, but it answers a question why AUDUSD goes higher, because USDCNH move has a direct translation towards AUDUSD moves. (M)MA100 was broken. This juice towards blue (M)MA200 is this one needed to close the gap for SPX/GOLD to touch (3M)MA200? We’ll find out.
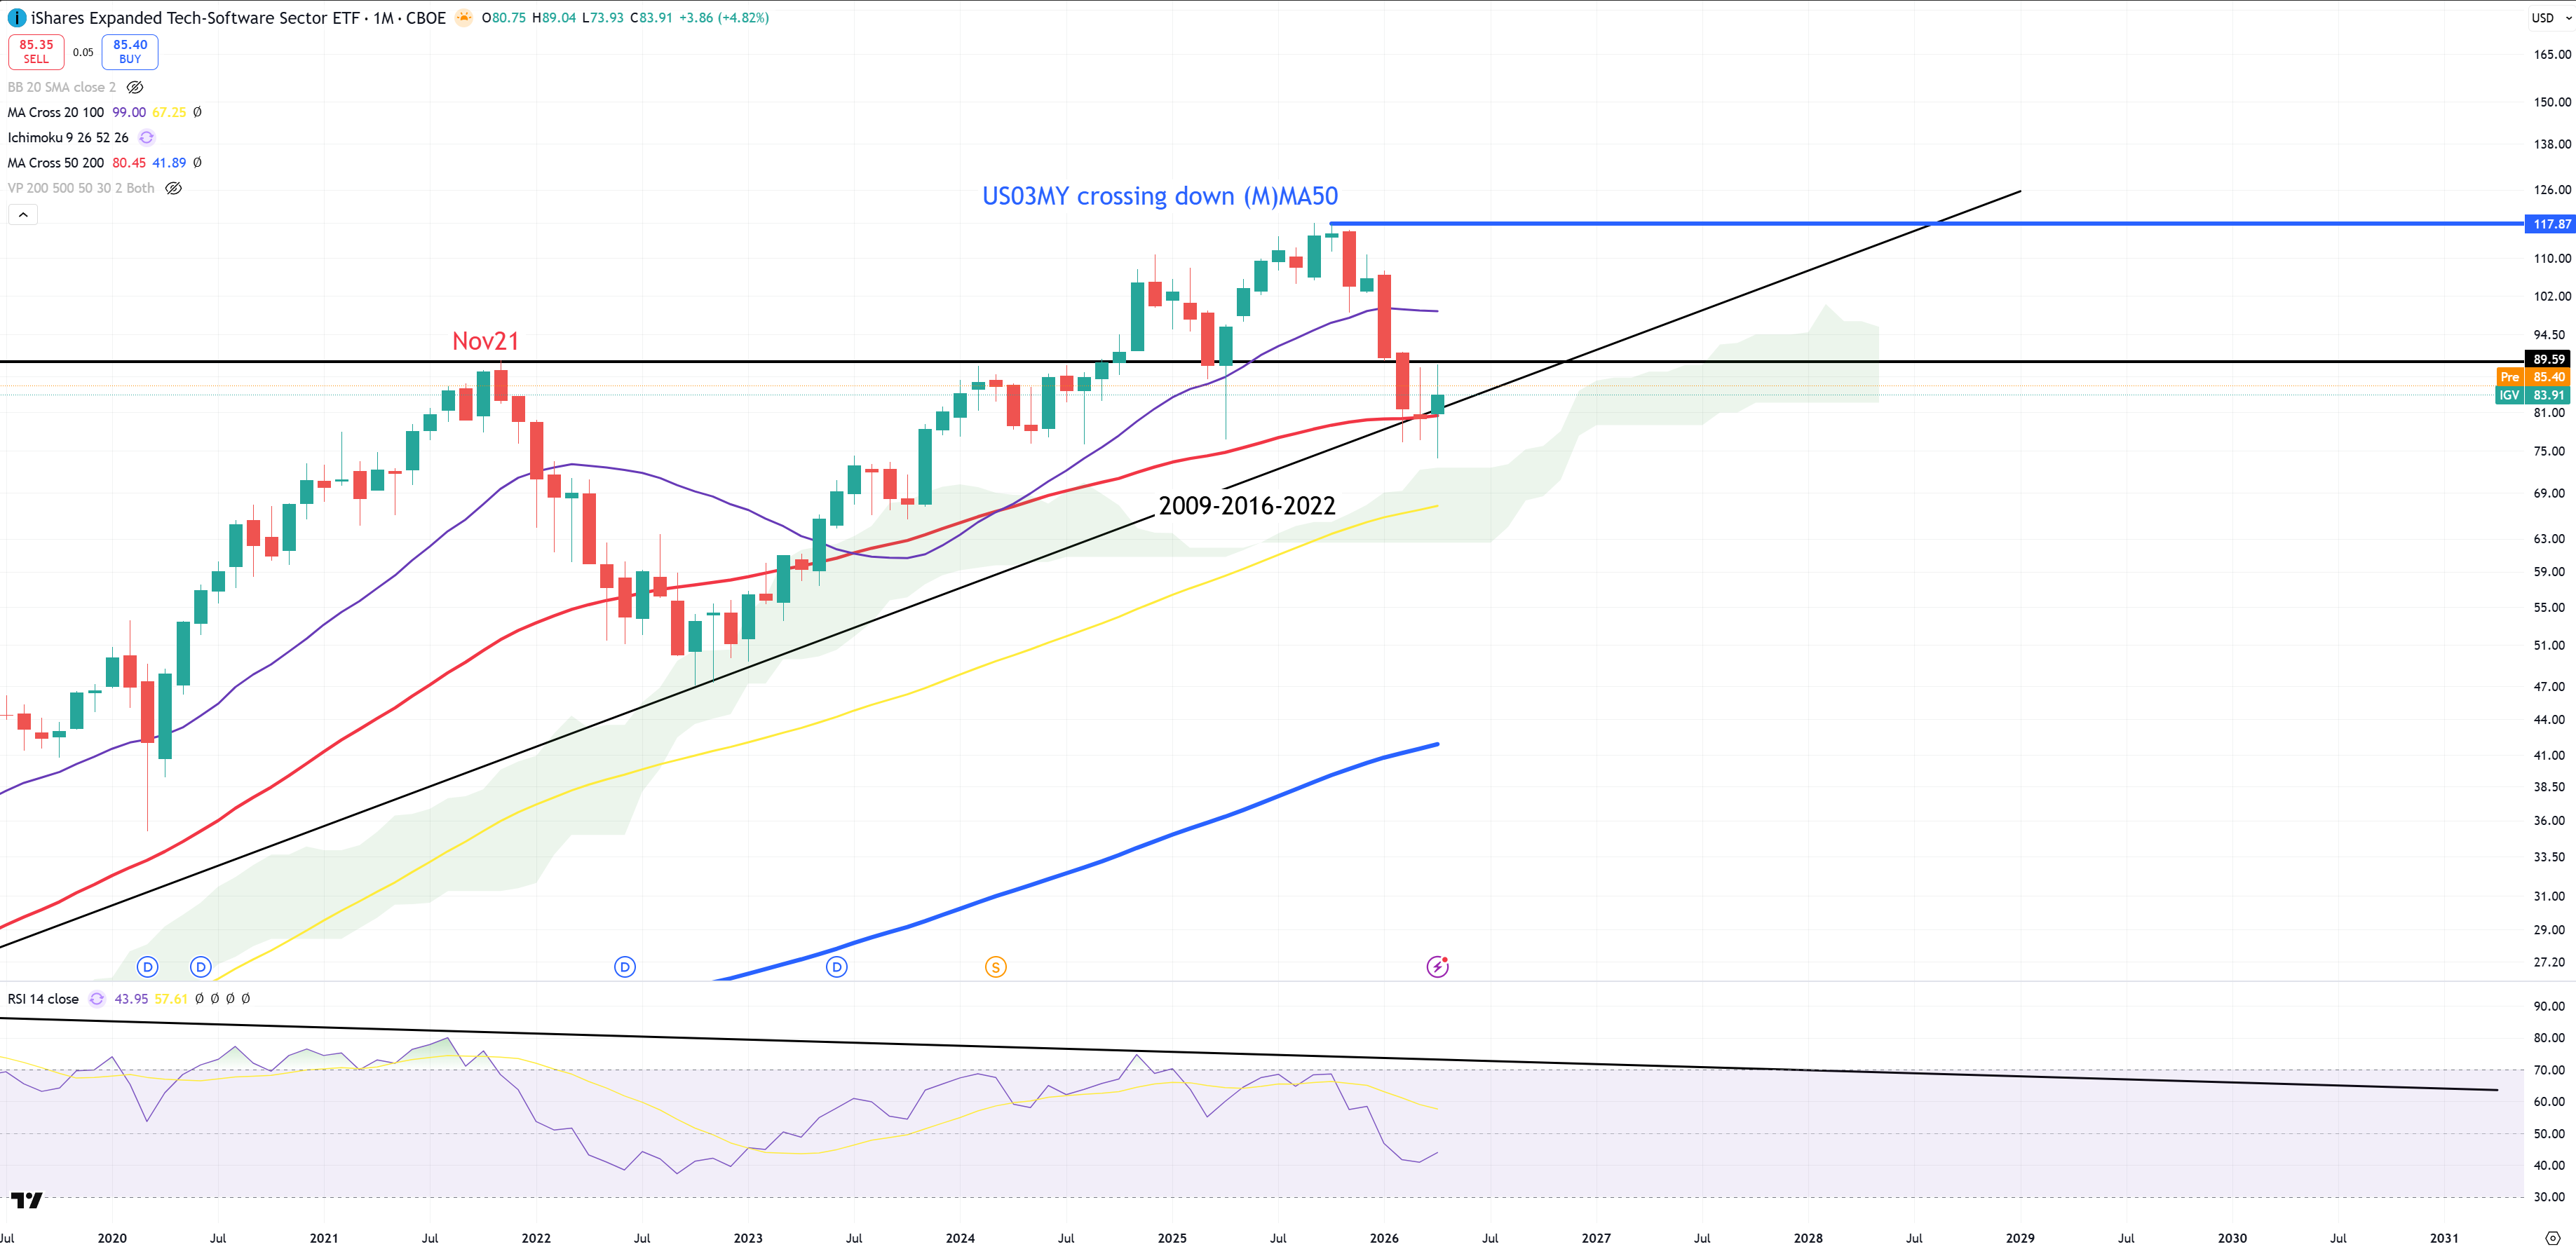
IGV – Software stocks, was one of key ETFs I had my eye if they close below (M)MA50 – not happened. That was I assume #1 ETF I was looking for a possible break of (M)MA50 :
MSFT – was also on this list
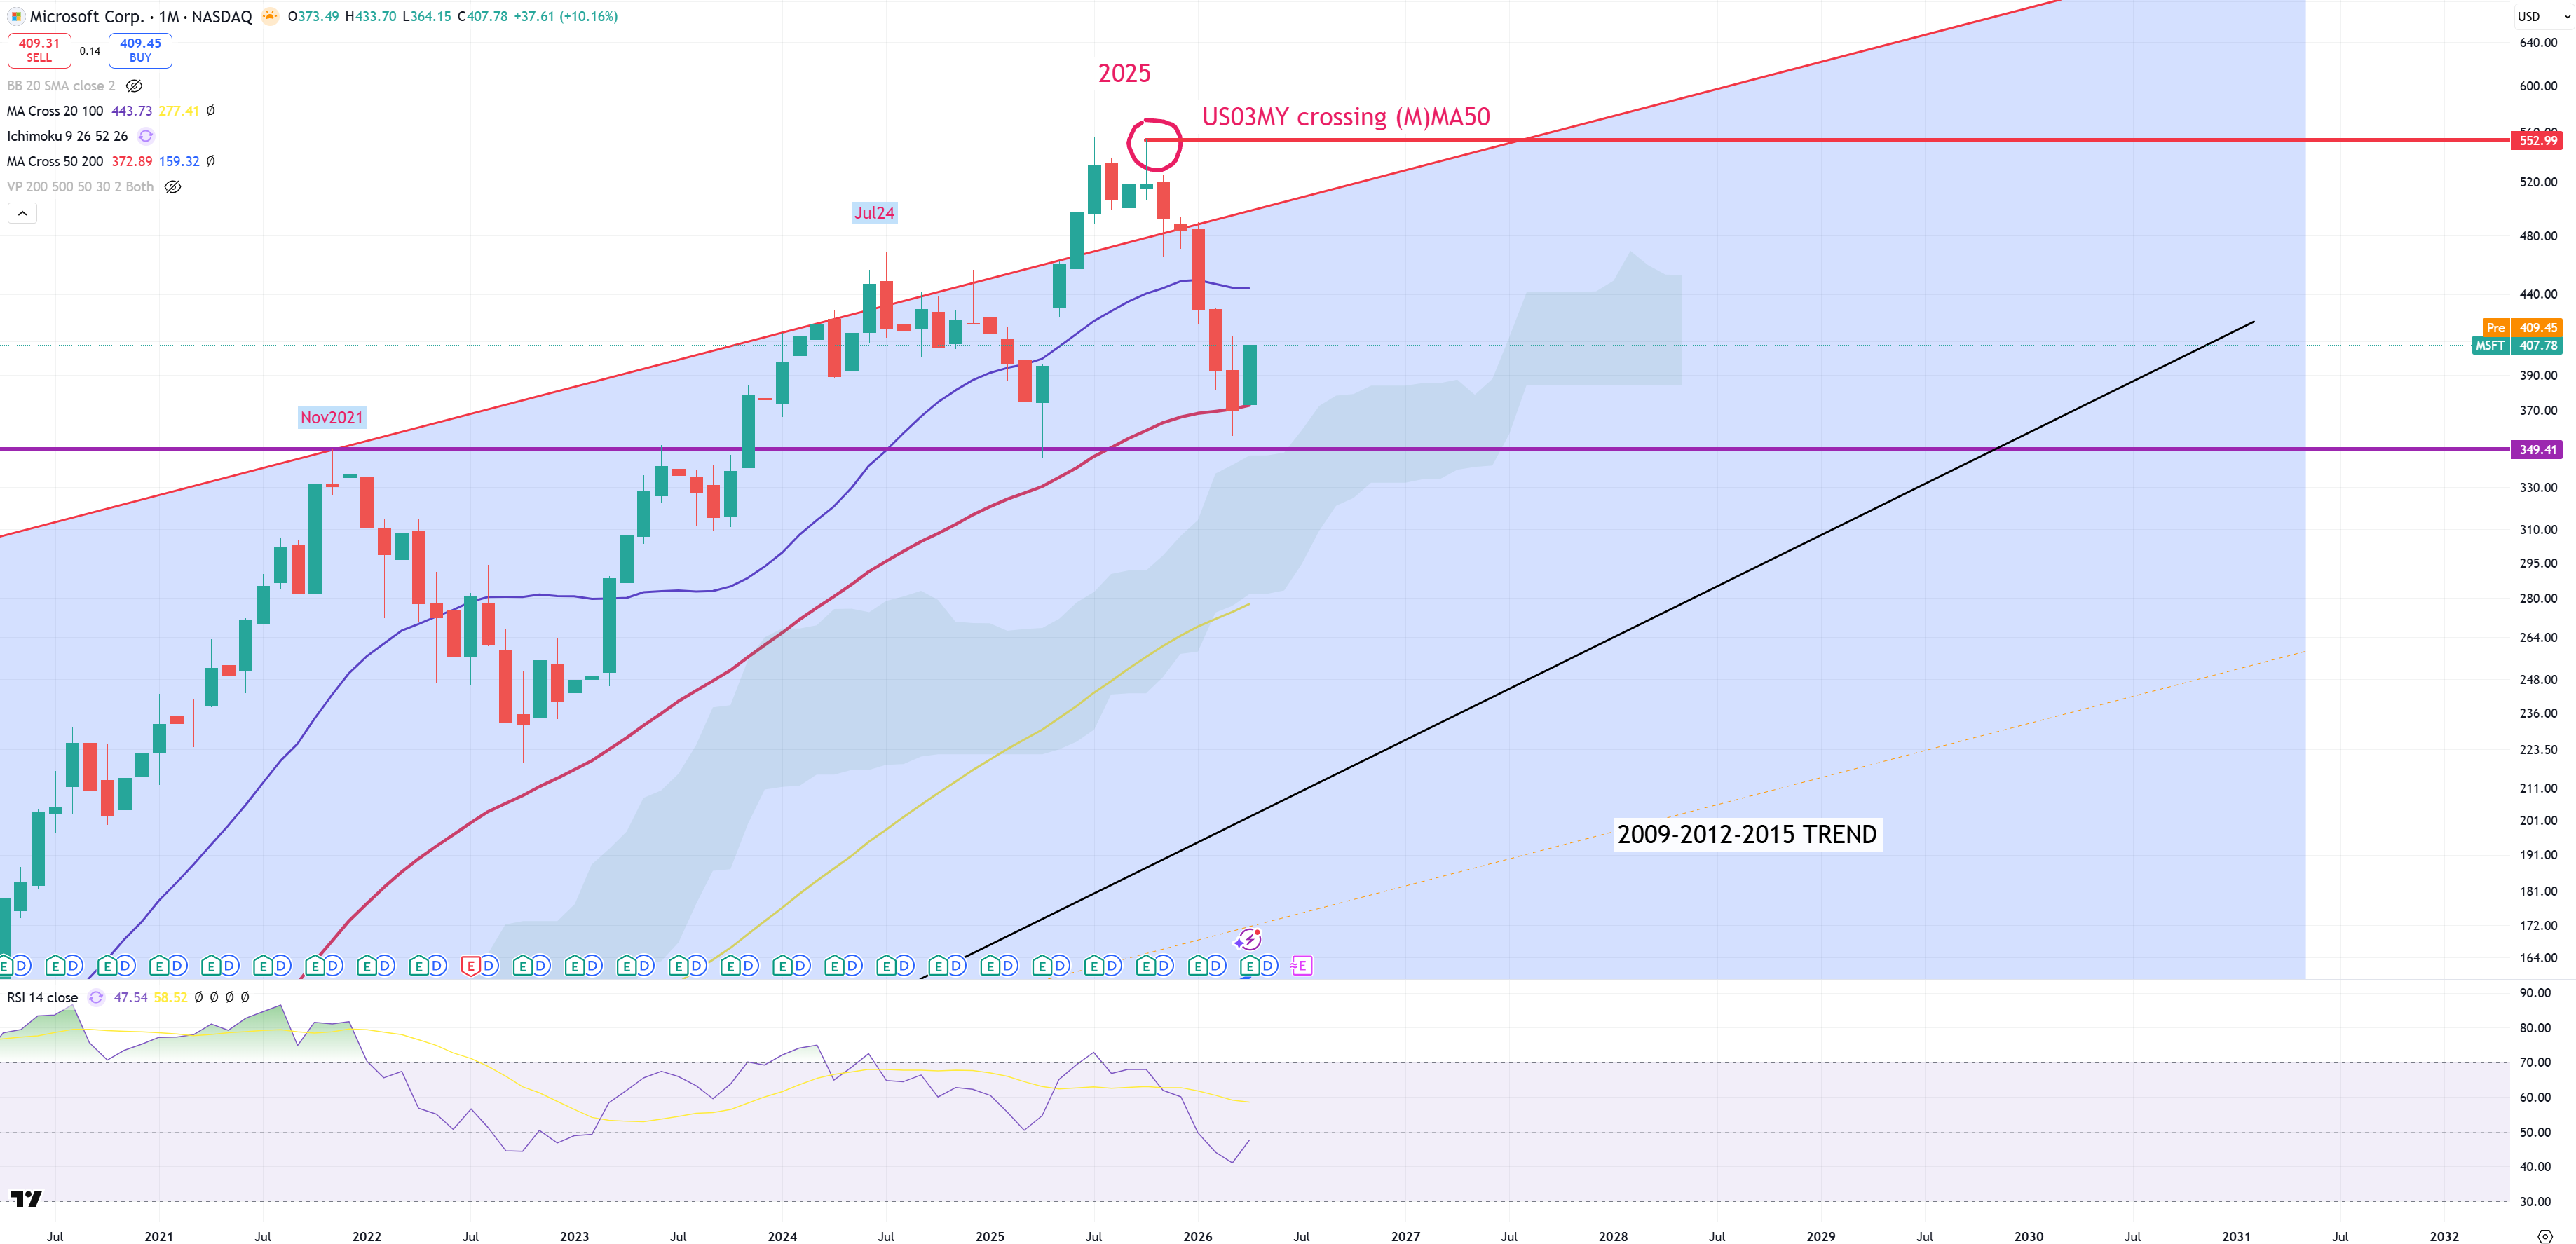
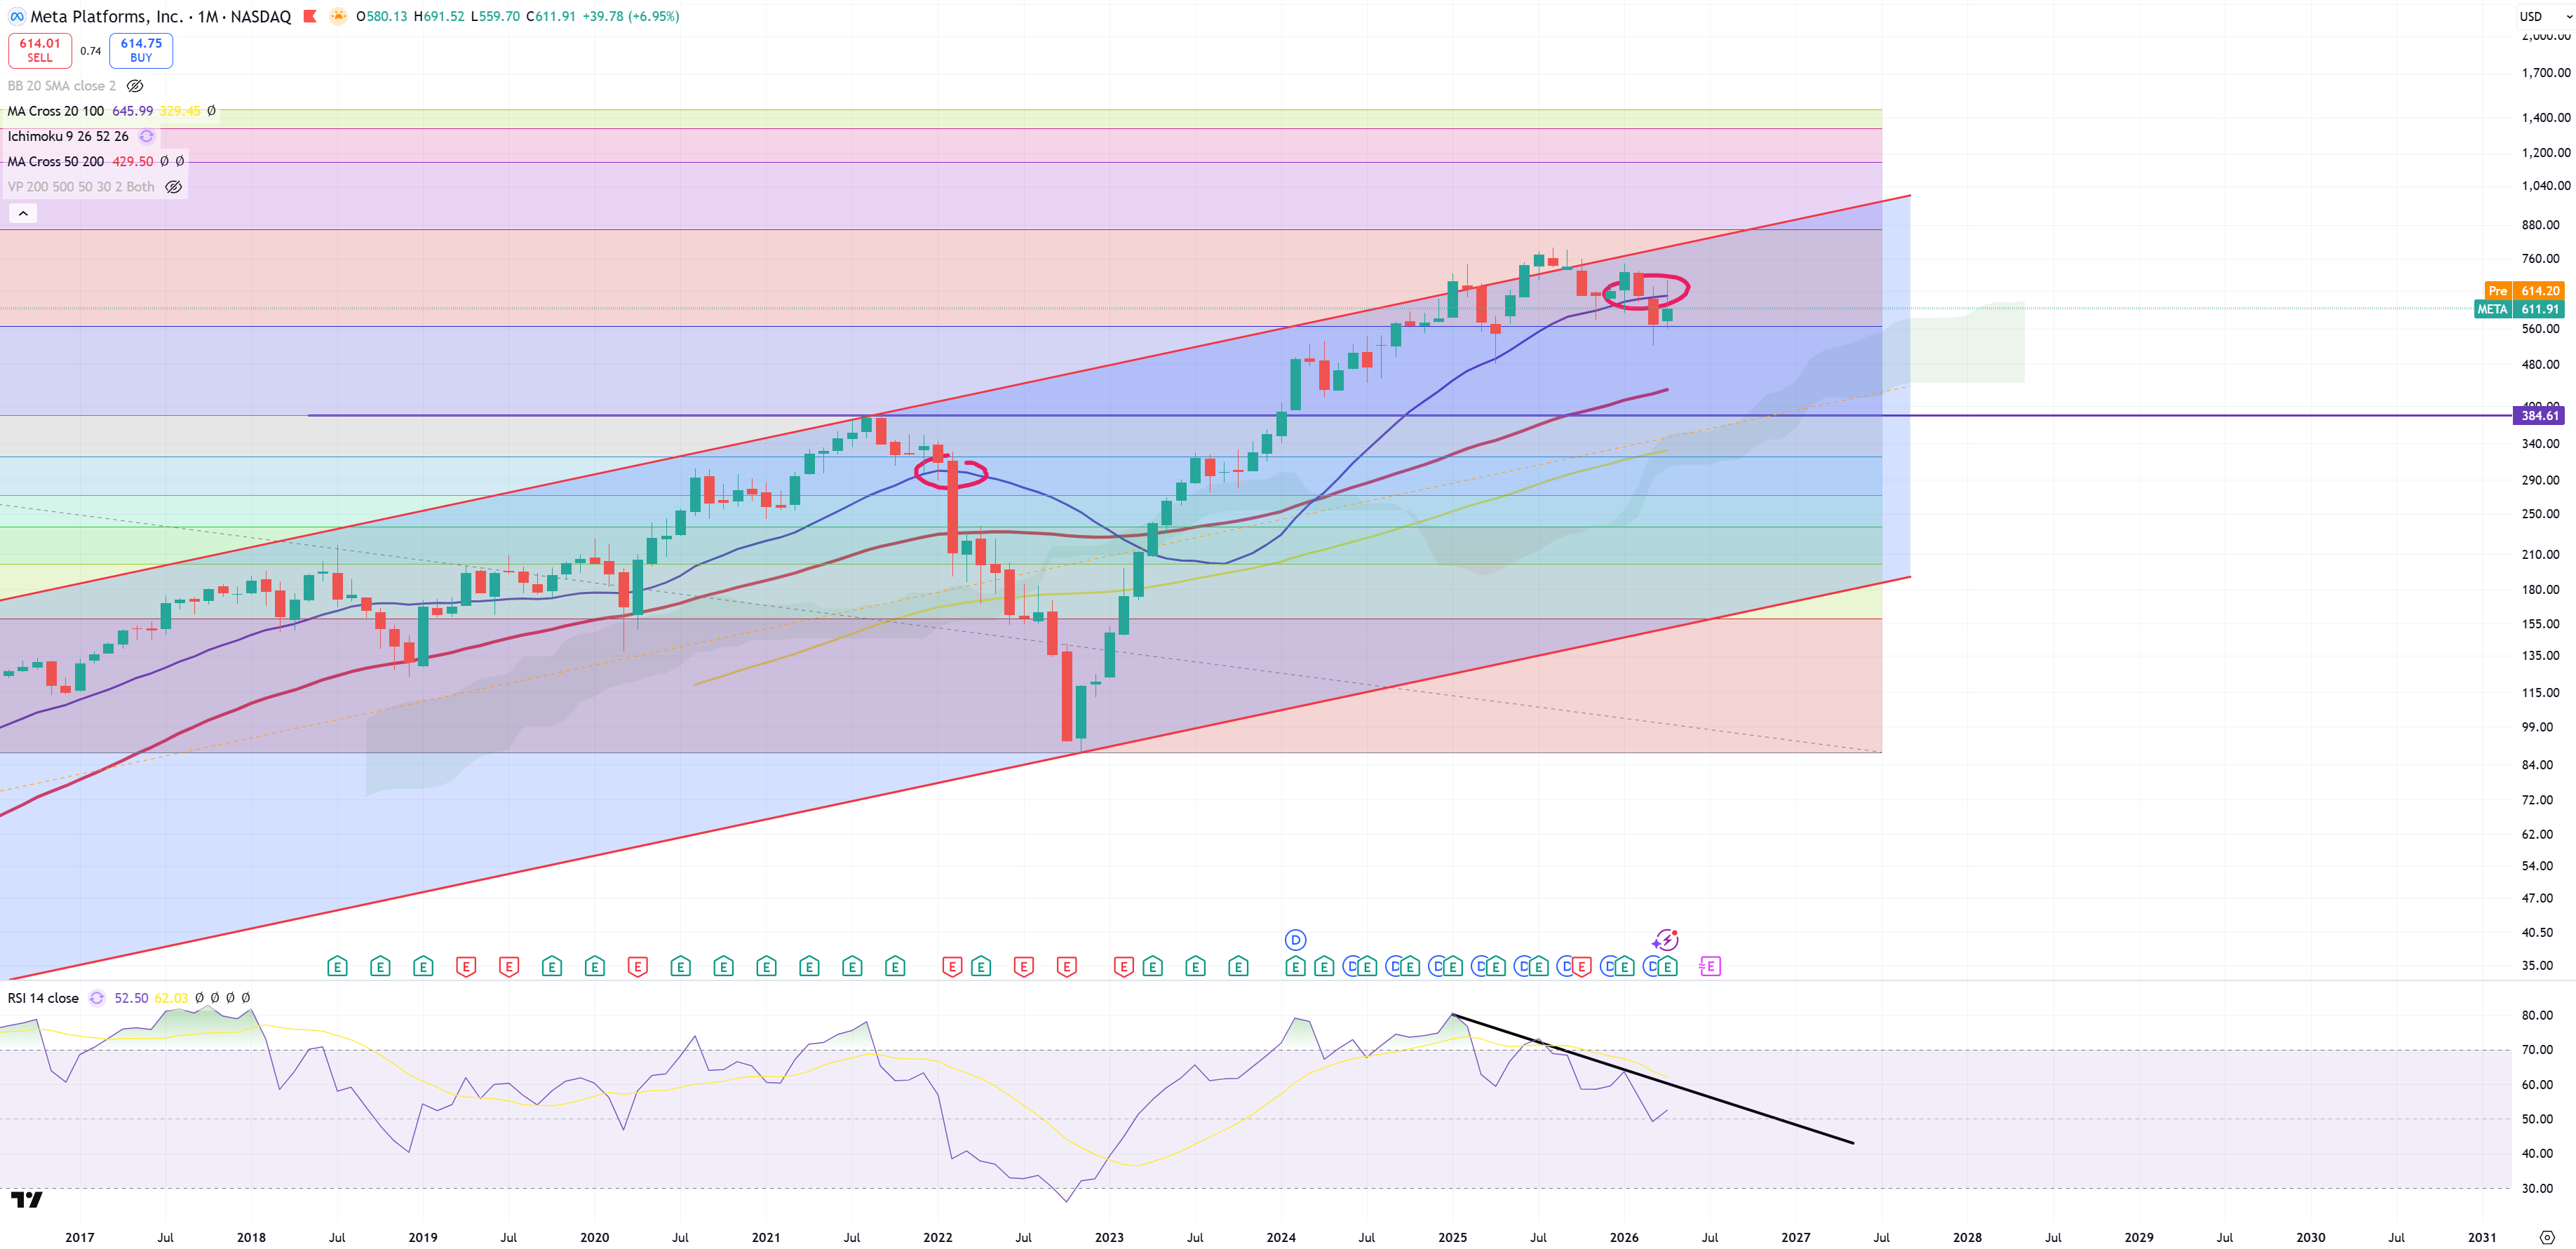
META – Meta rejected (M)MA20 this month, but MSFT is in way worse position as it has already lost (M)MA20, but (M)MA20 isn’t really a VERY meaningful indicator, but (M)MA50 is.
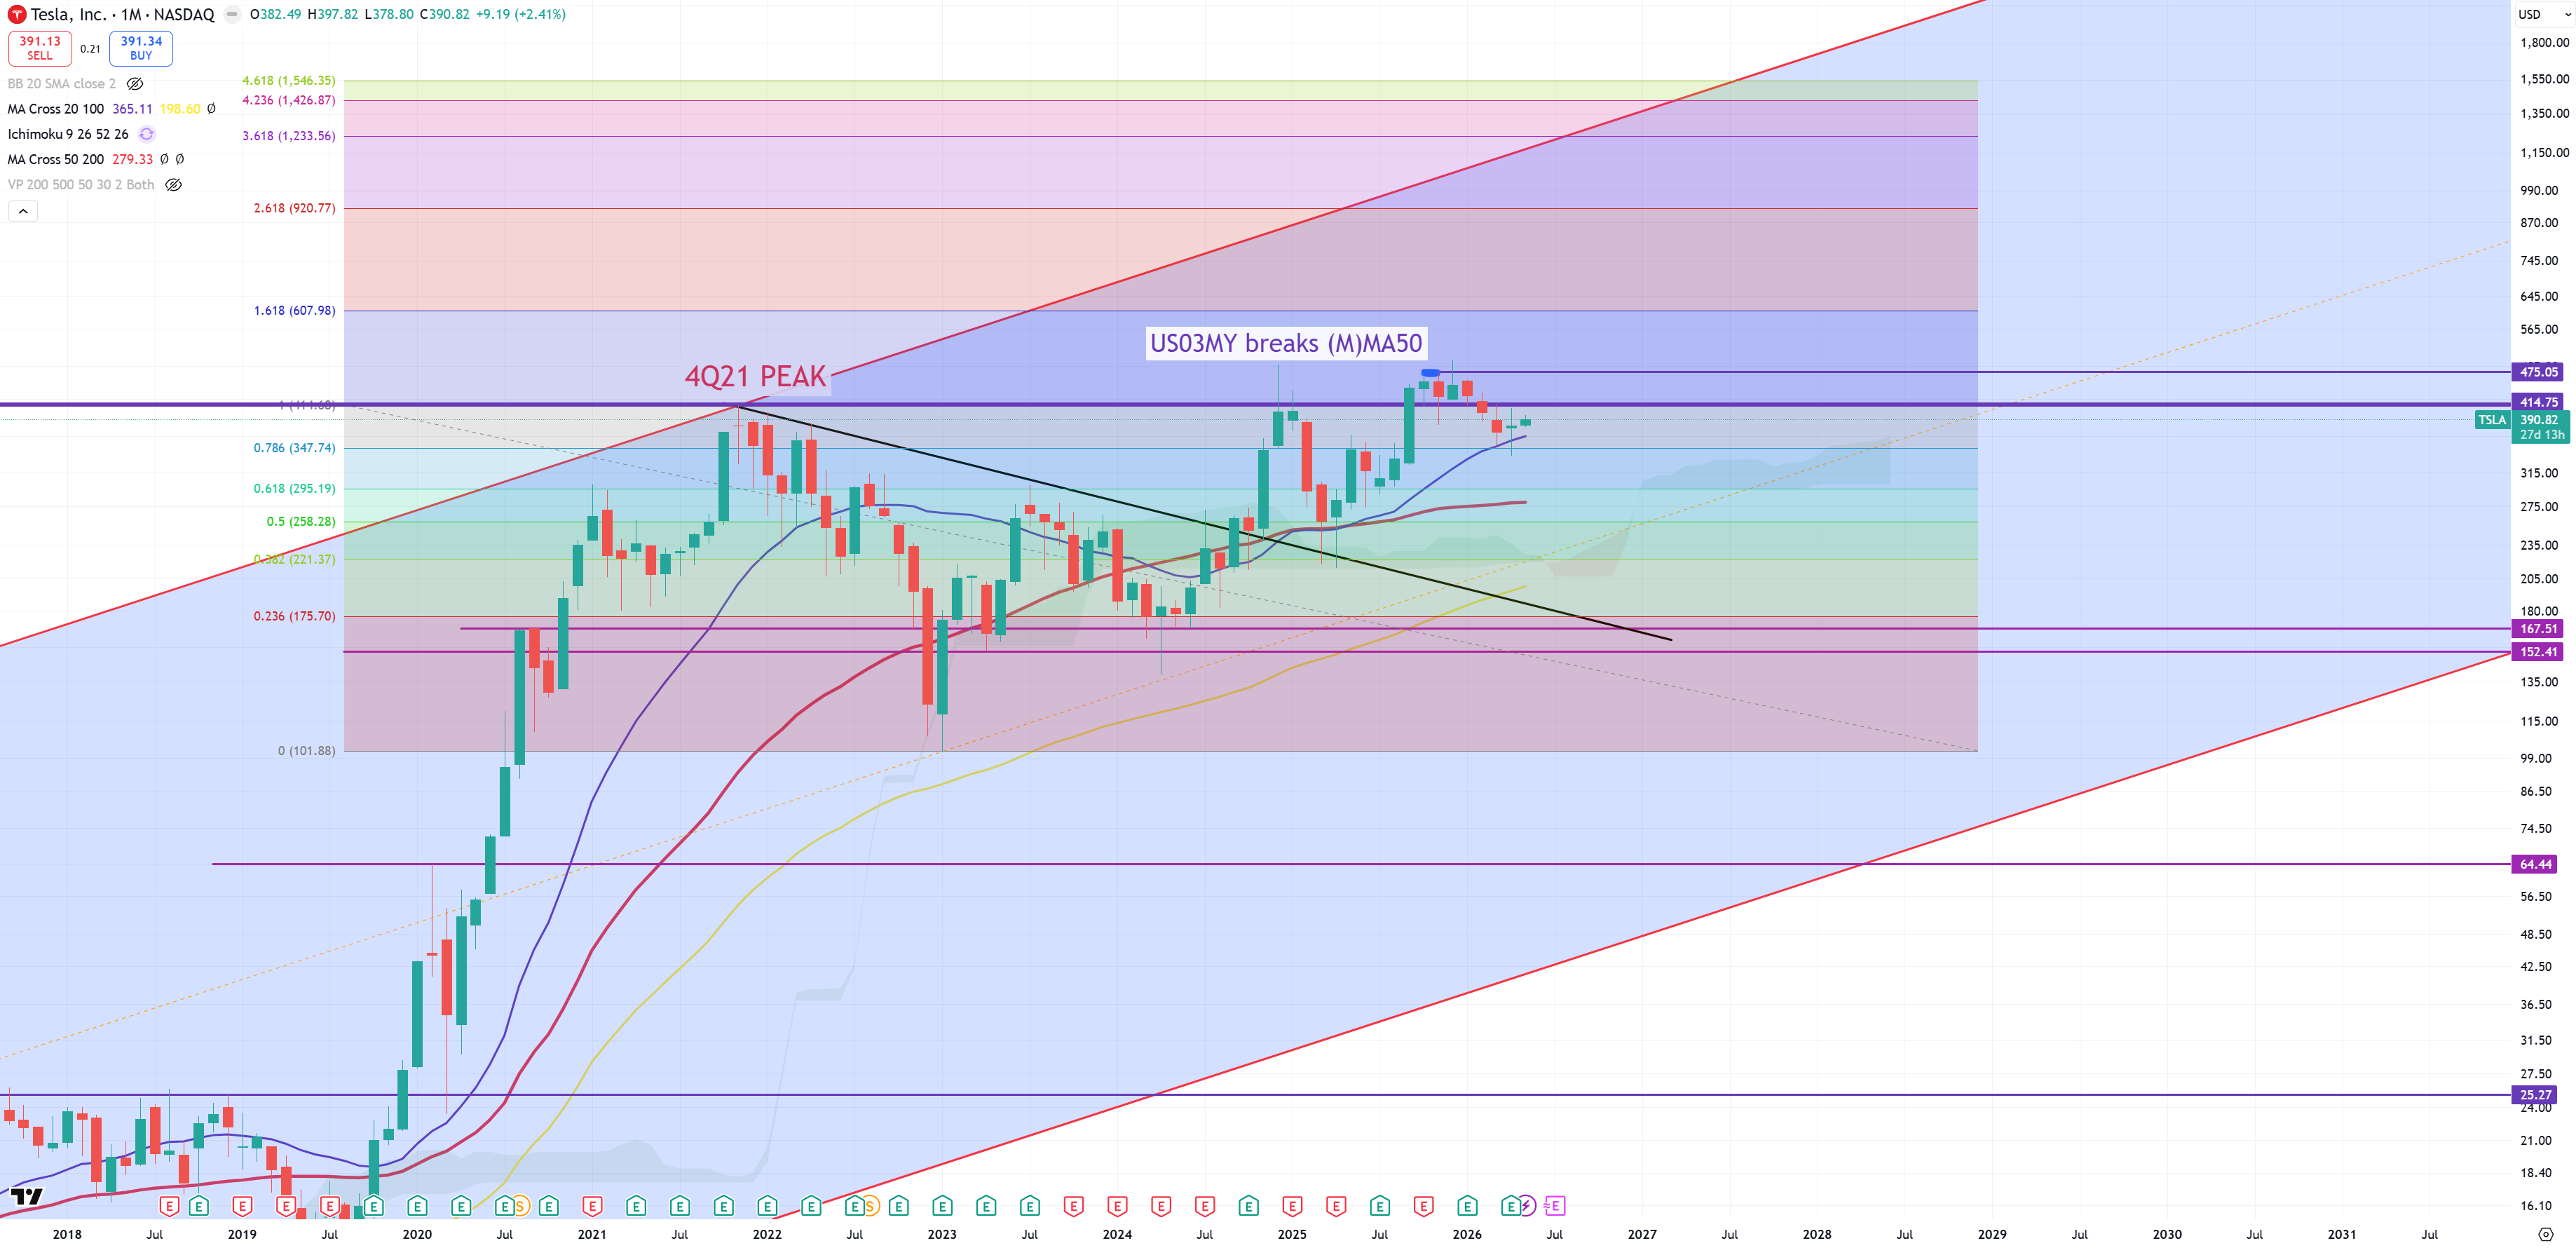
TSLA – It’s too long below 2021 peak, (M)MA20 was saved.
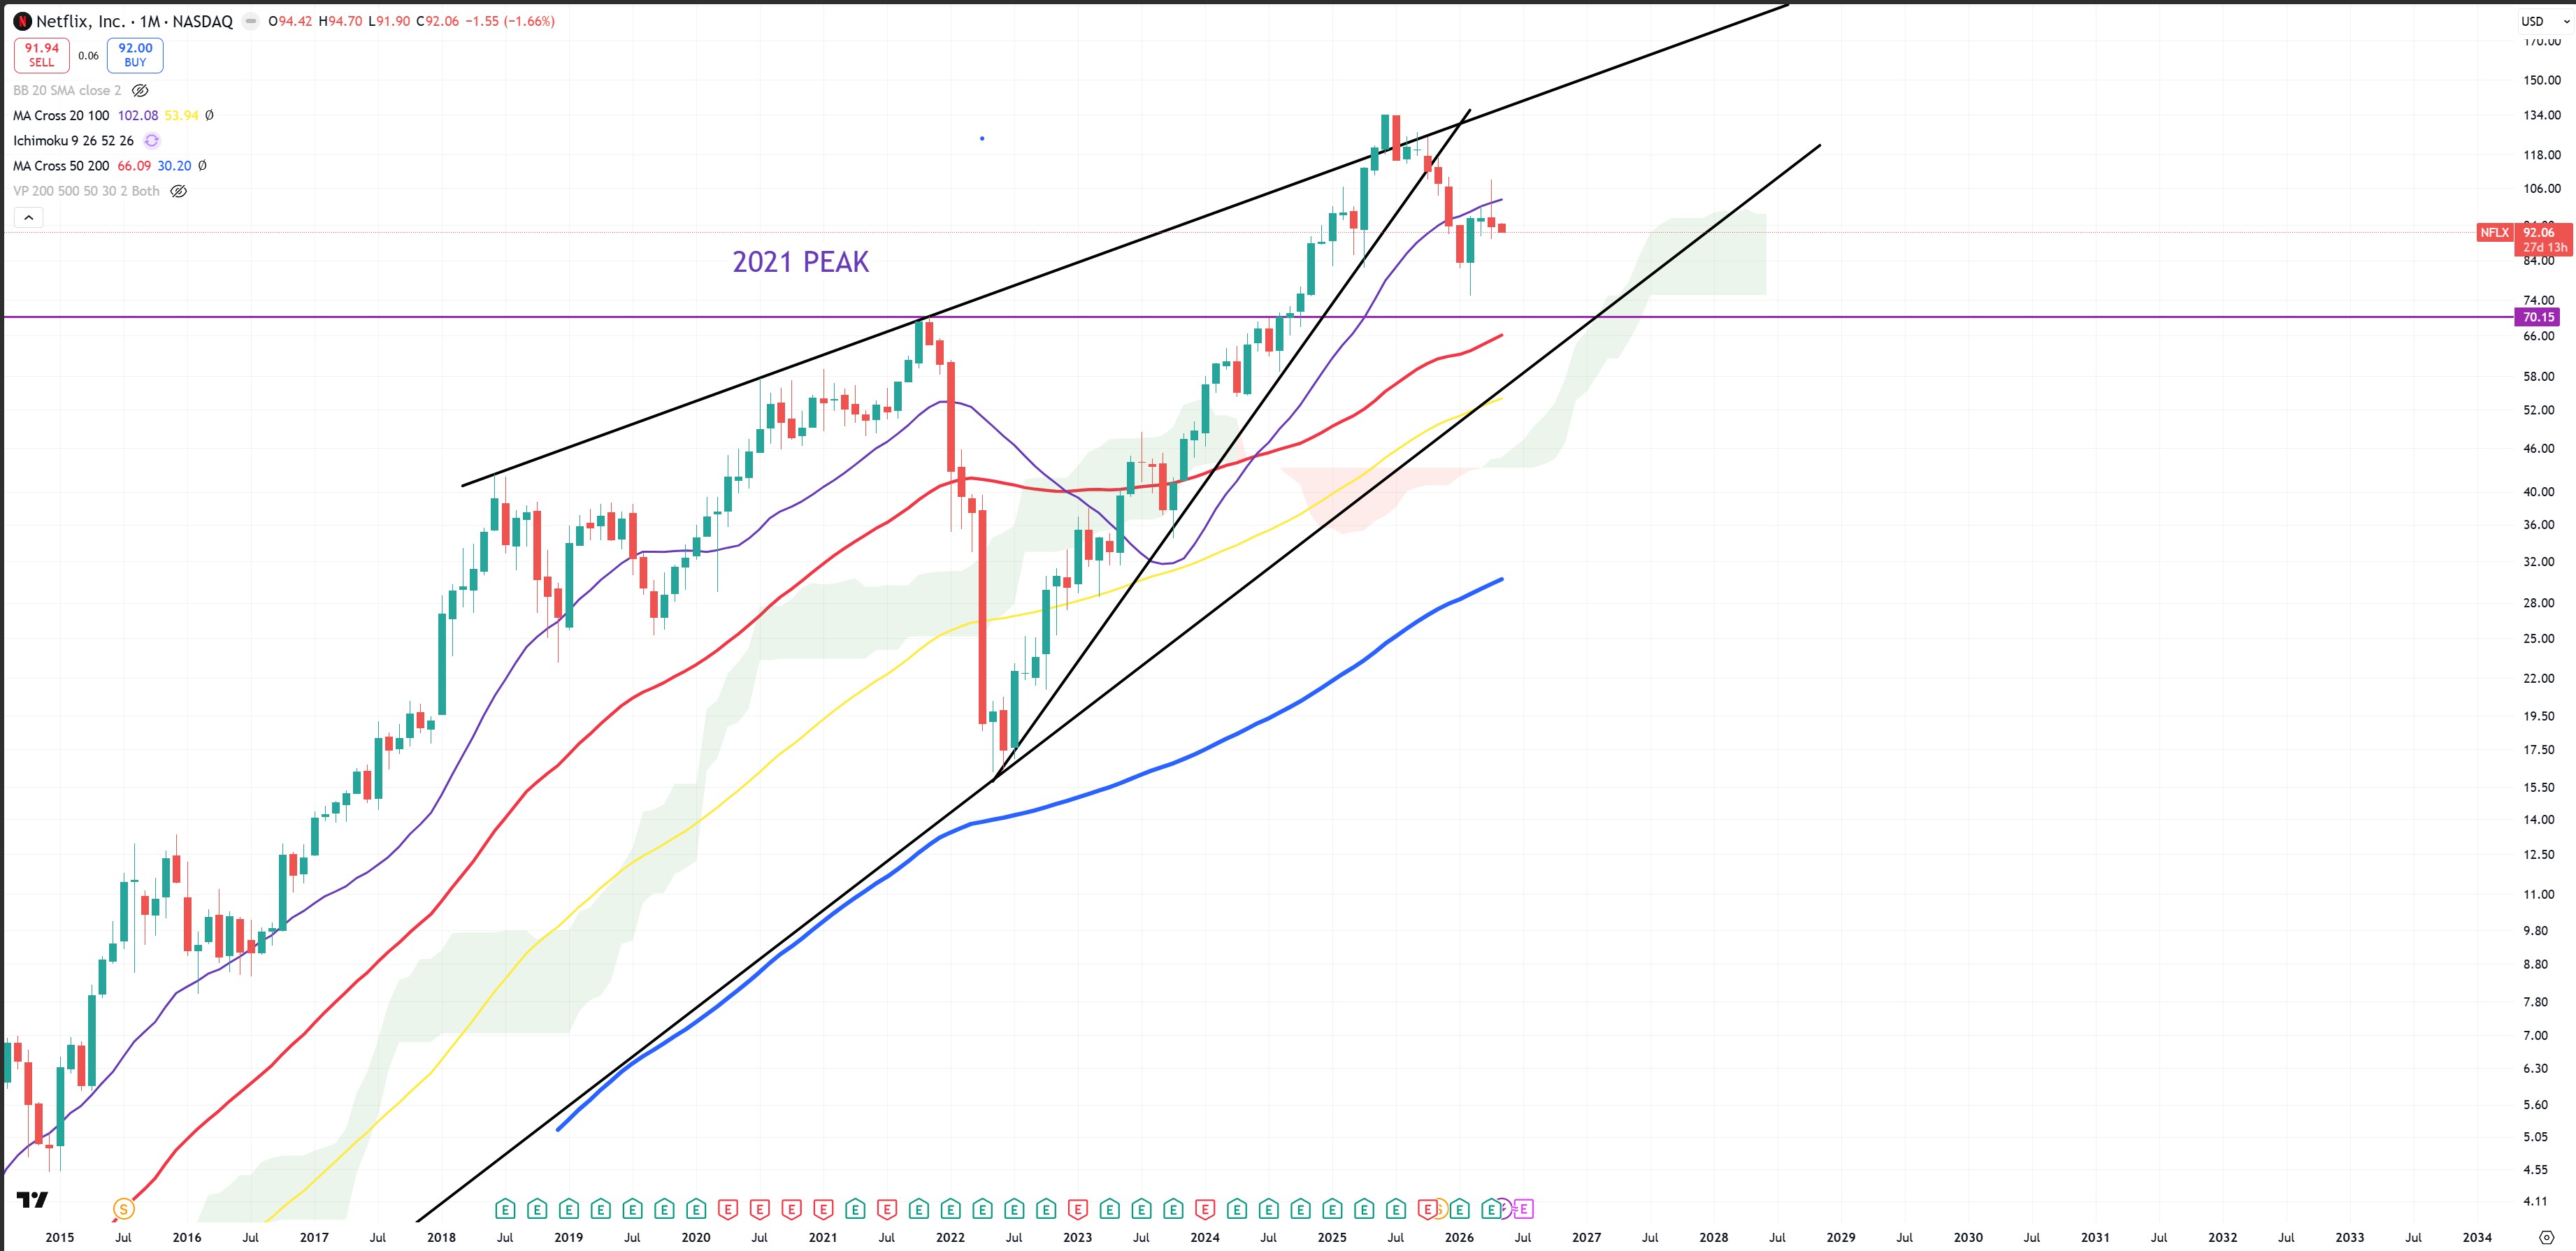
NFLX – it looks like for a preparing to a big move down
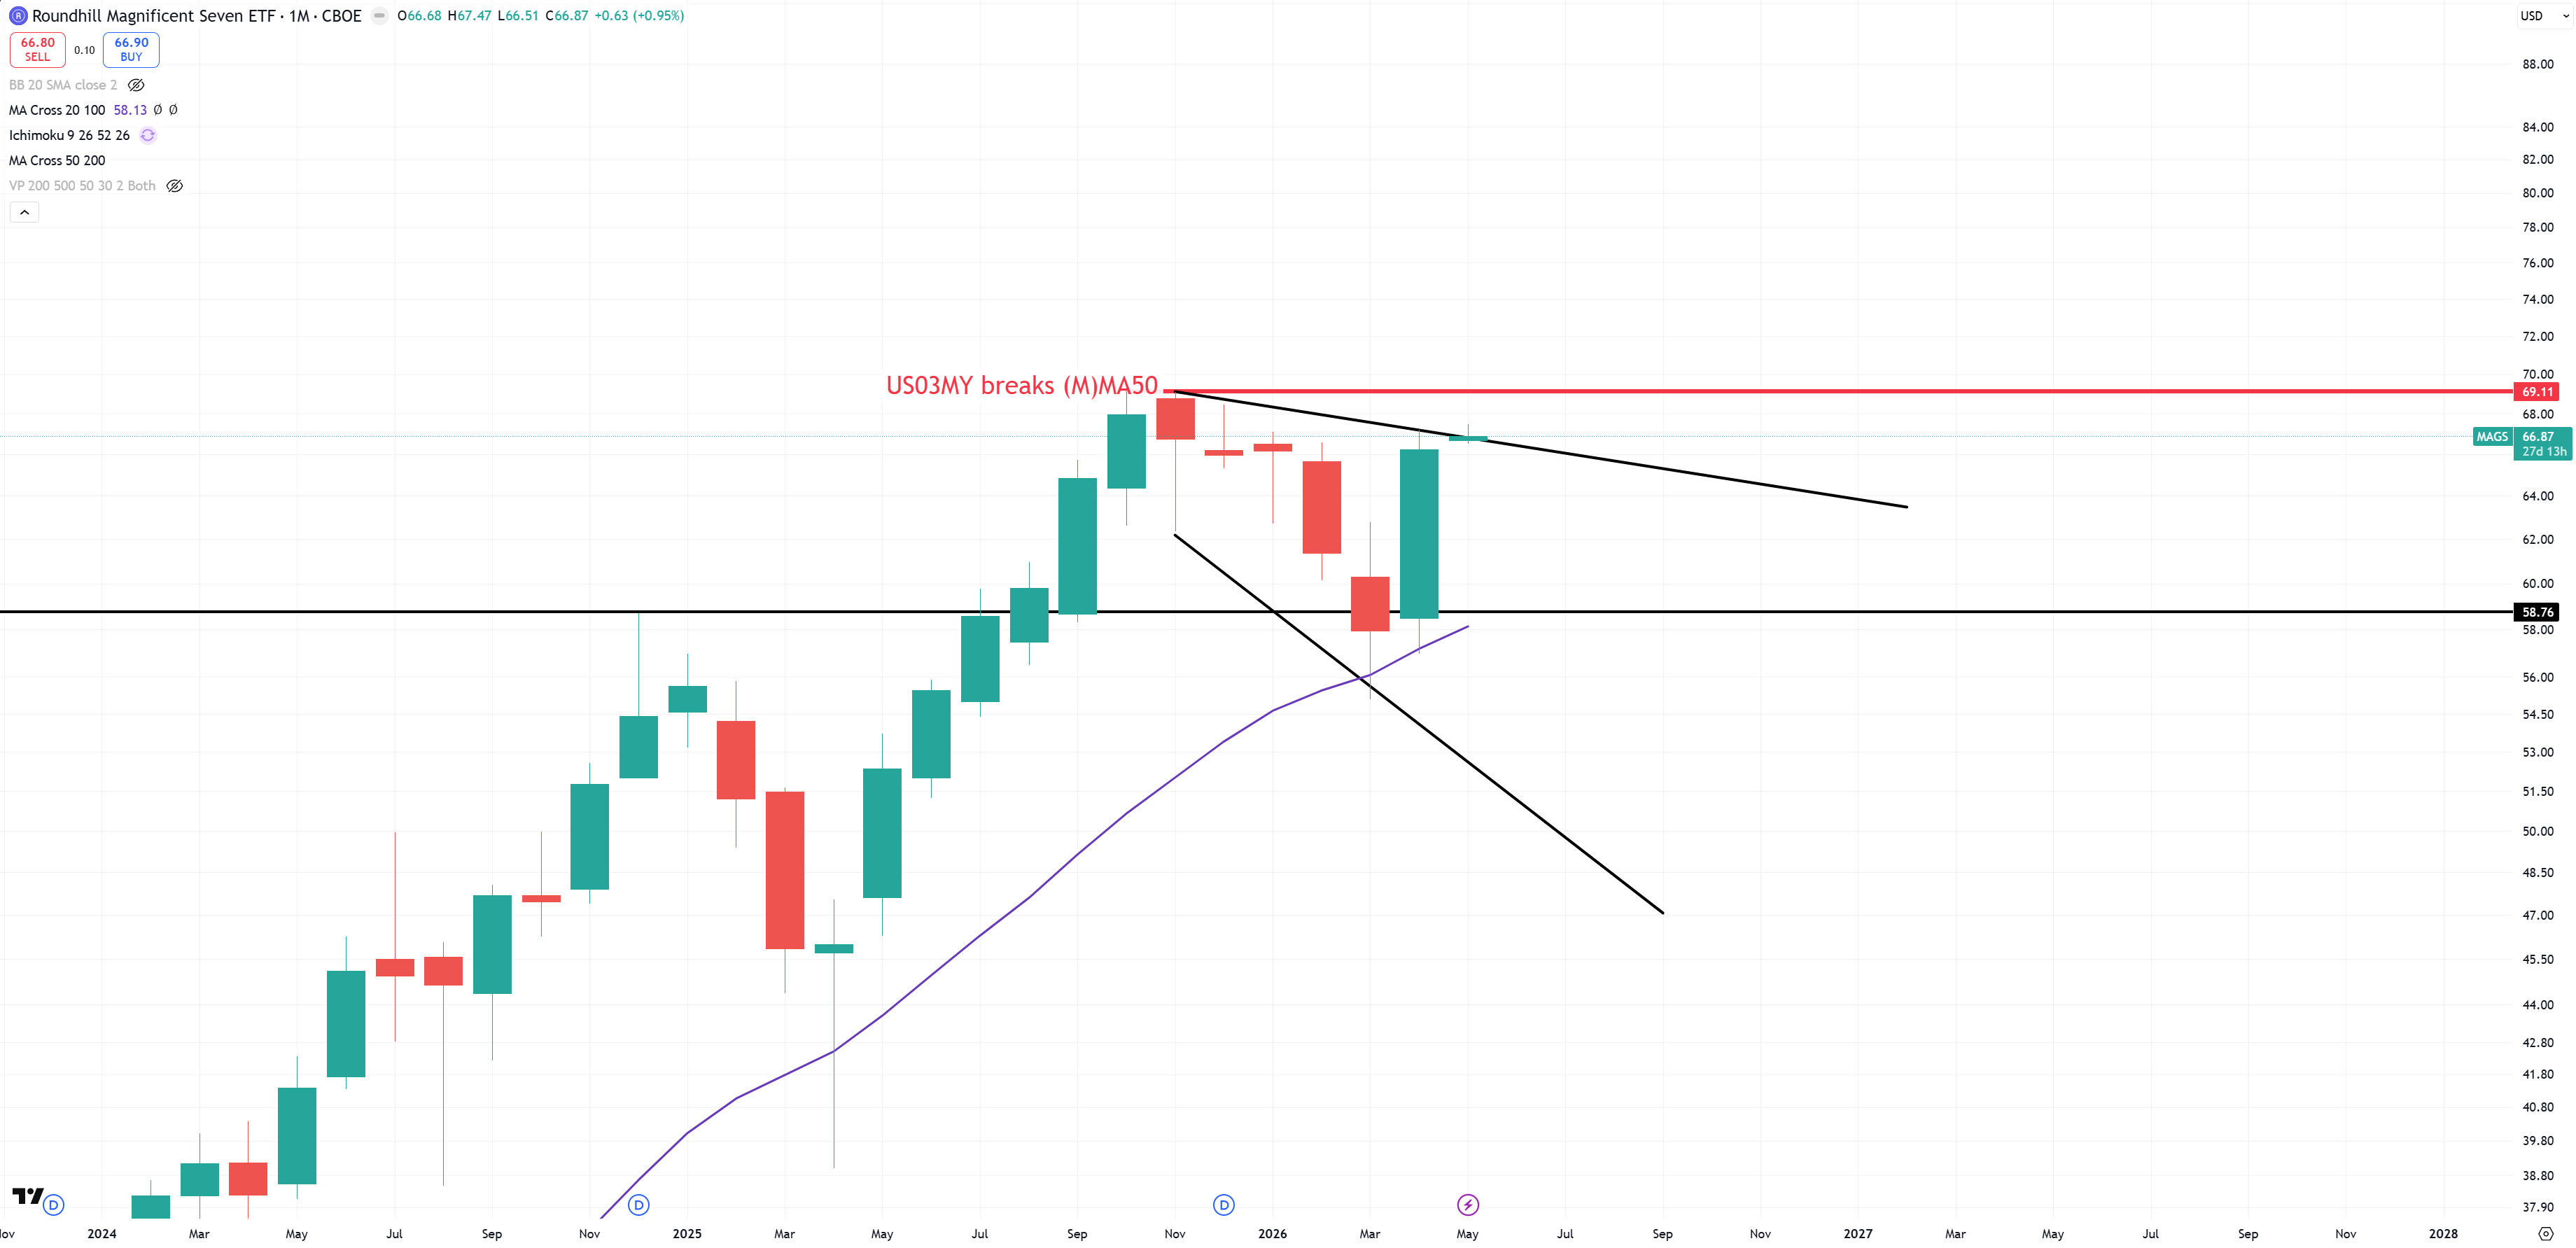
MAGS – Mag7 ETF
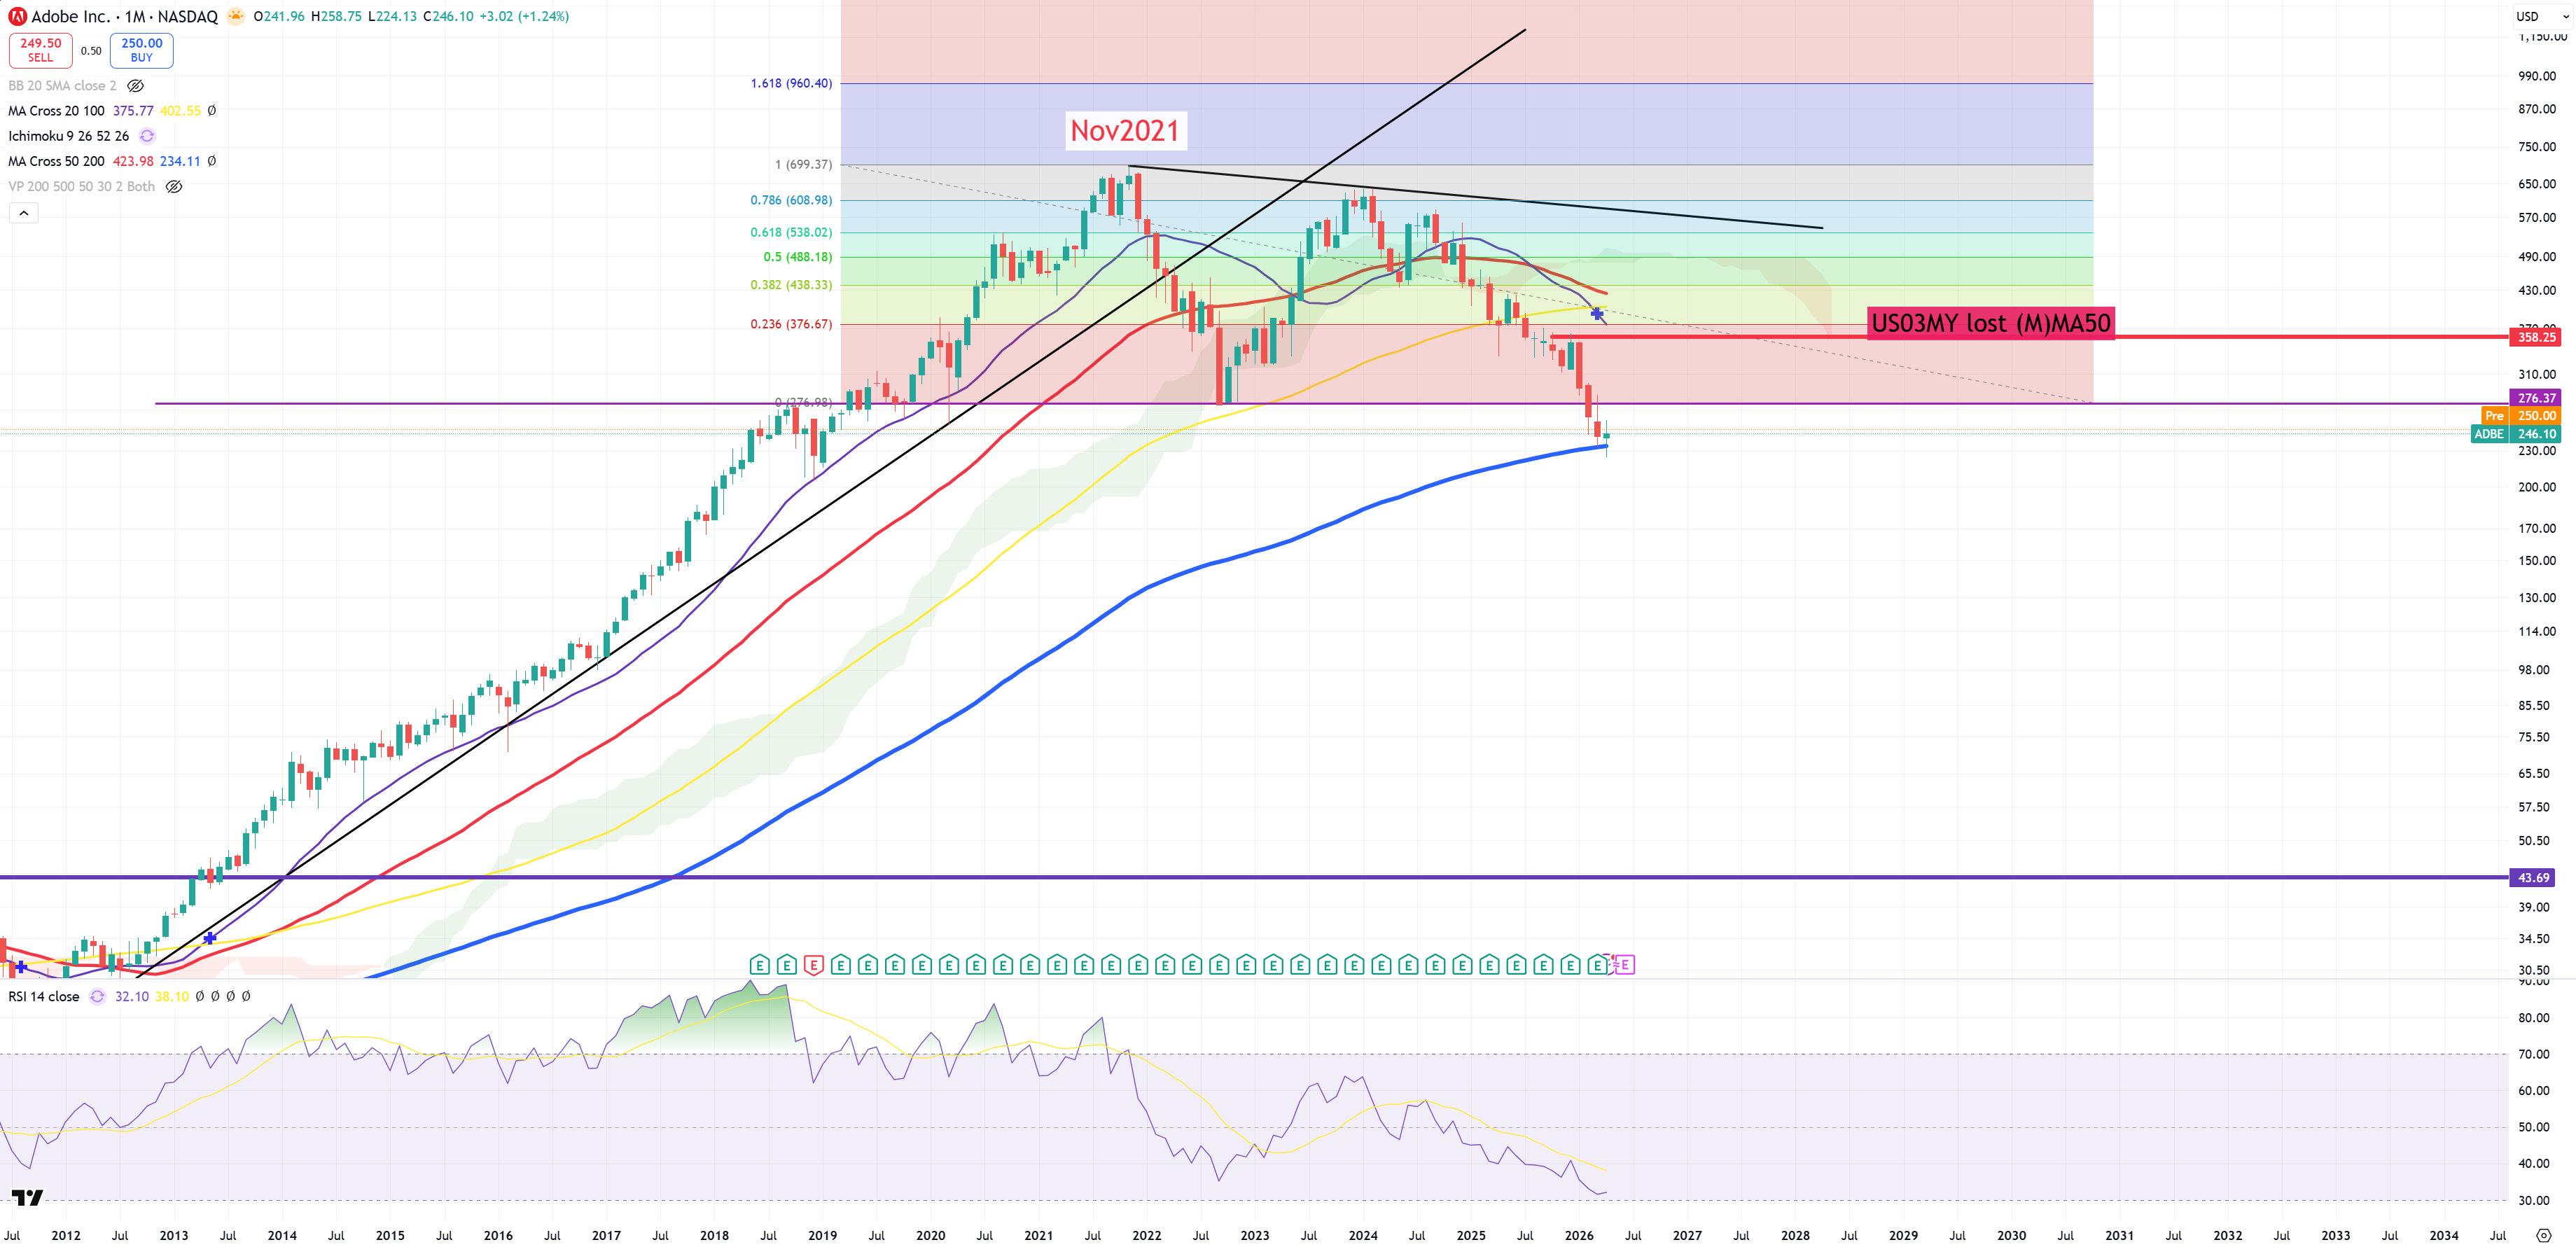
ADBE – first hit on (M)MA200
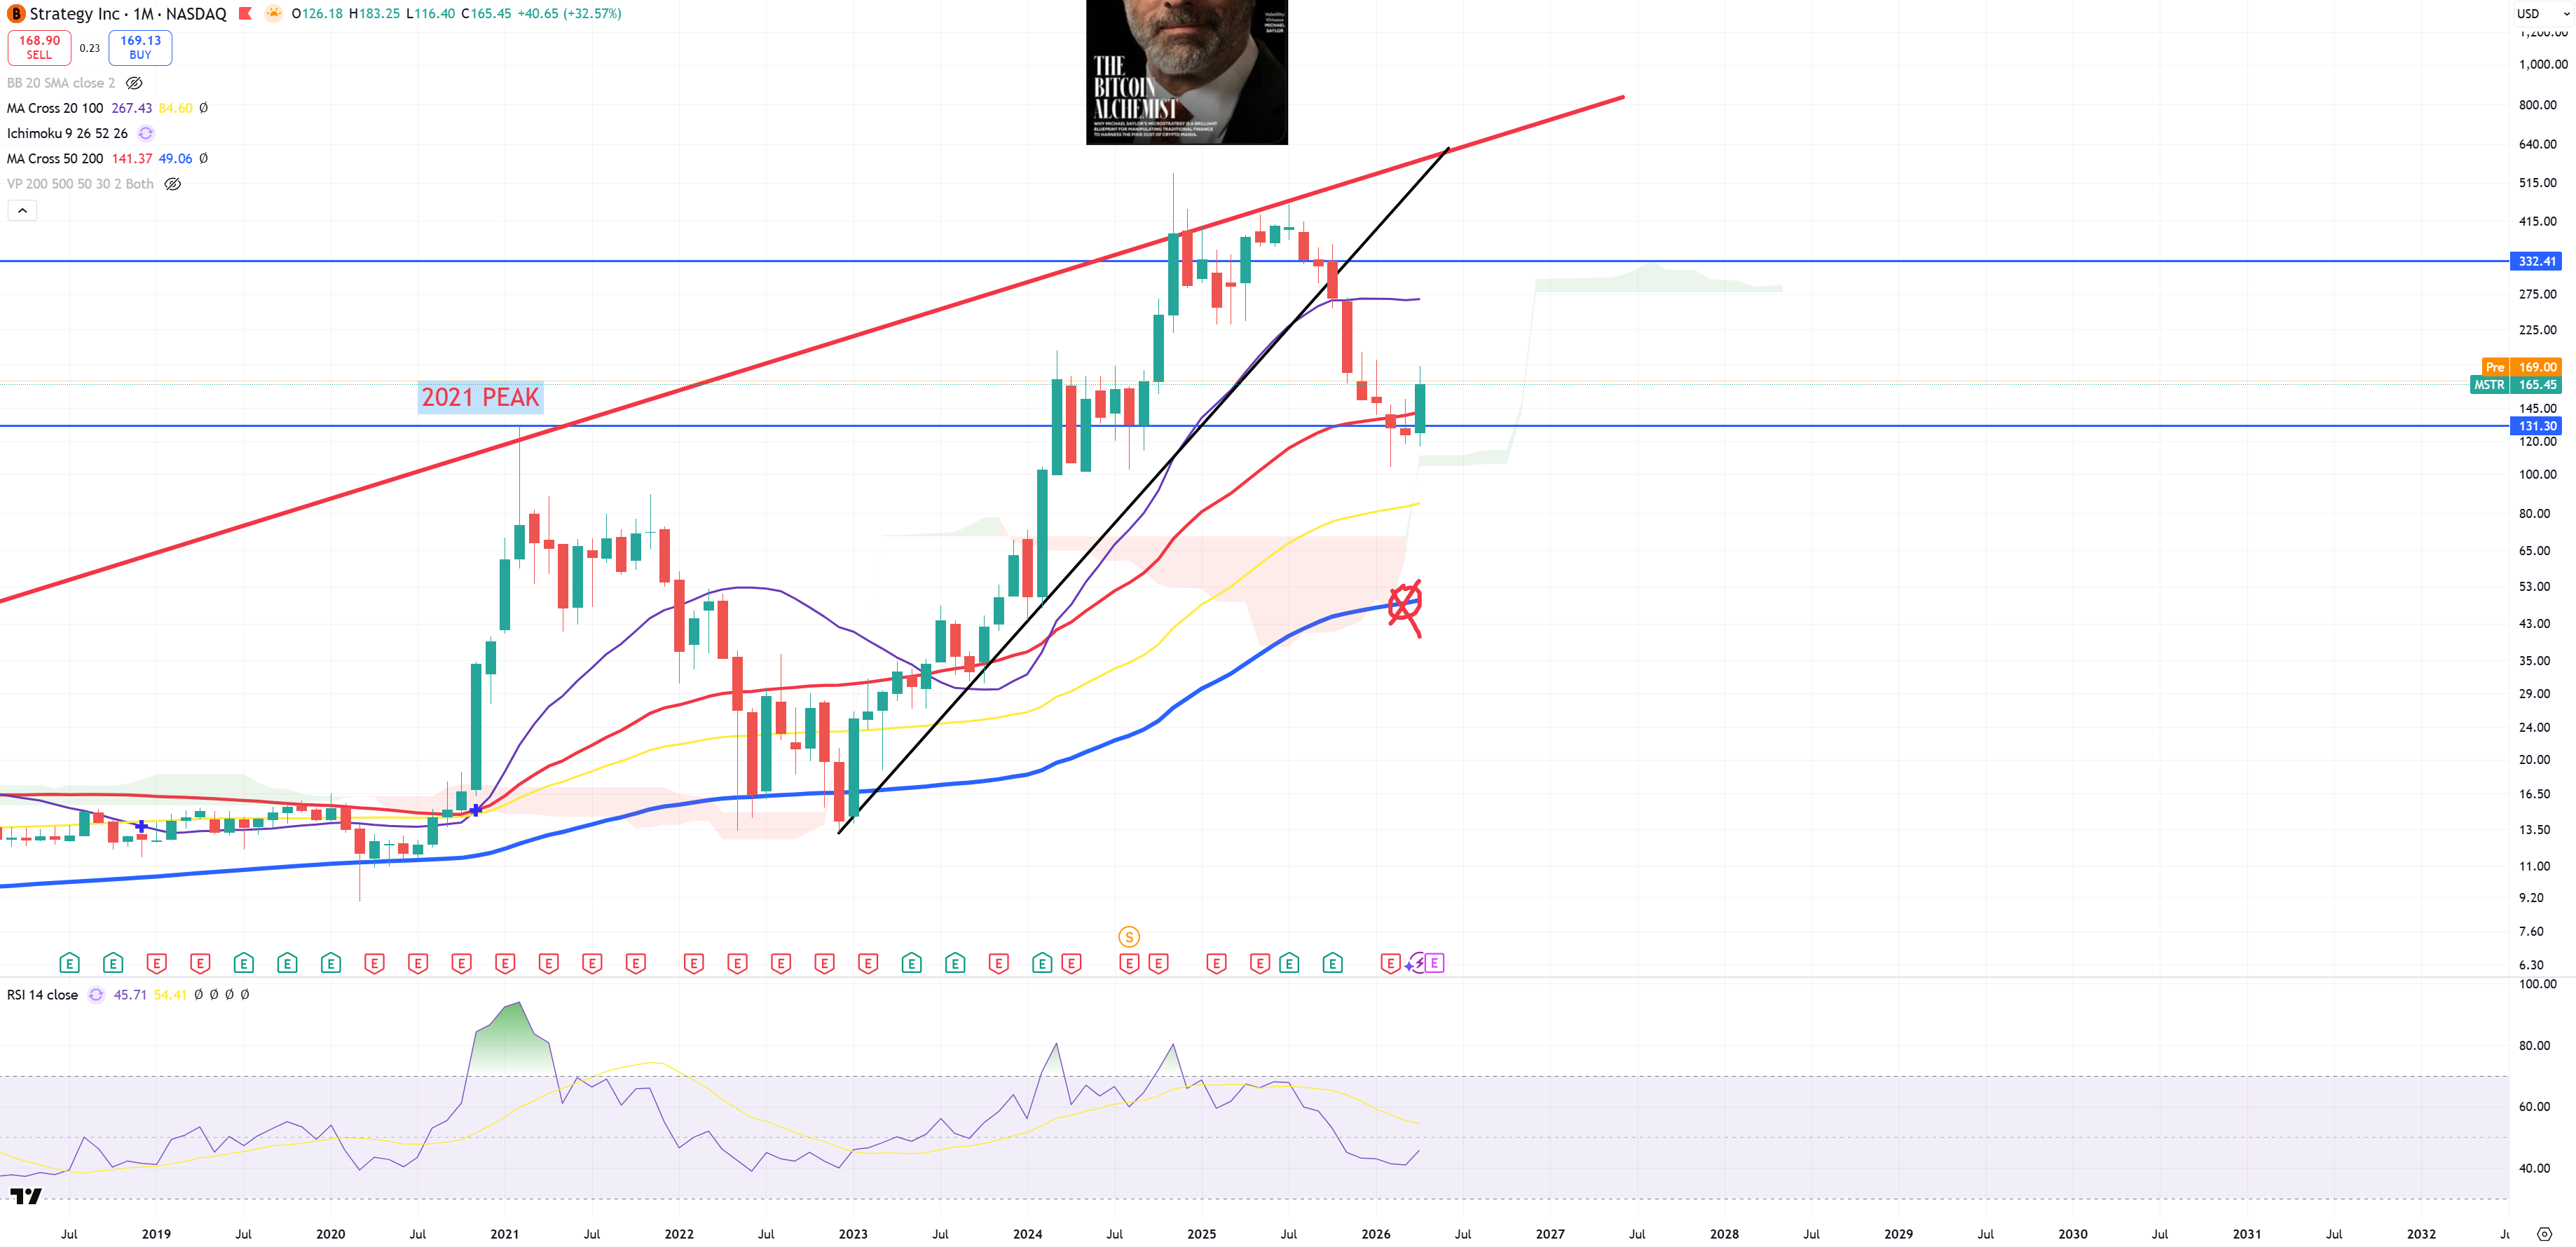
MSTR – and (M)MA50 failed to close below even 2021 peak was saved.
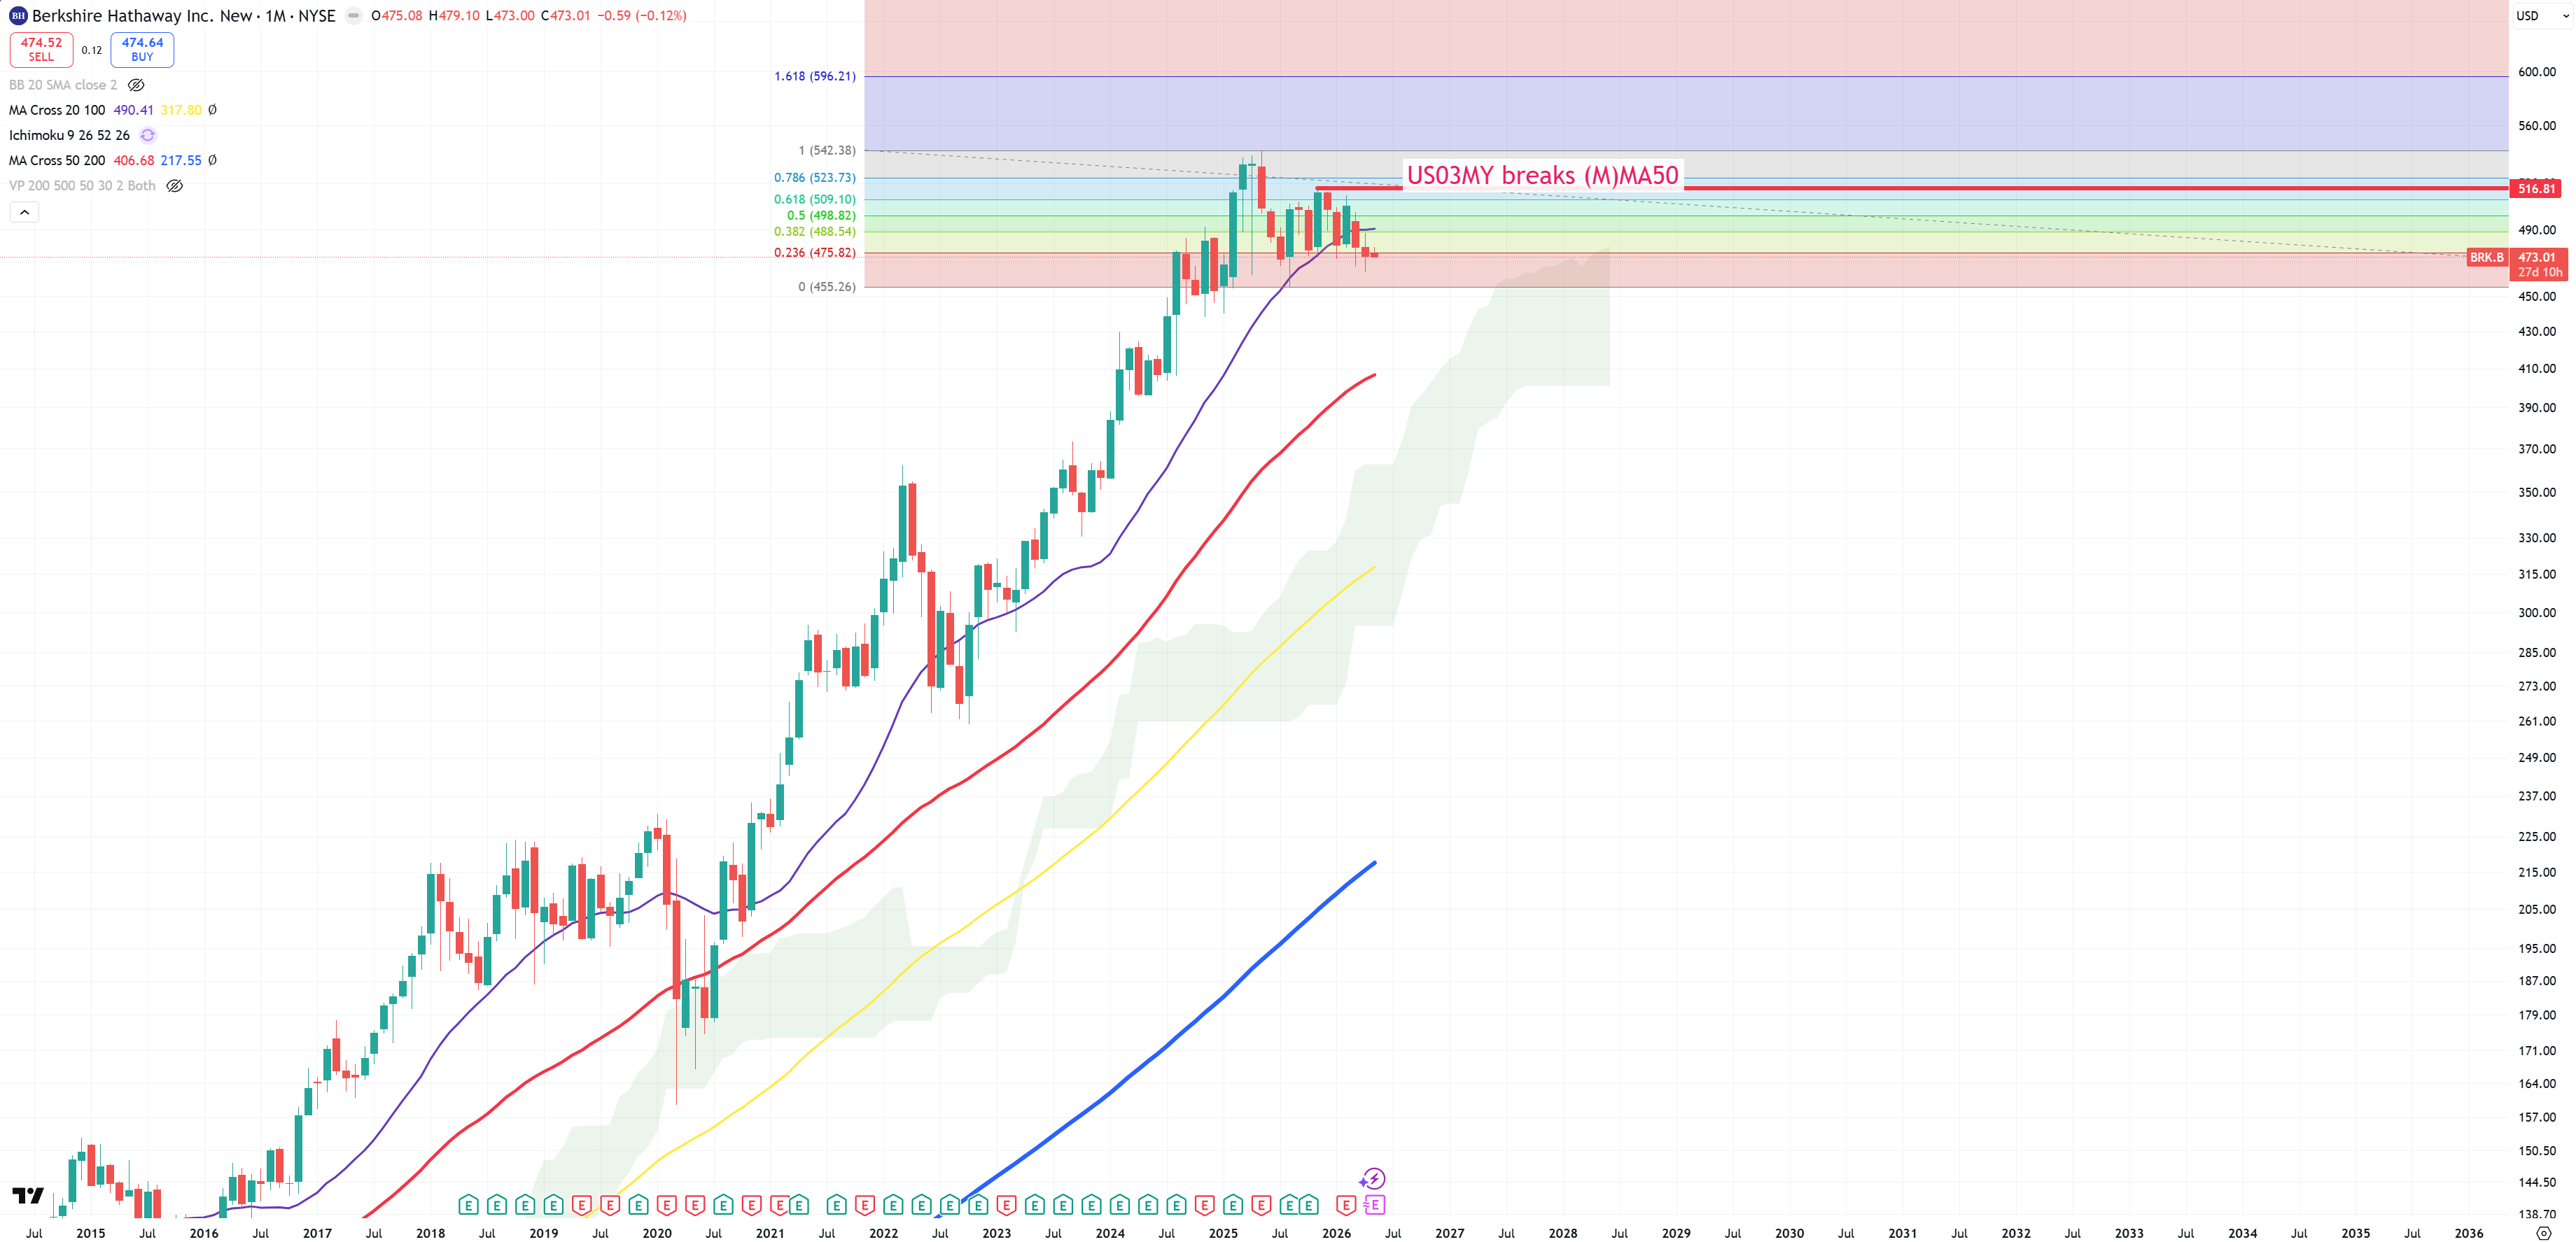
BRK – lost (M)MA20, red (M)MA50 is a next target.
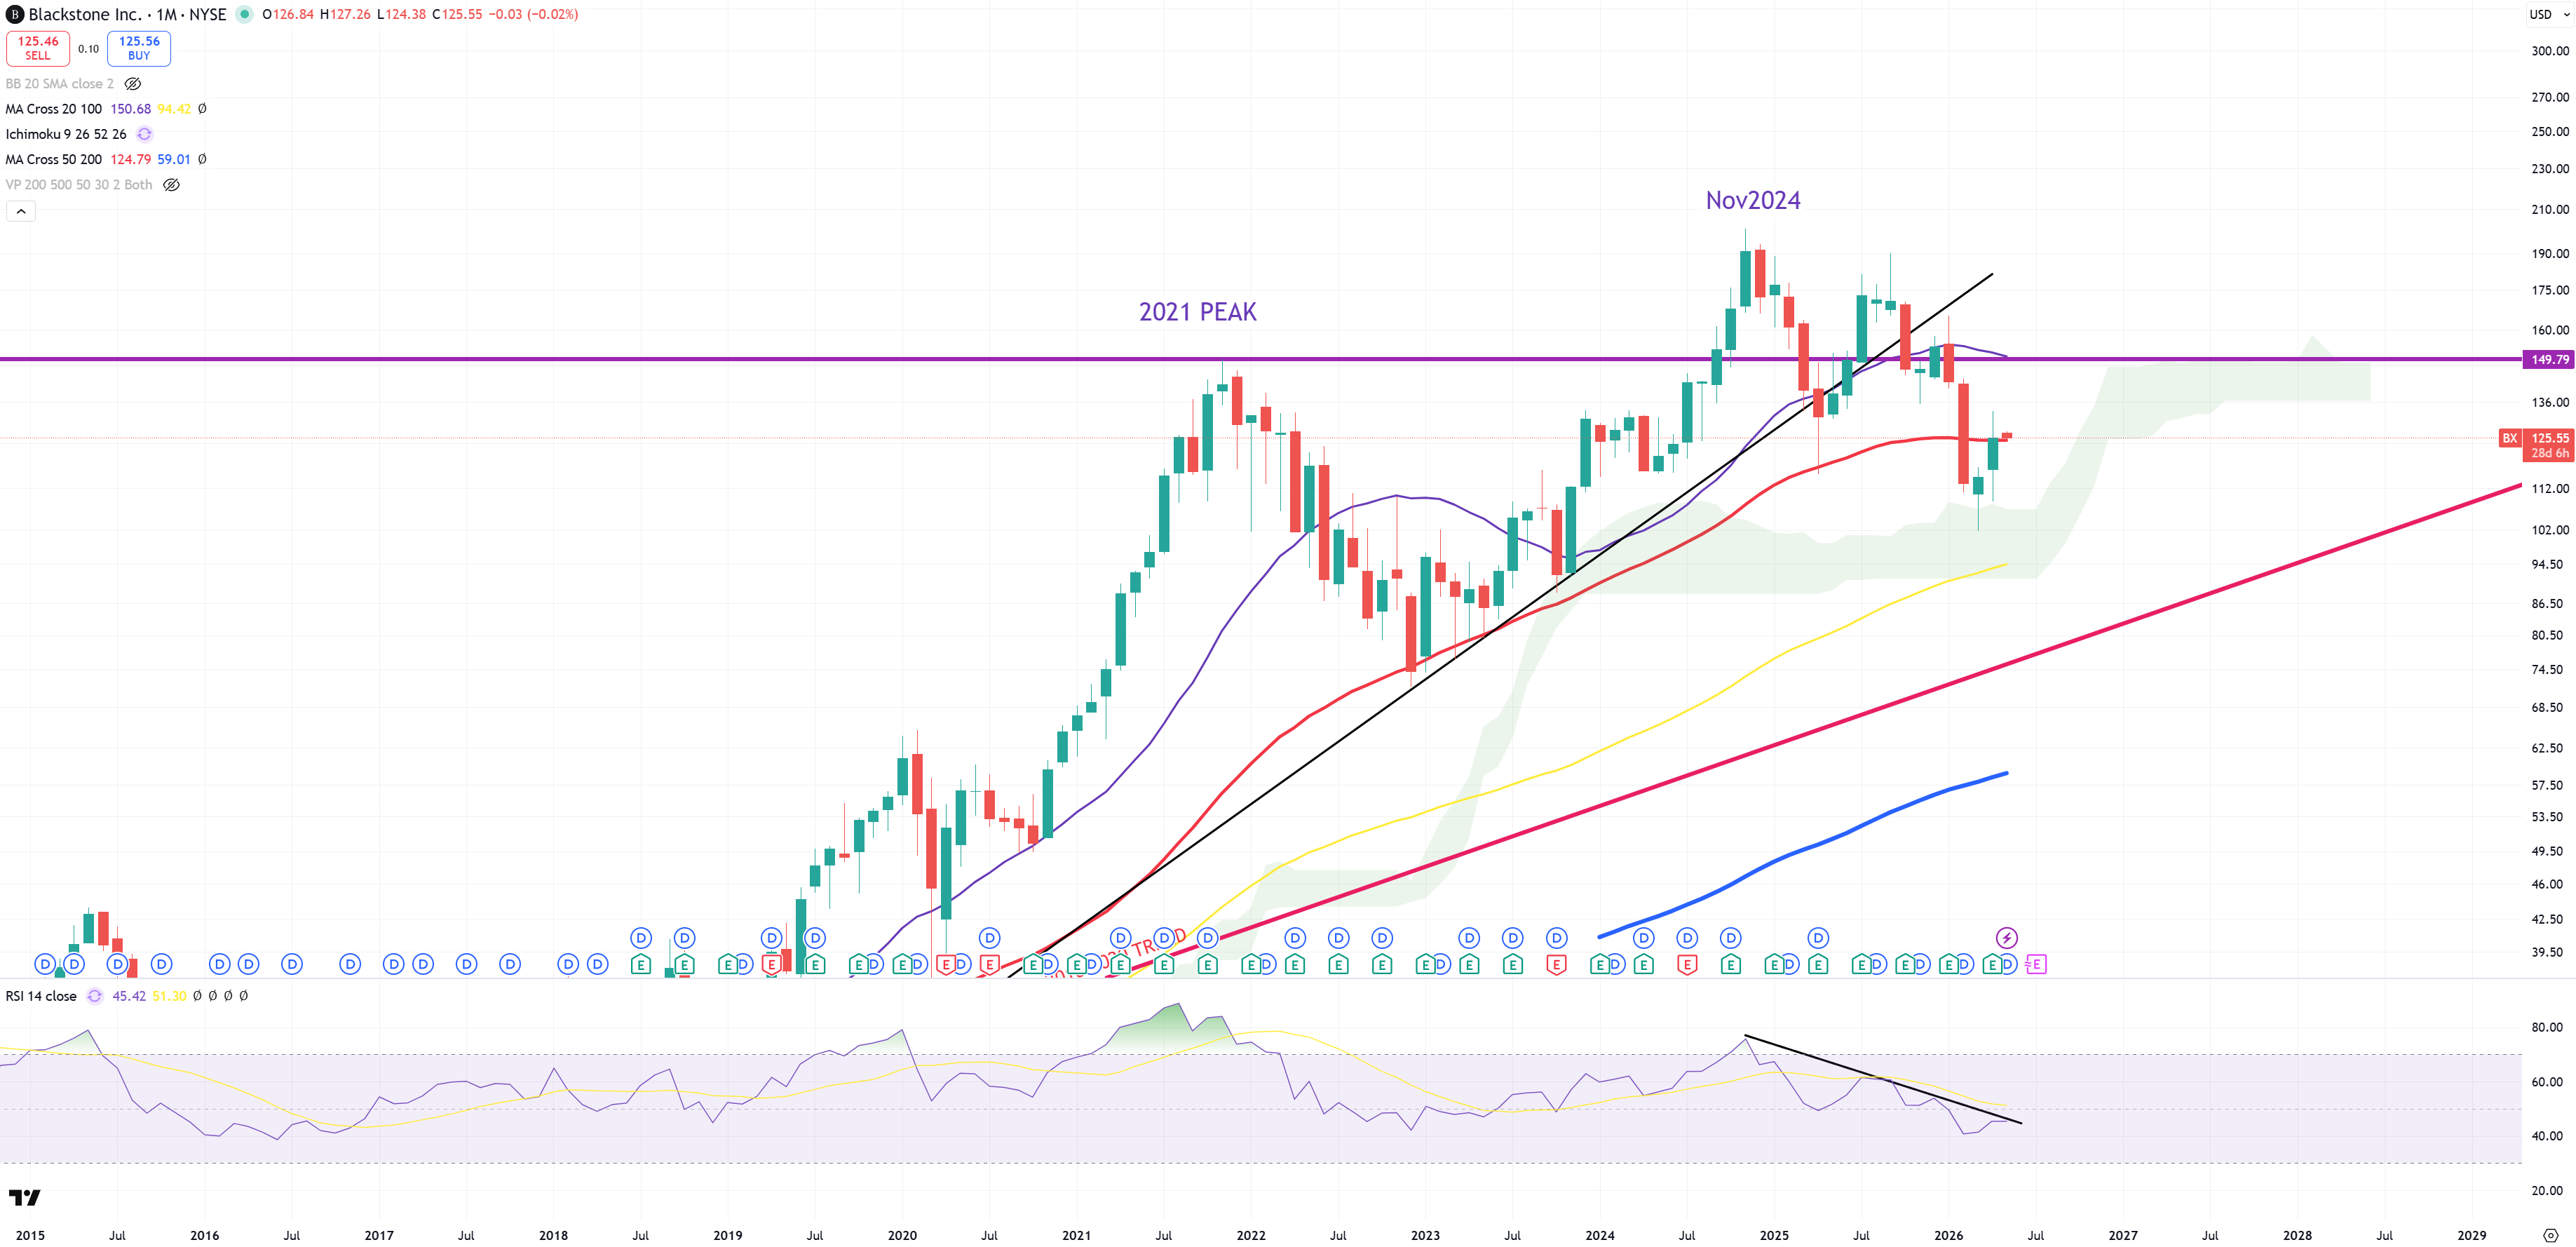
BX – also opens above (M)MA50
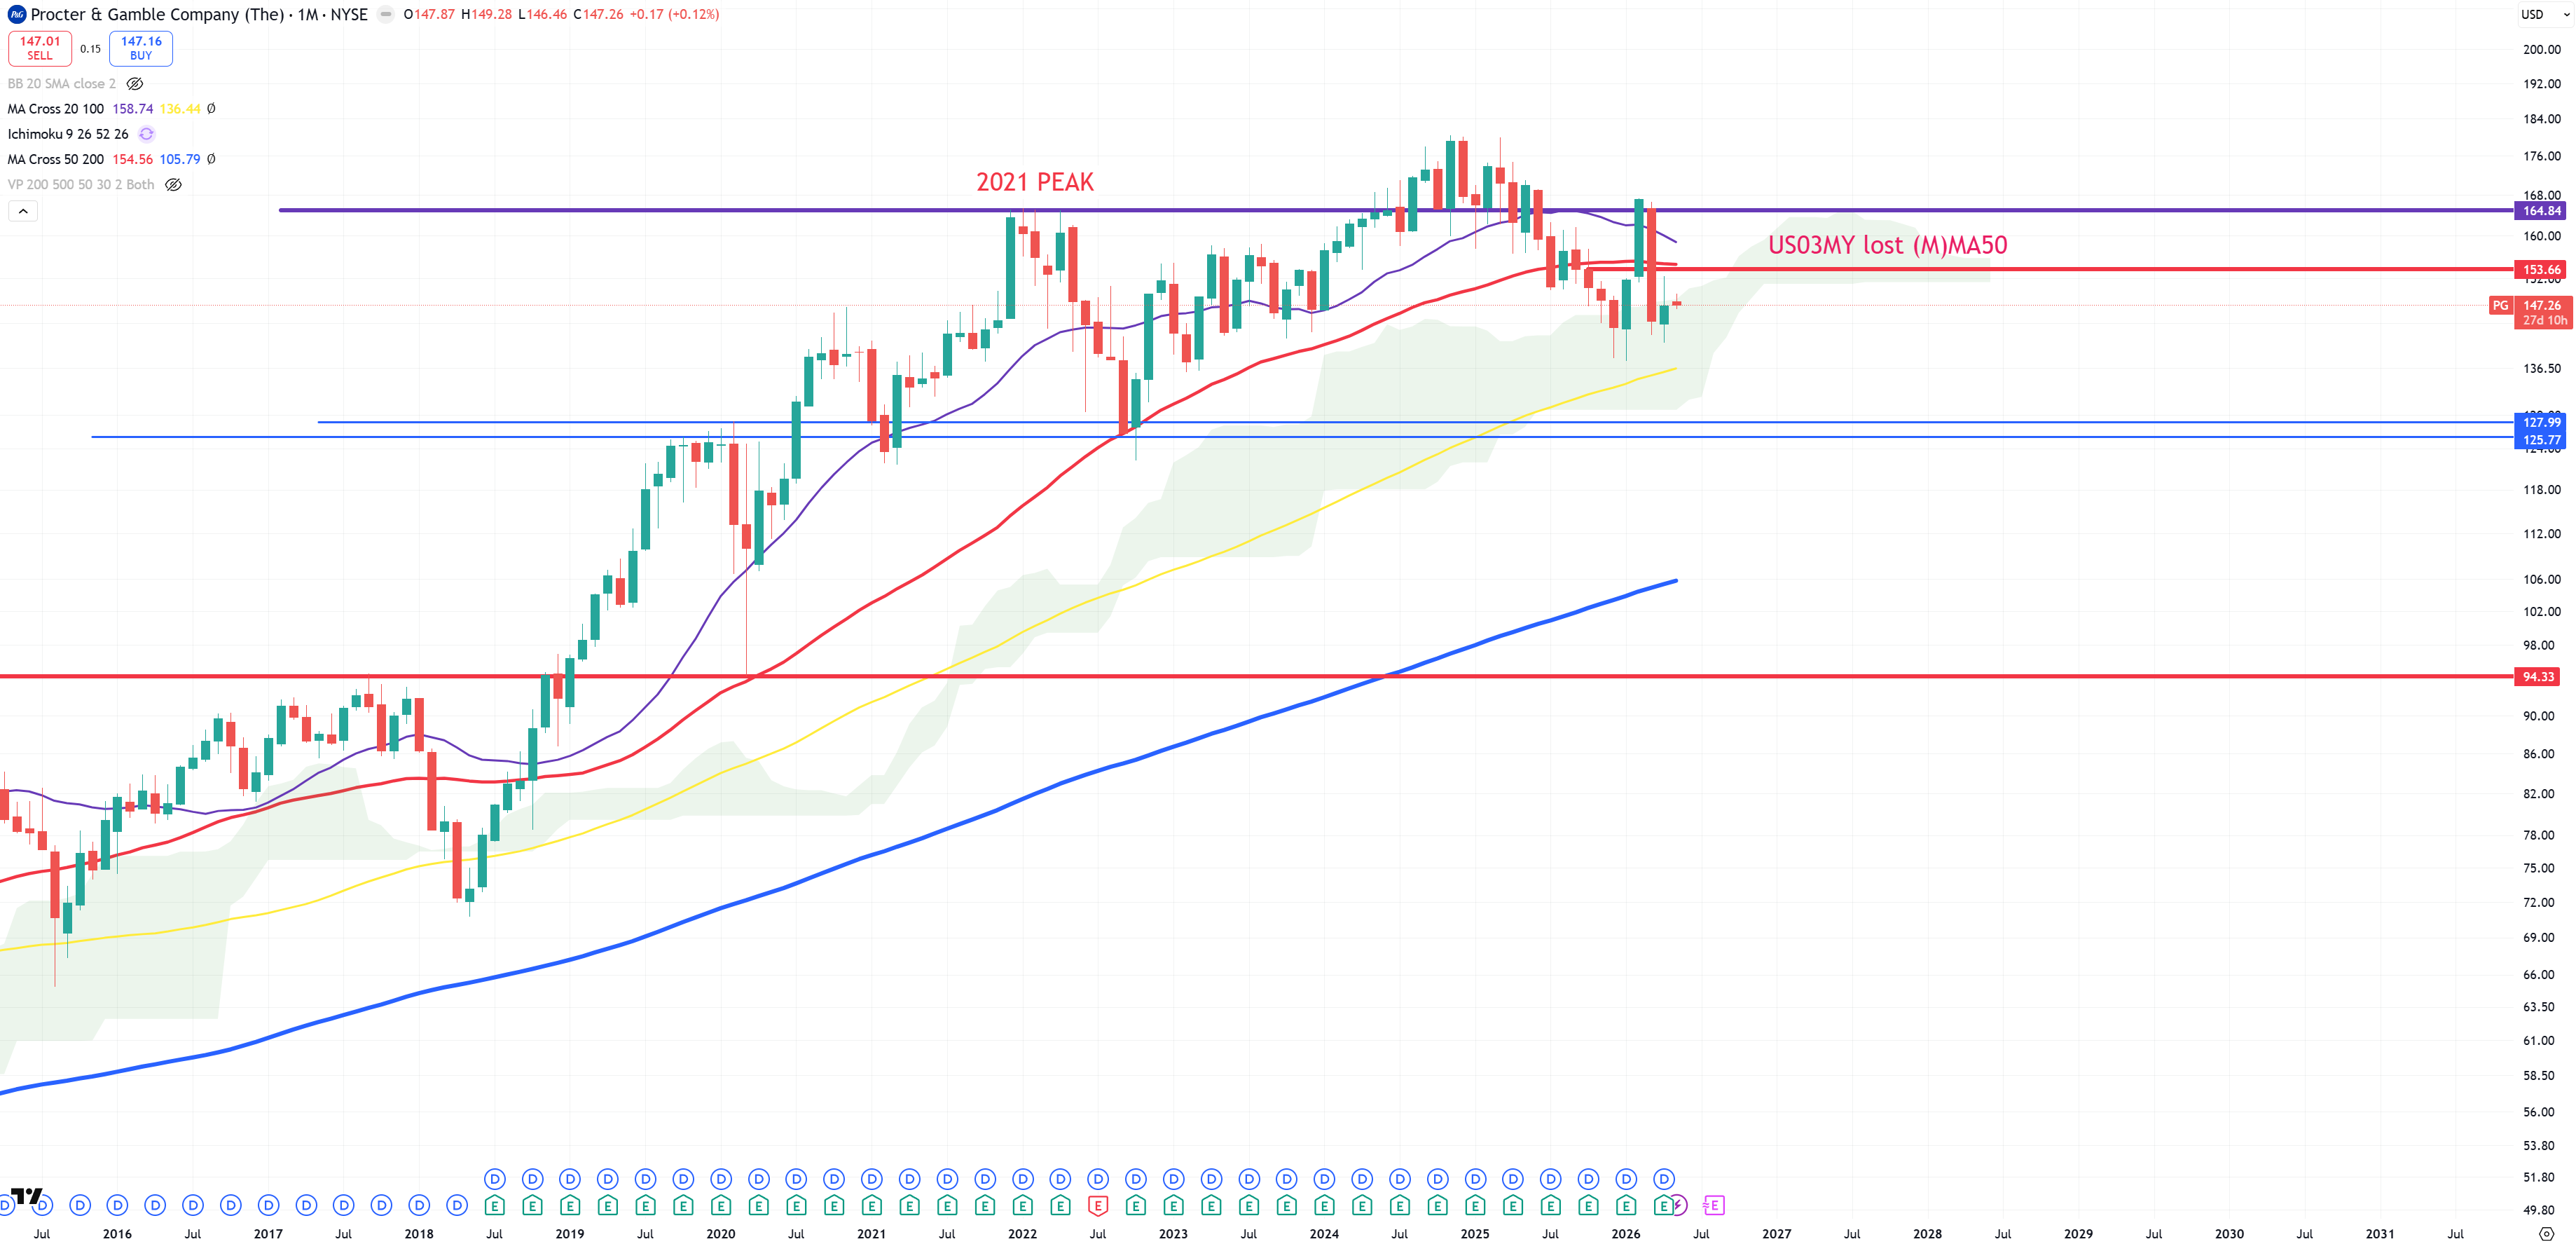
PG – doesn’t look too good
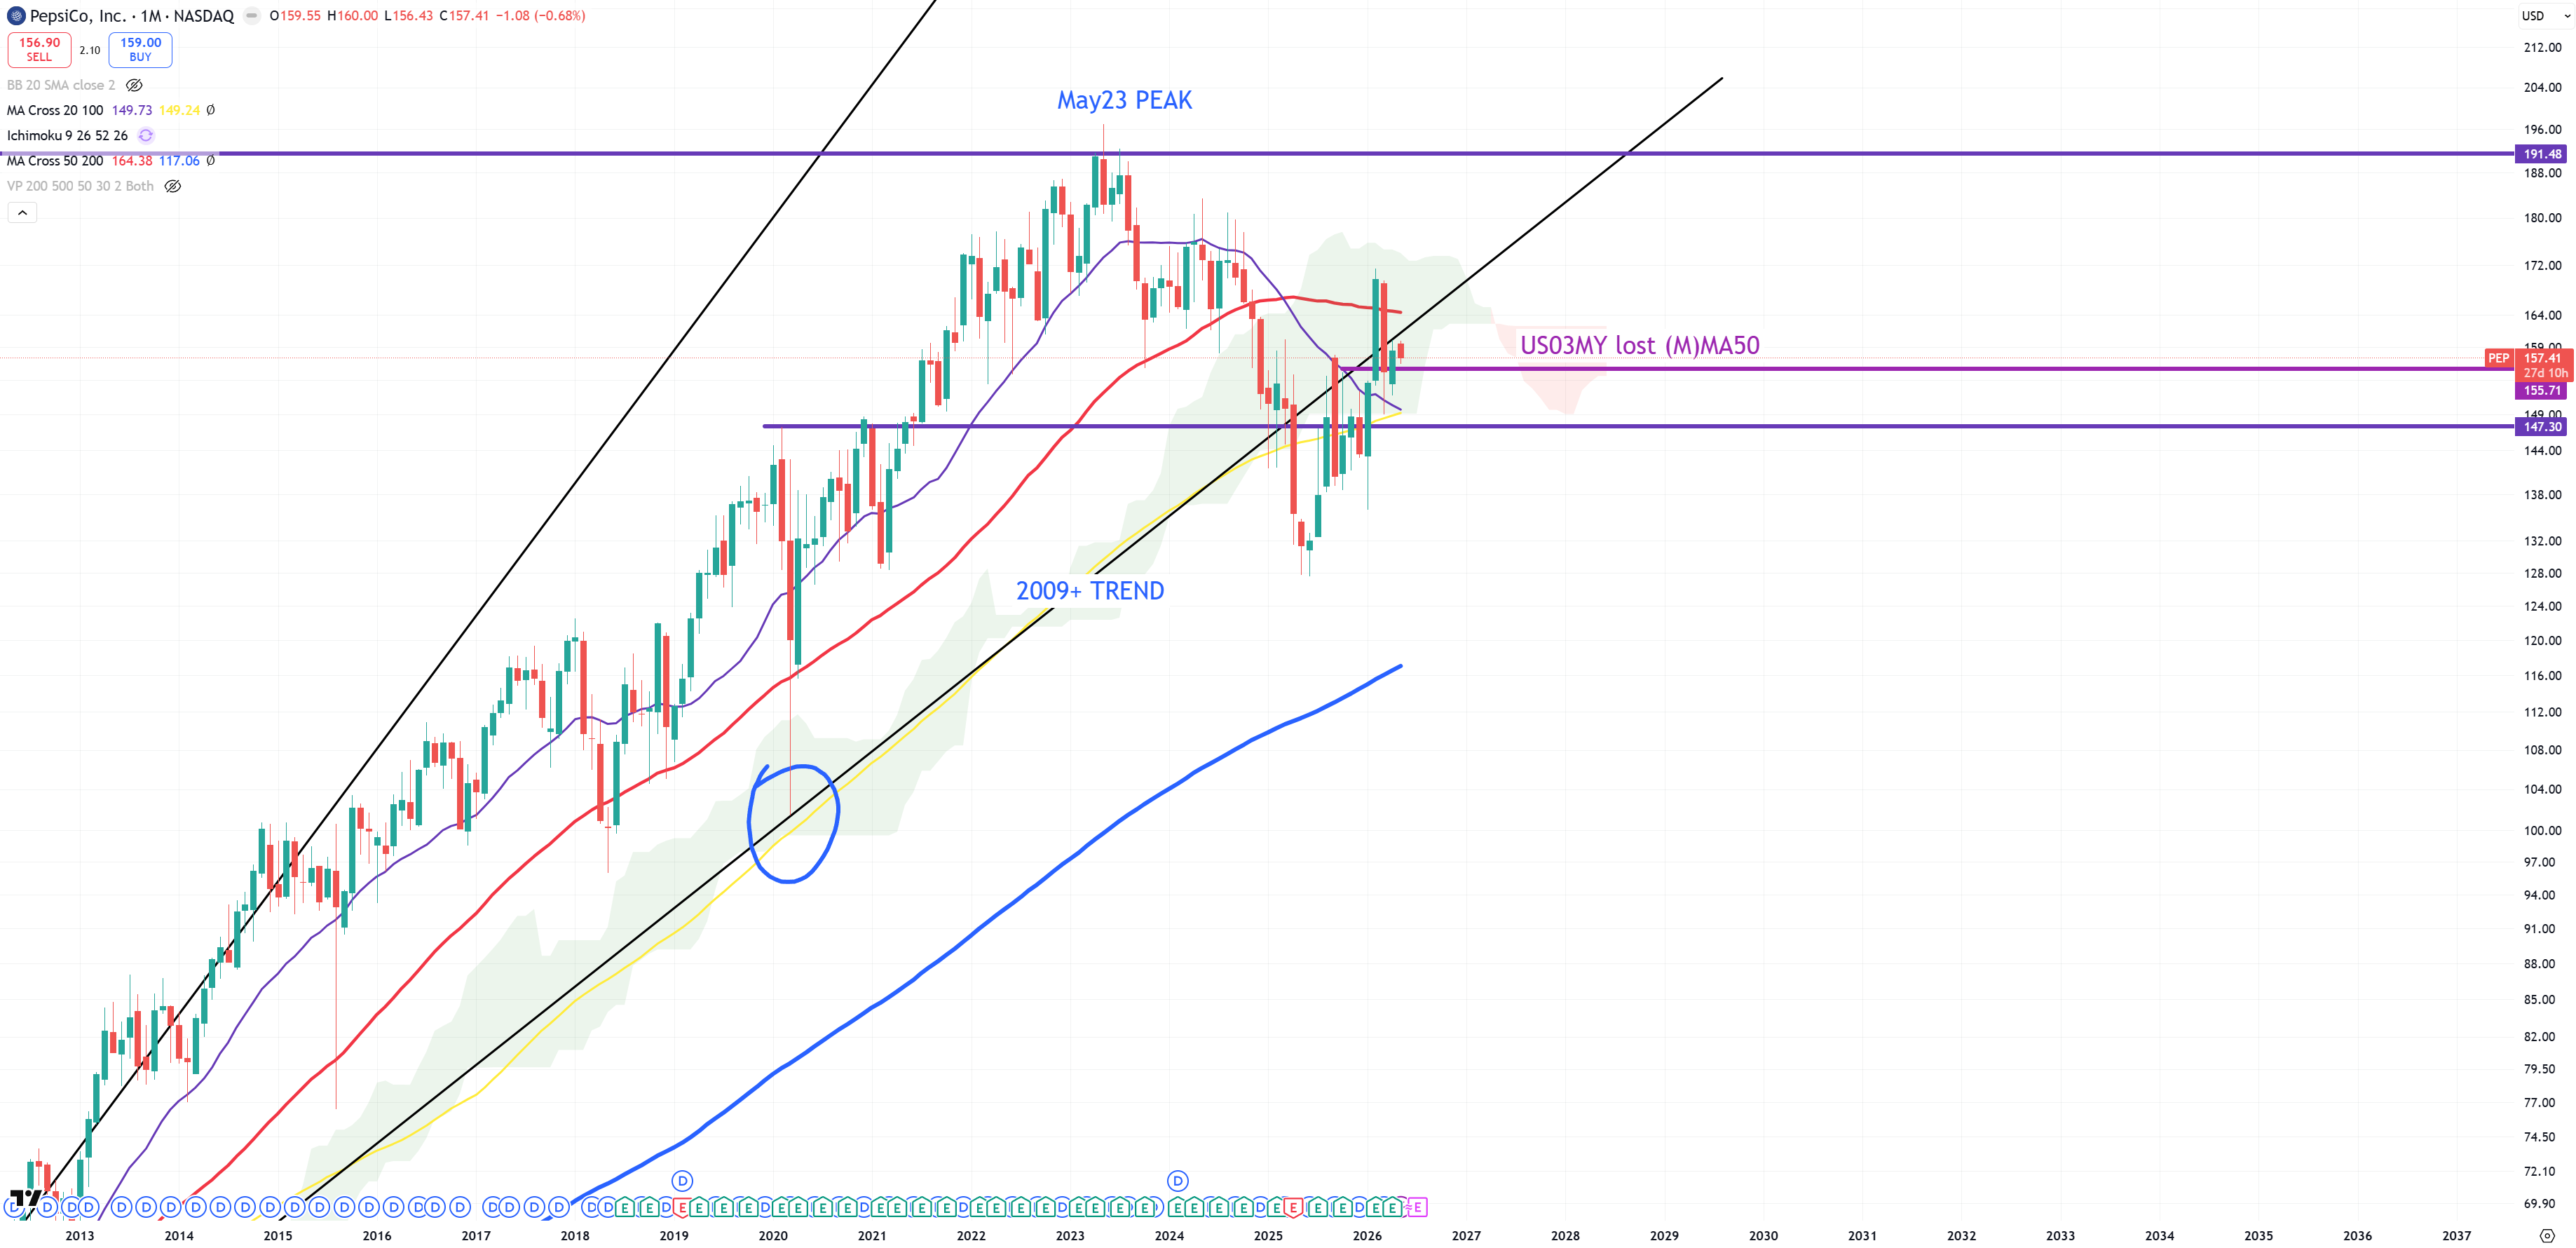
PEP – Pepsico : 2009 trend has been lost
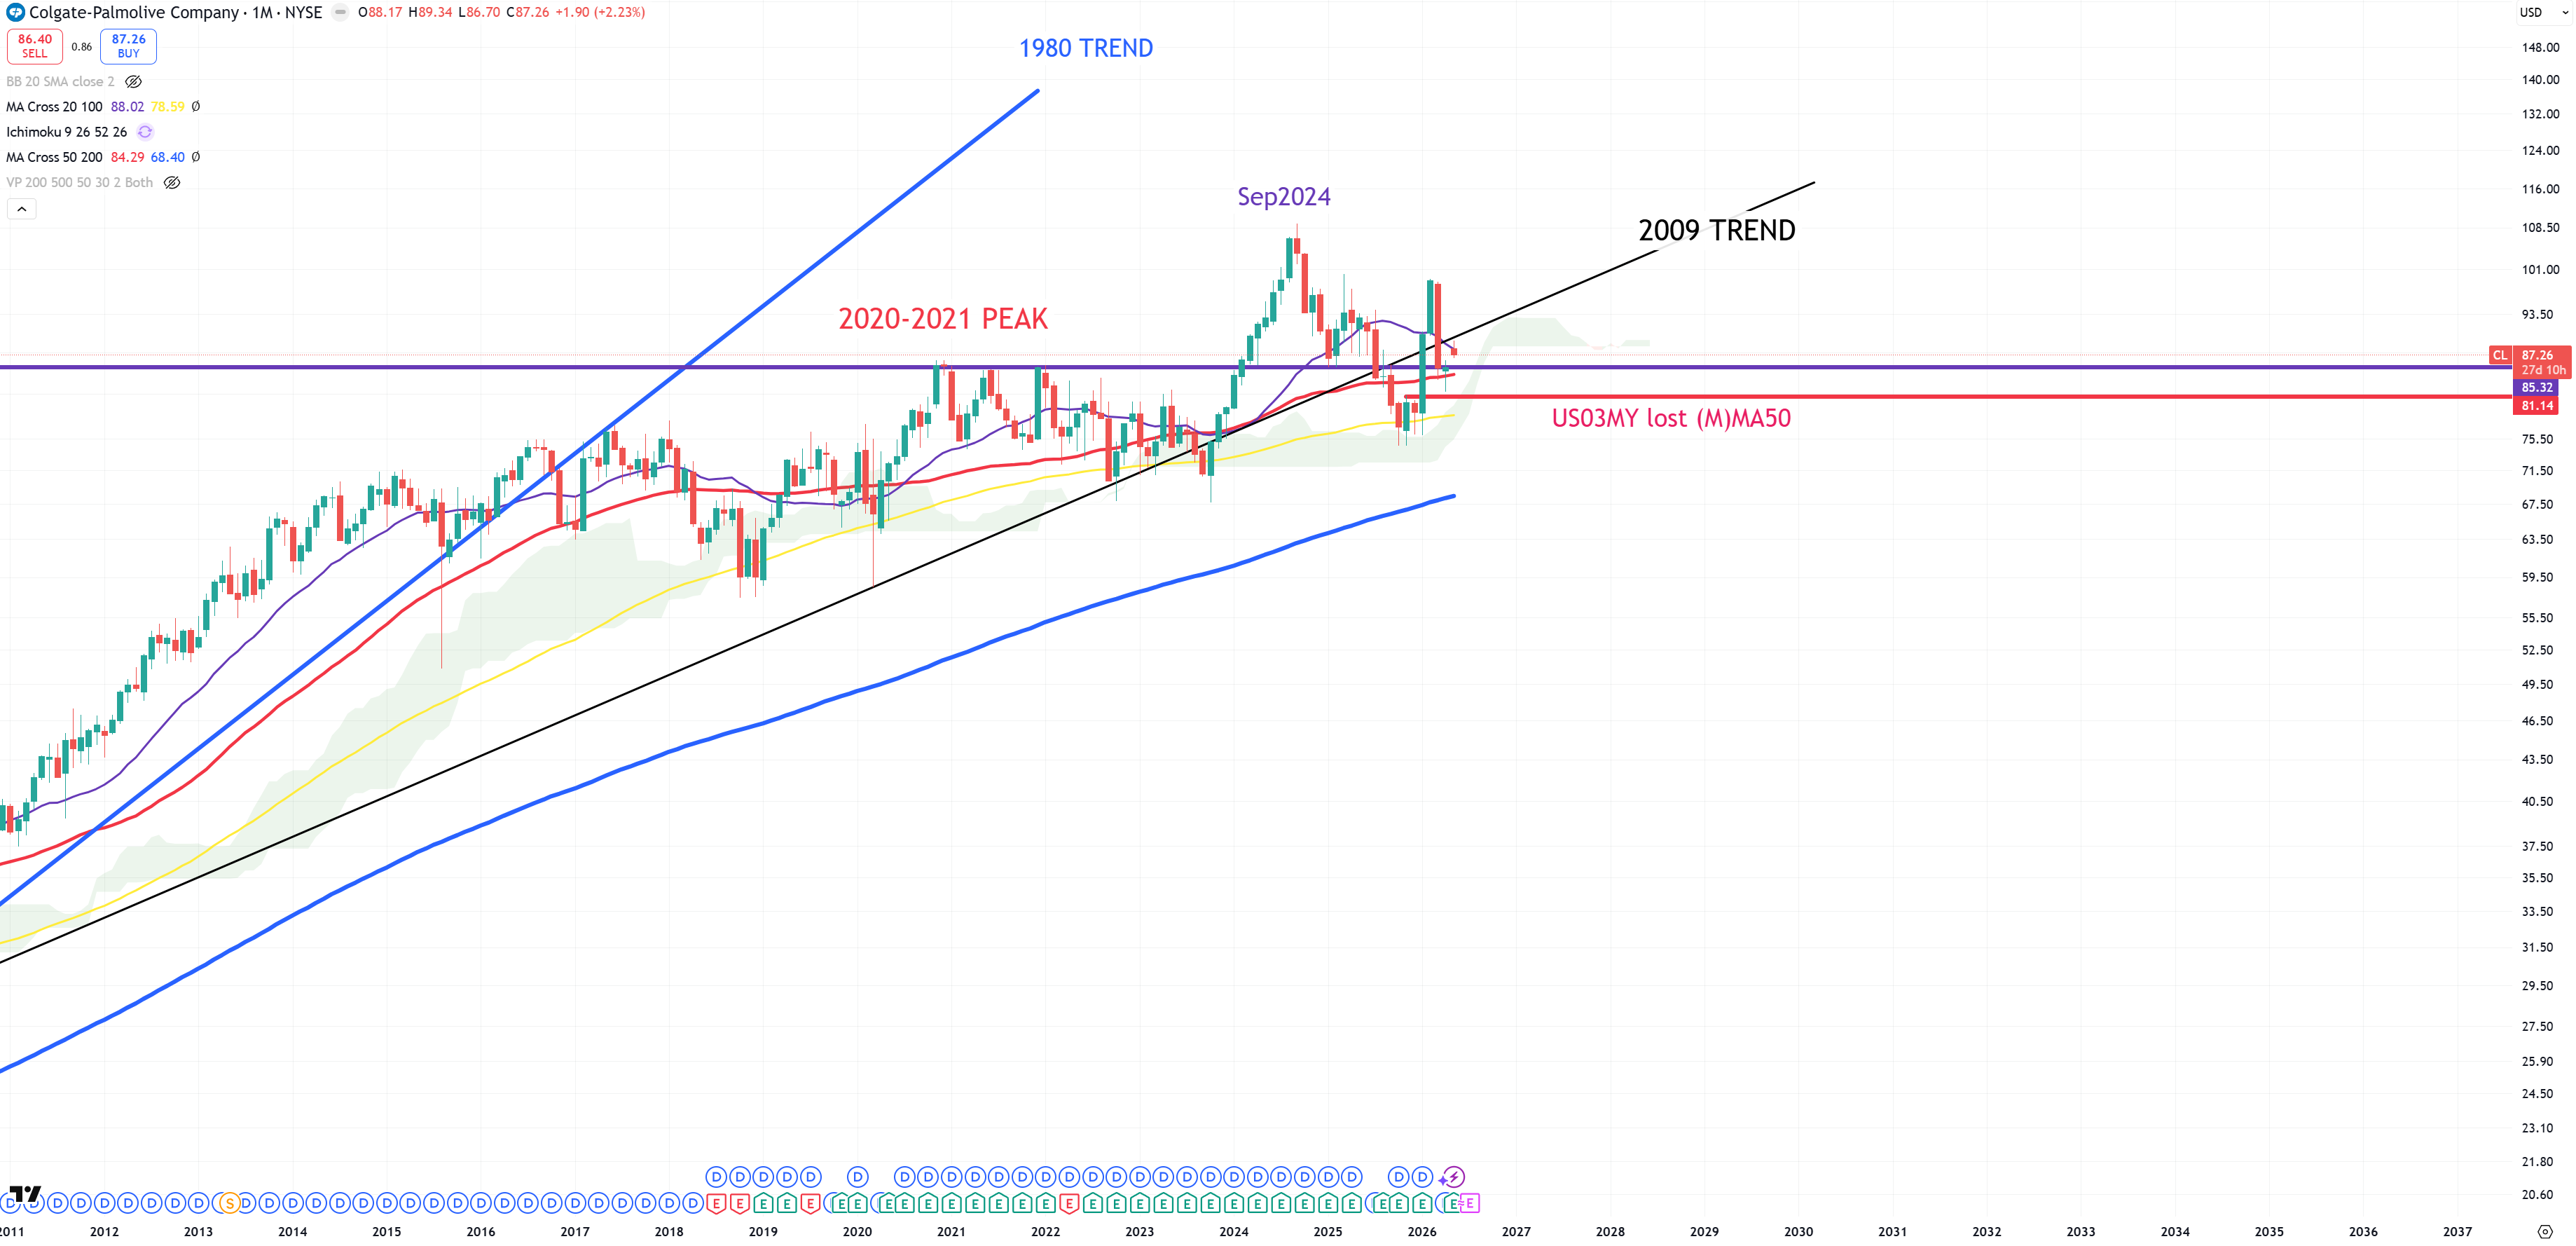
CL – Colgate : another try to jump > 2009 trend but failed
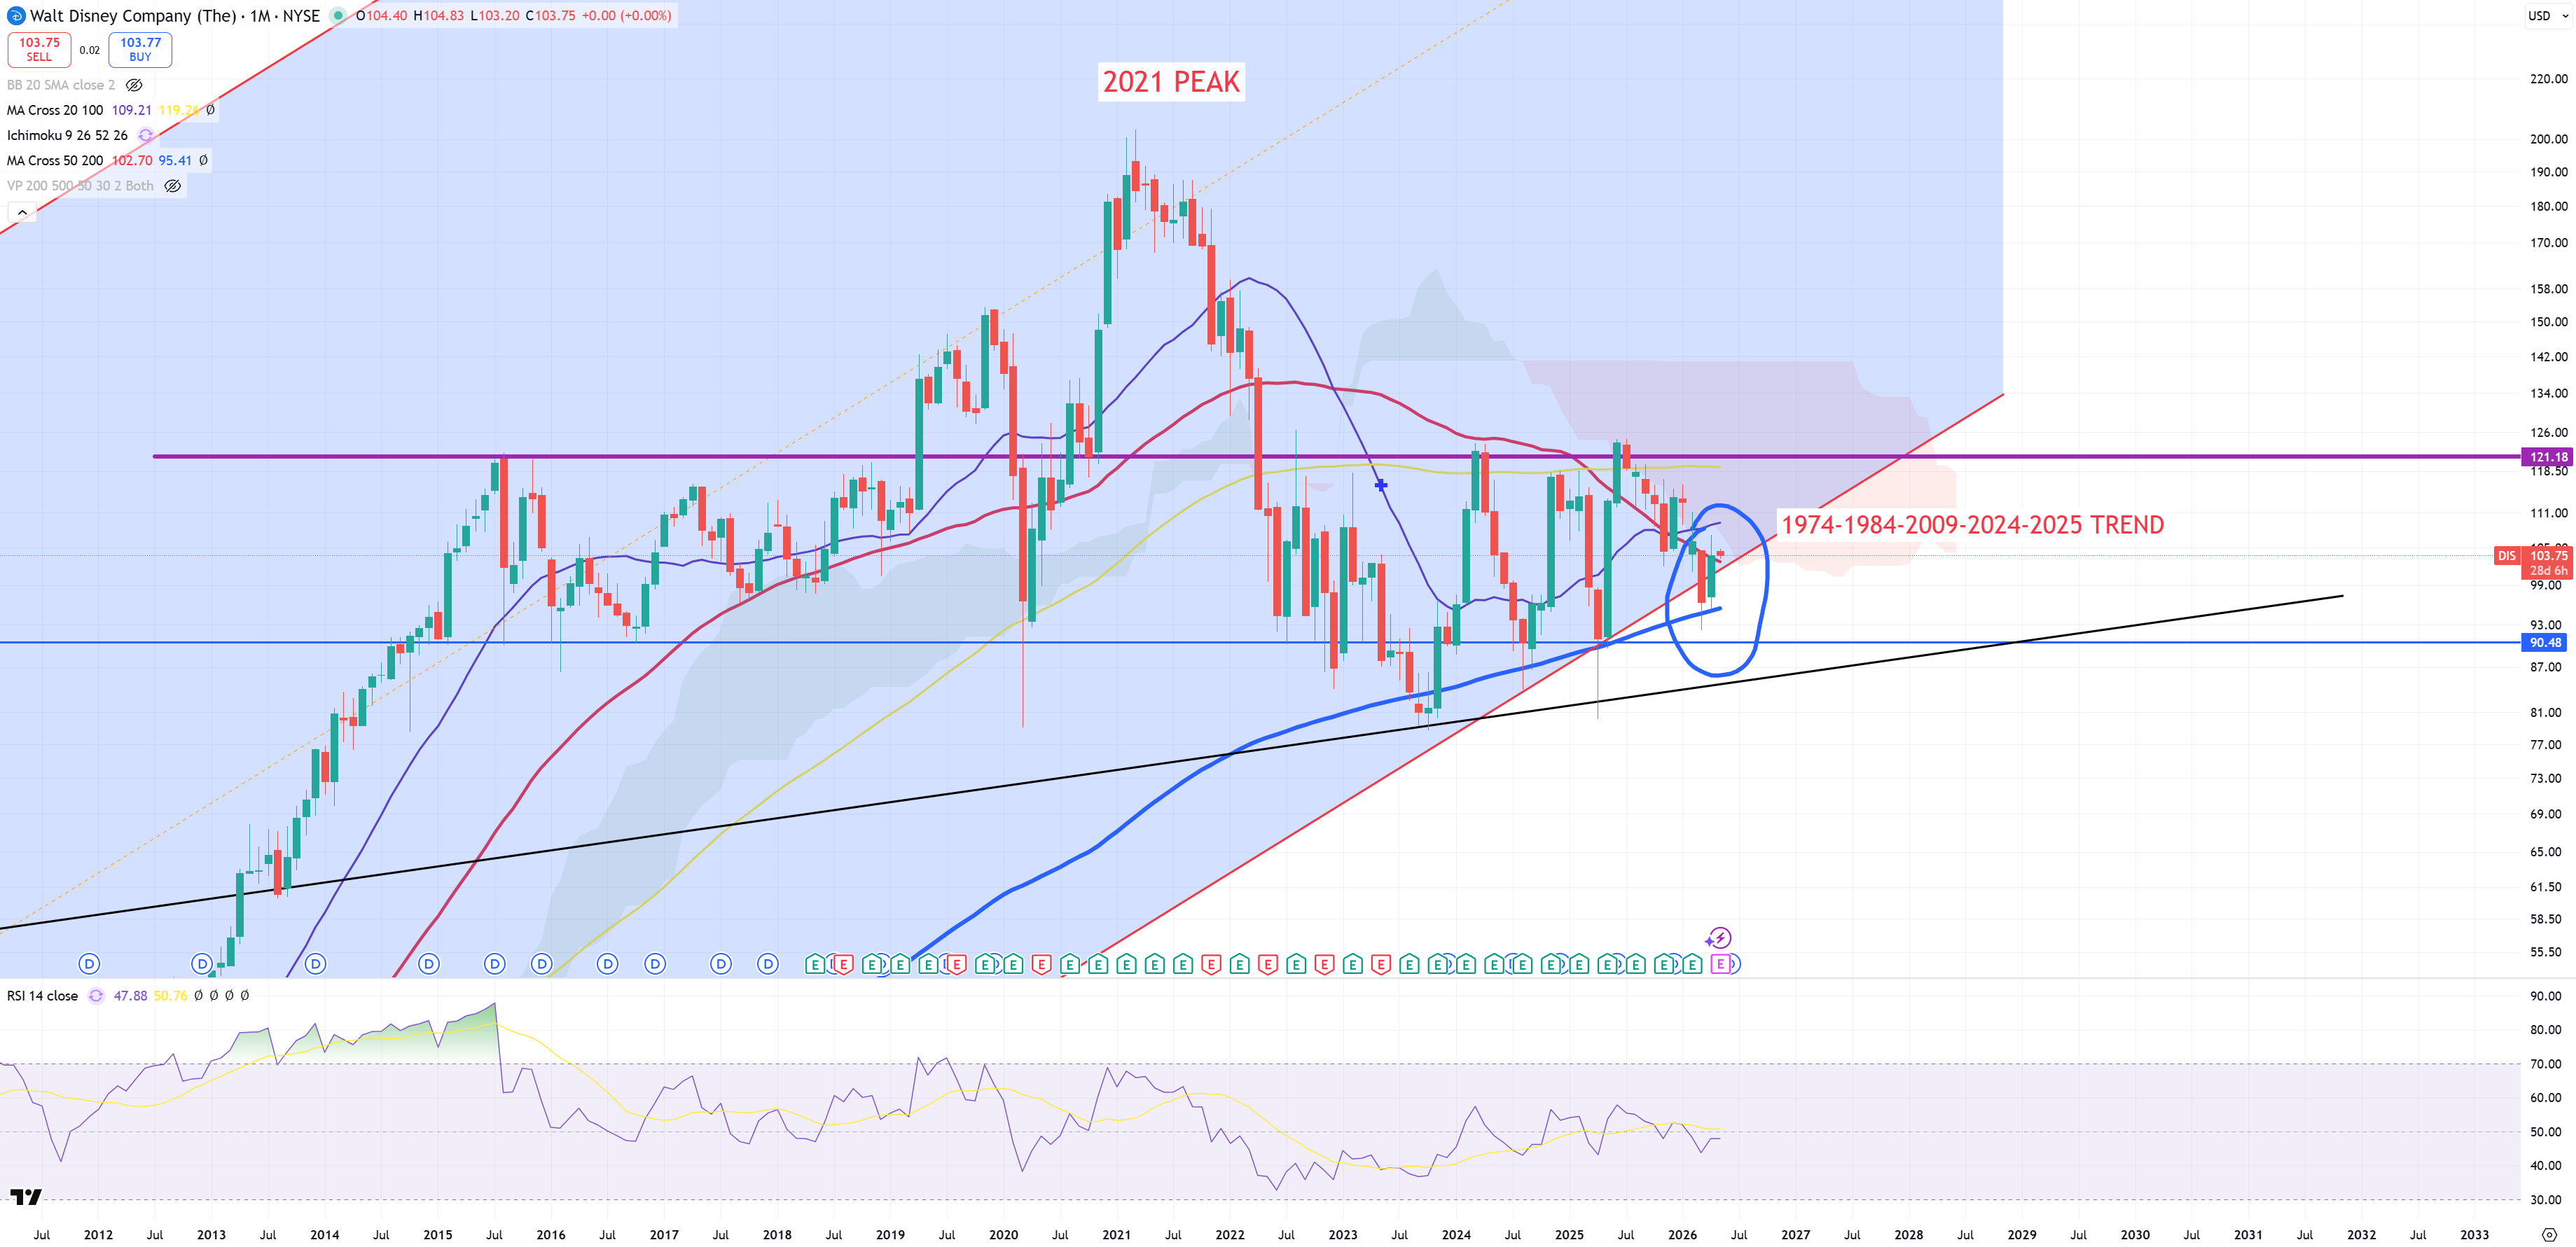
DIS – also keeps fighting for a massive move
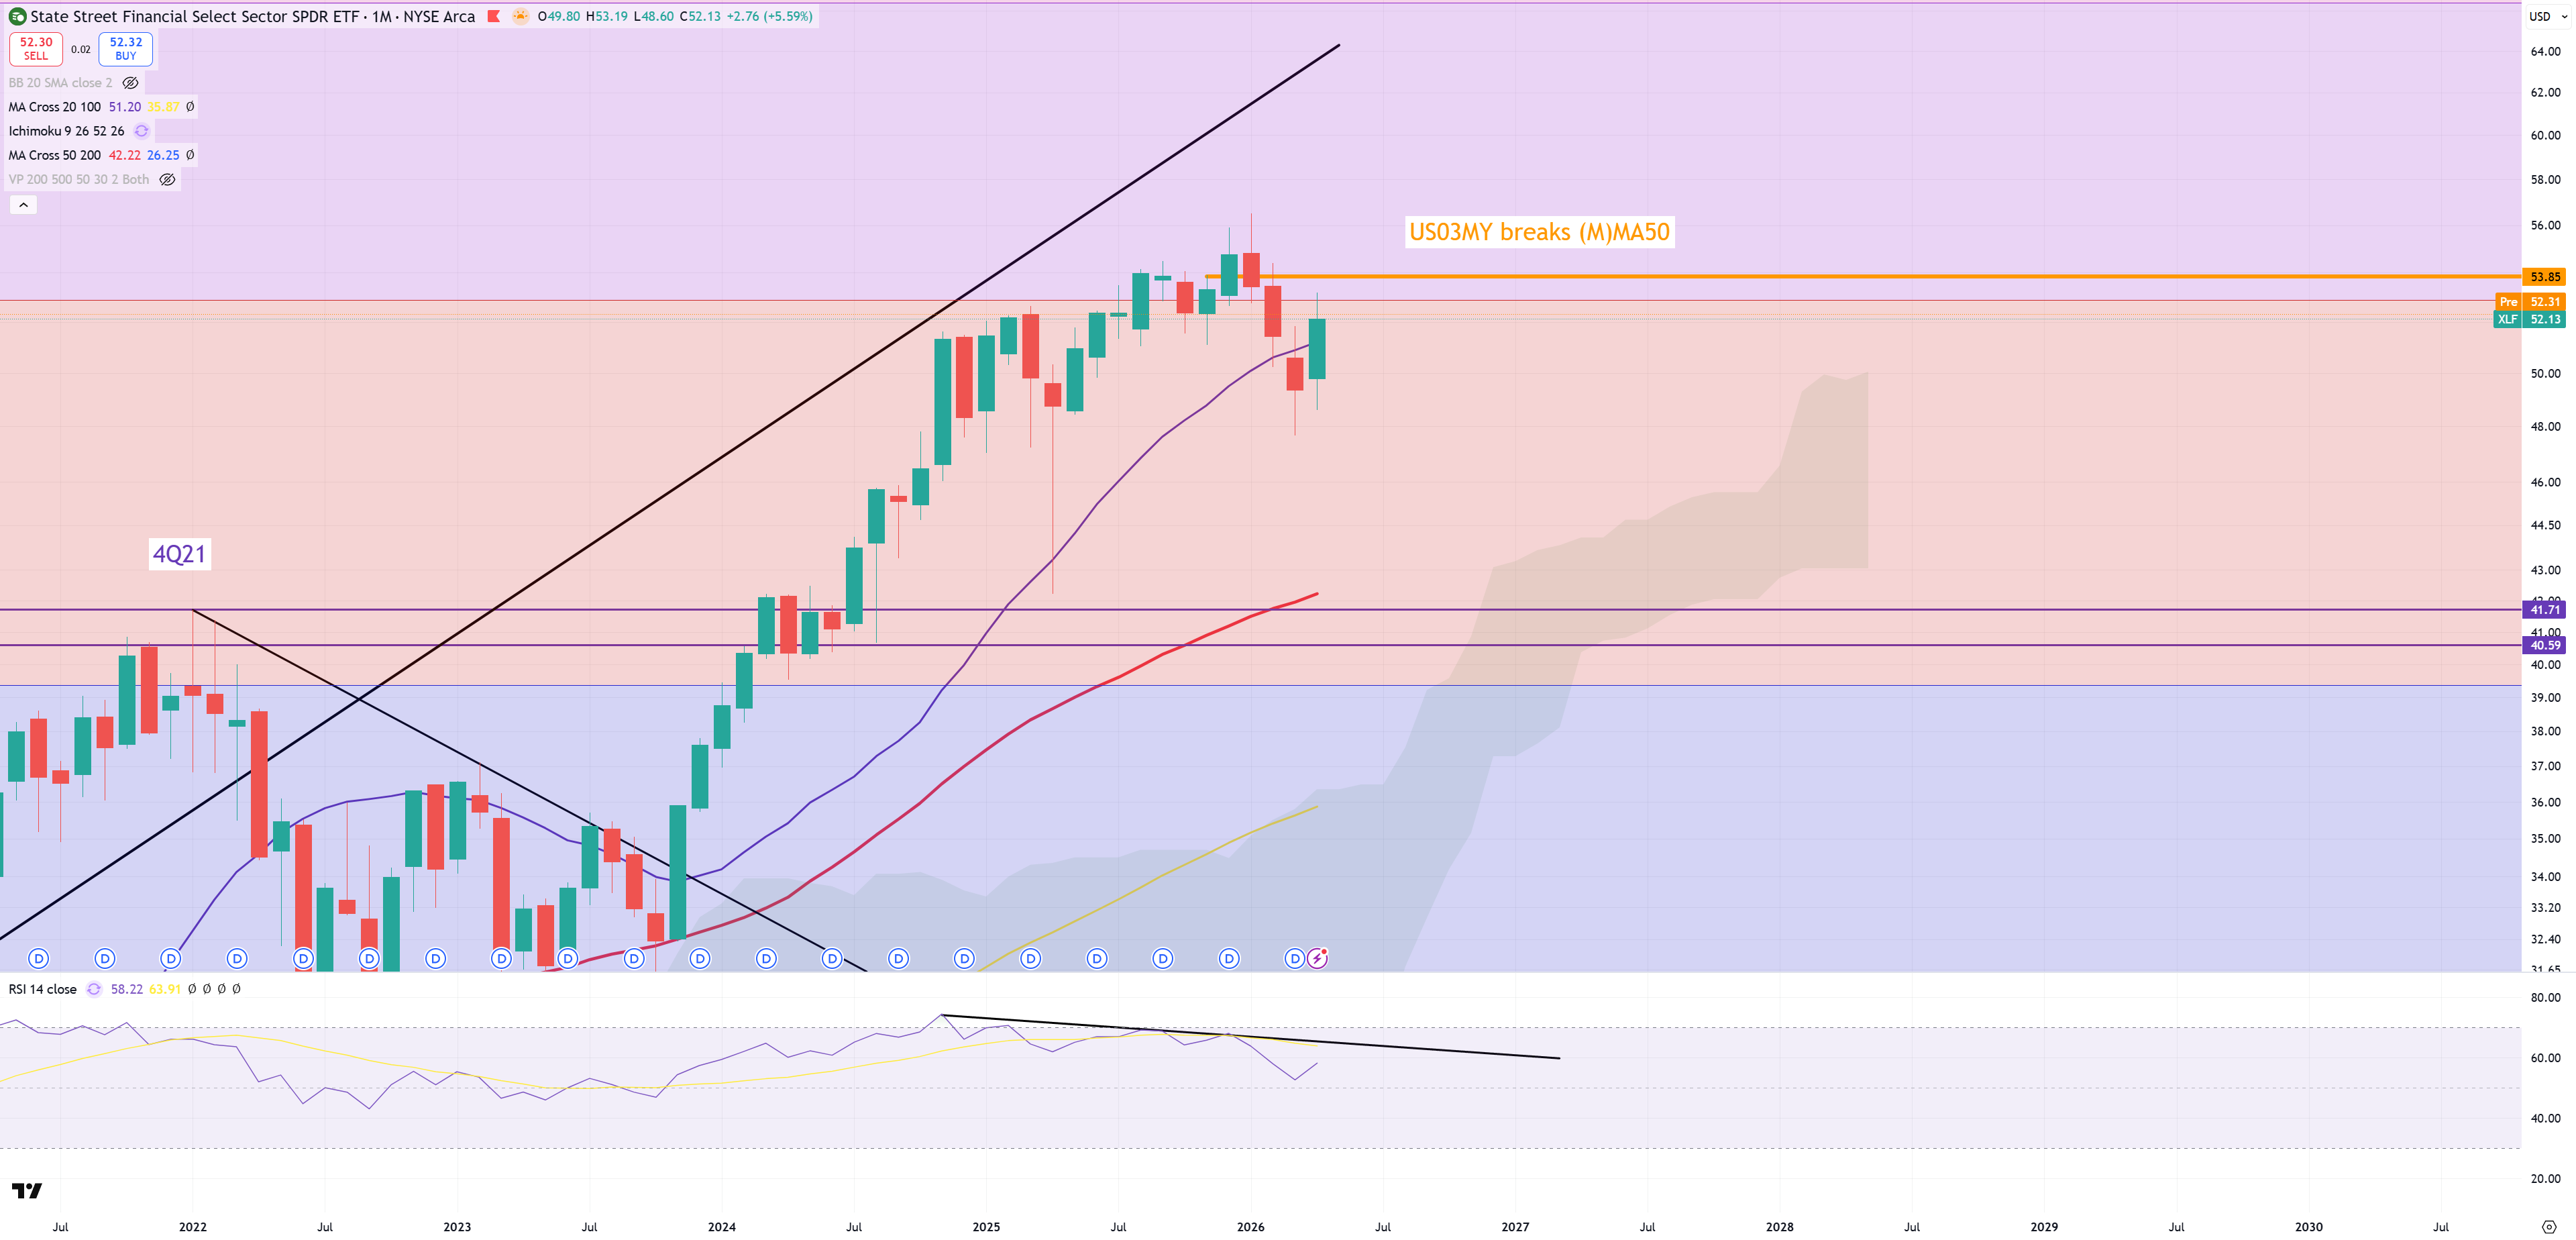
XLF – and (M)MA20 – also defended
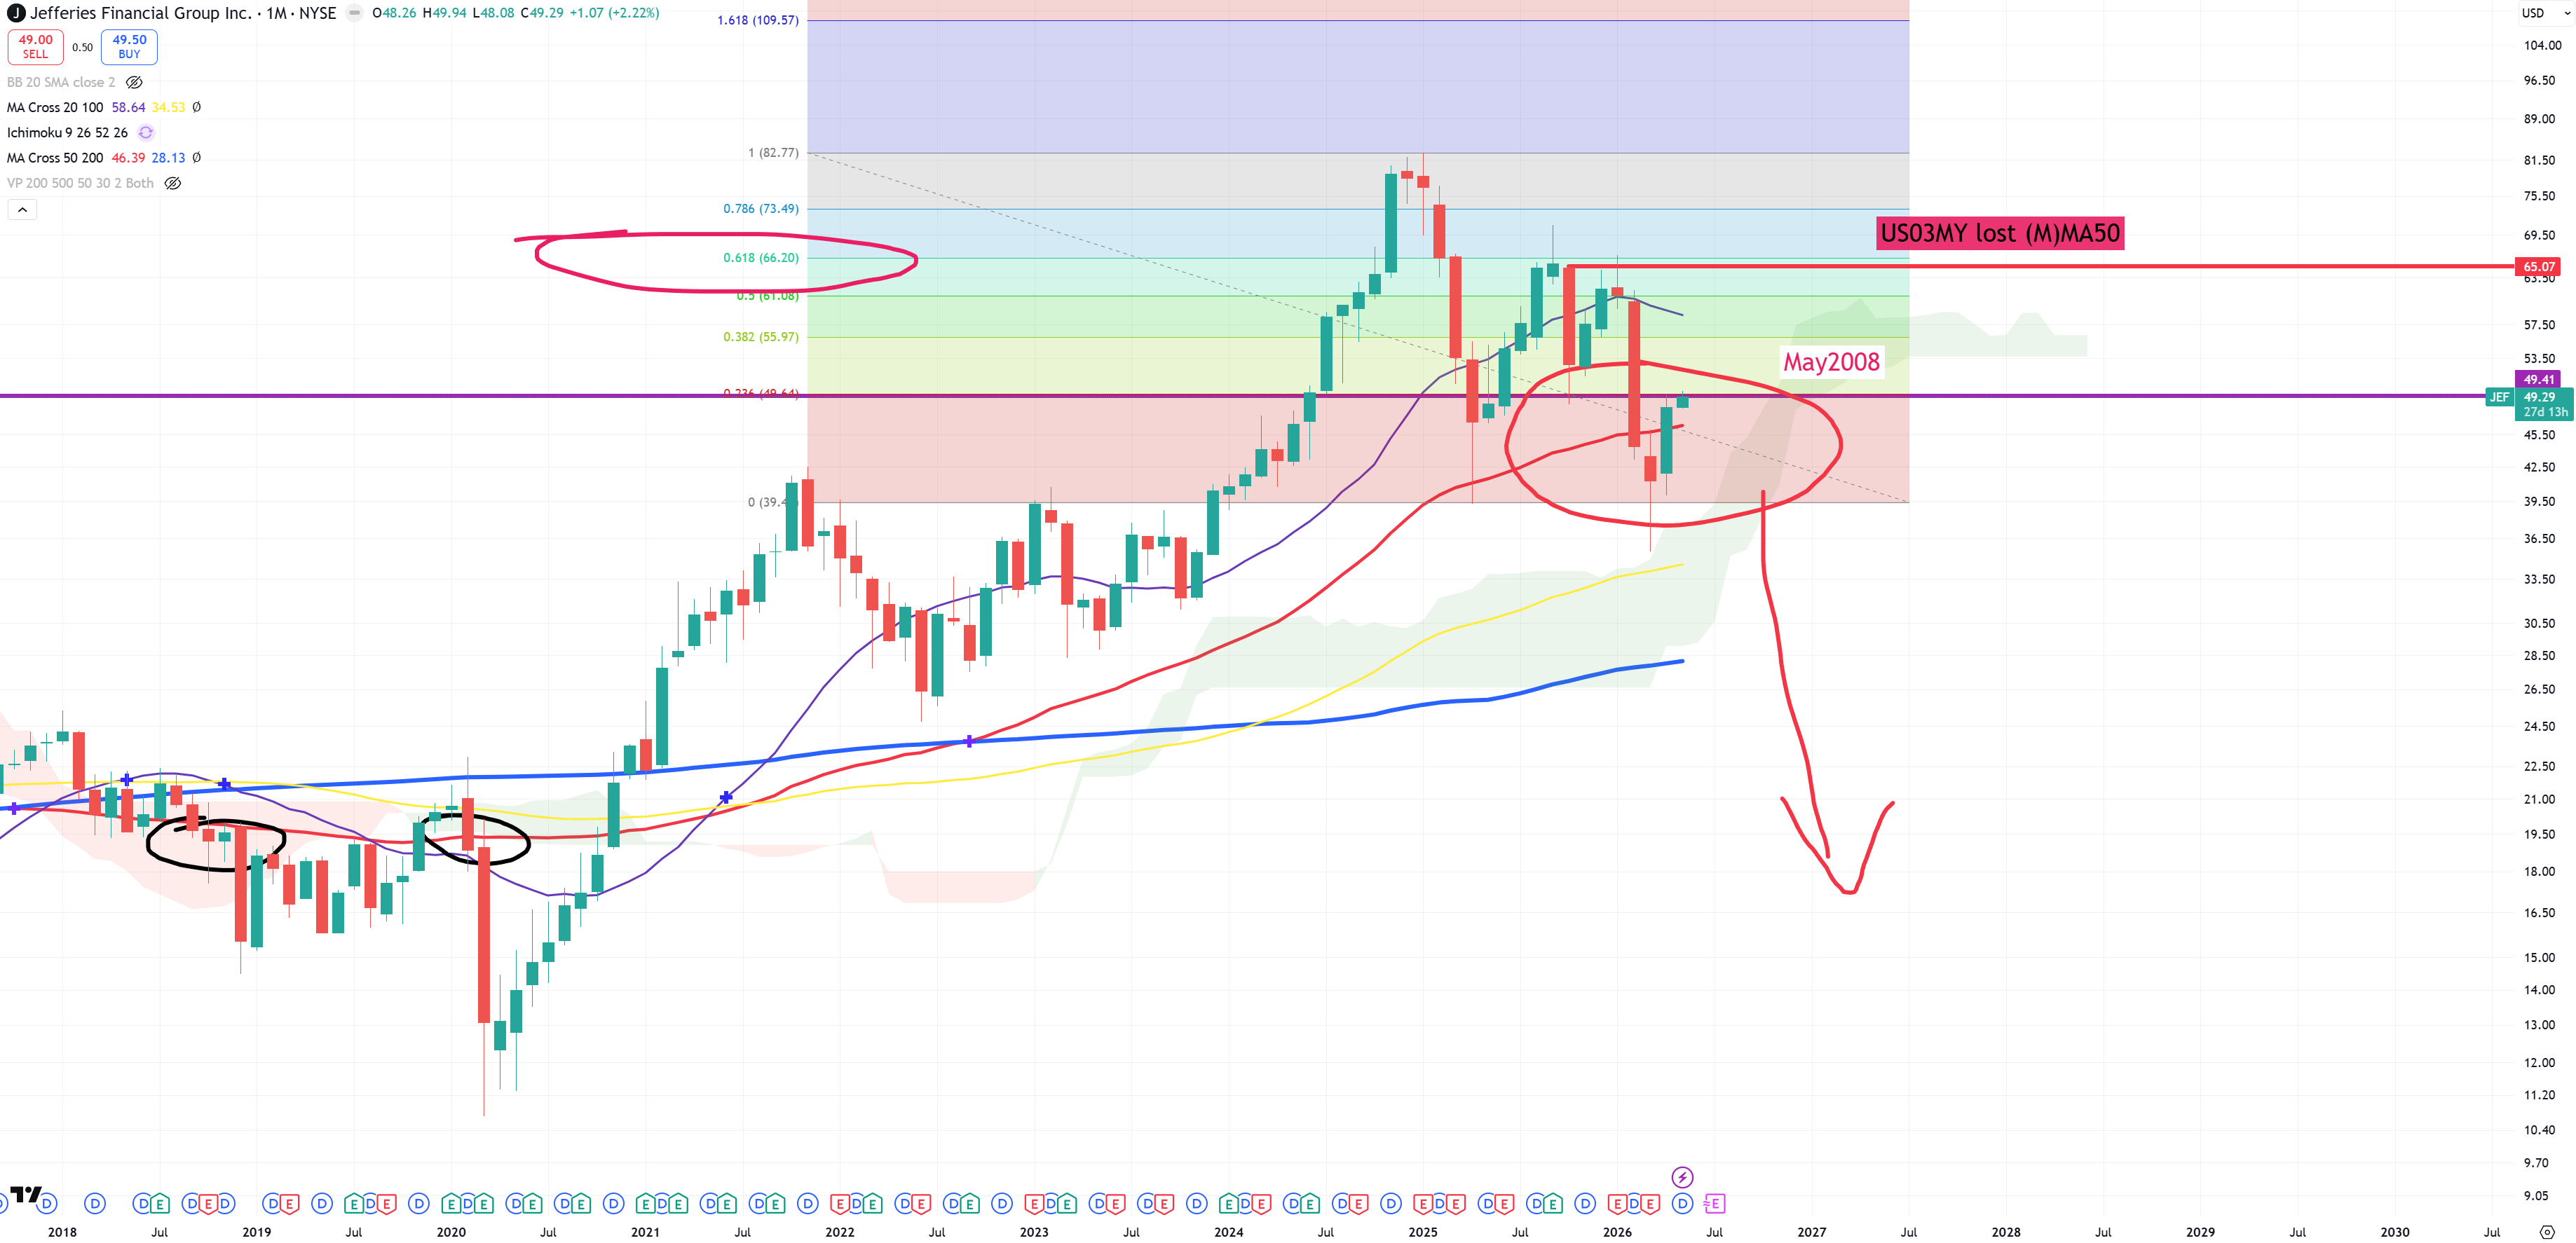
JEF – but if we take a look some banks and financial institutions the situation isn’t so good. Jefferies maybe managed to jump out from (M)MA50 break but it’s being hold on key 2008 resistance.
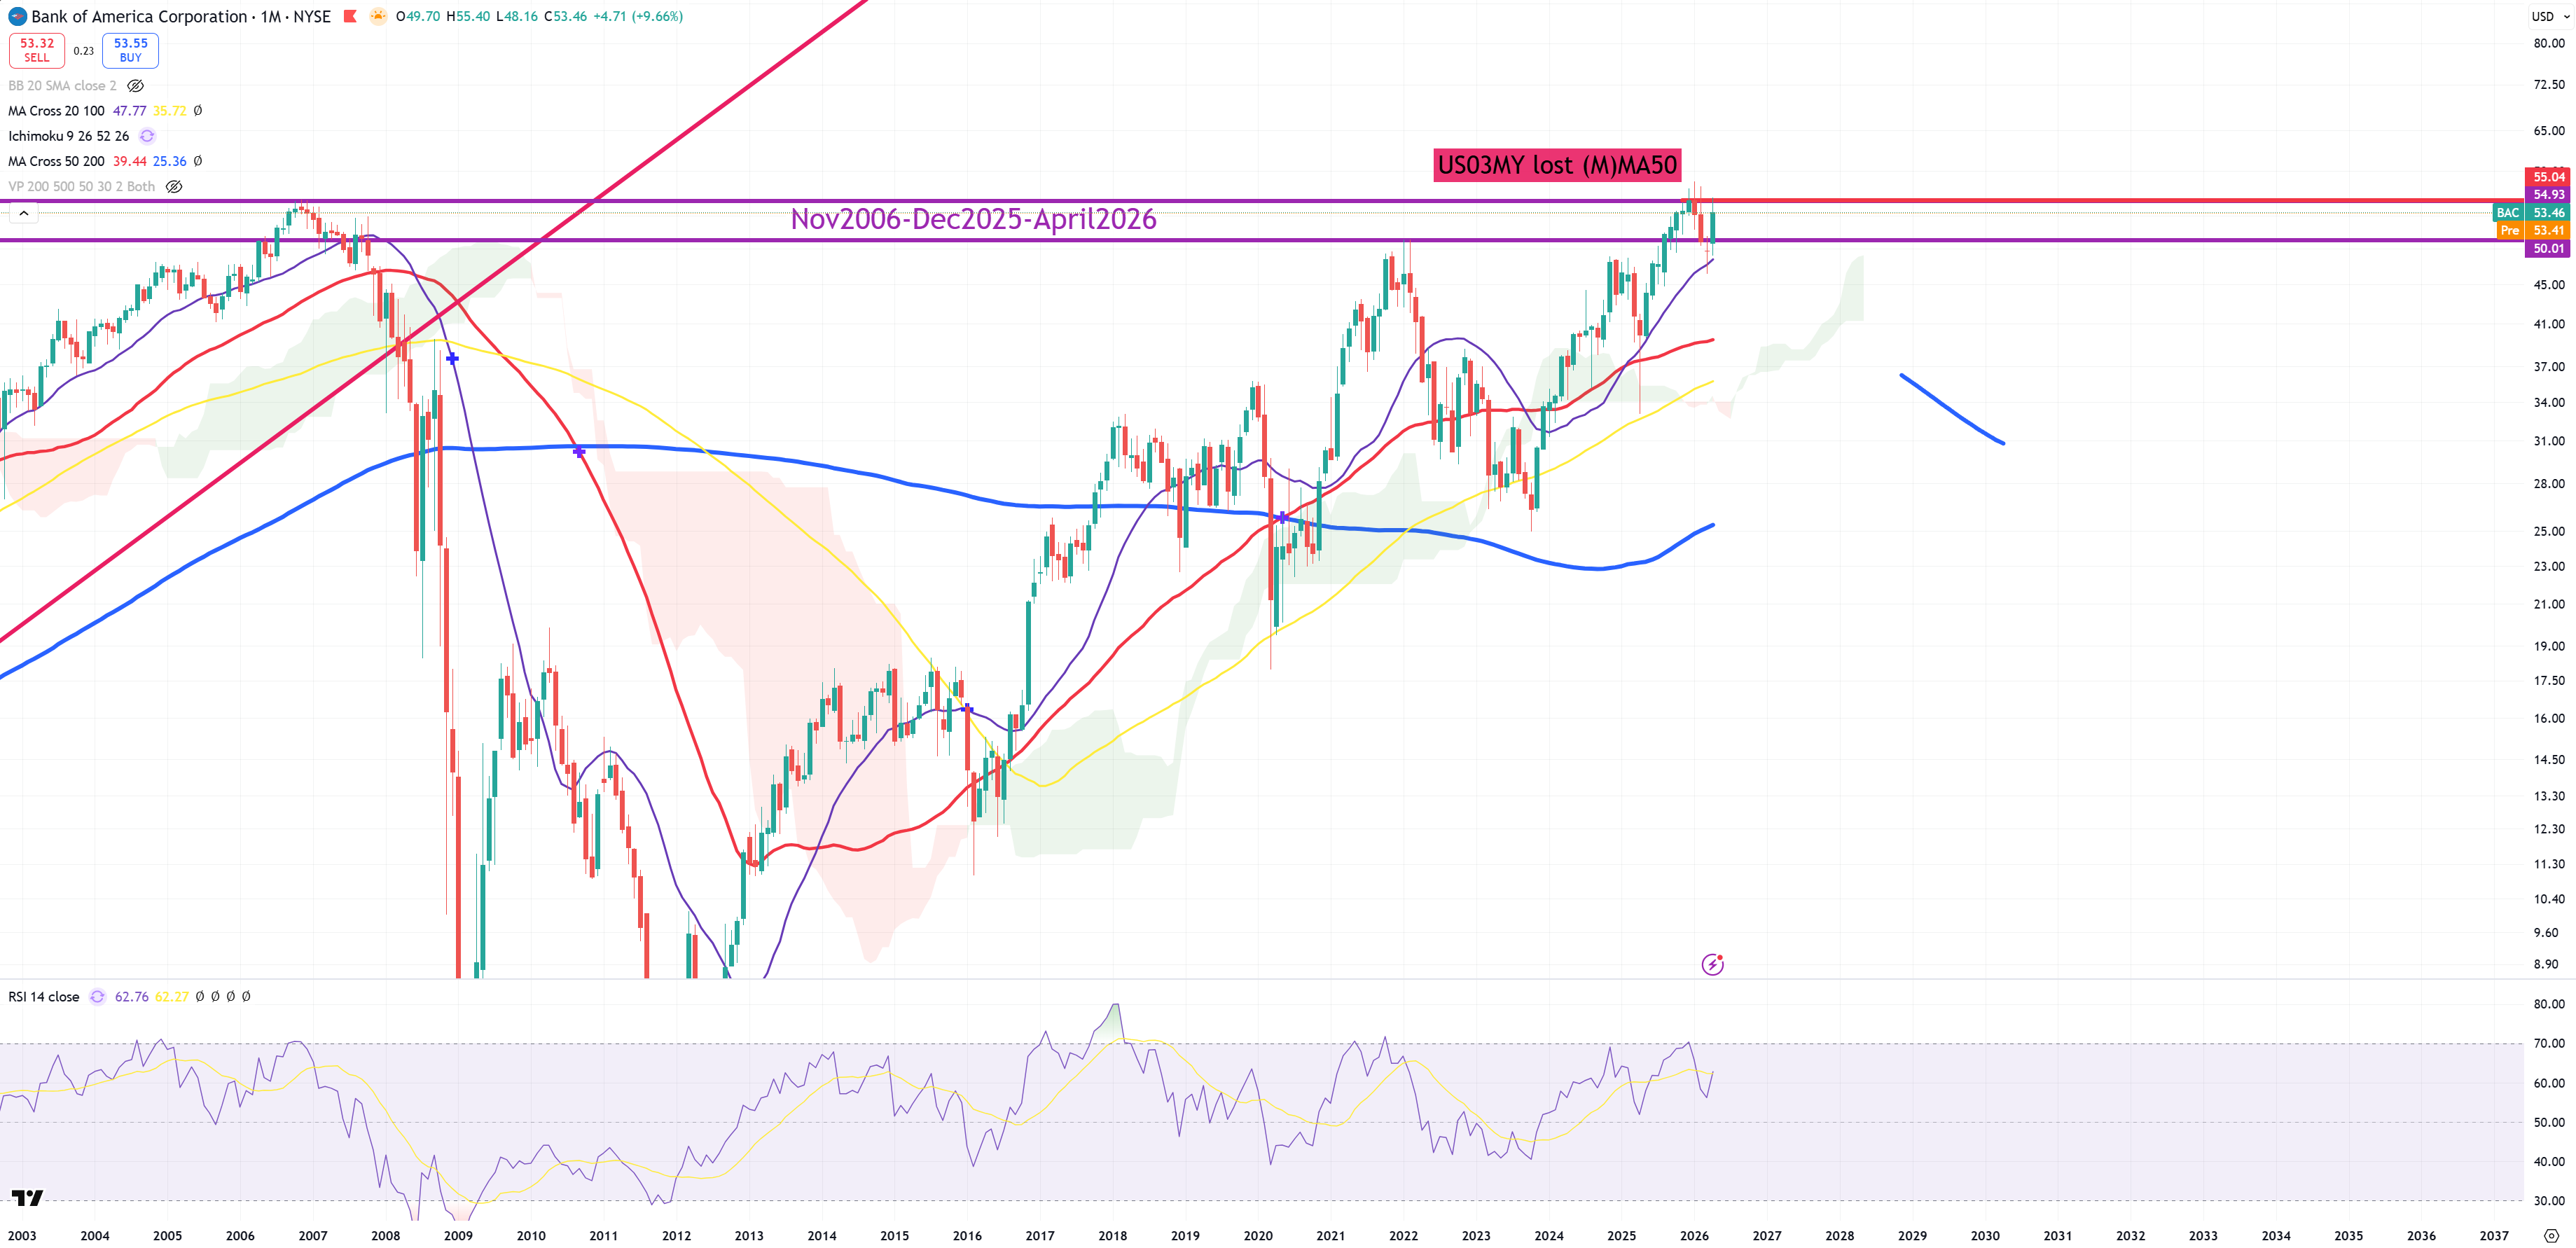
BAC – this chart connects so far all dots. Key resistance level = US03MY key moment :
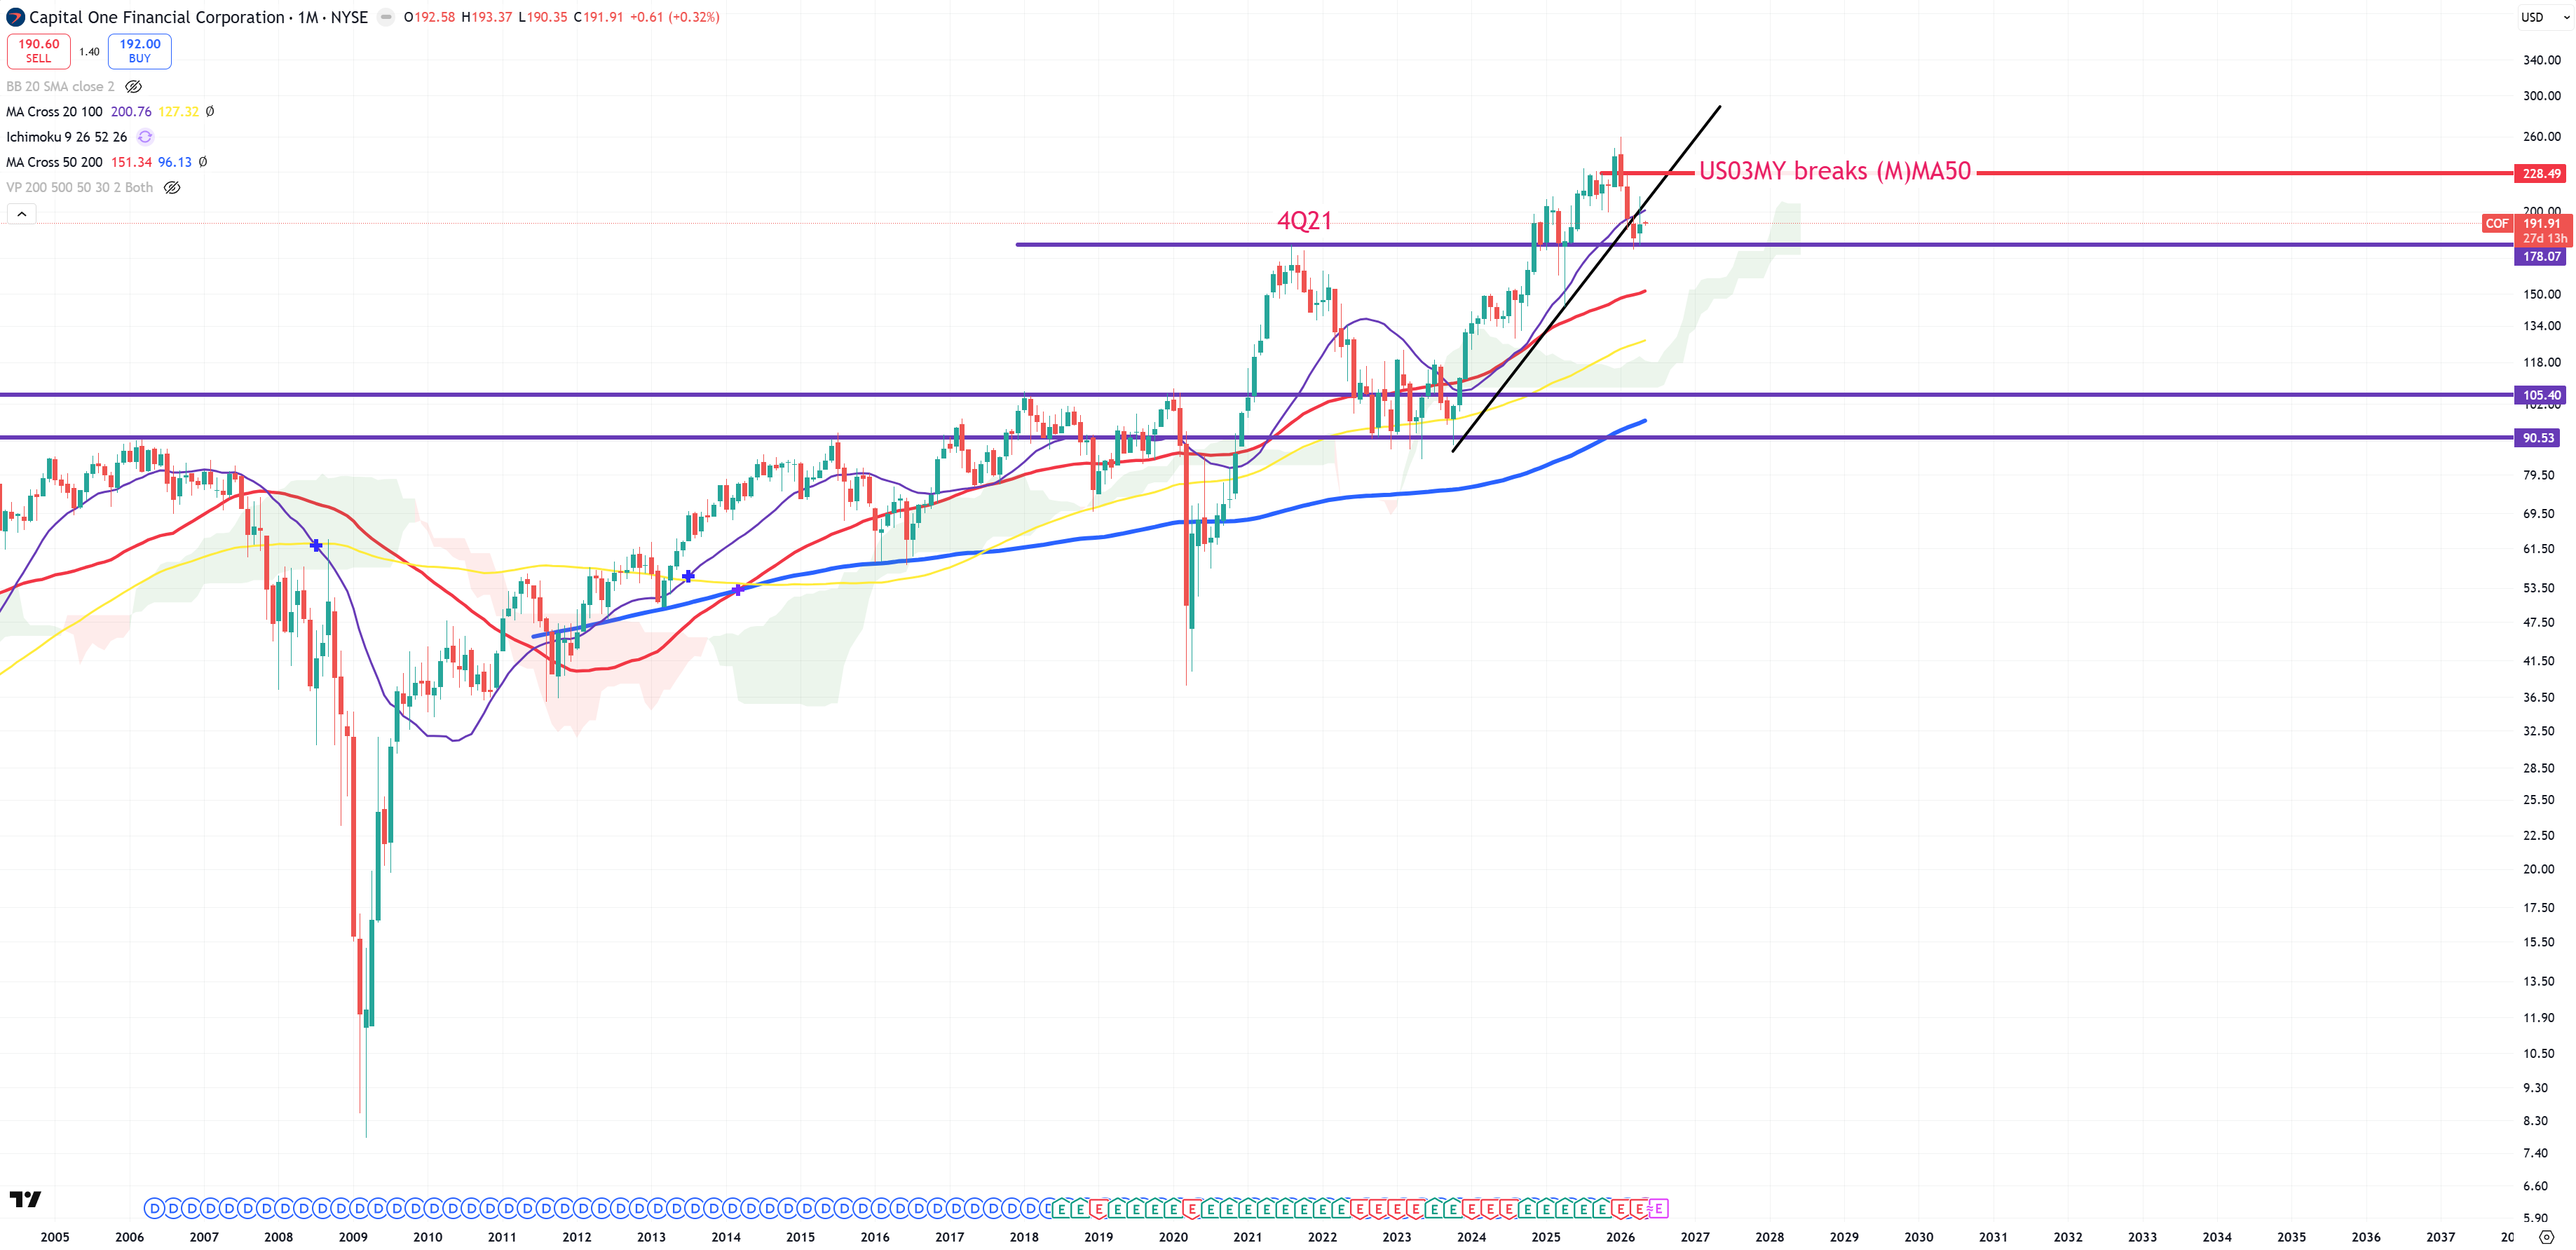
COF – that’s a bank which I observe probably the most, when it’ll manage to jump below 4Q21 level.
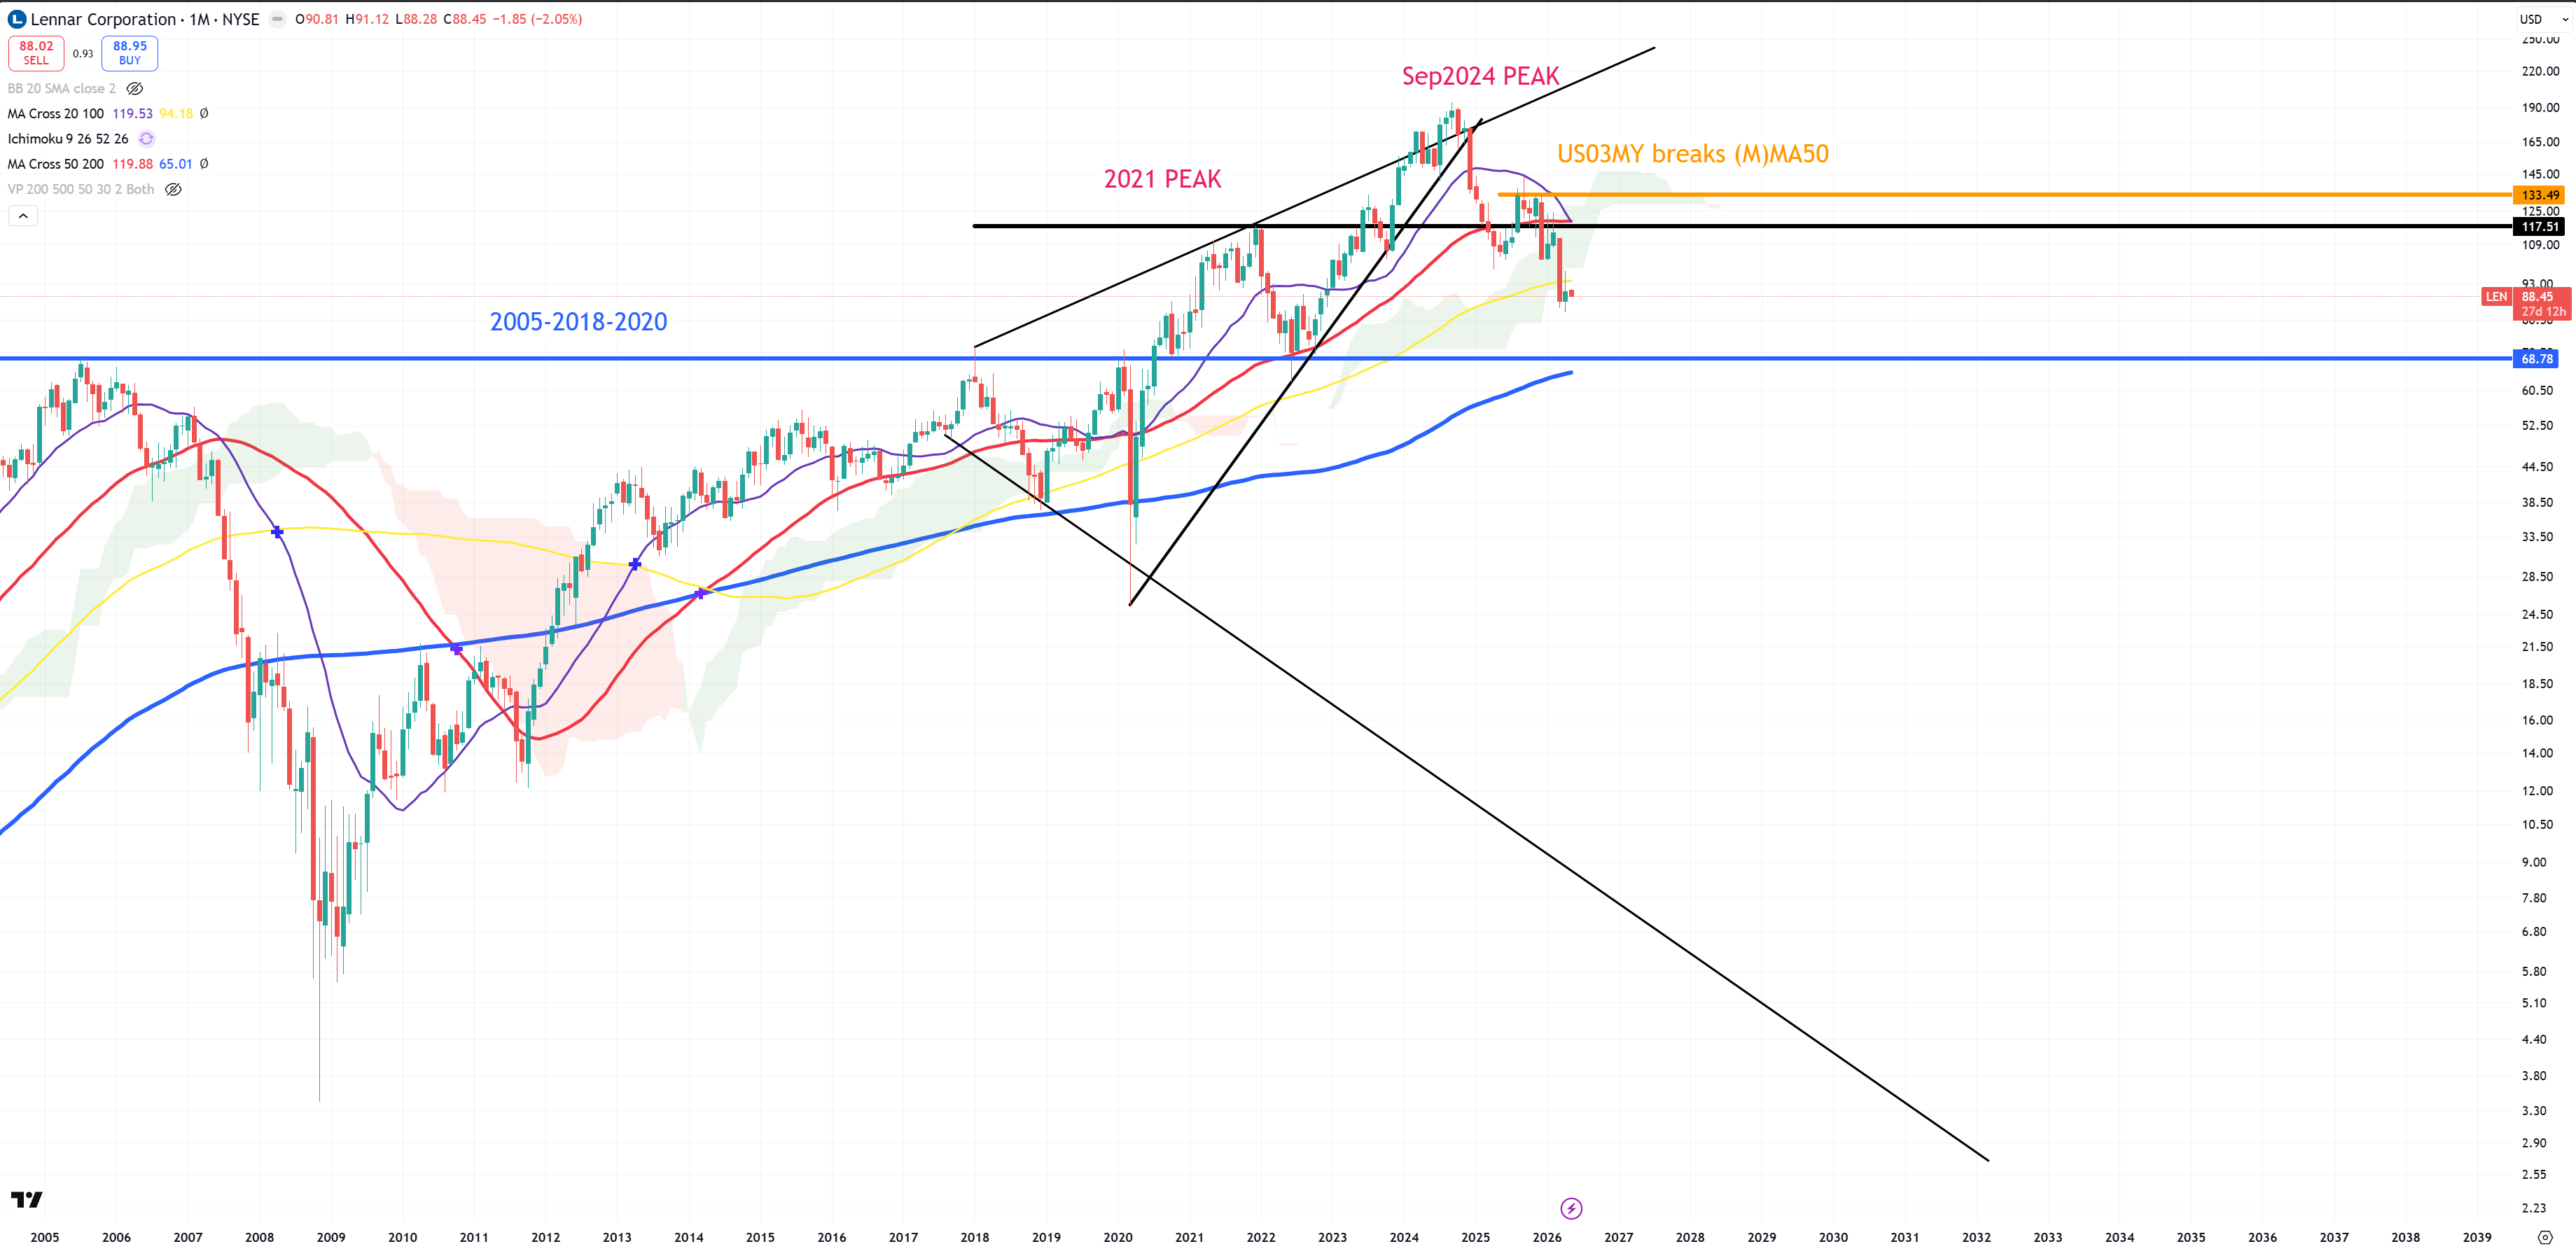
LEN – Key homebuilder – it’s very bad here :
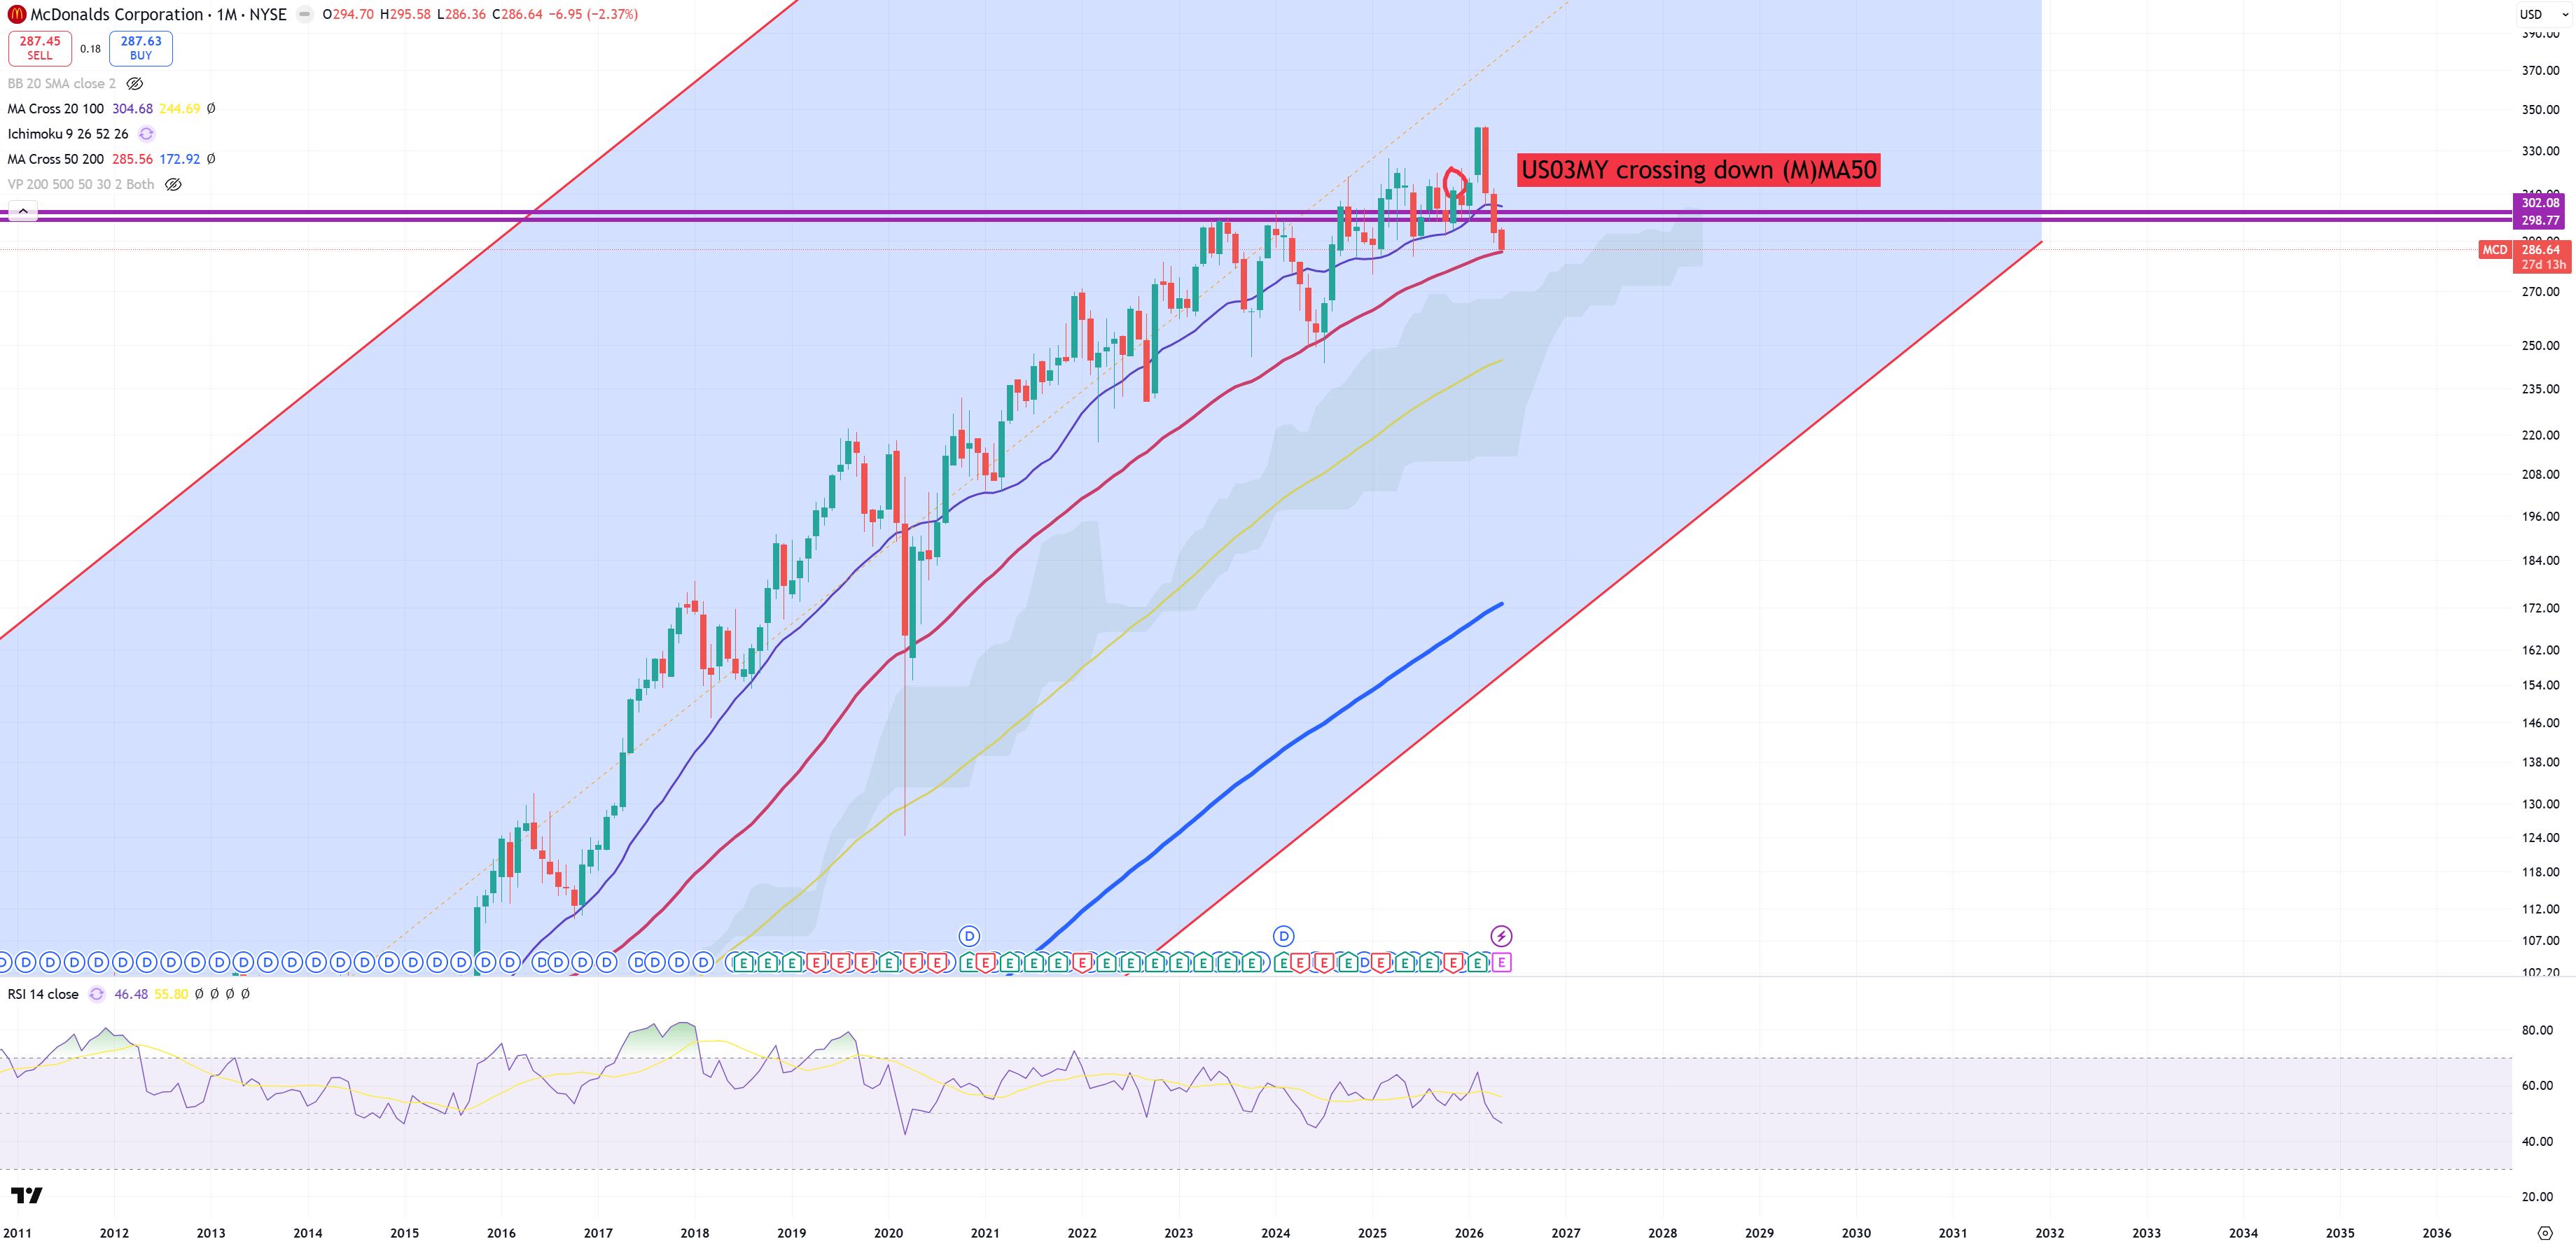
MCD back below key level and approaching towards (M)MA50
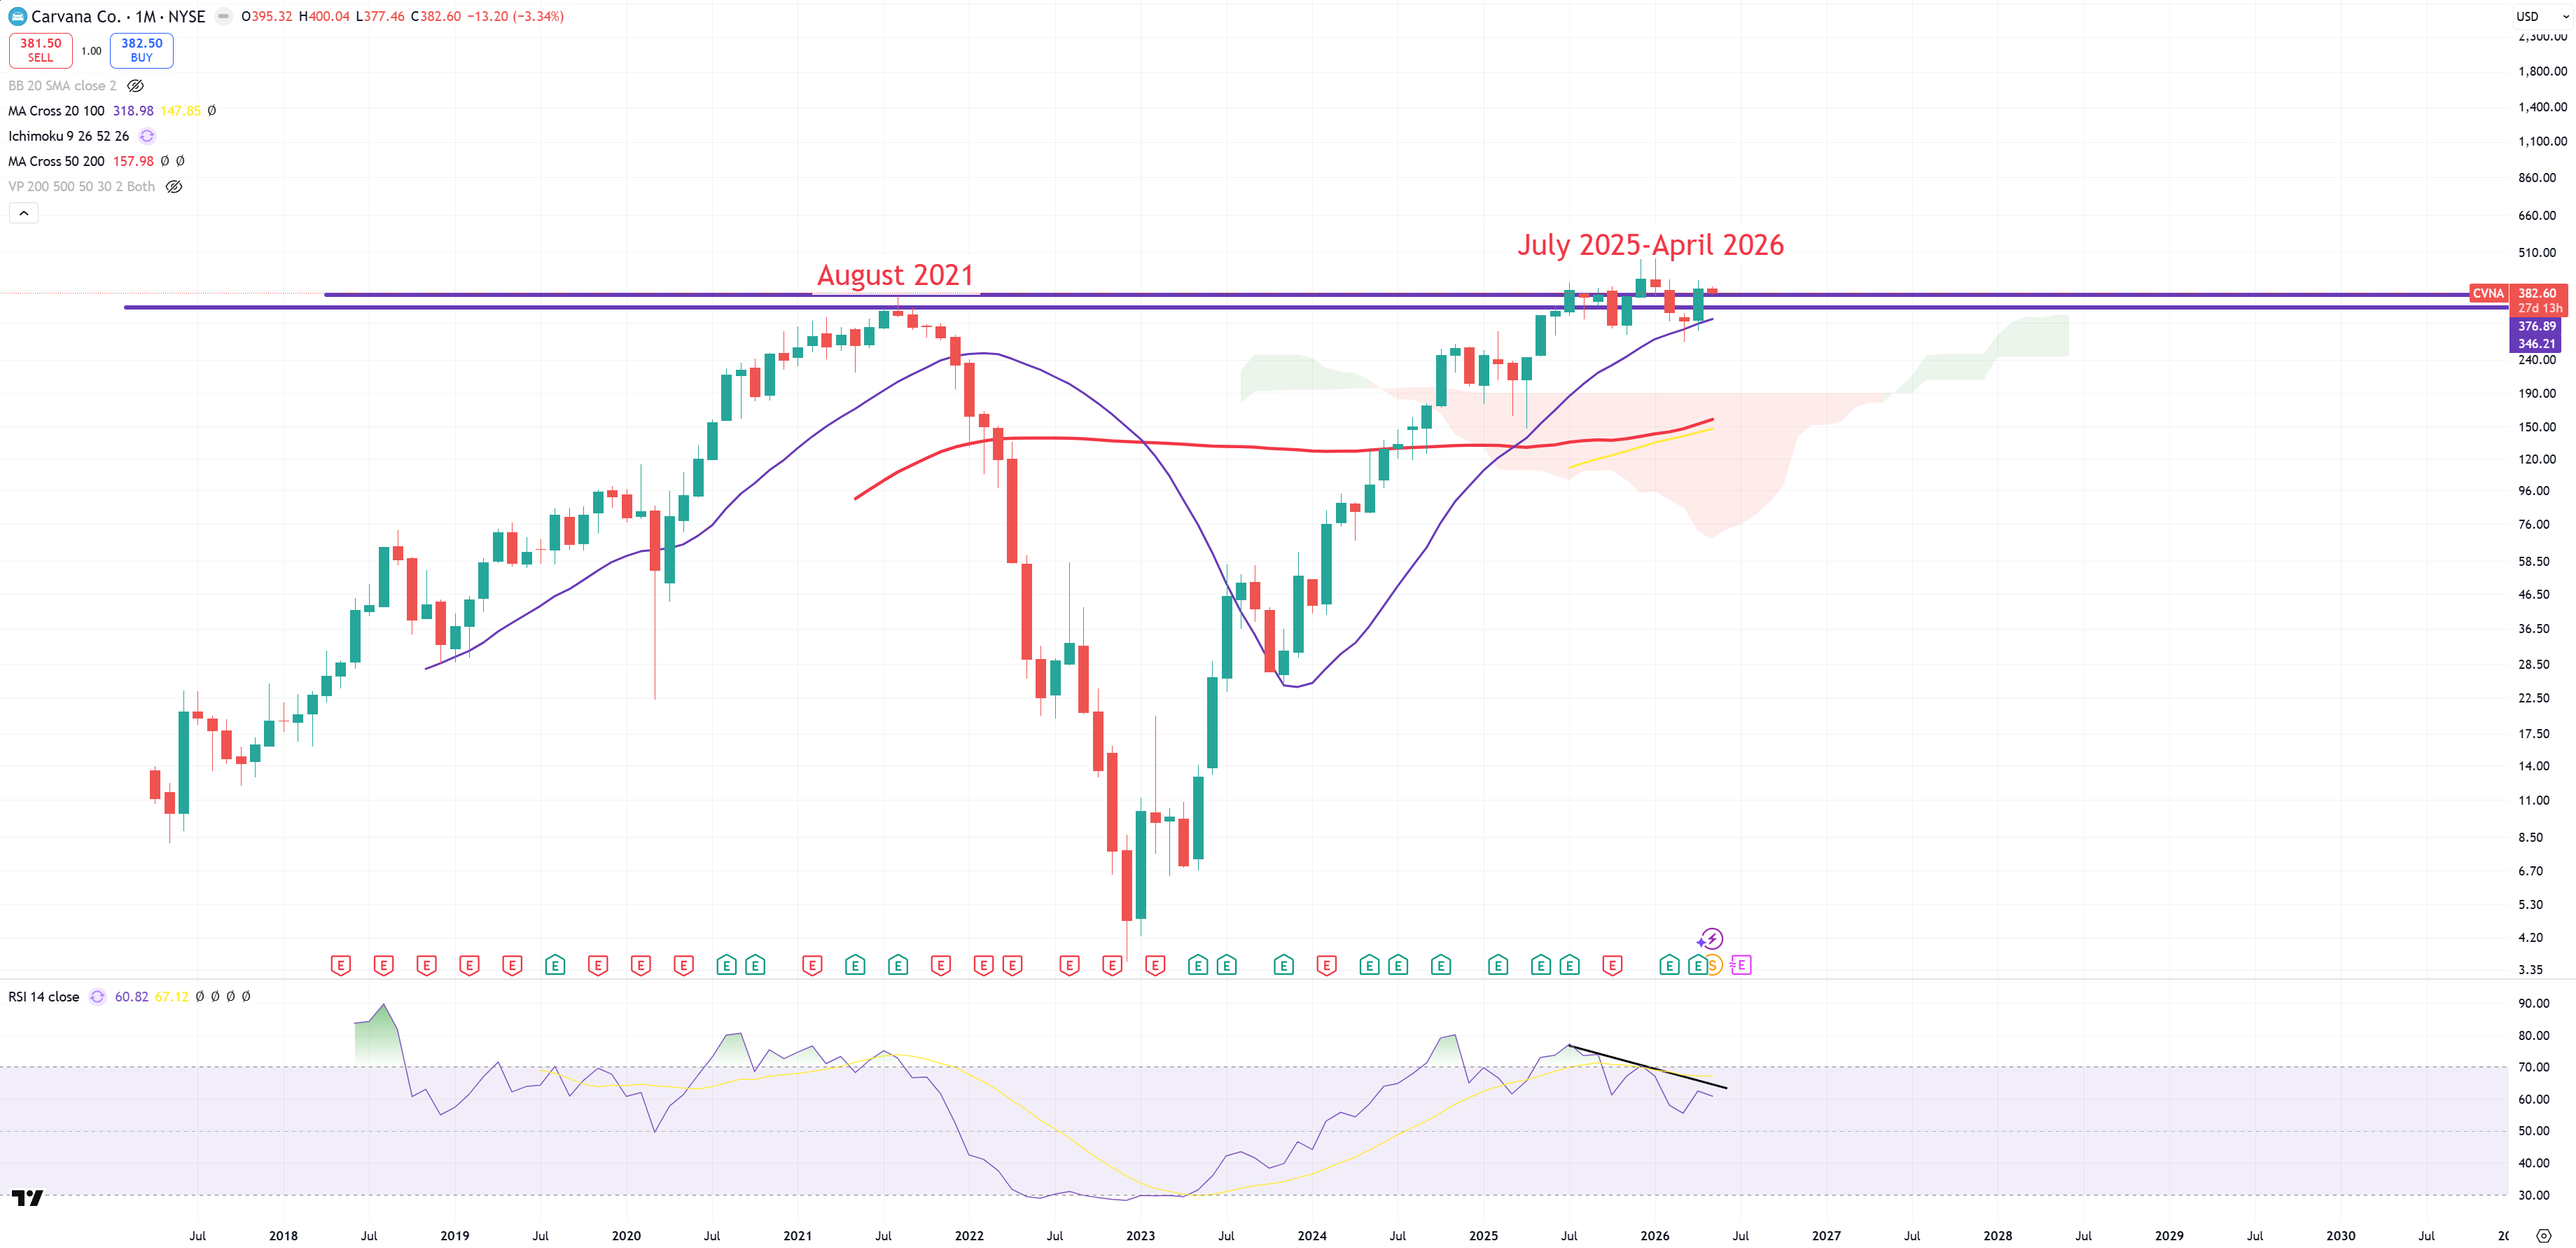
CVNA – also rotating around 2021 peak, it now takes like 1 year almost
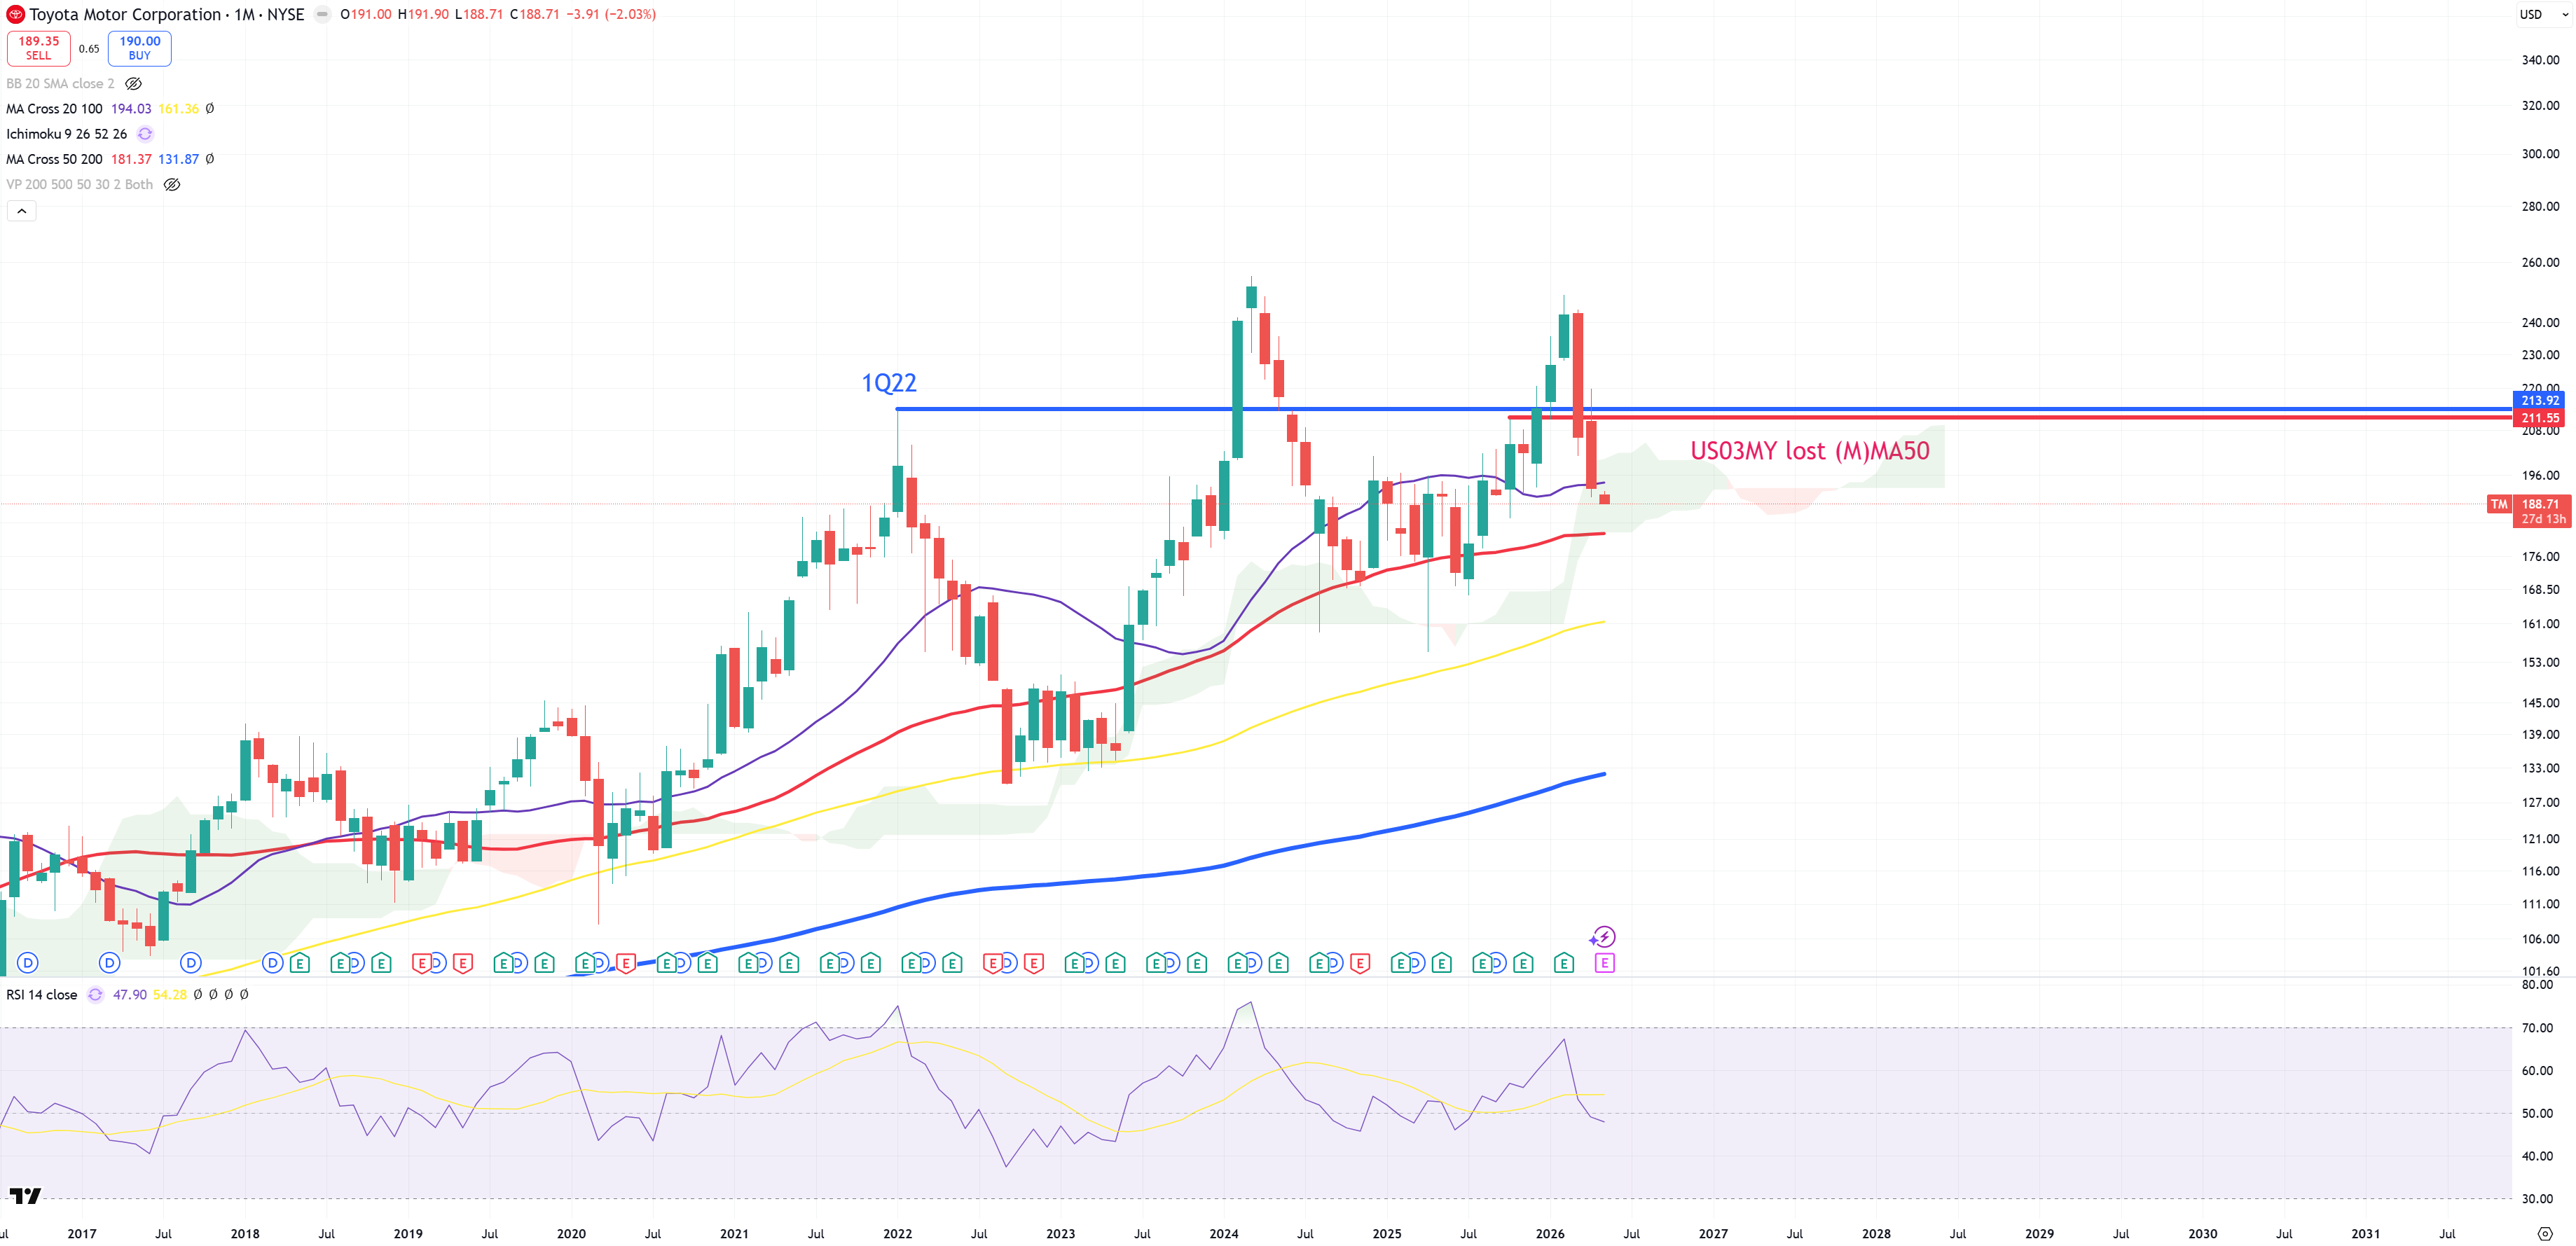
TM – Toyota – not much to see here so far.
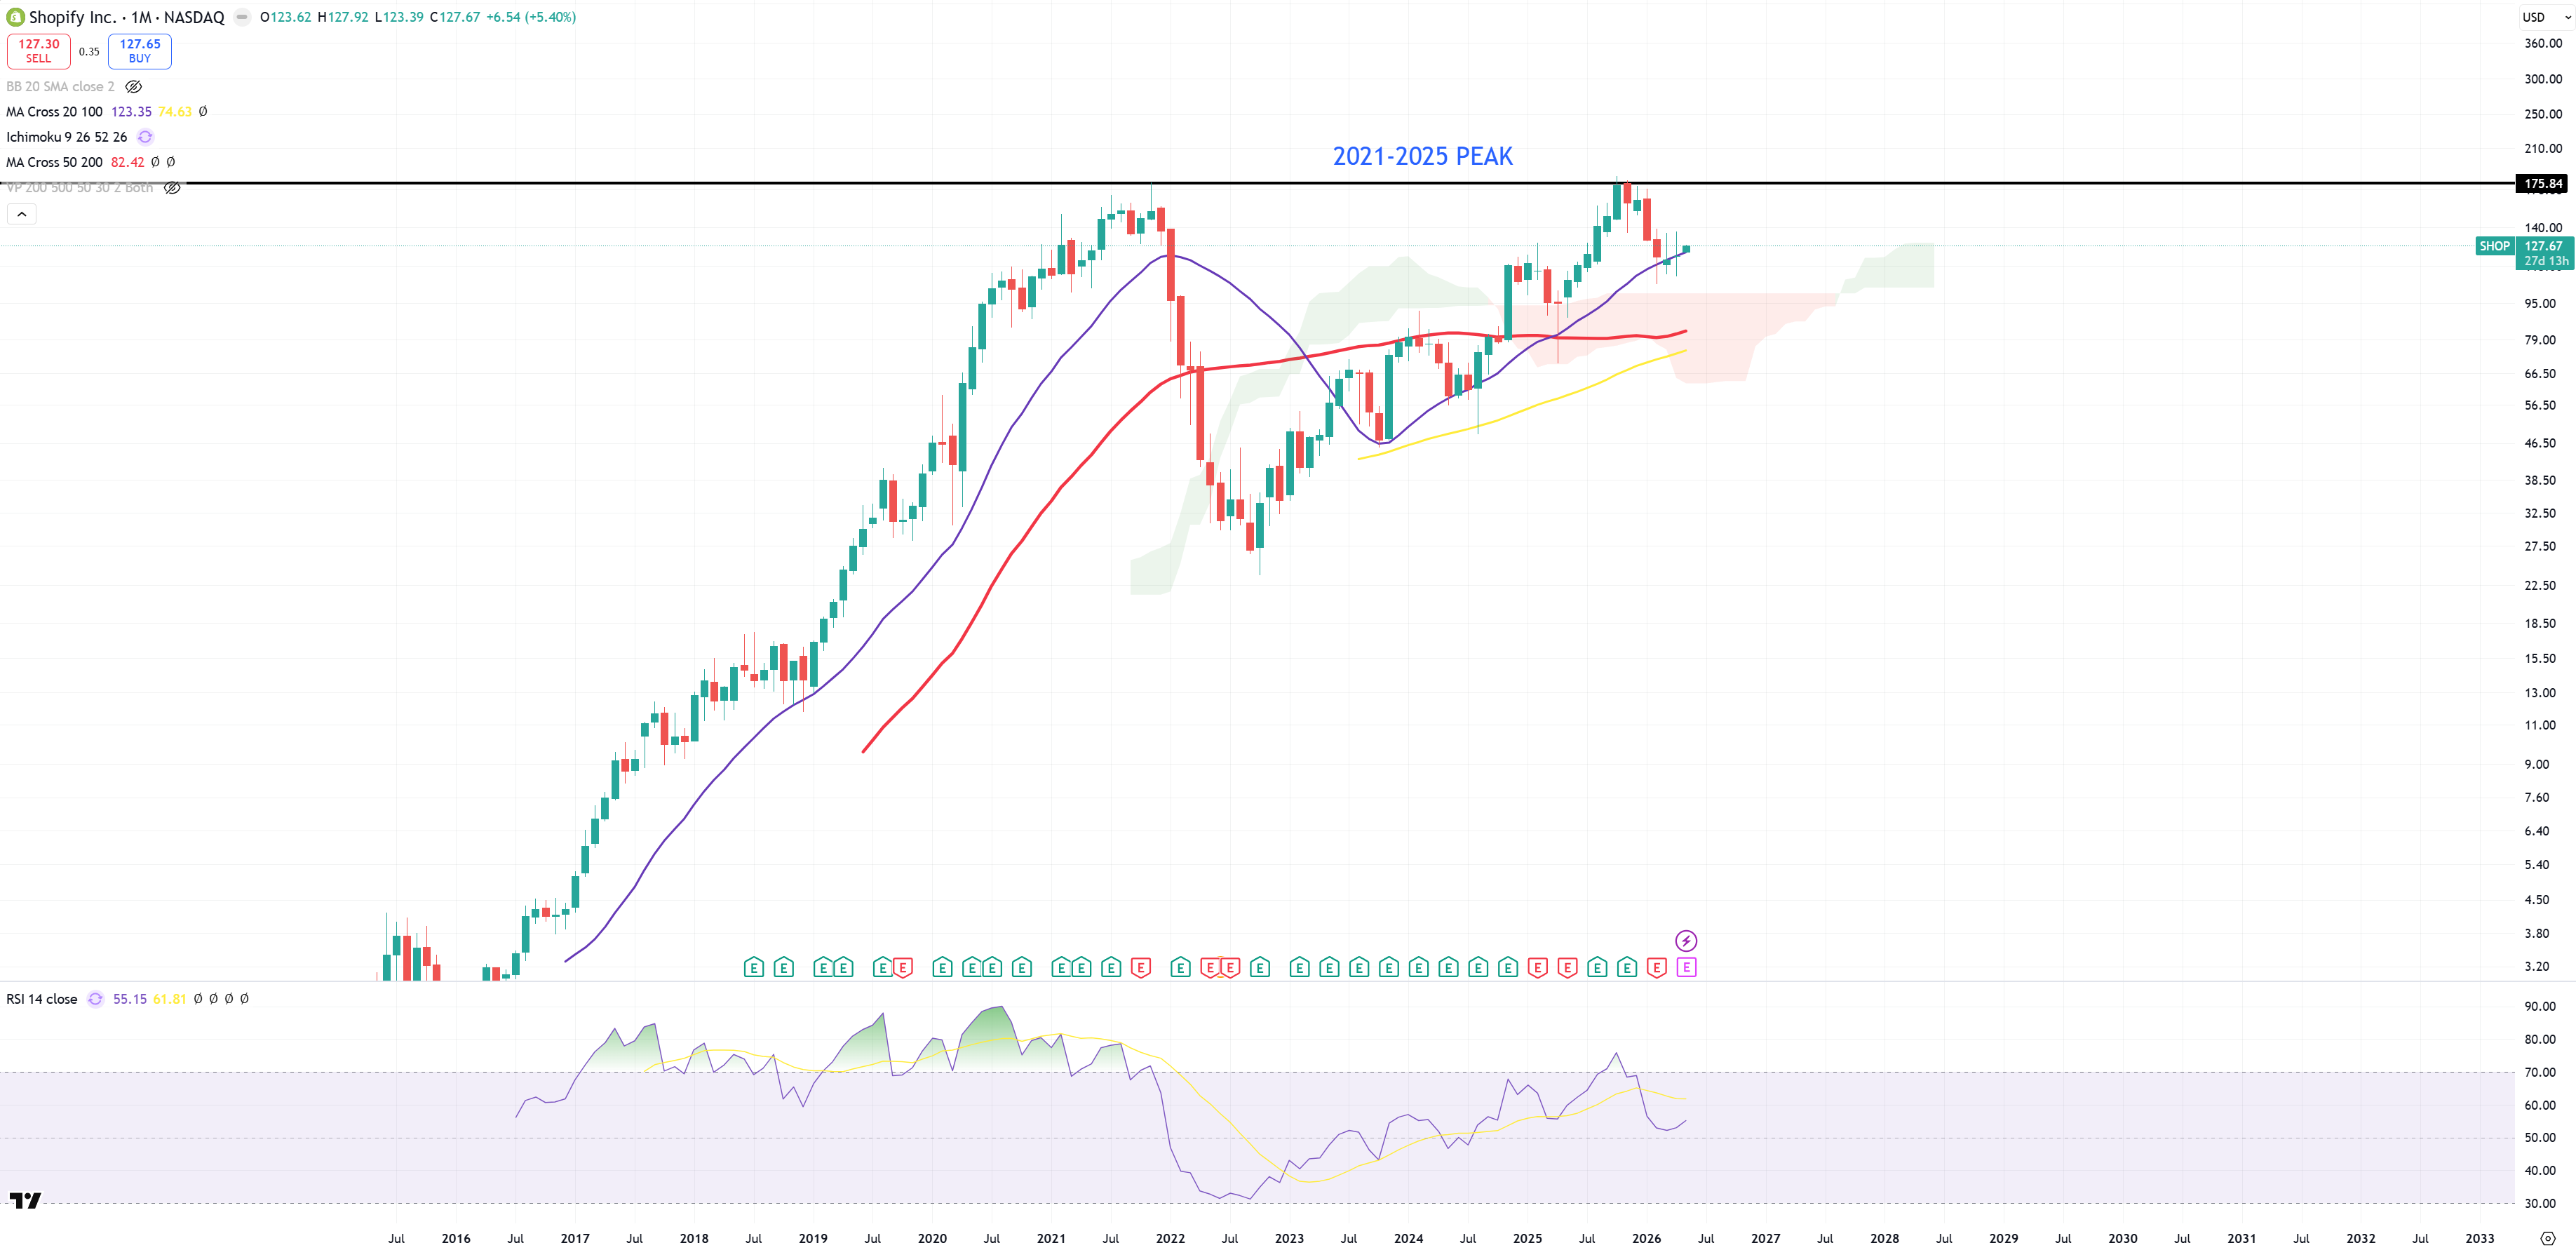
SHOP – still holds (M)MA20 but below 2021 peak
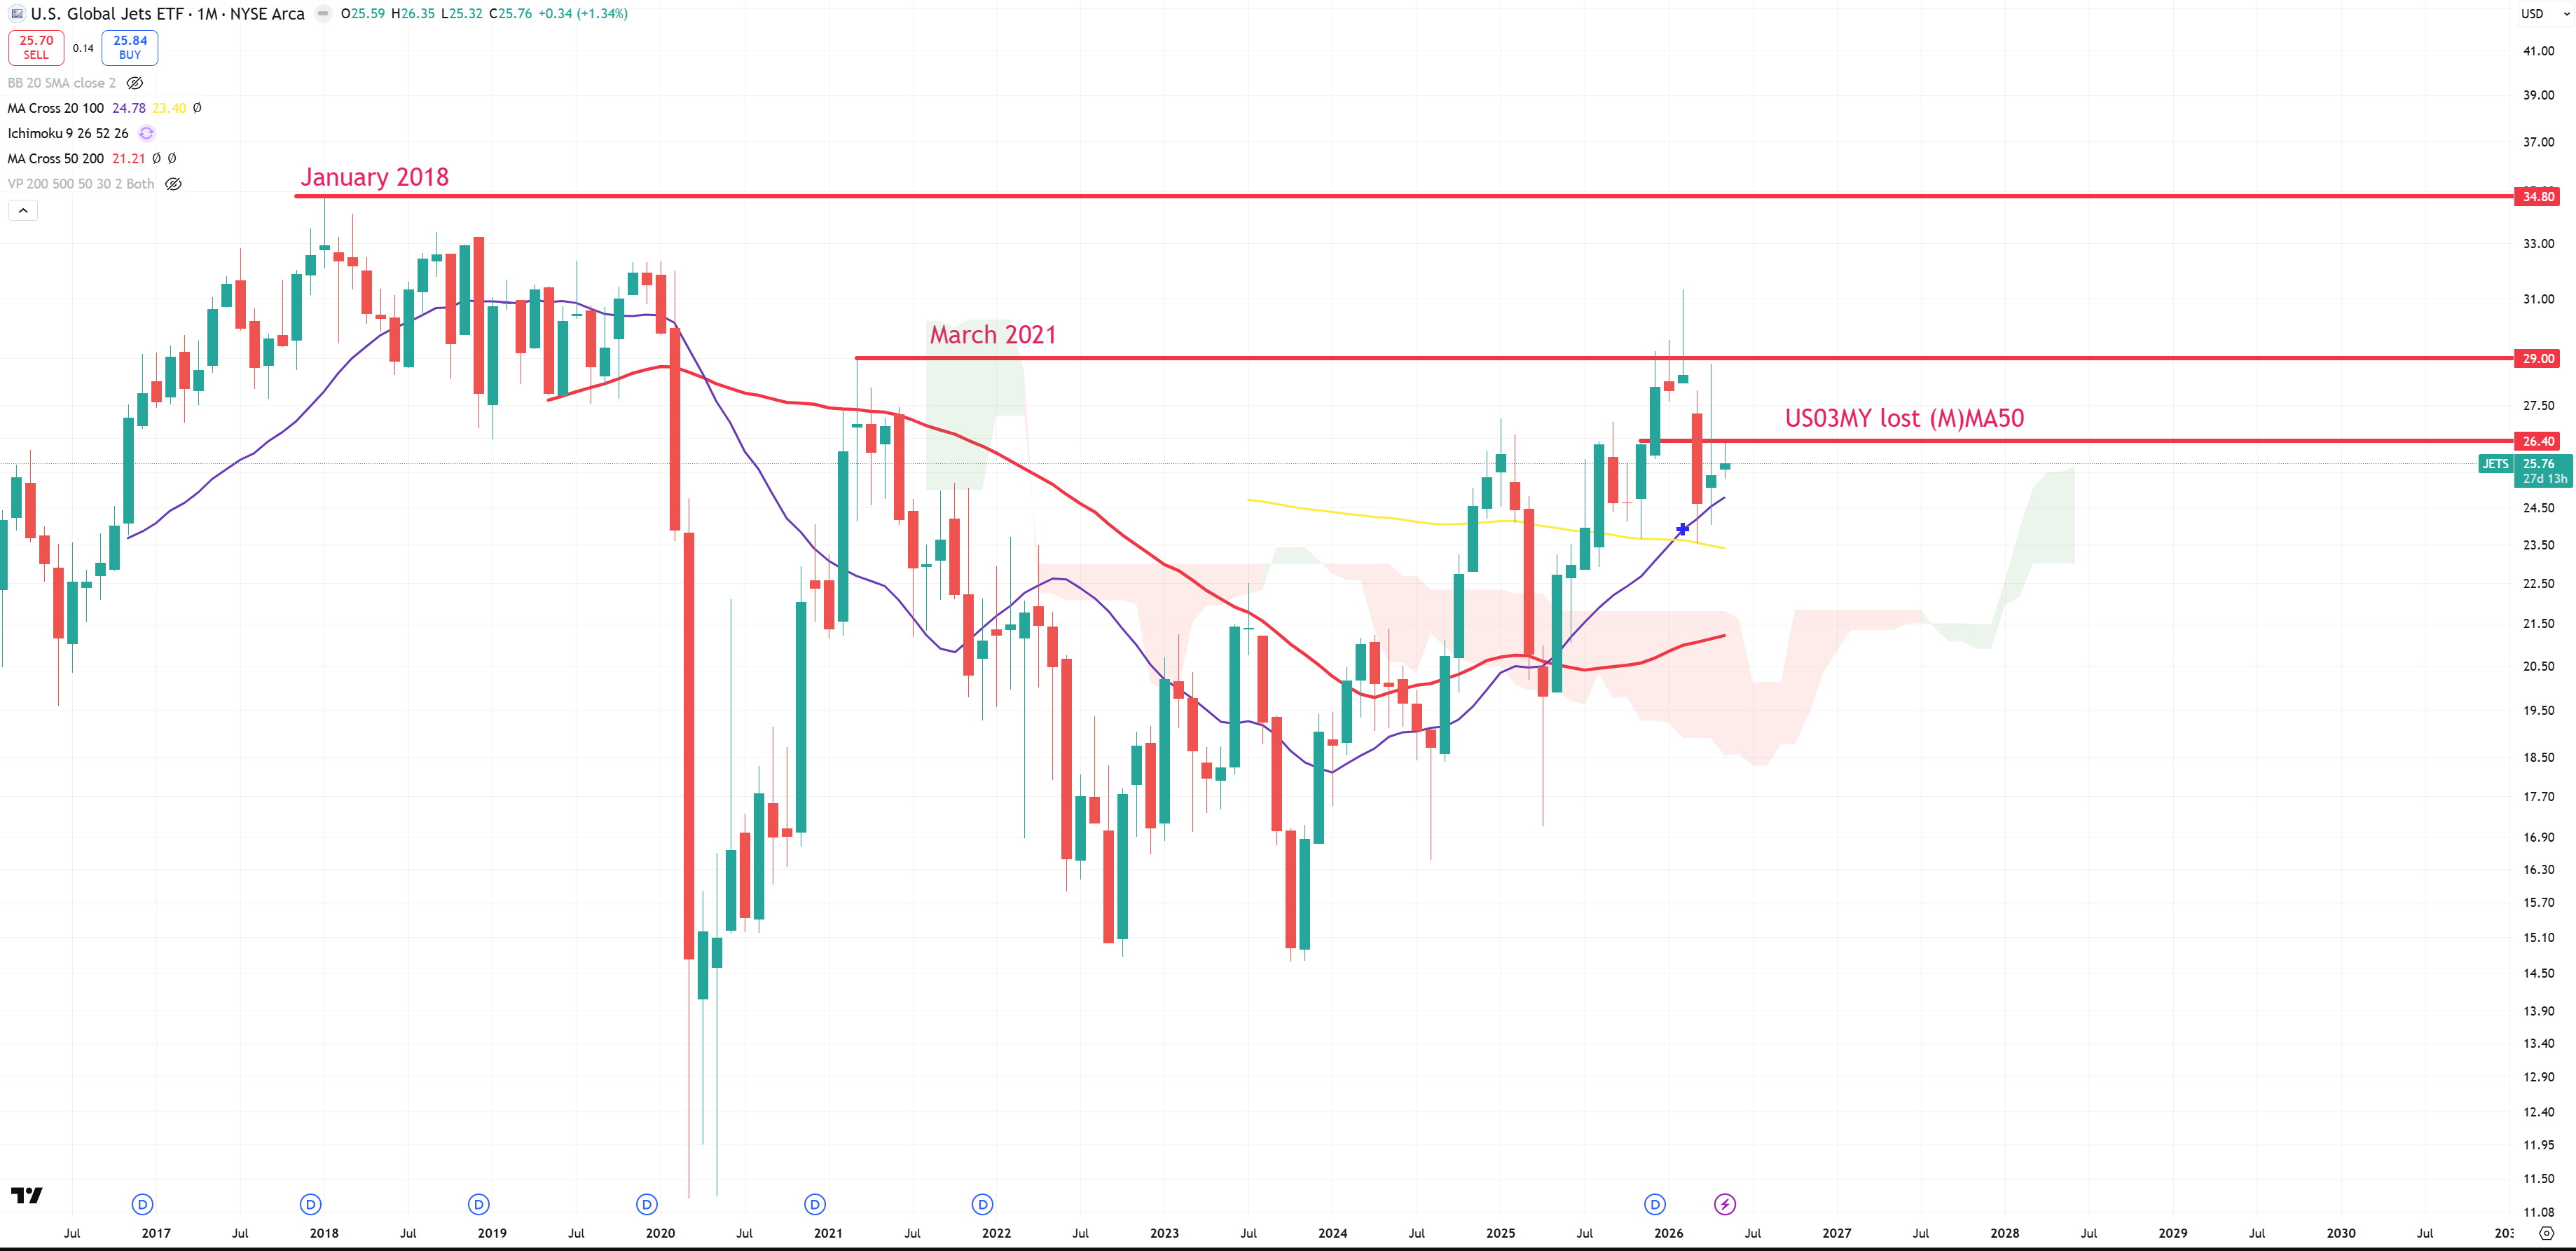
JETS – Global Airlines
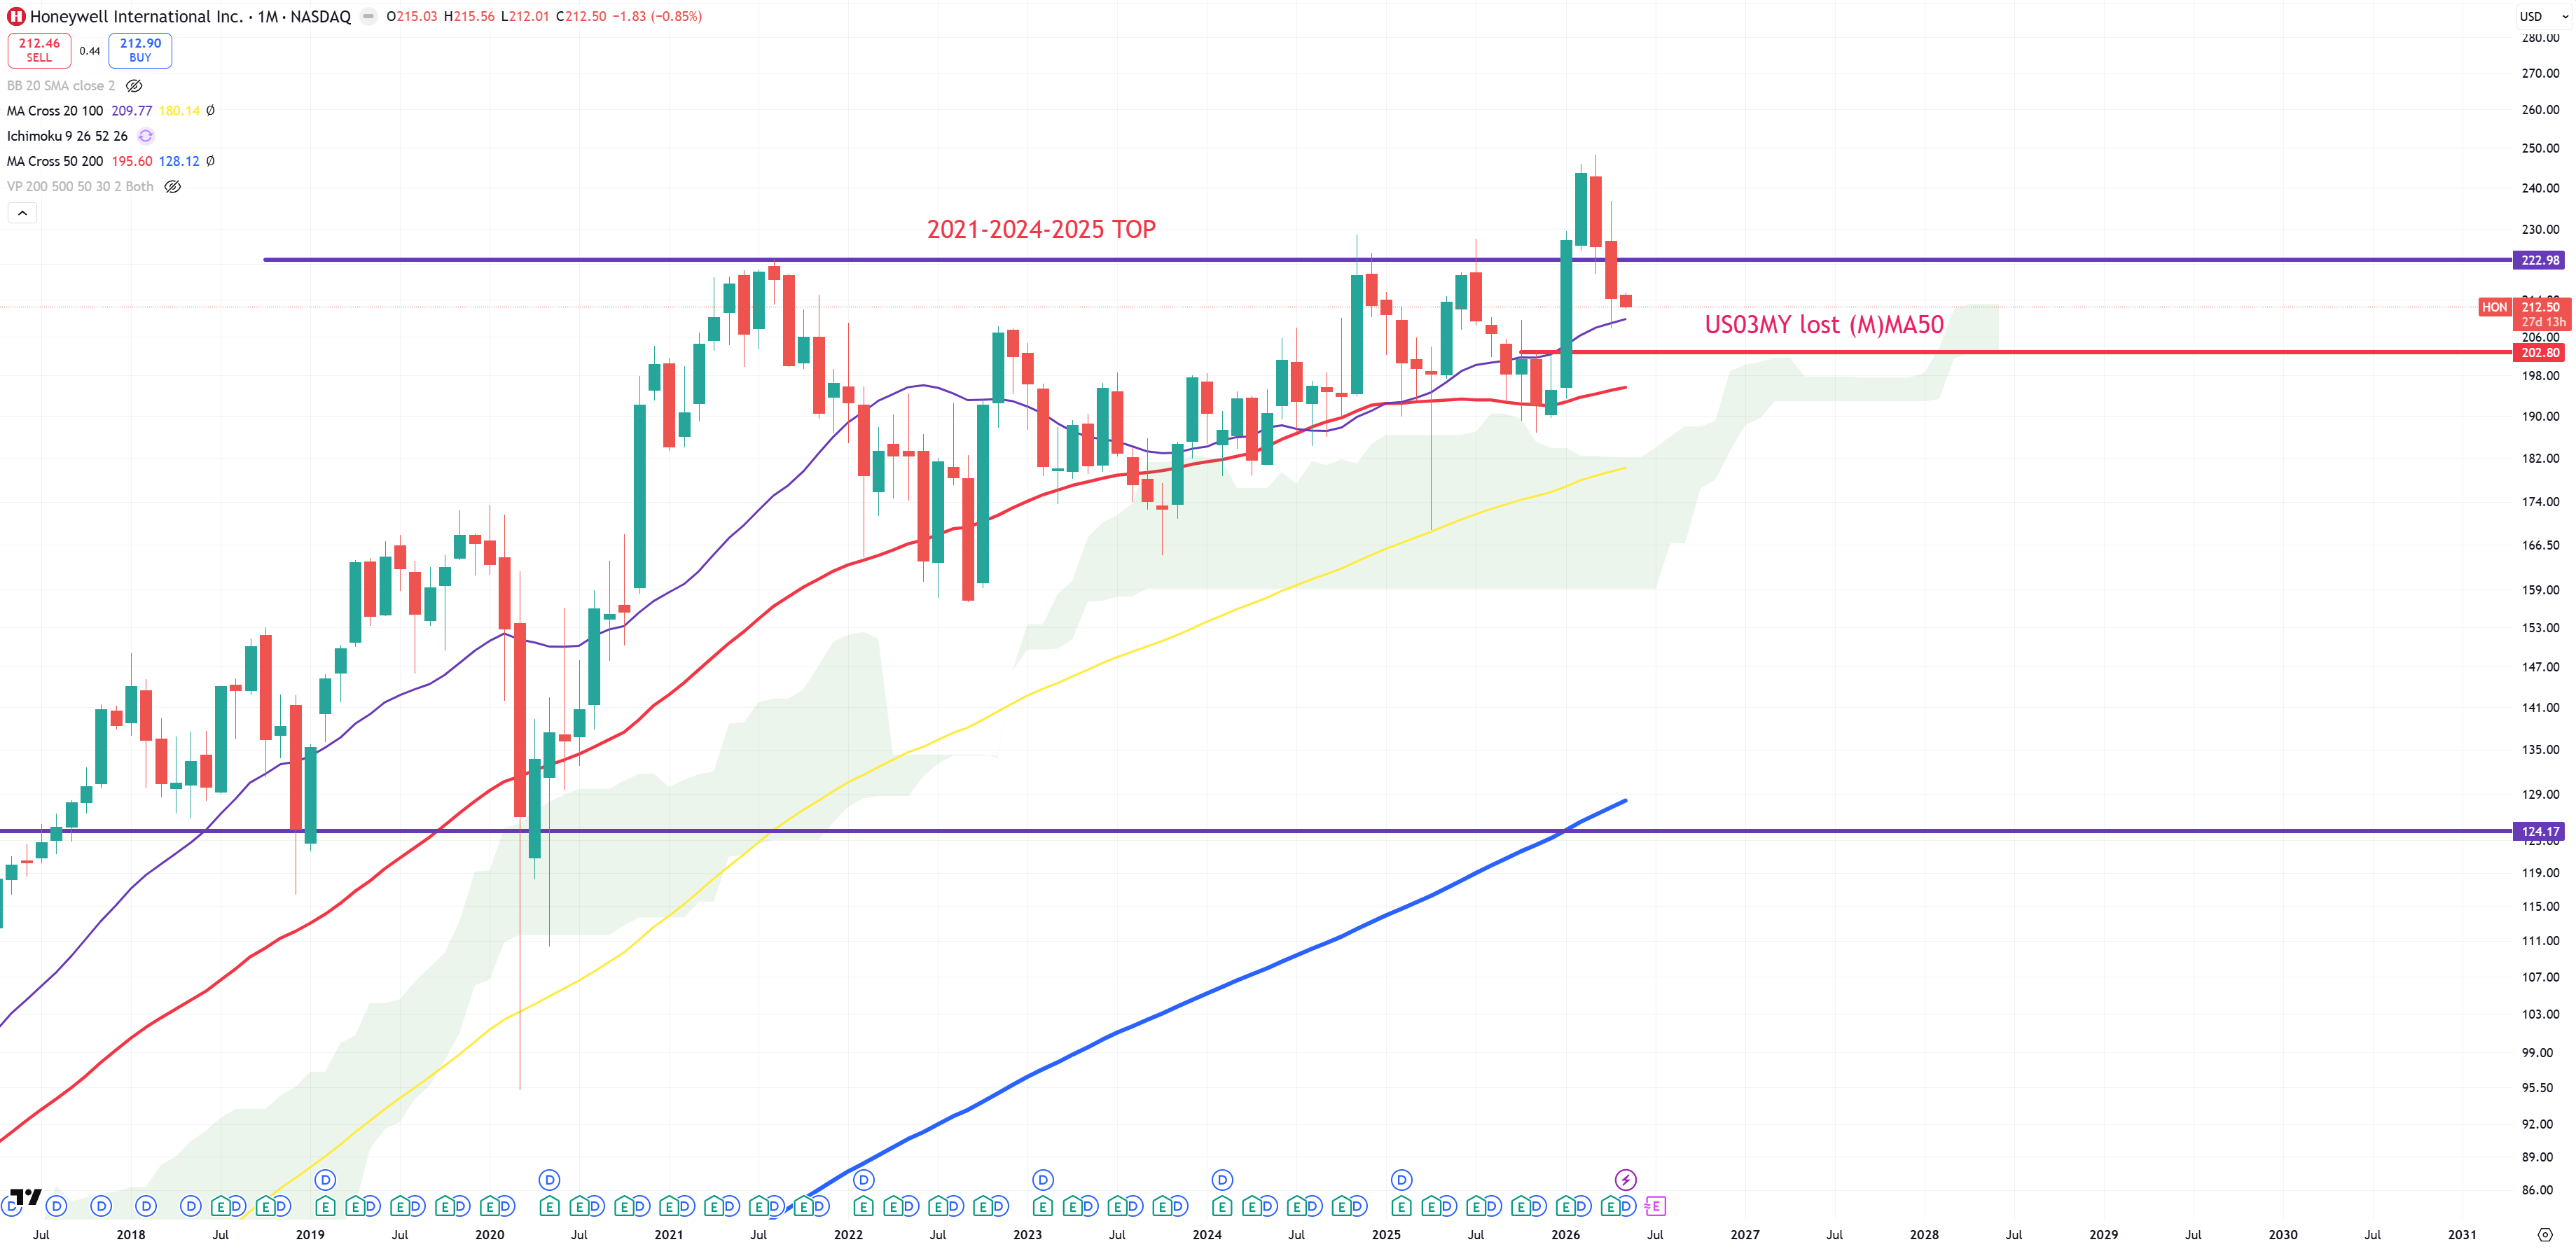
HON – Honeywell – nice trap above 2021 peak :
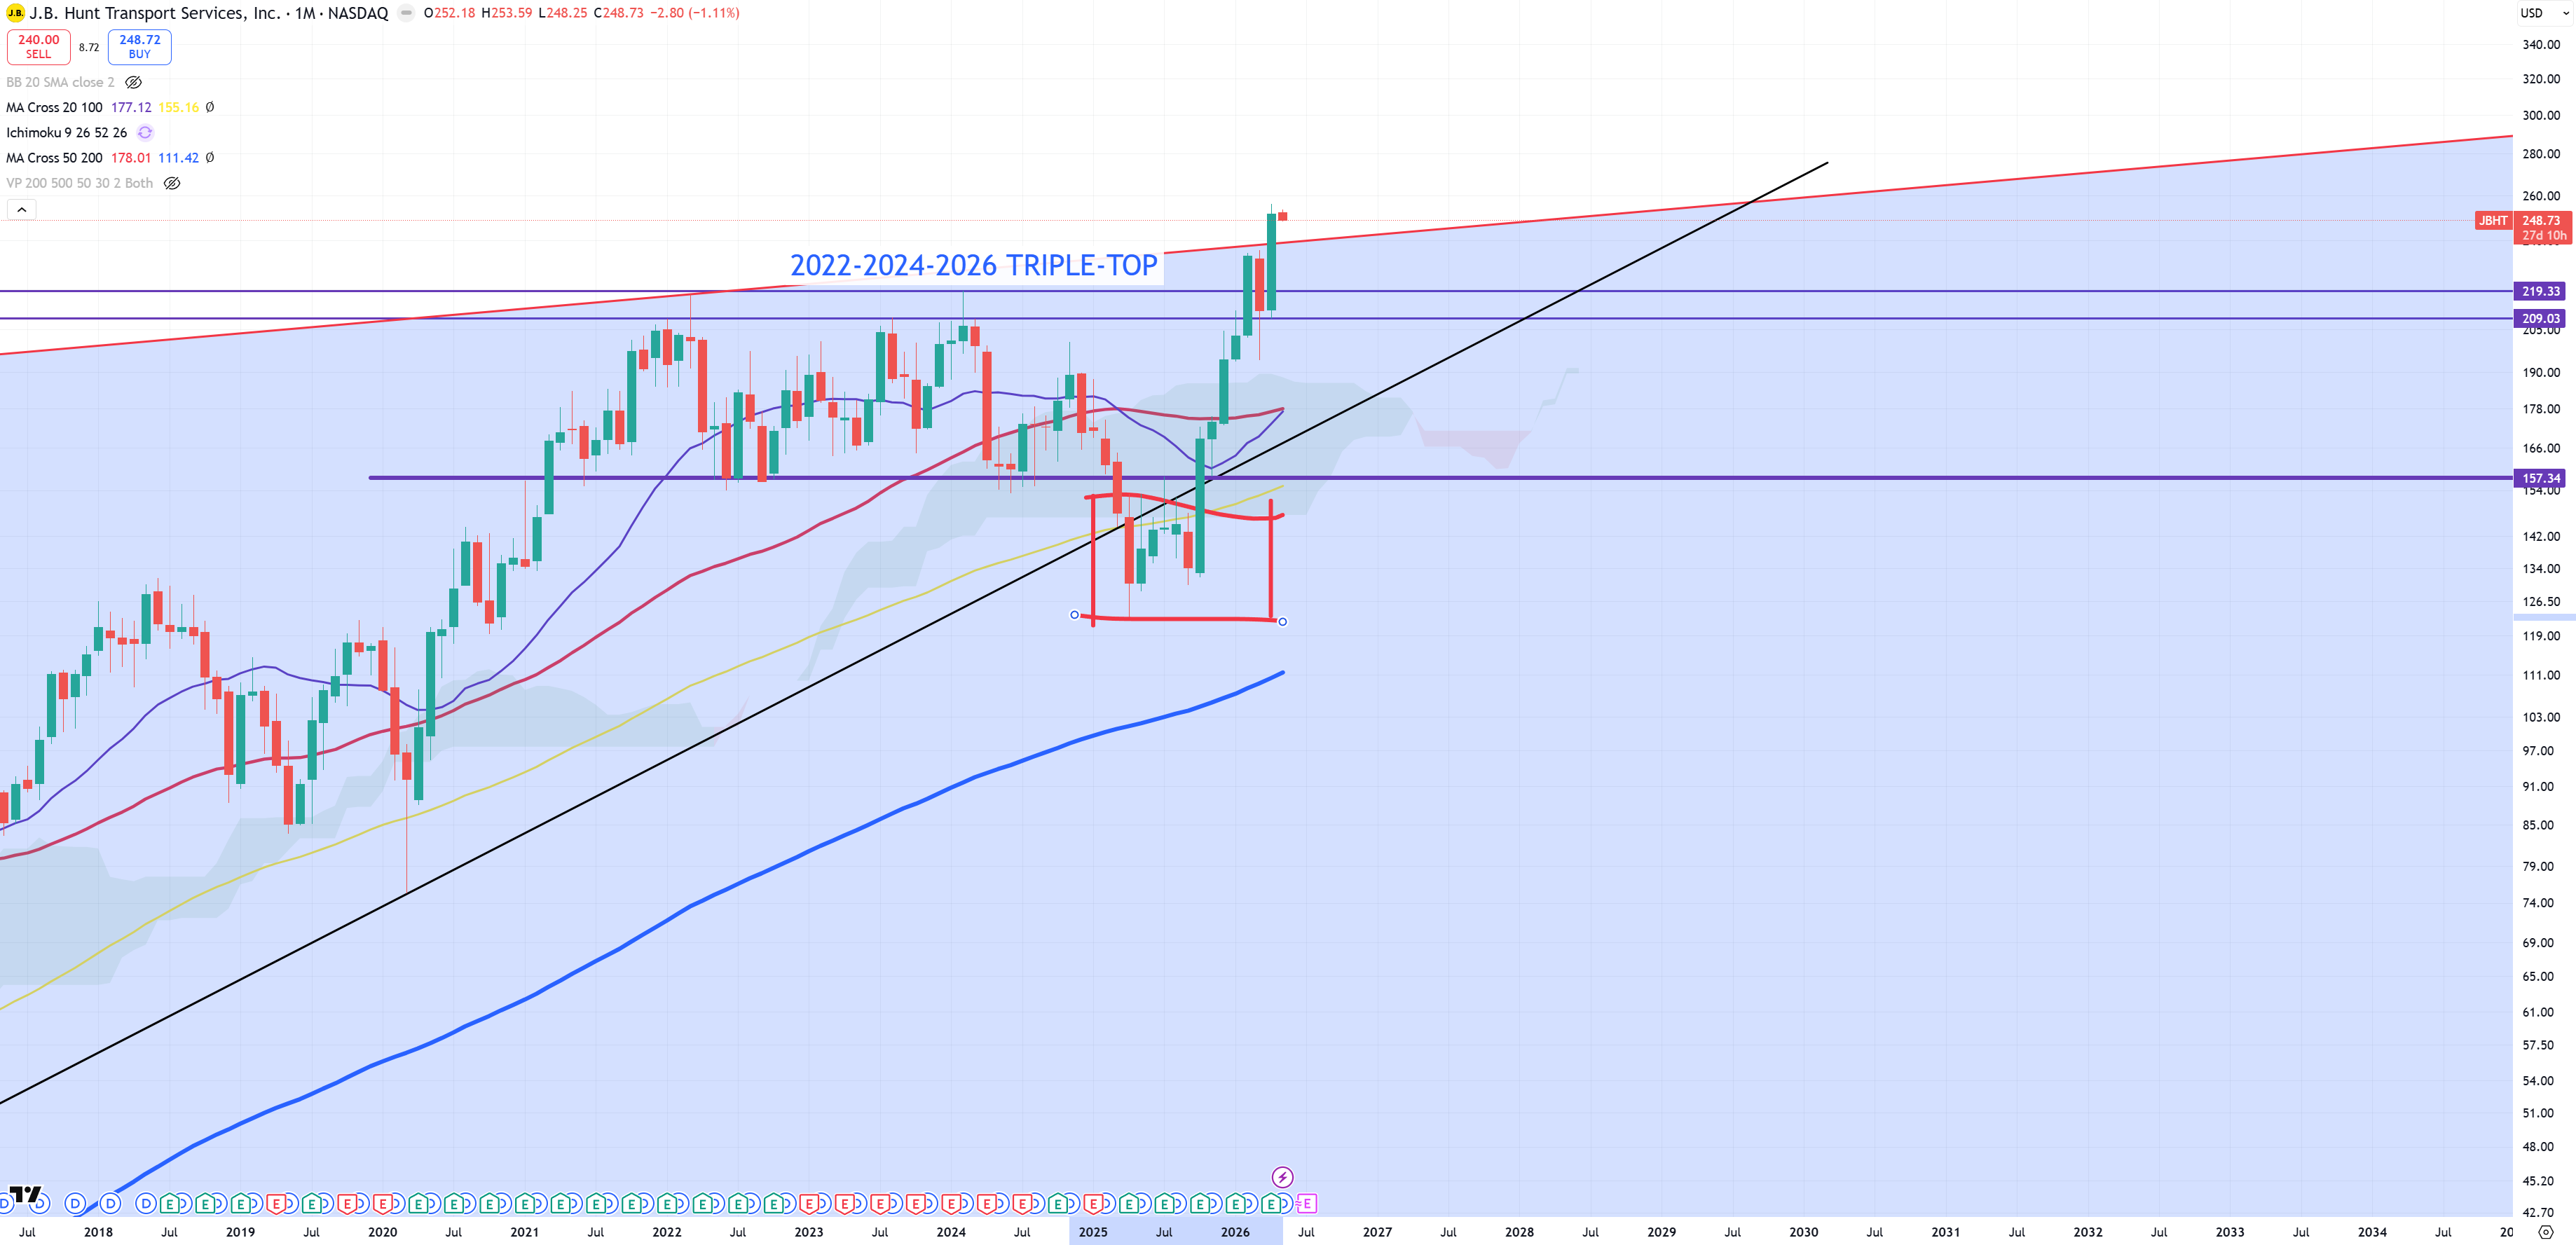
JBHT – So let’s call it transportation, there was a massive massive bear trap here. Not sure how this last move was related with CAR move up, but anyway it’s floating above key level
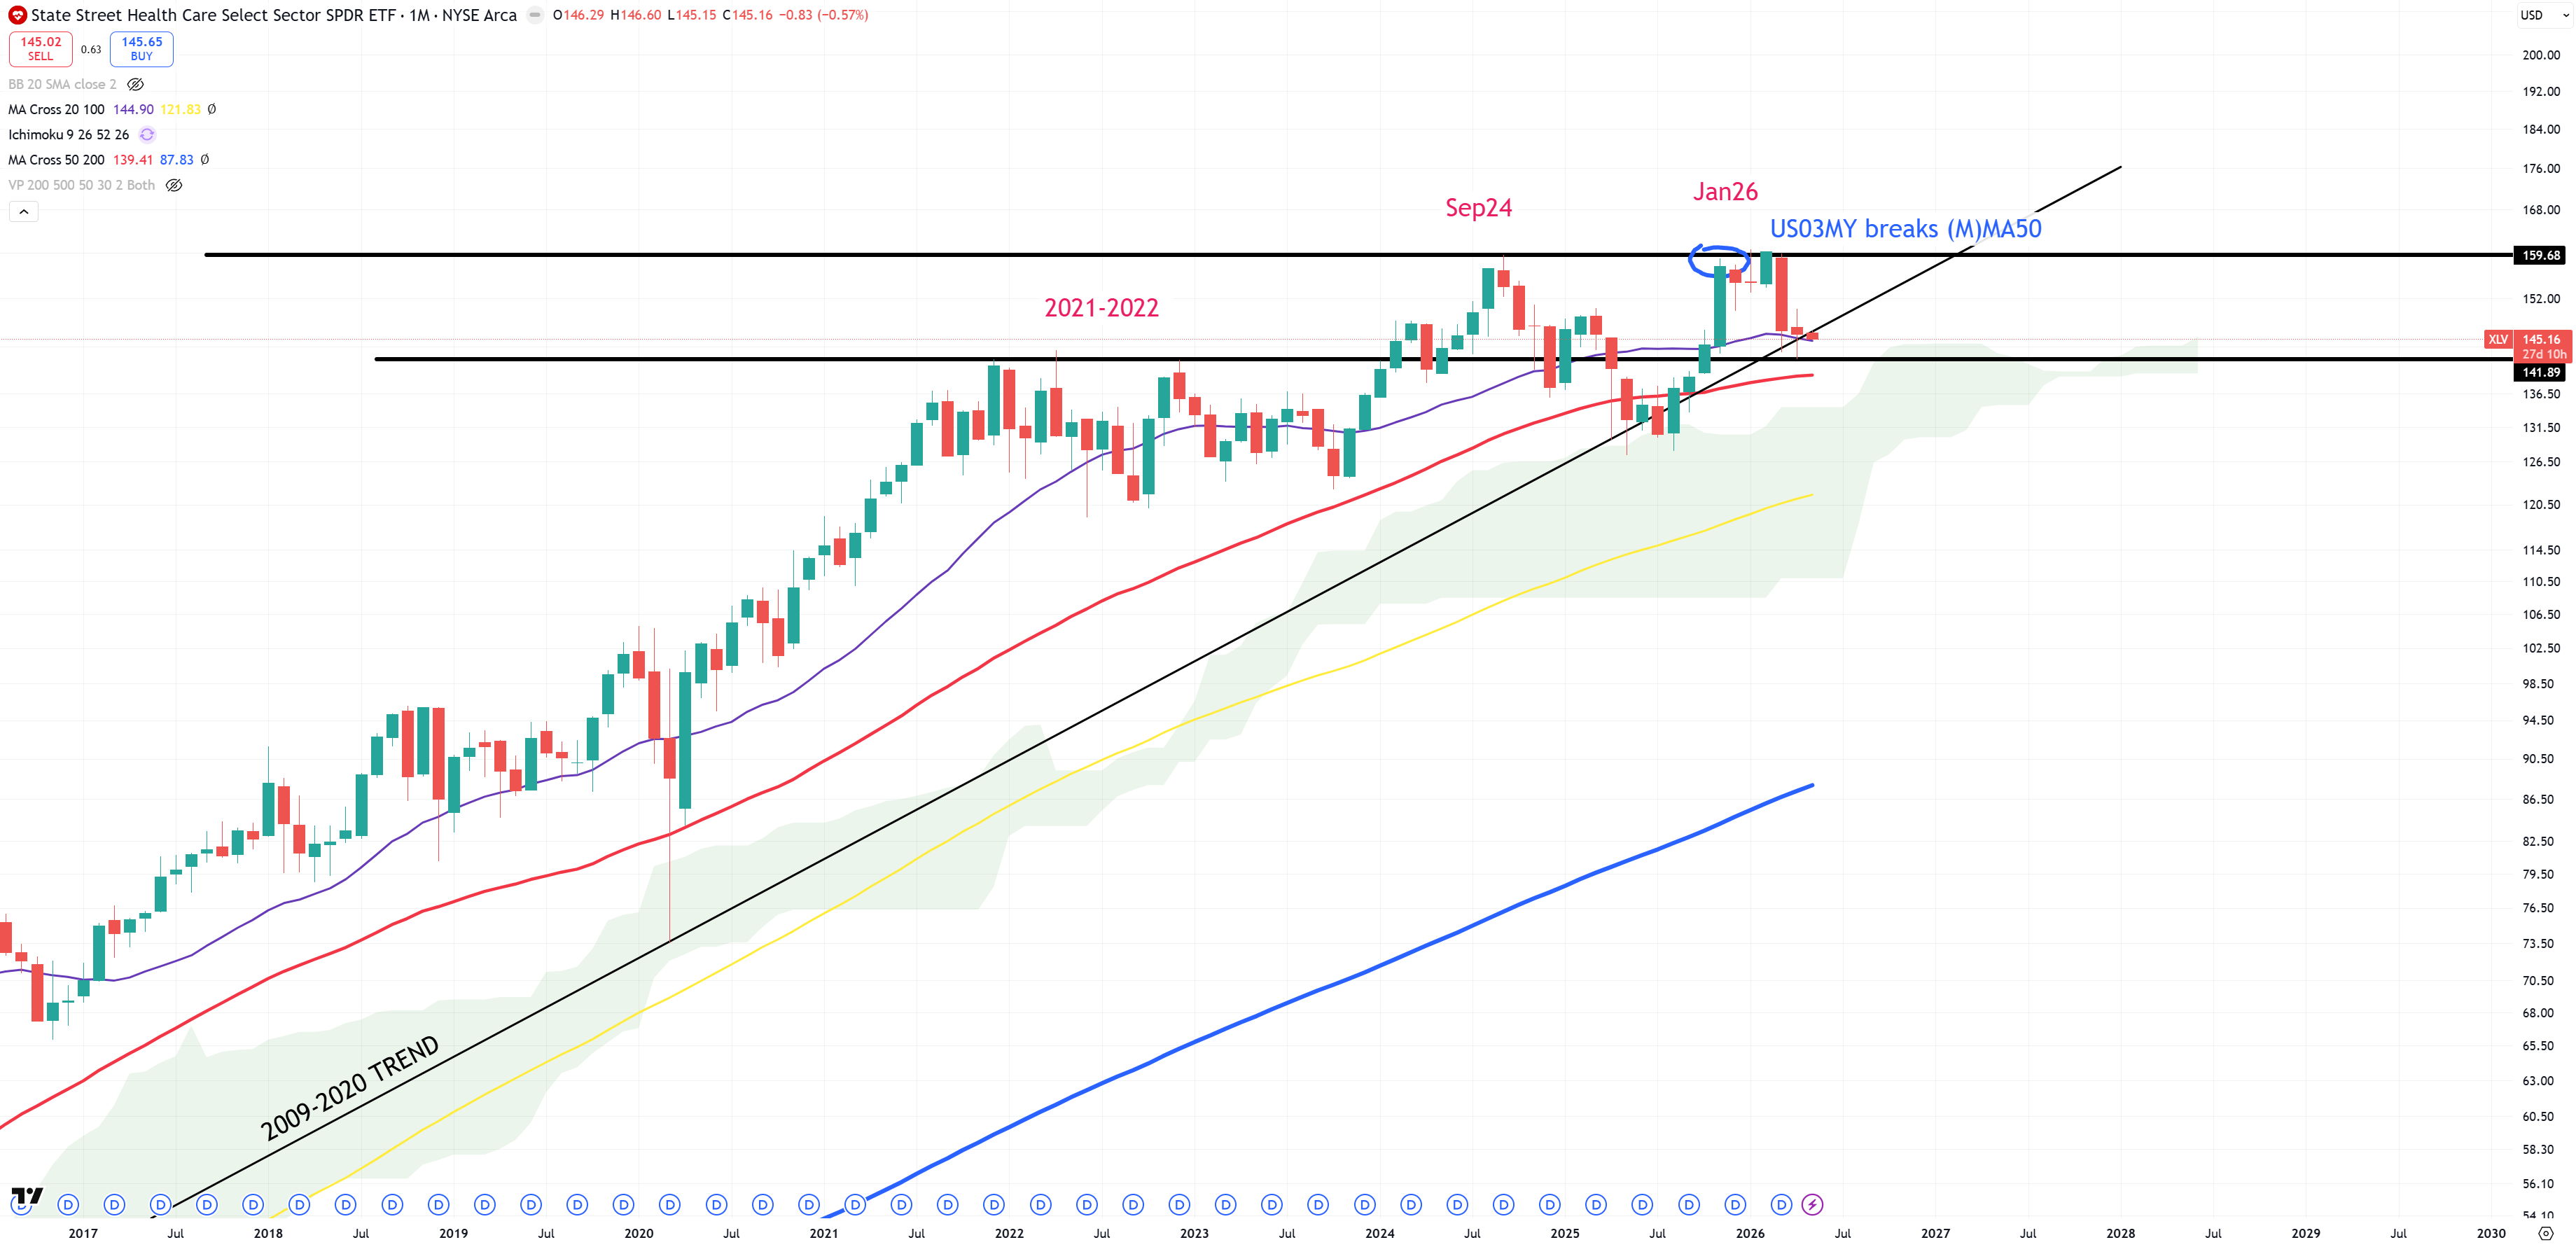
XLV – for sure something is wrong with HealthCare, April managed to close above (M)MA20, but we start below 2009-2020 trend again.
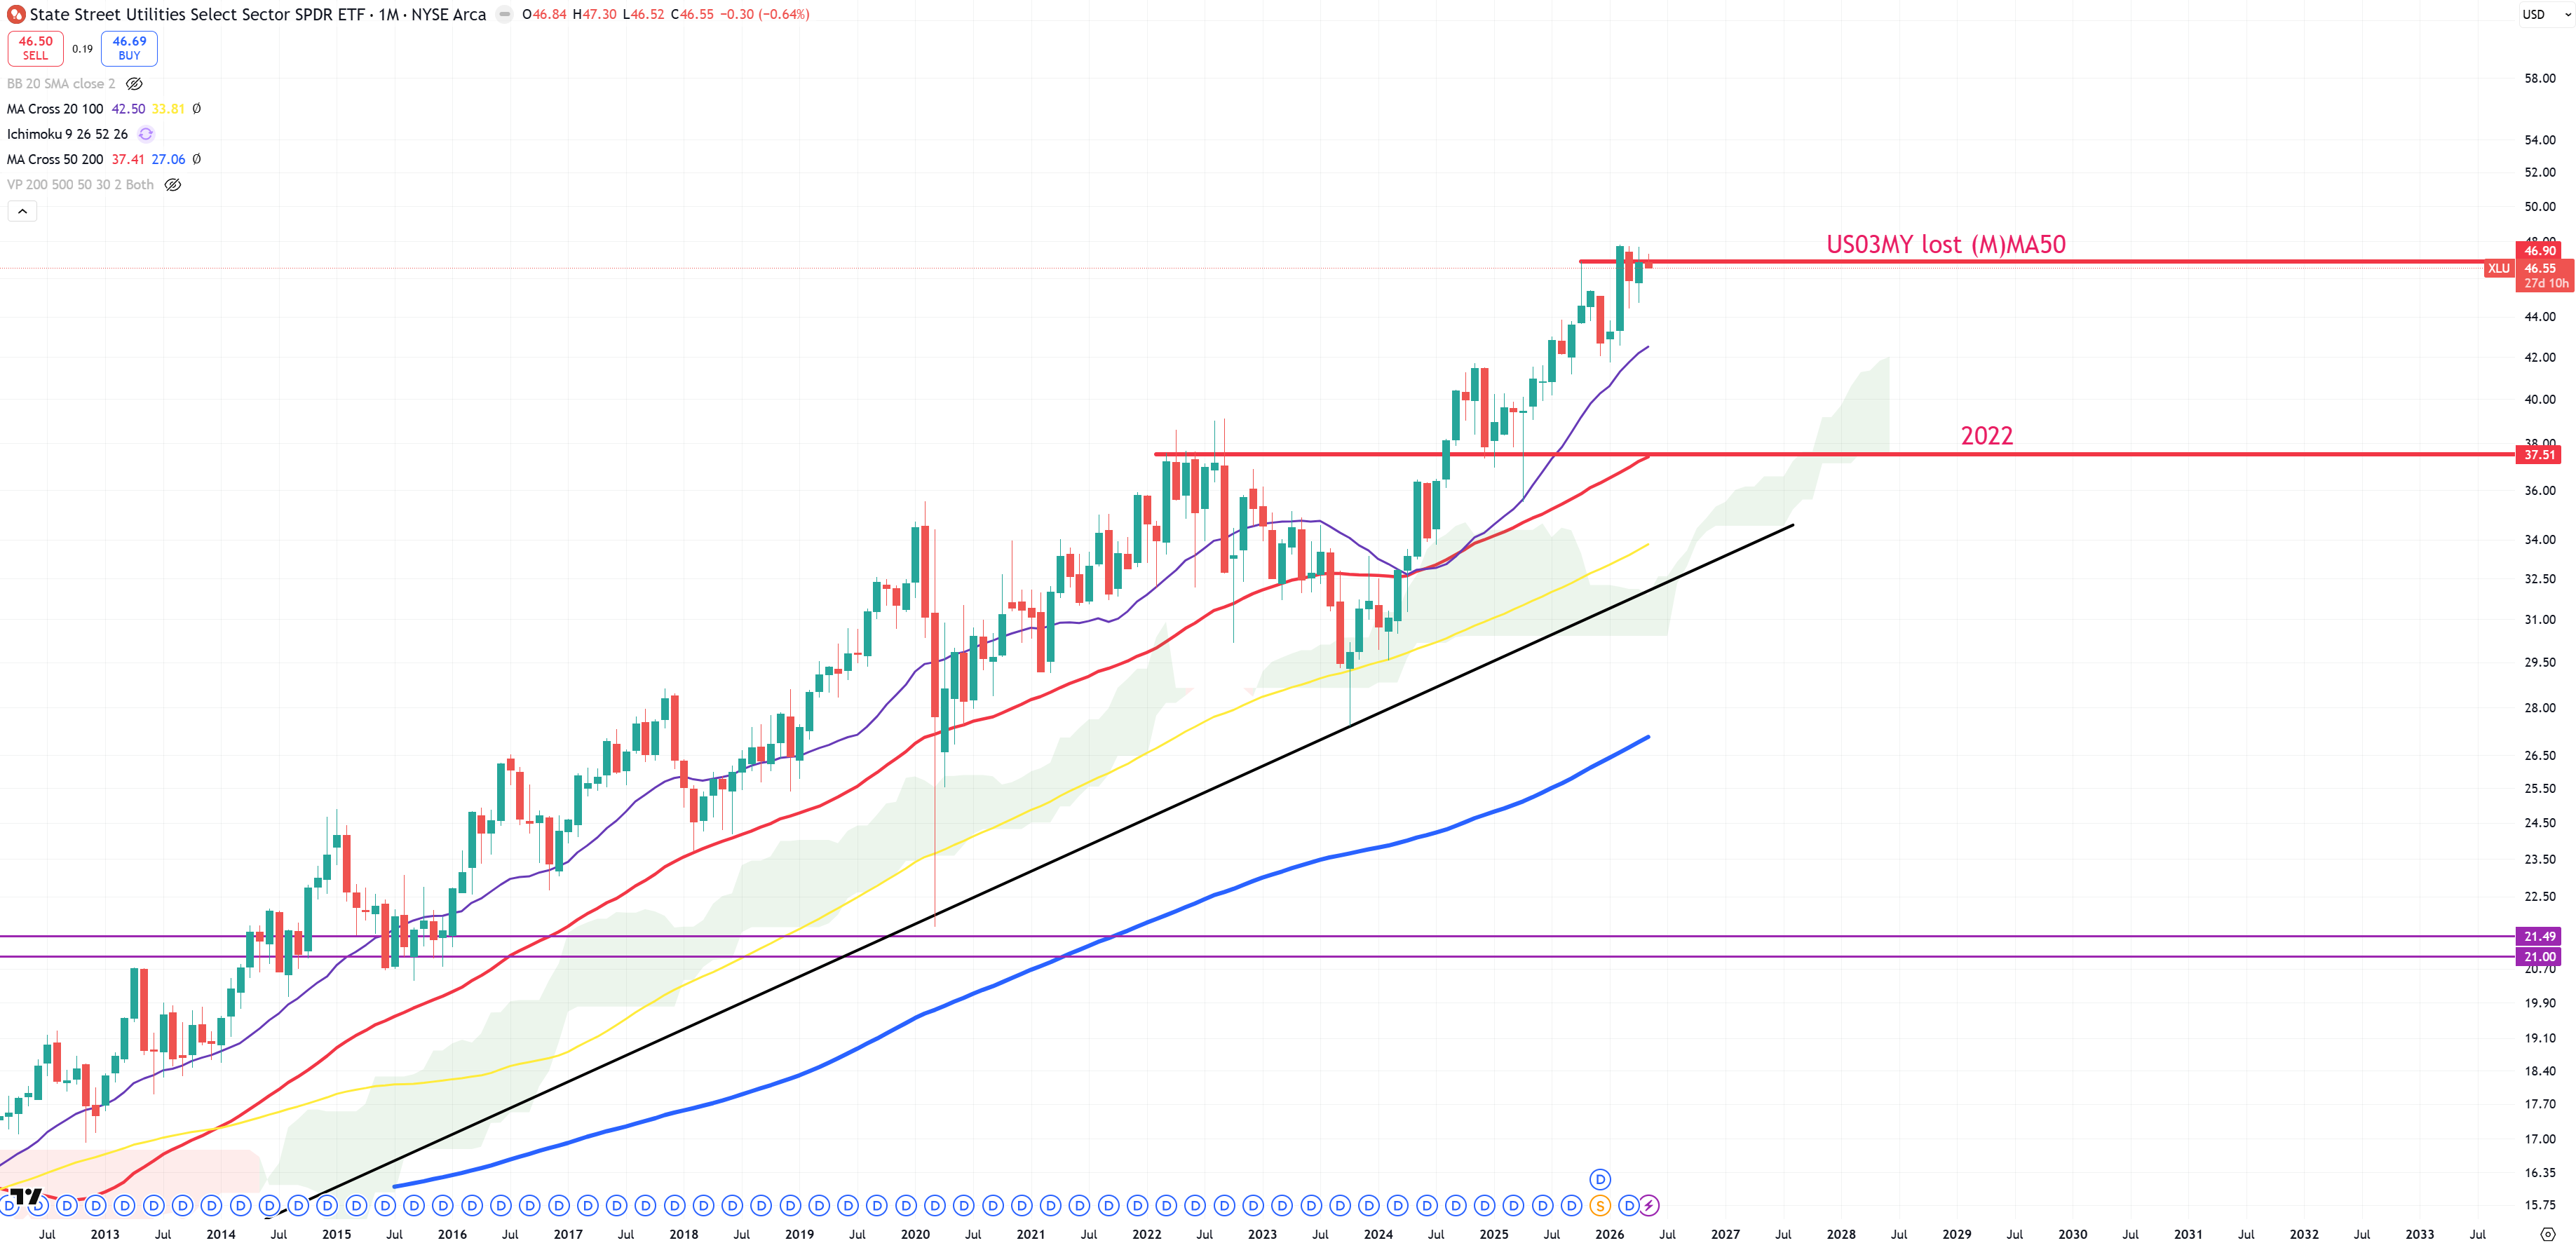
XLU – it’s always last too. Let’s find out how it’ll end from this level.
Bond market
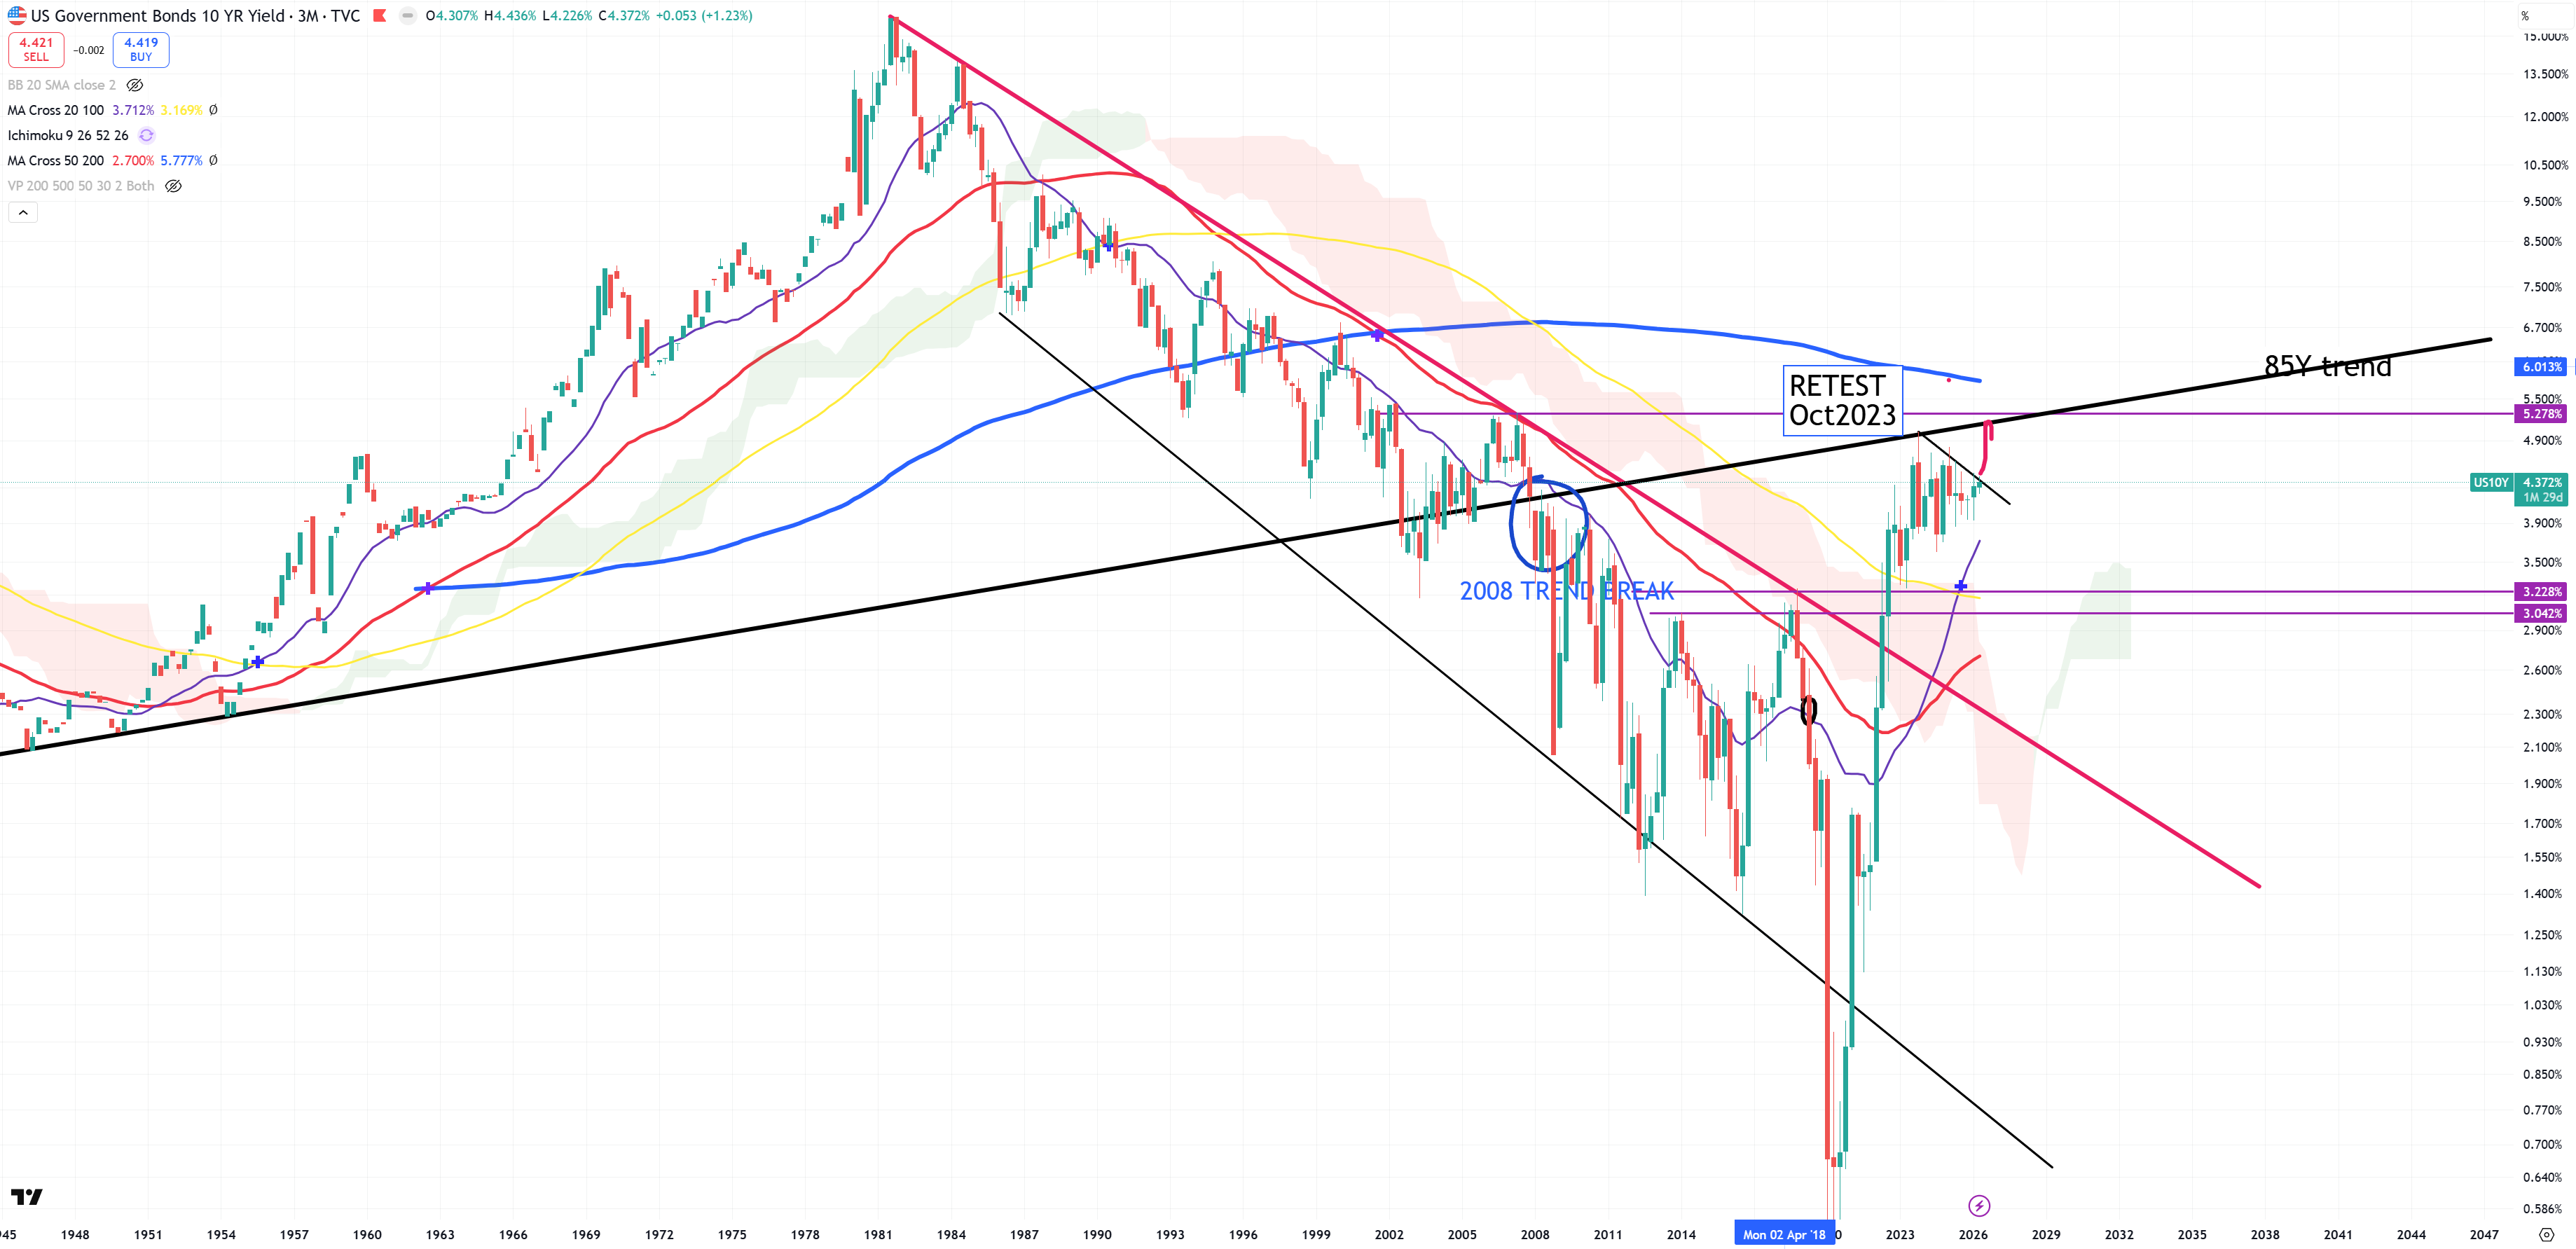
US10Y – super long term – this is even 3M view. There’s a risk of retest 85Y trend again with possible overshooting towards 6.0% to (3M)MA200.
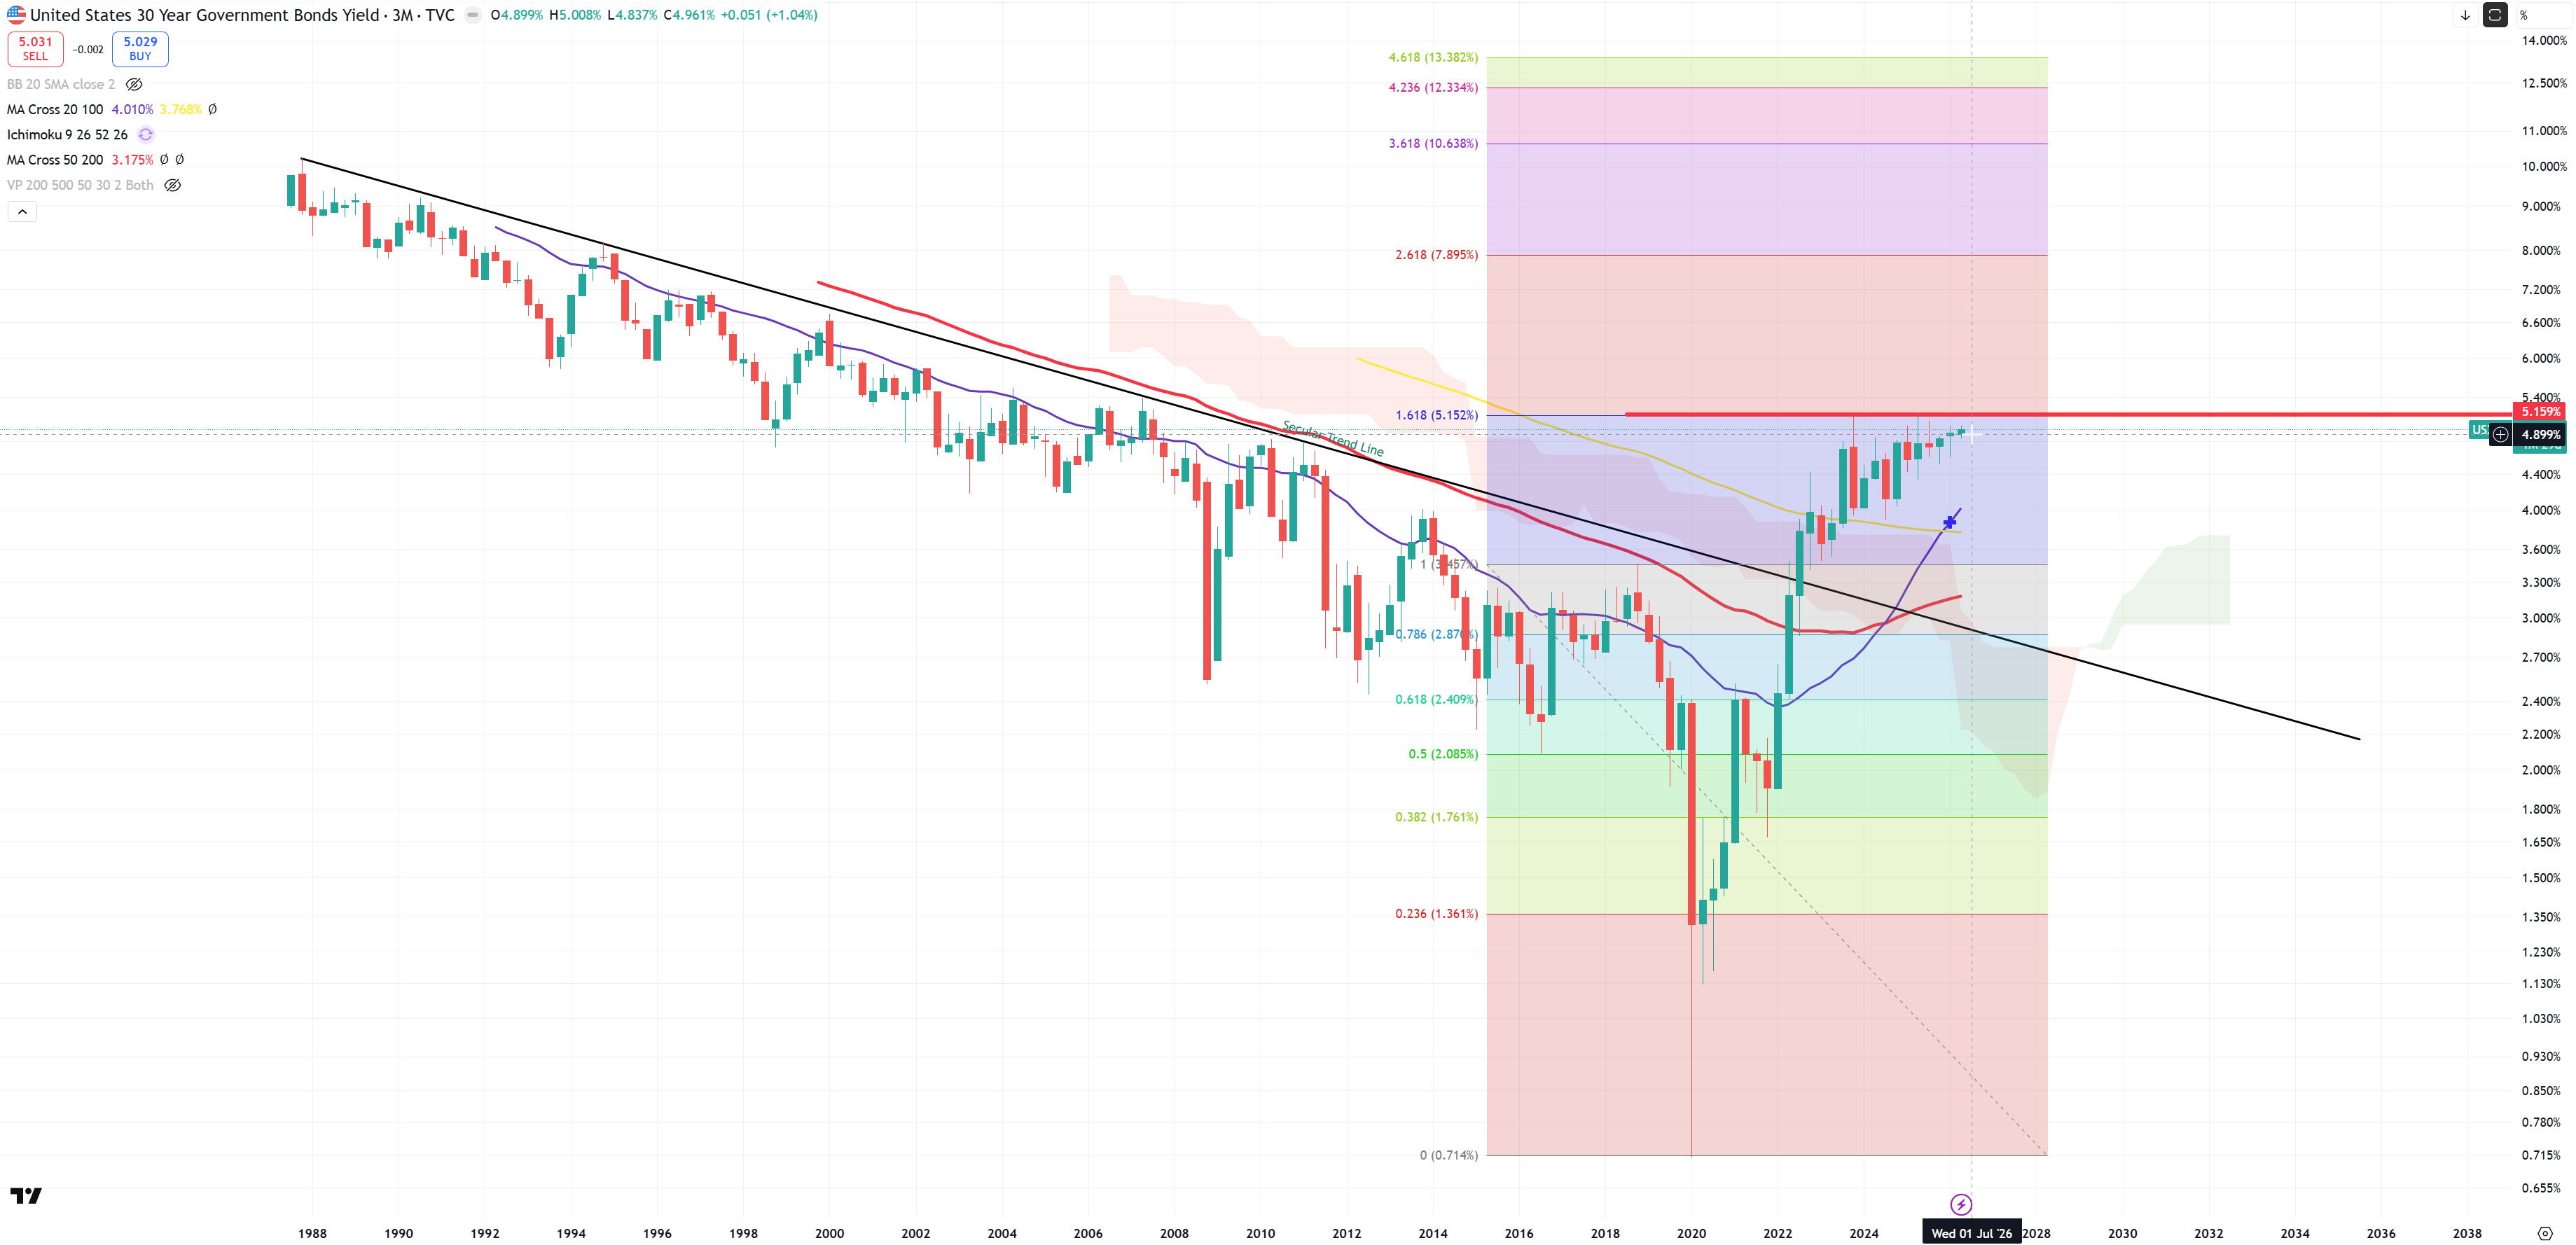
US30Y – and if US10Y would like to revist 6.0% I bet US30Y will like to revisit 7.5%
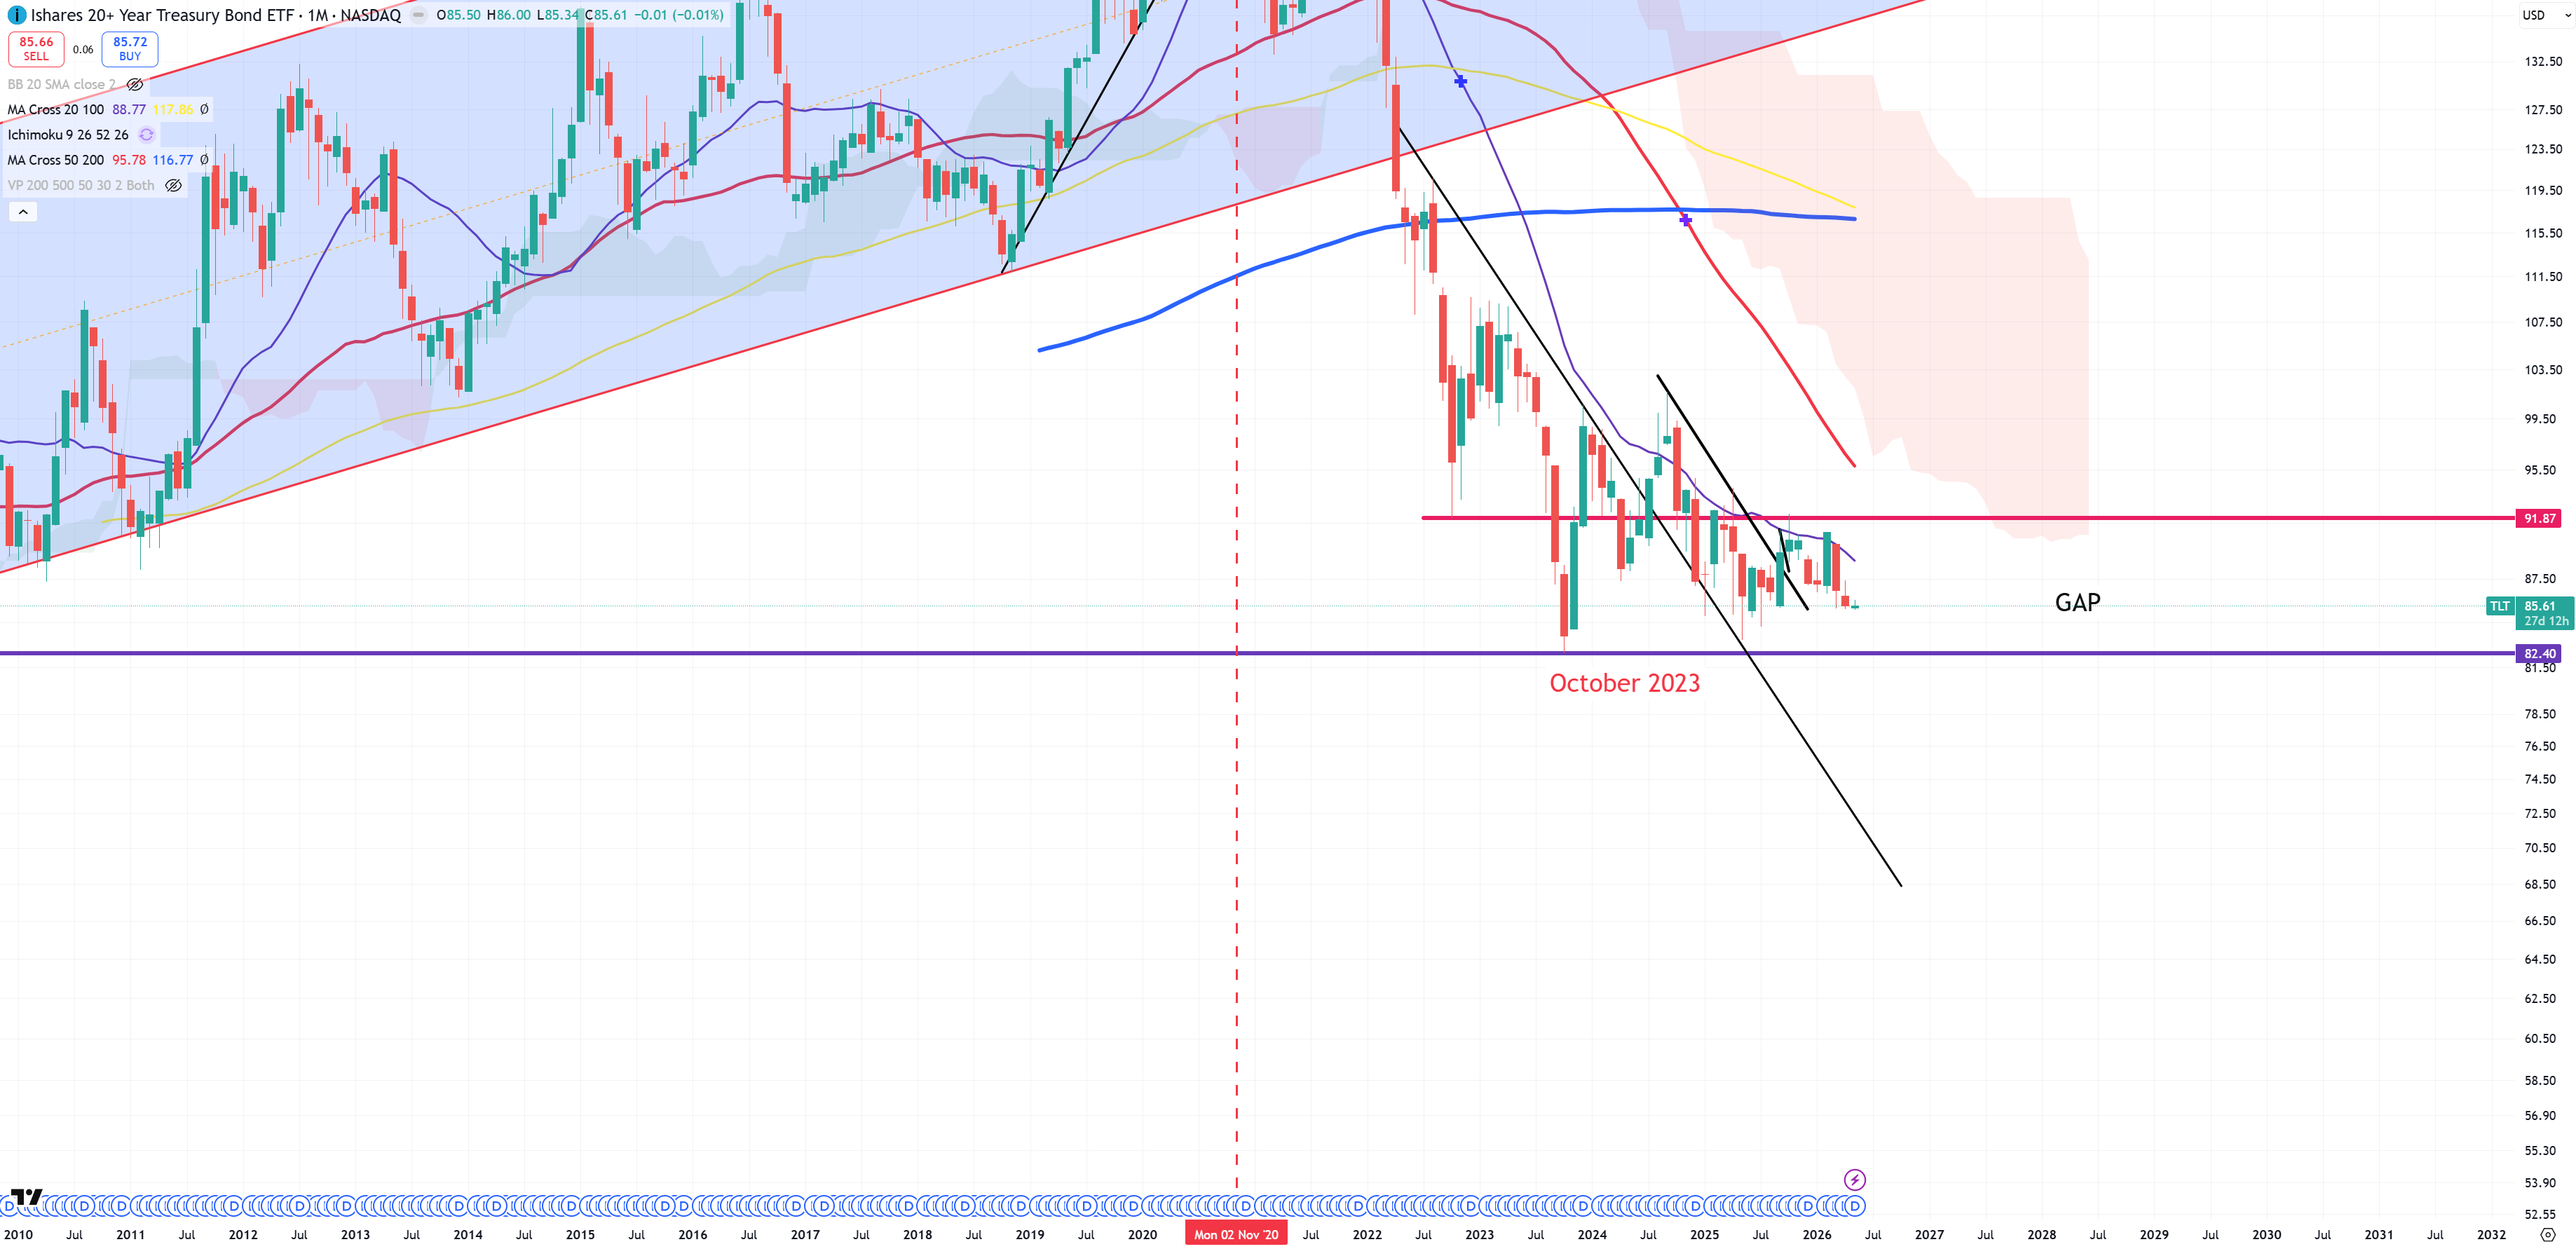
TLT – that means TLT will be forced to blow up this 82$ level. It can’t even pass (M)MA20 so downturn still persists.
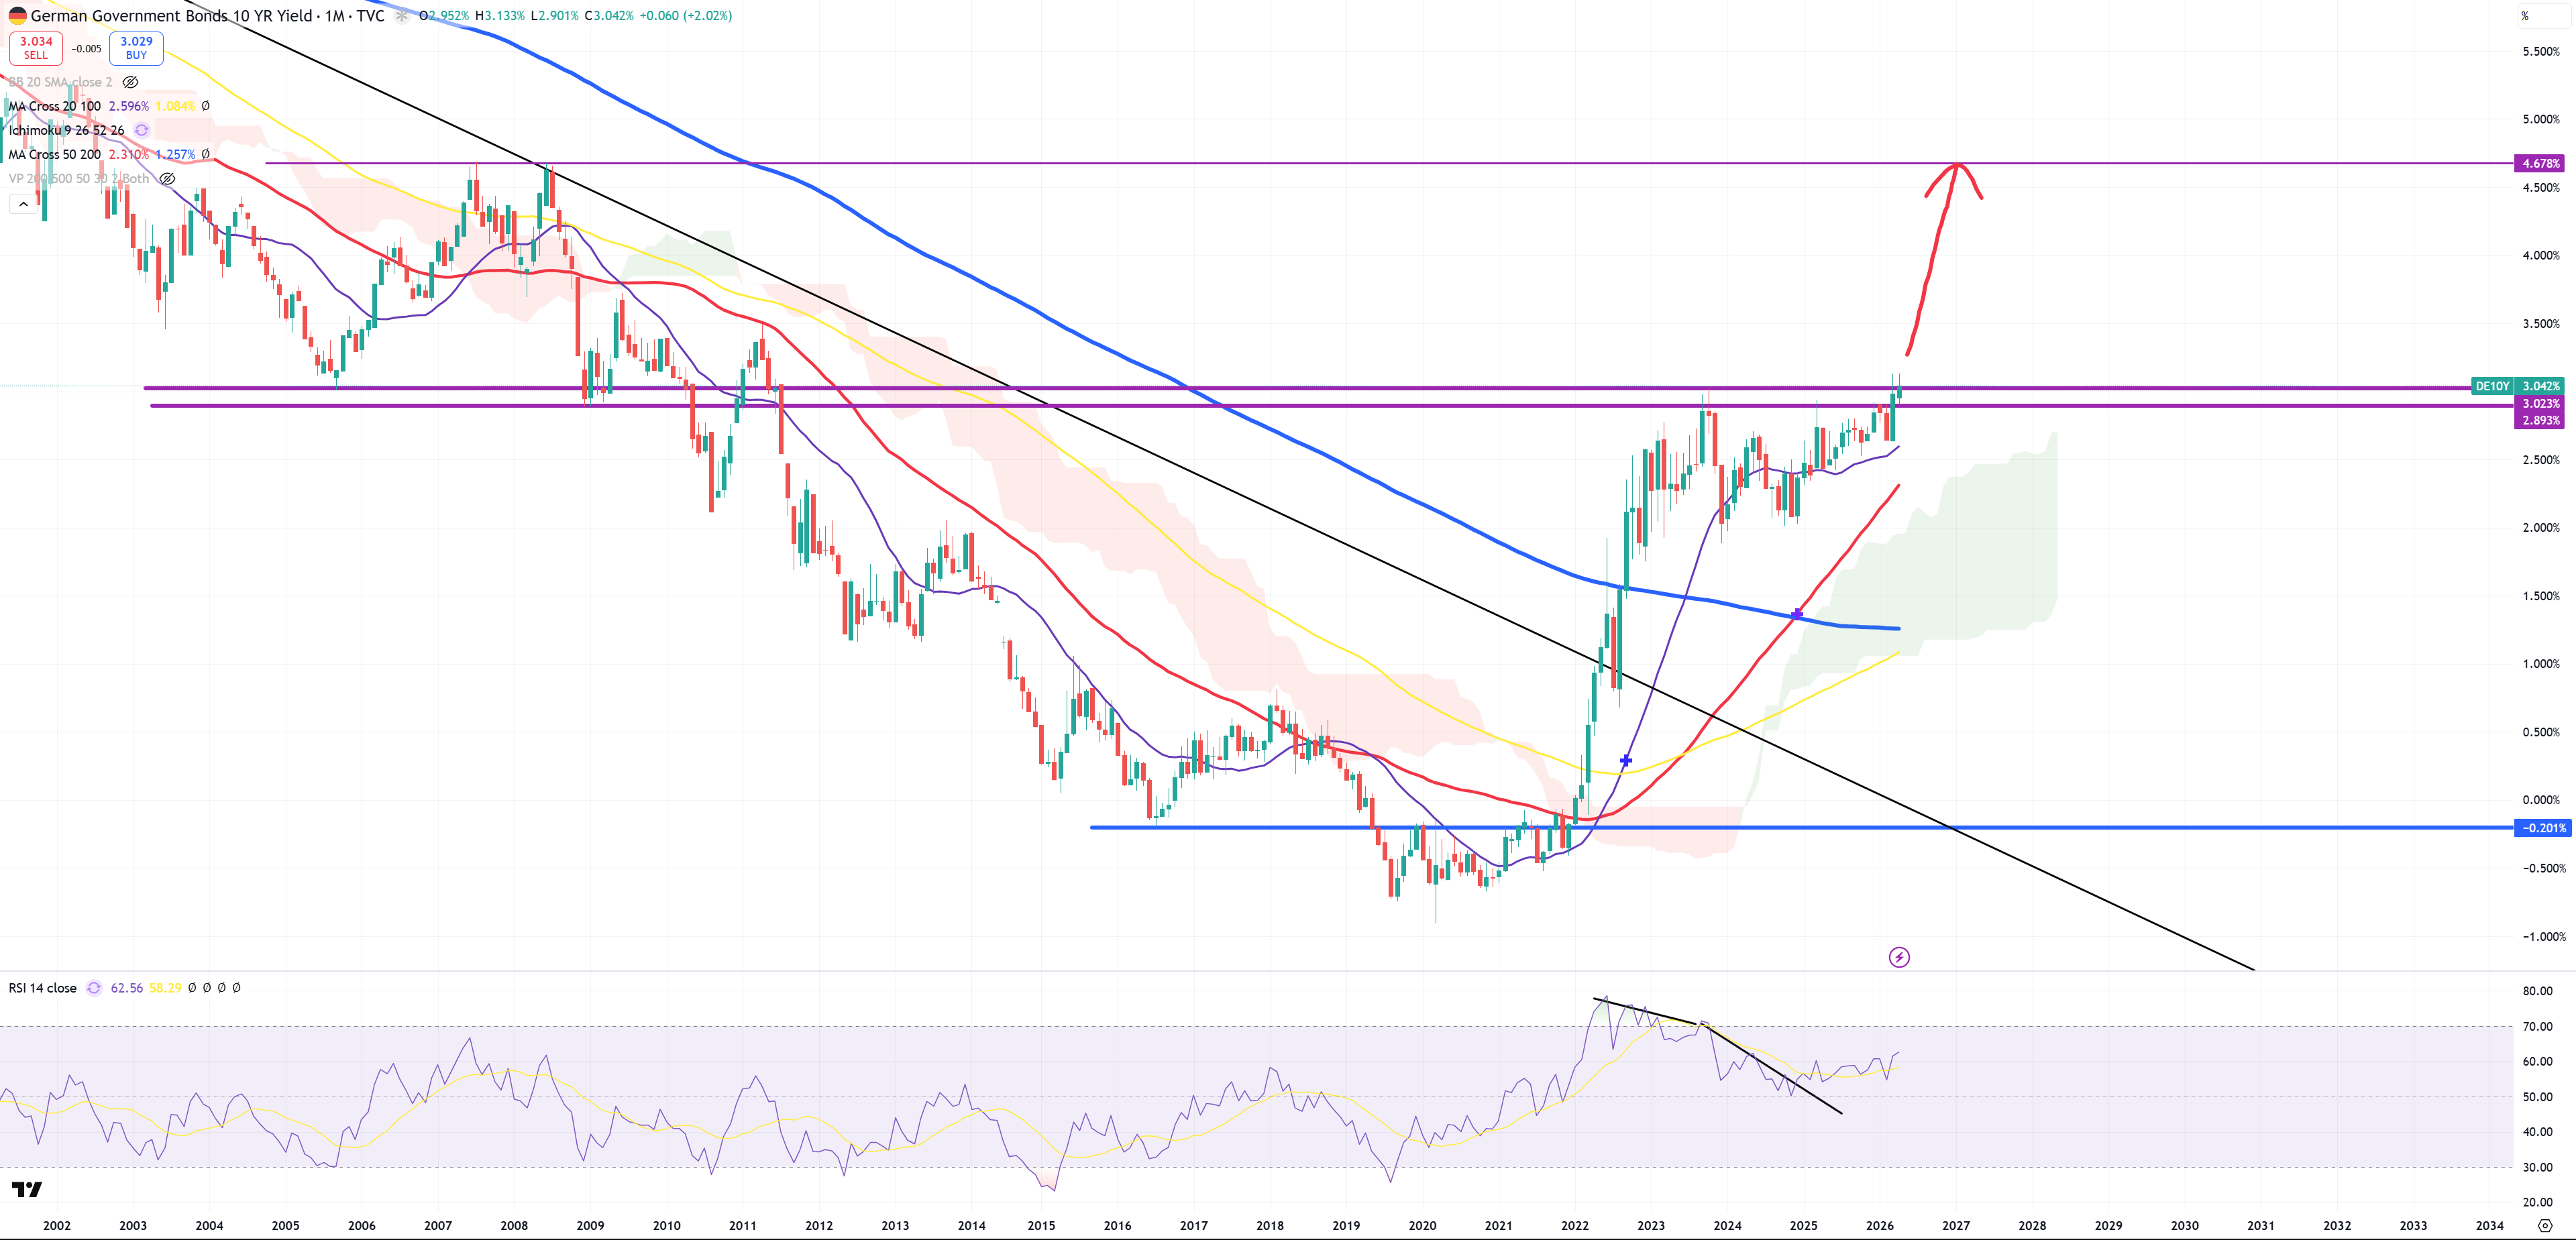
DE10Y – breaking 3.0% opening path towards 5.0%
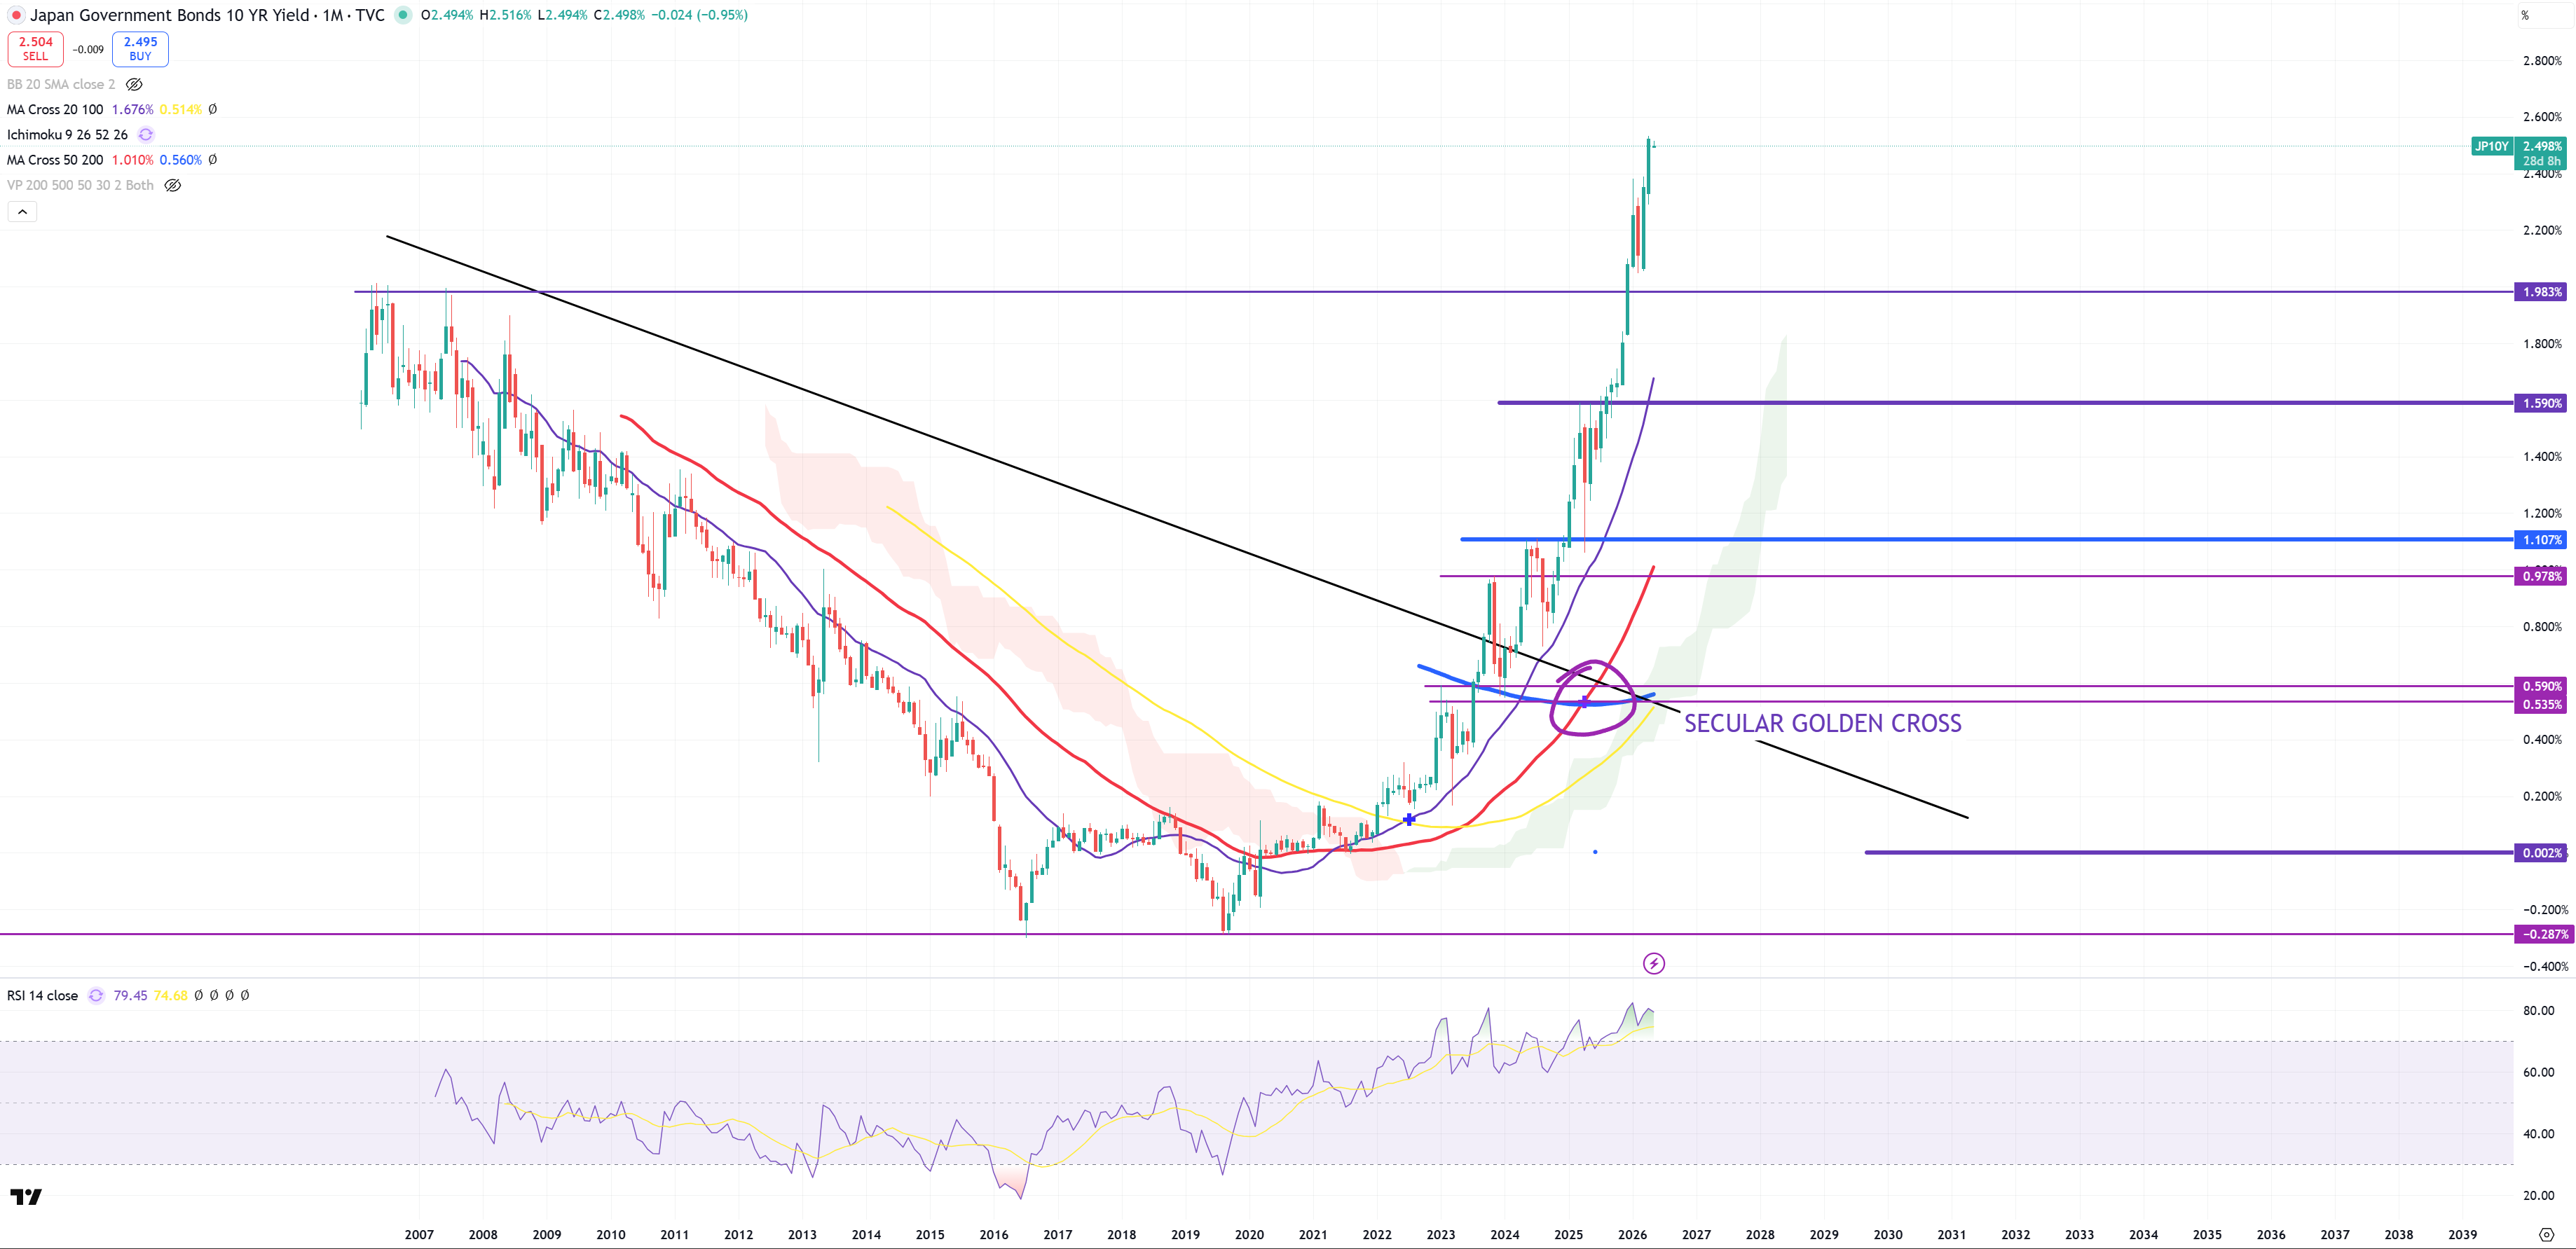
JP10Y – this looks like “SKY IS THE LIMIT” aka why not double from here?
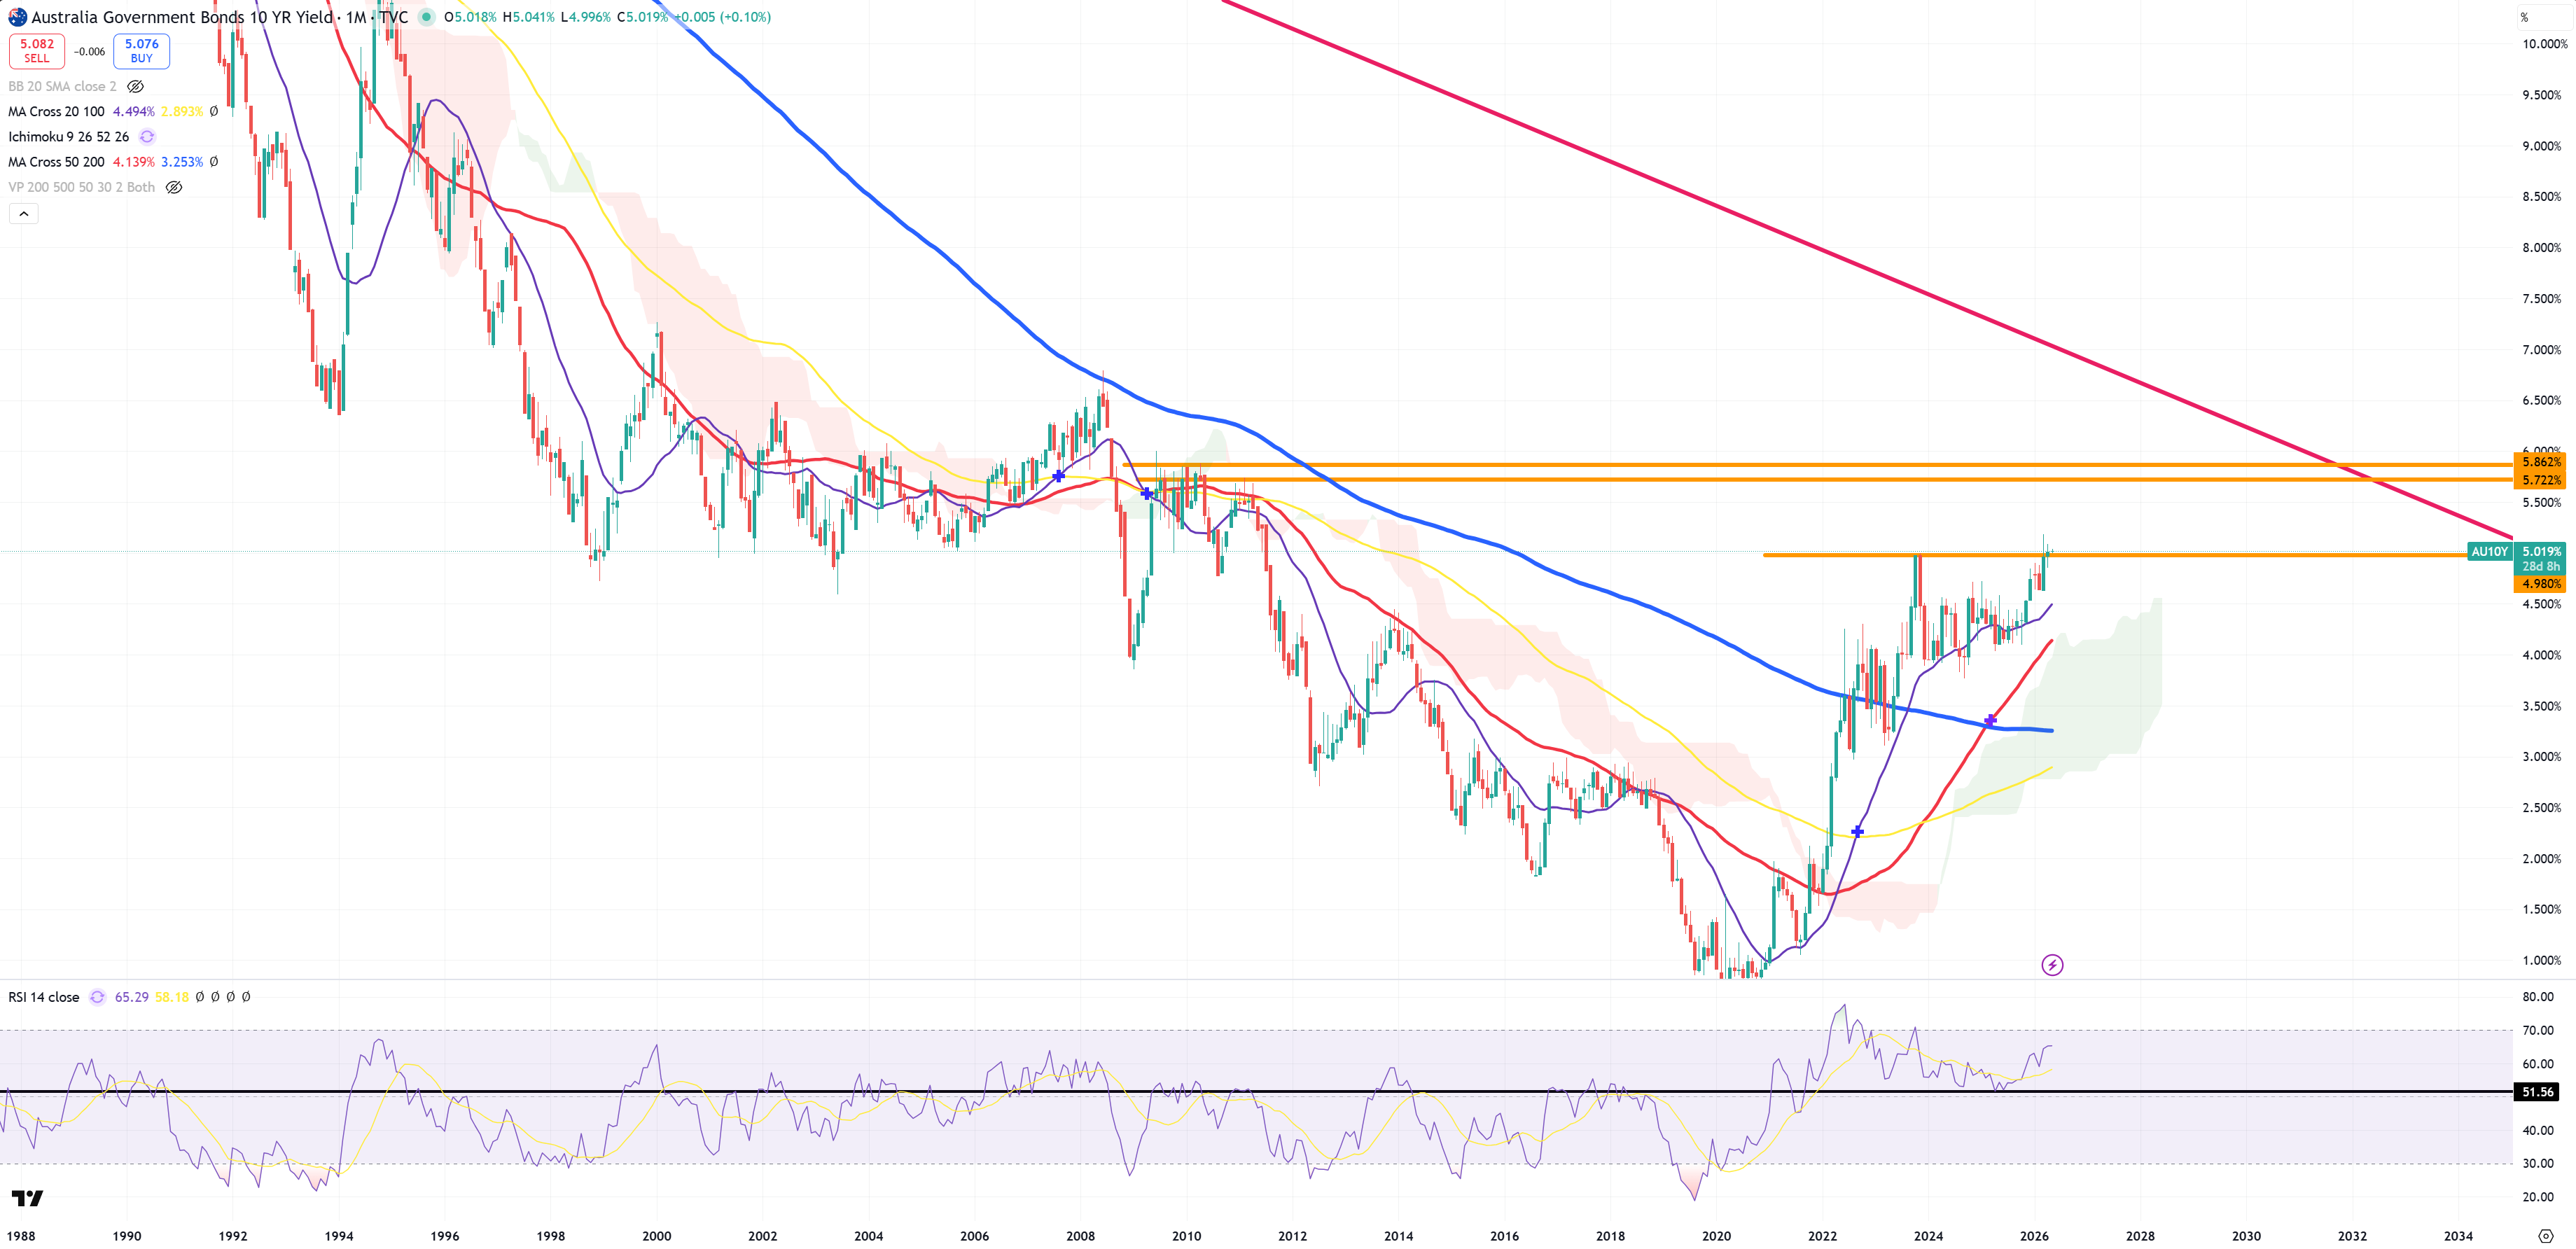
AU10Y – based 5.0% has been set why not going to 6.0%
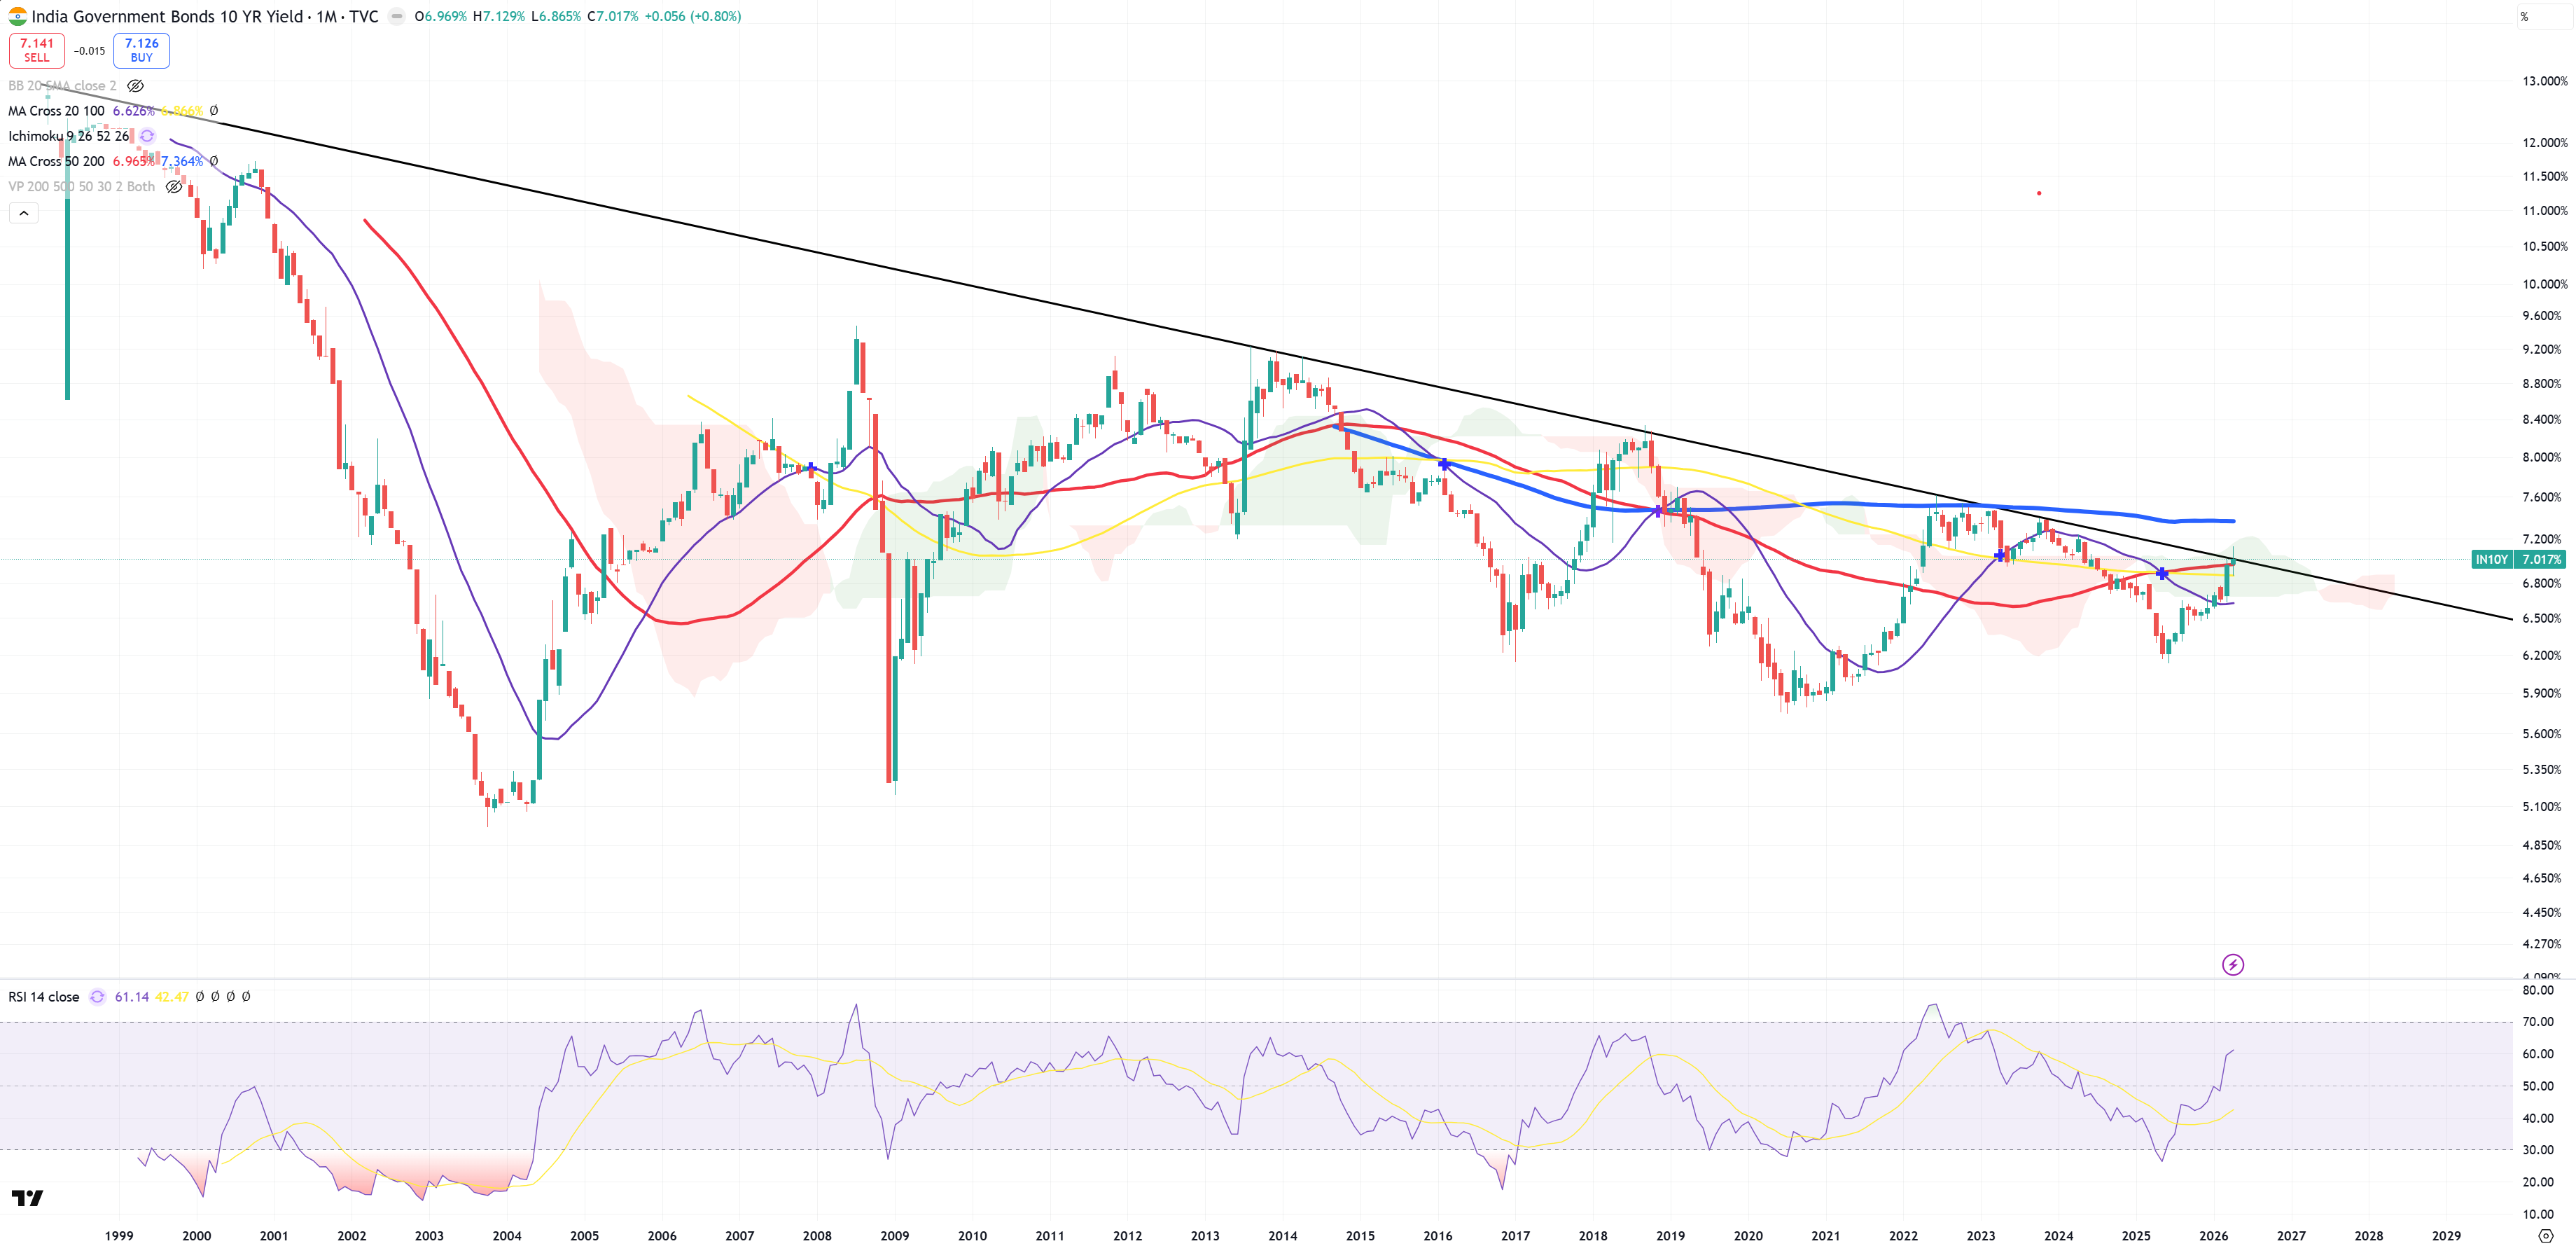
IN10Y – India probably wants to break this secular trend as it ended up above (M)MA50
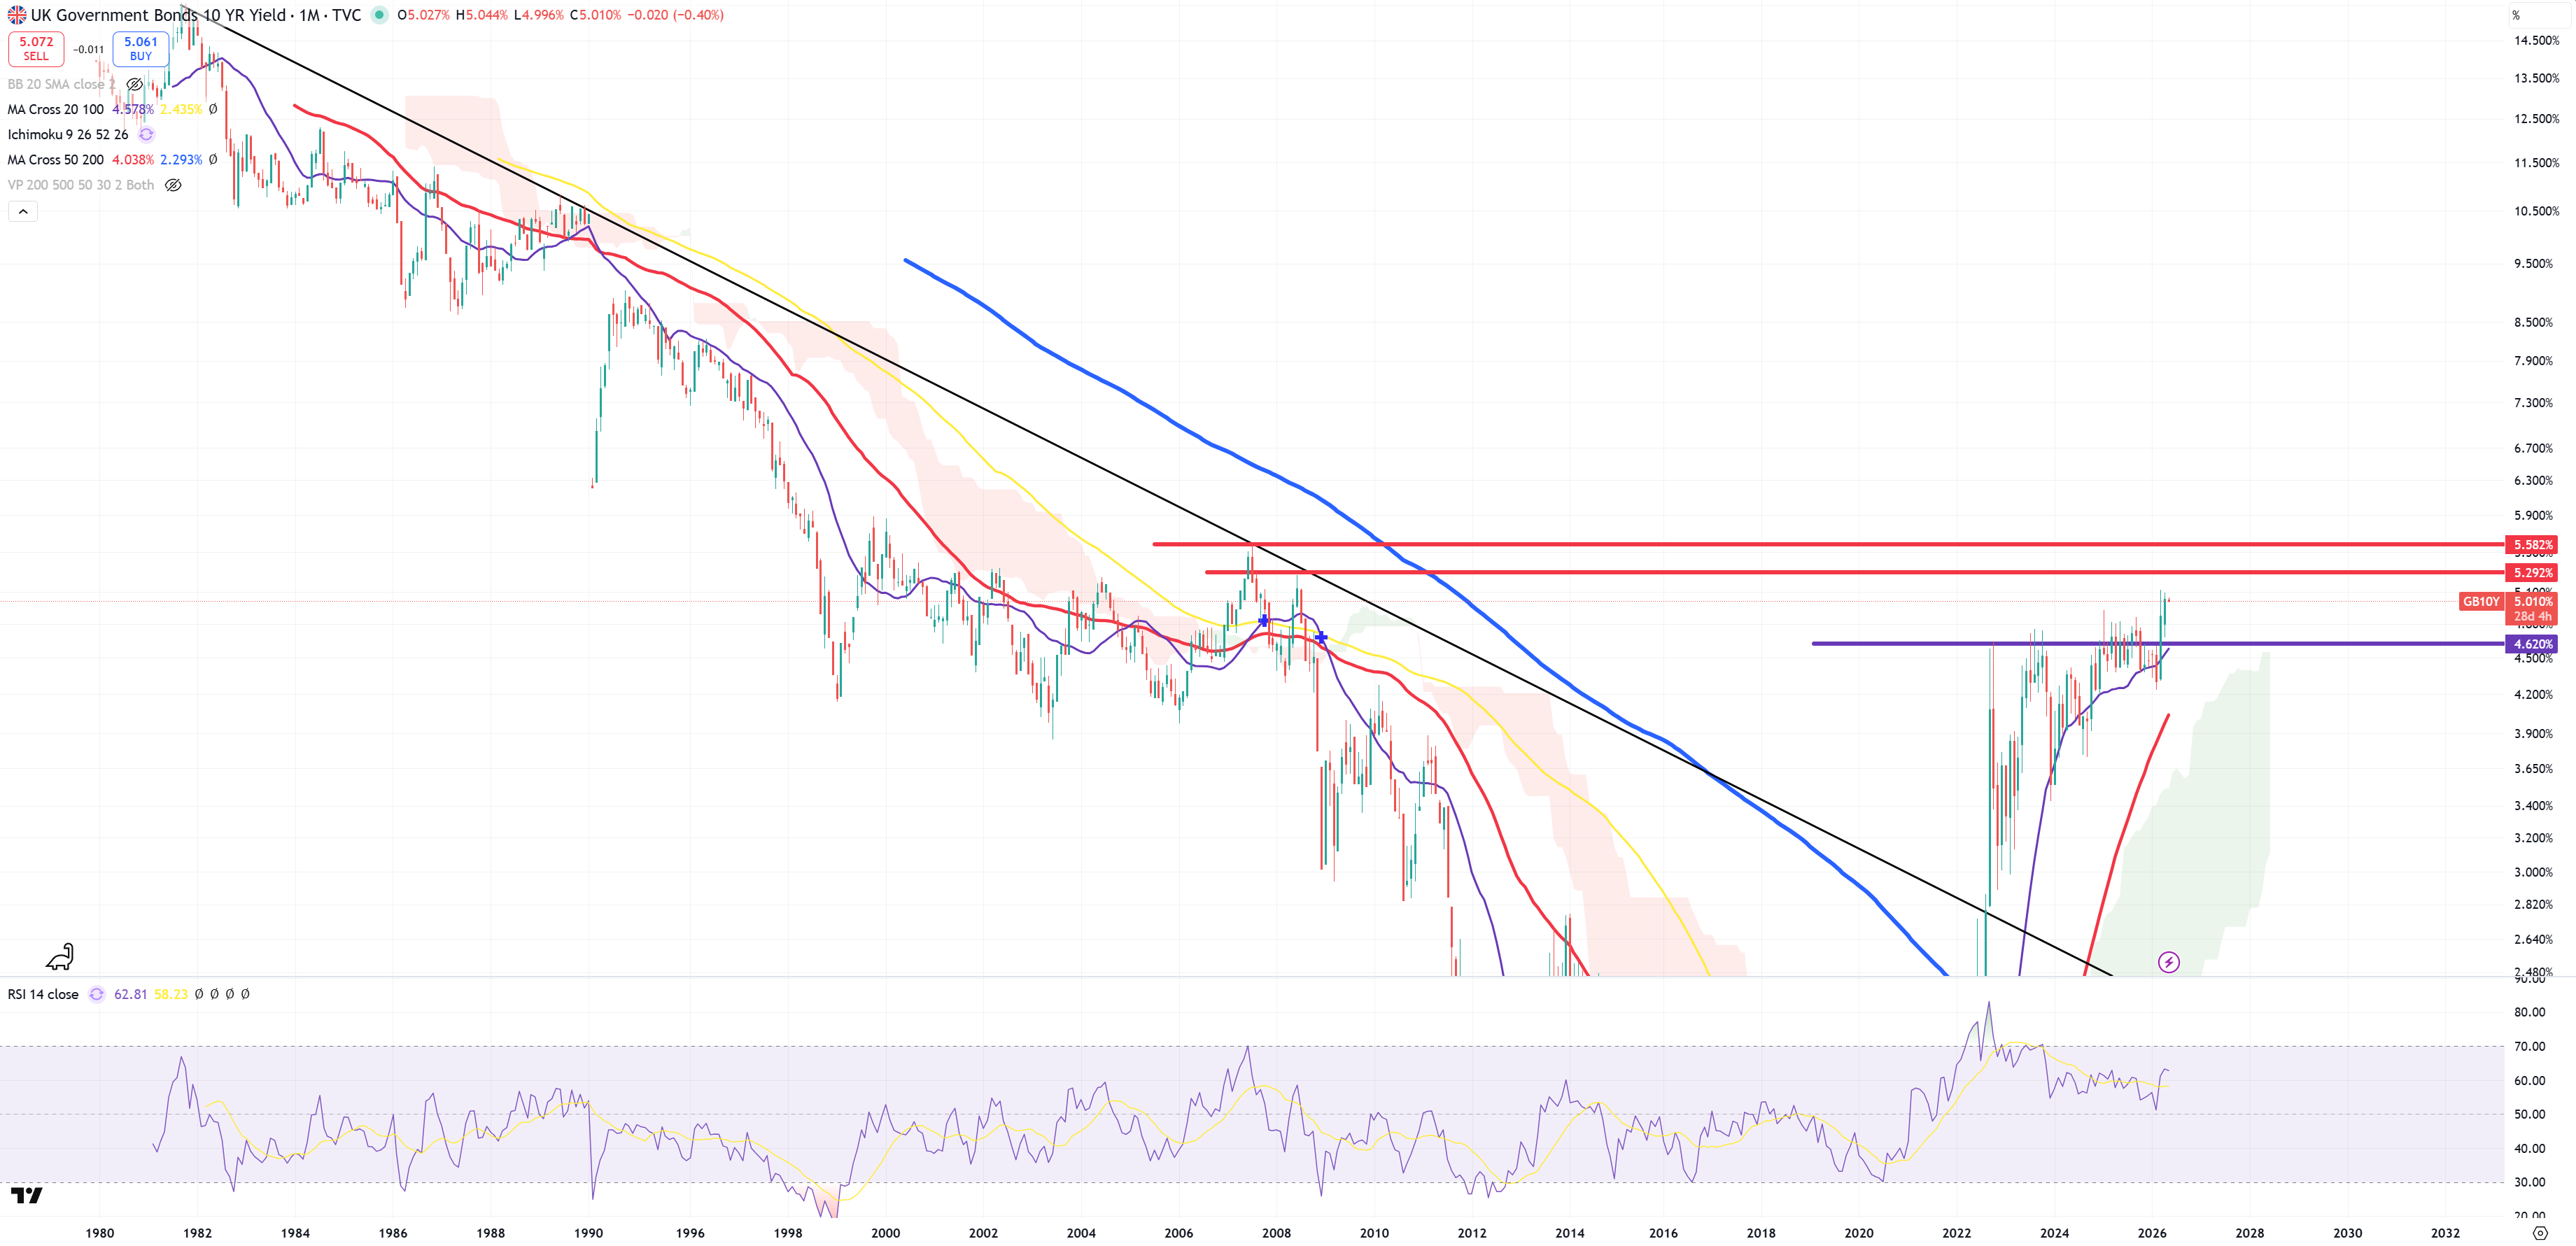
GB10Y – this looks terrible, breaking this 5.5% red resistance and sky is the limit. Great Britain is next Japan.
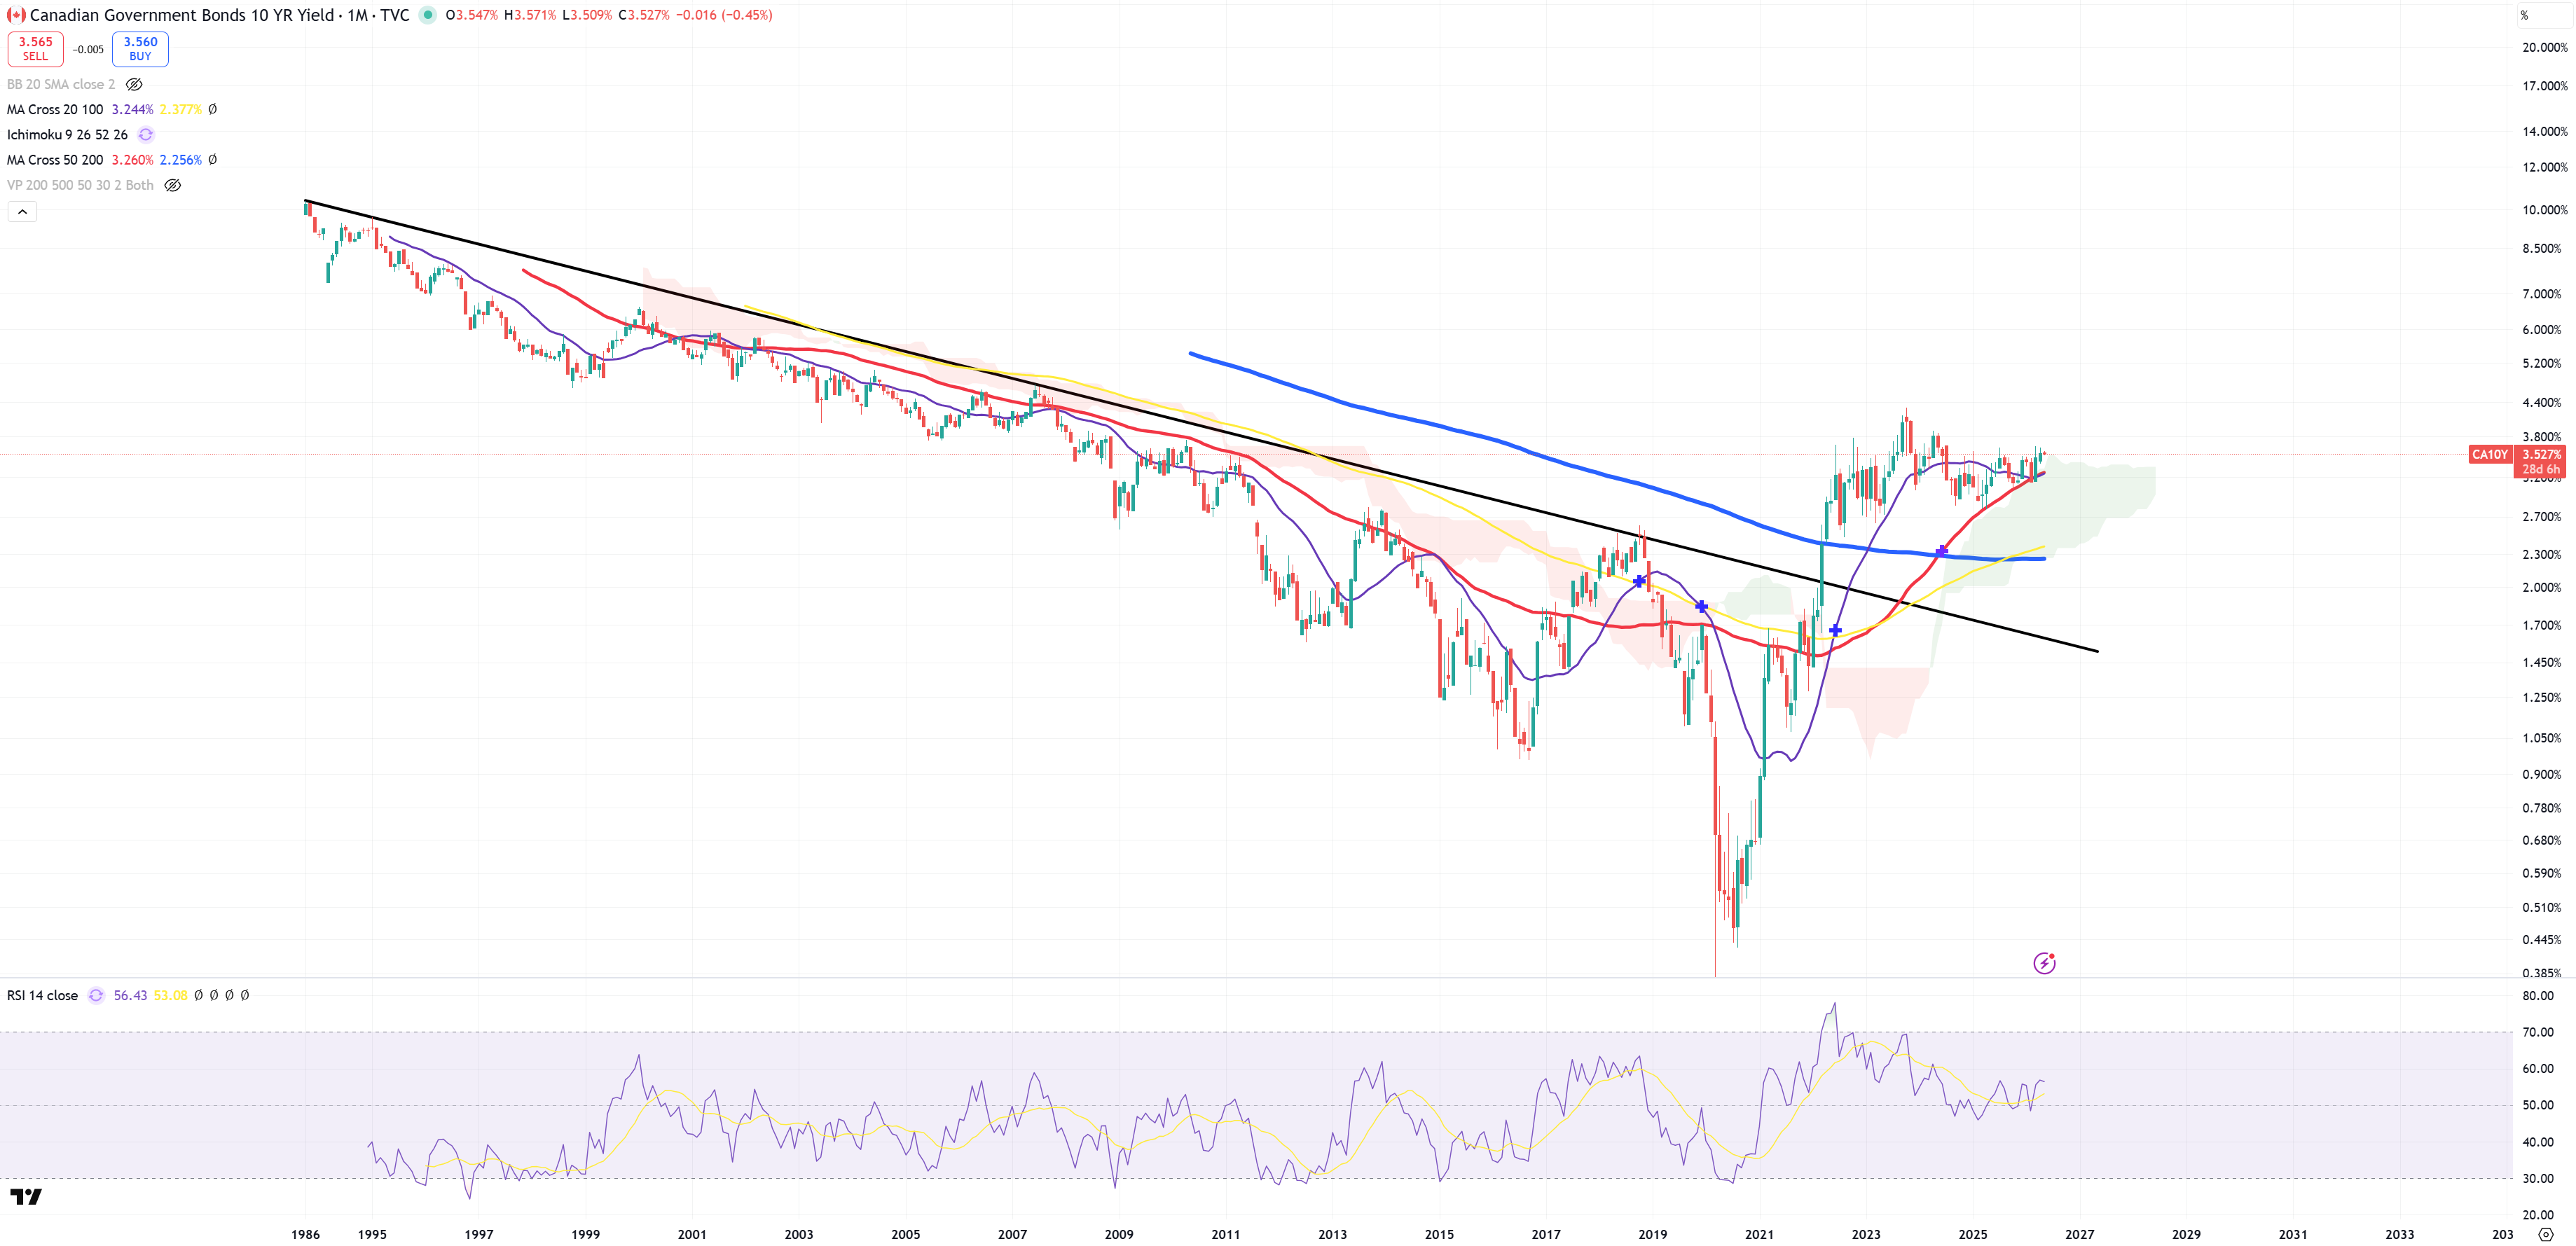
CA10Y – also in a big bull market
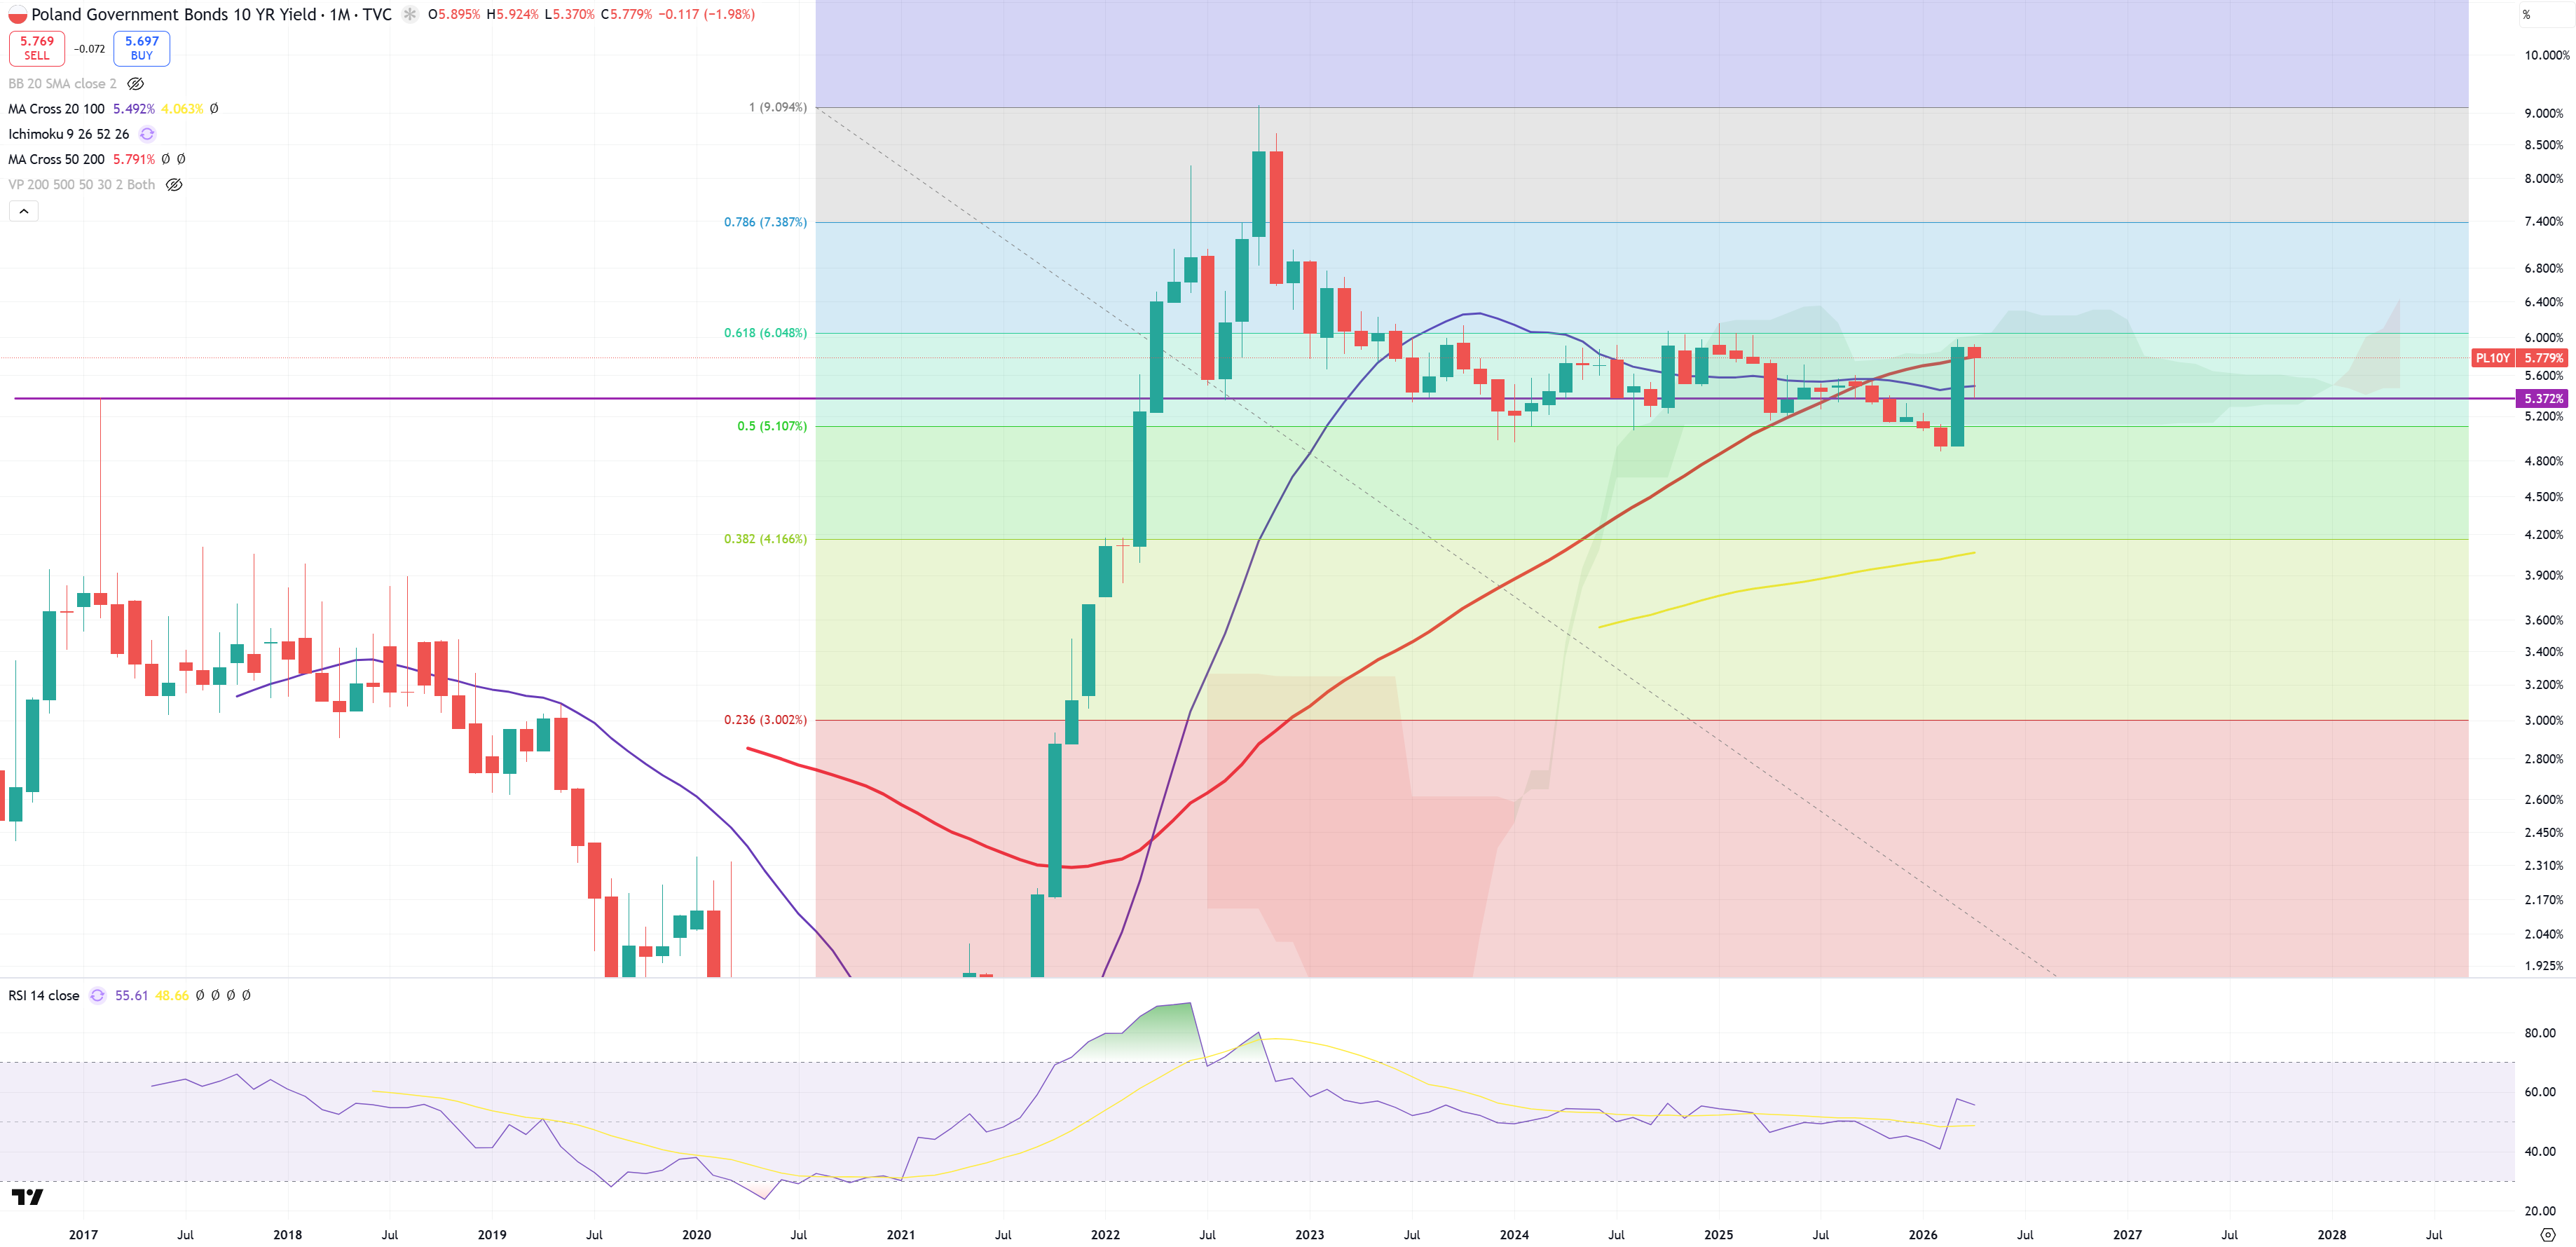
PL10Y – Poland – probably ending its bond market correction. Above (M)MA50 and looks like next wave of inflation to kick in.
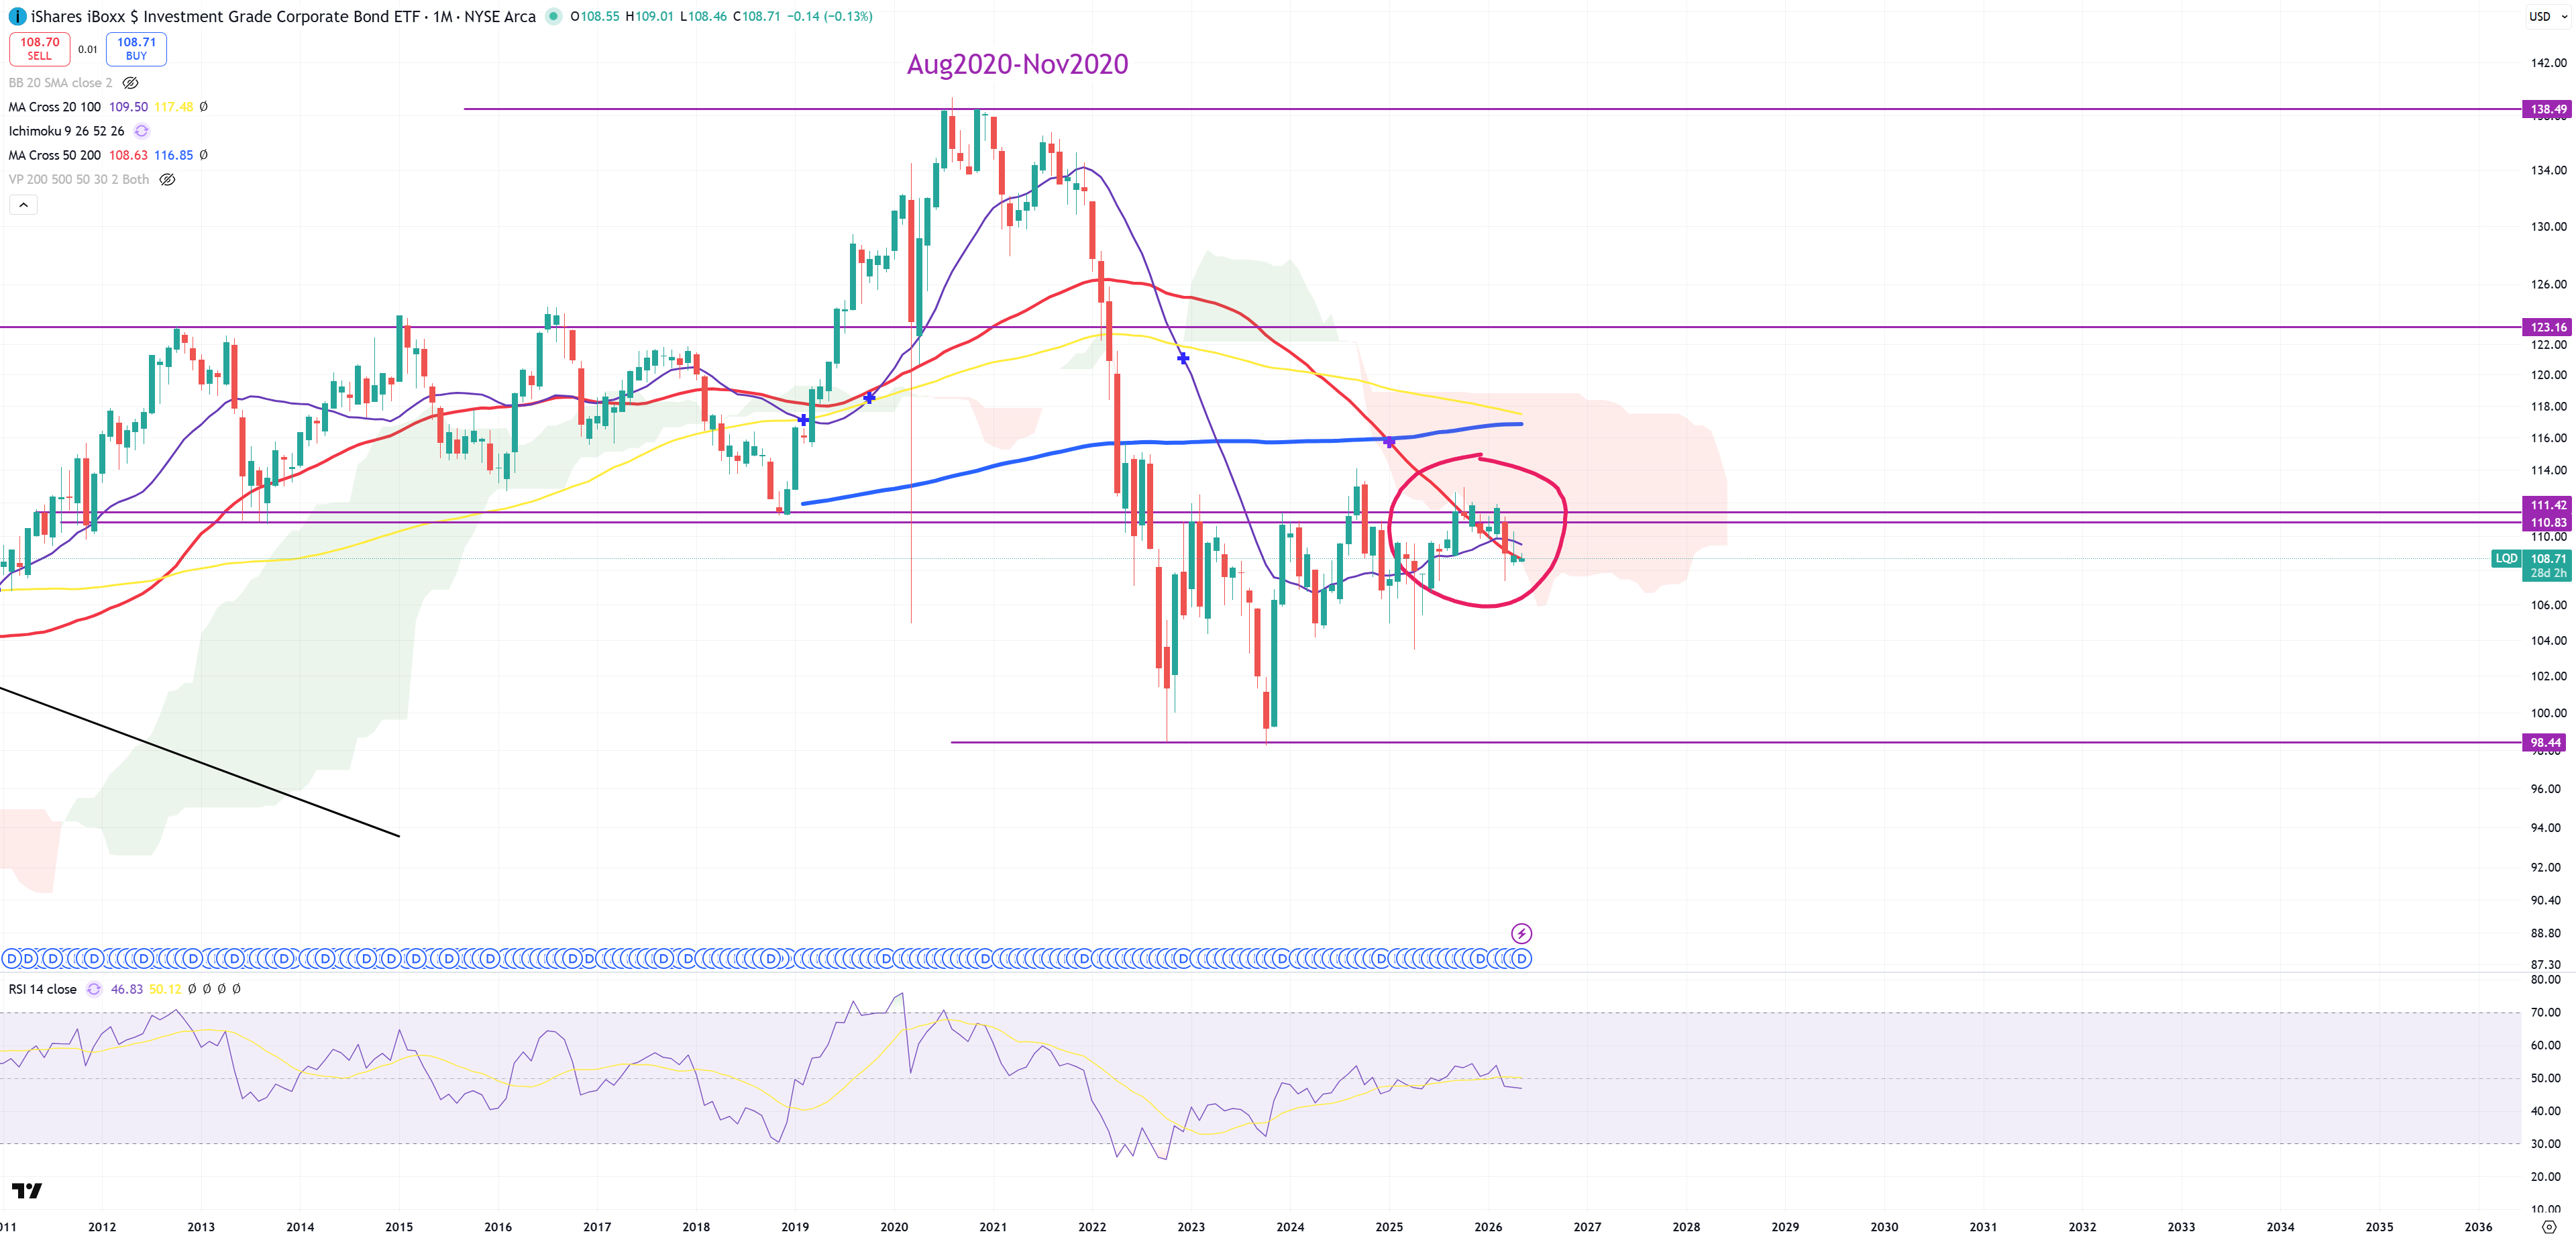
LQD – still below (M)MA50 and below key resistance
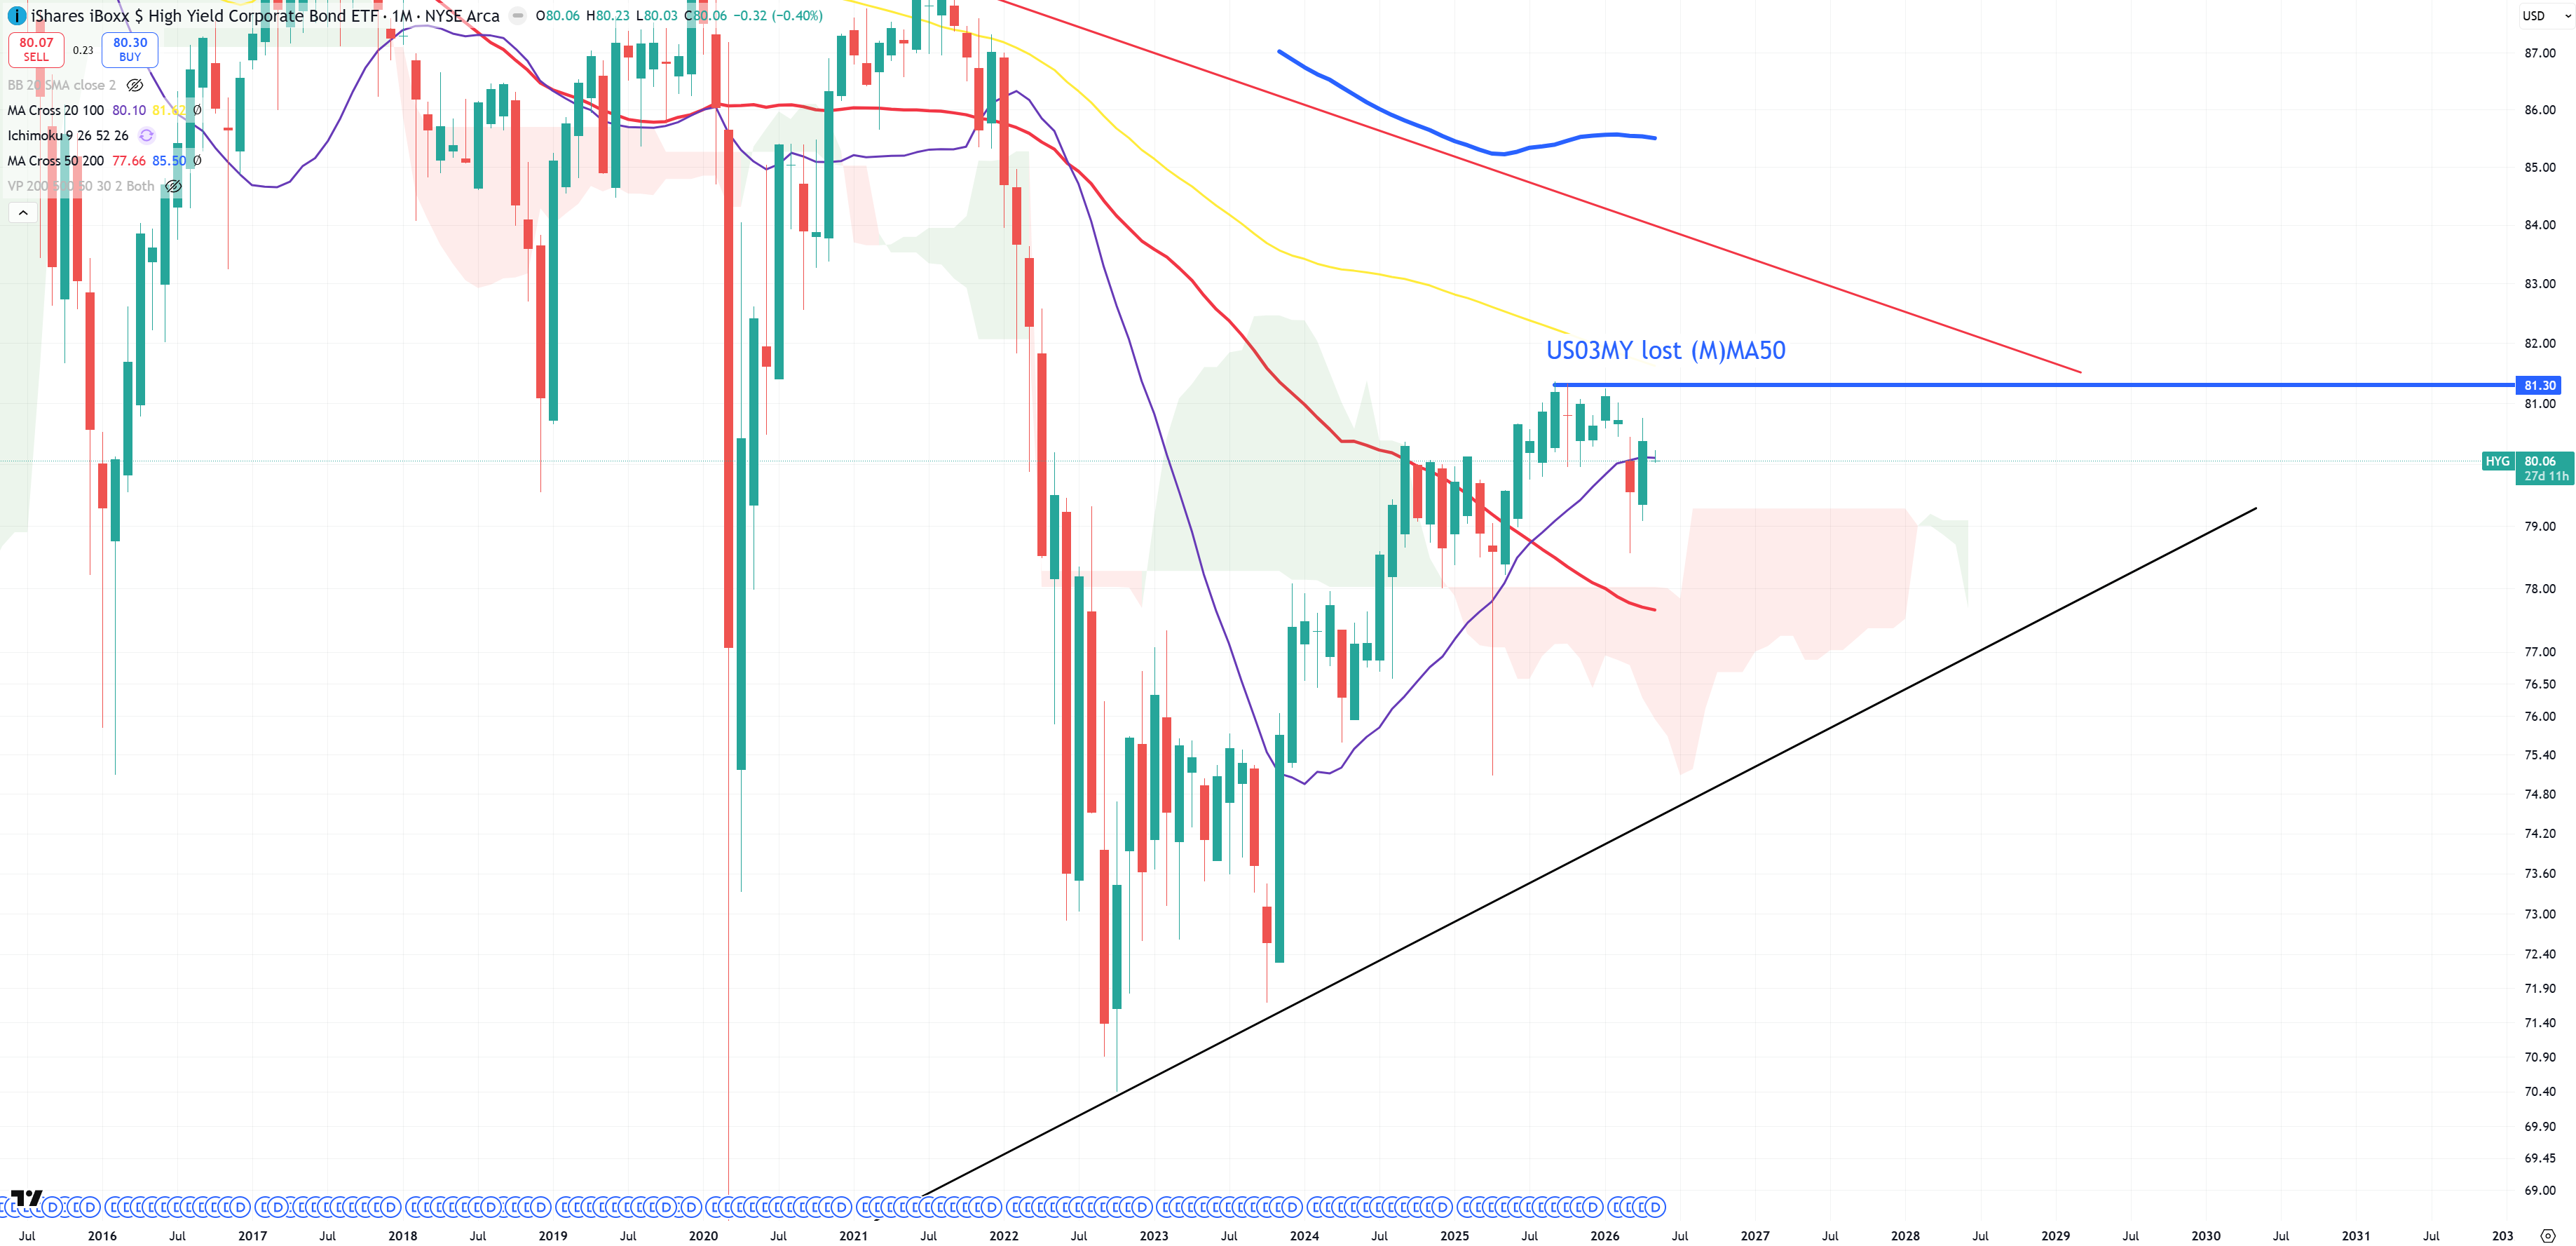
HYG – opens below (M)MA20
Countries
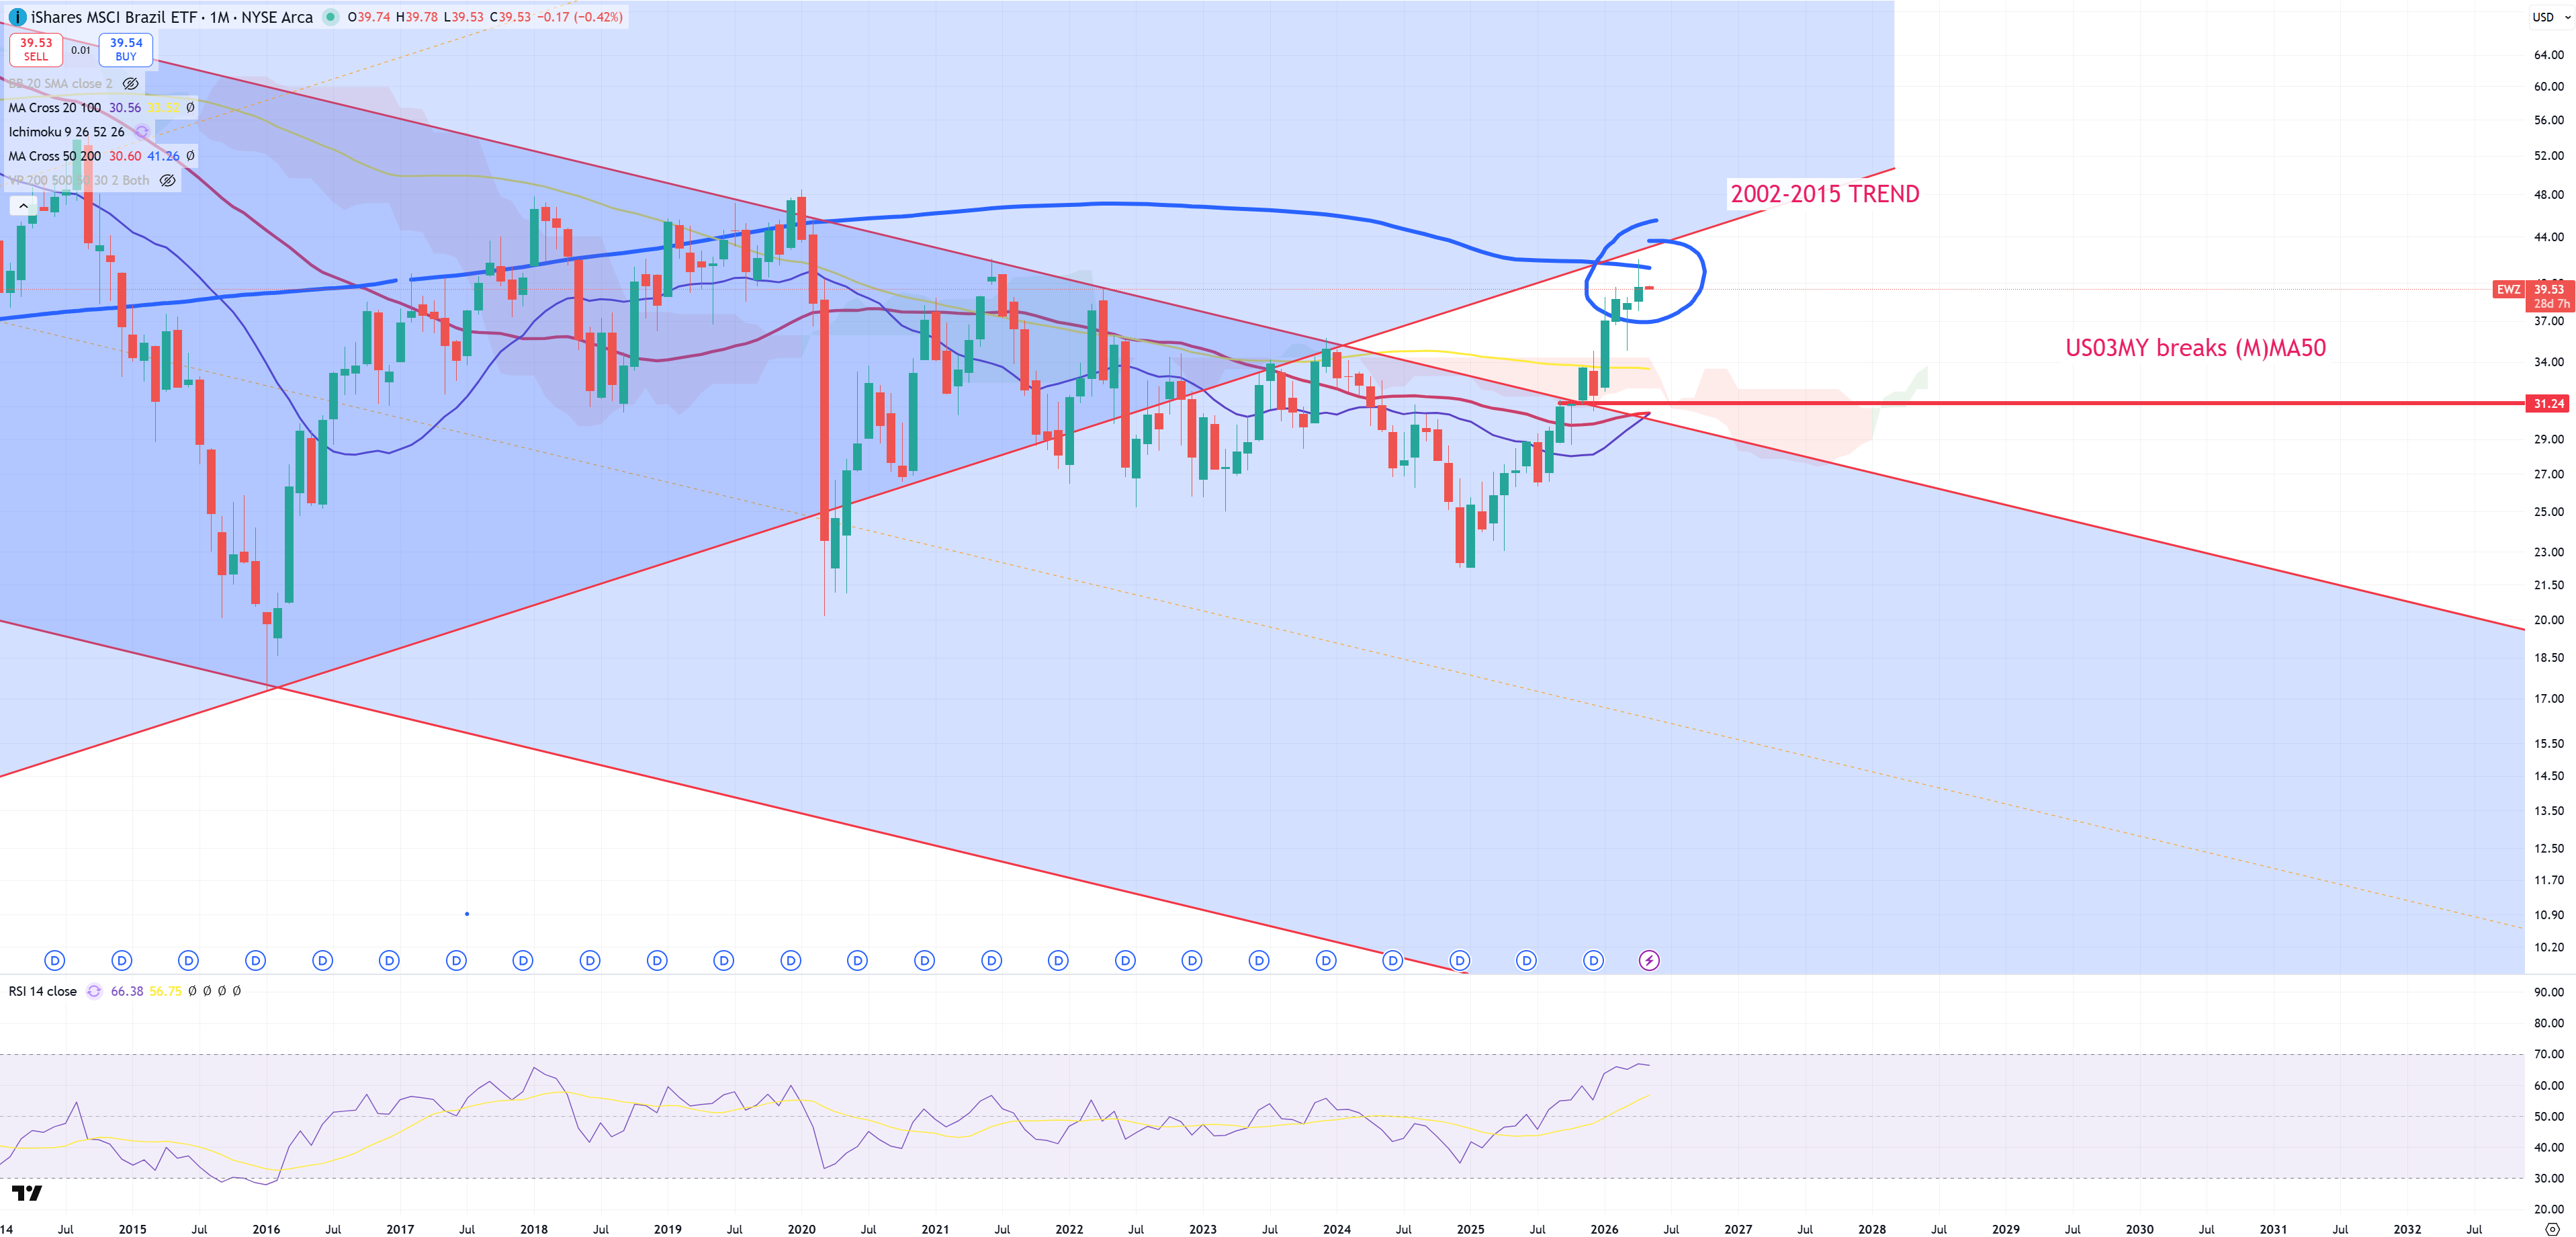
EWZ – Brazil – big moment, big trend ahead and secular bear market border (M)MA200. It needs to break 43$ to consider it returning to bull market.
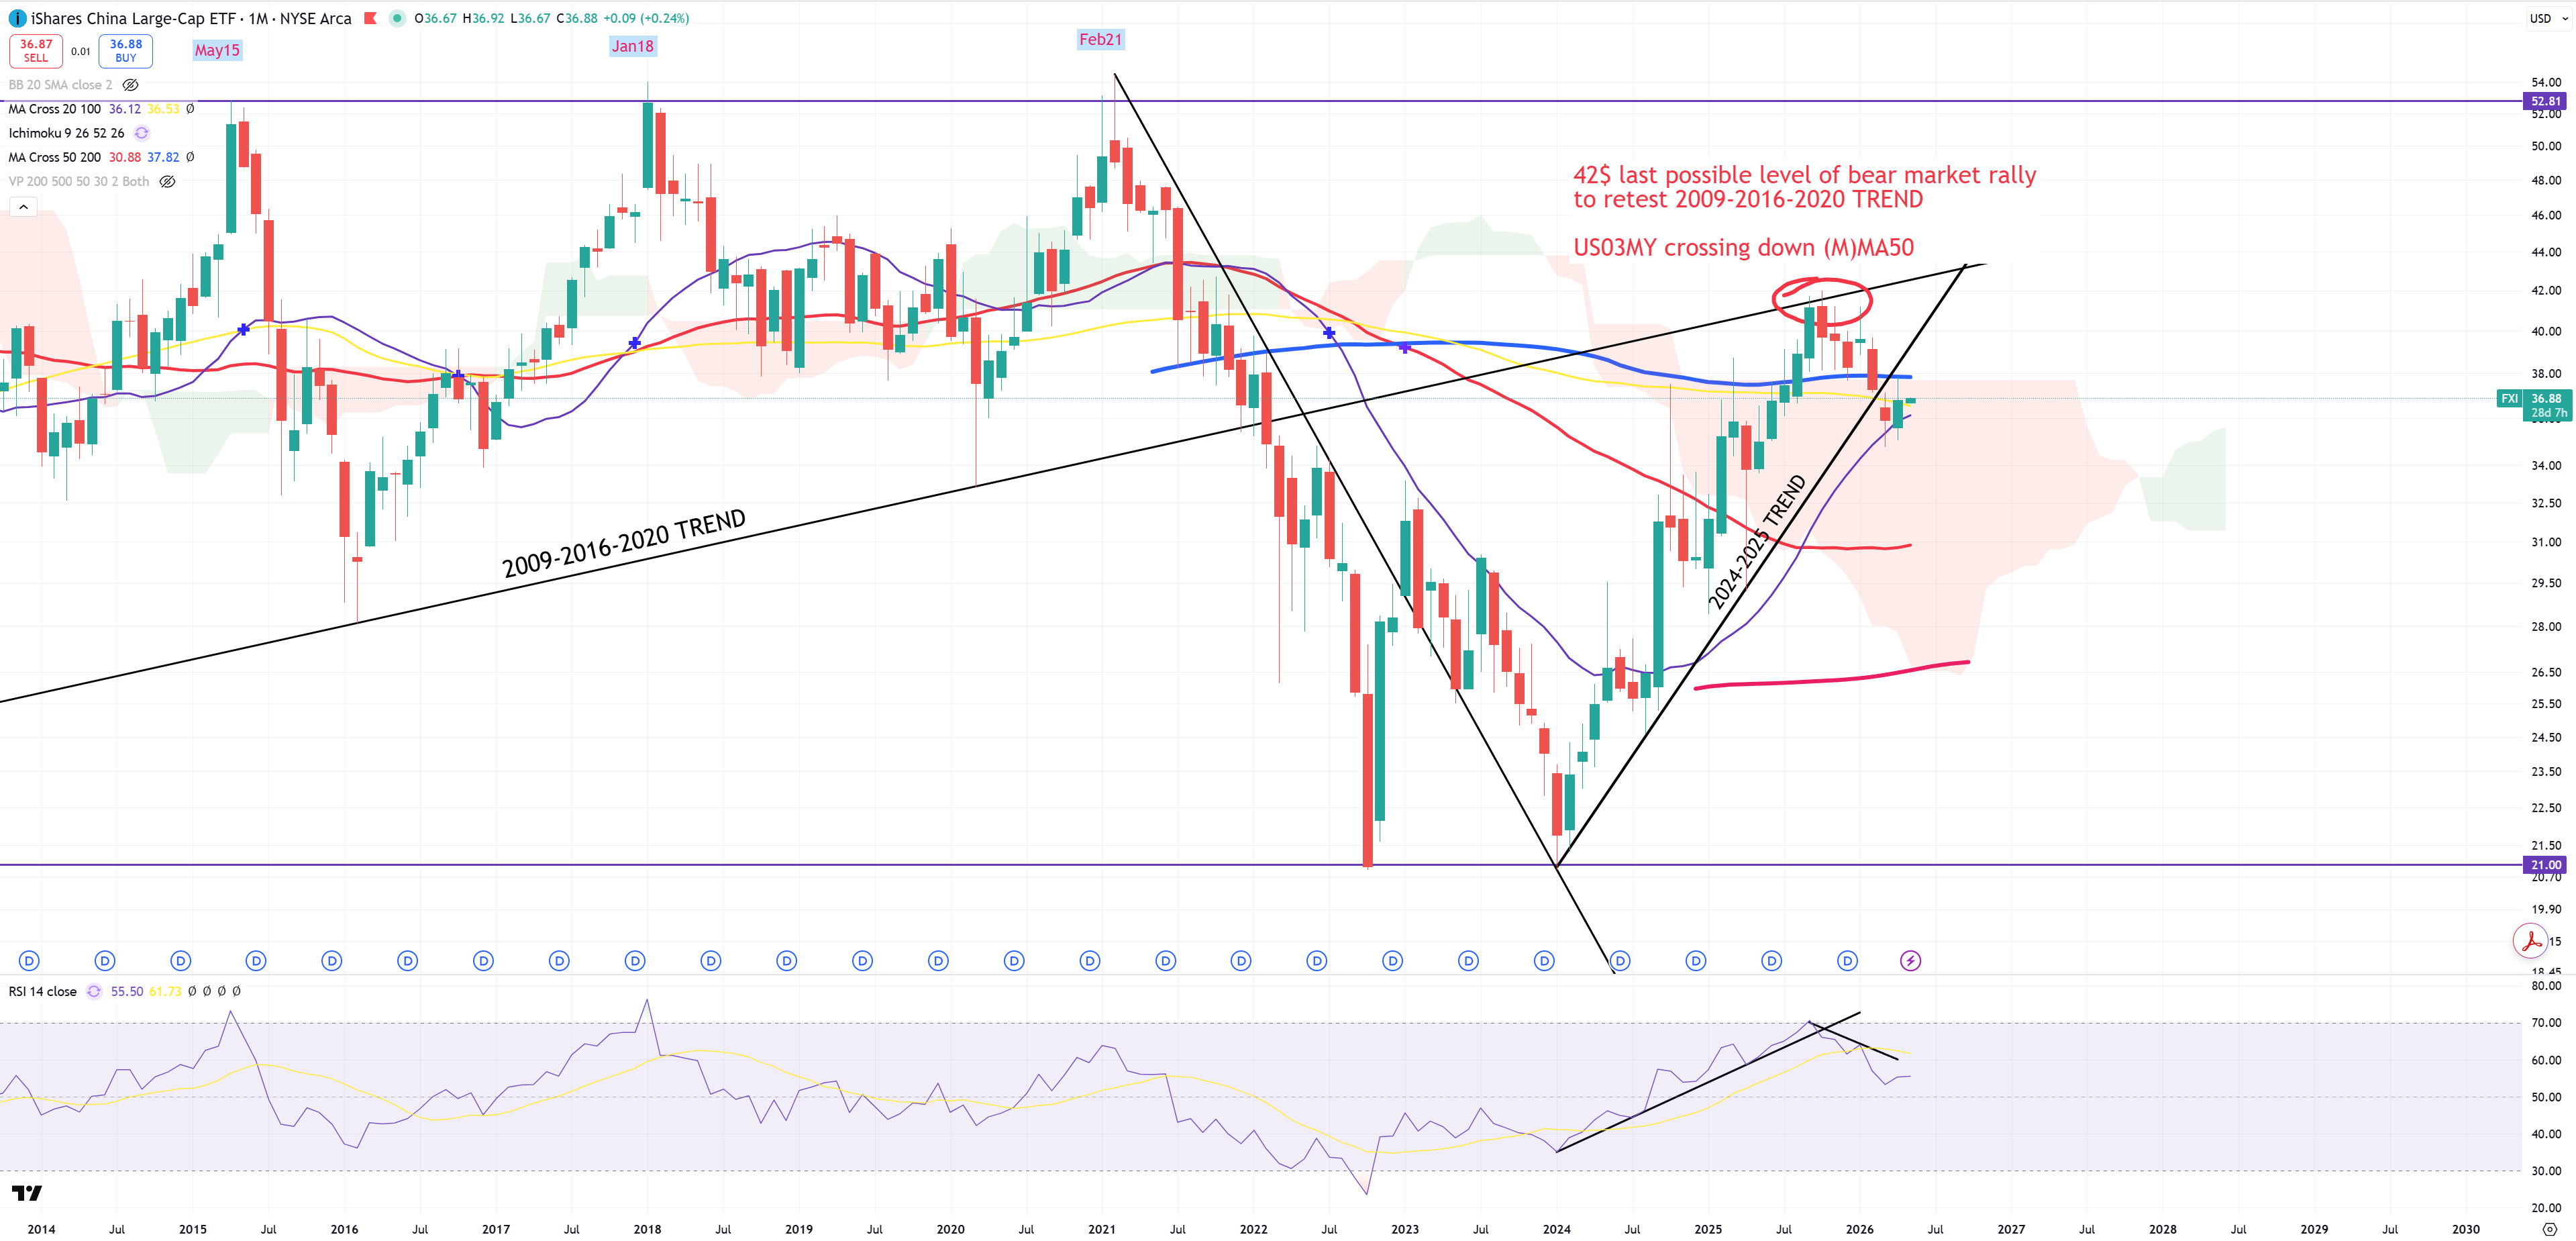
FXI – China – I think no need to comment it.
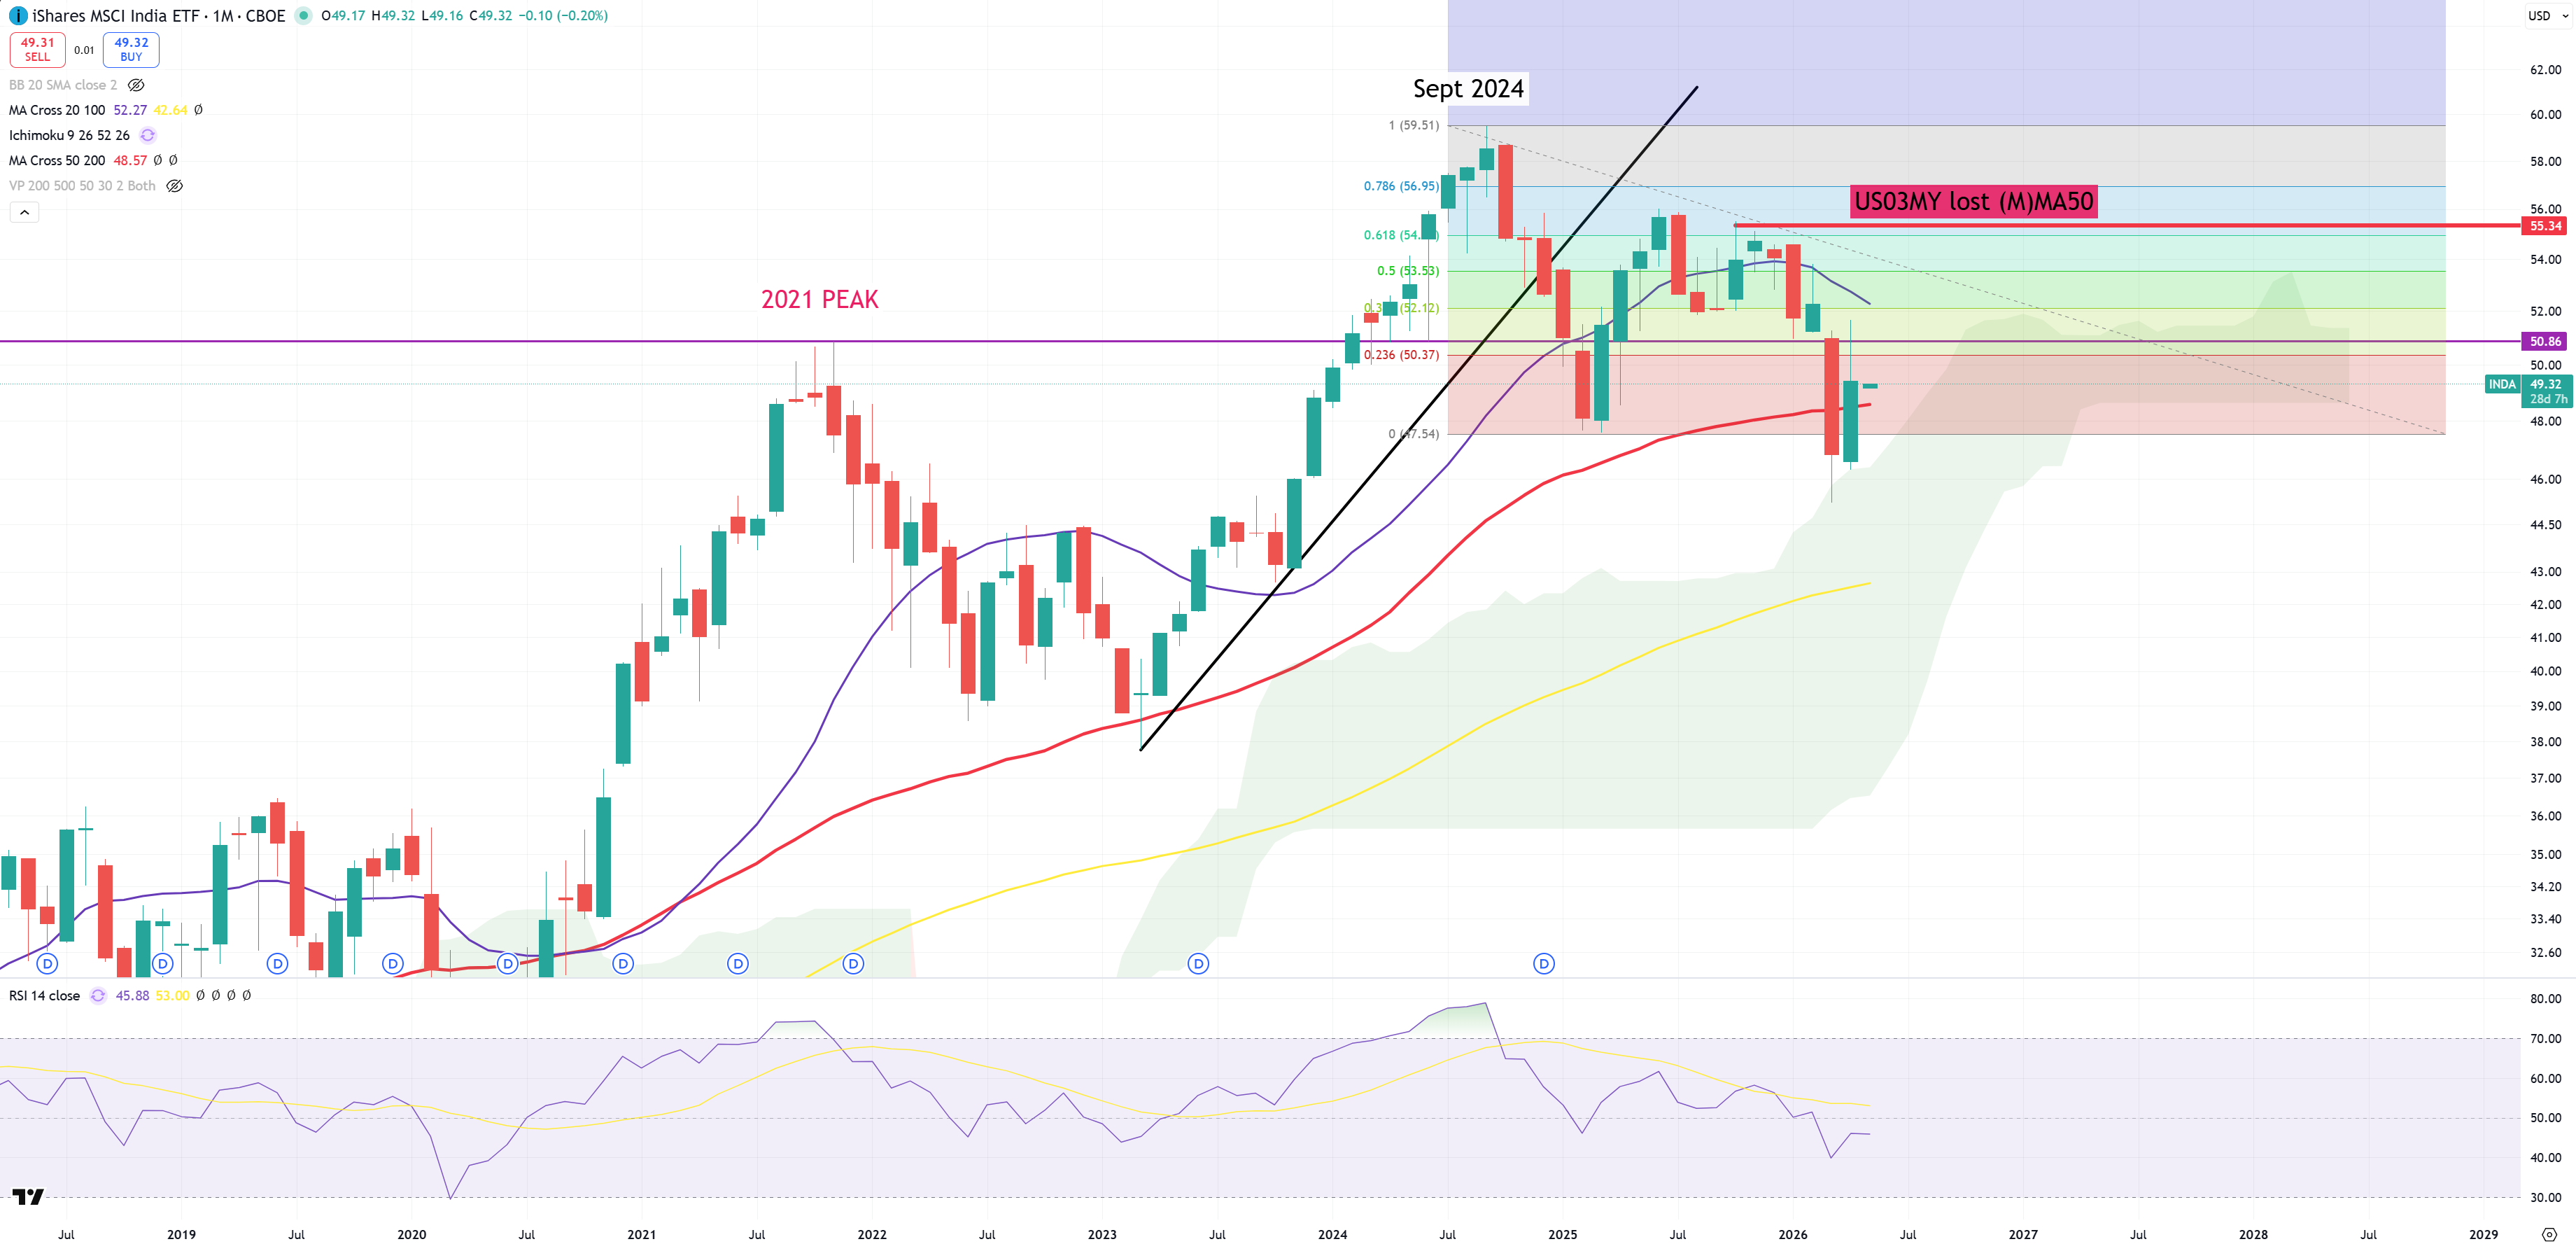
INDA – India – also defended (M)MA50
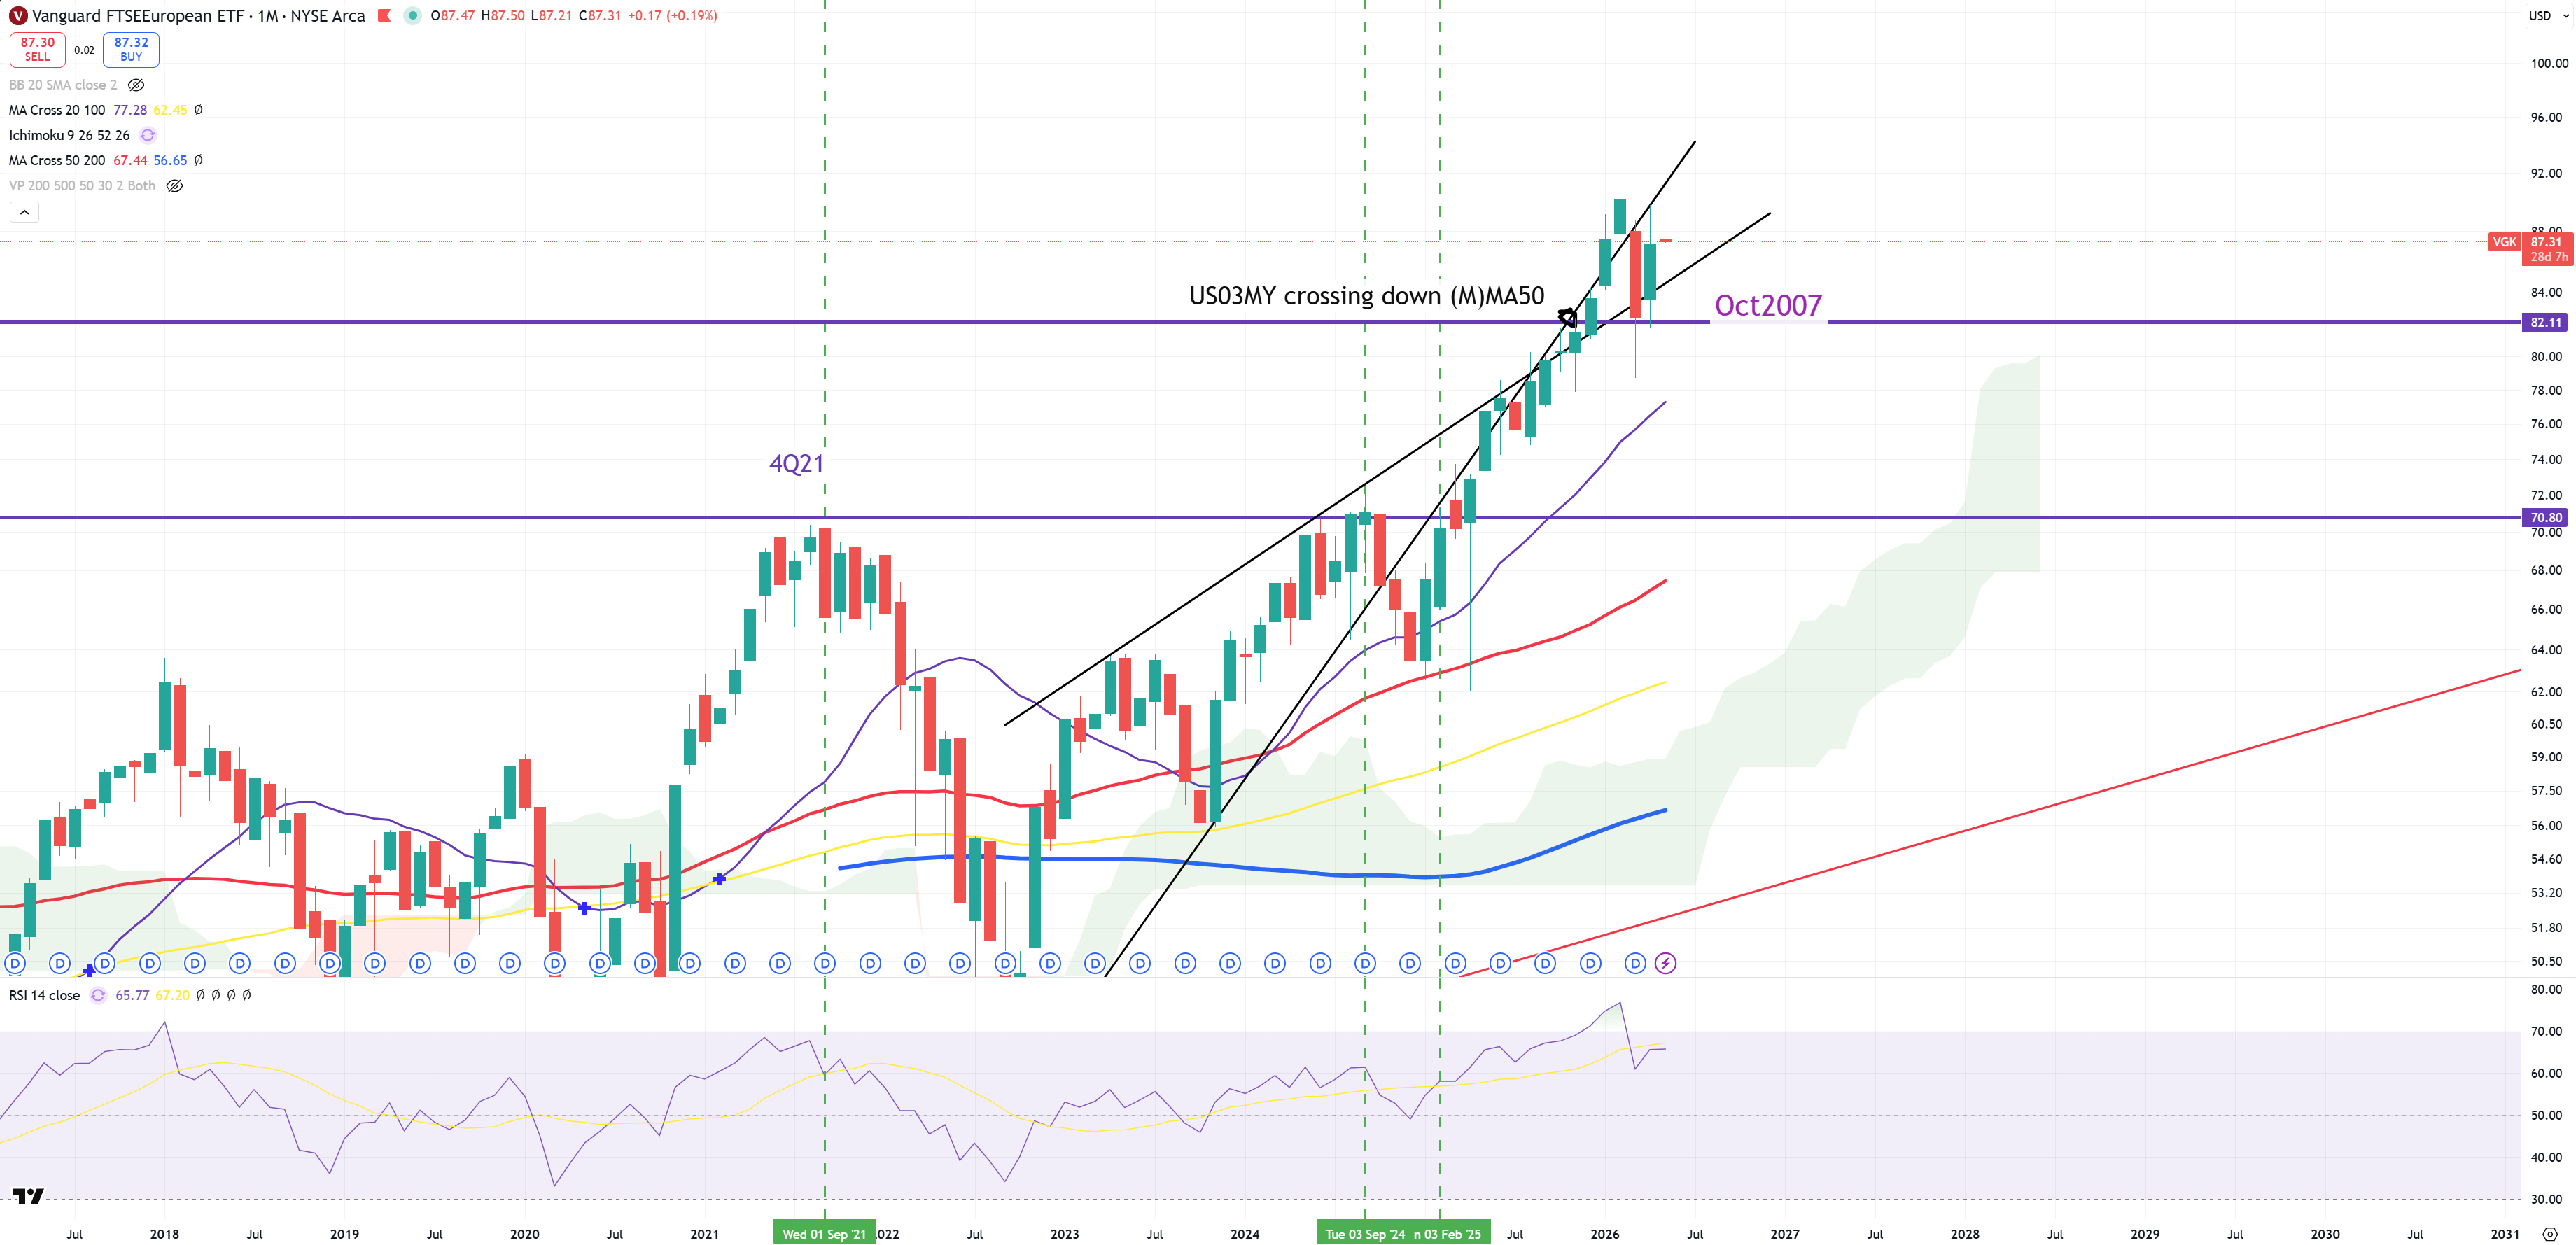
VGK – Europe in general – October 2007 peak matches level of US03MY (M)MA50 crossing. So far above. This move down will be blown by a big red candle. First attack failed.
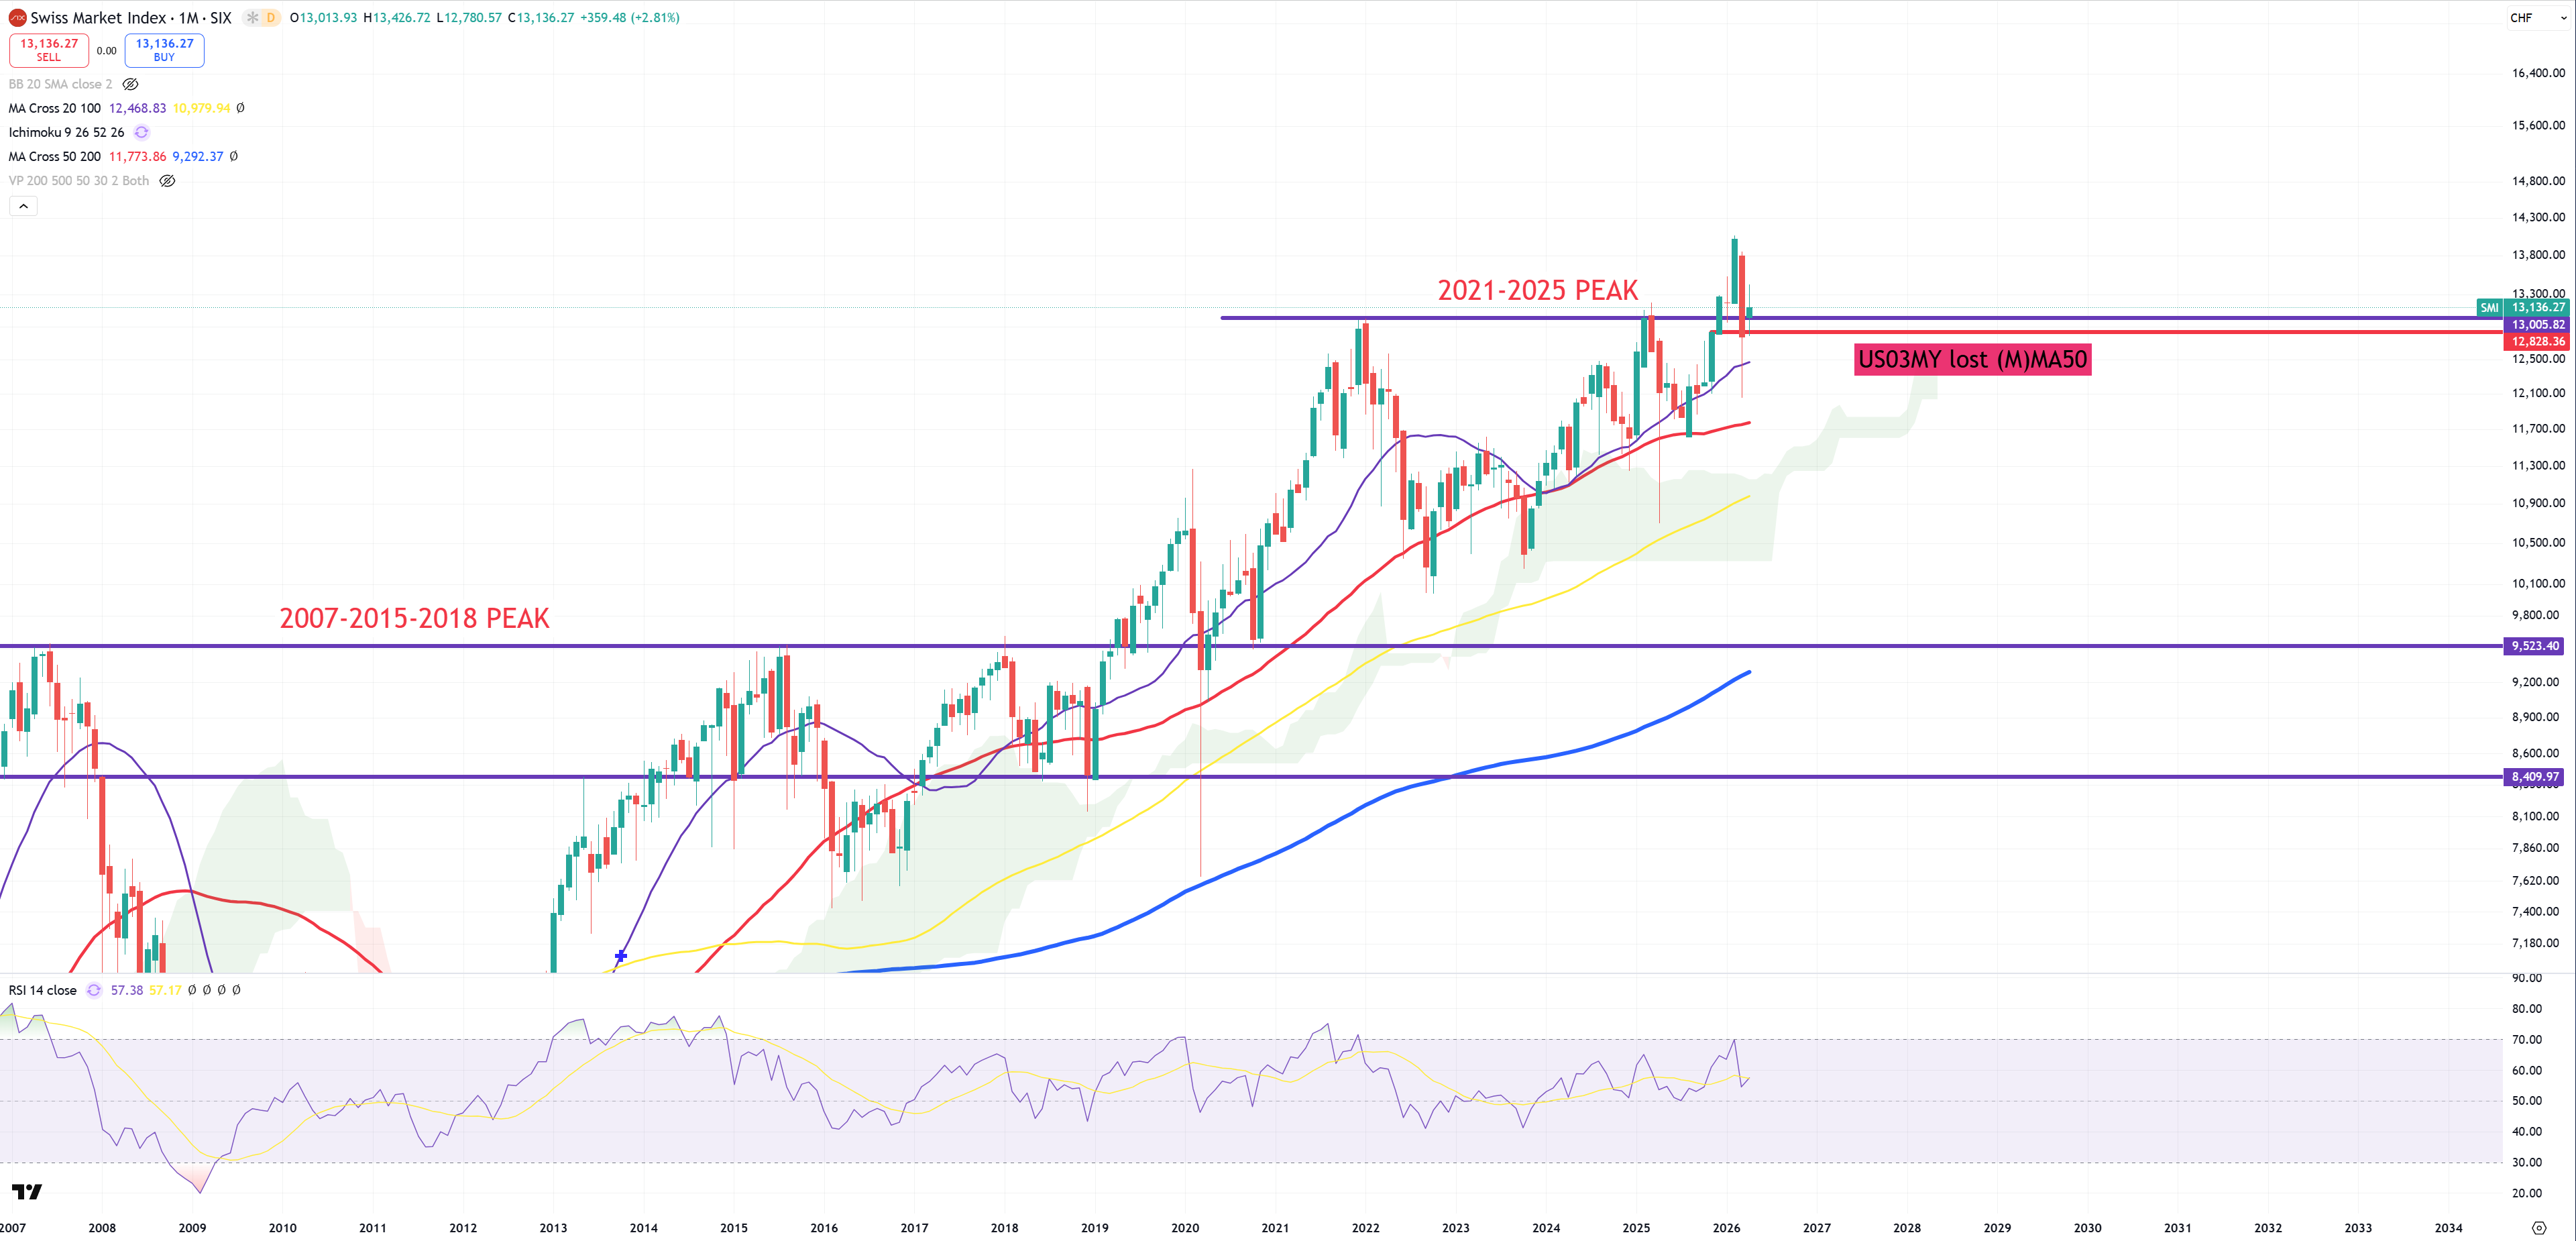
SMI – Swiss stock exhange – also back to 2021 level.
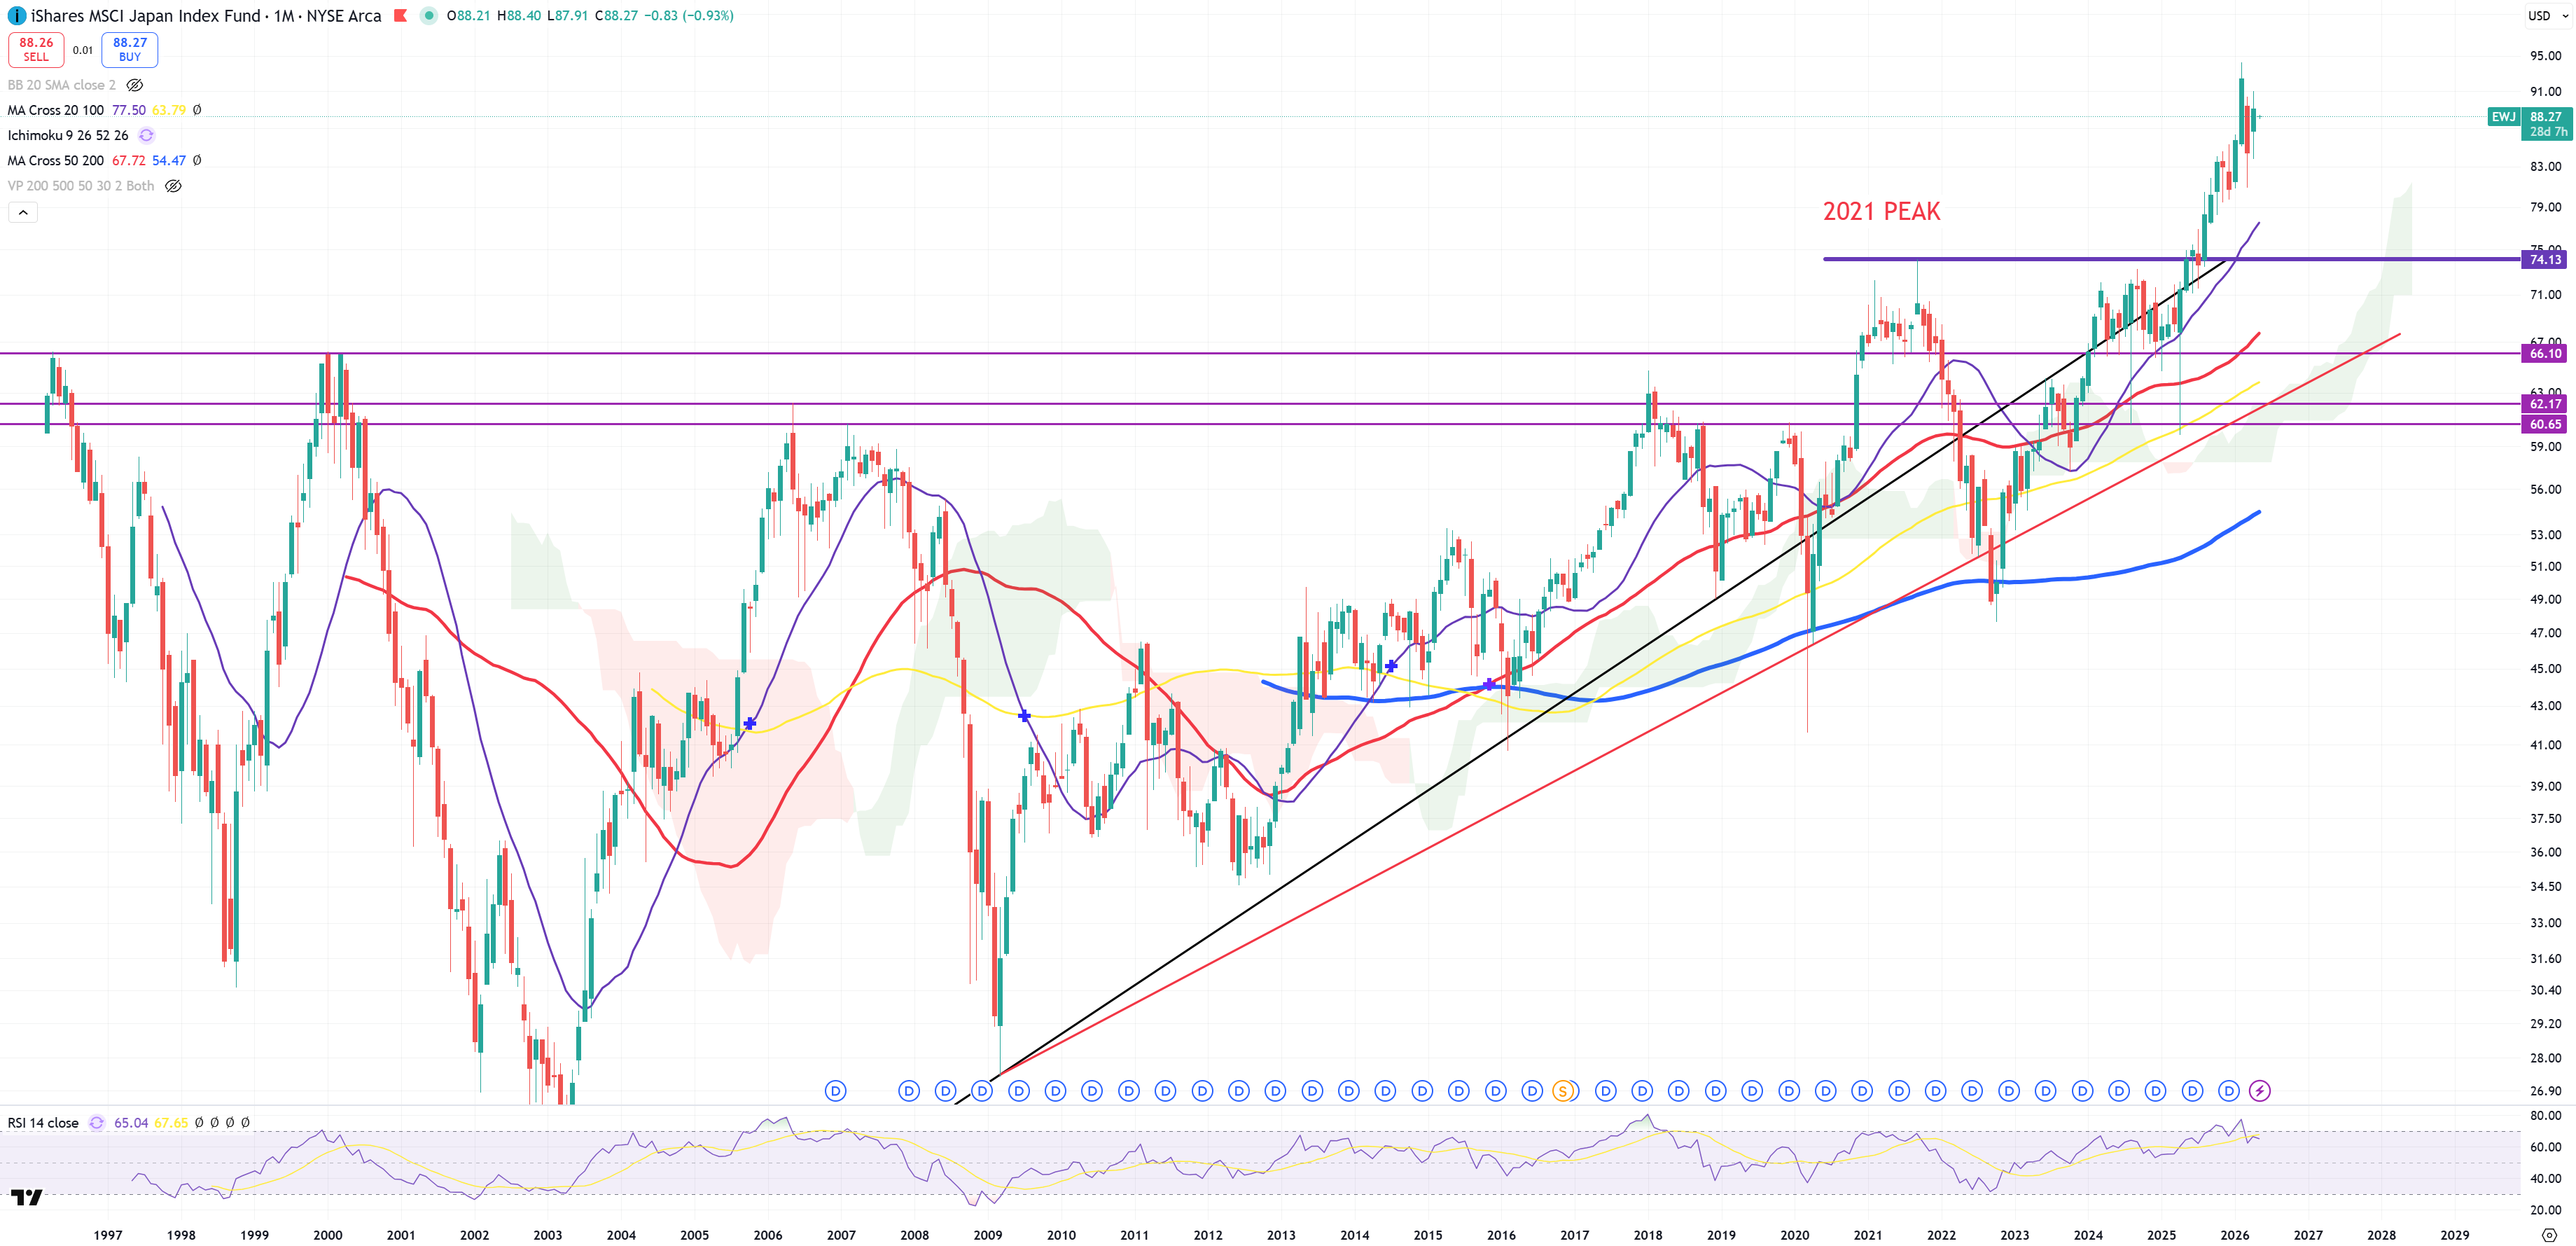
EWJ – Japan and here it’s something what blows my mind
BIG BEAR MARKETS
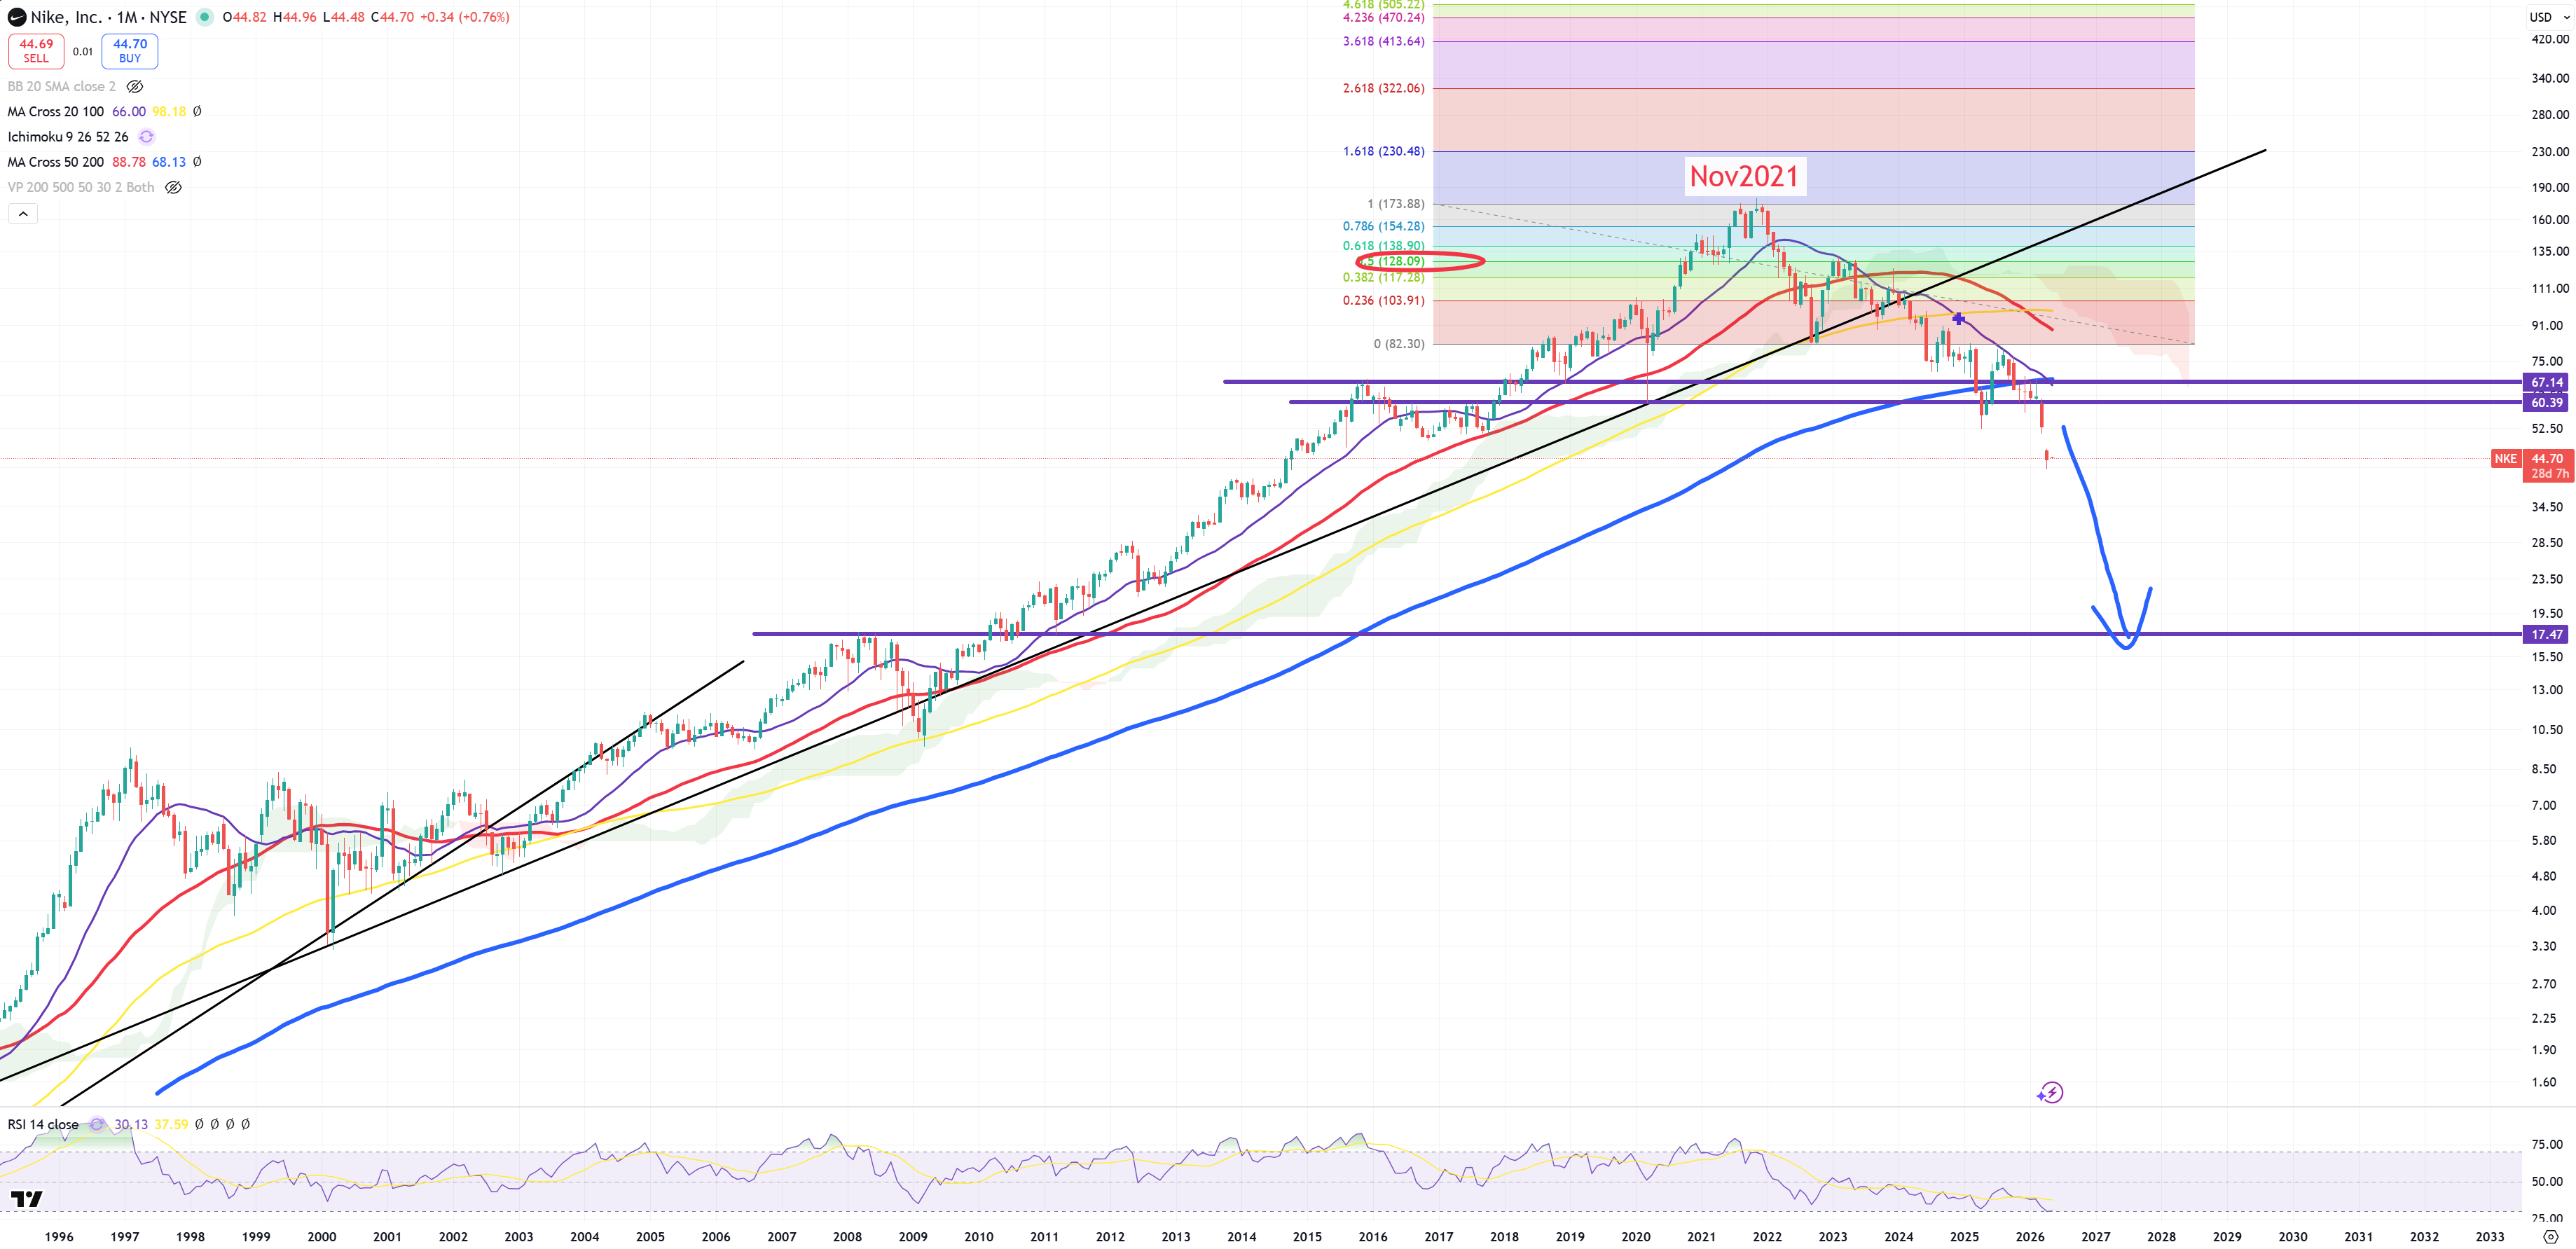
NKE – Nike with 17$ target
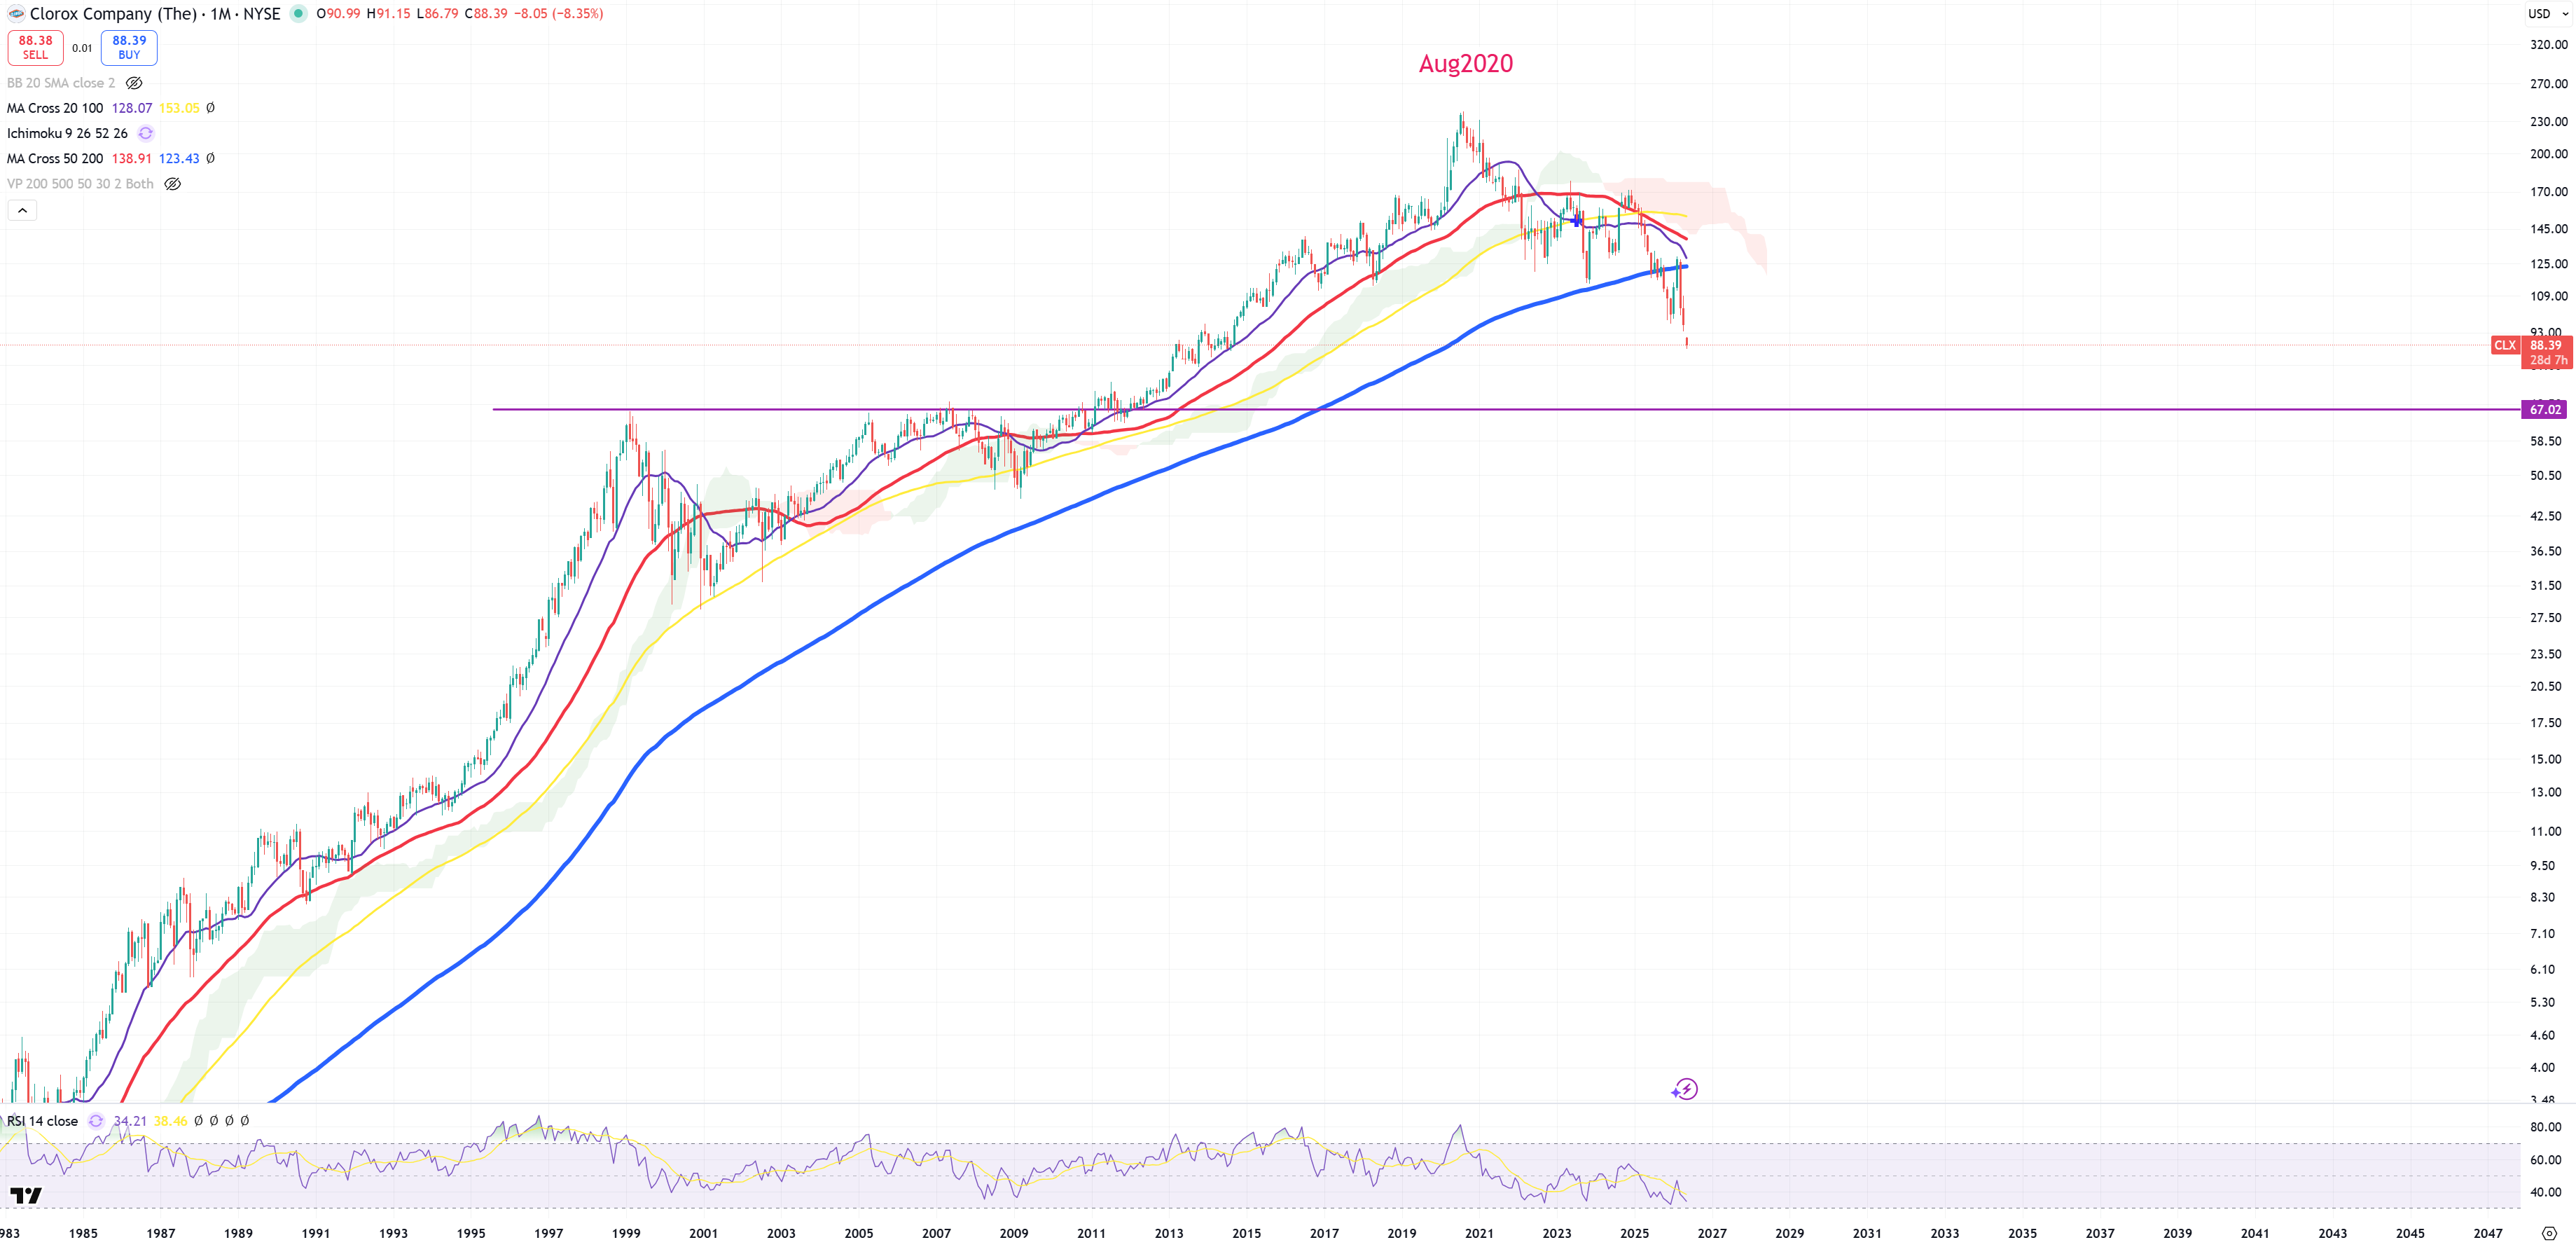
CLX going to 60$
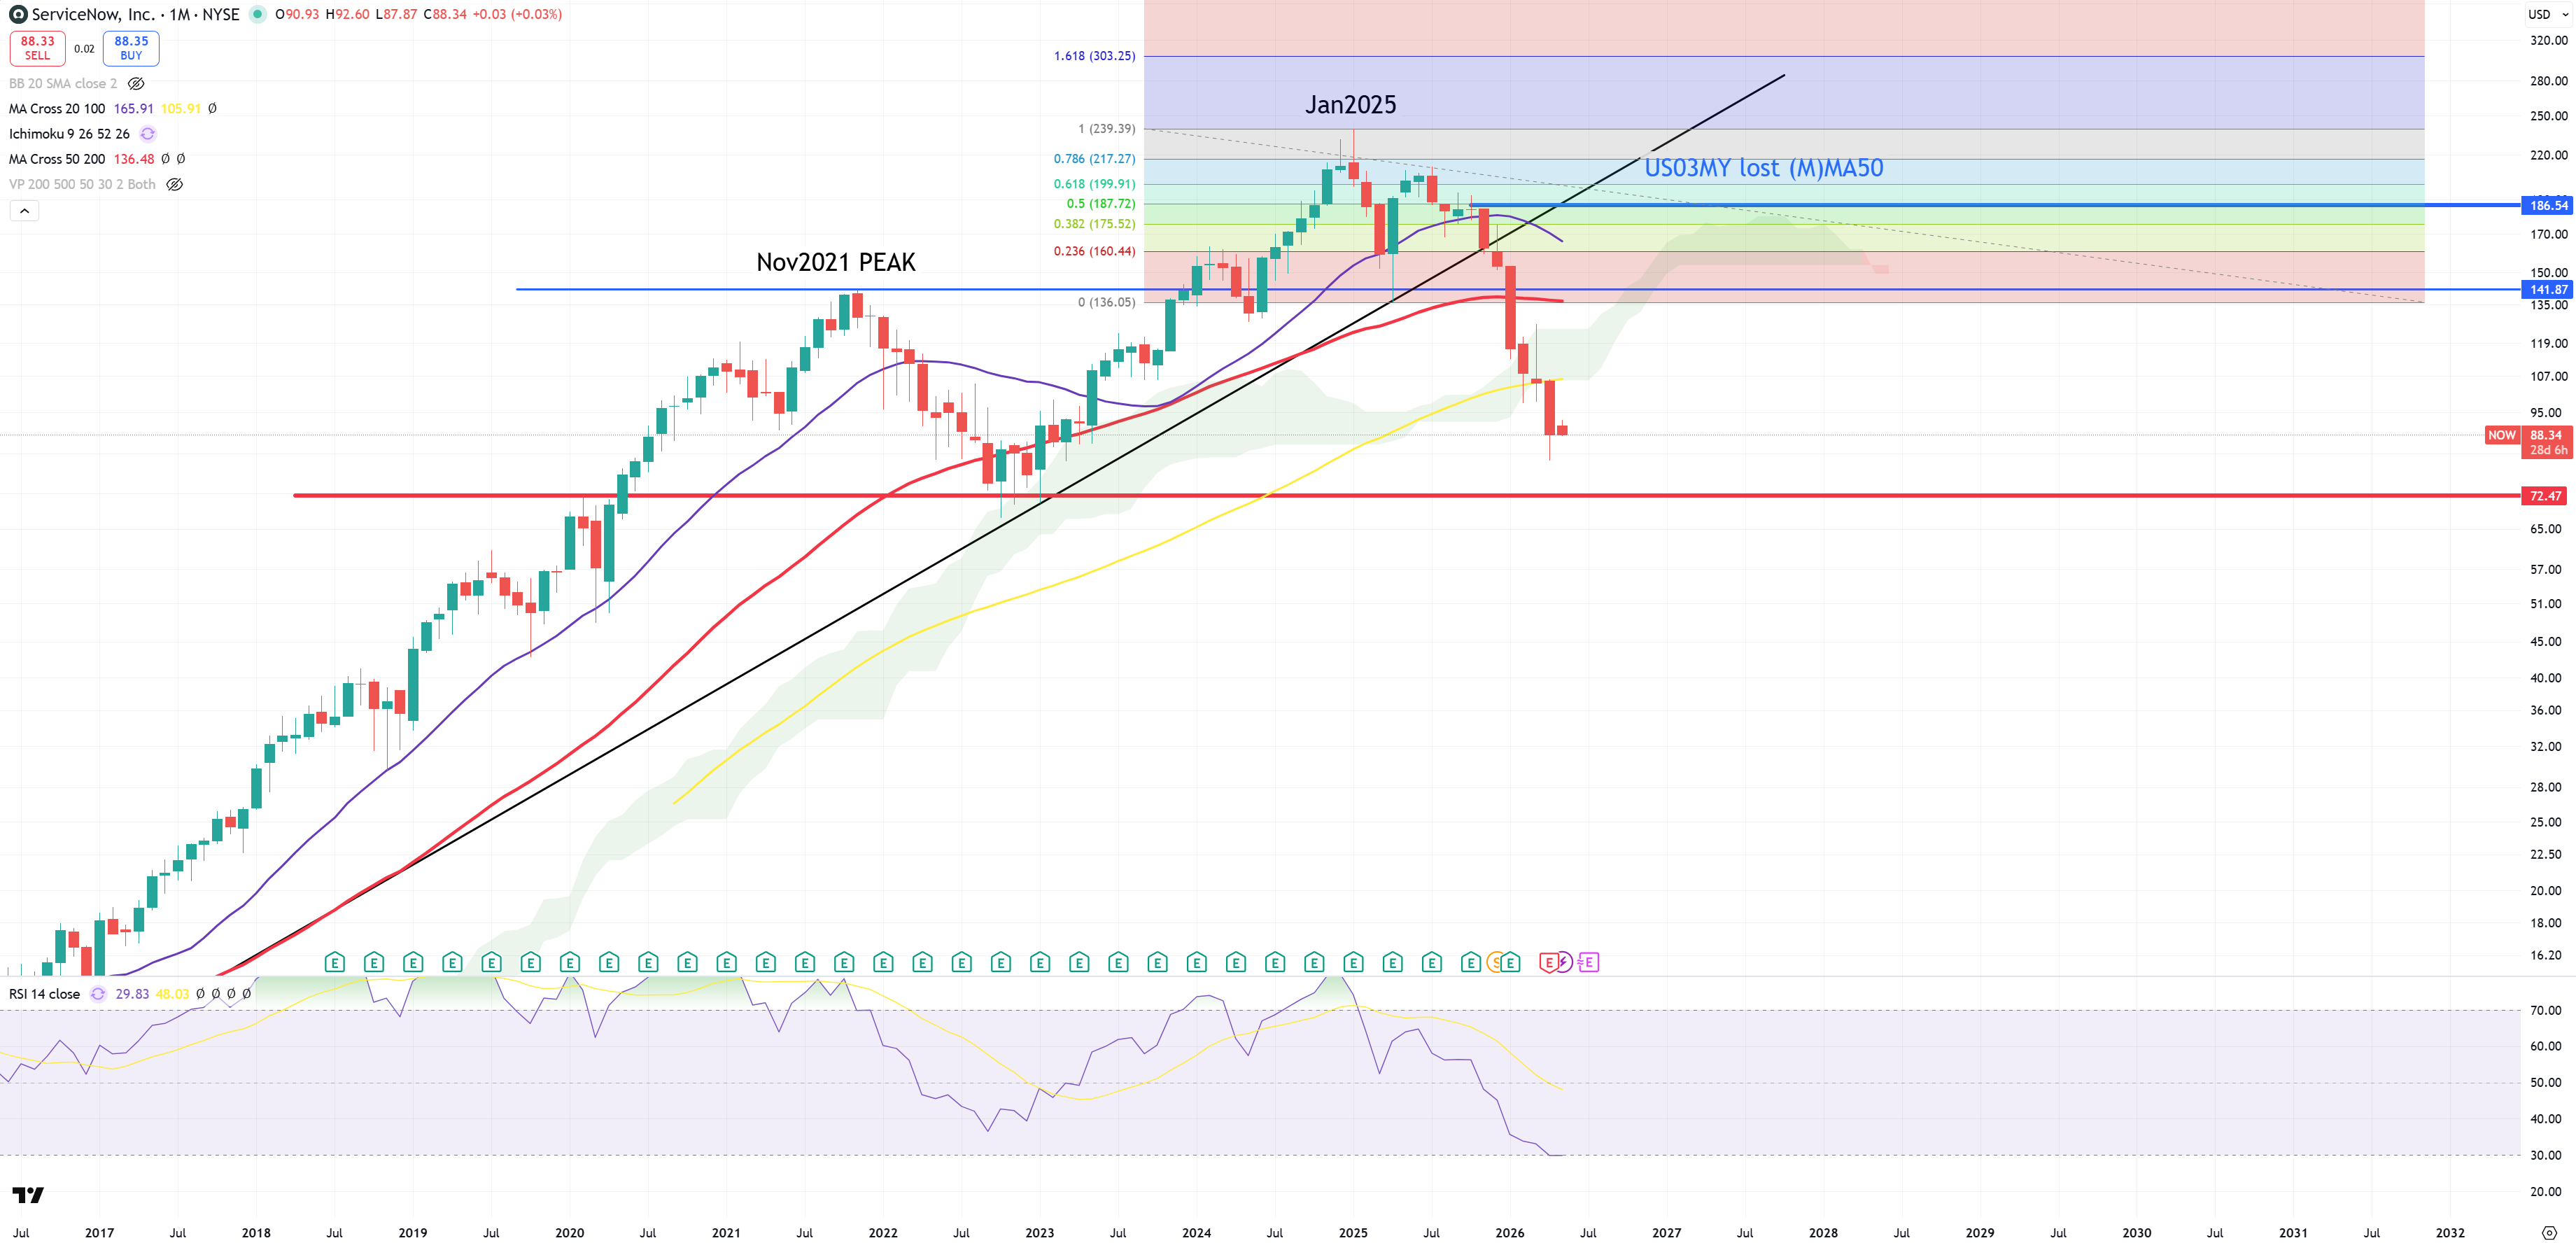
NOW
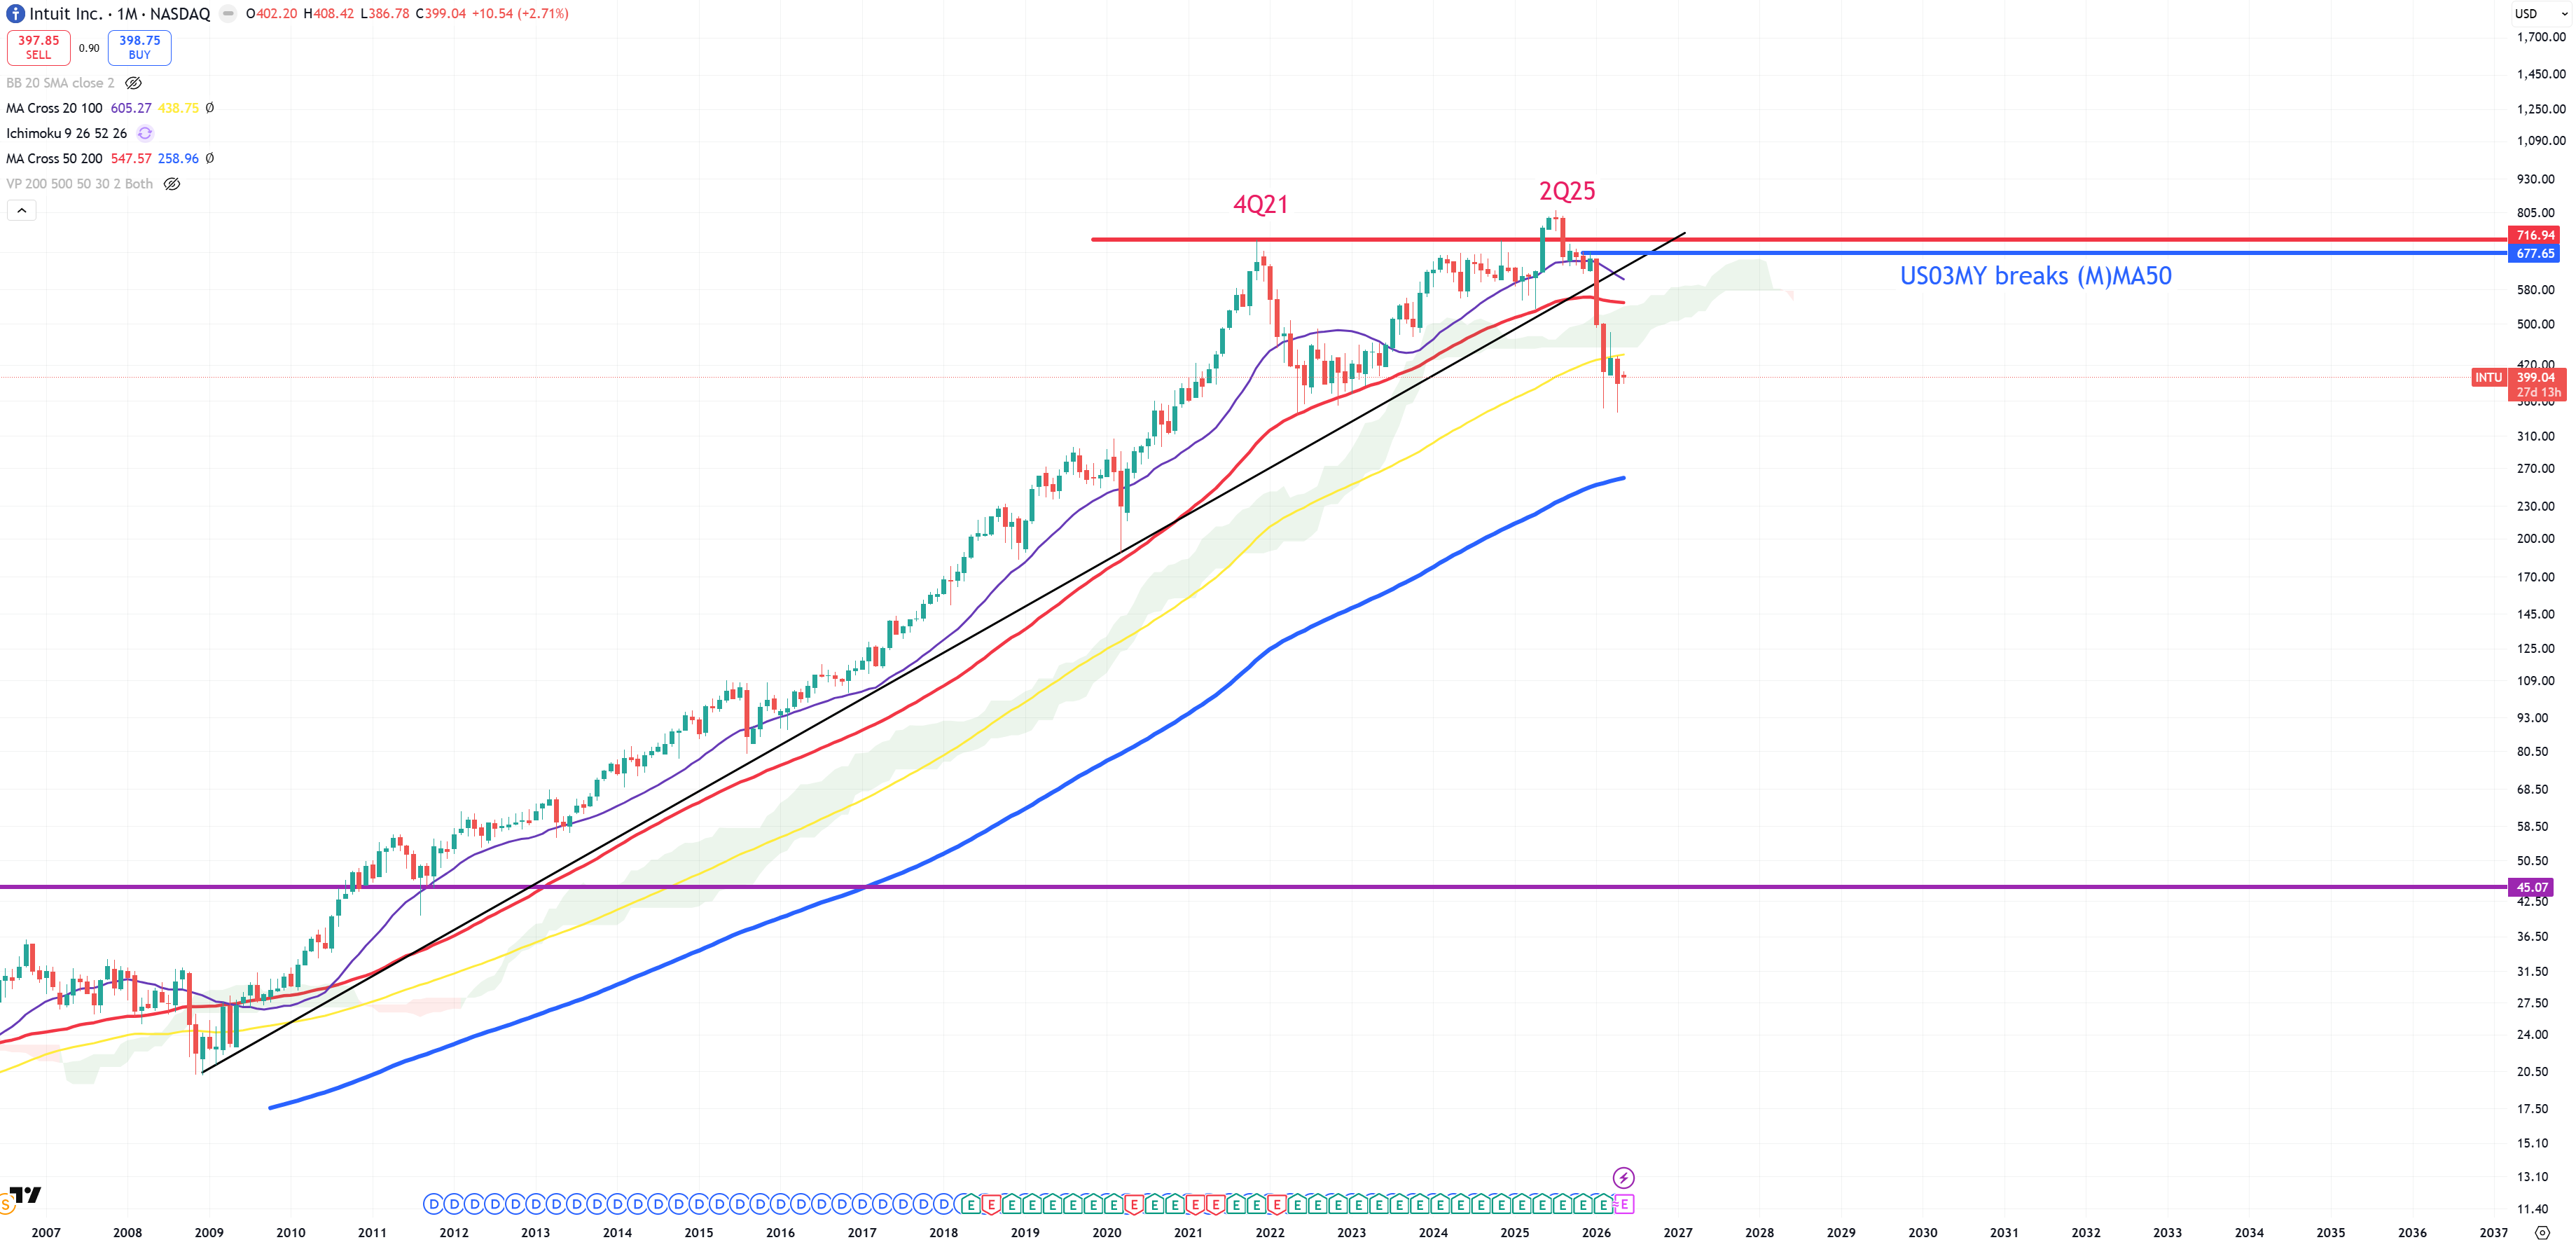
INTU
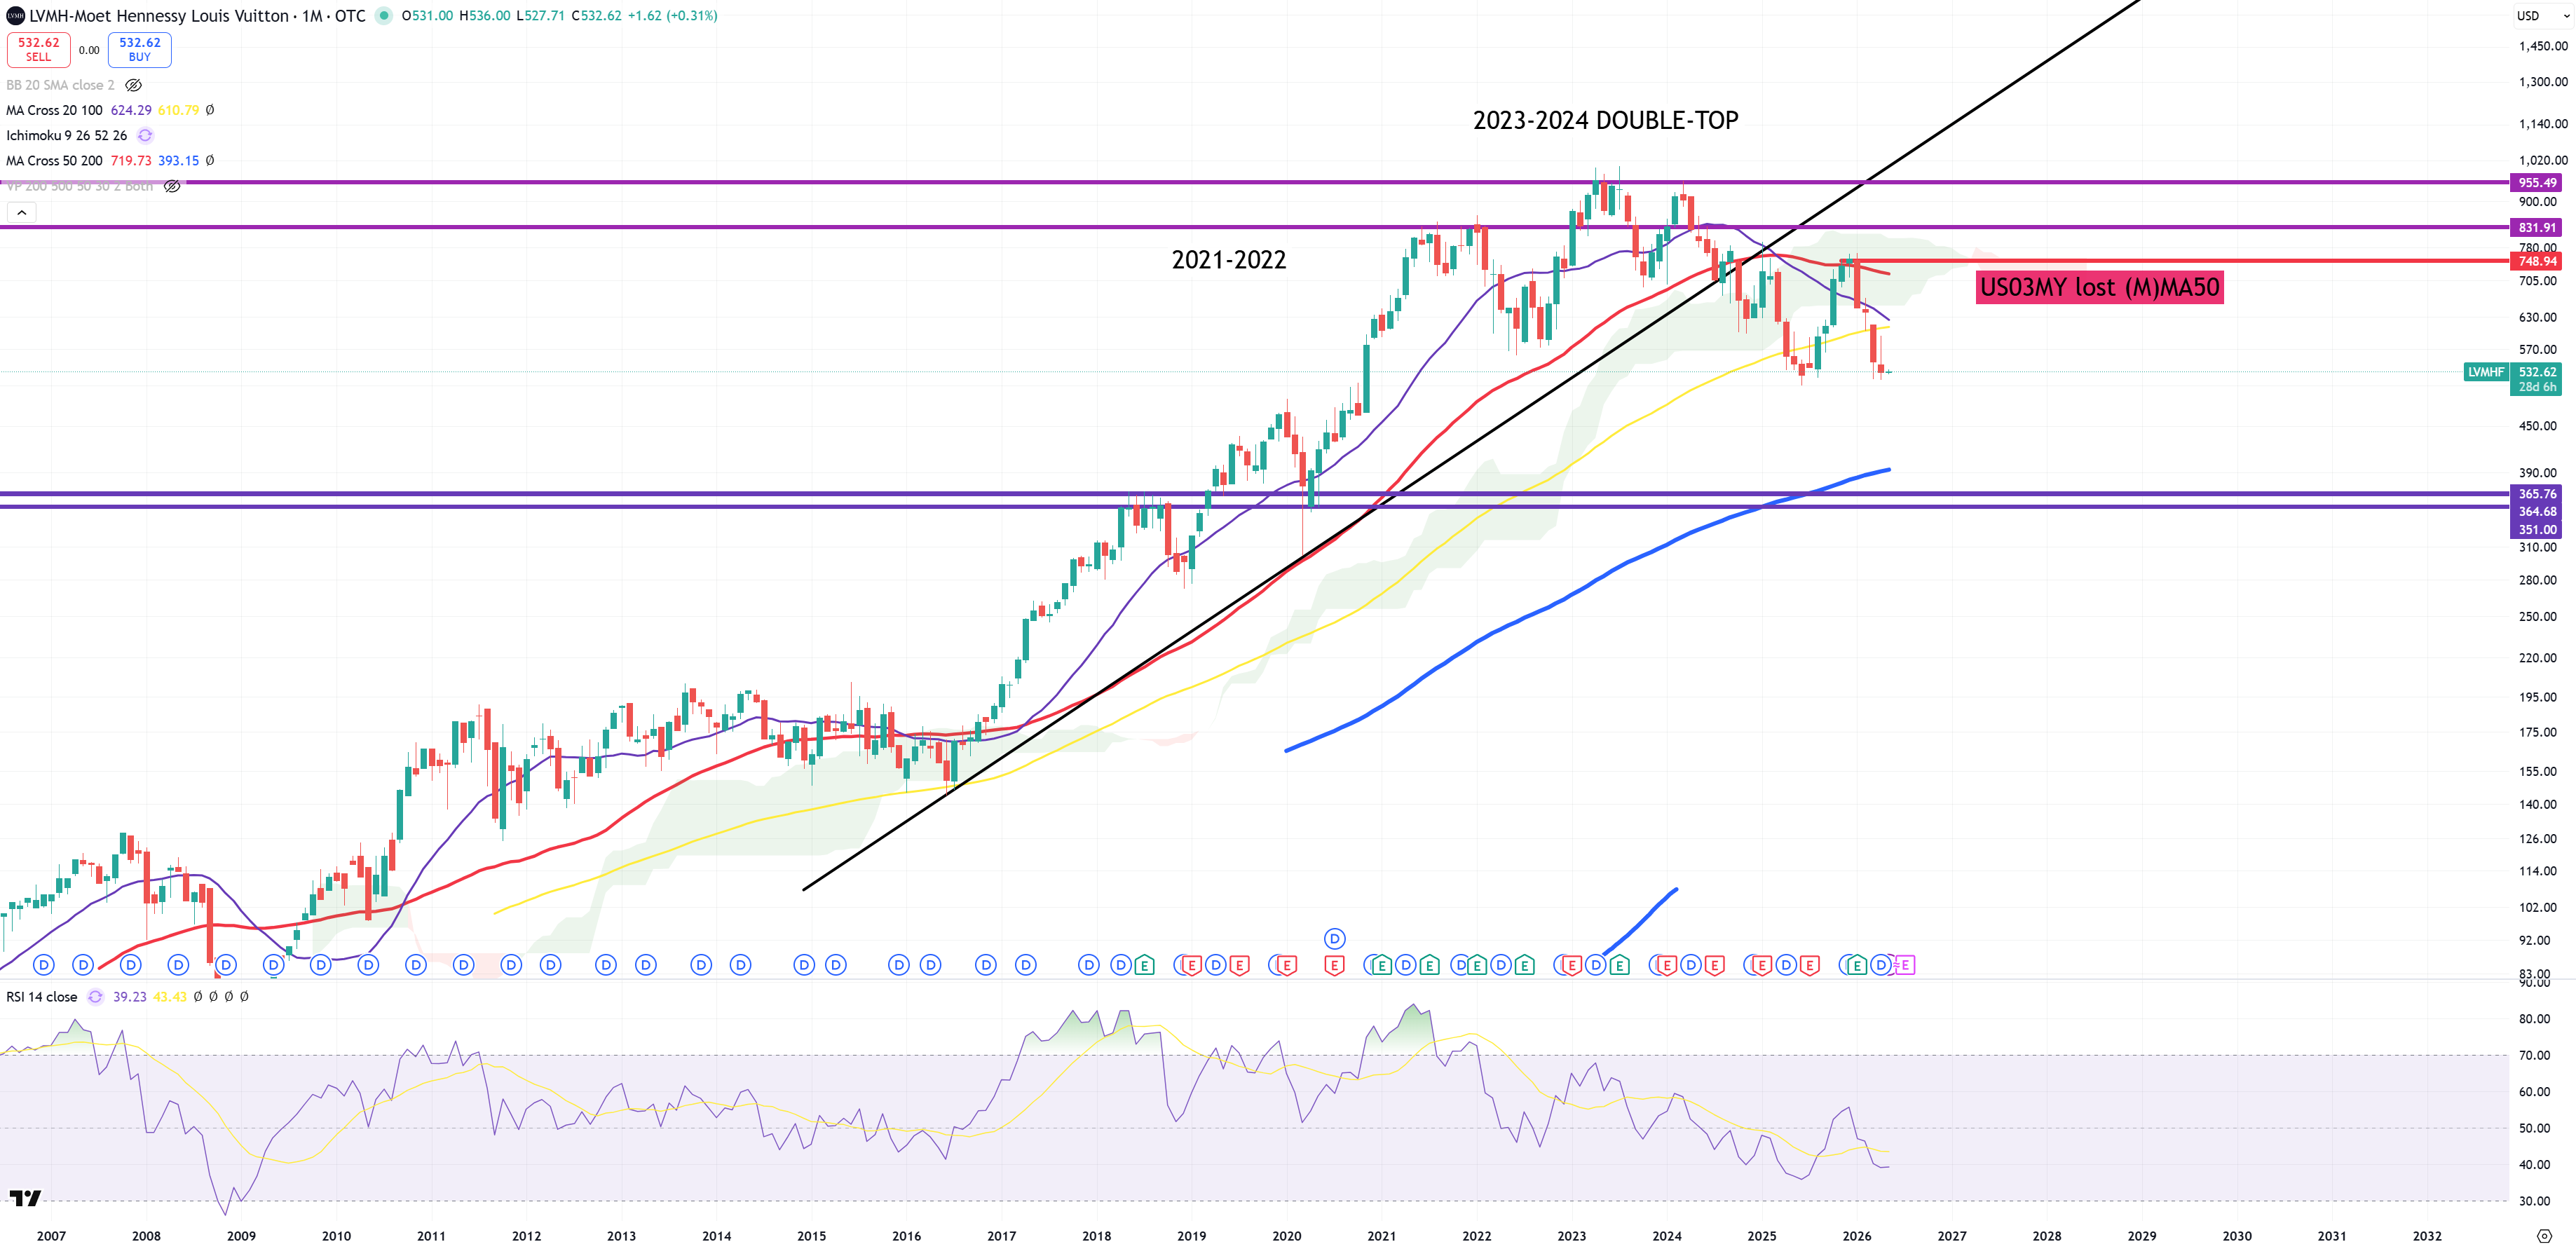
LVMH
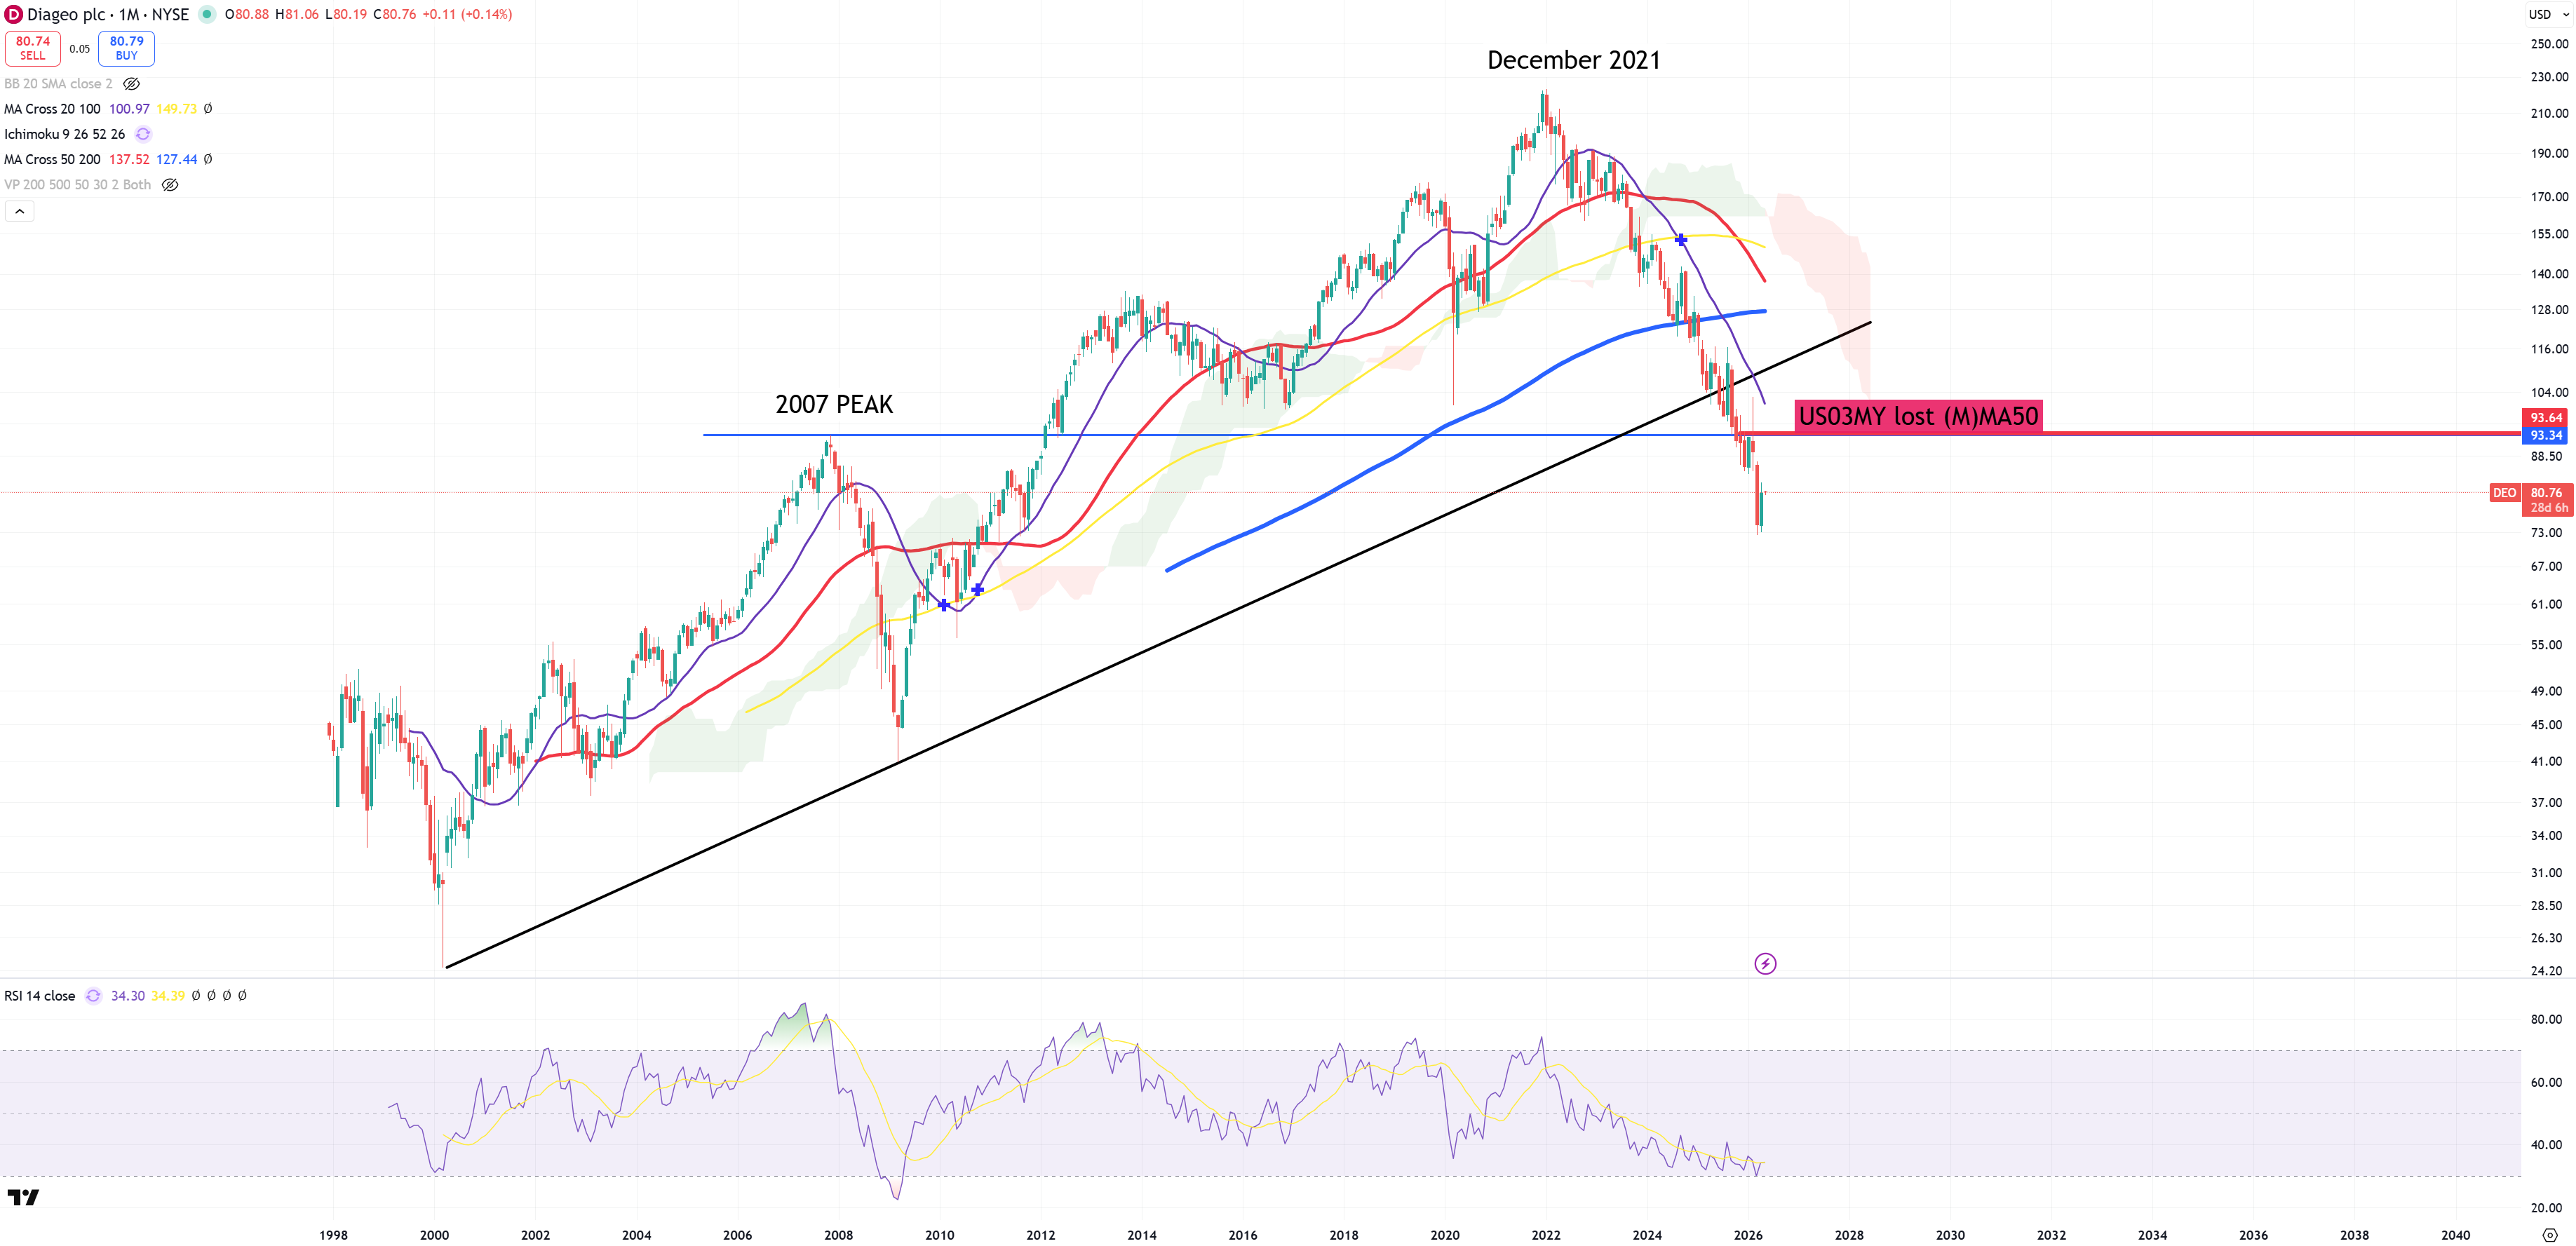
DEO
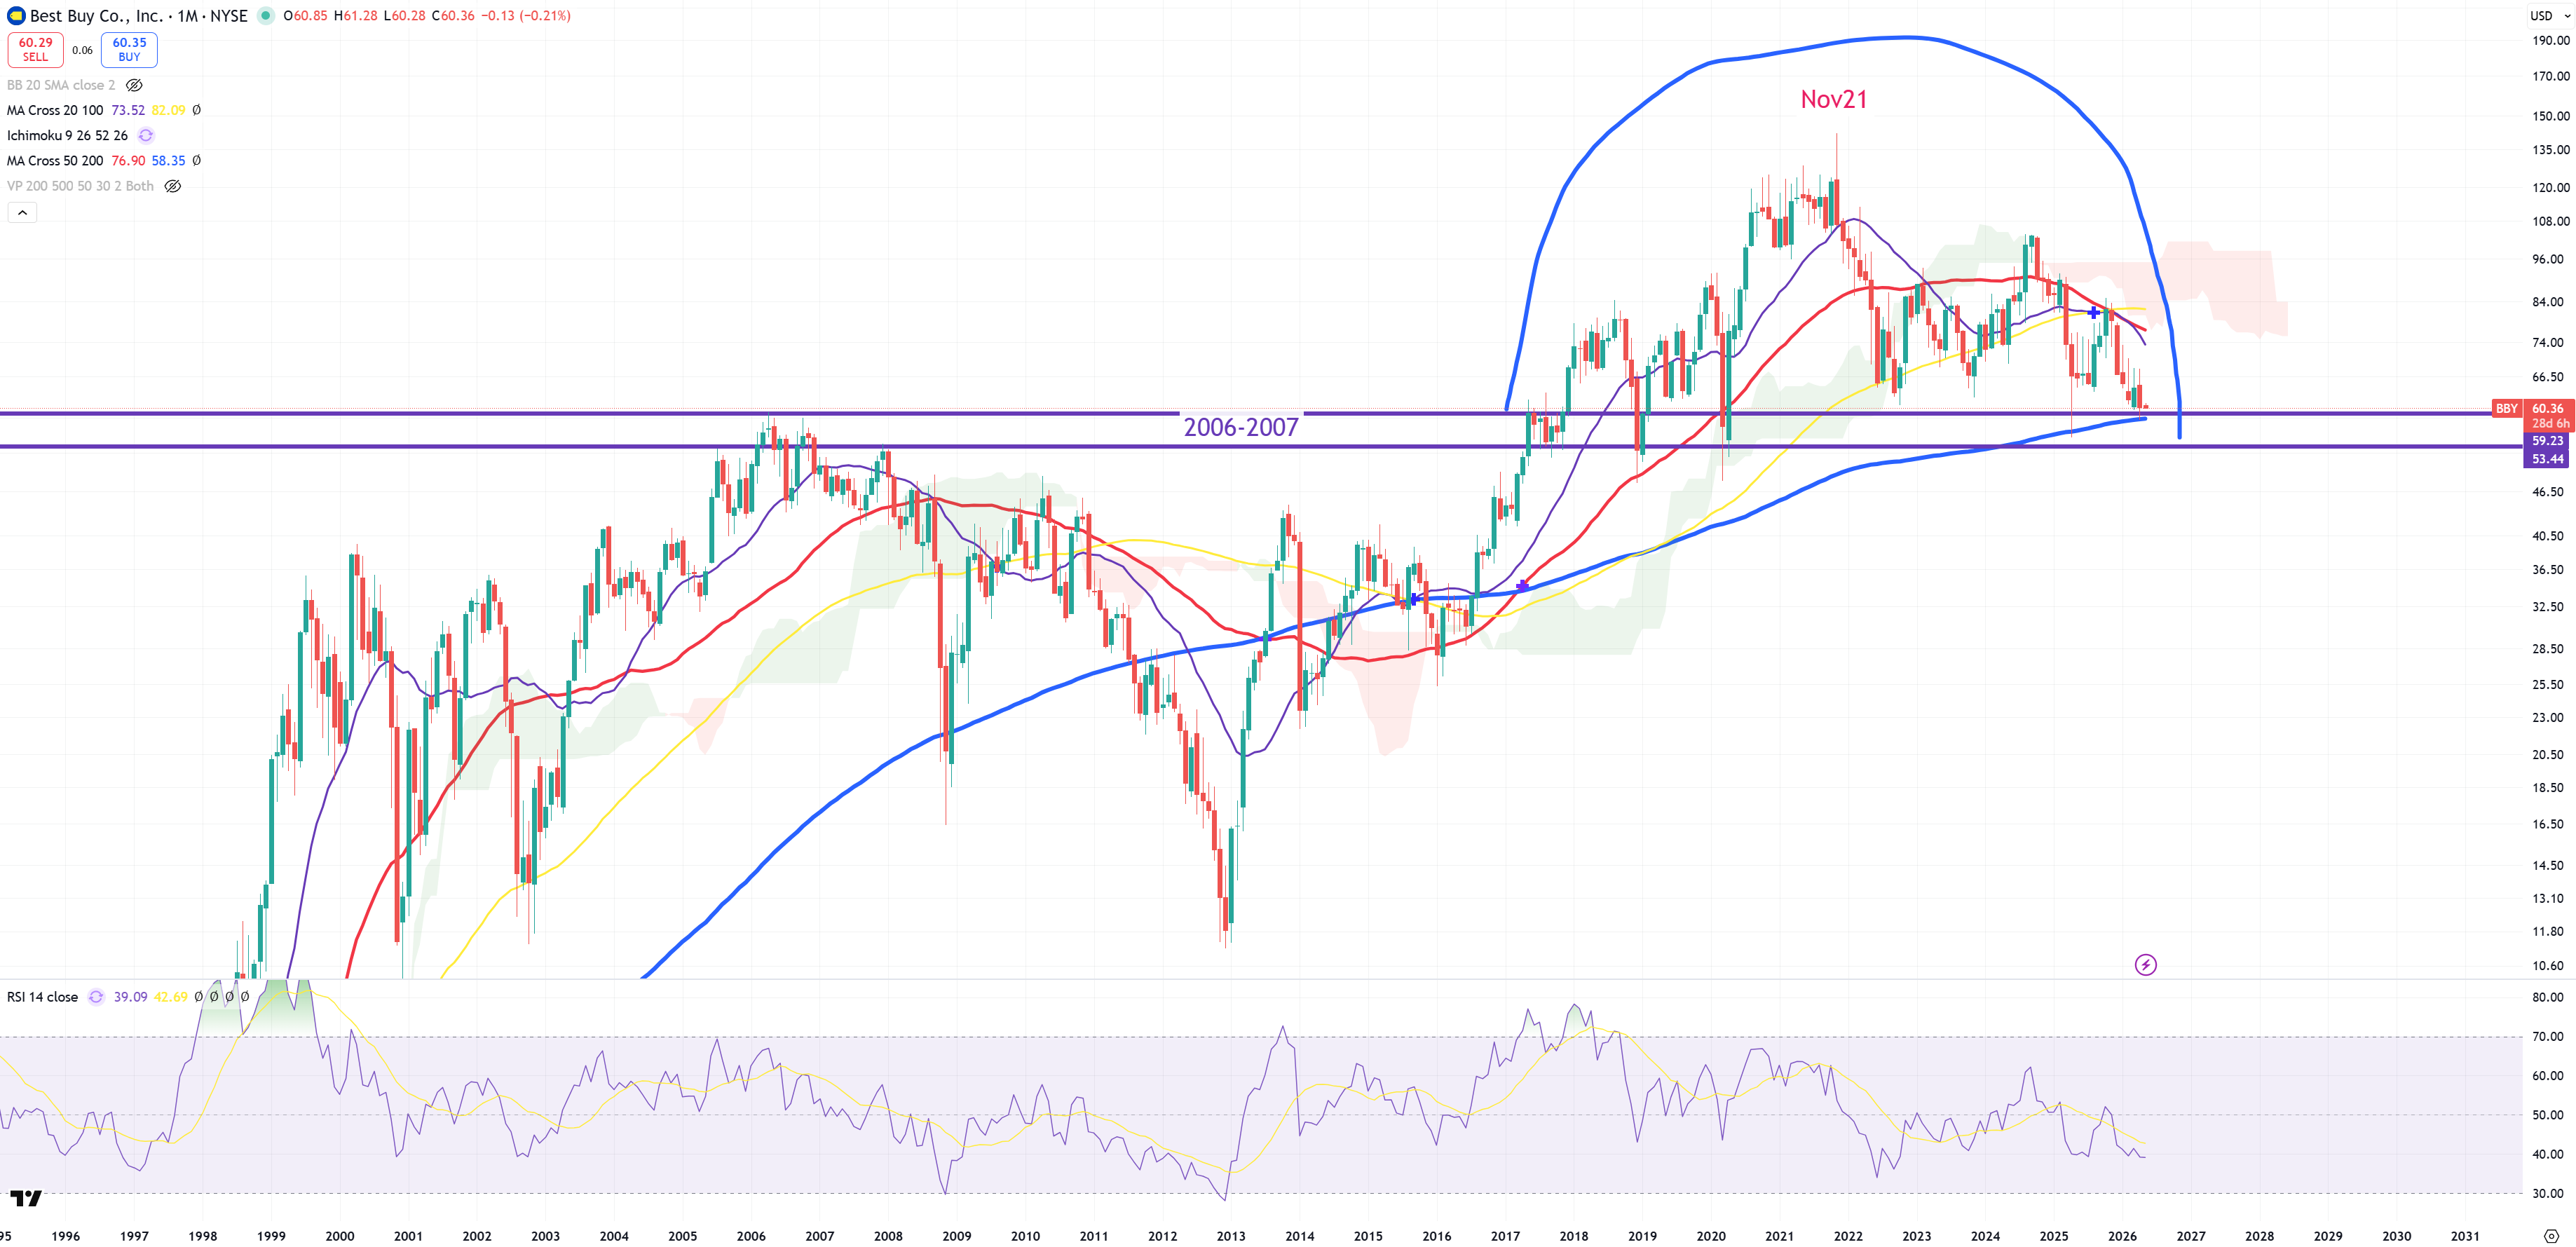
BBY – hard to call it massive bear market yet, but resting 2006-2007 support + (M)MA200 is in the same place :
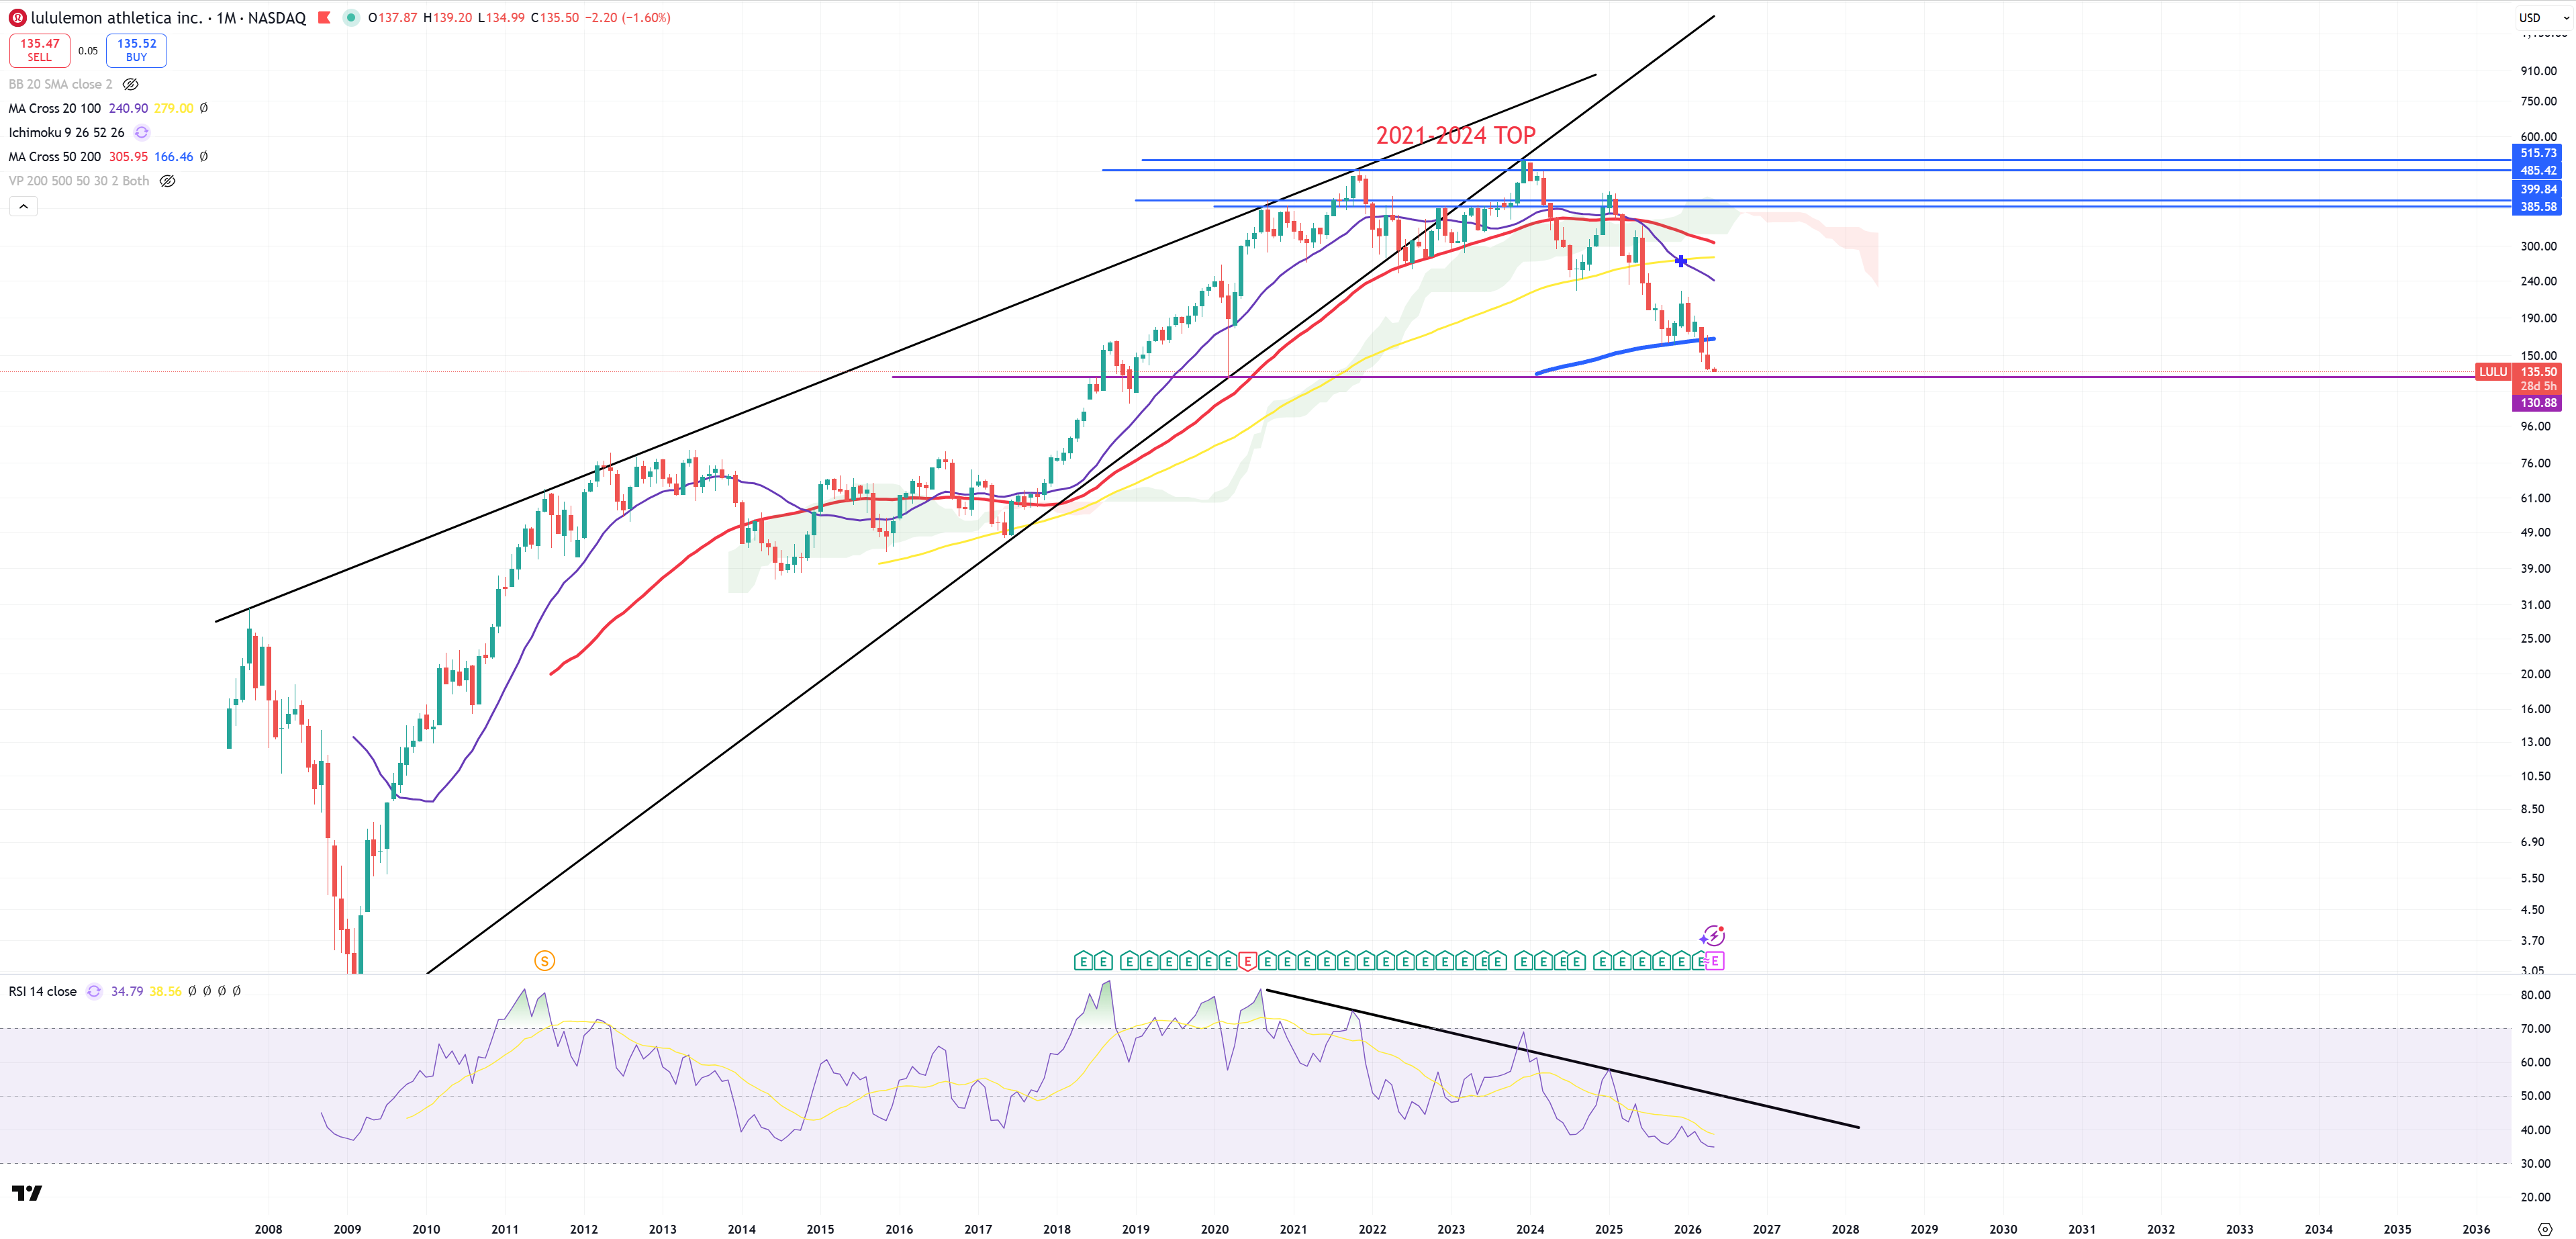
LULU – below (M)MA200 even
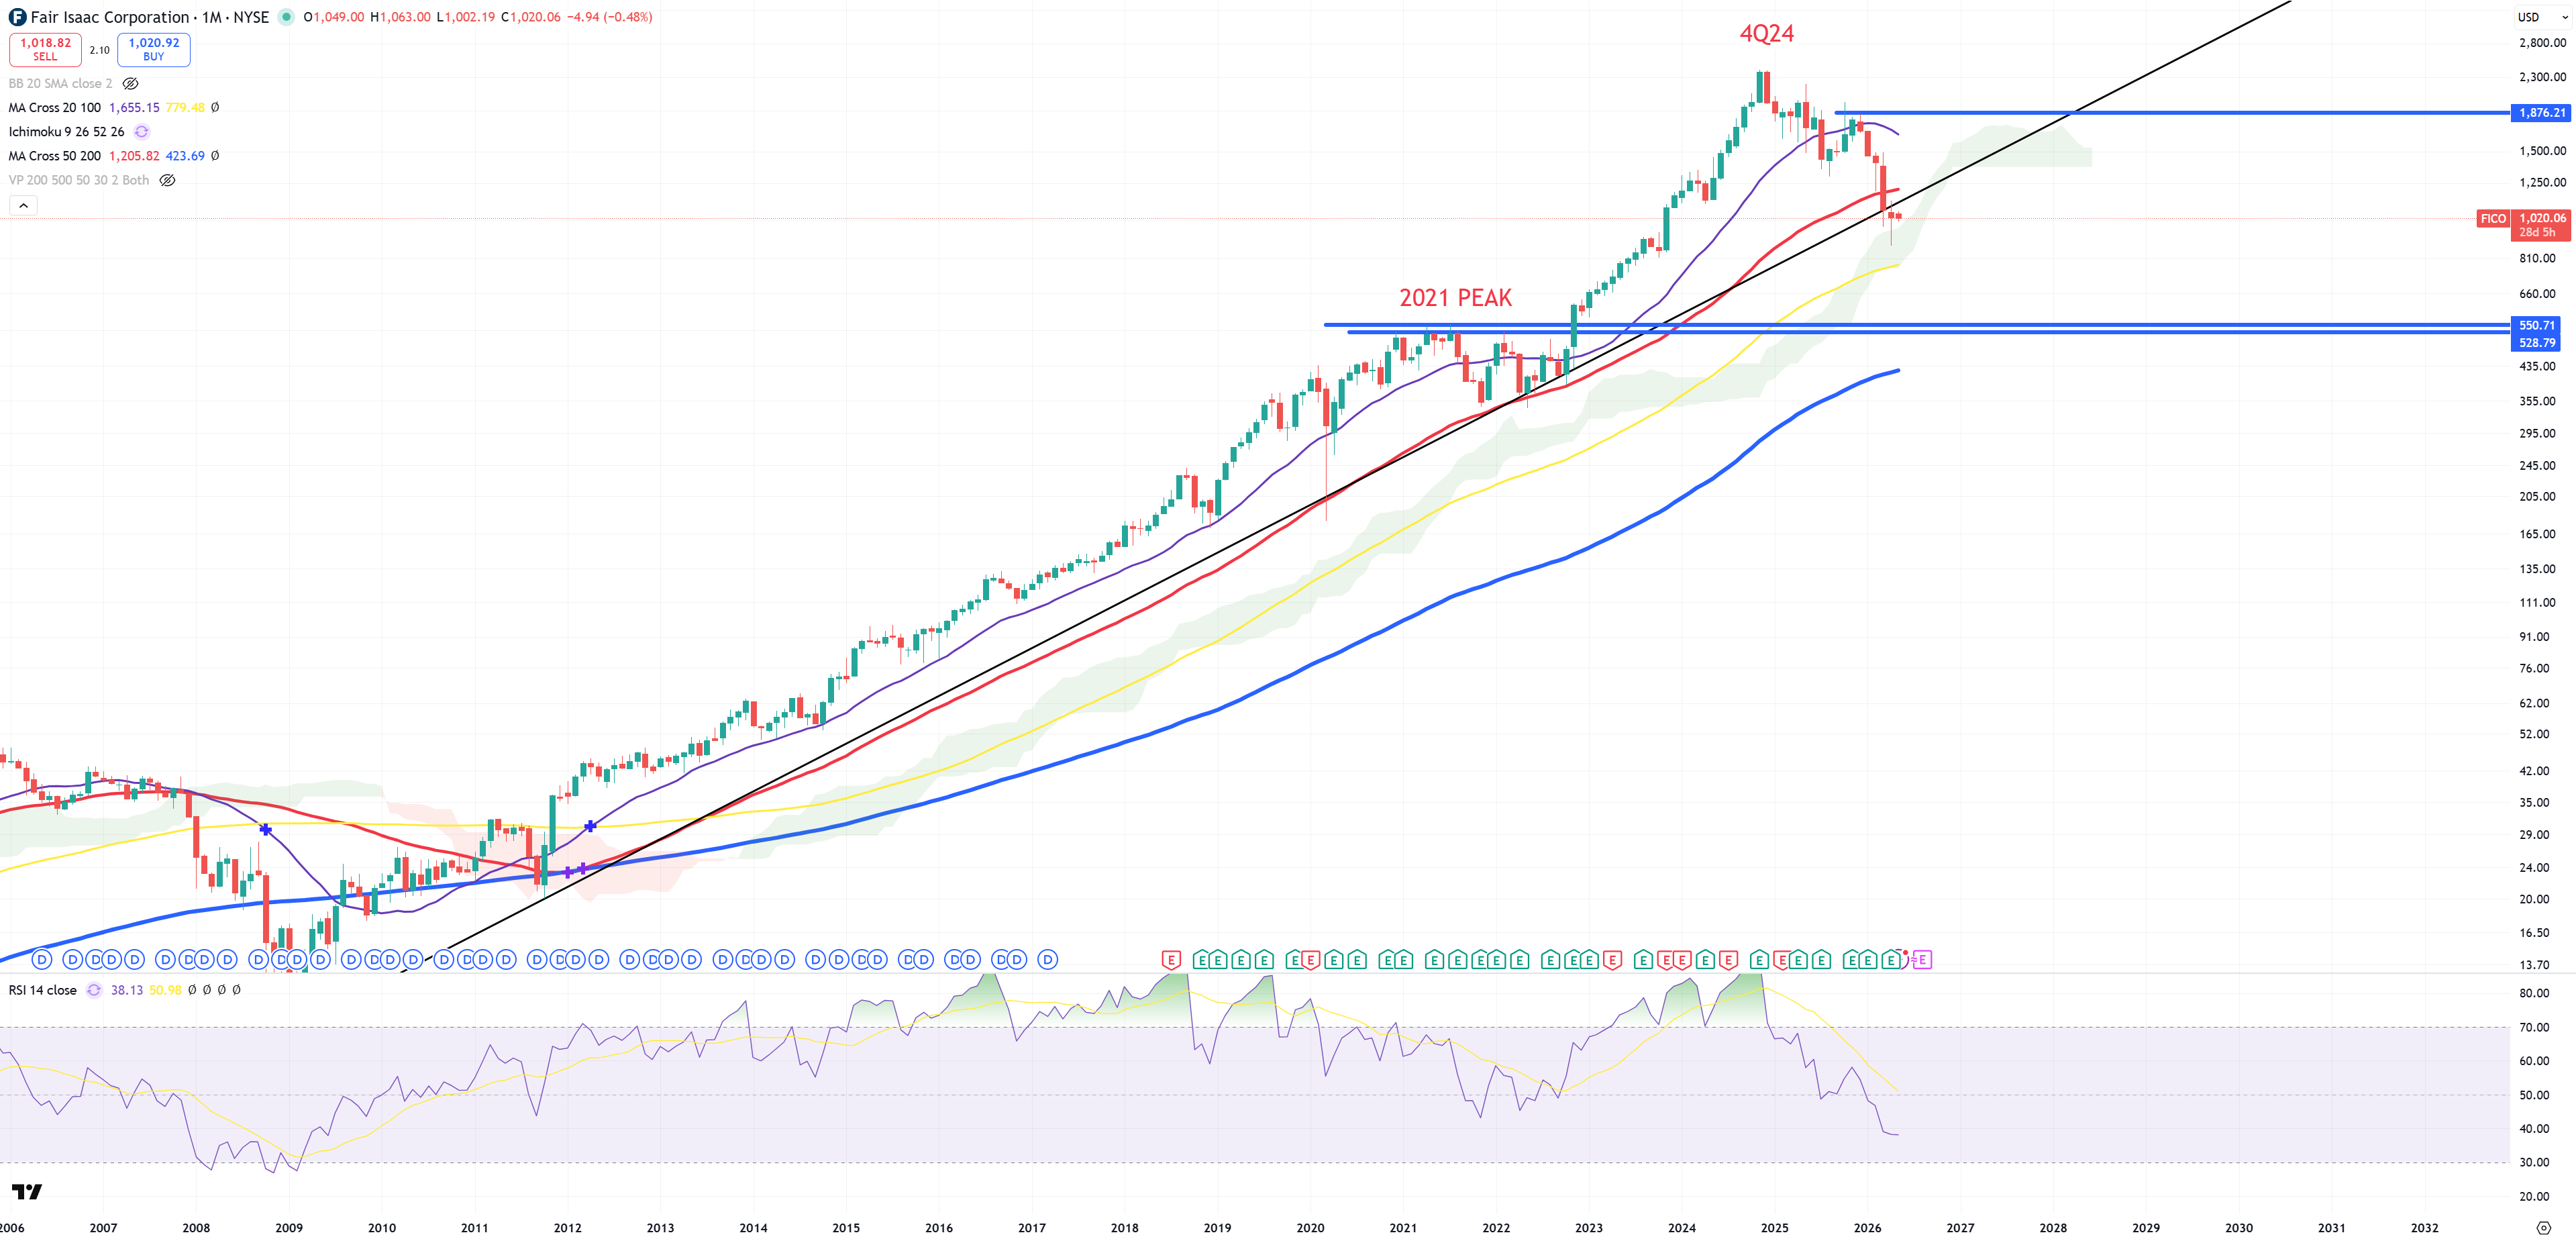
FICO
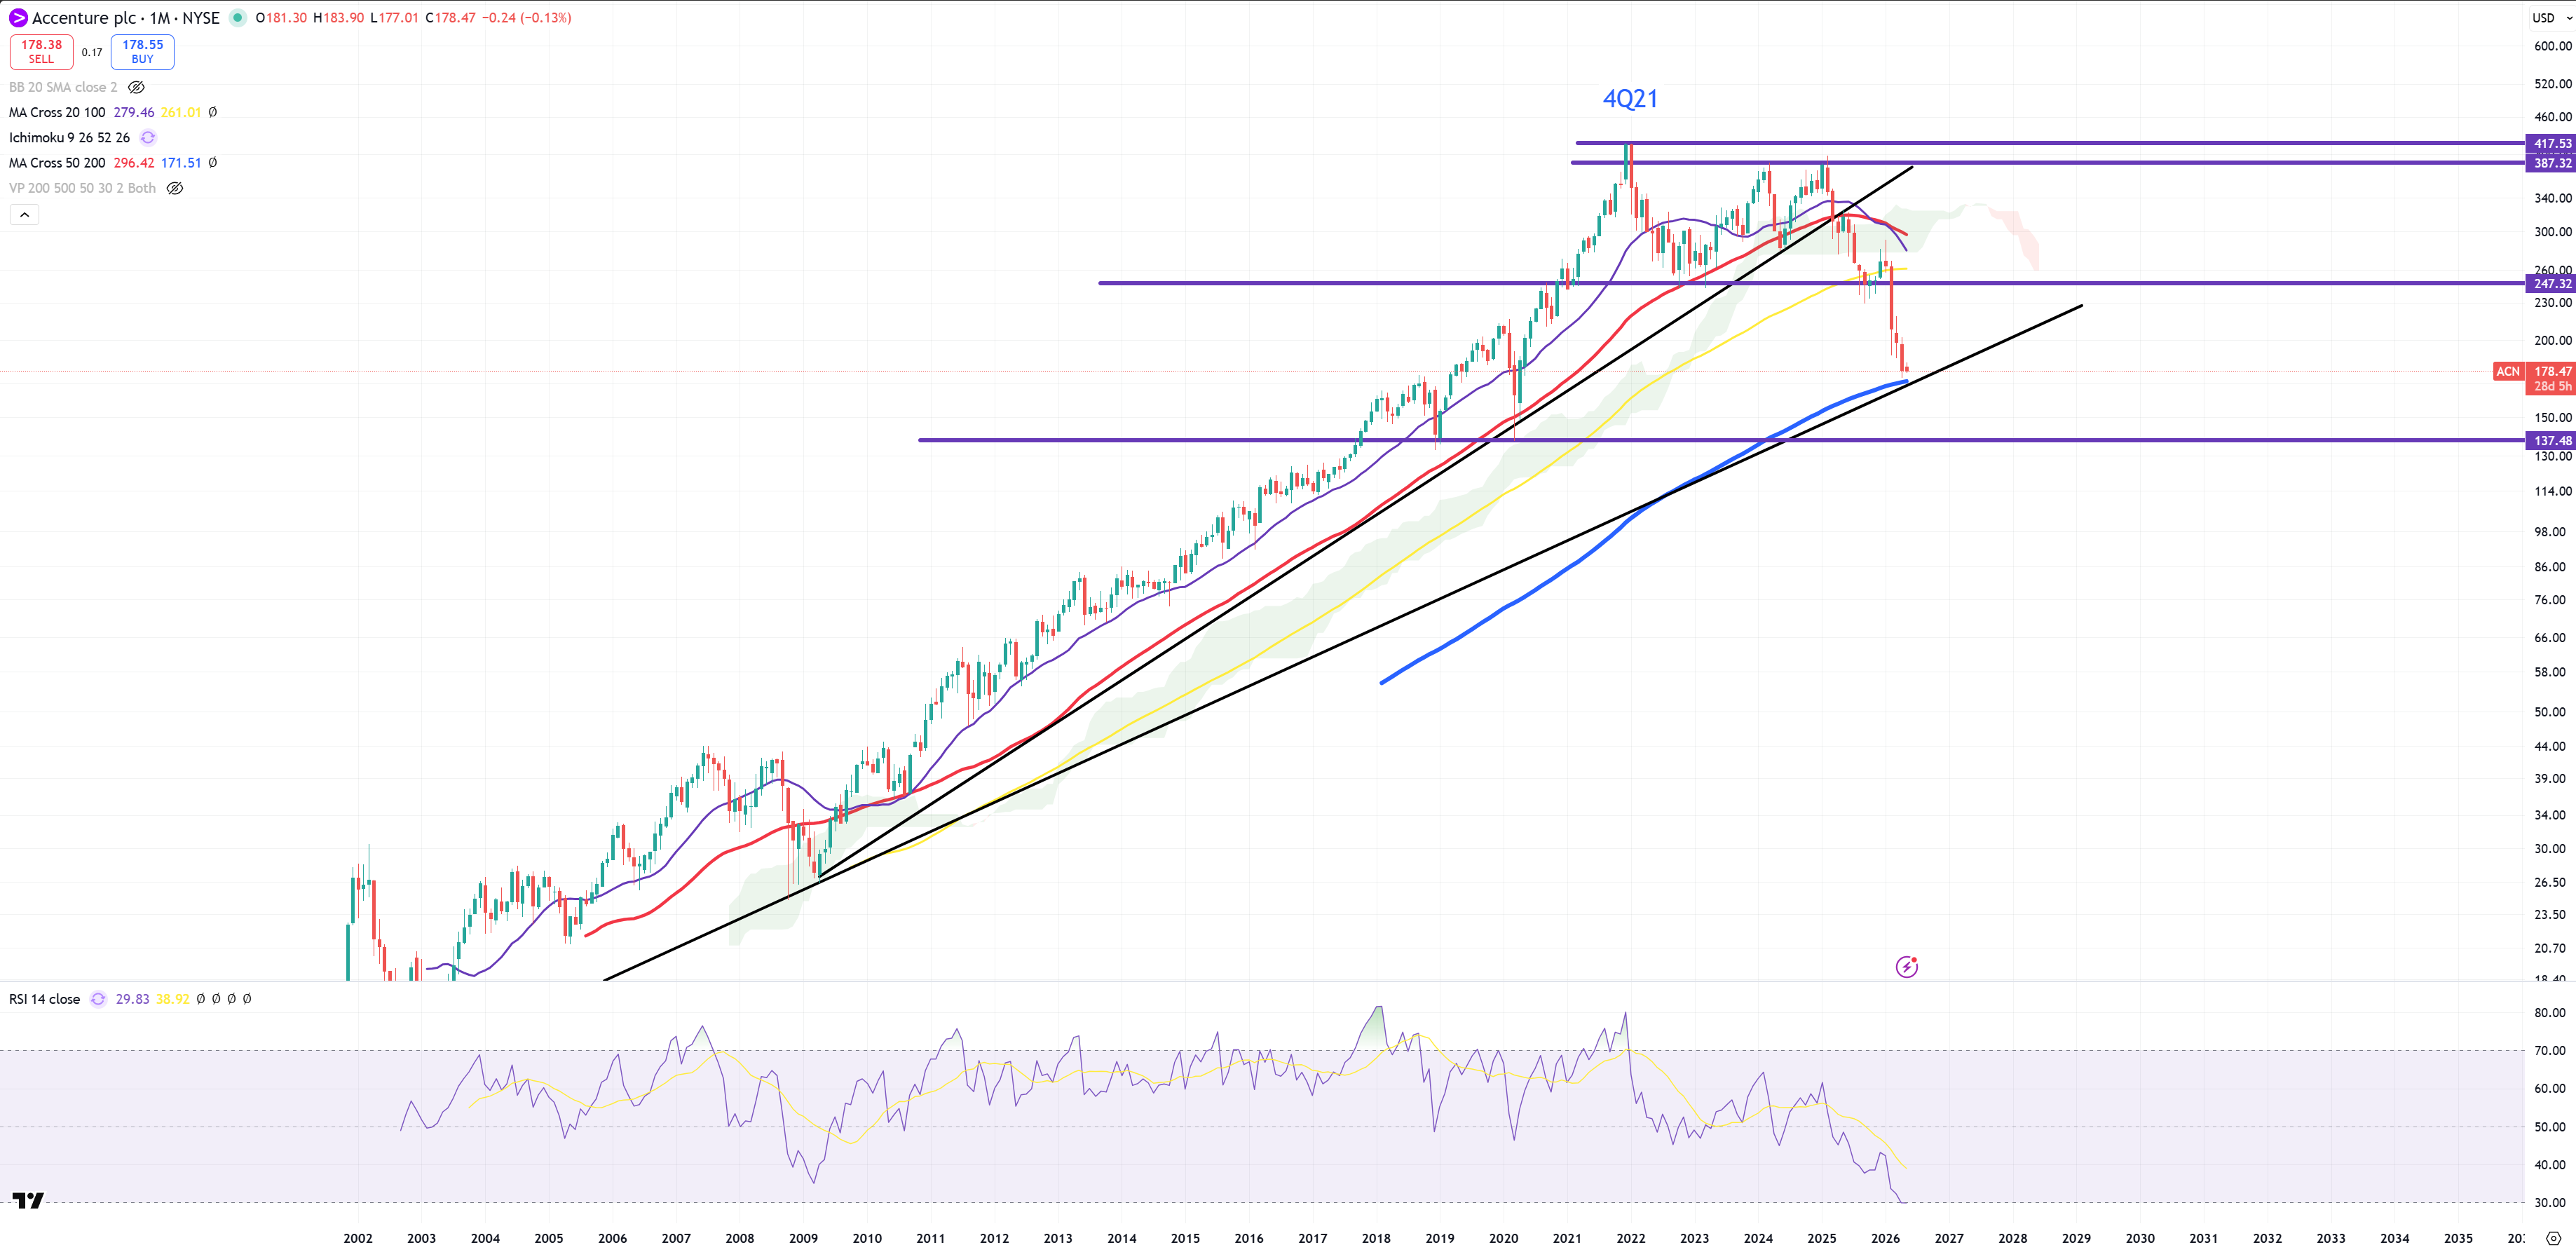
ACN – (M)MA200 approaching
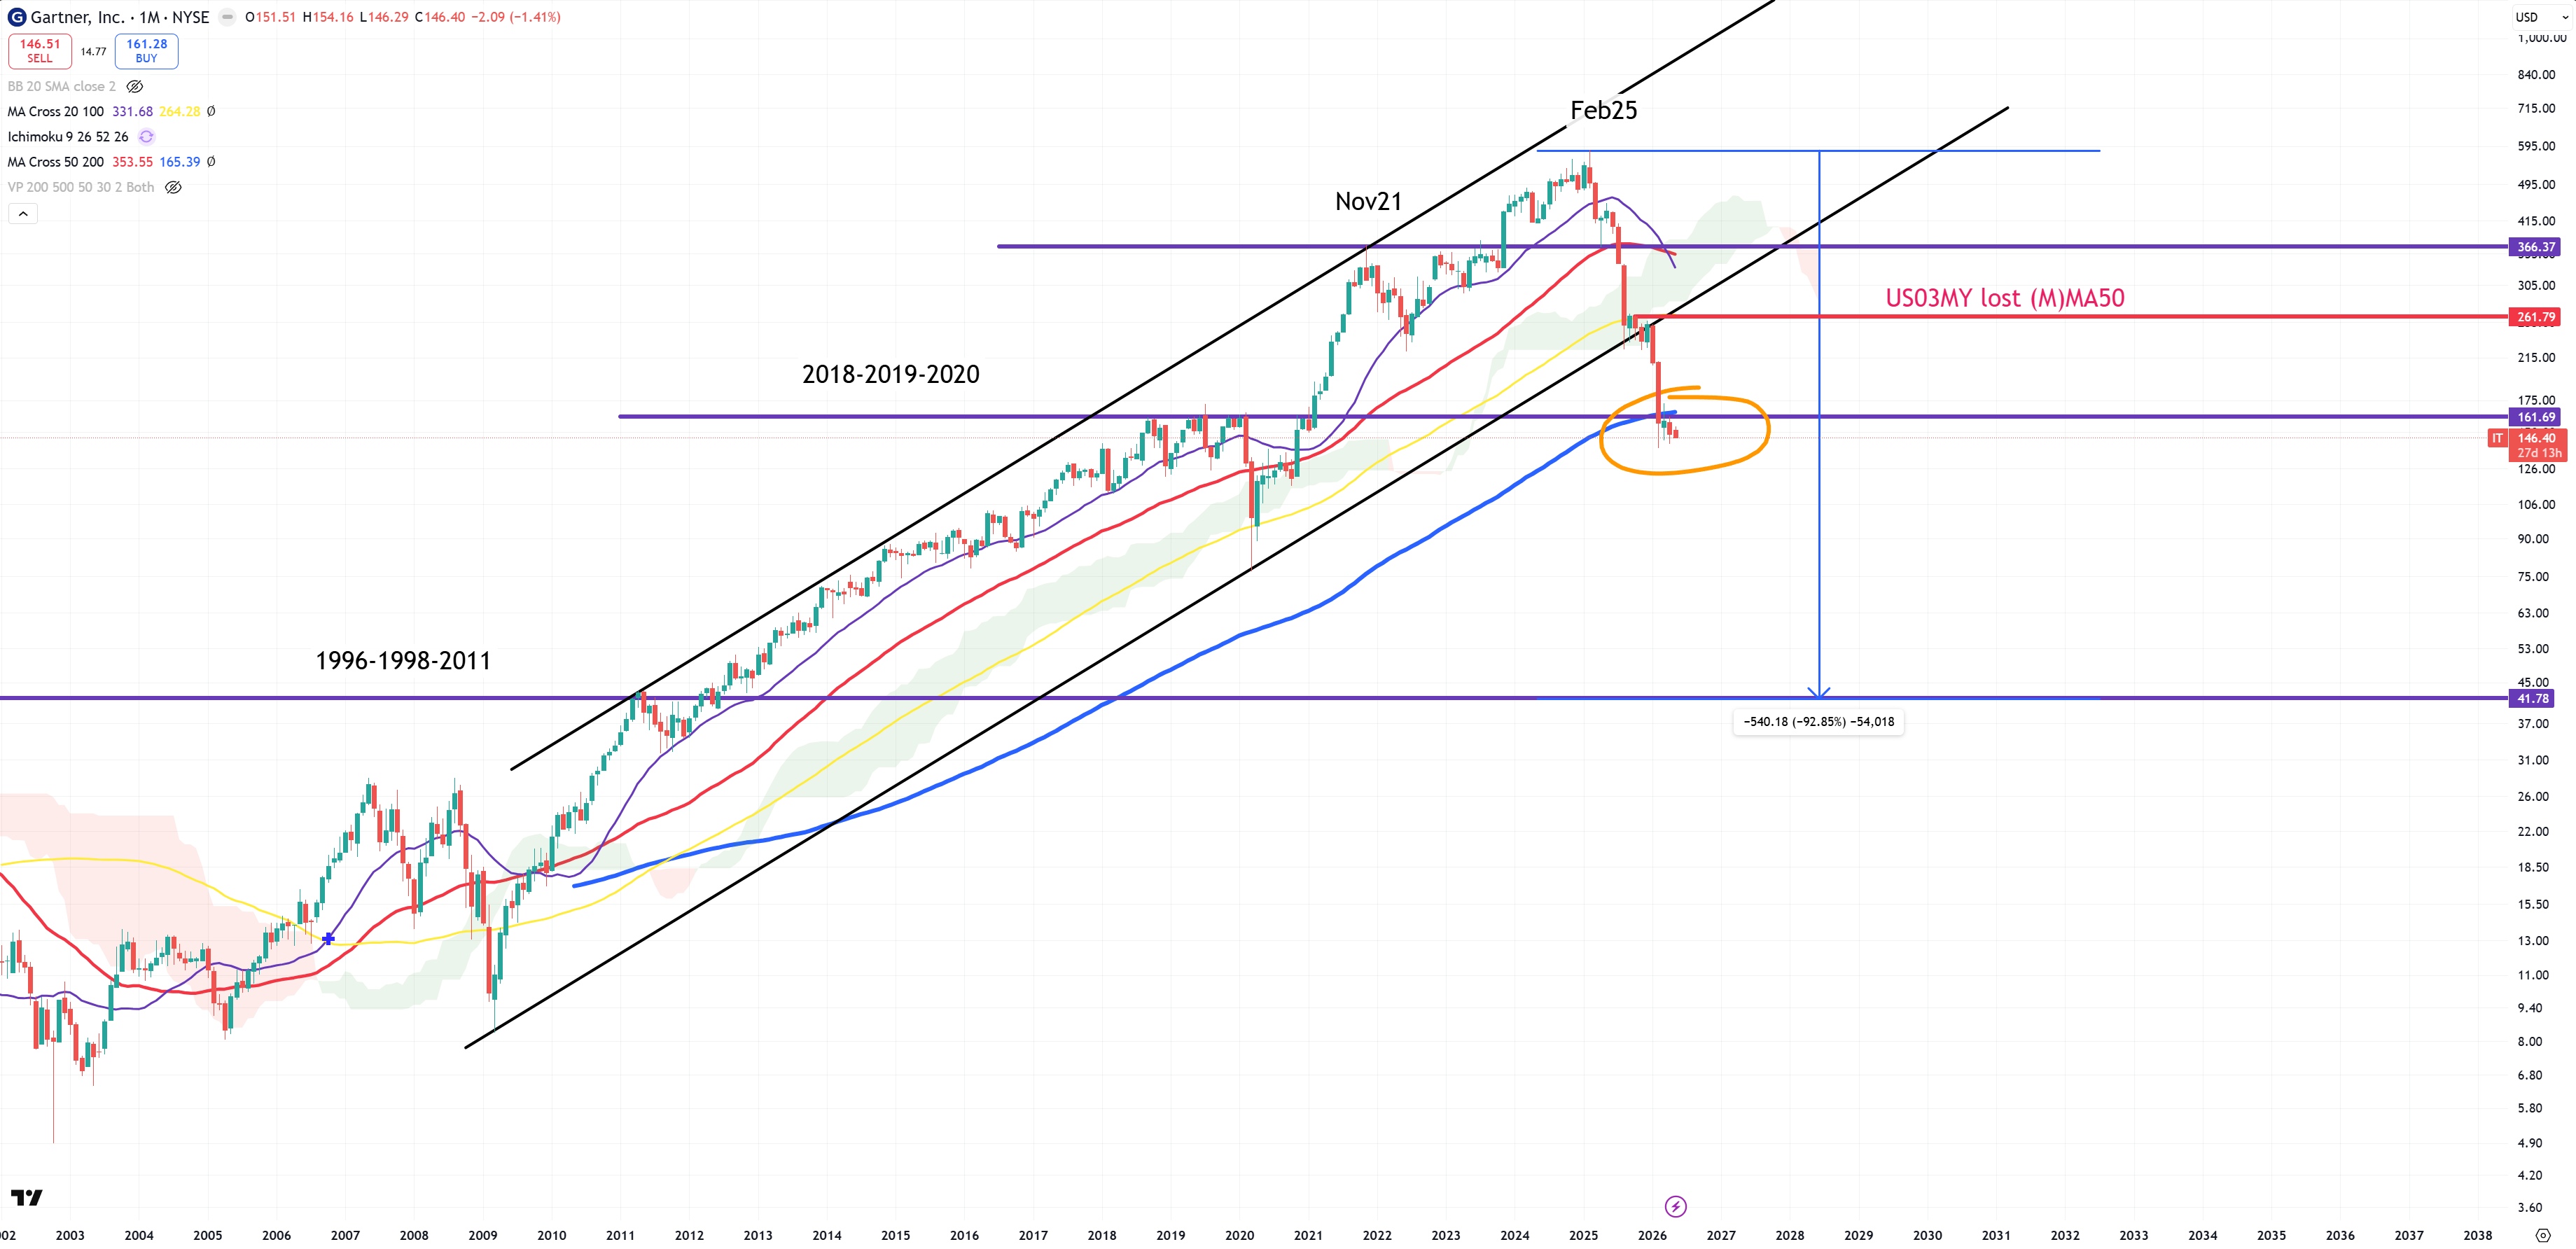
IT – Gartner below (M)MA200
Breadth continue to be weaker and still is expected to be weaker. As long as SPX/GOLD can’t pass (3M)MA200 and won’t touch this MA there’s a possibility of going higher. From the other hand still 1929-2000 trend awaits for SPX, you could have seen how aggresively market bought the dip on this trend line to defend the break. Longer term I don’t believe this break will be hold even seeing other indicators like 10y/3m or SPX/GOLD. GOLD bull market is IMO intact, but prepare for correction ongoing. Stocks keep dropping like a stone, except AI+SOX, because even now MAGS underperforms since 4Q25, META failed, MSFT failed, TSLA failed, NFLX failed. As long as US03MY still holds below (M)MA50 = 4.40% chance stagflation will morph into deflation persists. To get a reflationary 2022 moment it requires to break this 4.40% level to get “October 1999 moment”. Summary of April is still intact. Stocks in general keep dropping and finally this problem hit Mag7 stocks, while SOX/AI went parabolic. Even SNDK distance to (M)MA50 is now -87%, while infamous CAR managed to have this distance -82% achieving (M)RSI=97.22 -> I can’t remind right now anything like that move. Even last GOLD’s move managed to achieve max (M)RSI=95 till it started falling down.
Anyway this market is now on the edge of big junction. From one side there’s a risk of breaking 120$ oil prices = that will raise long end yields globally. From the other there’s a possibility of a massive drop to start offsetting demand destruction to adjust to cut suppy of oil raising unemployment. It’s still unclear where we’ll go.