07/2026
August 2, 2026

July candles are closed. Let’s take a look how different assets look like in a function of my thesis which I described here.
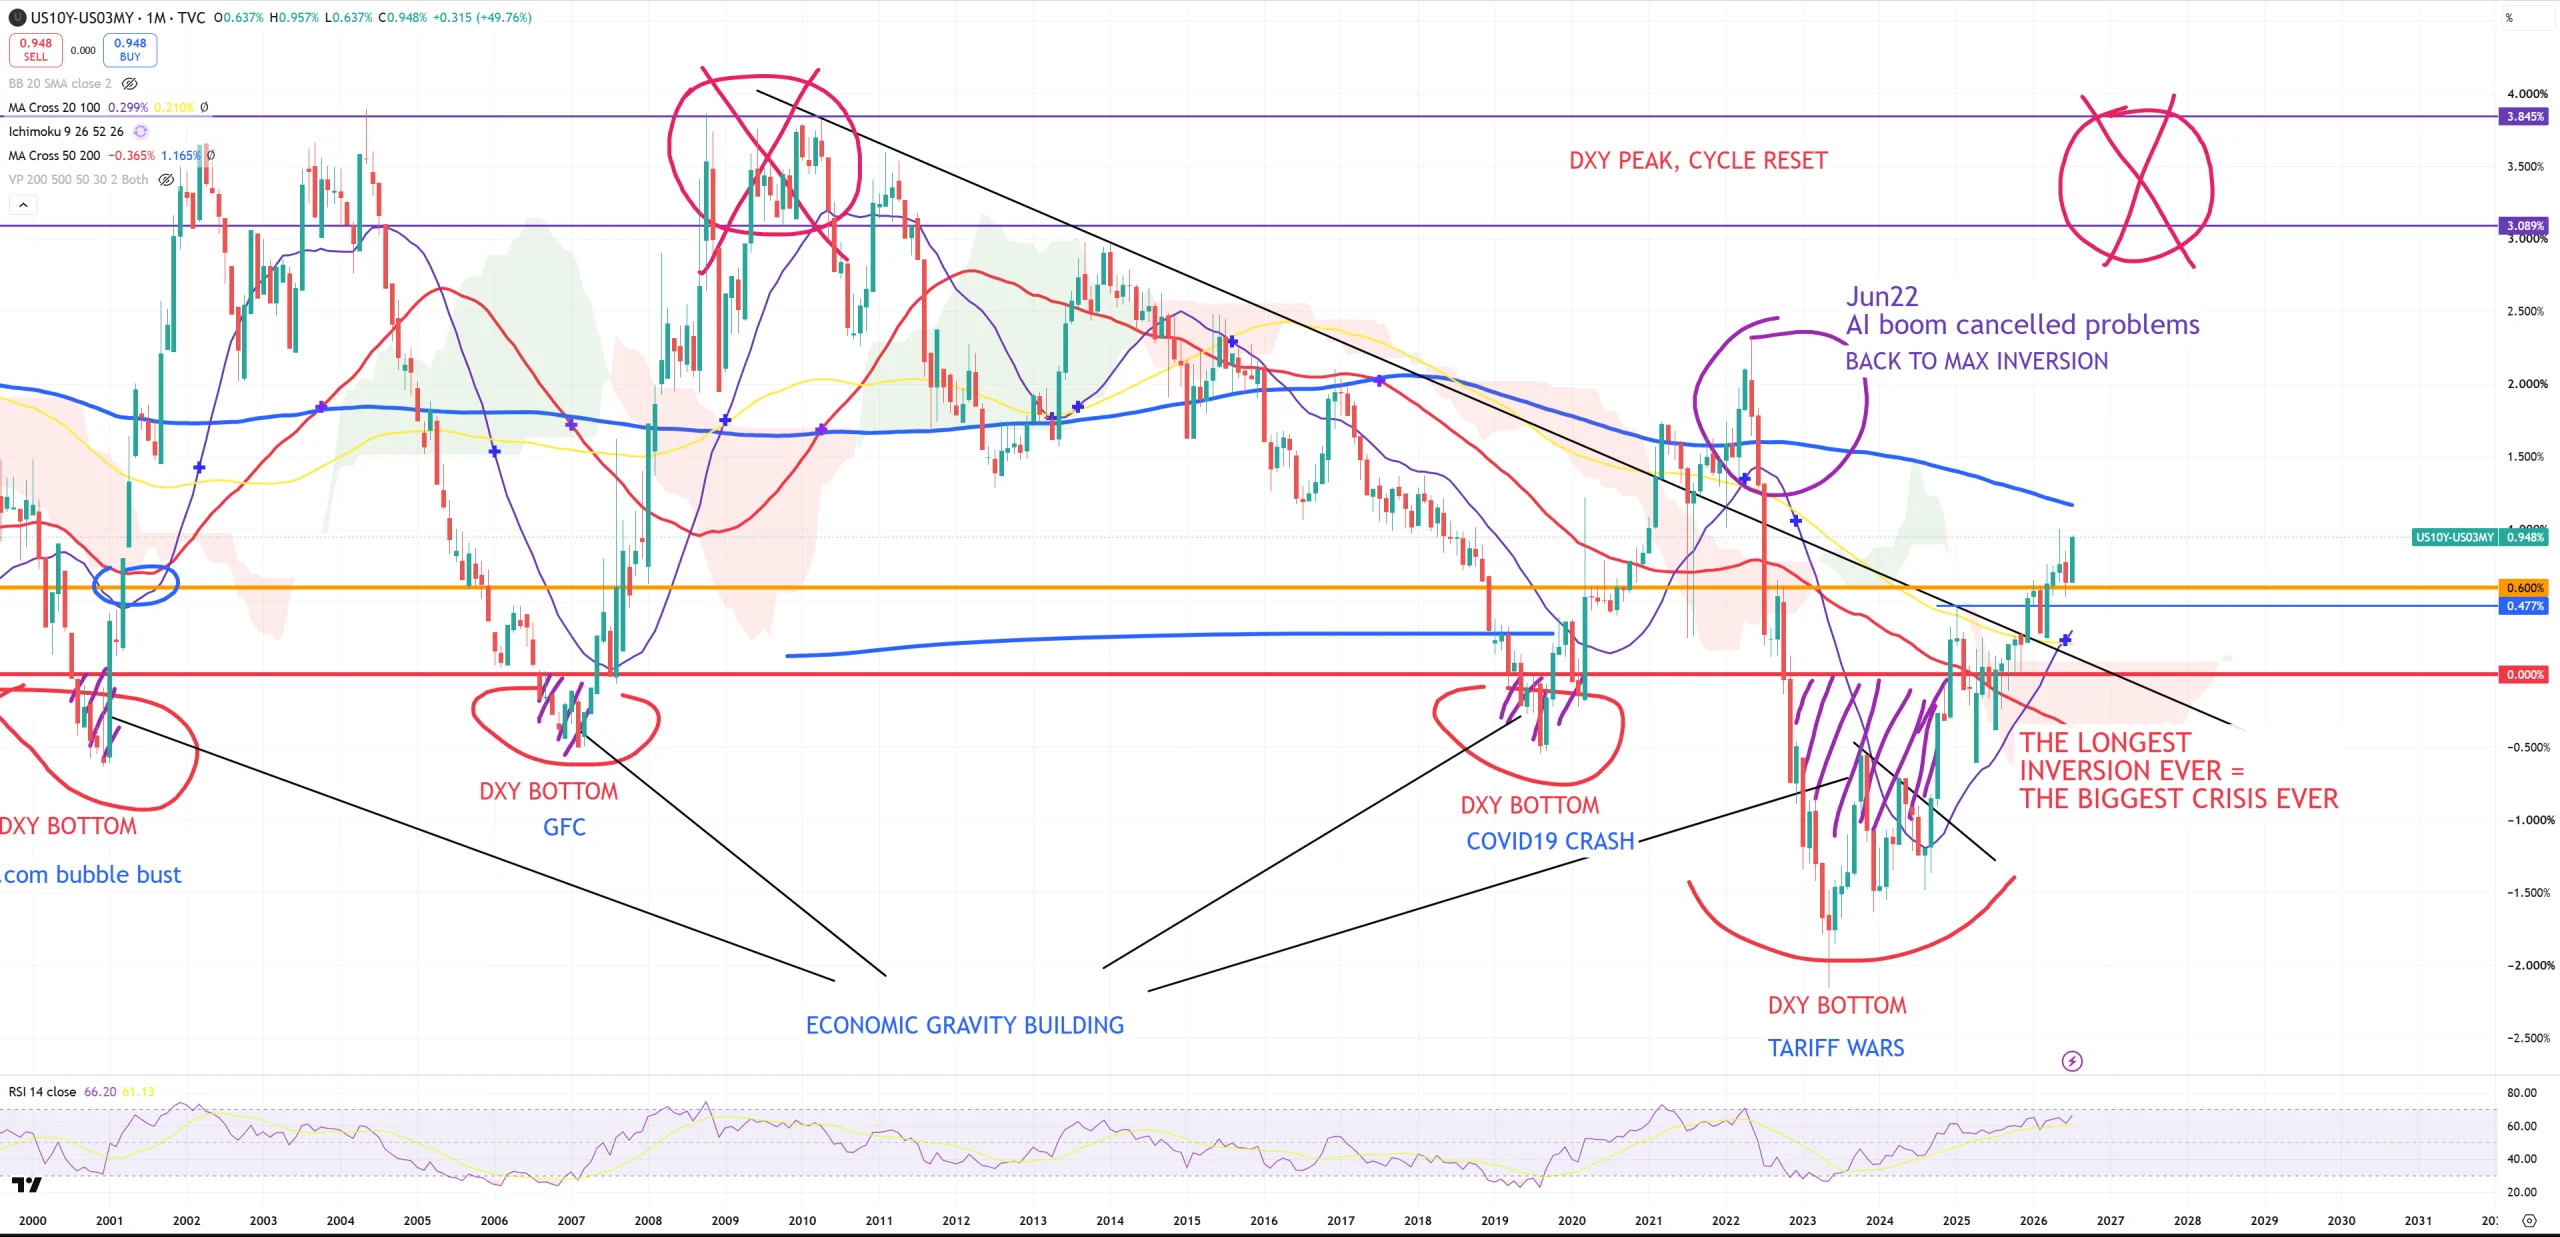
Finally since around April/May 2026, 10Y/3M floats over > +60bps and doesn’t want to go down, and IMO it’ll not go down if there’s the end of the AI bubble. Anyway the month came to an end and let’s see if something has changed.
Charts in this report (62)
10Y/3M – from my experience once we reached such levels > +60bps post uninversion there’s point of not only no return, but there’s a point where peak was already behind us. Blue (M)MA200 ahead, which last time was “saved” by an AI boom. We ended July on +95bps – the moment where Korean market has crashed, AI stocks like SNDK managed to drop. That’s exaclty how this rule should work
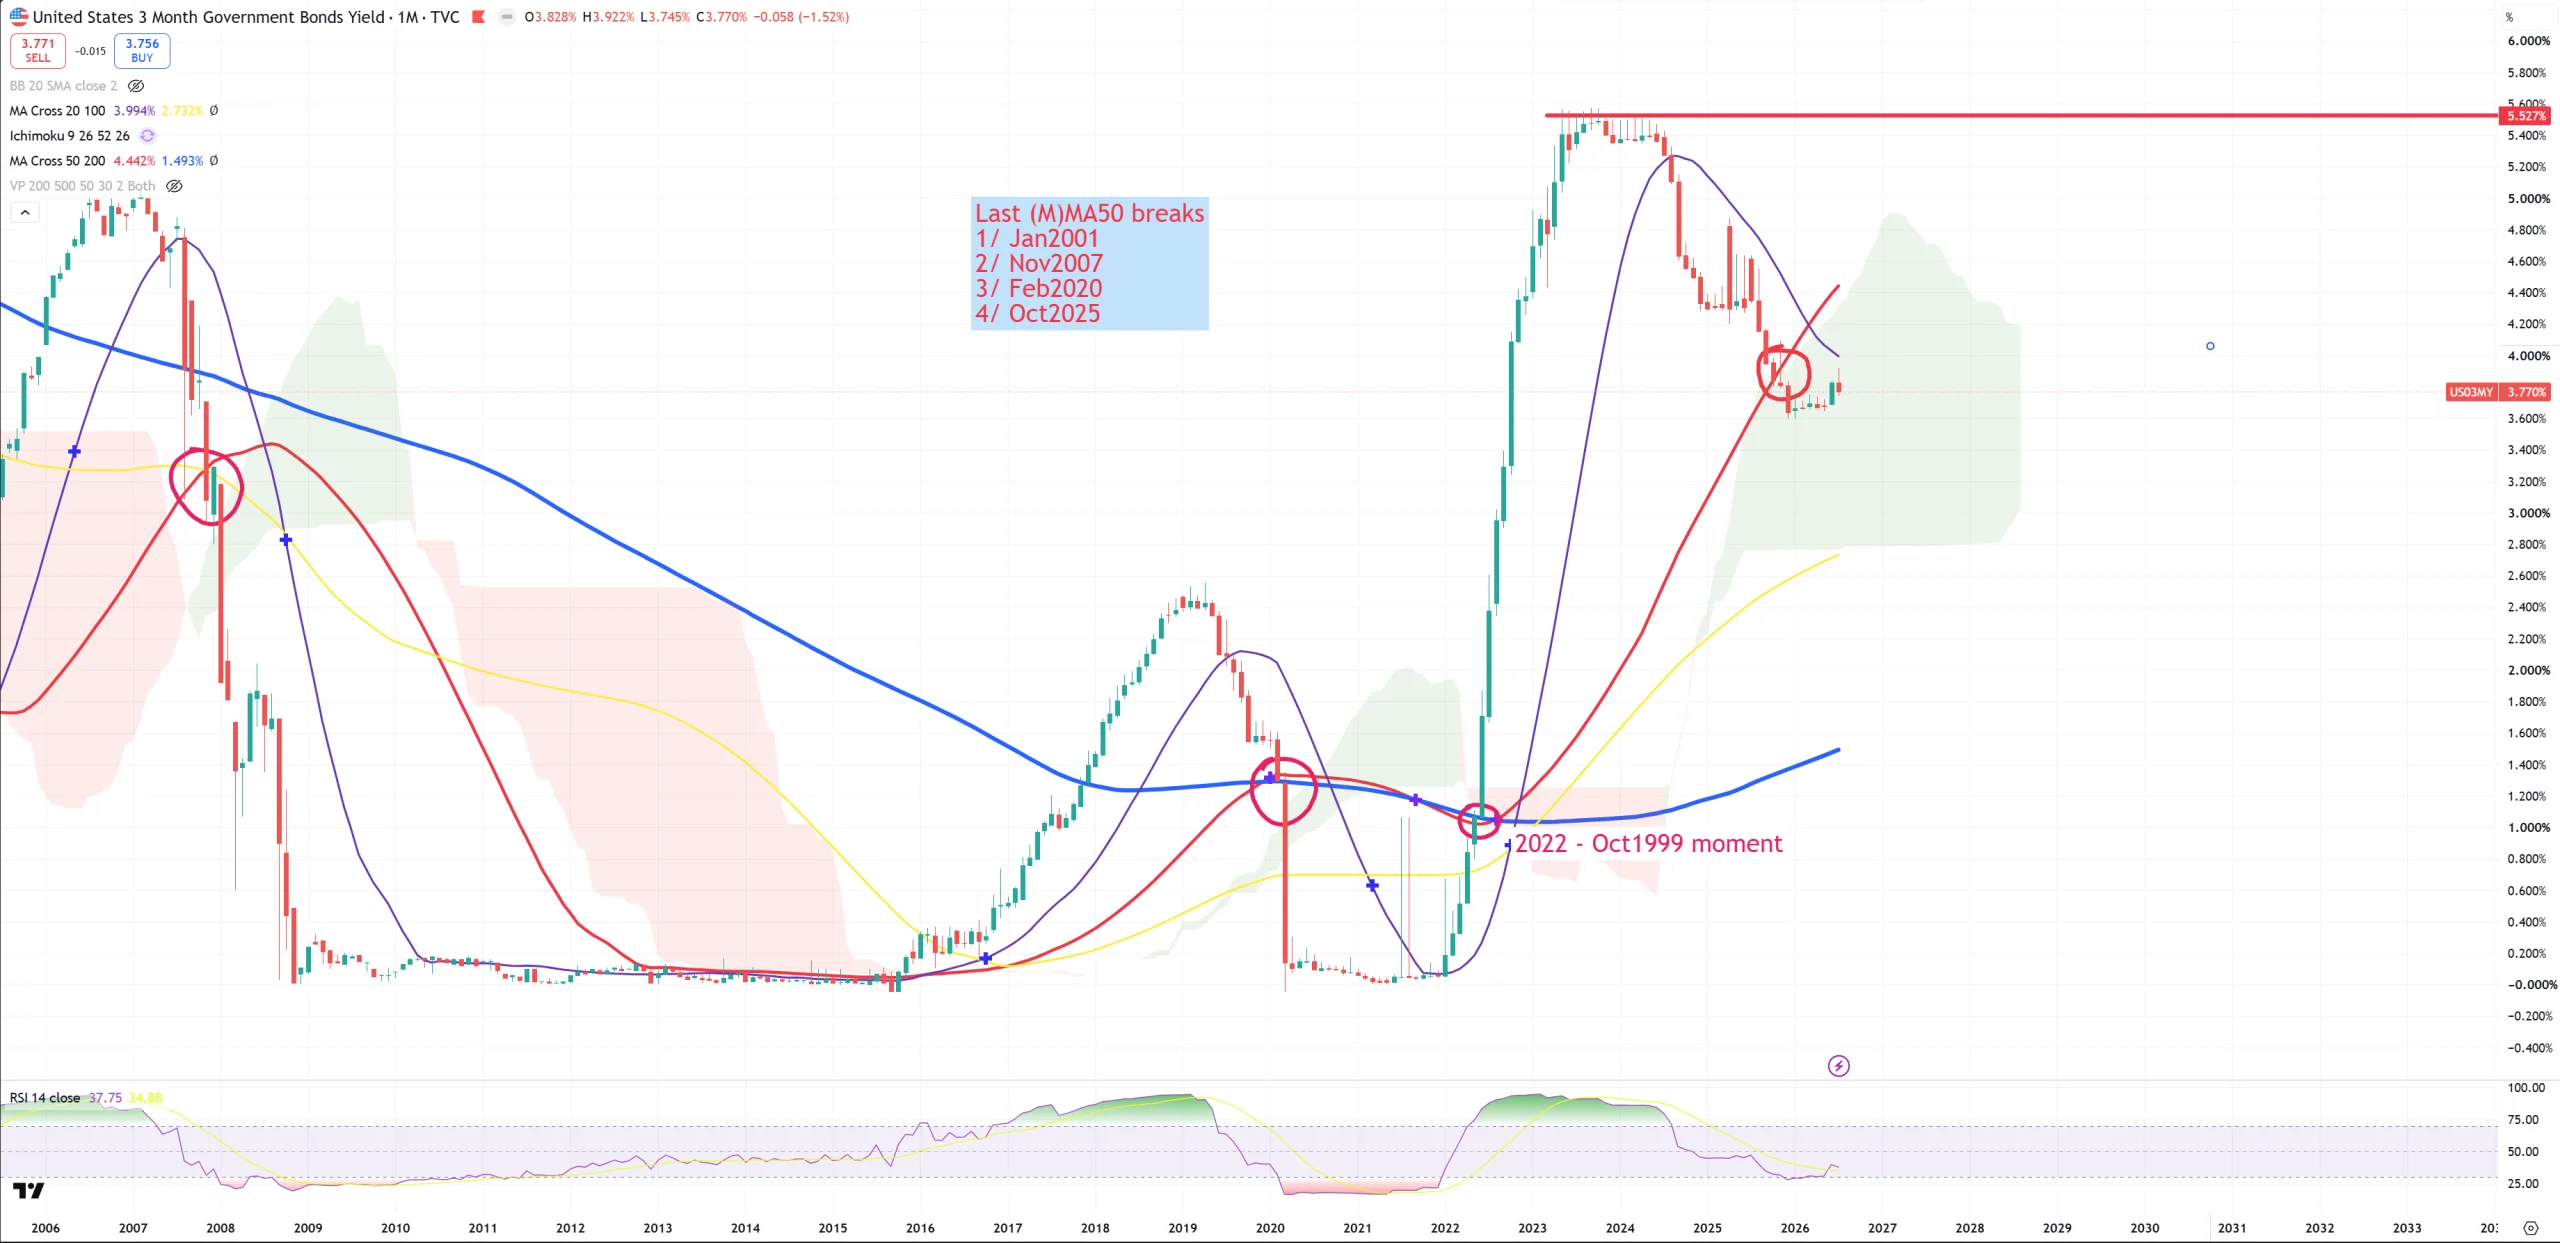
Broad market peaks once US03MY drops below (M)MA50 AND 10Y/3M uninverts PERMANENTLY > +60bps
US03MY – this old break of (M)MA50 happened in 4Q25. So my rule about broad market peak has fully arrived somewhere between April/May 2026.
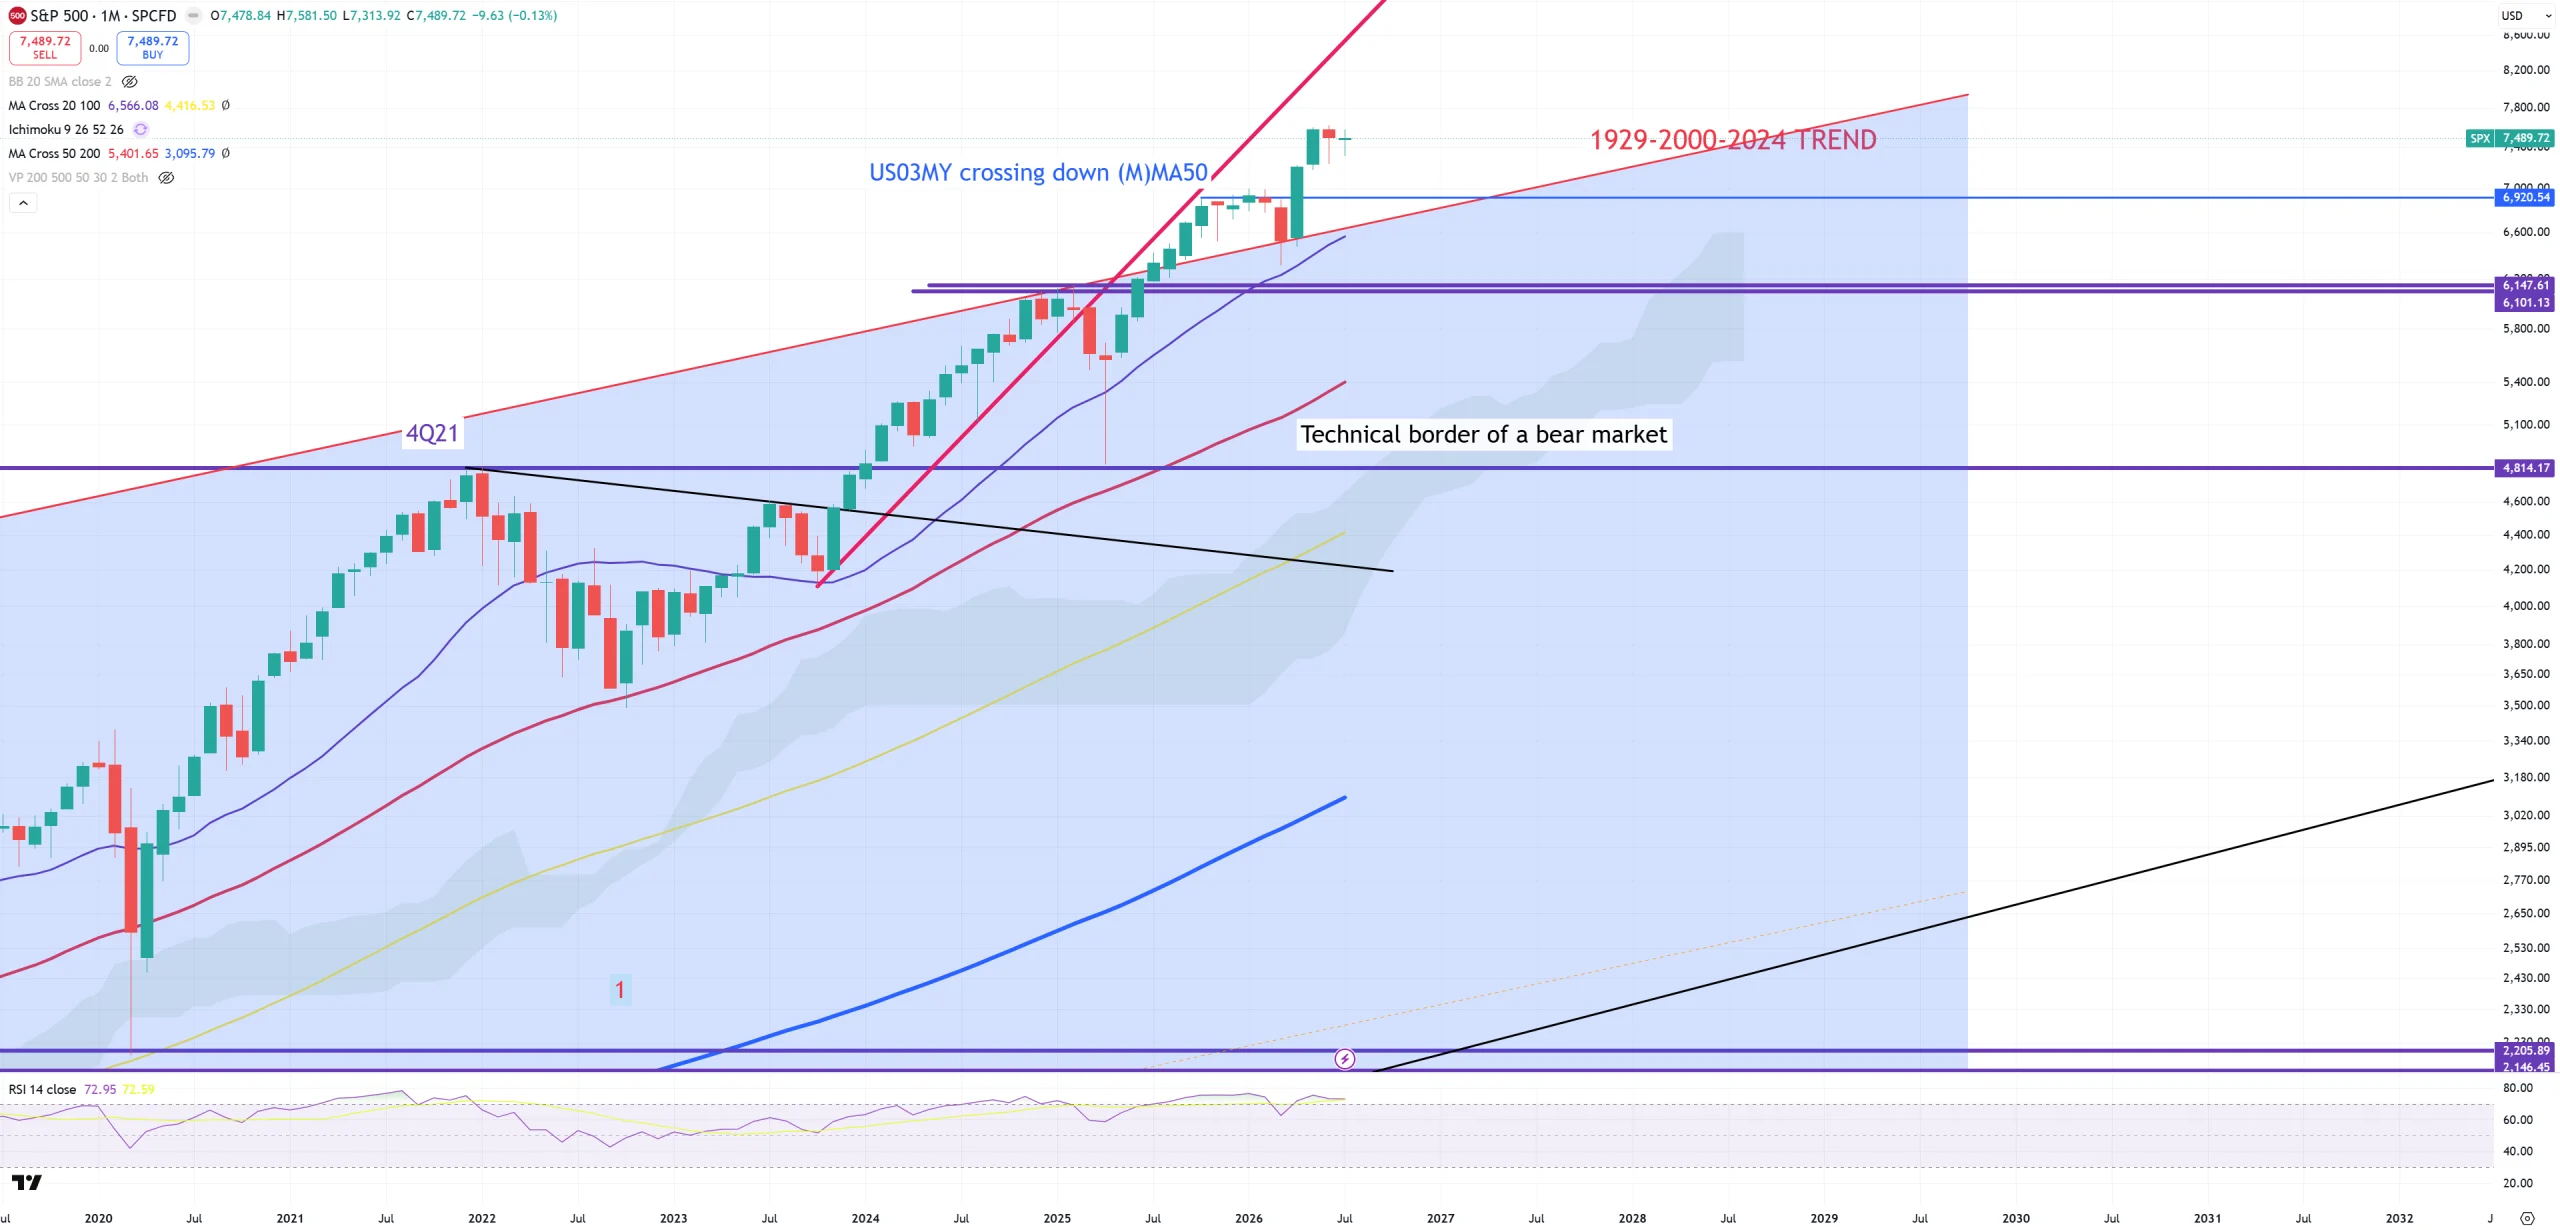
SPX – and its trend 1929-2000 still broken and (M)MA20 sits on 1929-2000 trend = 6660.
Let’s take a look what has happened on the market when my rule occured
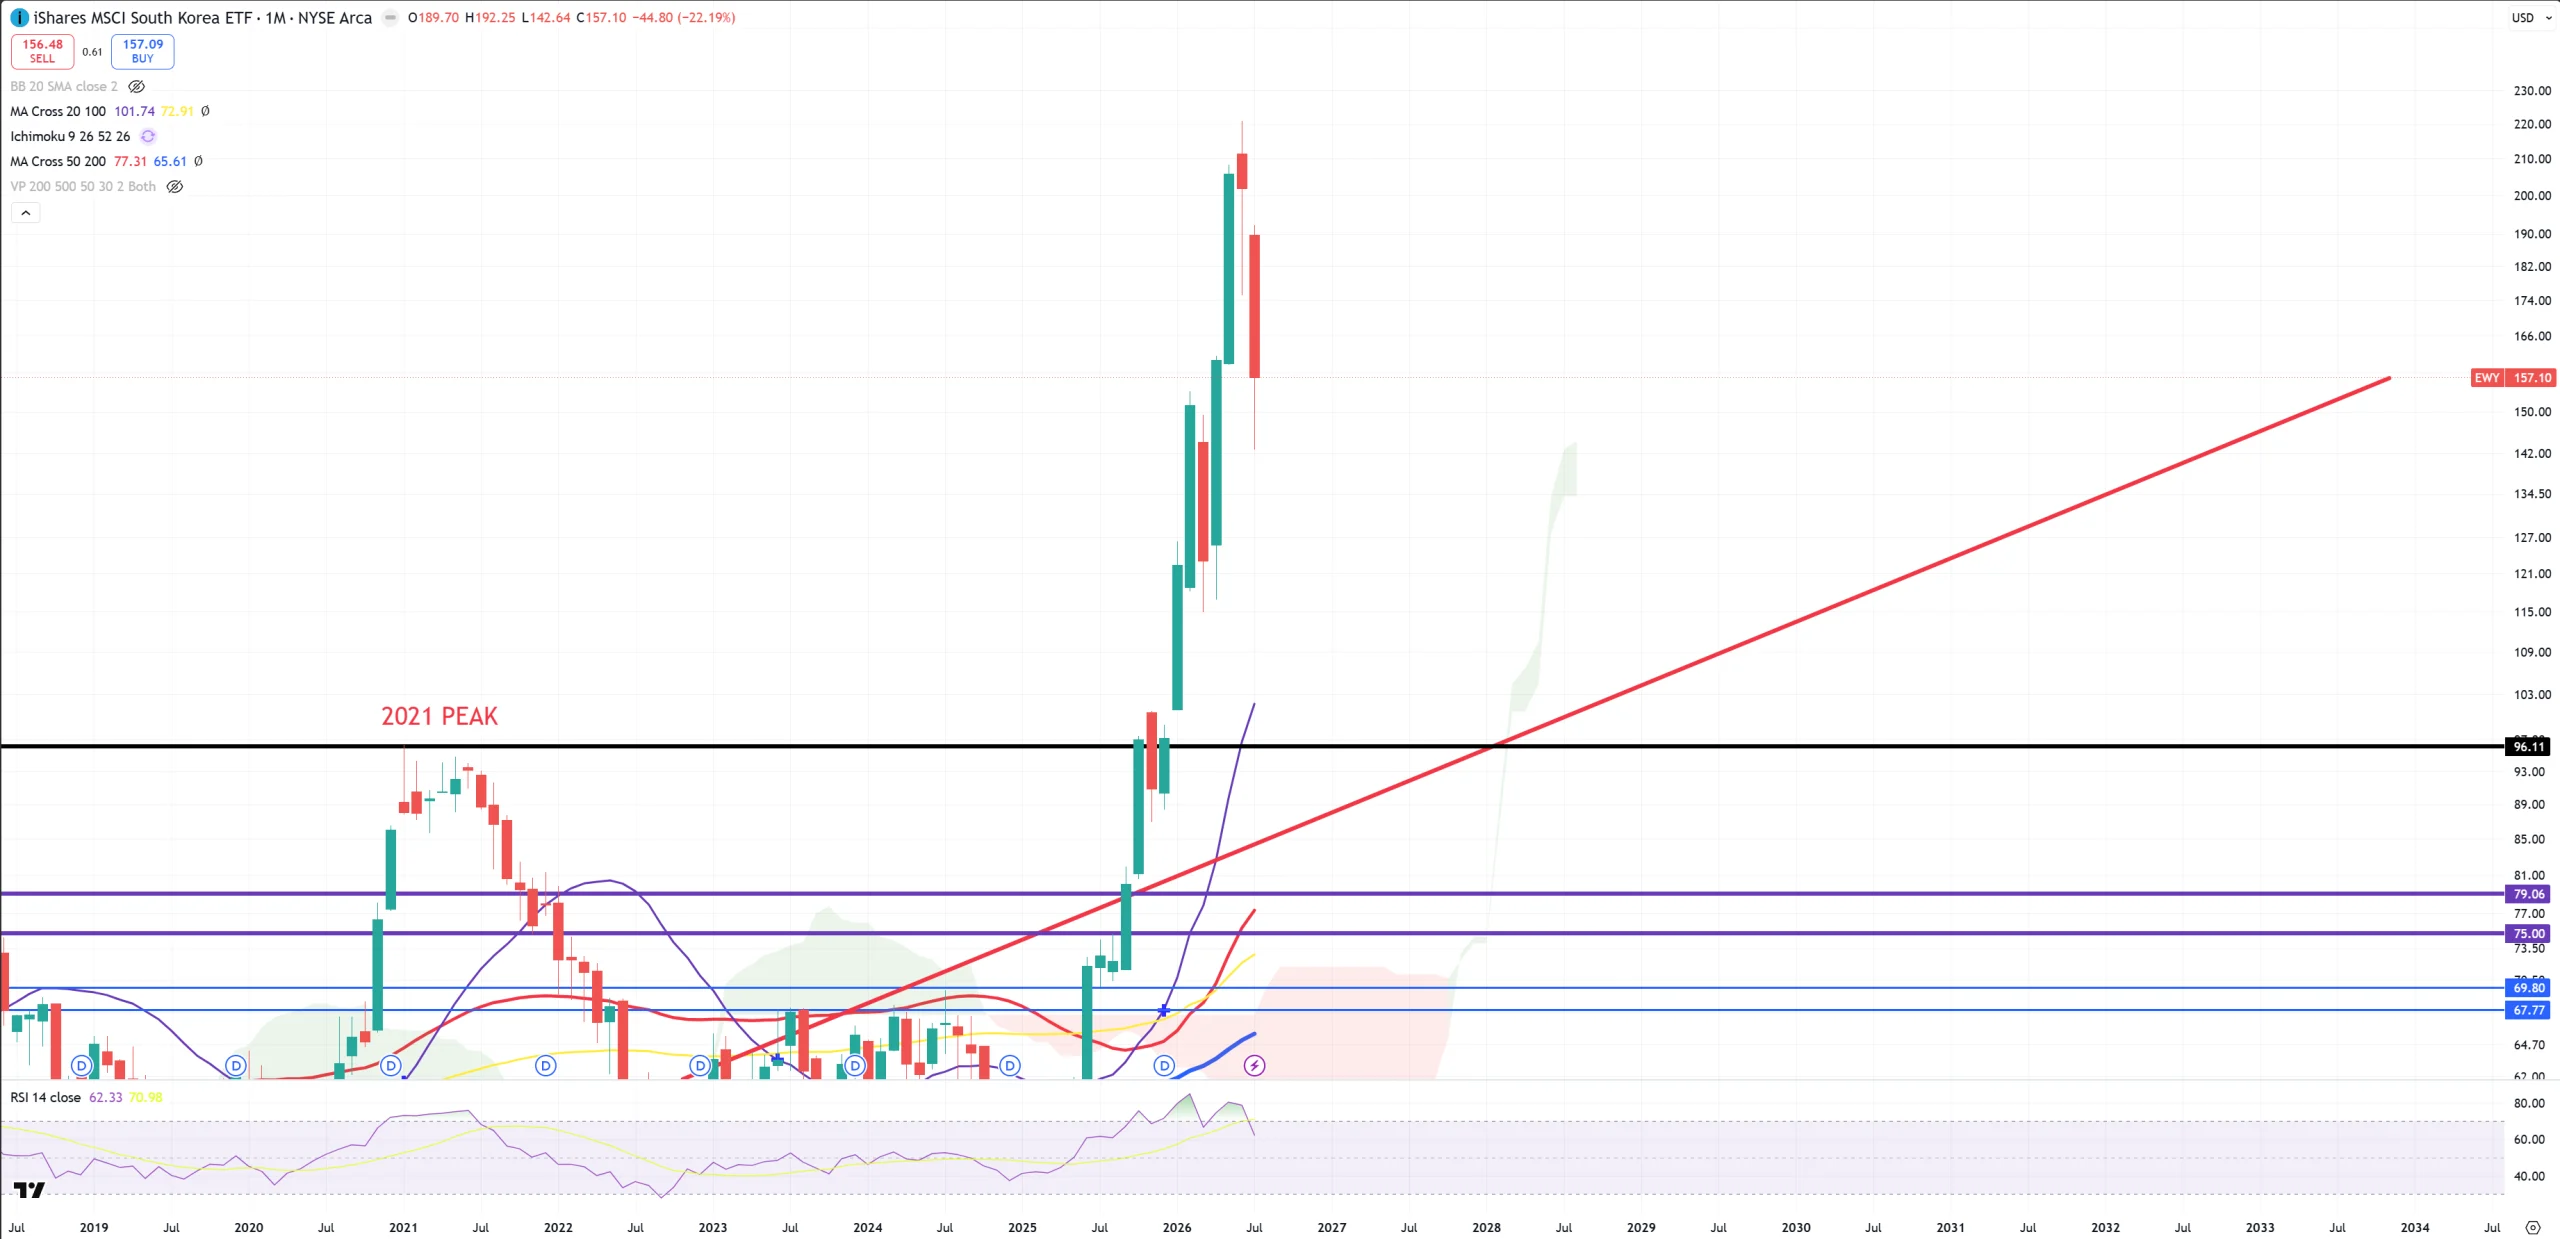
EWY – South Korean market has crashed, but nothing to see here yet.
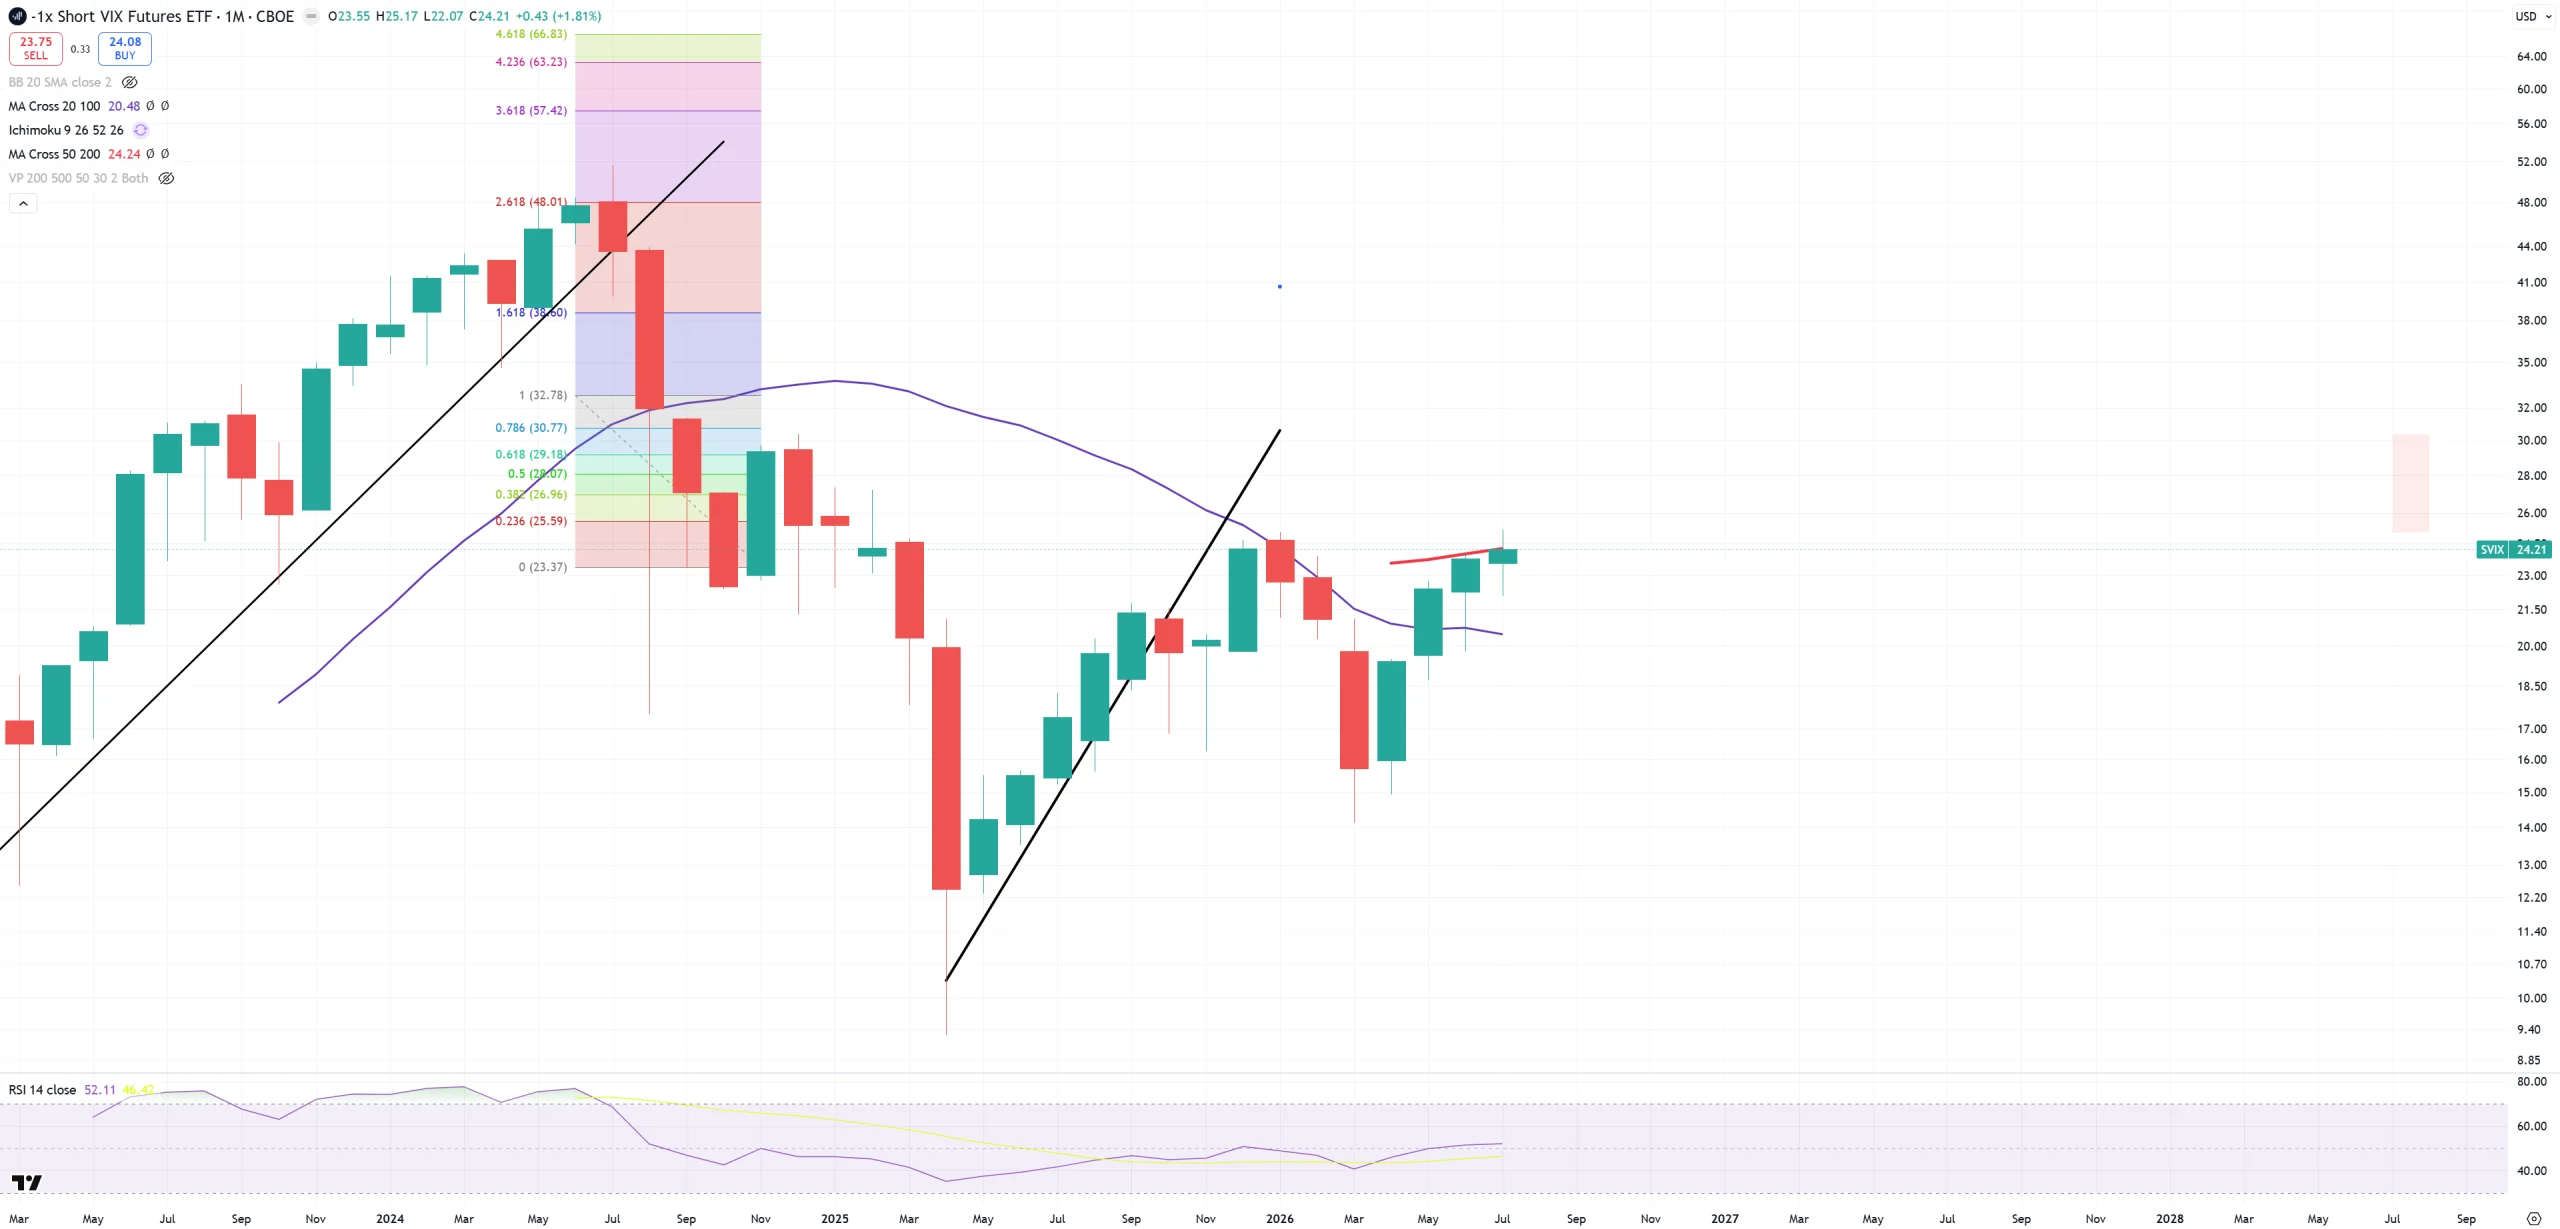
SVIX – prefectly retests (M)MA50 from the bottom
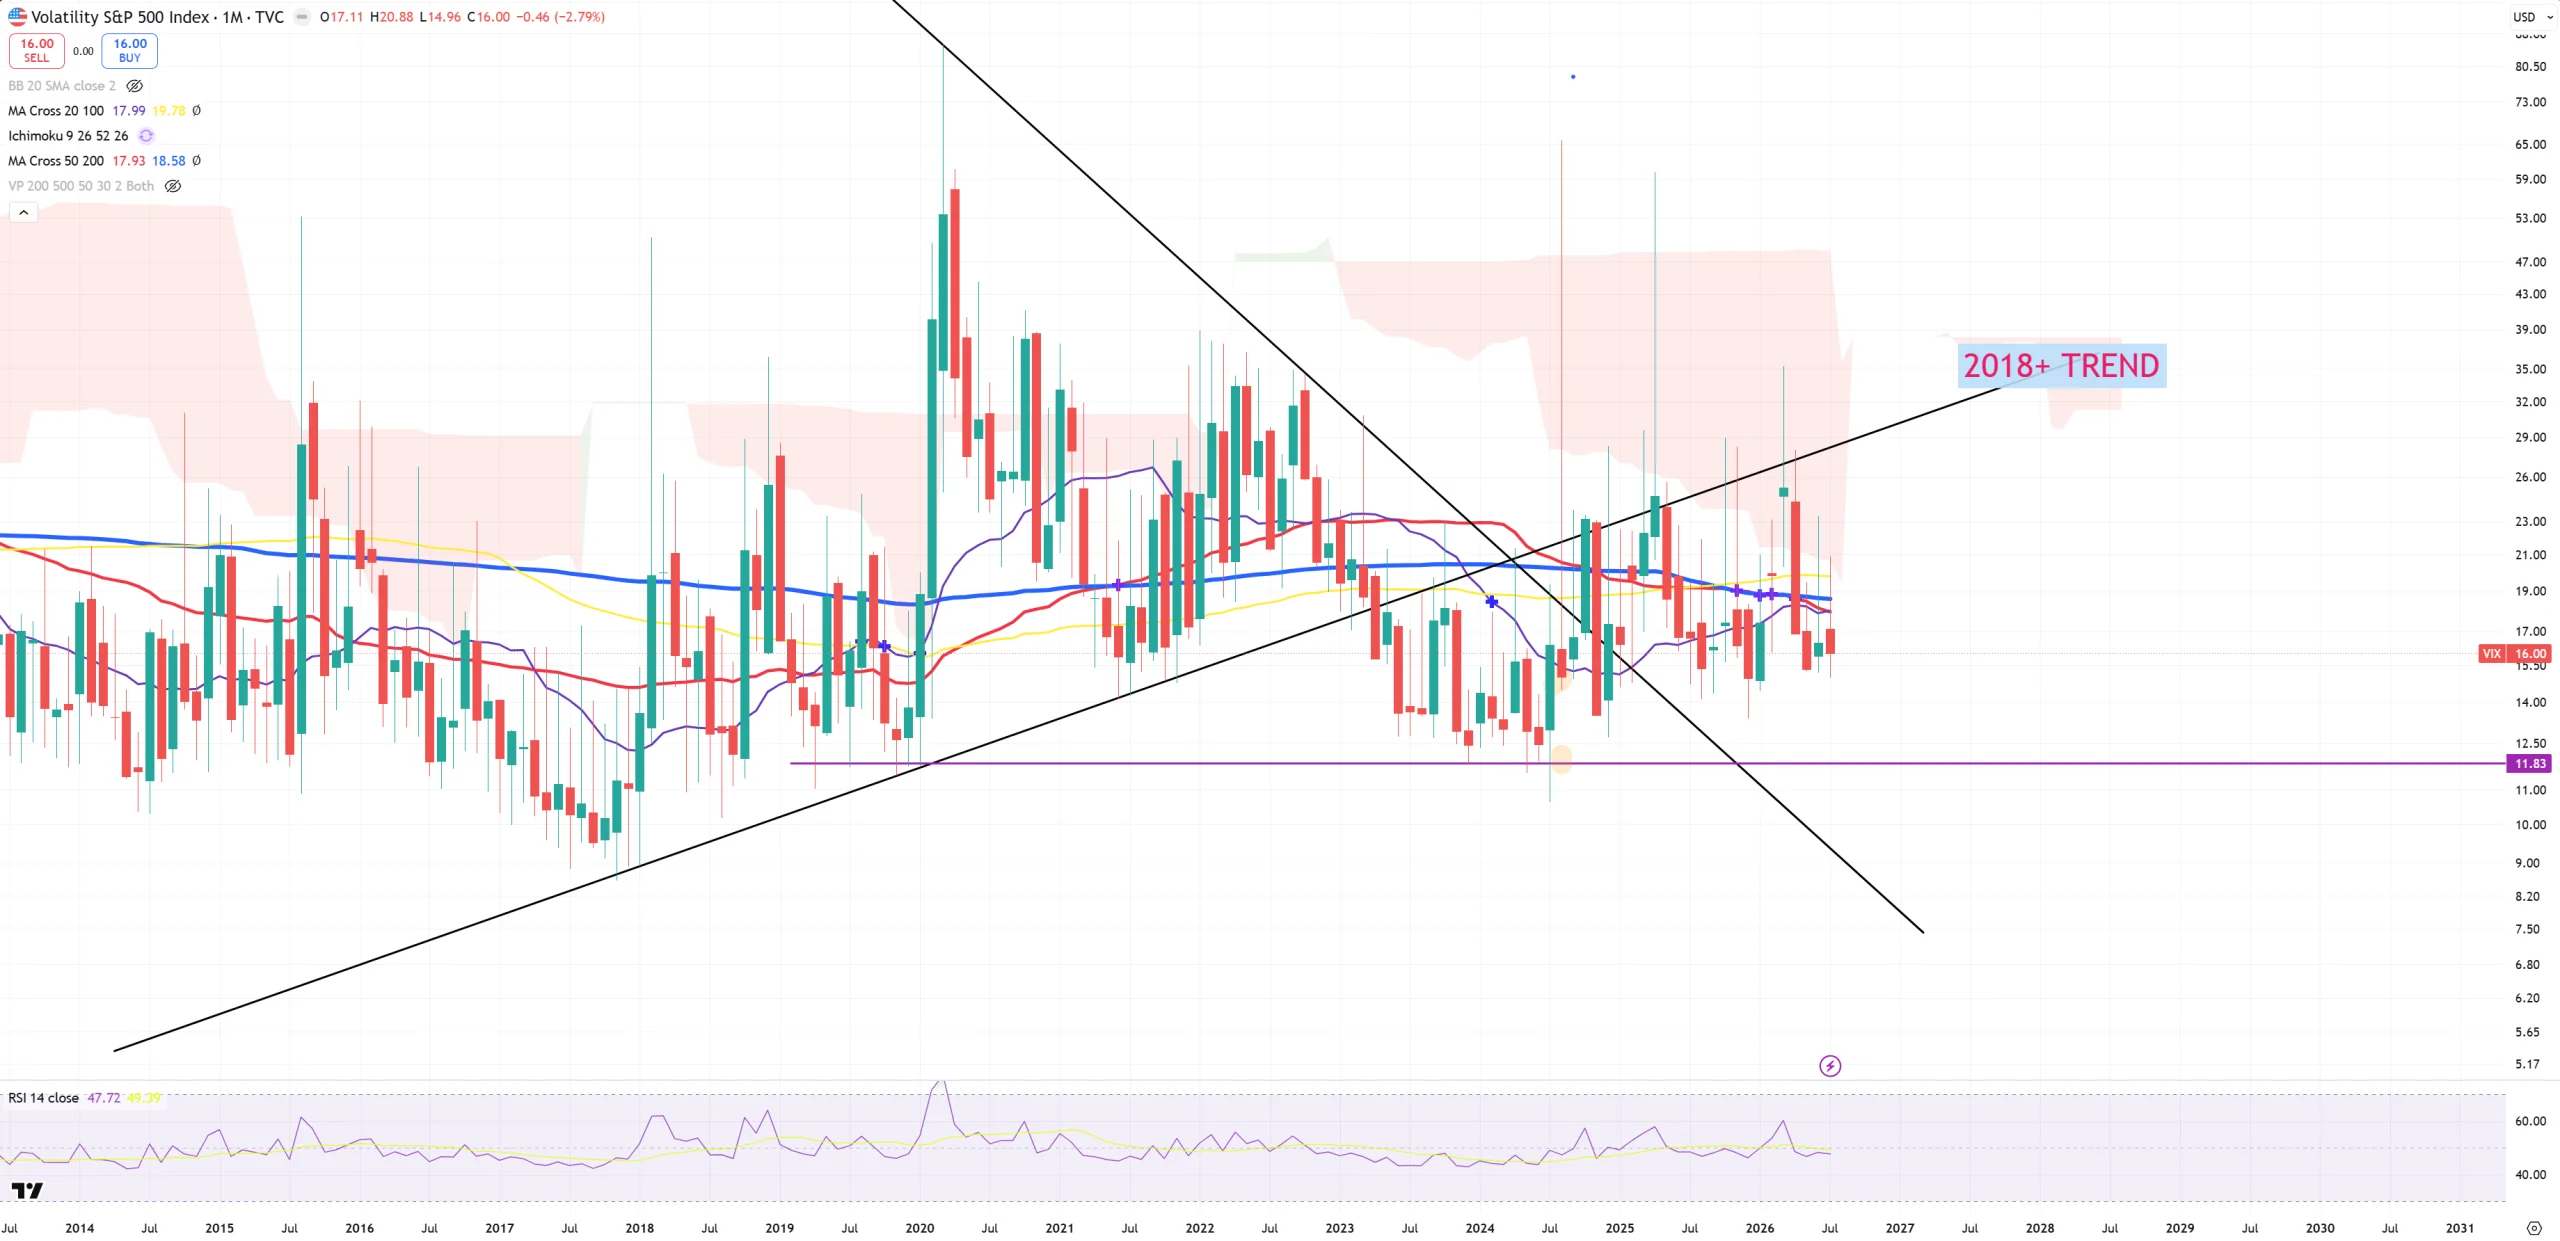
VIX – has 4x key (M)MAs above – all almost on the same level 18-20.
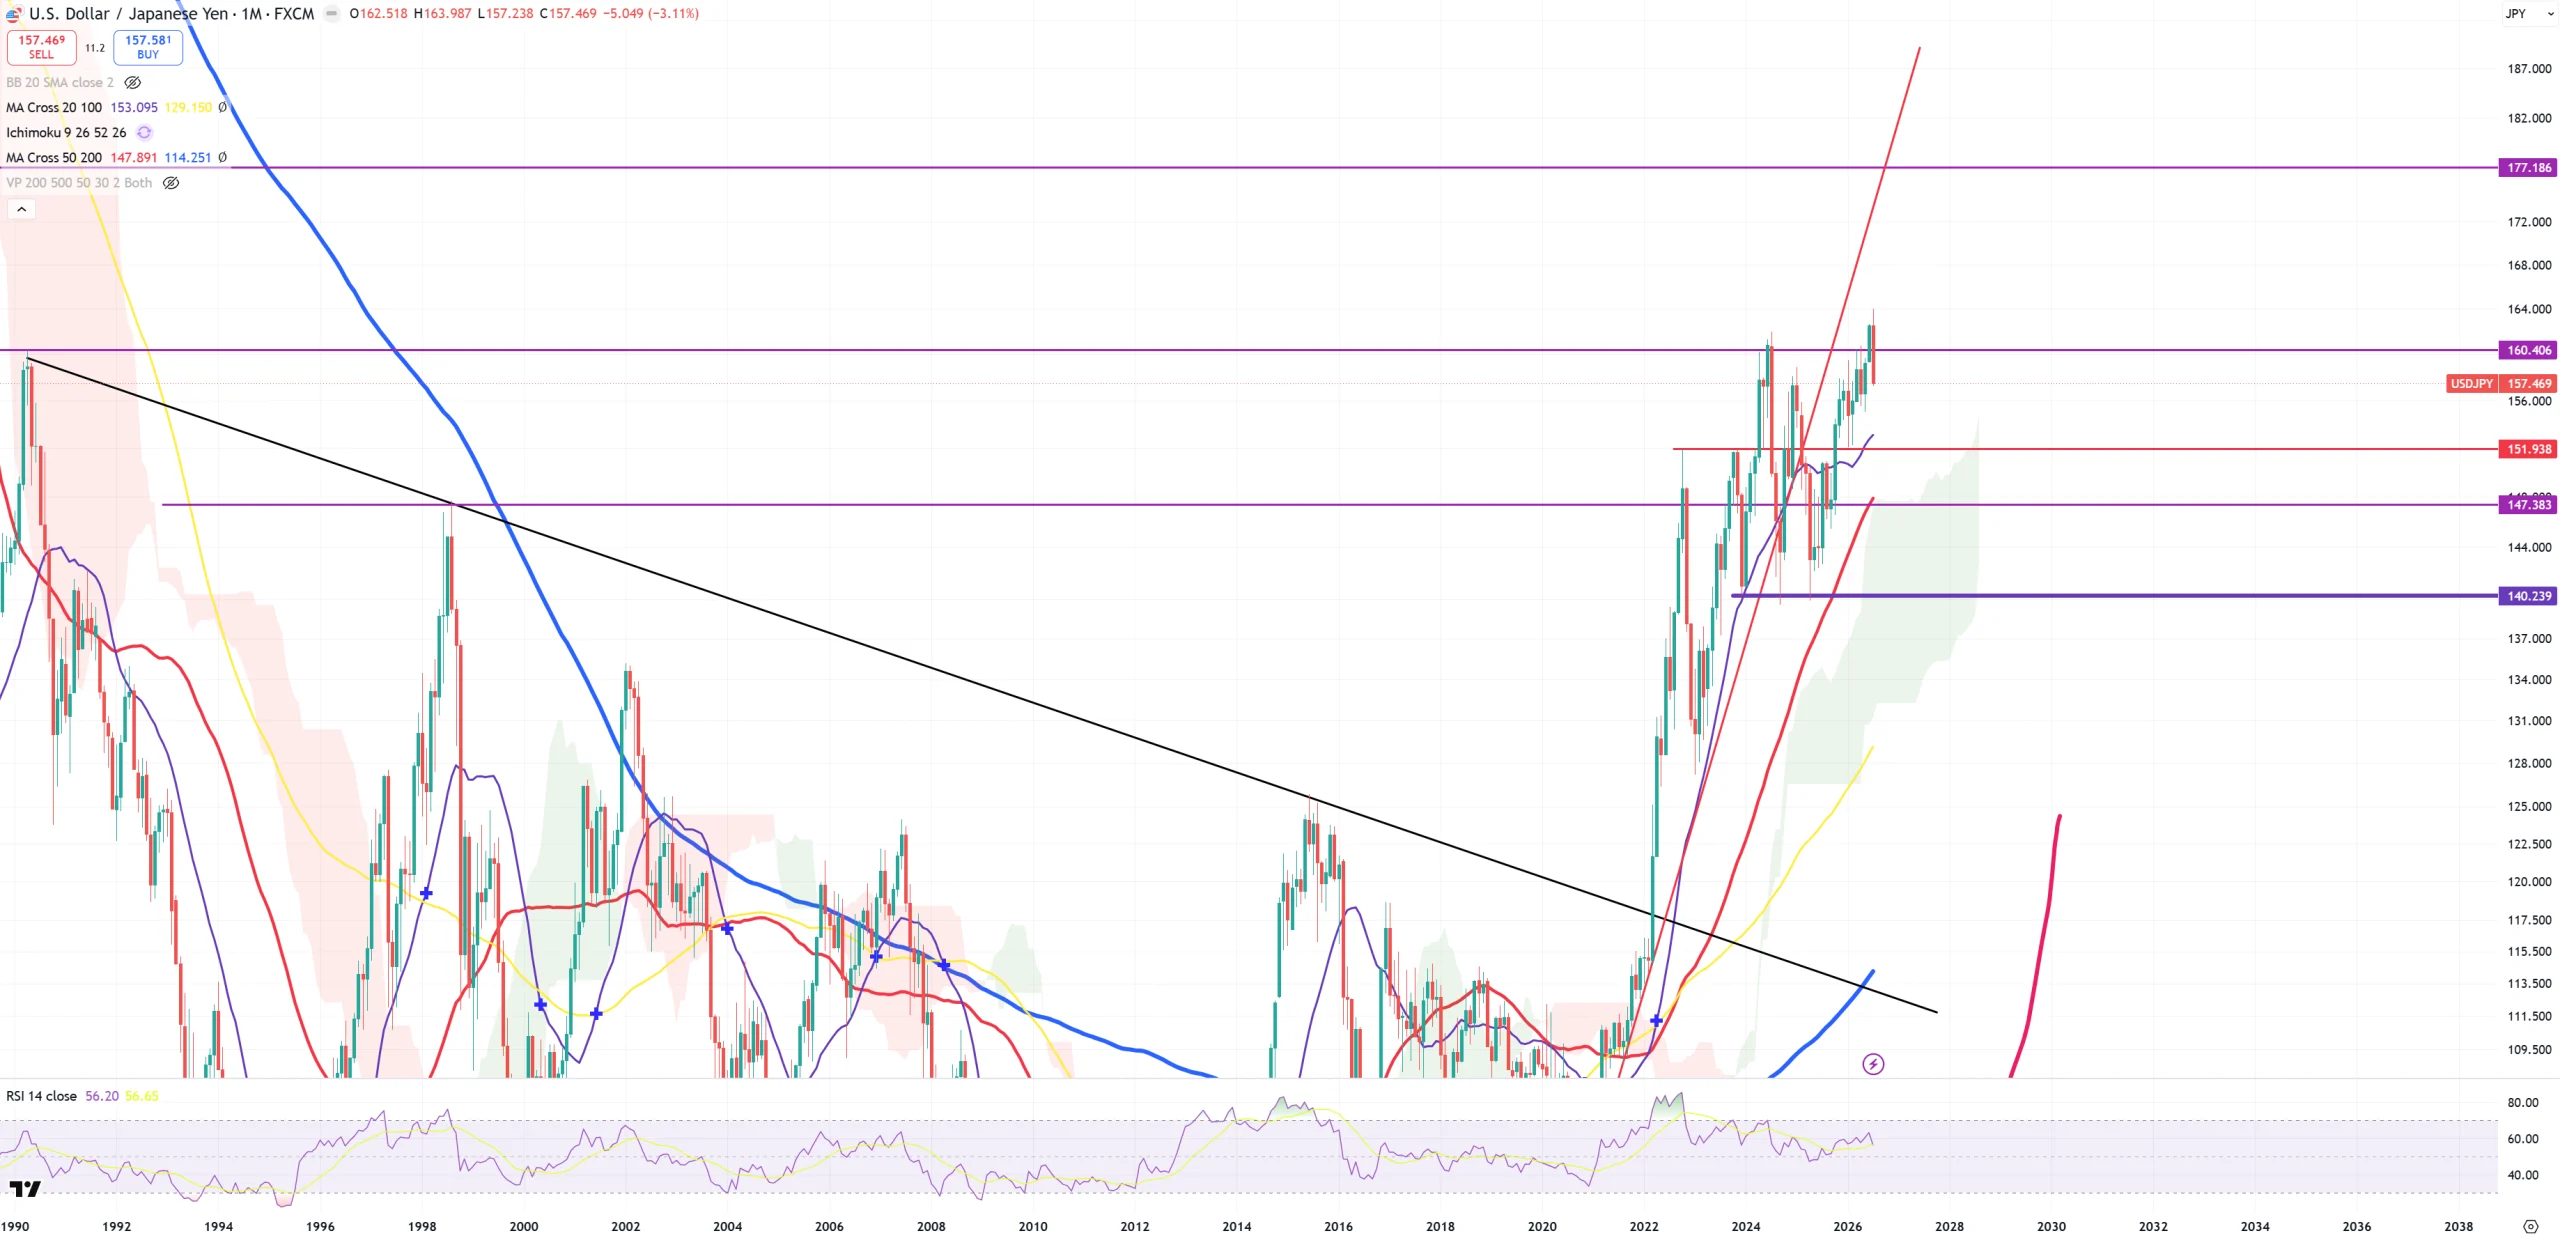
USDJPY – Japanese Yen tries to break to new ATHs but now the FED plays BoJ role, because BoJ role has been eliminated. Let’s see how long it’ll take
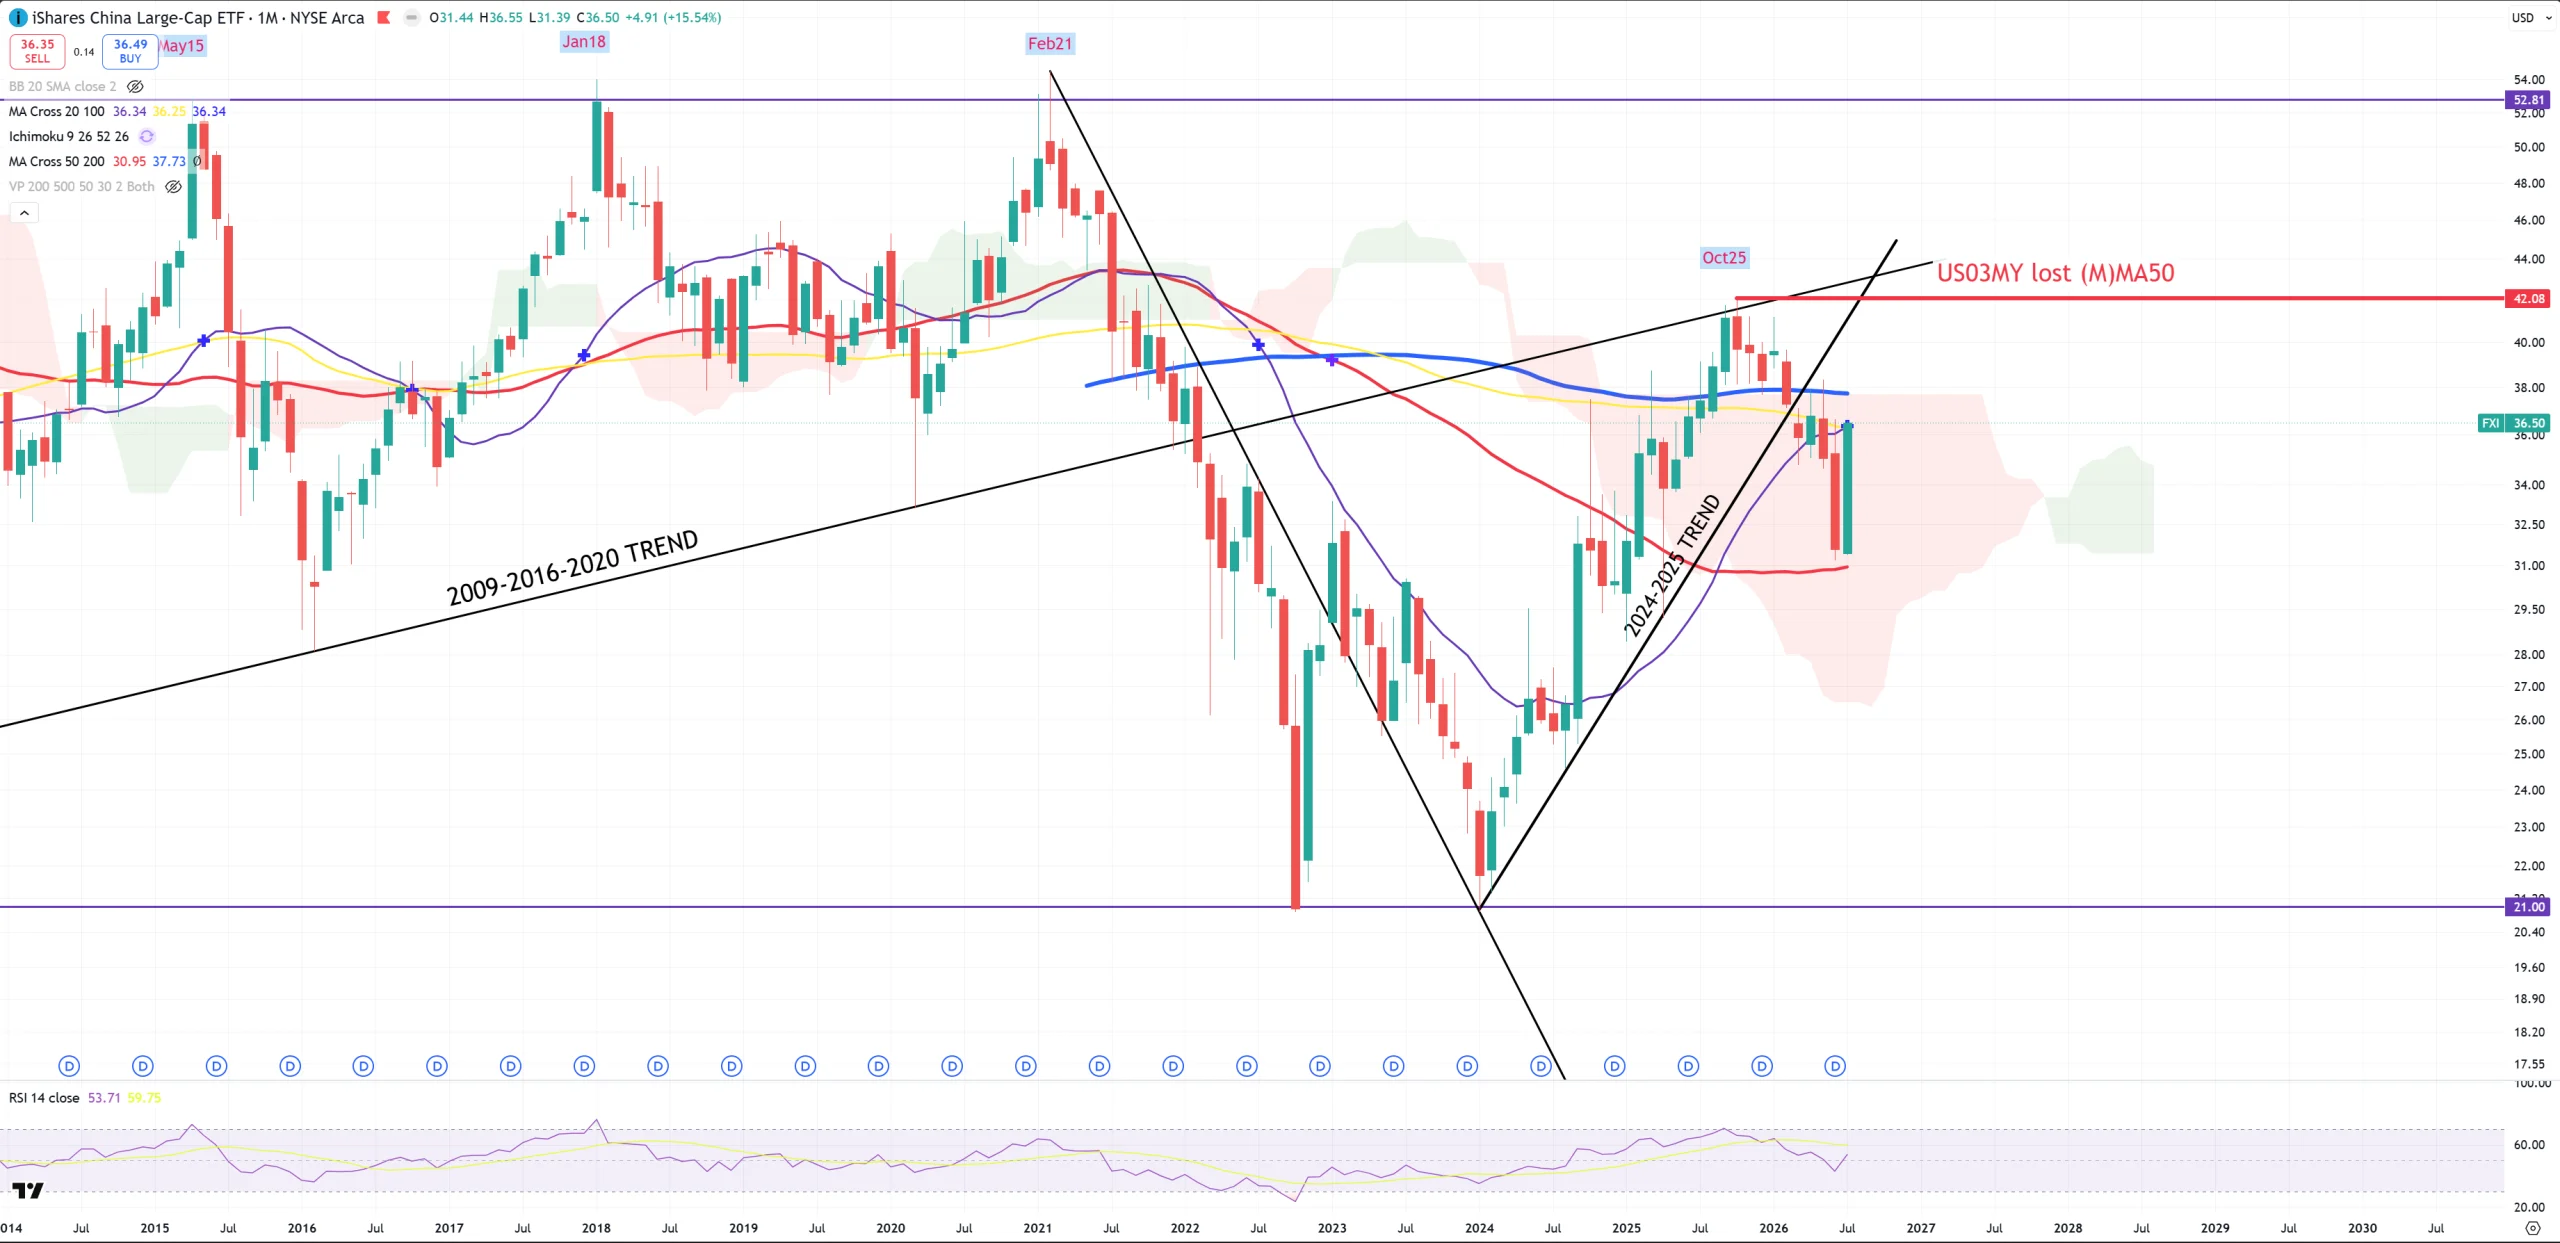
FXI – China – tries to retest couple key (M)MAs … (M)MA50 still ongoing
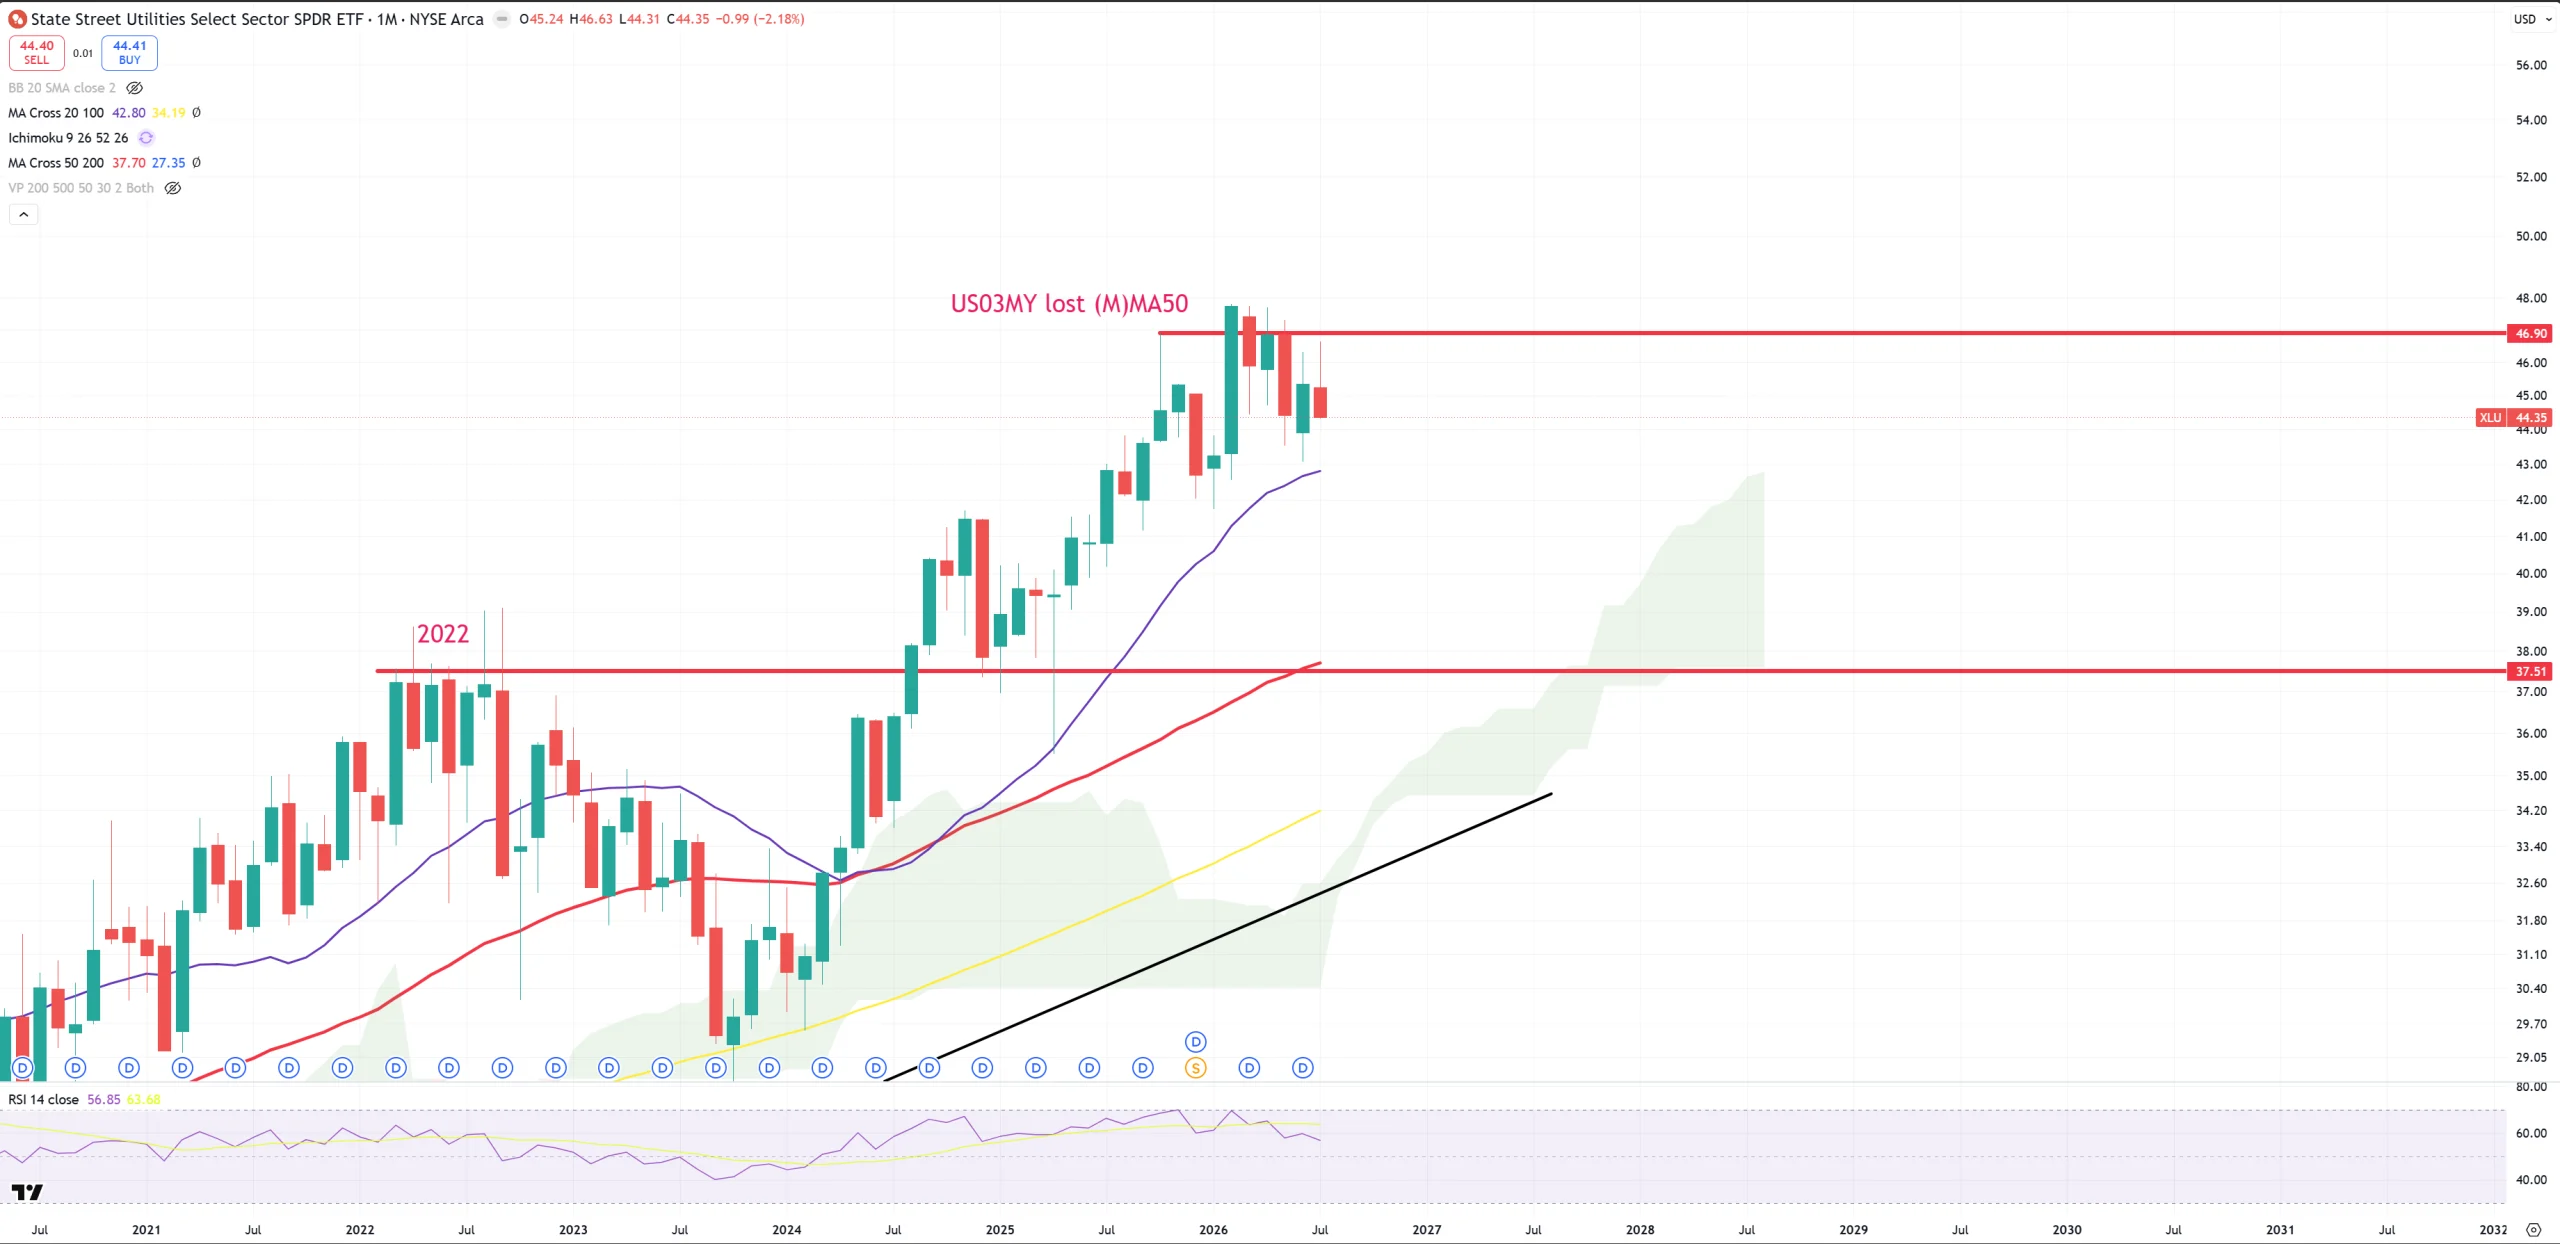
XLU – has problems to go above even 4Q25
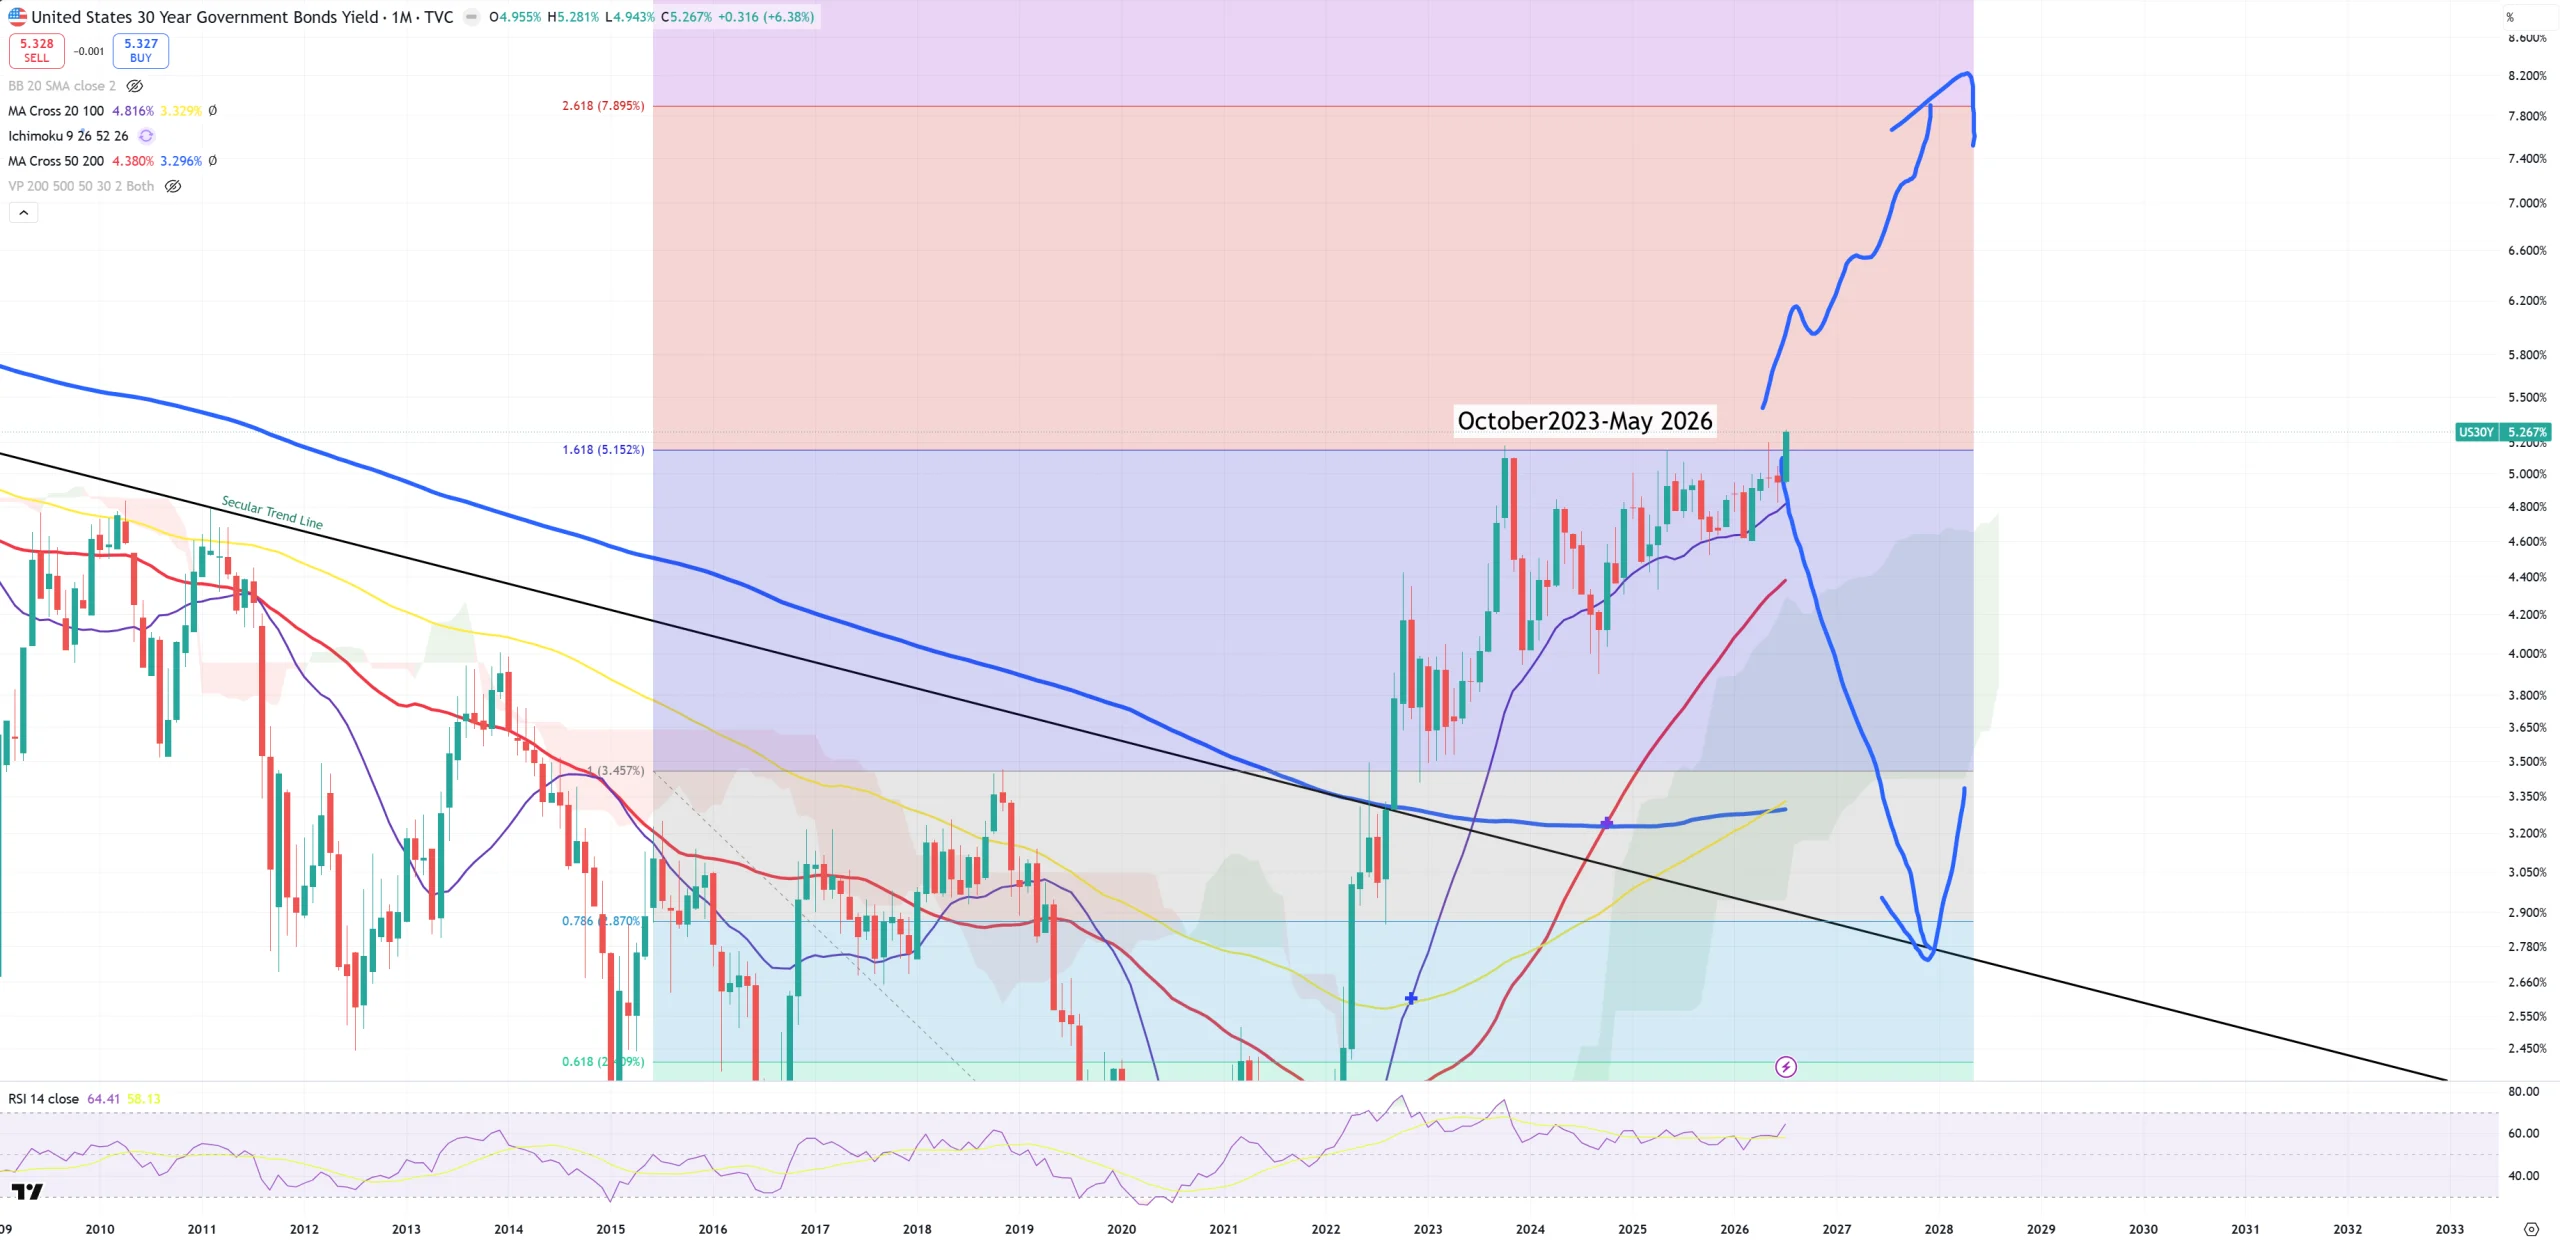
US30Y – this is a big moment for the bond market and probably for oil to get towards 150$ 2008 level.
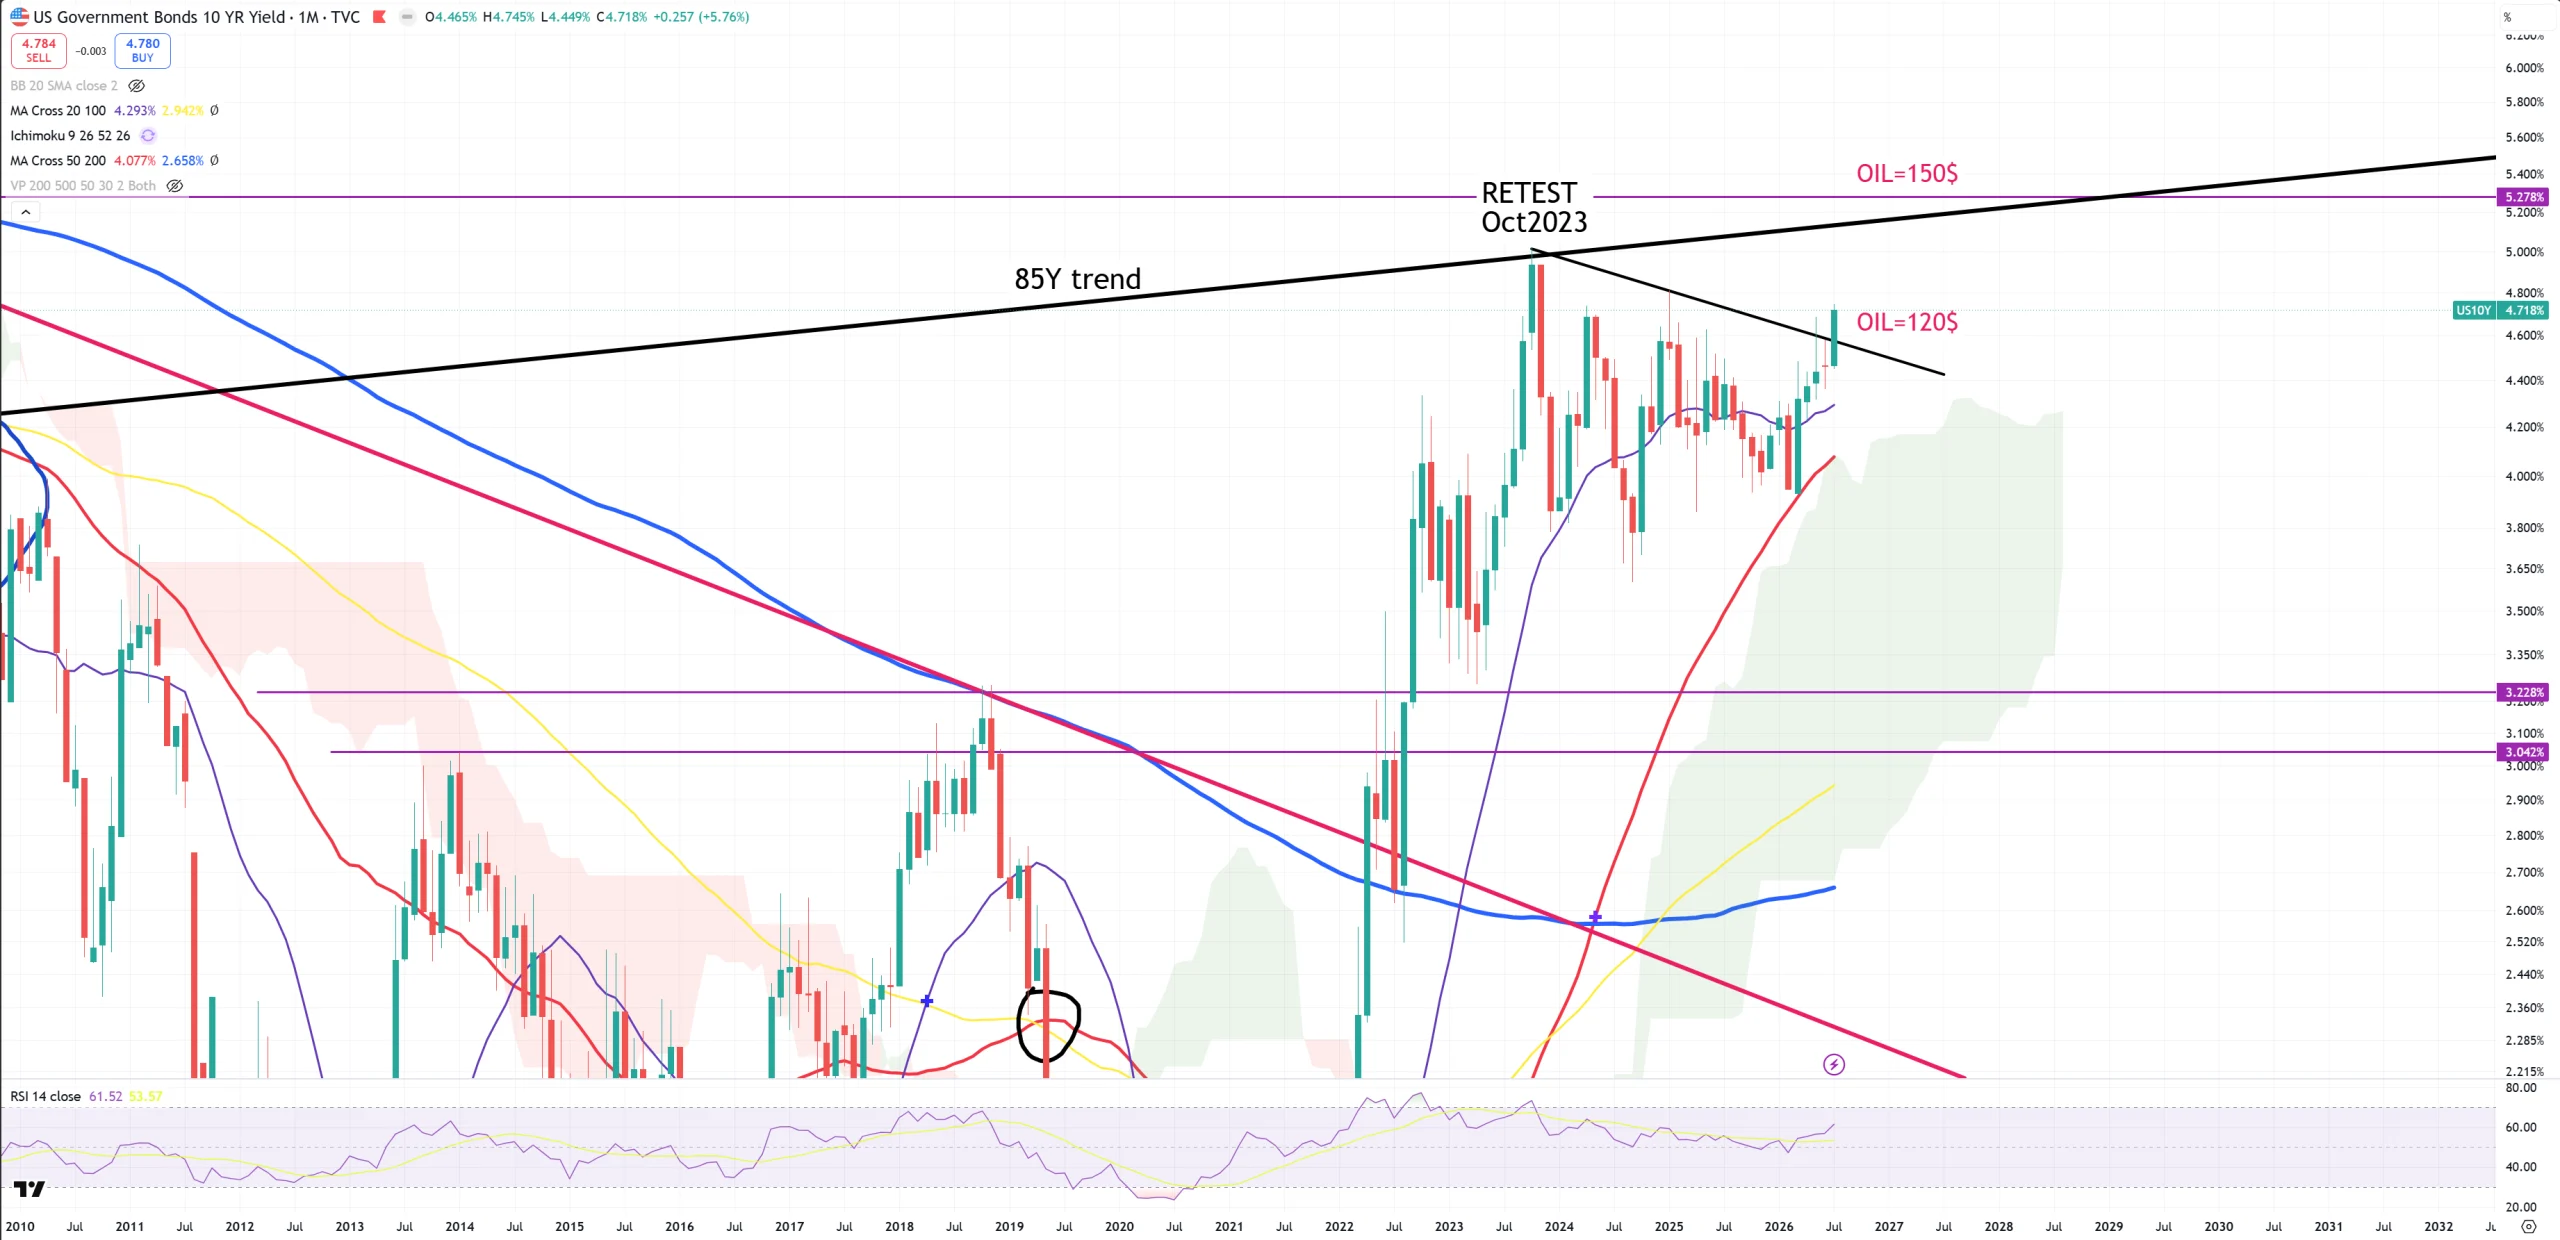
US10Y – probably another attempt to retest 85Y trend.
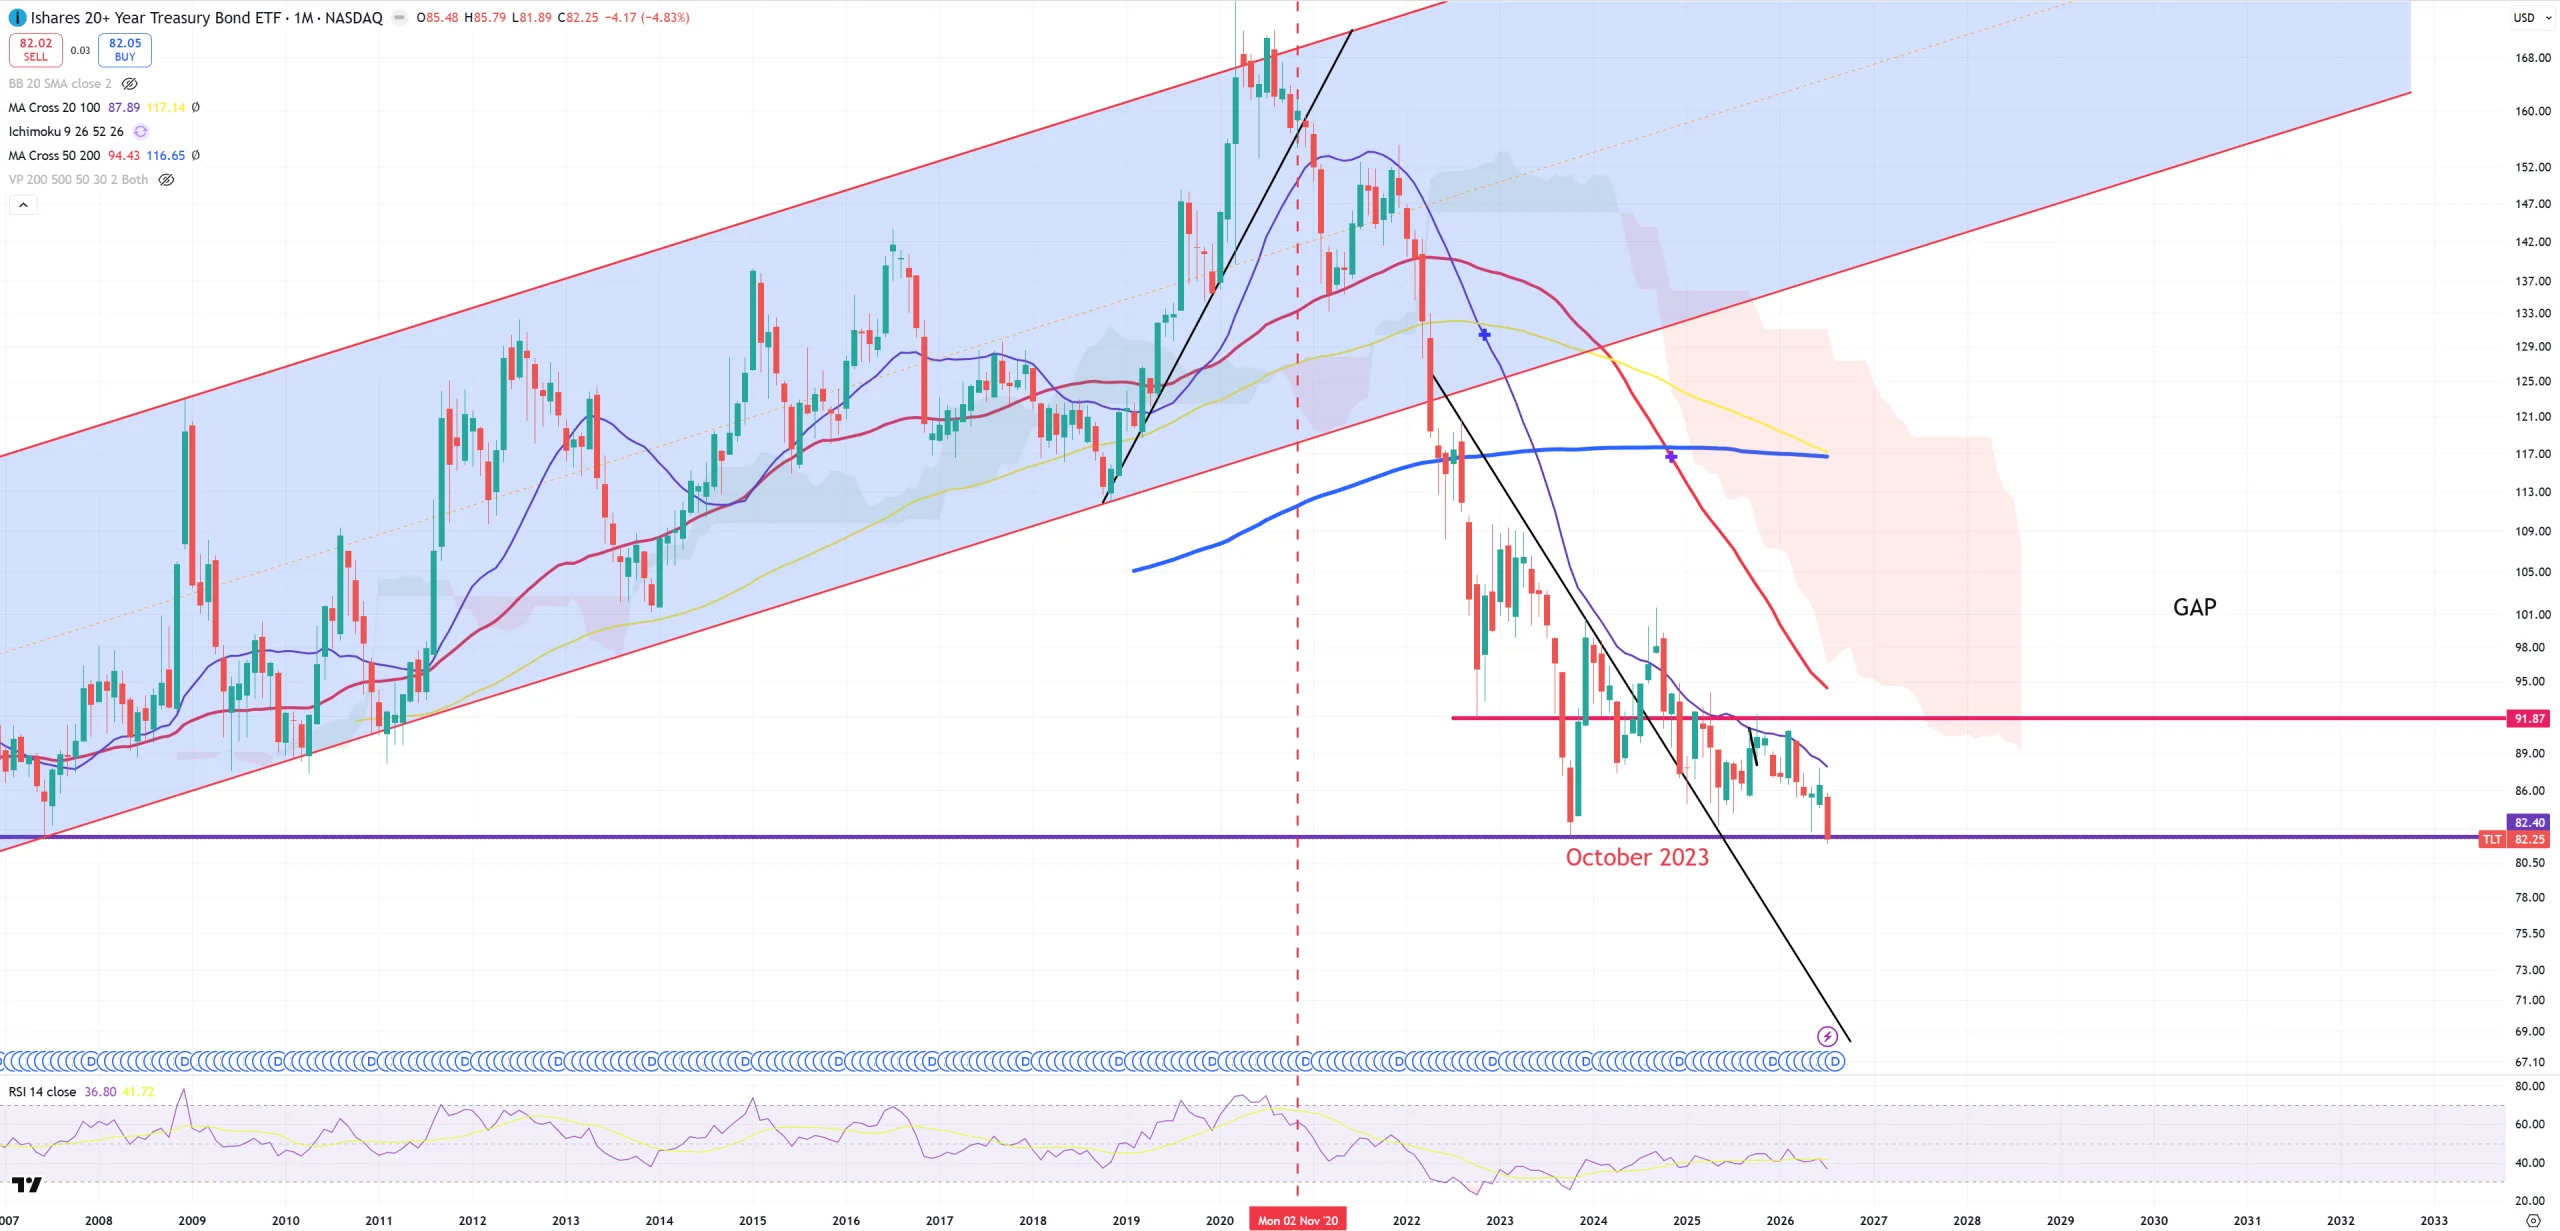
TLT – and its 82$ key level – there’s still no sign of bond bull market.
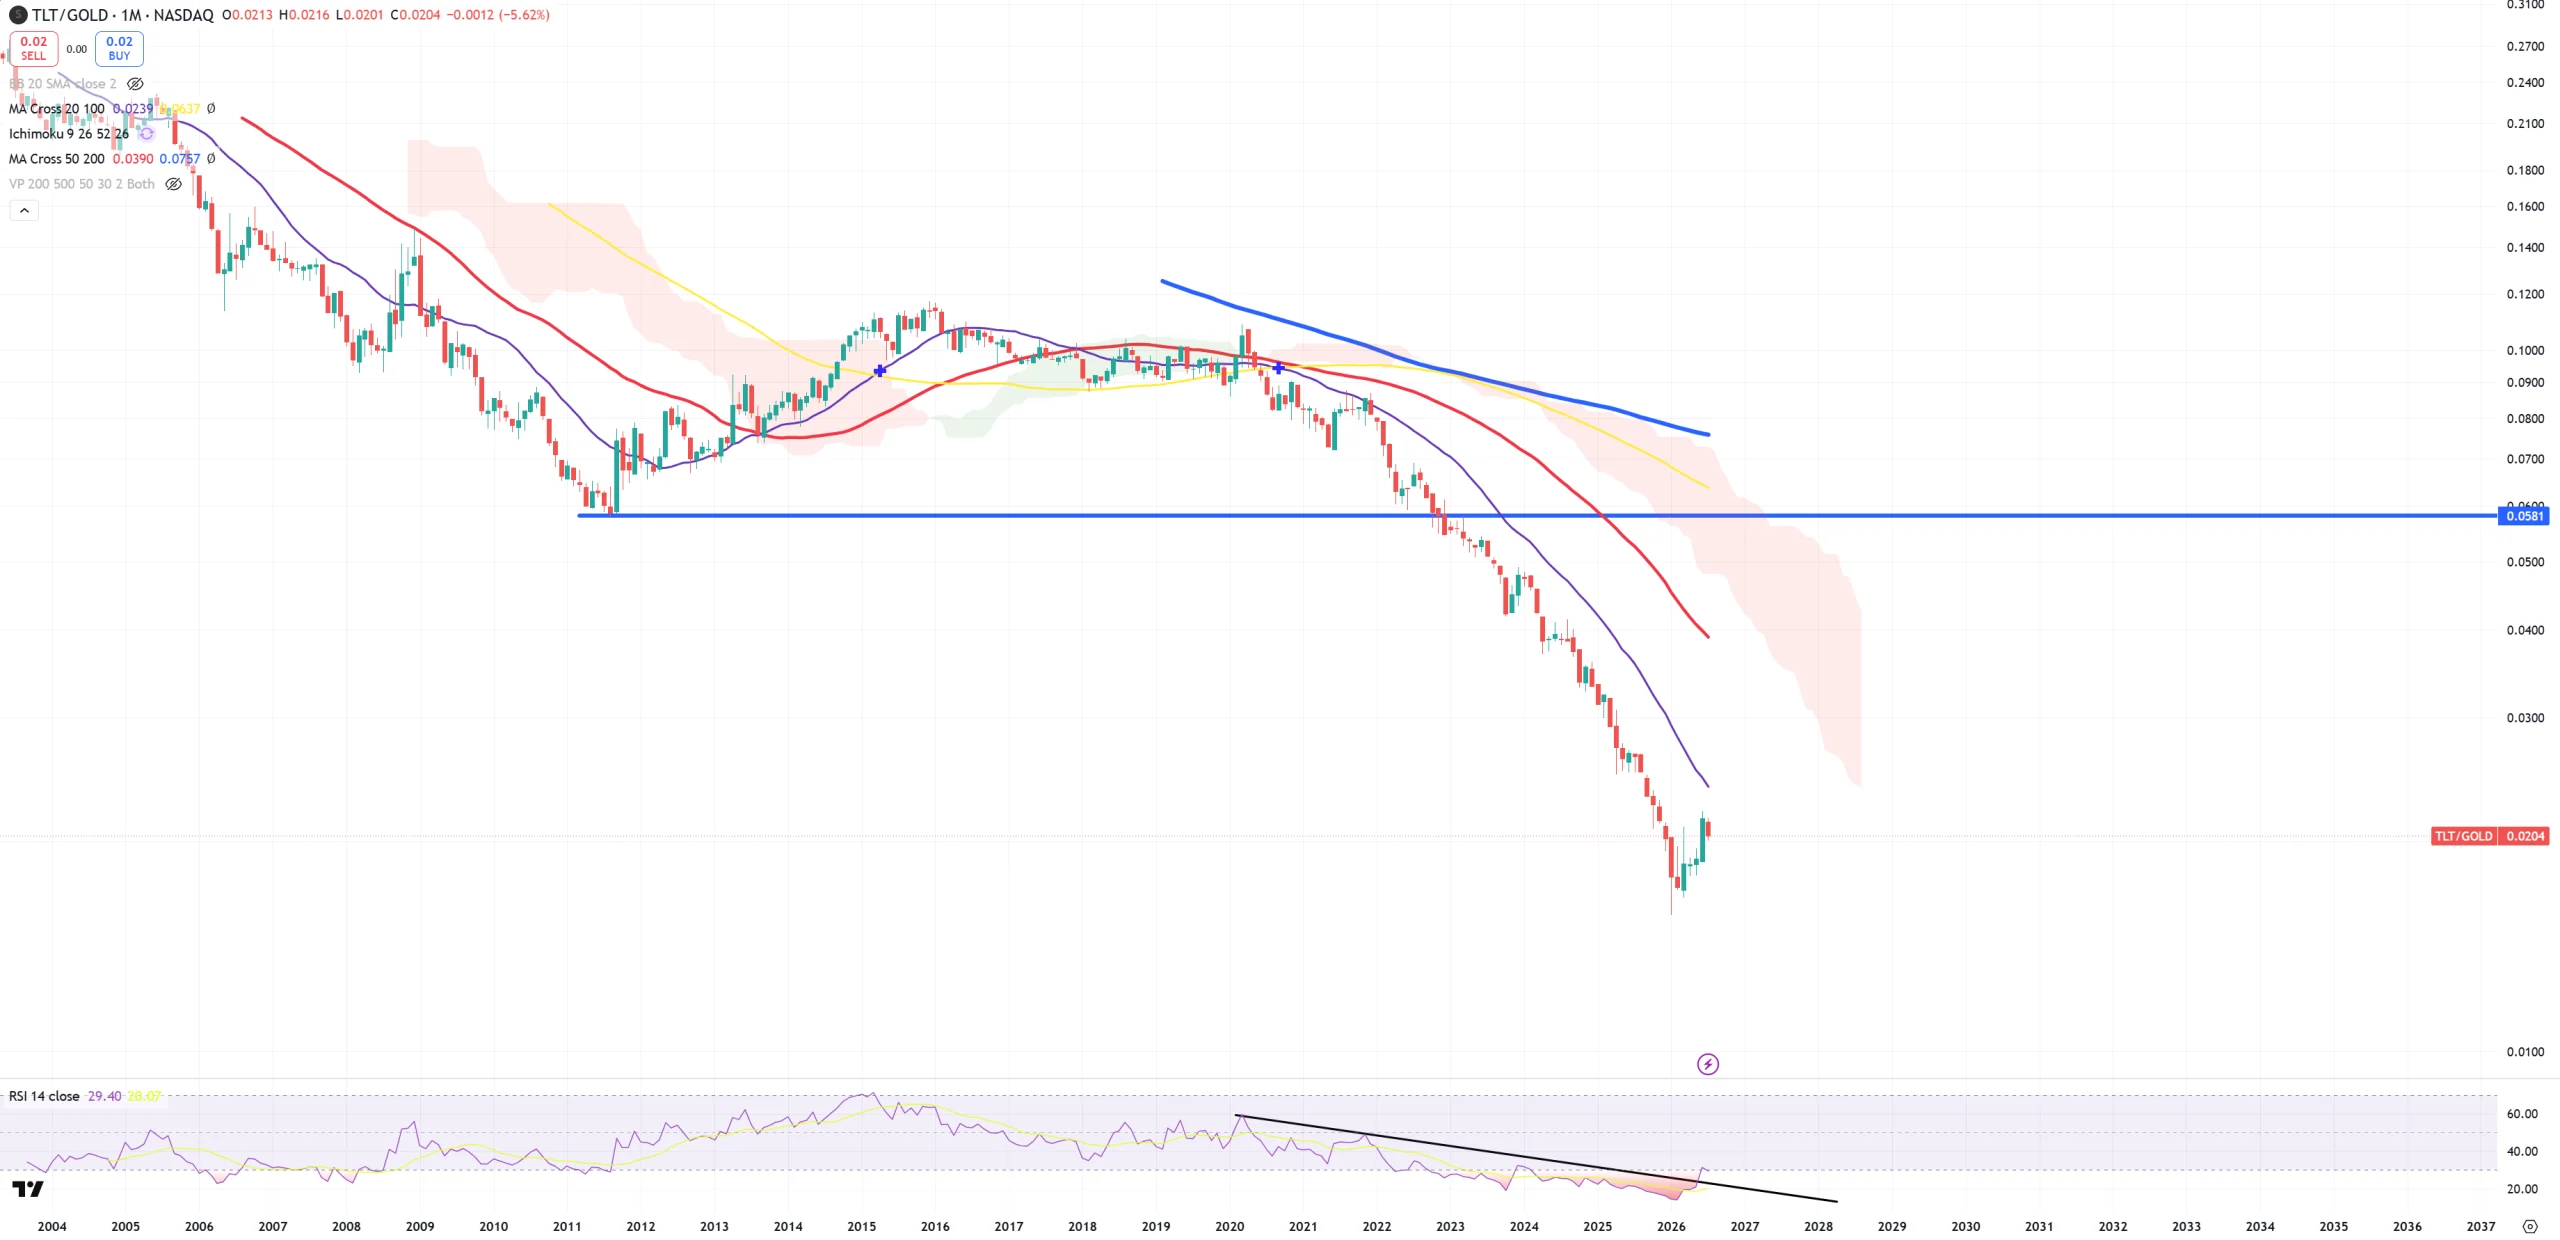
TLT/GOLD – something keeps happening, but still too weak reaction.
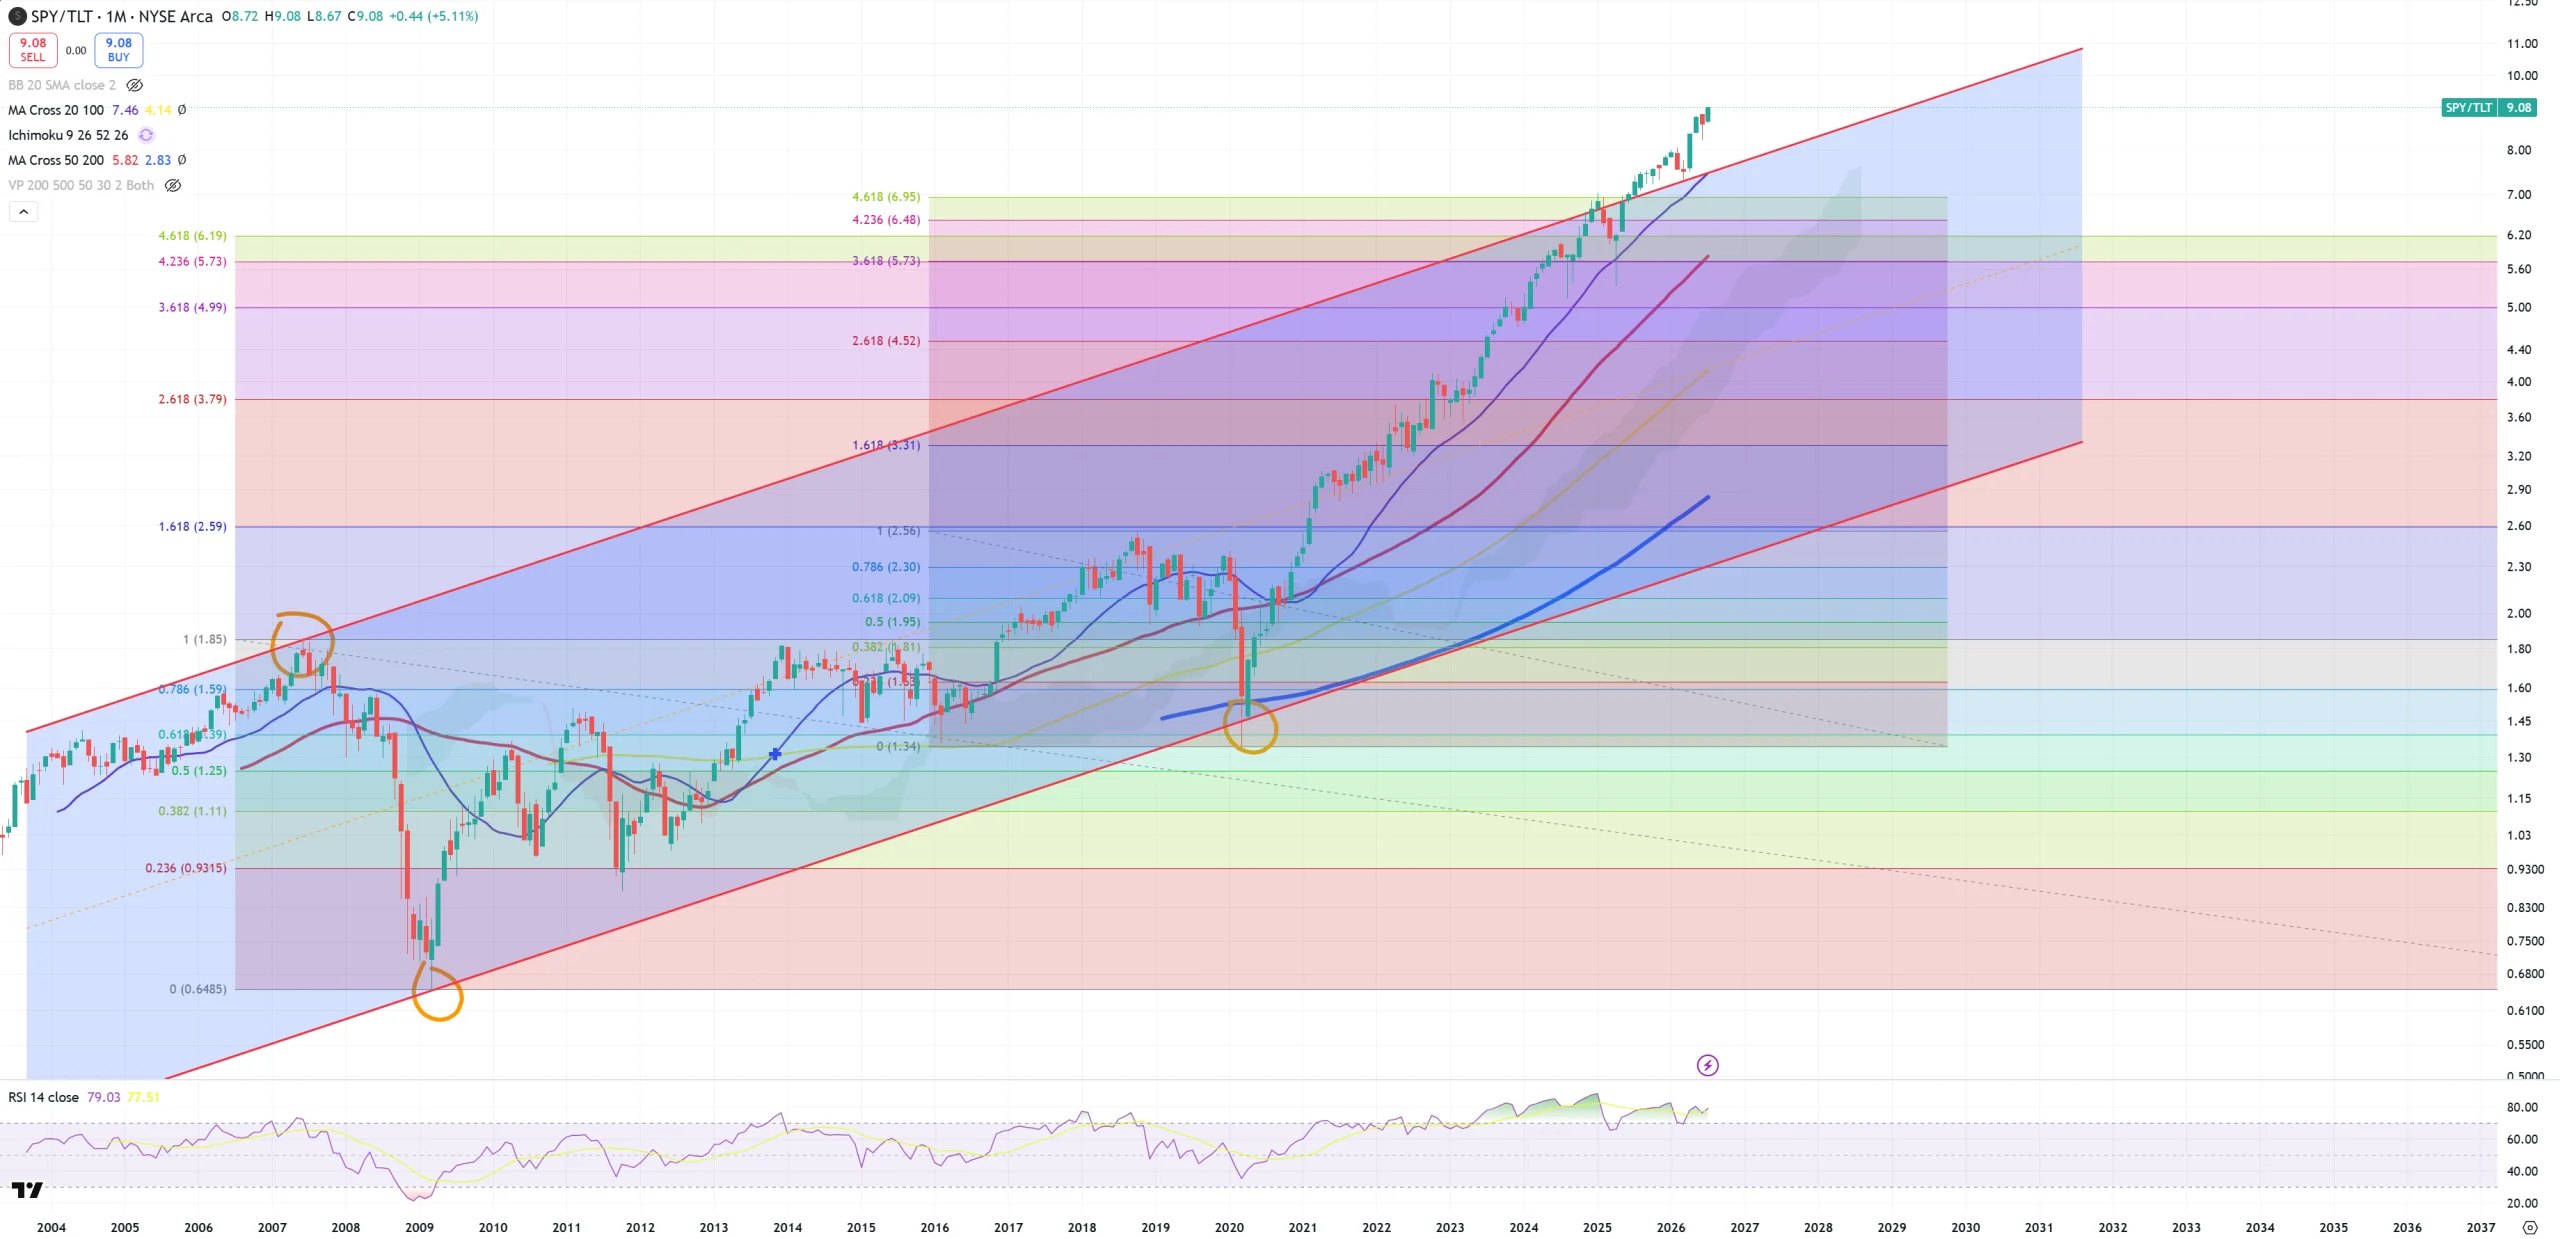
SPY/TLT – also no sign of any reversal
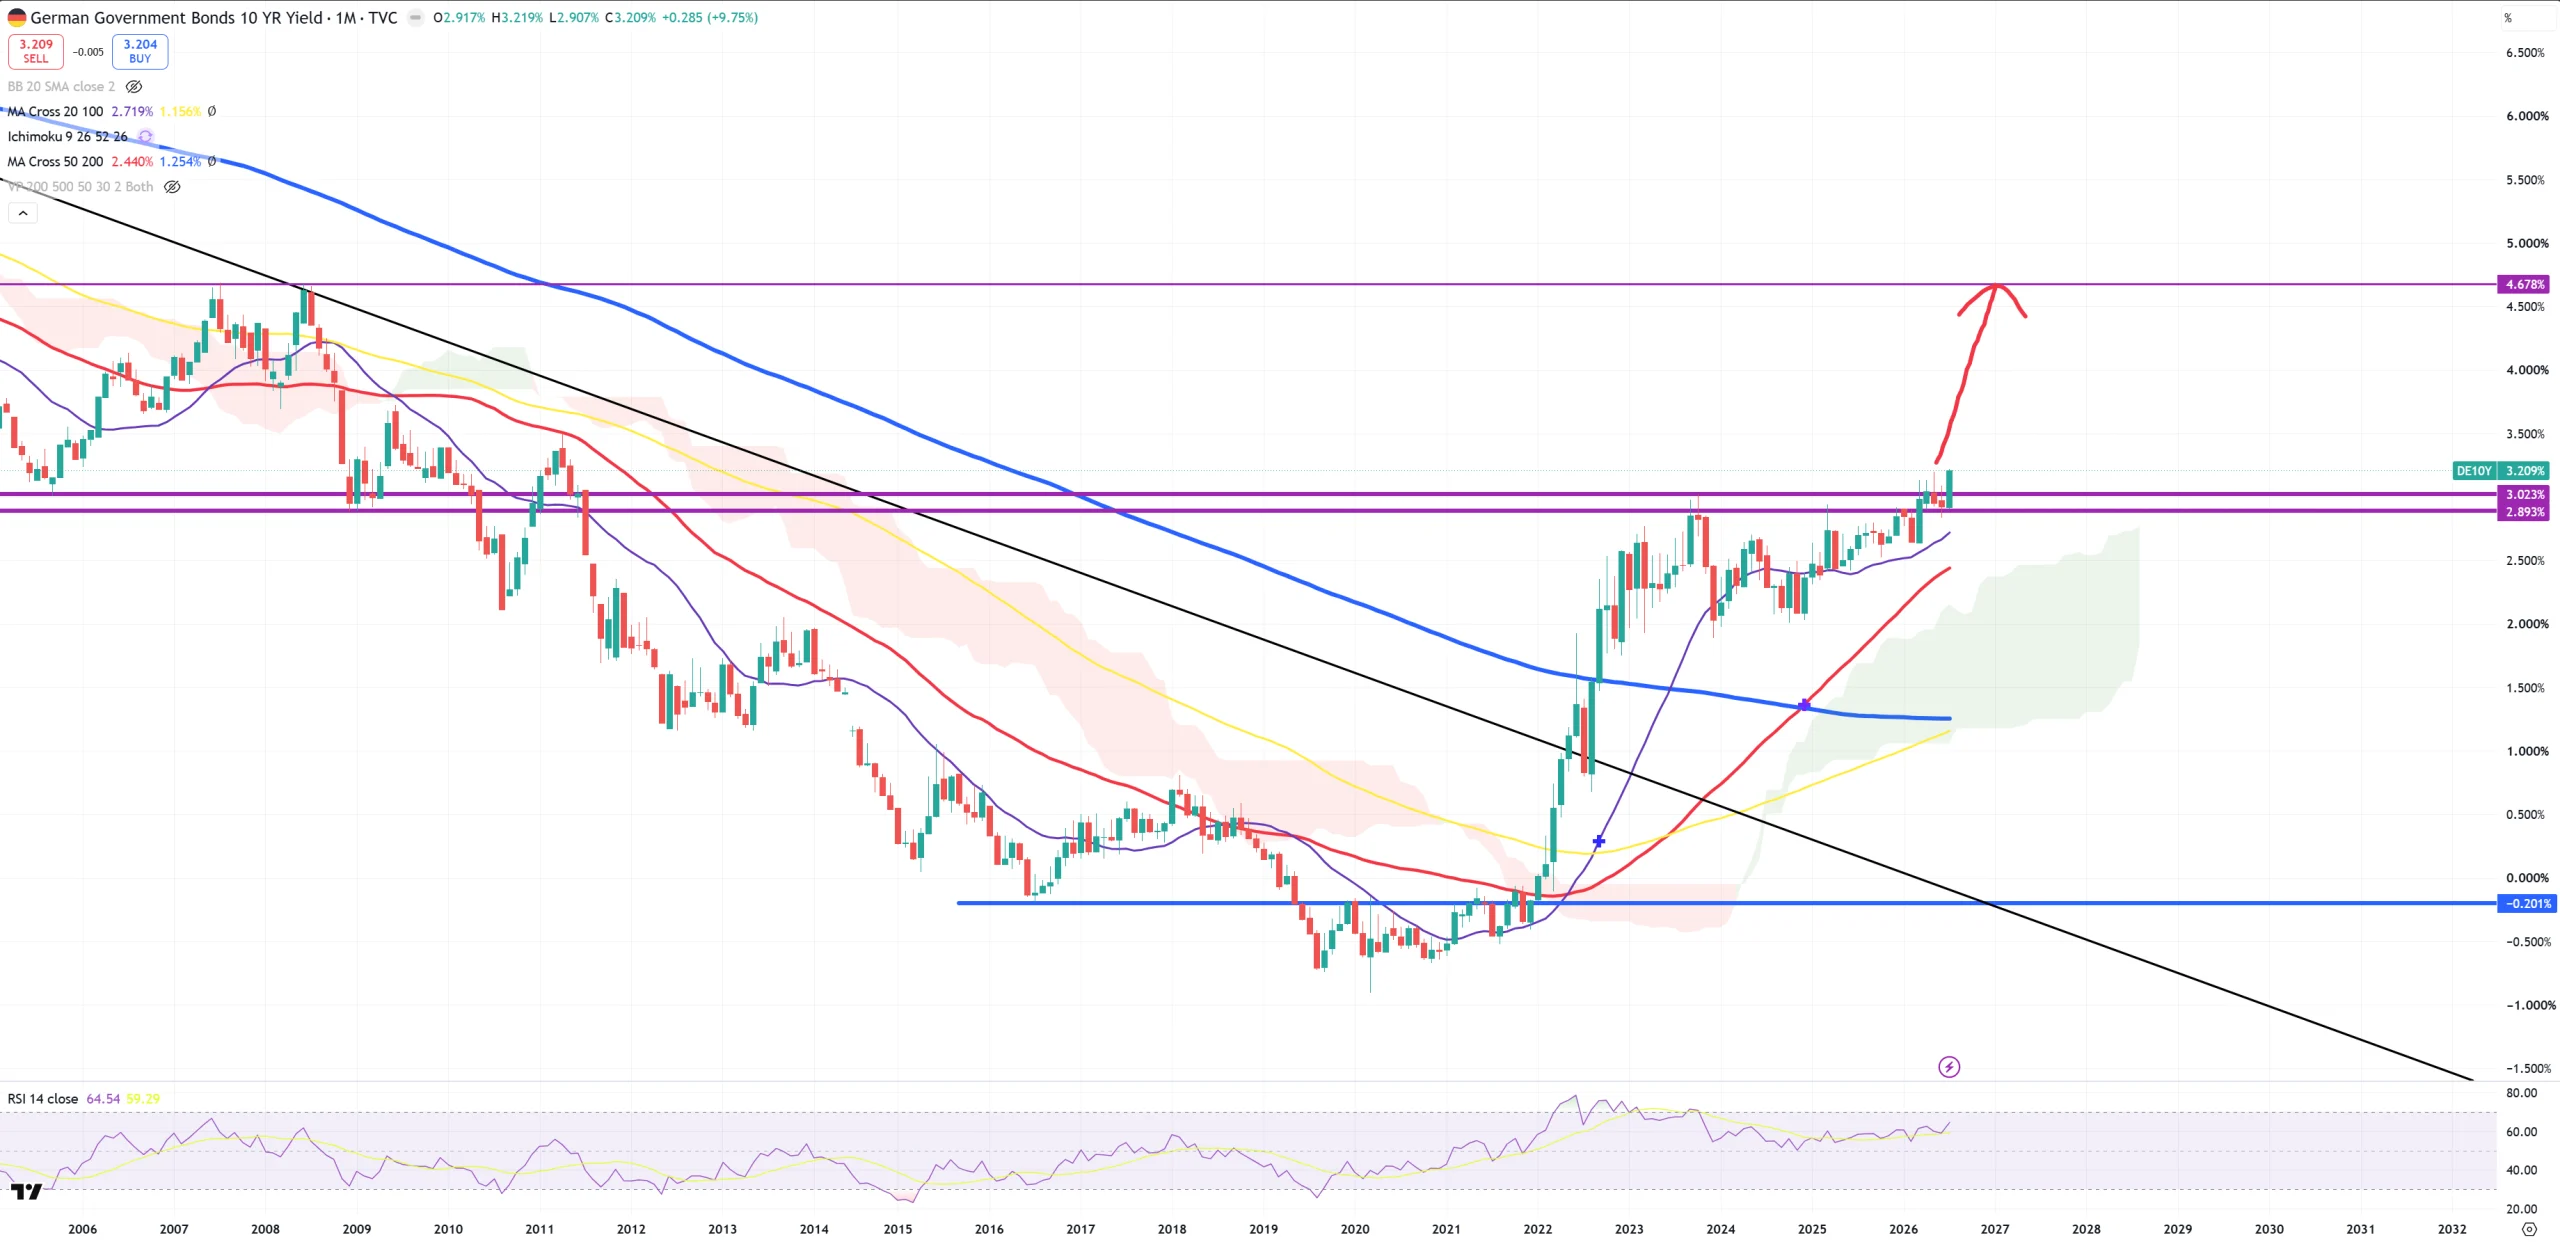
DE10Y – 5.0% seems to be coming
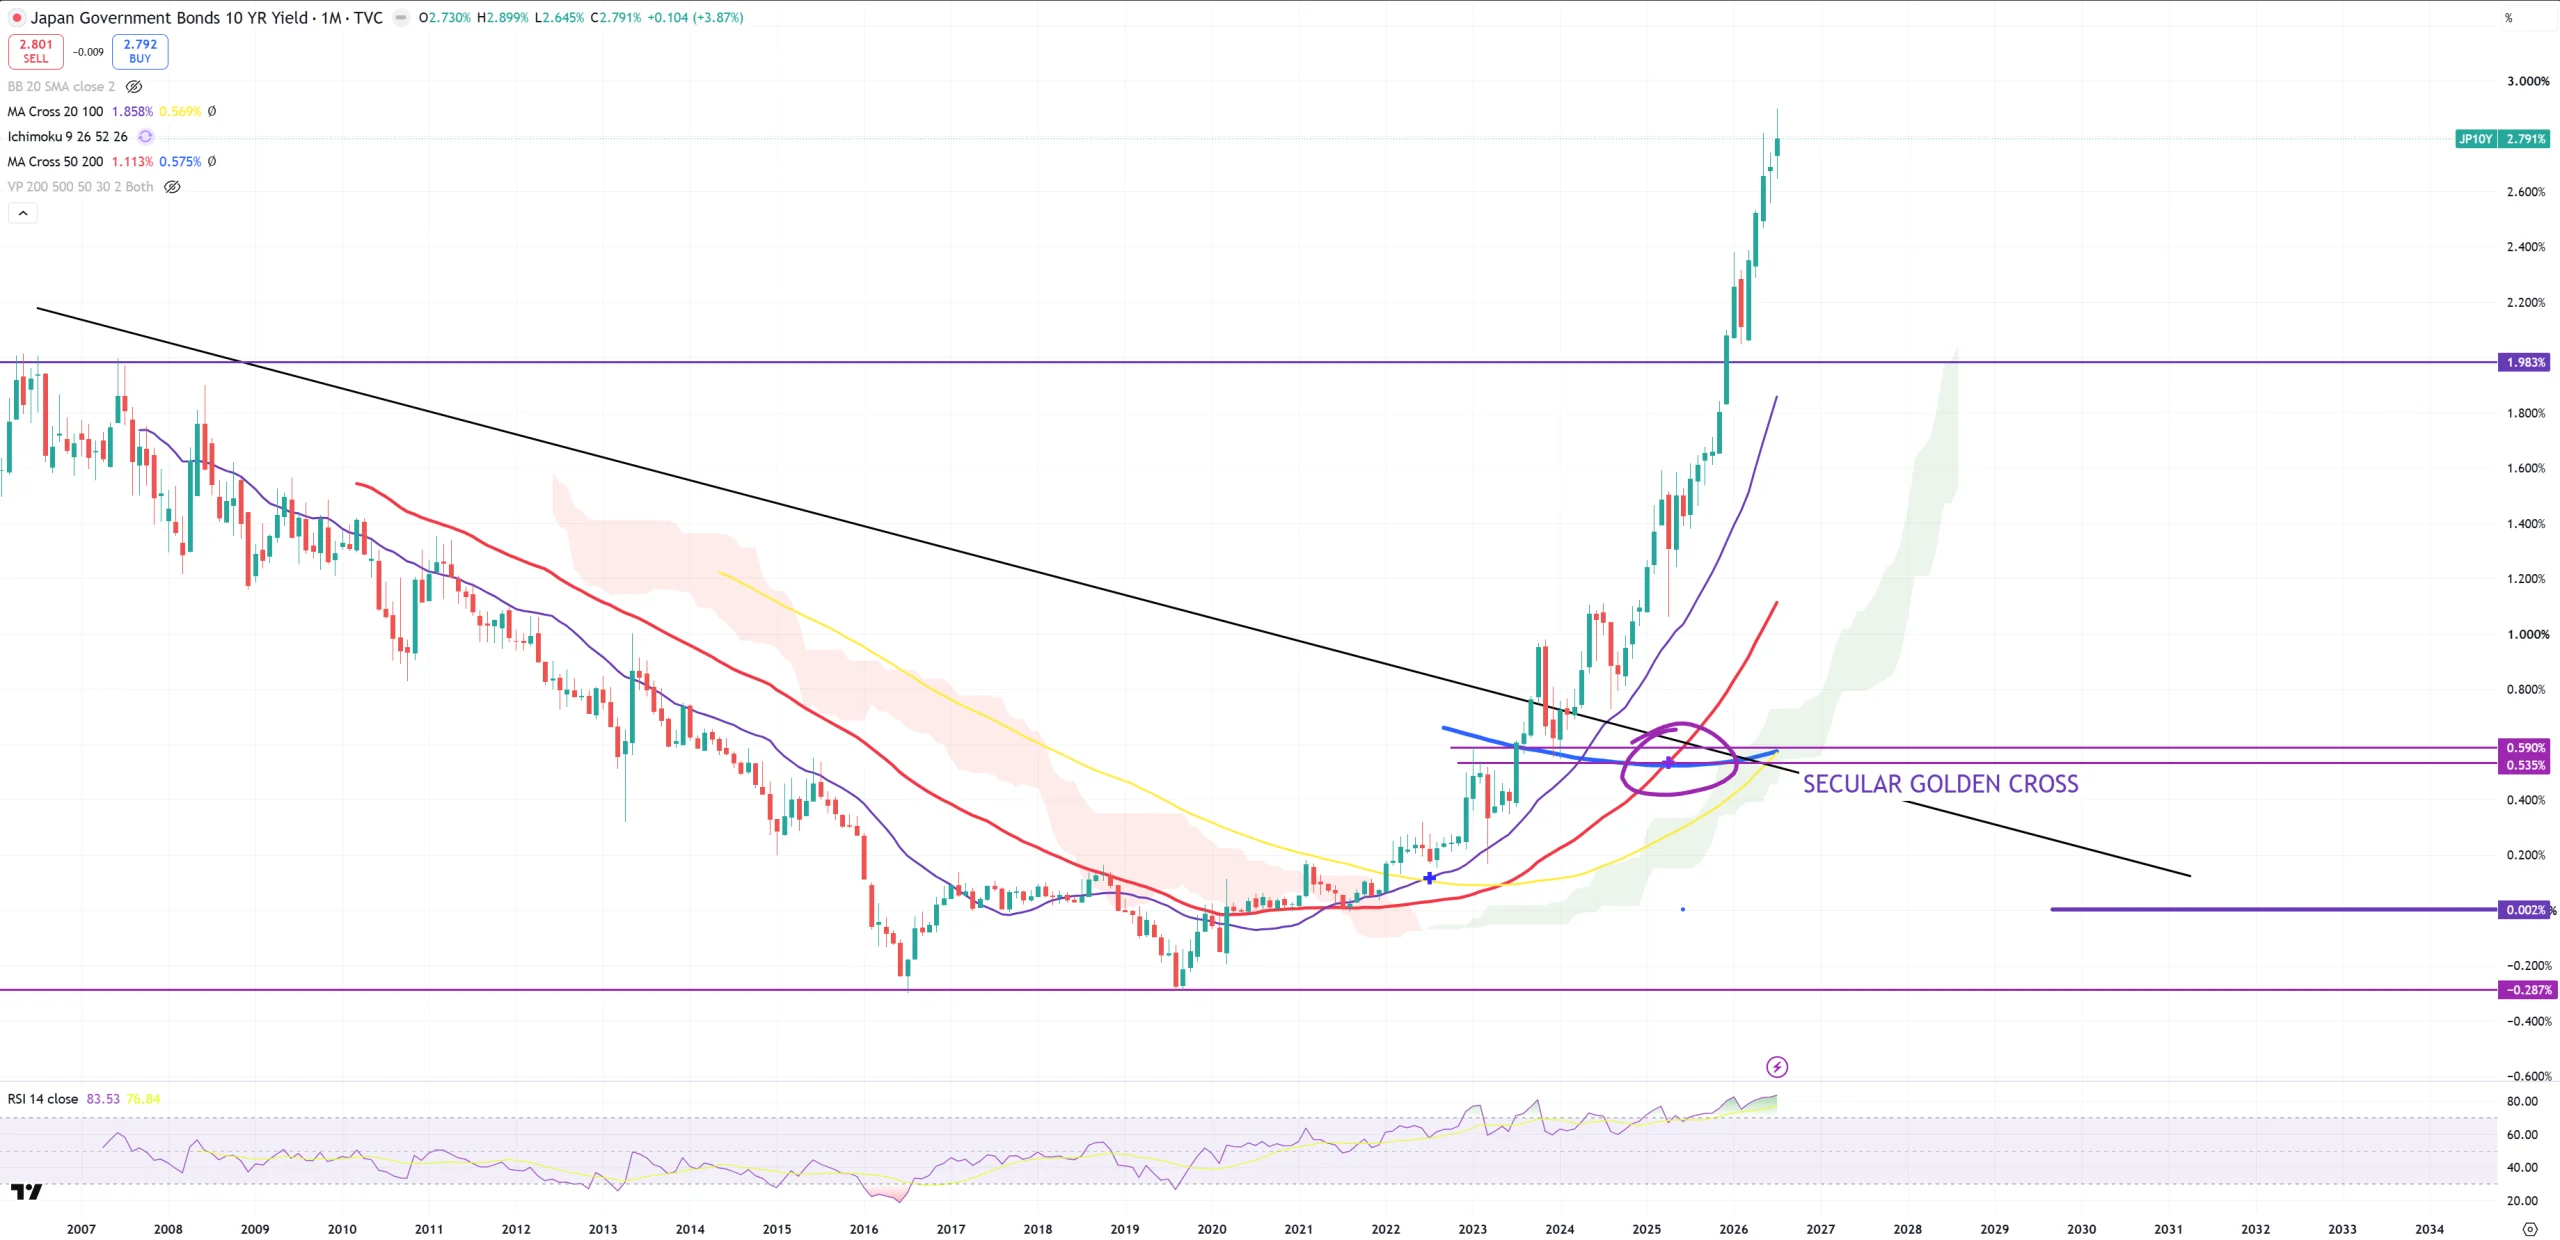
JP10Y – RIP
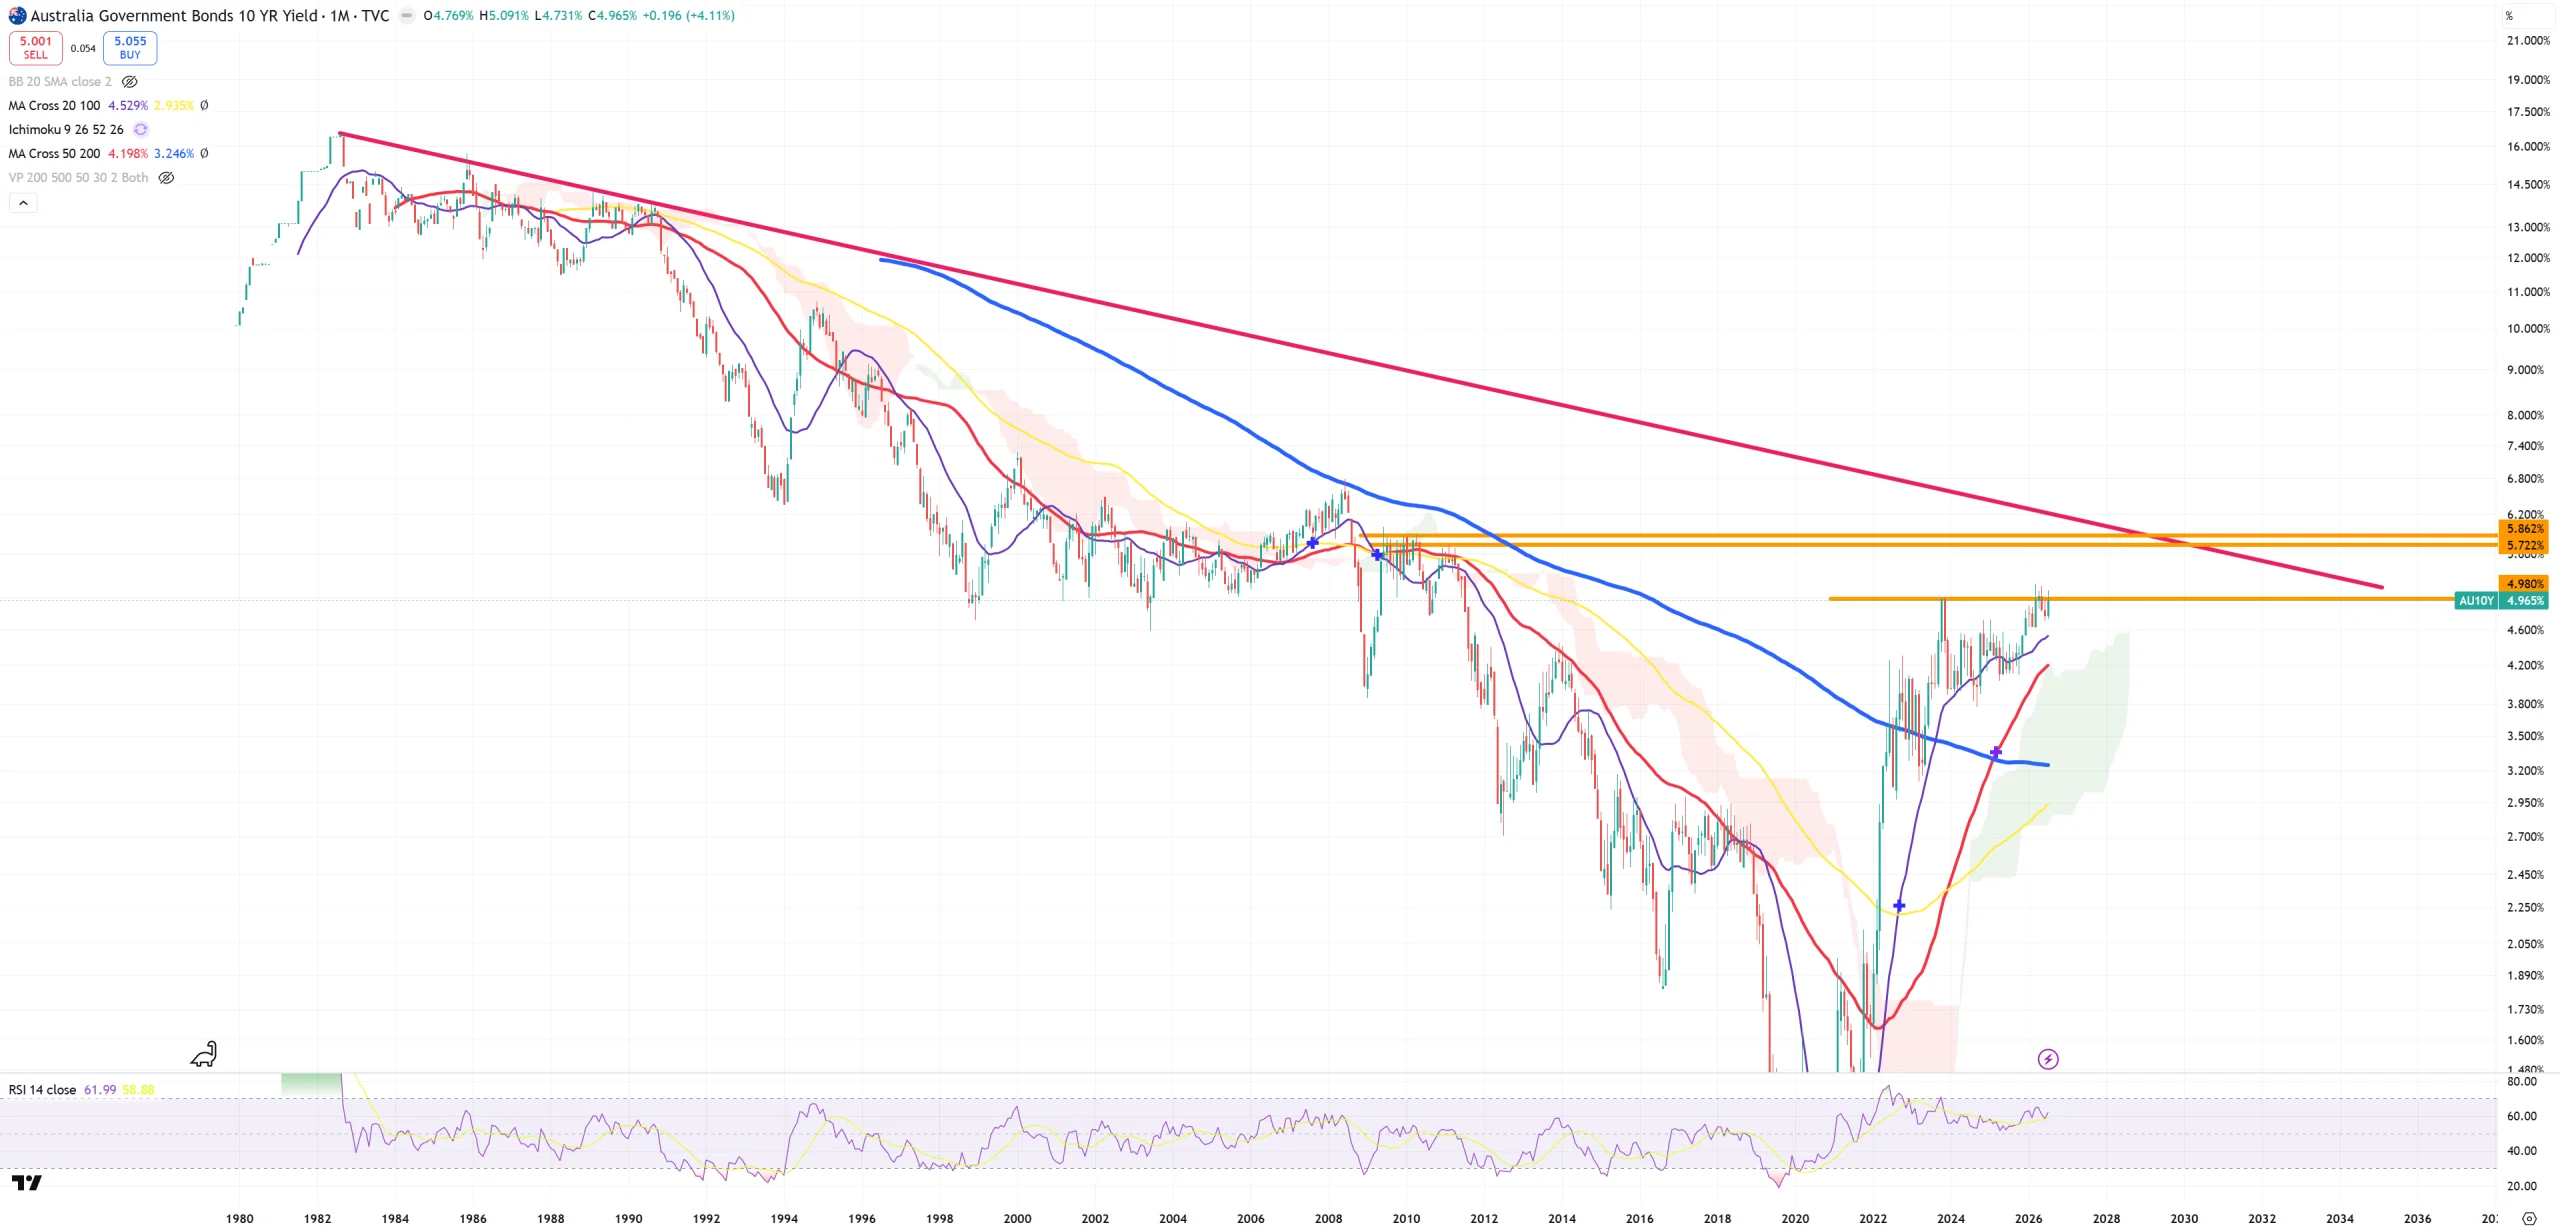
AU10Y – still fighting with its key almost 5% resistance
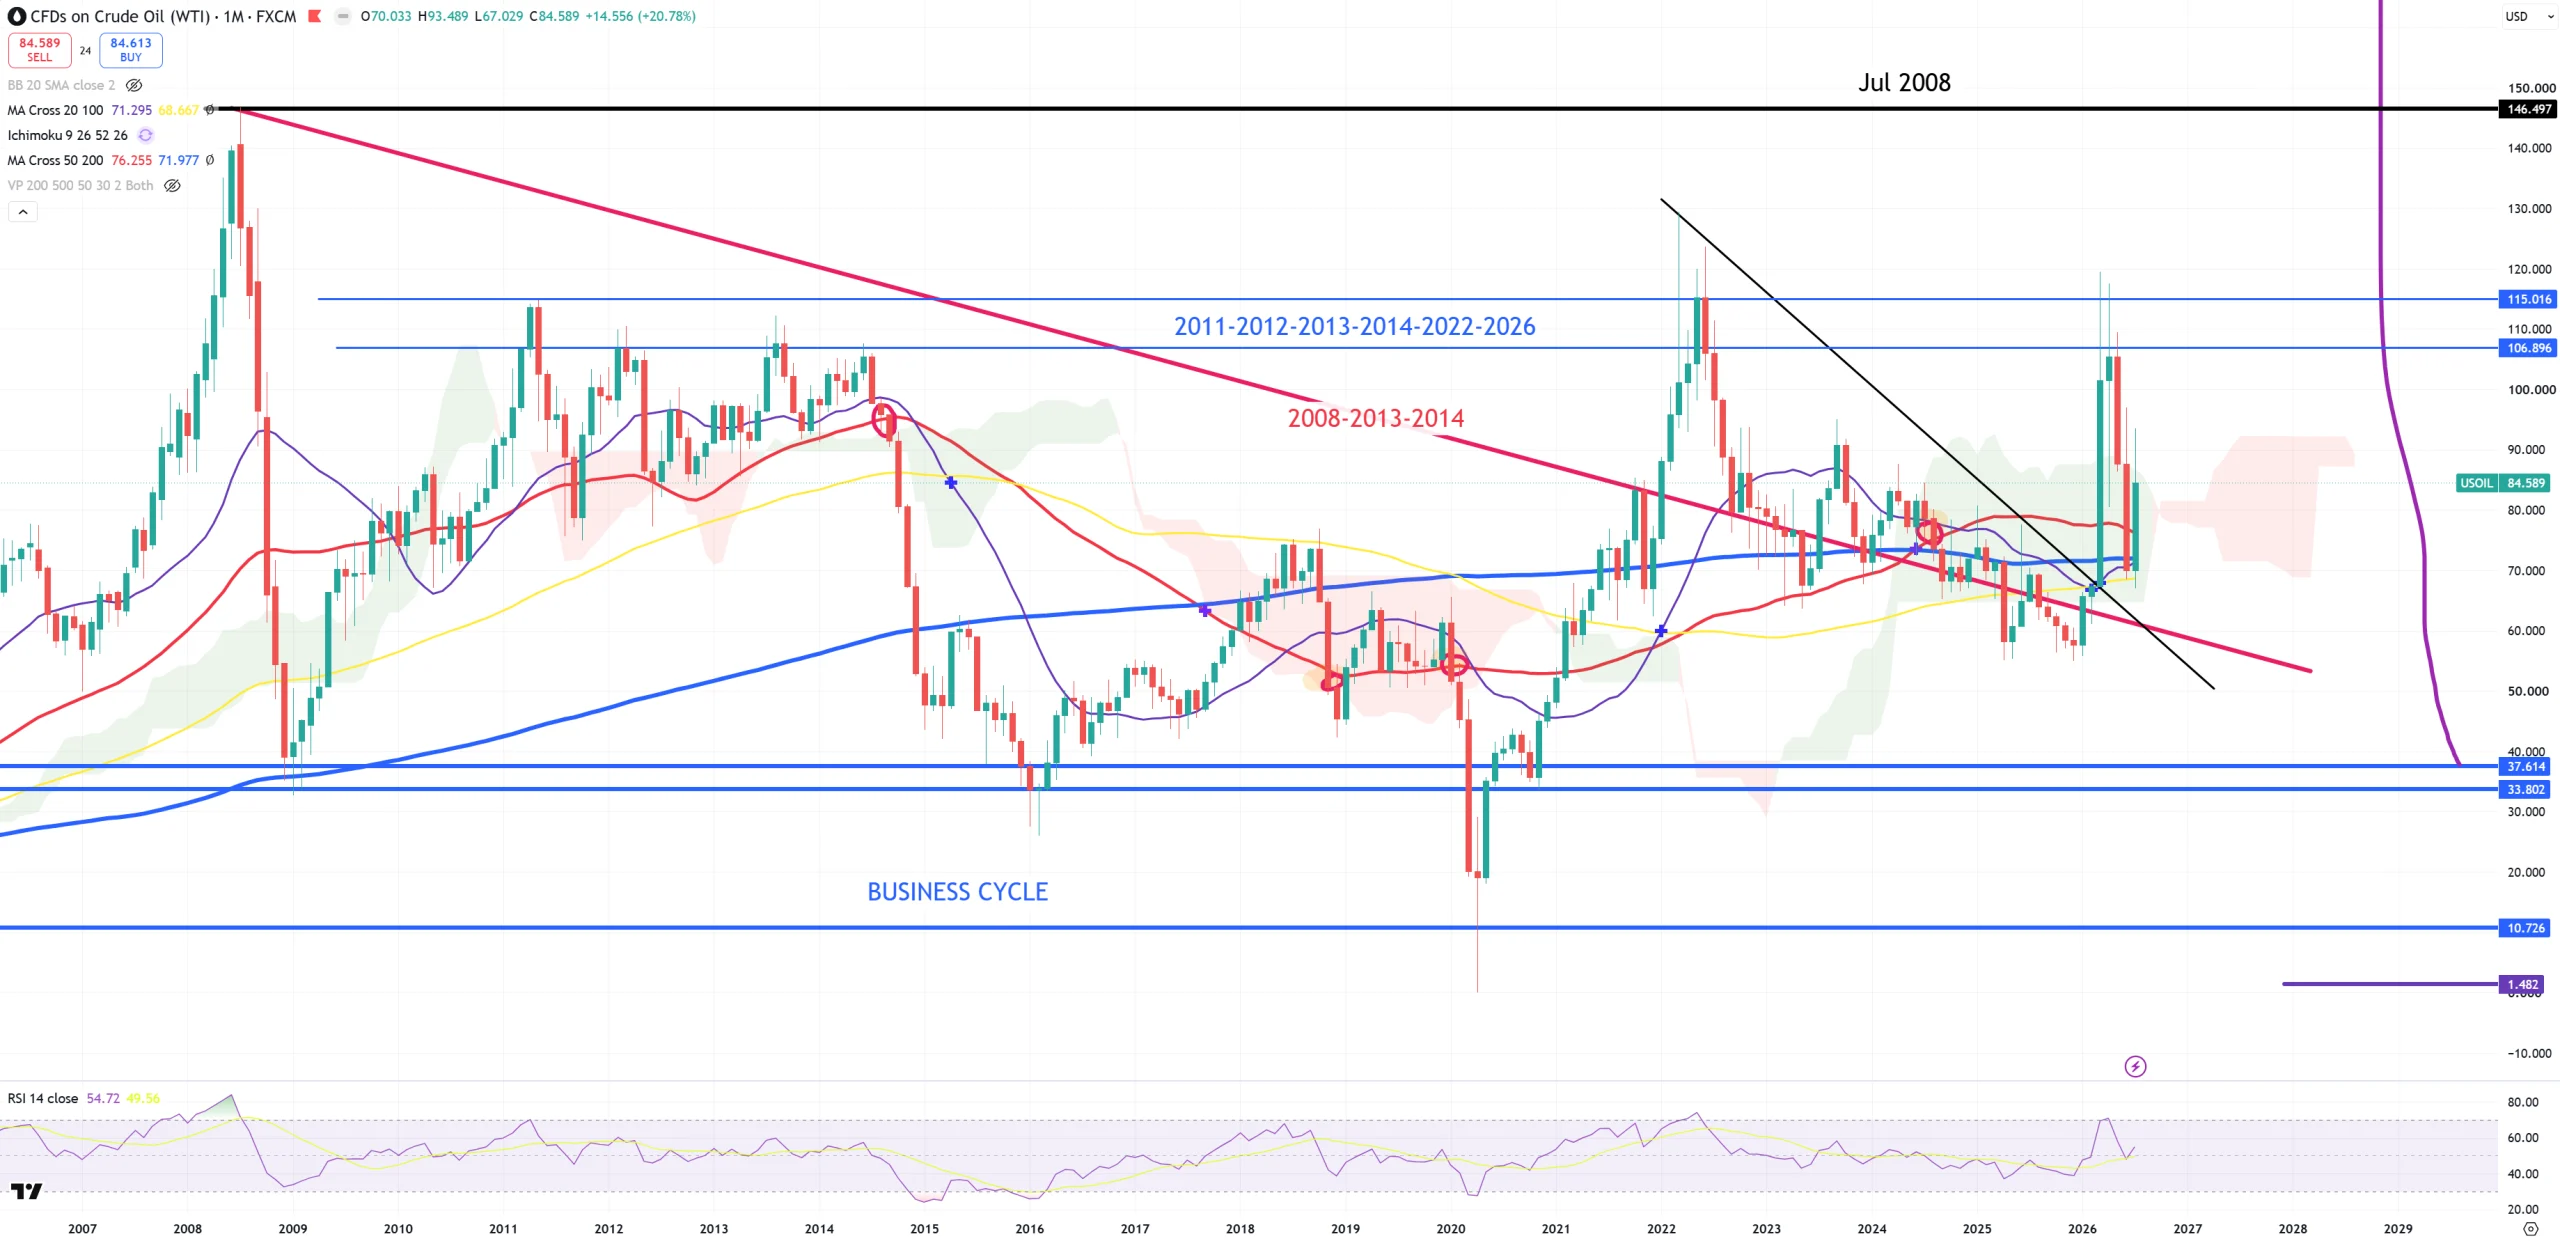
OIL – very brutal moves. First hit to key resistance and failed as expected. Here comes another attempt. Breaking 115-120$ level will get us to July 2008 147$ level. You can see how oil bounced on multiple (M)MAs. Being over (M)MA50 is bull market with another attempt to jump towards 115-120$ level.
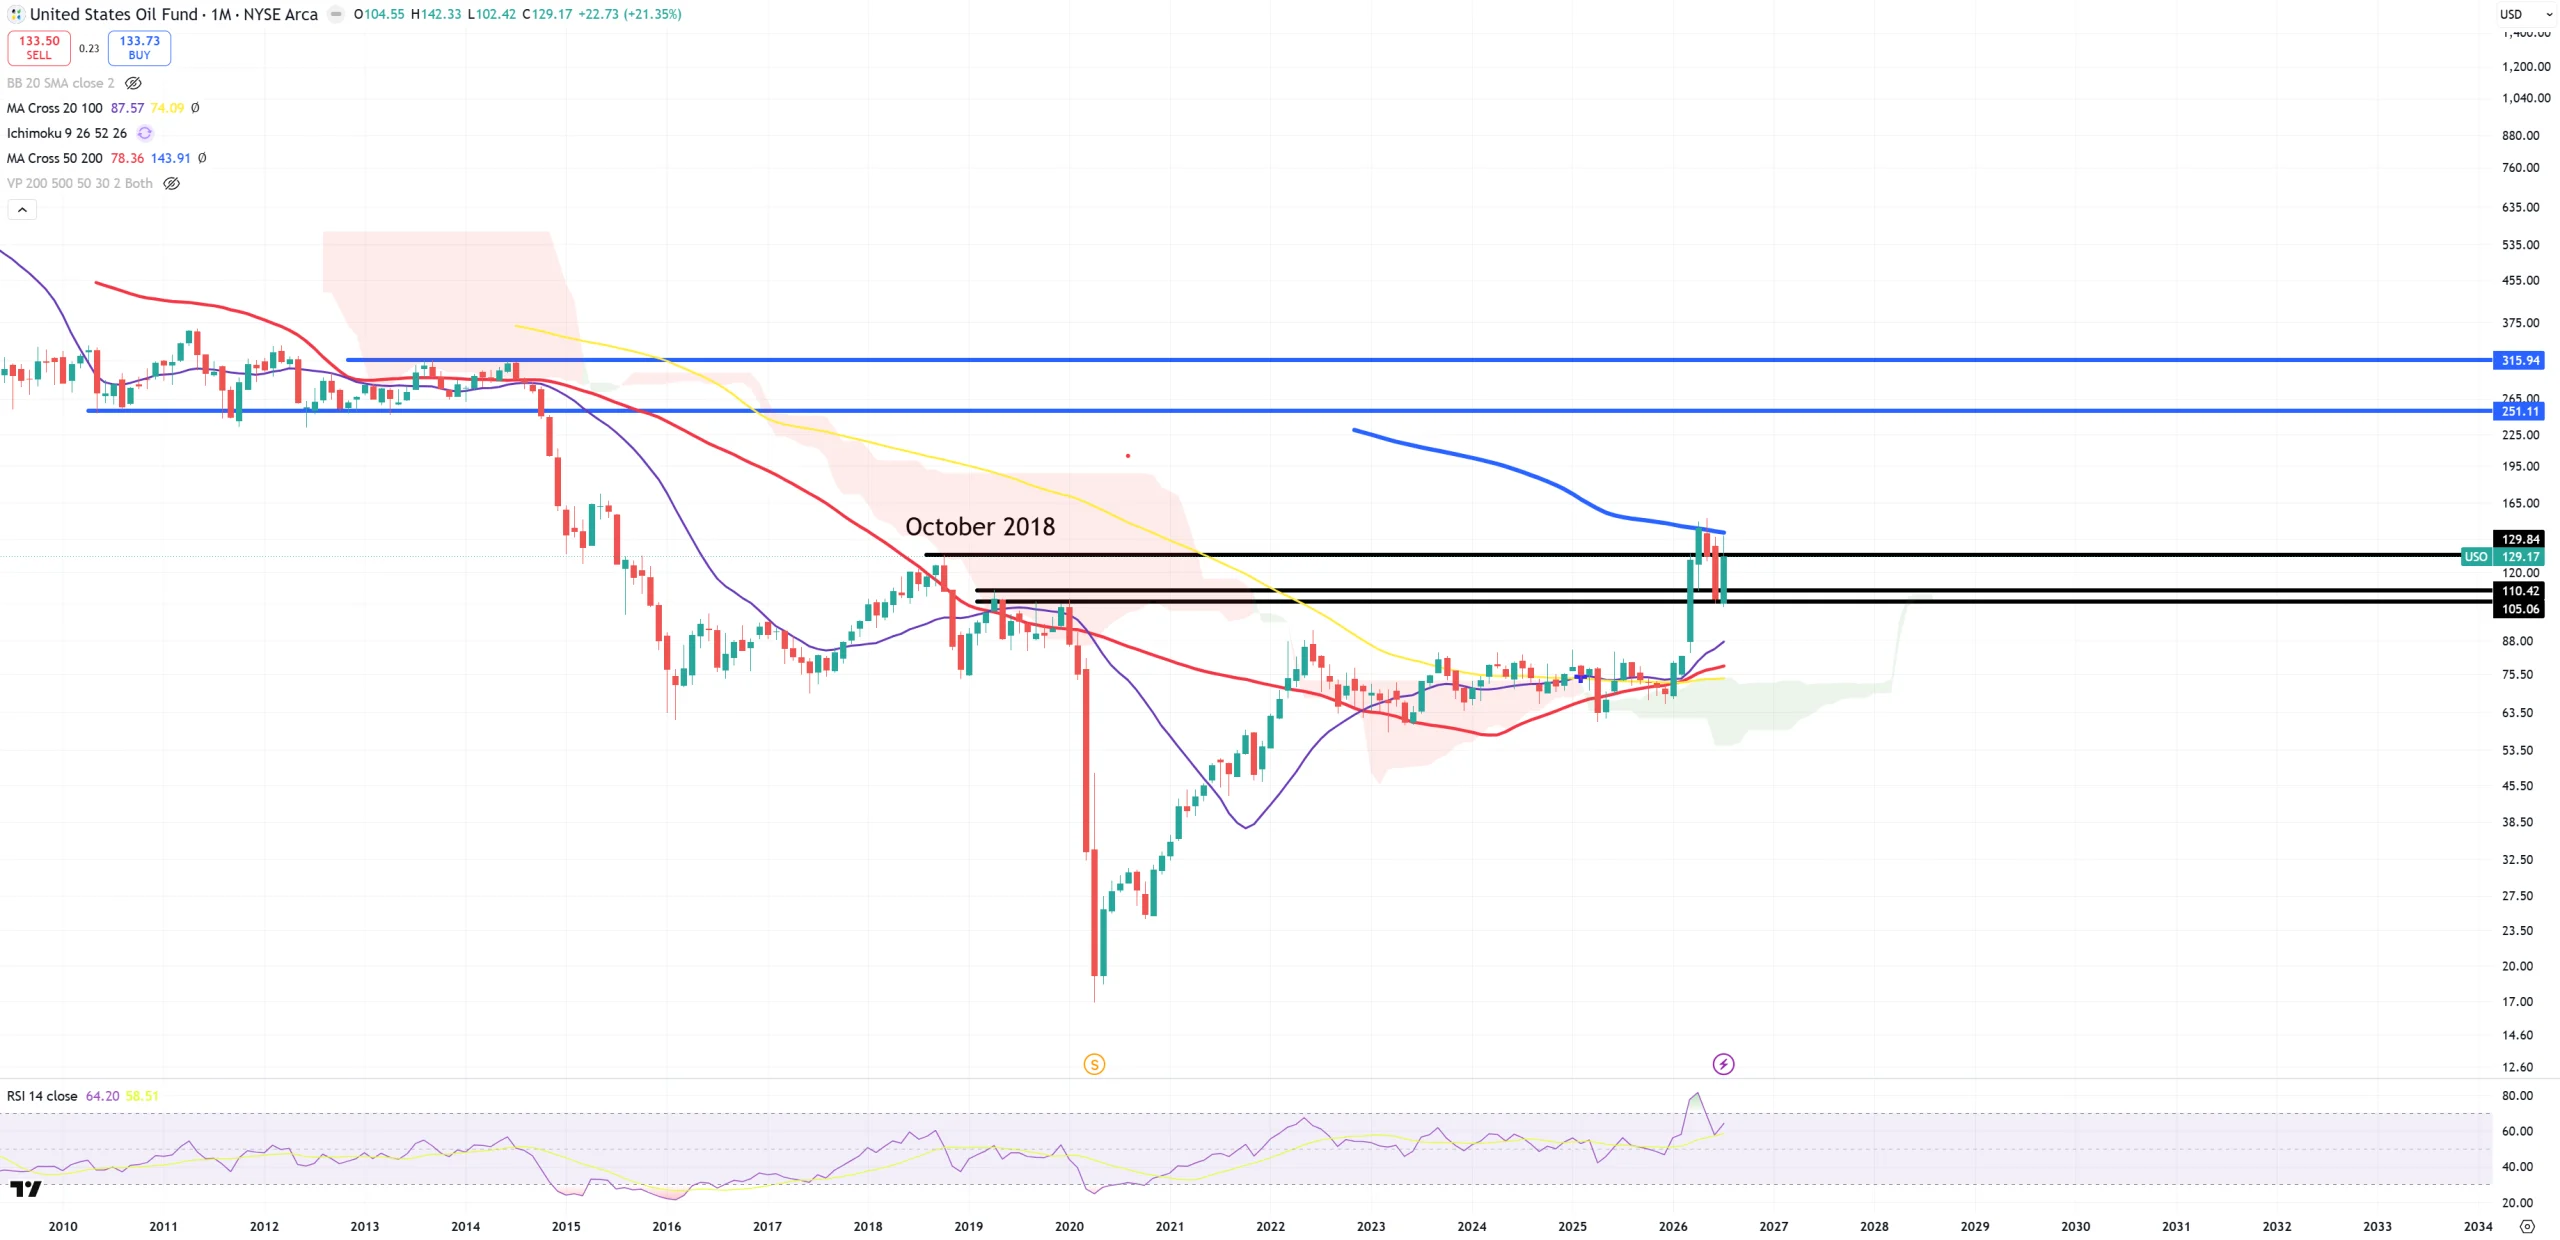
USO – this is way better picture how OIL got stuck between 2 key levels
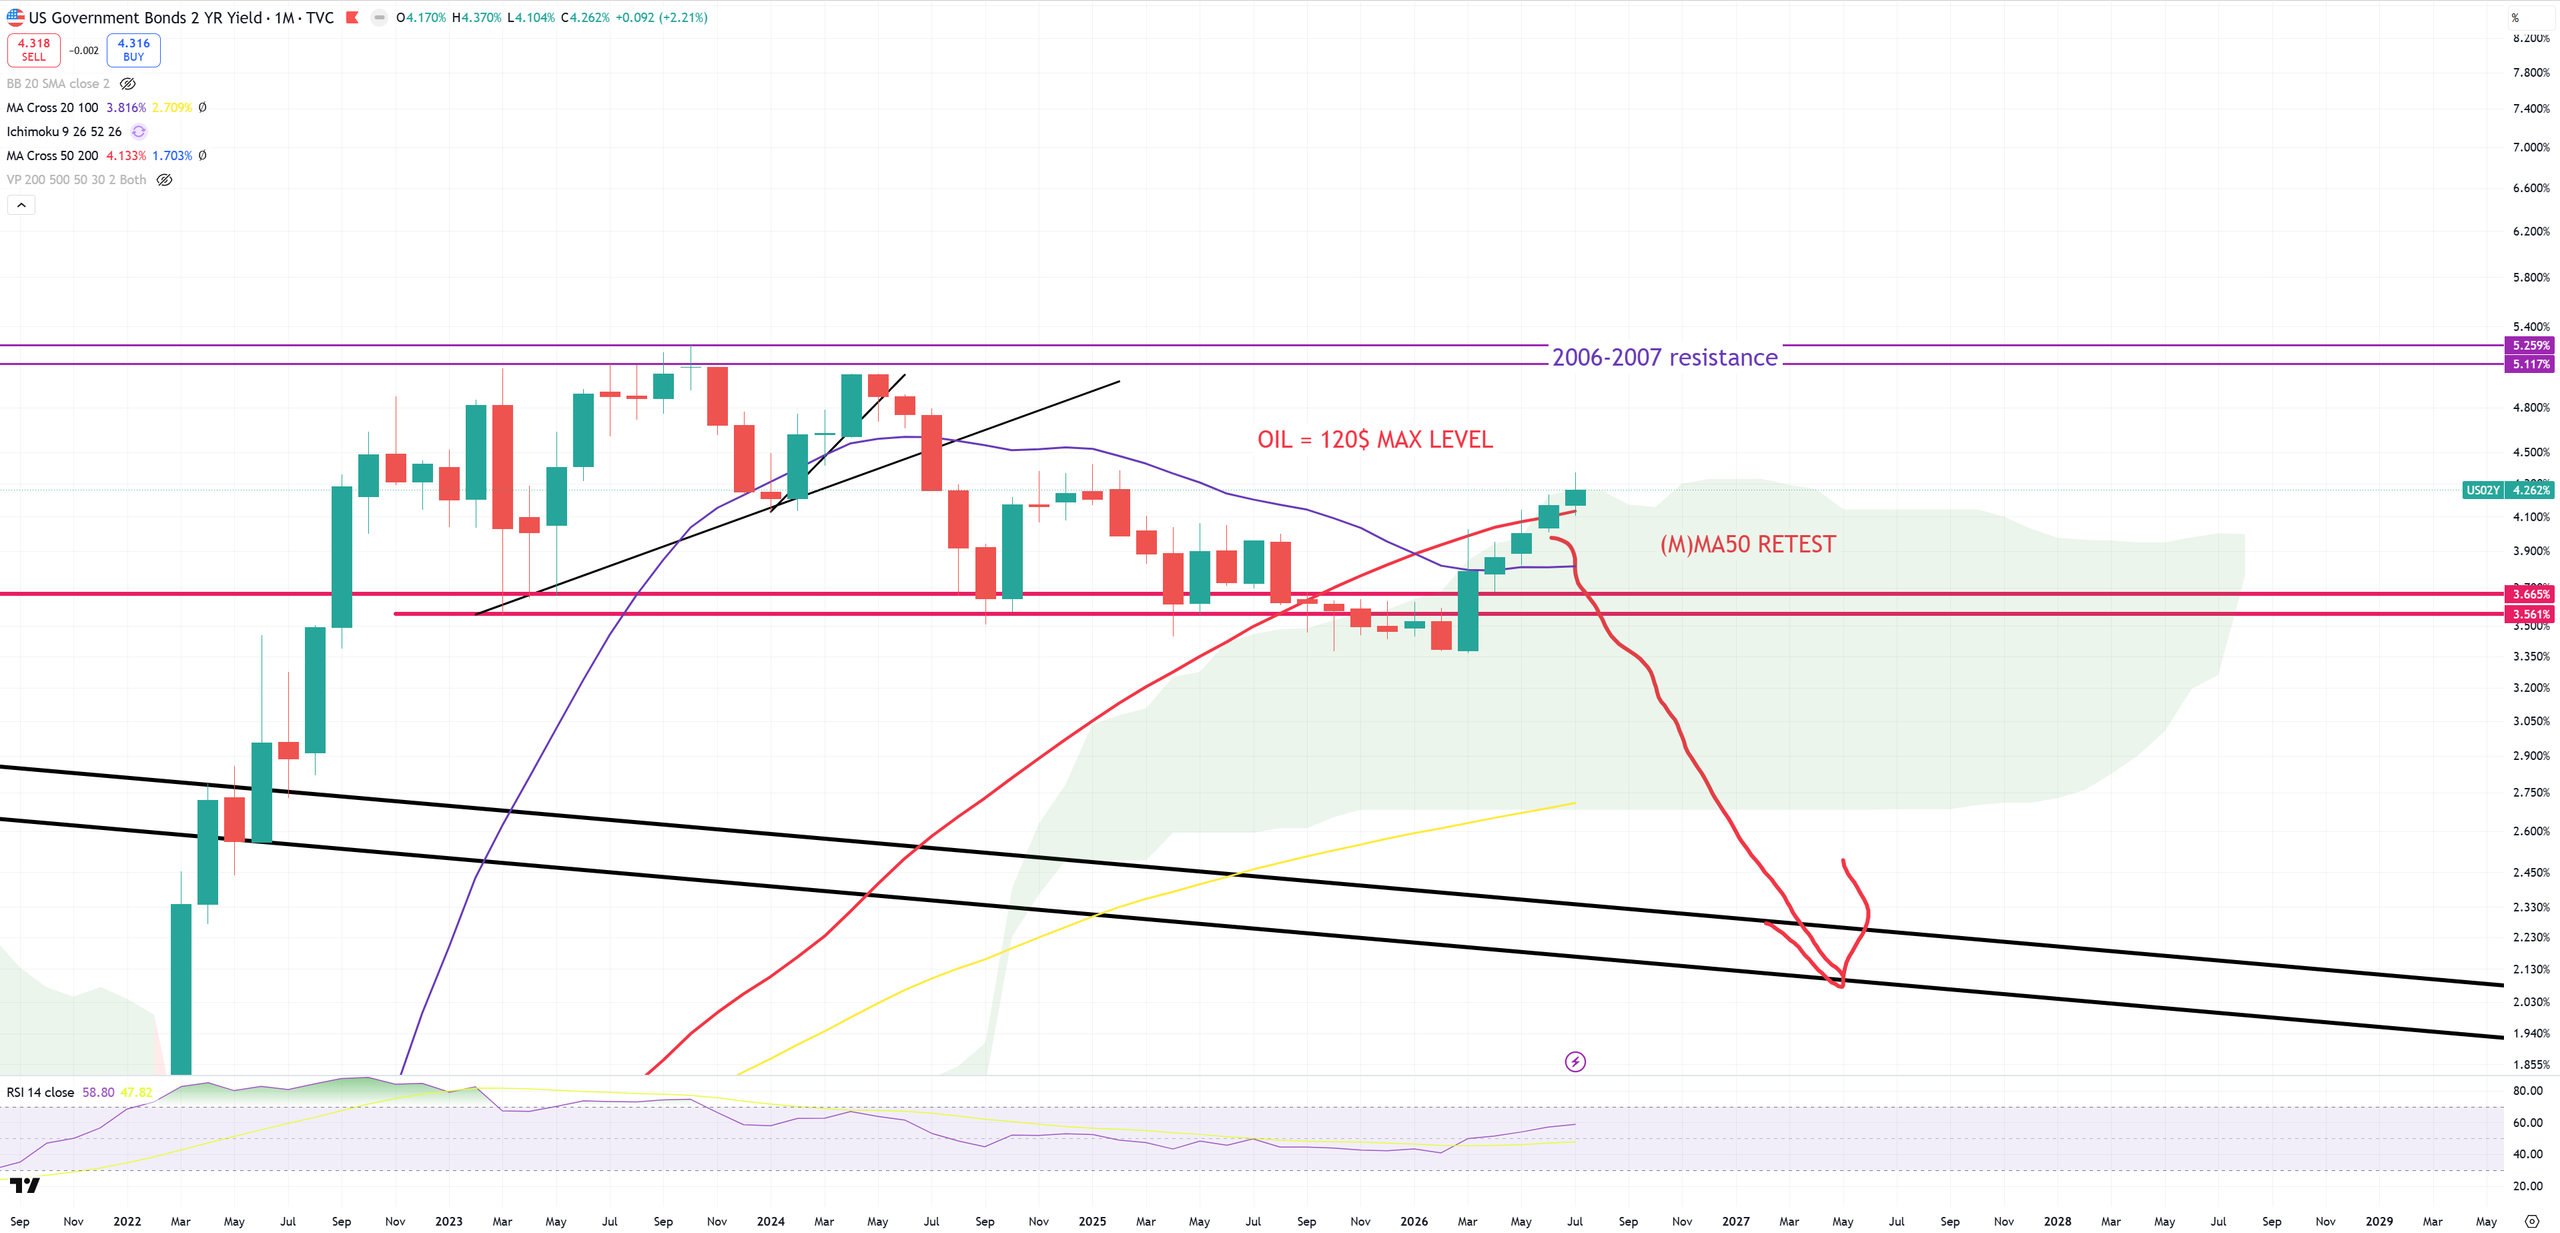
US02Y – and on 2Ys we see this (M)MA50 break! This 4.26$ level is the top of the green cloud. Once it’ll be a permanent break we’ll jump again to key 2006-2007 resistance, and I bet oil will jump to 150$ unless this move above (M)MA50 was a false move.
DJI/GOLD – keeps retesting the main break of 1980-2011 TREND. This chart is too long, so I need to compress it on 3M view.
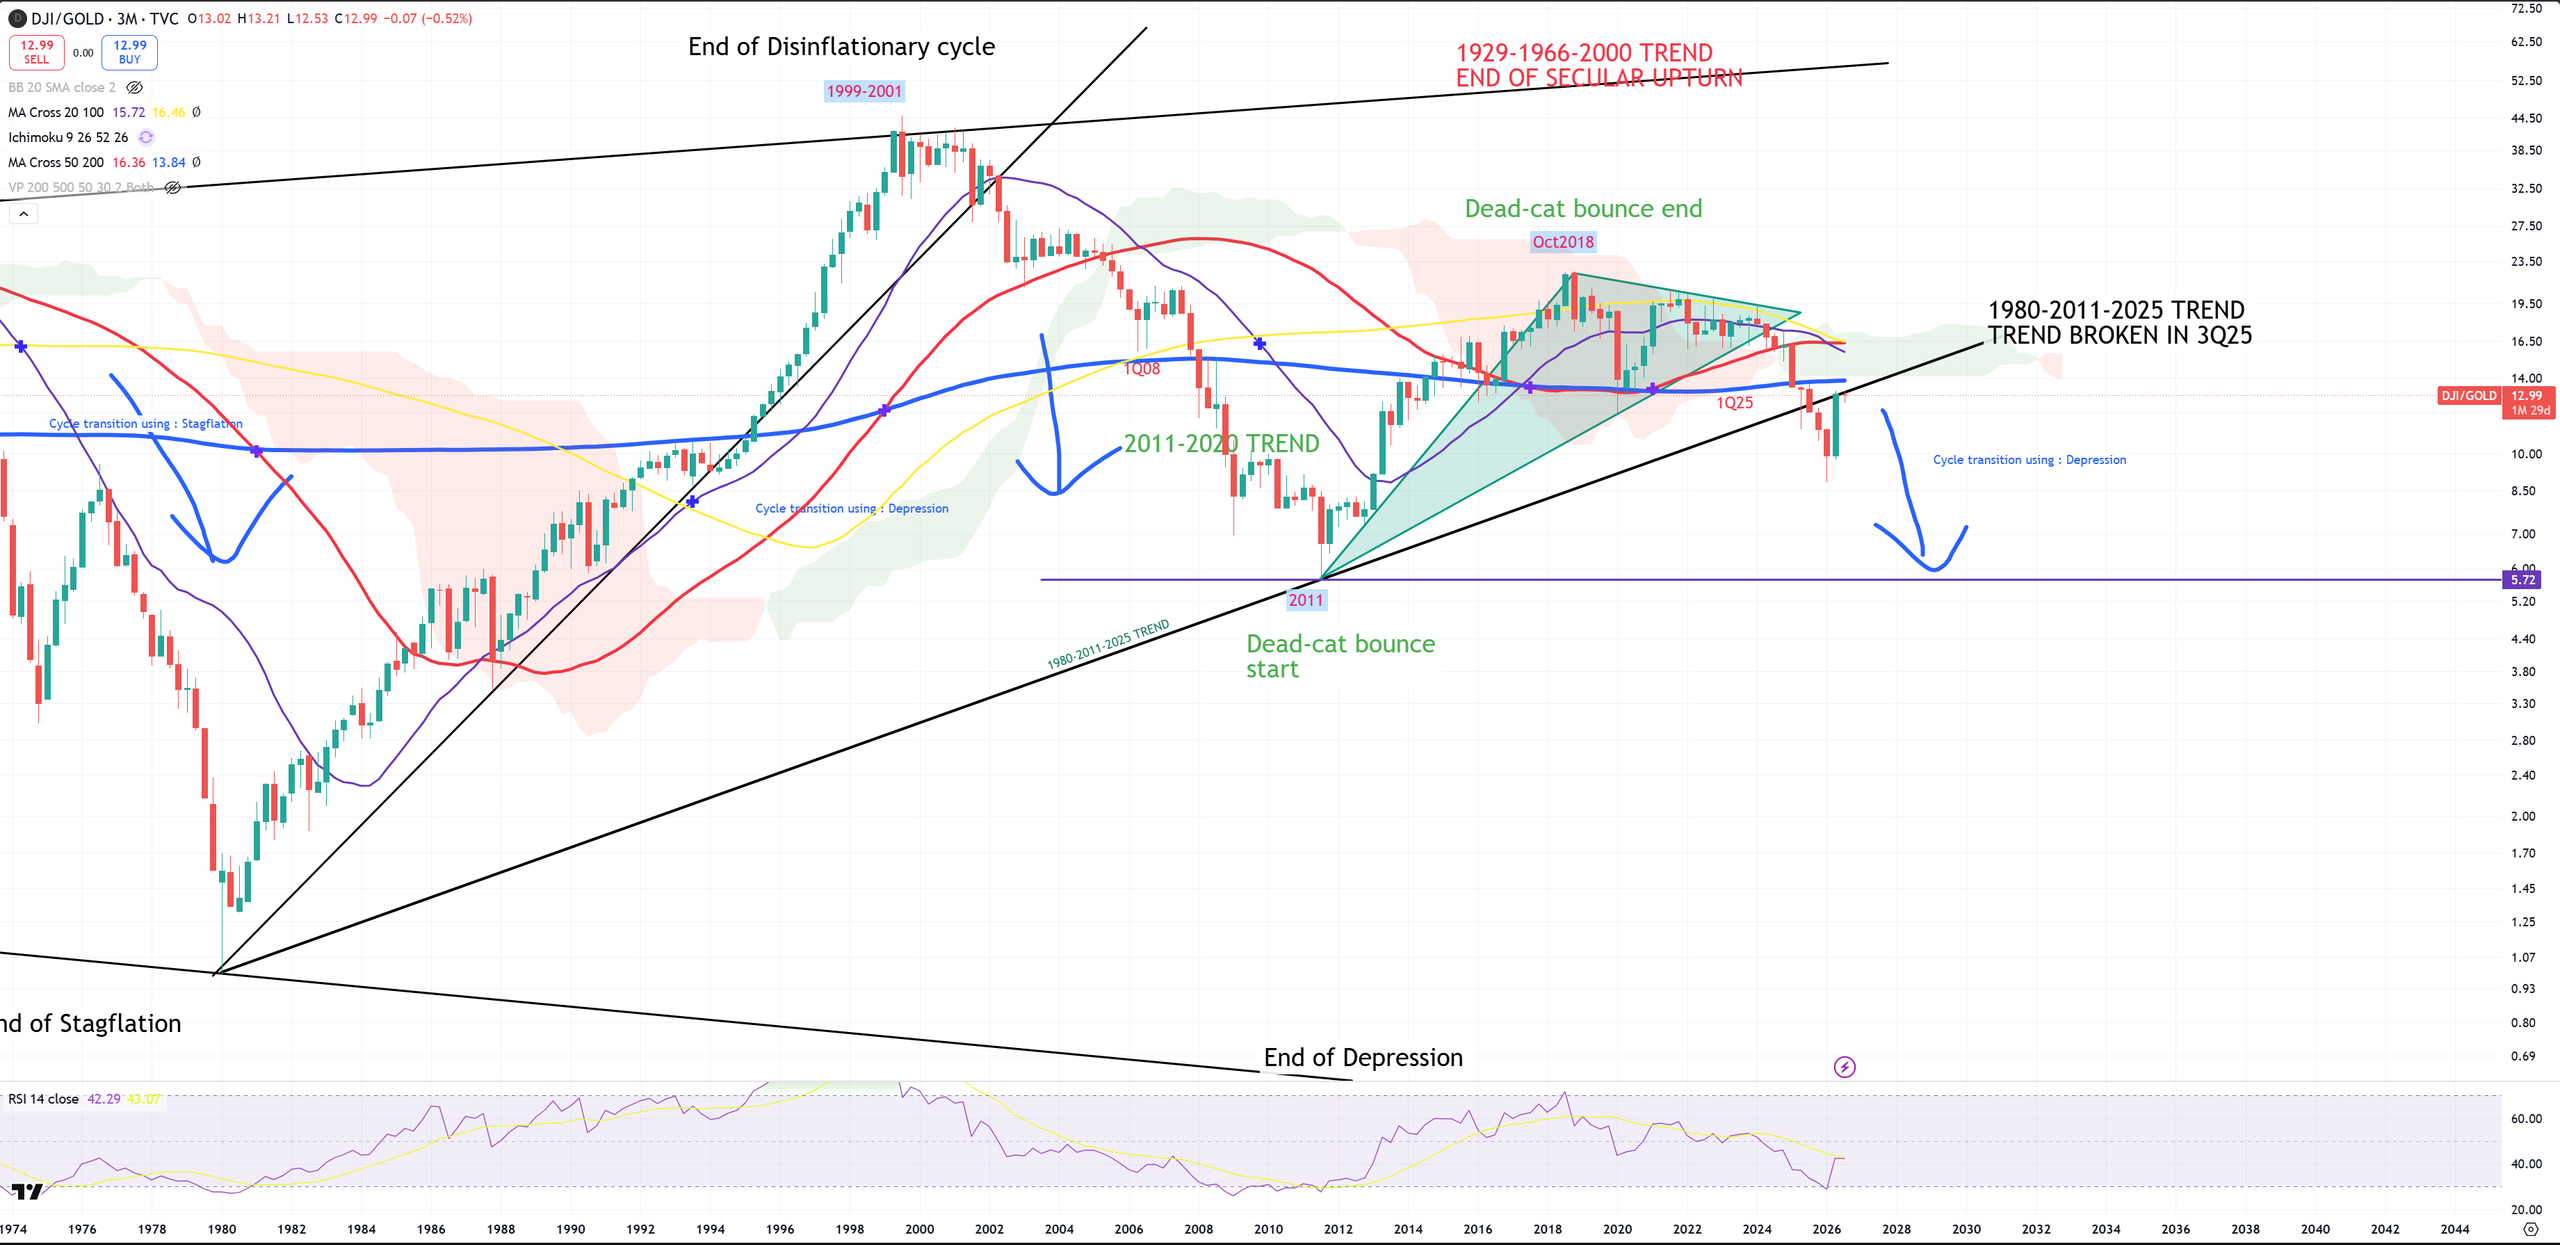
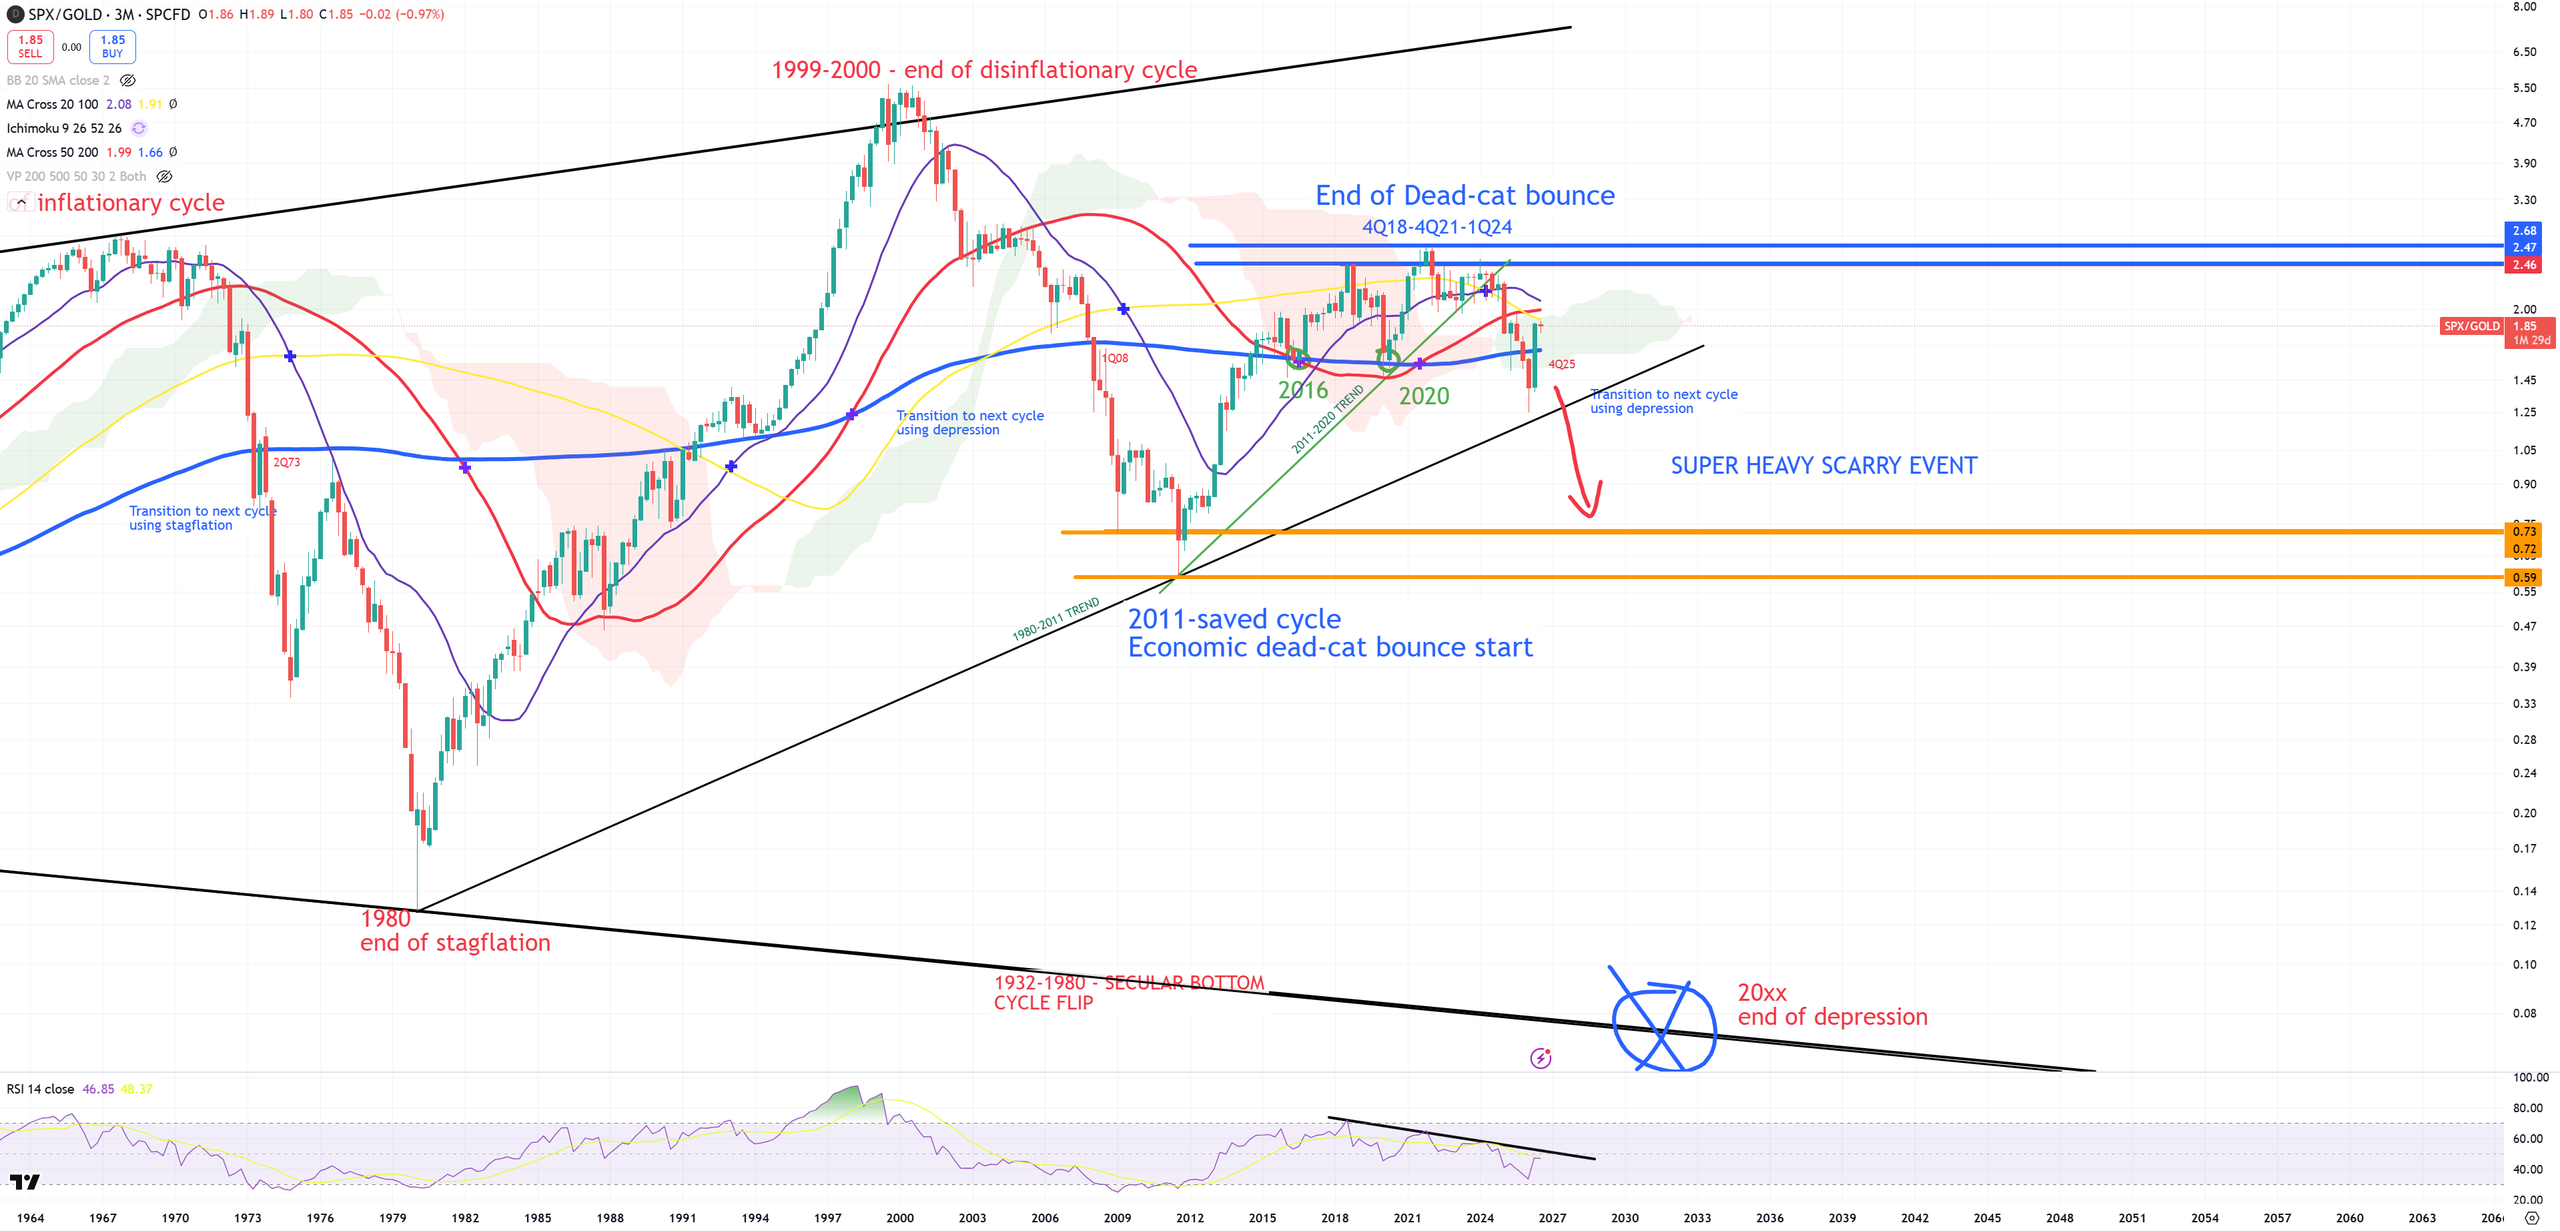
SPX/GOLD – it runs away from (3M)MA200 blue retest for the 5th time in history, but still two months left to close 3M candles. DJI/GOLD does not confirm this break so far.
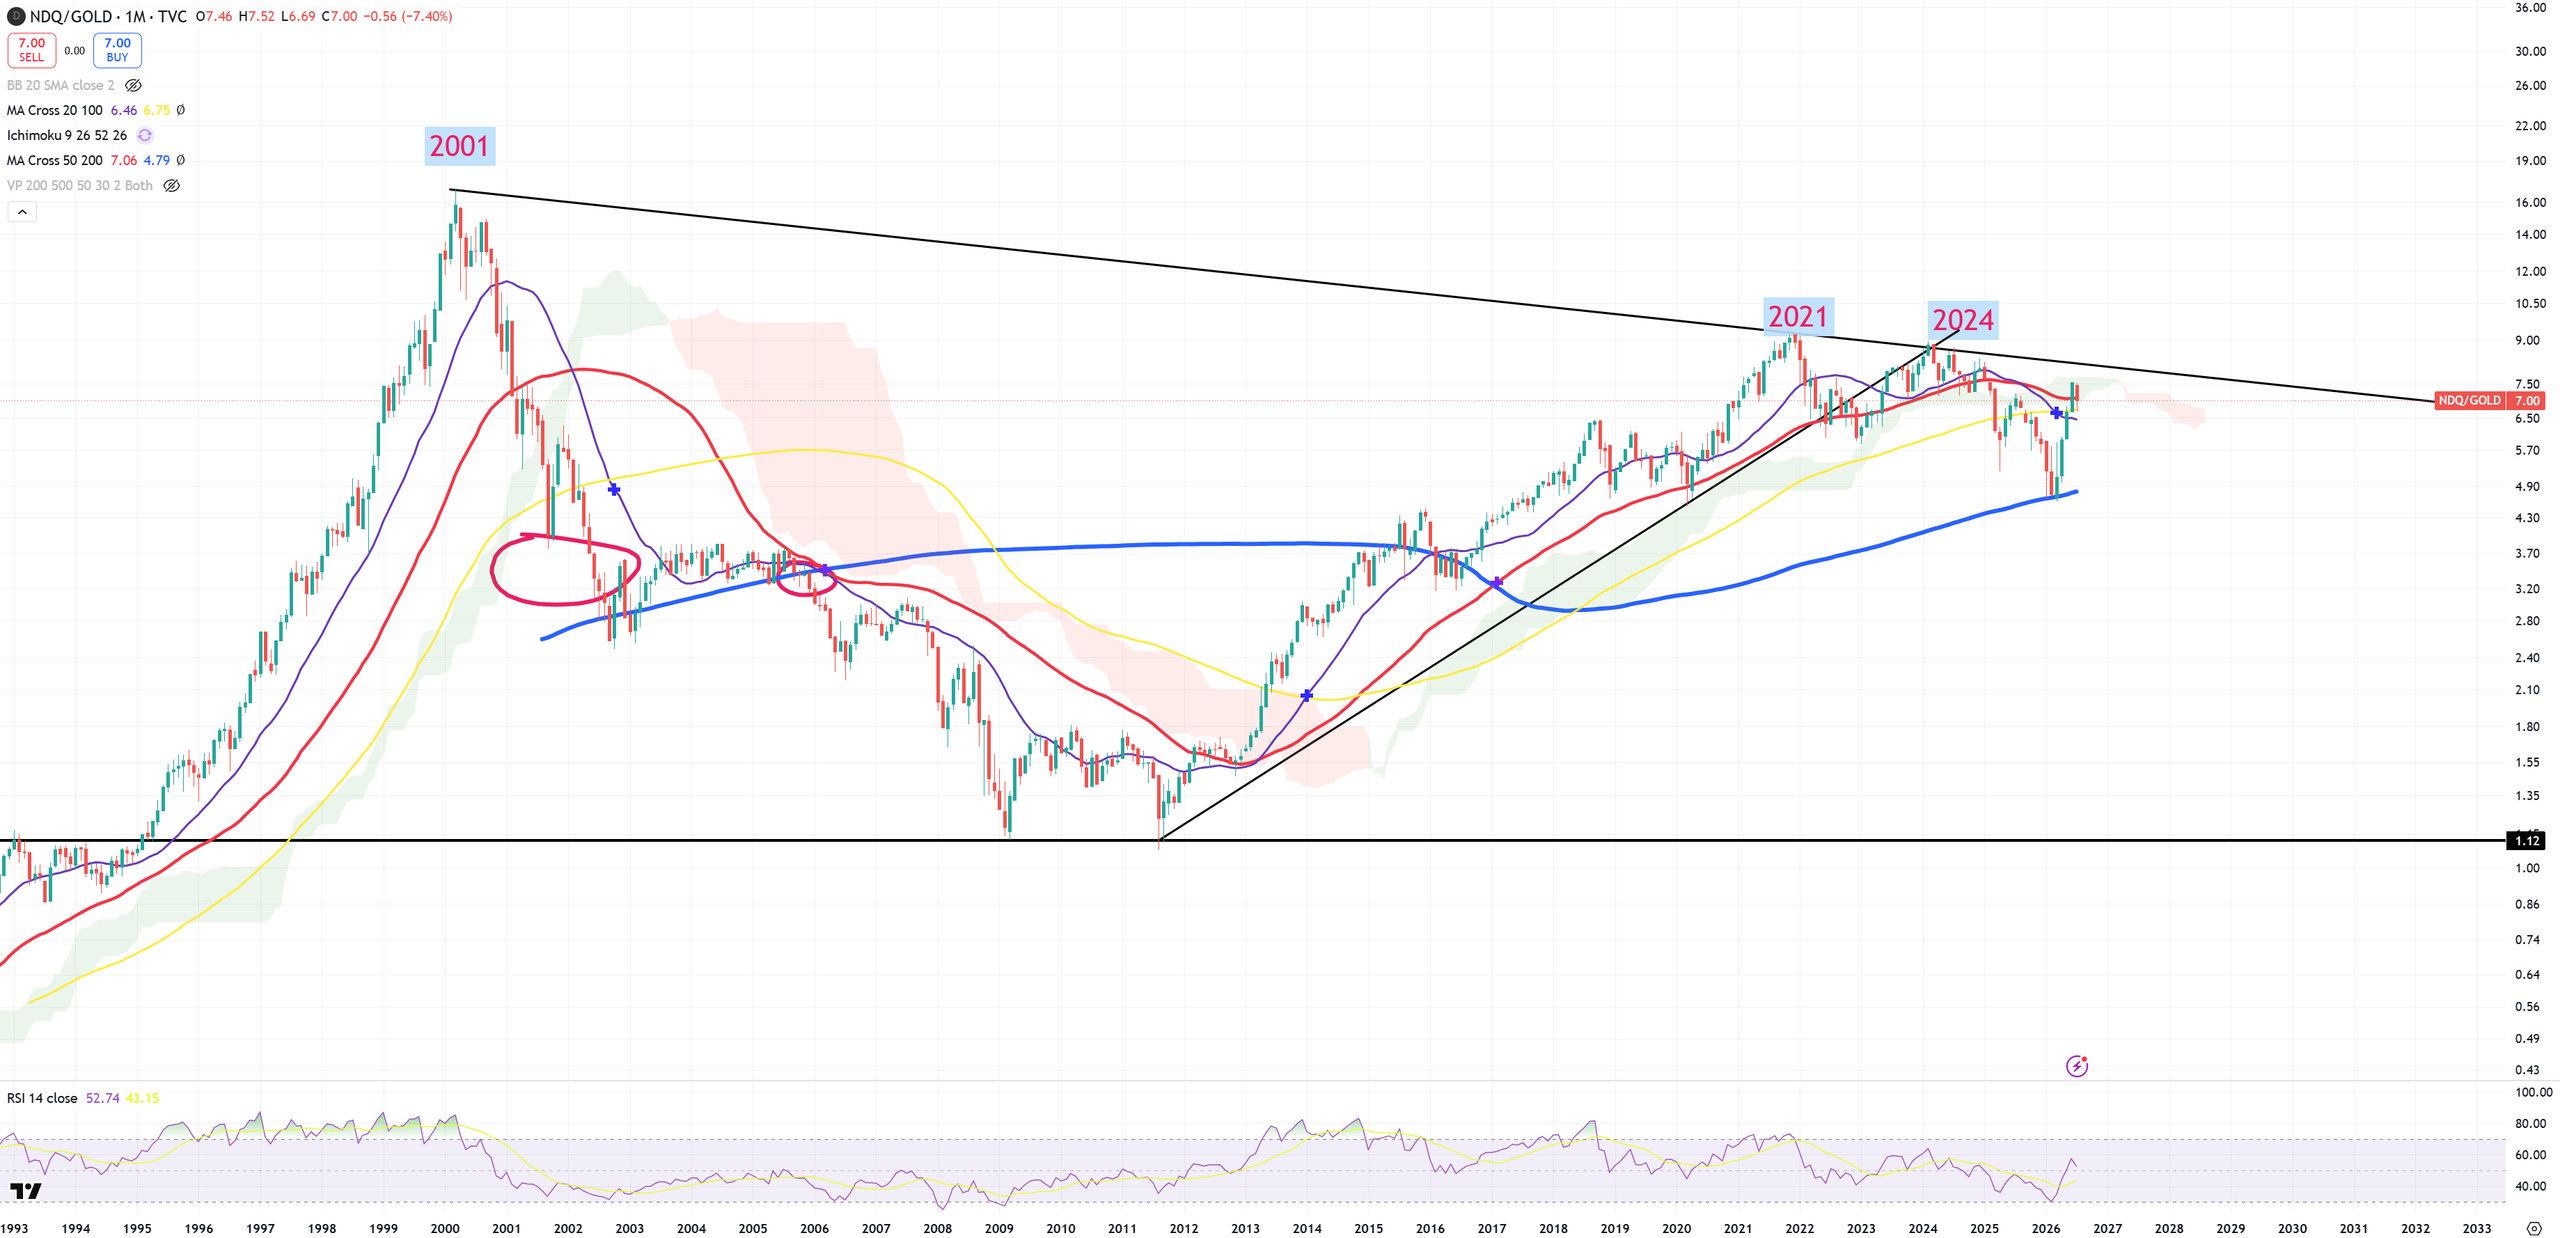
NDQ/GOLD – first (M)MA200 hit always means bounce. Now towards (M)MA50 and let’s find out how this will play.
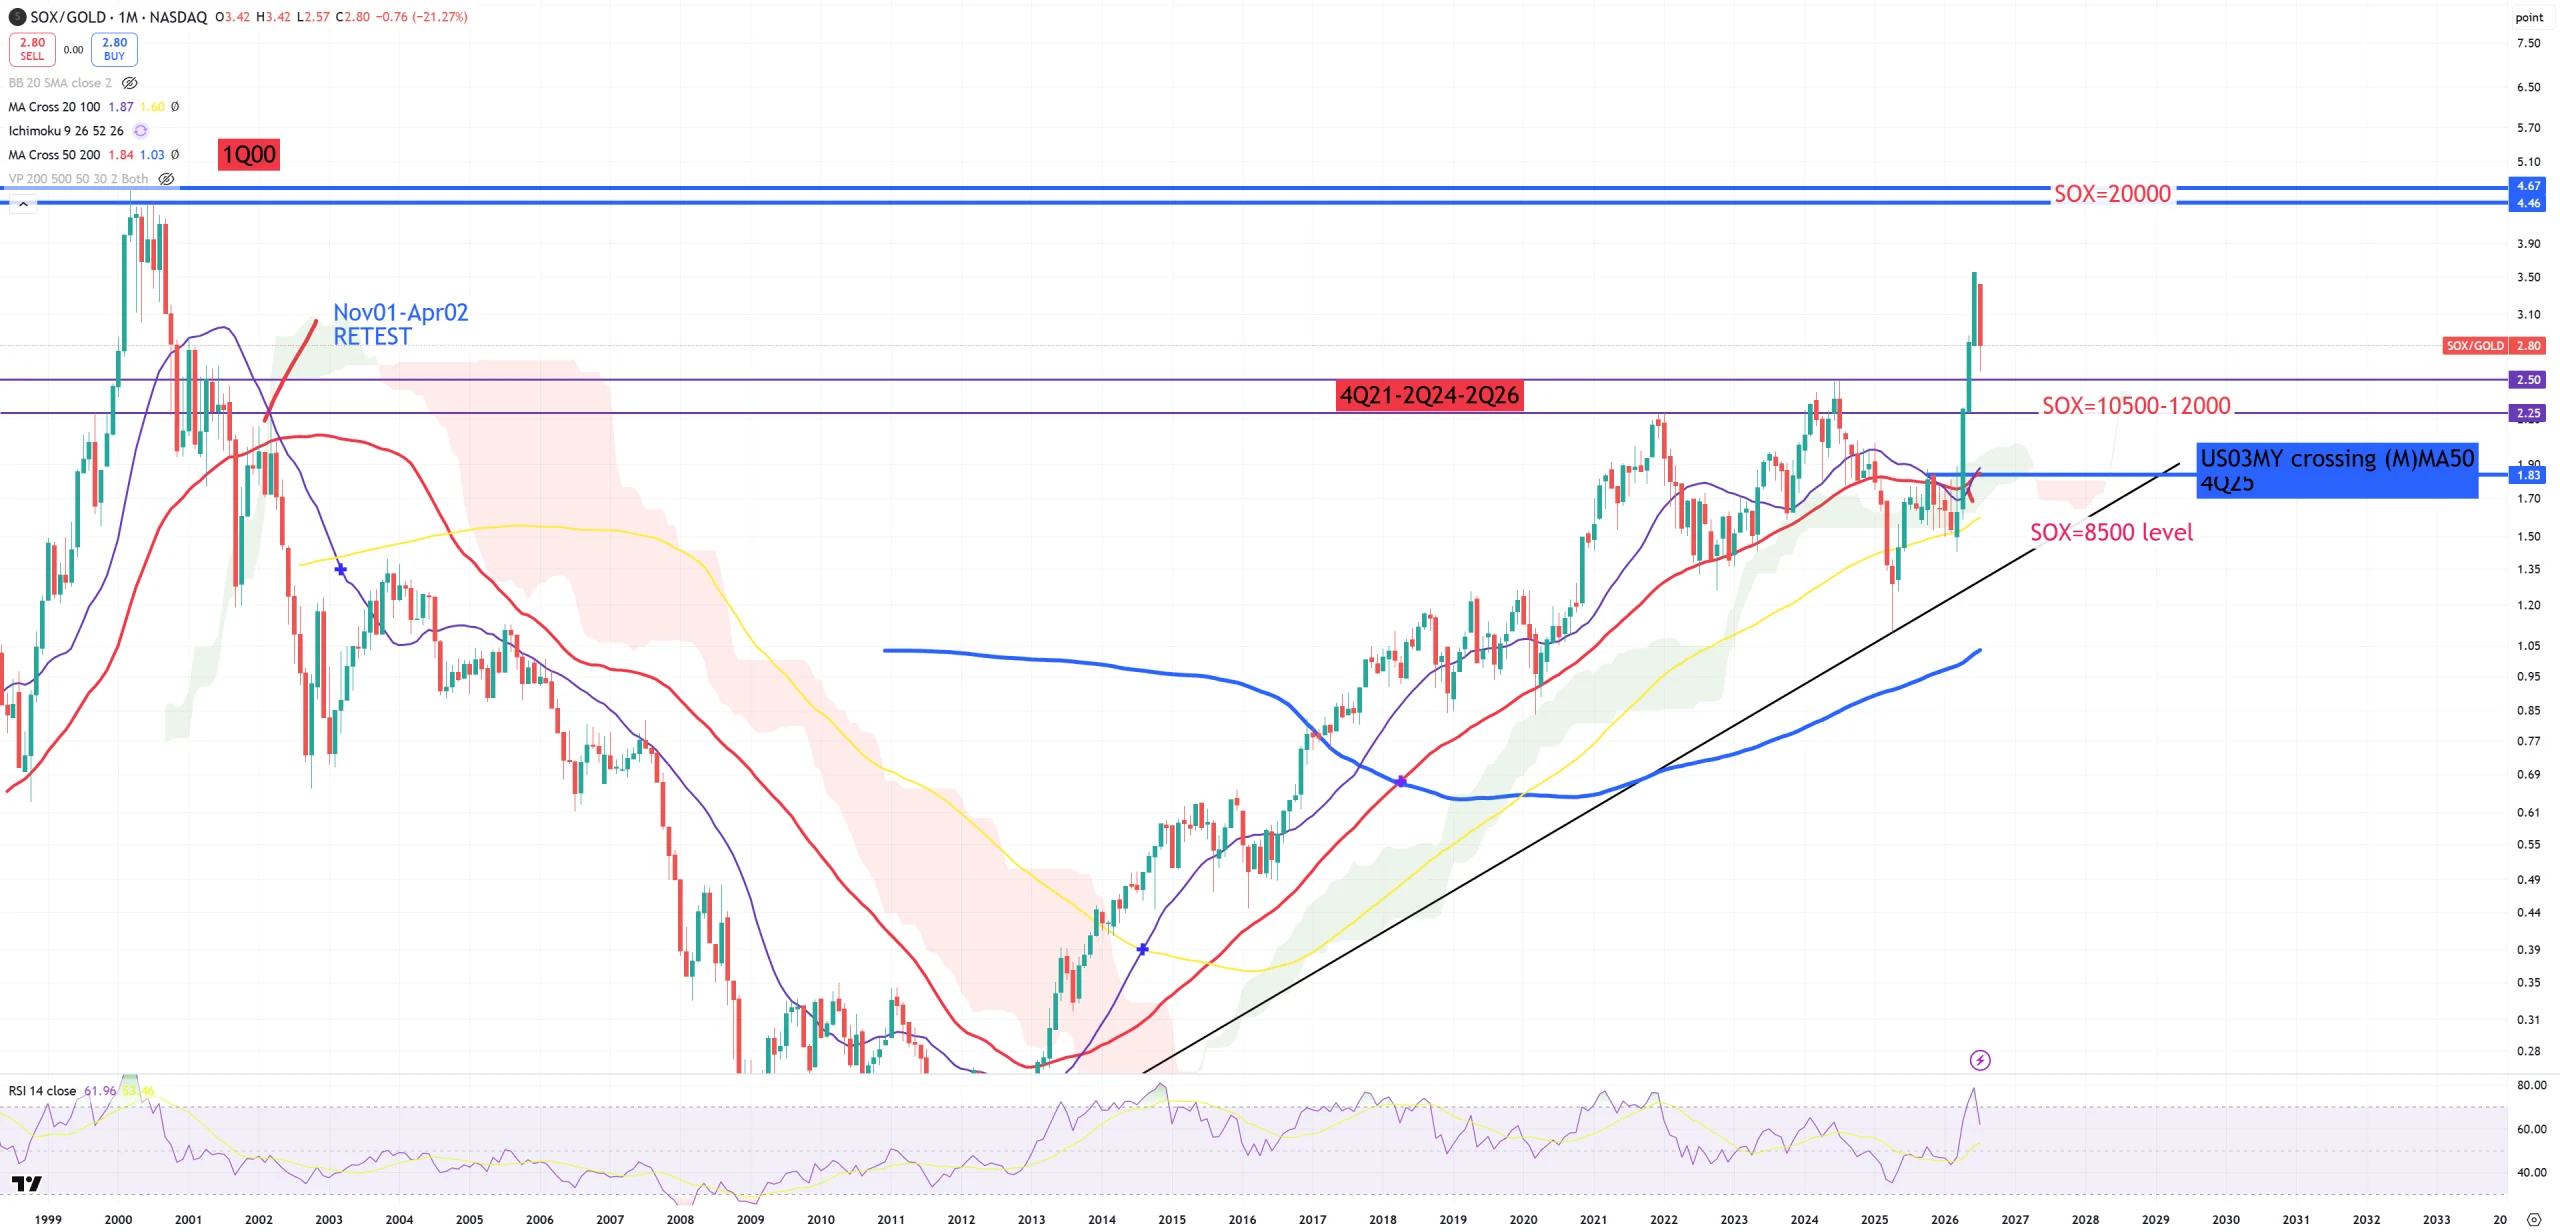
SOX/GOLD – hanging between key levels. Almost exactly in the middle. It reversed a bit and now stays on 11300 level. Those levels I put are “MORE OR LESS” – have that in mind. SOX alone says nothing.
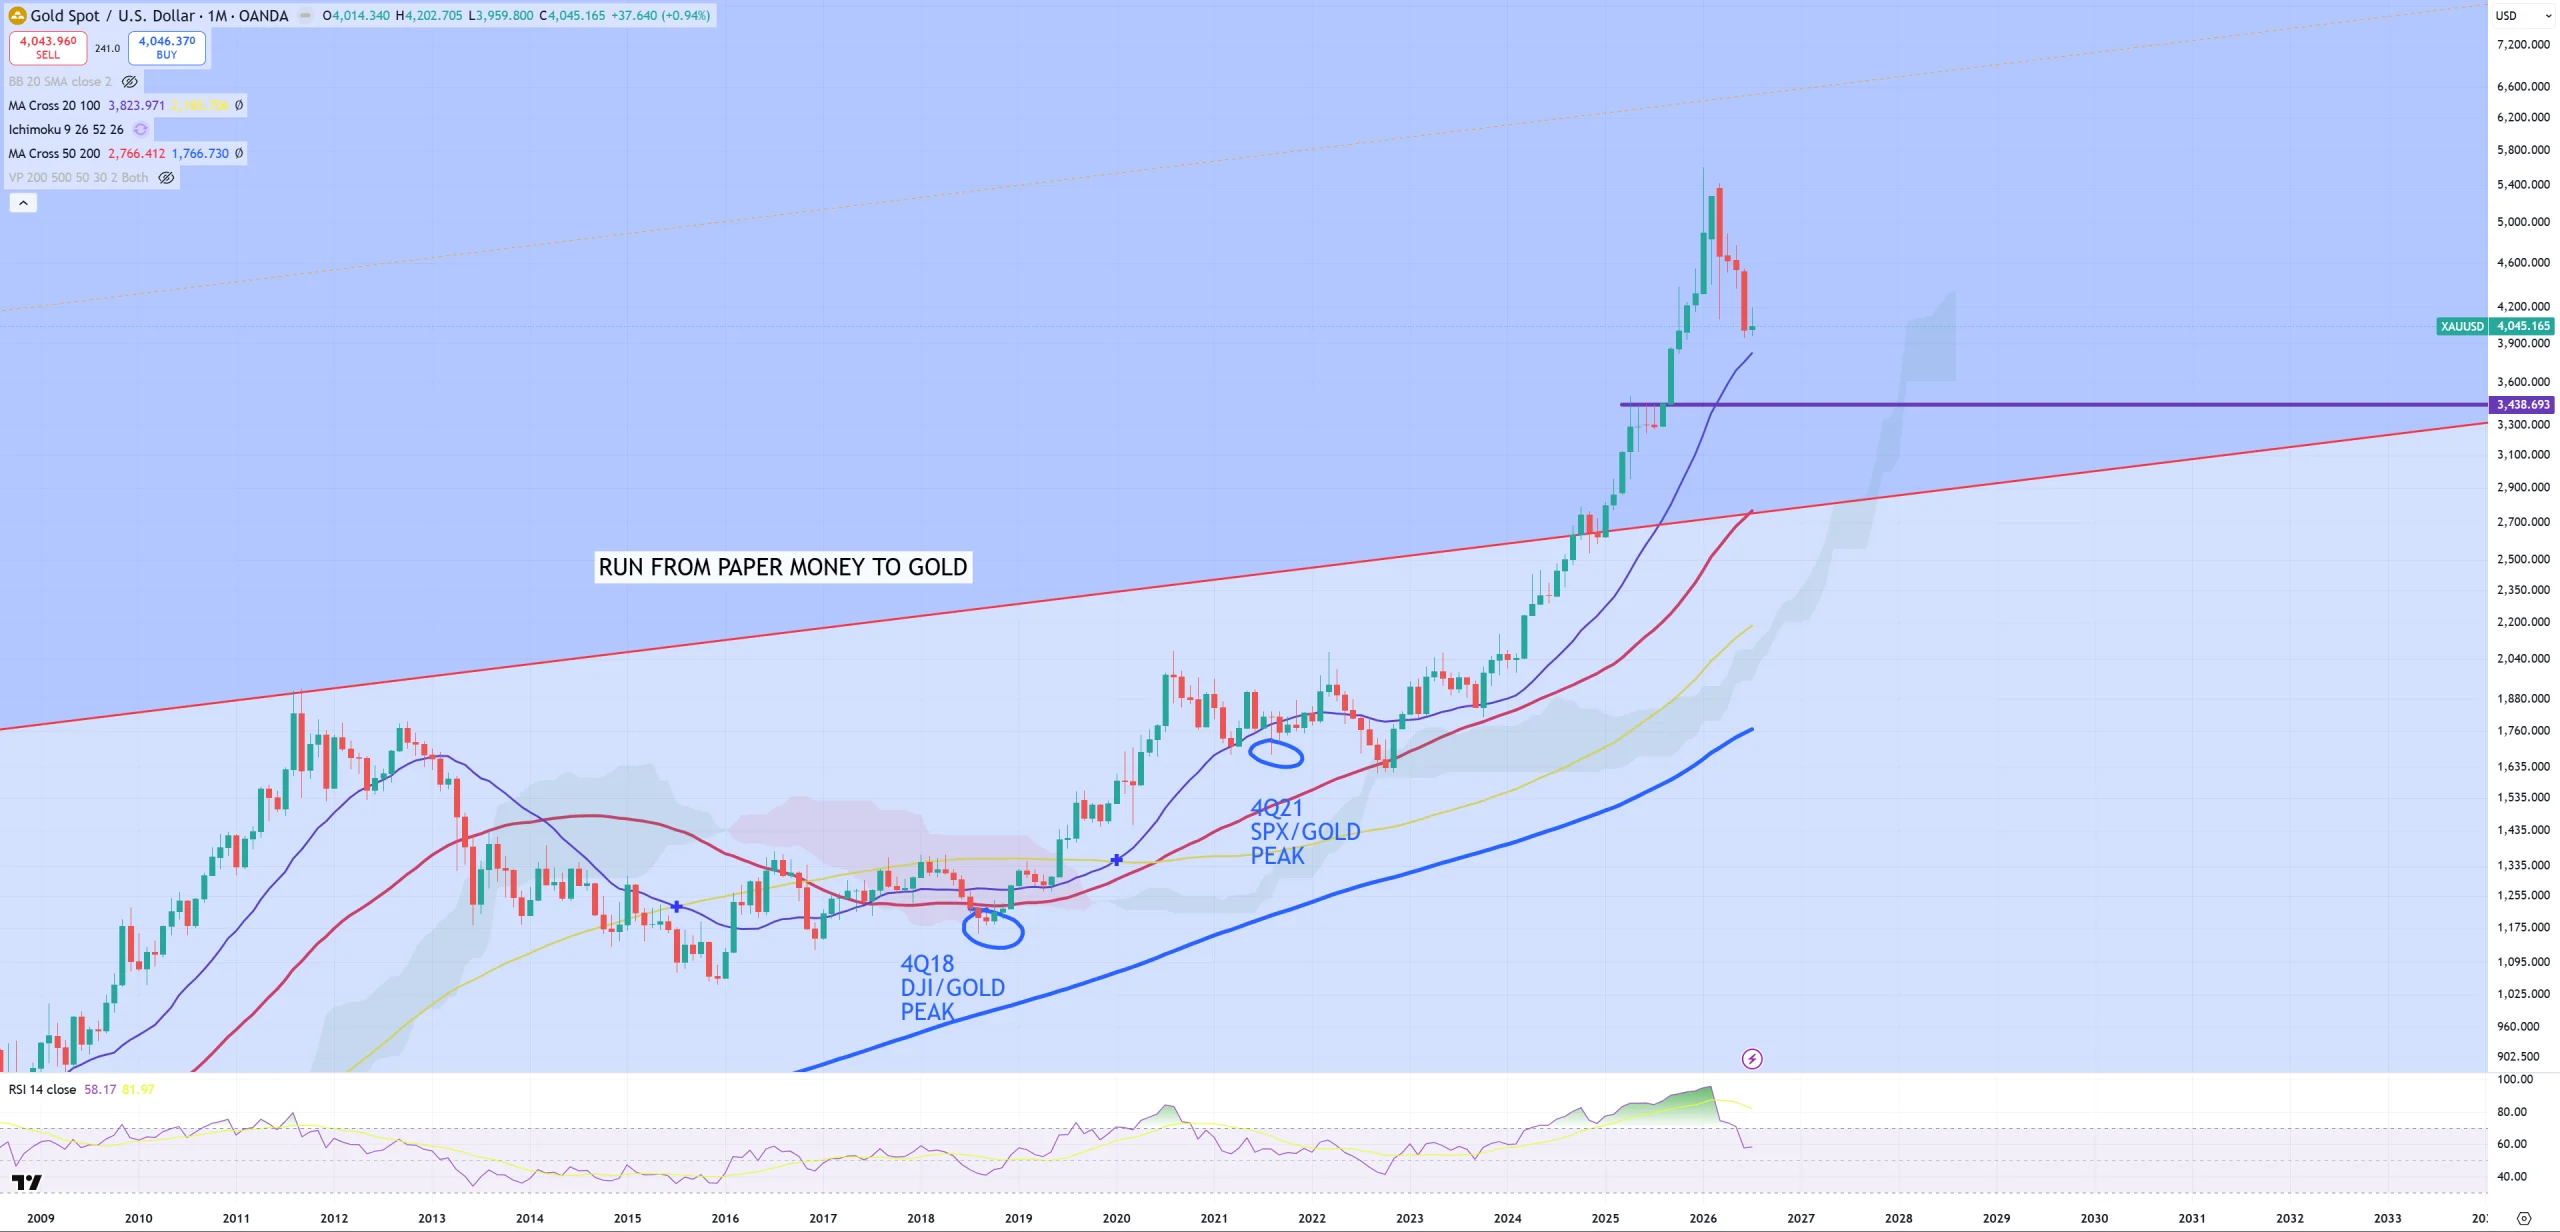
GOLD – still has some room for basic (M)MA20 retest
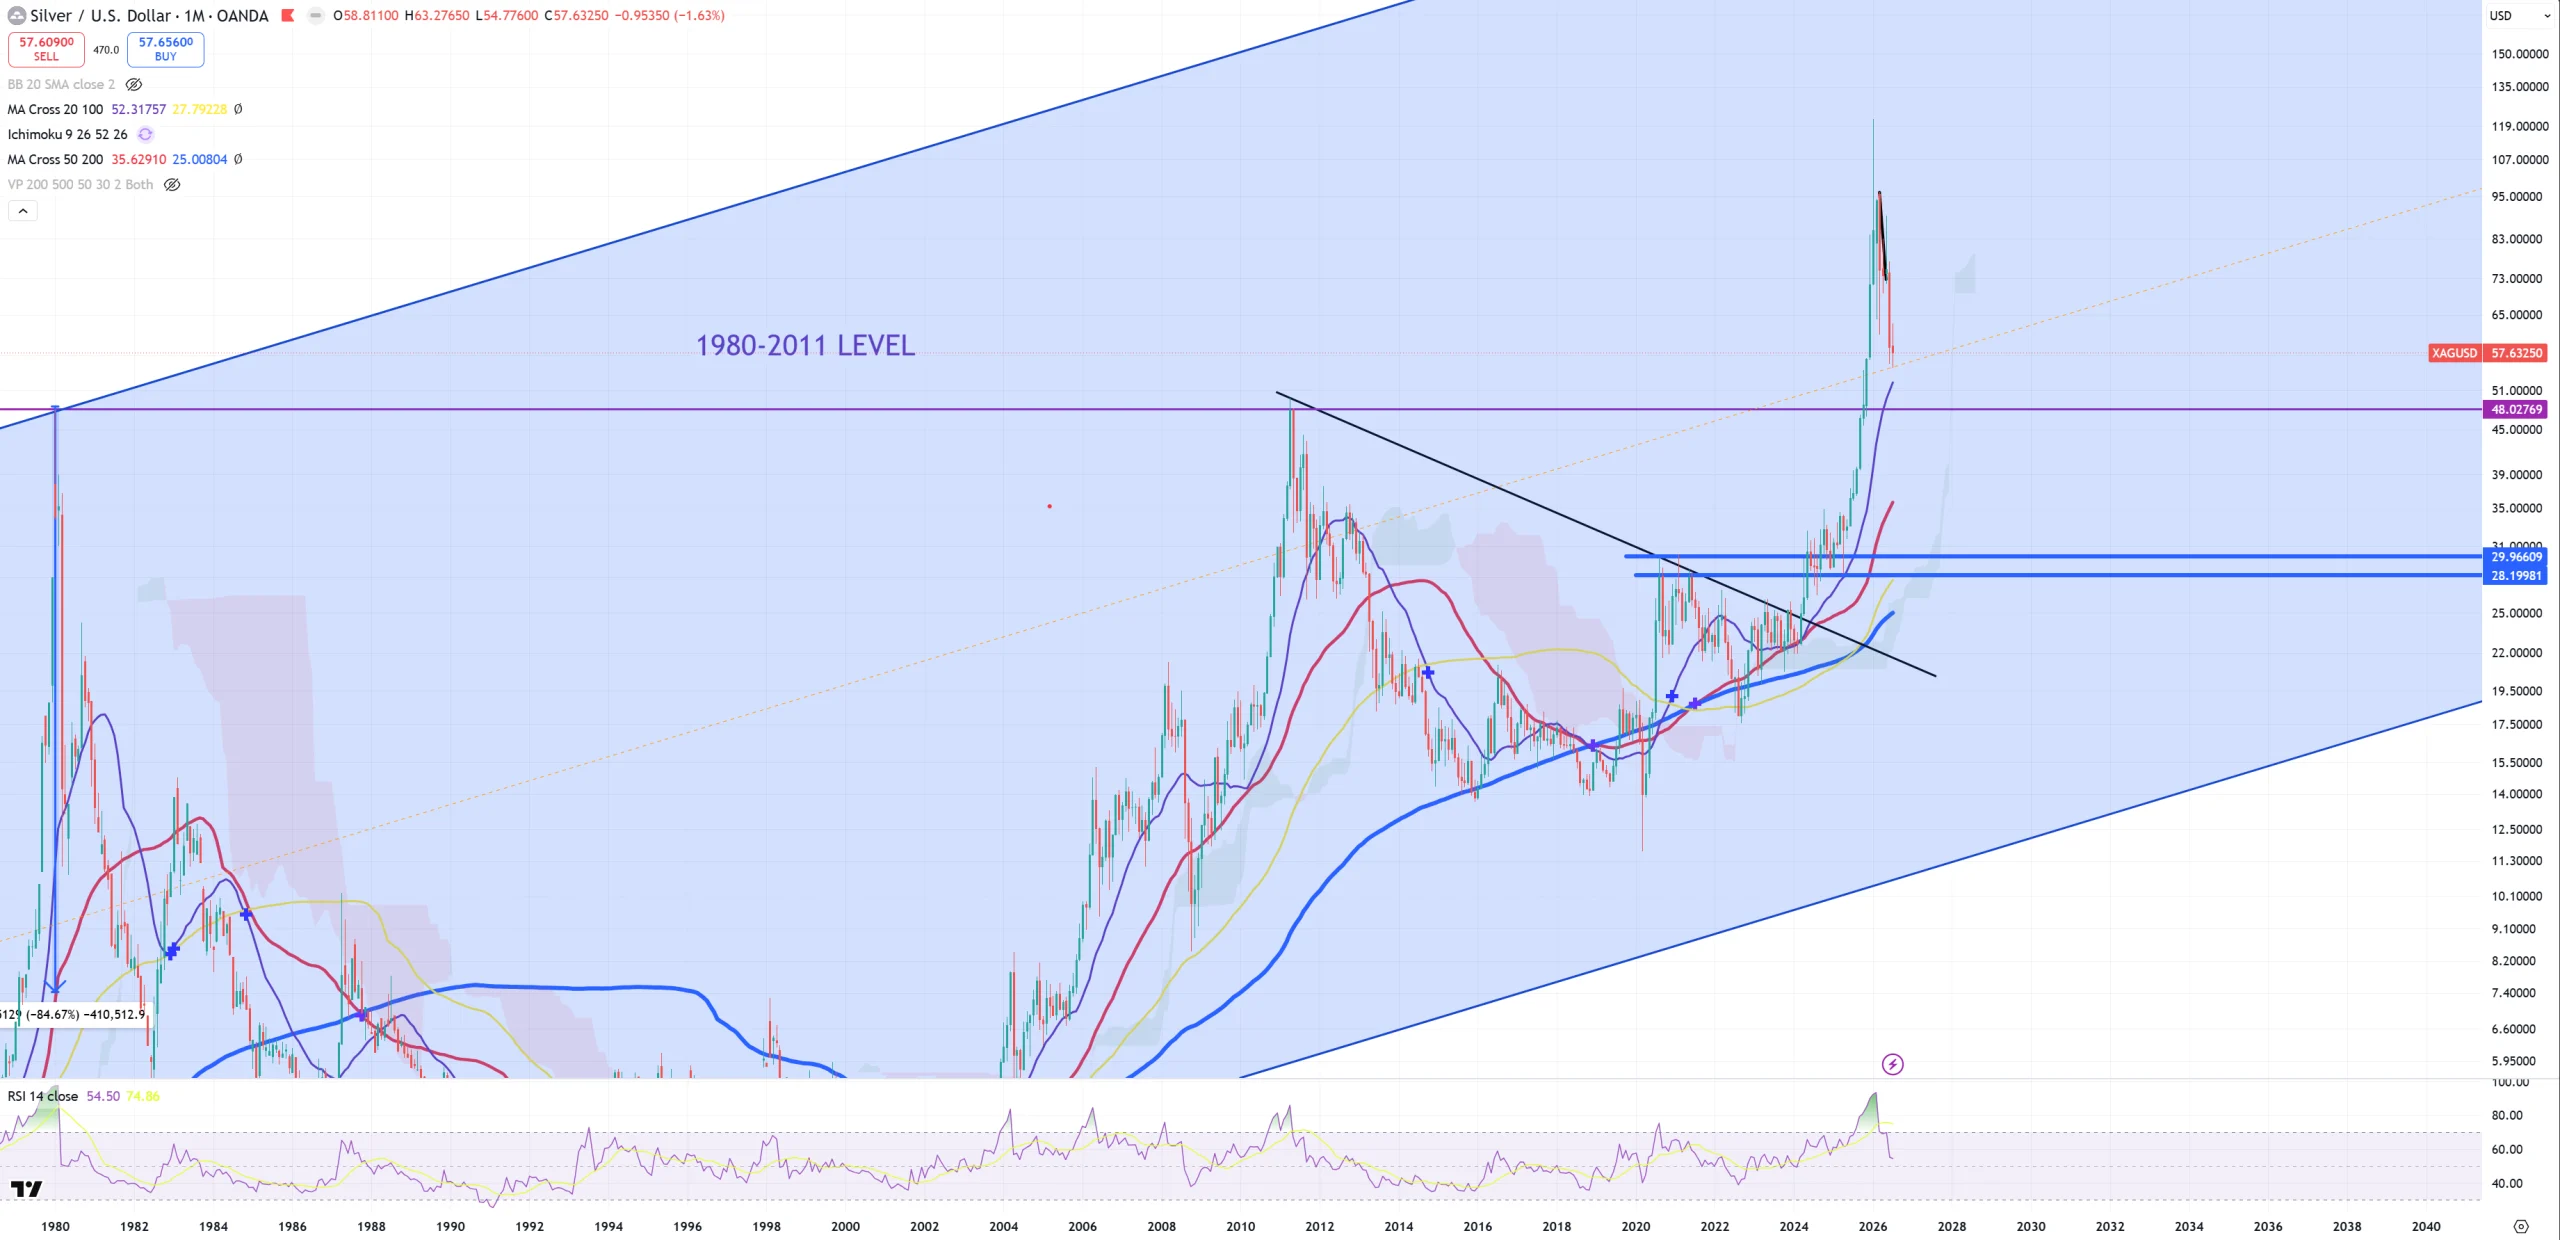
SILVER – you see the level
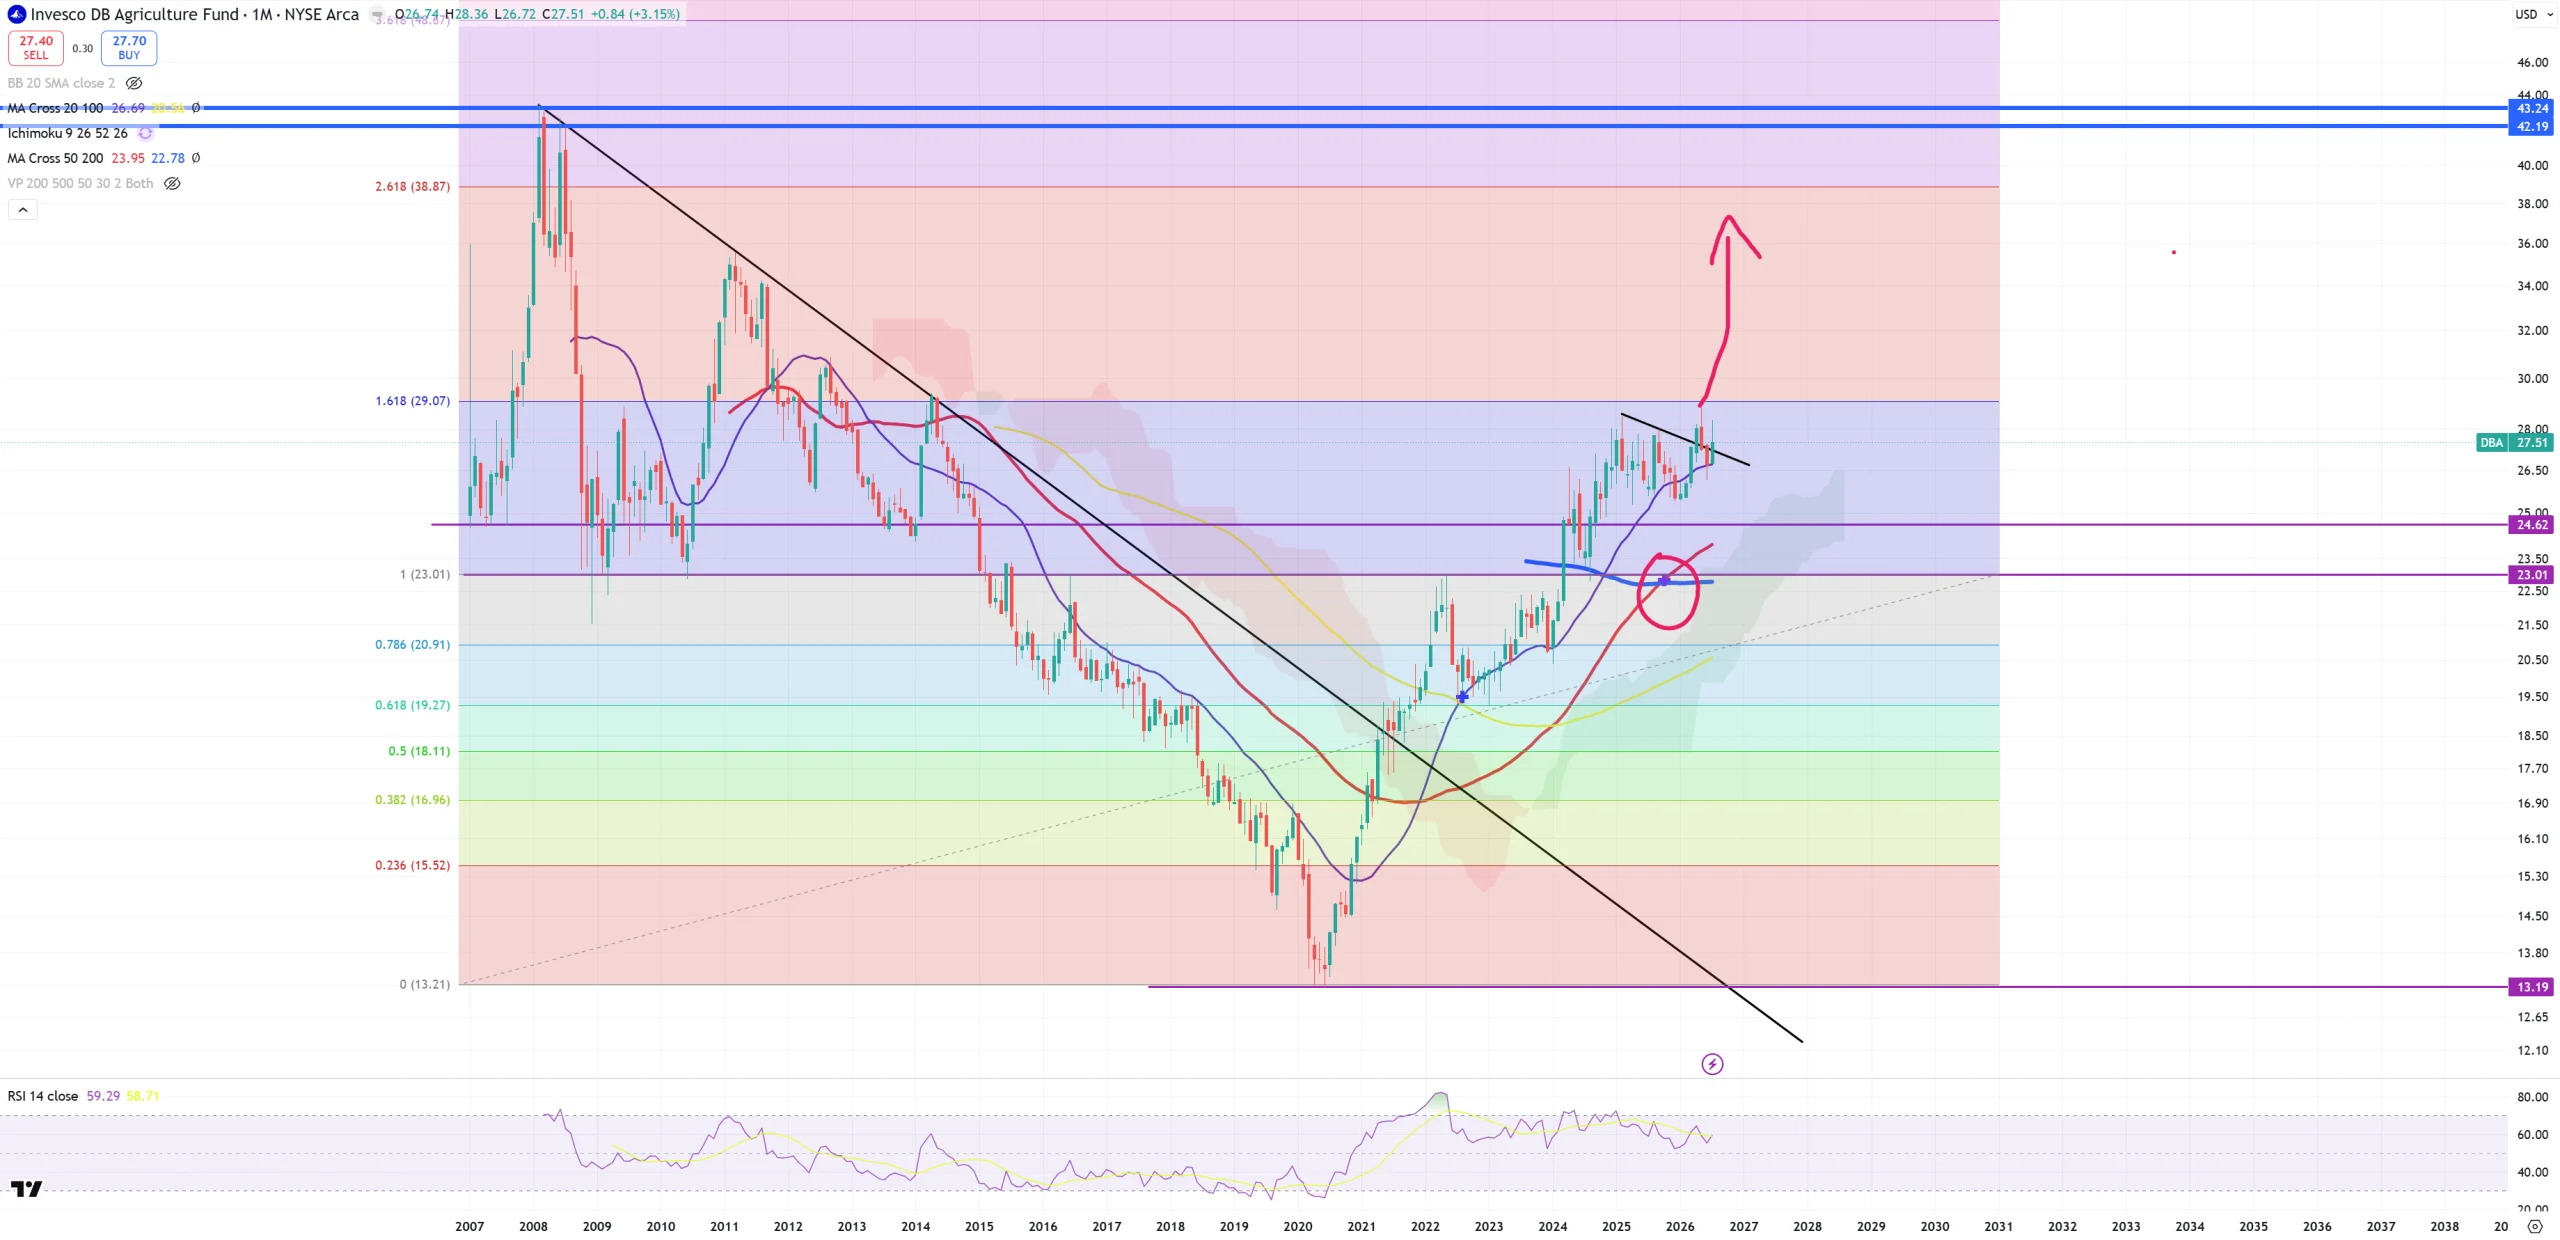
DBA – some kind of food inflation indicator
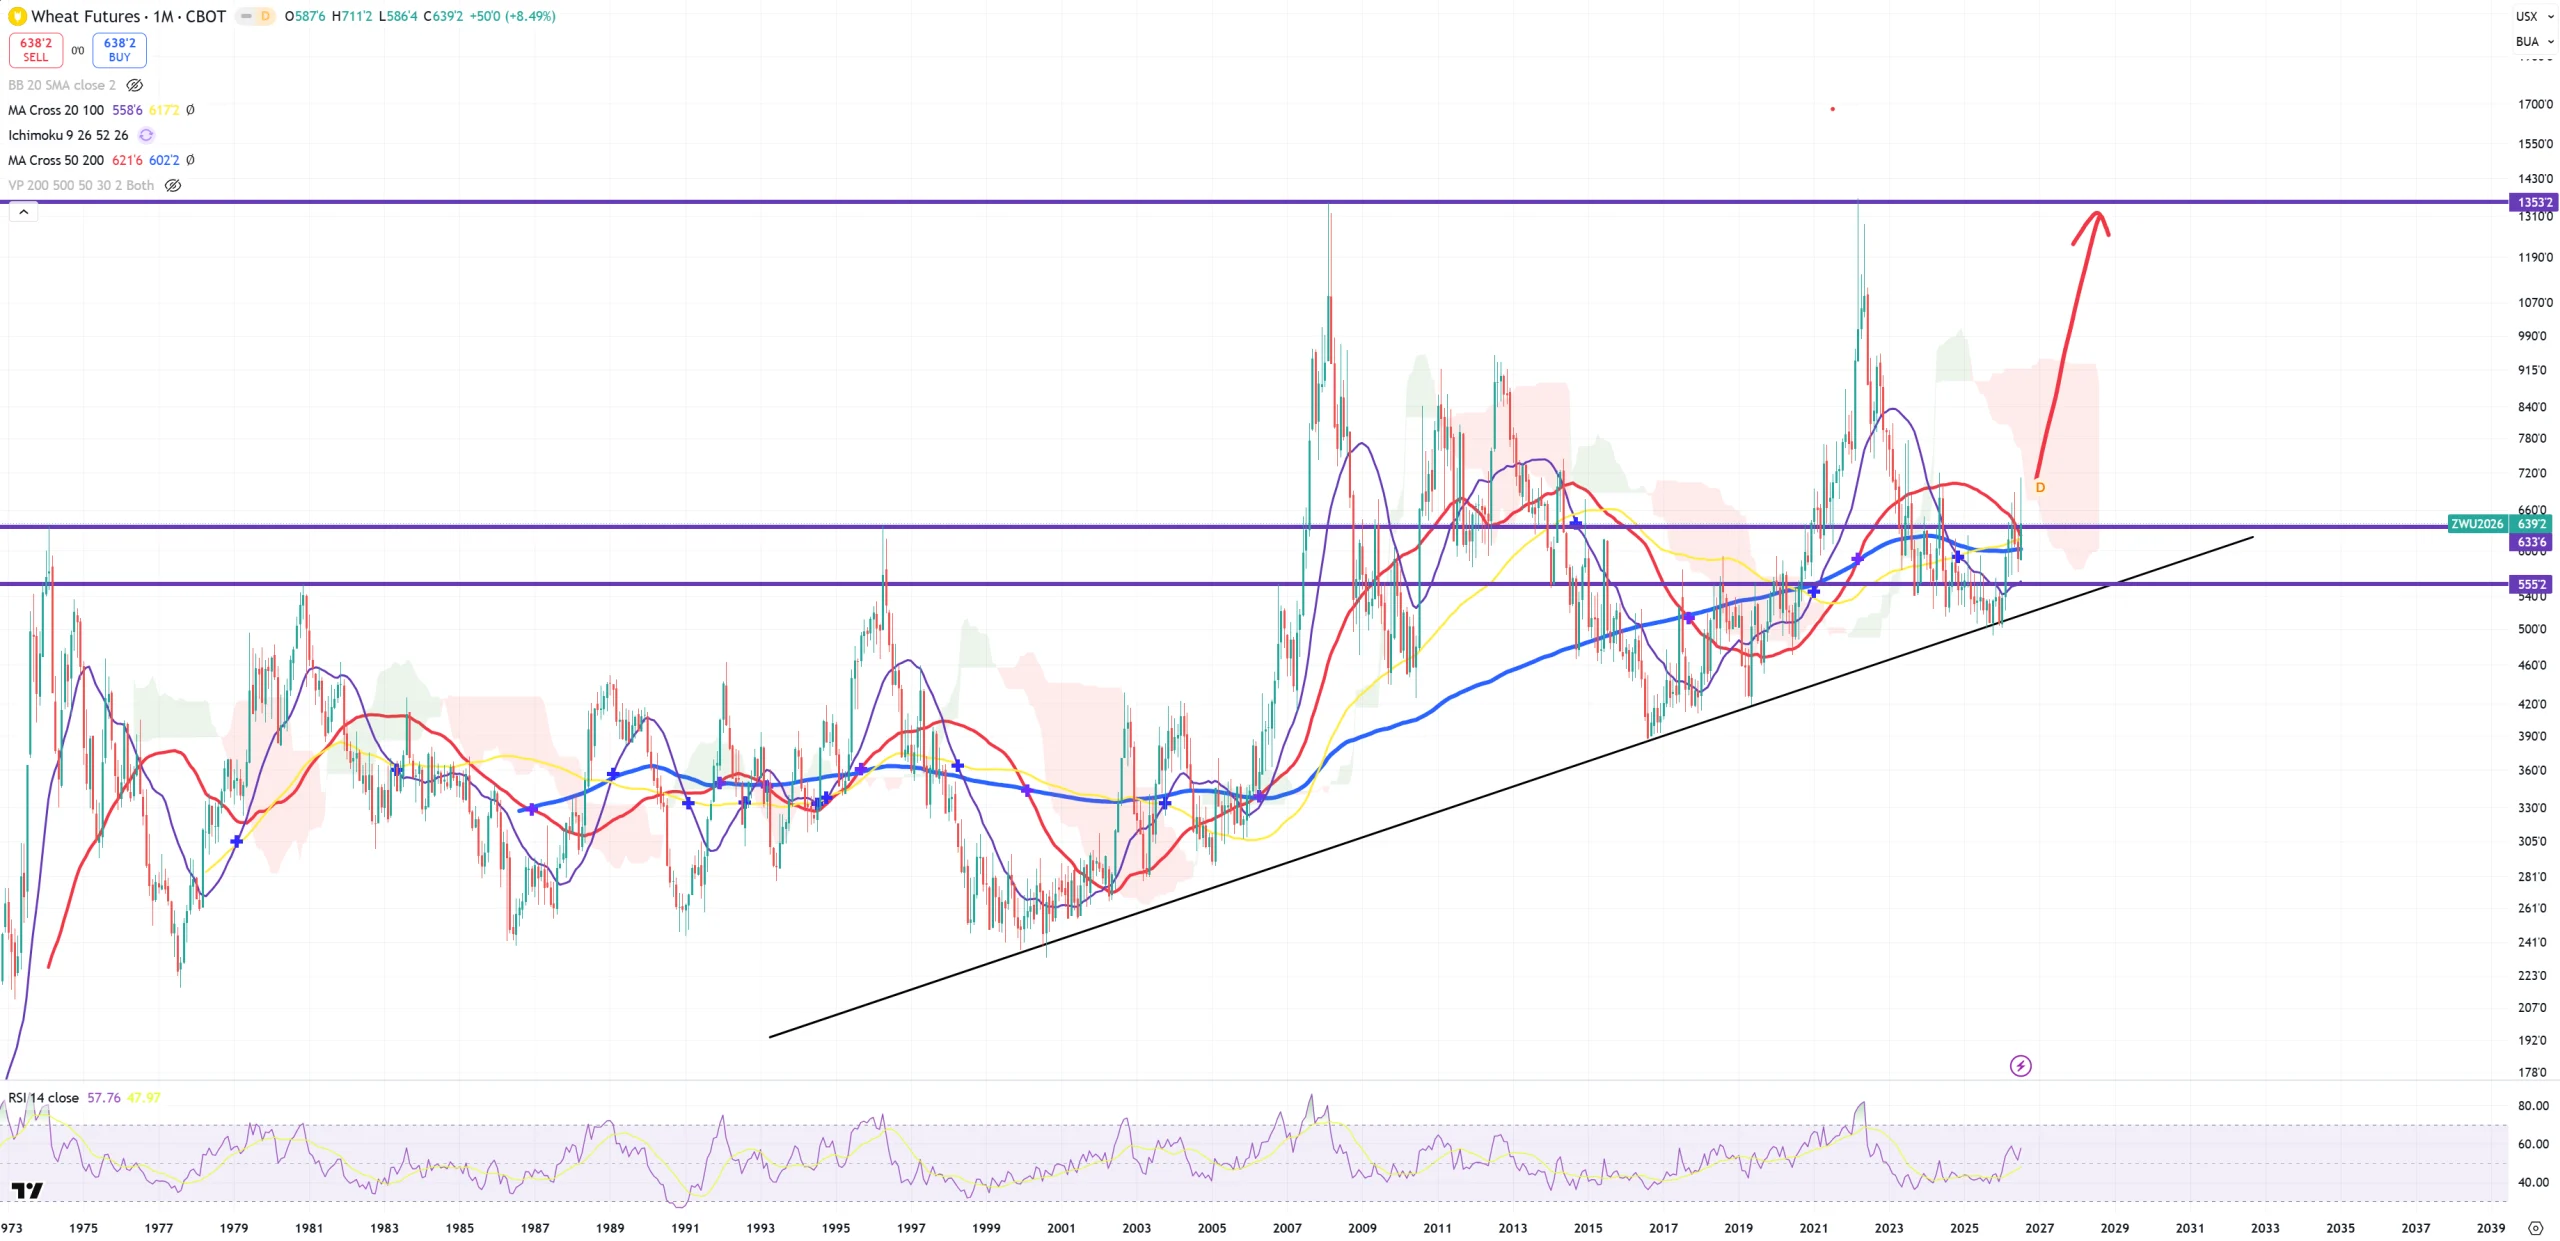
WHEAT – also on the edge
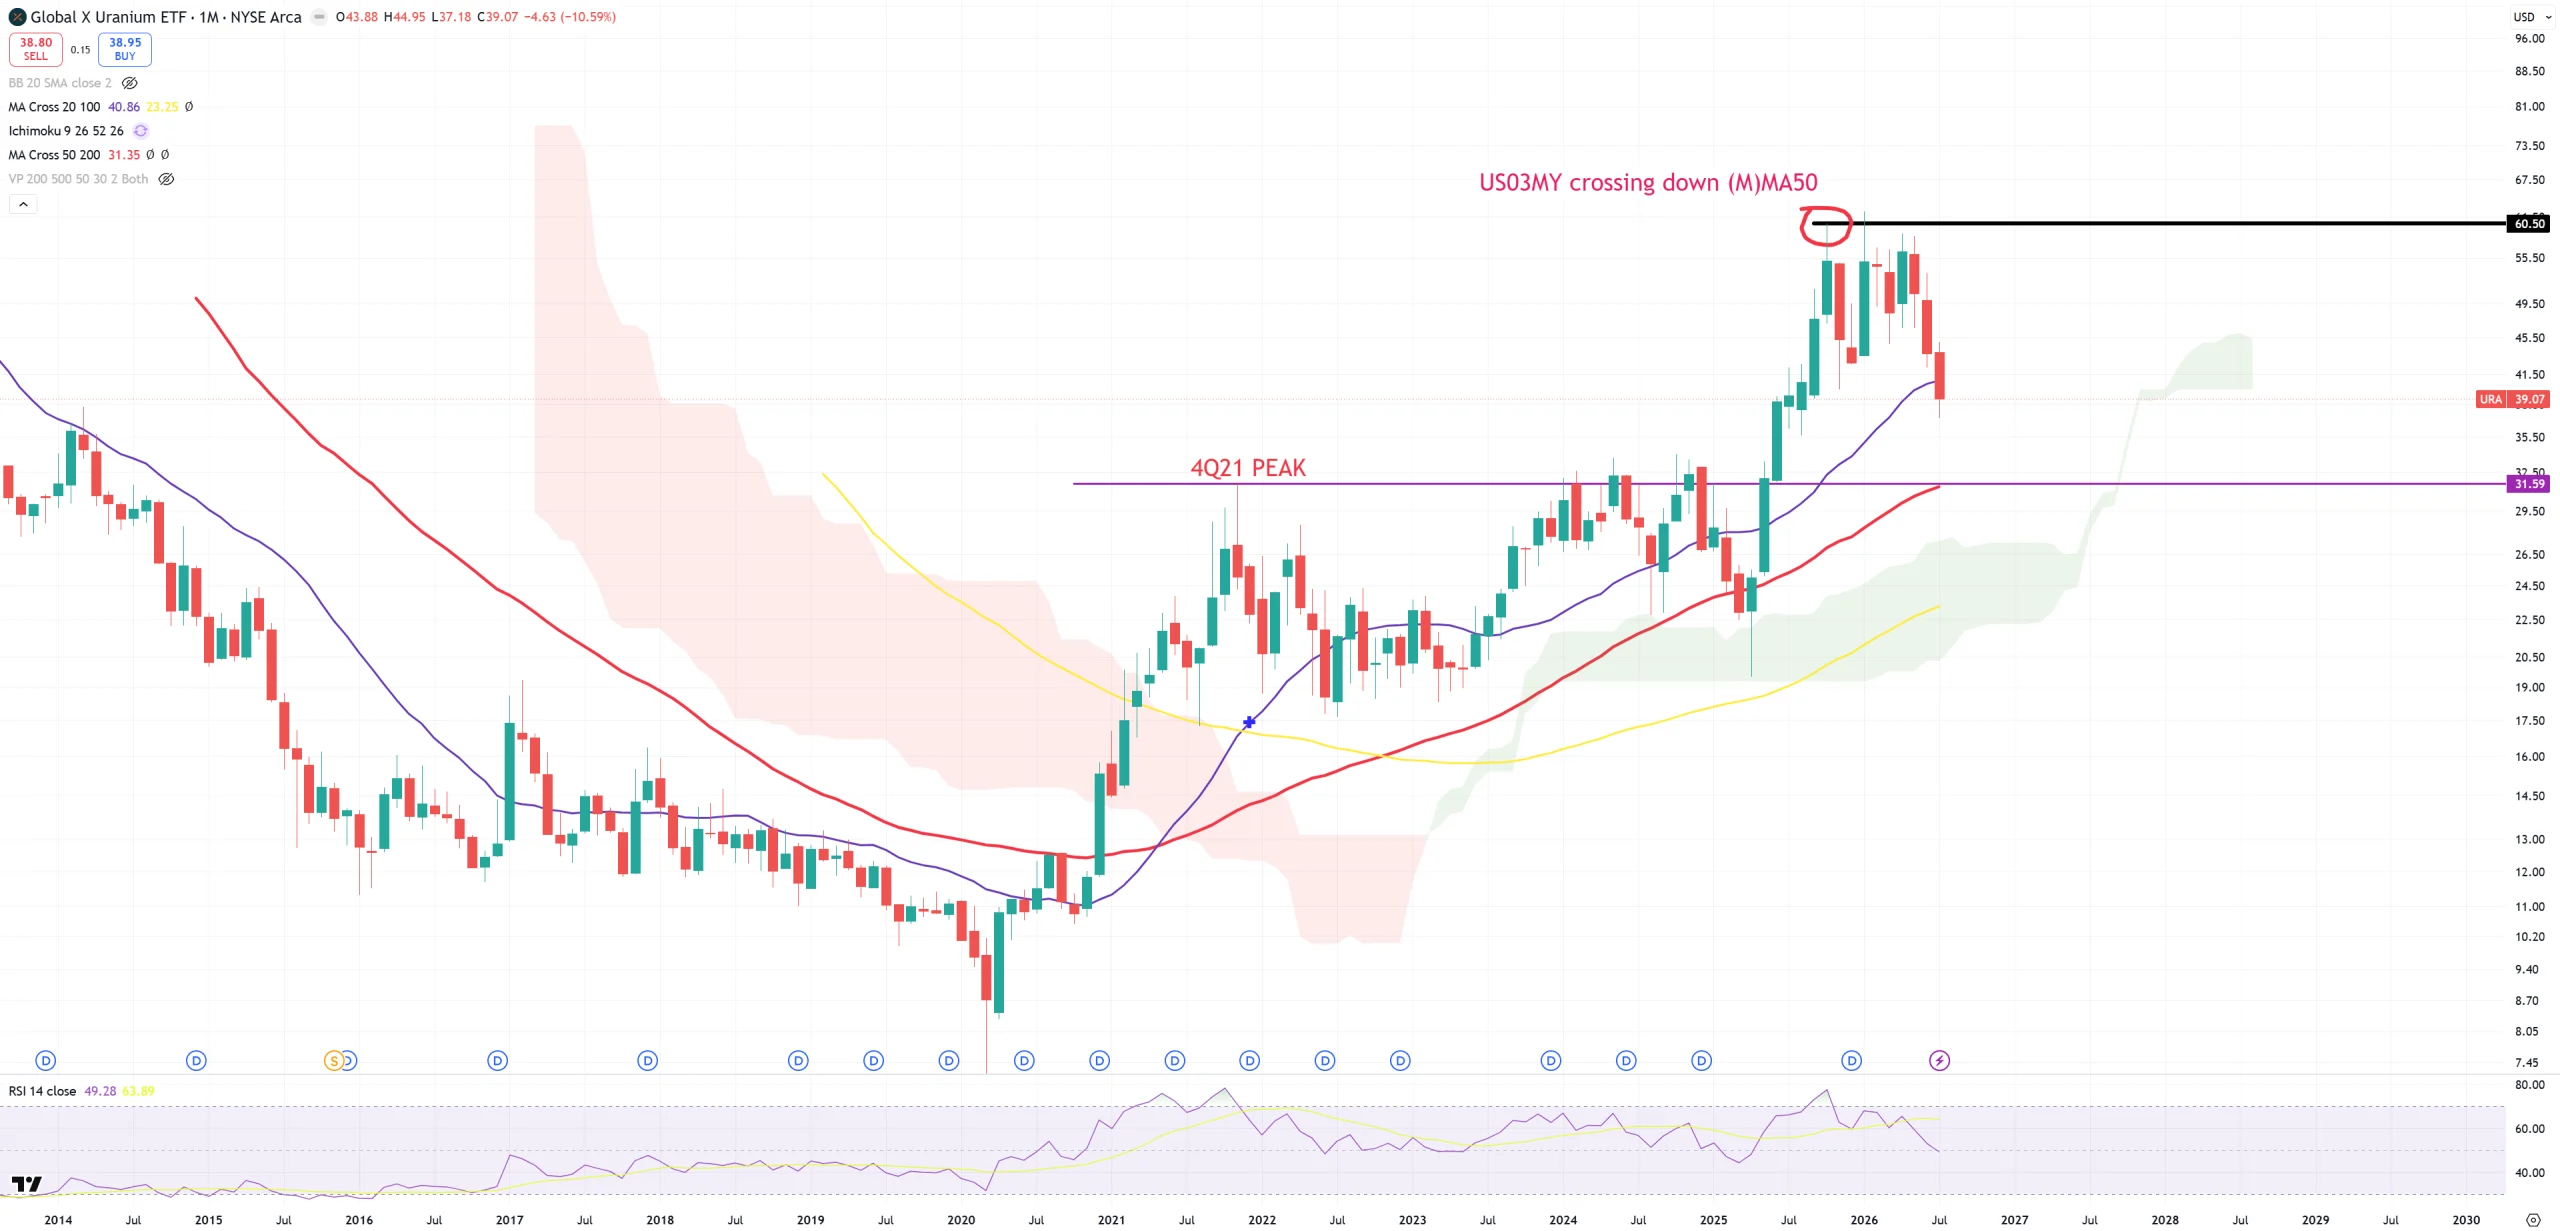
URA – it’s going to 31$ – perectly blended technical moment. 4Q21 level + (M)MA50. (M)MA20 has gone.
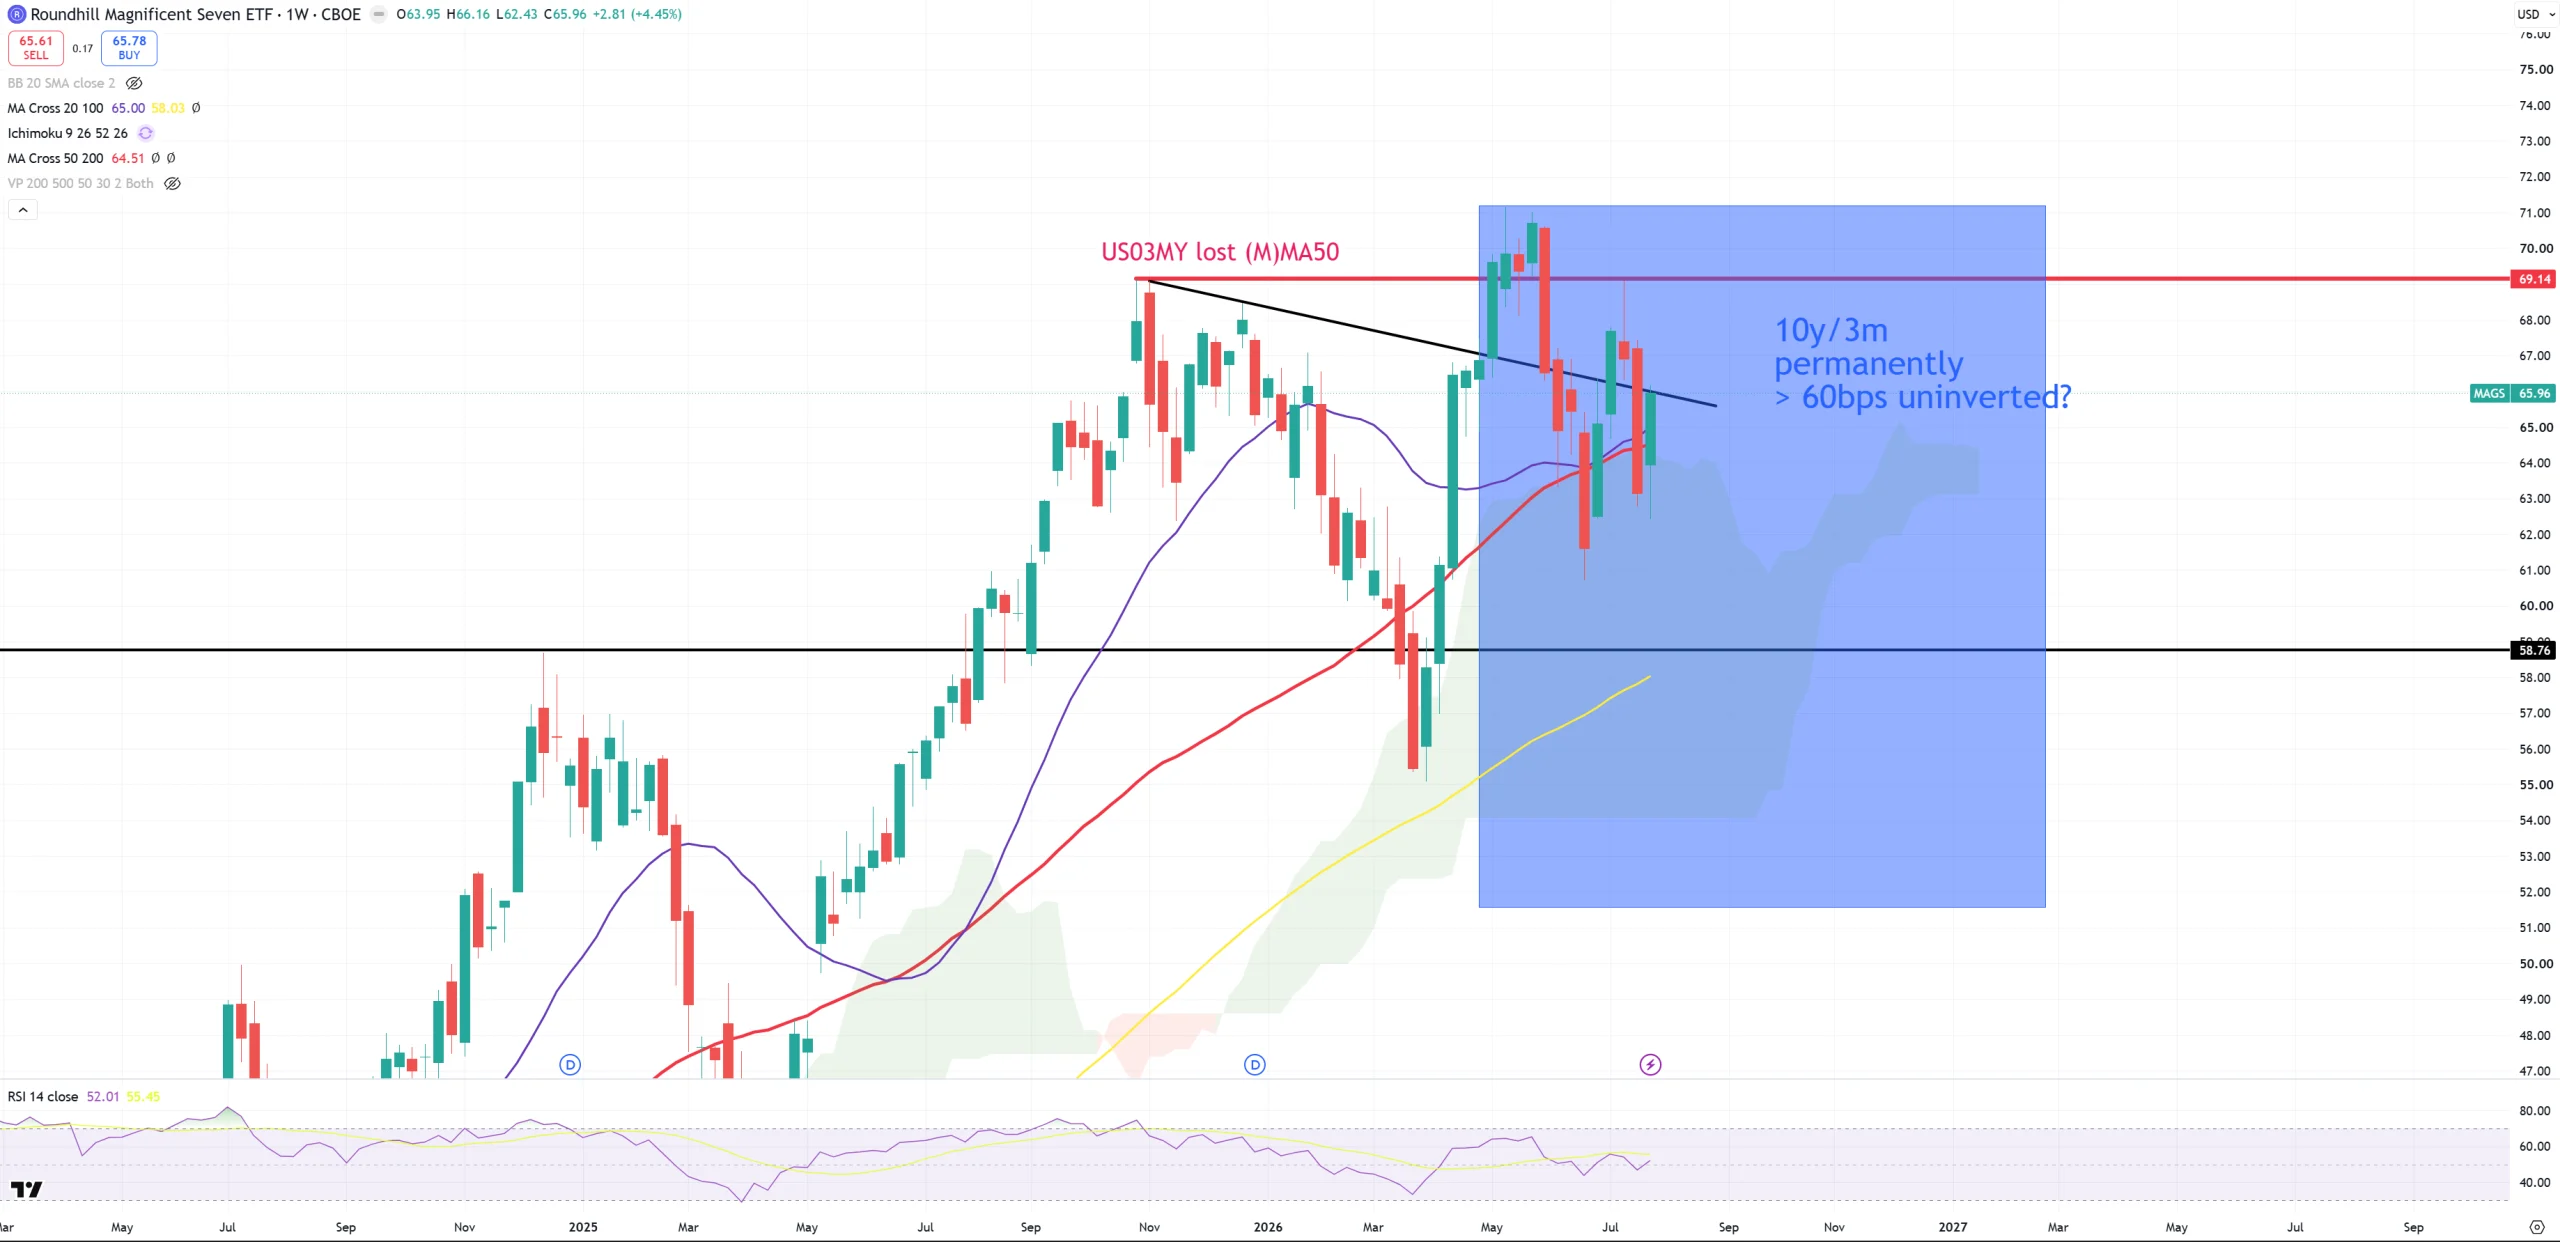
MAGS – I need to show you on (W)eekly because this ticker has very short history to see it on (M)
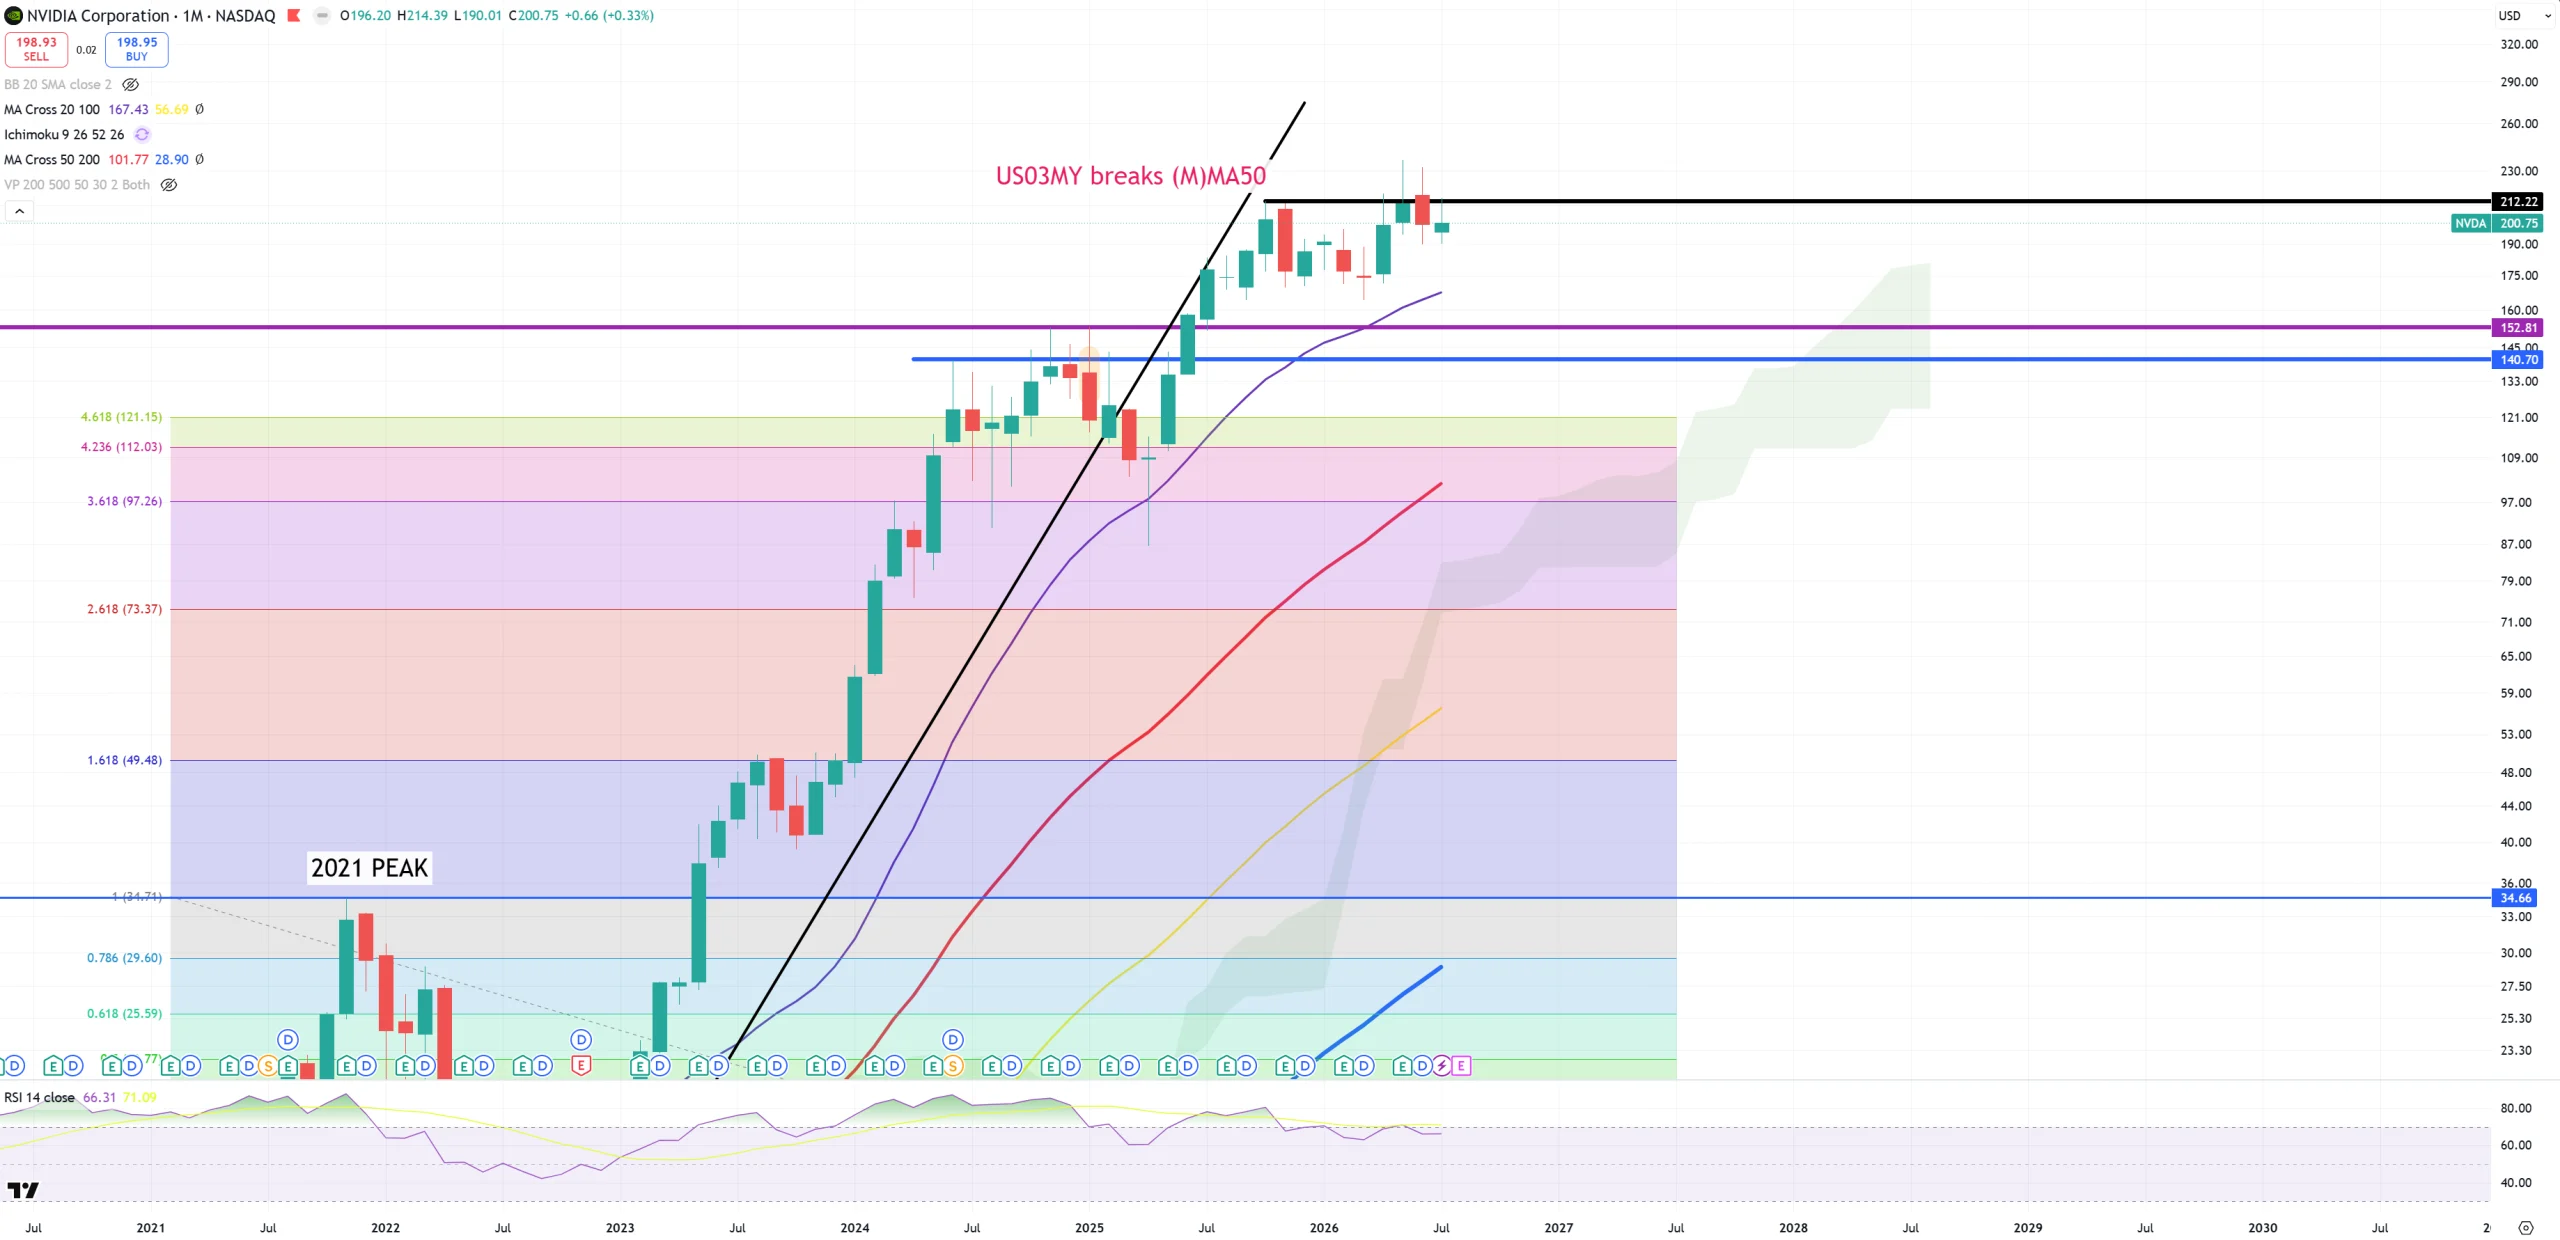
NVDA – holds the same pattern as MAGS
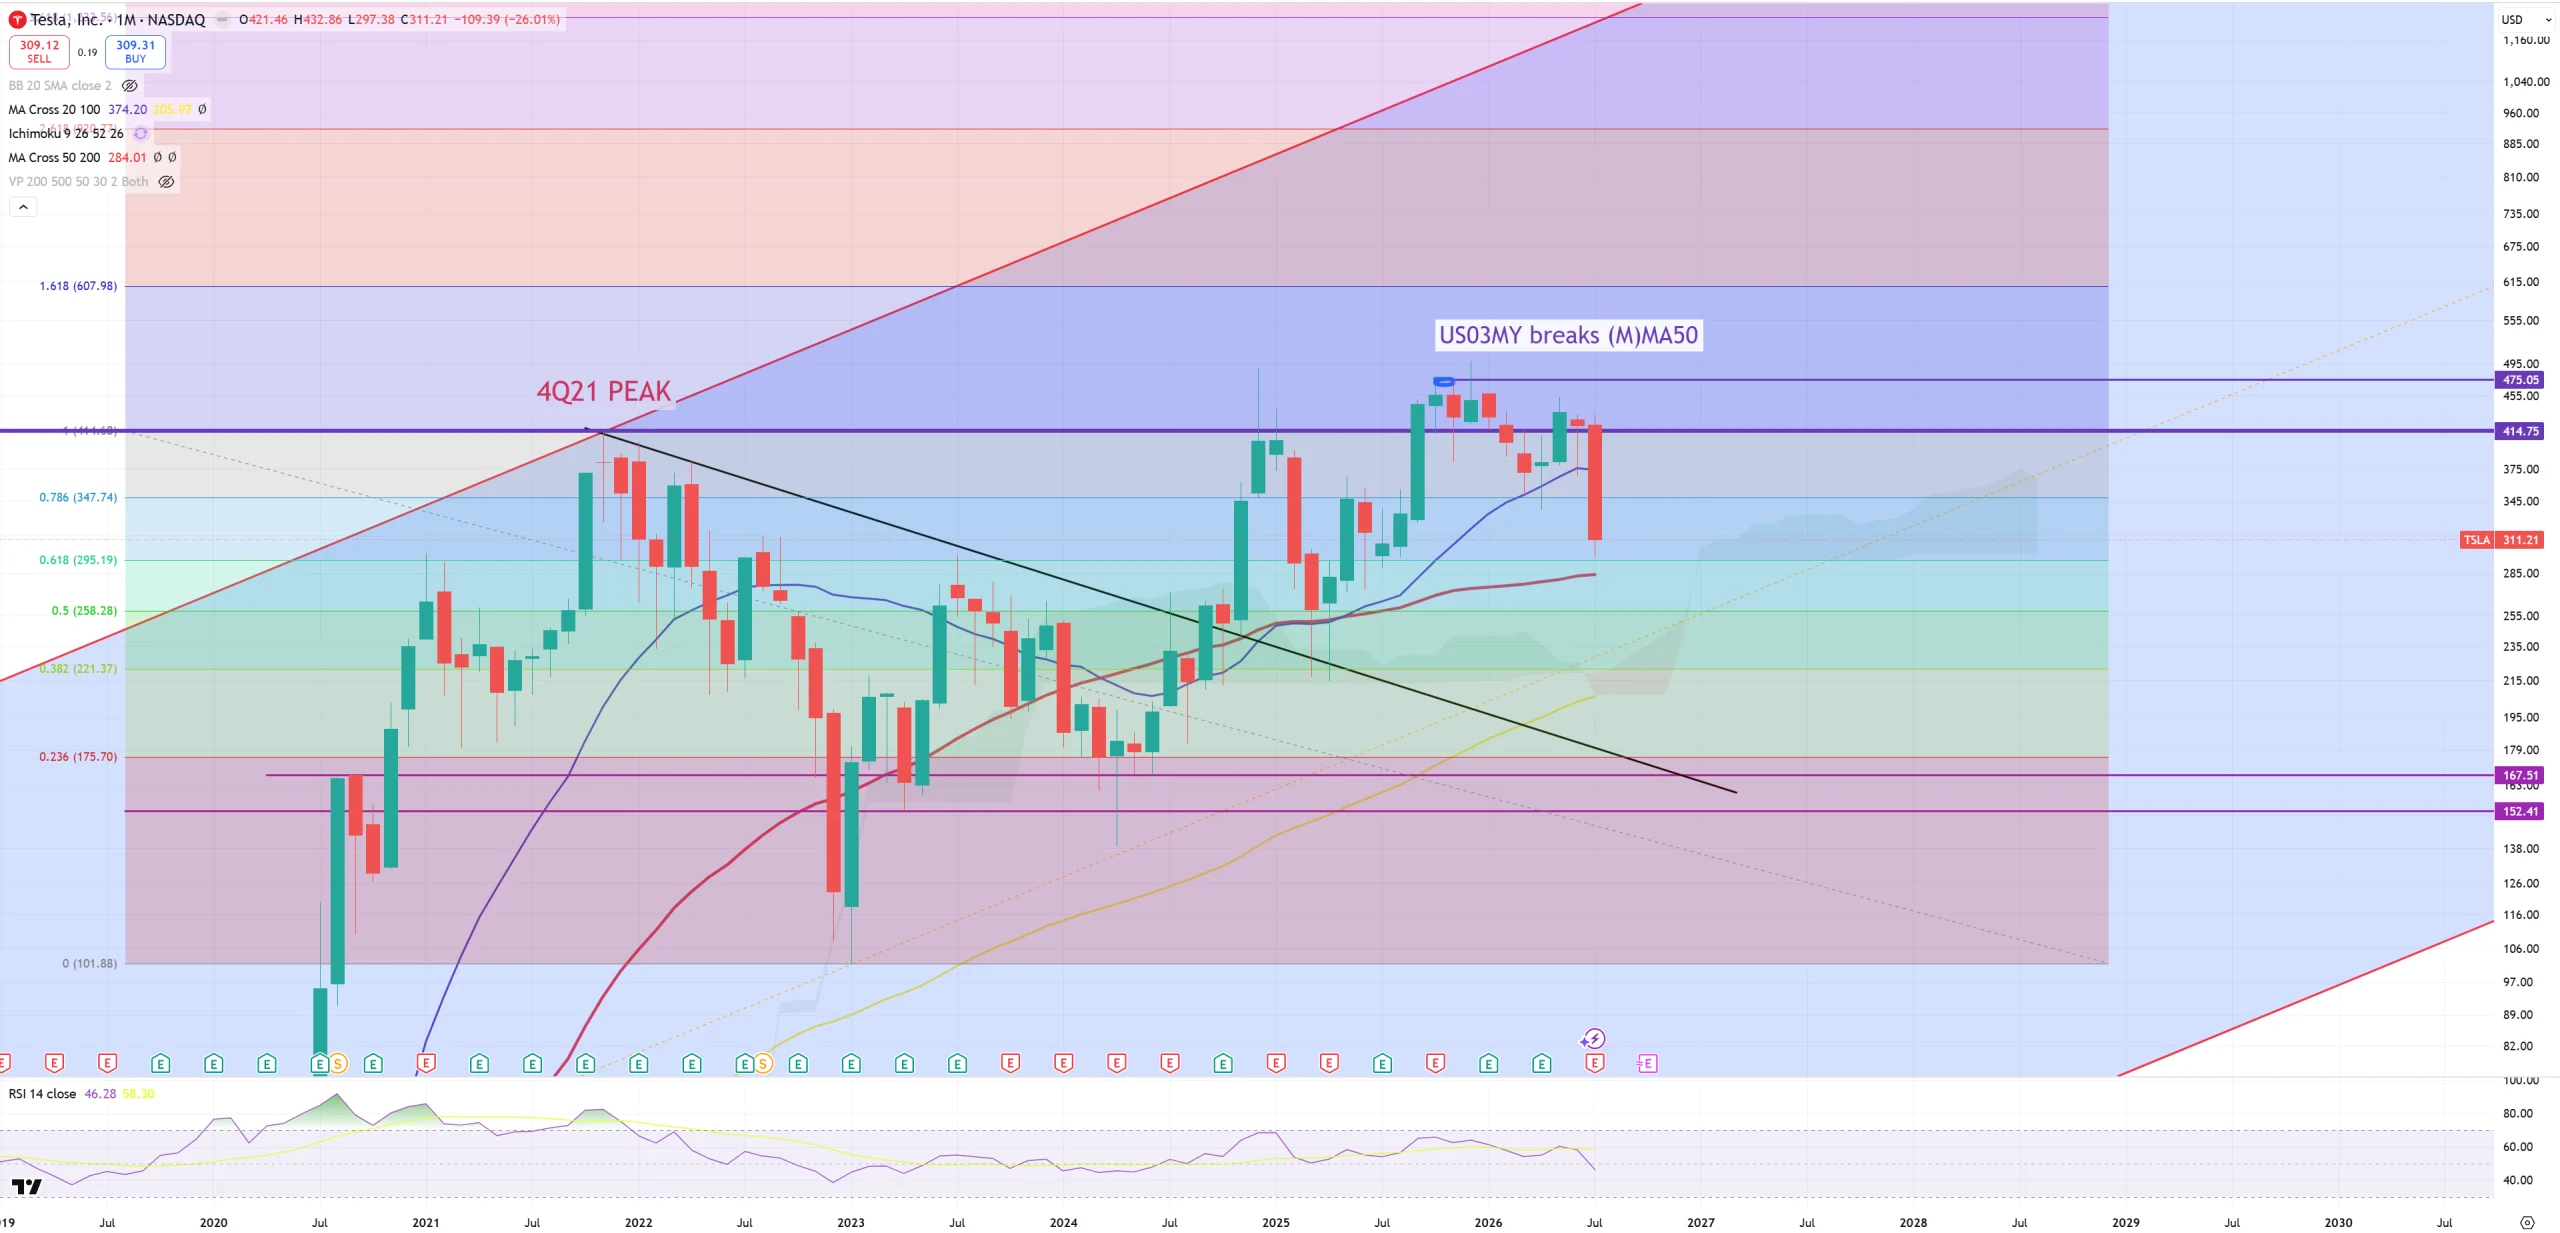
TSLA – also in big troubles as it can’t really get over 2021 peak
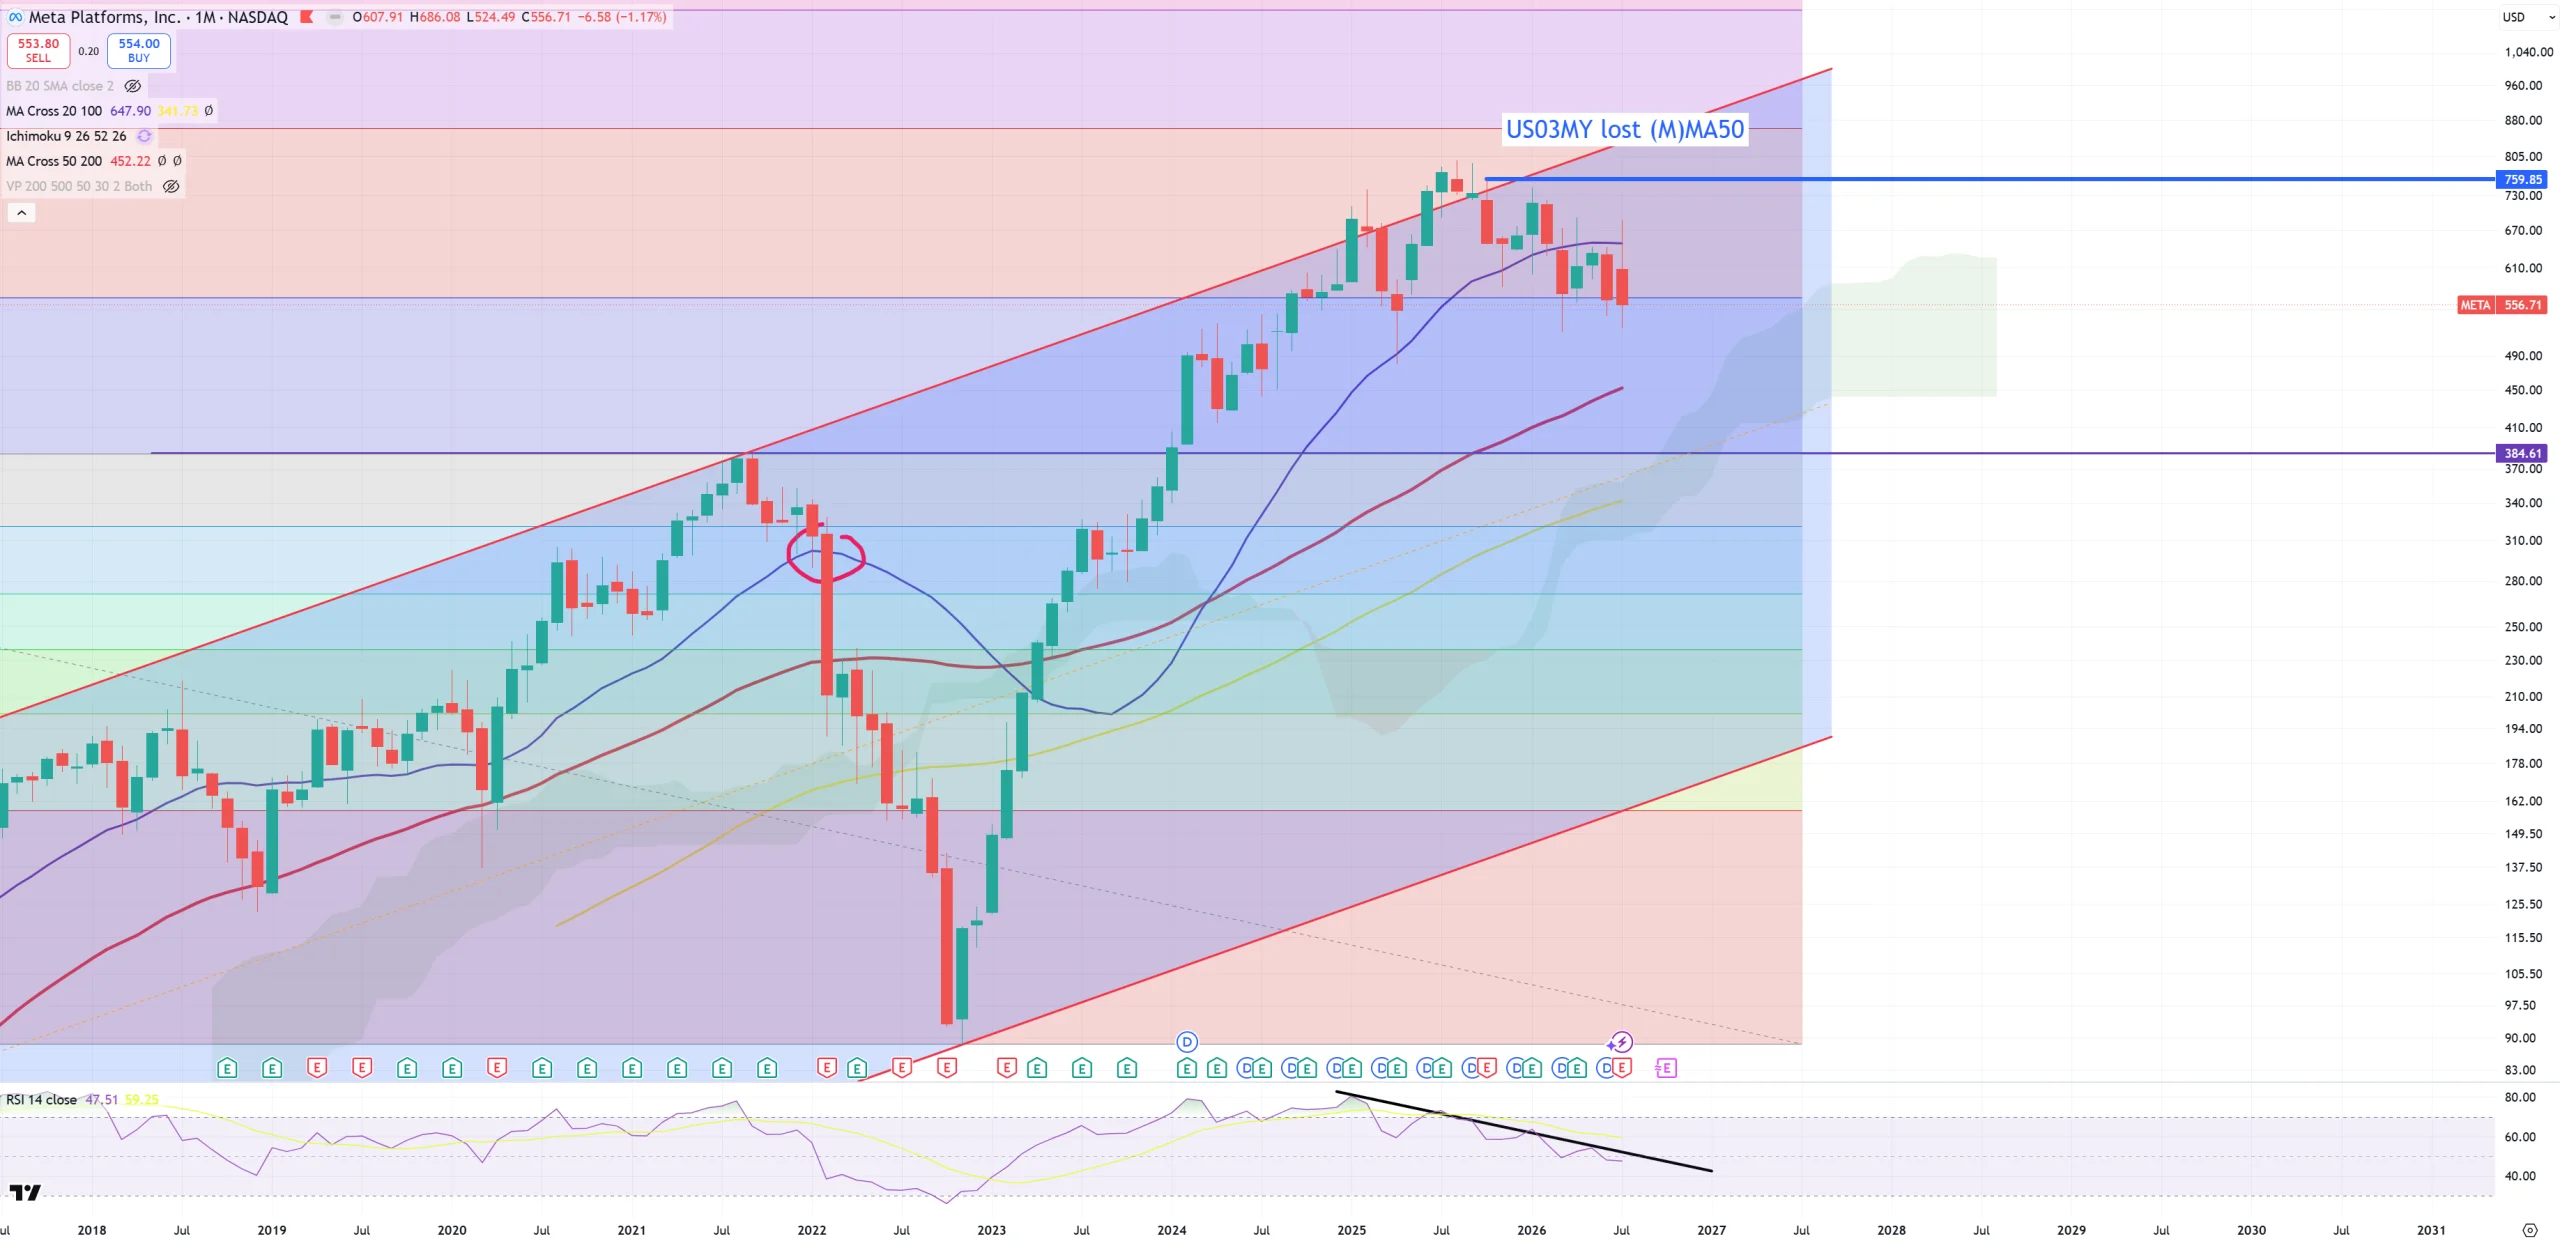
META – below (M)MA20 and it wants to test (M)MA50
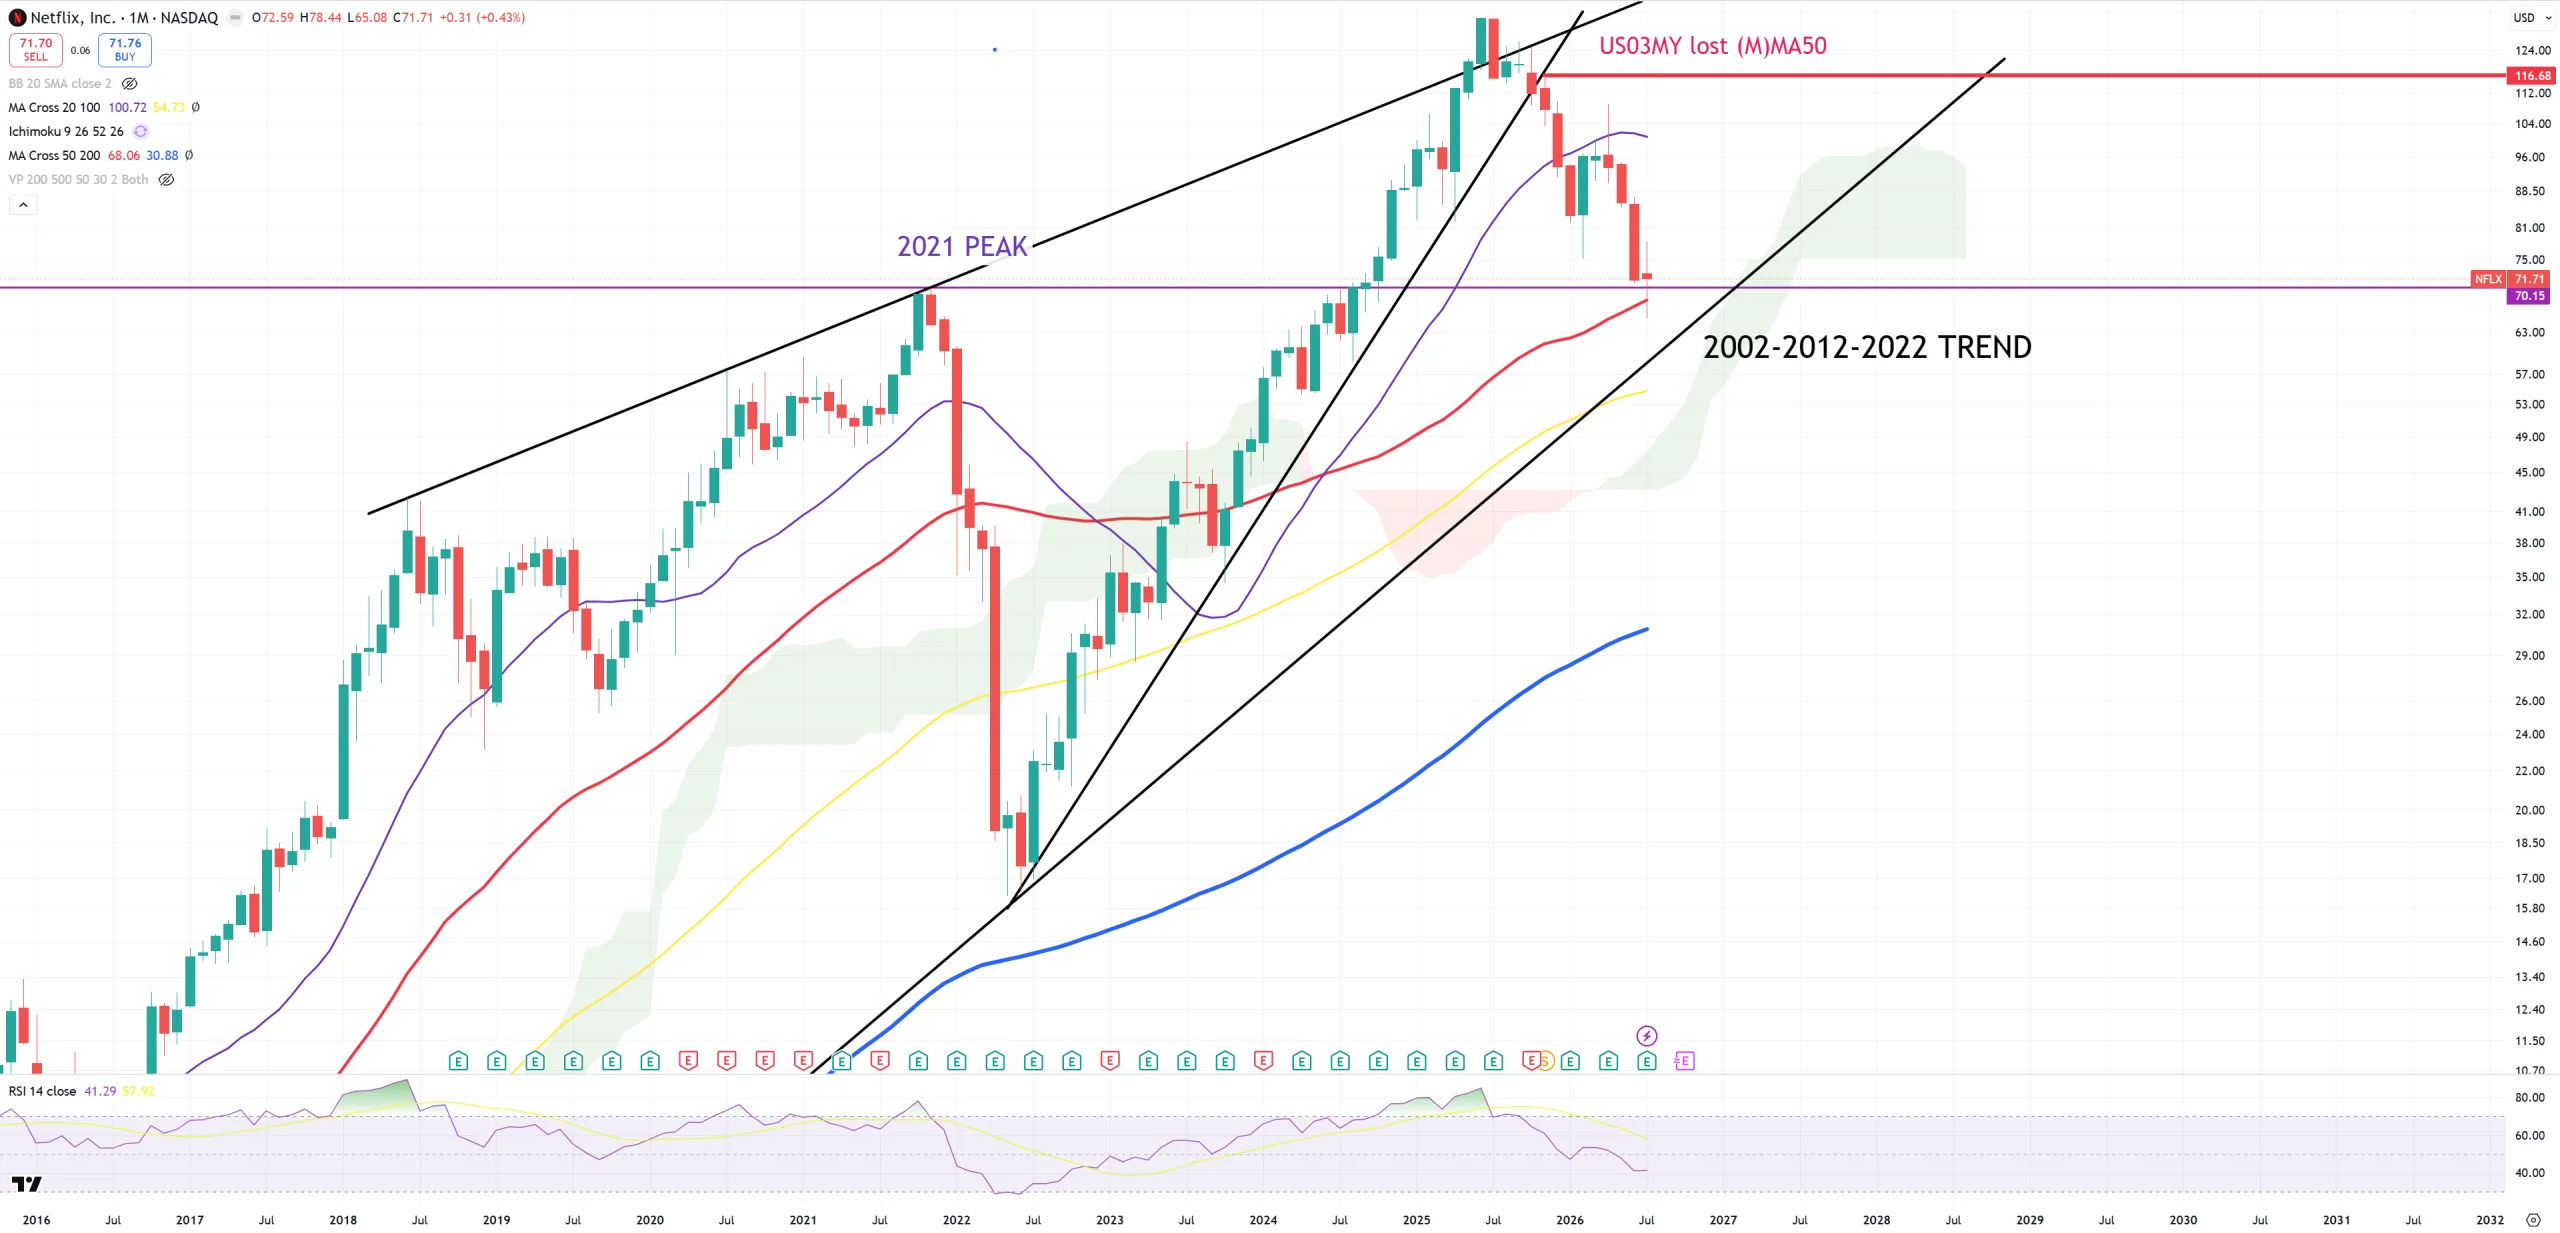
NFLX – big moment on strong multiple support levels
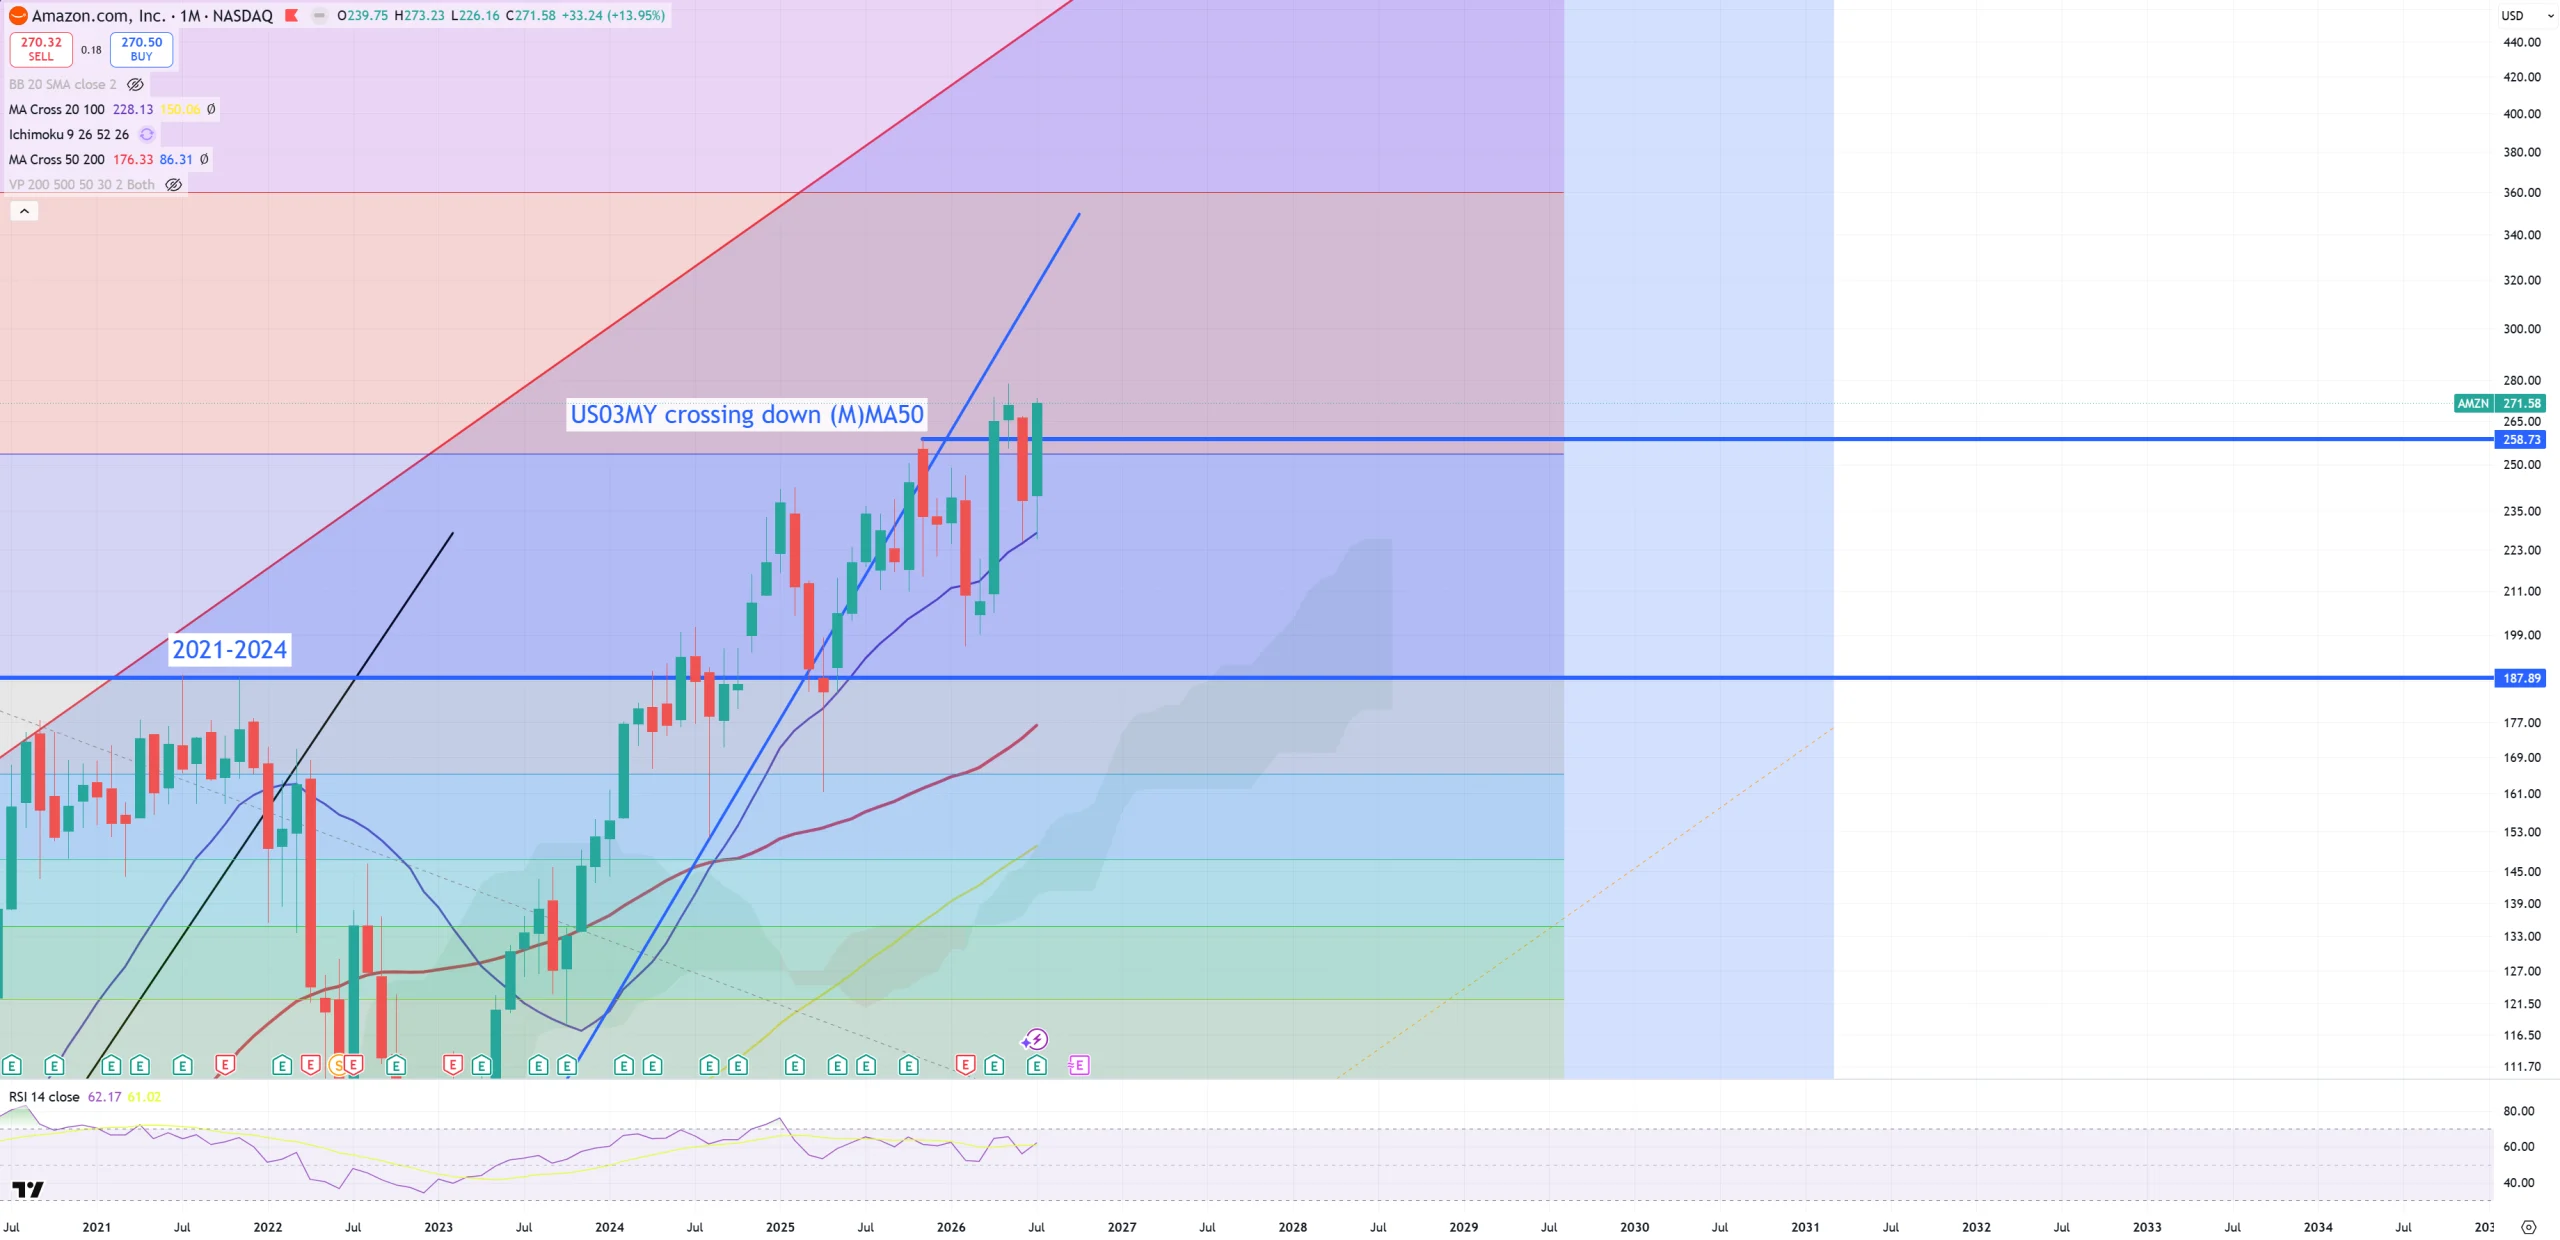
AMZN – Amazon after earnings had +15% (typical bull market bounce). (M)MA20 was support
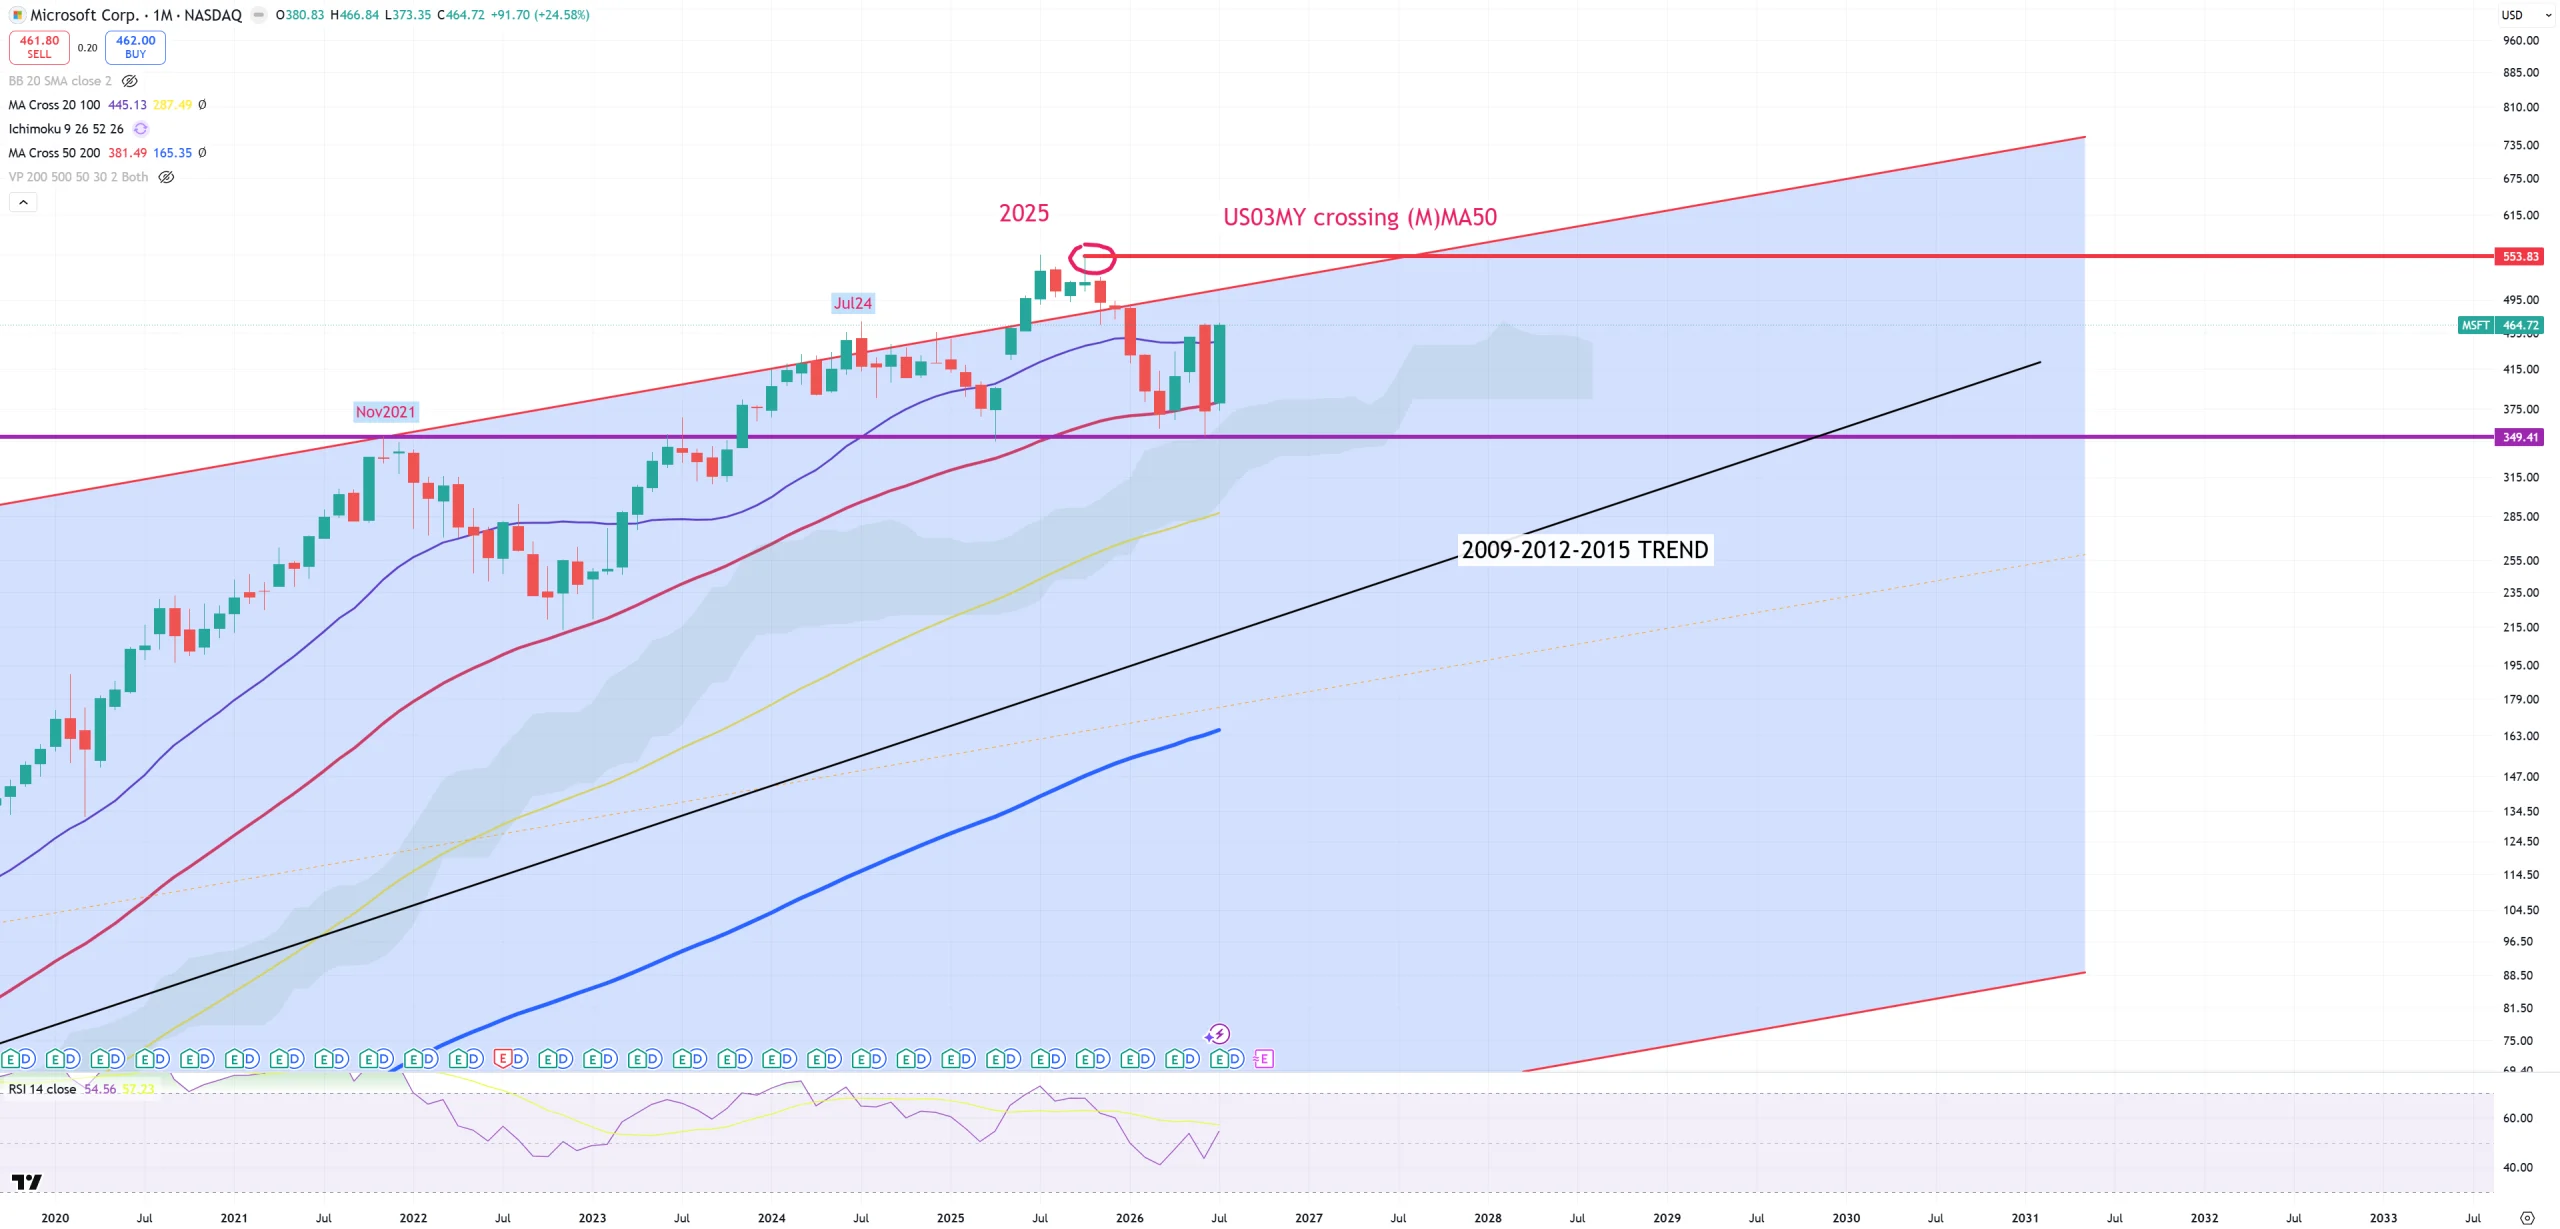
MSFT – it takes time on this red (M)MA50, best bounce since October 2008 :
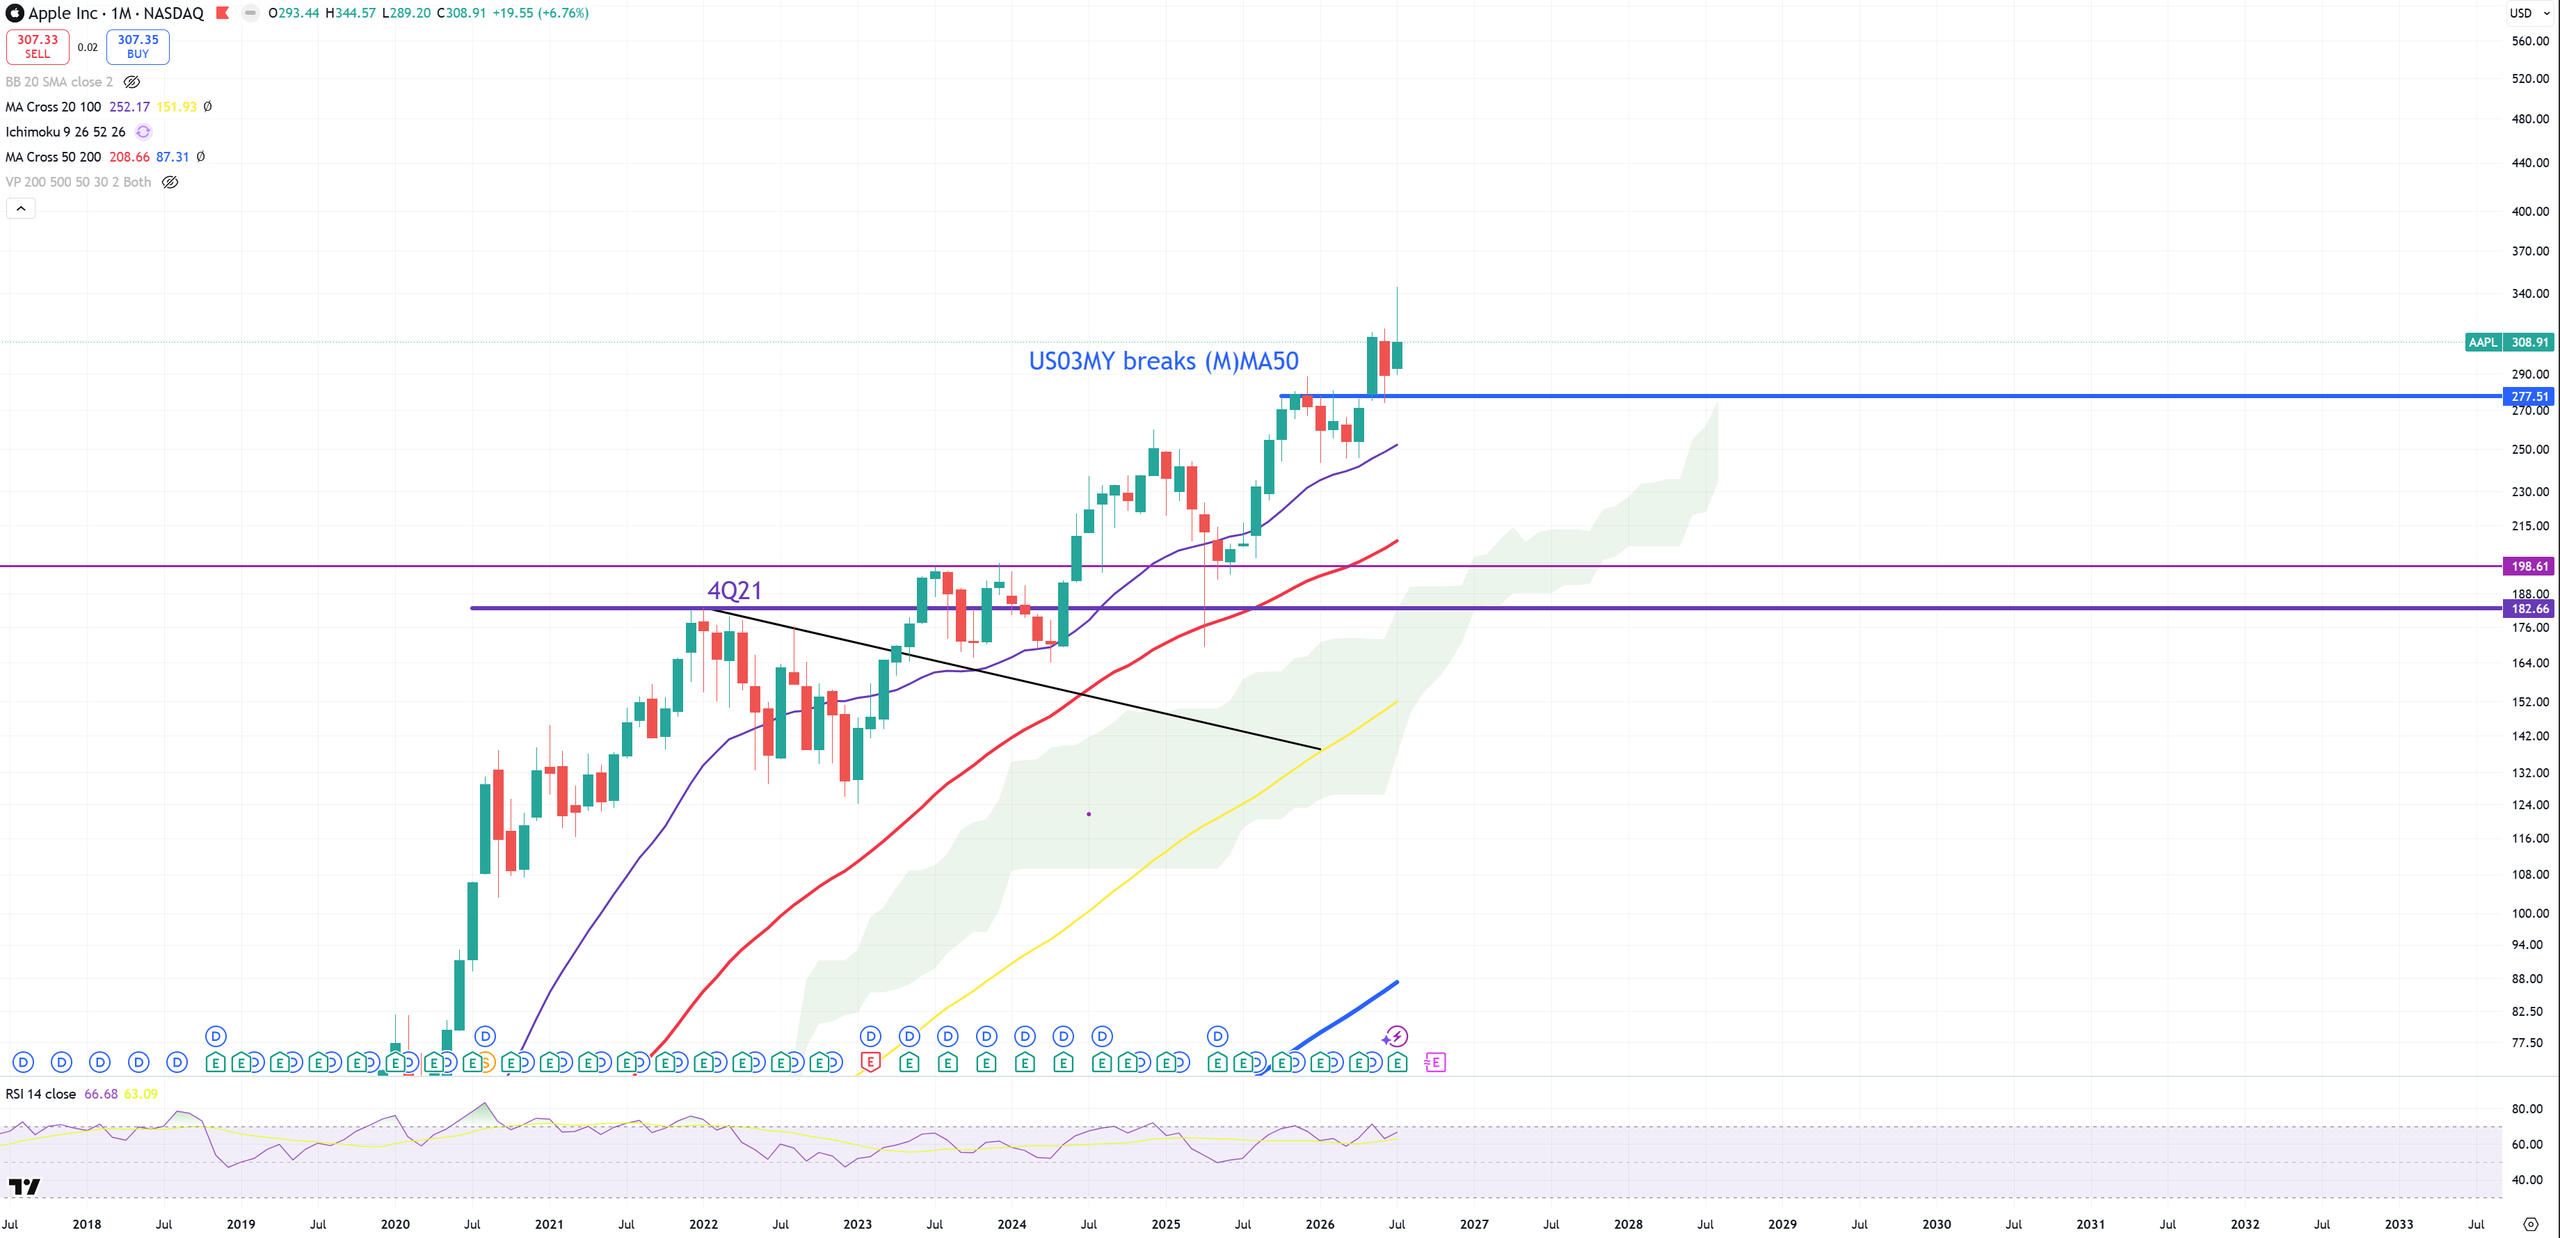
AAPL – very good situation so far. I cut all unnecessary lines
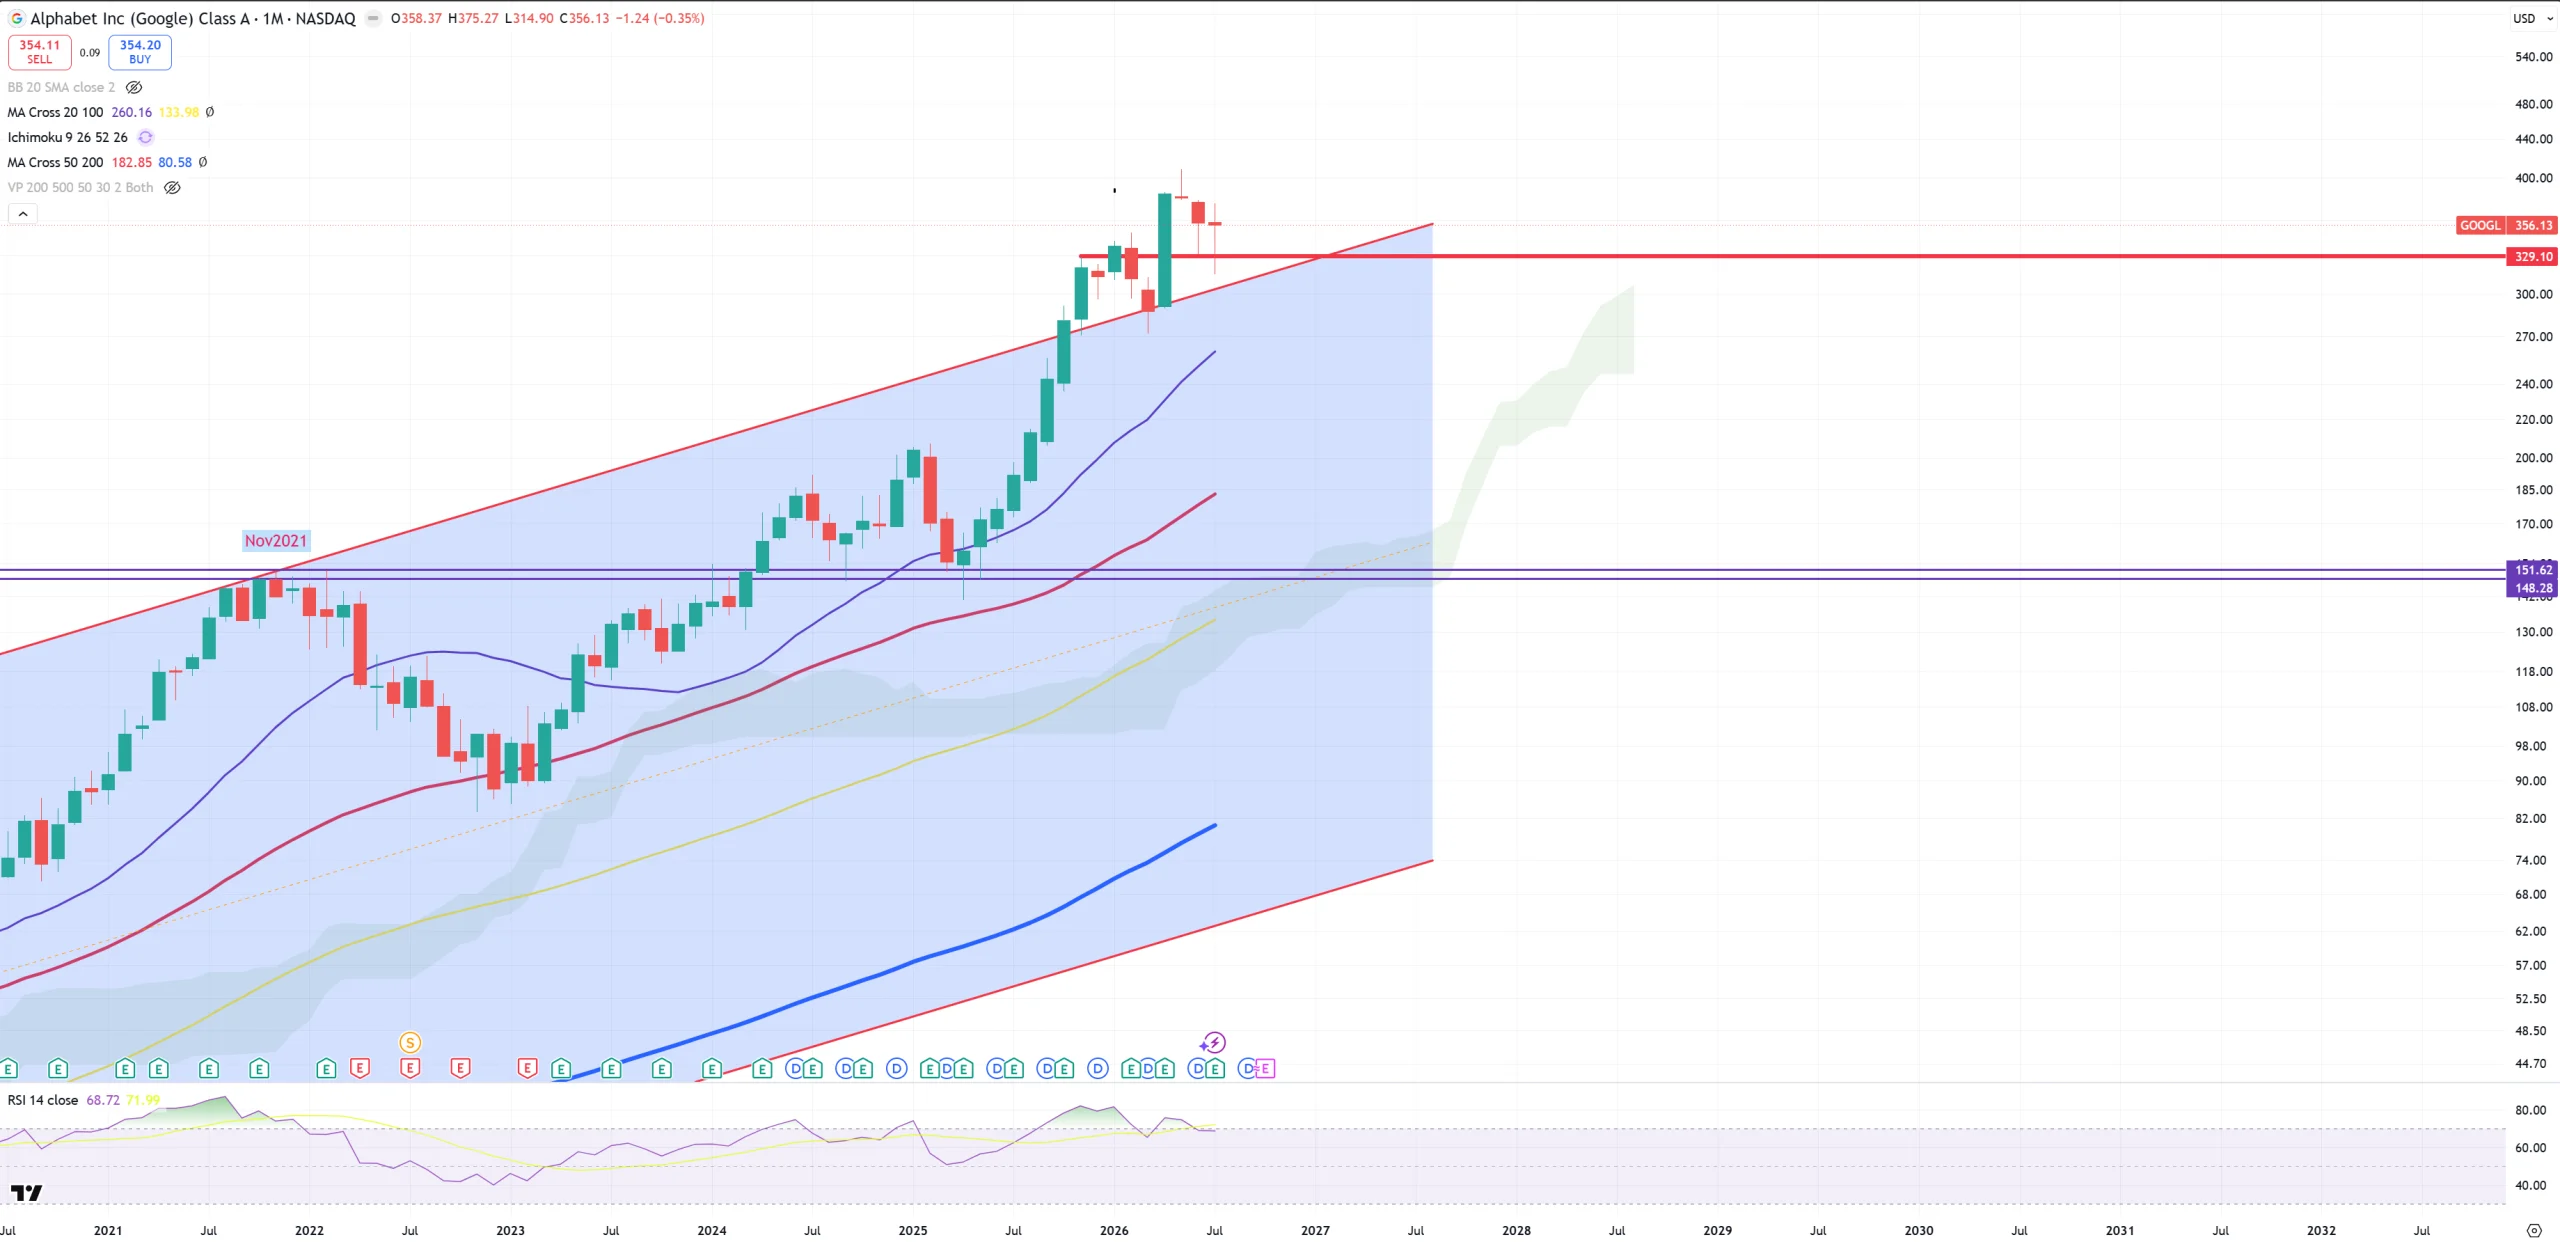
GOOGL – both with Apple are in the best technical situation.
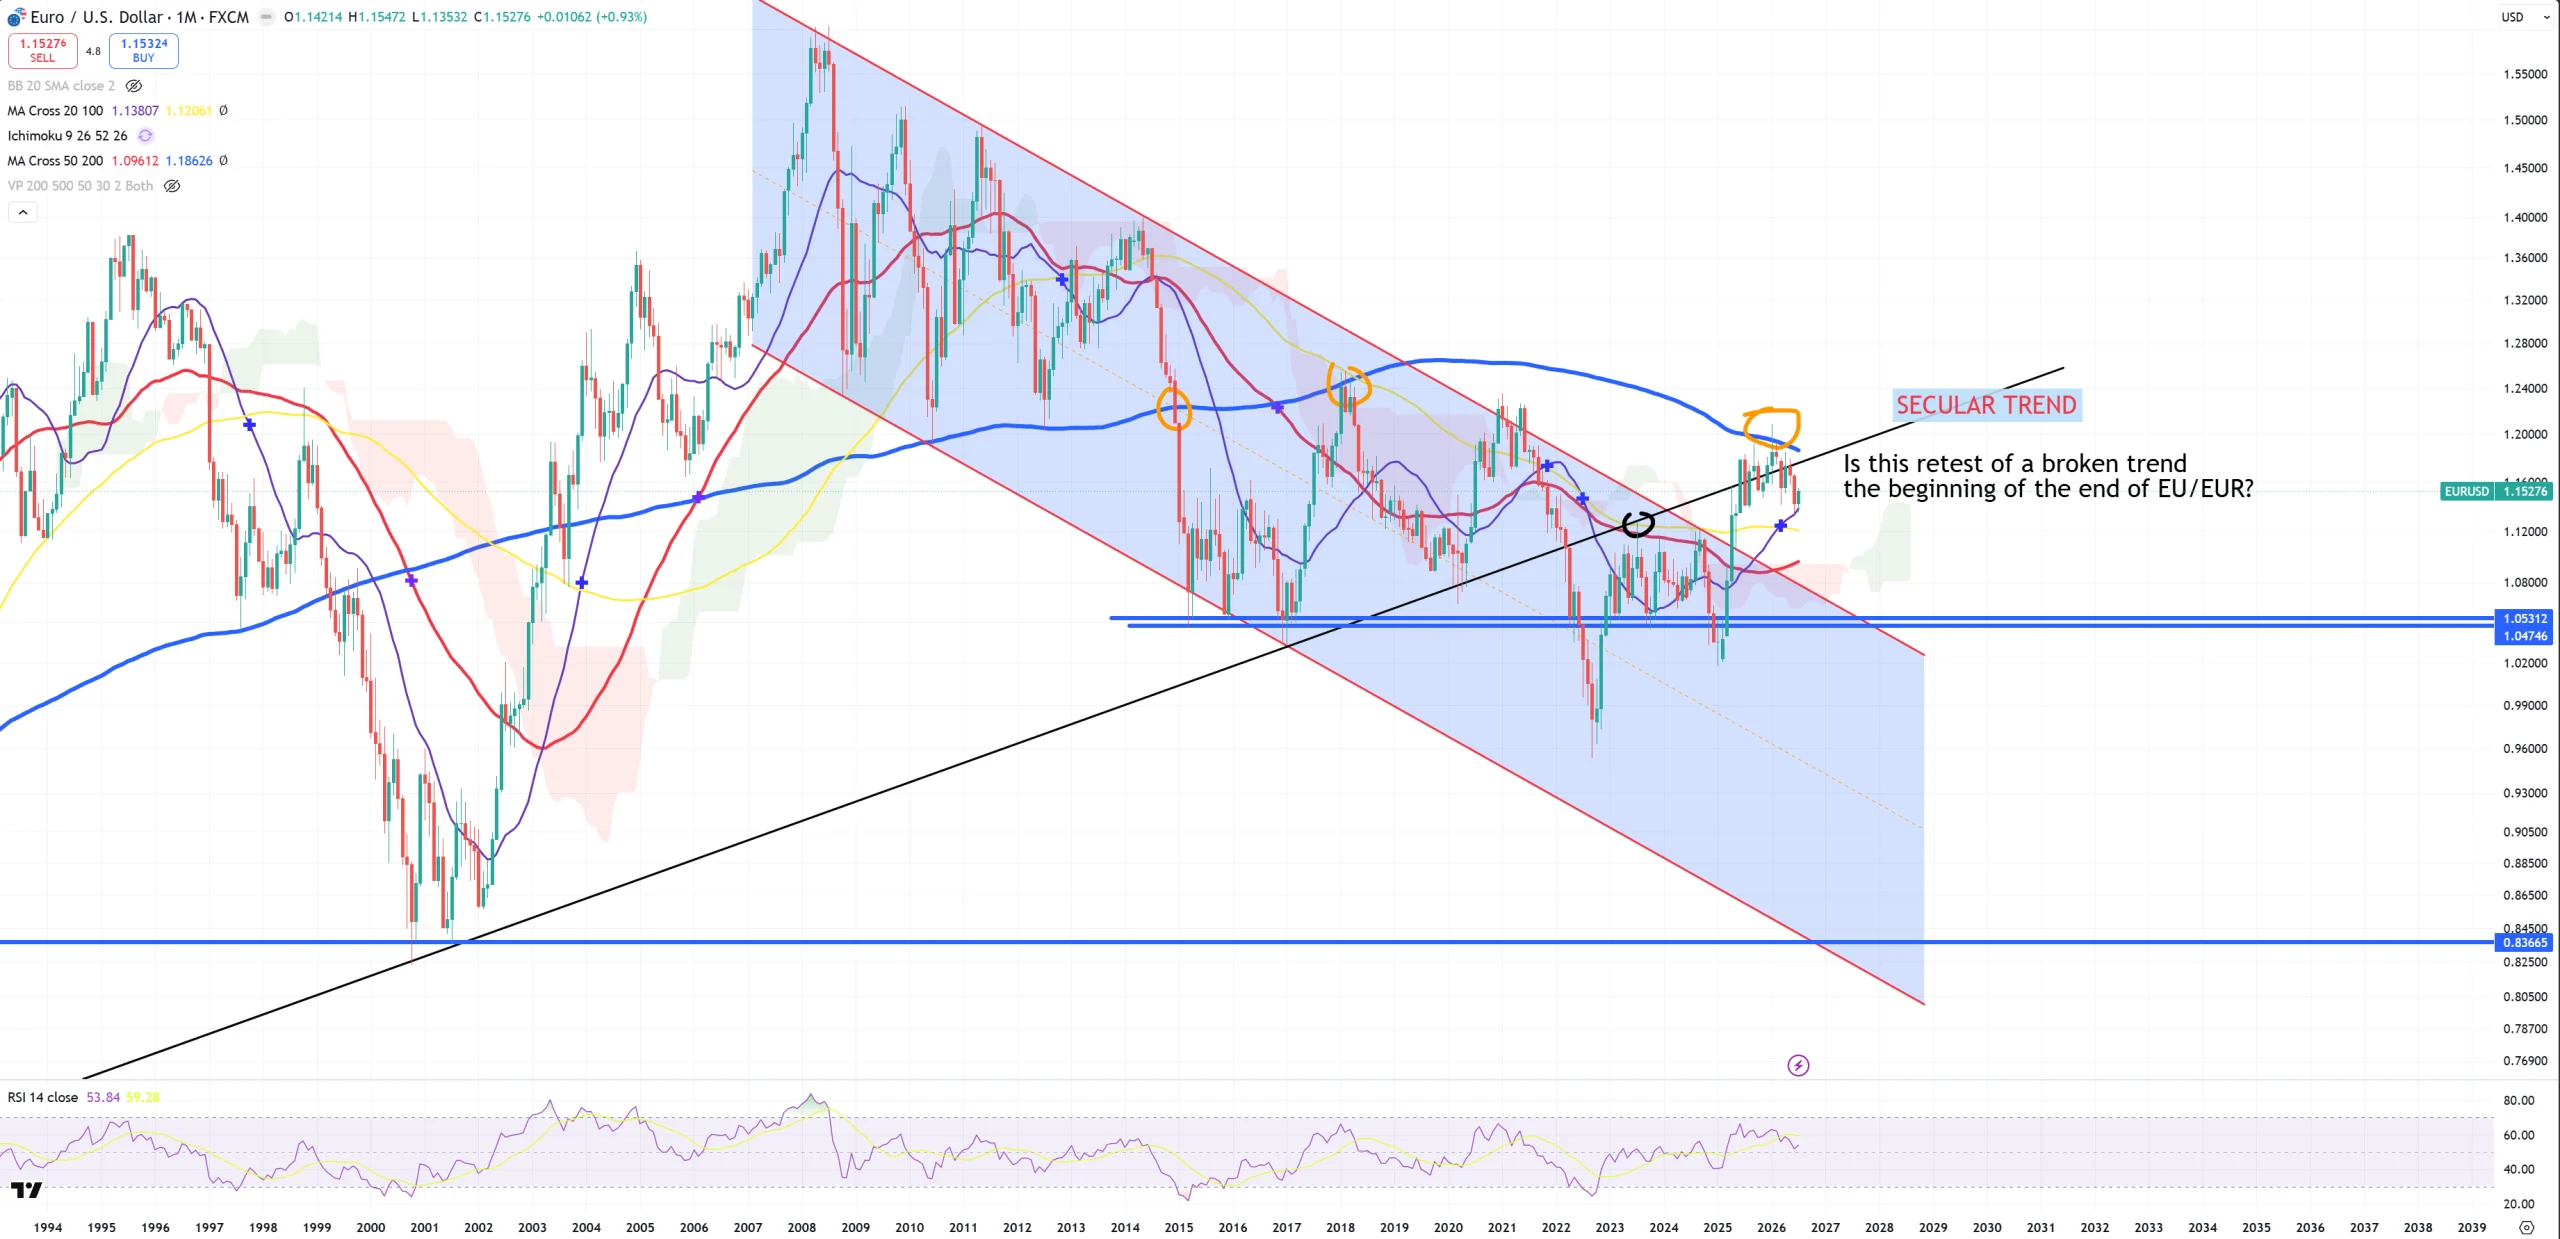
EURUSD – bounces off (M)MA20 ?????????????????off czy of
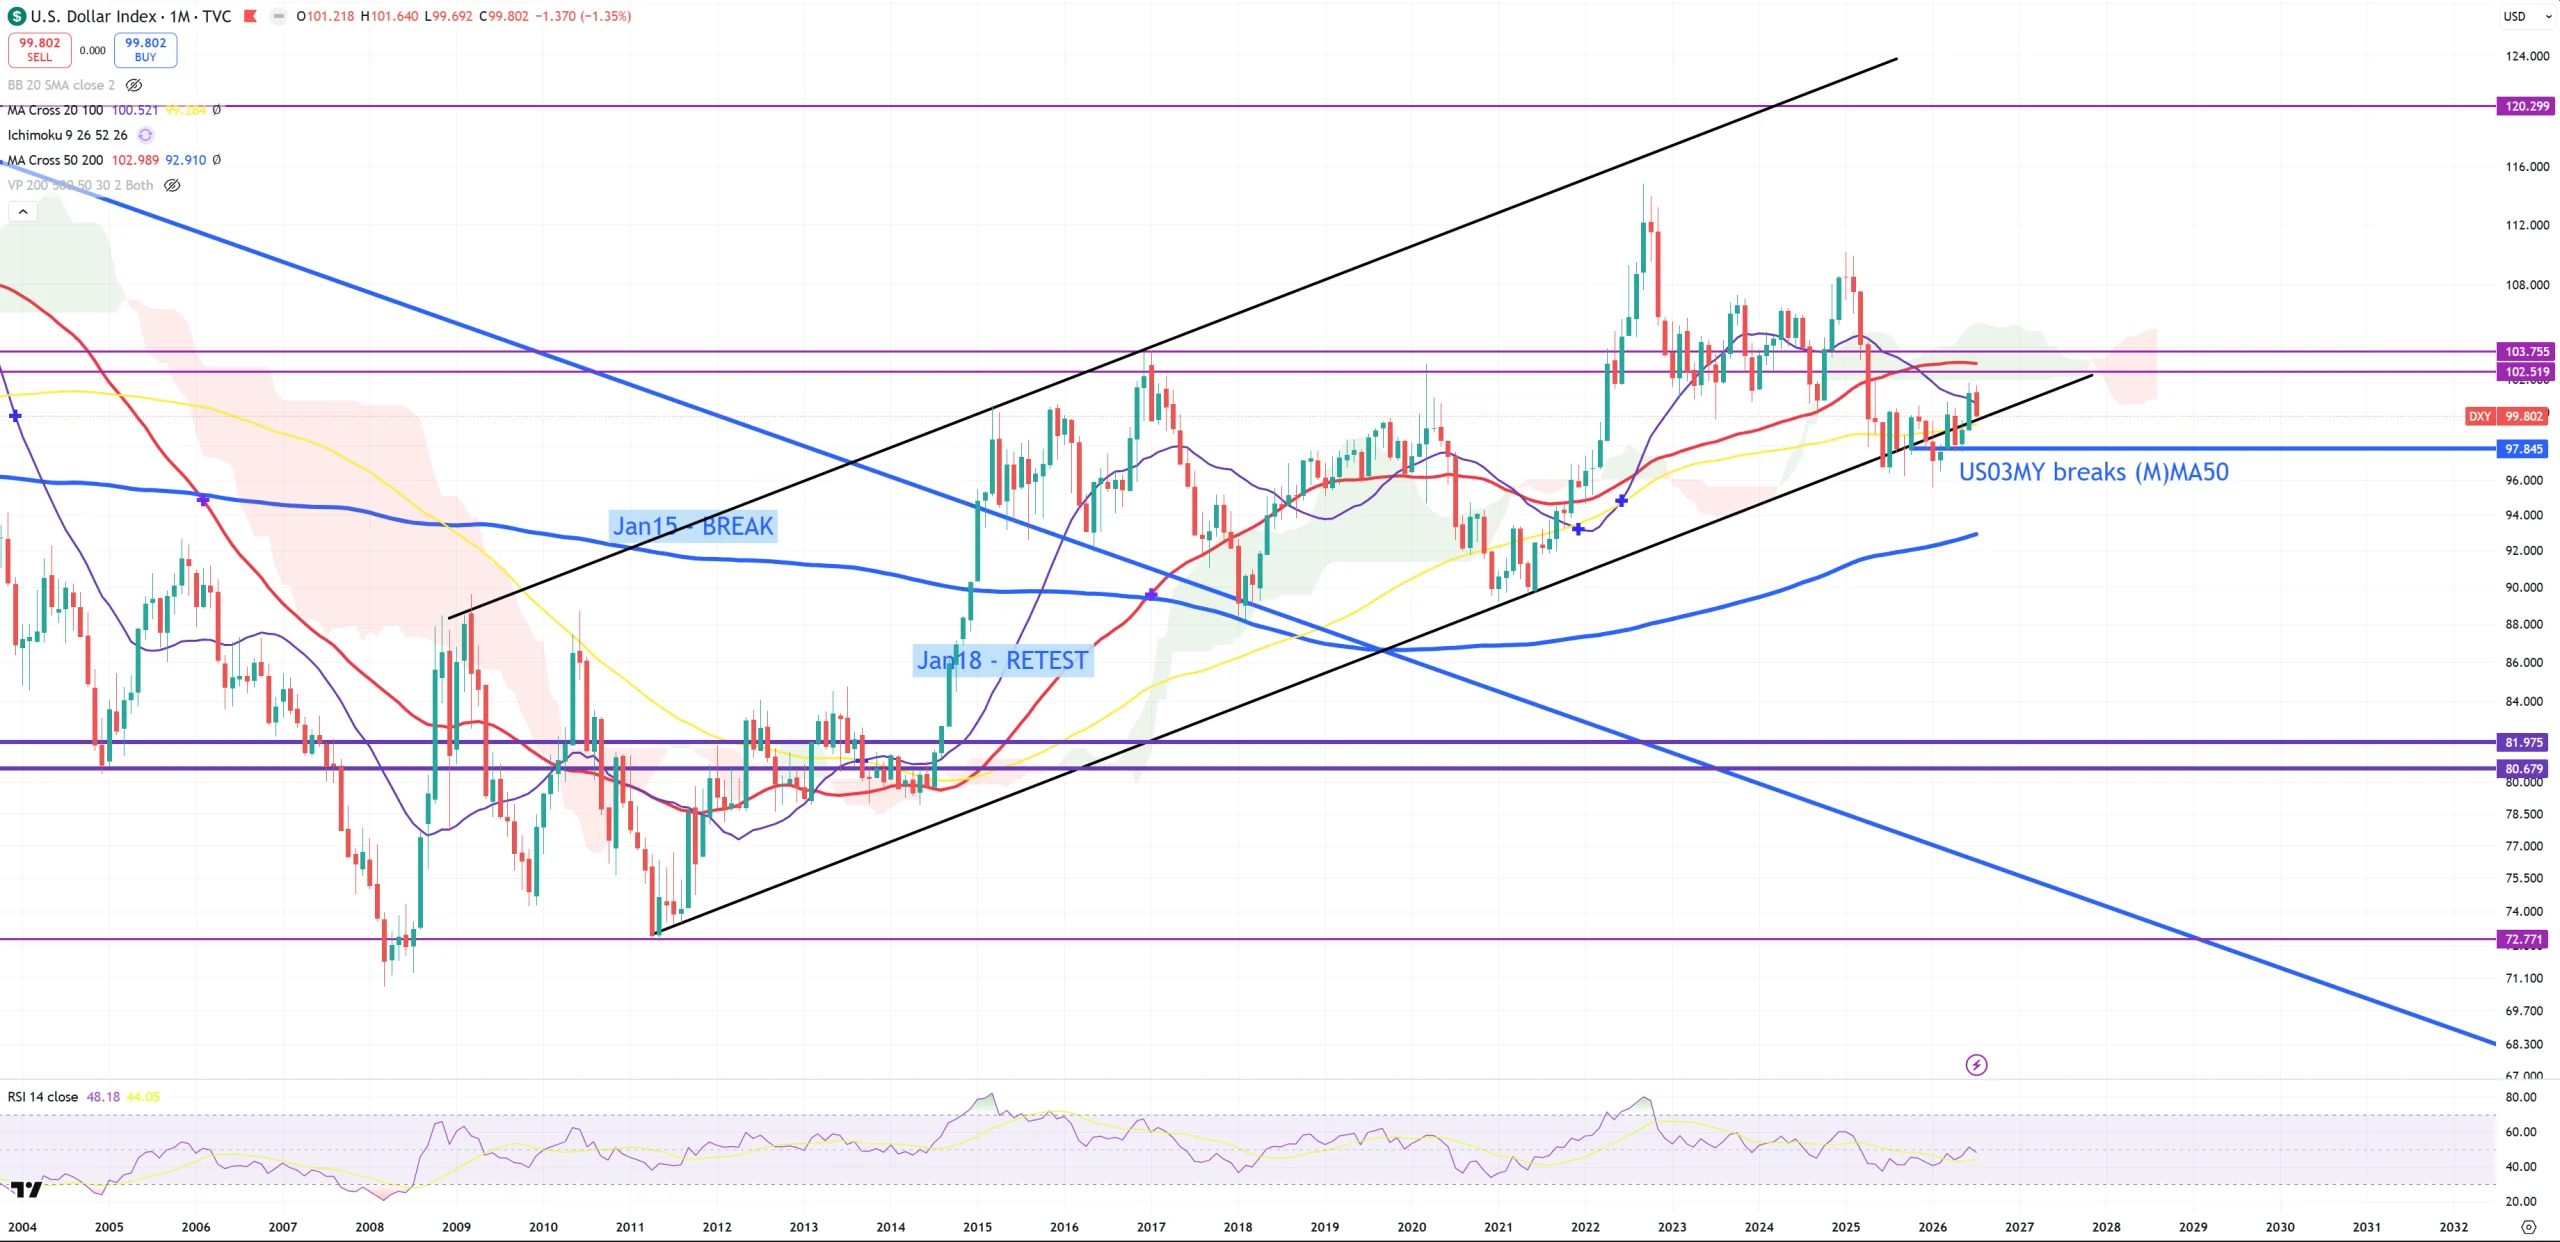
DXY – still jumping around its key trend
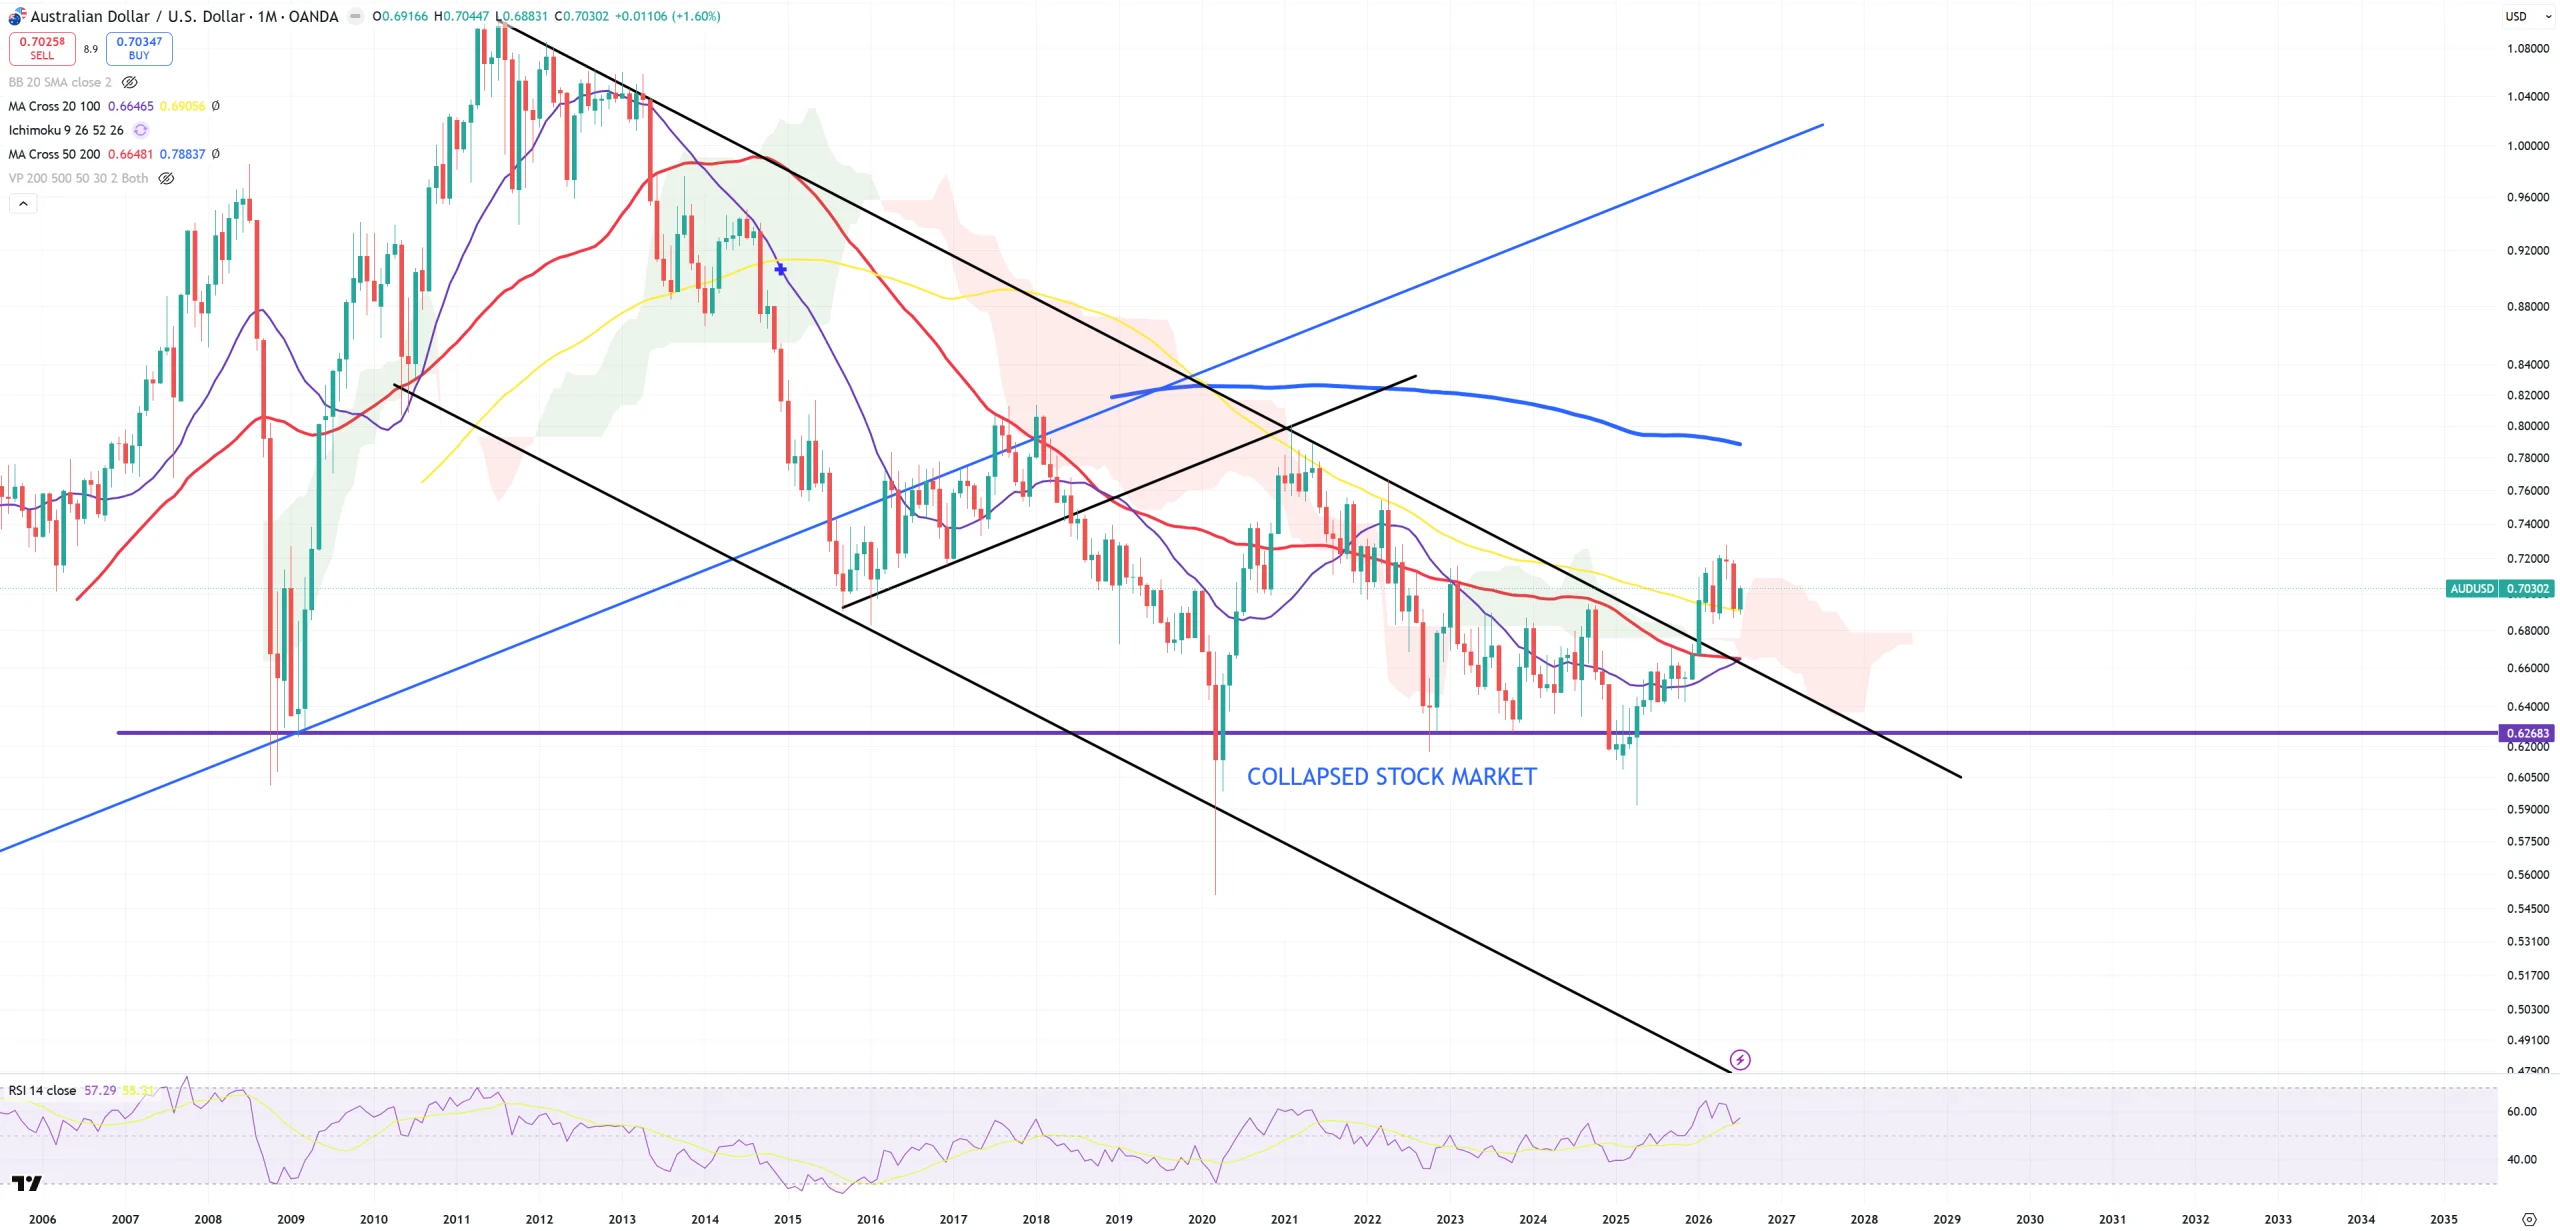
AUDUSD – main risk on/off pair now – support on (M)MA100, but on (3M) view we all know big level stays on 0.725 where (3M)MA50 sits
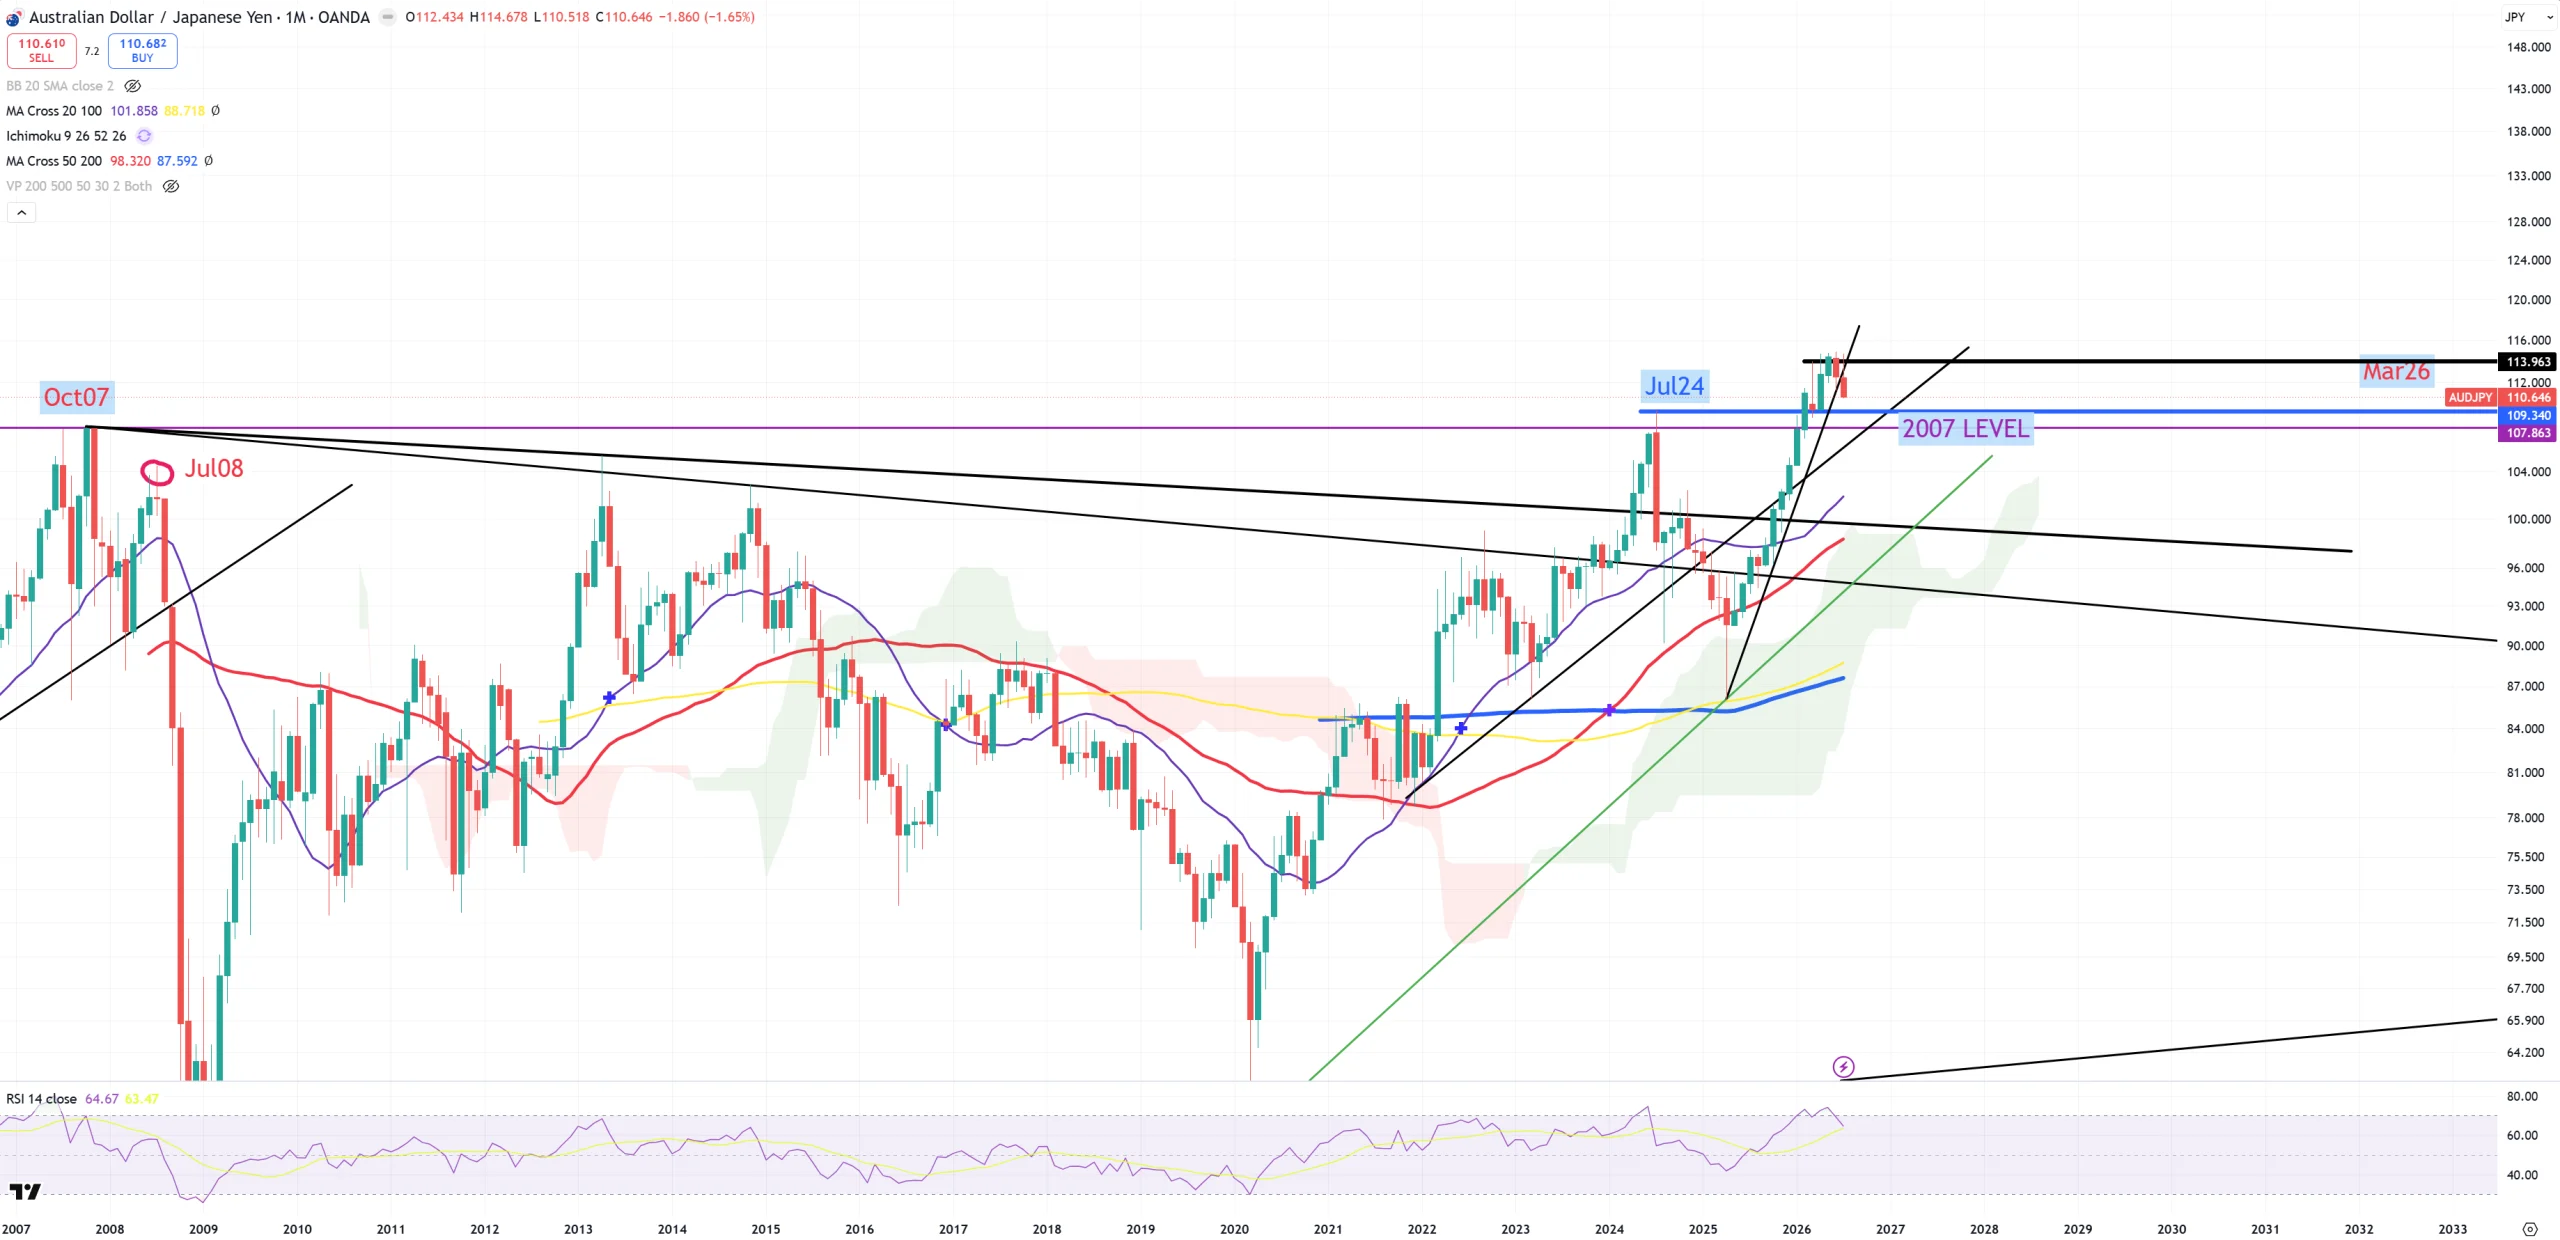
AUDJPY – the longer I observe this pair the more marginal role it has (because Yen is now a junk currency), but this October 2007 level still is important
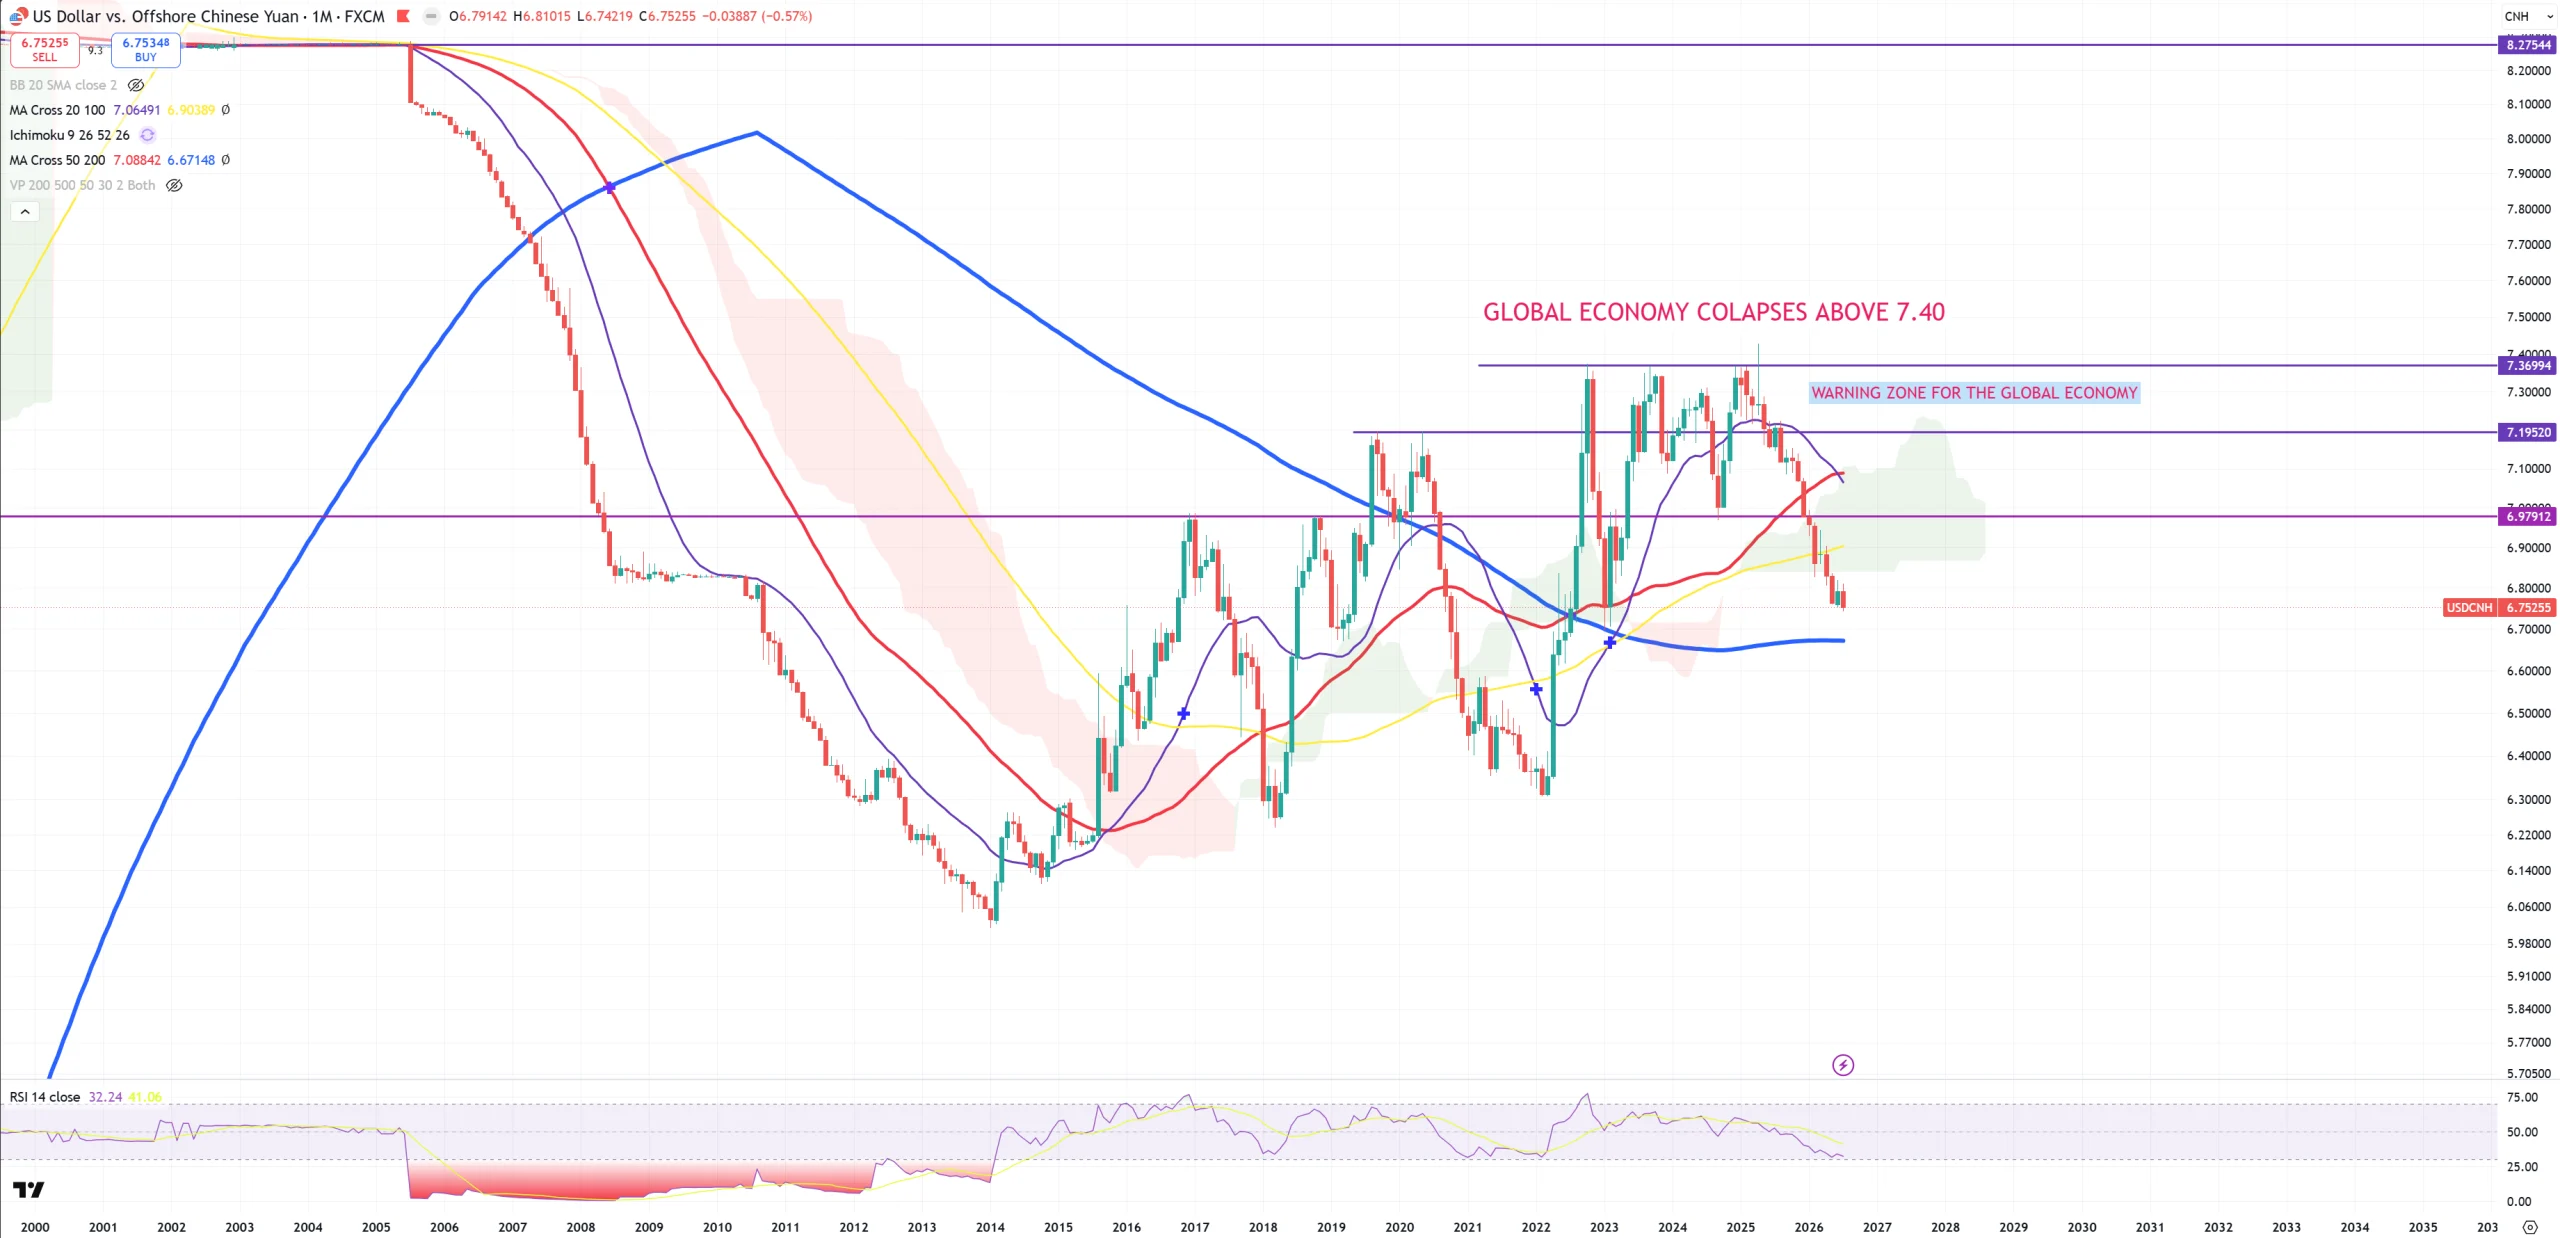
USDCNH – main pair – on (M) it’s in the middle of nowhere. On (3M) we have (3M)MA50=6.77 and it’s the key level but plenty of time. USDCNH reversal = US stocks falling off the trees.
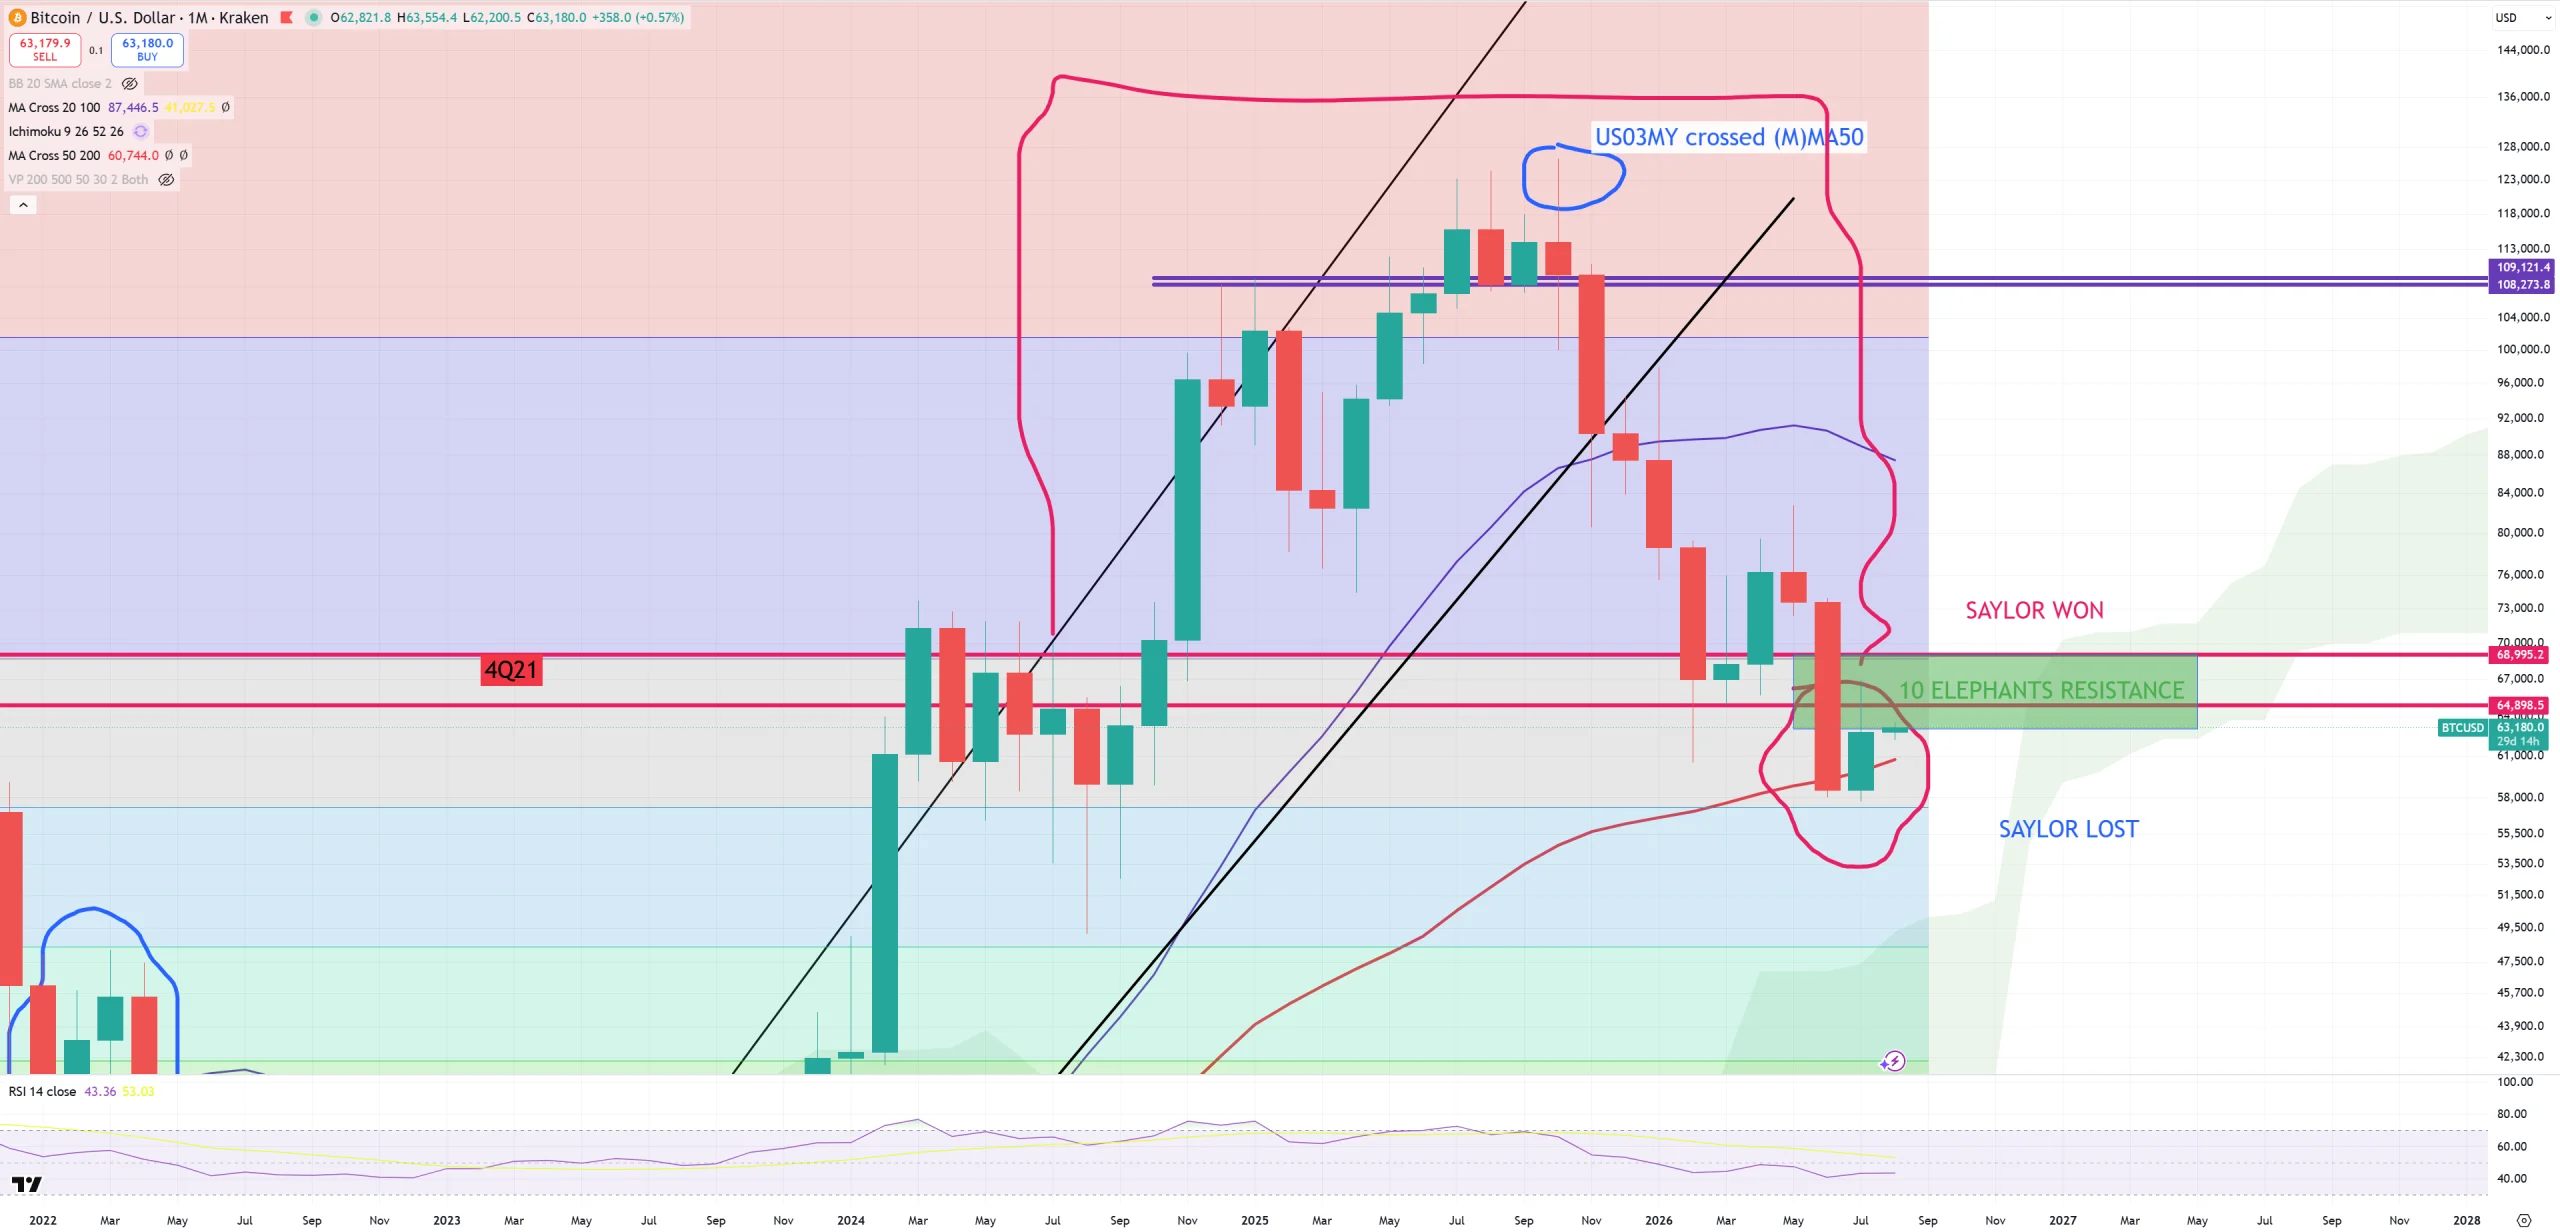
BTC – hits massive resistance level as it needs to save red (M)MA50
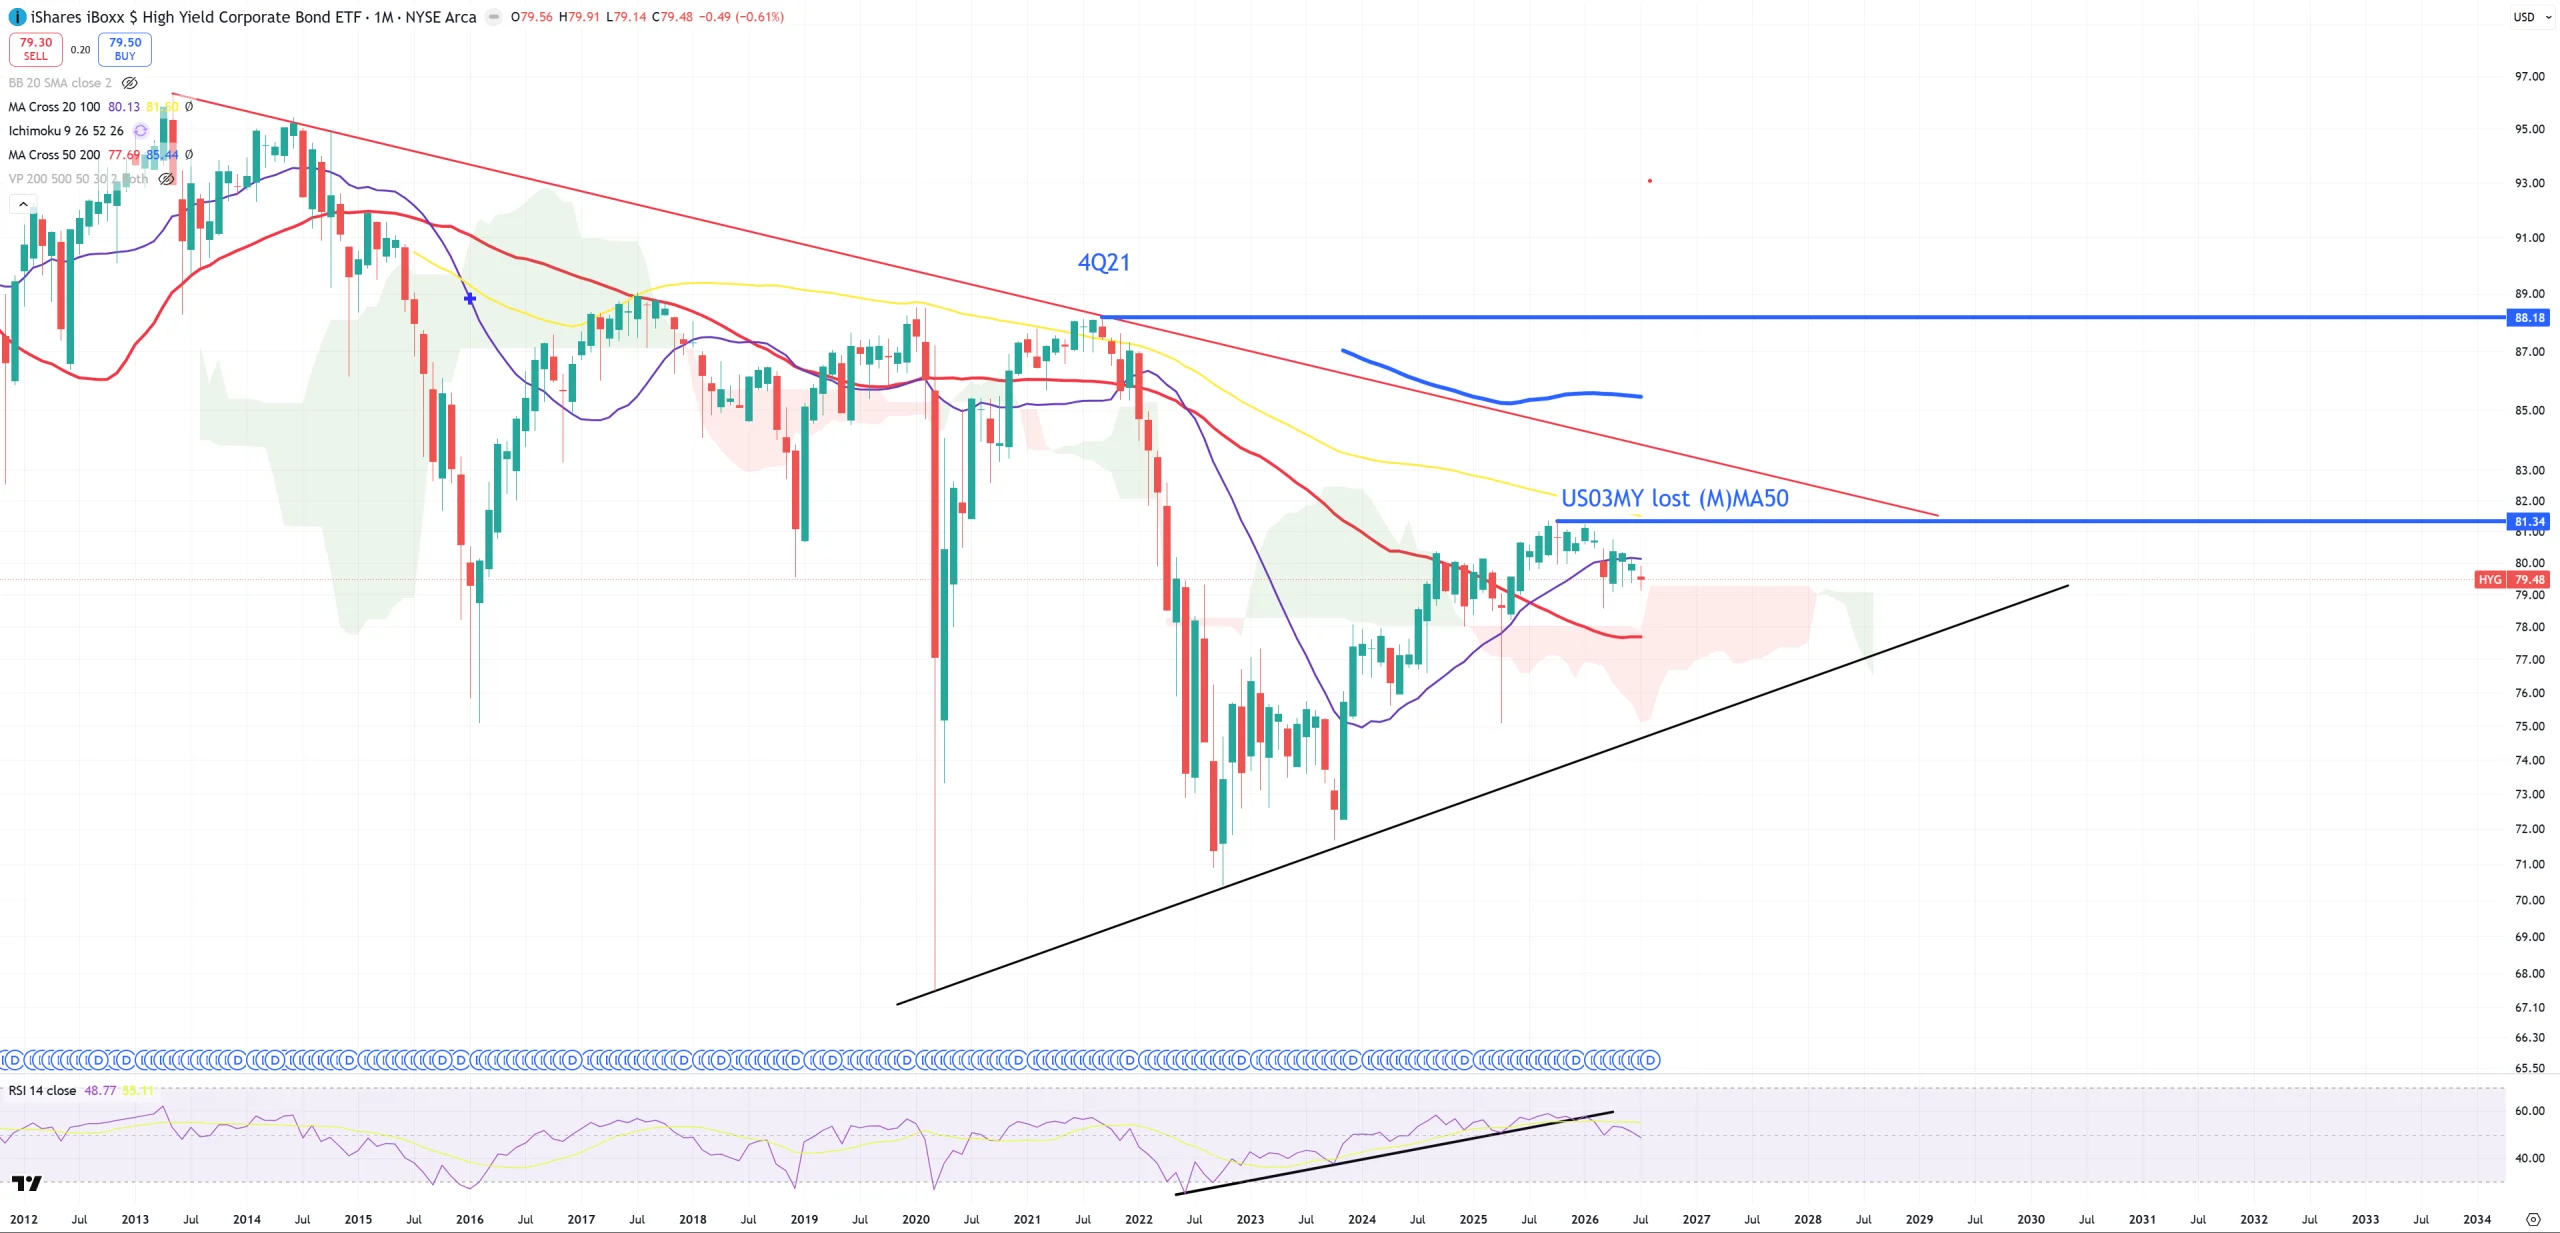
HYG – junk bonds – (M)RSI trend broken and now below (M)MA20
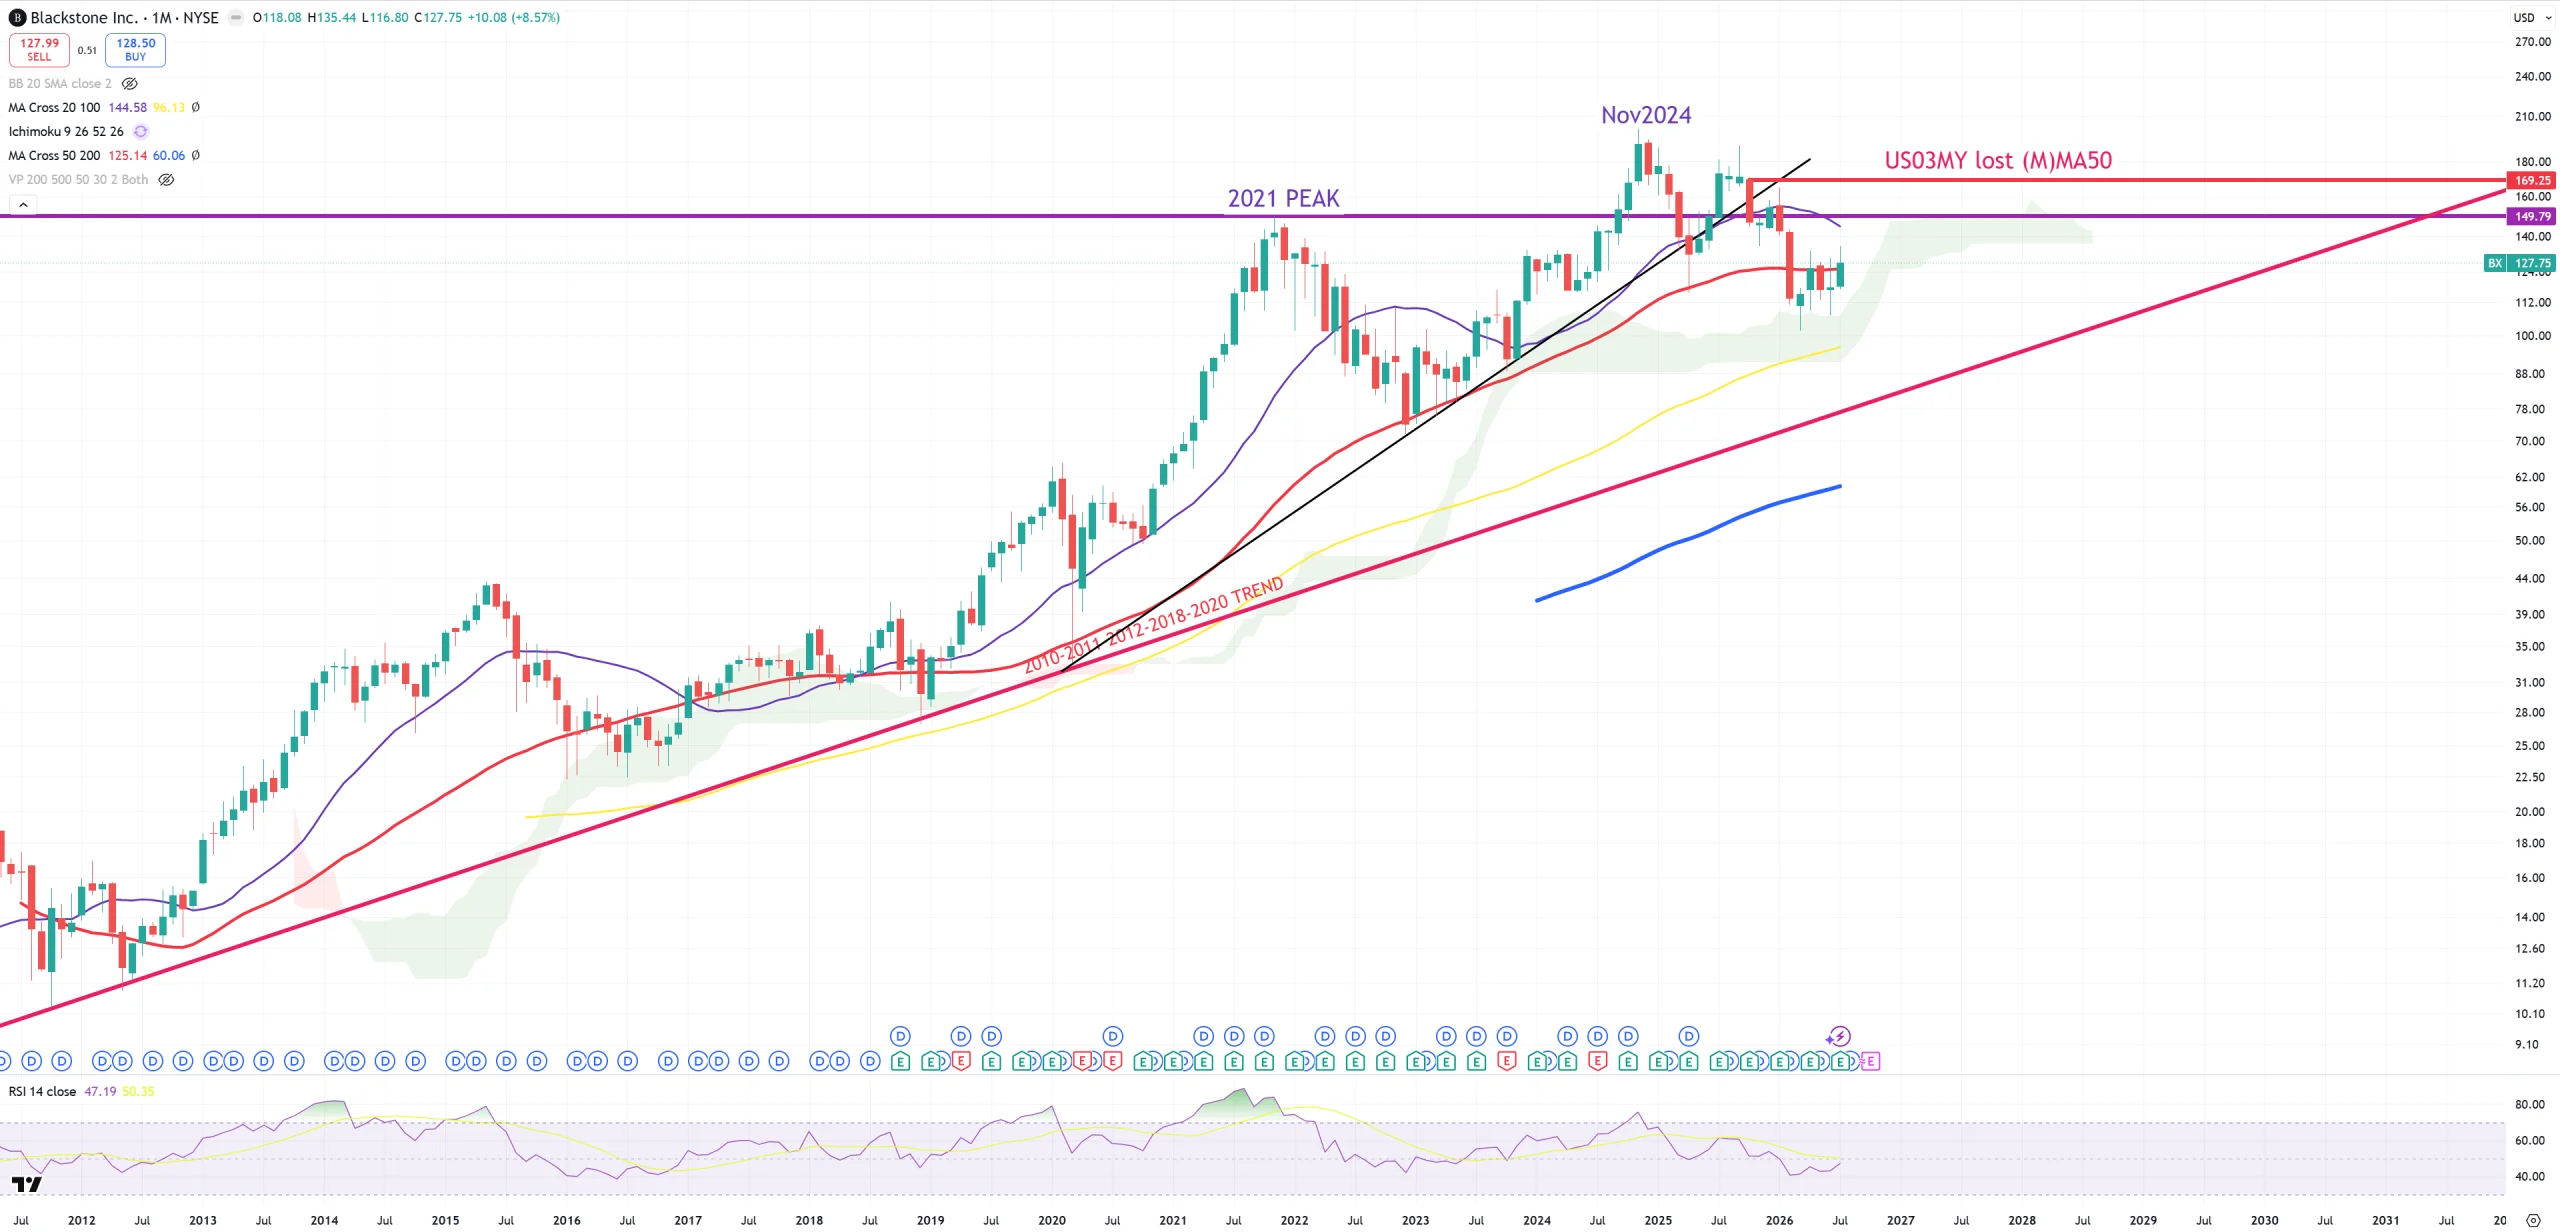
BX – no idea how Blackstone manages to go this way so long with yields going parabolic. Anyway it’s still (M)MA50 retest.
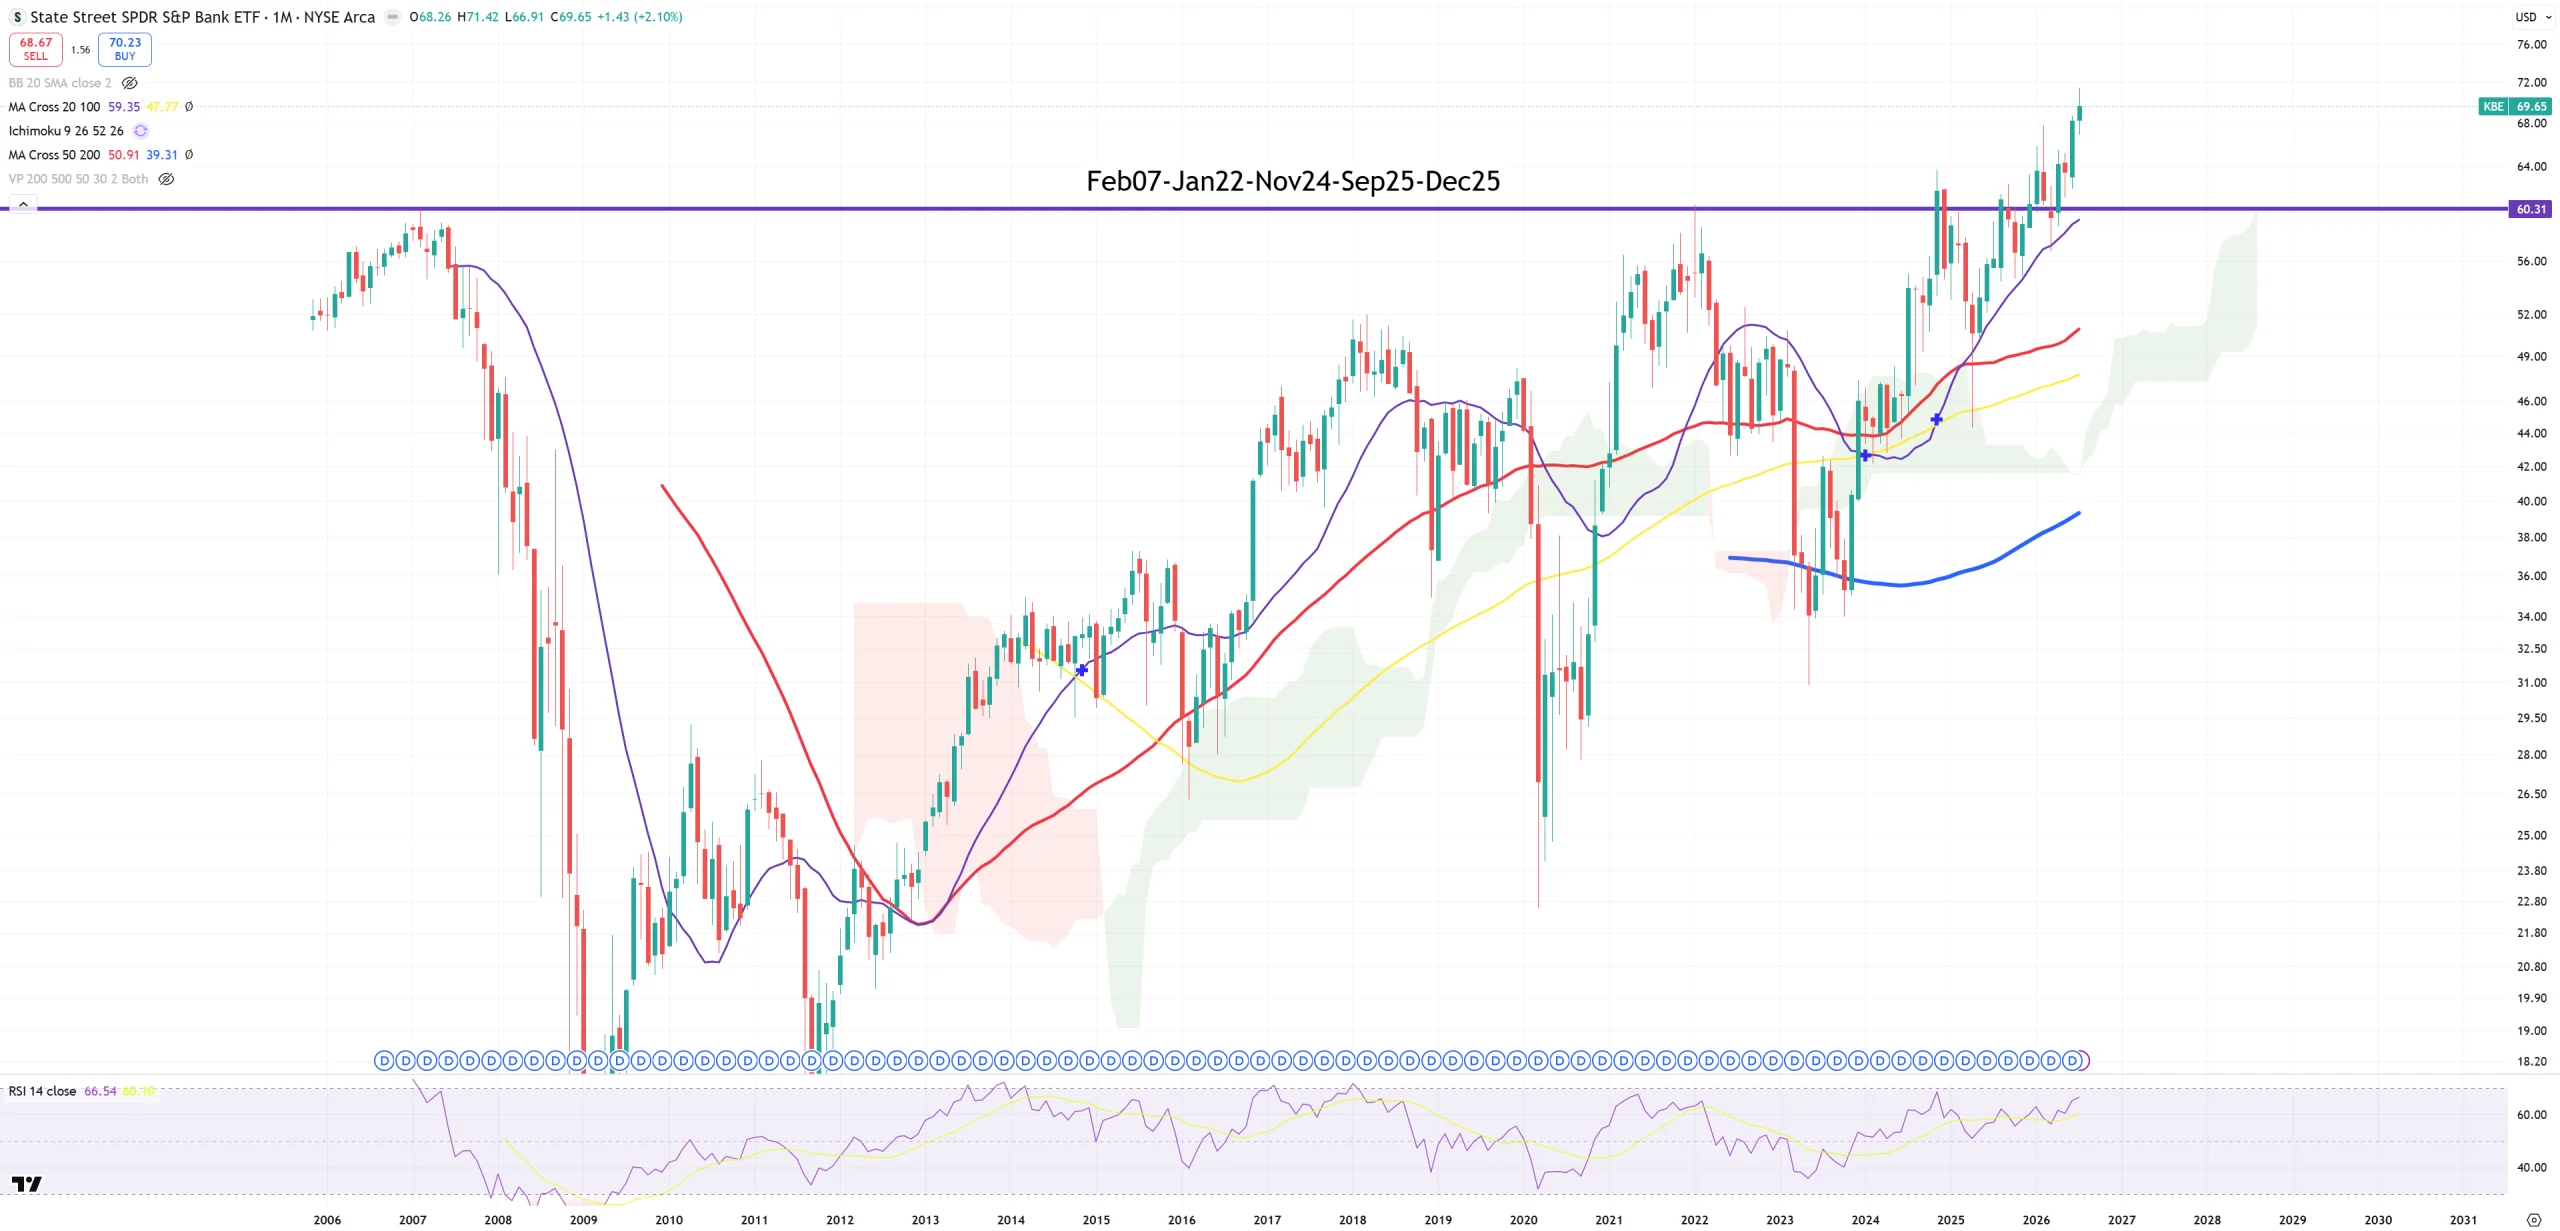
KBE – big banks – they so far totally don’t care about HYG
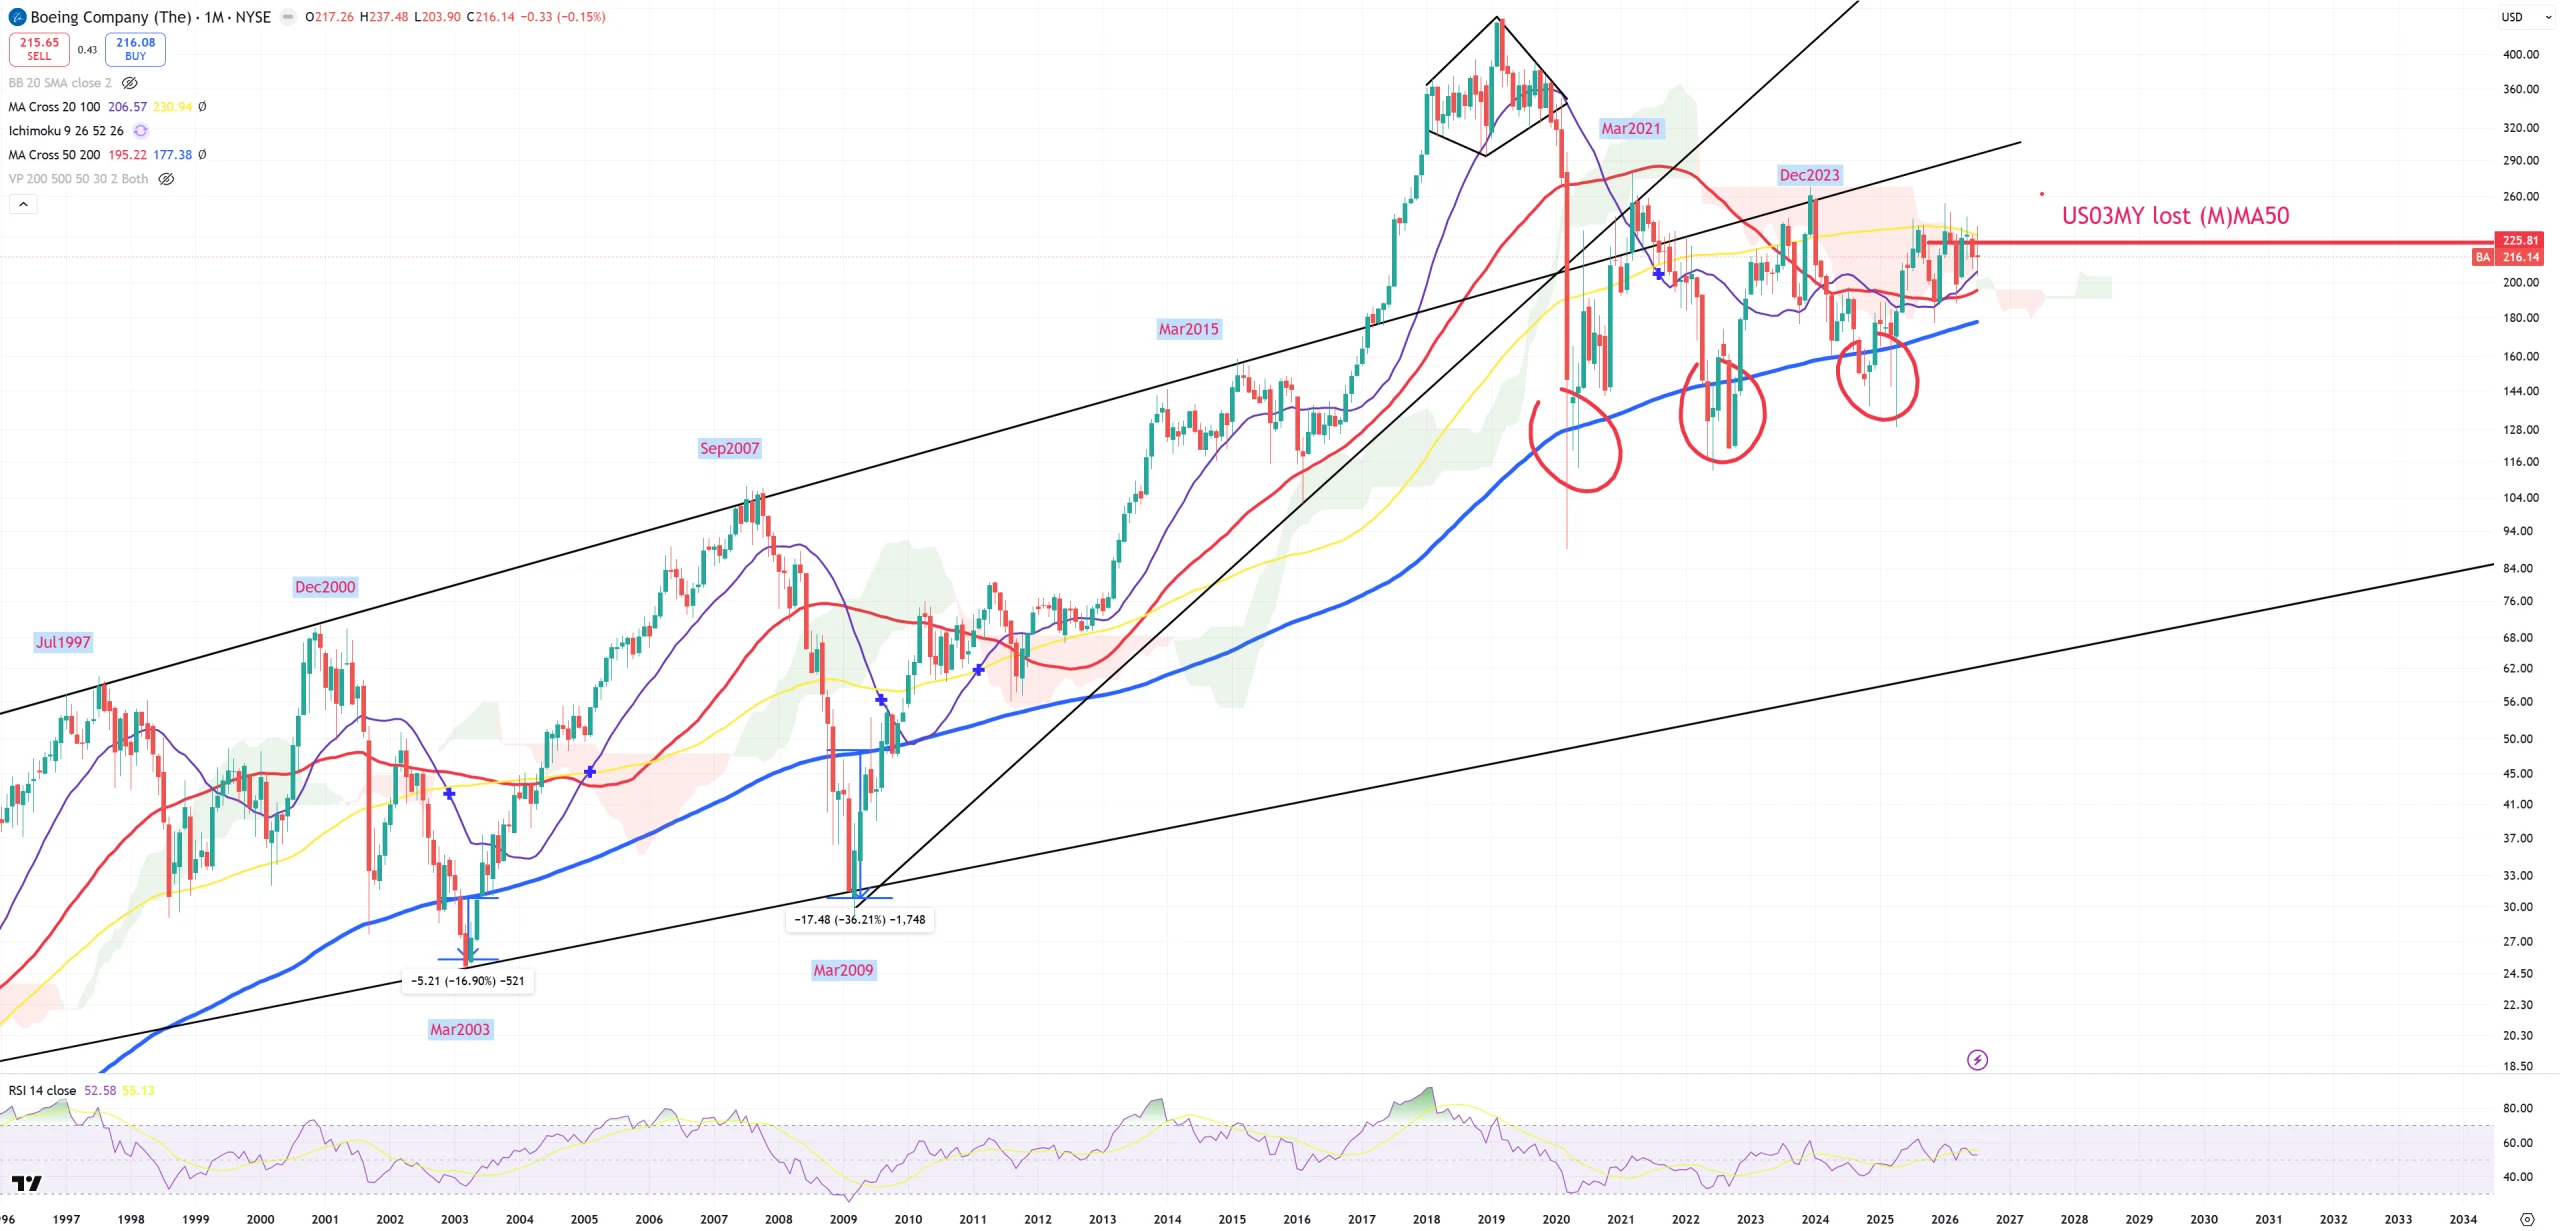
BA – I love Boeing chart – the moment this chart breaks blue (M)MA200 it confirms the bear market but we had 3 rescues. Will it get 4th after US03MY (M)MA50 lost moment? No idea, but probability keeps increasing with 10y/3m going higher too.
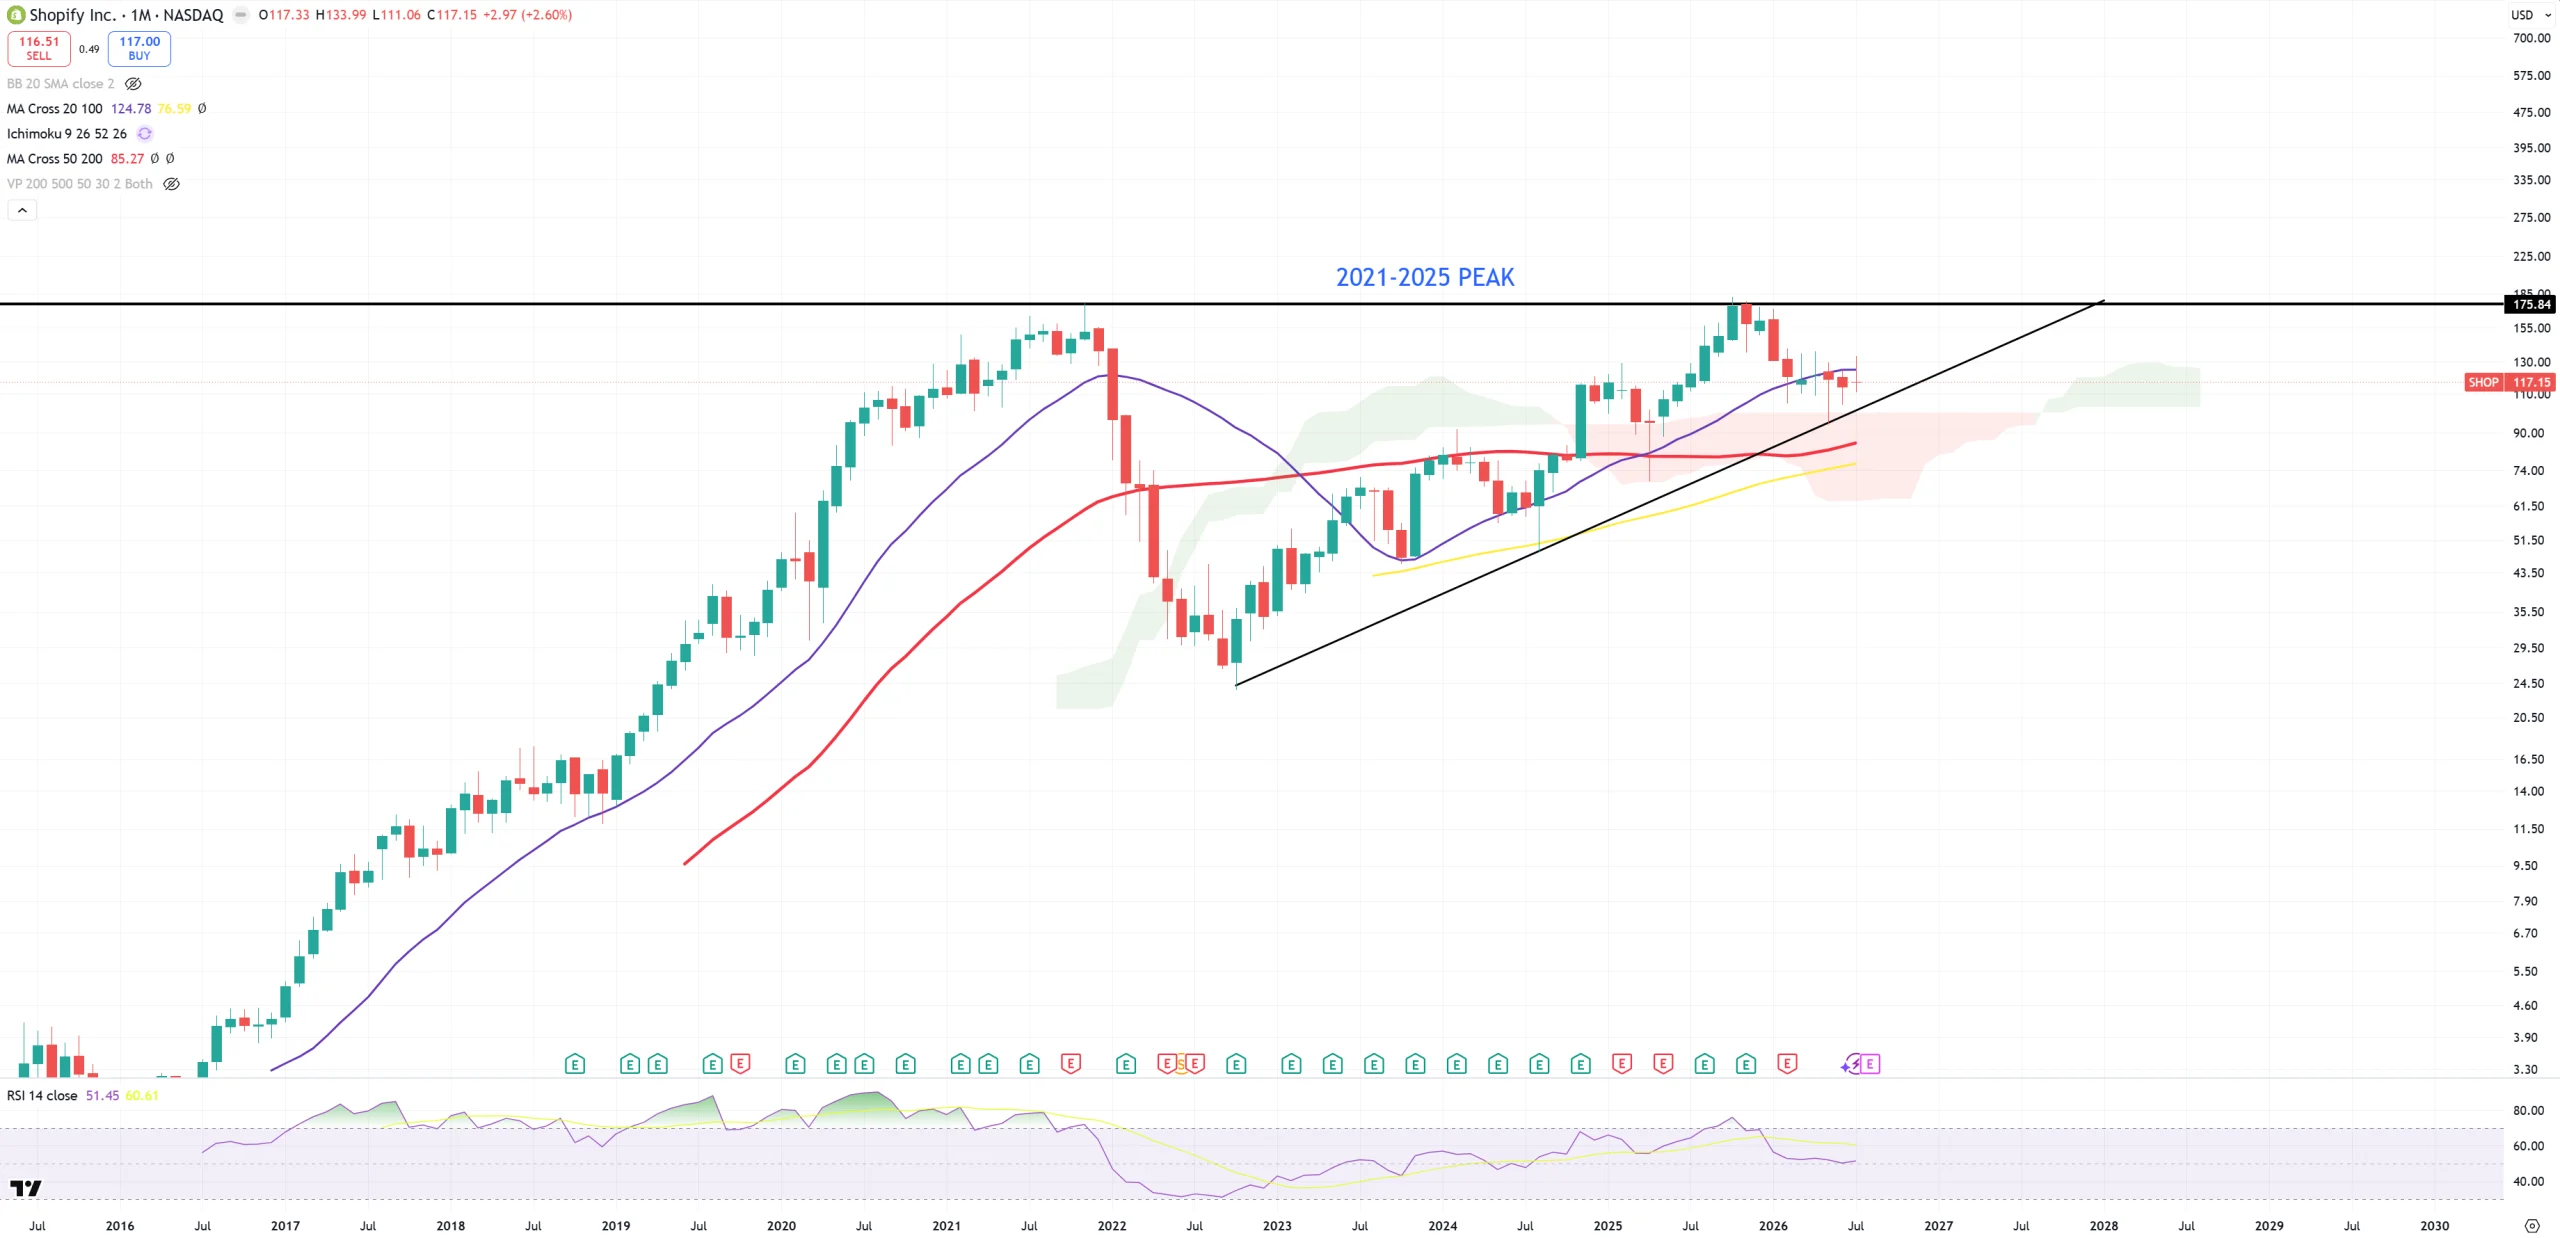
SHOP – one of those companies which peaked pefectly on 4Q21 and 4Q25 DOUBLE-TOP
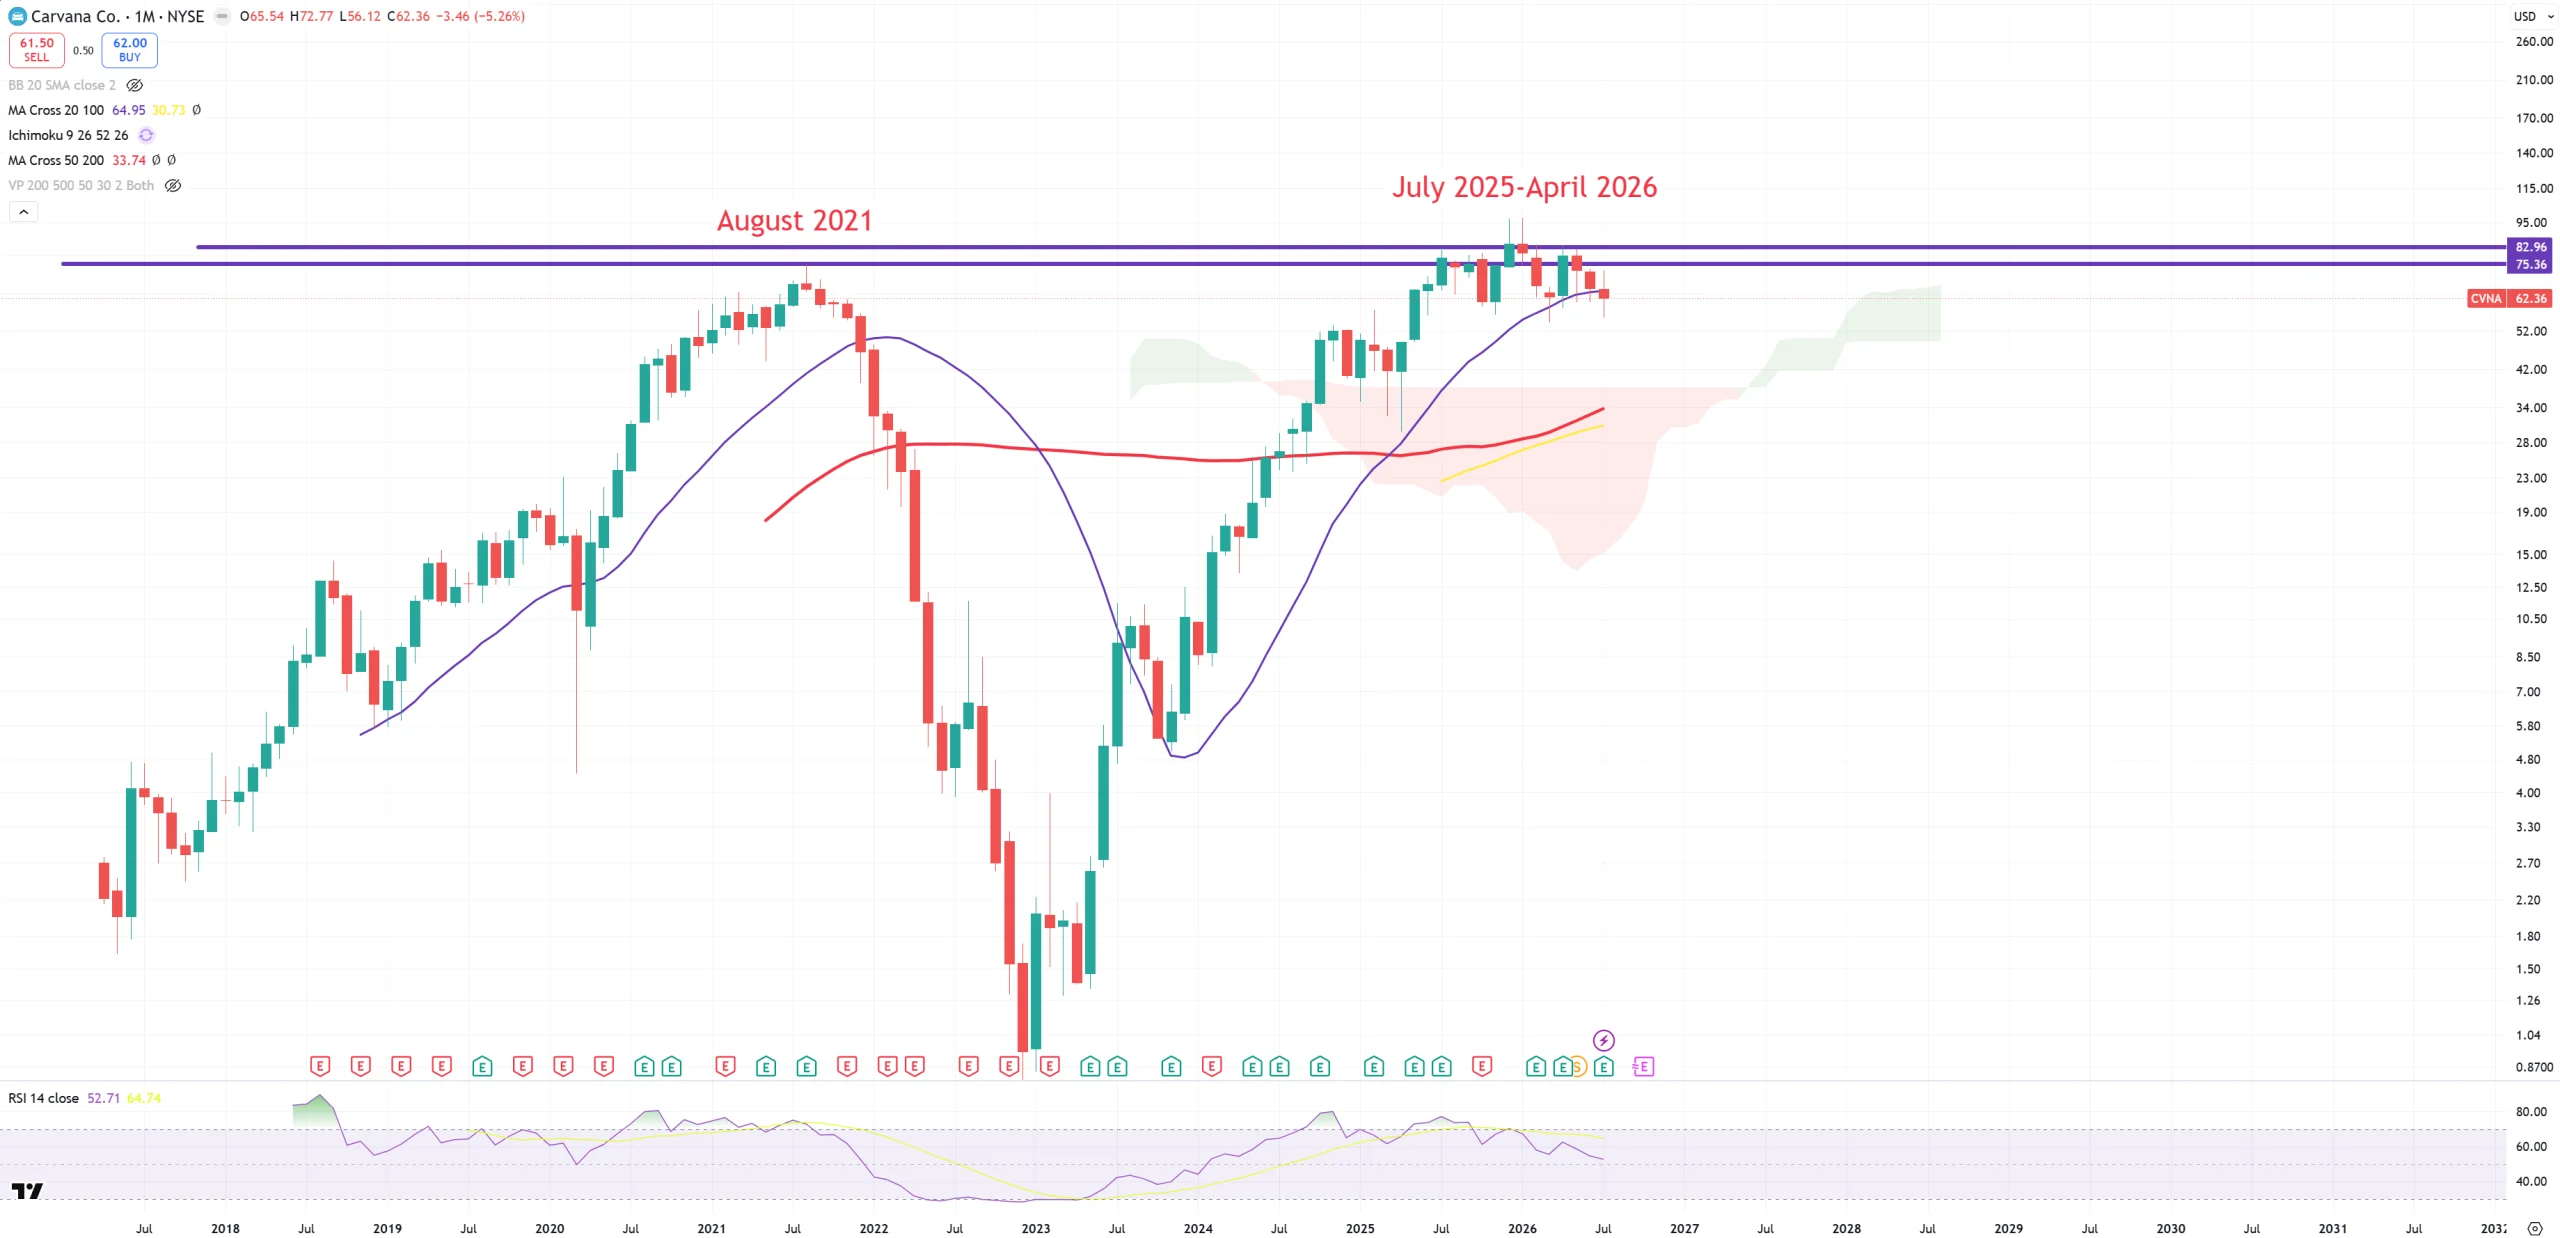
CVNA – also the same situation as SHOP
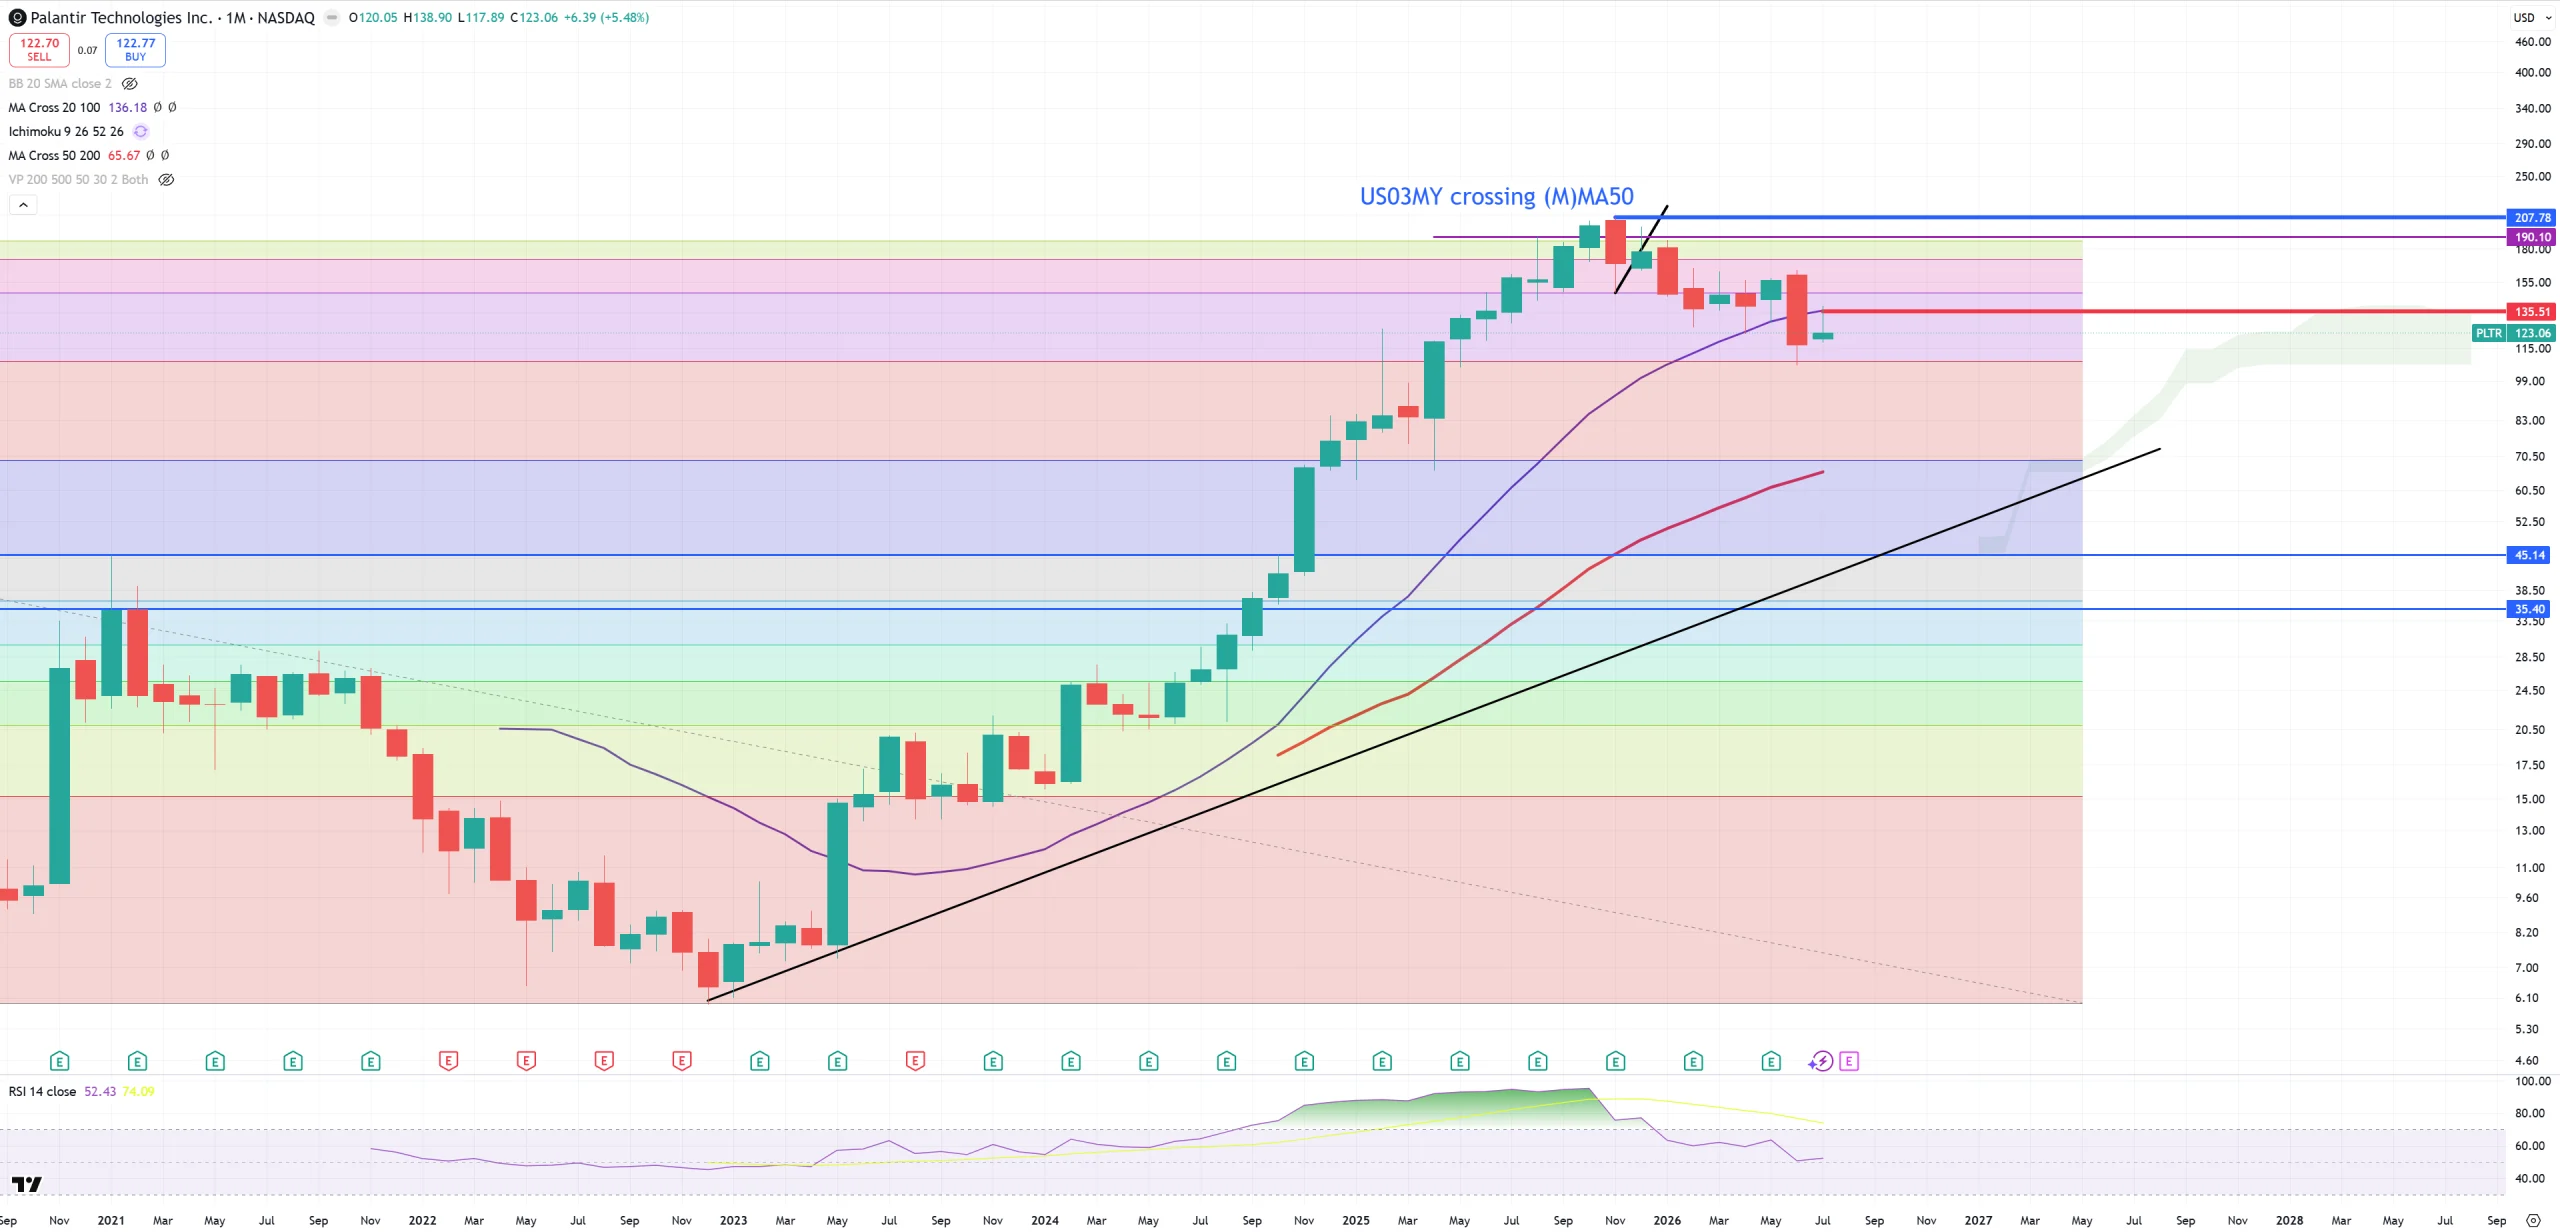
PLTR – holds below (M)MA20 – possible trend flip and confirmed lost high momentum bull market. This is a warning sign for now, but in line with my thesis.
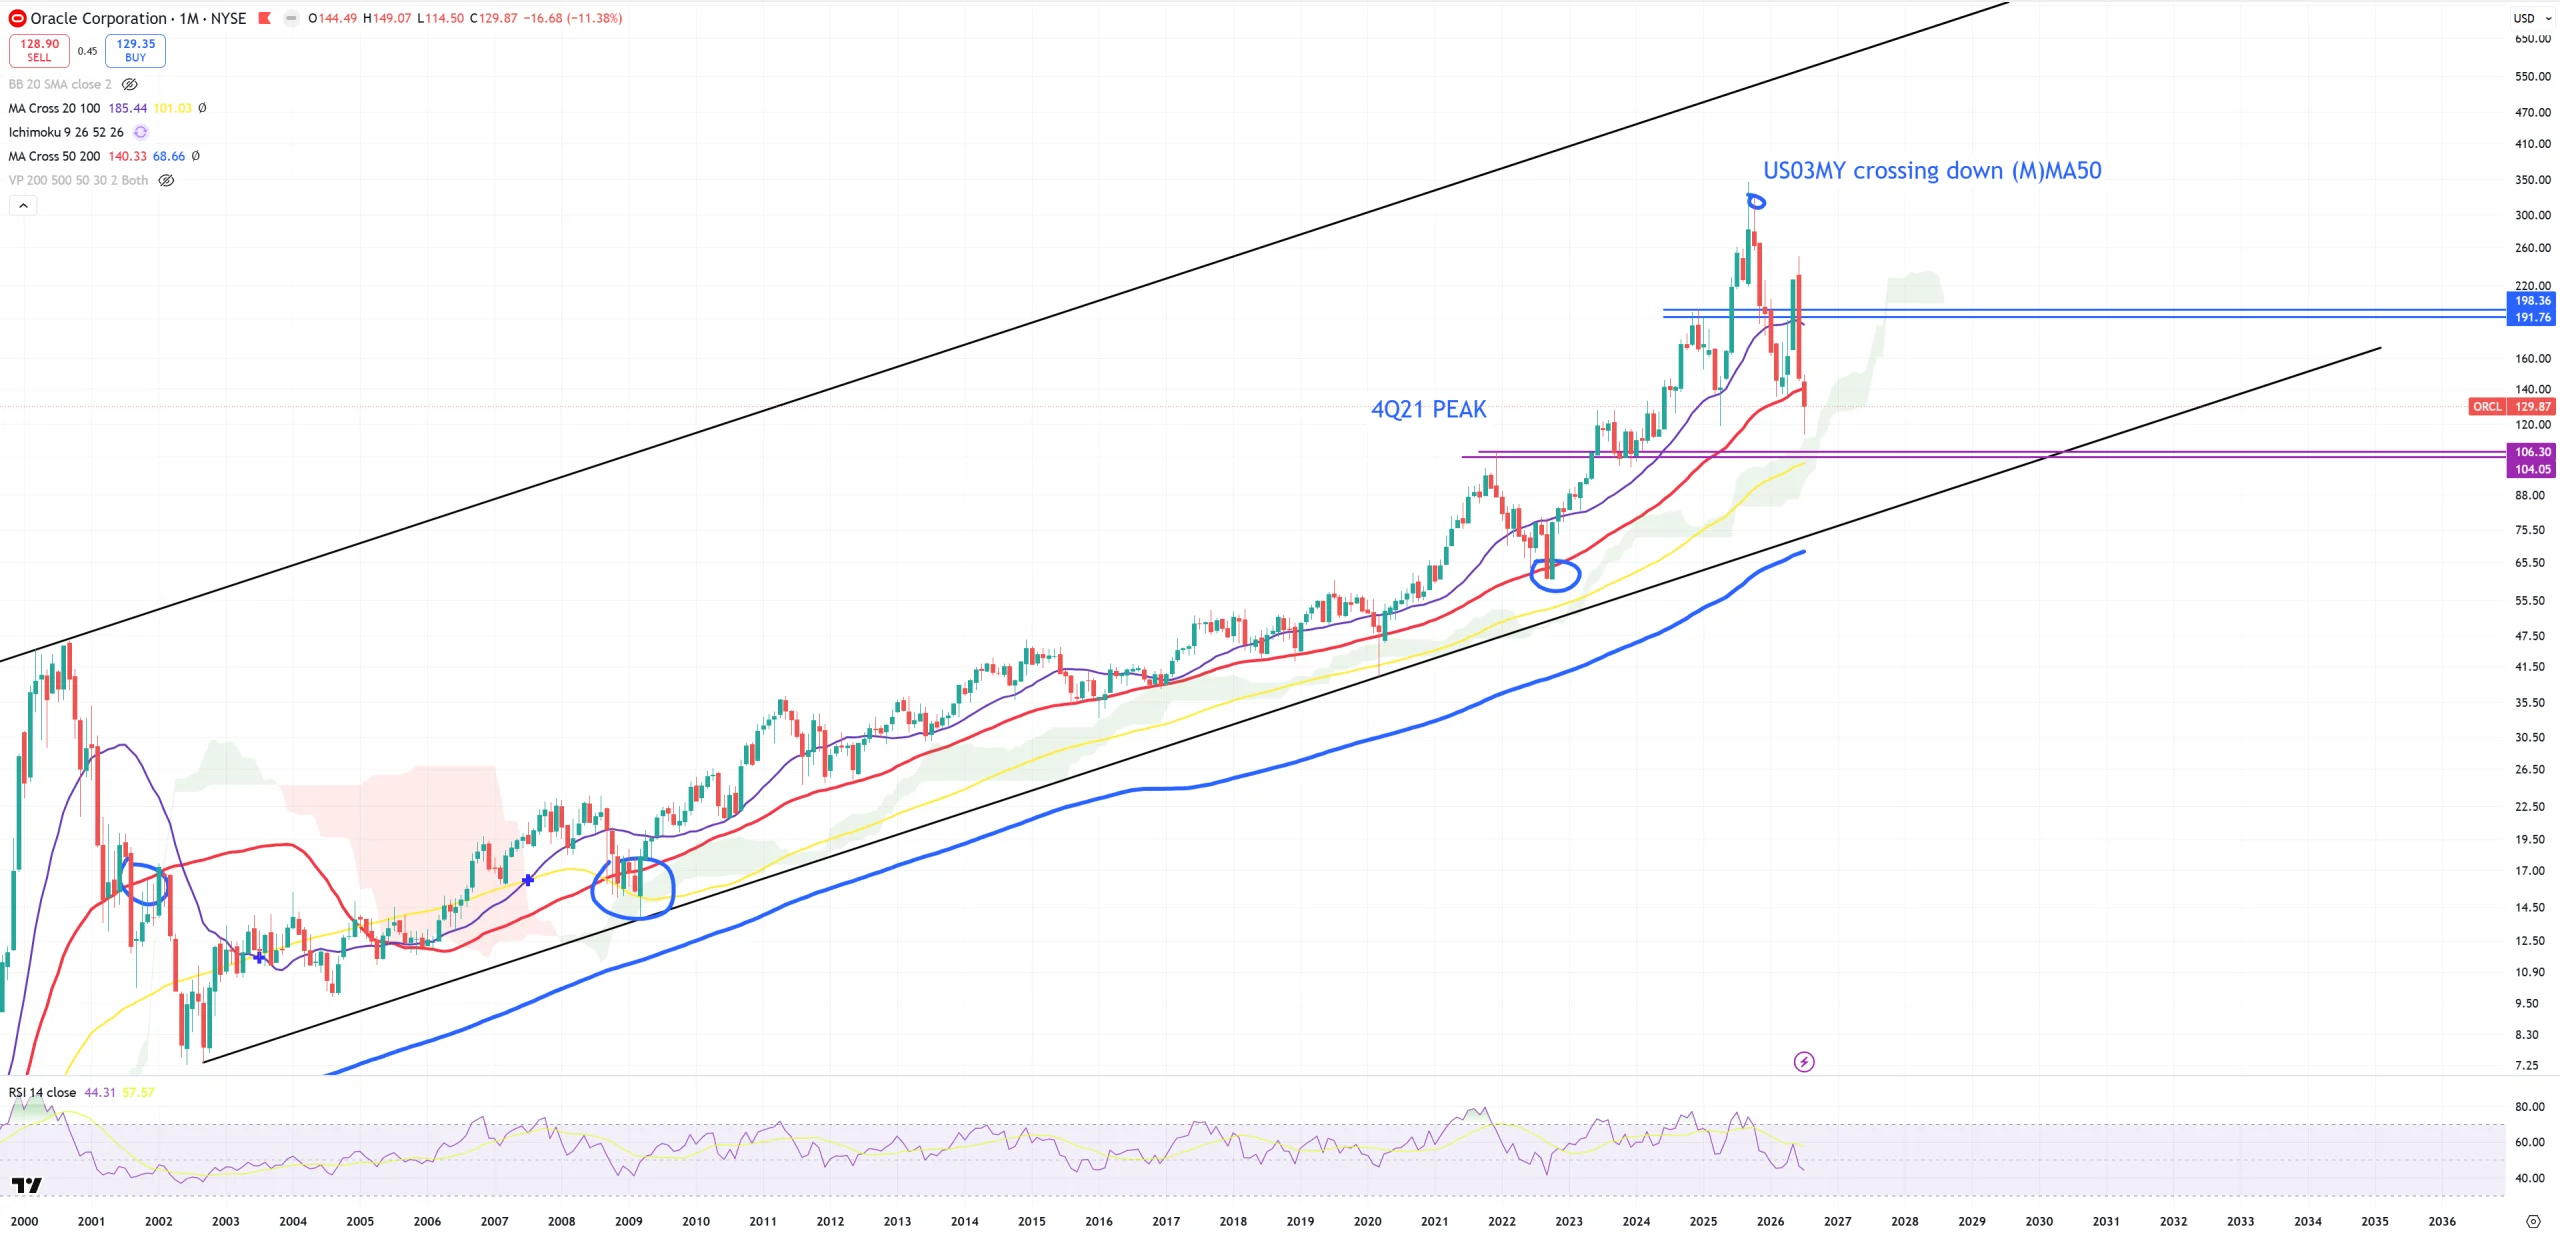
ORCL – no comment is needed
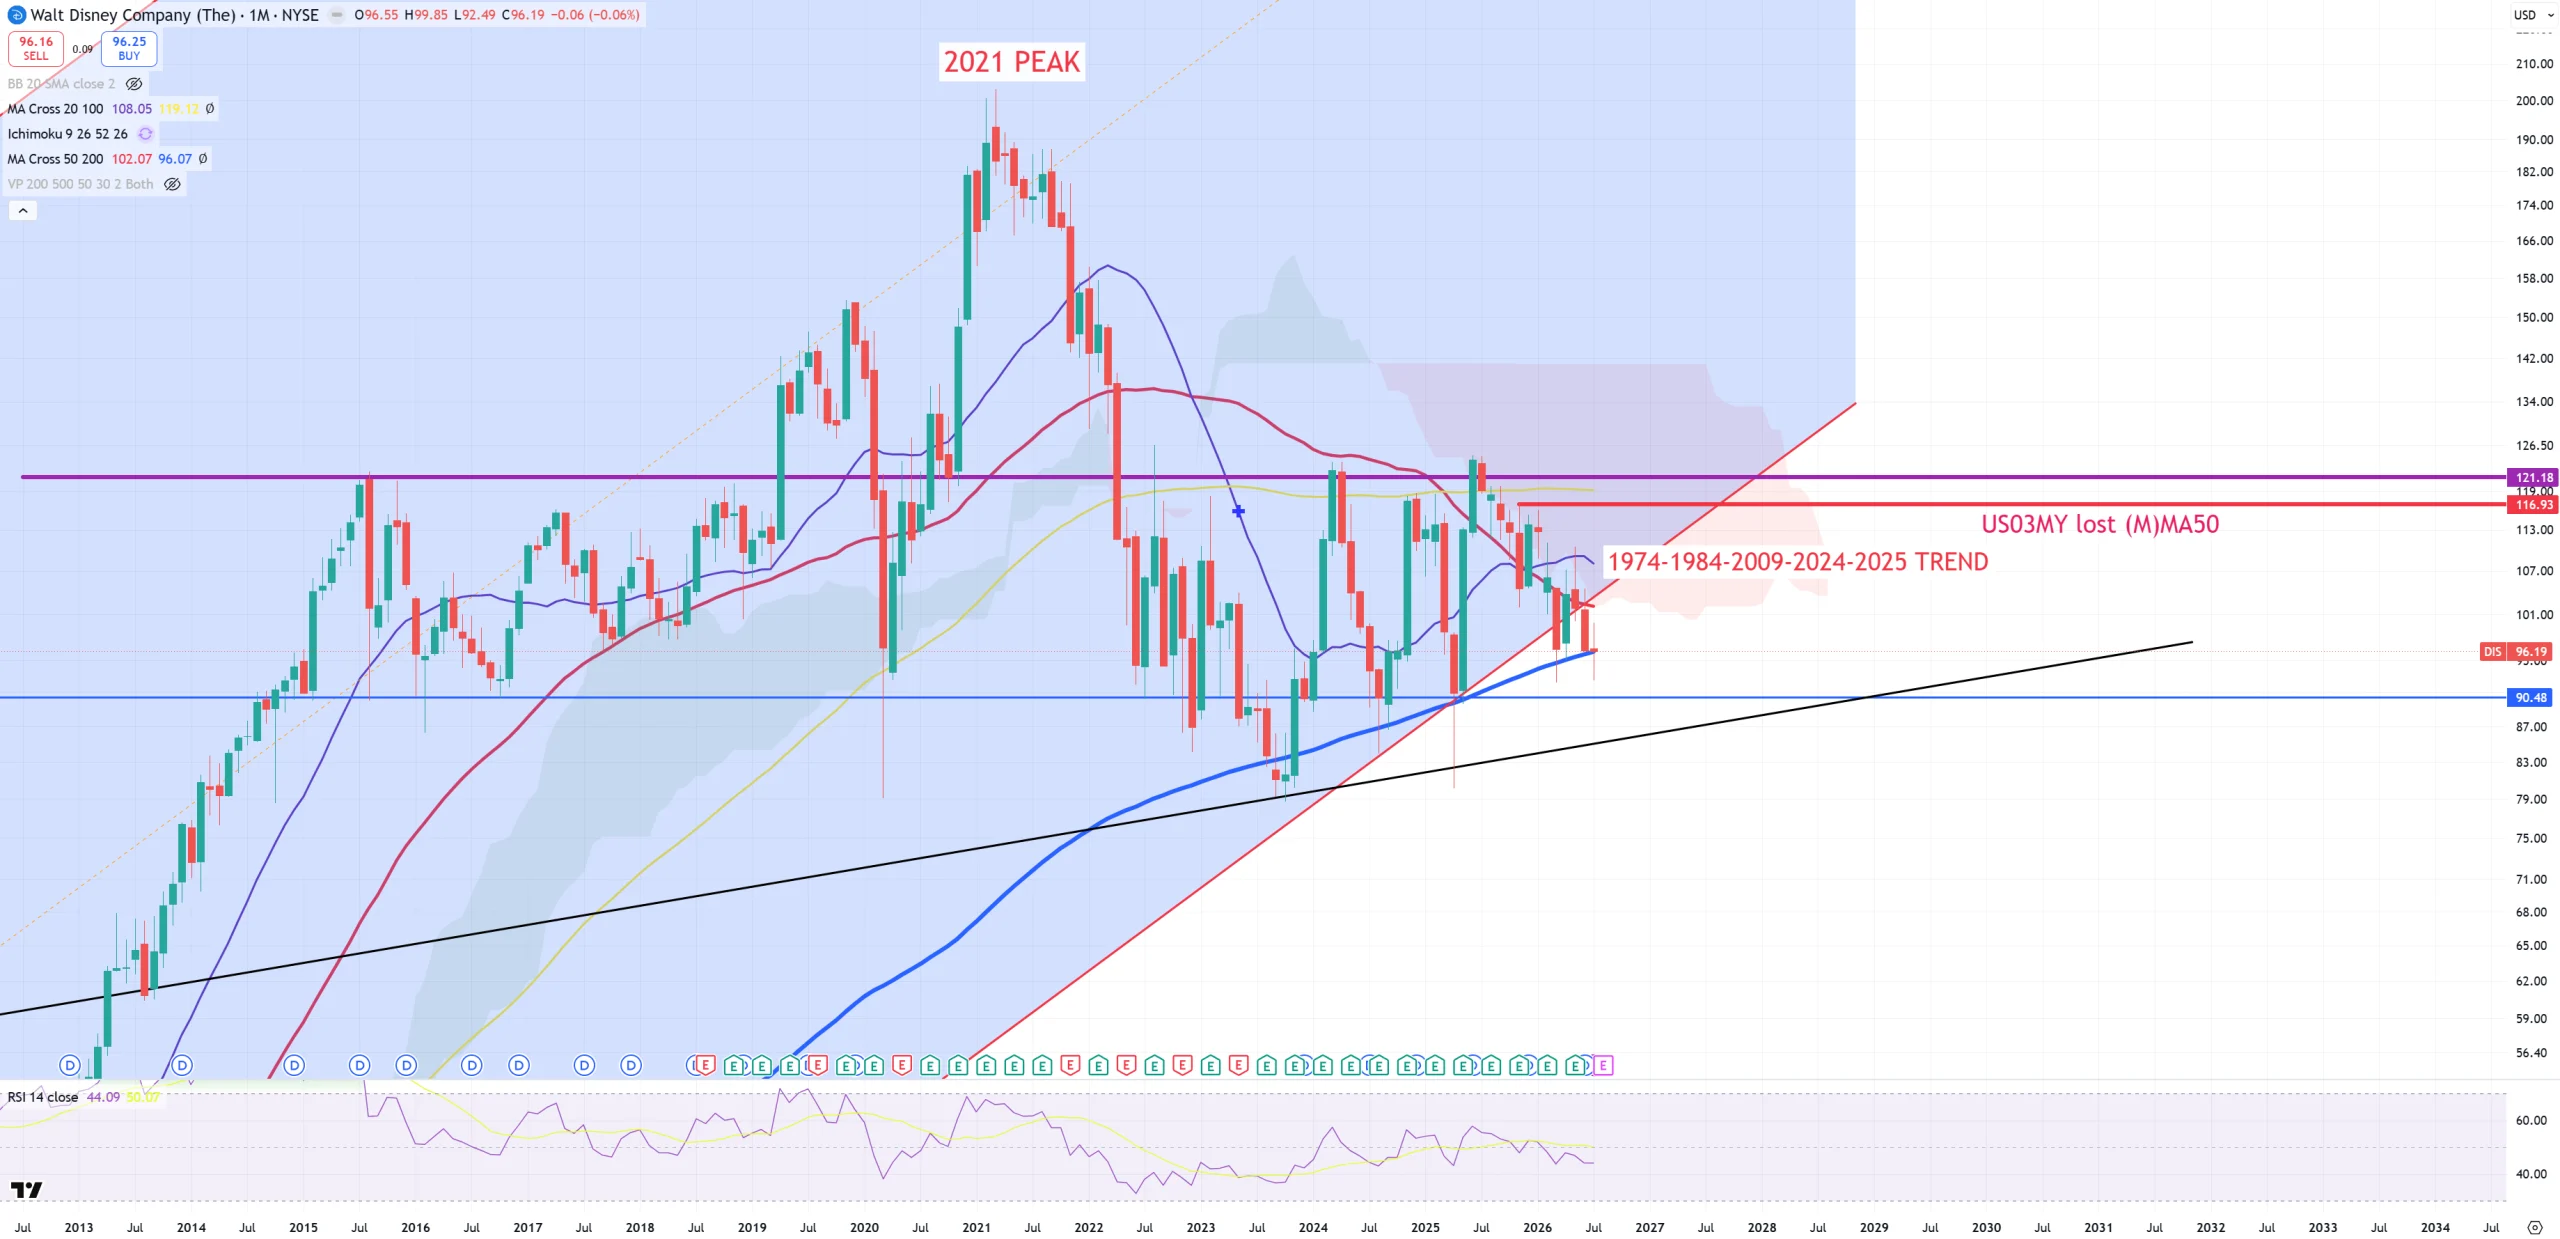
DIS – Disney lost its 1974+ trend and is on the edge of breaking its secular bull/bear market border – blue (M)MA200
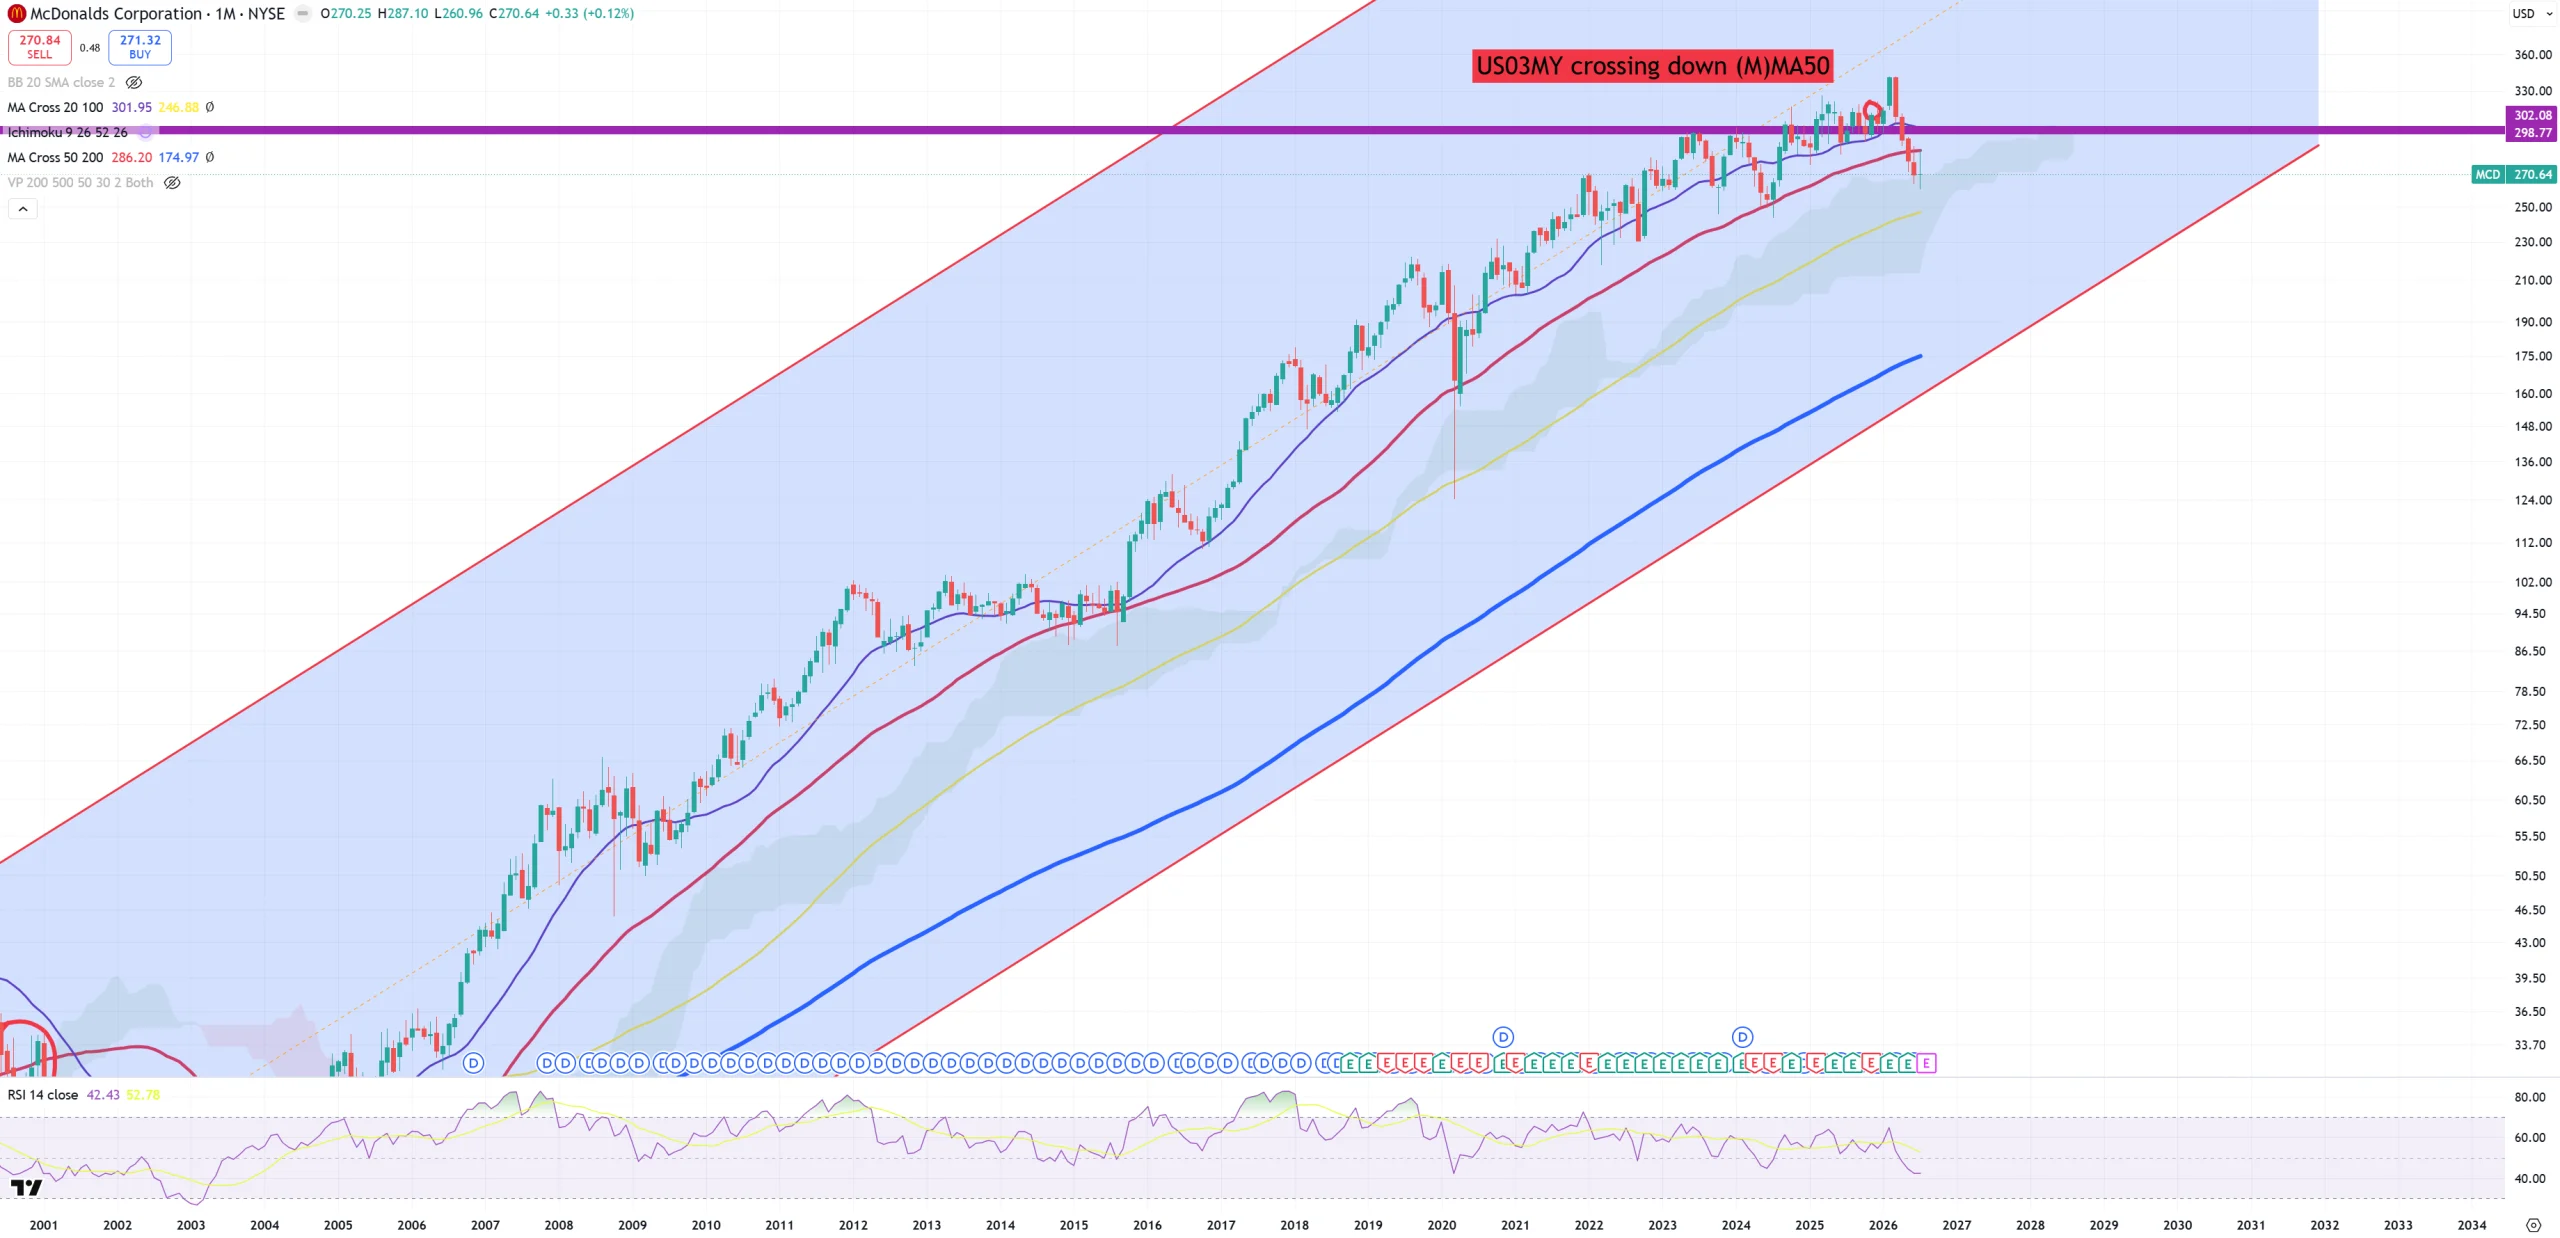
MCD – McDonalds – first (M)MA50 break since dot.com bubble bust :
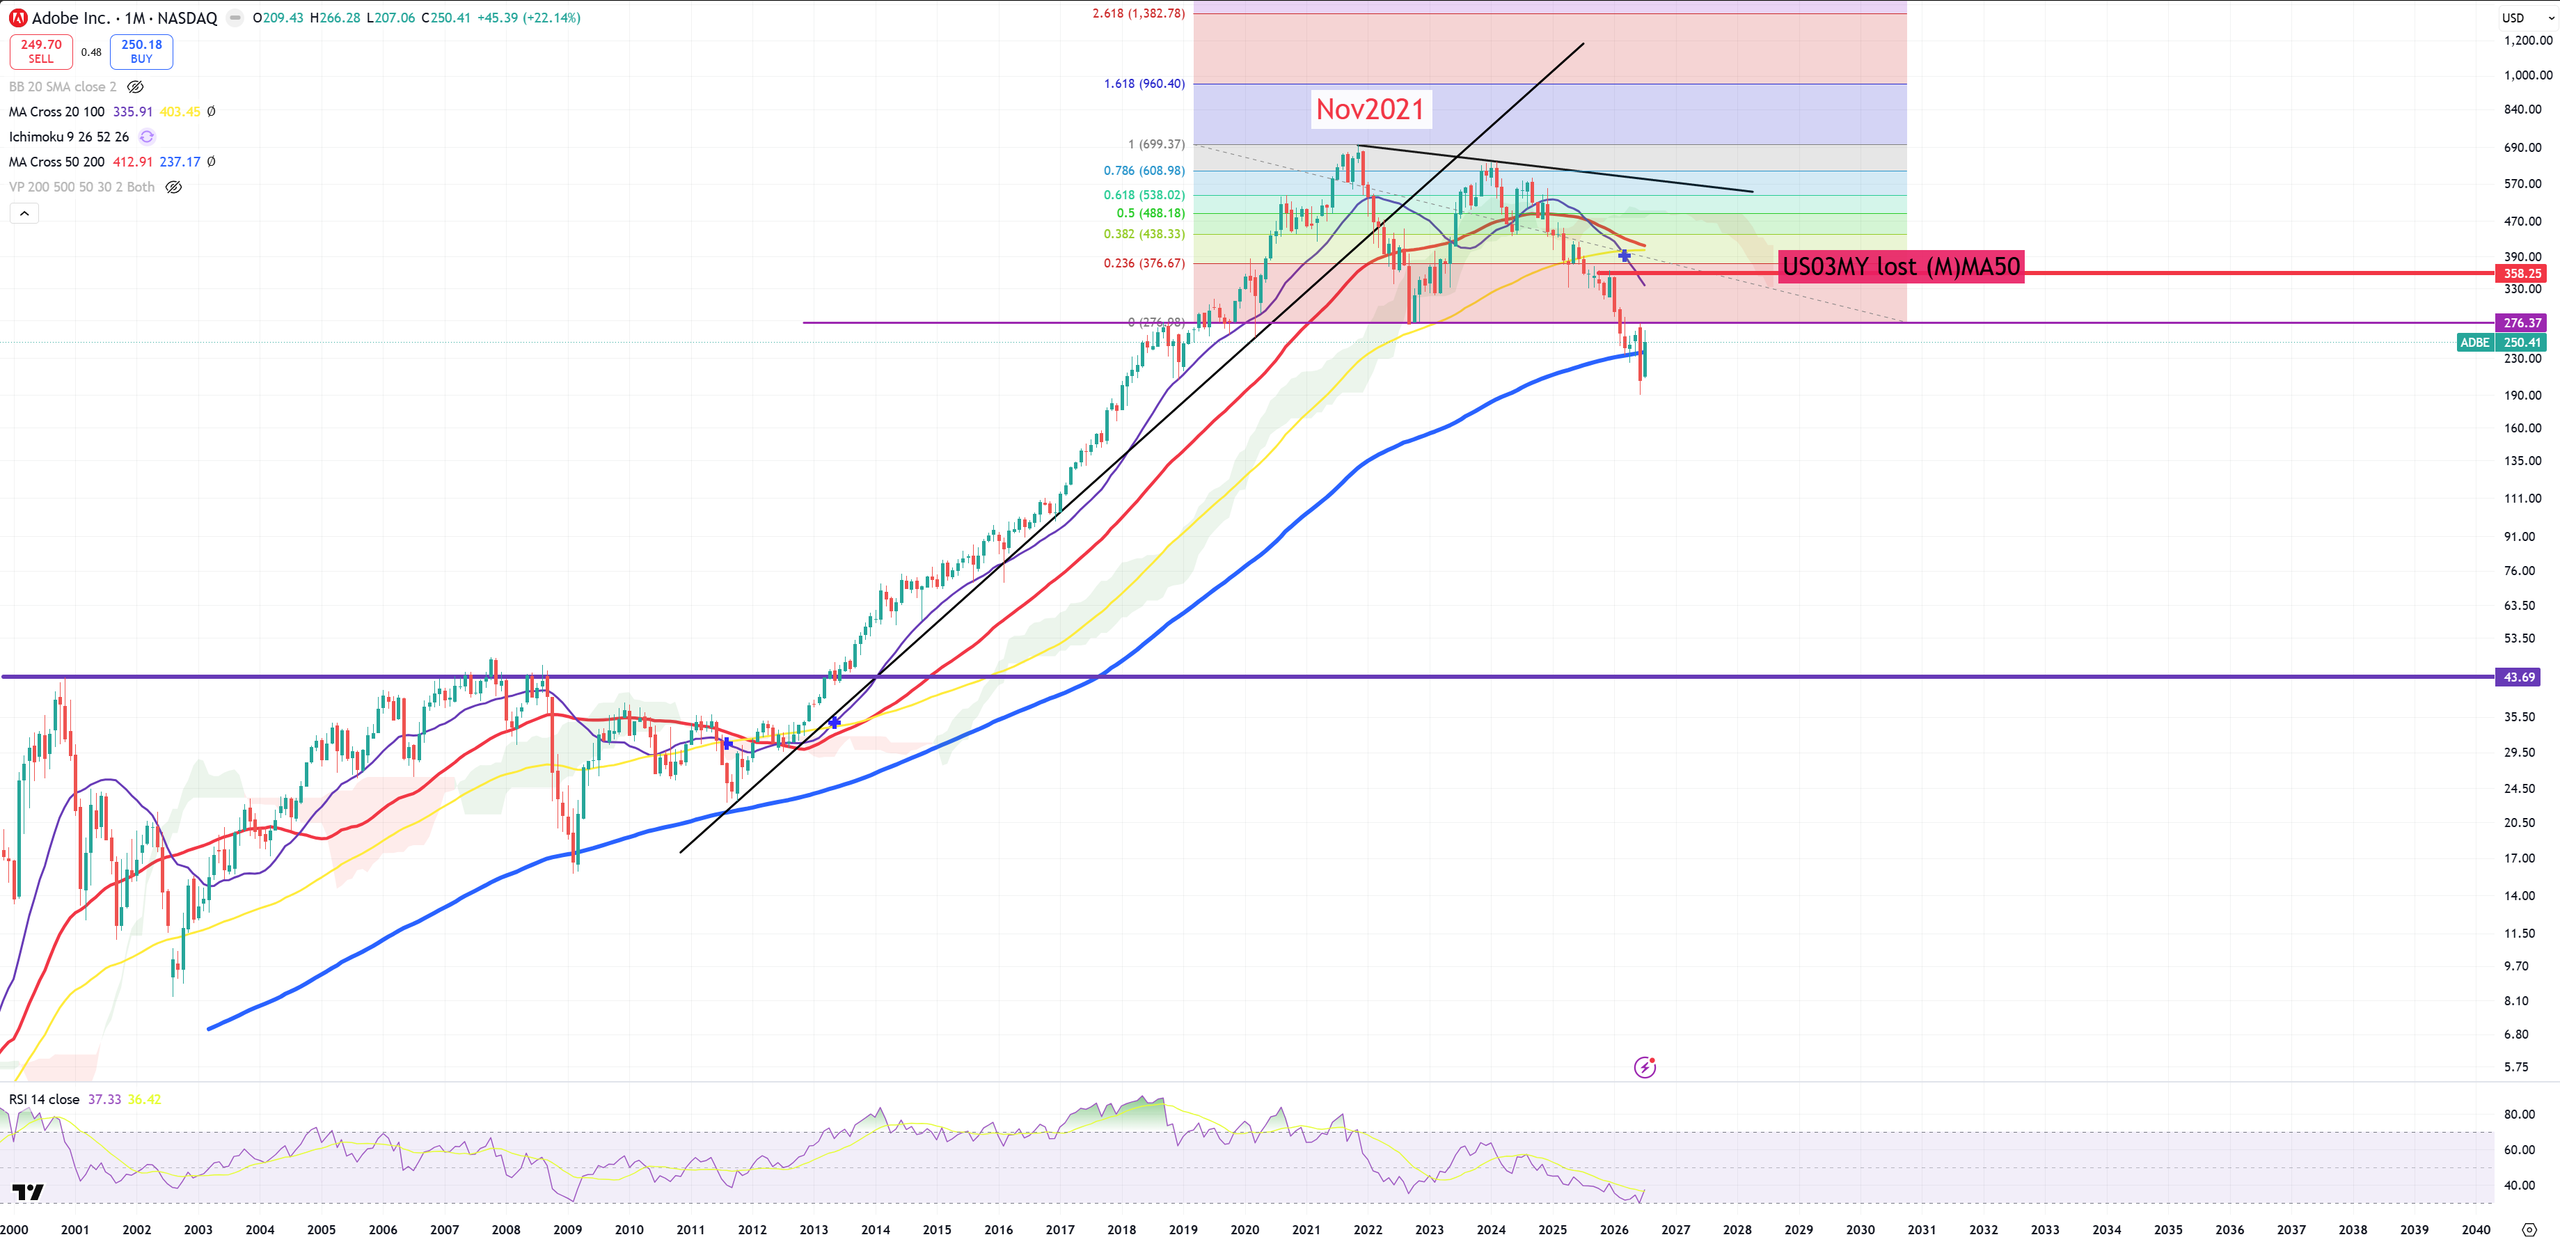
ADBE and its (M)MA200 fight. Normally it should be a big bottom like in 2009, but this time 10Y/3M is just +95bps and it has just started massive steepening post inversion, not like in 2009 when we had +350bps. Bounce yes, but bottom on this level – no.
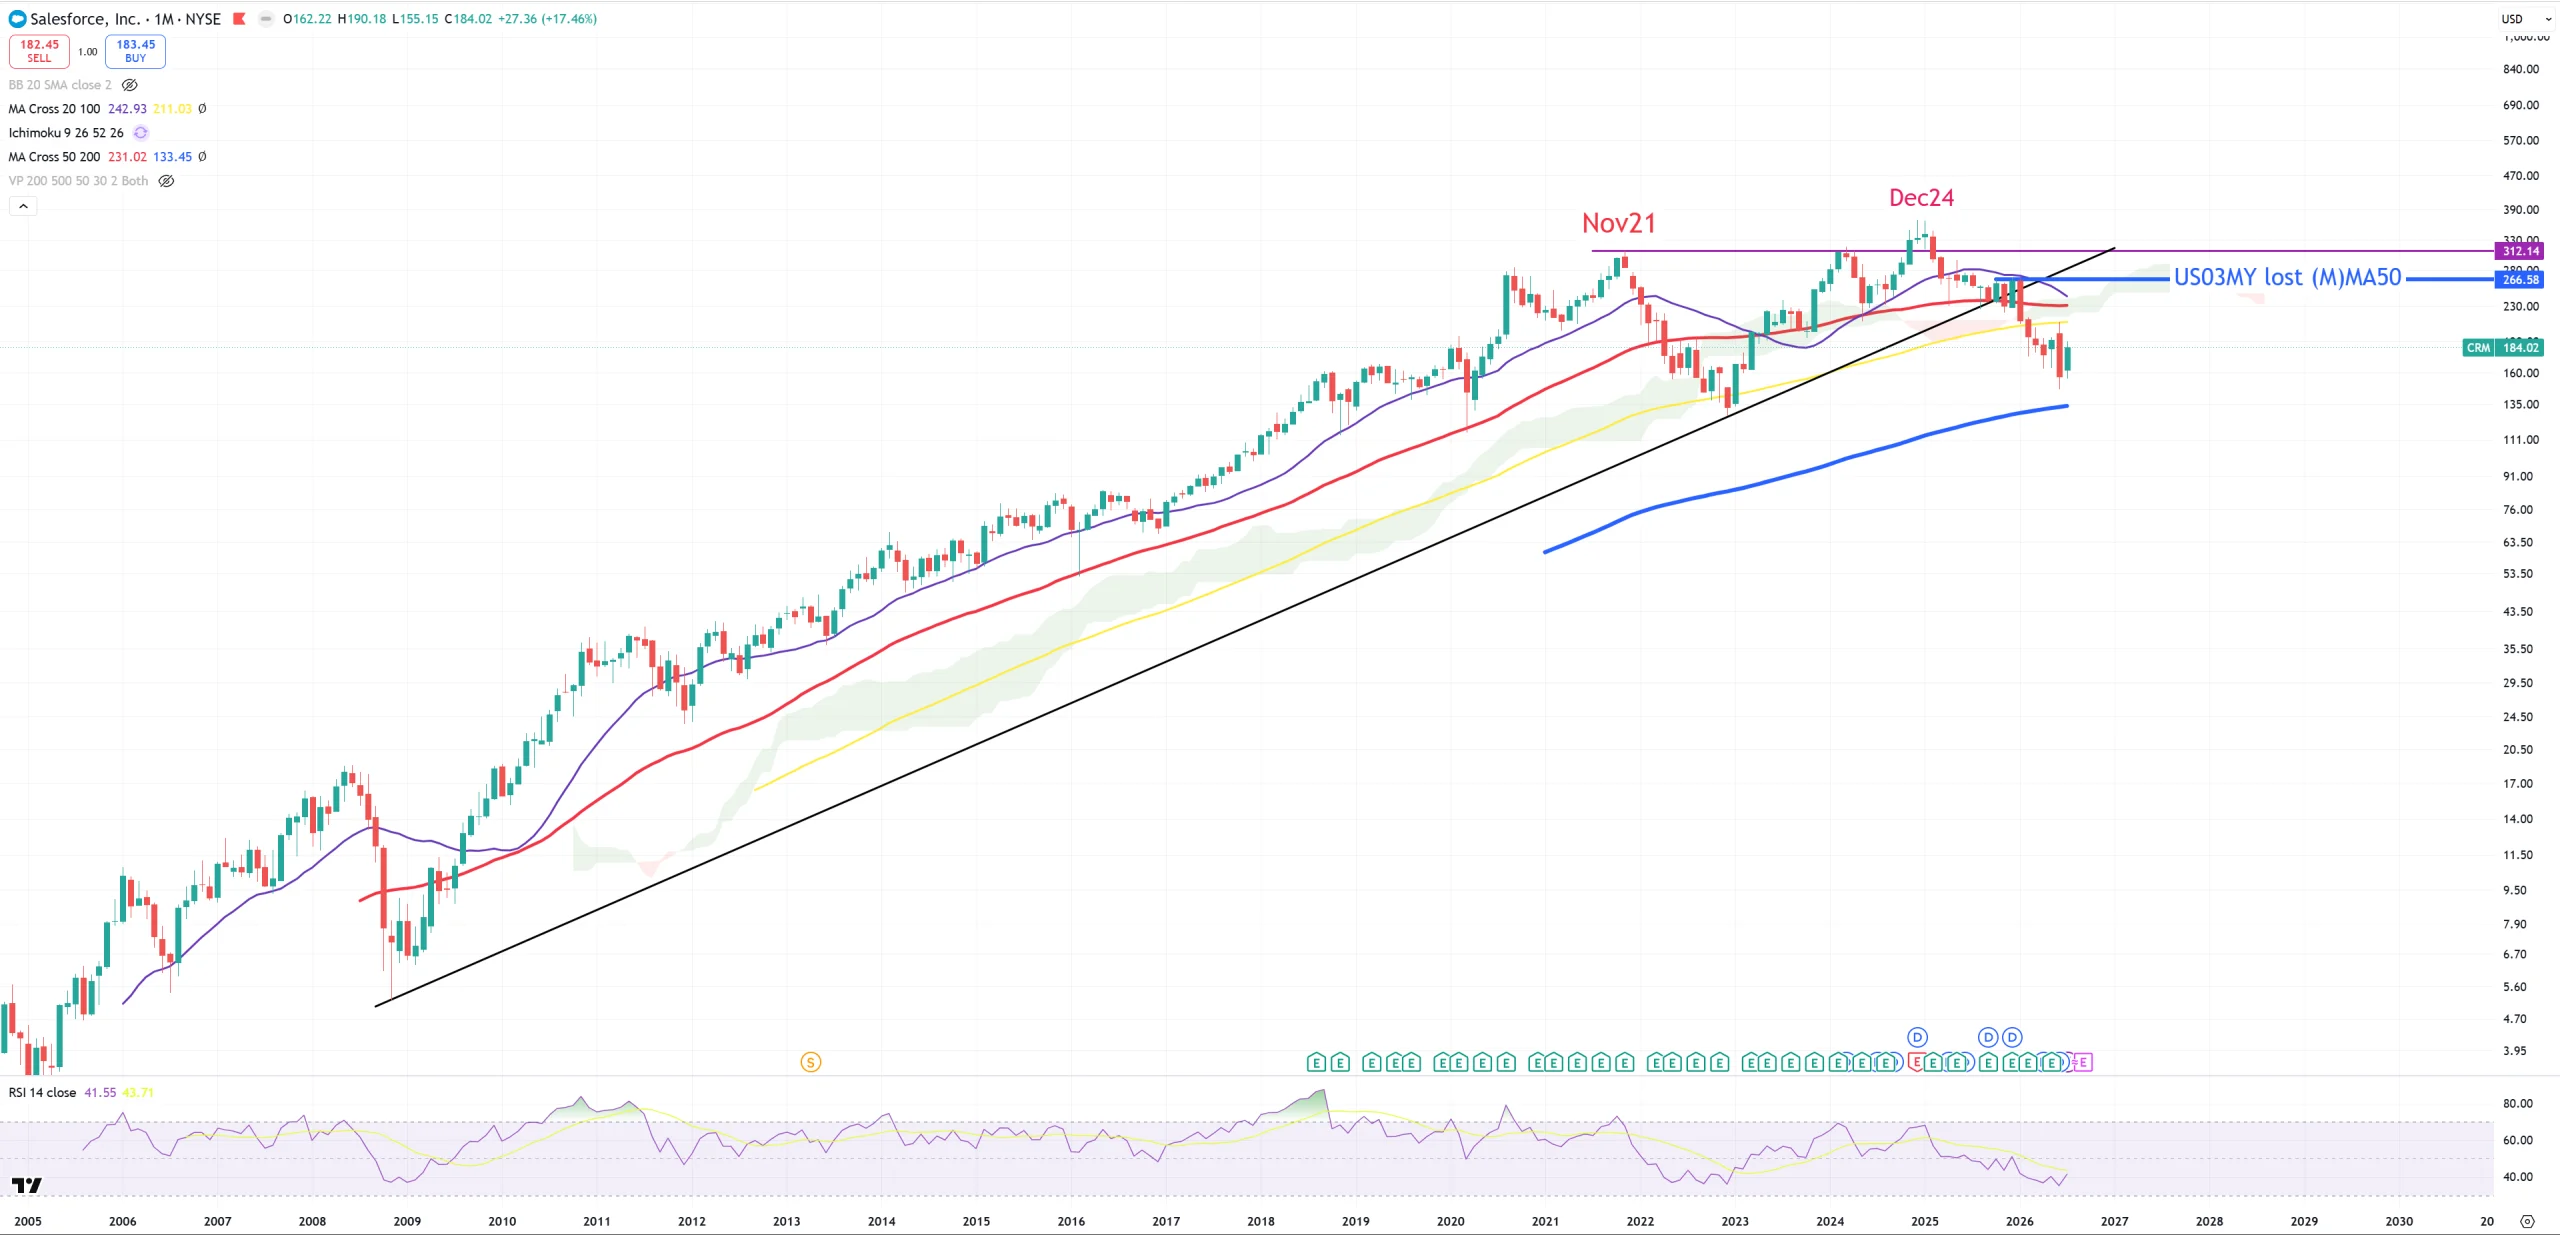
CRM – very weak and broken technical chart
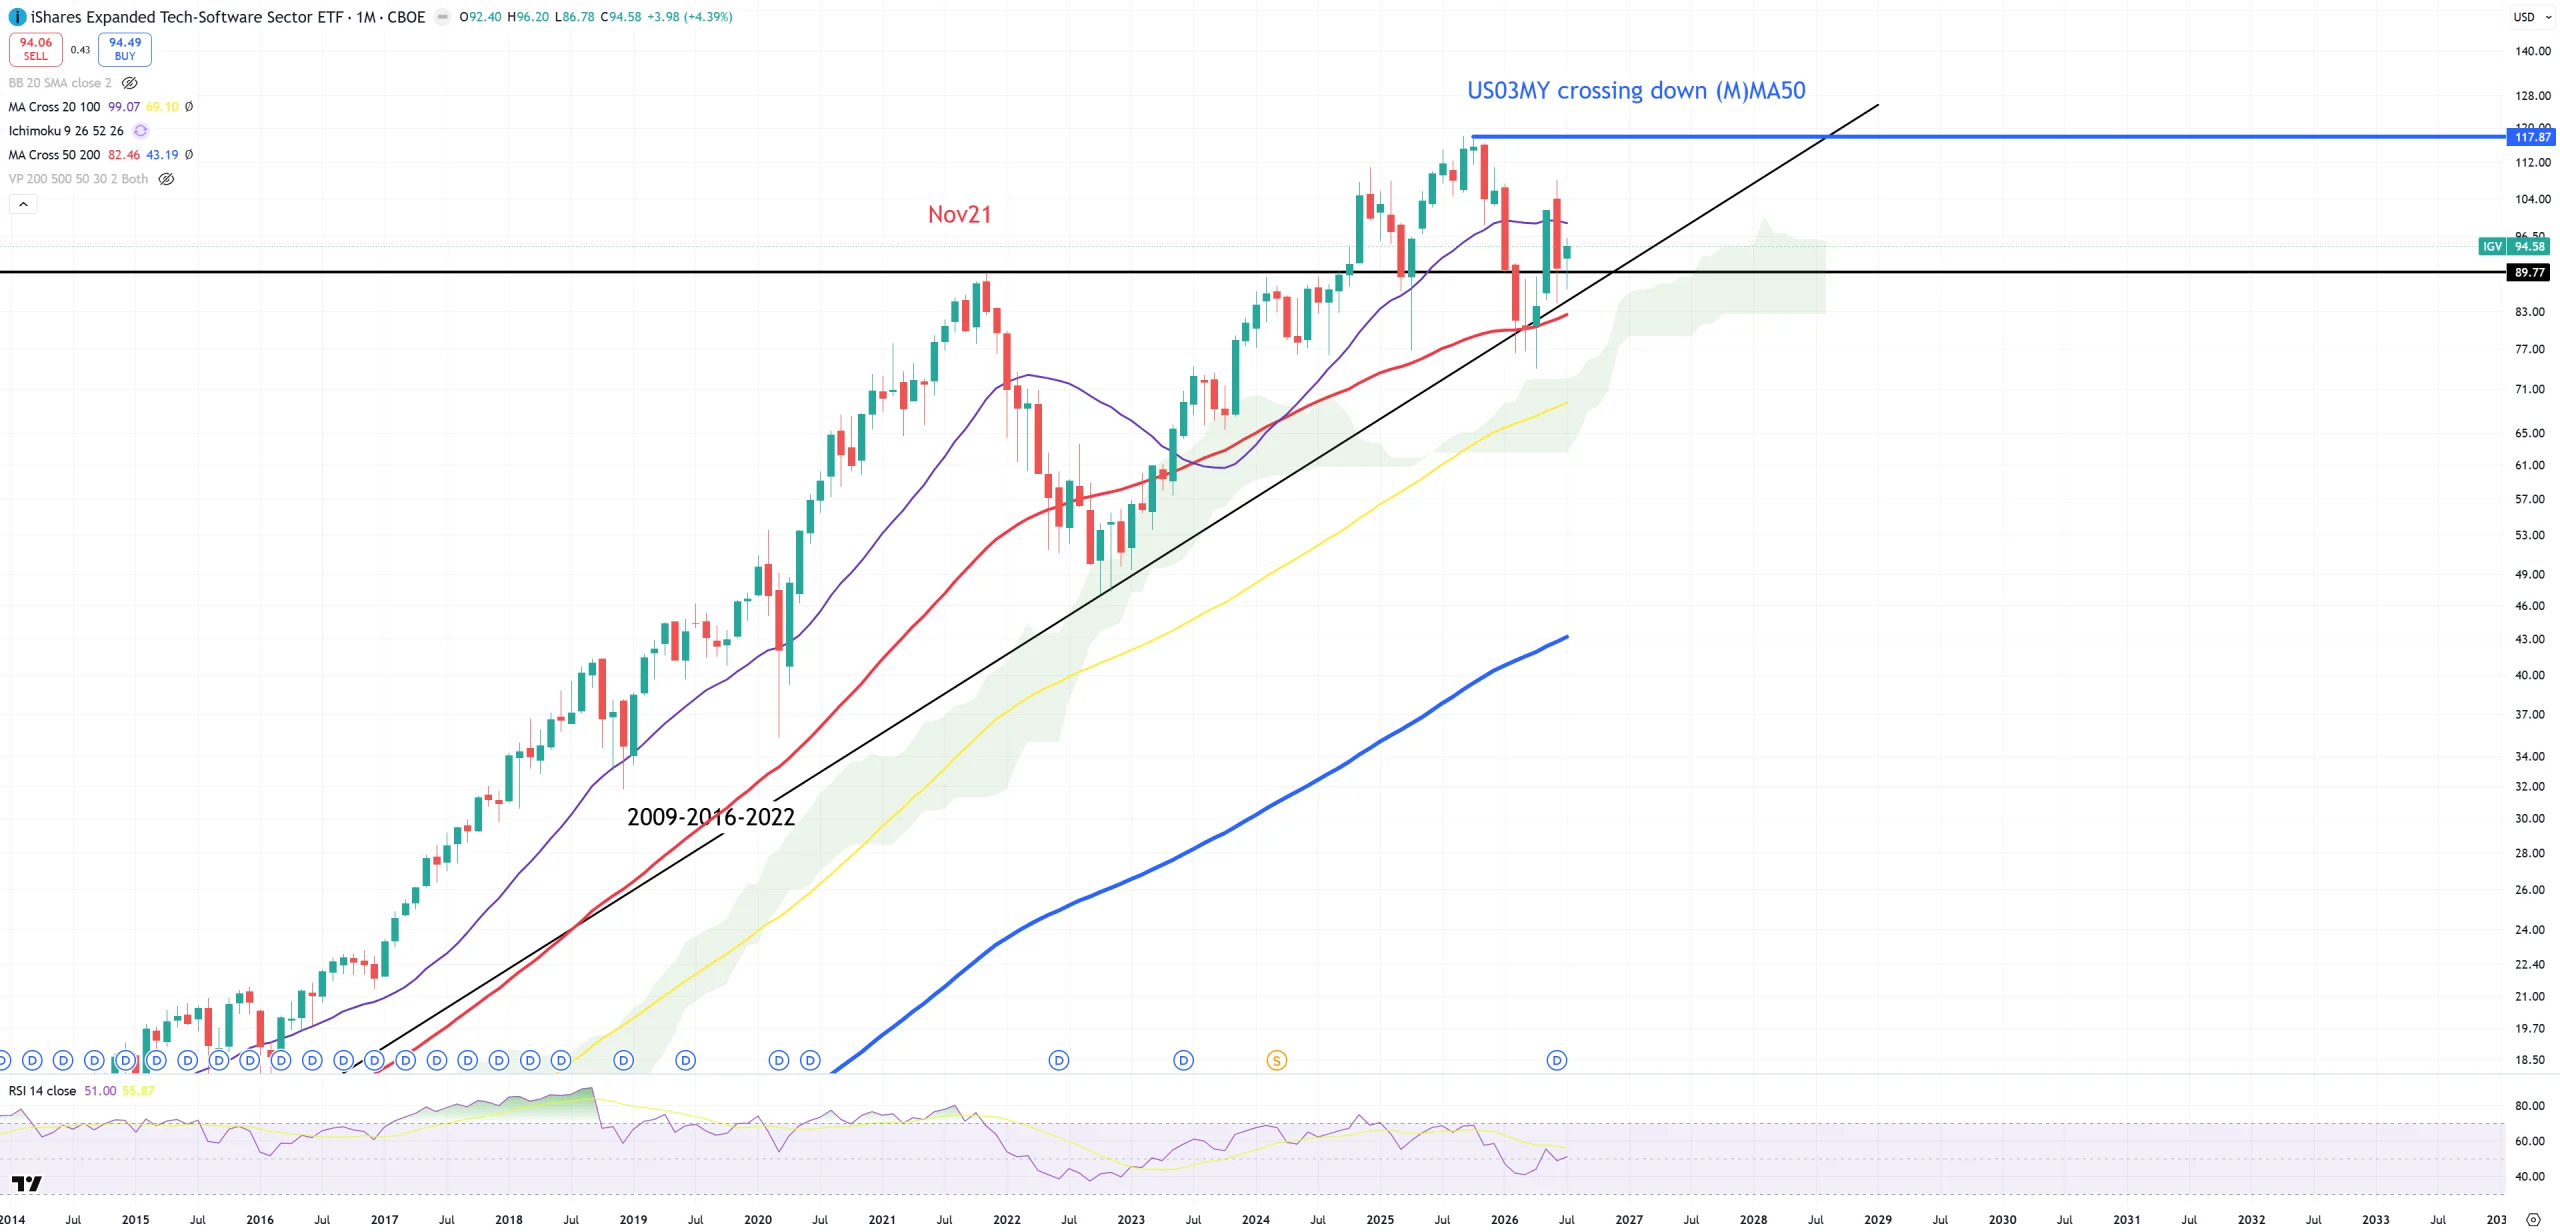
IGV – manages to hold (M)MA50 + TREND and now tries to jump below 4Q21 peak. My understanding is -> once it’ll be done permanently it’s game over and the higher 10y/3m goes post inversion the higher probability it’ll finally drop and break the trend, (M)MA50 and 4Q21 will become resistance.
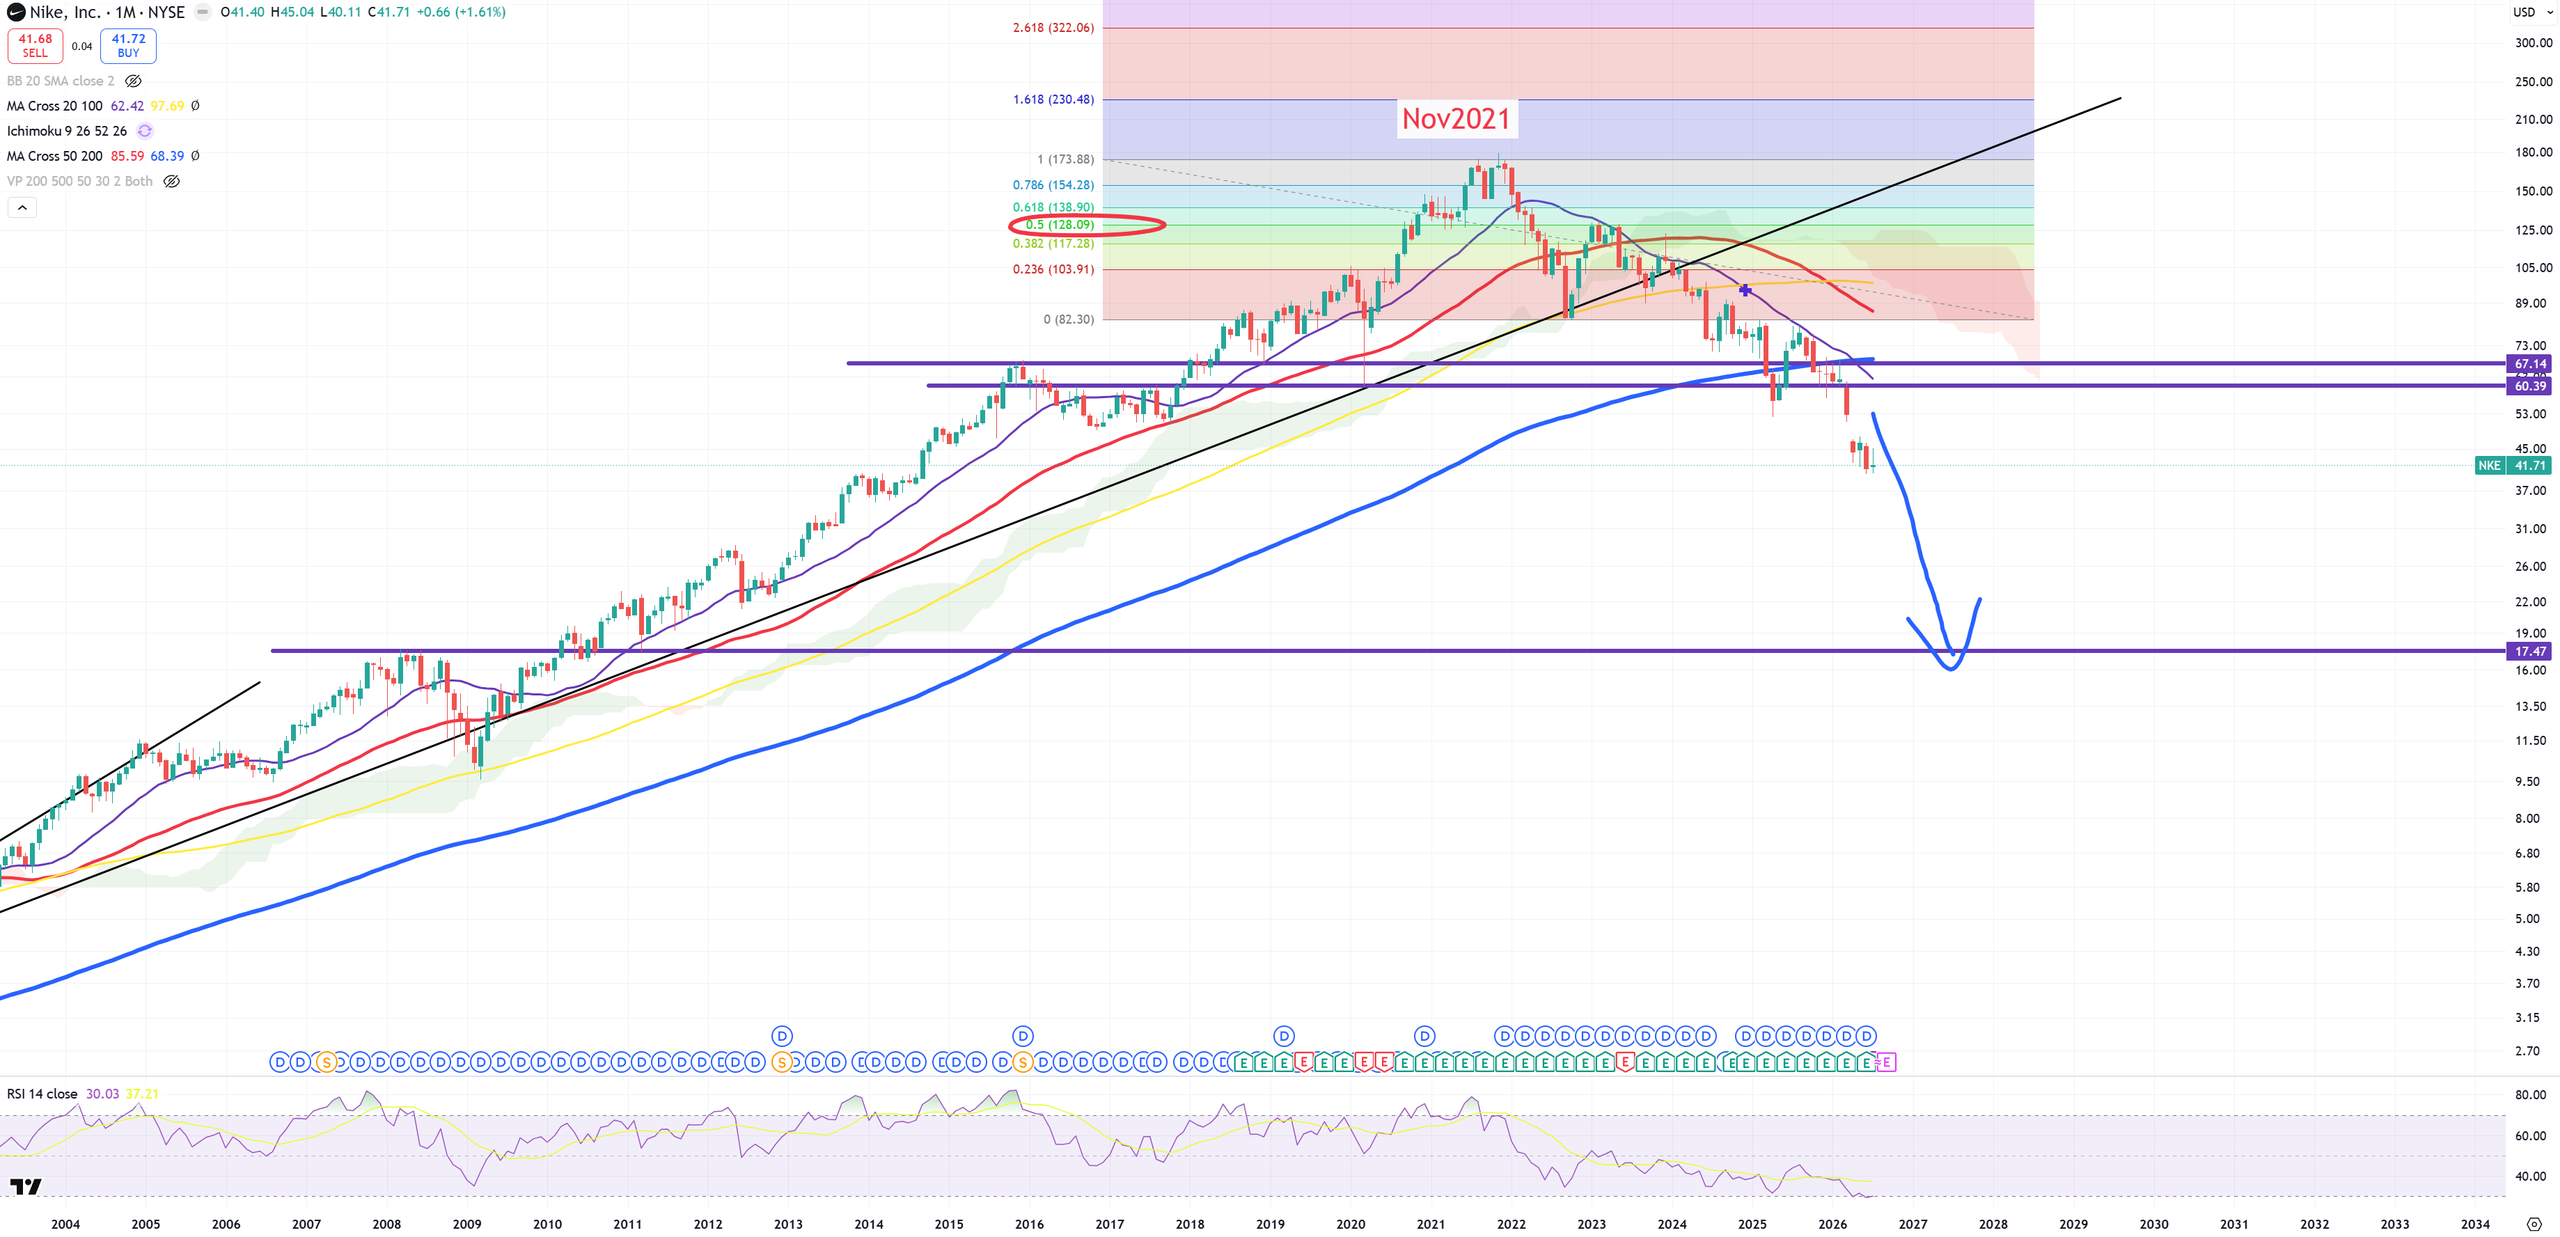
NKE – old target 17$ unchanged
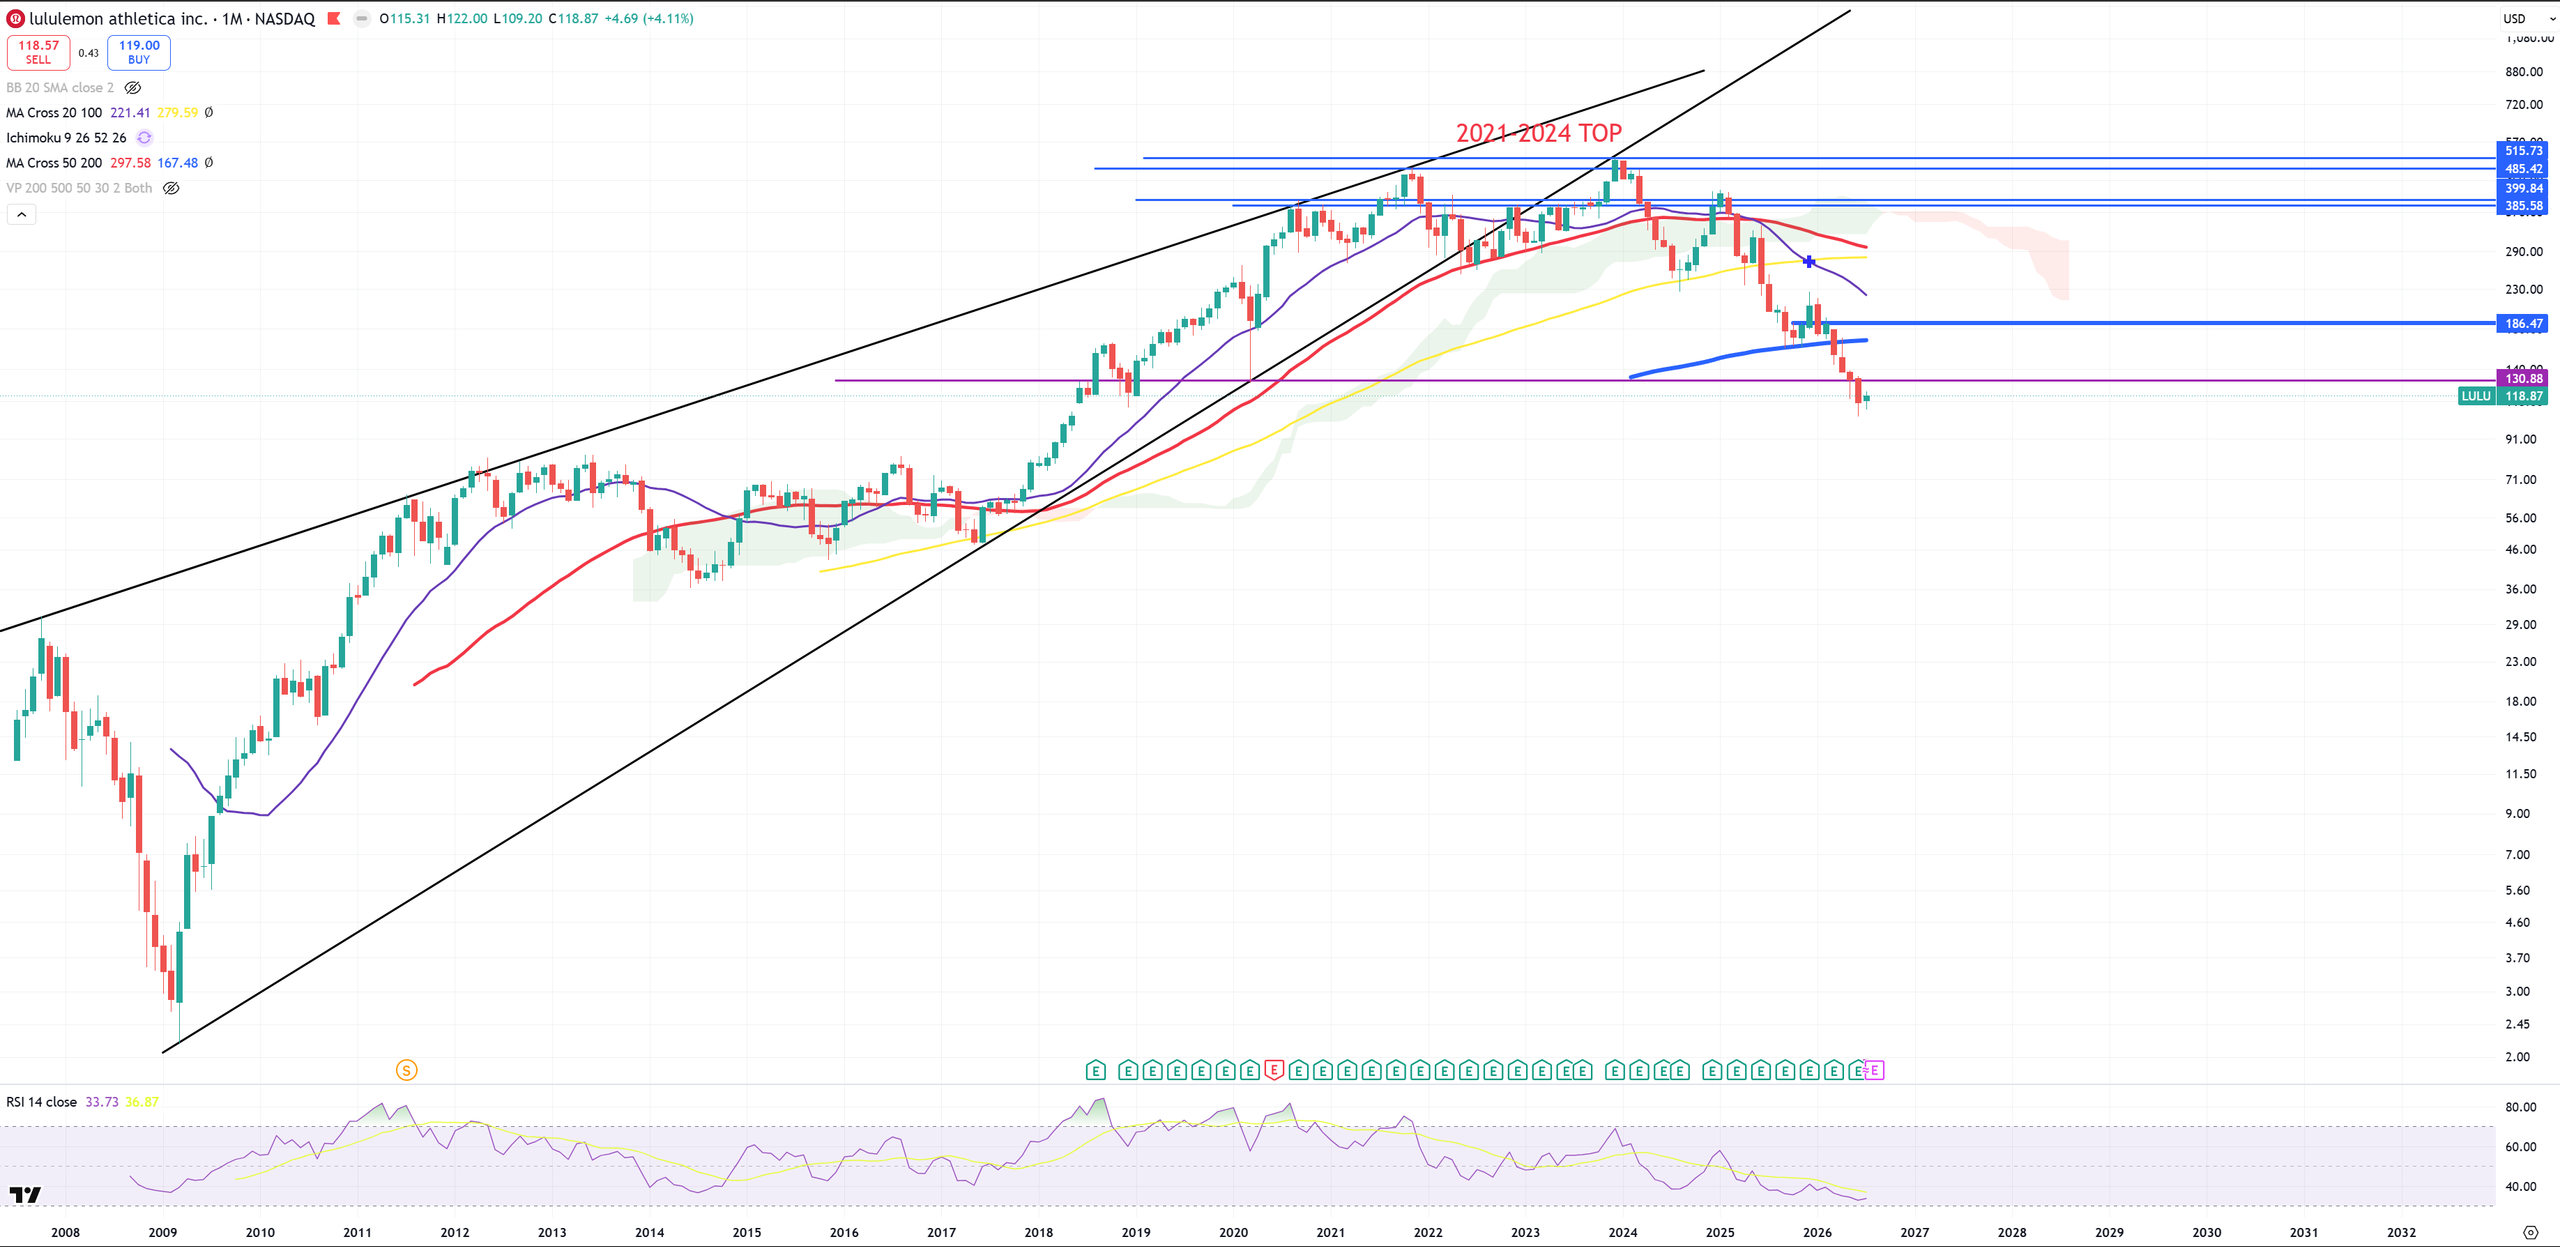
LULU – same setup as Nike what is not surprising
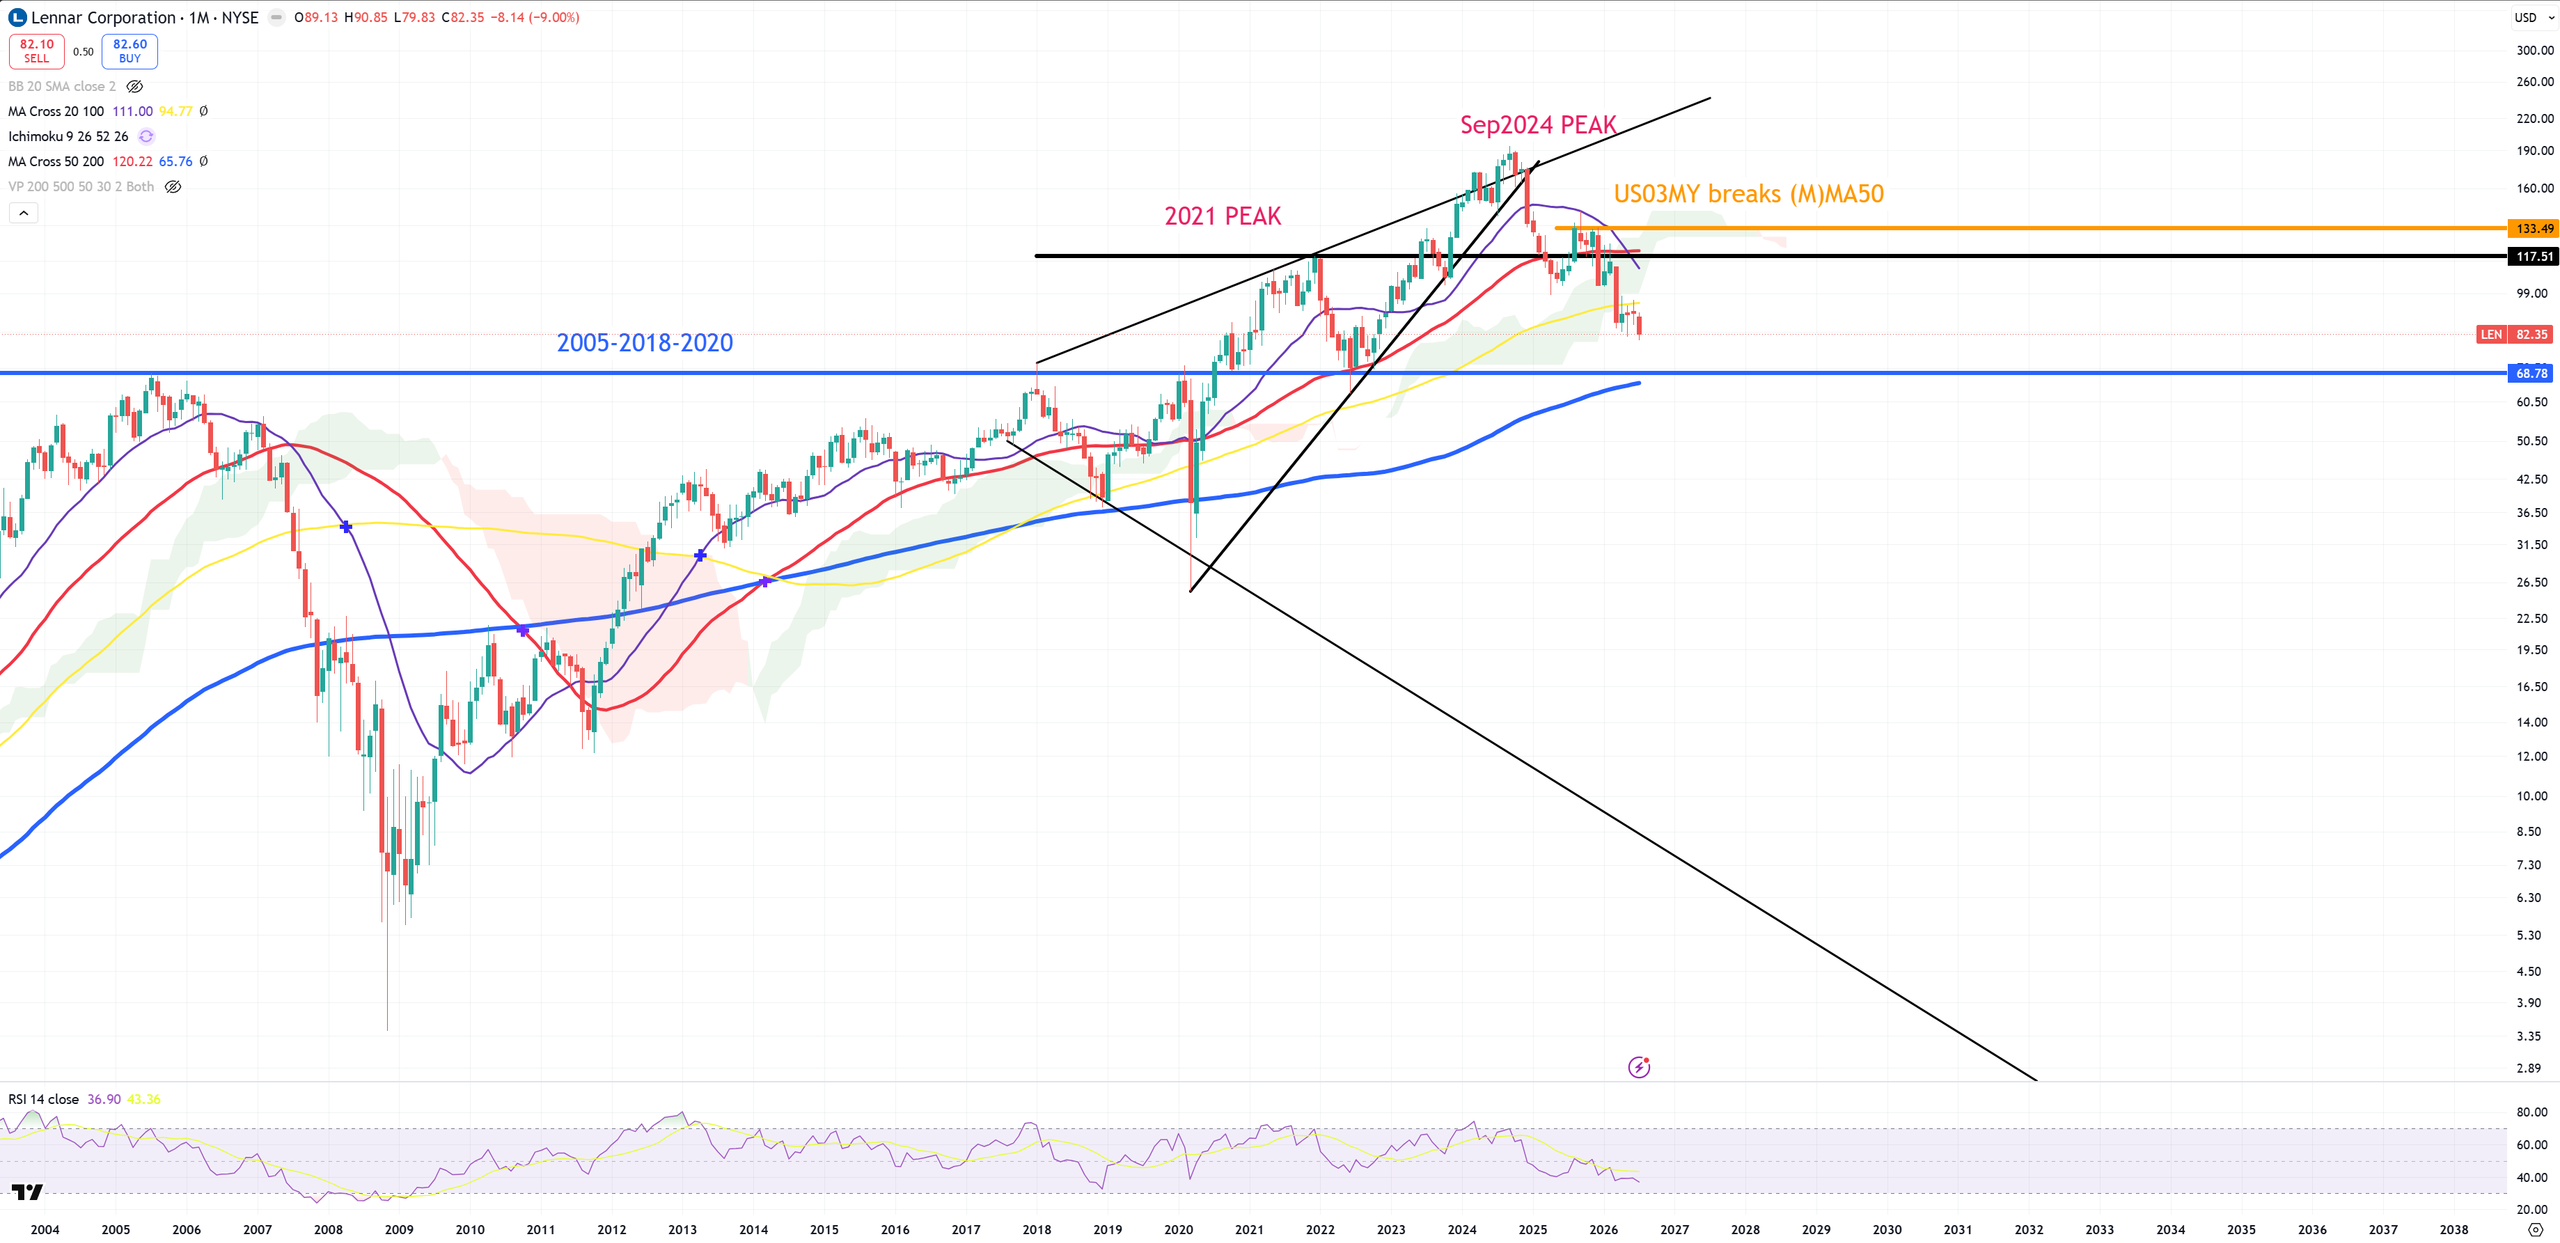
LEN – its going to 68$ – great support level + (M)MA200
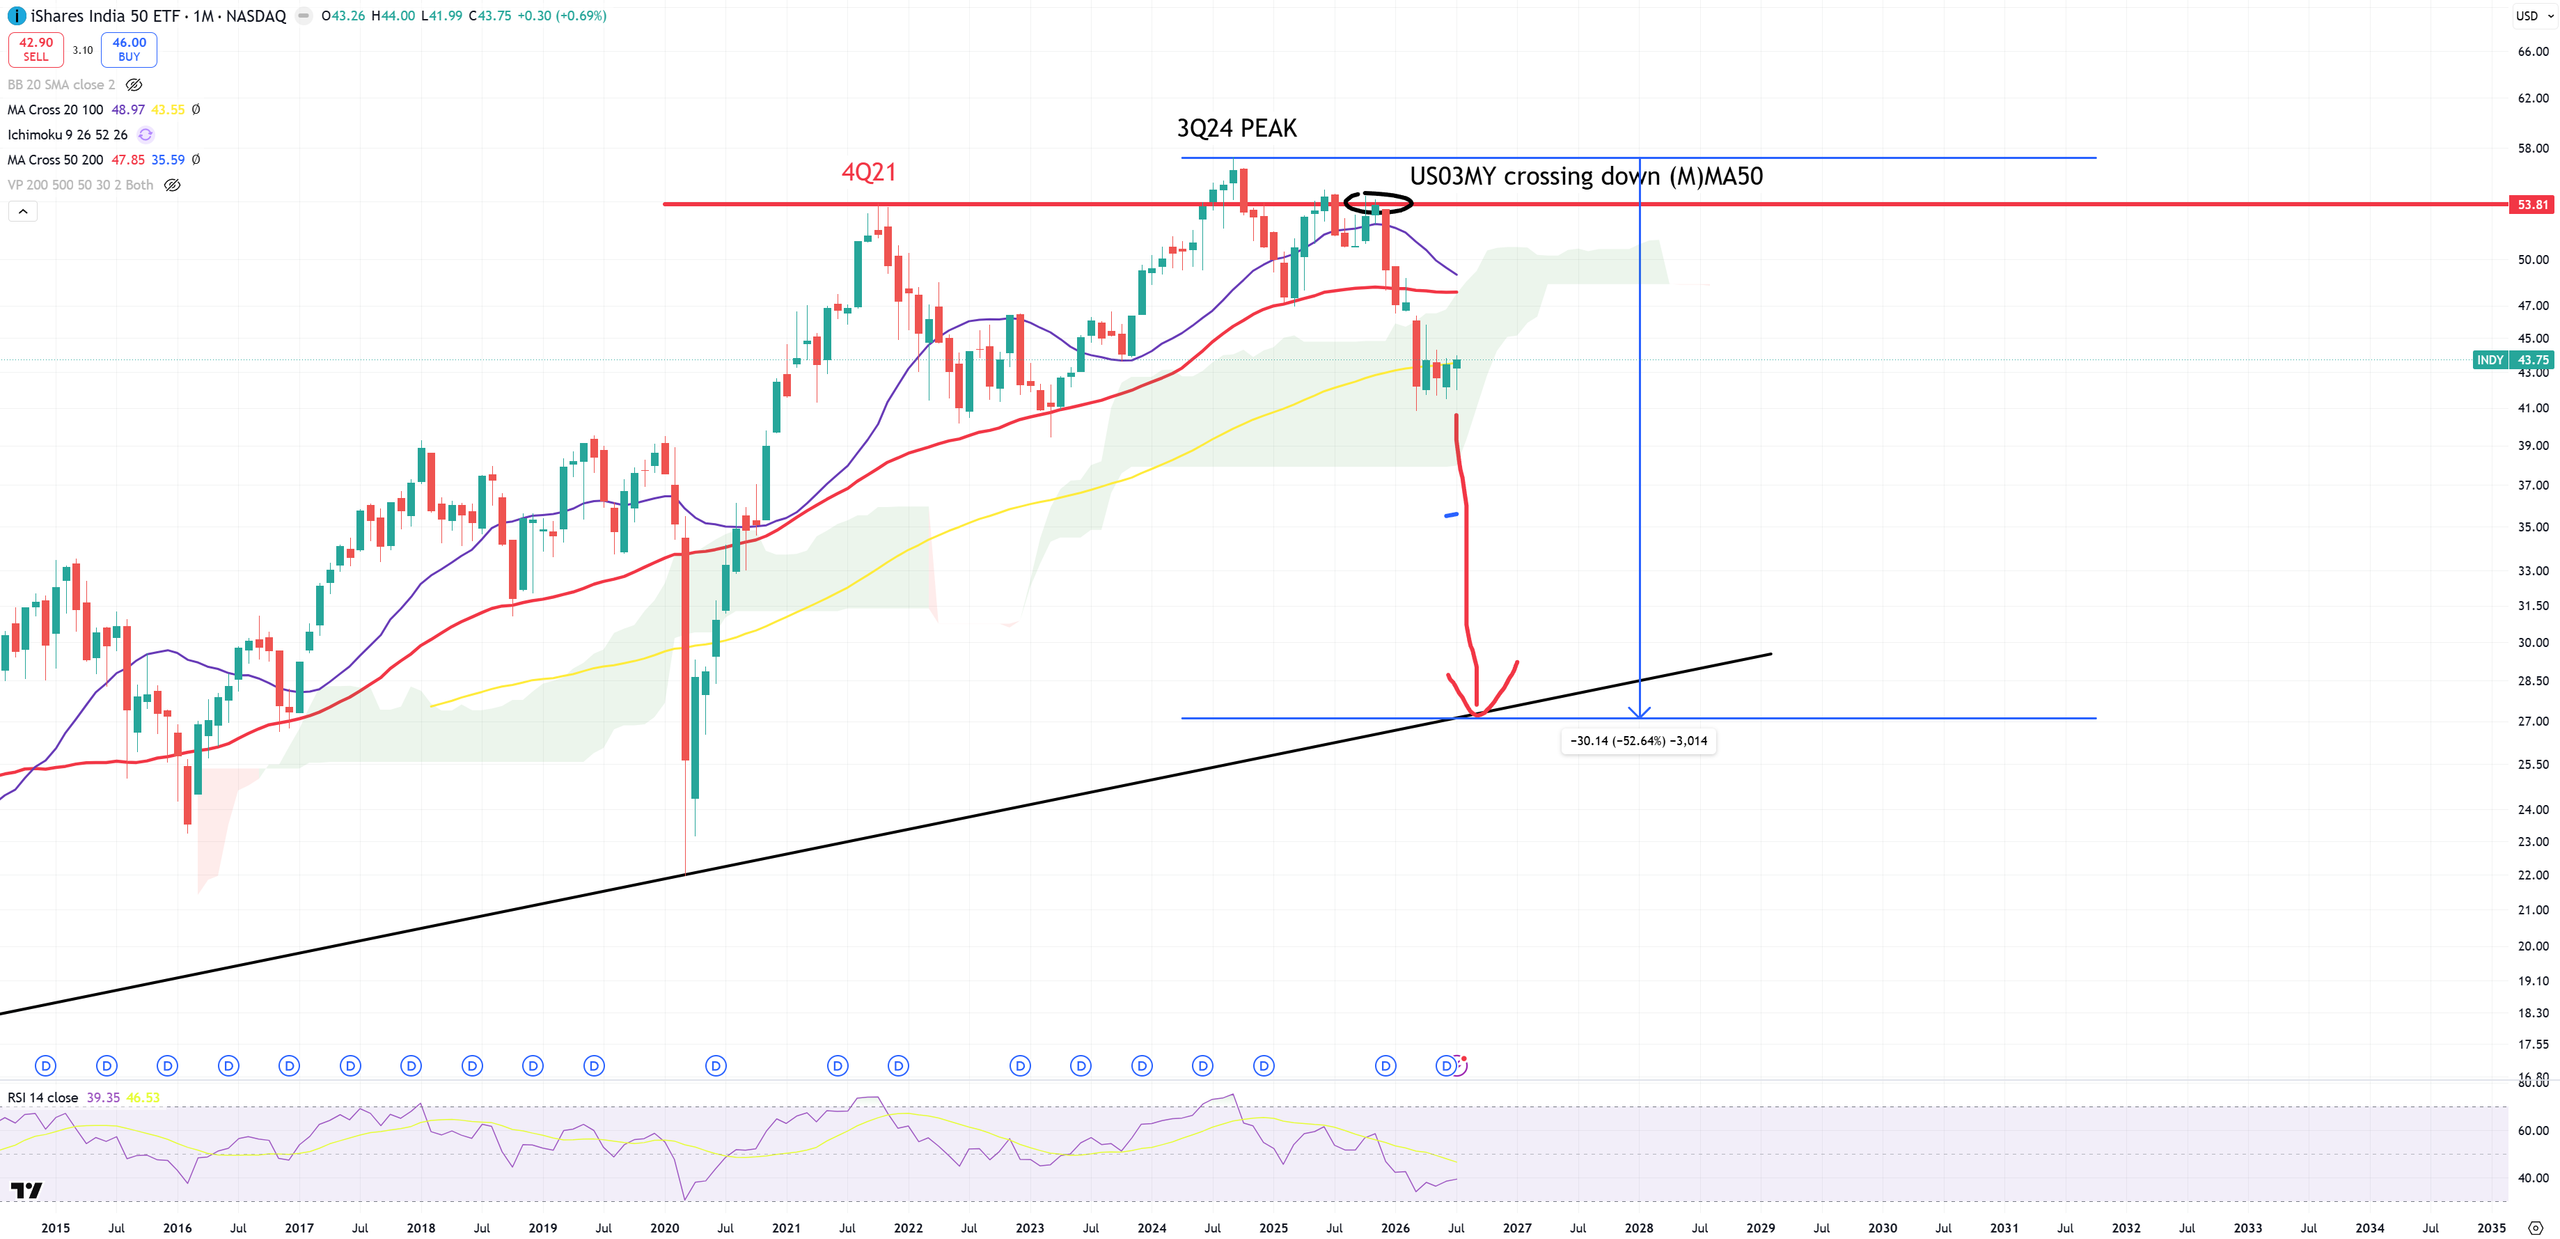
INDY – India is going to crash, but nobody knows how long it’ll be retesting this level
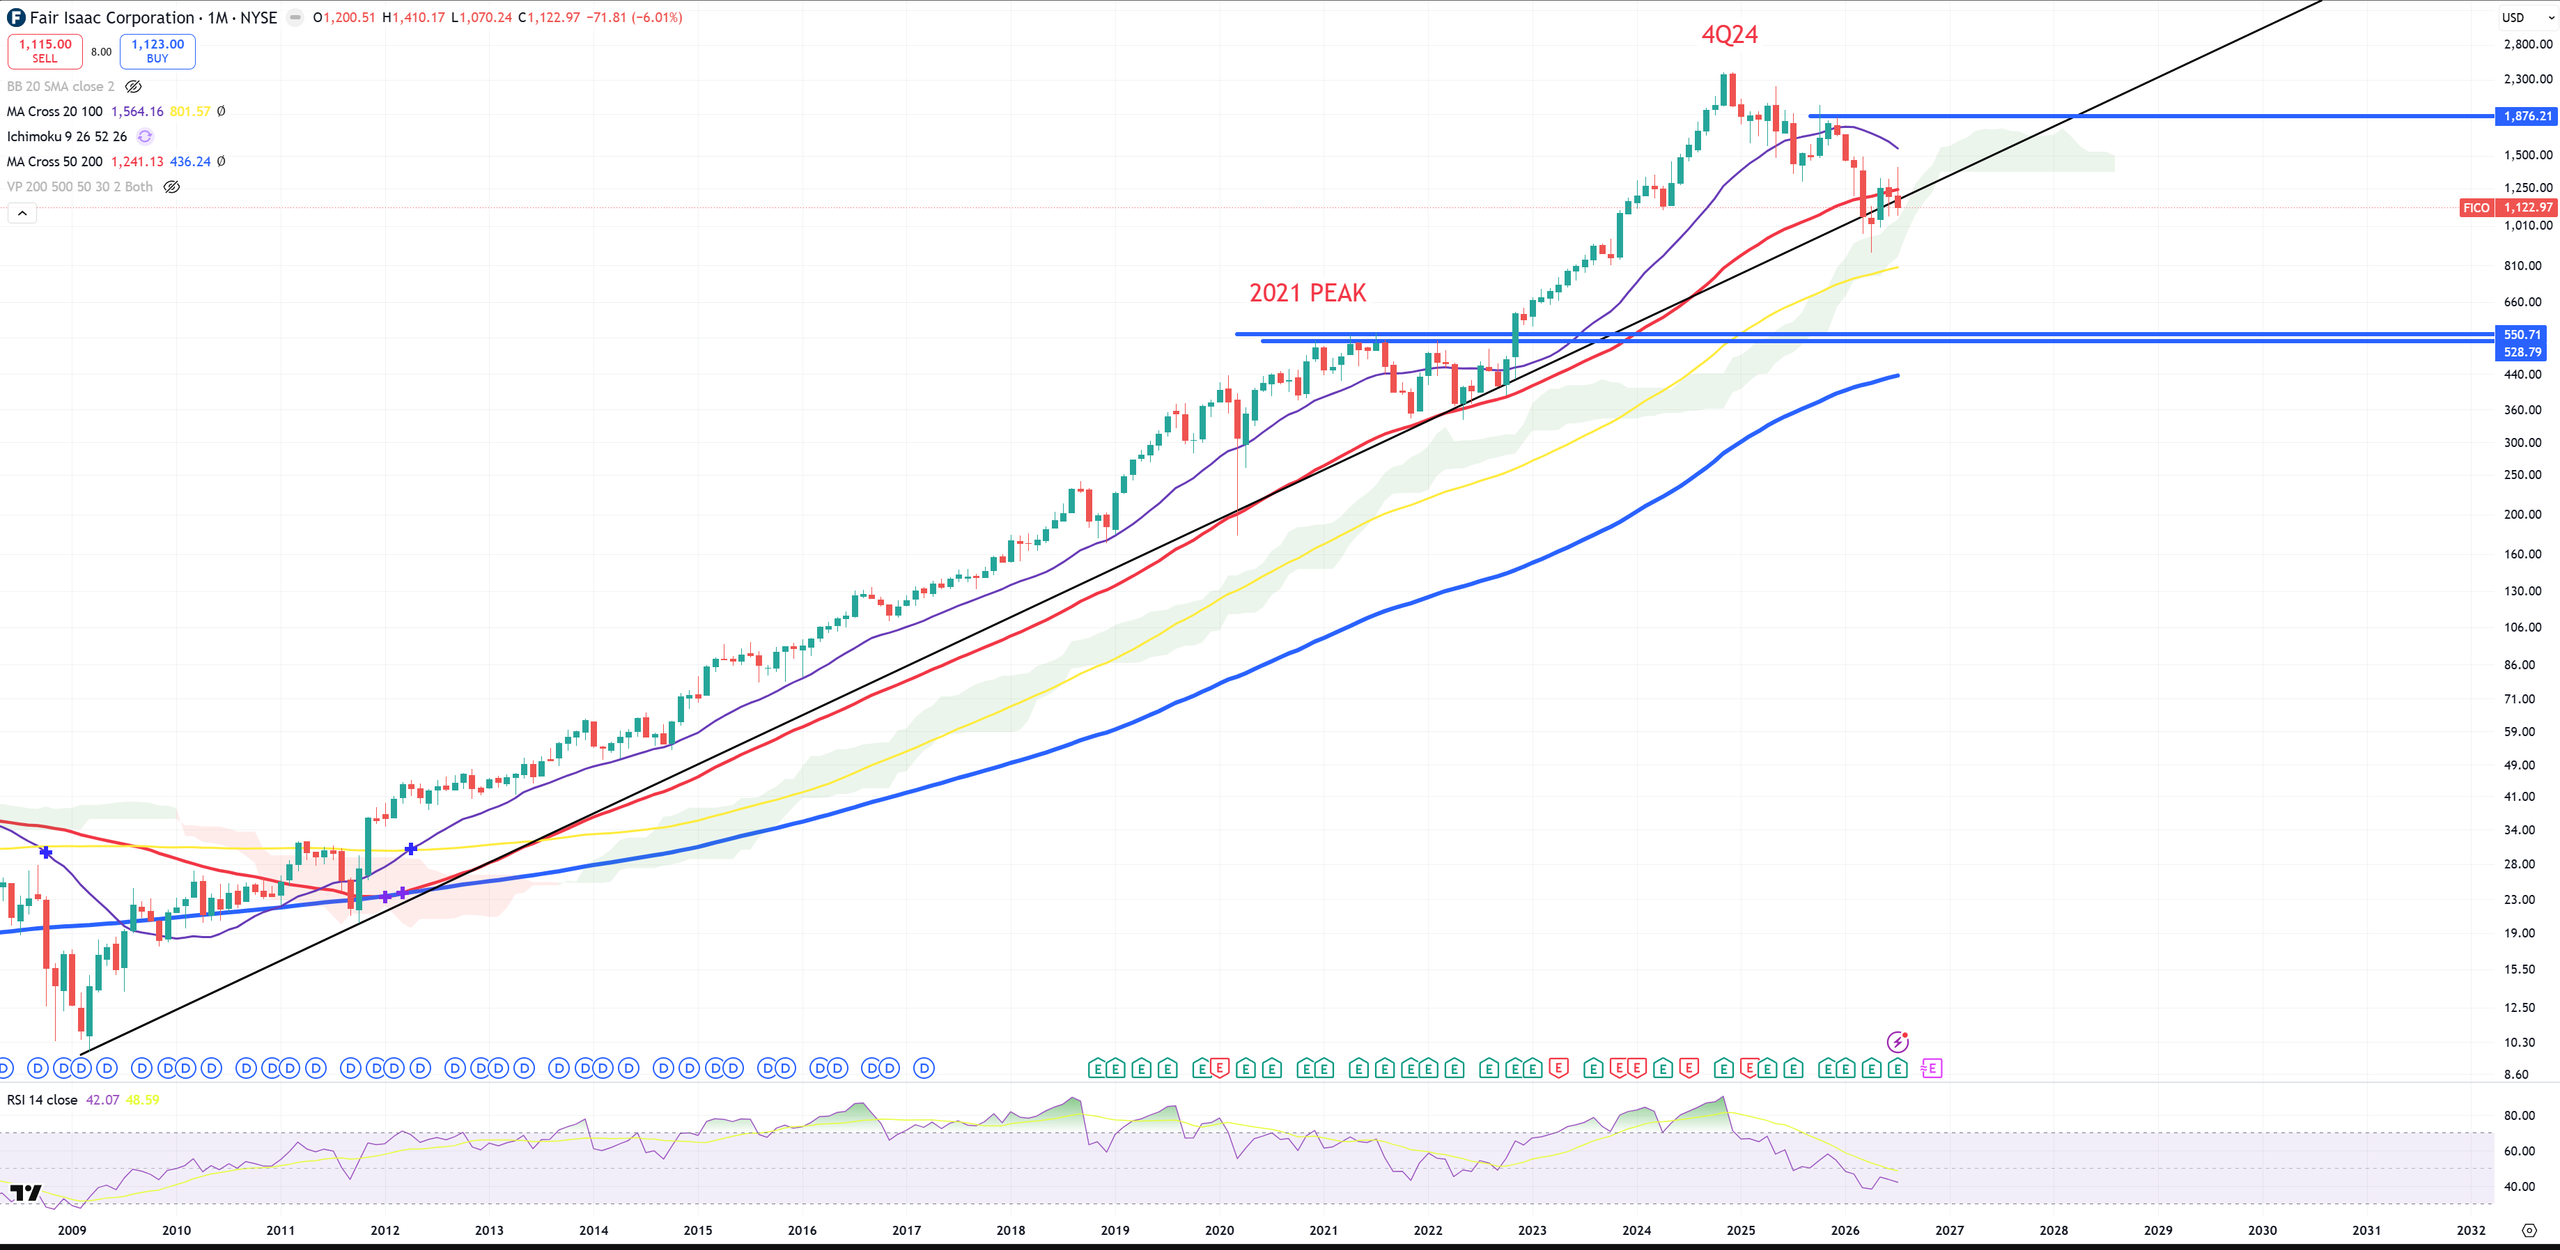
FICO – and its (M)MA50 + 2009 broken trend retest
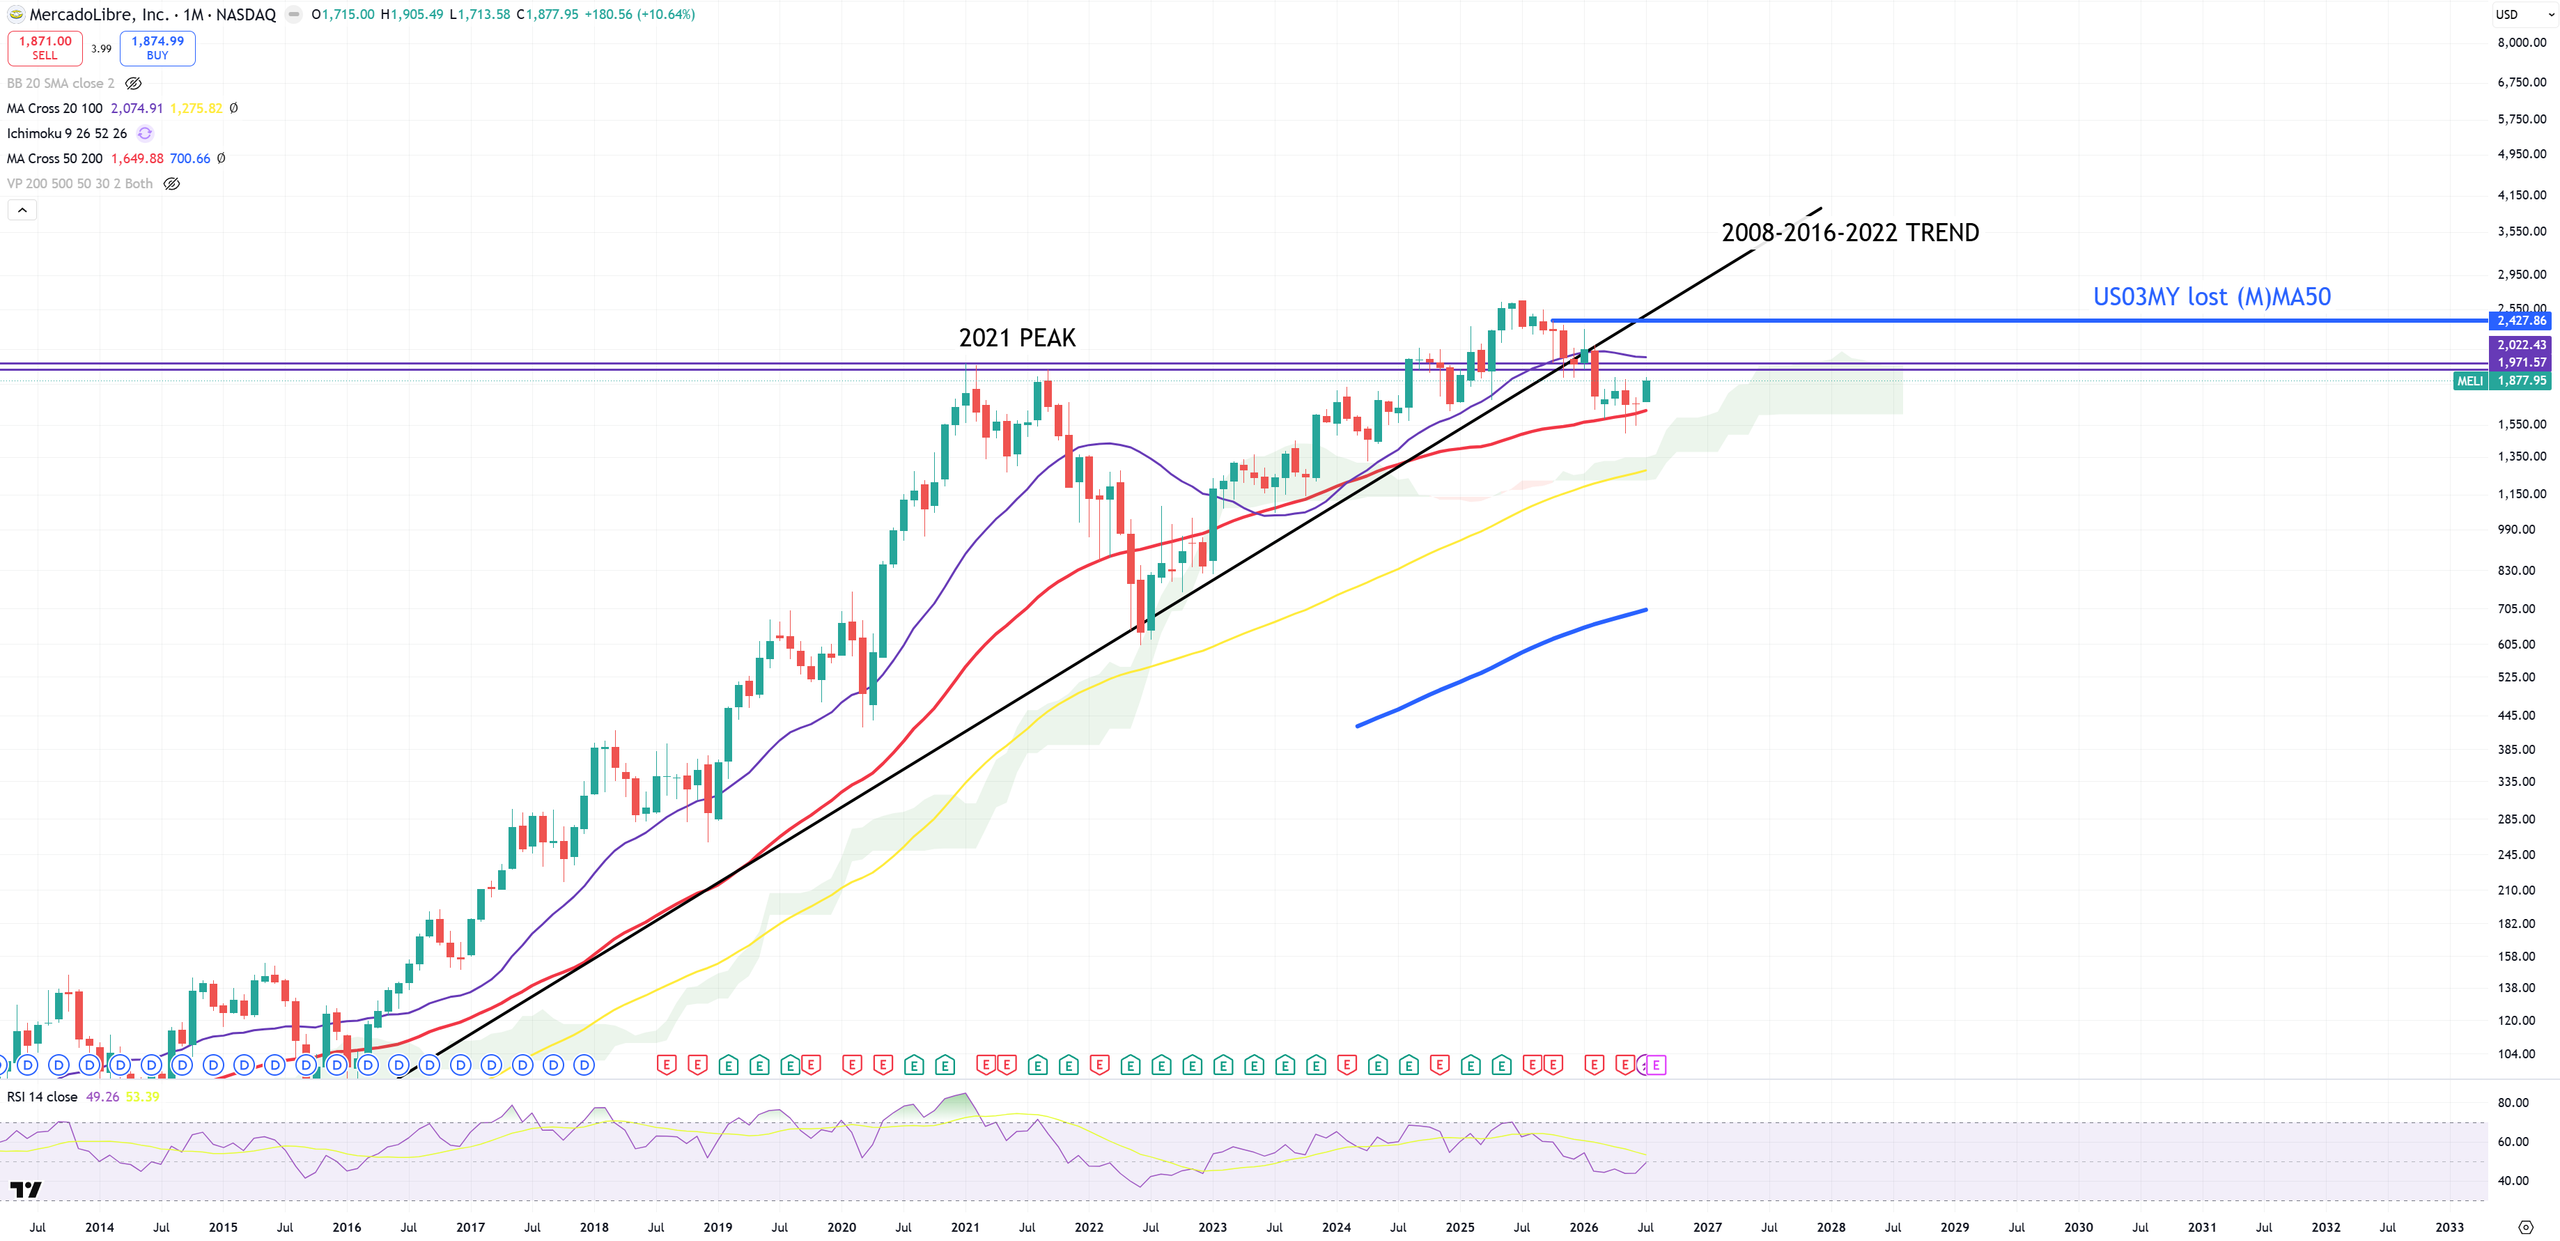
MELI – and its 2021 resistance now. So far (M)MA50 holds
Summary : KOSPI crashed, Microsoft jumps as good as in October 2008, 10y/3m is now +95bps and more and more companies are below 4Q21. We are on the edge of another spike of oil & yields. If bond market won’t reverse here they will lose another another 50-60bps on US10Y and that means oil might finally hit 147$ levels. MAGS losing steam. NVIDIA can’t really jump and SNDK crashed 57% after getting its first bounce. Seriously not much to cover this month as all eyes on OIL & YIELDS. Bank of Japan can close its doors so now US Treasury needs to buy Yen. Short term OK, longer term I don’t see even one reason why Yen should be stronger unless their yields will go really parabolic like crazy. Banks are doing super fine even if HYG and Private Credit keep tanking and Real Estate joins to them.
Again it’s still the edge. Oil to 150$ and Yields going bananas or oil to negative values and yields to ZIRP what I see from this record 10y/3m inversion. Something must give up and the chances are now 50/50.