02/2026
March 1, 2026

So it looks like the market starts breaking trying to leave my pattern. This time I won’t be sharing tons of charts, because we need to concentrate what’s going on. My prediction from the beginning of January 2026 is still very valid :
And what’s going on? Market cracks and private equity is going bust. Technical charts were telling us something is wrong and something will happen, but we all know, we won’t guess what it’ll be – we just know it’ll be a bad event or bad events. We start from basics – to check what’s going on, going to $$$, bond market, cycles indicators, AI bubble, Crypto bubble. Can we reverse again the trend and why everything what is above 4Q21/1Q22 is crashing down. Old followers know the reason very well.
I use 4 (M)MAs and here’s my interpretation. Violet (M)MA20 = high momentum bull/bear market, red (M)MA50 = technical border between bull/bear, yellow (M)MA100 = middle point often bull/bear trap level, blue (M)MA200 = secular bull/bear market.
Main indicators :
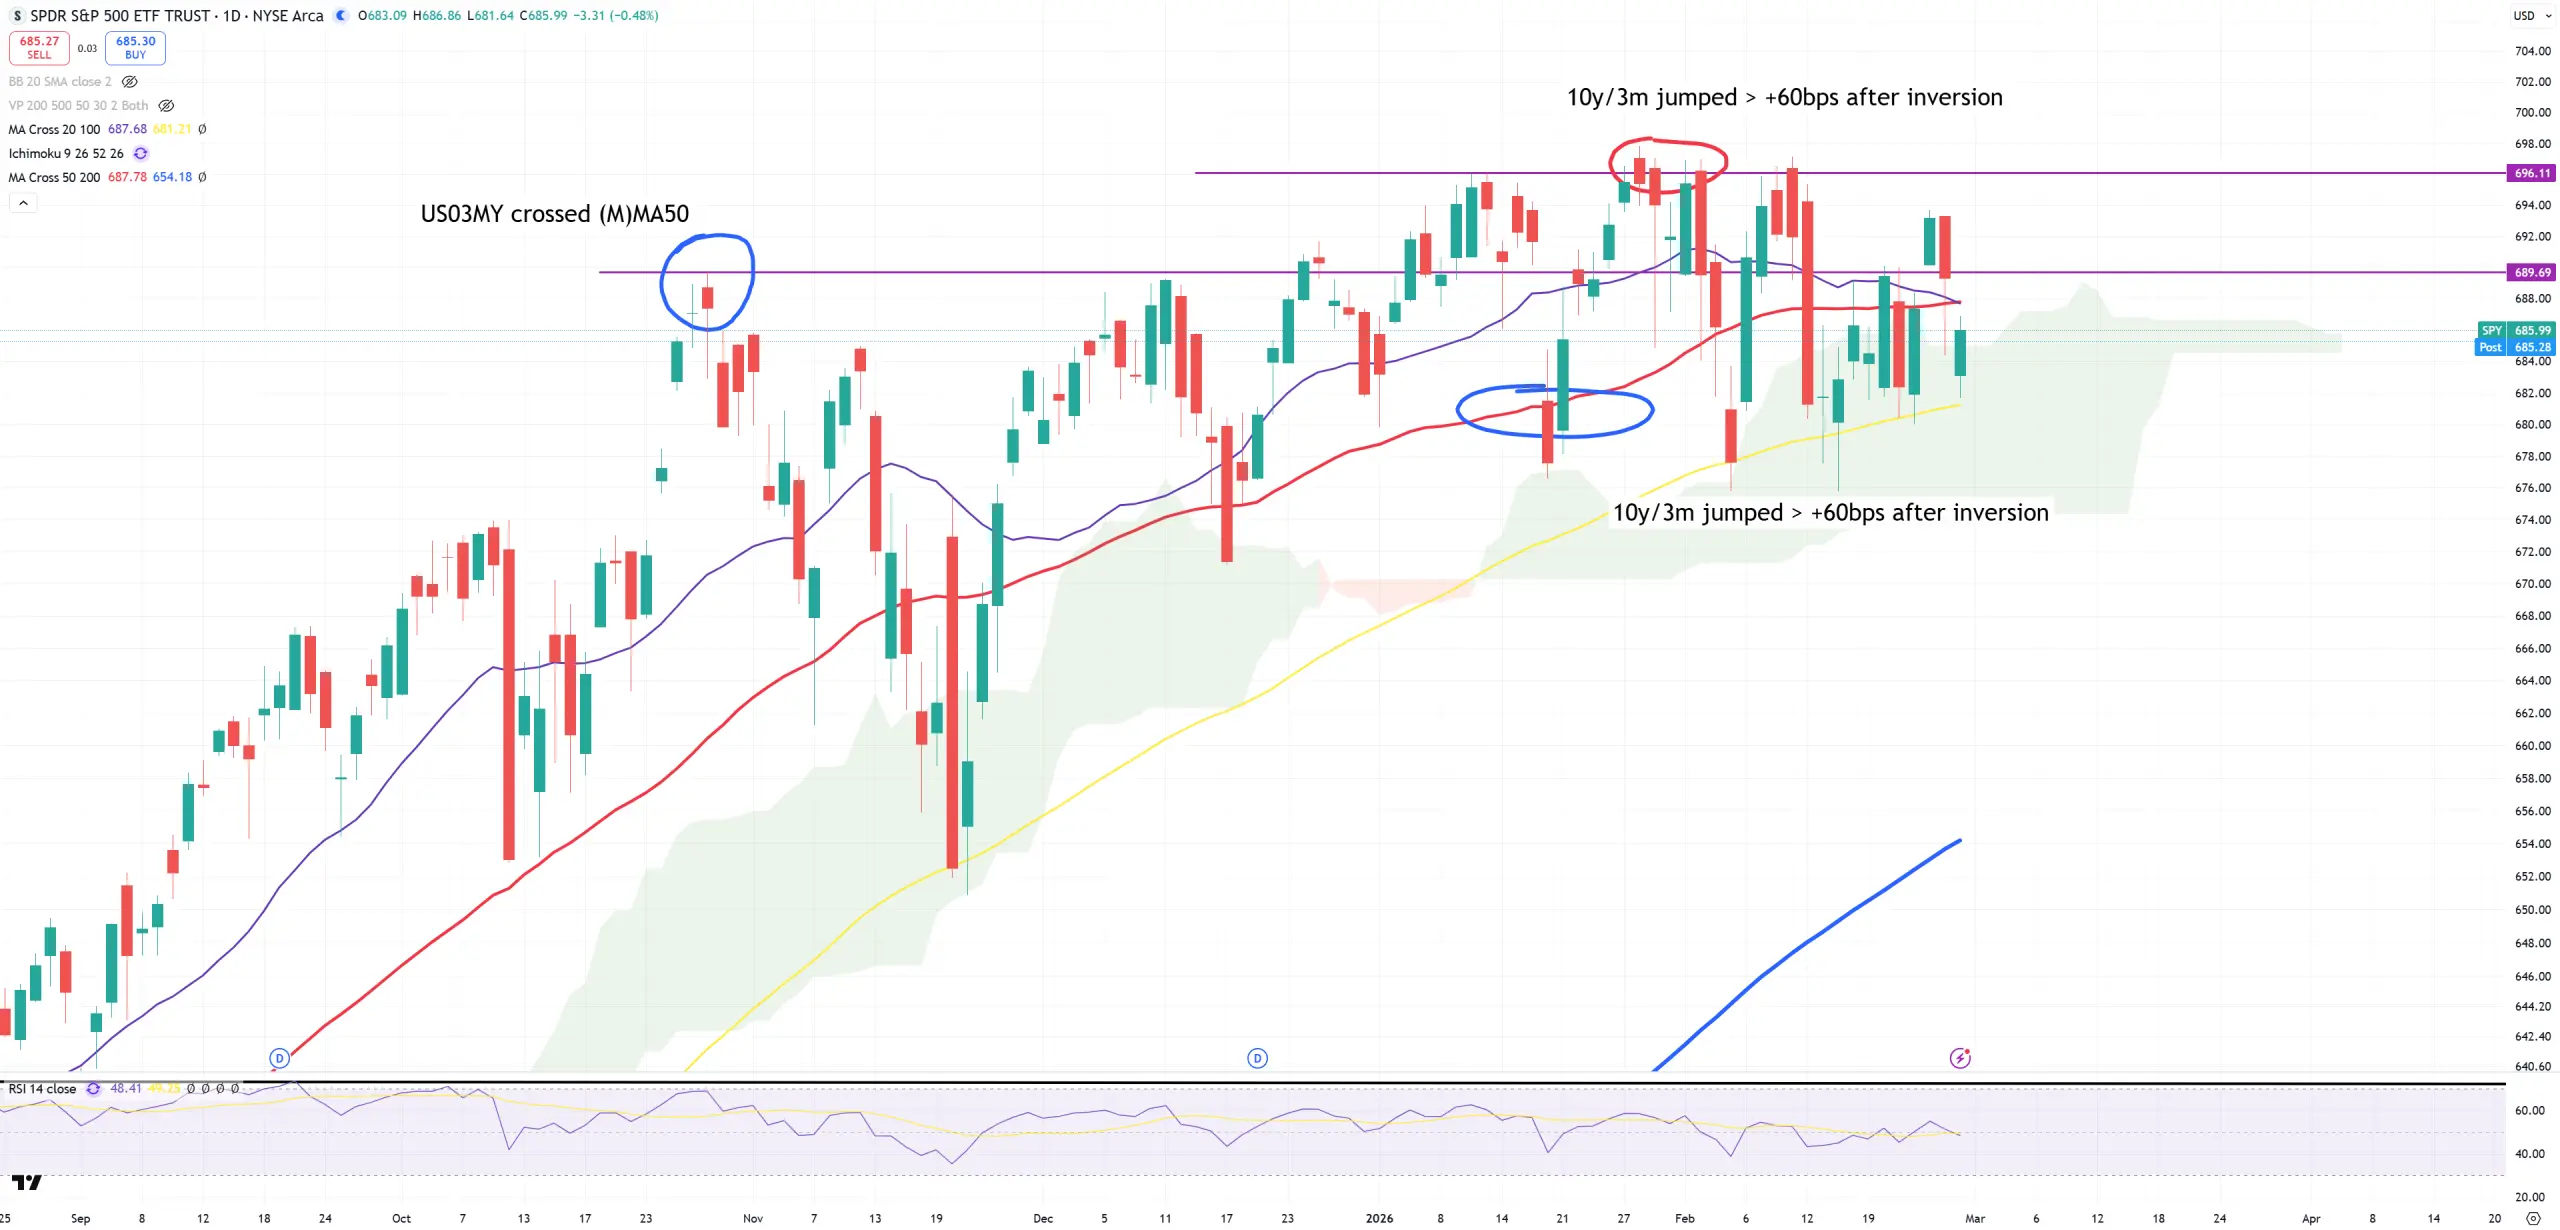
SPY – so let’s check this technical pattern. It’s just (D) to get an idea if we end below October/November 2025 peak. Those people who don’t remember – search for “Mastering technical turn of the market” on my blog
SPX – I’m still waiting when it’ll close below 1929-2000 trend, not happened I think YET…
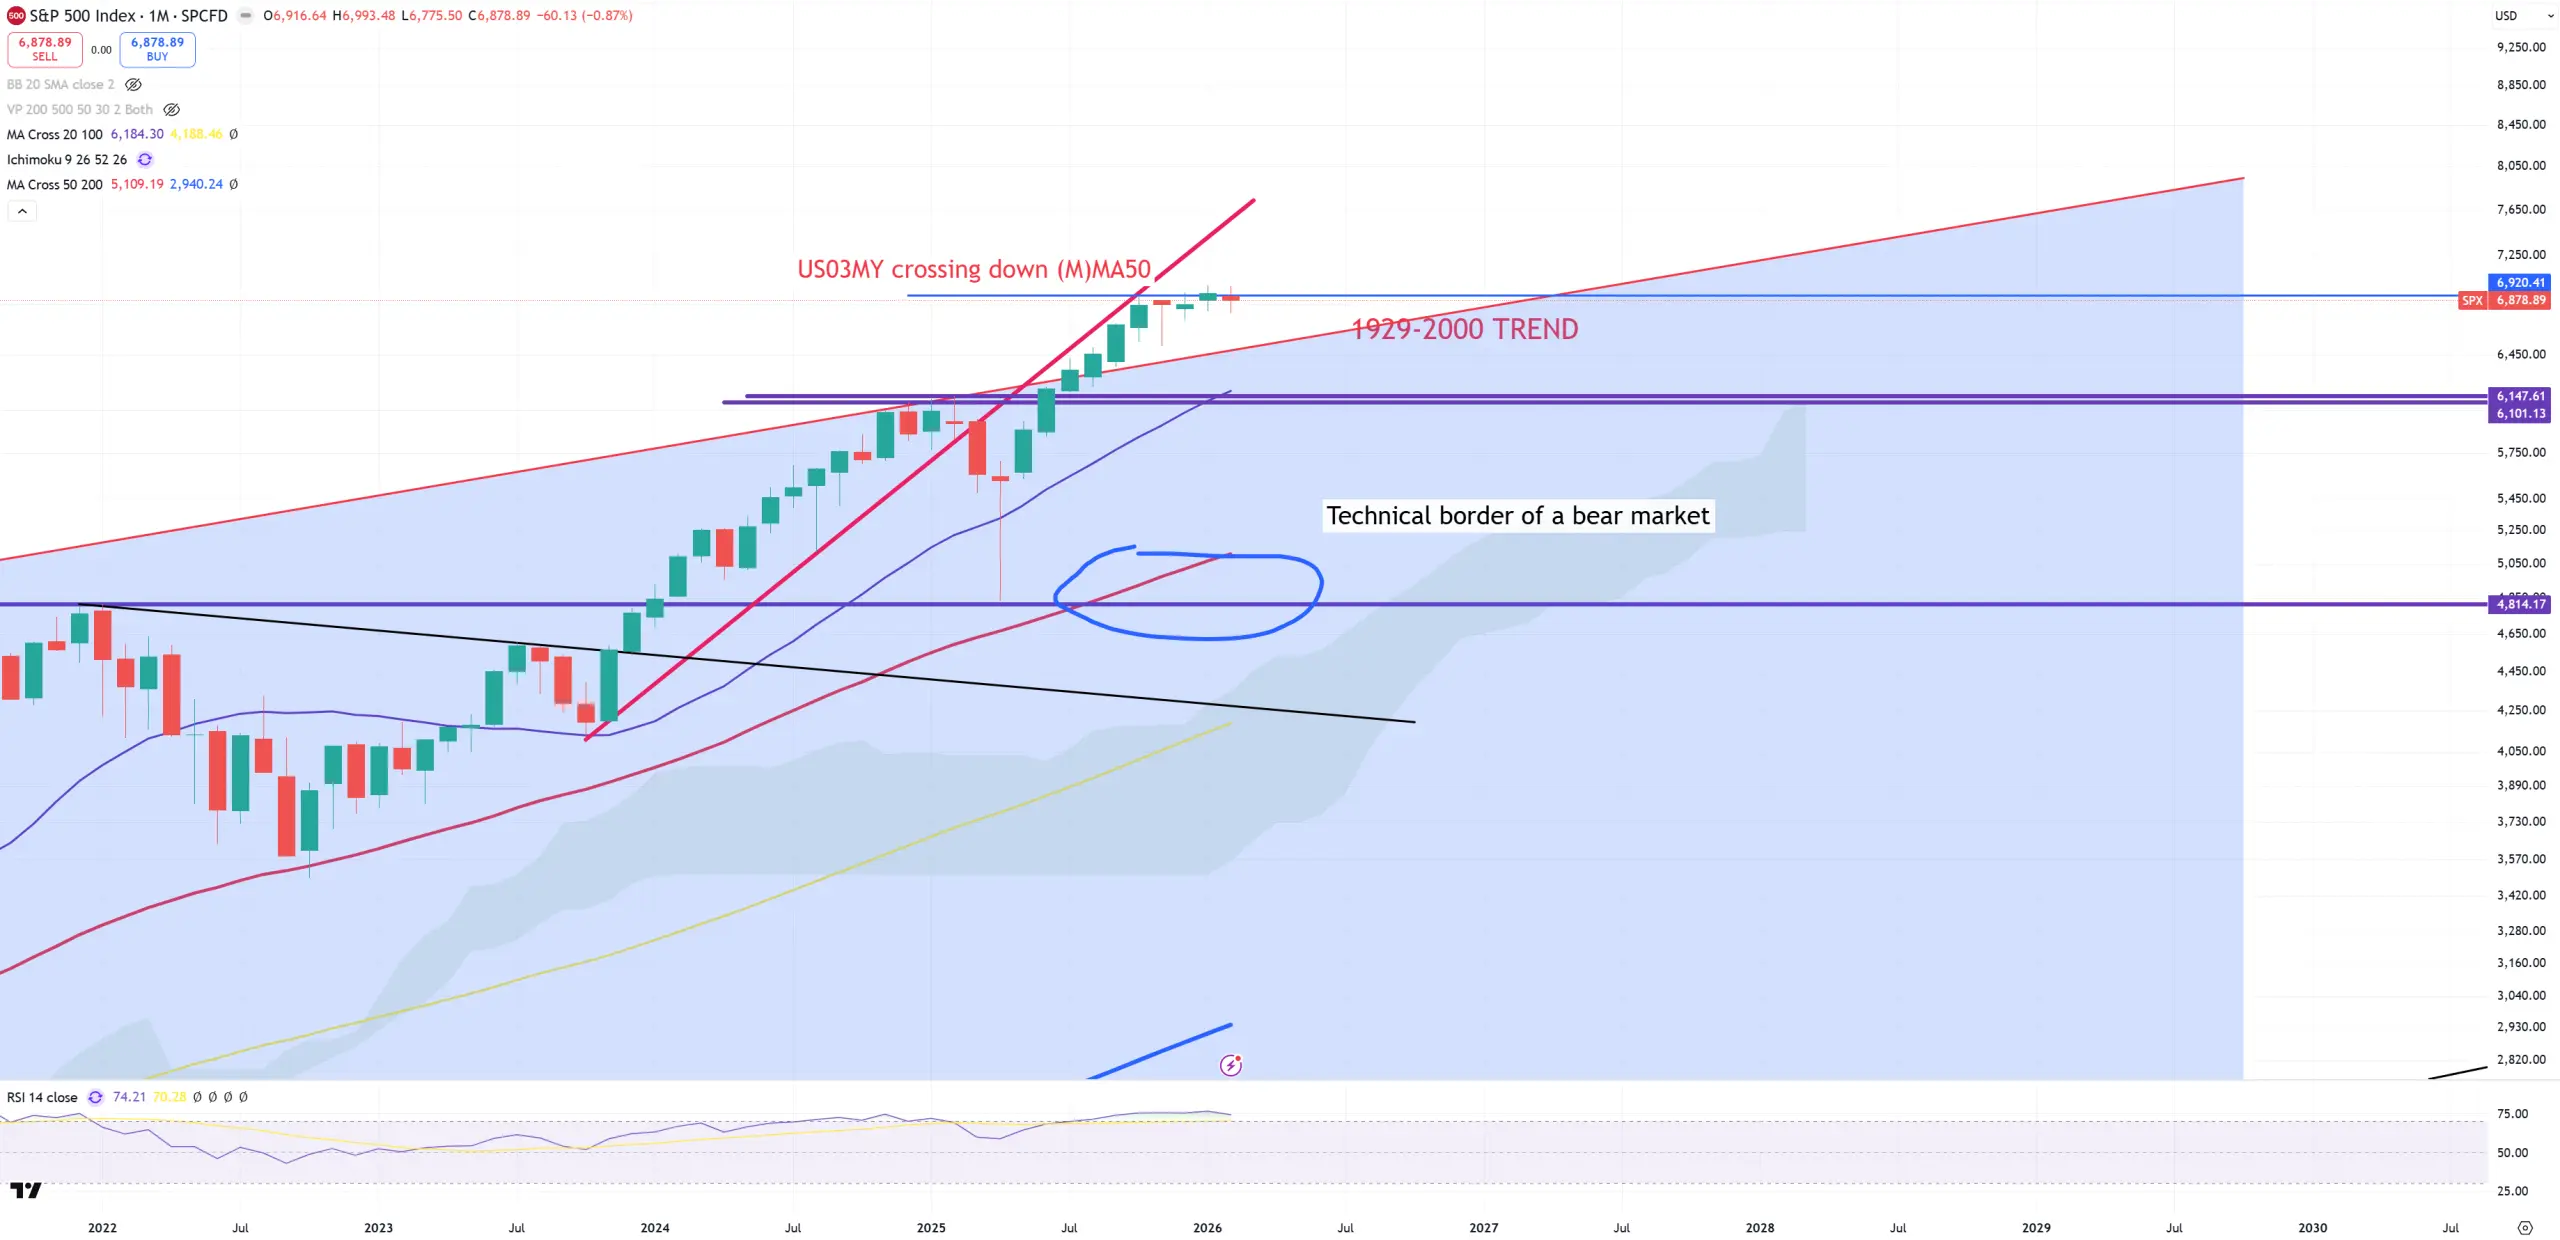
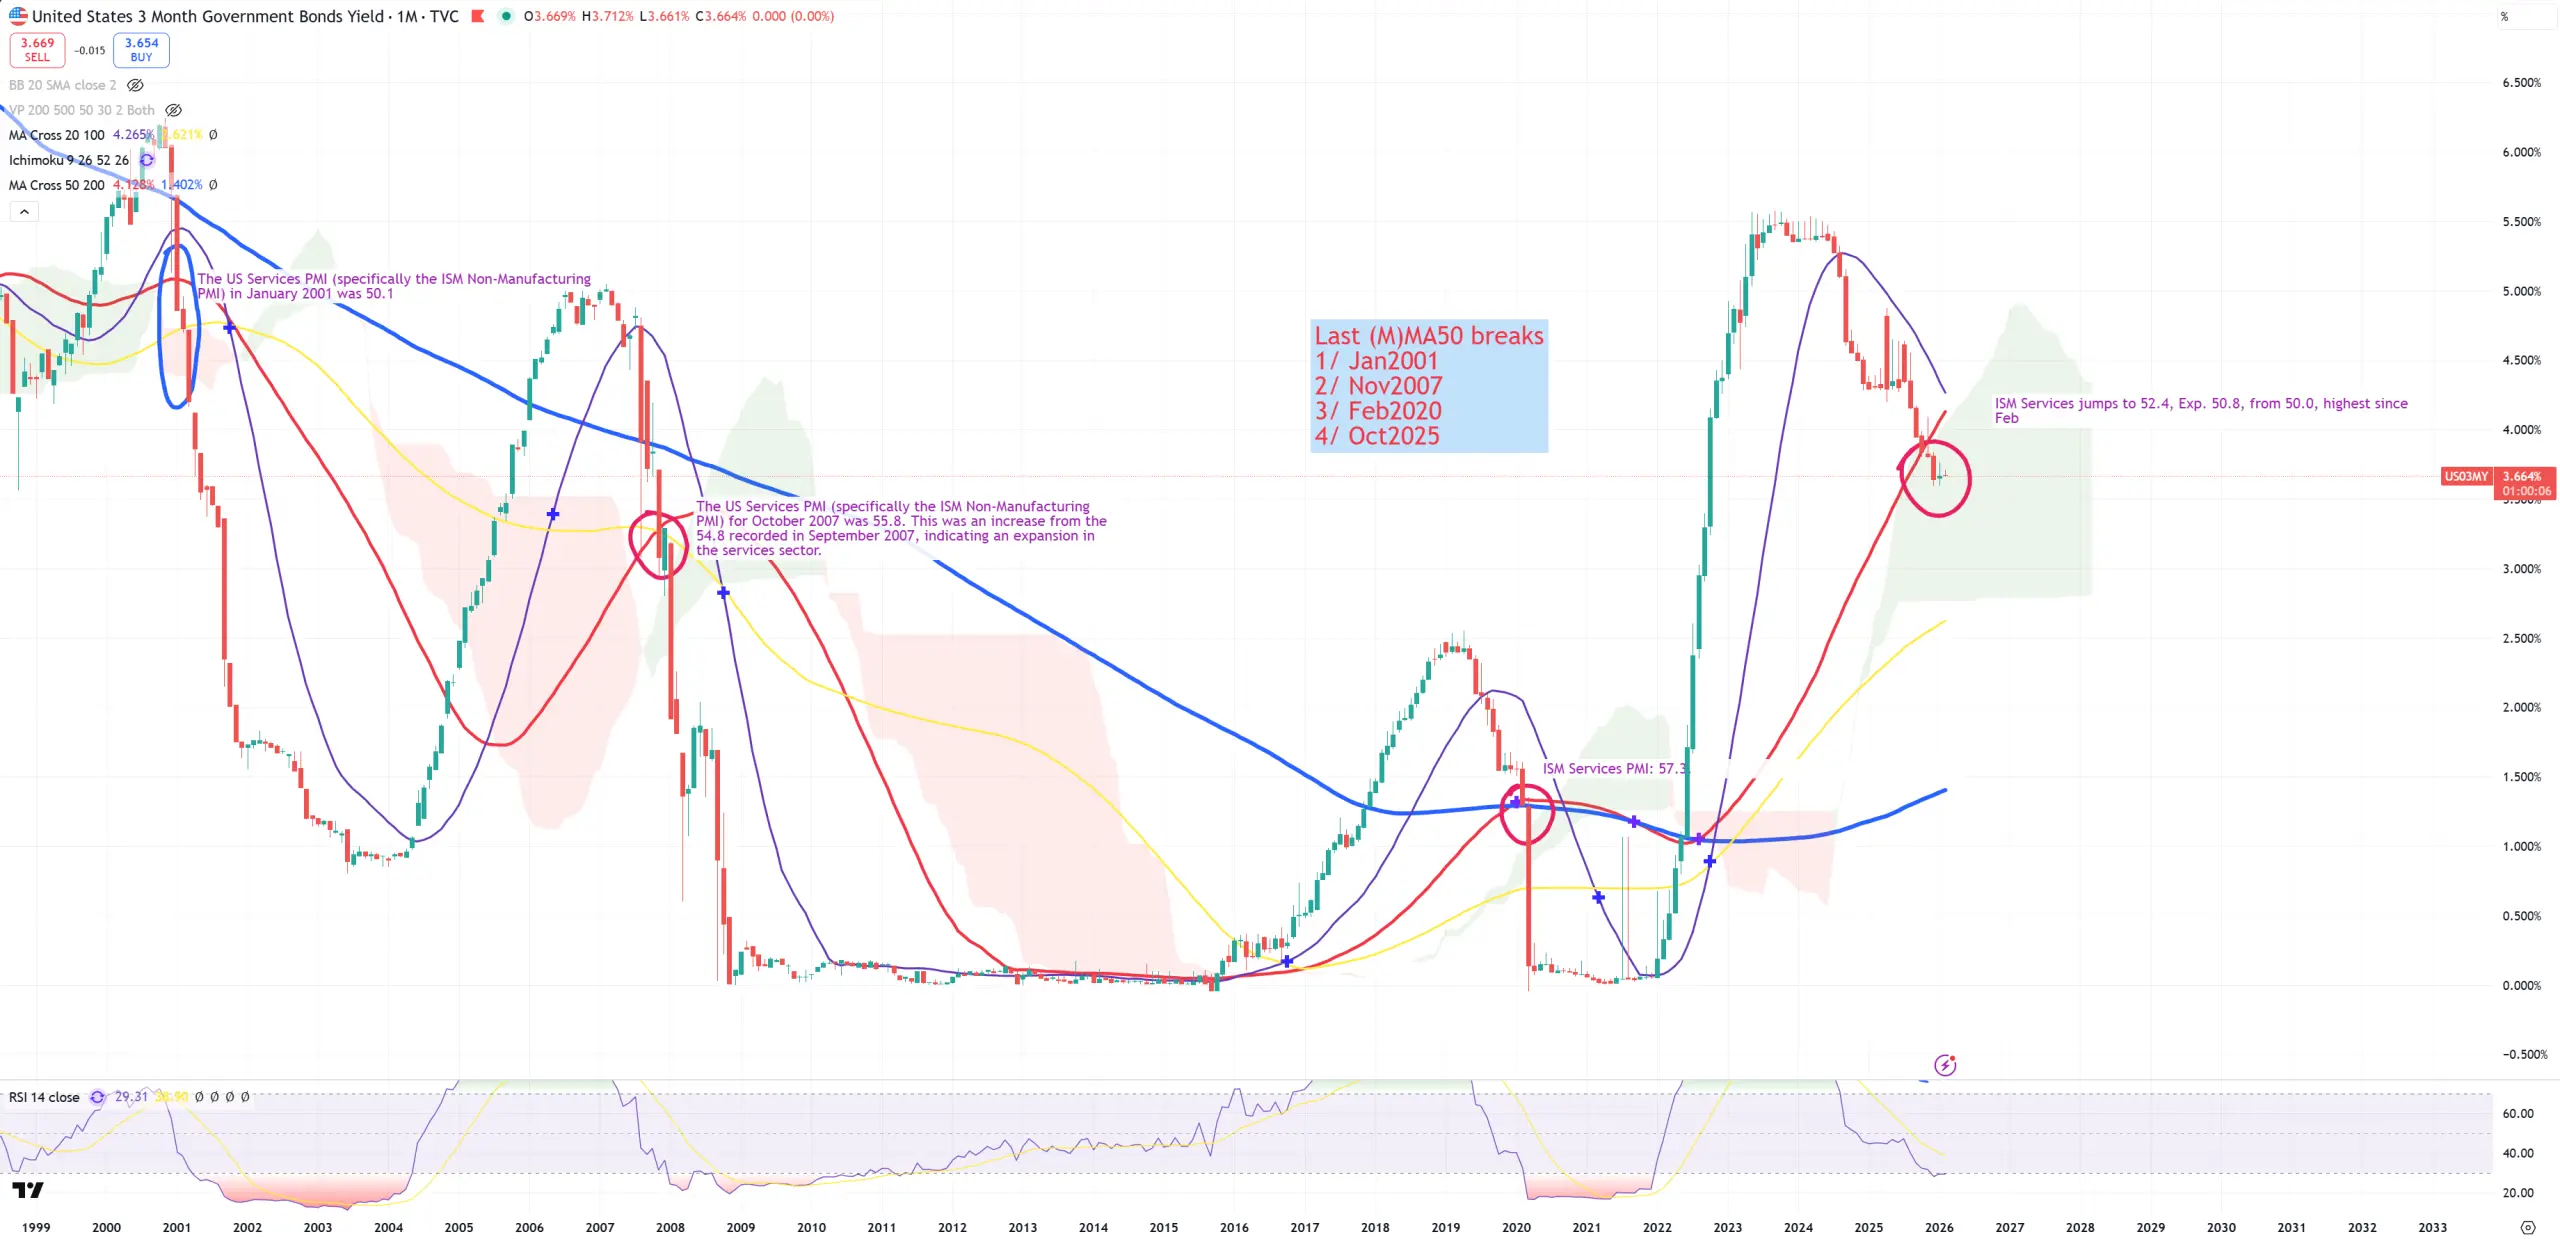
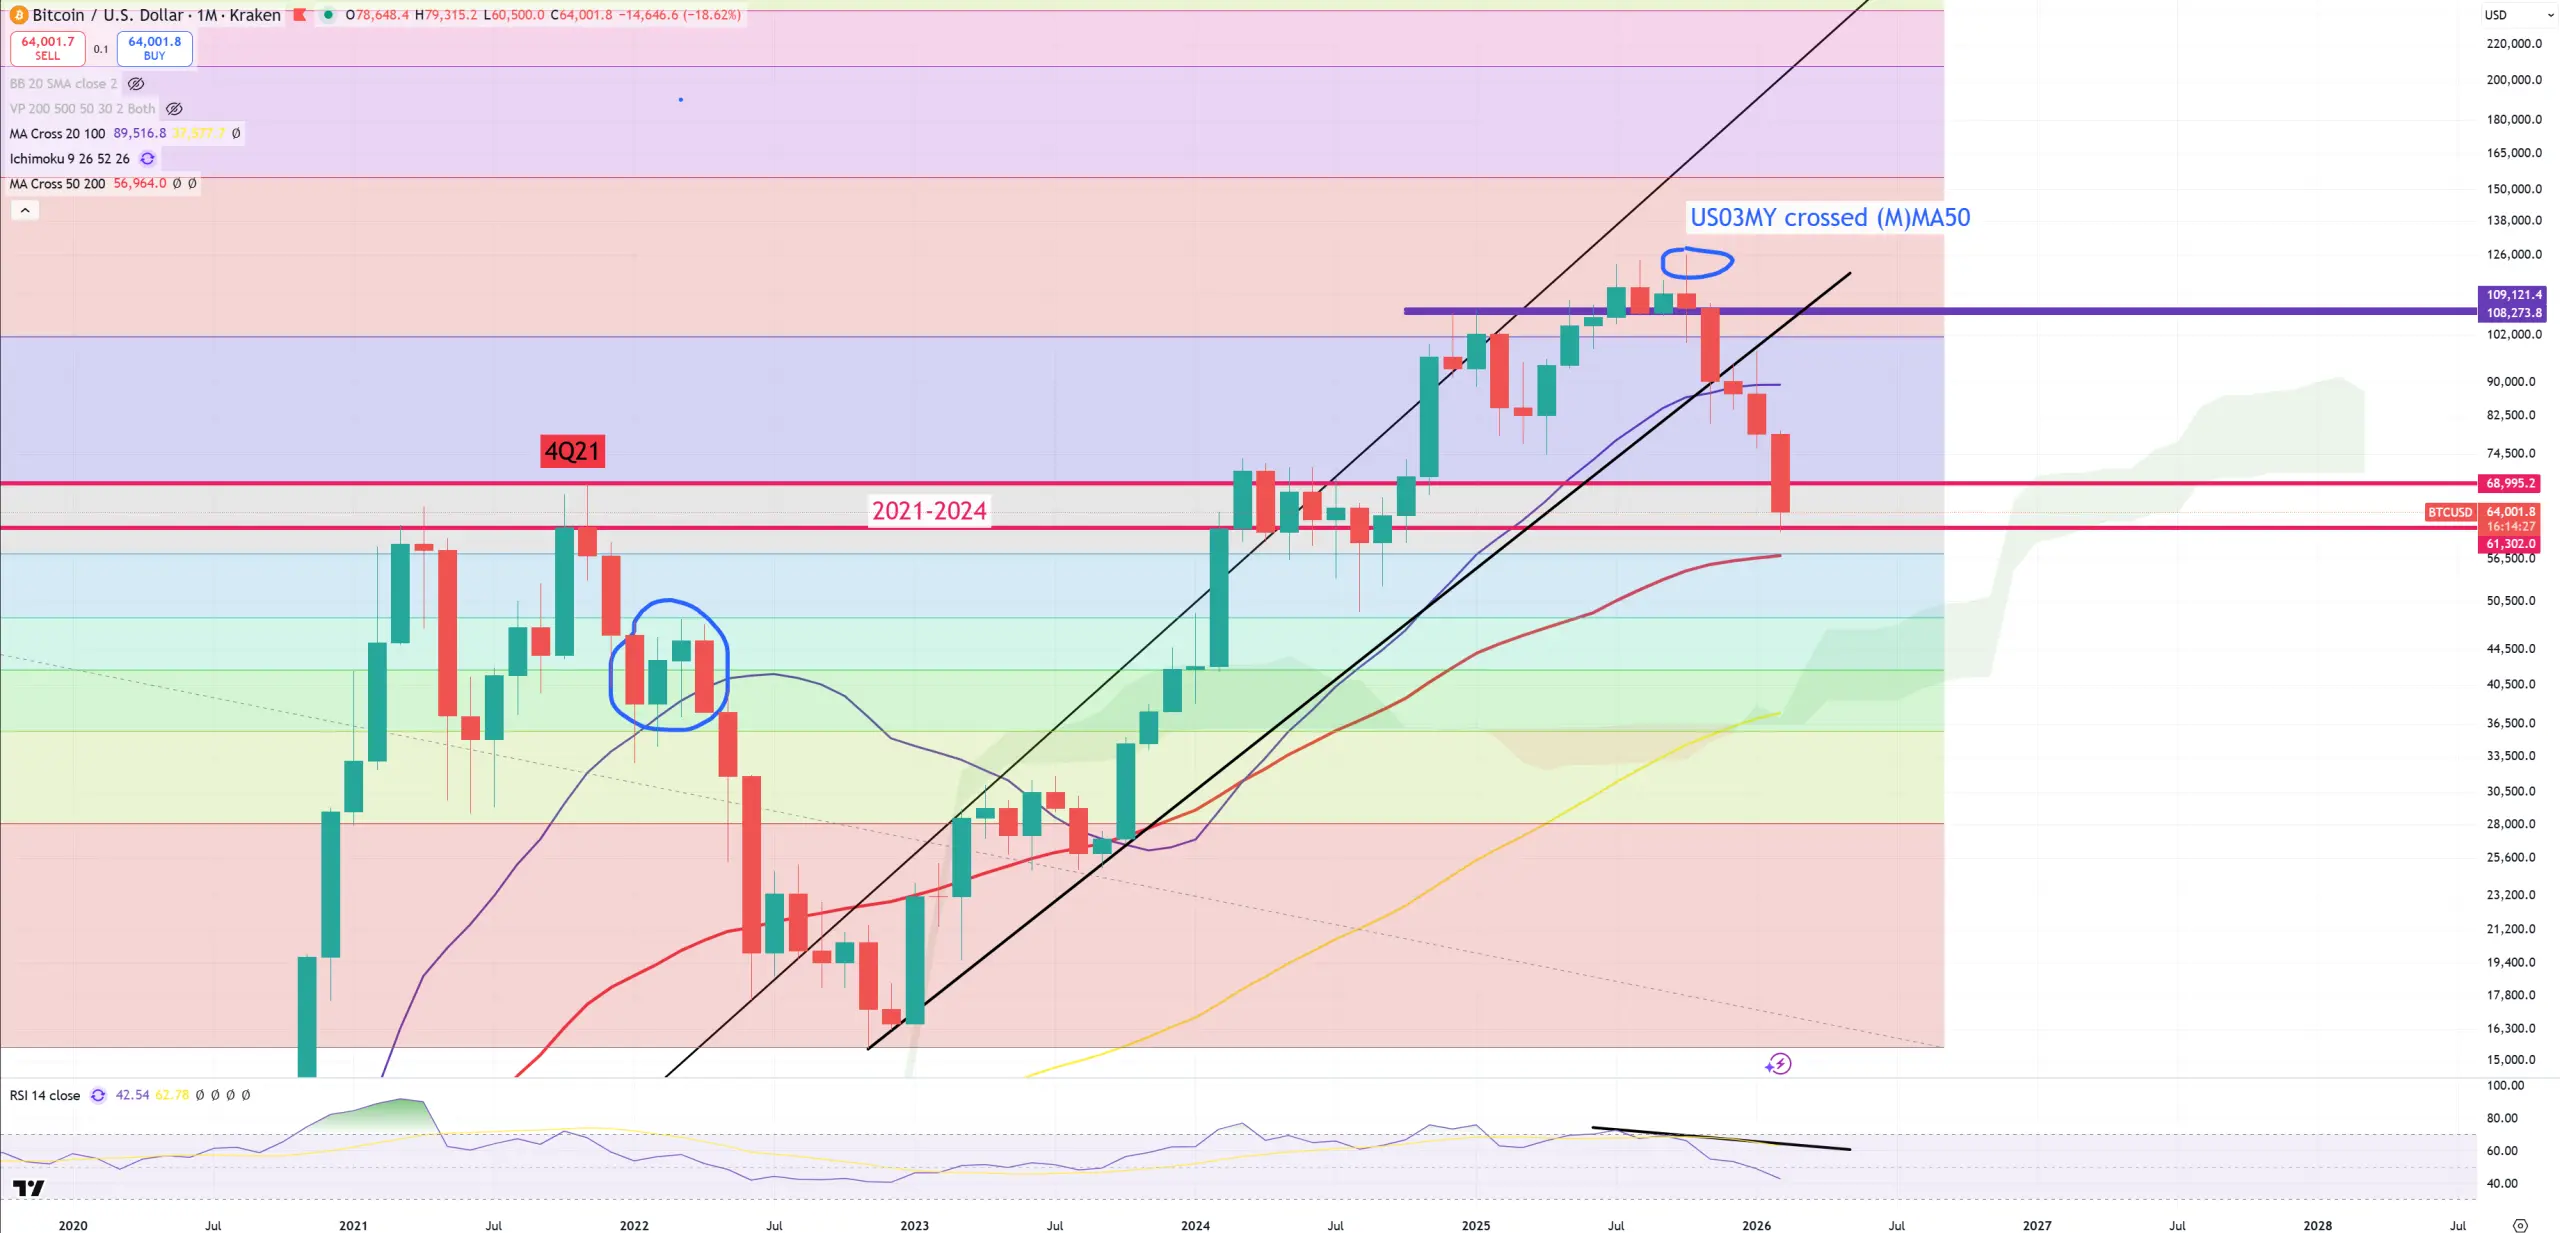
US03MY – so main indicator of topping indexes. Once it broke (M)MA50 it’s mostly game over for stocks. So that’s our October/November 2025 moment.
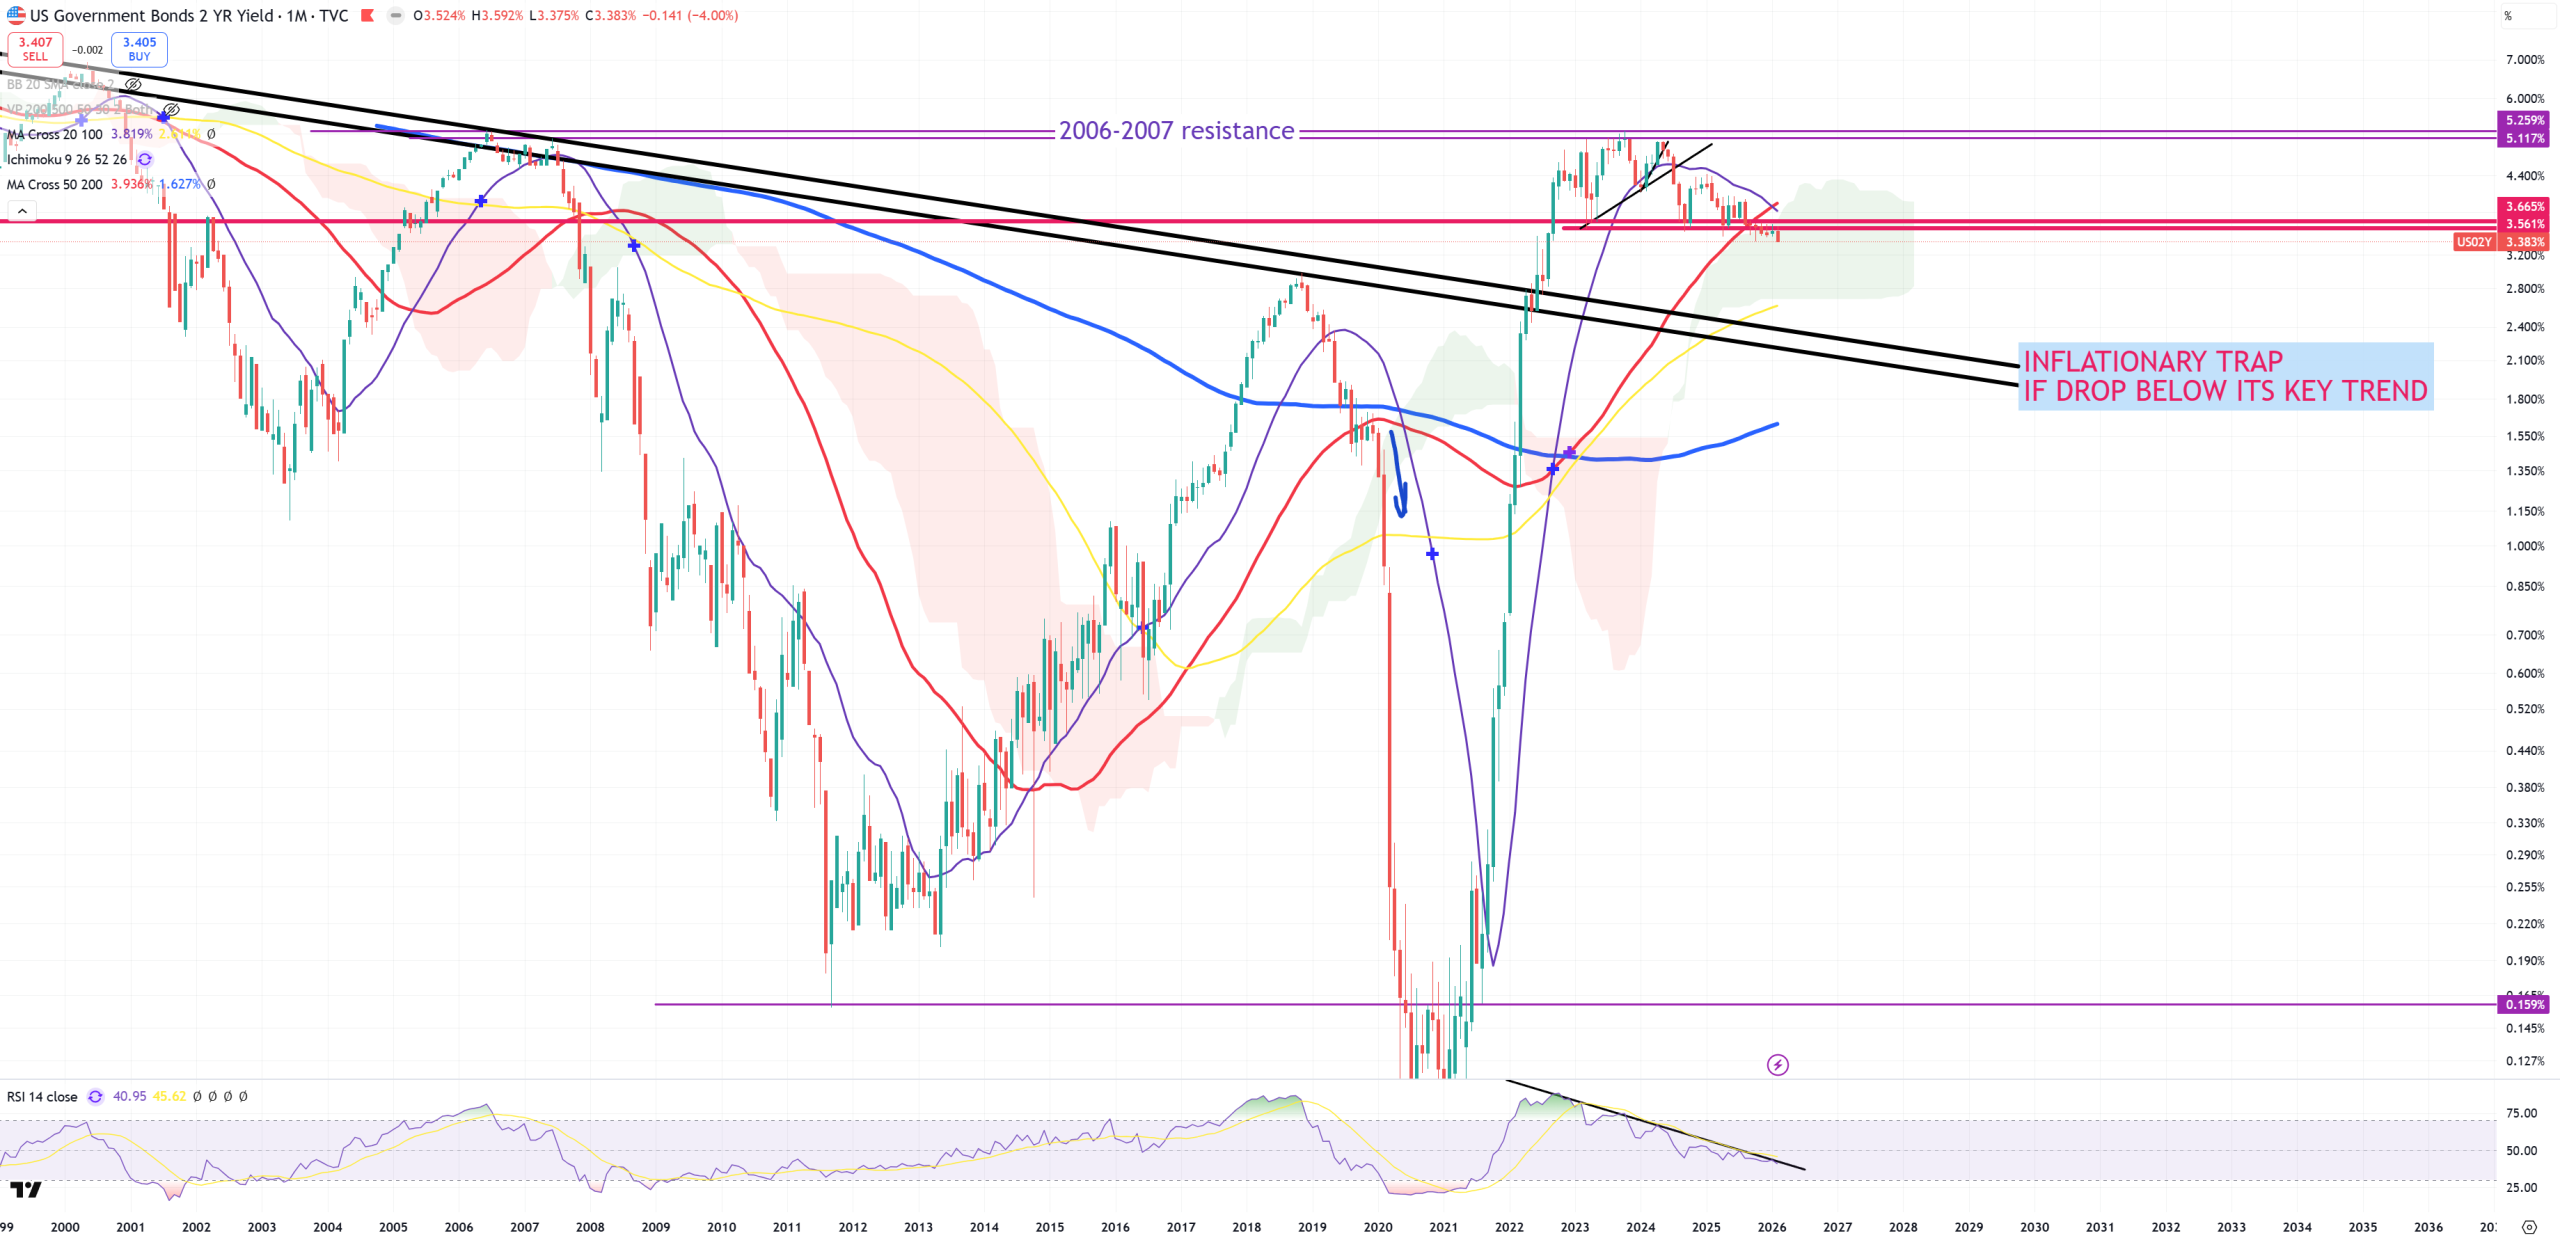
US02Y – we know more rate cuts coming, 100-150bps on the beginning.
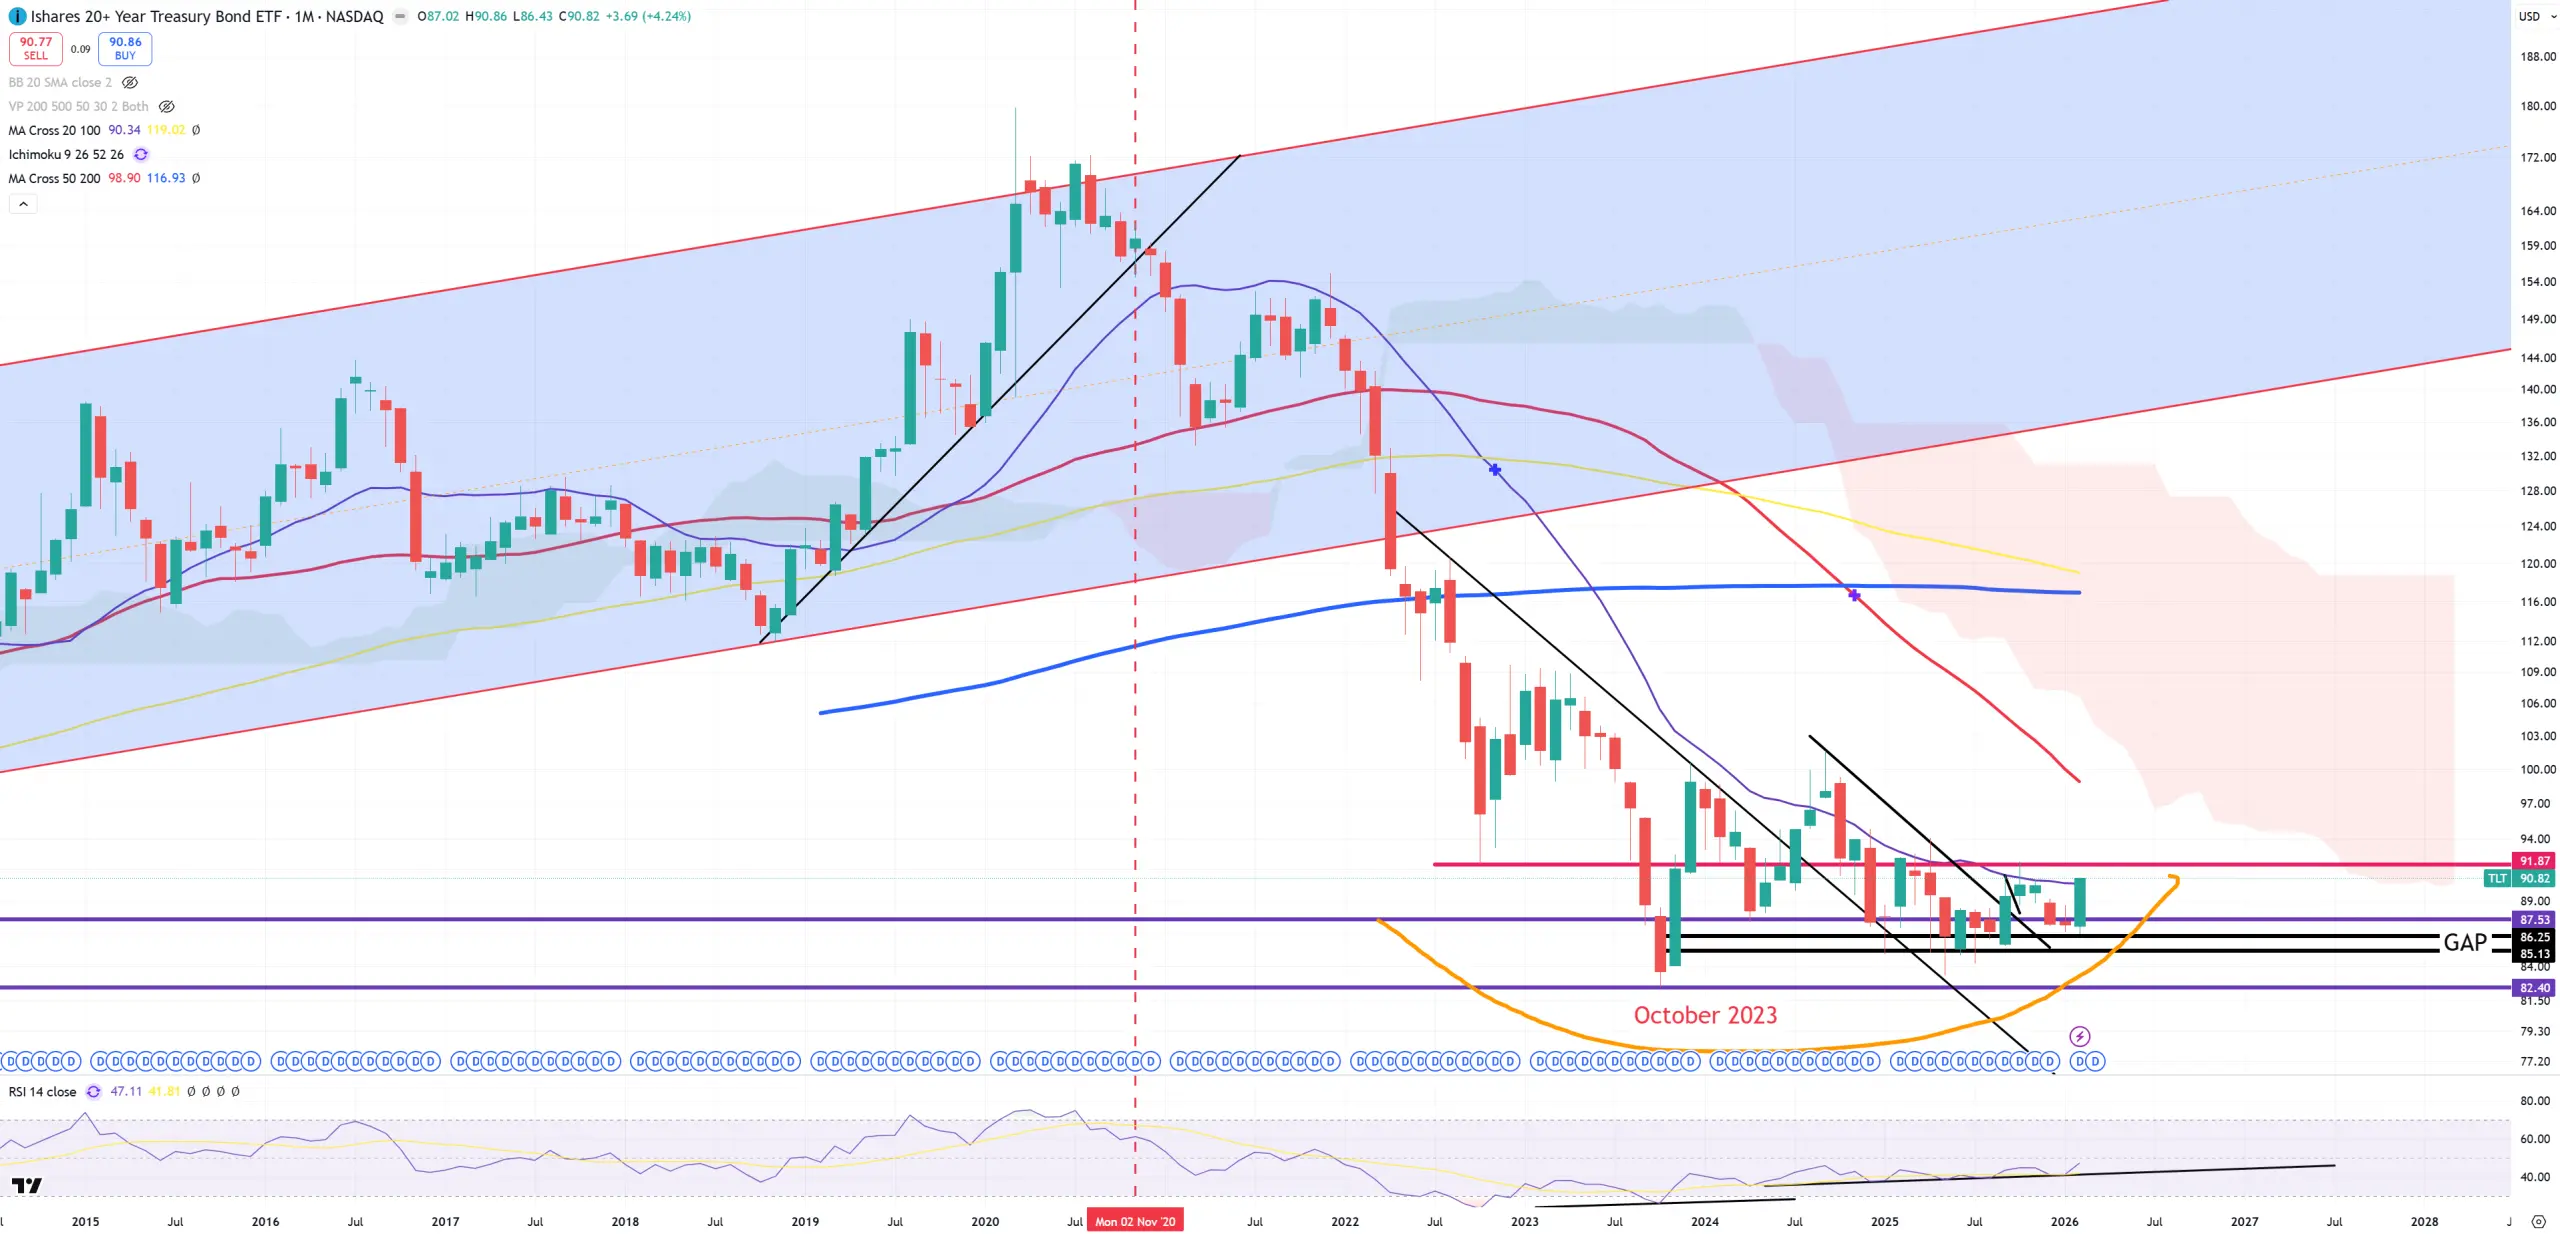
TLT – my old prediction says October 2023 82$ is the bottom – we closed above (M)MA20 in Feb2026 = possible trend change.
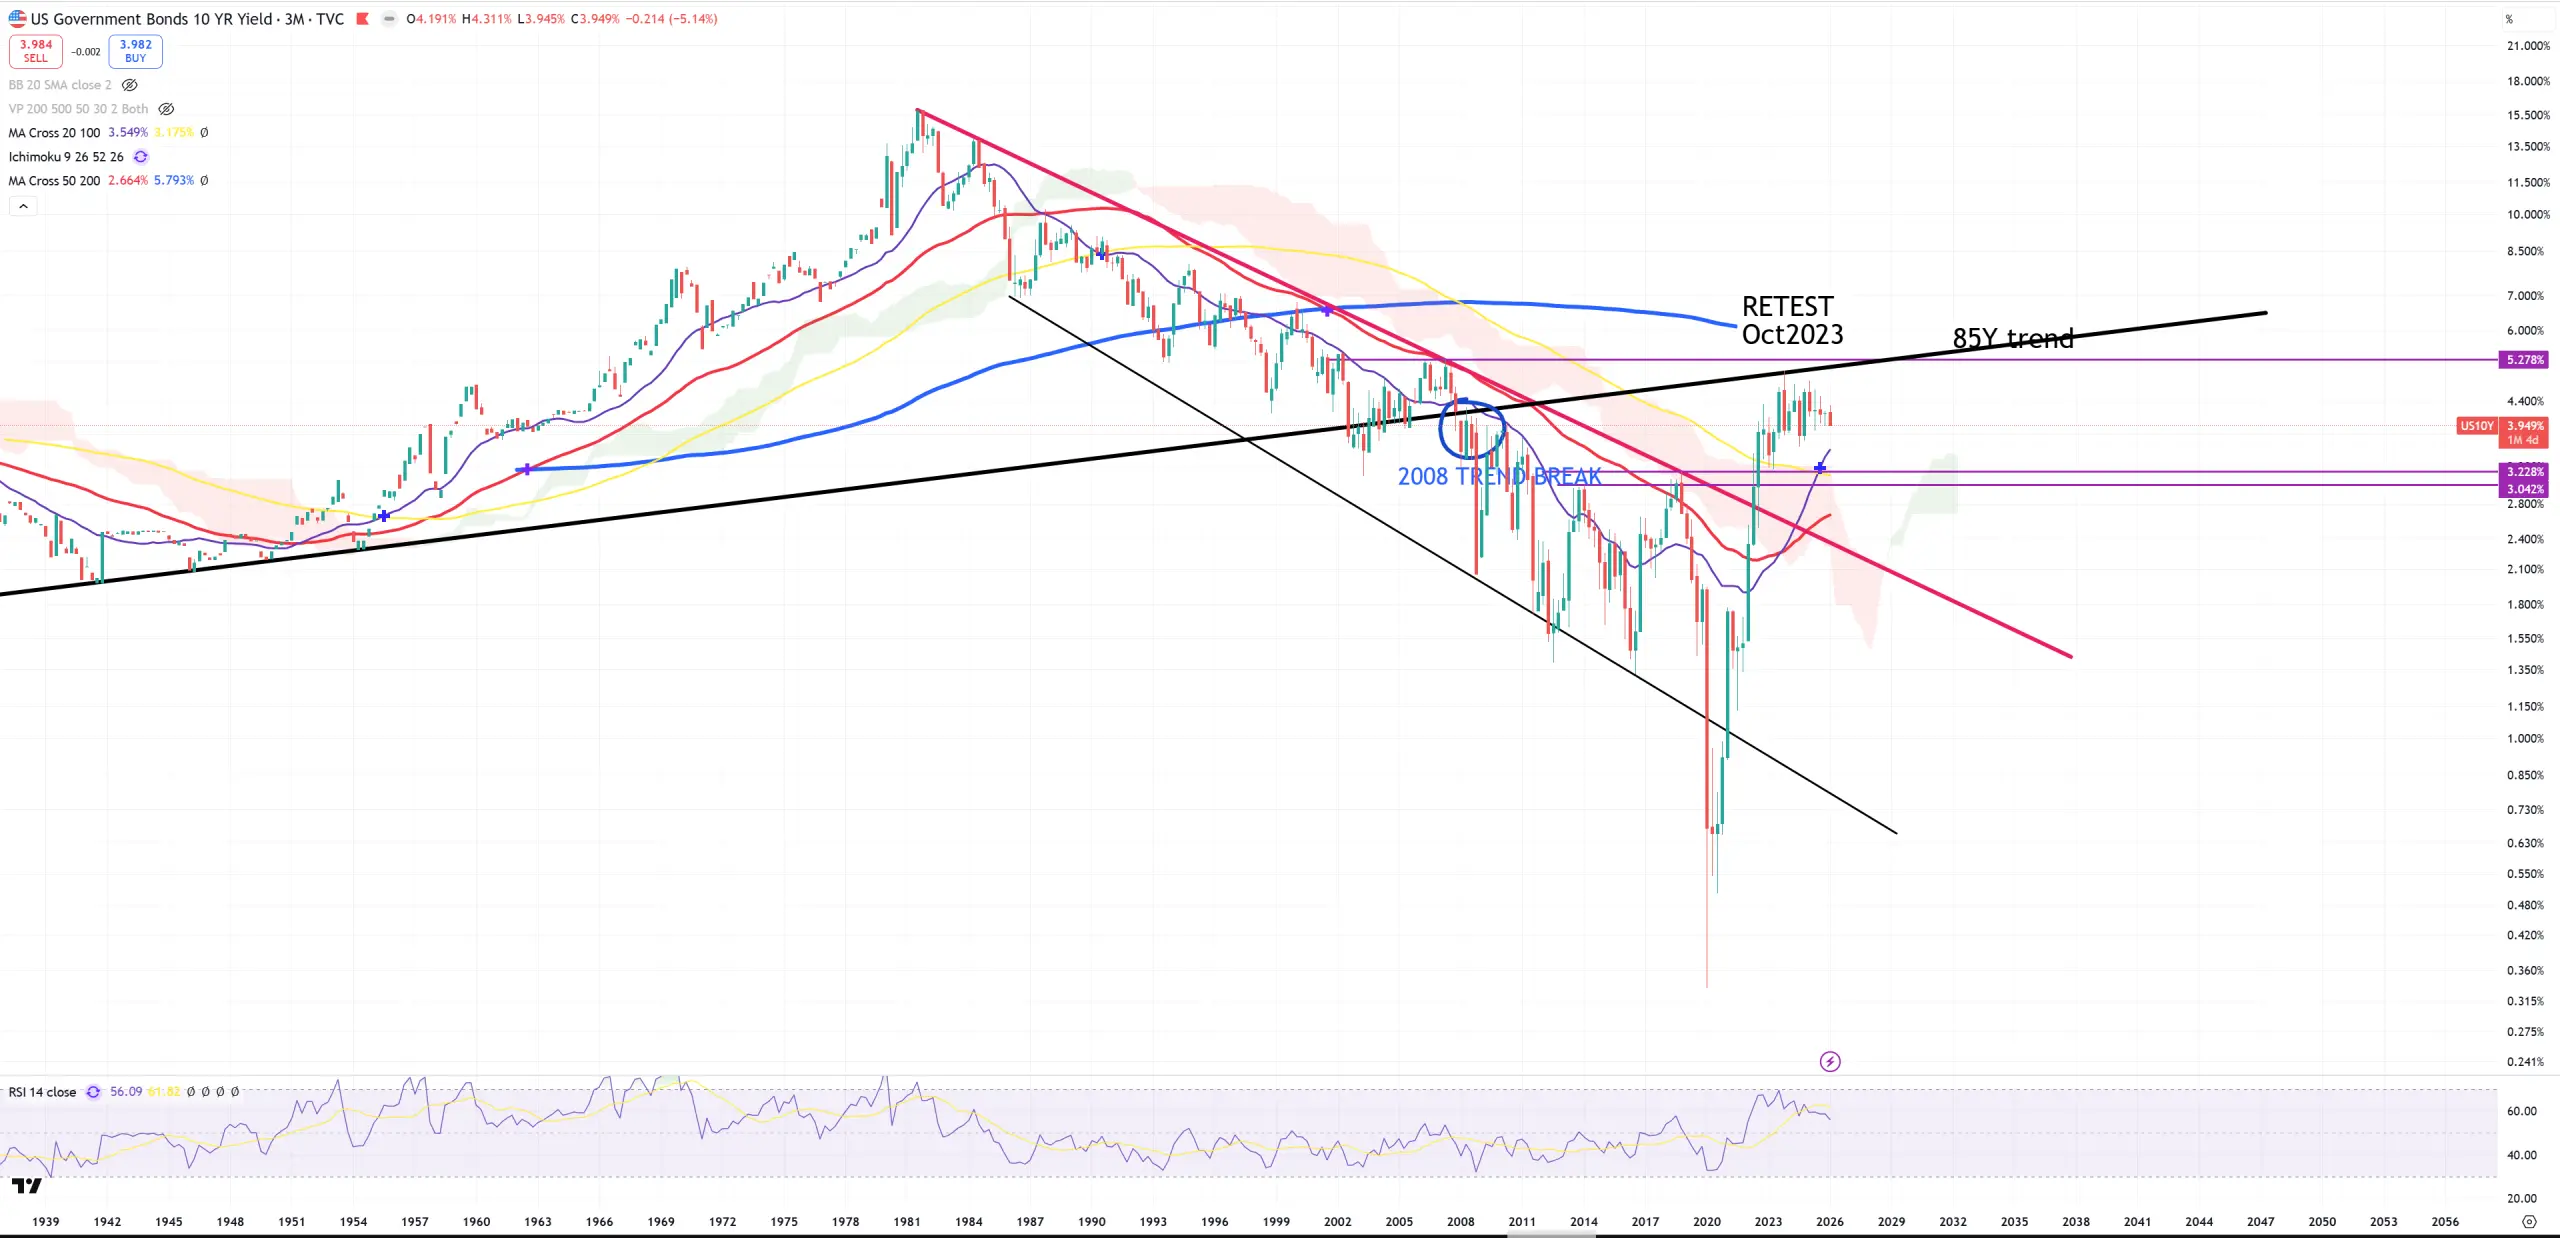
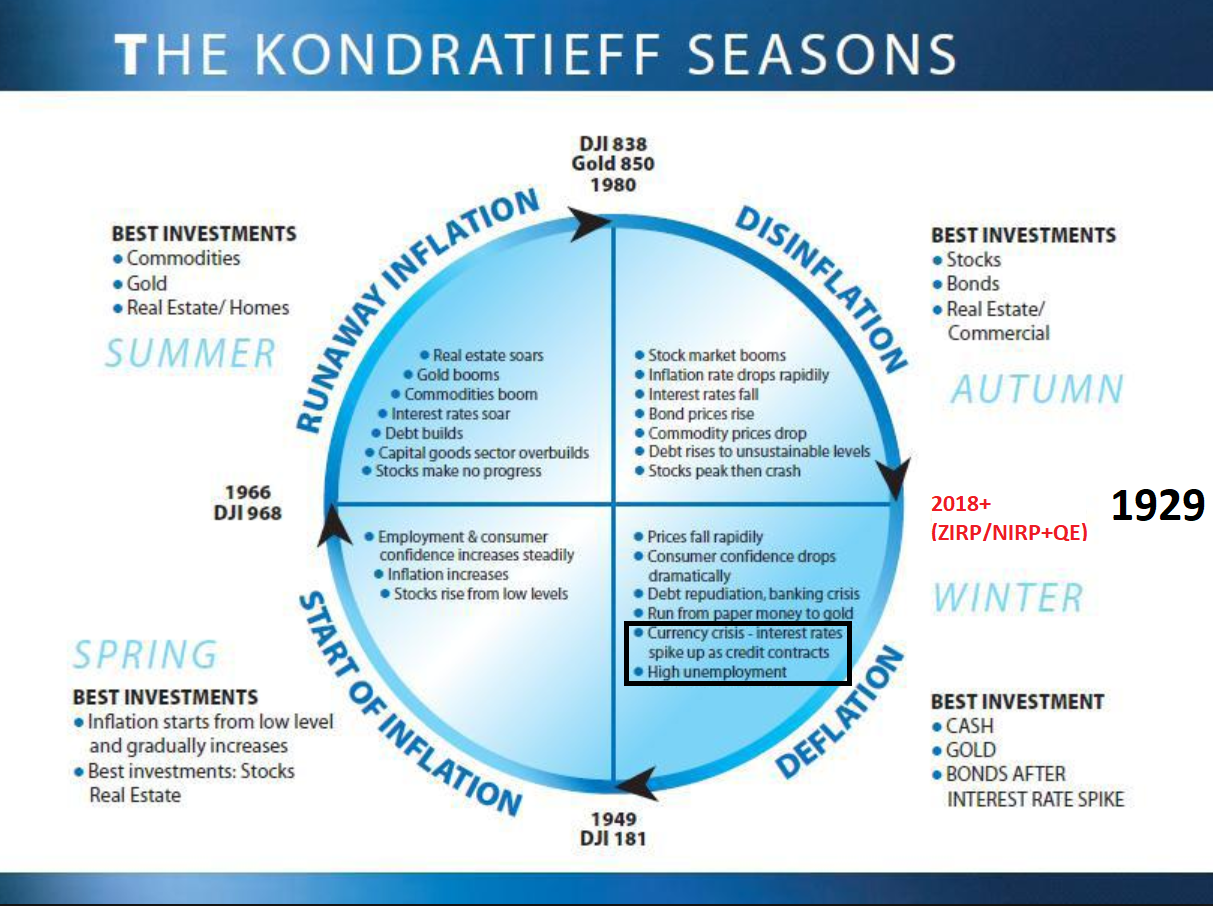
US10Y – in this (3M) view you can see where October 2023 really is. That’s a moment called : BONDS AFTER INTEREST RATE SPIKE from the Kondratieff seasons. That’s probably the most powerful retest to broken long term trend I’ve ever seen. This October 2023 is in reality a moment where true secular bear market in bonds would have arrived. 85Ys trend matches also blue (M)MA200.
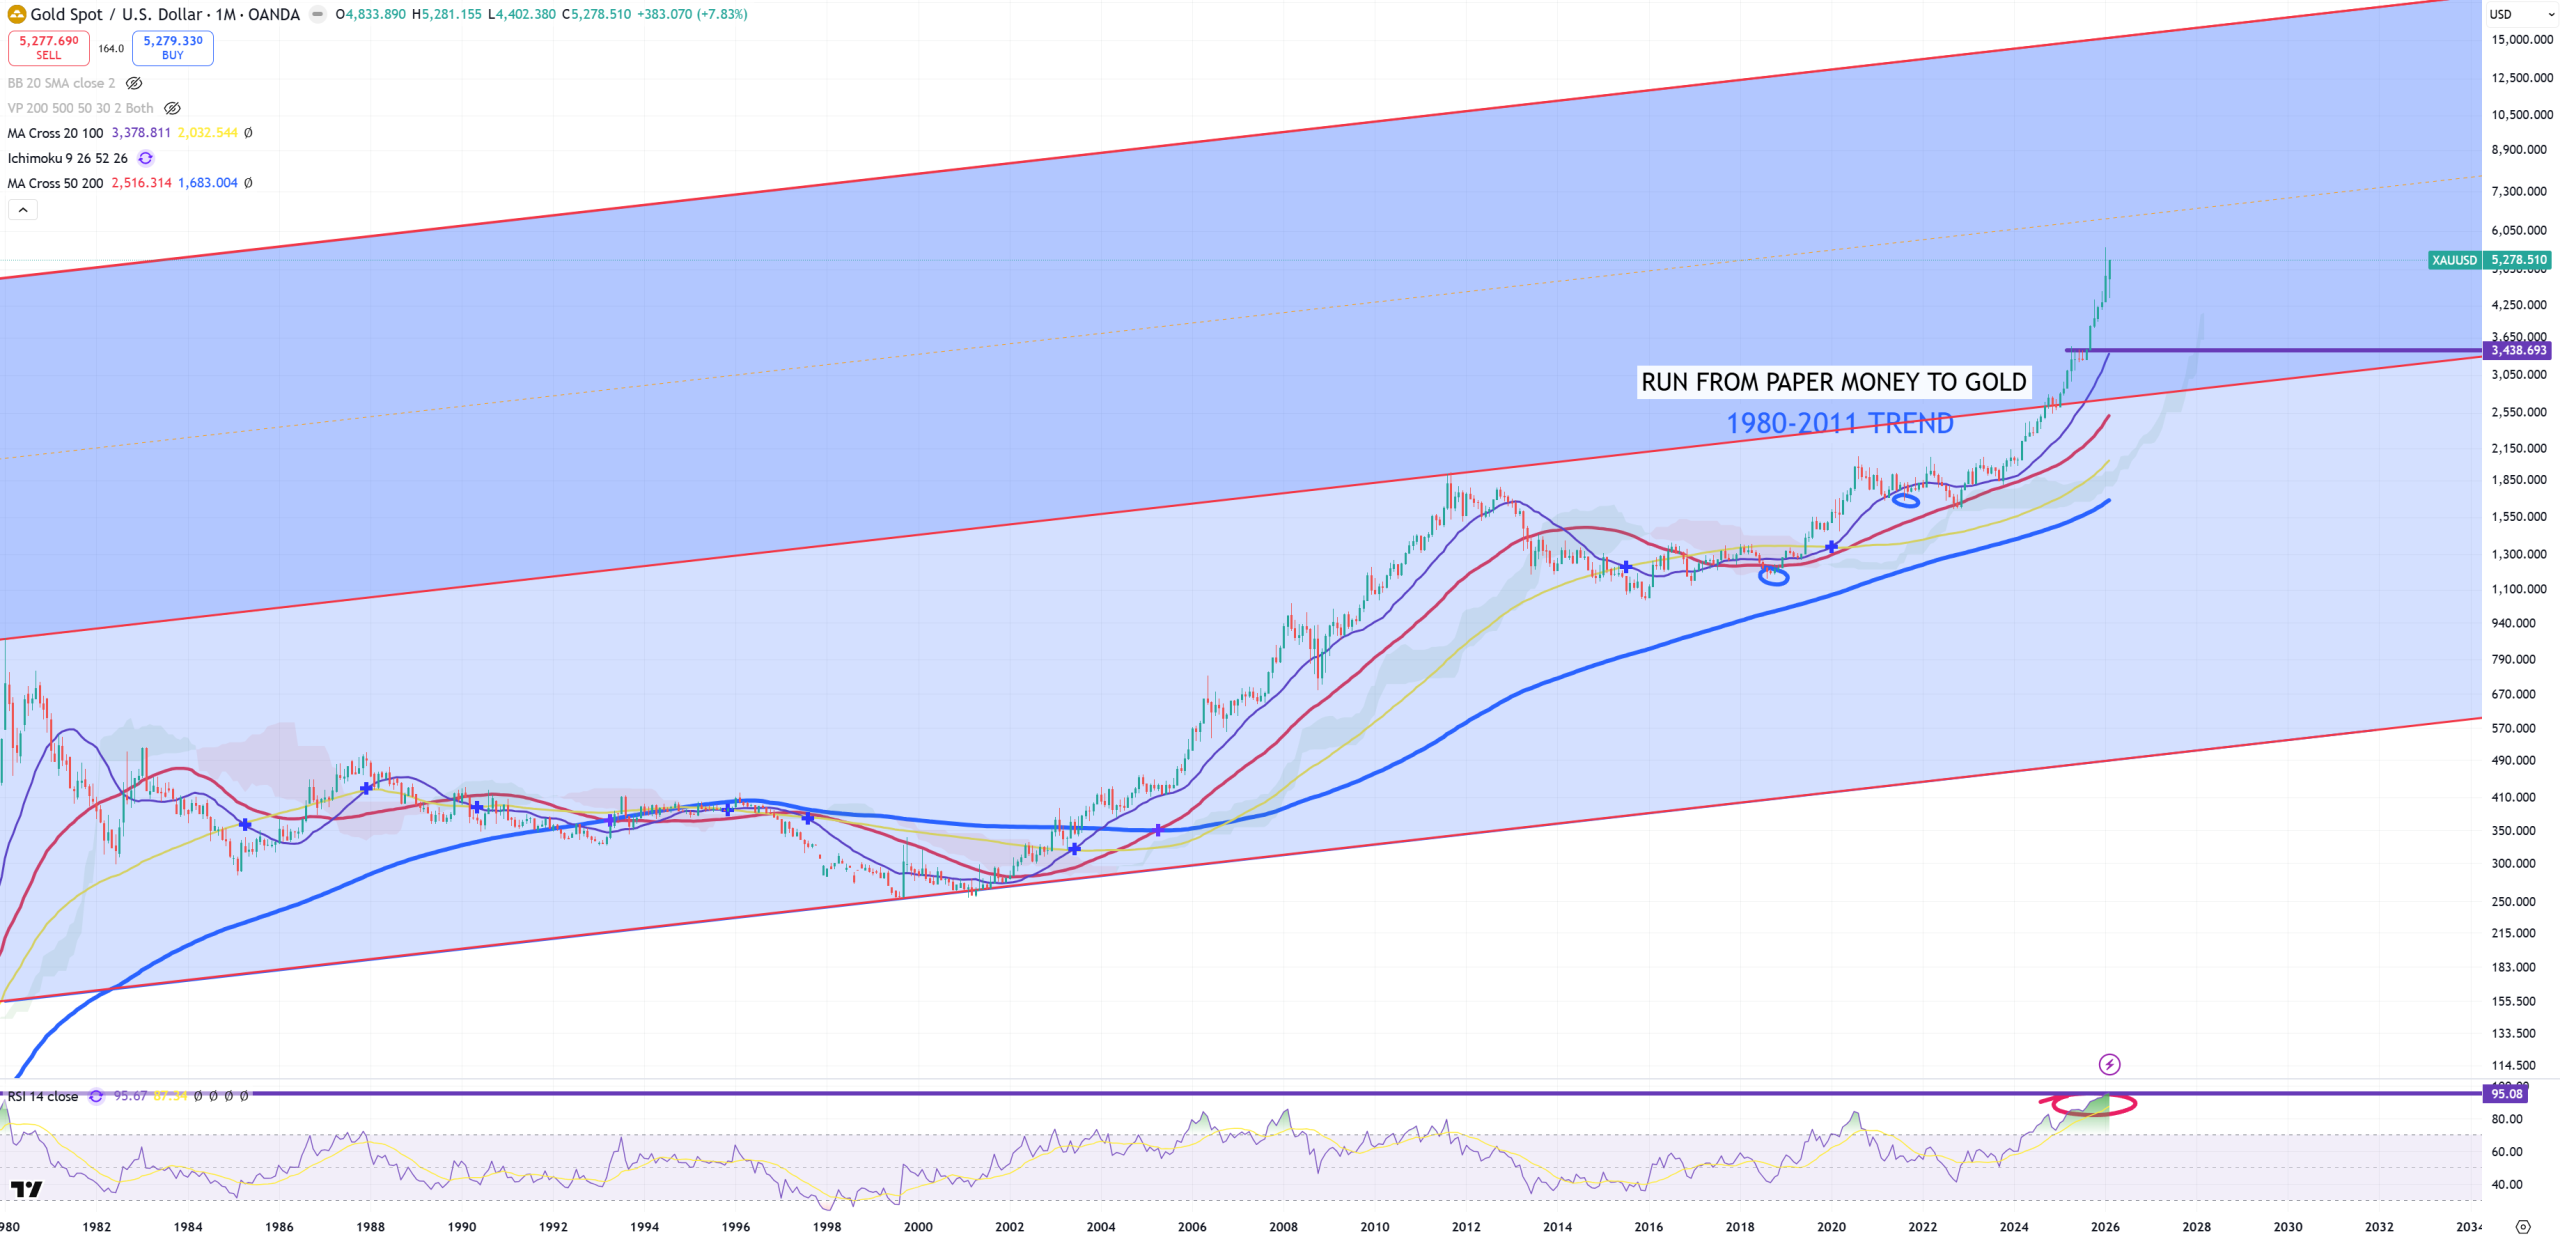
GOLD – it’s the greatest asset to be watched as a hedge about economic recovery or bust. Since 1980 till ~2000 we had gold bear market = start of secular disinflationary cycle. Later we had a run till 2011, QE+ZIRP/NIRP+MMT correction till 2018 and … RUN. GOLD up = economy/cycle down, GOLD down = economy/cycle up. More detailed cycles will be explained a bit lower on DJI/GOLD and SPX/GOLD ratios.
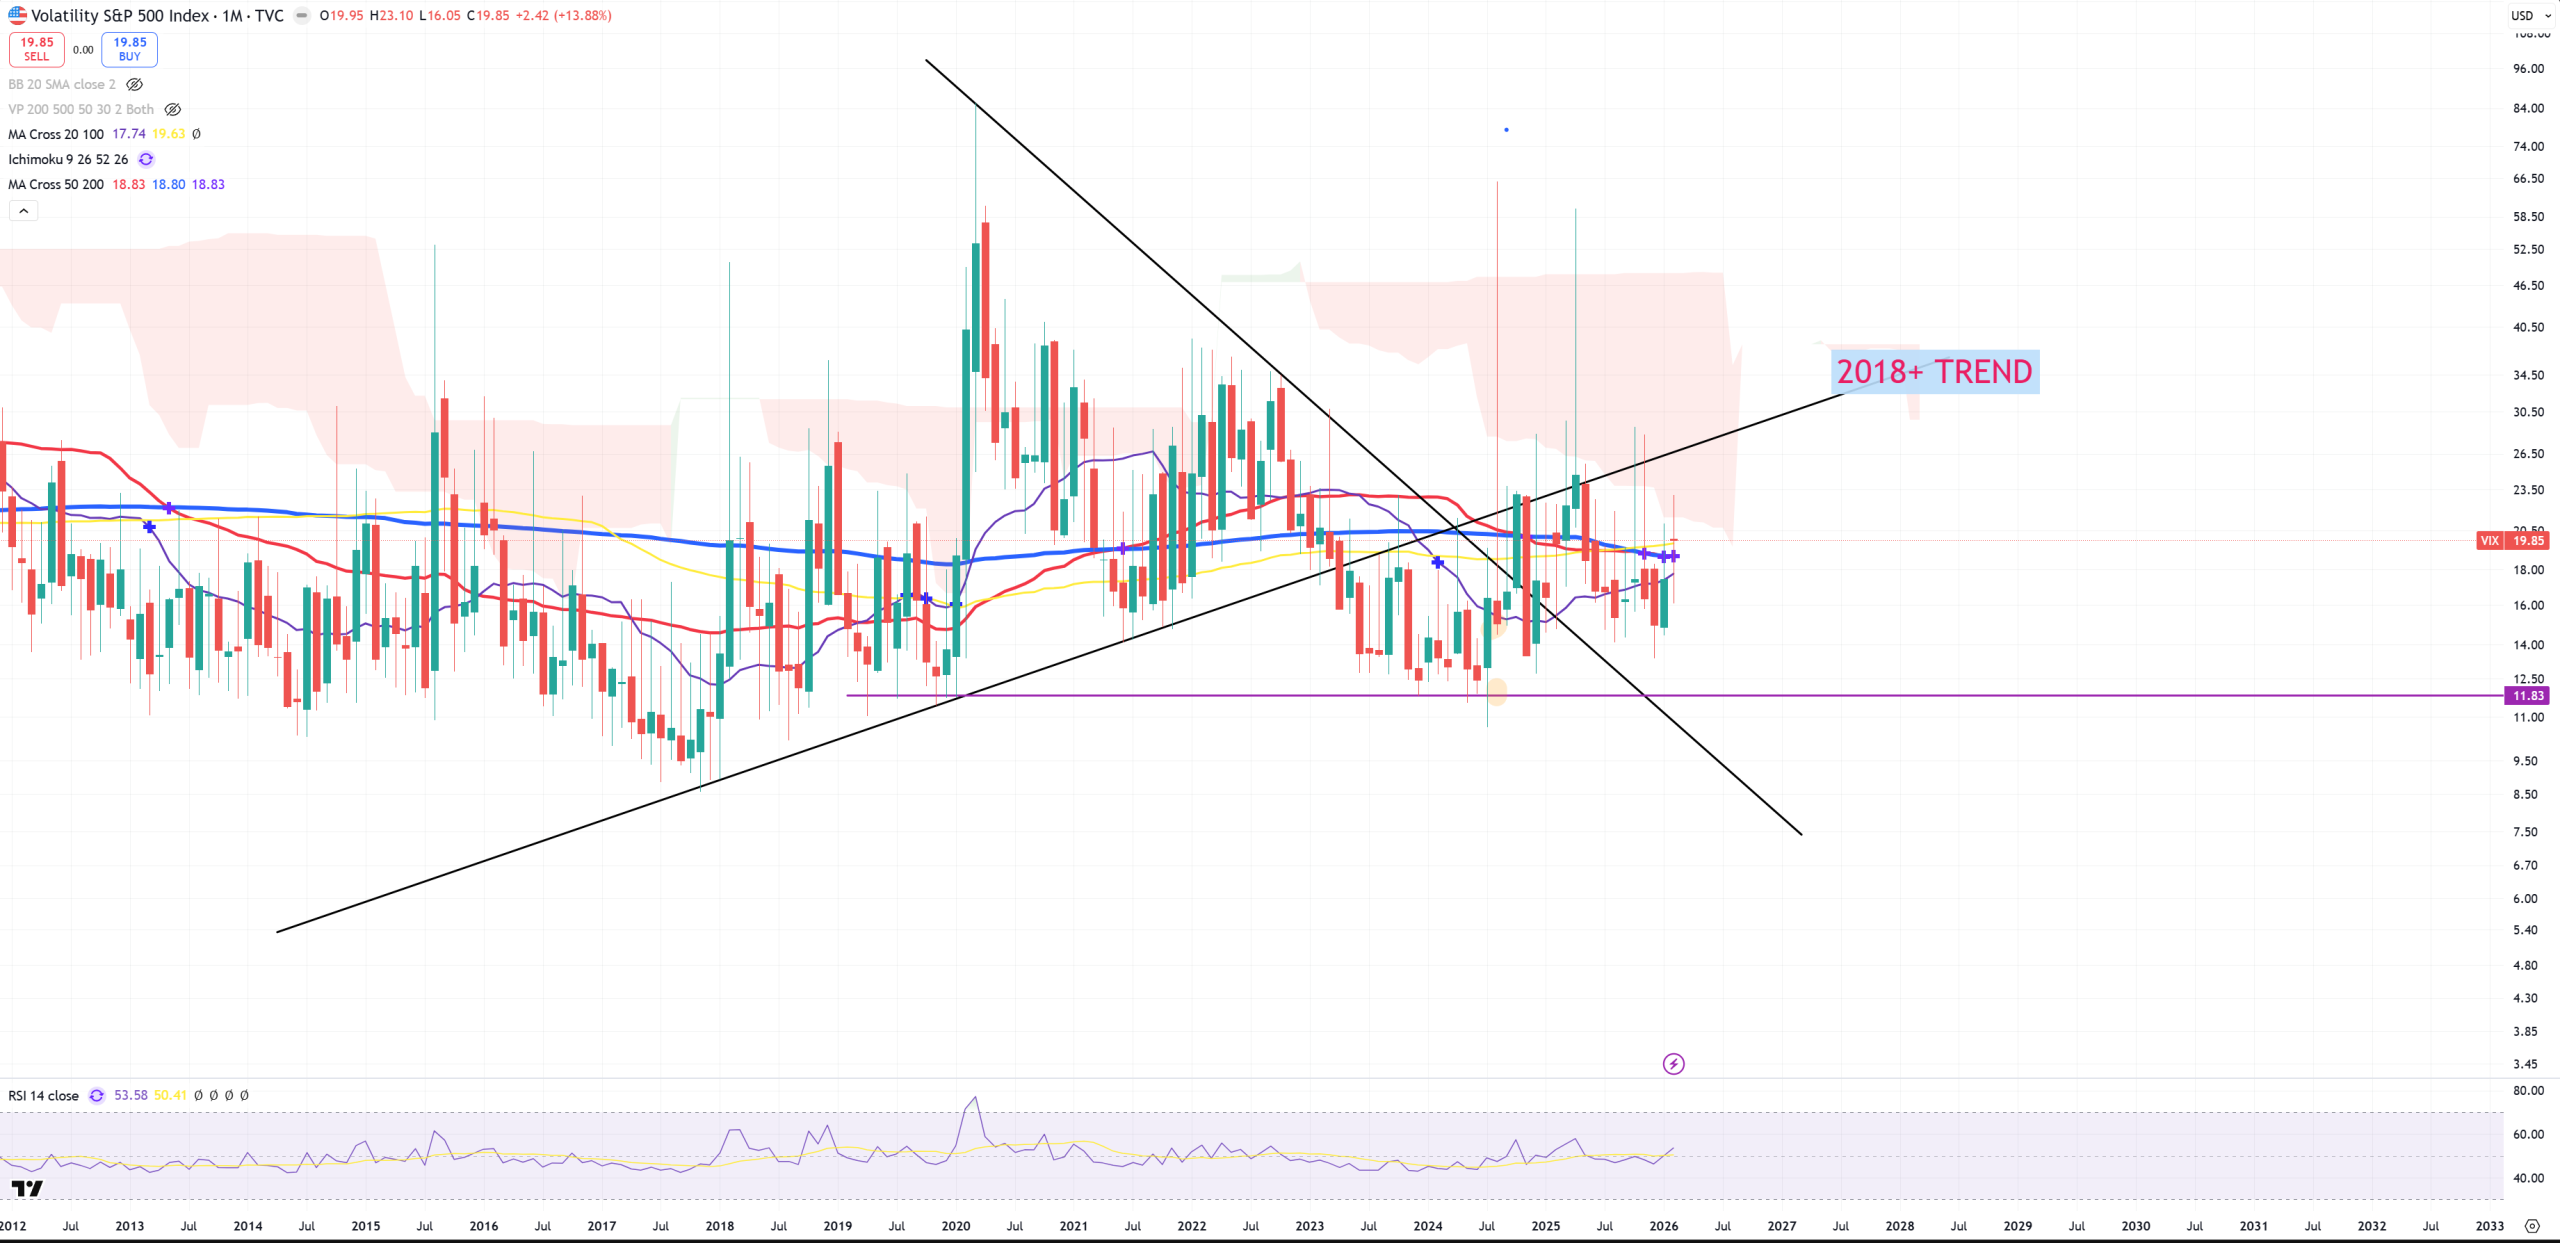
VIX – still below 2018 trend, but above all key (M)MAs
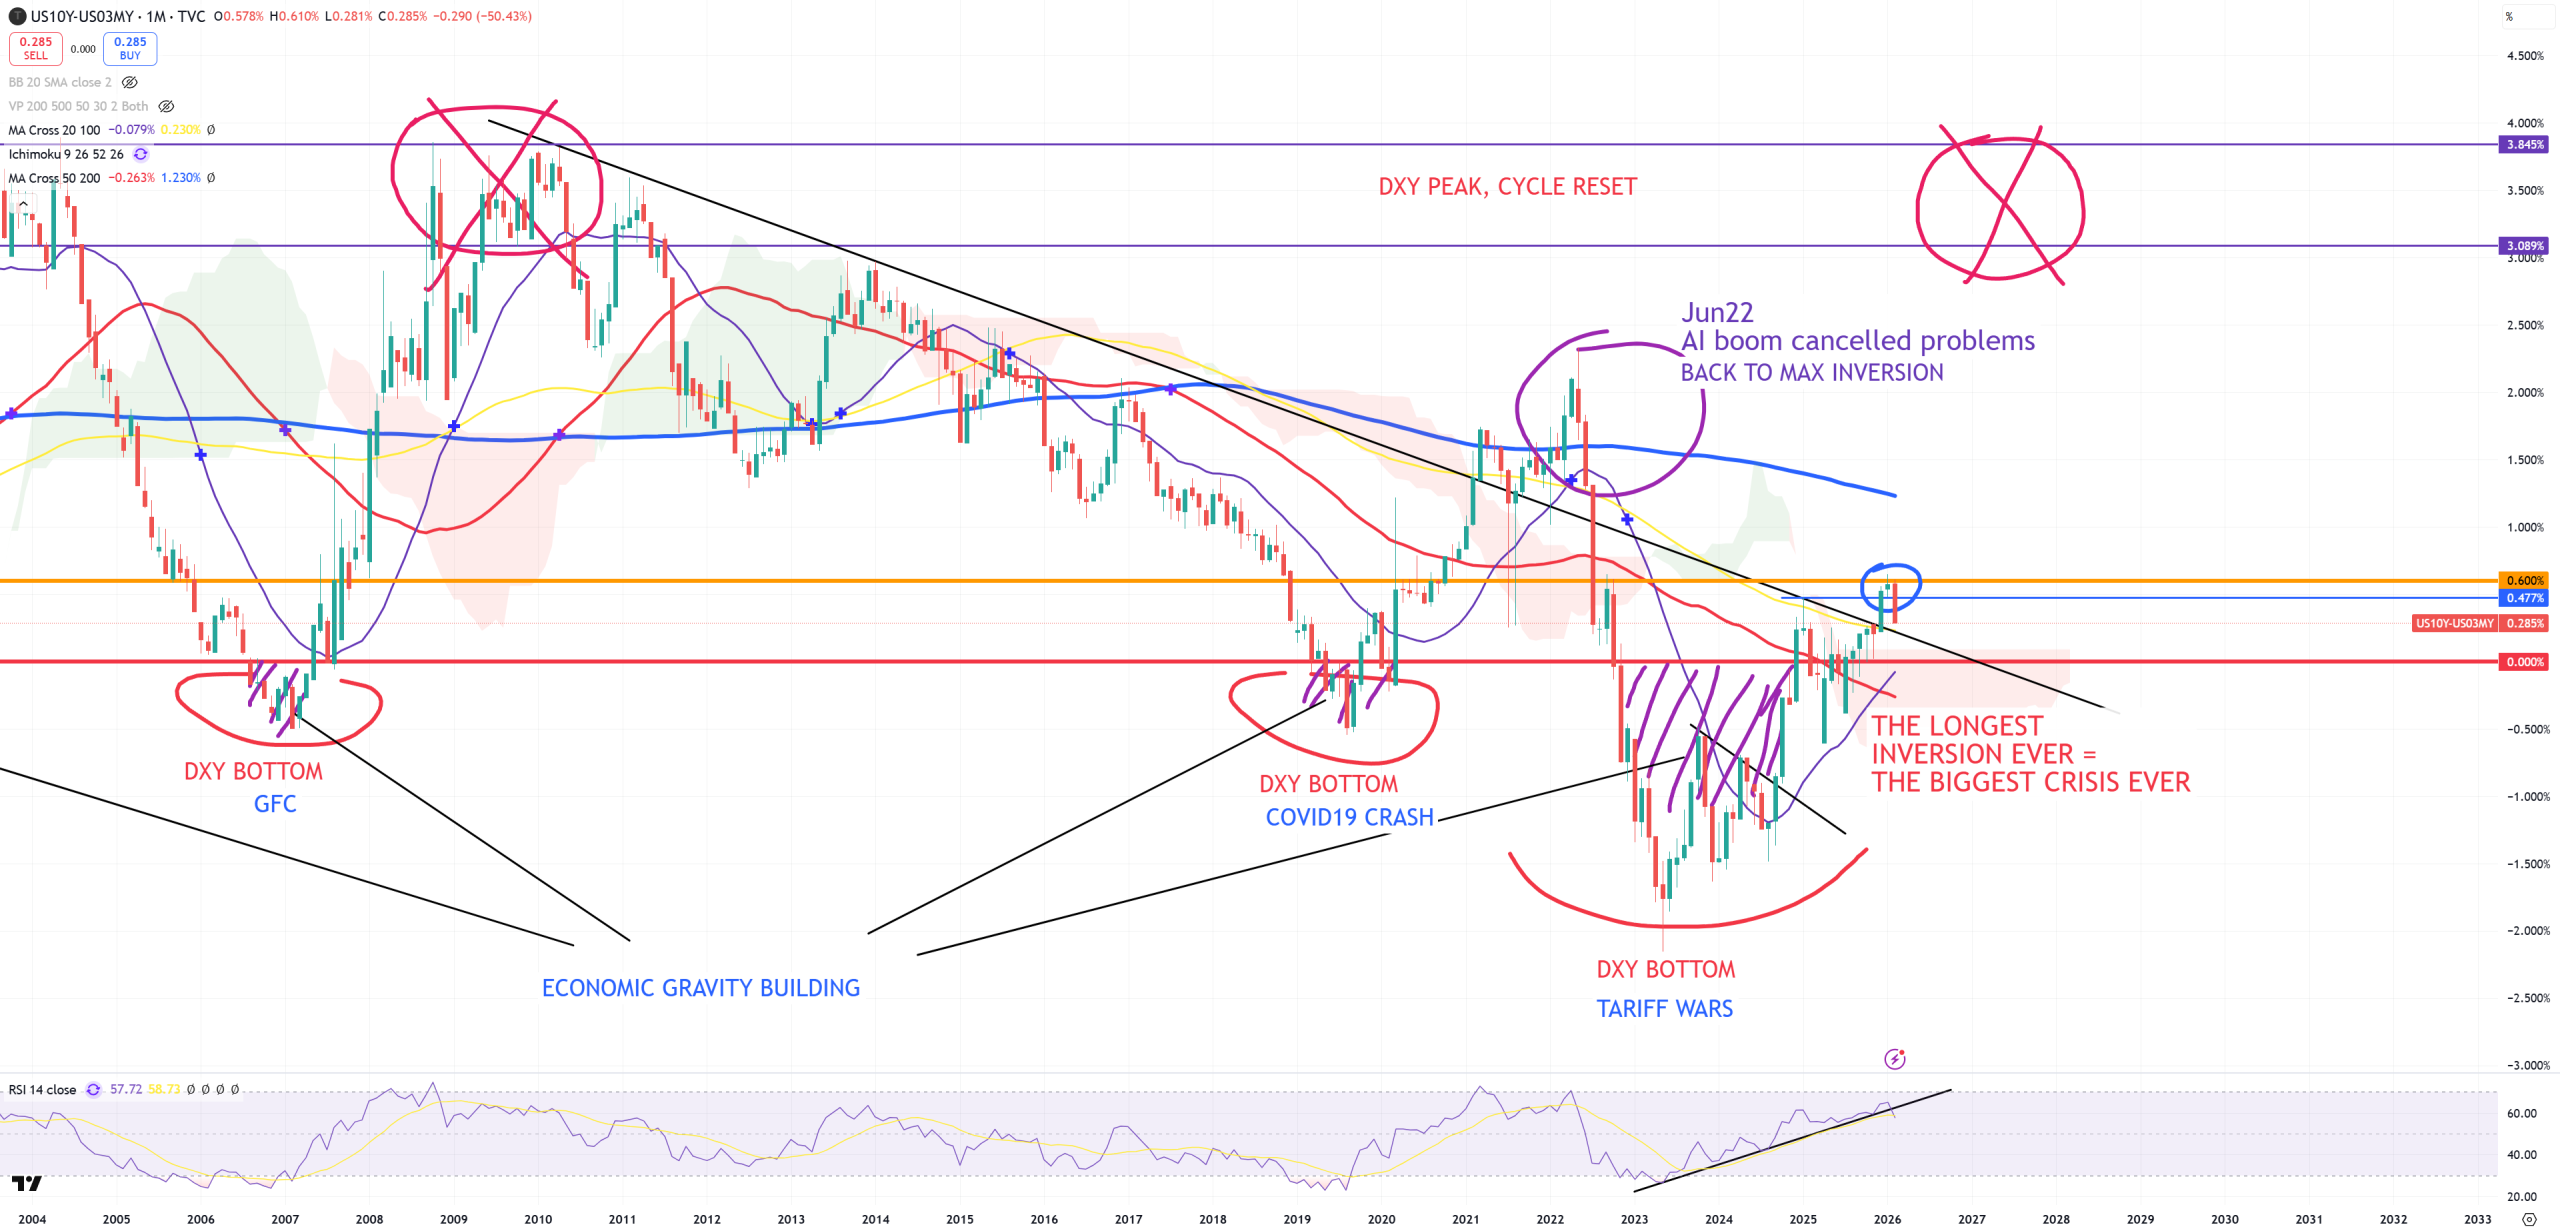
10Y/3M – break over +60bps after inversion = gravity has been released. So far this +60bps level was rejected as I bet we’re going to retest black trend line :
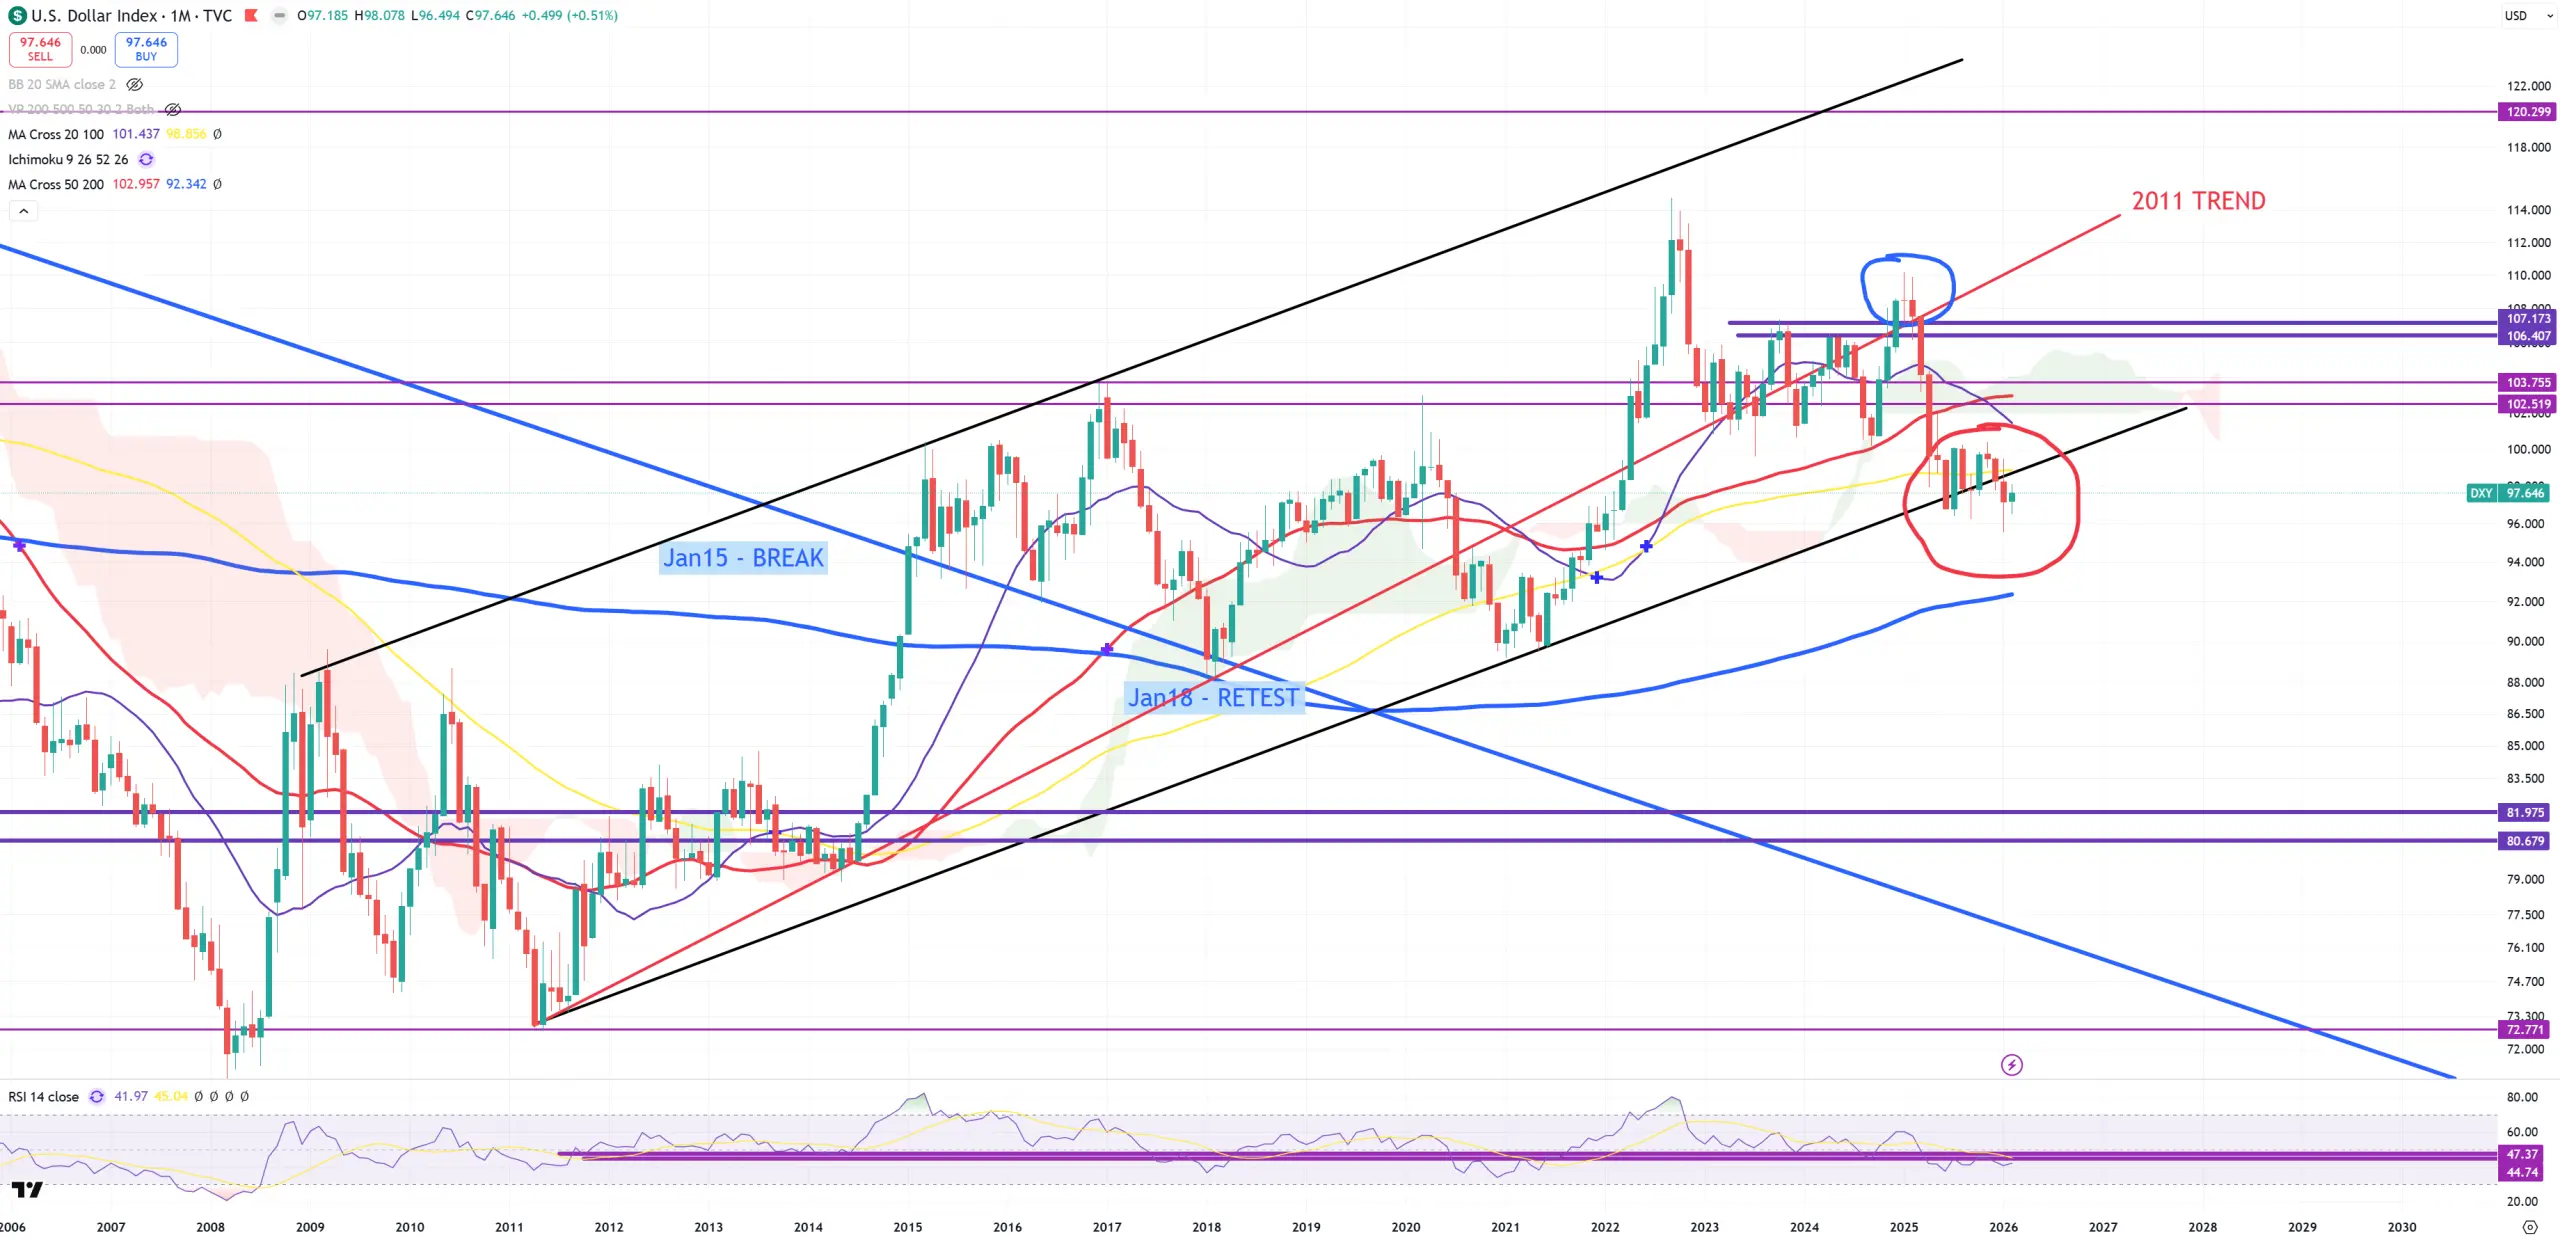
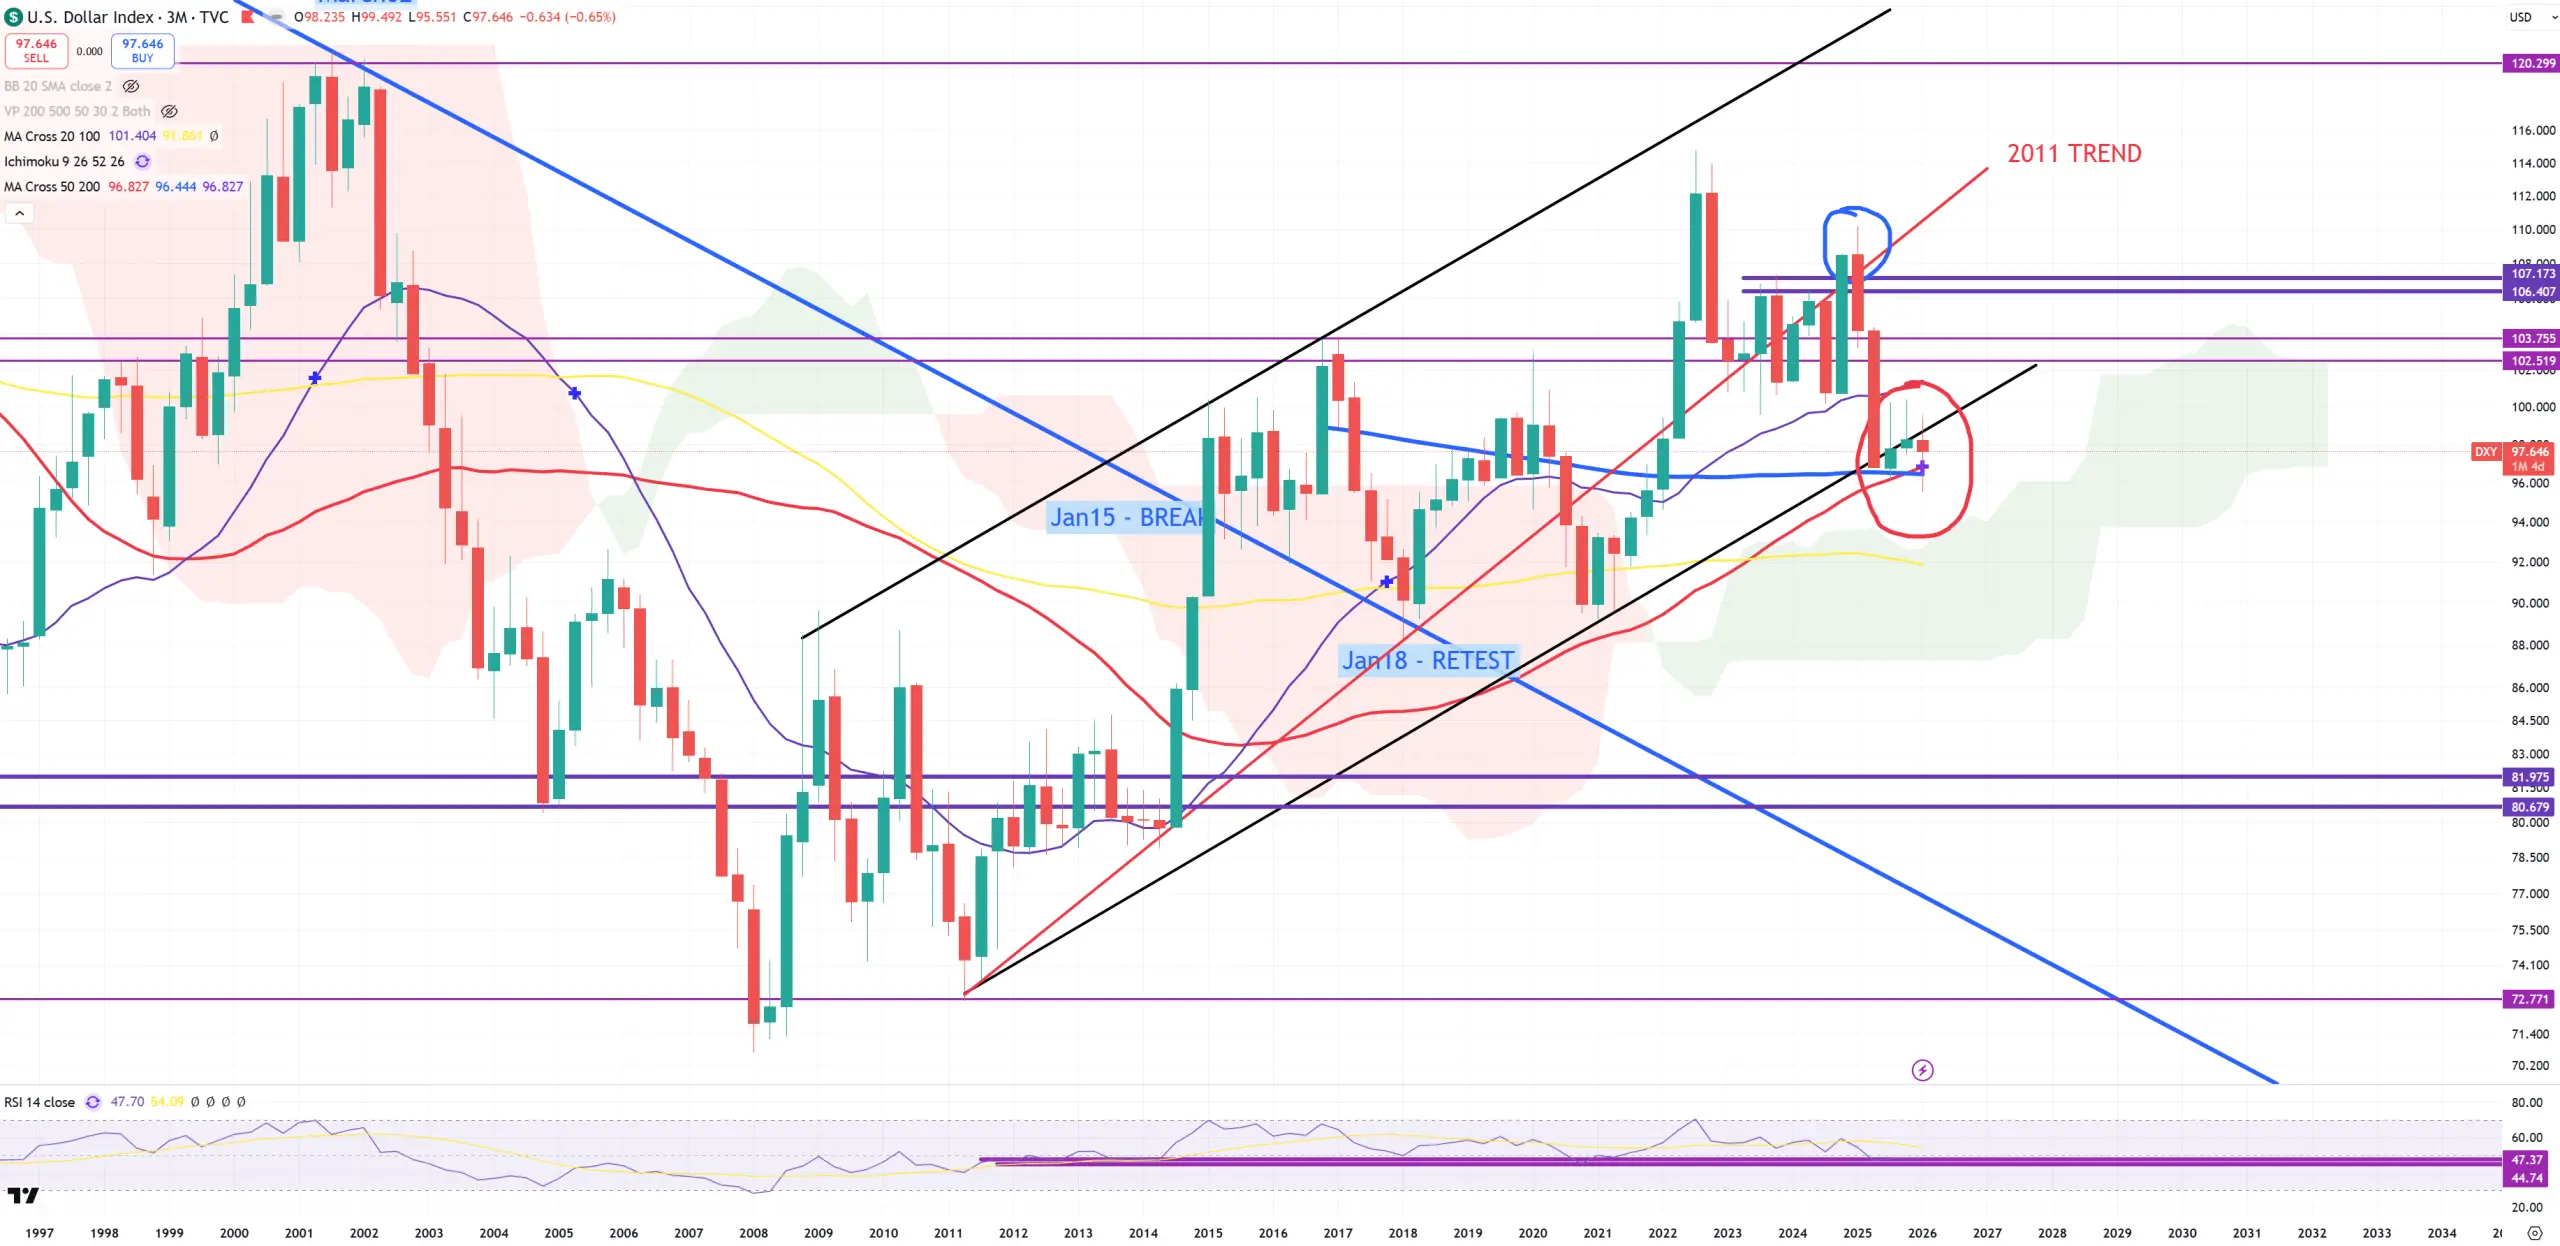
DXY – This index is very mixed. It’s on the edge of my last border to consider it as a bear market, but it not yet happened. On (M) – it looks really bad, below trend, below yellow (M)MA100, but lower level can be seen on (3M) chart as a cross of (3M)MA50 and (3M)MA200 and that’s the last border of a bull market = ~96.5. I’m extremely mixed on the $$$ even I still consider it as massive bull market, which is now testing its last razor thin edge. Can it break down, of course, but I’ll be a bit surprised.
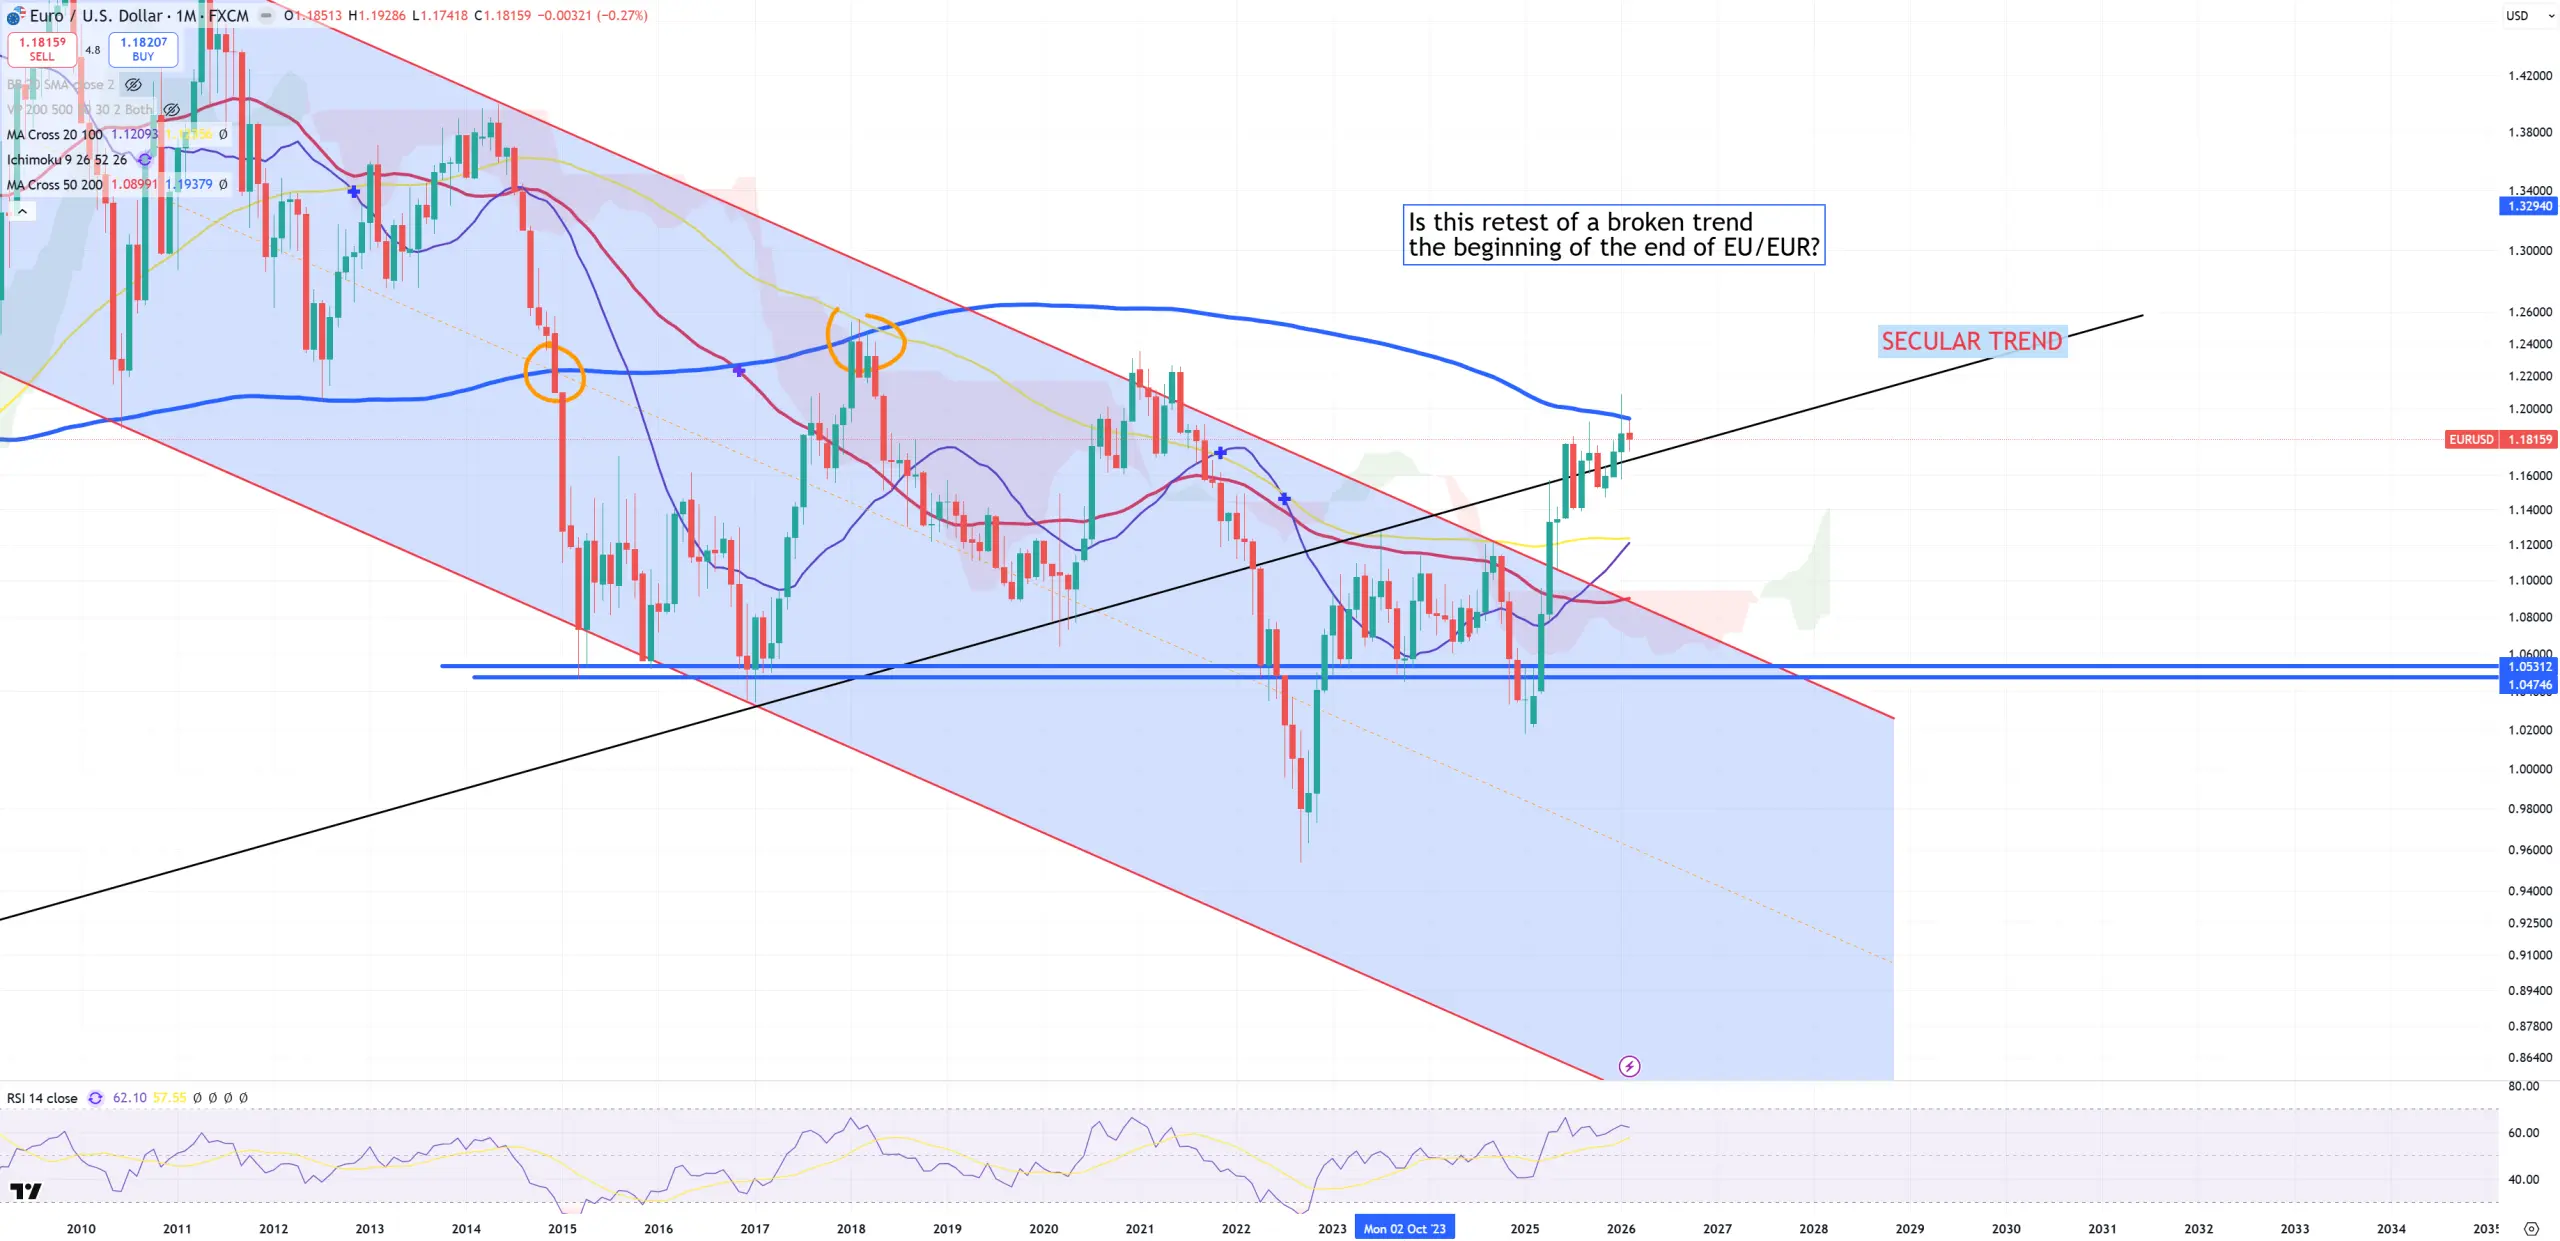
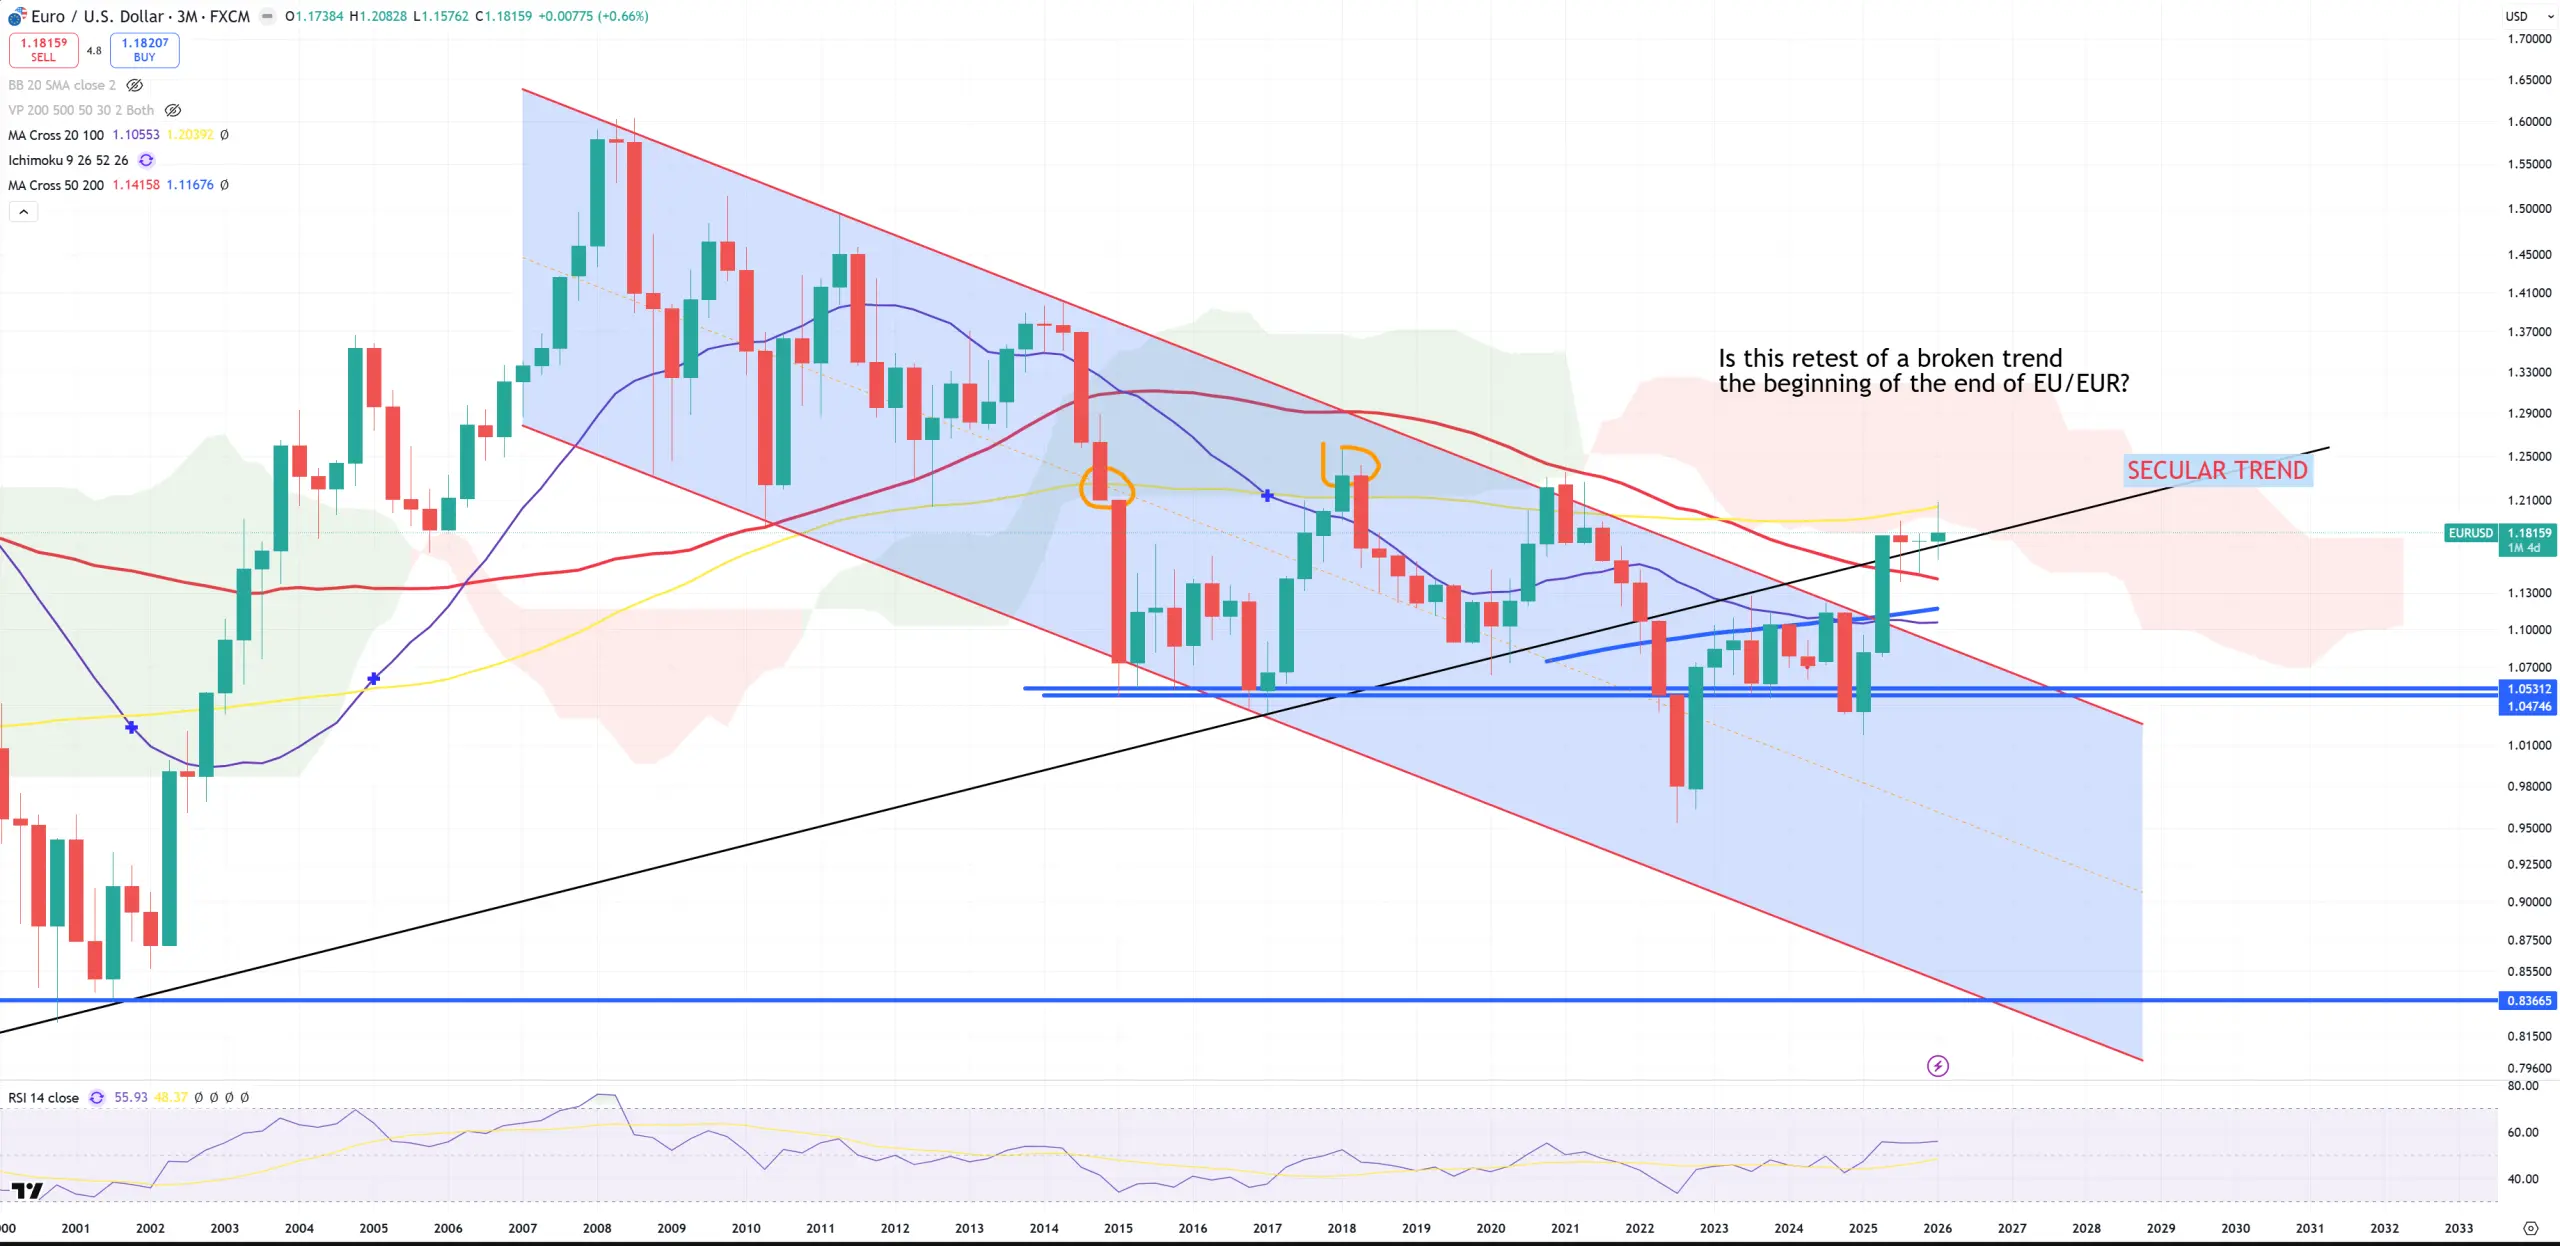
EURUSD – because EURUSD is over 50% of DXY it also hit last border which is (M)MA200 and (3M)MA100
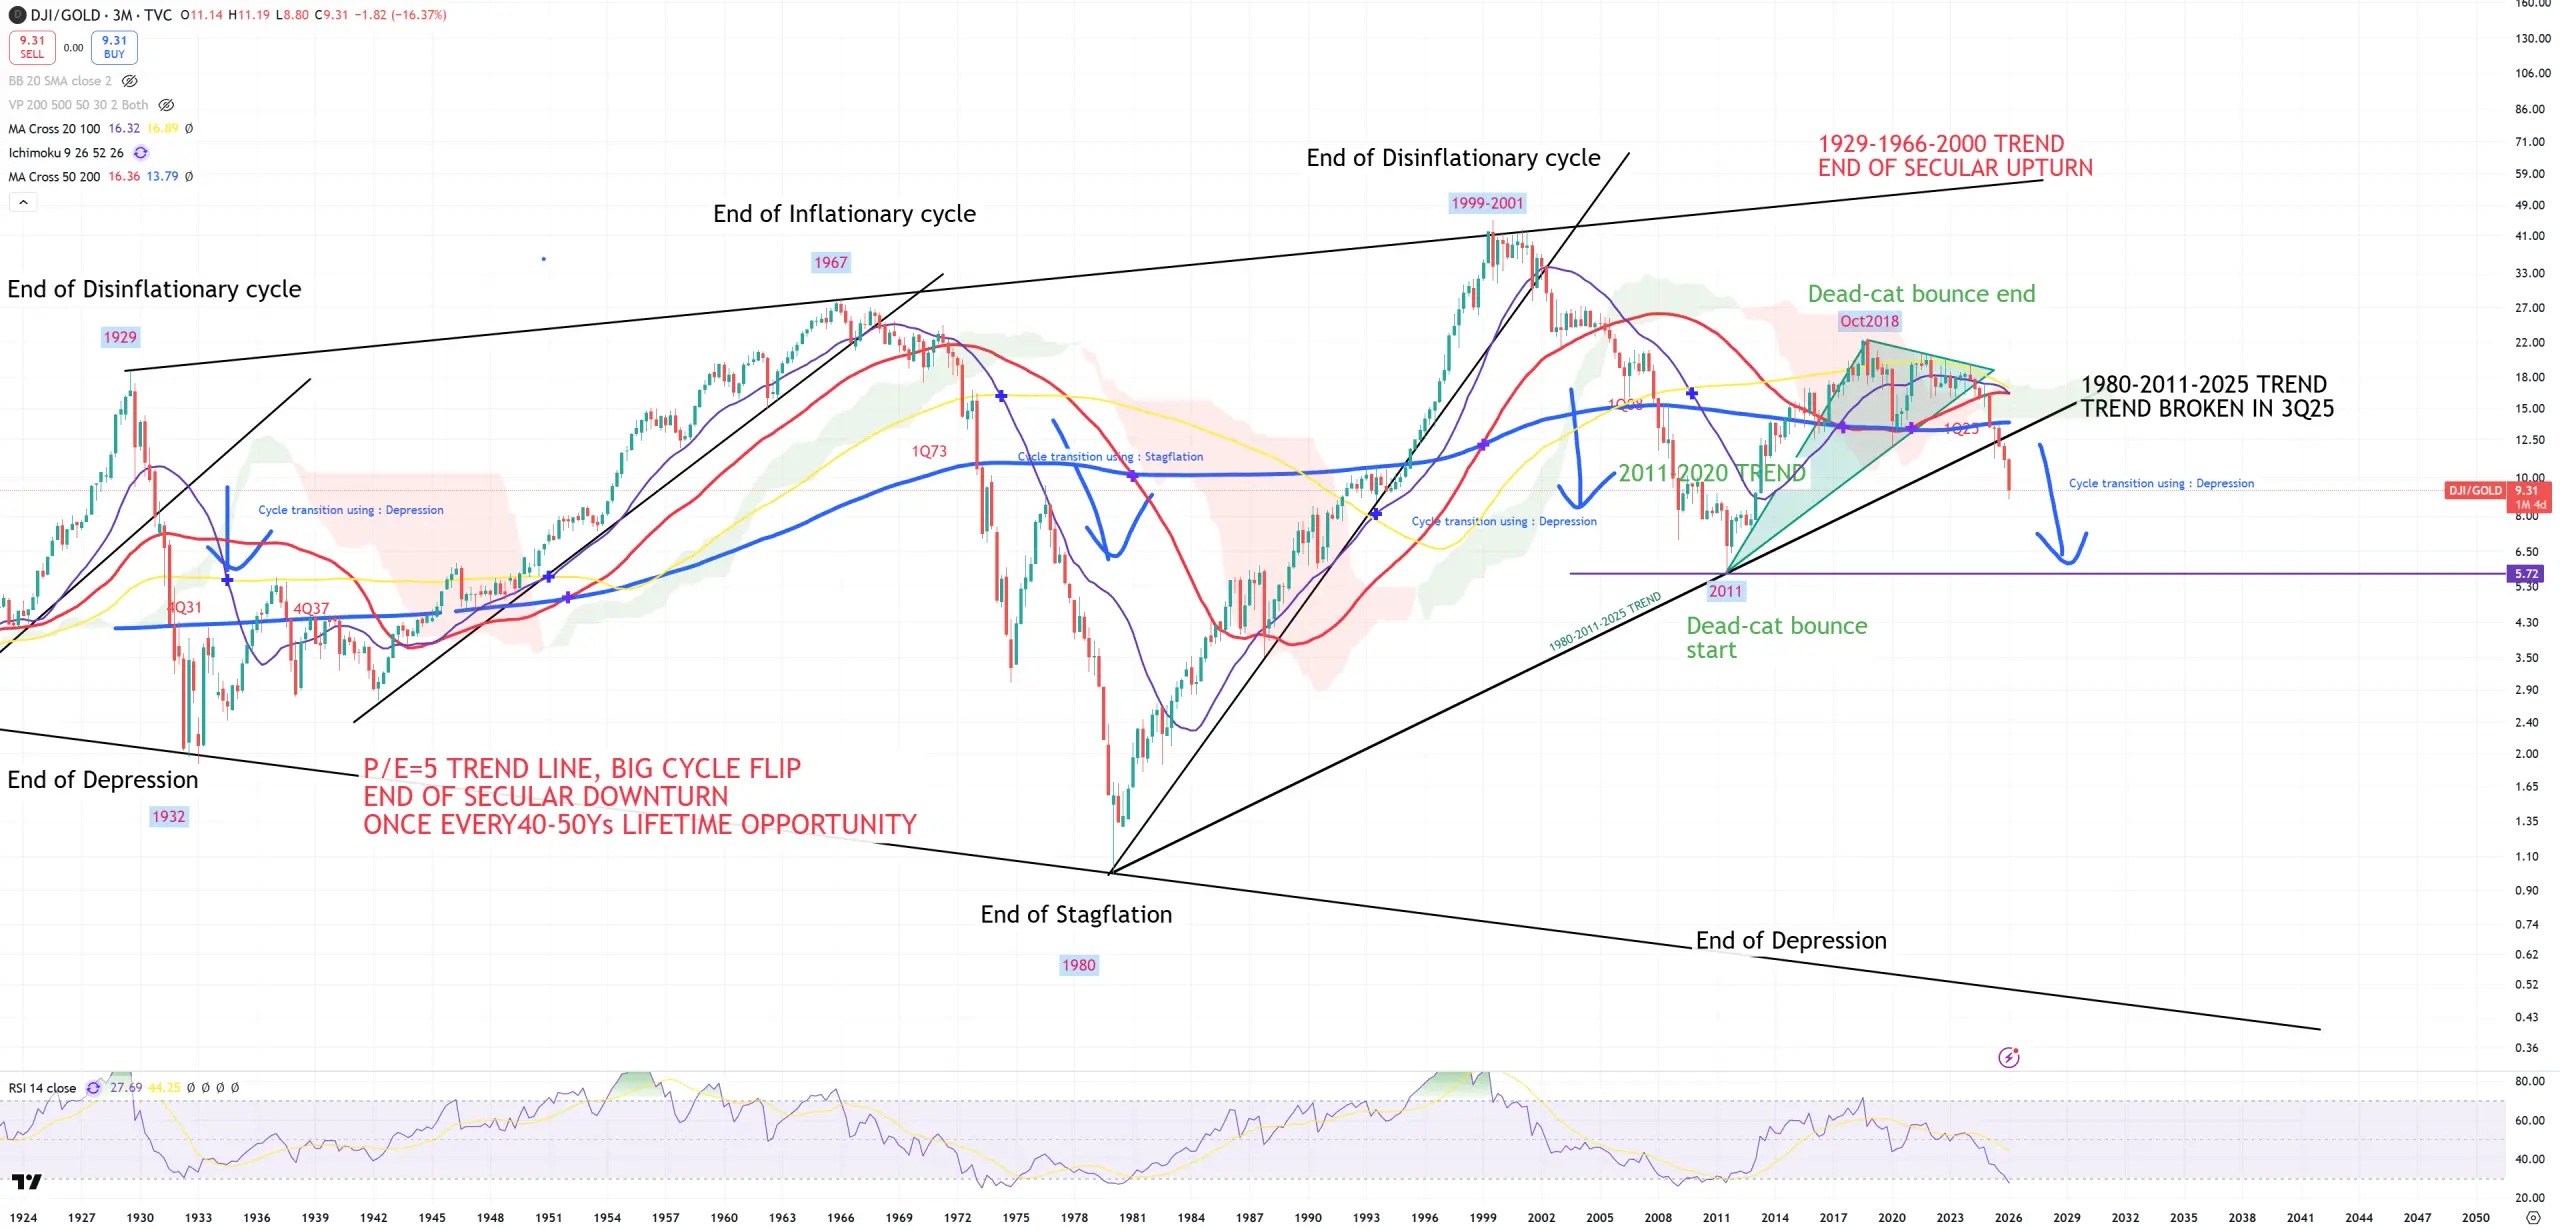
DJI/GOLD – 1st cycle indicator. I view this chart only on (3M) view. 1980-2011-2025 trend broken. Cycles are interlaced it means we rotate the cycle using deflation. Lower trend 1932-1980 is 0.5 and I think that’s where we are going. Sell gold if you reach this 1932-1980 trend line. Peak in 4Q18 ending 2011+ dead cat bounce.
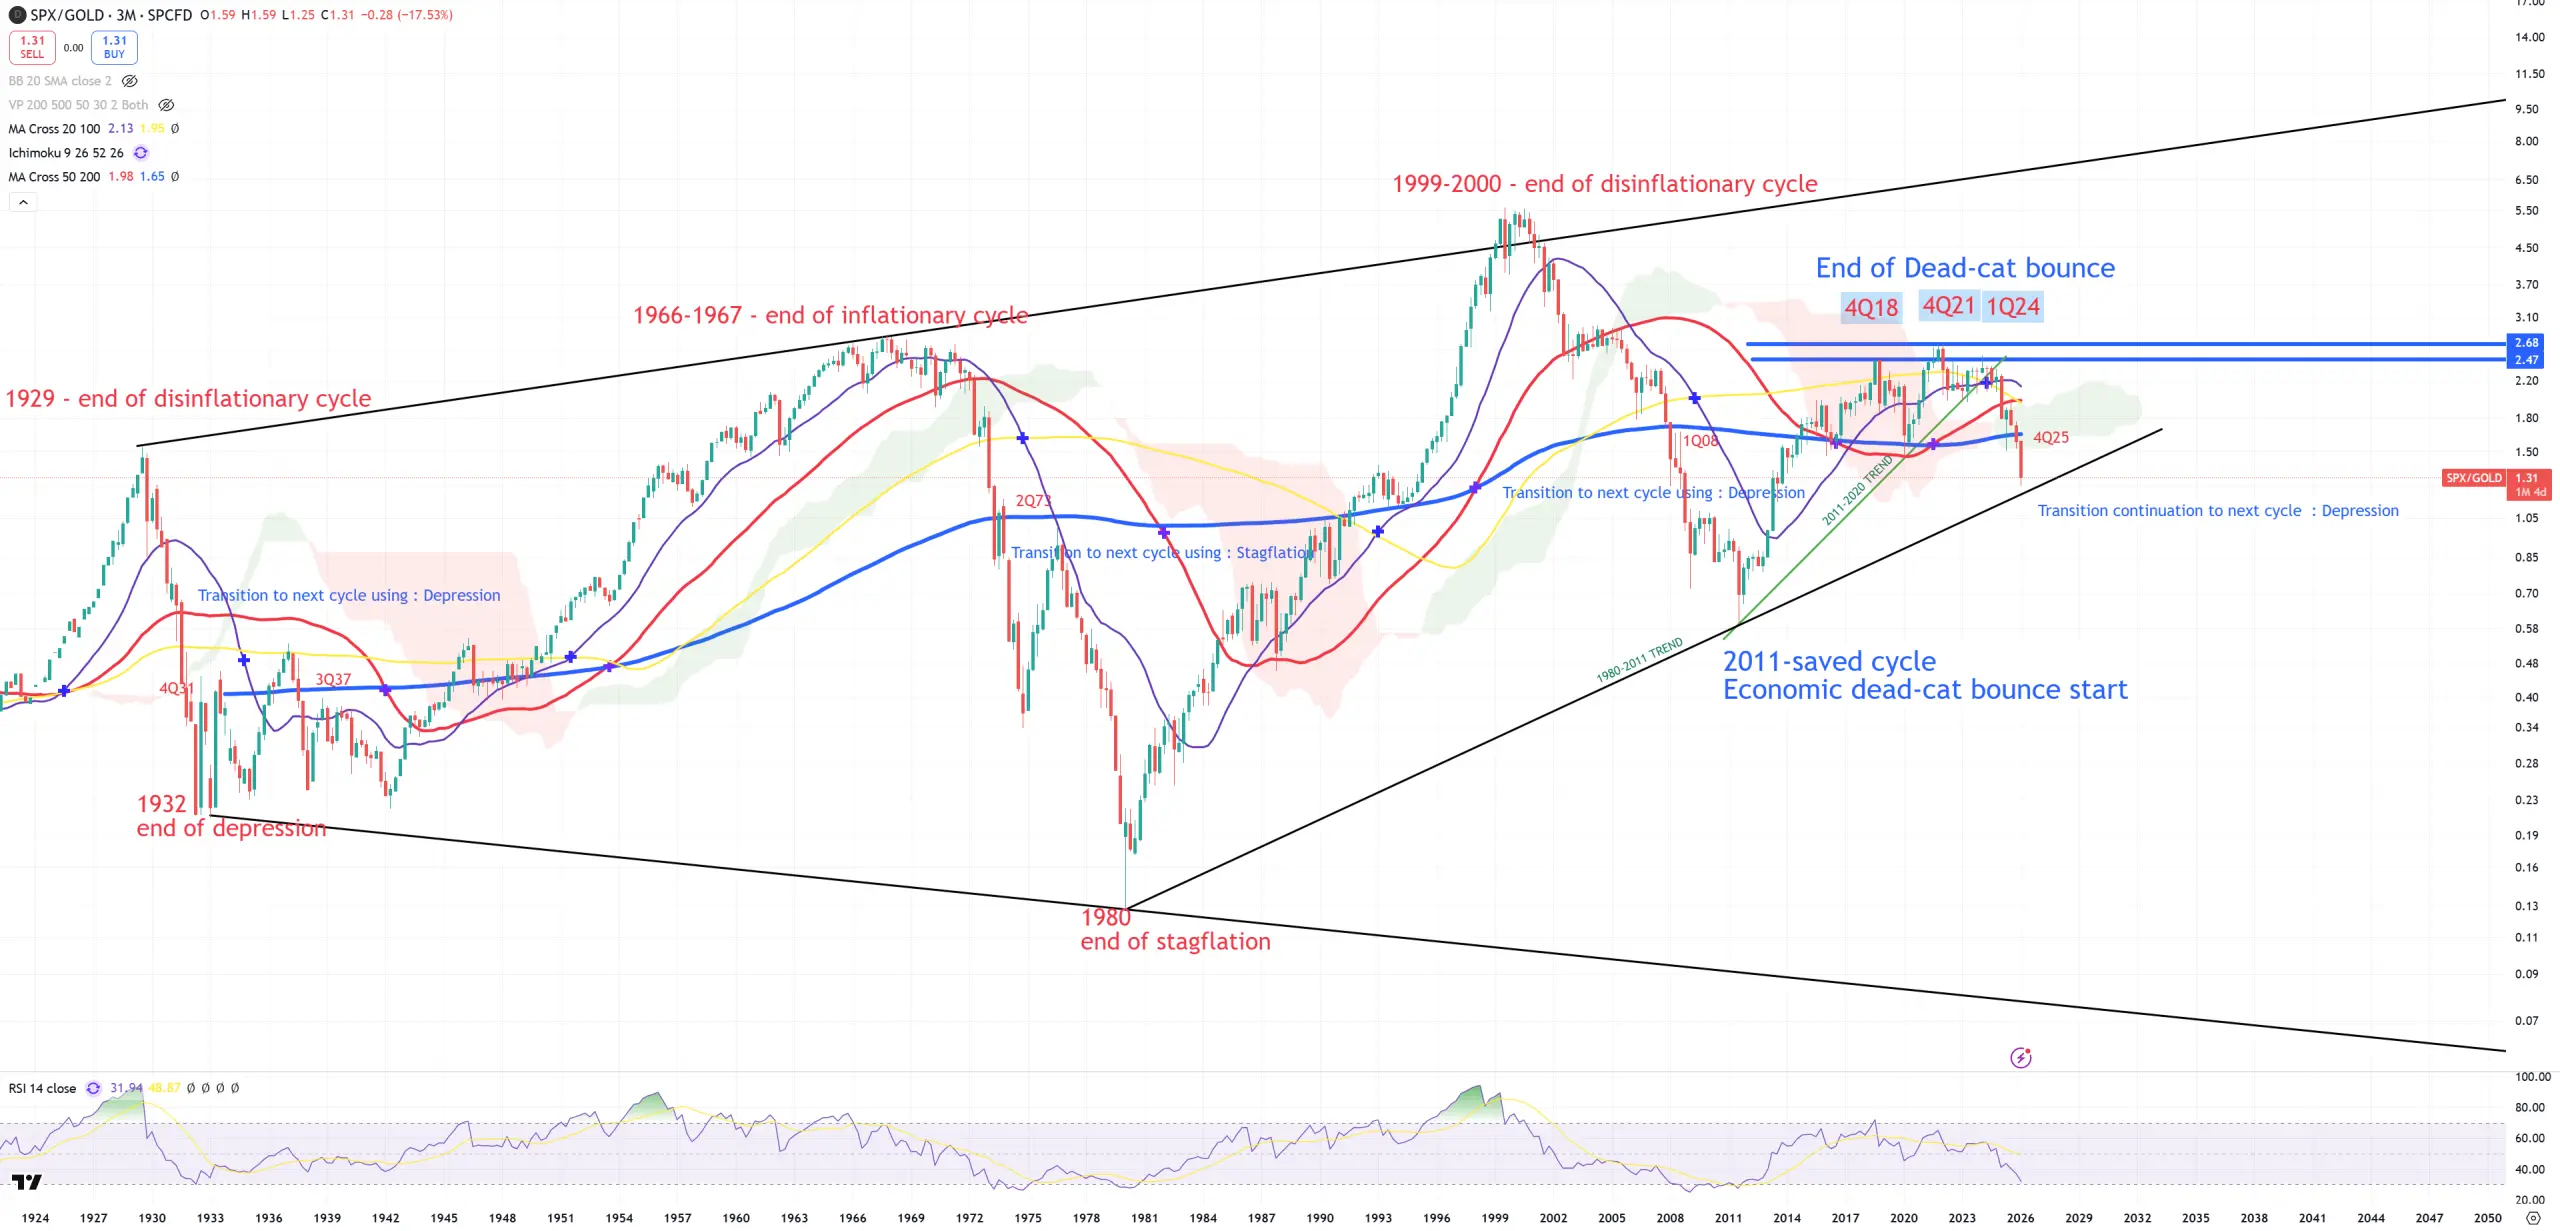
SPX/GOLD – 2nd cycle indicator. Peak in 4Q21, not 4Q18 like DJI/GOLD. Never in a history those 2 charts (DJI/GOLD vs SPX/GOLD) were so different. Looks like DJI/GOLD is more about forward looking, while SPX/GOLD is more about actual situation. 1980-2011 trend has not yet been broken here yet (because on DJI/GOLD it’s broken in 3Q25). Also (3M) view. SPX/GOLD was #1 chart I was looking at the whole 2025 : when it’ll break blue (3M)MA200. It happened in 4Q25 or more detailed : October/November 2025 – yes that’s the same date when US03MY broke (M)MA50. 1932-1980 trend is 0.07. Once SPX/GOLD broke (3M)MA200 and soon even break 1980-2011 trend there’s no possibility to reverse the economy without big troubles. The cycle has closed all doors. From this moment only bad events or worse events. 5th break of (3M)MA200 : 1931, 1937, 1973, 2008, 4Q2025.
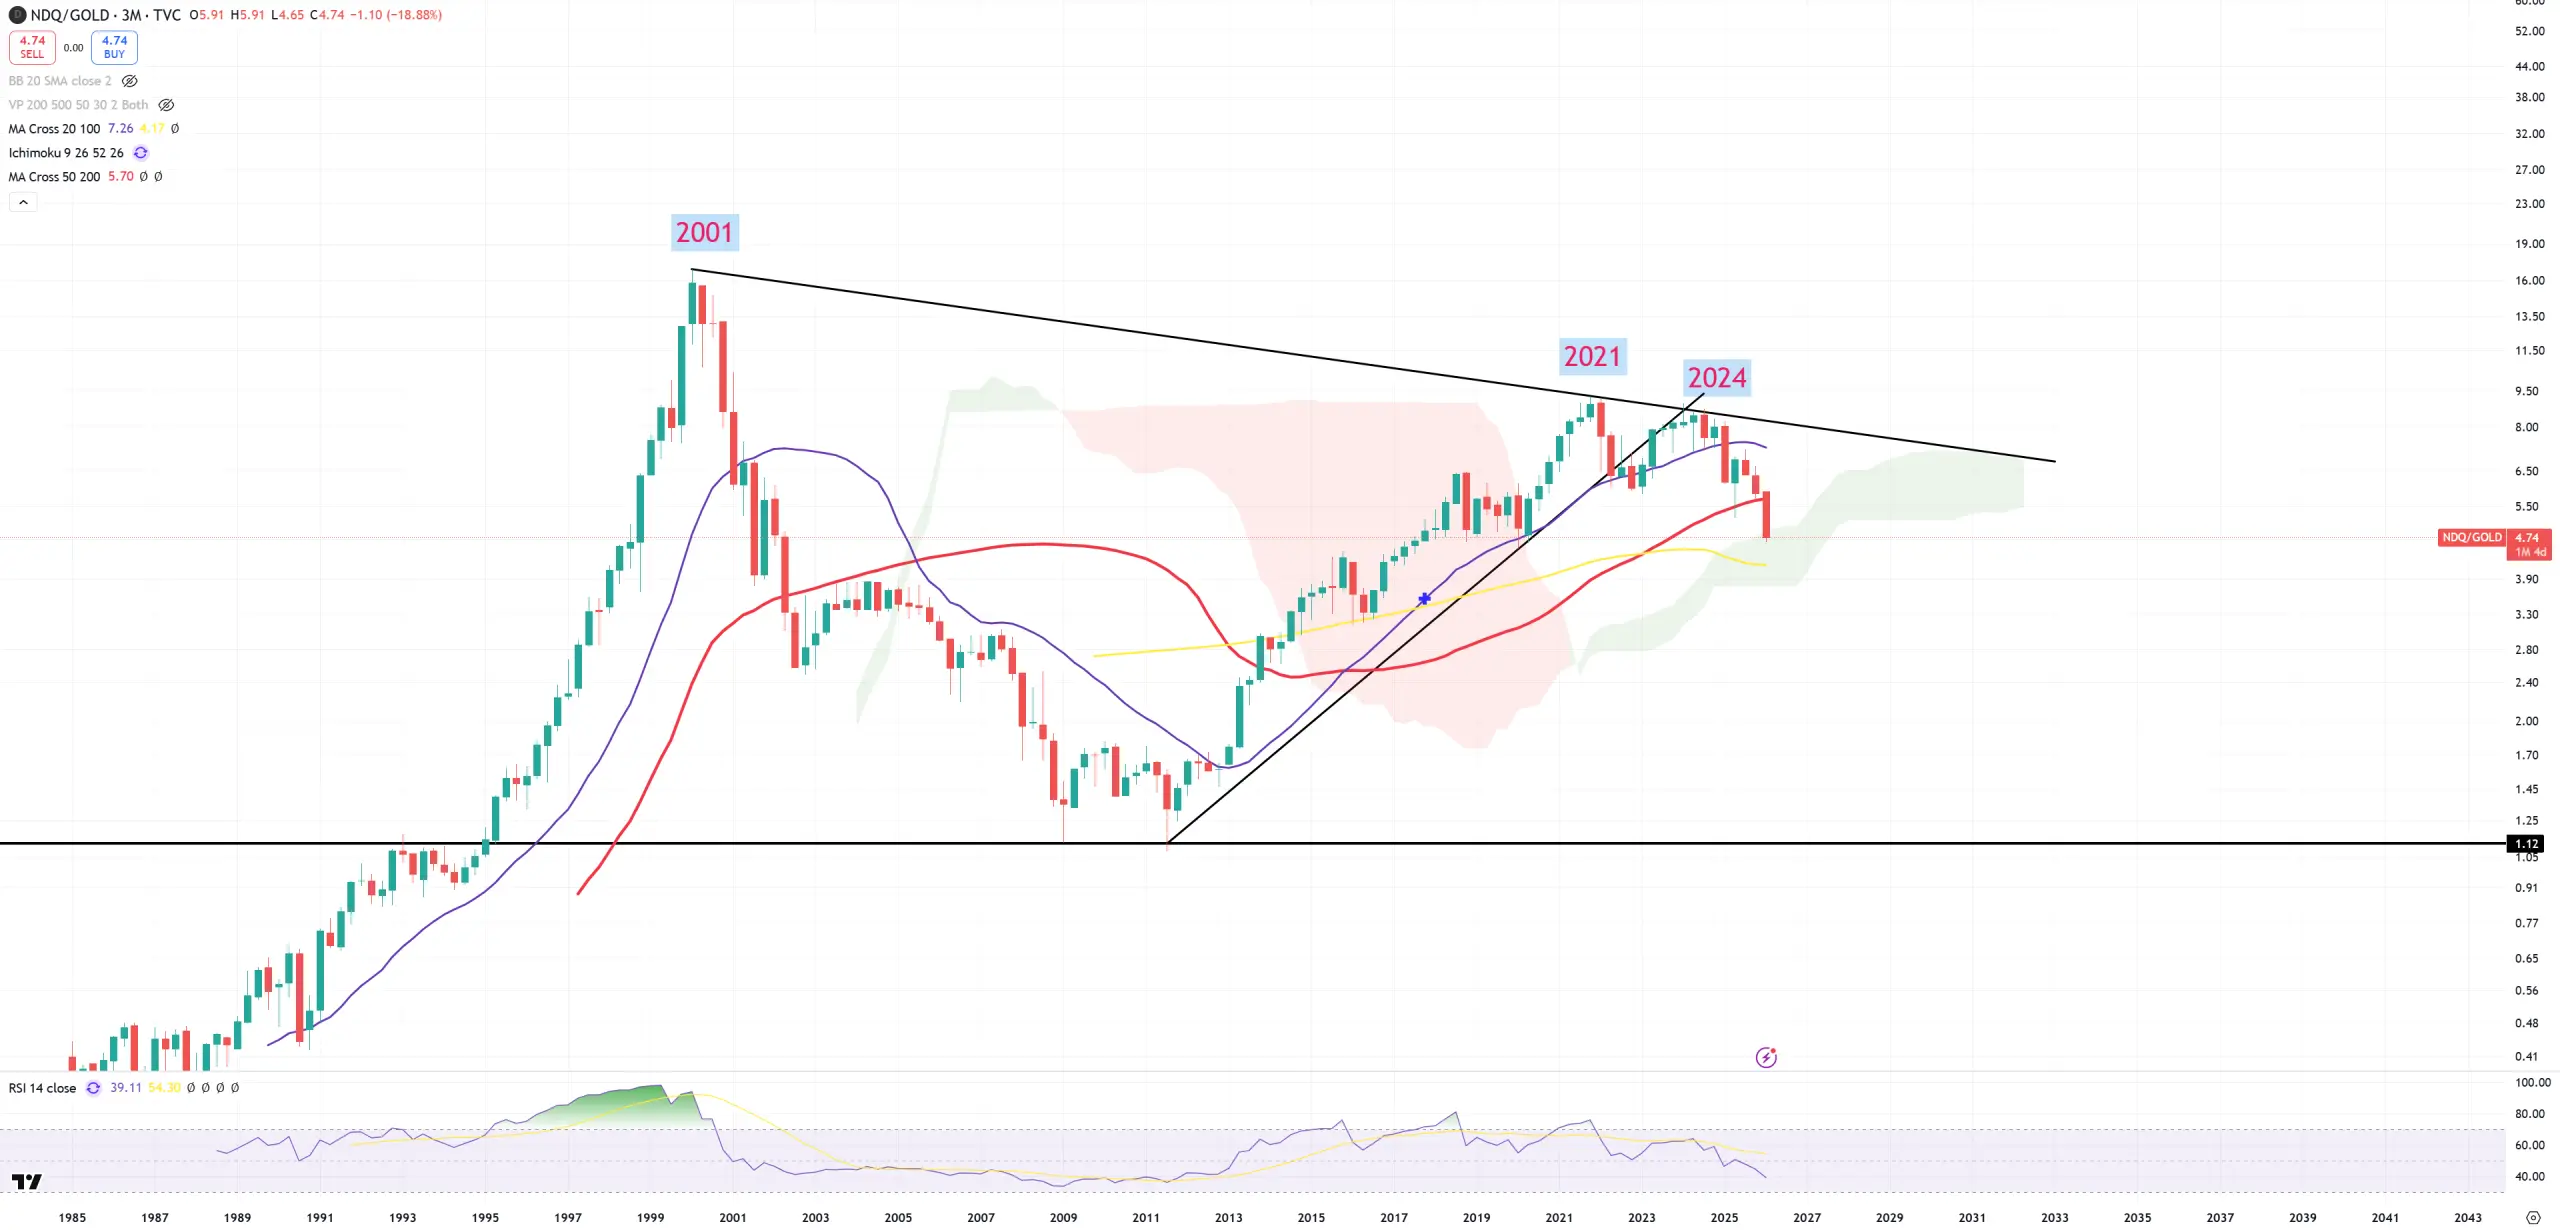
NDQ/GOLD – 3rd indicator, but not really important. Peak in 4Q21, lower peak 1Q/2Q24 and went down. Support ratio is around 1.00 and that’s IMO where we are going. There’s no even blue (3M)MA200 here as it’s of course (3M) view, but we see even red (3M)MA50 is gone (still March is needed to close (3M) candle). Companies like Adobe
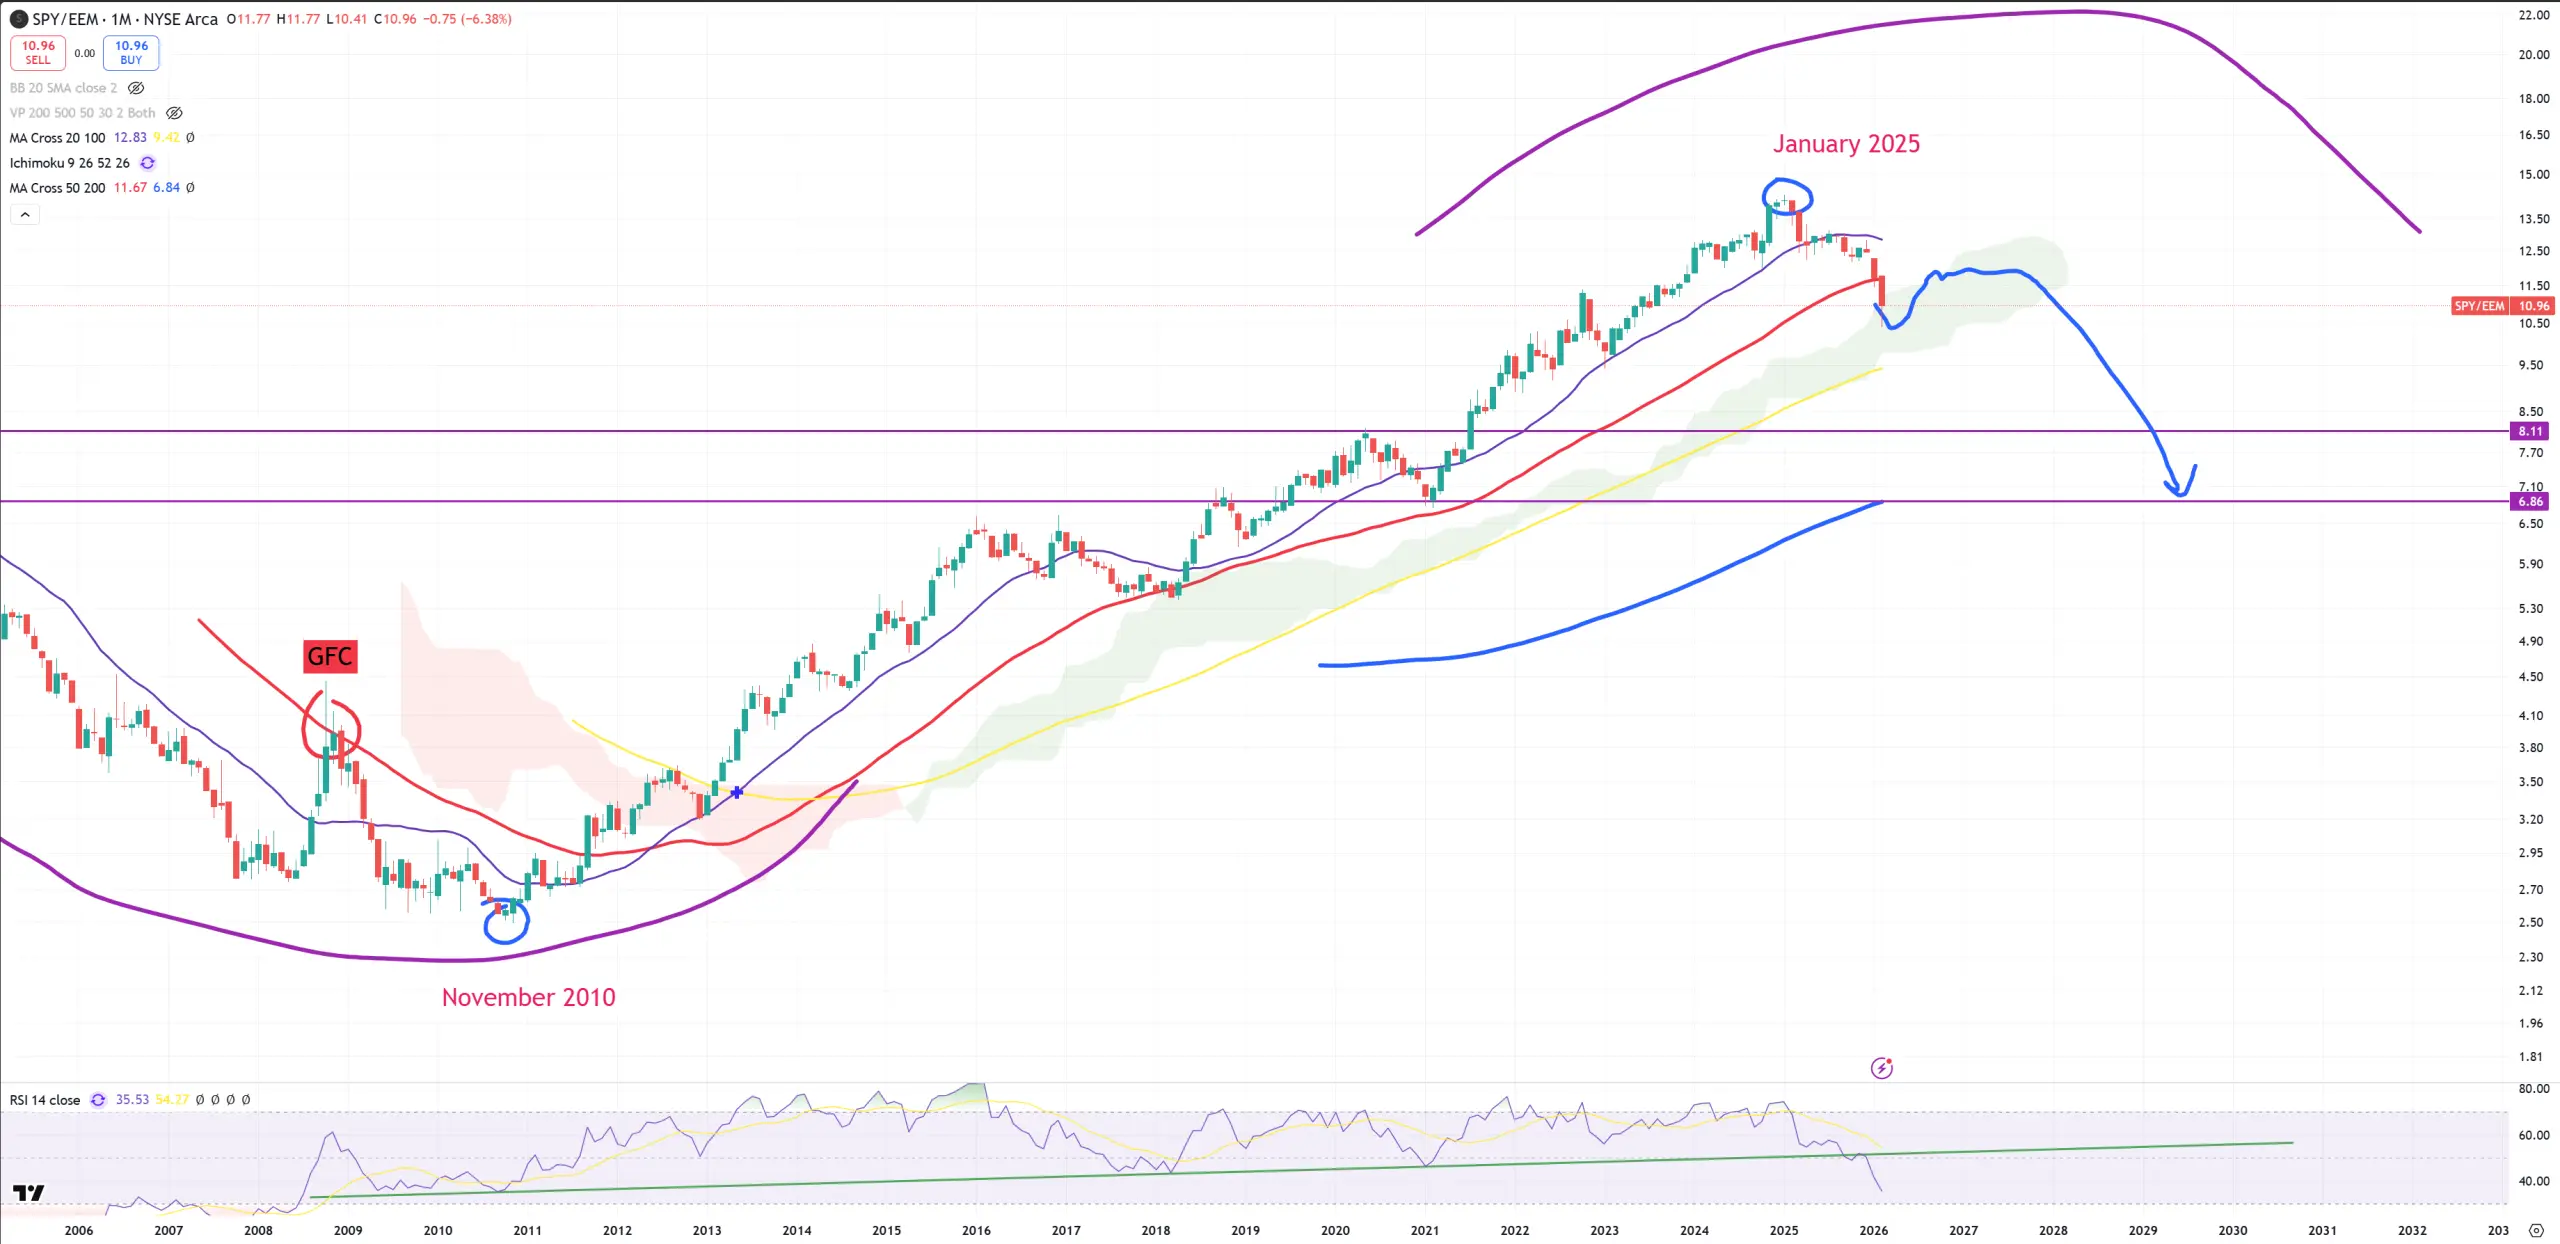
SPY/EEM – we can see in this ratio that cycles indicators finally have caught stock market. This ratio peaked in Jan 2025 and now it has broken (M)MA50. This is a cycle change for stocks = economic cycle change confirmed by DJI/GOLD SPX/GOLD has finally hit stocks.
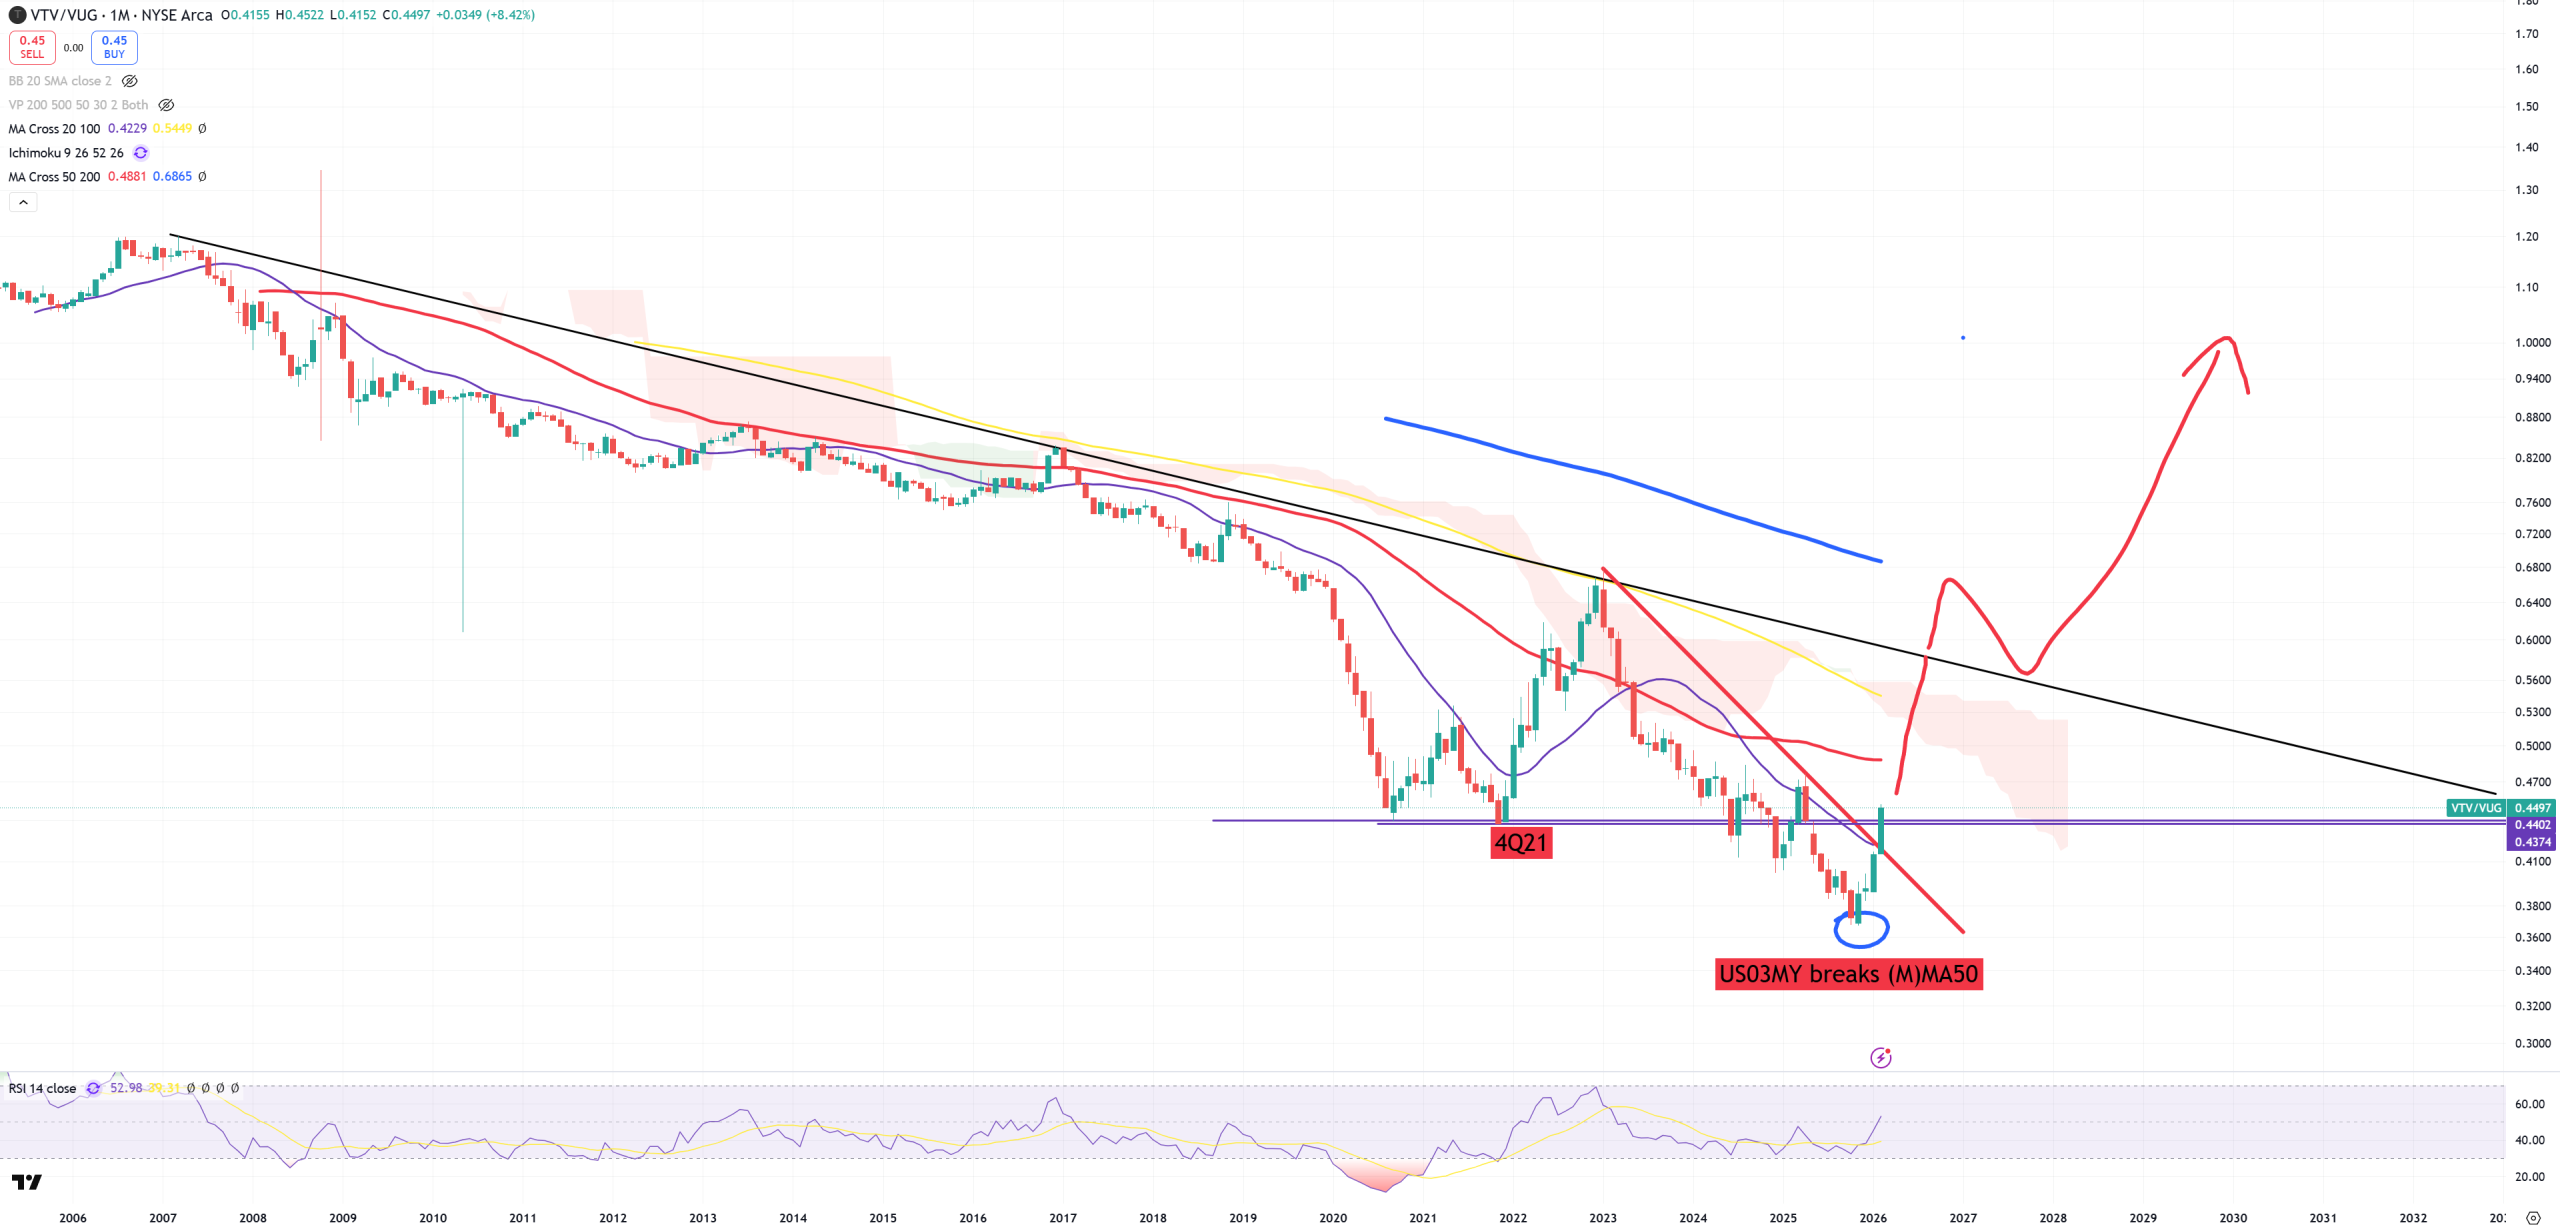
Value/Growth – just like SPY/EEM crossed big junction. This 4Q21 level was recovered.
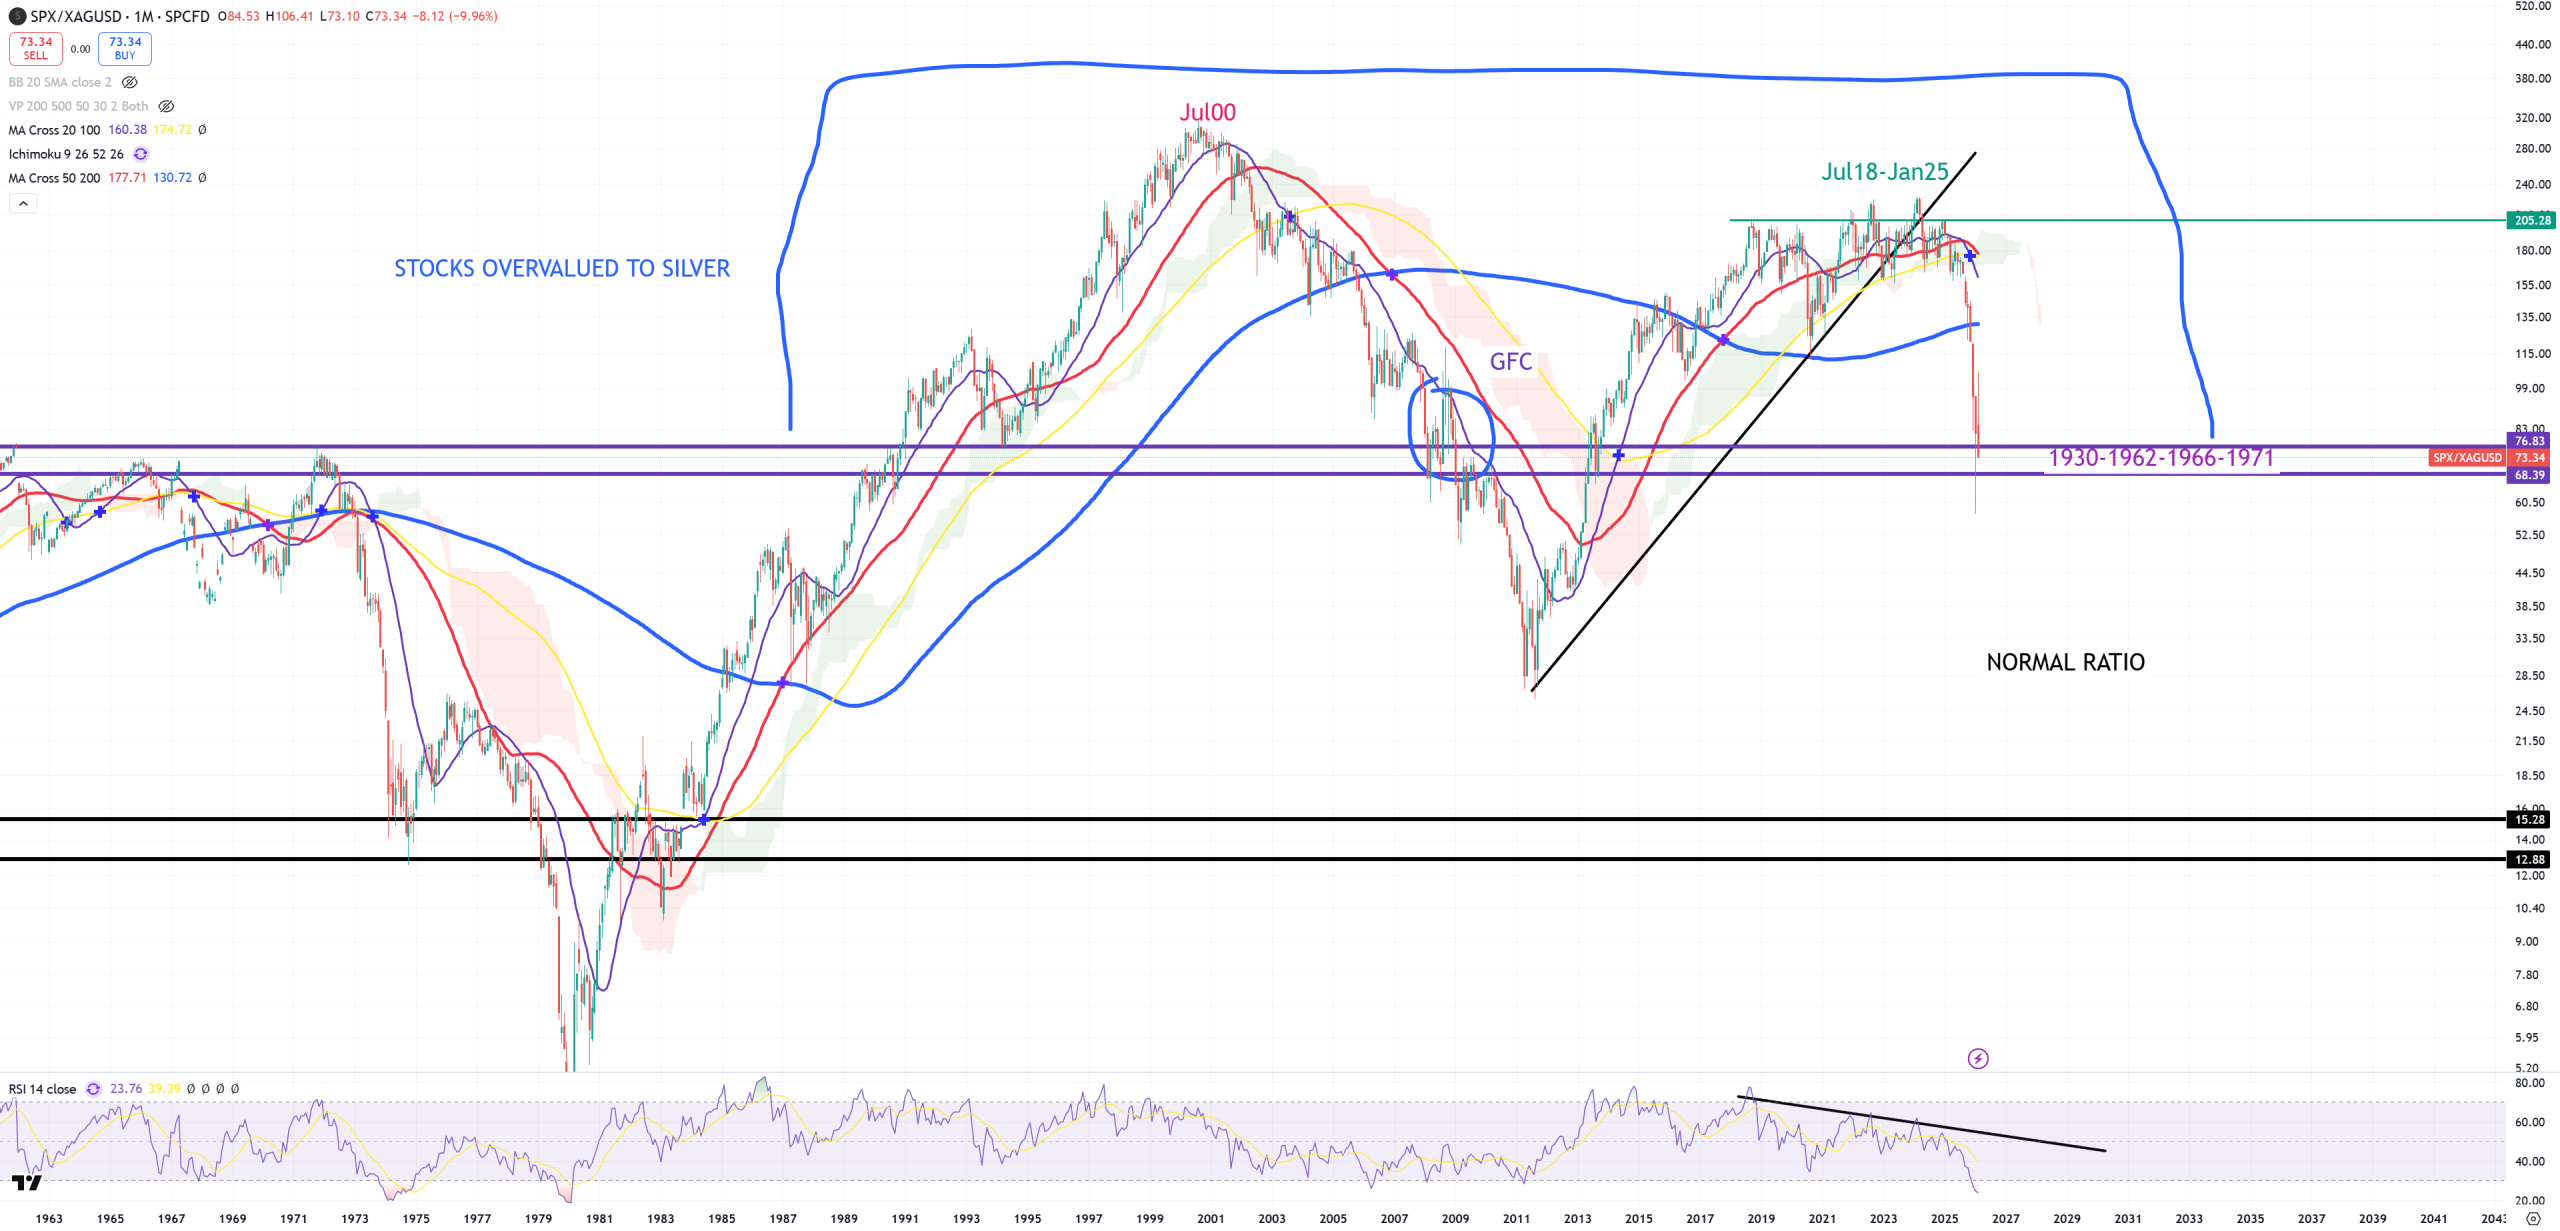
SPX/SILVER – I don’t bring Silver chart, because not much you’ll see there except 50$ support and 200-250$ top channel resistance. This ratio is more important as last time from this support level GFC occured. Once we break this 1930-1962-1966-1971 support level it opens path to 15 value (now 75).
AI bubble
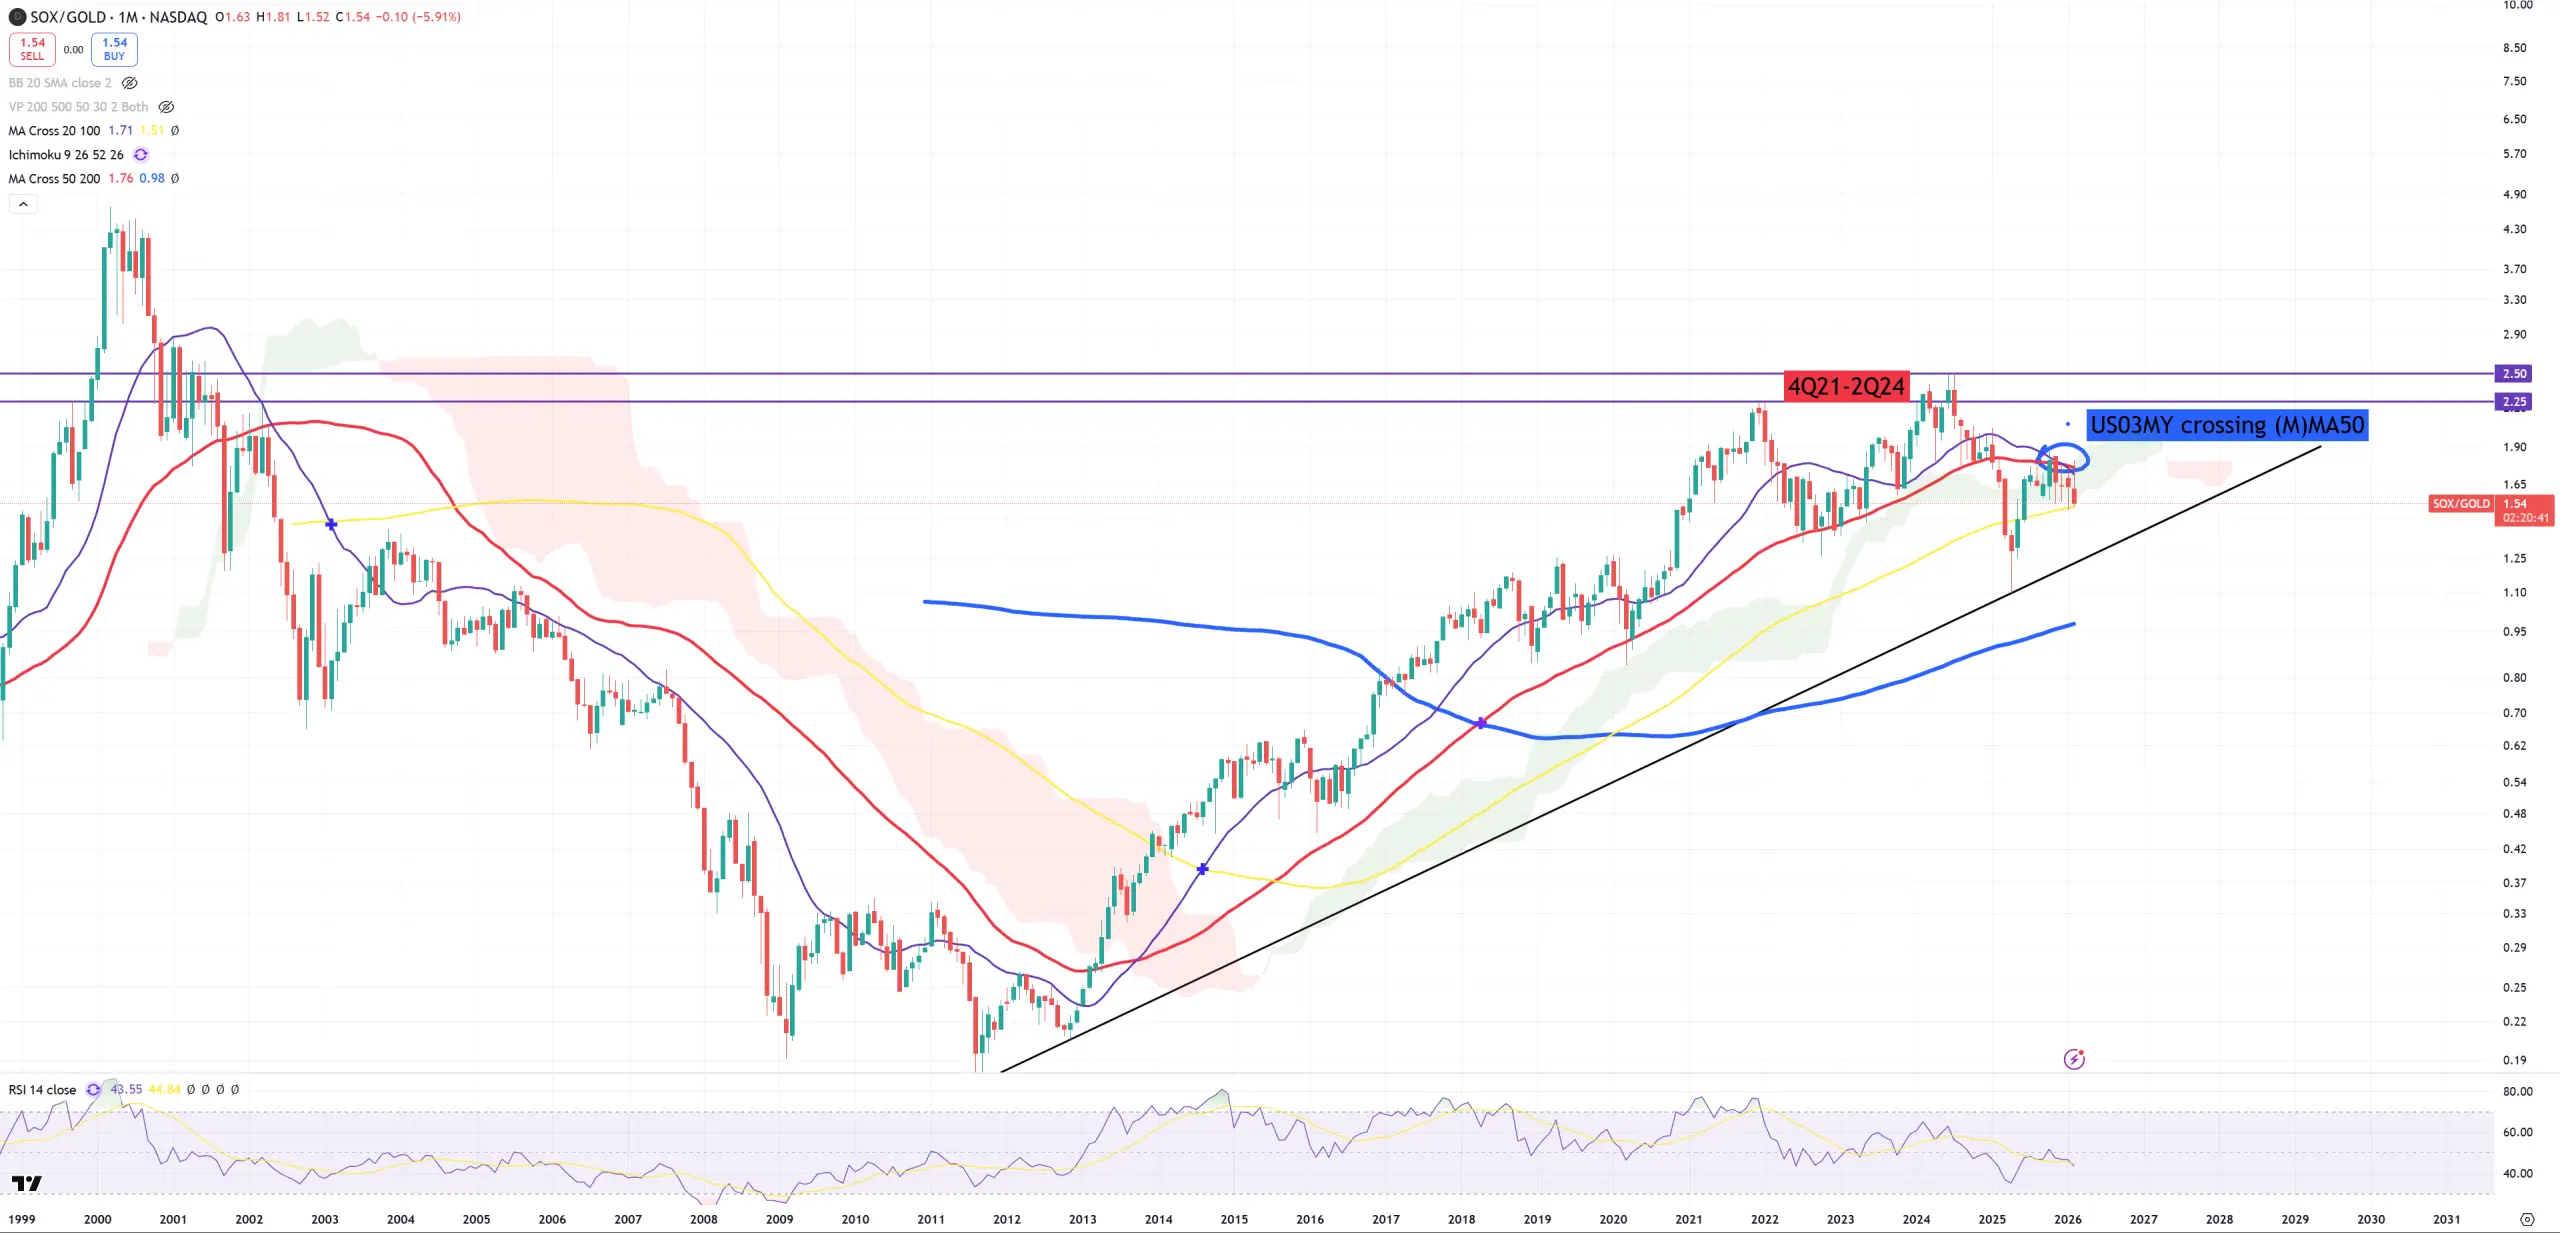
SOX/GOLD – let’s call it a cycle indicator for our AI bubble. Highest point : 2Q24. This 4Q21 was lower but not super low. We clearly see a big cyclical decline of SOX from 2Q24. Break (M)MA50 and entering a technical bear market for the first time since September 2001. The moment we retest (M)MA50, US03MY broke its (M)MA50 – the same time Nvidia hit its 212$ level. As I’ve been saying, the biggest crashes happen when market break (M)MA50, retest it from the bottom and fail. Since September 2001, market was retesting (M)MA50 till April 2002, and once this retest failed, NDQ dropped another -45%. This ratio and this technical position mostly tell you : You have no idea how low SOX can go. Let’s wait when 2011-2012-2025 black trend will be broken.
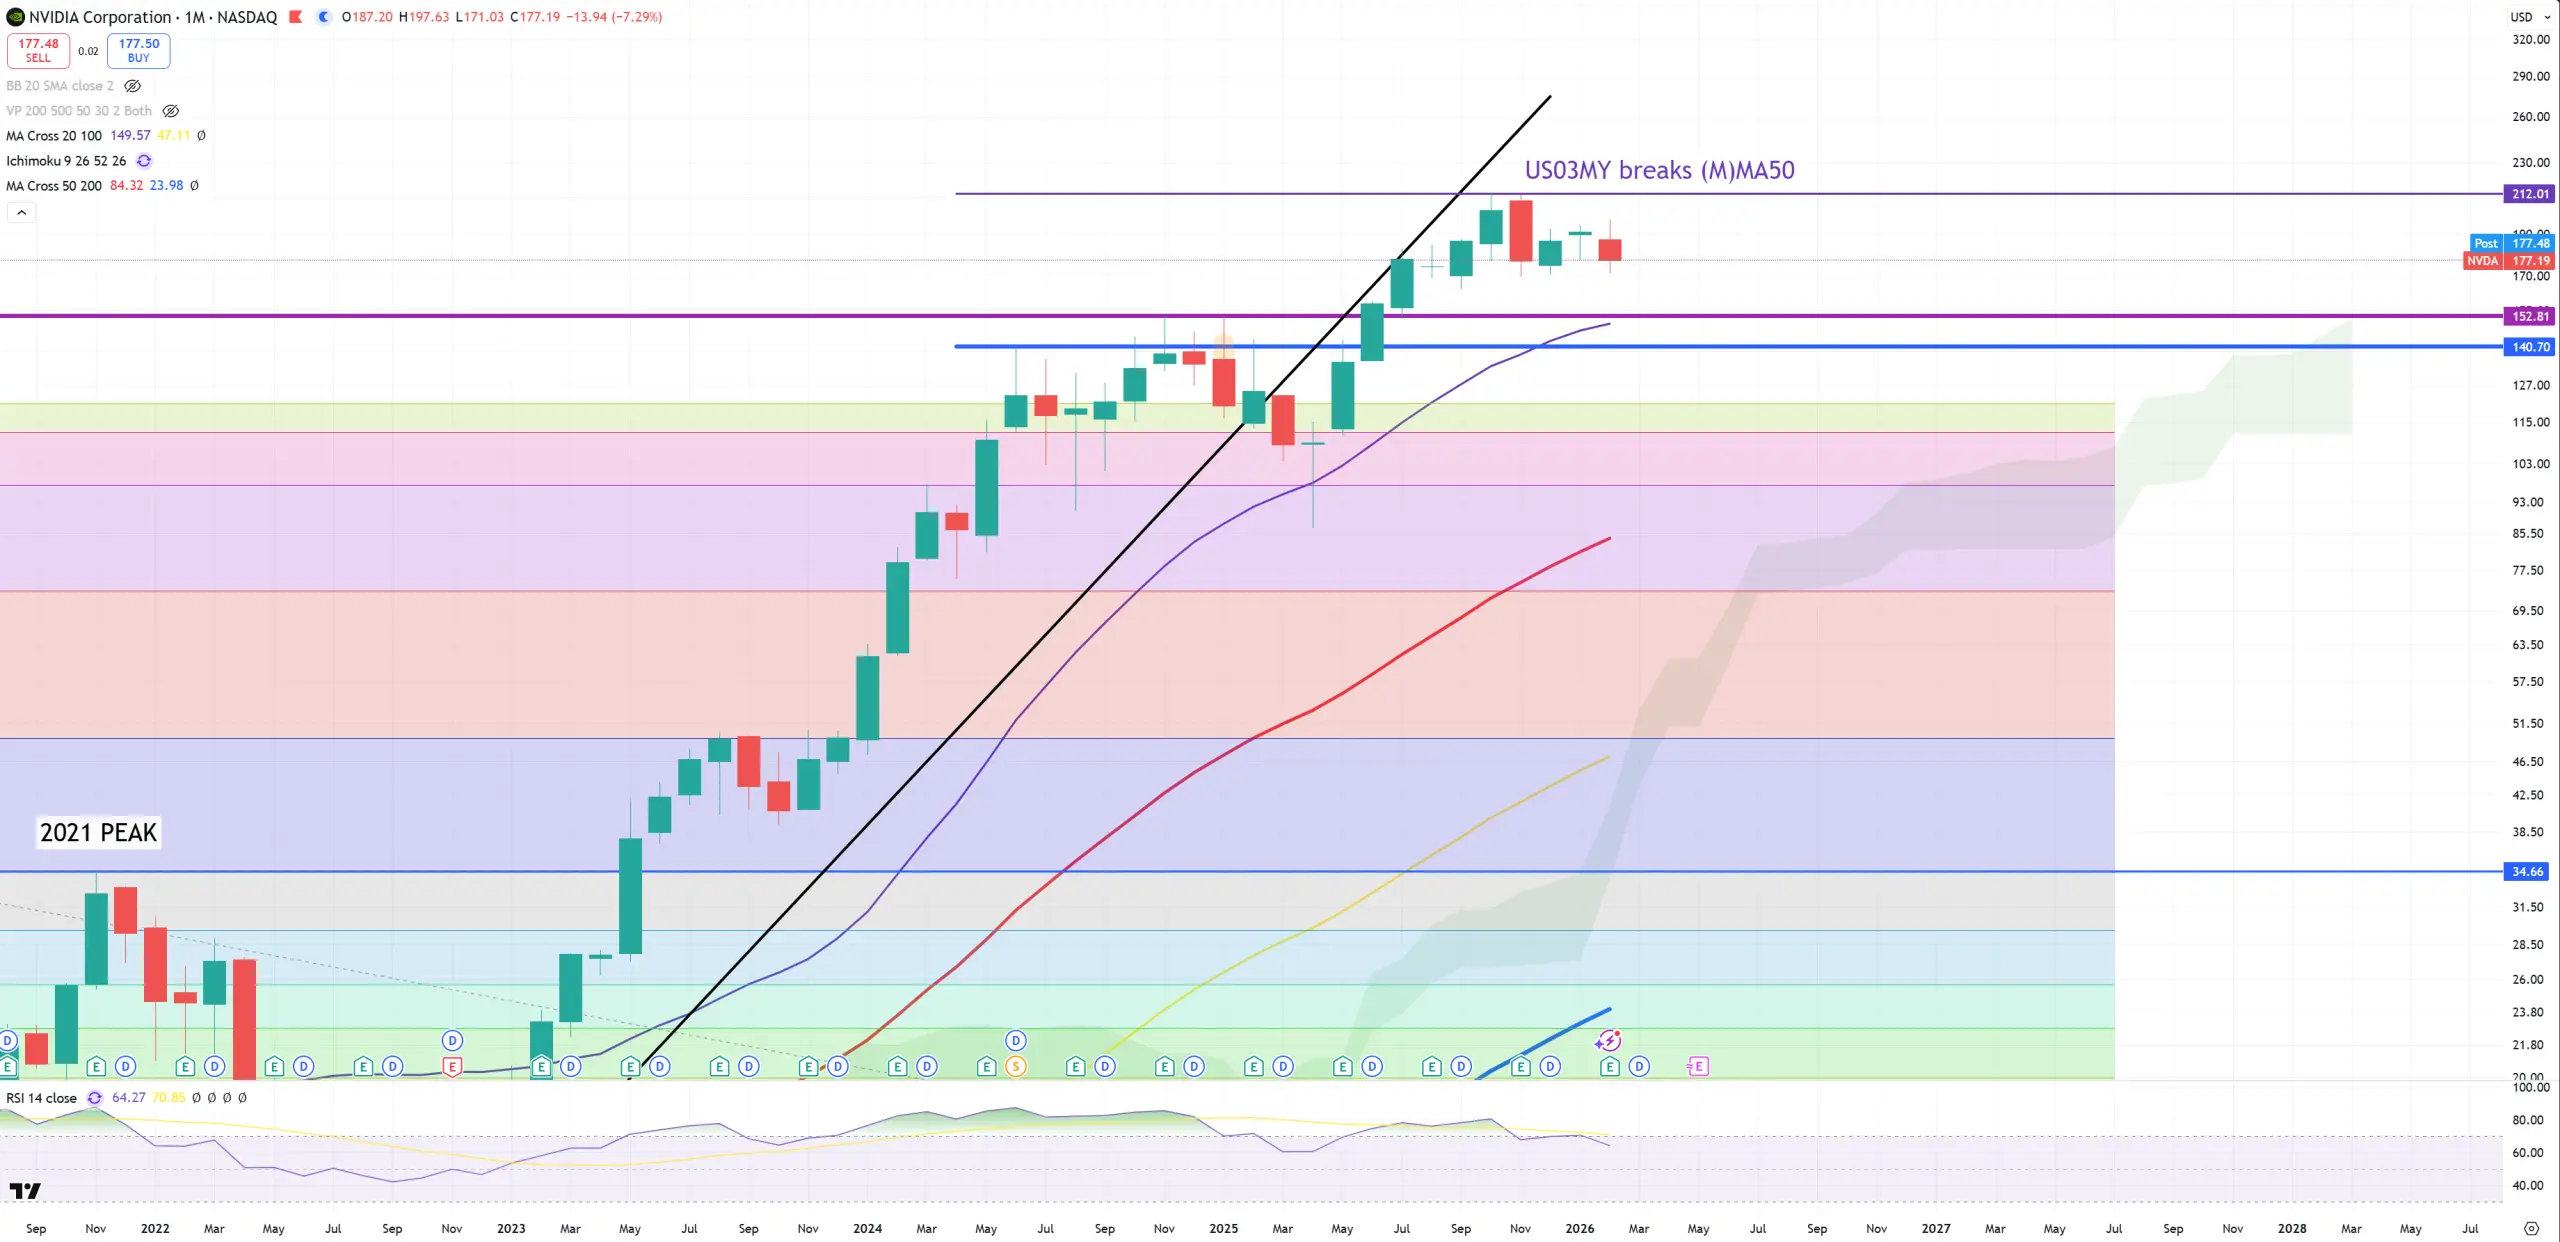
NVDA – That’s our symbol of the AI bubble, I won’t be sharing other companies because it doesn’t make any sense. If NVDA goes down, rest will go down too. NVDA peak so far happened EXACTLY the moment US03MY broke (M)MA50 = 212$. 2Q24 SOX/GOLD peak is 140$-150$. We can clearly state that everything that is above SOX/GOLD 2Q24 peak is a massive bull trap and distribution.
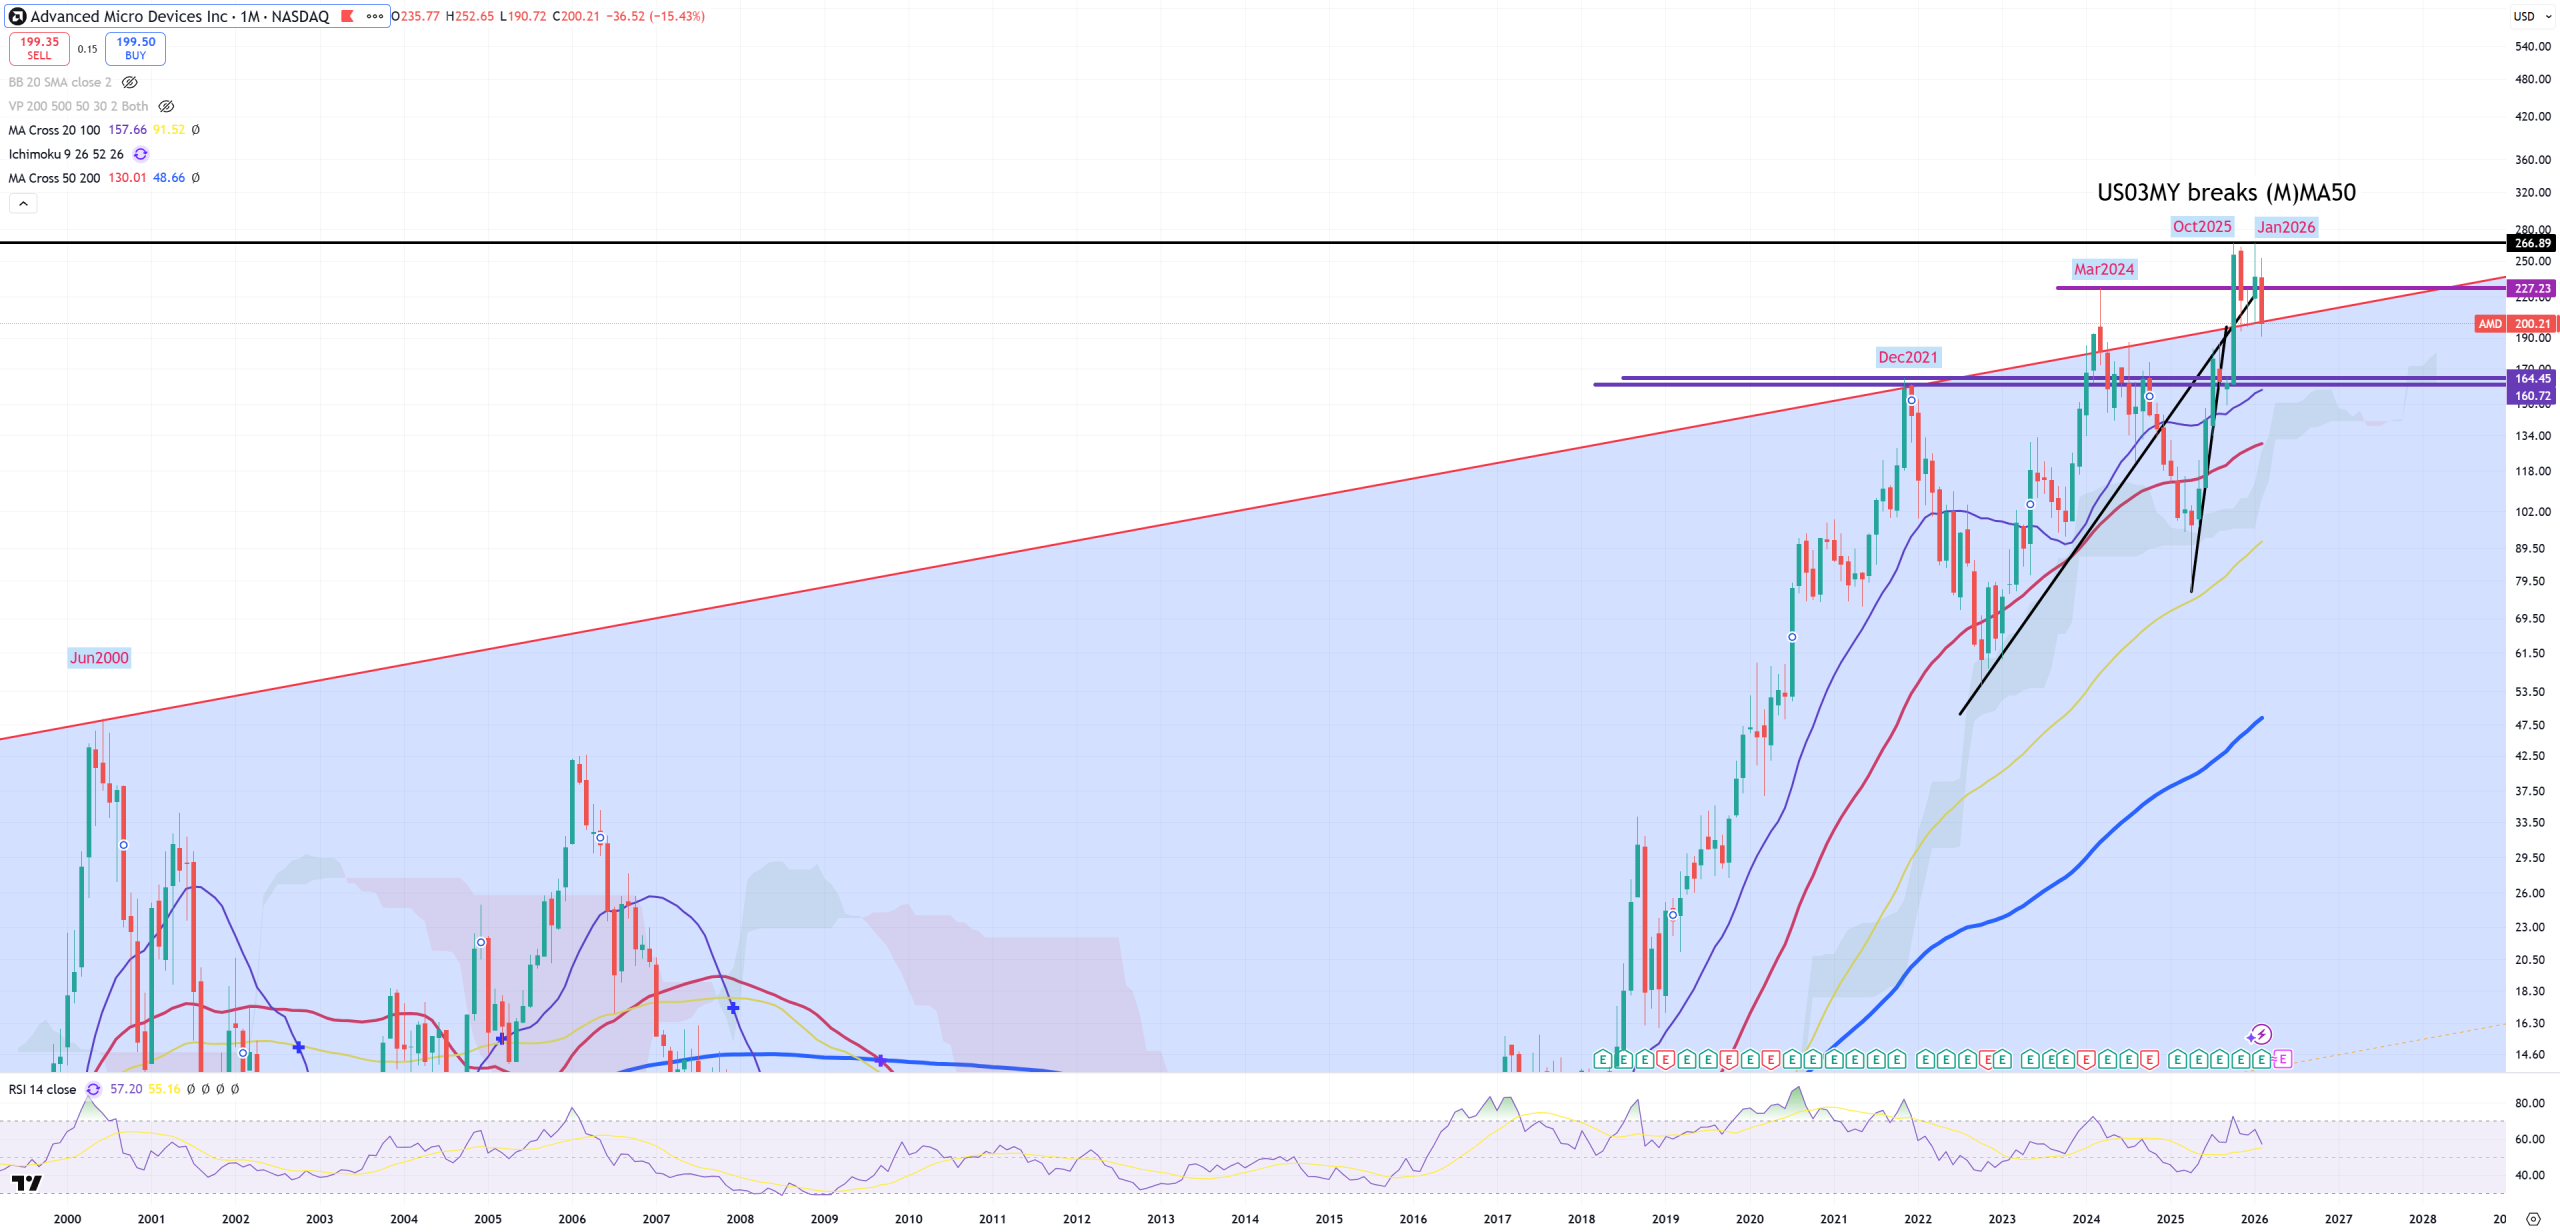
AMD – 1984-2000-2021 trend, a small spike above ended up by March 2024, later huge spike and double-top Oct25-Jan26 = US03MY breaks (M)MA50 level. It wants to go back below its main 1984-2000-2021 trend.
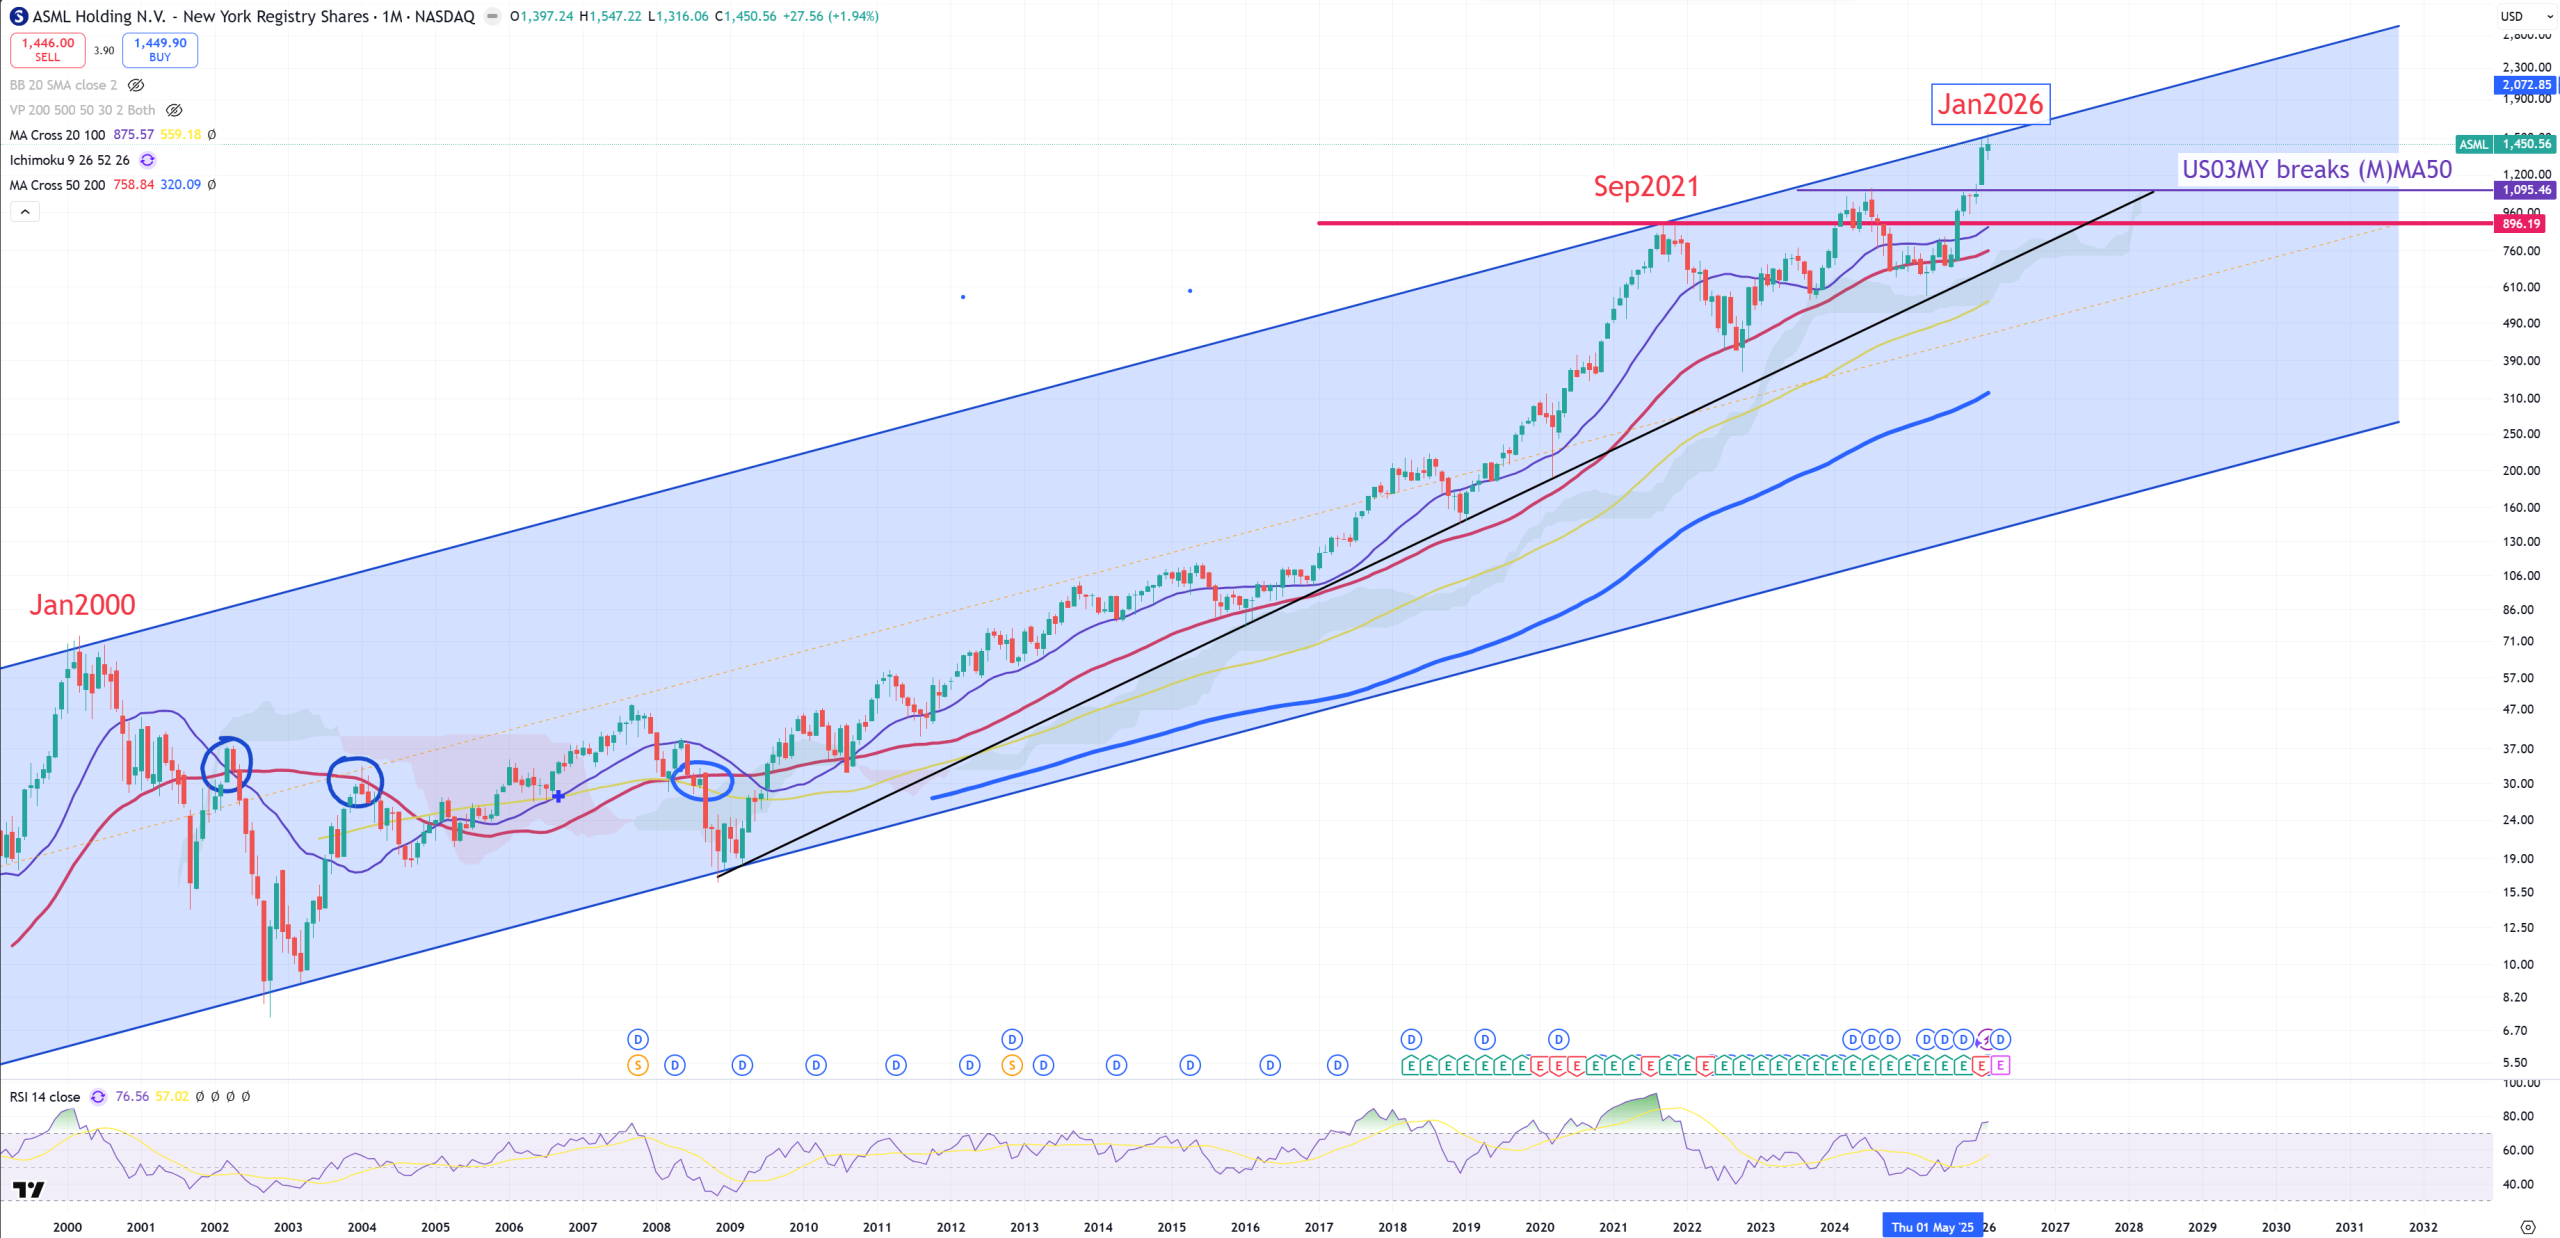
ASML – trend 2000-2021 matched with January 2026 level. US03MY break is on 1095$ level. Big break or rejection.
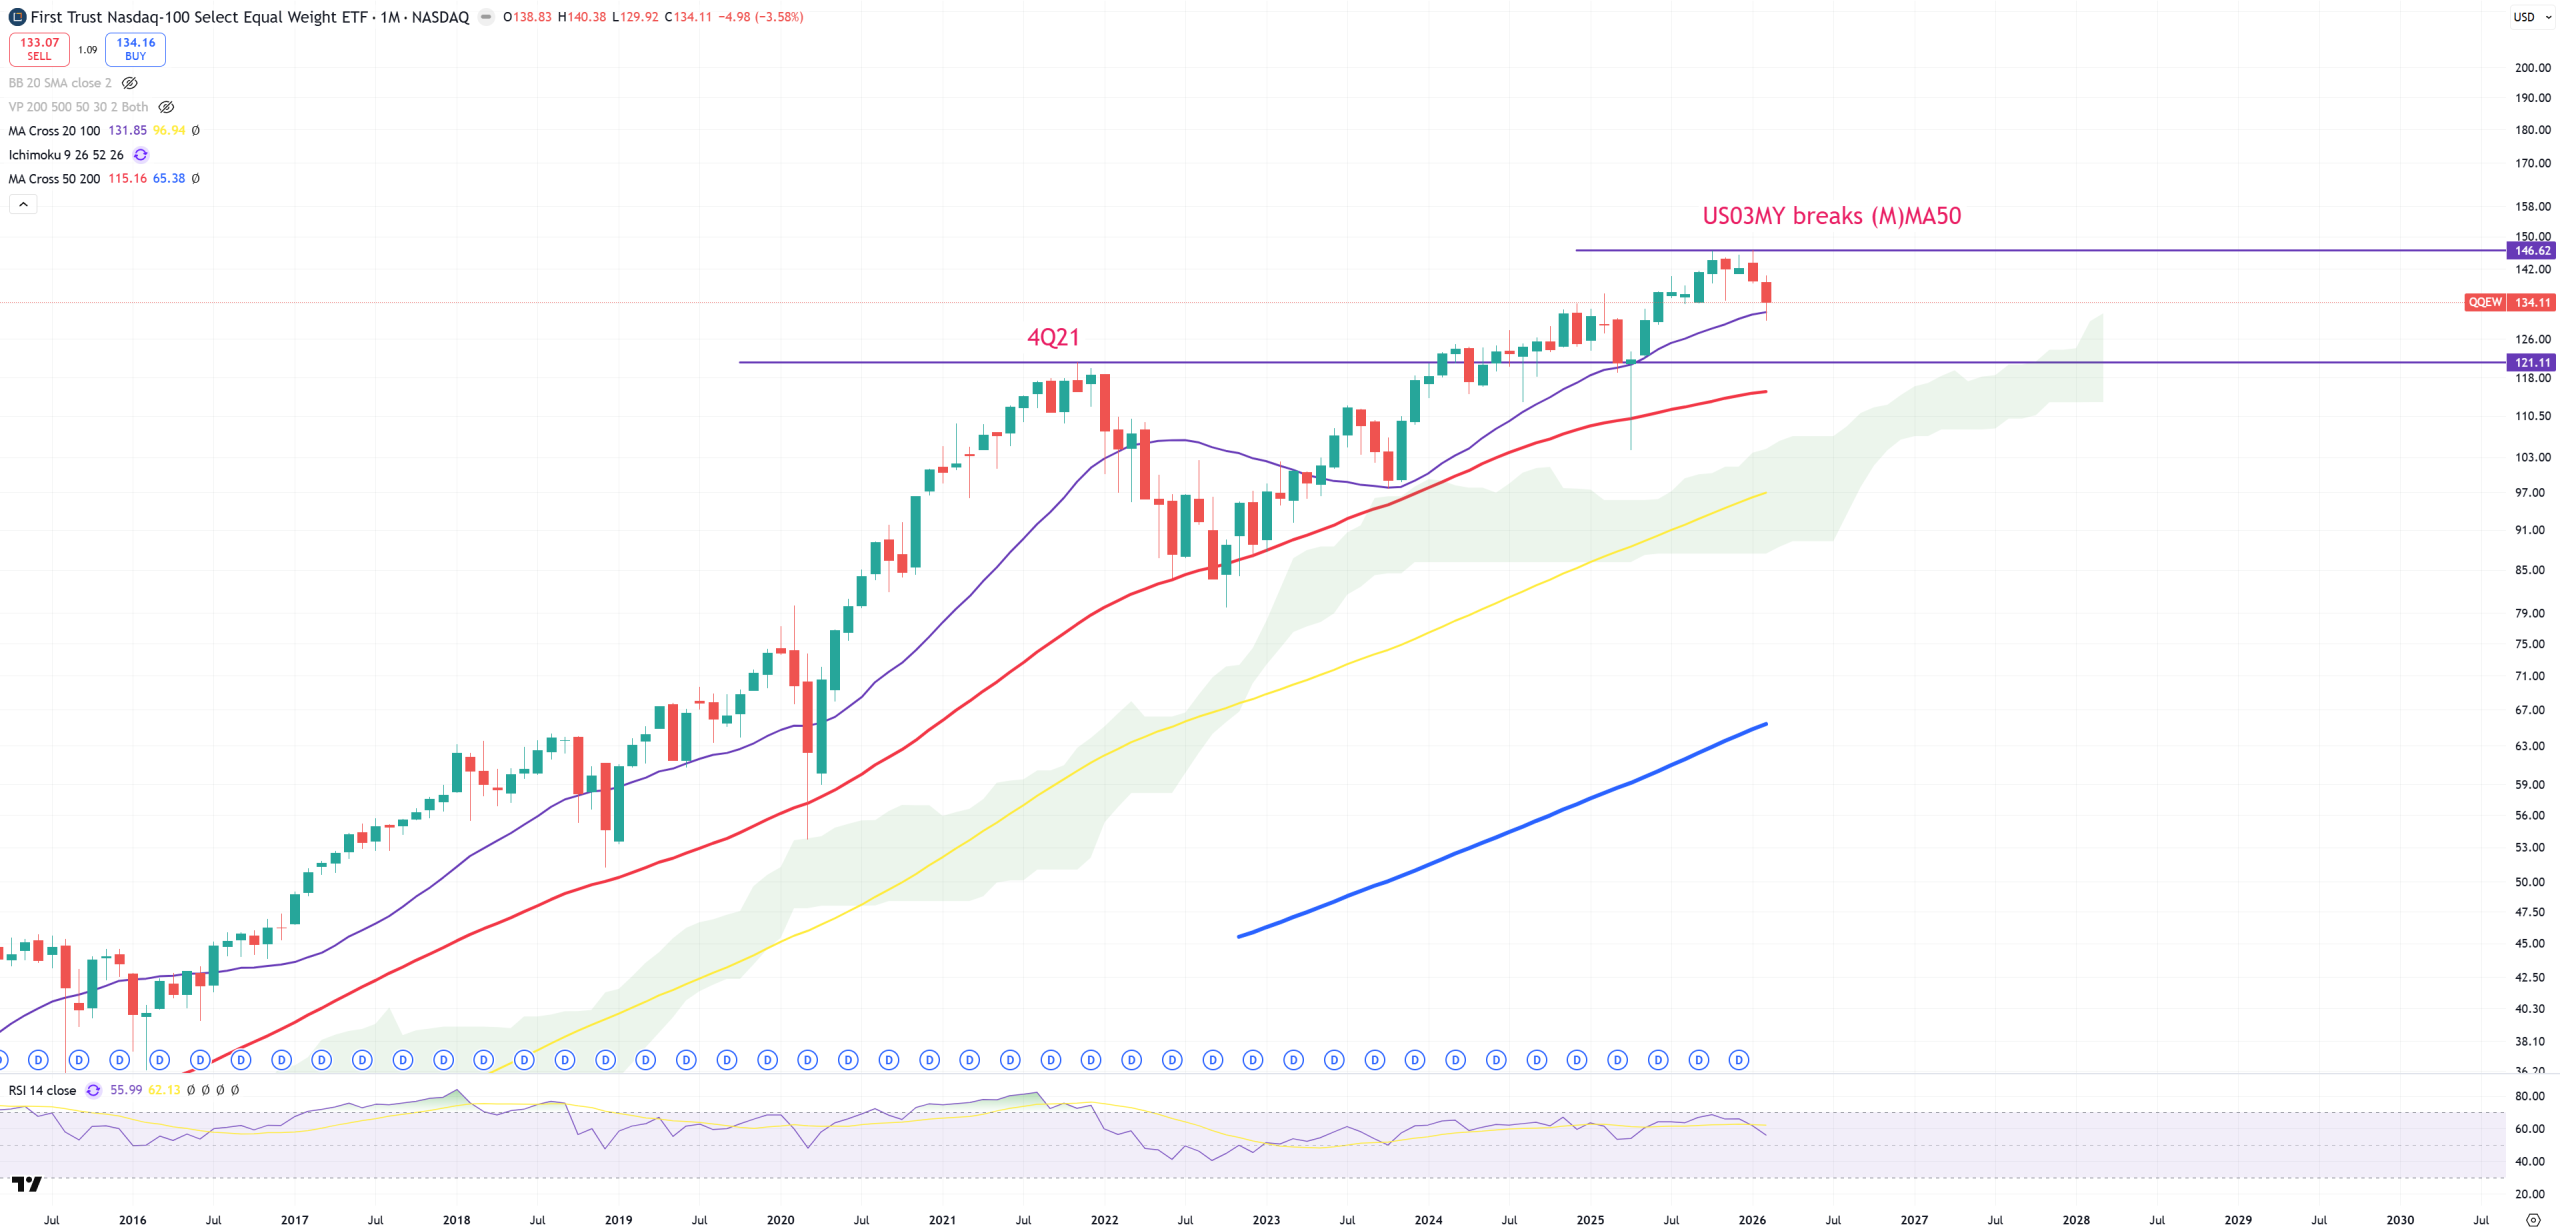
QQEW – Nasdaq Equal Weight – we also see a very similar pattern to NVDA
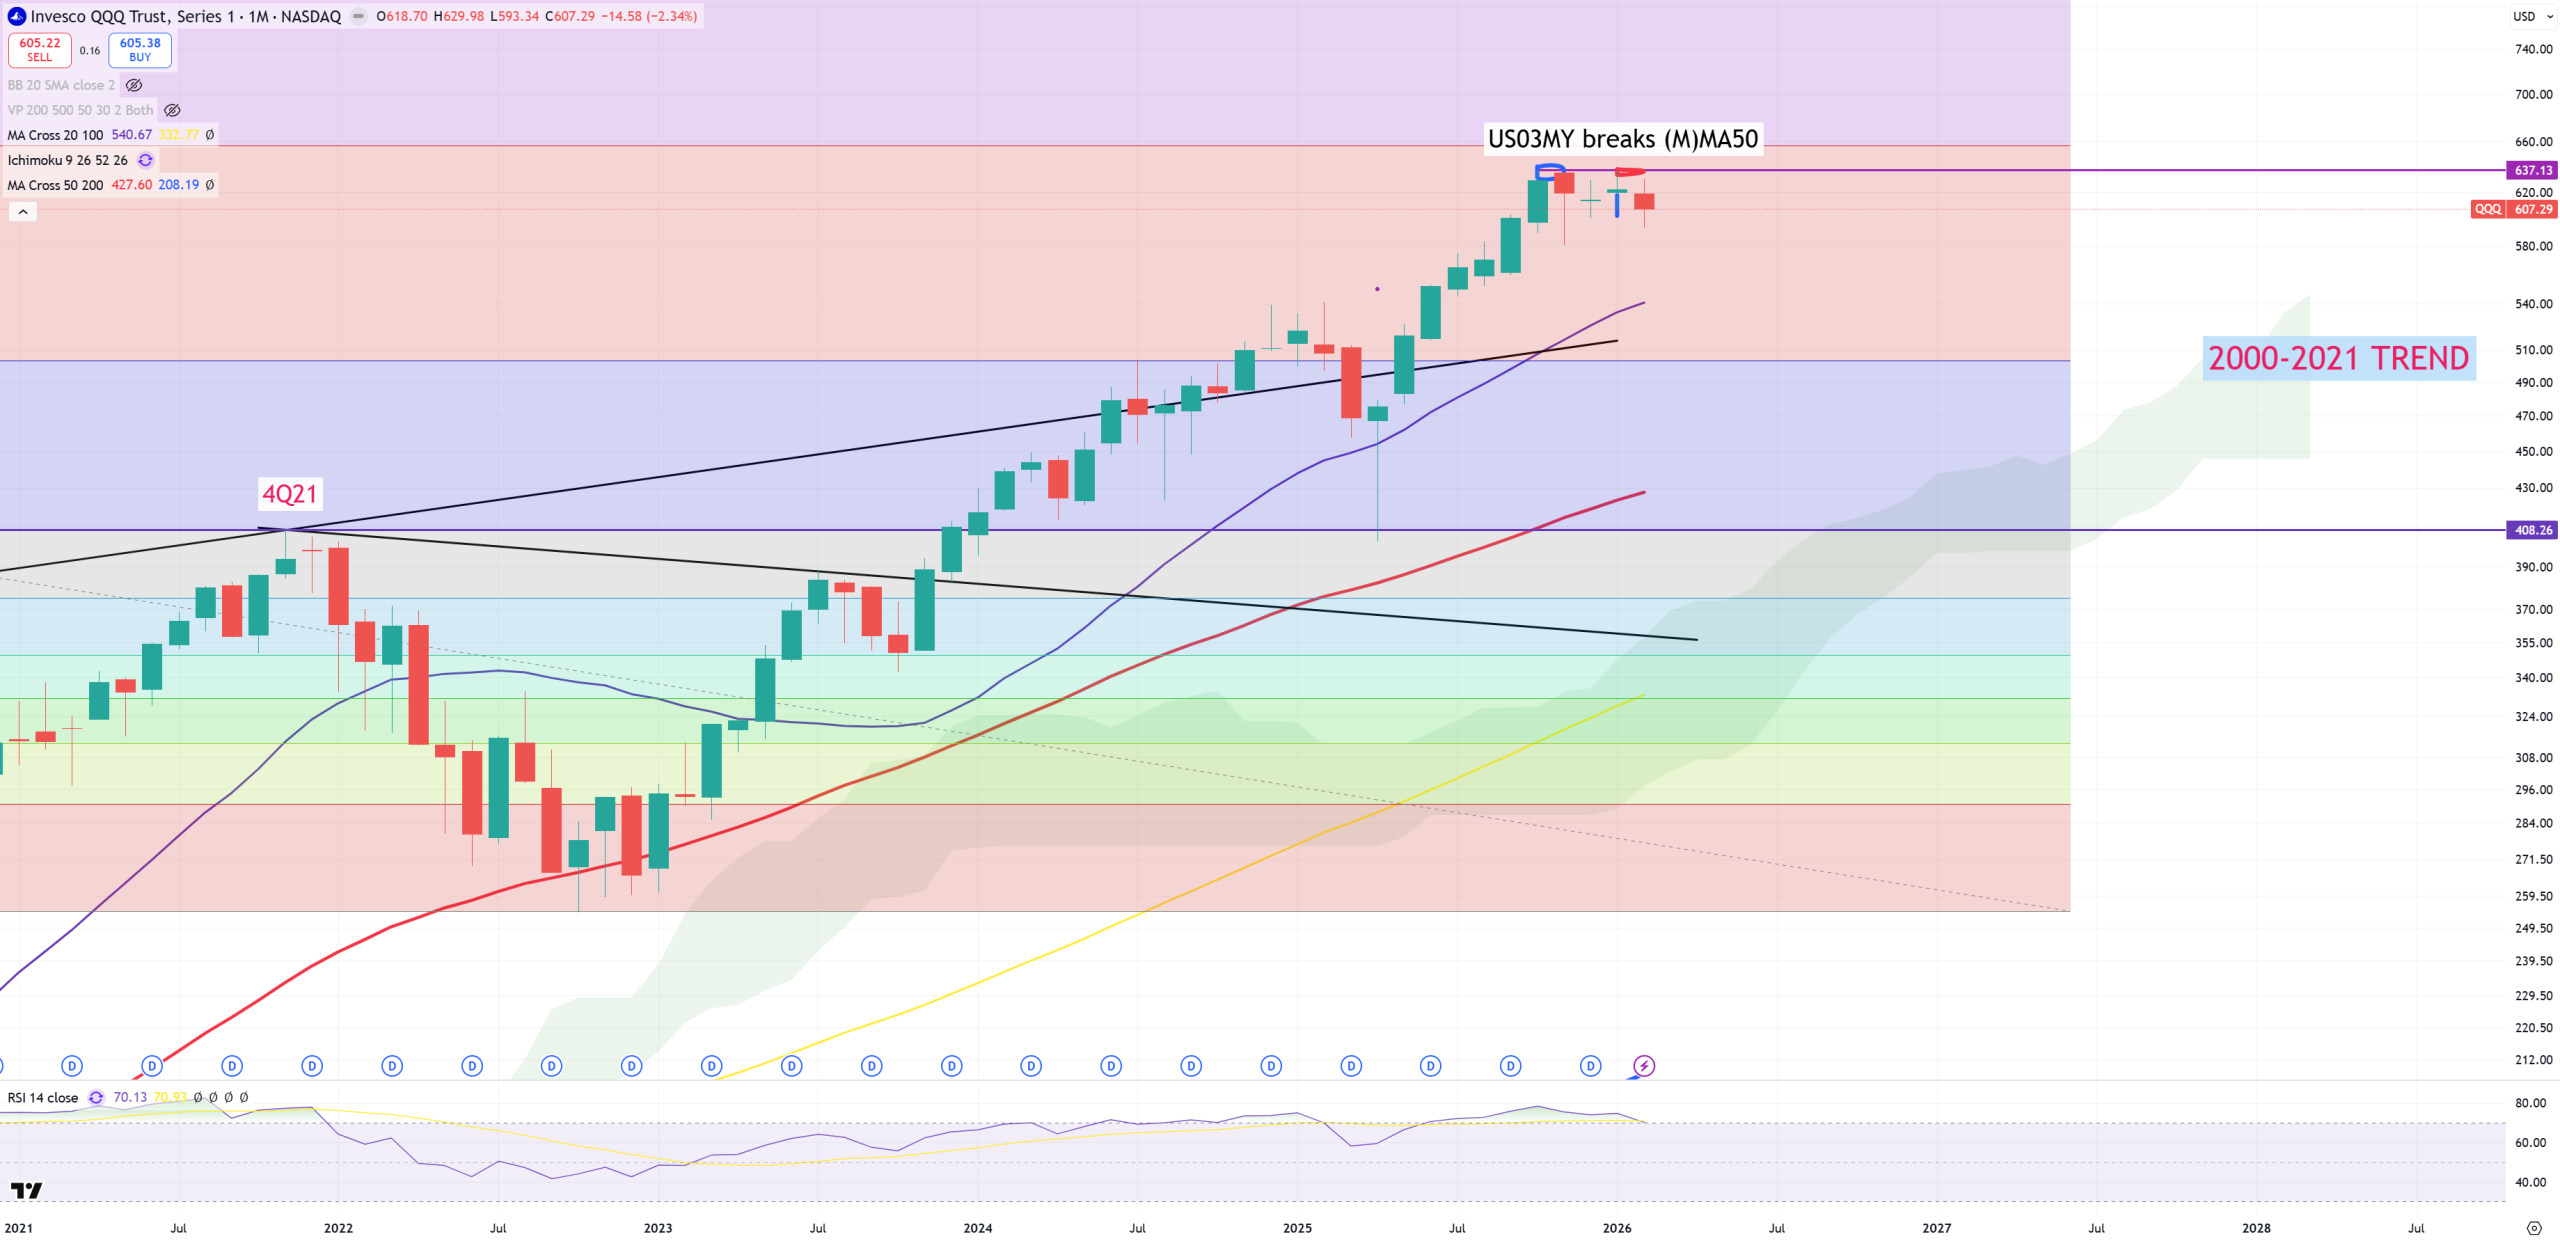
QQQ – Nasdaq 100 looks a bit different. 4Q21 peak is almost 36% lower than 637$ the moment US03MY crossed down (M)MA50. Mag7 bubble is SOOOOOOOOOOOO HUGEEEEEEEEEEE.
Crypto Bubble
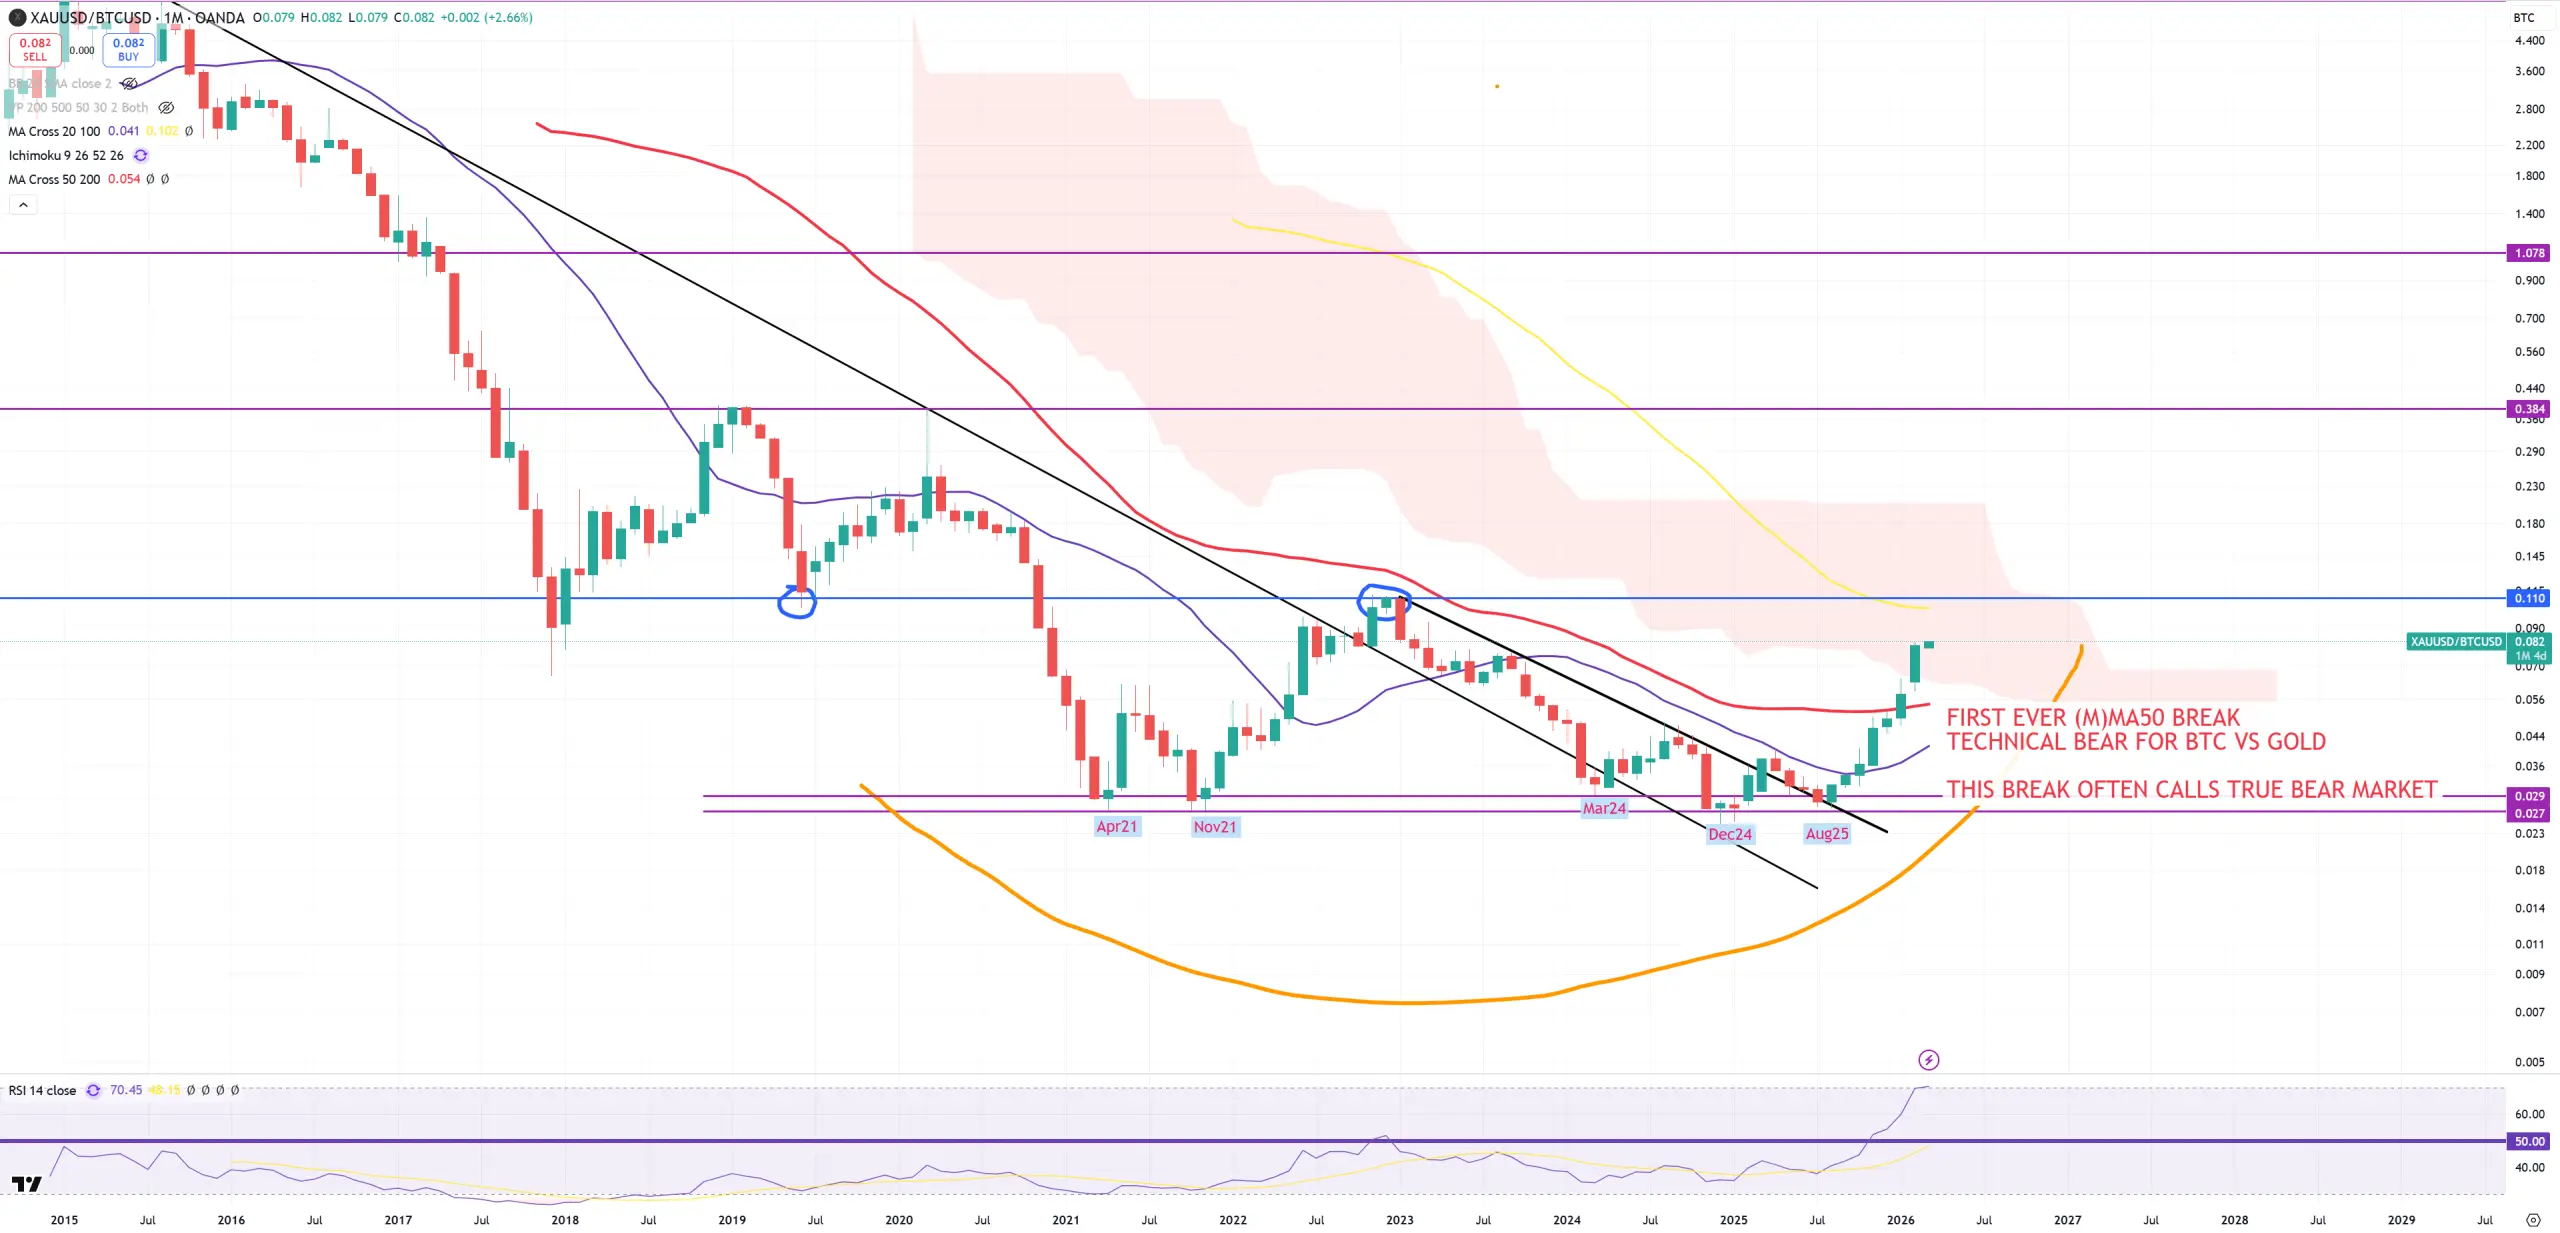
GOLD/BTC – main indicator of a BTC bust started to reverse from … of course 2021 – so the moment where SPX/GOLD made its peak. In reality that was a moment when BTC bubble has gone bust. (M)MA50 has gone and we can say good morning to the first ever true technical bear market for BTC. All indicators which was working during cyclical bull market (even with -80% corrections) will suddenly stop working. Yellow (M)MA100 in play.
SPX/BTC – BTC now underpeforms even SPX, but (M)MA50 has not broken.
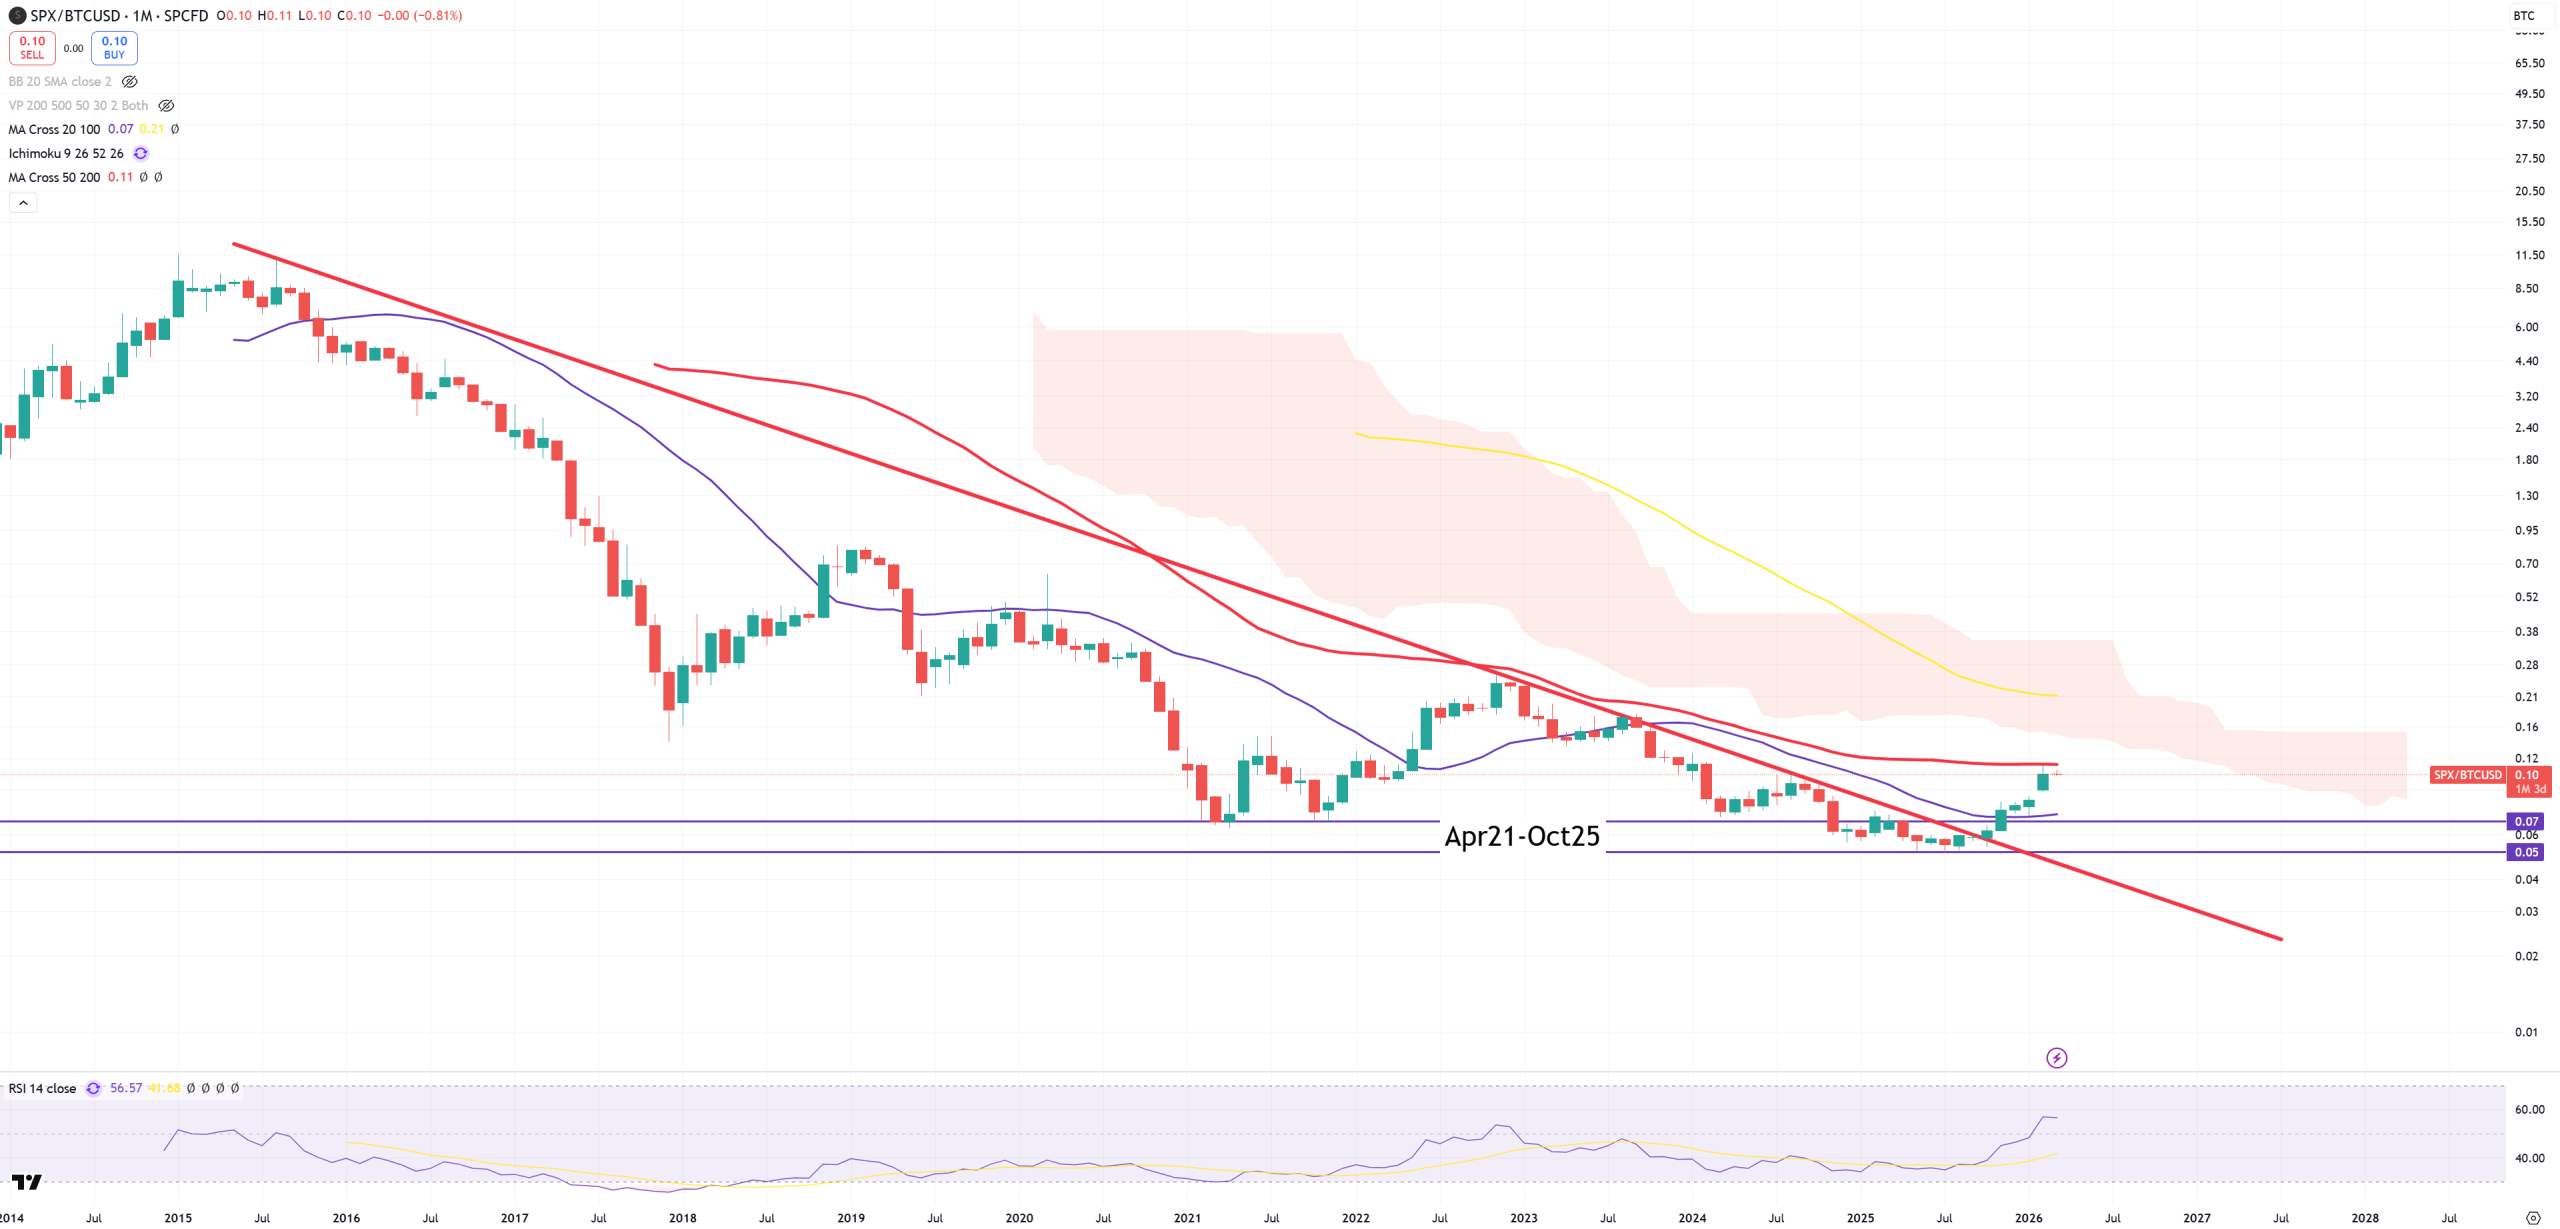
BTC starts below 2021 peak, and when that happens it’s already DONE, As GOLD/BTC found its resistance on 2021 level, it was just a matter of time when we’ll go below 2021 peak. This move above 2021 peak (> 70k$) was just a massive bull trap and distribution for BTC maxis who were trying to convince the whole world BTC is going to 1M$, while in reality it was entering its first true technical bear market ever. You see that this 2021 level is around red (M)MA50 another technical border between bull/bear. Late 4Q22 we managed to break this (M)MA50, but the same time GOLD/BTC ratio failed to break its (M)MA50 = that was just a bear trap that time, but it looks now a true ugly big bear has entered the game.
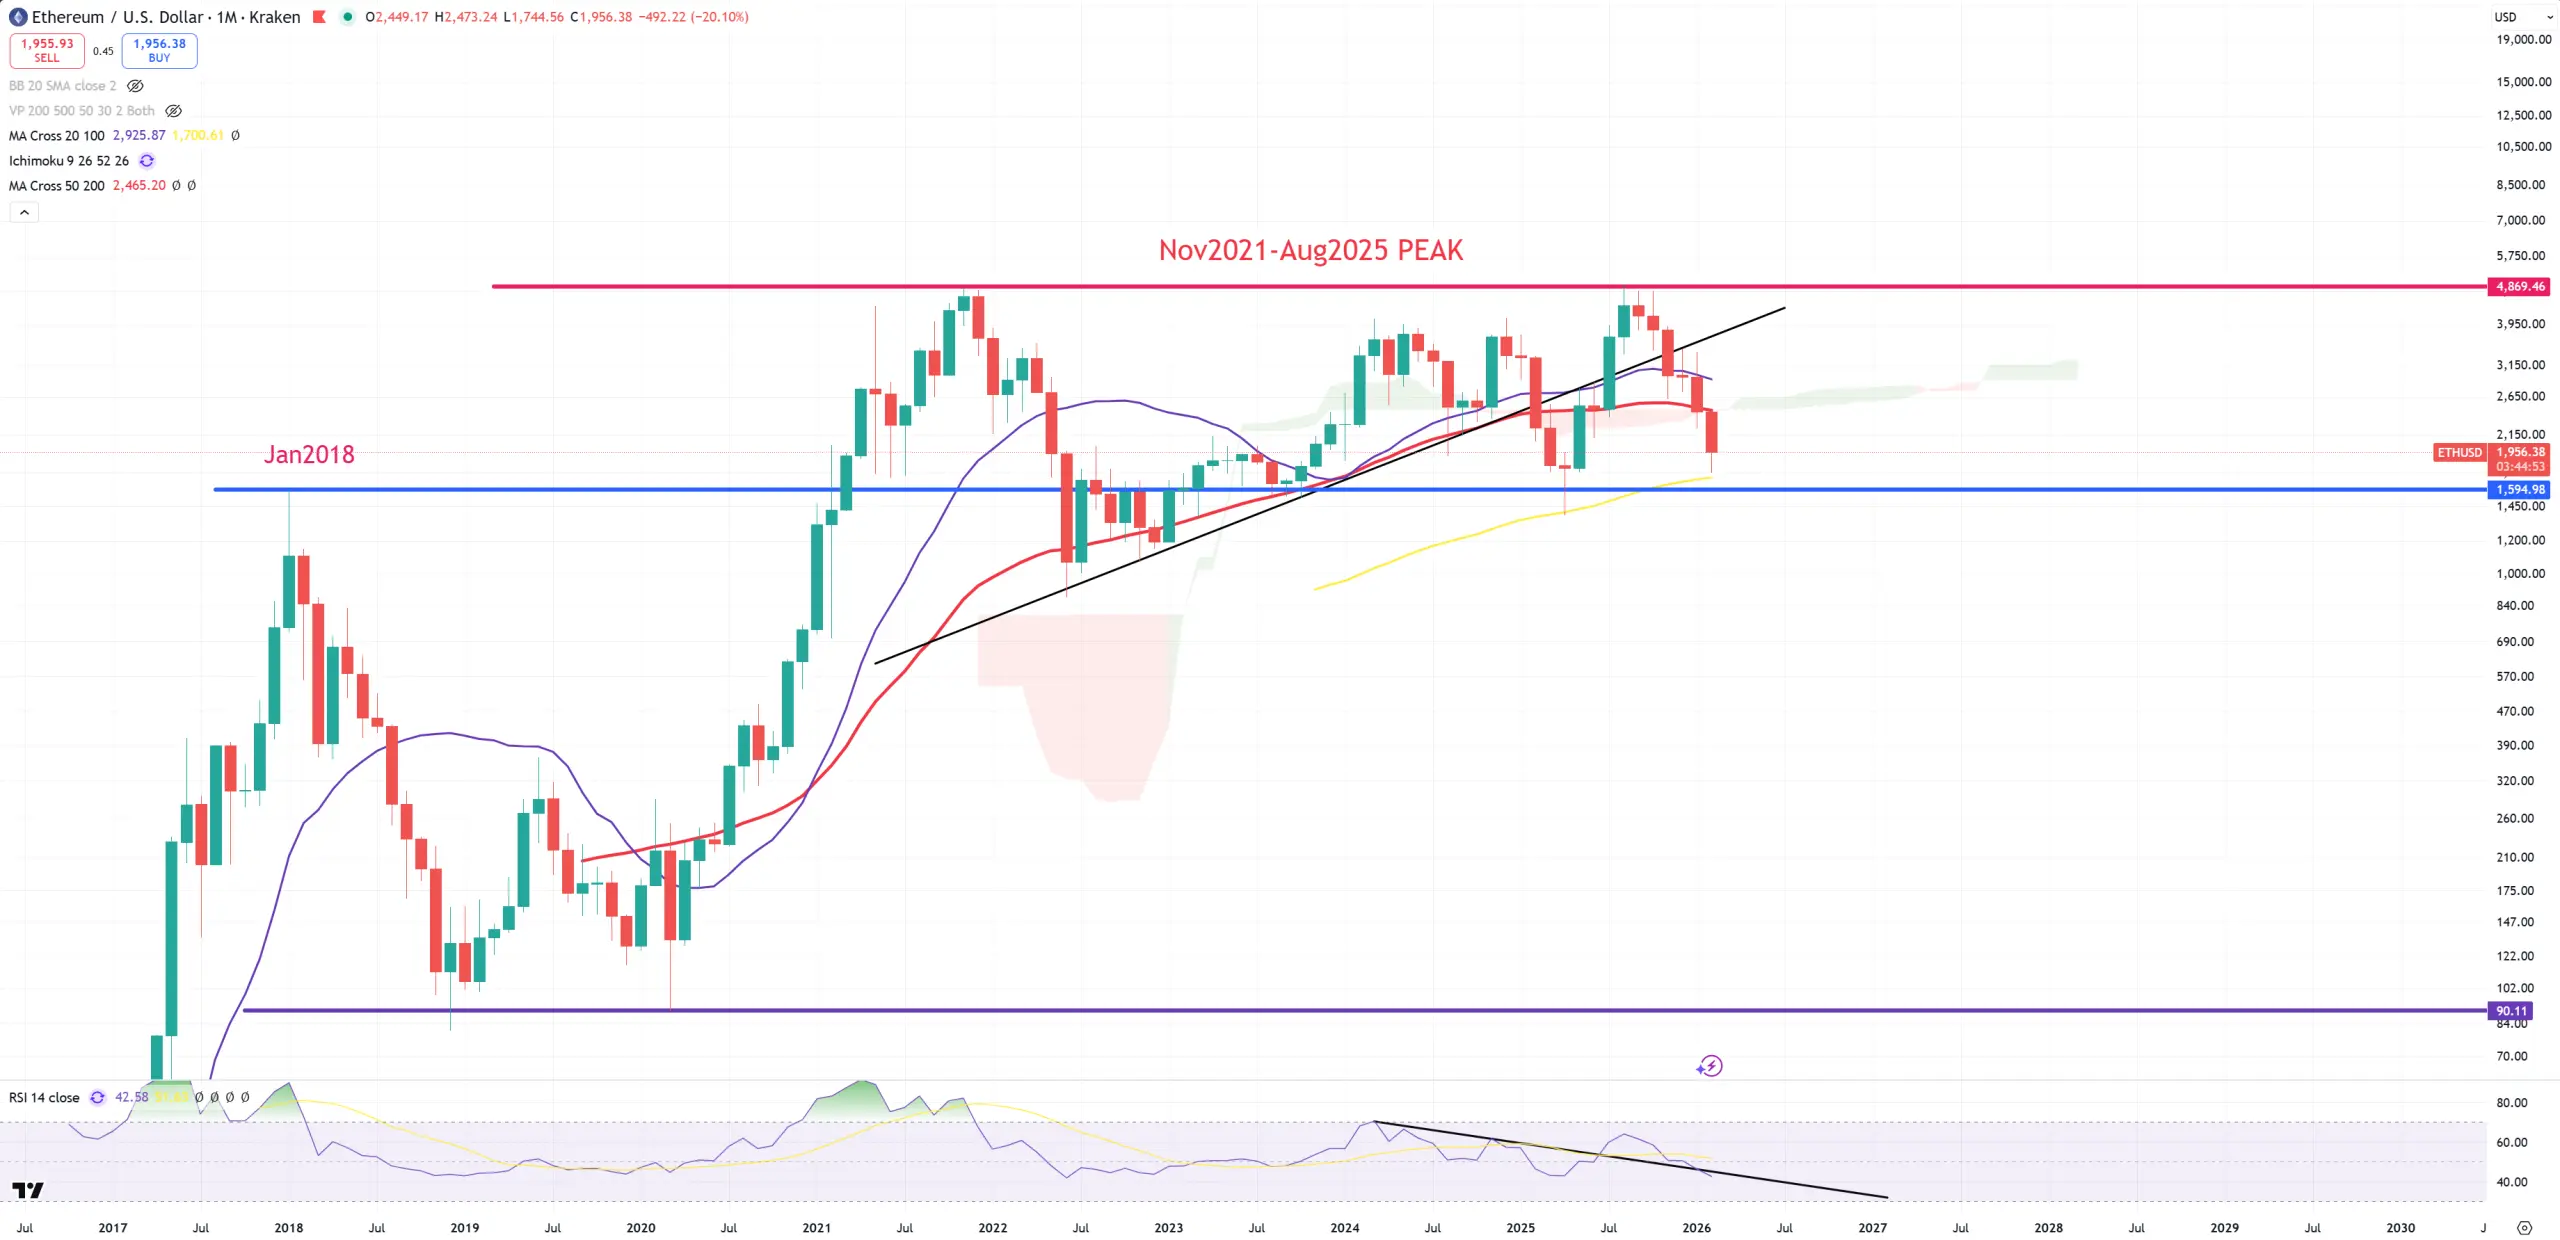
ETH – double top situation is way worse than BTC, because right now we’re below (M)MA50. Breaking below January 2018 peak opens doors to 90$ level. I know it sounds crazy but that’s what chart keep saying.
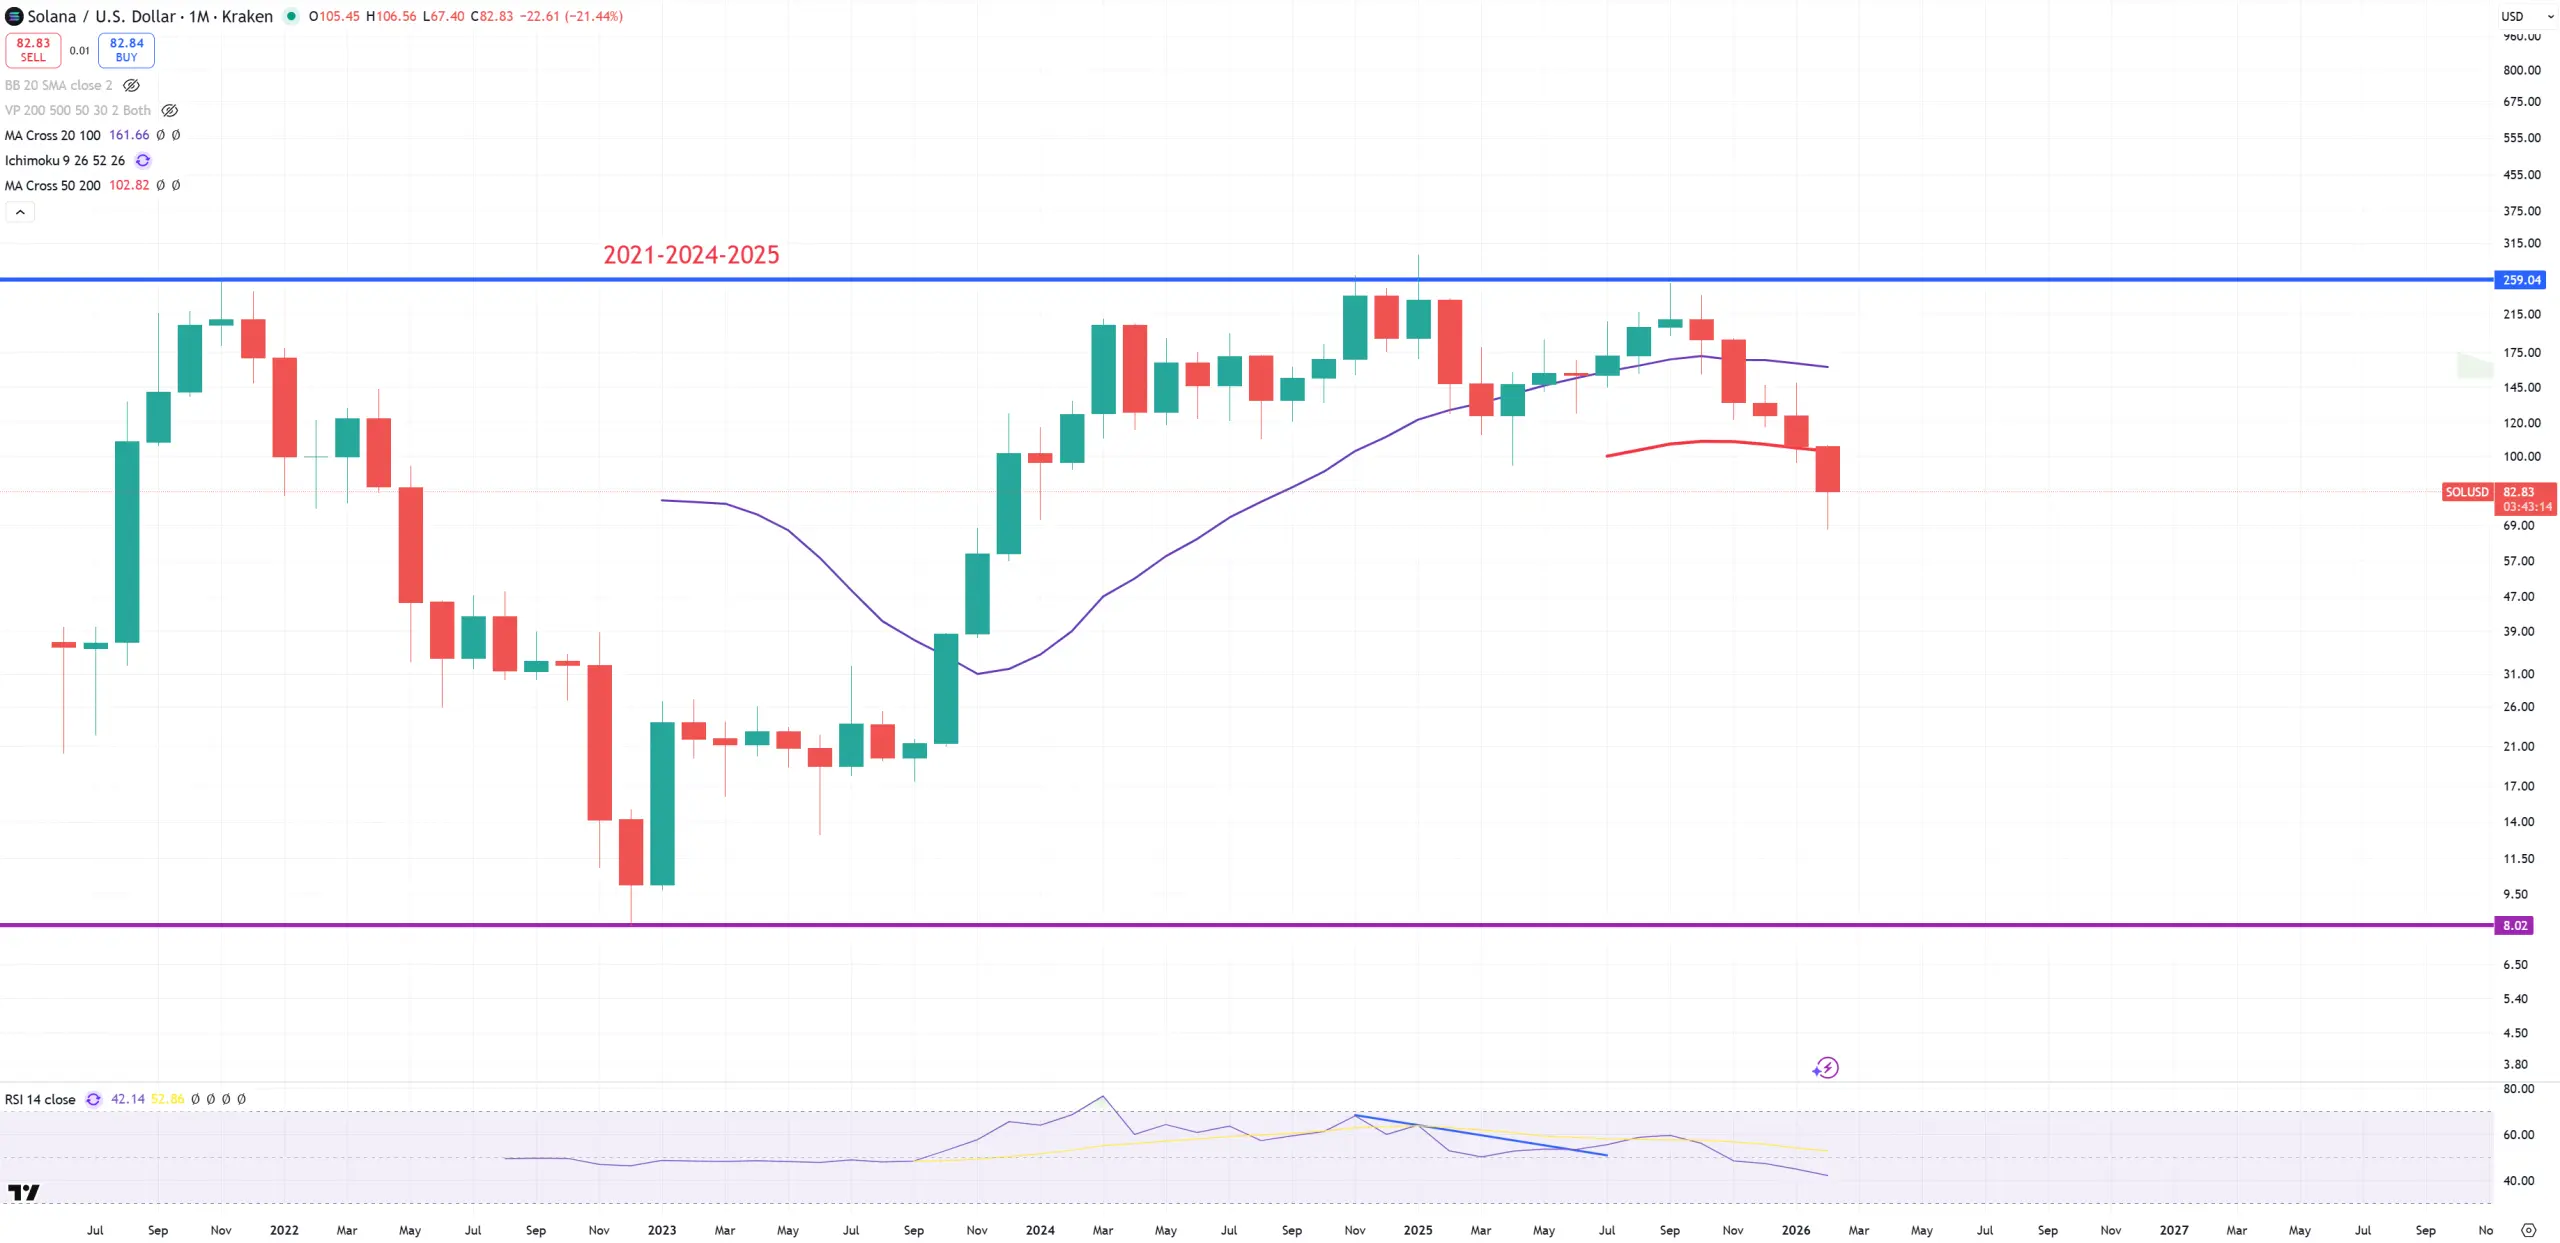
SOL – same setup as ETH – nothing to add more
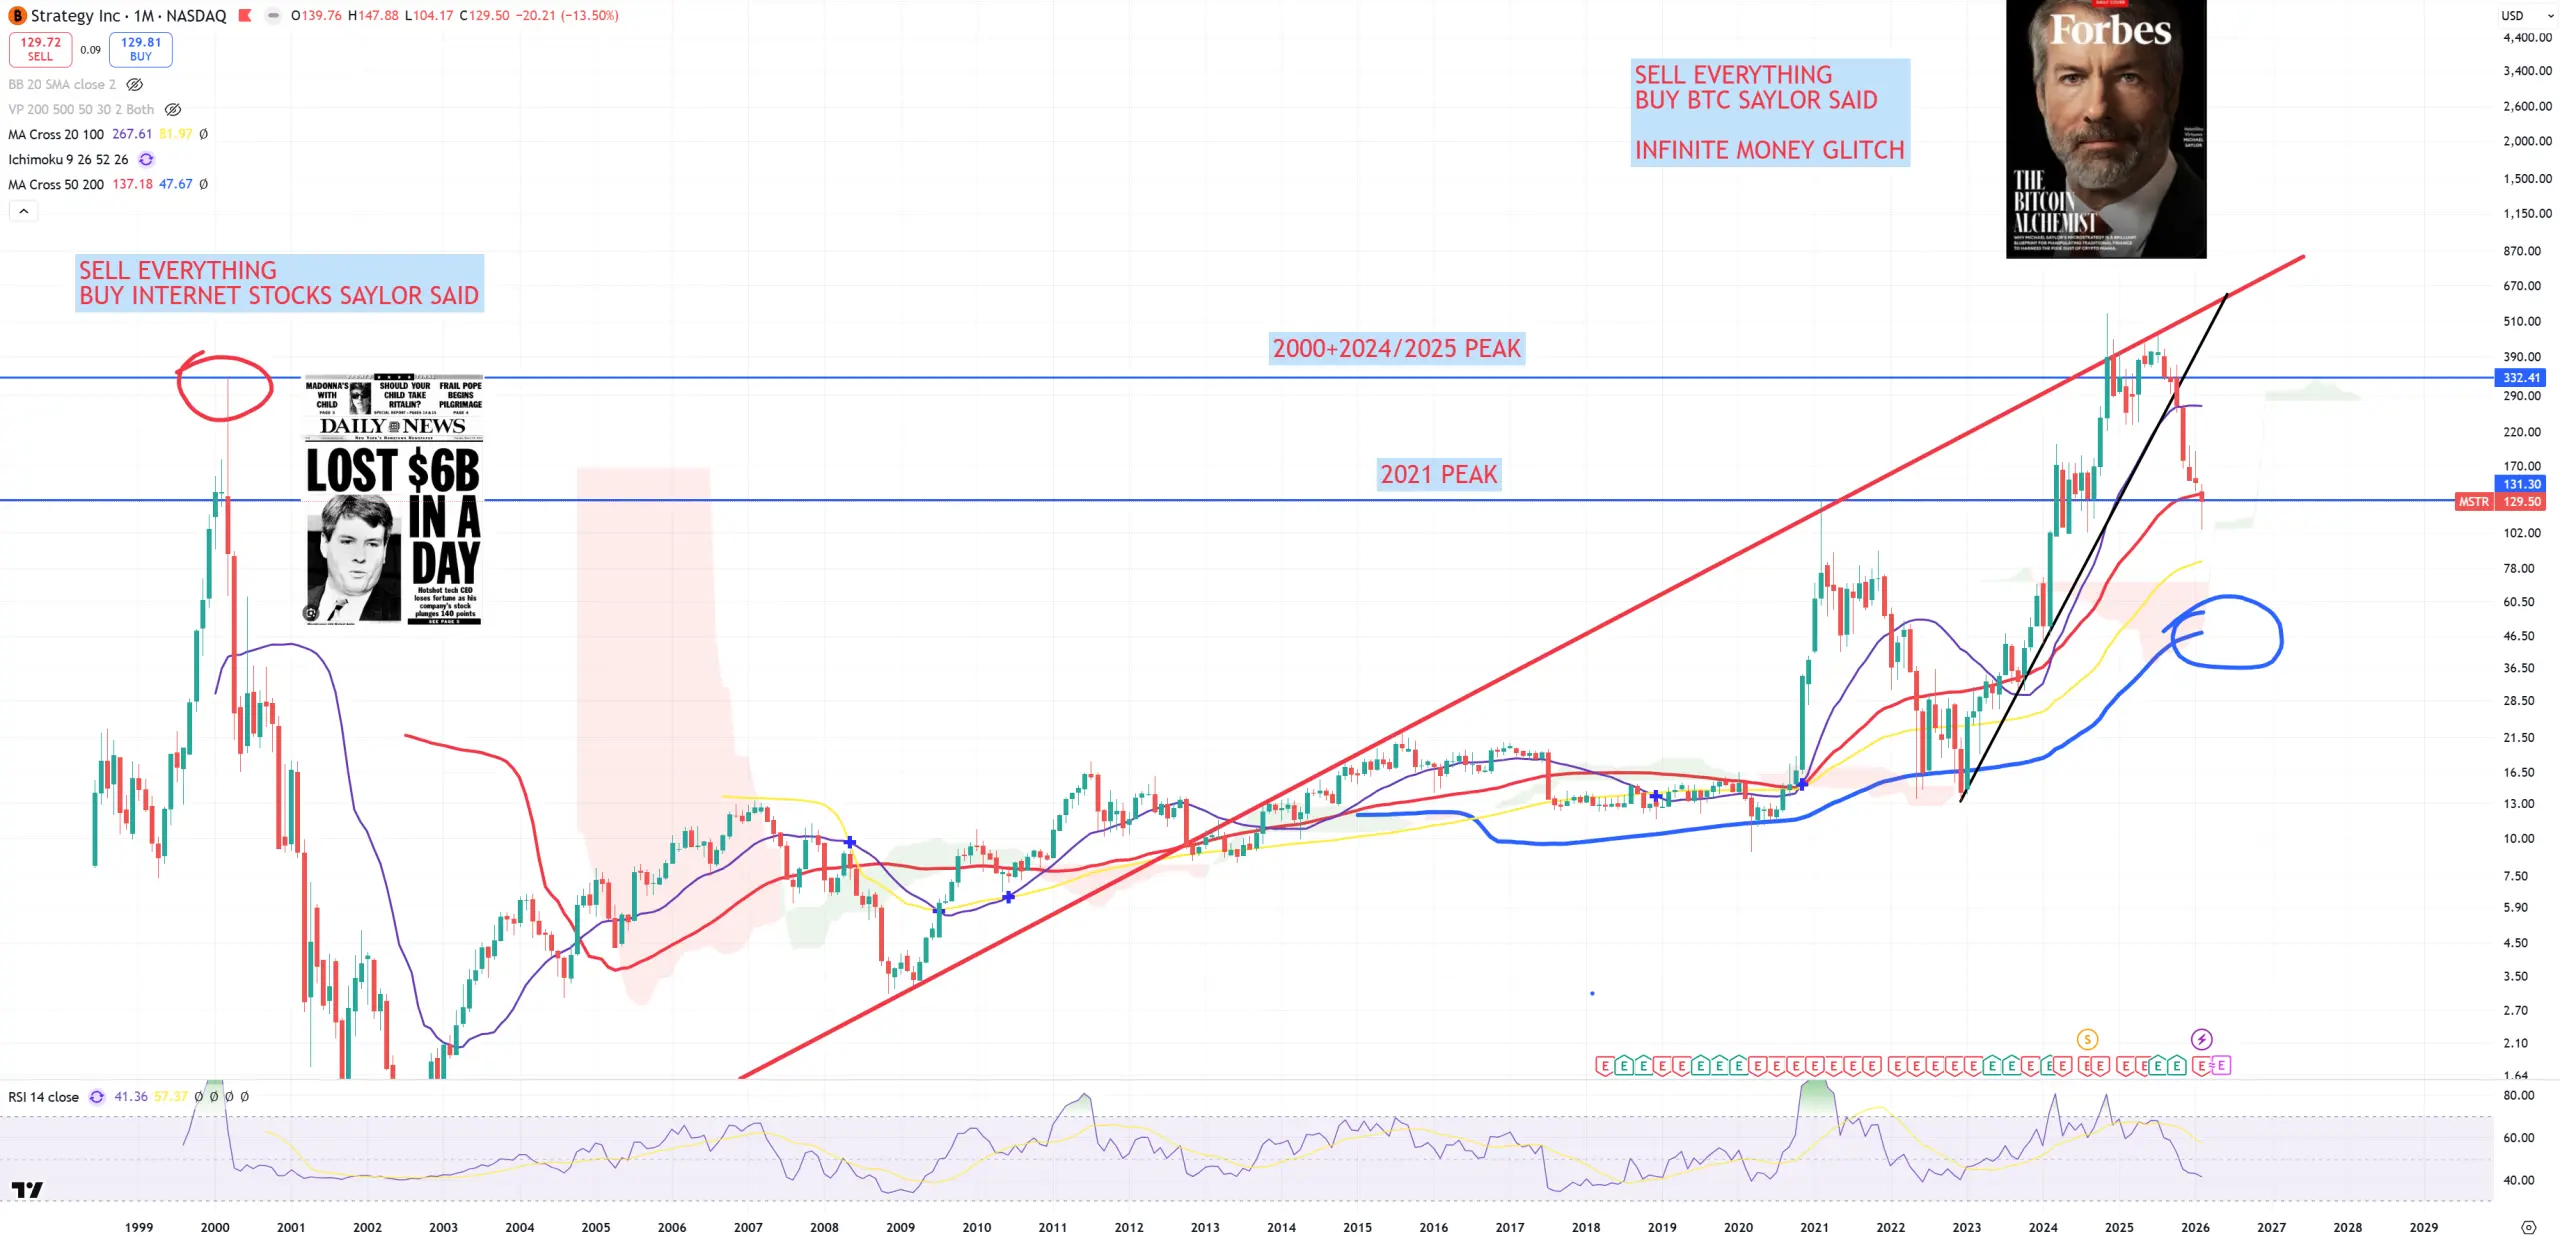
MSTR – we can’t forget about the main BTC Treasury machine. The situation looks dramatic for MSTR. It placed a double-top (with some false spikes) with infamous dotcom bubble peak, crashed without any bounce below (M)MA50 and 2021 peak. If it won’t regain above 2021 peak and red (M)MA50 it’ll crash another 50-80% with final target on blue (M)MA200 = 40$.
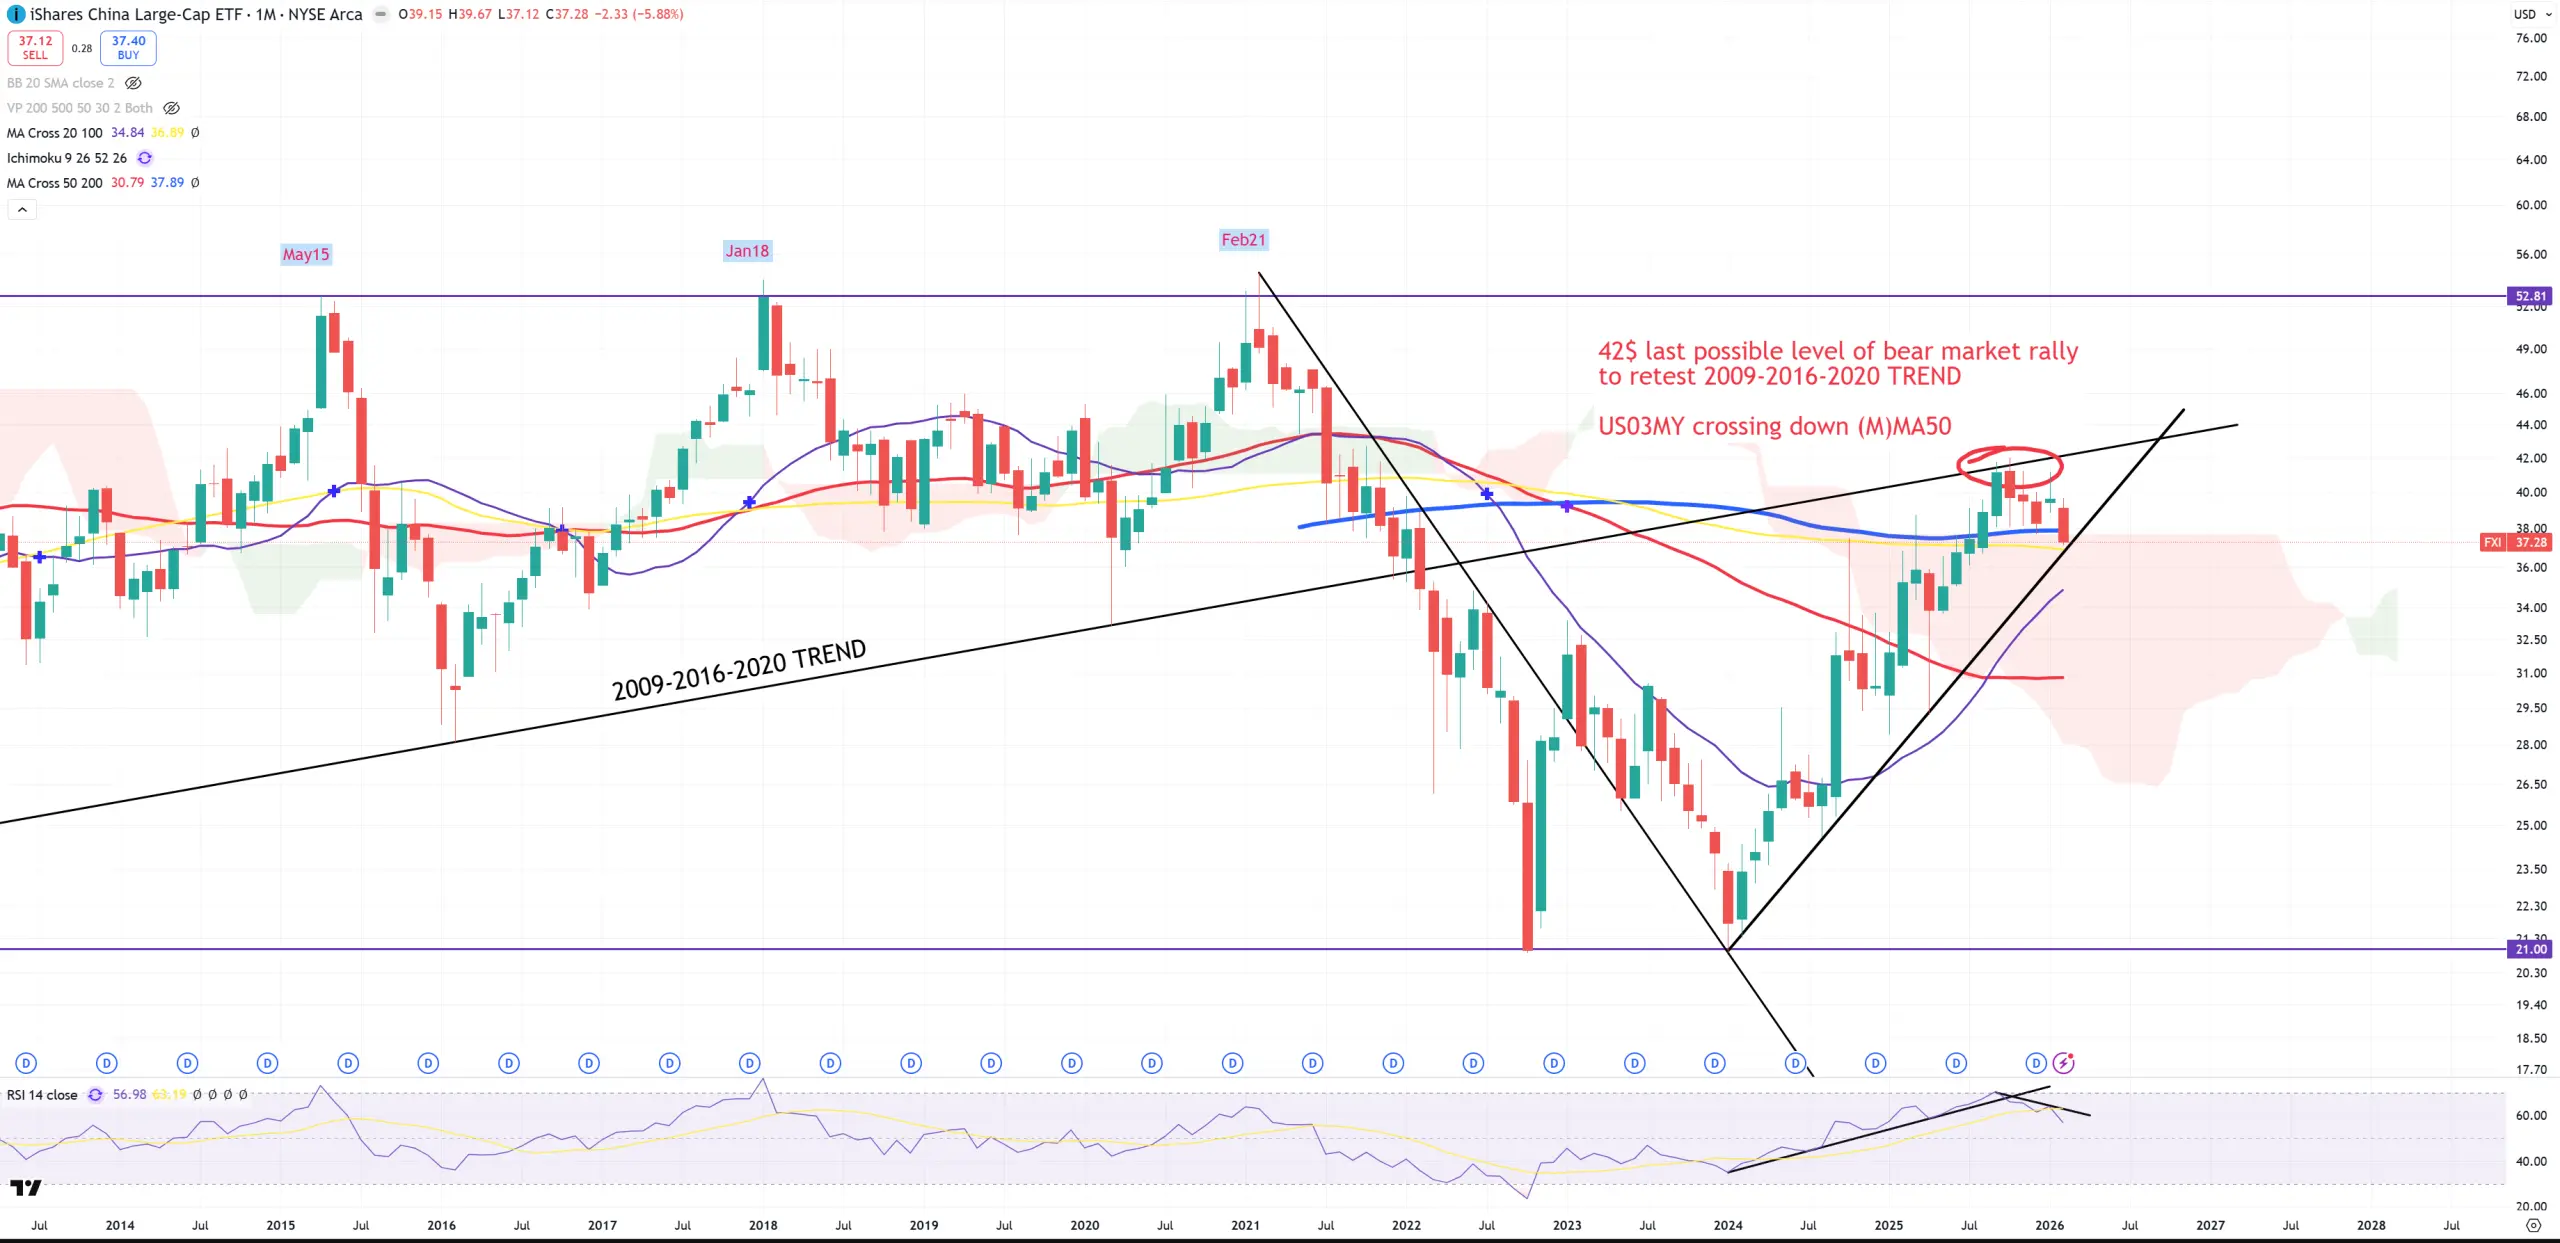
Chinese bear market rally has come to an end – Yuan mixing in $$$ thesis
FXI – China after 2.5Ys of bear market rally since the beginning of 2024 reached its last possible point to retest 2009-2016-2020 TREND, even breaking (M)MA200 – secular bear market border, but in February 2026 we managed to close below (M)MA200 and probably we open below the trend.
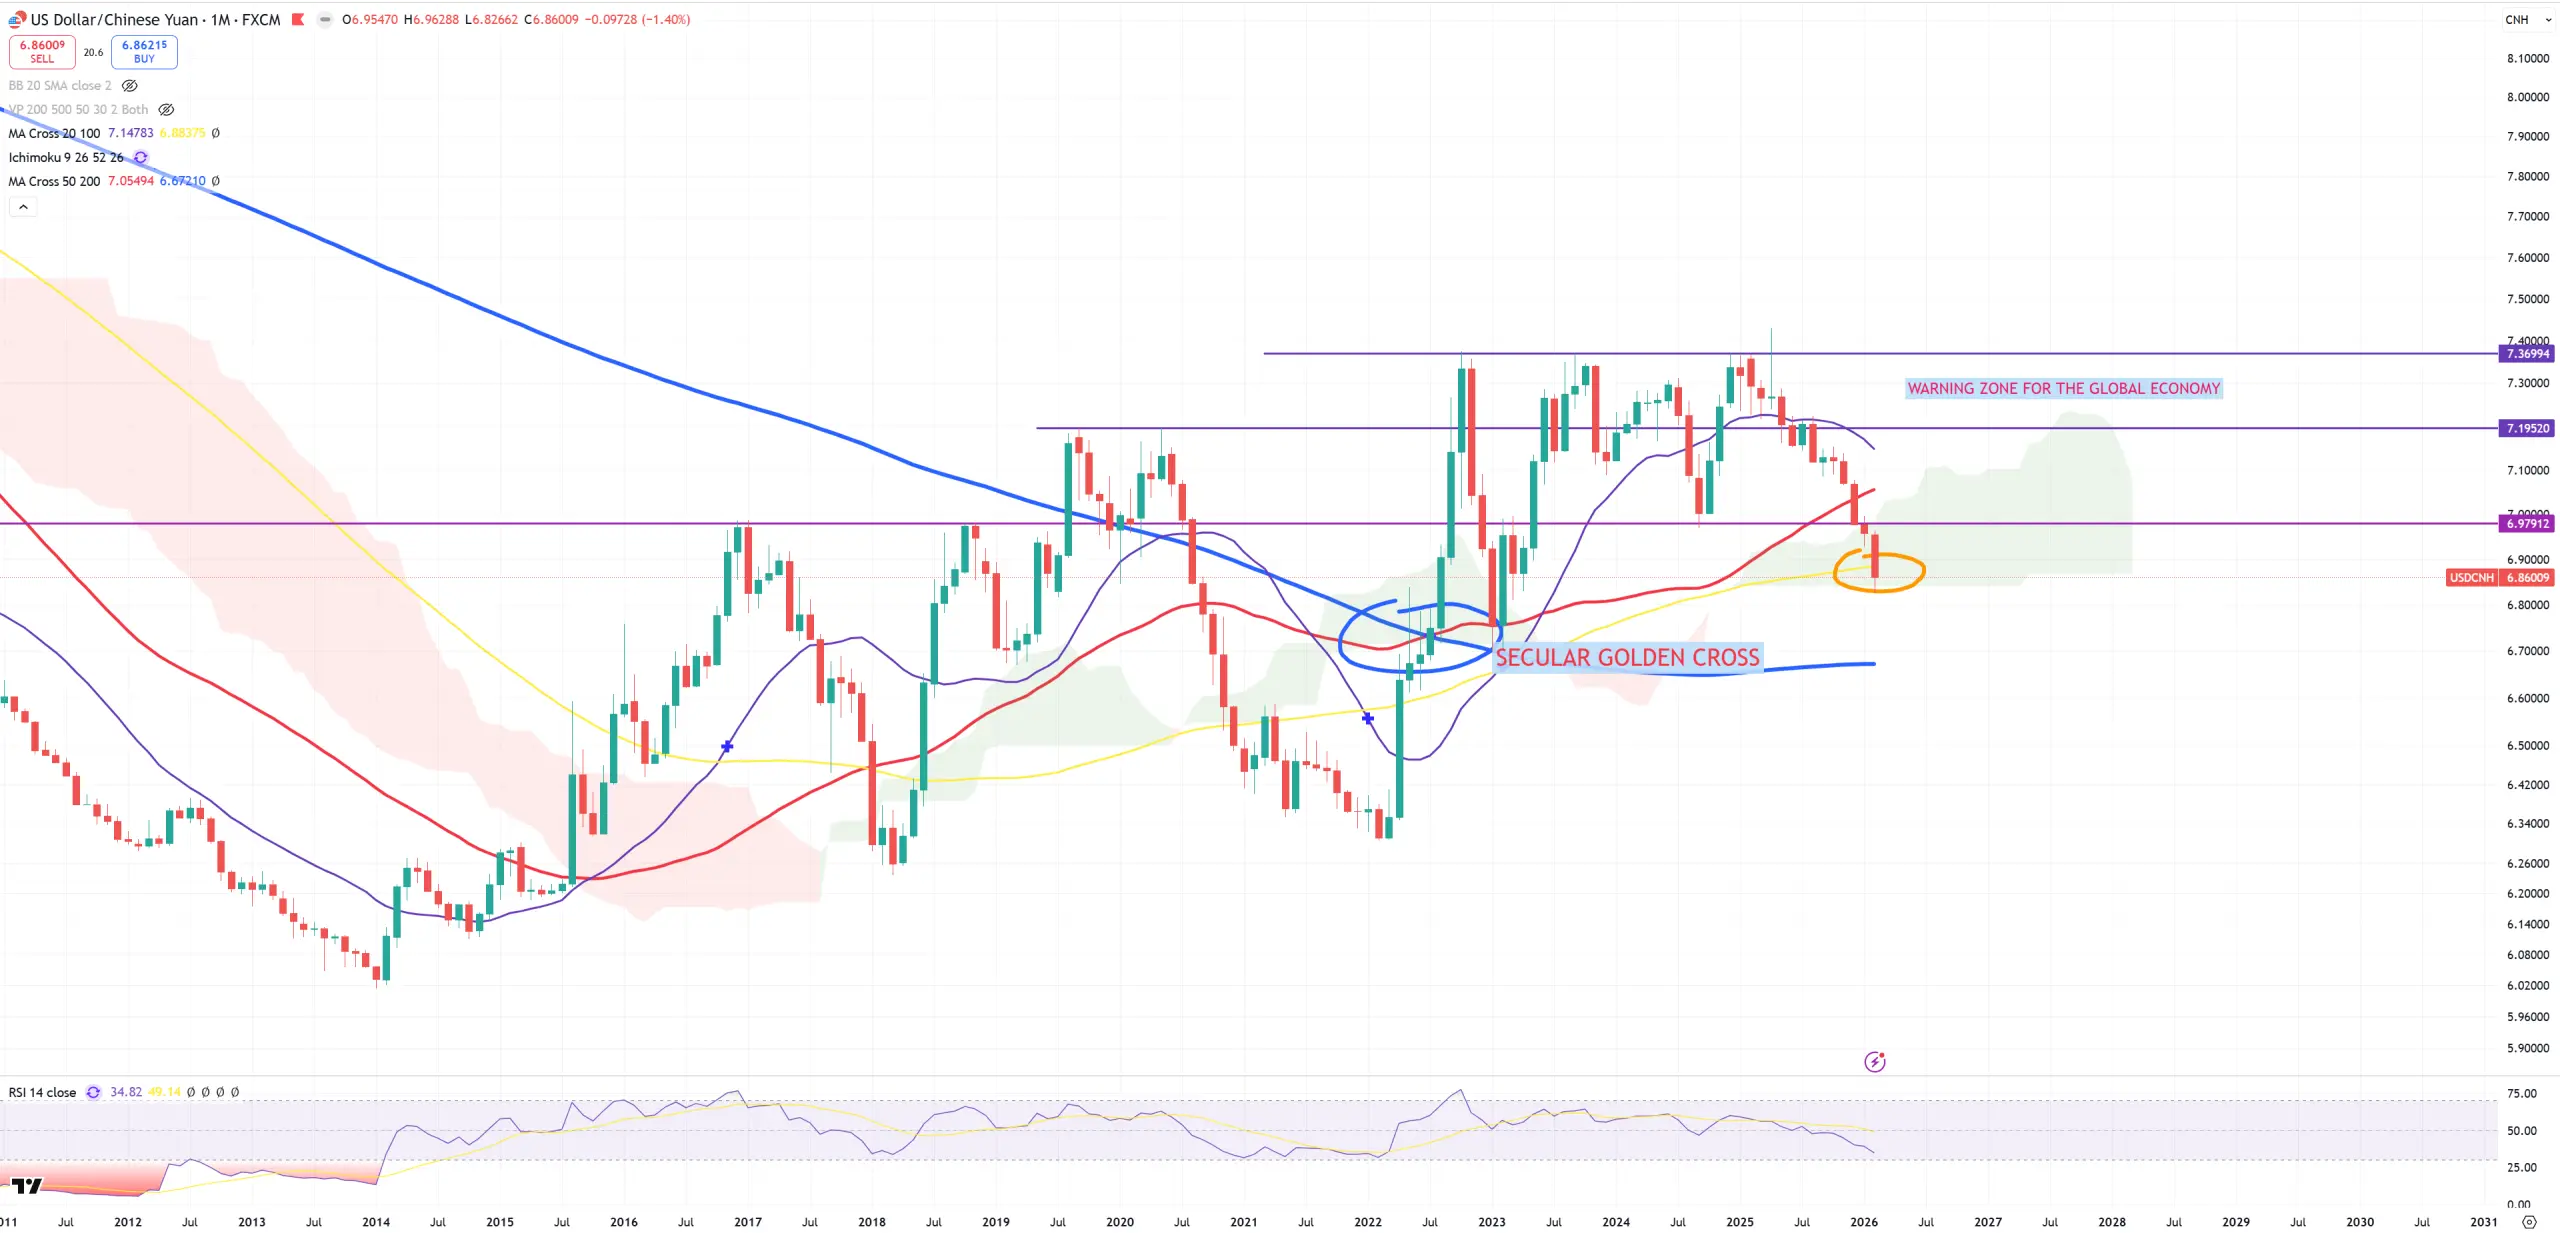
USDCNH – as I’ve been saying the power of the $$$ is a weakness of the Yuan, and USDCNH breaks (M)MA100 this month, while EURUSD rejecting (M)MA200, but DXY breaks also (M)MA100, but keep last strong resistance around 96.5 – I can’t remind where last time I saw such a mix of gordian knots which can’t really give us an answer : is the $$$ going lower, or is the $$$ going higher. Today it’s almost impossible to answer that question. There’re some indicators telling us it is, and some indicators telling us it isn’t. While I keep my DXY bull thesis intact until 96.5 will be broken it means Yuan must soon jump fast above (M)MA100 – typical border between bull/bear trap level. Strong Yuan blows up Chinese economy, but from the other hand they don’t have any choice. They made ridiculous statement about Yuan become reserve currency, while in reality it’s not even a free floated currency.
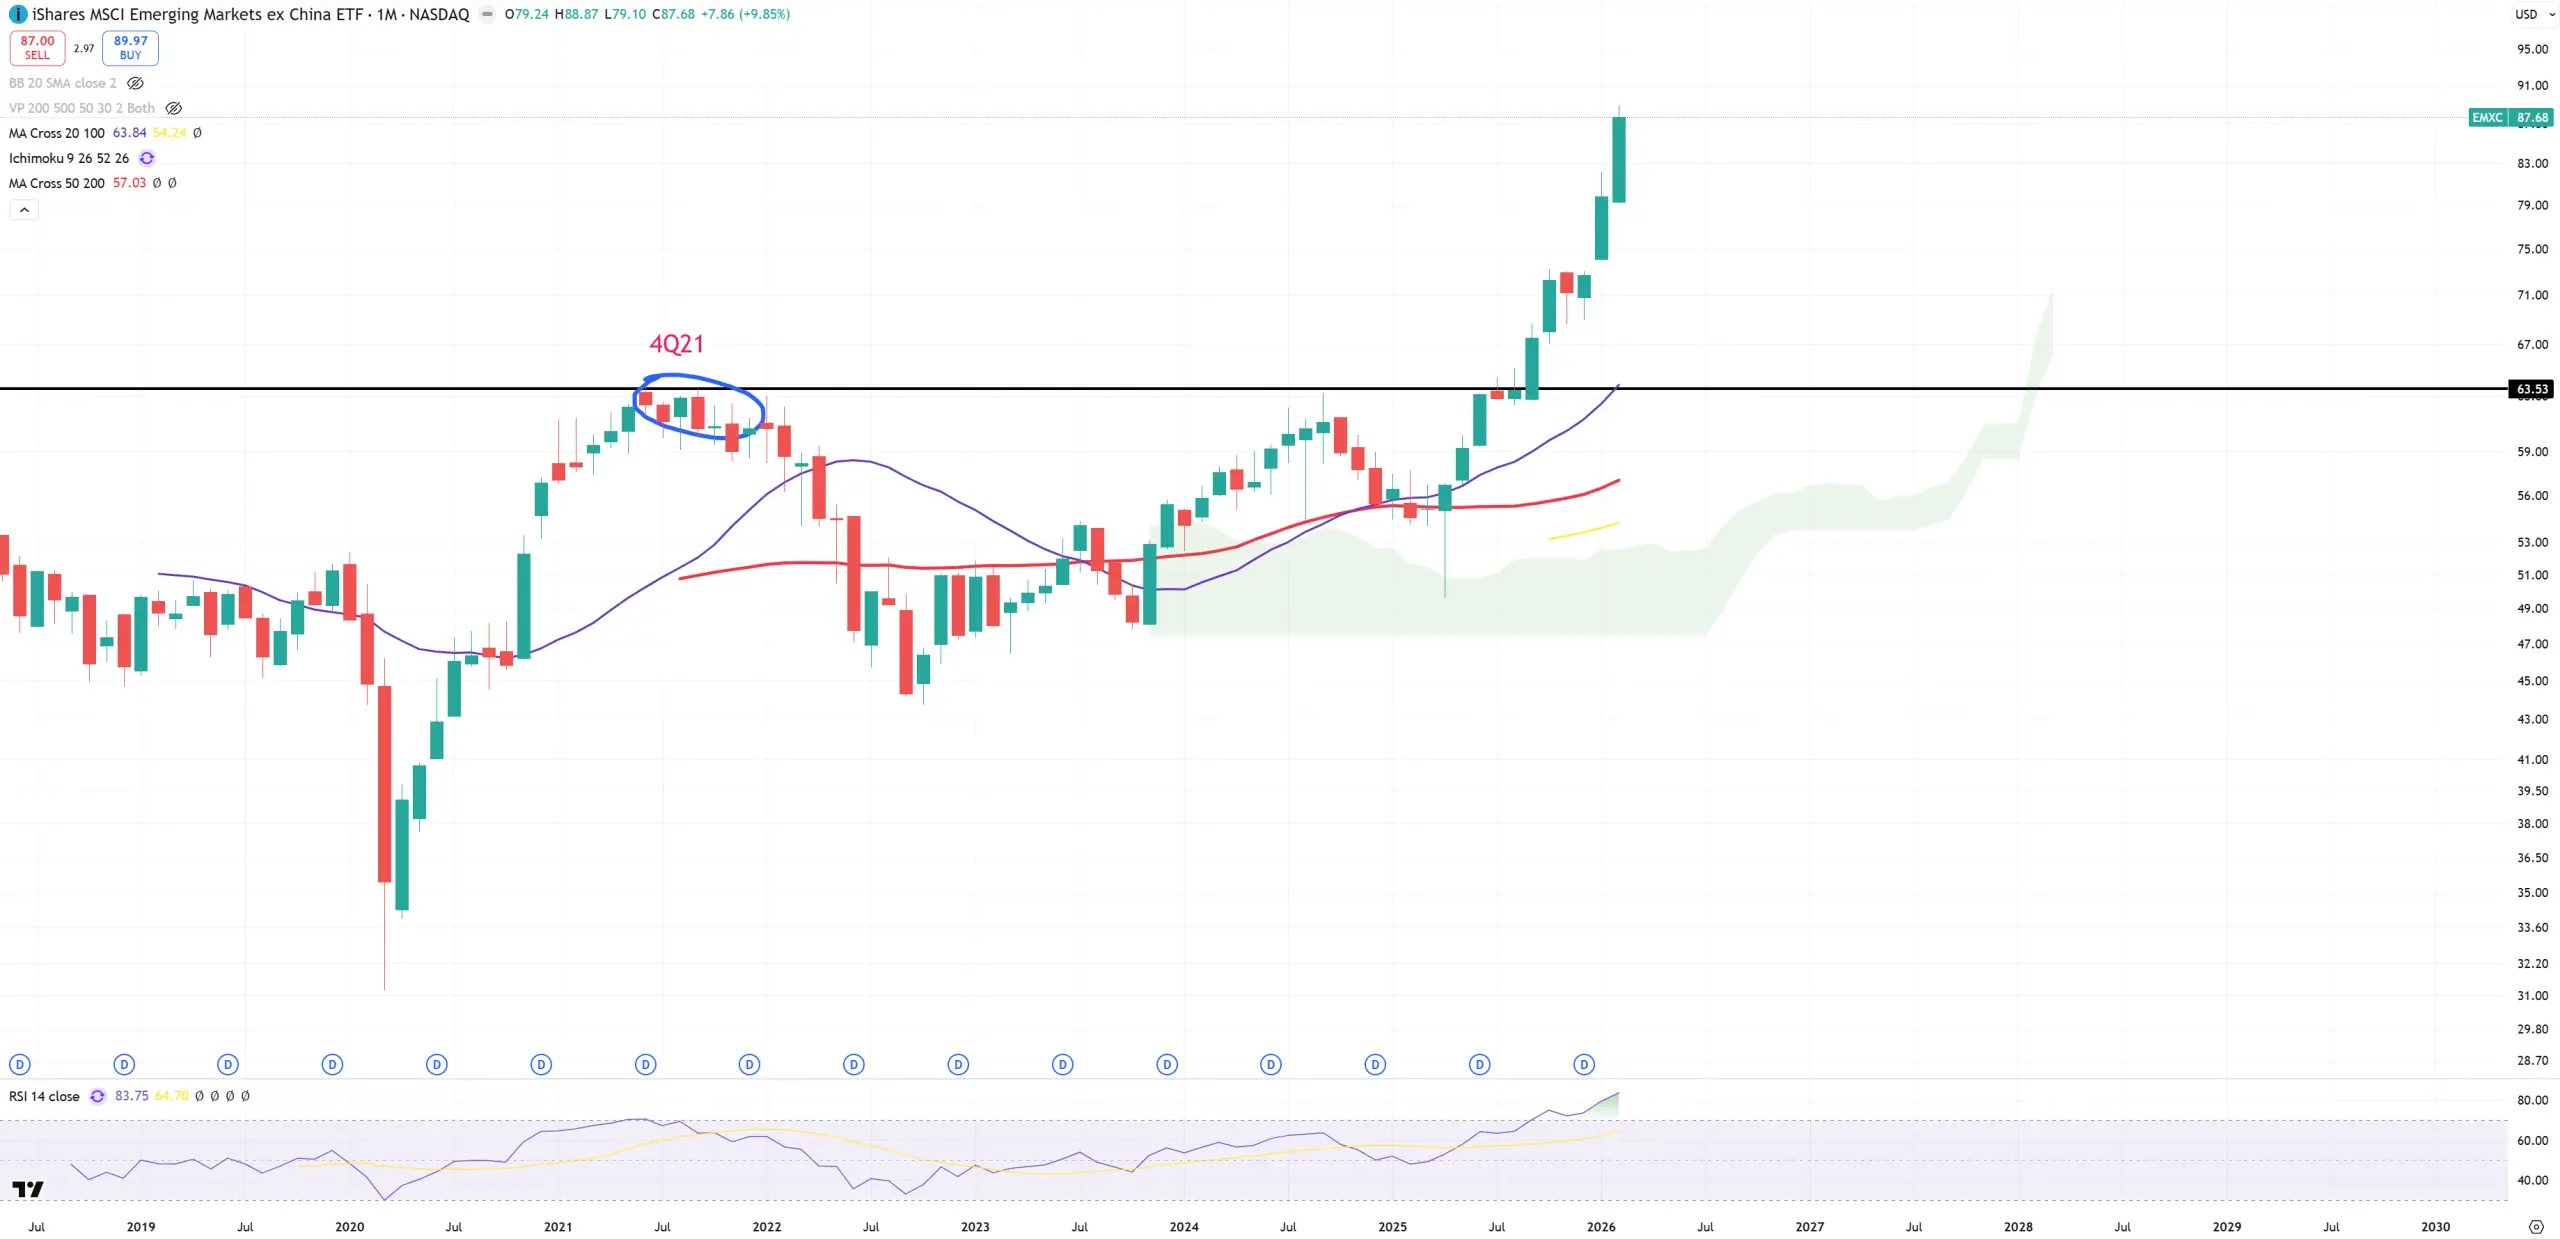
EMXC – Emerging Markets excluding China went … parabolic, what is not really surprising once DXY plunged. I will keep to my main thesis, that everything what is above 4Q21 peak will reverse below it, that means we’re probably need to see $$$ reversal to blow EMXC apart.
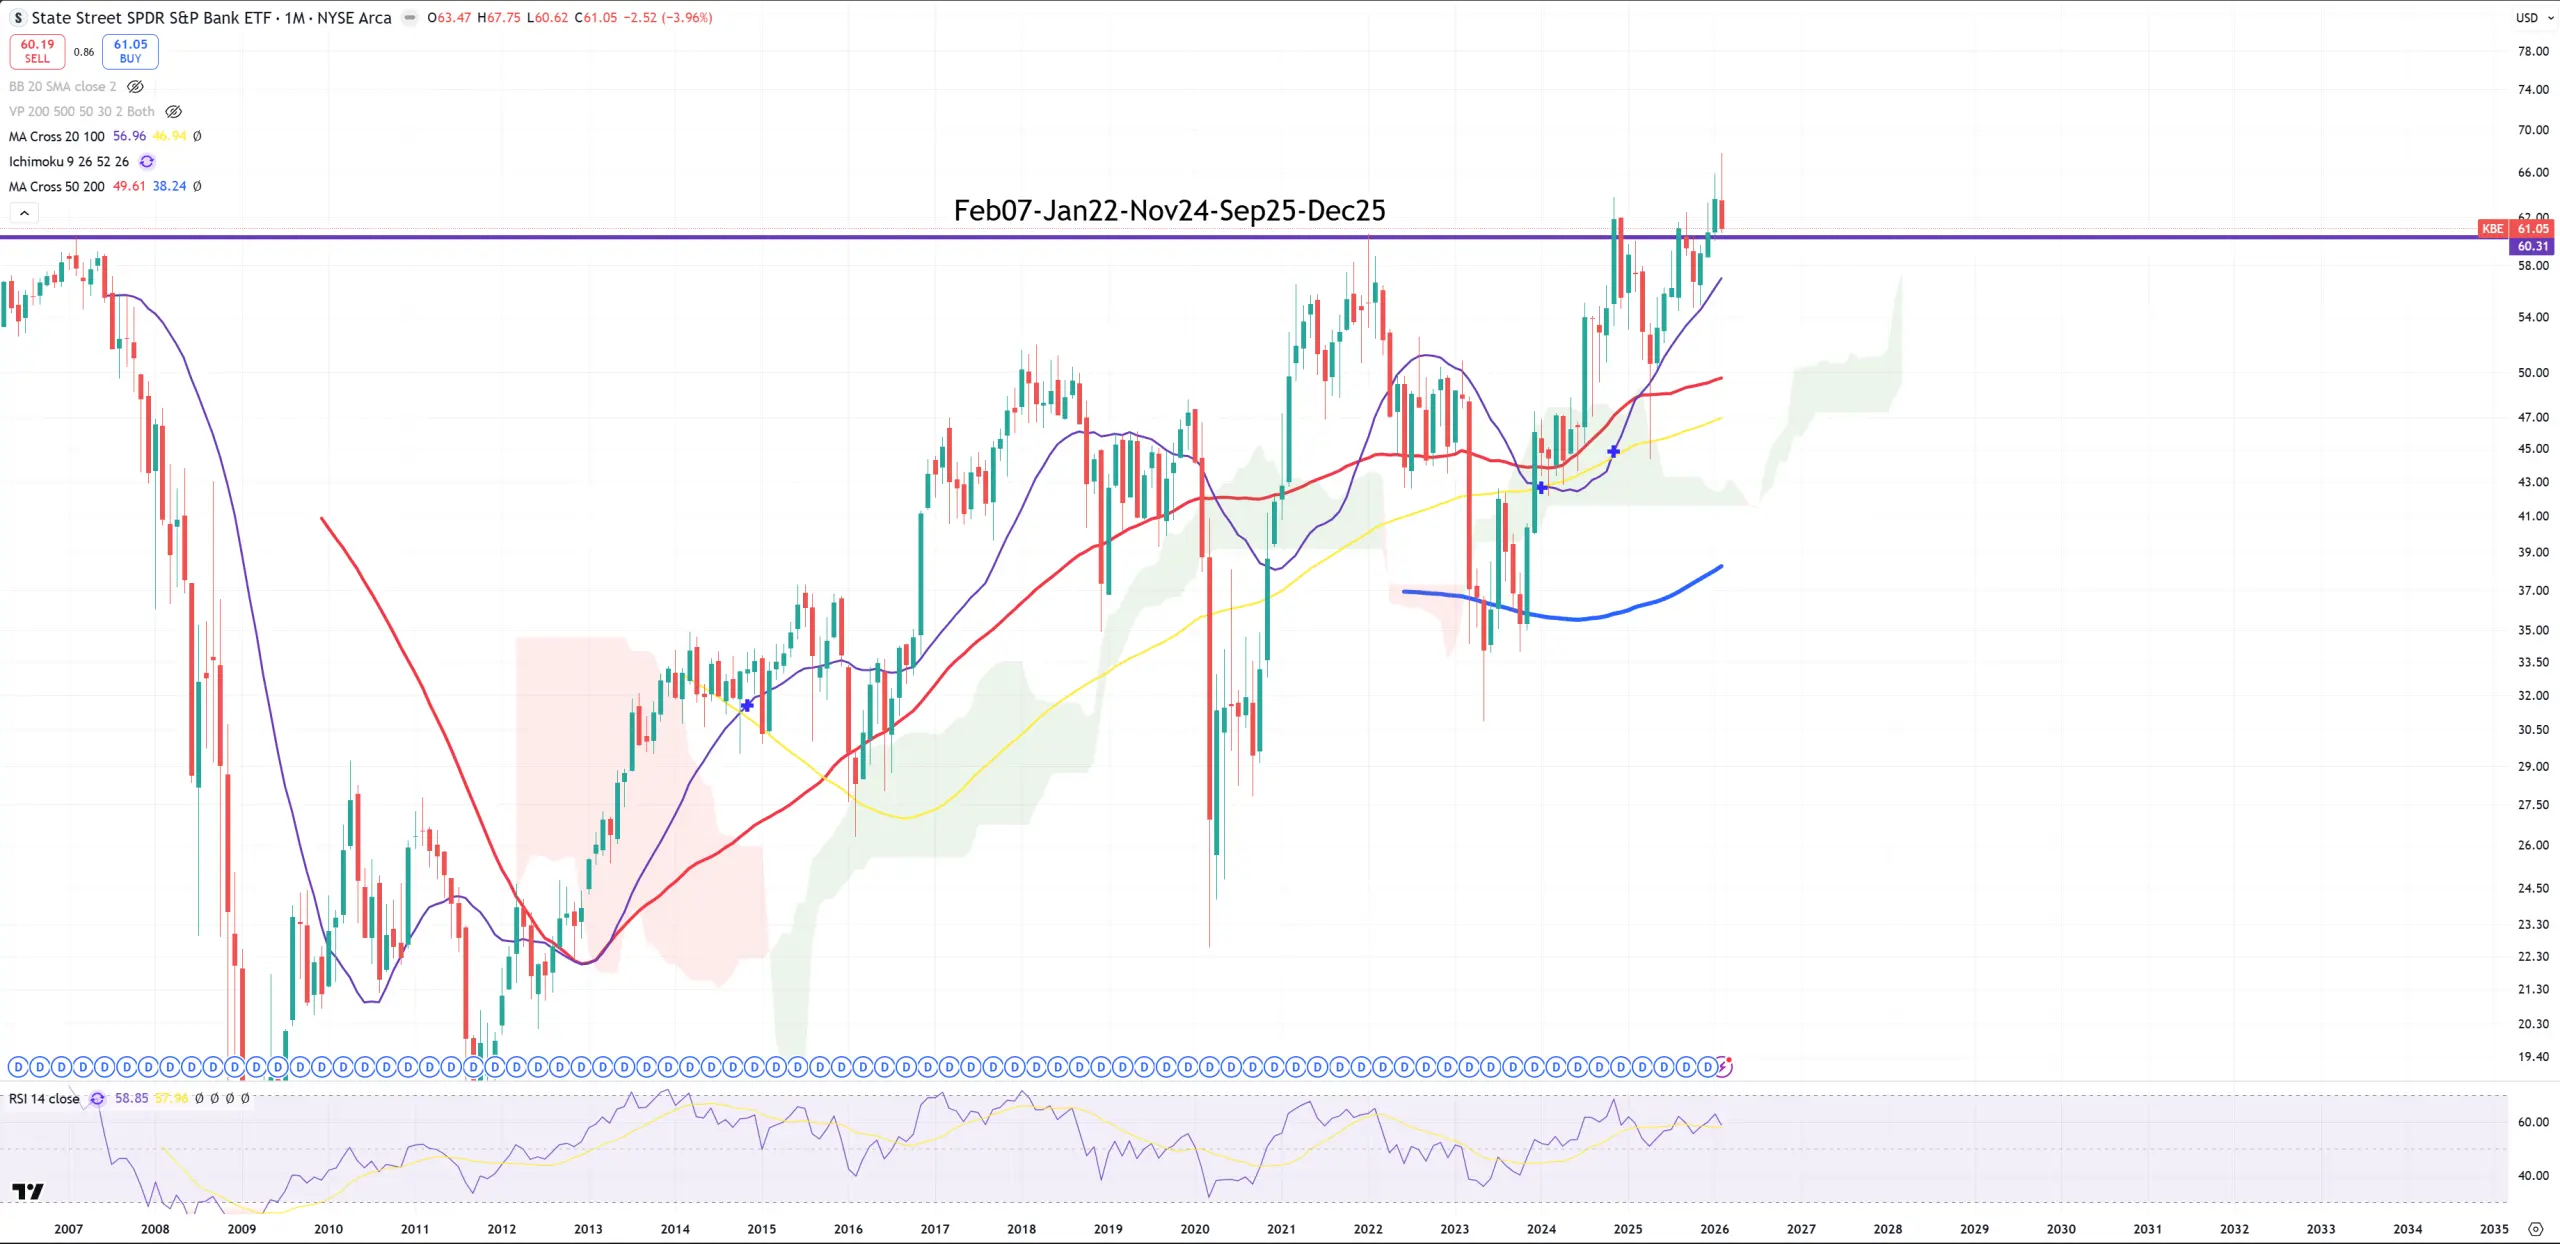
Banking crisis?
KBE – there’s a huge resistance level around February 2007 peak. February 2007 peak = 1Q22 so in reality that’s very close to cycle peak 4Q21 level. We’re now a bit above this level, but that’s a massive bull-trap.
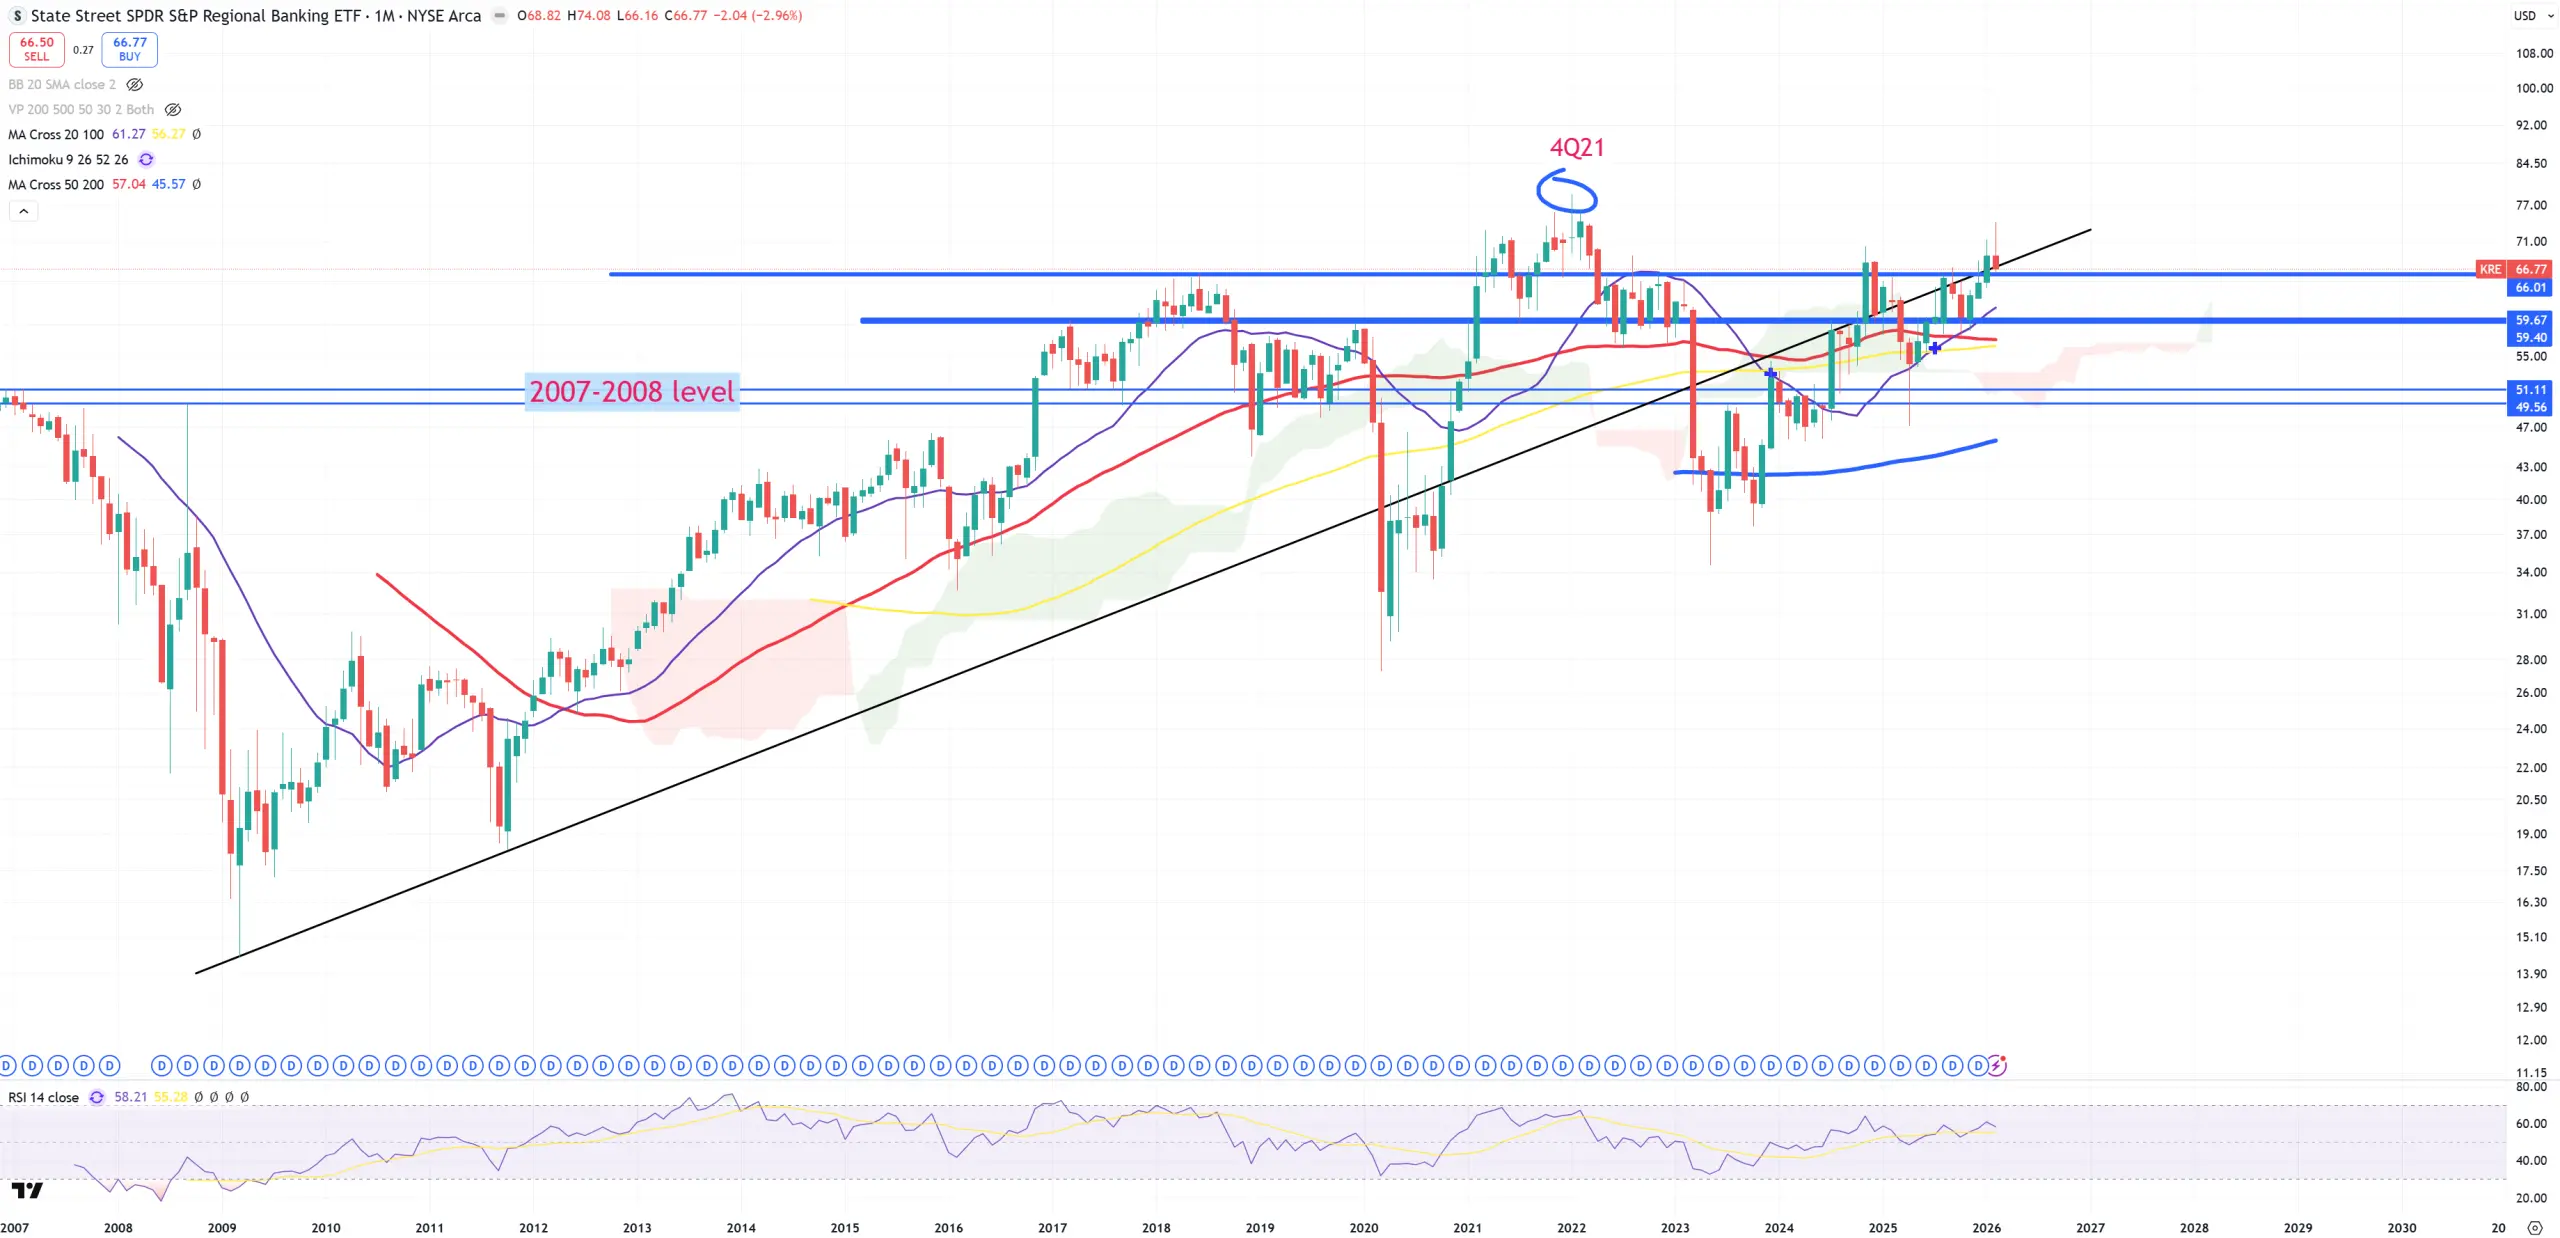
KRE – 4Q21 is a peak and now all the game is about the massive 2009-2011 trend line :
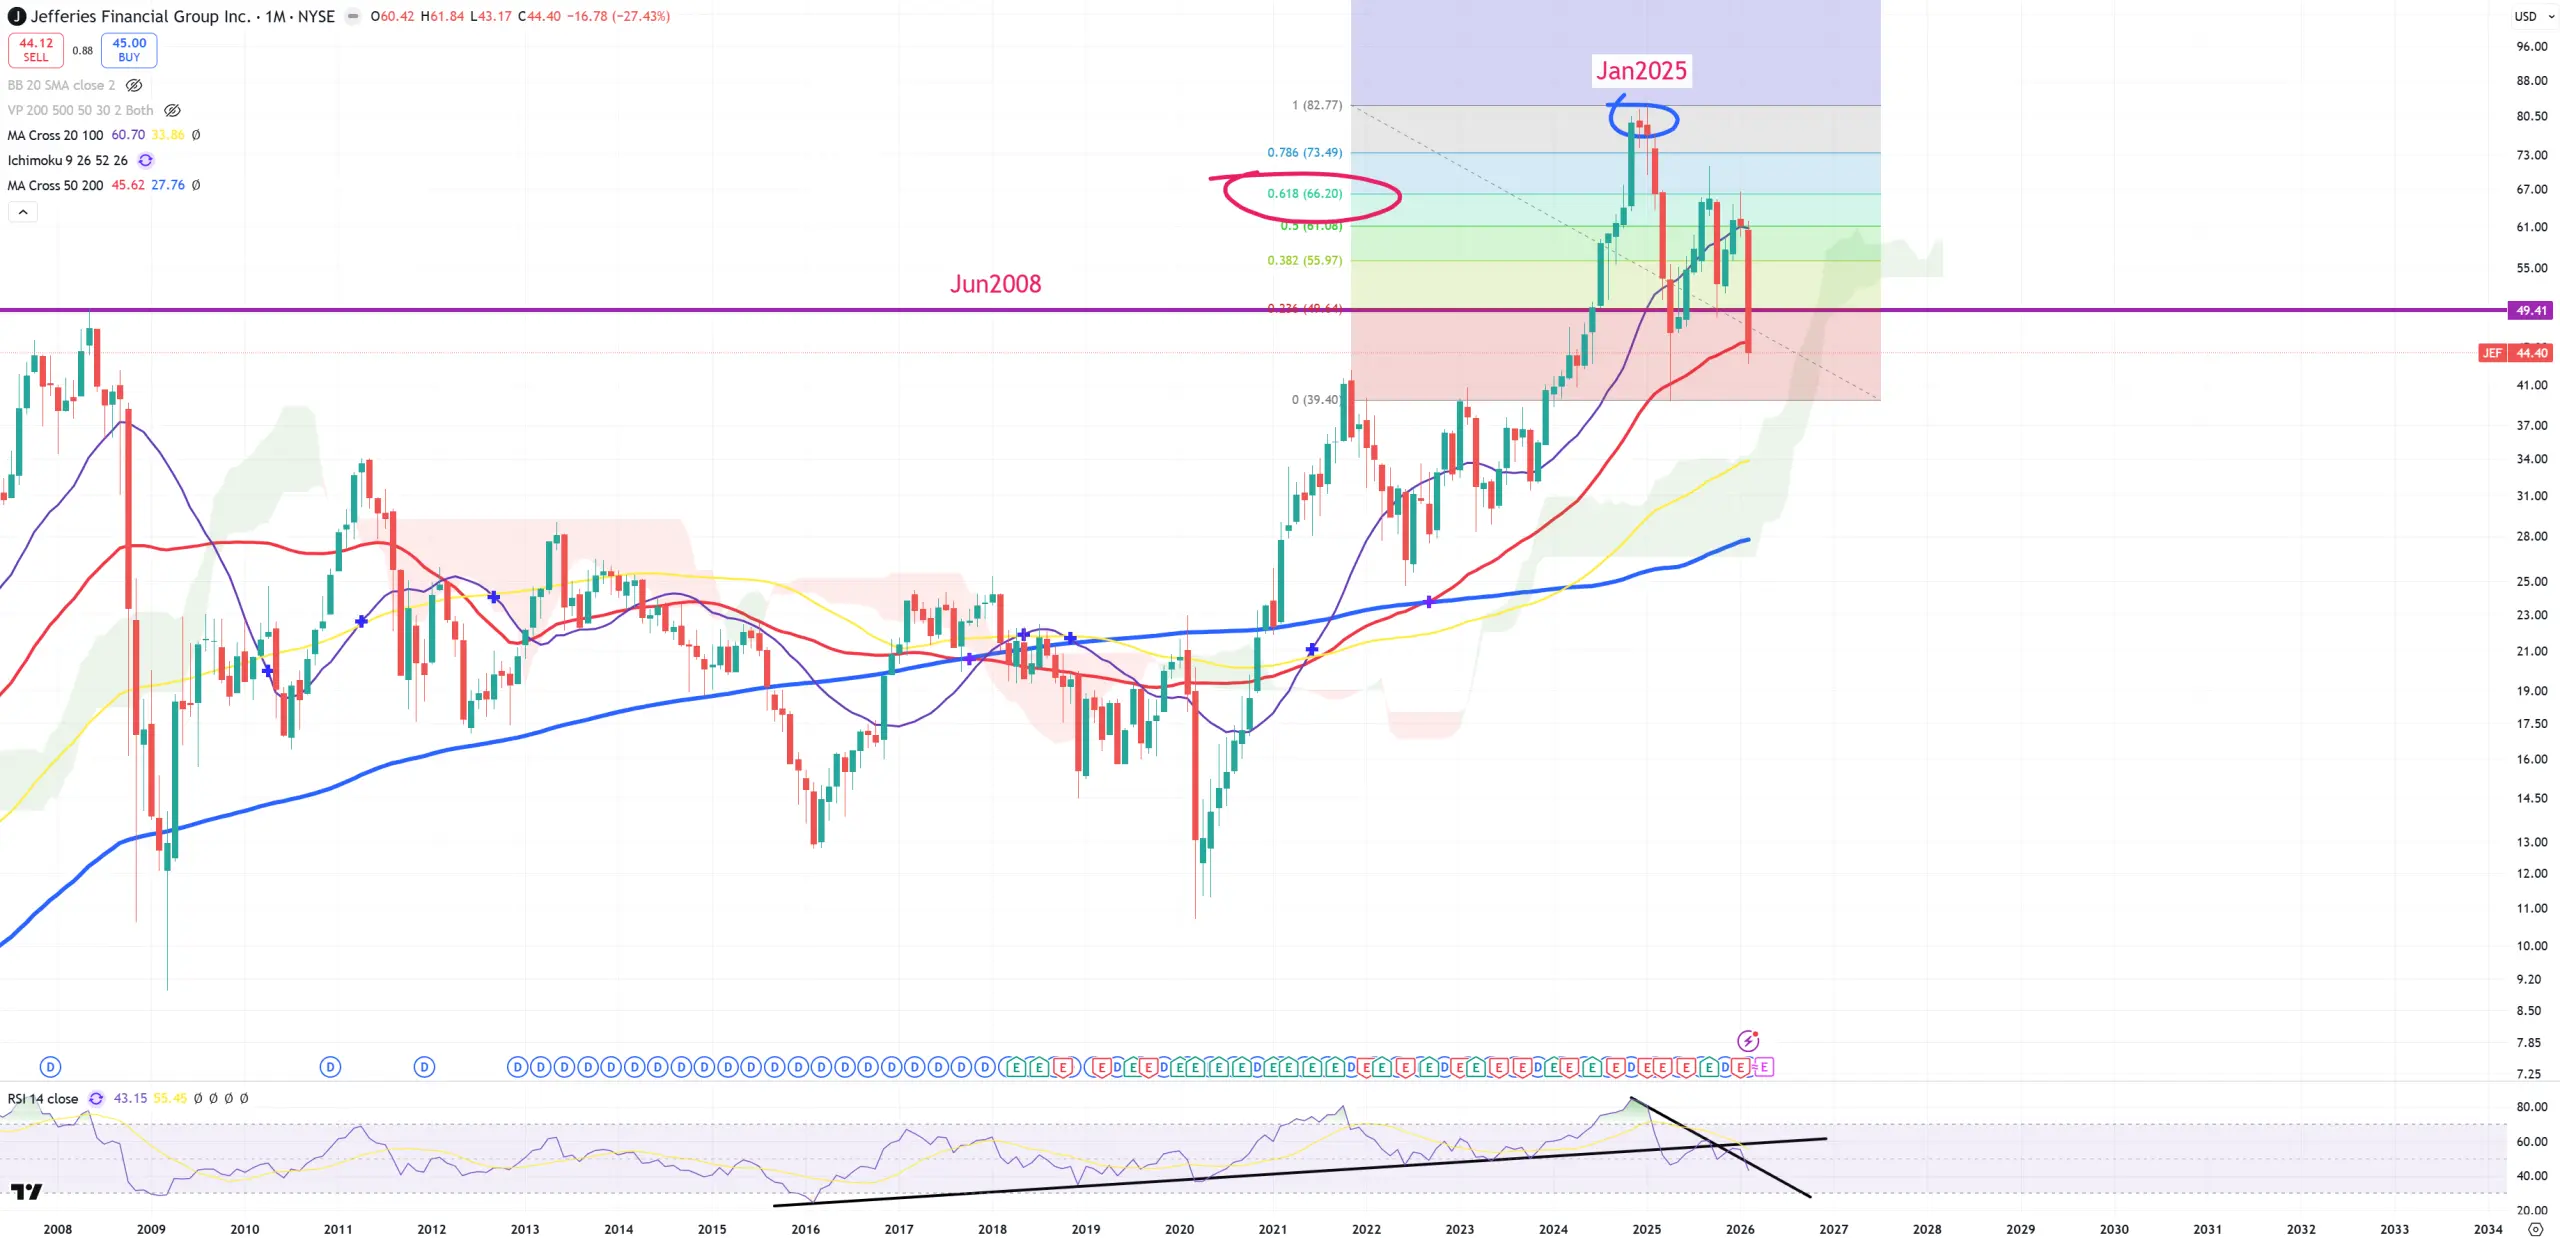
JEF – in last day it managed to close below 2008 peak and below (M)MA50. We’ll soon hear about big troubles of JEF.
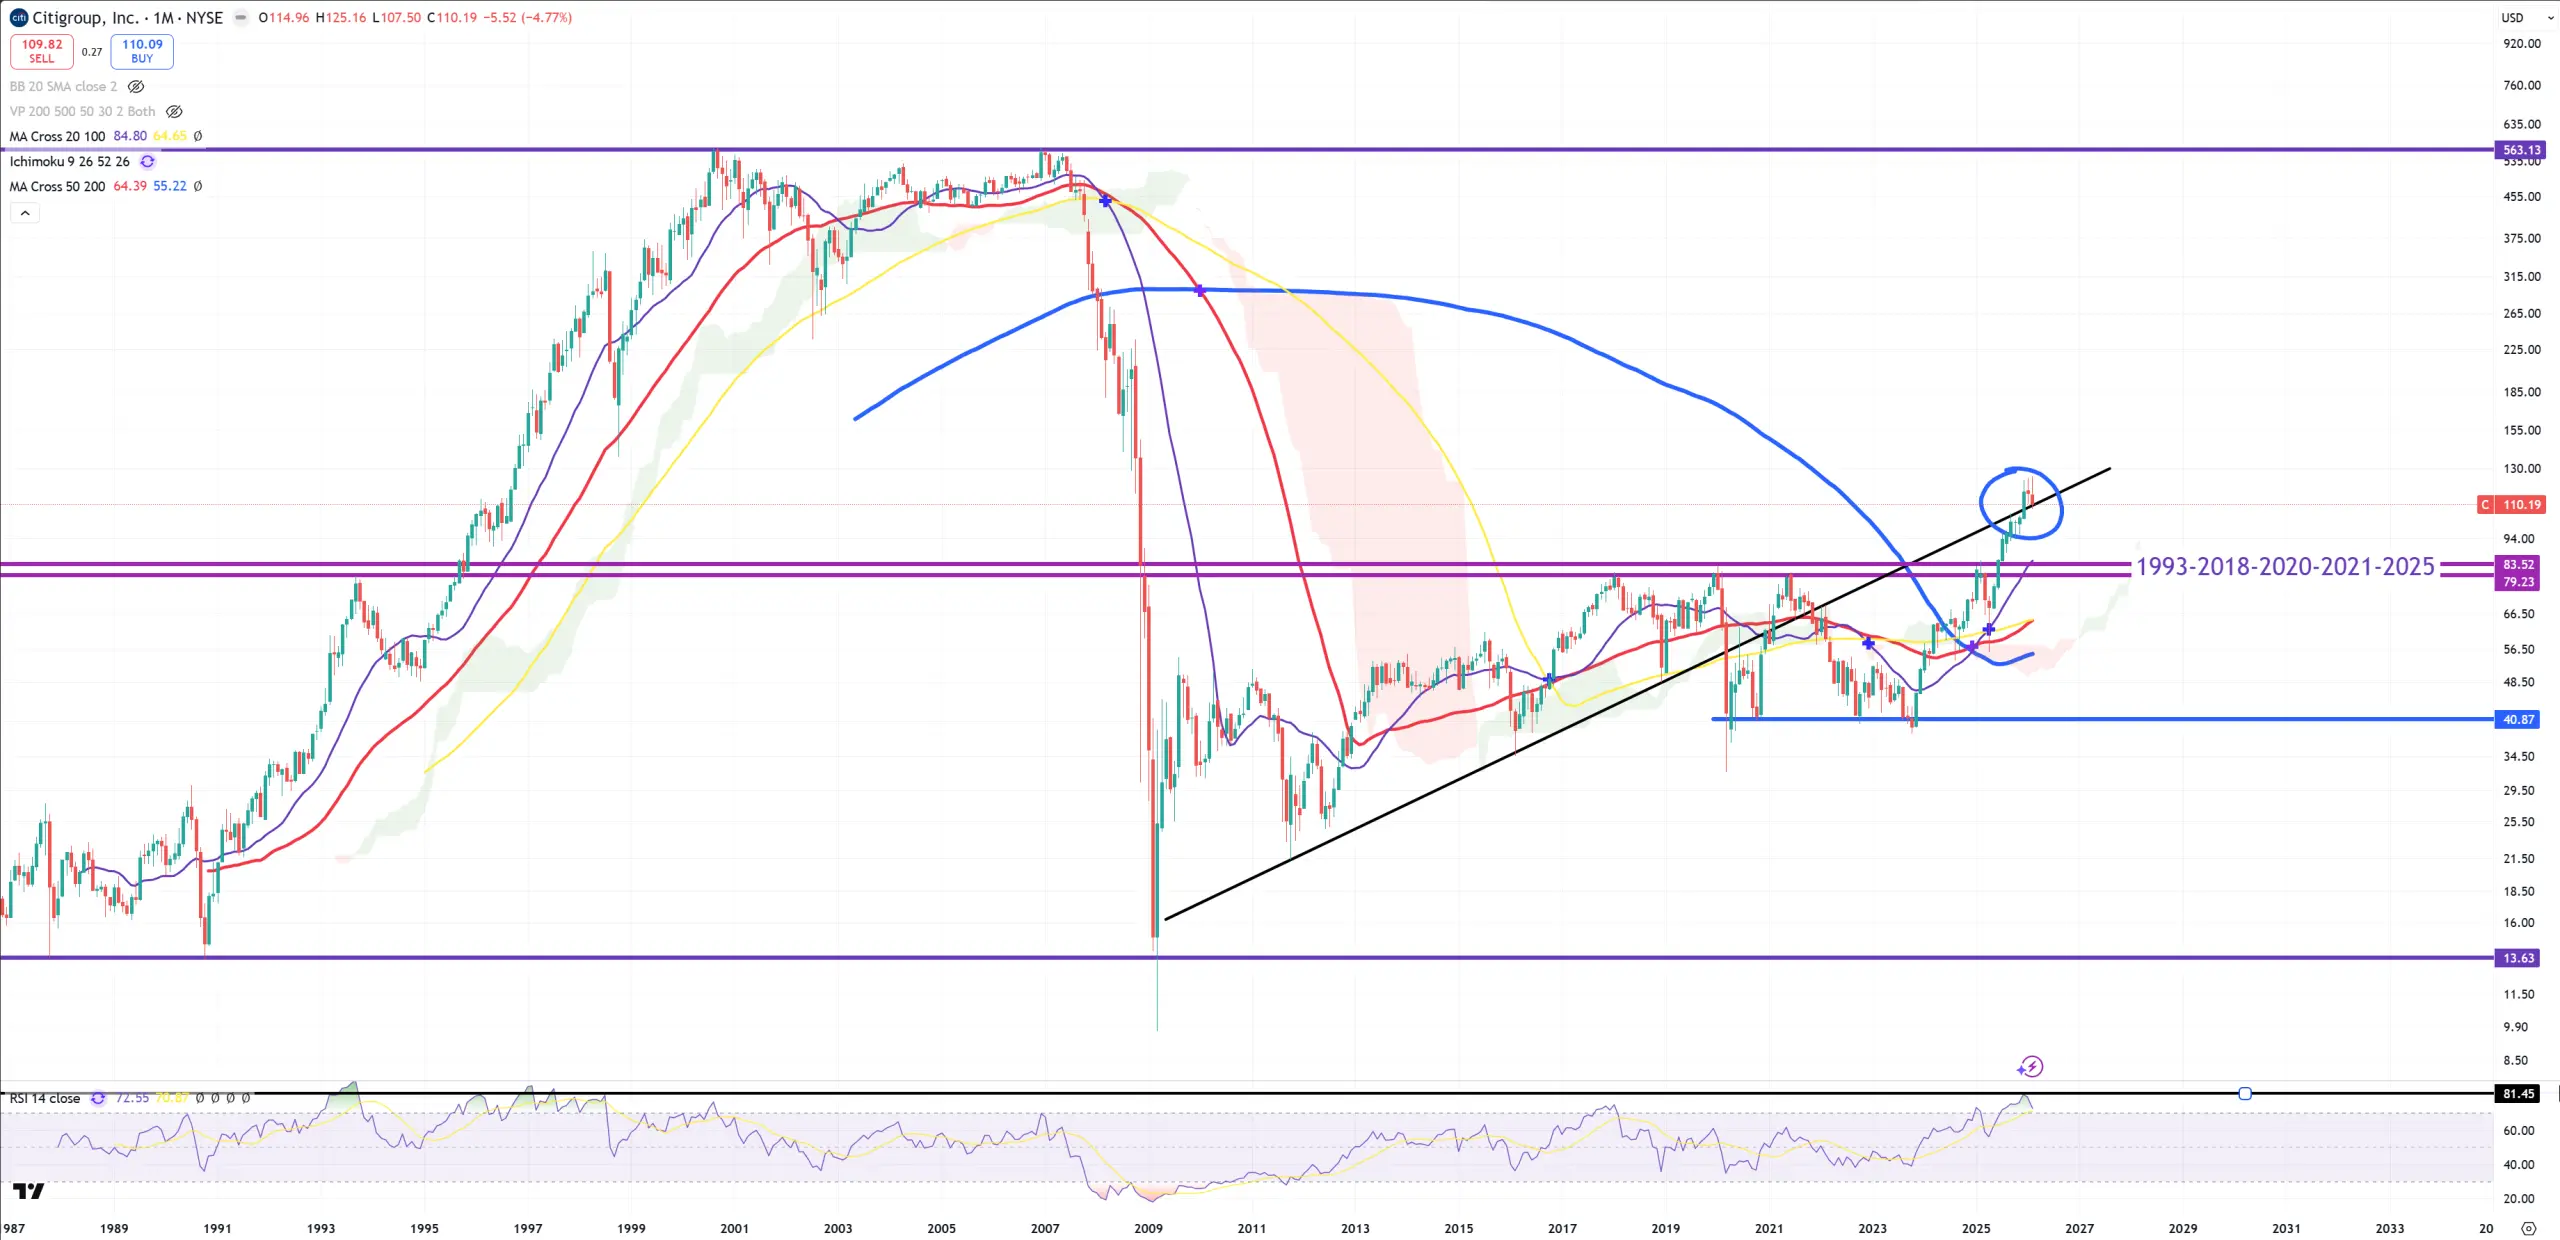
C – that trend is the last possible moment for C to consider last move as a … now what bear market rally with new ATHs? That doesn’t make any sense, but anyway this level is now important if we start March 2026 from rejecting it :
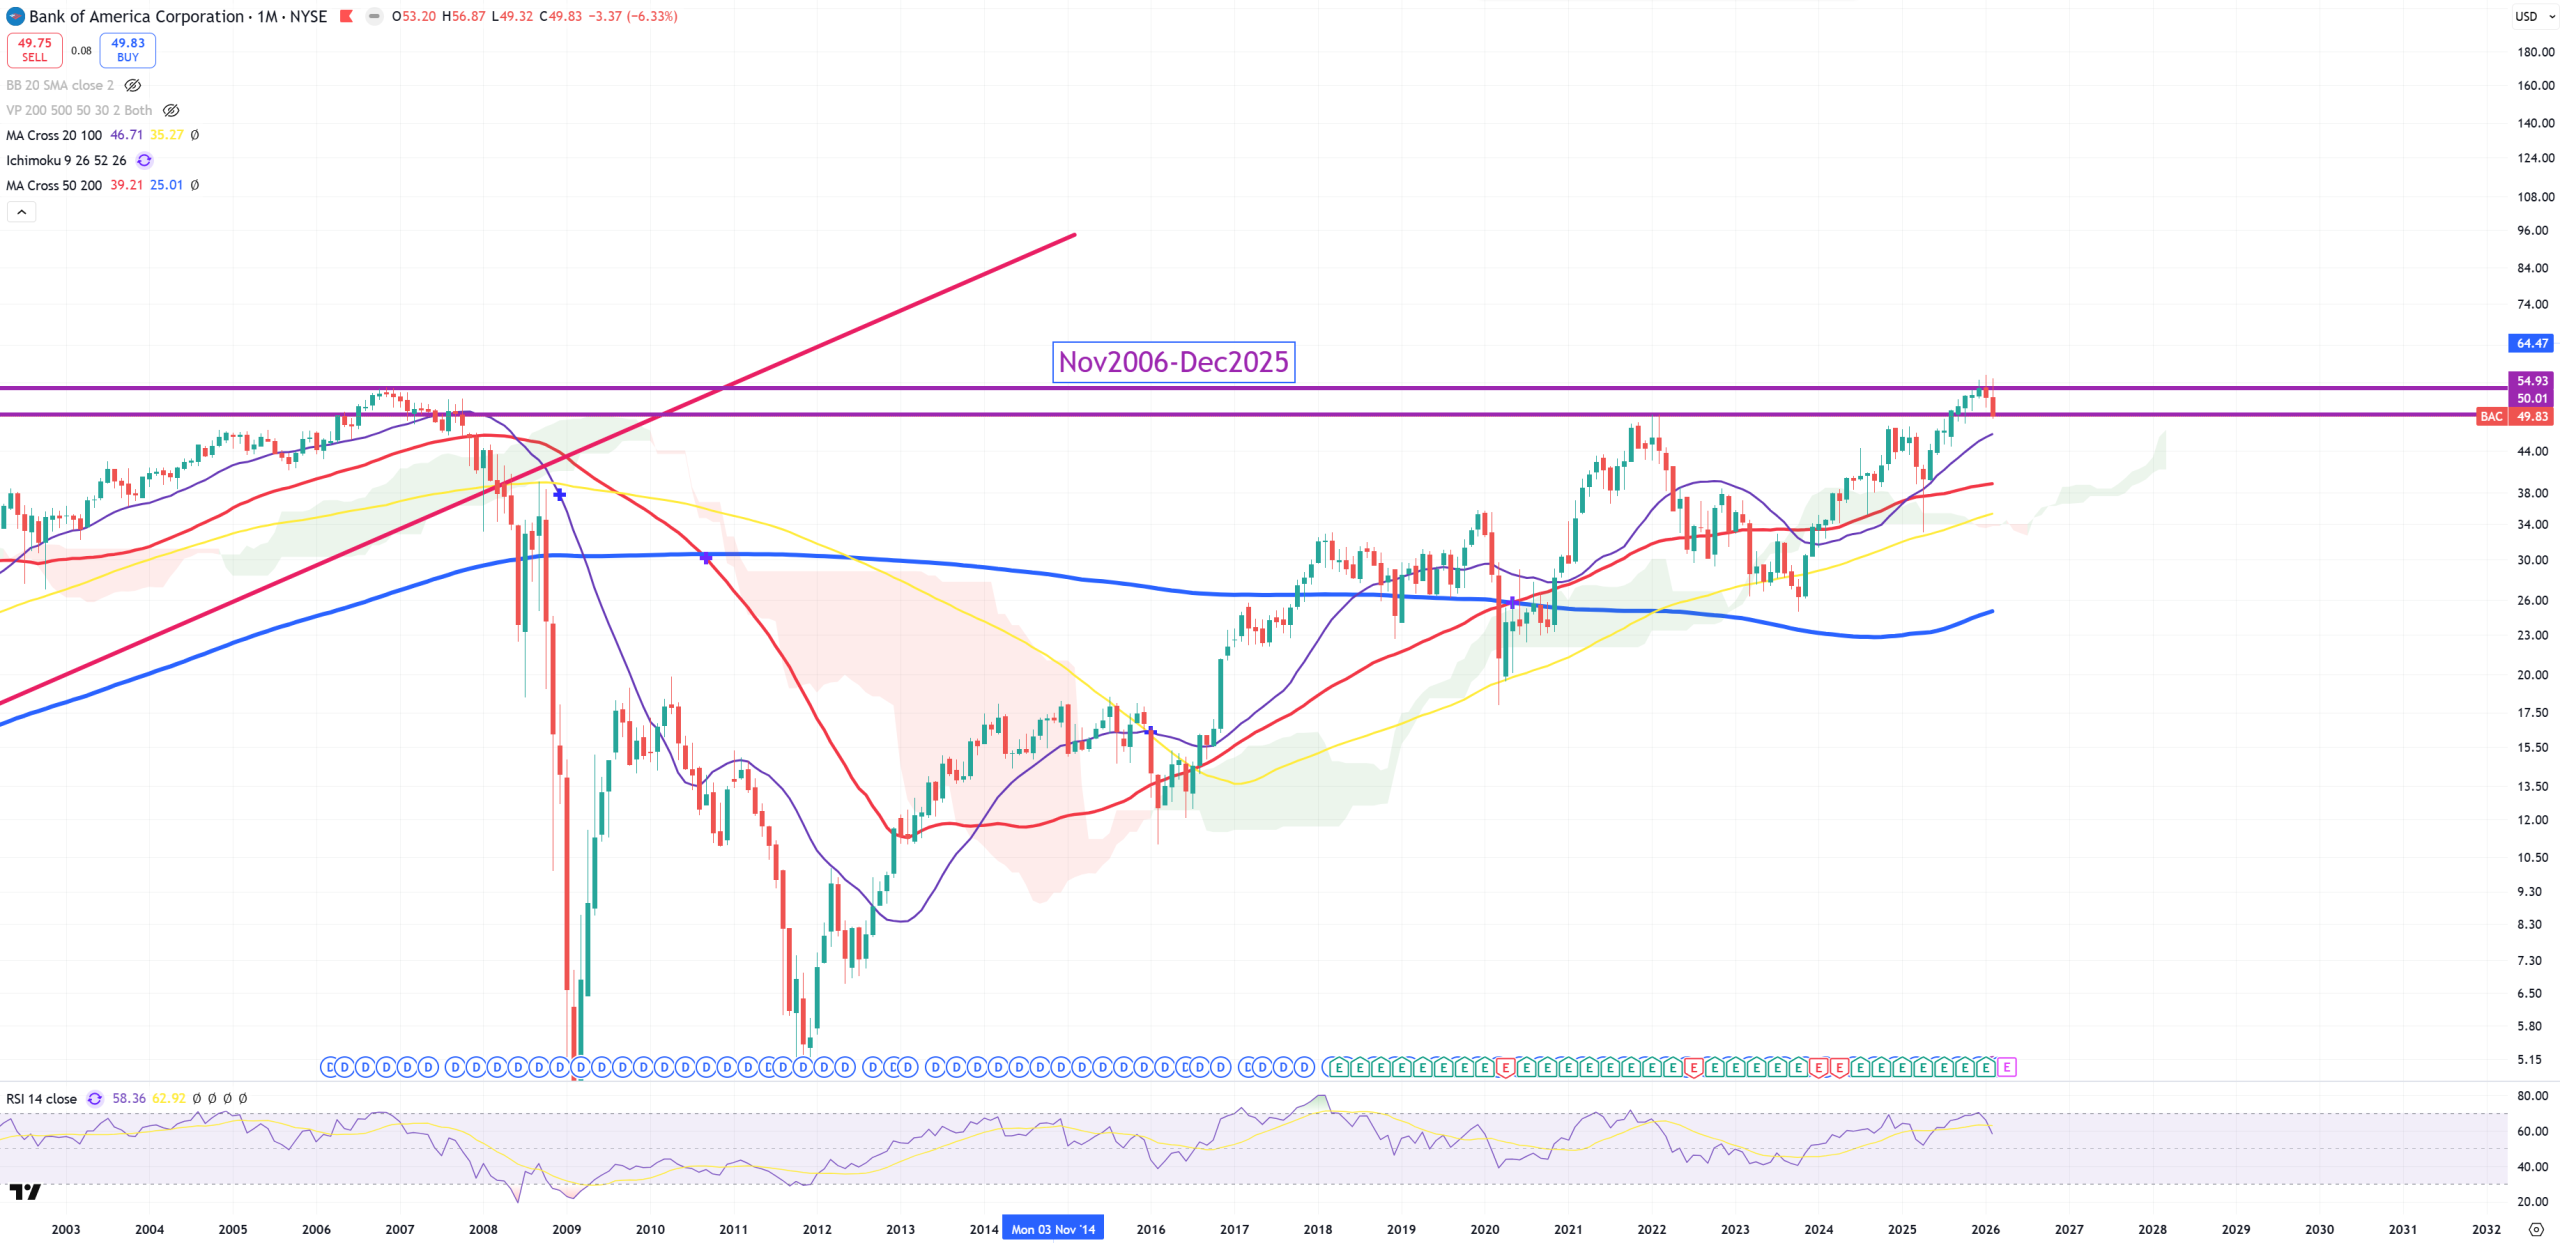
BAC – this setup is more obvious
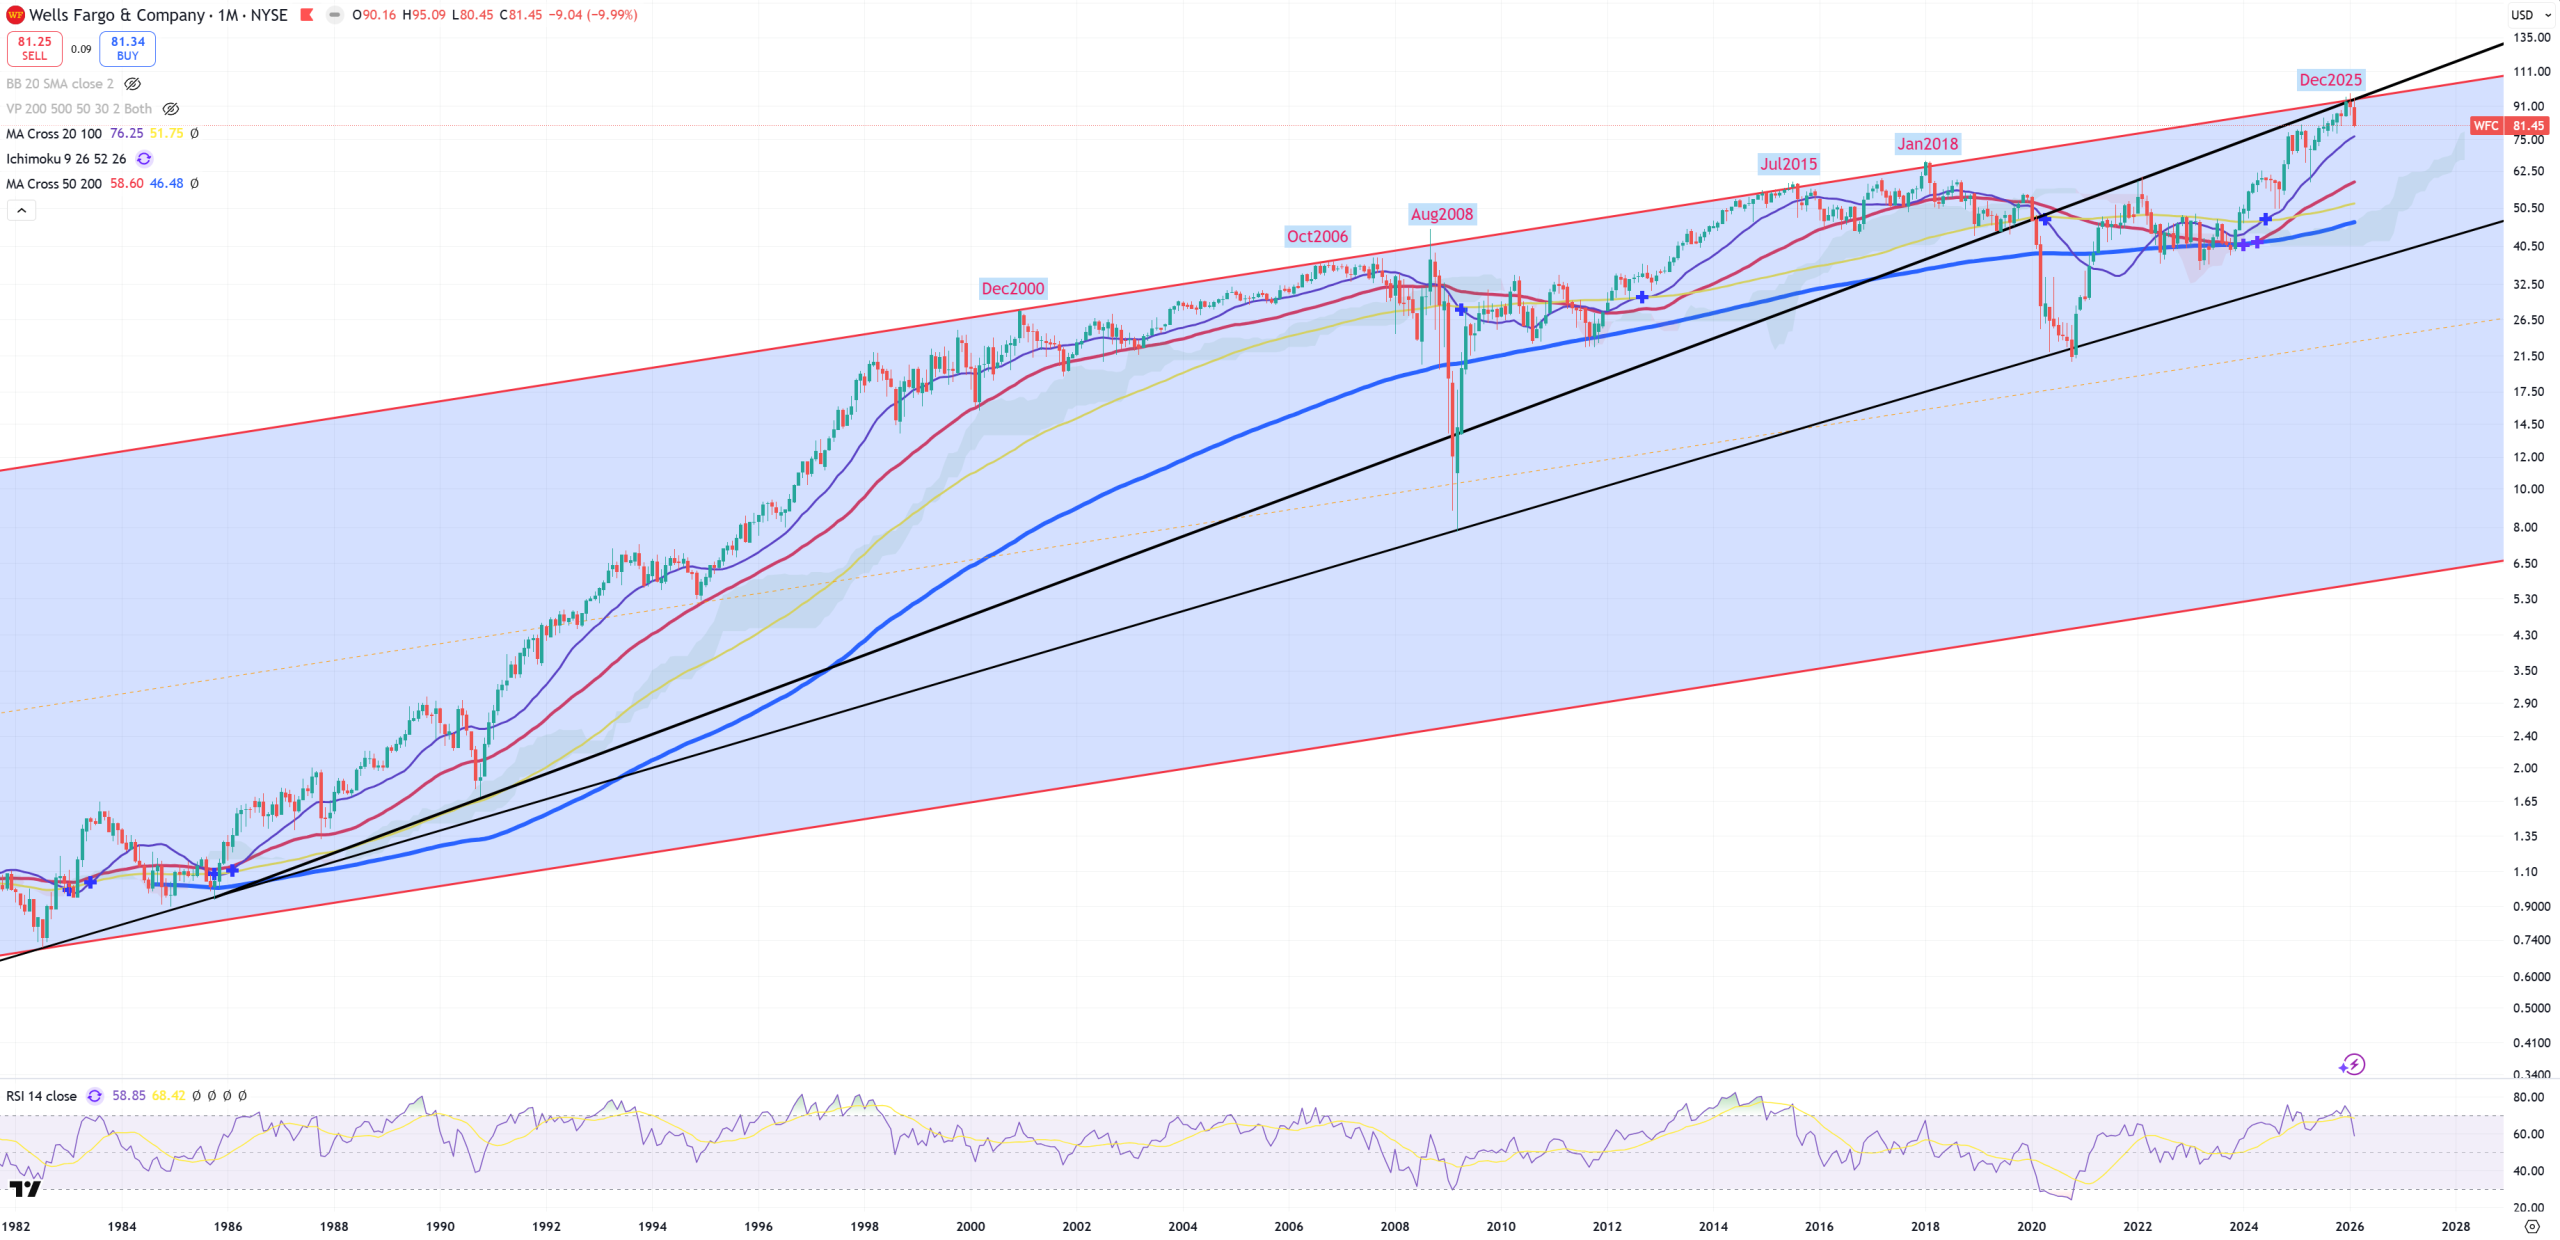
WFC – this is one of the most perfect trend line I’ve ever seen.
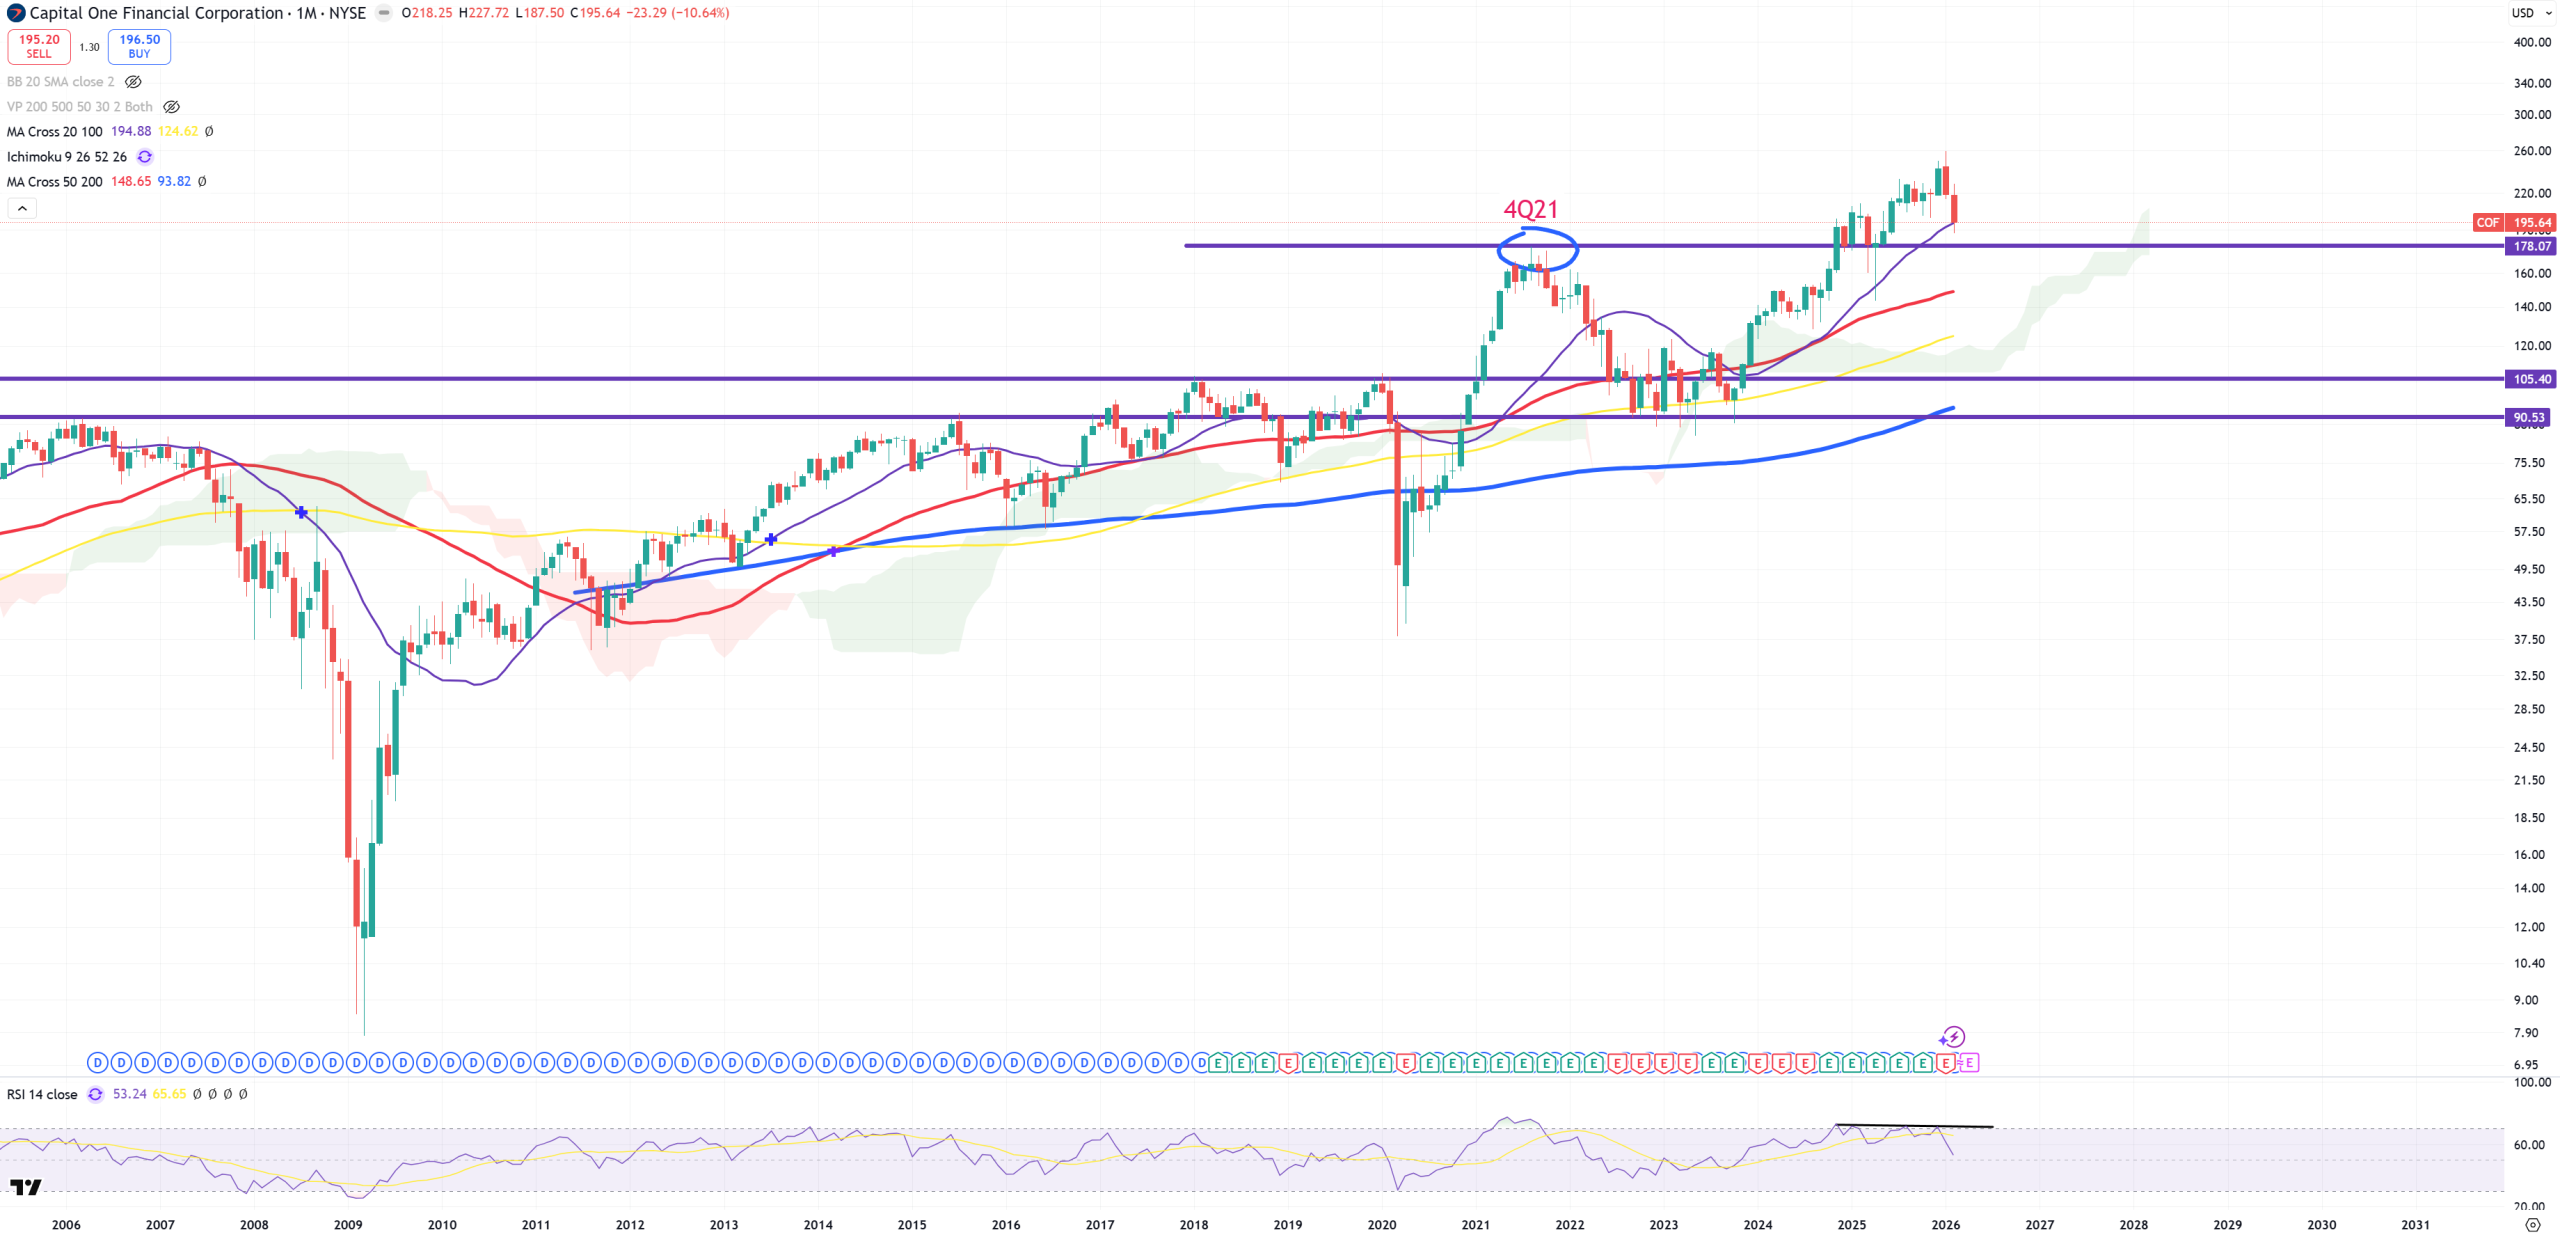
COF – this is the most important company from Financials I observe. So far 4Q21 holds
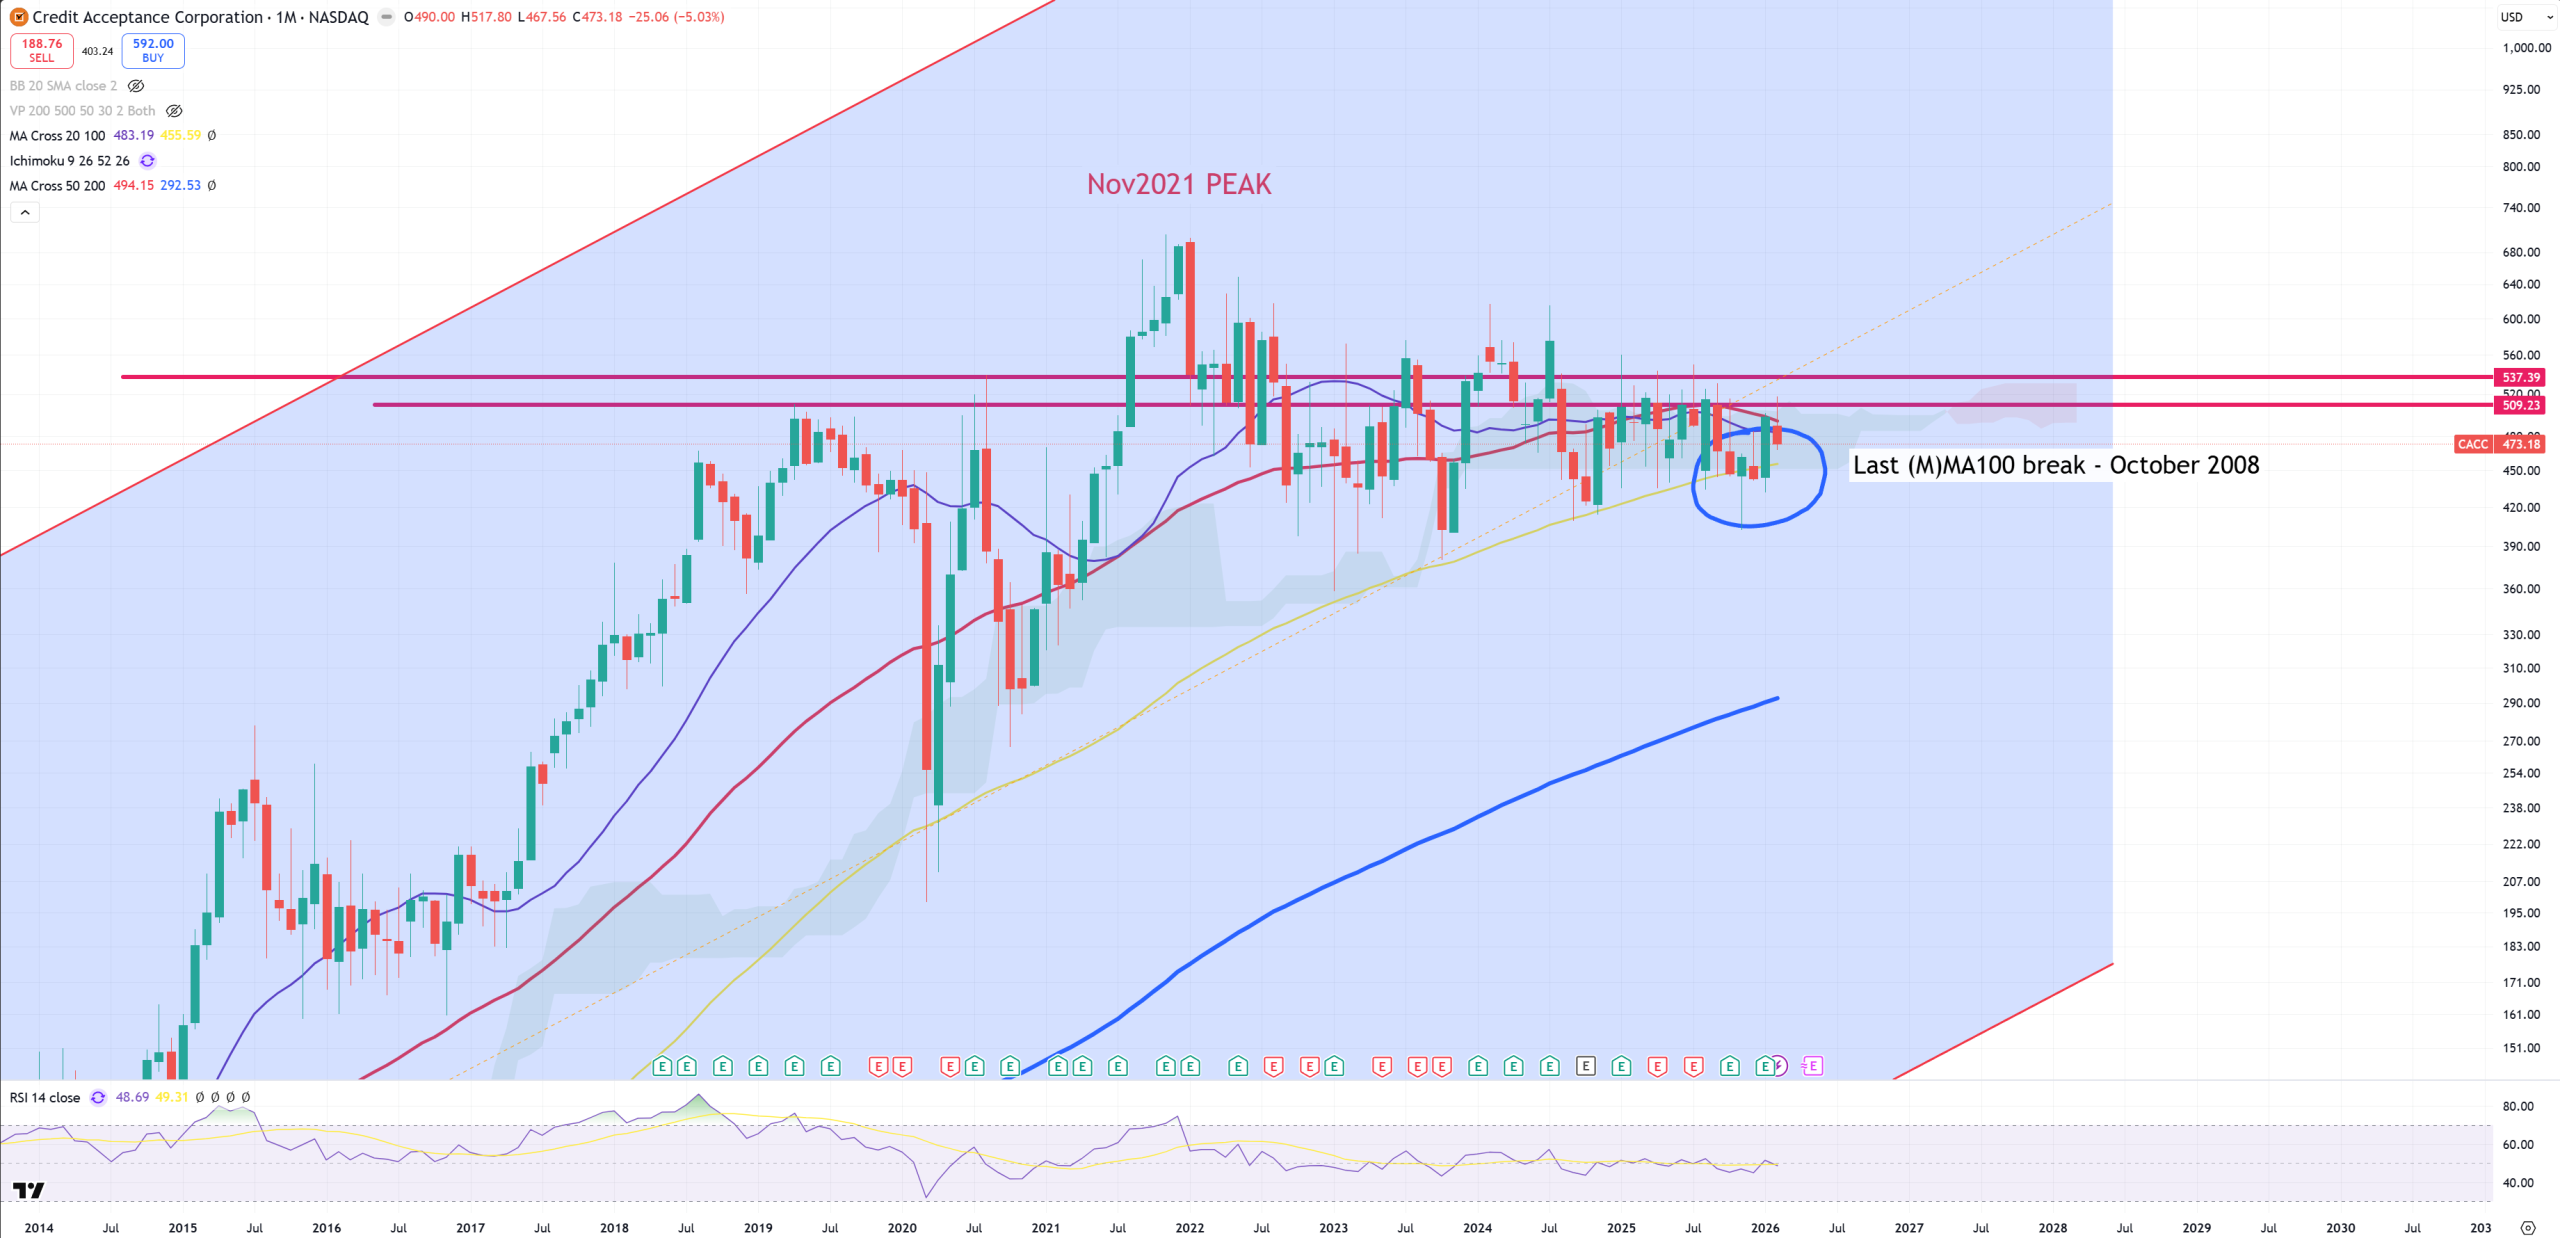
CACC – still trying
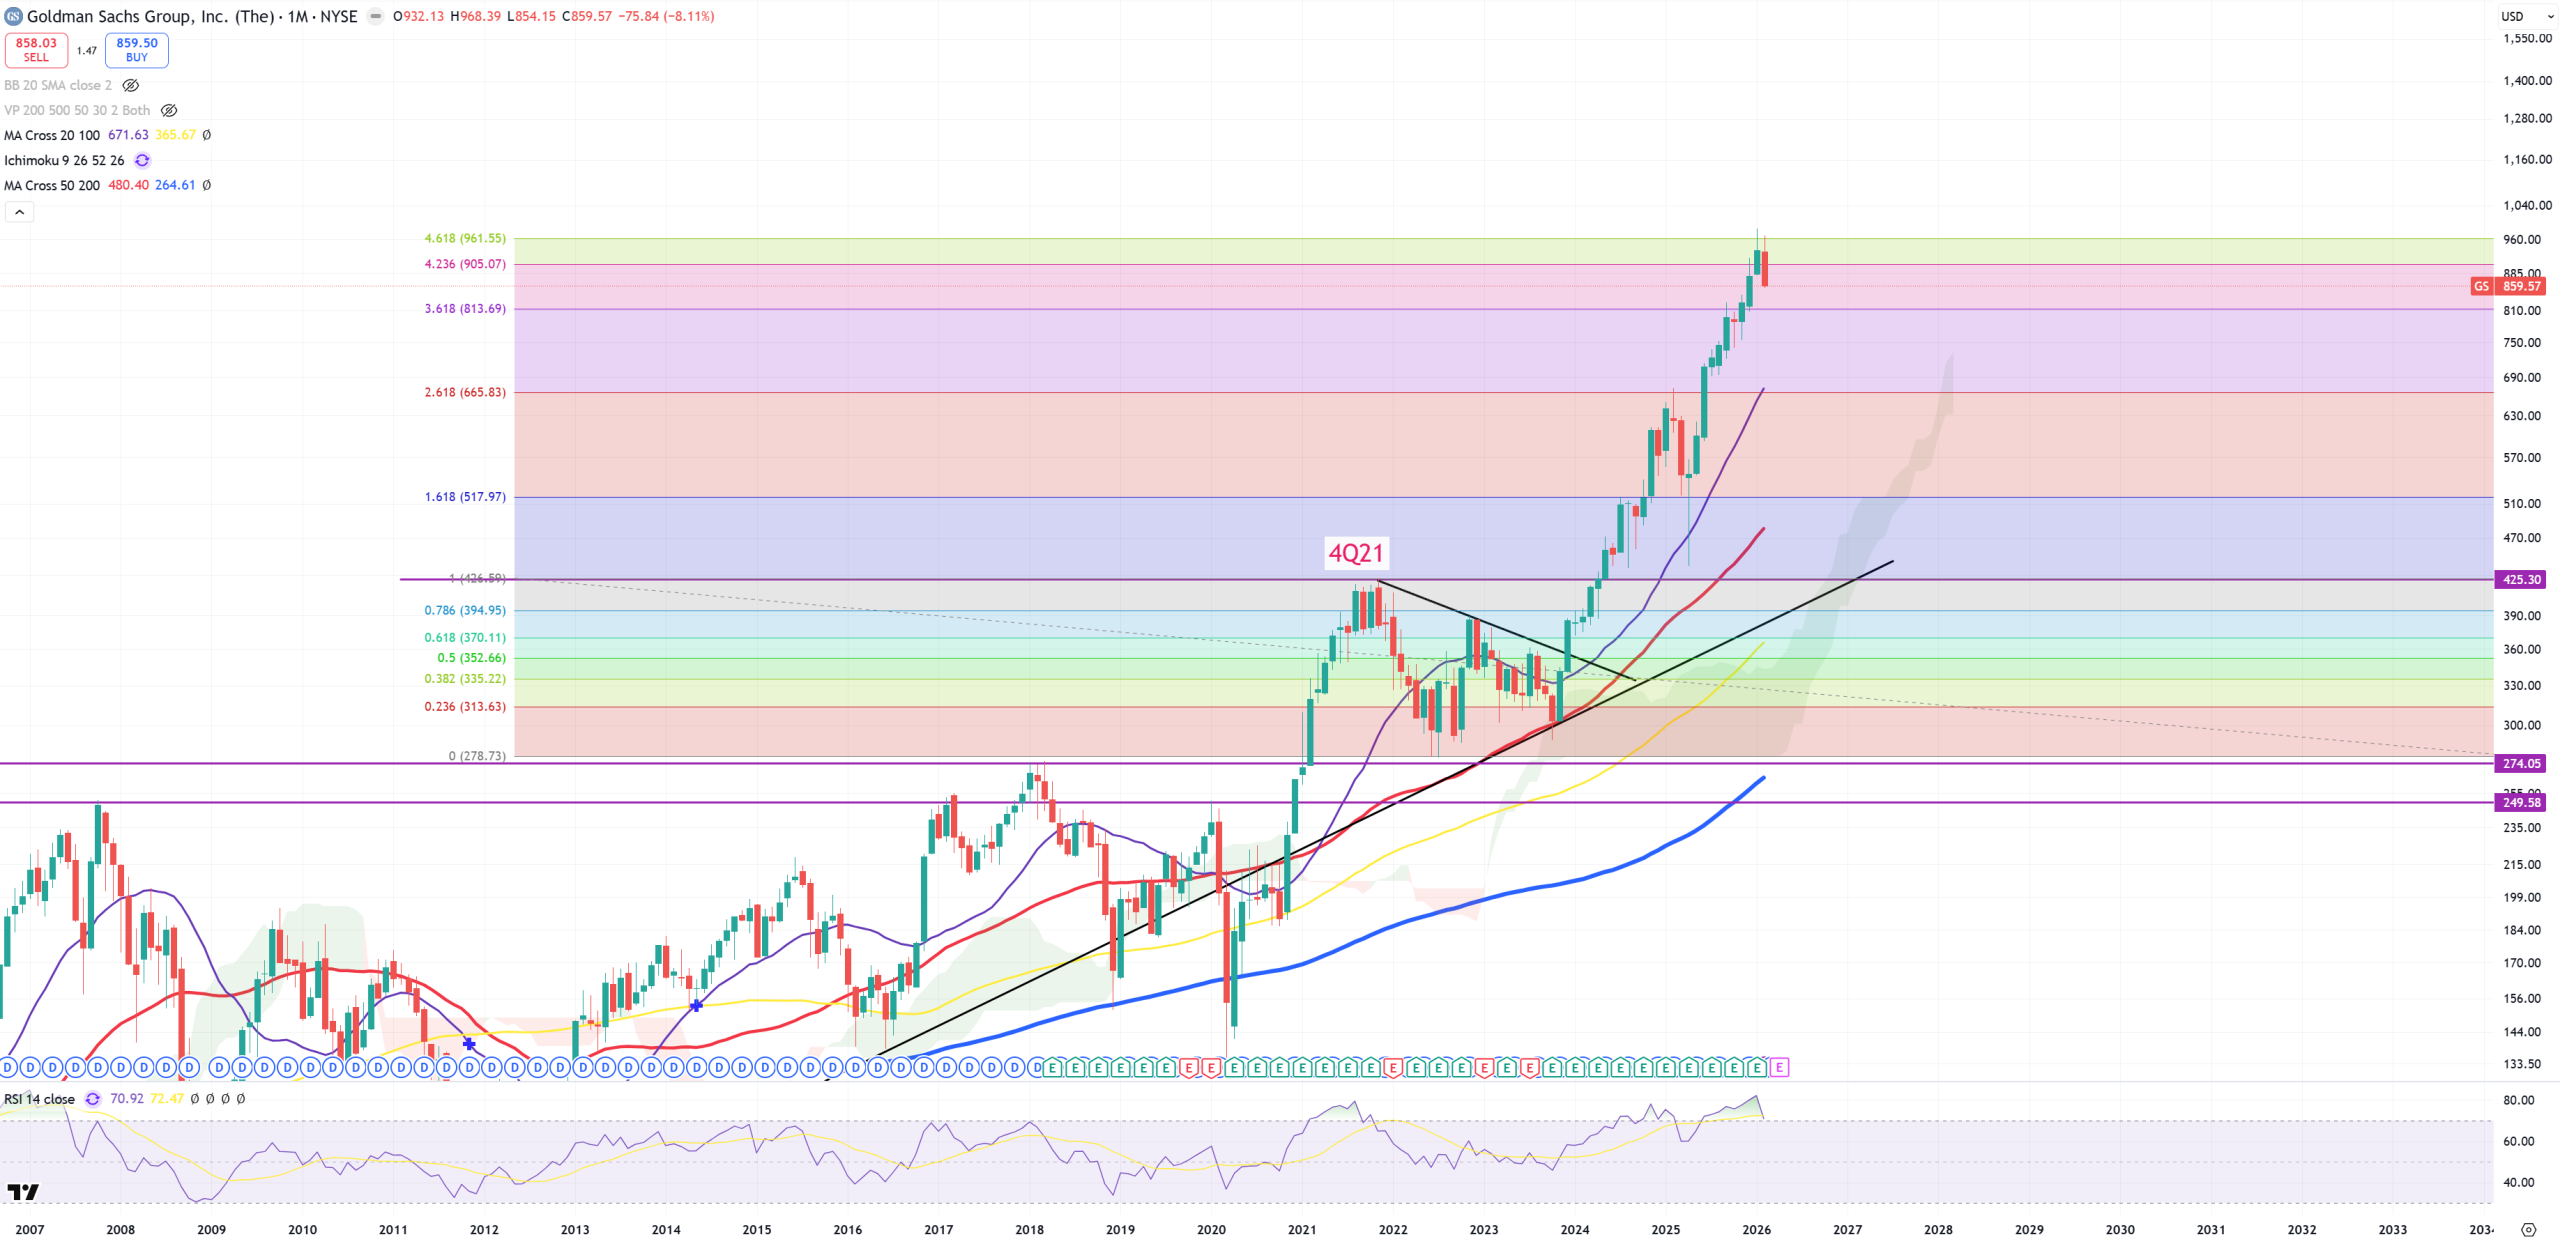
GS – I won’t share charts of MS/JPM because they are in a parabolic move up without any meaningful technical pattern except last FIBO level on 2021 correction measure. This sign is not really important.
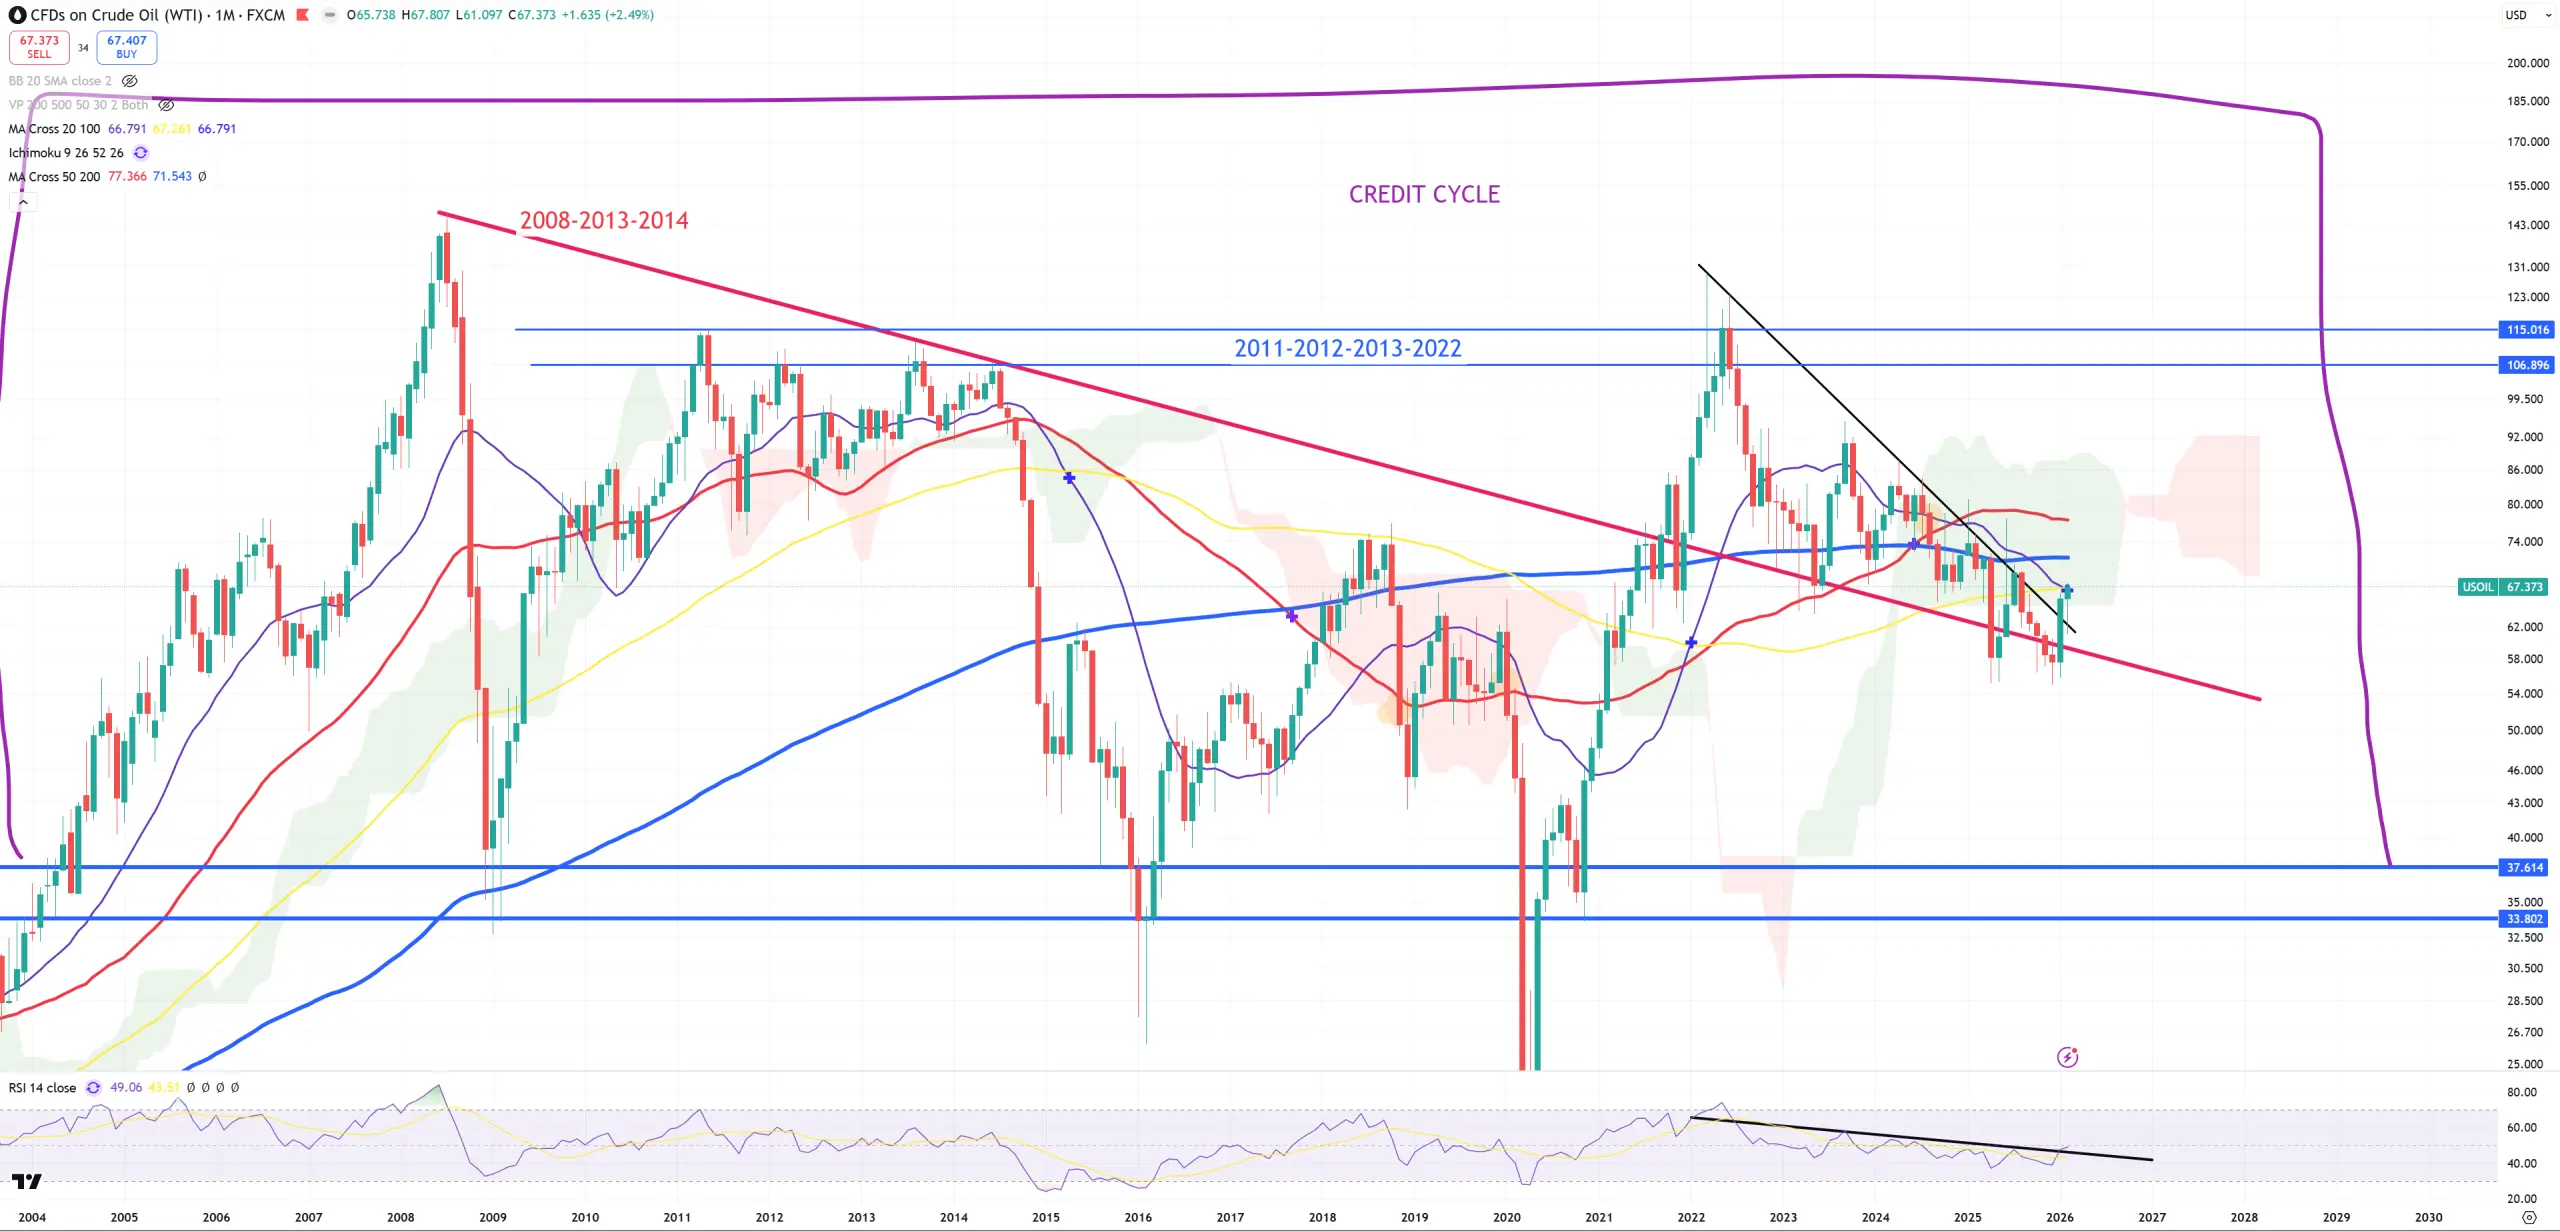
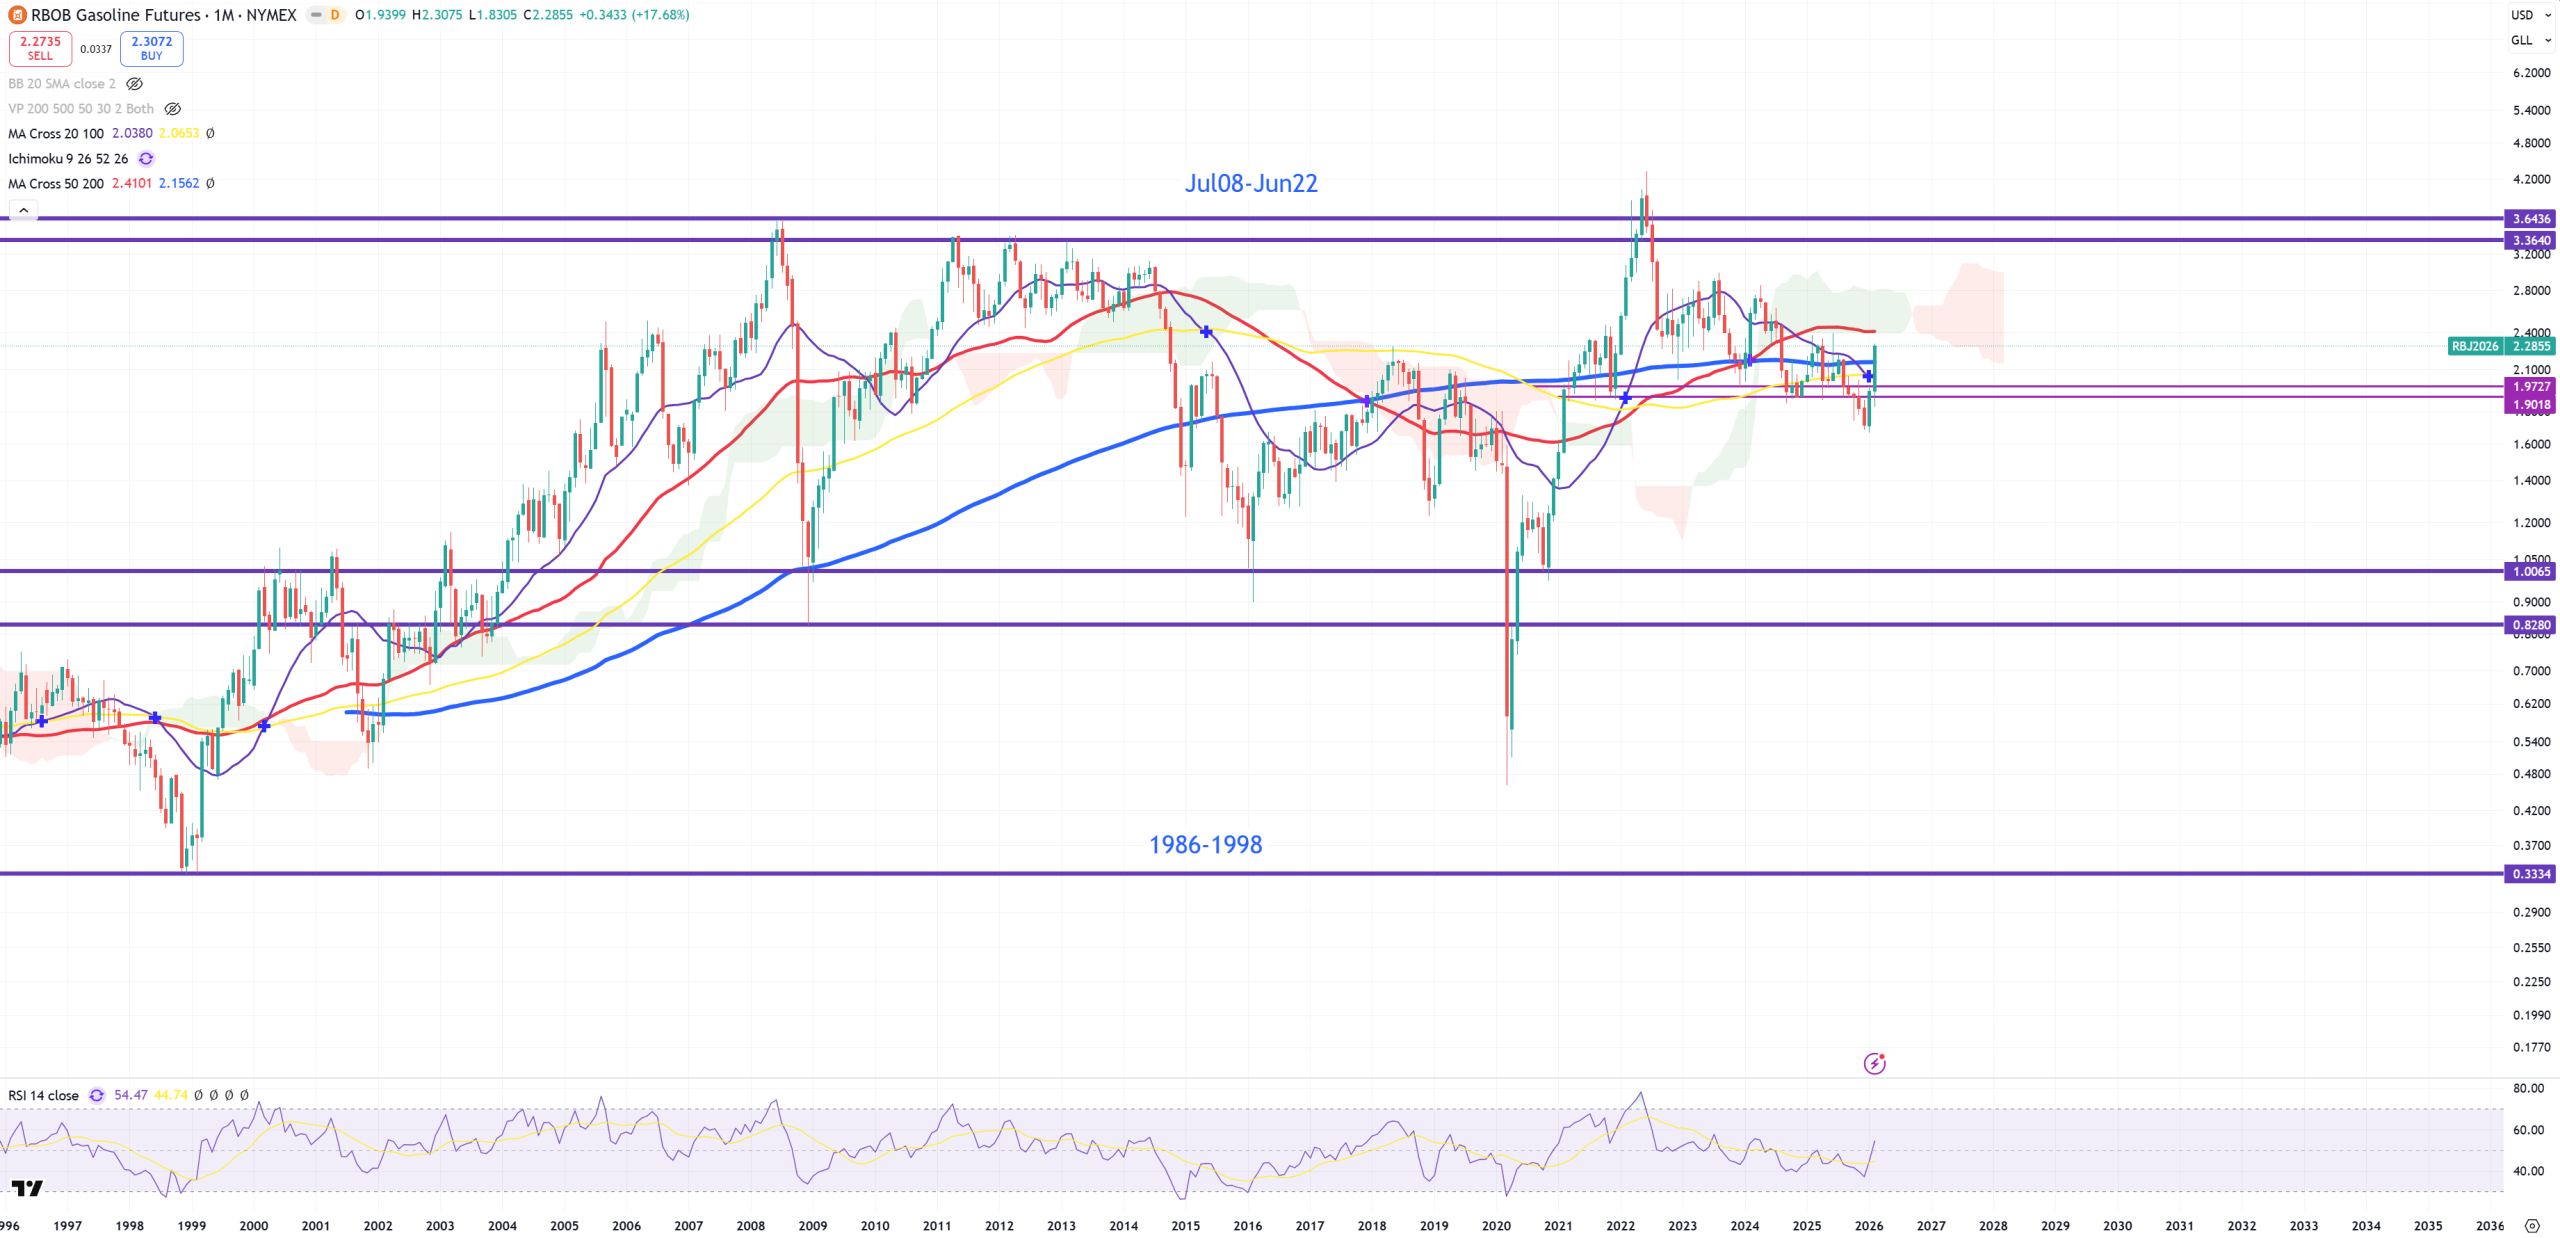
OIL spike and other commodities
OIL – this technical pattern was about to break back below red trend line, but it still resists. We all know US-Israel attacked Iran, so we’ll have like +10% spike here. Red (M)MA50 is around 77.5$. Looks like market has decided it needs bigger oil spike to crash the economy.
RBOB – Gasoline – that was a false break below this 1.80 so the path to 0.8 is stopped. Same as oil.
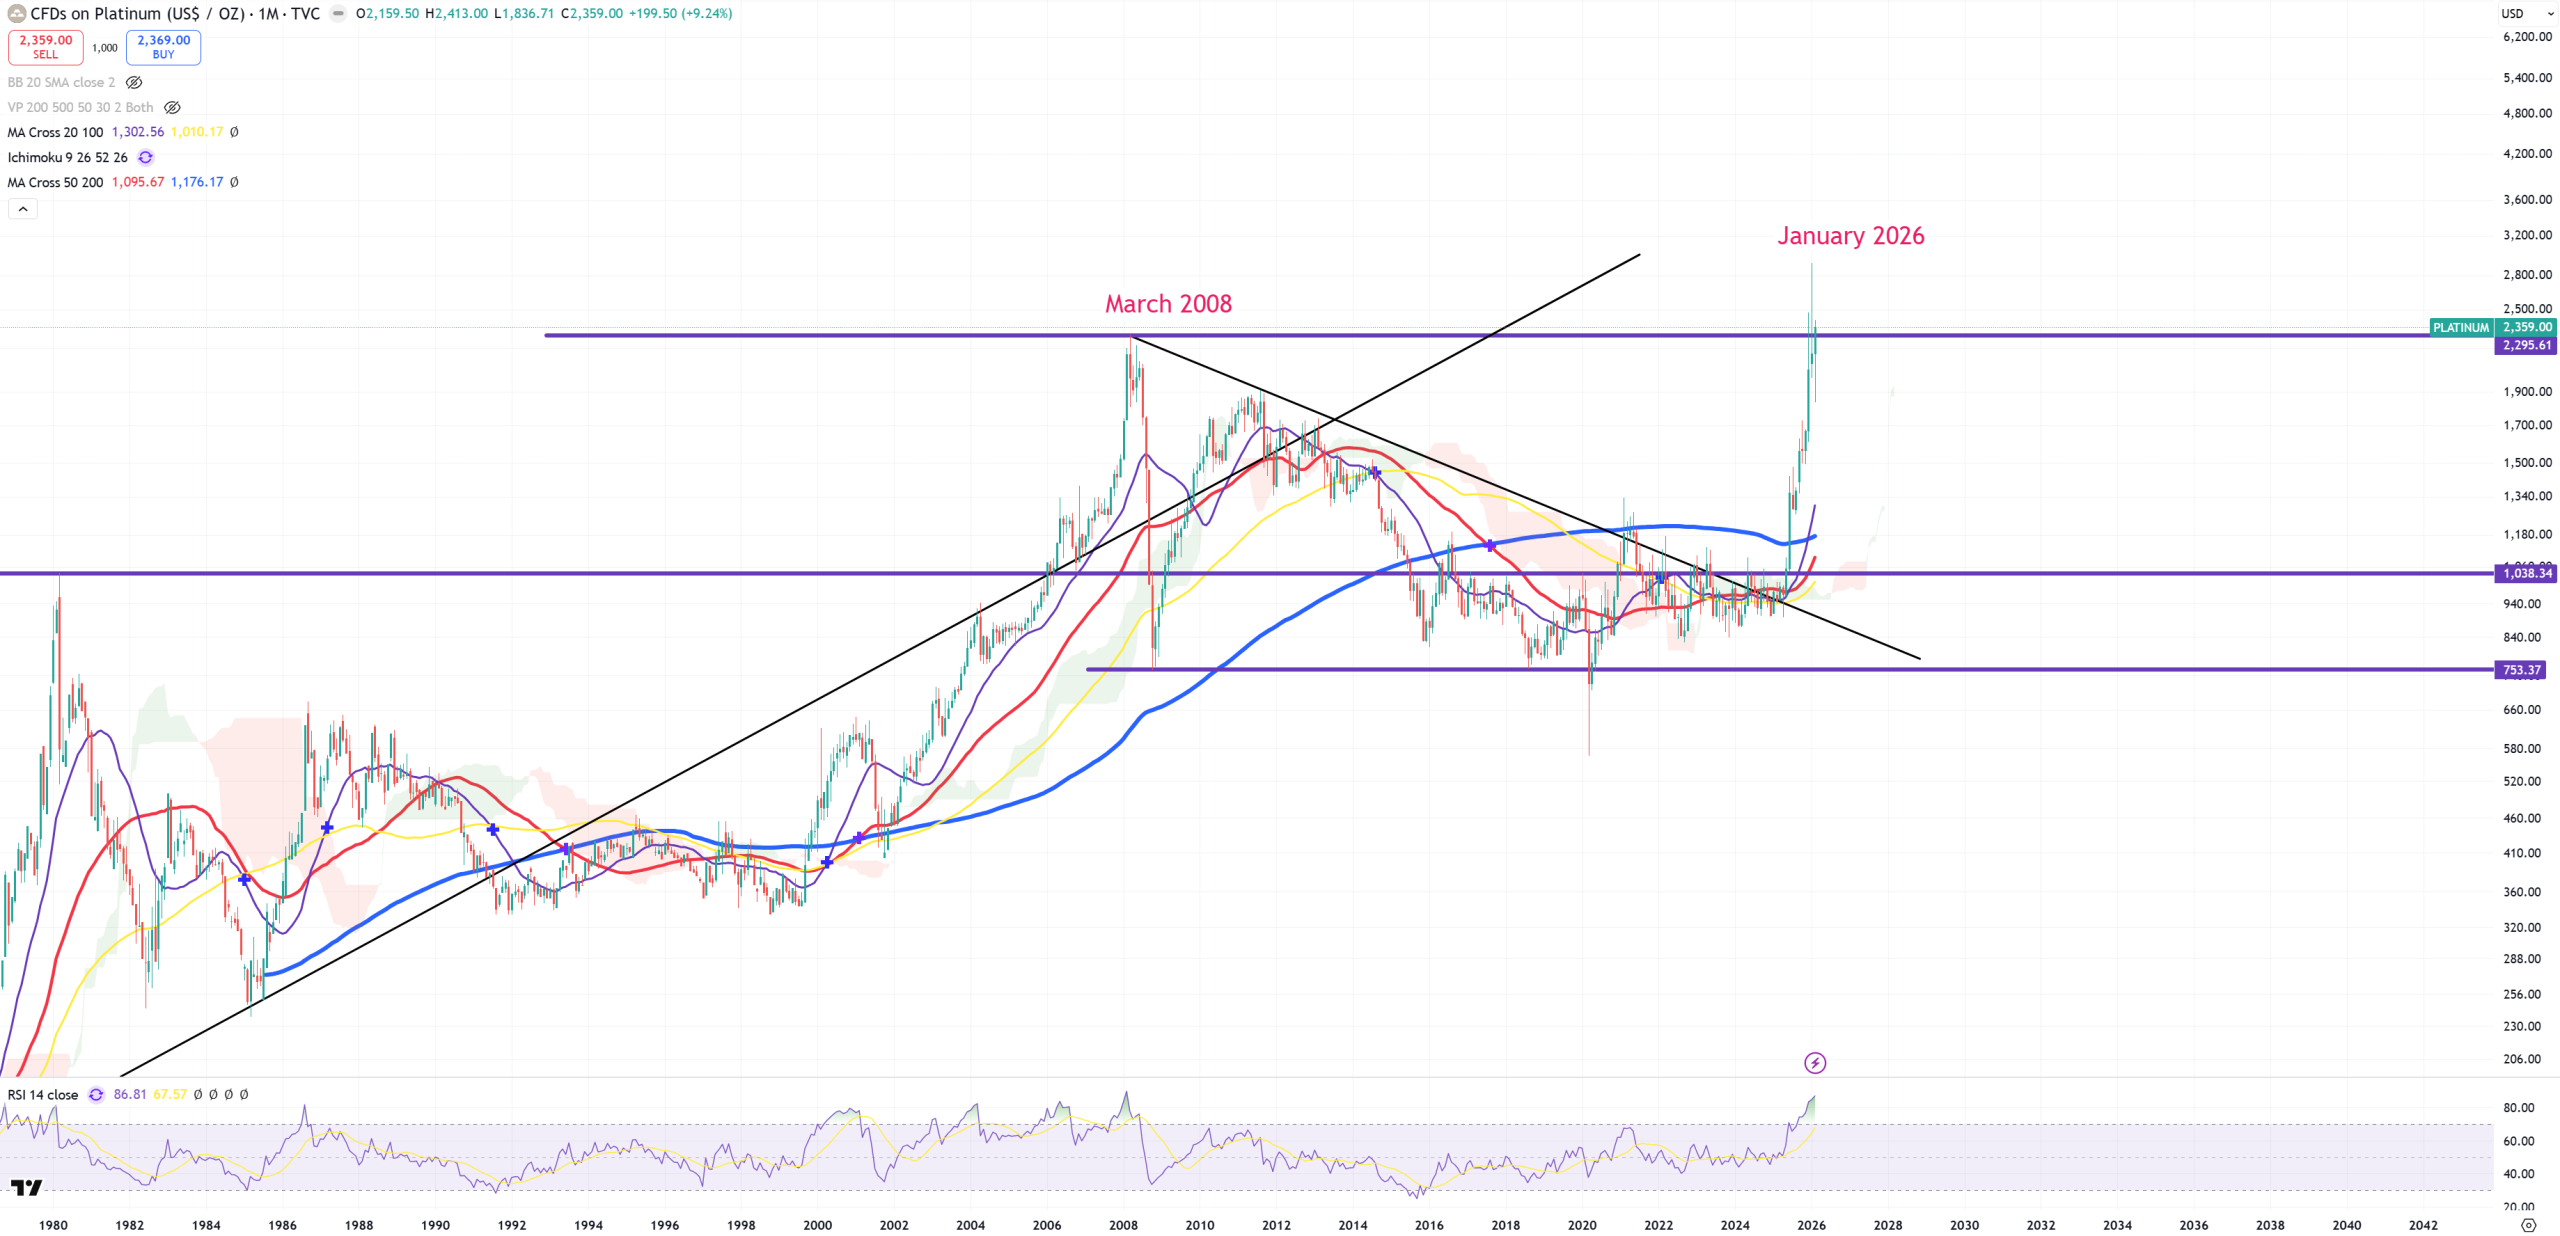
PLATINUM – fights for its powerful moment
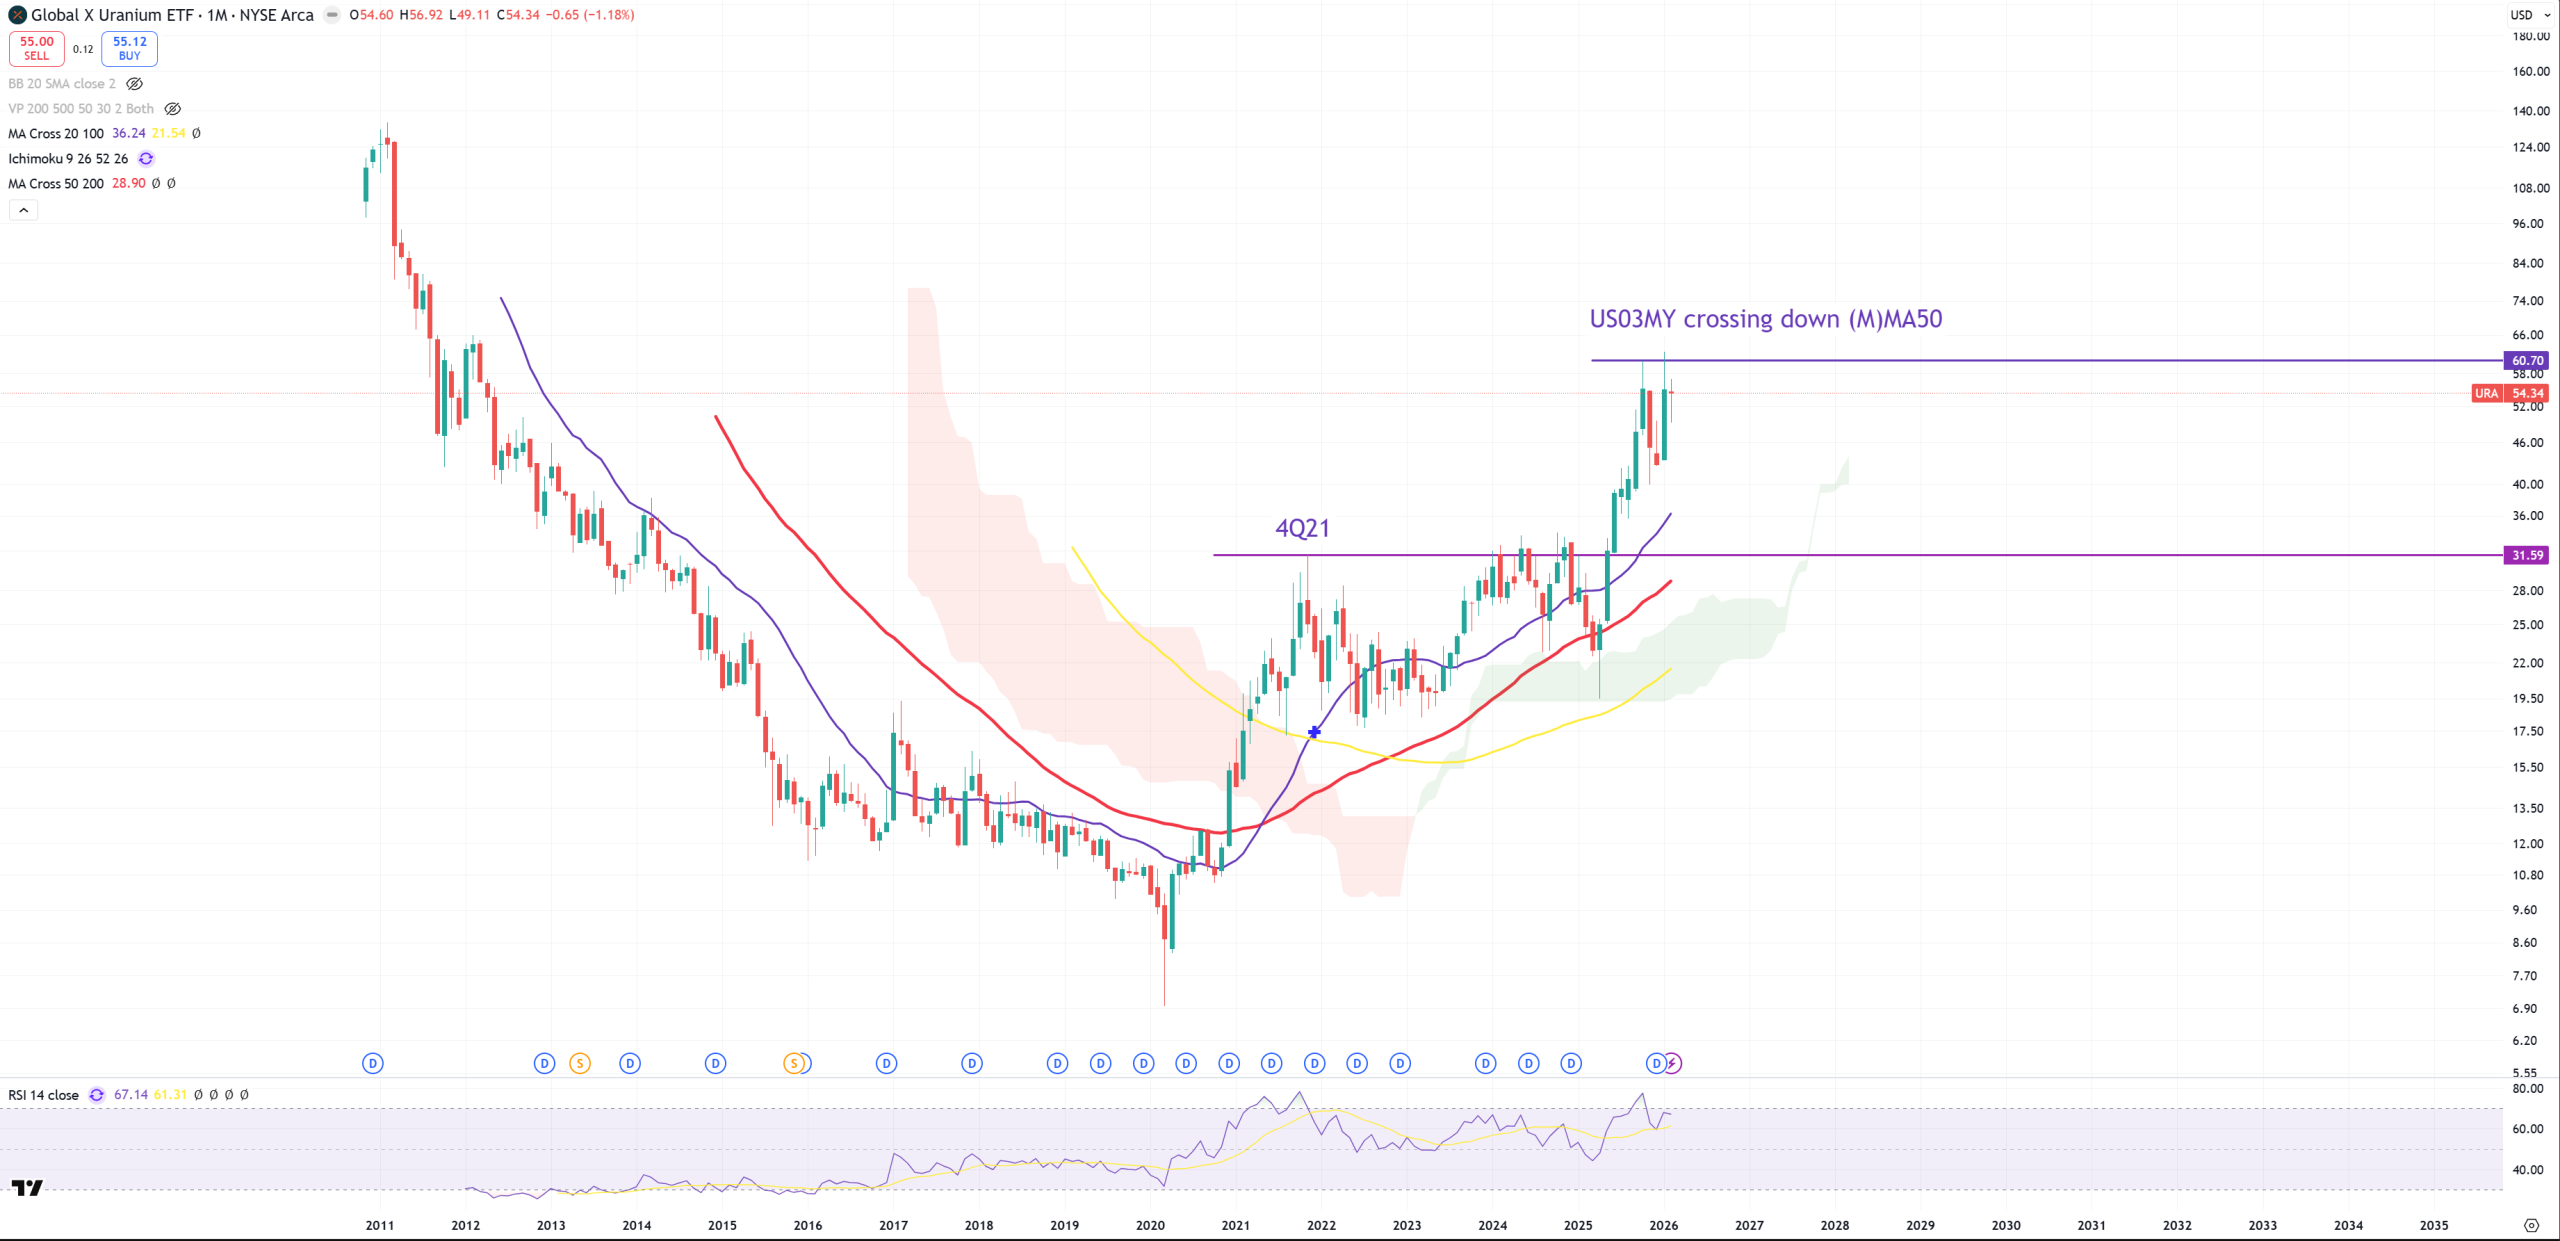
URA – I know many of you are obssesed about this ETF. I will leave 2 indicators marked and feel free to interpret this chart by yourself.
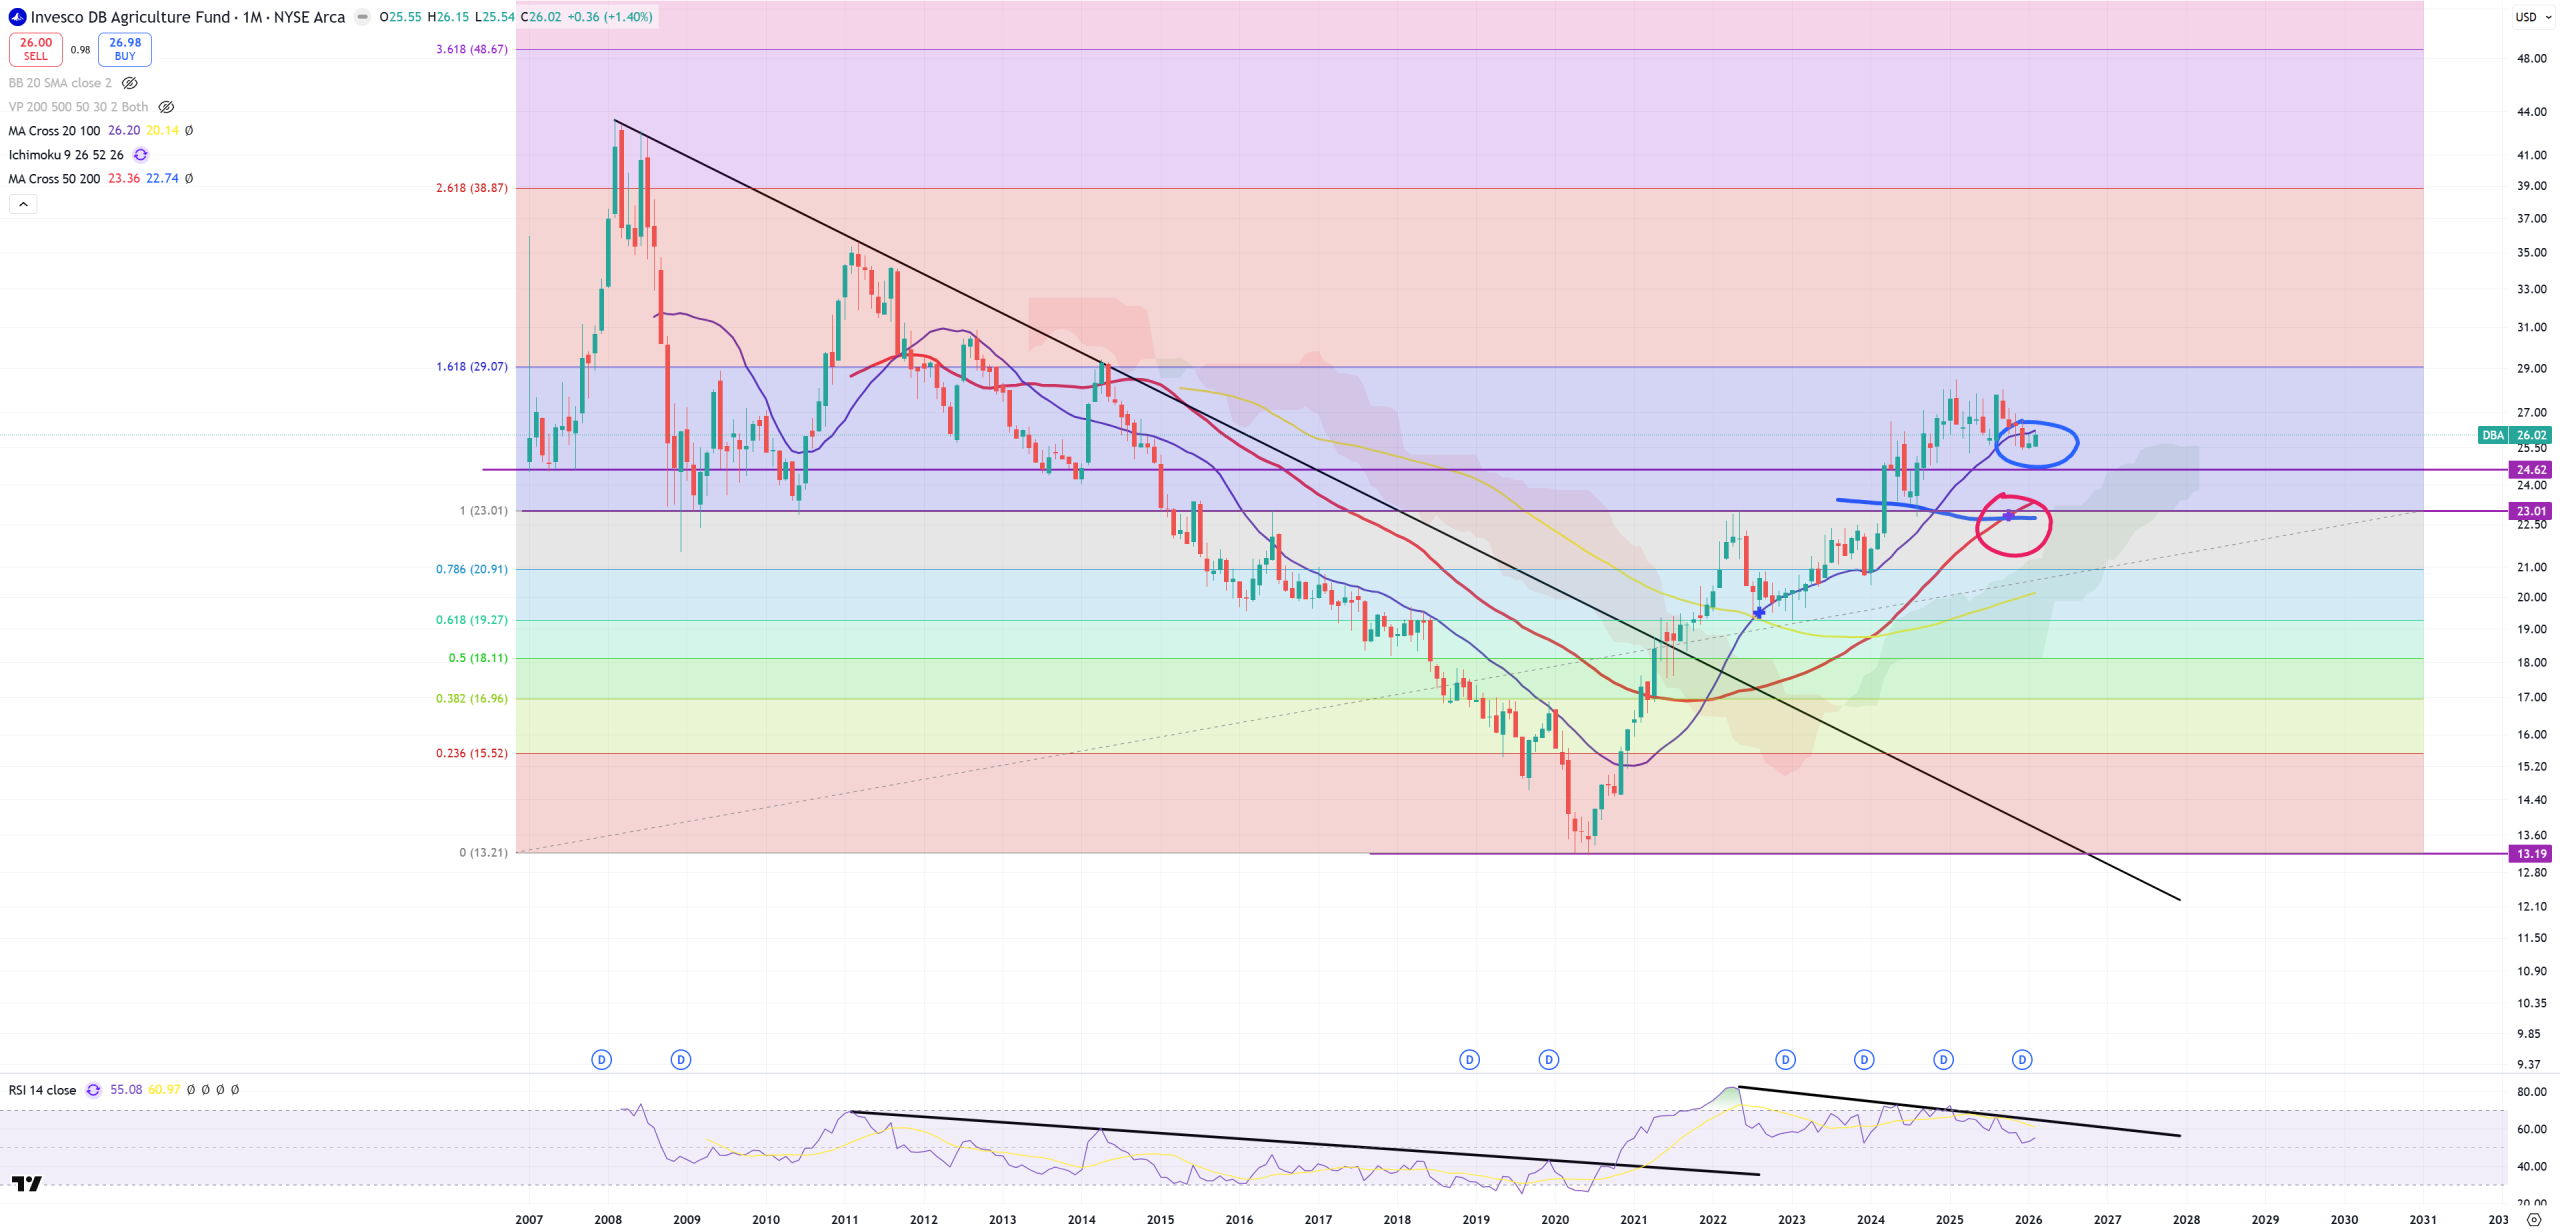
DBA – Agriculture – retesting (M)MA20 from the bottom with negative divergence of (M)RSI = possible trend change, but now secular golden cross is exactly on the same support level as 2009-2010 level :
$$$ on the edge – currencies
In main indicators I shared my view about DXY index, combined with EURUSD & USDCNH in section about China, here we’re going to see some currencies. As I mentioned before DXY situation is SO SO SO mixed and razor thin it’s really hard to judge what’s going to happen. While my last border of bullish thesis still holds and uninverting 10y/3m should bring $$$ higher I’ve seen some dependencies which during last couple years have stopped working anylonger. We have 14Y record shorts on $$$, so one bad move and DXY will go … parabolic.
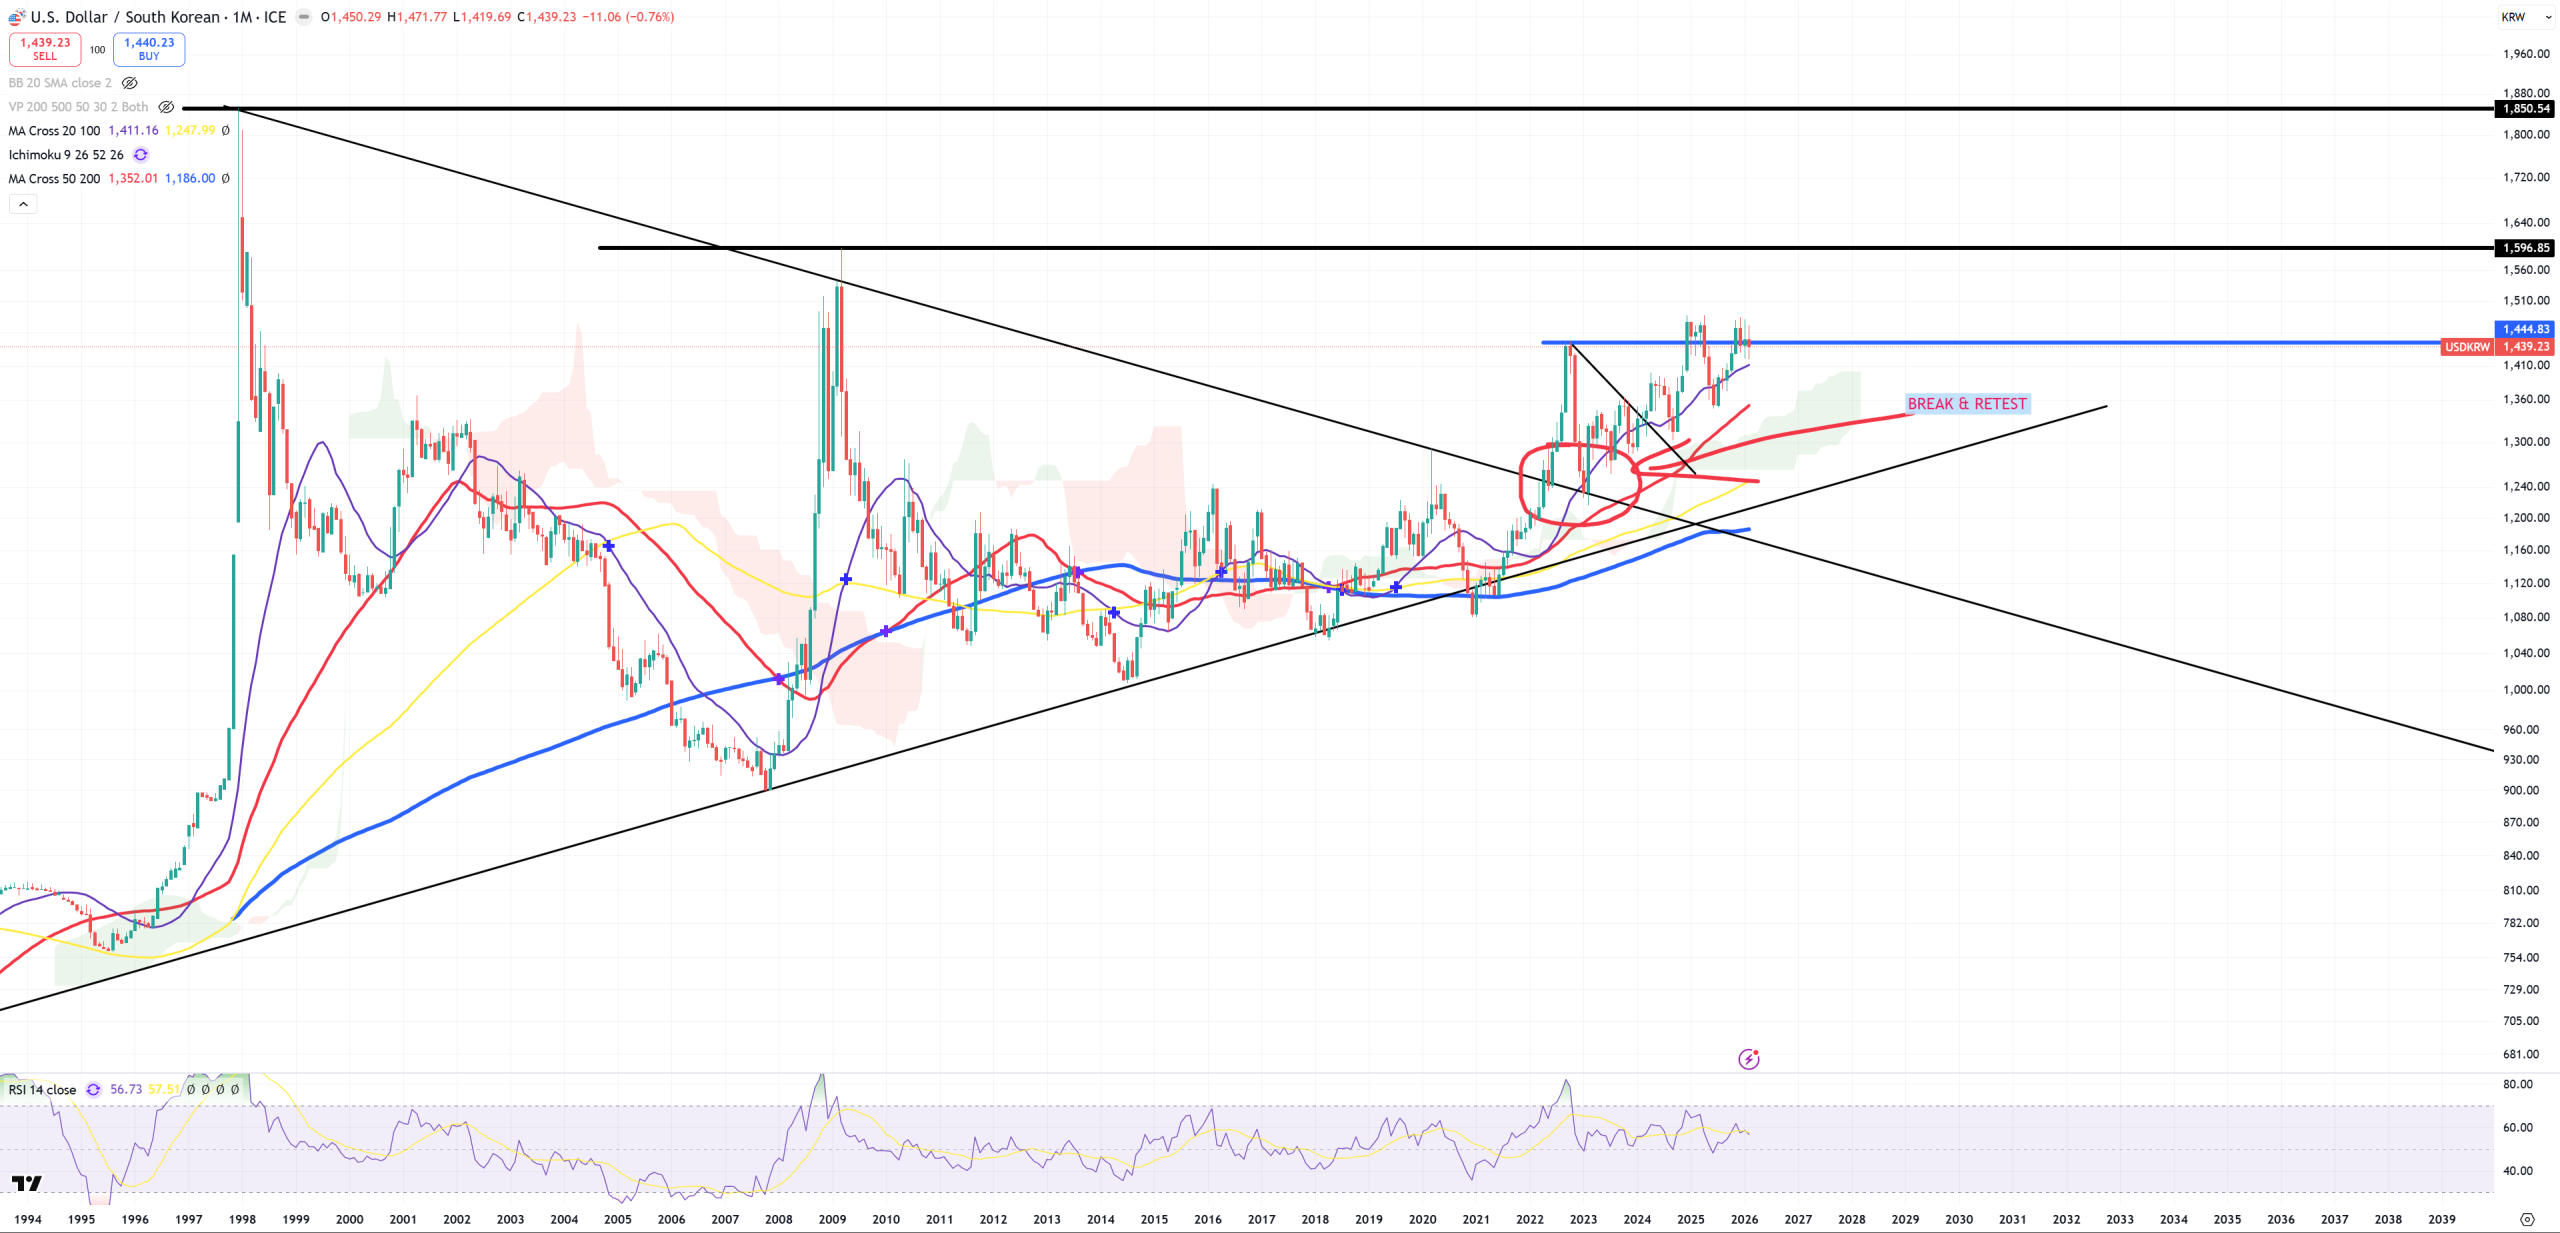
USDKRW – just like DXY -> razor thin edge. Without strong AI bubble
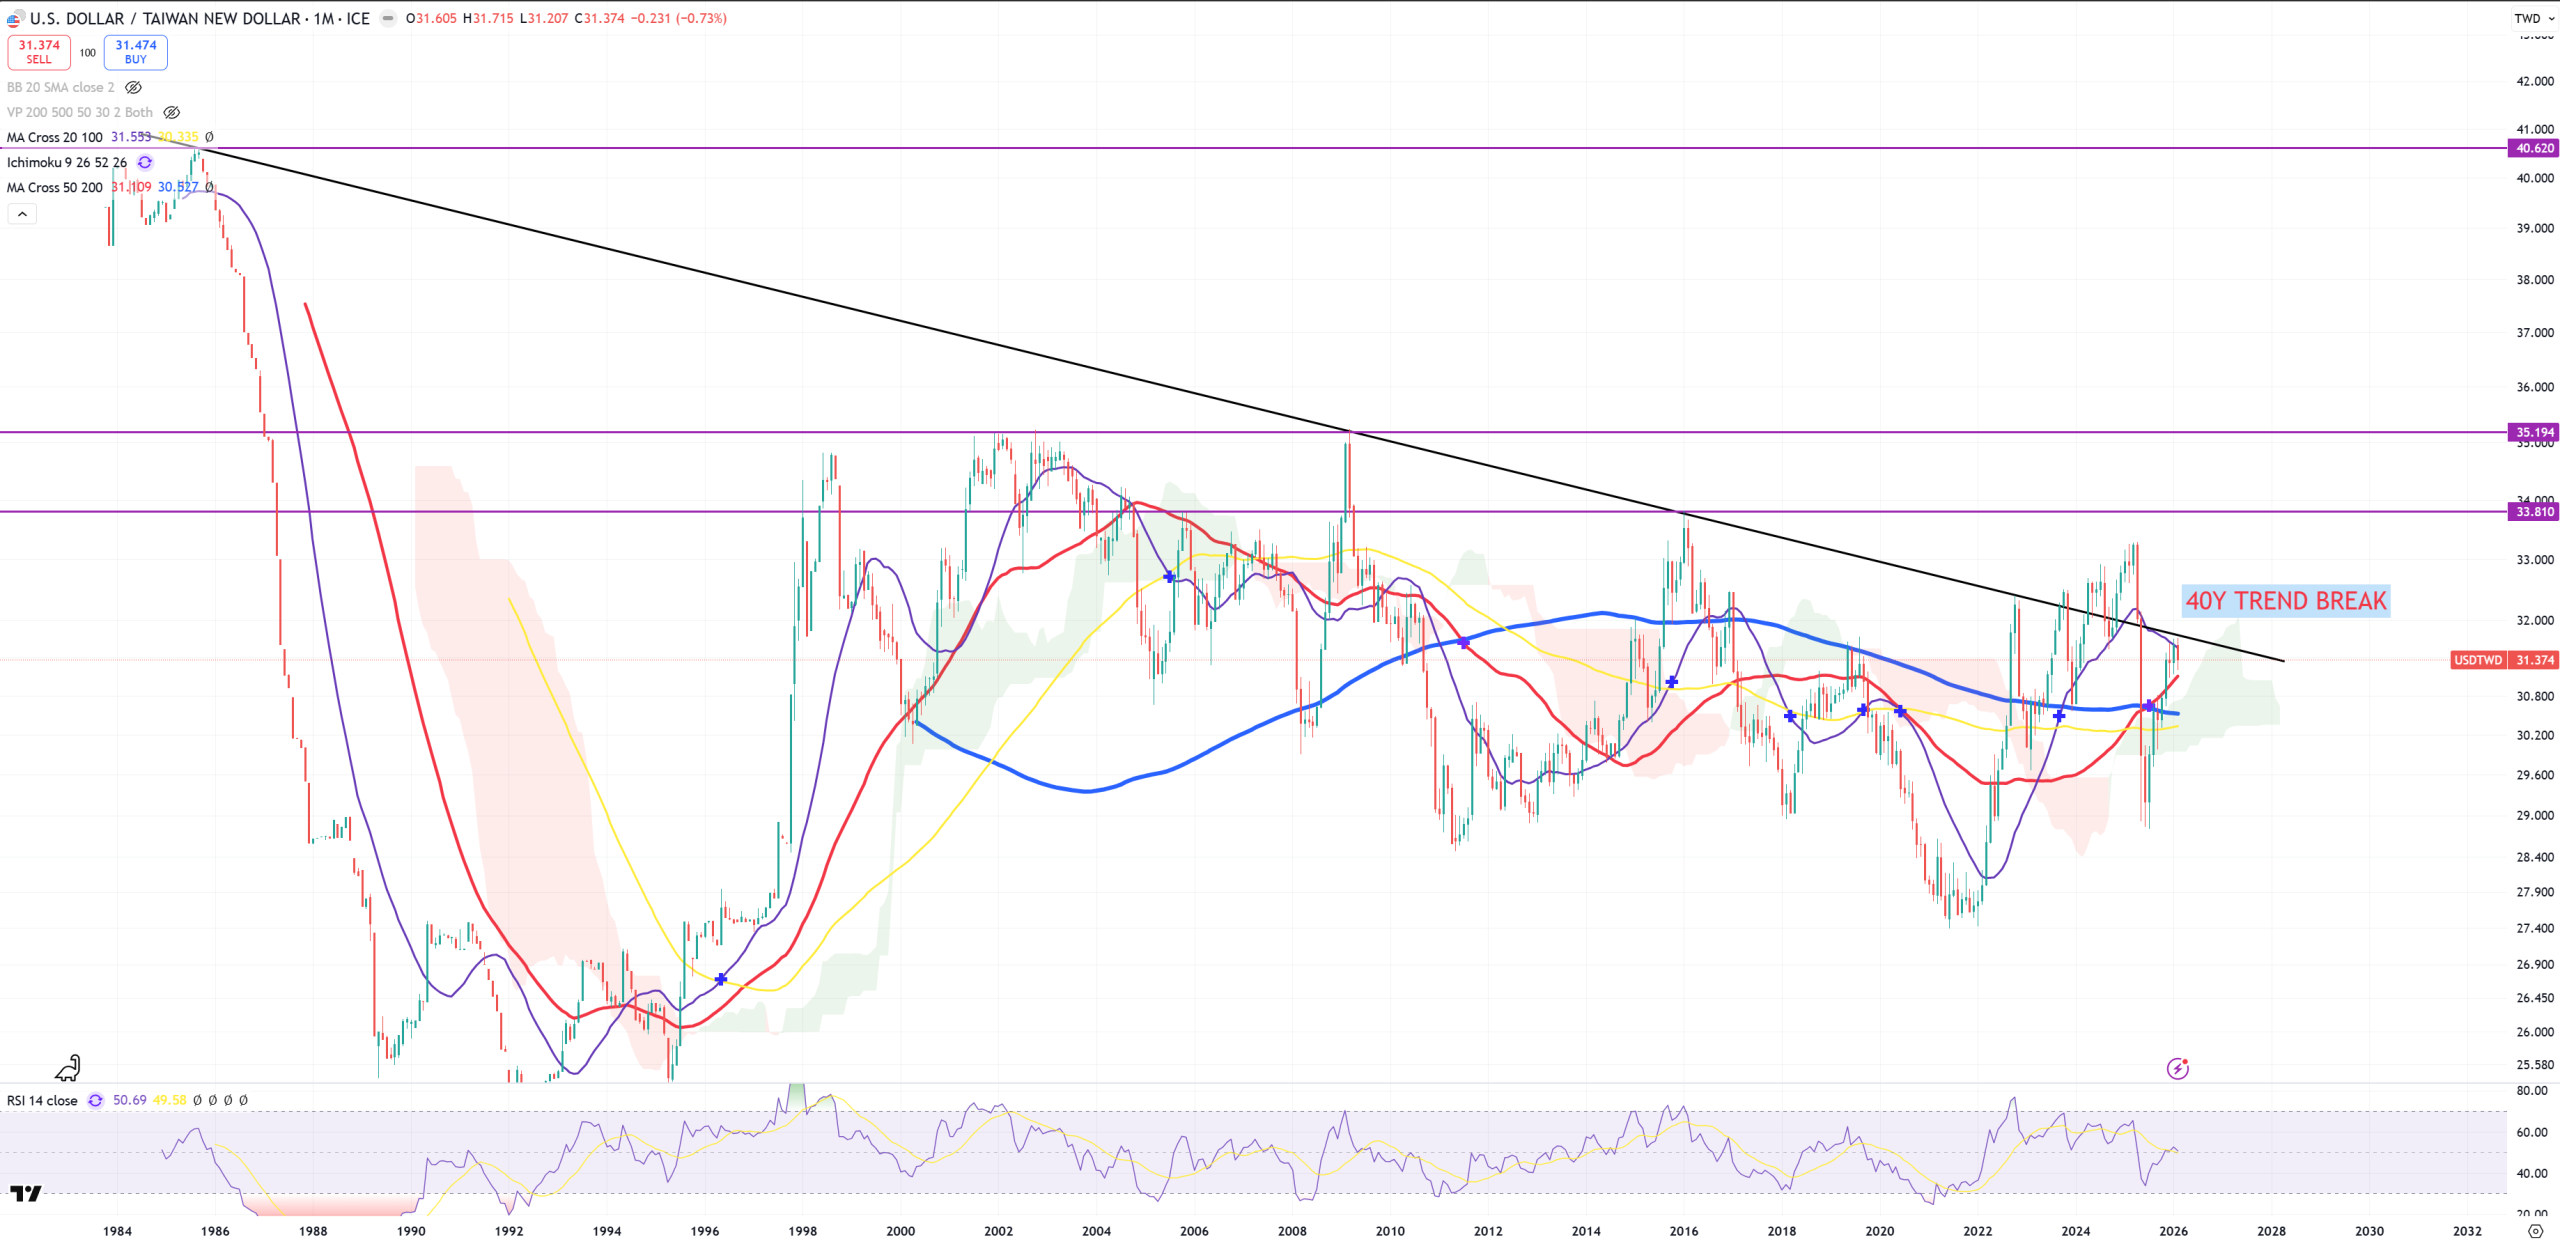
USDTWD – again razor thin. Big break or reject 40Ys trend
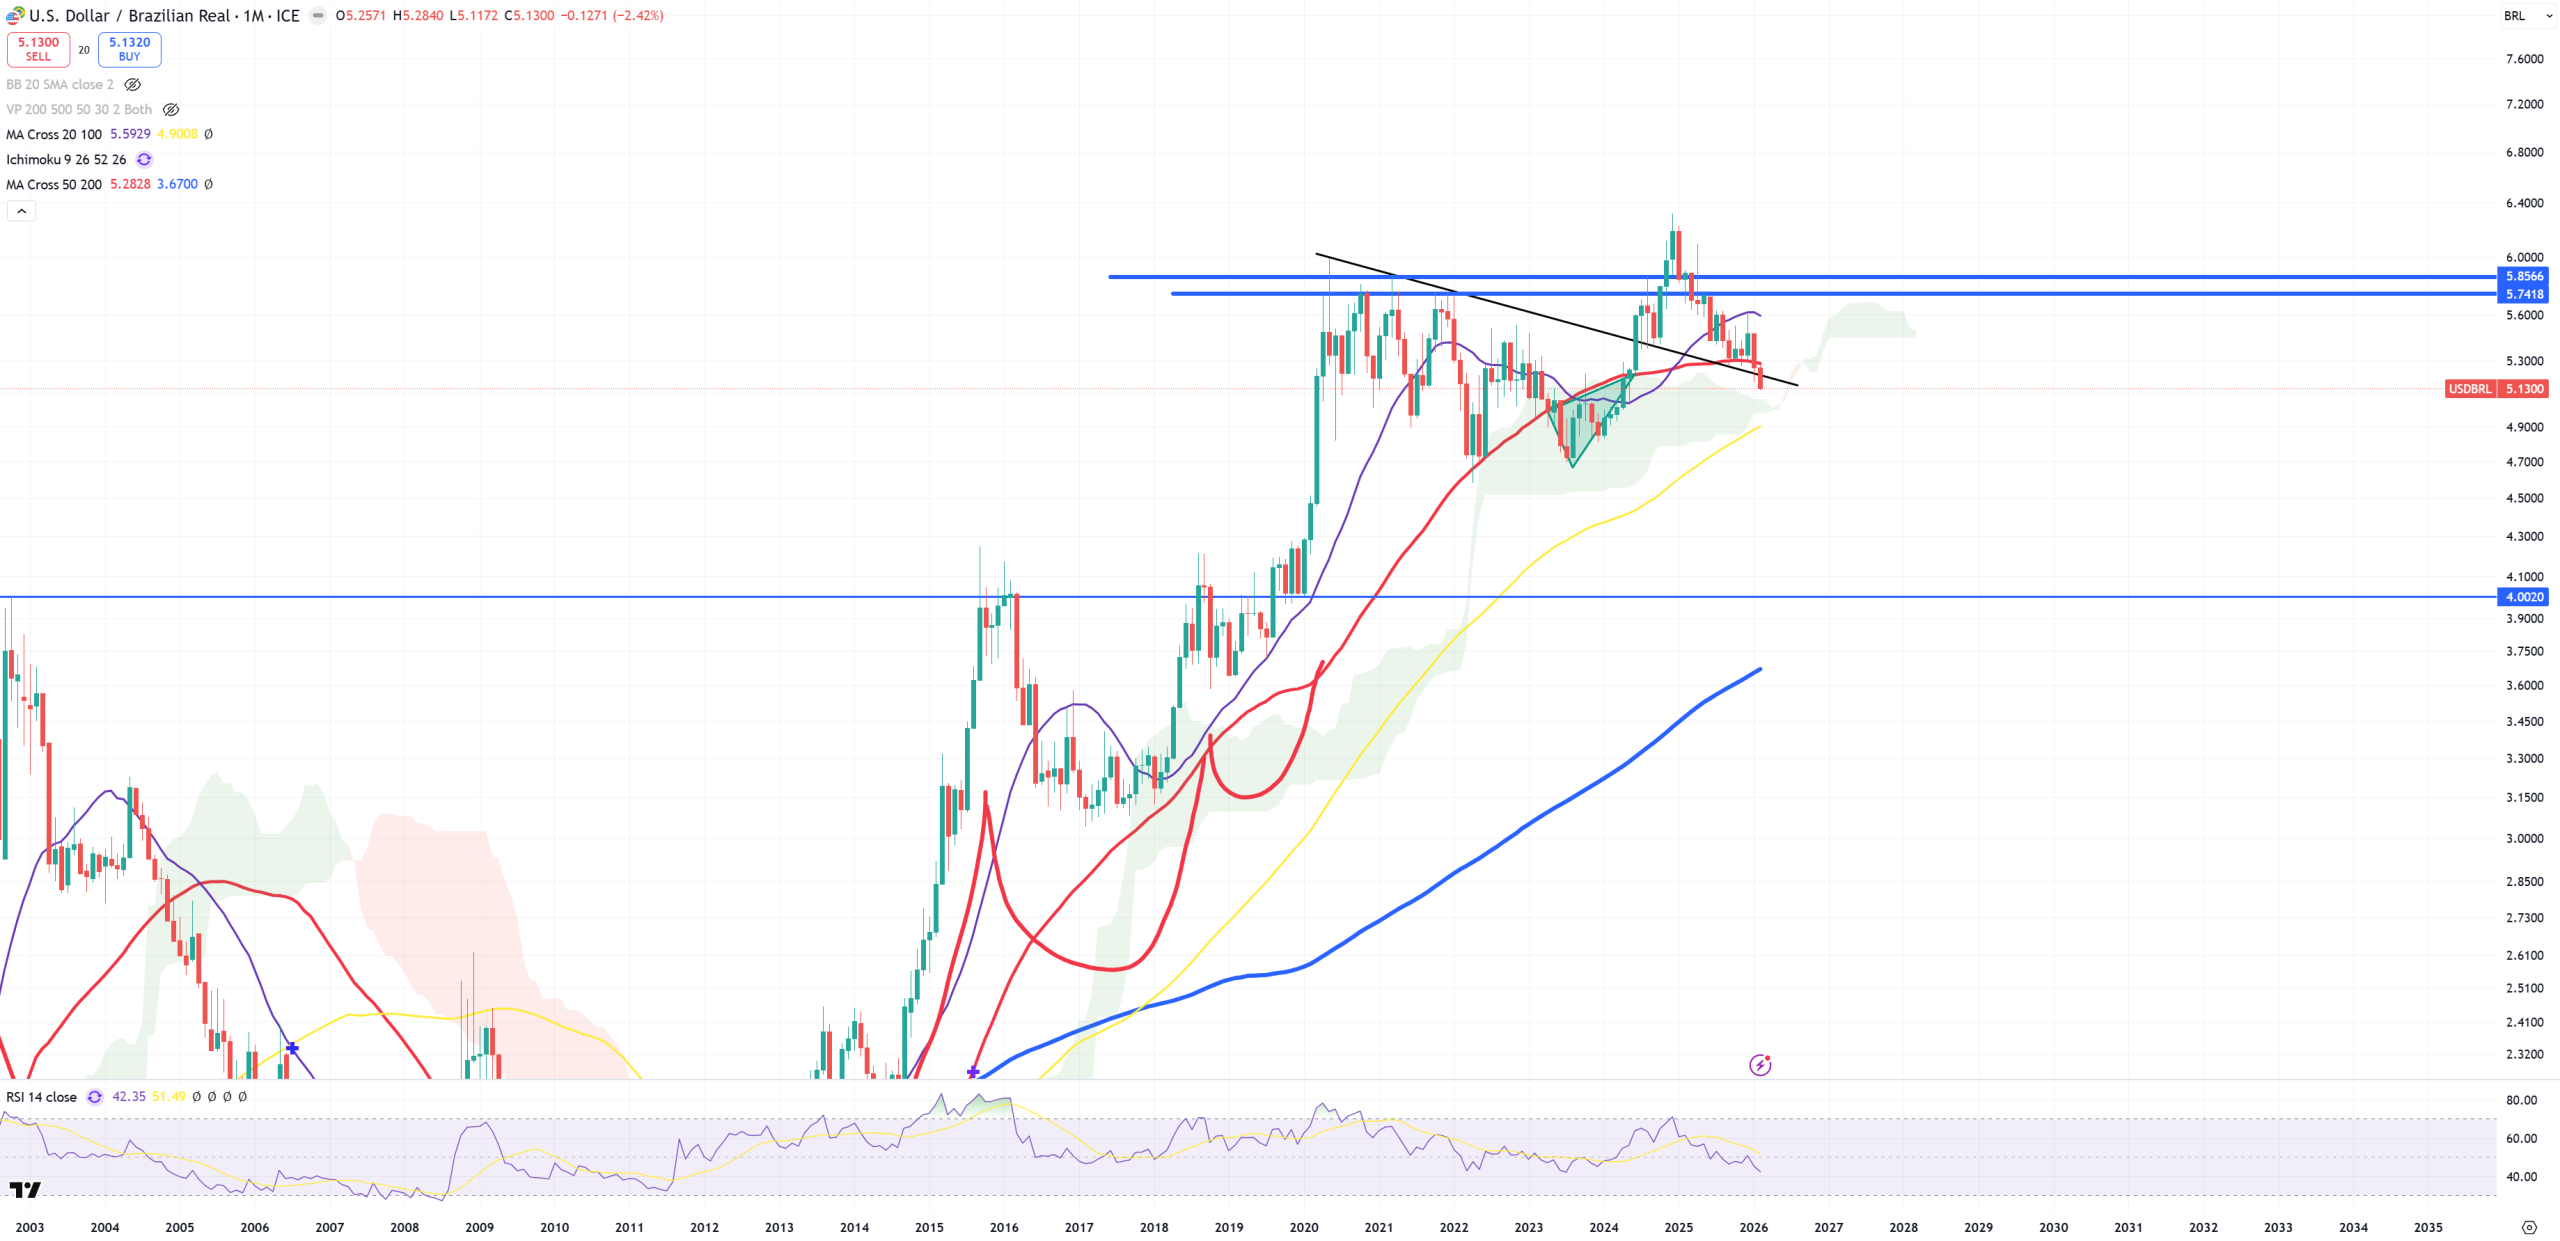
USDBRL – now it’s below (M)MA50, but black trend is also important. Big break or that’s just retest with a bear trap here?
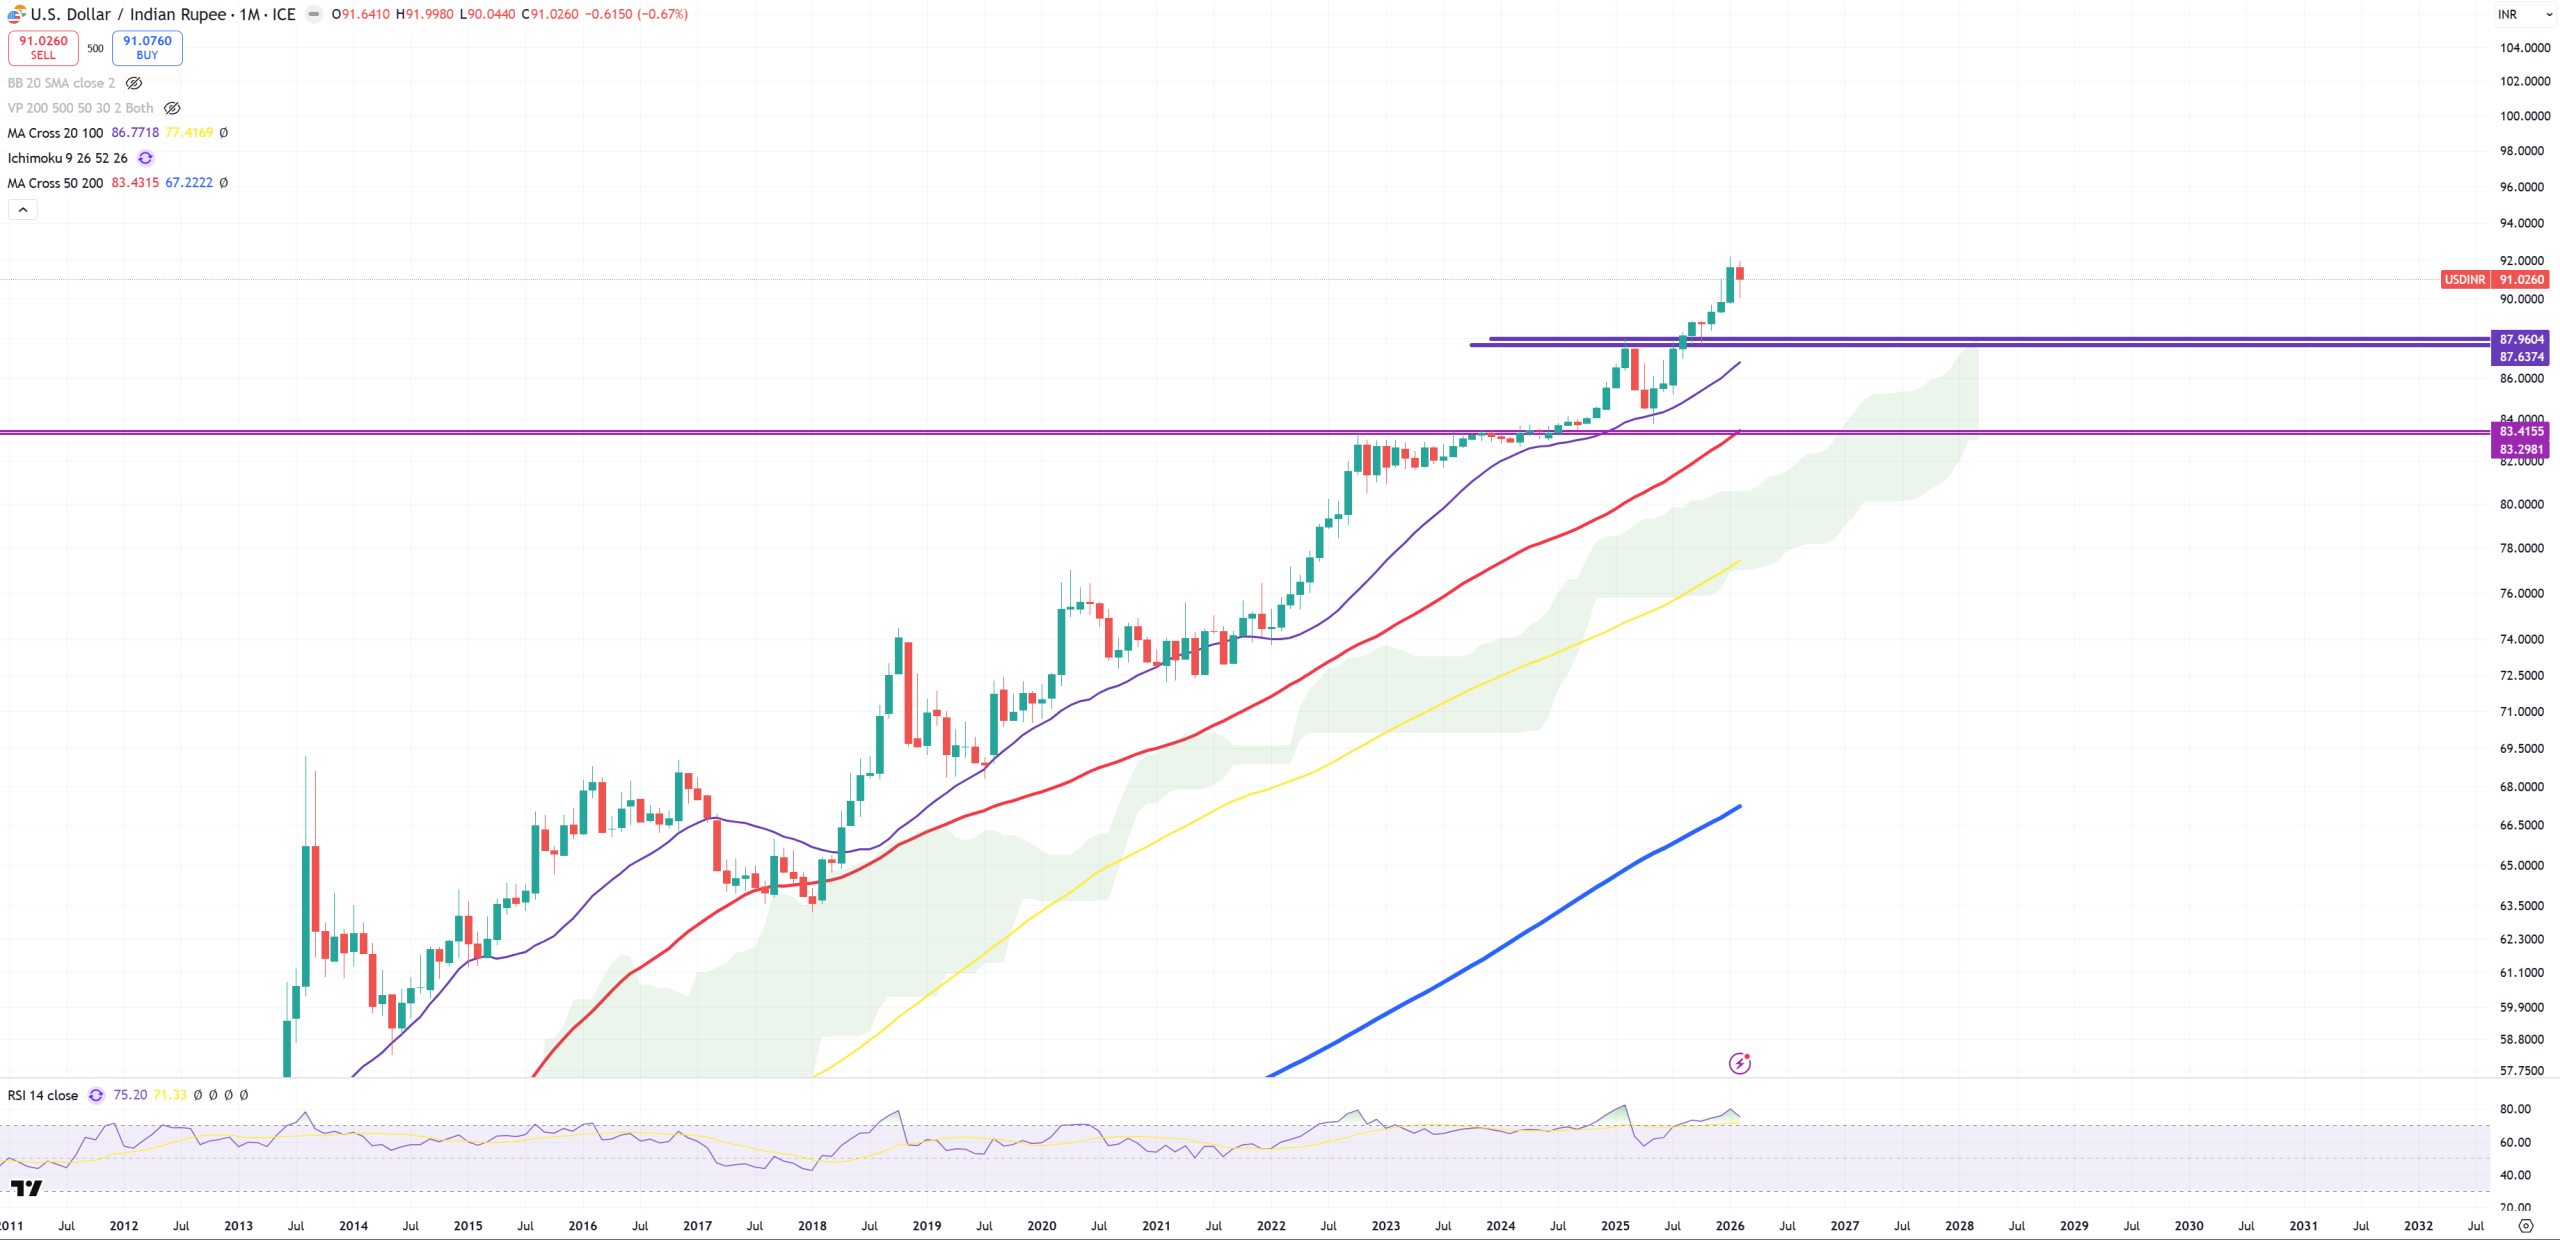
USDINR – here’s we have a very clean break
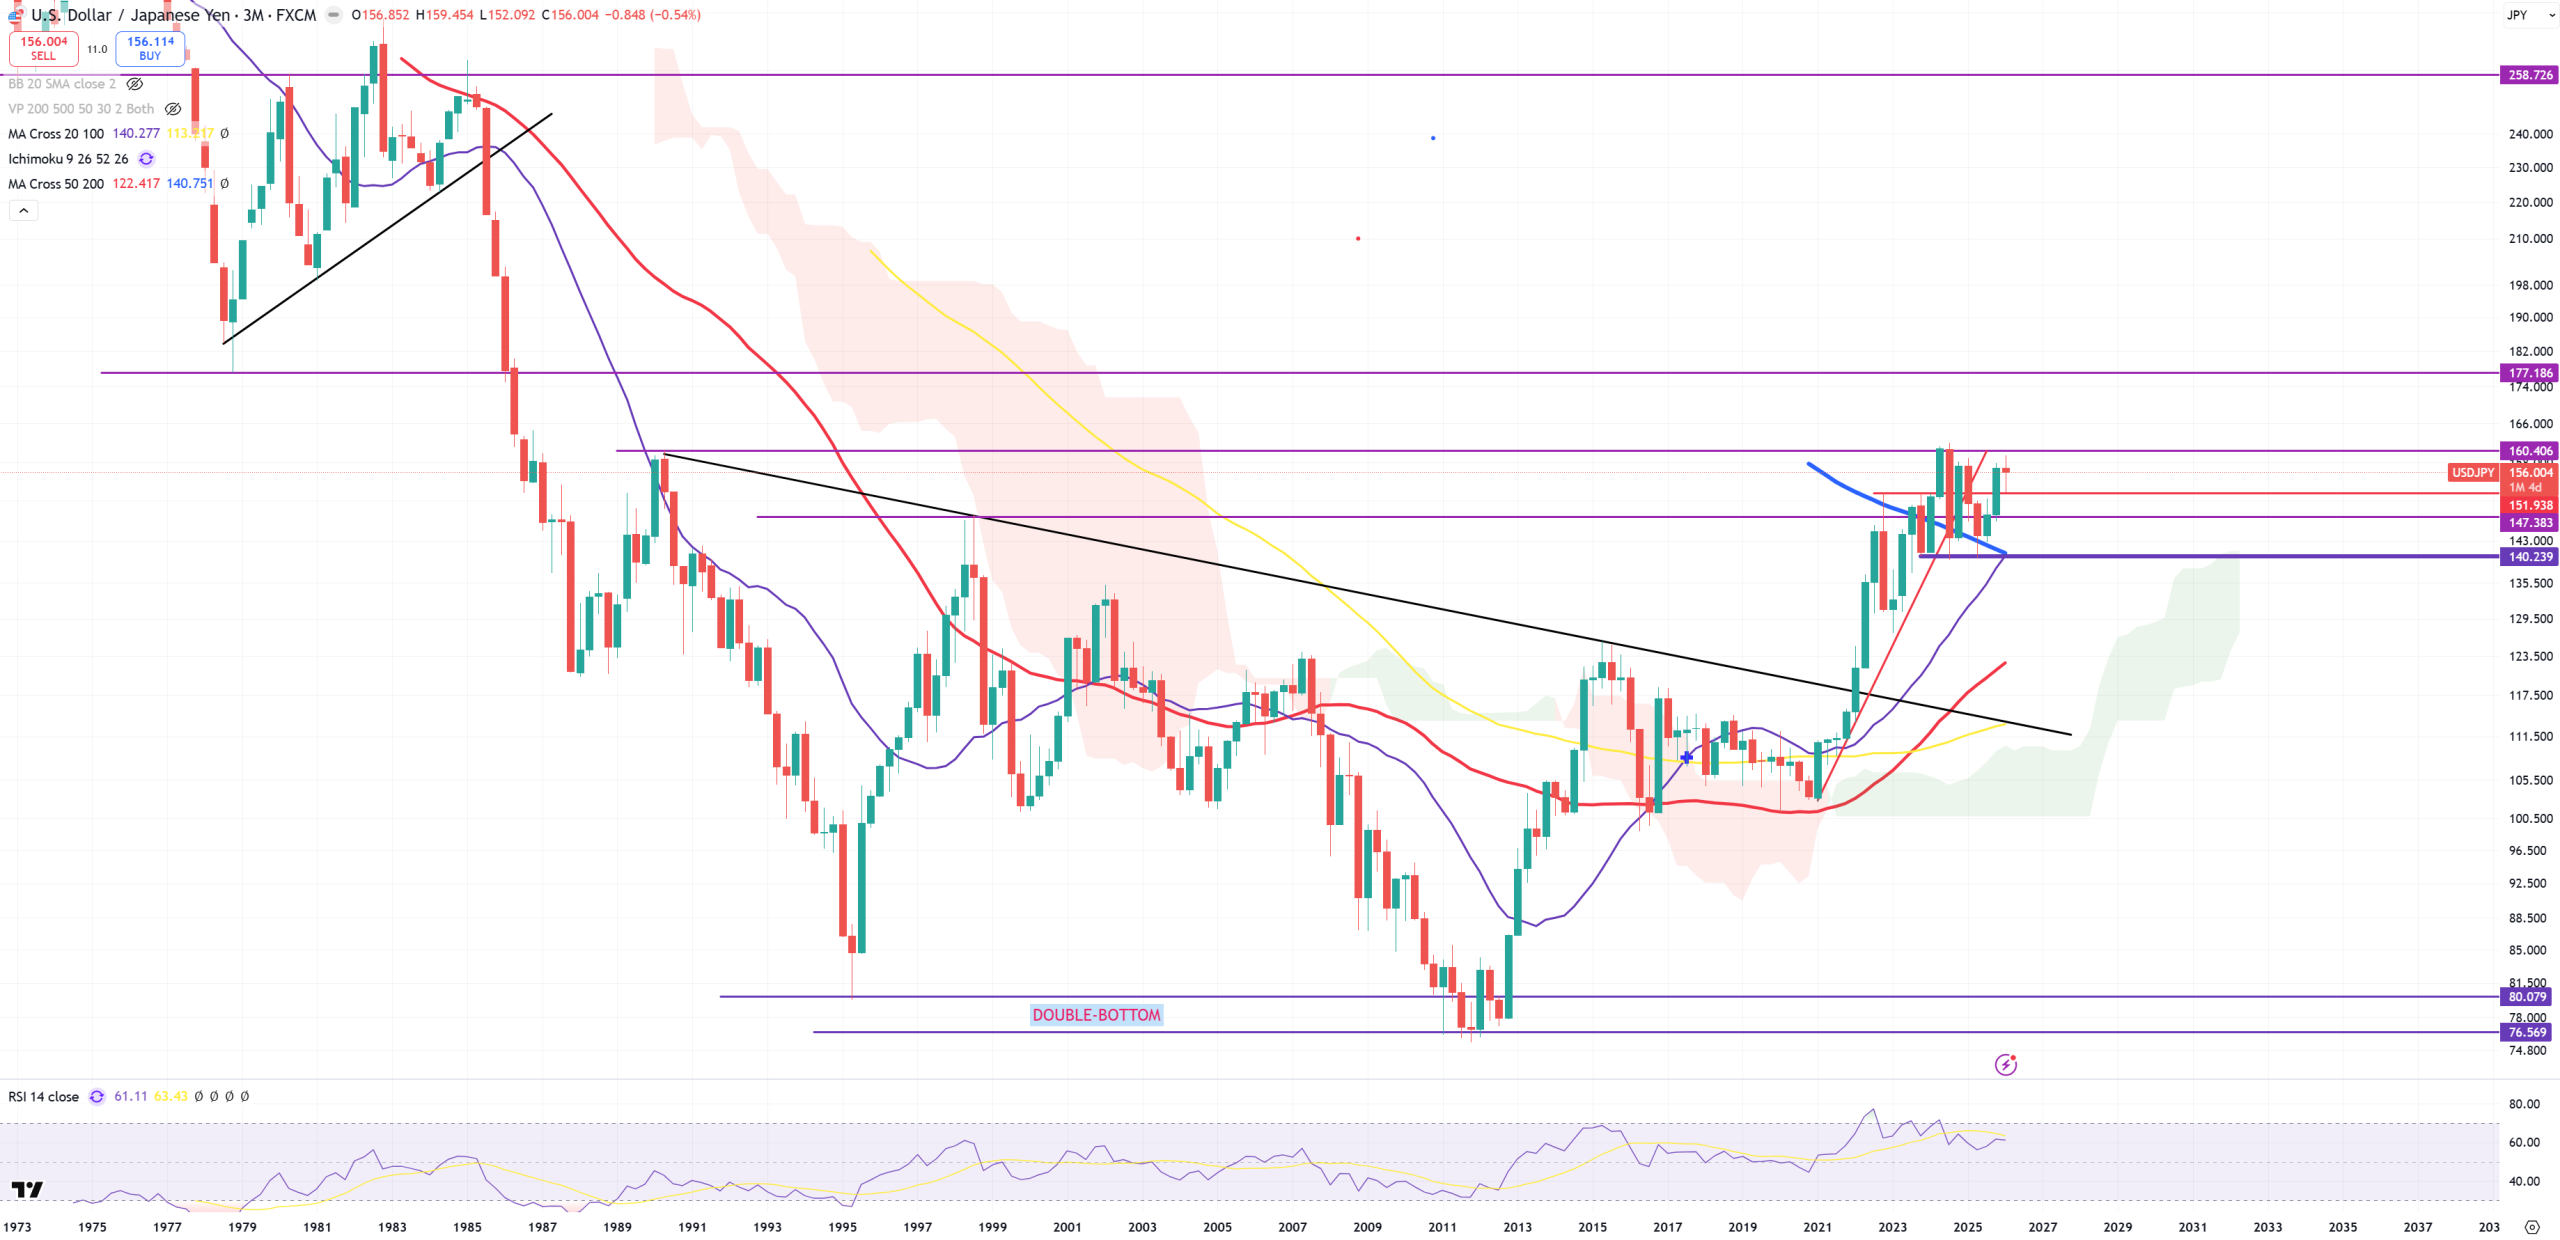
USDJPY – it can go to 300 or it can go to 110. No idea. Range 140-160 is totally neutral. This is 3M view to get a better view
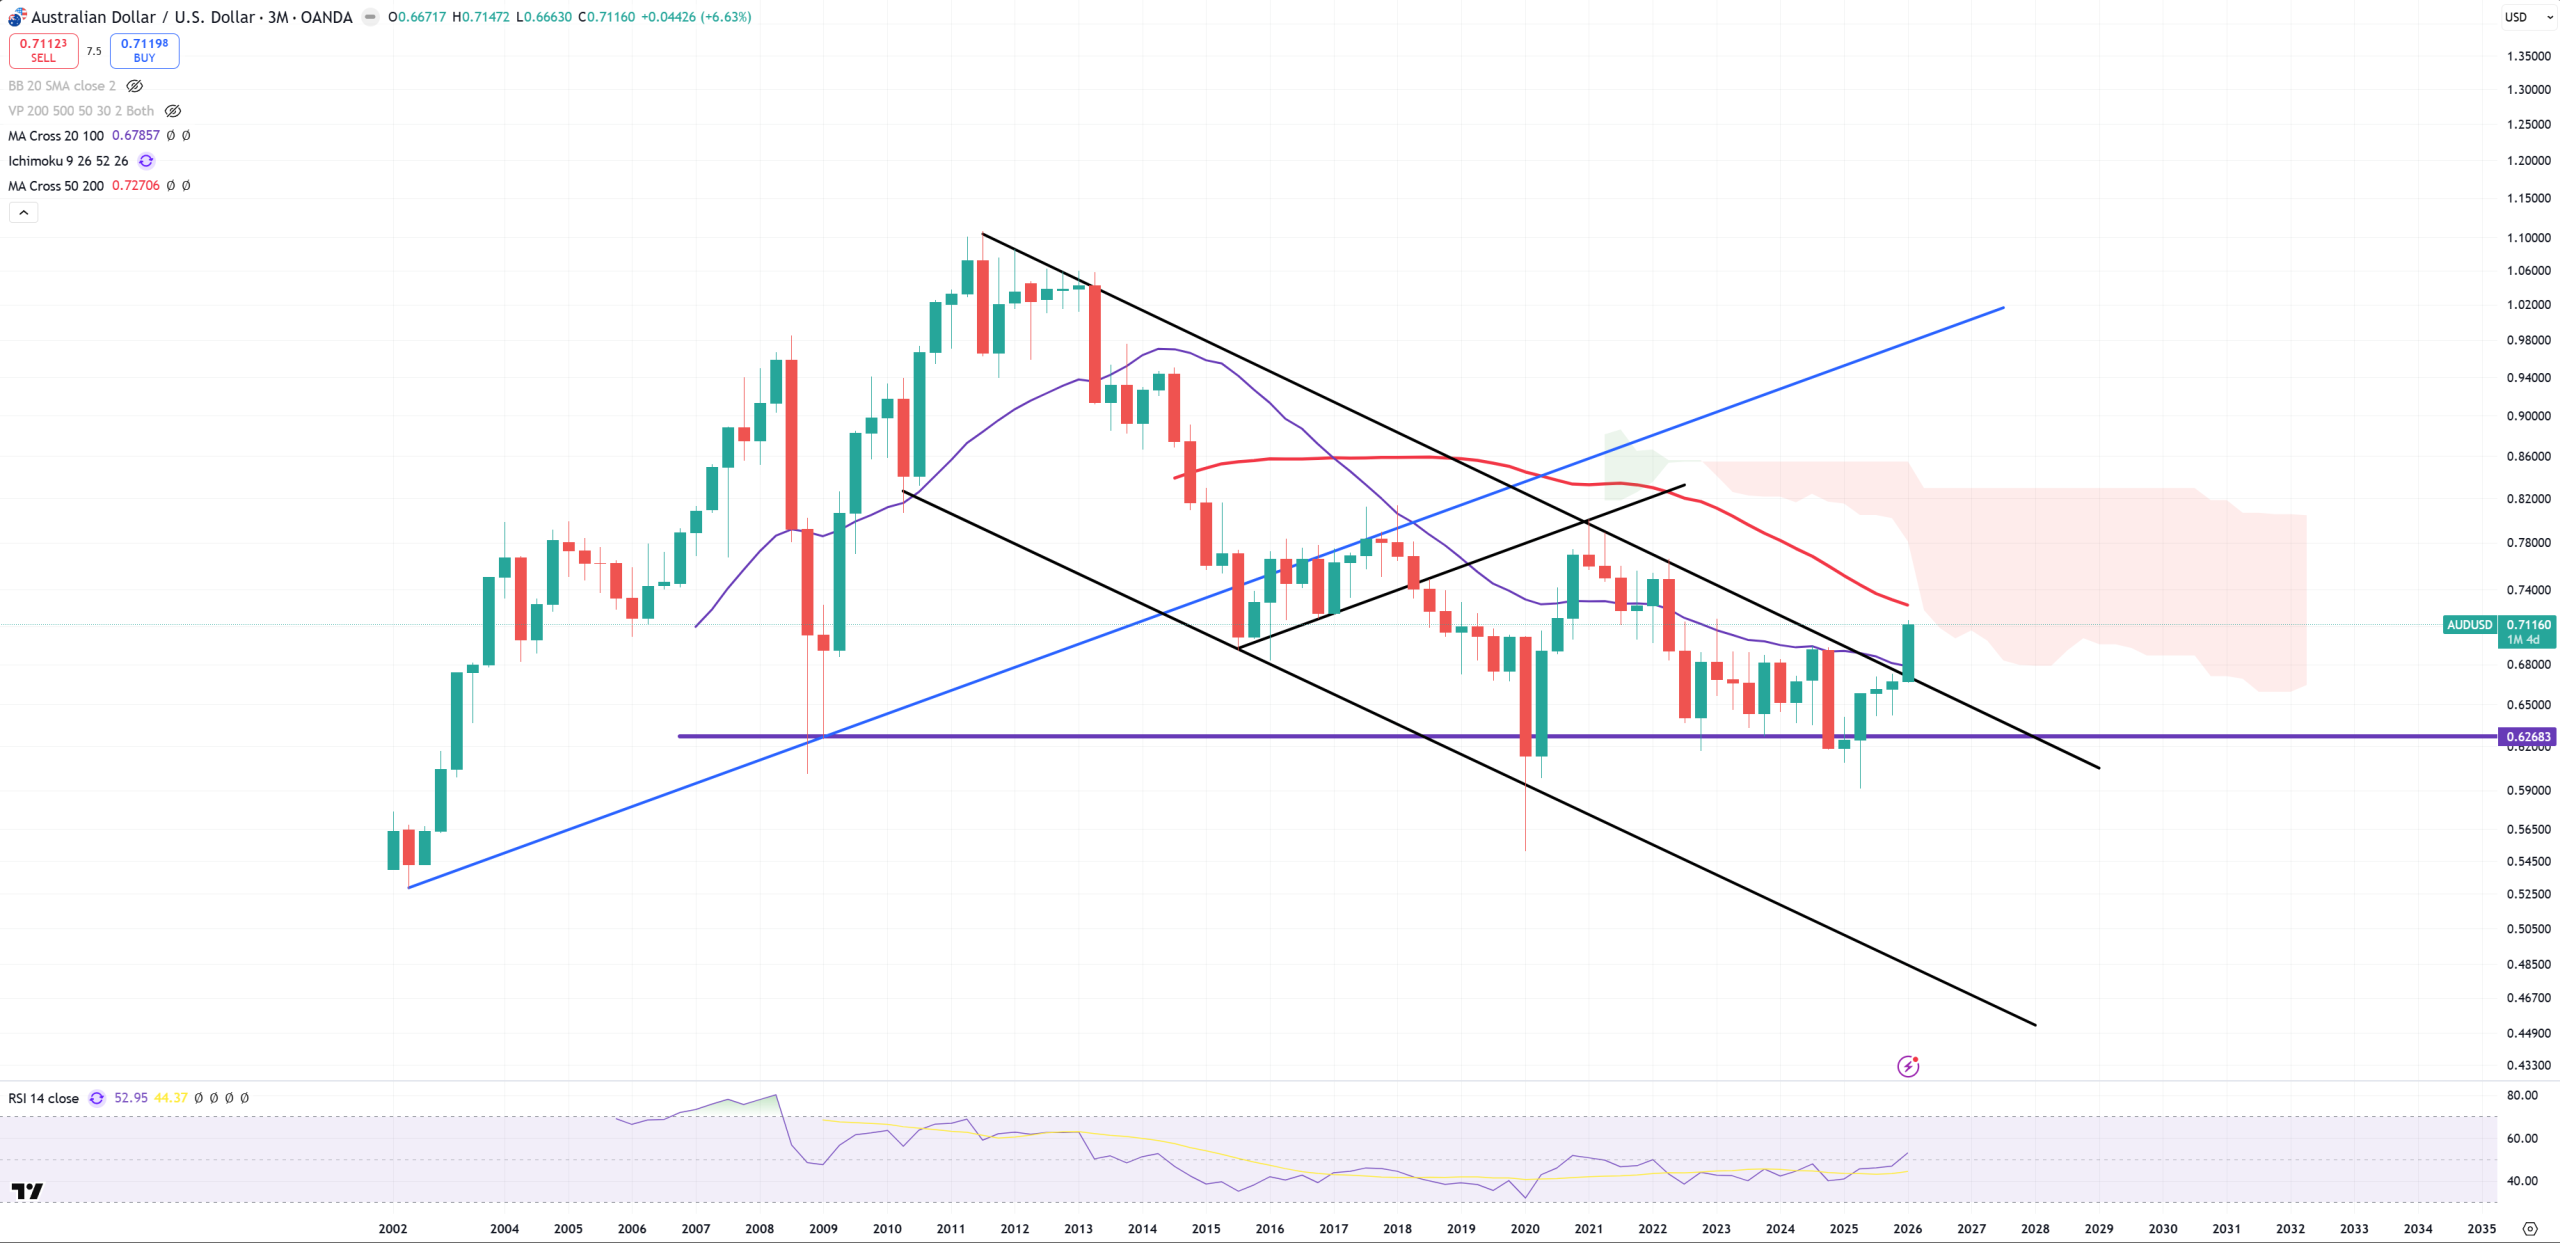
AUDUSD – it’s a derivative of USDCNH, so as USDCNH breaks (M)MA100 we also see here some junction break and that’s correct. This is 3M view to get wider view
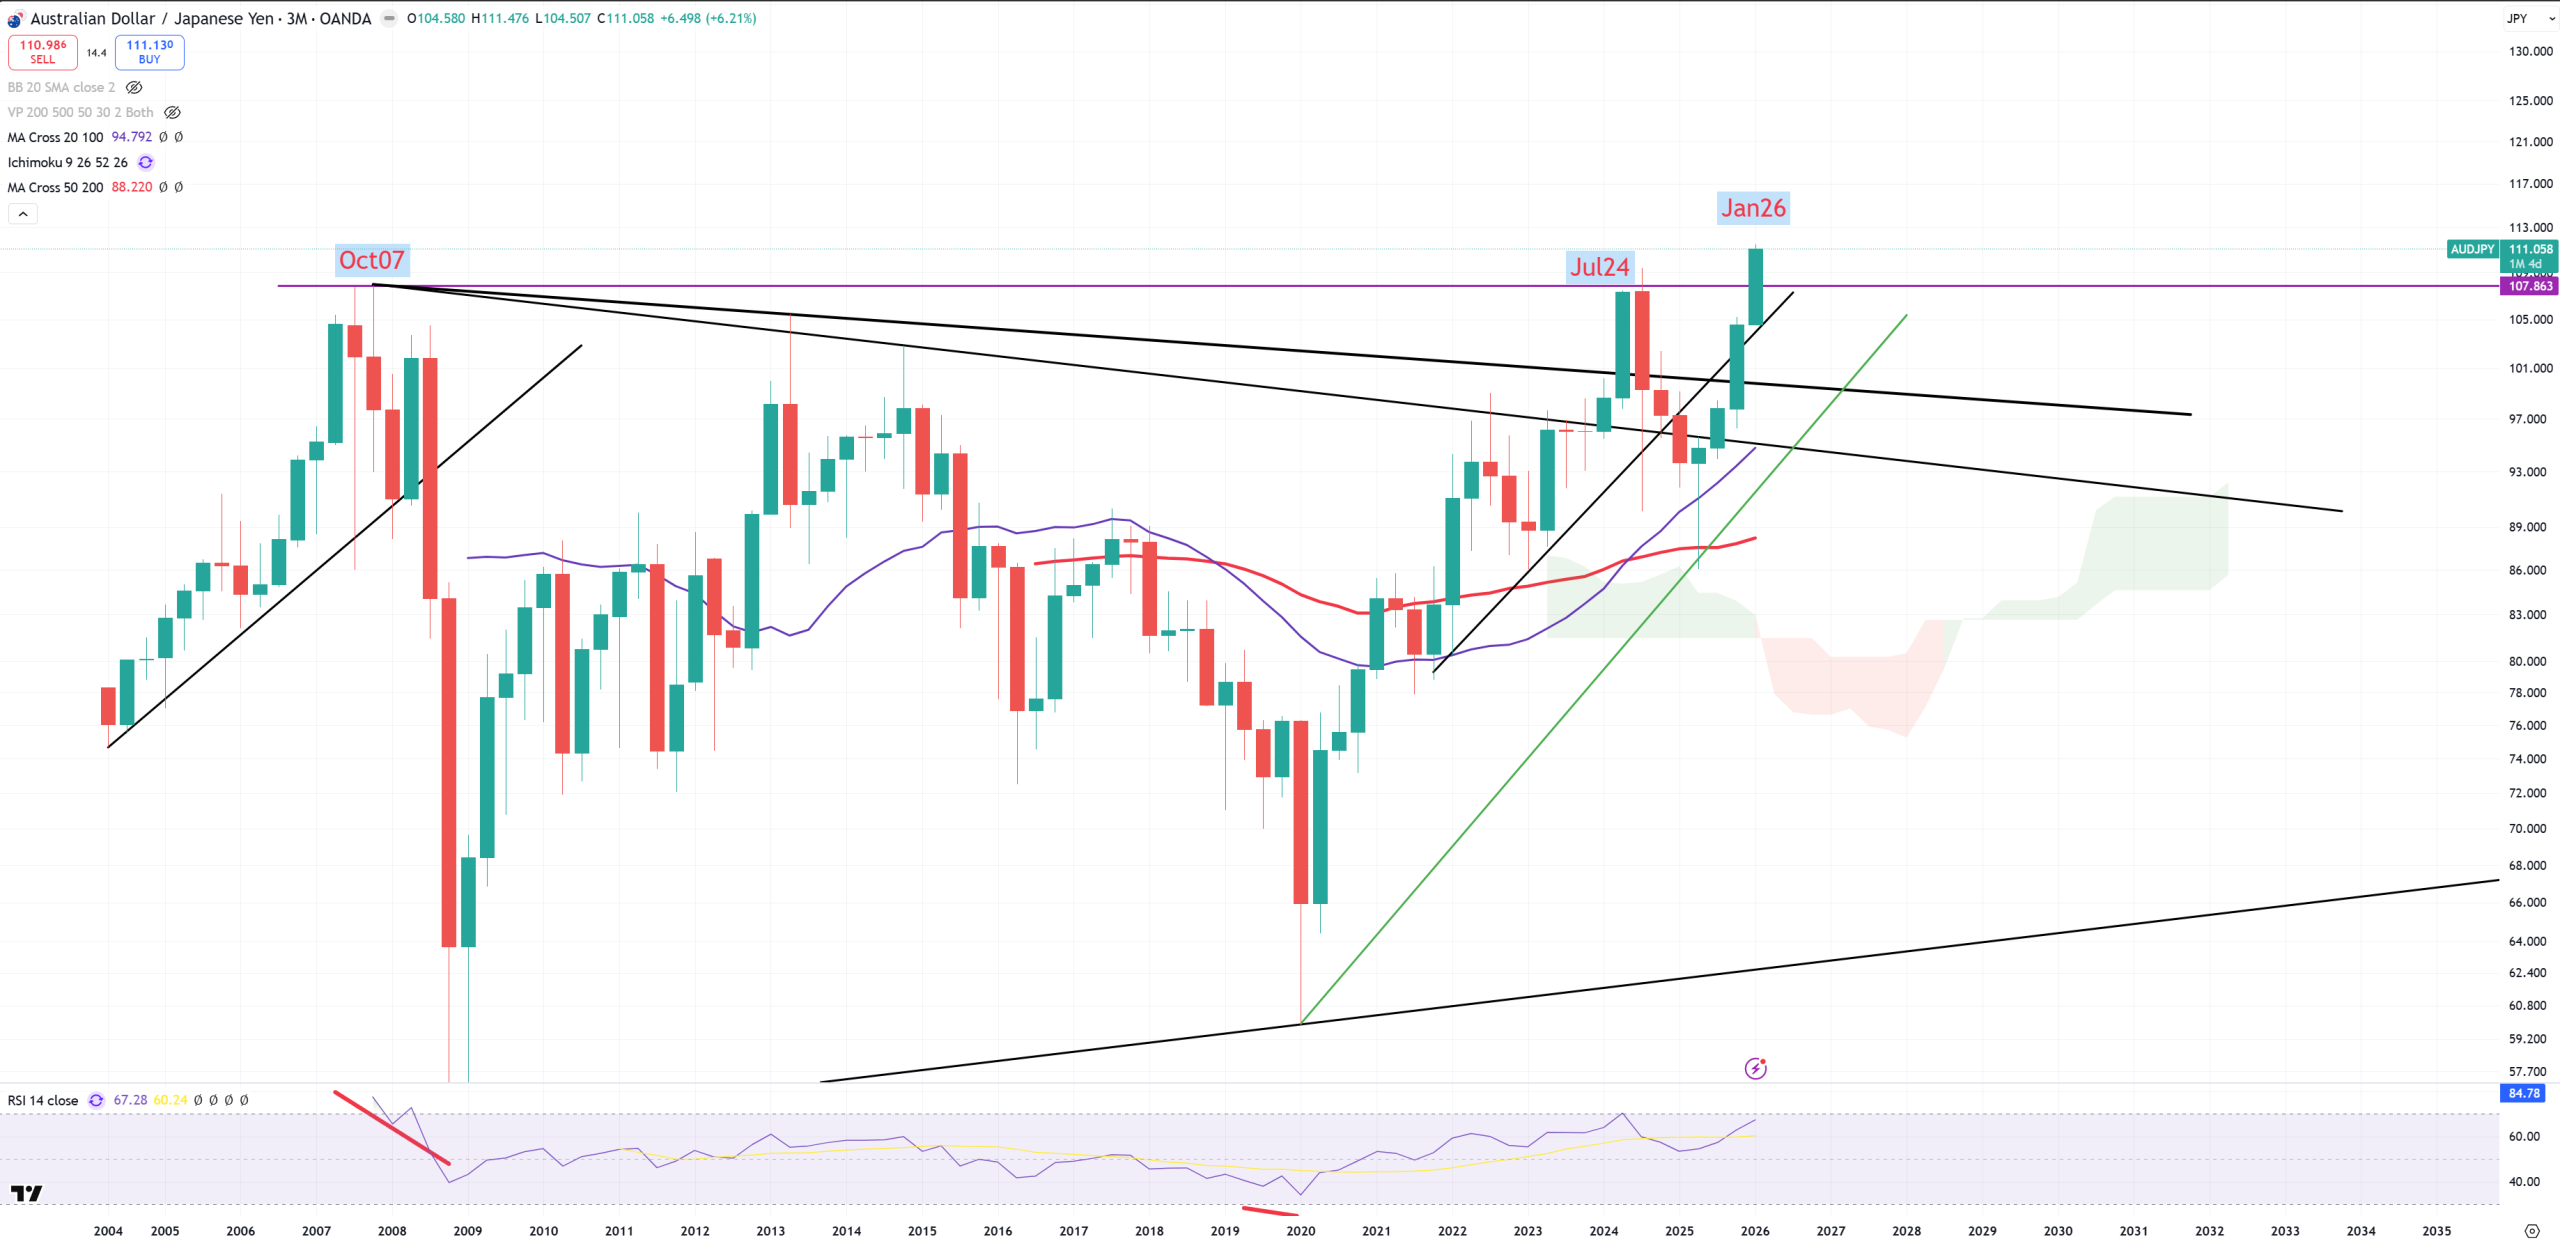
AUDJPY – so the main risk-on/off pair. Big break or massive bull trap here?
Magical 4Q2021 peak – SPX/GOLD peak
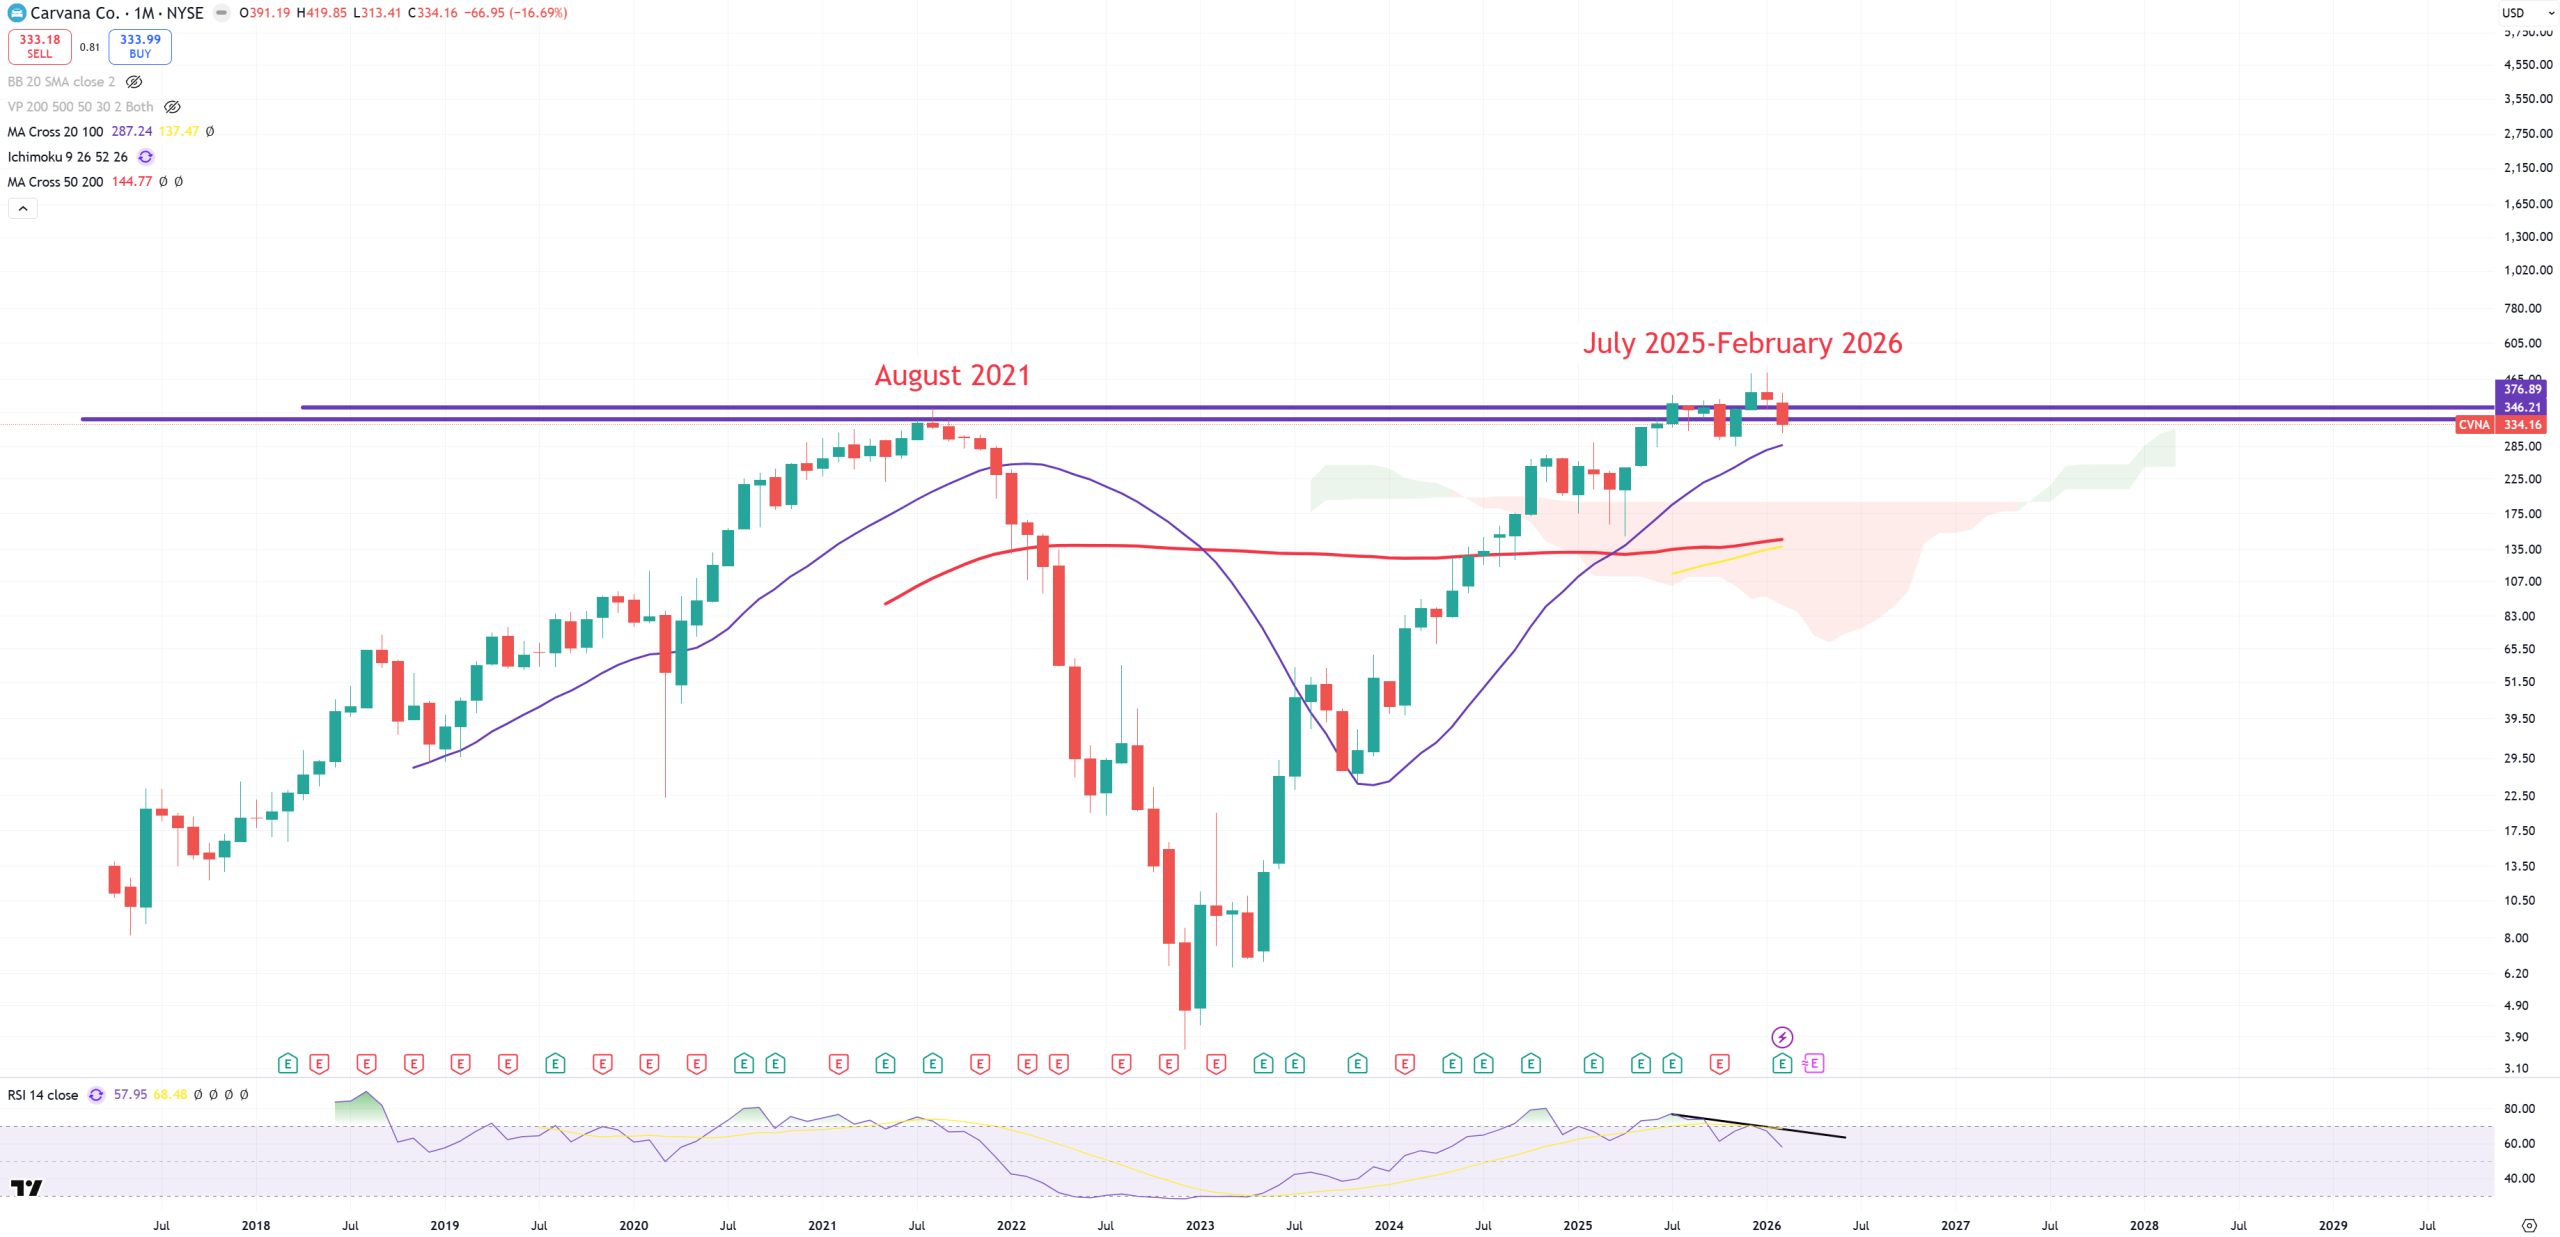
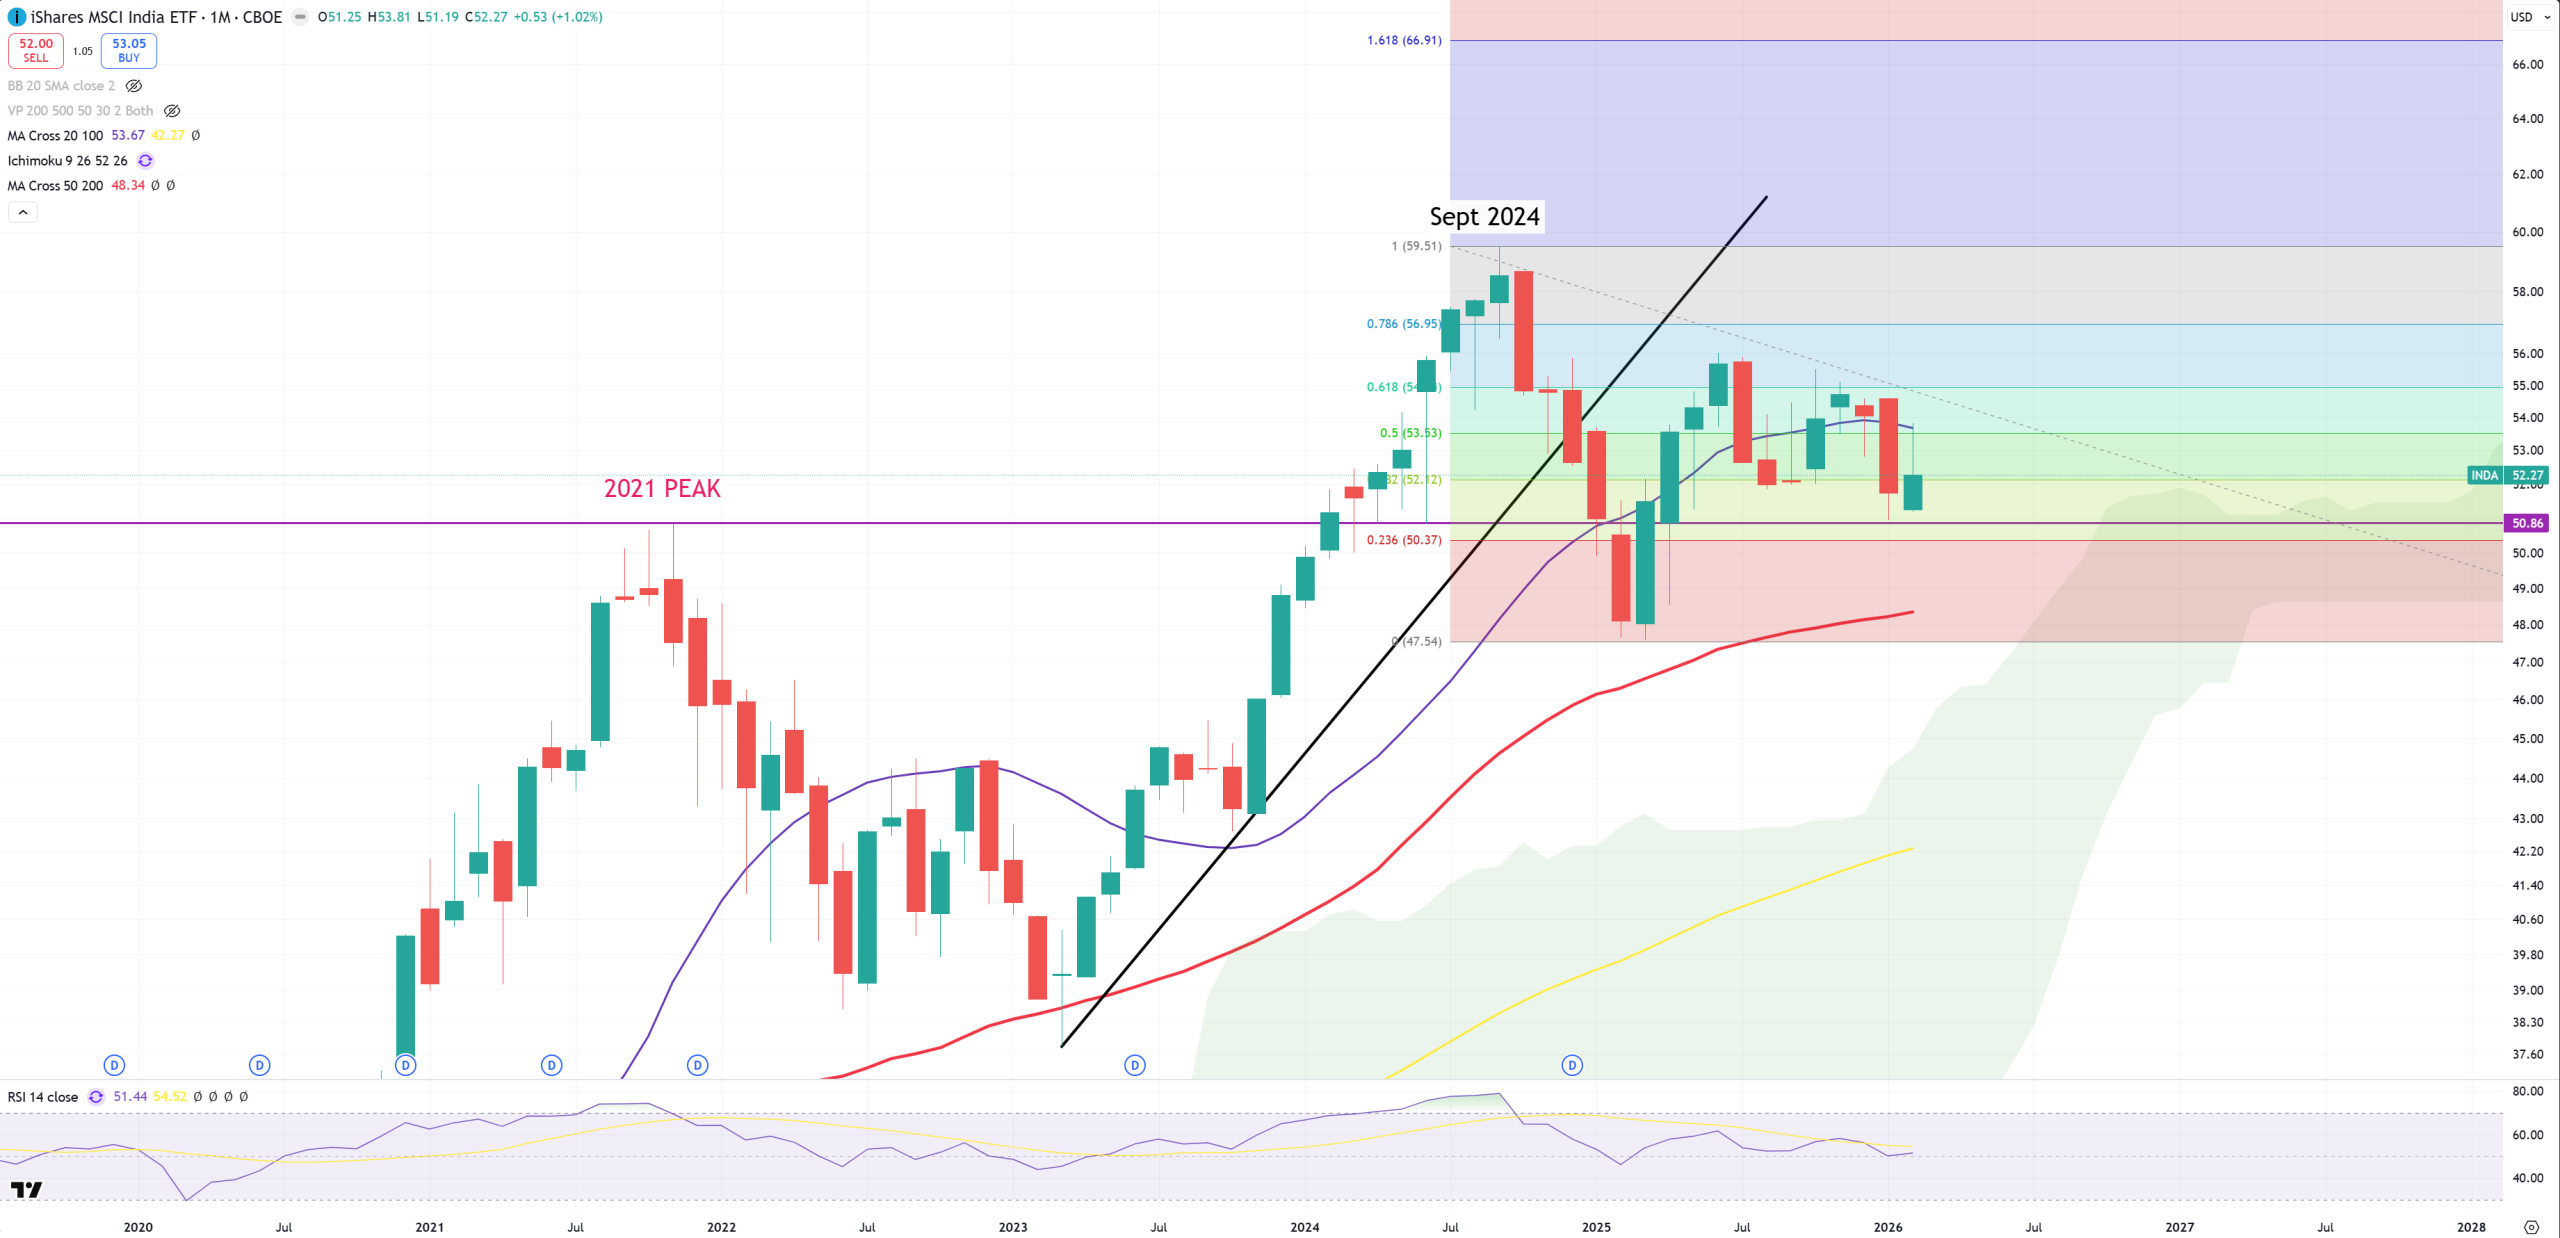
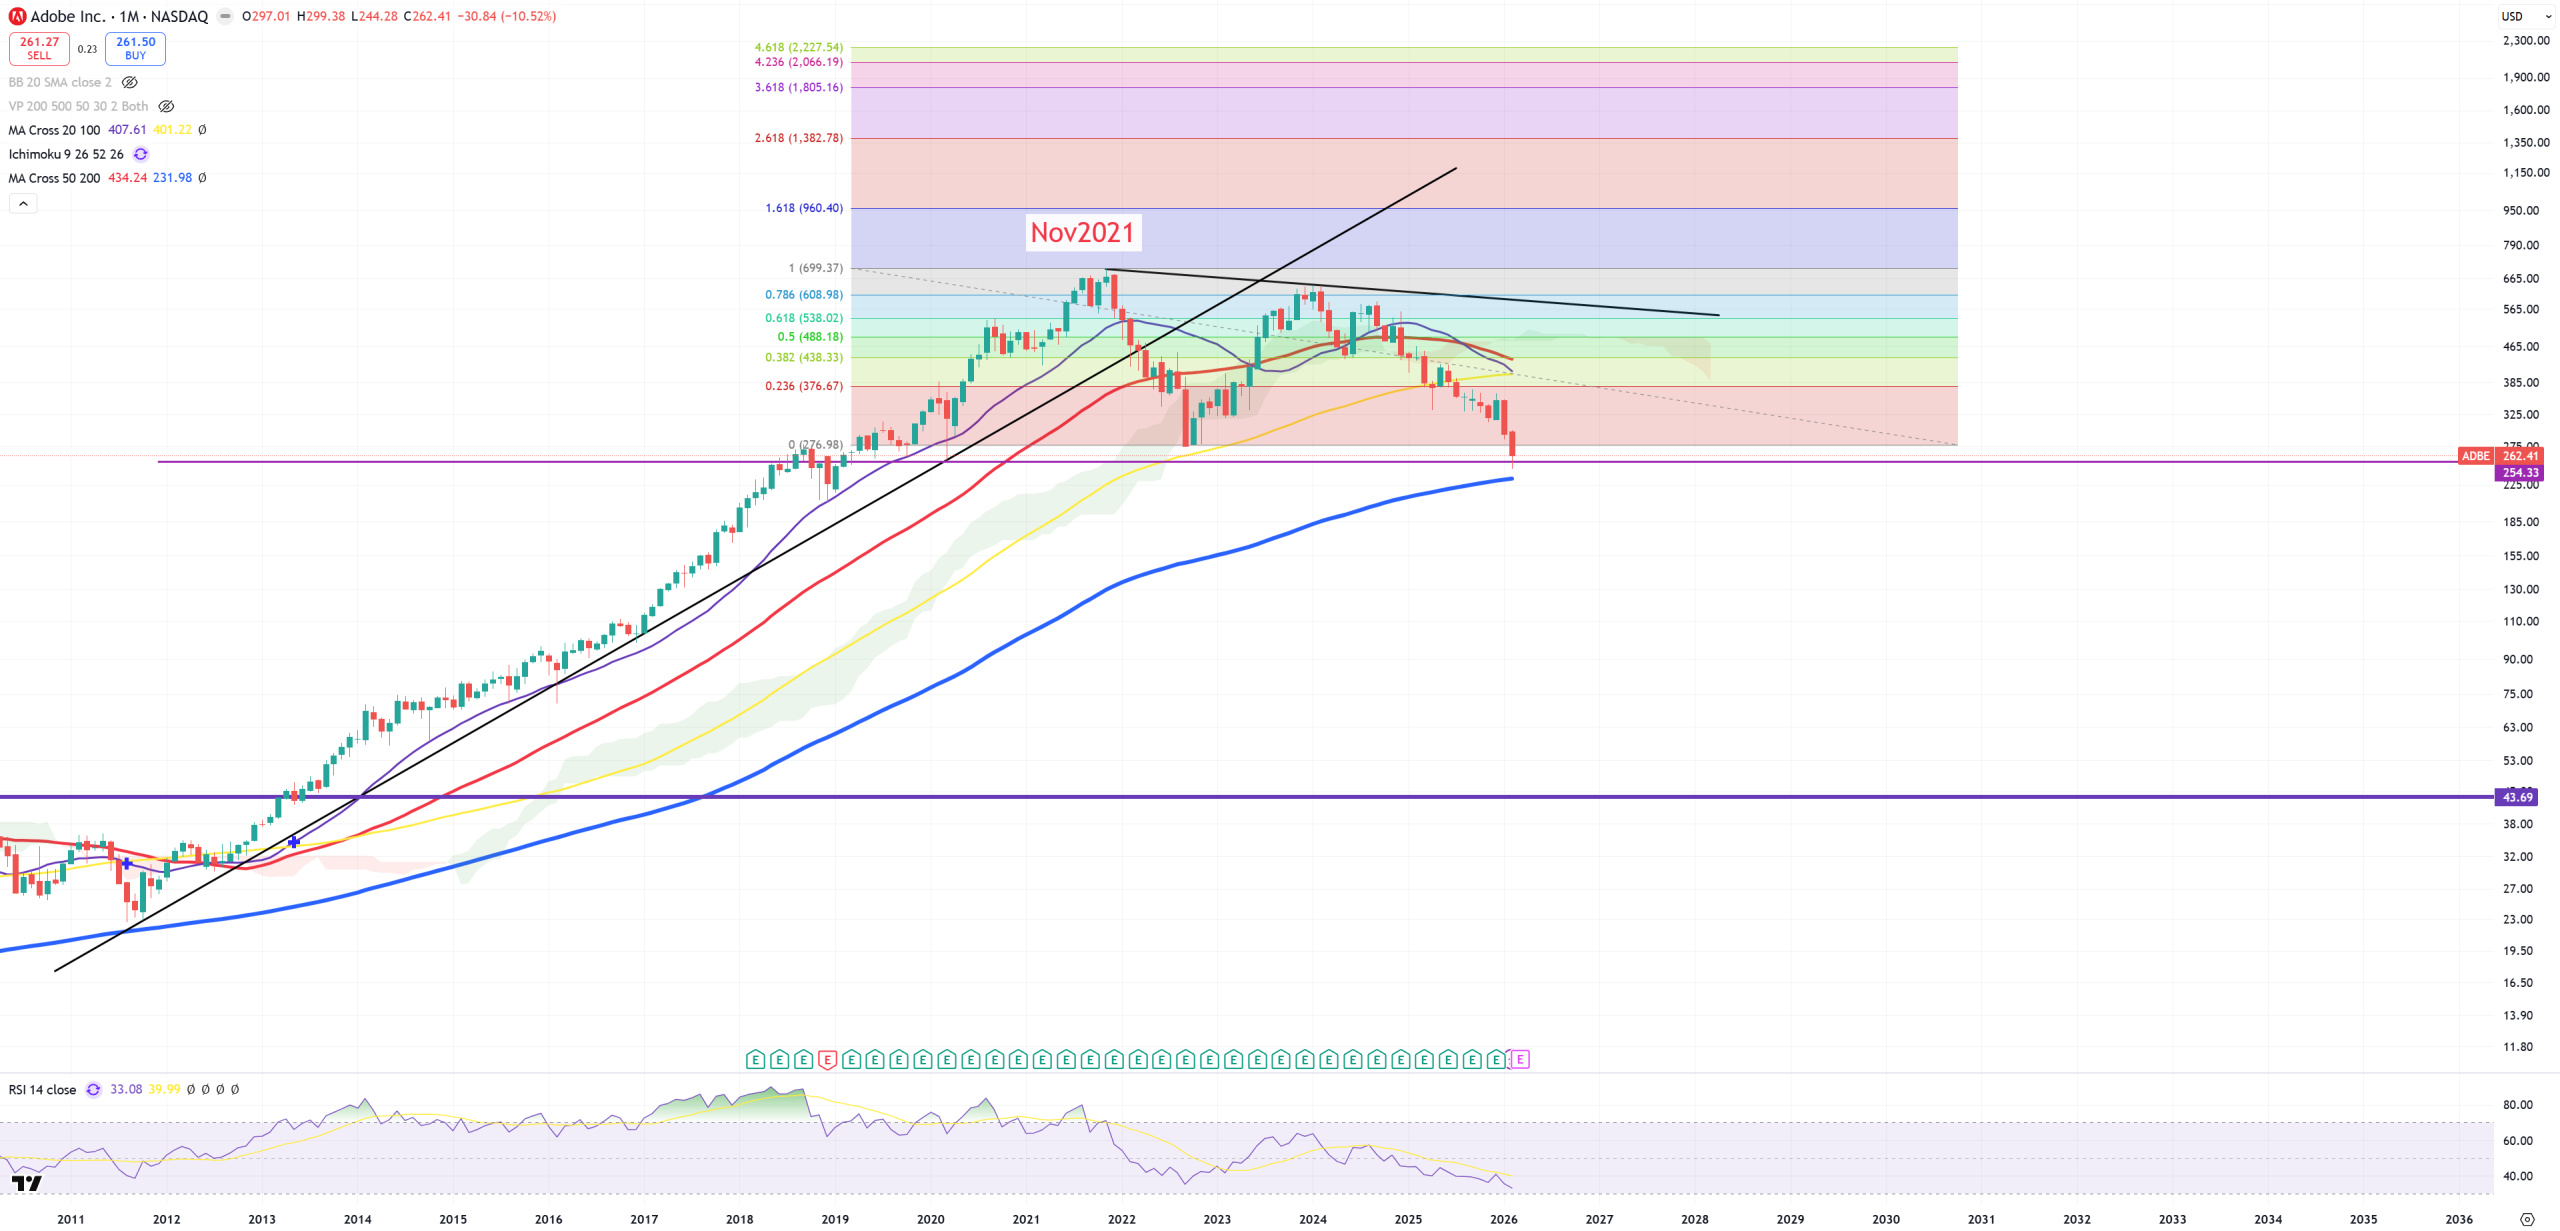
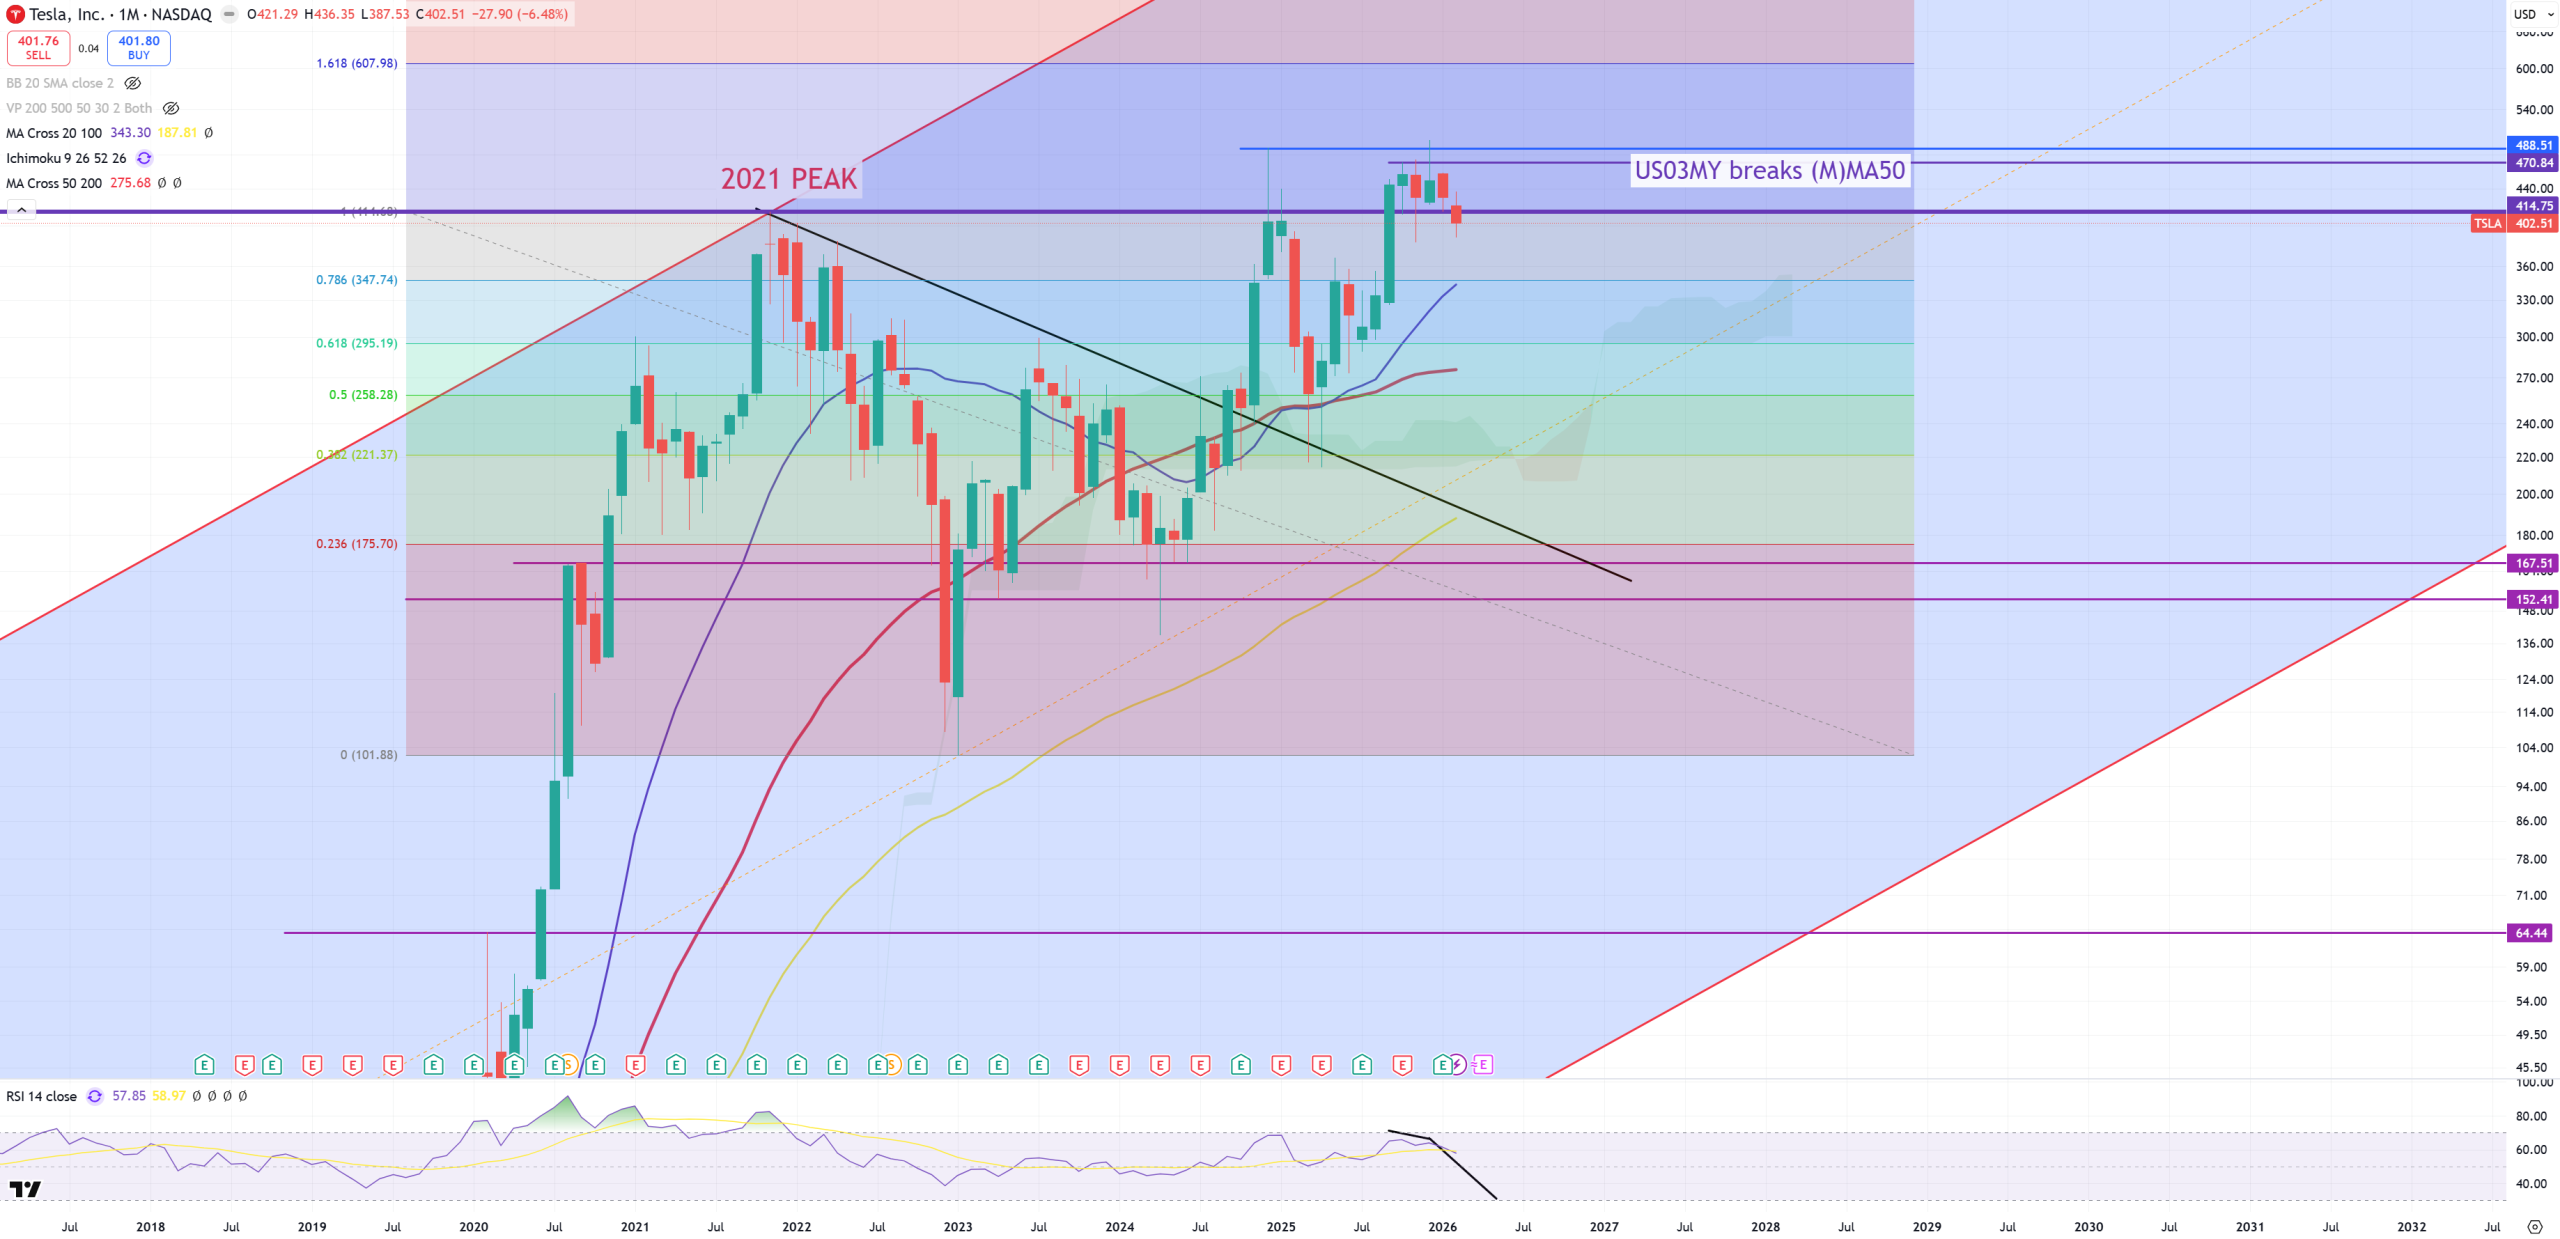
Couple examples, I’ll give you a key you need to check it out. My bet is : everything is going to reverse below 4Q21/1Q22 peak, once it’s done it’s game over. 3 examples
CVNA – here we have perfect double-top
INDA – India ETF – almost
ADBE – below even 2020 lows
TSLA – now below 2021 peak.
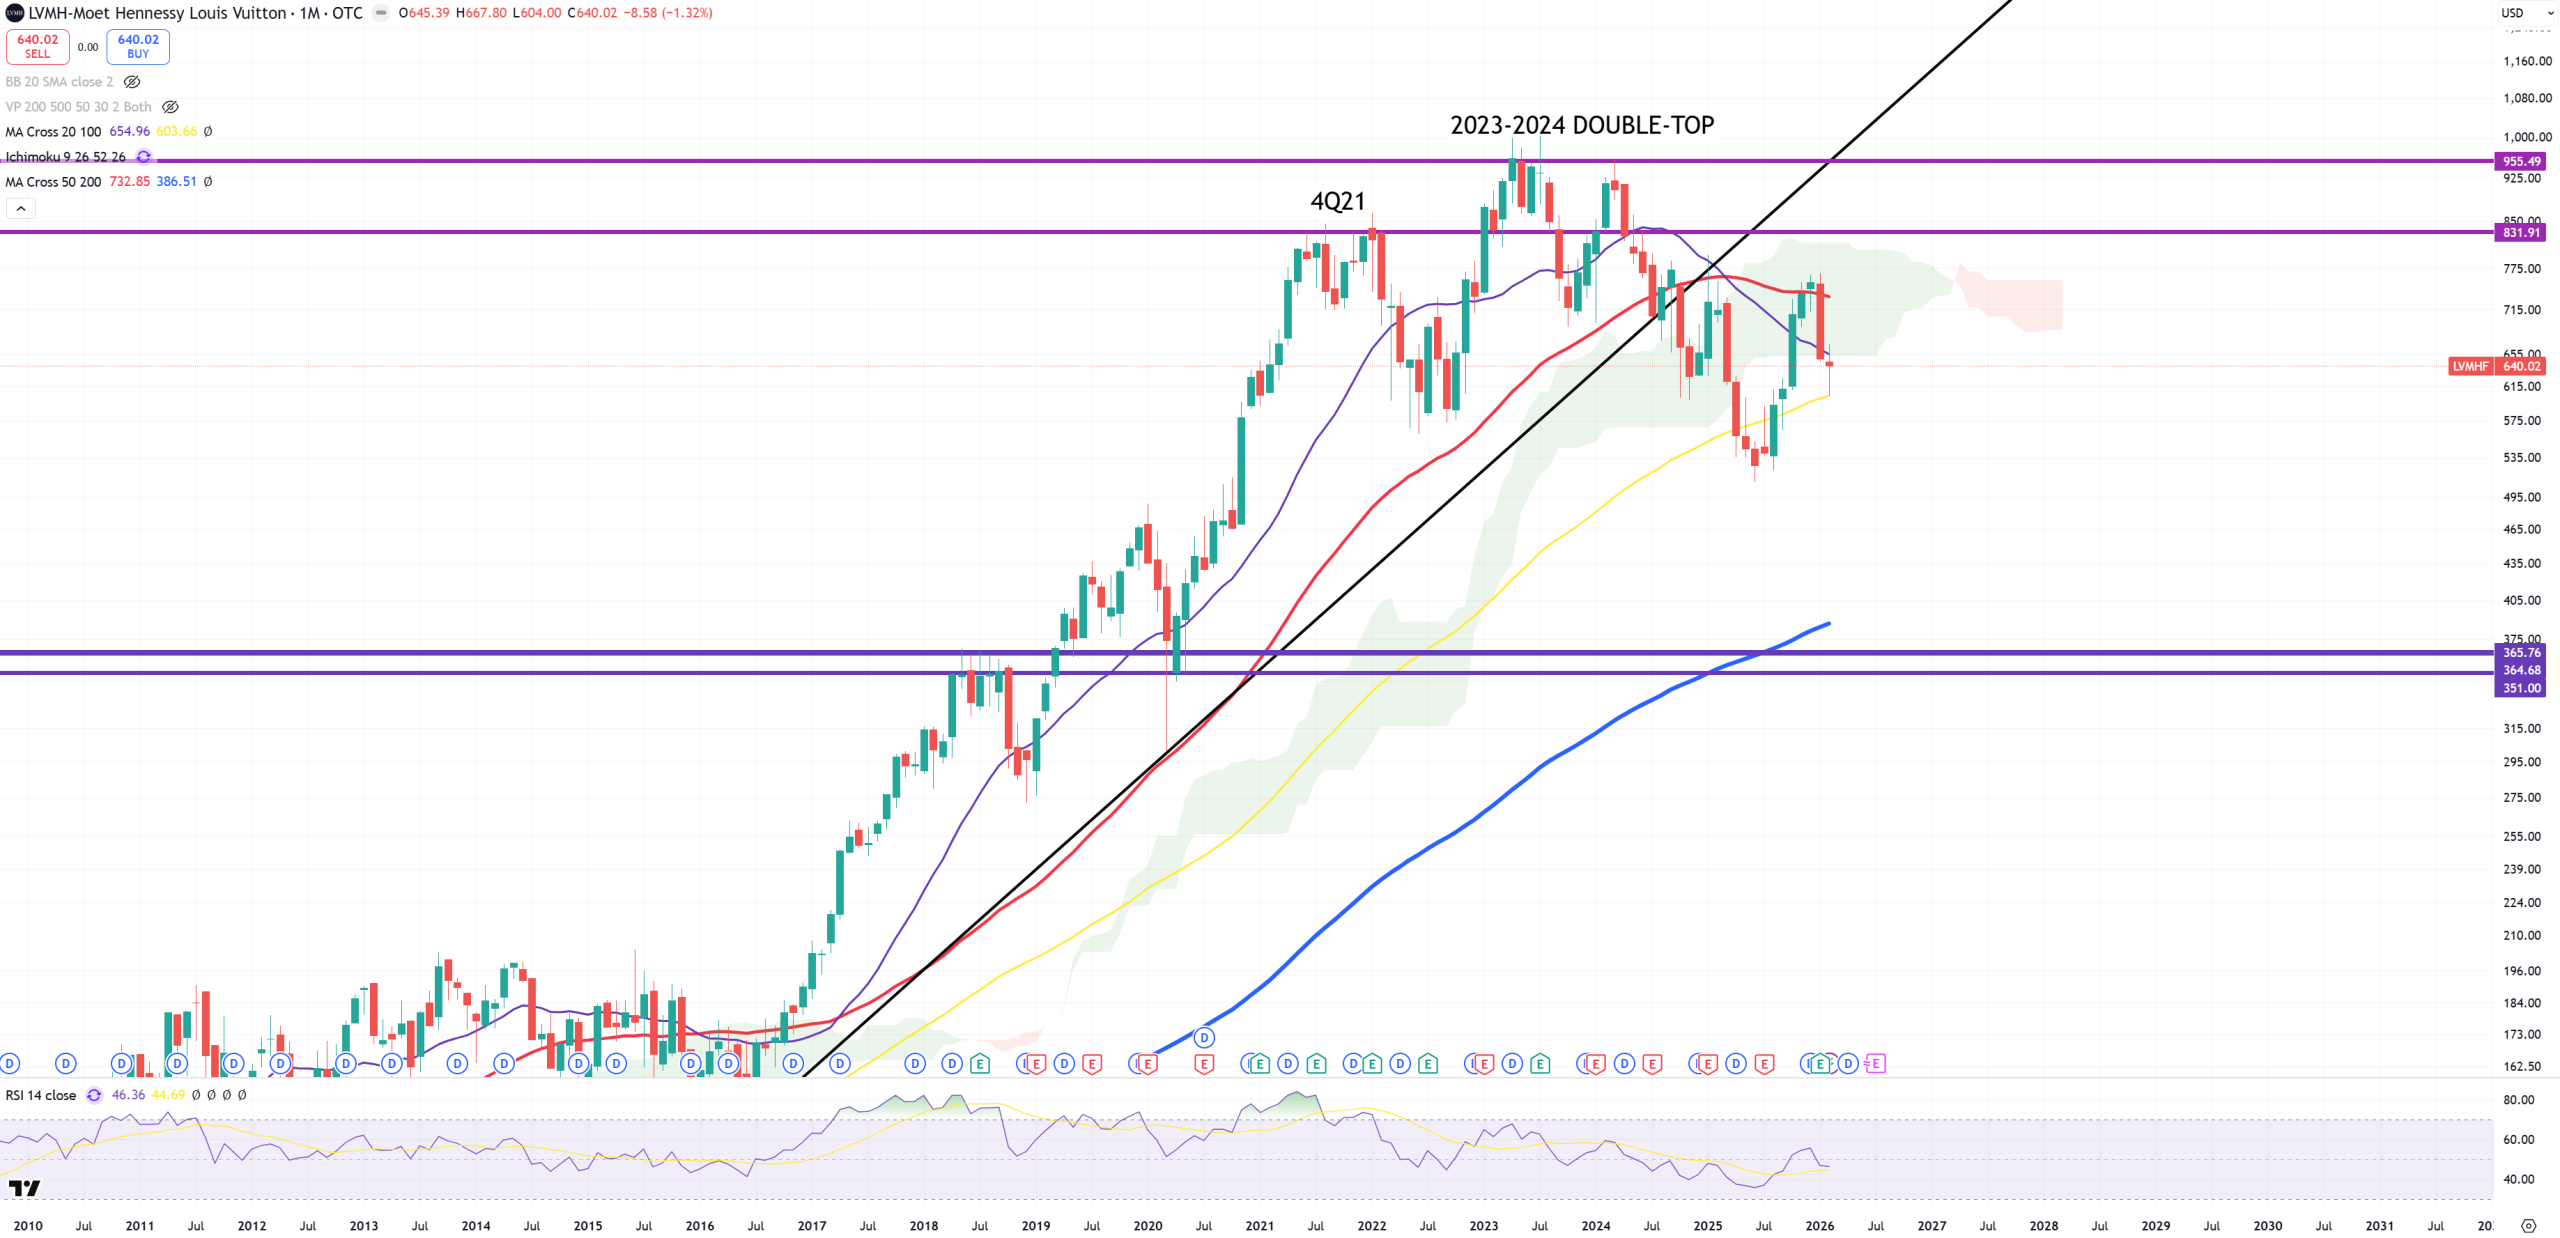
LVMH – Louis Vuitton :
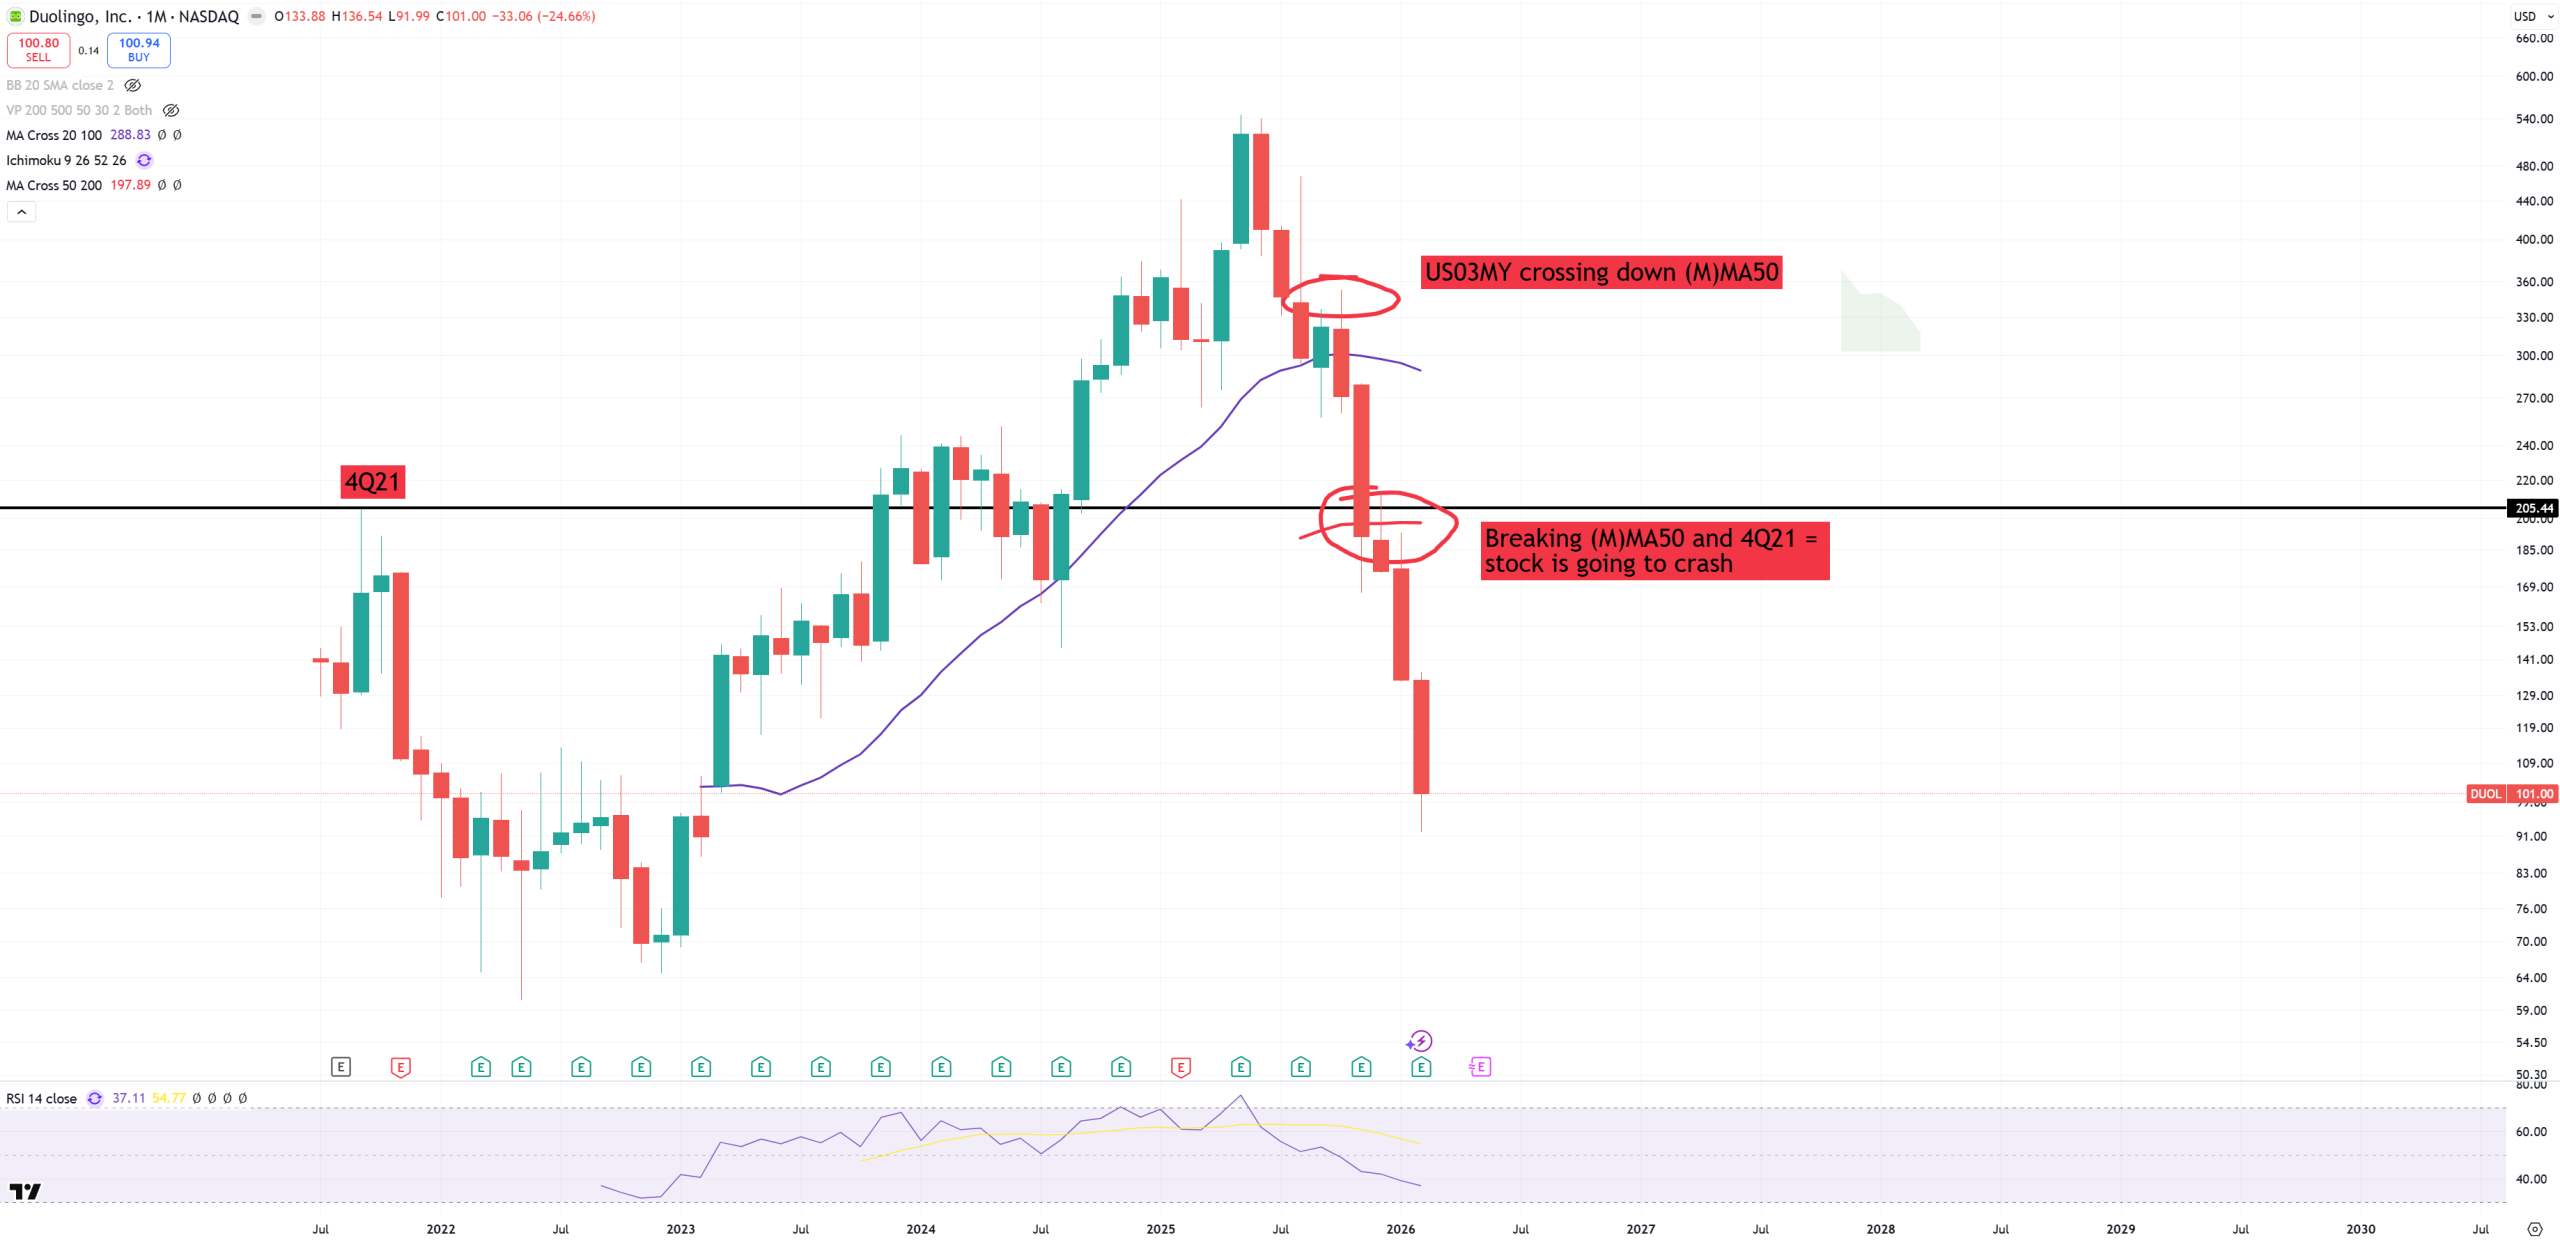
DUOL
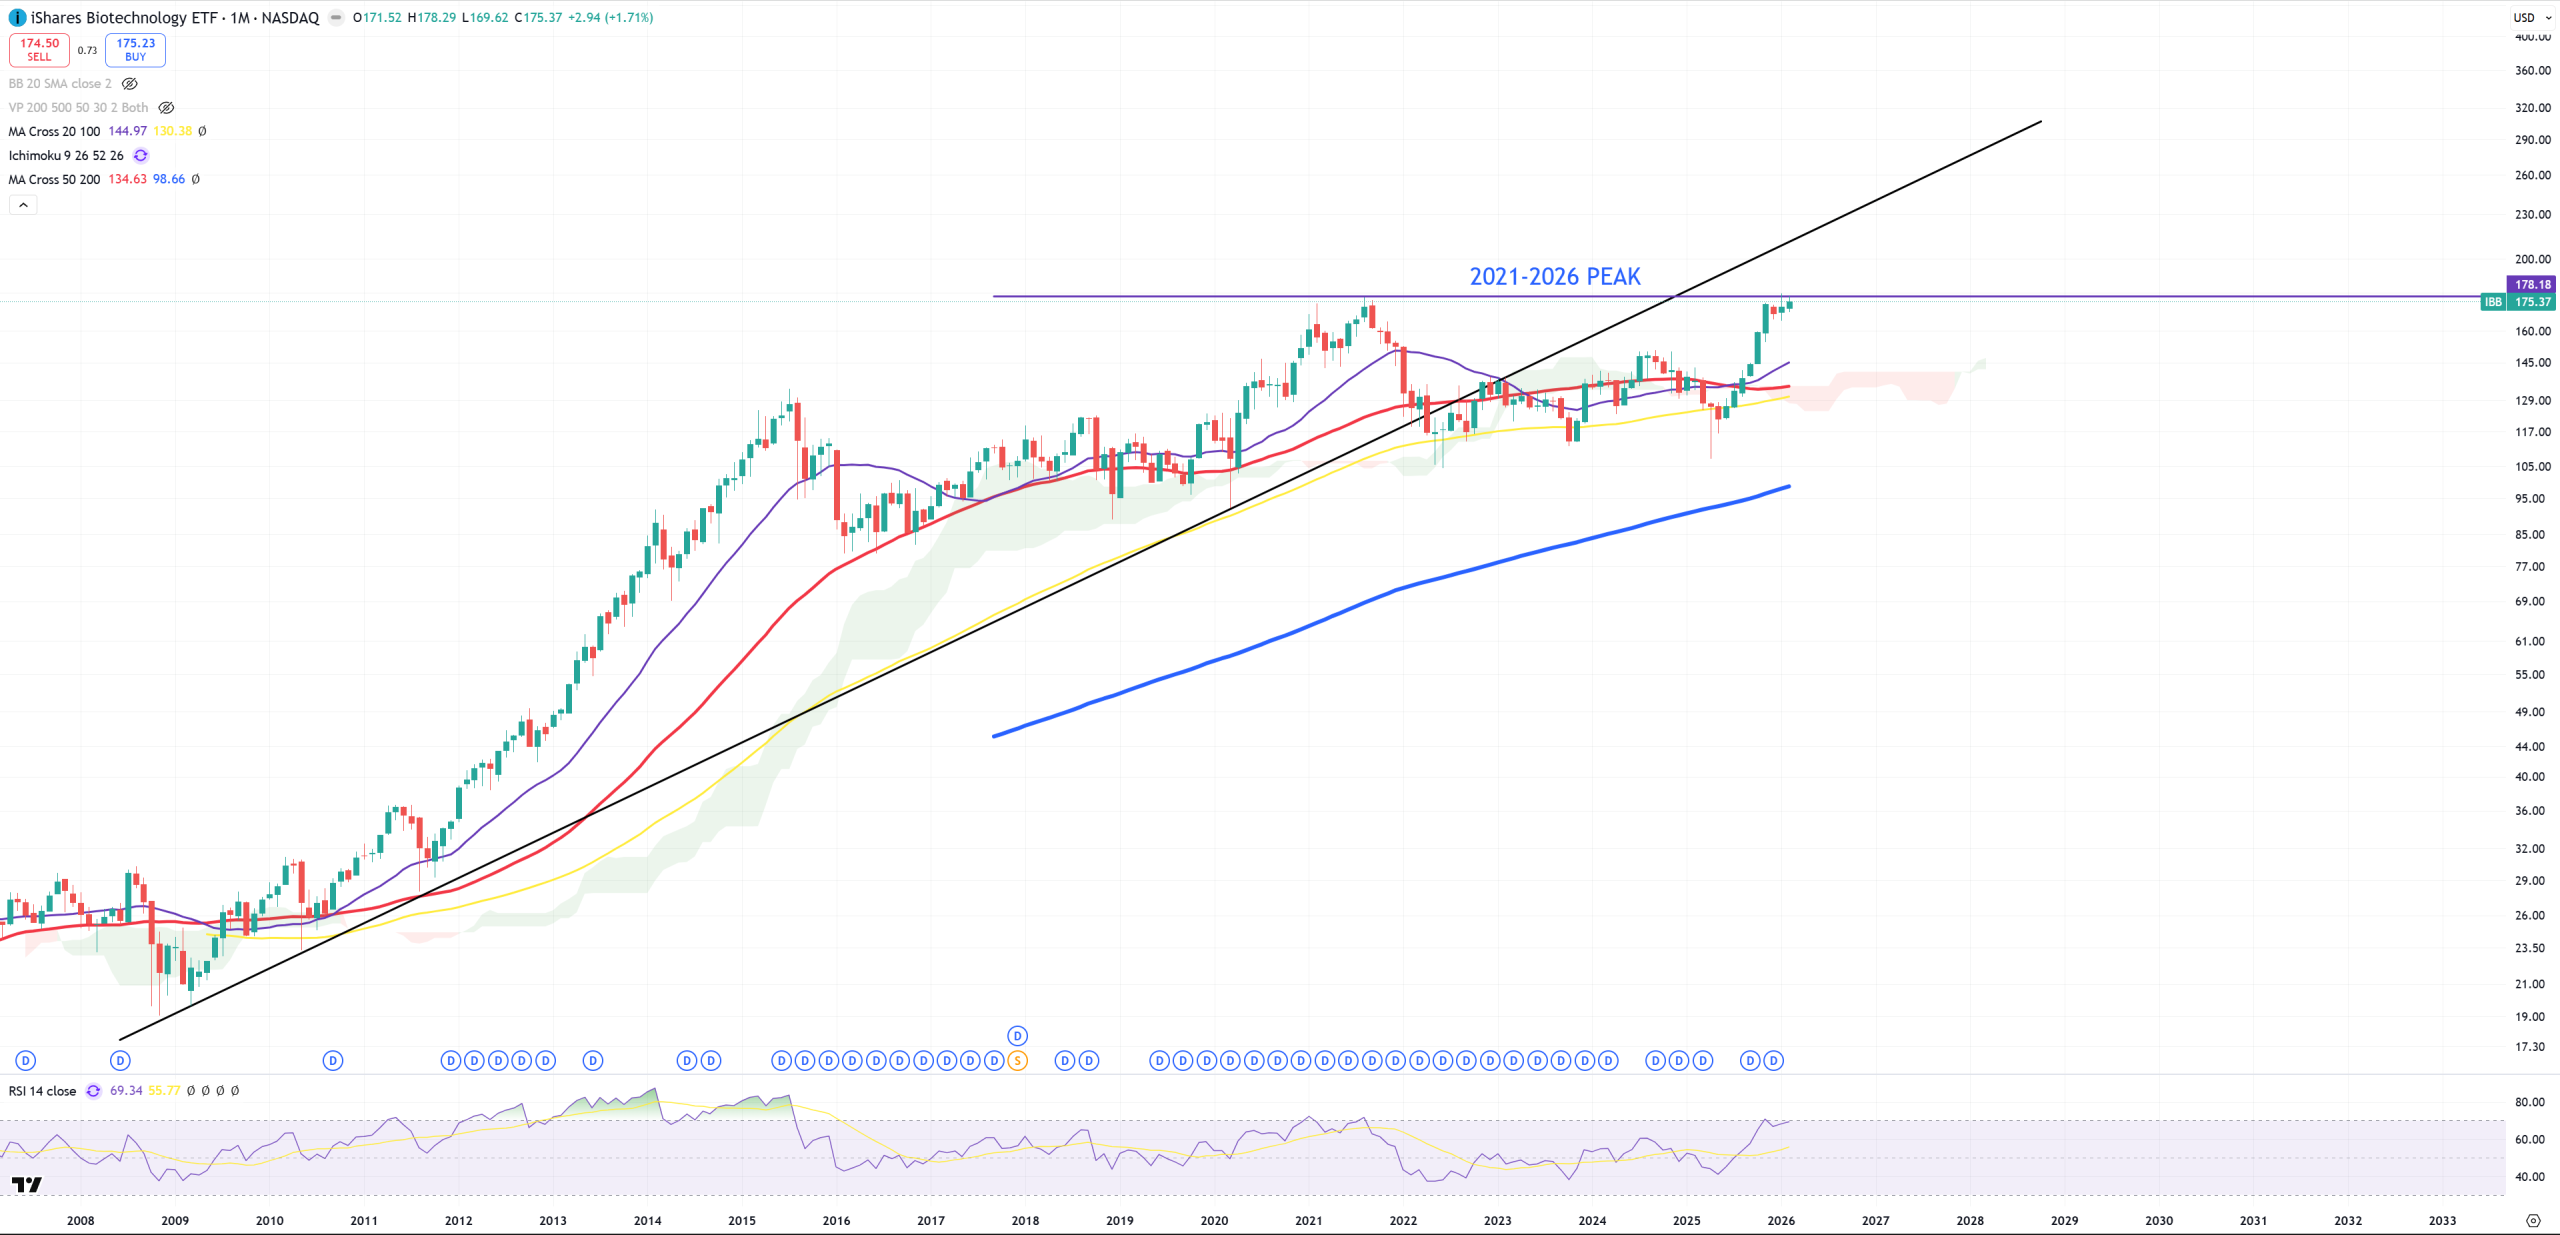
IBB – Biotech
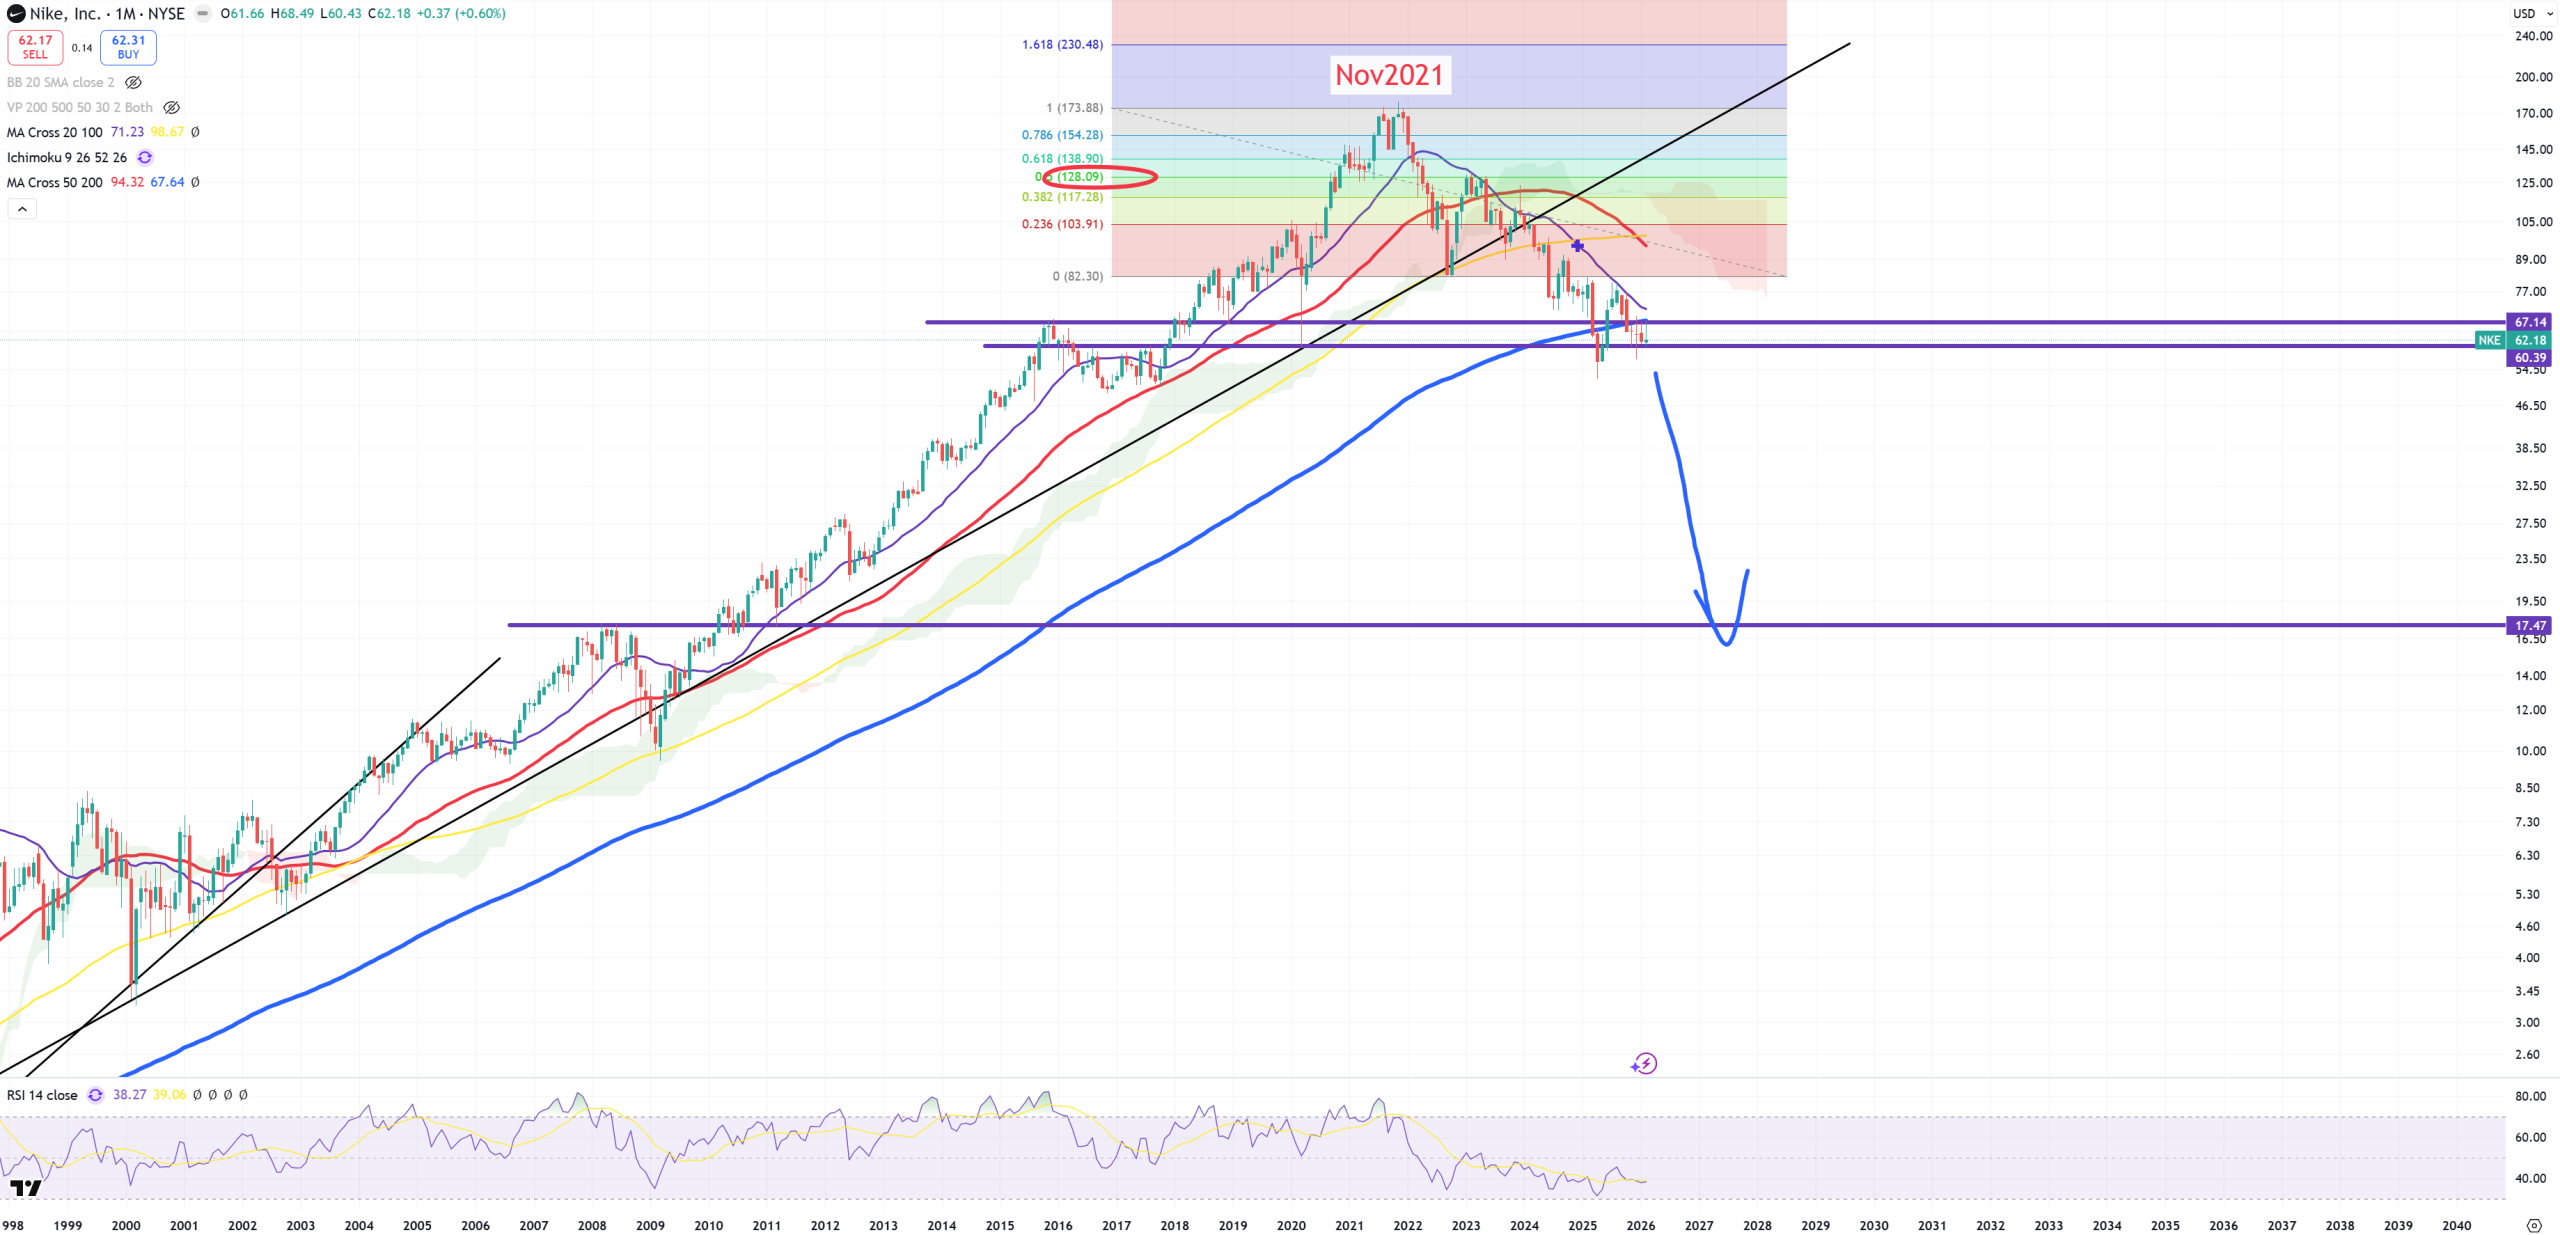
NKE – it looks like going bankrupt. 17$ target
Shockers
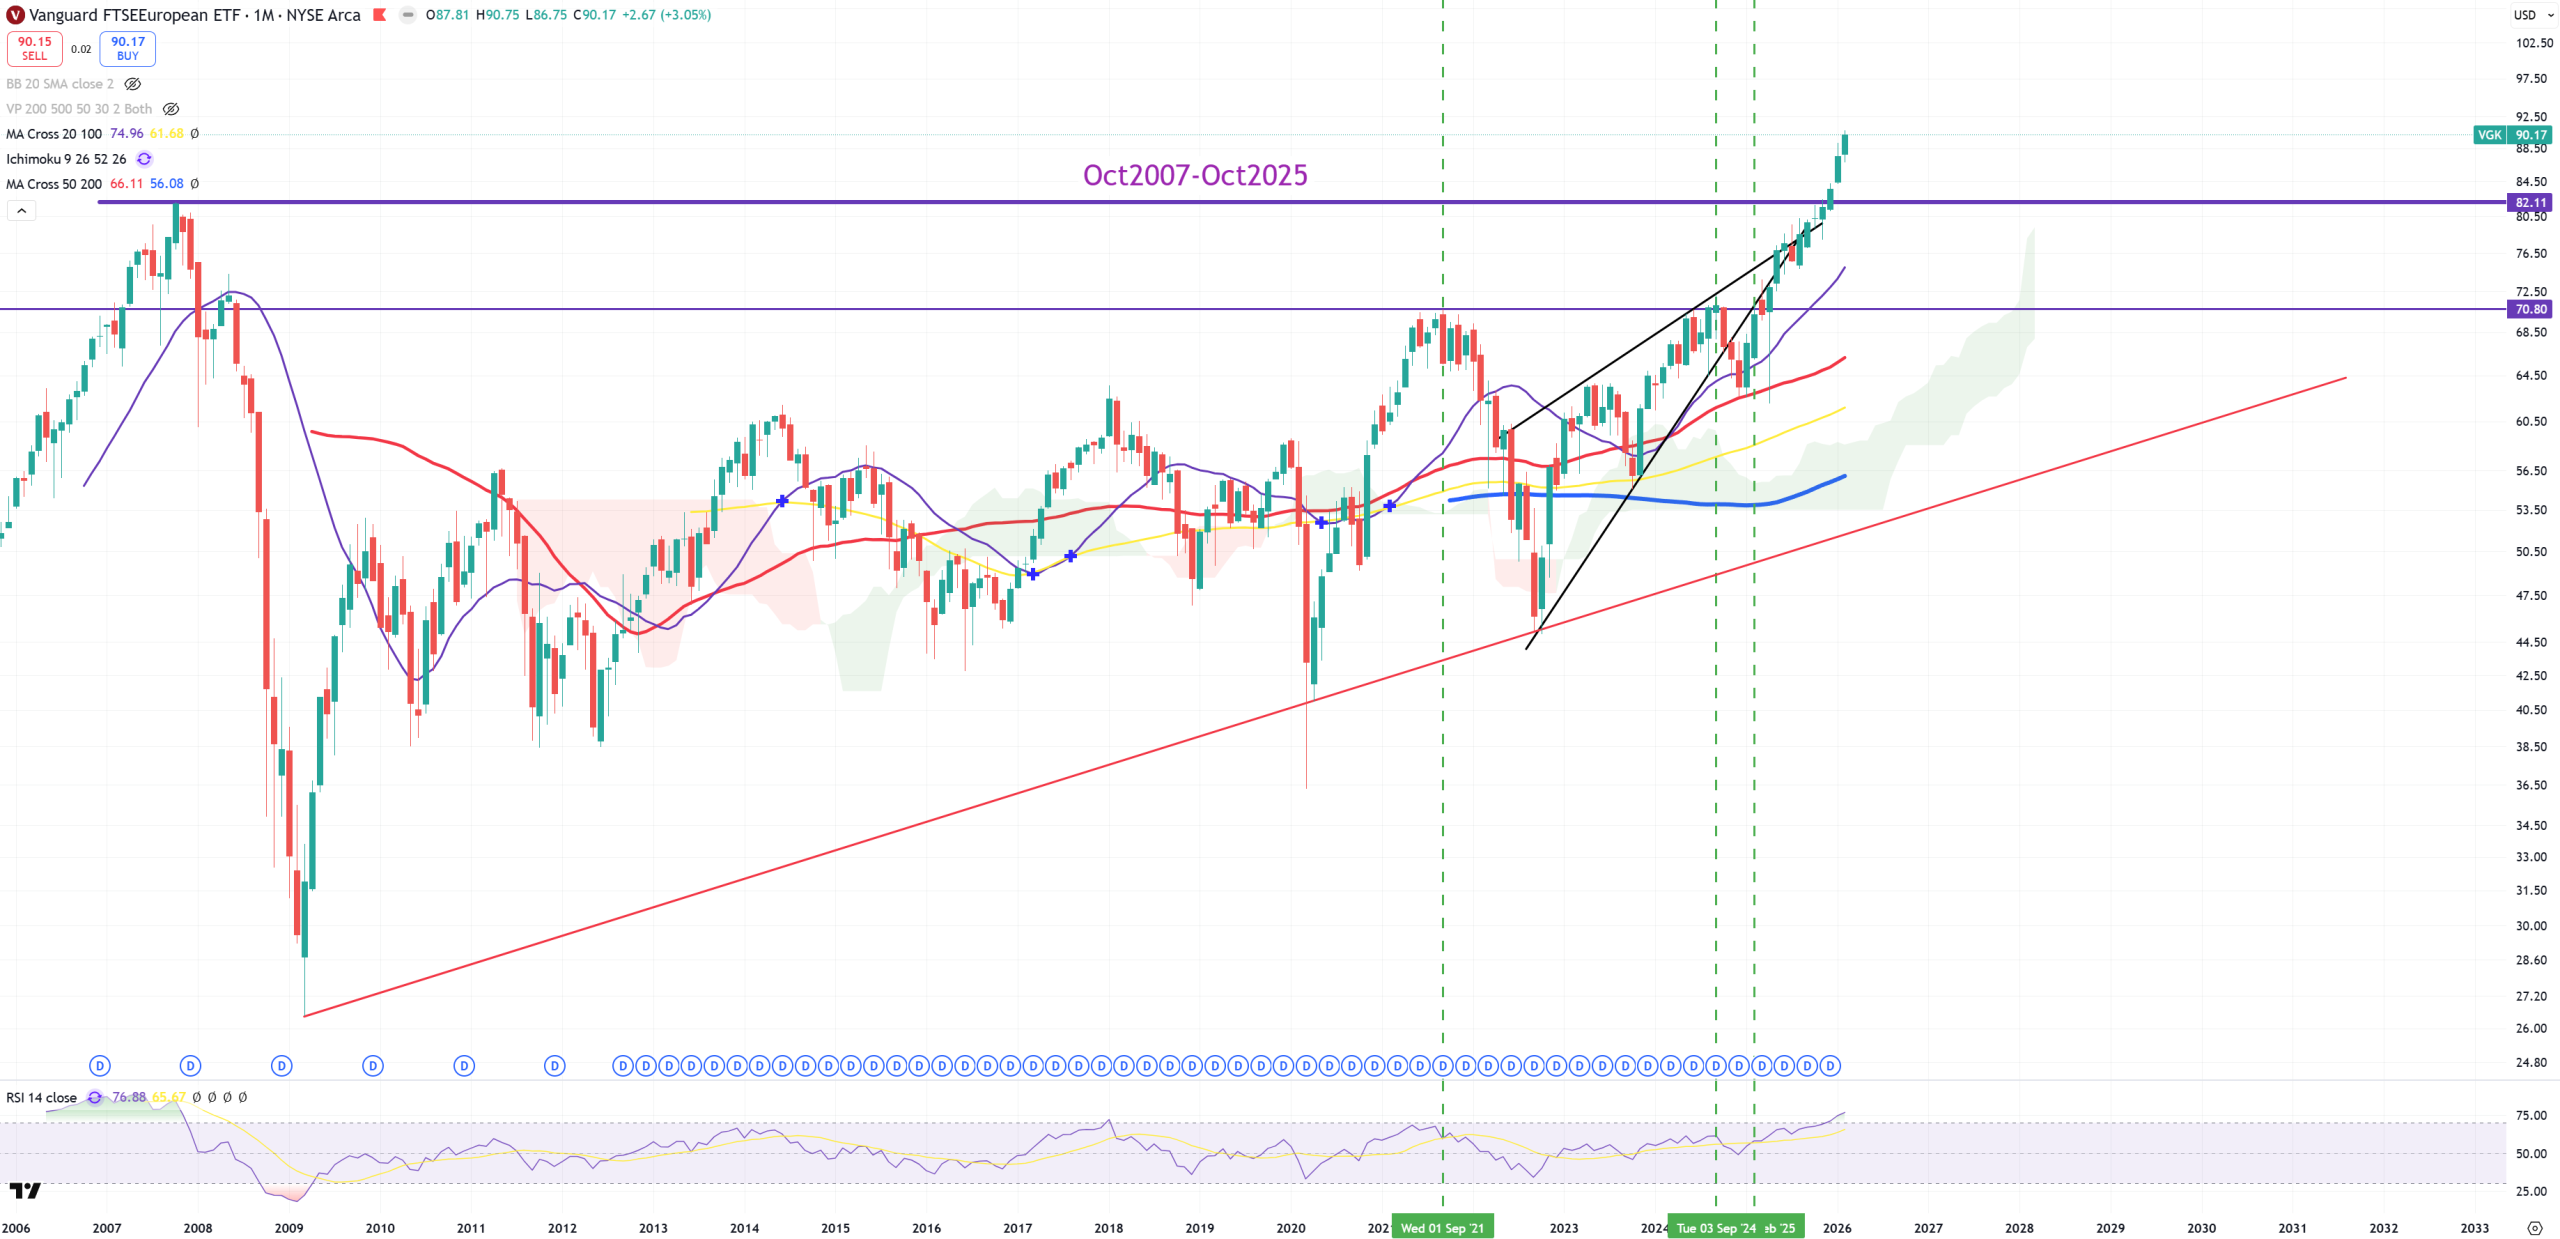
VGK – Europe – that’s probably a key shocker breaking this 2007-2025 level. Big break or bull-trap?
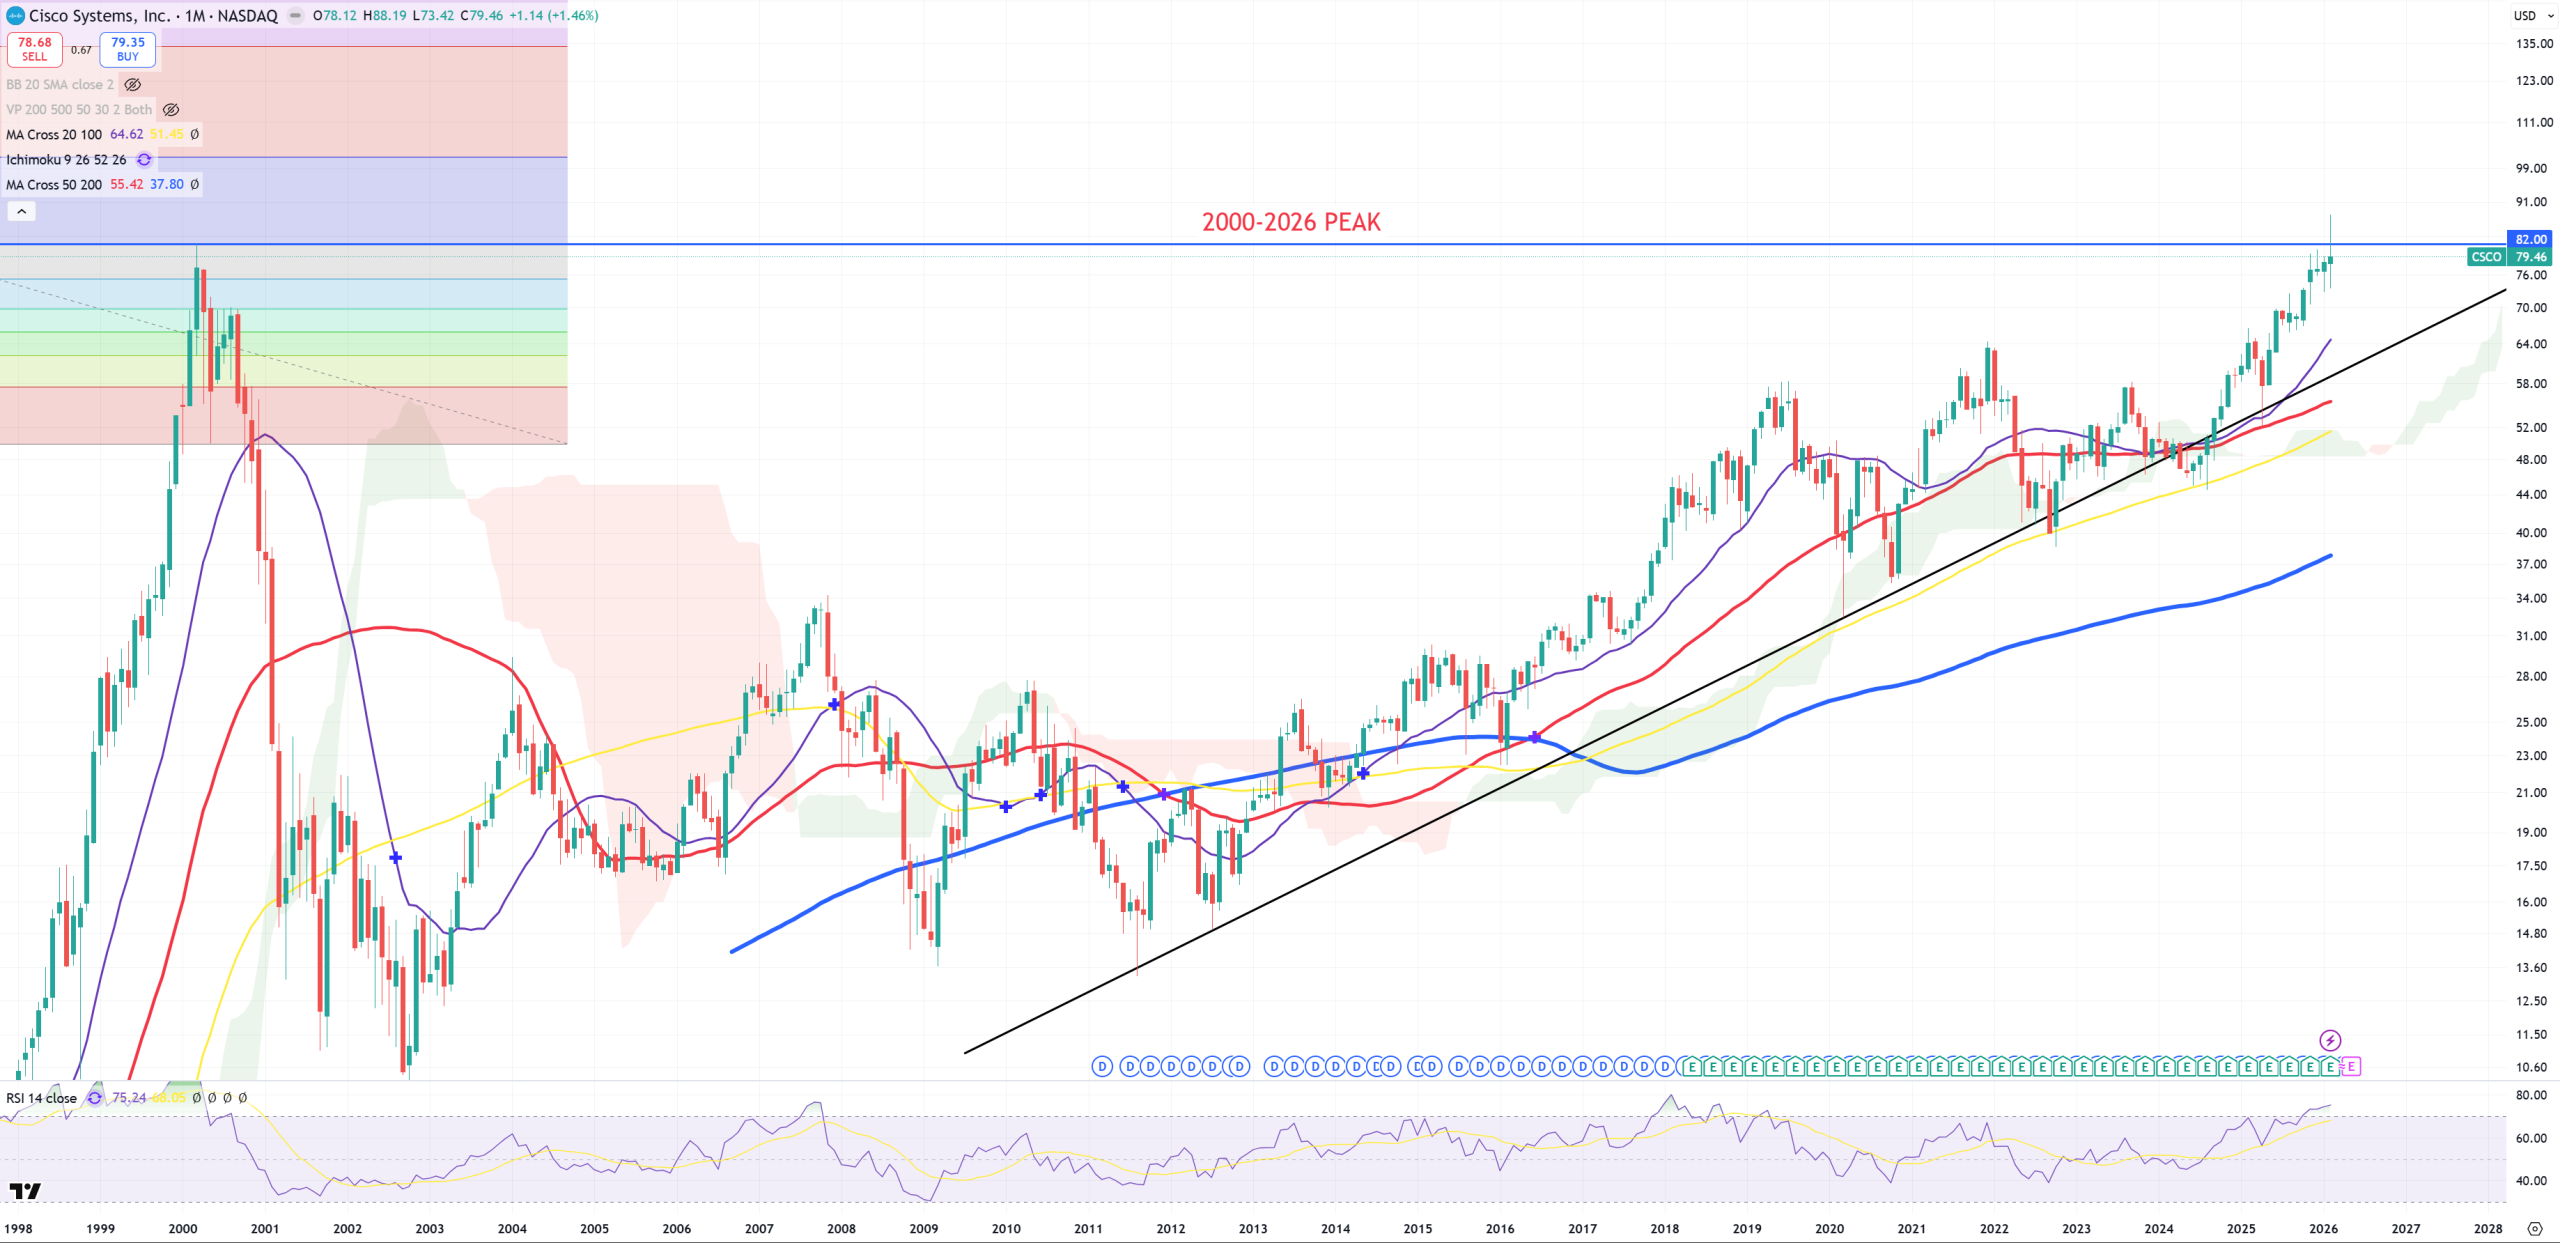
CSCO – perfect double-top?
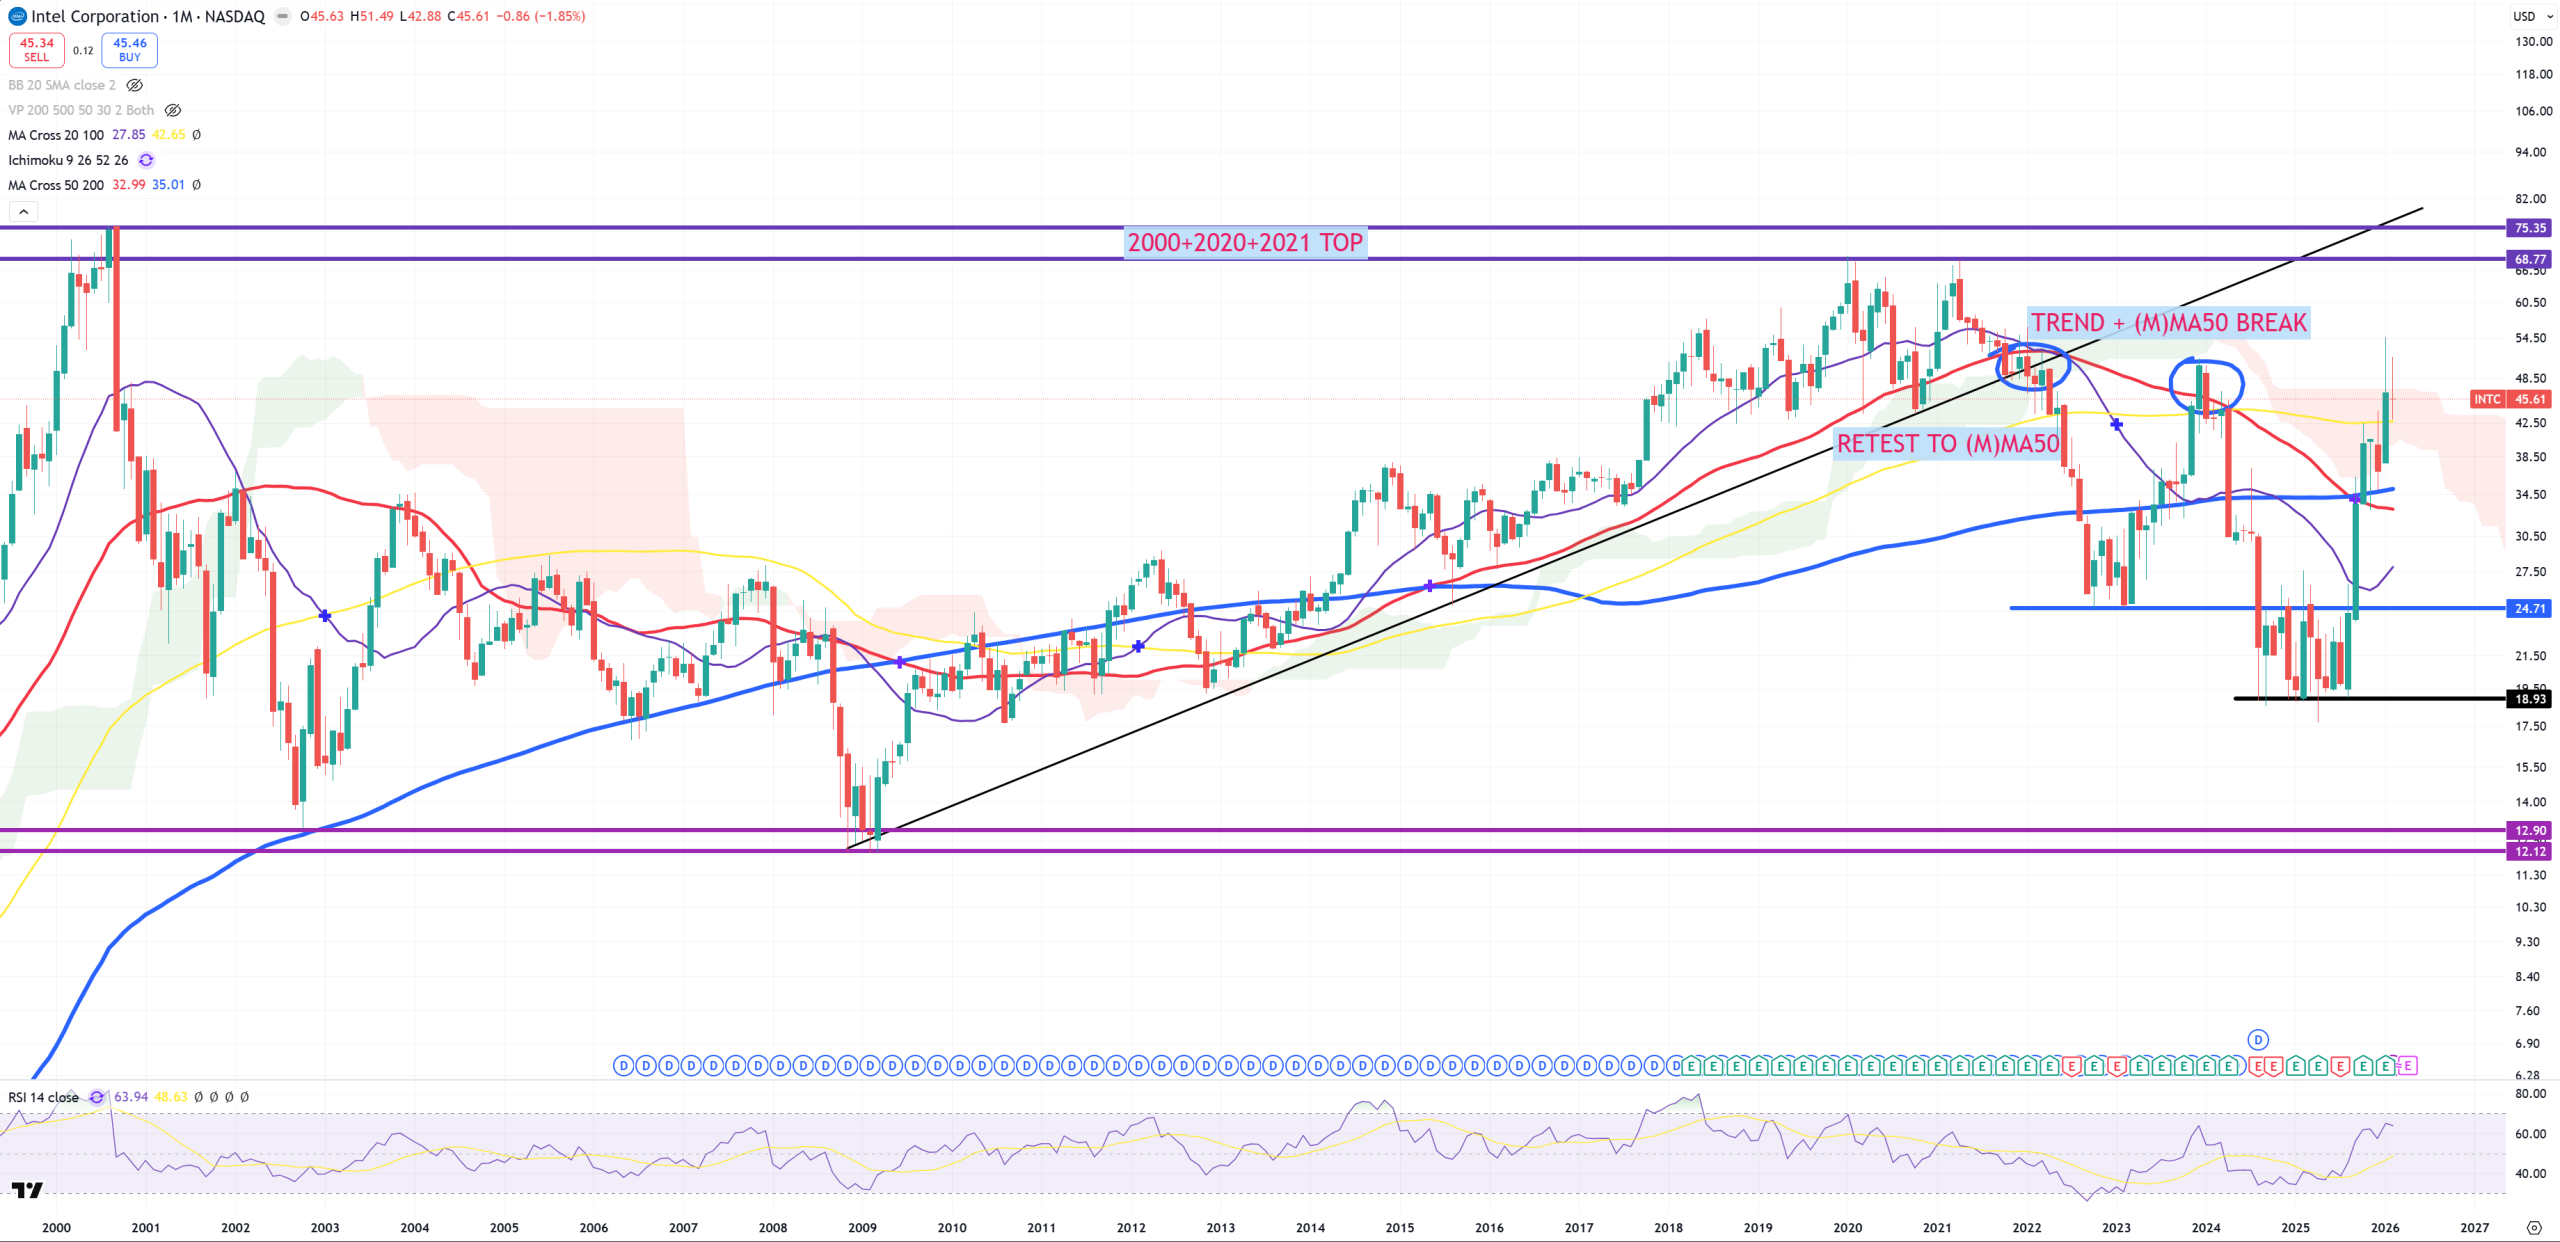
INTC – shocked it’s above yellow (M)MA100.
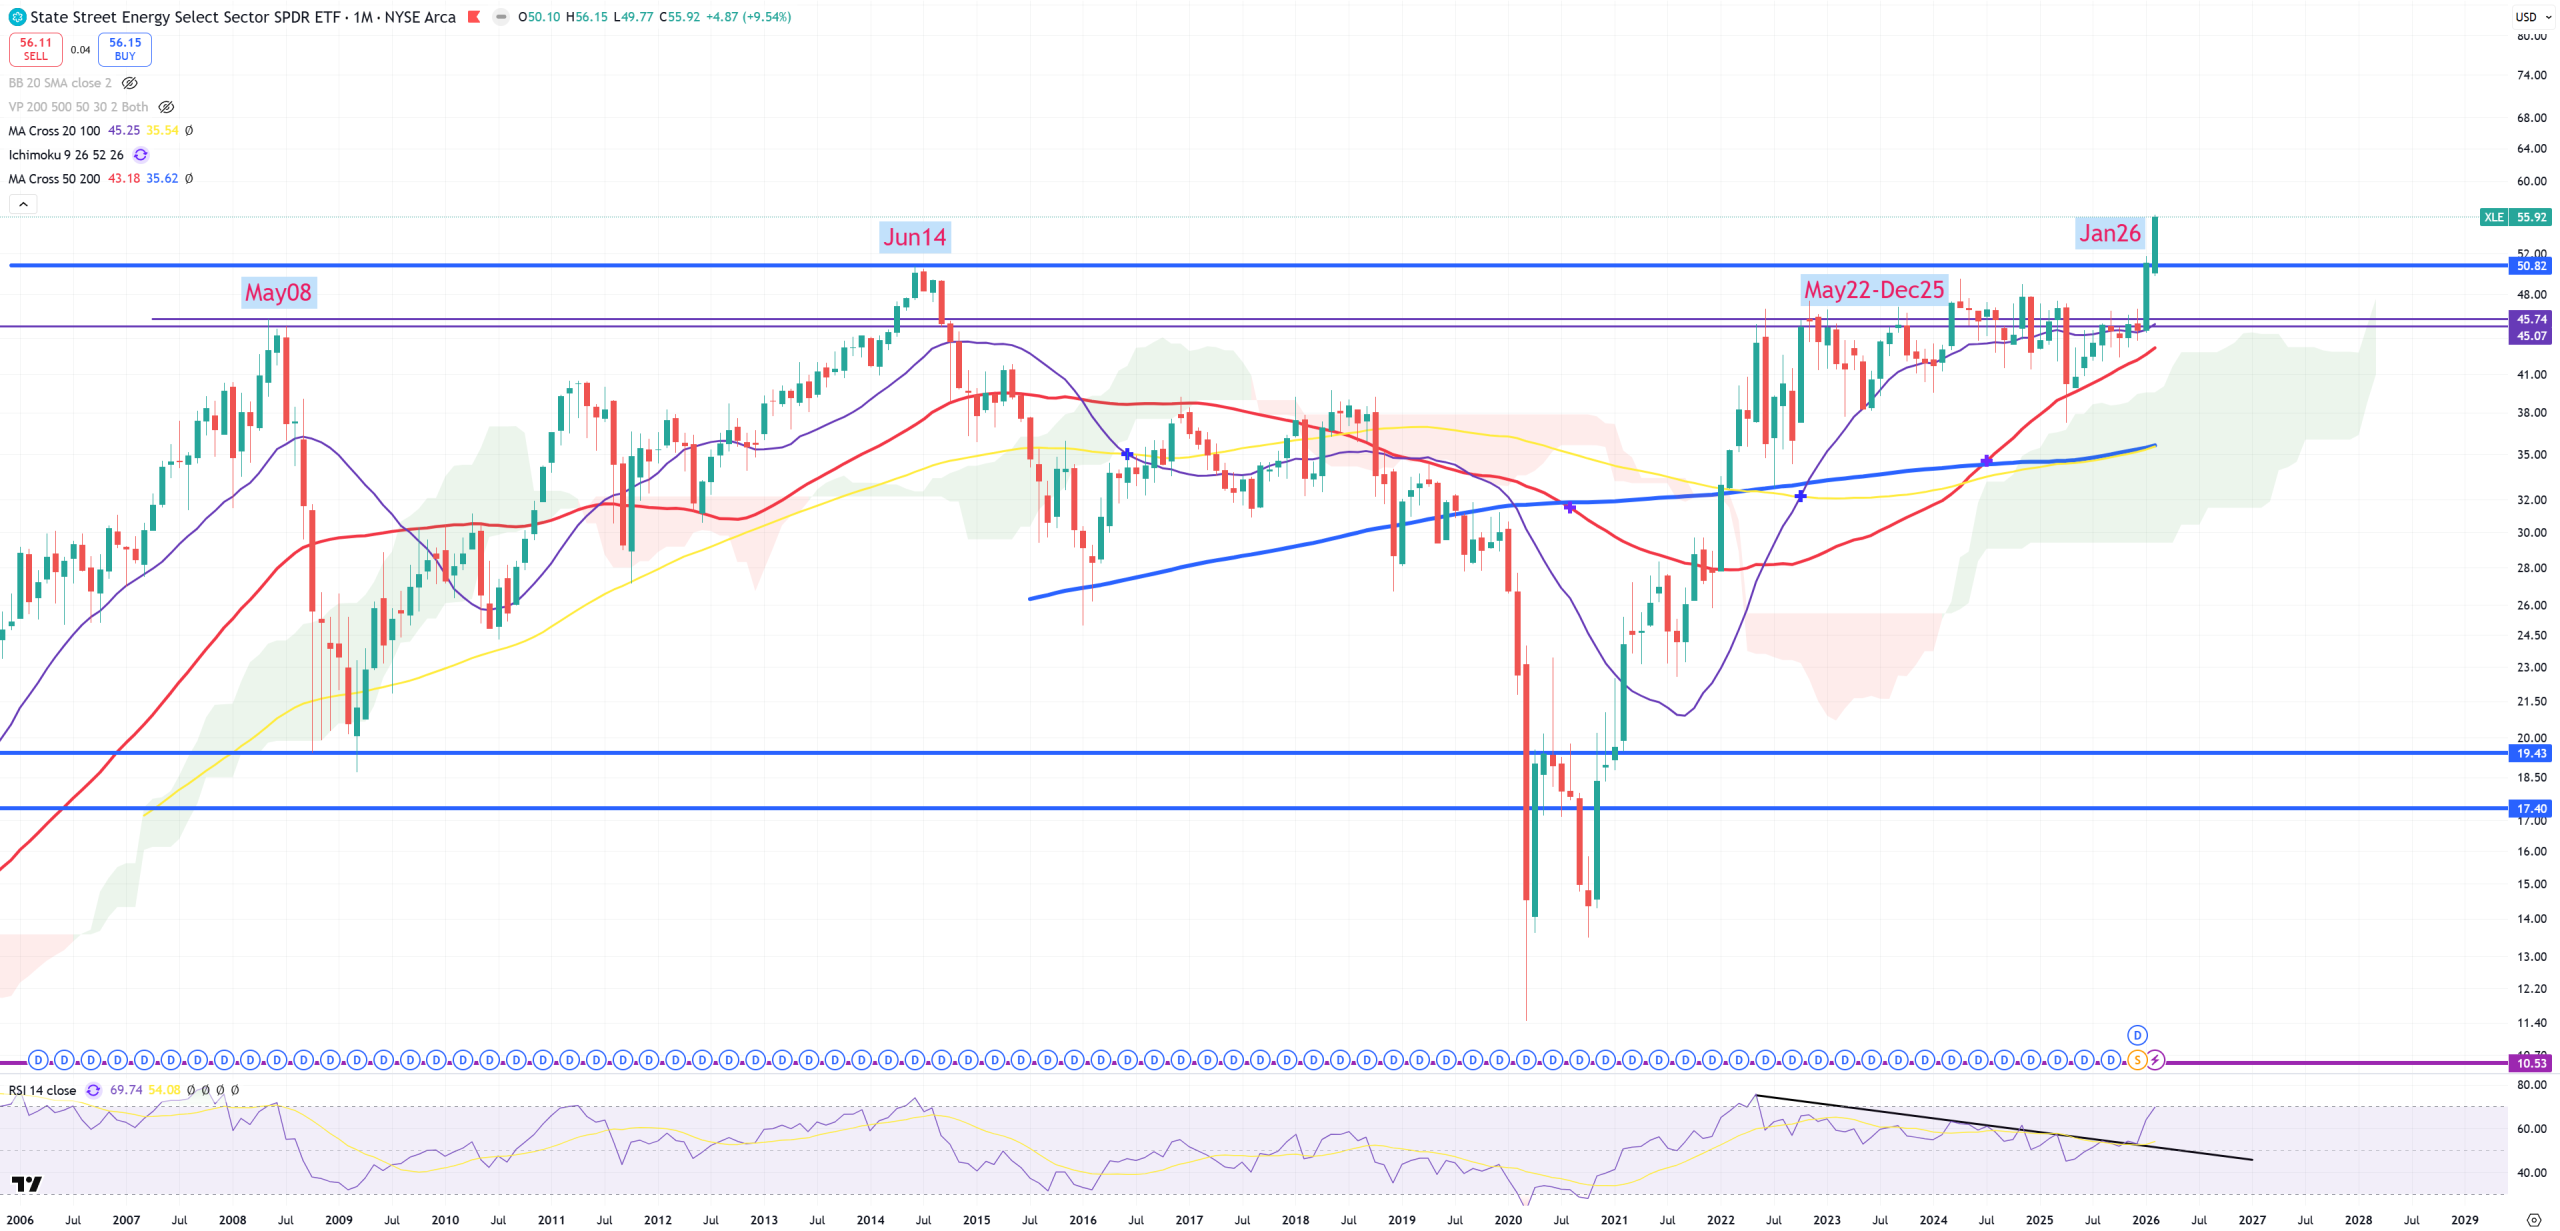
XLE – Energy is another shocker leaving 2014 resistance. Big break or big trap?
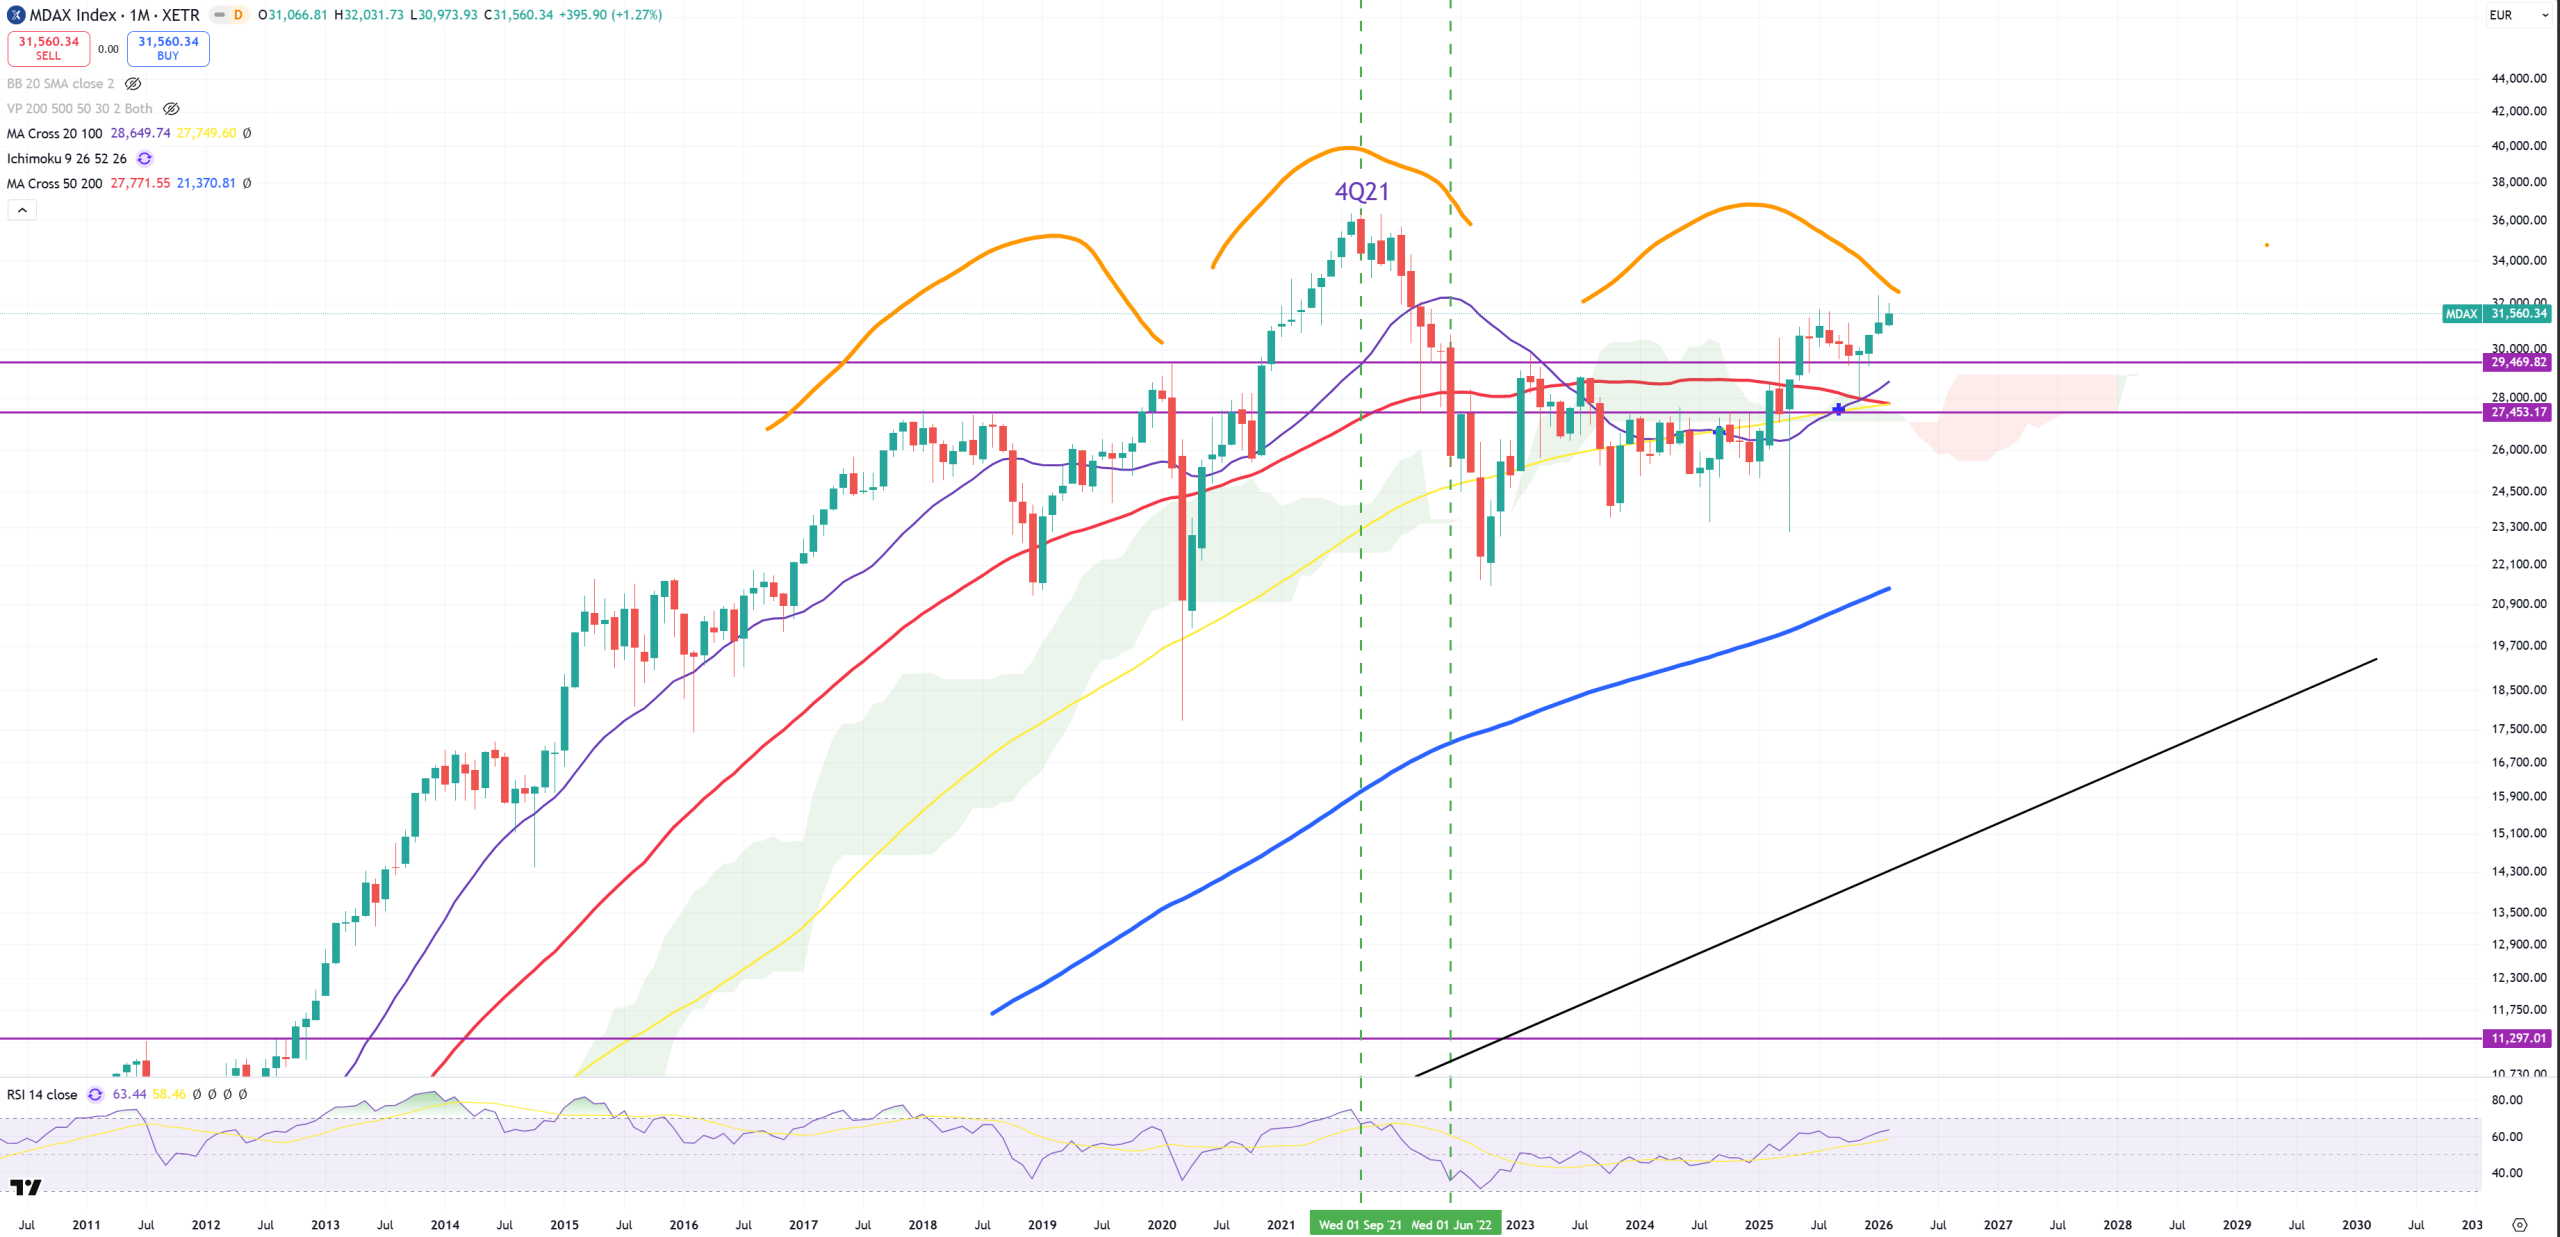
mDAX – mid-cap DAX – Germany are in a downturn since 2018. While DAX has exposure to global world, mDAX is mostly about local market. It’s still below 2021 peak, but I did not expect to jump above red (M)MA50 since some time.
In 4Q21 plenty of stocks peaked, and that’s how it should be done. SPX/GOLD peak = most stocks peak, but there’re still sectors which are lagging and the longer it takes the more sectors/countries/stocks etc will be taken down below this SPX/GOLD cycle peak. US03MY (M)MA50 break kicked in the moment SPX/GOLD broke (3M)MA200 so in 4Q25. We can split stocks mostly into 2 categories. Those who peaked when SPX/GOLD peaked and those who peaked once US03MY broke (M)MA50. Still we don’t have a shot from 10y/3m above +60bps, but I think retest to +20bps coming what I described before.