2025 year end
January 3, 2026
So 2025 was probably one of the most important year in a history. Finally after long year, two key cycles indicators was taken down and crashed below their key MA closing the big cycle. We’re now just waiting for 10y/3m to cross +60bps post inversion with just 3bps left.
There’ll be a MIX of 3M and M view. Without a doubt we’ll concentrate on “big cycle end” and this time will be a bit different as I won’t show stocks/ETFs. I’ll be this time as short as possible to give you a hint what technical charts have just told us at the end of 2025 and at the end we’ll analyze all points from typical WINTER cycle period, and you’ll get my LOGIC why I call 2026 as the beginning of a Greatest Depression.
Saying short. I analyze just 4 indicators. SPX/GOLD, DJI/GOLD – cycle indicators, US03MY – stock market peak indicator combined with 10Y/3M – gravity indicator. If you want to remind those indicators go back to the topic above.
US03MY – we start from “stock market” peak indicator from the model. Closed below (M)MA50 late October, so in reality we can say November 2025 was fully below (M)MA50. In a moment we’ll see SPX and DJI related to this (M)MA50 break.

SPX/GOLD – I was waiting for this ratio to close below (3M)MA200 for the whole year, finally this (3M)MA200 break kicked in mostly the moment US03MY broke (M)MA50. (3M) view below. SPX/GOLD started rotation in 2018, with highest peak in 4Q21 (a lot of stocks made peak during this period), and in 2Q24 broke 2011-2020 trend. In 4Q25 finally broken (3M)MA200 for the 5th time in 100Ys : 1931, 1937, 1973, 2008, 2025.

DJI/GOLD – this is the weirdest cycle since data is available. We had to wait another 3Qs to get a confirmation from SPX/GOLD. While DJI/GOLD peaked in October 2018, it hasn’t made any new top. Just one move down, breaking (3M)MA200 in 1Q25. So we have 1Q25 DJI/GOLD break and 4Q25 SPX/GOLD break. Never in a history those 2 ratios managed to close so different. DJI/GOLD left even green Ichmoku cloud.

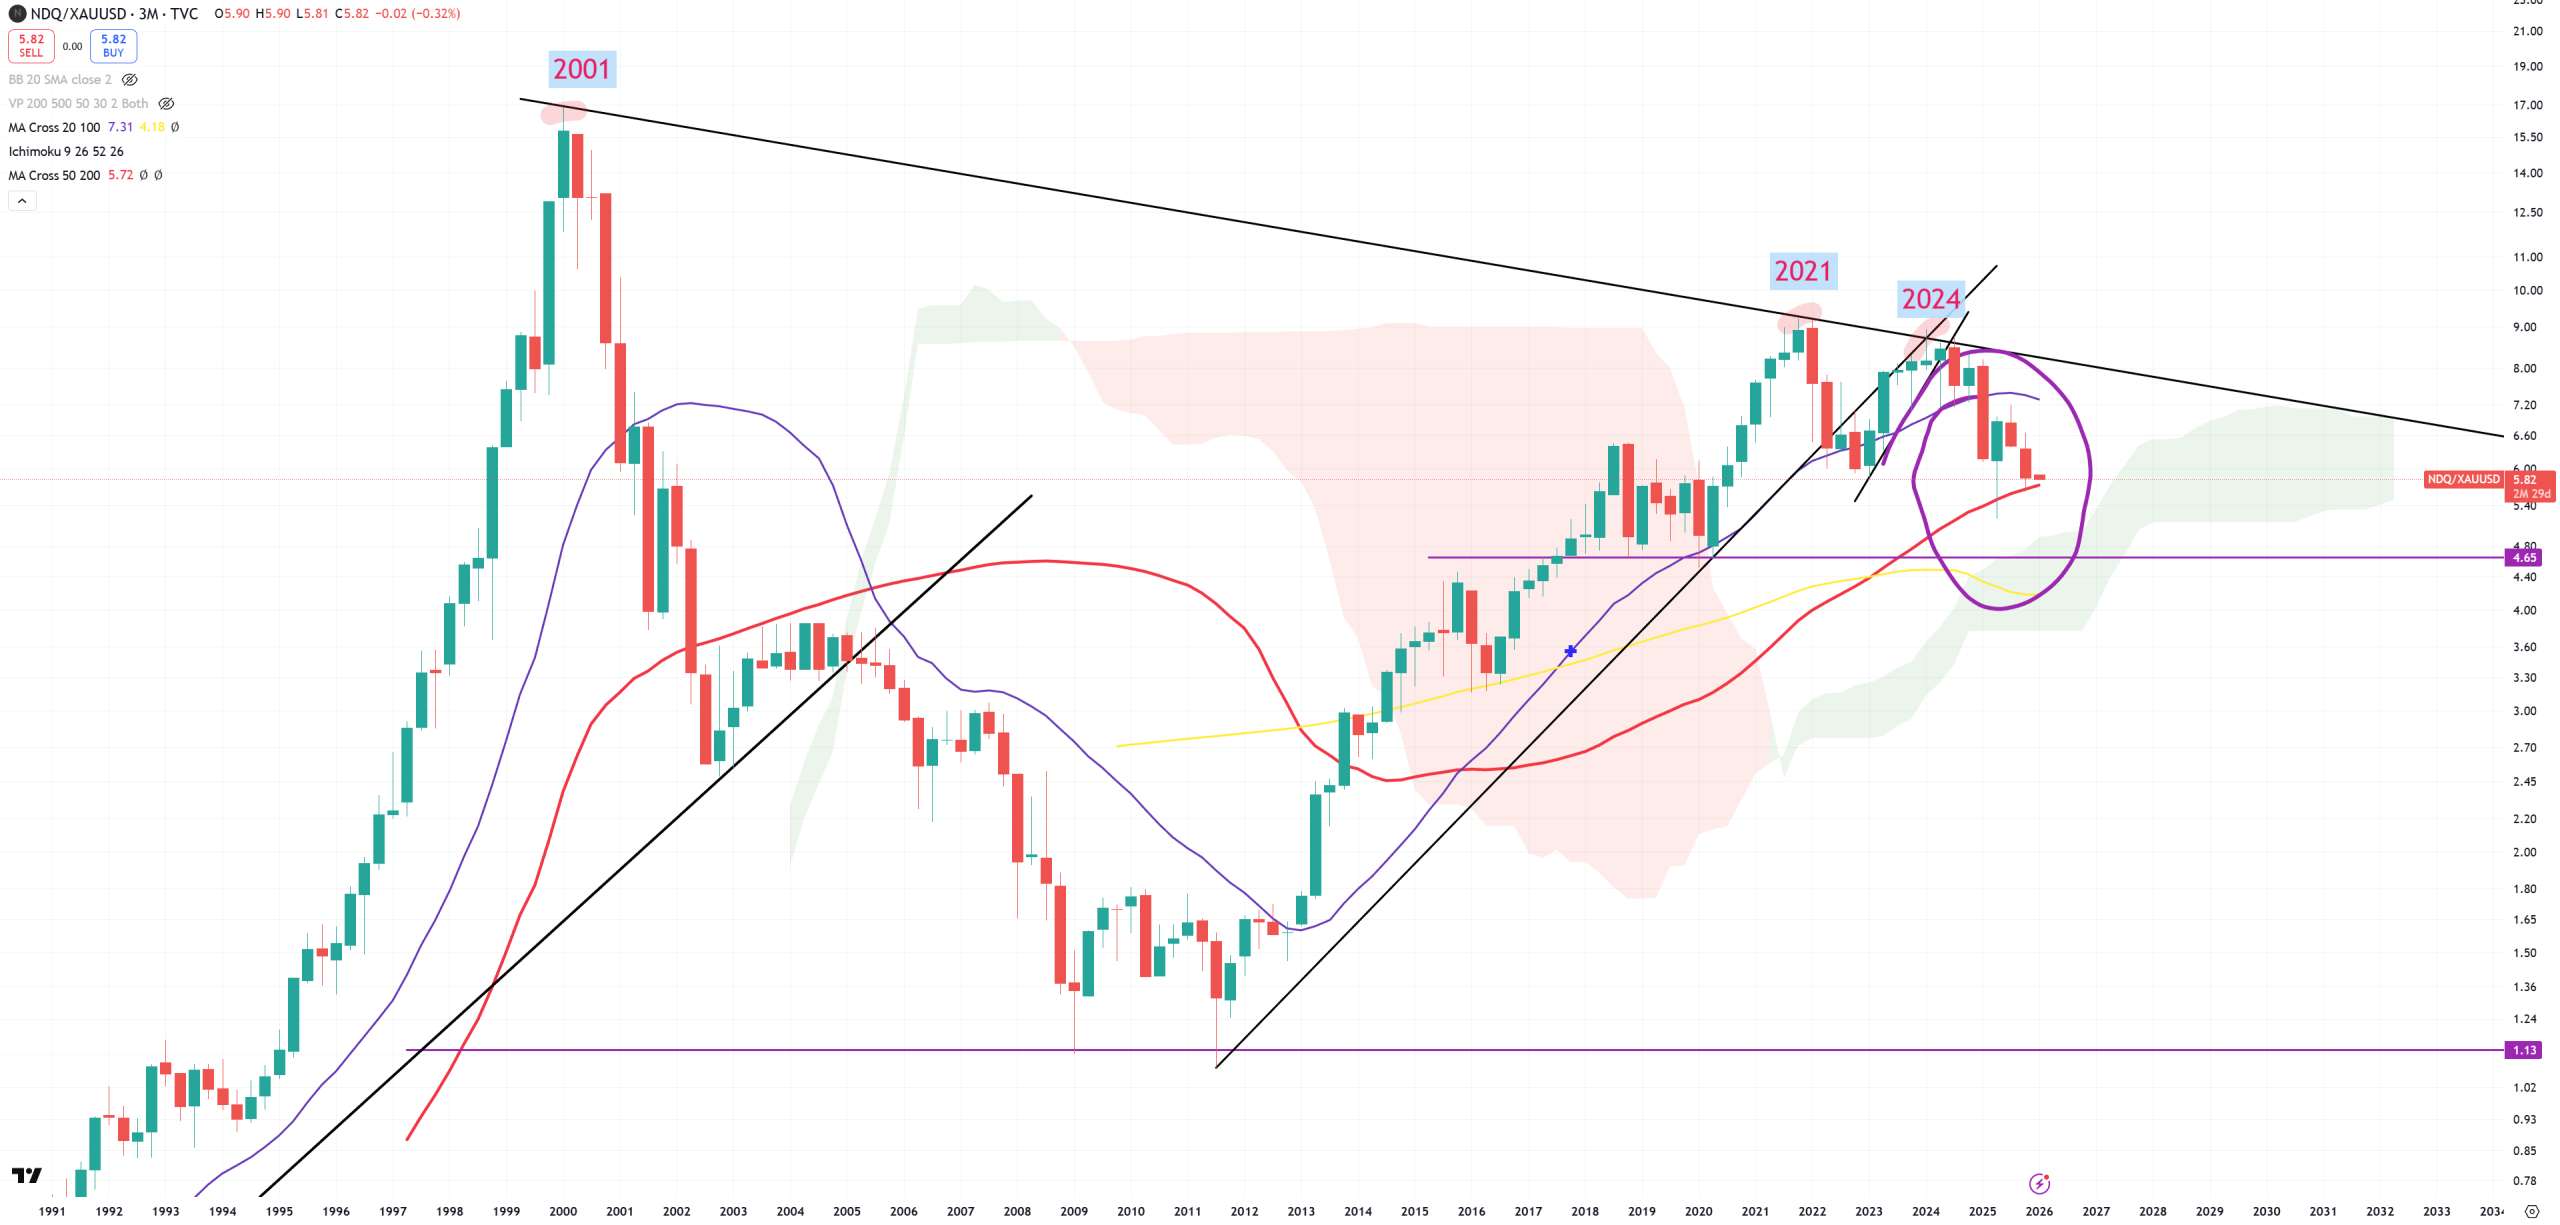
NDQ/GOLD – this is additional cycle indicator, which I don’t pay any attention because of too short period of time where we can get data. We also have 4Q21 as a cycle top, 1Q24 lower top and now (3M)MA50 ahead. No matter what you say you have 3 charts showing you that gold is going to outperform spx, dji and ndq – and it’s just the beginning.
10Y/3M – gravity indicator. +60bps post inversion combined with US03MY breaking (M)MA50 is an ultimate dead combo. We have +57bps now. My bet is once US03MY breaking (M)MA50 it’ll force 10Y/3M to uninvert

SPX – on couple views. First to show you a moment when US03MY crossed down (M)MA50 – it was late October 2025 and 6920. Second on (M) and 1929-2000 trend. As you probably get it, I expect the 1929-2000 break as a super big bull-trap in a situation where both cycle indicators closed to full collapse mode, US03MY broke (M)MA50 and 10y/3m is on the edge of breaking +60bps


DJI – also couple views based on the same indicators like SPX. Two violet horizontal lines are two peaks between end of October and beginning of November 2025 which I classify as a moment when US03MY broke (M)MA50. Later we see DJI with 1929-2000 trend and those 2 violet horizontal lines.


GOLD – I marked with 2 blue circles moments when DJI/GOLD peaked (4Q18) and SPX/GOLD peaked (4Q21) – prices : 1150$ and 1690$. I’d like to remind that DJI/GOLD and SPX/GOLD pointing for outperformance doesn’t mean gold won’t drop. Right now it’s almost (M)RSI=93. Gold will drop but as I expect for 1% of gold drop SPX should get 2-3% drop.

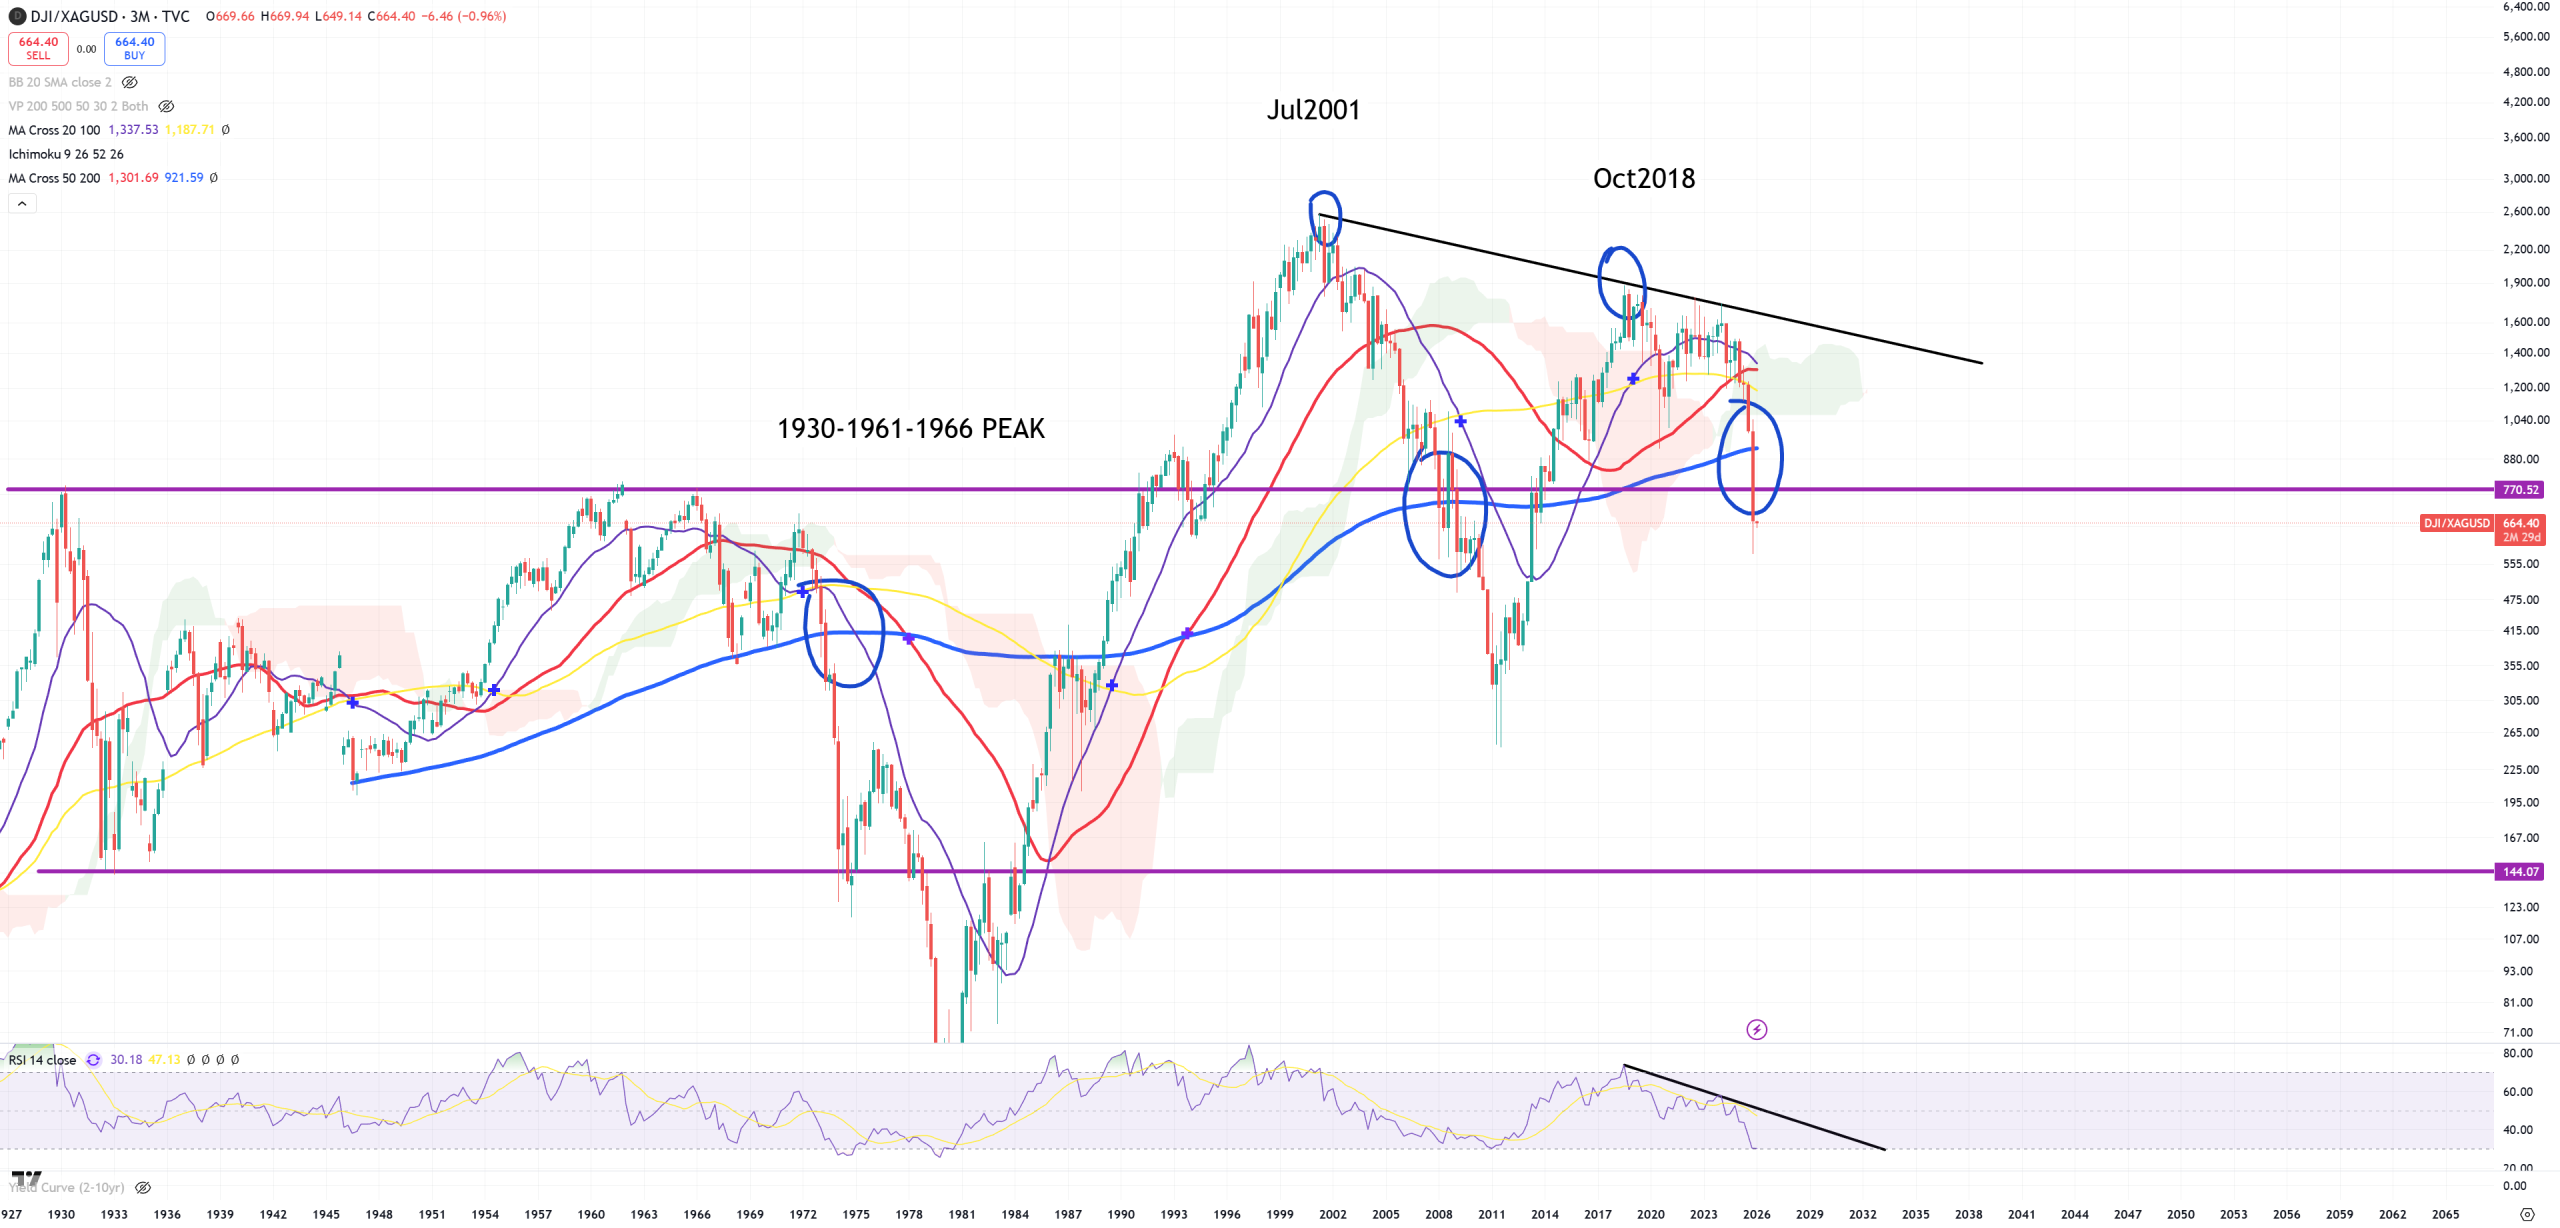
DJI/SILVER – just before we’ll take a look on Silver, we need to show this ratio. Also (3M)MA200 gone and finally for the first time since 90s – silver starts to have a fair value, because I assume everything what is above 1930-1961-1966 resistance is some kind of bull-trap. Peak almost silimar to DJI/GOLD – 2001 and perfectly same 4Q18 later. Low value is 144 and 20 is massive bubble. Right now it’s 665.
SPX/SILVER – almost similar to DJI/SILVER. I has not dropped below 1930-1962-1966-1971 resistance. 2000 peak and later huge consolidation for 6.5Ys and finally also below (3M)MA200. Low value is around 12-15. Now 95.

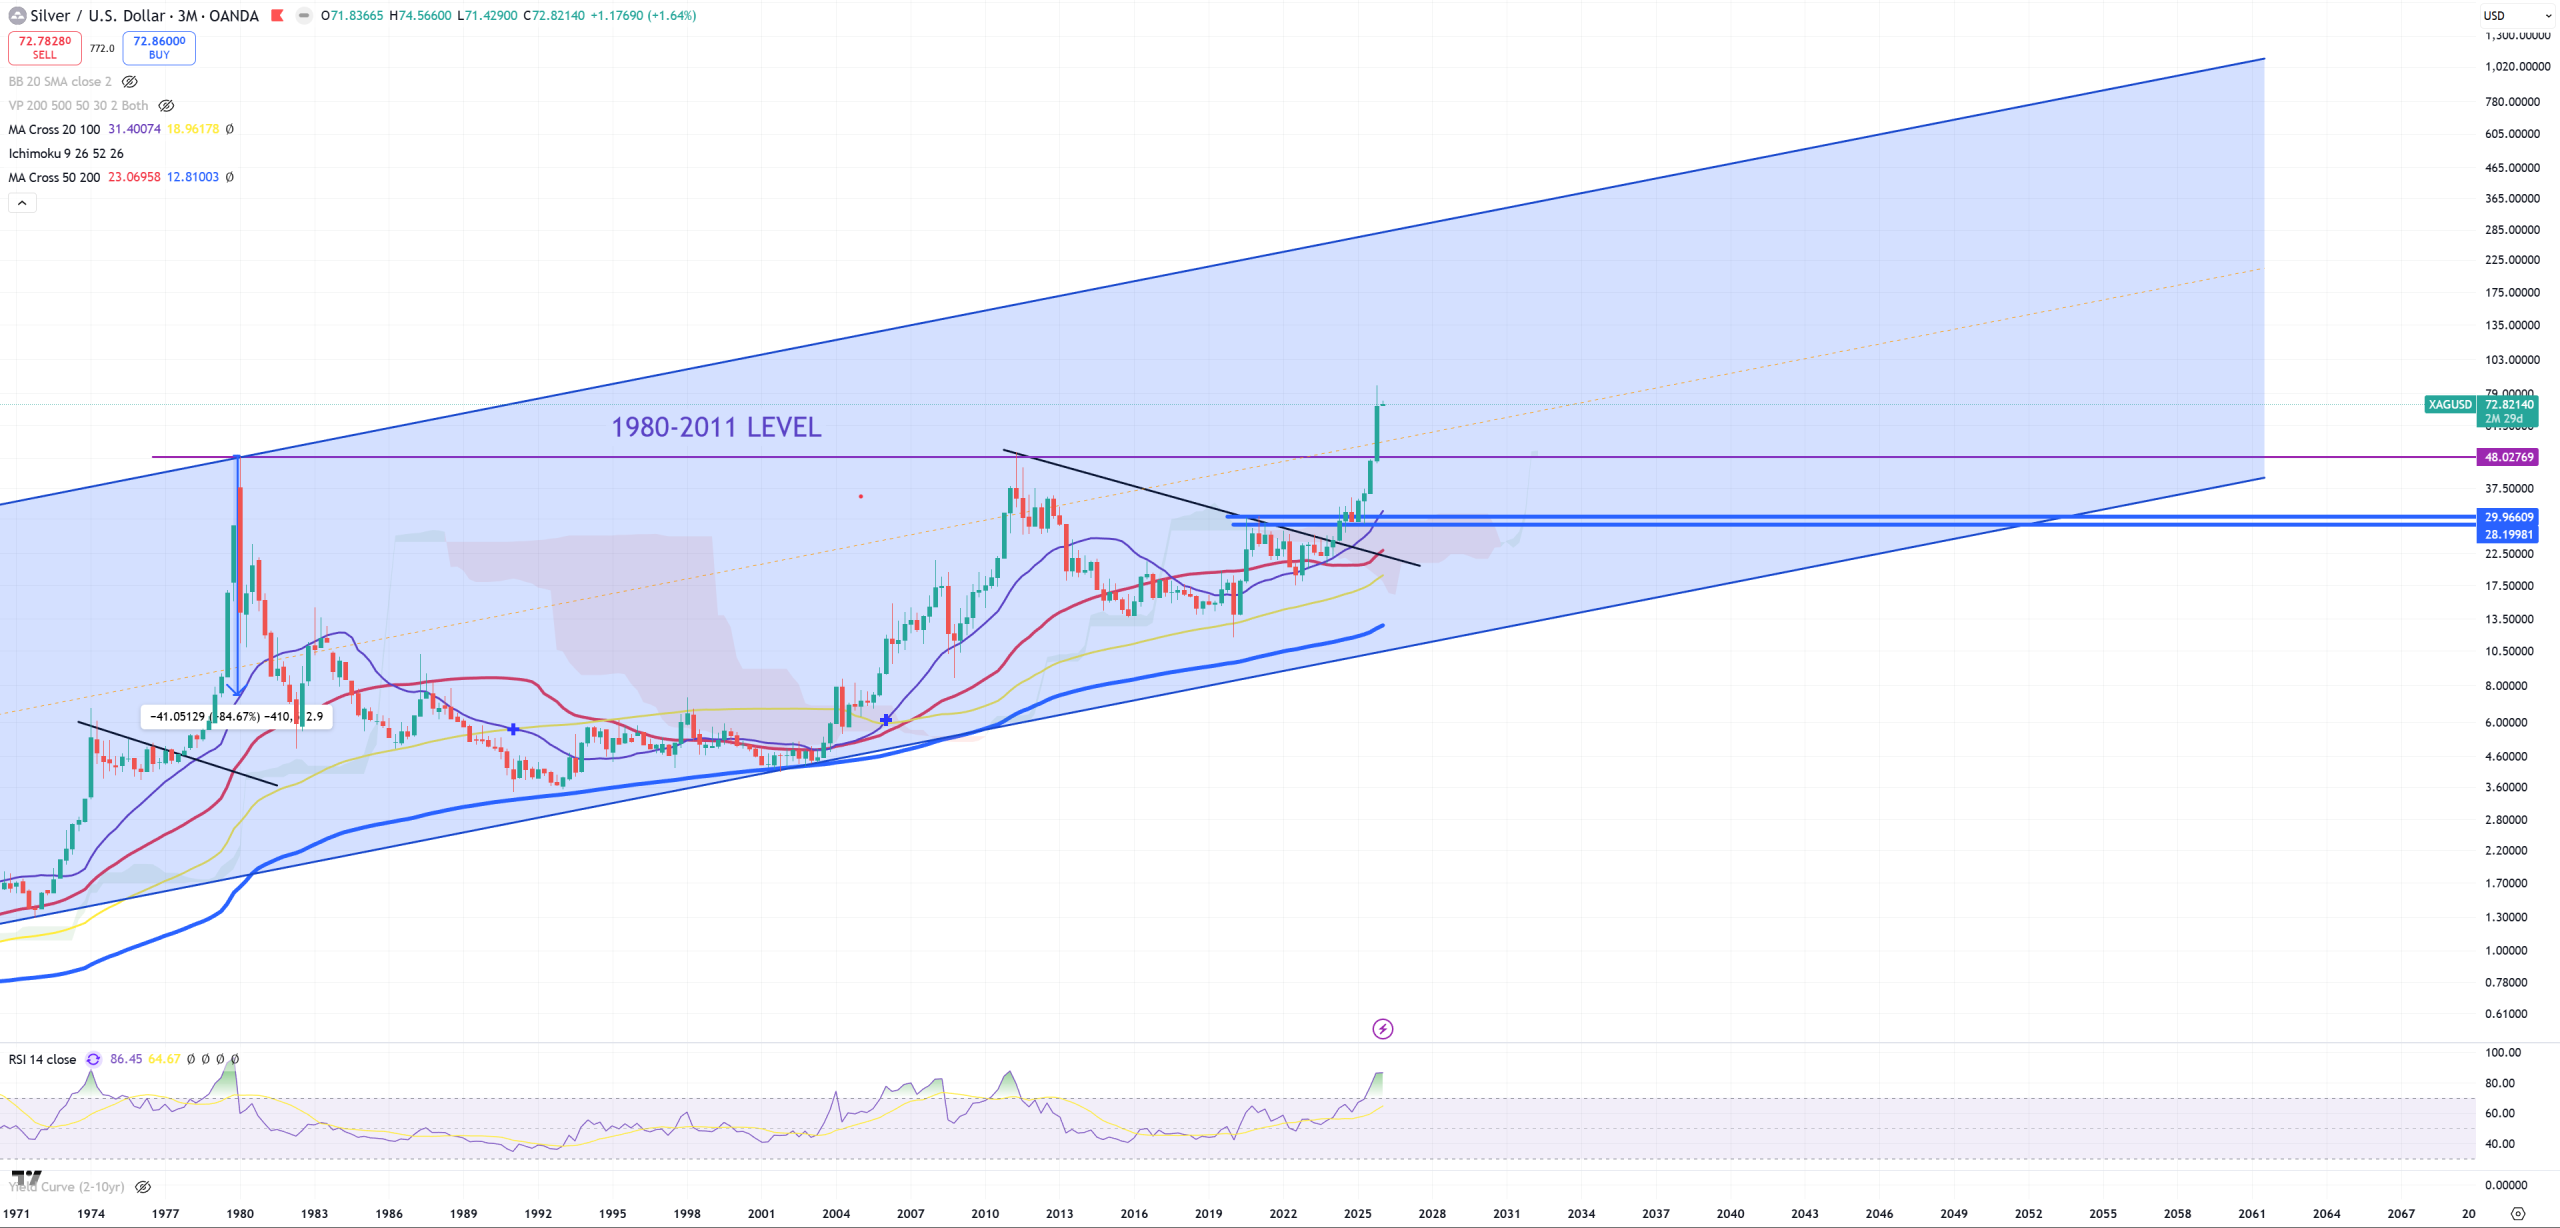
SILVER – after small entry we now see how Silver has just started to be correctly priced
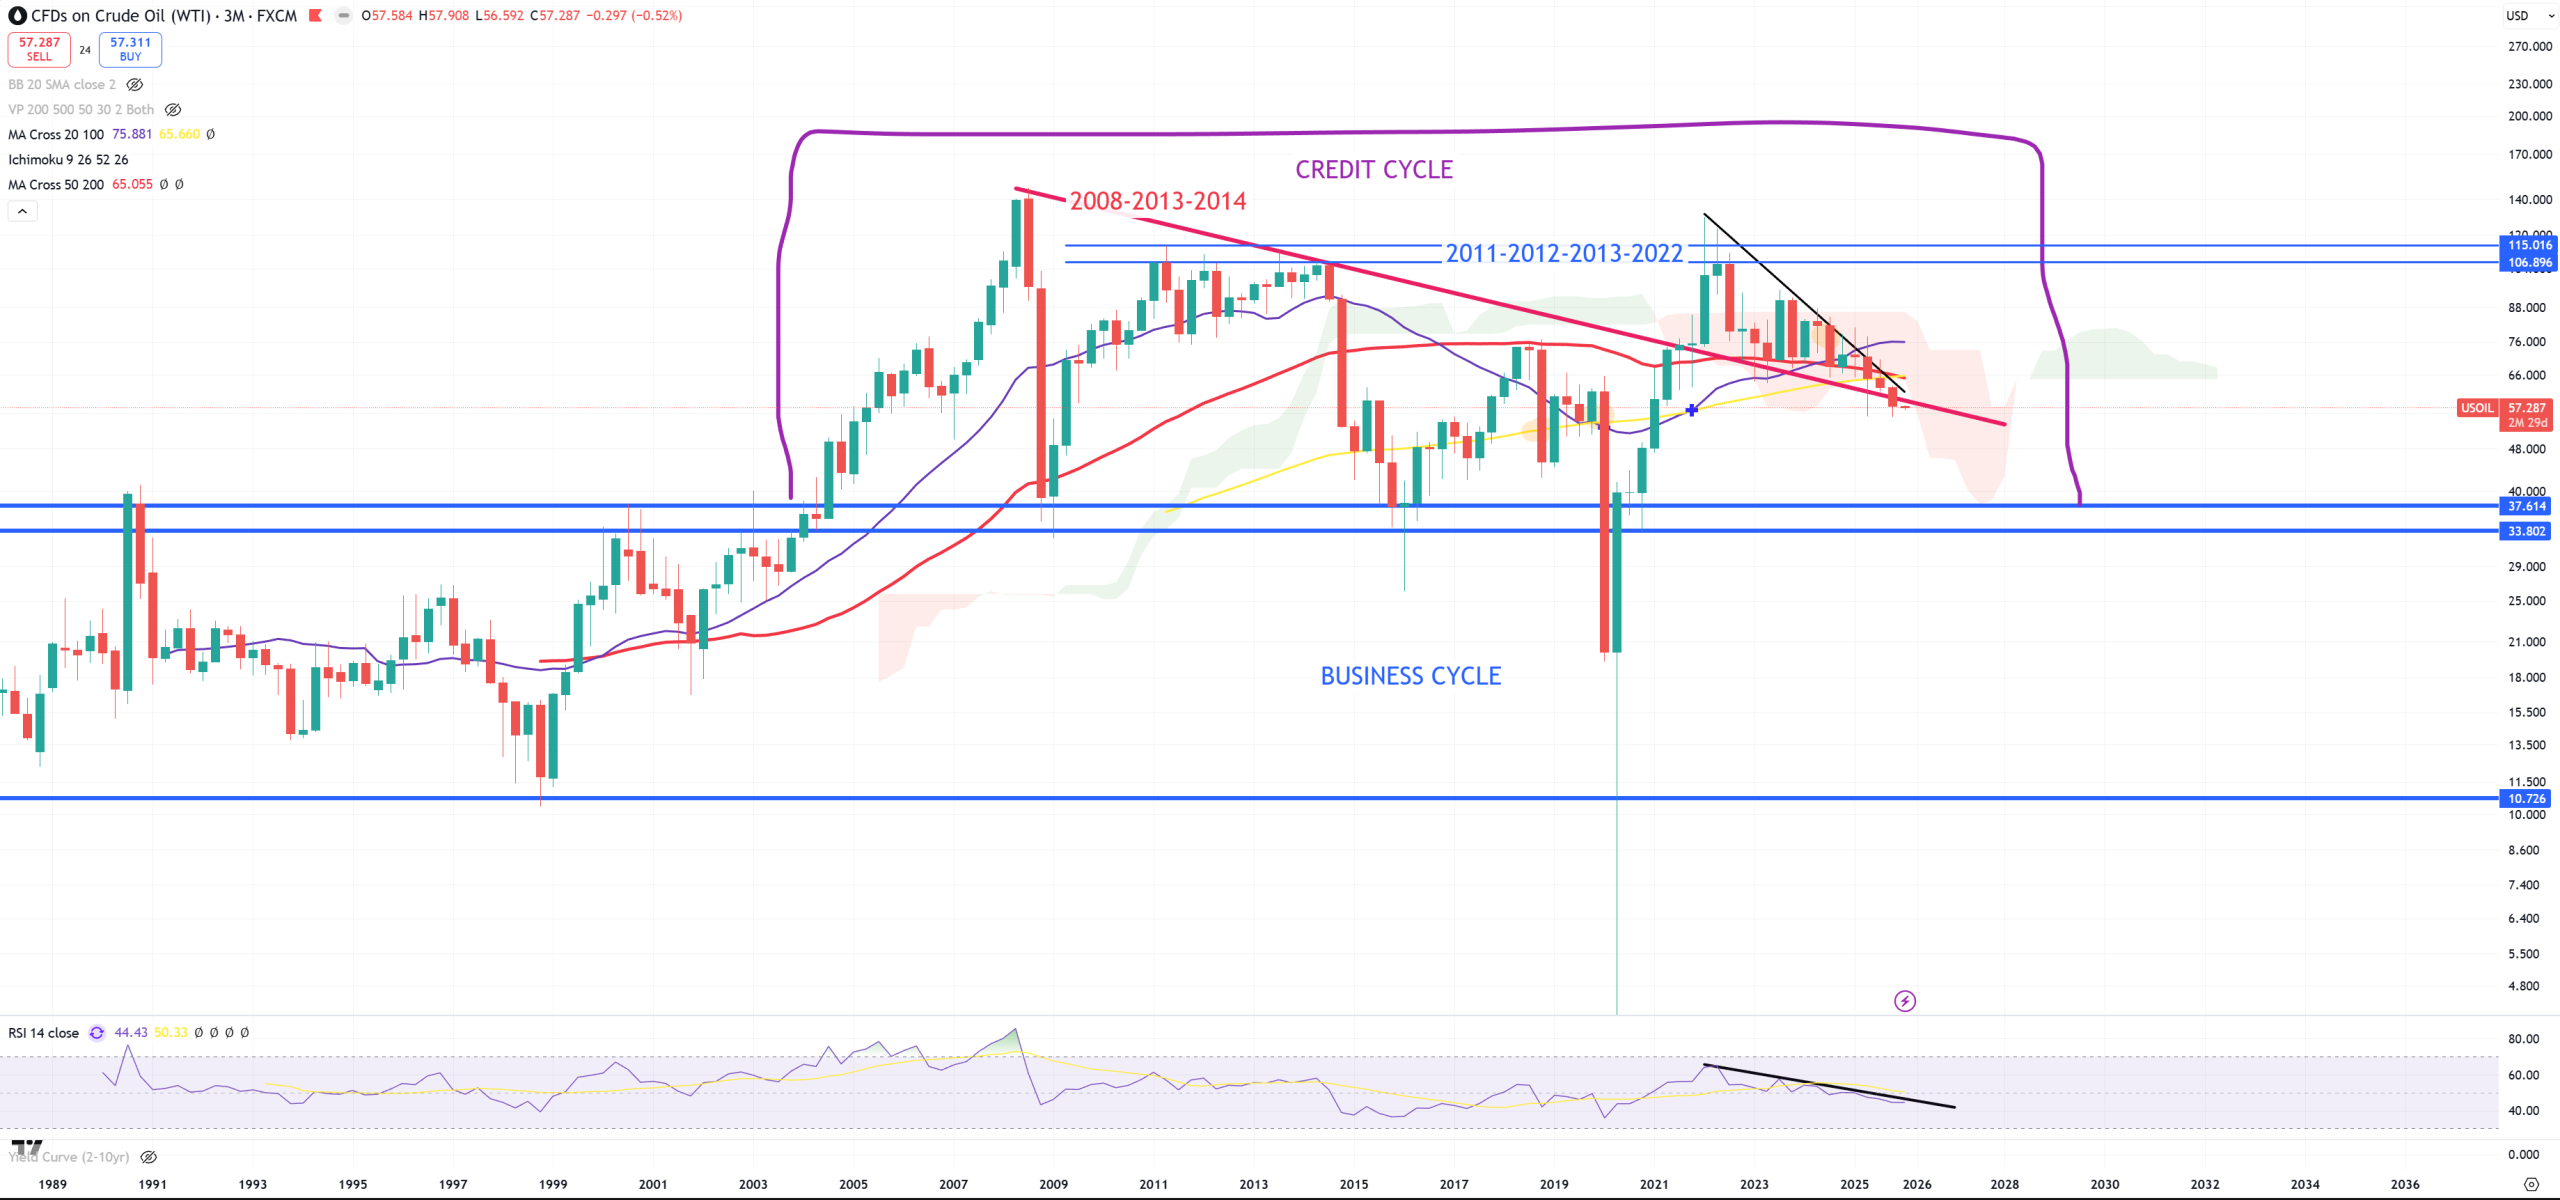
OIL – Oil and gasoline dropping, let’s see OIL on 3M view – if you seriously see here 2nd wave of inflation like in 70s good luck. In current cycle it’s now IMPOSSIBLE to ignite inflation without 5000-10000$ Direct Stimulus Checks. US can’t afford it because it’ll lift on long end towards probably 7-10%. No analysis is needed here. If credit cycle has come to an end fair value is between 10$-40$
RBOB – gasoline – same problem like OIL. 0.80-1.00$ is next target and if credit cycle has come to an end – 0.3$ to 0.8$.

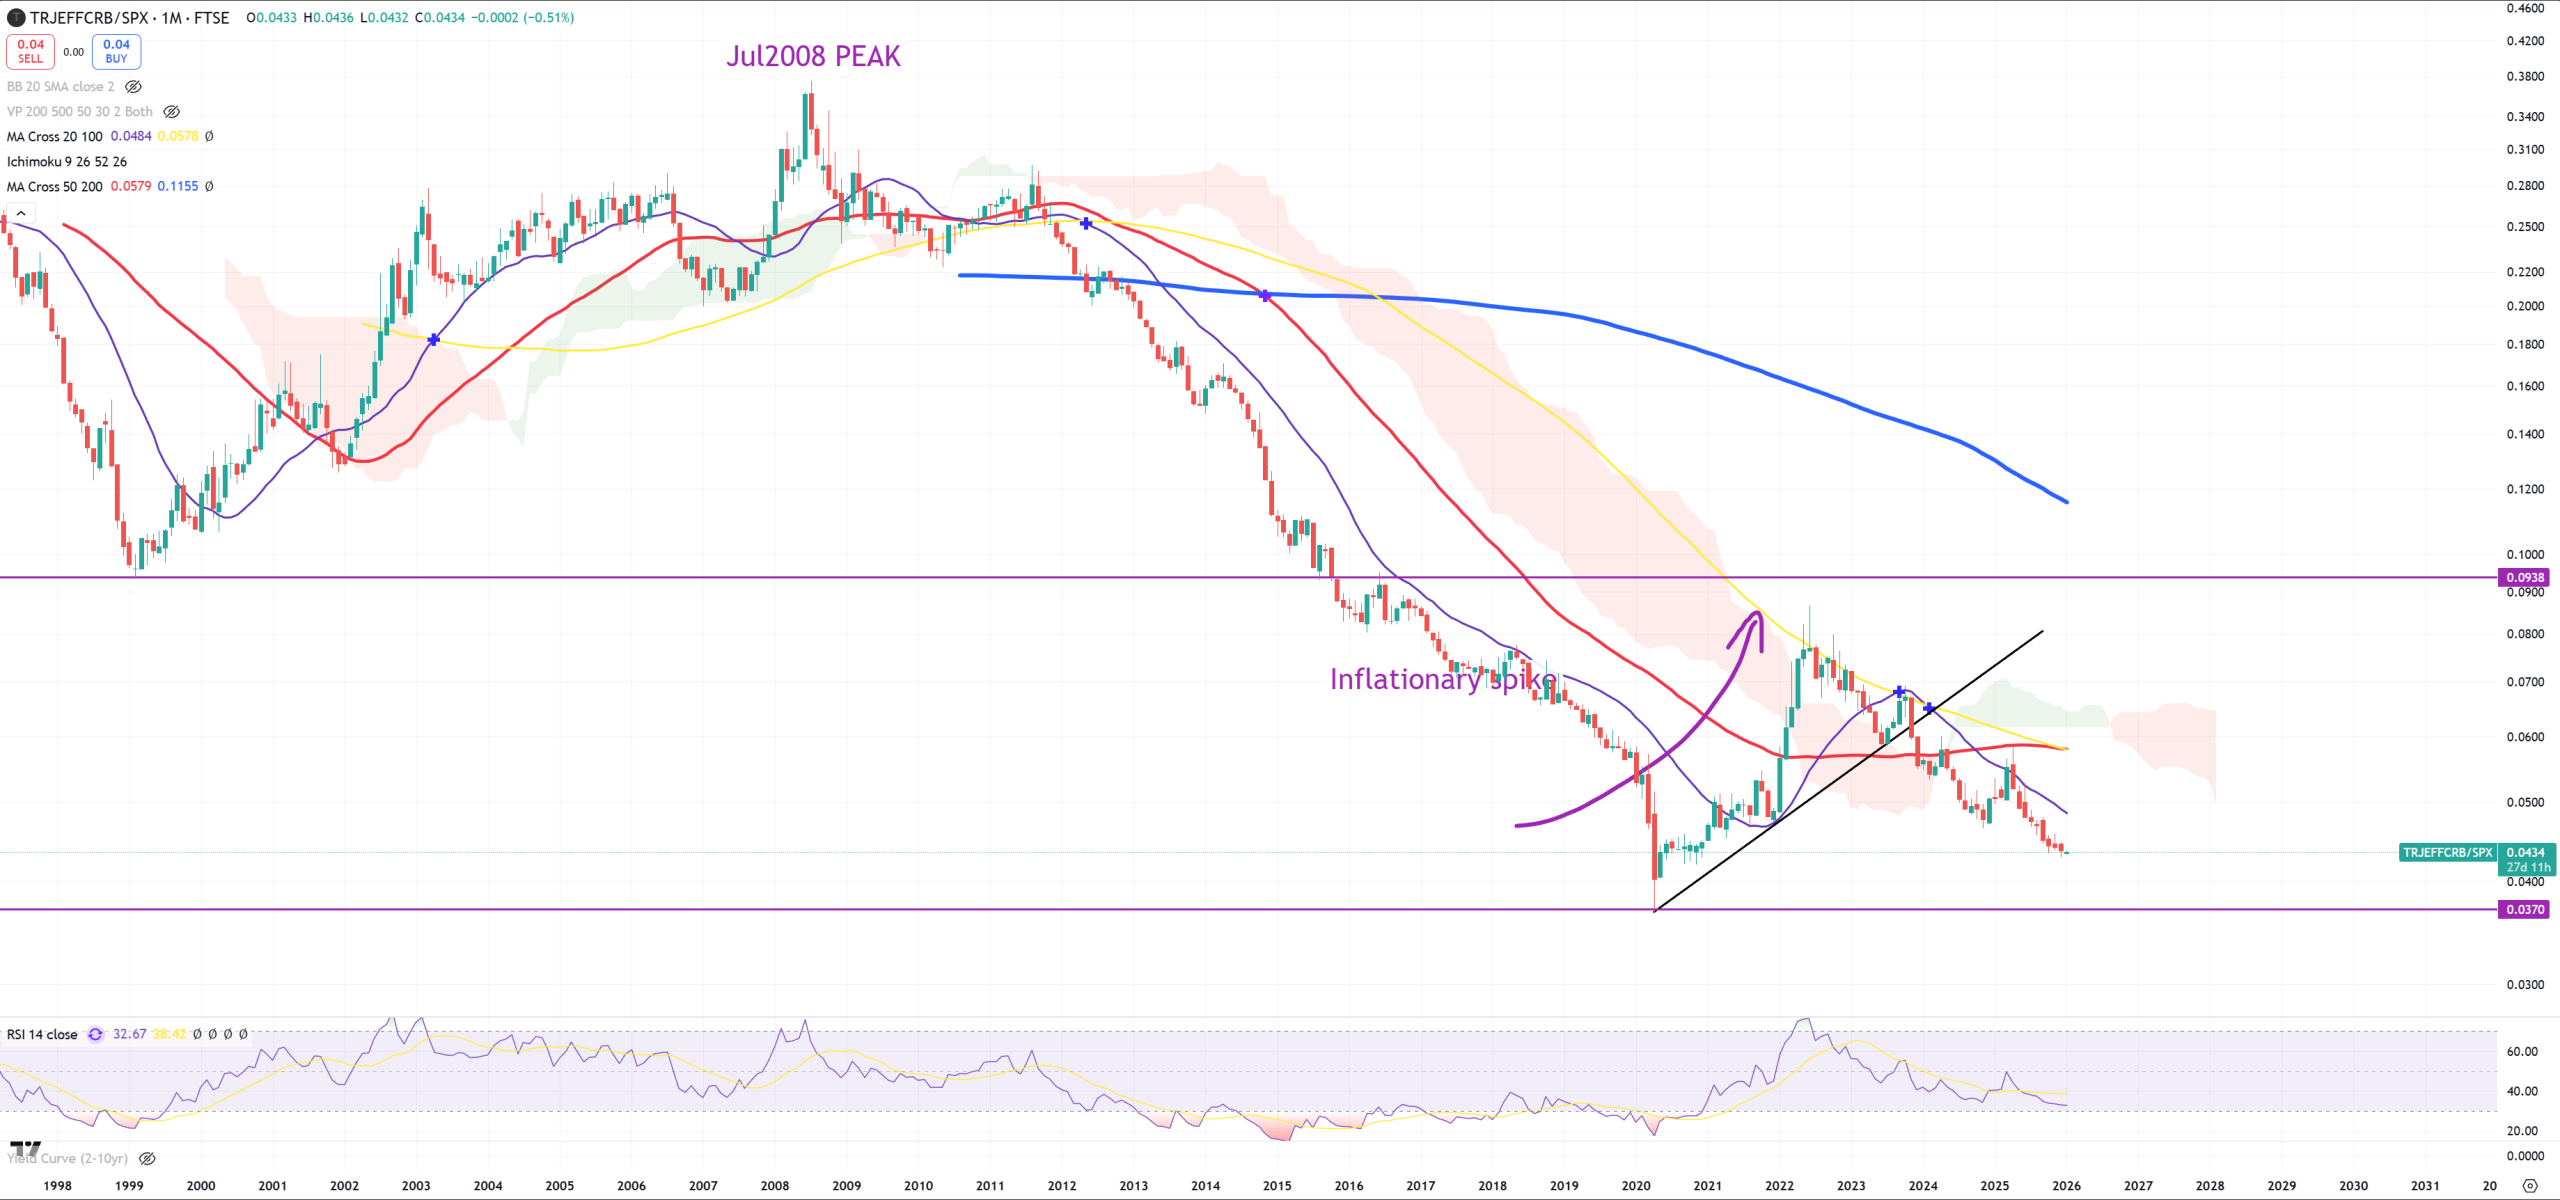
CRB/SPX – So Commodity Index CRB / SPX ratio shows us last inflationary unnatural spike. We see (M) view and yellow (M)MA100 test (typical bull/bear trap level). We’re approaching towards 2020 lows and looking on everything I expect this ratio to drop below this level?
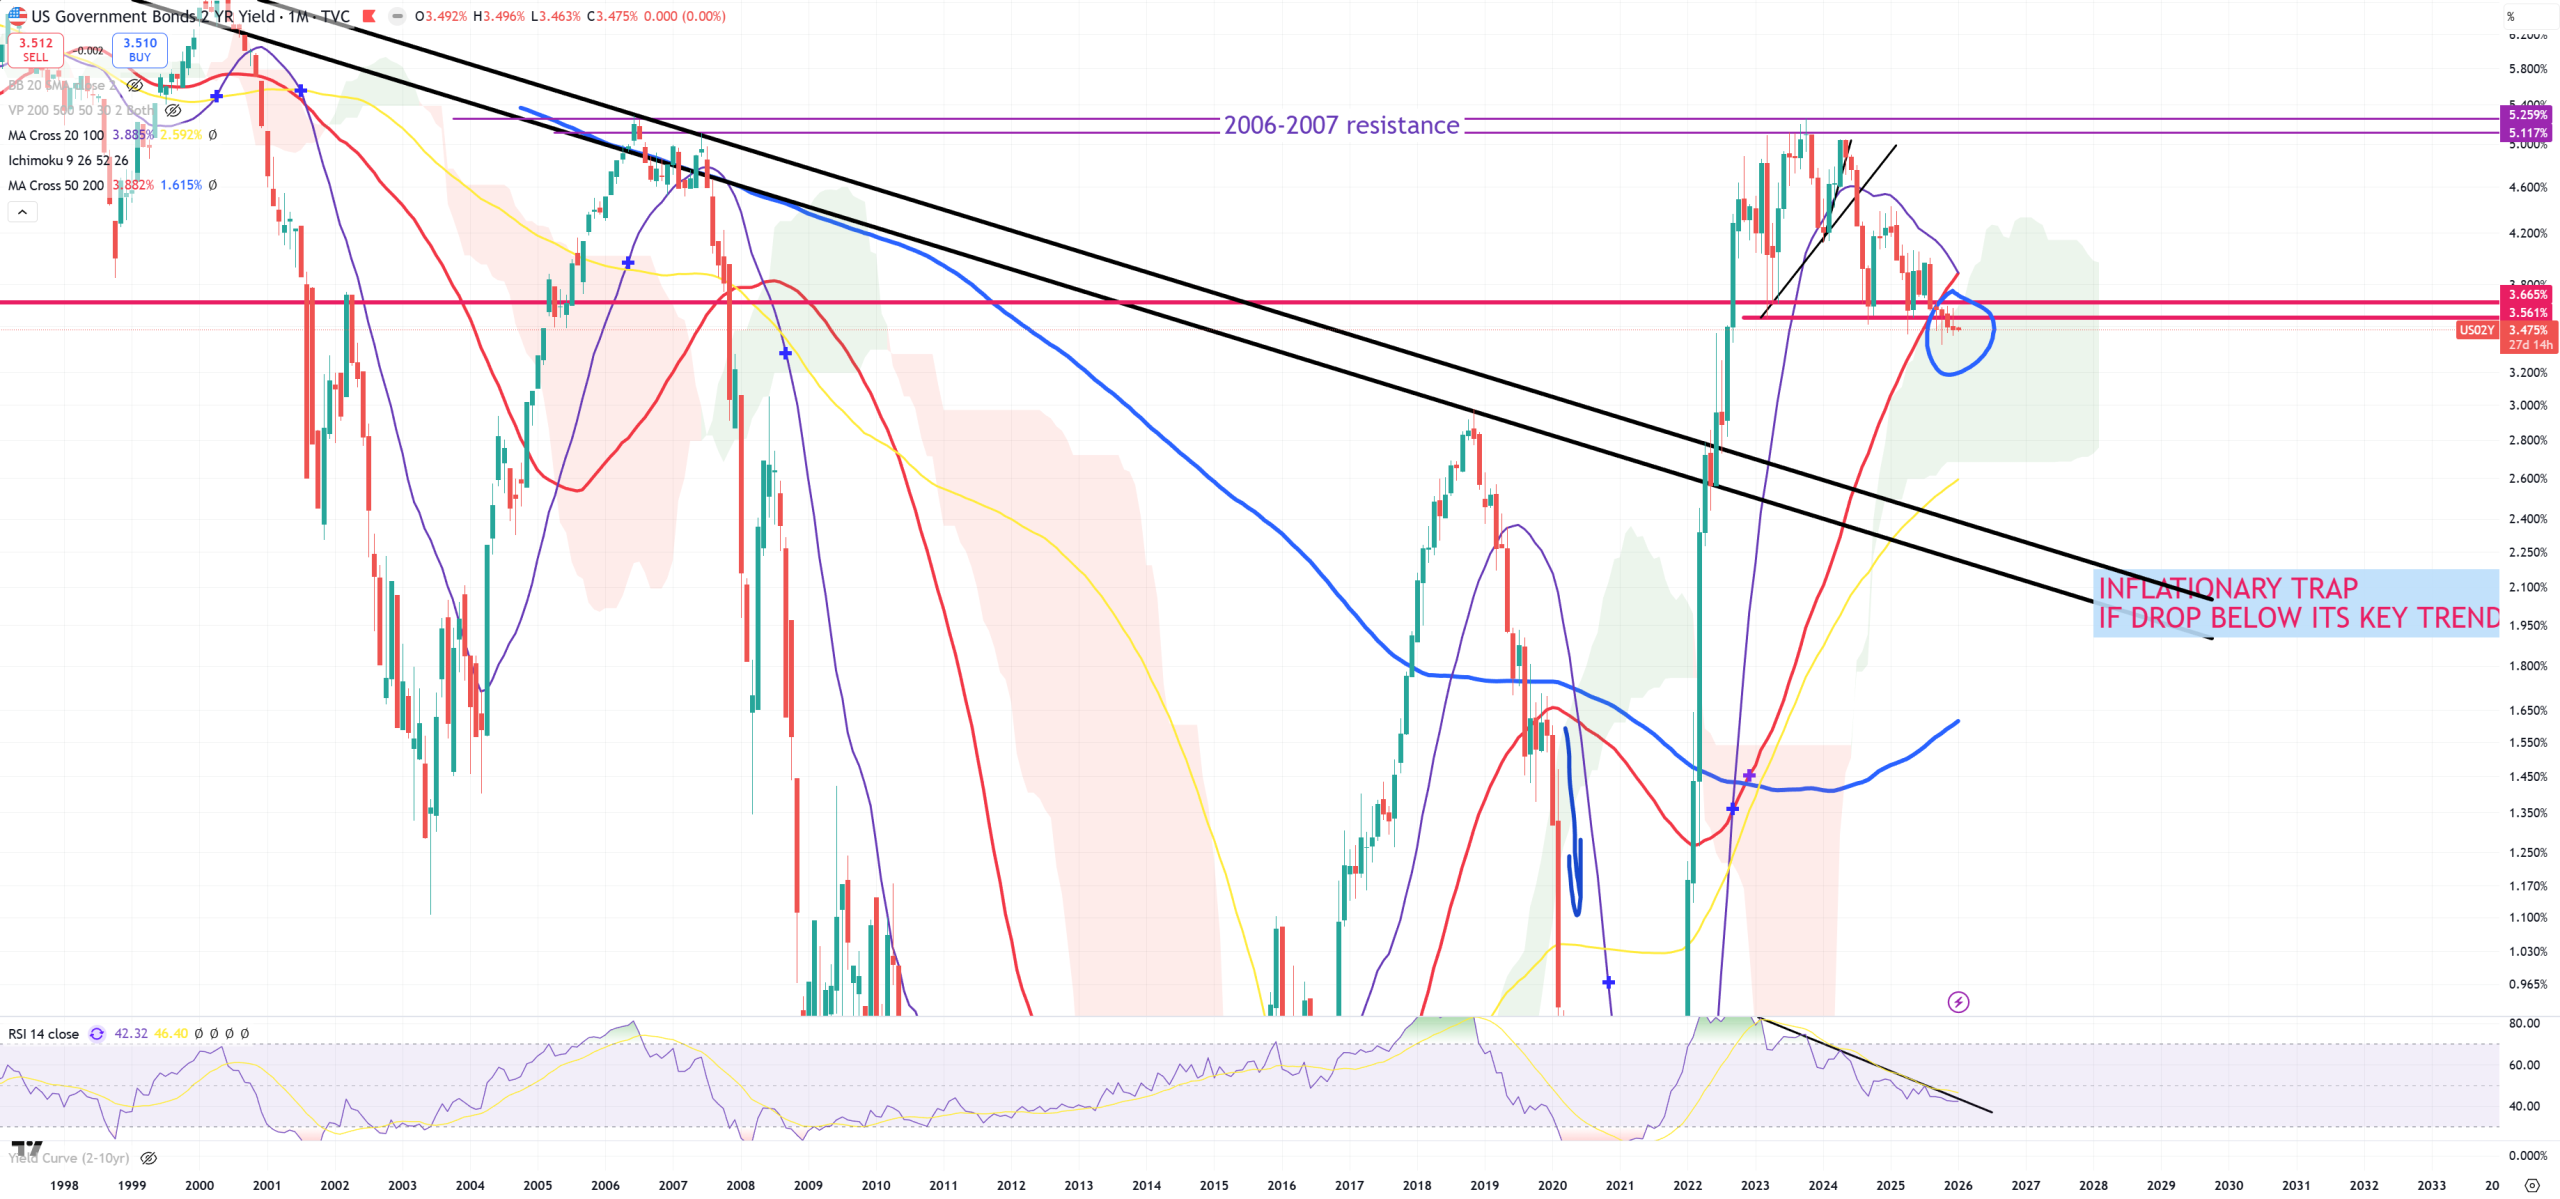
US02Y – (M)MA50 broken given a green light for US03MY to break (M)MA50. Because both OIL and Gasoline showing us last inflationary spike was in reality 100% correlated with MMT, I expect US02Y to go back below 2% signing a confirmation – last inflationary spike was just MMT driven spike.
US10Y – this is 3M view to show you retest moment October 2023 :

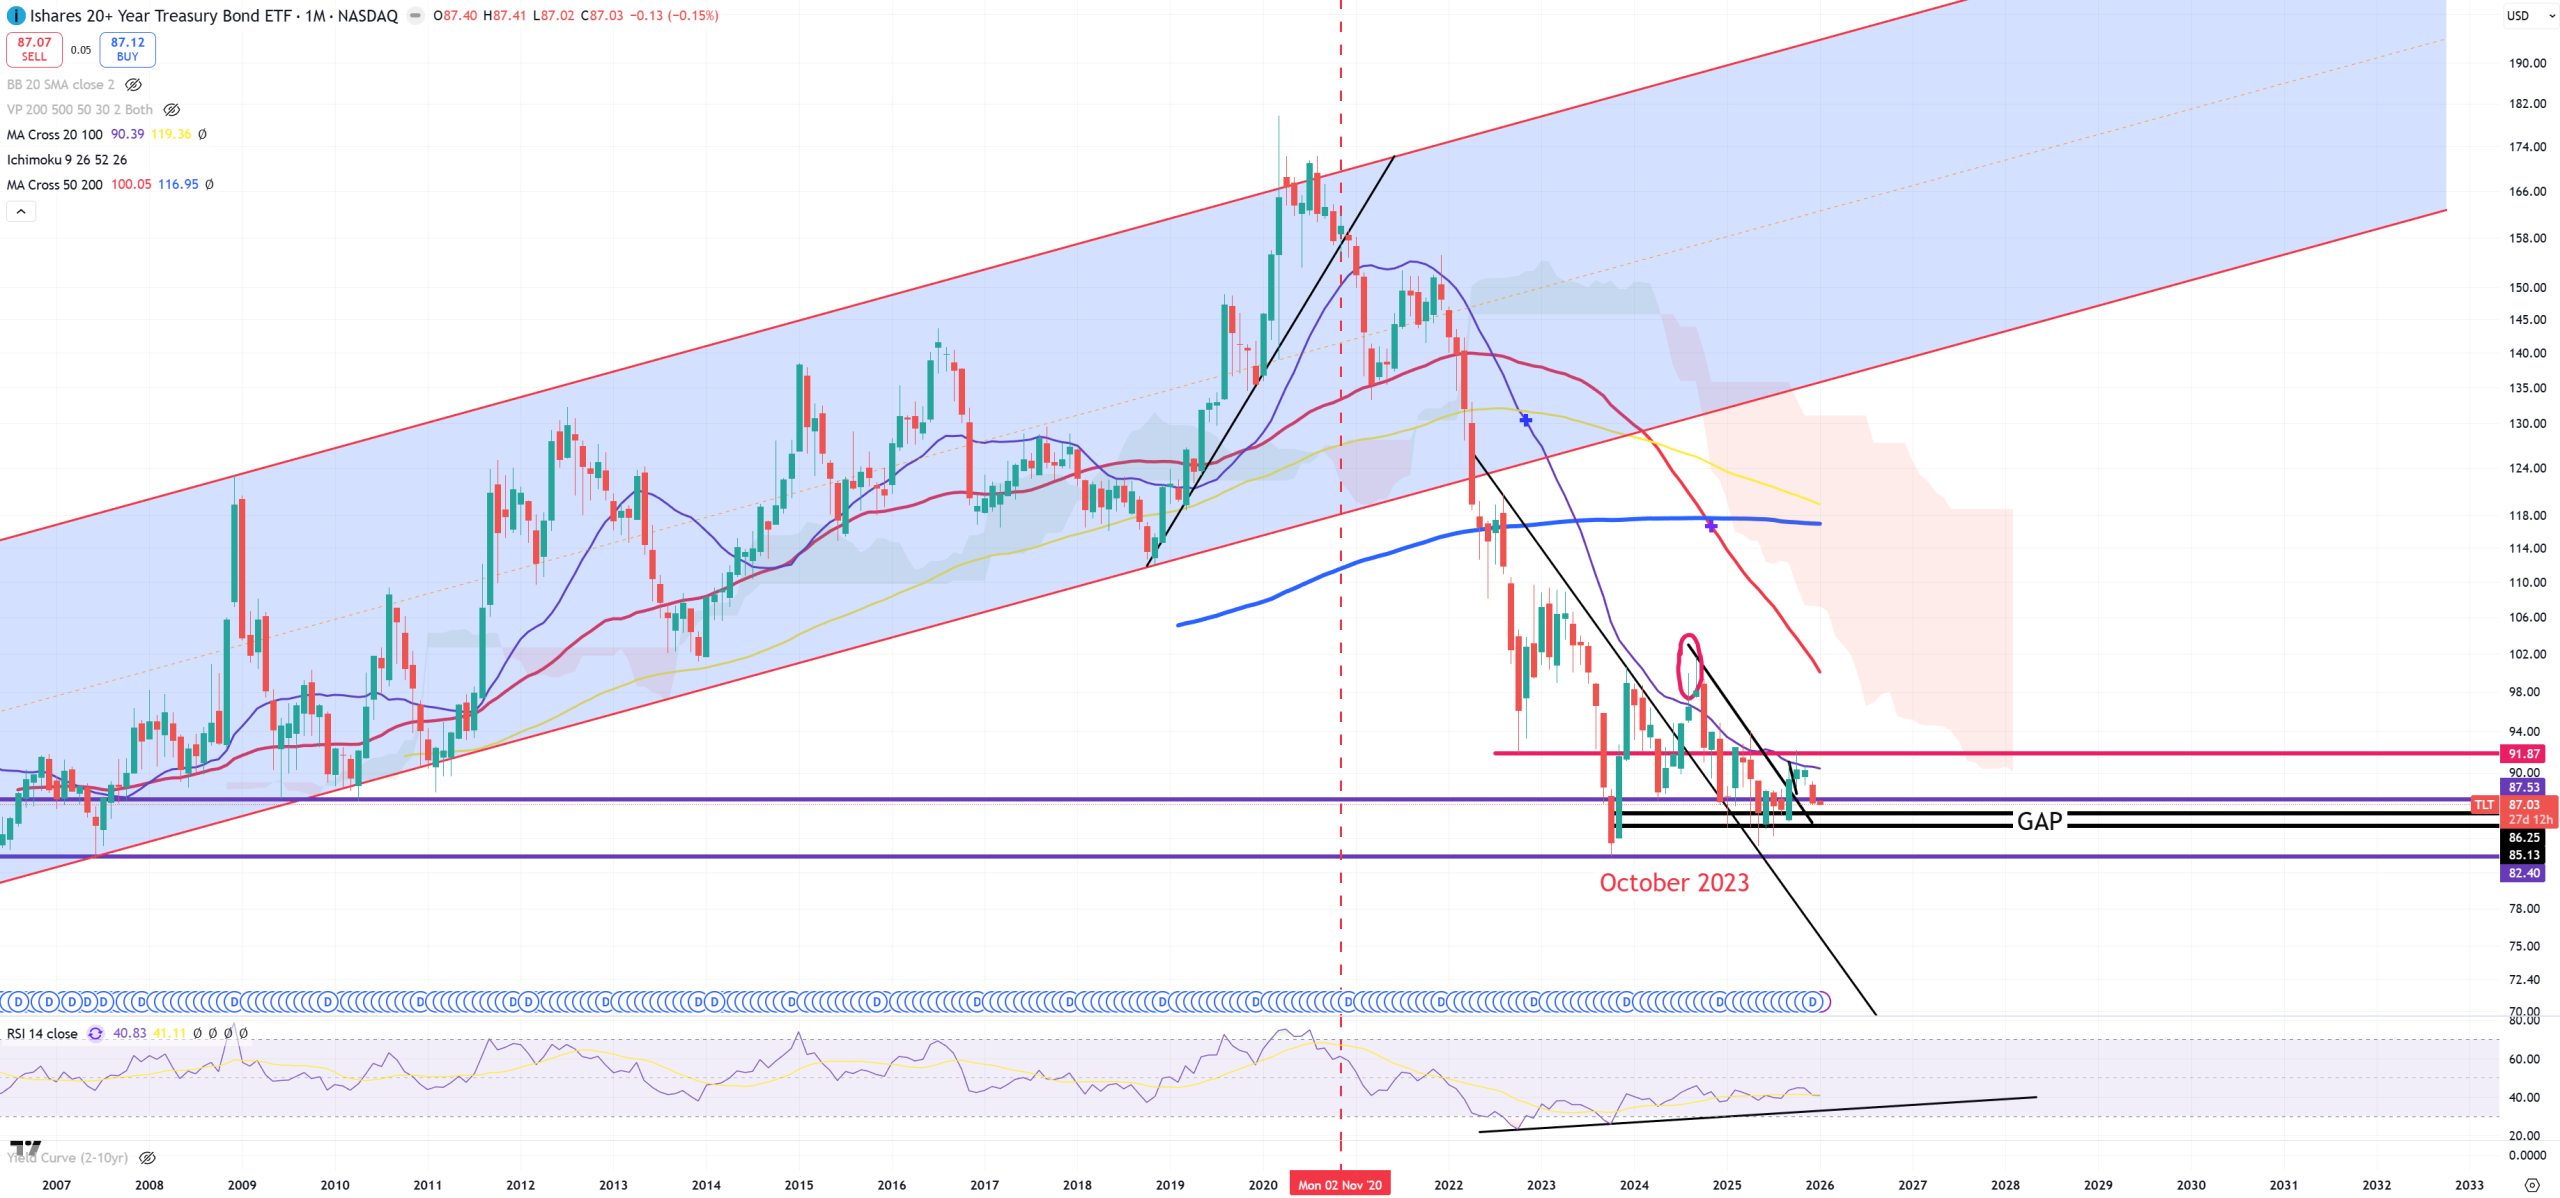
TLT – nothing to be shown here except October 2023. 82$ = October 2023 so 85Y retest to trend from US10Y. 87.5$ should be a support. We’ll find out in the future.
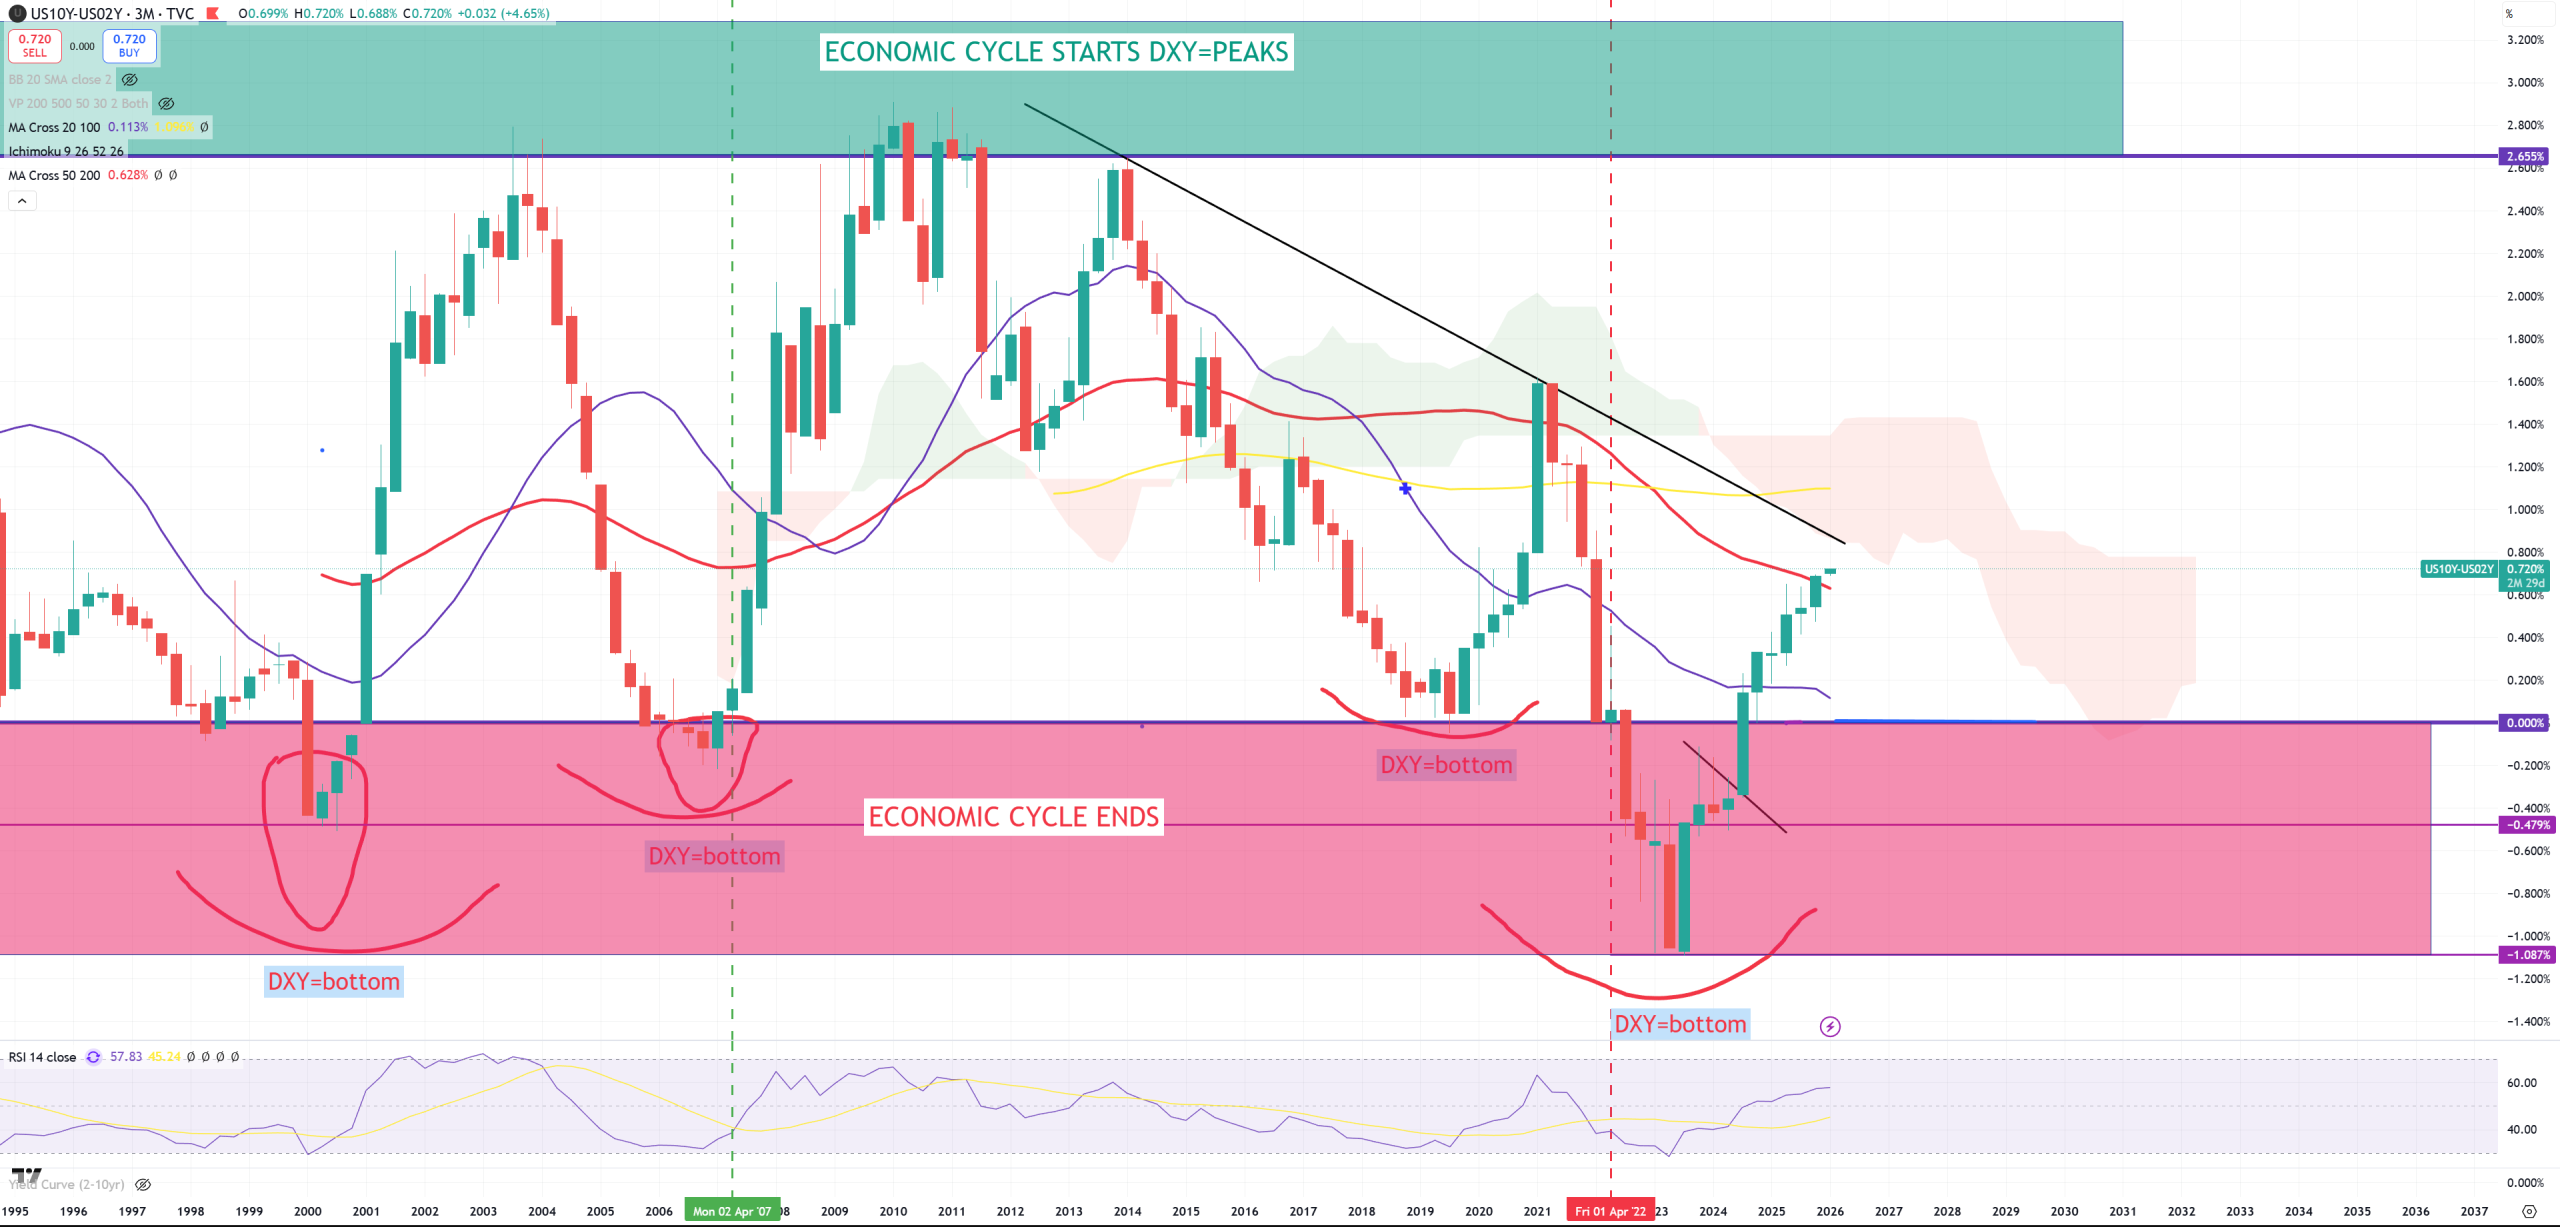
US10Y/US02Y – second key yield-curve which shows the path for 10Y/3M – also (3M) view. Look on this red (3M)MA50 break in reality the first time since October 2007
DXY – $$$ index on (3M) view looks like that. The most important thing is super-secular golden cross from red (3M)MA50 crossing up blue (3M)MA200. We are still operating around 2011 trend with 96.5 ultimate bottom and 98.5 is now 2011 trend. My idea is once SPX/GOLD broke (3M)MA200 it’ll force 10y/3m and 10y/2y to fully uninvert resting GOLD gains and adding $$$+TLT into the game

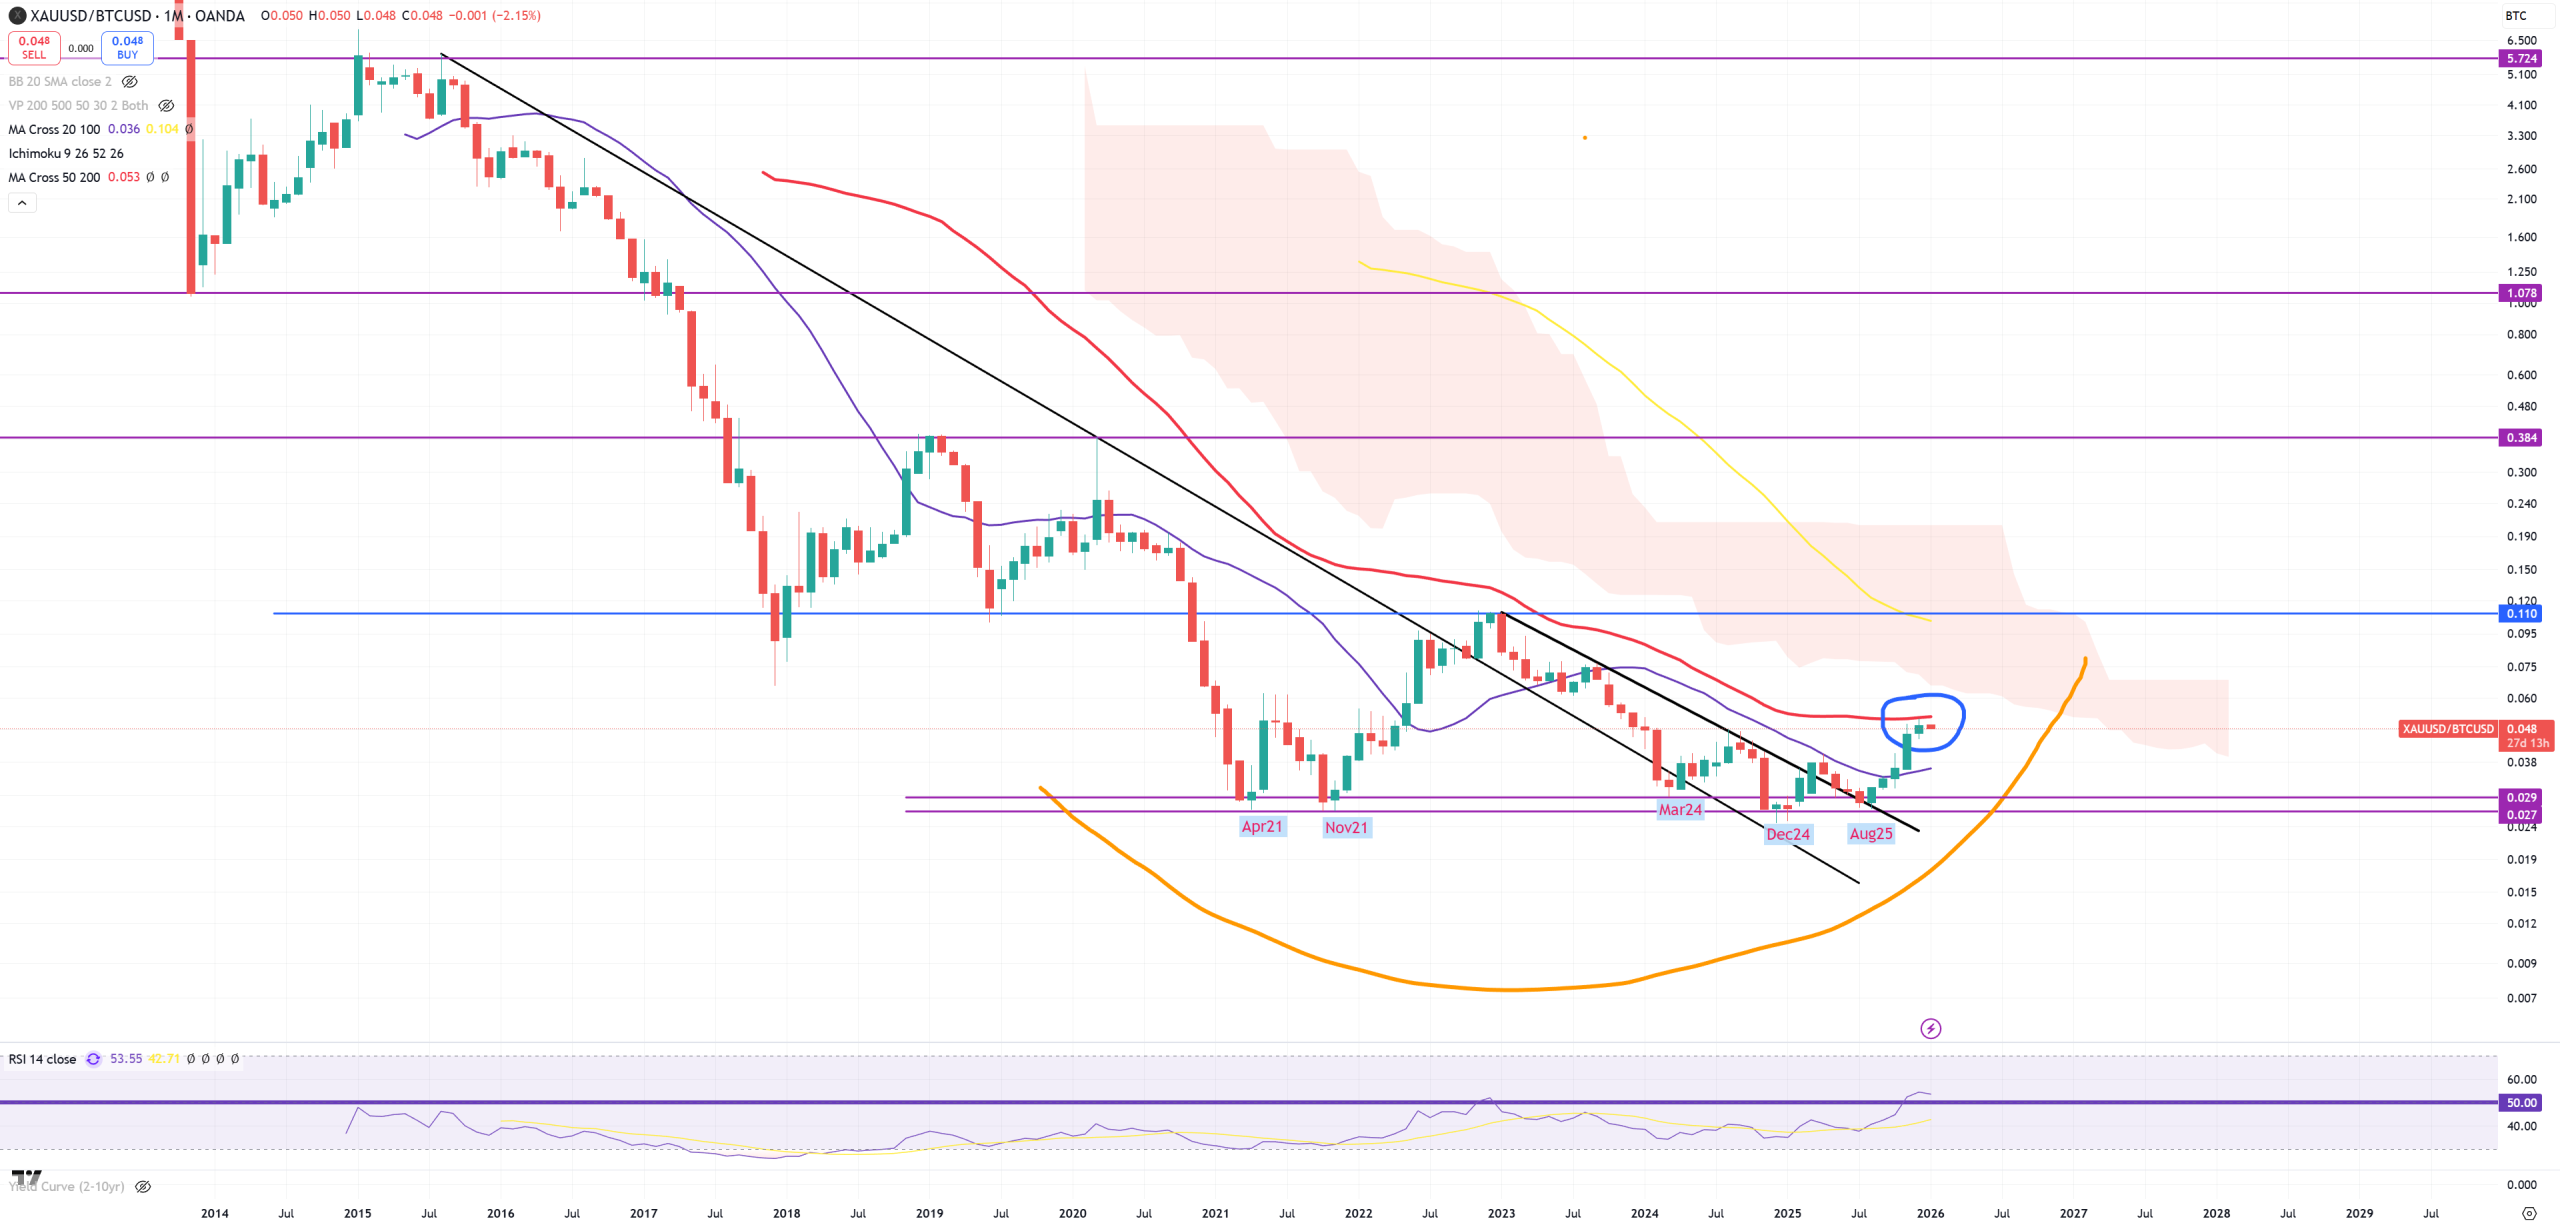
GOLD/BTC – we can’t forget about crypto. My bet is – once this red (M)MA50 will be broken – crypto will enter its first true technical bear market. We have not seen true bear market ever in BTC – just corrections in the same bull market
BTC – starts 2026 from retesting broken (M)MA20 – possible trend change. 2021 peak (SPX/GOLD peak) is set on 75k$ – once this level will be broken and GOLD/BTC will jump > (M)MA50 it’s big RIP for crypto.

As you see. End of 2025 I put all important charts and this time I bypass those sector ETFs/stocks etc to show you the path. What charts are telling us?
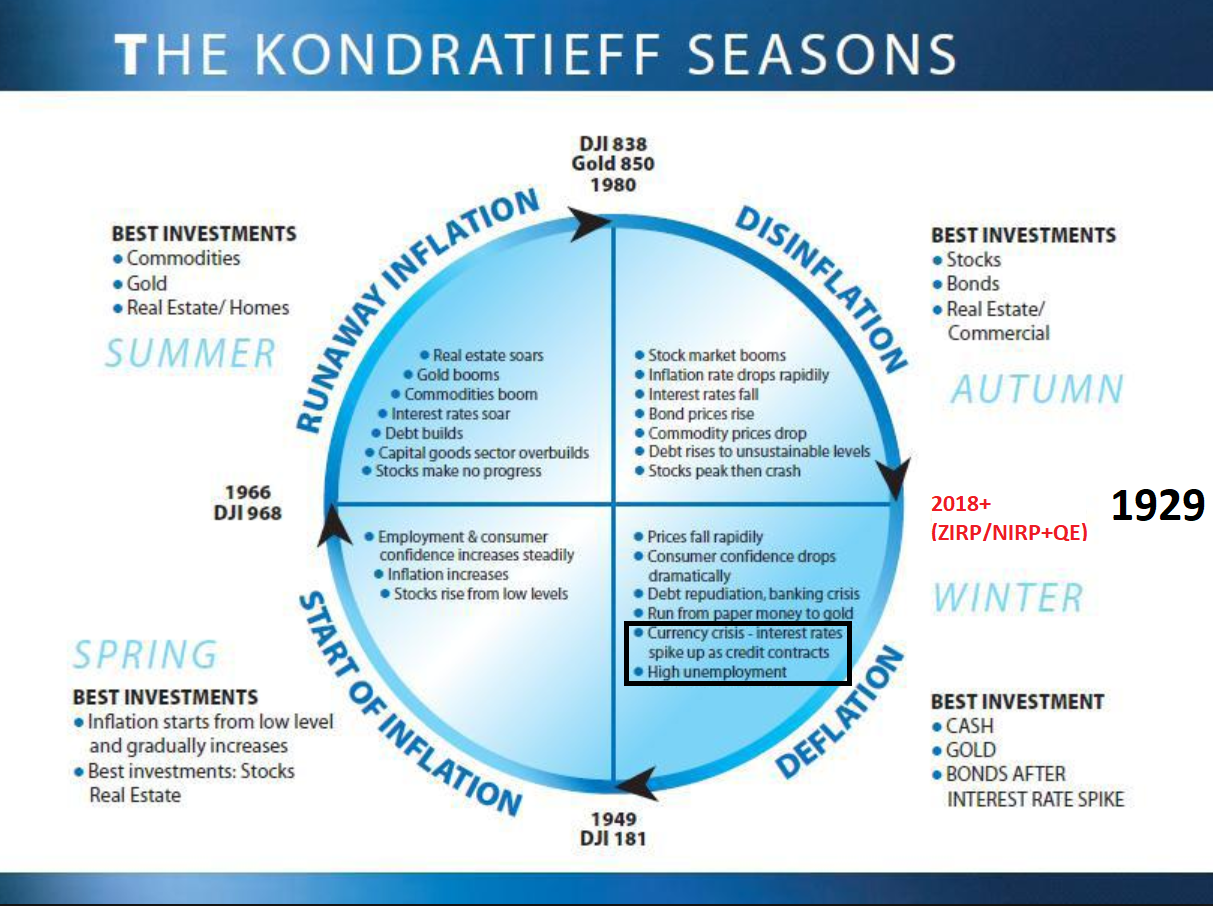
First of all I still believe between 2018+ (DJI/GOLD peak) and 2021 (SPX/GOLD peak) as a continuation economy has started to rotate. In 2H24 trends on those cycle indicators were broken flashing warning and in 1Q25 DJI/GOLD broke its (3M)MA200 and in 4Q25 SPX/GOLD broke its (3M)MA200. This MA from my analysis is super important from cycle level as during 100Ys it told us that the biggest economic crisises to kick in. I also treat current reversals in SPX/GOLD and DJI/GOLD as a continuation of 2008 cycle which was interrupted for 10Ys using unconventional tools which power has exhausted. Let’s take a look on details of WINTER cycle.
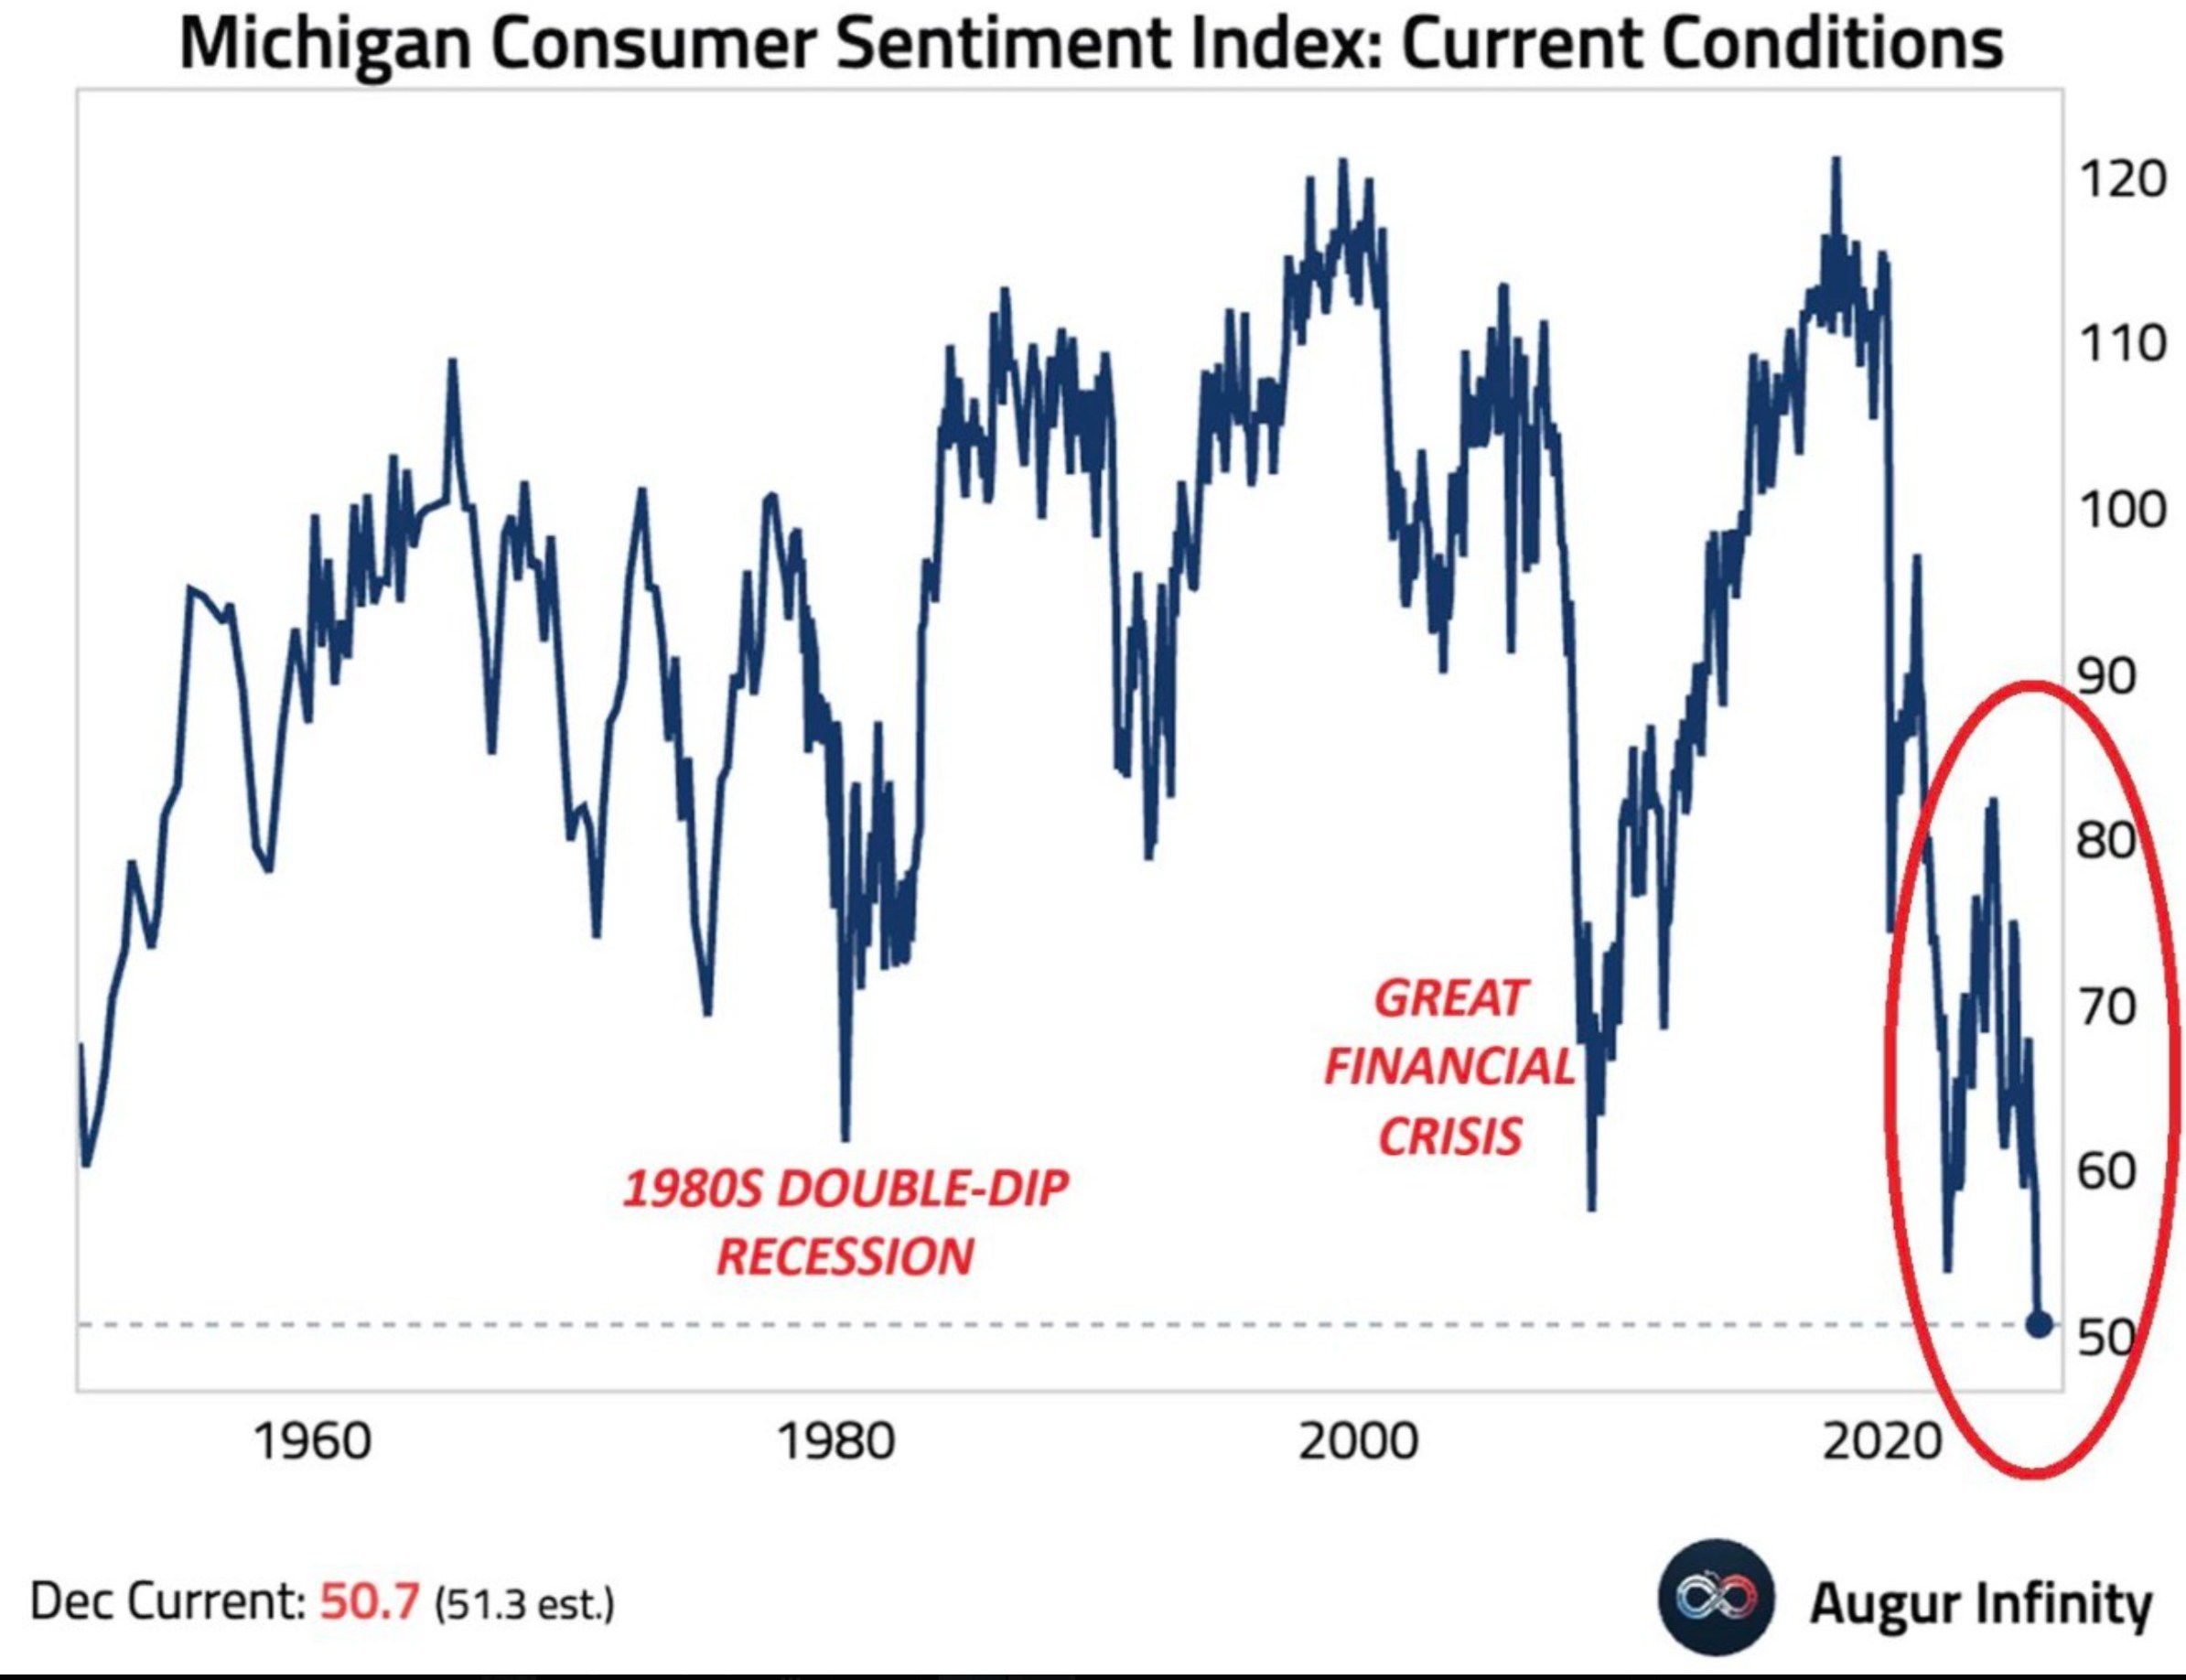
CONSUMER SENTIMENT DROPS DRAMATICALLY :
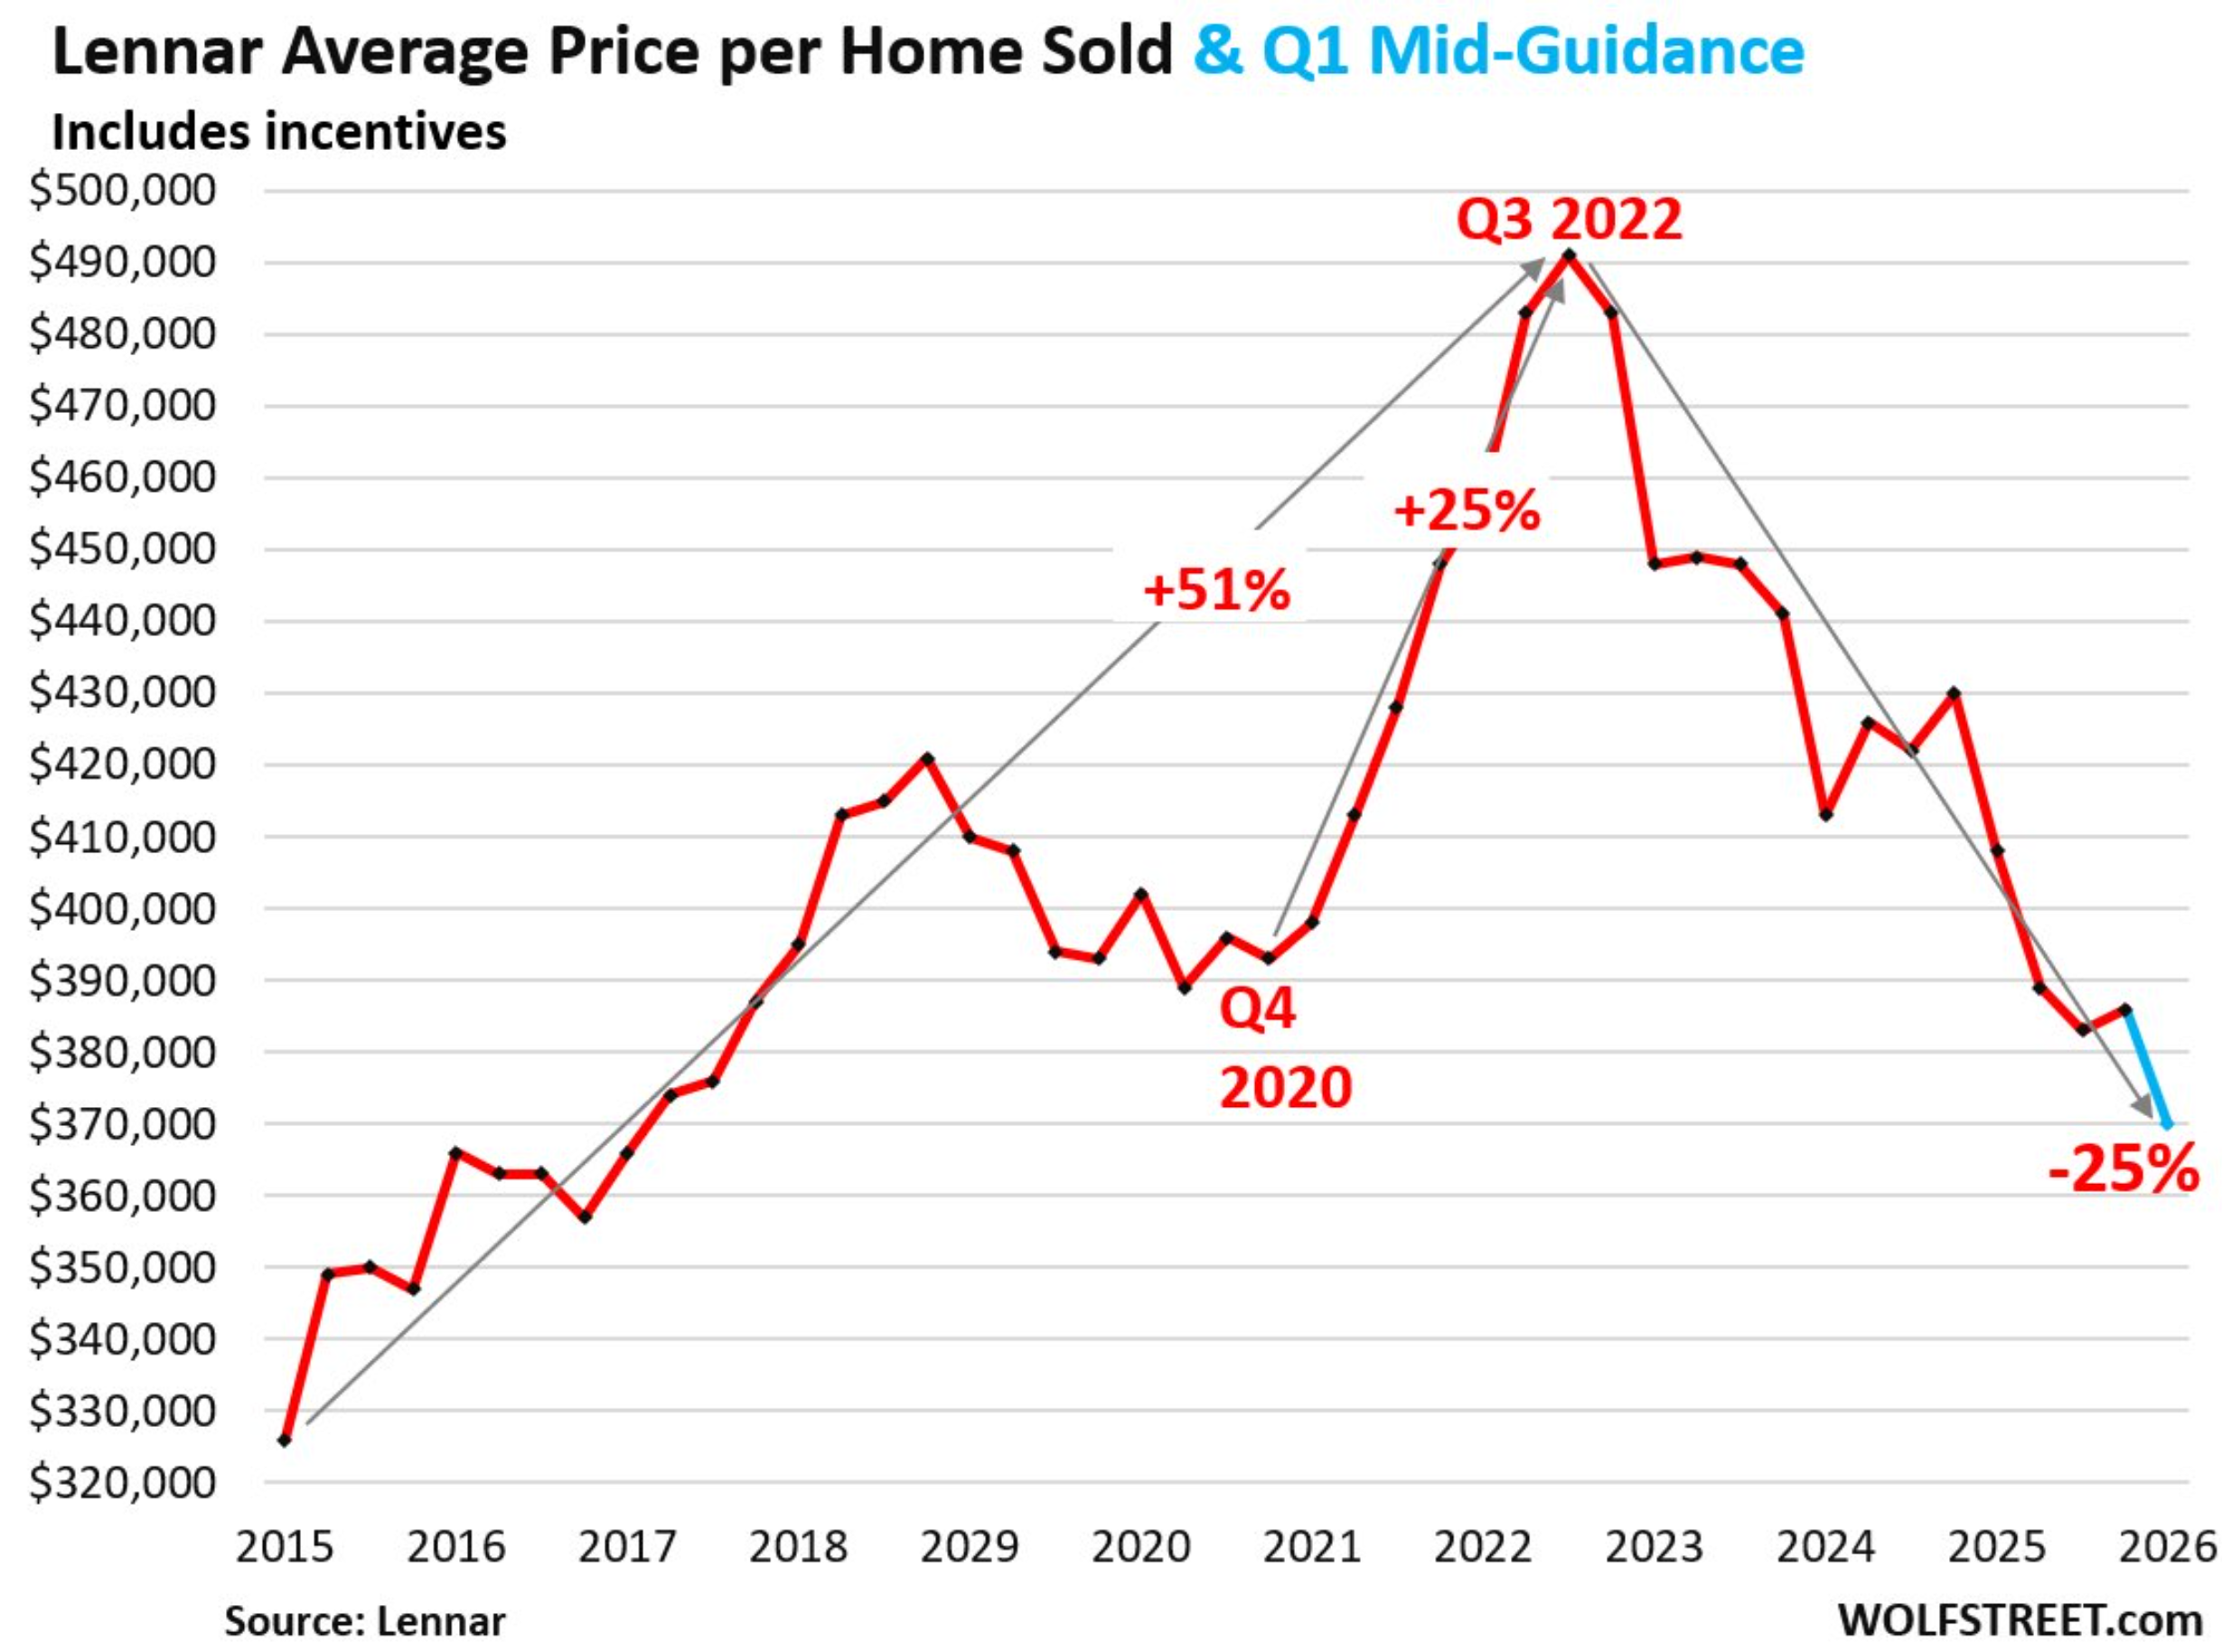
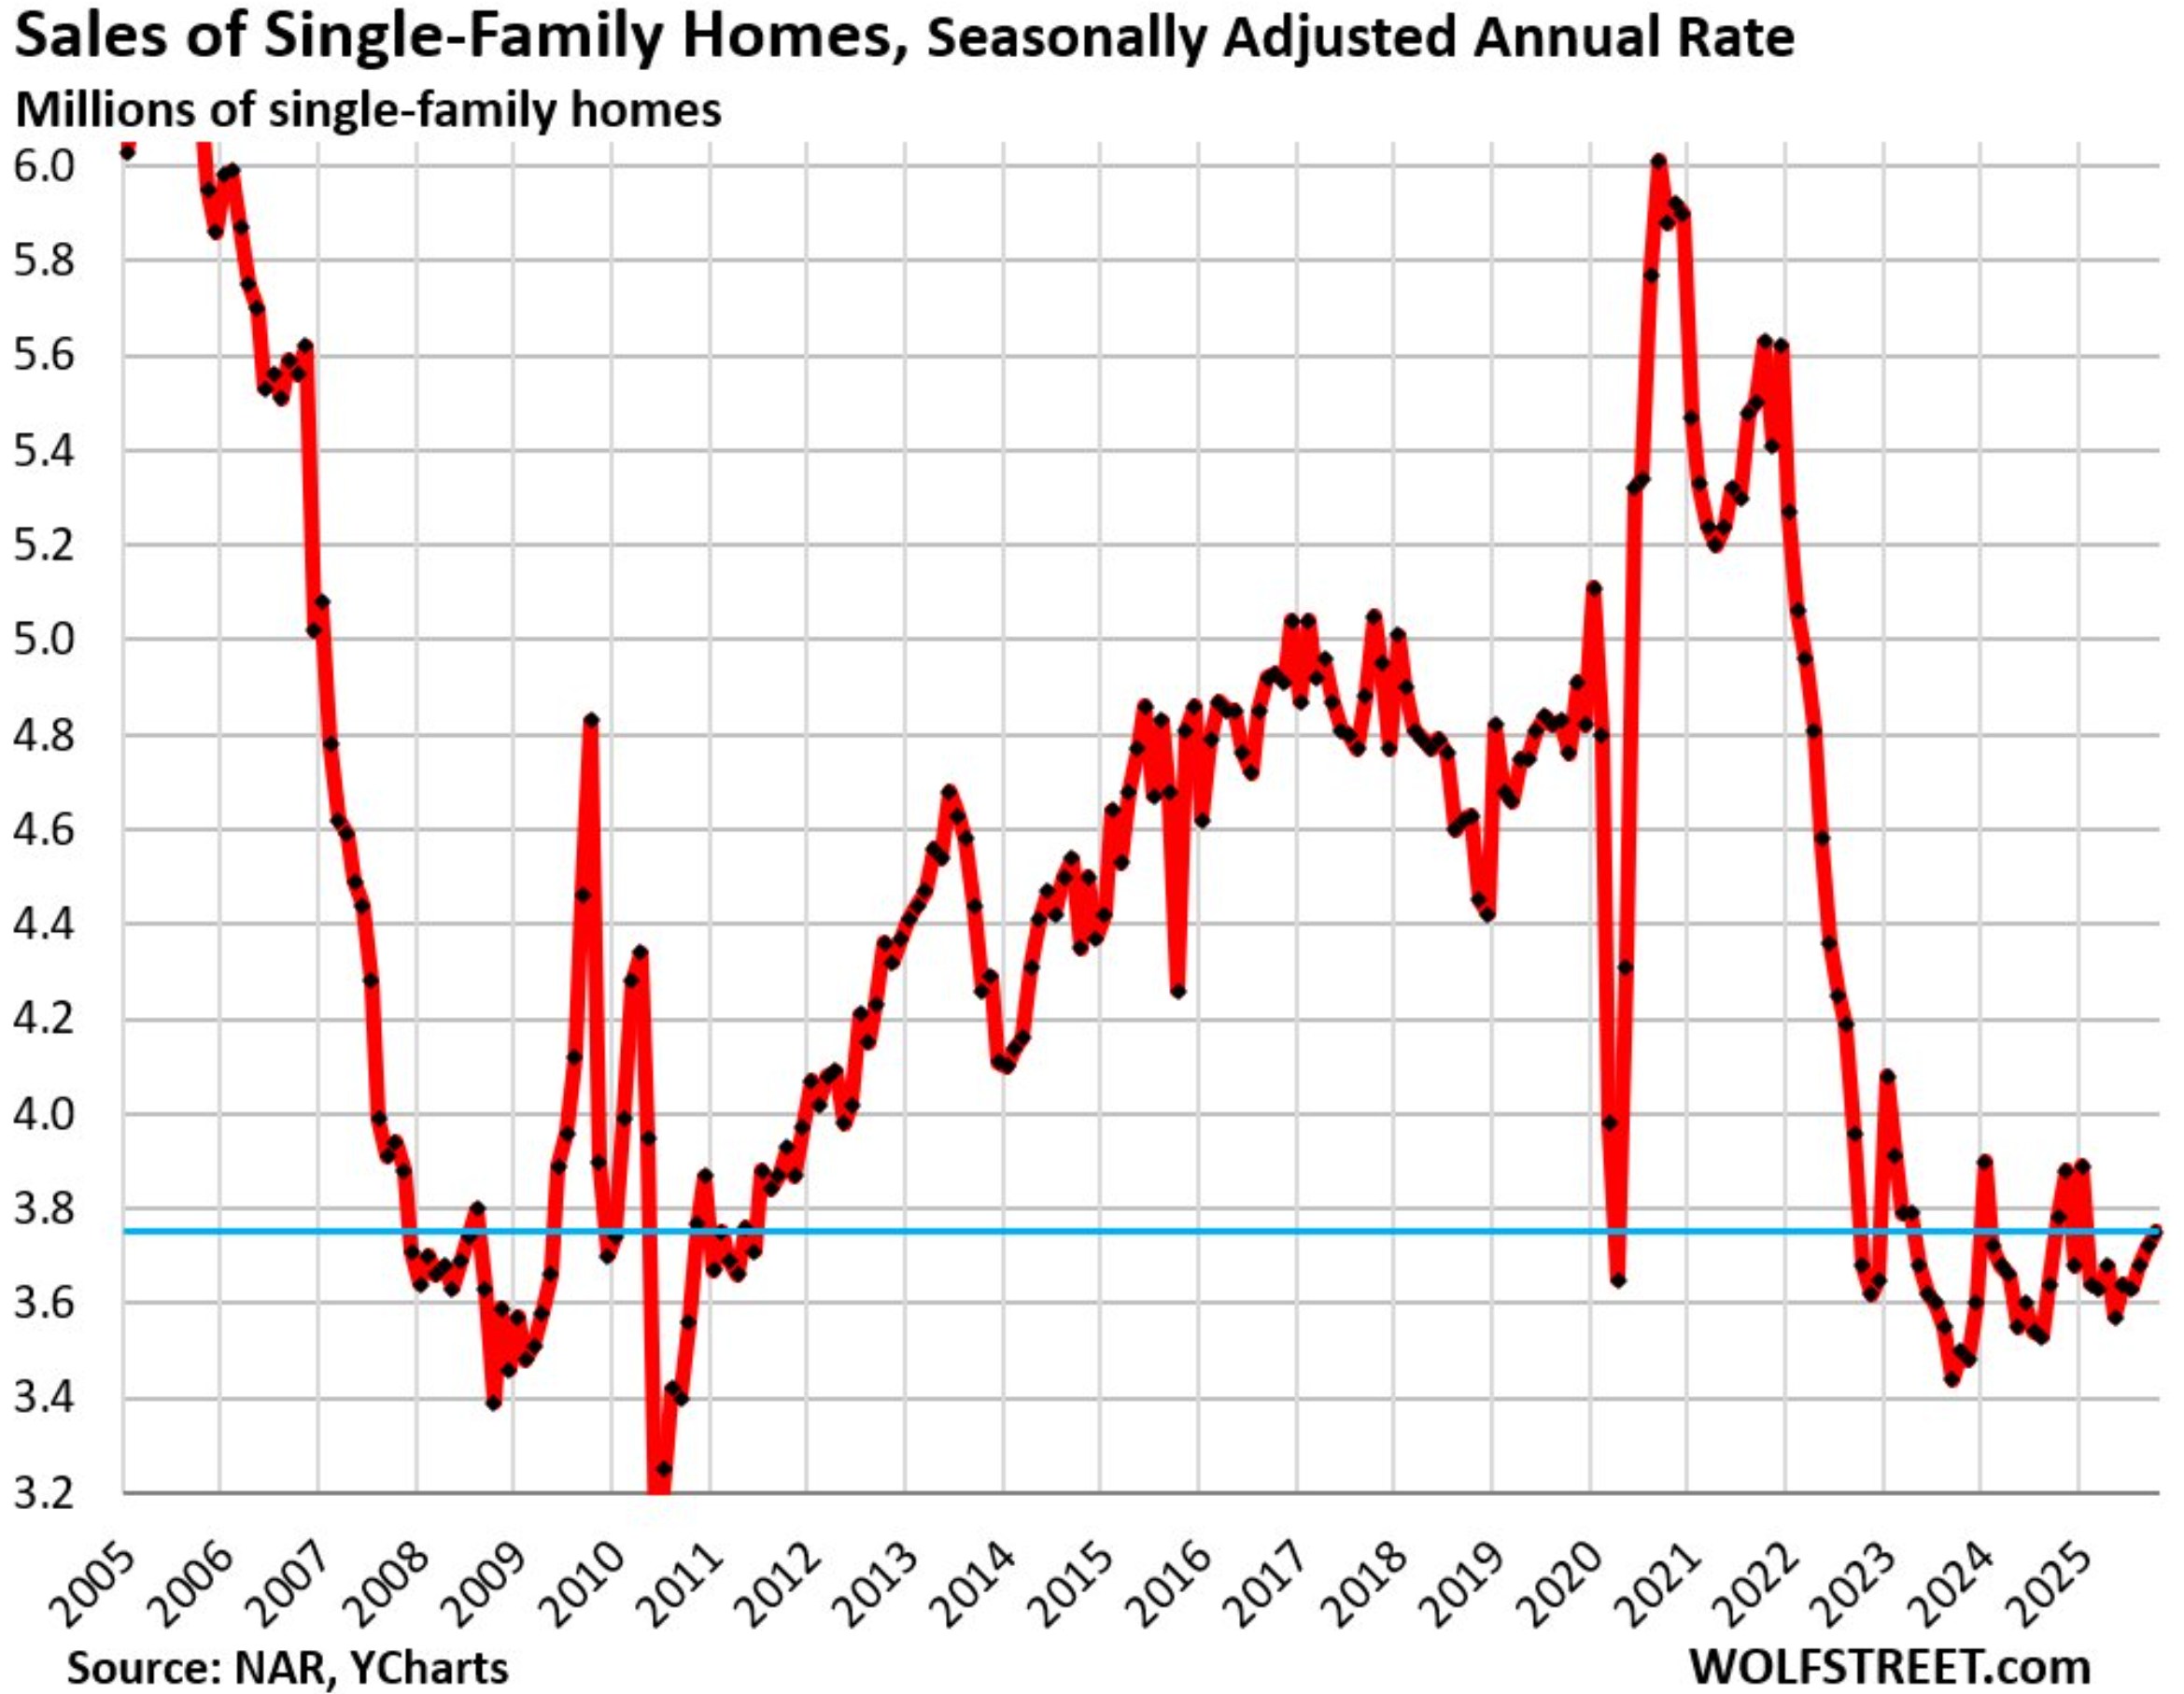
PRICES FALL RAPIDLY – it’s not only about housing. Remember that economy to deflate needs to crash real wages. To do it it needs to lift up “basic inflation” : food+energy+shelter ++ healthcare to eliminate demand on 70% of GDP (worthless consumption) forcing prices to fall.

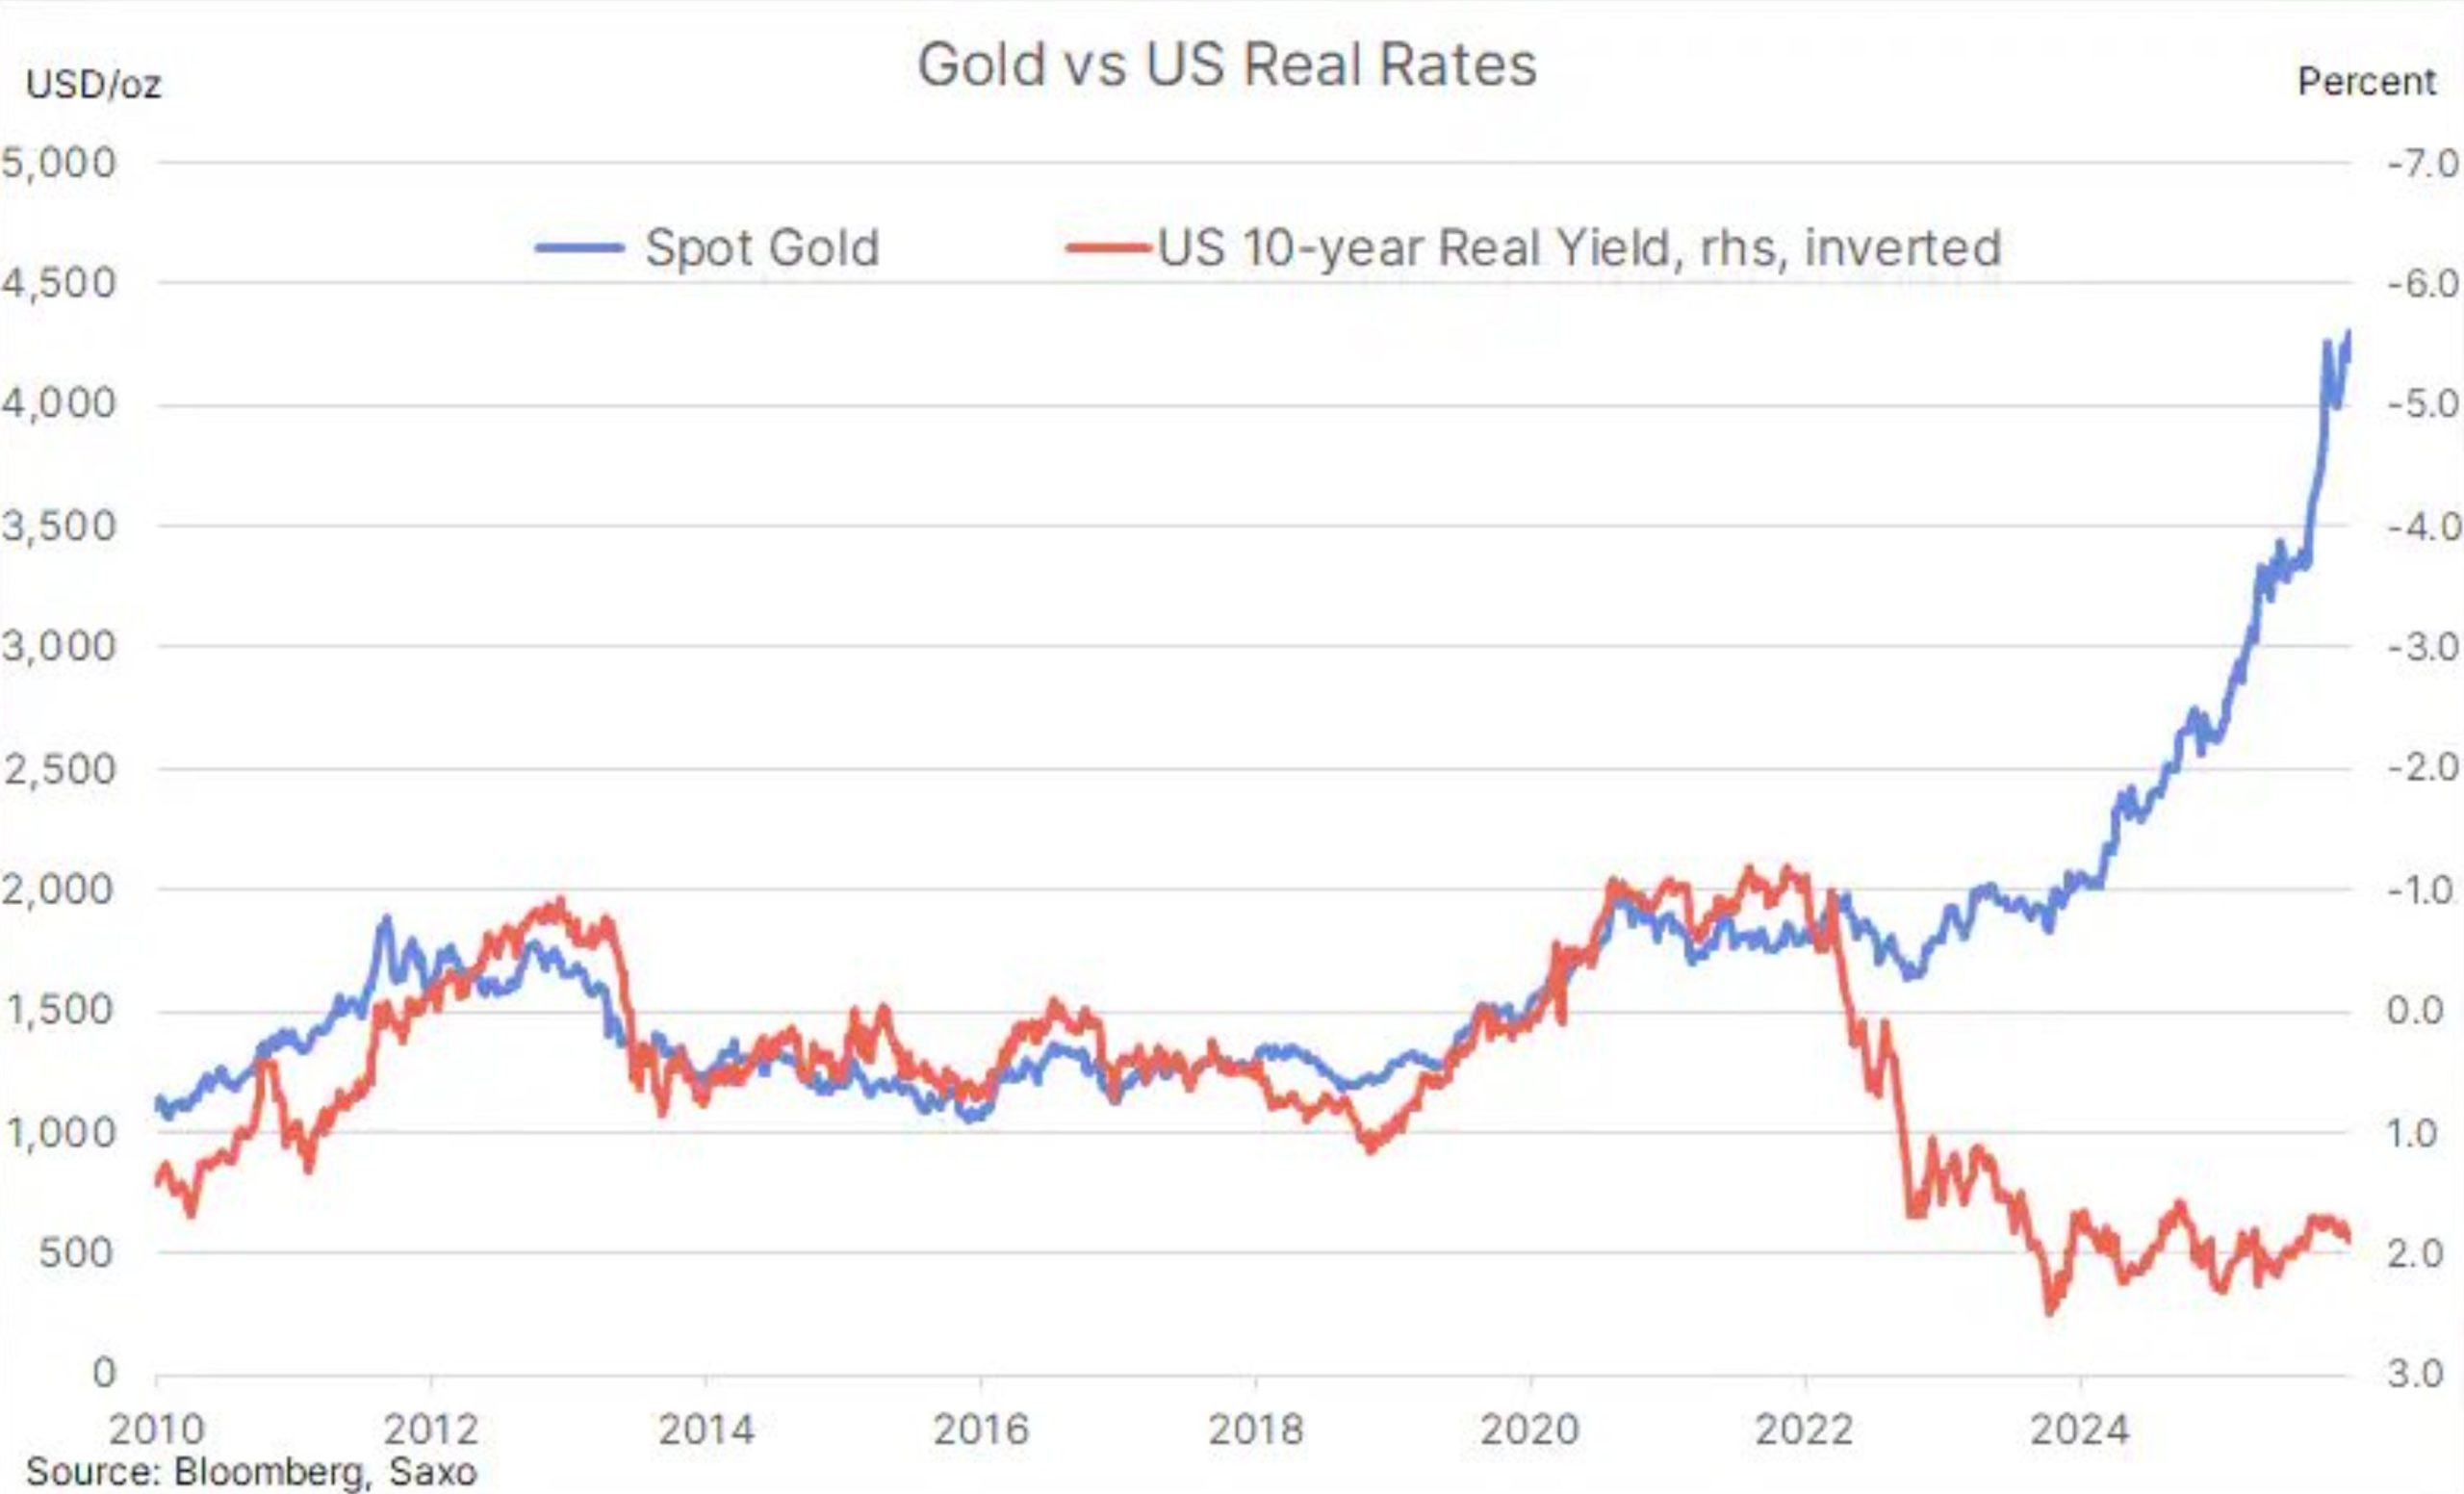
RUN FROM PAPER MONEY TO GOLD – I don’t need to show any evidence here now, what is important is how correlation to Real Yields has been broken. Remember this 4Q21 SPX/GOLD peak? We see here that this correlation started to break around 1Q22.
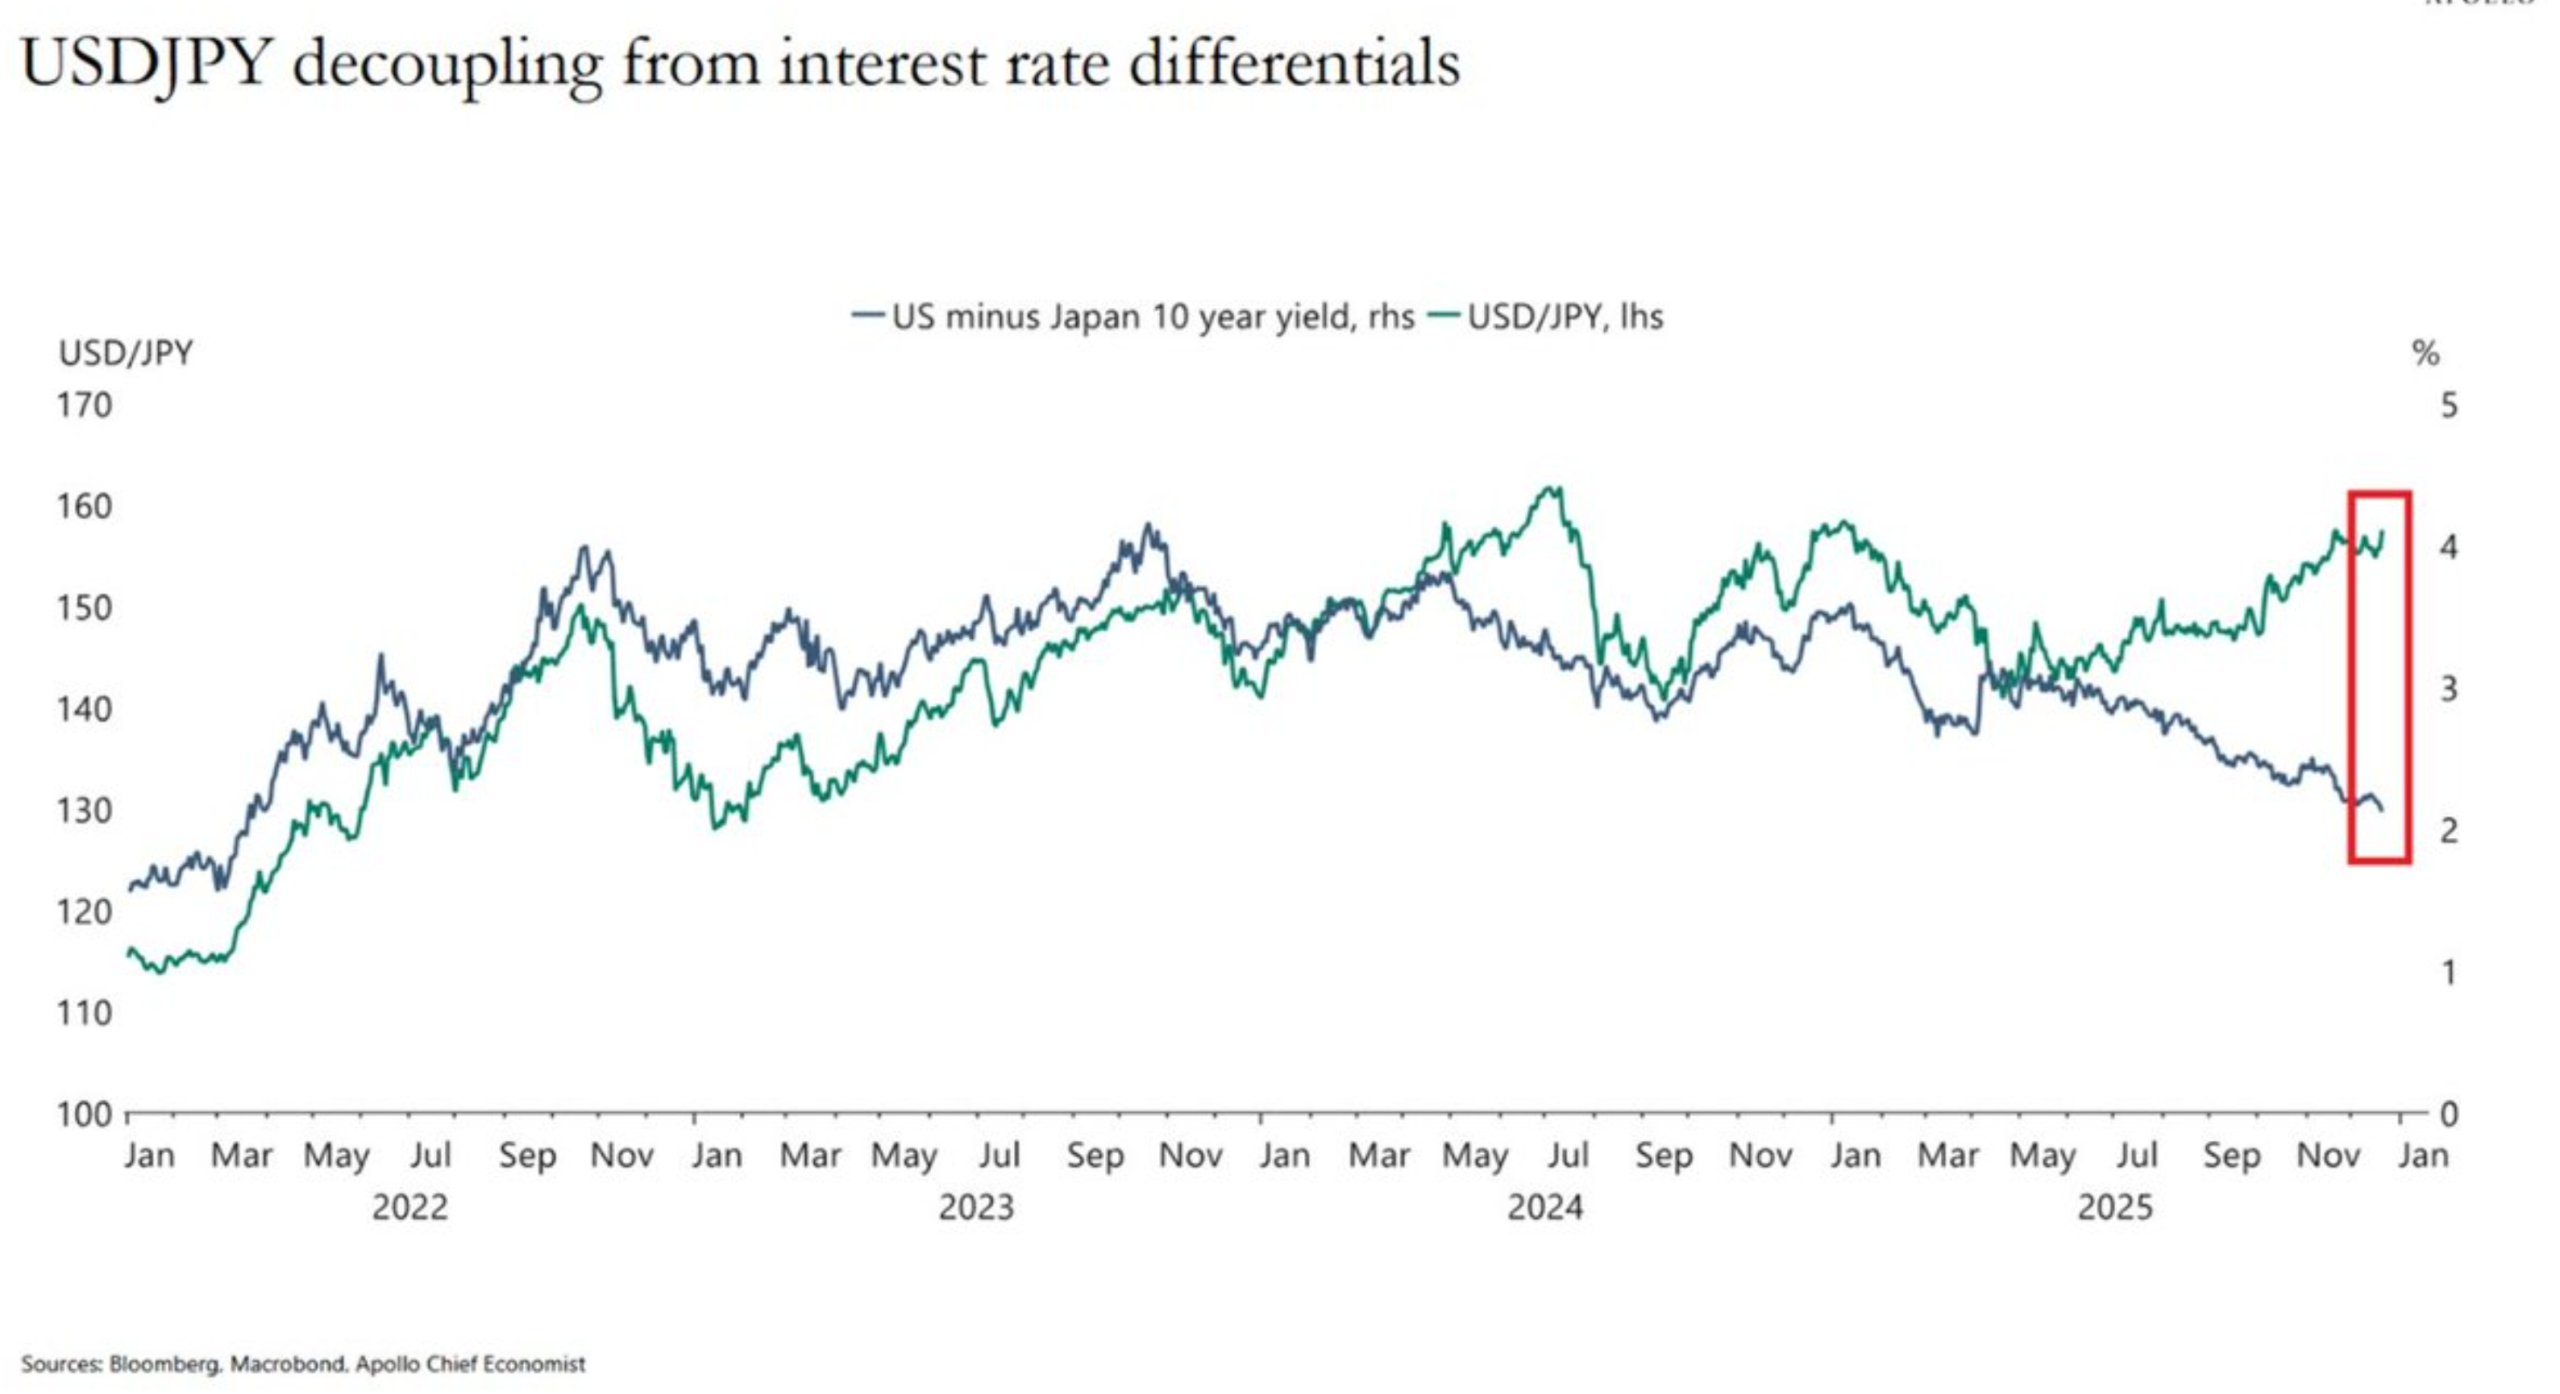
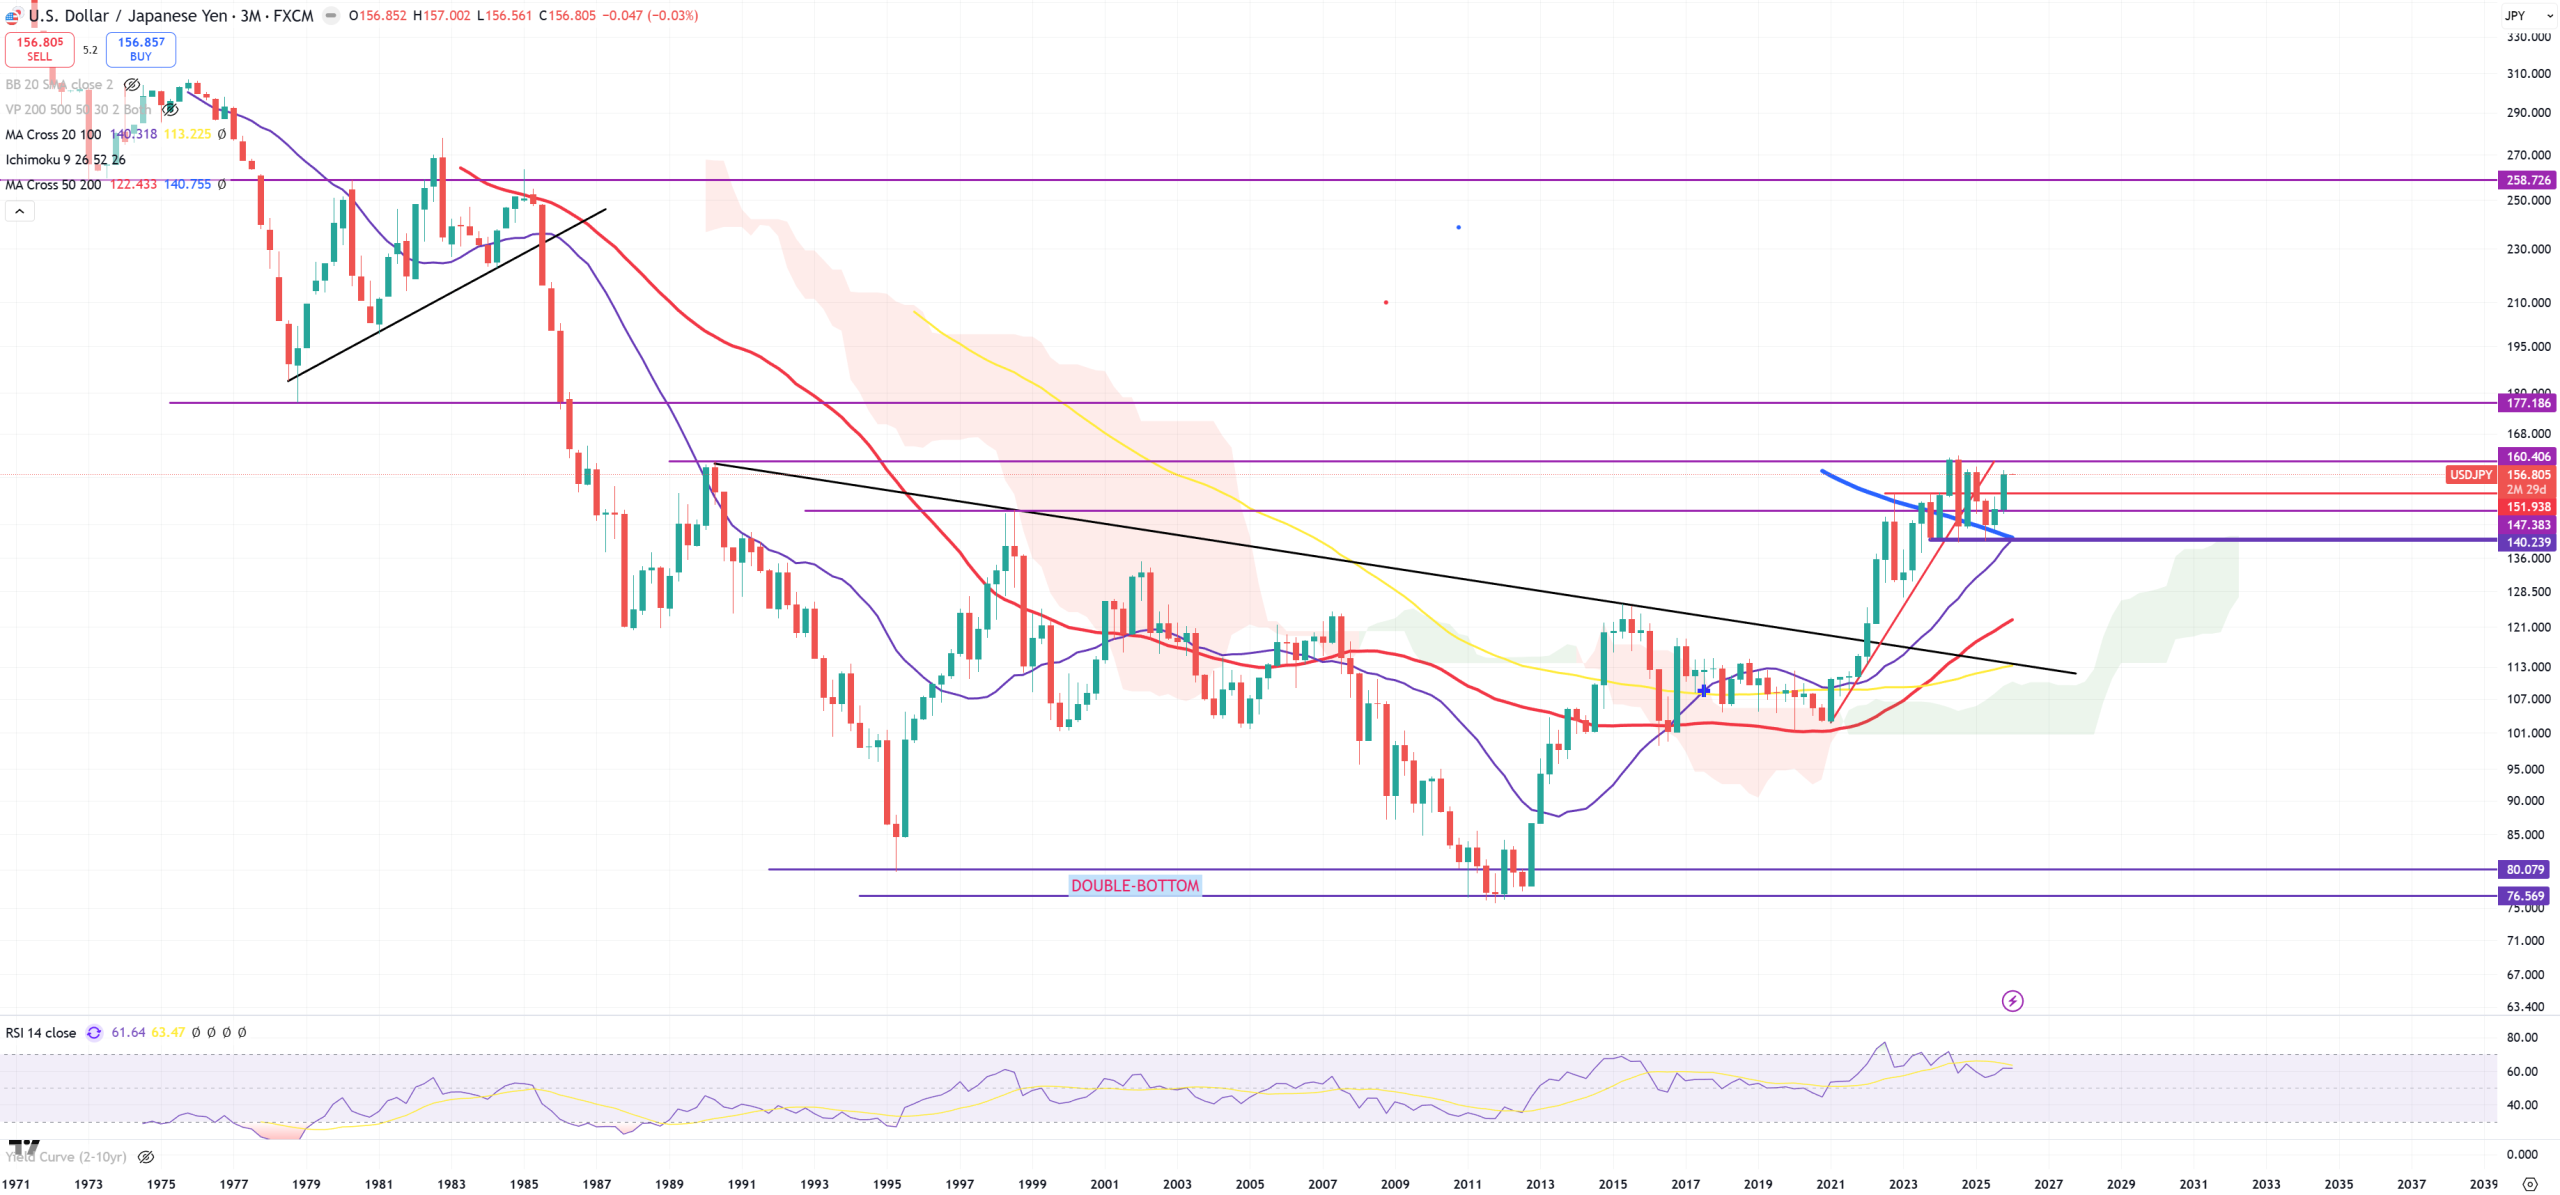
CURRENCY CRISIS – INTEREST RATES SPIKE UP AS CREDIT CONTRACTS – I think that’s what Japan is doing right now, but I expect it’ll spill over to other countries soon, below JP10Y (on M) + USDJPY (on 3M). You also see that USDJPY has broken its correlation with US Treasuries – as expected. If USDJPY won’t break 140 (3M)MA200 the path towards 300 is opened. That’s what’ll IMO happen to each currency excluding USD which will give up at the end.

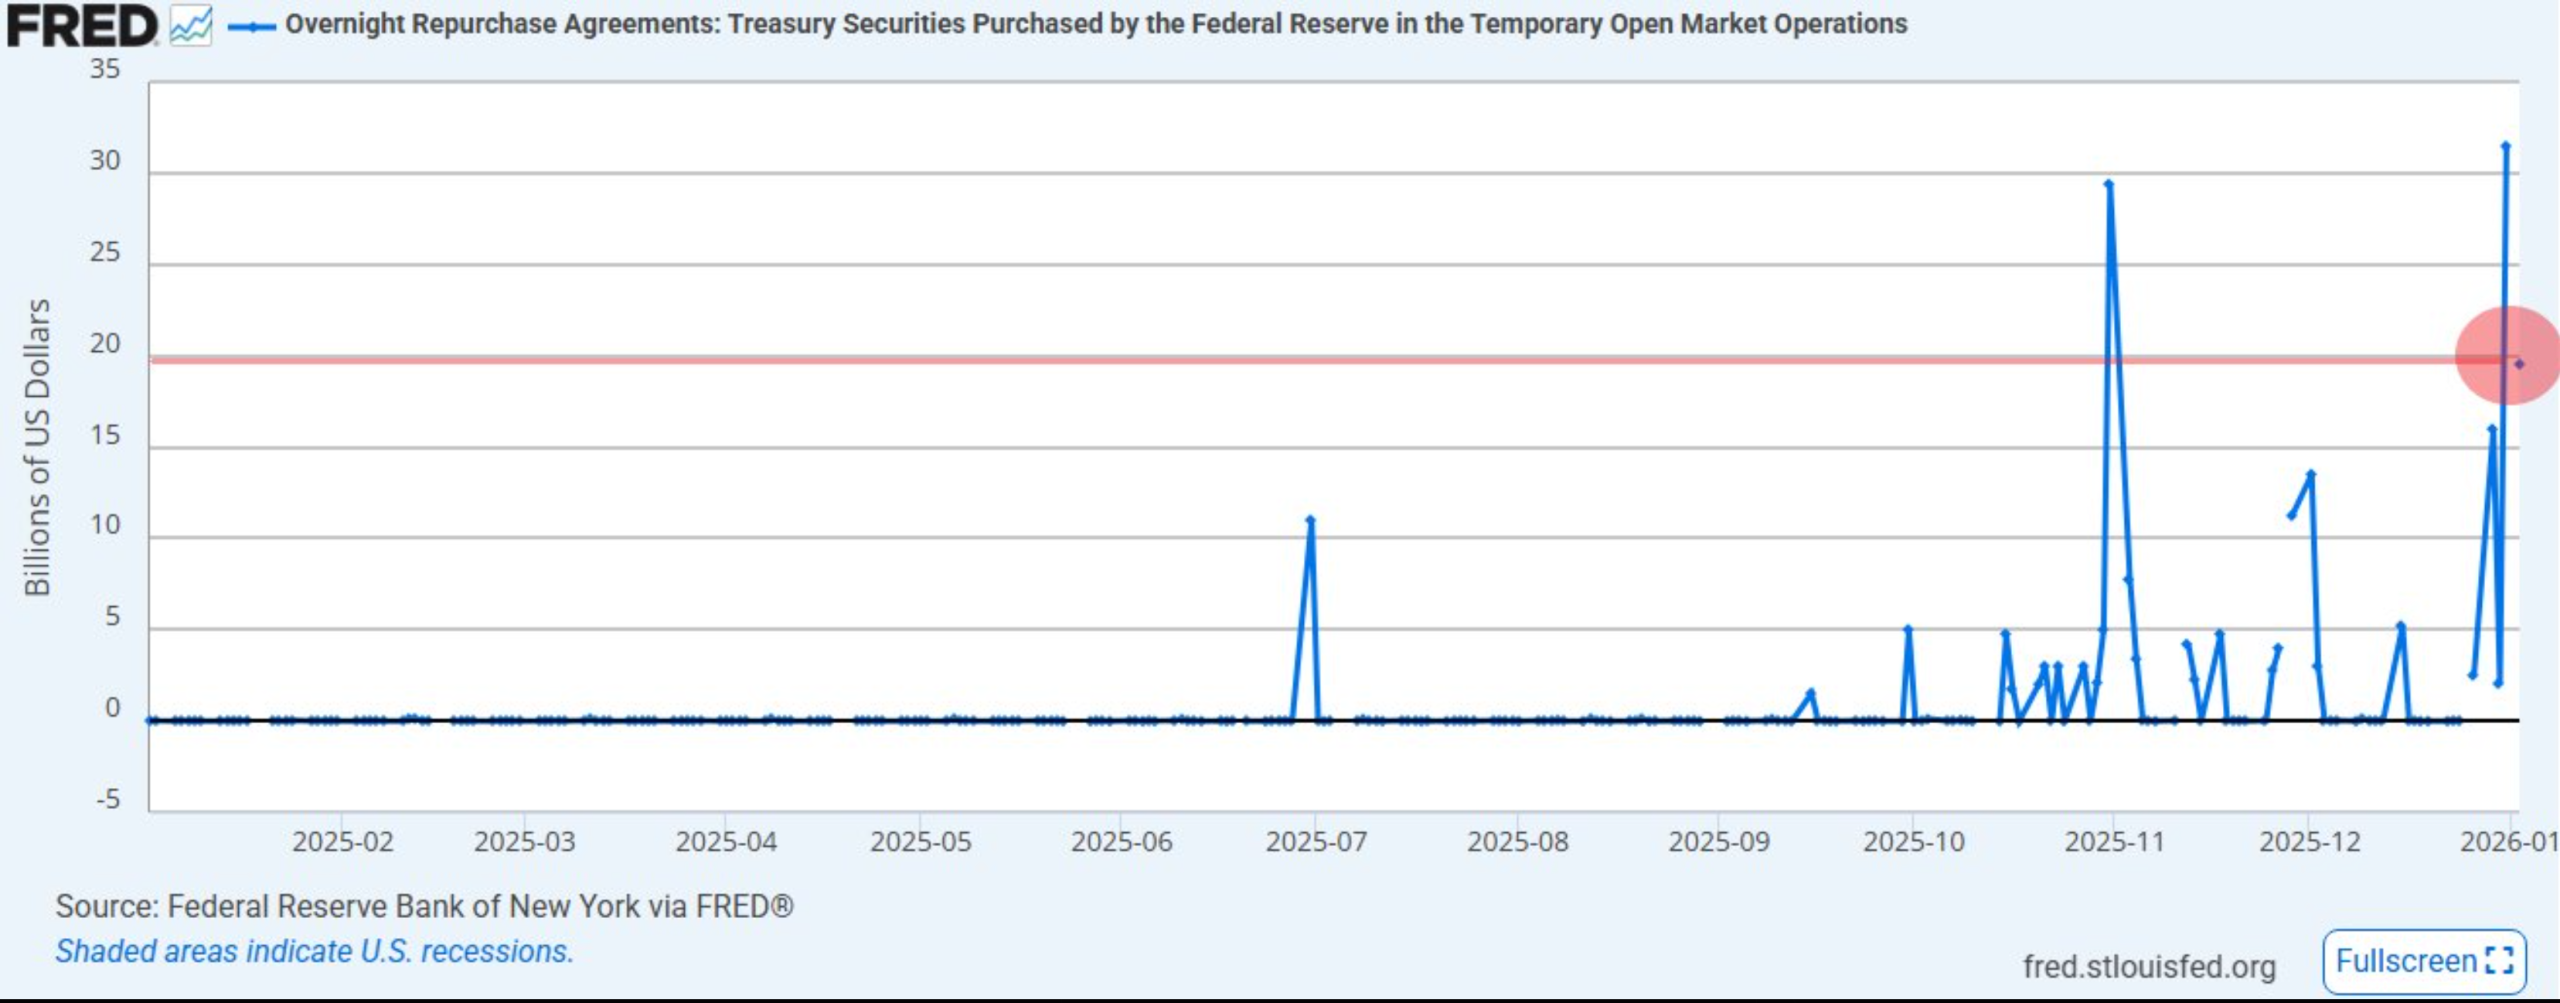
DEBT REPUDIATION, BANKING CRISIS – this is really a big point and I expect it to materialize once finally SPX/GOLD broke (3M)MA200 in 4Q25 which will ignite 10Y/3M spread to go parabolic up. In 4Q25 we have REPO spiking, while many say it’s normal, I say it’s not looking on technical charts.
HIGH UNEMPLOYMENT – yes I expect high unemployment – it tells me 10Y/3M about it and 1200 days below uninversion level +60bps. Not much happening right now (in official data), but it will
So that’s why based on those technicals I raised this issue that :
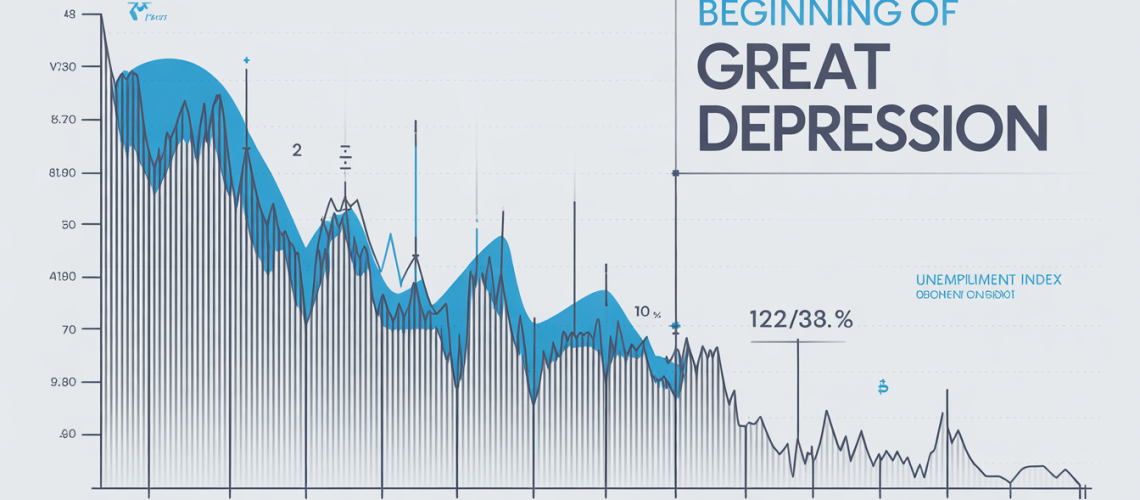
2026 – is the start of the greatest depression ever recorded
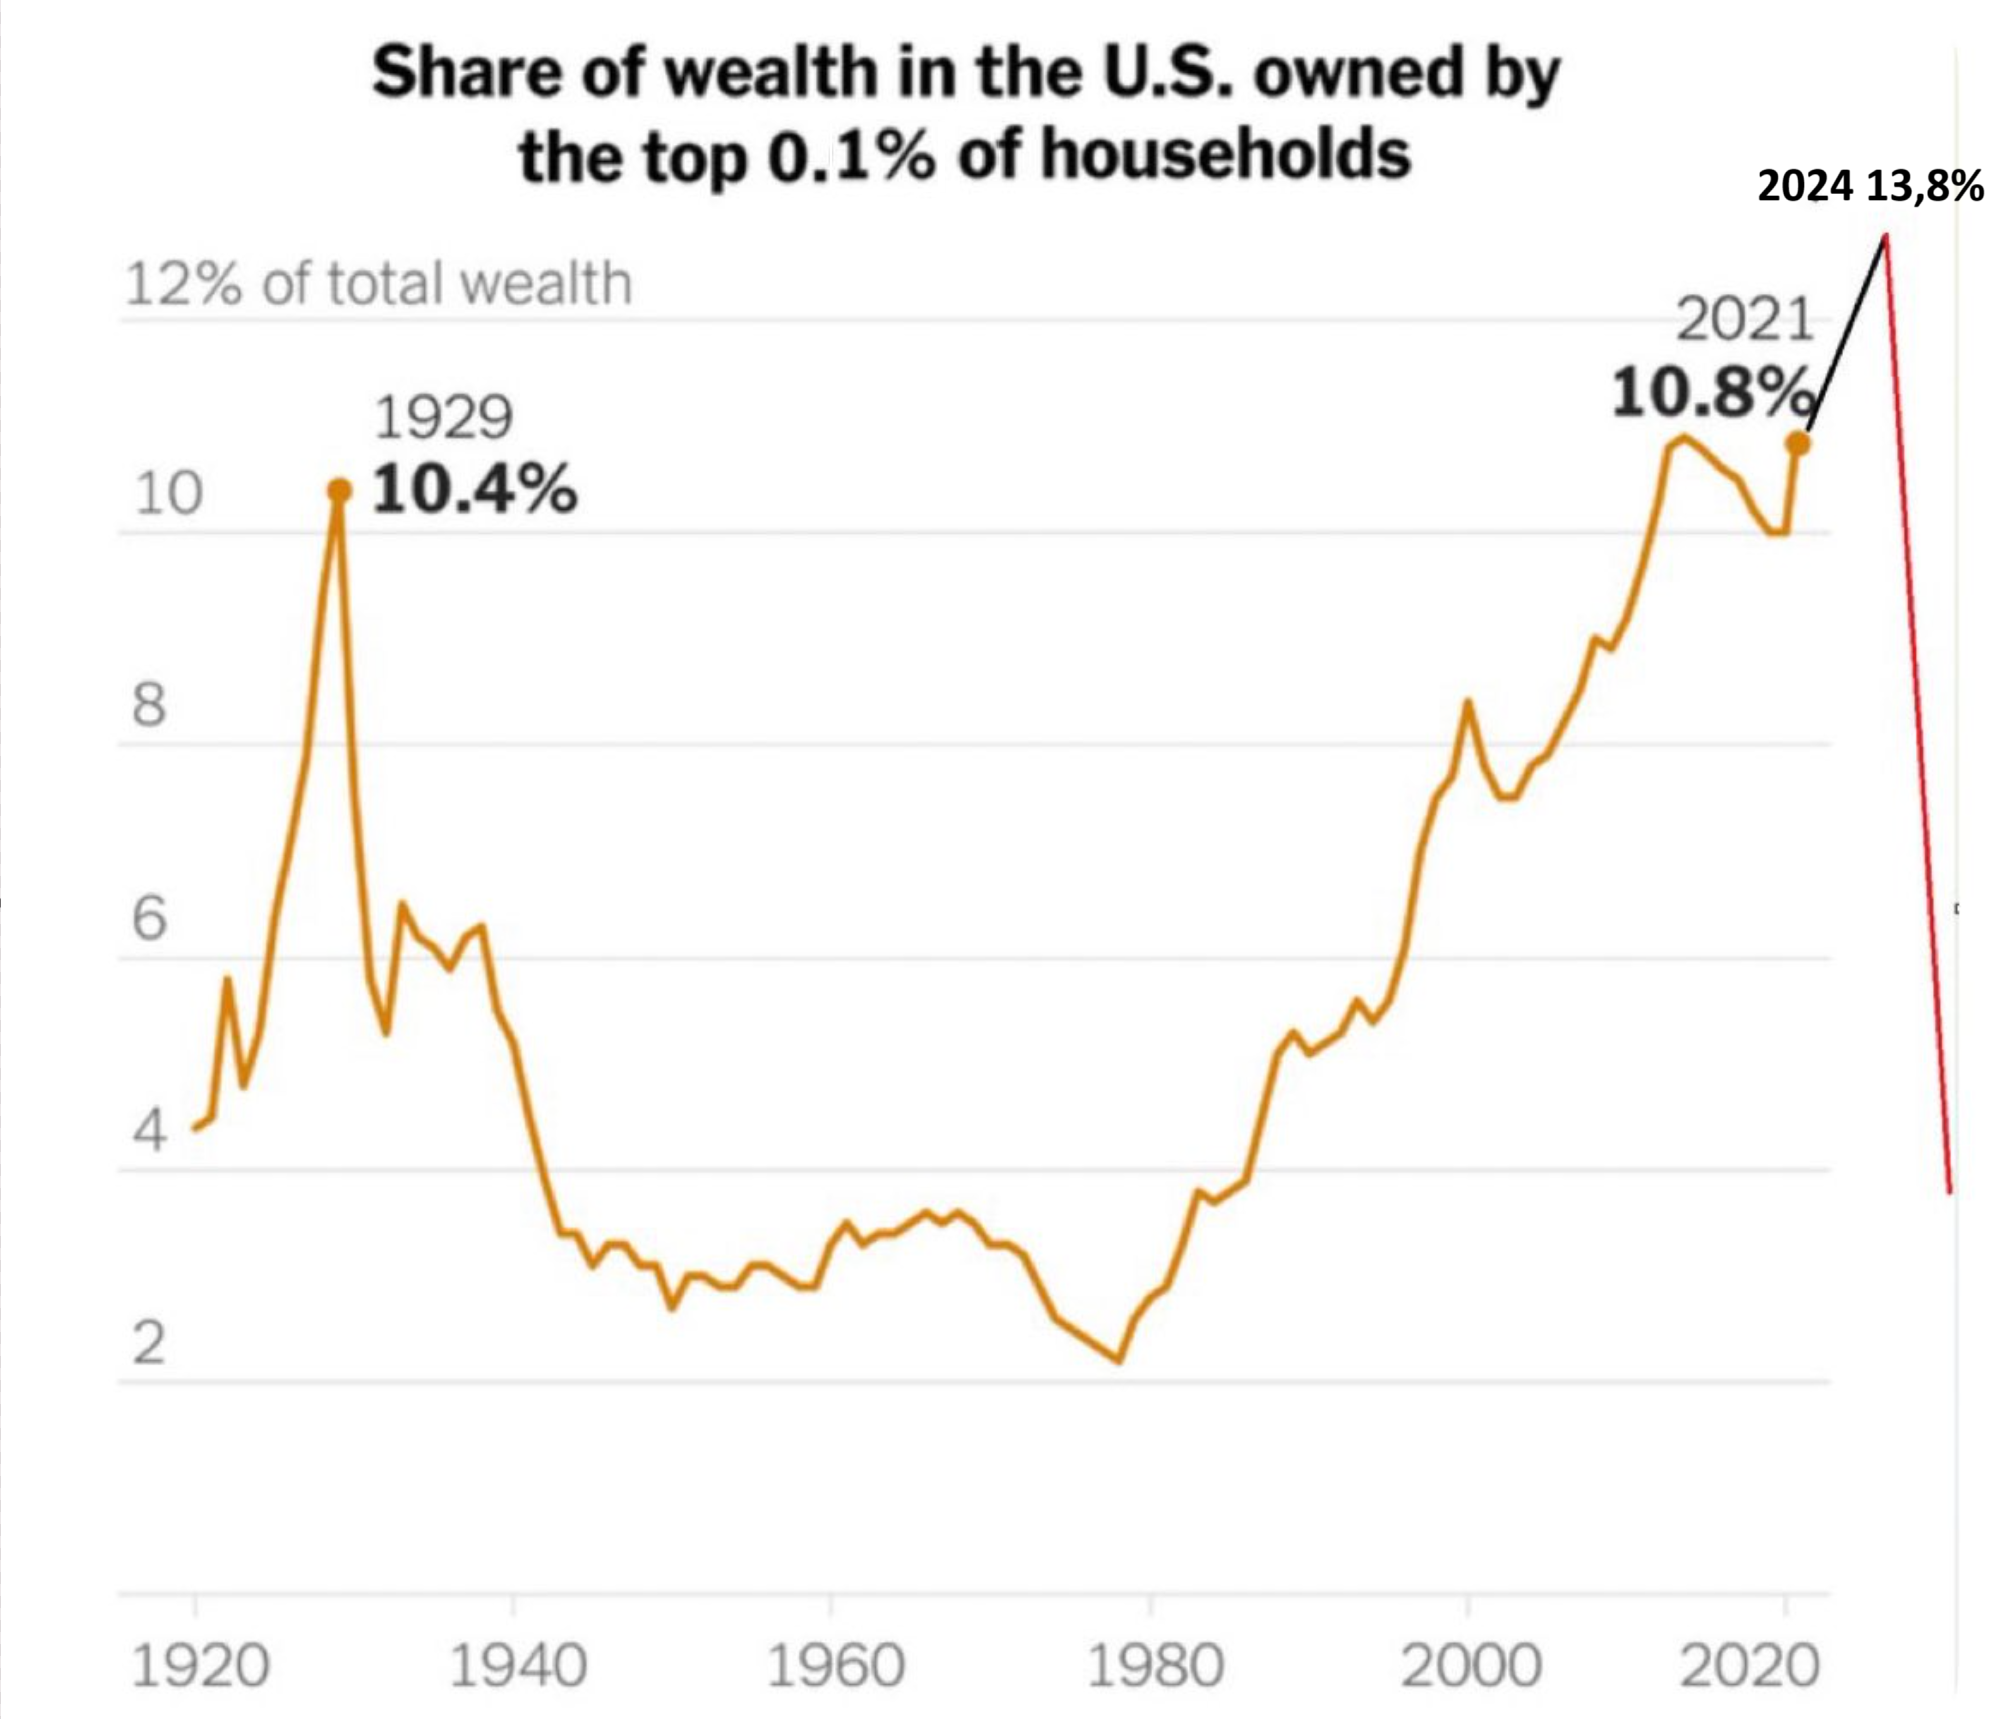
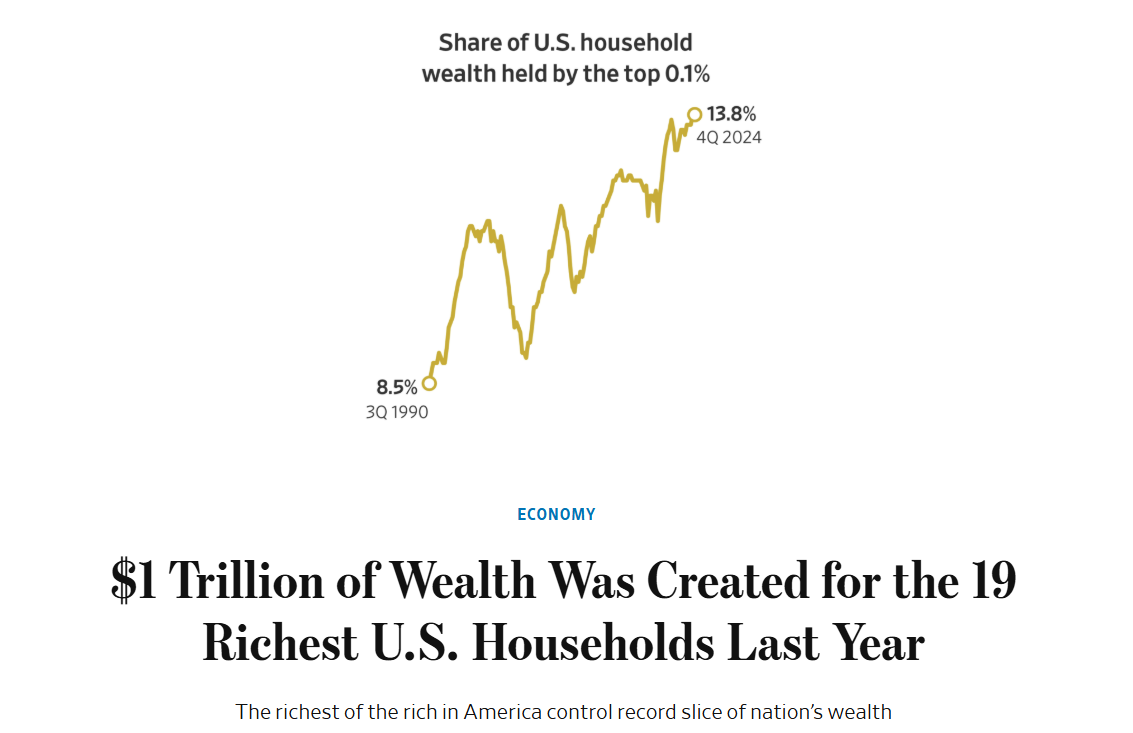
This inequality level is too high to be sustained igniting demographics problems, killing long term growth. We have great example from 1929 that 10.4% wasn’t sustainable. Current 13.8% achievement was caused ONLY because of MMT, but payback will be way higher dropping from 14% than from 10%.
[…] 2025 year end […]
[…] 2025 year end […]
[…] 2025 year end […]