01/2026
January 31, 2026

January 2026 is behind us, so let’s find out about setups. Initially I’m going to control my thesis which actually I invented around 2-3Q2025 : crossing (M)MA50 by US03MY and uninverting 10y/3m reaching > +60bps = market top. Those who know nothing about my theory you (and are new followers) can find it on my blog. Just look for “Why I see 2026 as the beginning of the Greatest Depression”. Of course it’s now mandatory to check all my 4 indicators how they’re positioning. As usual I’ll show you some charts which are interesting in some kind of logical queue.
Reminder #1. I operate o 4 key (M)MAs. Violet (M)MA20 – high momentum border, Red (M)MA50 – technical border between bull/bear, Yellow (M)MA100 – middle point often level of bull/bear trap, Blue (M)MA200 – secular border between bull/bear.
Reminder #2. I measure the bubble by its distance to (M)MA50. -60% till -69% – it’s a big bubble and a warning, -70% till -79% it’s a tulip bubble category, -80%+ is : GET THE F… OUT OF HERE and -90%+ it’s like a lottery ticket with 99.9% probability for 1B$.
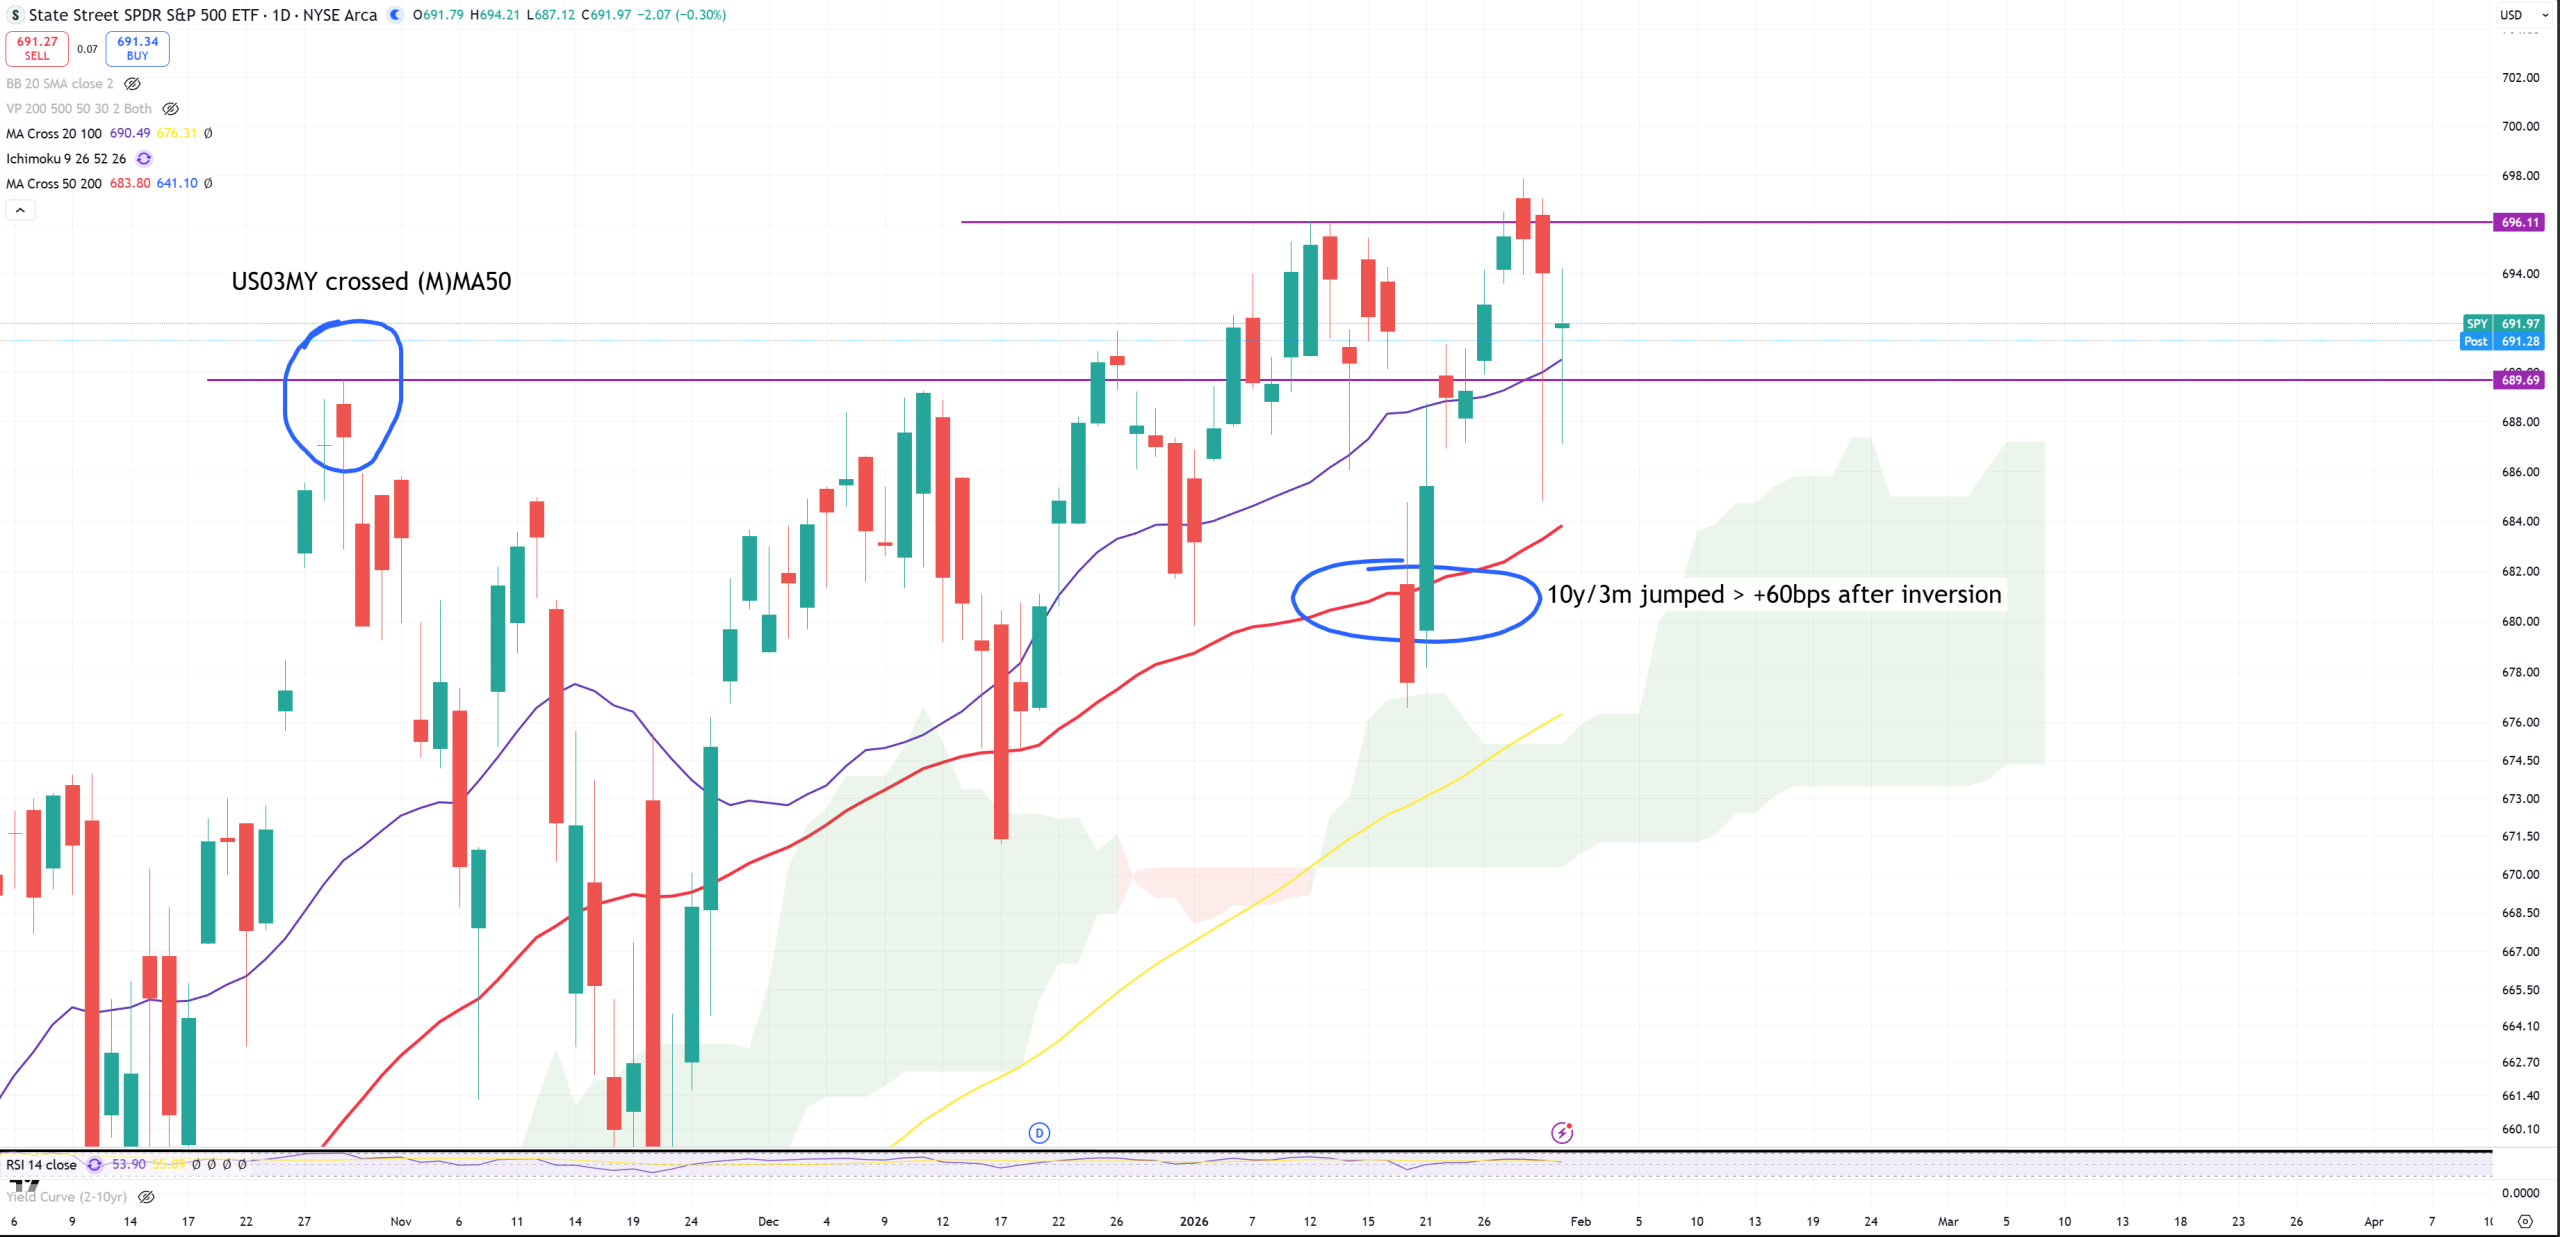
SPY using my theory. There’ll be a fight for this 689 level but once it’ll release big magic IMO will happen. There’s IMO no better indicator for stocks and general indexes as US03MY breaking (M)MA50. That doesn’t mean the top is behind us, but small marginal top might arrive soon, mostly until 10Y/3M uninverts over +60bps. We don’t have for today 10Y/3M > +60bps.
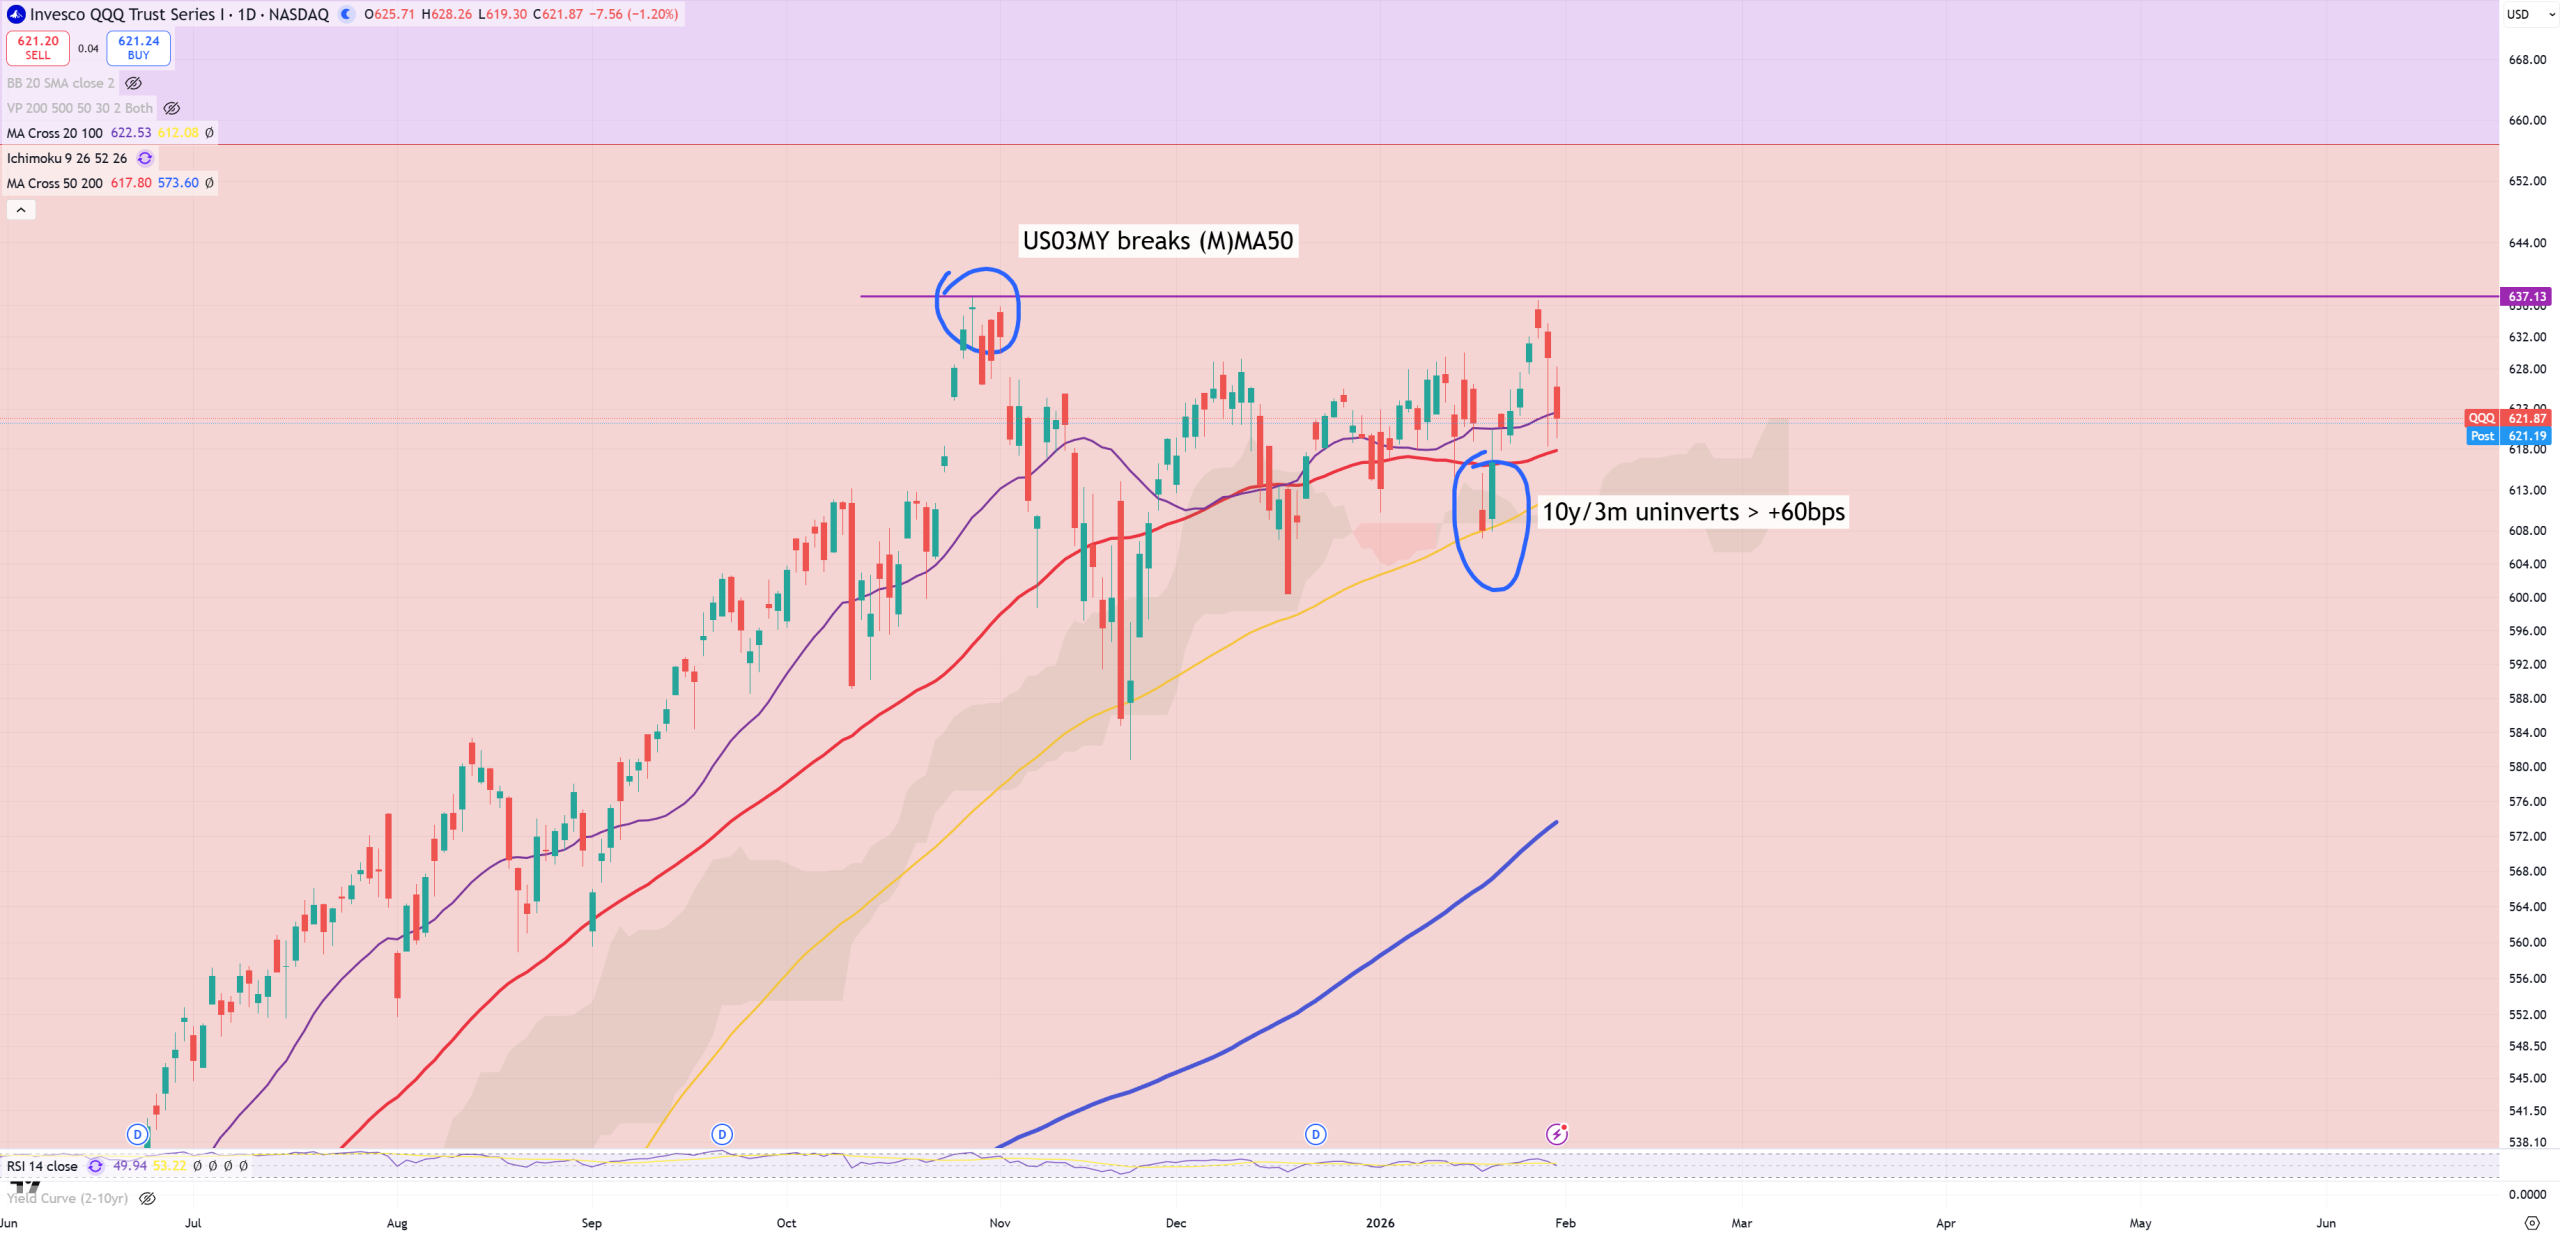
QQQ – using same theory
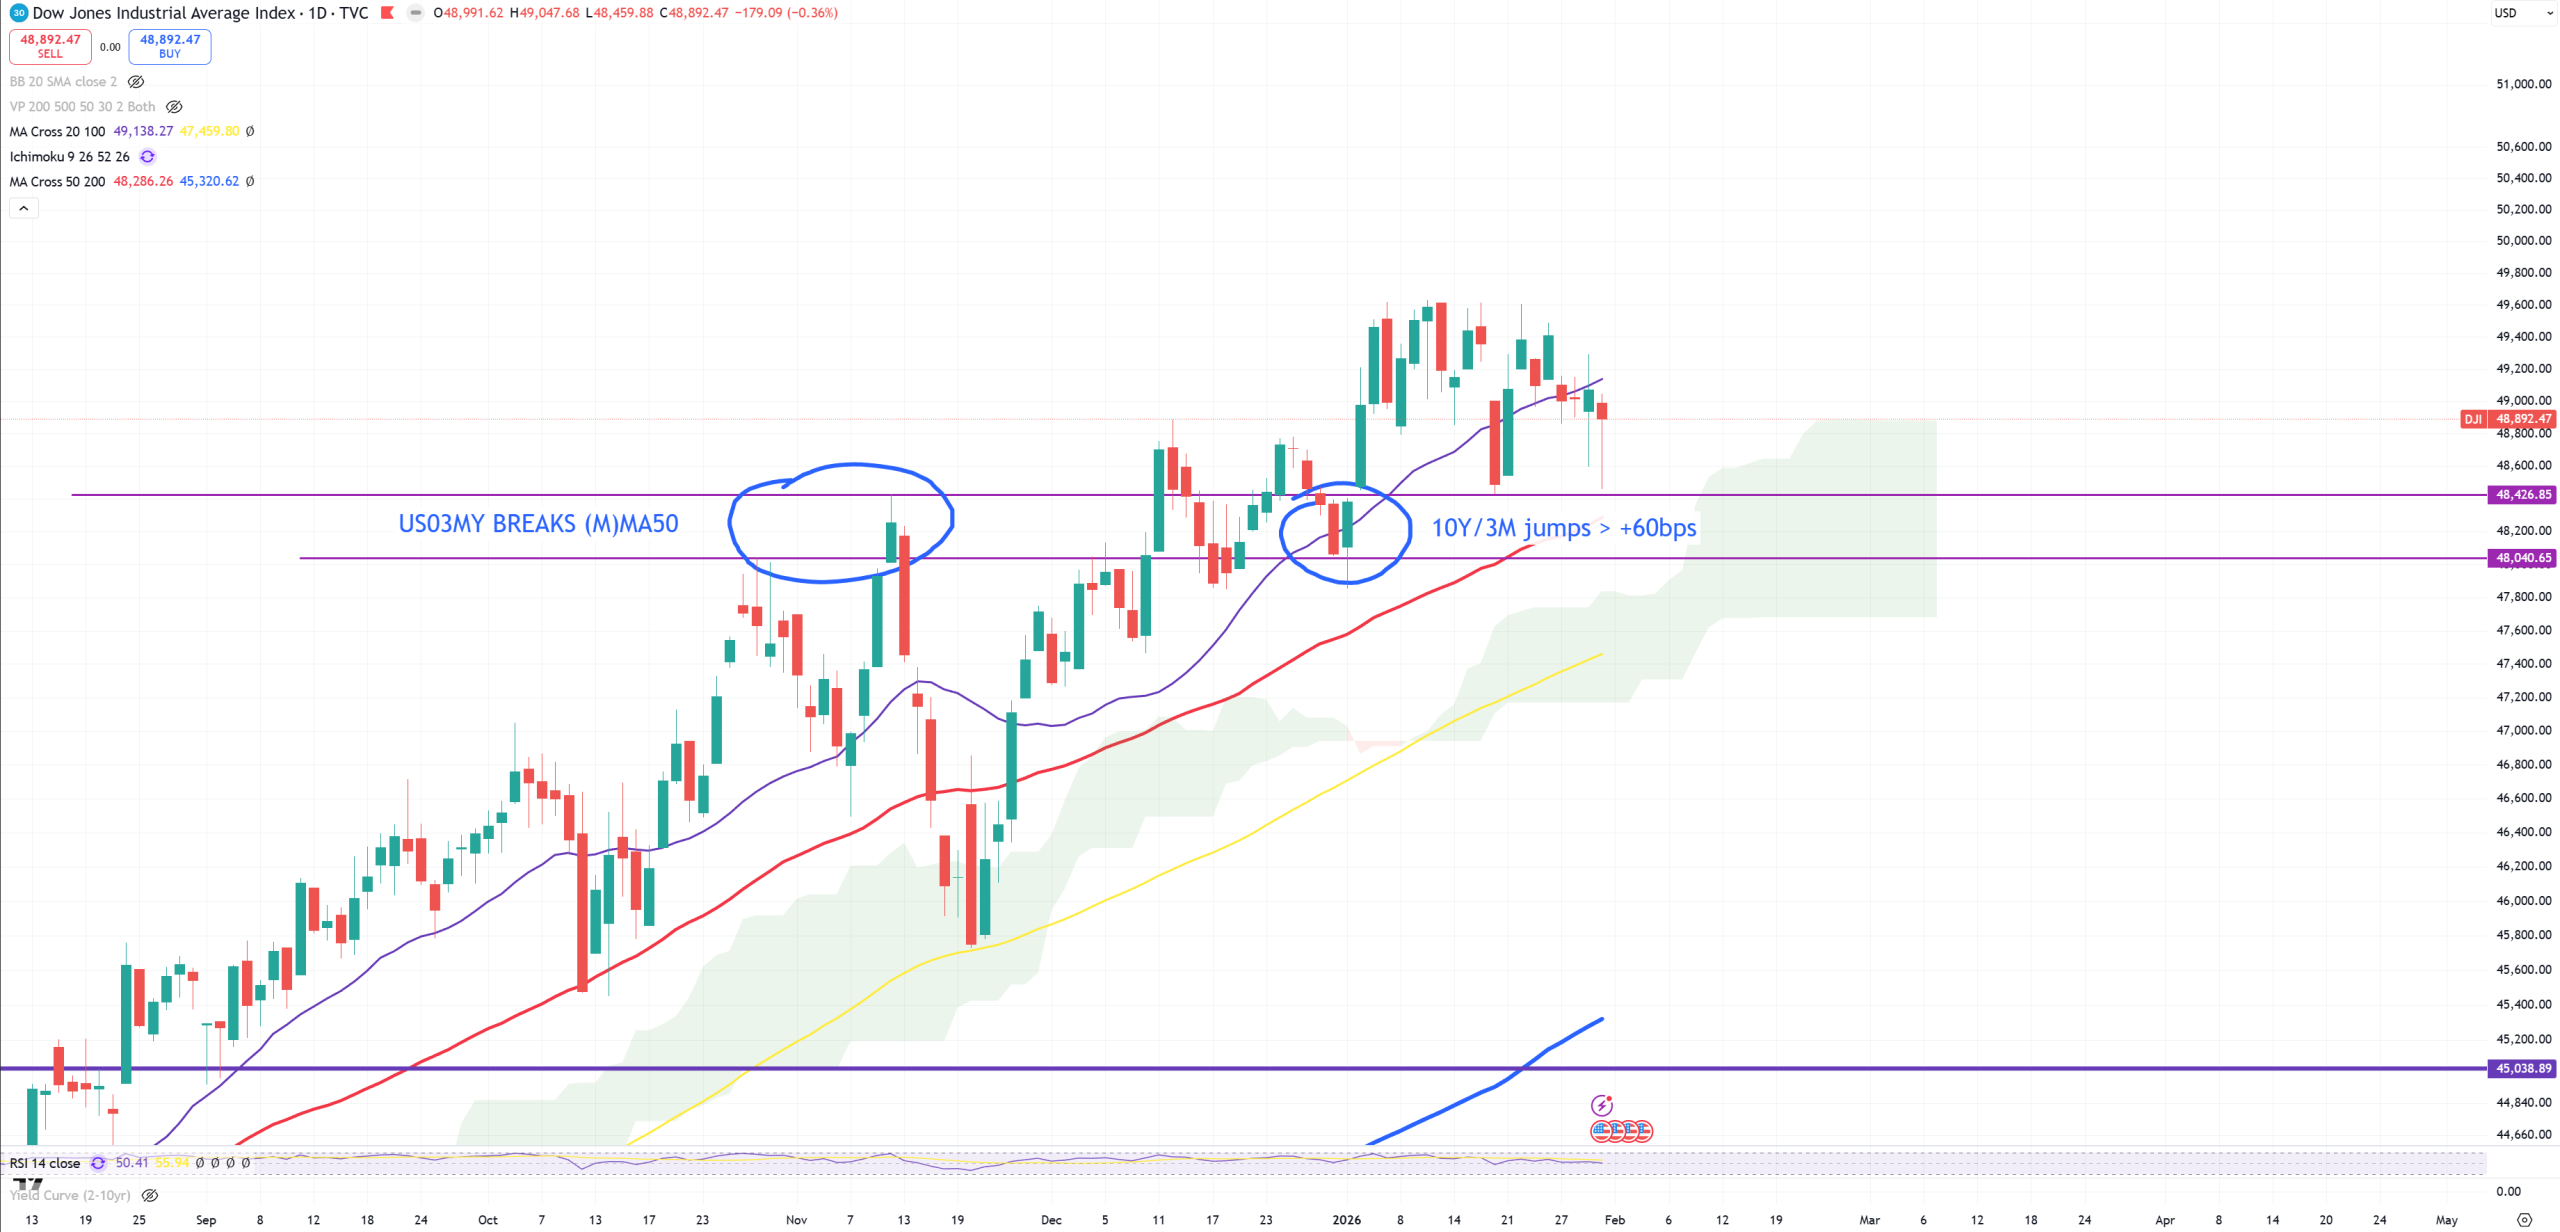
DJI – using same theory
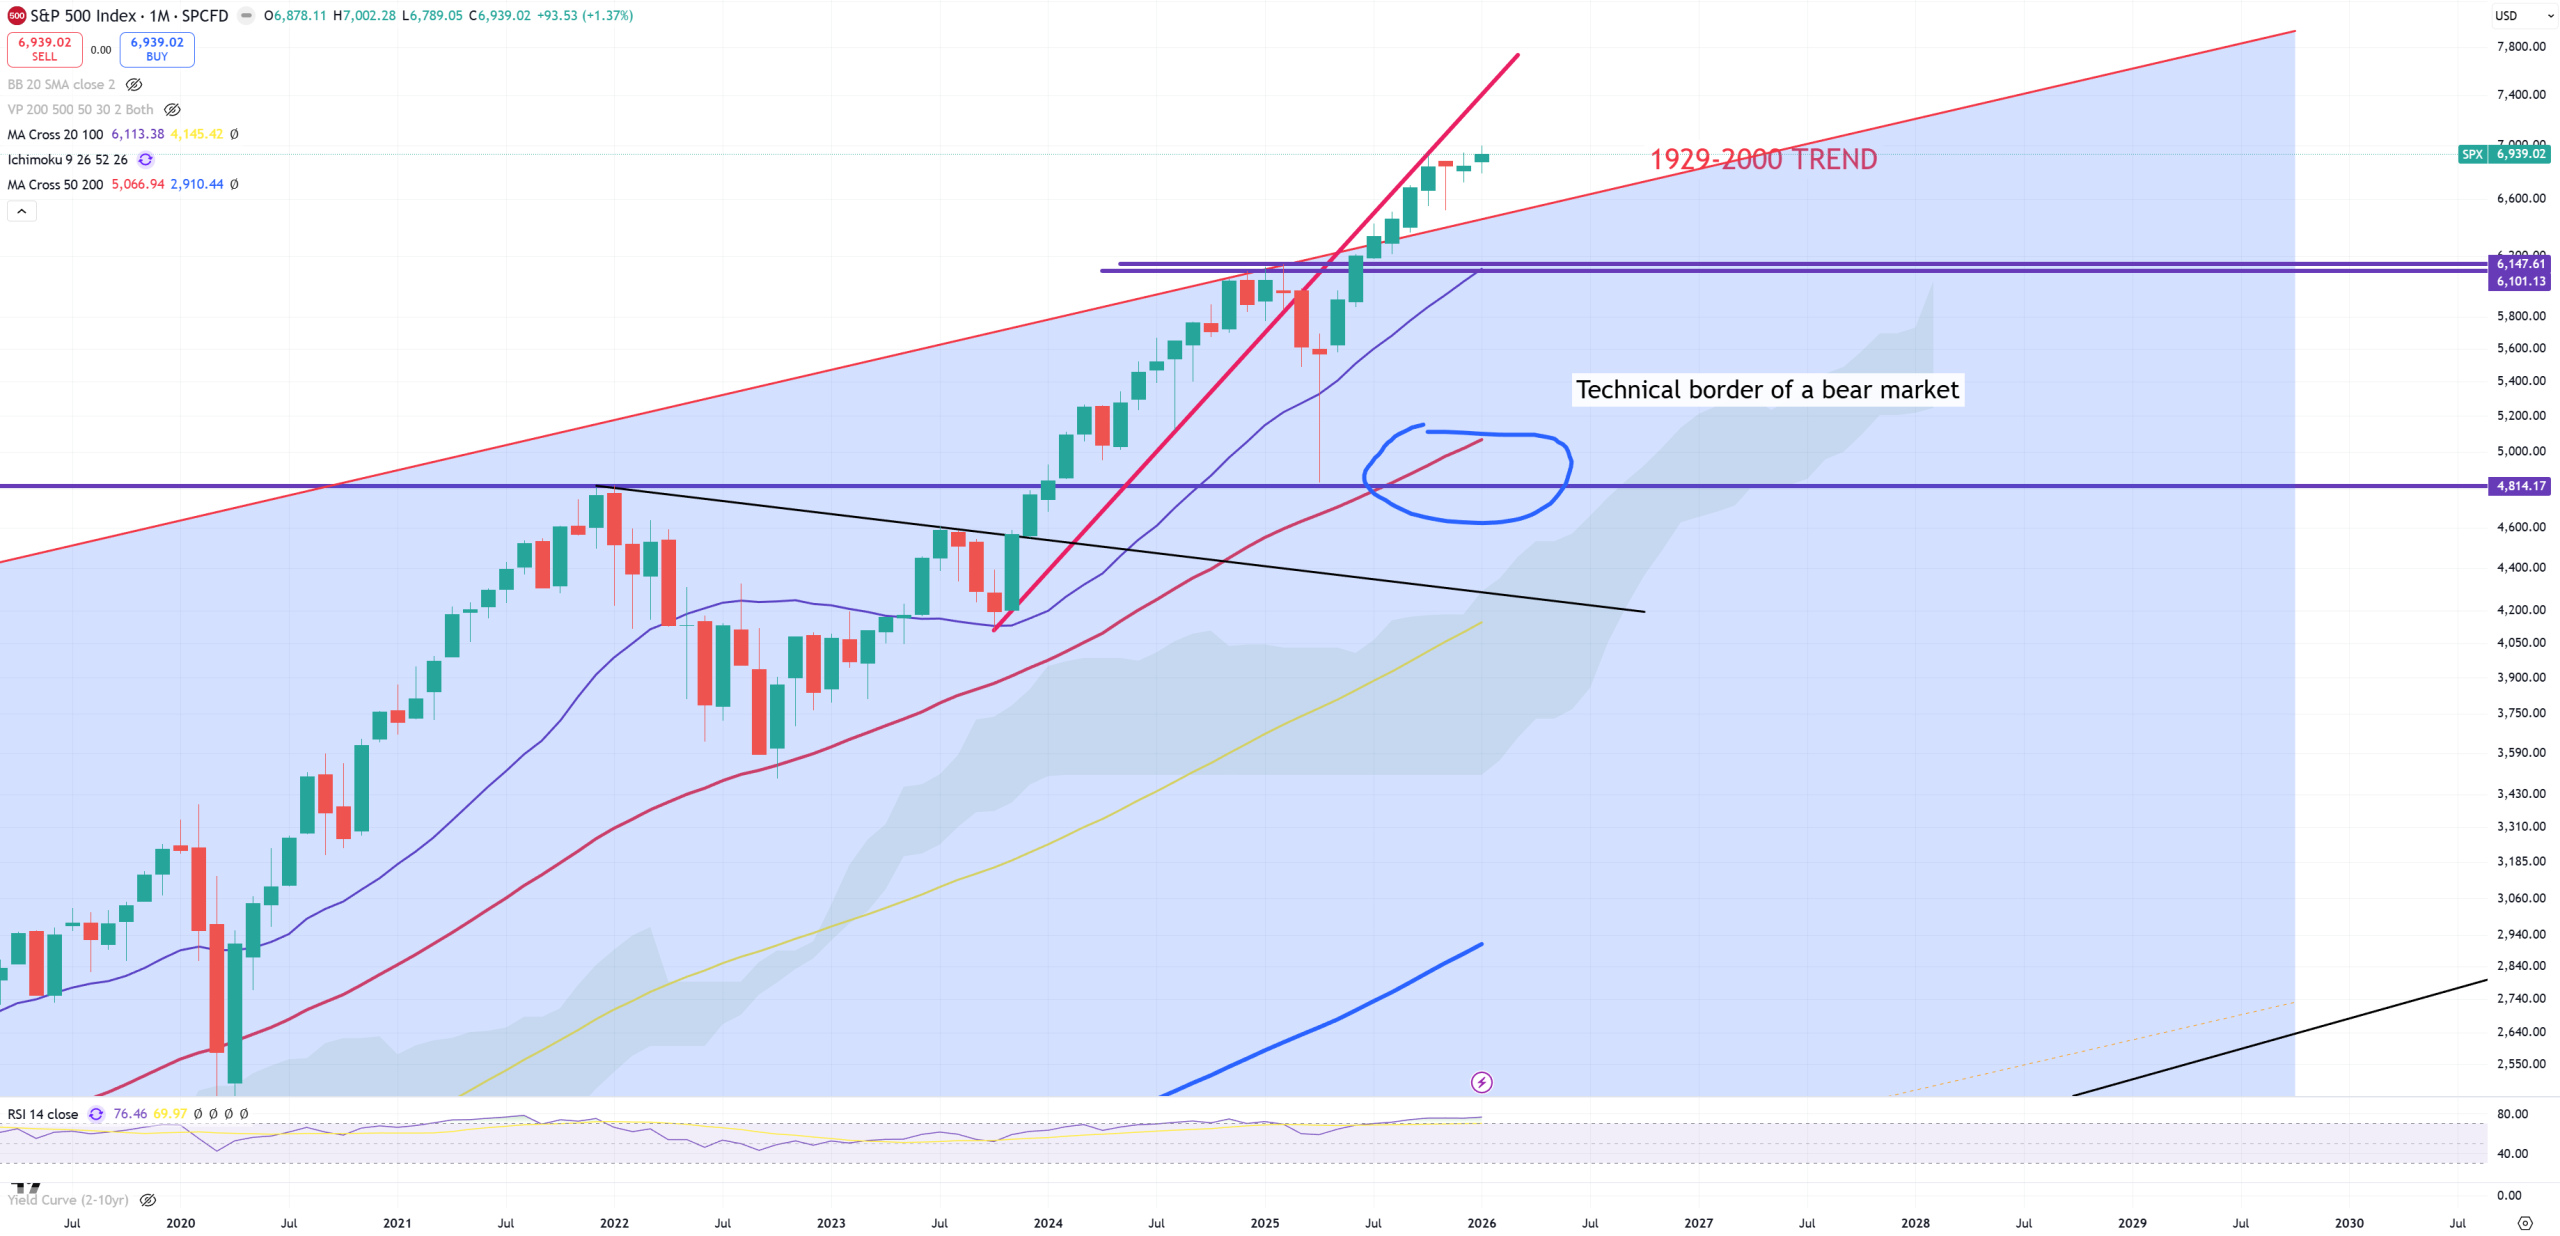
SPX – and its 1929-2000 trend still broken, level for Feb 2026 is 6490-6500. You all know I don’t believe this break.
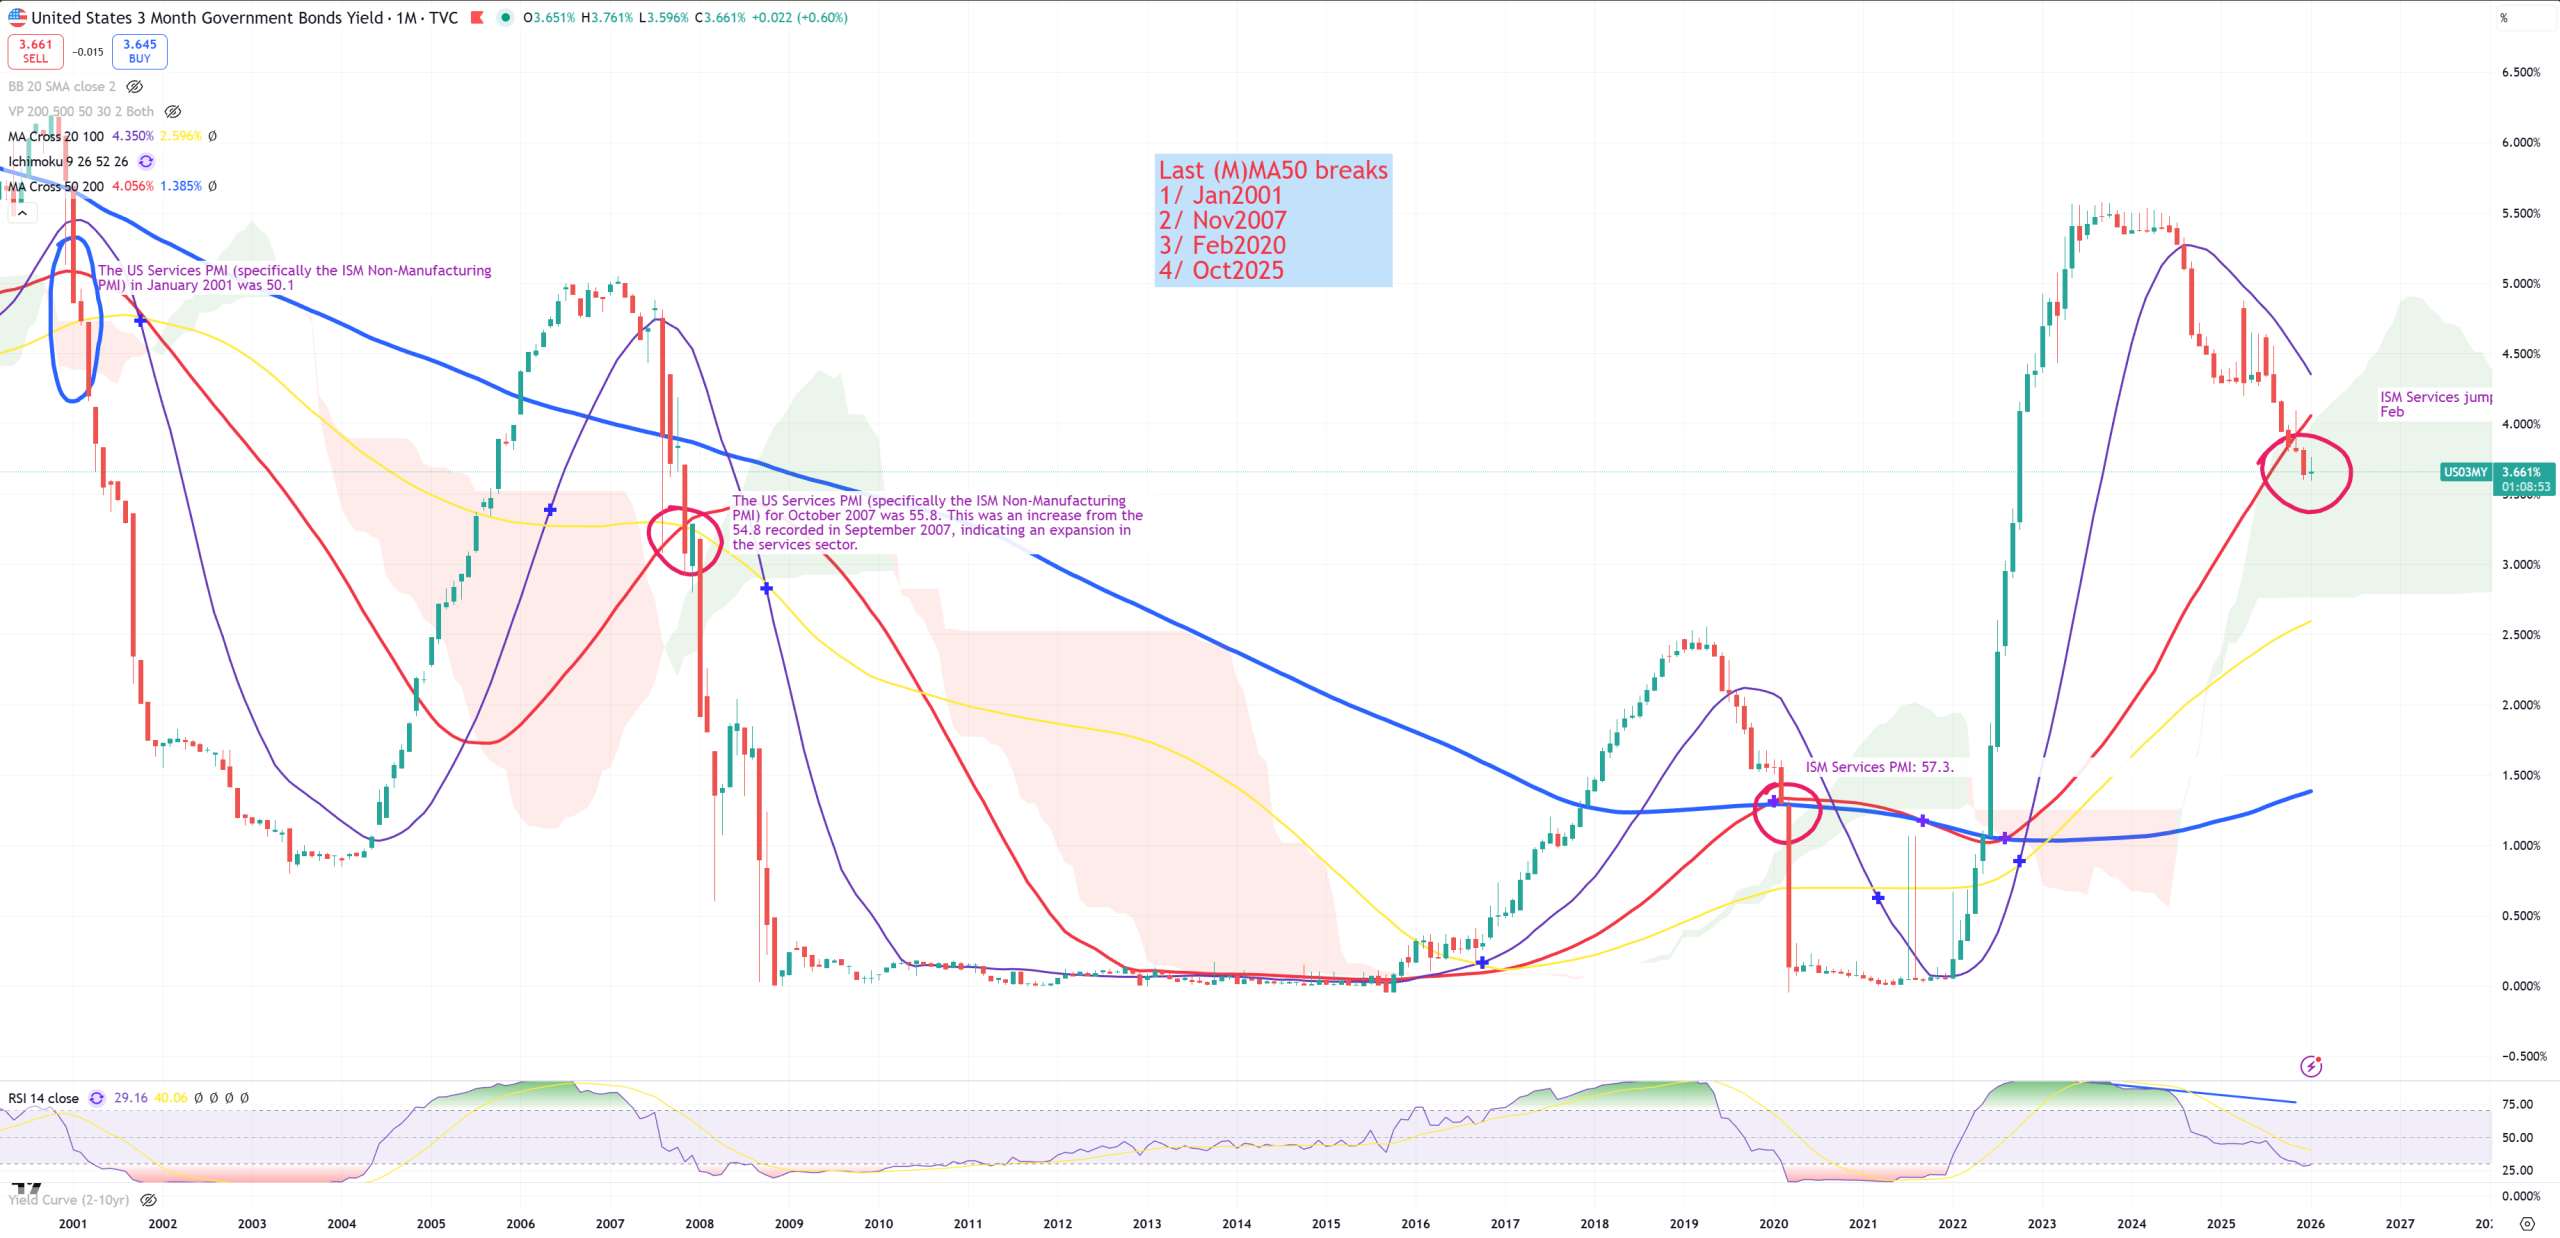
US03MY – main indicator of stock market topping and its (M)MA50 level which was broken late October 2025, beginning November 2025 – the same time SPX/GOLD passed (3M)MA200 closing the cycle, confirming DJI/GOLD which was a bit earlier.
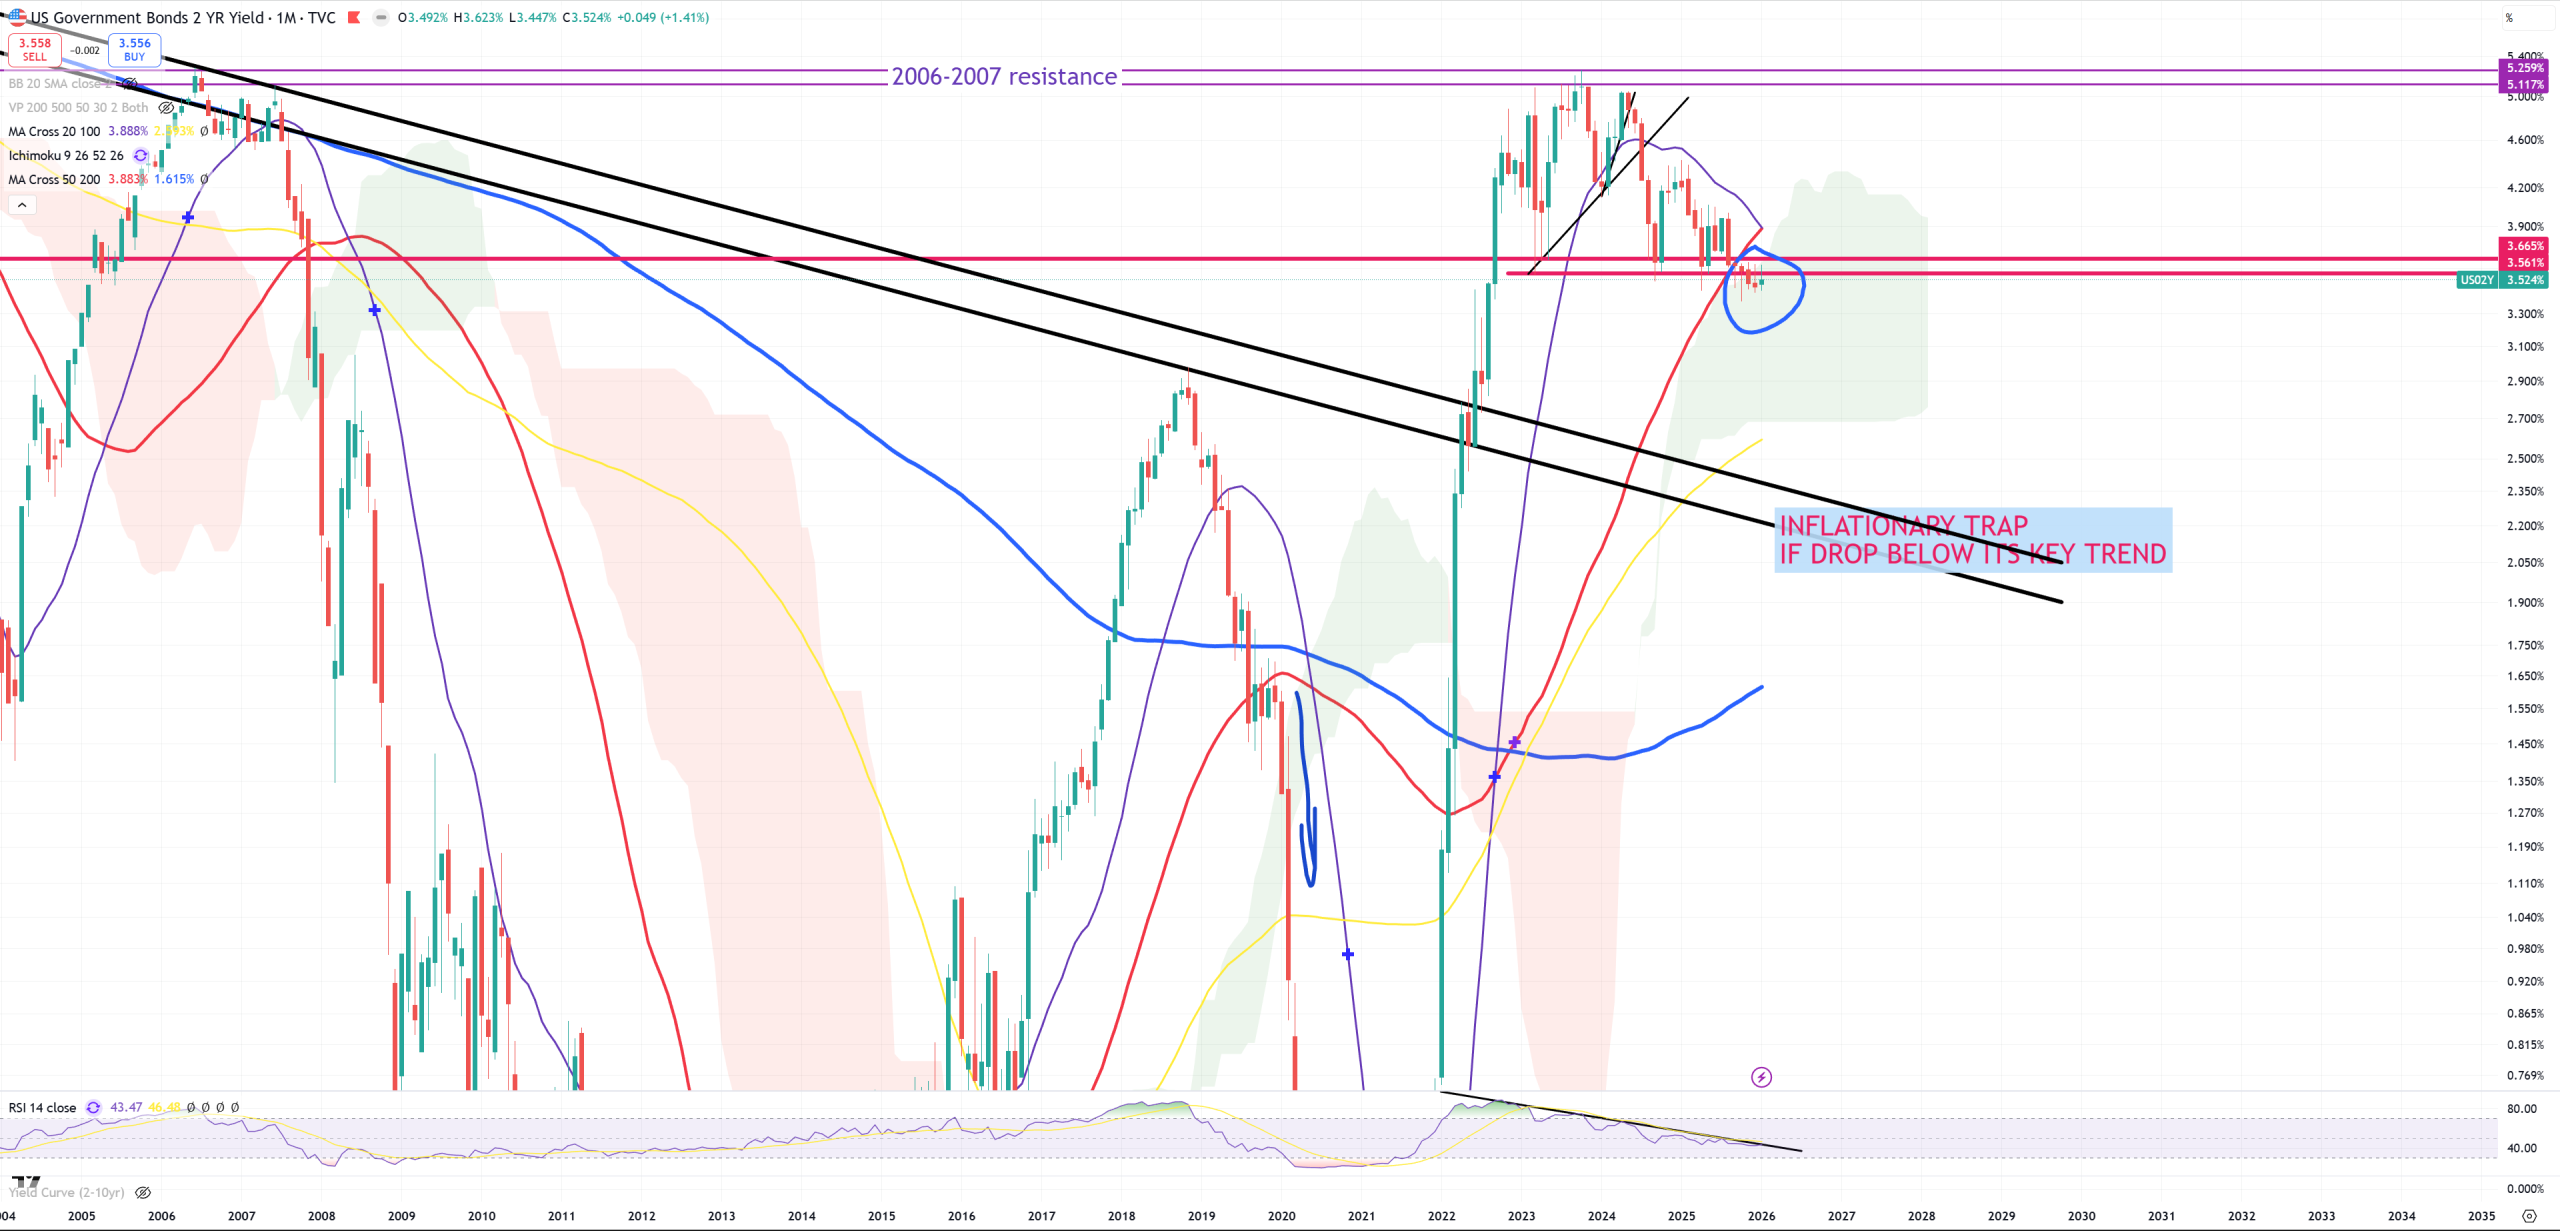
US02Y – leads US03MY – this level 3.60% is now massive resistance and I bet a move through a green part of cloud will be very fast.
GOLD+SILVER (physical in a proportion ~90-95%/5-10% based on value) and US02Y are my 2 main financial assets I hold. GOLD+SILVER since late 2017, beginning 2018 and US02Y since 2024. They both represent around 80% of my allocation.
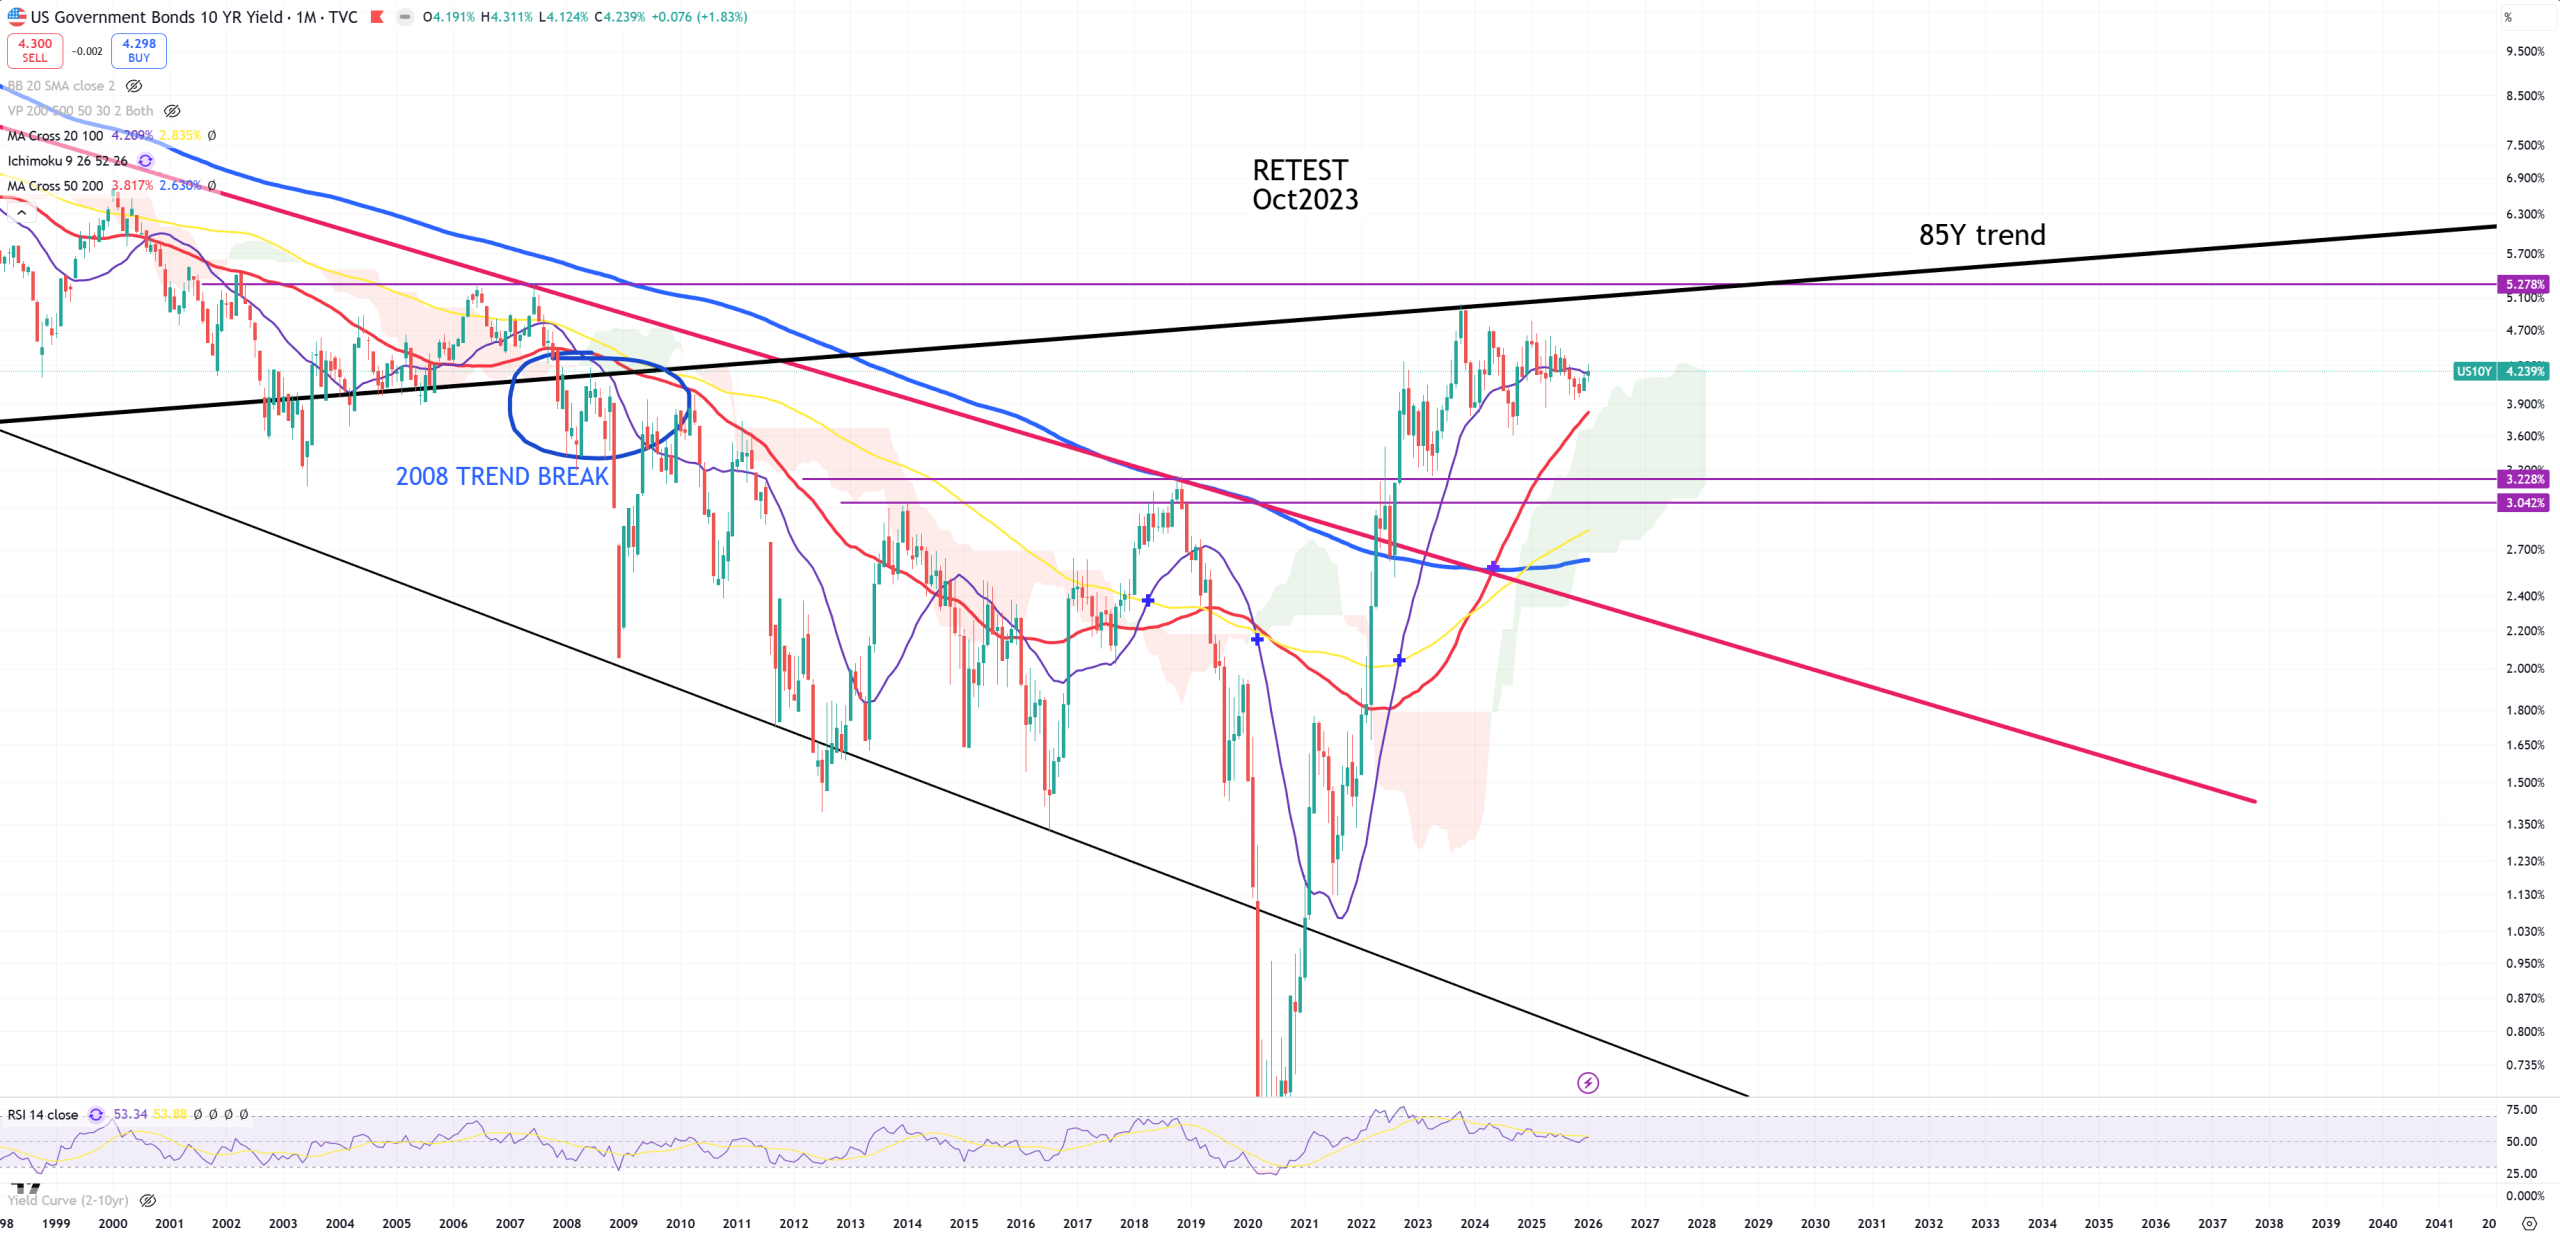
US10Y – so once we talk about US Bond market let’s take US10Y view. Nothing happens here since 2 years. It’s all now a fight for (M)MA20.
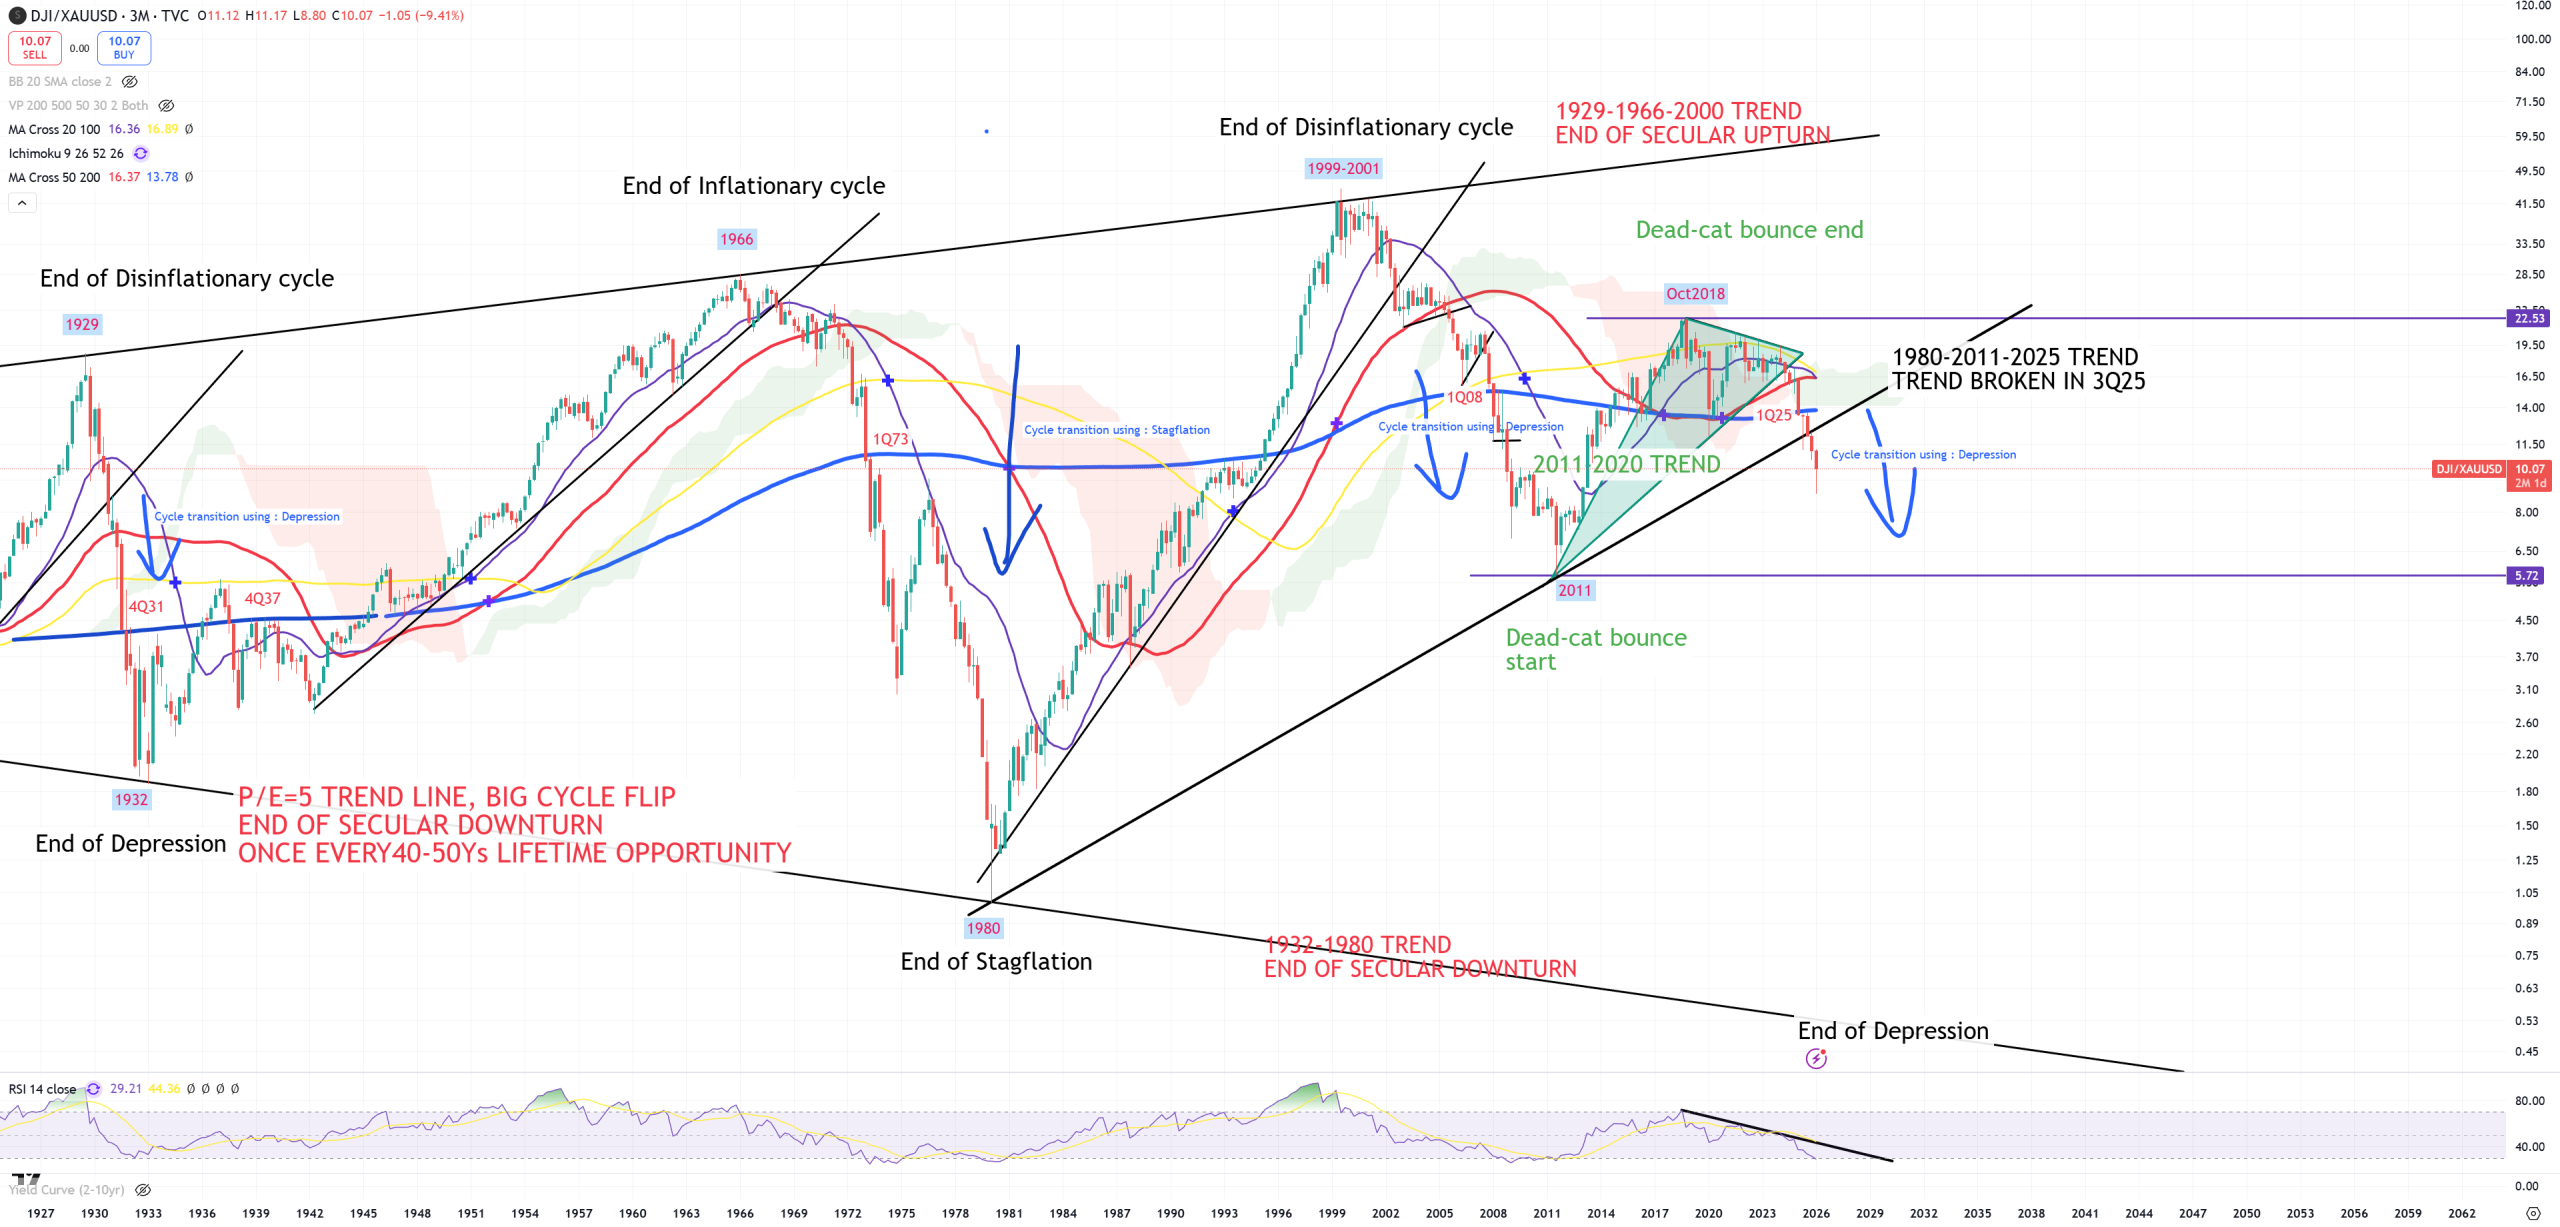
DJI/GOLD – 1st cycle indicator – looks like it’s moving forward. The lower it is the worse in the economy. It has zero constraints to get towards 2011 level : 5.72. Peak in 4Q18, (3M)MA200 break in 1Q25. This is 3M view. My bet you can hold gold until we’ll reach 1932-1980 trend line if you consider very long term period. Cycle indicator <> Stock market indicator. Stock market is not the economy … until it is. Stocks lagging cycles to couple with them very fast later and follow the cycle.
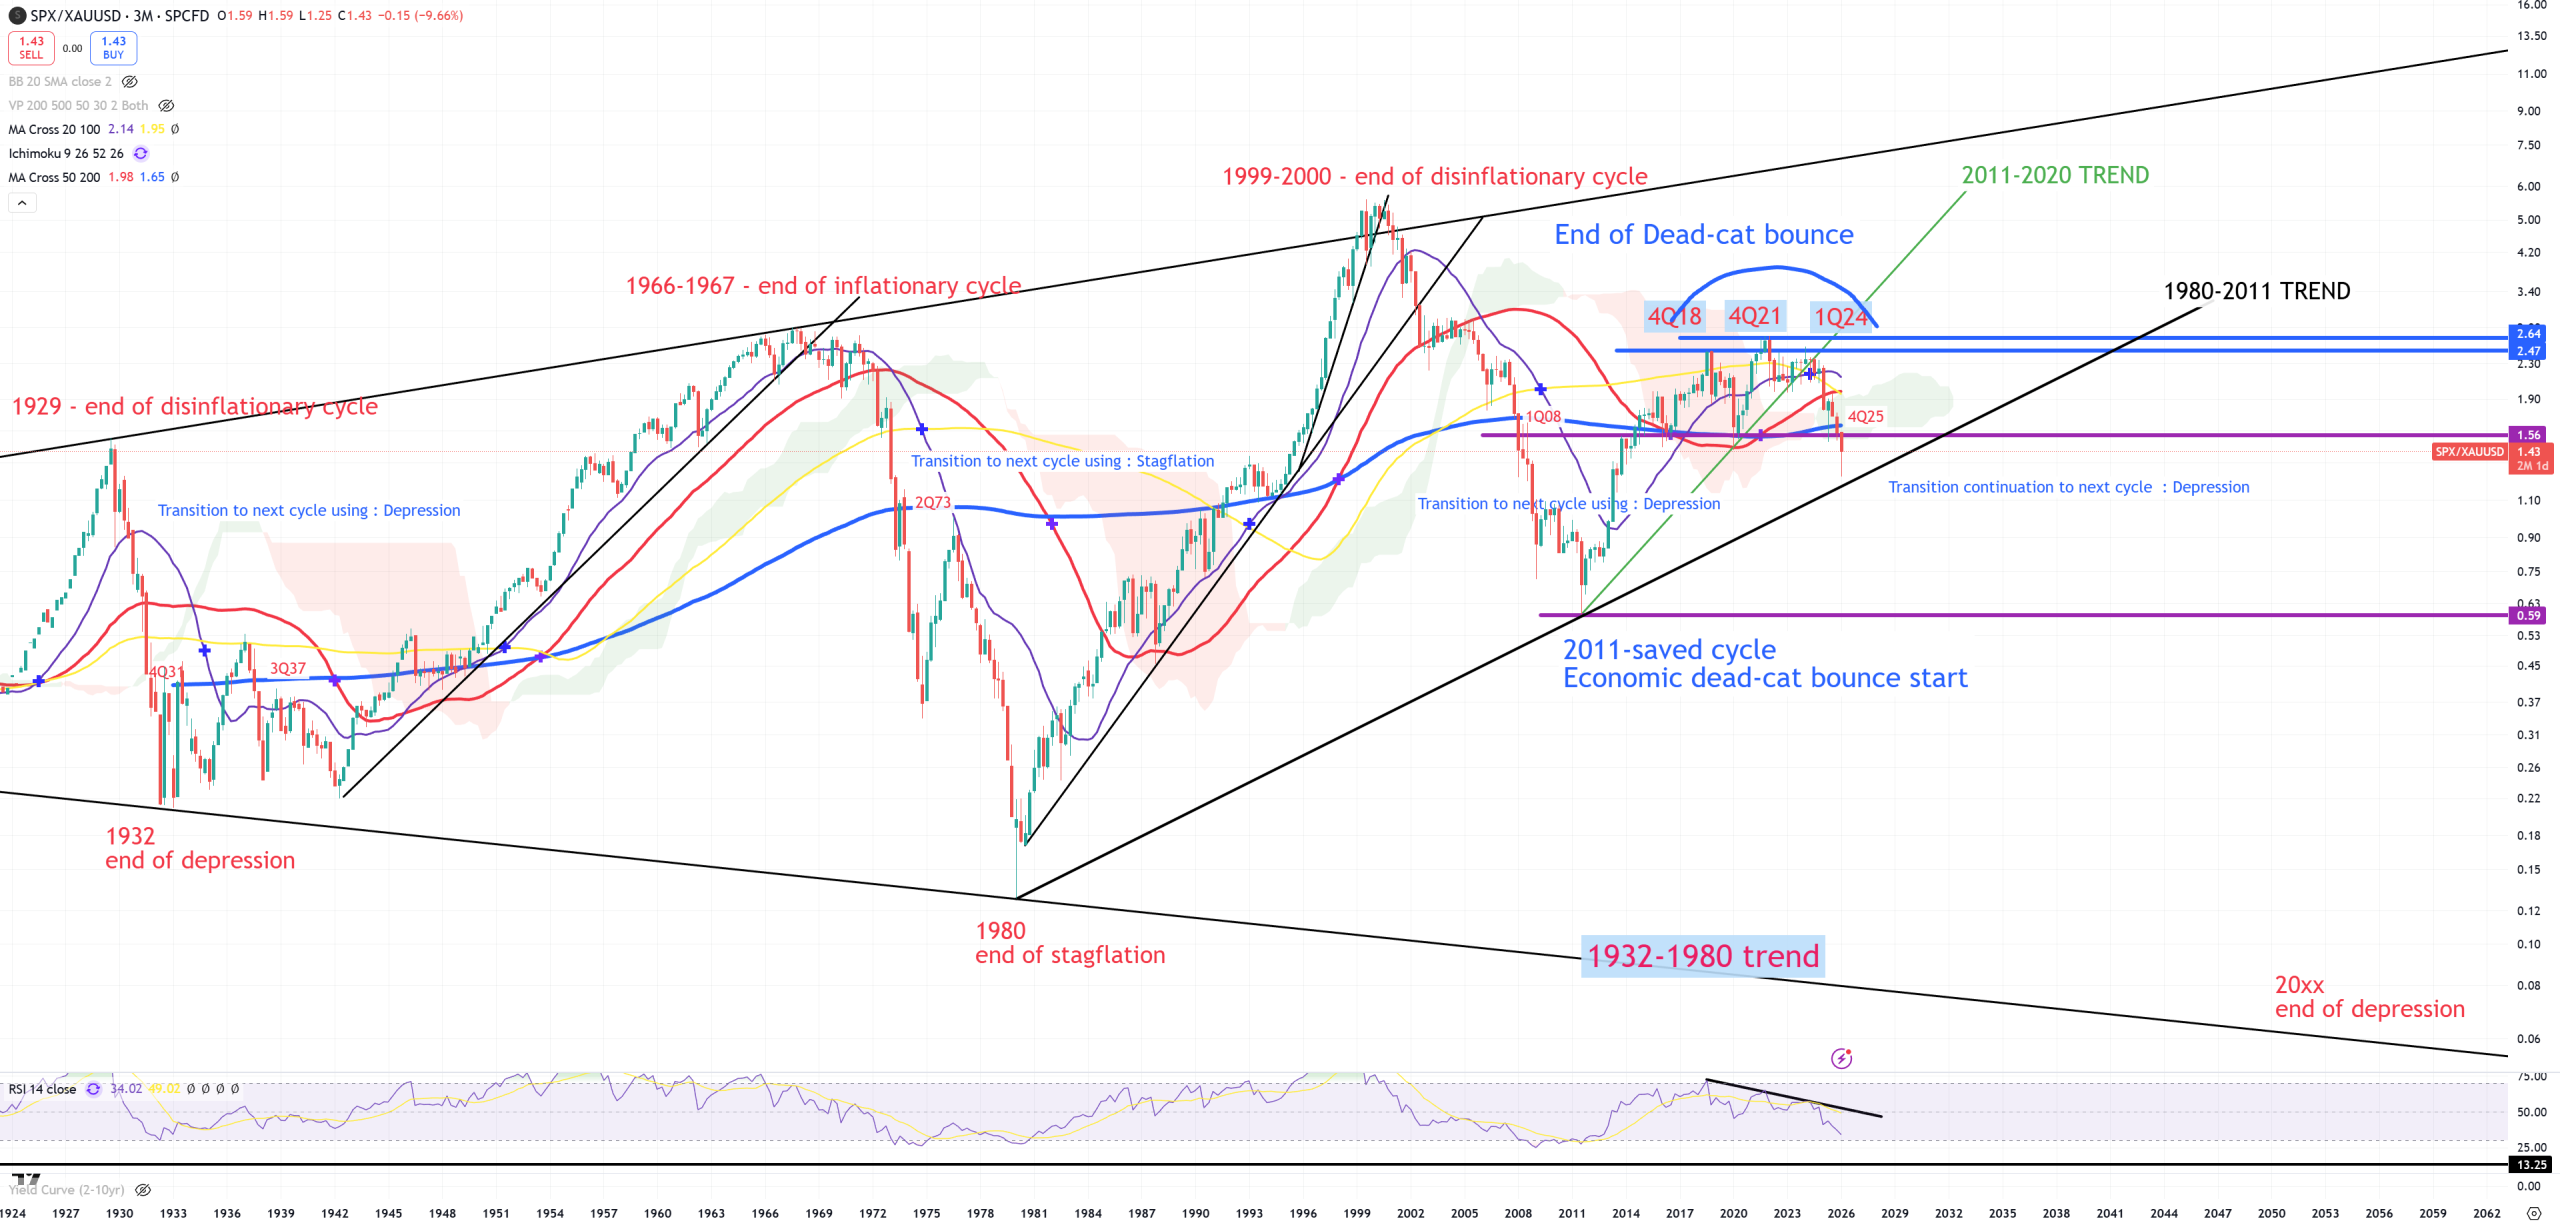
SPX/GOLD – 2nd cycle indicator. I was waiting the most the whole 2025 for it to close below (3M)MA200 and finally it did it in 4Q25, confirming DJI/GOLD (3M)MA200 break in 1Q25. So based on this break we can say : THE CYCLE HAS CLOSED ALL THE DOORS AND CUT THE OXYGEN. Peak in 4Q21, so assuming that DJI/GOLD peaked in 4Q18 we can say the economy reached its peak of prosperity somewhere between 2018-2021. Remember this 2021 especially because tons of stocks peaked in that year. So let’s take a look now on other setups having in mind key indicators already analyzed. View is on 3M because that’s a super long term chart, also look on 1932-1980 trend line.
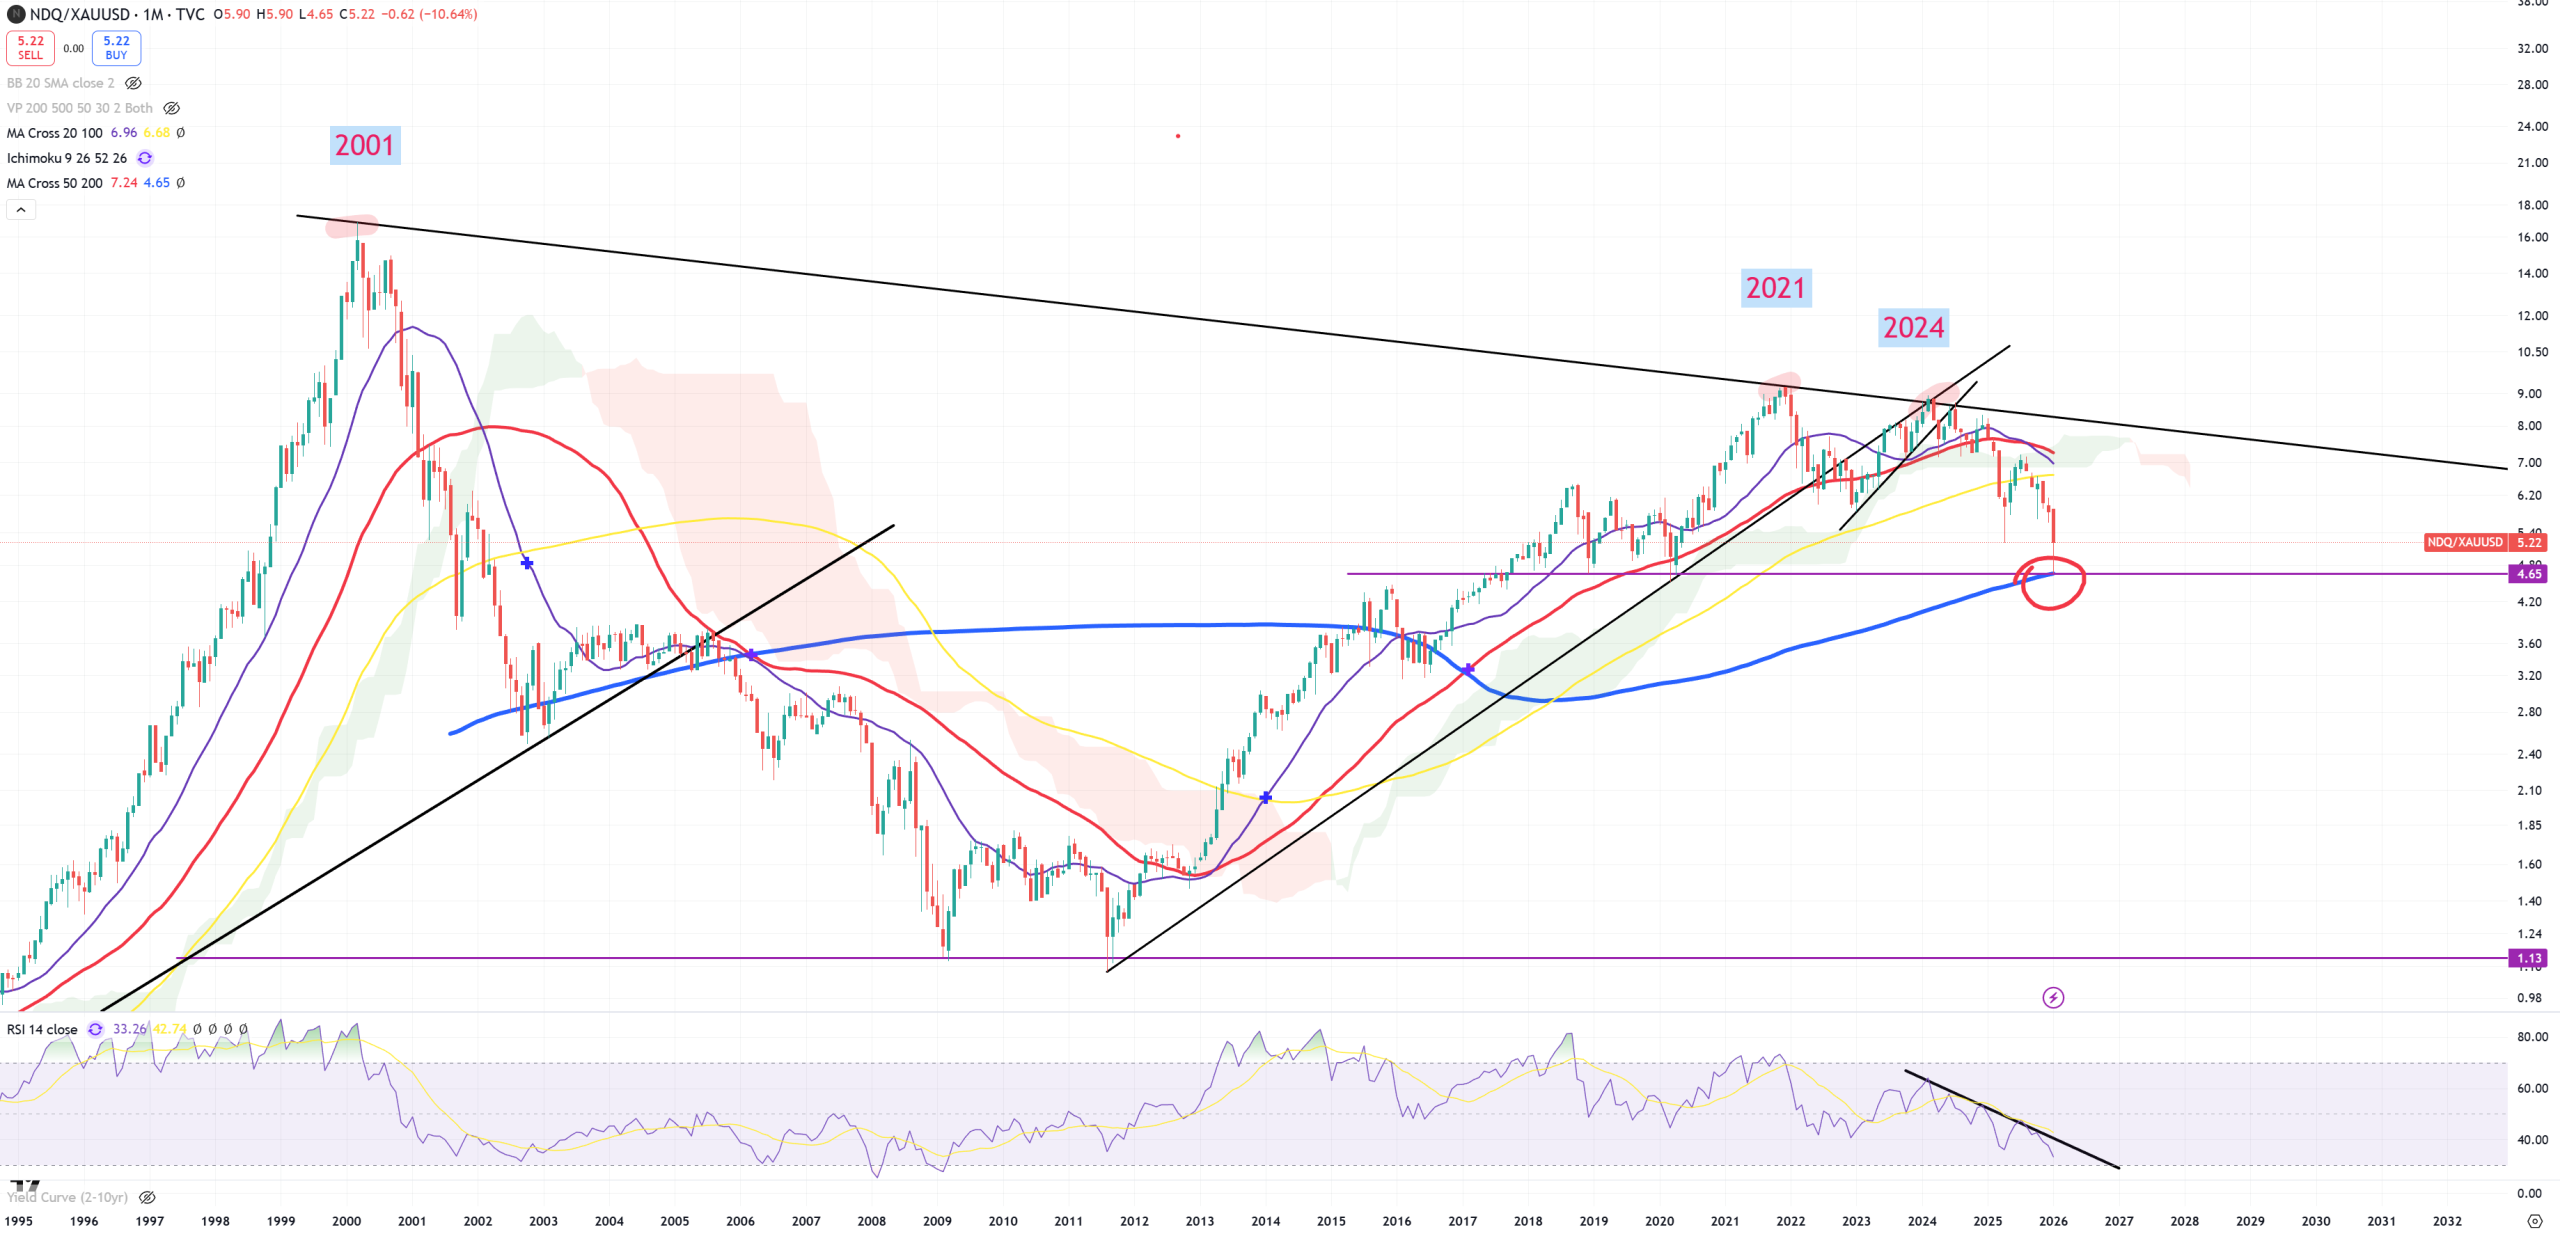
NDQ/GOLD – let’s call it 3rd cycle indicator, but I don’t really watch it. For fun. Massive moment on (M)MA200, cycle peak in 2021 of course.
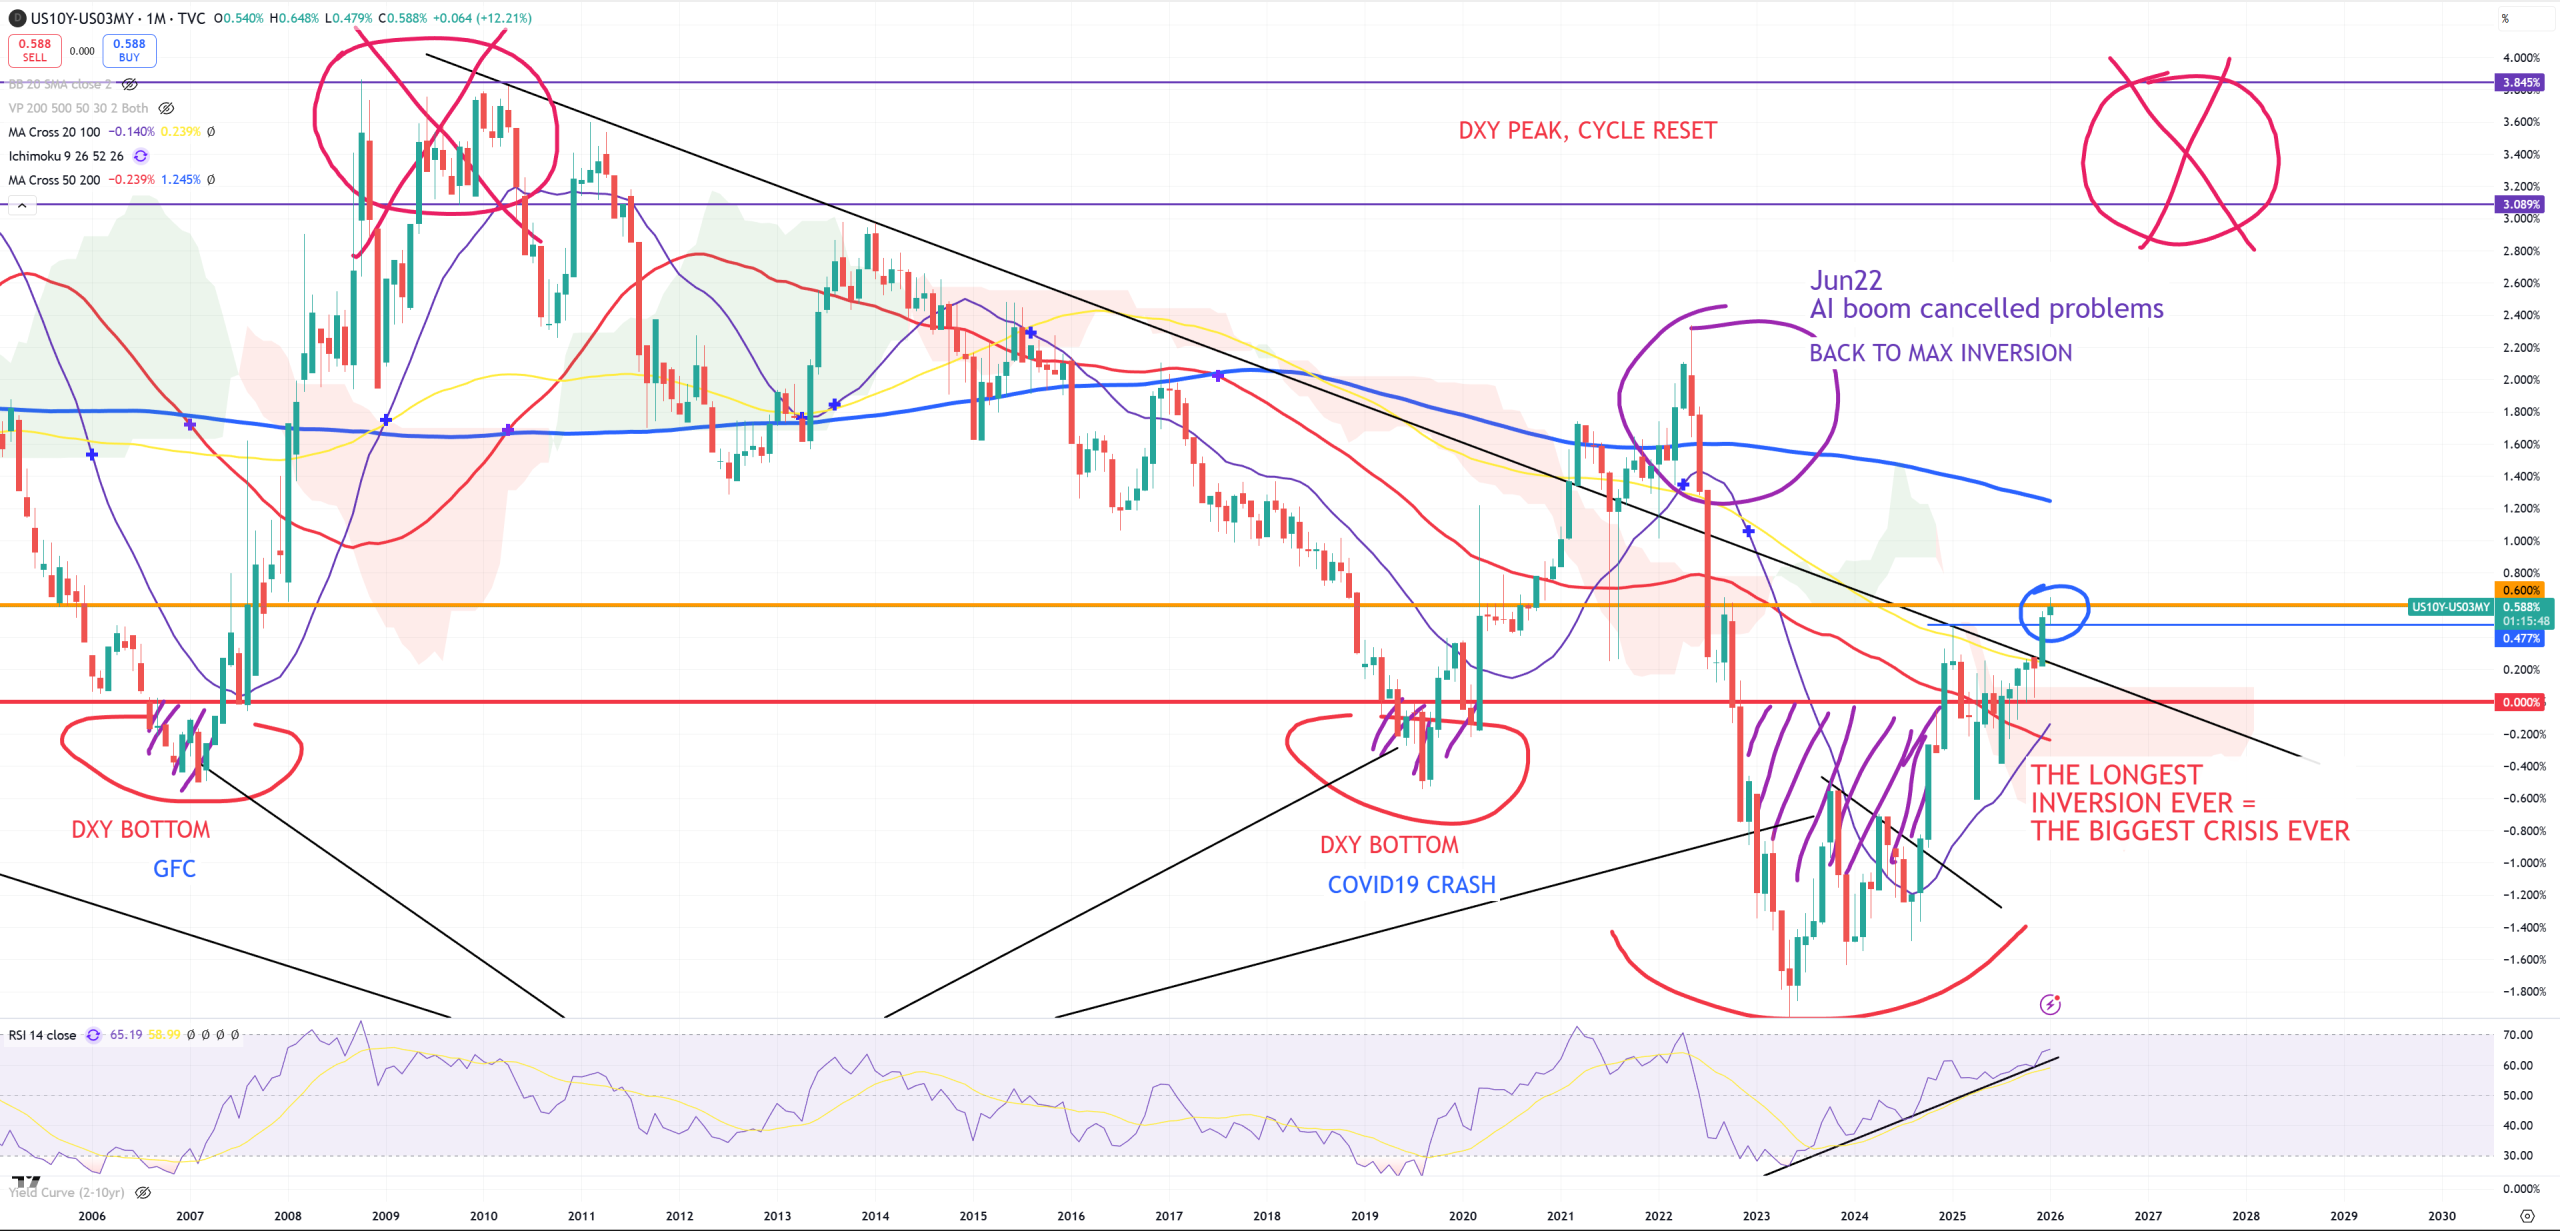
10Y/3M – additional indicator for stock market topping. On (M) we are on the edge of breaking +60bps. Trend post 2009 broken, but it has happened already and that was a trap around (M)MA200. We see black and white that we’re operating on the same 2009+ cycle because we haven’t reached +350bps still. Postive divergence on (M)RSI still. HUGE move will come here – big rate cuts. Considering the amount of days of inversion we are beating all records, which previously belonged to 1929. But 700 days vs 1100-1200 days (today) is a big difference. That’s why you should see RECORDS breaking everywhere – mostly macro data, like for example this one below. This level 1100-1200 days points also for record ever unemployment. Considering 2008 and 2020 levels, those 2 periods should be called small not important corrections vs what’s going on now. Once 10y/3m uninverts, $$$ should get a boost but that’s not 1:1 or this time is different.
US FACES FIRST POPULATION DROP IN HISTORY, ESTIMATES SHOW
1M$ question is where DJI/GOLD & SPX/GOLD will be once 10y/3m will jump to +350bps. Will they touch 1932-1980 trend lines once 10y/3m will reach +350bps or not. Because if not – we’ll get another recovery cycle during “cycle closing procedure”. My bet is that 80% we will reach 1932-1980 trend and in 20% we’ll get a recovery cycle.
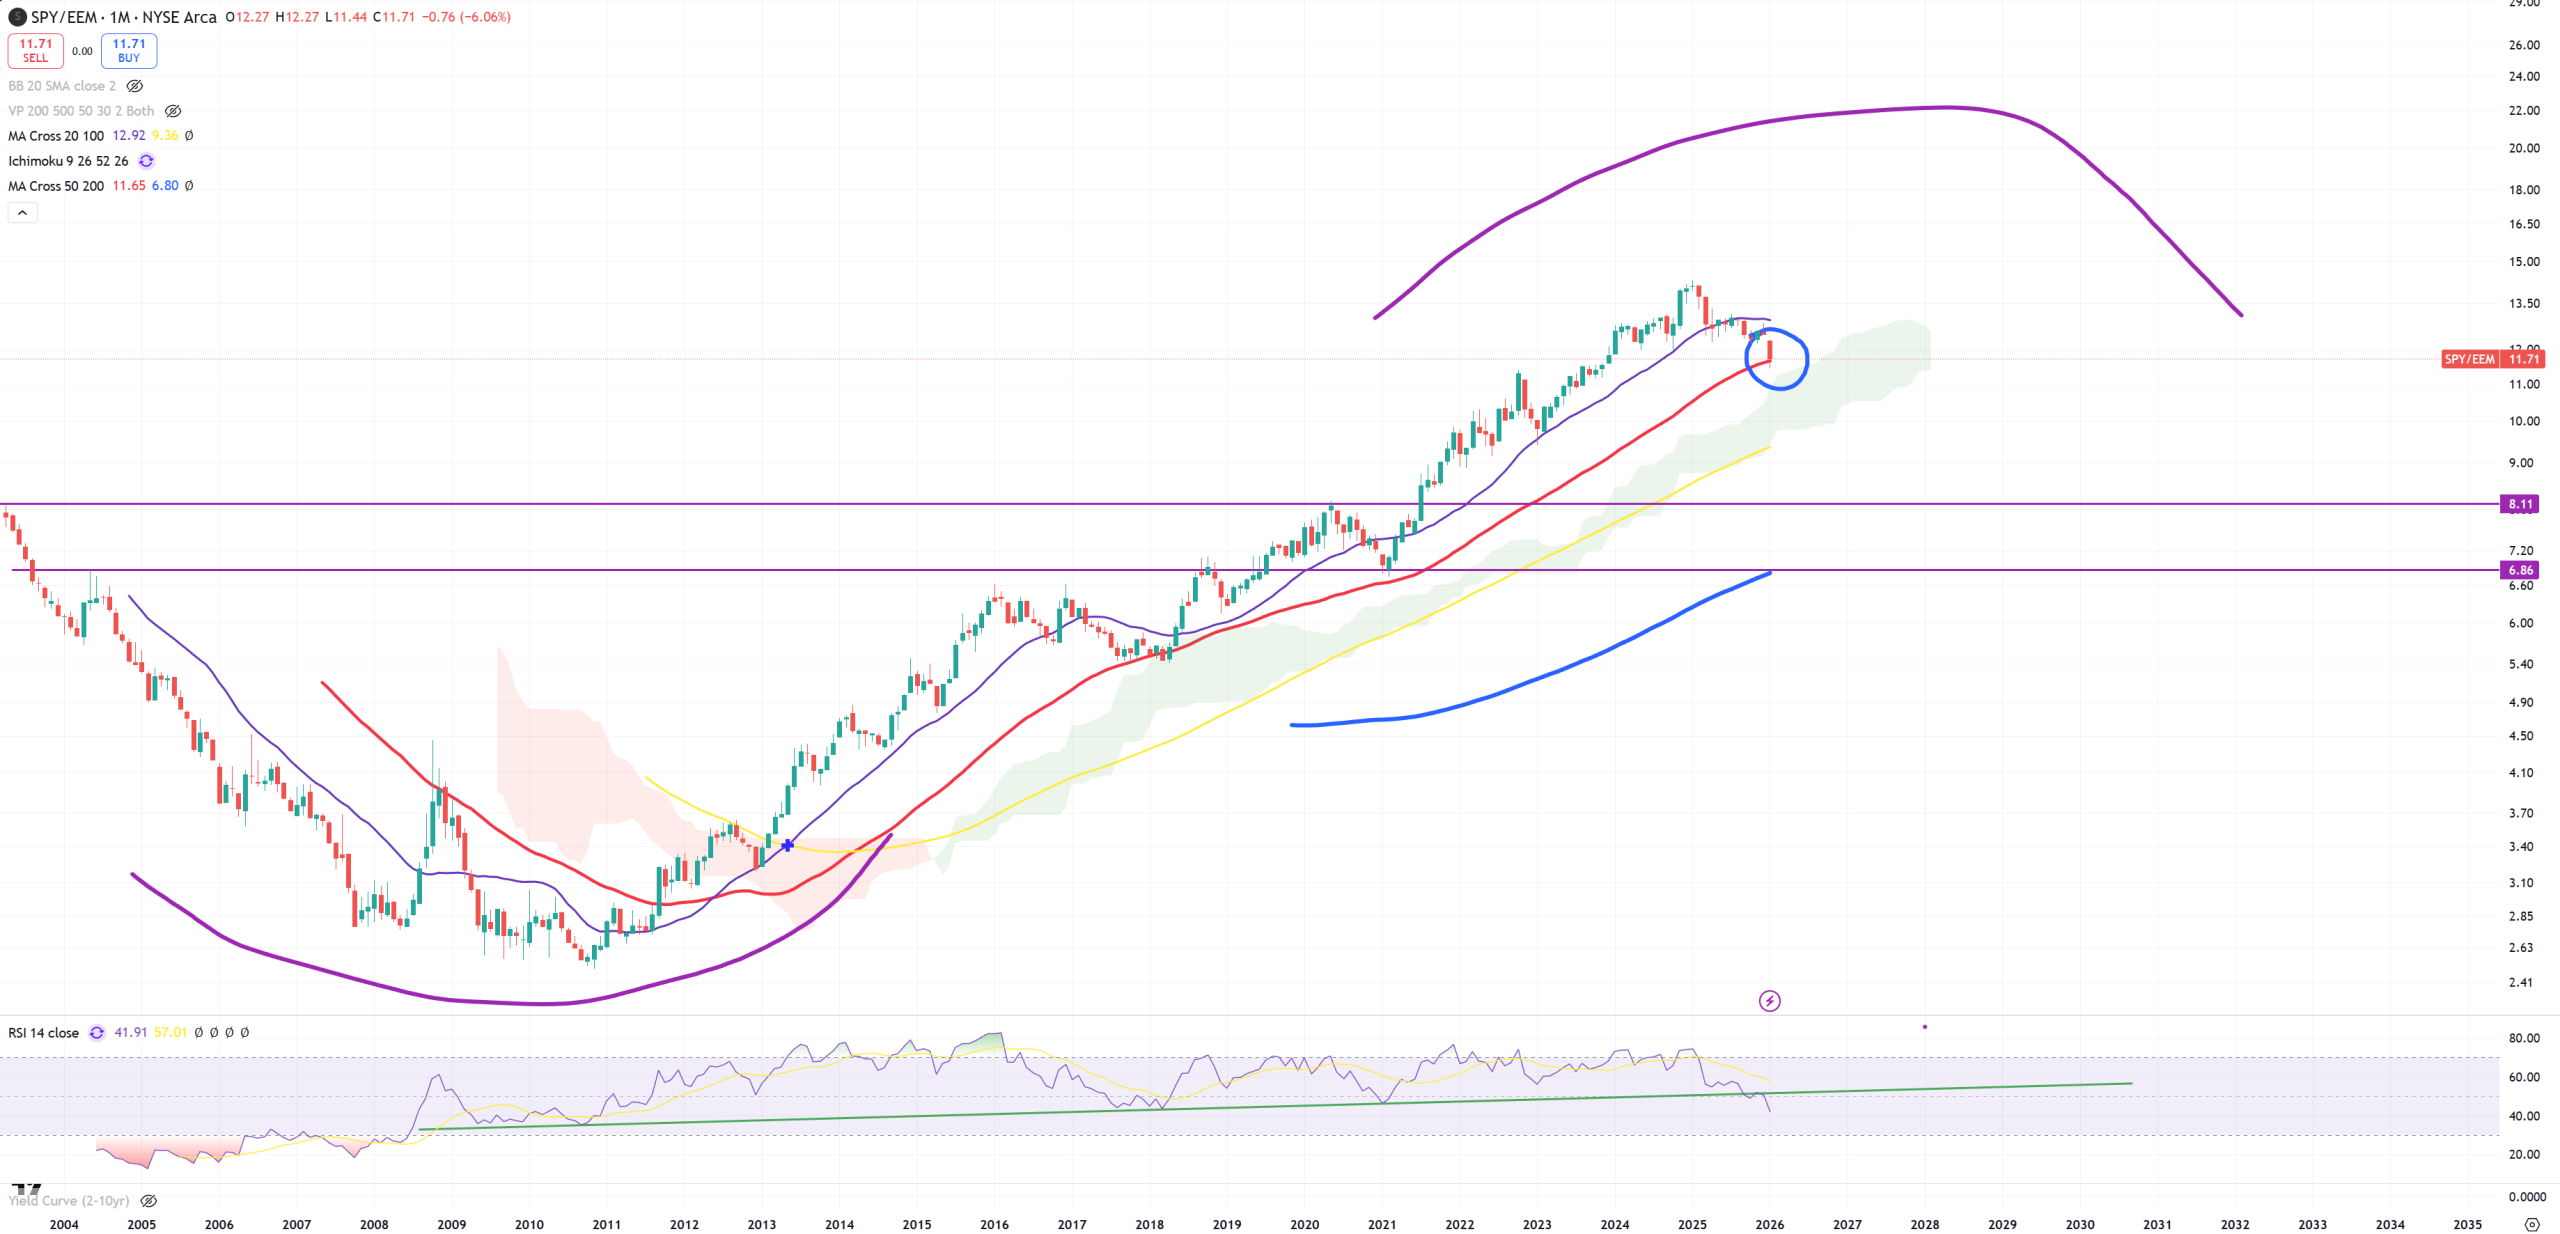
SPY/EEM on the edge of (M)MA50 break – another confirmation of cycle rotation. If we open below (M)MA50 on February (because such breaks occur in that way) it’s official. Peak in January 2025.
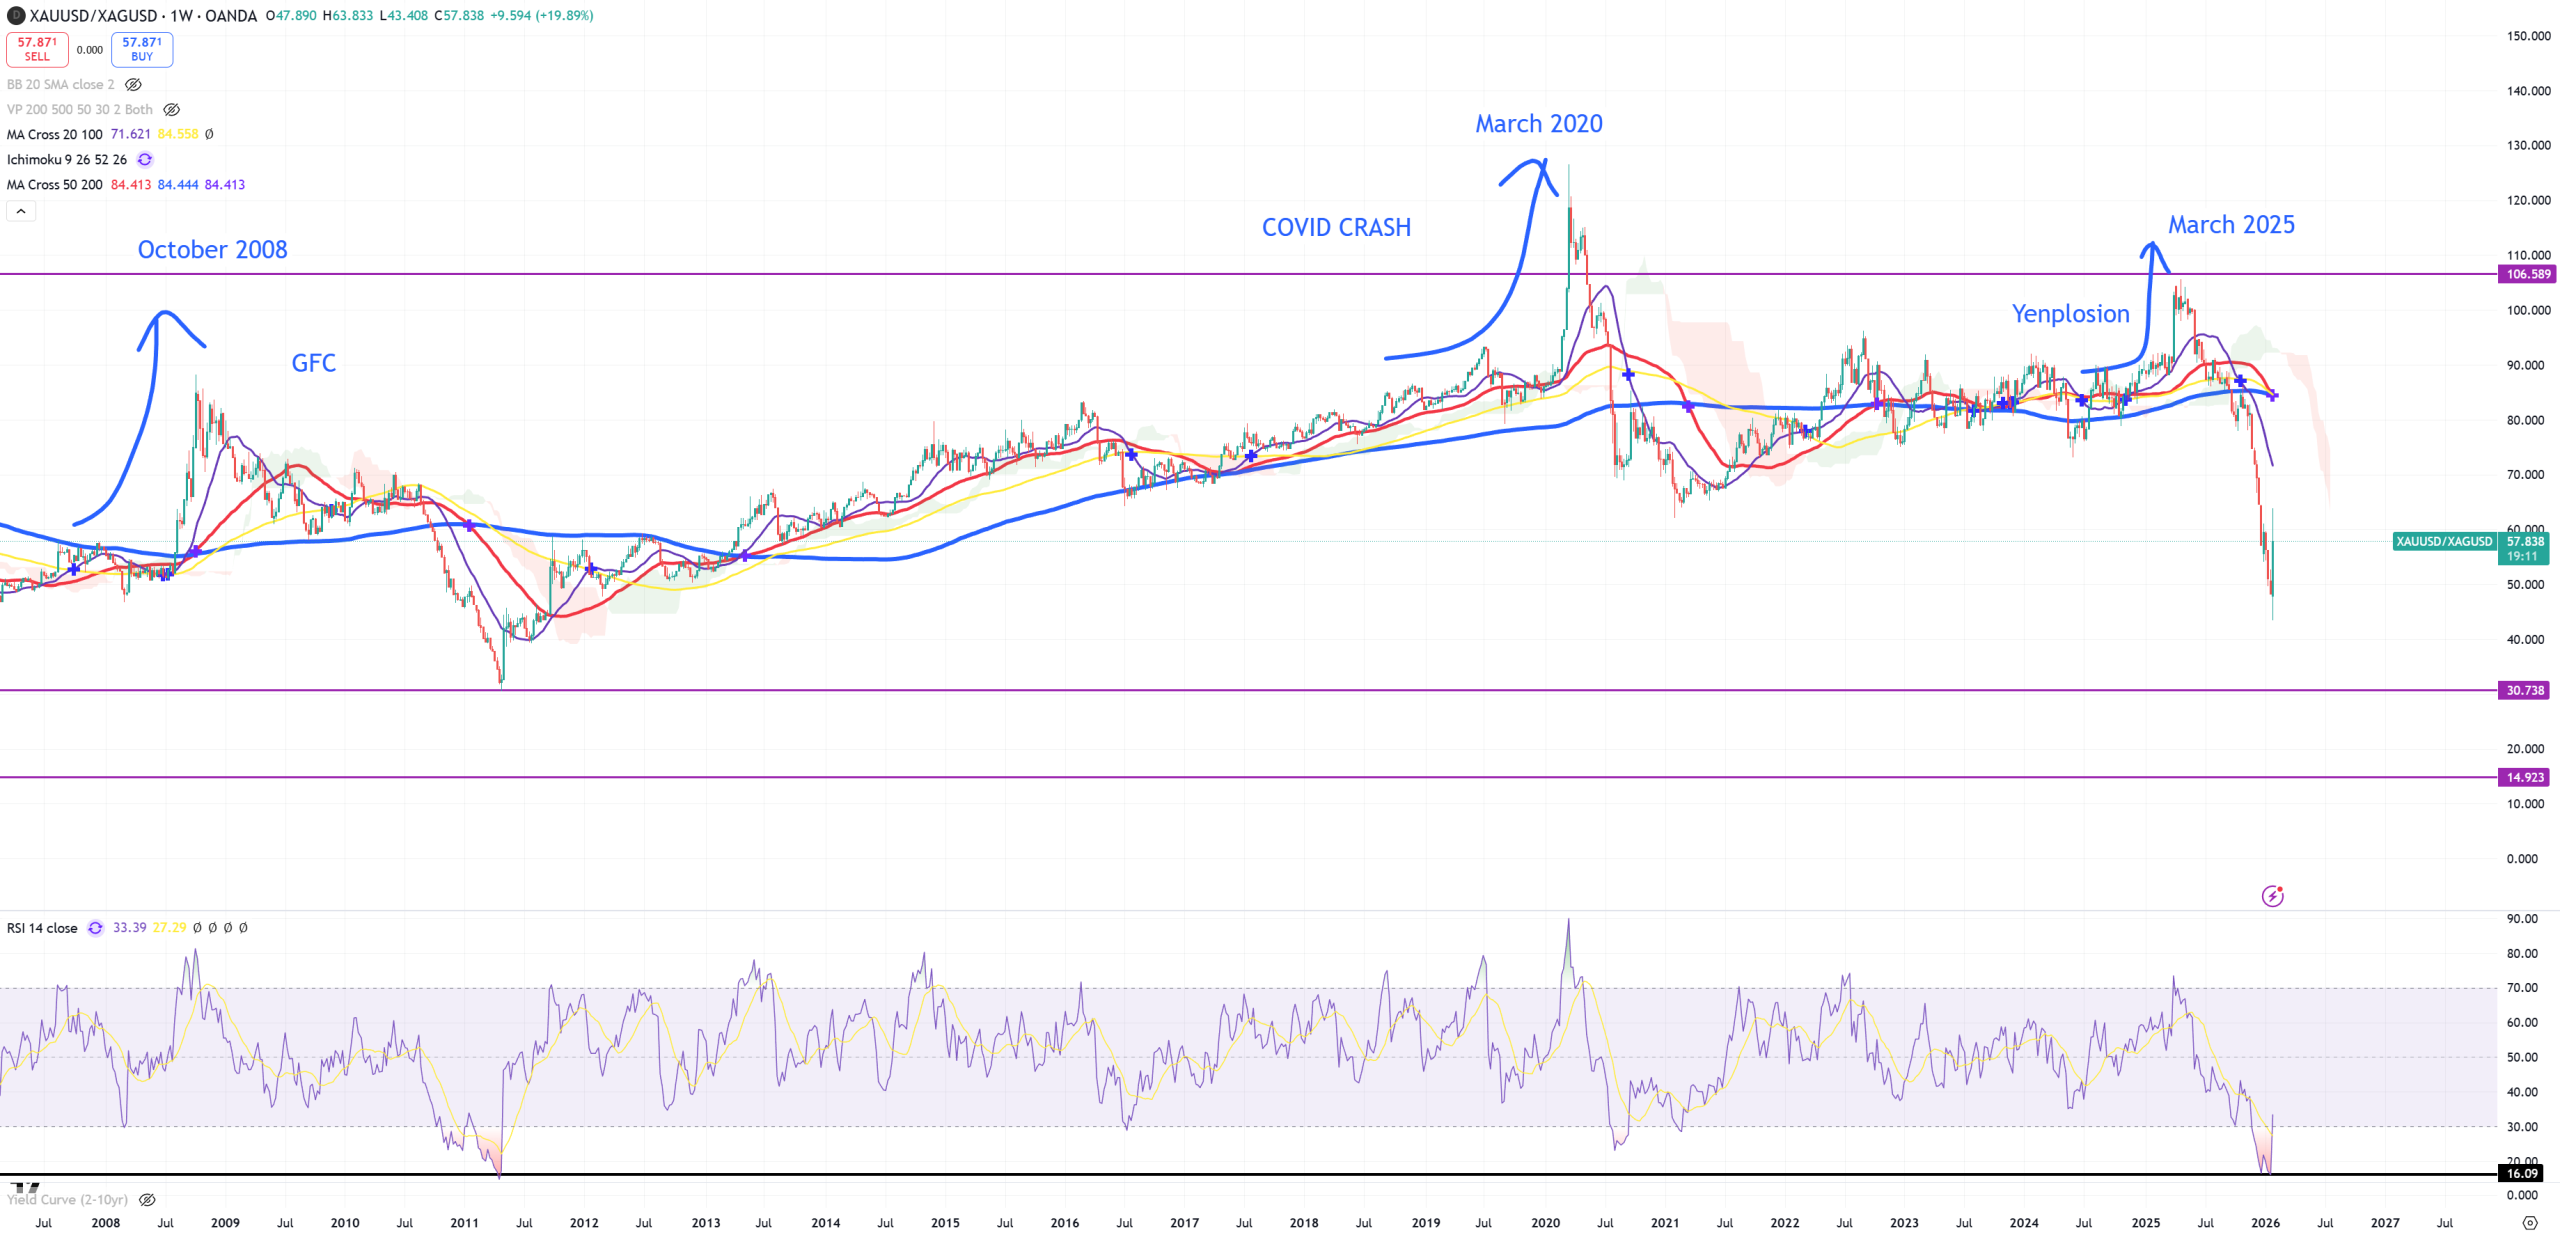
GOLD/SILVER ratio – 10Y/3M uninverting and GOLD/SILVER ratio. Since 2007 we had 3 times when 10Y/3M was uninverting and GOLD/SILVER ratio spiked. All 3 here. In March 2025 we uninverted for a “second” just to go back to inversion again. During economic crash this ratio goes HIGHER, as gold >> silver.
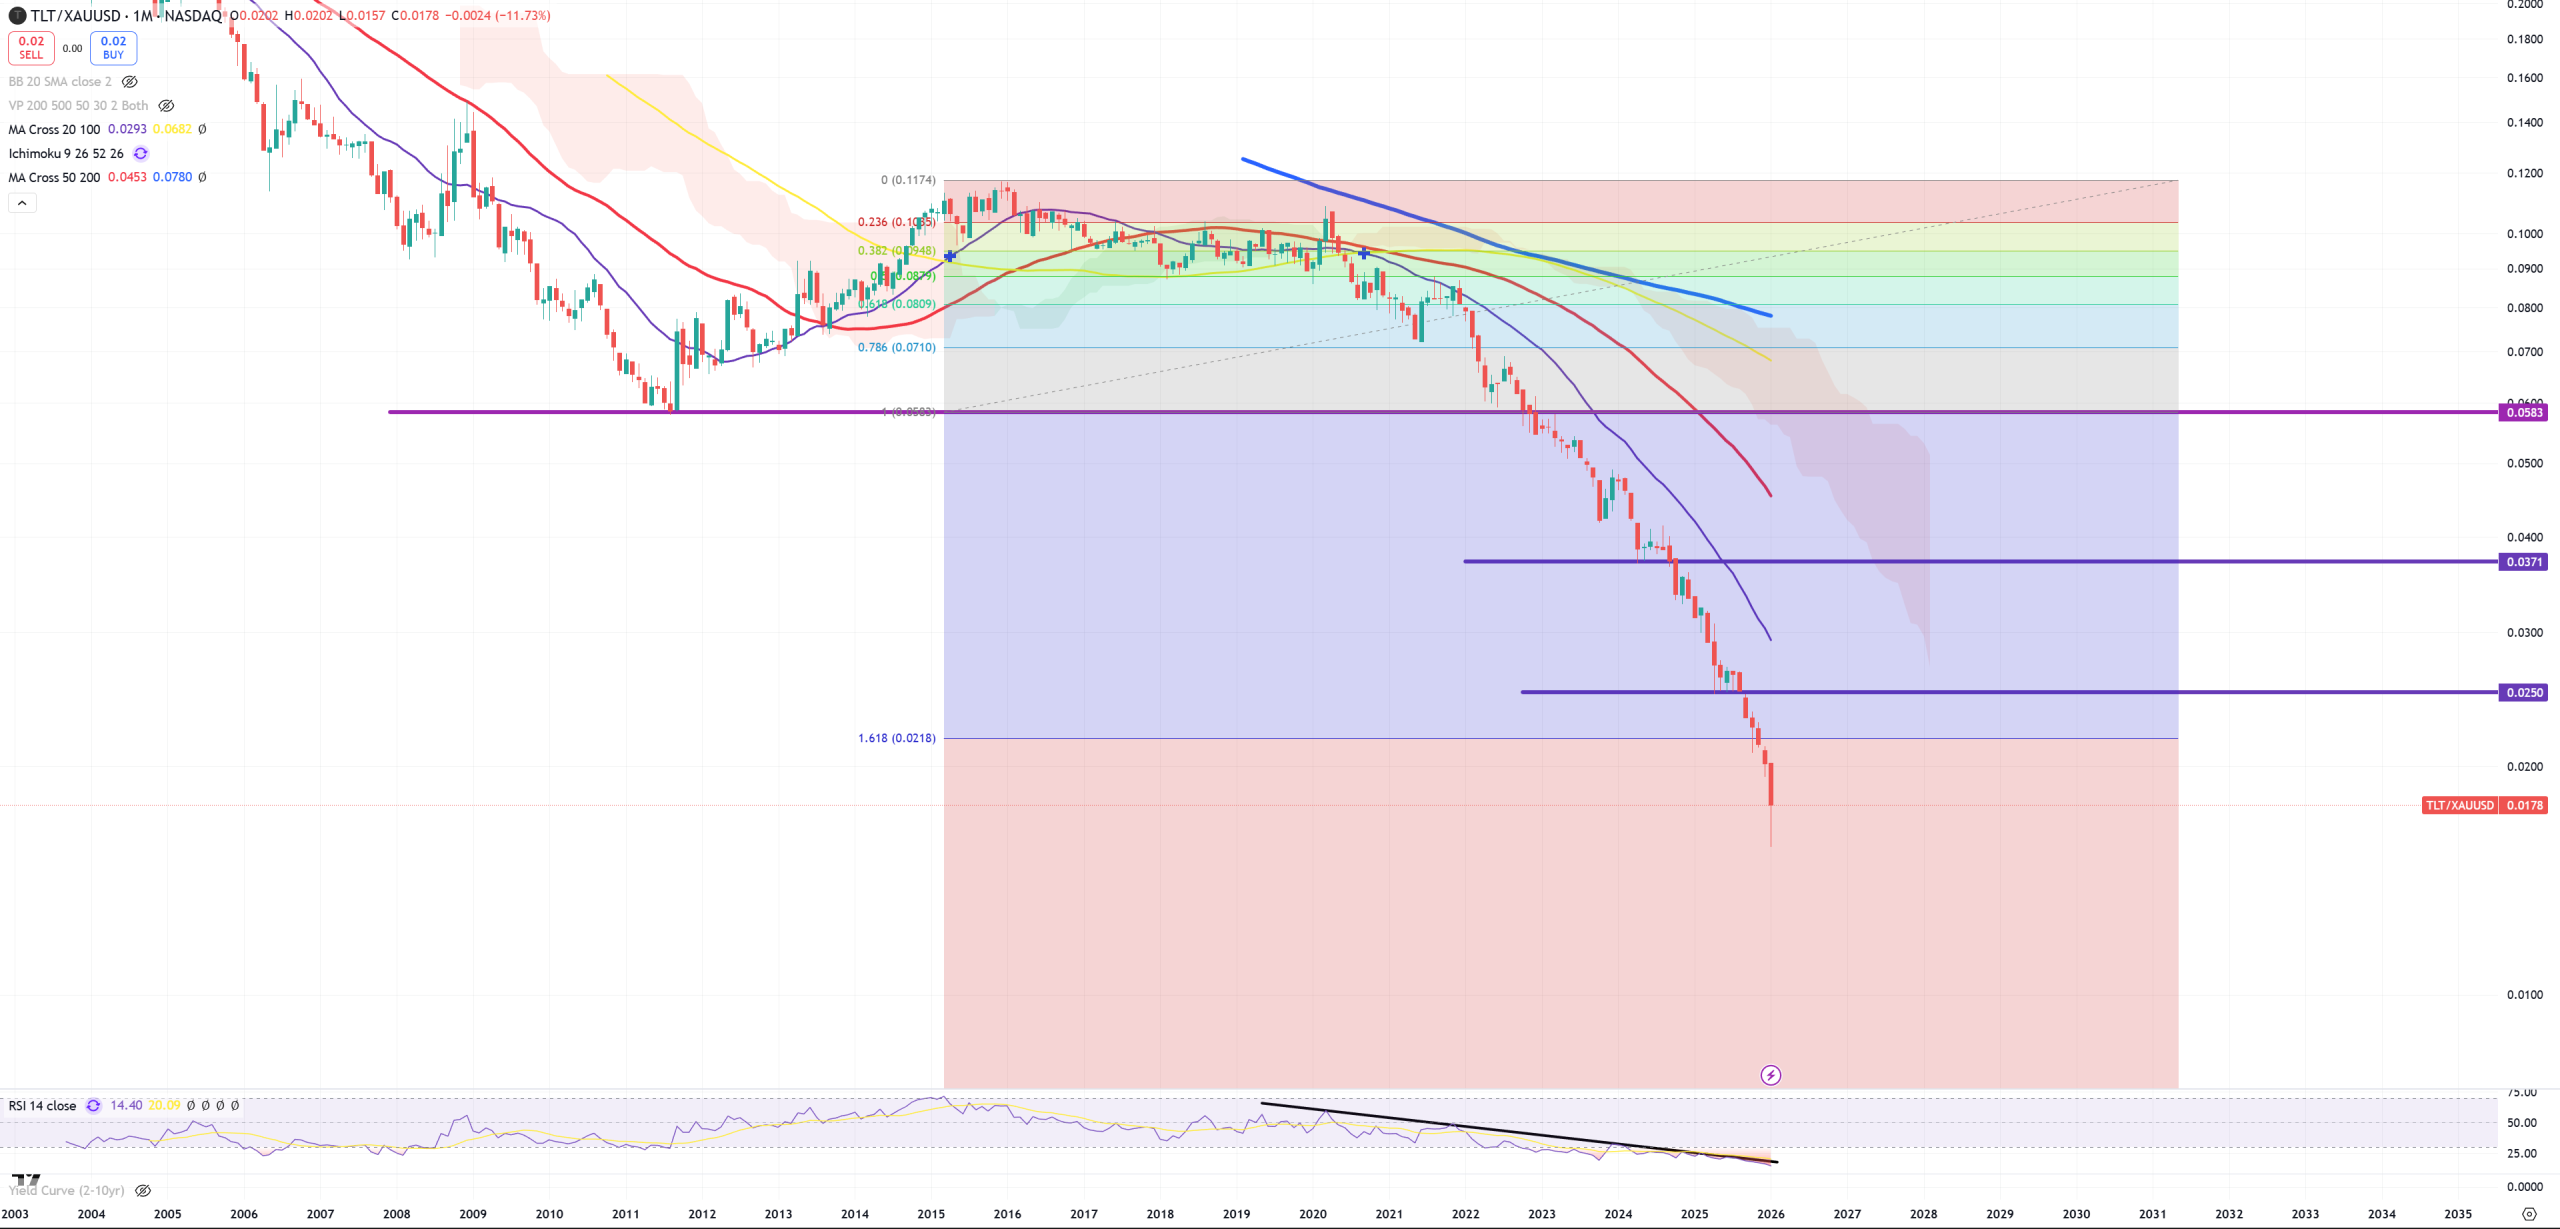
TLT/GOLD and (M)RSI = 14. This ratio can easily reverse like SILVER on Friday.
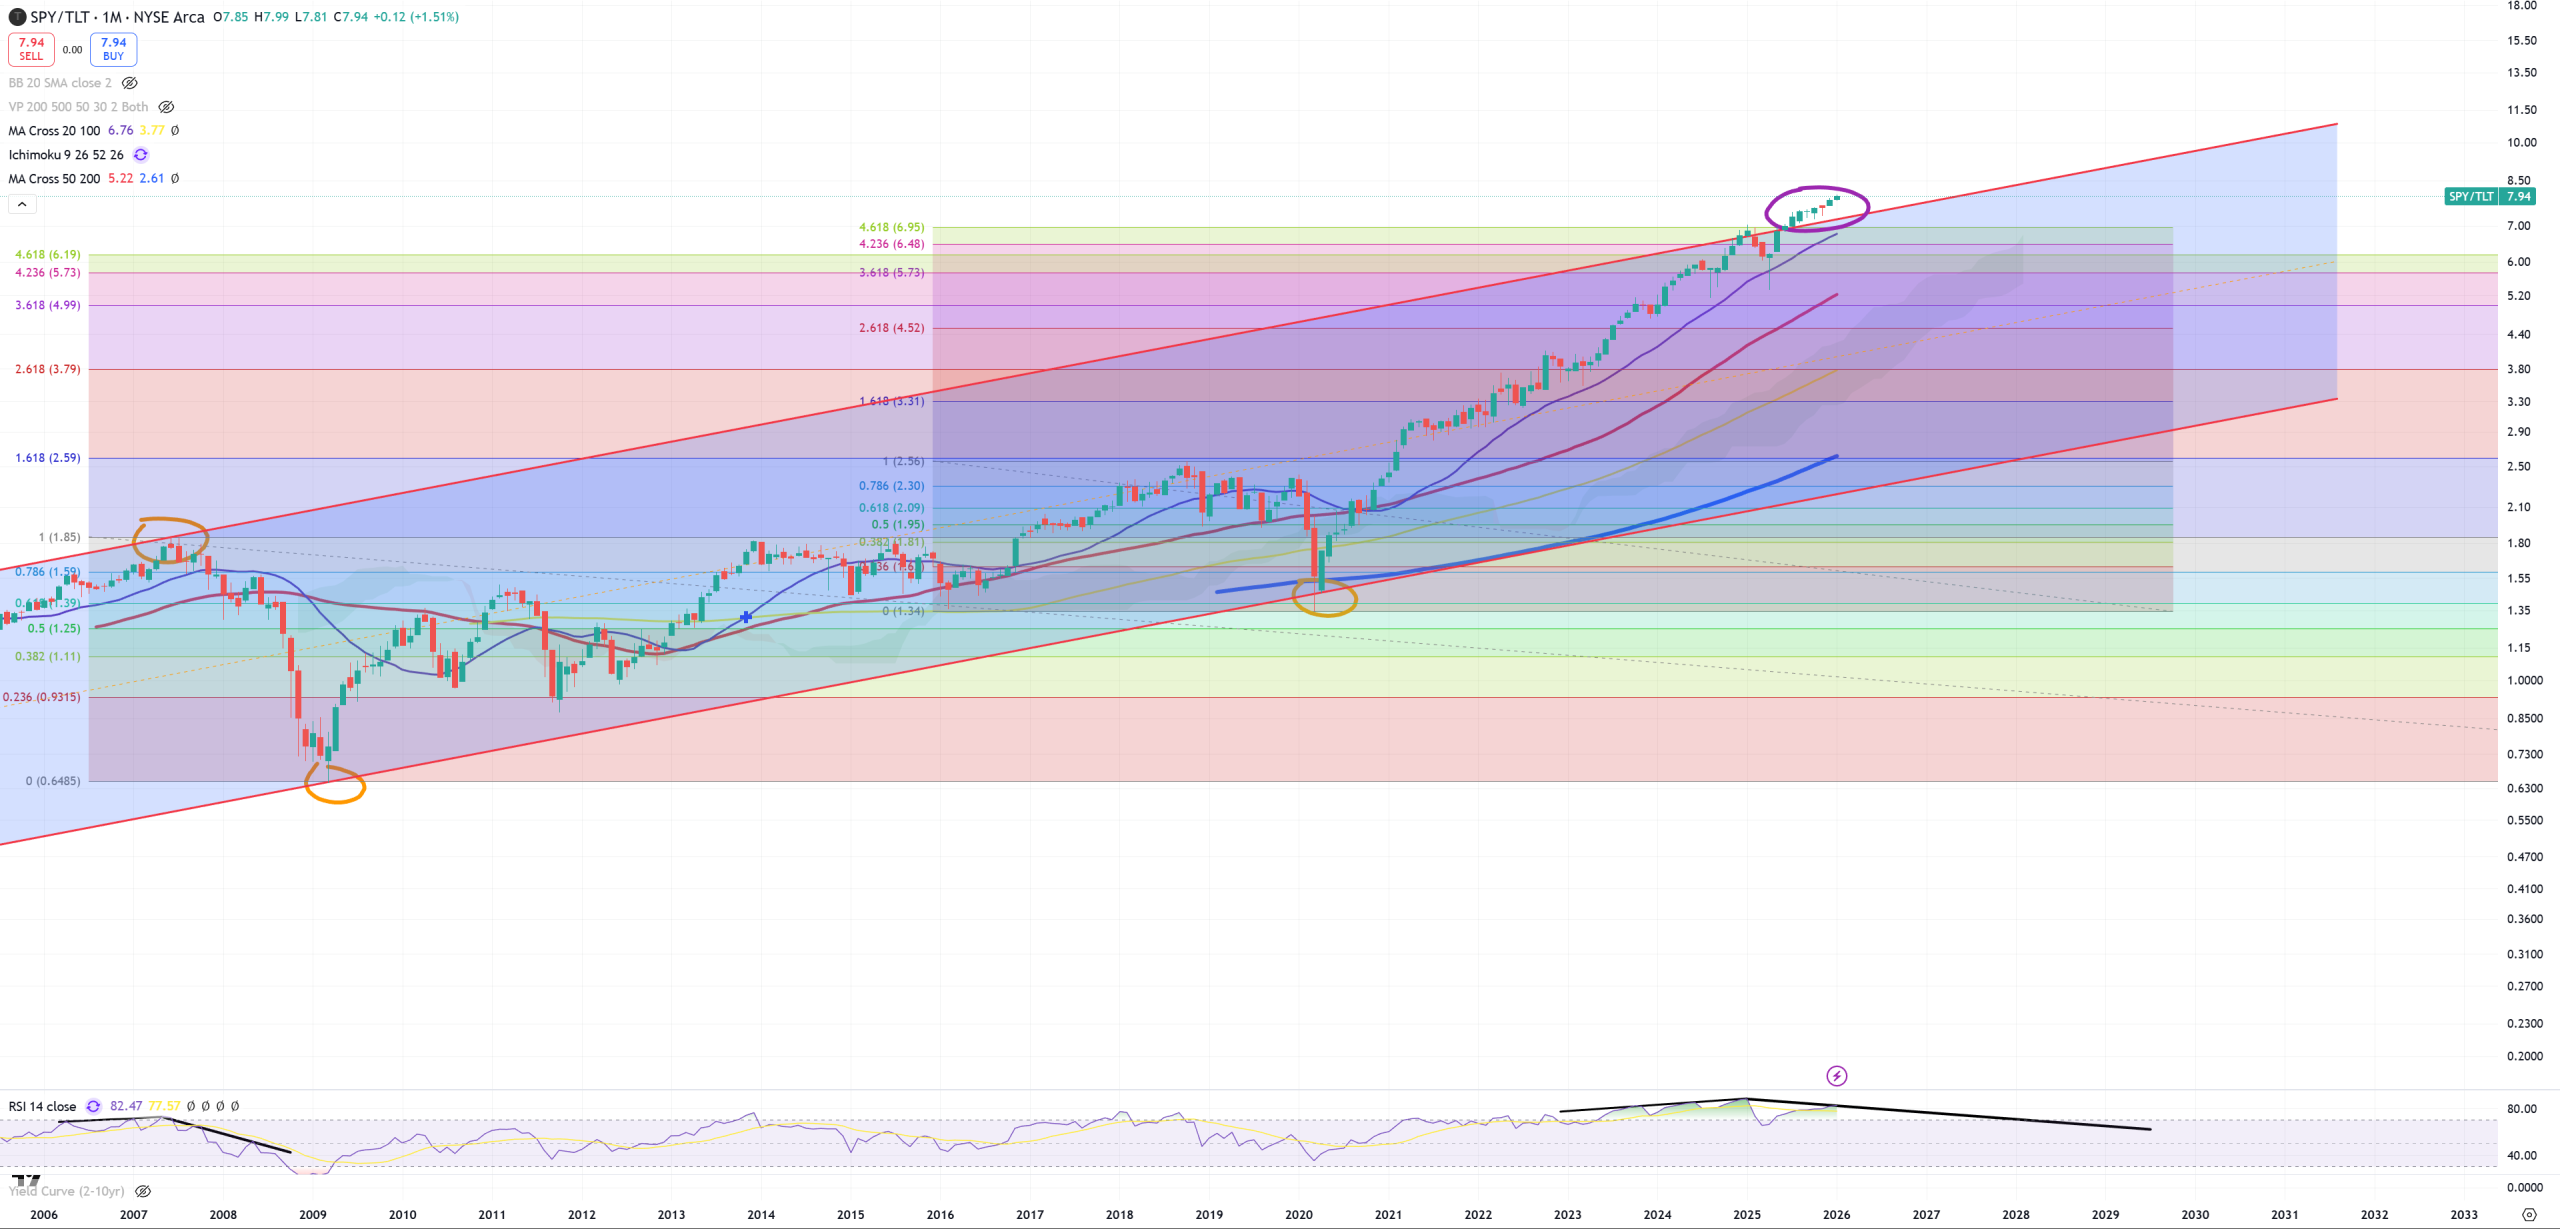
SPY/TLT – this channel has too short history to be considered as “proper”, but so far let it stay here. (M)RSI is huge here. There’s still no confirmation about reversal
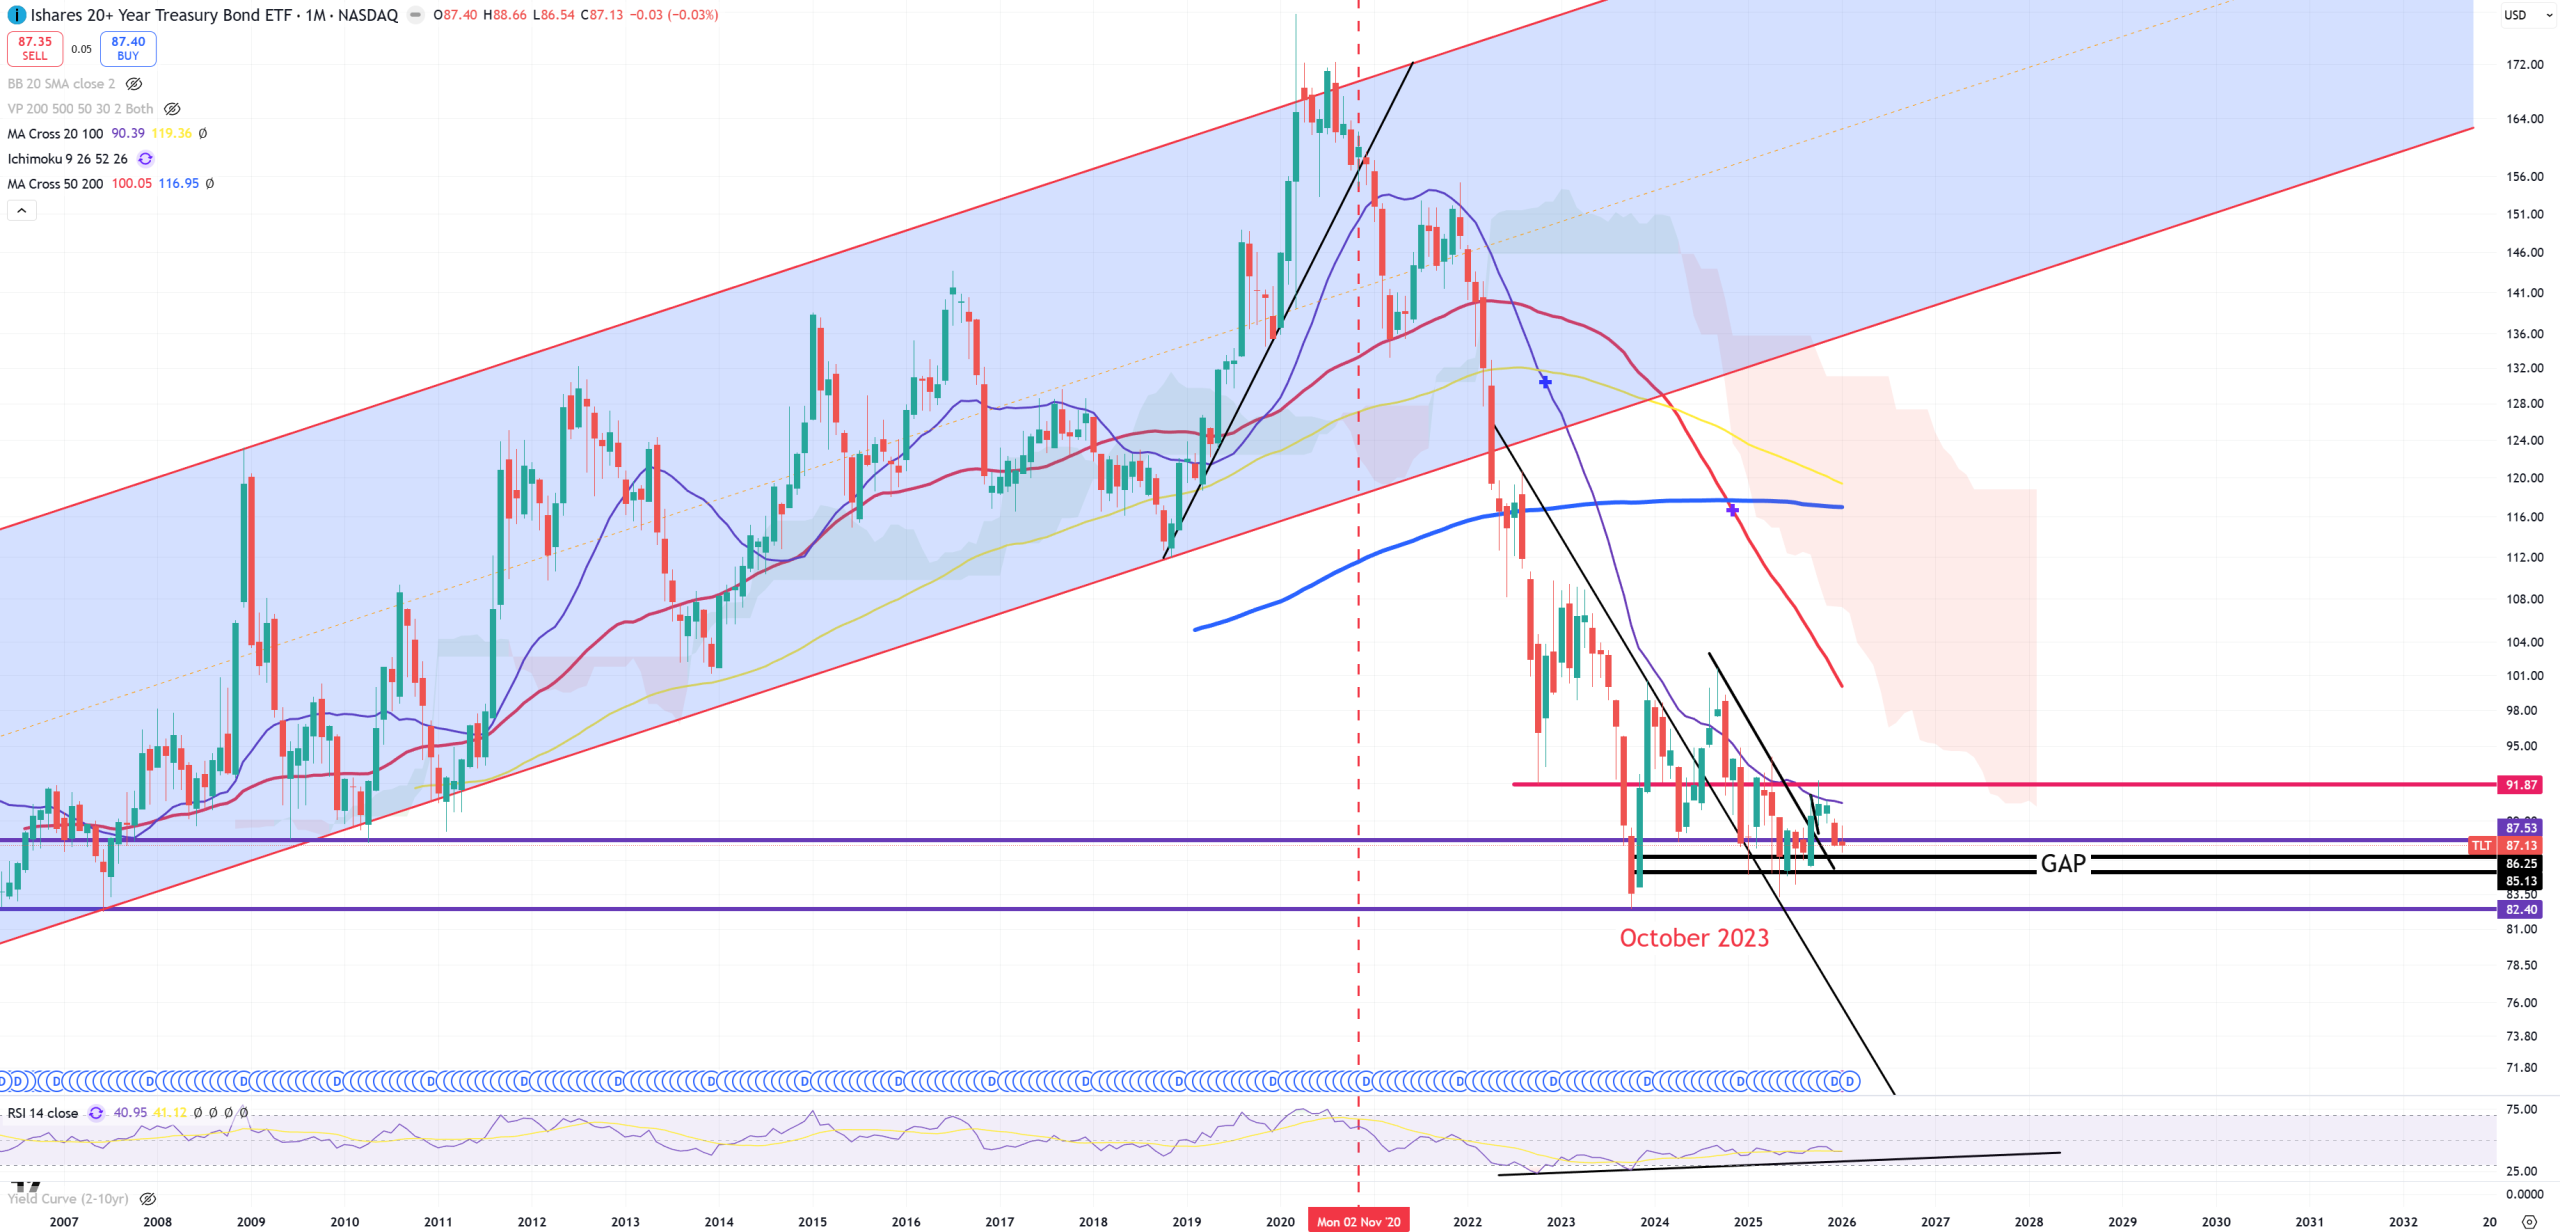
TLT – this 87.5 level should act as a support, but so far it failed. No signs of a reversal (no need to hold TLT until we see a reversal)
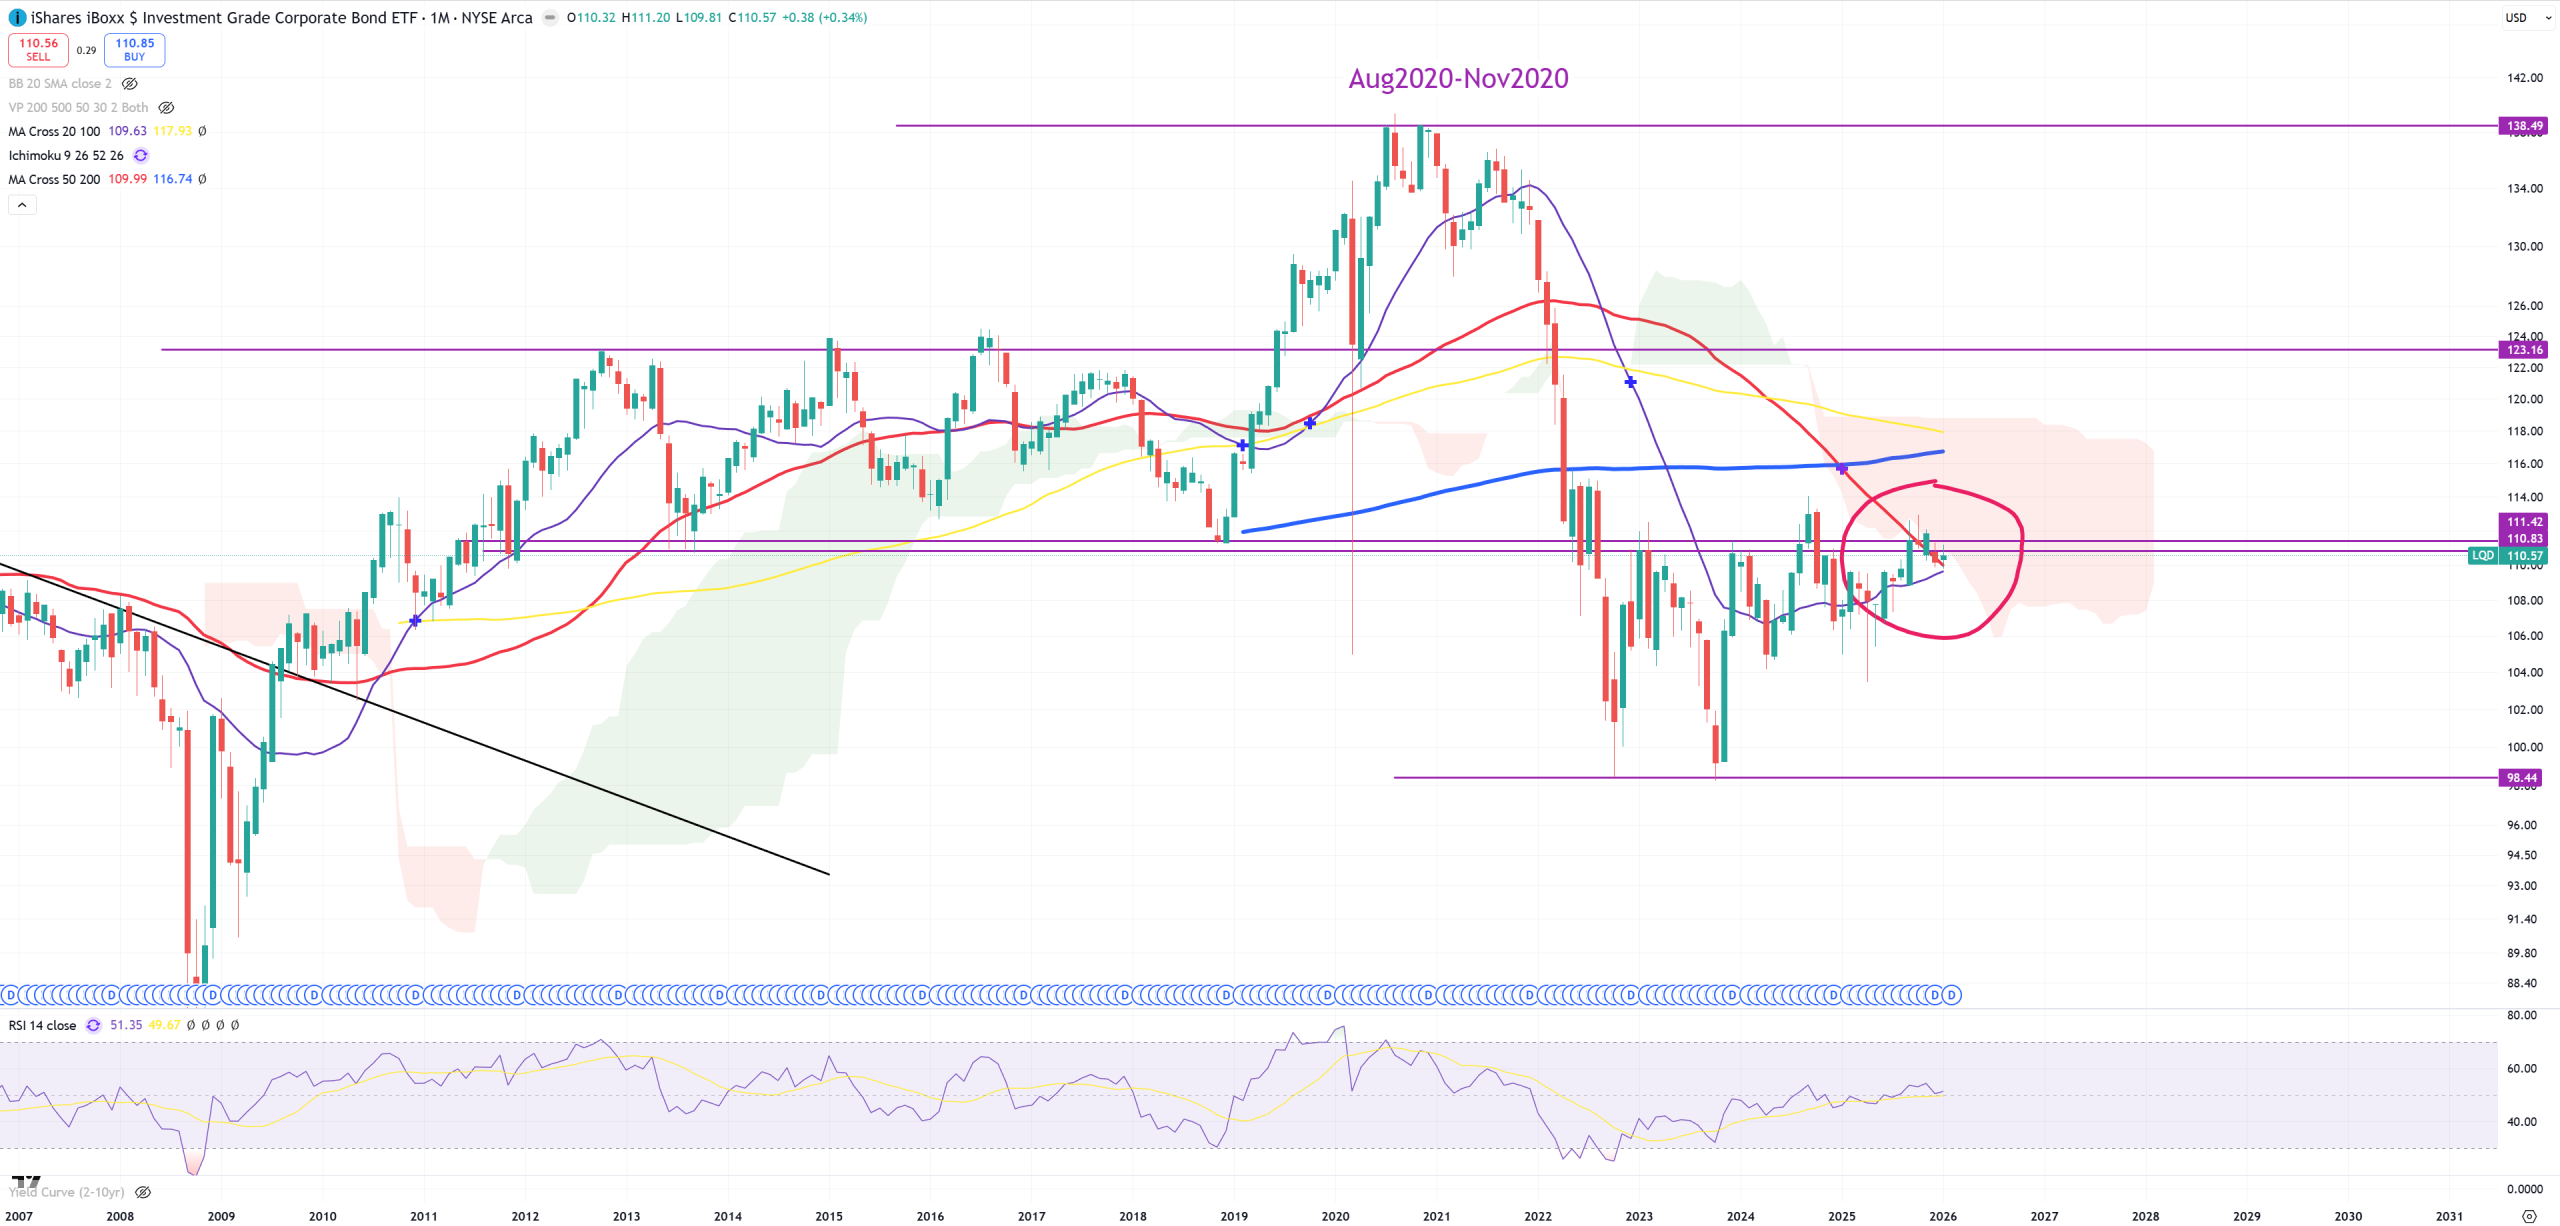
LQD – retesting, if that’s a bear market (M)RSI = 60 is max
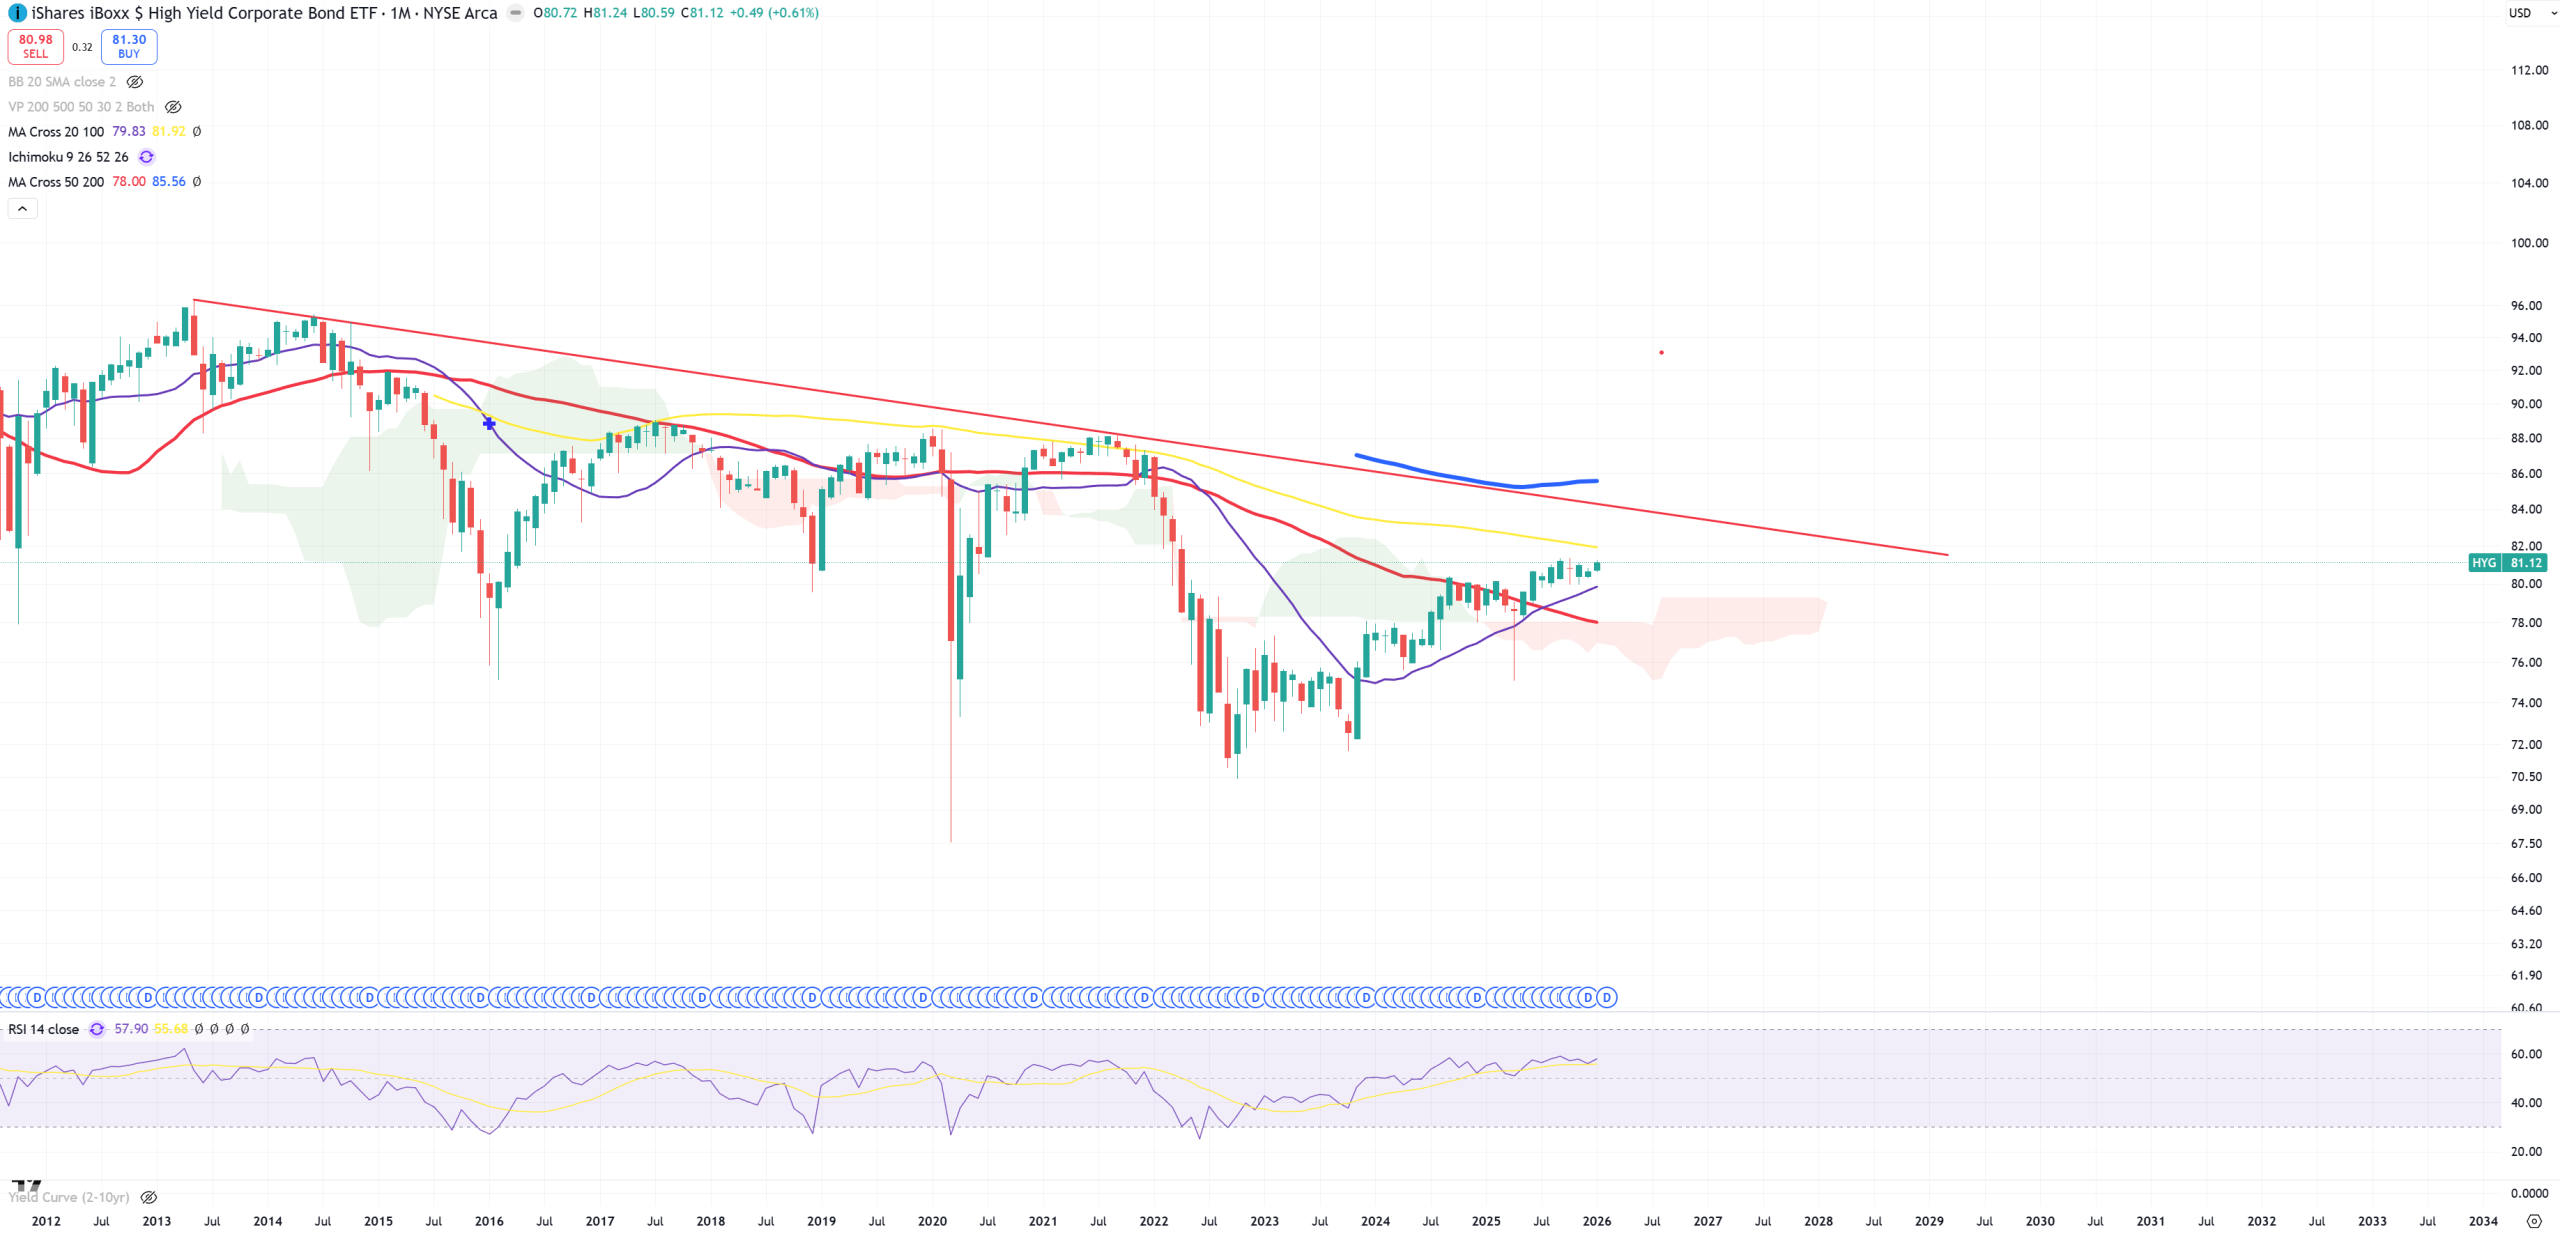
HYG – so far not so bad, yellow (M)MA100 ahead, level of possible bull trap.
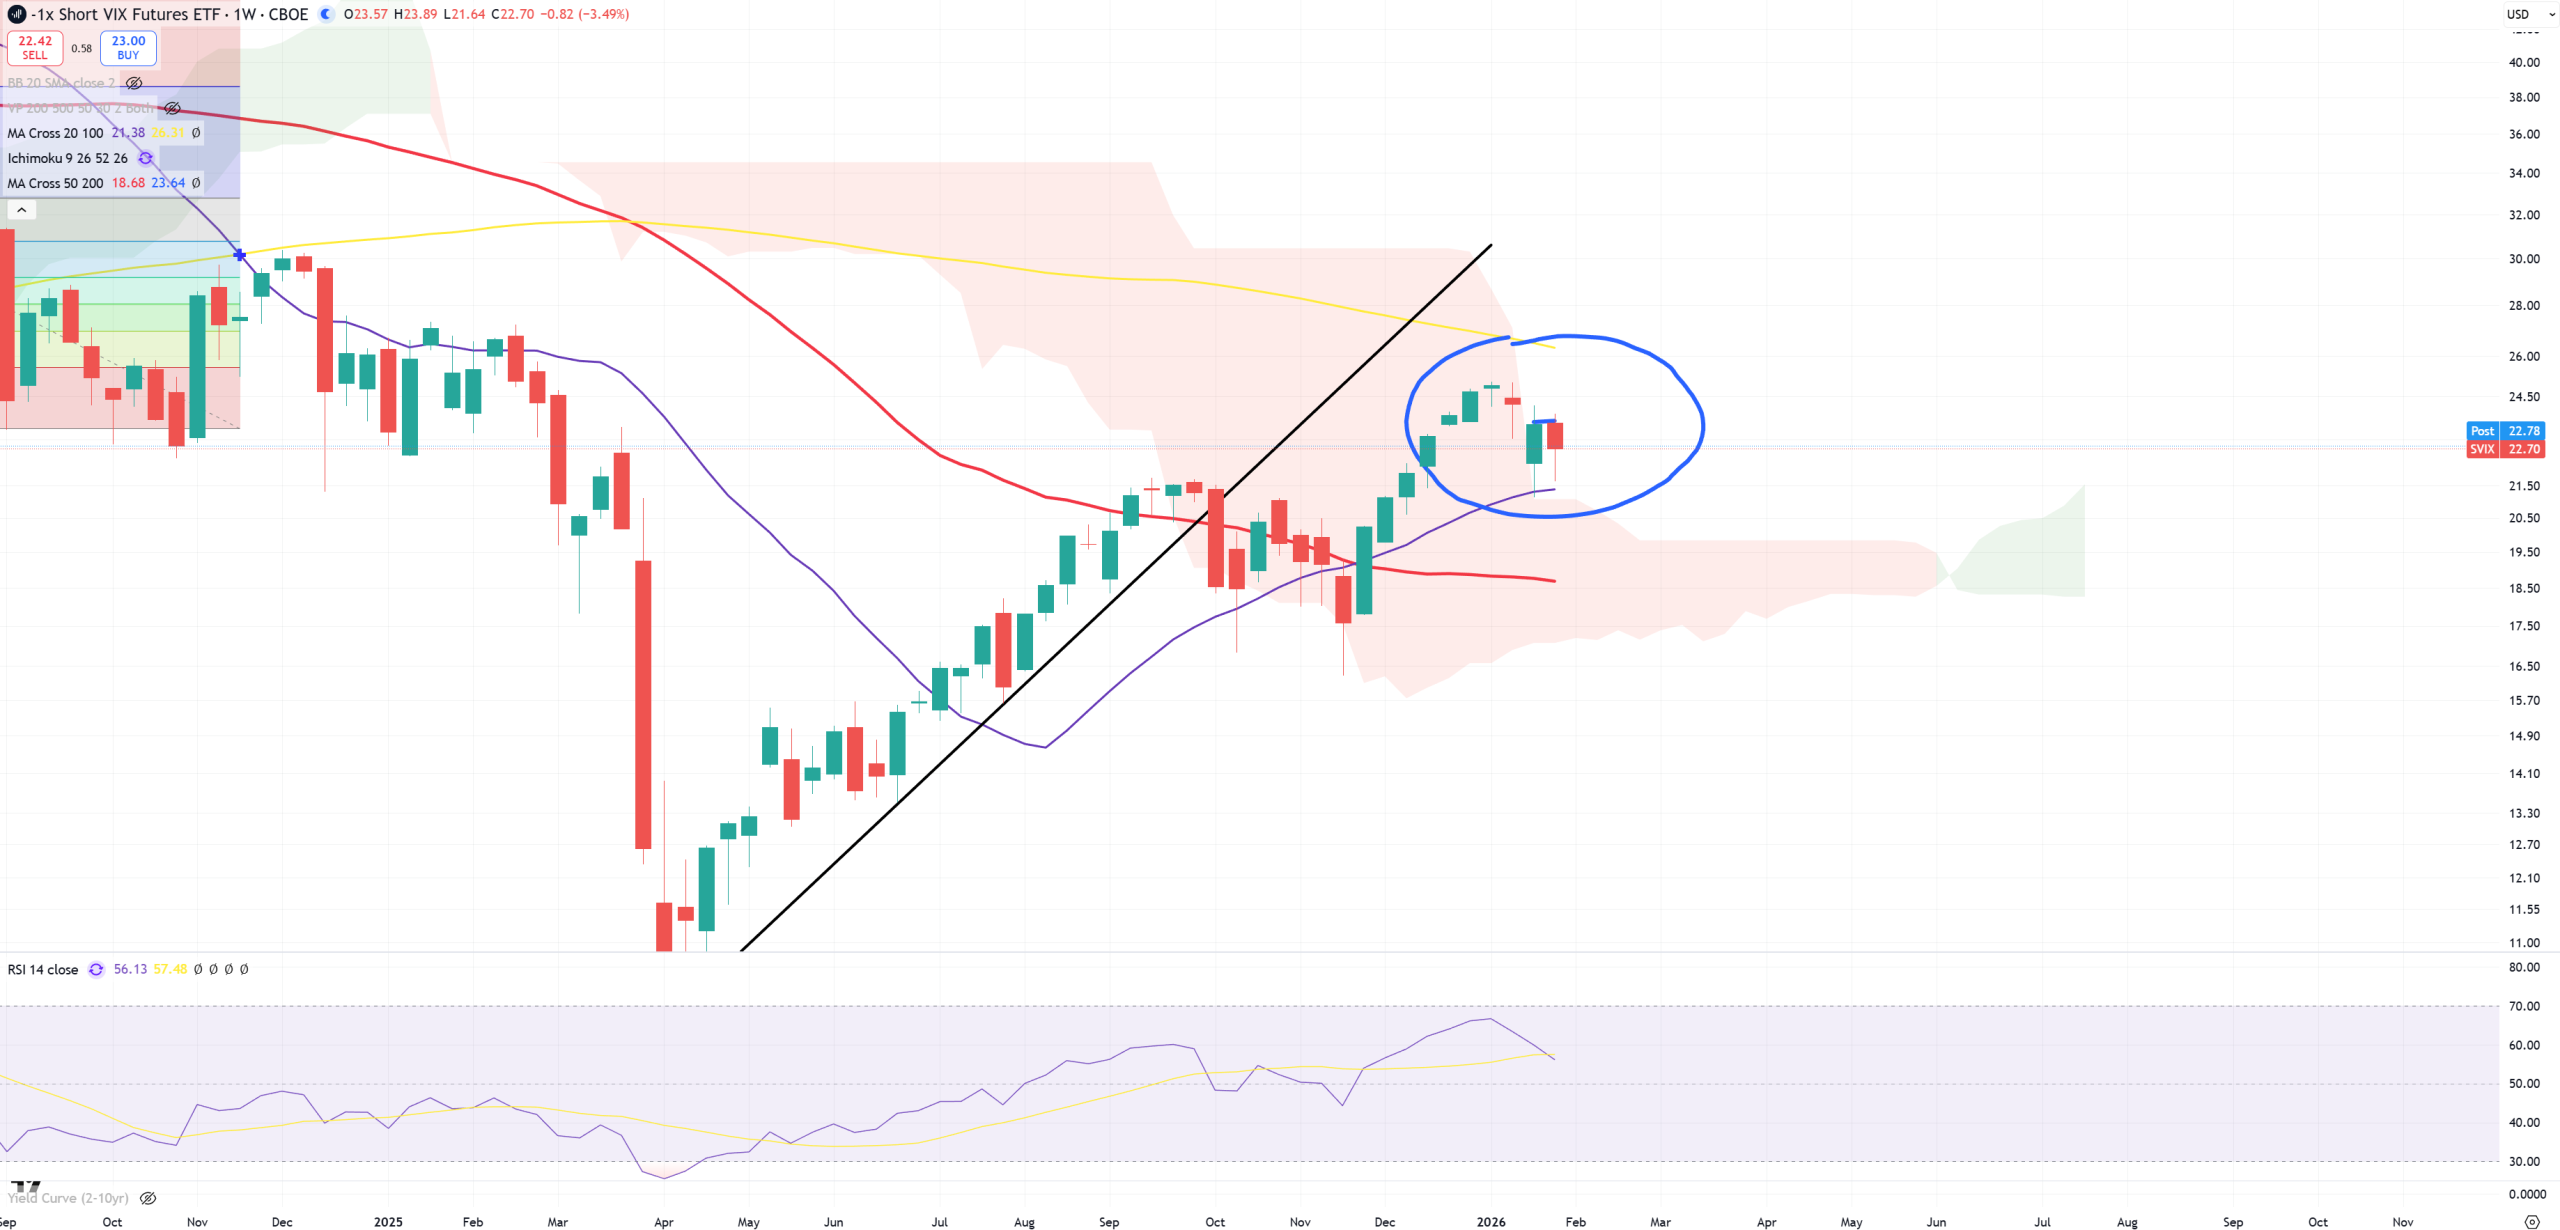
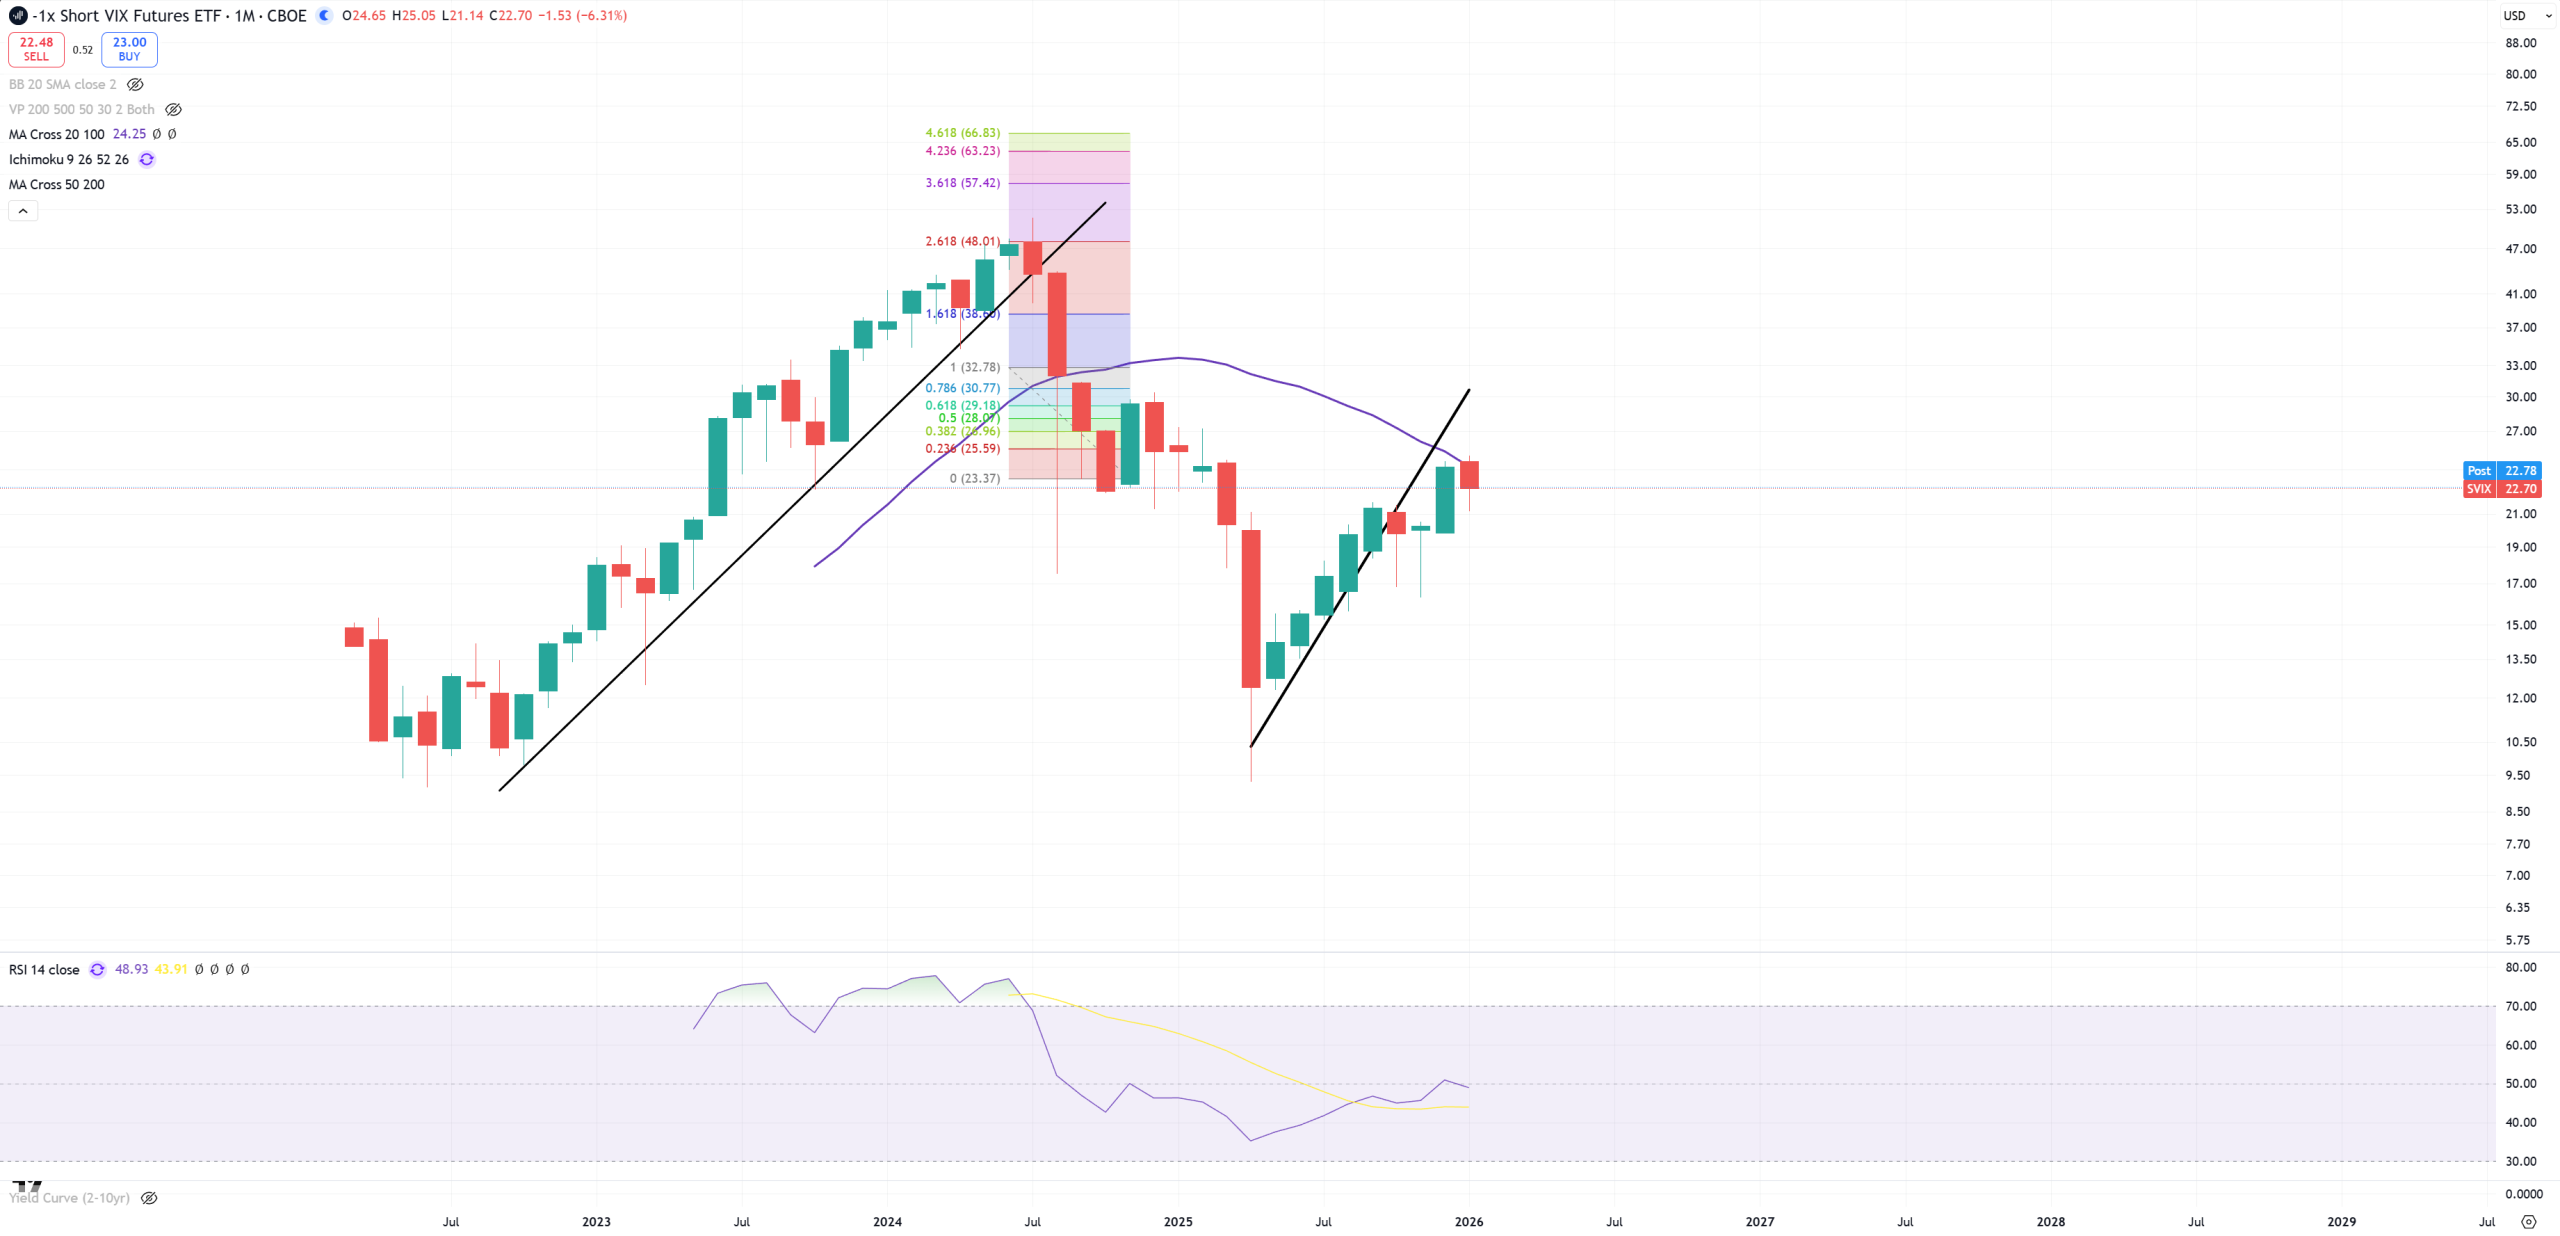
SVIX – finally we have (W)MA200 here. I know we’re talking about monthly candles, but (M)MA50 doesn’t exist on SVIX yet, but (M)MA20 of course. First chart is (W) and visible blue small (W)MA200, second is (M) and (M)MA20.
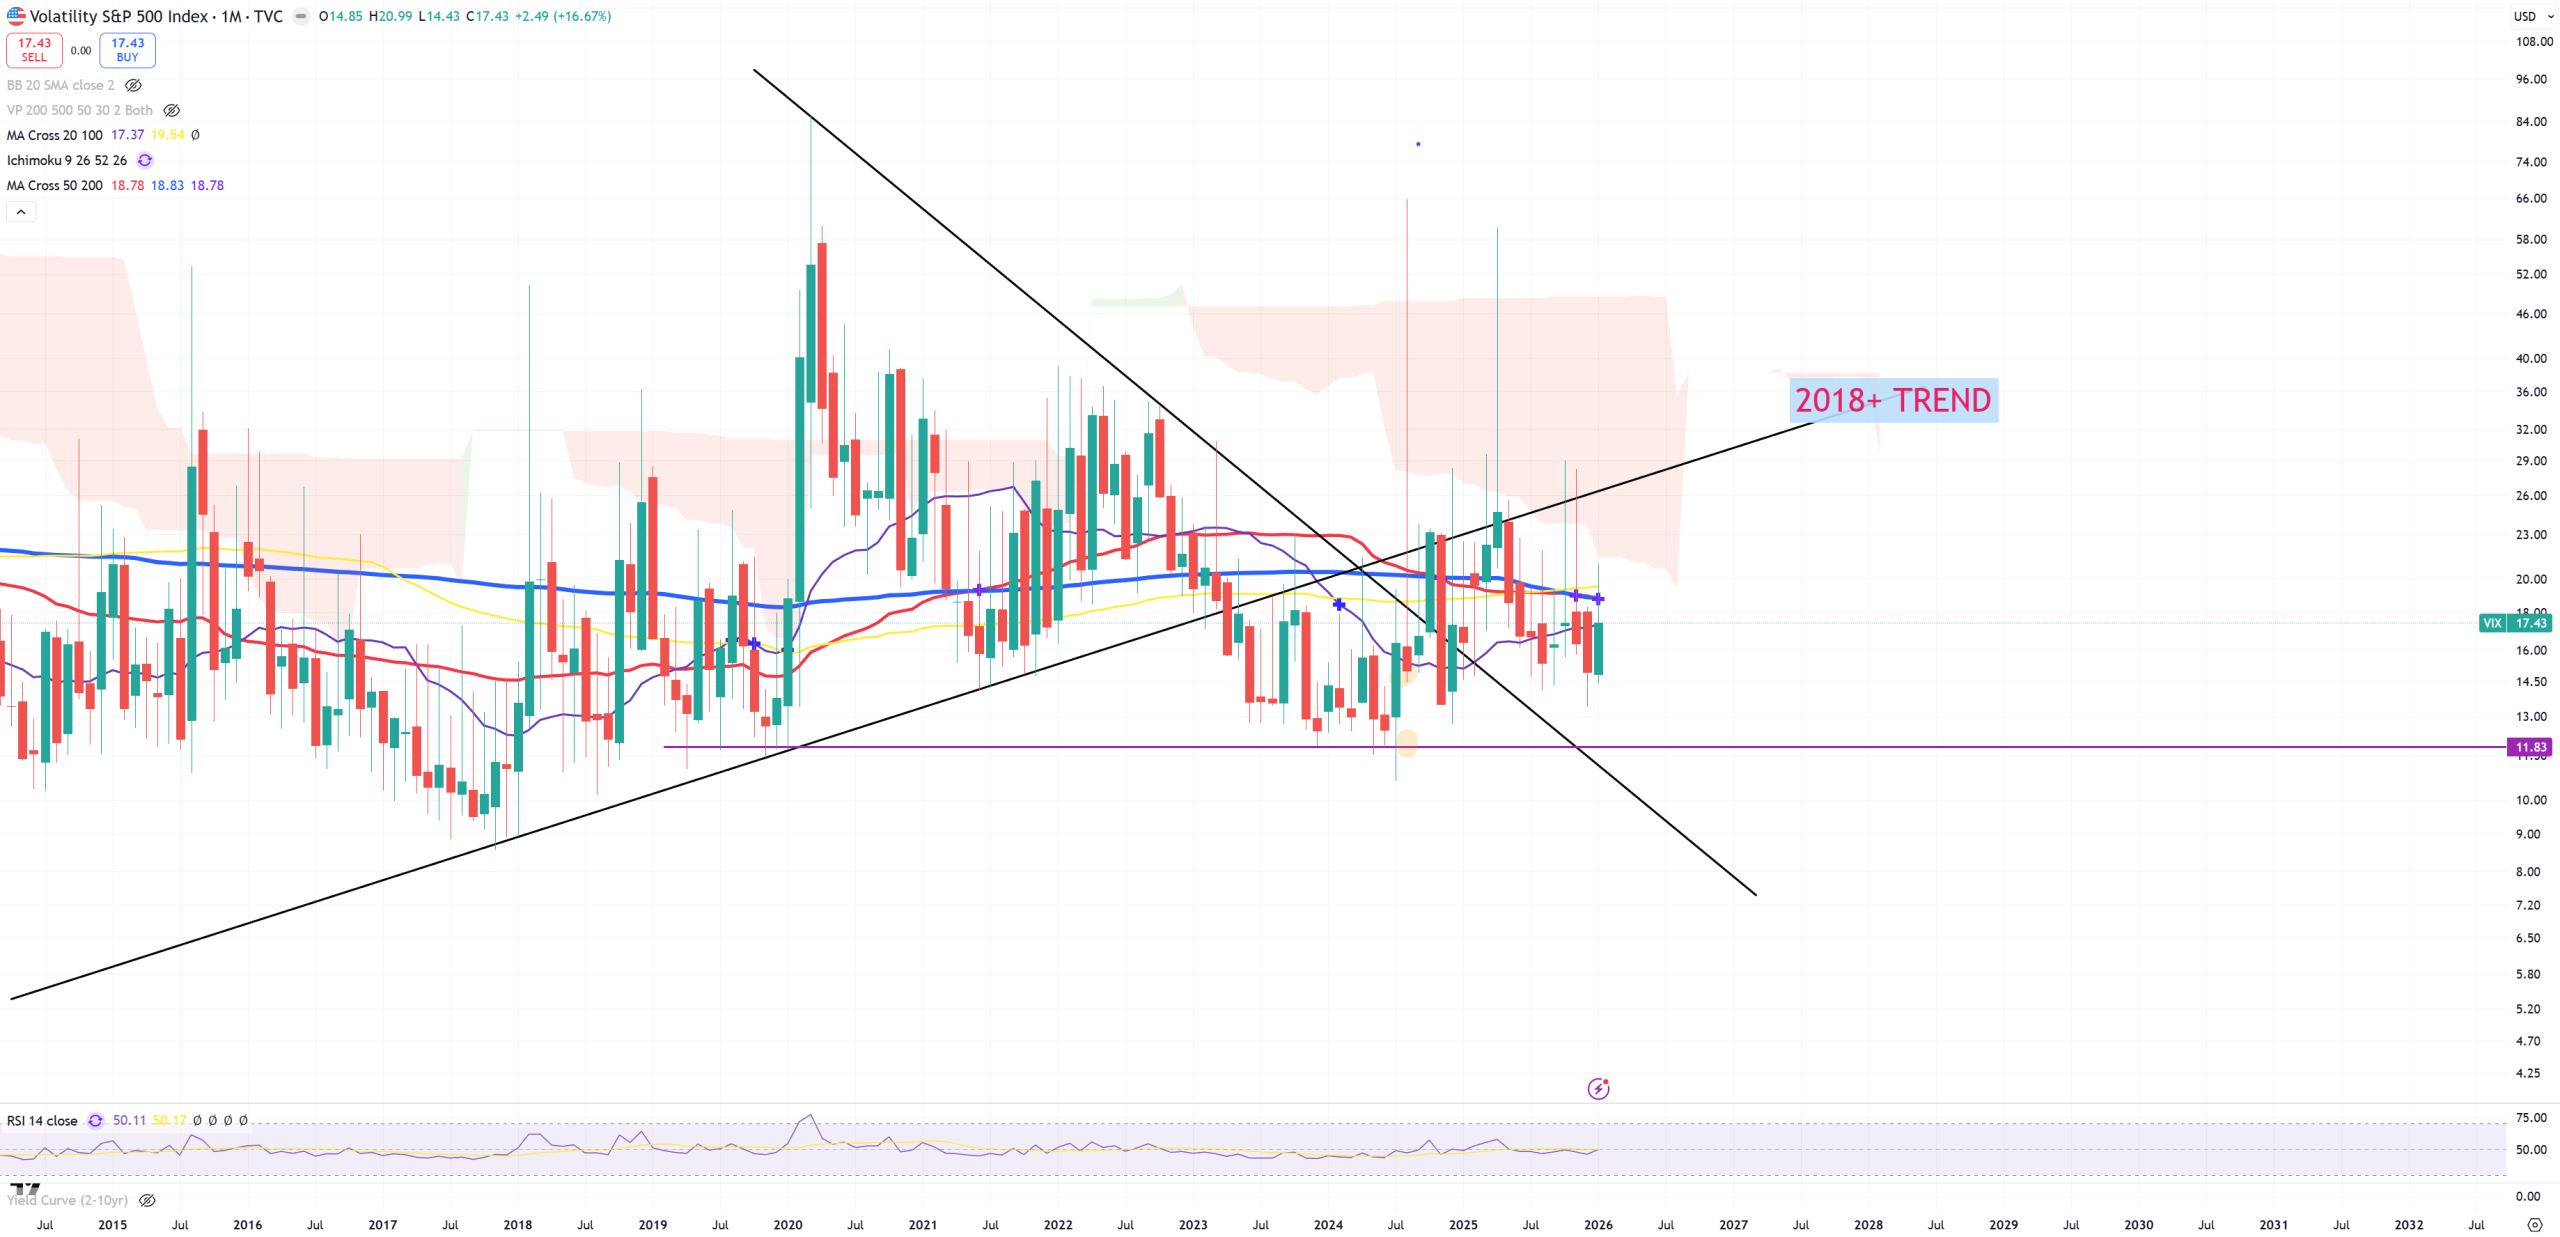
VIX – it says nothing. Strong resistance on multiple (M)MAs. 2018 trend is important due to DJI/GOLD 2018 peak, telling me this consolidation below the trend is like keeping the ball underwater and its legacy trend is way higher.
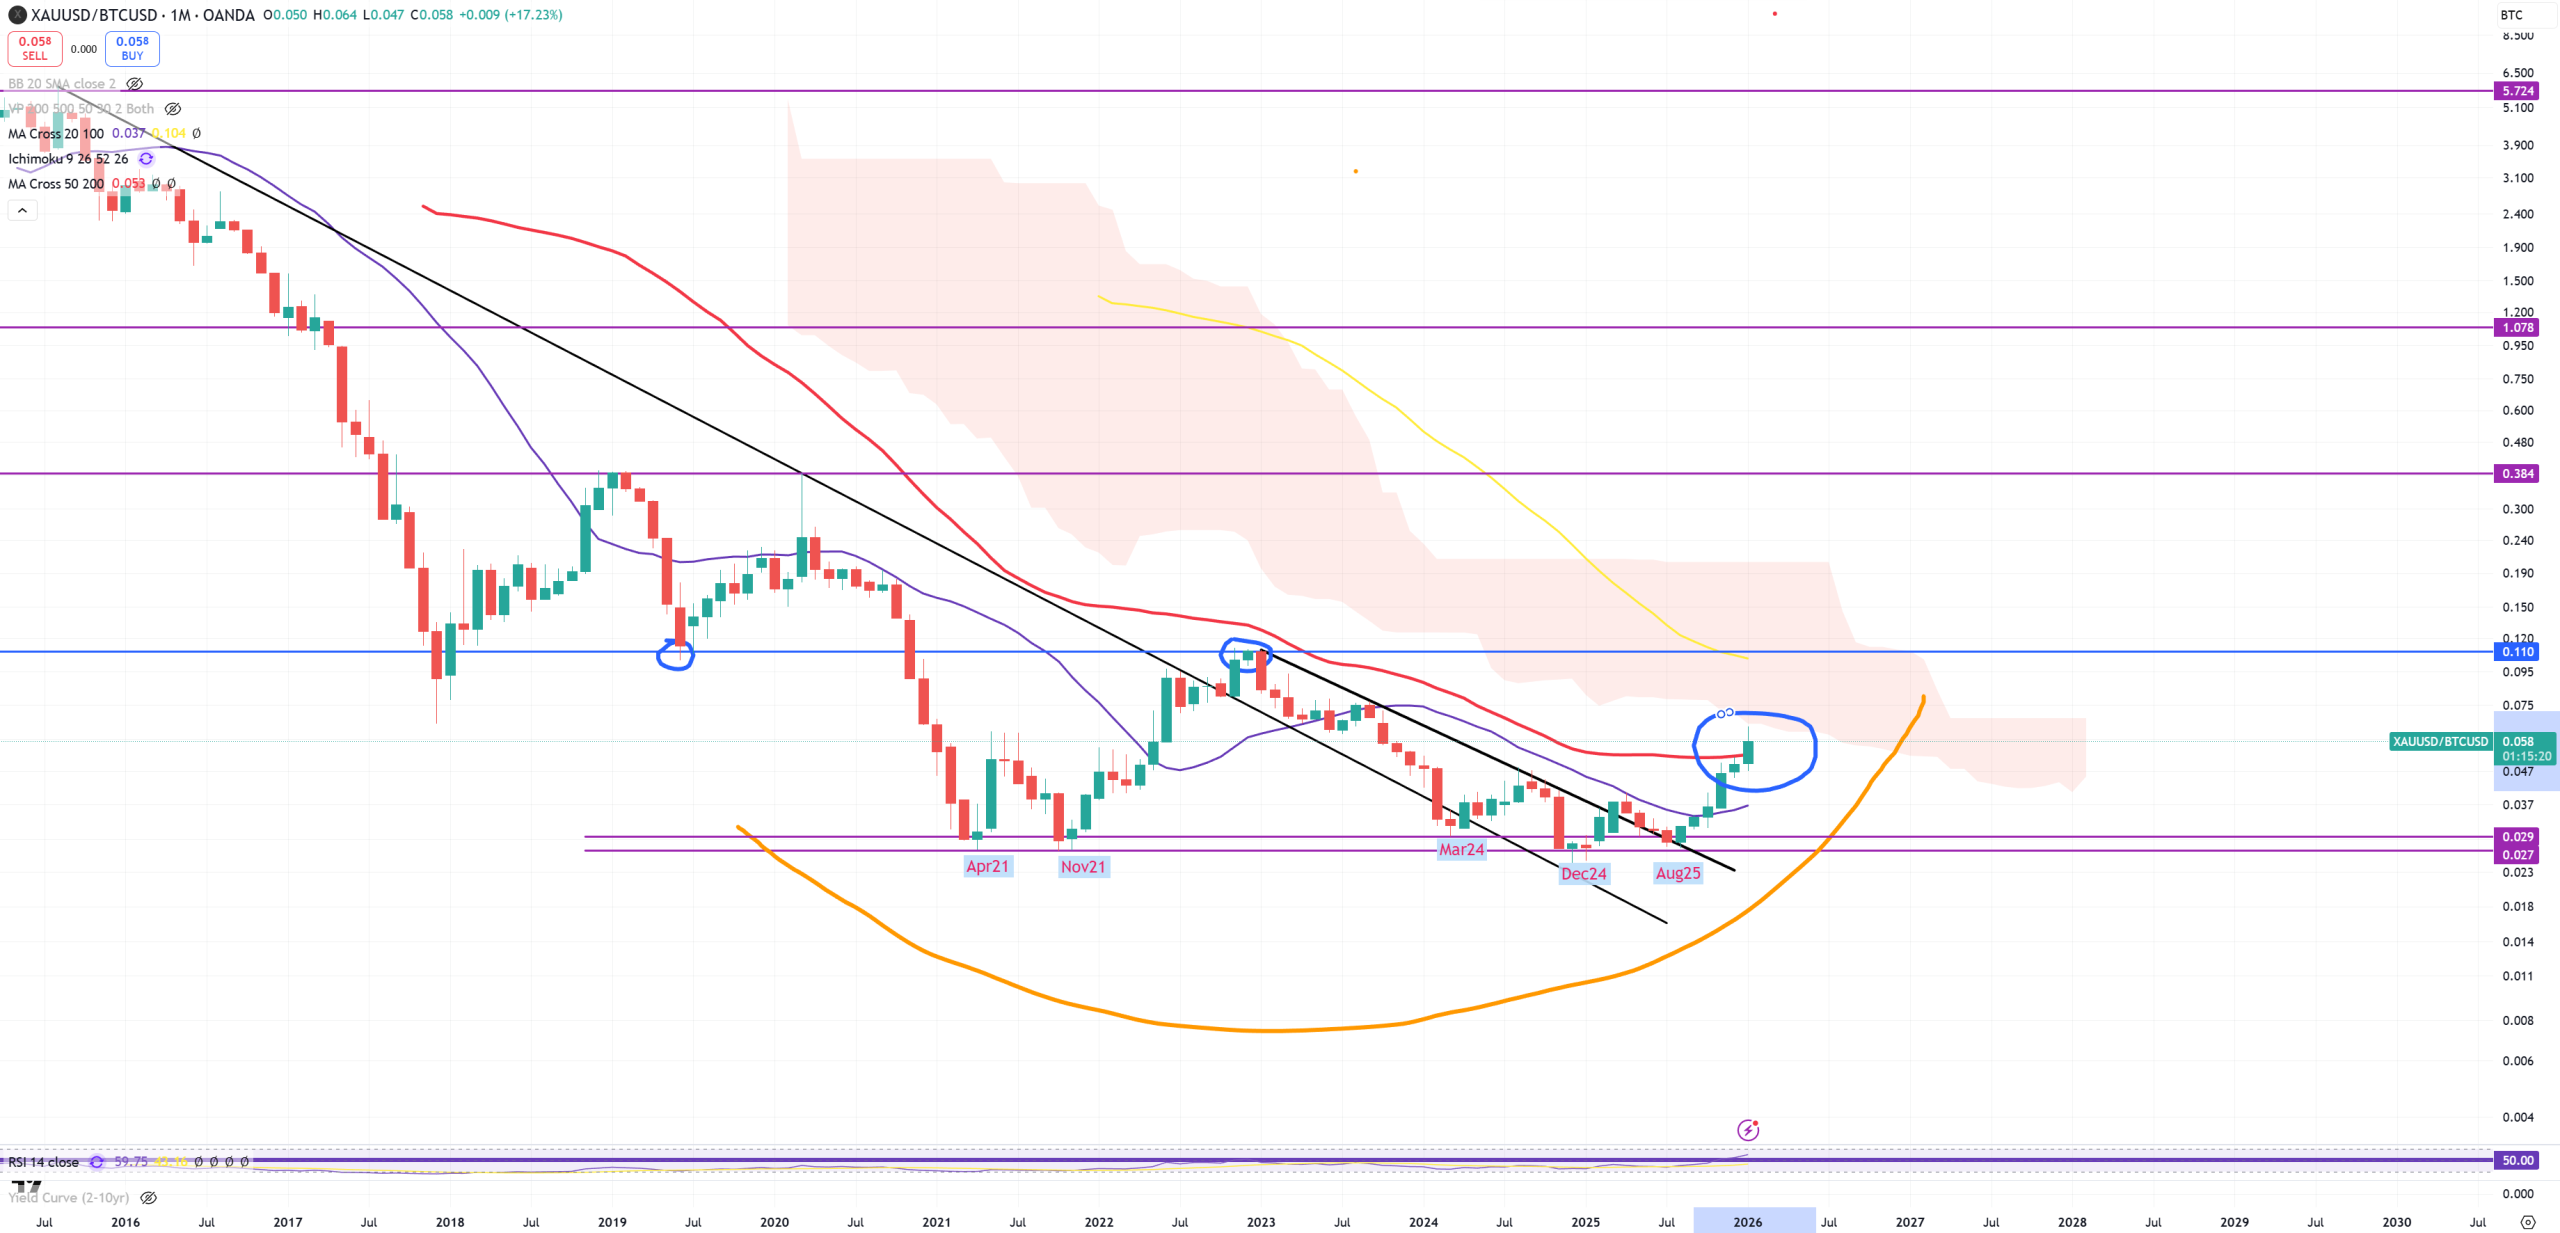
GOLD/BTC – finally (M)MA50 has gone for the first time ever. Expect outperformance of GOLD vs BTC, I call this moment : The first real technical bear market for BTC ever. Next level is about 0.11
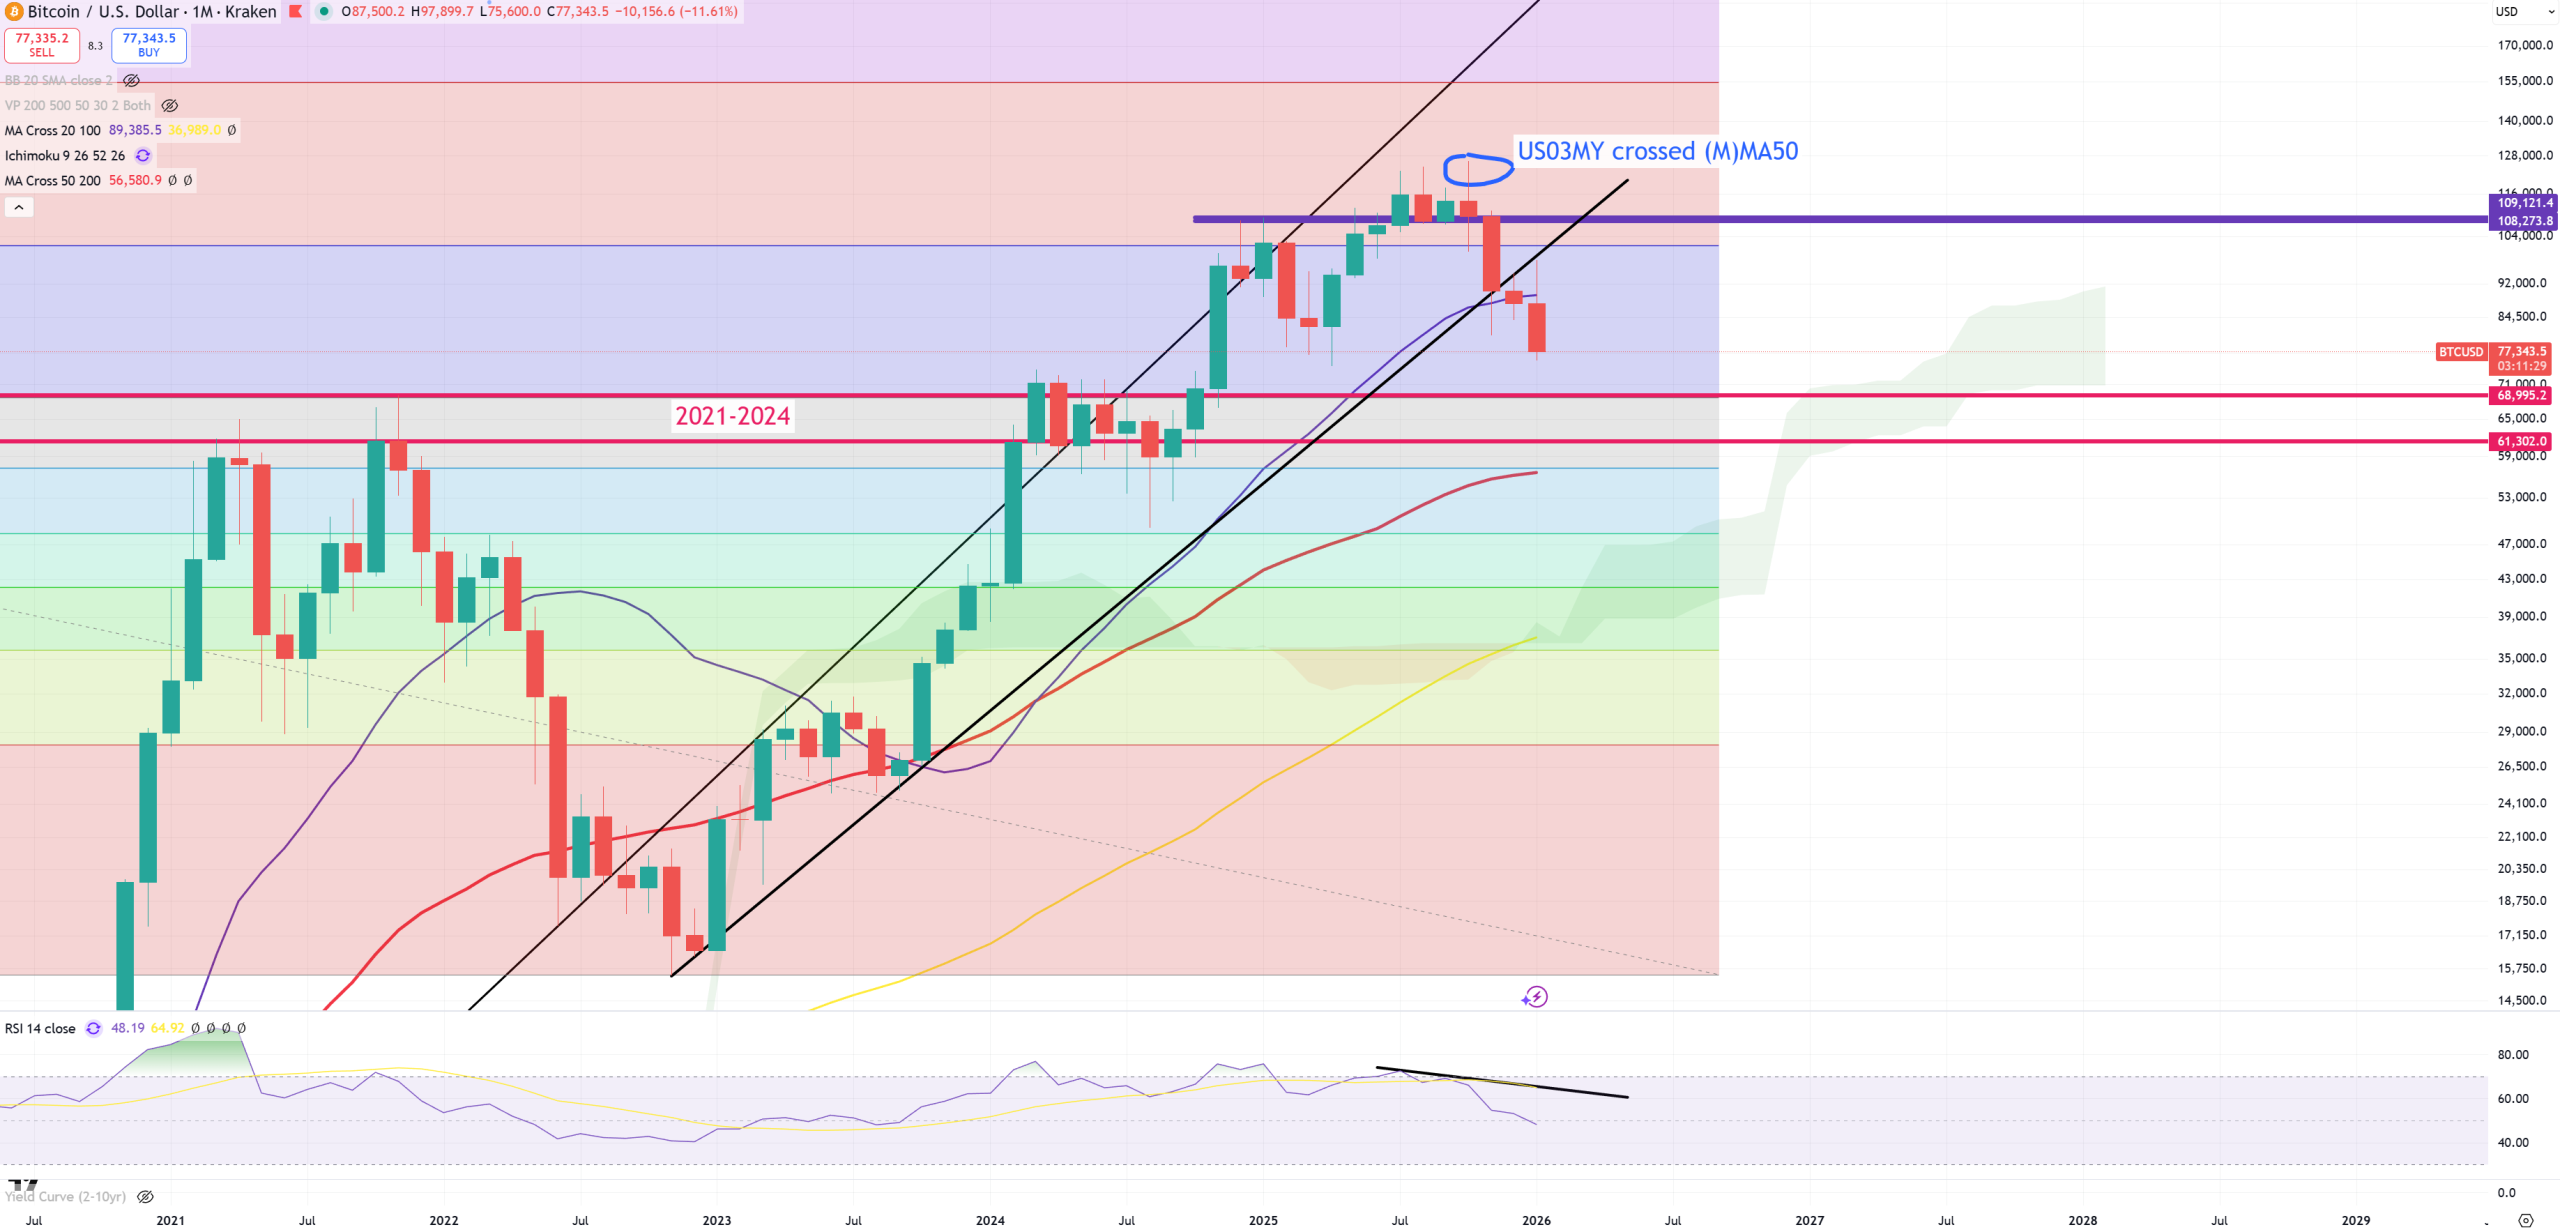
BTC – as GOLD/BTC breaking higher taking down (M)MA50 problems kicks in for BTC. You see a moment when US03MY crossed down (M)MA50. Now below (M)MA20. 2021 is a key level for everything matched with (M)MA50 almost exactly on the same position = ~60k$. I even posted on my blog – why BTC enters first true technical bear market some time ago.
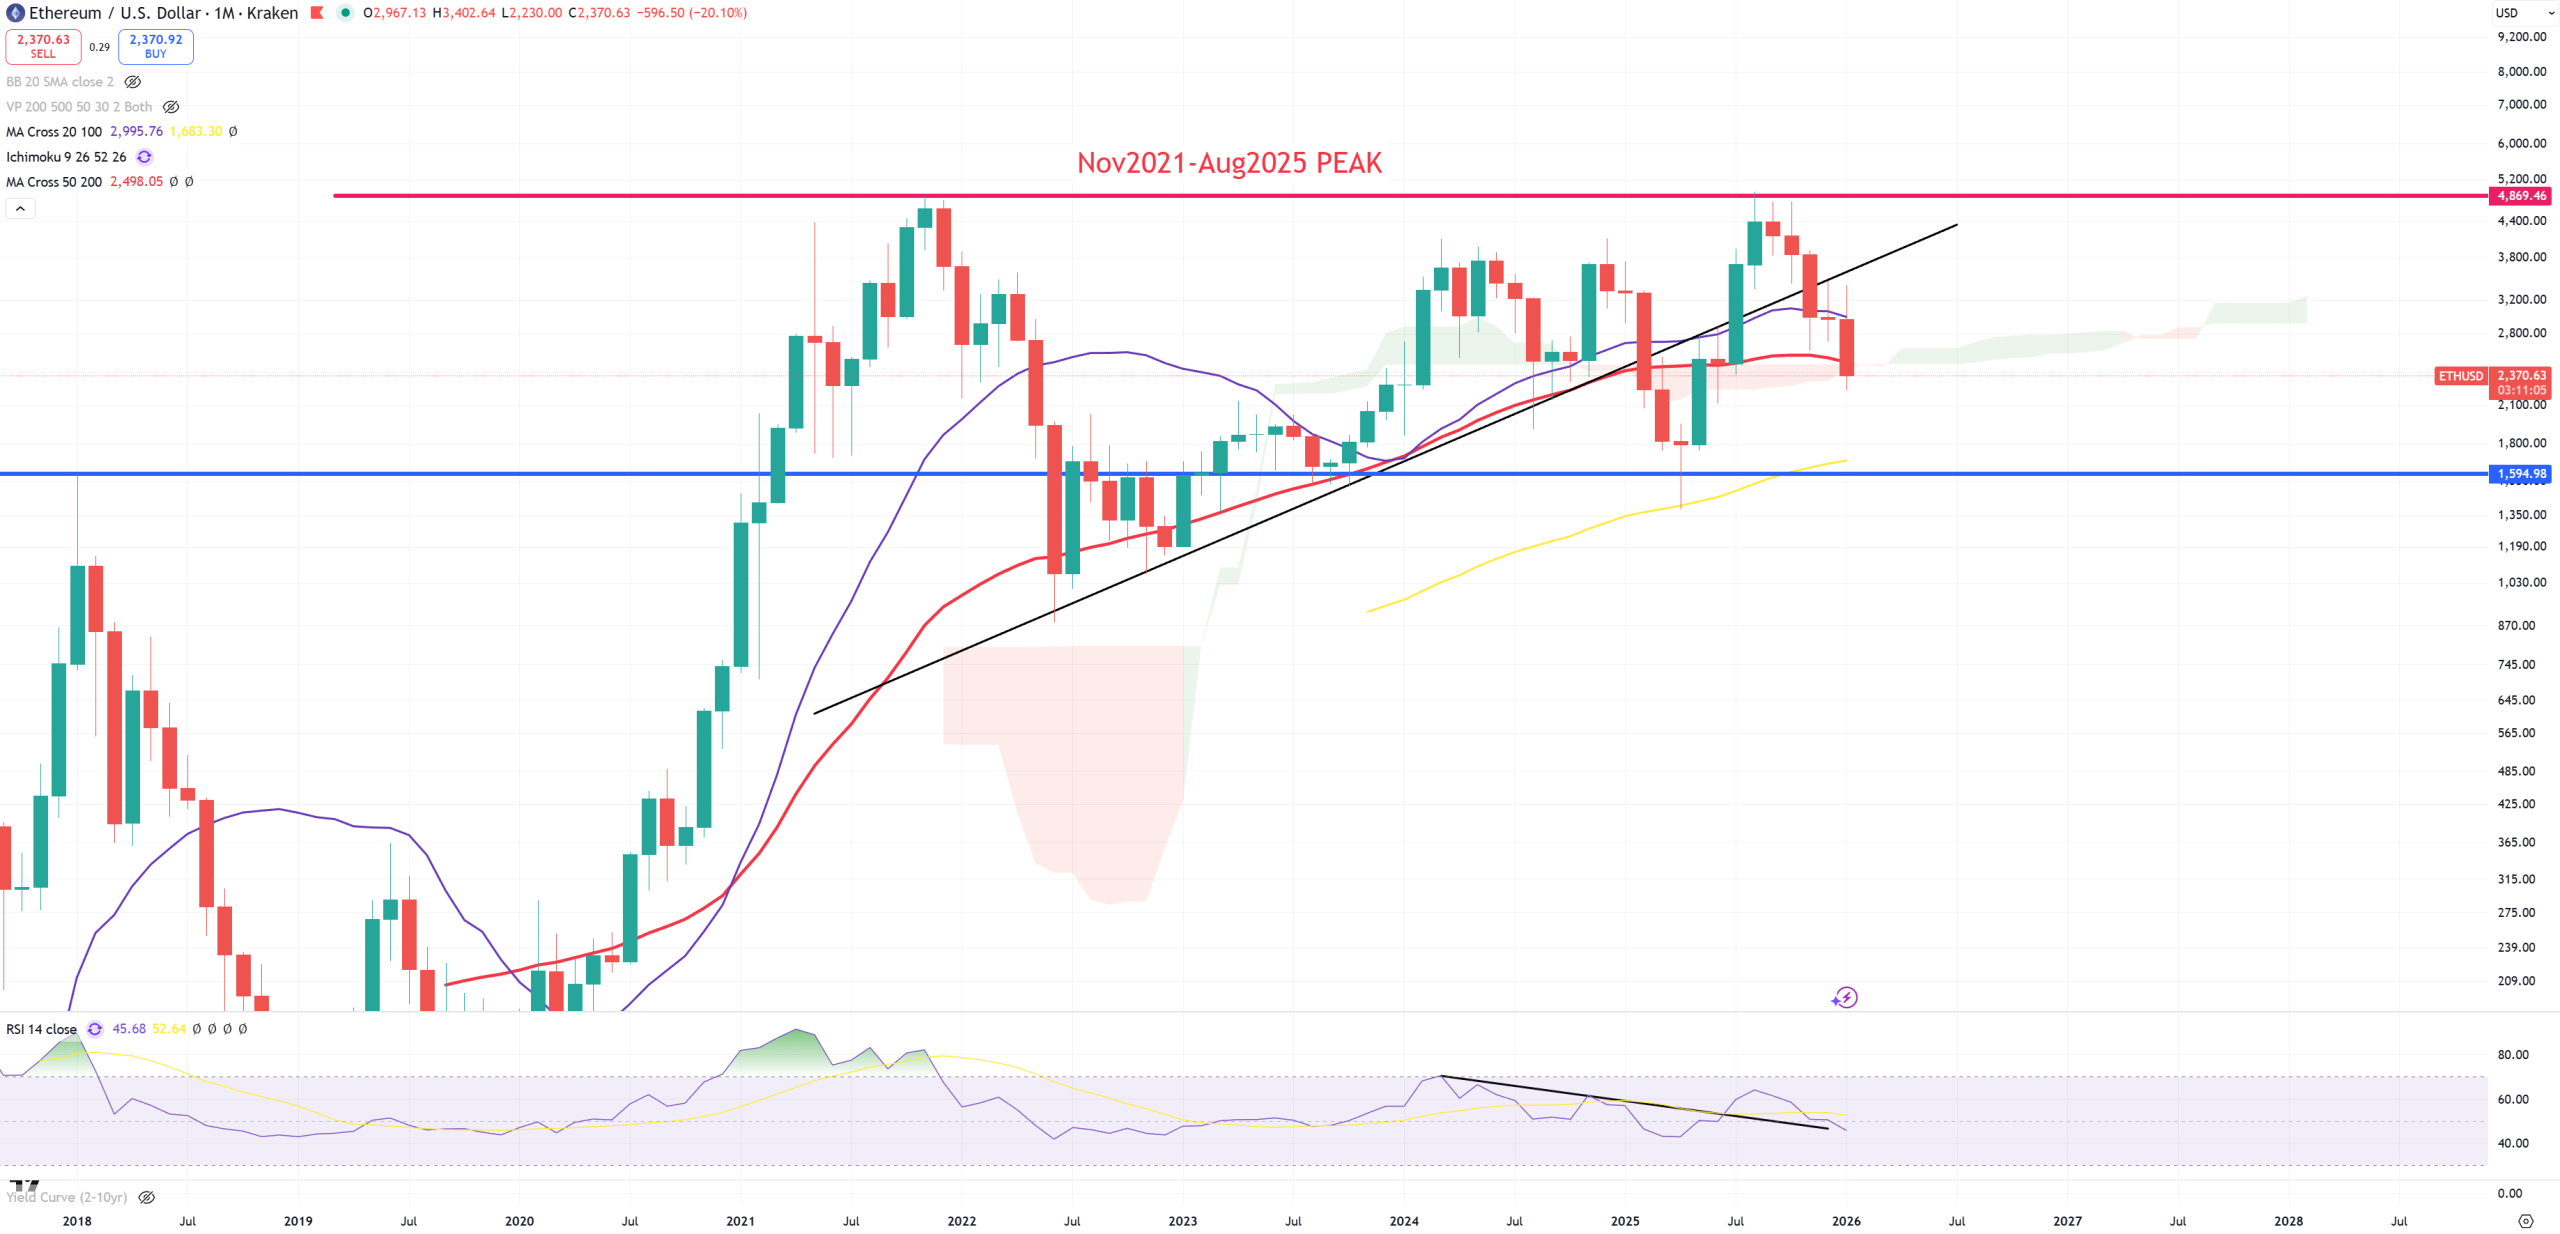
ETH – it was trying to break (M)MA50, but (M)MA100 saved it making the break bear trap. Now double-top and again flying around (M)MA50, while short term trend is broken, now (M)MA50 is getting broken.
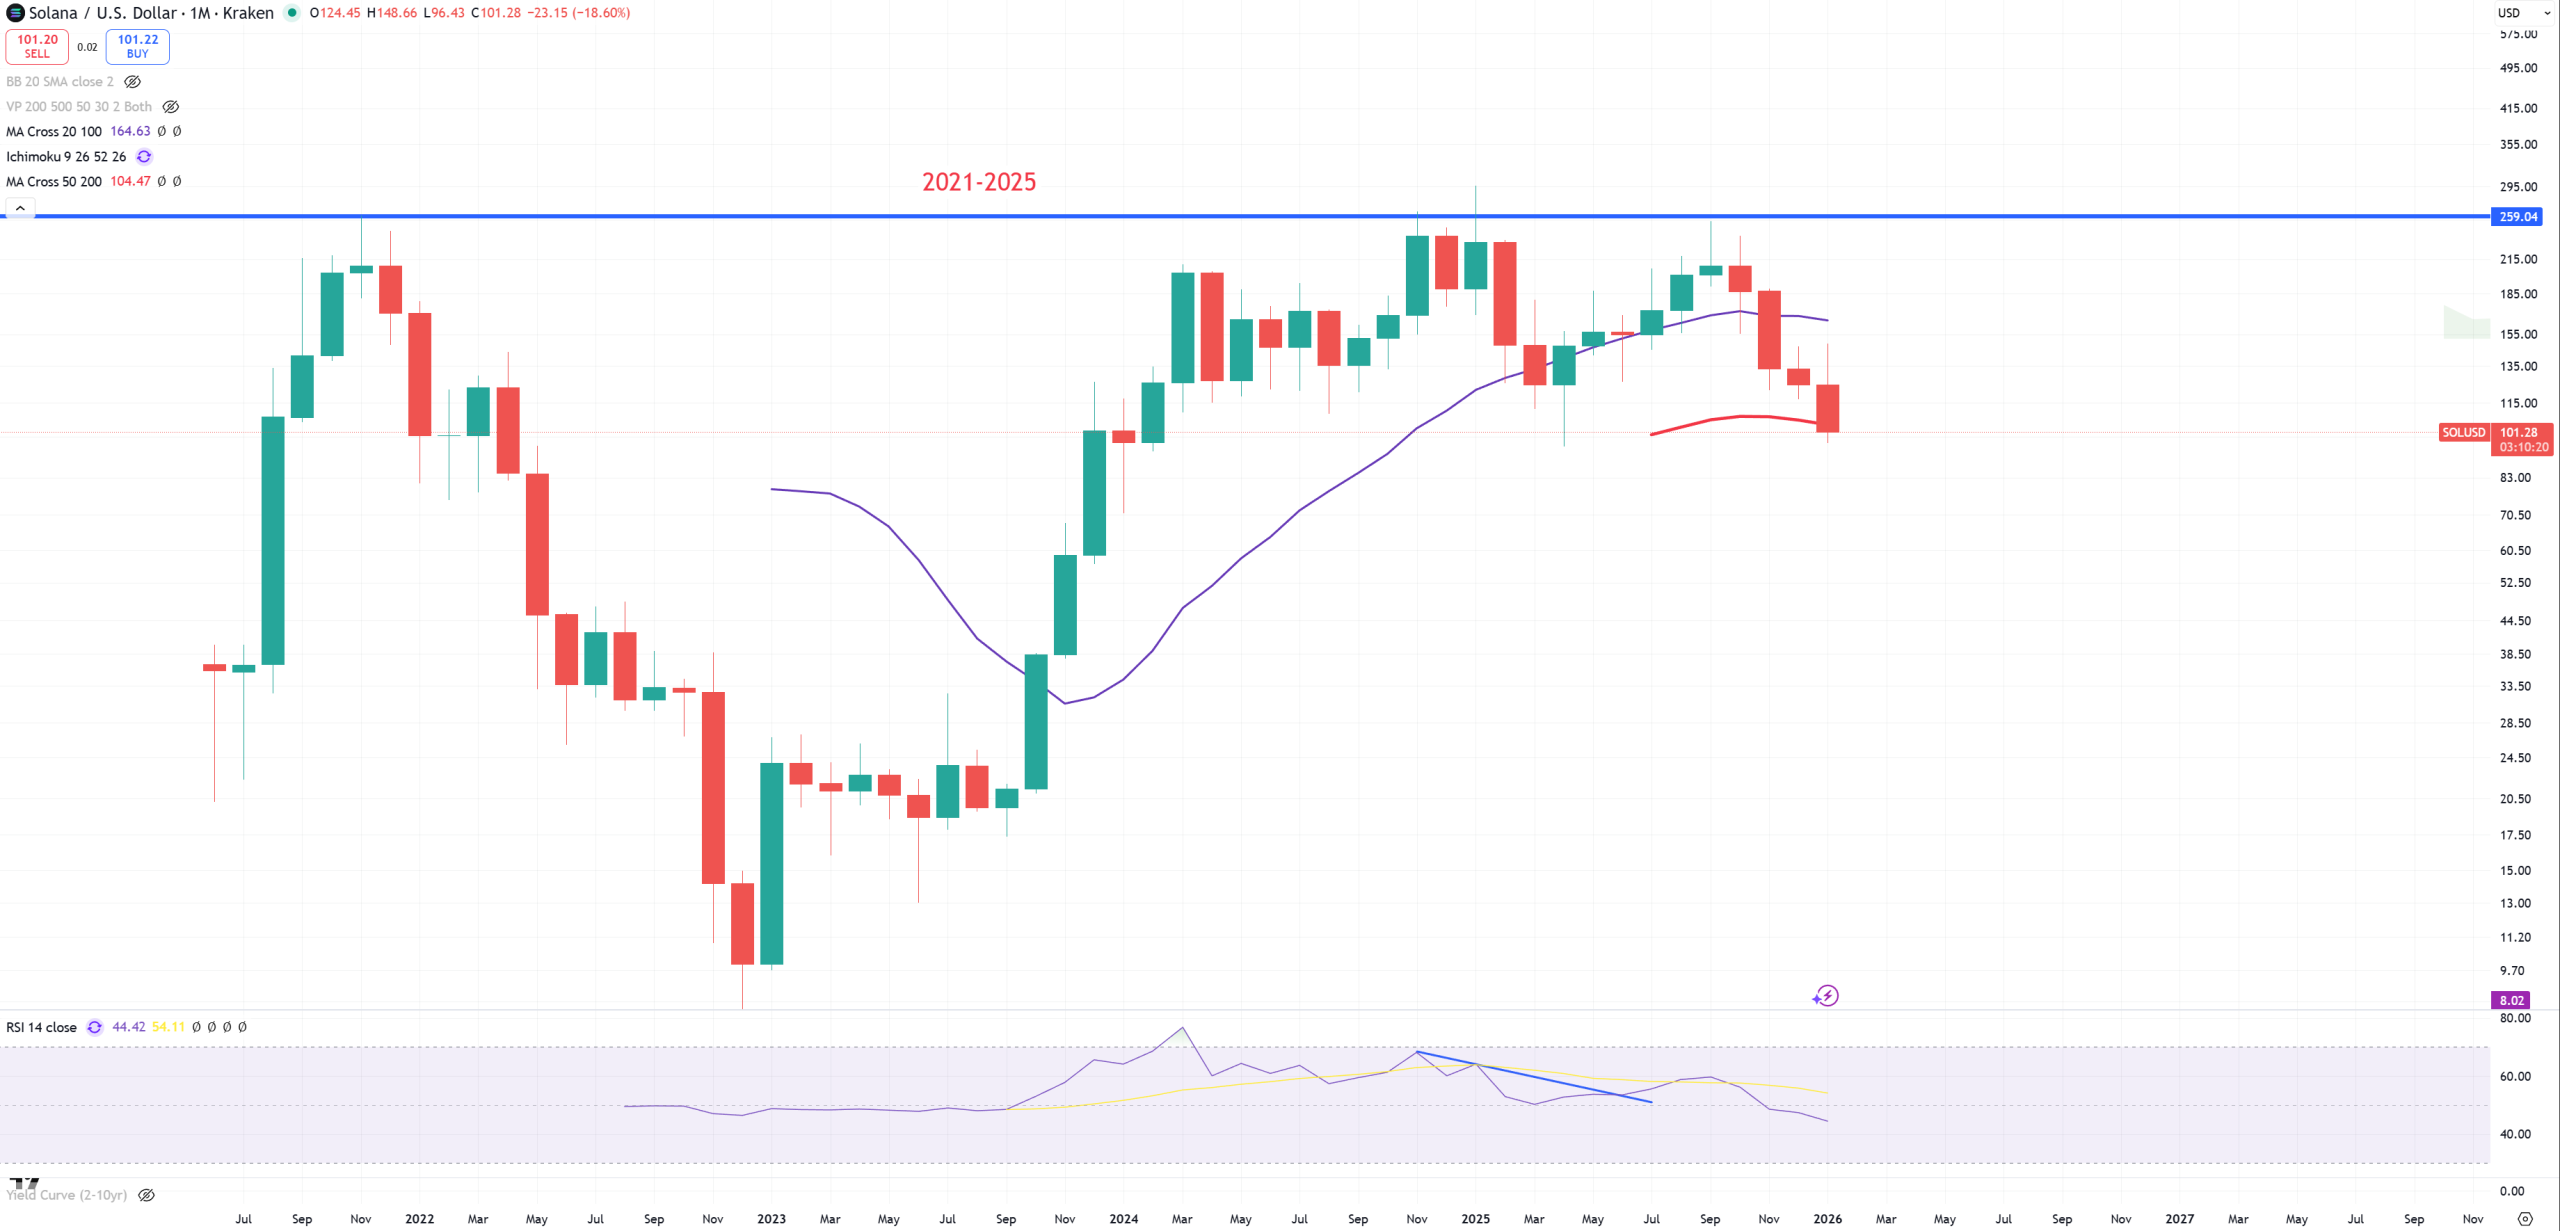
SOL – it’s the same setup as ETH
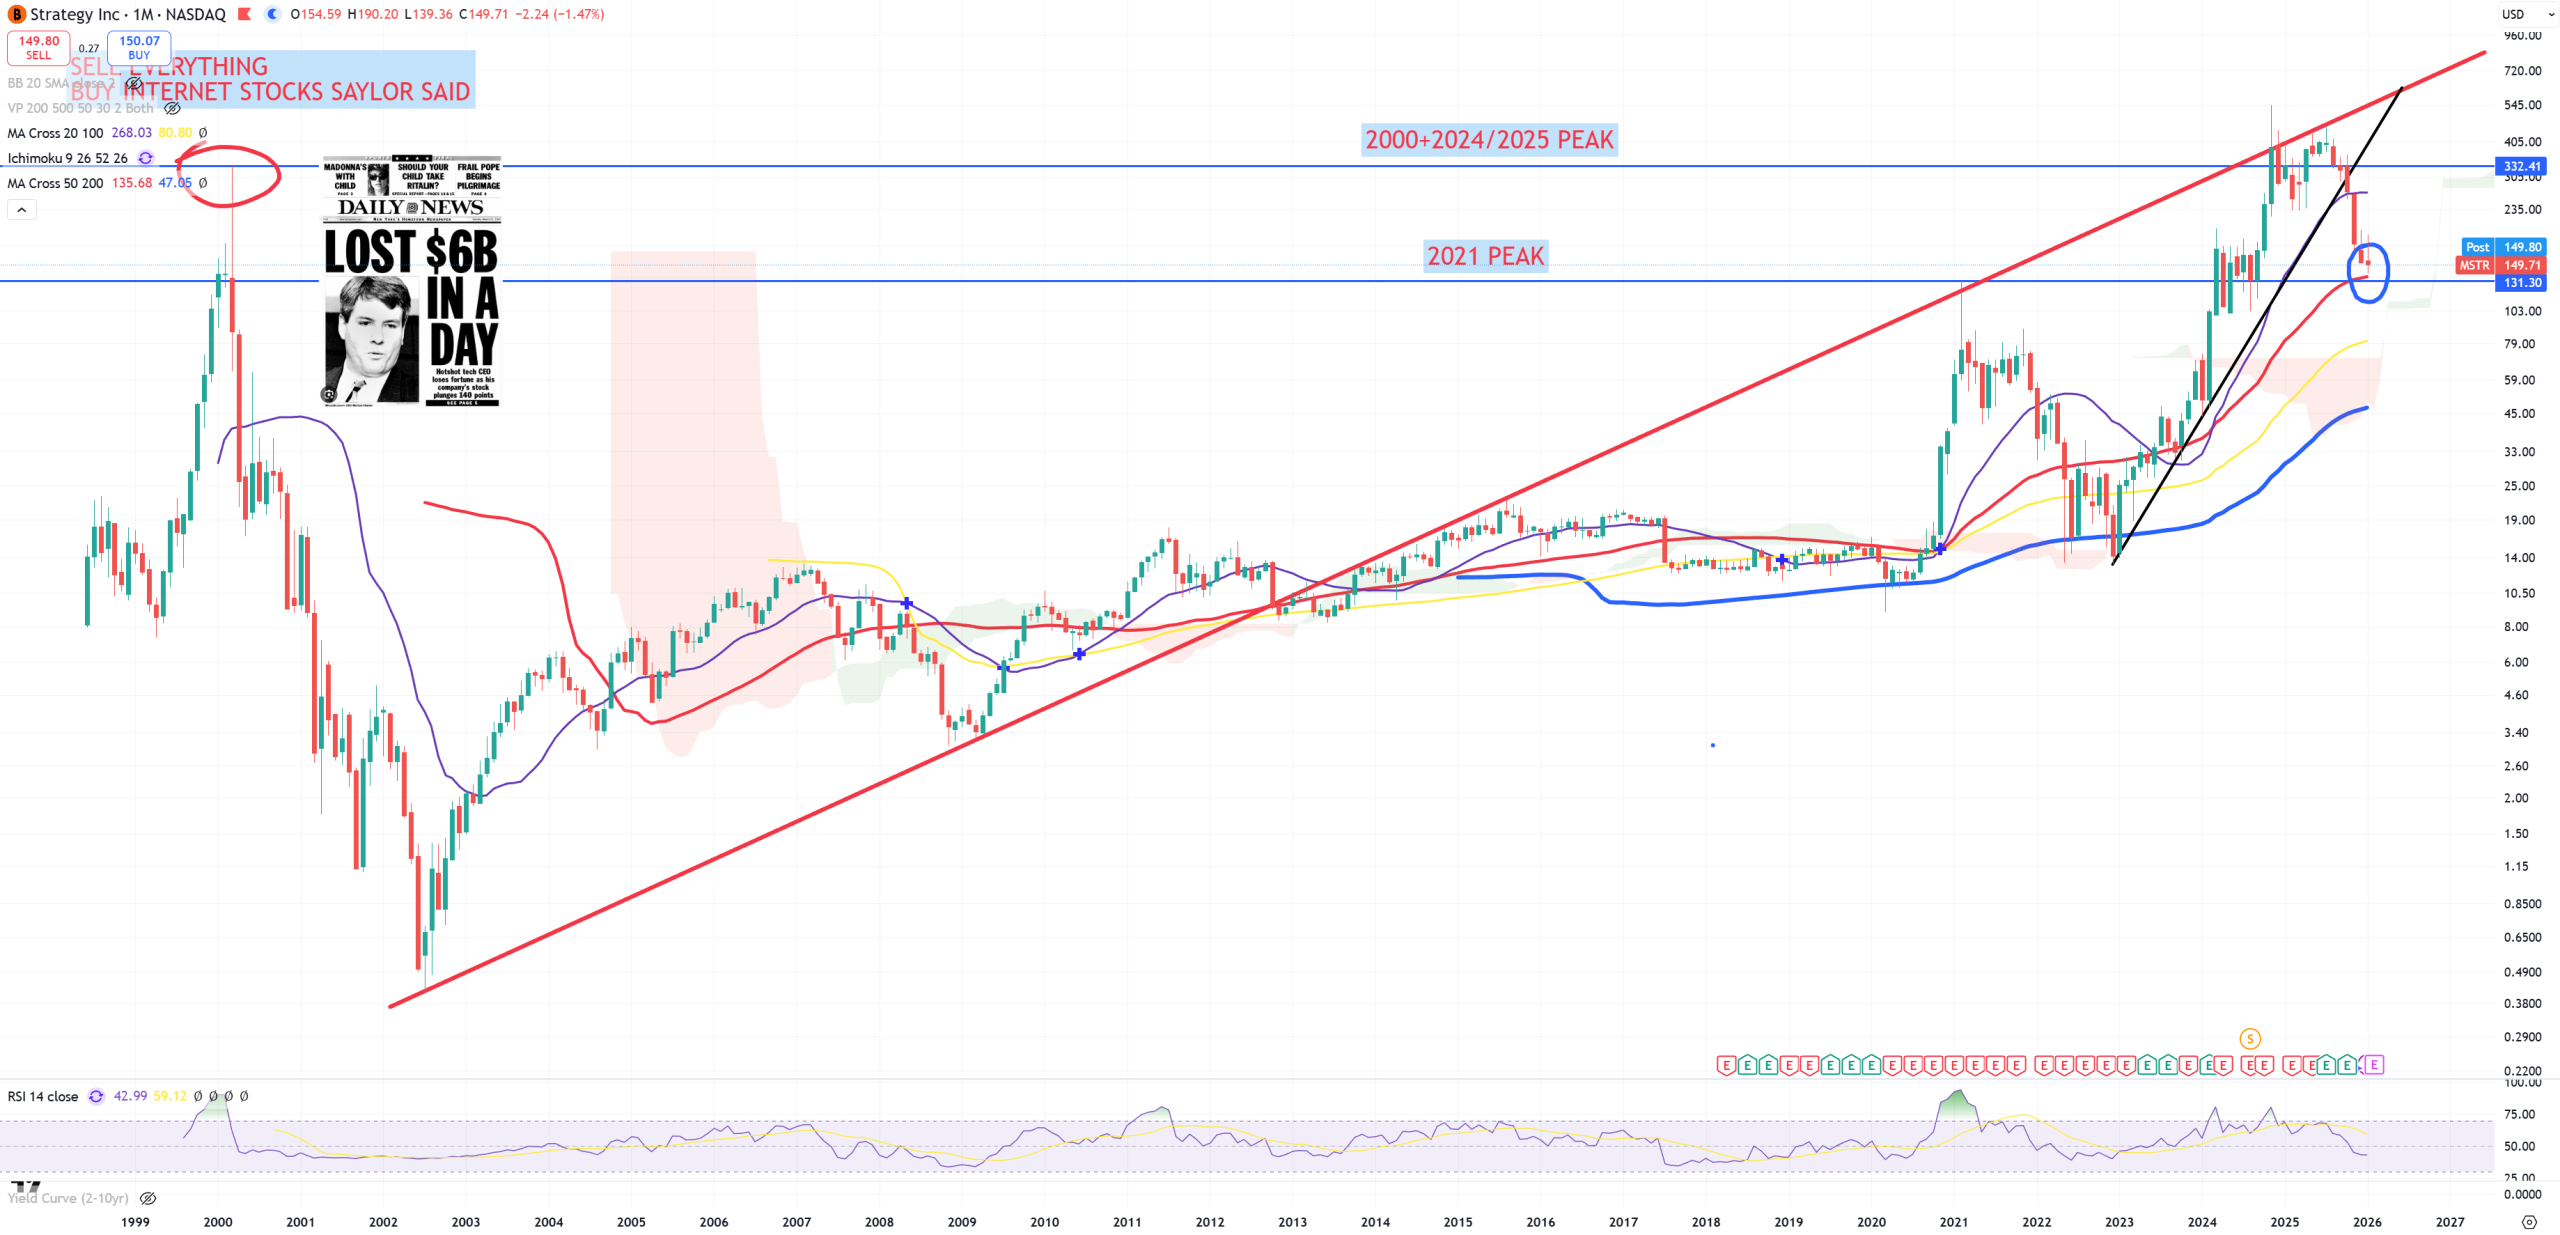
MSTR – (M)MA50 so far was not touched just like 131$ level – 2021 level. That was a nasty DOUBLE-TOP with some false spikes and now another turn into a technical bear market. I think once 2021 level will be taken down, it’s longer term RIP. Imagine opening below 2021 peak in February 2026.
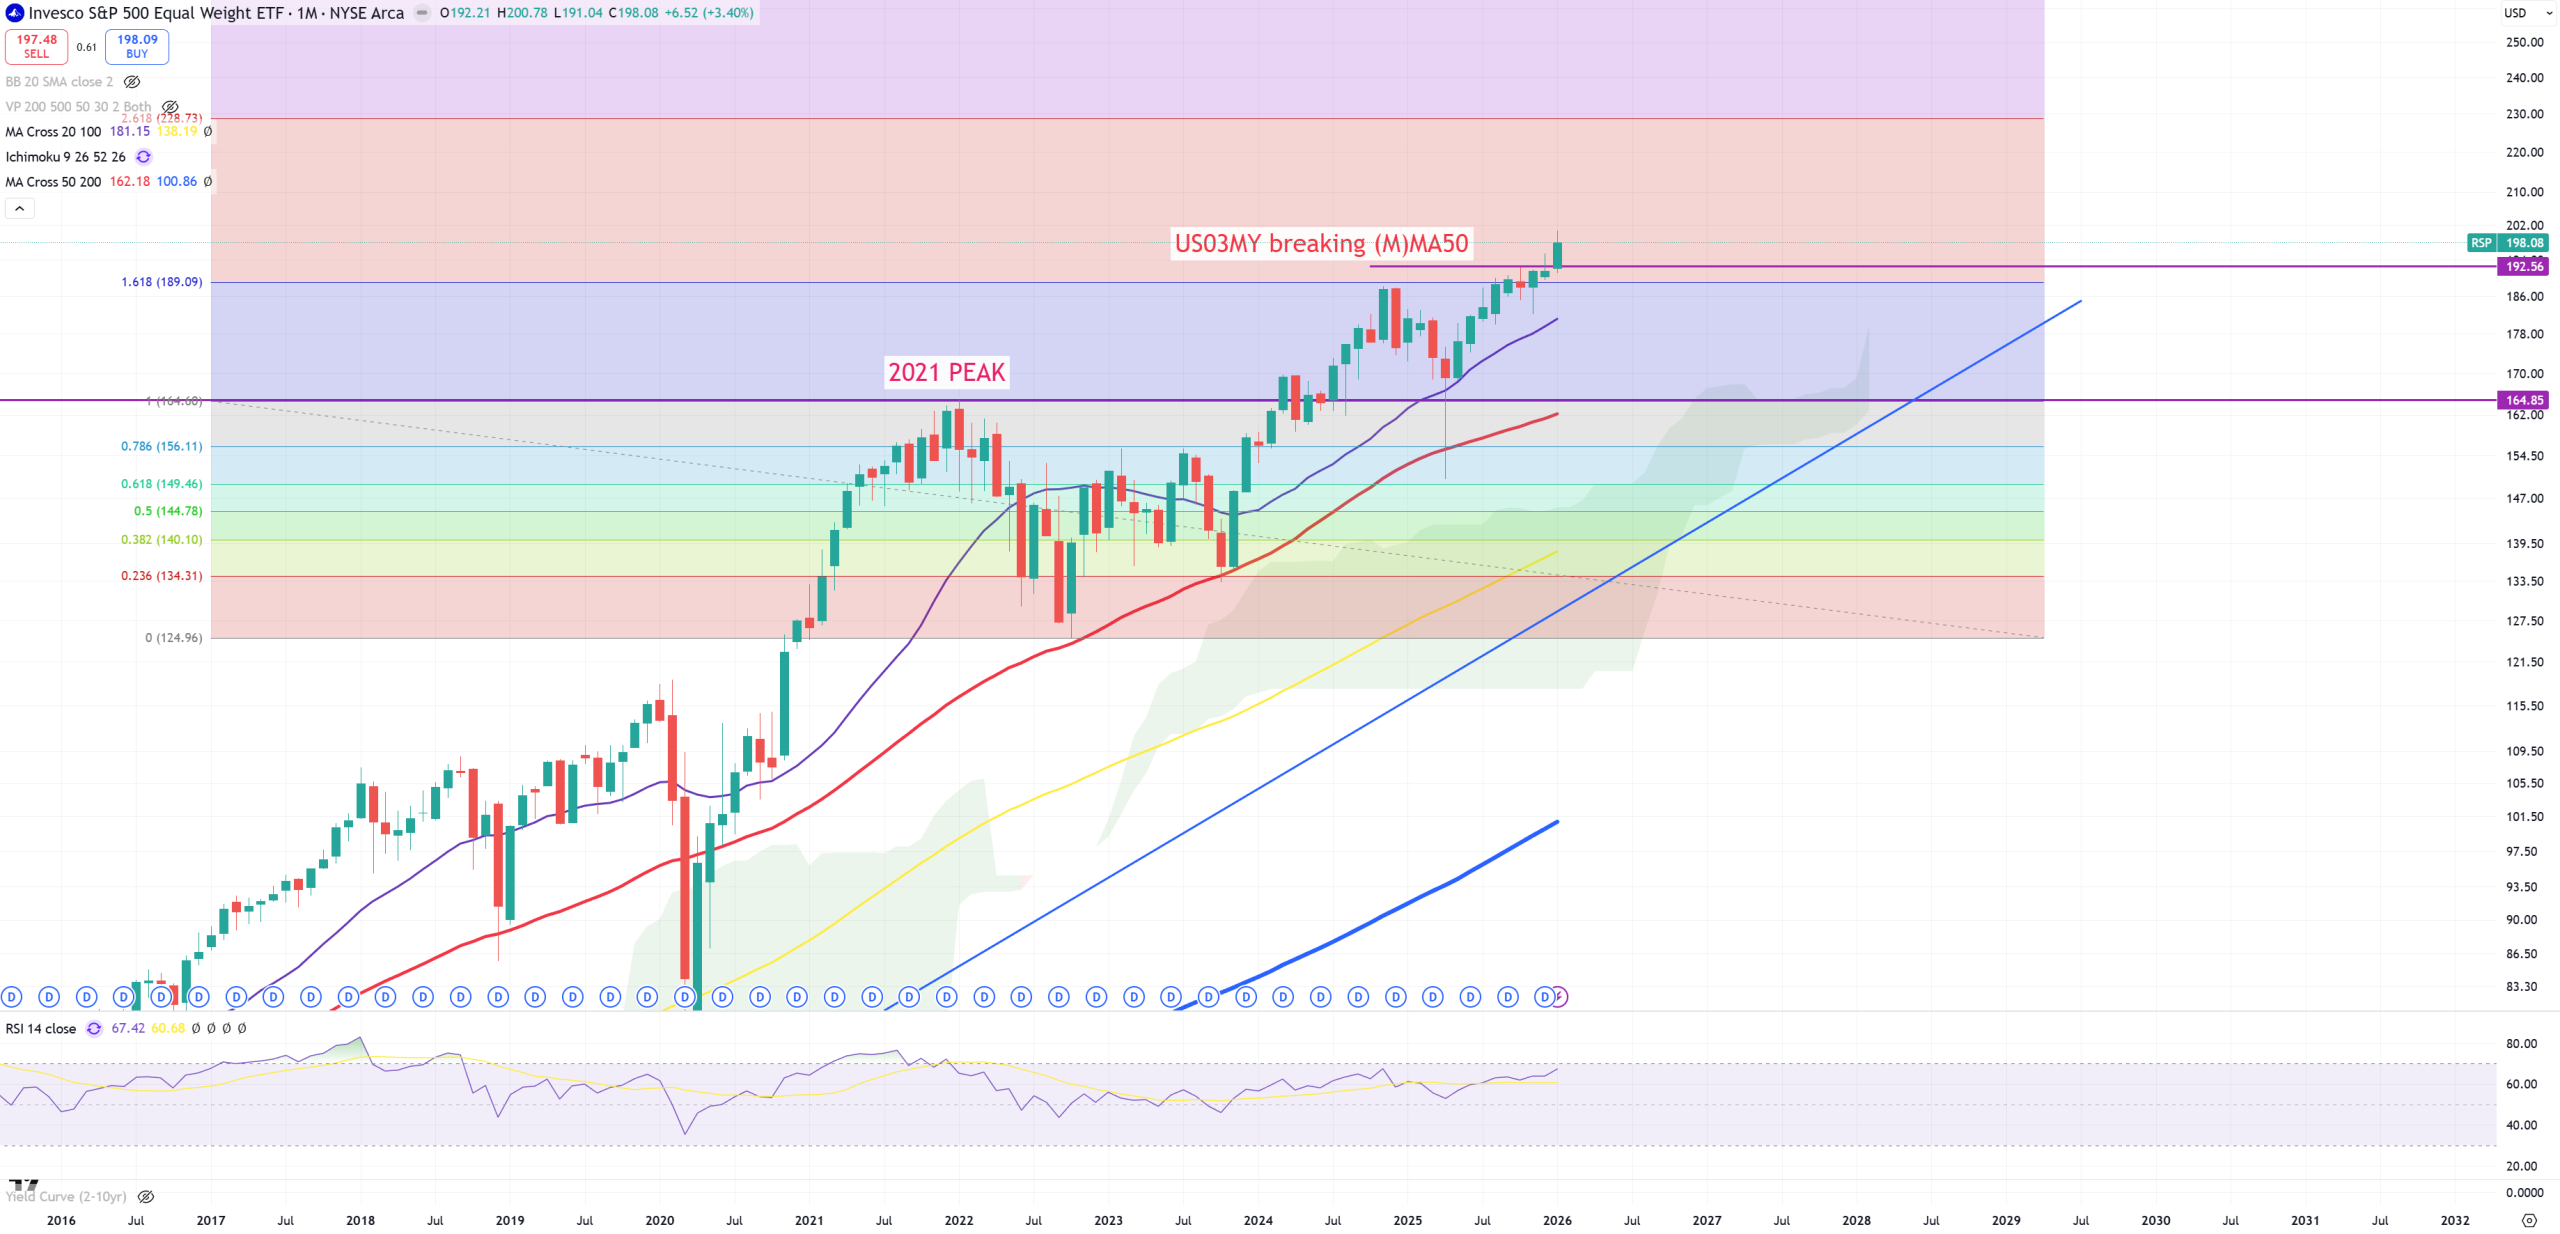
RSP – SP500 Equal Weight – not much to see so far. 192$ is the level once US03MY broke (M)MA50.
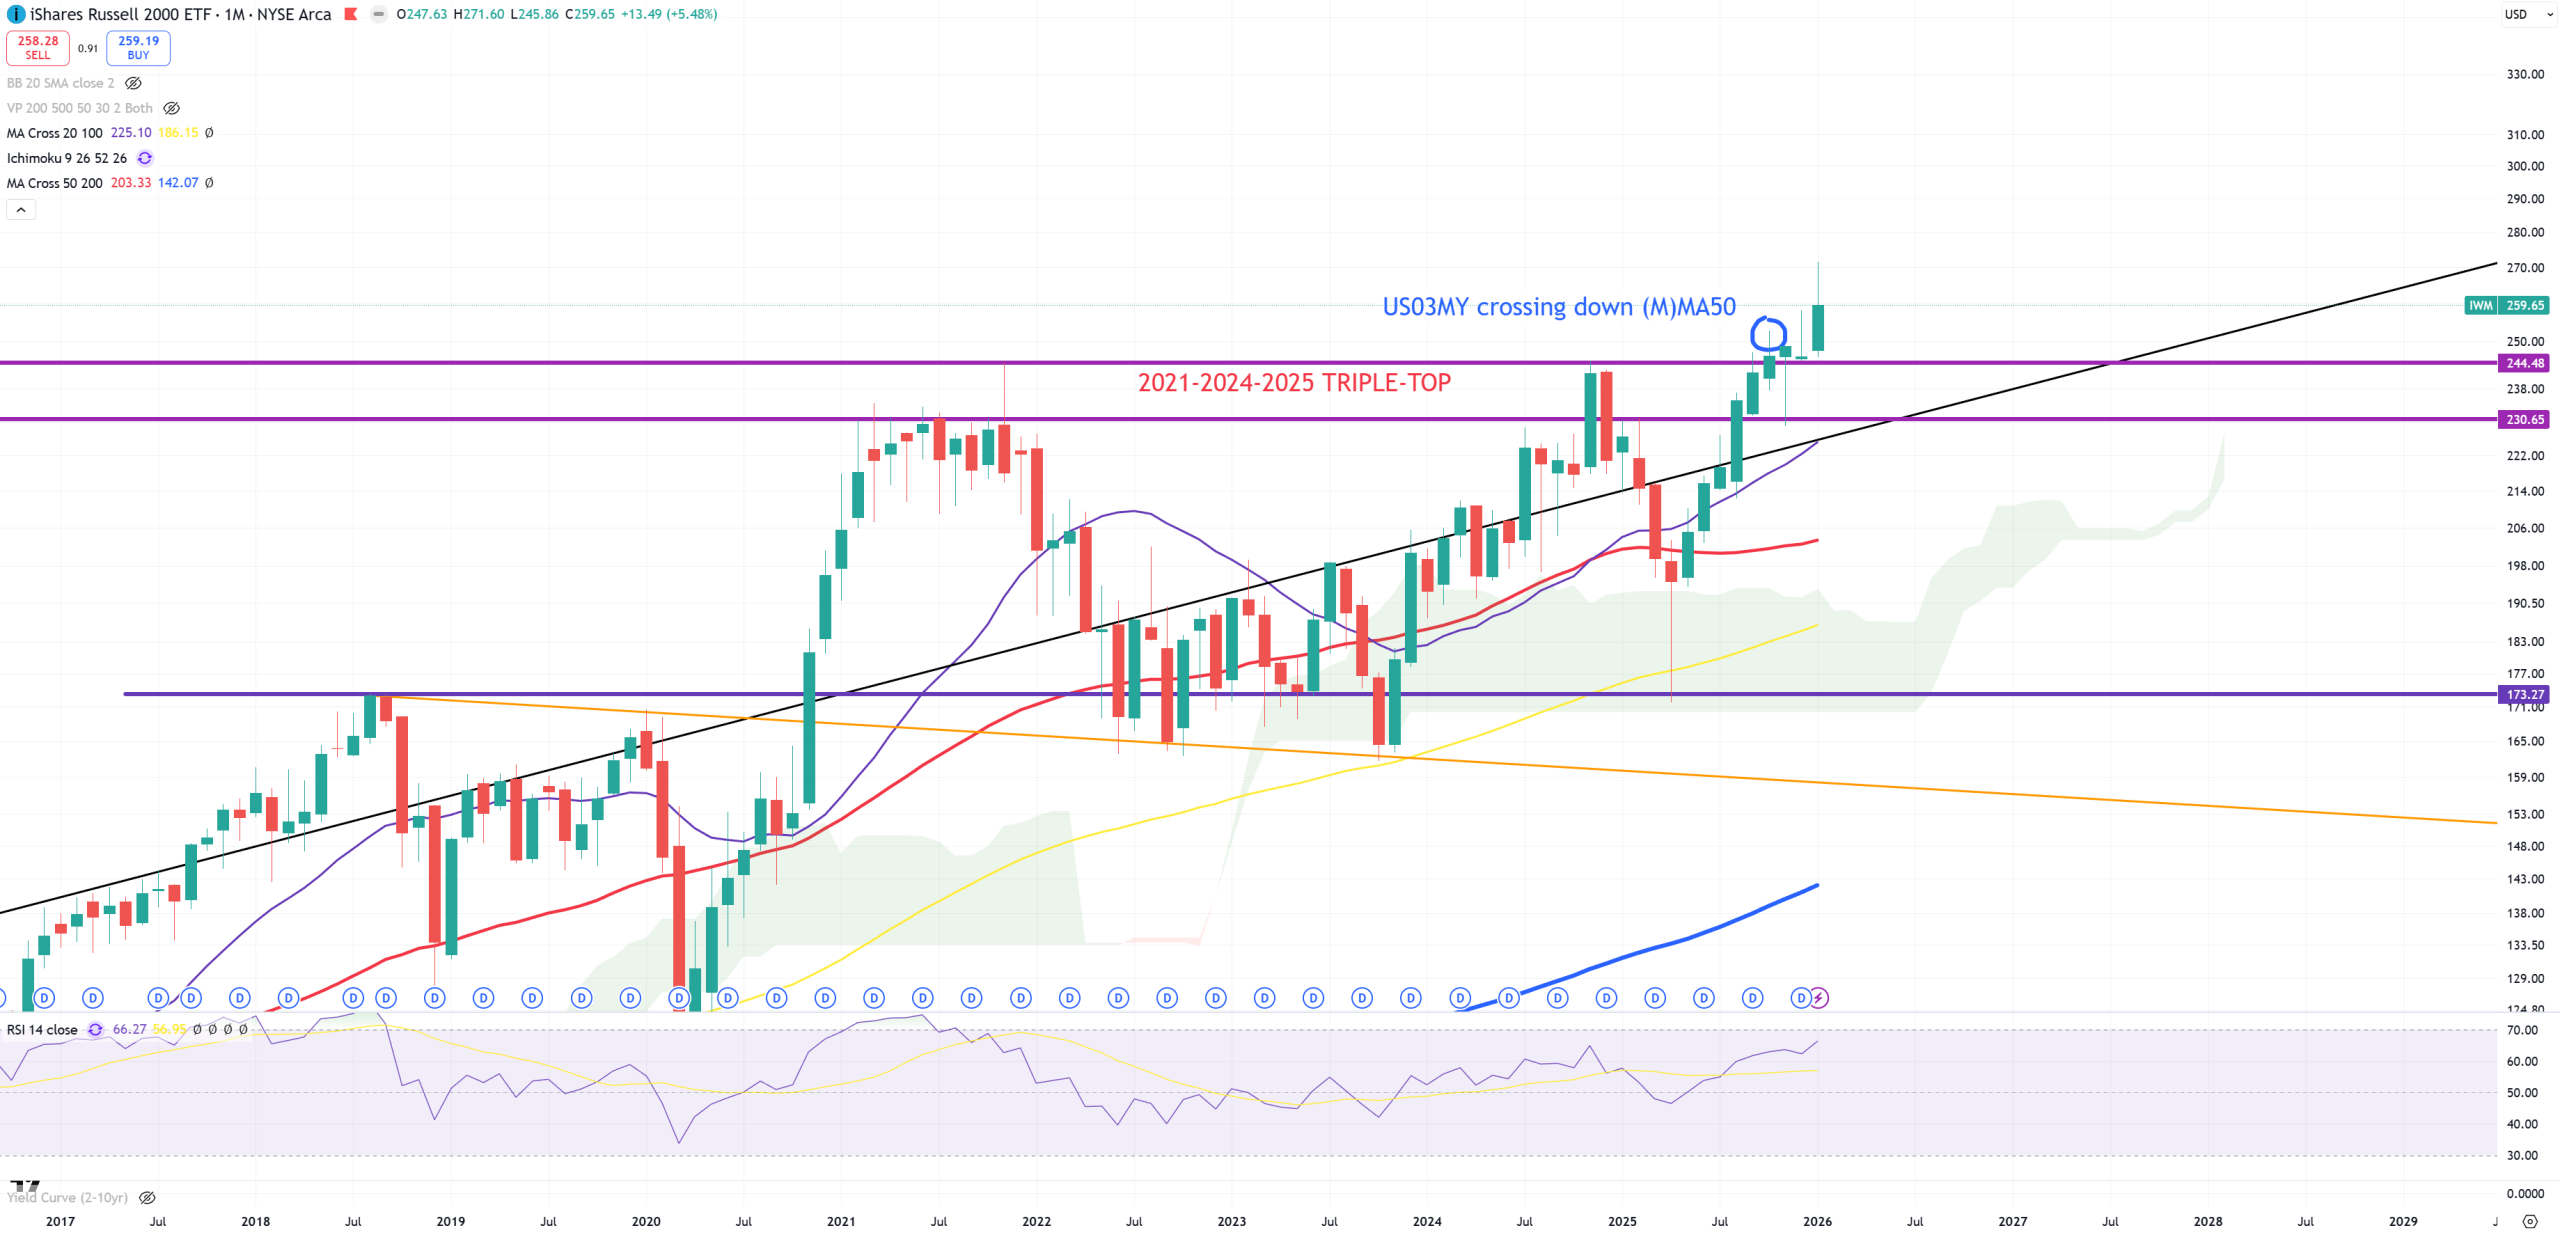
IWM – Small Caps – break or big bull trap?
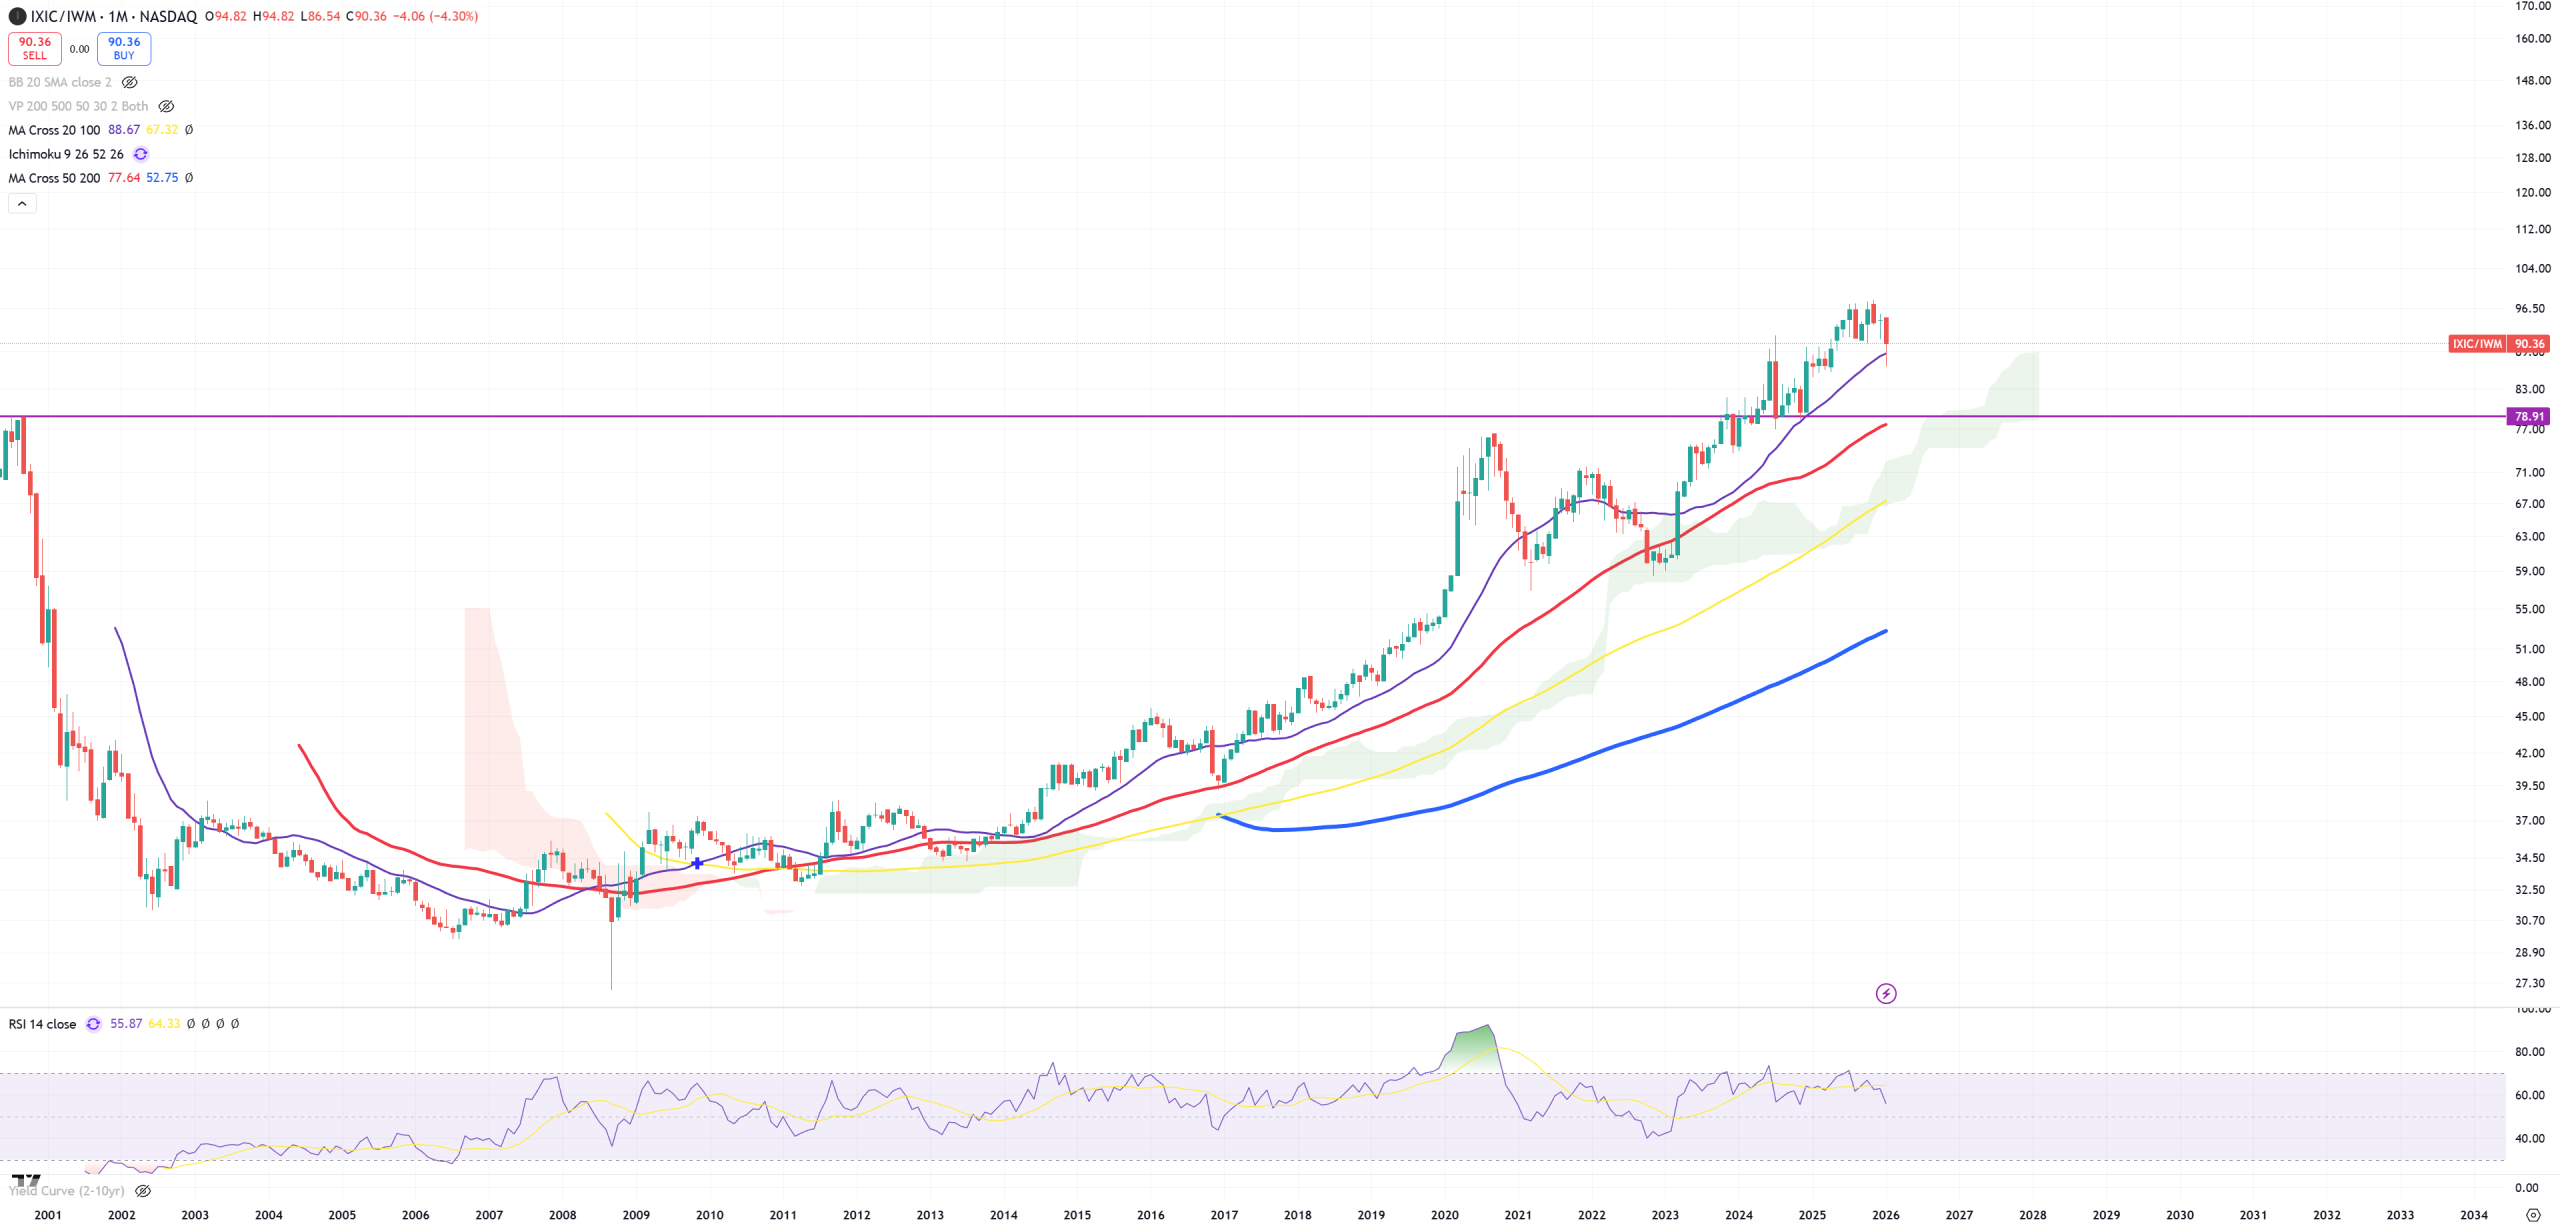
IXIC/IWM – Nasdaq Composite / IWM – big break or massive bull trap? (M)MA50 sits on 2000 support.
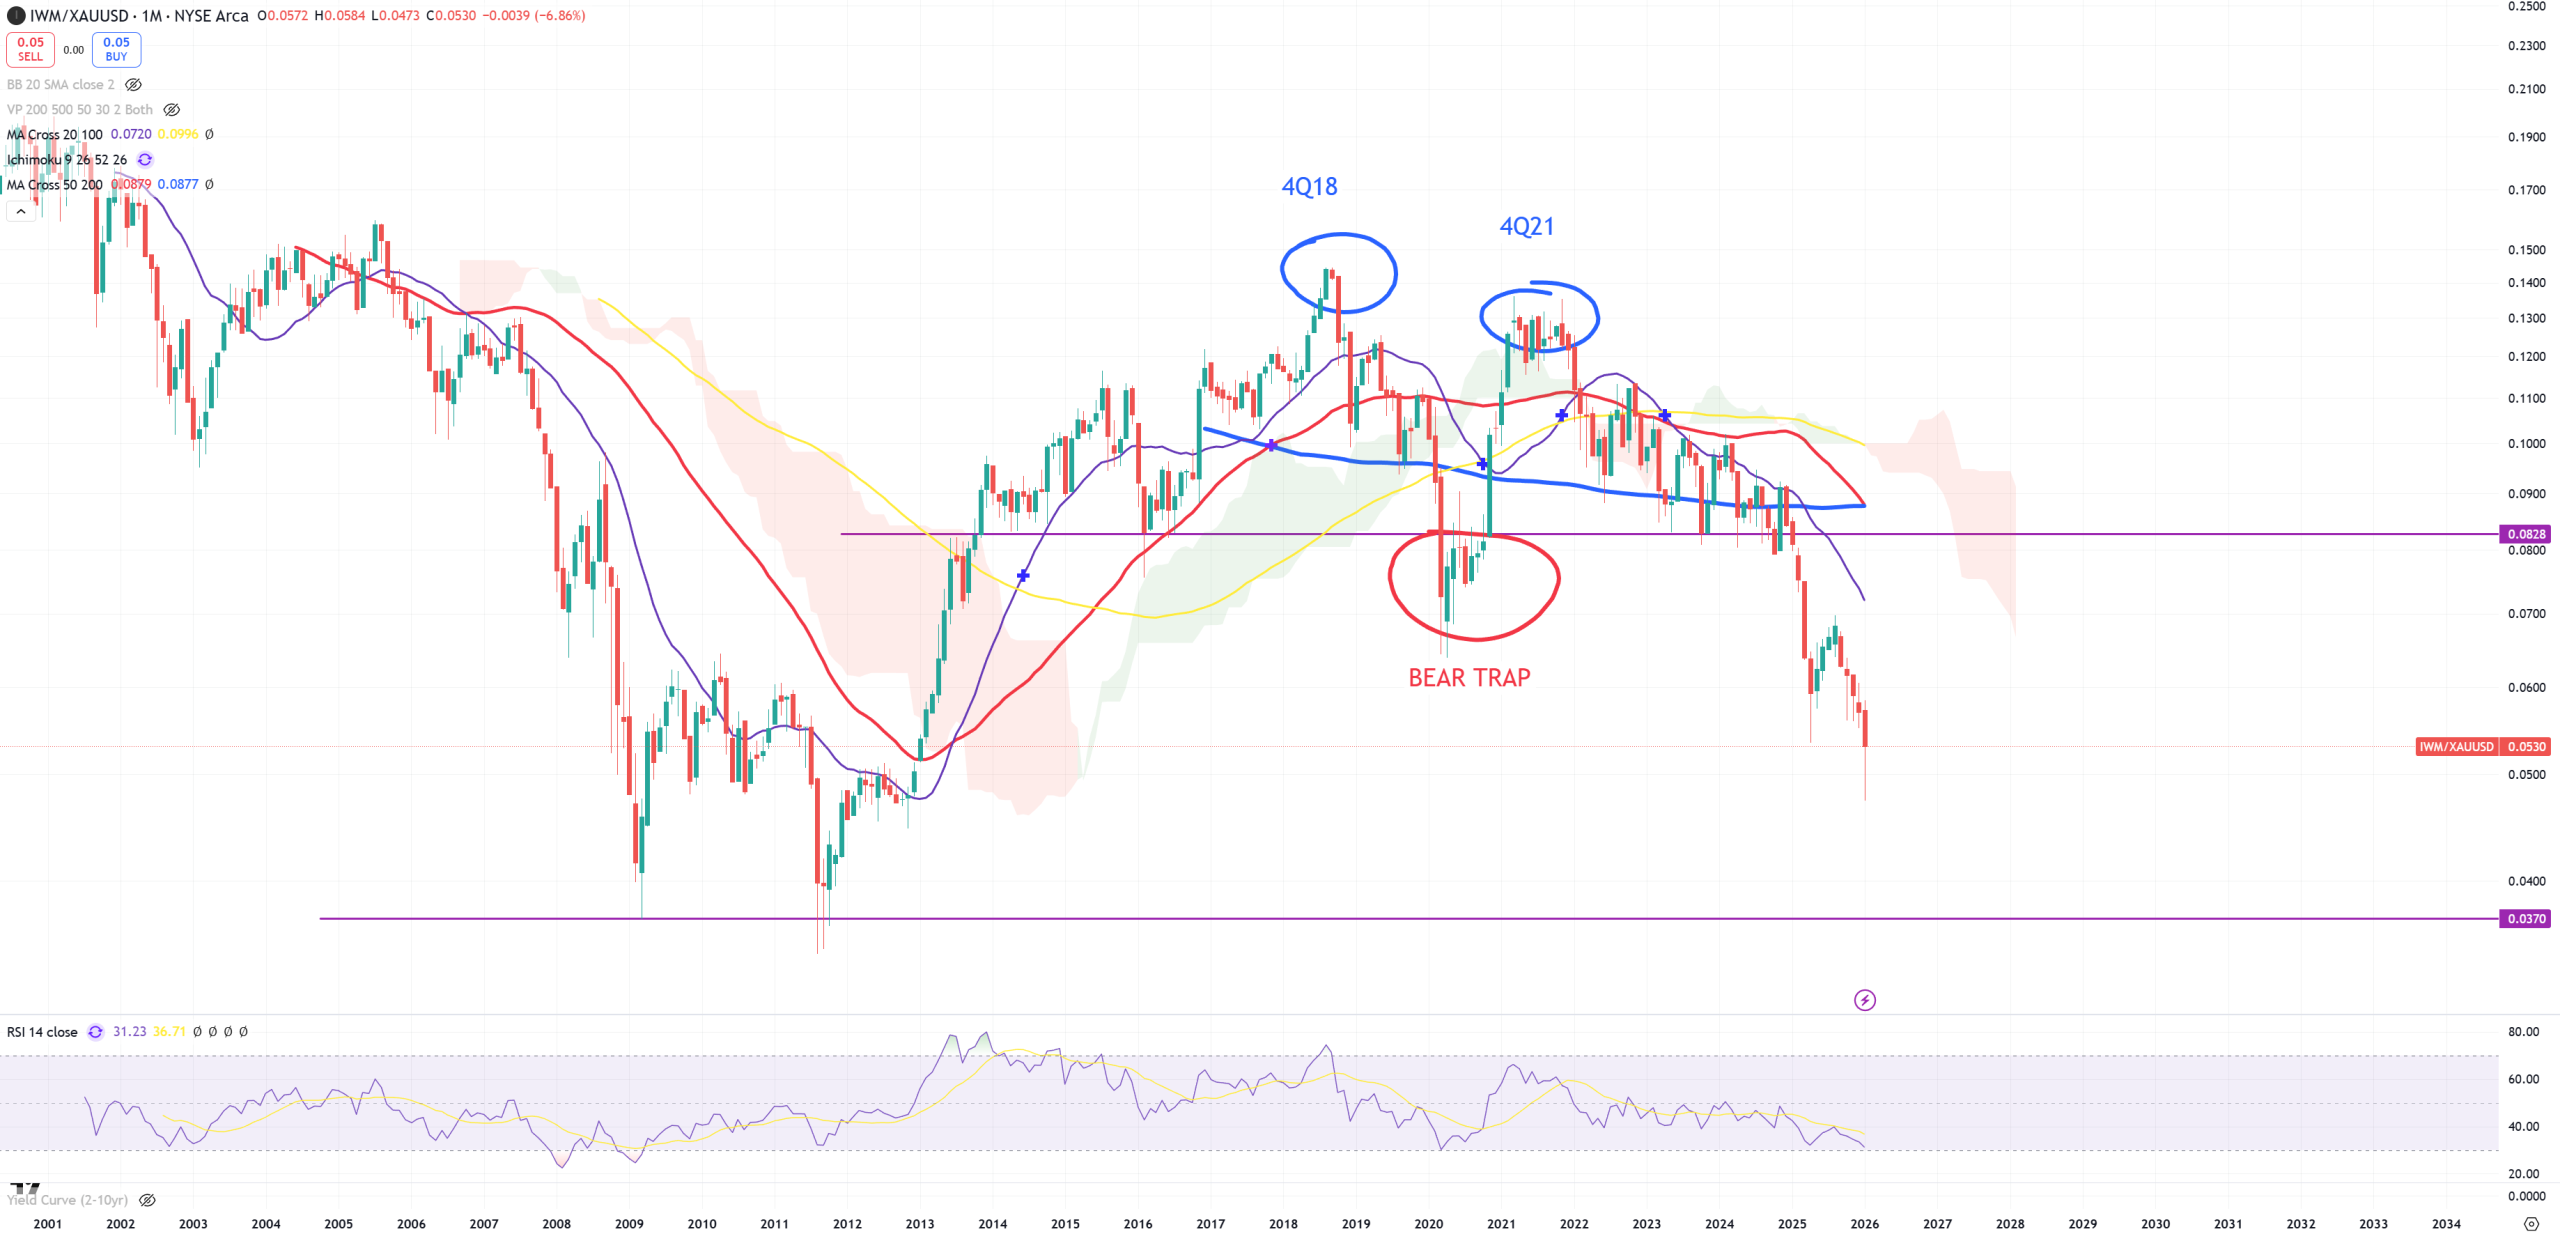
IWM/GOLD, so two peaks : 4Q18 (DJI/GOLD peak) and 4Q21 (SPX/GOLD) as dead-cat bounce. We see that 2020 was a massive BEAR TRAP. Now we are way lower than 2020 lows in this ratio and we’re going probably to break 2009-2011 lows on 0.037 level
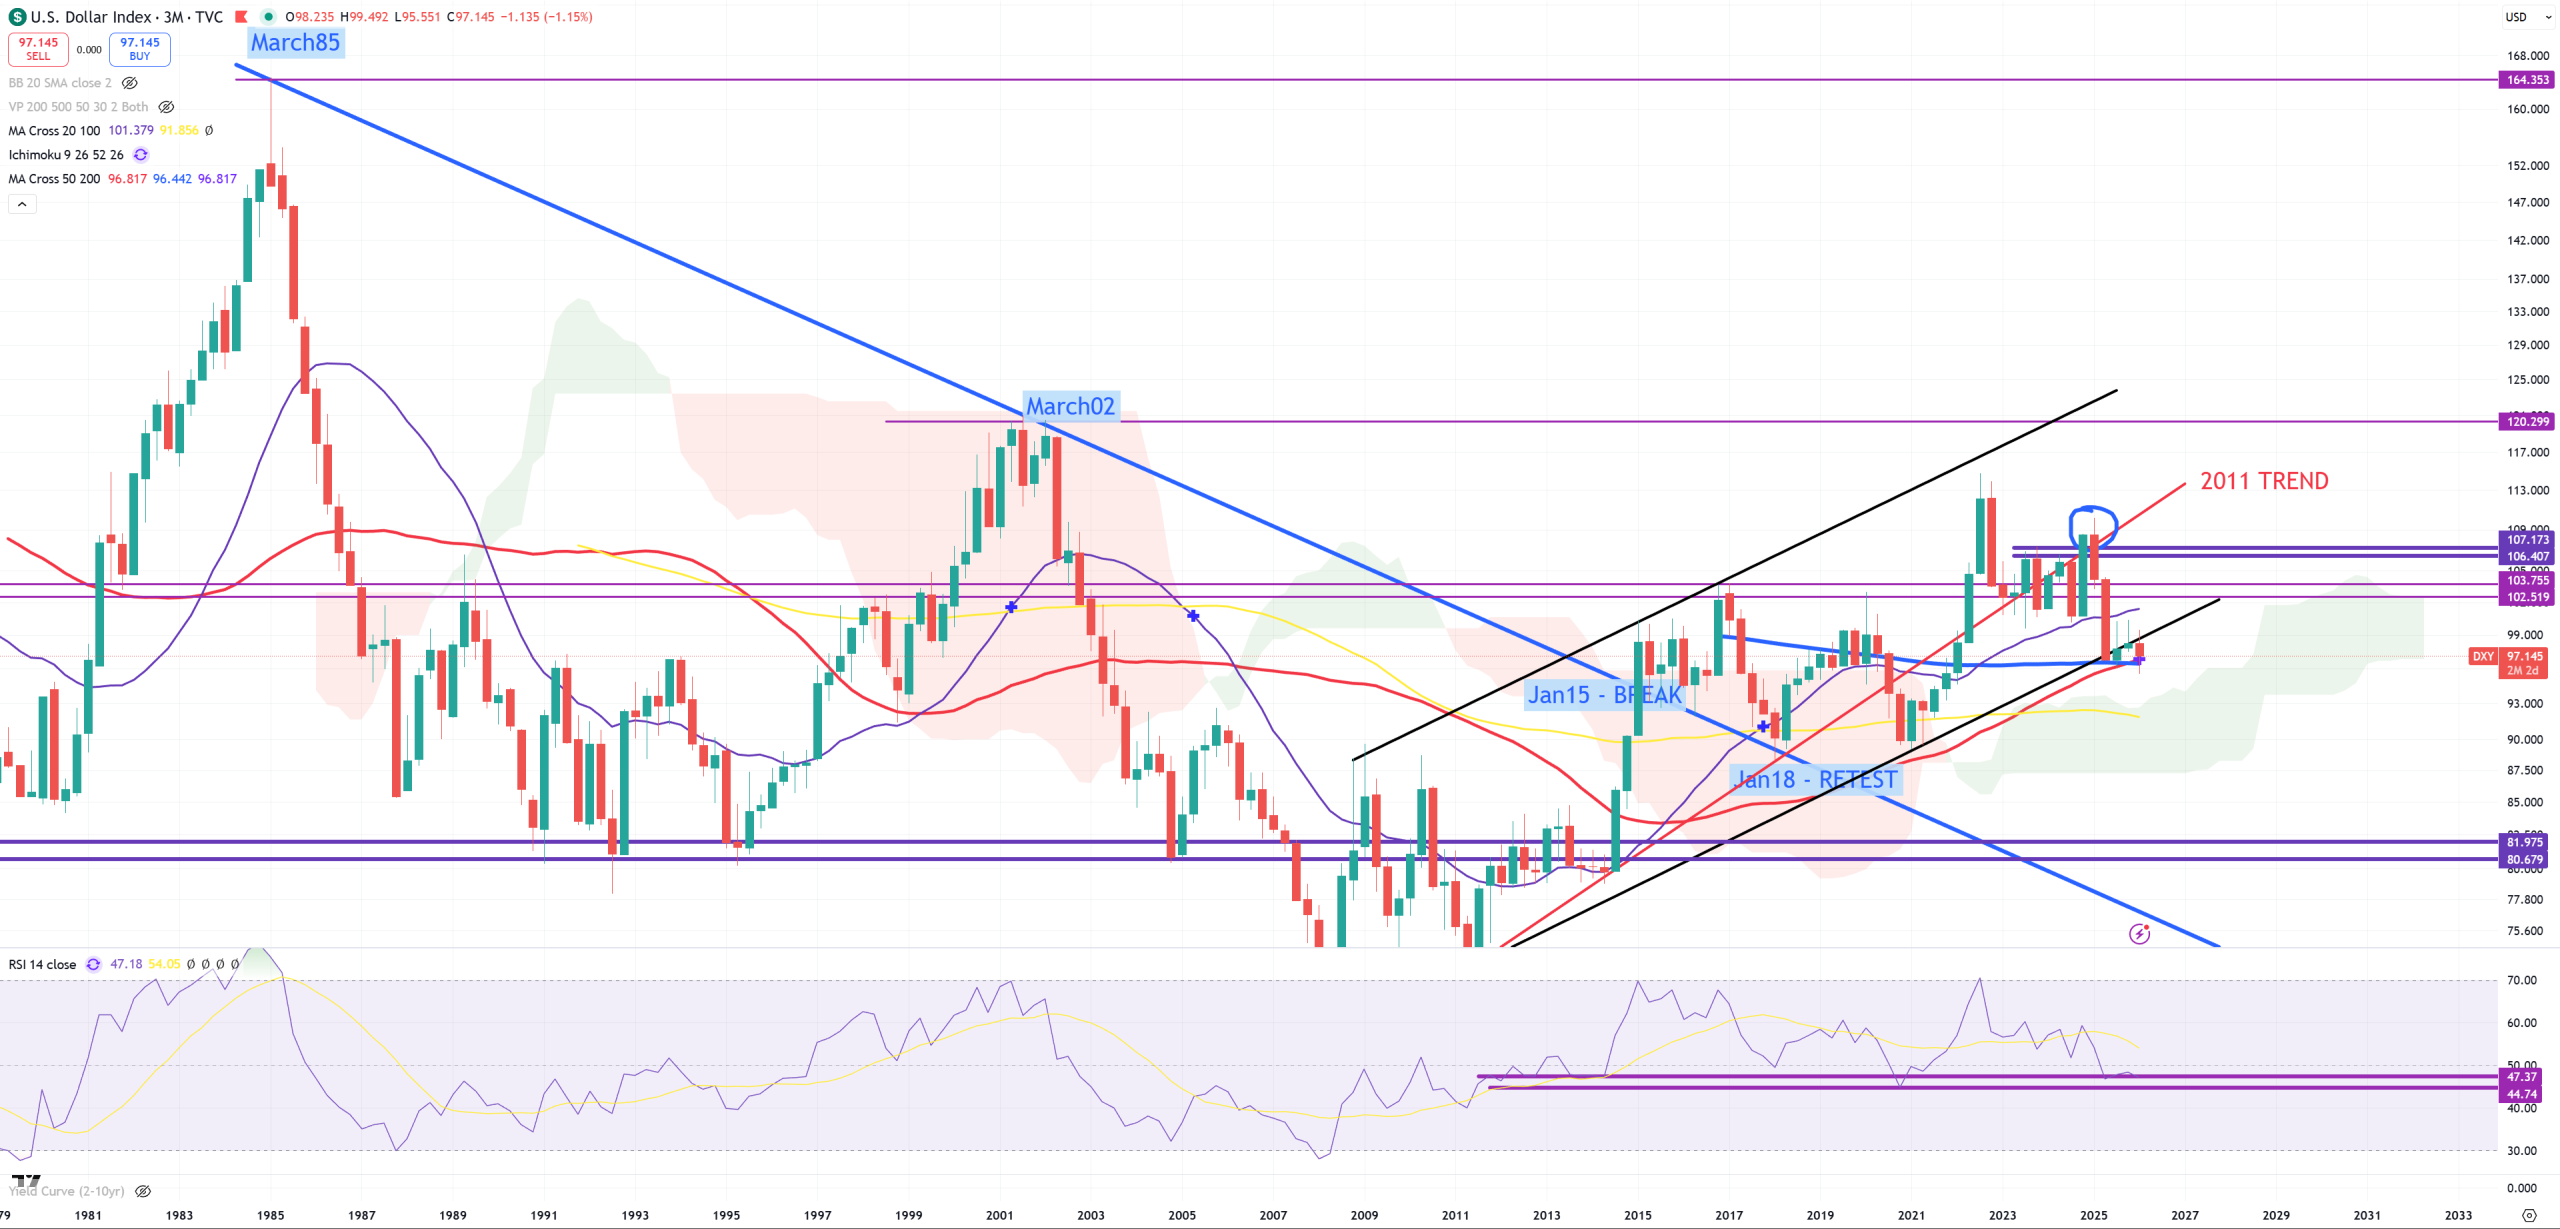
DXY – my last bull thesis sits on 3M chart and super secular golden cross (3M)MA50 and (3M)MA200 = exactly 96.4 now. We managed so far to close over 97, so bull thesis is still intact.
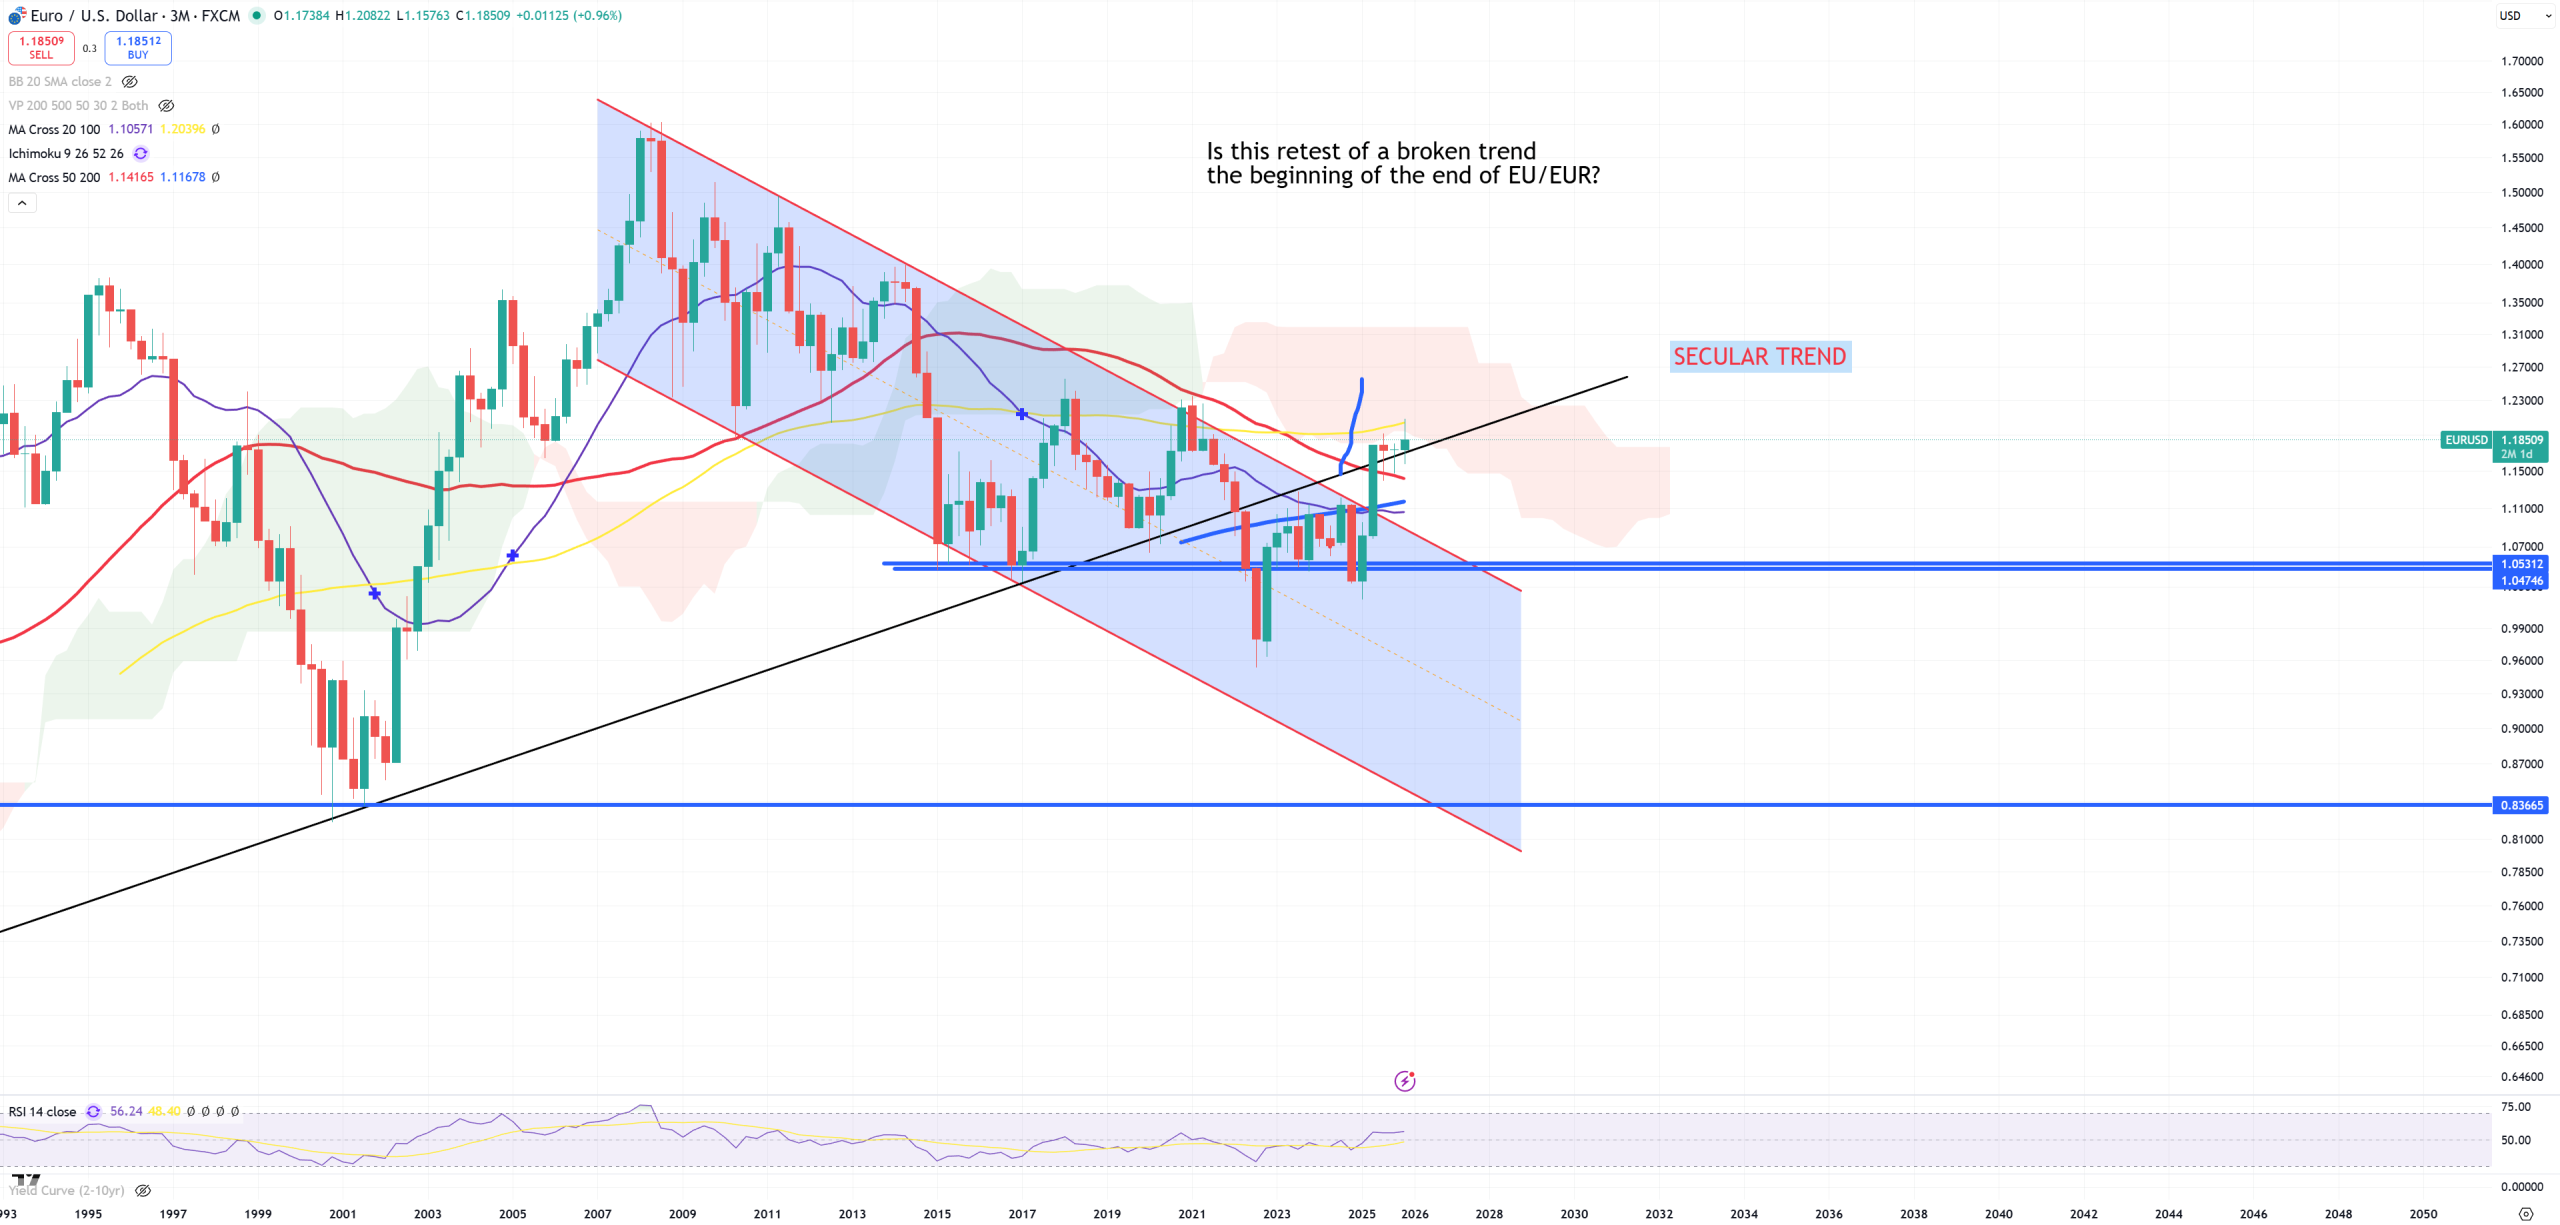
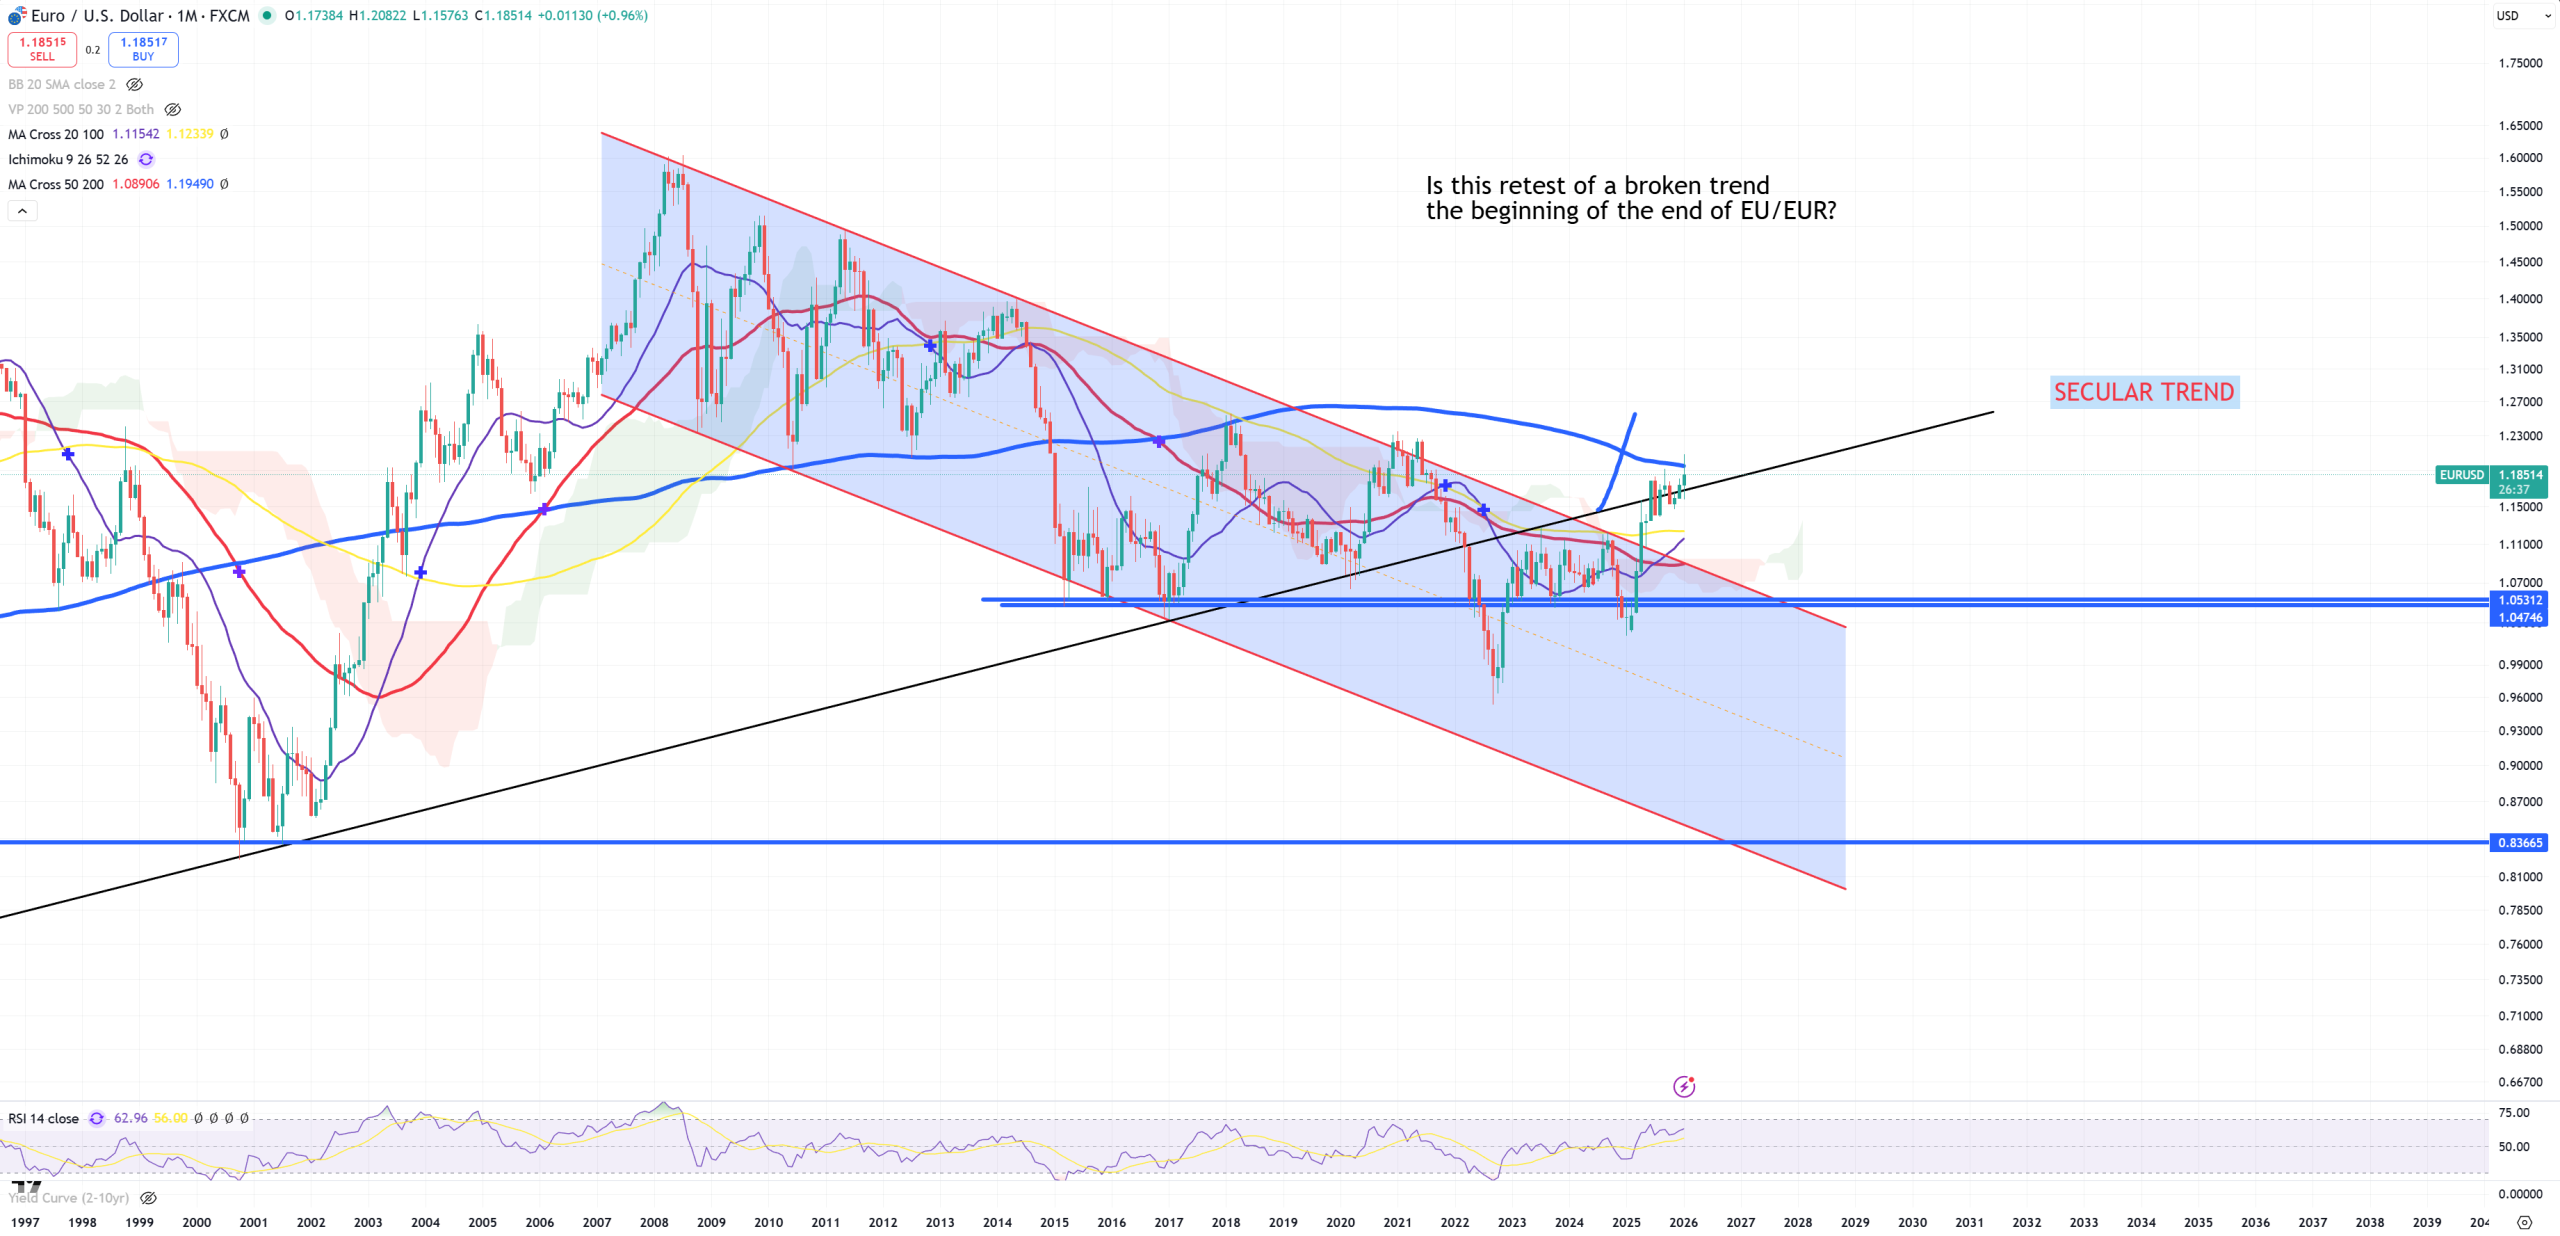
EURUSD – main contributor to DXY index. We see (M) and (M)MA200 – last level and (3M) and (3M)MA100. First view 3M second M. (M)MA200 once it was crossed down in 2014 was always the last border.
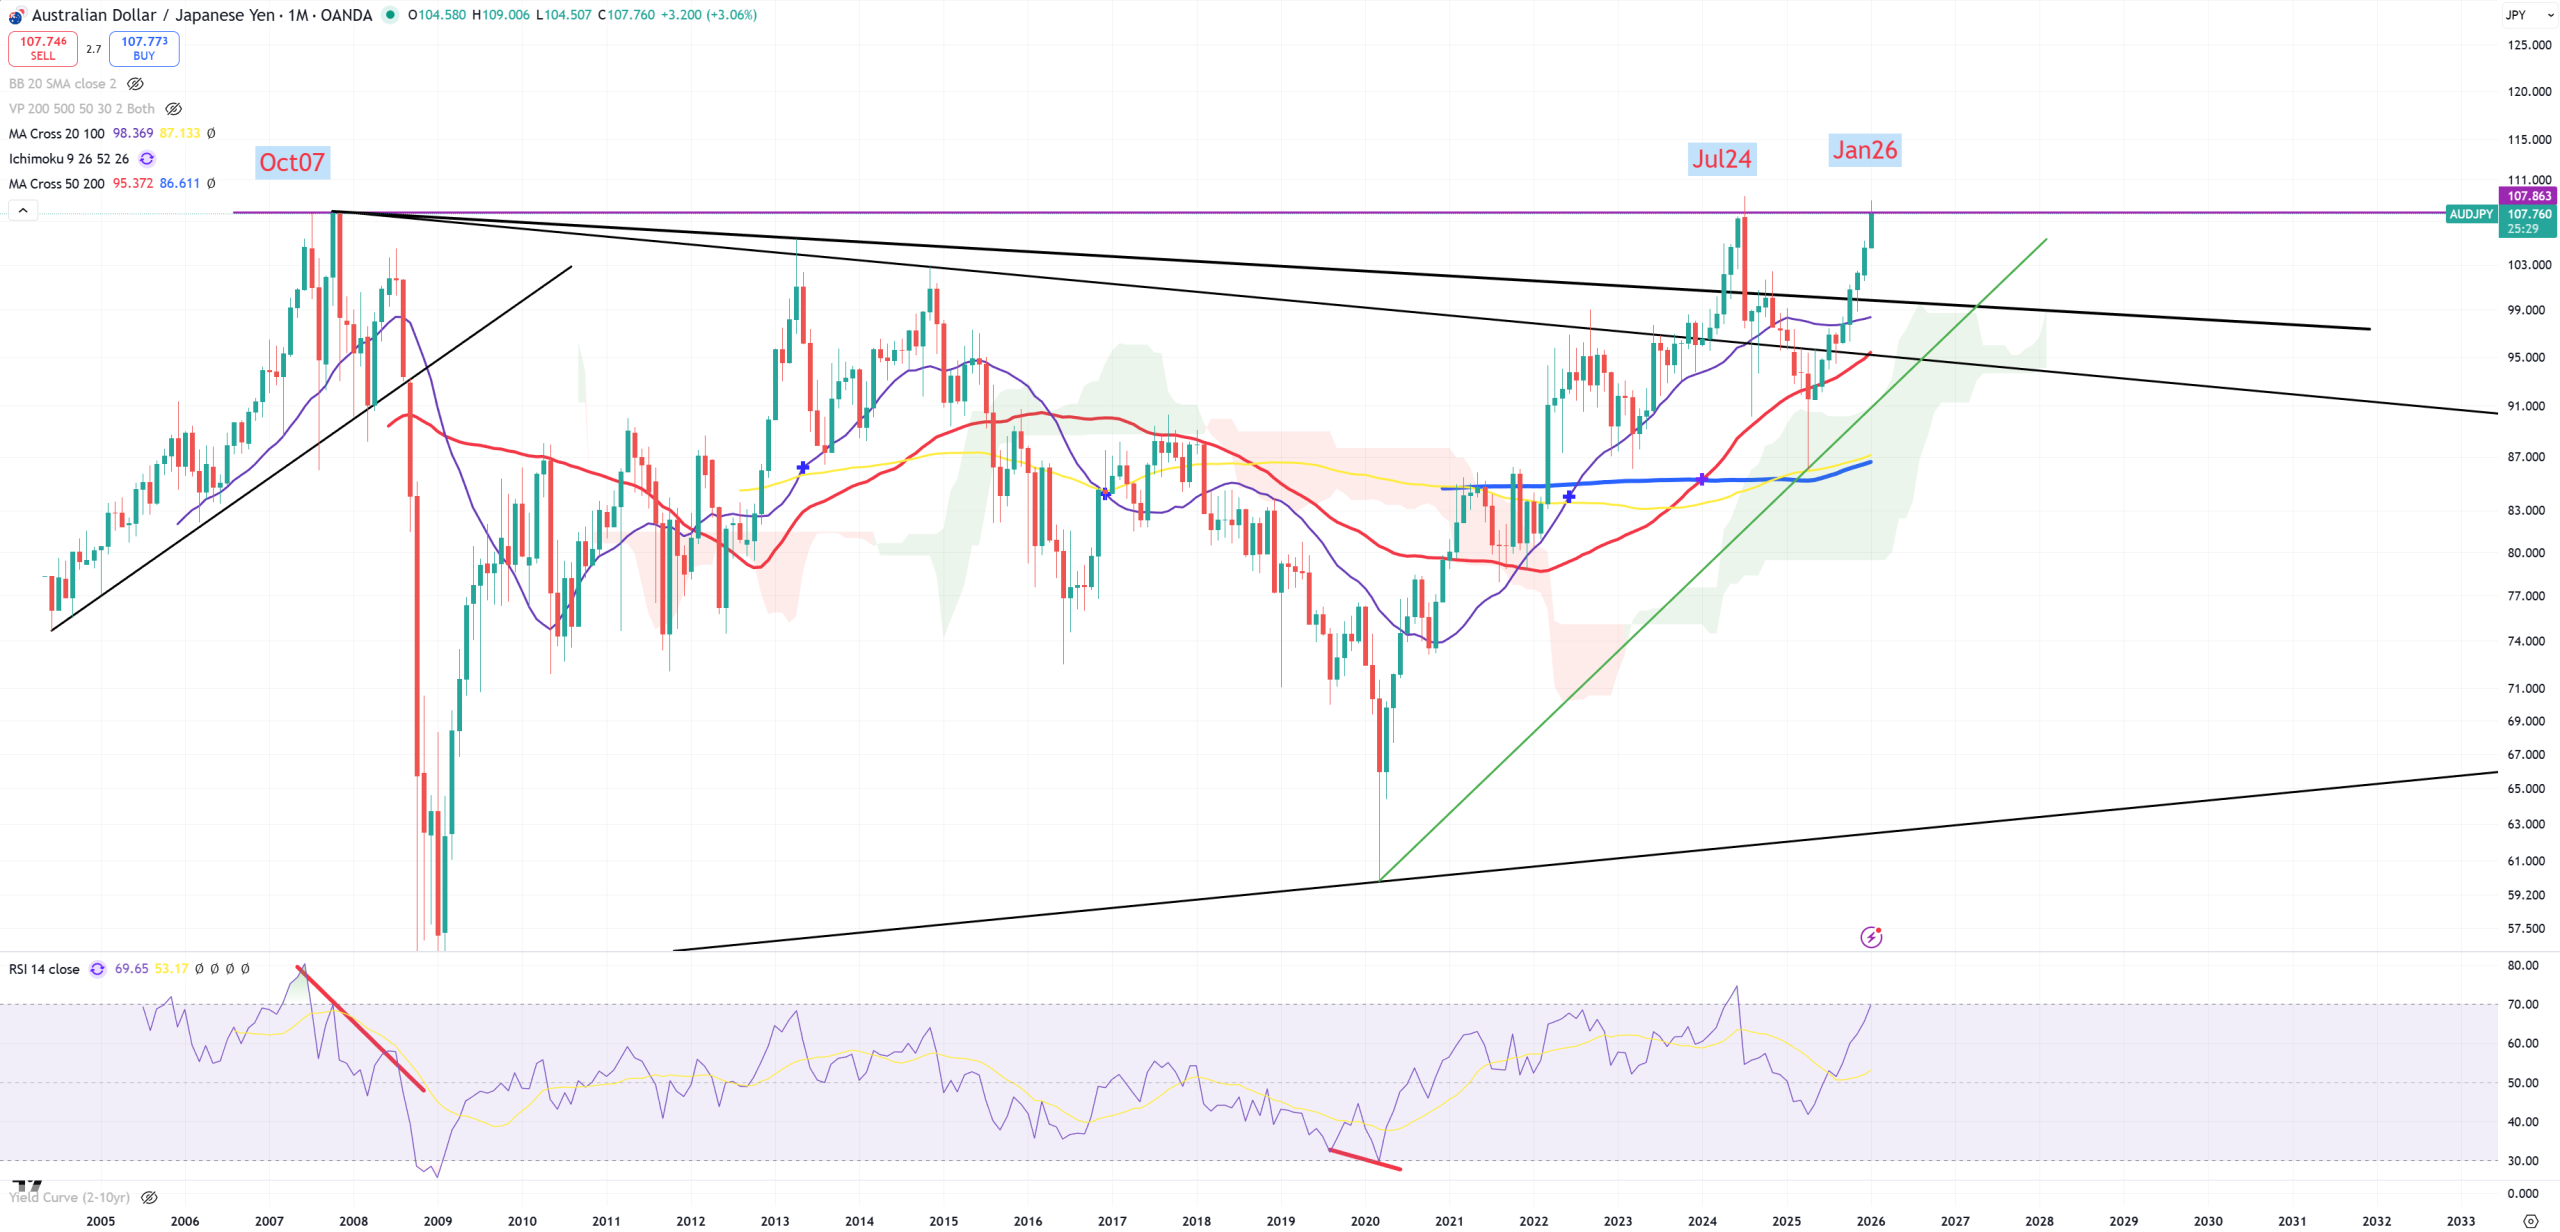
AUDJPY – risk on/off pair and we have a perfect close
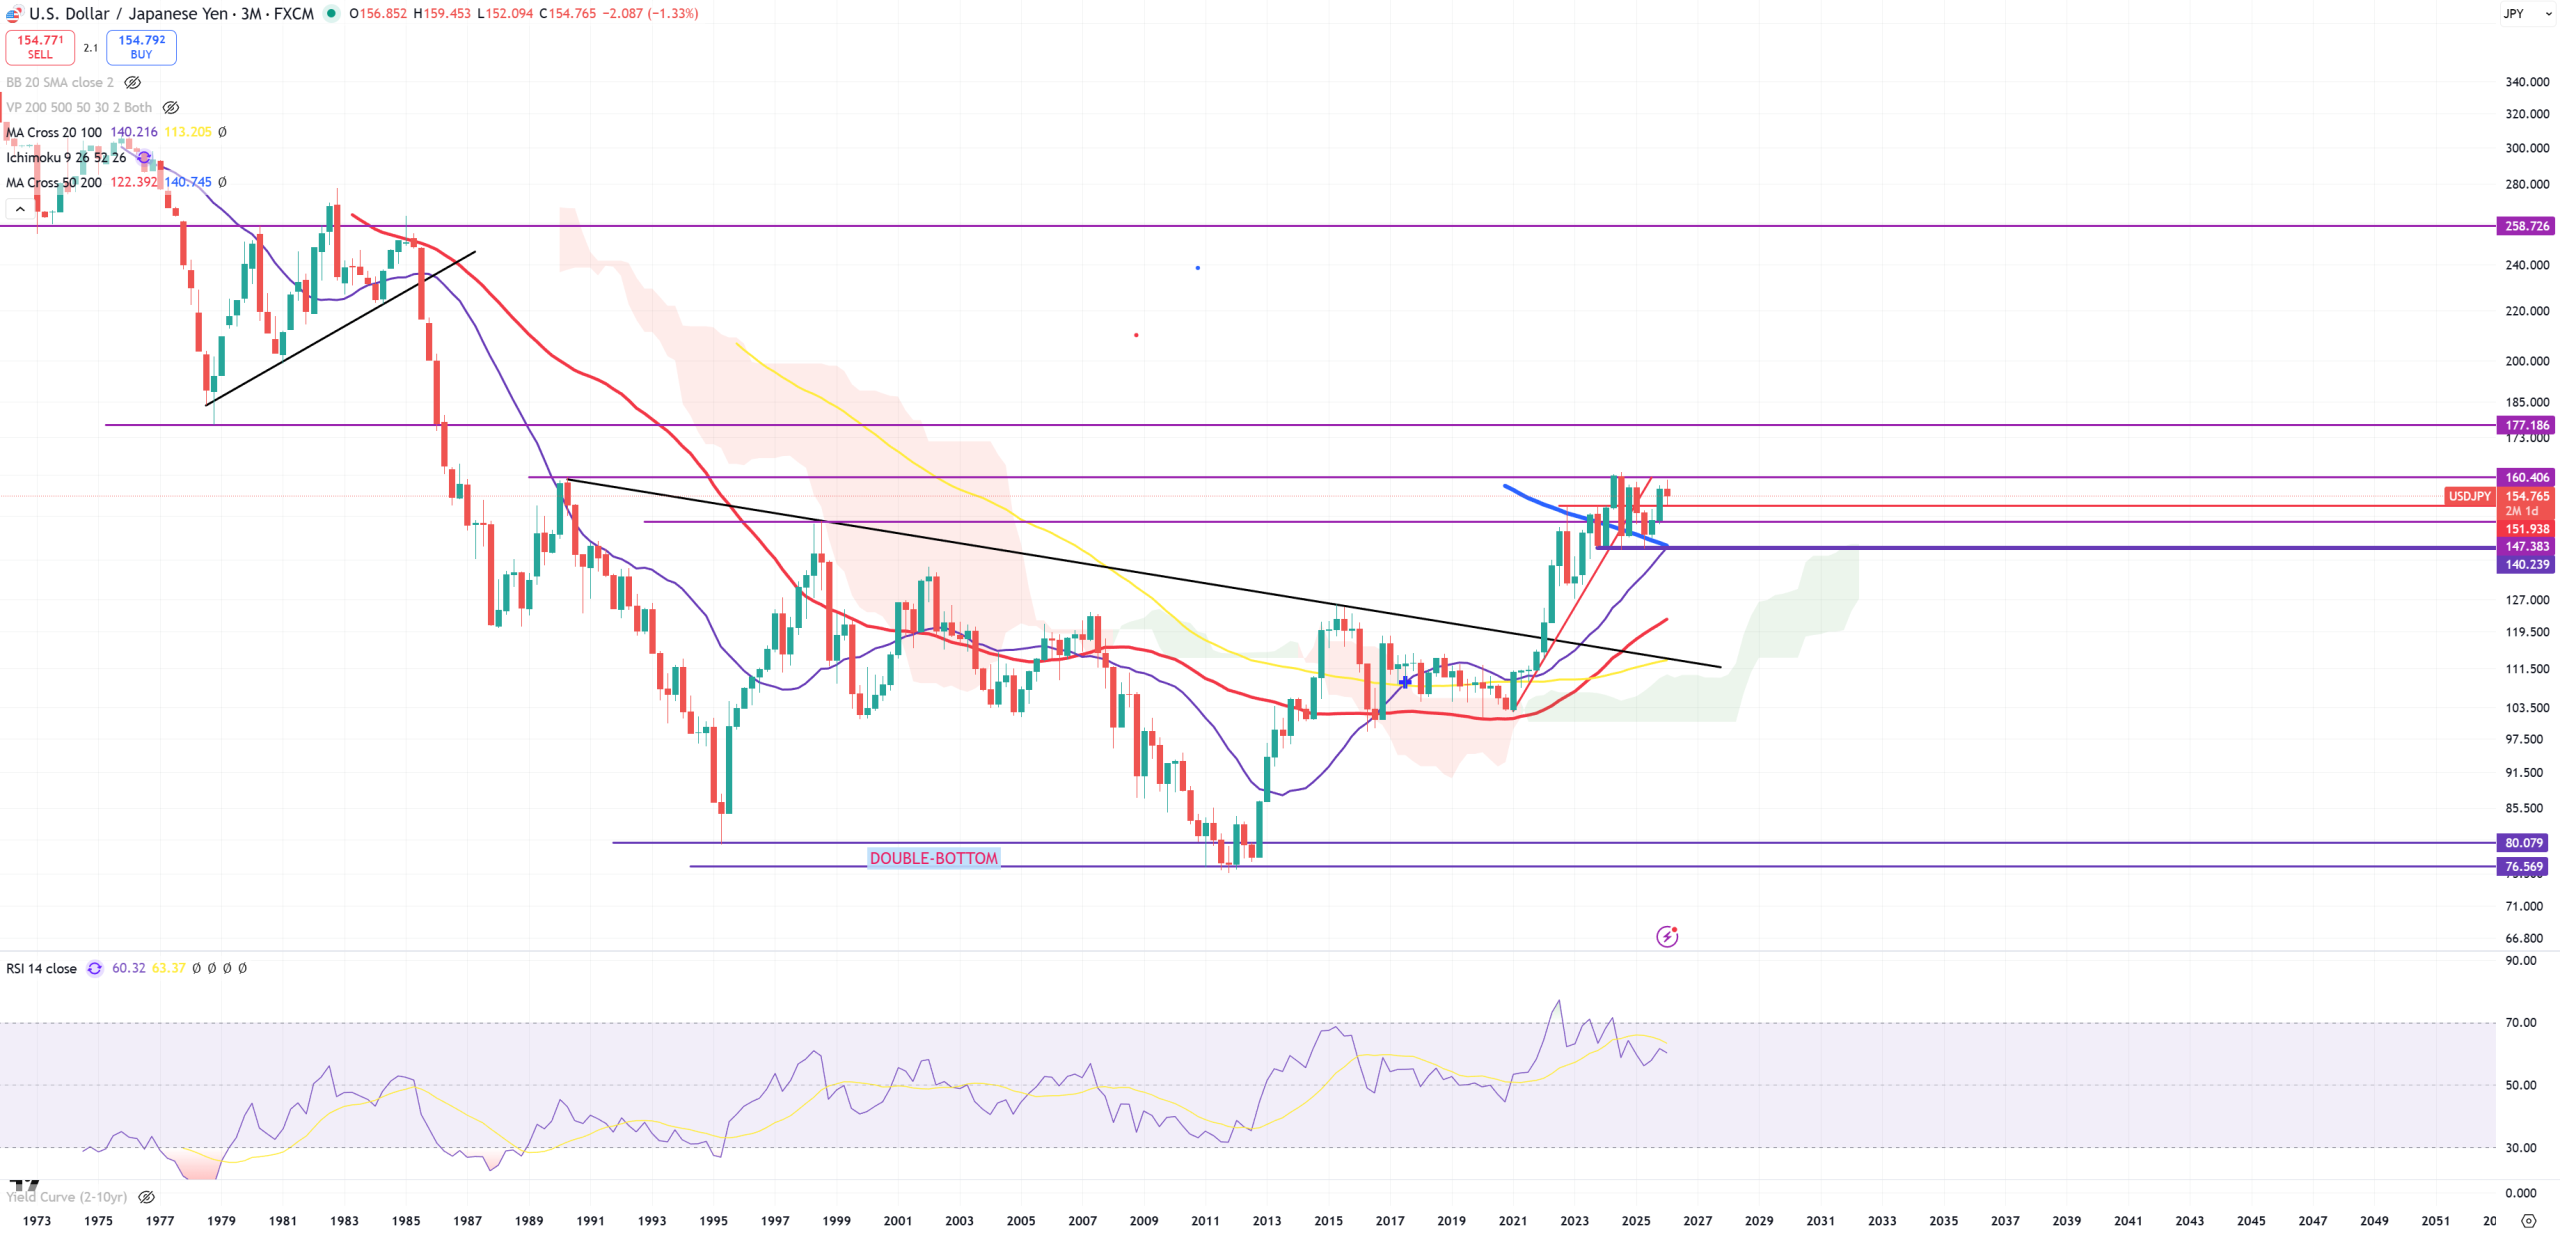
USDJPY – so many people asking about USDJPY – but I have totally no idea. On 3M view we see (3M)MA200 around 140 which is support. Resistance is 160, next 180. Between 140-160 it’s neutral level. Over 180 it’s a path towards 300. And yes I think USDJPY will hit 300, just have no idea if it’ll happen with a correction or without.
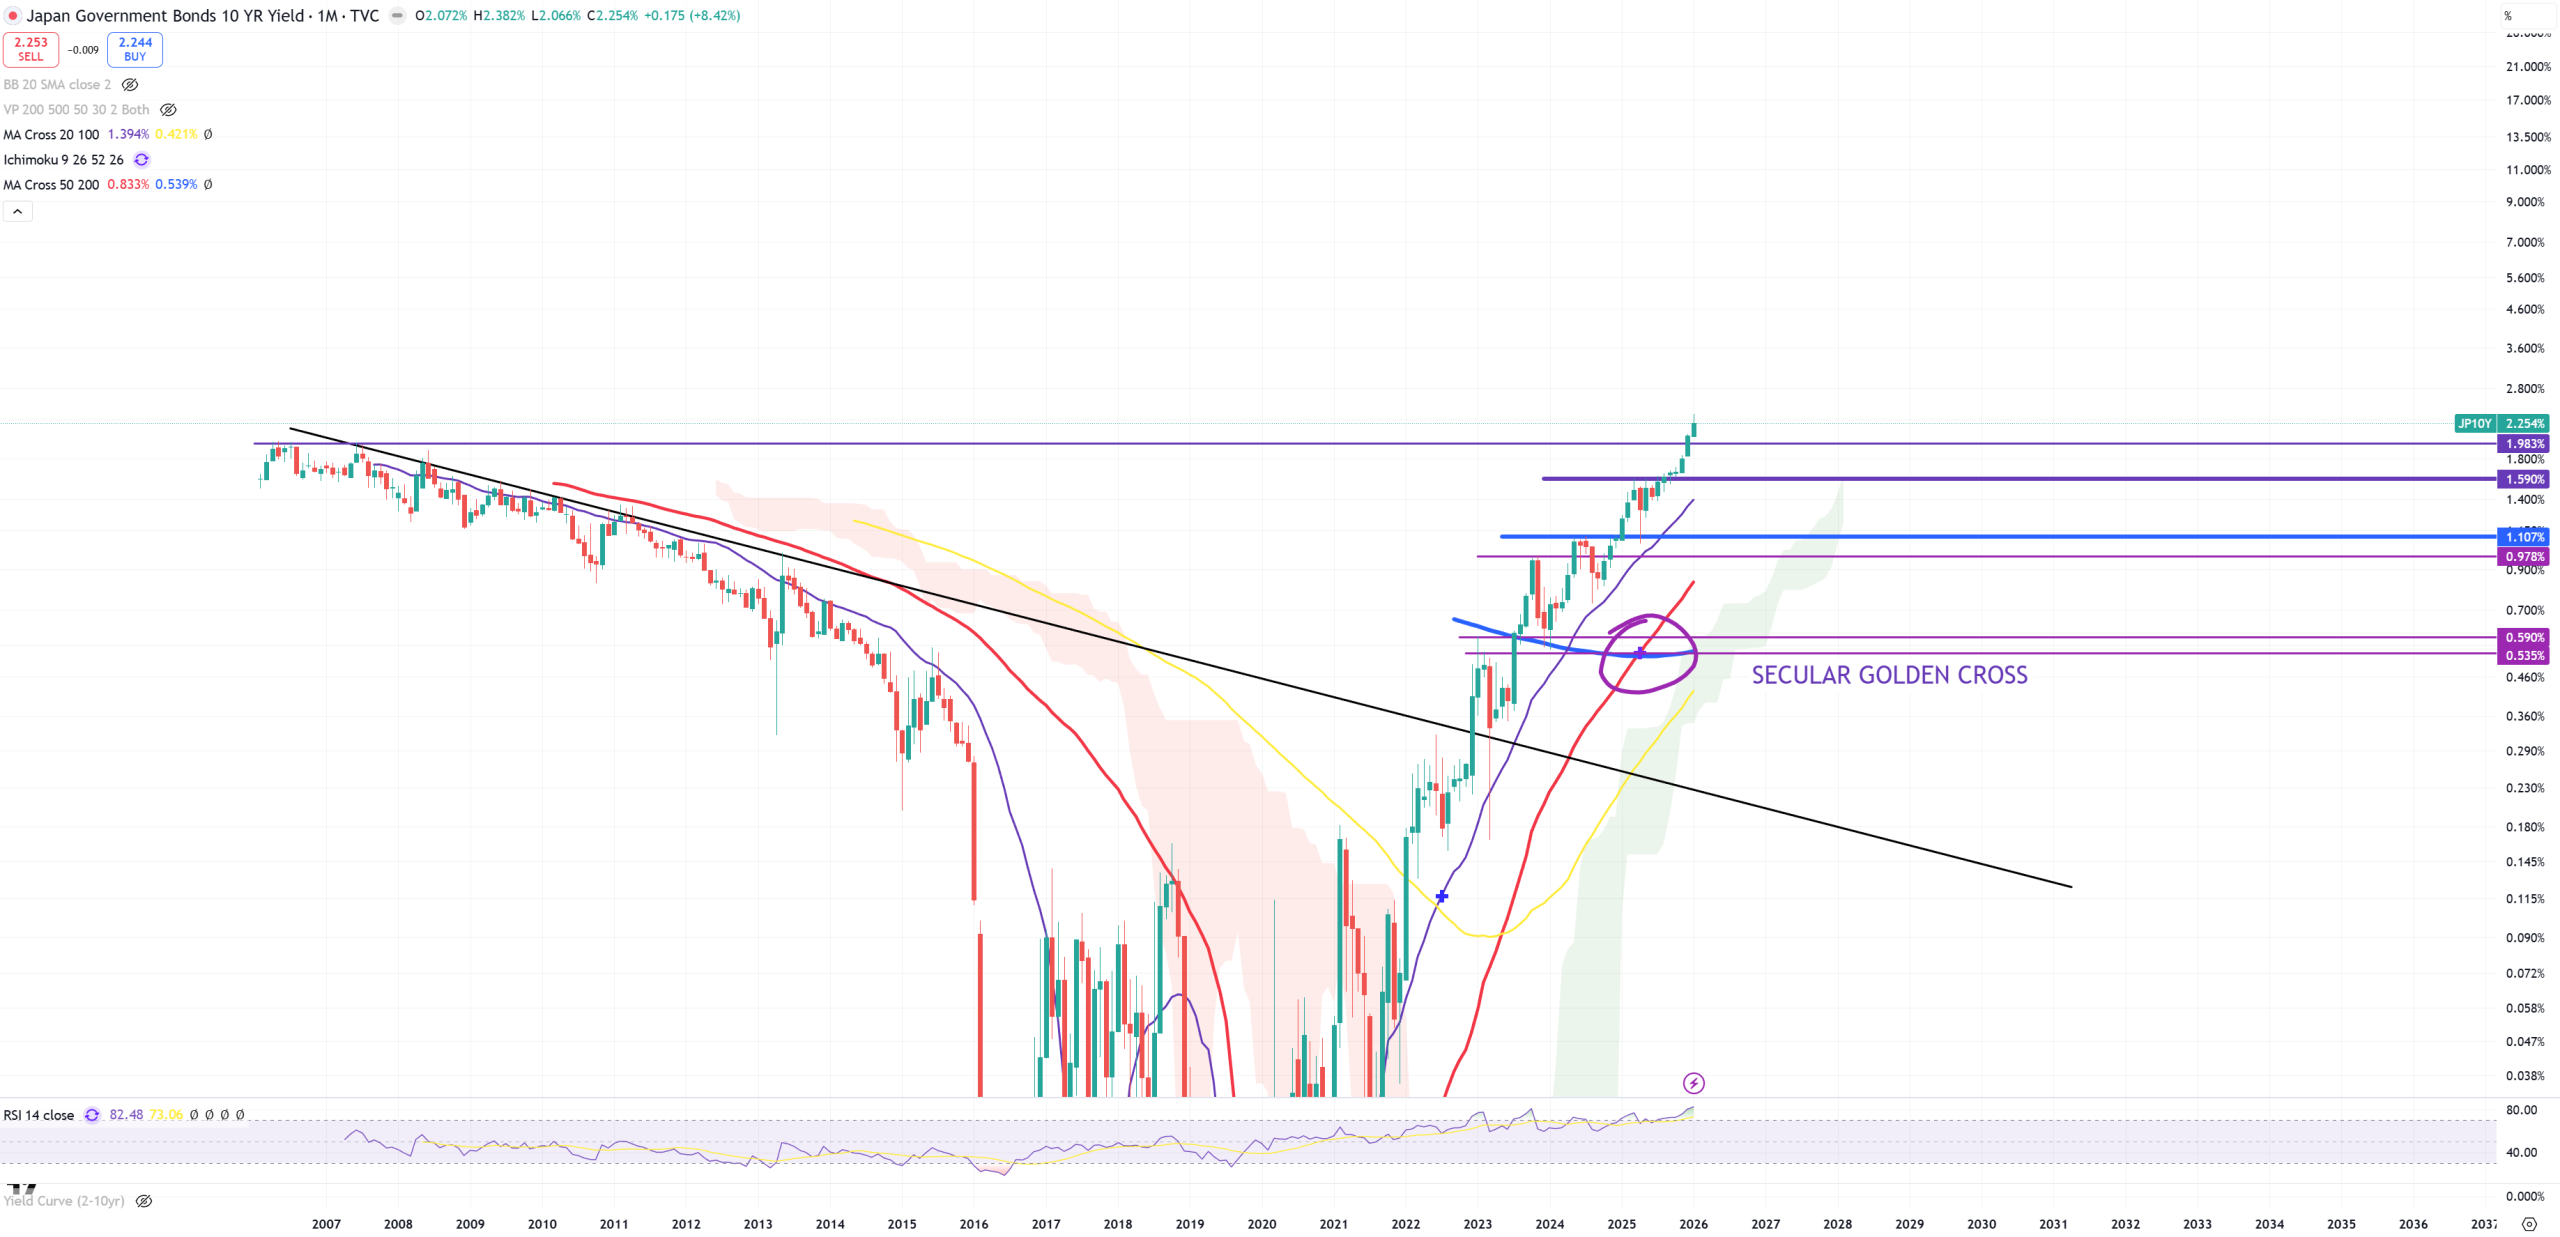
JP10Y – we need to see JP10Y – in general if we take a look at Japanese yields all look the same … “Broken”
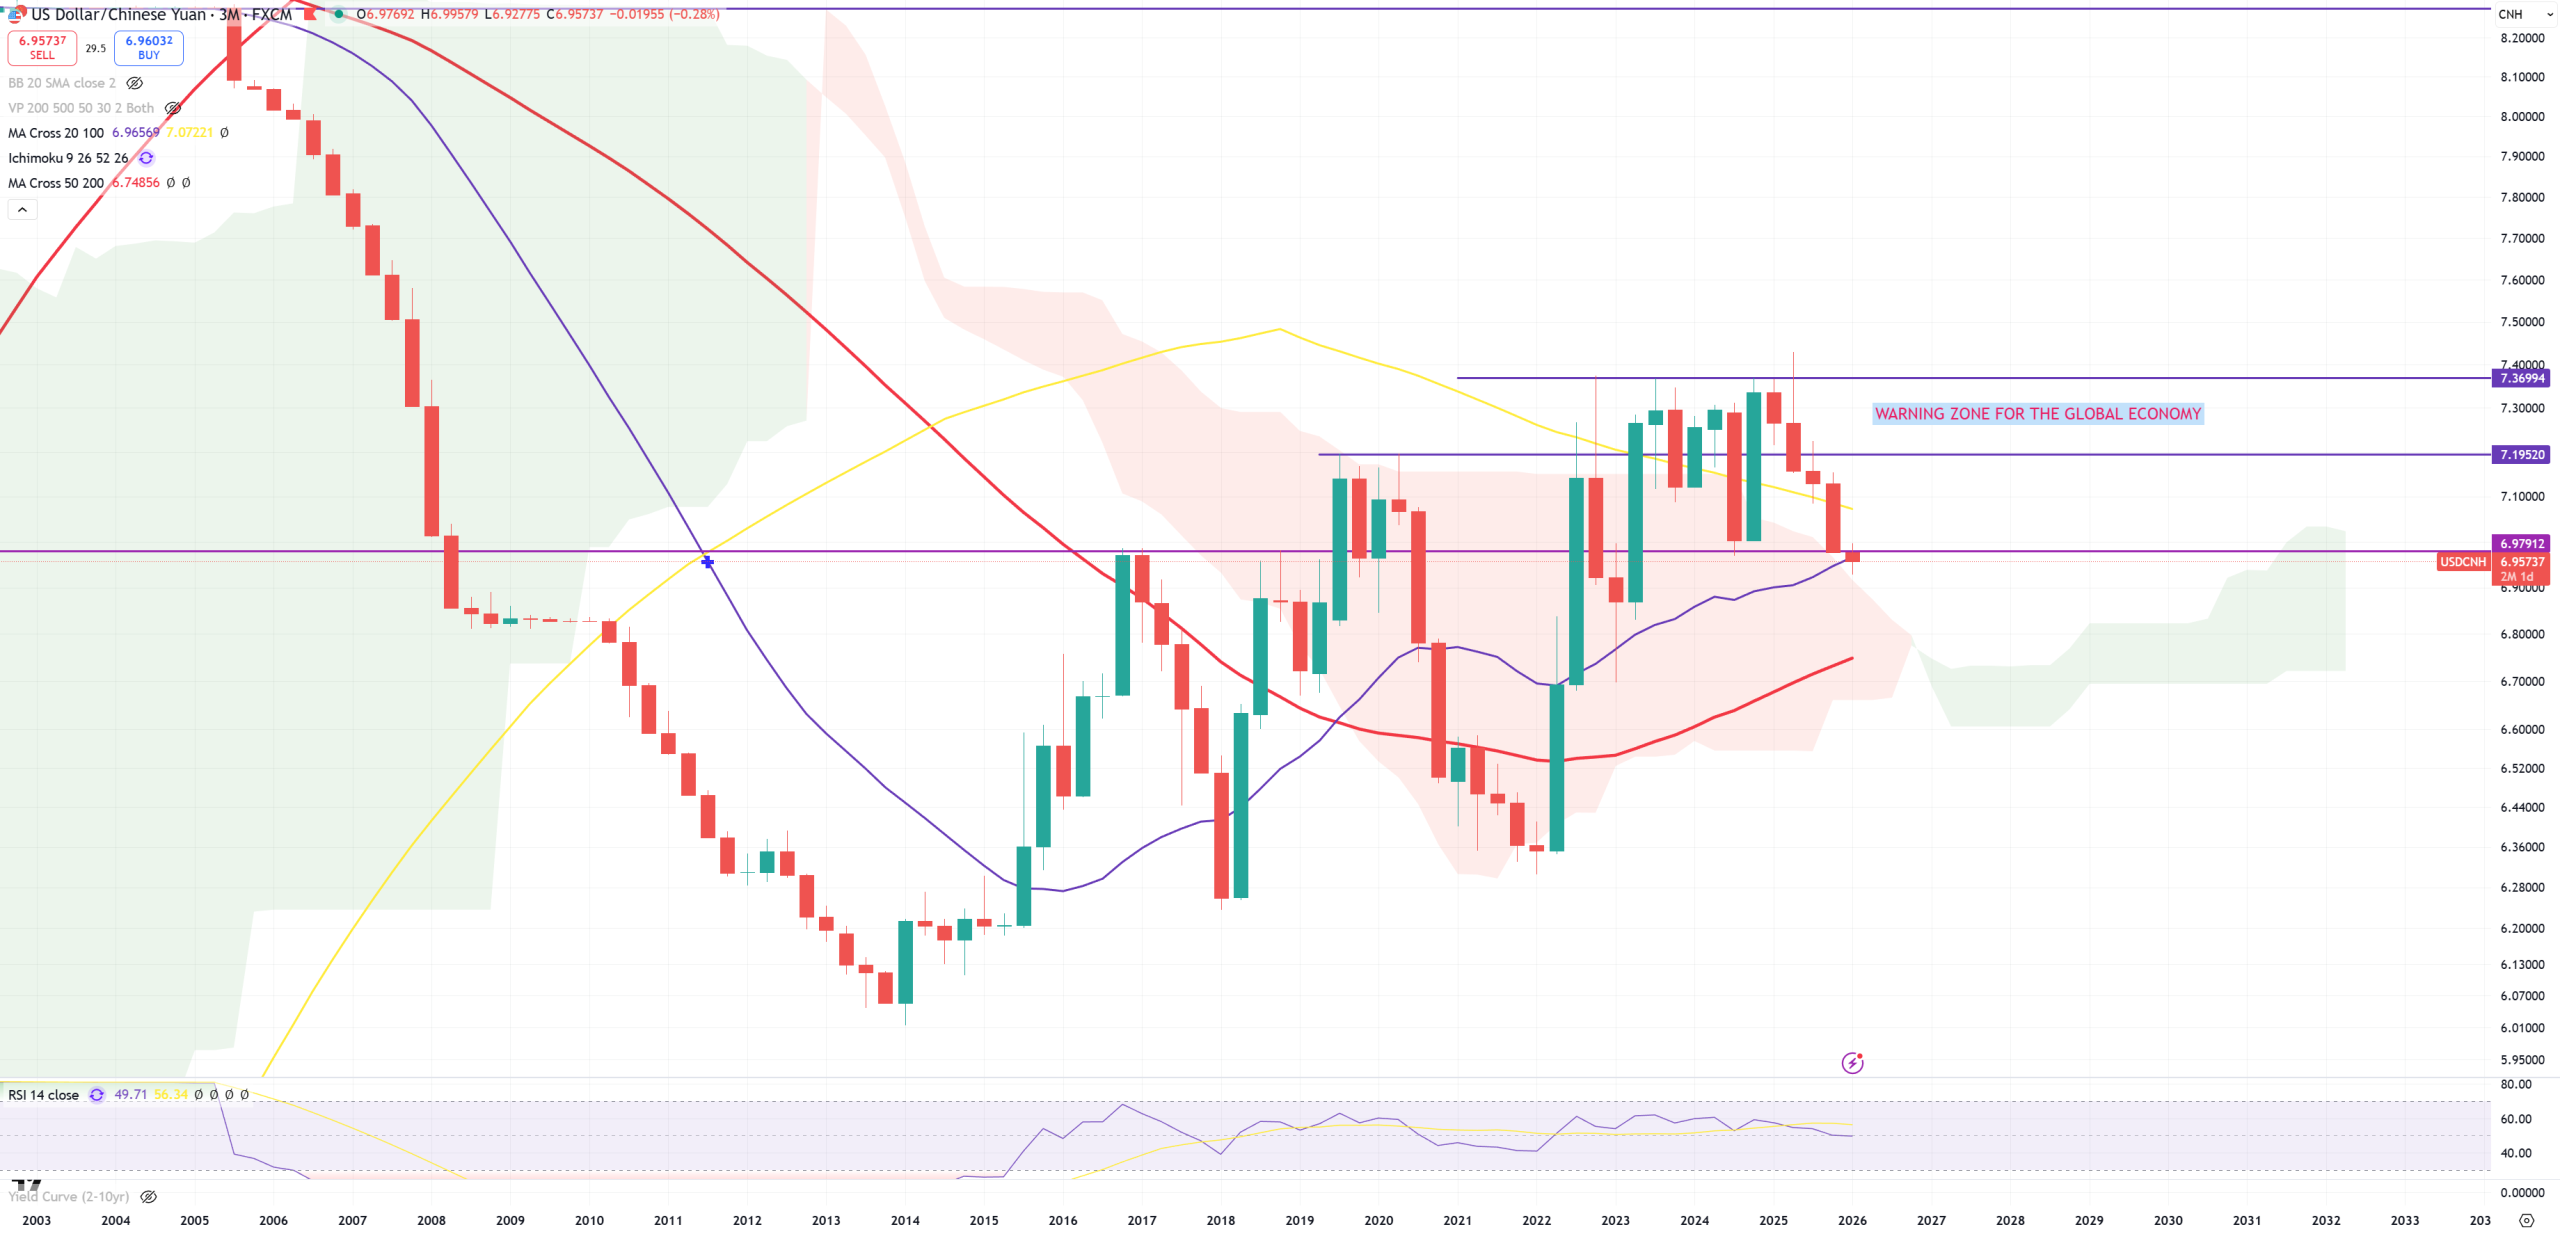
USDCNH – the power of the $$$ is the weakness of the Yuan, once USDCNH starts going up, $$$ is going stronger. This is 3M view and this 6.97 is IMO my last level, just like DXY=96.4. I still think people are on a wrong boat with just a bear market rally on China. I might be wrong, but so far those levels were not broken as long as DXY is > 96.4.
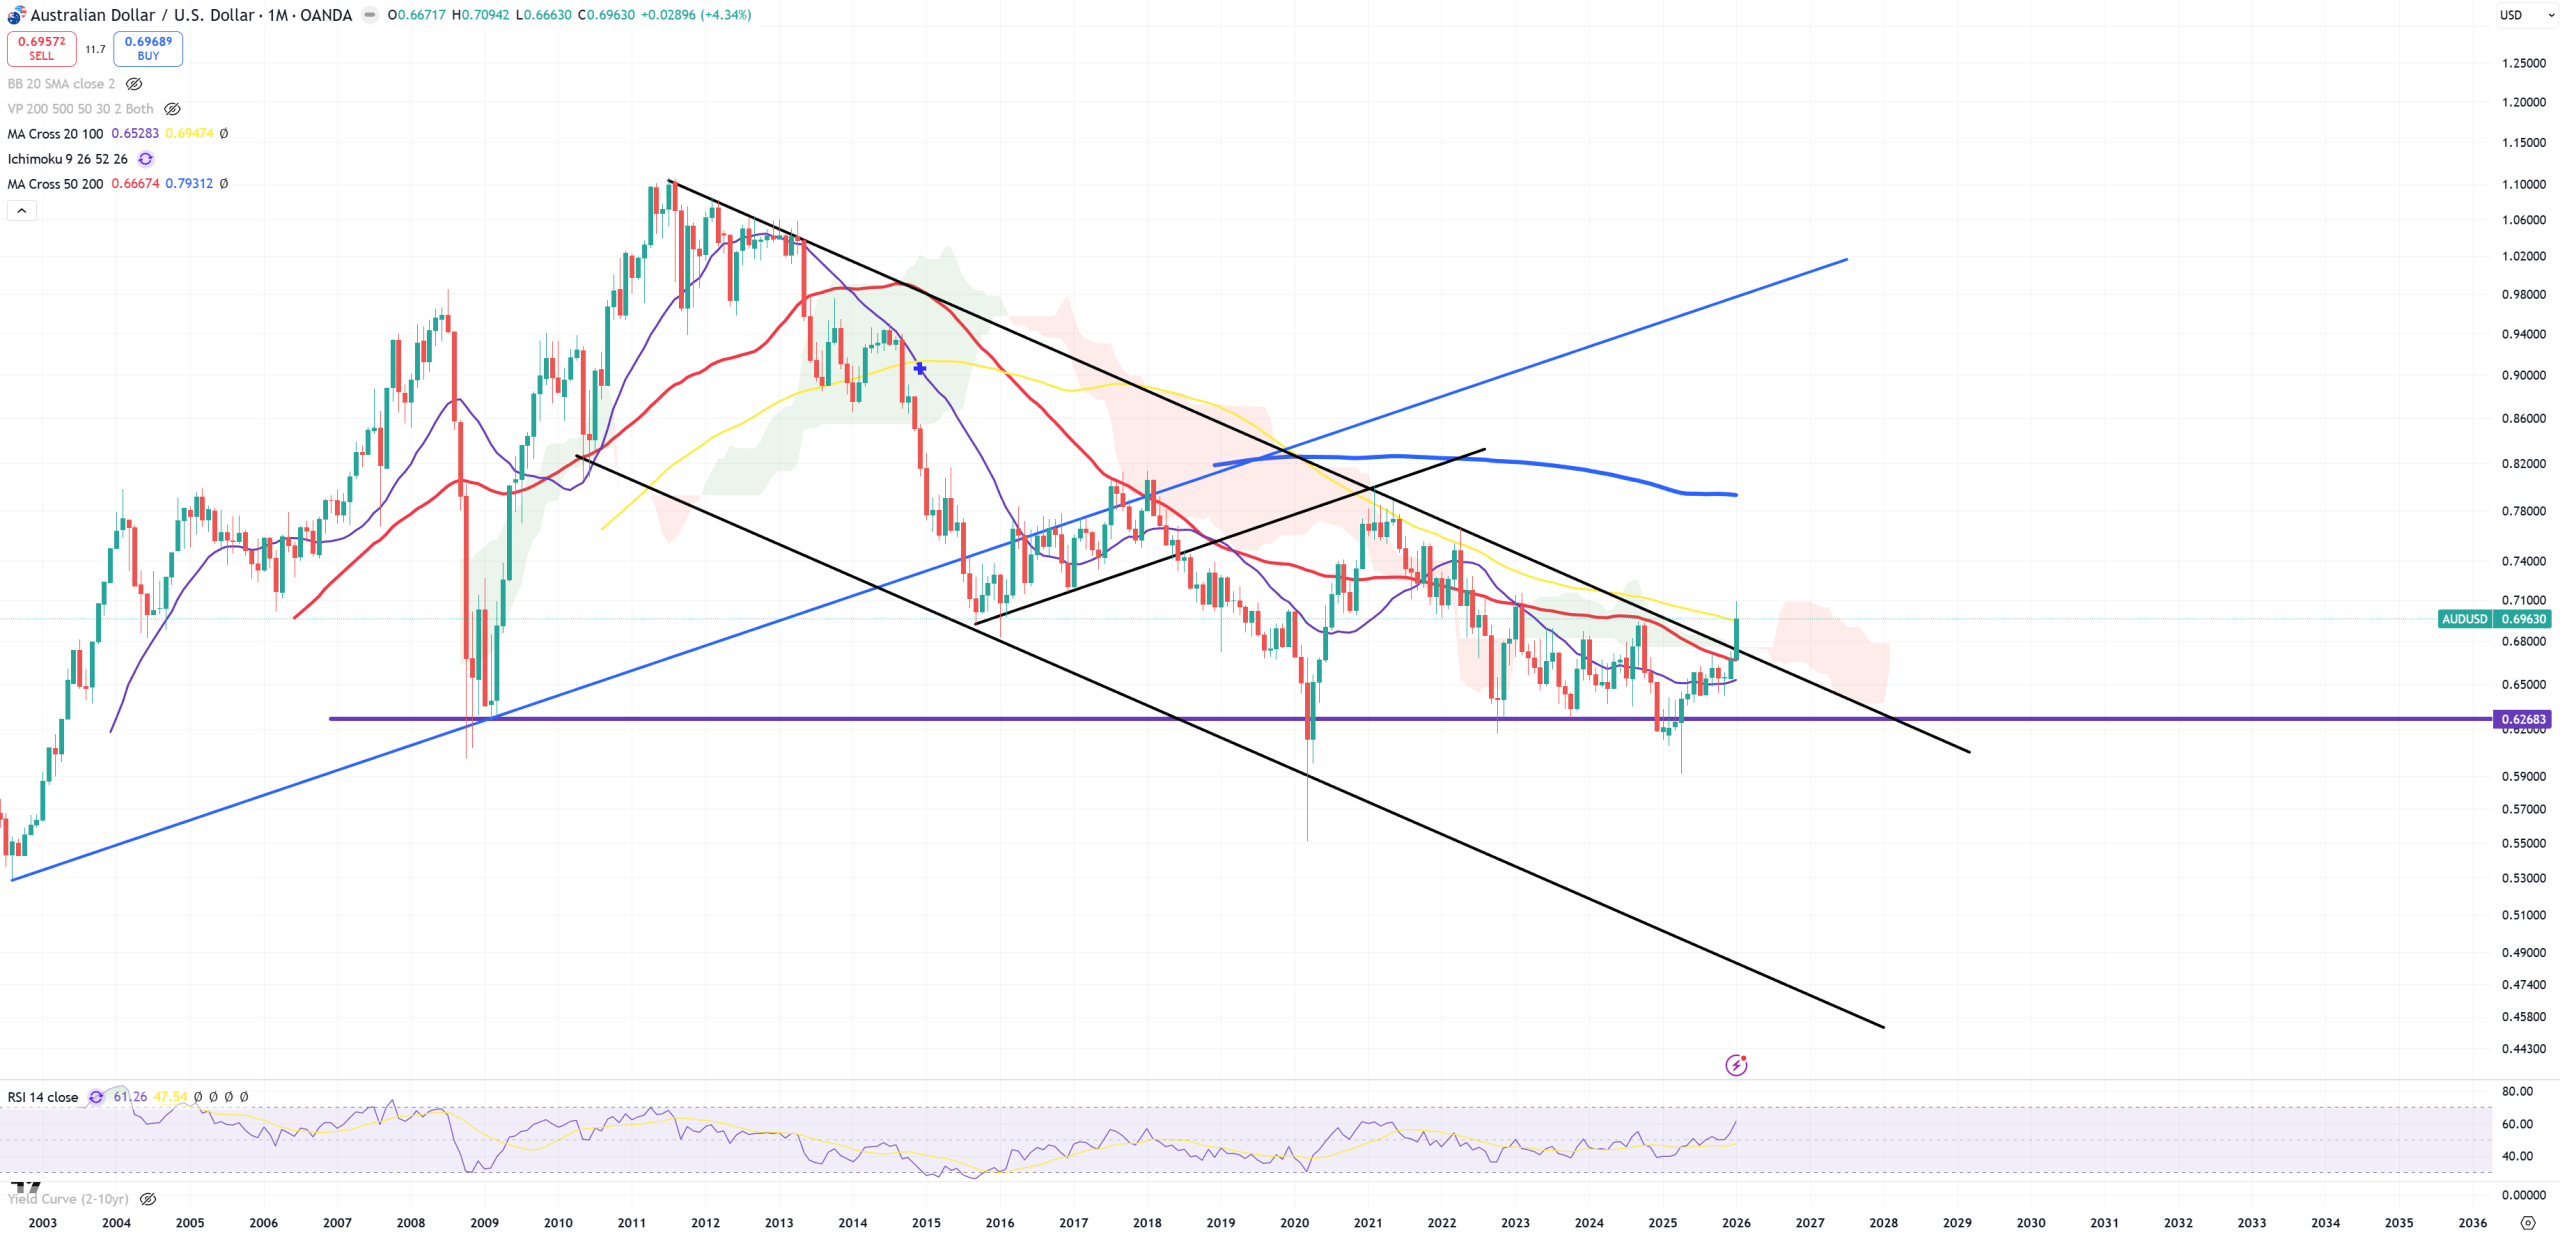
AUDUSD – it’s a derivative of USDCNH and it’s trying to break just like USDCNH tries to break 6.97 level. You see market doesn’t want to make it easy. As AUDUSD is a pair from AUDJPY which hit 3xTOP you need to see this AUDUSD pair … saying strong … CRASHED.
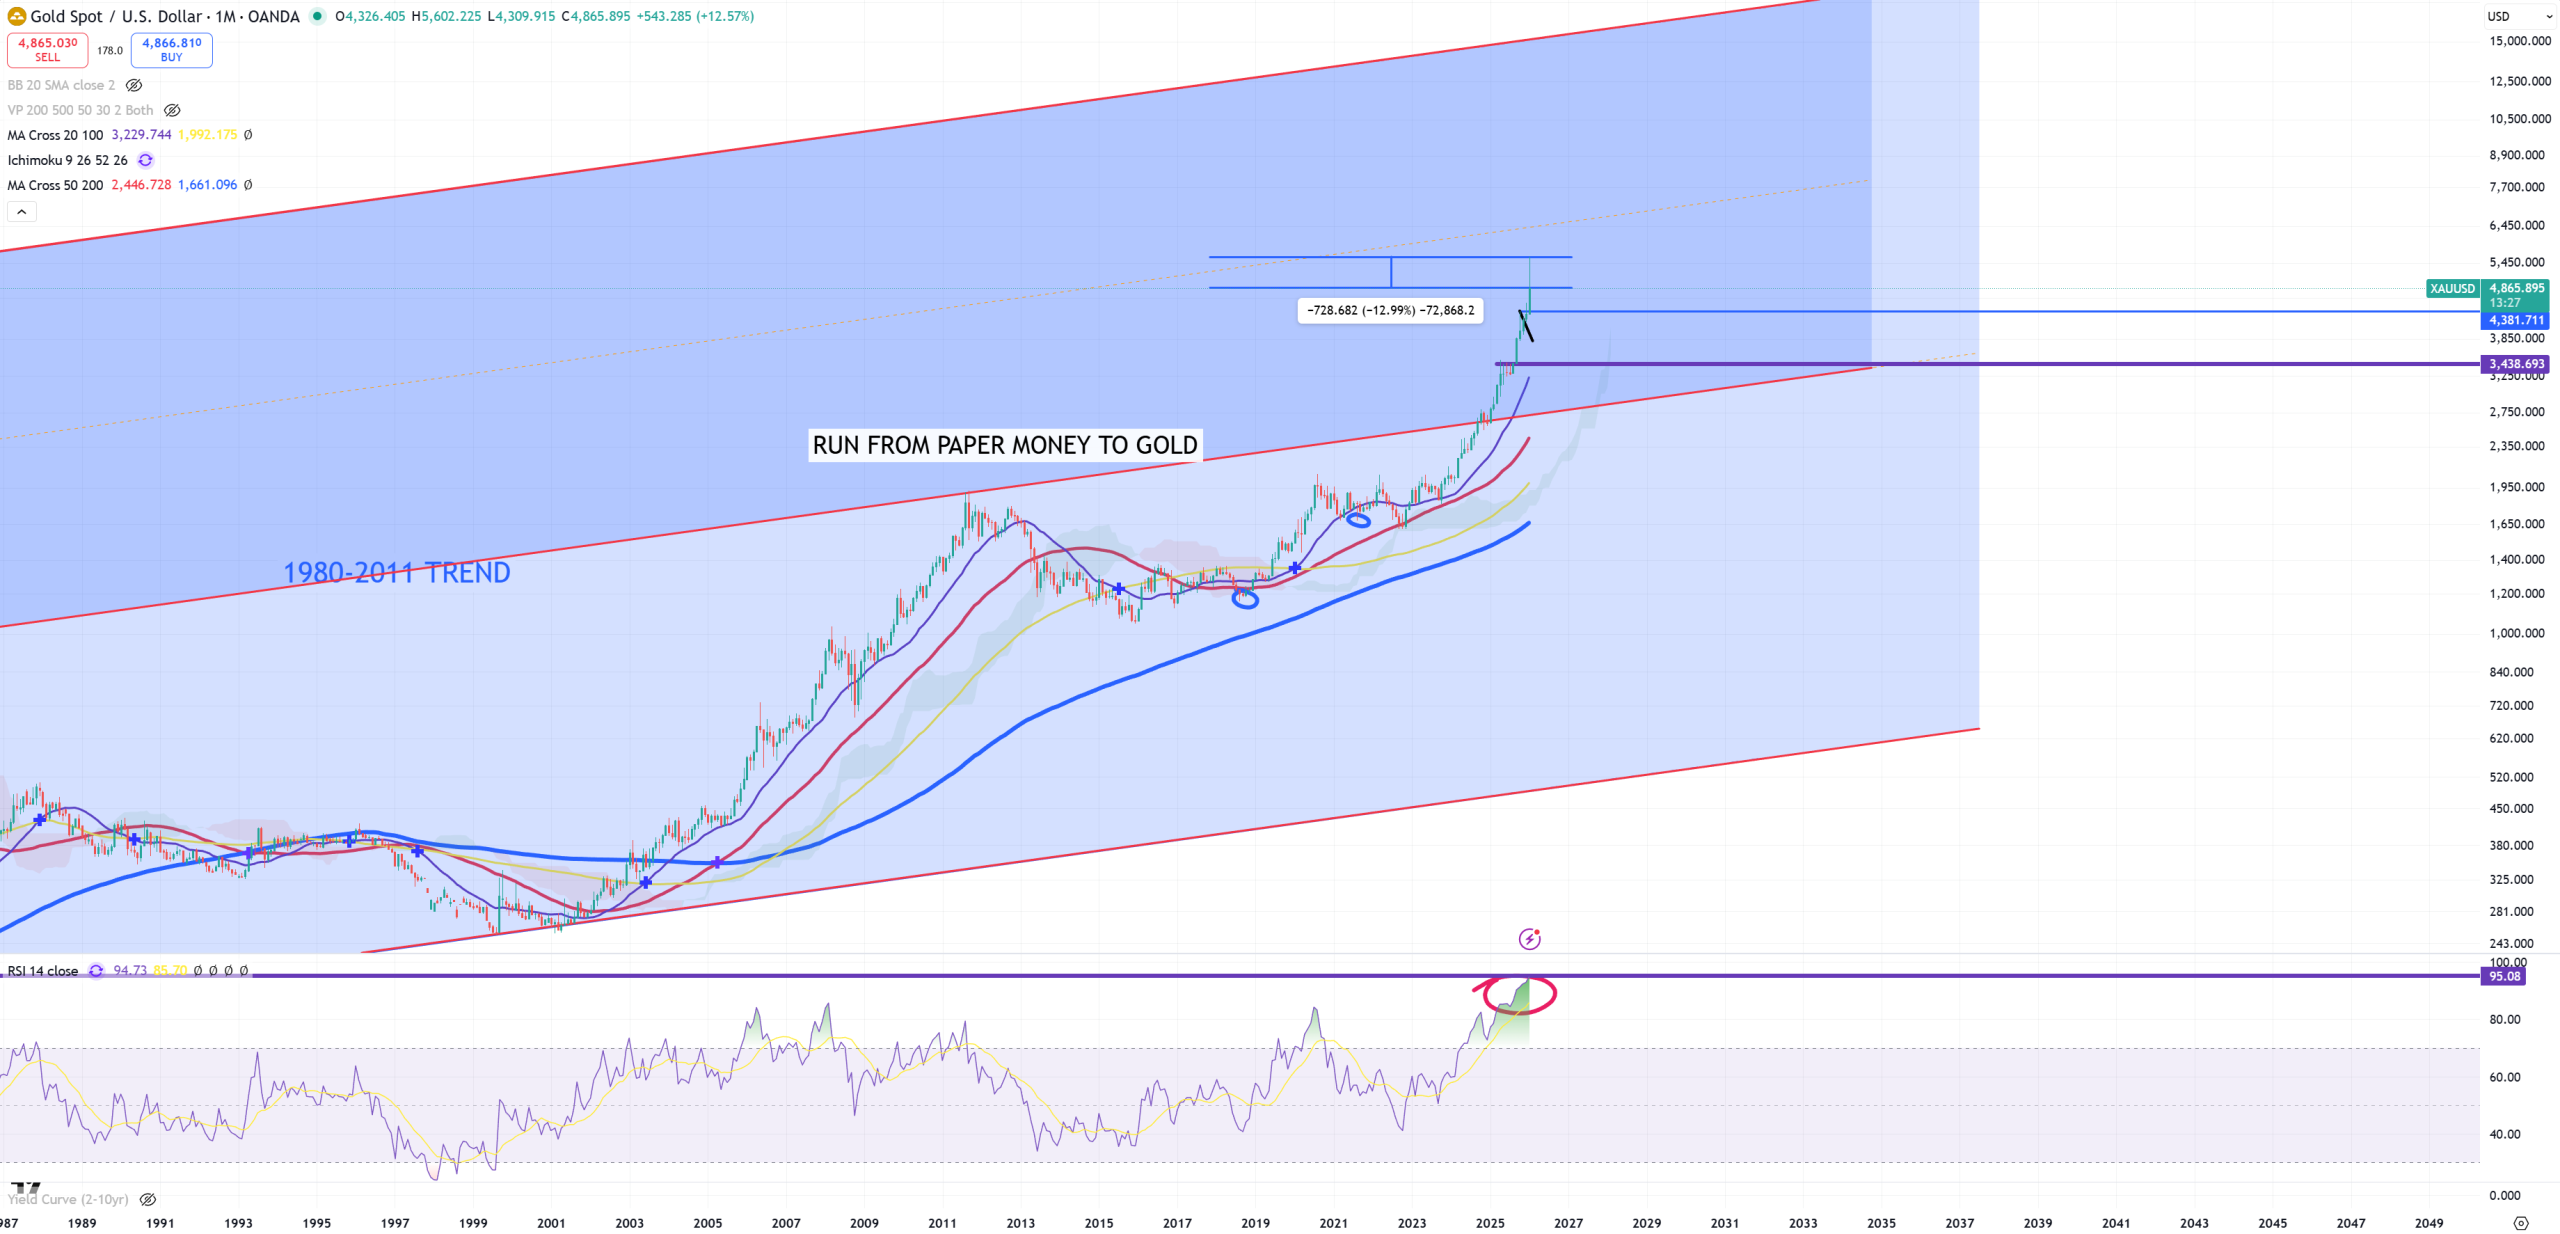
GOLD – nothing special here. First -13% correction in the parabolic run, if you consider how low SPX/GOLD and DJI/GOLD targets are you shouldn’t even worry
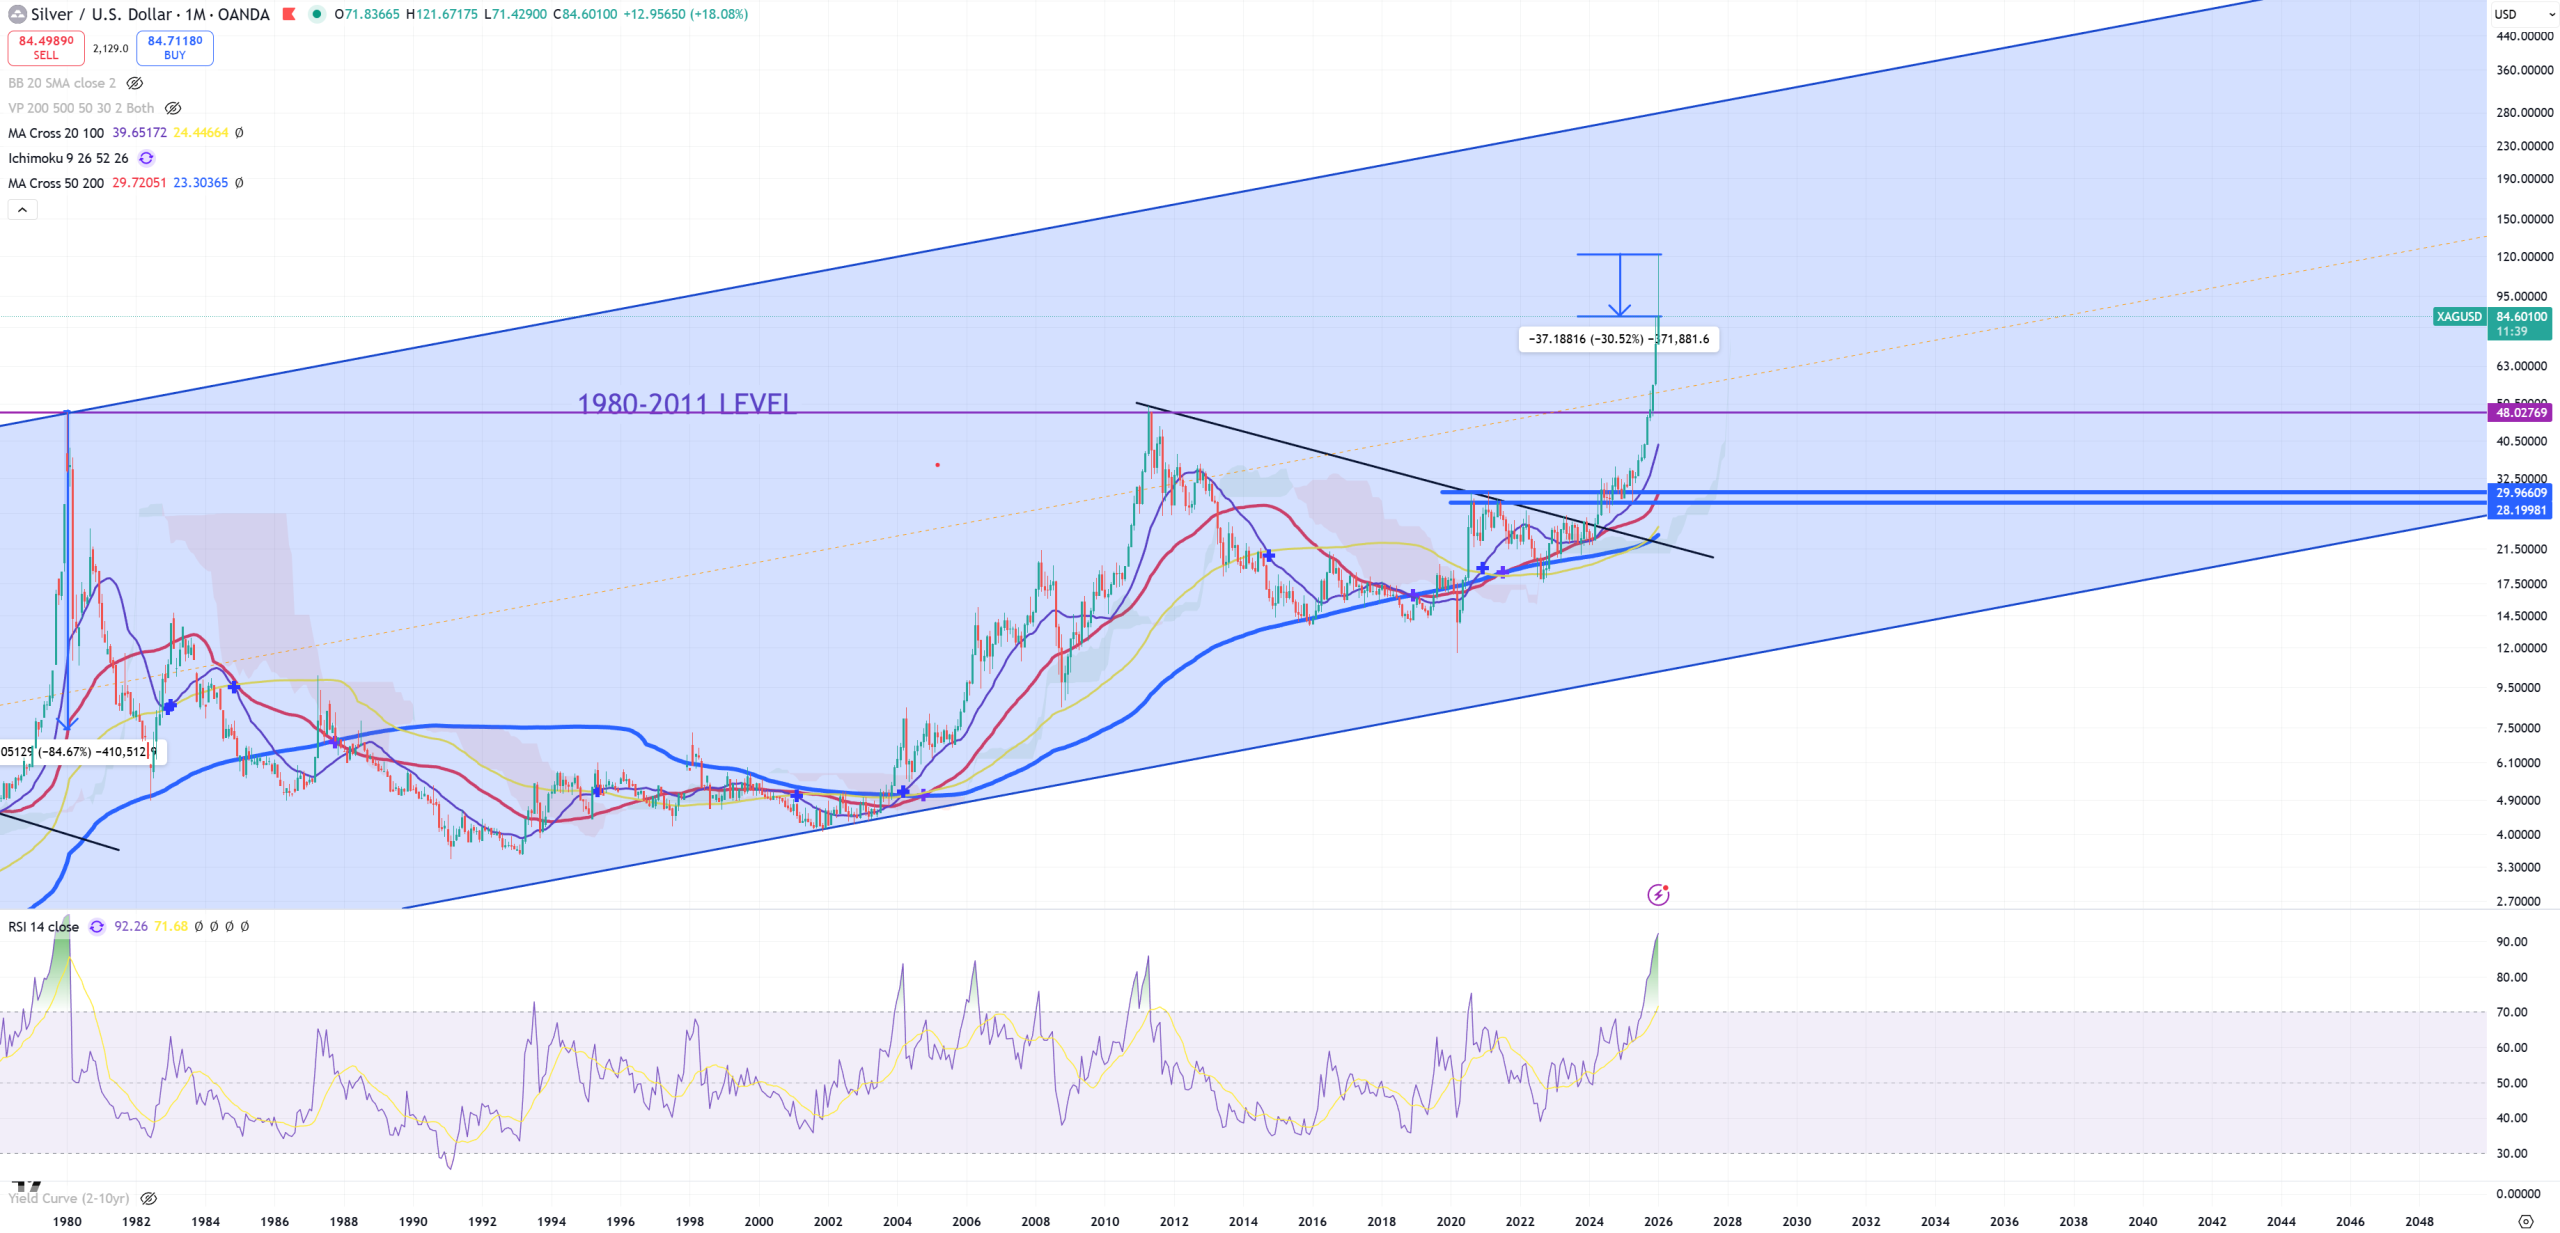
SILVER – it’s way more volatile. Last month was best ups since 2008 and best downs since 2008. I’d say it again. It’s possible to retest 50$ level, but once it’ll be done (mostly by economic crash) the wave should take us towards 200-300$ having in mind DJI/SILVER and SPX/SILVER levels.
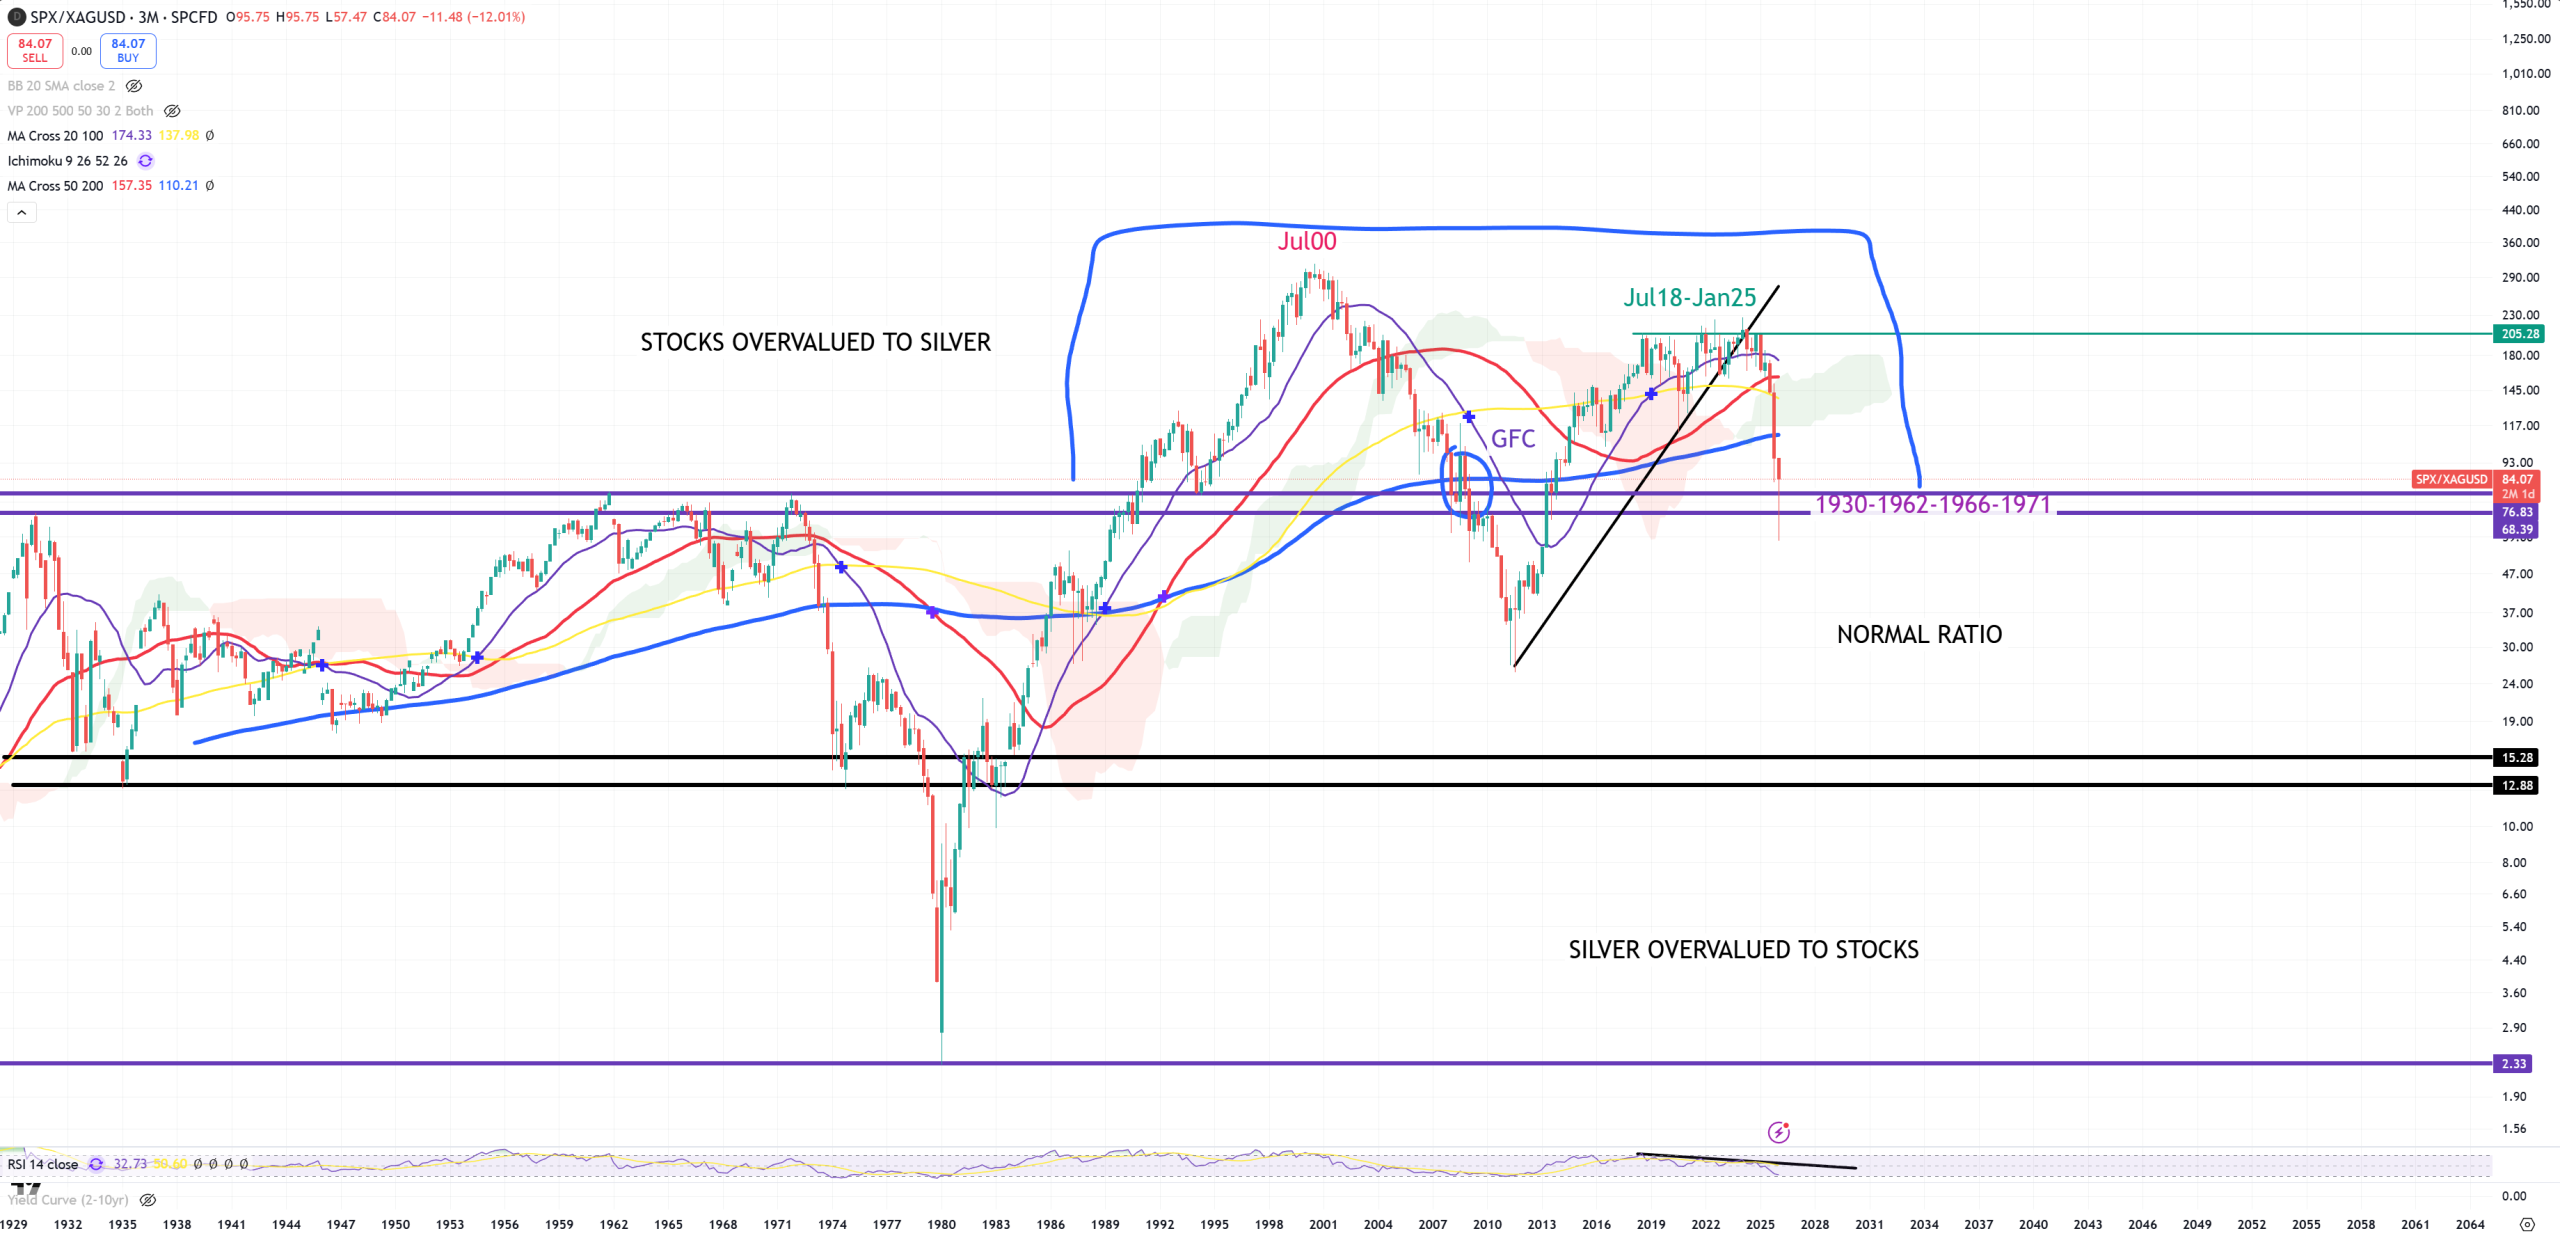
SPX/SILVER – This is 3M view. We have a massive support still now. Last time we broke blue (3M)MA200 + this support we had GFC. Have in mind being above 1930-1962-1966-1971 level is considered as STOCKS overvalued to SILVER. Last time during this transition around blue (3M)MA200 and breaking this support 1930-1962-1966-1971 we had GFC. It’s important technical junction.
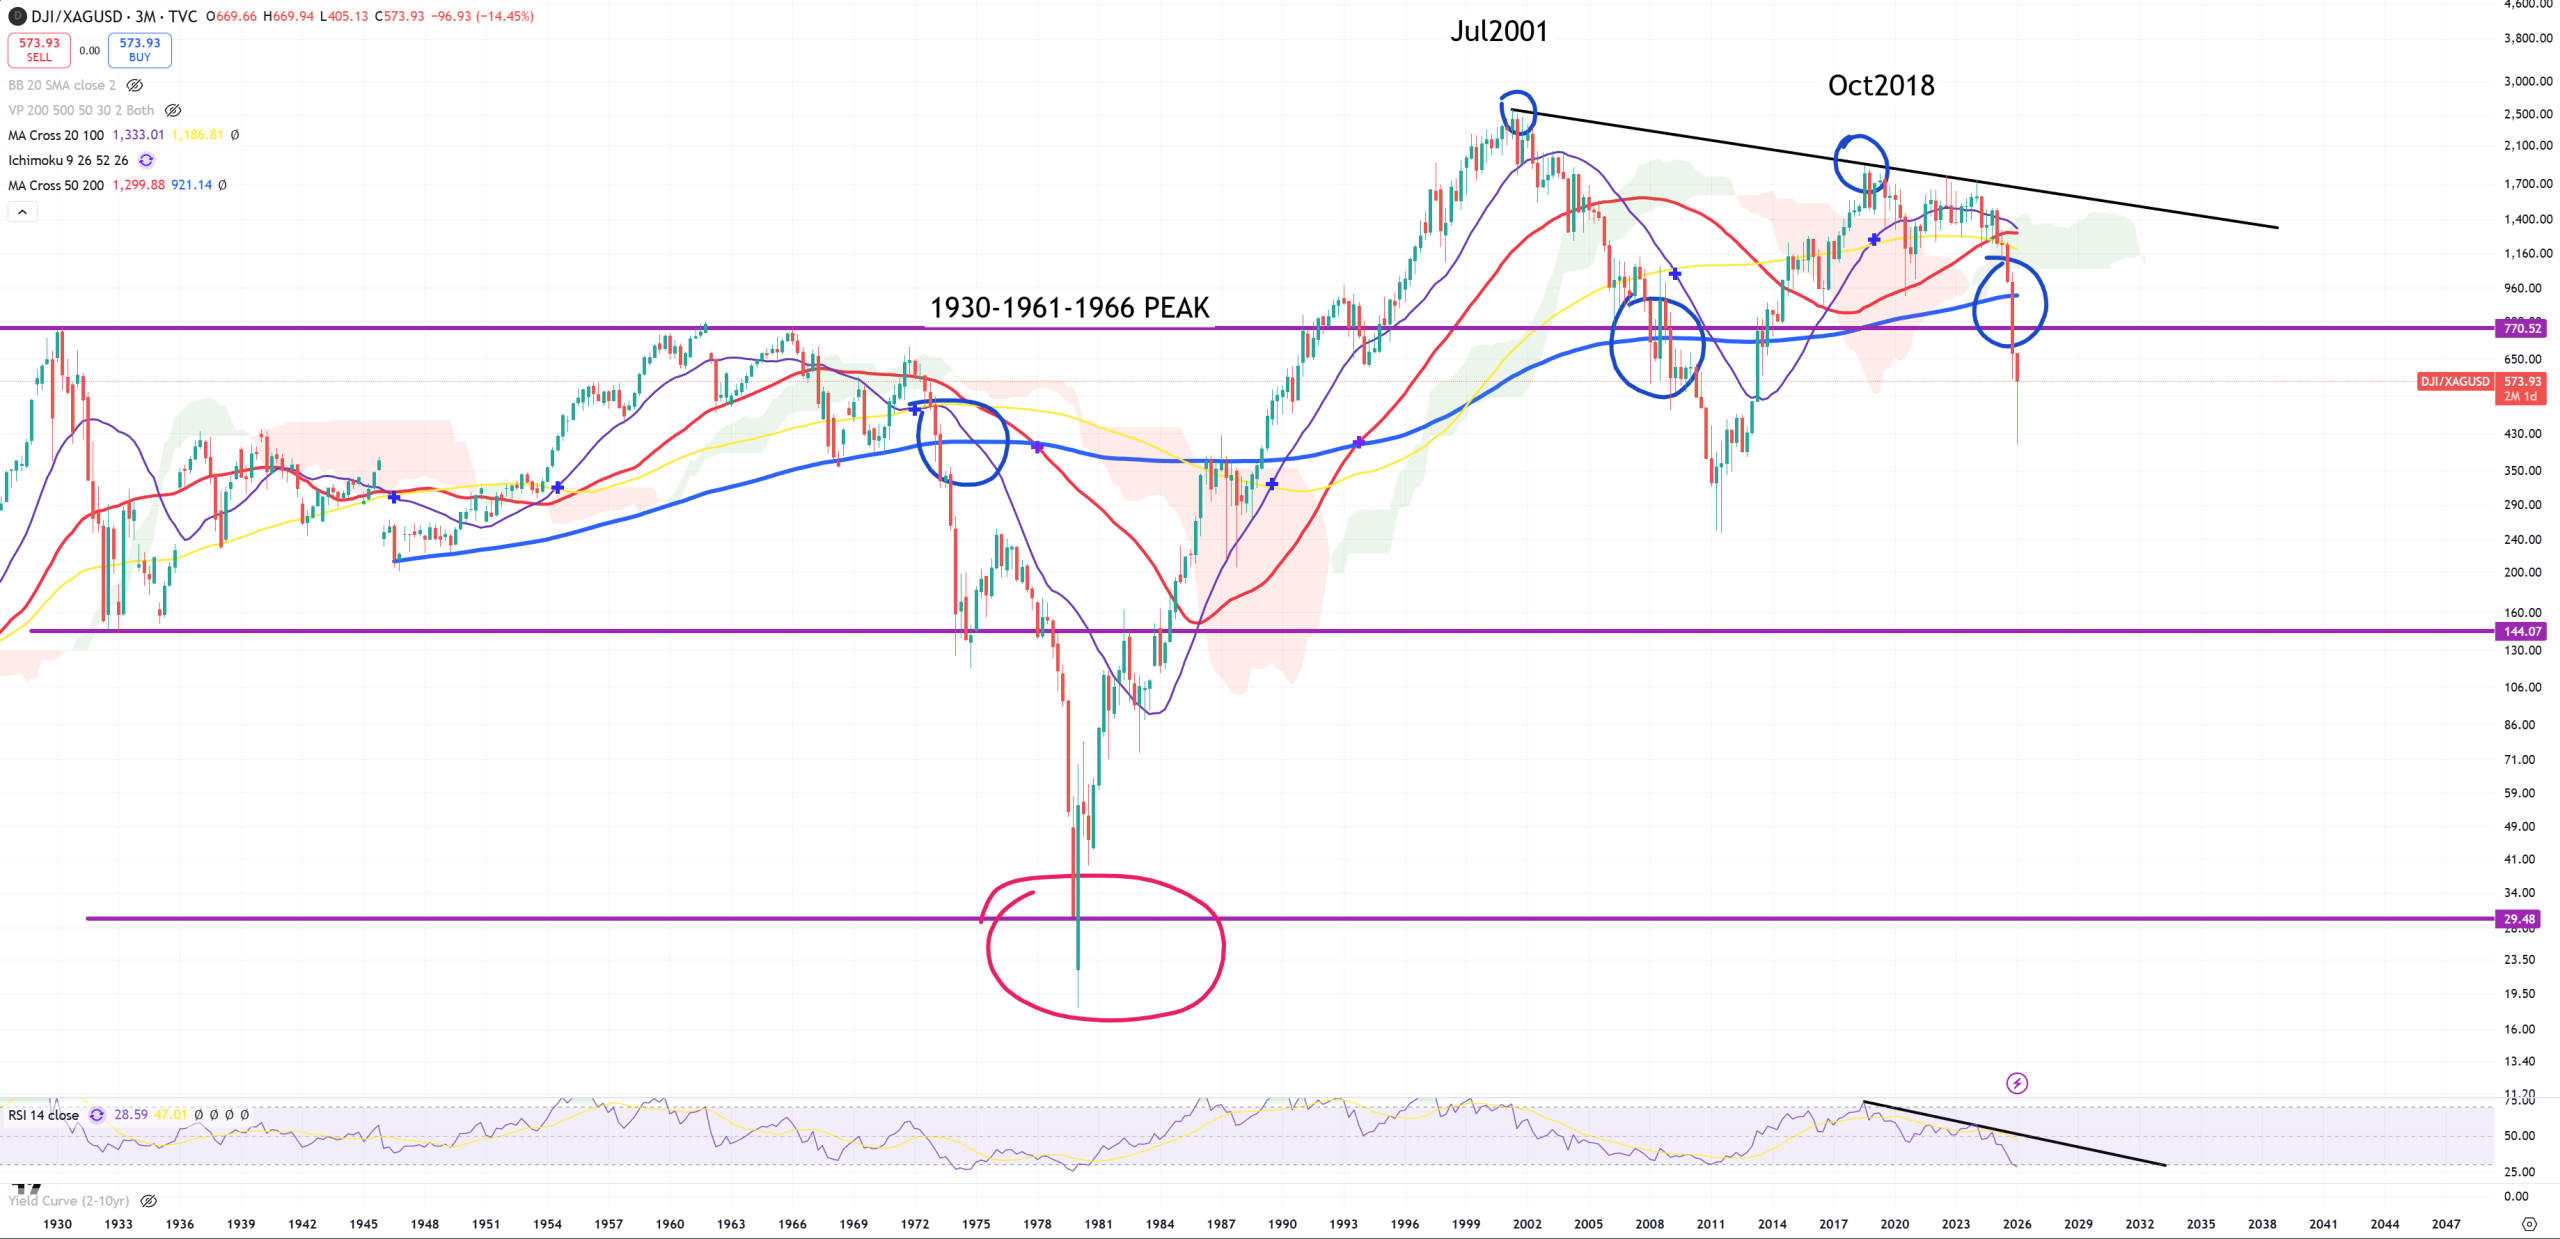
DJI/SILVER – candle here is nowhere. The gap level between DJI/GOLD & SPX/GOLD is 3 quarters looking on (3M)MA200 break. Not in DJI/SILVER vs SPX/SILVER. Here (3M)MA200 has gone the same time : 4Q25. Last break was during GFC.
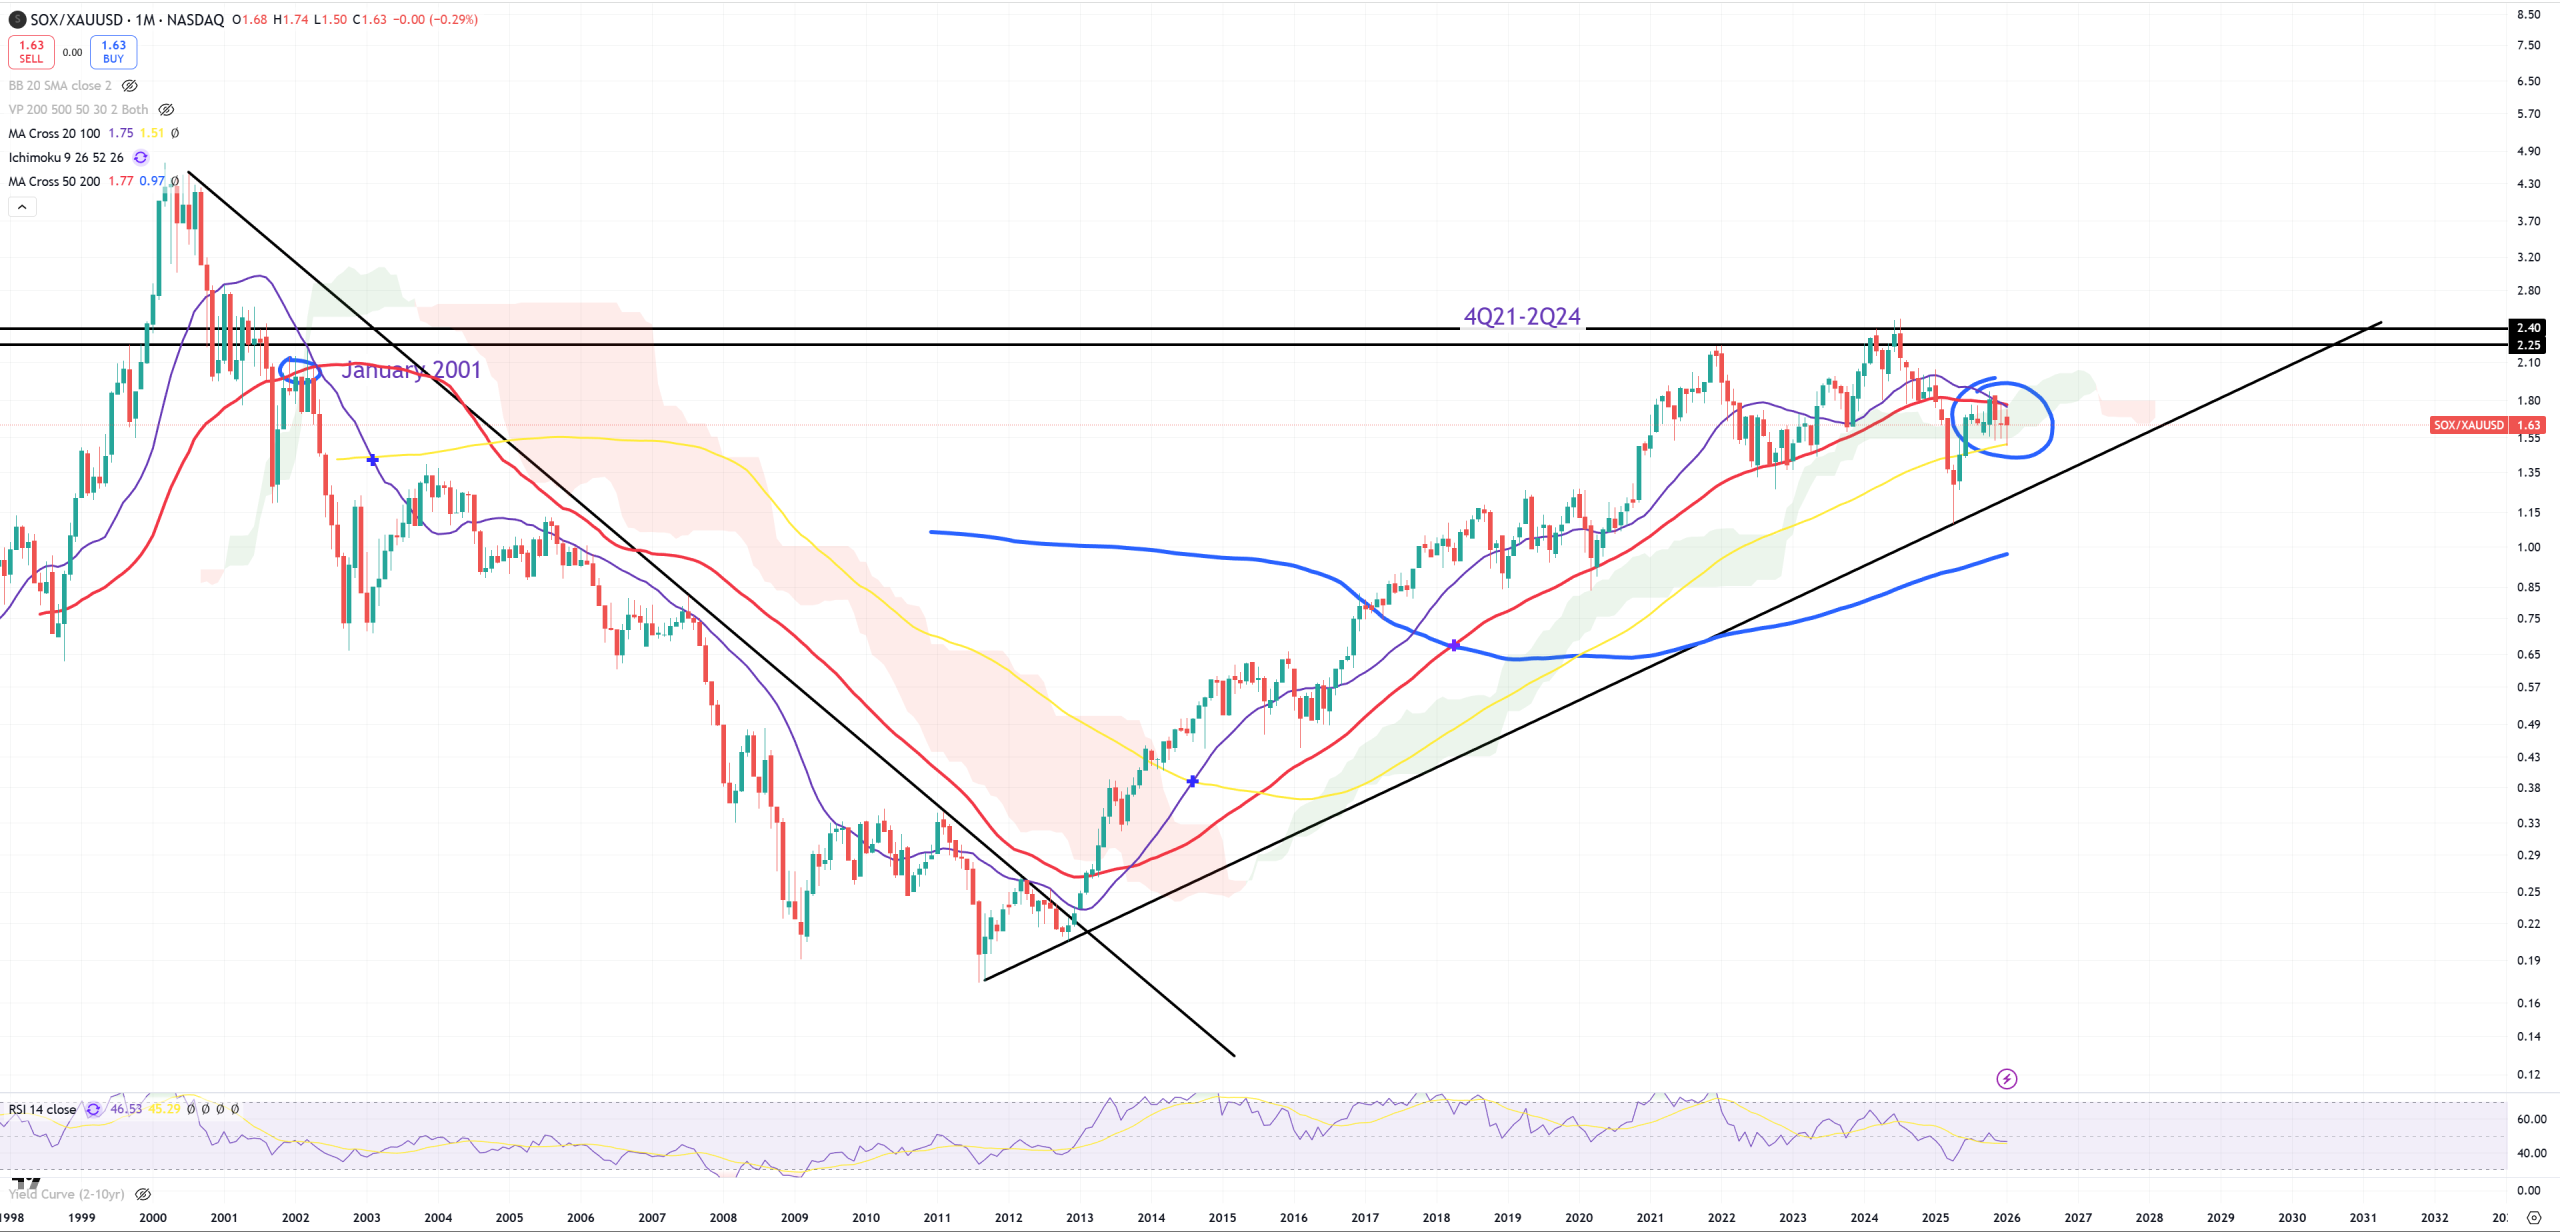
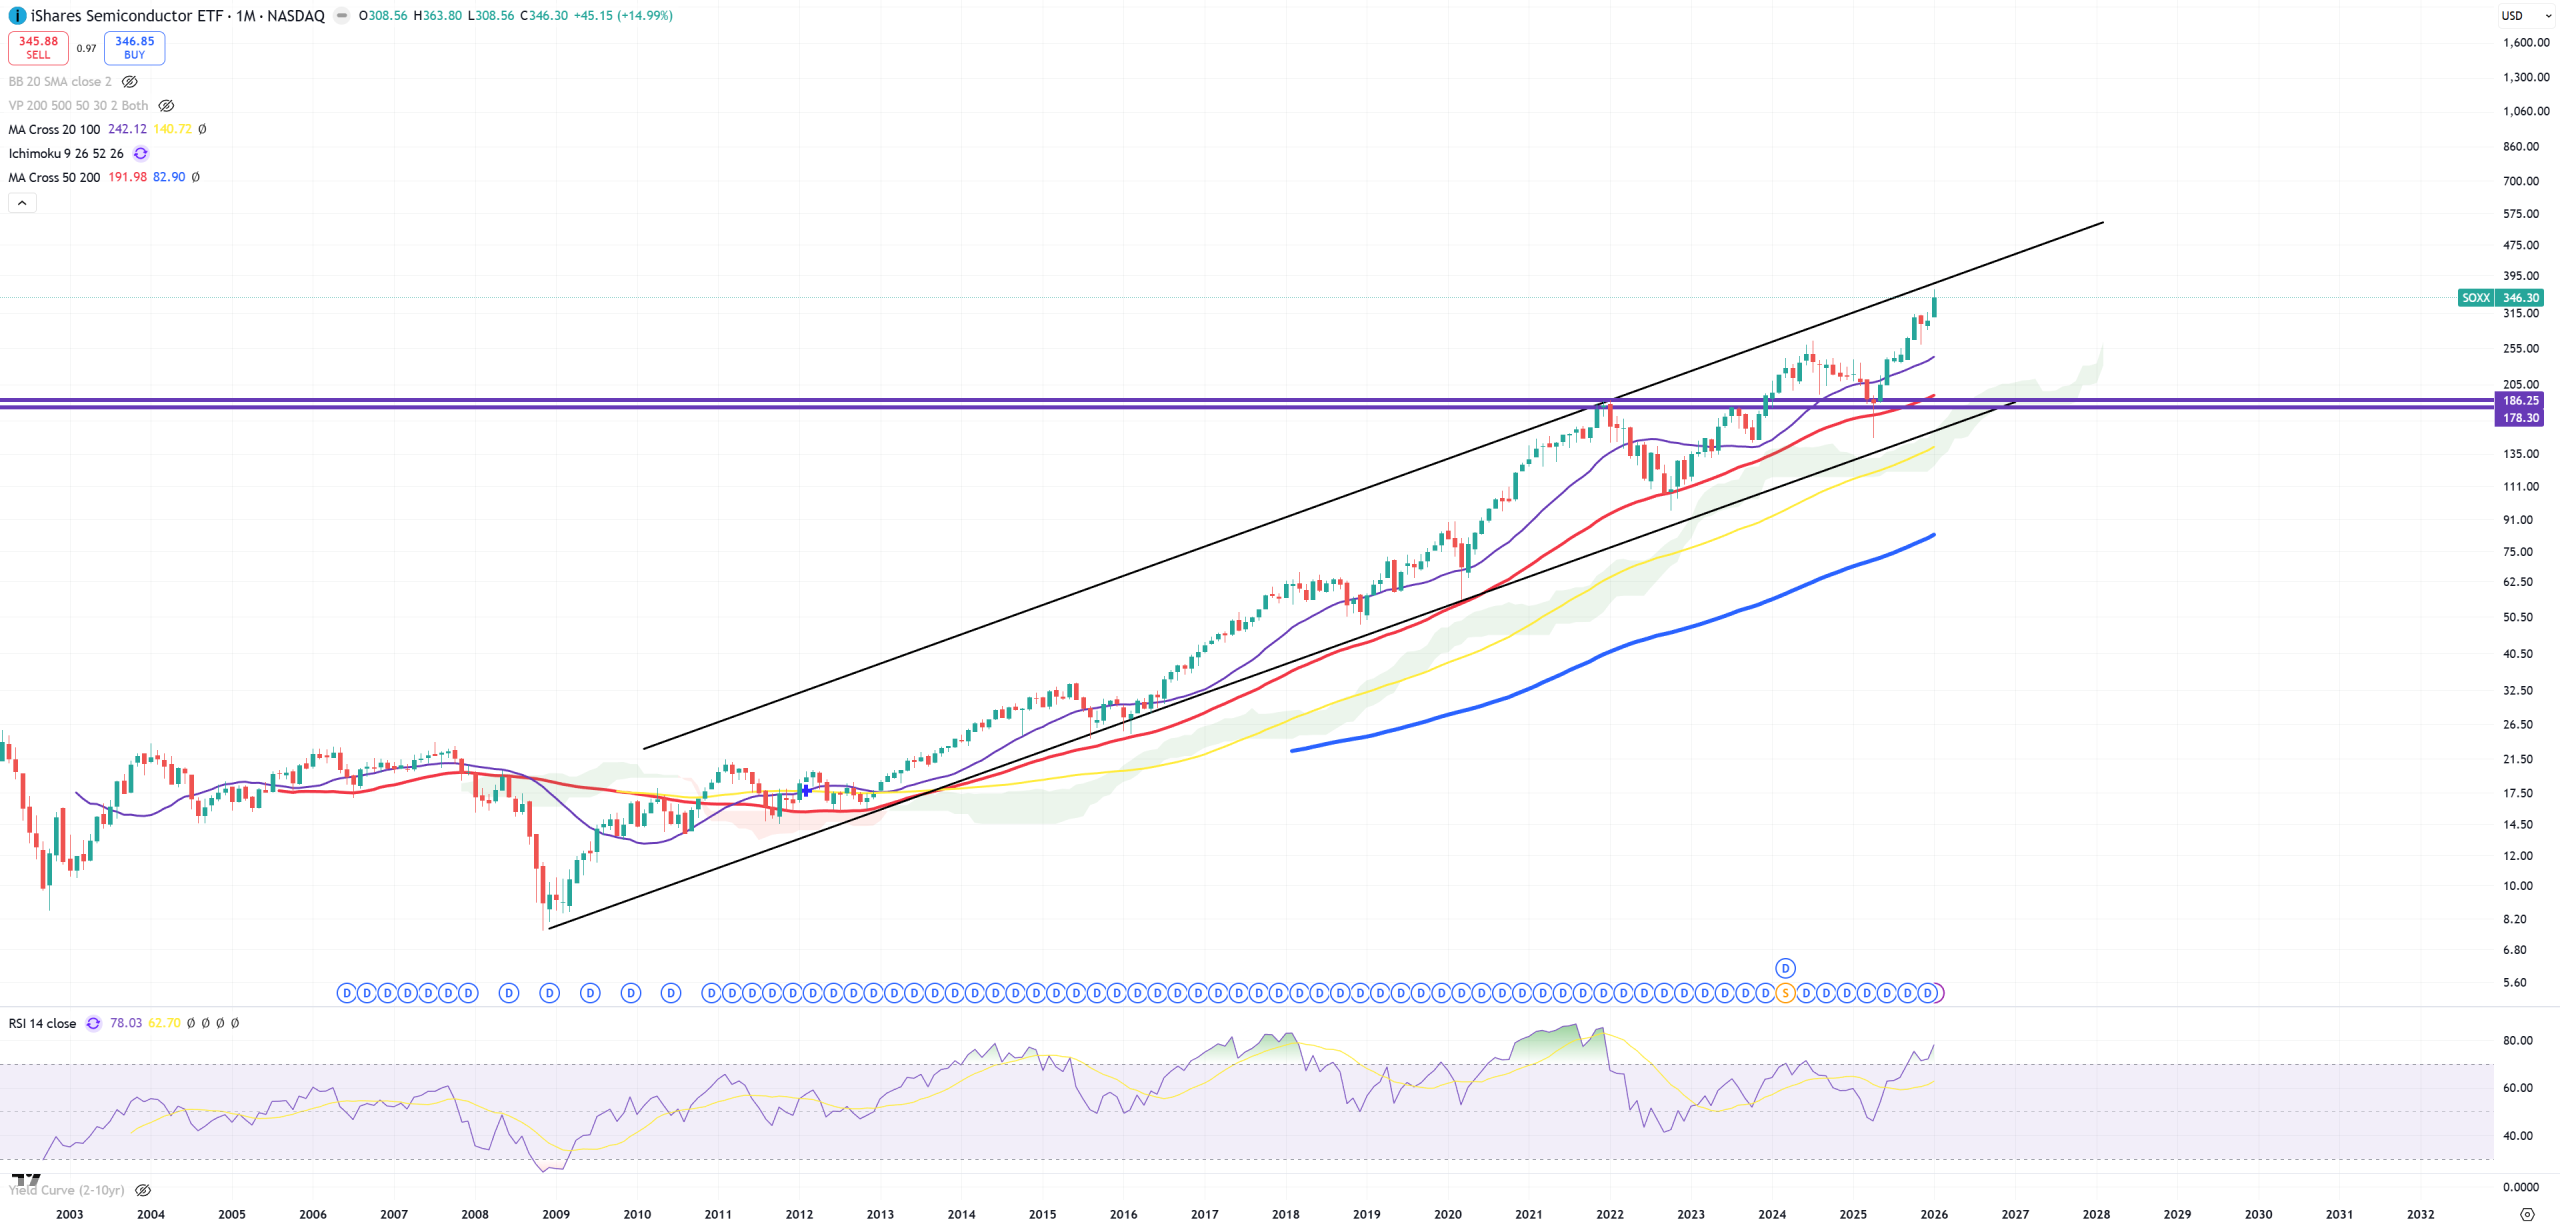
SOX/GOLD – you see a moment of (M)MA100 support (GOLD tanked). Retest (M)MA50 will have massive consequences, because this charts point us market is in decline behind the curtain. Once this retest will come to and end and (M)MA50 will act as a resistance we’ll see SOX peak.
SOXX – in general.
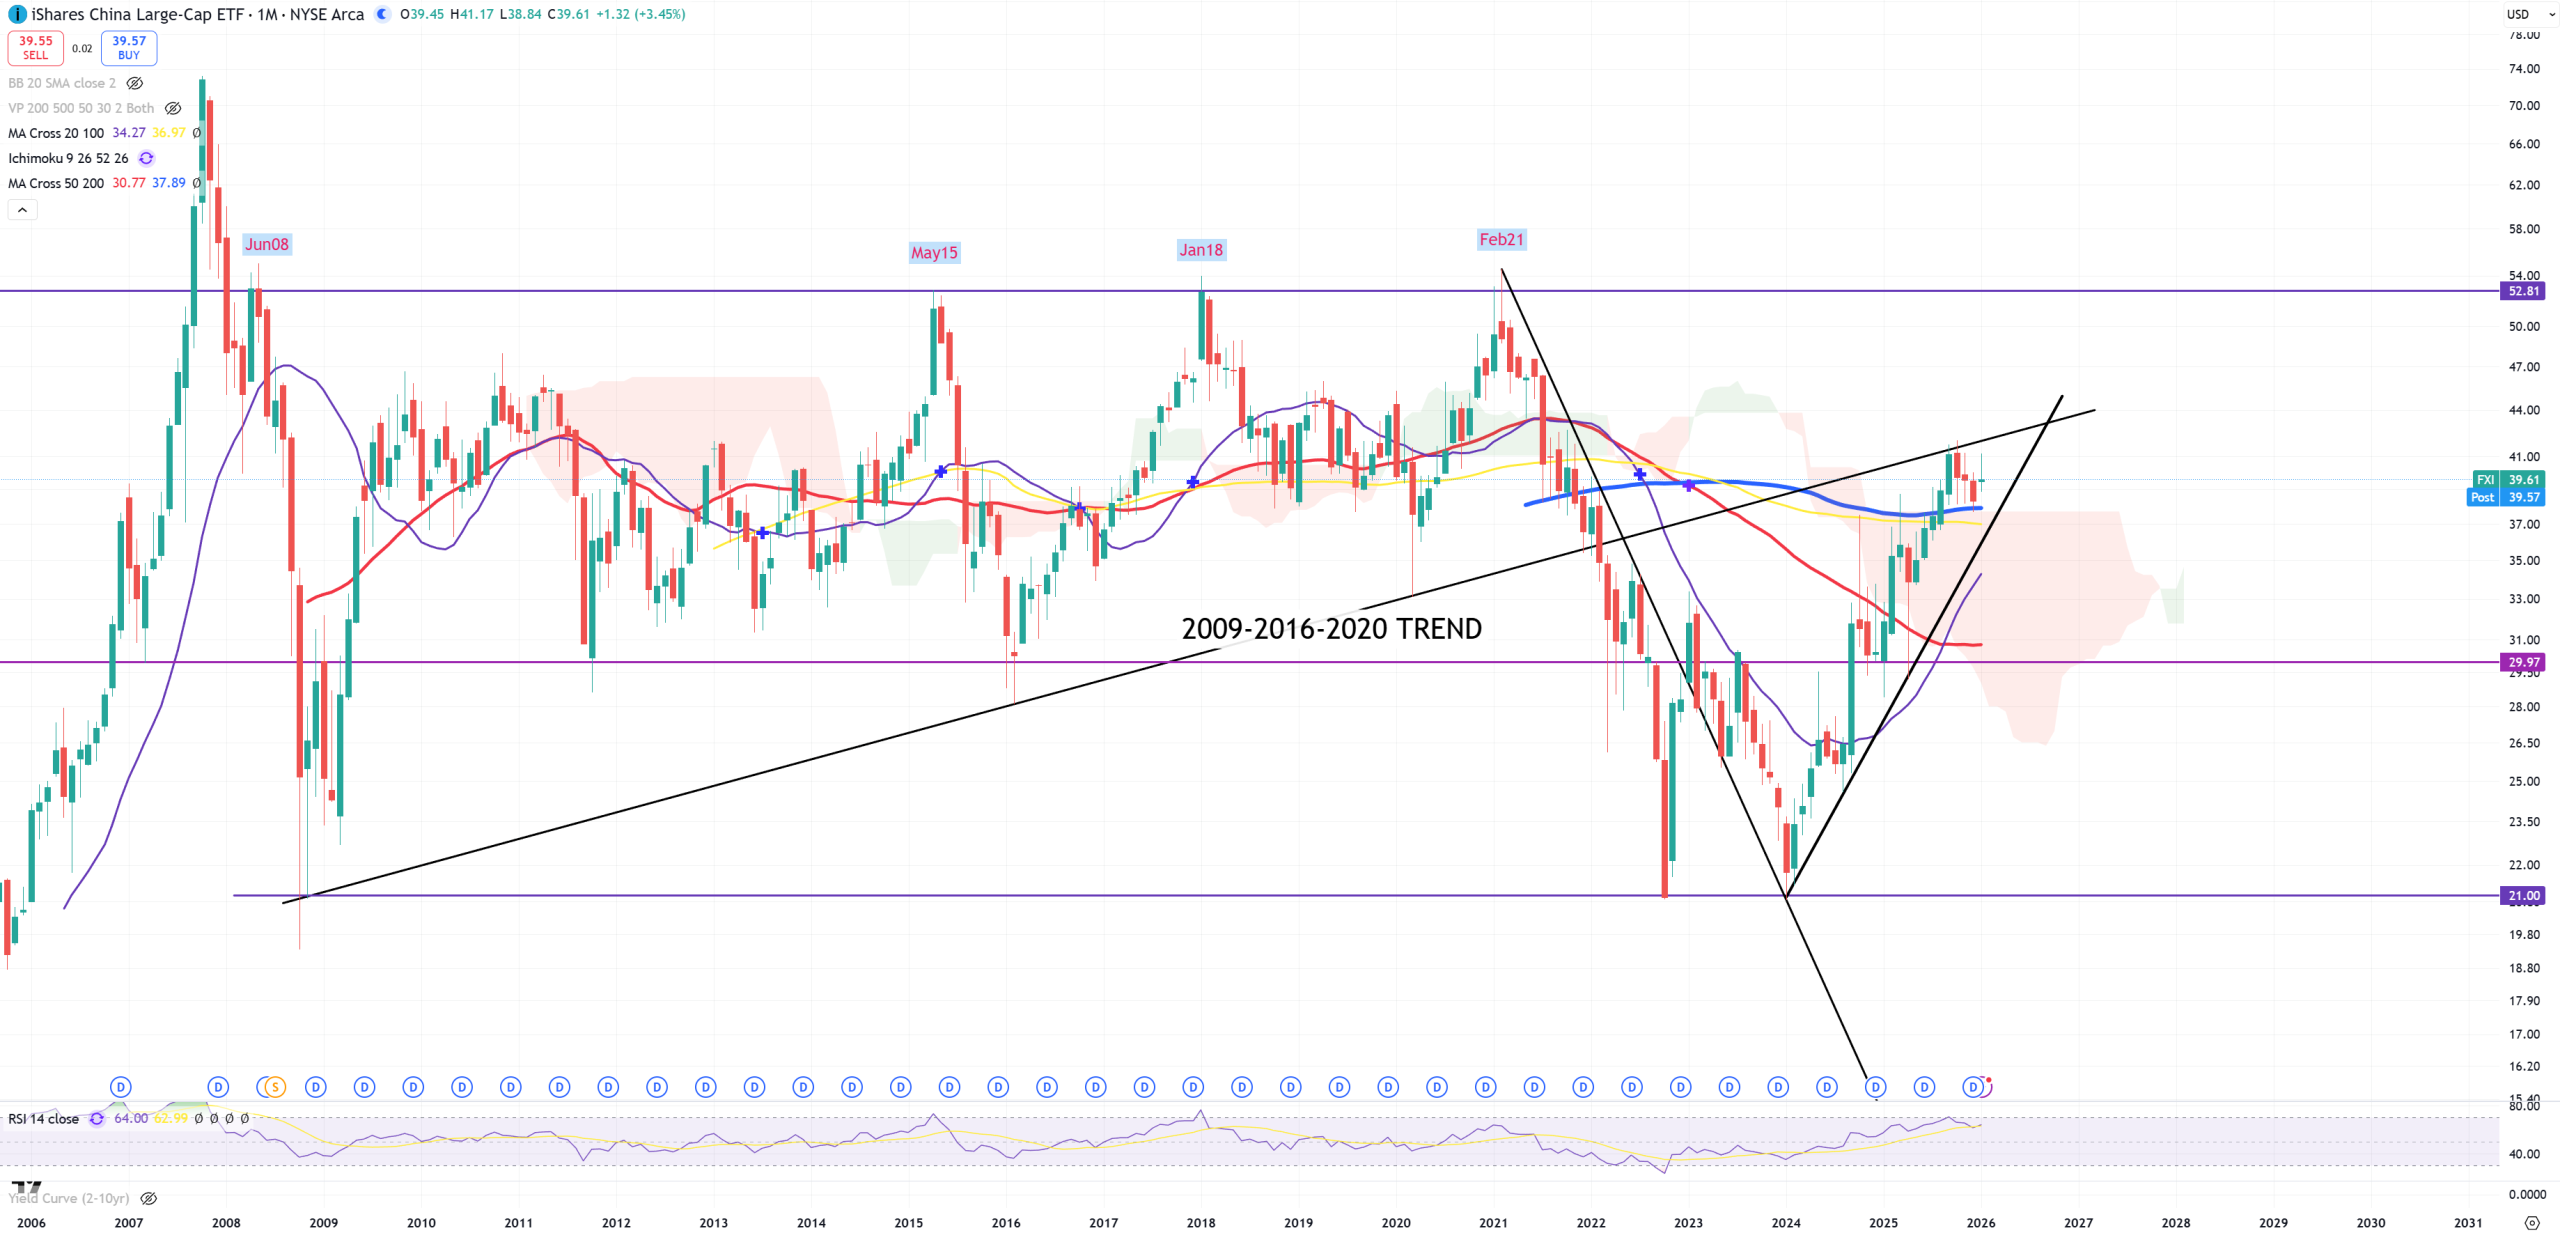
FXI – China peaked in 2021 and nothing has been changed. 2009-2016-2020 is the last trend retest and last level to consider FXI run as bear market rally with final retest and peak 42$. Once blue (M)MA200 will be broken chances to go back to 21$ (and breaking it) will be high.
Stocks charts
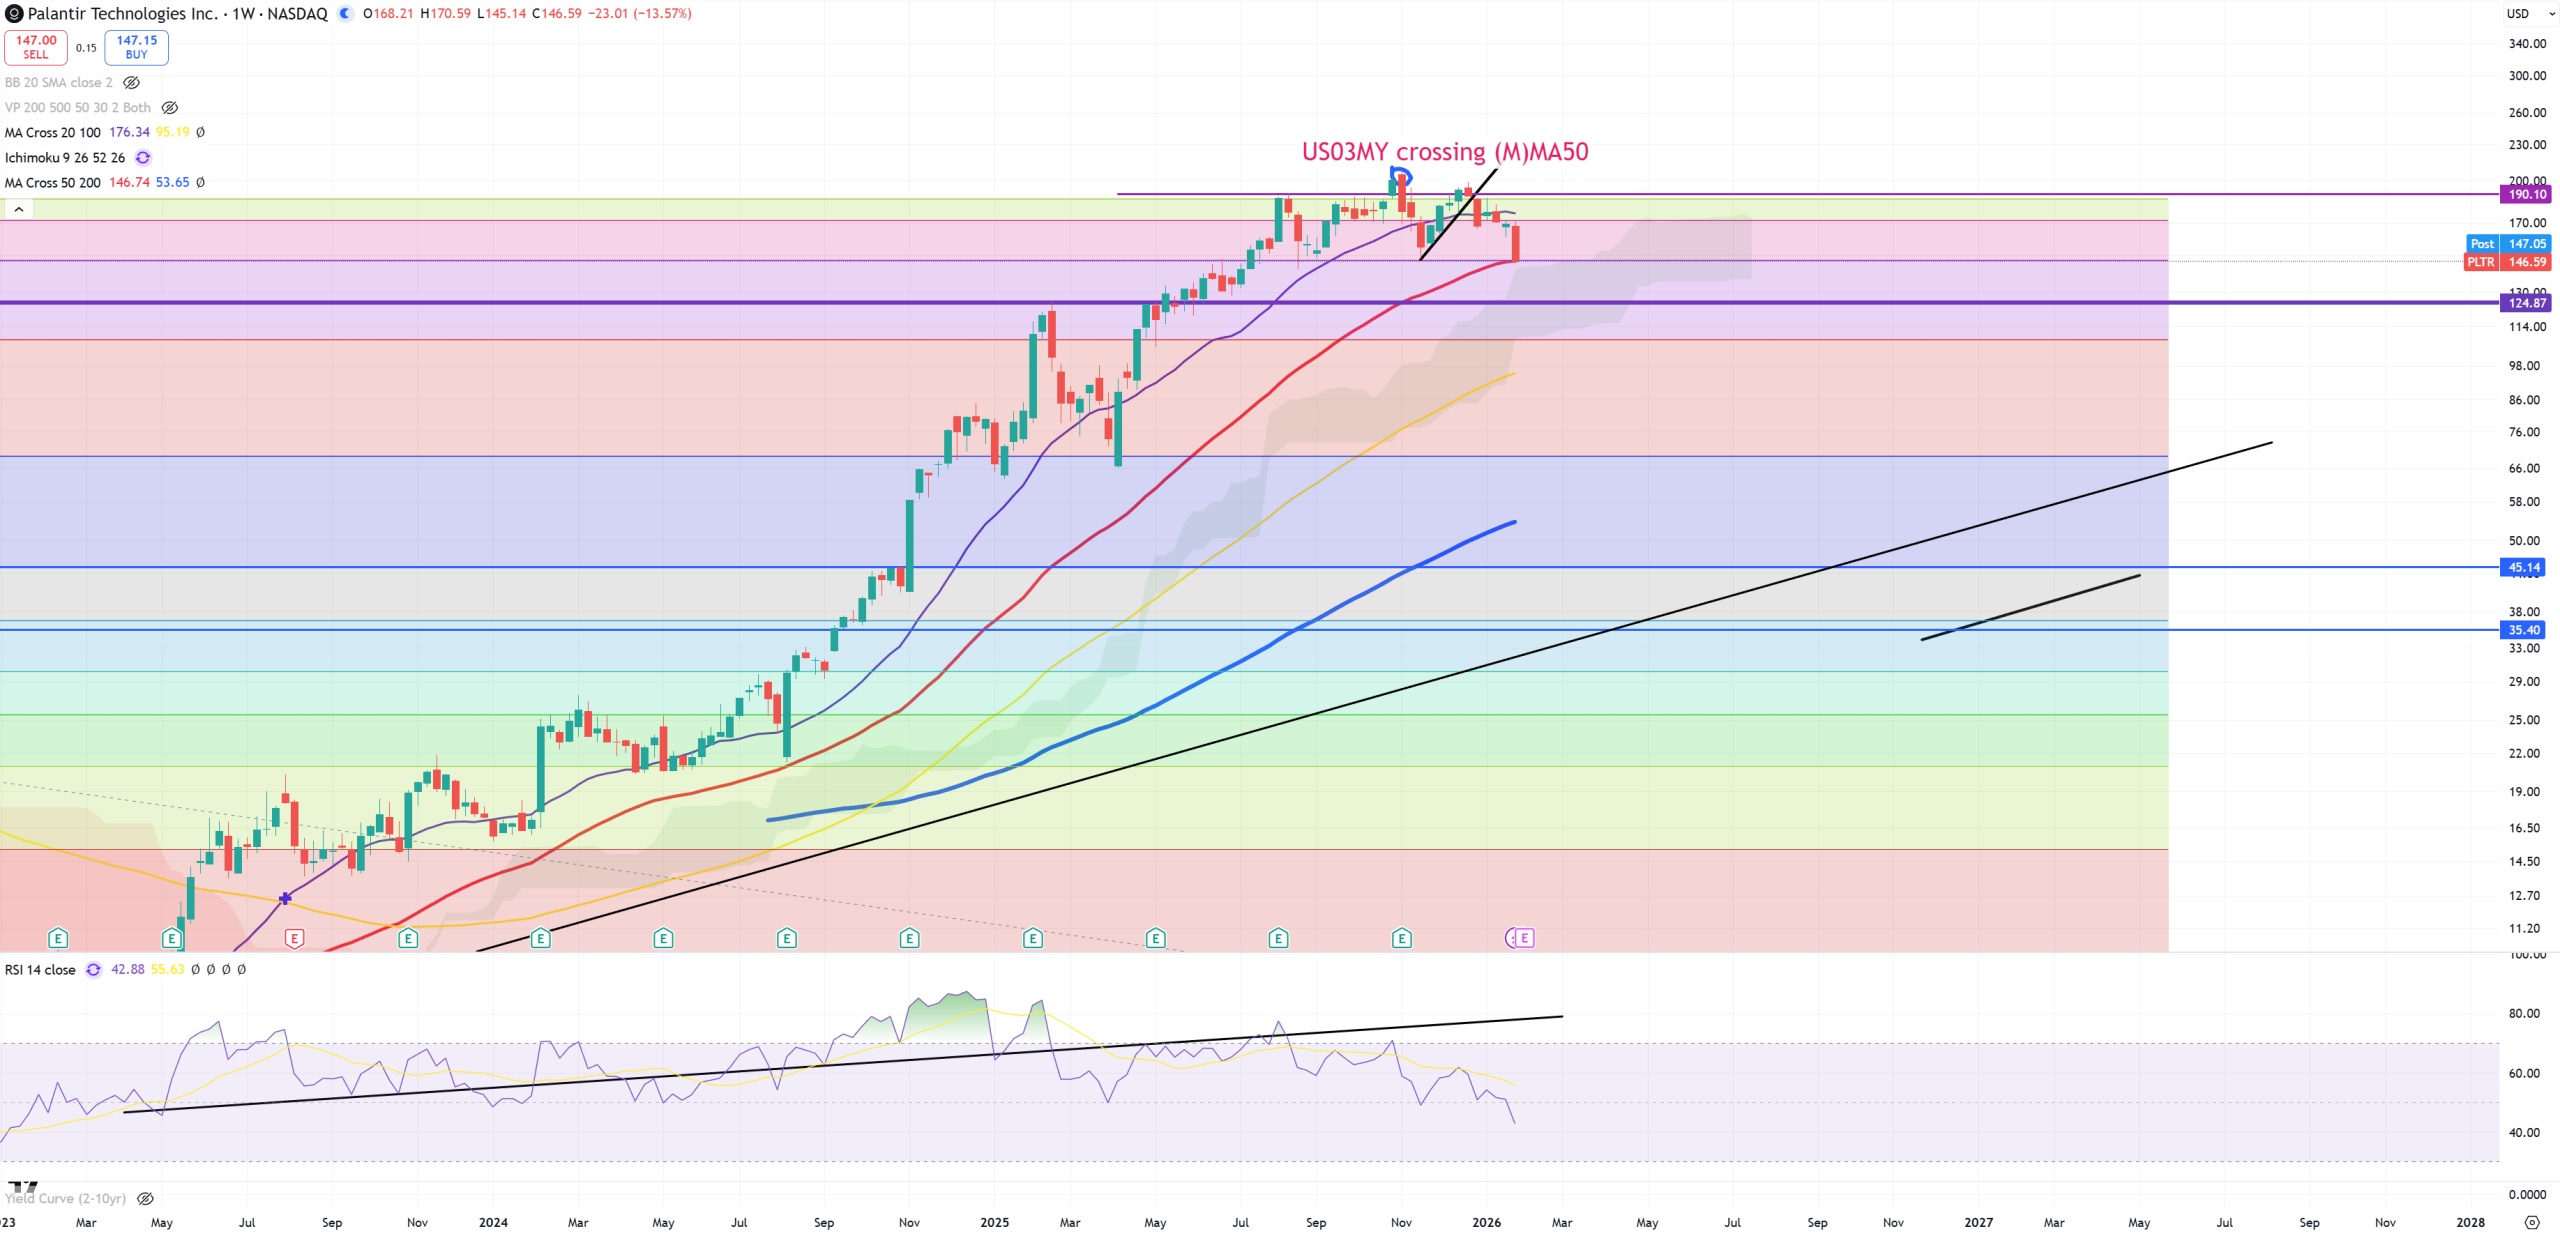
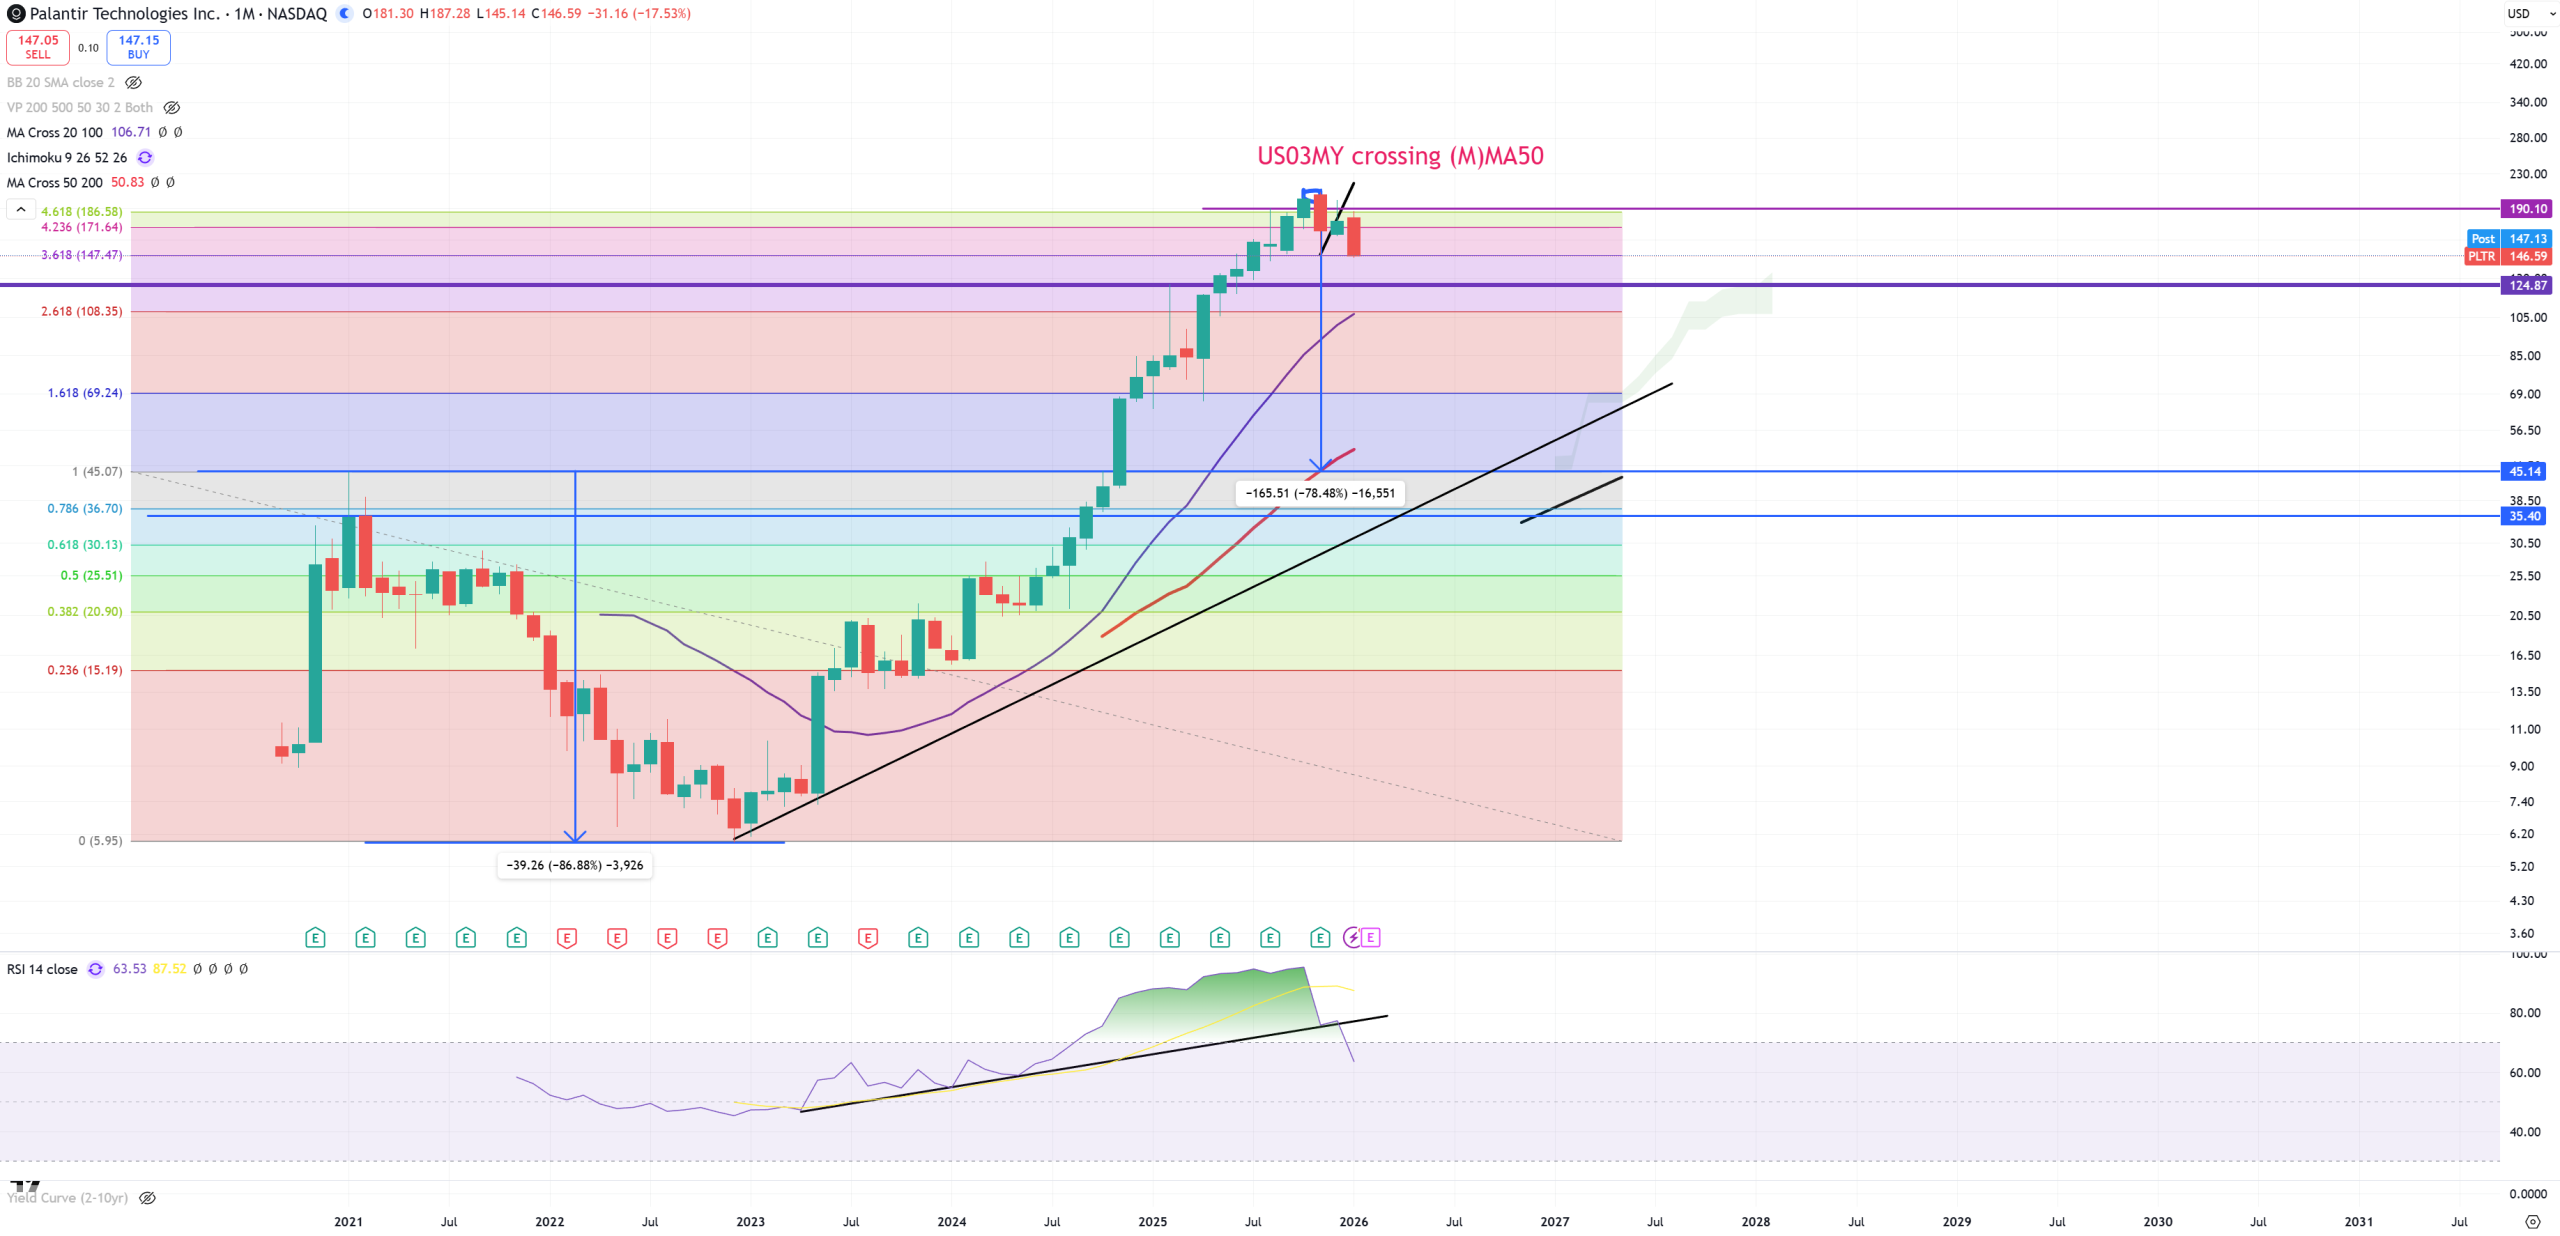
PLTR – Beautiful chart, PLTR has earnings soon, but so far (W)MA50 gone. PLTR is so big parabolic bubble I have to show you first (W) chart. So far US03MY crossing (M)MA50 placed a perfect top for this company. Distance from its 210$ peak to (M)MA50 is -78% – that’s tulip bubble category. (M)RSI trend broken. First (W), second (M).
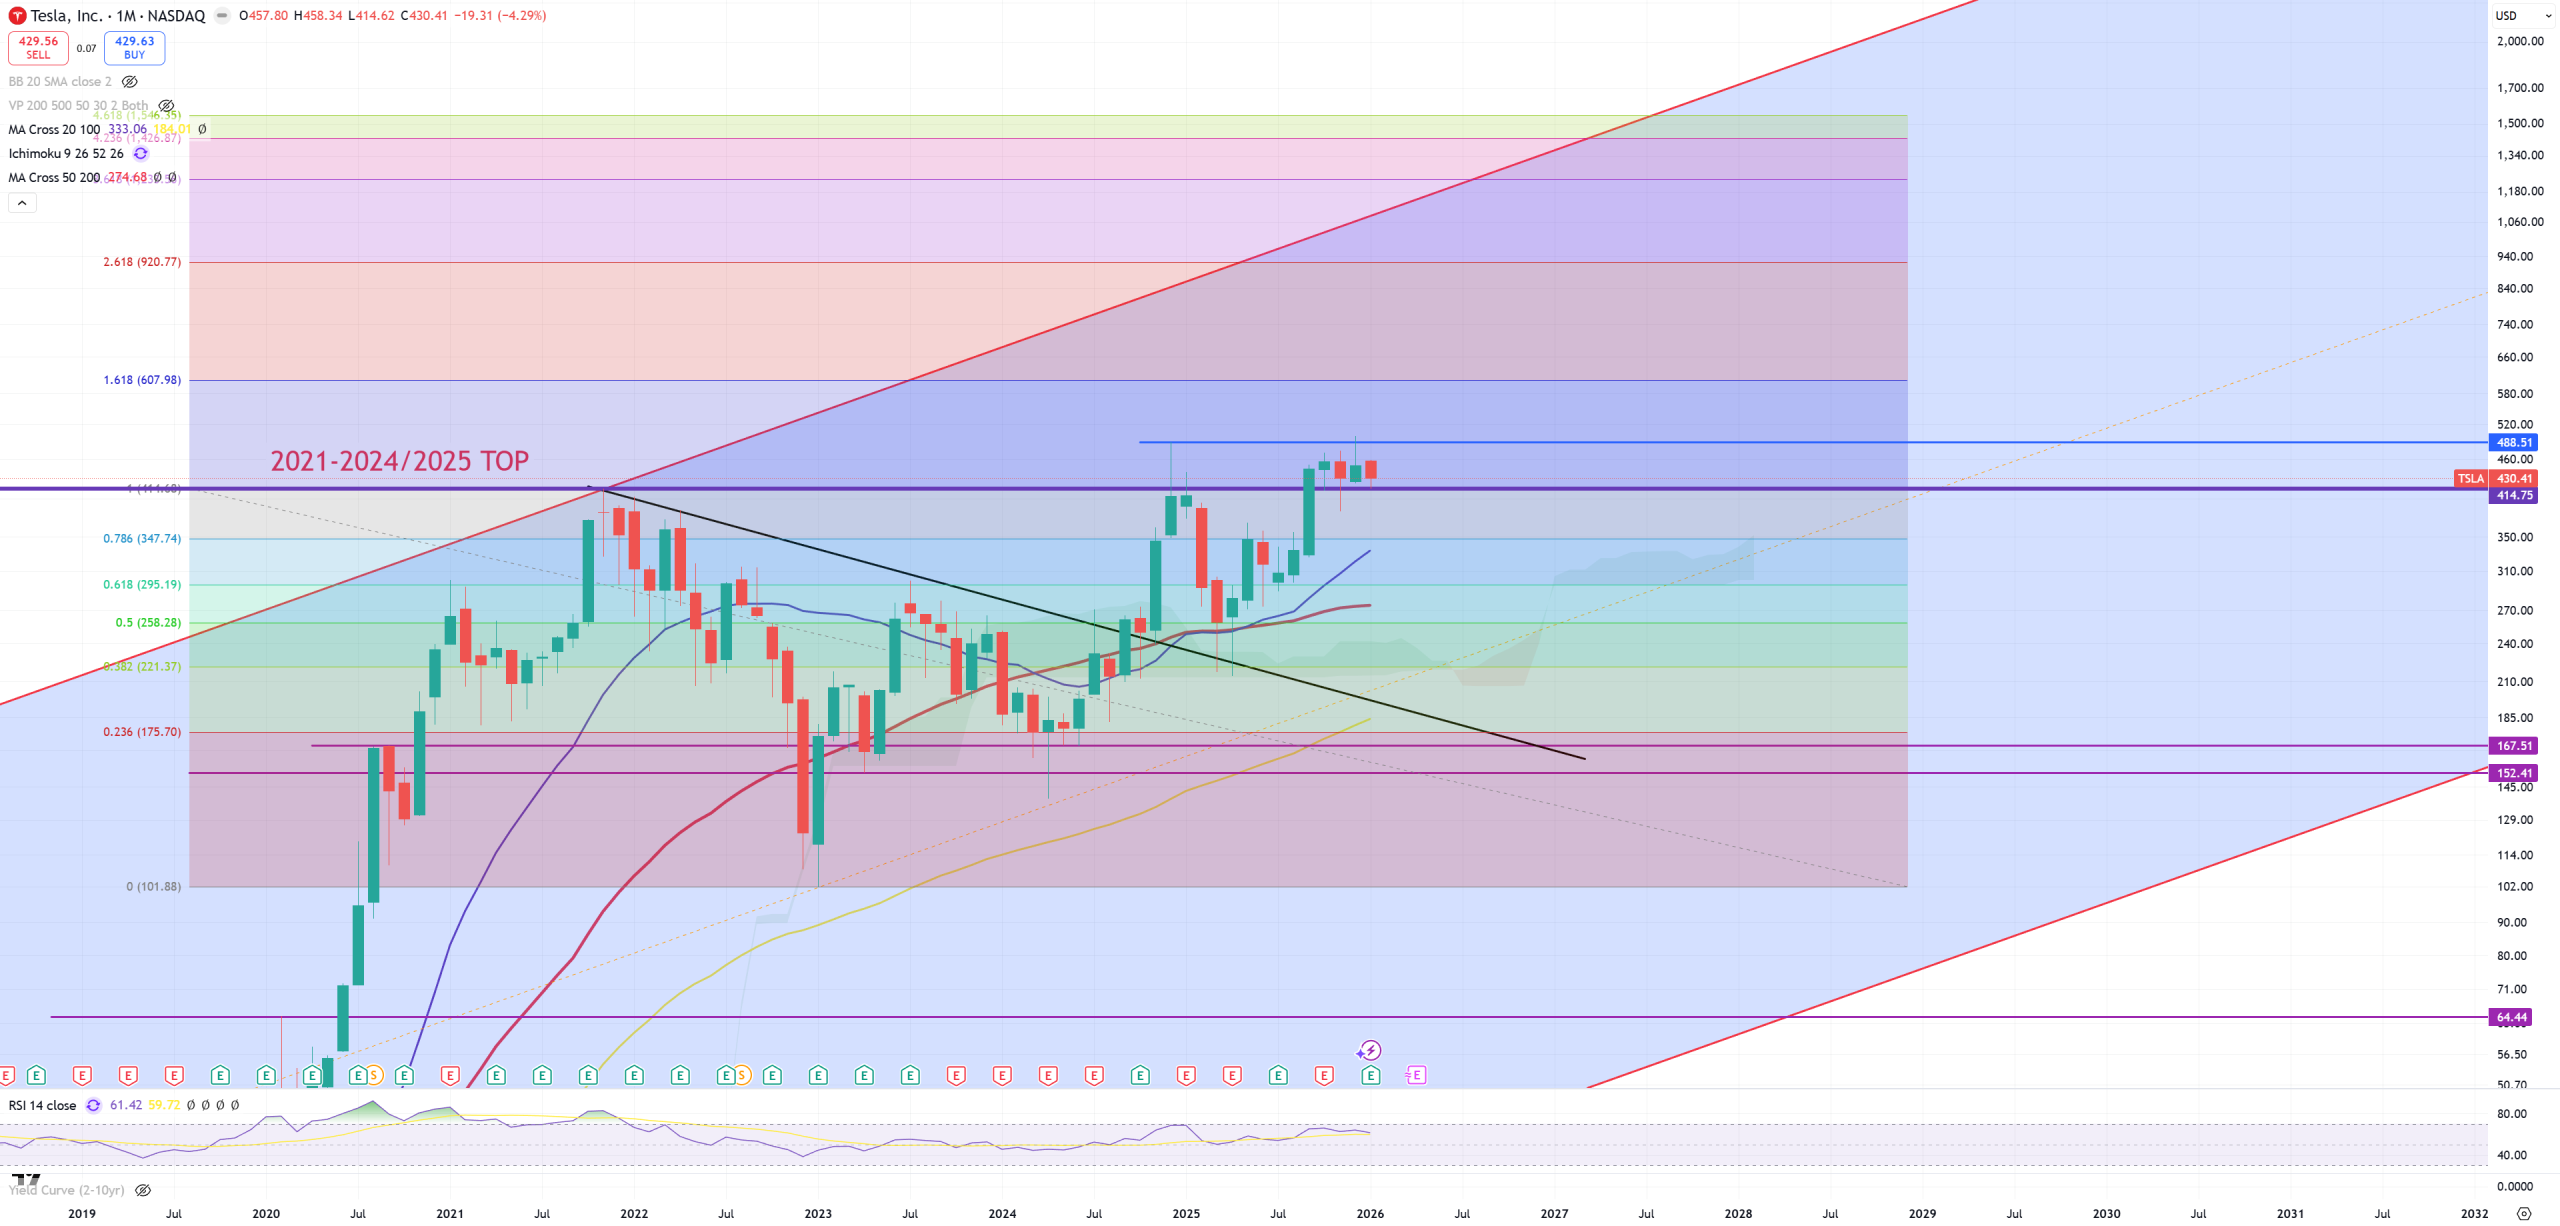
TSLA – this 414$ level is defended until its now. I believe it’s a massive bull trap and lifetime opportunity to go short from 499$ level.
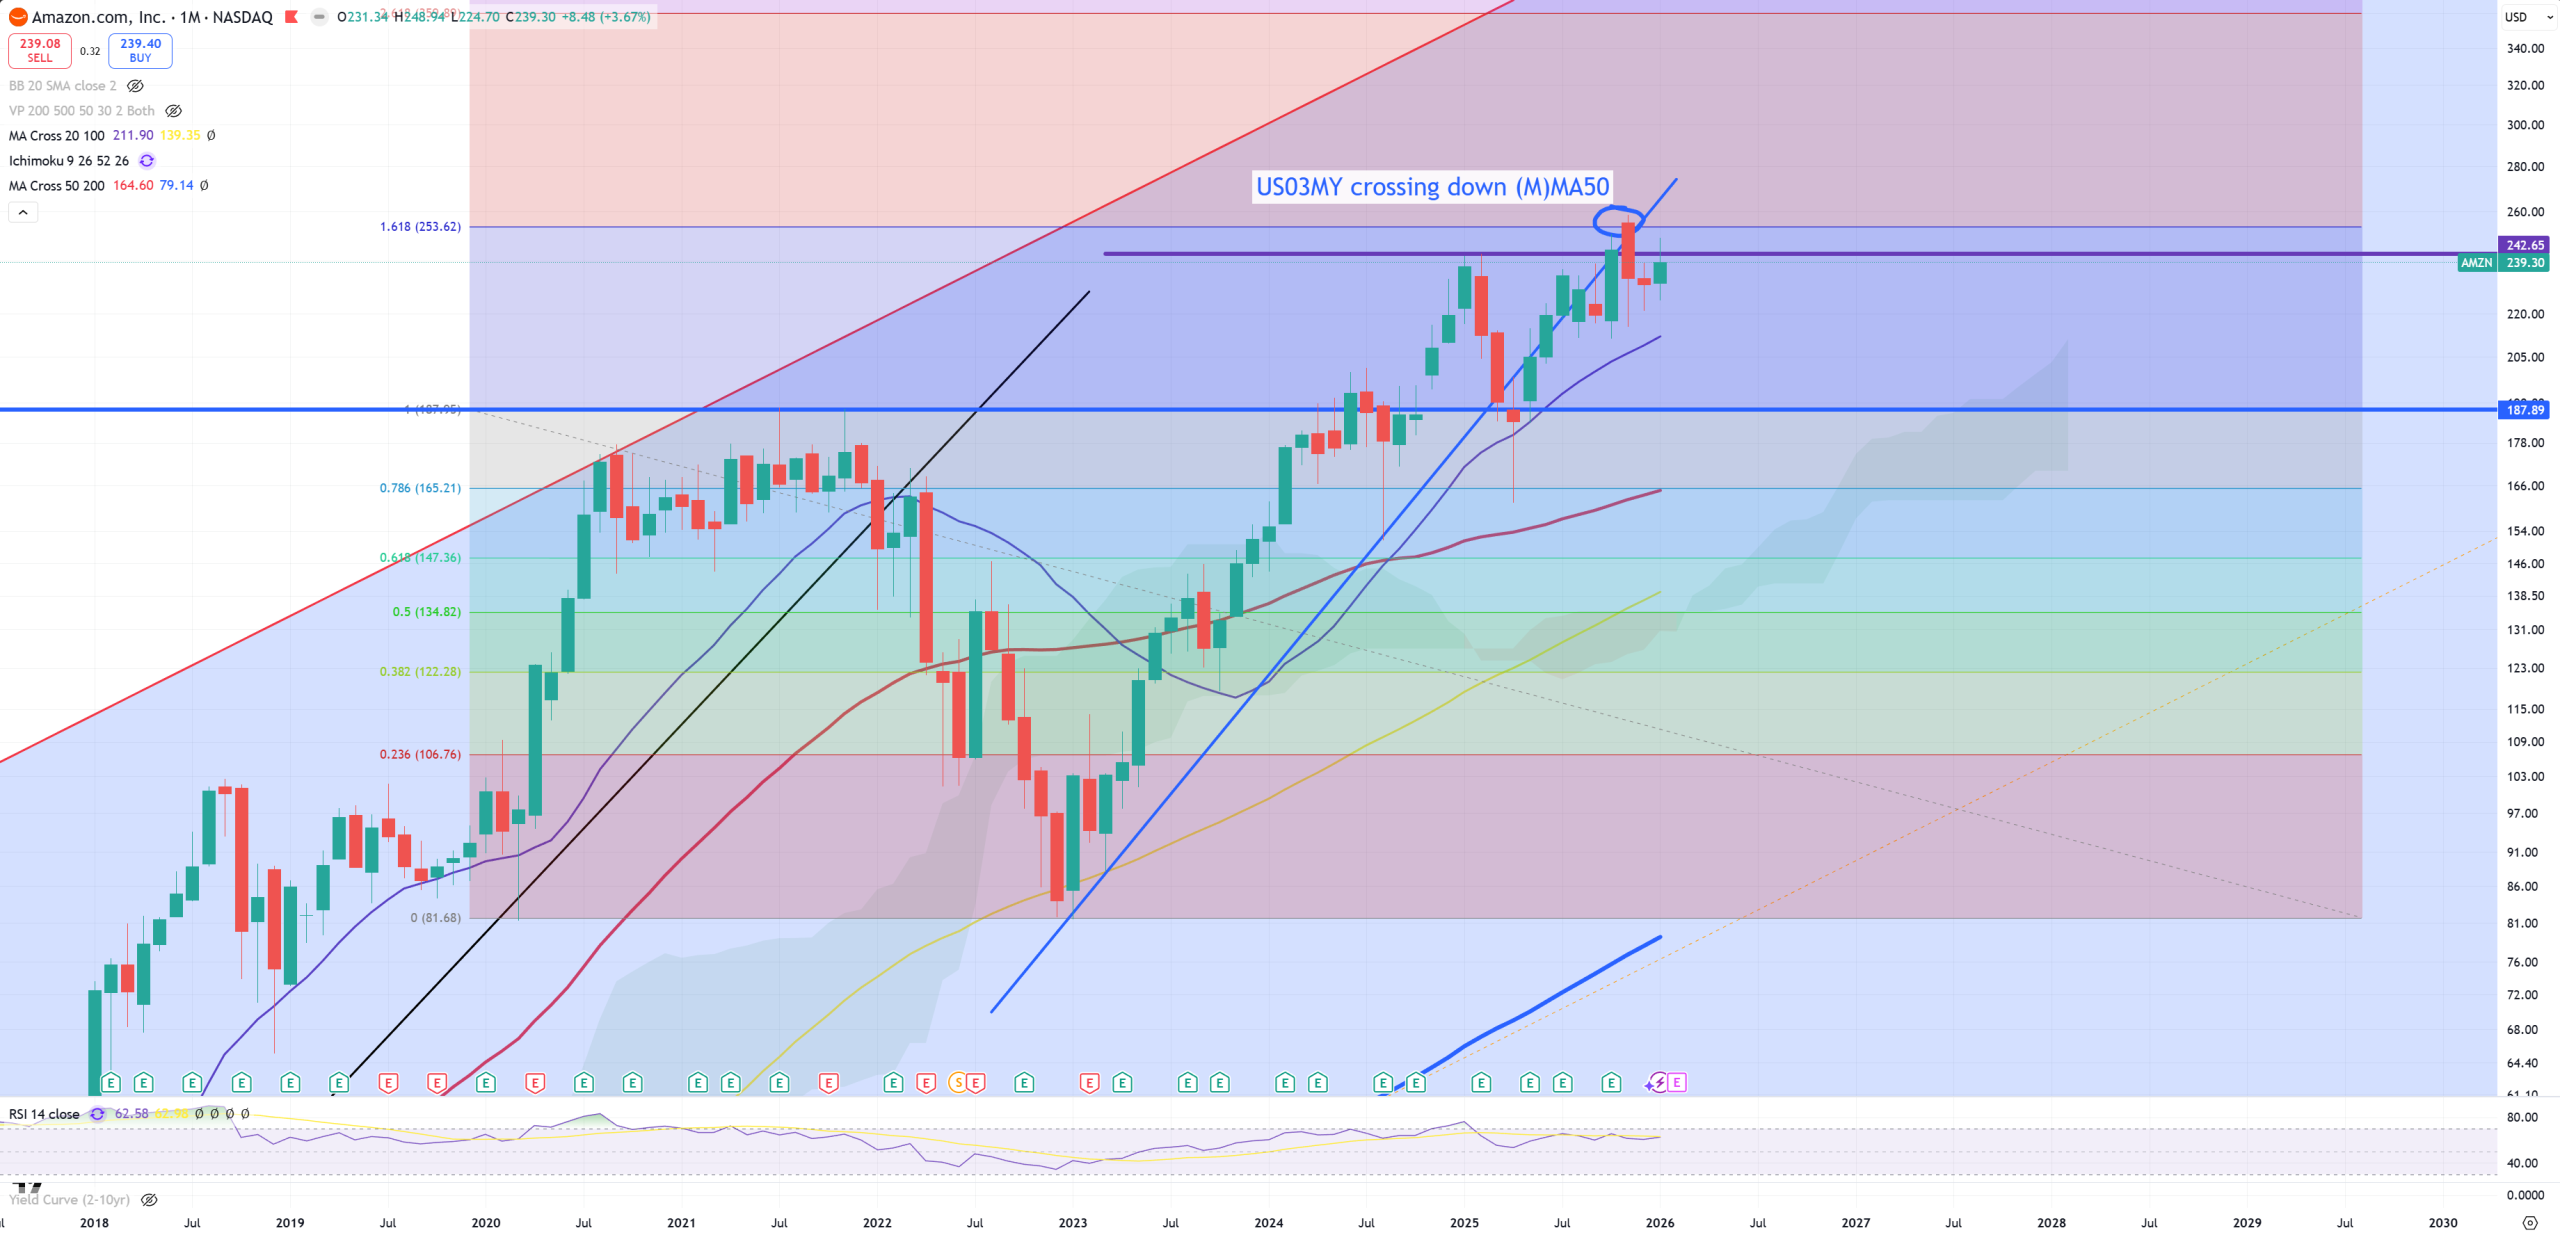
AMZN – also nice to see this US03MY break
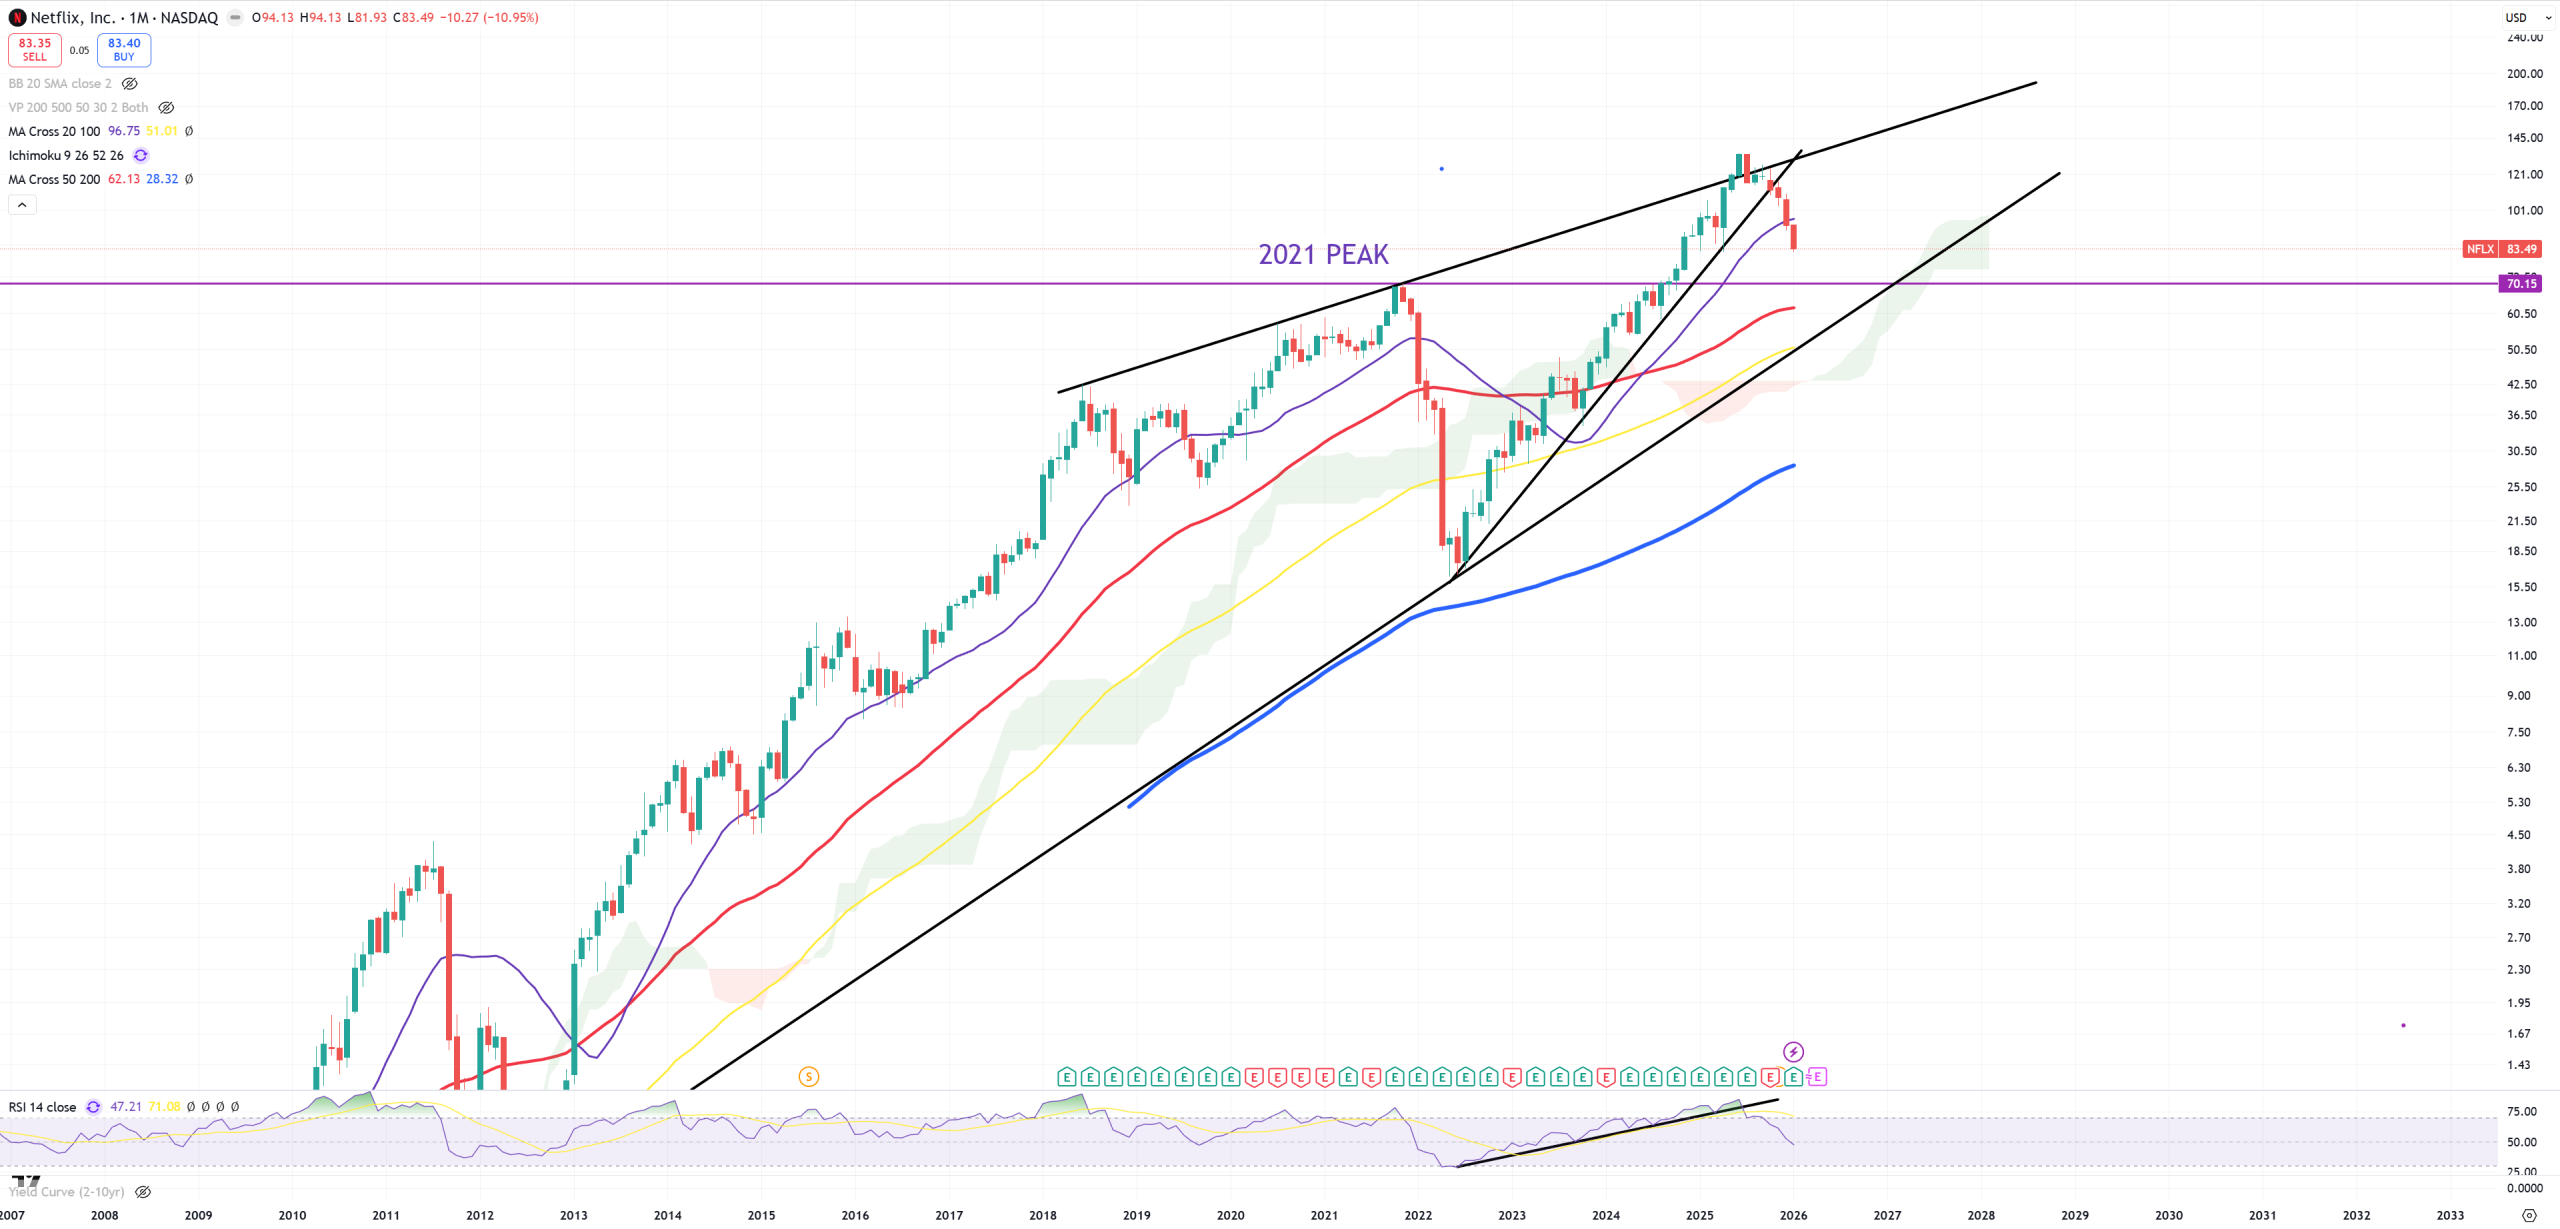
NFLX – once this 2021 level will give up, there’ll be a problem
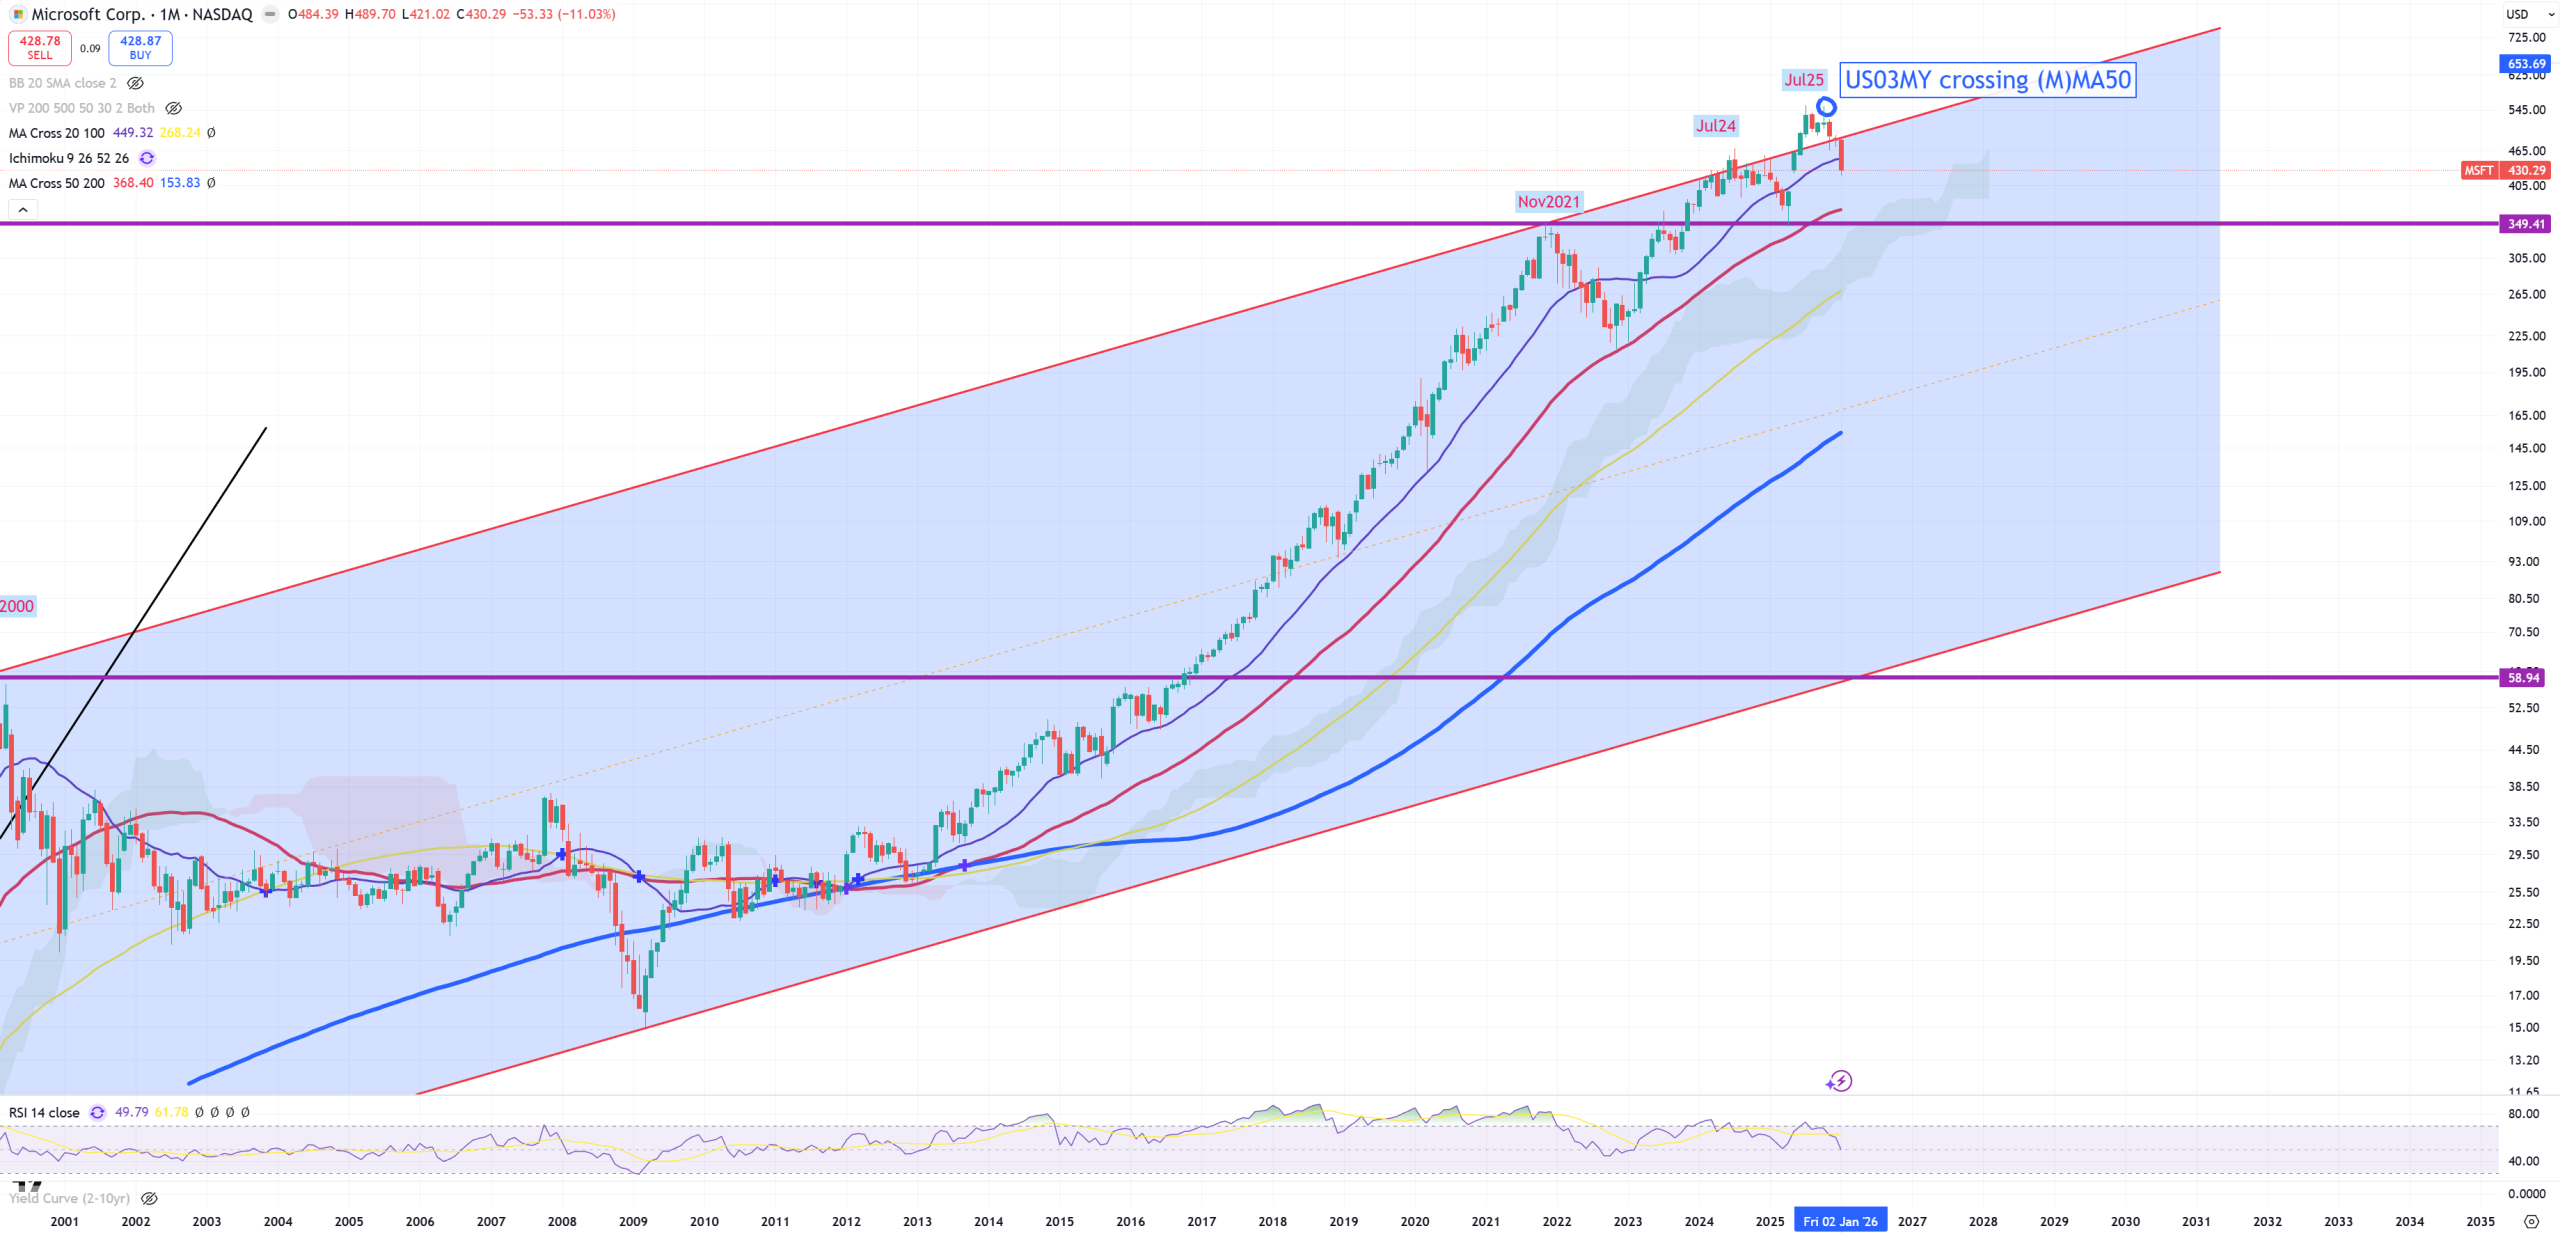
MSFT – returning to channel, and peaked almost exactly when US03MY crossed down (M)MA50 so far ~553$
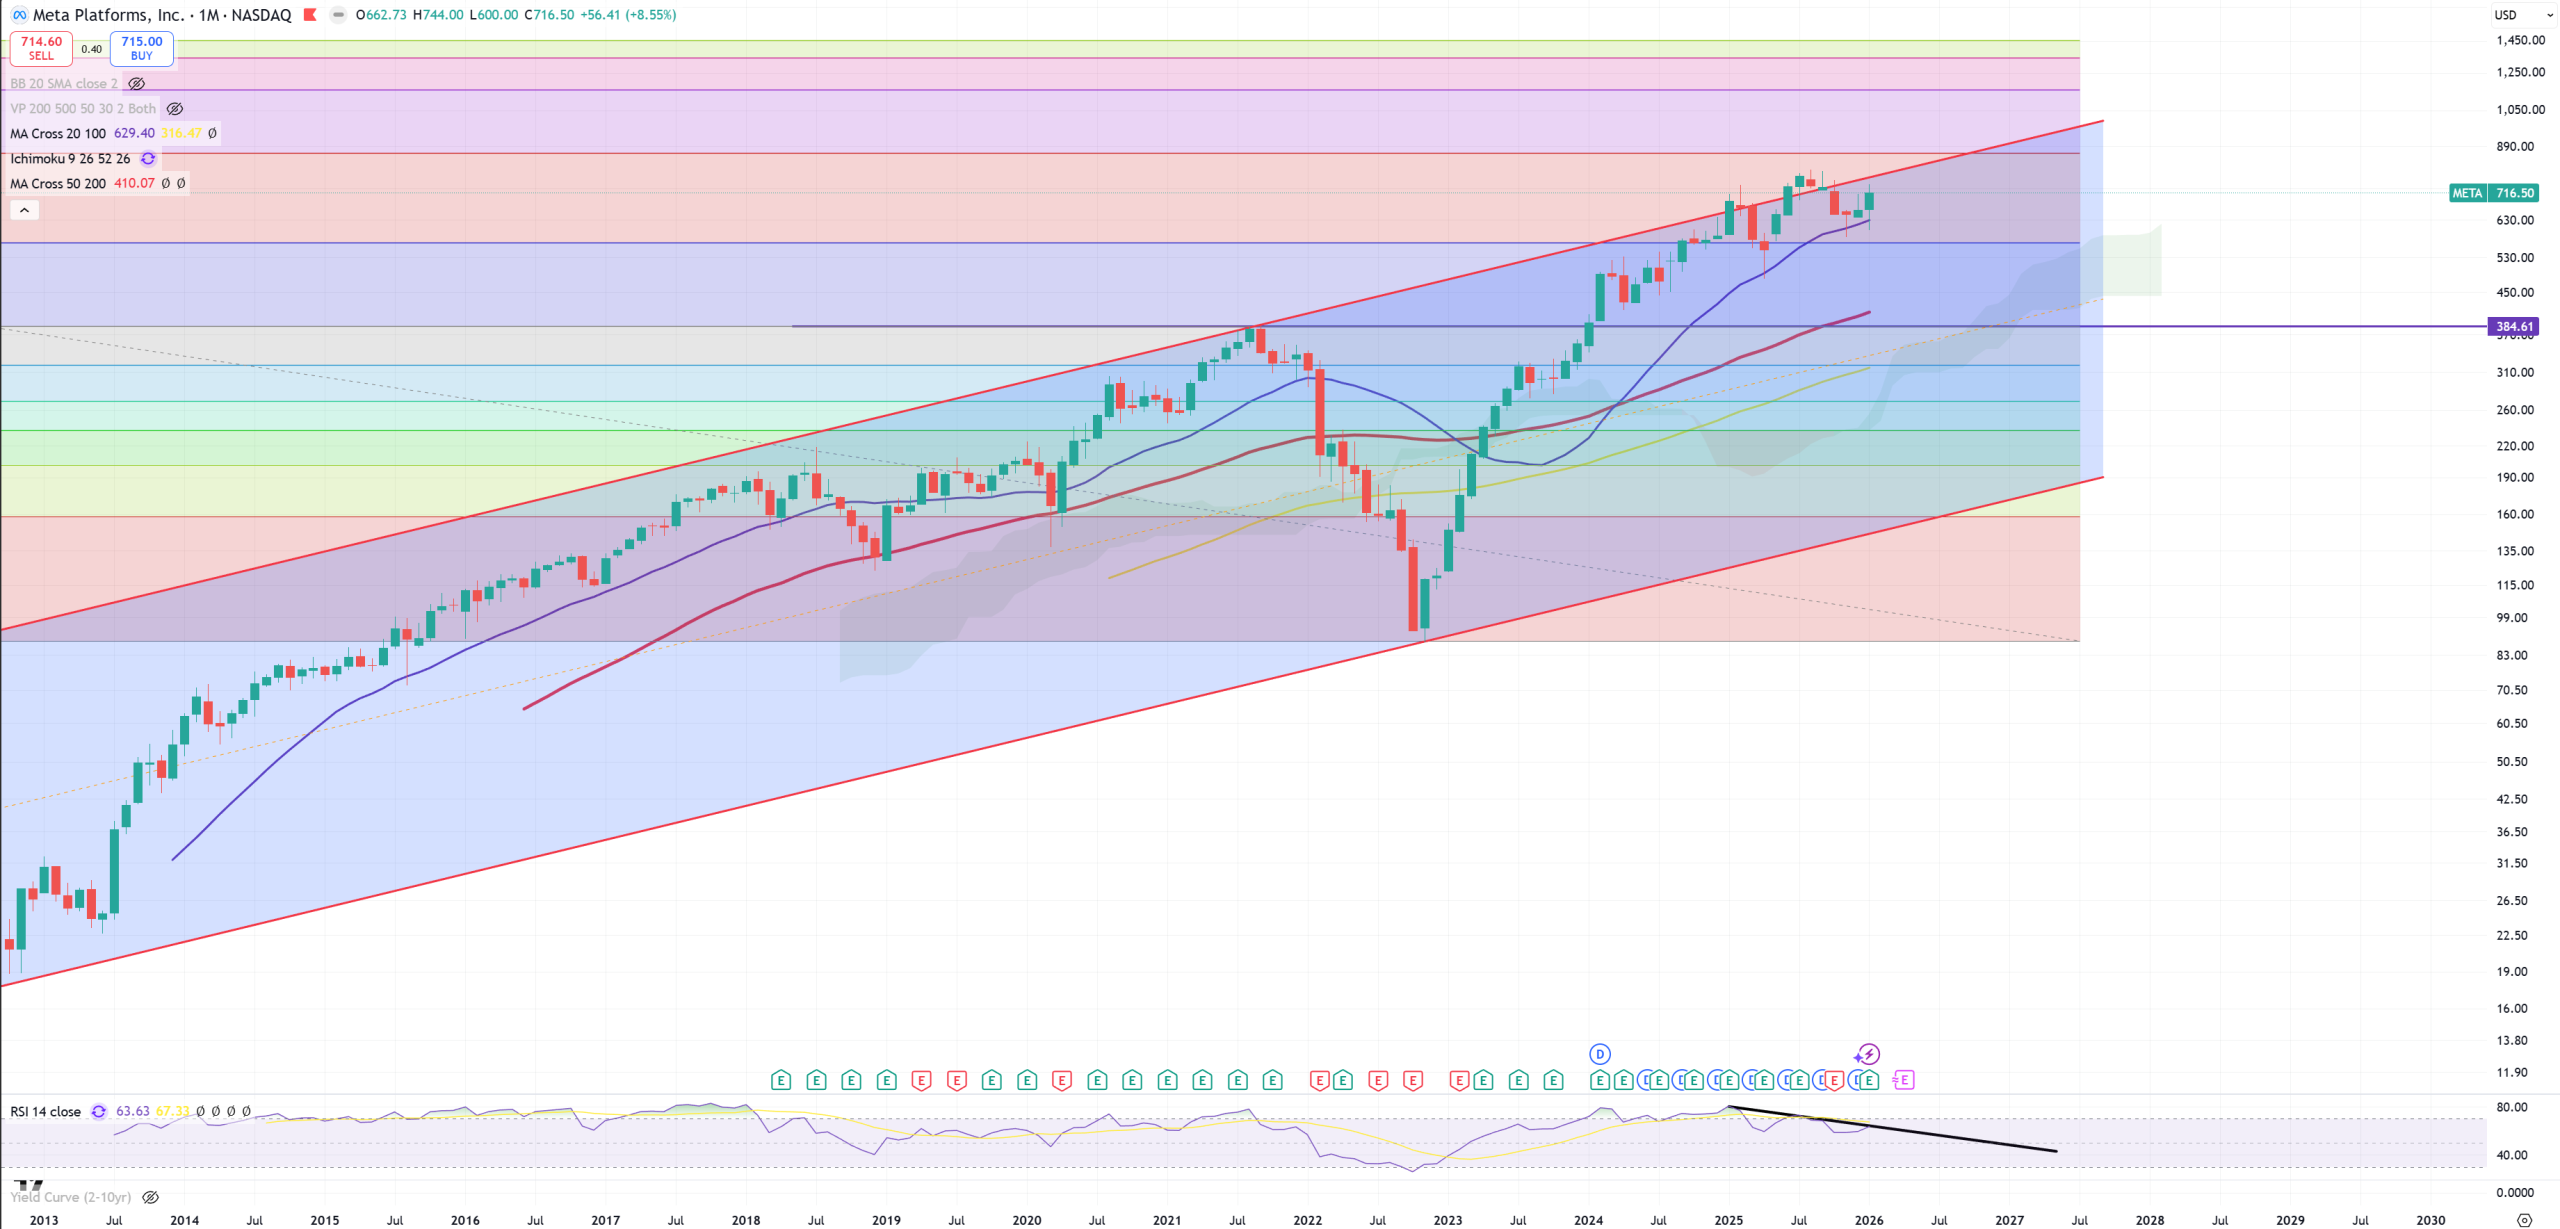
META – Nothing to see here, (M)MA20 holds
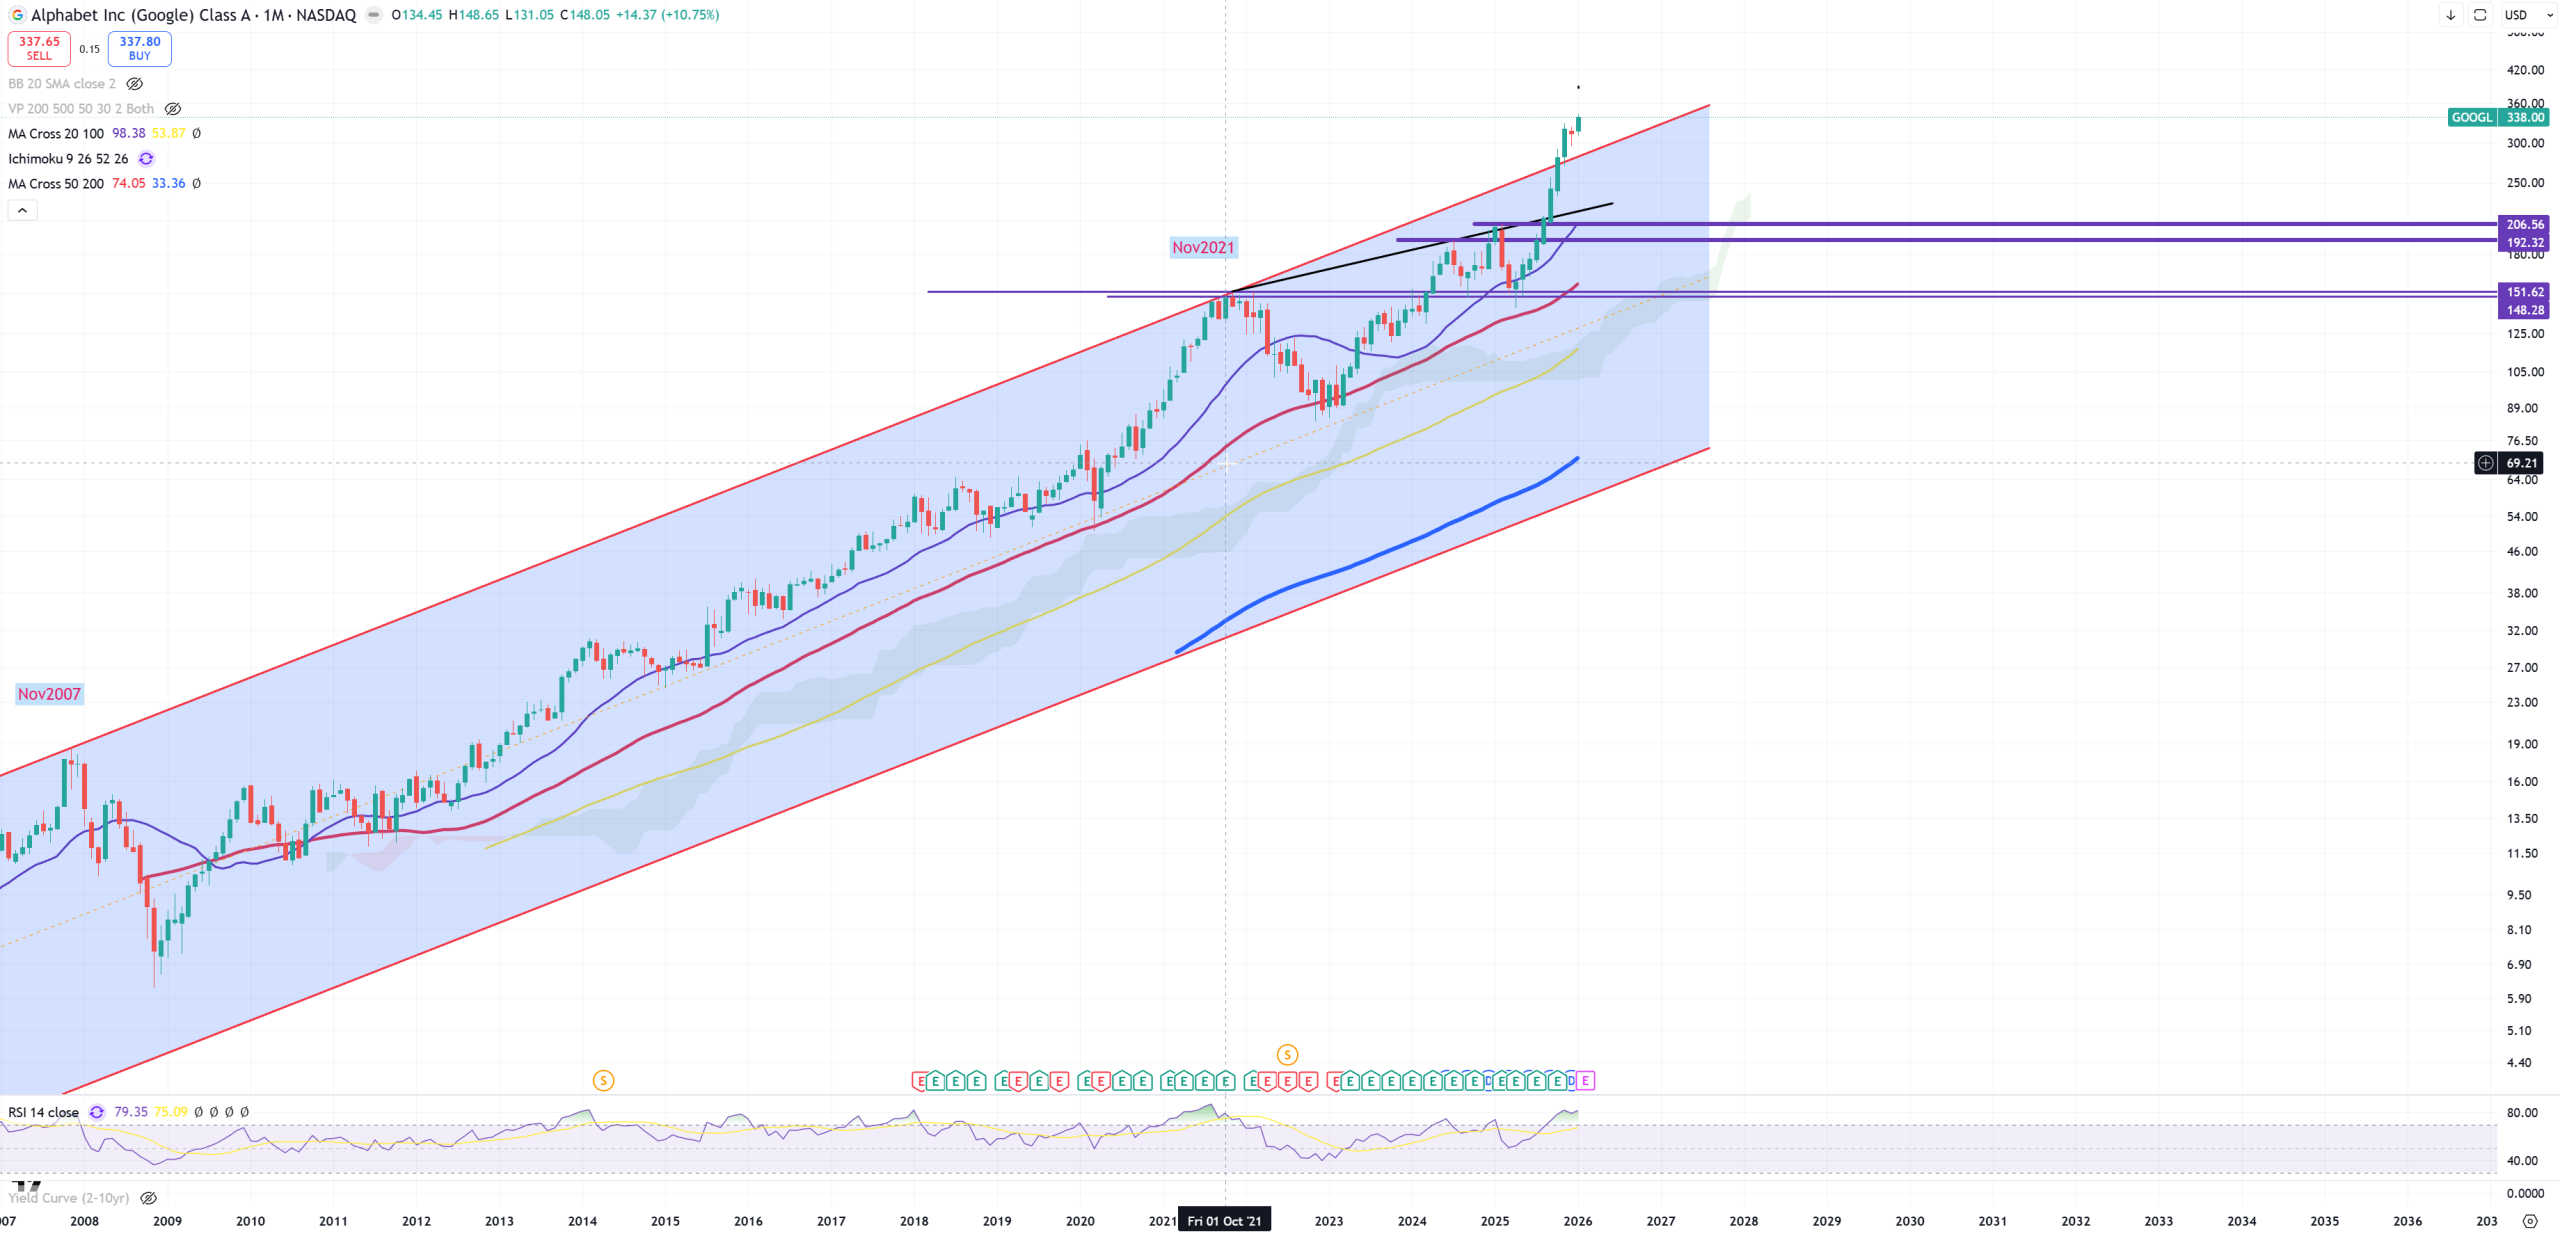
GOOGL – exceptional move
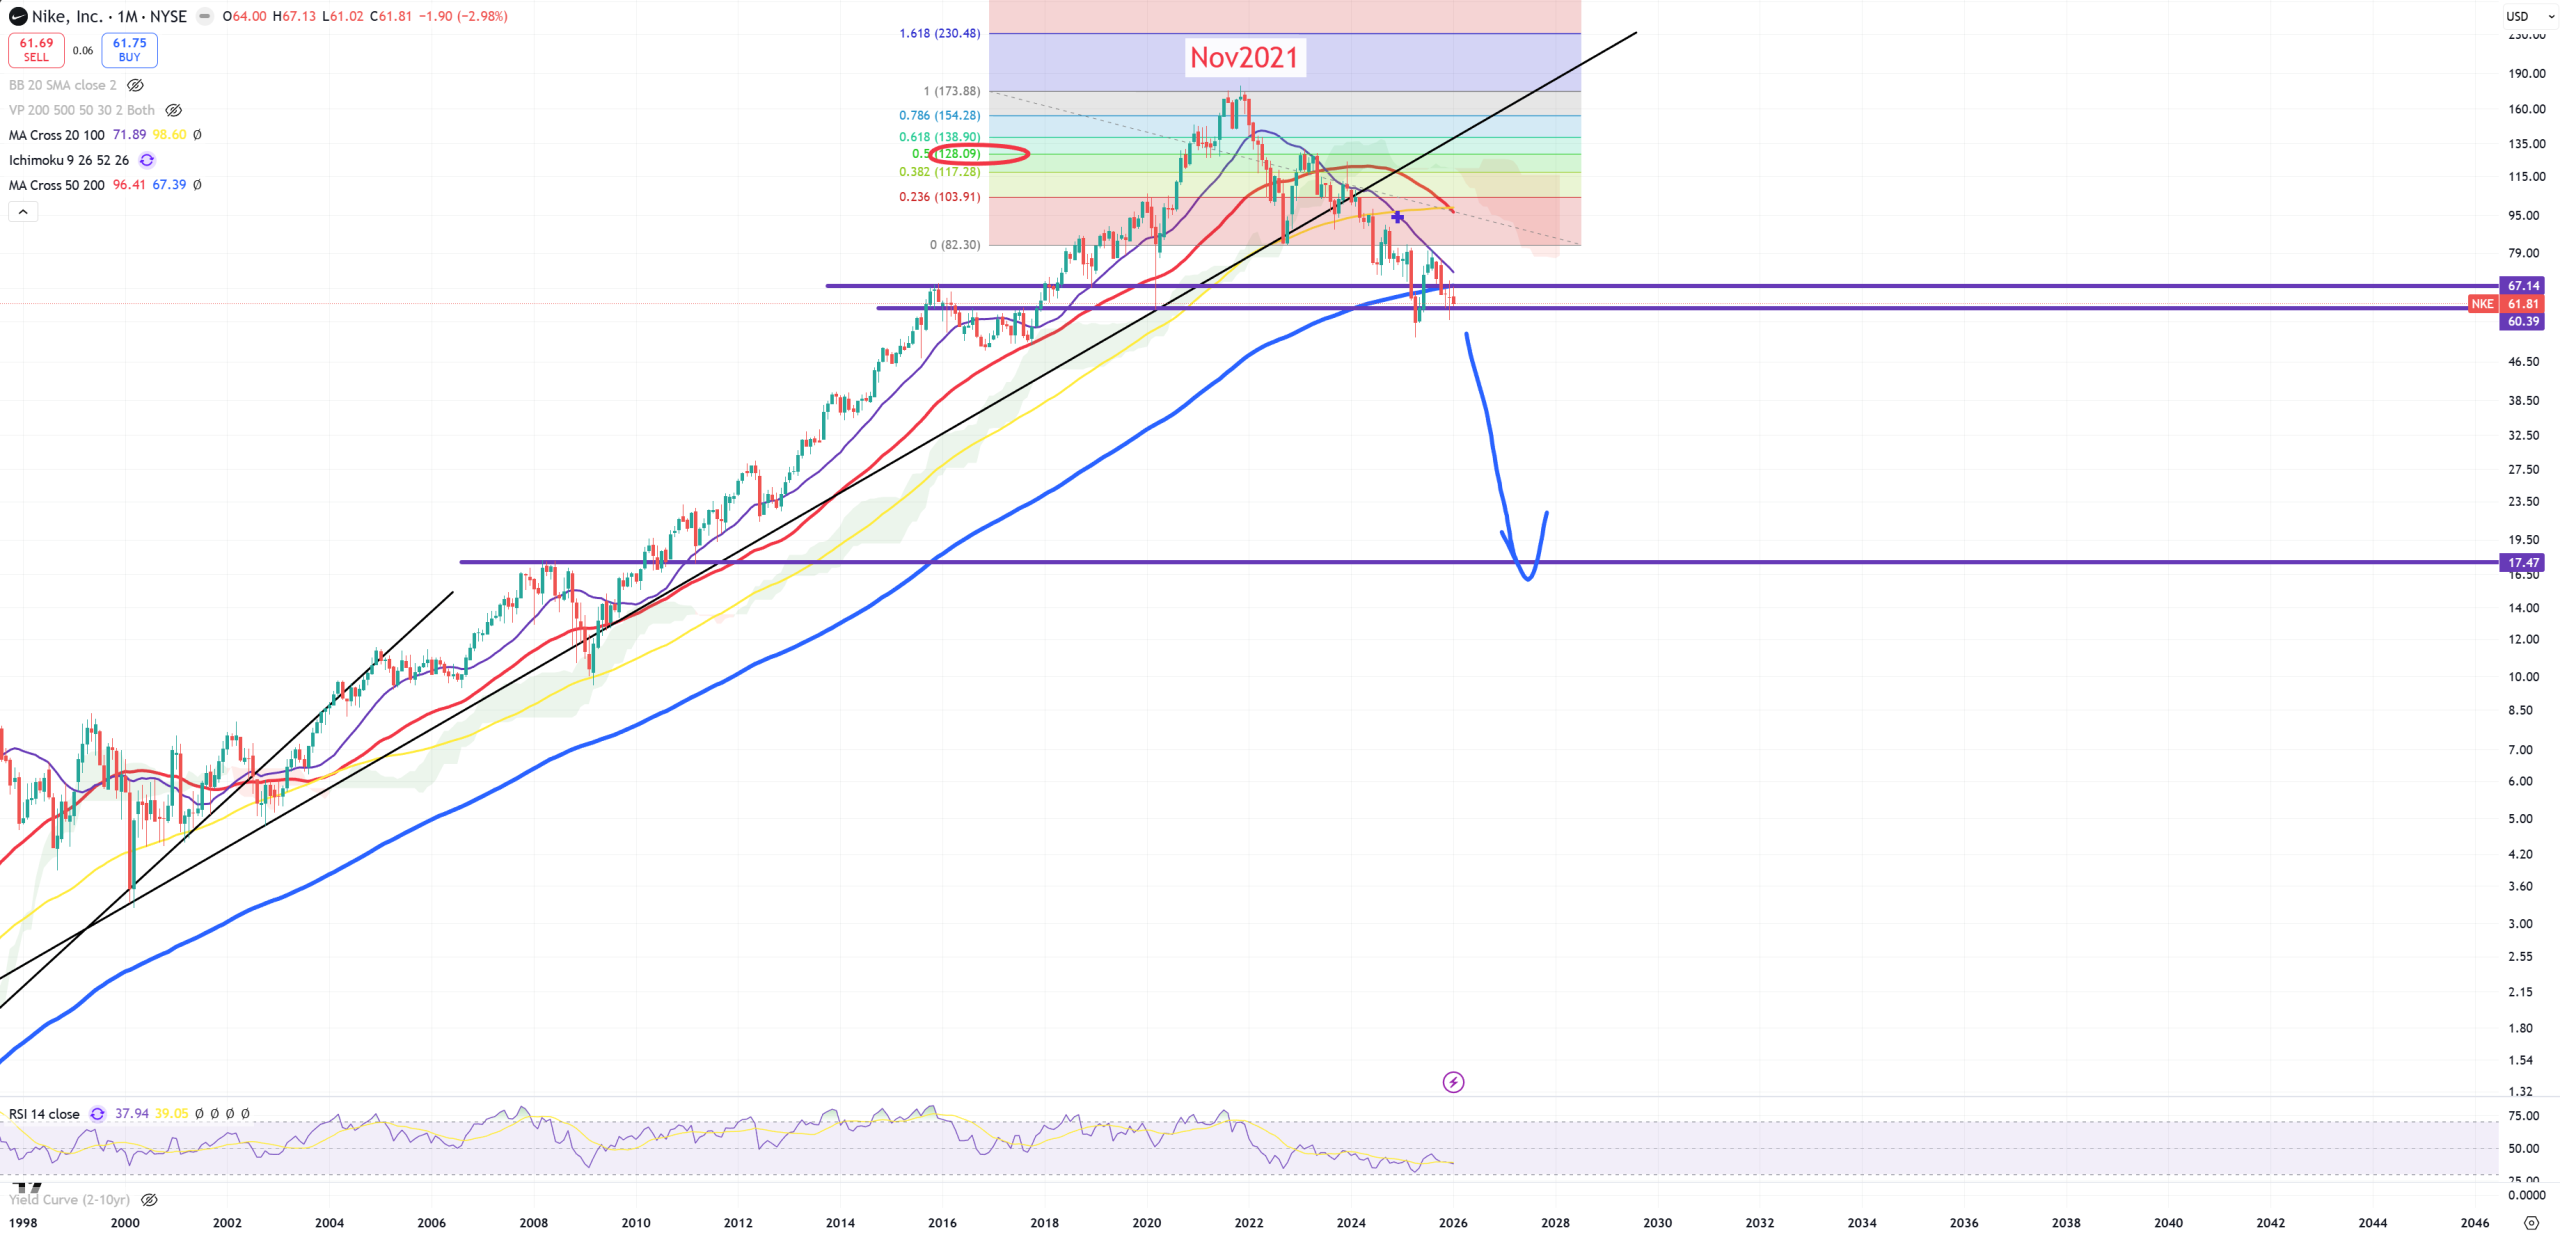
NKE – Nike – oh this looks like a bankrupt company…
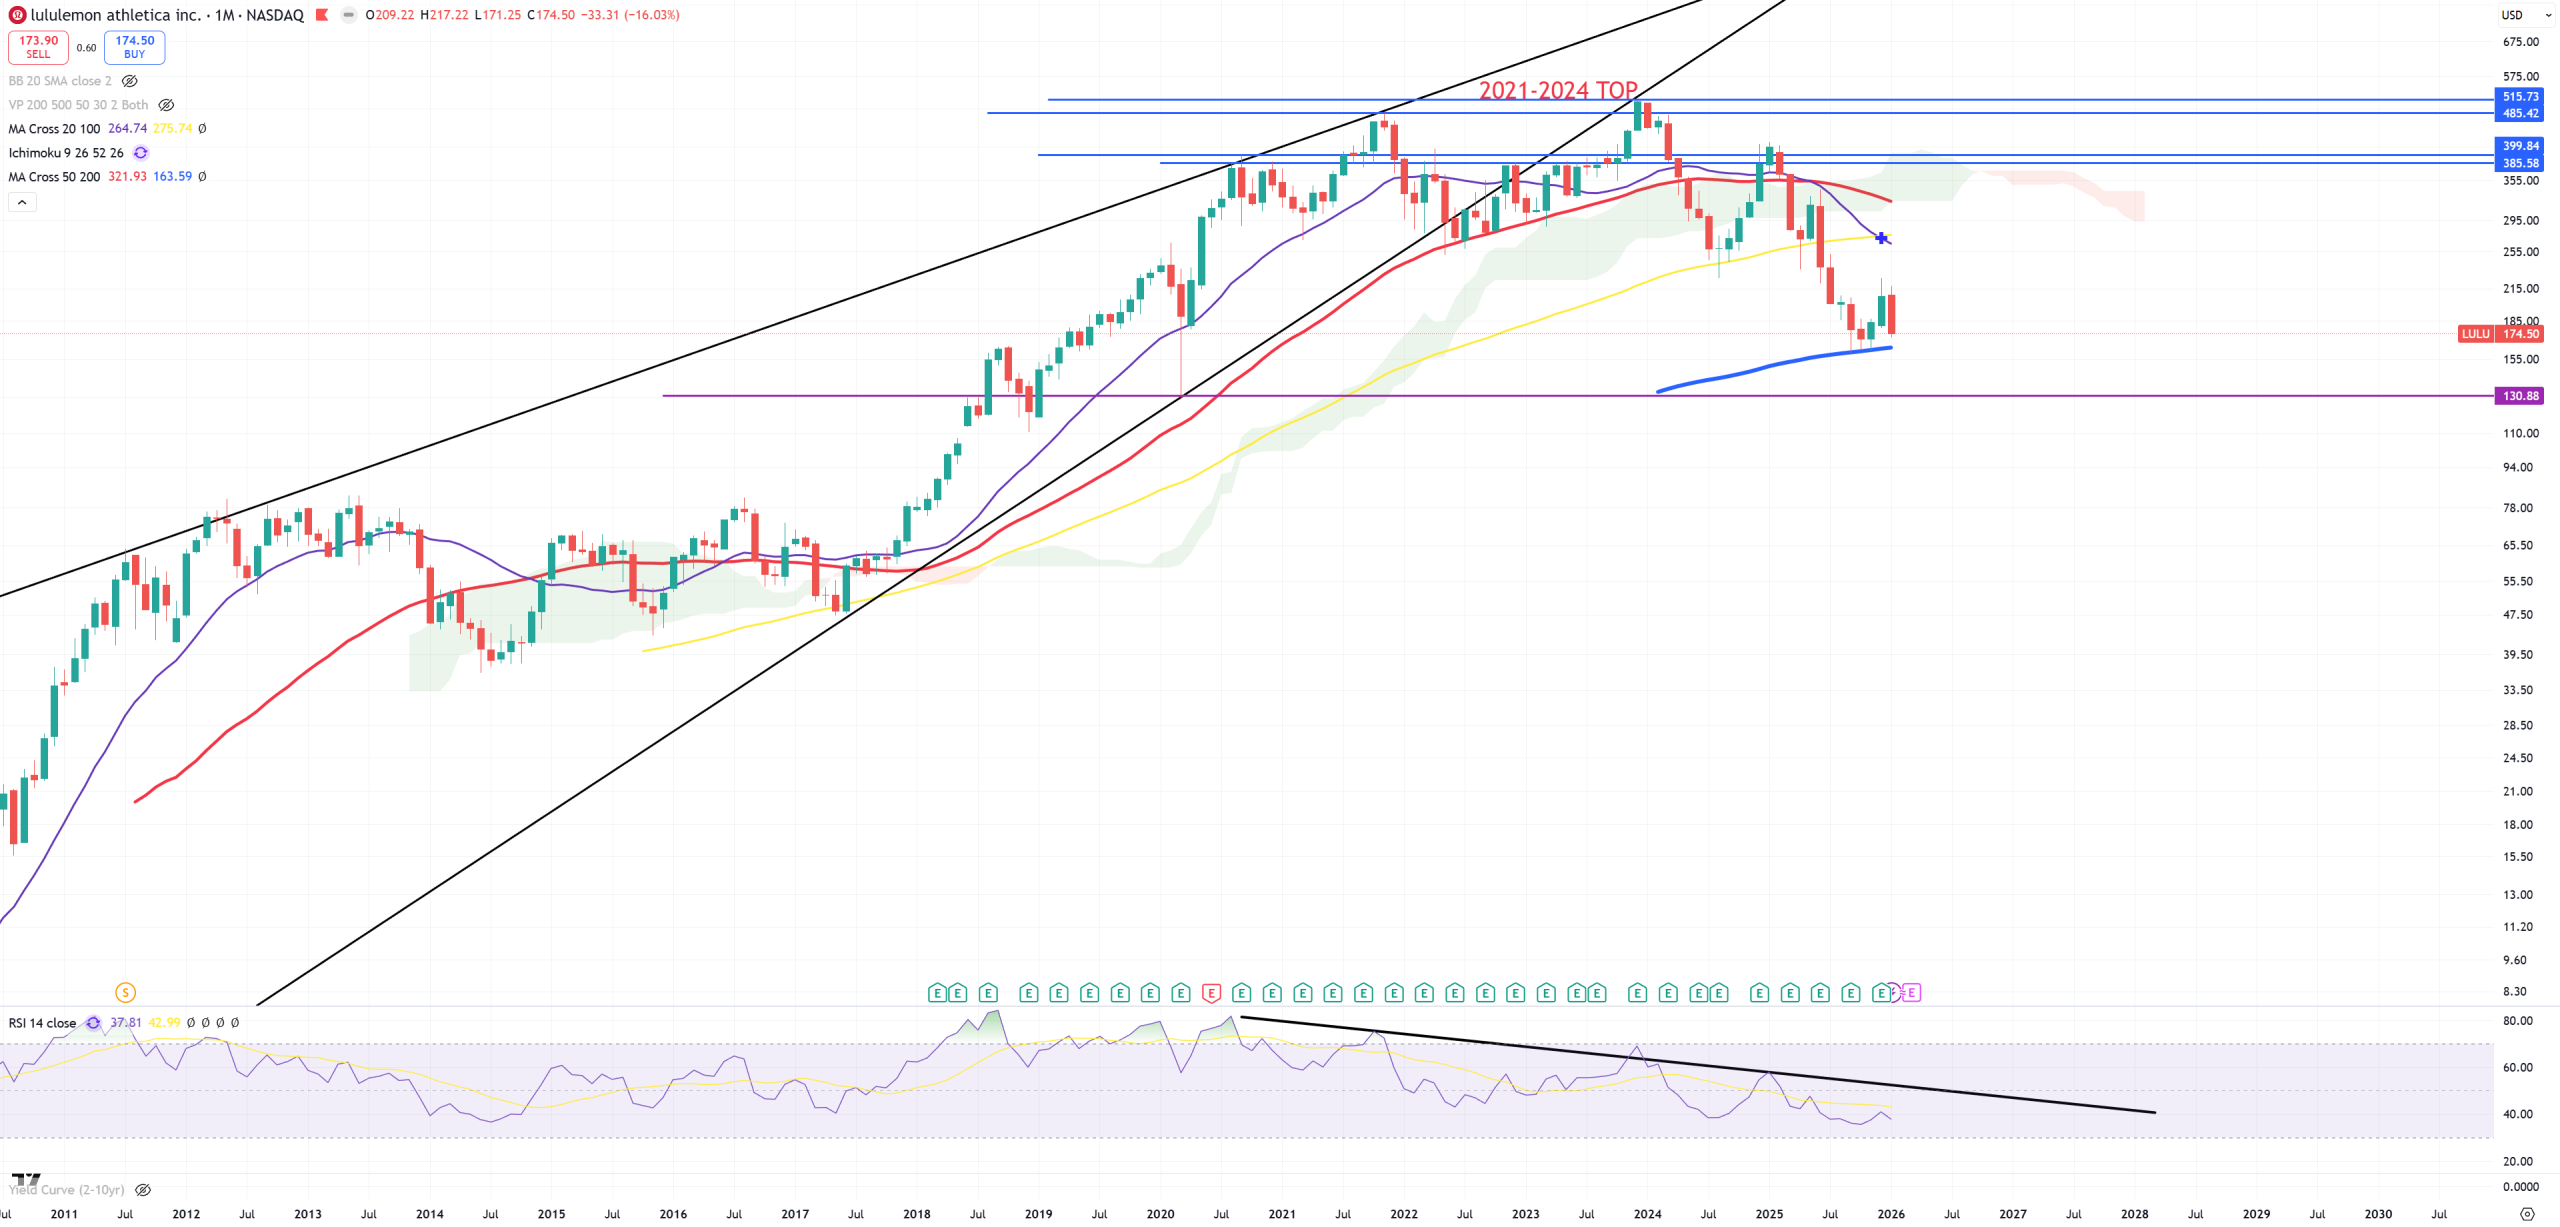
LULU – It’s very similar to NKE, just a bit over (M)MA200
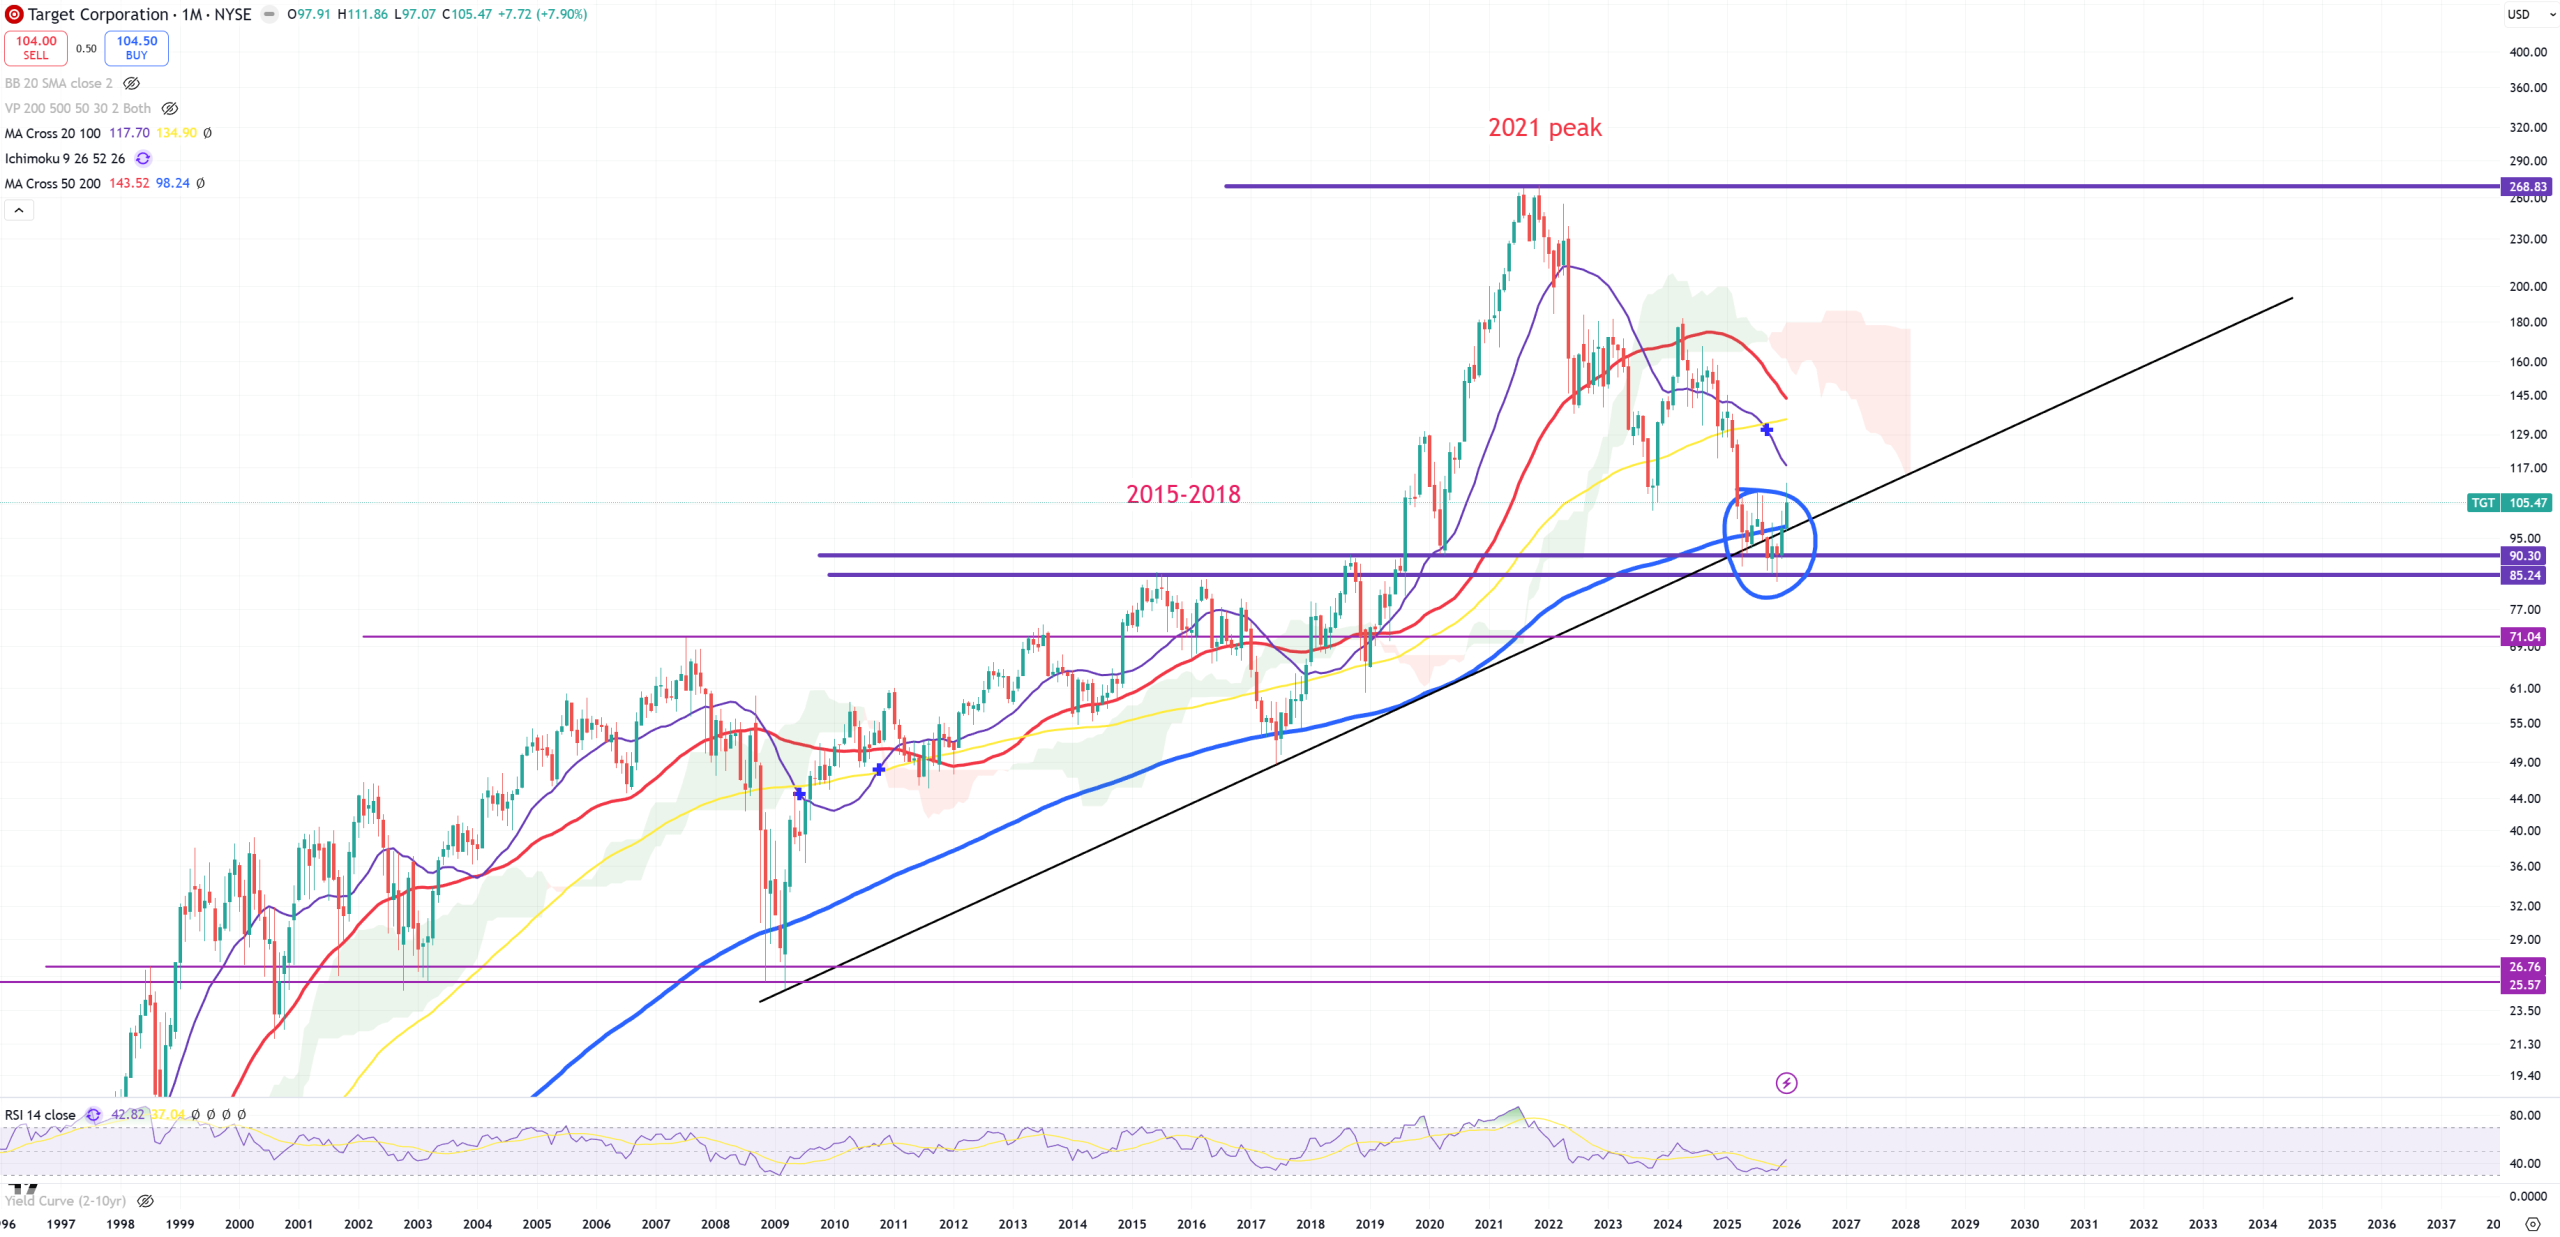
TGT – Target tries the same pattern as Nike
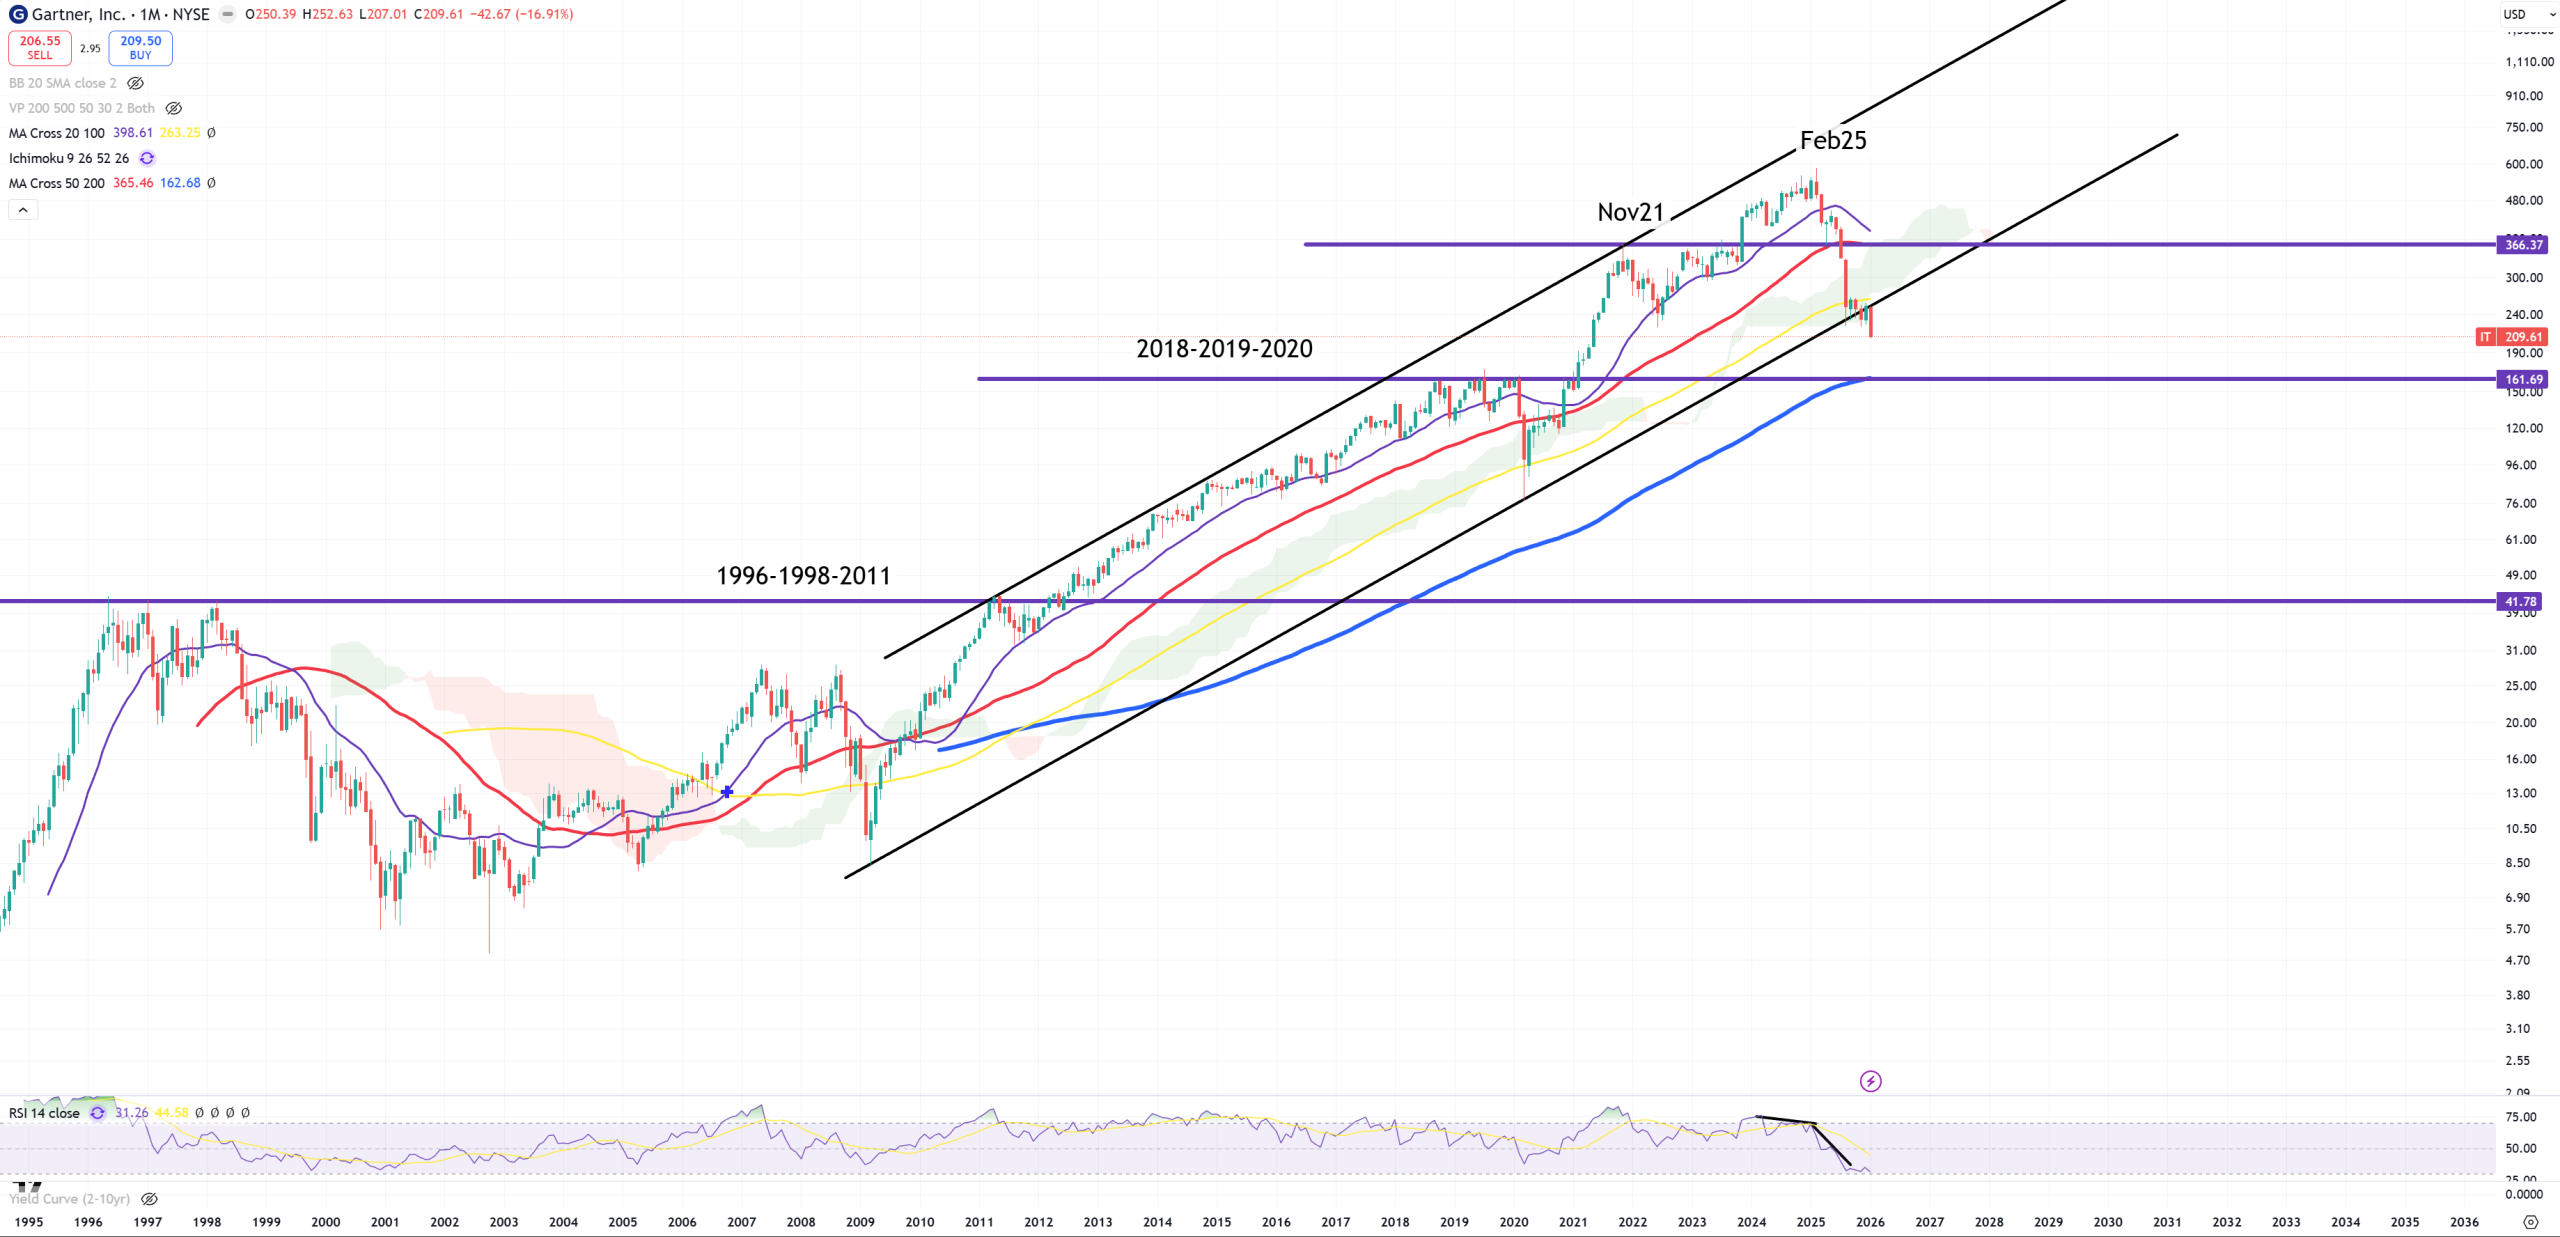
IT – Gartner – it’ll be a crash here
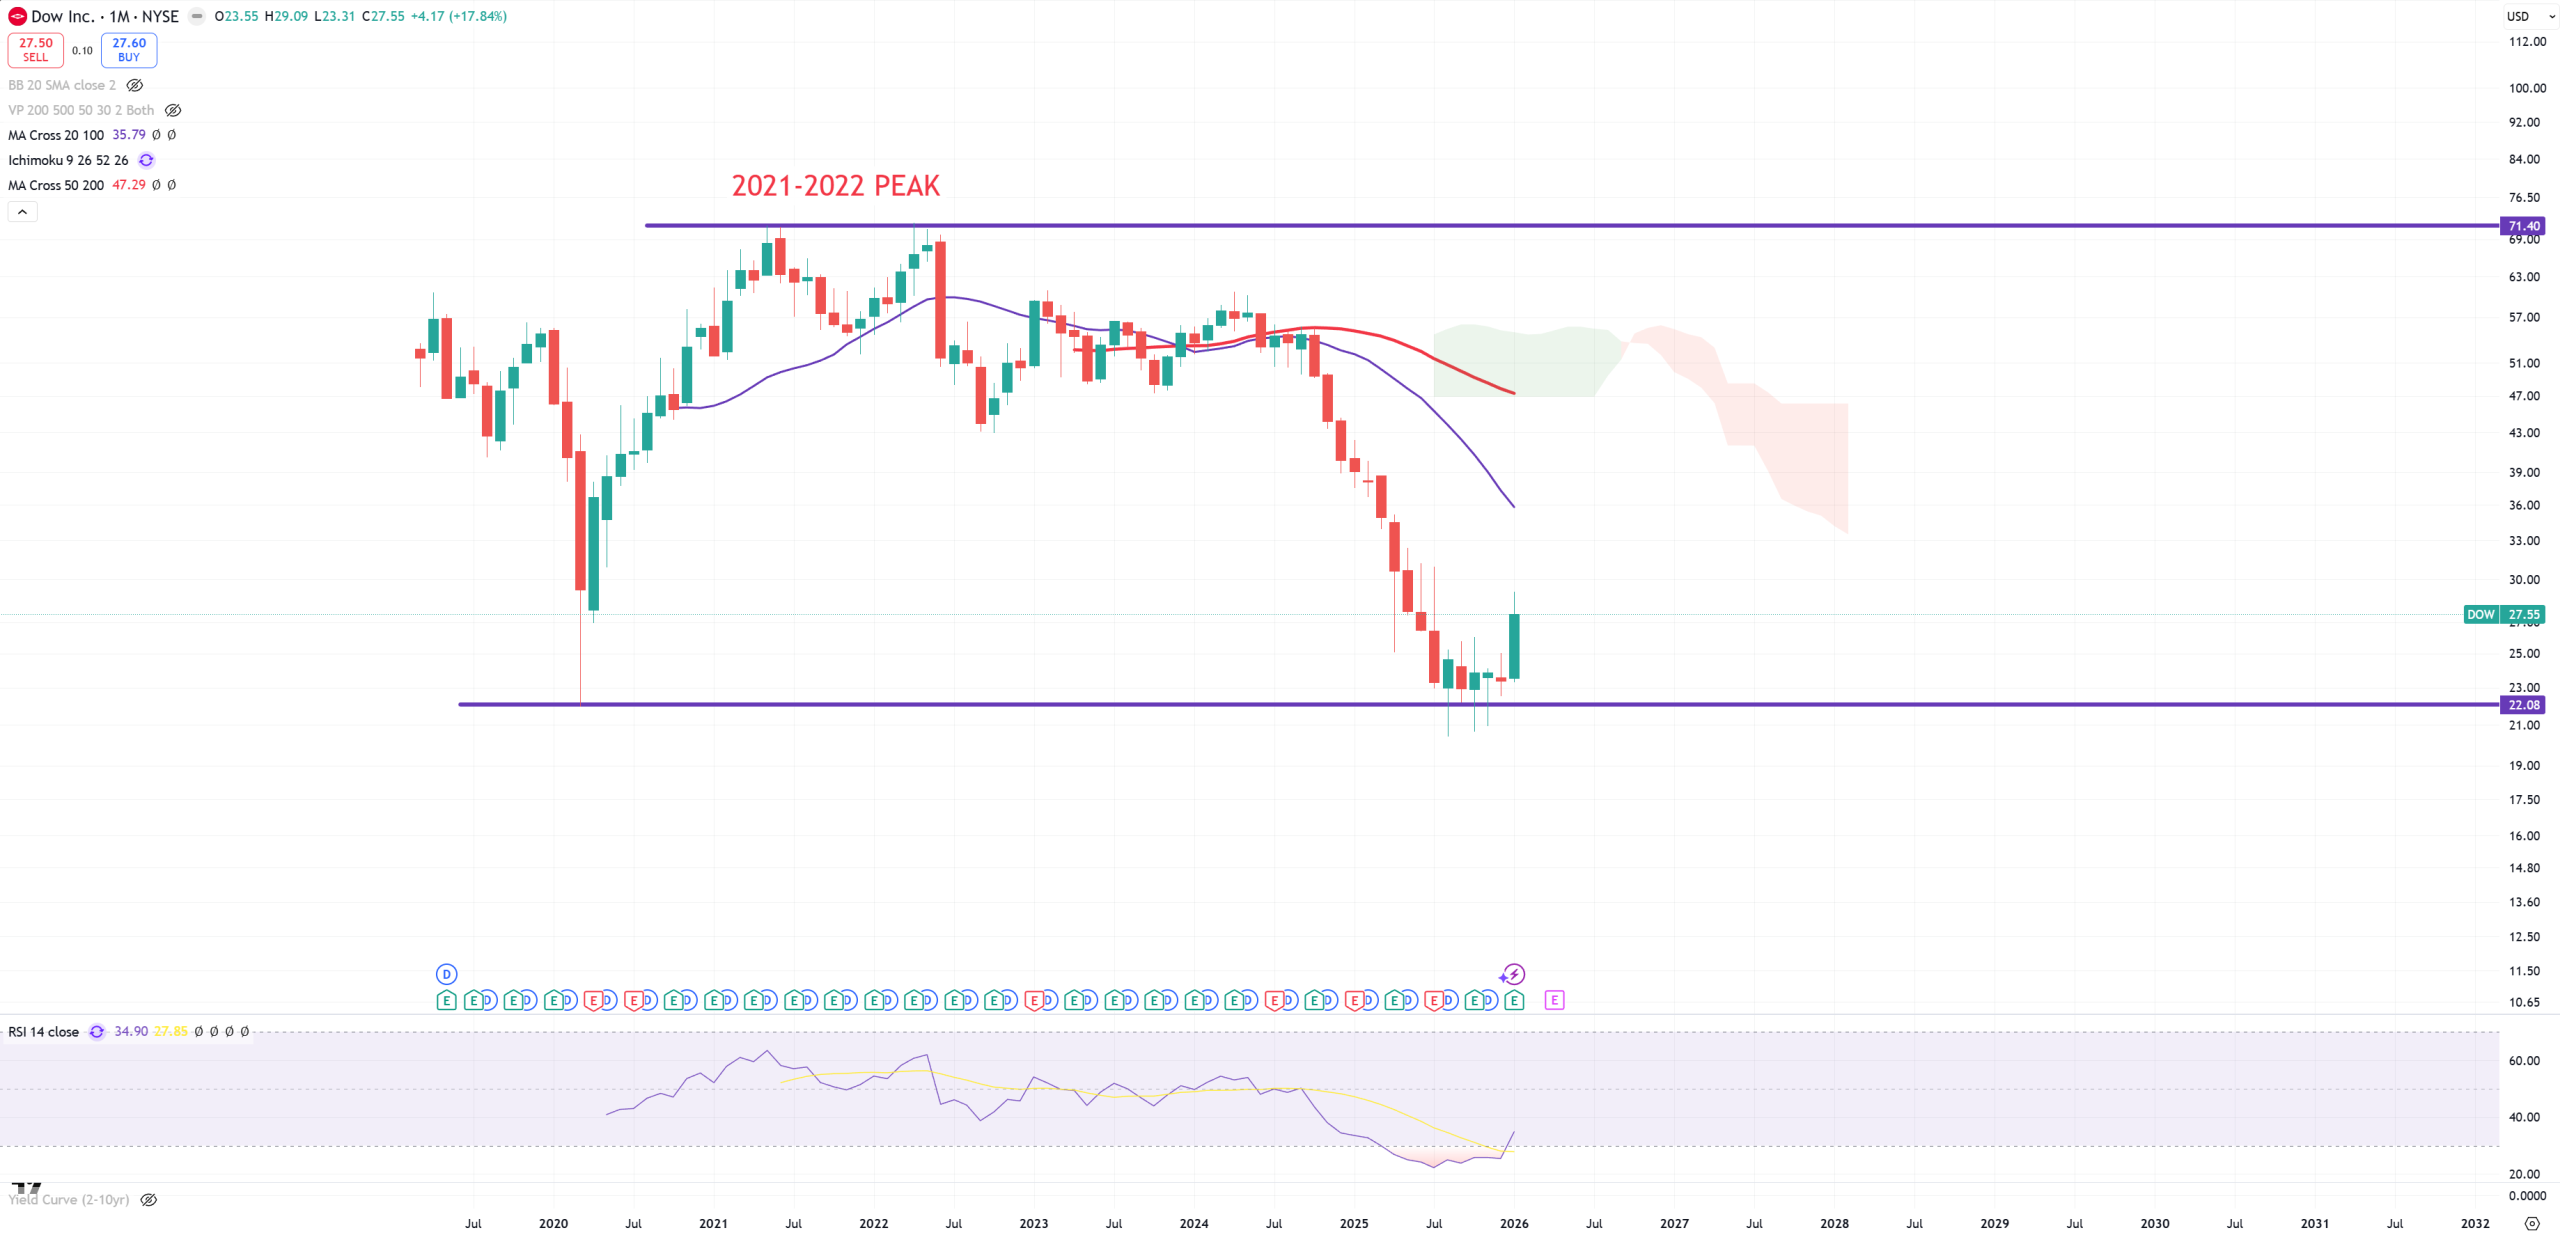
DOW – I don’t believe in this support, but I believe in a bounce which will take us to new ATL.
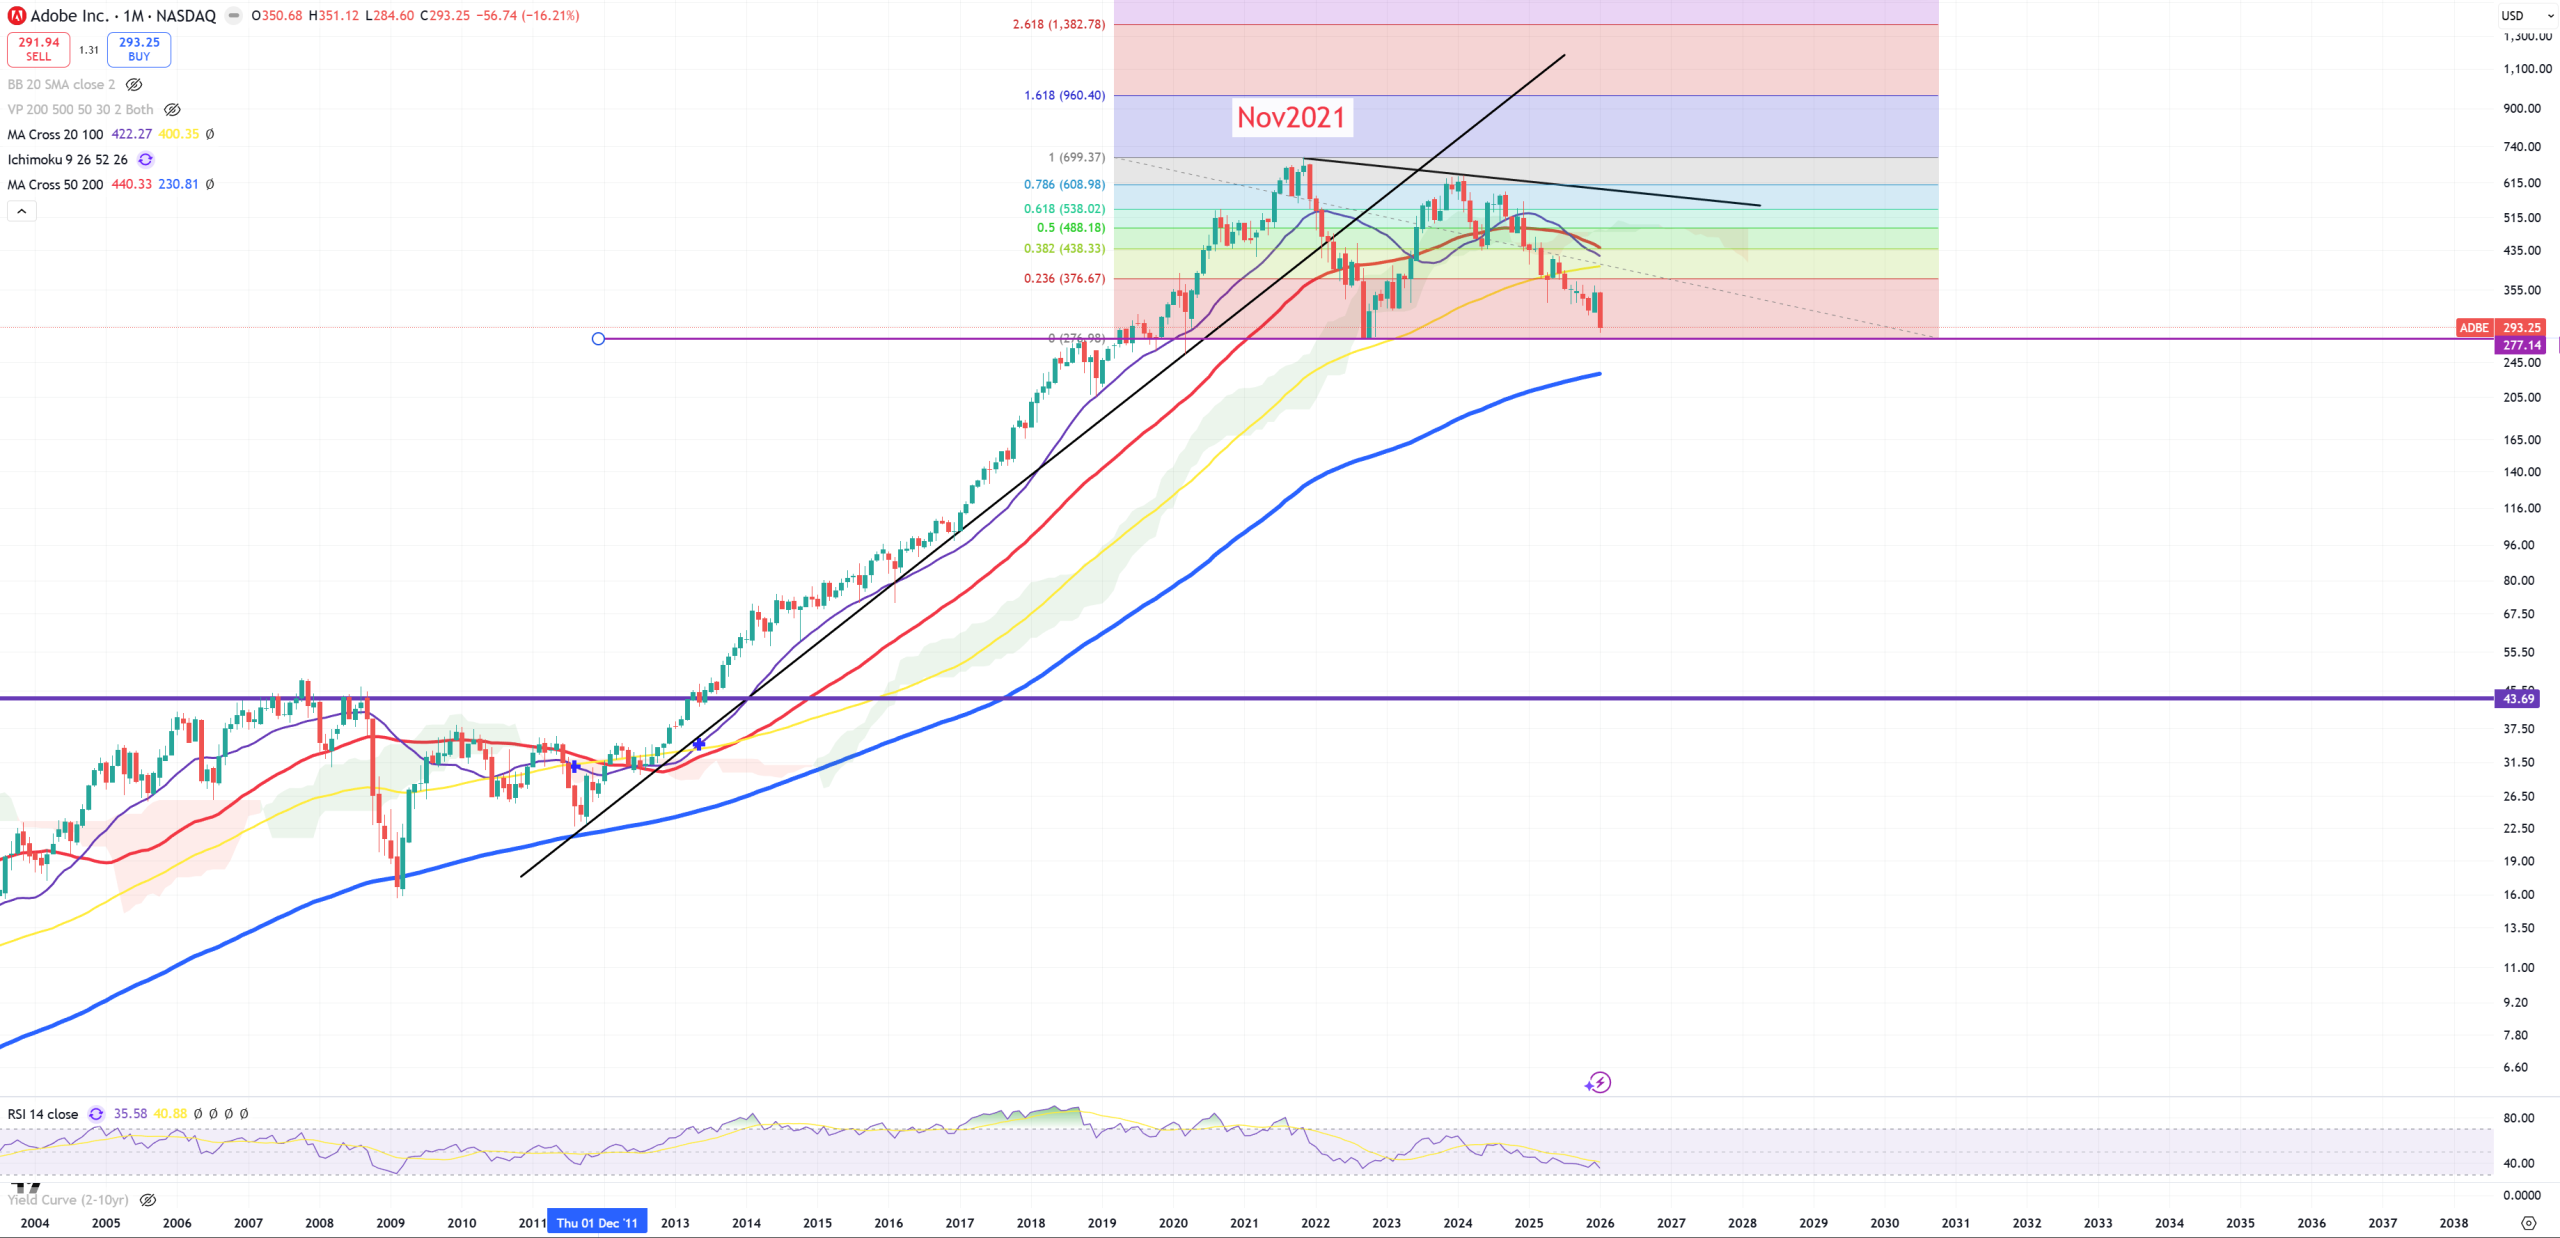
ADBE – Adobe – below (M)MA100, approaching to 2020-2022 support level :
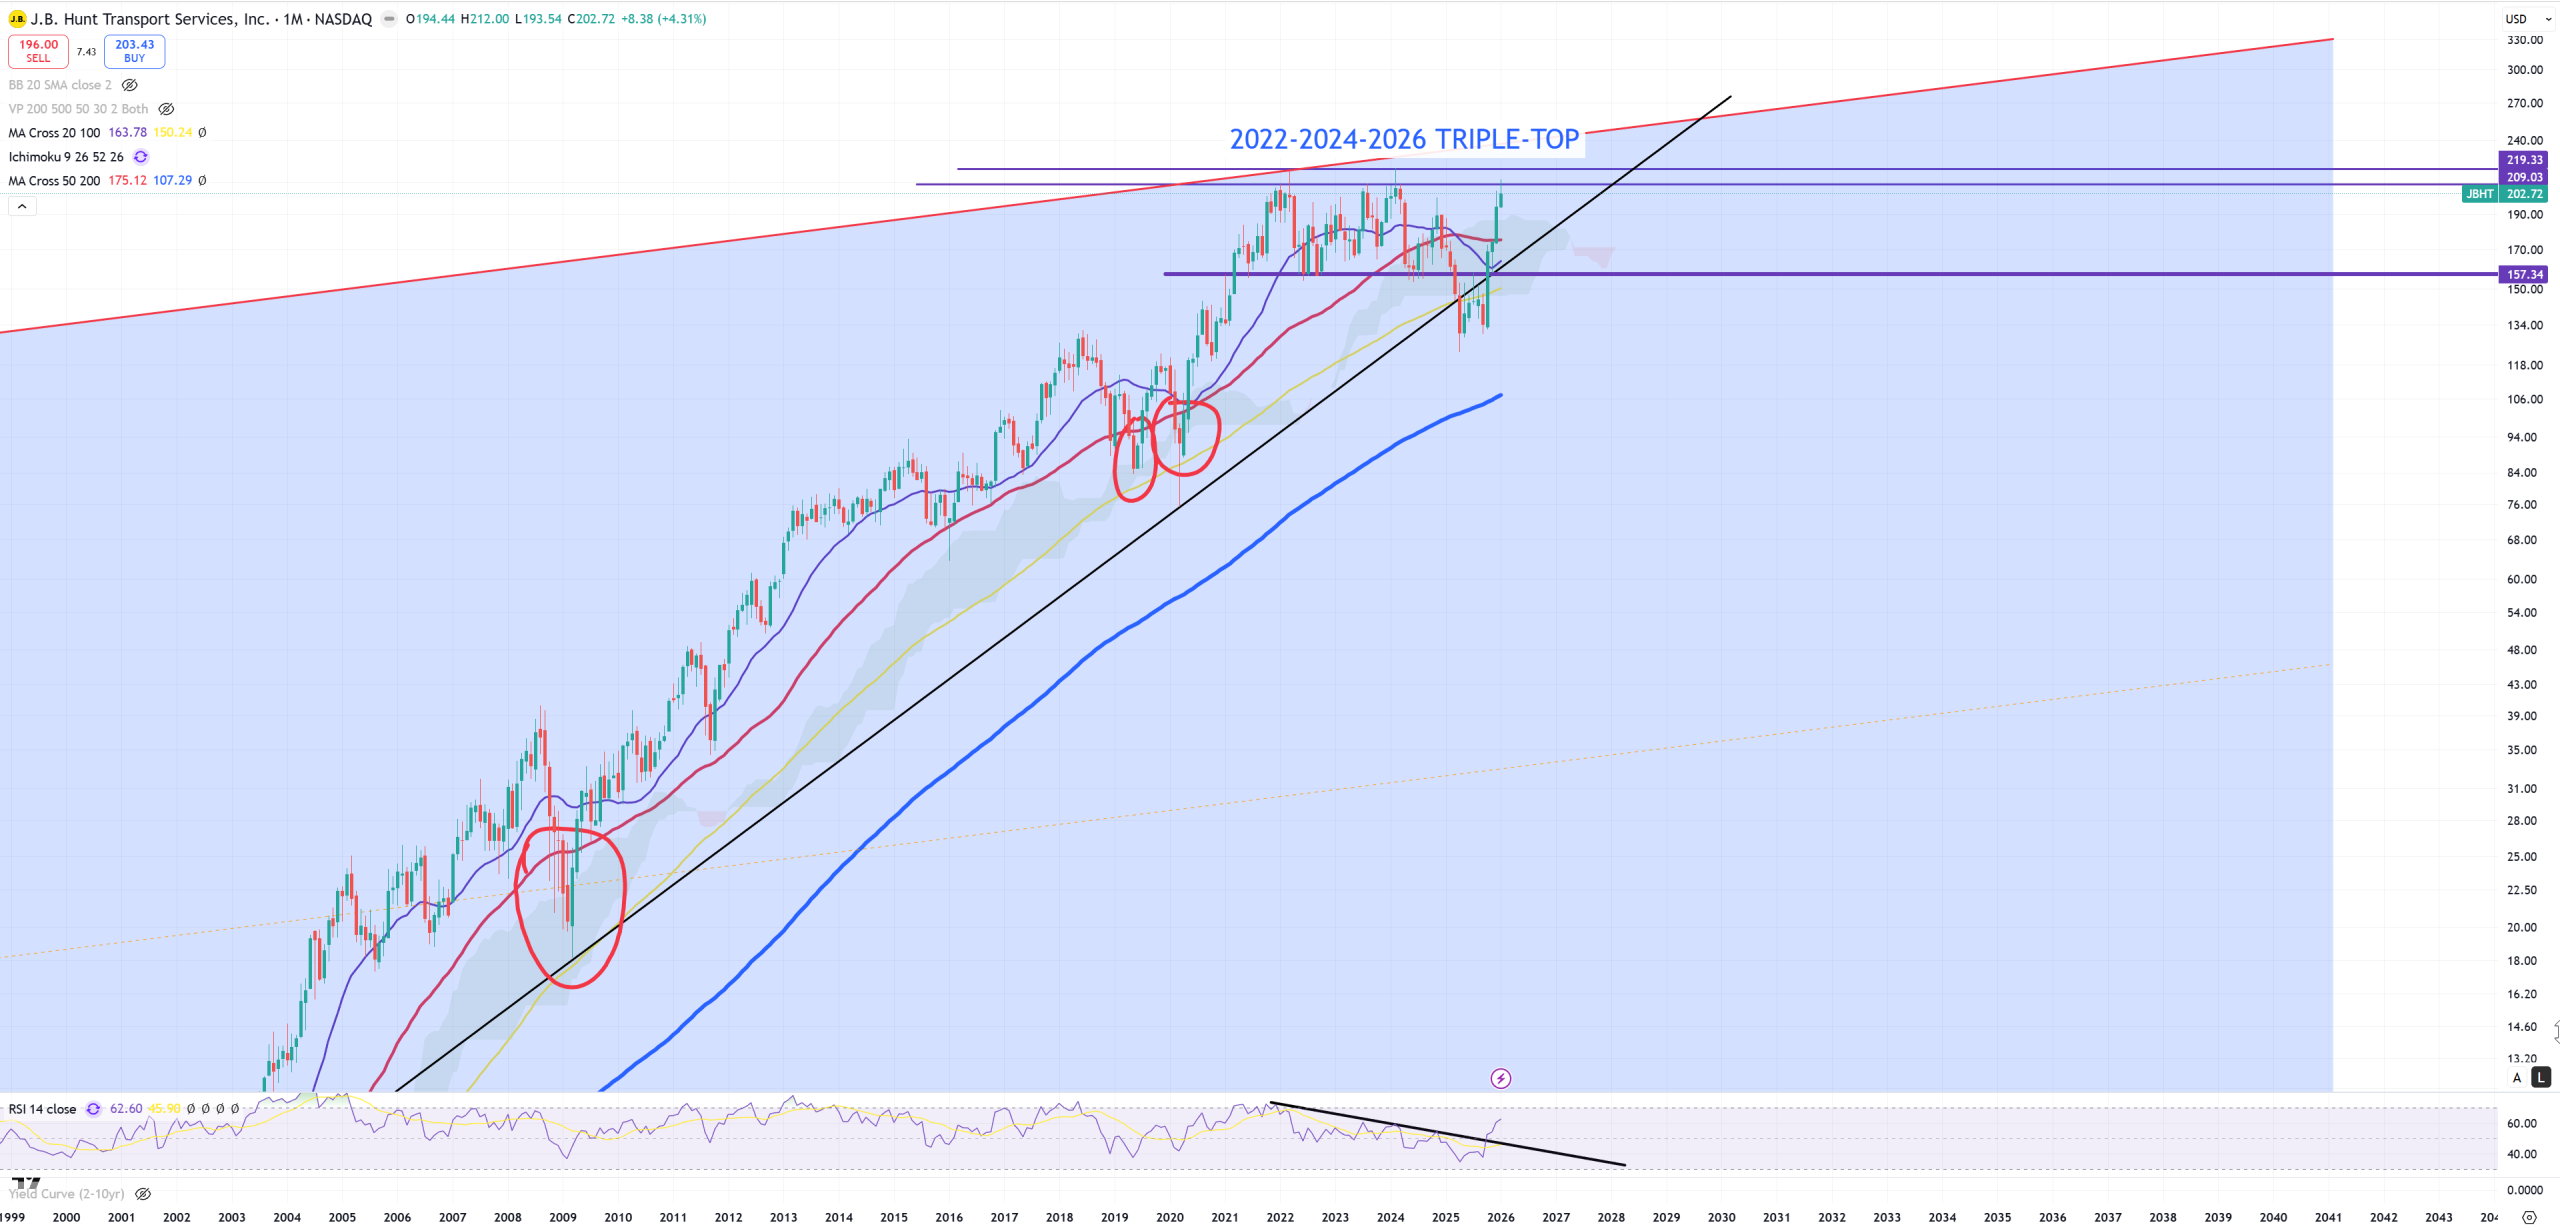
JBHT – this chart is one of the top that tricked me… 2009 trend broken, (M)MA50 broken, bull/bear trap level yellow (M)MA100 broken, retested to trend and … FAILED as it run to 3xTOP
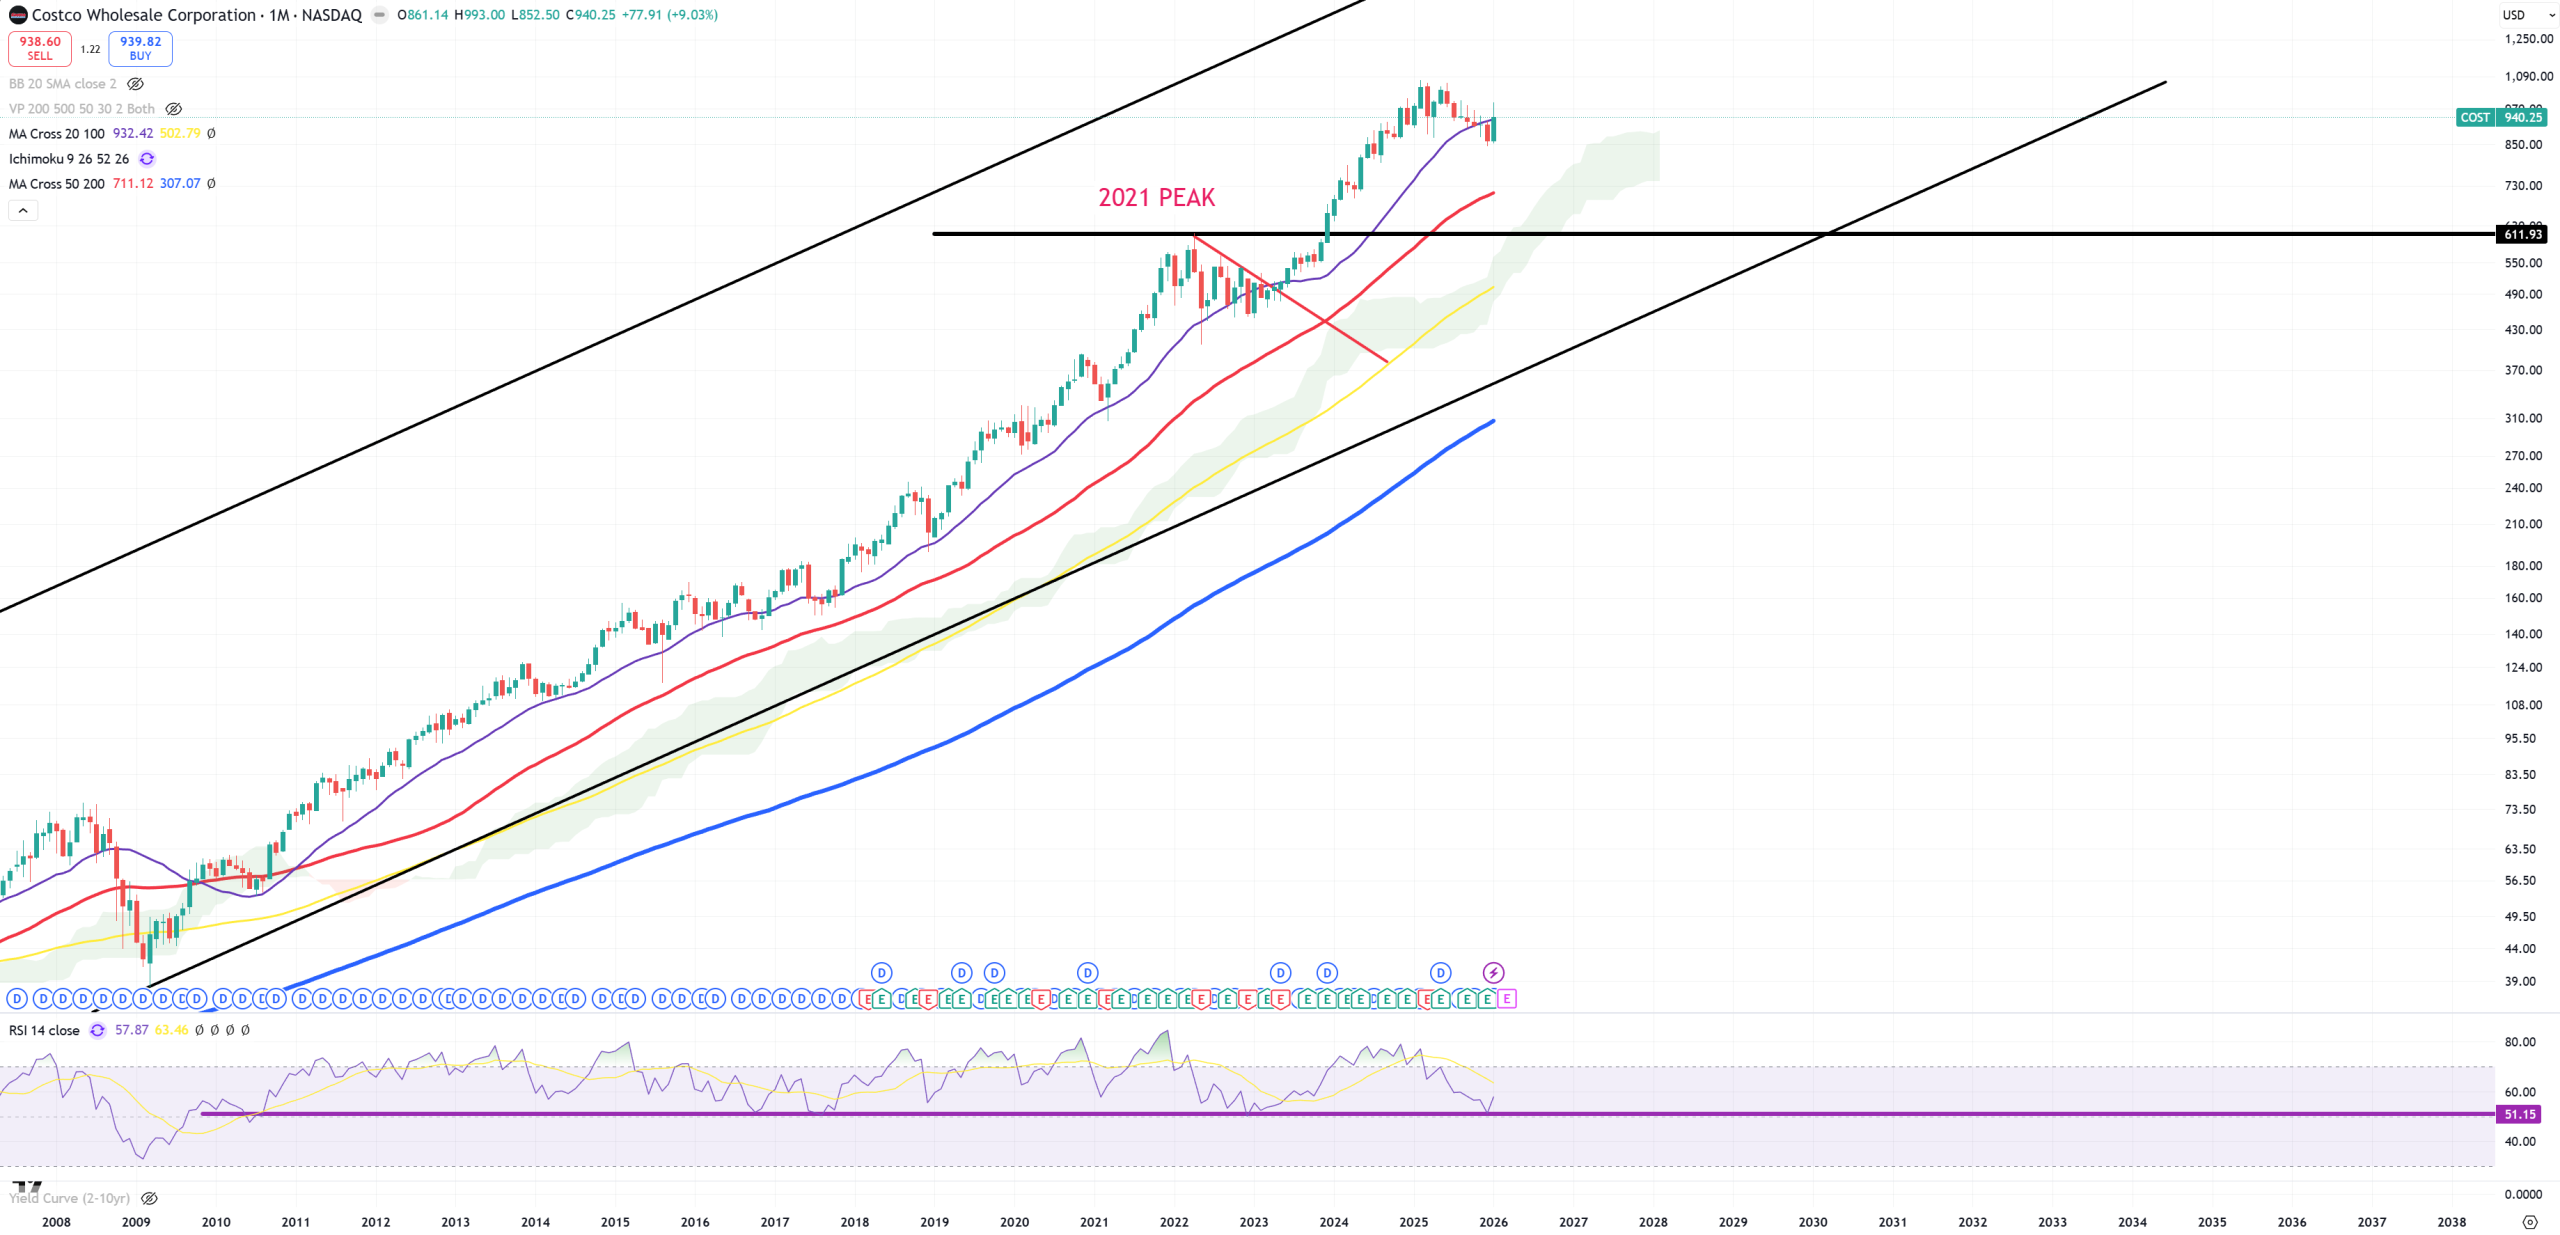
COST – Big moment – (M)MA20 and possible trend change
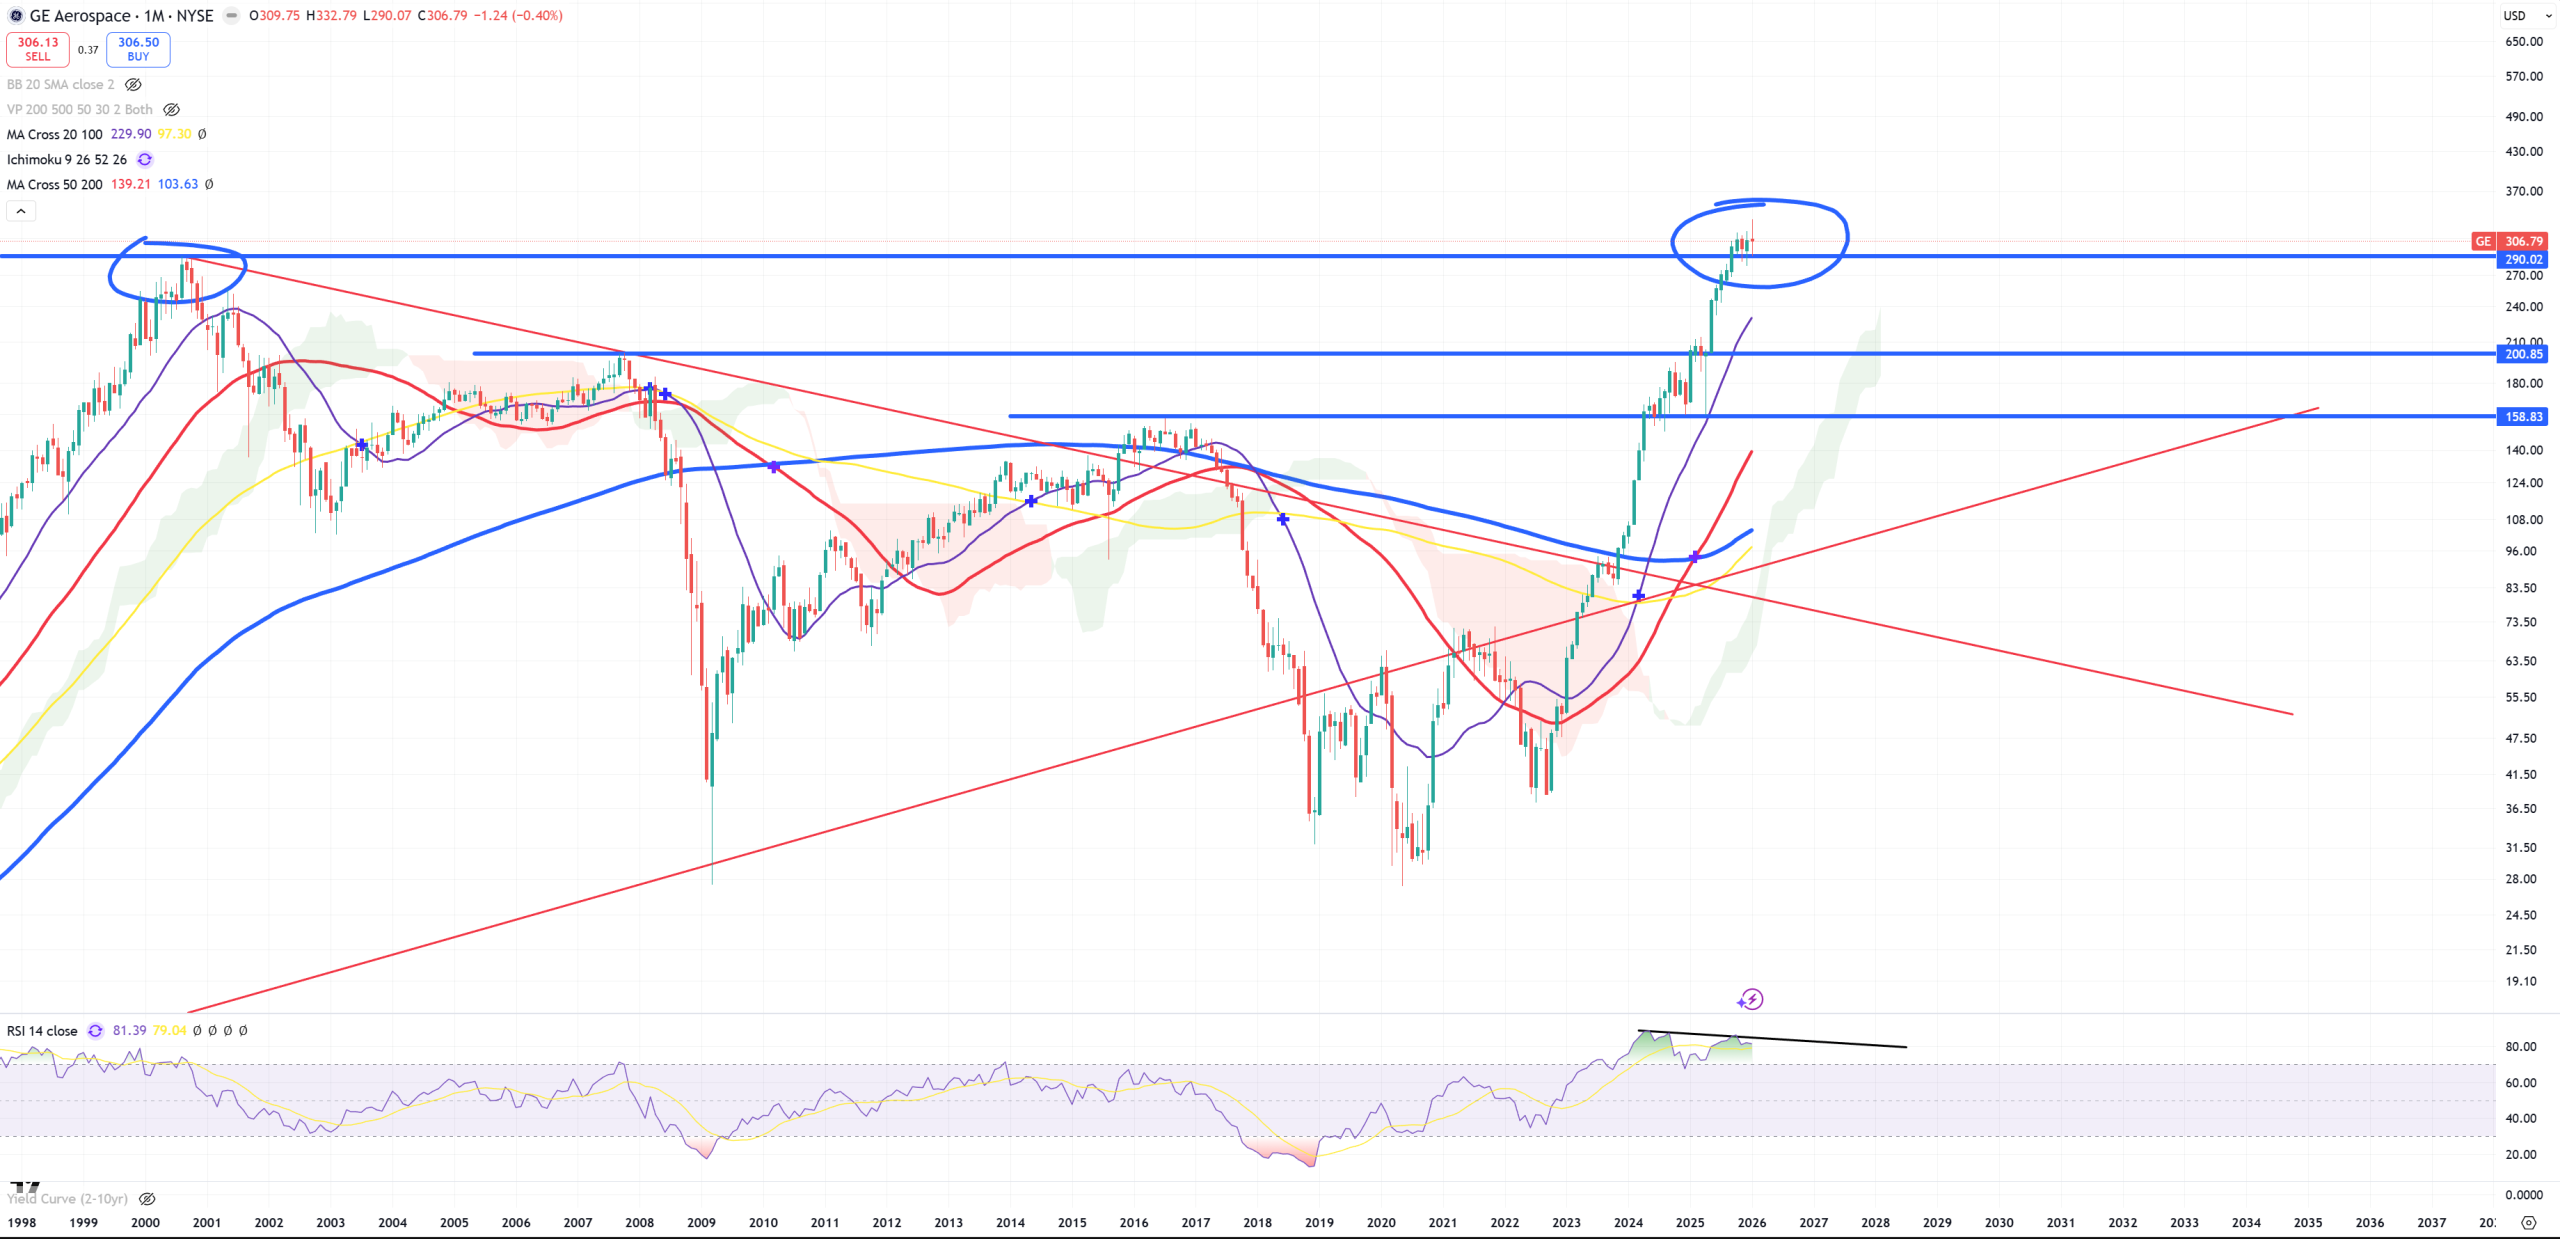
GE – Enormous run
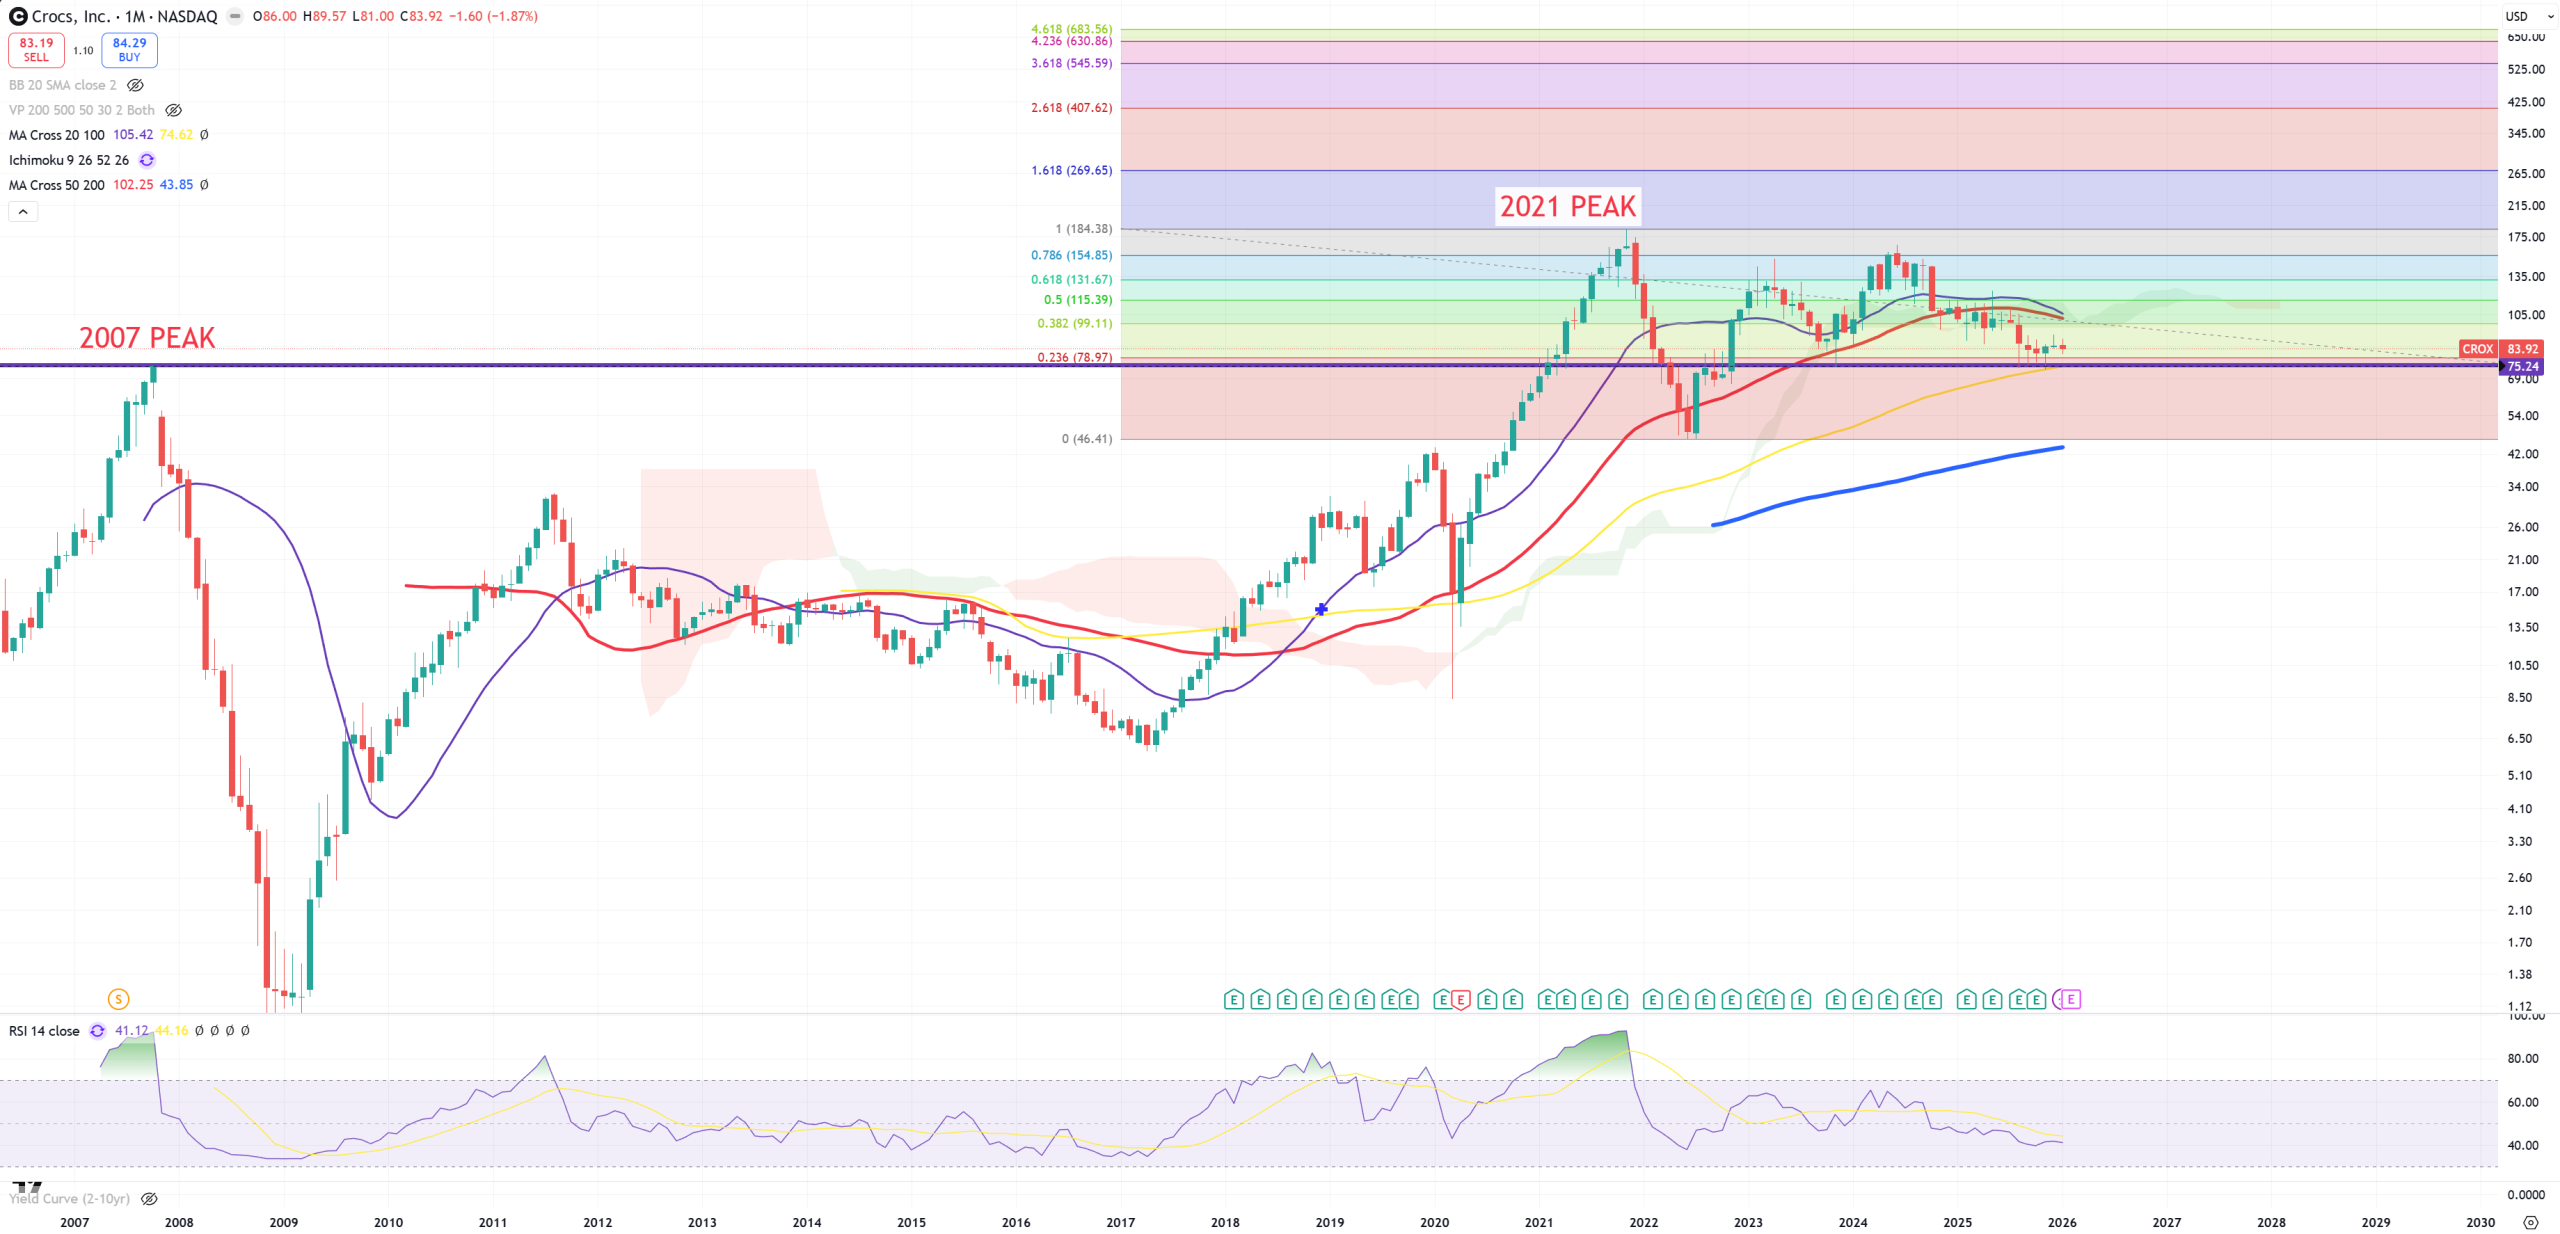
CROX – will it move back below 2007 level?
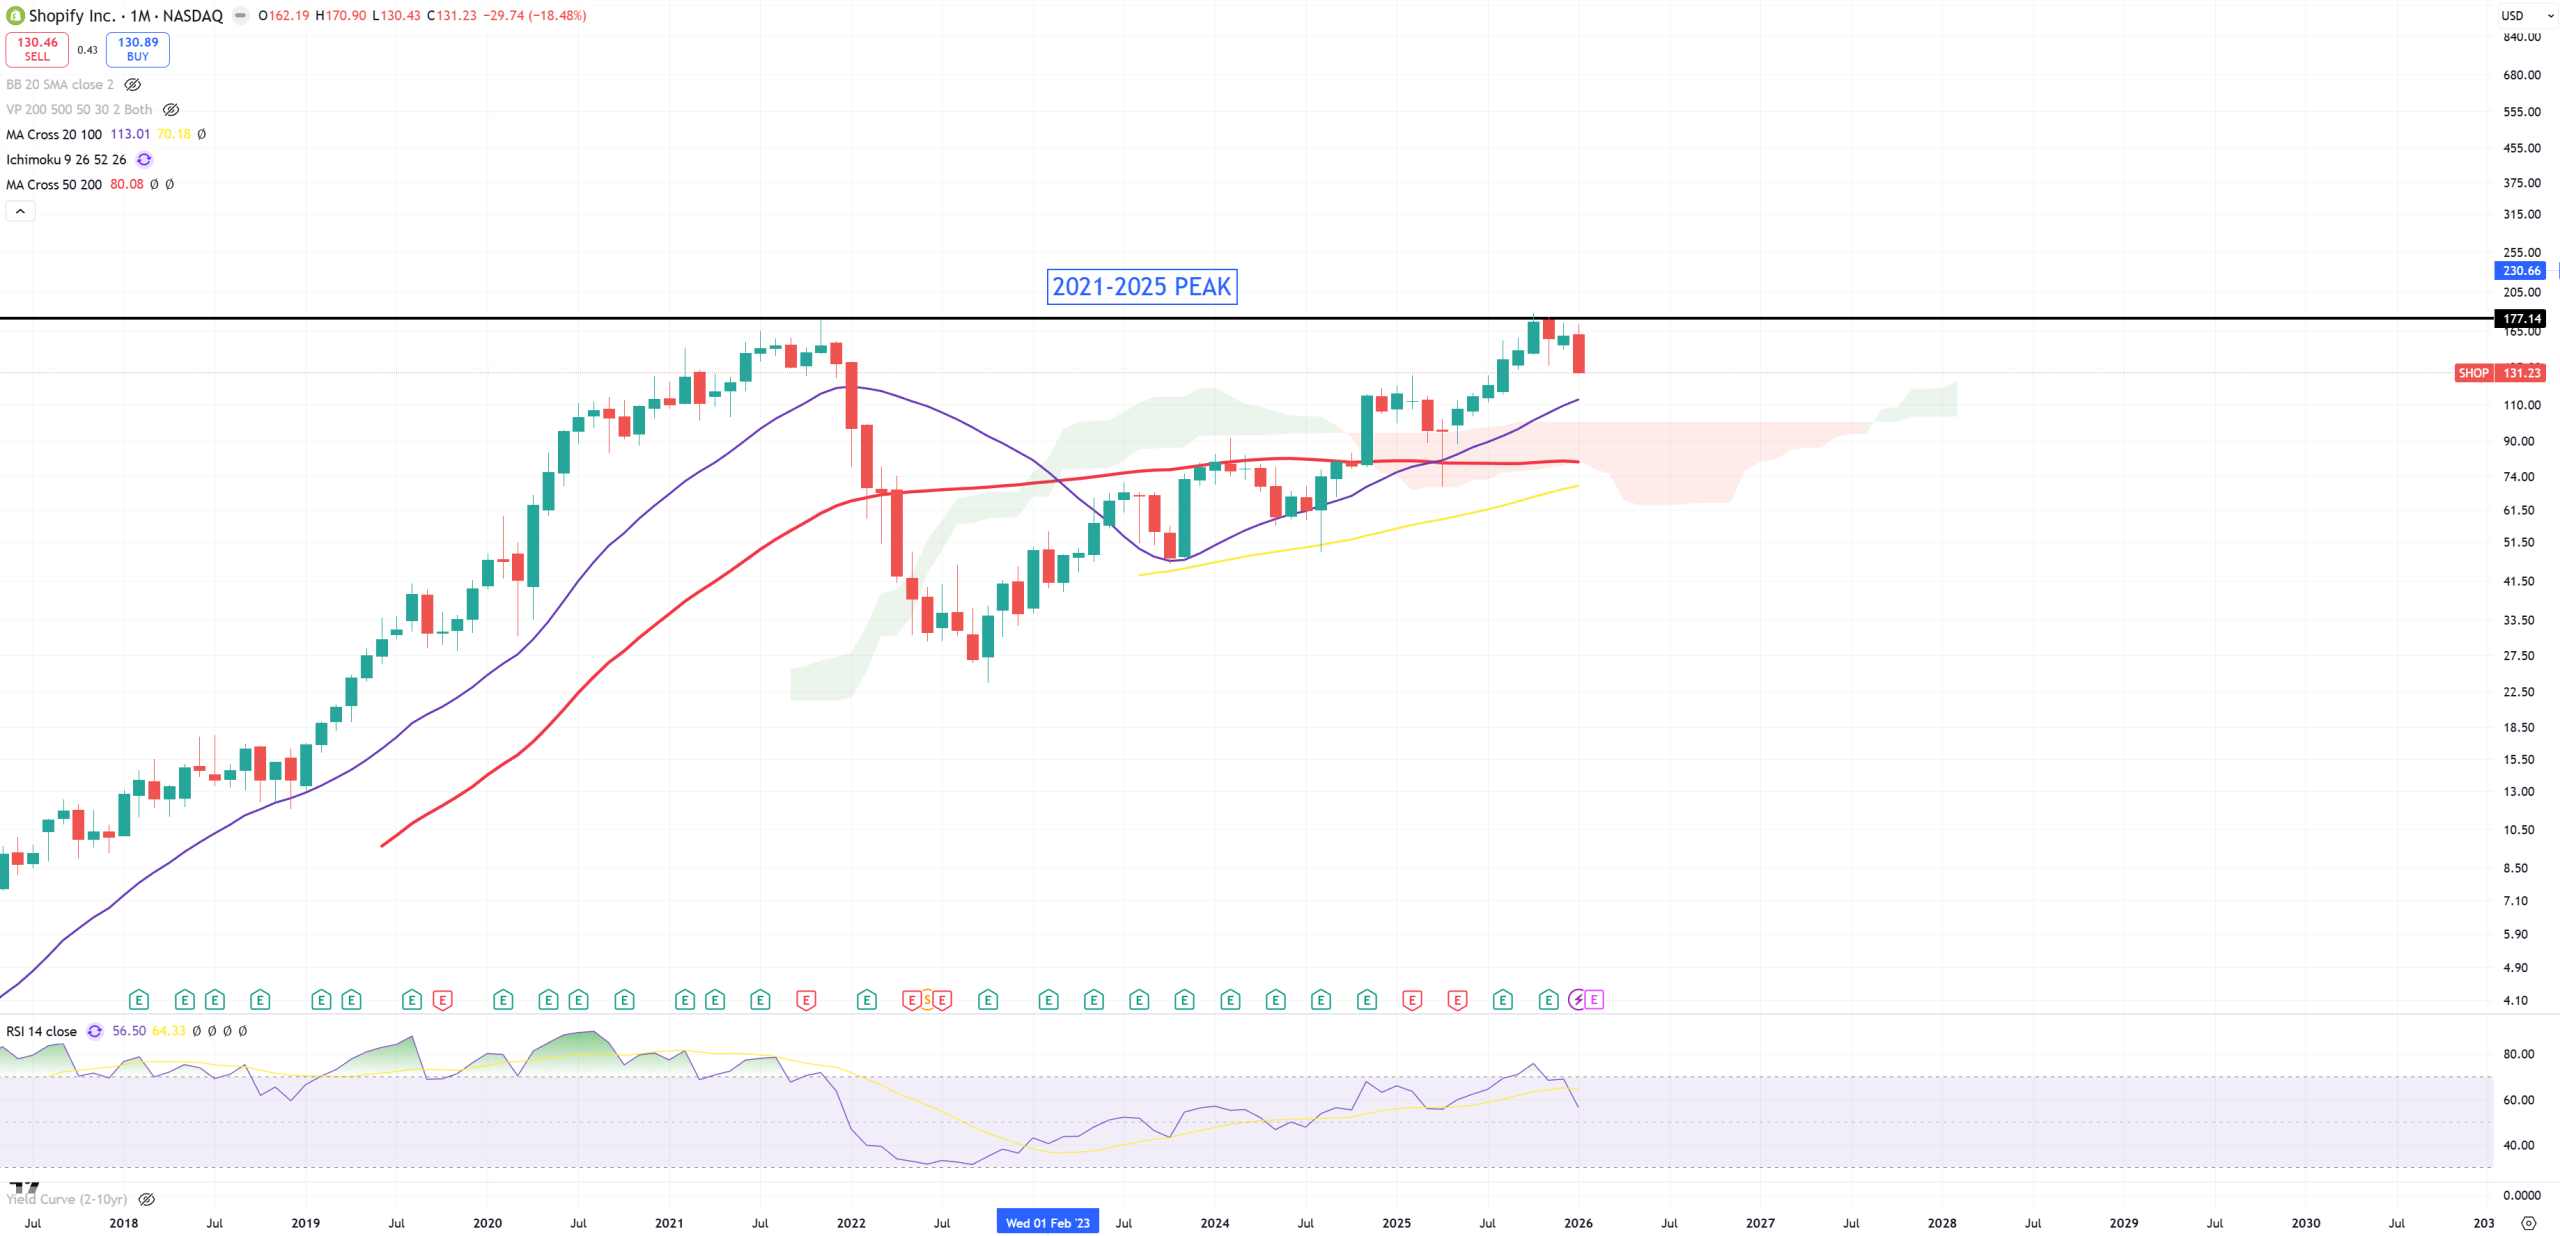
SHOP -so perfect
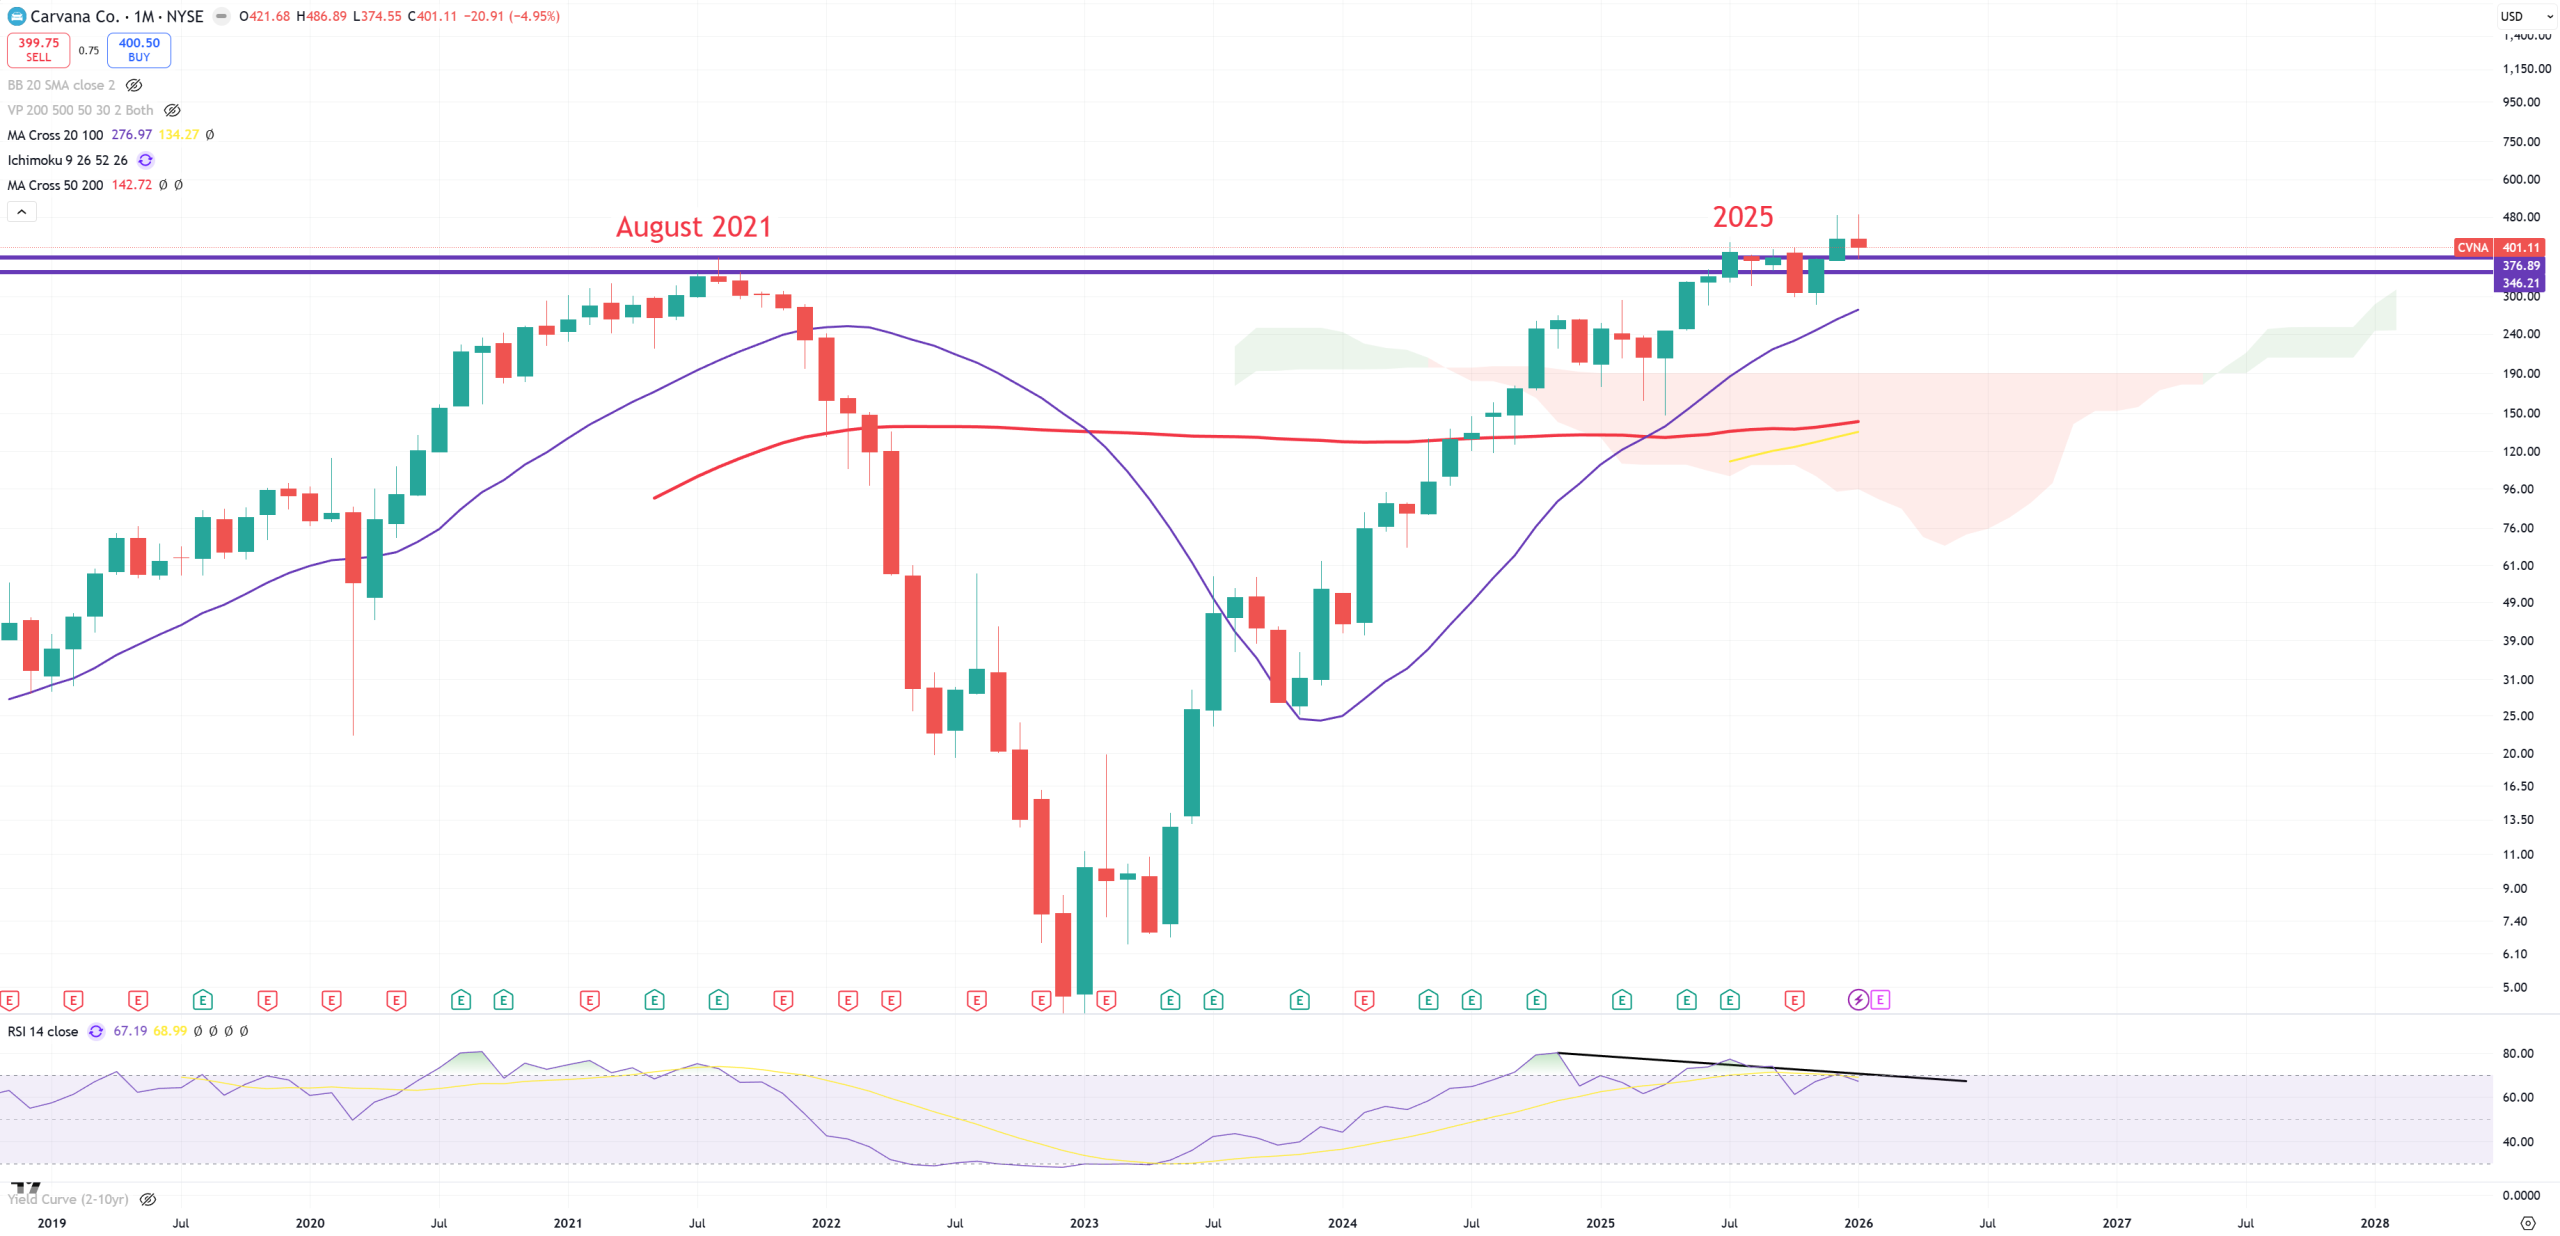
CVNA – scam of the decade. Initially I though post 2022 bounce it’ll end on (M)MA50 but … nope.
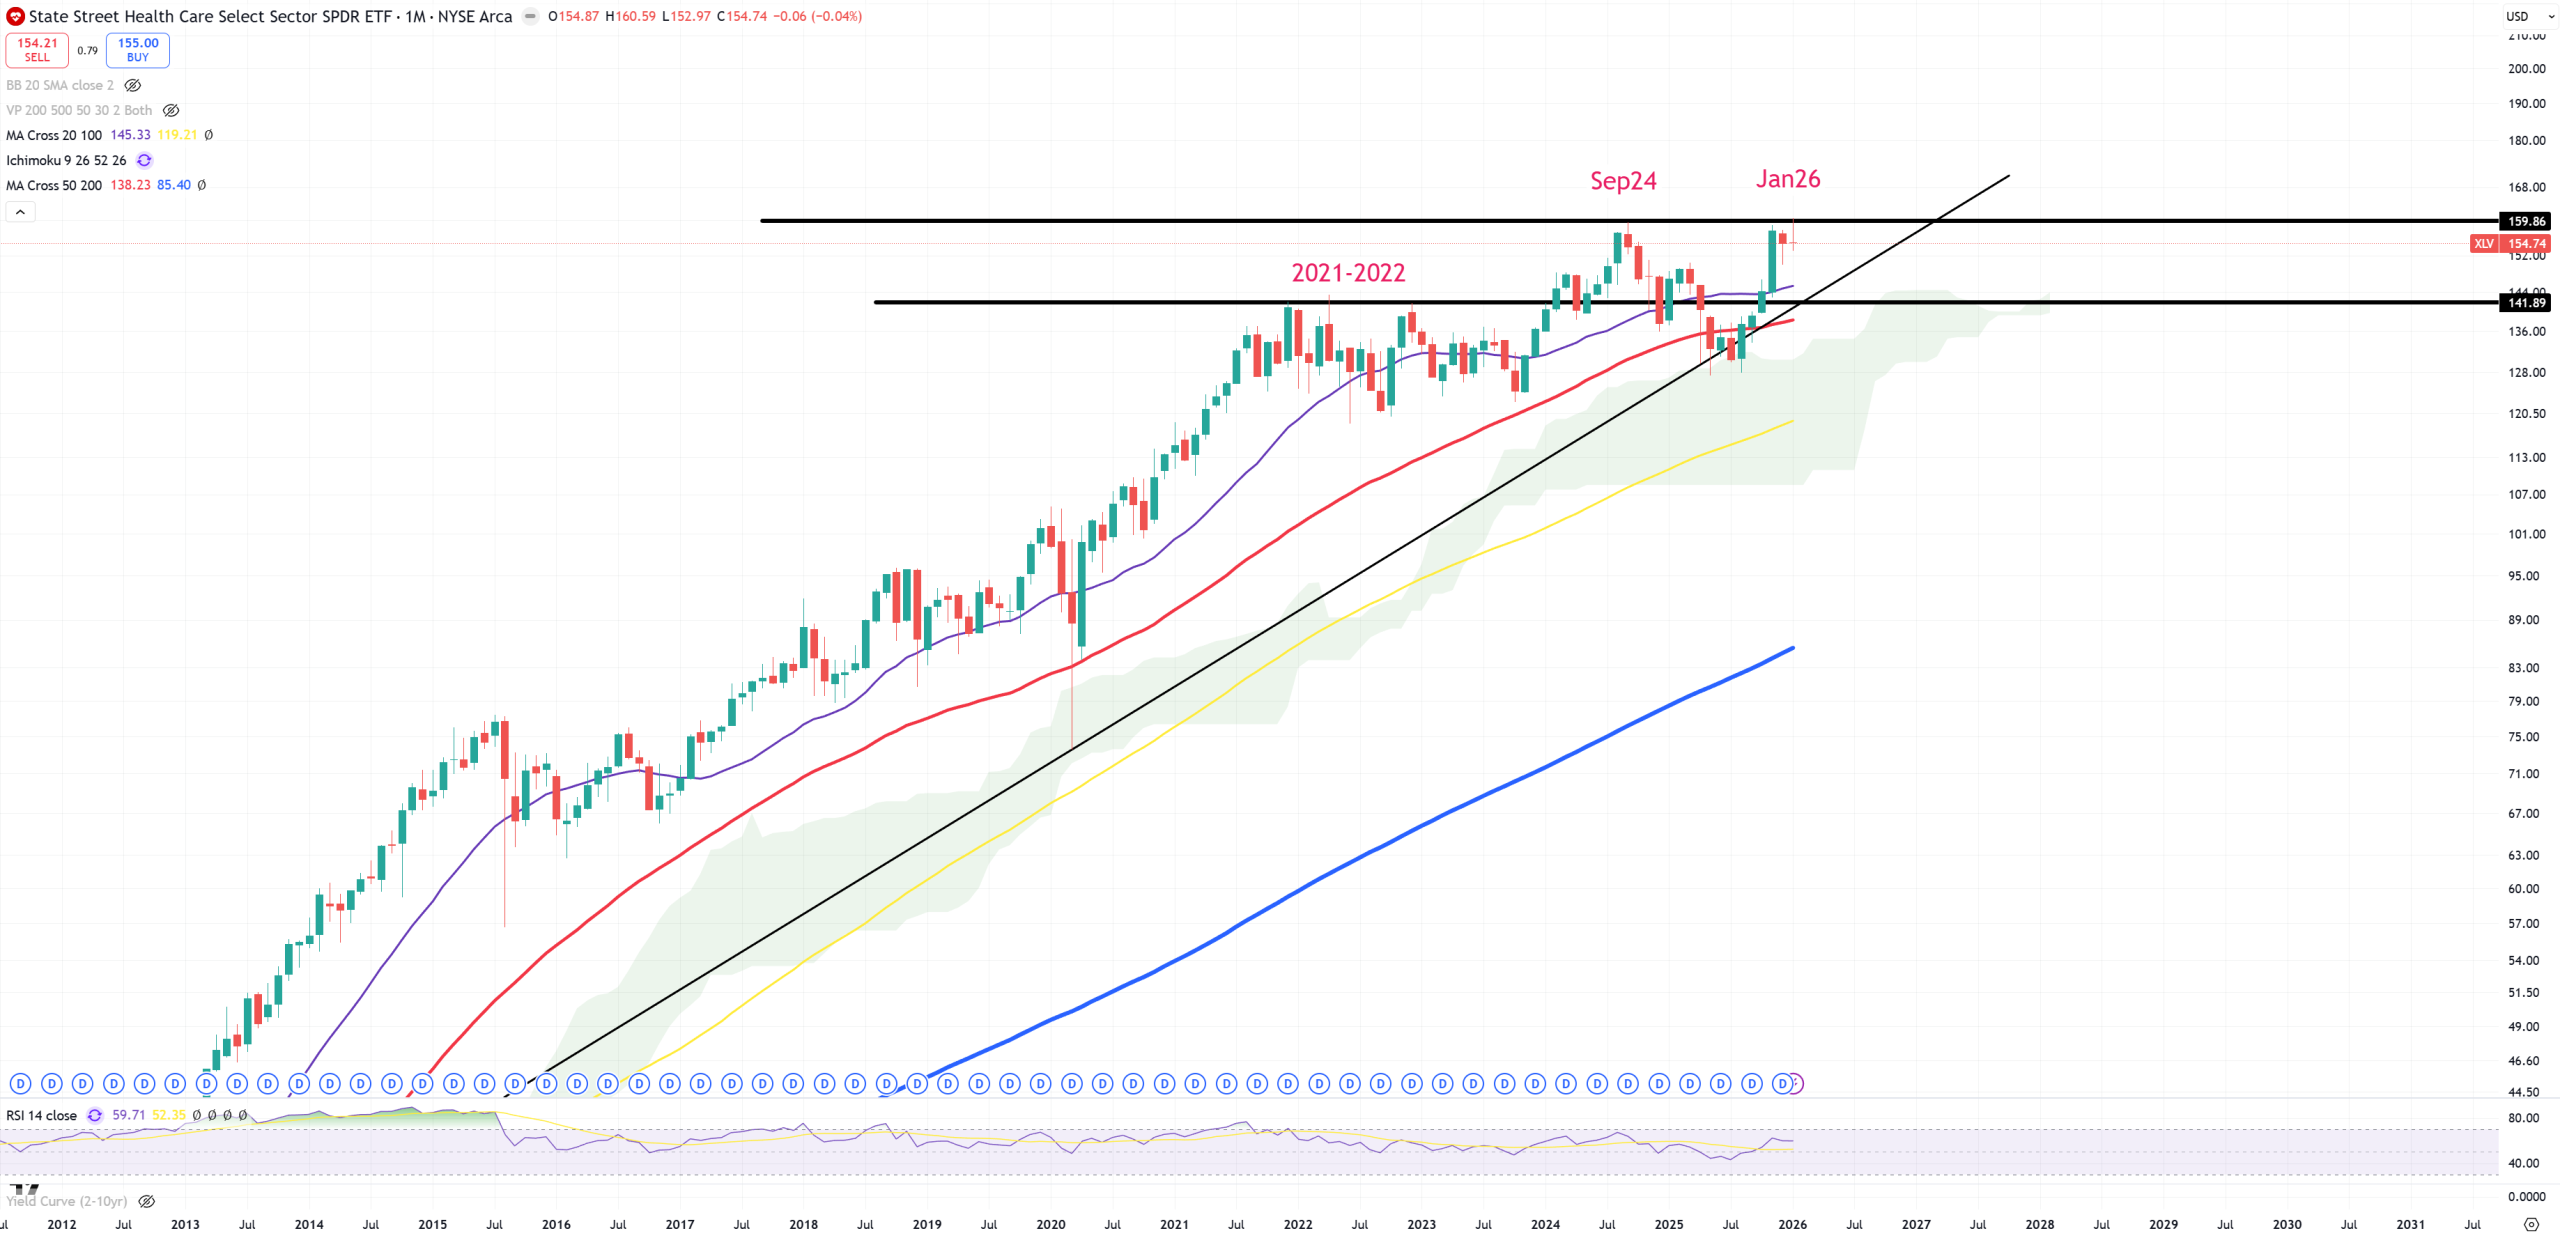
XLV – Healthcare did almost exactly the same what JBHT, but yellow (M)MA100 was safe.
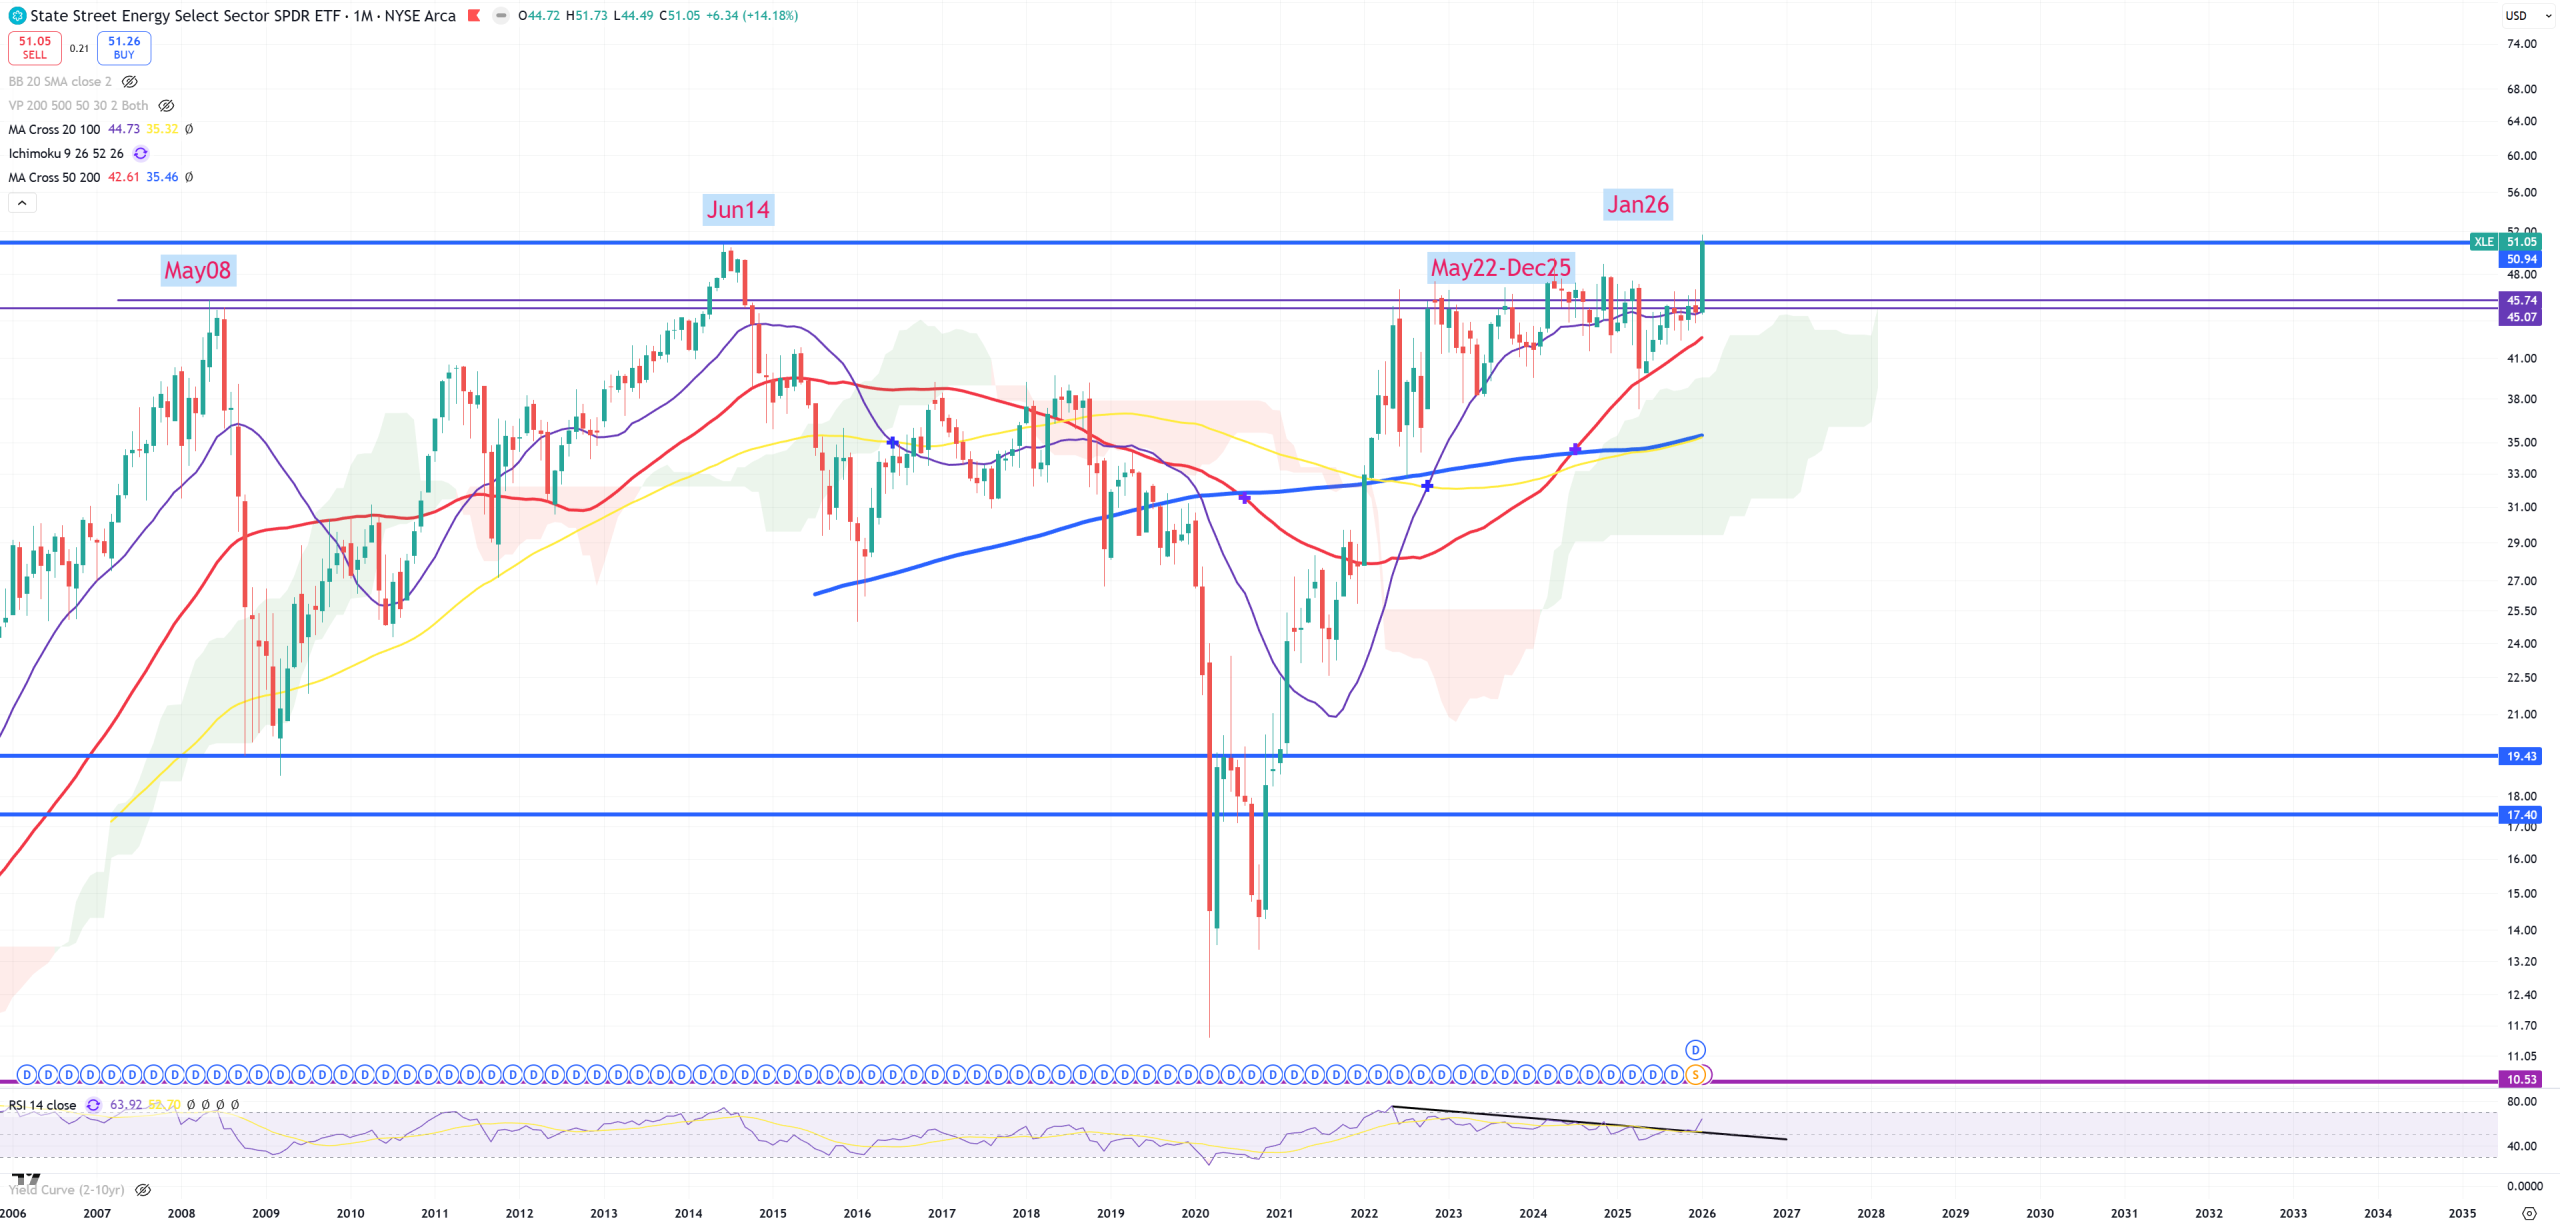
XLE – Energy hits Jun 2014 level
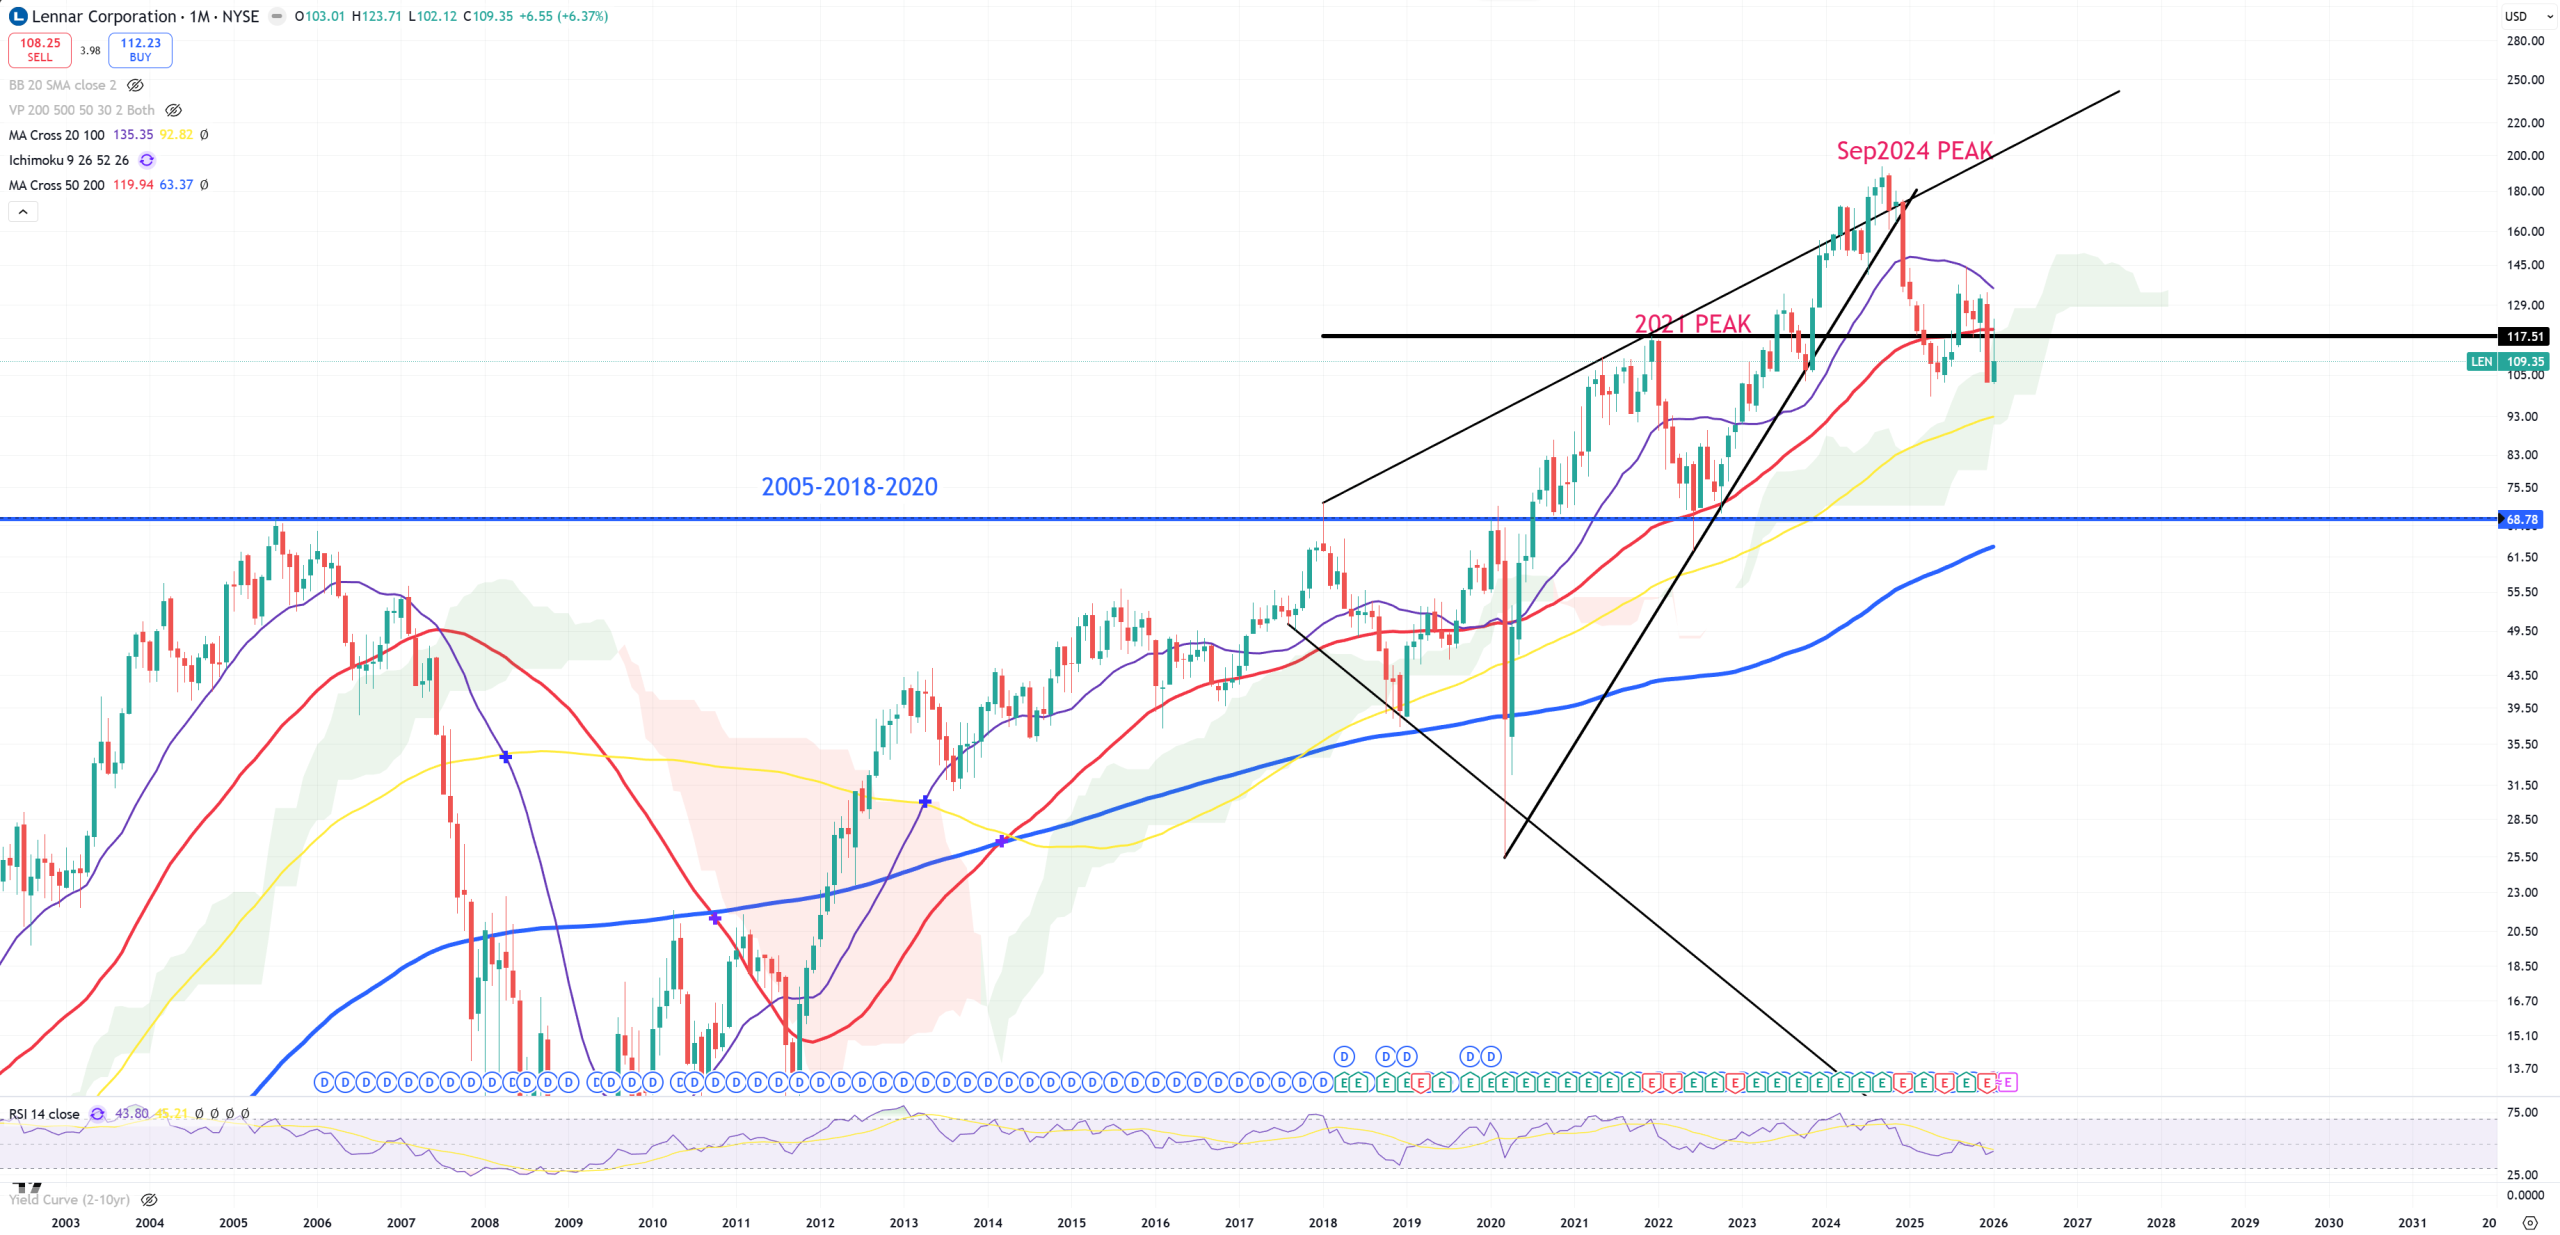
LEN – Lennar, big warning for Real Estate, now below 2021 peak, below (M)MA50 – technical bear market, cloud and (M)MA100 ahead and we’ll get to 2020 level.
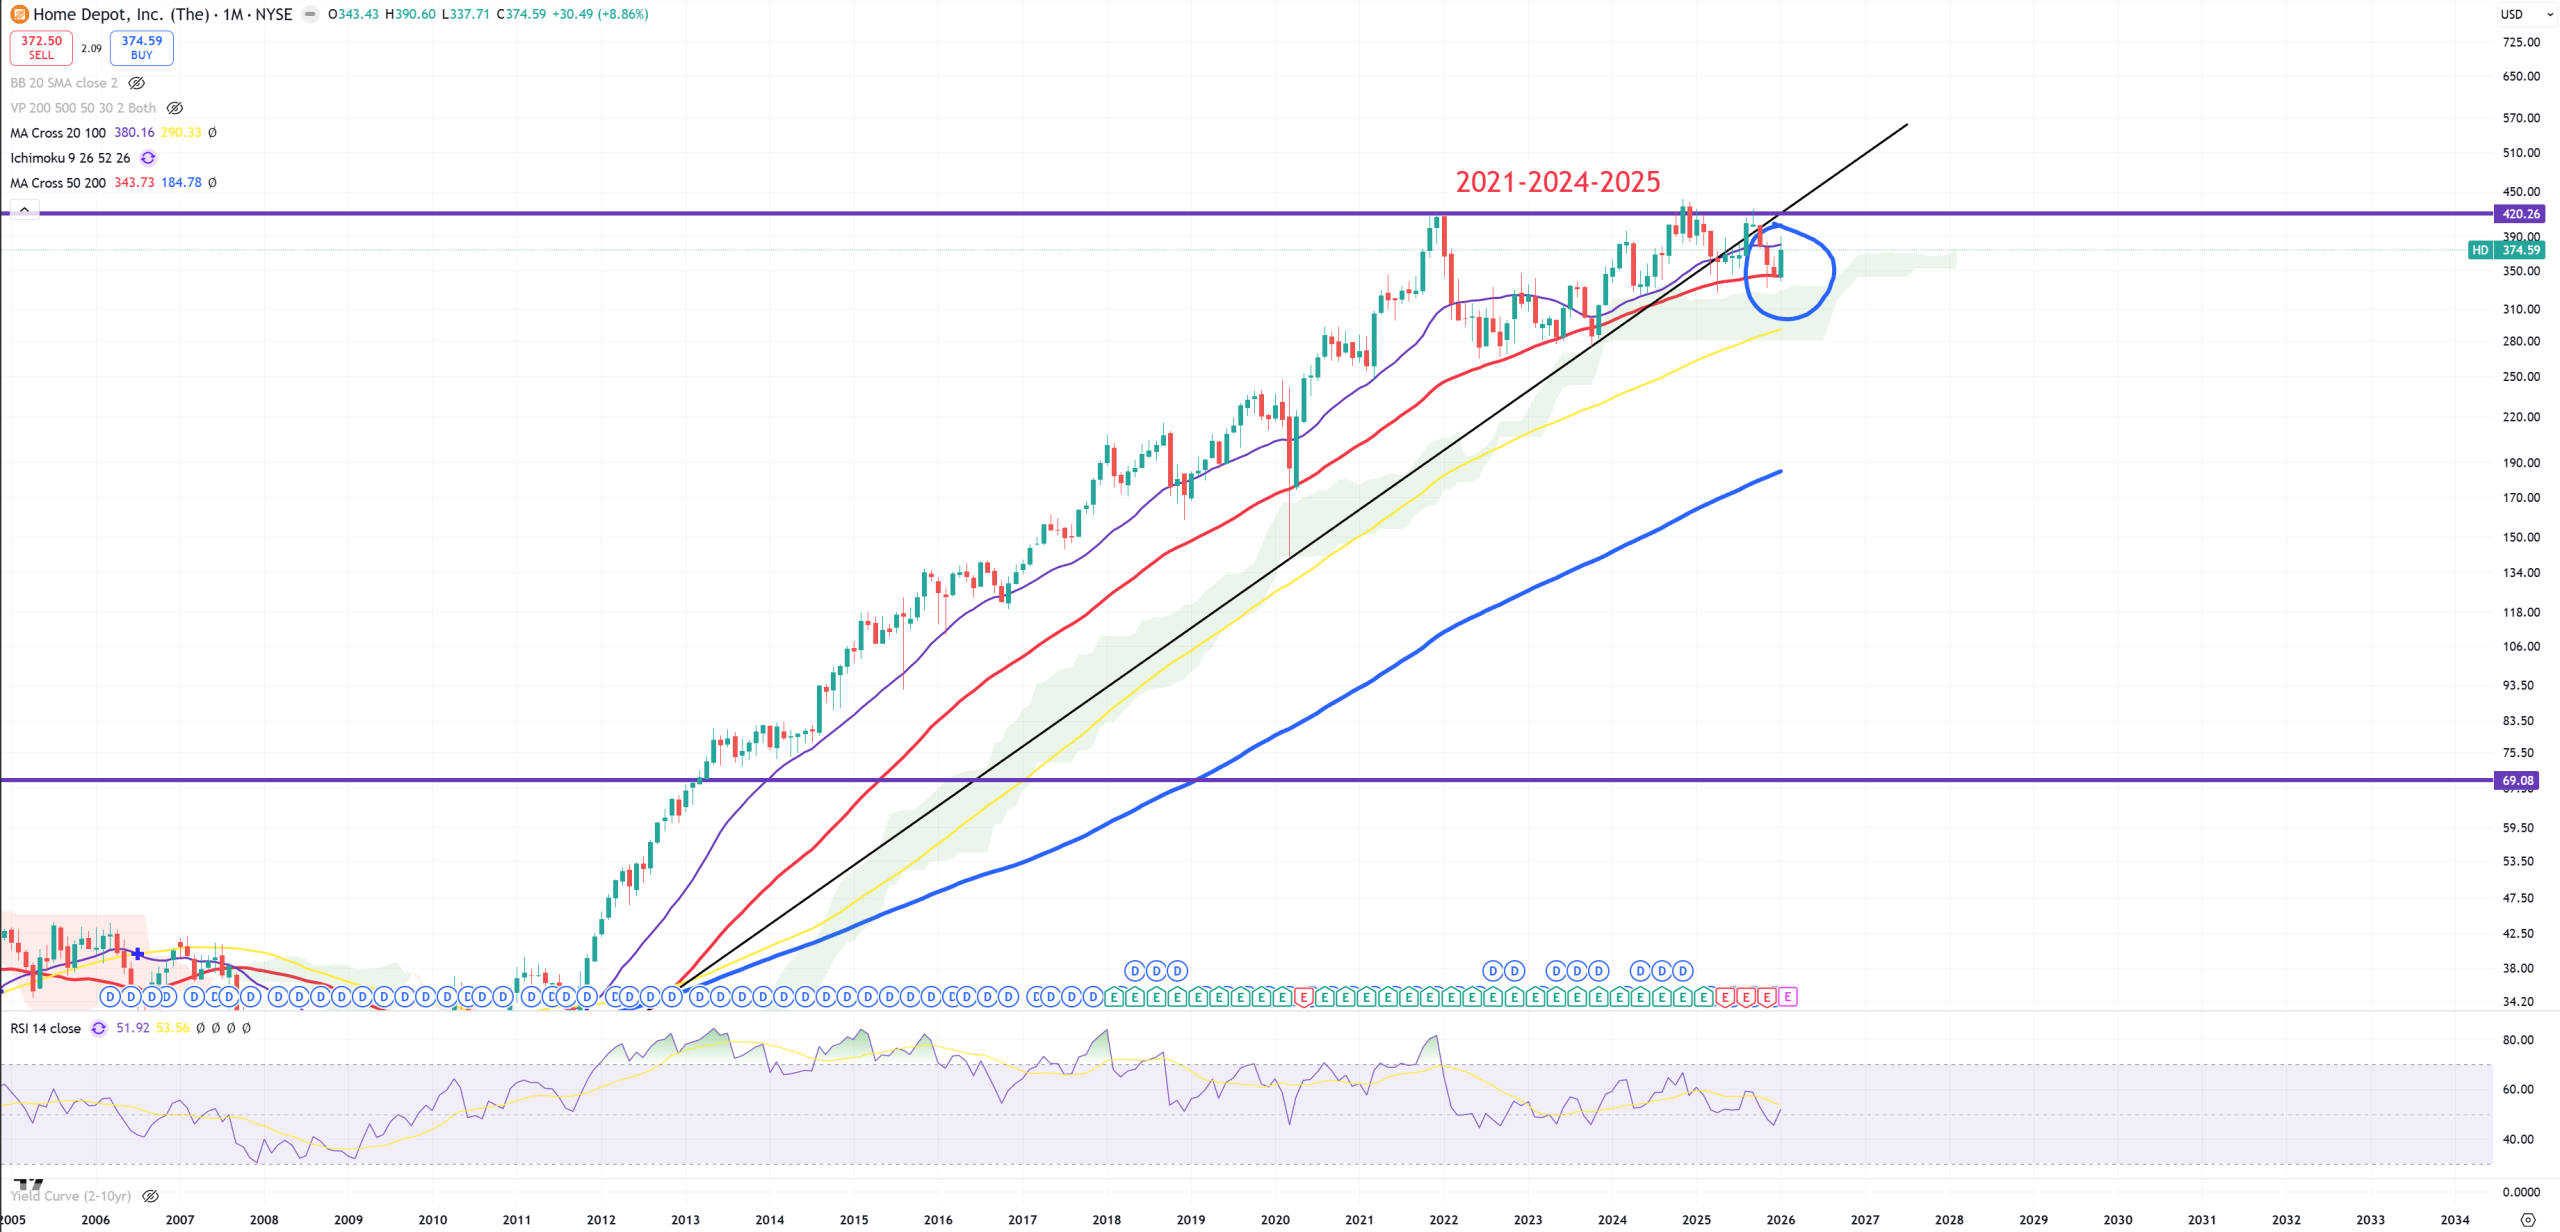
HD – Home Depot – big fight around (M)MA50, but 2009 trend gone.
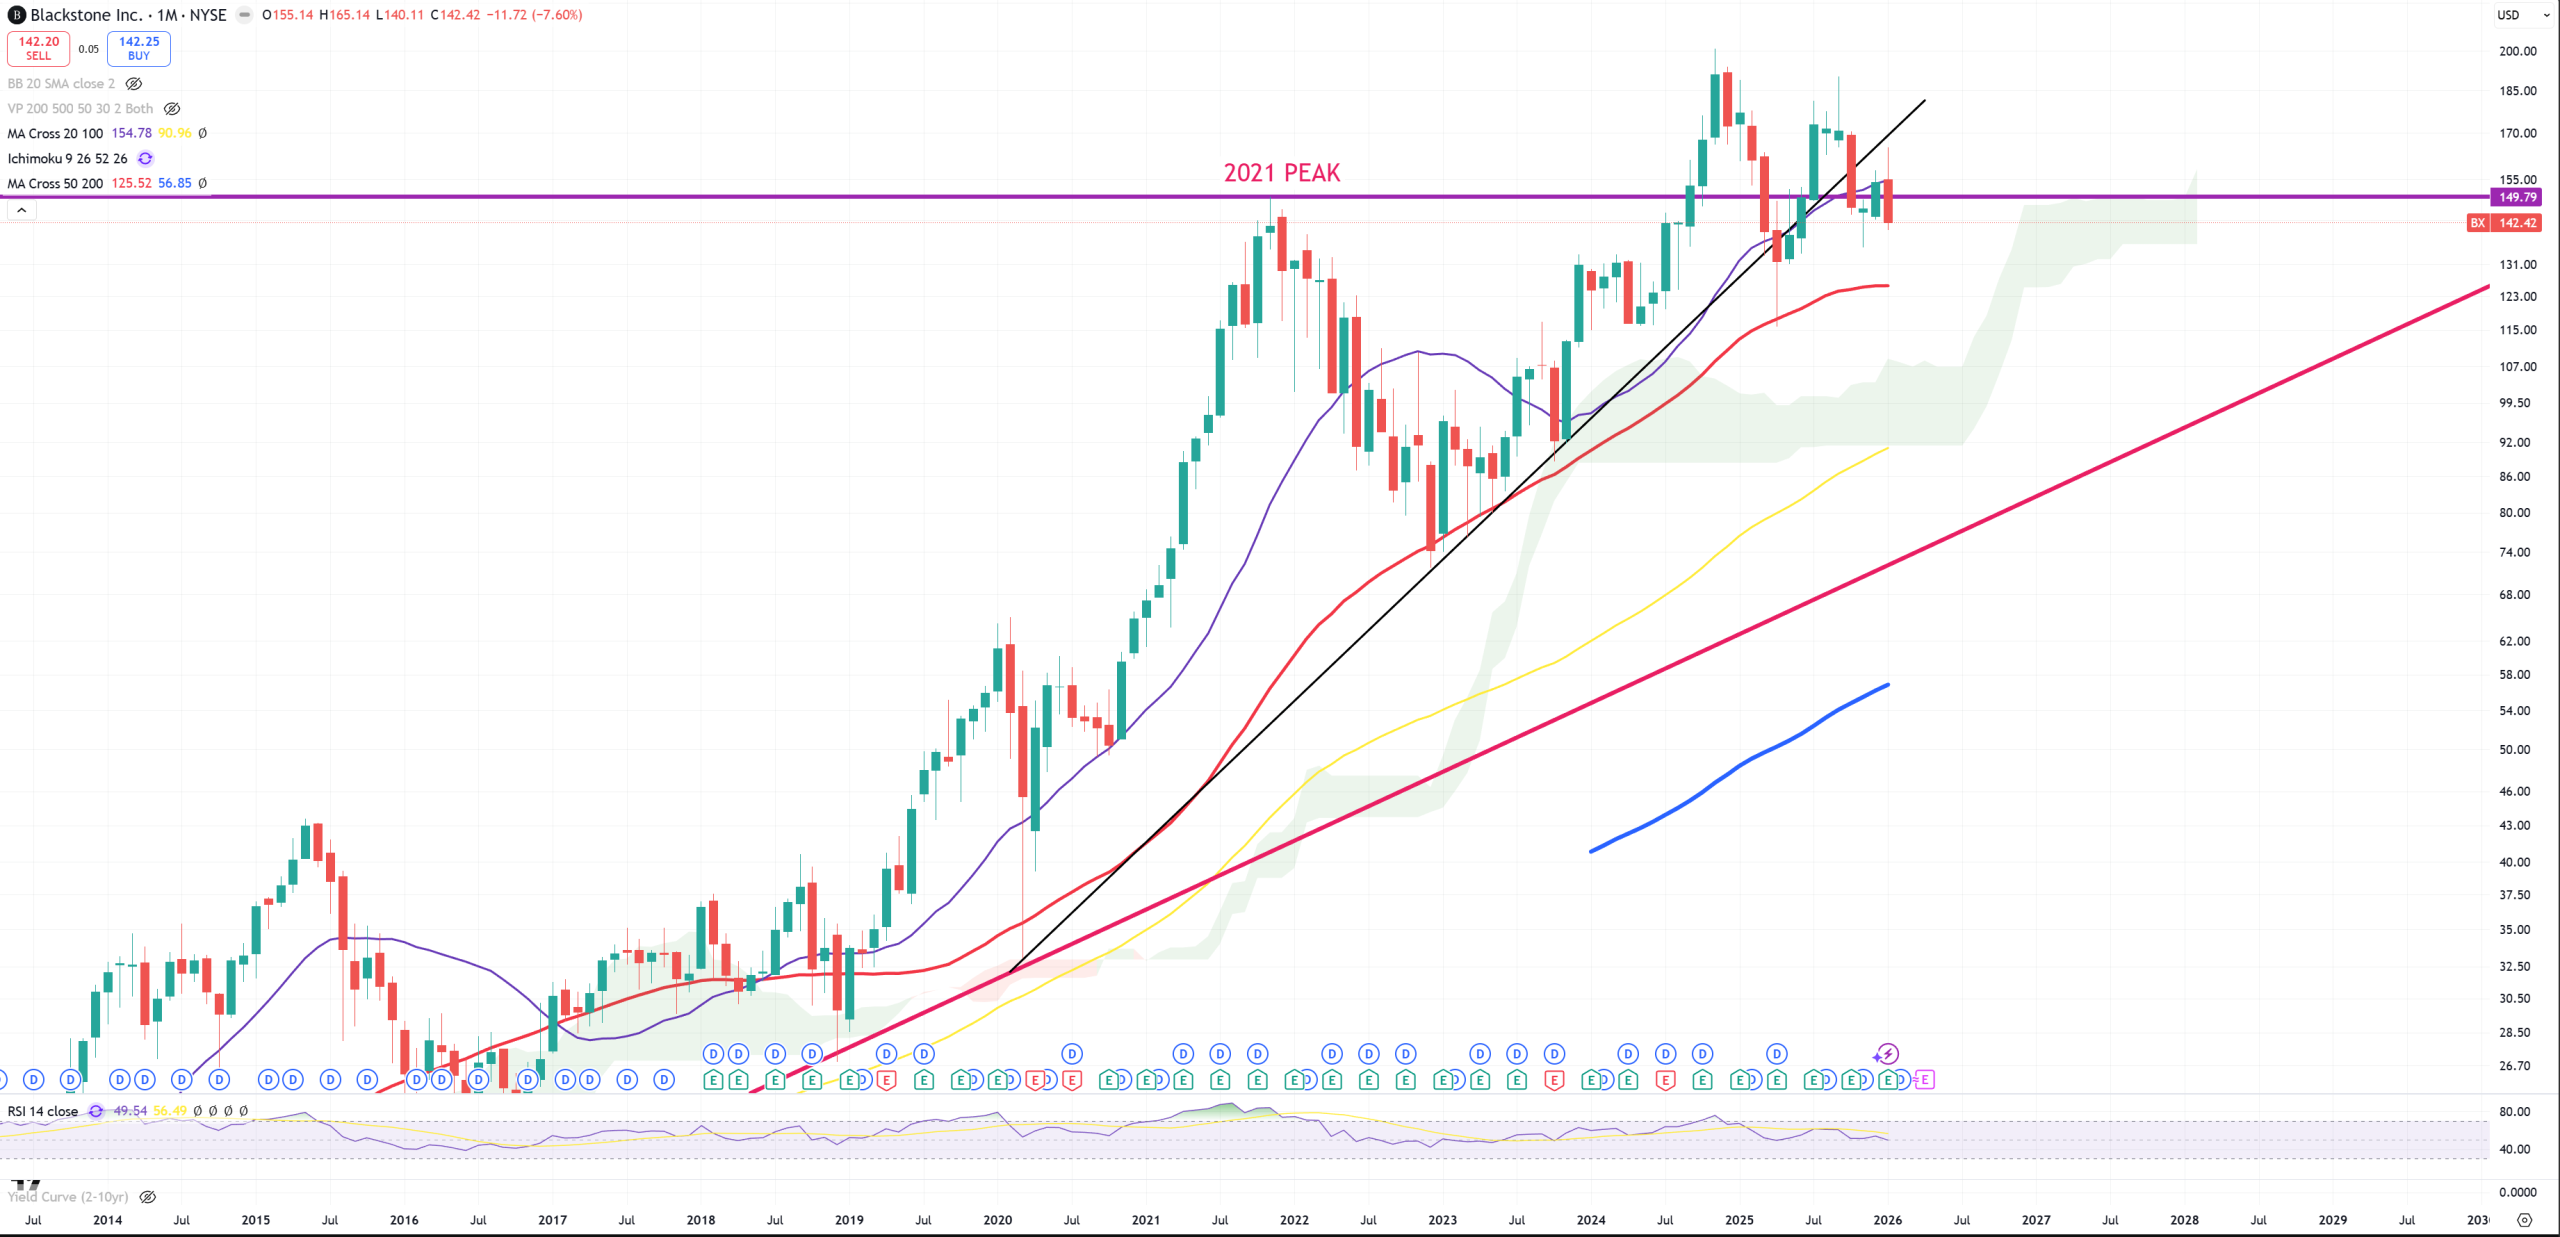
BX – BlackStone is going like 1:1 like Lennar
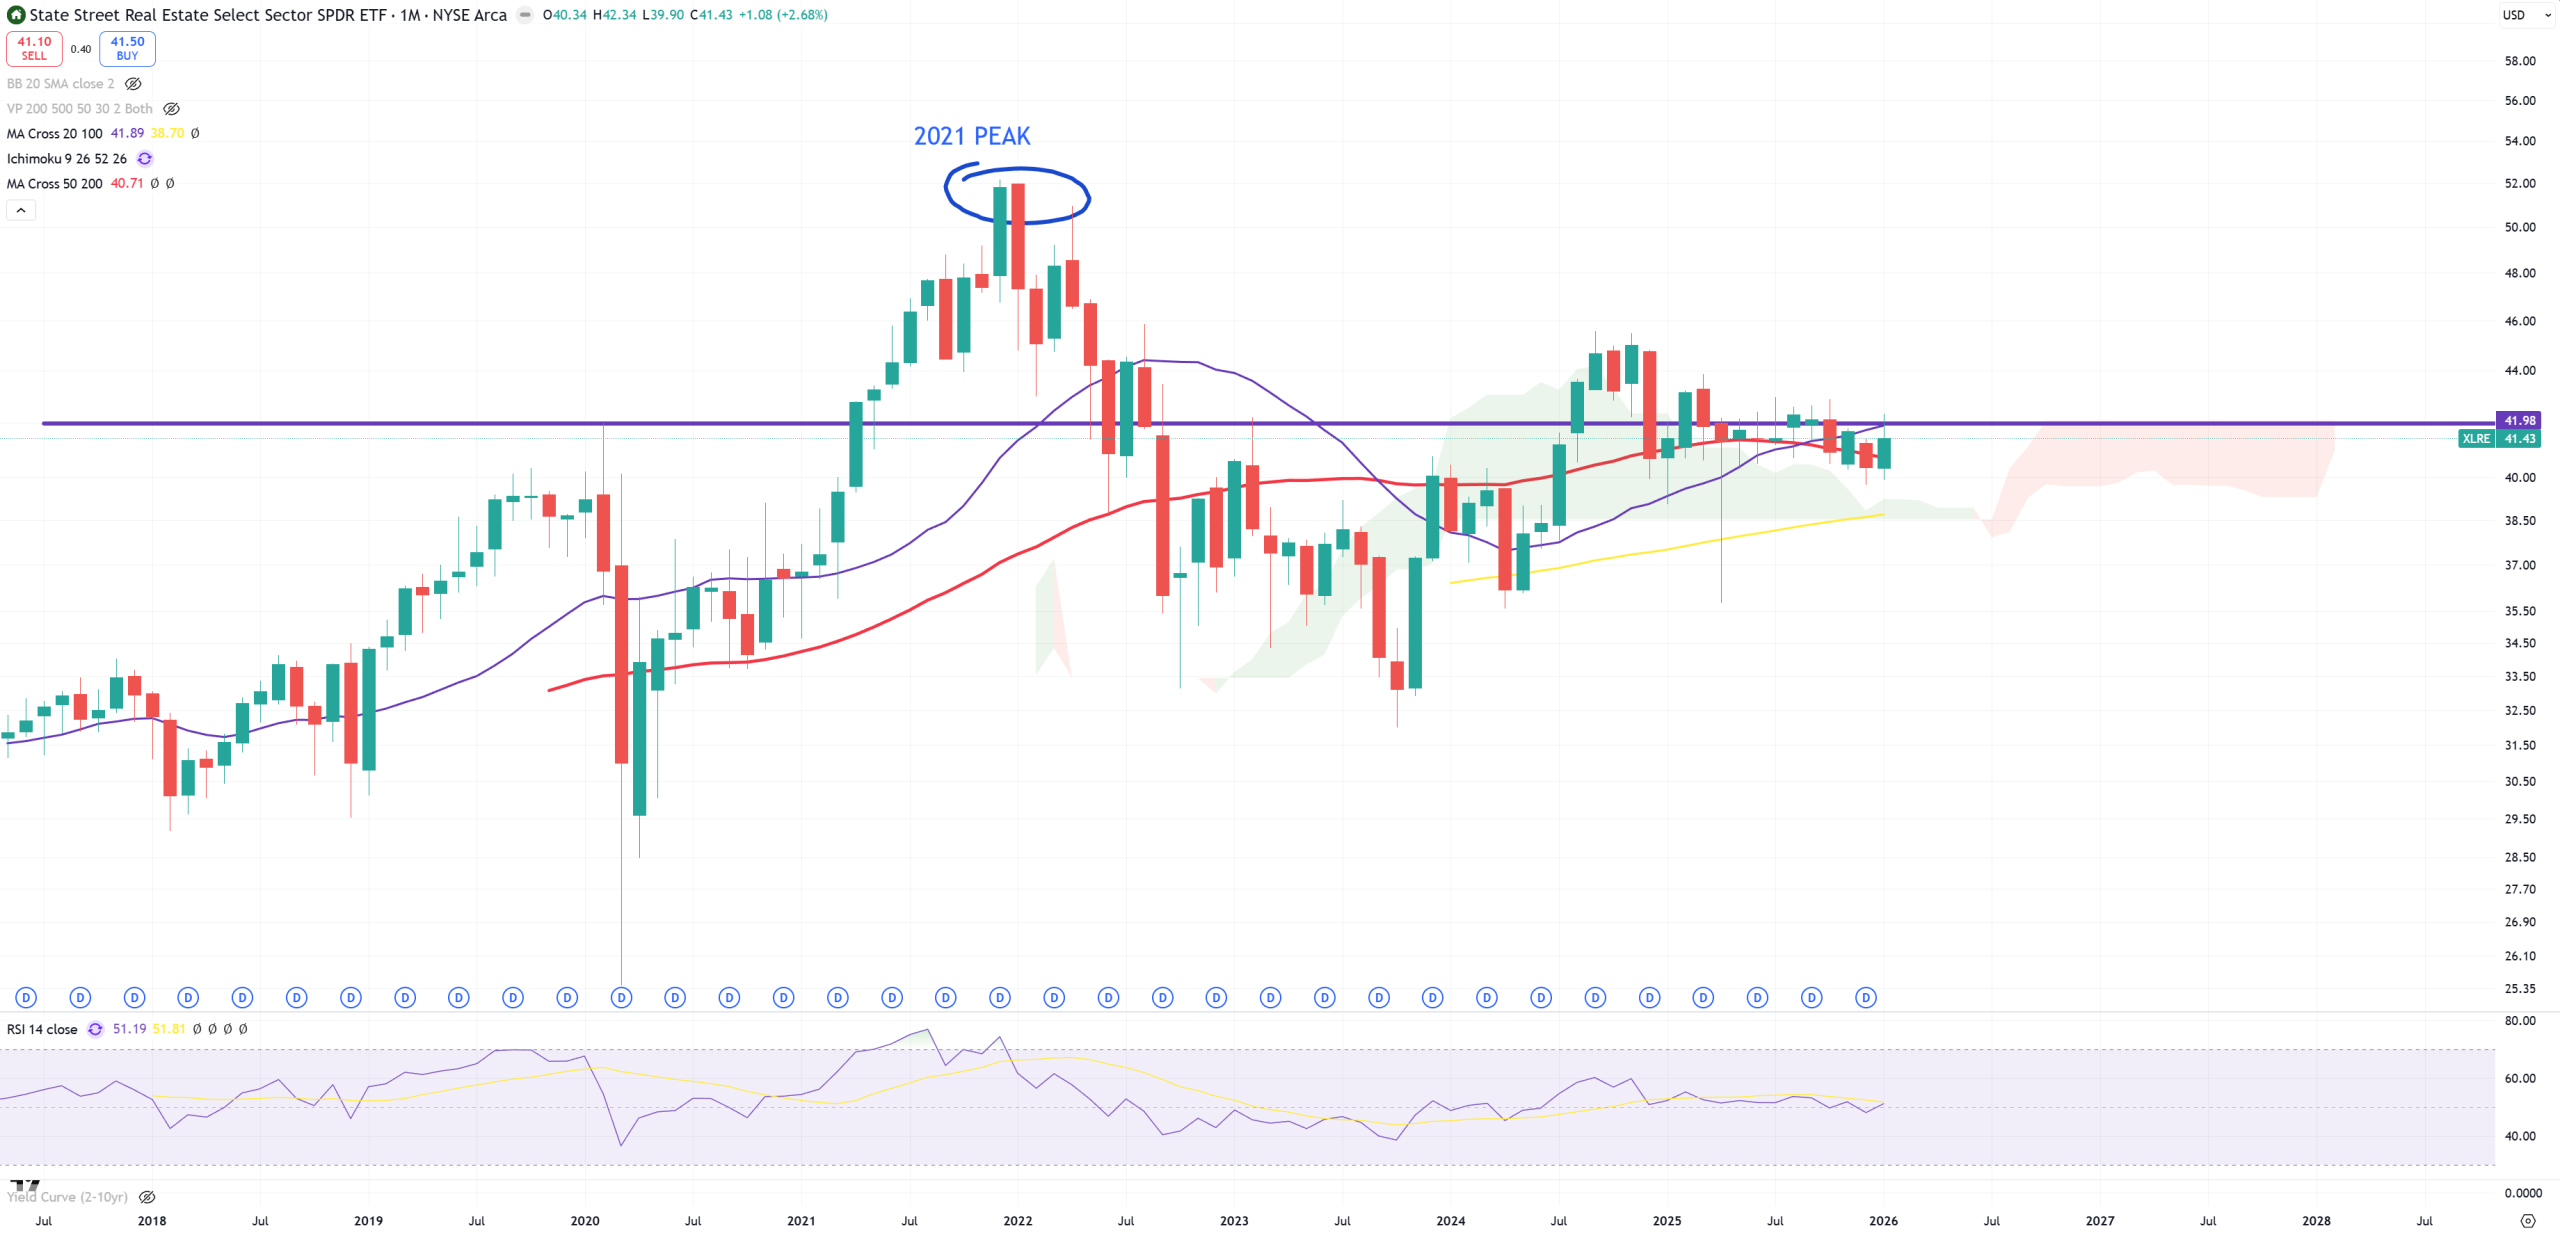
XLRE – Real Estate Index Fund. If you bought late 2021, beginning 2022 you are really really really fucked. Now retesting 2008 level
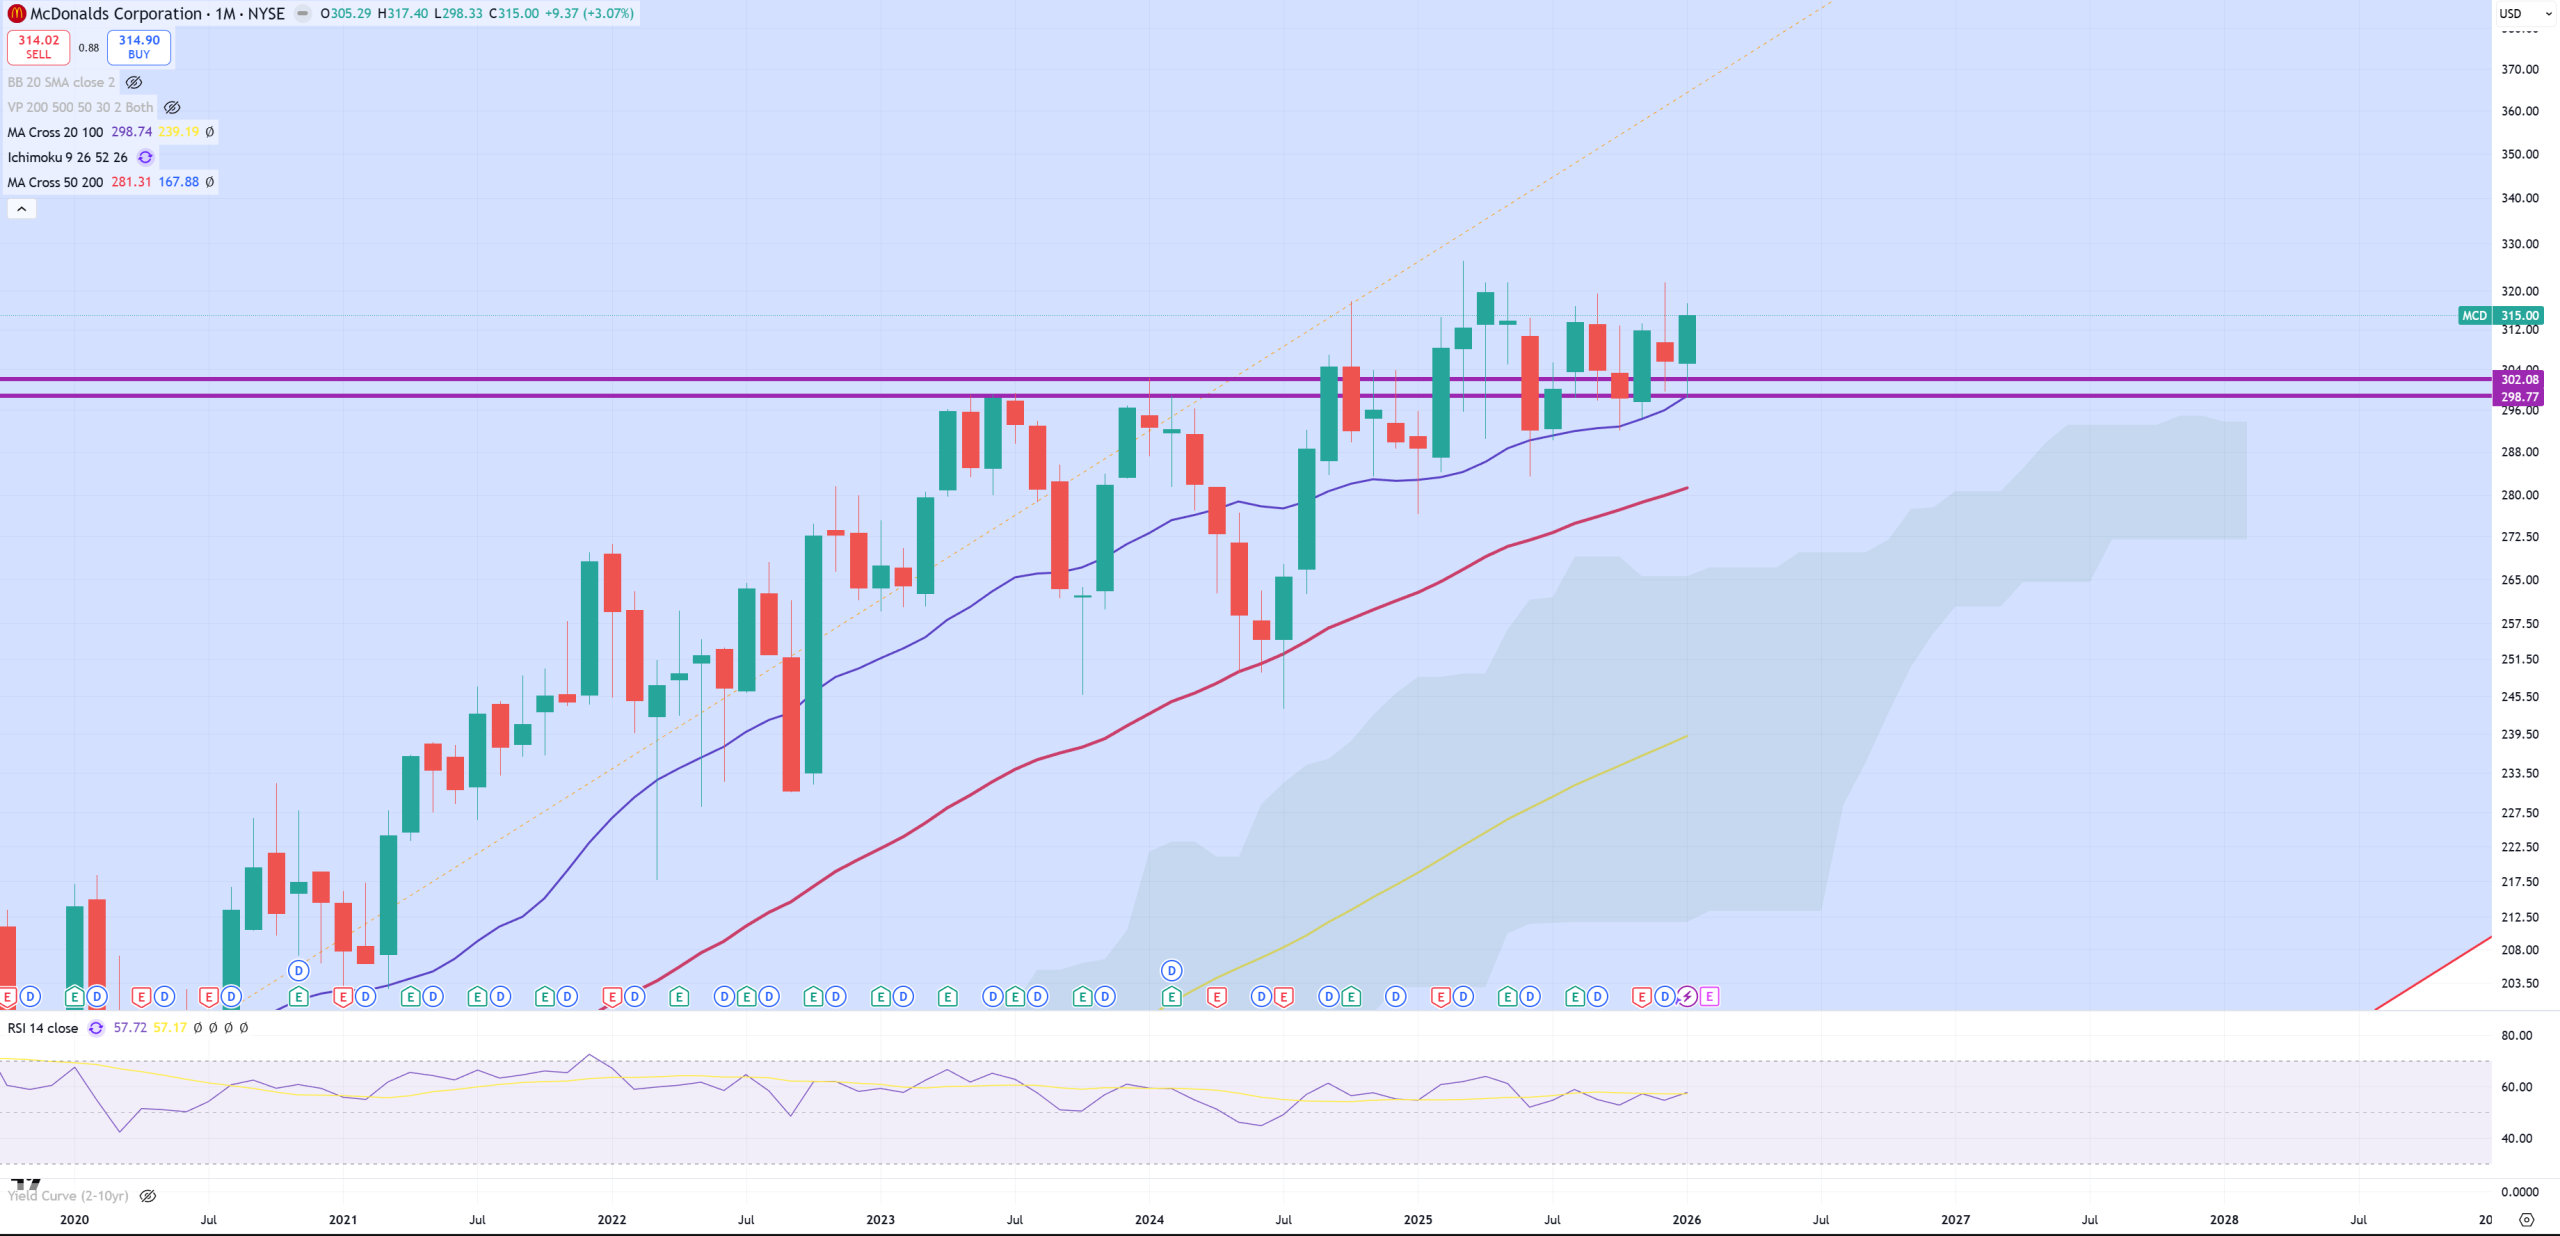
MCD – McDonalds trying to stay around this level for 3Ys
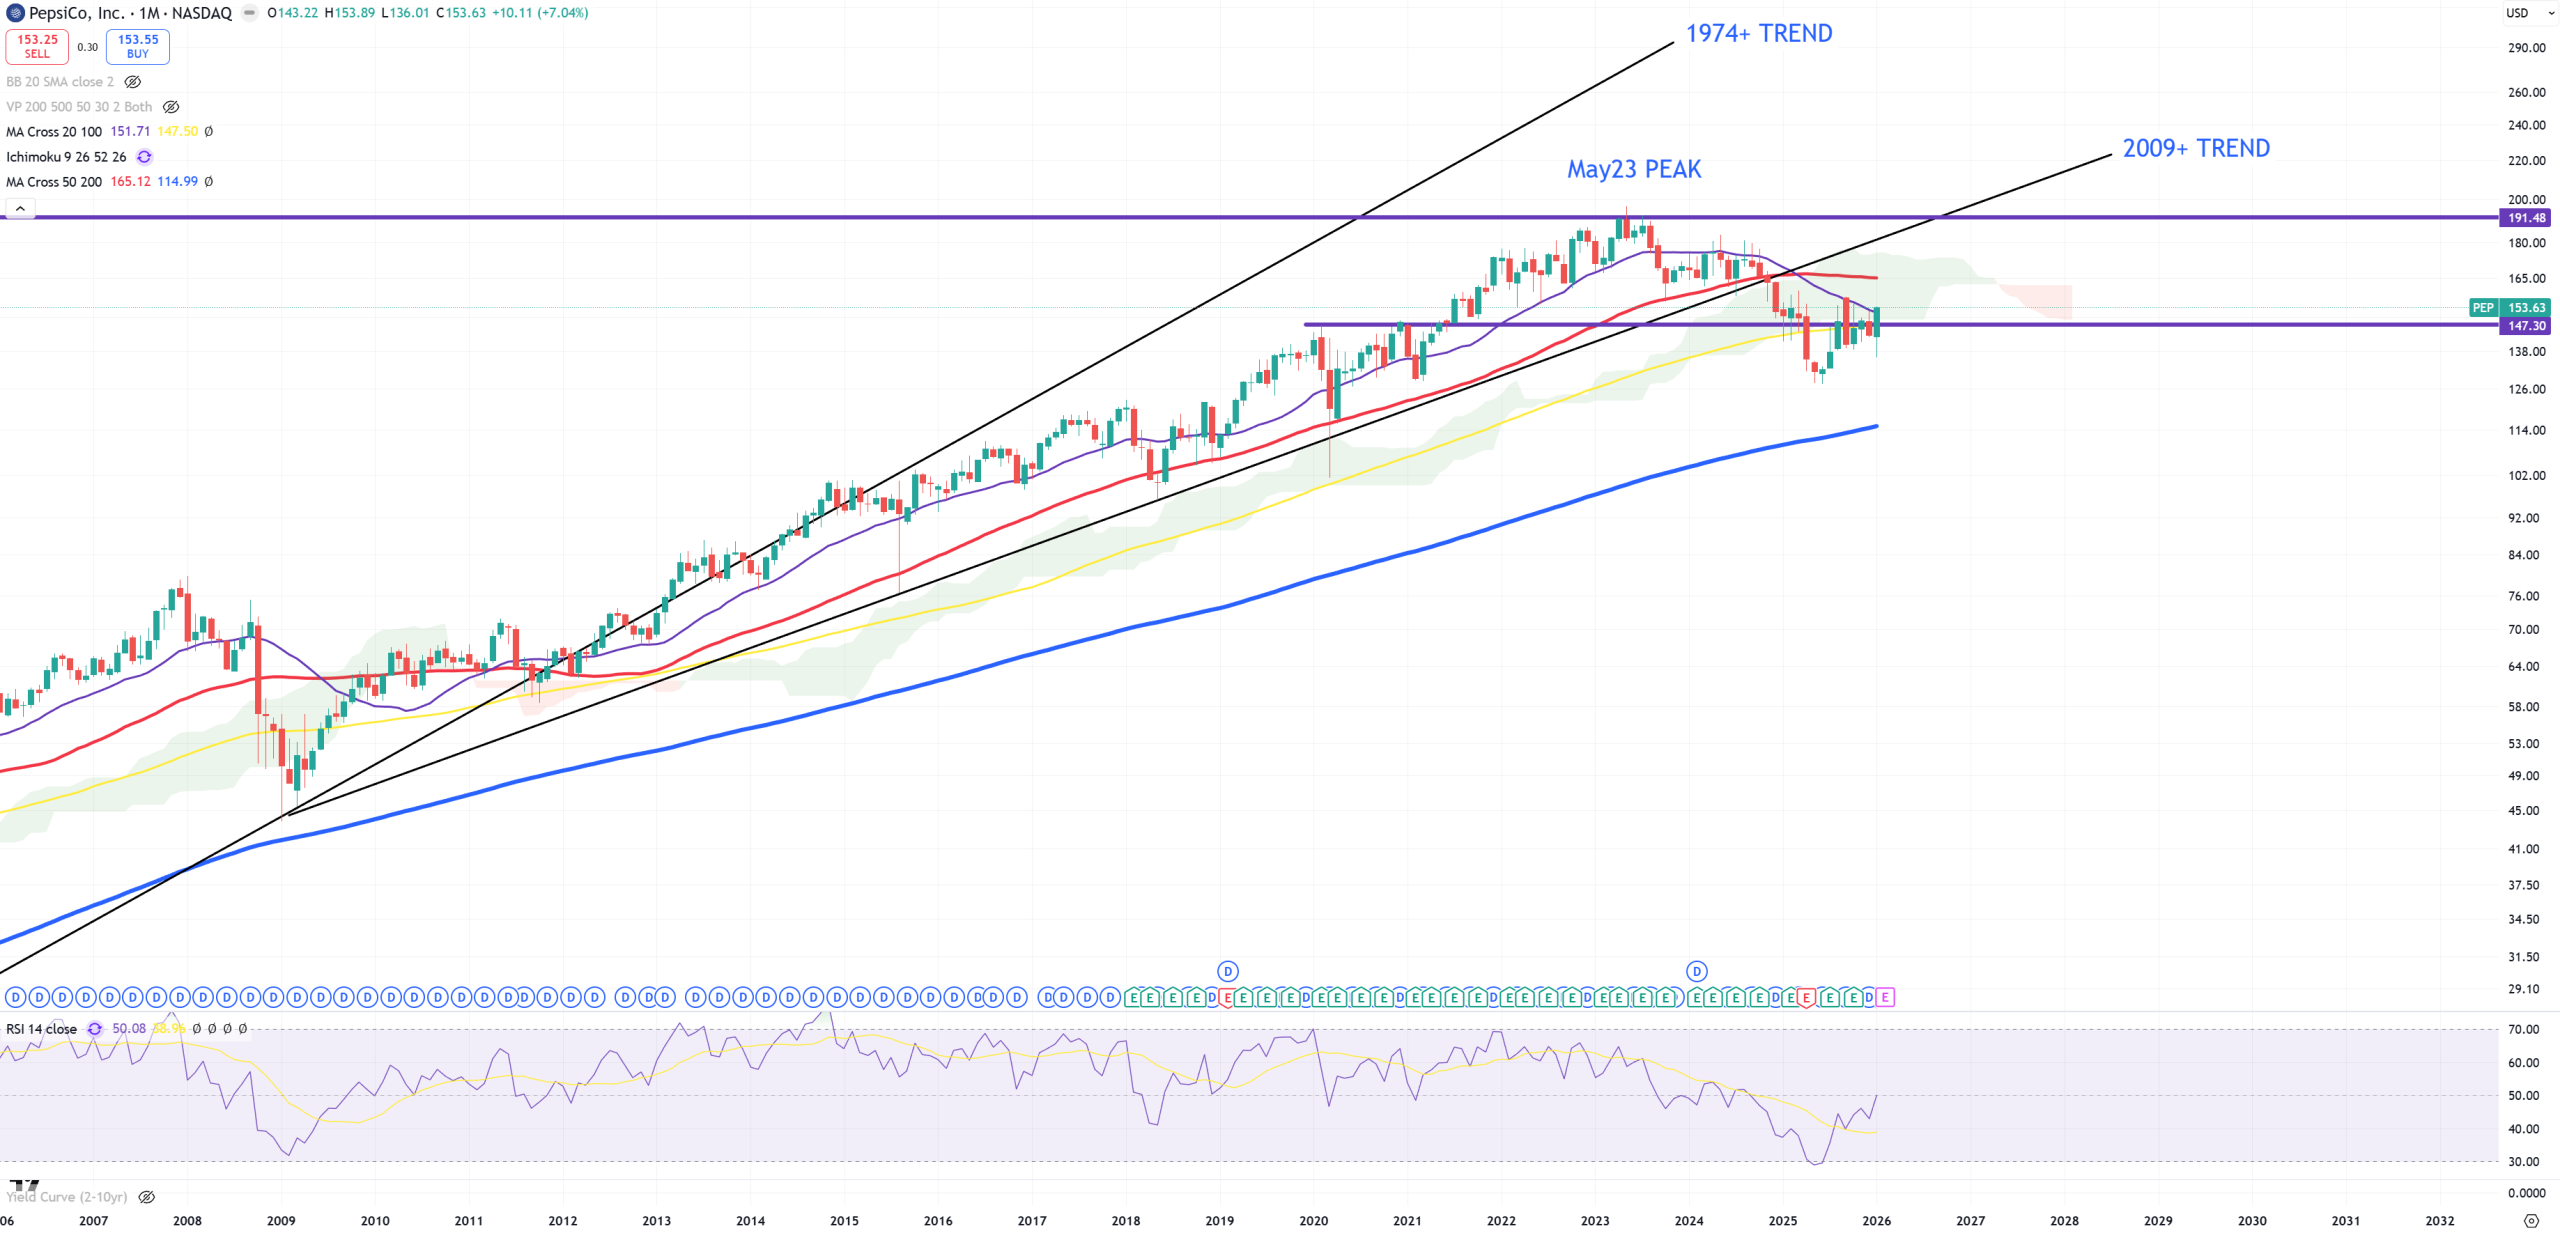
PEP – Pepsico looks very bad
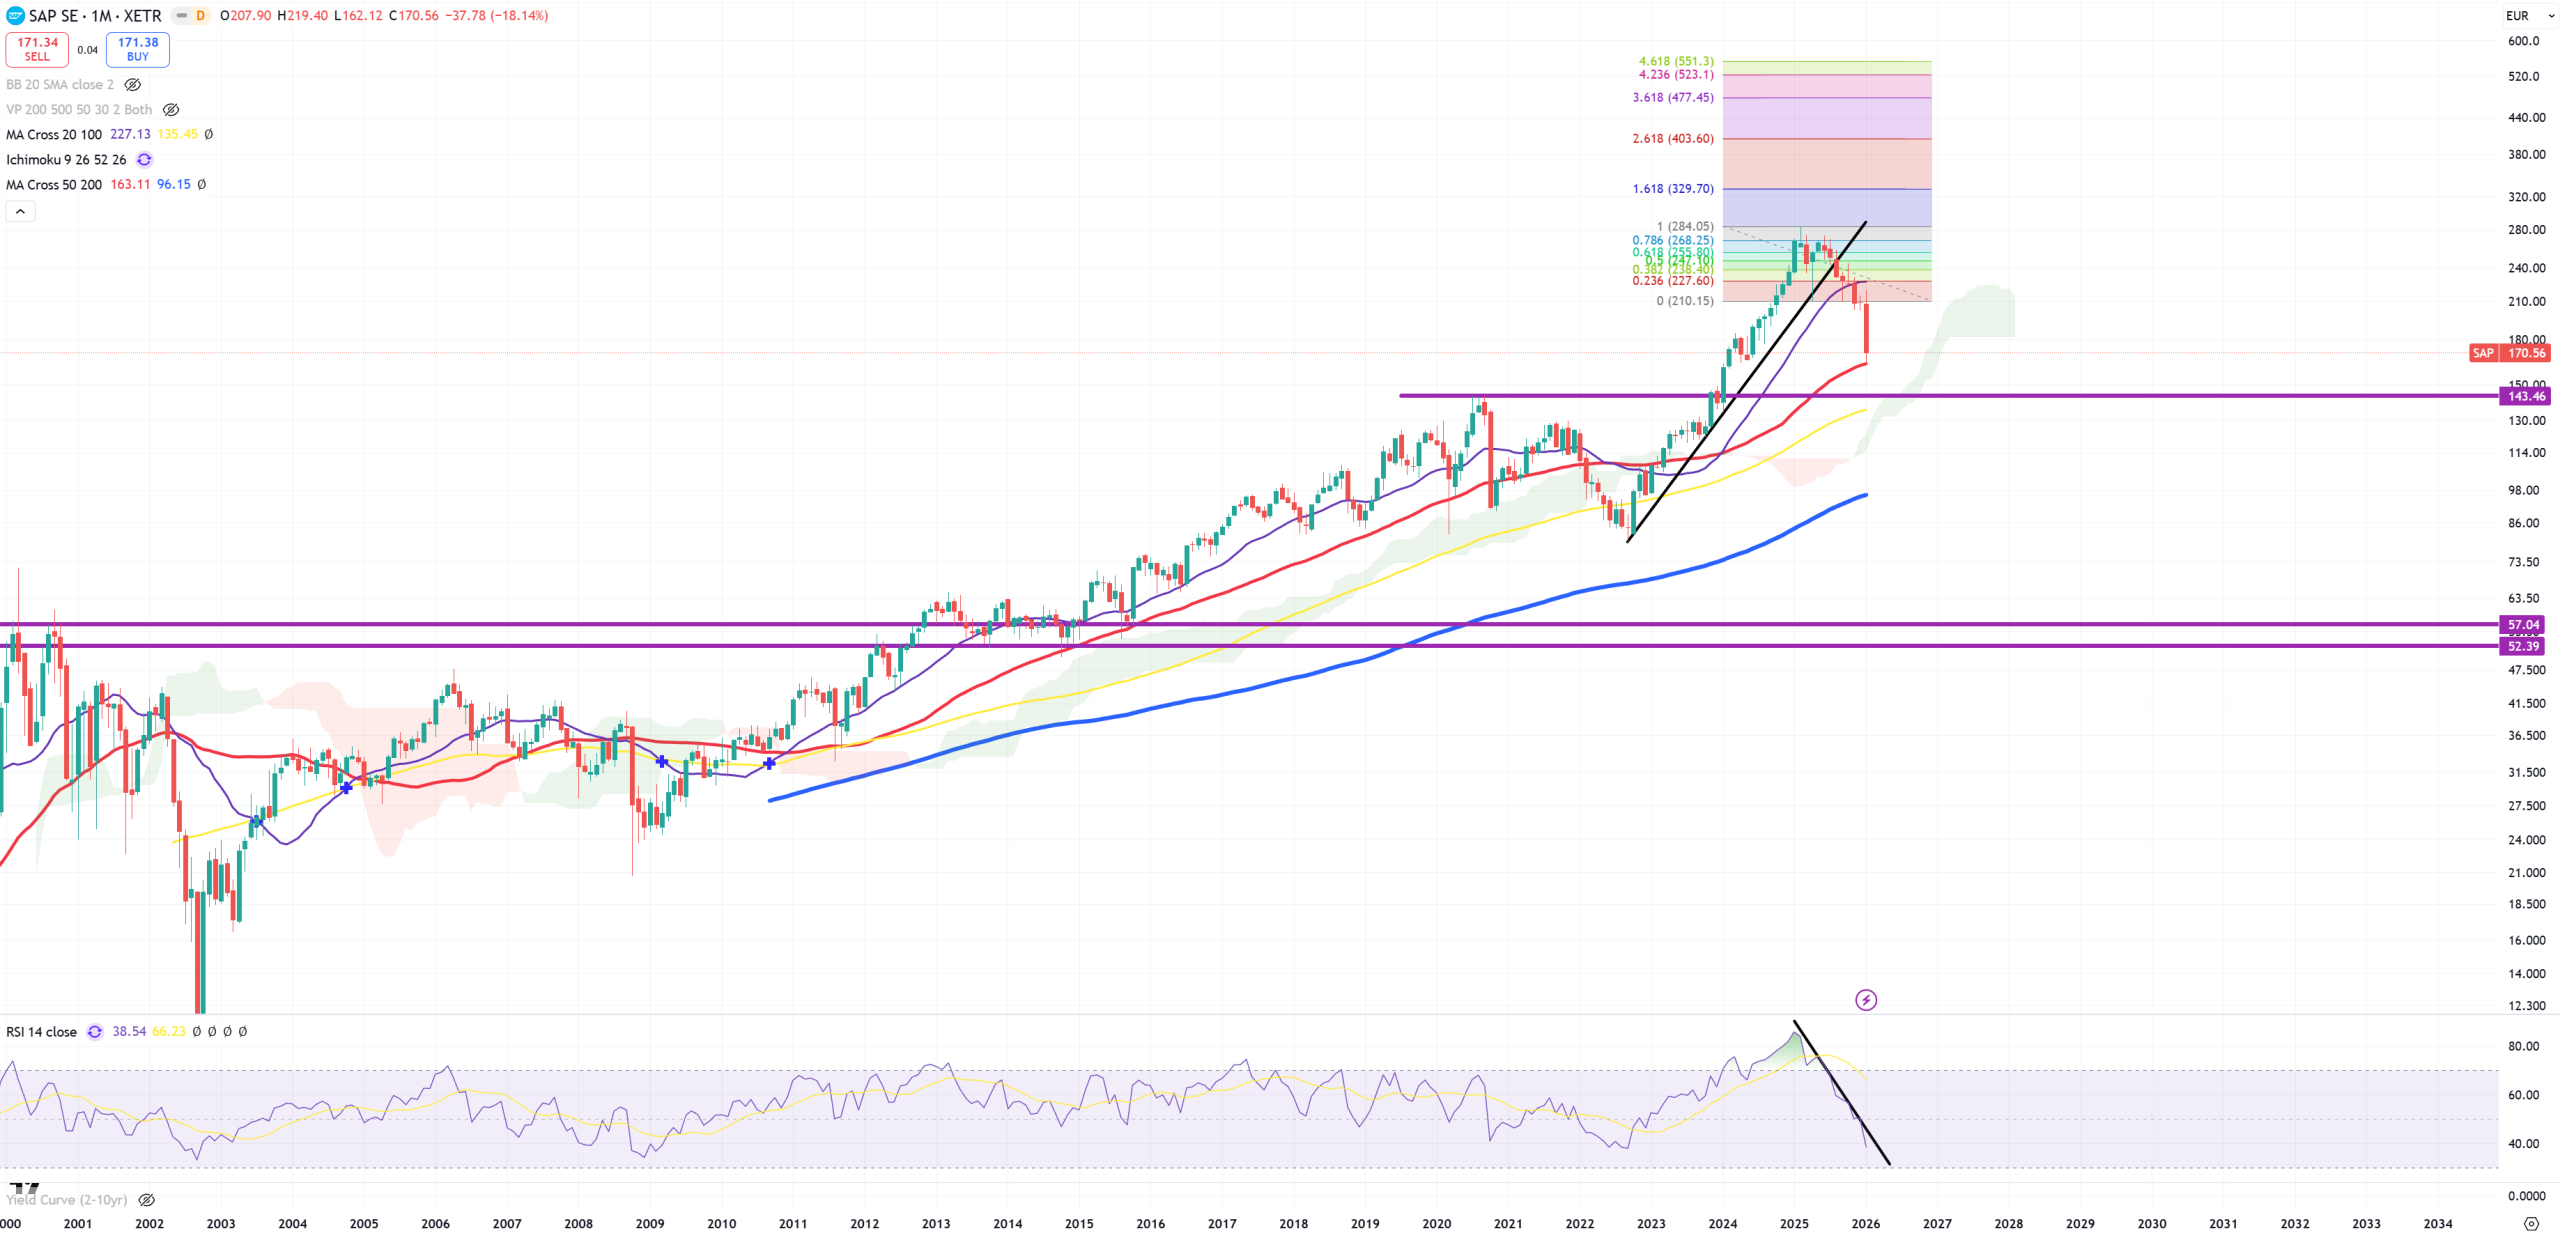
SAP – holding (M)MA50
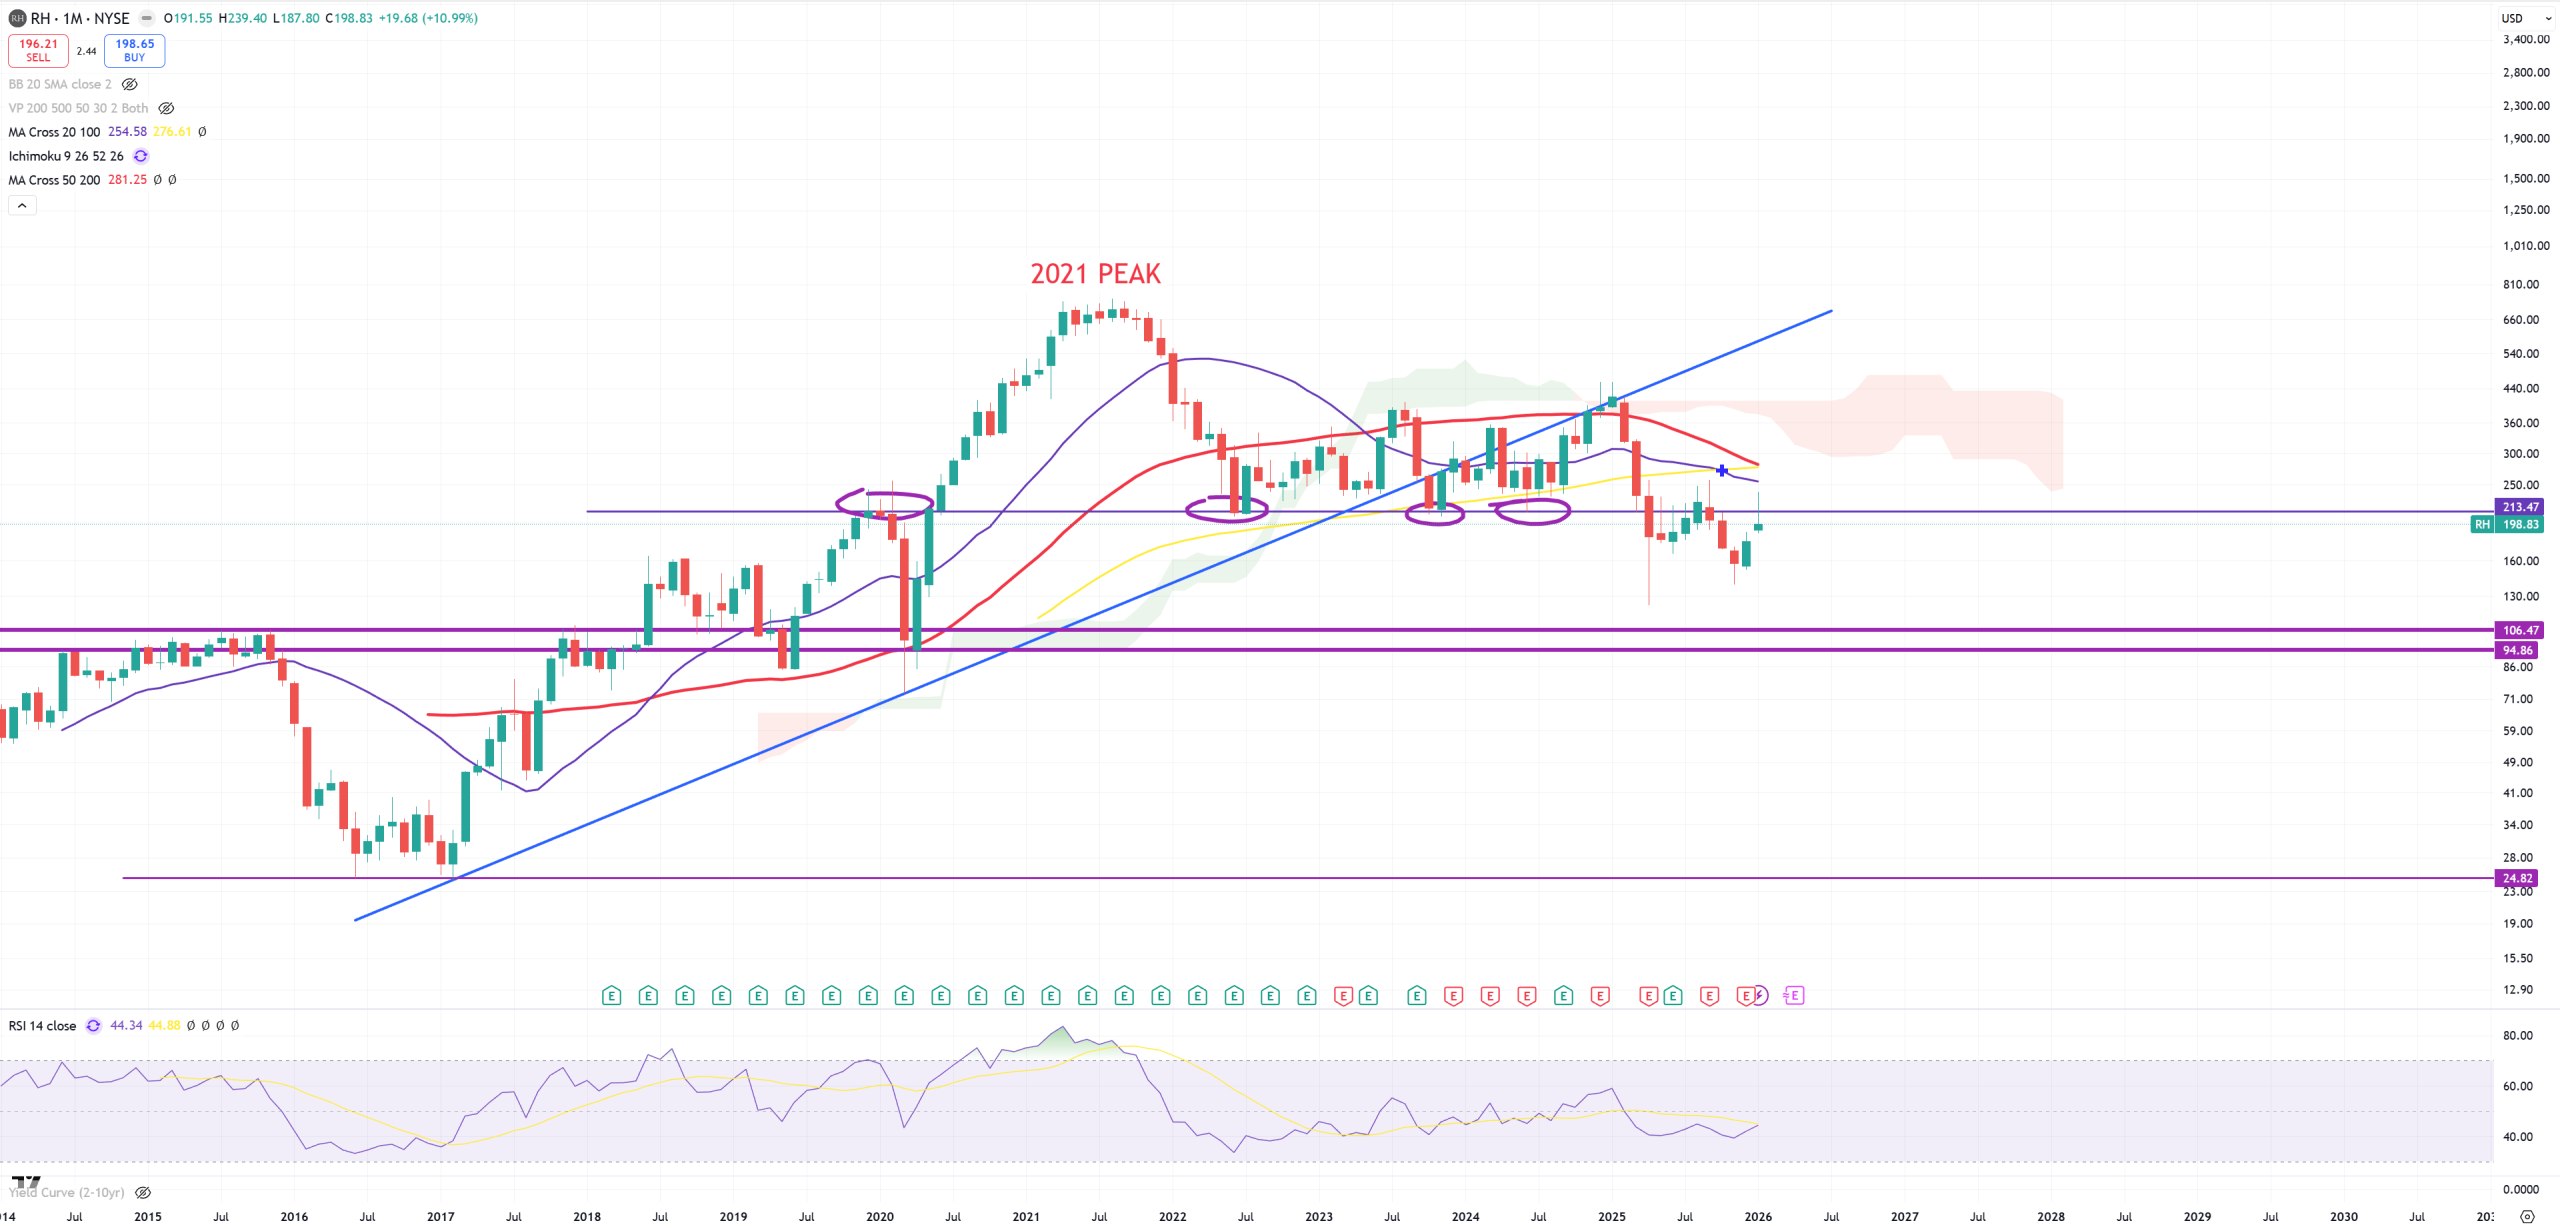
RH – beautiful setup
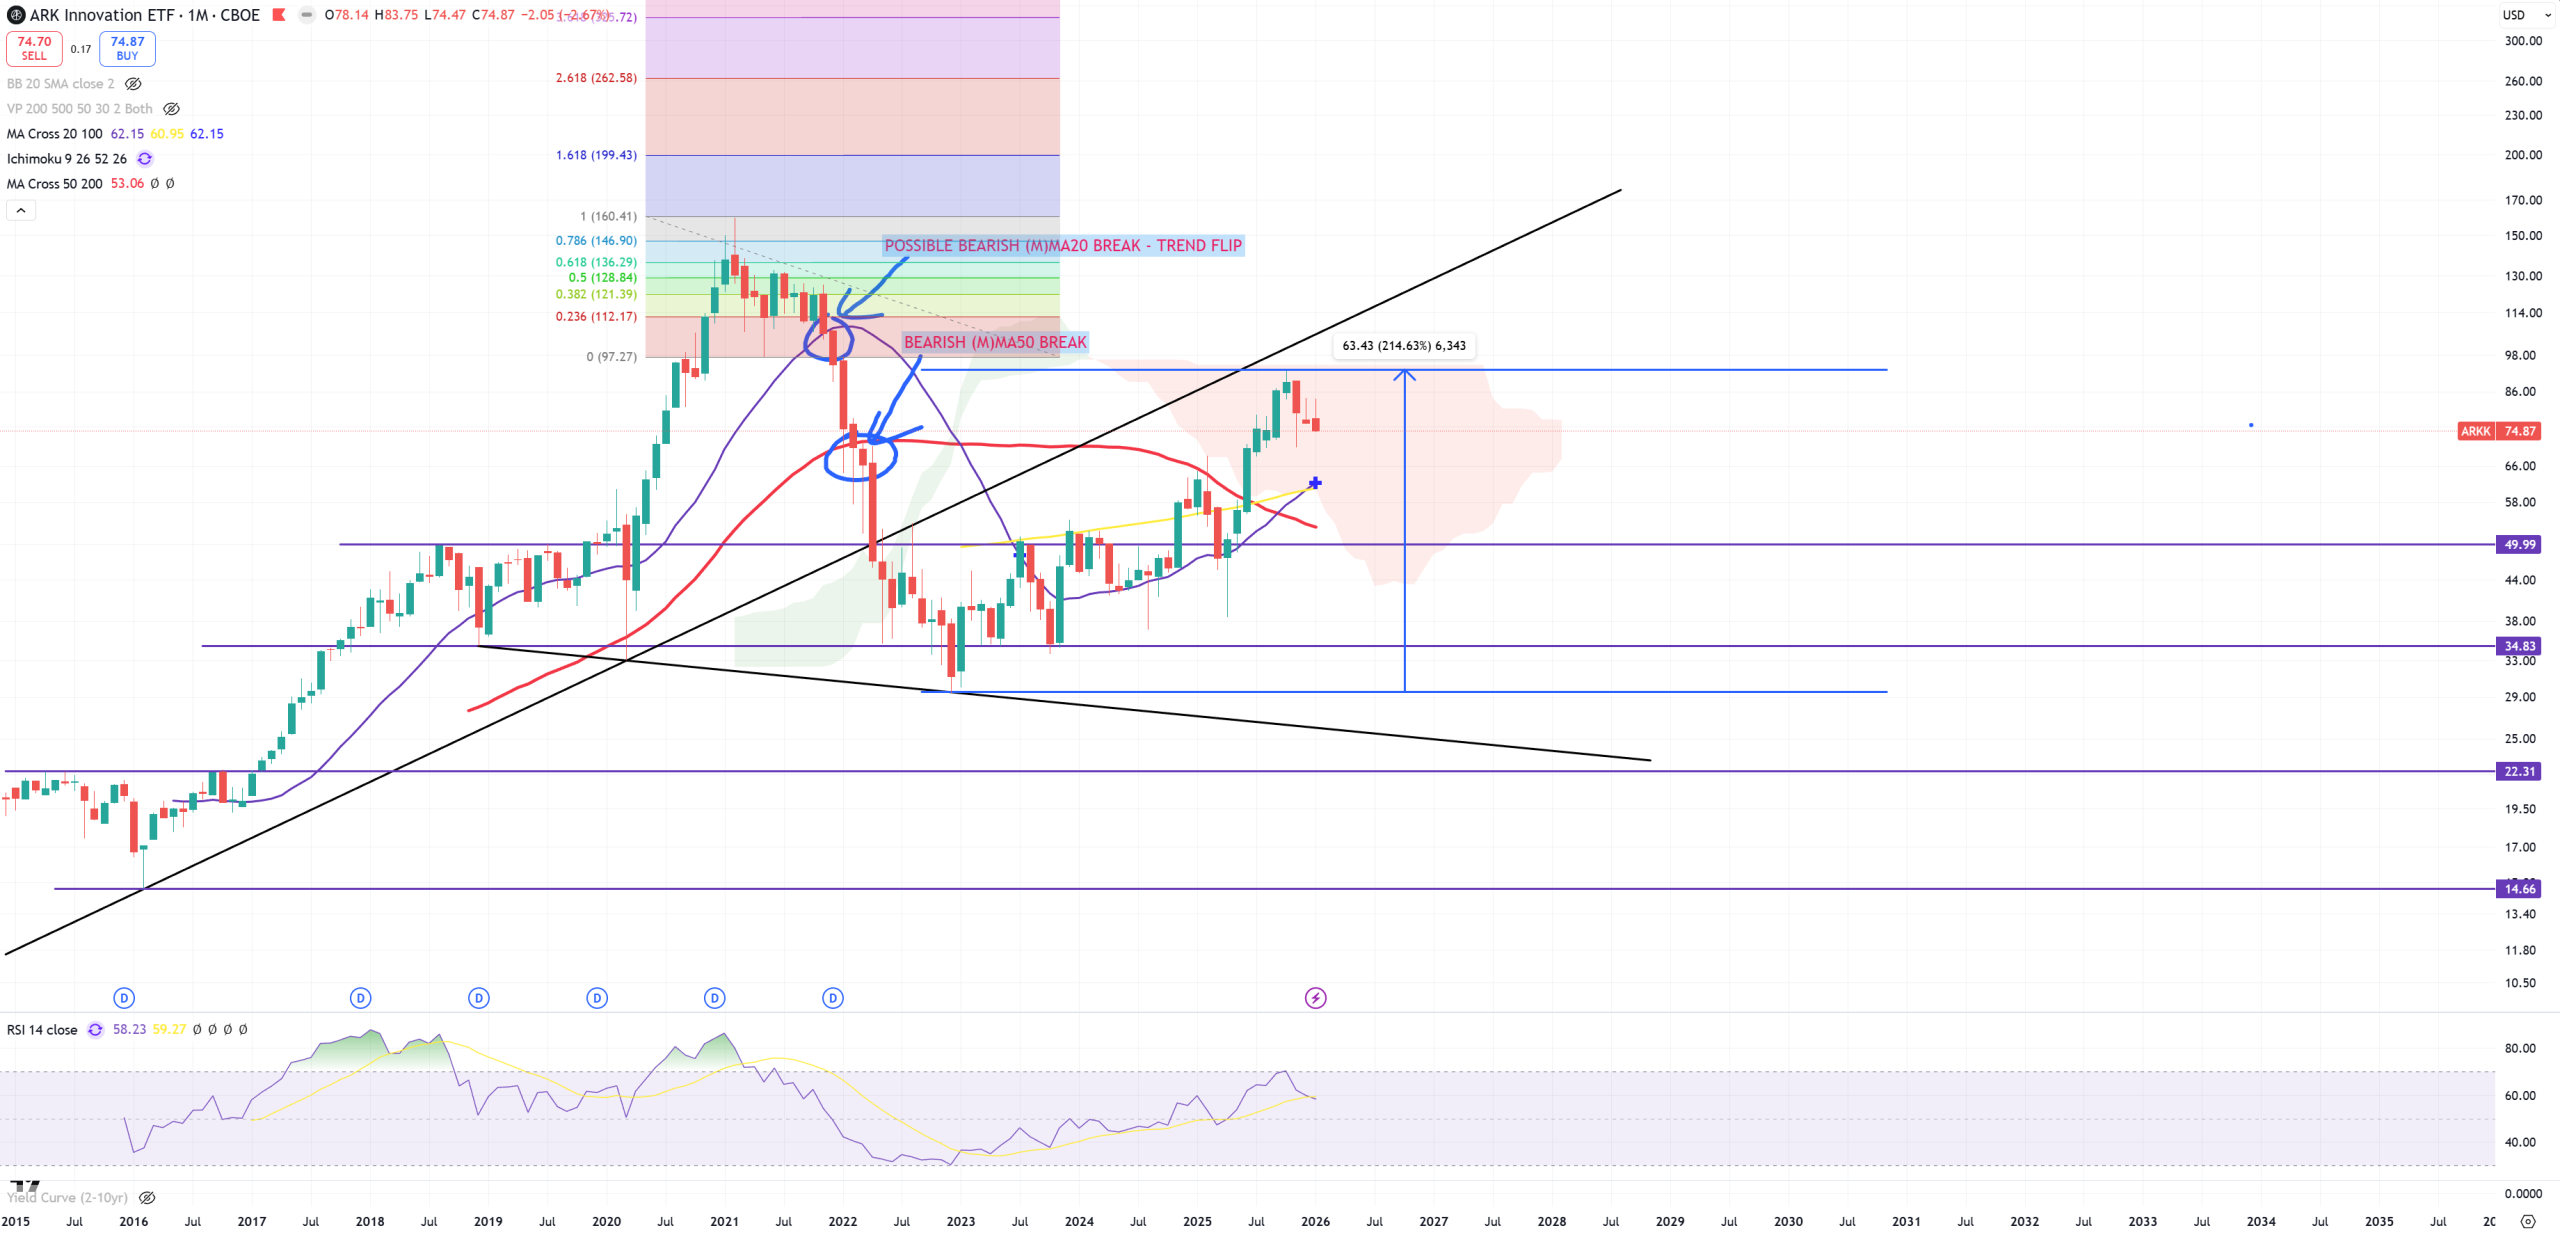
ARKK – Ark managed to jump by 214%, but is it a bear market rally? All was working fine till (M)MA50 & (M)MA100 break pointing for top level as a retest to broken black trend. It’s almost there.
AI/SOX stocks
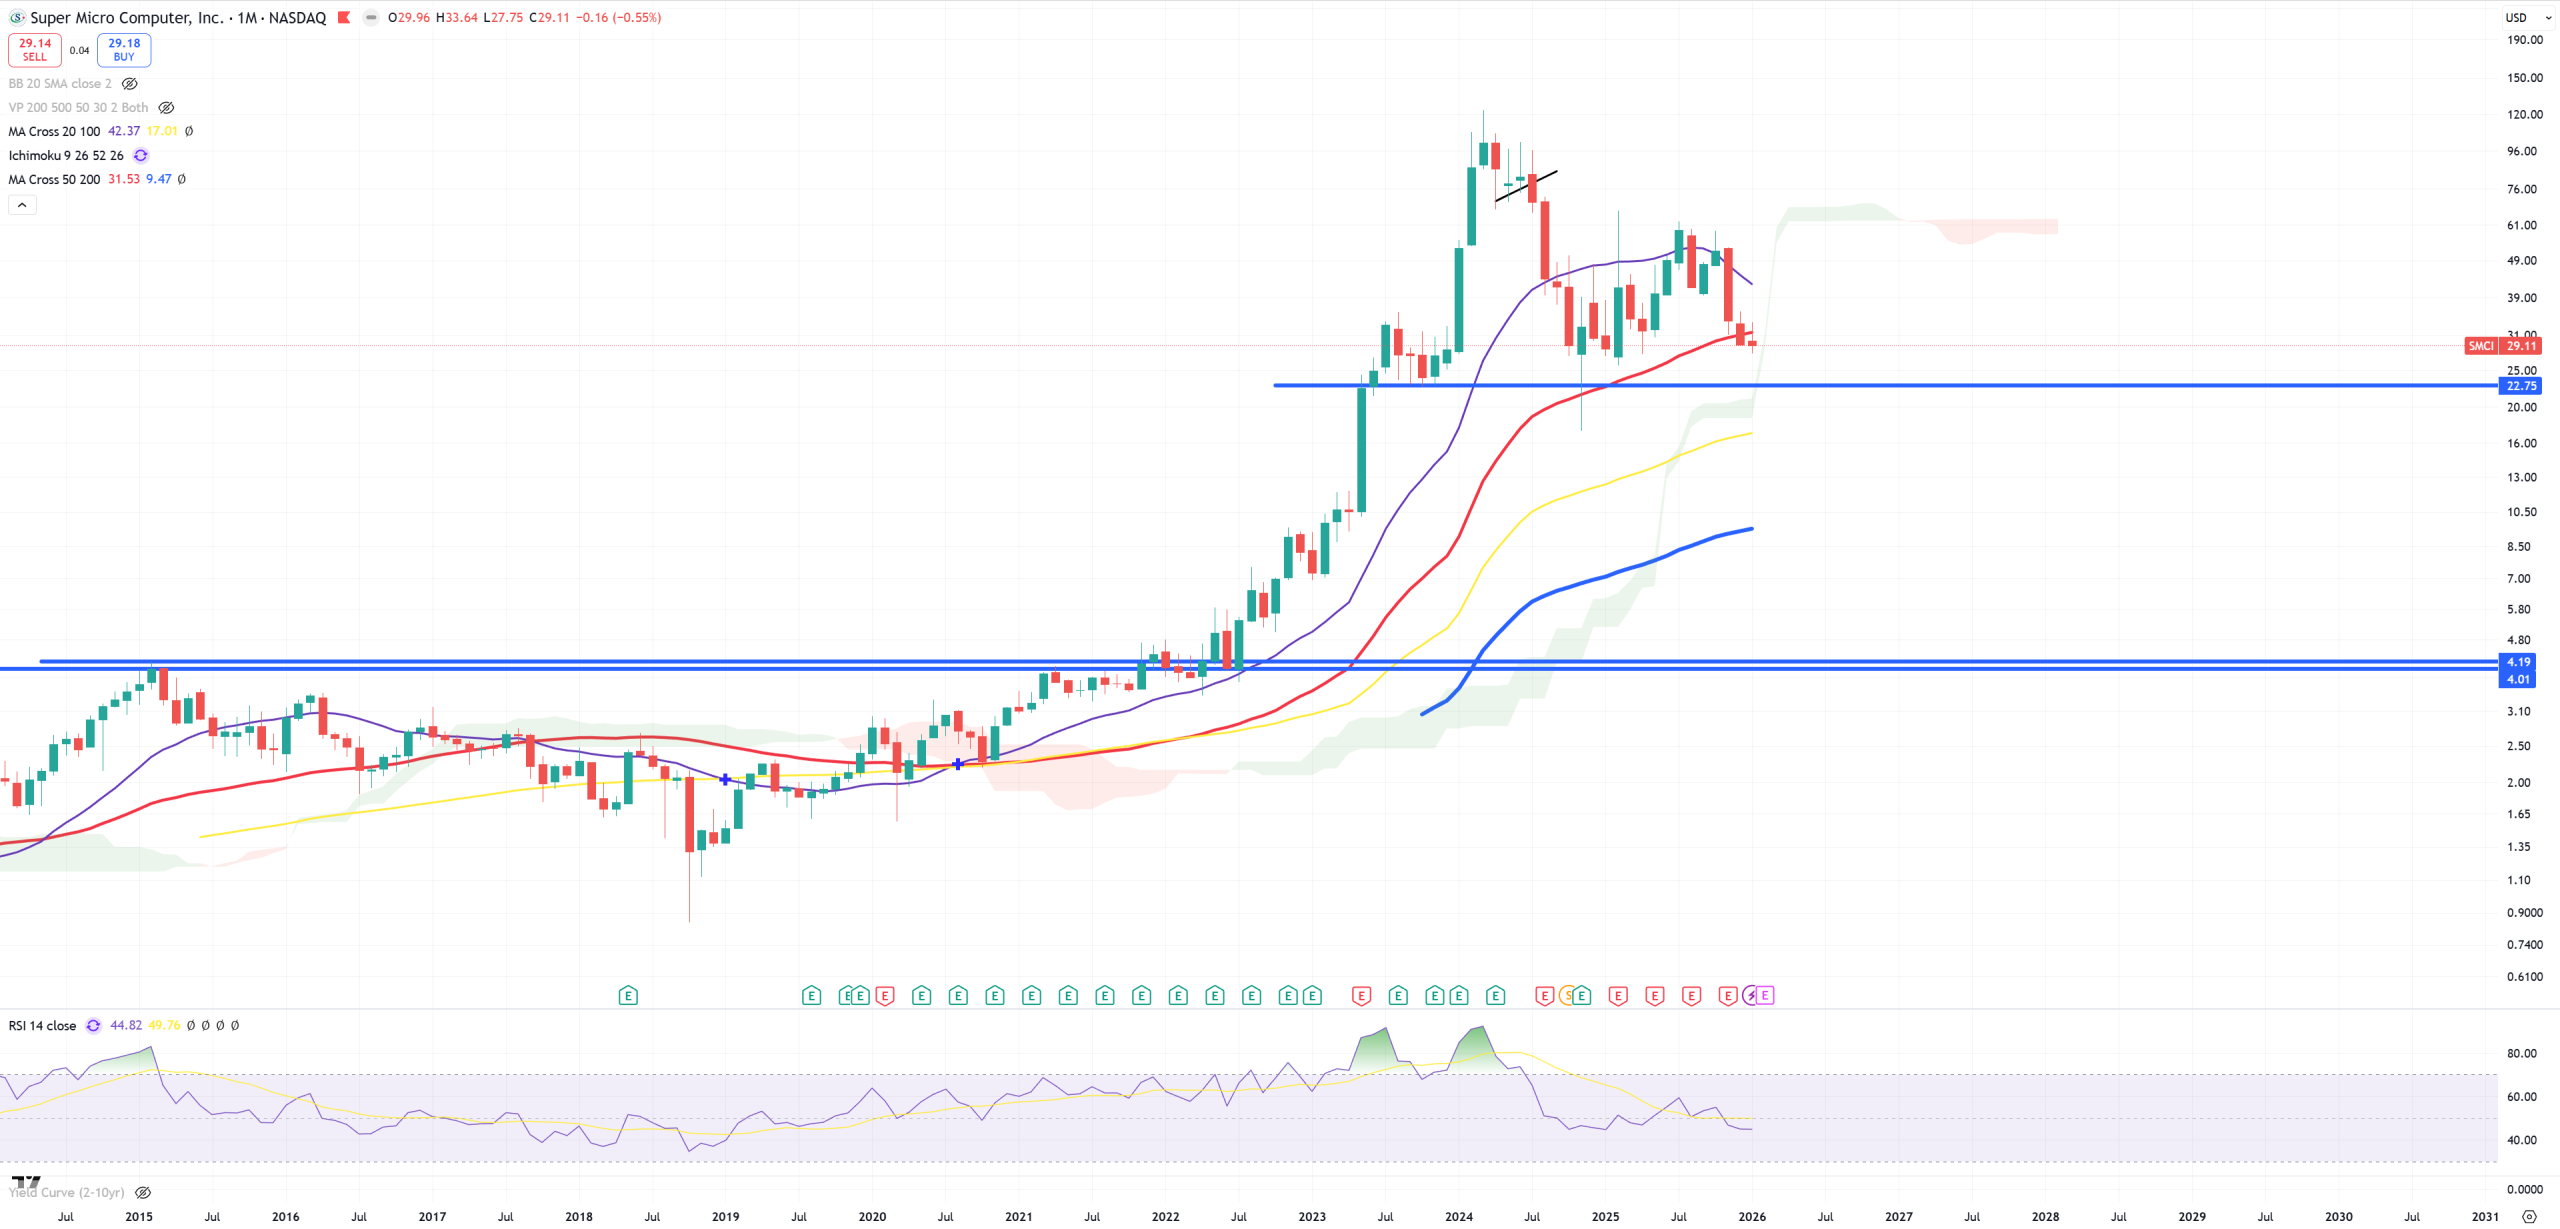
SMCI – It was #1 bubble for me some time ago, later I flipped it to MSTR, now TSLA & PLTR in reality but I still think 4$ is a fair value. (M)MA50 holds after a break, and as I’ve been saying : “The biggest crashes happen when market breaks (W)MA200 & (M)MA50, retest it from the bottom and … fail”
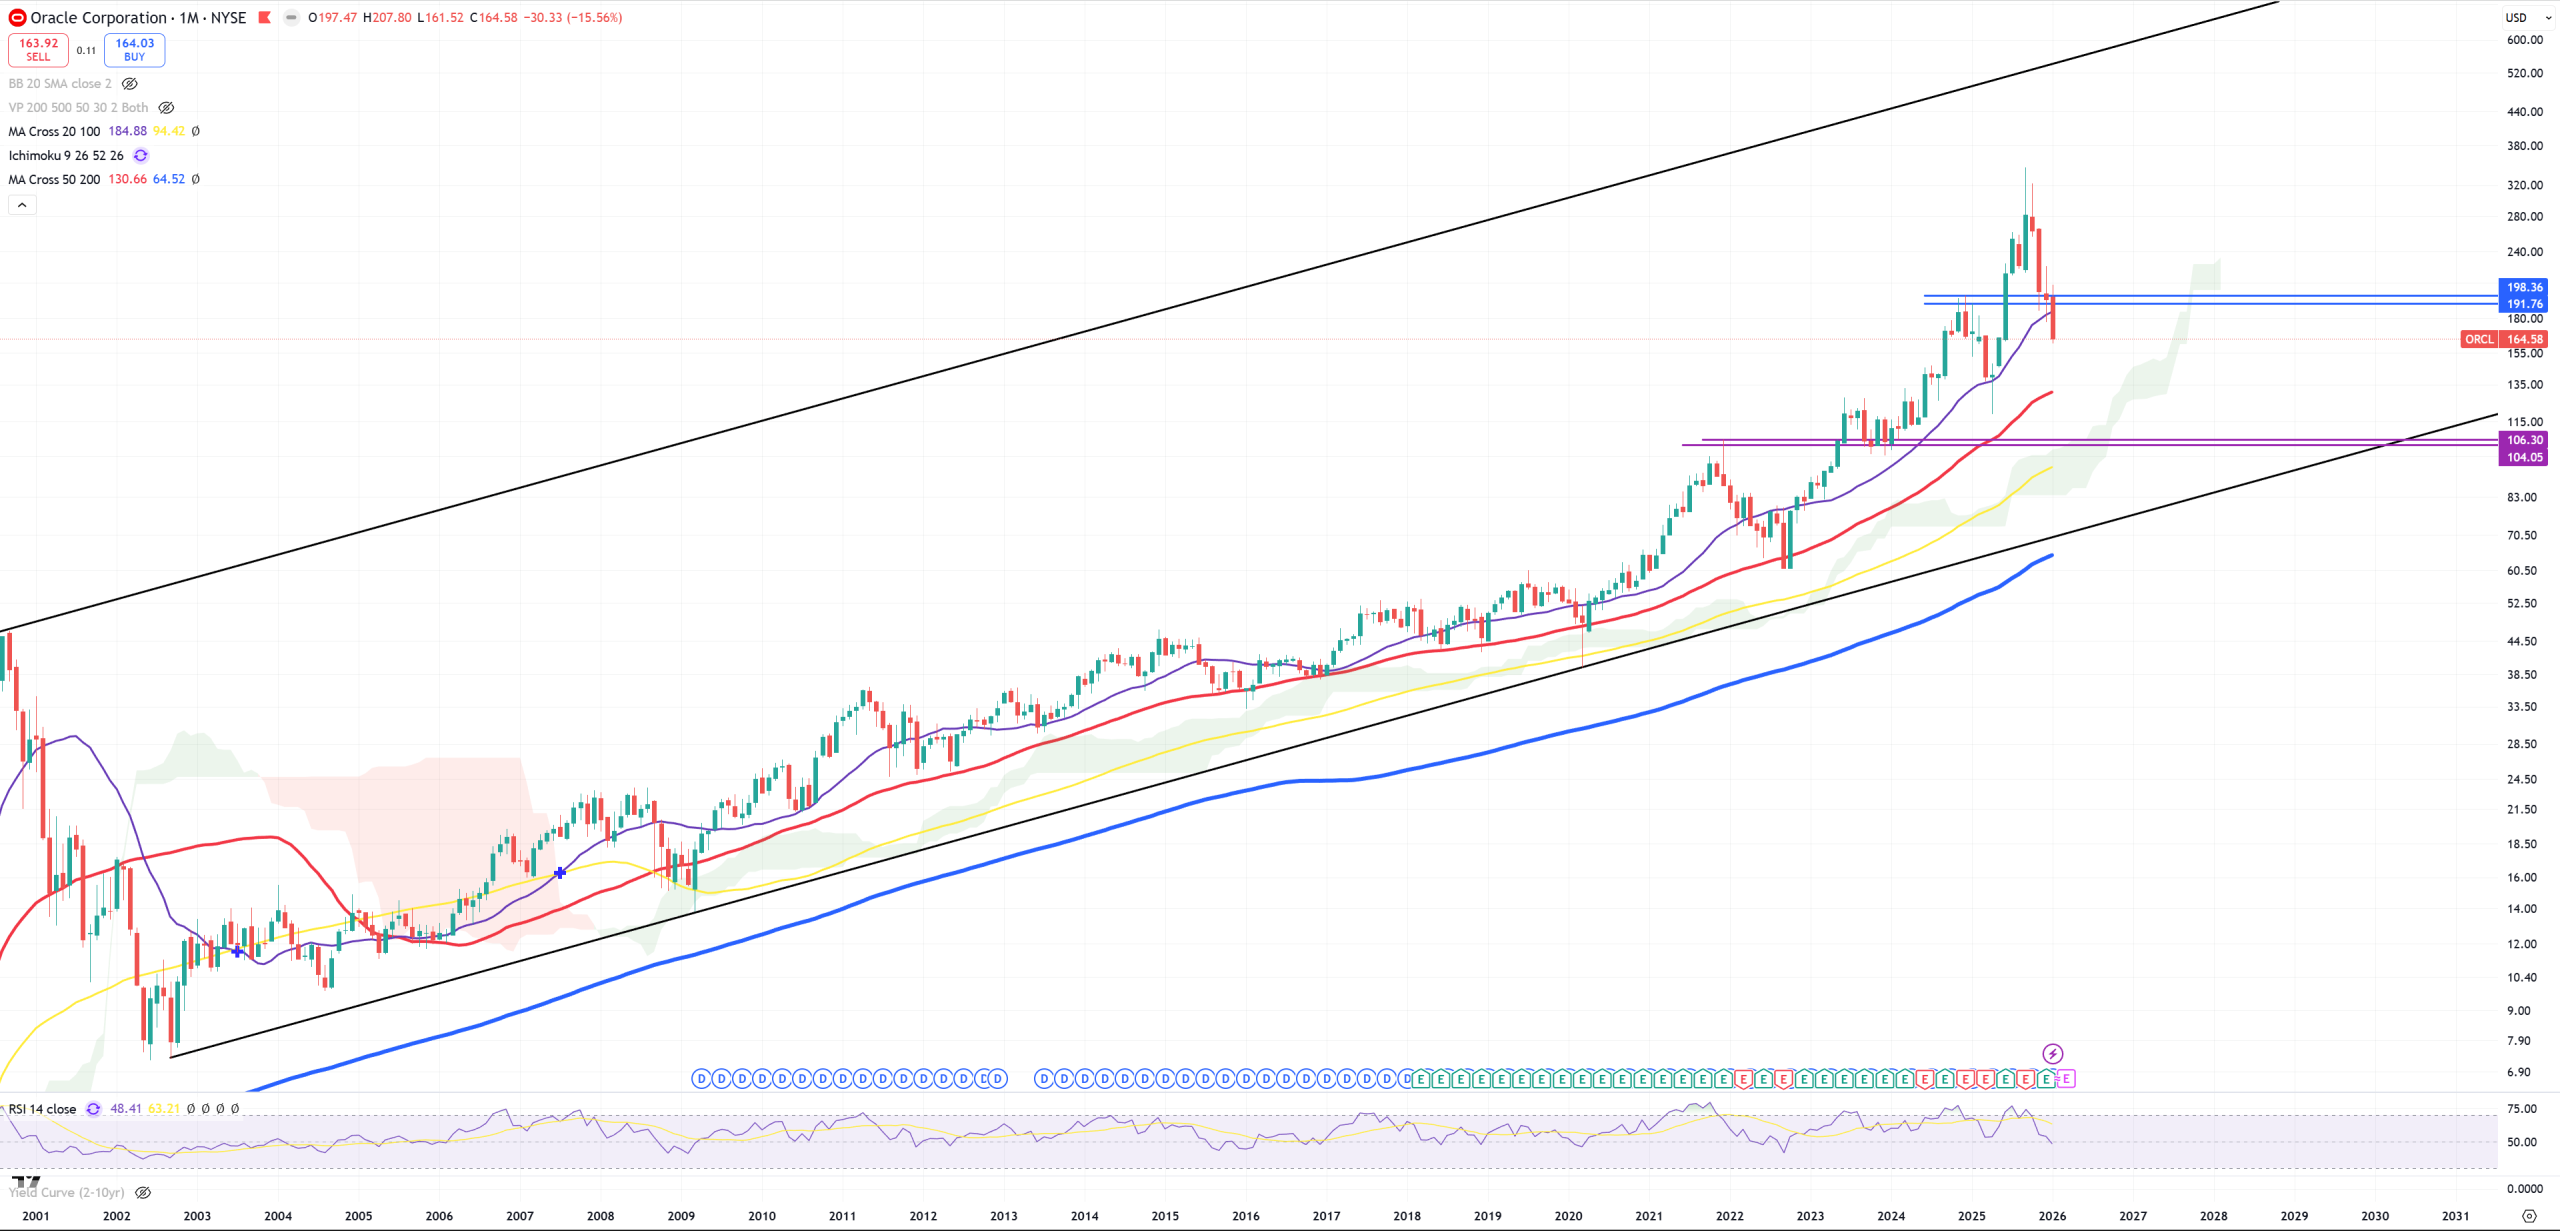
ORCL – this chart doesn’t need any comment
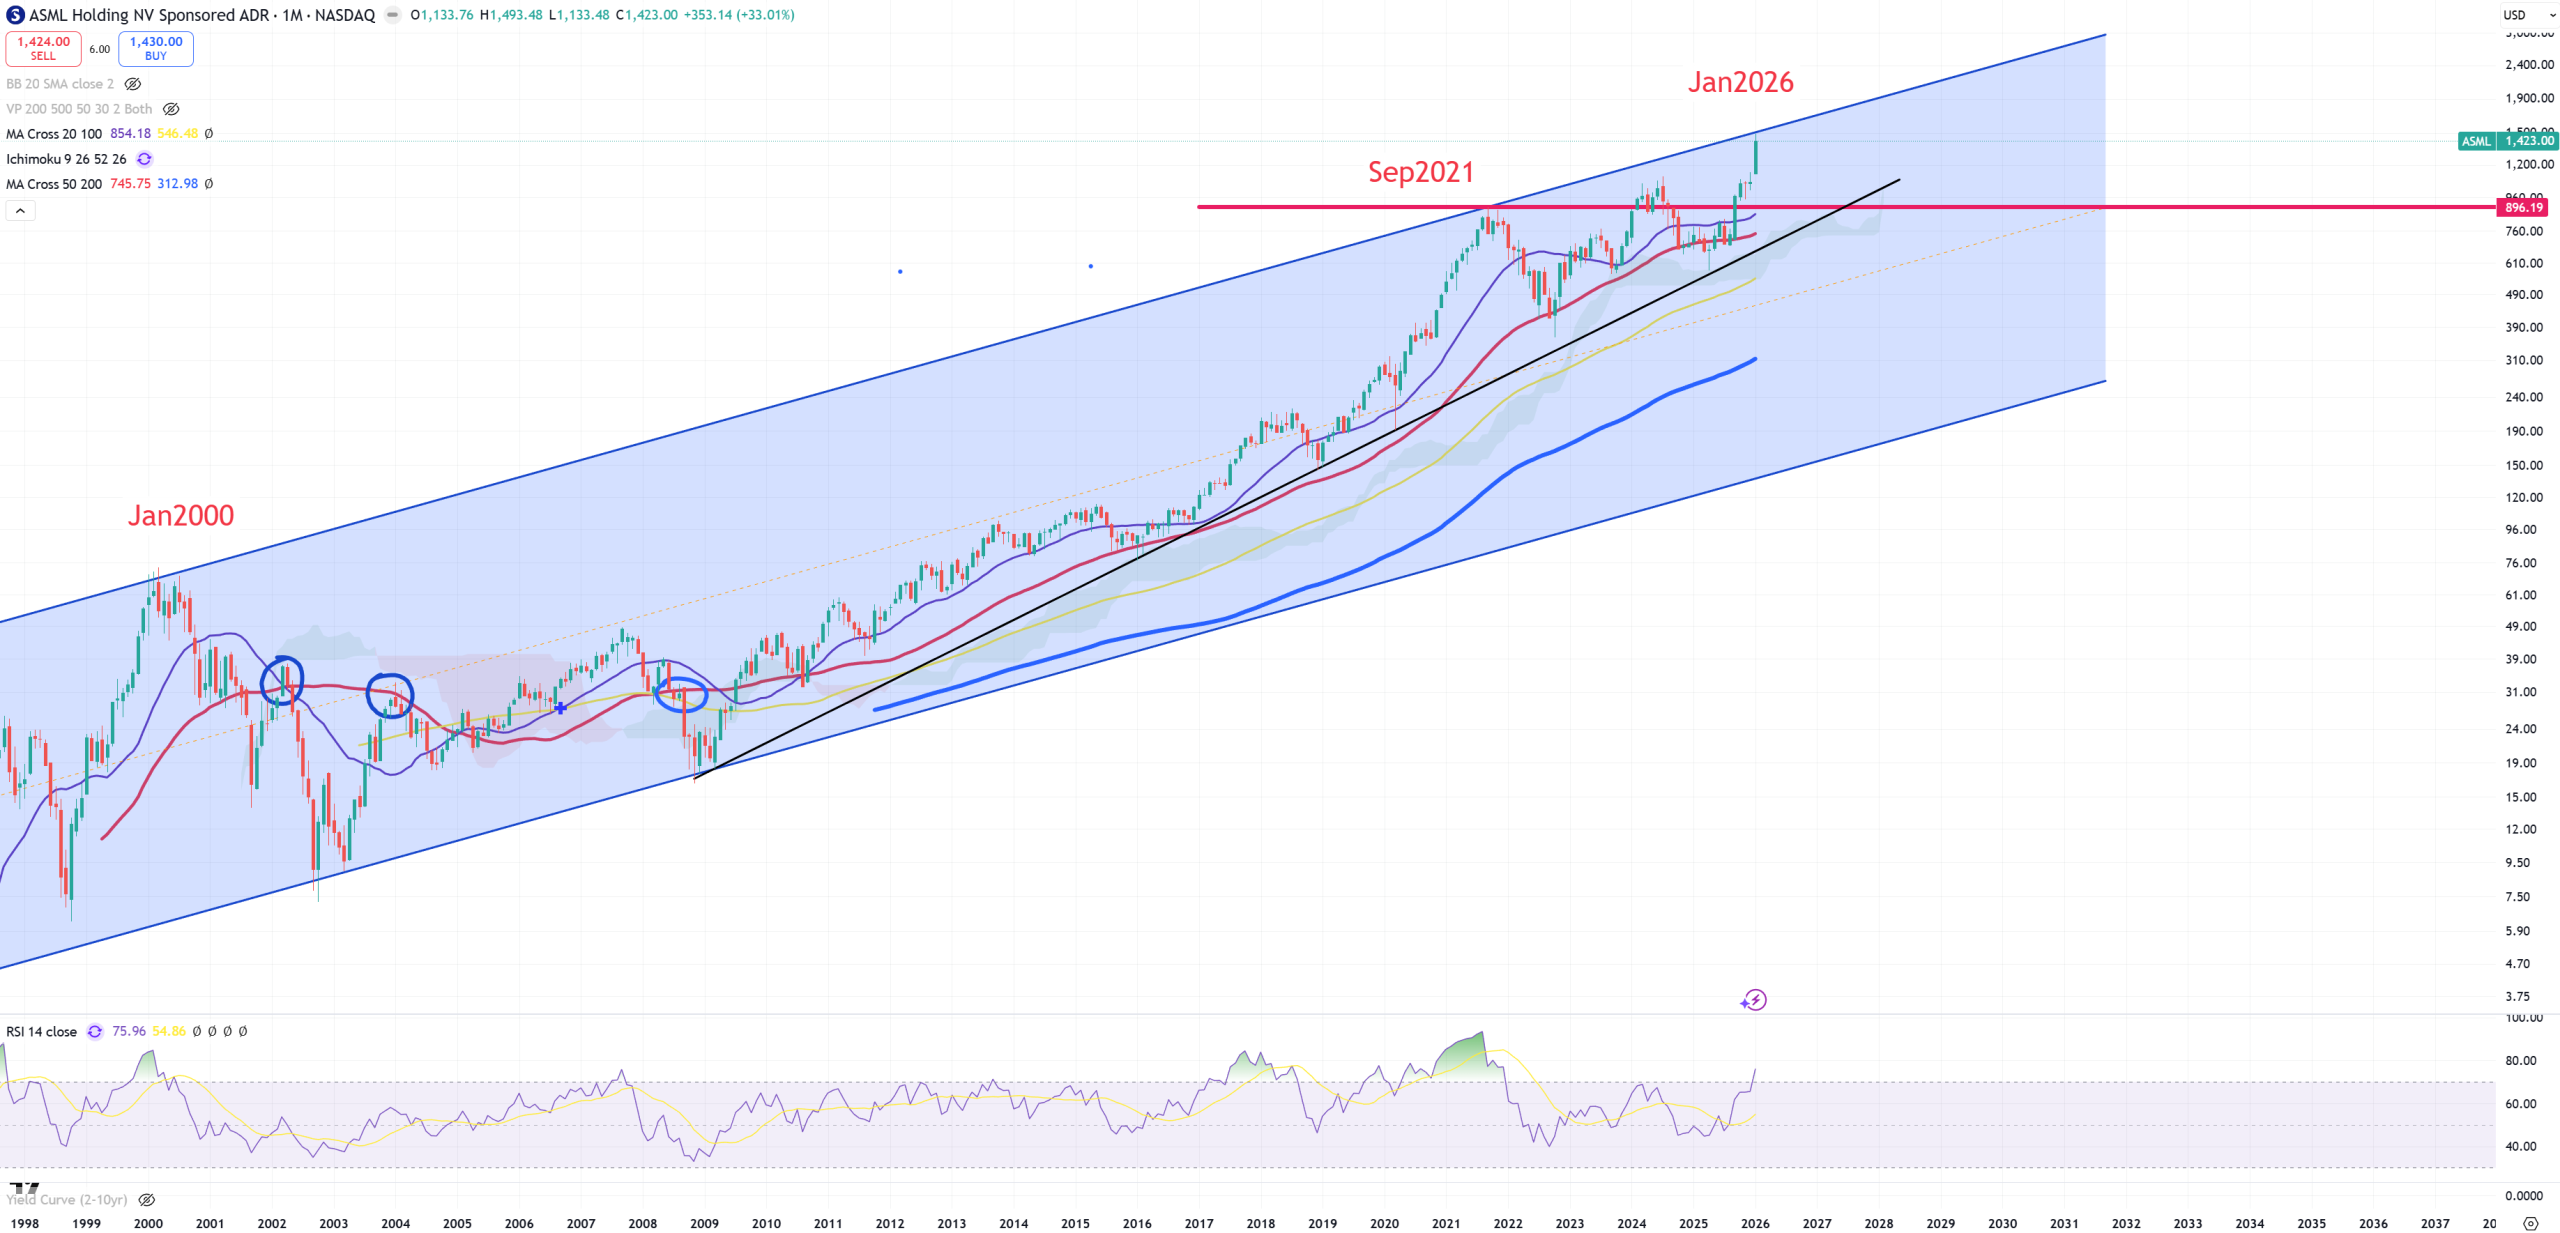
ASML – 2021 peak was broken once, but failed, later it was trying to break (M)MA50 but failed and jumped to upper trend.
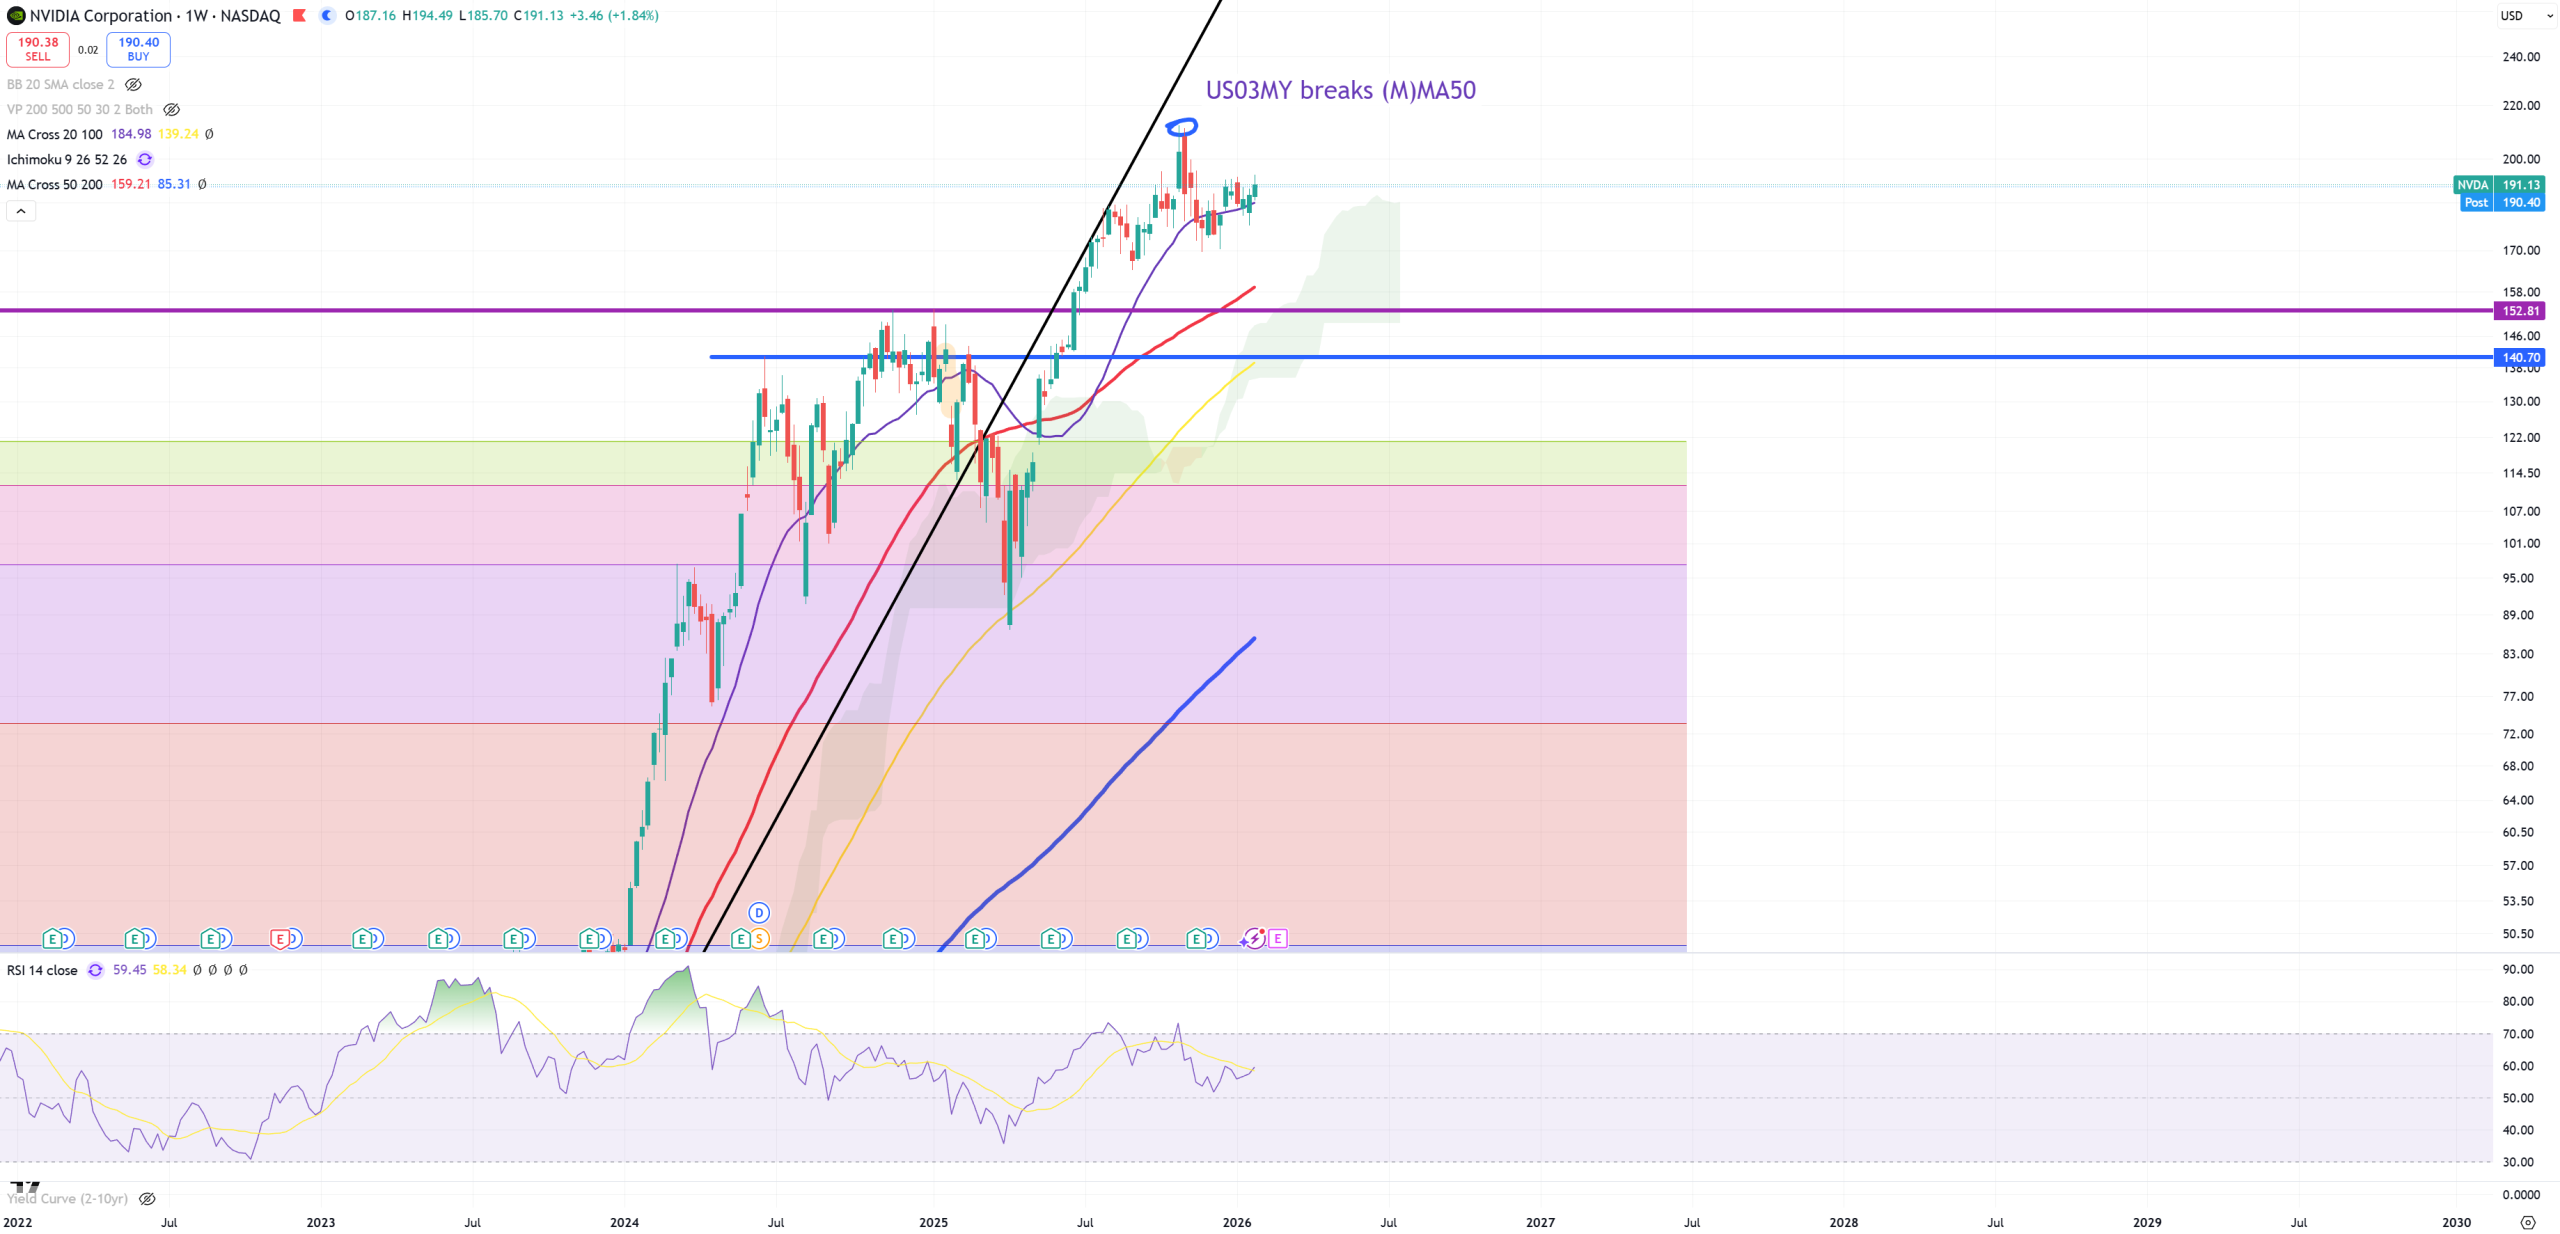
NVDA – so far this US03MY moment placed this top. (W) view and nothing to see it here more. Not sharing any other chart, because nothing is to show. Distance to (M)MA50 is -65% today. Initially I thought it was peaking between 142 and 152 but that was very wrong assumption. We had to wait for US03MY to break so far to place a possible peak.
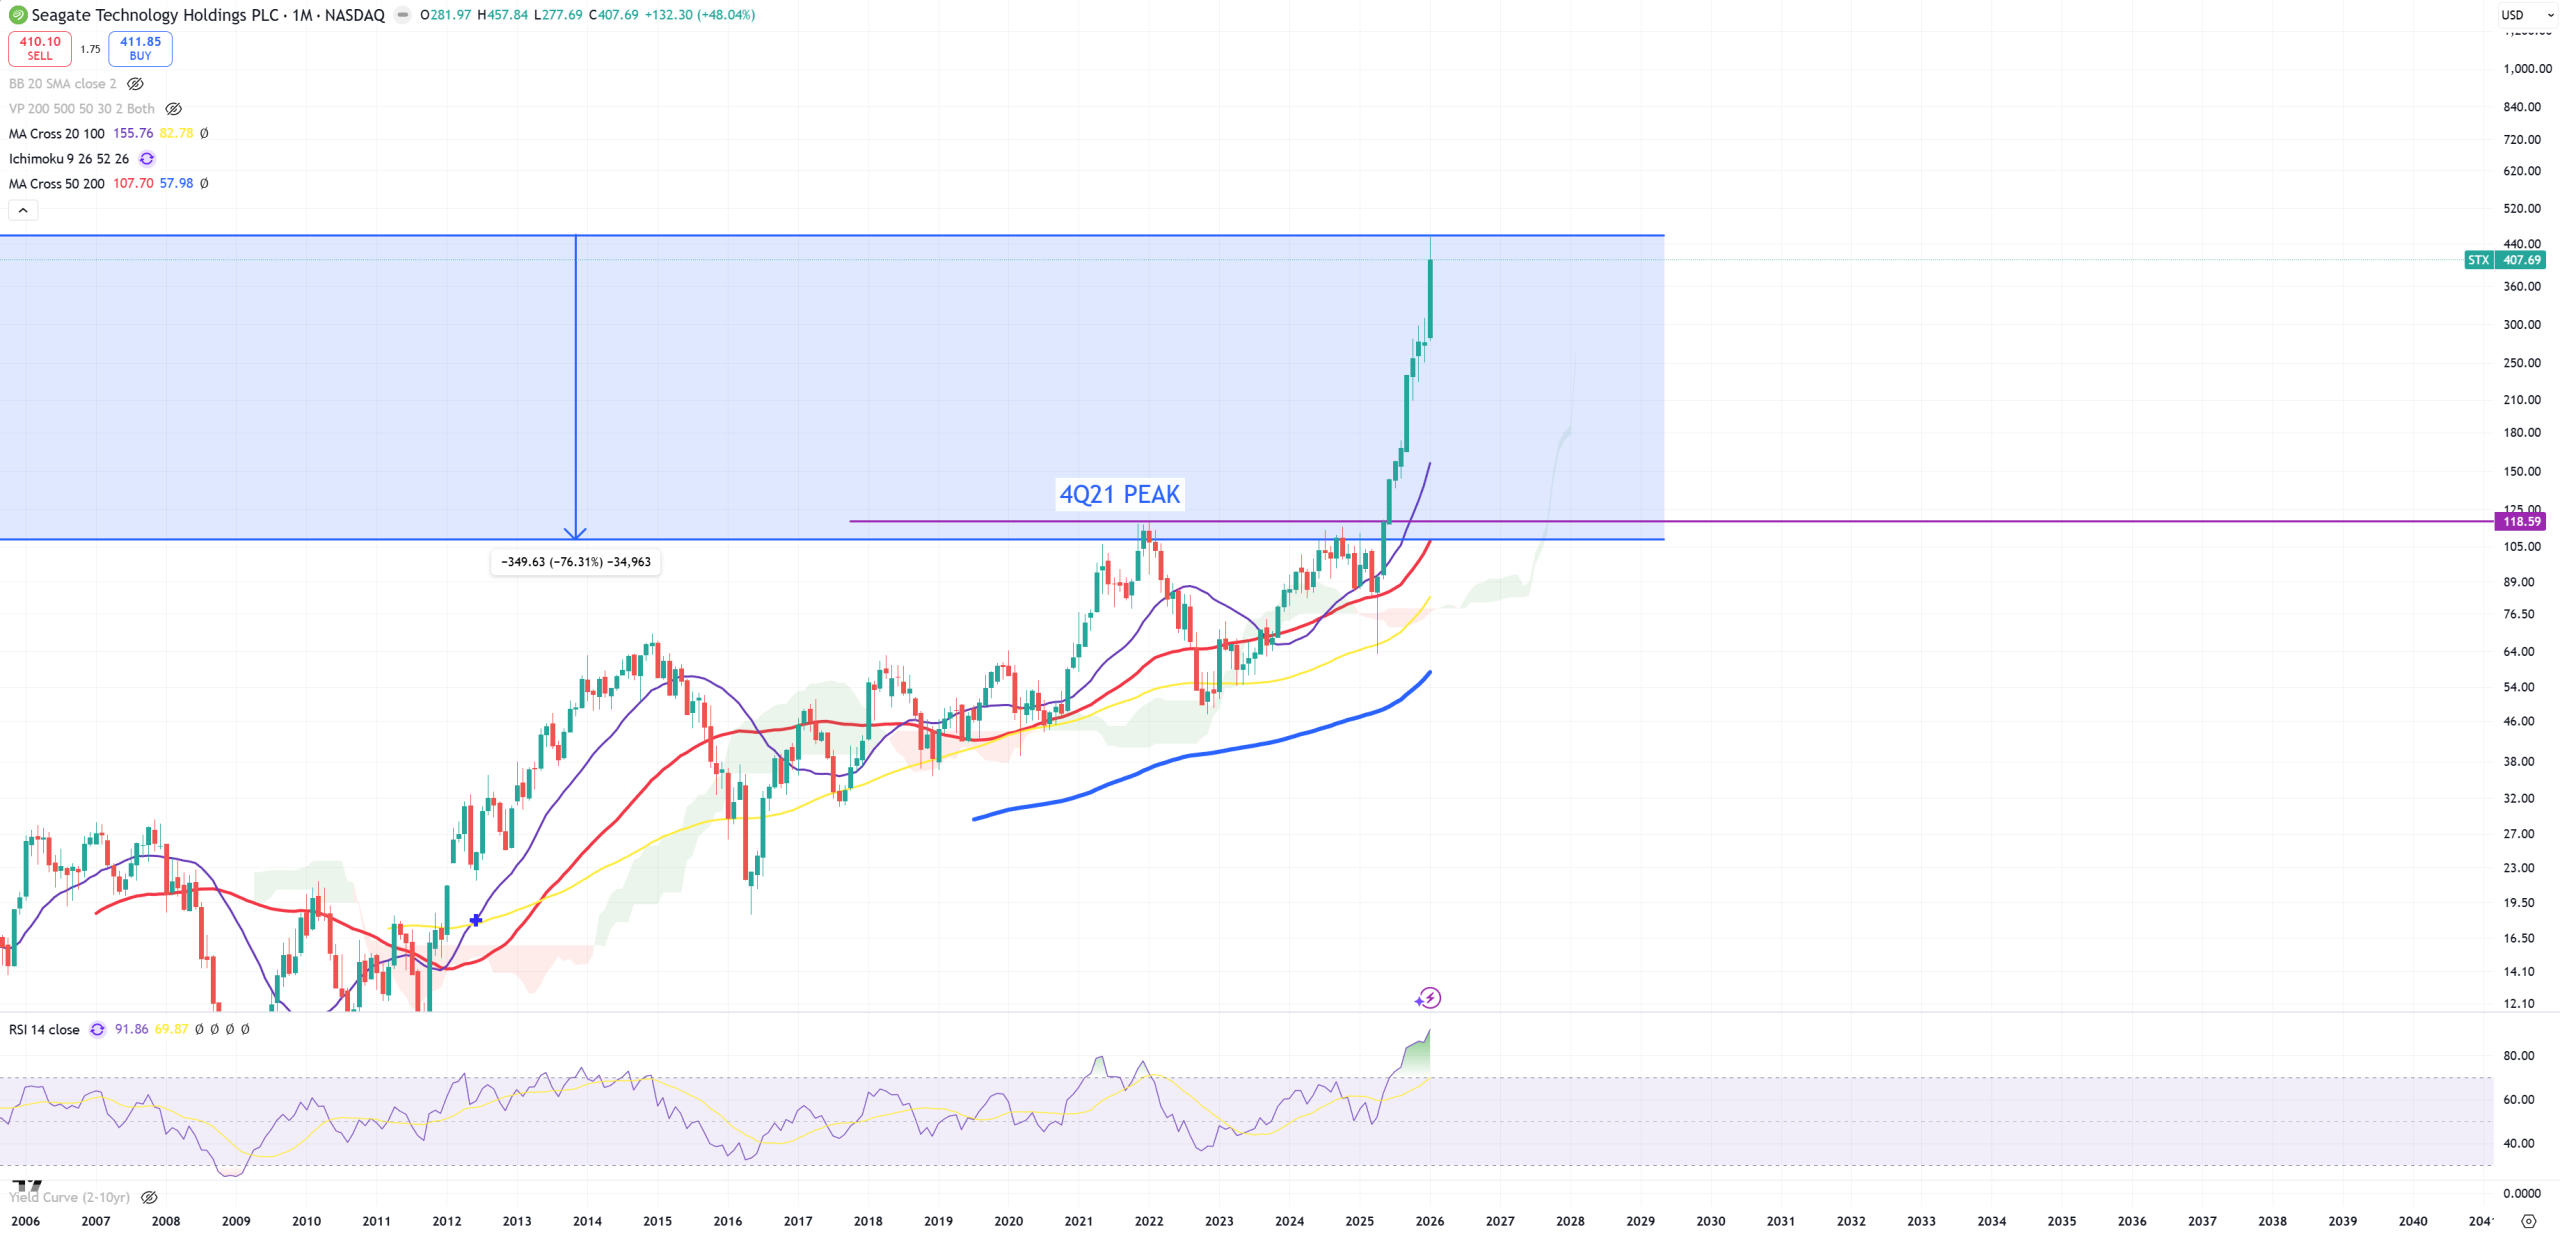
STX – Seagate – parabolic move -76% distance to (M)MA50. Not much to see here.
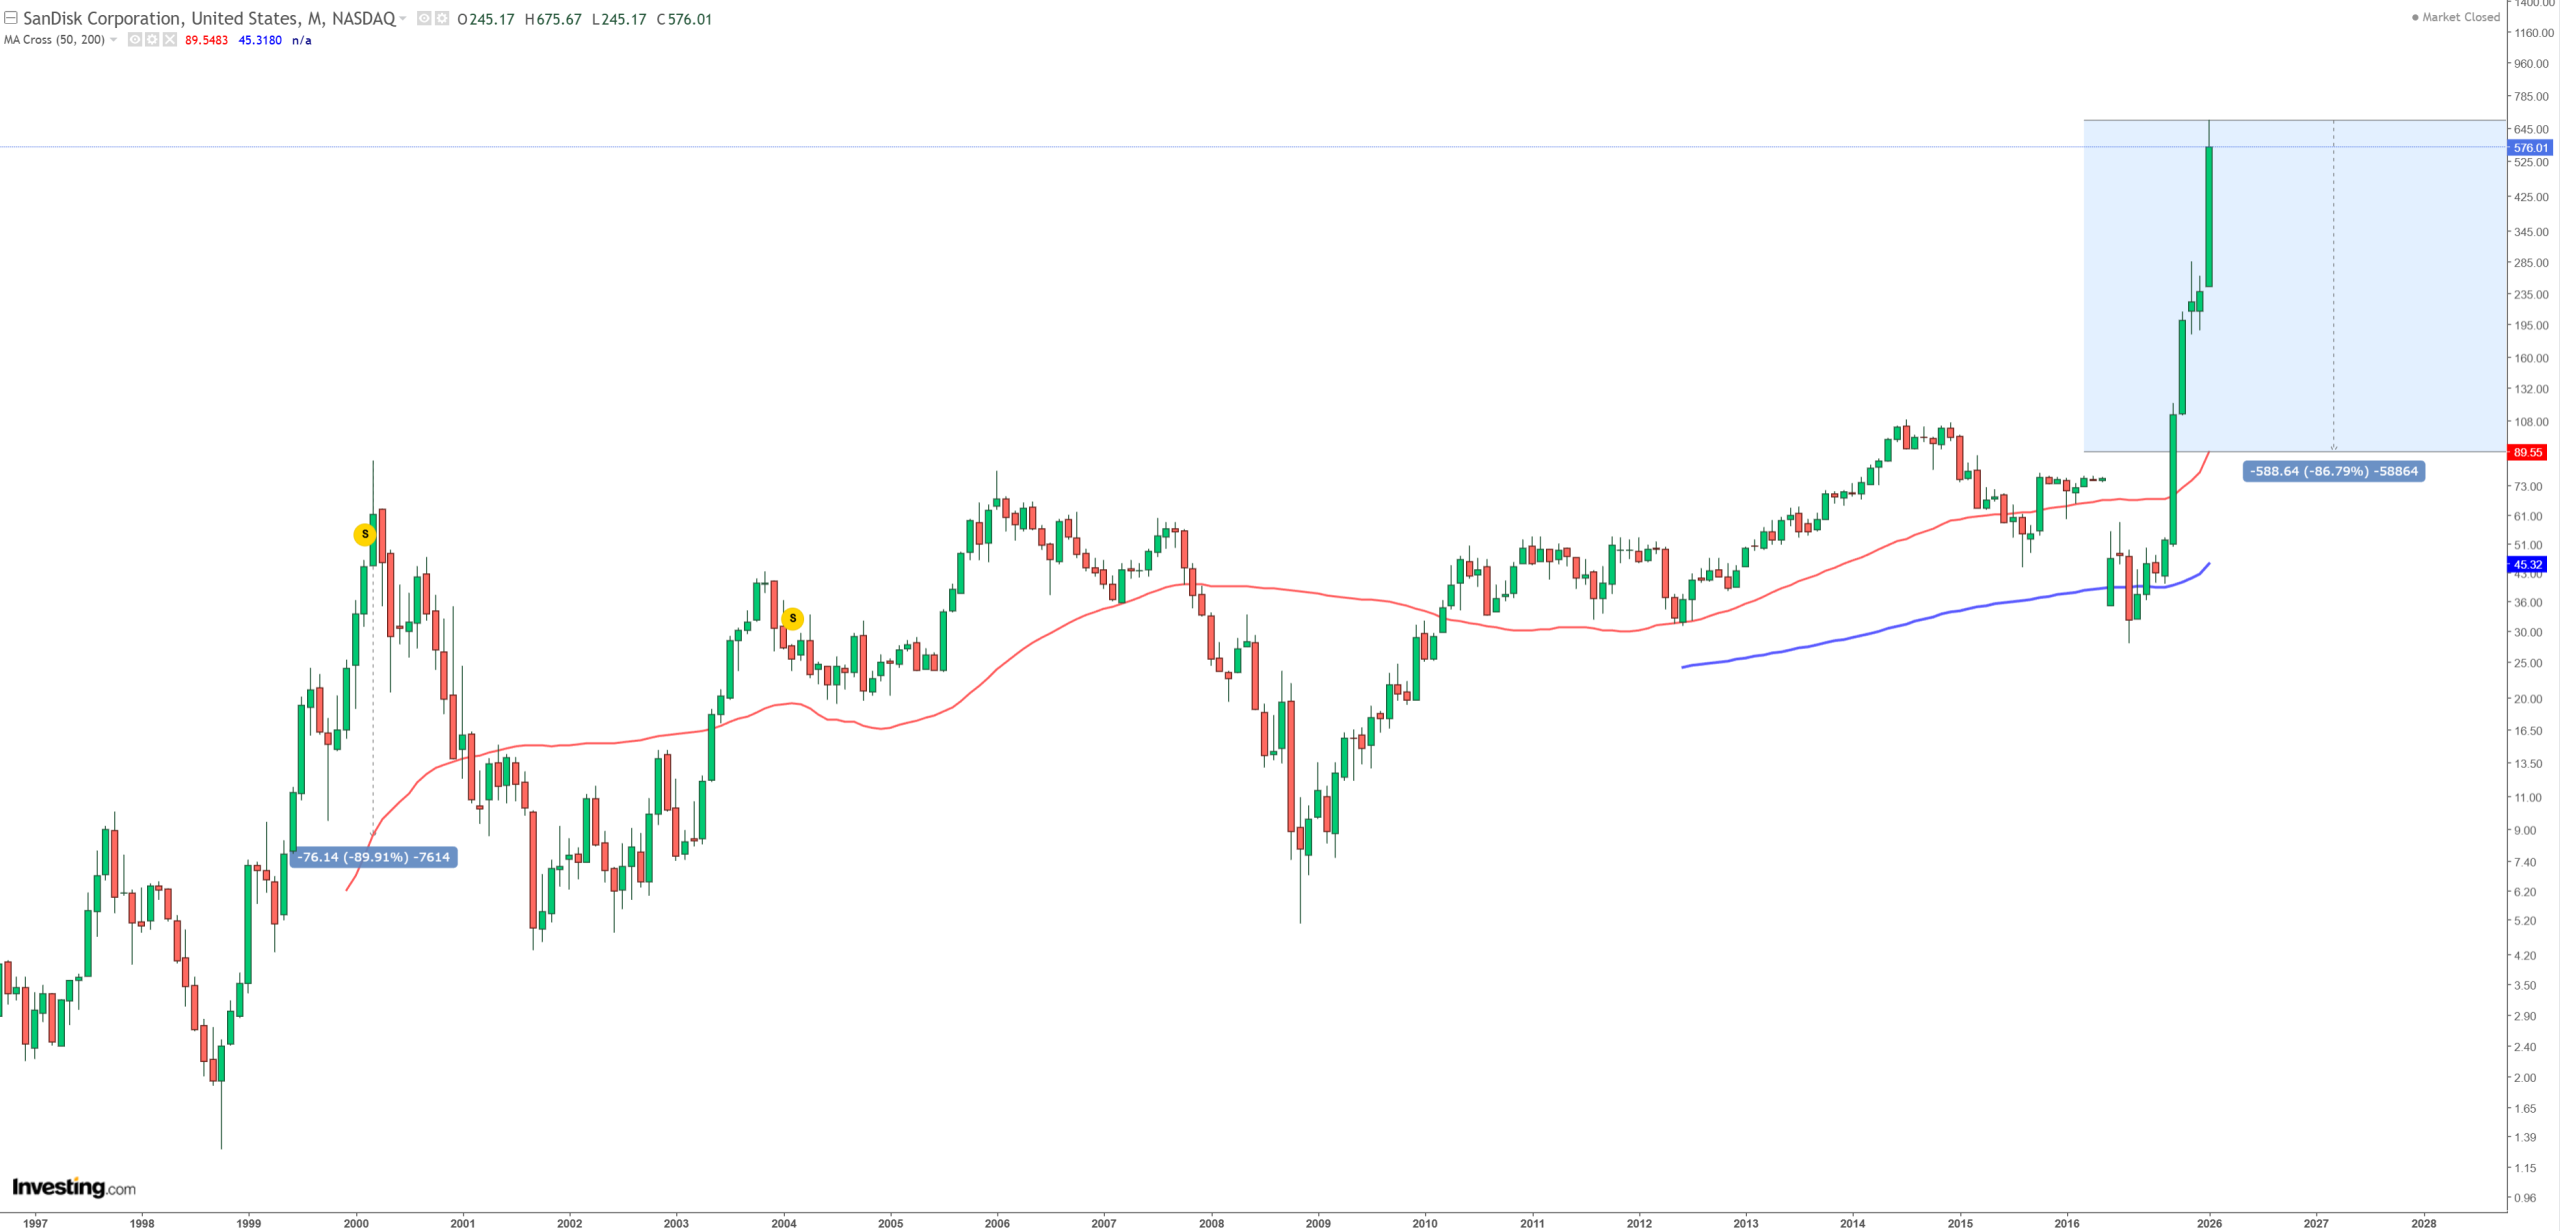
SNDK – SanDisk – oh boy … Distance to (M)MA50 is -87%, during dot com bubble peak we managed to get around -90%.
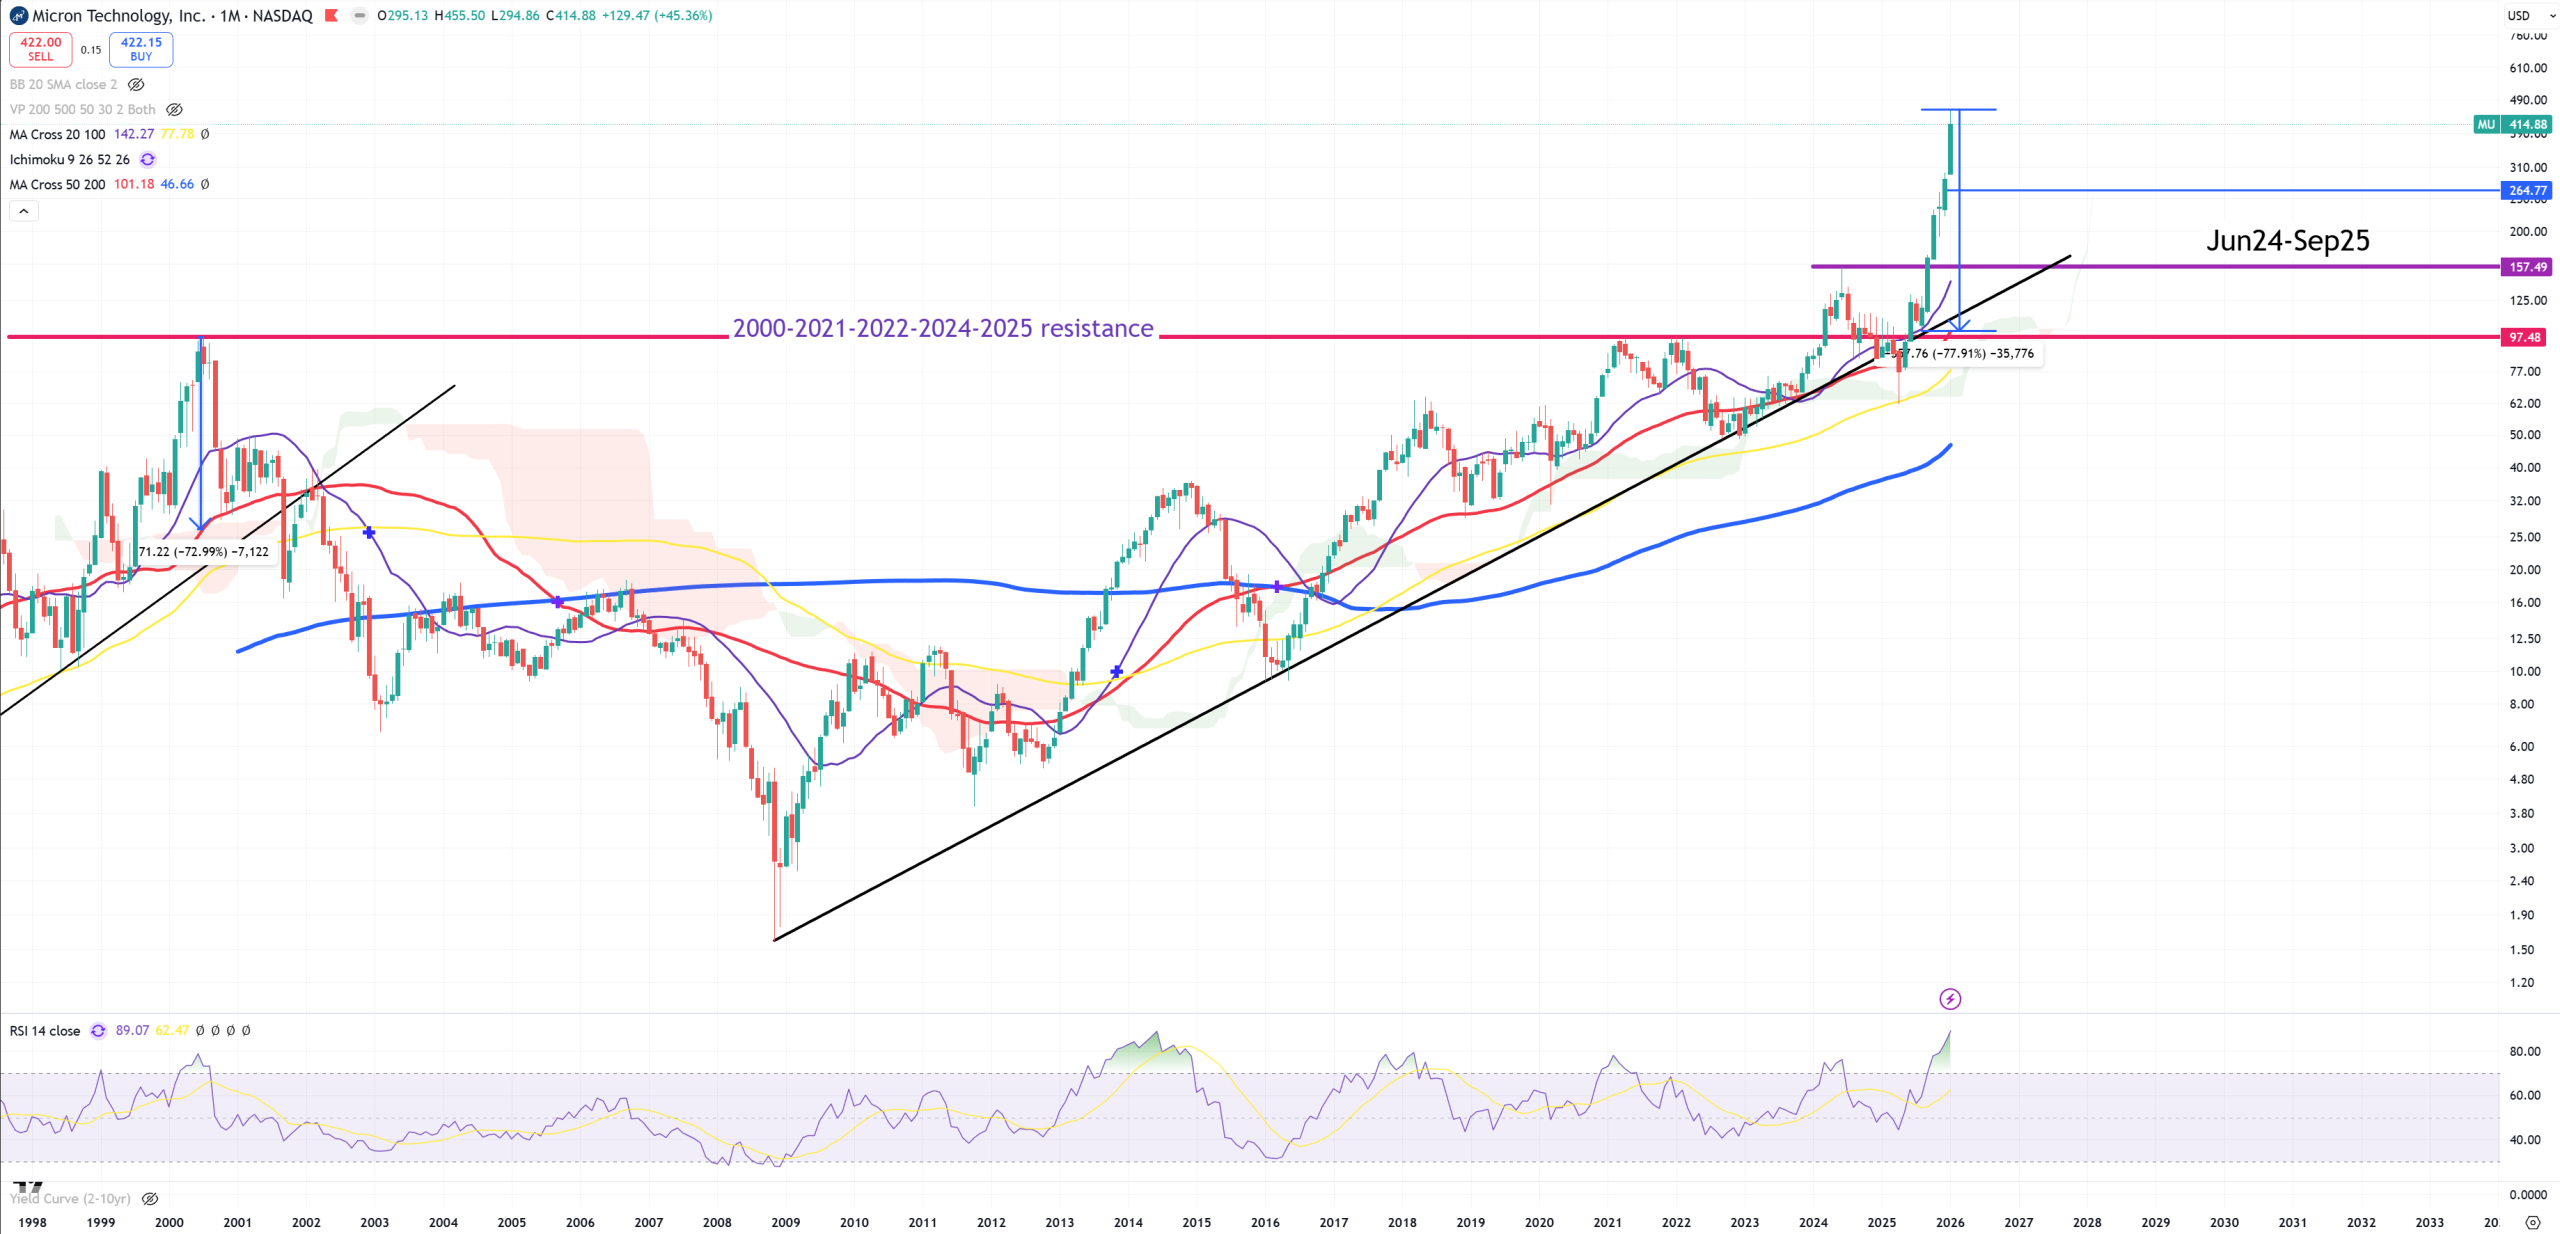
MU – Micron – even dot.com bubble wasn’t so bad with just -73% distance to (M)MA50 during peak. Now it’s -78%.
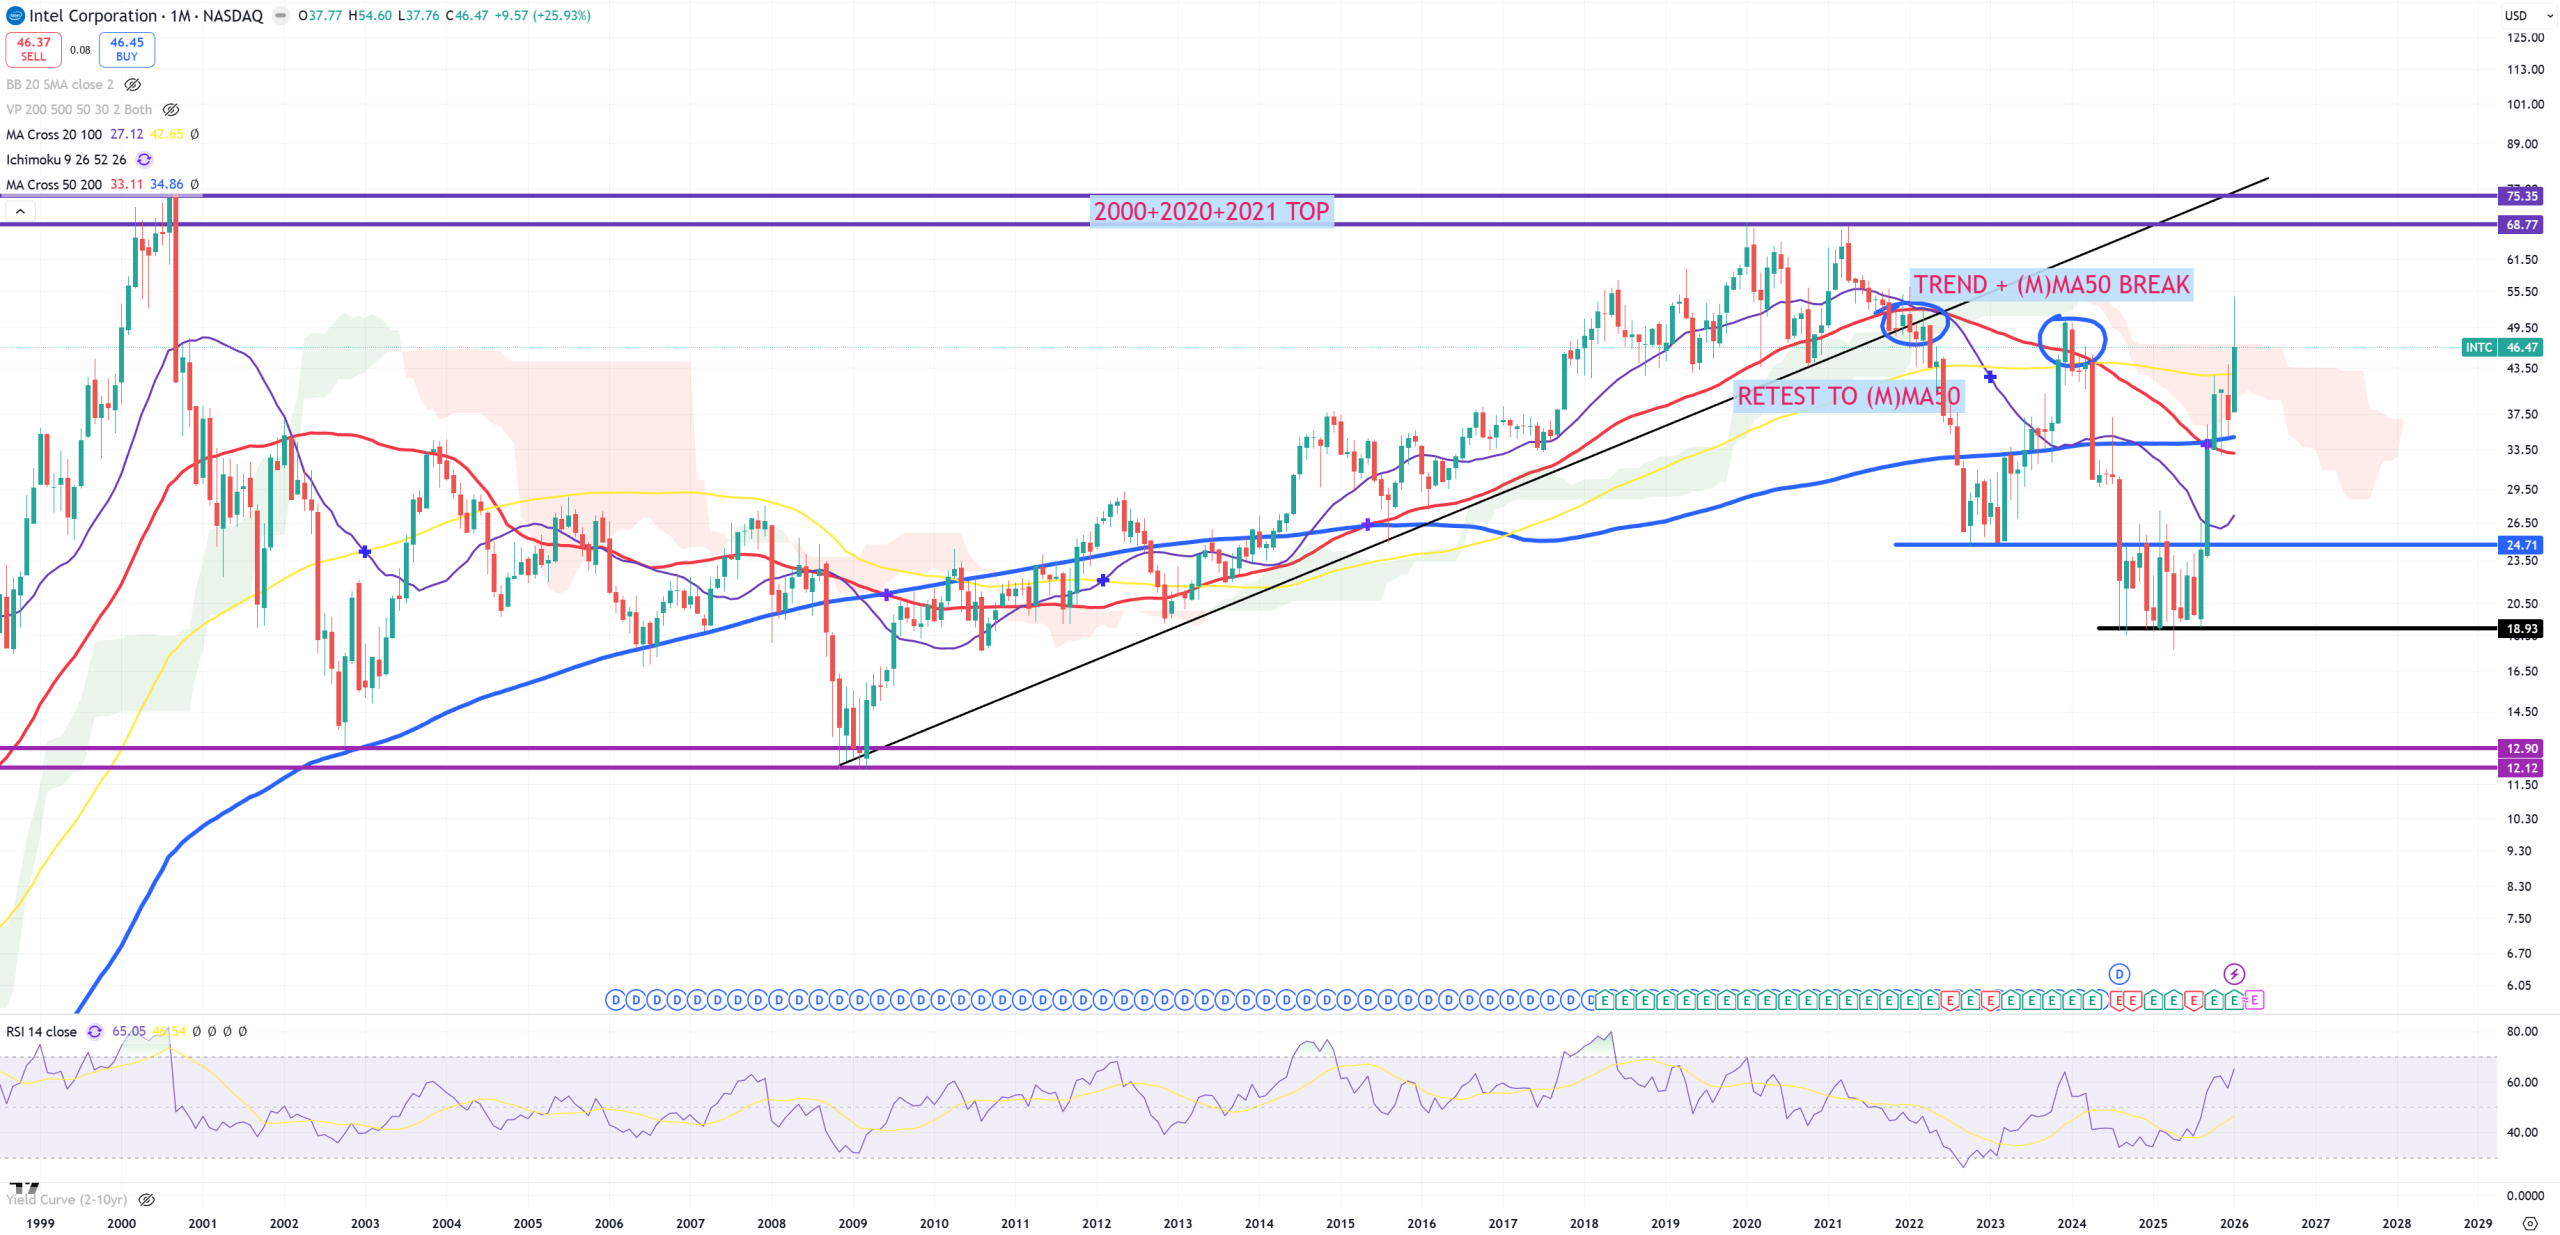
INTC – Would be great for the bears to open below yellow (M)MA100 in February 2026. Will it happen – I don’t know.
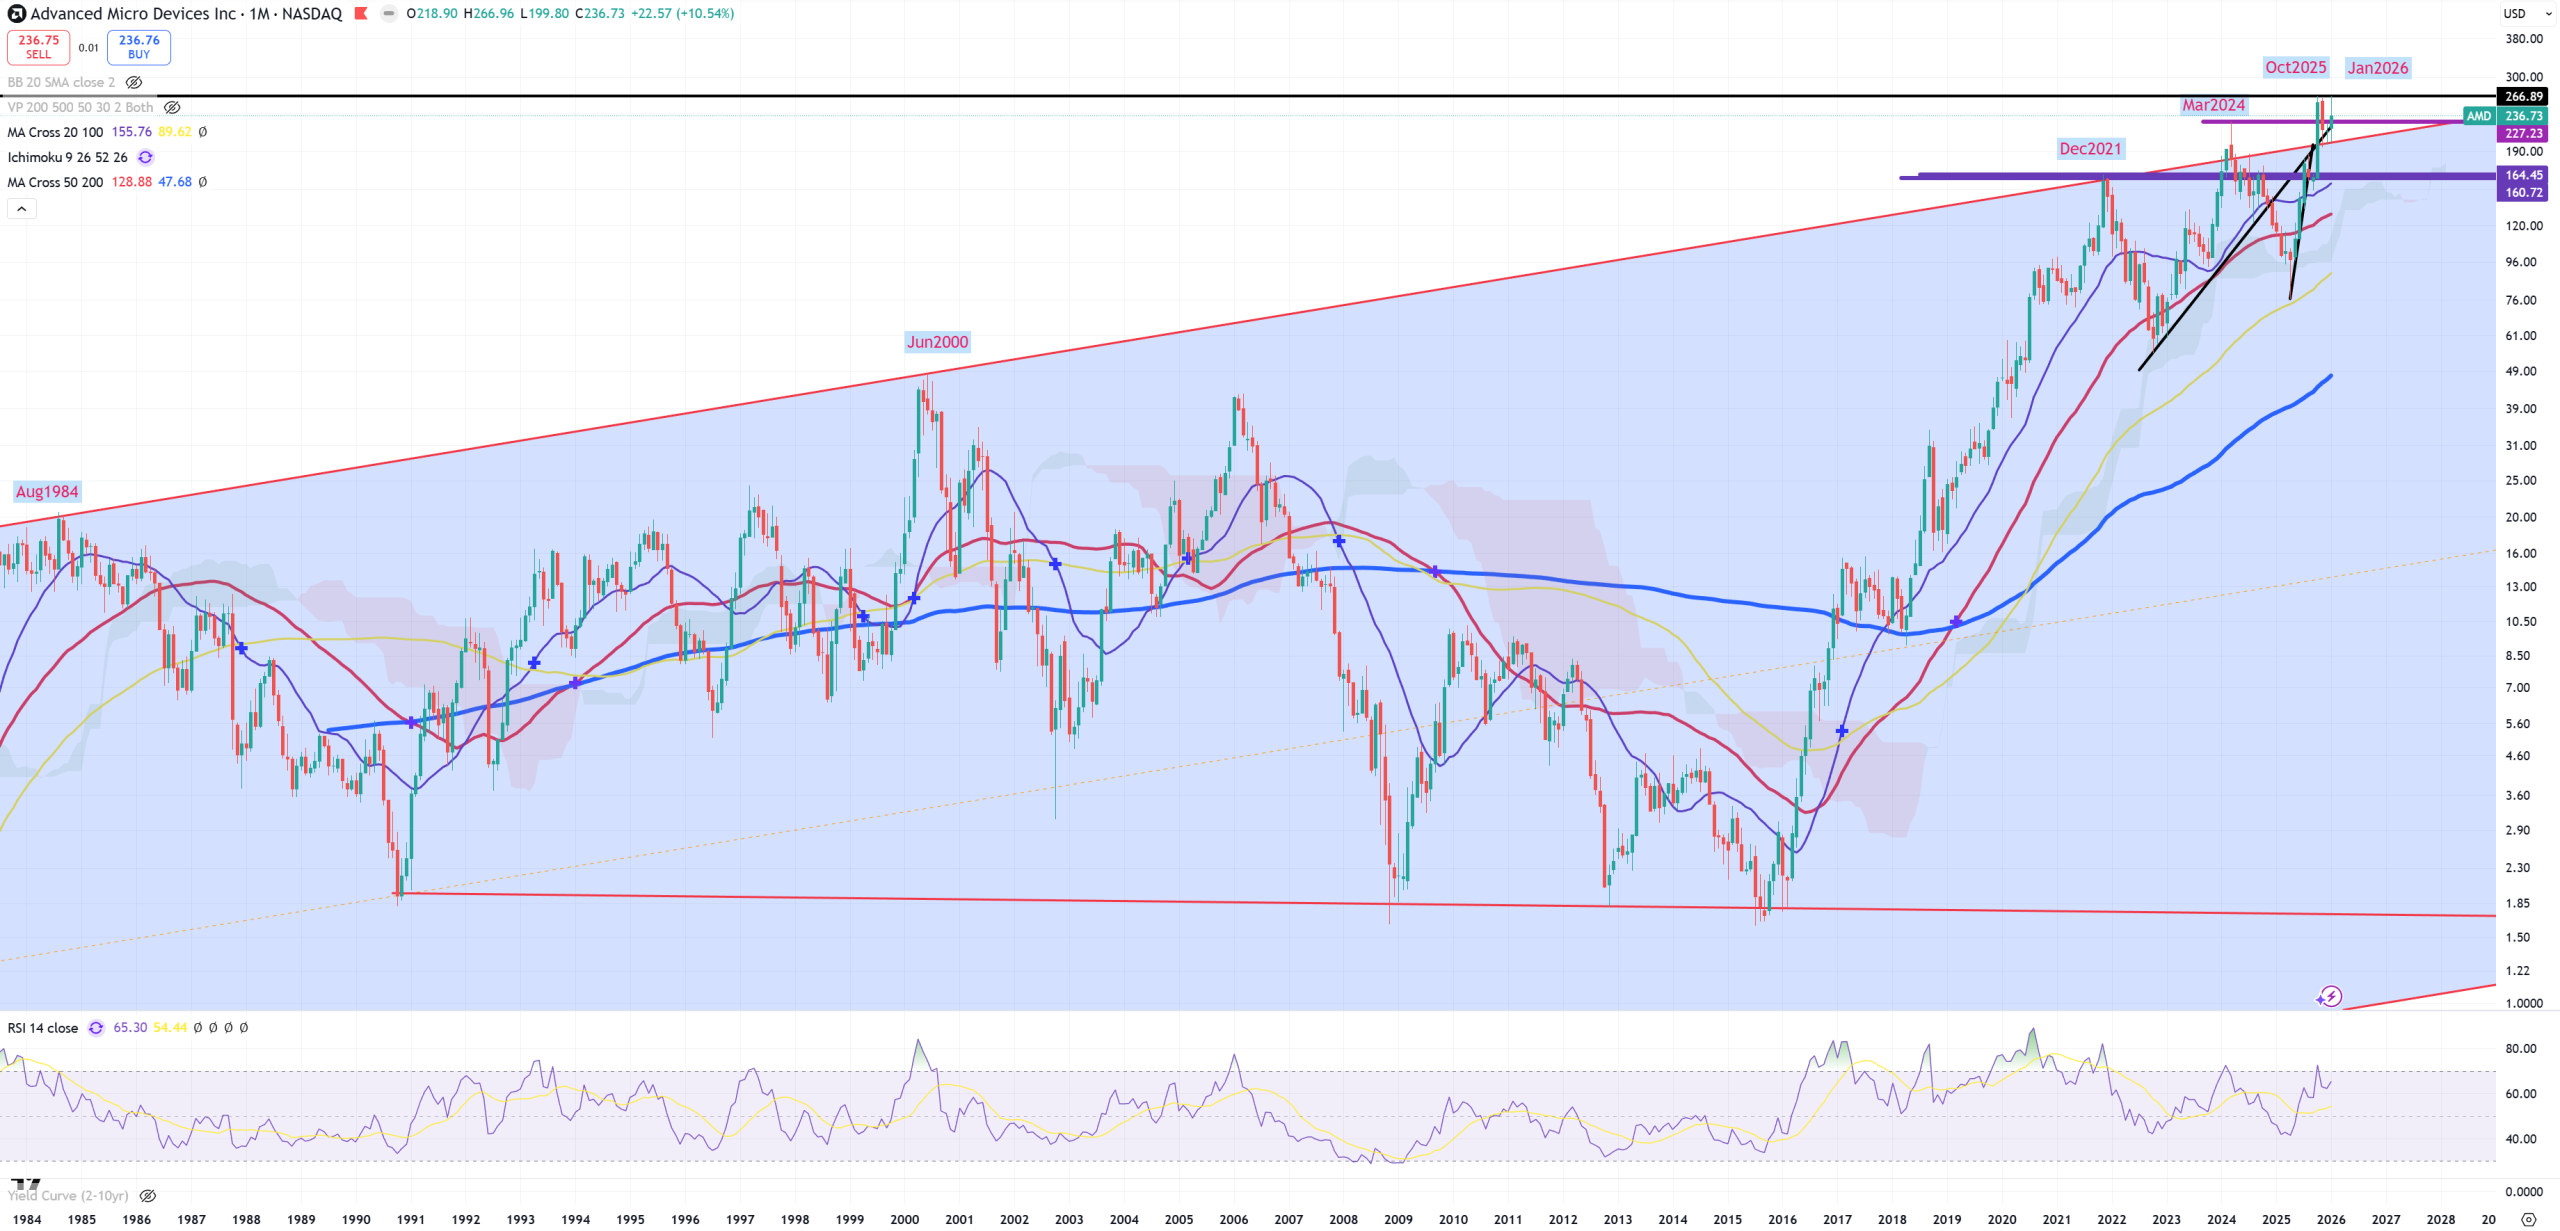
AMD – has great trend 1984-2000-2021-2024, but in 2025 it managed to jump a bit above. Now local possible DOUBLE-TOP around … October 2025 (yes that’s where US03MY crossed down (M)MA50) and now January 2026.
Commodities charts
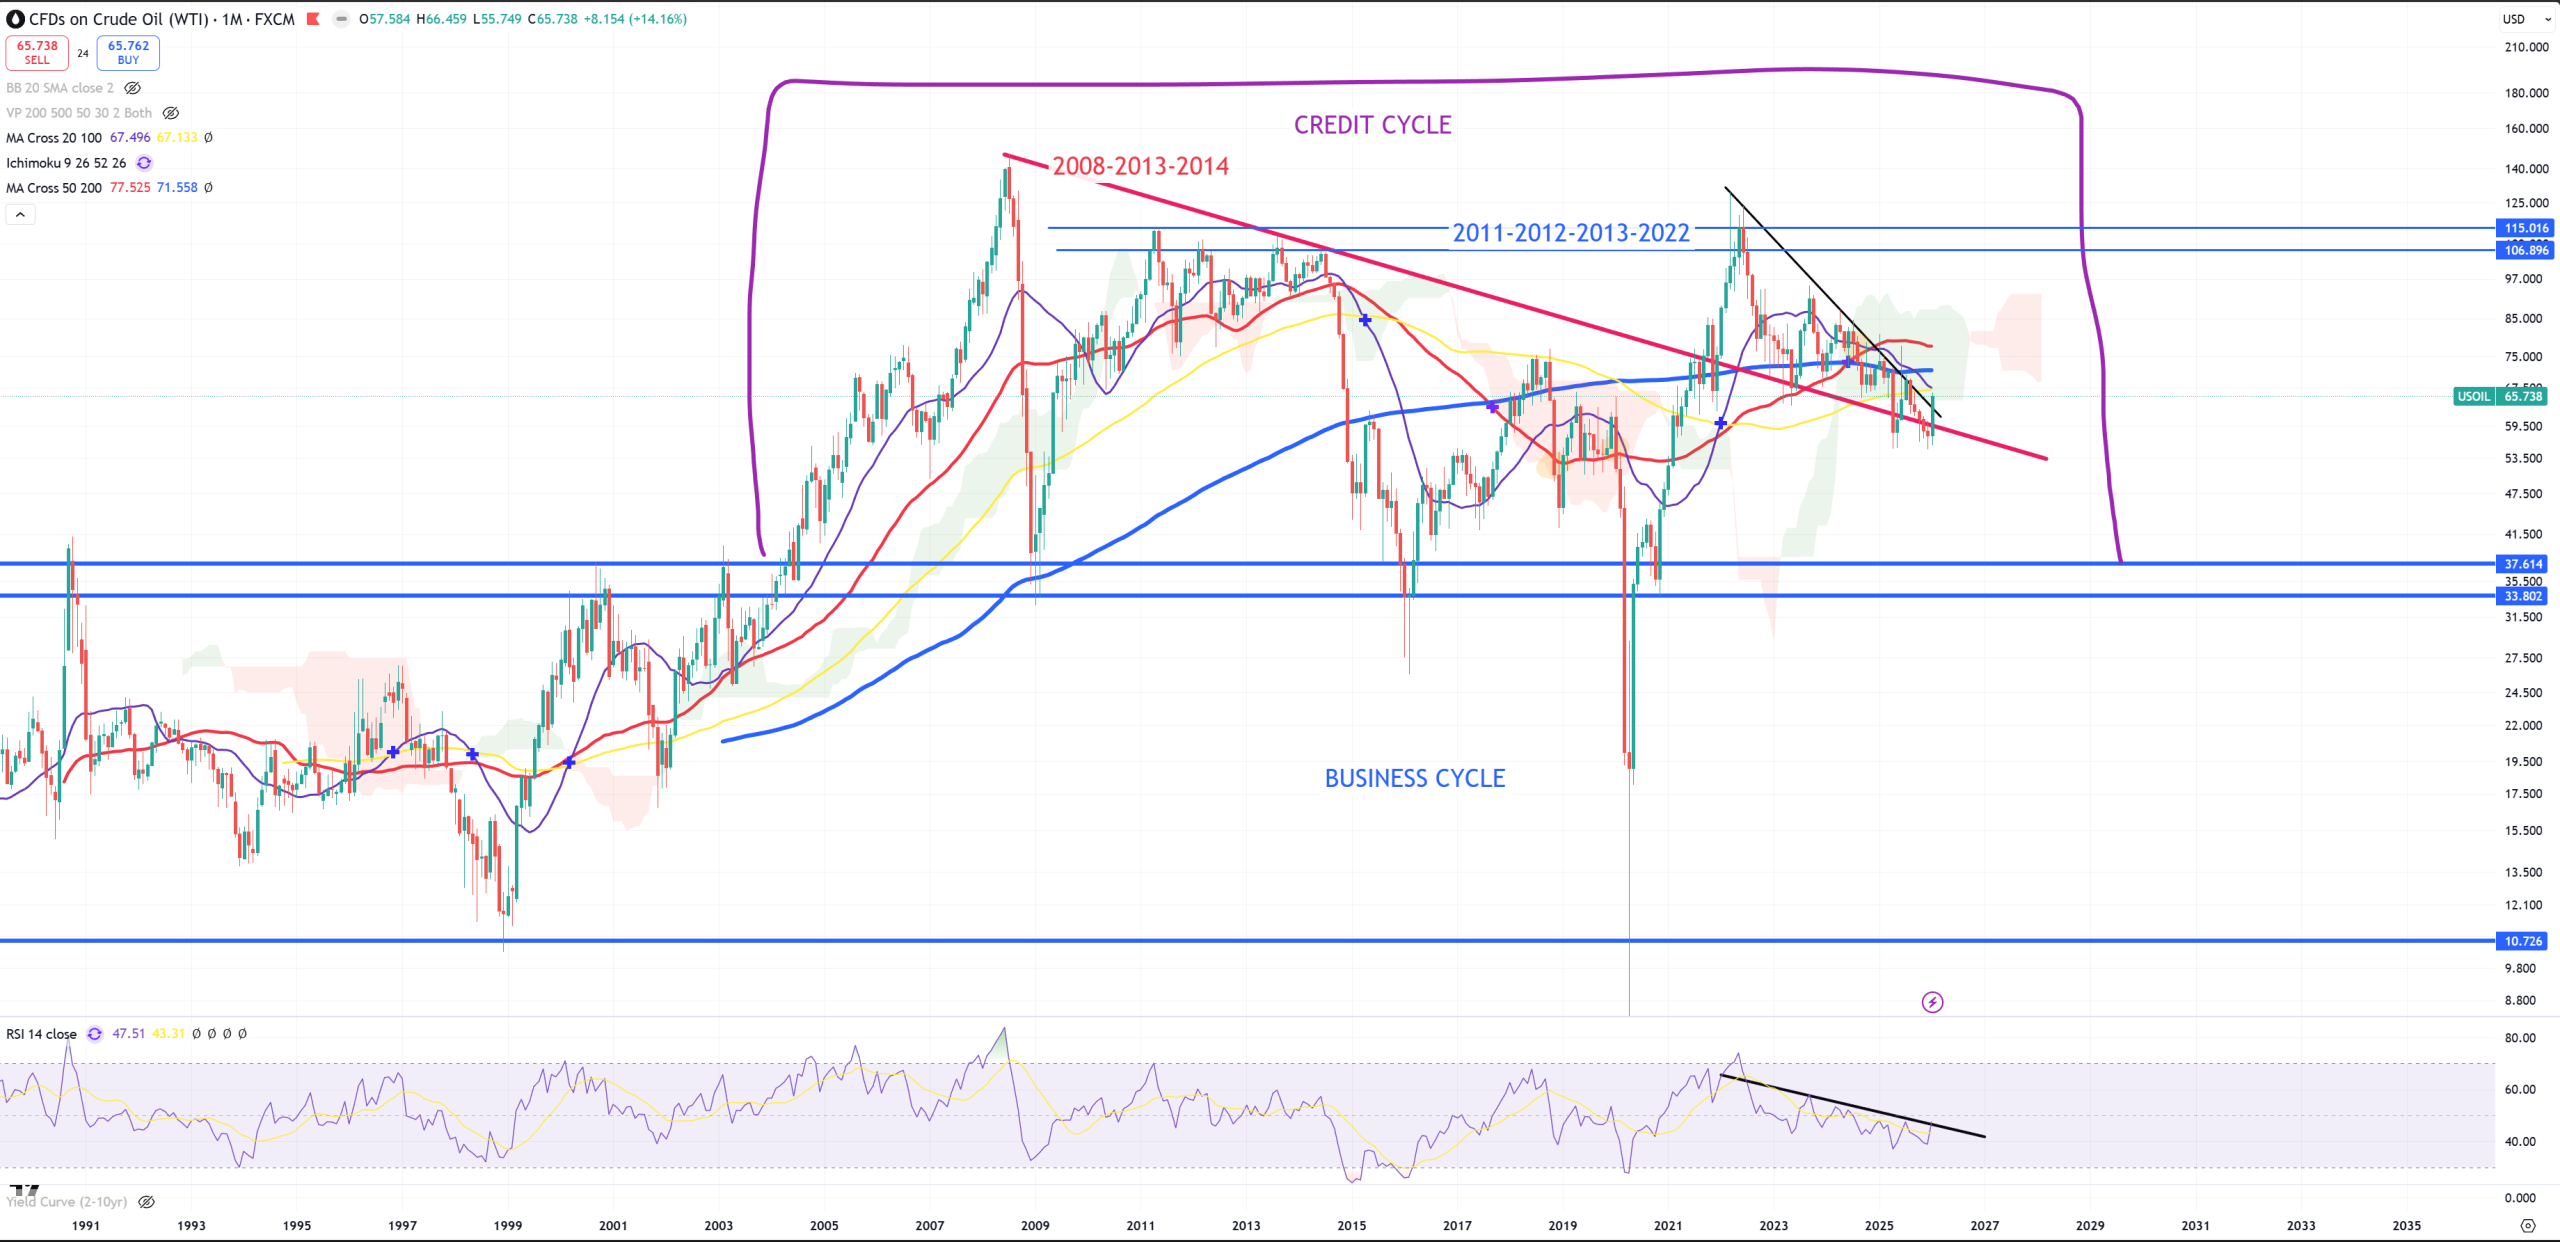
OIL – not easy, fight about this RED trend line will be massive
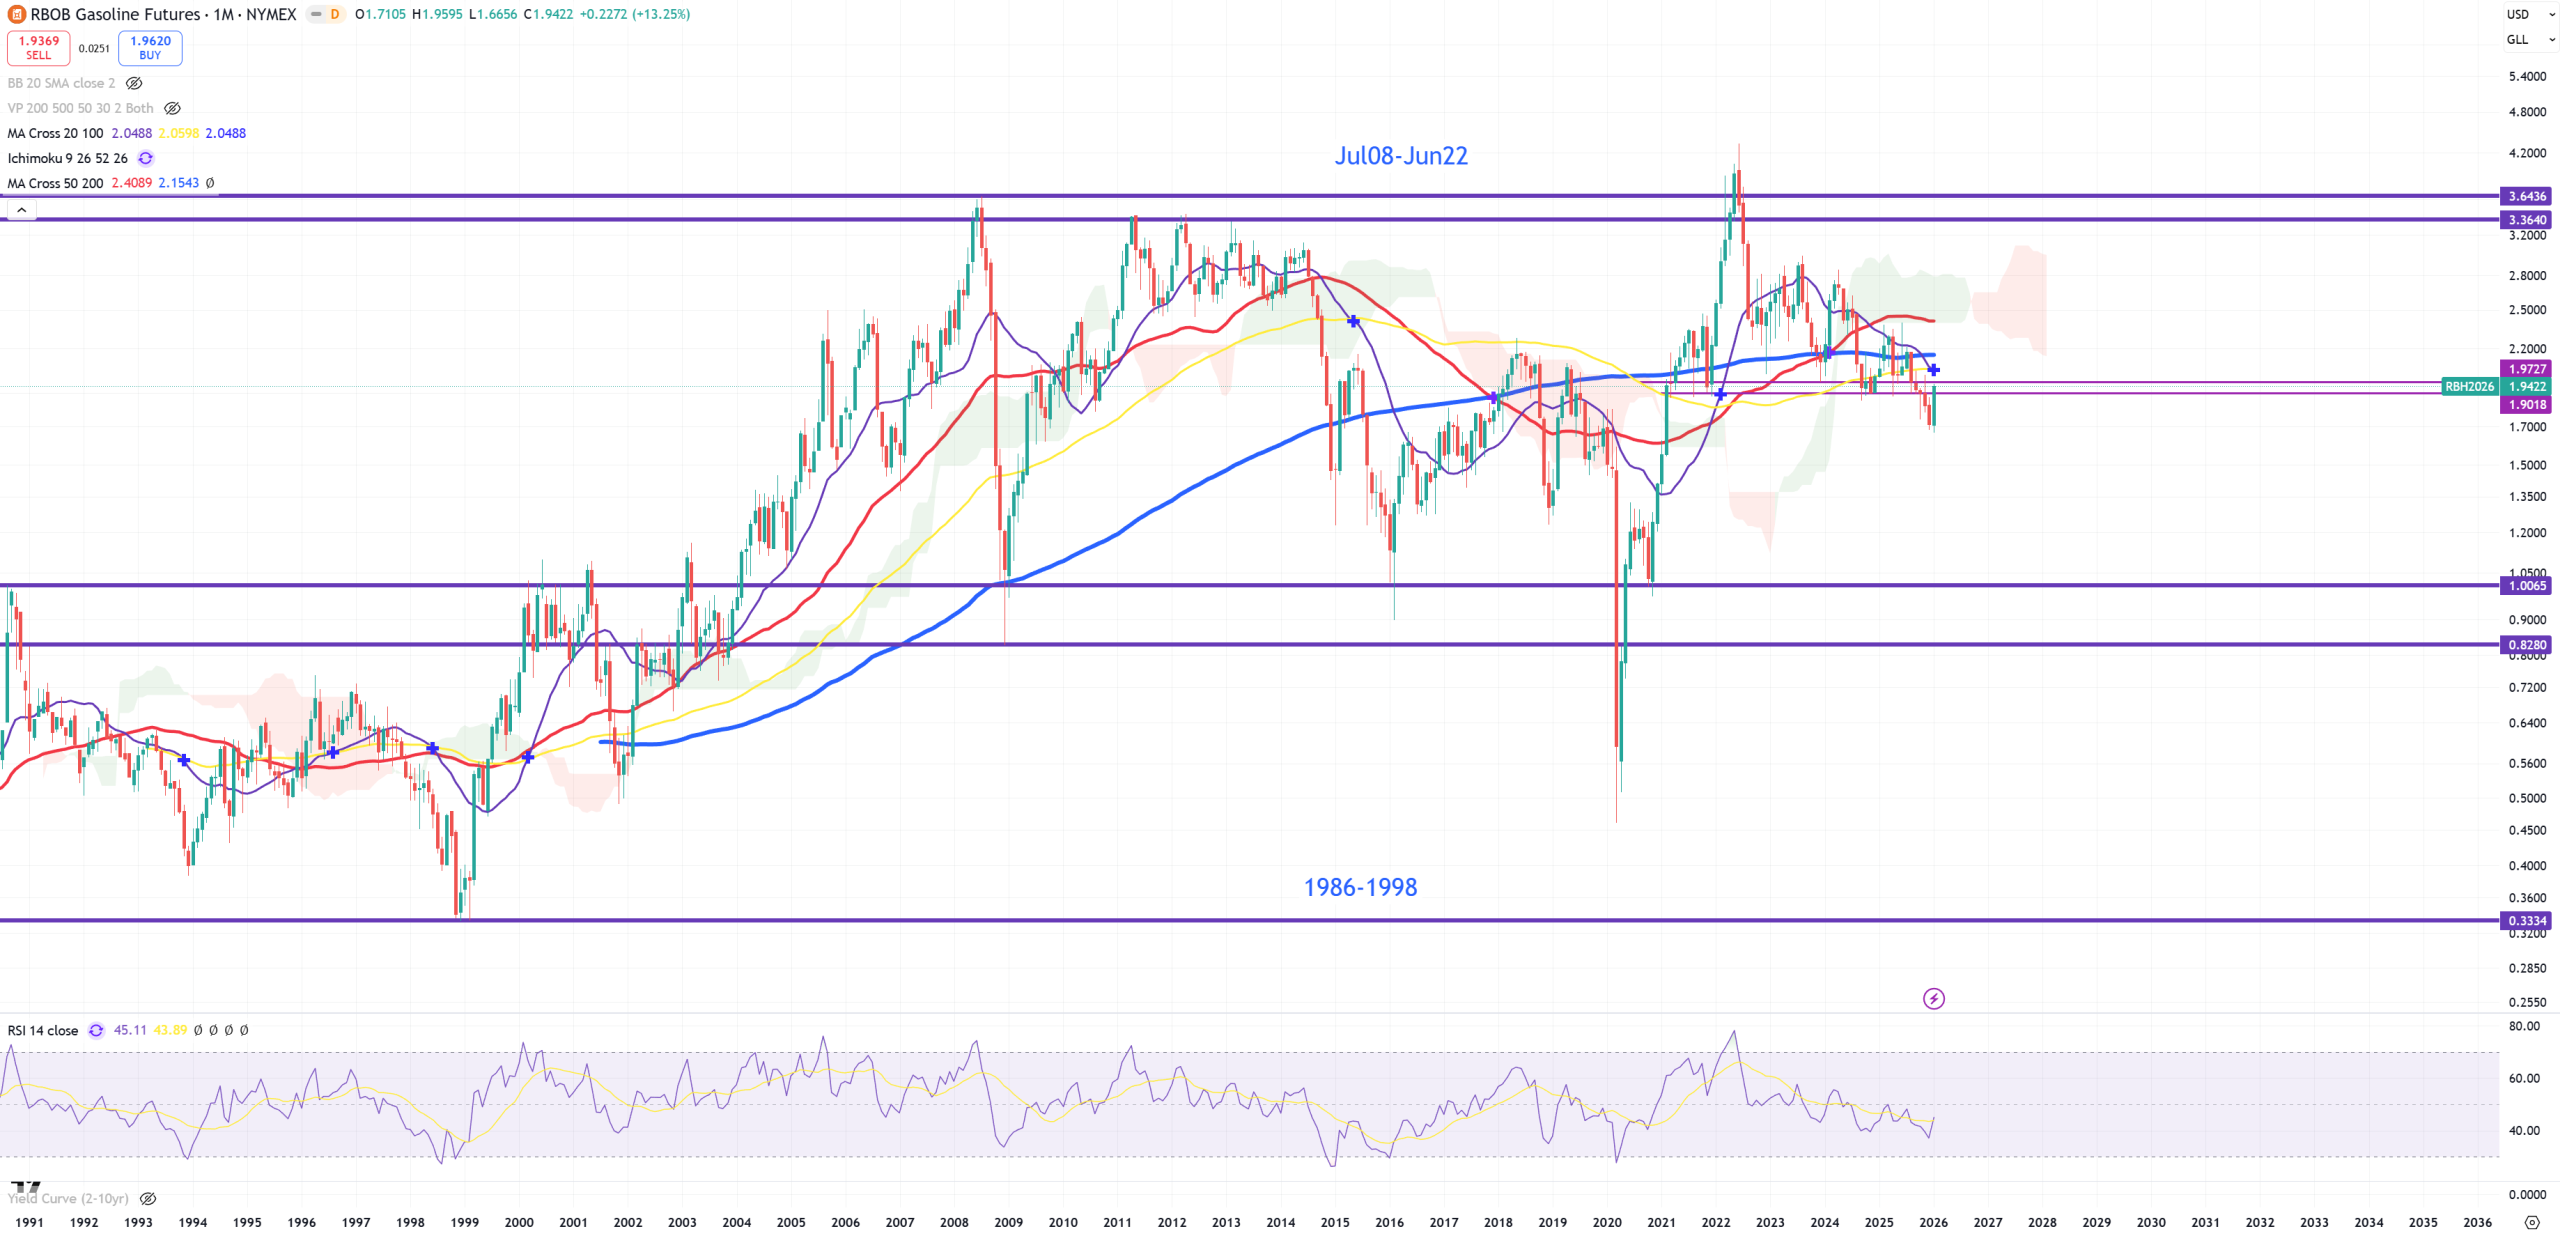
RBOB – Gasoline – retest to broken support, which is now resistance
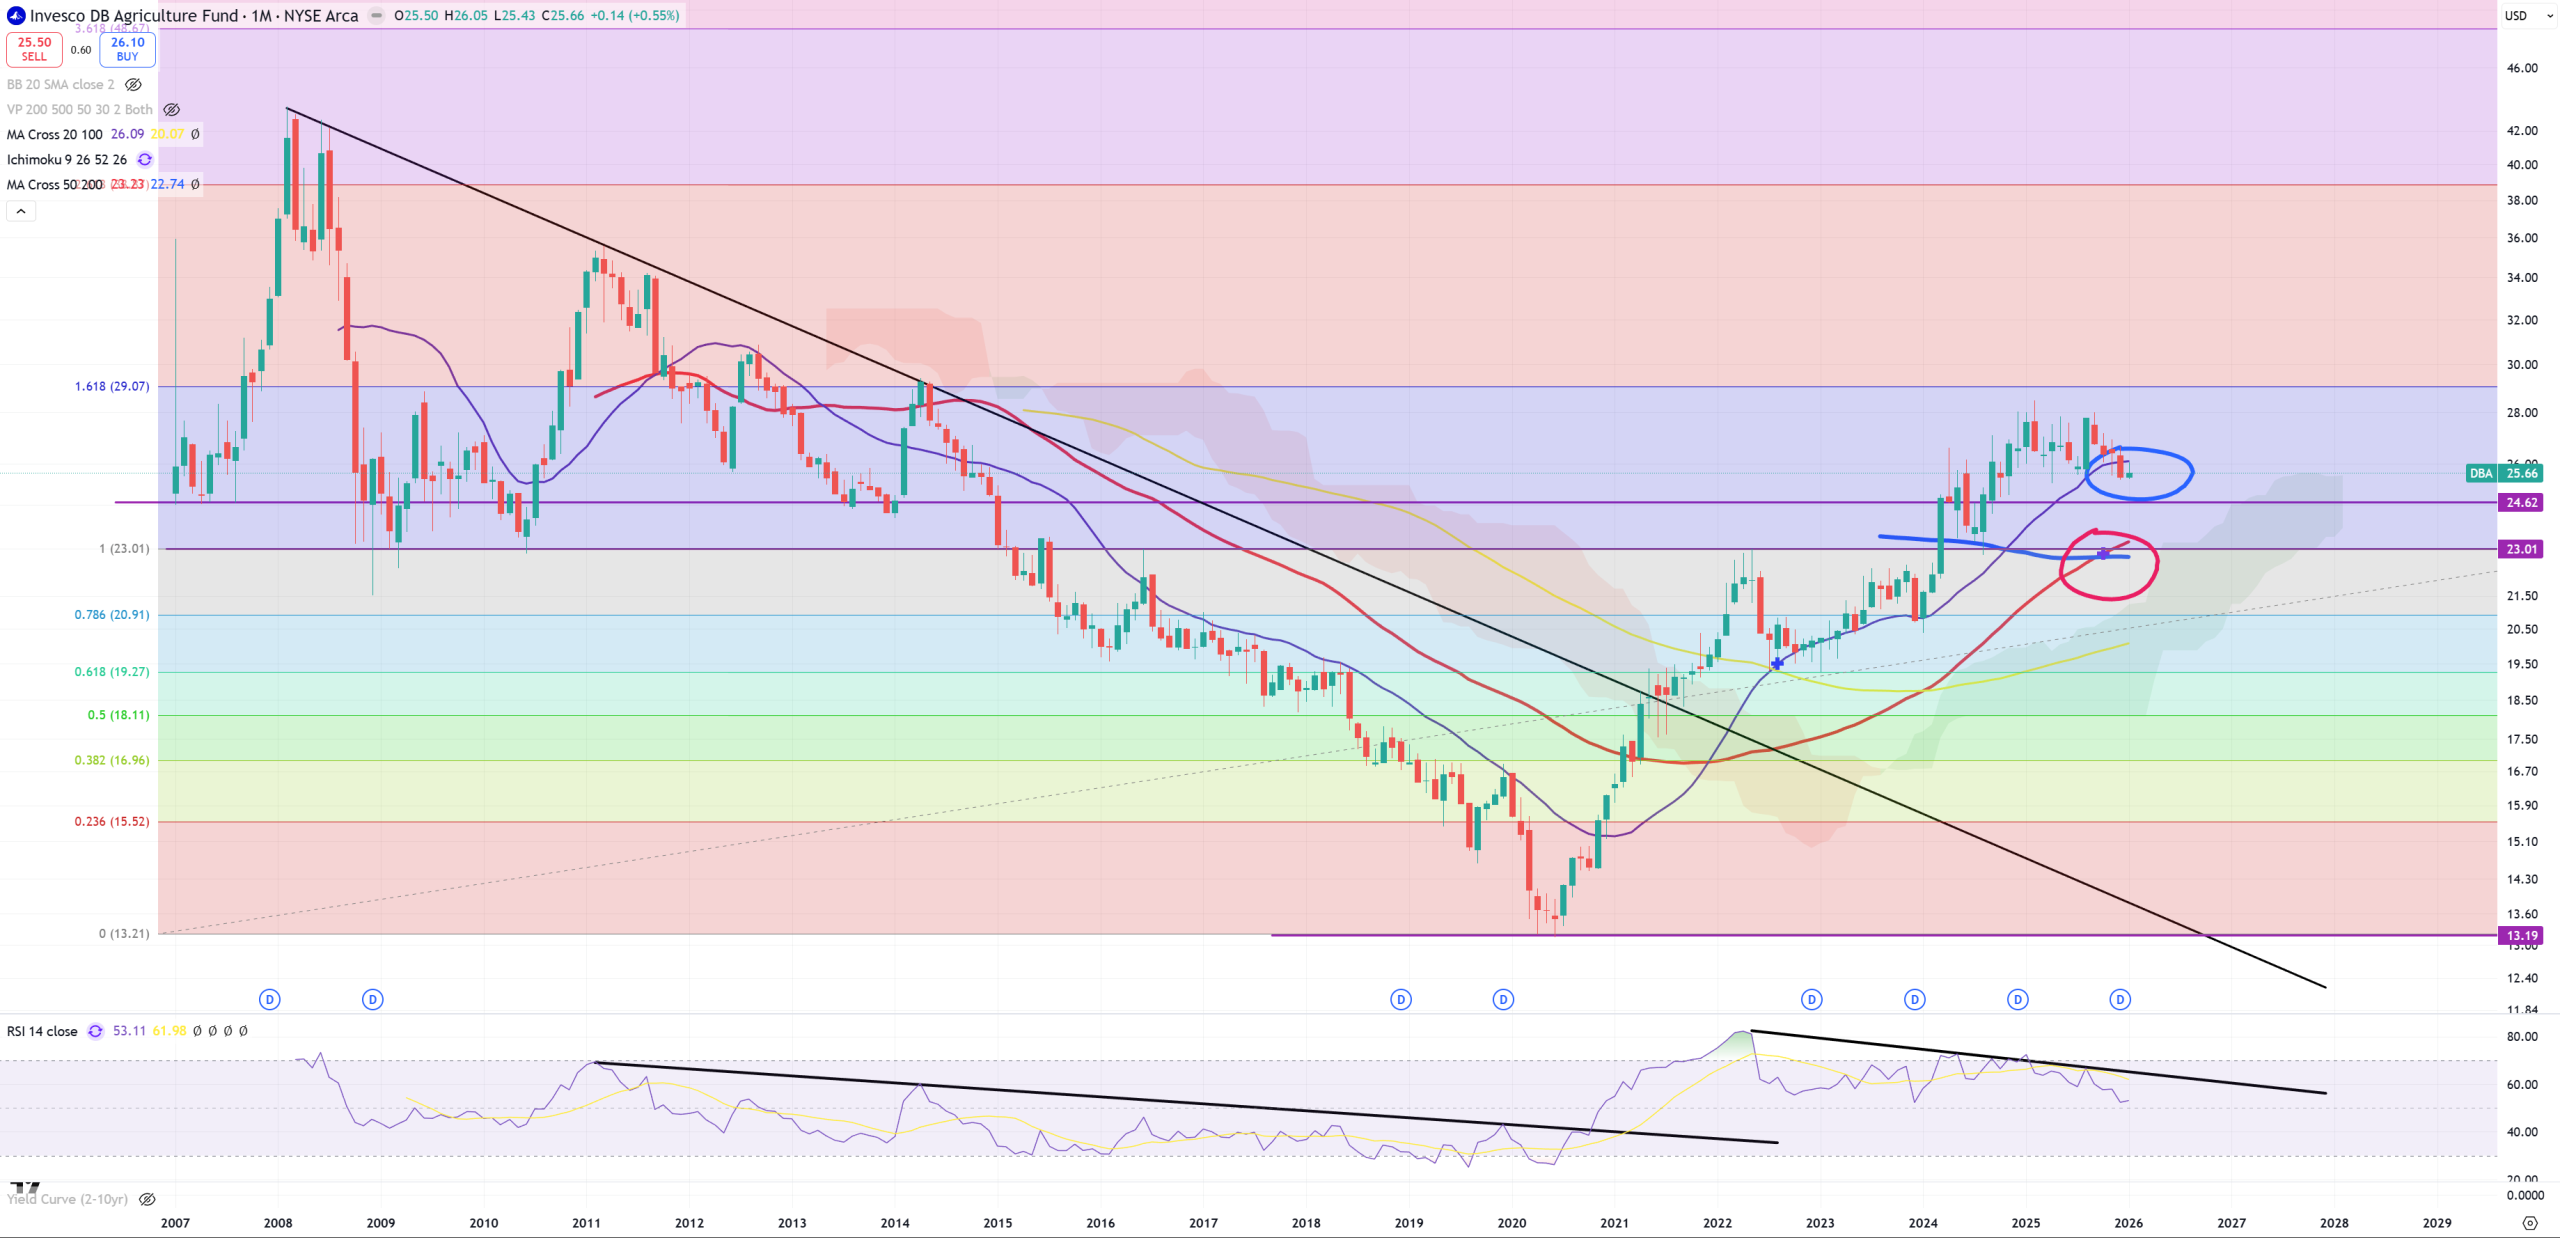
DBA – Agriculture and (M)MA20 broken – if this trend is flipping and food inflation is about to crash – bad things will happen
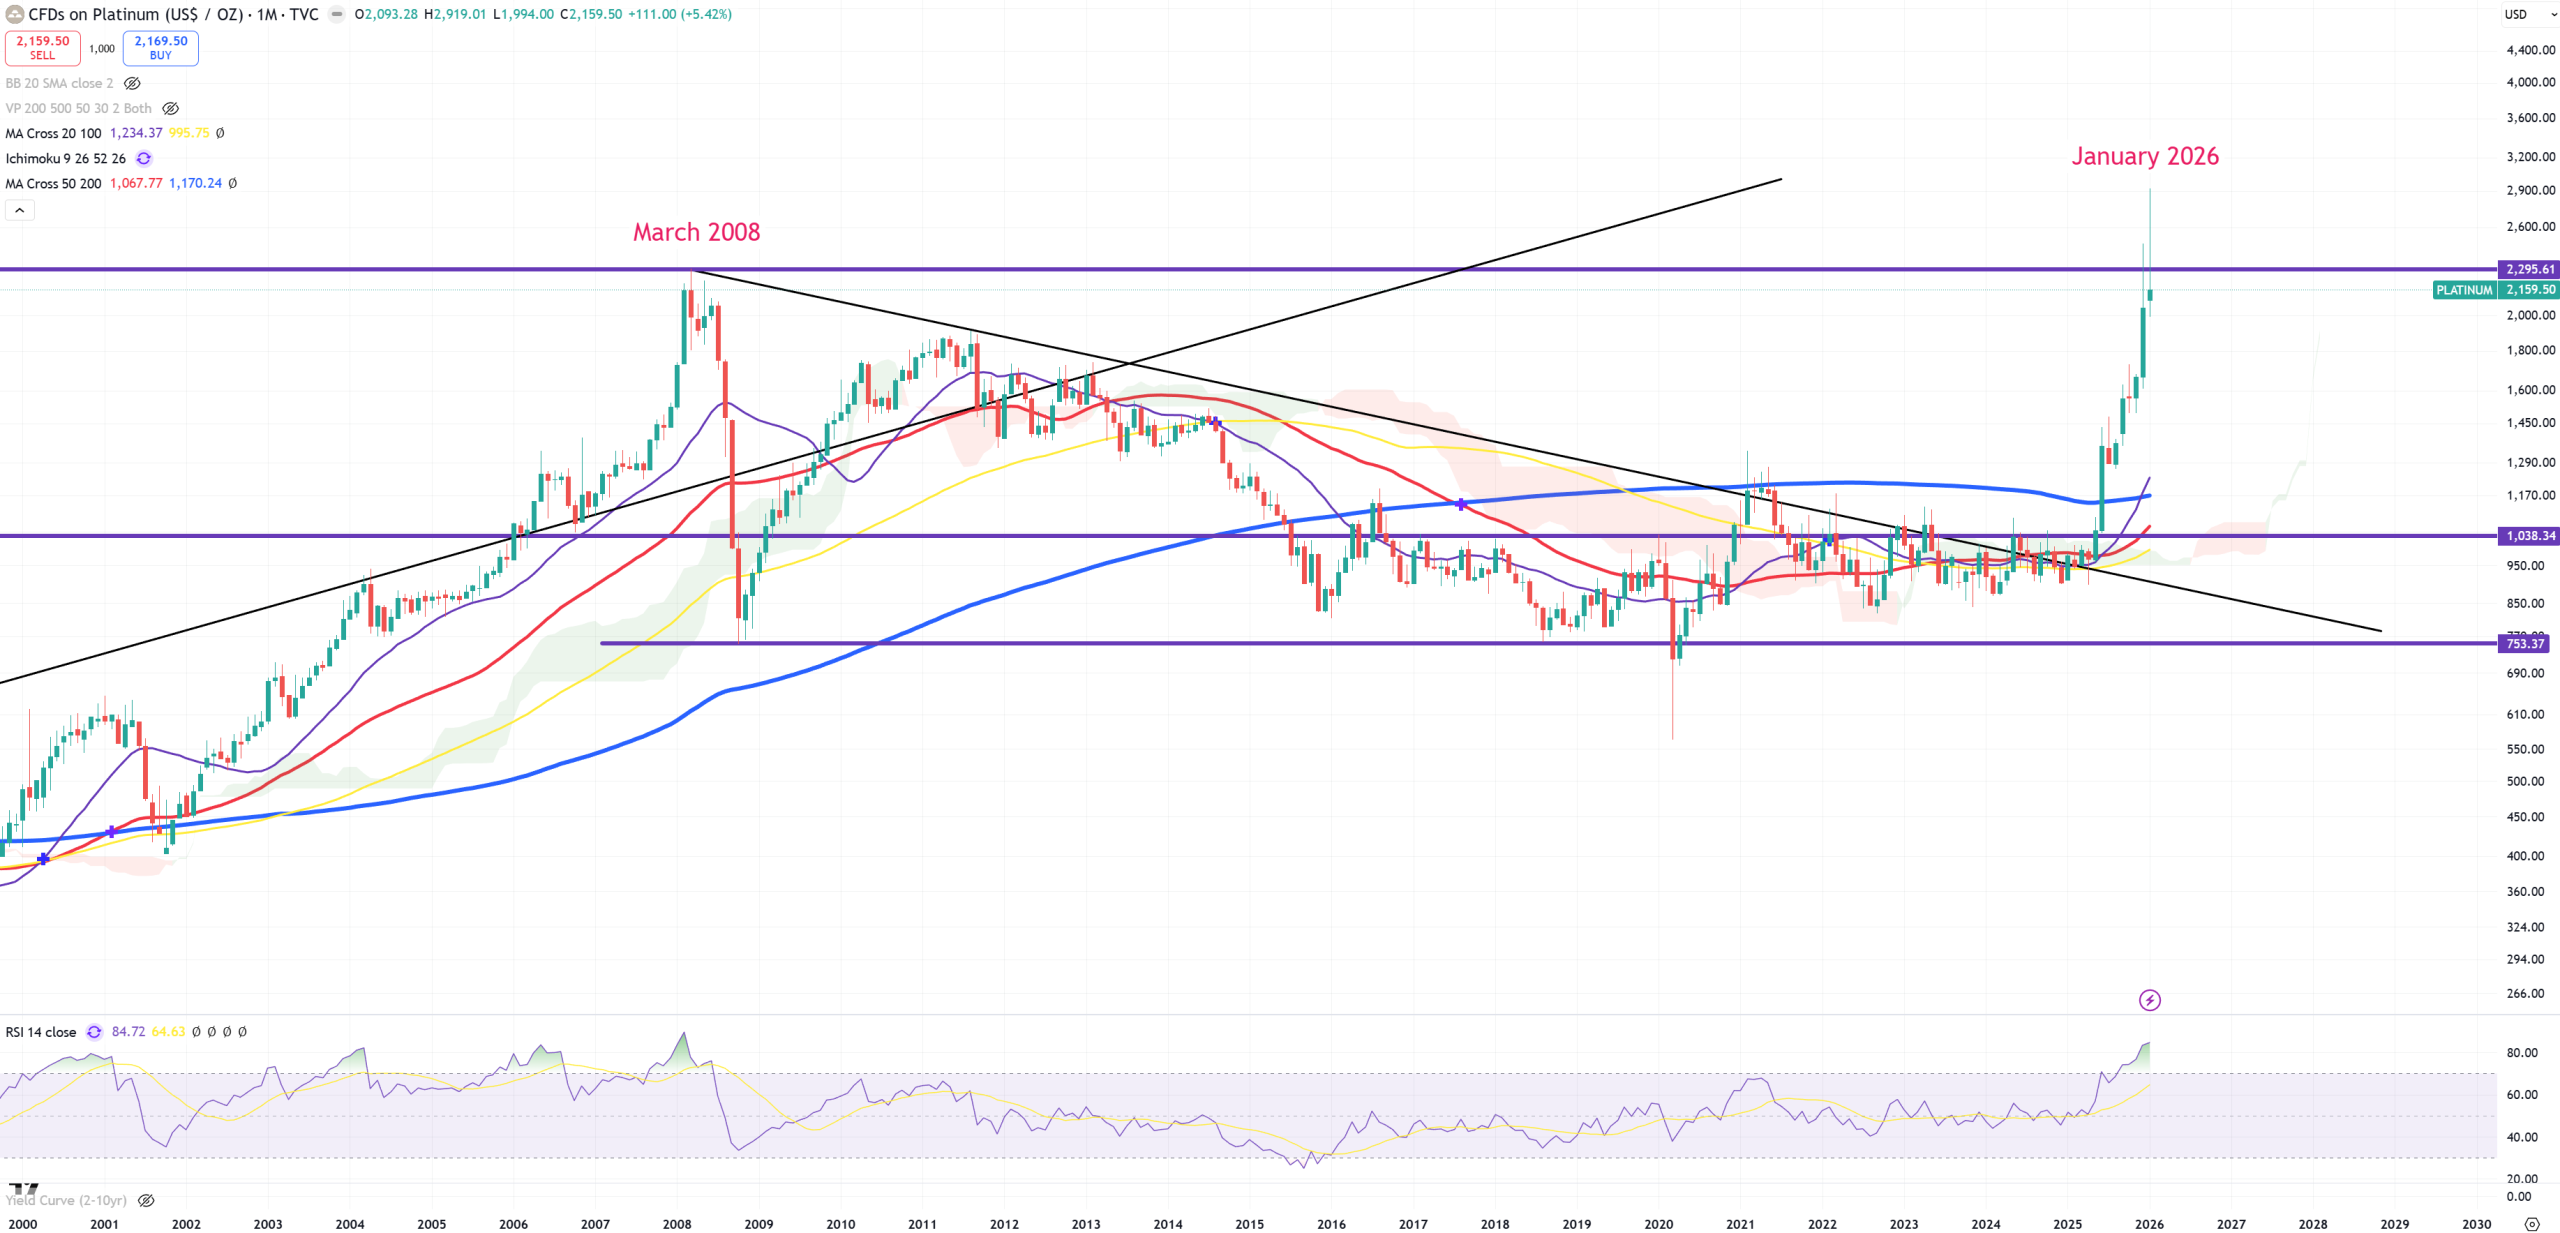
PLATINIUM – double dop with March 2008 level so far
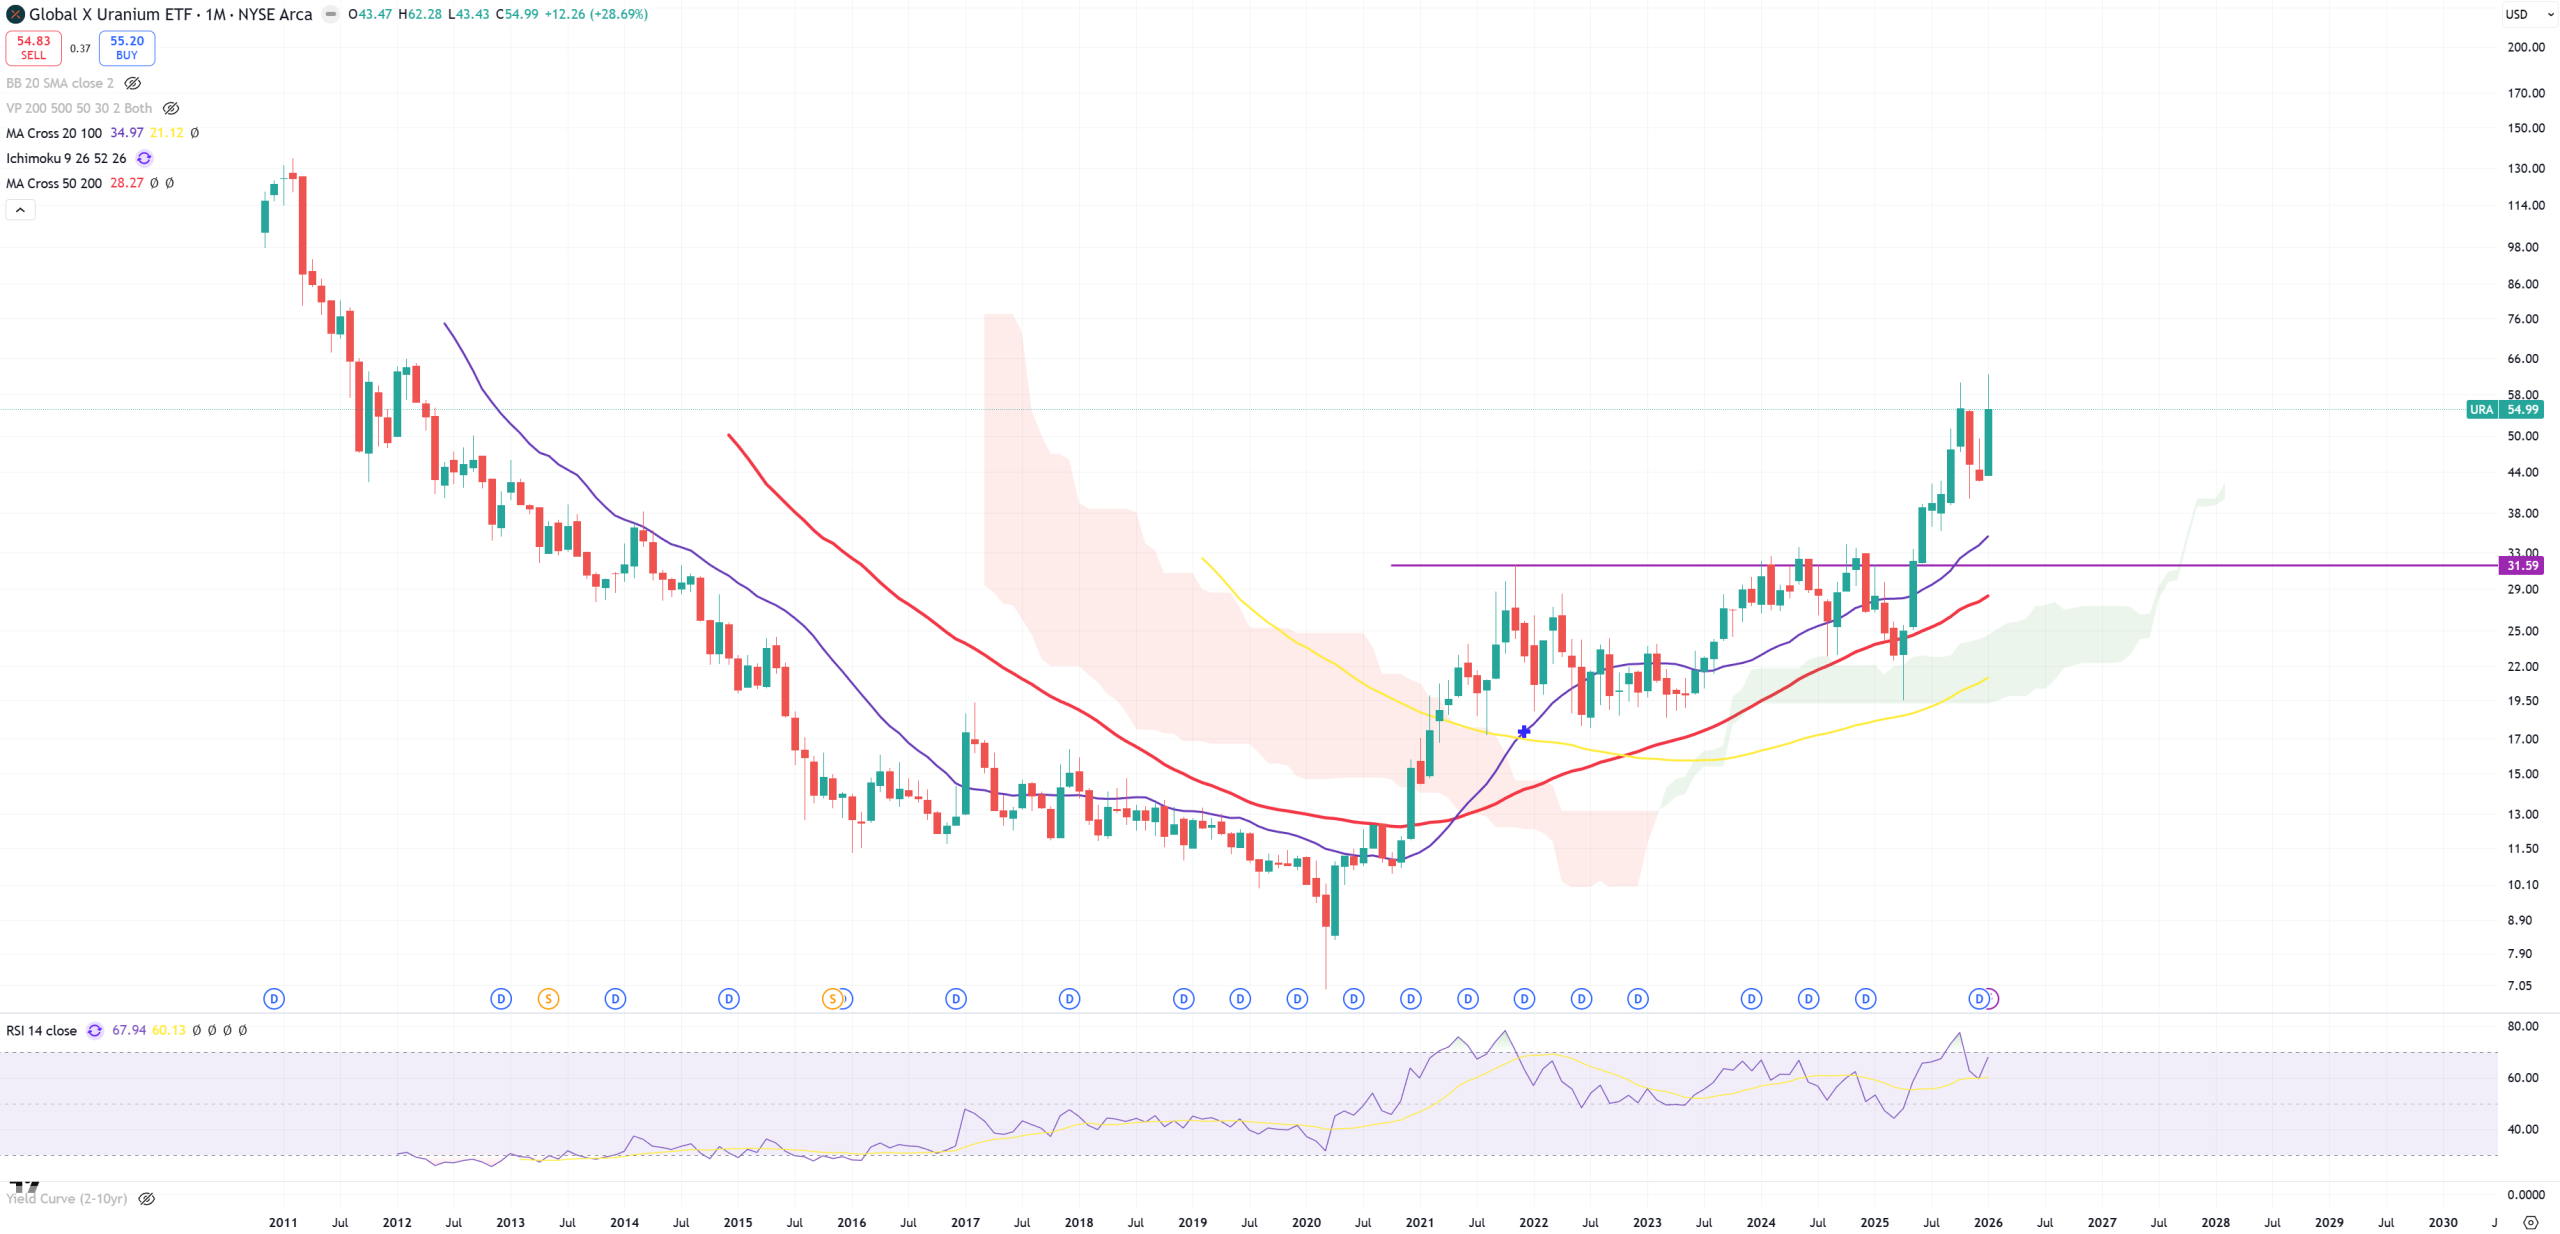
URA – Many people keep asking about that. Hard to say anything here. It can go to 130 or it can retest 30.
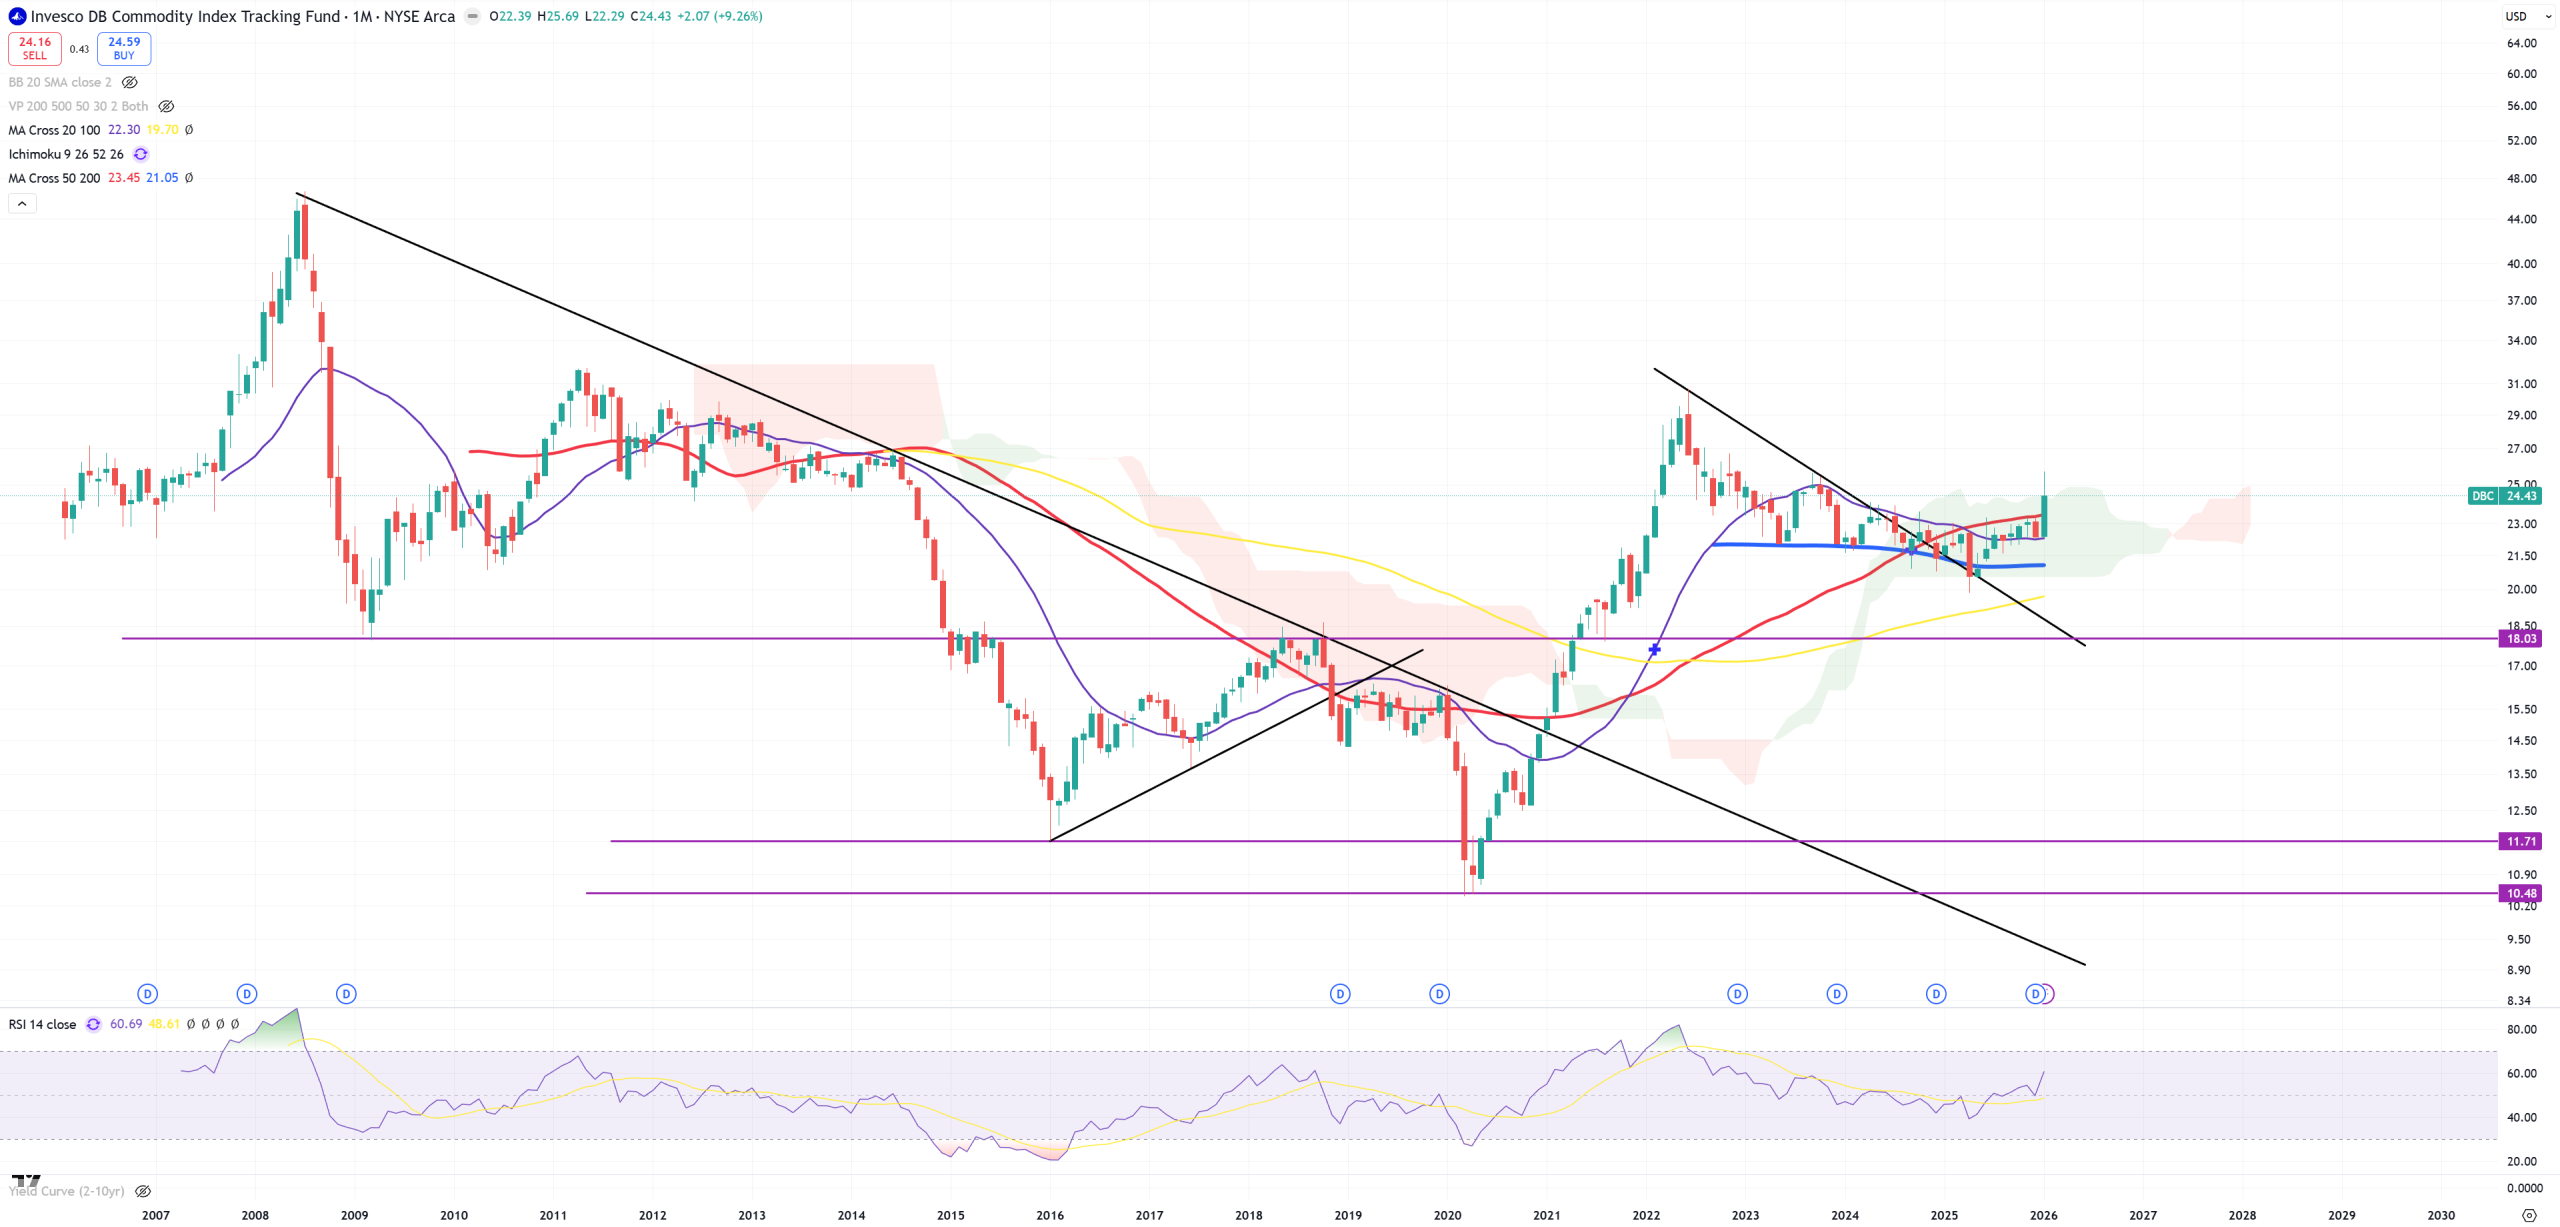
DBC – Commodity Index Trucking Fund – I’ll tell you why I don’t like this ETF. Because it contains GOLD & SILVER and GOLD is even #1 commodity in % points here. This can misinterpret a lot commodity bulls.
Other nations / currencies
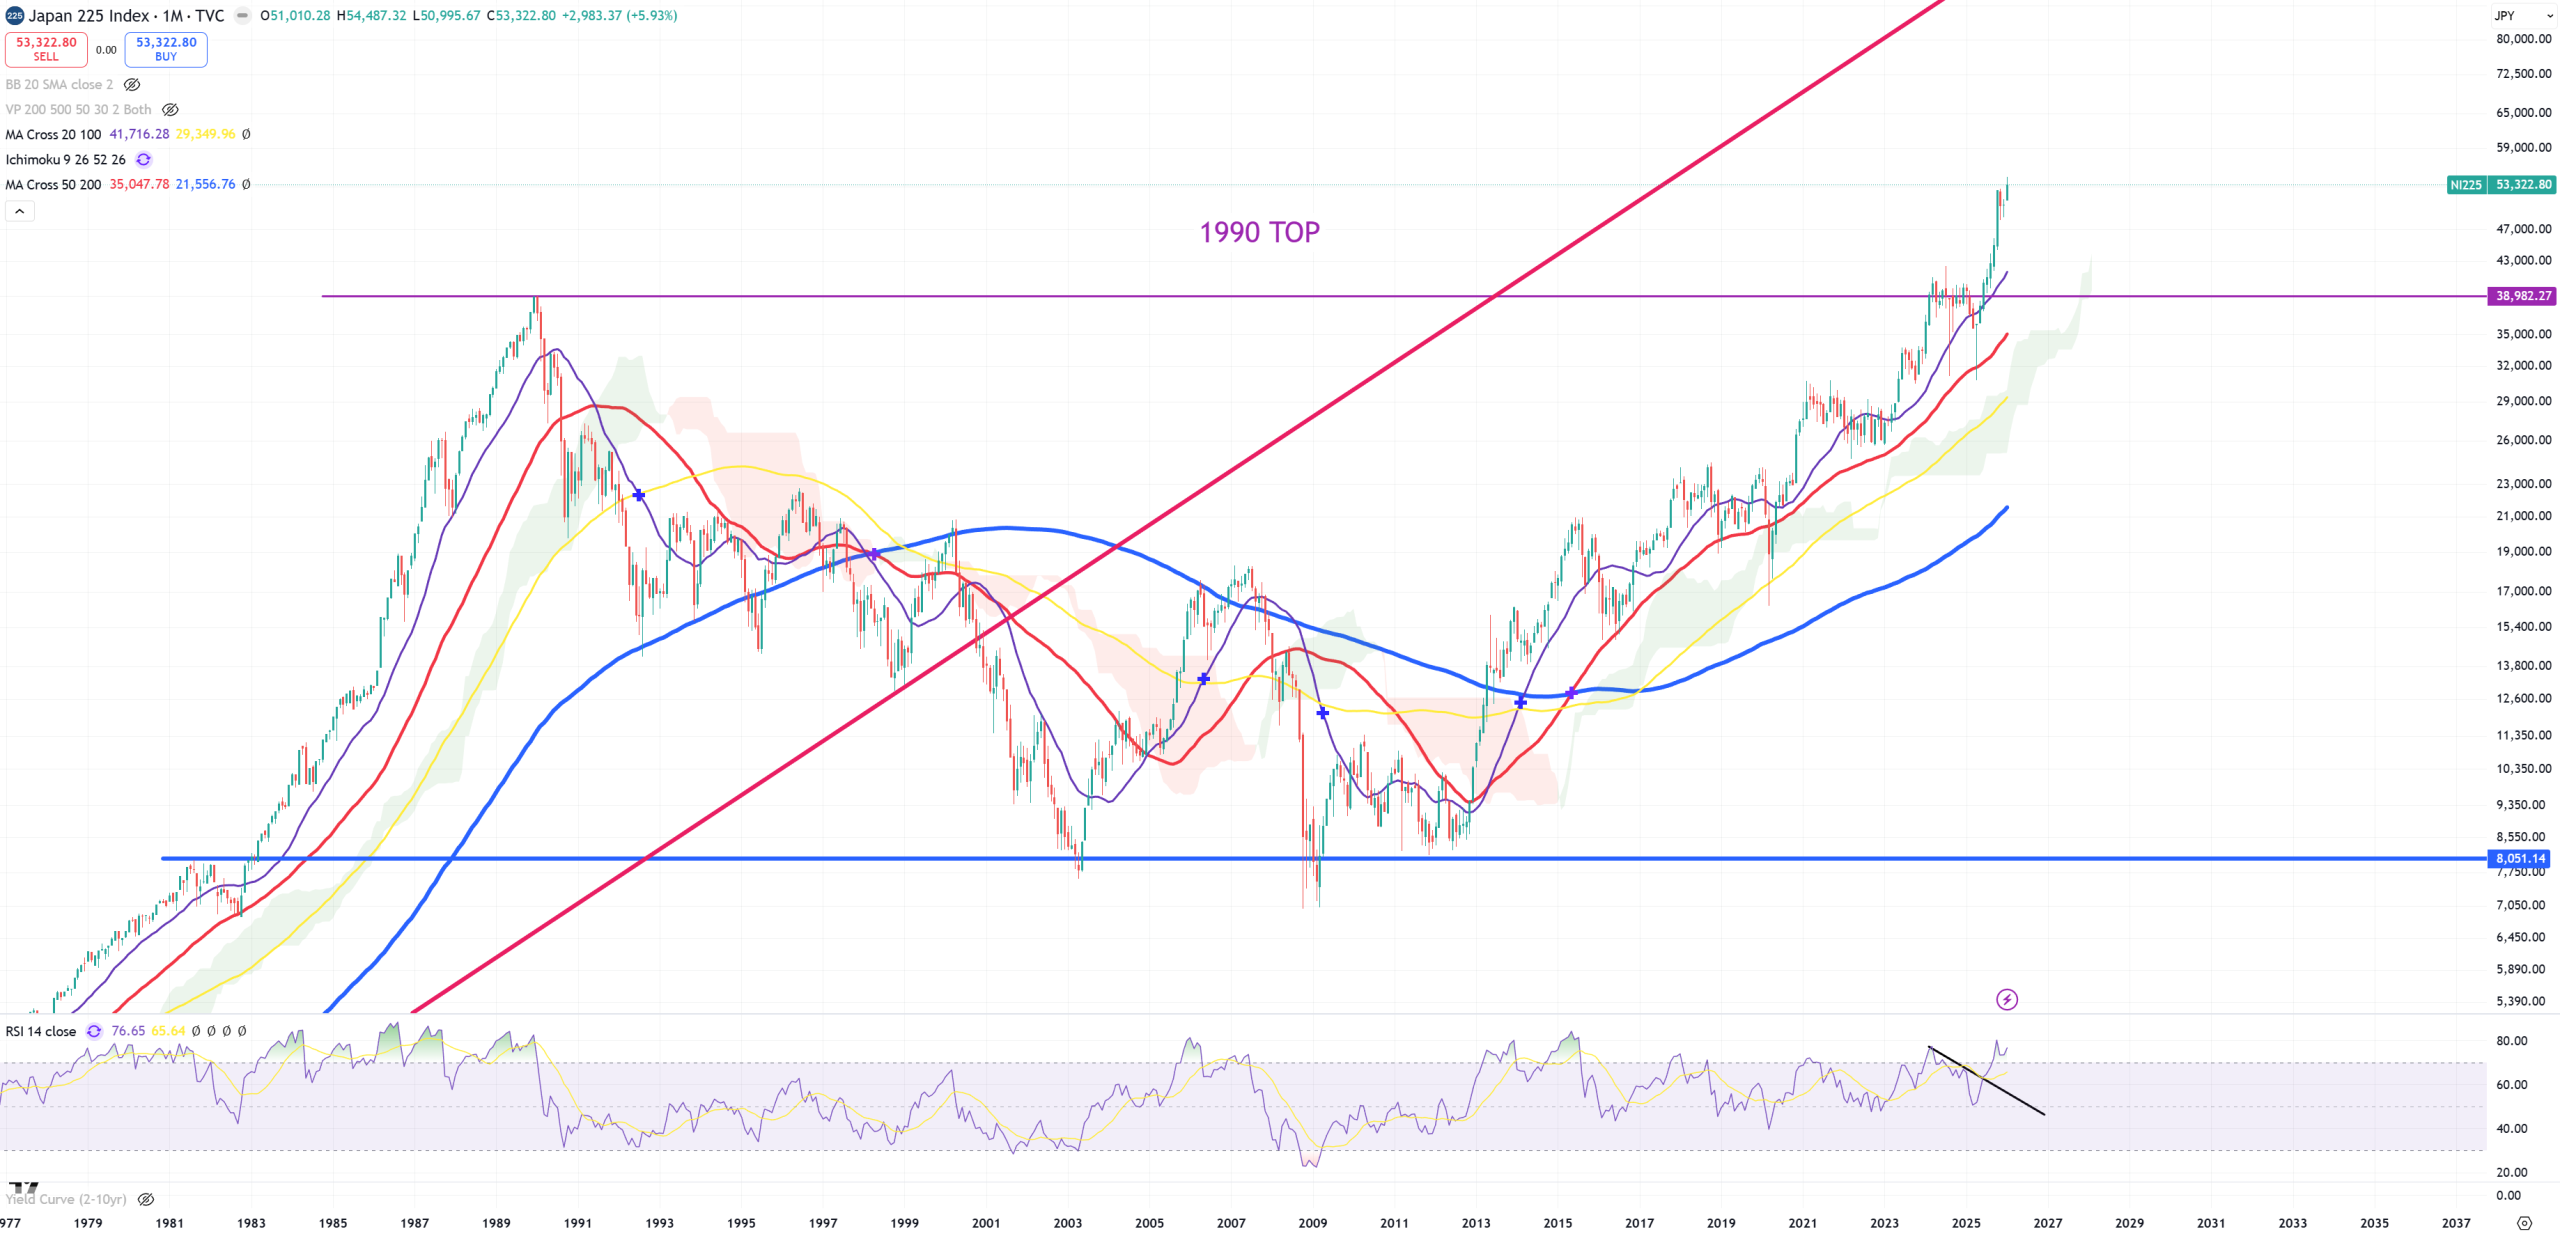
NIKKEI225 – yes I’m surprised it crossed this 1990 level, but once 10y/3m finally uninverts I bet it’s a trap just like Platinium?
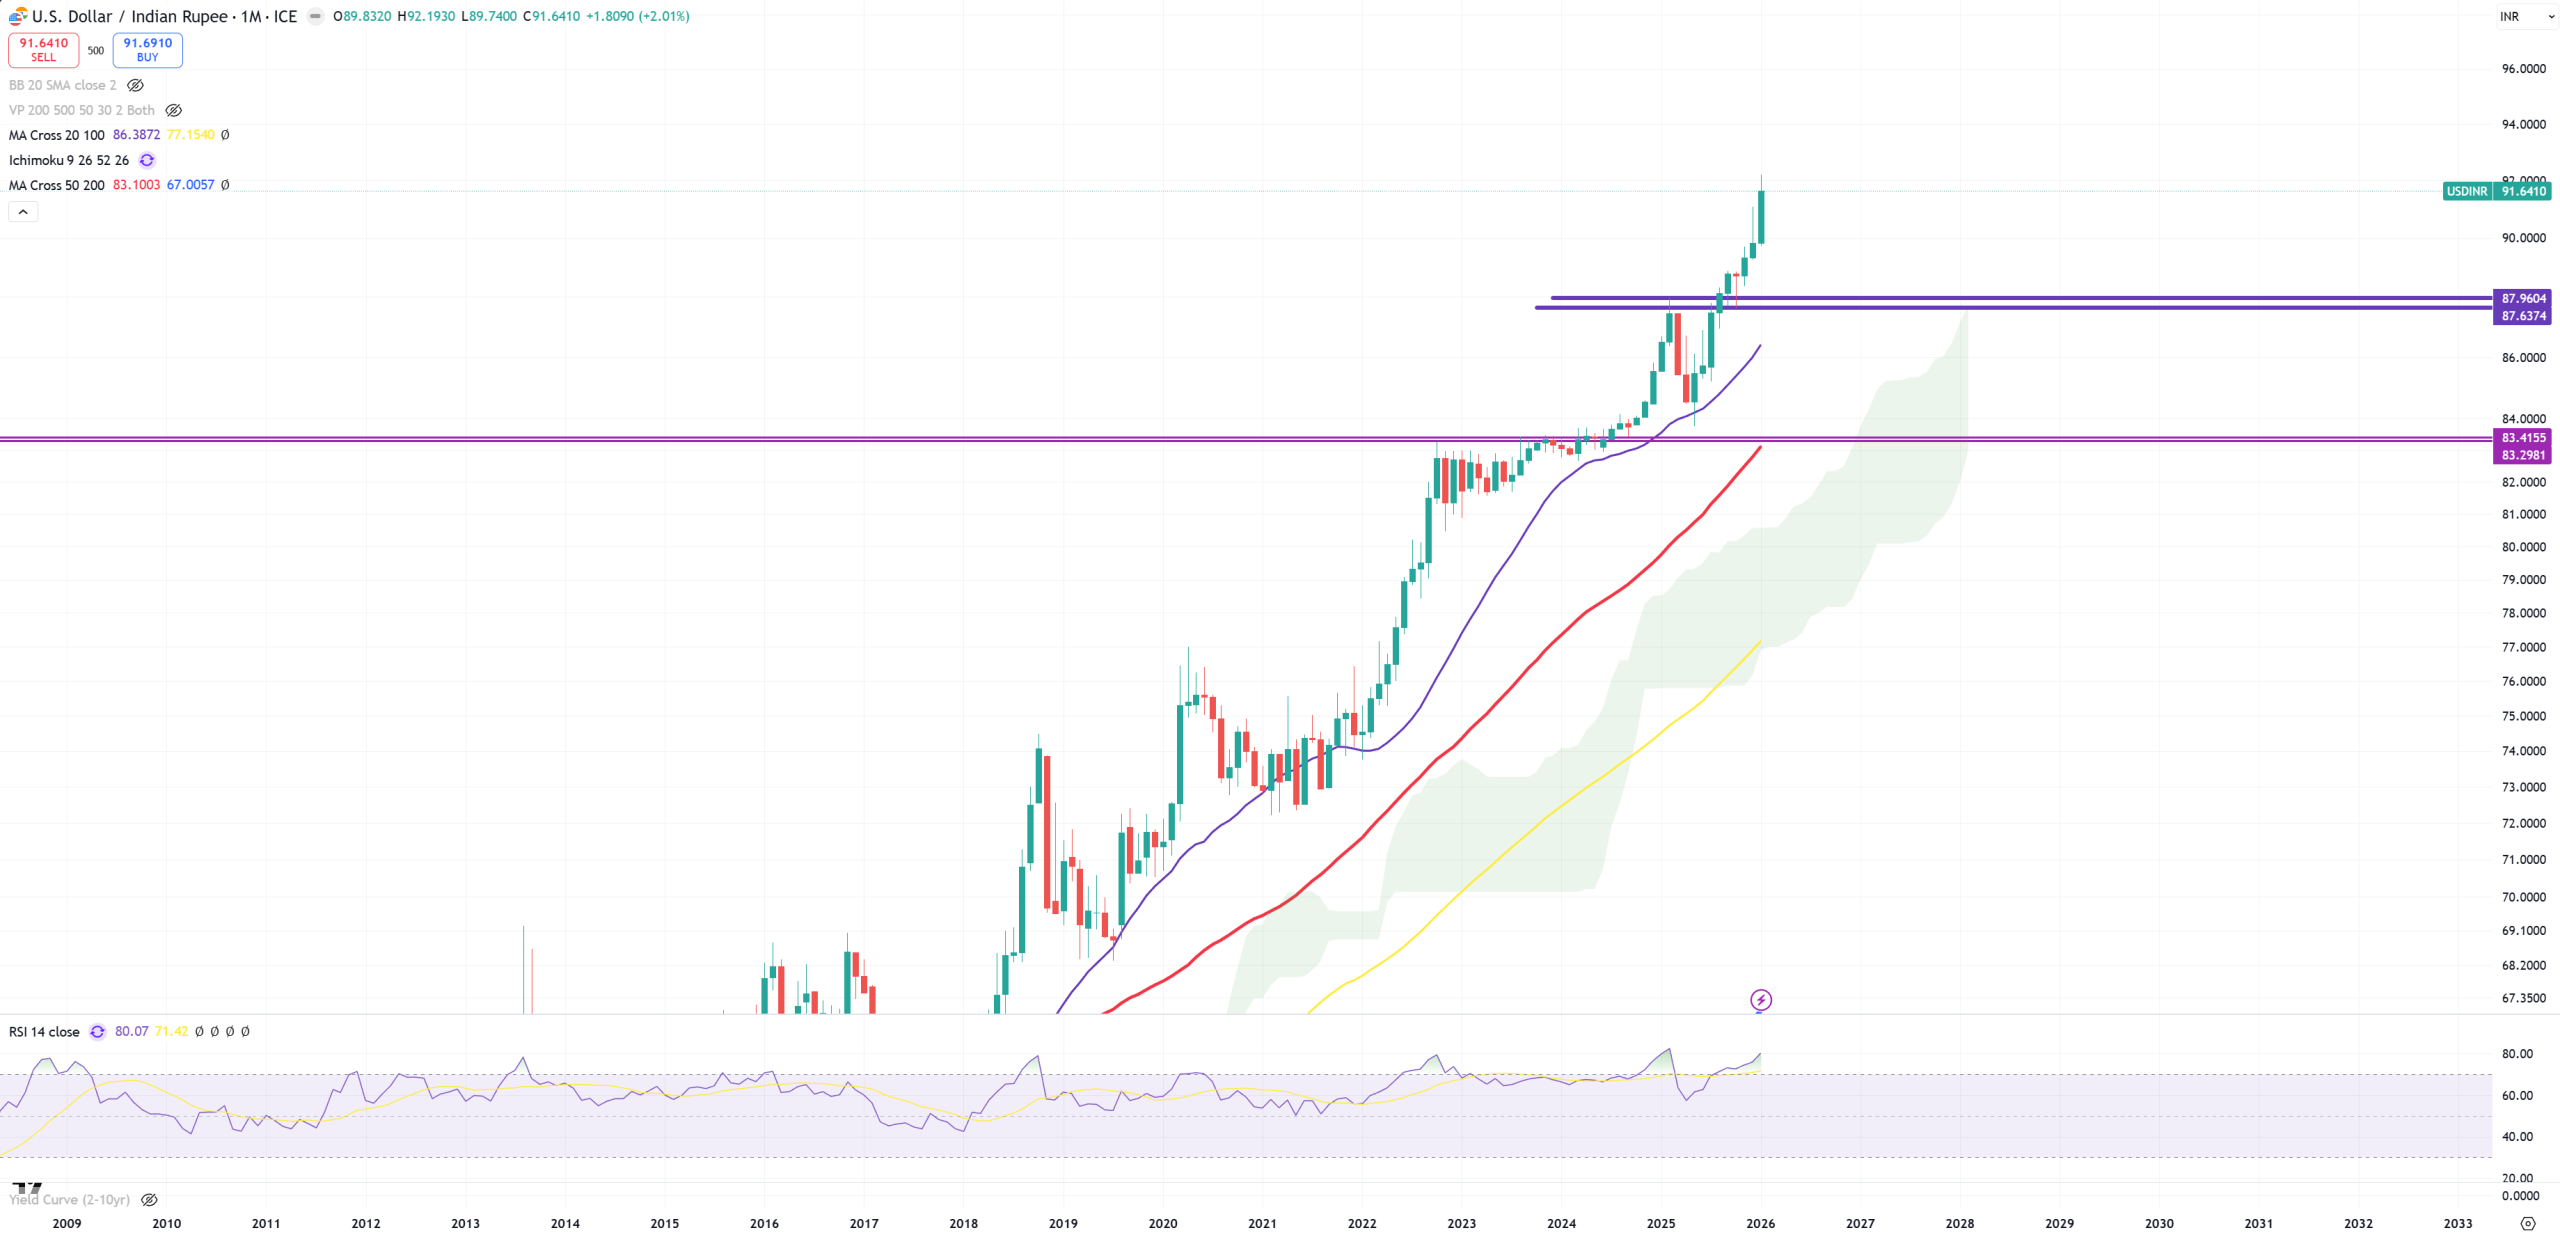
USDINR – Indian Rupee is going bust
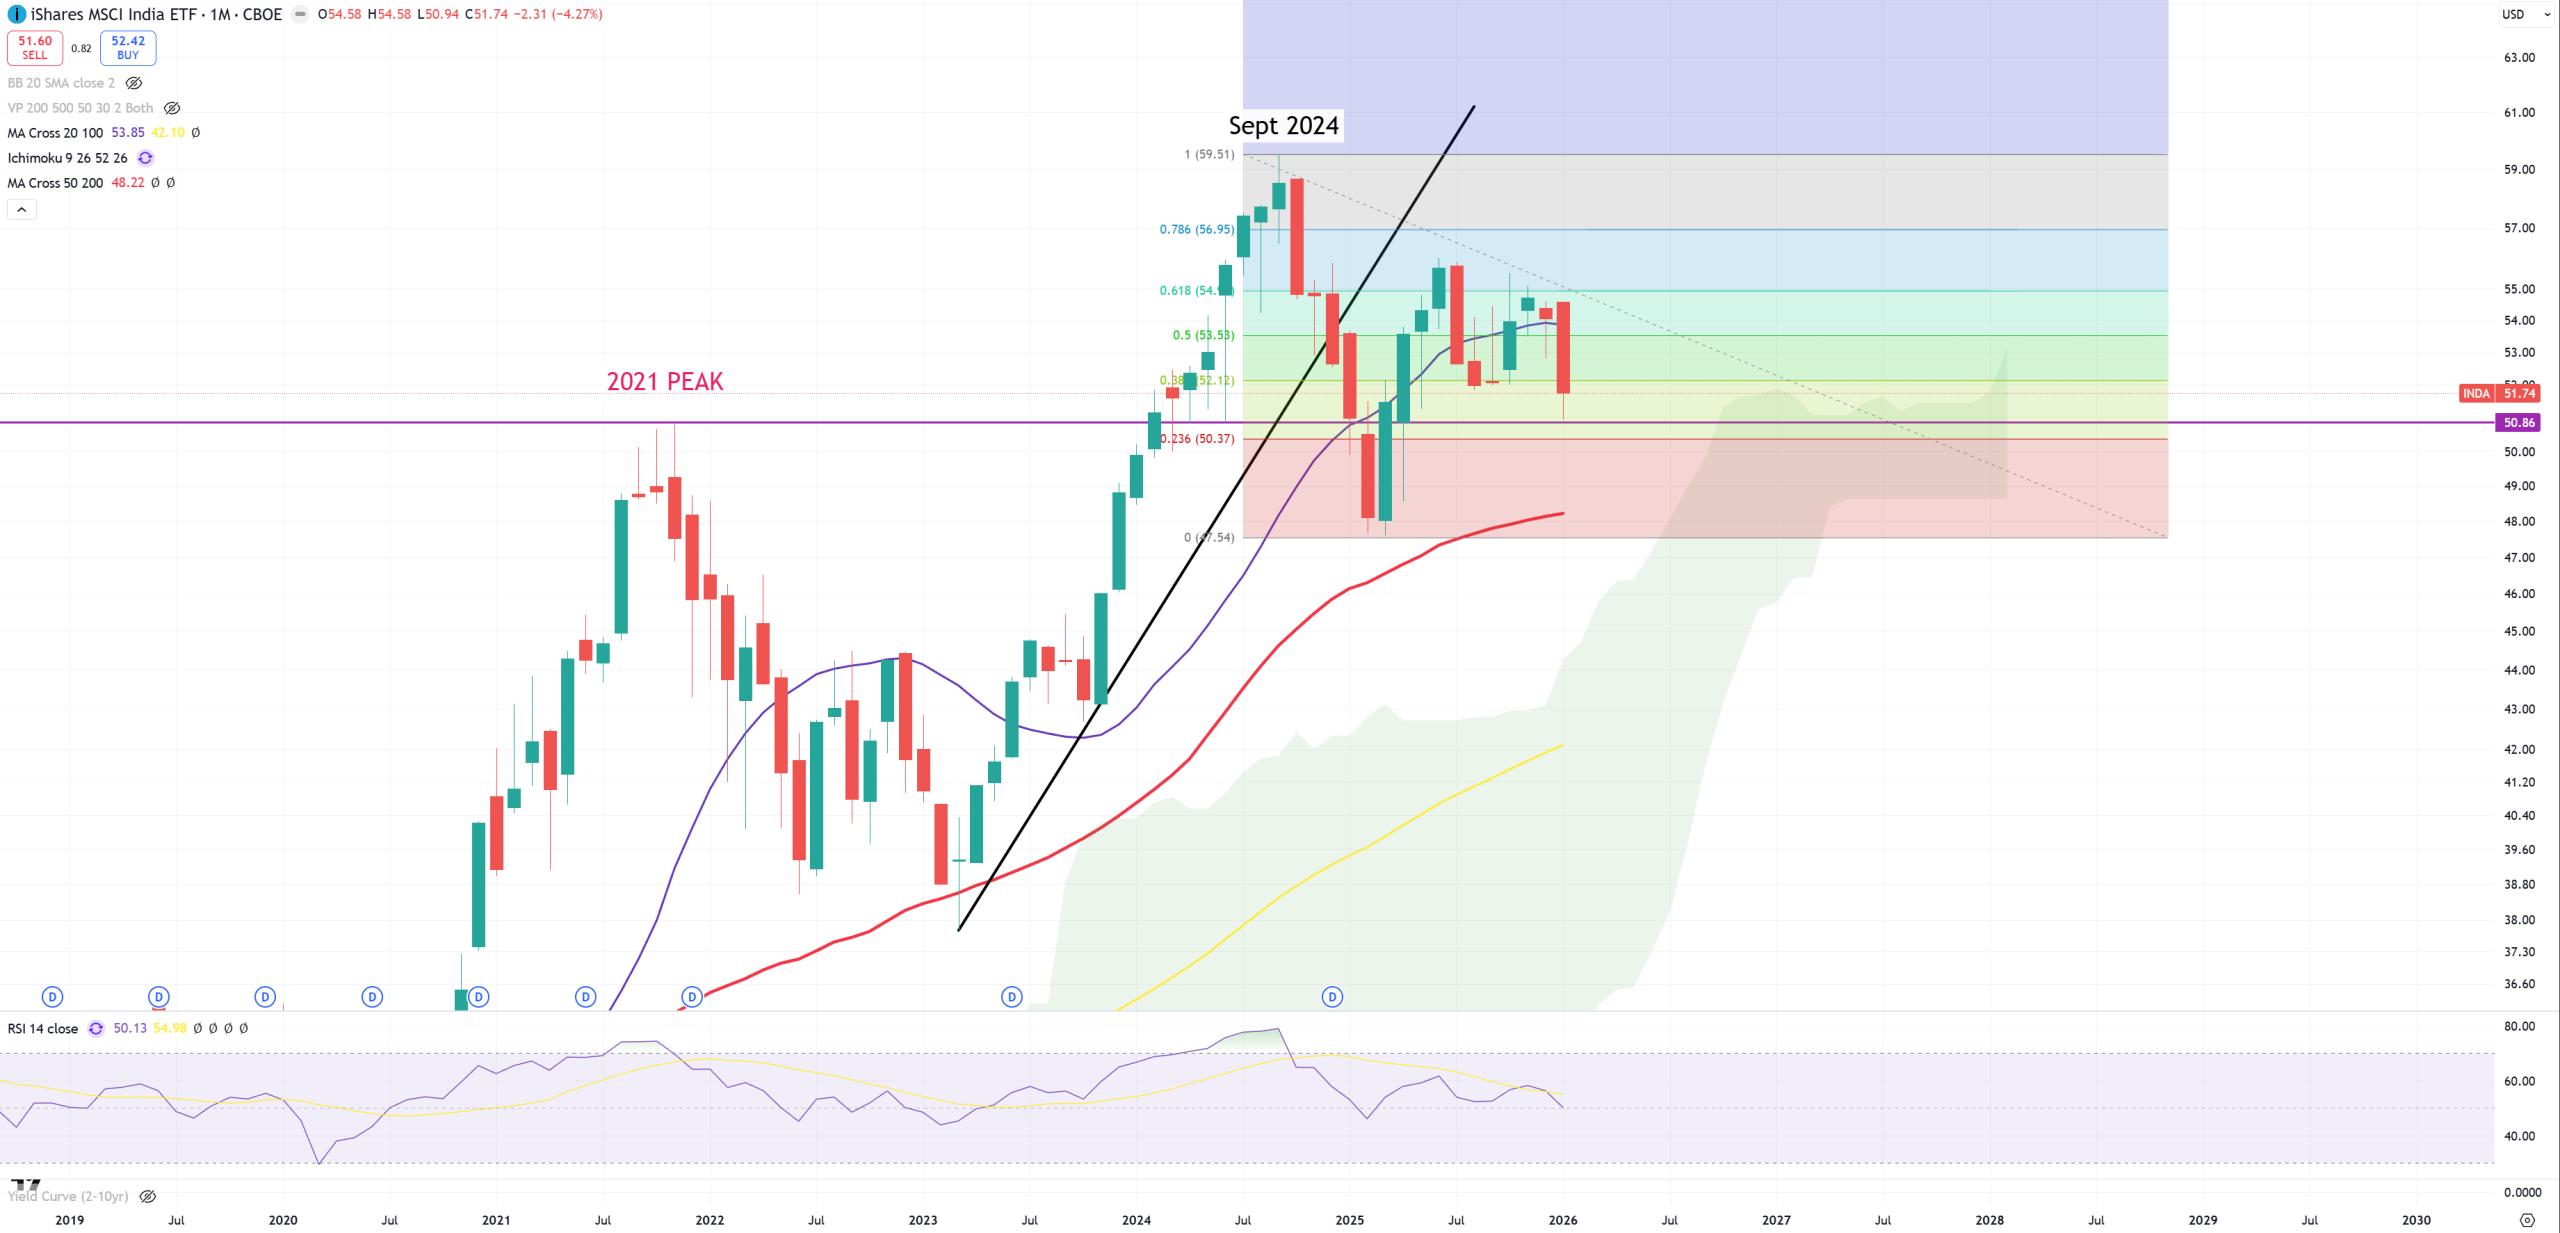
INDA – India is around breaking below 2021 peak
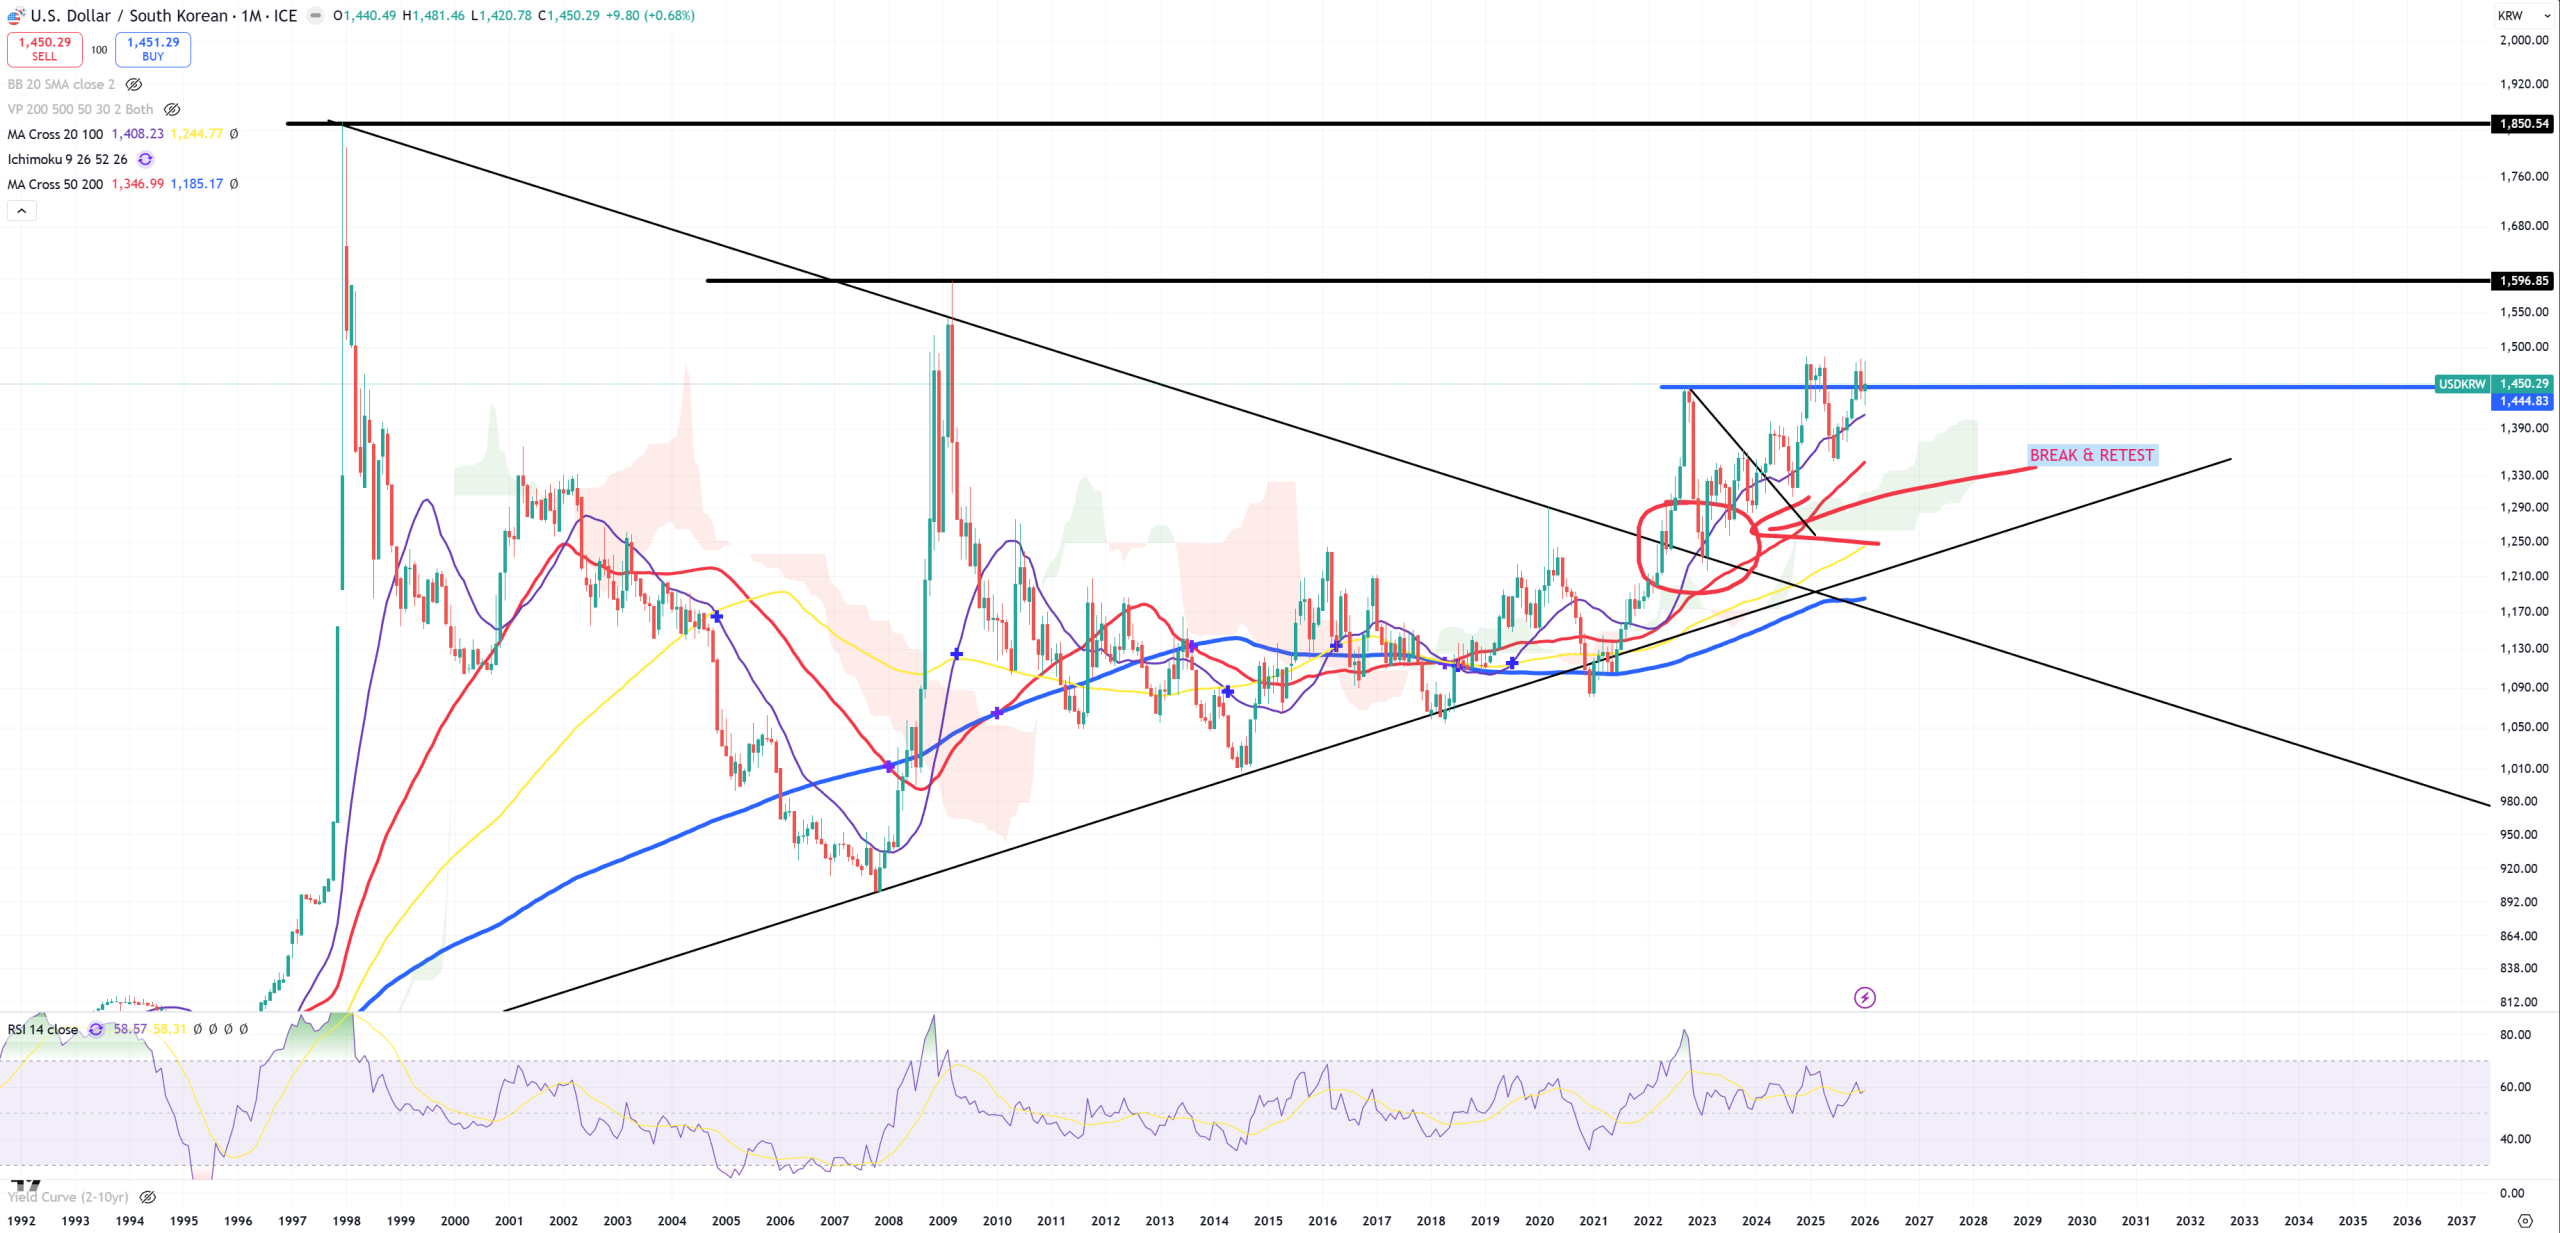
USDKRW is on the edge of a break. In 2022 when DXY=115 USDKRW was on the same level as today when DXY=97.
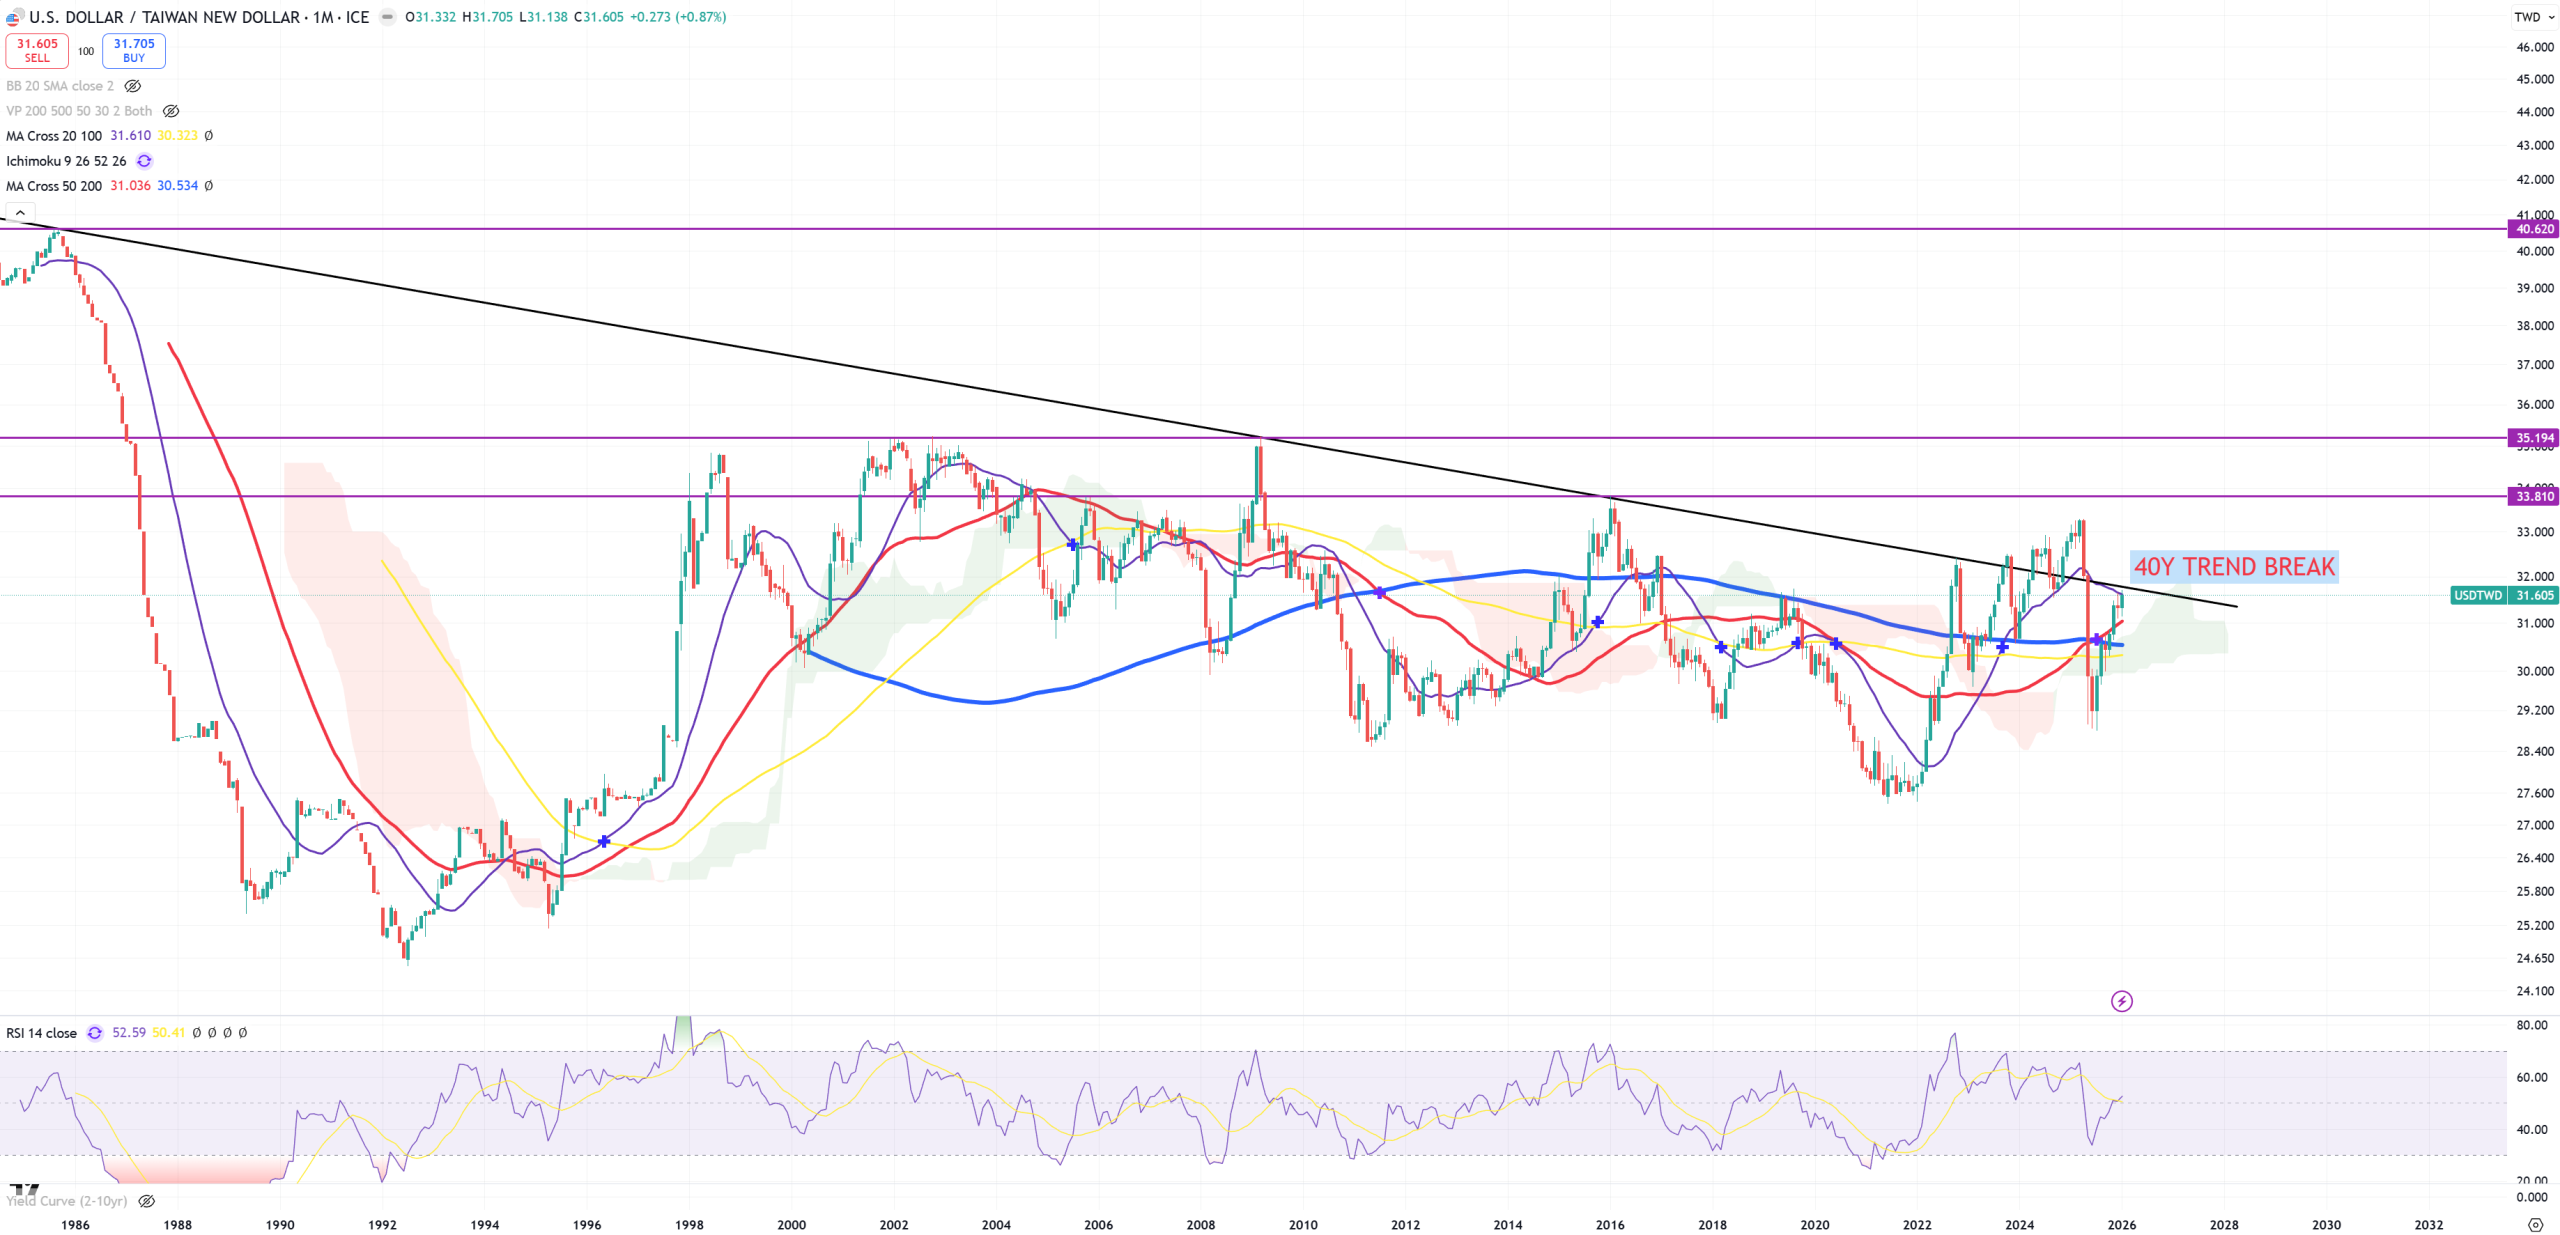
USDTWD – Taiwan $$$ – again on the edge of a break of its 40Y trend.
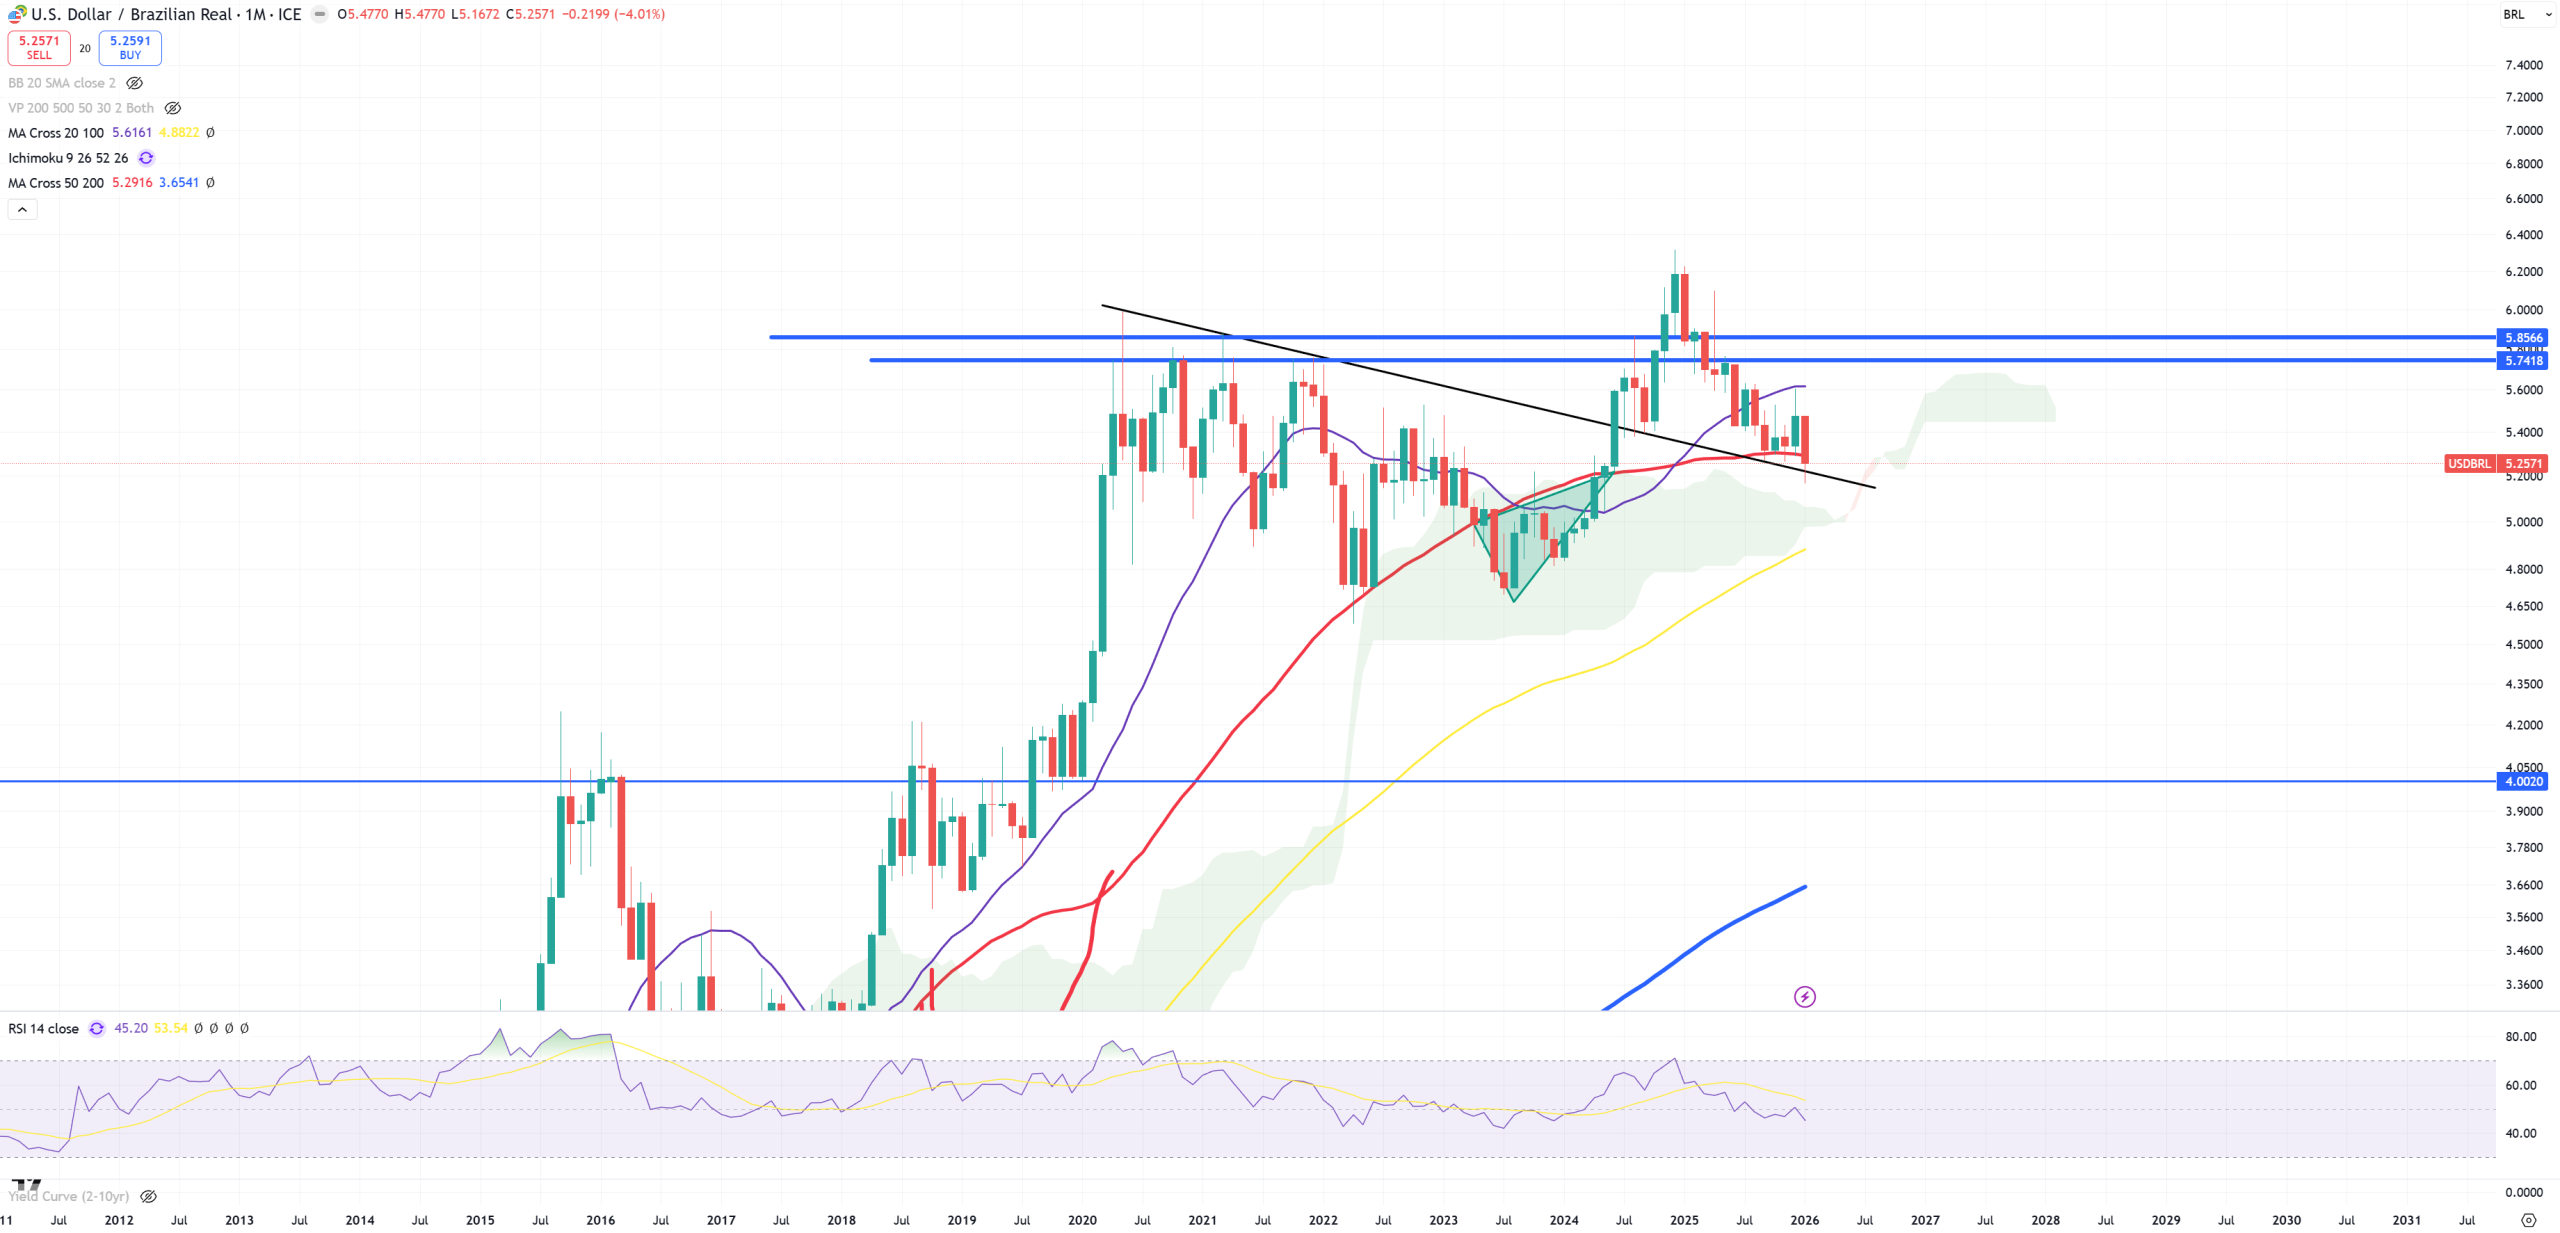
USDBRL – Last moment
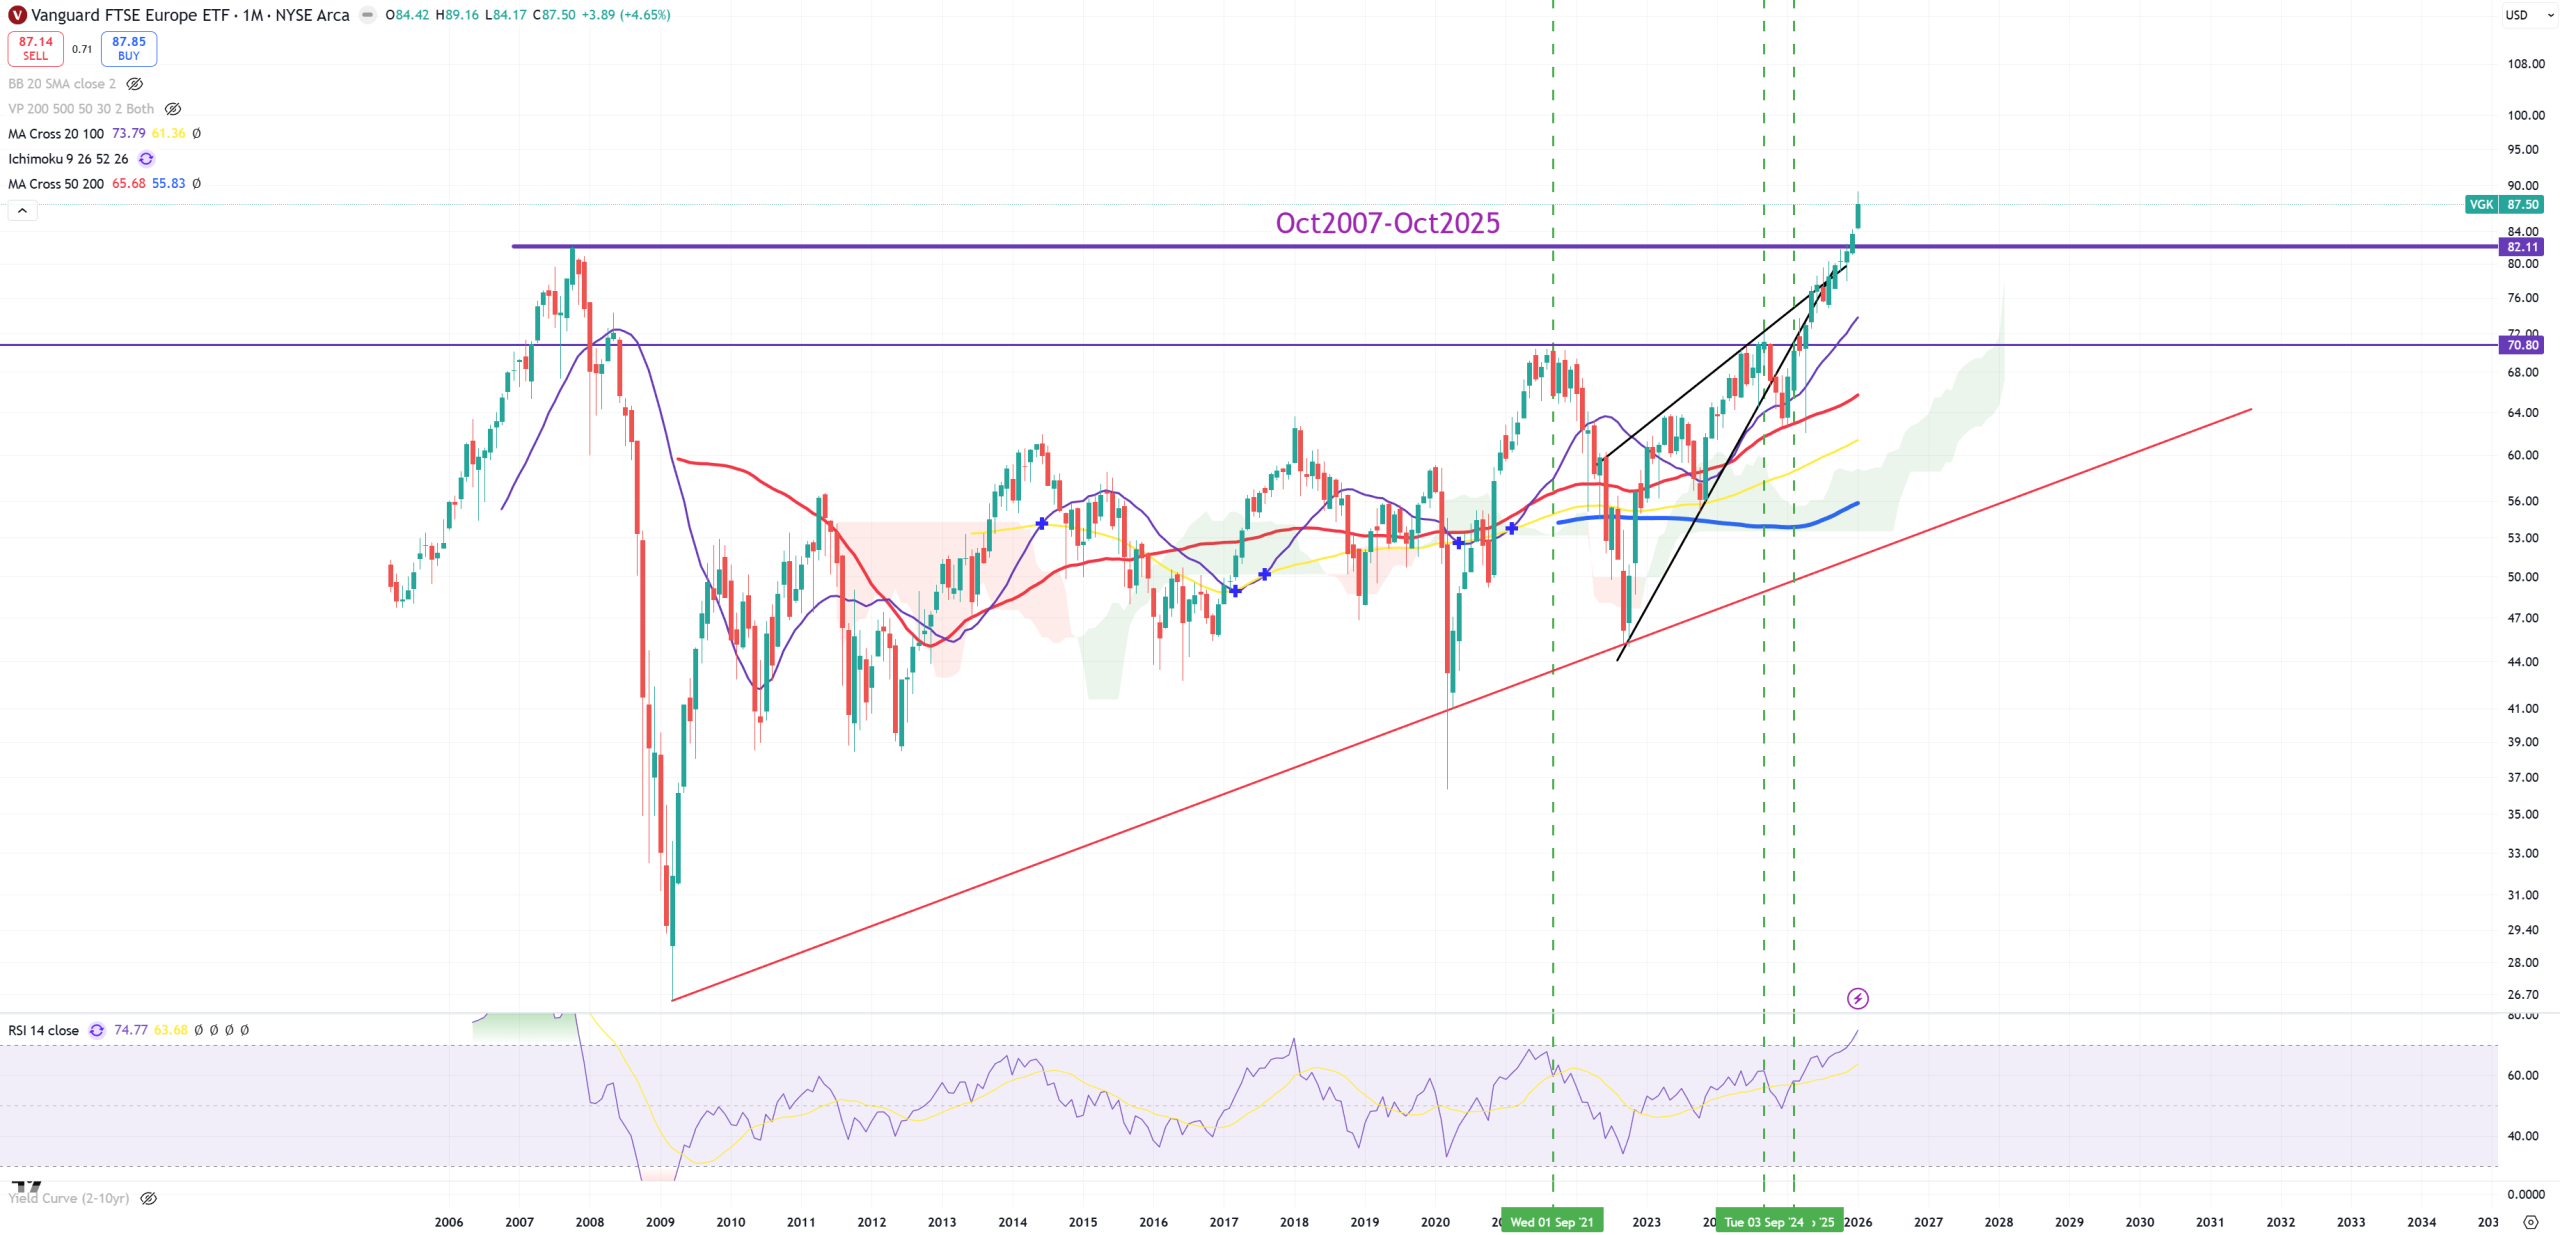
VGK – Europe – as you probably get it : I don’t believe in this break above October 2007 level.
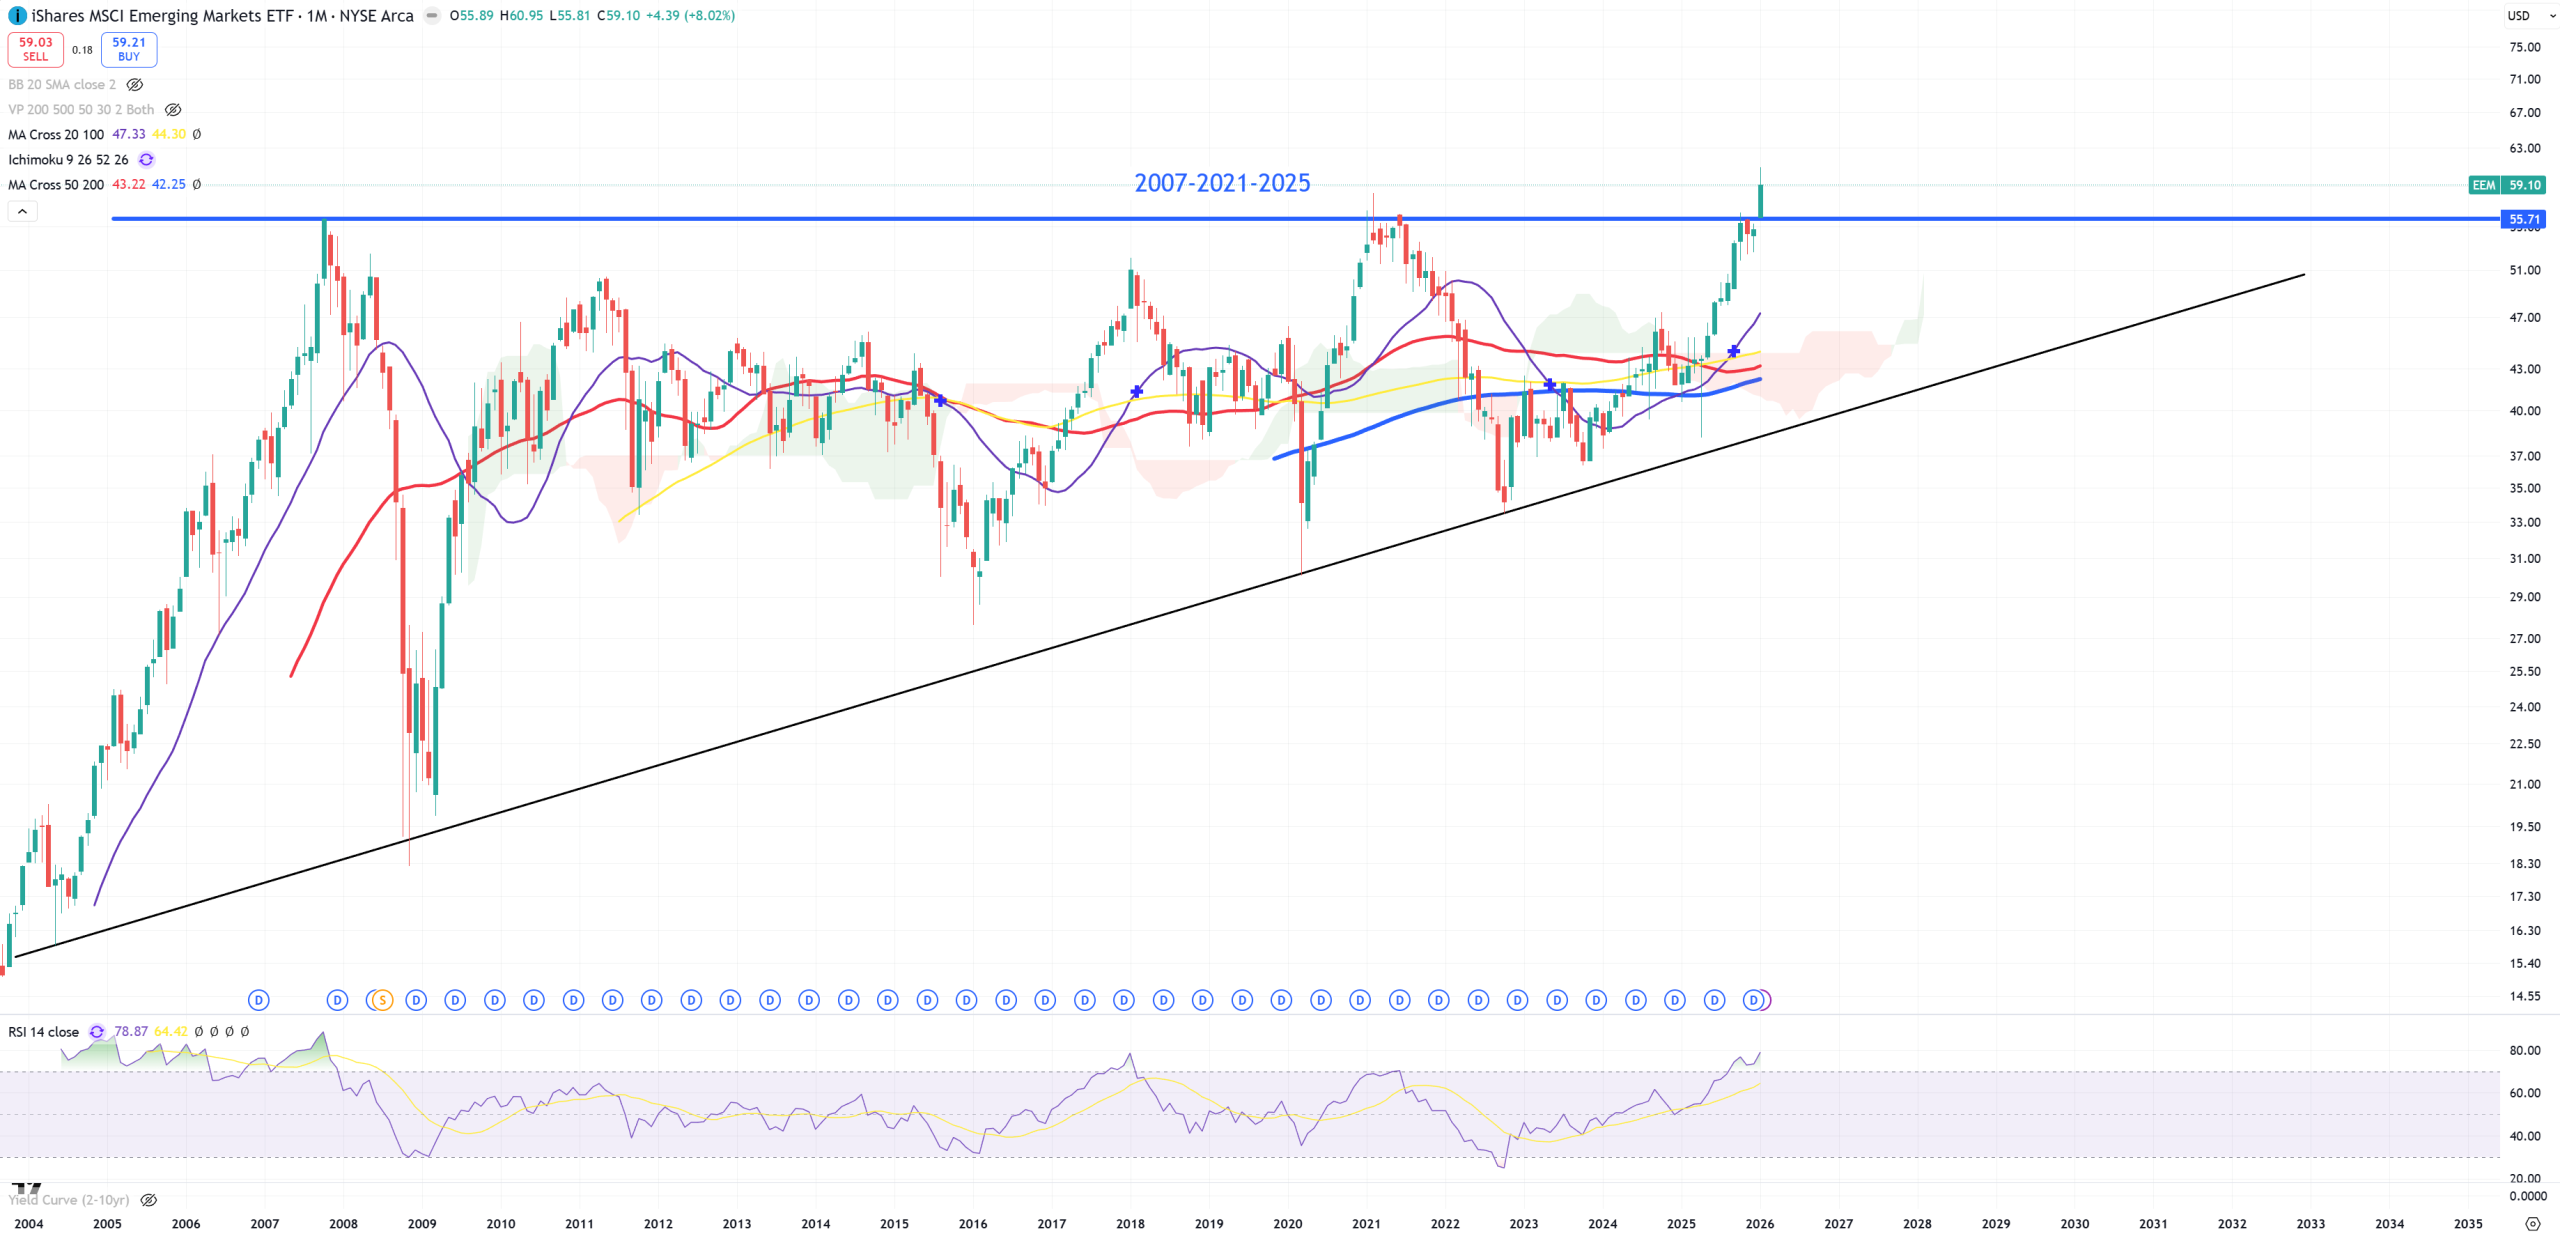
EEM – Emerging Markets – big move up and break or big overshooting
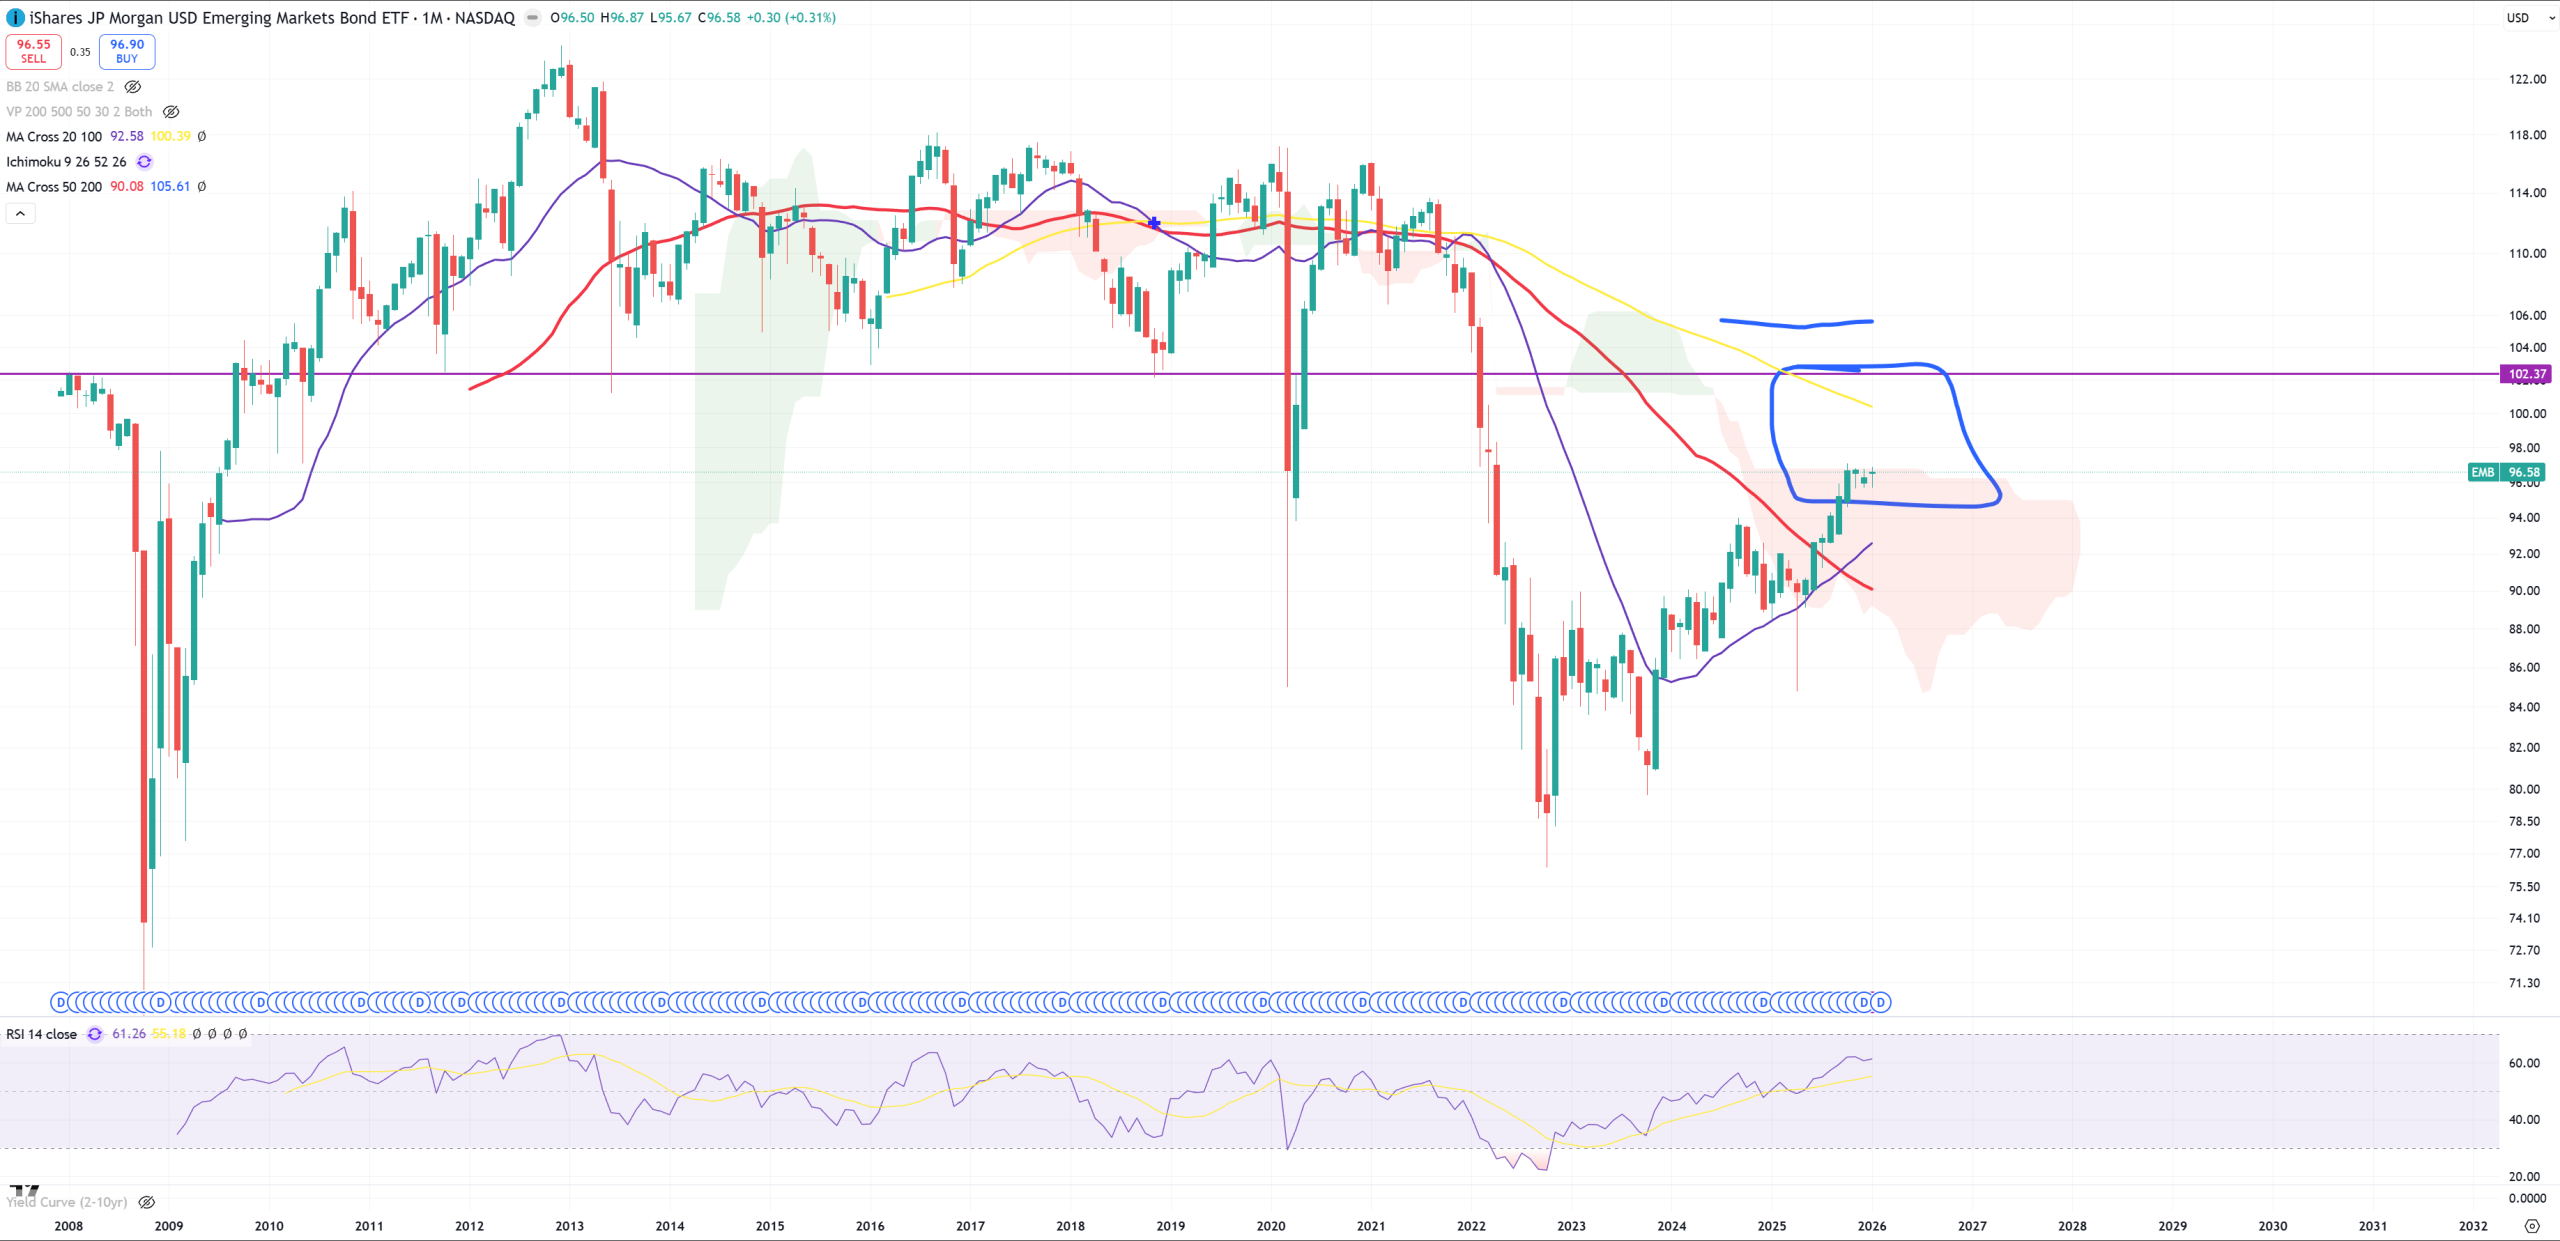
EMB – Emerging Markets bonds are really on low levels to EEM index. Something doesn’t add up.
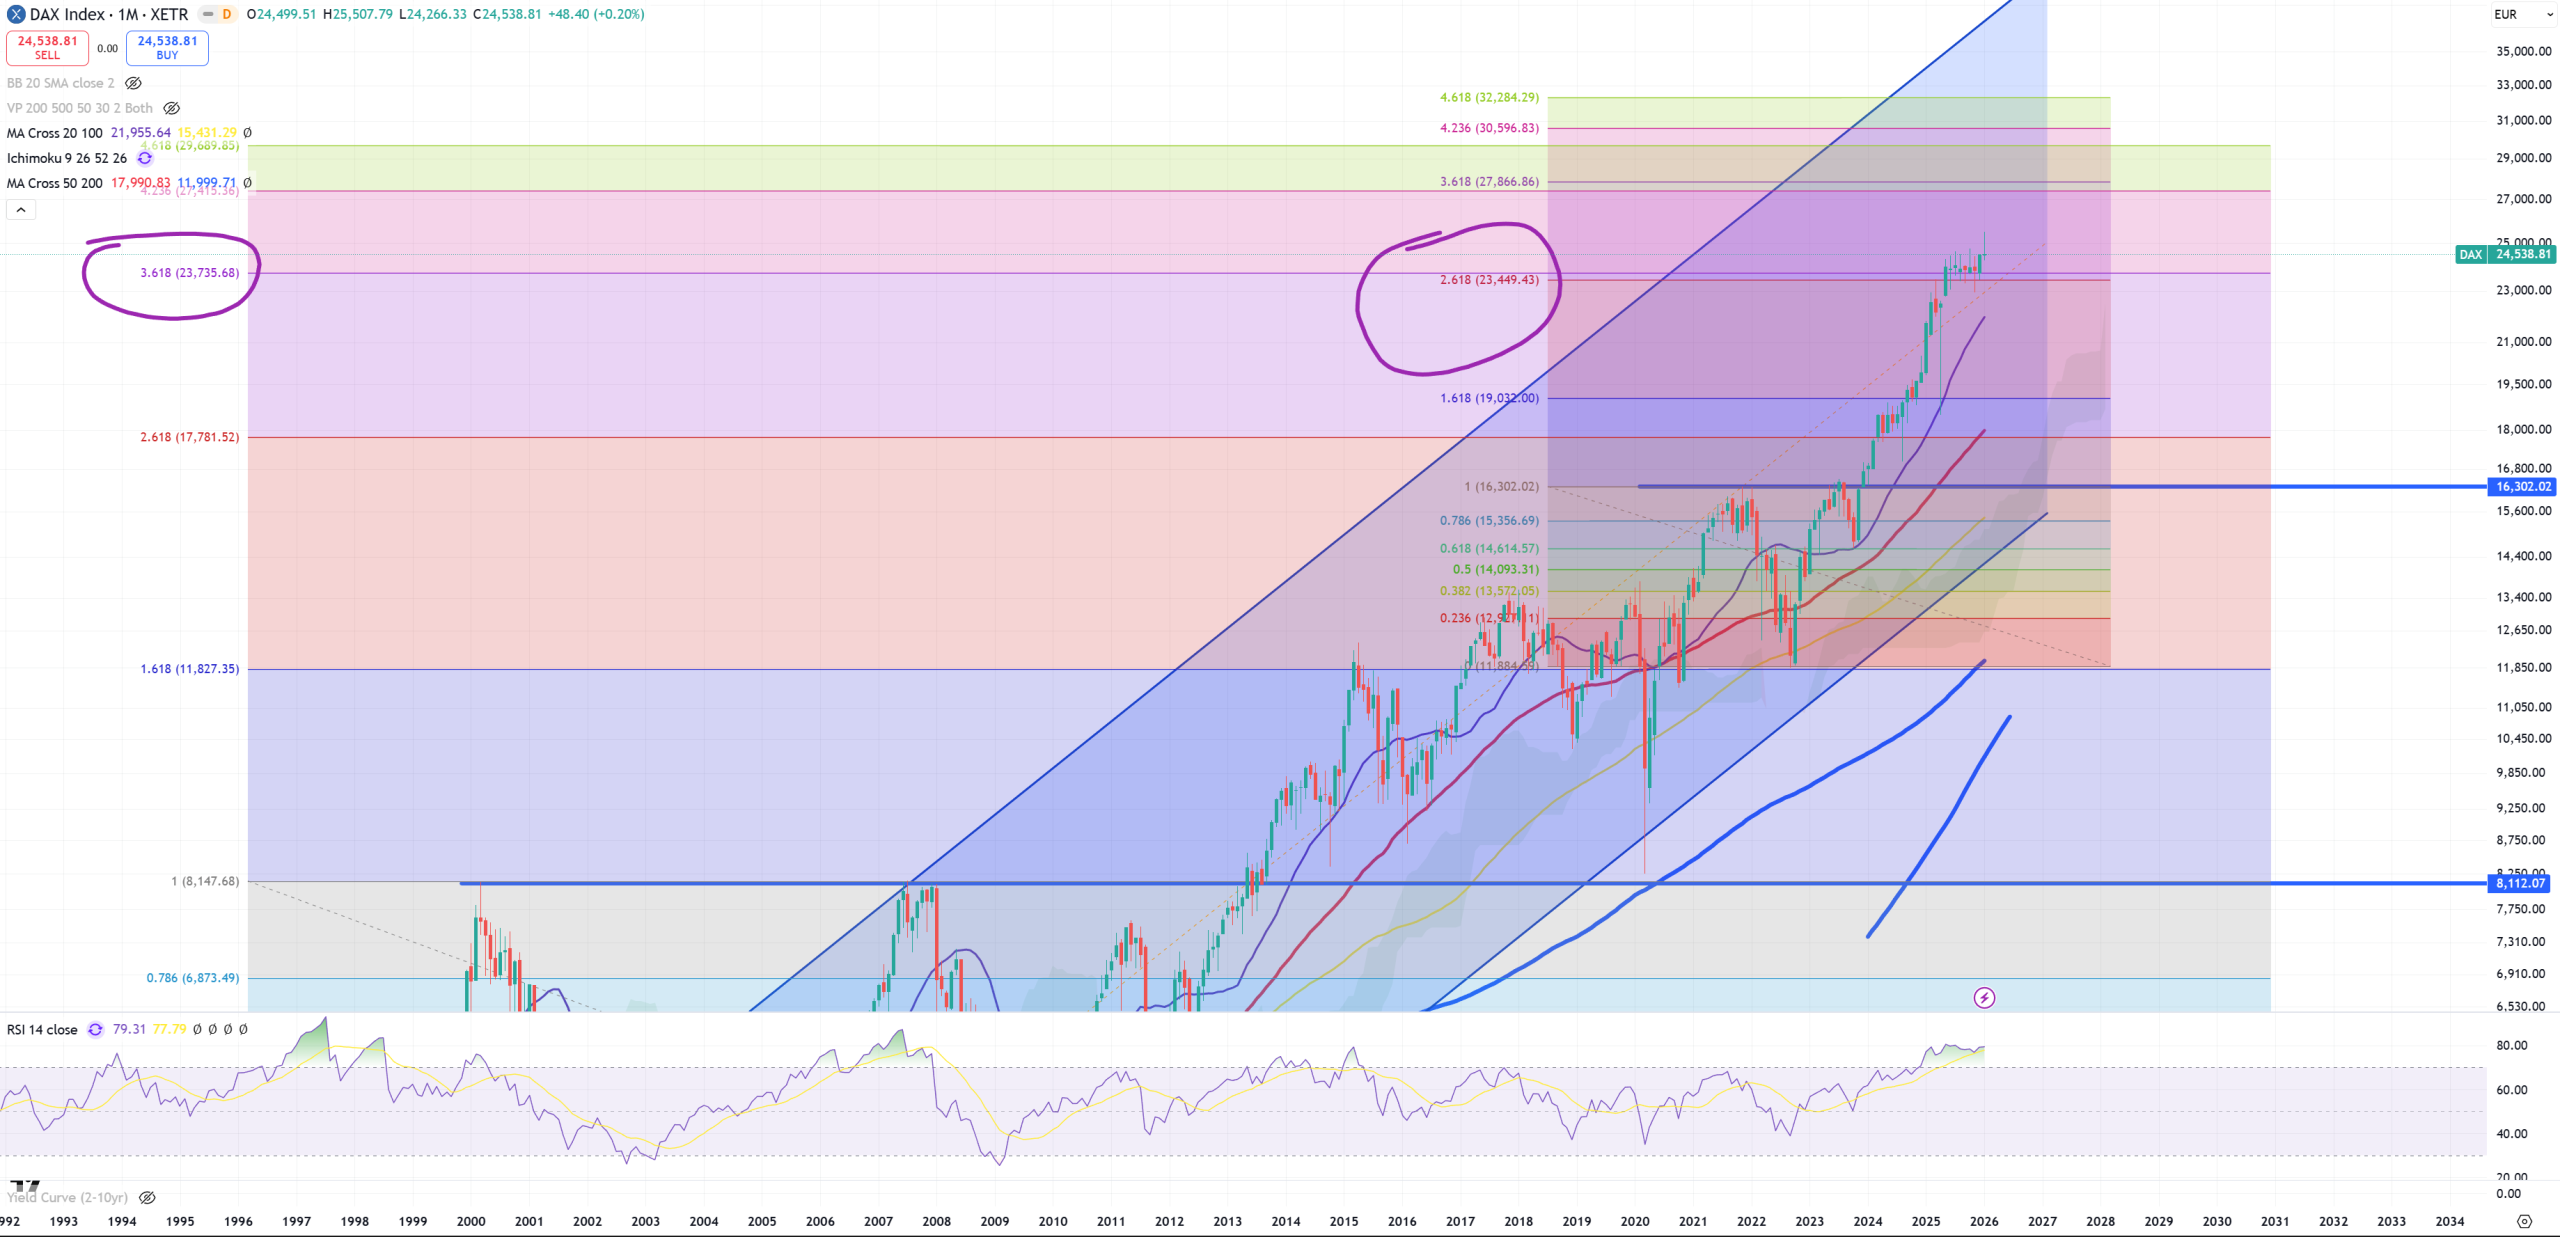
DAX – floating all the time around this 24500 level
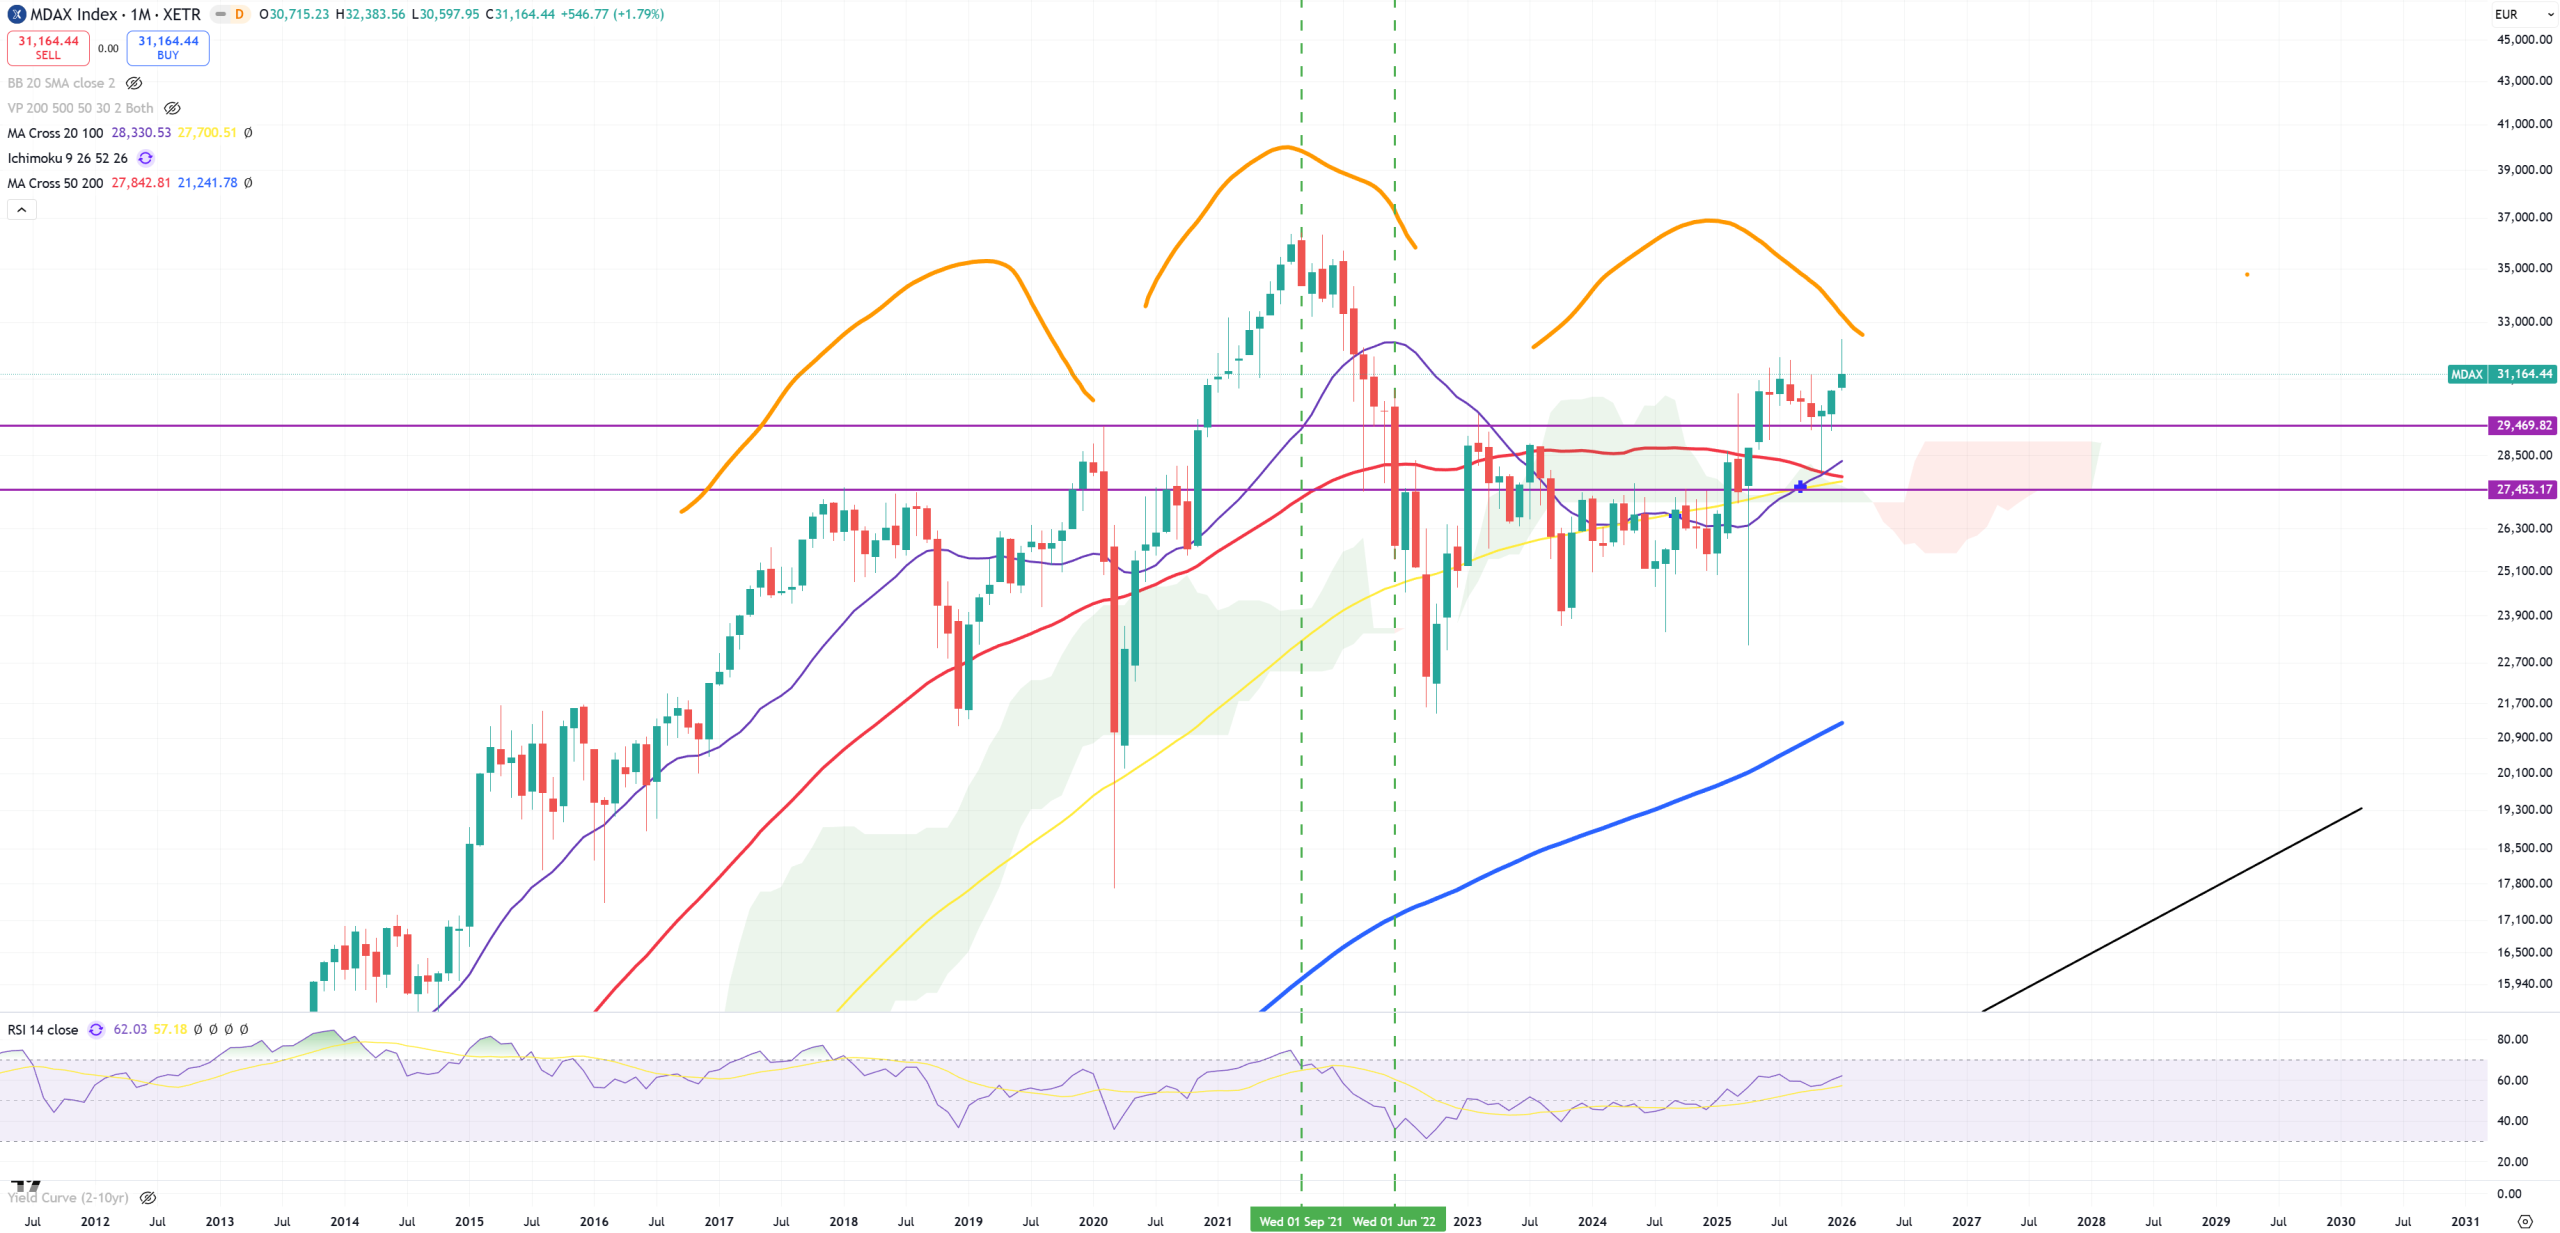
mDAX – is one of top 3 biggest surprised to me
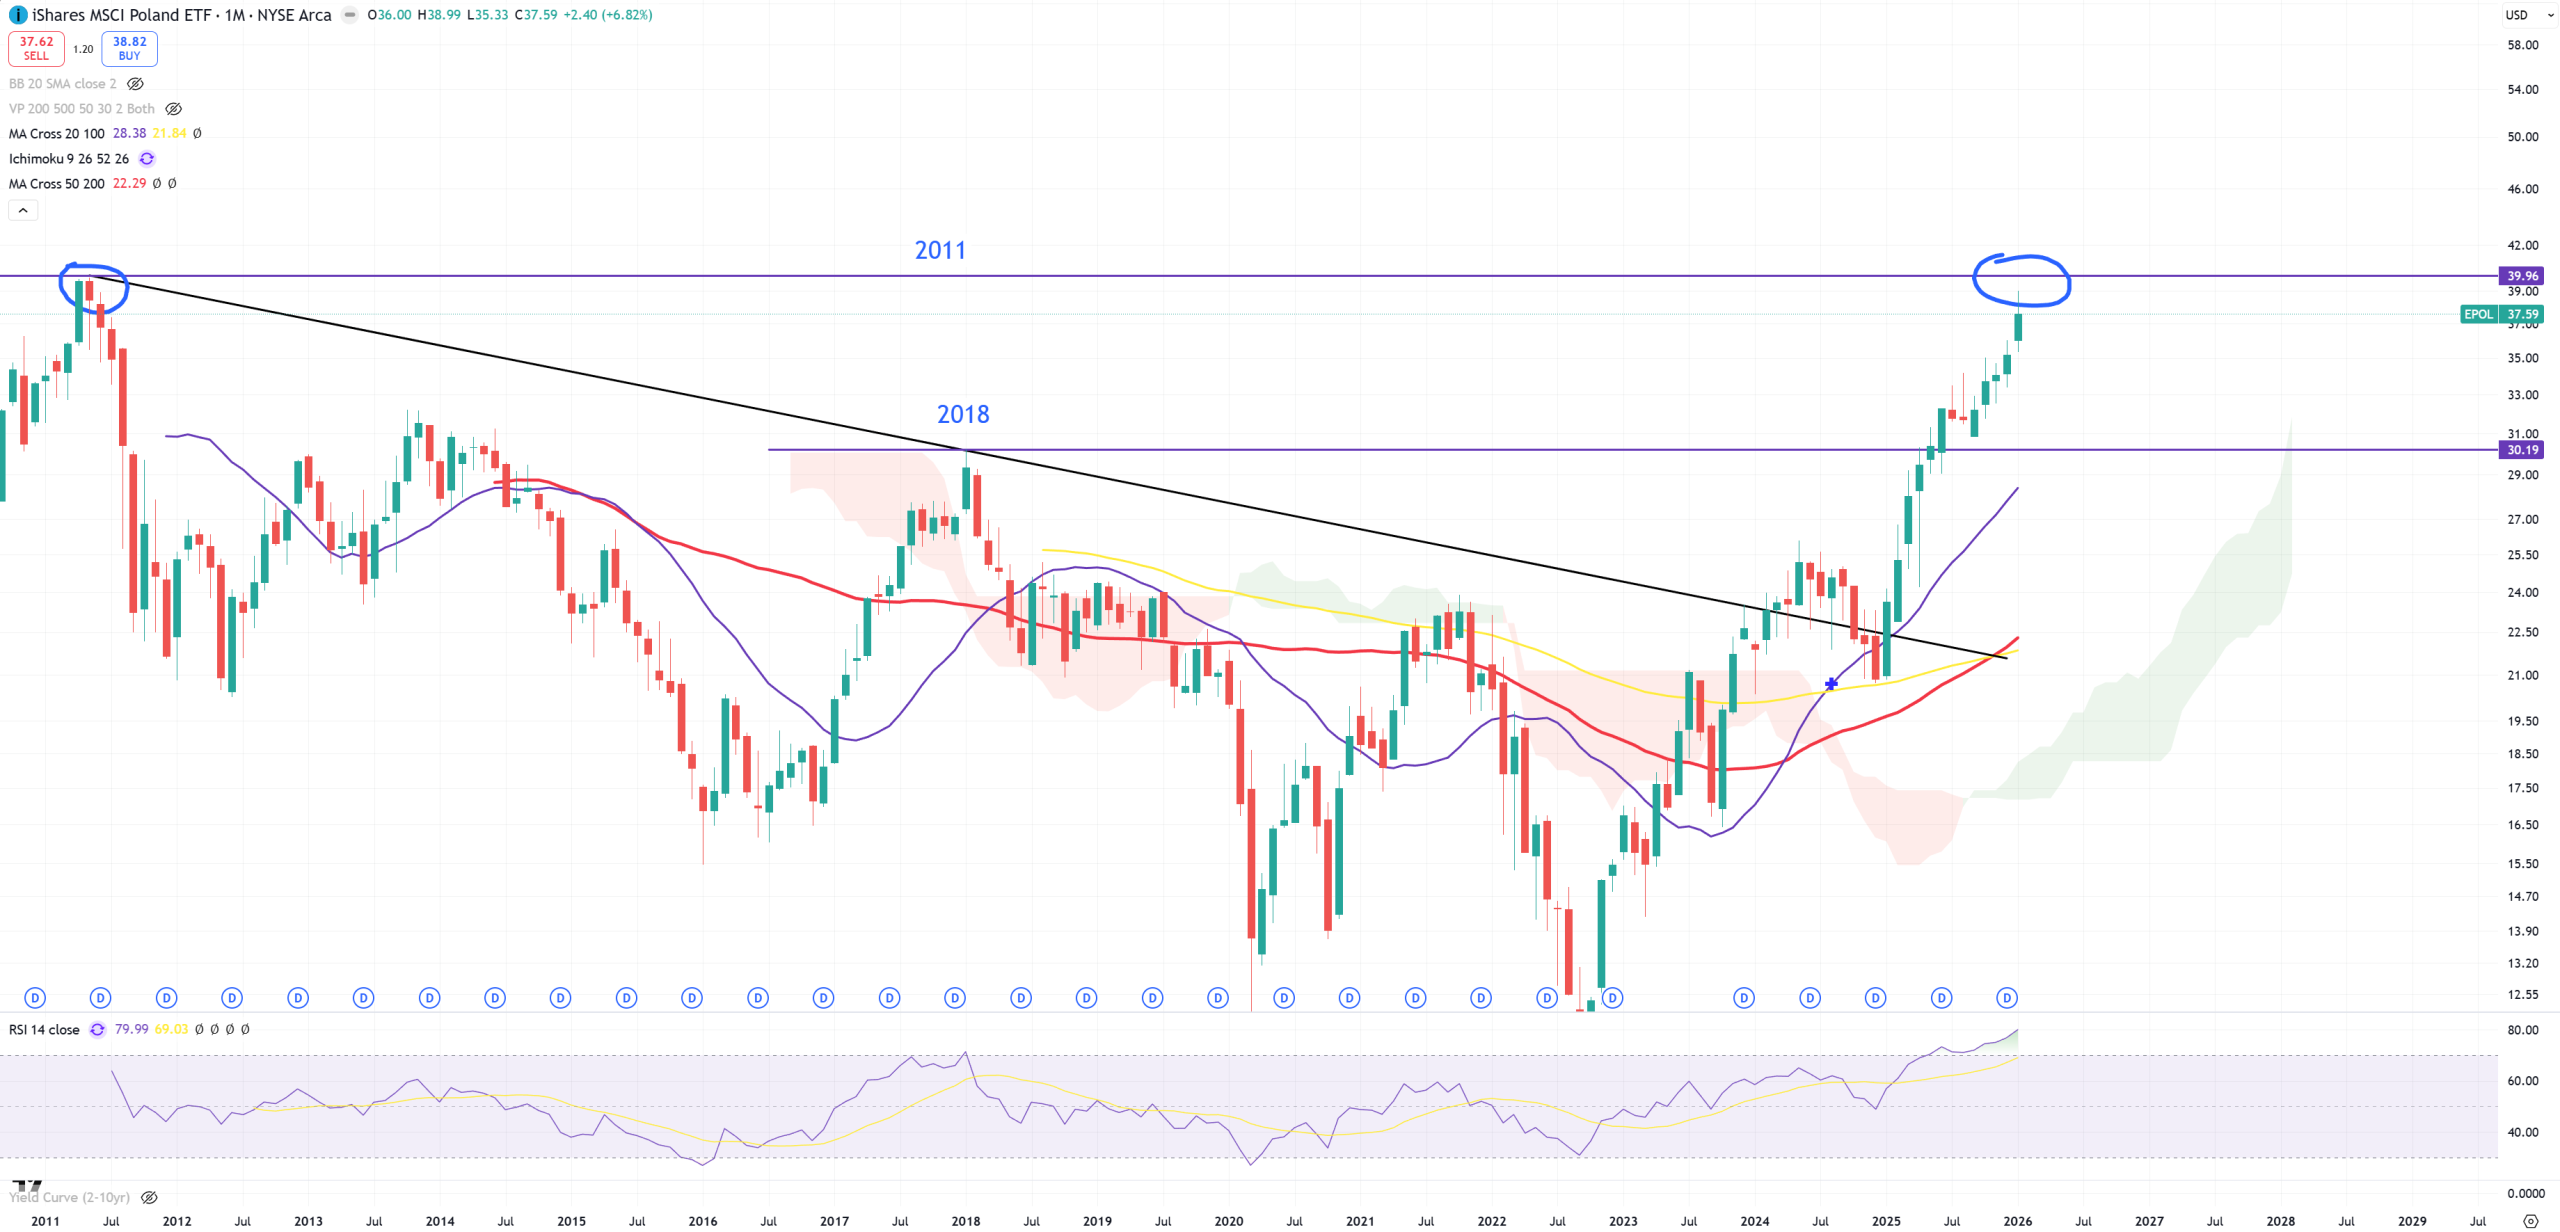
EPOL – Poland
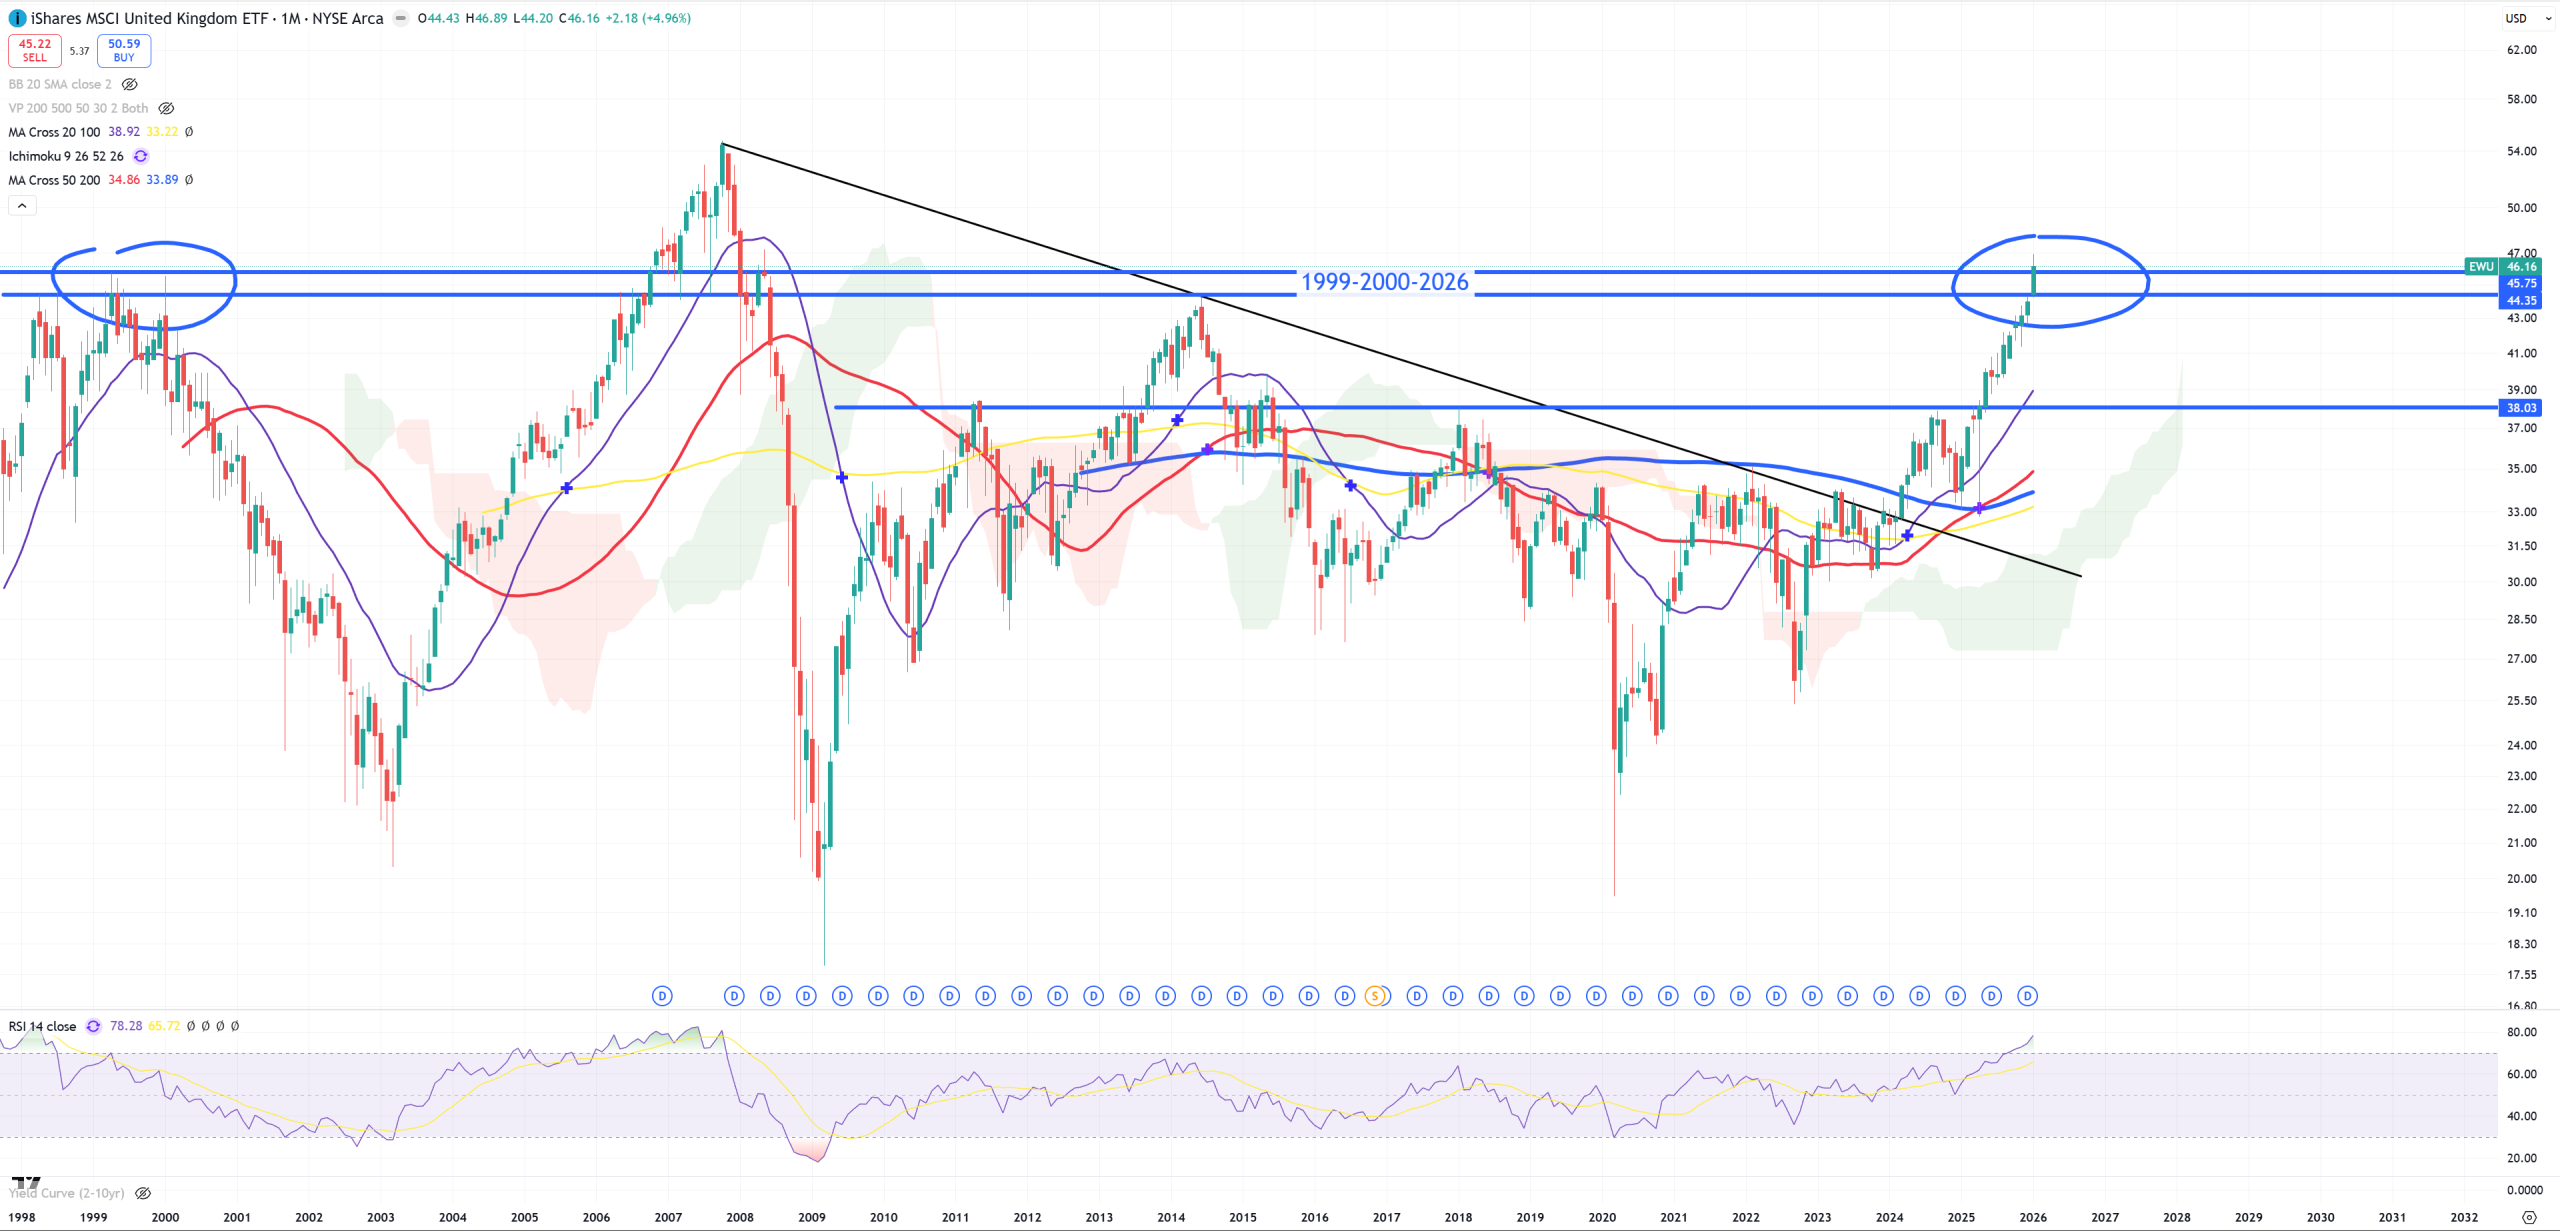
EWU – United Kingdom
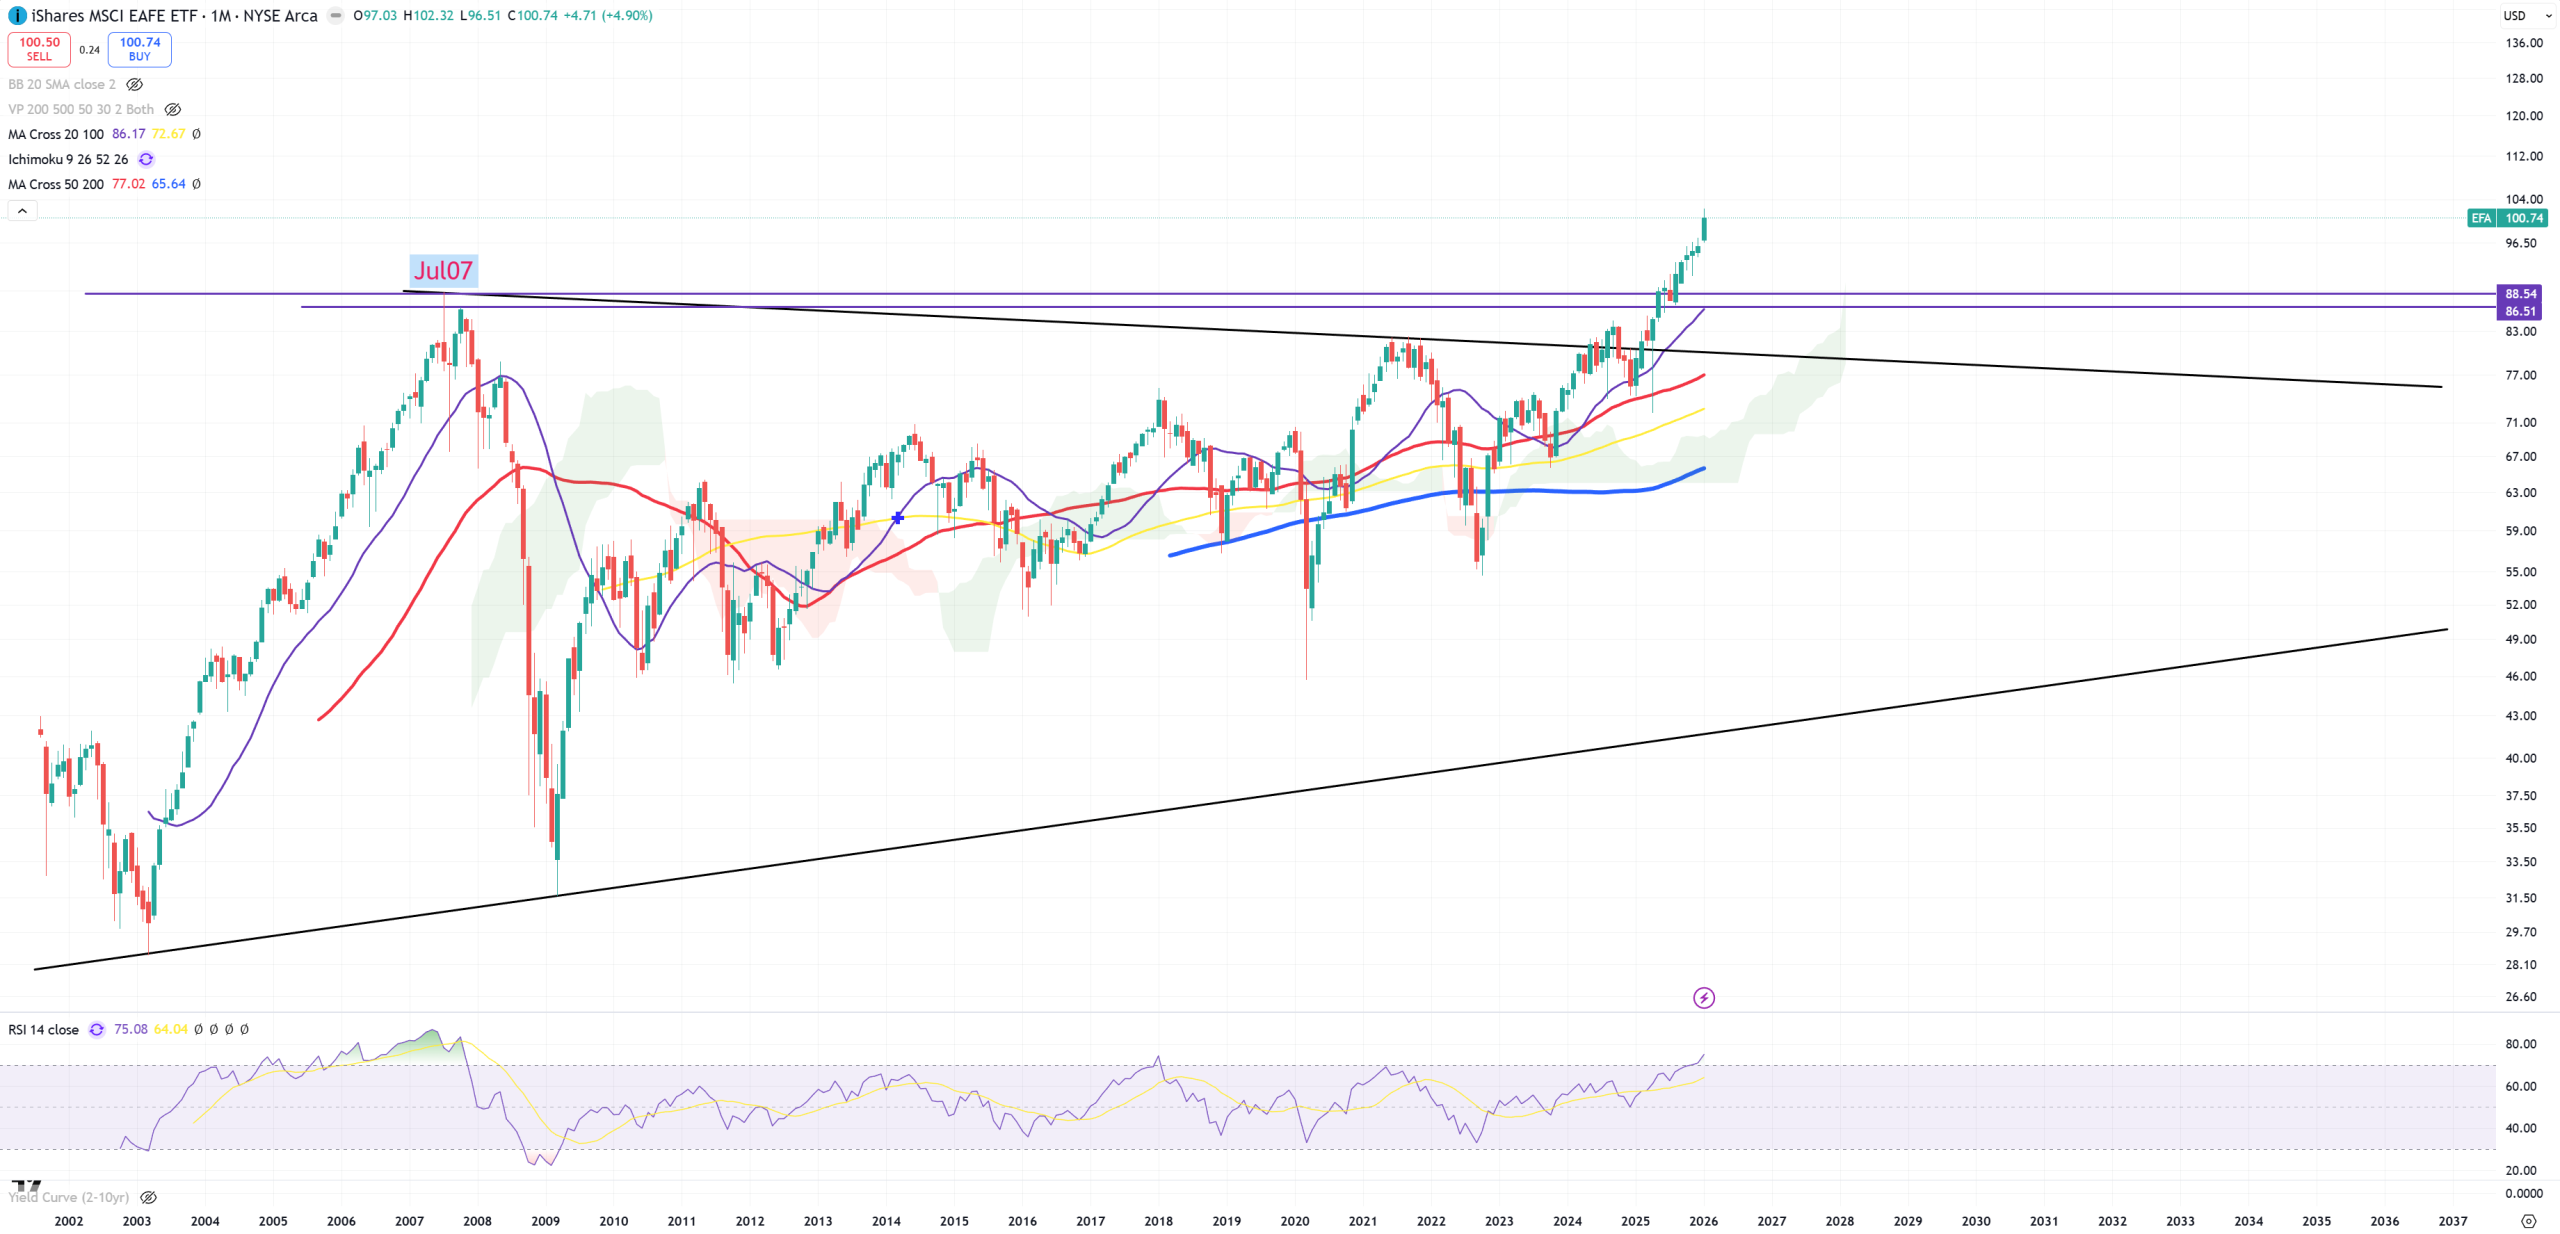
EFA – Developed markets excluding US – you know I don’t trust this 2007 level break
Banking sector – needs now a separate column
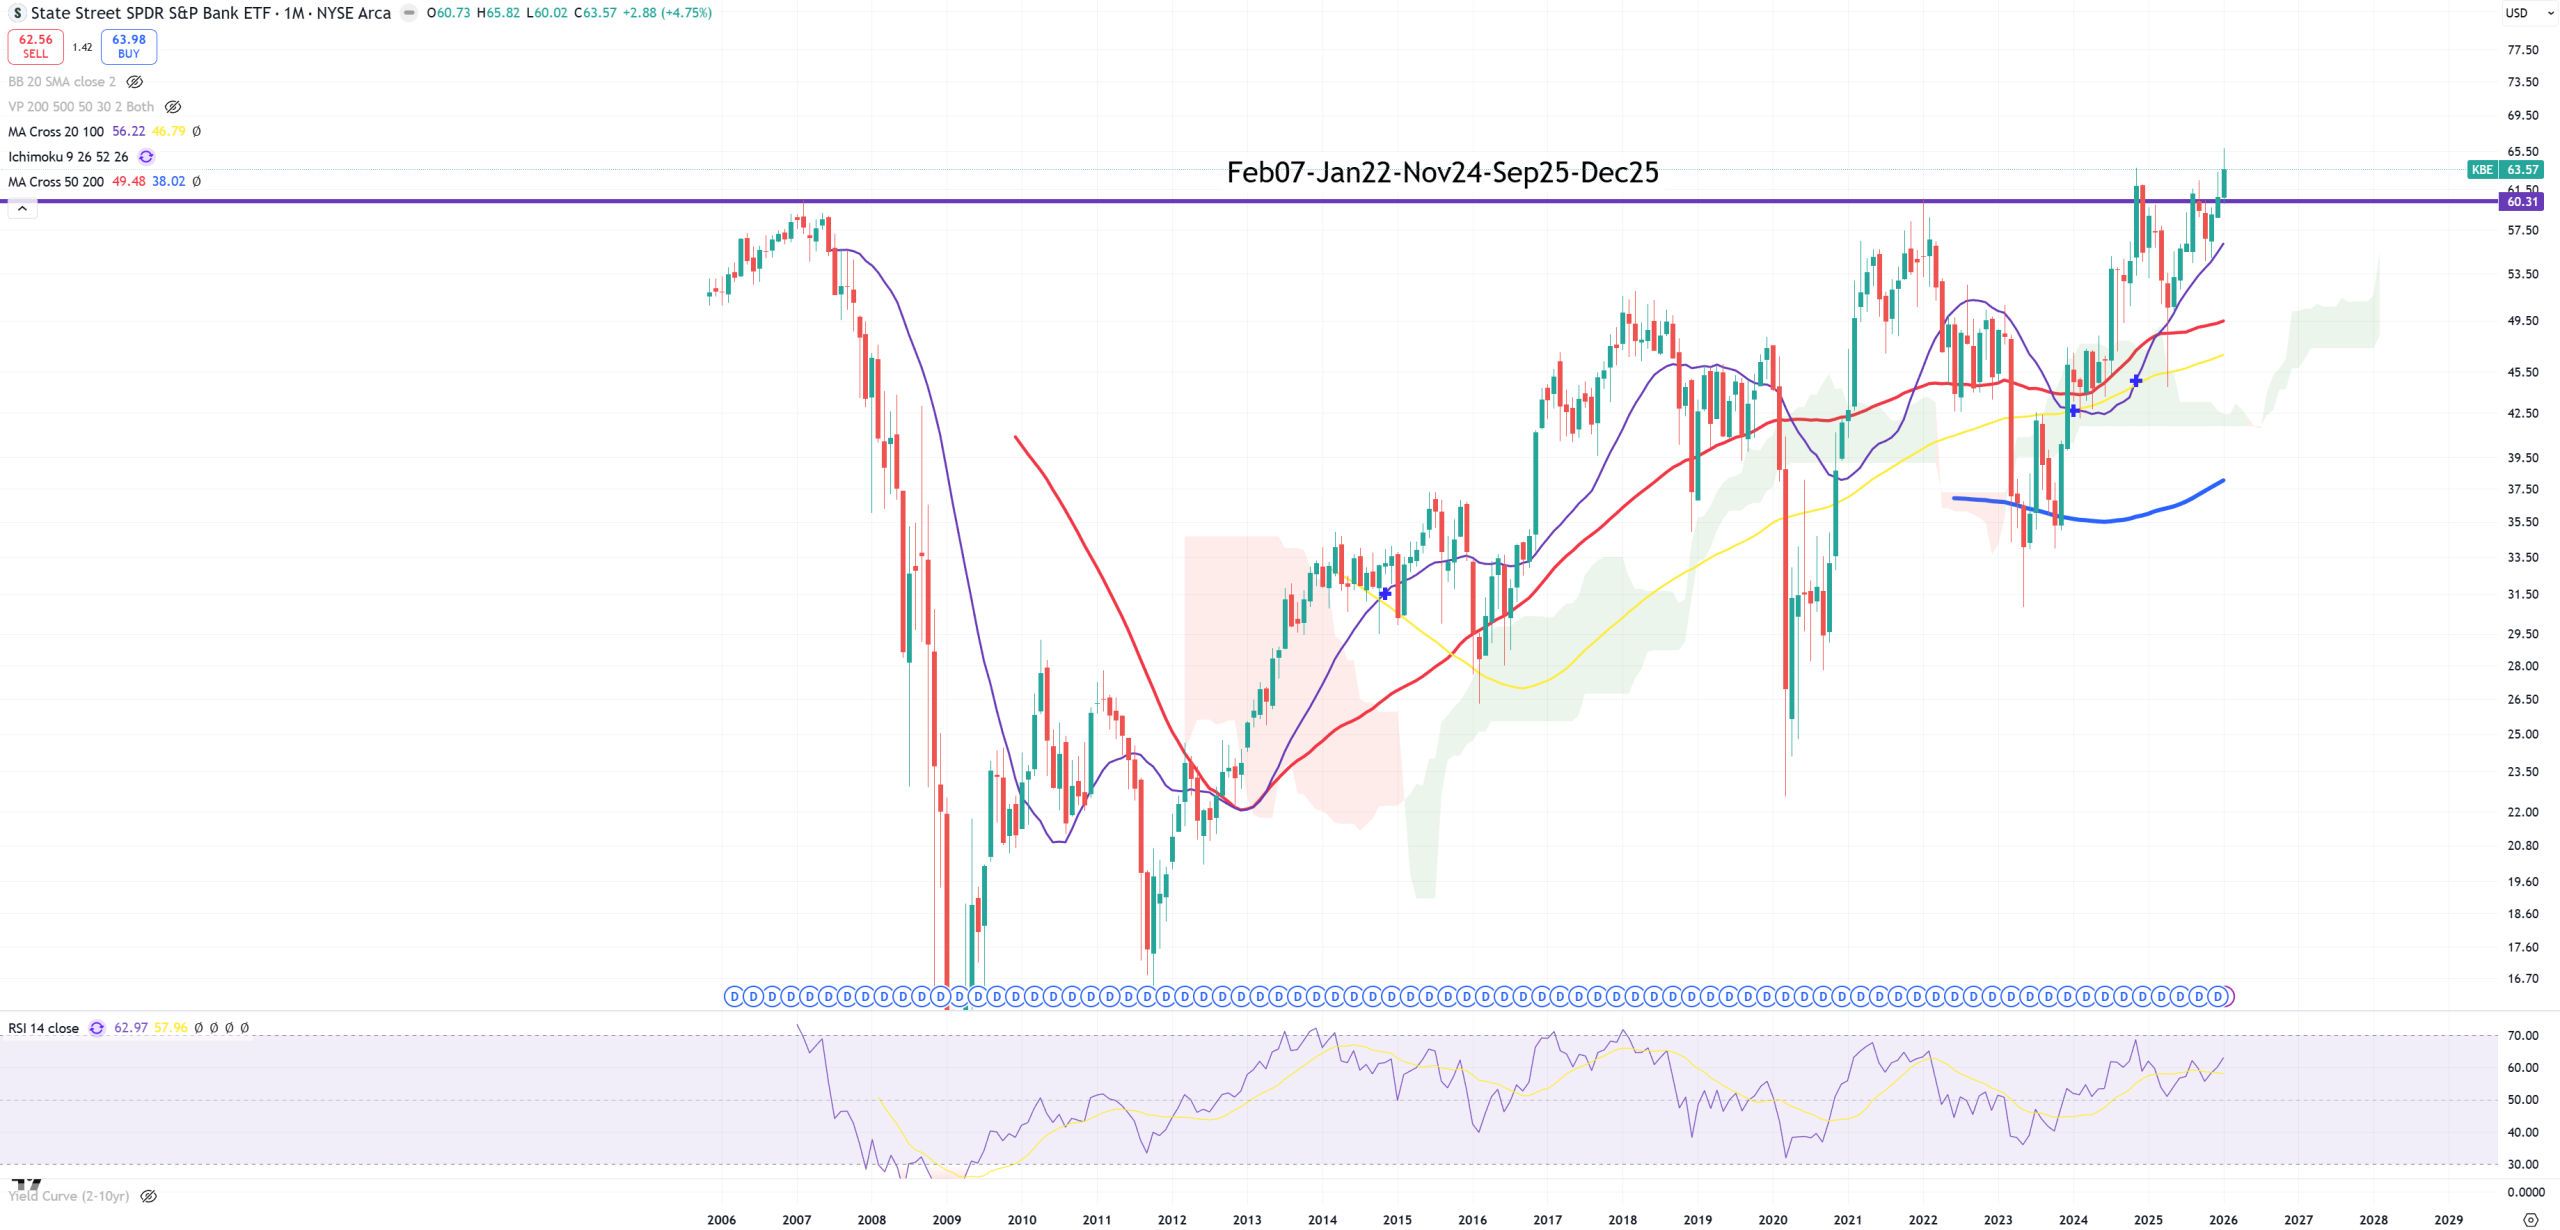
KBE – so far breaking higher, but … I don’t believe it
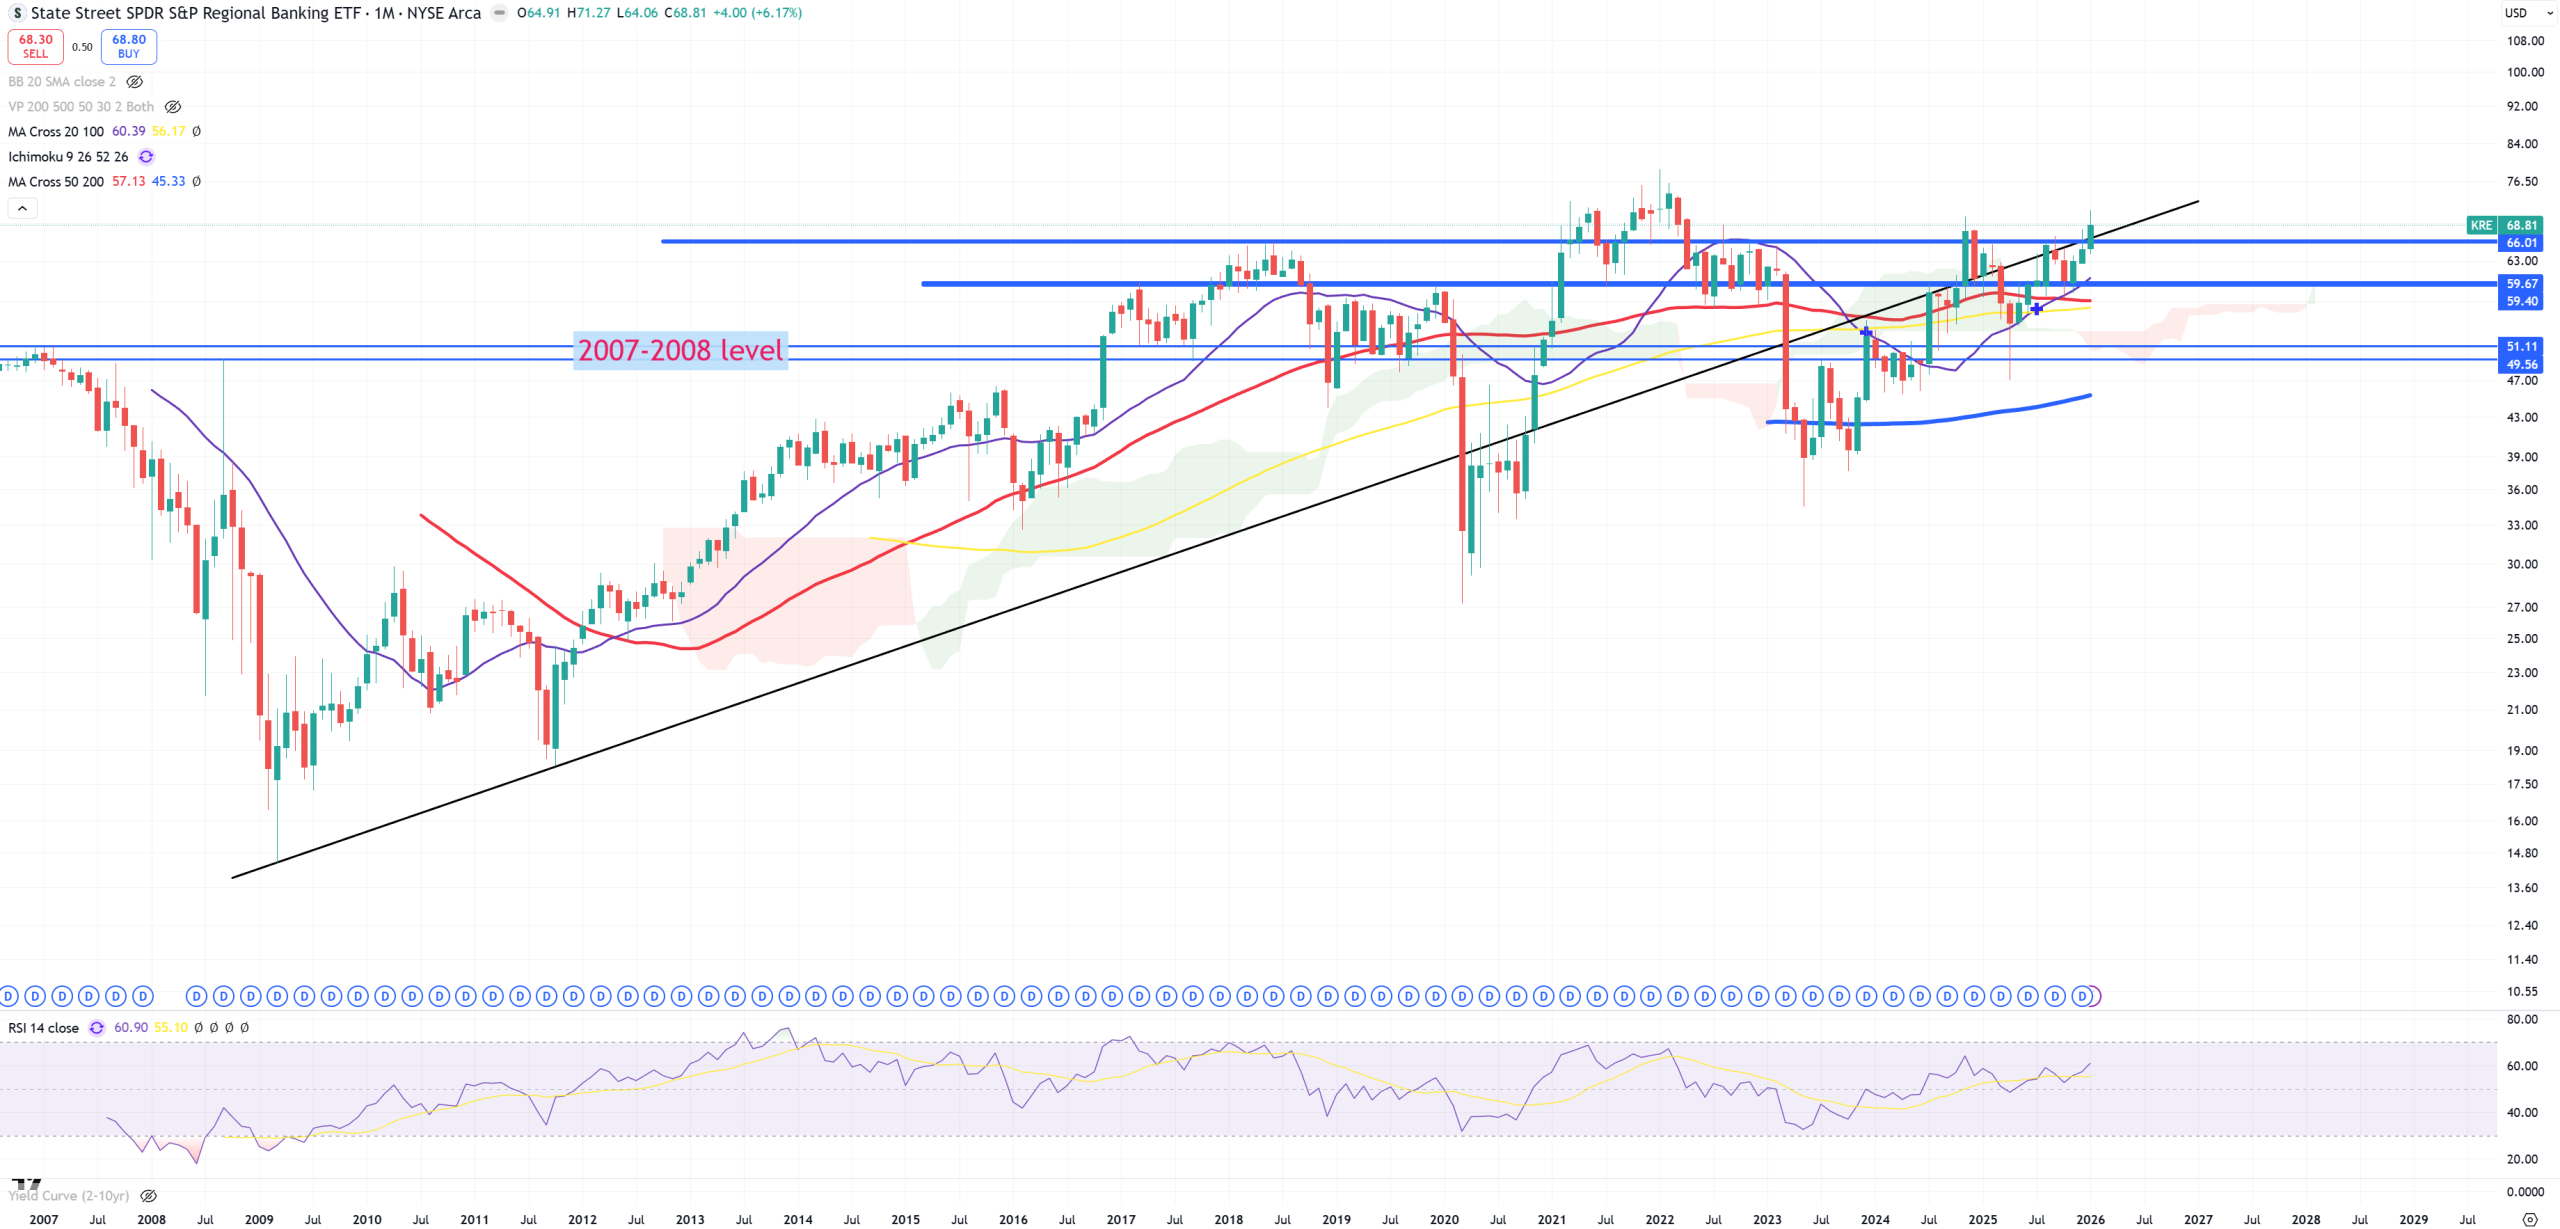
KRE – Regional Banks so far also floating around possible level of big reversal
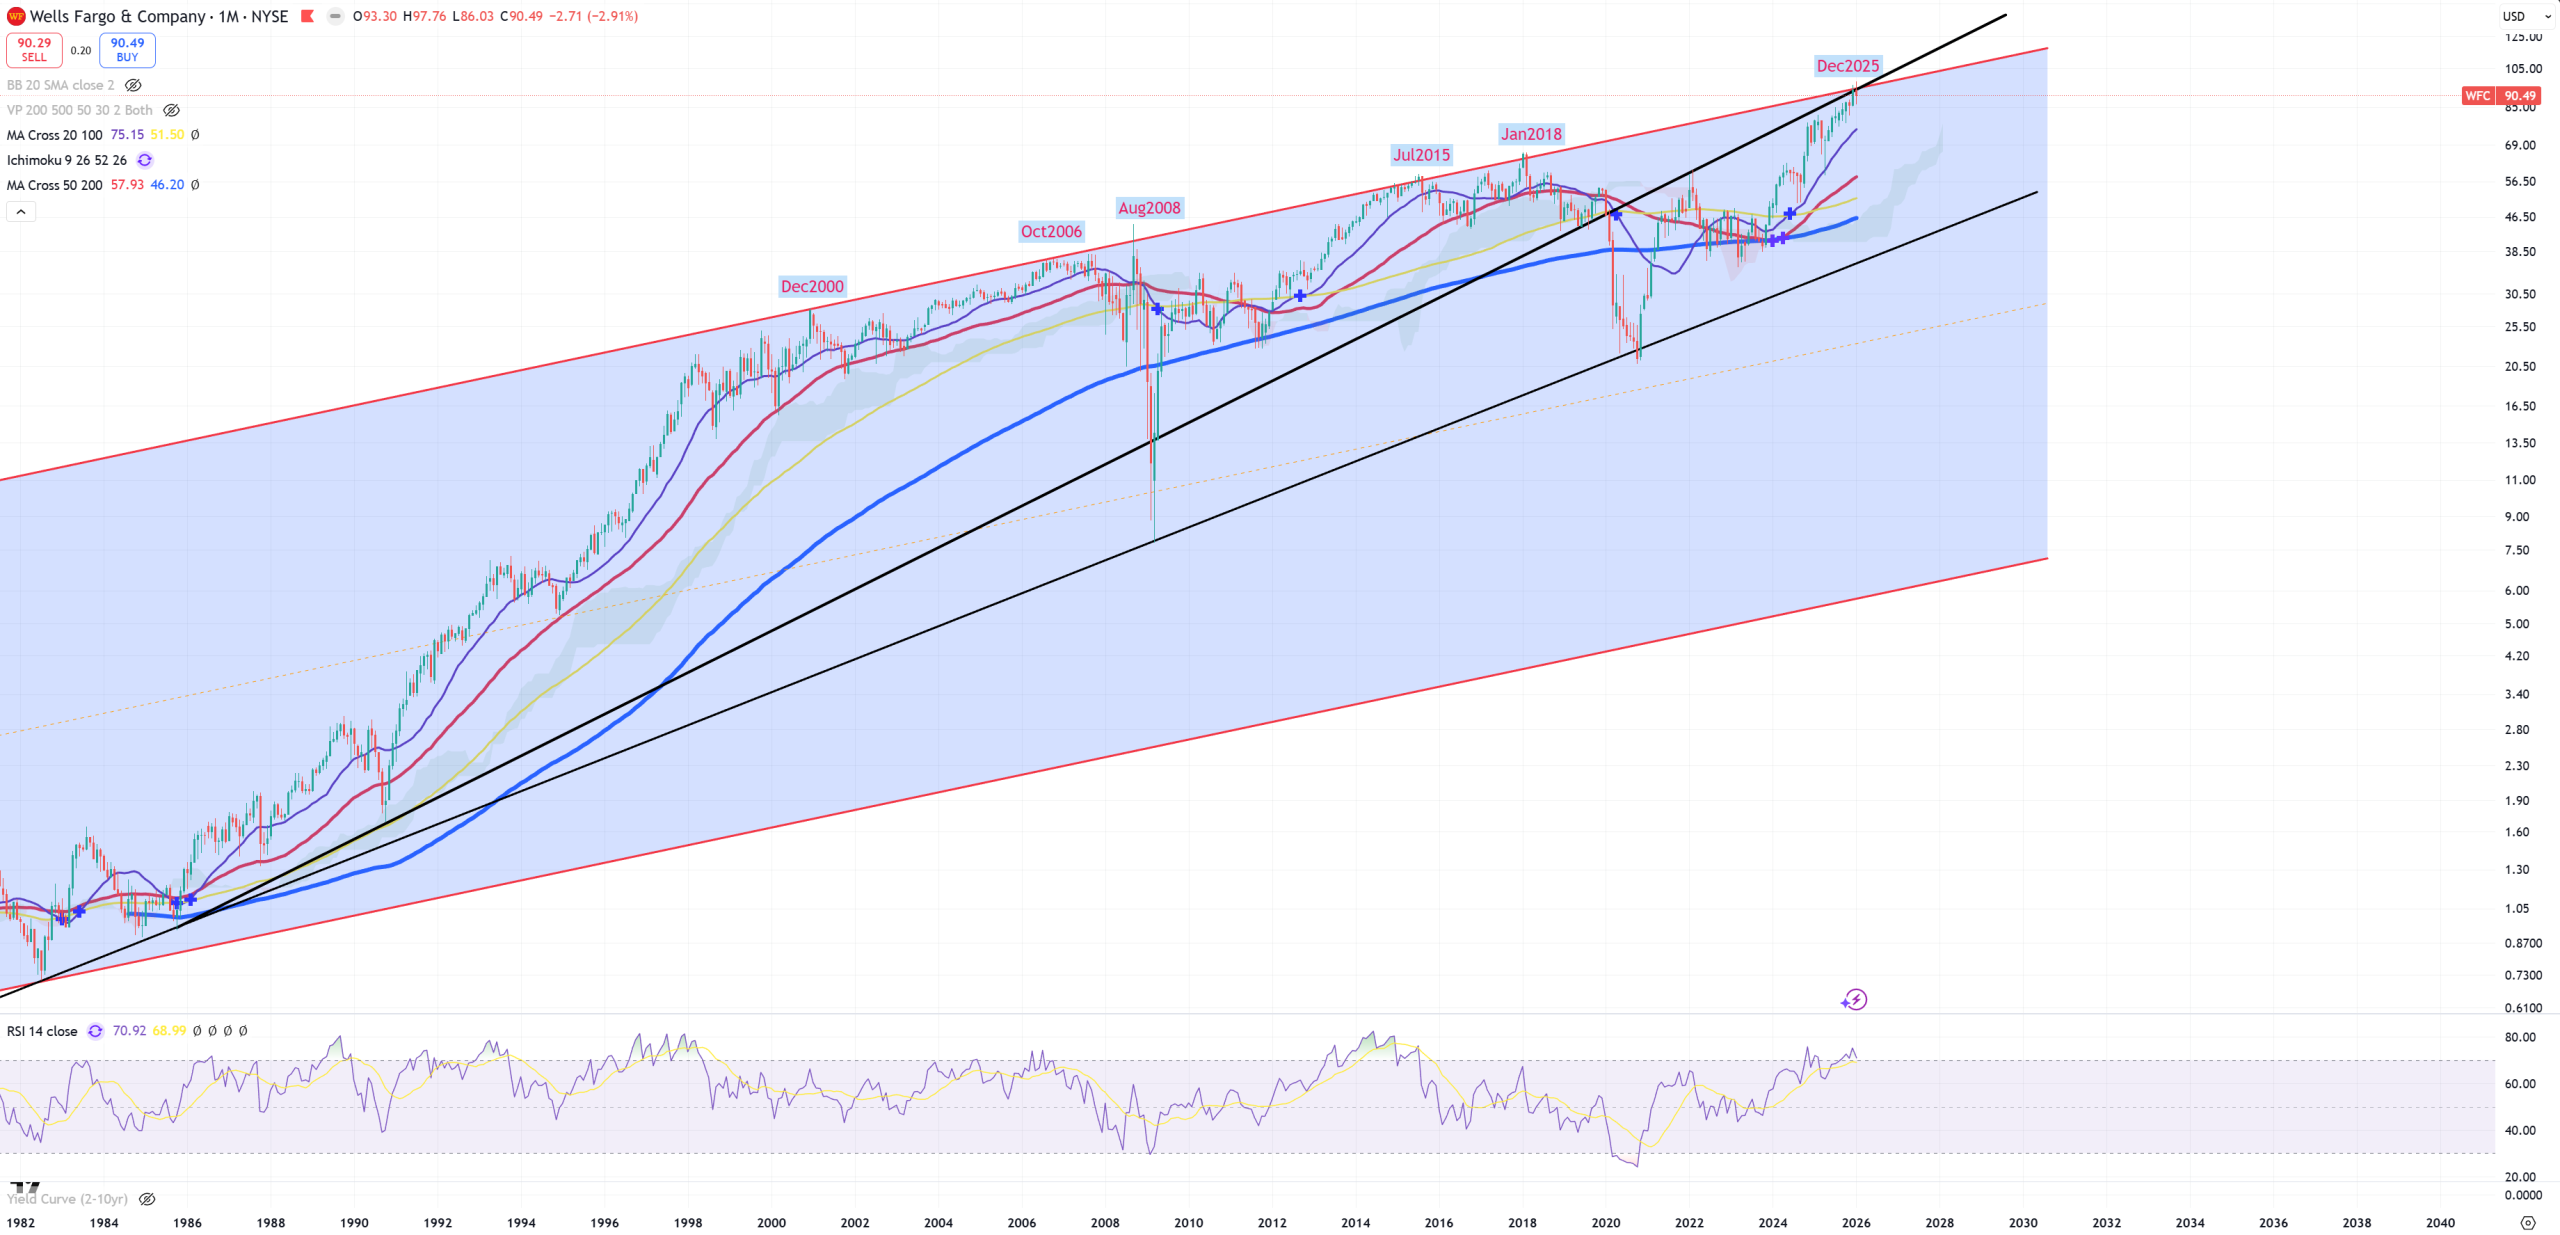
WFC – My favorite big bank due to perfect trend
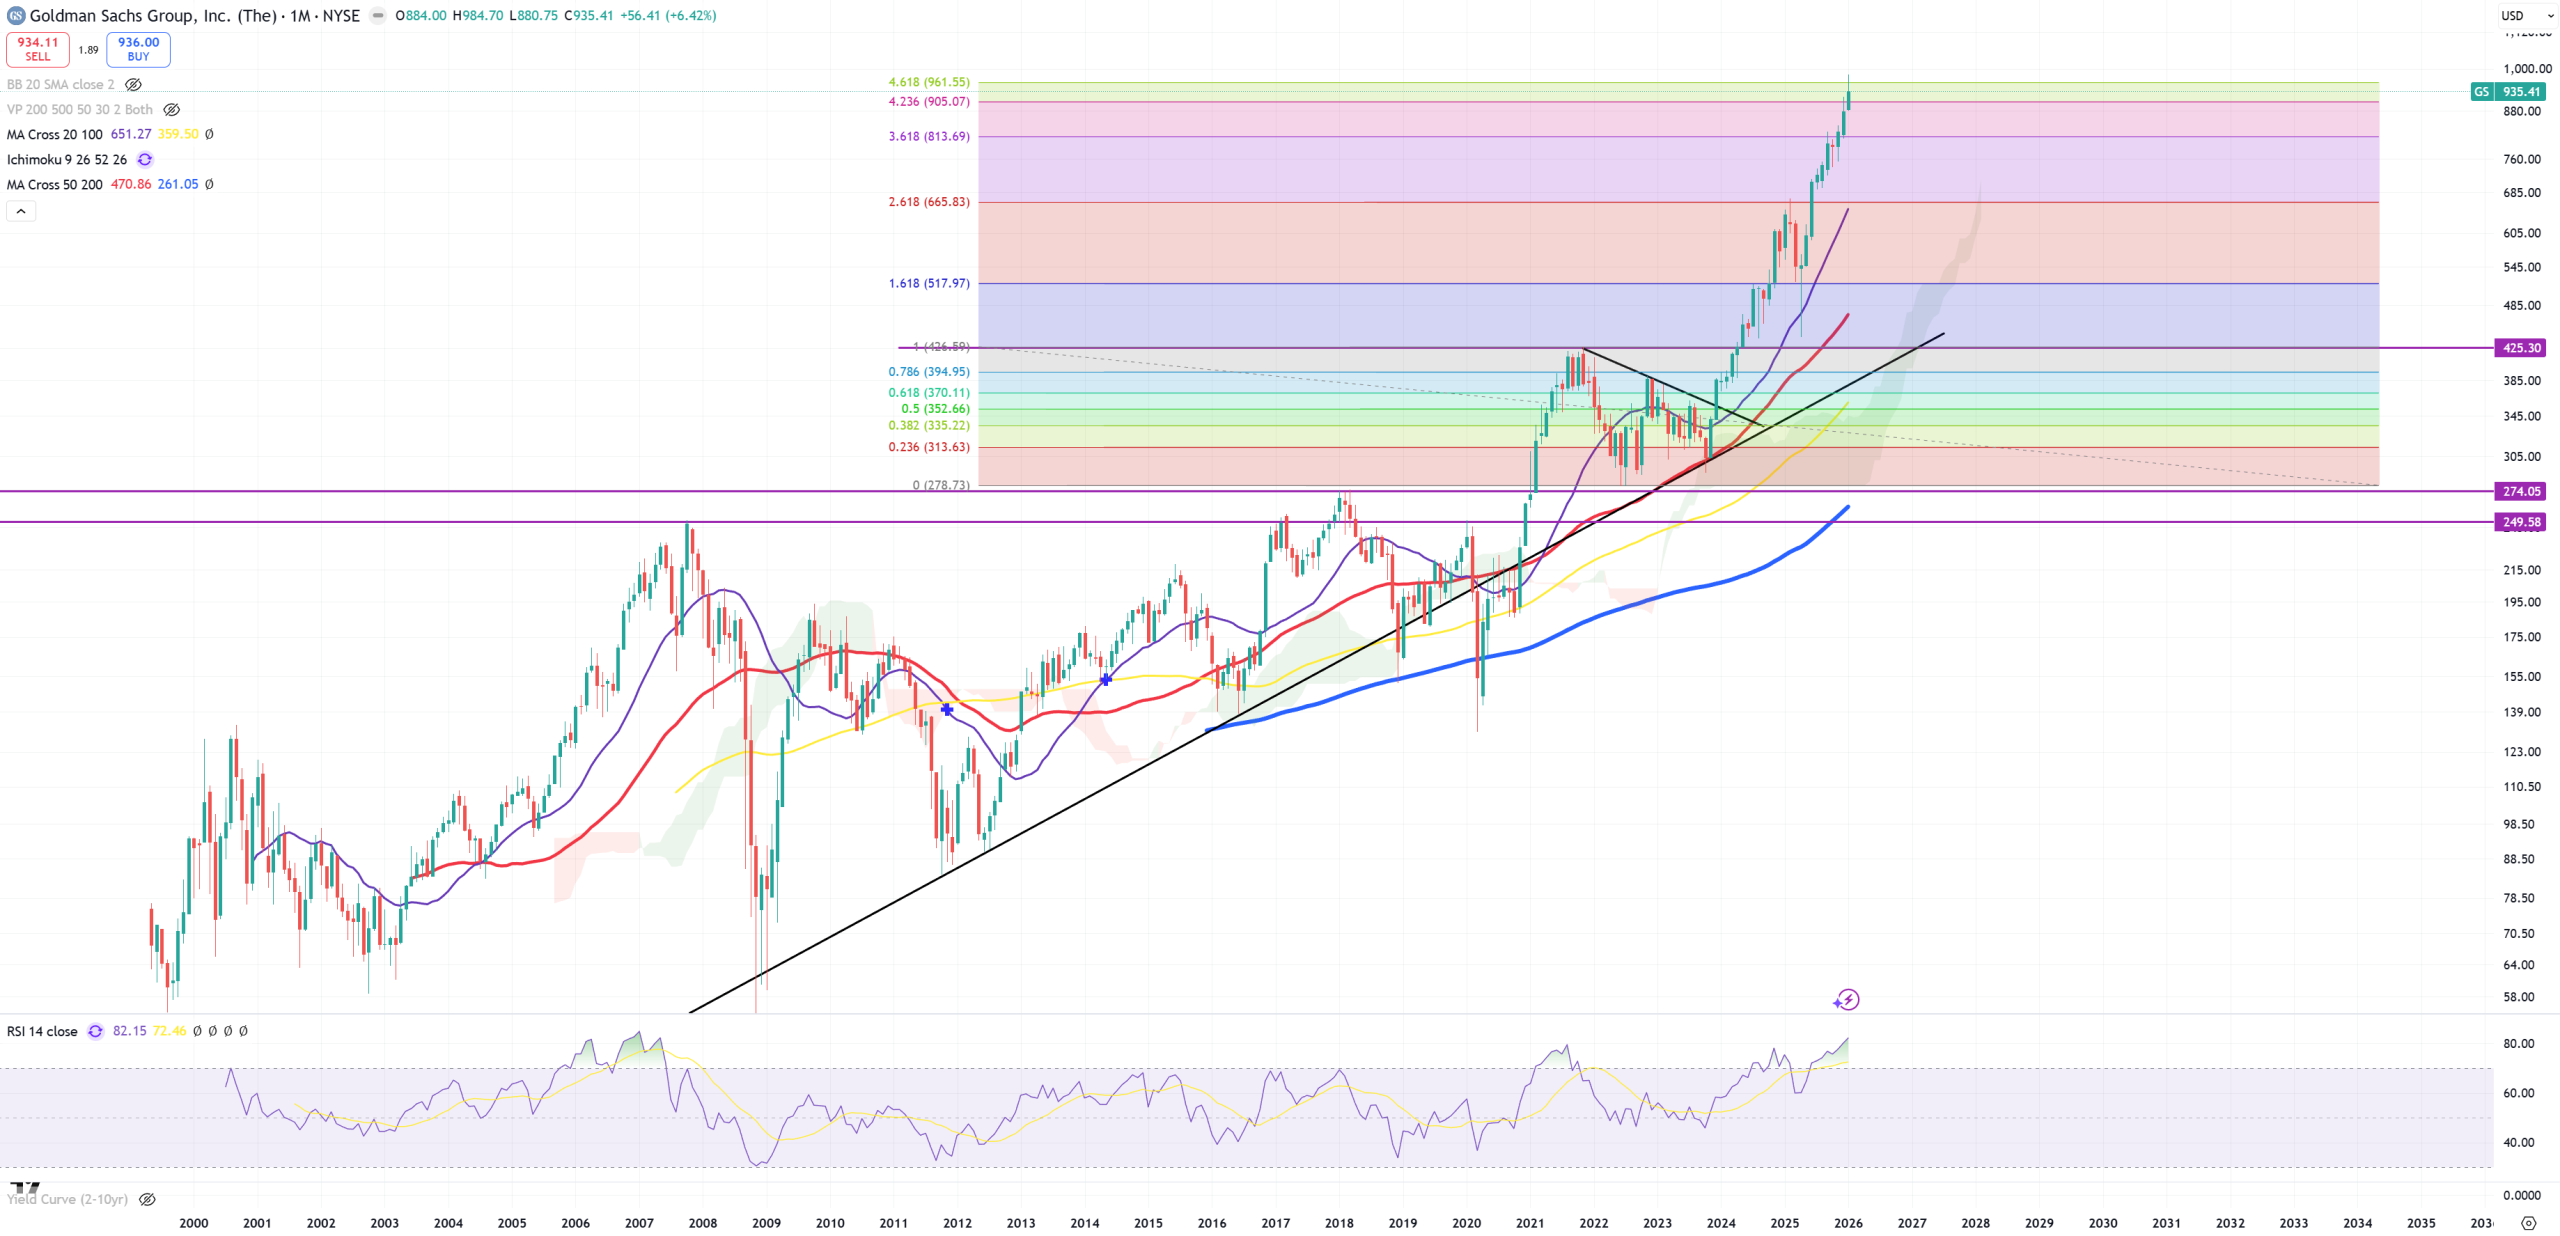
GS – Goldman Sachs is like a meme stock, just like MS or JPM.
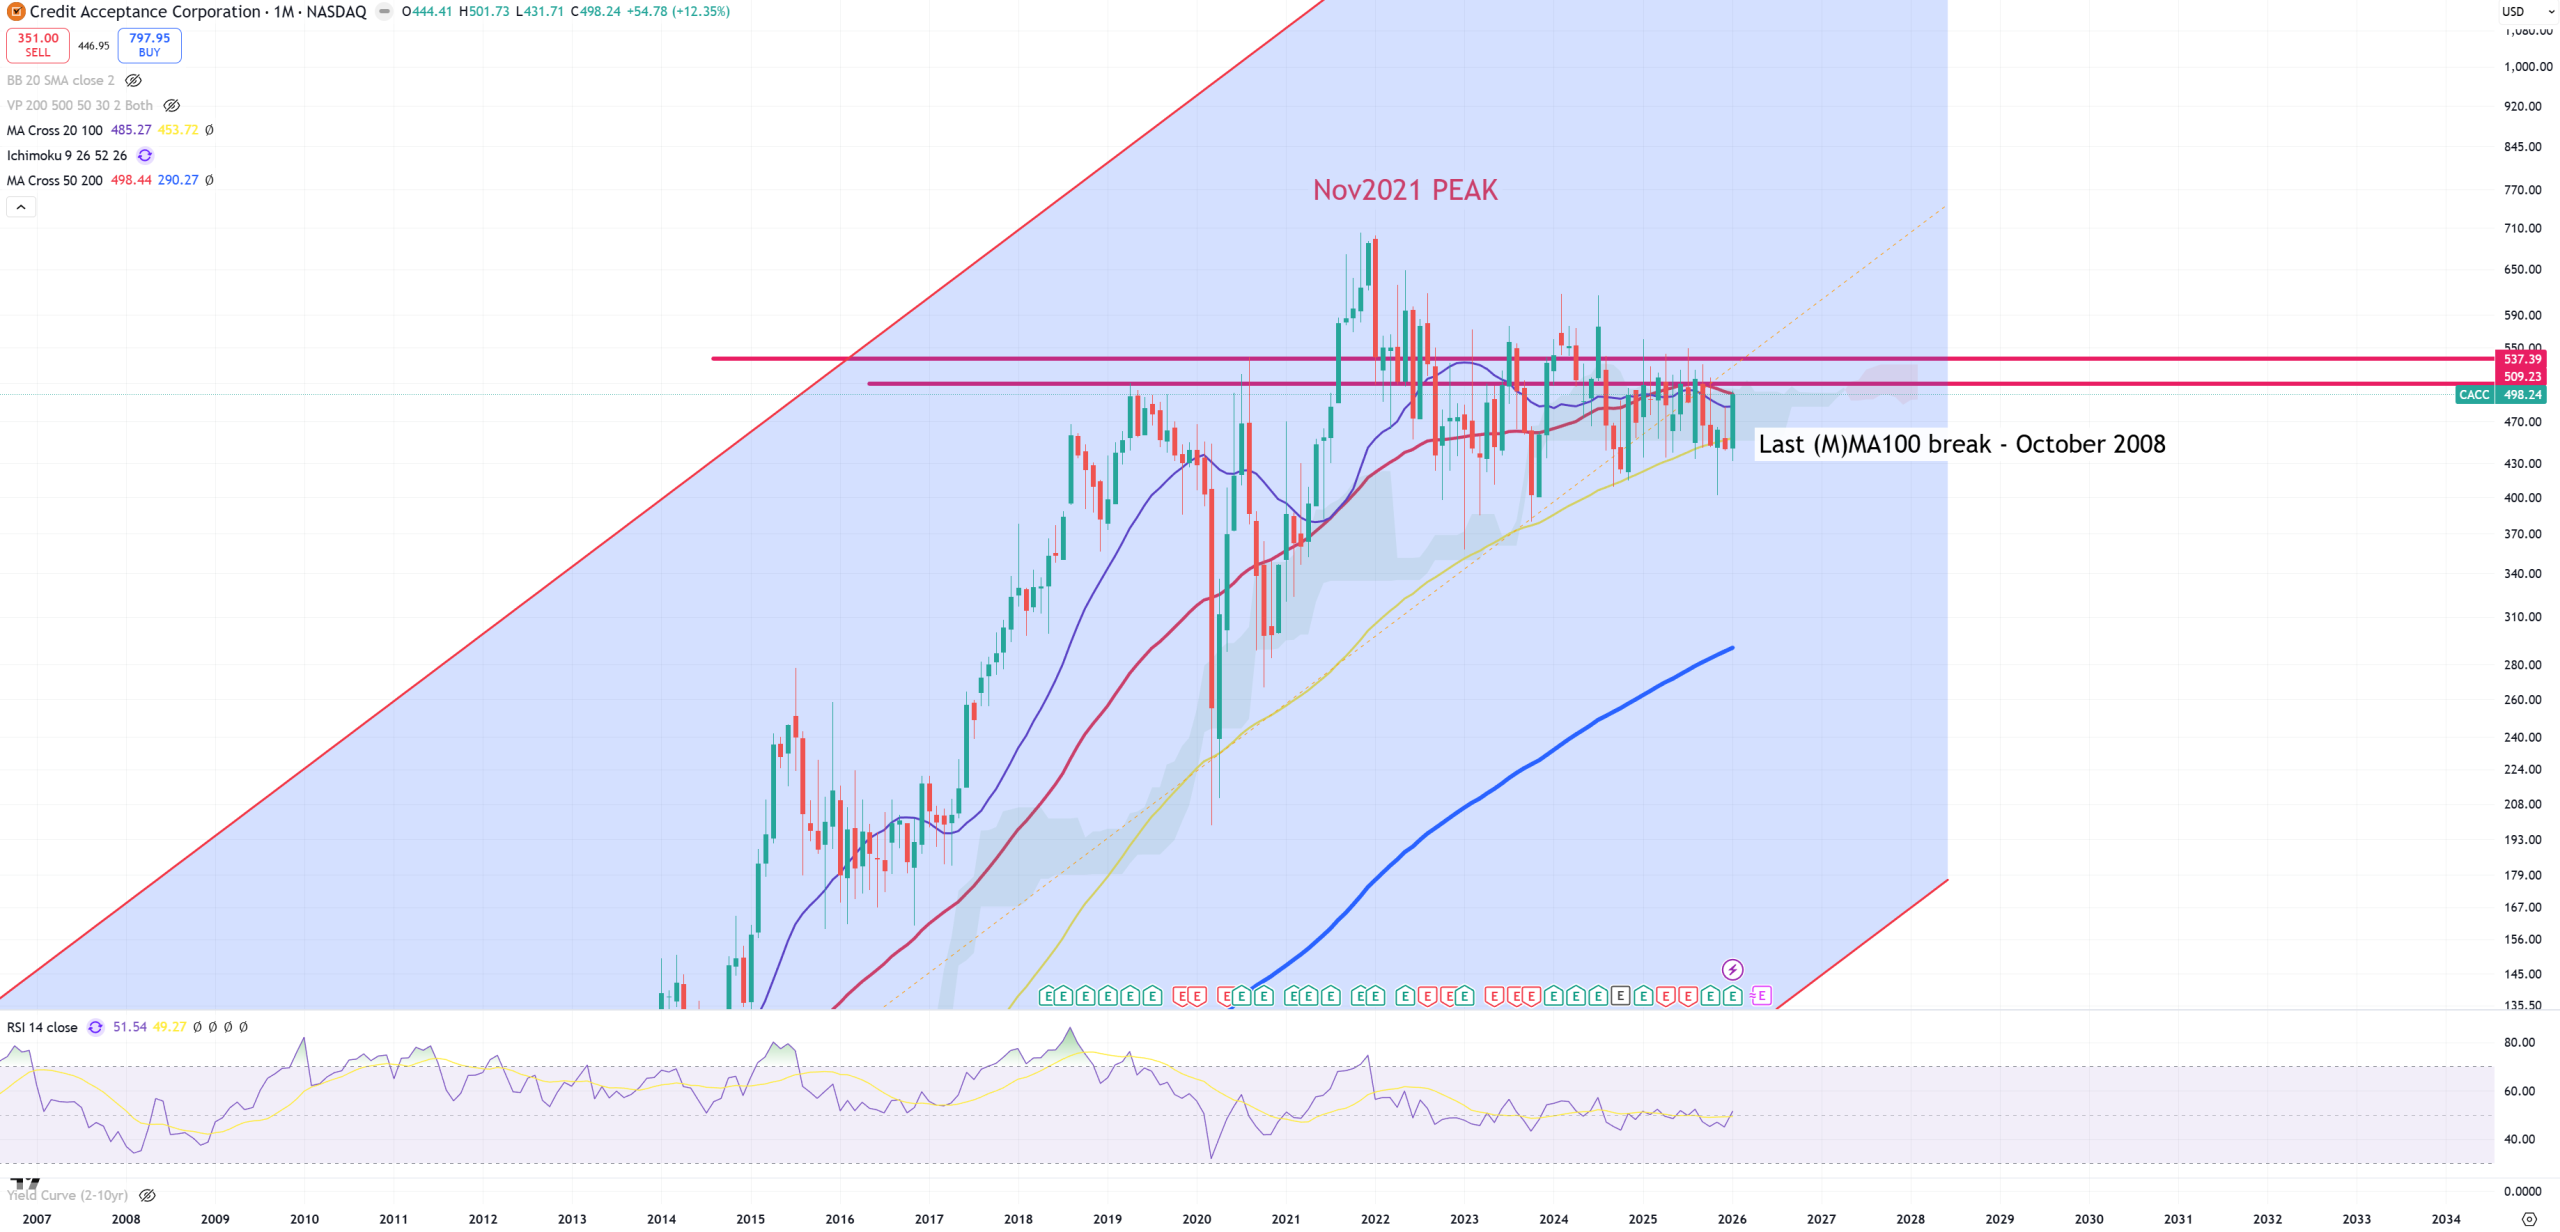
CACC – and October 2008 vibes. Last break of (M)MA100 was in that moment. Fighting still
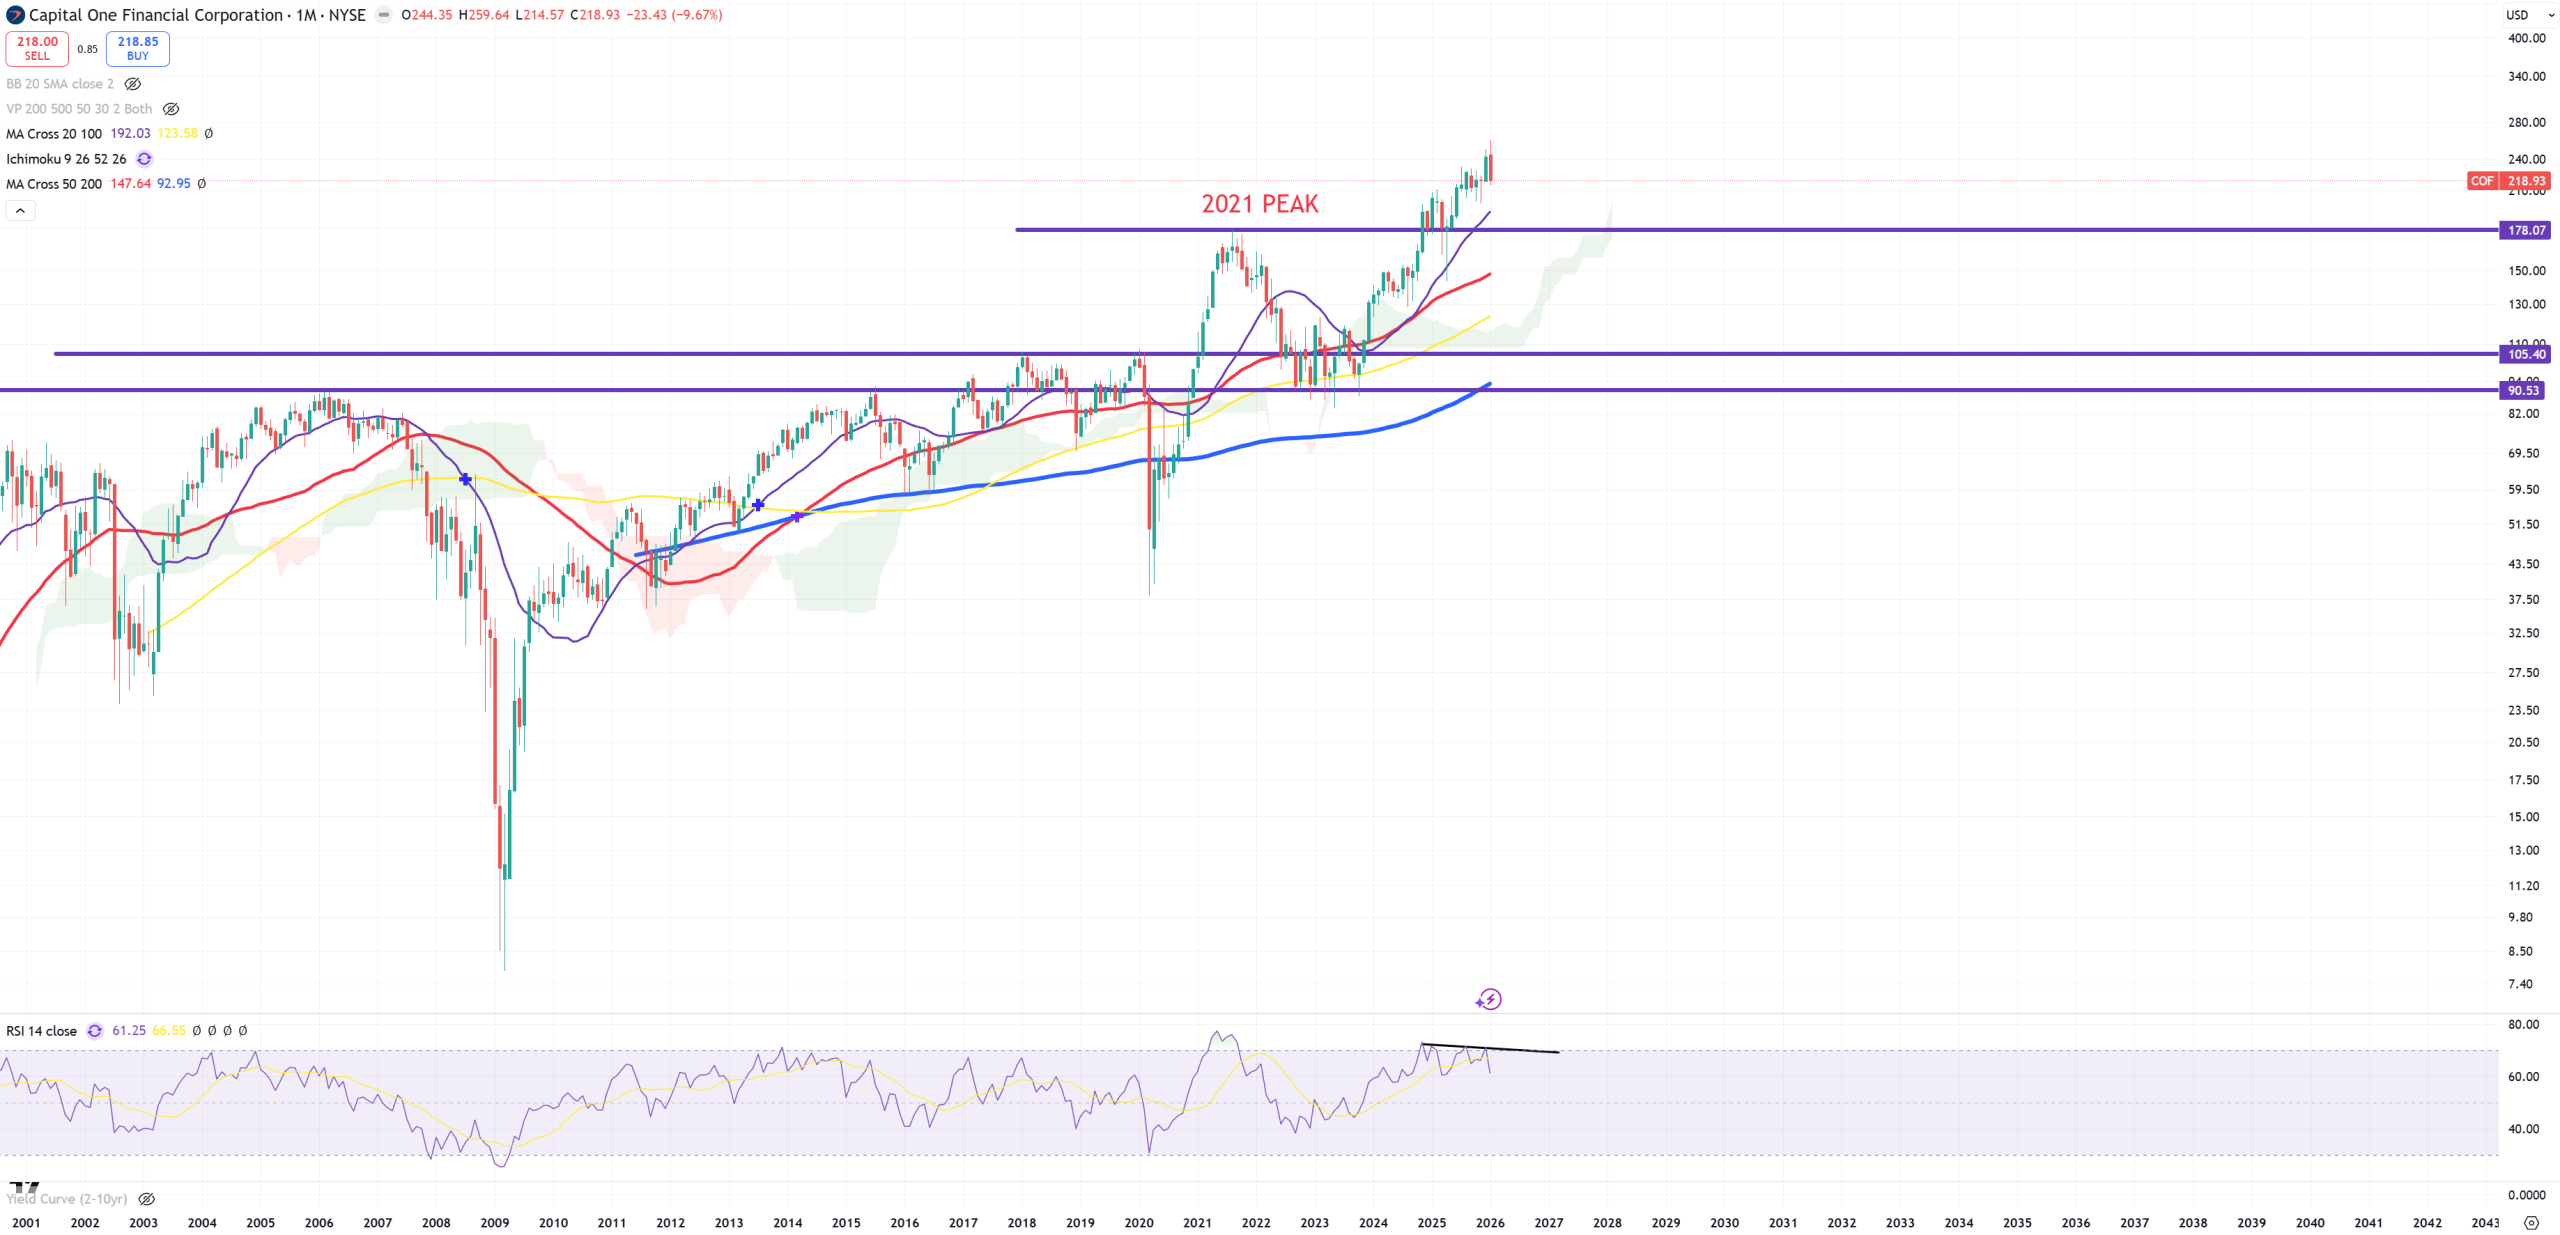
COF – I’m very interested in COF. 2021 peak so far and nothing more.