12/2025
November 30, 2025

Enormous moment approaching in cycles indicators as both SPX/GOLD and DJI/SILVER were not able to pass (3M)MA200, but for the end of a quarter we have 1 month left, so we’re going to observe today just (M) key charts
We start from the big break of (M)MA50 on US03MY – this break with inverted yield-curve or uninverting yield-curve tells us peak is around the corner or just behind us
US03MY -and they key break. I treat this indicator as the final stock market peak. Based on this break around October/November 2025 we’ll also see couple important technical setups here, so you can see how beautiful charts allign.

US02Y – the break of US03MY isn’t surprising looking on US02Y. Just look on this big negative (M)RSI divergence. Next stop is around 2-2.5%, breaking this level we’re going to ZIRP again.

SOFR – and its (M)MA50 break in Sept 2025. Bull market in yields going down has arrived.

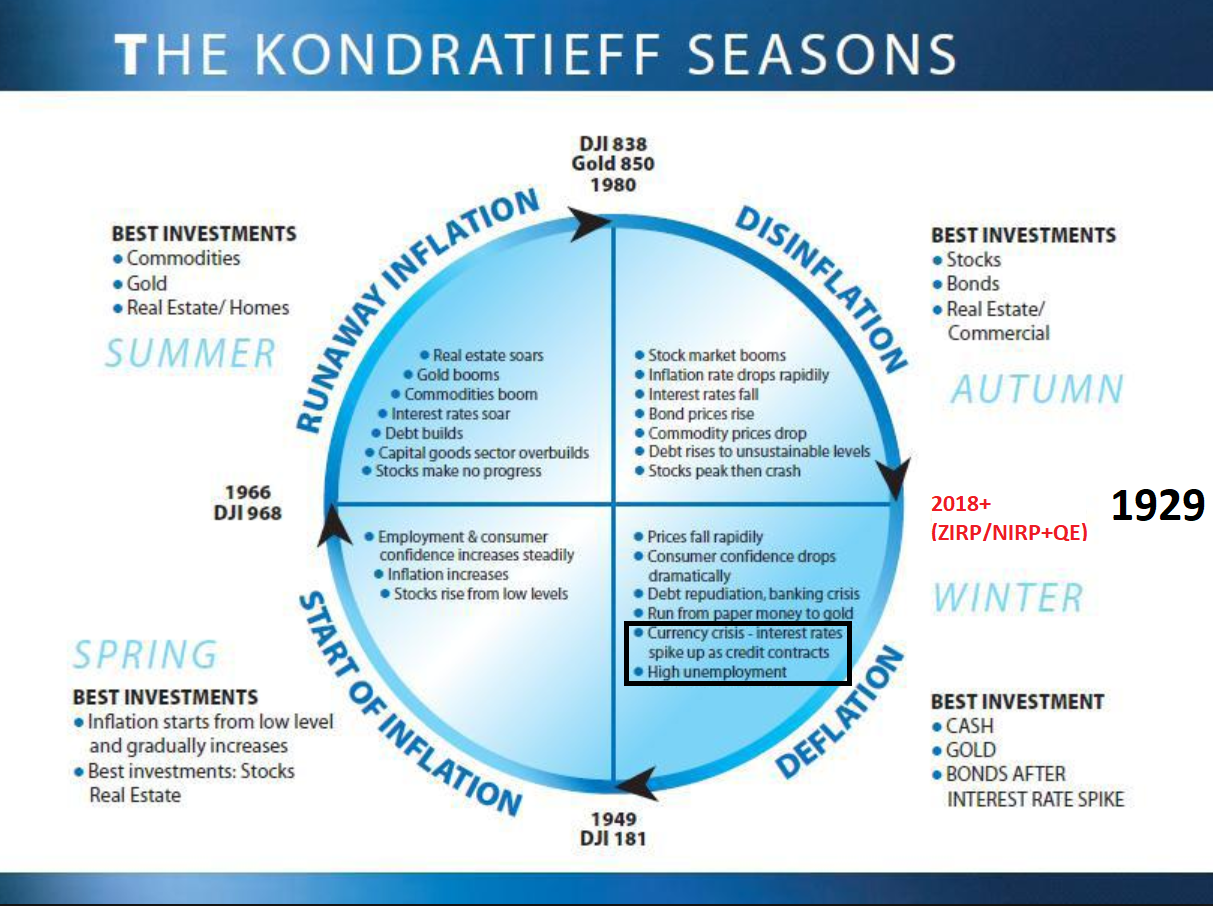
US10Y – I’m showing you on 3M view – to get better view. My conviction is that this Oct 2023 is the moment of “BONDS AFTER INTEREST RATE SPIKE”

US10Y-US03MY – my favorite spread. (M)MA100 and trend are on the same position. Not broken. Annoying +20bps and 1130days of inversion. Breaking +60bps always was “THE END”.

TLT – that’s why based on US10Y assumption Oct 2023 TLT=82$ should be an ultimate bottom. November 2025 closed not above violet (M)MA20 so far still.

HYG/TLT – my simplified version of credit stress

HYG – doesn’t look really bearish

LQD – but watch LQD, Junk HYG looks way better than investment grade LQD. No doubts we see panic on the market trying to push everything above key MAs.

MOVE – Bond Volatility has massive resistance here, but I think (3M) candles will be needed. First is (M) second is (3M) and (3M)MA50. Market needs to hold 10Y/3M flat, but that kills the economy way more powerful, let’s see how long we can do it. I don’t need to tell you MOVE down = stocks UP = AUDJPY up = USDCNH down. Currency pairs you’ll see later.


VIX – can’t forget about volatility, at some point of time this 2018 trend will return. Why 2018? Because DJI/GOLD peaked there. I think this move below 2018 trend is artificial and without logic considering DJI/GOLD 2018 peak and SPX/GOLD 2021 peak and their (3M)MA200 breaks. Somebody tries do to EVERYTHING not to tank in a heavy manner, but without a bigger plan.

SPY/TLT – while I’m not really sure this channel is valid (too short period of time), let’s stick to it. (M)MA20 holds – no change in trend still.

In general I expect that US bonds will get bid, while others slowly will get sold the same as their currencies longer term. Good example is still Japan, USDJPY UP and JP bond yields UP. If somebody would ask be what debt I’d like to hold that’ll be only US bonds, and I share this thesis since some time. TLT has not gone for 2 years from this level, but you get a nice dividend to offset this, but during next 2026-2027 I expect TLT to outperform everything including GOLD.
DXY – on (M) it’s still bullish. Trend holds and yellow (M)MA100 broken, but we can’t forget about DXY and (3M) view. Probably post US03MY I think this is the most important chart. Second chart is 3M – we see massive 96 level support including TREND + super secular golden gross when (3M)MA50 crossing up (3M)MA200. Have in mind this super secular golden cross – we’ll need it in currency analysis.


SPX – that chart is the most dissapointed so far as it’s not really sticking to others, but let’s find out if my thesis will be valid that it reality this chart forced us to make an analysis on (3M) view. Anyway 1929-2000 trend is broken. December 2025 1929-2000 trend stays on 6420 level.

RSP – Equal Weight SP500, 2021 acts as support and matching with (M)MA20.

QQQE – Nasdaq 100 Equal Weight

Key cycles indicators
DJI/GOLD is broken since “ages”. For the first time ever we see the moment where DJI/GOLD is broken below (M)MA200 & (3M)MA200 while SPX/GOLD not. DJI/GOLD is presented on 3M view because (M)MA200 was broken long time ago and (3M)MA200 is way more valuable as last break we had in 1Q08 :

SPX/GOLD – also 3M view. We need end of December to see if this (3M)MA200 was broken or not. Last break 1Q08. While DJI/GOLD broke (3M)MA200 in 1Q25, you clearly see we have a chance to break SPX/GOLD in 4Q25. First chart is 3M second M. Finally (M)MA200 from second chart is broken.


NDQ/GOLD – it’s a bit different story here, but red (3M)MA50 is support. Also December 2025 will show us a path if this (3M)MA will be broken opening path for longer term plunge of this ratio

DJI/SILVER – I’m adding this indicator because of Silver explosive move. Do we have (3M)MA200 break? We will find out in December 2025. Last break of this MA happened during GFC in 2008, previous in 1973 crisis. You see how rare this break is. Not showing M view because (M)MA200 was broken in September 2025 and (3M) view in this indicator is way more important.

GOLD & SILVER market – we all know cycle indicators DJI/GOLD breaking down telling us GOLD & SILVER will outperform stocks market in a secular manner.
XAUUSD – GOLD it looks like parabolic run has just started. (M)RSI is 92 – that’s huge, but it can stay in a big value during parabolic runs. In 1980 distance from peak to red (M)MA50 was -75% (definition of a tulip bubble). Today just -44% – not much. To get back to -75% gold needs to jump fast to 10000$.

XAGUSD – SILVER – looks even more powerful than gold, this 1980 level was finally broken & retested. Distance to (M)MA50 in 1980 was -85% – that’s like OKLO or PLTR today. If somebody tells you about SILVER bubble just show him DJI/SILVER. In 1980 we hit 15 today it’s 850. Considering this channel is valid we can expect run towards 250-300$.

GDX – we can’t forget about GDX. Initially long time ago I thought GDX will manage to drop to double-bottom from 2015 level, but this break above blue (M)MA200 and red (M)MA50 invalidated this thesis. No comment is needed here.

Currency collapse progressing and some bond markets are collapsing too. Remember that DXY last support level was 96 how technicals on currencies match with this level.
USDJPY – we need to start from USDJPY and blue (3M)MA200. This level around 140 is an ultimate border to consider JPY bullish. Failure to take this level still indicates USDJPY is going UP. Can we say DXY=96 means USDJPY (3M)MA200 = 140? probably

JP40Y – breaks and going higher. It looks like Japanese Yields = GOLD prices

USDBRL – this (M)MA50 holds so far as it should

USDPLN – last level 3.60 and (M)MA200

USDKRW – no comment needed

USDTWD – returning probably from a trap. Again above (M)MA50 & (M)MA200, and again approaching to its 40Ys TREND. First break turned out to be a trap.

USDINR – India is officially “f**ked”

USDCAD – key level is 1.465, so far above all key (M)MAs and violet (M)MA20 fighting with key resistance 1.40.

GBPUSD – Pound looks very strange. It broke super long term support on 1.40, but also broke black trend line and is above all key (M)MAs. This super support 1.40 now matches with blue (M)MA200. Hard to say what’s going with it, but path is like 1.40 retest.

USDCHF

USDCNH – Yuan has big support around 7.00. Because AUDUSD is a derivative of USDCNH and AUDJPY tells us when stocks going up when down, Yuan is the KEY to this puzzles.

AUDJPY – risk on/off pair. (M)MA50 hold now retest to the trend. AUDJPY = stocks up, AUDJPY = stocks down.

AUDUSD – above (M)MA20, below (M)MA50. Will be hard to break this 2009 lows support, but I bet we’ll break it. Next target after a break is 0.45.

Just different well known stocks which needs attention. Later we see currencies, sector ETFs, country ETFs.
LVMH – Louis Vuitton – it wanted to back from below (M)MA100 to retest (M)MA50 from its bottom AGAIN.

RICK – RCI Hospitality – strippers clubs and below (M)MA200

TGT – Target and below (M)MA200

NKE – Nike and below (M)MA200

LULU – fights to save (M)MA200

OWL – Blue Owl – private credit and AI sponsor. Below (M)MA50

BX – BlackStone – OWL & BX together show us the path

CRM – closed below (M)MA50

CVNA – Carvana, broke (M)MA50 and next level August 2021 retest. Make it or break it

ADBE – Adobe blue (M)MA200 magnet which has never been broken

CROX – Crox and final support + Yellow (M)MA100

BA – Boeing ends below (M)MA50, this company shows how many times we have avoided bear market not breaking (M)MA200. I like to say Boeing and its (M)MA200 loves to confirm technical bear market in stocks in general.

DIS – Disney below (M)MA50

SBUX – Starbucks – retesting from the bottom (M)MA100.

MCD – McDonalds – fight for this 300$

CHH – Choice Hotels – double-top here and trashed below key levels

CMG – Chipotle, trying to get (M)MA100 support

KO – Coca Cola

PEP – Pepsi Cola looks way different than KO, somebody is wrong KO or PEP.

HON – HoneyWell fights for (M)MA50 for a long time

CL – Colgate – below (M)MA50 and below 2009 trend

MOS – Mosaic – big moment

Country ETFs
FXI – We have to start from China. My last target to consider this bounce as bear market bounce with 2021 peak is 42$ and that’s retest to 2009-2016-2020 TREND. Small overshooting blue (M)MA200 and let’s see how it’s going to play at the end of December 2025 to close 3M candles.

Shanghai Composite – China tries everything to escape the death-trap. Just like FXI = 42$ is the last moment, Shanghai Composite has its last moment too :

EEM – Emerging Markets hits 3xTOP level

SPY/EEM – maybe like this?

EFA – Developed Markets excluding US, weird – massive break > 07 peak.

INDA – India doesn’t want to give up despite massive USDINR break

EWY – South Korea – I don’t believe in breaking 2021 peaks in general. If you don’t remember what happened in 2021 = SPX/GOLD peaked. Somebody bought some time here around 1Q25 to squeeze it higher.

VGK – Europe – and DOUBLE-TOP hit

EWJ – Japan – 2021 peak was broken

EWG – Germany is in economic free fall while EWG is at ATHs. Blow-off top and I don’t believe in breaking this 2007-2018-2021 PEAK level.

EWZ – Brazil. The moment USDBRL finds support on (M)MA50, EWZ finds resistance on (M)MA100 – typical bull/bear market trap level

Commodities other than GOLD & SILVER
DBA – Agruculture ETN – (M)MA20 holds – looks like new wave of food inflation is about to kick in. Long term secular golden cross has arrived and 2009 lows = big support, but negative divergence progressing.

DBC – retesting from the bottom (M)MA50, fighting hard not to drop below (M)MA200

OIL – nobody should be surprised that oil drops if you see US03MY breaks and US10Y retest to 85Y trend (first charts in this report). My assumption is that fair value of oil is between 10$-40$ everything above is caused by credit cycle, but credit cycle won’t last forever. You see we are now back below red trend line – pointing us that last inflationary spike was “engineered artificial spike”.

CRB/SPX – CRB Index/SPX shows you inflationary spikes levels.

COPPER – On (M) holds (M)MA50 and now trying to jump above 2021-2022-2024-2025 resistance. USDCNH down = Copper UP

PLATINUM – I bet we’re going to see here 2300$ and 2008 peak level

Financial Sector
KBE – Banking Index – no need to comment, but above all (M)MAs

KRE – Regional Banks – big support around 59$

JEF – Jefferies – the symbol of First Brand collapse – no I don’t think this break above 2008 level is valid. Now it’s (M)MA20 rejection, next plunge will wipe out this 2008 support.

WAL – Another example of KRE bank and its setup

C – Citi – while others like JPM or GS are going parabolic meme GME style, C has its last retest level – yes this is also shocking this 1993-2018-[…] level was broken.

CACC – below (M)MA100

COF – my #1 to watch in junk credit lender.

Energy Sector
XLE – Energy : 3.5Ys banging to Jun2008 resistance. This is really great example of 10Y/3M inversion. While 10Y/3M doesn’t want to uninvert since May 2022, XLE doesn’t want to drop.

XOM – Exxon

CVX – Chevron – below (M)MA50 again. I bet this break above 2014-2018 level is a destribution moment. Trend 1974 broken and retested twice. CVX has avoided (M)MA200 break so far.

Real Estate Sector
DJUSRE – Real Estate sector fights to survive with massive resistance

XHB – Sector ETF – fight for (M)MA20

LEN – Lennar and its (M)MA50 matches 2021 peak which market will be defending

TOL – (M)MA20 defended, looks way better than LEN

HD – Home Depot – 2009 trend broken and (M)MA50 as a support

LOW – Lowe – the same as HD

BLDR – Builders FirstSource below (M)MA50

Transport – looks really bad
DJT – Dow Jones Transportation.

JBHT – depsite first true 2009 trend break, retest (M)MA100 from the bottom – magic save has arrived and now (M)MA50 retest has been hit.

UPS – in case you missed, it’s on 2005 level.

AAL – American Airlines

DAL – Delta

TECH & SOX – tech and SOX should not be put together, but it’s mostly bullish and no sense to split it. I’ll try to point some not bullish setups here on certain stocks, or “on the edge”.
XLK – Tech – not even touching (M)MA20, nothing bearish here

SMH – Semiconductors. Correction to (M)MA20 and another FIBO level, also nothing bearish here

SOX/SPX – are we breaking or not?

NFLX – Netflix looks weird

TSLA – let’s see if this 2021 peak small break is a trap or not

TXN – that one looks really bad

MSFT – will it return to channel?

NVDA – (M)MA20 is on a key 155$ level. 2021 level = 35$. Distance from current level to (M)MA50 is -66% and we are approaching to tulip bubble category.

AMD – so far above 1980-2000 trend break was very short lived.

META – first defence (M)MA20 holds

ASML – to show you ASML I need to show you (D) chart first, so you can see a gap. On (M) we see a defence from (M)MA50 break so far.


QCOM – QualComm, (M)MA20 saved but below 2021 peak

SMCI – my old bet unchanged – dead cat bounce building with (M)MA20 resistance. Break of (M)MA50 will get us towards 4$.

CRWV – Not a long history but this 0.618 is the most typical dead-cat bounce level

MSI – Motorola – (M)MA20 broken. Look how 1970 TREND matches with 2000 peak. For sure it’ll be big support here and bounce.

ARKK – I put it in TECH – this is another shocker that it broke (M)MA50 and final retest to trend is around 102-103$.

PLTR – Palantir – considering this 200$+ peak distance to (M)MA50 is almost -80% that’s tulip bubble on steroids.

Crypto world – looks like it breaks for the first time ever. No despite -80% drops in BTC we have not experienced true technical bear market in crypto. Just corrections.
GOLD/BTC – my bet if red (M)MA50 will be broken = bear market in crypto. We see this rotation since of course 2021.

SPX/BTC – October 2025 we have 10Ys trend break and jump > (M)MA20. It means SPX will outperform BTC. What happened in October 2025? US03MY broke (M)MA50.

MSTR – we can’t even start talking about BTC without MSTR – as I was expecting break > 2000 peak 333$ was a big massive bull trap. Looks like 130$ is next level or if we try to get lower that’s ~70$ for a first true bear market rally like +100%.

BTC – as expected, BTC saved (M)MA20. Correlation between MSTR & BTC seems to be gone making big pressure on MSTR. I don’t believe MSTR will manage to hold its BTC. I bet once Saylor will be removed like during 2000 collapse and forced to sell his BTC (like all other BTC Treasury Companies) it’ll be a bottom. Next true support is 2021 level = 70k$ – that level also matches with red (M)MA50 – so technical bear market break.

ETH – closes below (M)MA20, double top and of course 2021 level.

BNB – Binance Coin – I can’t believe it broke this resistance, but let’s see how it’ll end on 3M, so end of december

SOL – Solana – giving back (M)MA20

Sector ETFs
IWM – Small Caps – not really a sector, but decided to put it here, 2021 level is now support.

XLV – Healthcare – market saved it from (M)MA50 technical break

UNH – but UNH still looks bad just (M)MA100 retest. Very hard to break blue (M)MA200 for the first time EVER.

XLU – Utilities going parabolic, they are always last.

XLY – Consumer Discretionary

XLP – Consumer Staples – (M)MA50 holds and 2009 trend

COST – Costco below (M)MA20

XLI – Industrials, super bullish so far.

XLB – Materials

XLC – Communications
