Mastering technical turn of the market
October 28, 2025

In this topic I’d like to share my personal view, how to identify big turns on the economy and the market. This cycle is super weird, but I’ve observed same behavior from key assets and I still try to master this thesis, but I can introduce you some key points and basic technicals. I’m trying to create this thesis as short as possible.
First of all is “THE CYCLE” turn.
“THE CYCLE” turn has nothing to do with stock market, but it mostly peaks key macro data.
“THE CYCLE” contains of two charts : SPX/GOLD and DJI/GOLD.
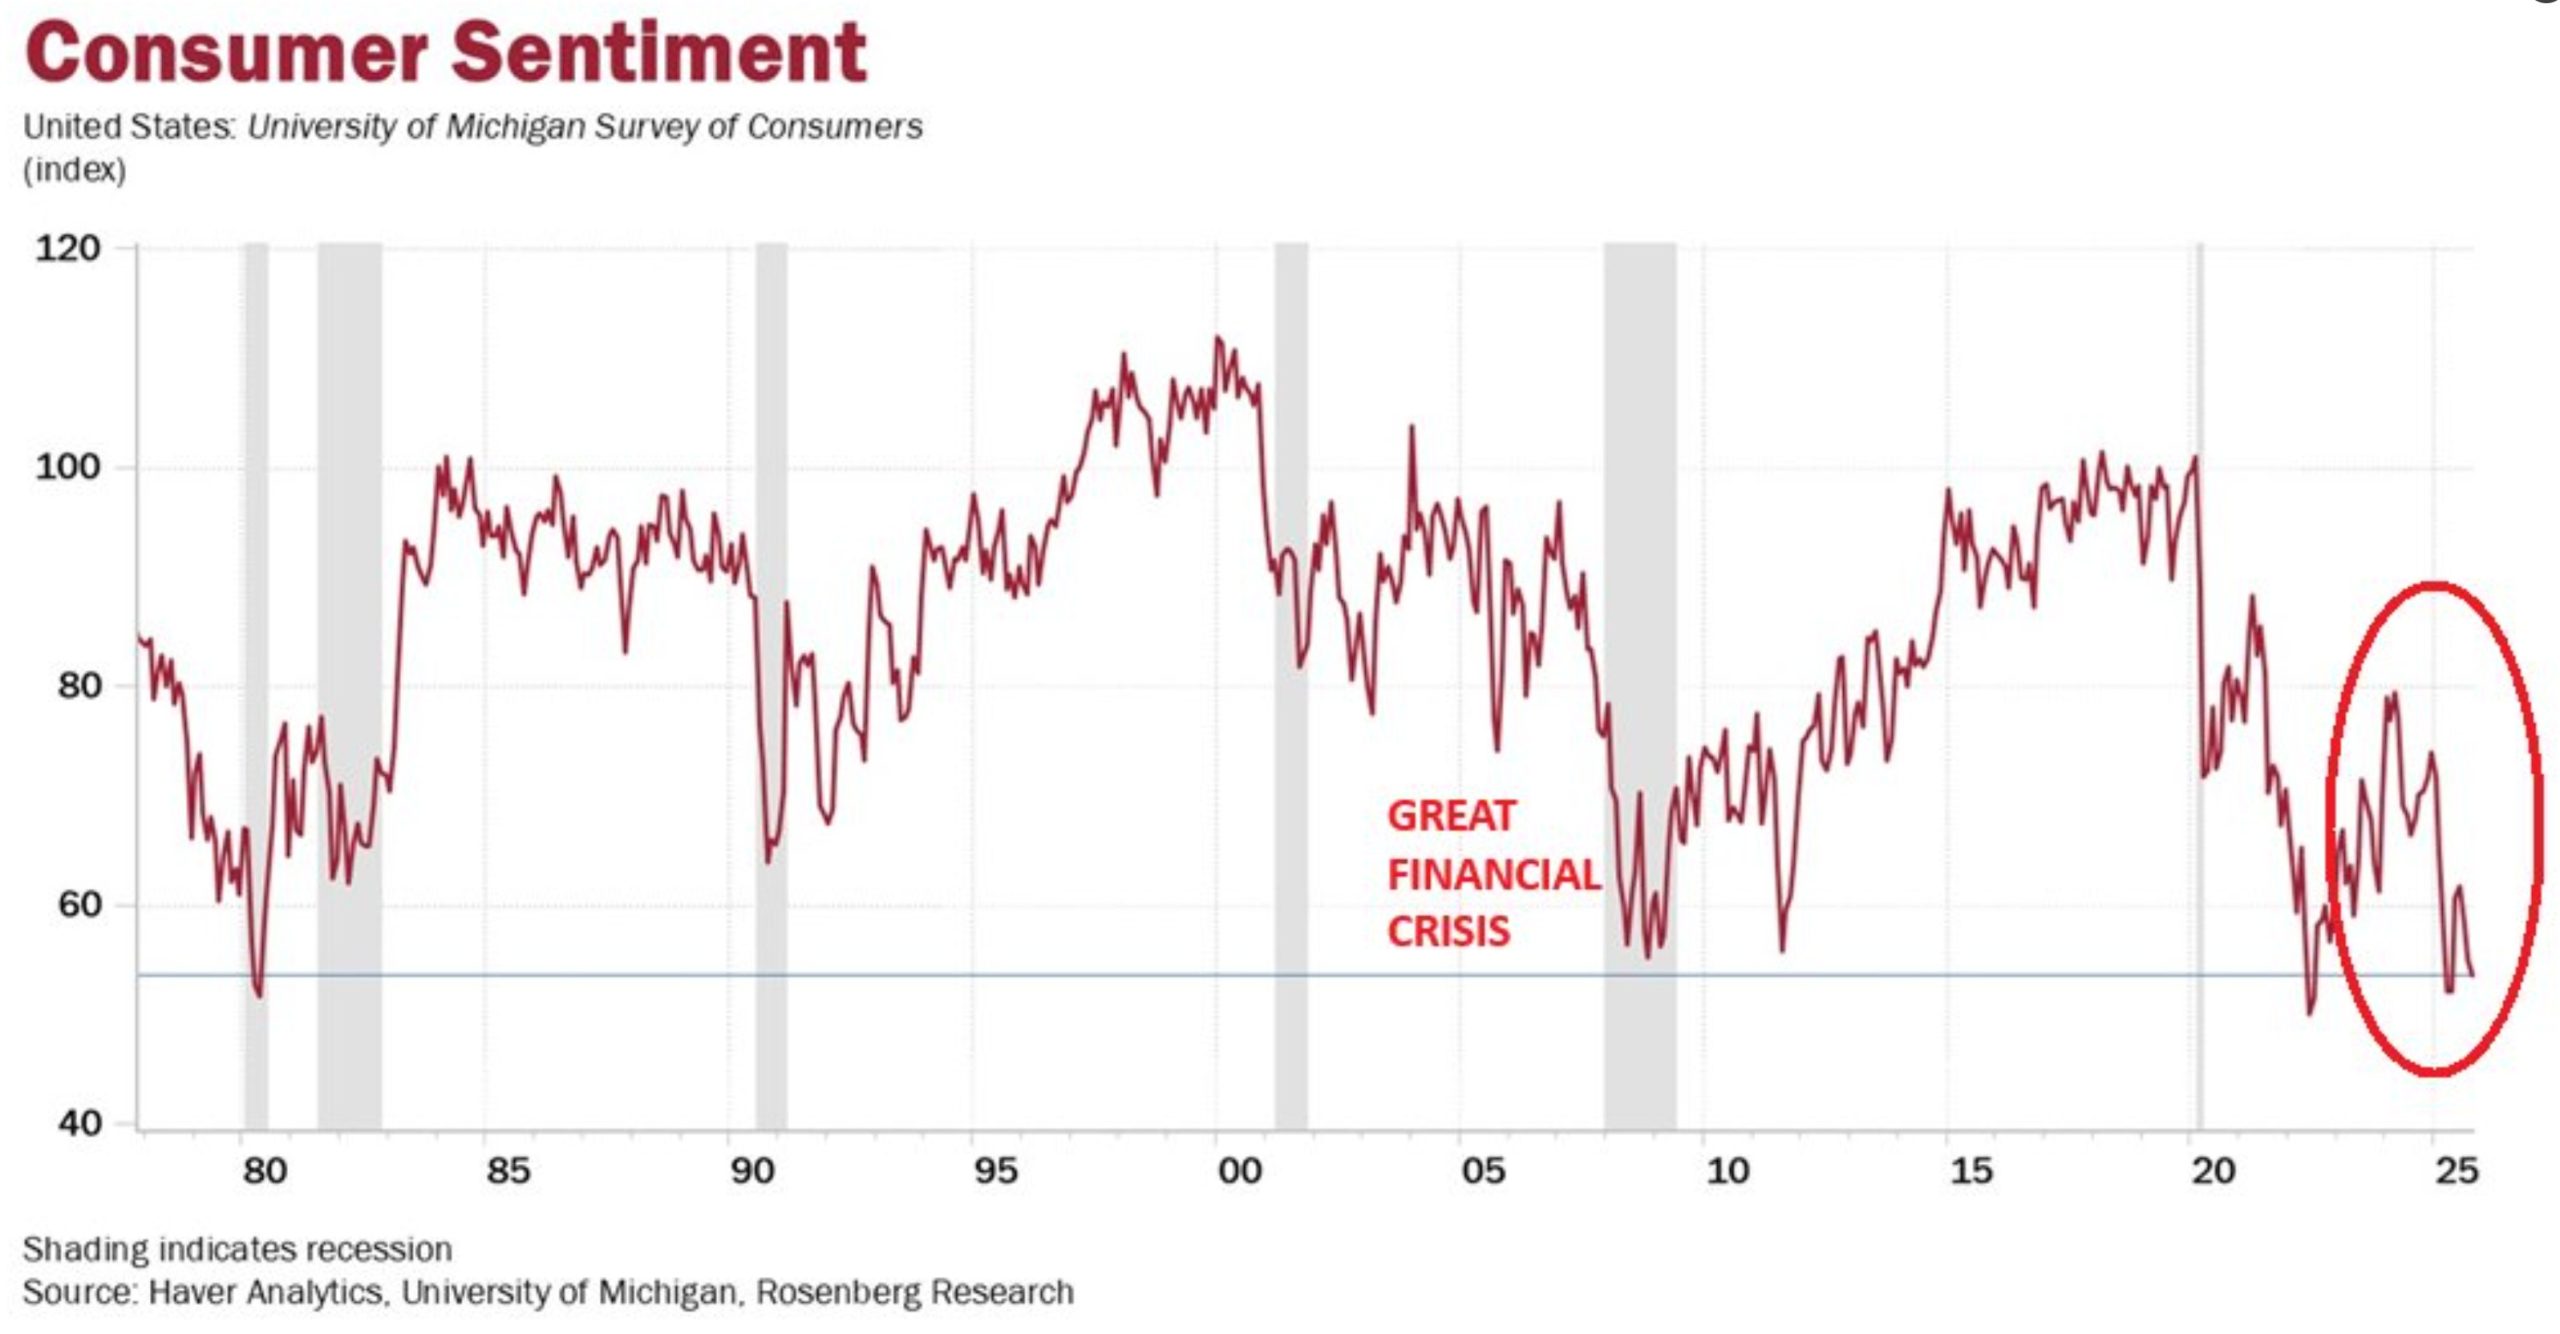
Below you can find two macro charts : Consumer sentiment, which has the highest value in 2018, but we can say it’s mostly const between 2018-2020.
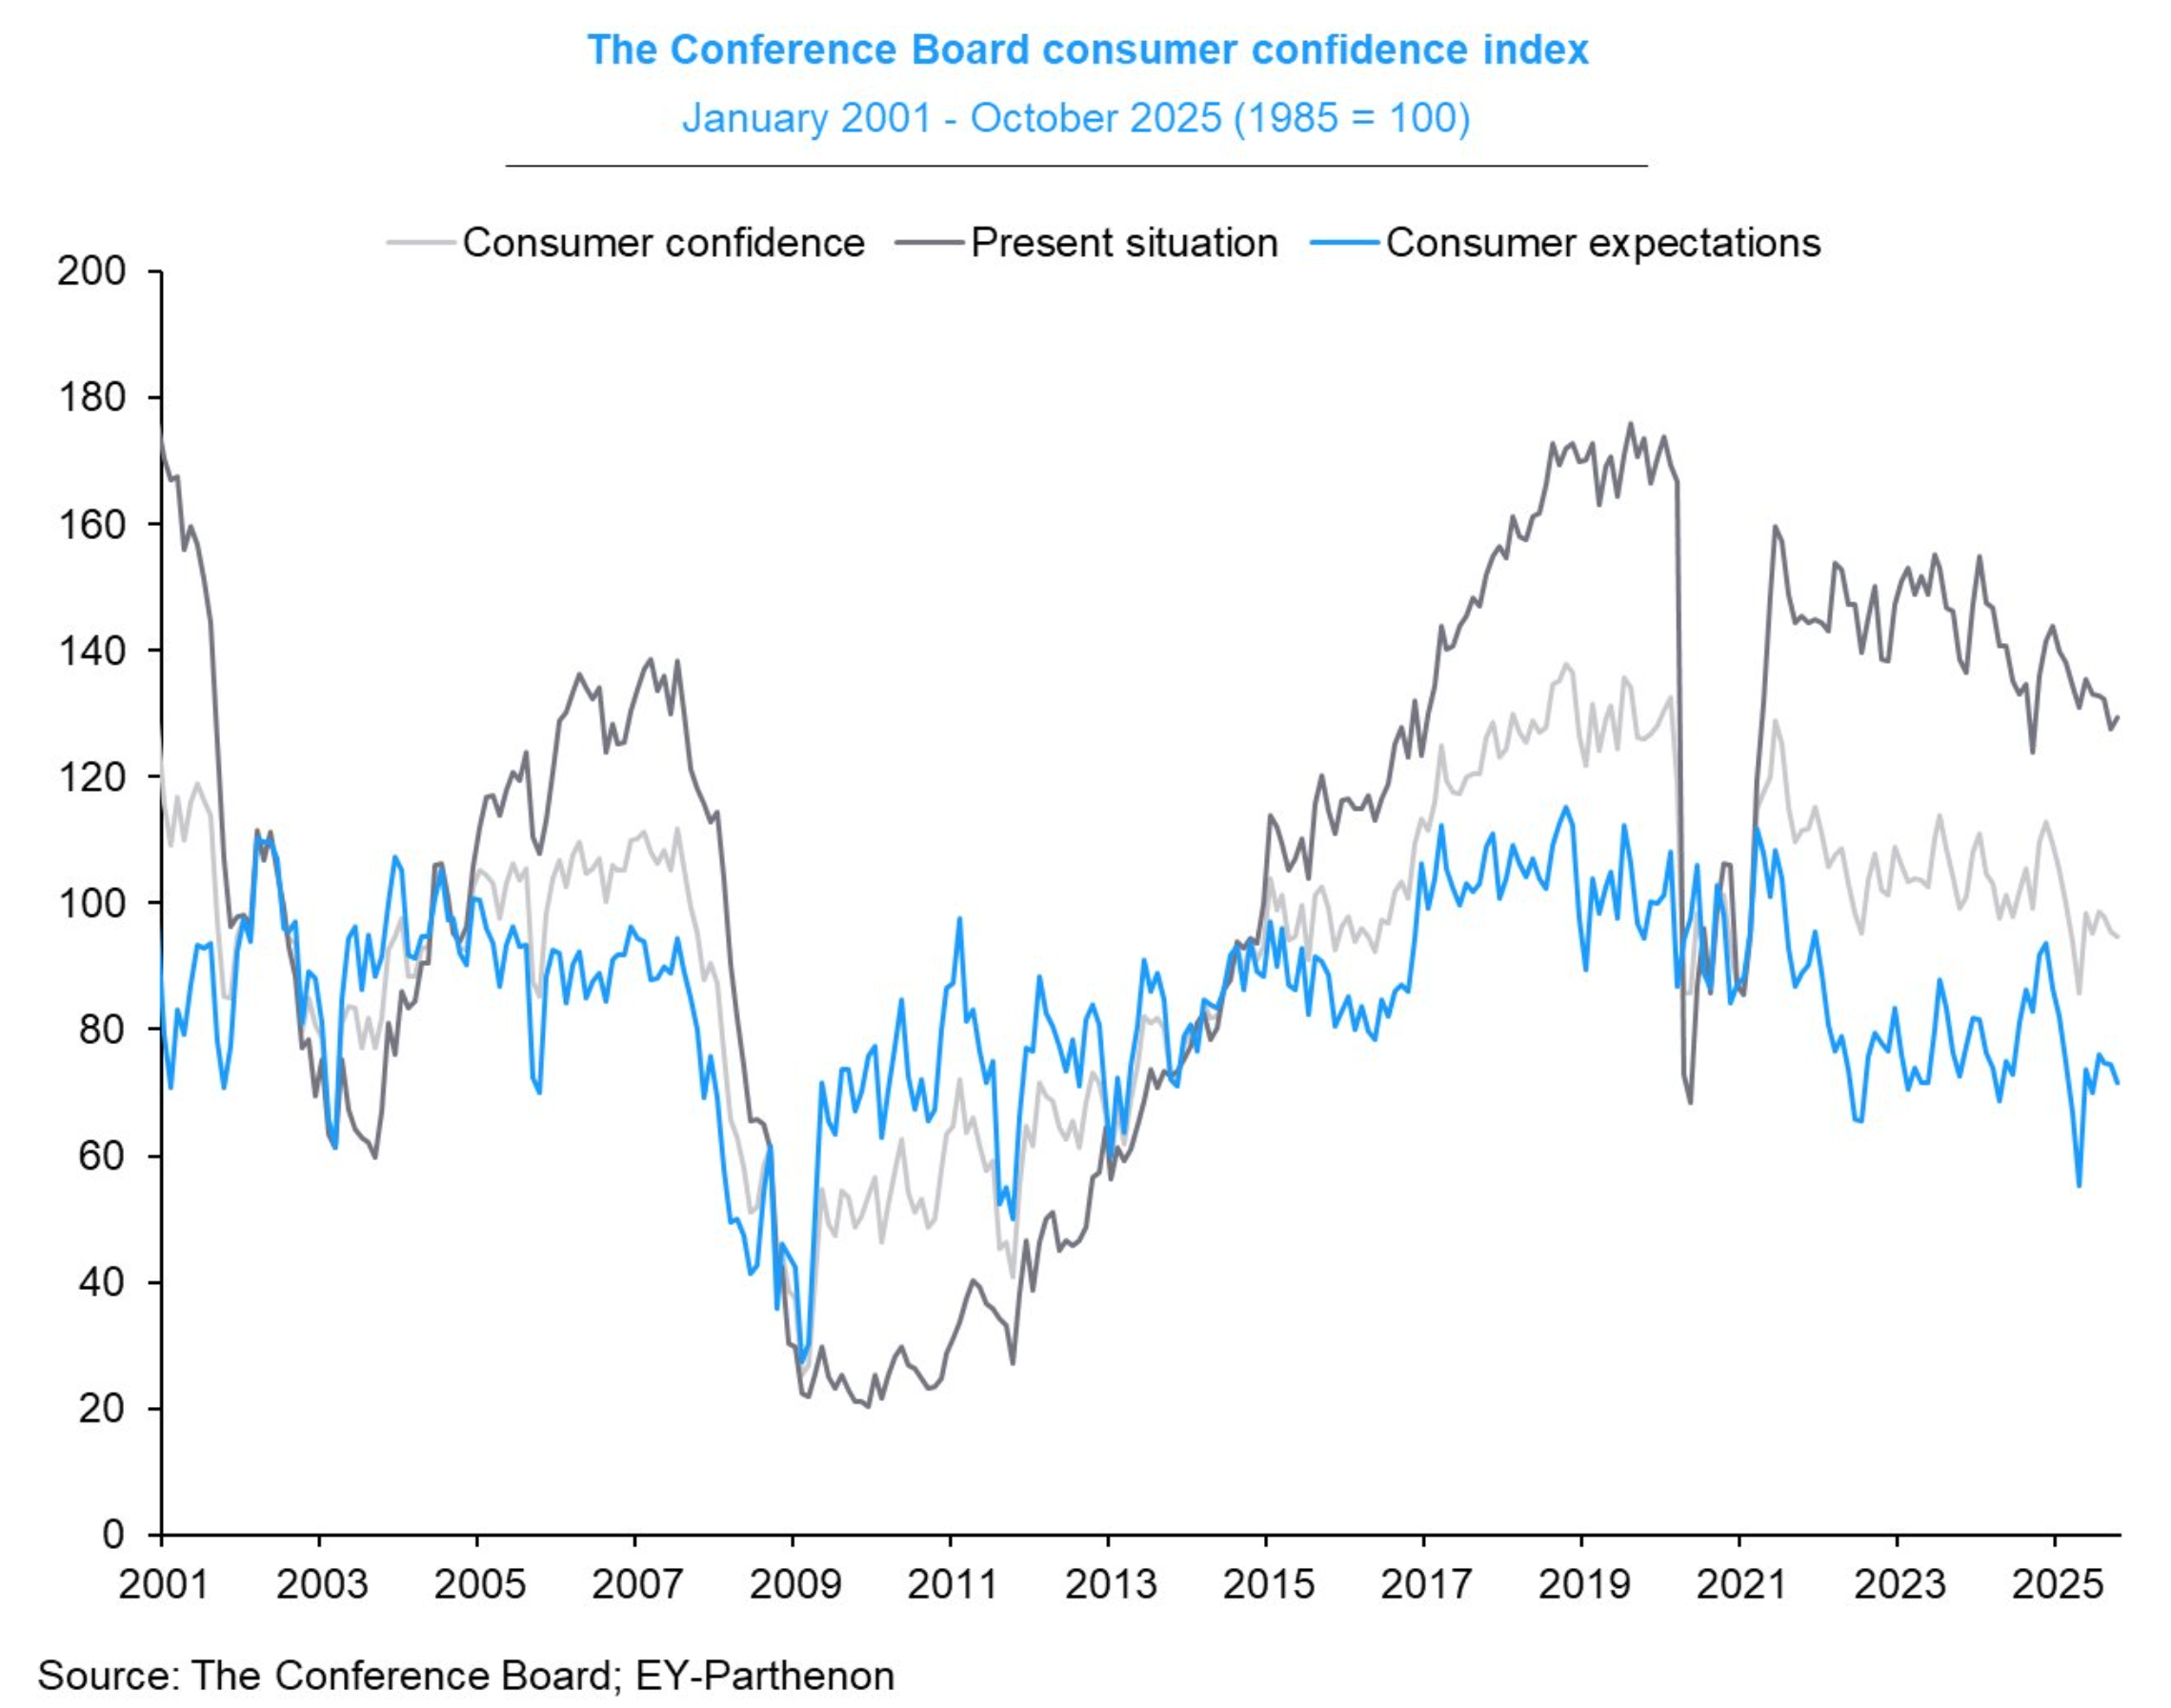
Different version of Consumer Confidence Index shows highest value around 2020
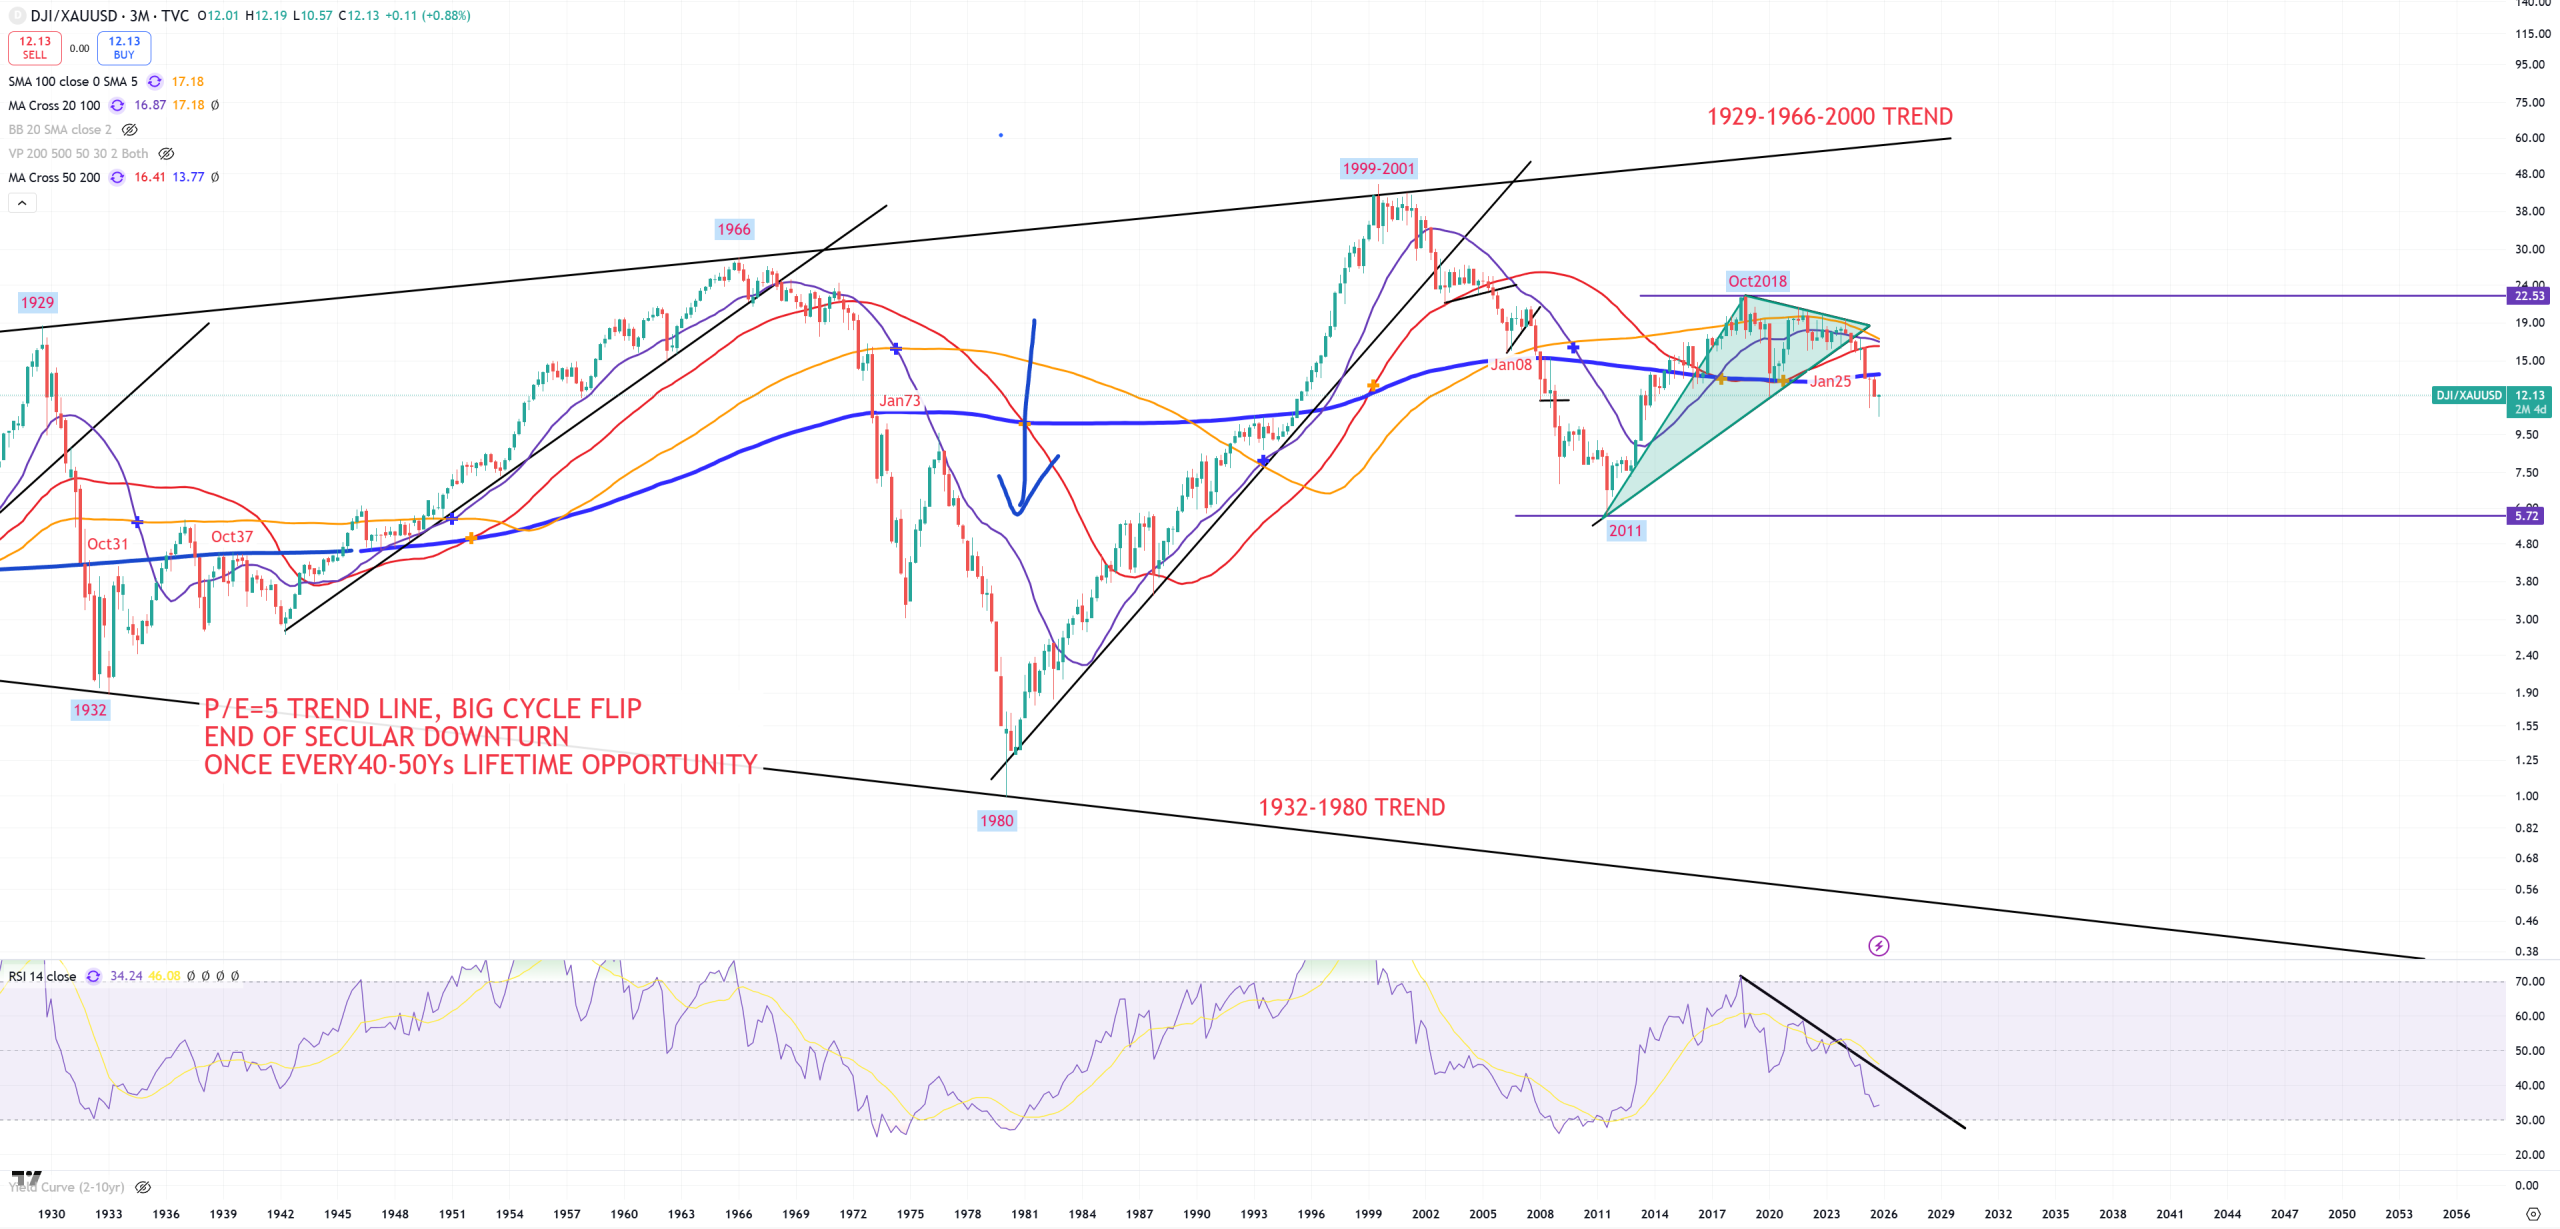
DJI/GOLD – I prefer DJI vs SP500 because of two reasons. First : DJI in most cases doesn’t have the biggest bubbles in its index. Second : it has a bit better technical pattern than SPX/GOLD. We clearly see here the economy made a cycle peak in 2018. It’s also worth to mention this blue (3M)MA200, as it turns out it’s the most important MA in long term cycles which determines big cycle changes. It was broken so far couple times down : 1931, 1937, 1973, 2008, 2025.
DJI/GOLD seems to be alligned with us consumer sentiment peak around late 2018. Please have in mind how low 1932-1980 trend line is. This is the peak of secular downturn and that’s the ultimate target where to sell gold.
SPX/GOLD – SPX/GOLD should follow DJI/GOLD almost 1:1, but as I said, year 2025 is really weird. As DJI/GOLD is already broken looking on (3M)MA200, SPX/GOLD not. SPX/GOLD seems to be better catching job market peak in 2021.
This blue (3M)MA200 isn’t broken here, and peak of SPX/GOLD happened in 2021. My assumption is until this (3M)MA200 won’t be broken market is still heavily cracked.
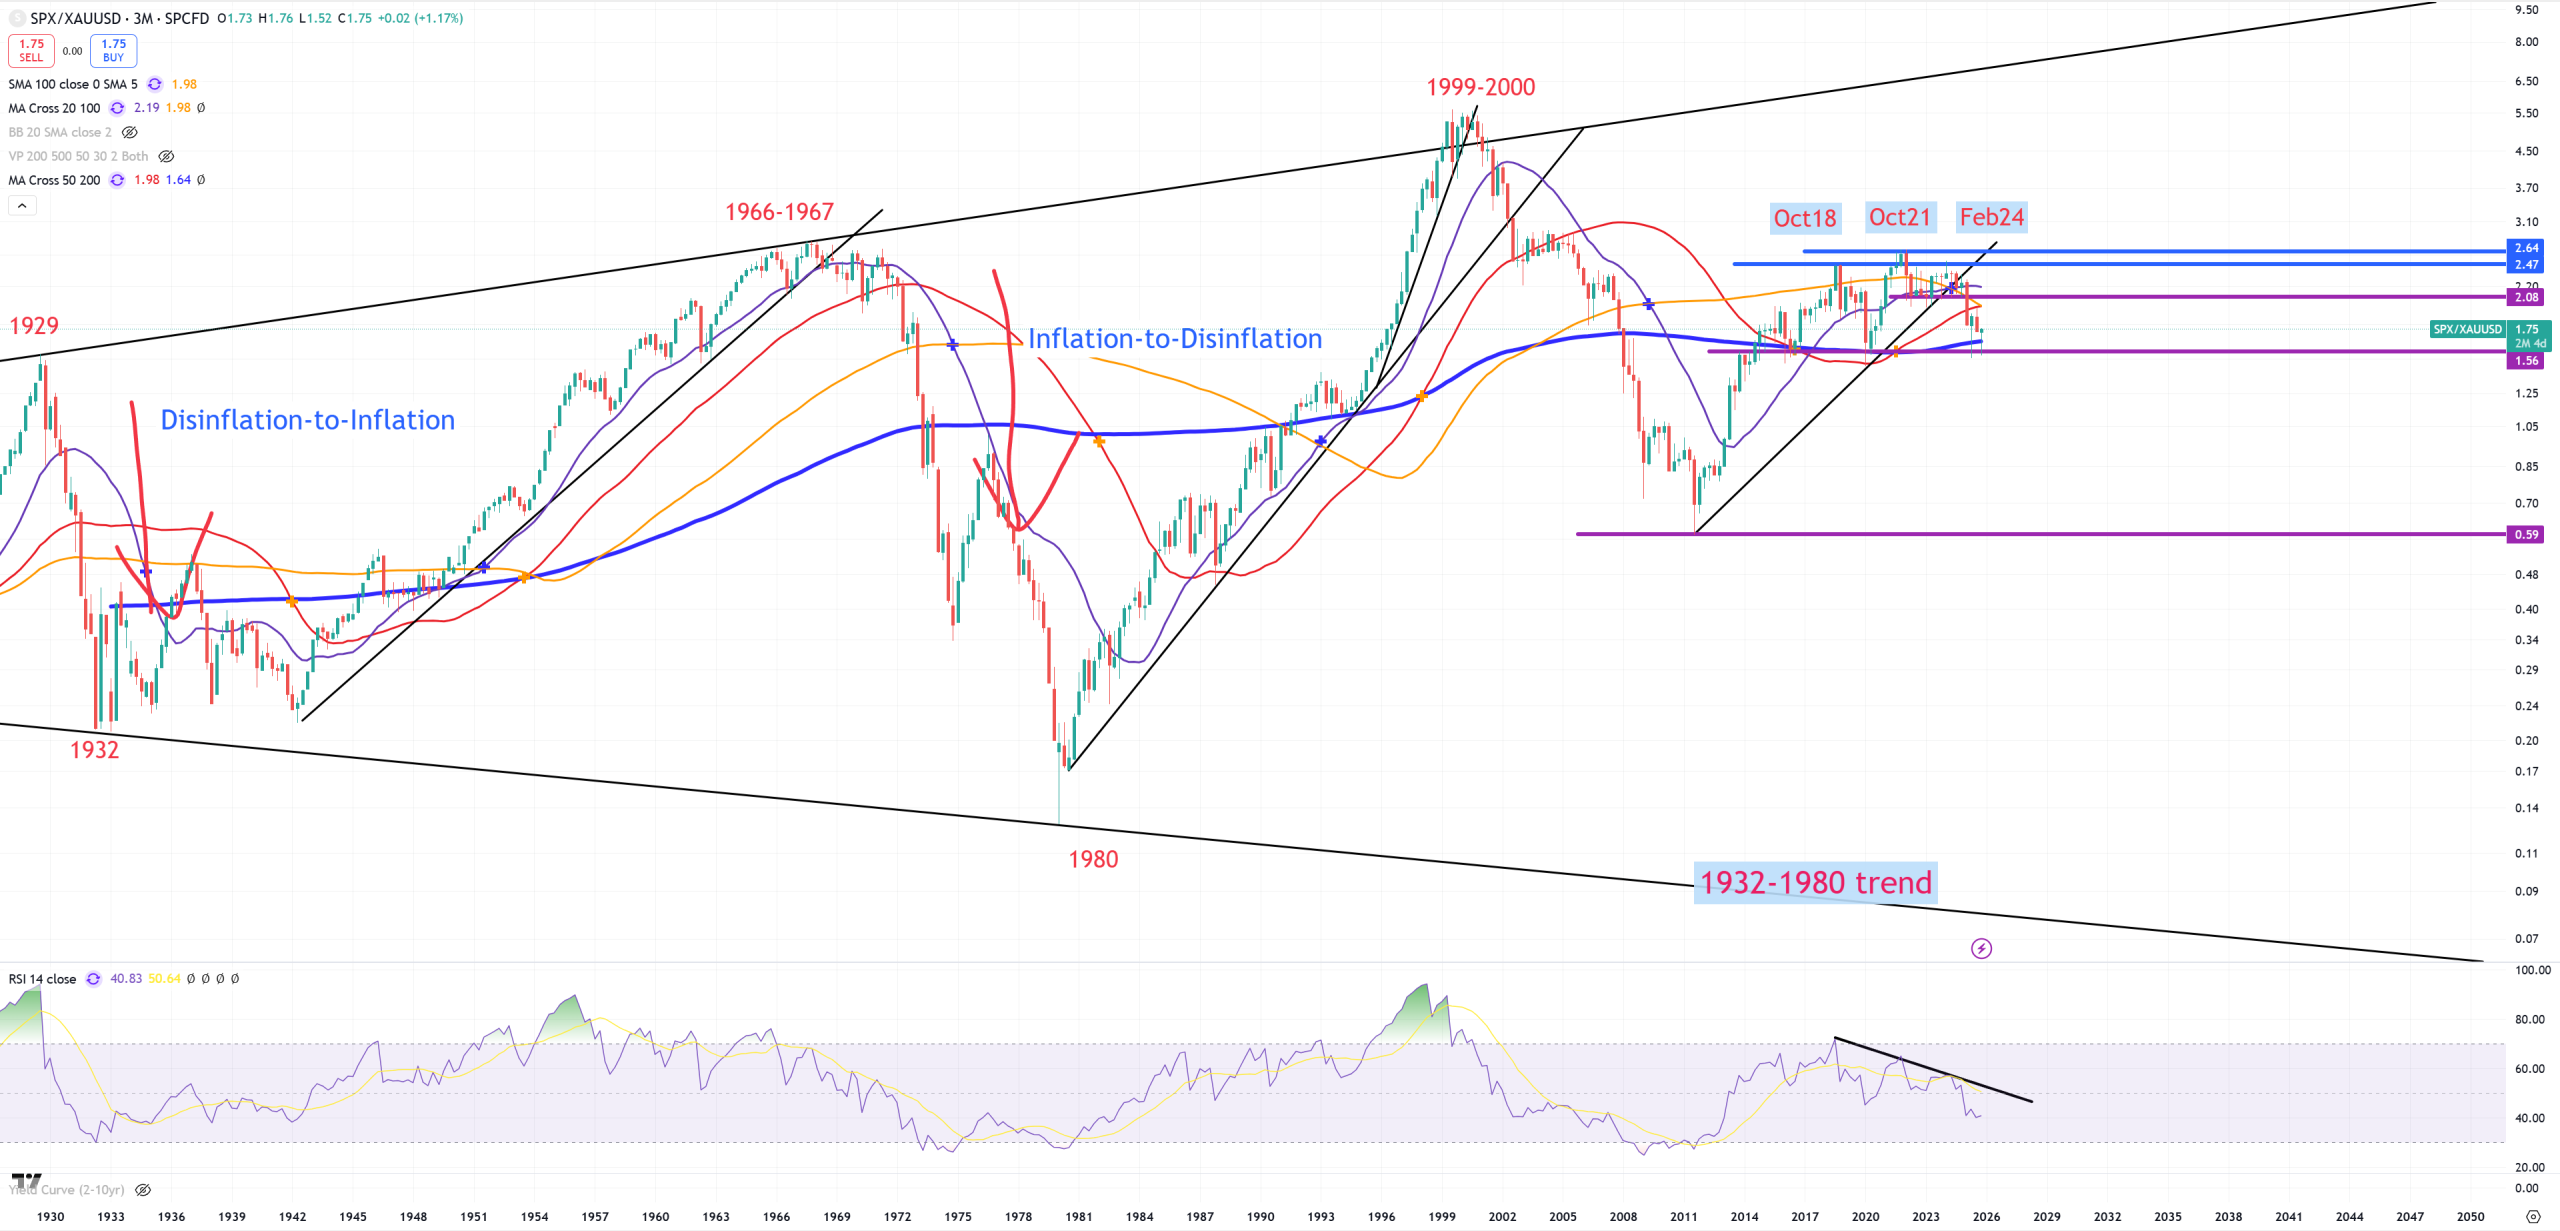
Mostly SPX/GOLD and DJI/GOLD cover exactly the same periods of breaks/peaks, but not in current times.
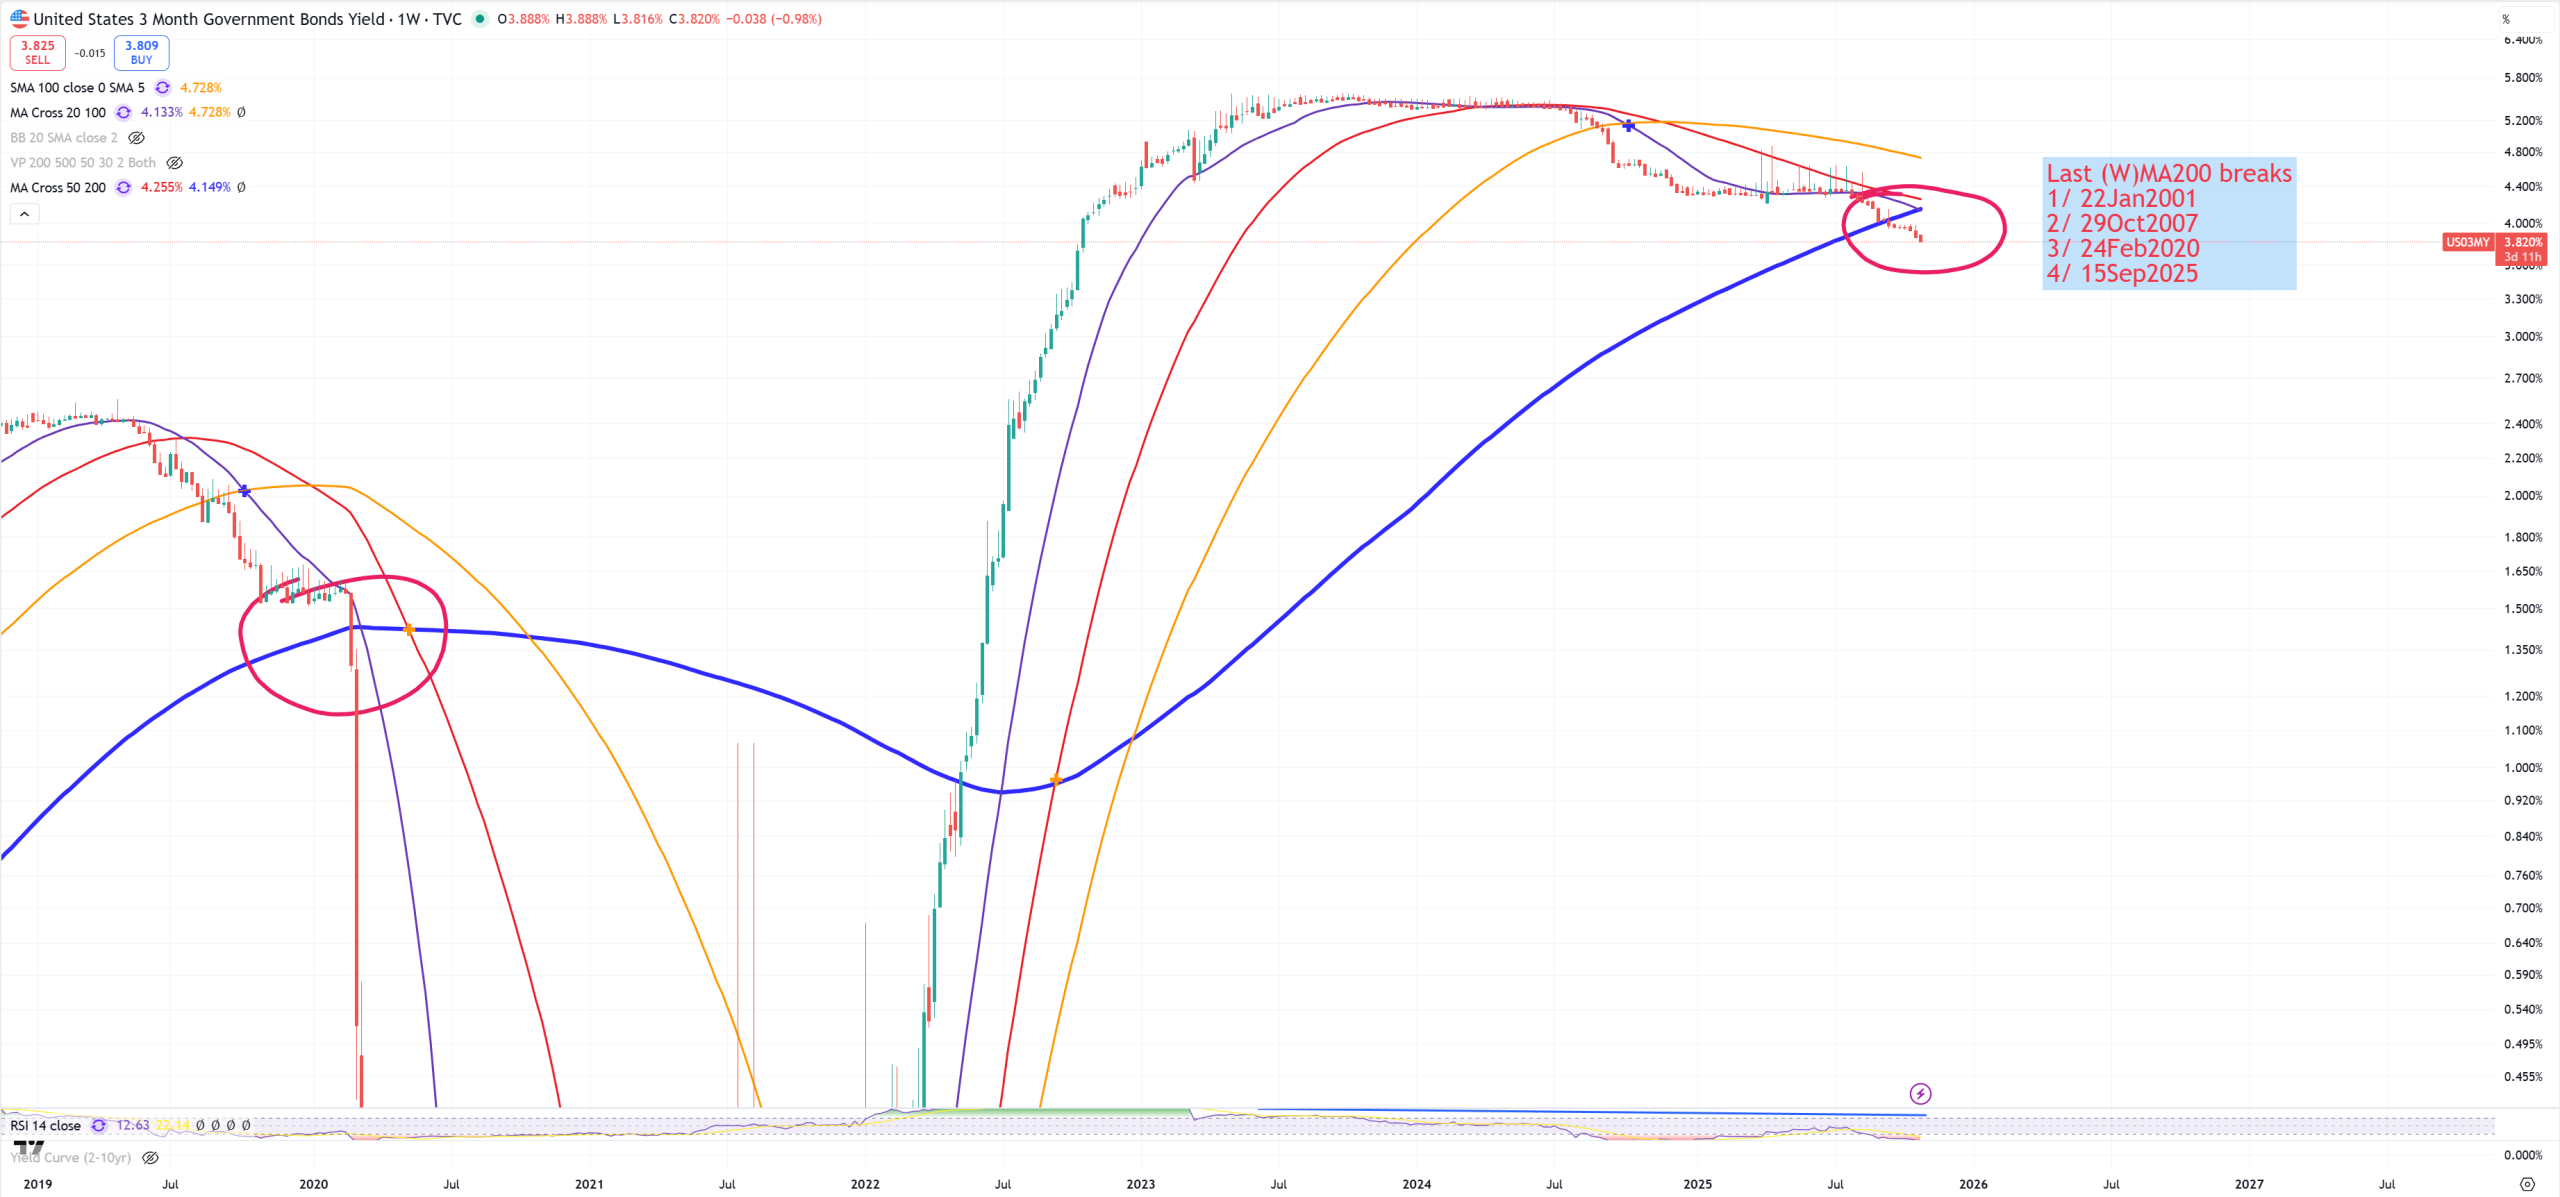
US03MY – 3M bills are probably the most important indicator about possible peak of the market. It follows US02Y. I’m showing this US03MY first because I want you to see how SPX/GOLD and its (3M)MA200 links with key (M)MA50 break on US03MY.
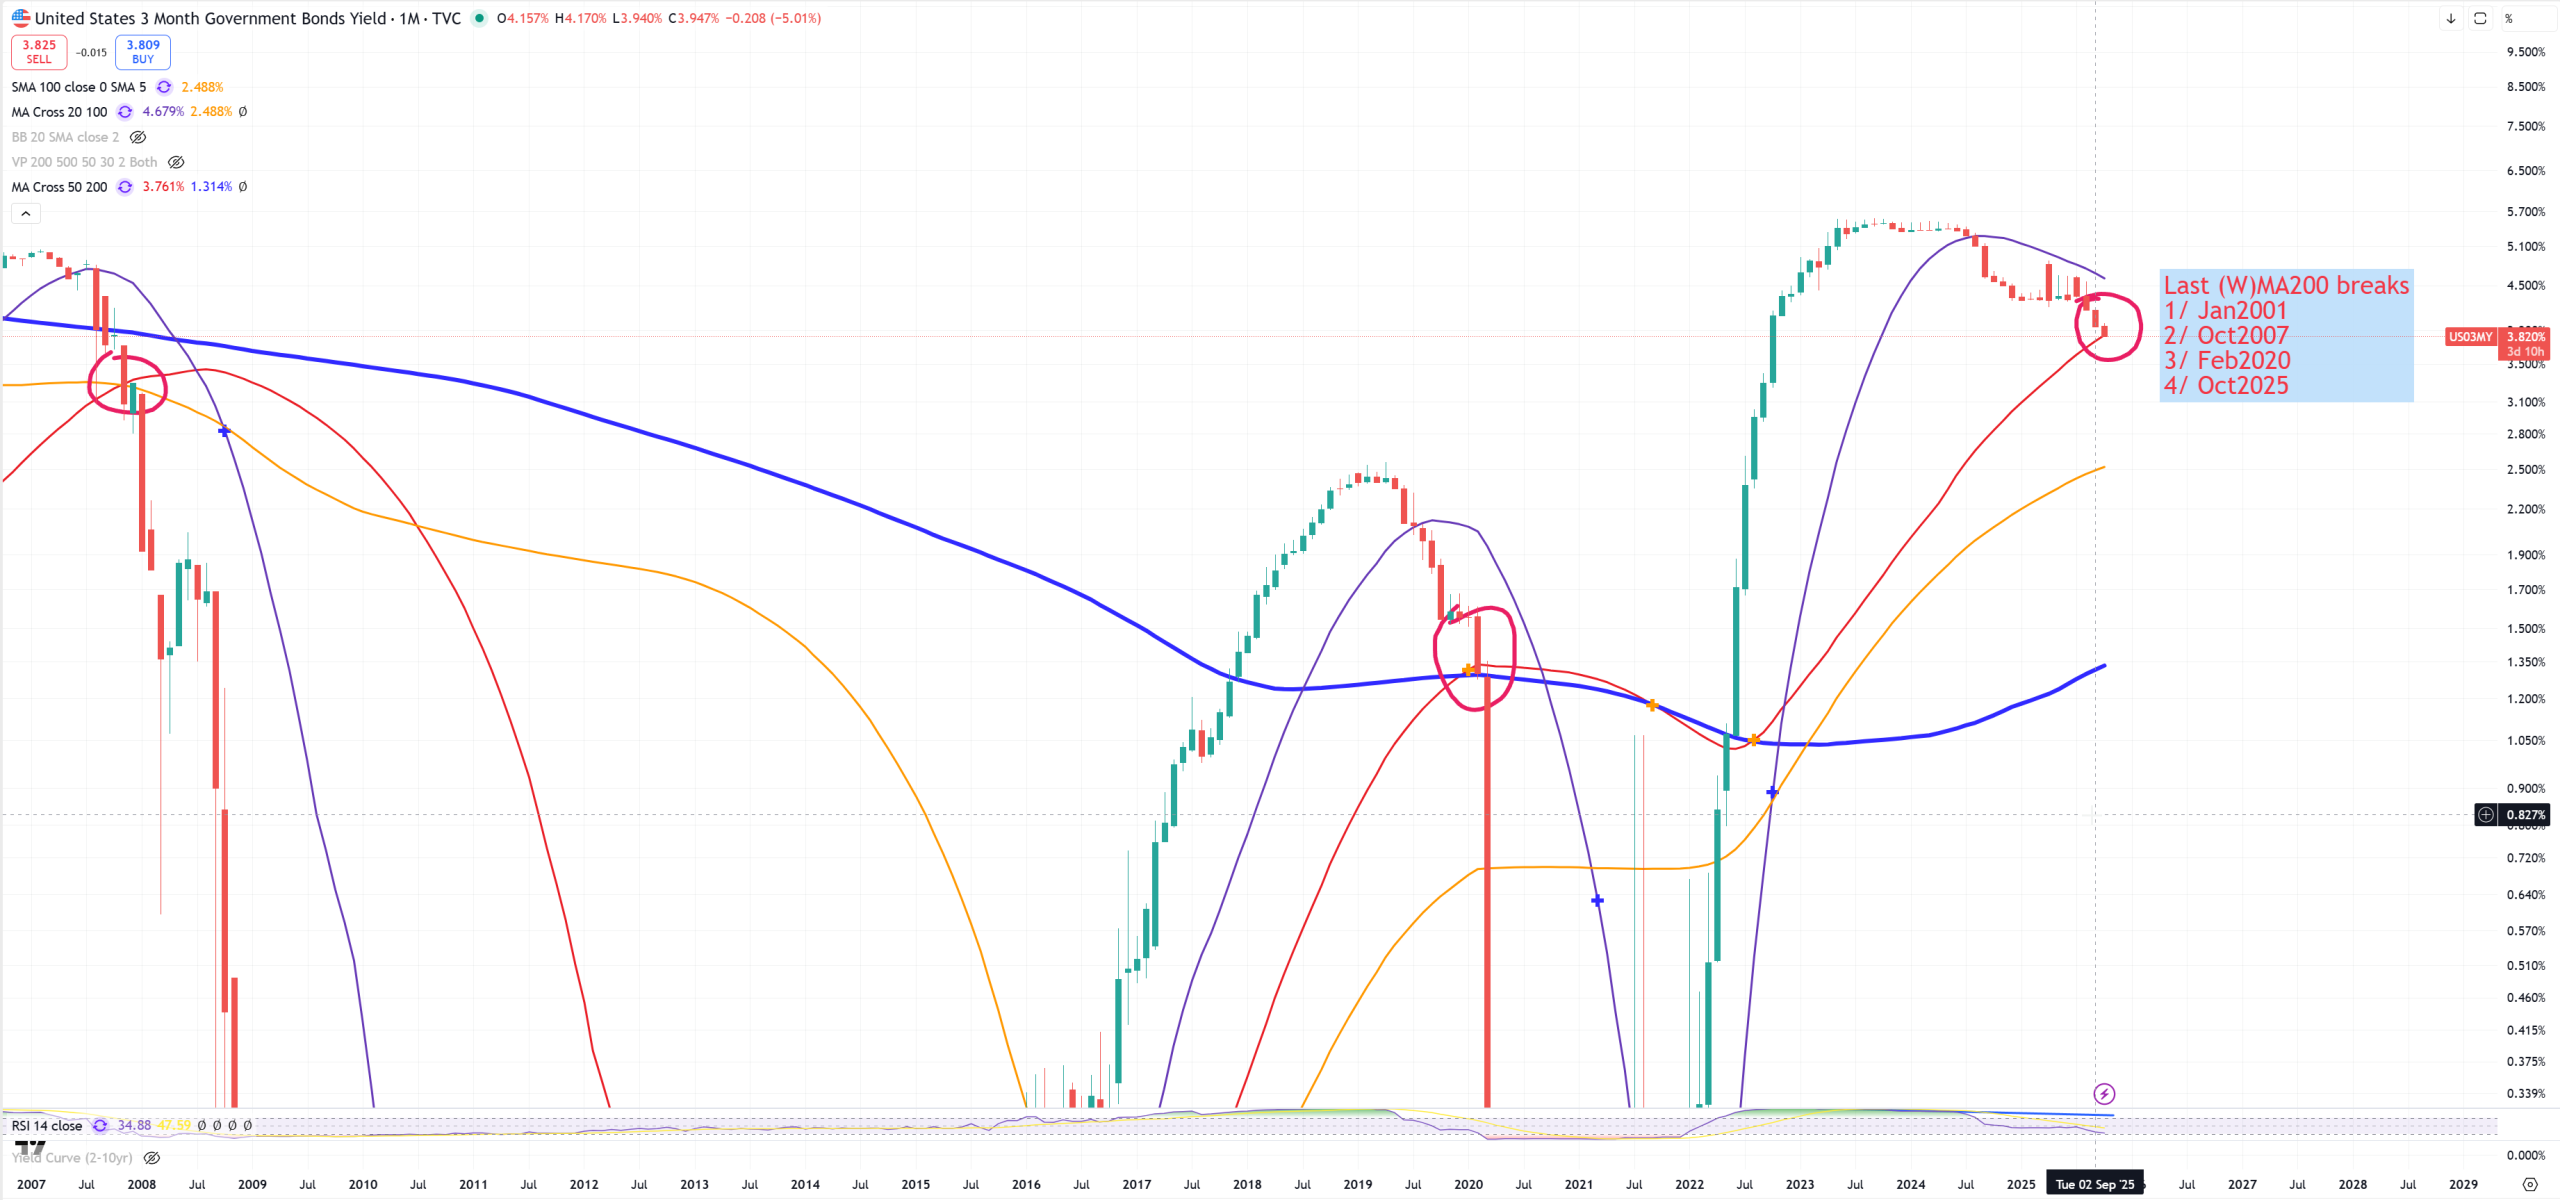
But initially I always track (W)MA200 first to get a full break. (M)MA50 break must follow behind (W)MA200 break. Below you can see the dates of (W)MA200 breaks :
From SPX perspective, these are the peaks of the market :
20Mar2000, 8Oct2007, 18Feb2020
But if we take a look on (M)MA50, you can also see that (W)MA200 date is not covering (M)MA50 date. (W)MA200 break we had in the middle of September while (M)MA50 is still fighting (just like SPX/GOLD fights for its (3M)MA200 break). We have FED cuts on Wednesday 29th Oct 2025 and still couple days to close (M) candle.
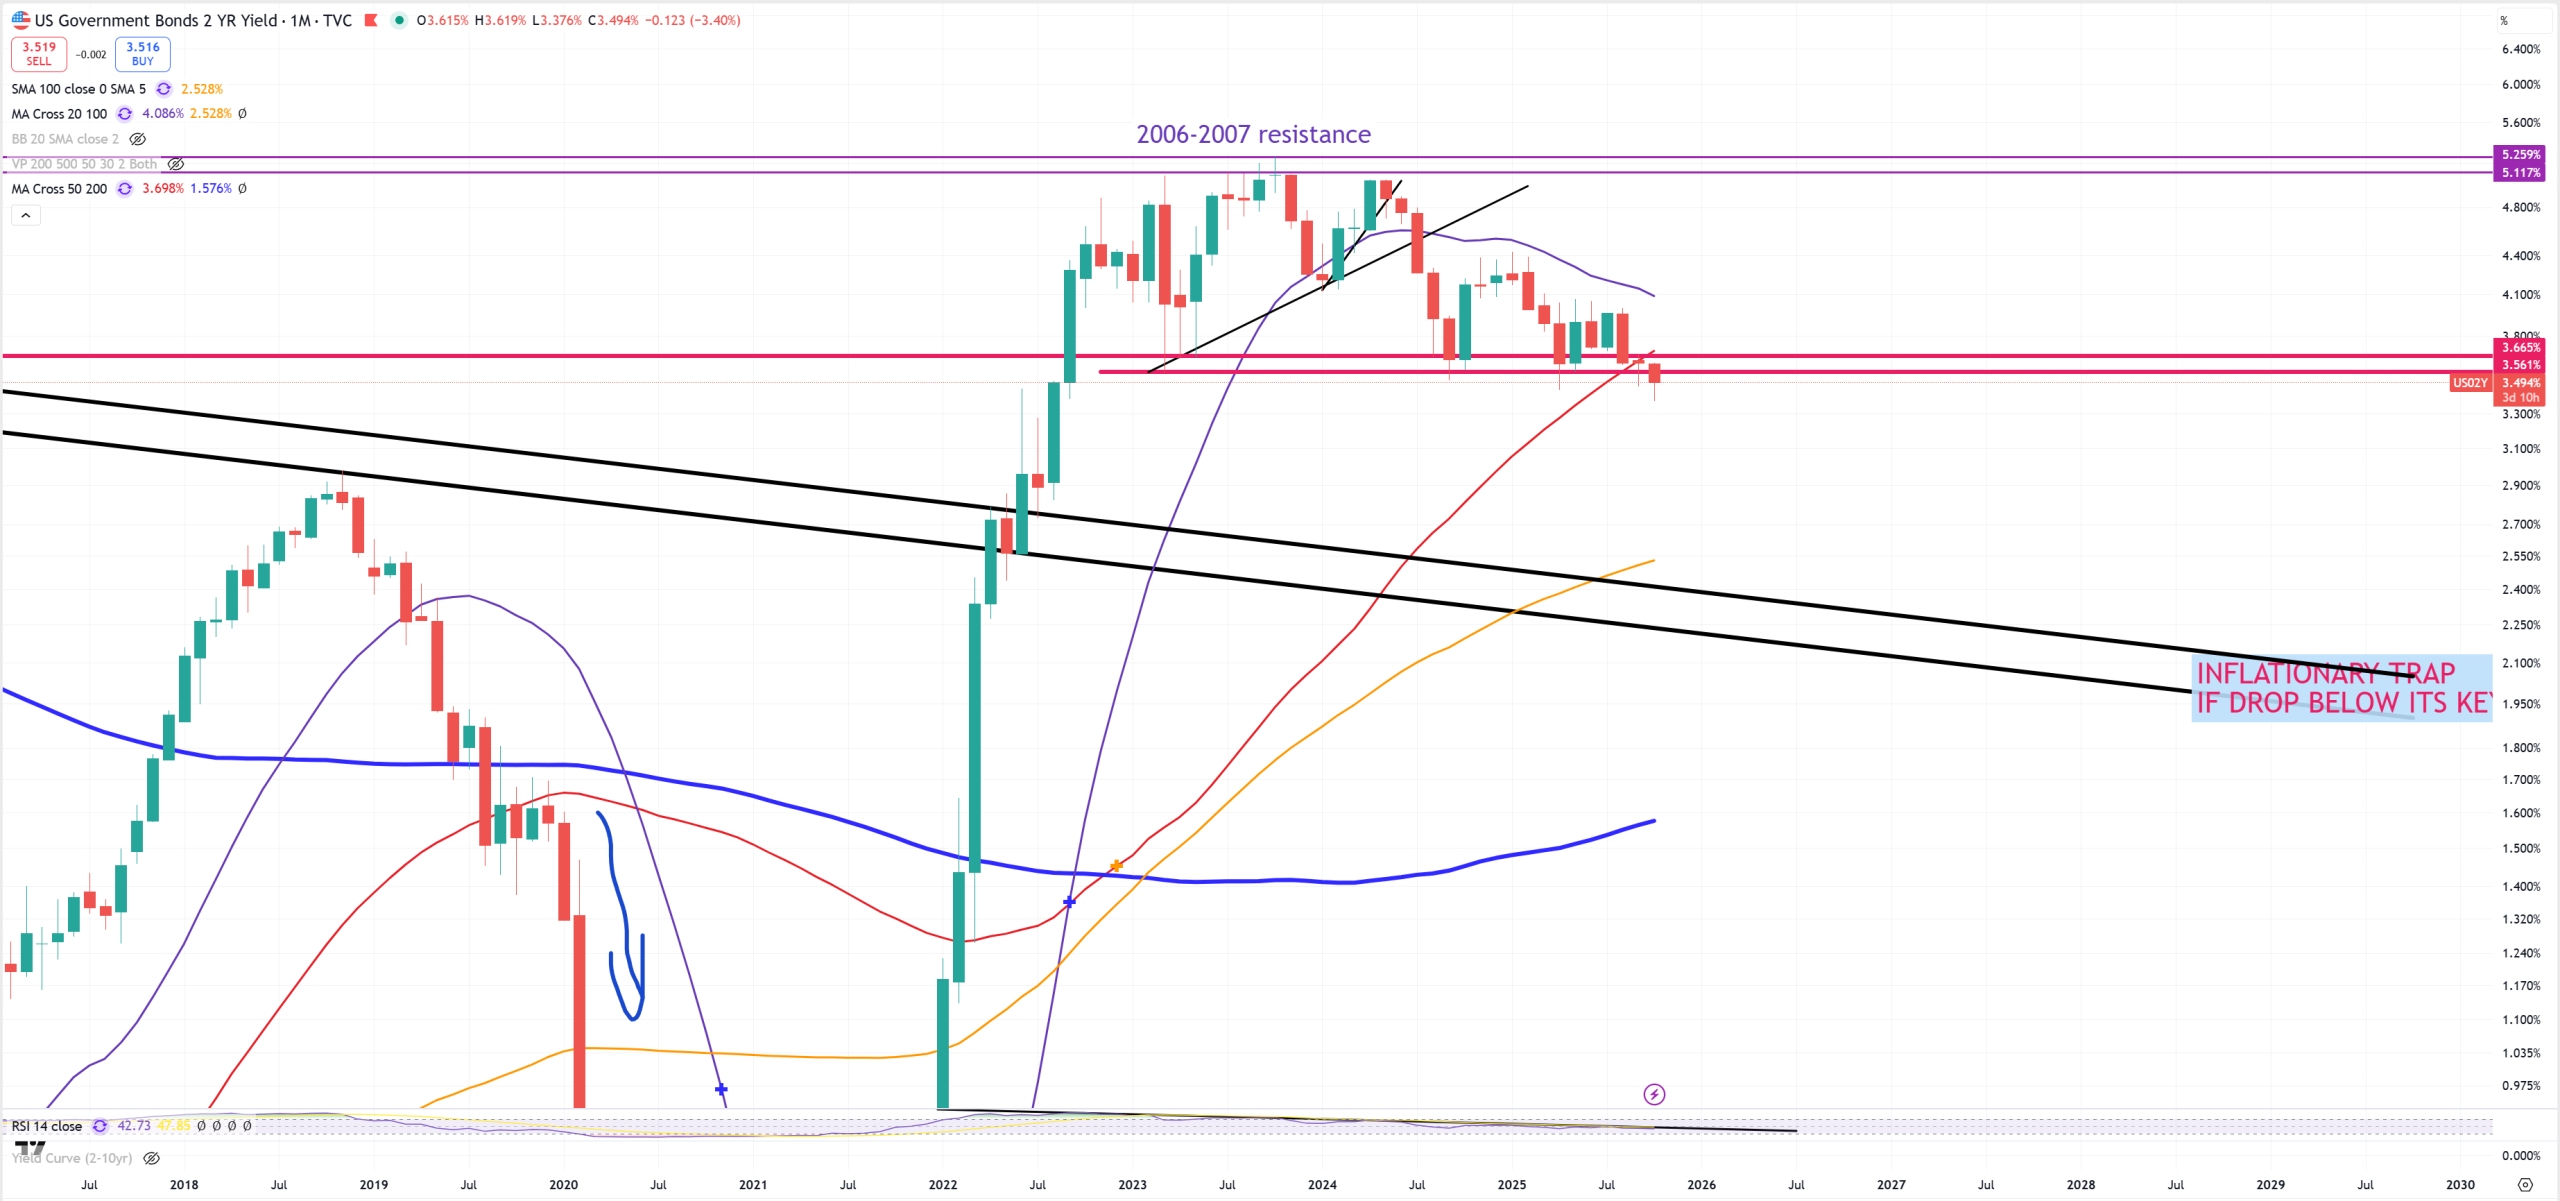
US02Y – US02Y gives us a prediction of US03MY and where FED Funds Rates should be. (W)MA200 break happened in July 2025. US02Y is 3.5% while FFR is 4.25% = FED is too tight by 75bps NOW.
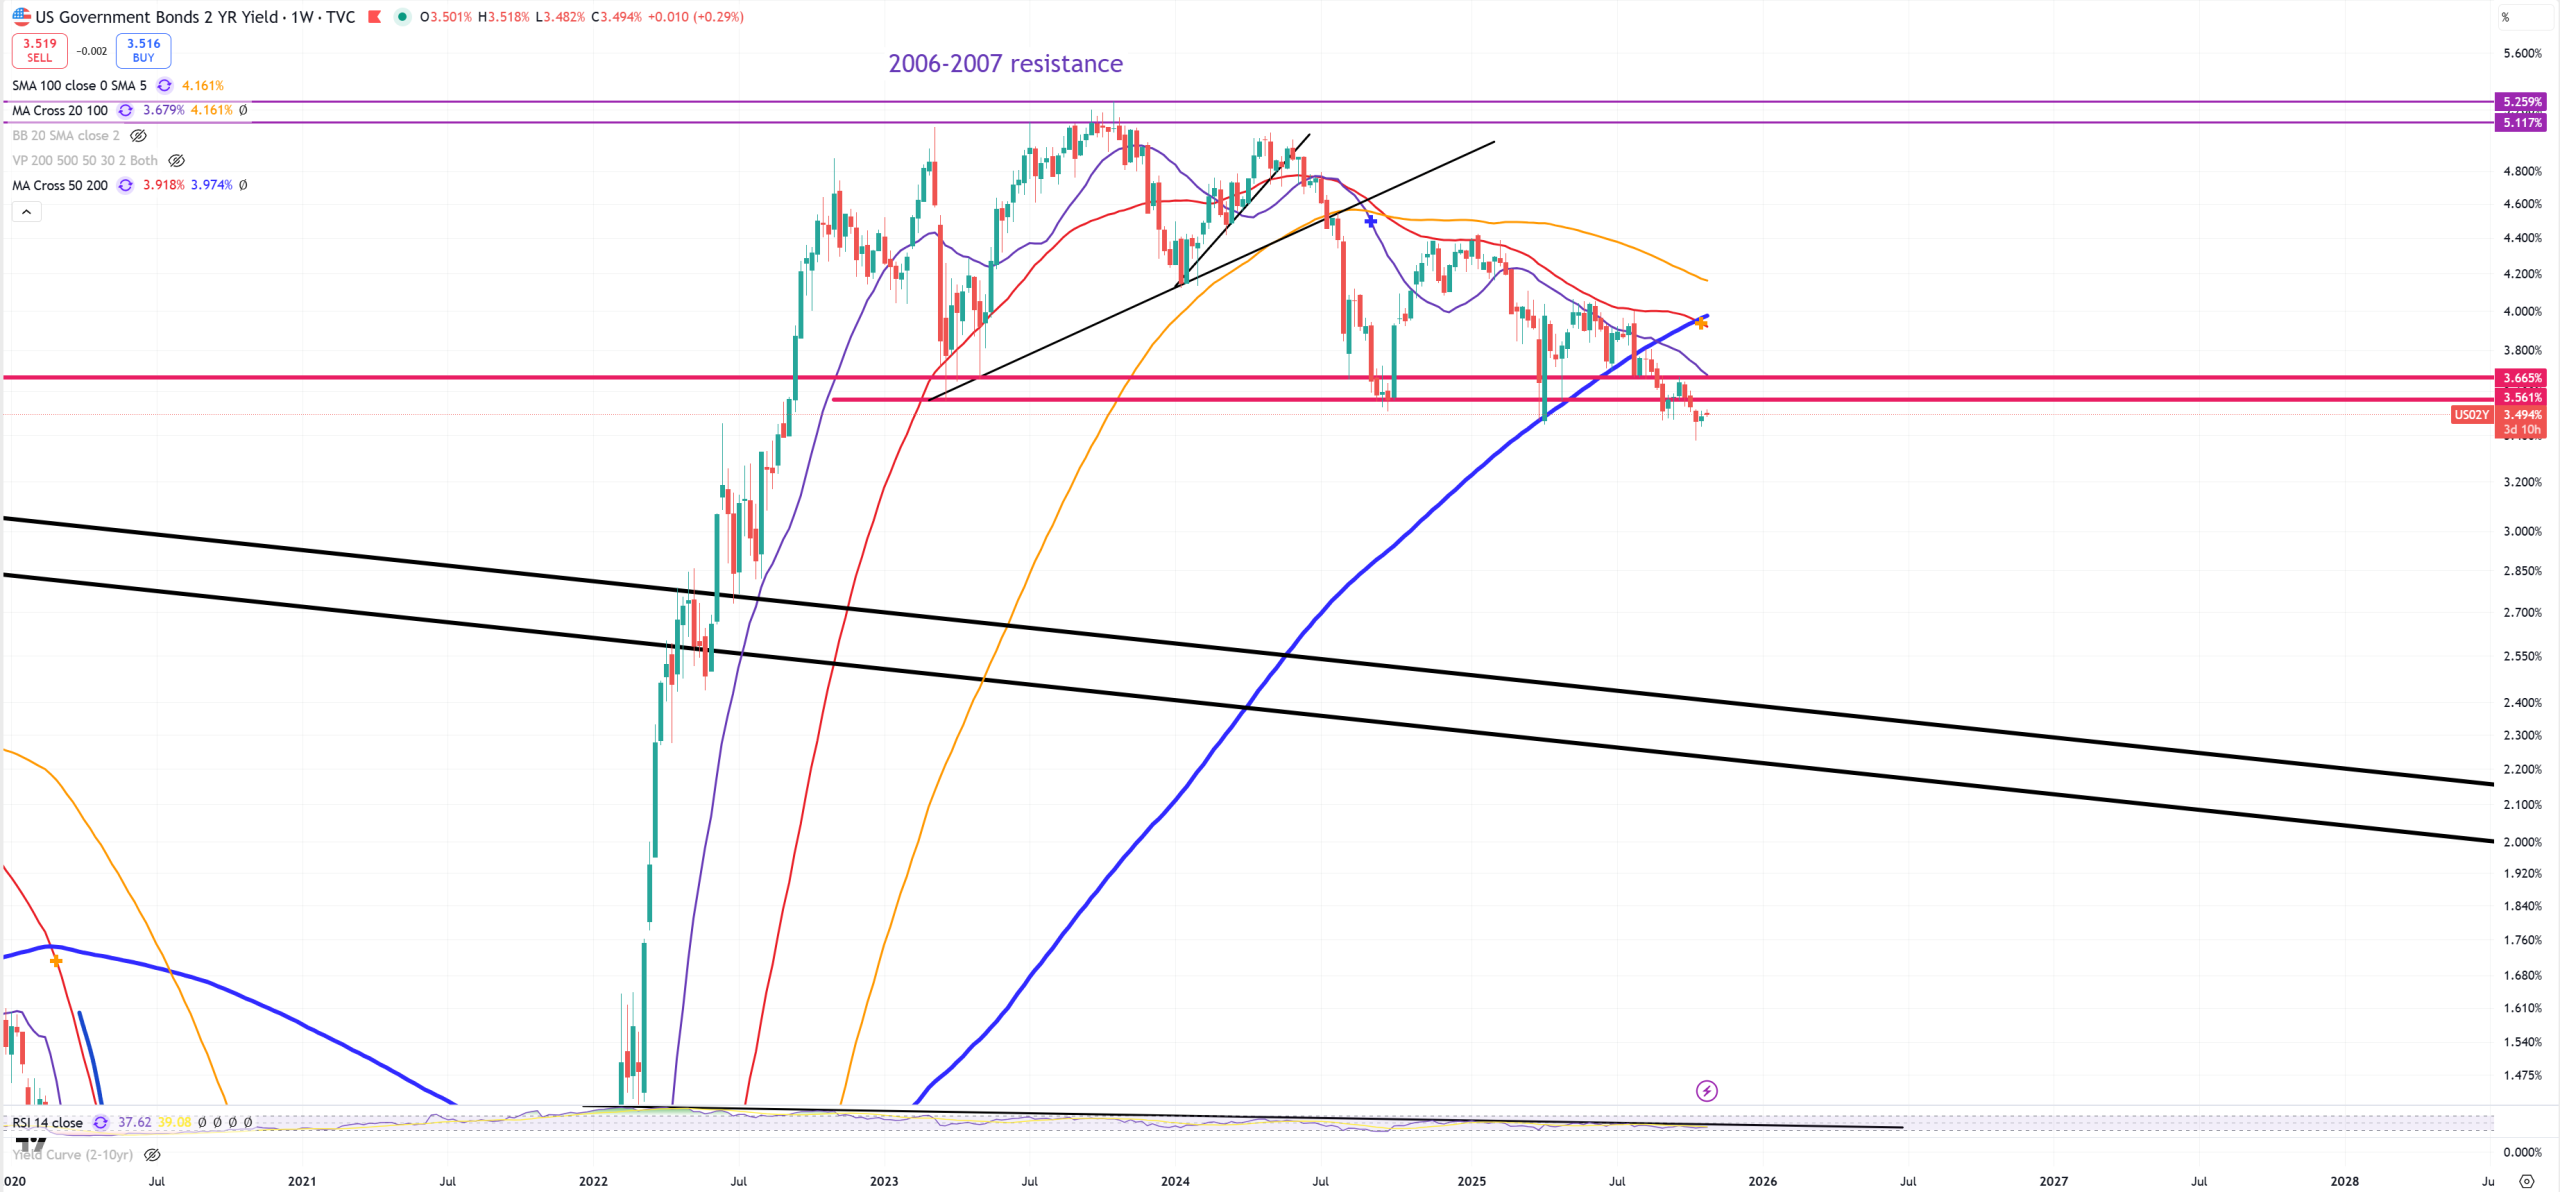
(M)MA50 break happened in September 2025
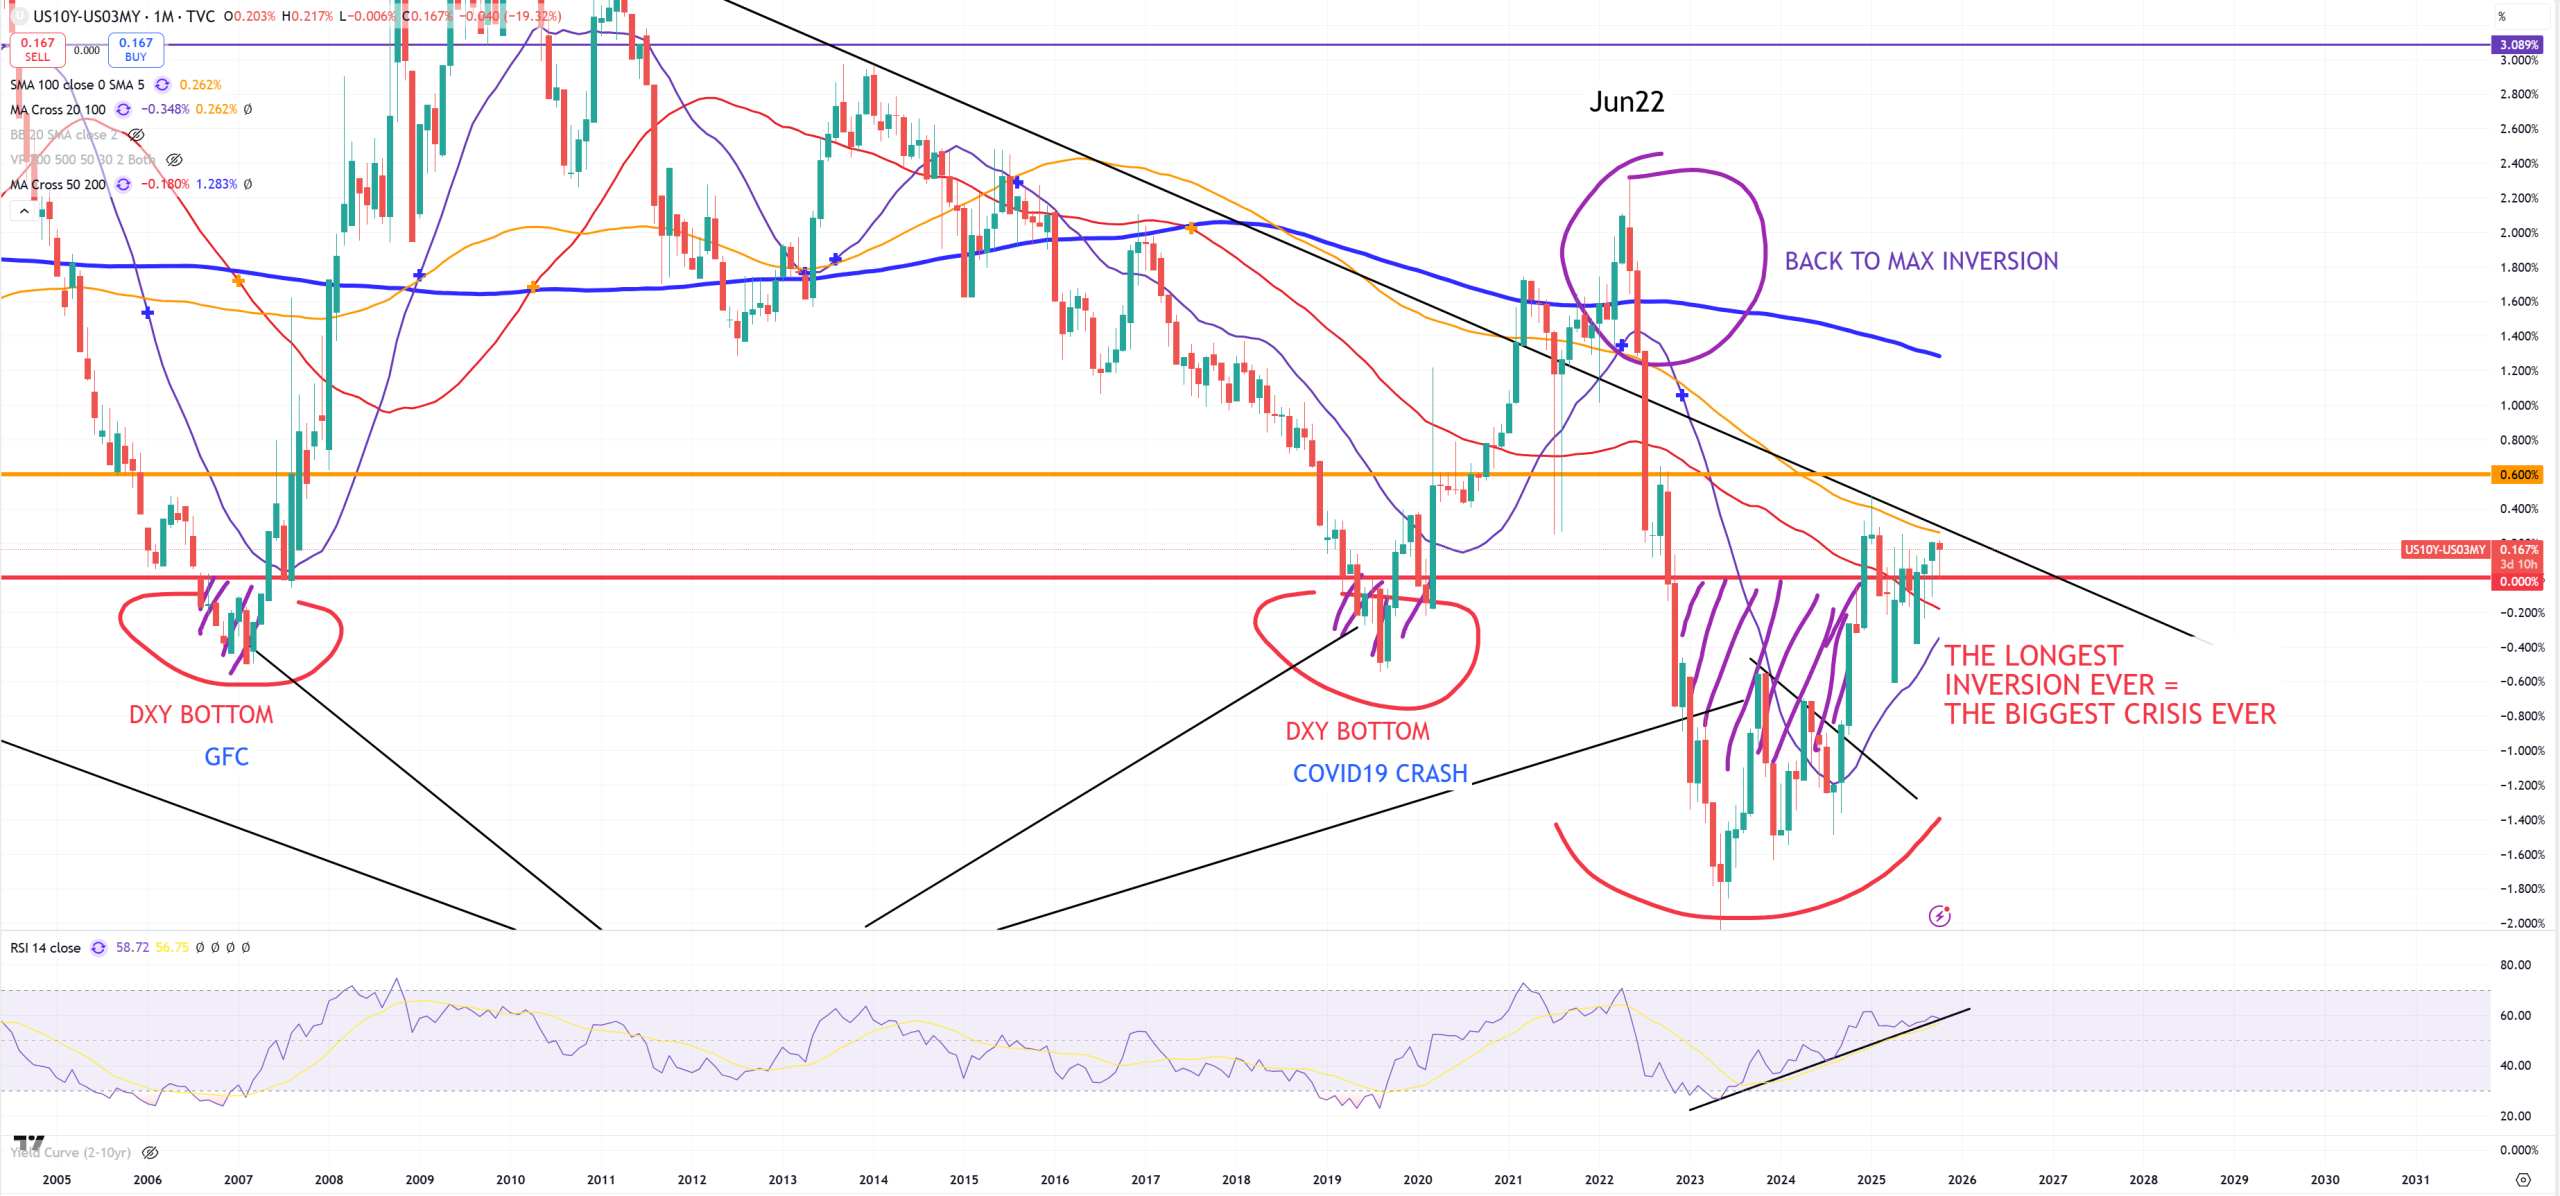
We can’t forget about the most important spread US10Y – US03MY which from my experience says GAME OVER once it breaks 60bps after inversion (yellow horizontal line). It’s not happening because so far both SPX/GOLD and US03MY have not broken their key MA.
To interpret what does this inversion mean I always say : It’s a gravity of the economy. You can artificially try to keep a lid on uninversion but the same time you’re adding tons of gravity for the economy, so buying some time will make economical problems exponential. I think so far that’s an idea of this cycle so far.
When we had last time 60bps break post inversion :
26Mar2001, Aug/Sep 2007, 9Mar2020
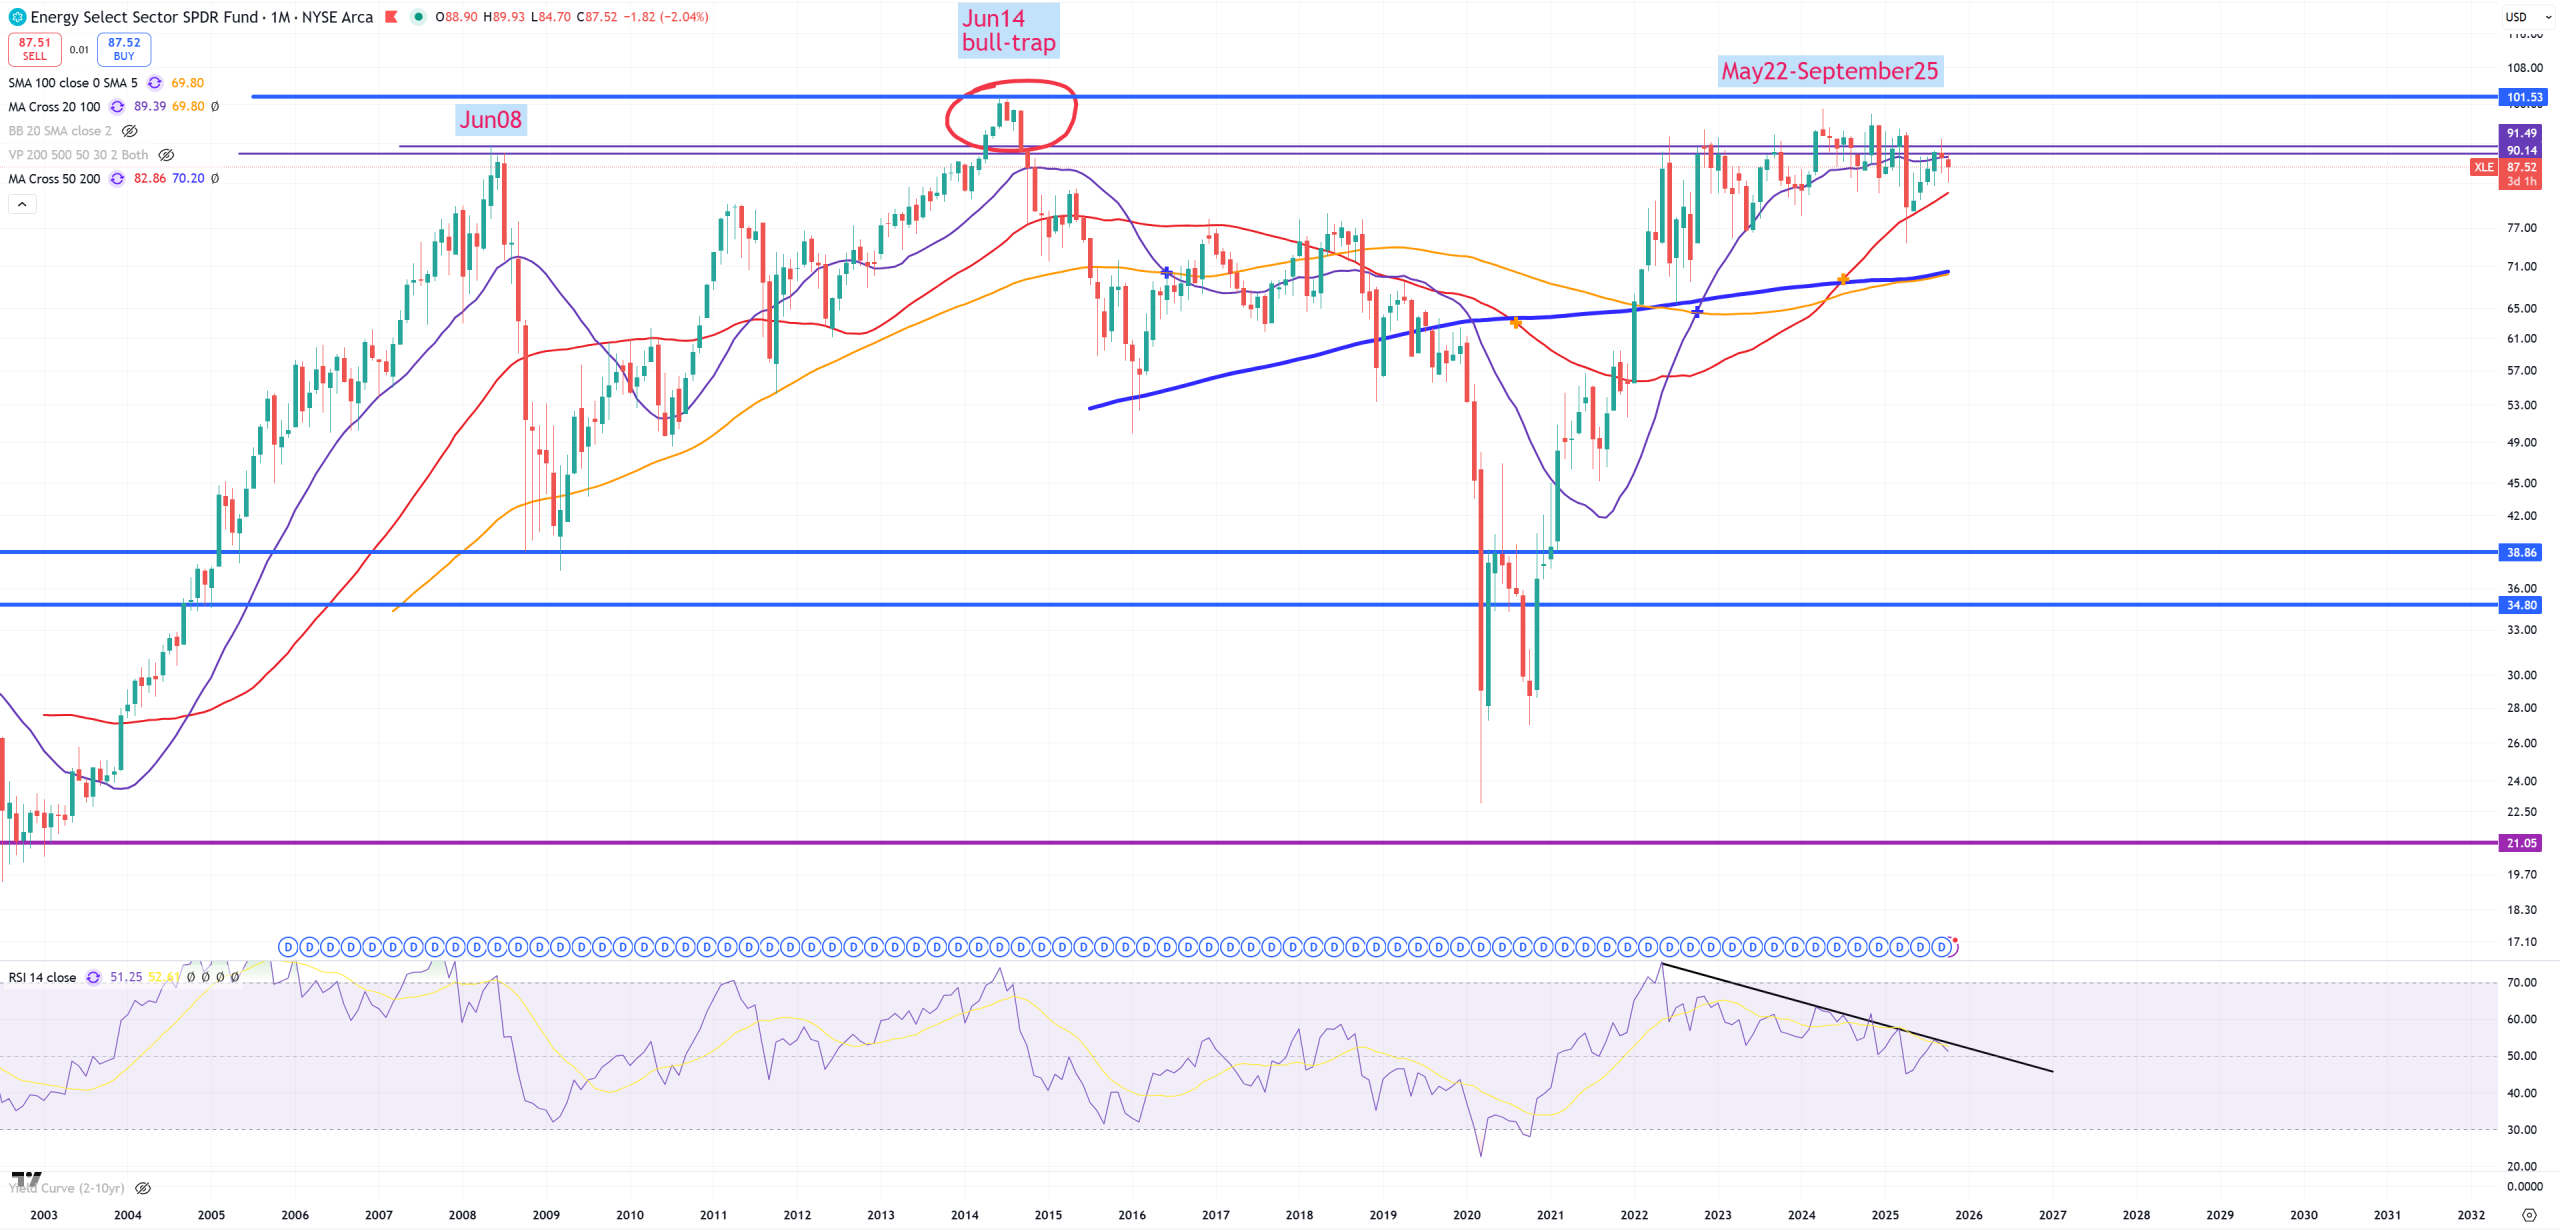
The first good example to show you how keeping yield-curve not uninverted is XLE. You see that on (M) that it’s banging towards Jun2008 resistance since May22, so in reality the moment 10Y/3M started to invert. As yield-curve uninverts the pressure for stocks is raising and pressure for DXY to go higher raising too.
My observation tells me also : The longer and deeper inversion of 10Y/3M is the more powerful the crisis will be and unemployment, but 10Y/3M needs to break +60bps first. How long we can keep this 10Y/3M around inversion? I don’t know, as all statistics and average periods calculations went bust as 10Y/3M is now ~1100 days flying around inversion, beating previous 1929 record of 700 days. An average period of inversion takes around 250 days.
And to end this analysis US10Y is needed and what we can see here is that many people including me started to call this break of red trend line a flip to bond bear market, but it doesn’t make any sense as we’re still operating on a secular disinflationary cycle. It doesn’t work like that.
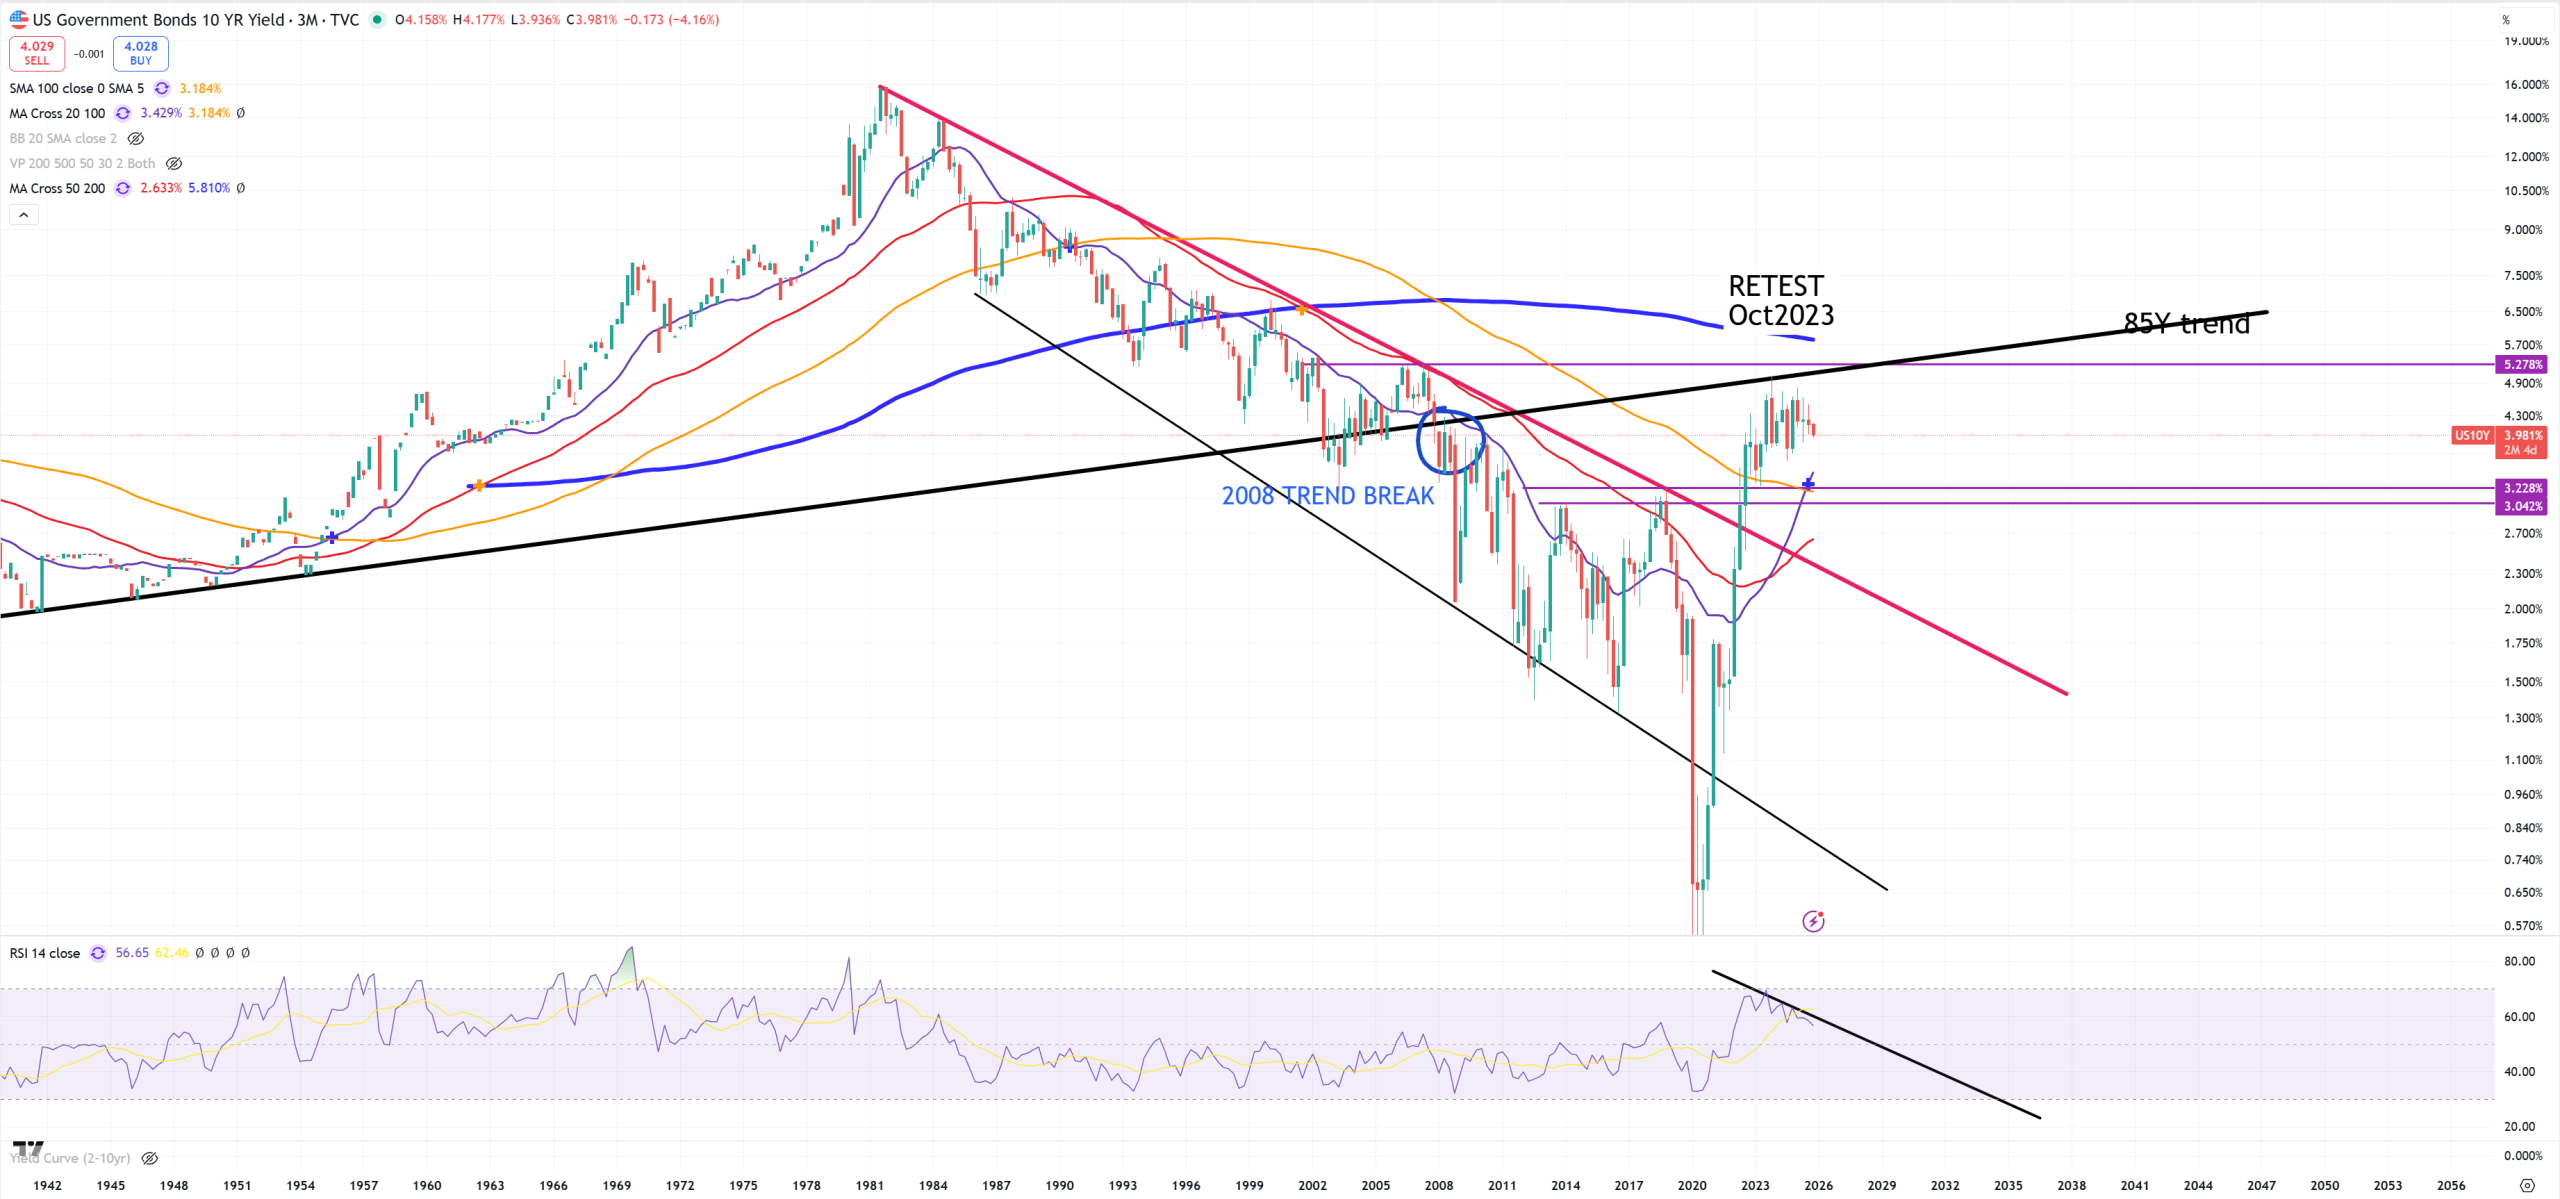
It’s impossible to have bond bear market when wealth inequality looks like that, when the economy transfers everything towards top 10% later top 1-2% and rest is repossesed and stop paying their debts = debt deflation en masse.
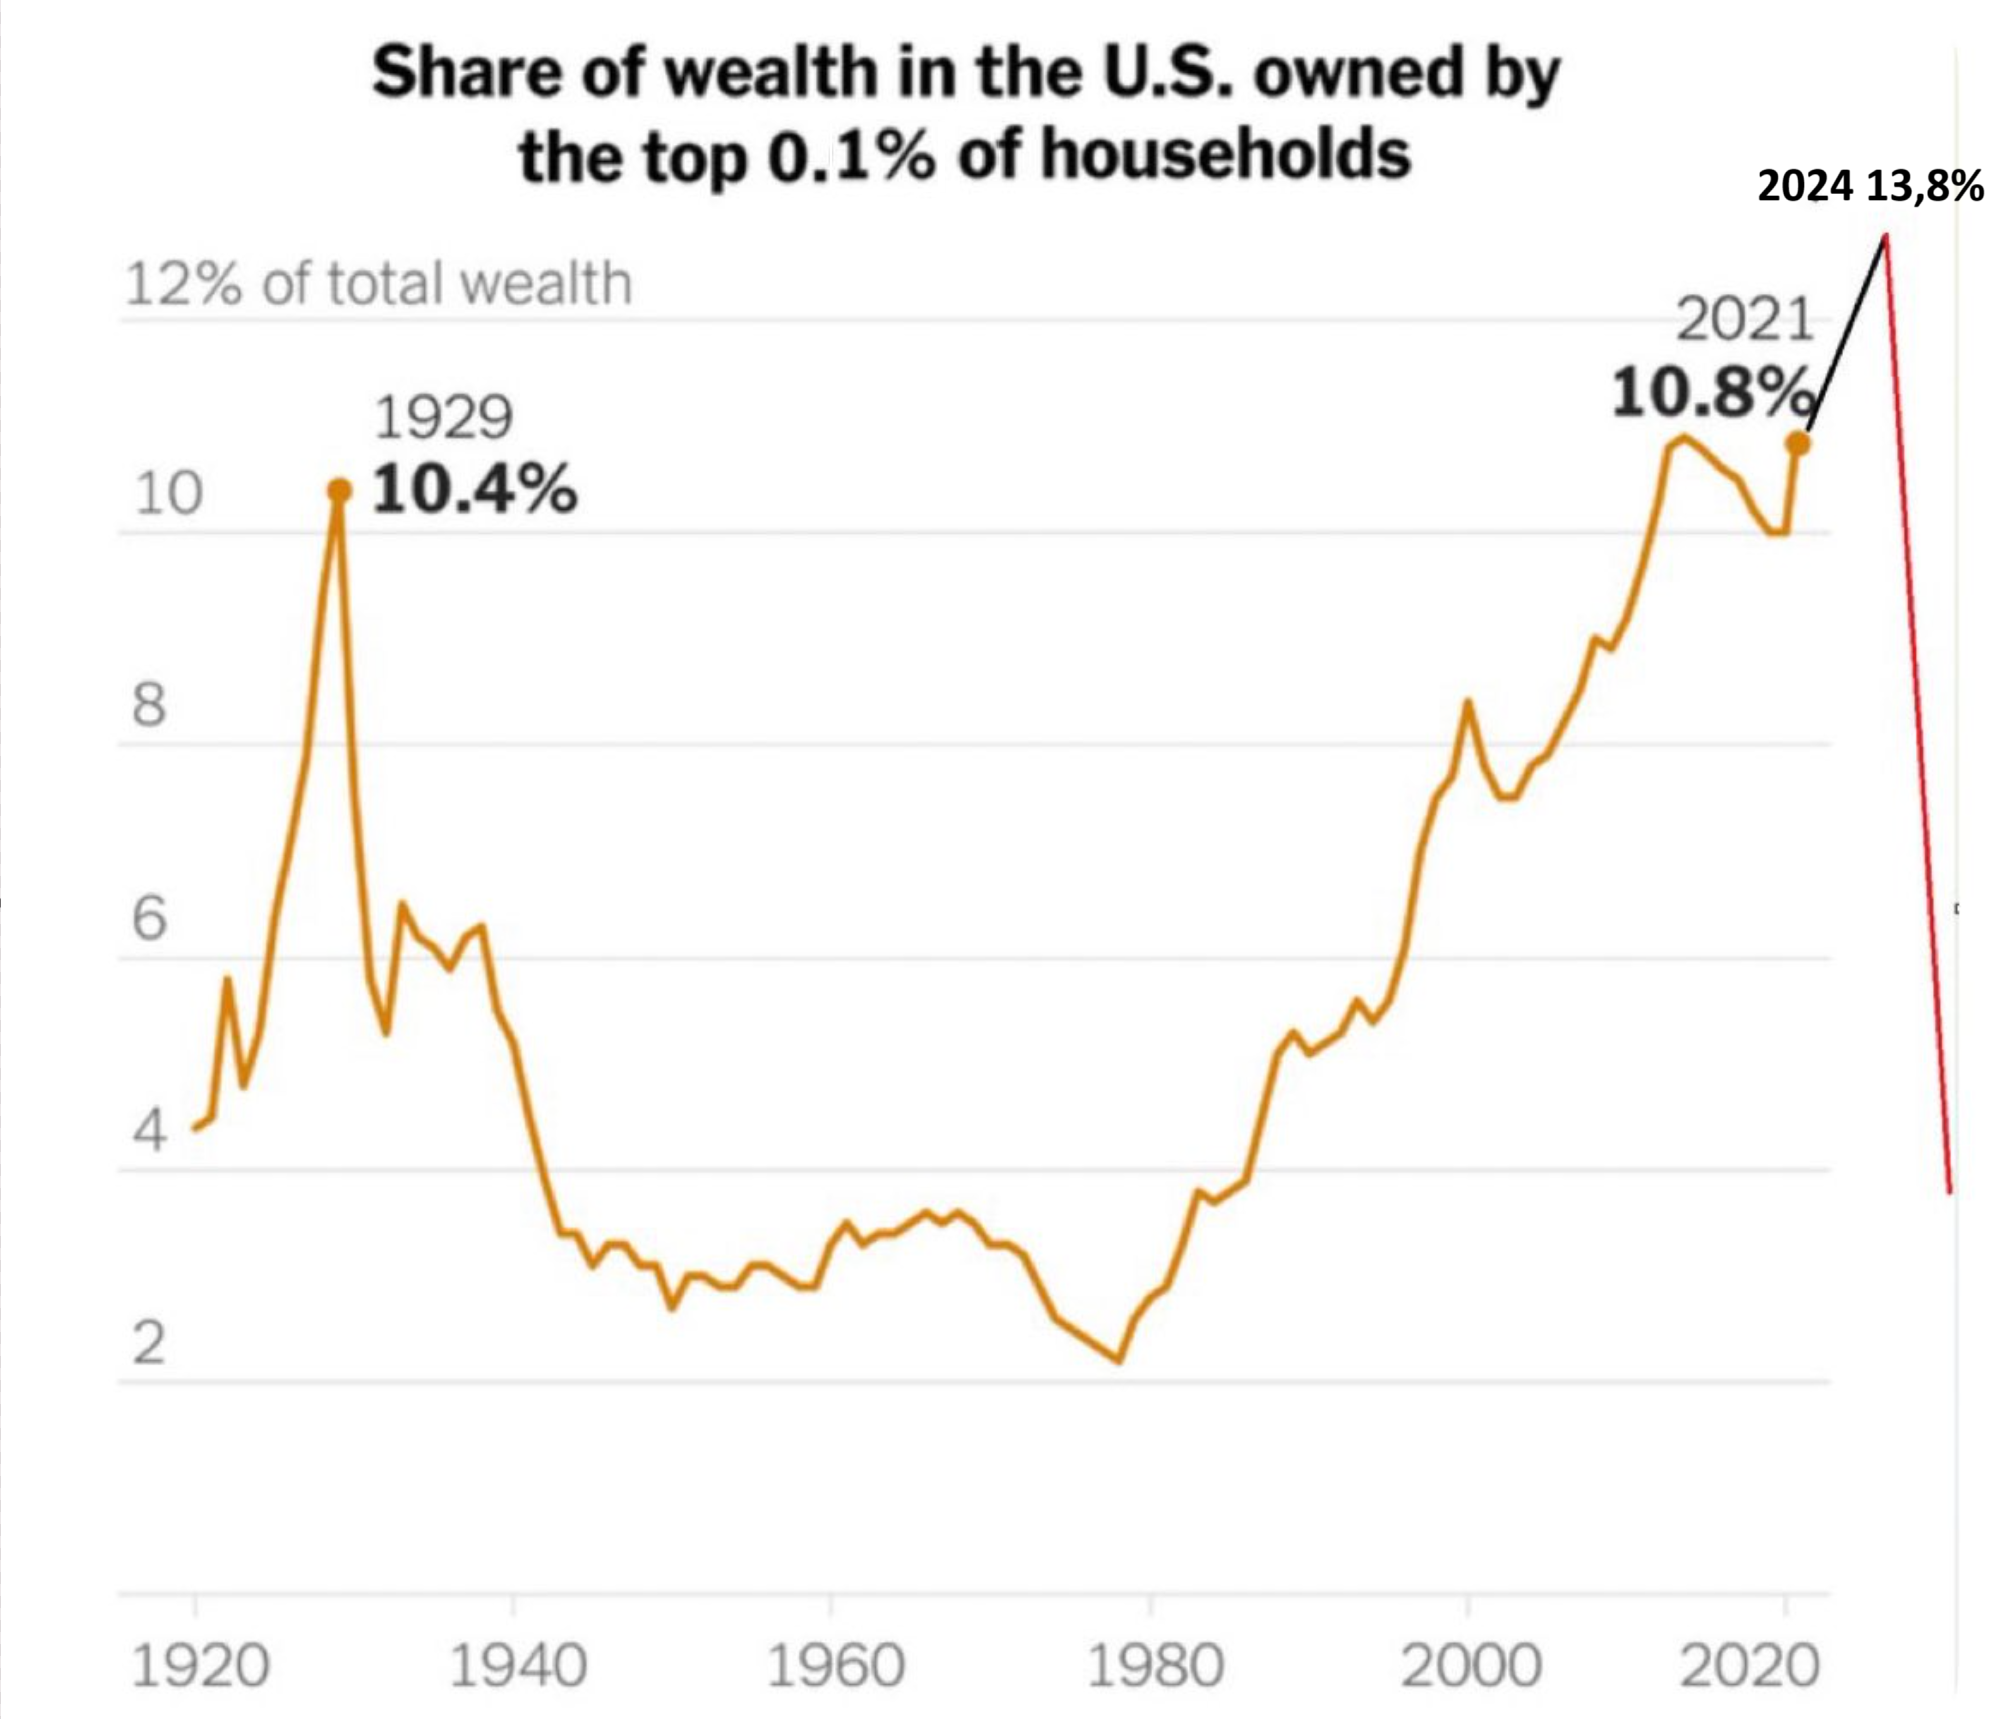
But this US10Y retest in October 2023 is super important, because if it is just a retest to trend break. It means the move down in yields will be biblical telling us this artificial spike of inflation was just “an epic spike of inflation” still in the same disinflationary cycle which in reality moved wealth to top 0.1% from 10% in 2020 to almost 14% in 4Q24 -> that’s how inflationary spikes work in disinflationary cycles.
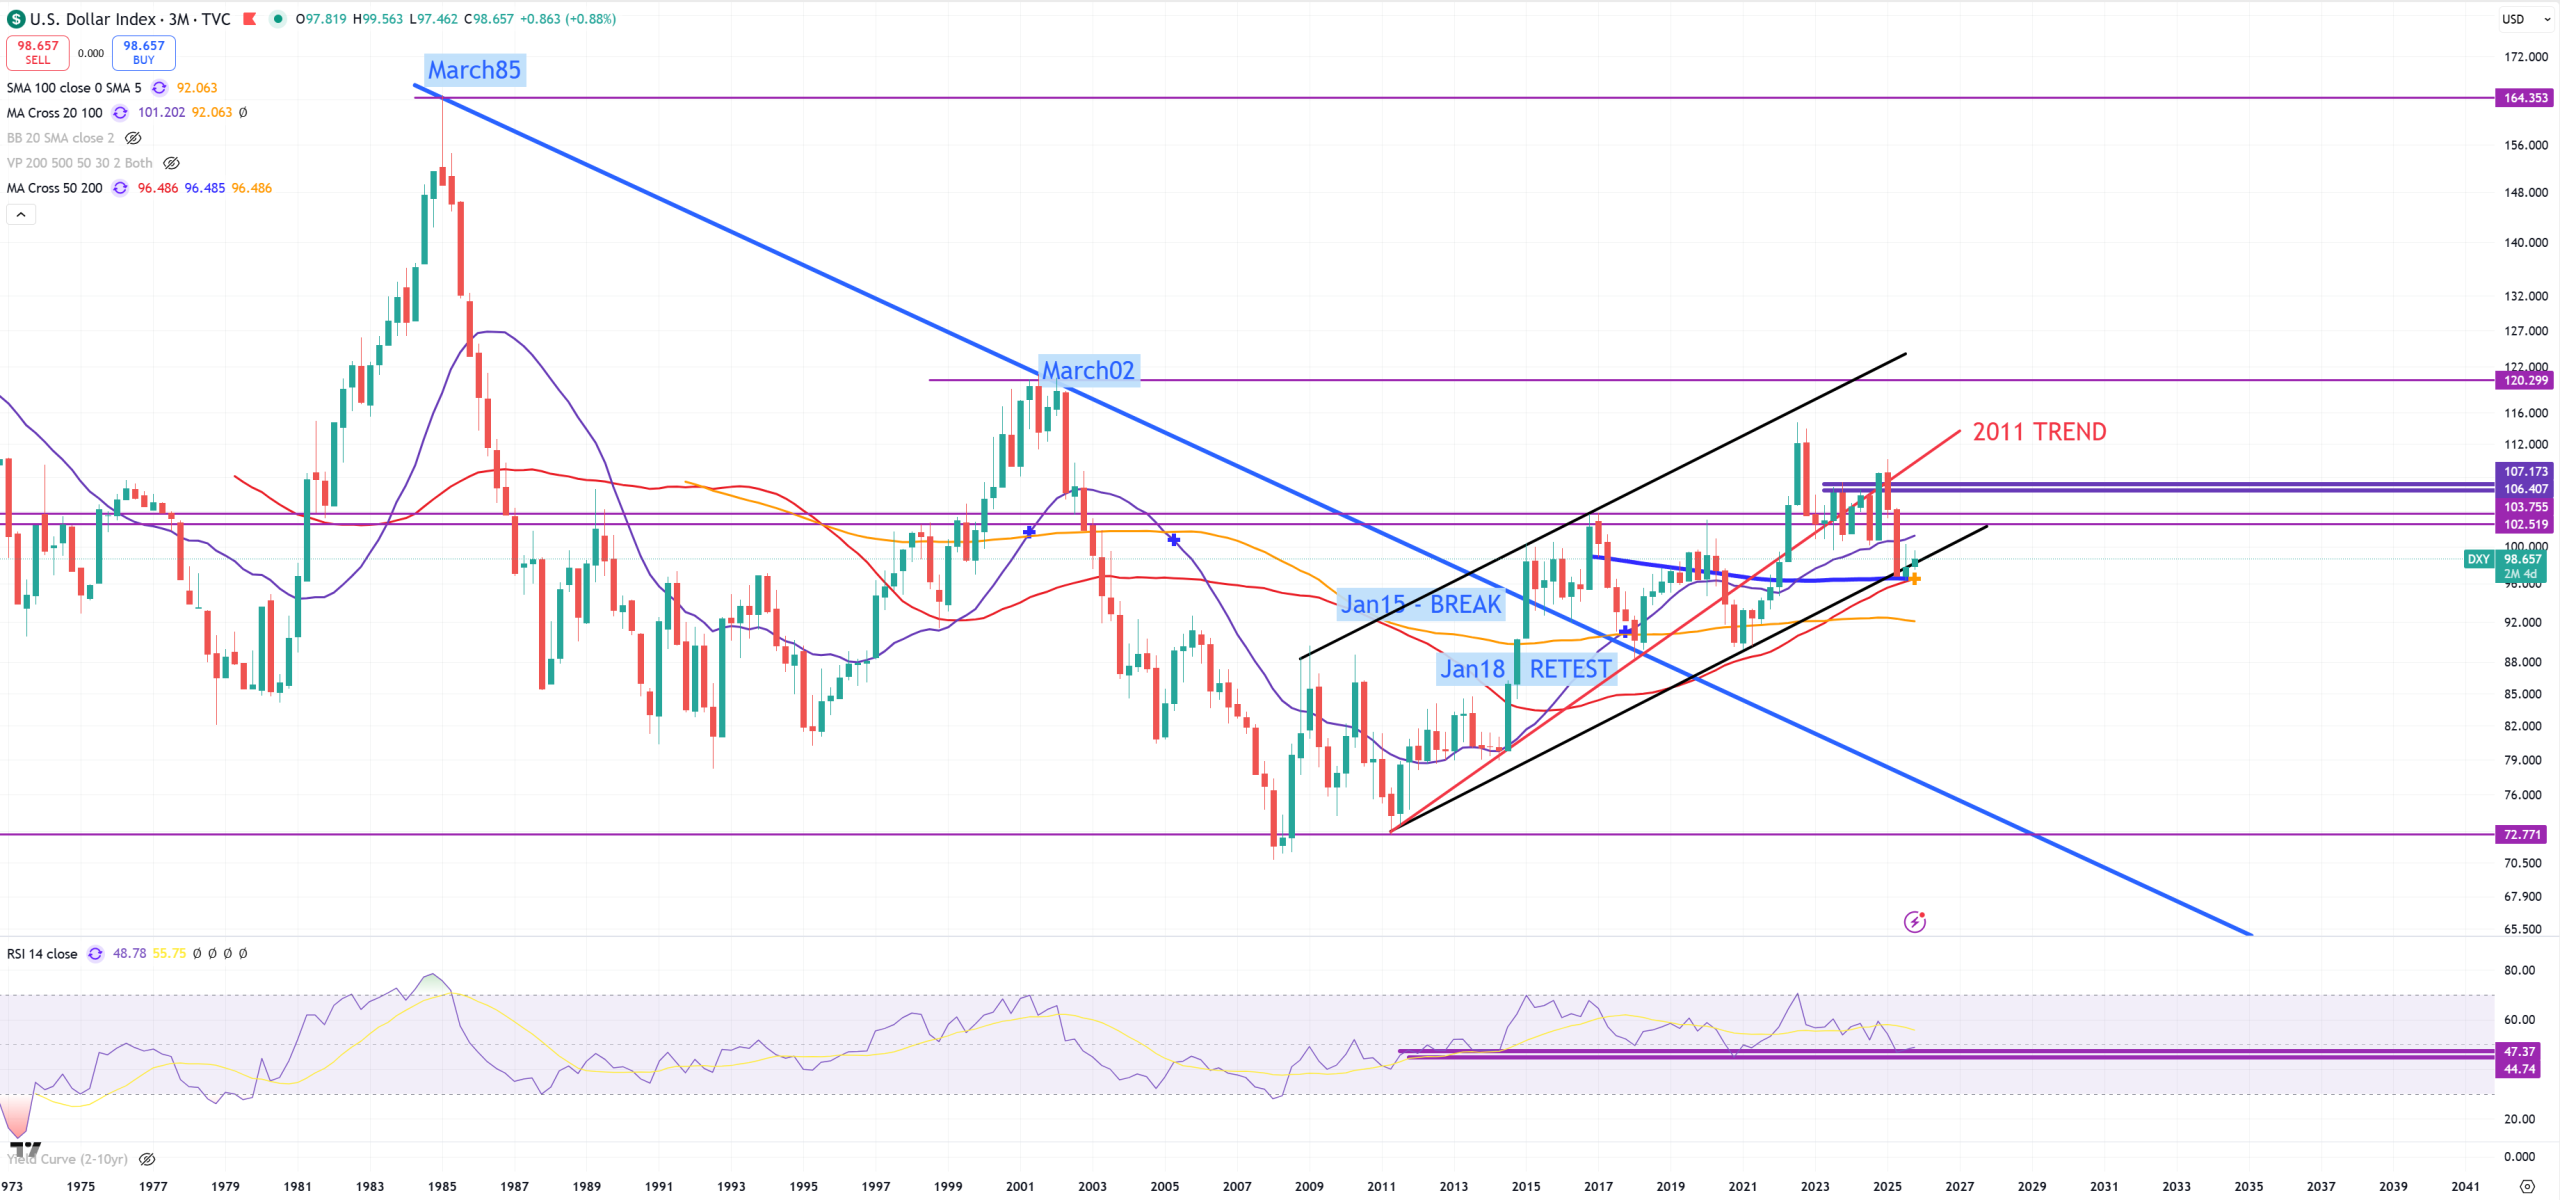
There’s also another key asset to follow. It’s DXY. This view is (3M) just like DJI/GOLD and SPX/GOLD and guess what. DXY holds the same technical indicator (3M)MA200 like DJI/GOLD and SPX/GOLD trying to break. The problem is even wider because we see even here something what I might call super secular golden cross where red (3M)MA50 crossing up blue (3M)MA200 creating this small yellow “+”. My assumption says : the longer and deeper 10Y-3M is inverted the higher DXY will jump at the end with 2 targets still 120 or 160. So the moment US03MY tries to cross down (M)MA50 the same moment DXY tries to find support around multiple key indicators like (3M)MA50/(3M)MA200, trend and (M)MA100.
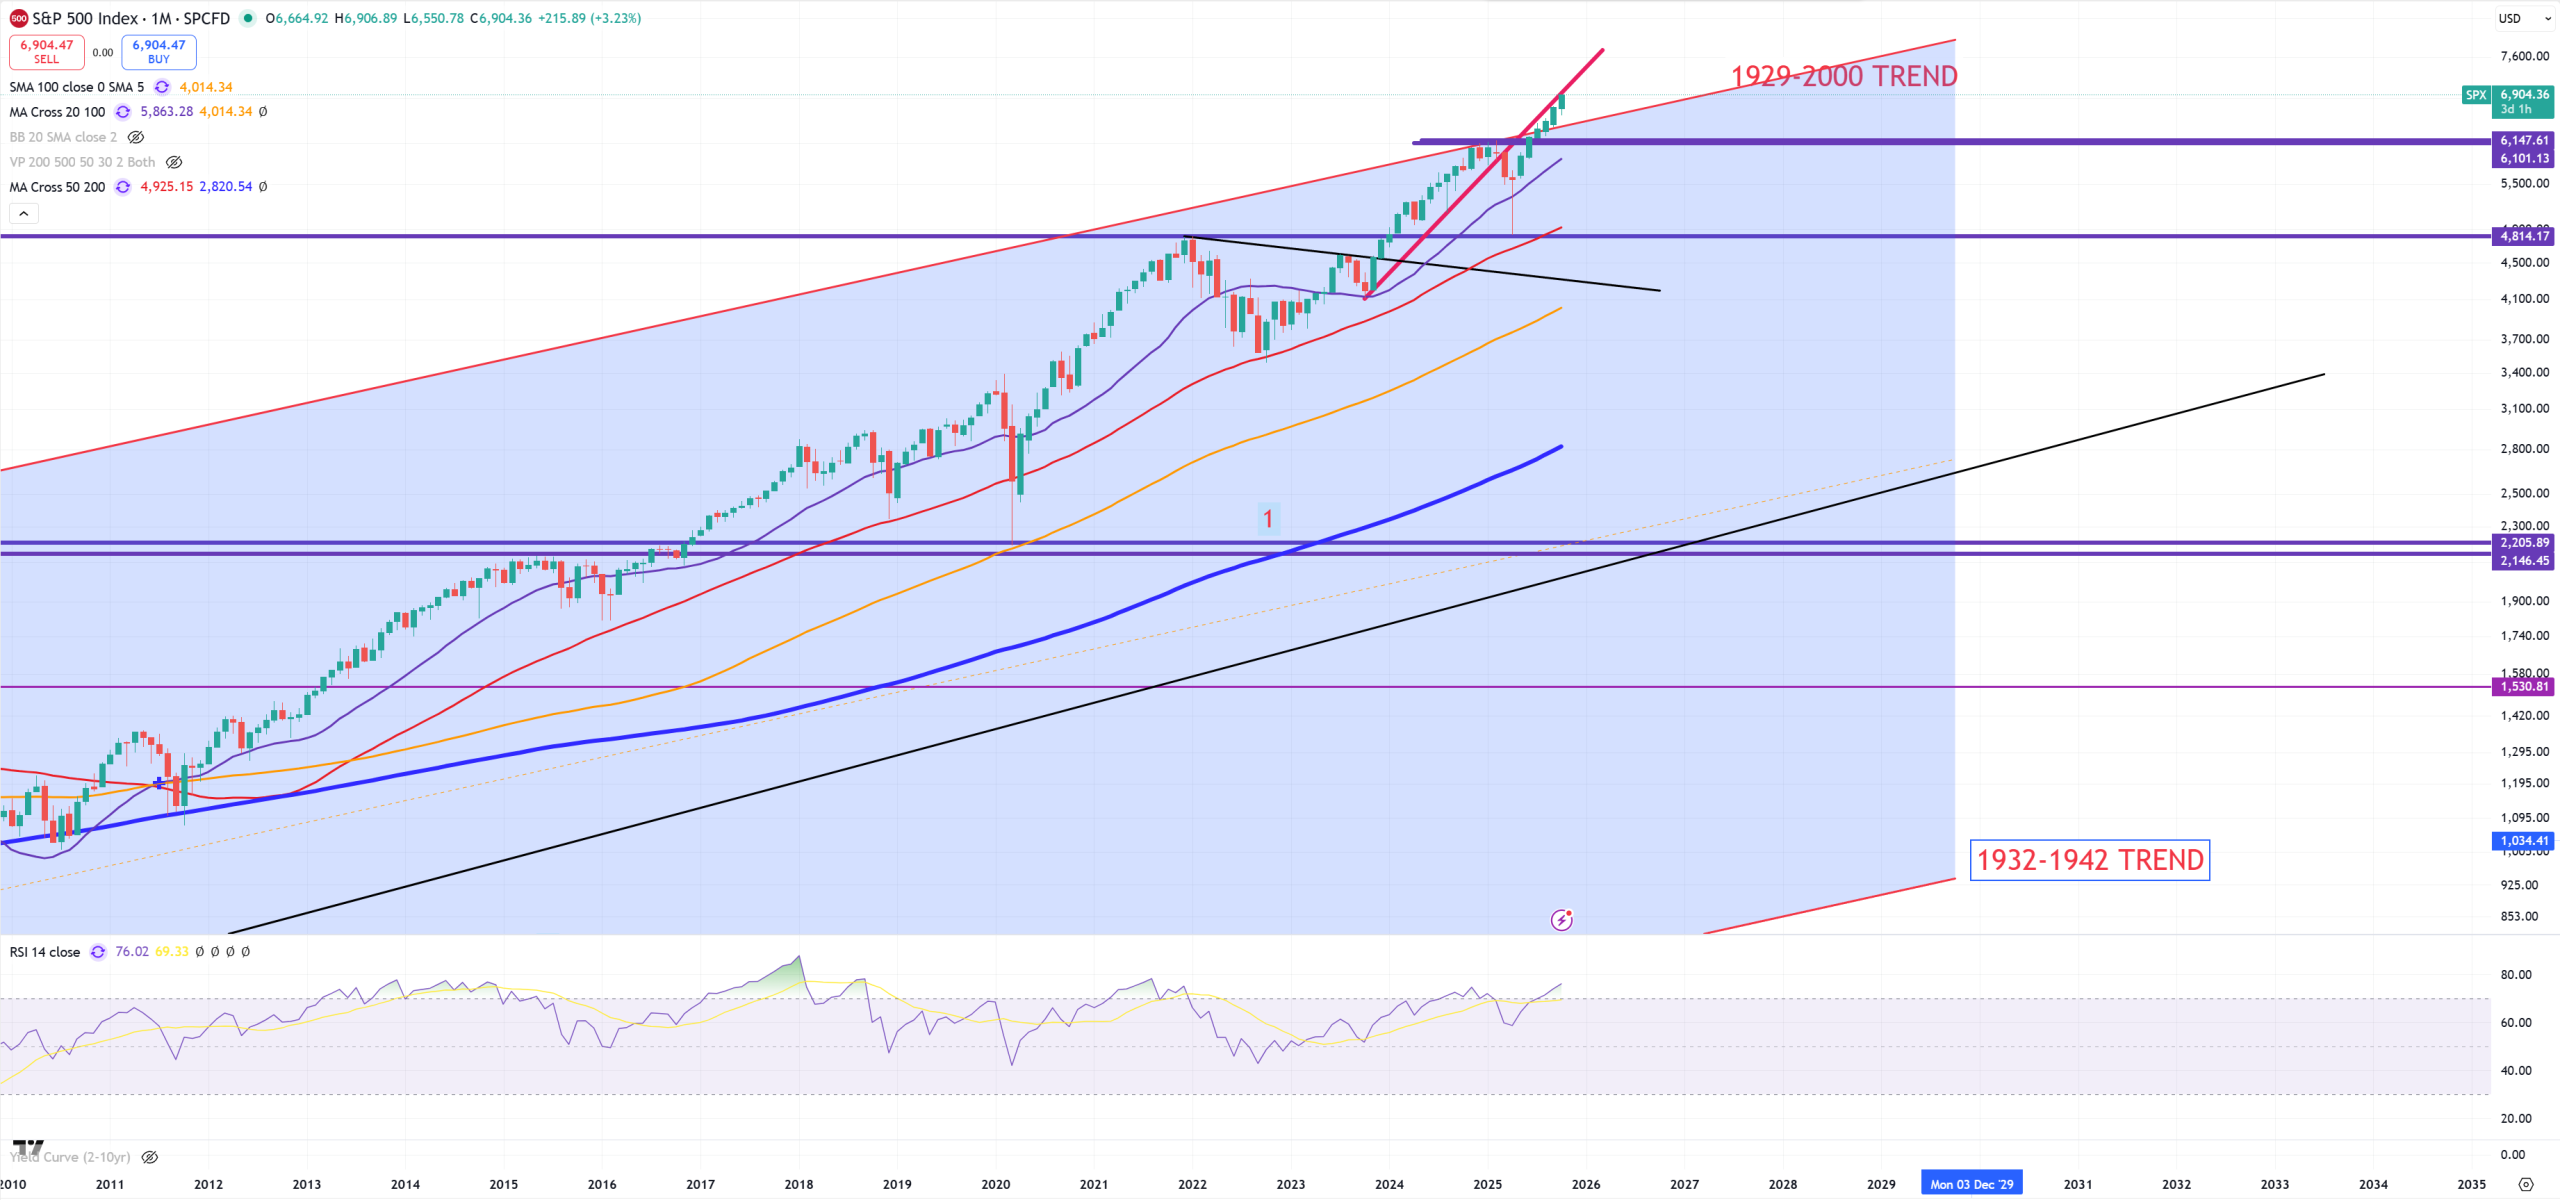
At the end we’ll take a look on SPX super long term chart it also does not match, just like SPX/GOLD does not match with DJI/GOLD (3M)MA200 break. US03MY has also not accomplished its (M)MA50 break, but the truth is stock market is the most stupid market as the bond market is the smartest market giving real hints.
It would be too perfect for SPX to hold its 1929-2000 trend, but it might turn out it’ll hold it if we flip to (3M) view and see it at the end of December 2025.
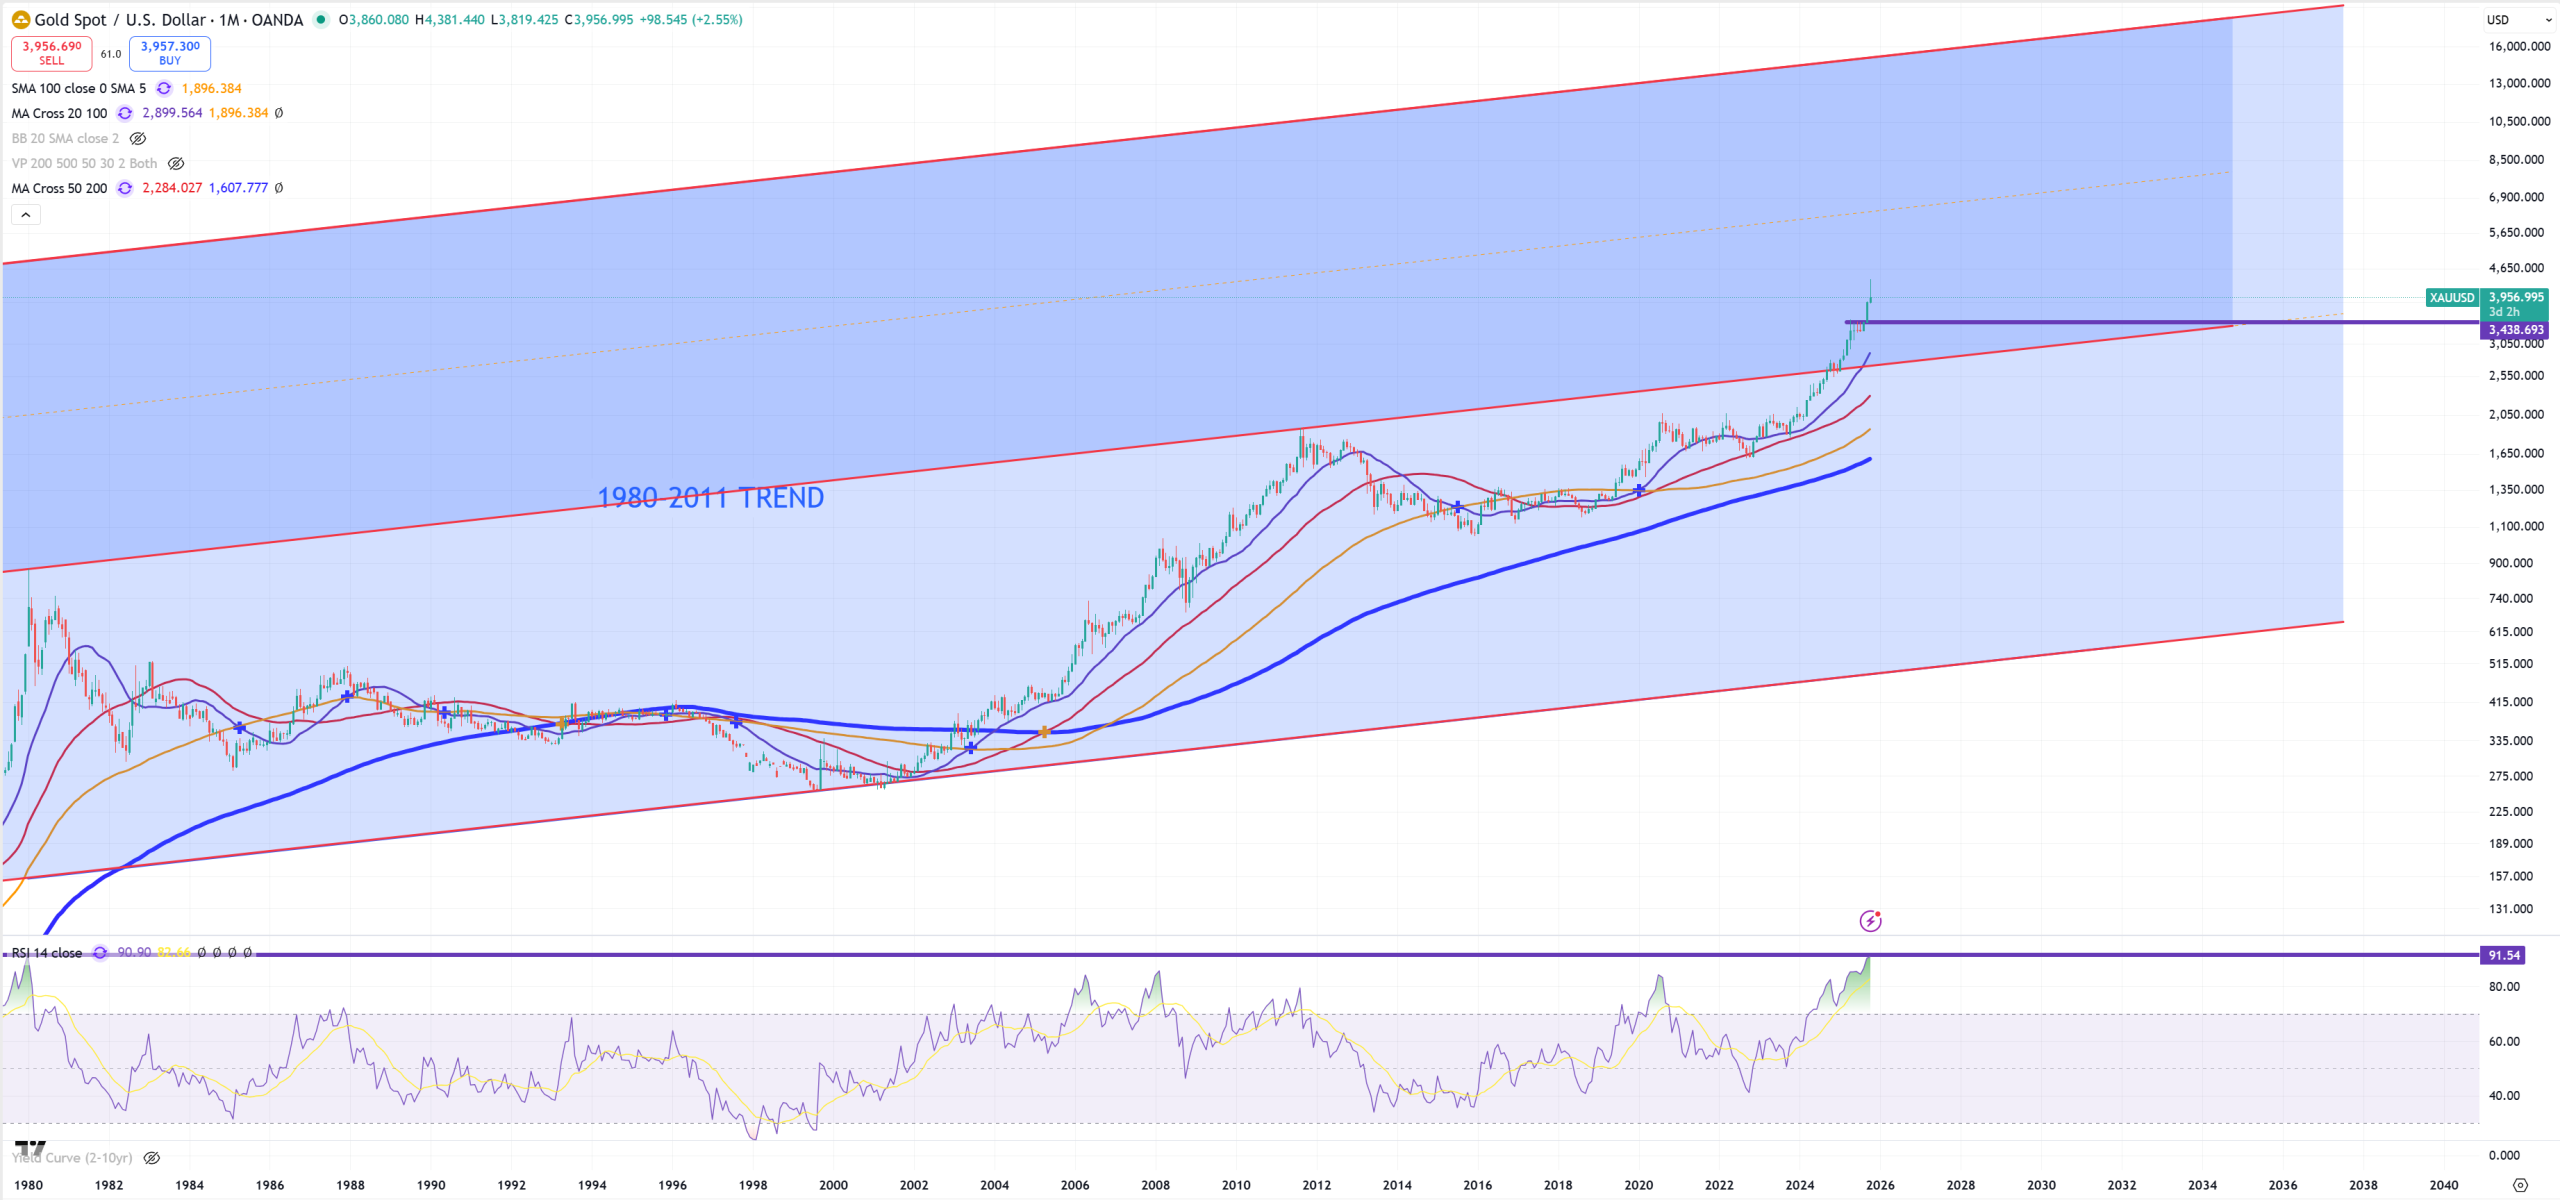
GOLD – gold is the most predictable asset. If you take a look on SPX/GOLD and DJI/GOLD you’ll see the bull market in gold has started in 1999-2000, XAUUSD = 260$ with a correction between 2011-2018/2021 (depends what we take into consideration : 2018 -> peak DJI/GOLD, 2021 -> peak SPX/GOLD). While gold has very huge (M)RSI the bull market in GOLD will be hold until I assume DJI/GOLD and SPX/GOLD will hit both lower trend lines of 1932-1980 trend. Both dates are super important because 1932 ended up a big crisis giving a flip of the economy towards secular inflationary cycle and 1980 ended also a big crisis setting up the economy for the biggest boom : secular disinflationary cycles which according to DJI/GOLD and SPX/GOLD ended up by 2018 or 2021. I wrote about GOLD some time ago.
From the other hand SPX can’t drop if :
(M)MA50 on US03MY isn’t broken
10Y/3M isn’t > +60bps post inversion
SPX/GOLD can’t break (3M)MA200 so far.
Summarizing October 2025 will be very important and this 29th October 2025 rate cut.
This market is still heavily cracked, each month even more, but it’s not fully cracked still.
My assumption is still unchanged. Since 2018 from long term perspective you should not be interested in stocks at all based on DJI/GOLD peak, as stocks should be replaced to GOLD.
The situation now is even more funny, because at some point of time we need DXY+US Bonds to rally. Are we approaching towards this moment? You need to anwer yourself after you read this article.
[…] Mastering technical turn of the market […]