11/2025
November 1, 2025

Situation at the end of October has changed a bit. The market is still heavily cracked but in reality it’s still nothing “alarming” from technical point of view. Today we’re going to start from the bond market and the $$$. To understand how I interpret key 4 MA :
violet (M)MA20 = high momentum MA, red (M)MA50 = typical bull/bear border, yellow (M)MA100 = typical bull/bear trap level, blue (M)MA200 = secular border
Also remember each chart is 4K, so if you need to look closer, you need to open it using right mouse click in a browser.
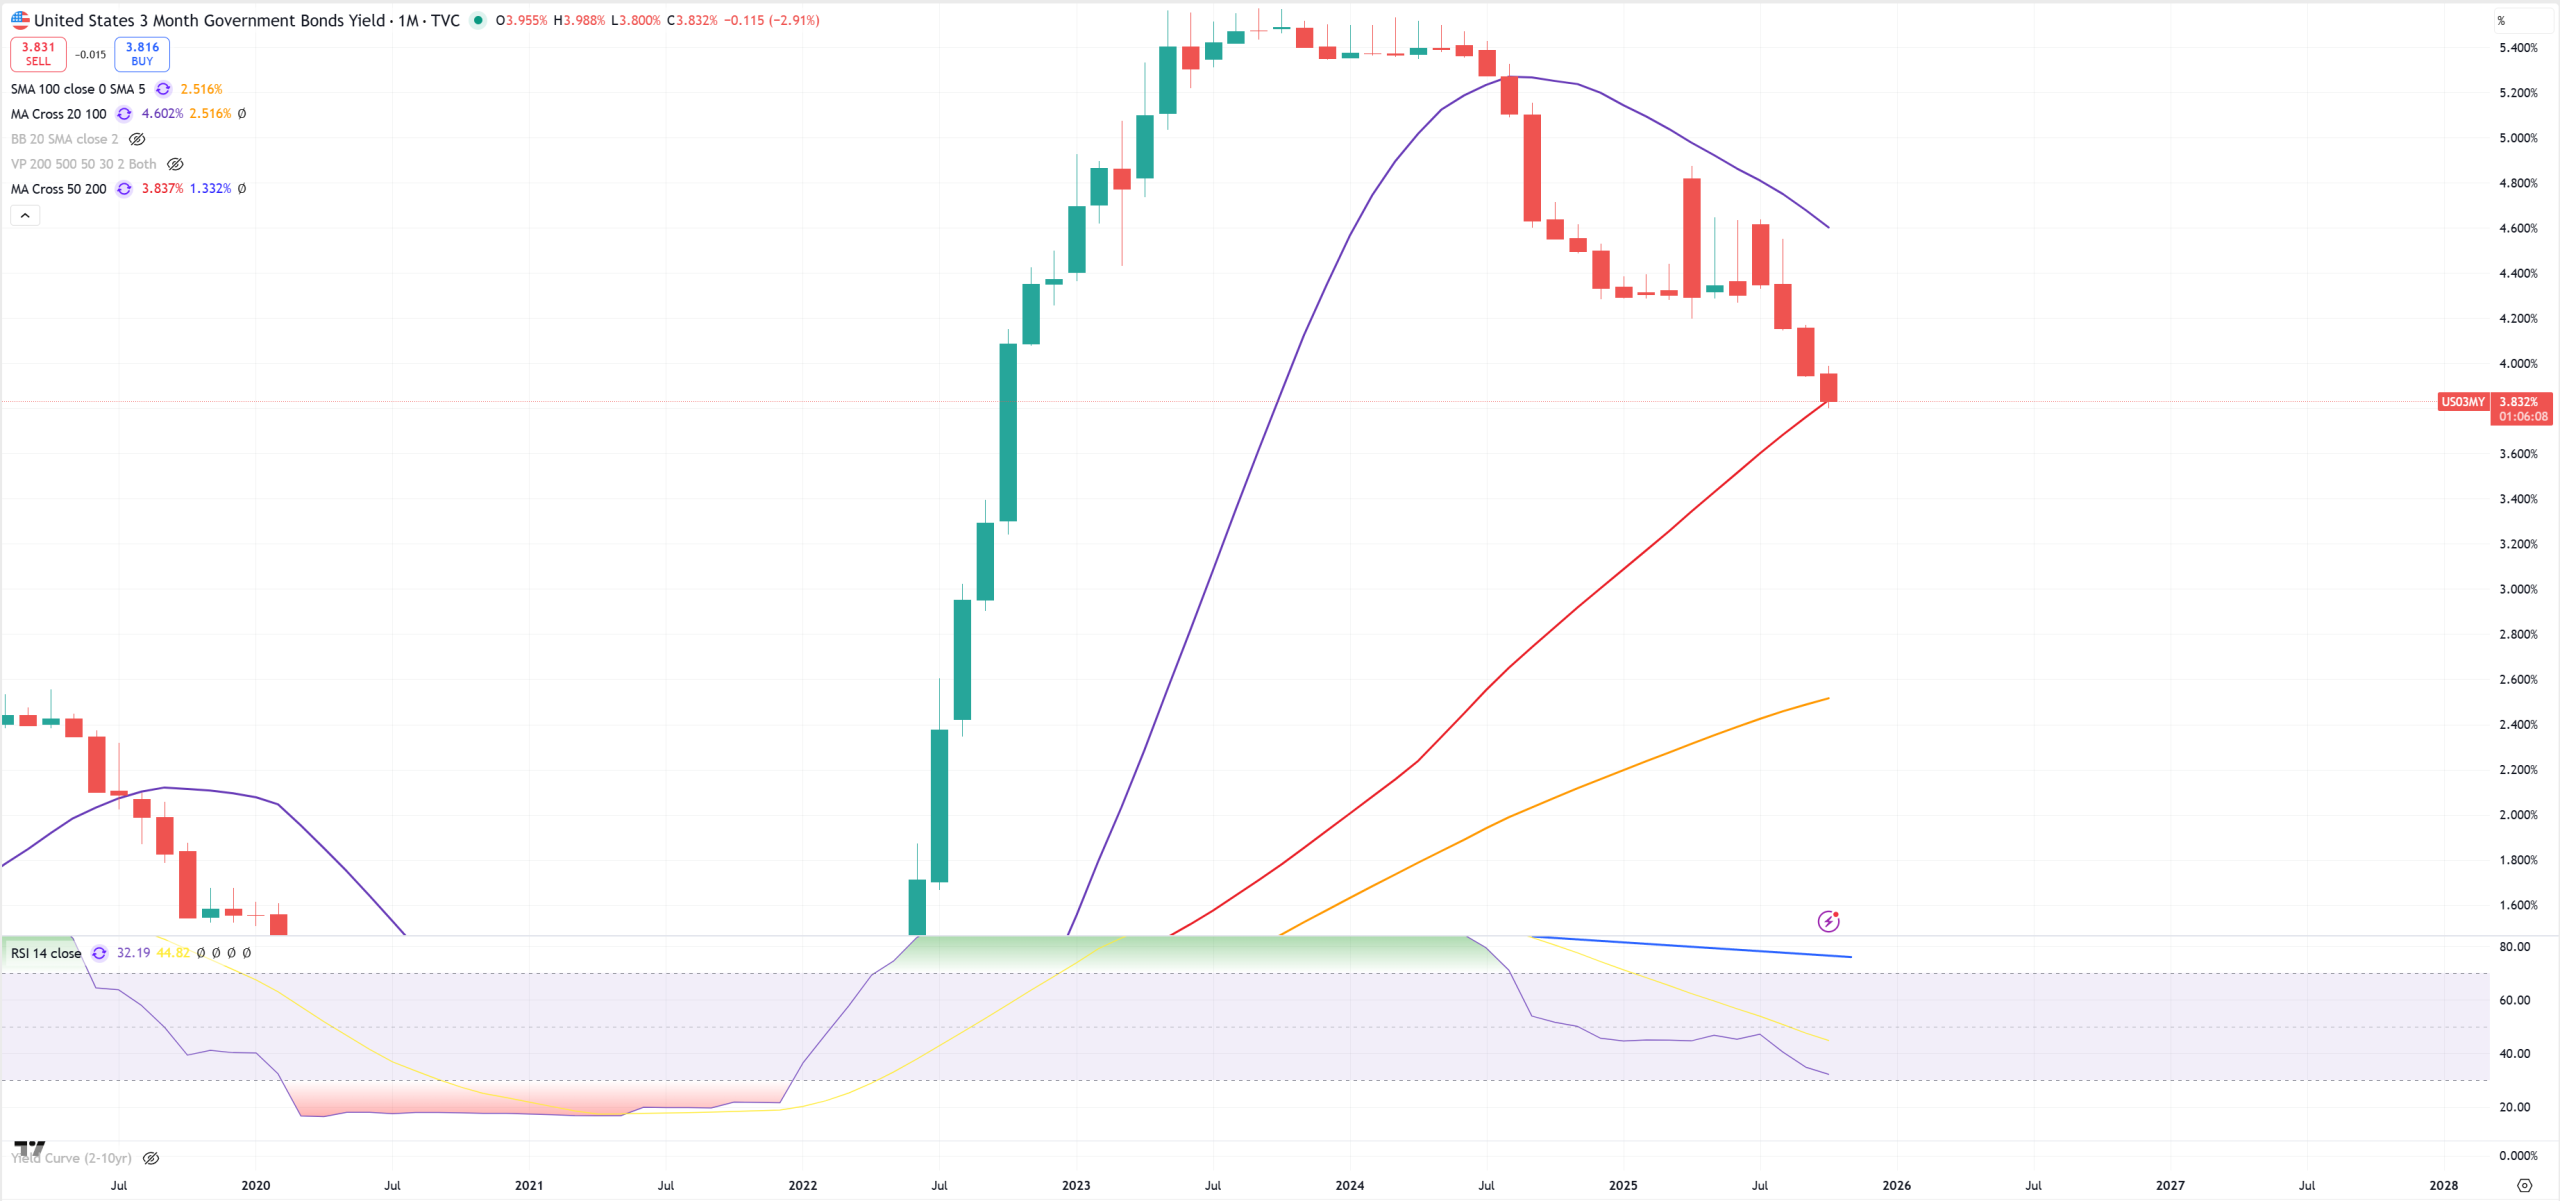
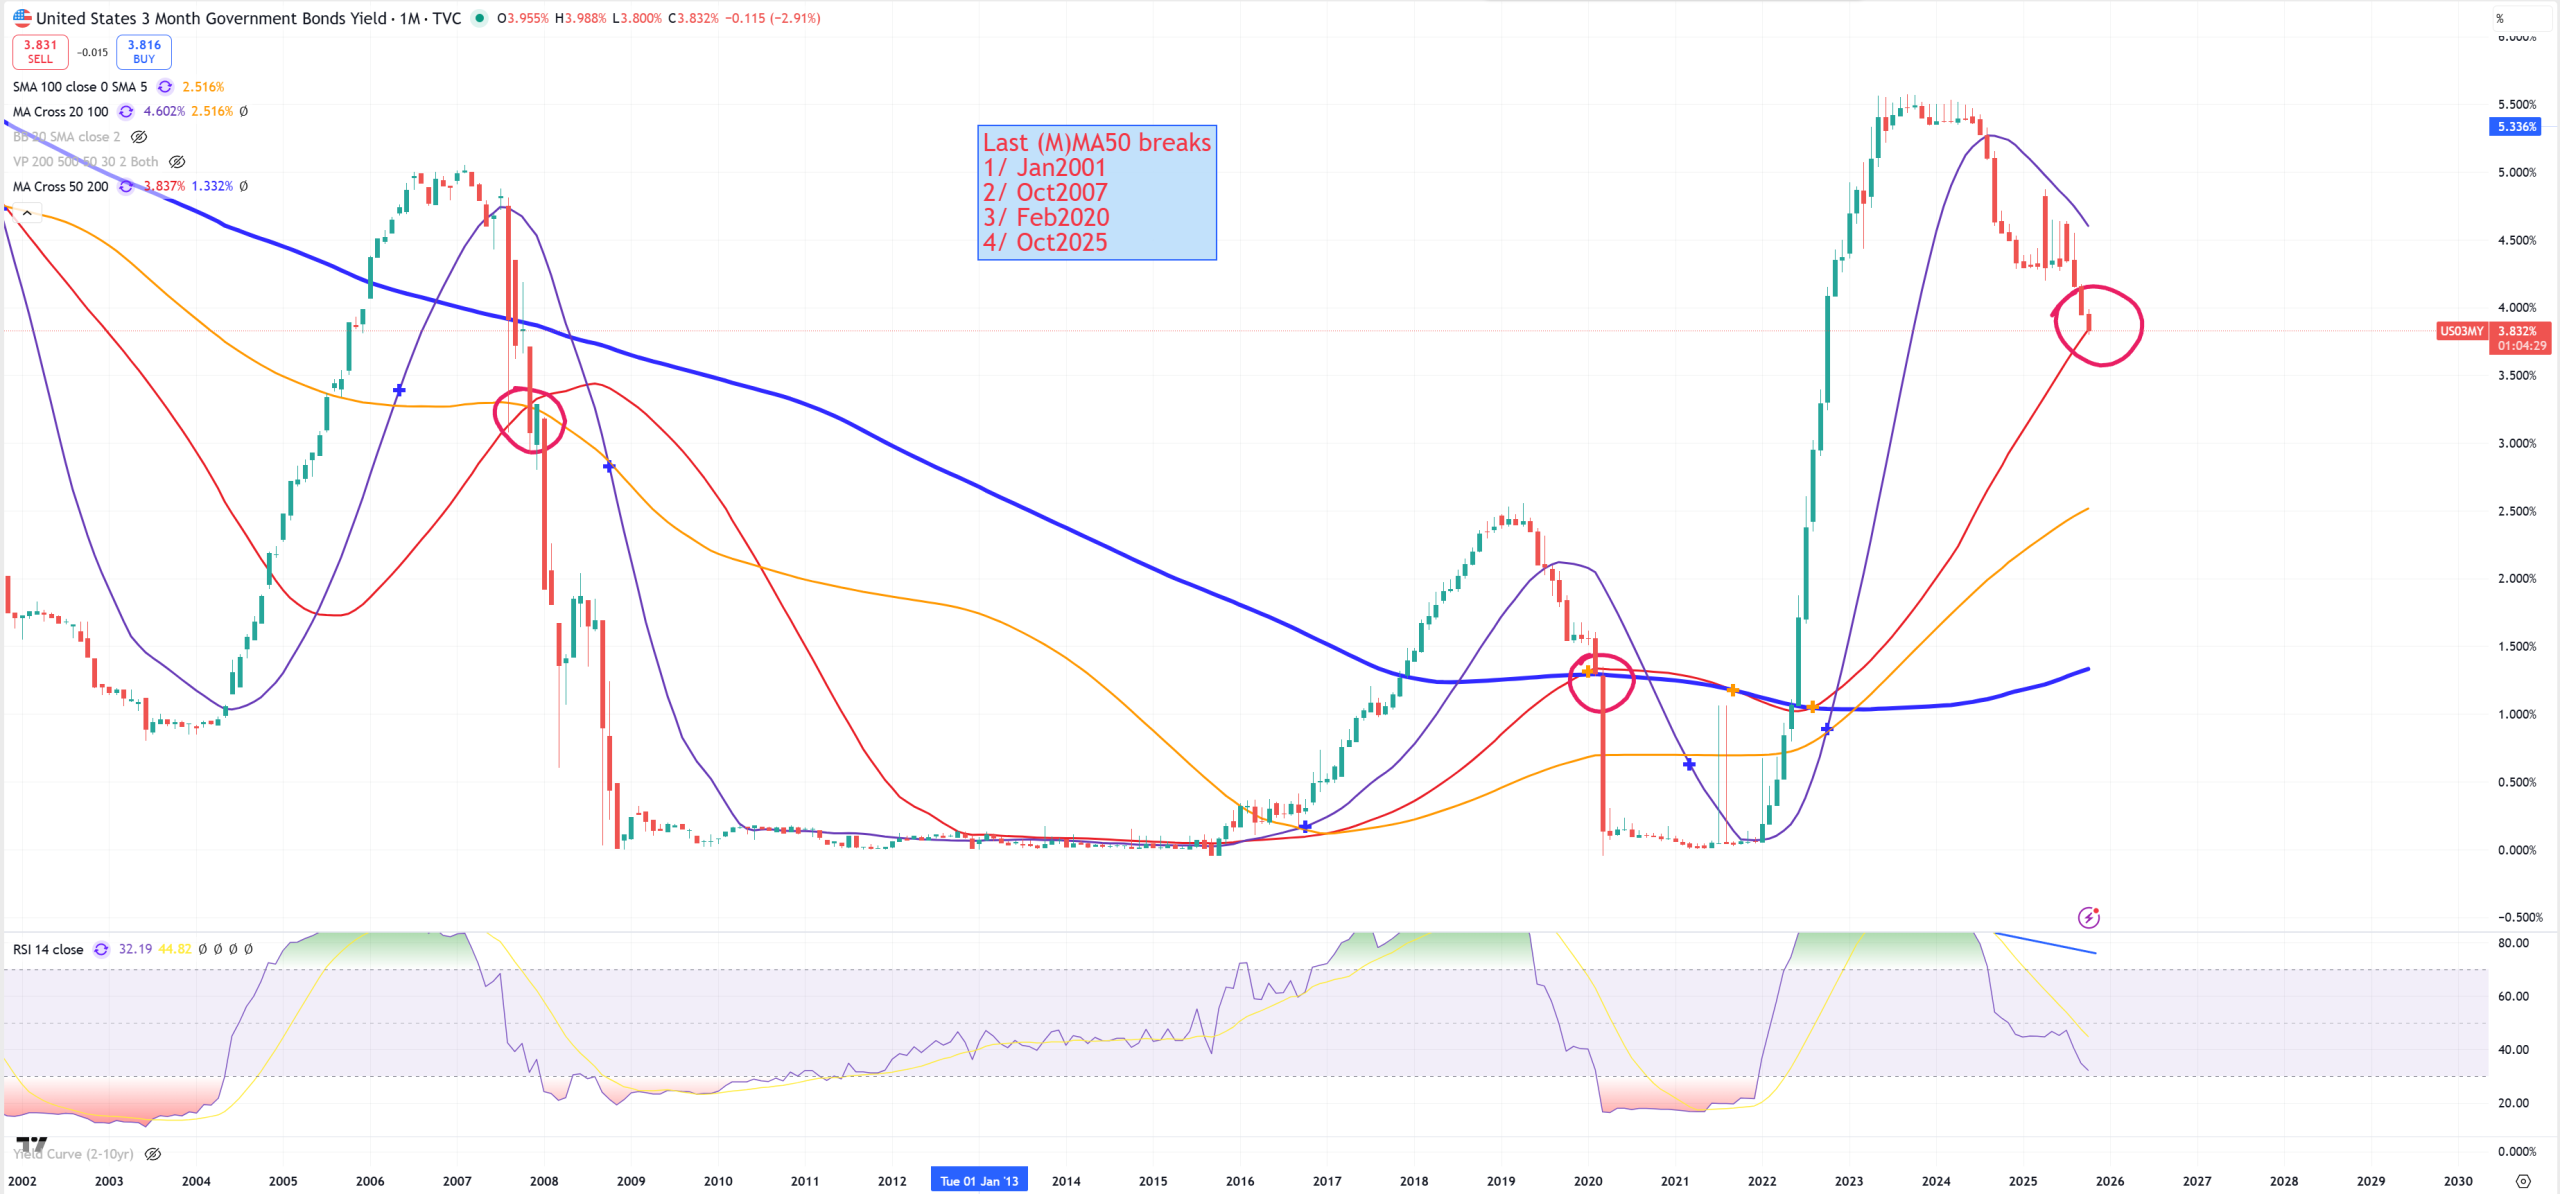
US03MY – Let’s see if my still “mastering” theory will be valid as (M)MA50 break of US03MY during inversion of the yield-curve (or during process of uninverting after longer period of time) so far marked the problems perfectly. (M)MA50 = 3.873% and we finished 3.832%. So probably starting next month will be below (M)MA50. Break is break so we can add Oct2025 as this moment. Let’s see if we’re going to start November 2025 below this red (M)MA50
I’m saying this : in 12/13 moments when US03MY crossed down (M)MA50 during inversions/uninversions of the yield-curve, market’s peak was behind us or just 1-2 weeks in front of us. Just look how during this break other charts build their own setups
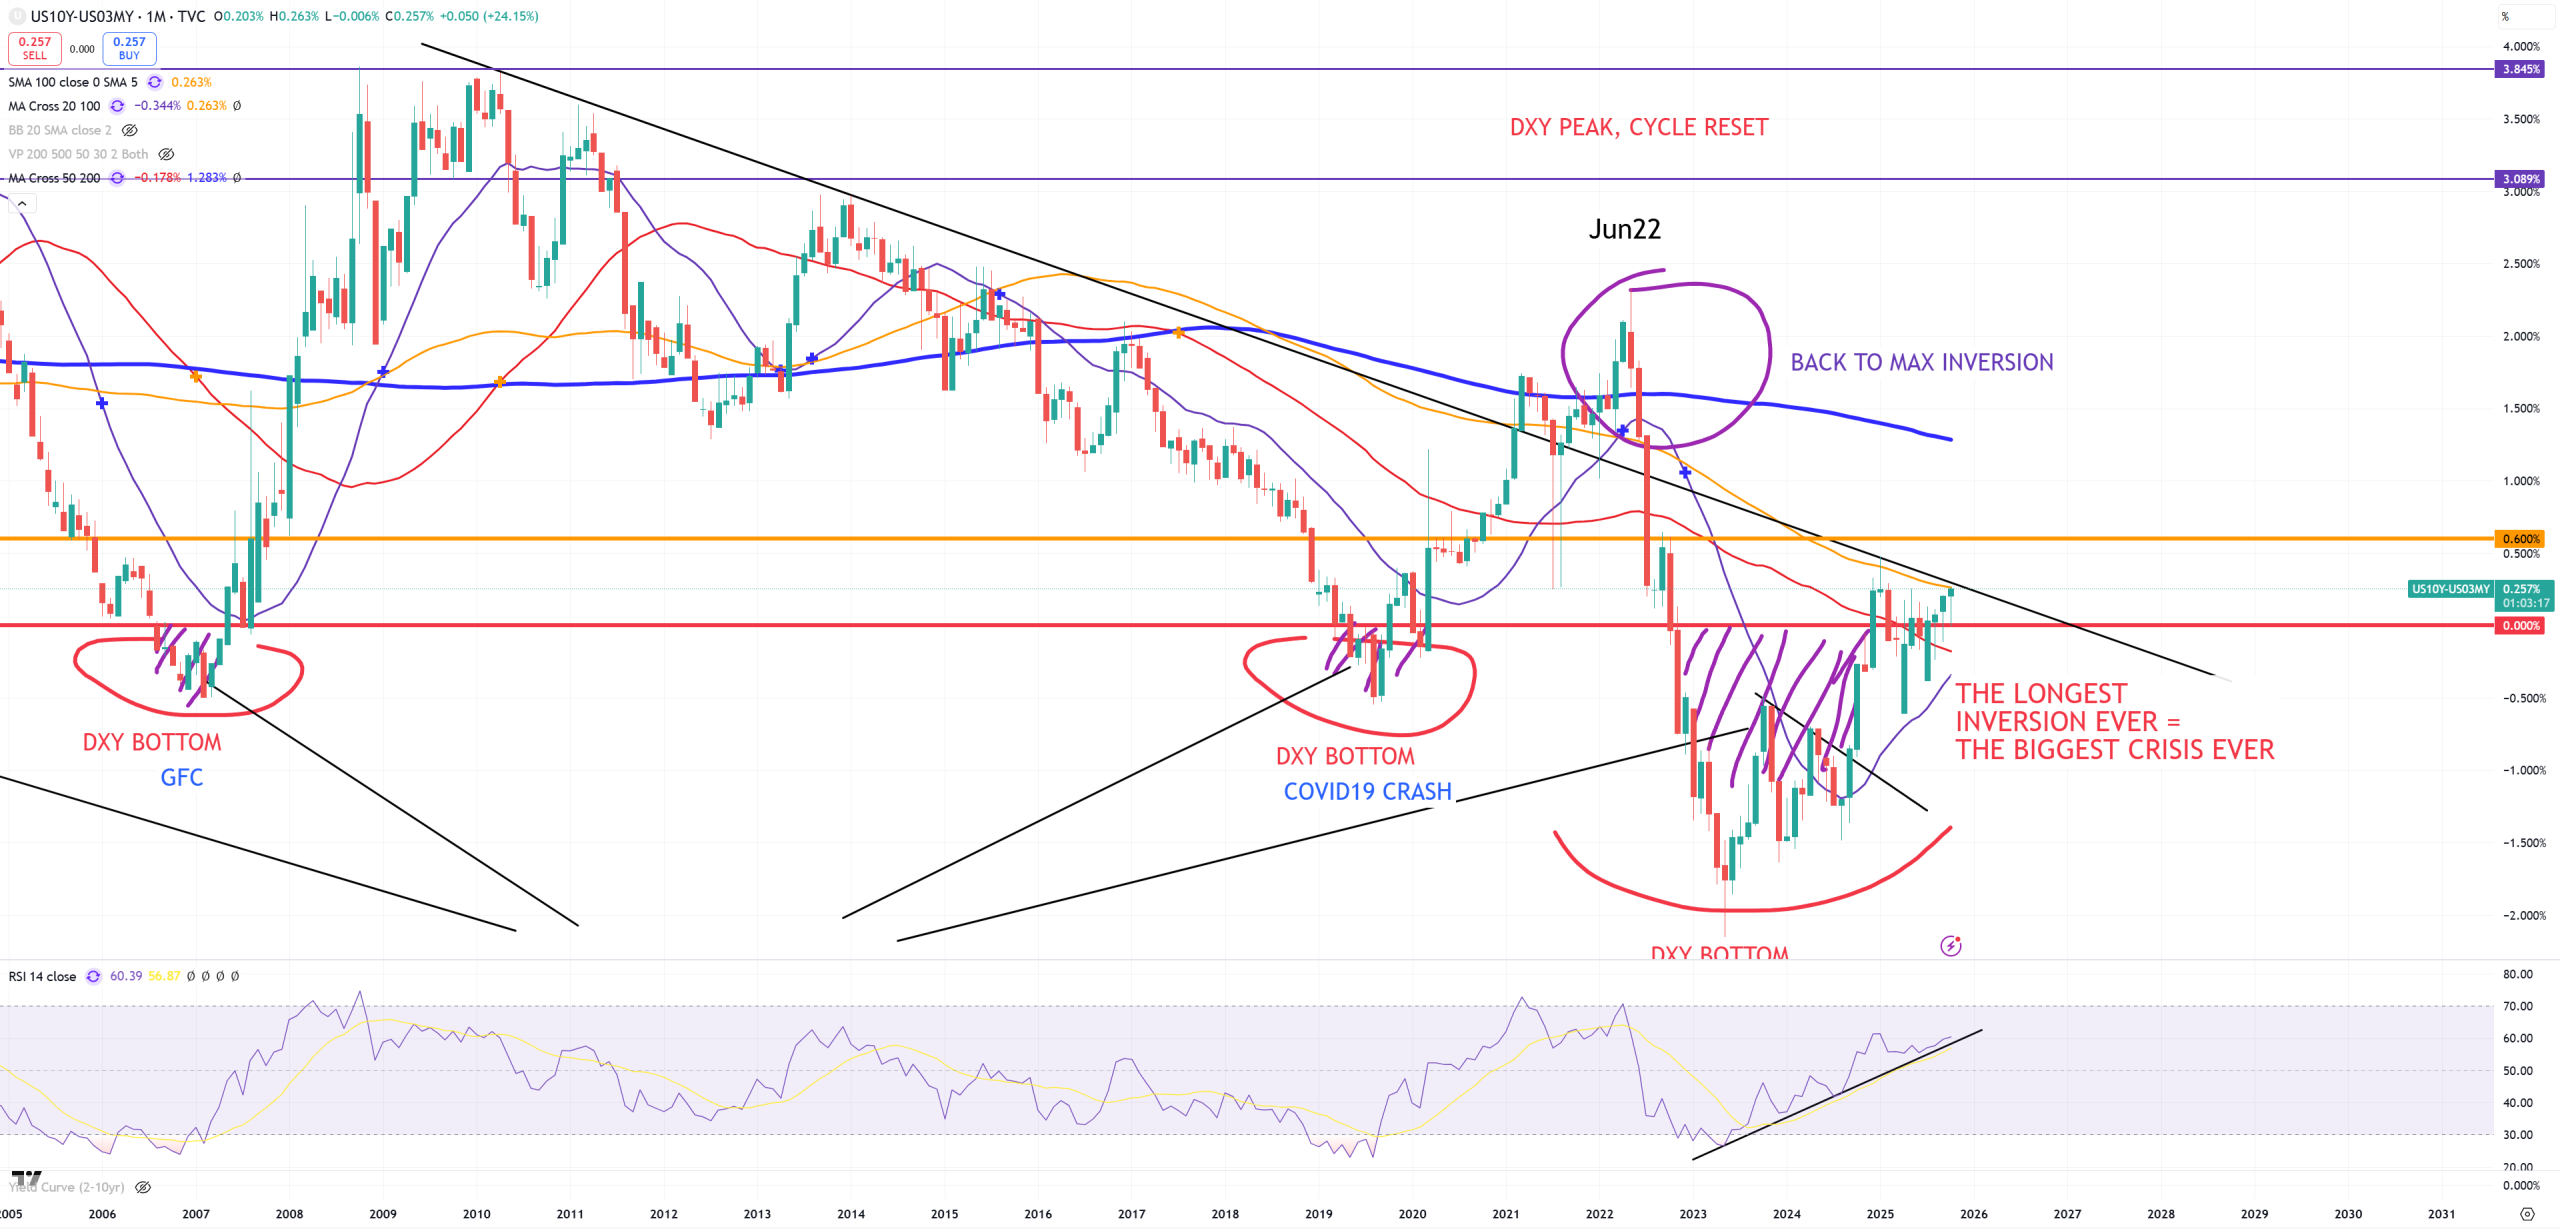
US10Y-US03MY – this spread is on the edge of breaking the trend + yellow (M)MA100. Let’s find out how technicals are positioned when US03MY breaking (M)MA50 at all. It’s +26bps so far and my idea is = uninverting curve is DXY bullish, the higher this uninversion goes. Cycle resets when 10Y/3M jumps > ~350bps. Have in mind that DXY=~100 when 10Y/3M is just +26bps.
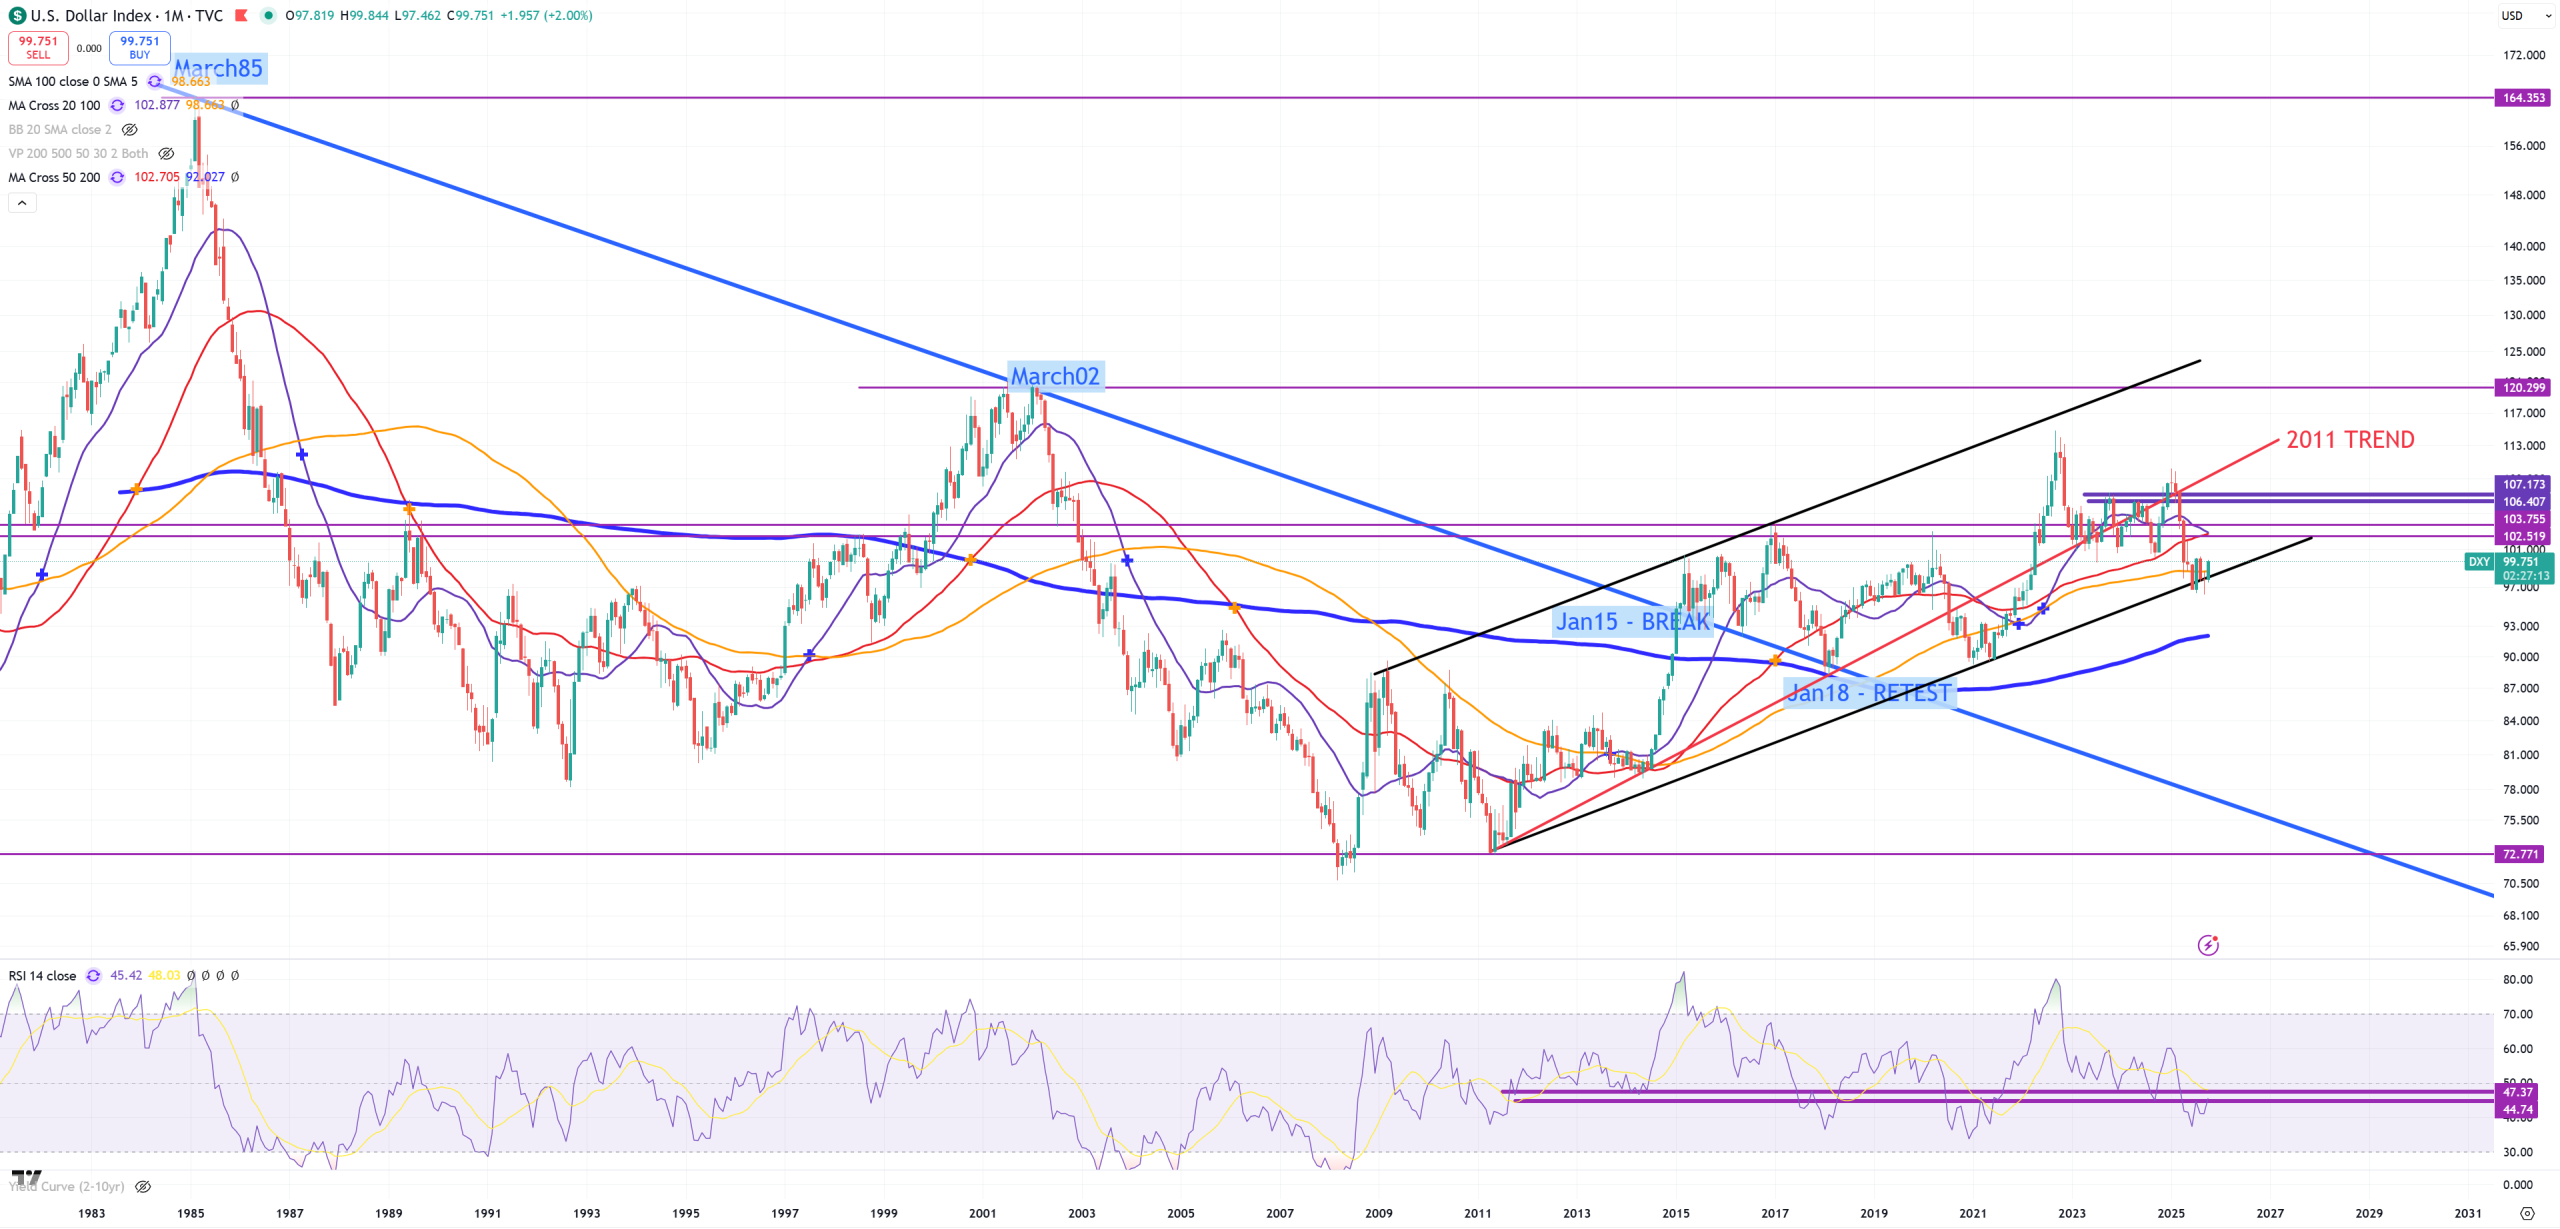
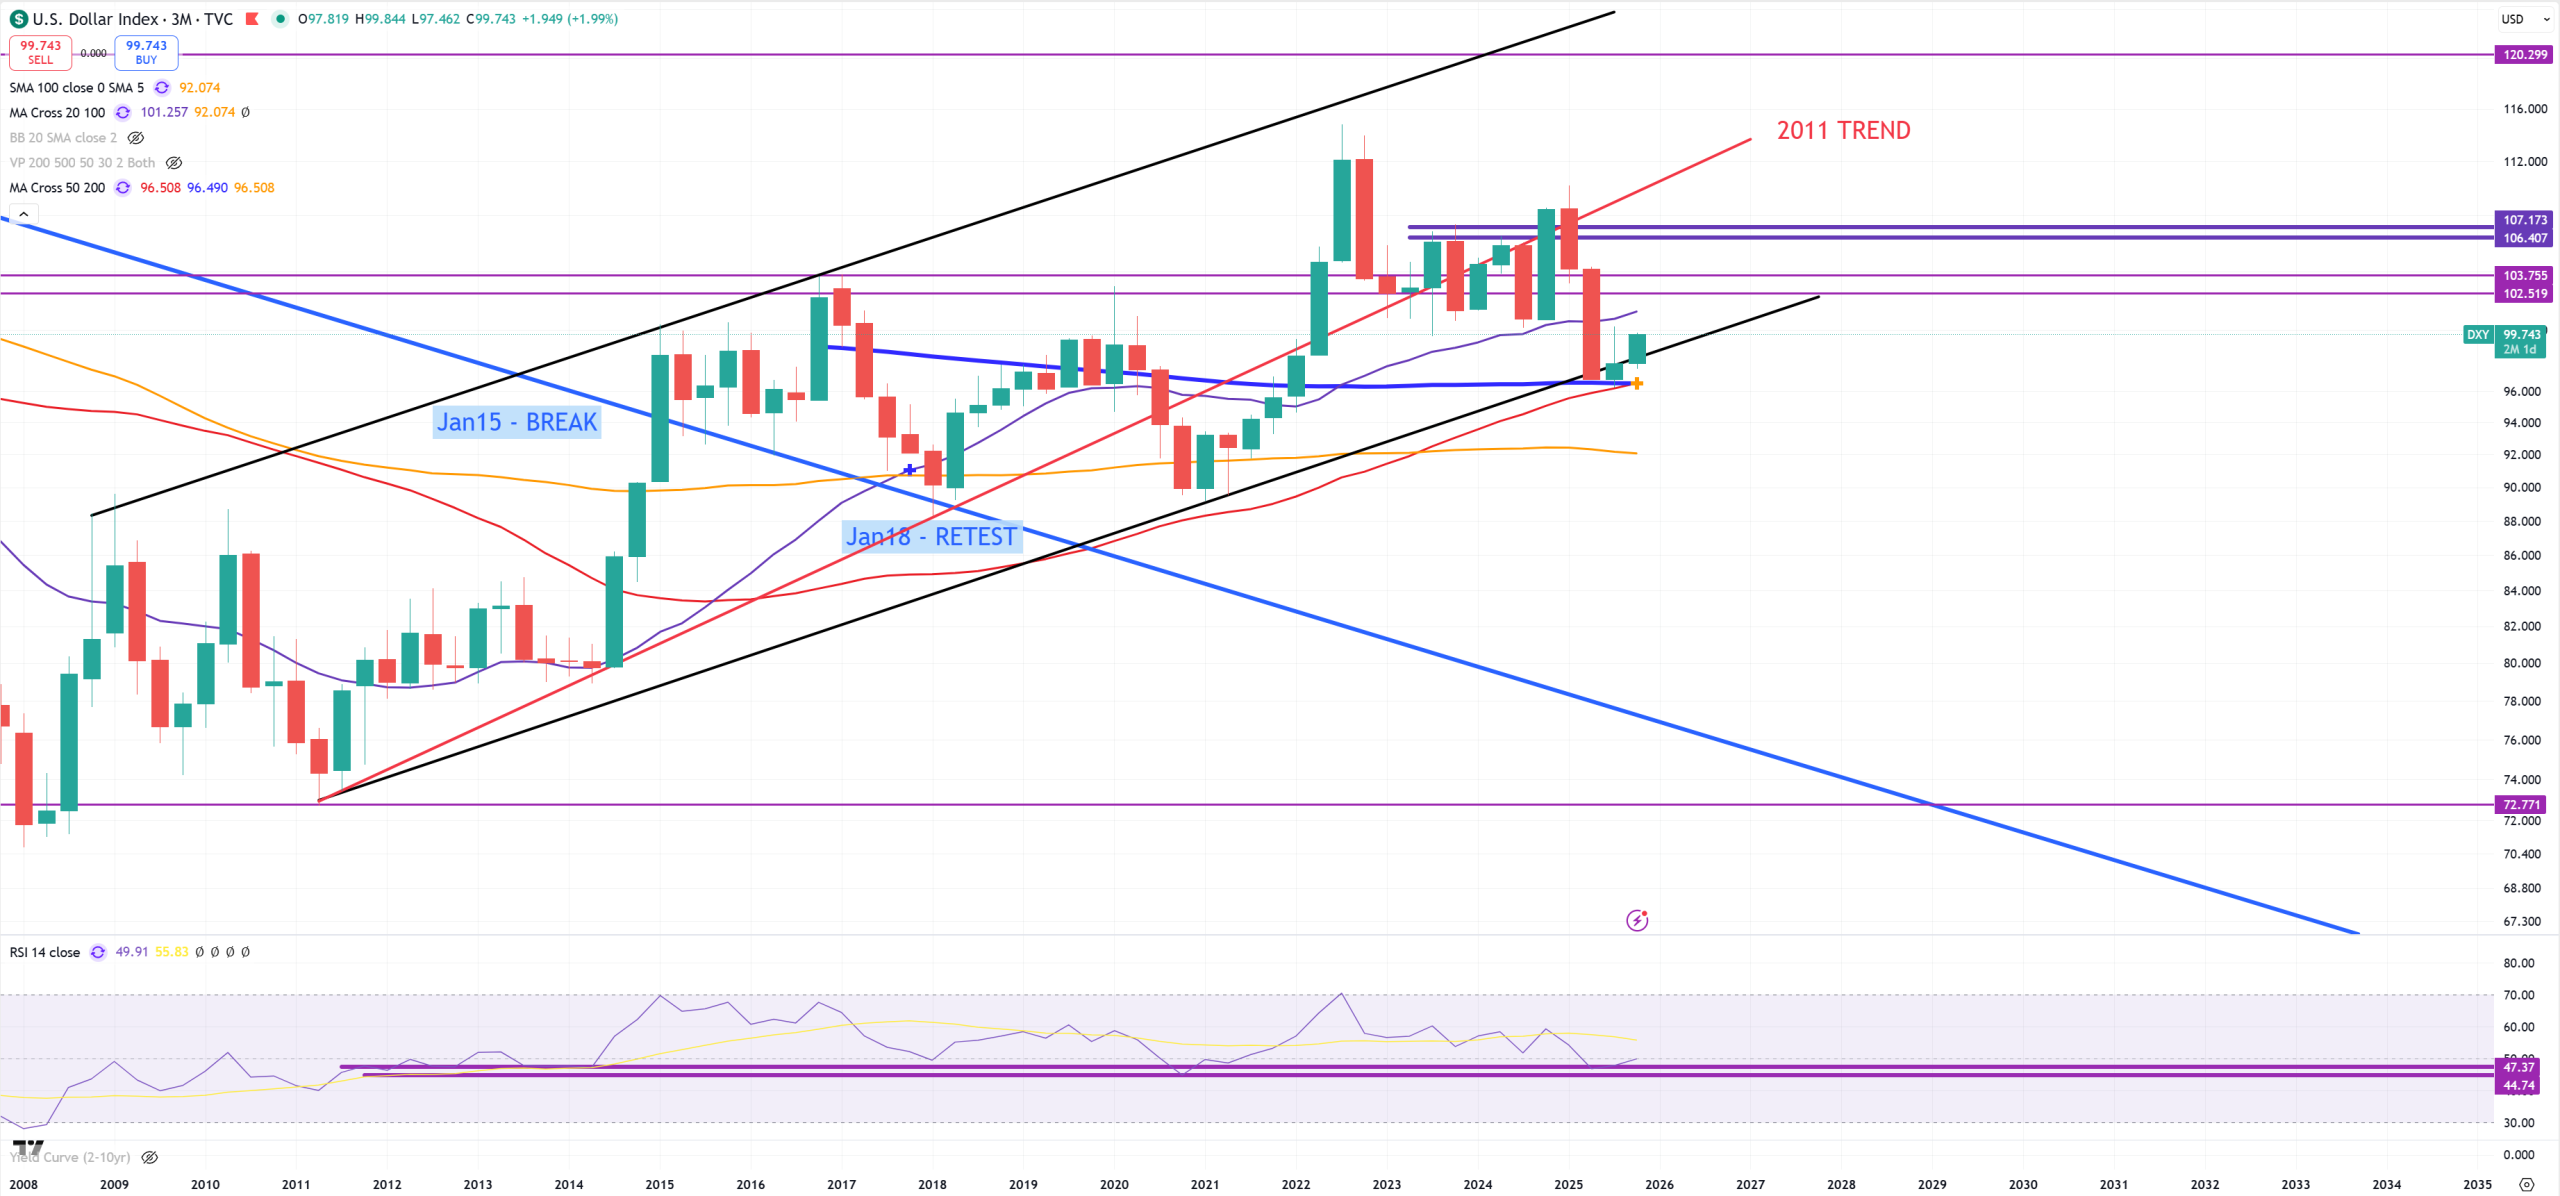
DXY – on (M) it regains (M)MA100. My idea is at some point of time cycle will have to reset (10Y/3M jumps to 350bps) and you’ll see DXY on one of 2 levels : 120 or 160. First chart is (M) second is (3M) and the ultimate super secular golden cross with 96 huge support crossing (3M)MA50/(3M)MA200 + TREND.
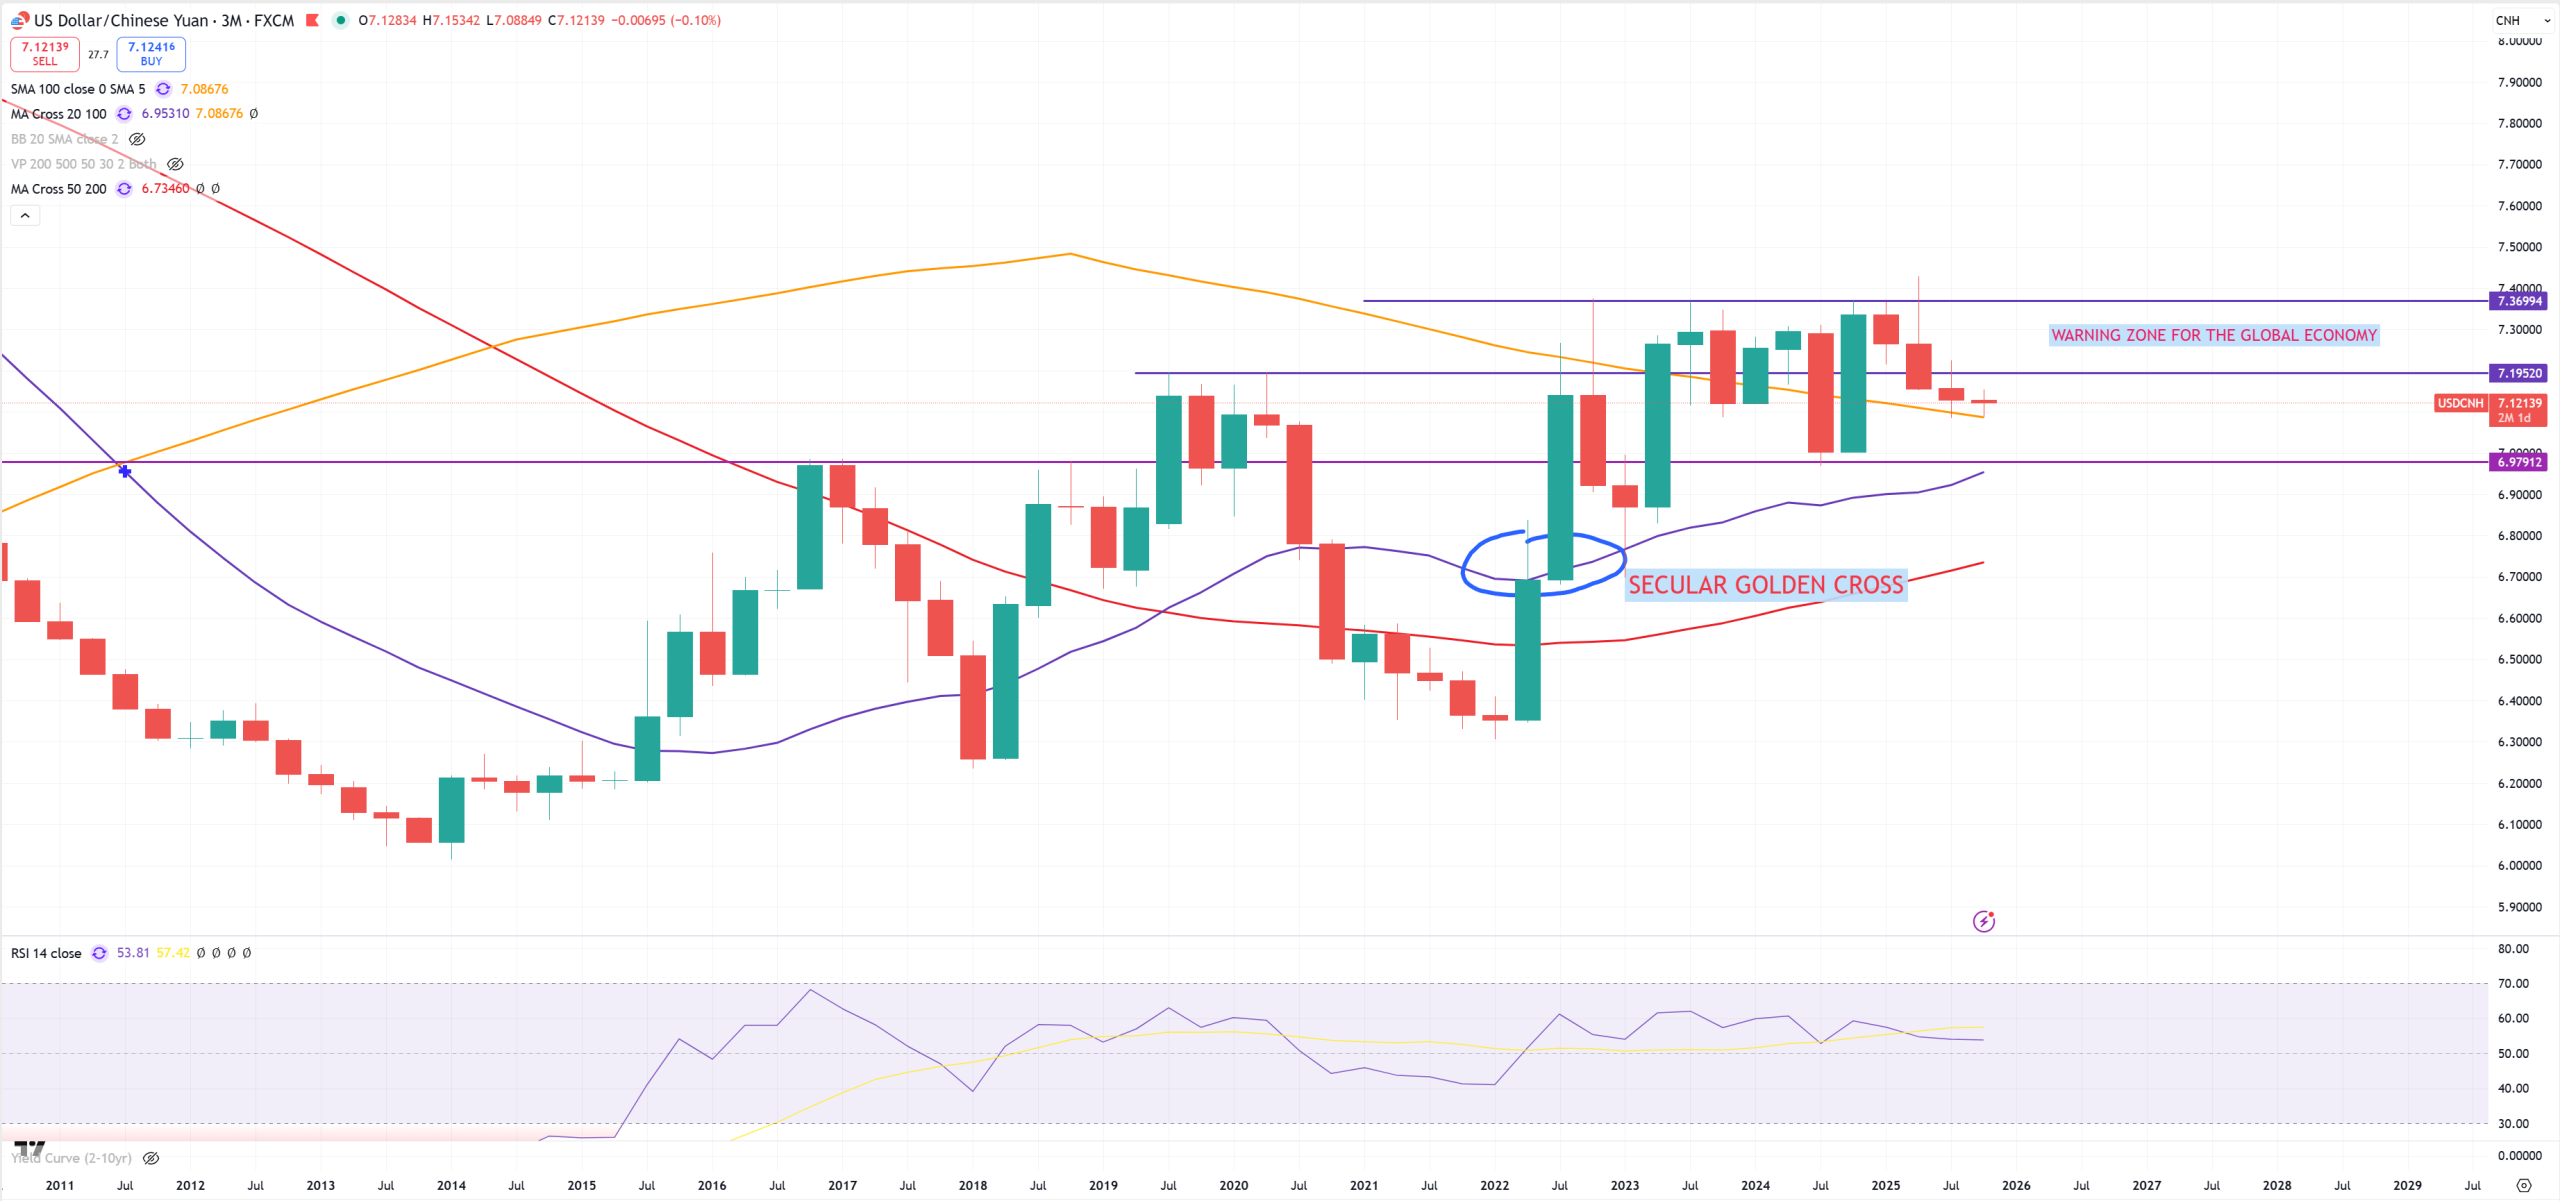
USDCNH – the power of the $$$ is a weakness of the Yuan. We need to take a look on Yuan in 3M view, because I observe it loves (3M)MA100 support. In reality if we break this 7.08 down next level is 6.93, but if you look on DXY there’s no room for that move as 7.08 is 96 in DXY with multiple big support
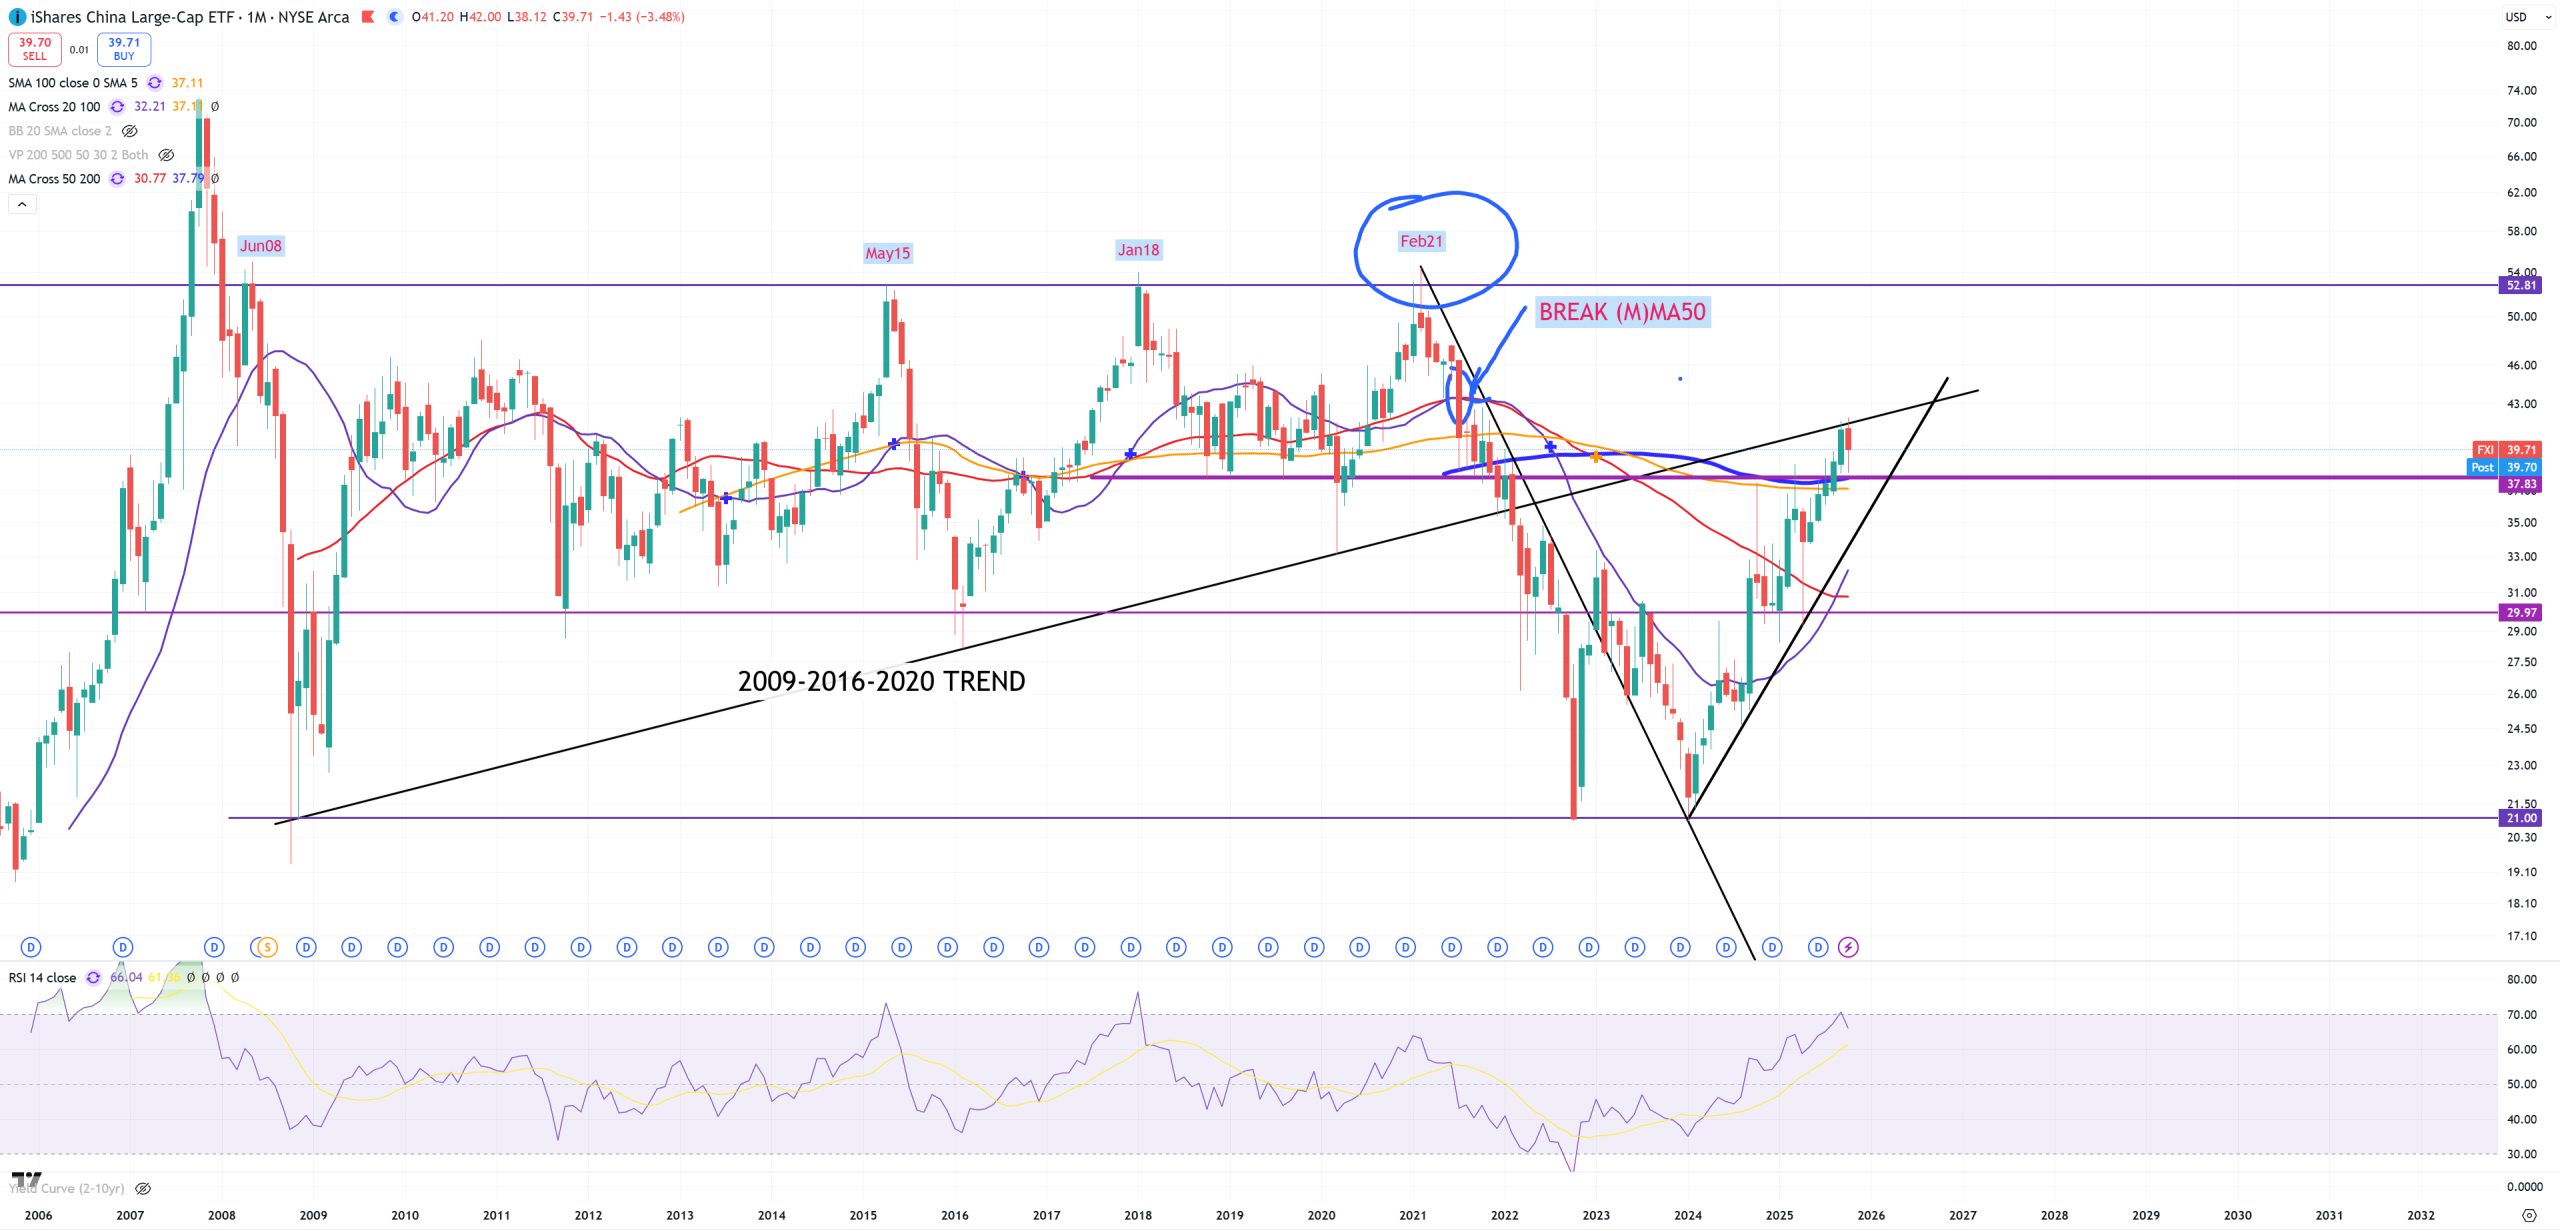
FXI – also Chinese stock market in $$$ looks “alligned”. 42$ is the last moment of retest to stay bearish, so 42$ is USDCNH = 7.08 and DXY=96. FXI hates USDCNH going up = DXY going up.
DJI/GOLD – the big cycle indicator, nothing to see here. GOLD still is going to outperform stocks heavily. Remember this 1932-1980 trend line. As 10Y/3M needs to jump to 350bps this line will be going lower. If 10Y/3M hits 350bps you’ll see DJI/GOLD on some kind of a support. First I see is 5.72, but ultimate goal is 0.5 now it’s 11.5 and peak was in Oct2018 – 22.5. If 10Y/3M jumps to 350bps and DJI/GOLD = 0.5 it’ll hit big downturn in just 1 cycle. If 10Y/3M jumps to 350bps and we hit for example this 5.72 (2011 level DJI/GOLD support) = new recovery cycle will arrive. It means we won’t clear the economy in 1 big cycle down. 1 big cycle down was in 1929-1932, but during 1966-1980 you can see for example around 1973 big spike of DJI/GOLD ratio. That was a 2Y recovery cycle in downturn.

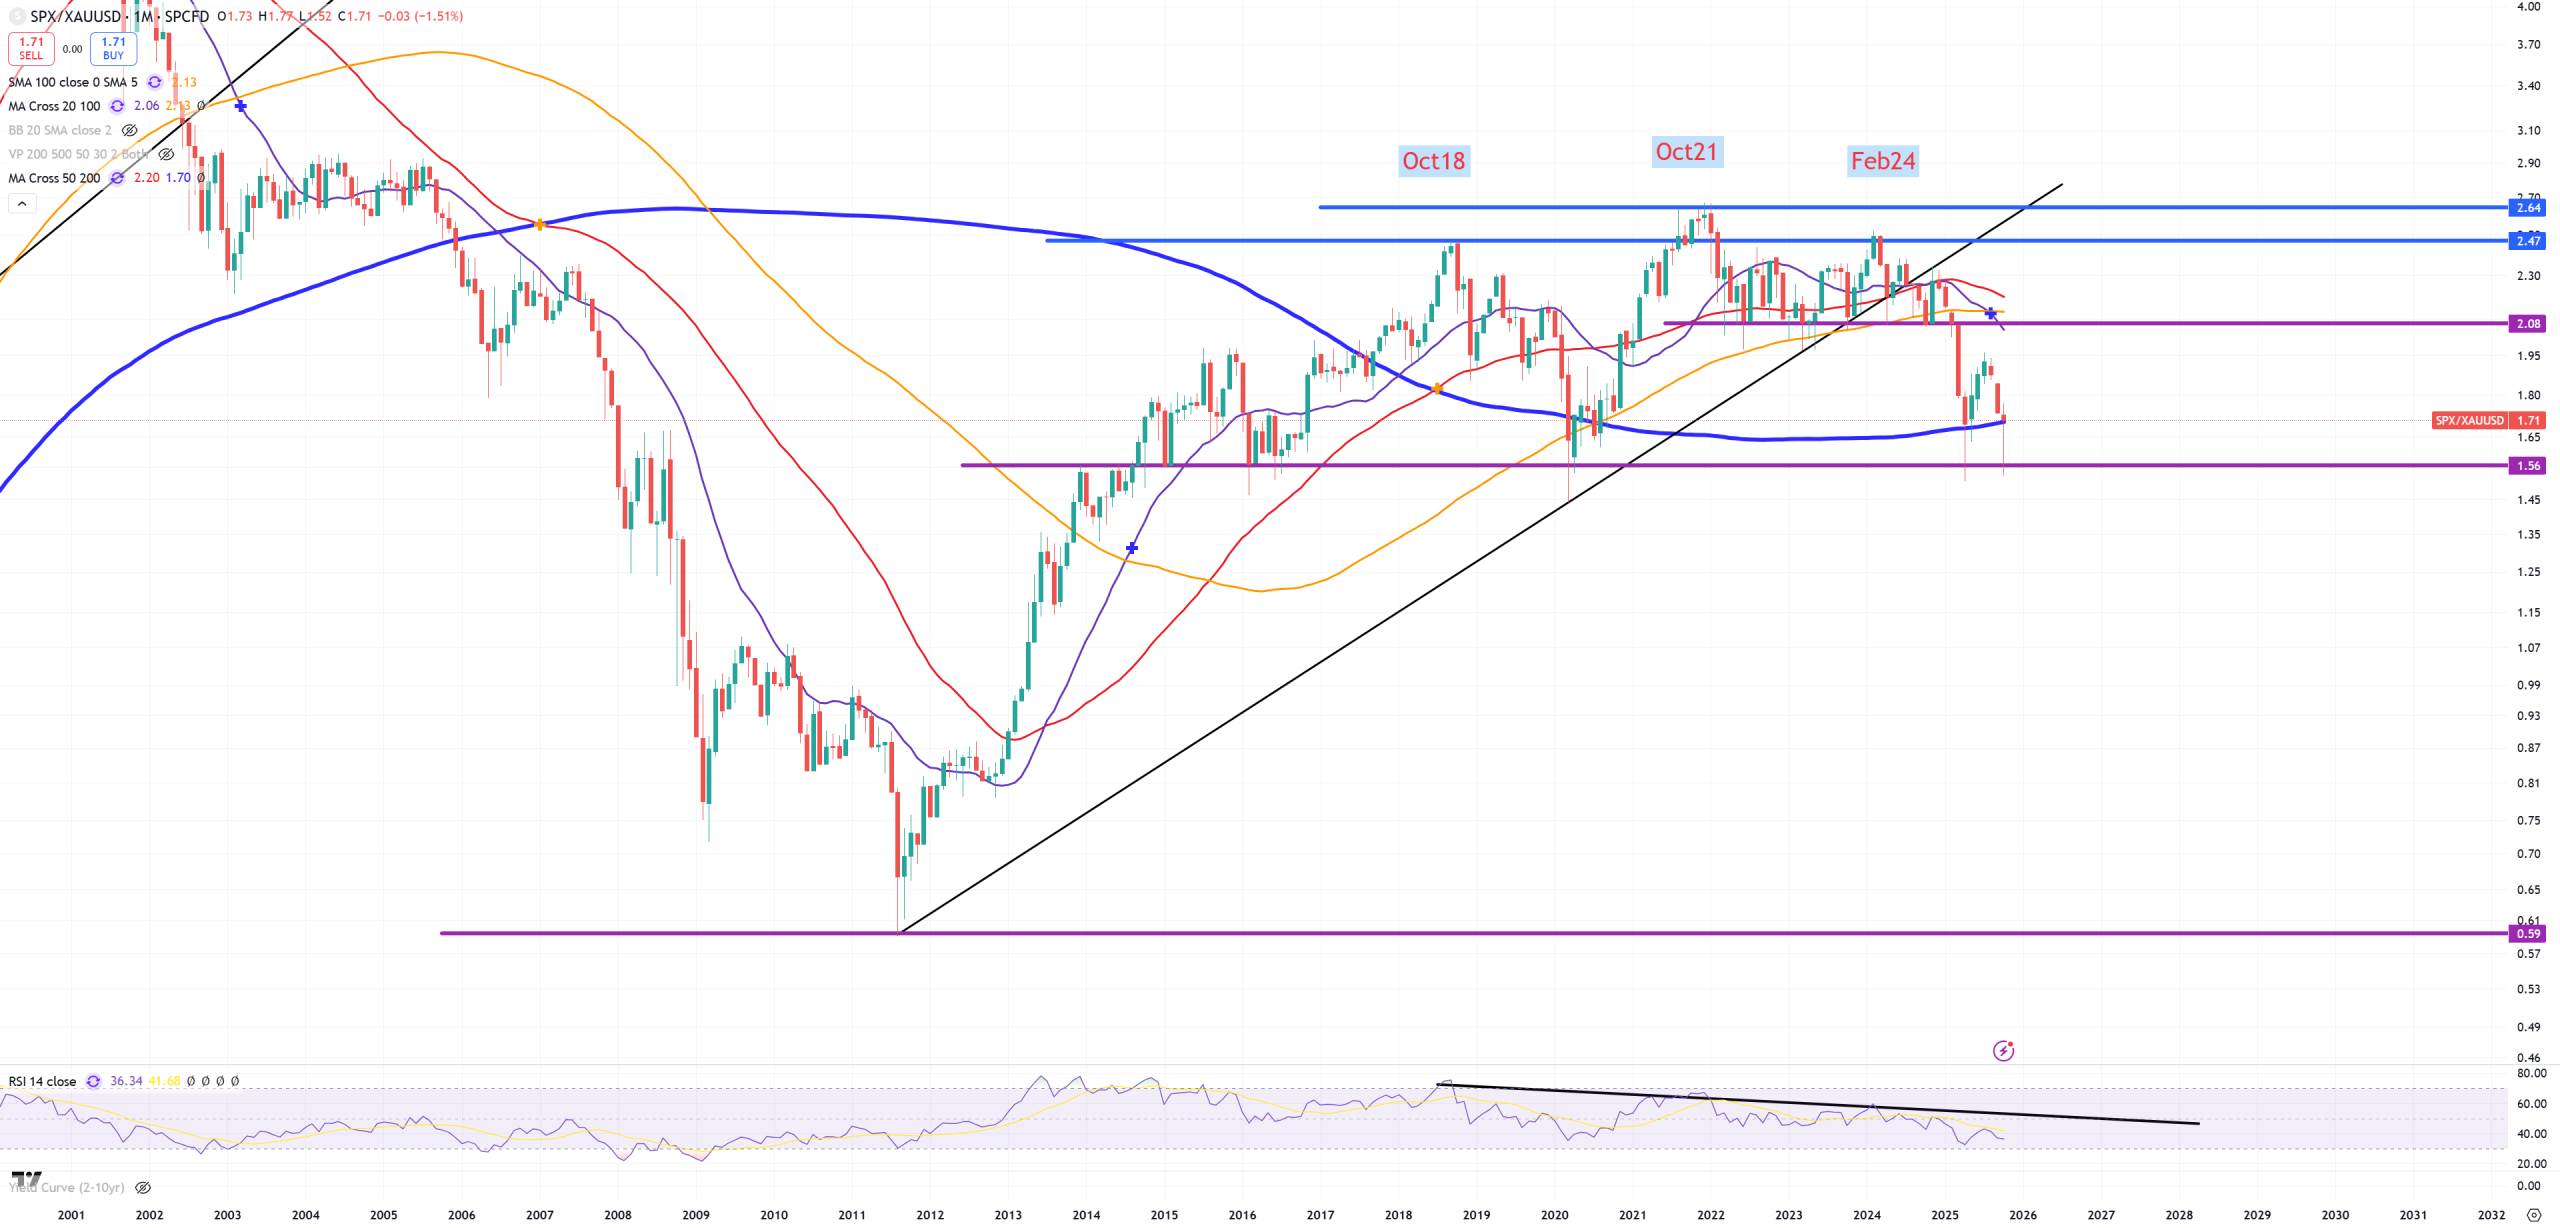
SPX/GOLD – (M)MA200 was not broken here and you see we closed above it but on the edge. All depends where we open November? Said many time it’s rare (can’t even remember if that happened) that DJI/GOLD <> SPX/GOLD in breaking key technicals like we see these days. I think it’s all because of AI jump in a part of downturn cycle which rescue a bit the market :
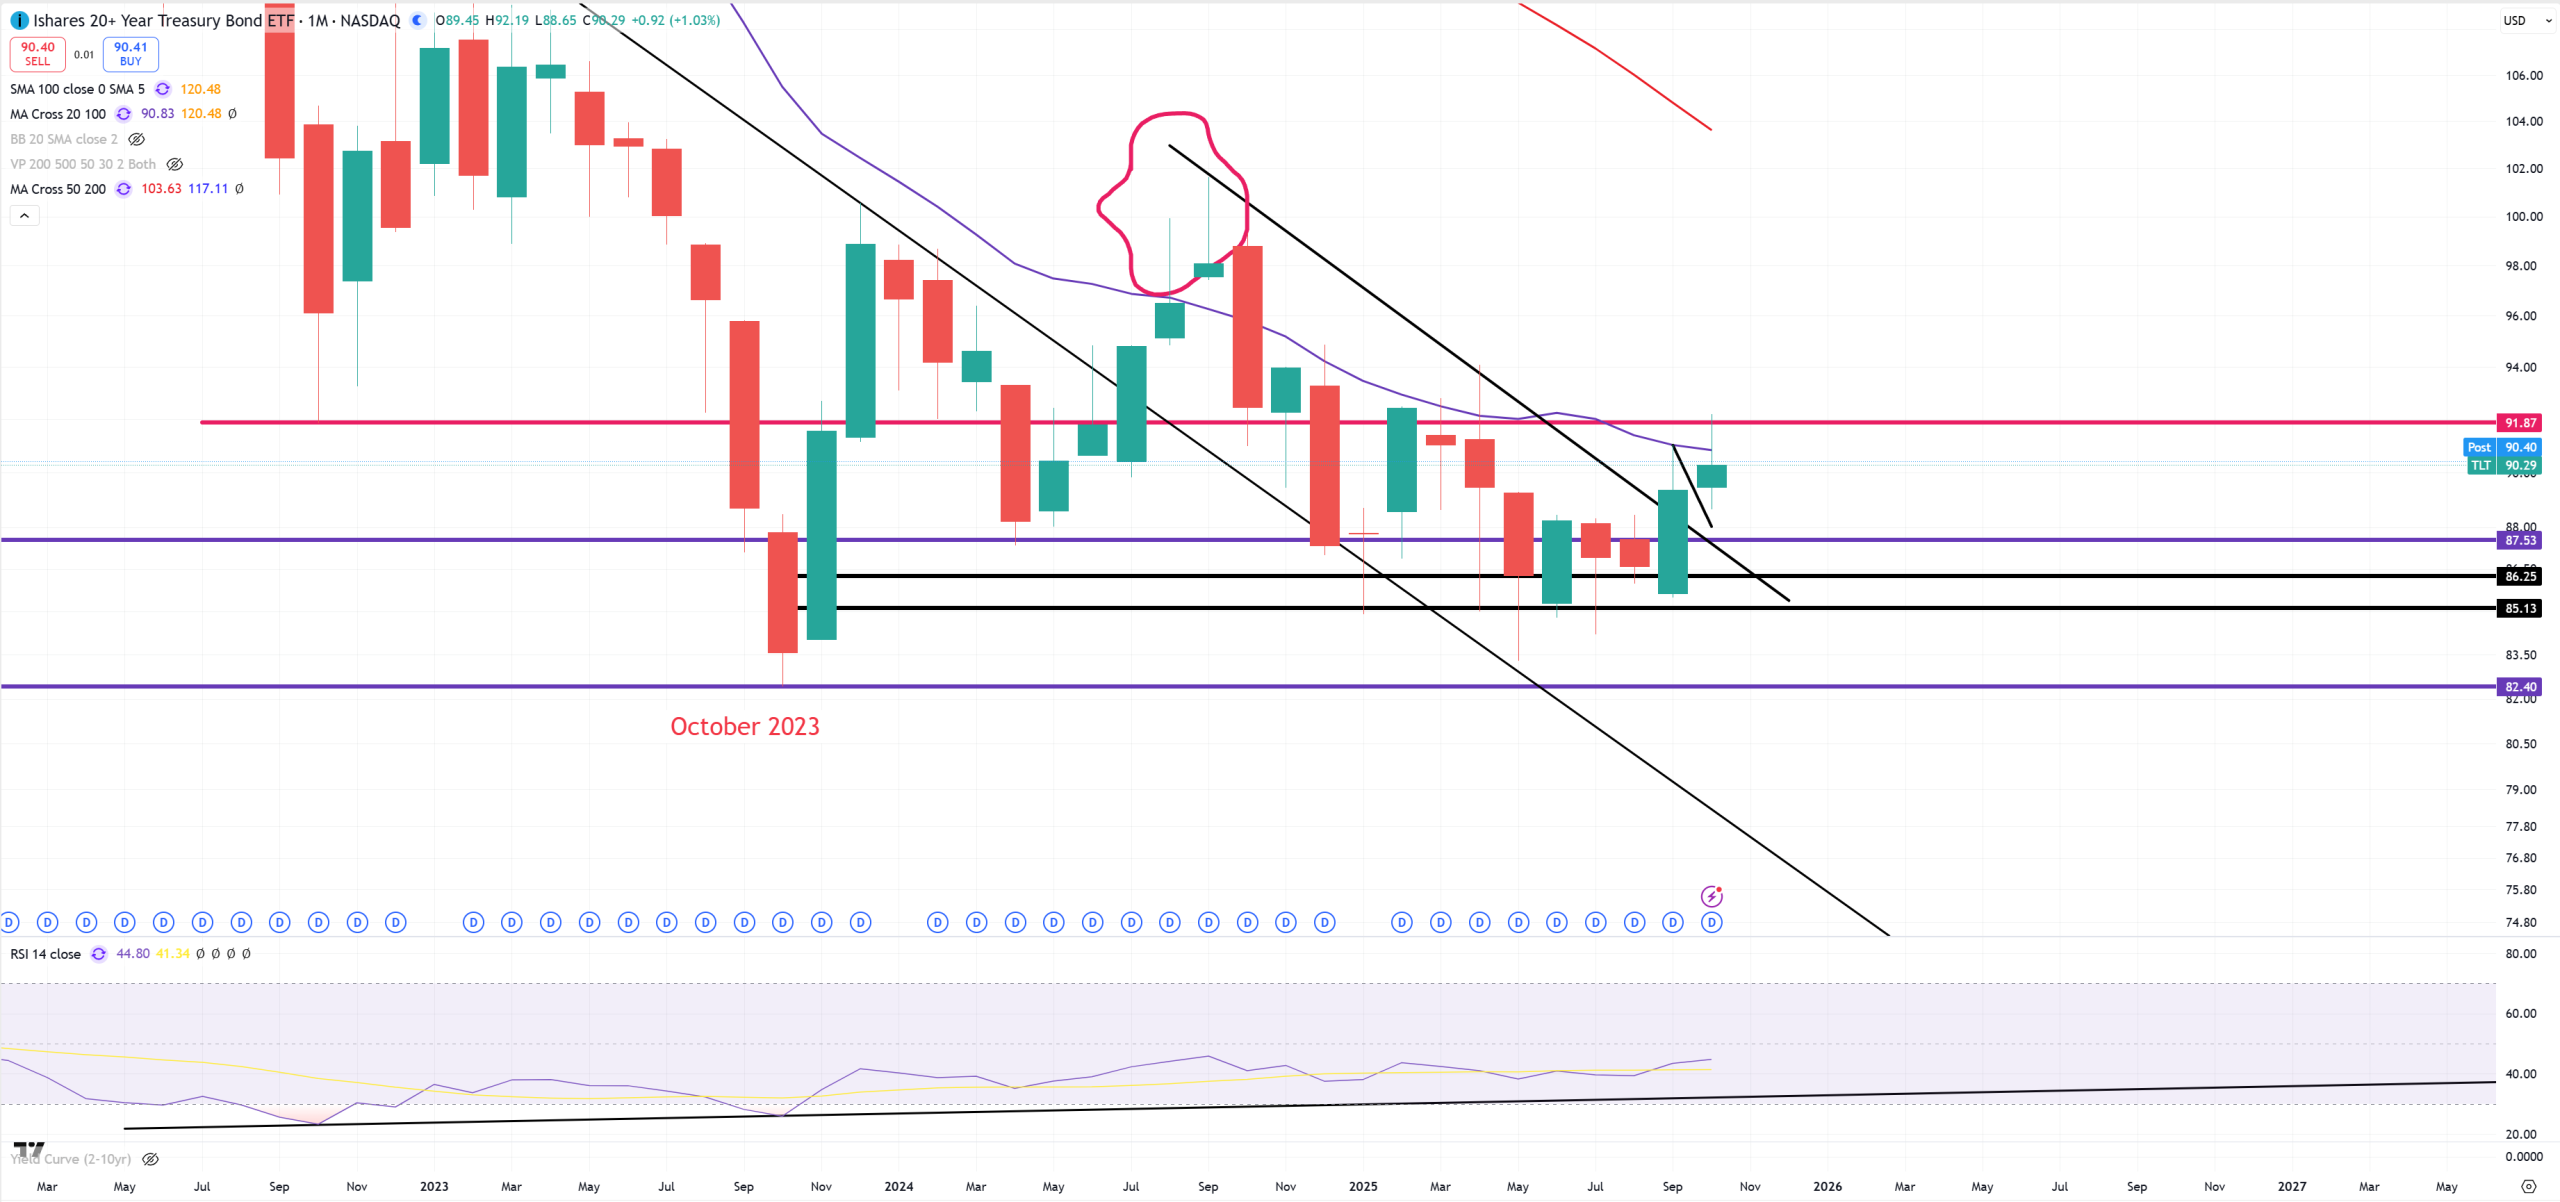
TLT – I am a bit dissapointed by TLT by not breaking (M)MA20 = ~91
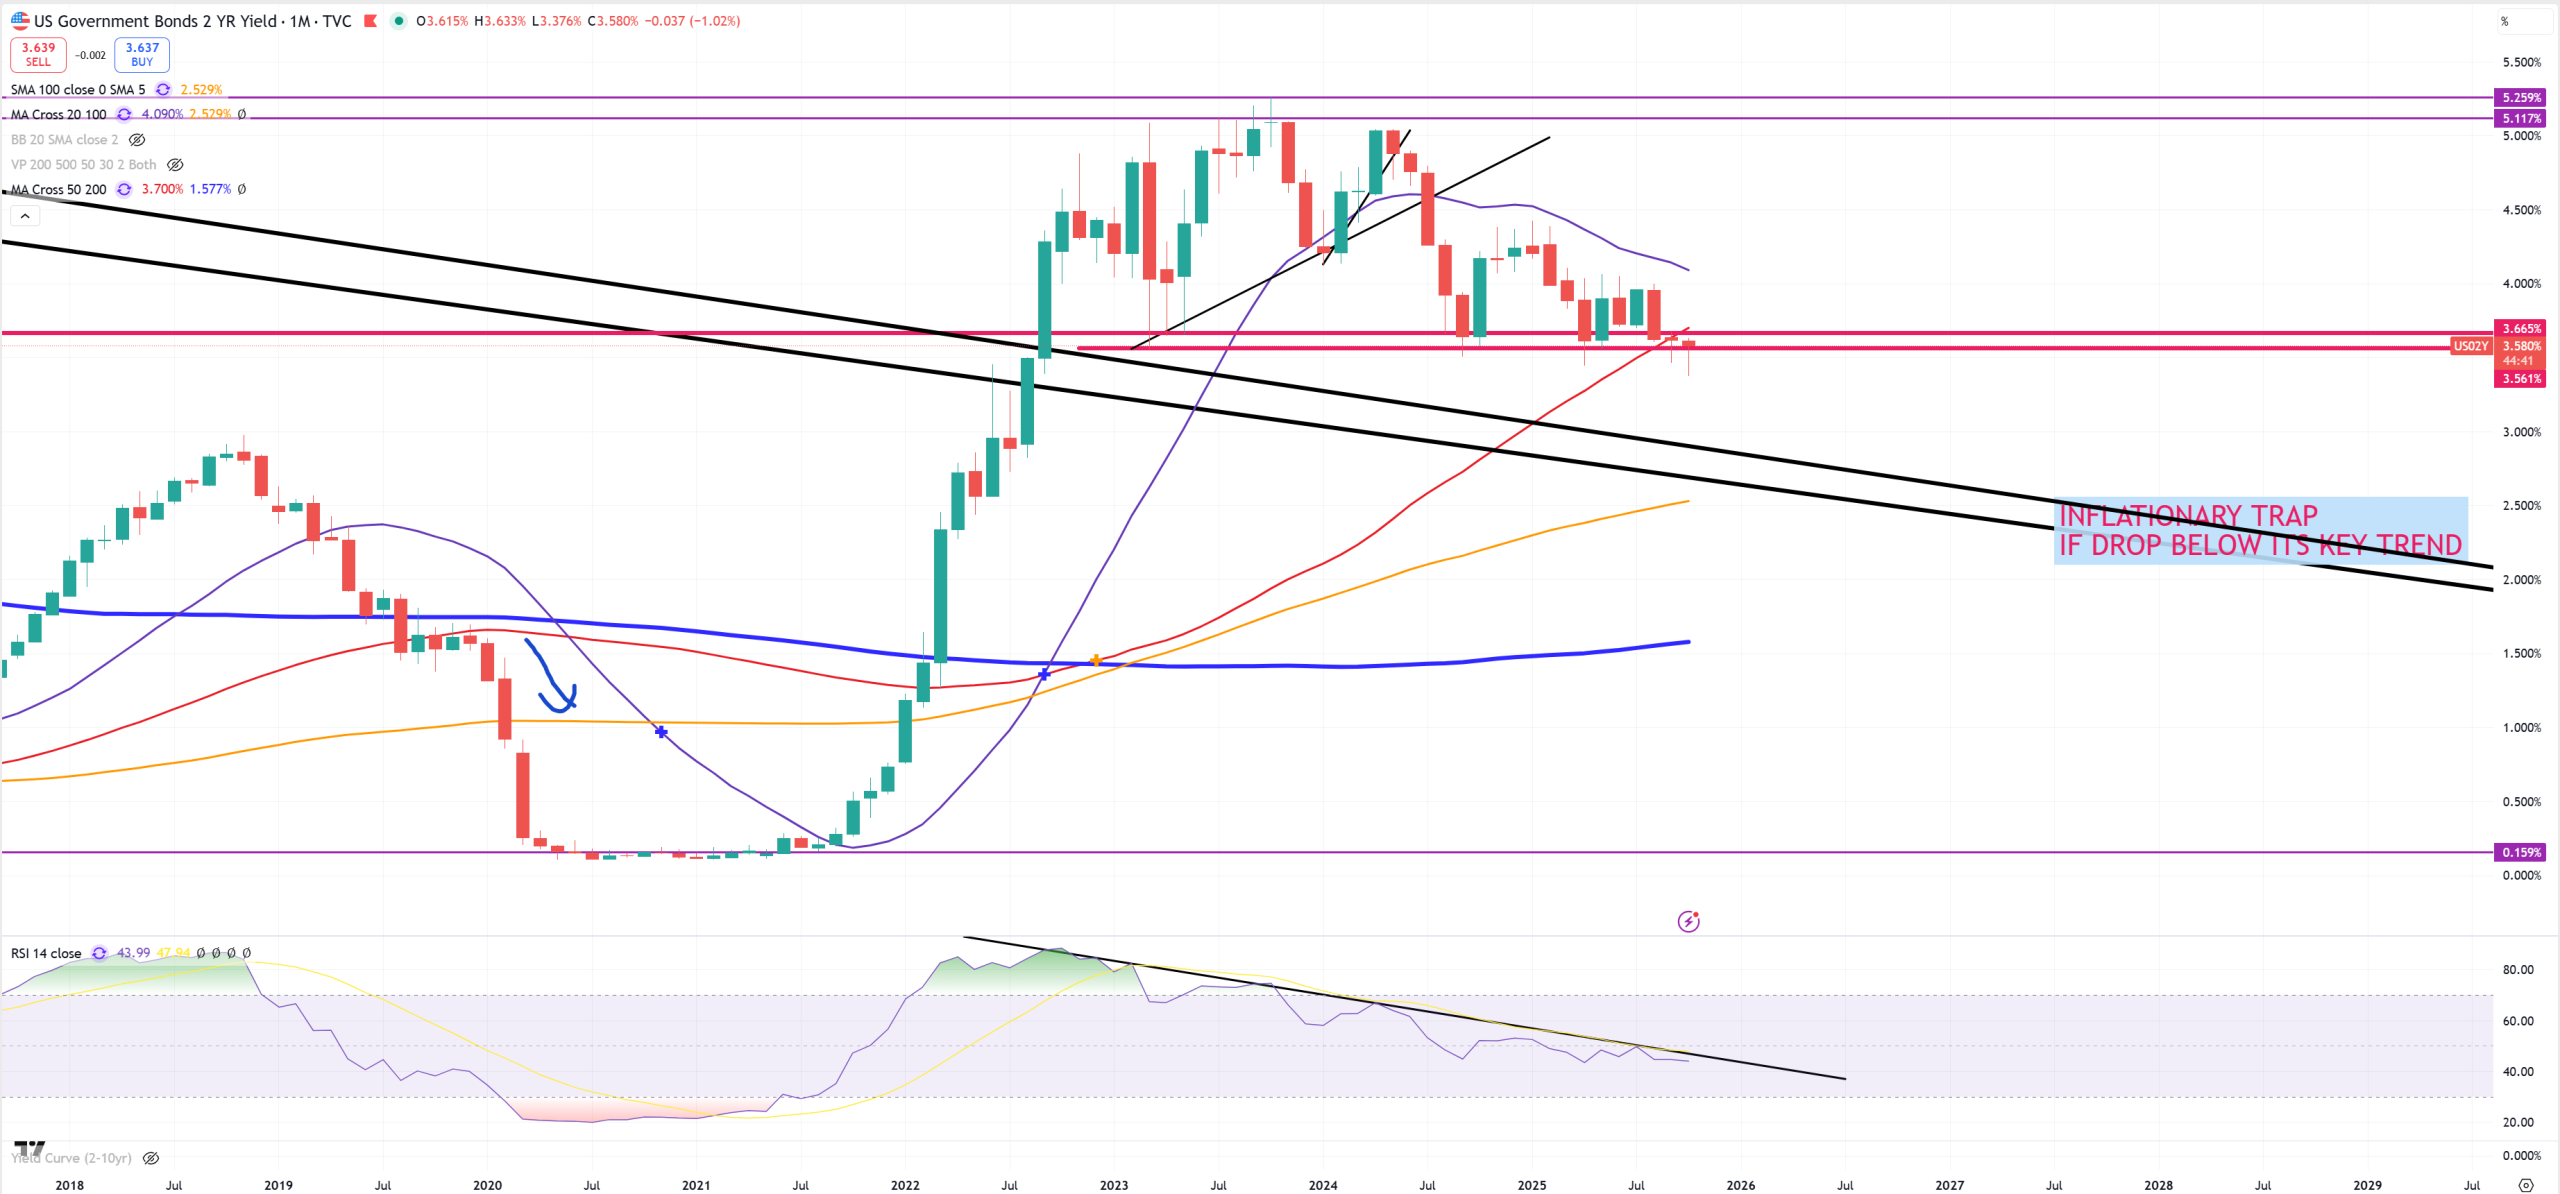
US02Y leads US03MY. It’s broken, below (M)MA50 for second month pointing us FED is too tight by 50bps (so far).
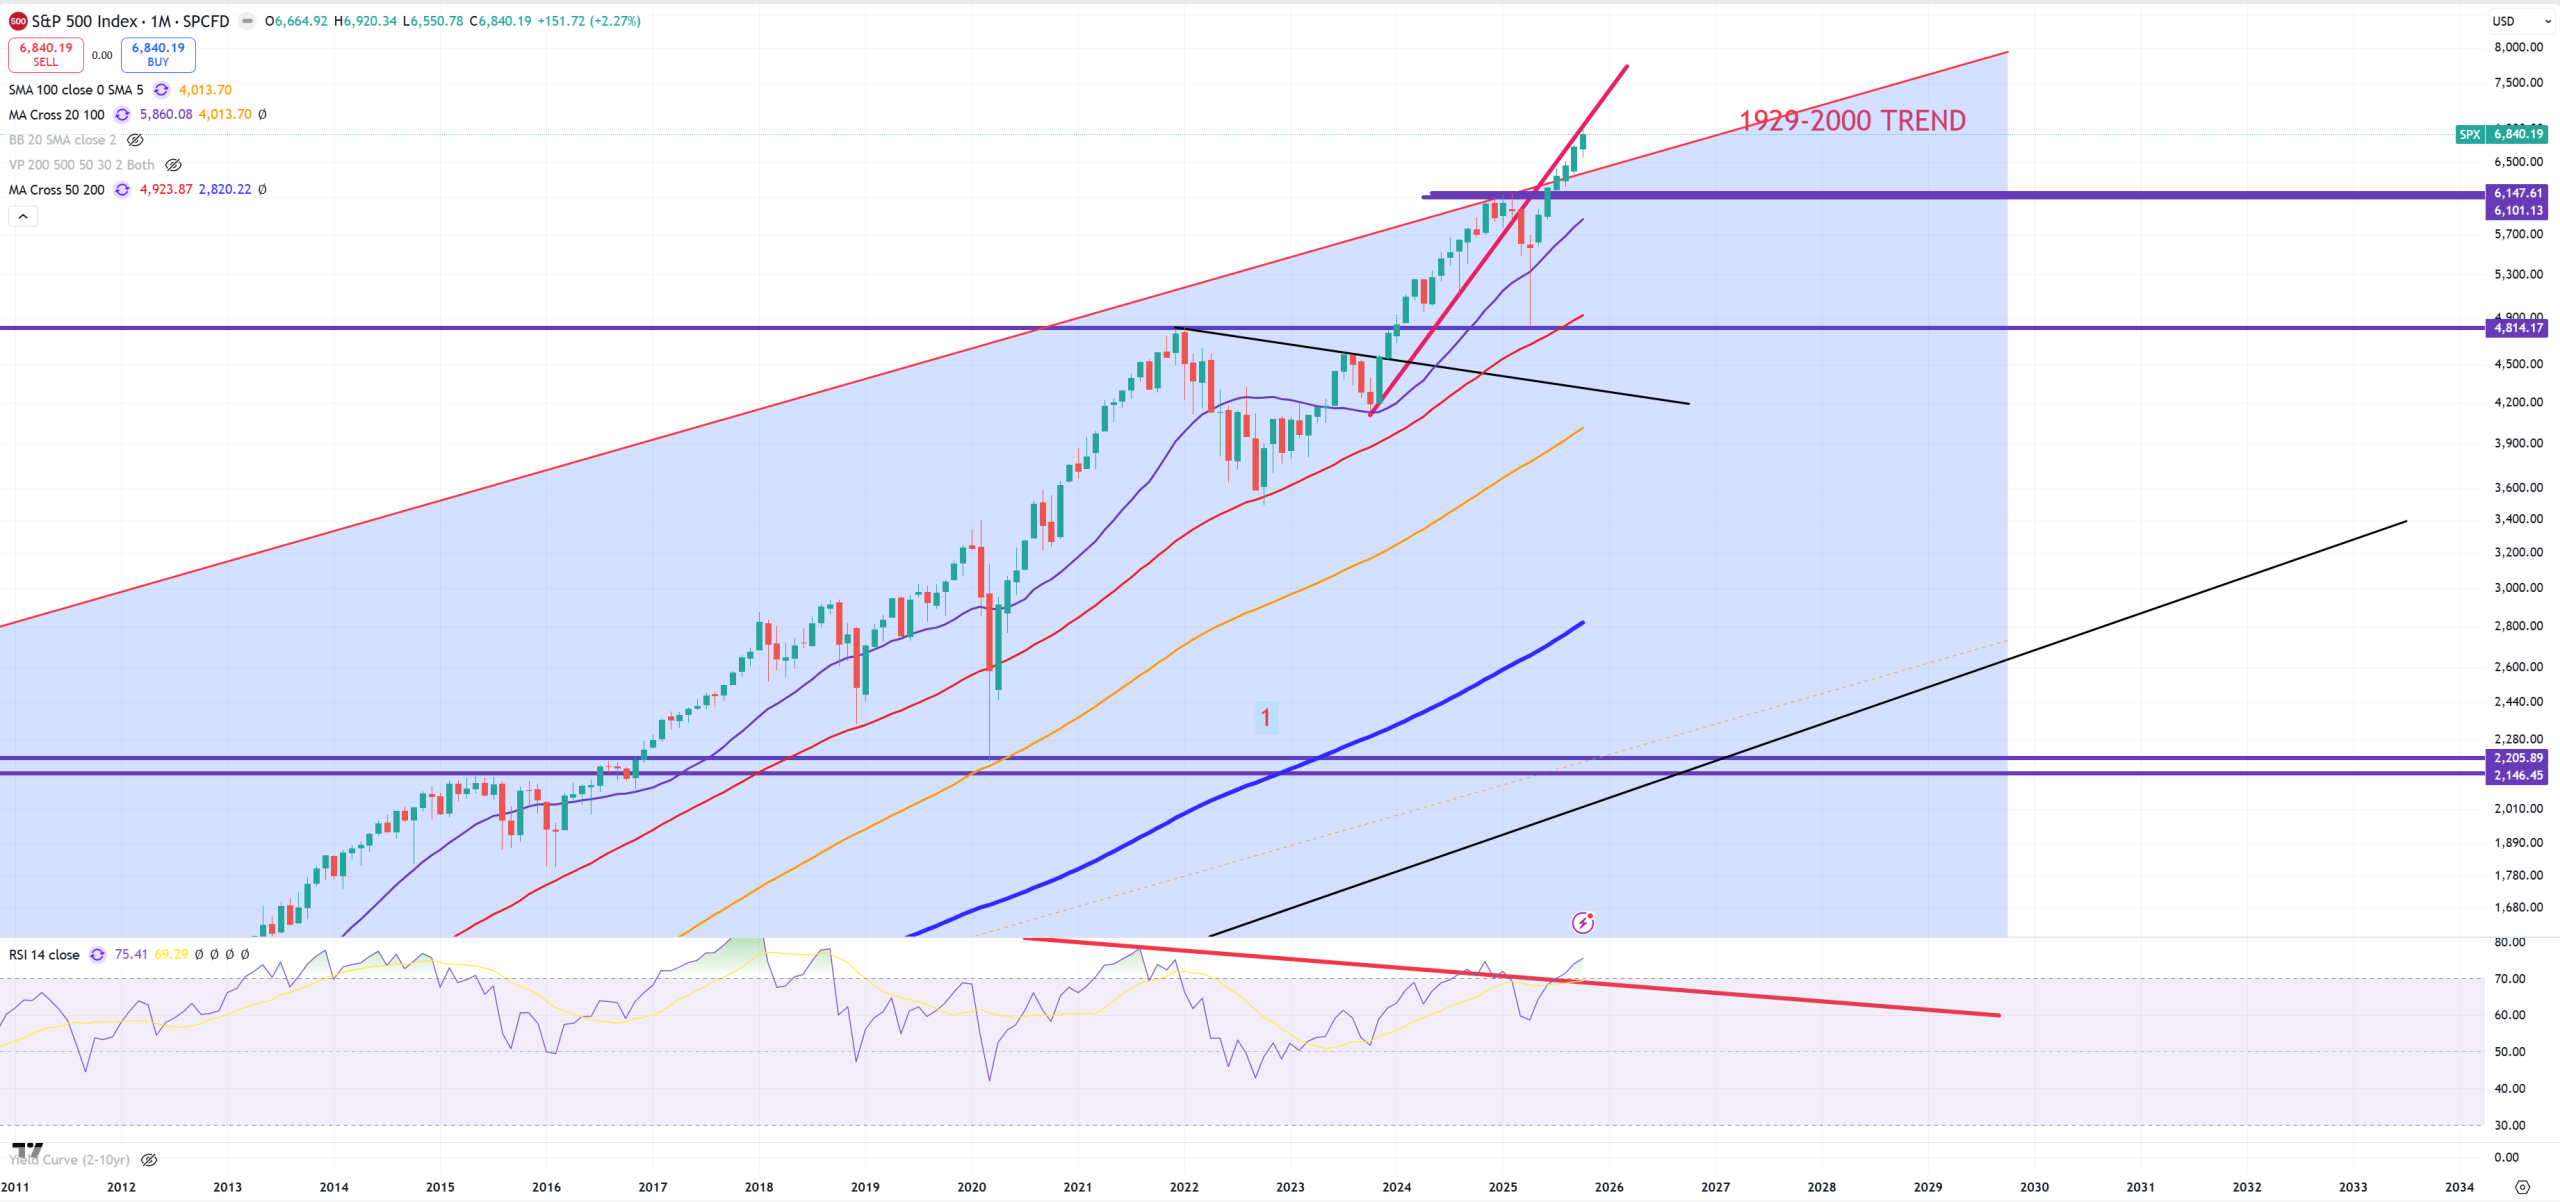
SPX and its 1929-2000 trend, November limit is 6420. You all know I totally don’t believe breaking such long term trend lines, especially if bond market starts chasing deflation, but break is break.
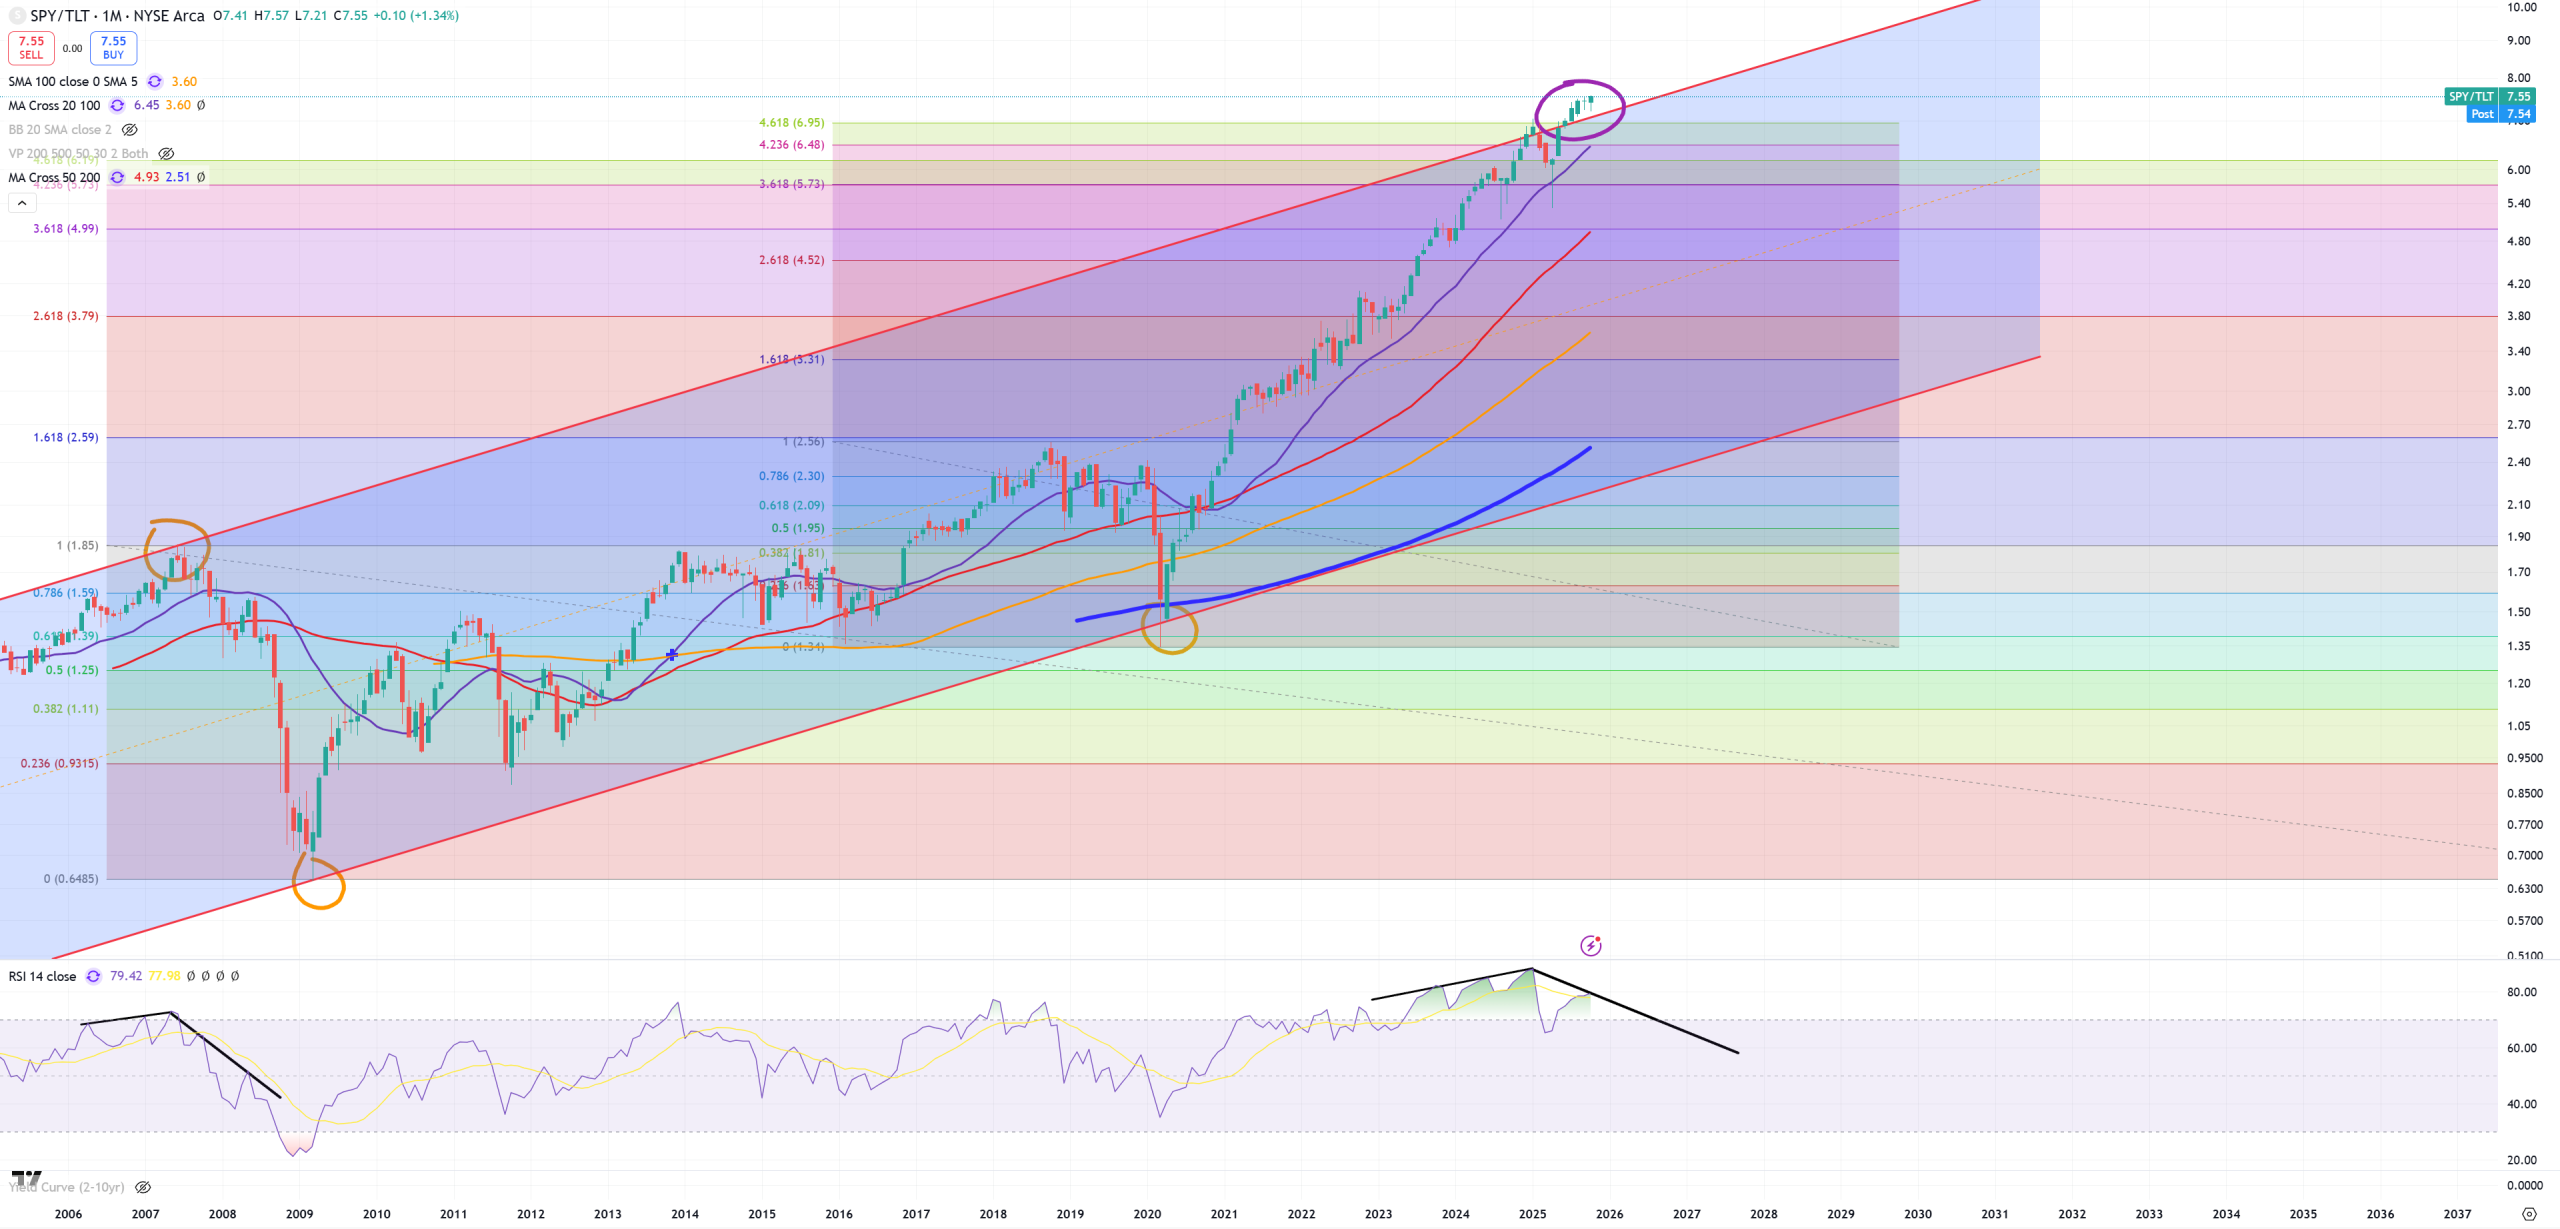
SPY/TLT – as you see this ratio doesn’t want to reverse. First TLT did not cross (M)MA20 at the end of October, second SPX/GOLD did not cross (M)MA200 down too. It’s all cracked and nothing more.
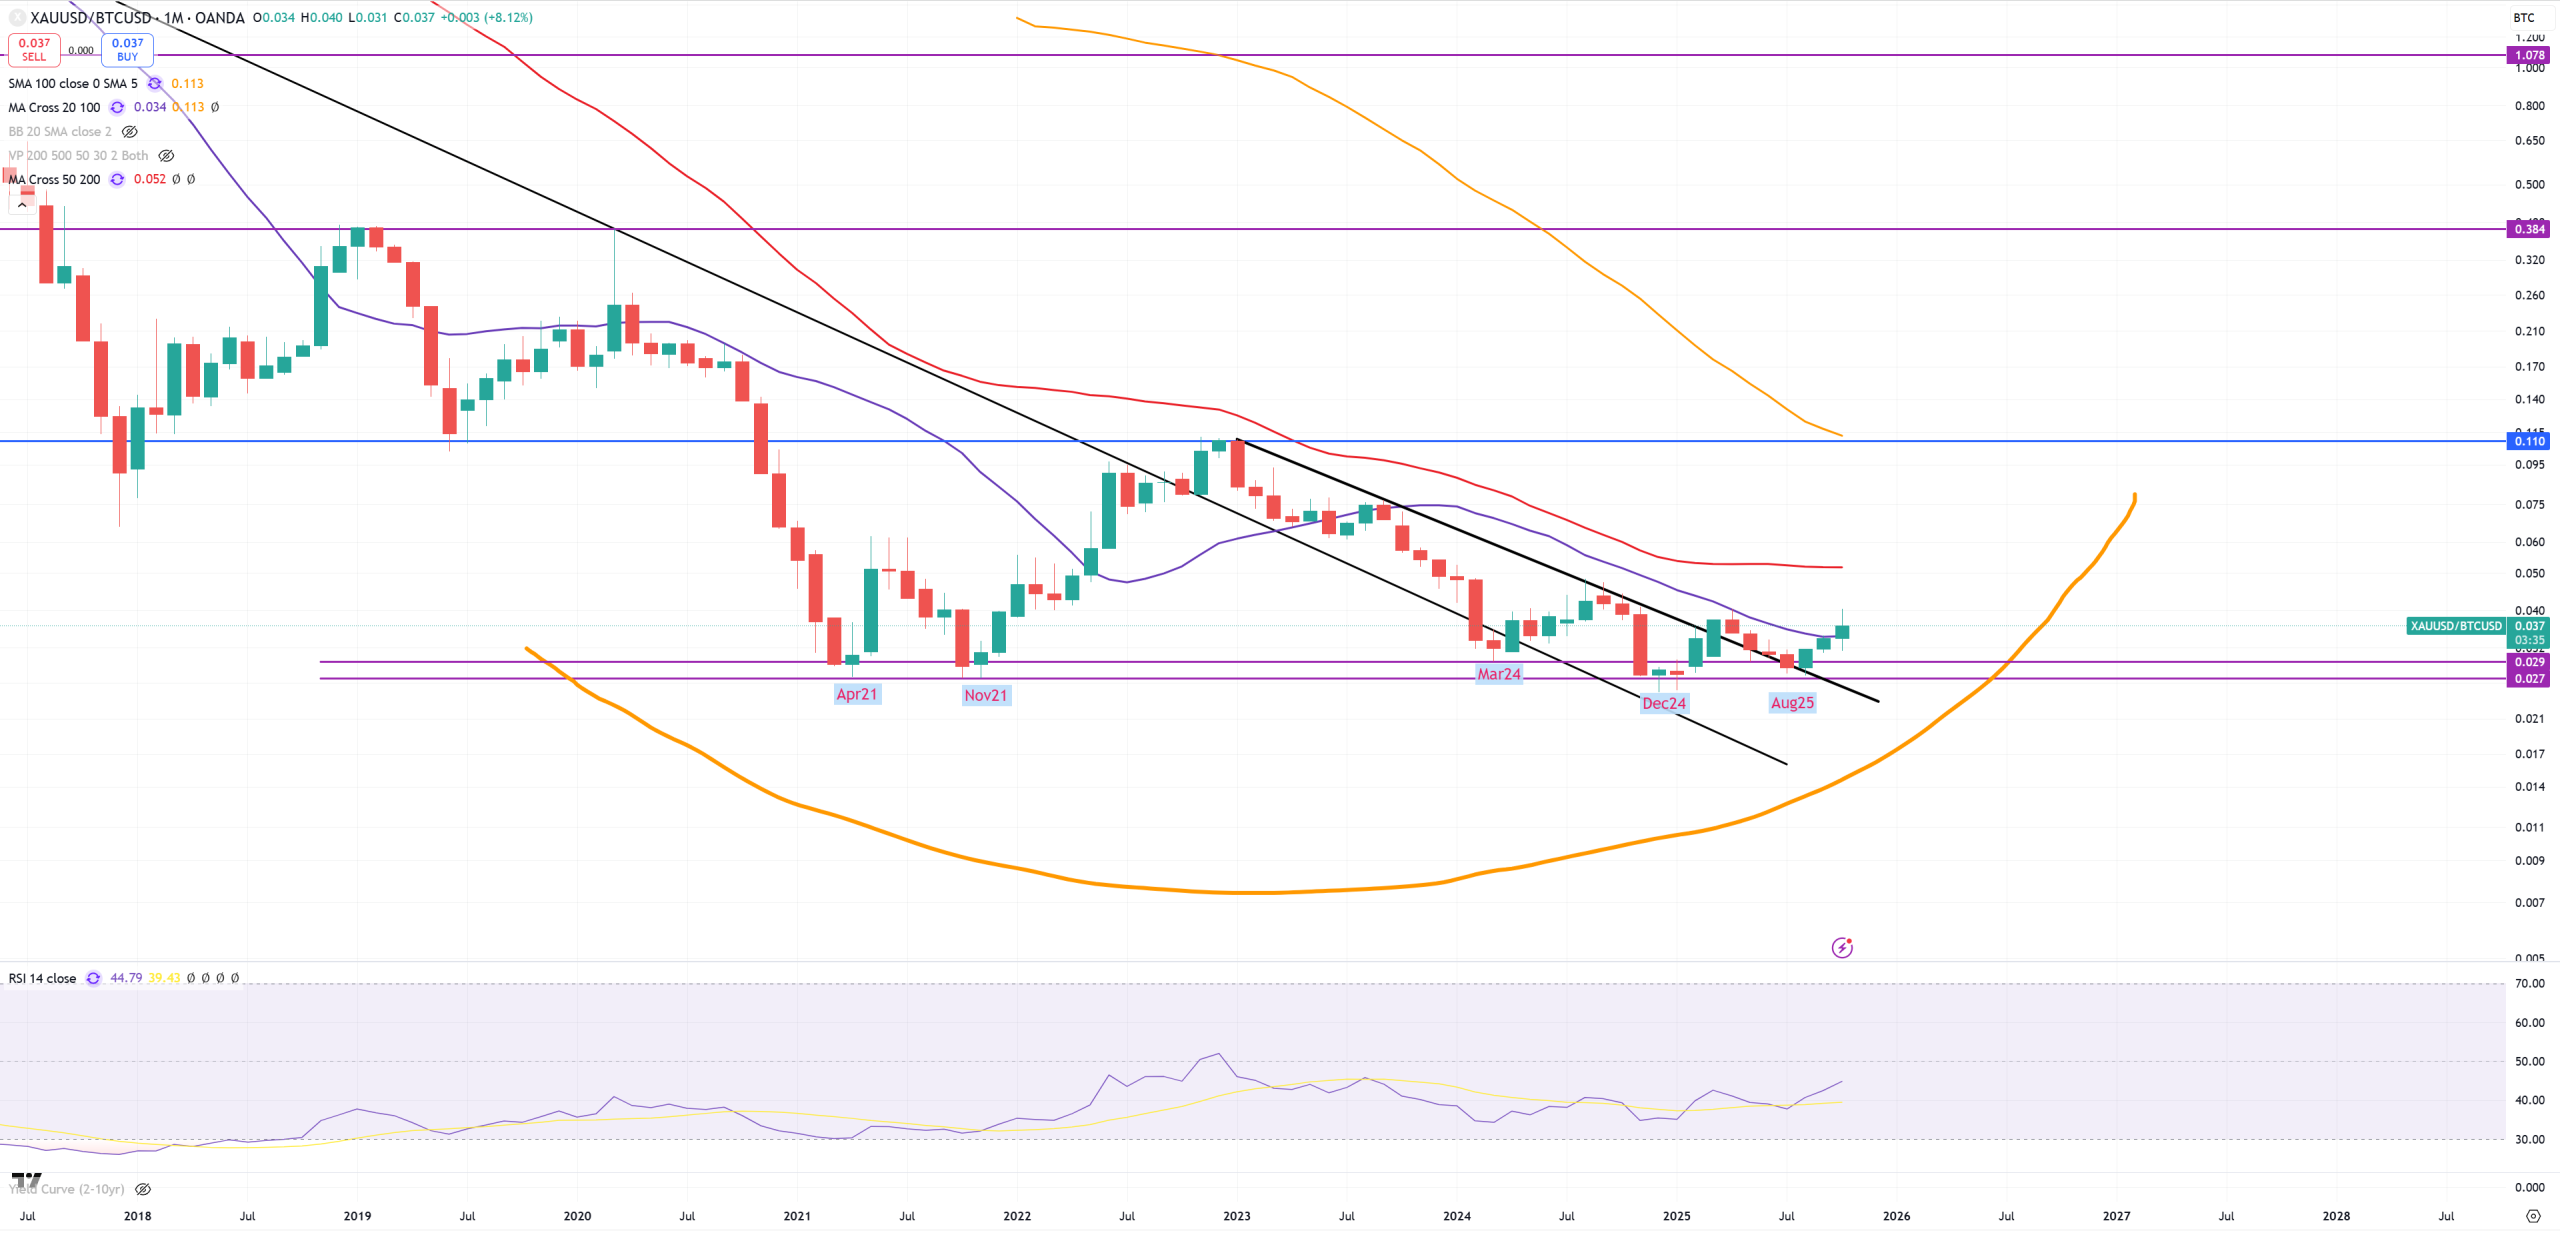
GOLD/BTC – and here we have a kind of success breaking (M)MA20 = gold is going to outperform btc.
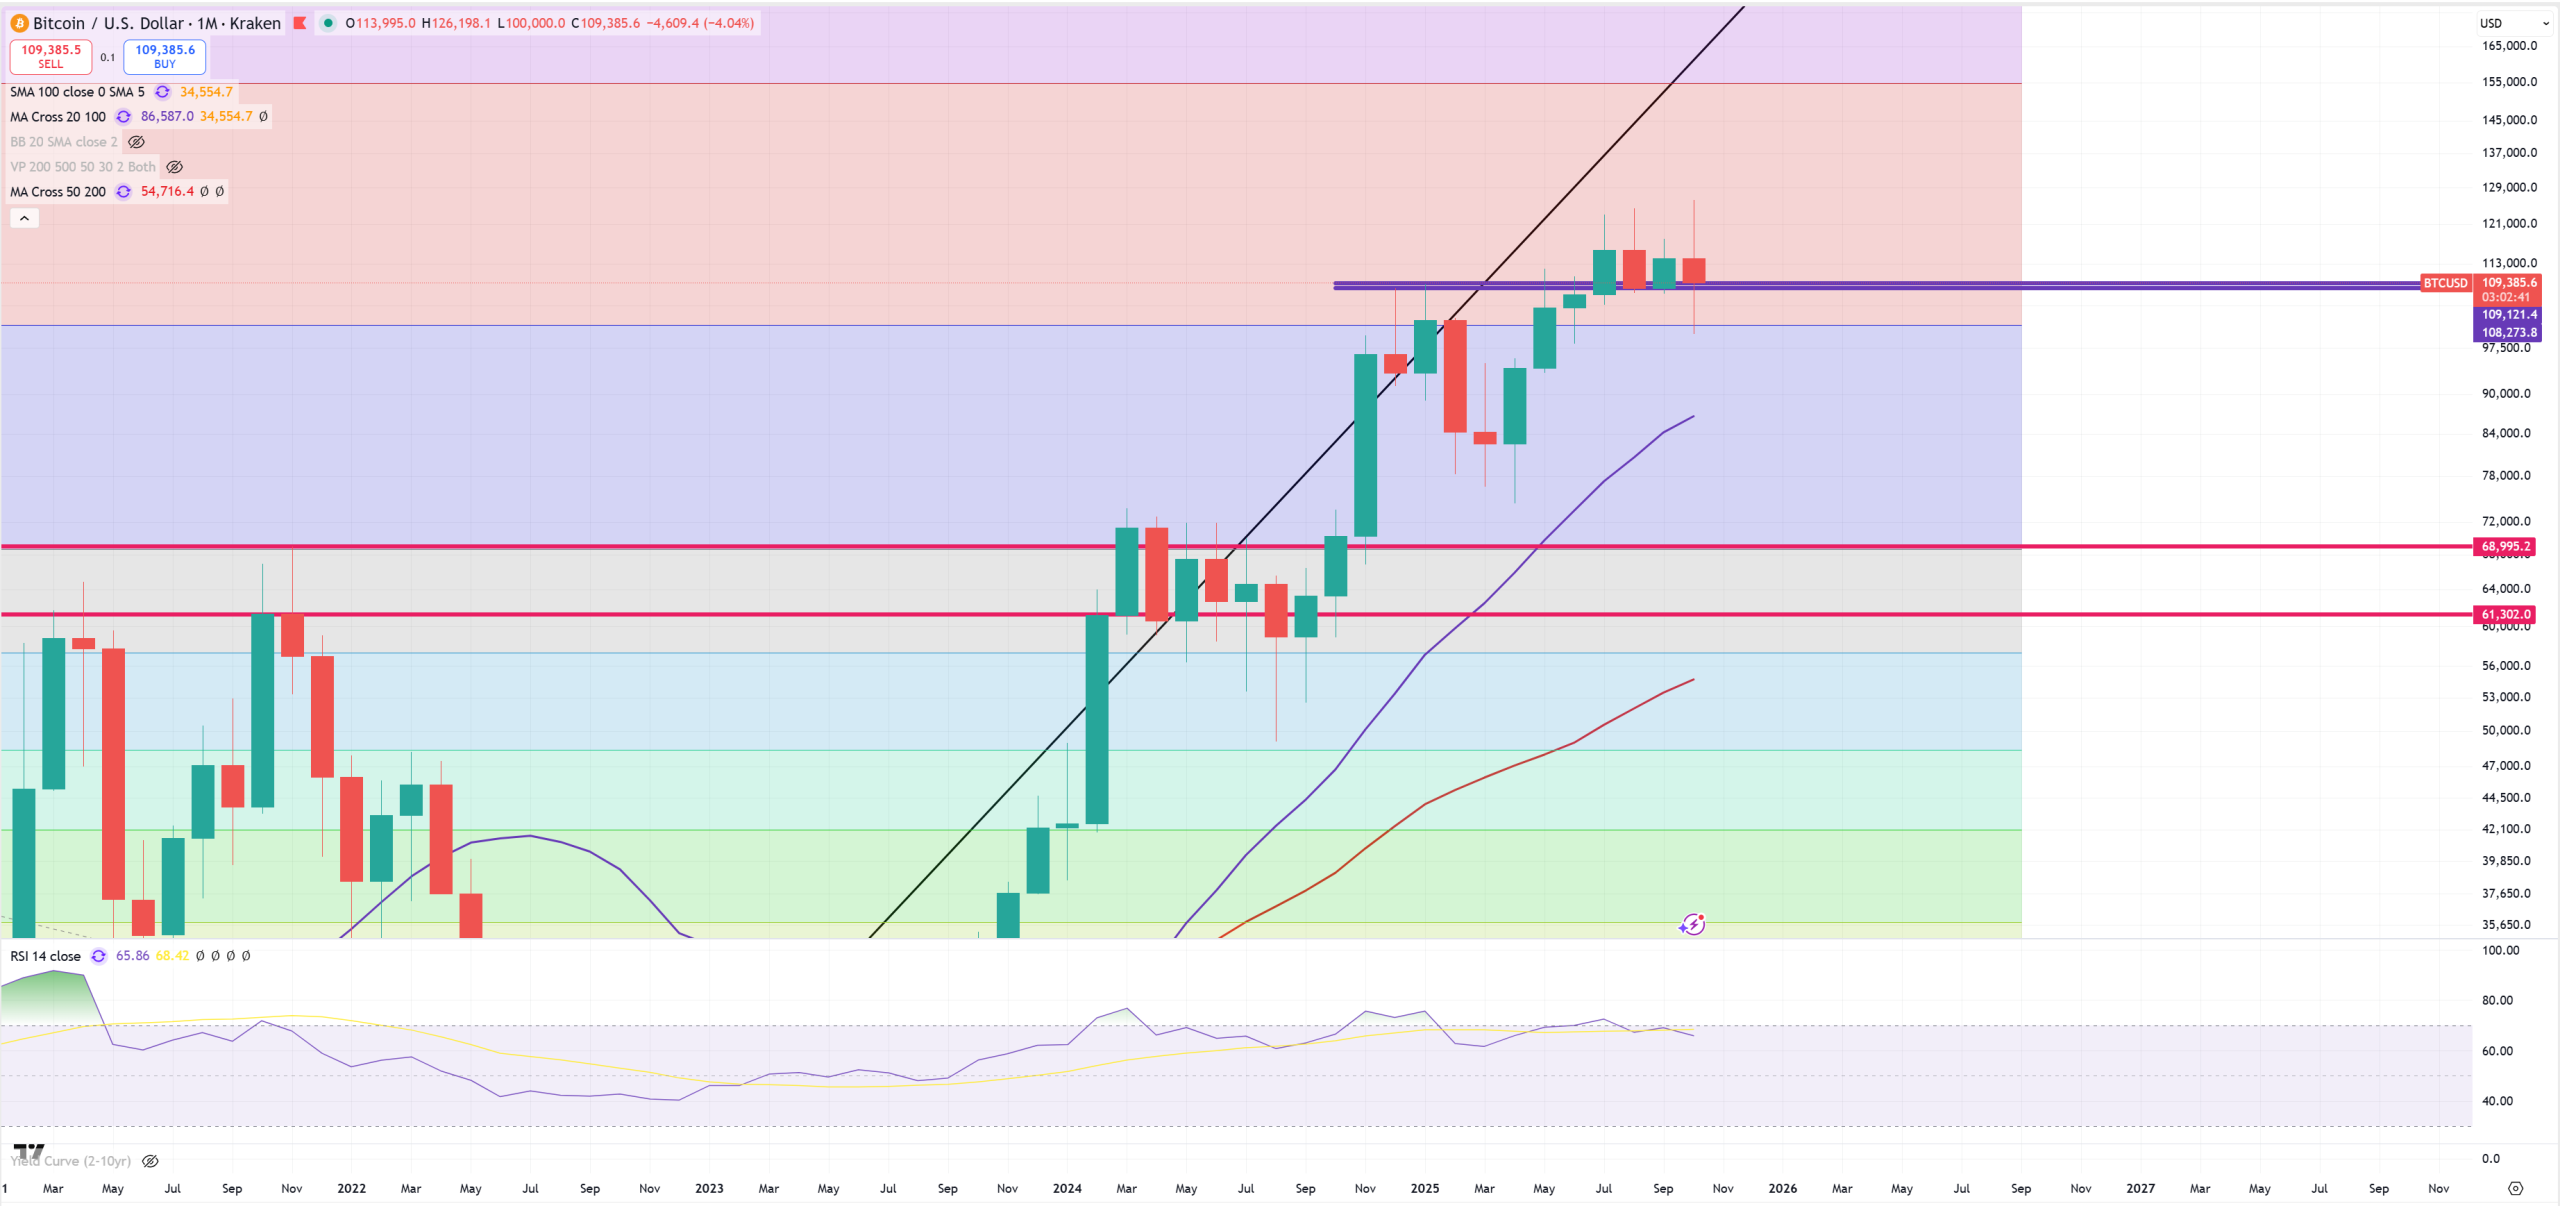
BTC – well that’s the same case as SPX/GOLD with (M)MA200 hanging on it but not breaking. BTC is trying to defend this support because the break should send it first to (M)MA20 (~85k$) later to key support 70k$
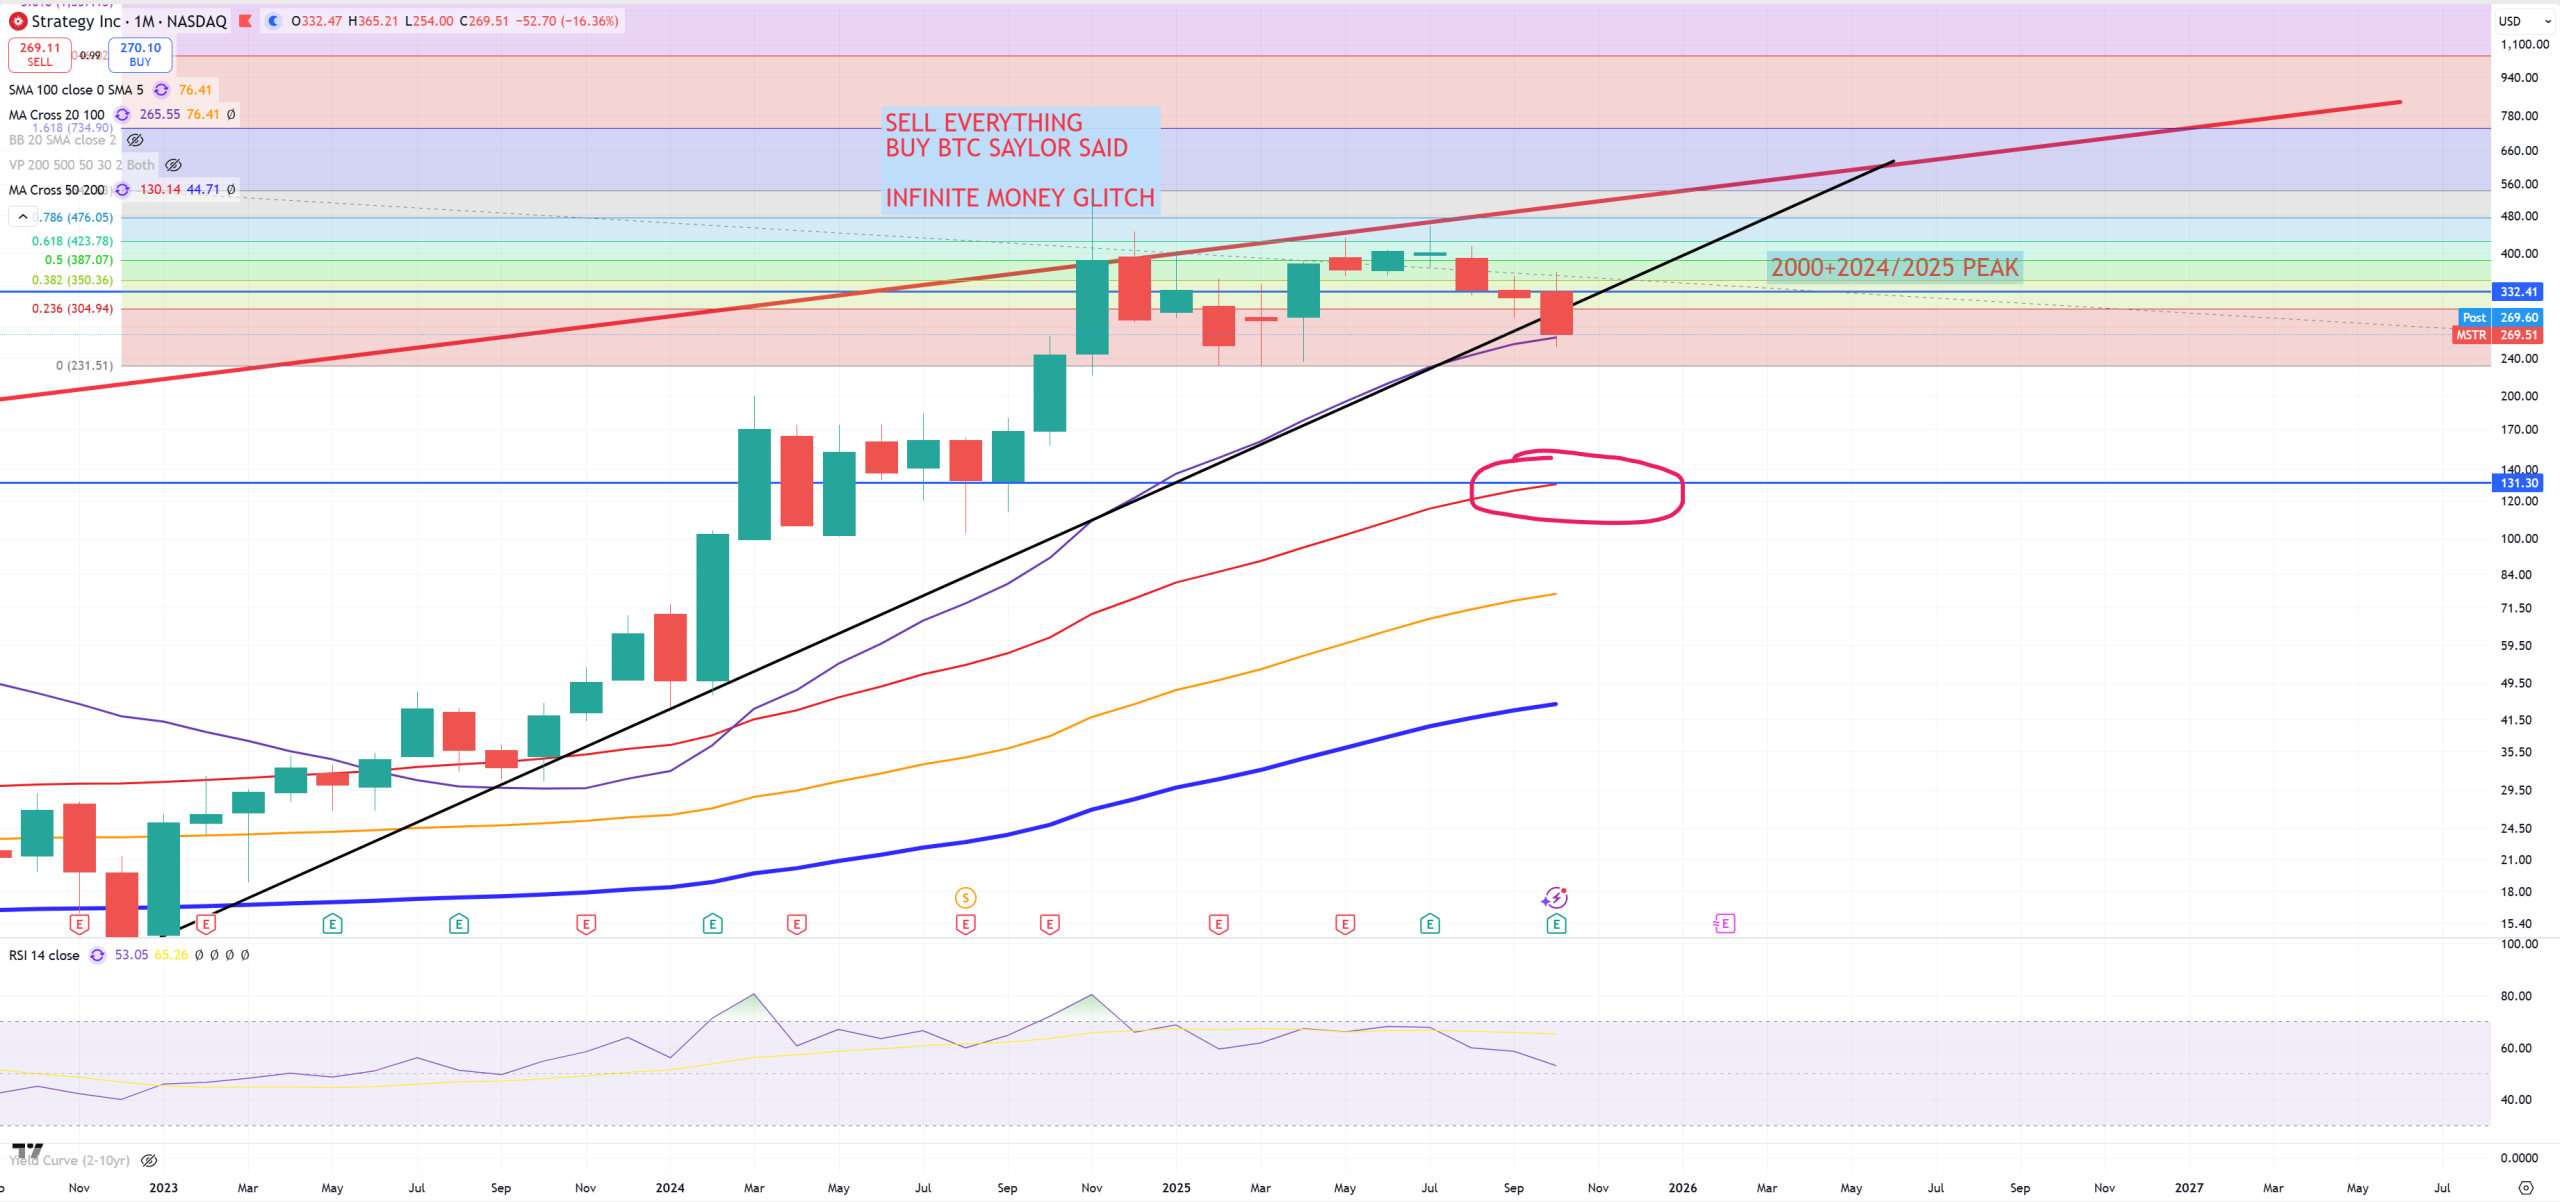
MSTR – my favorite company. Discussing BTC without MSTR is pointless. As BTC tries to grab this support, MSTR is broken in 2 ways : it’s below 2000 peak and below broken trend, but hangs on (M)MA20 for a possible momentum change. After break there’s no other support until 130$.
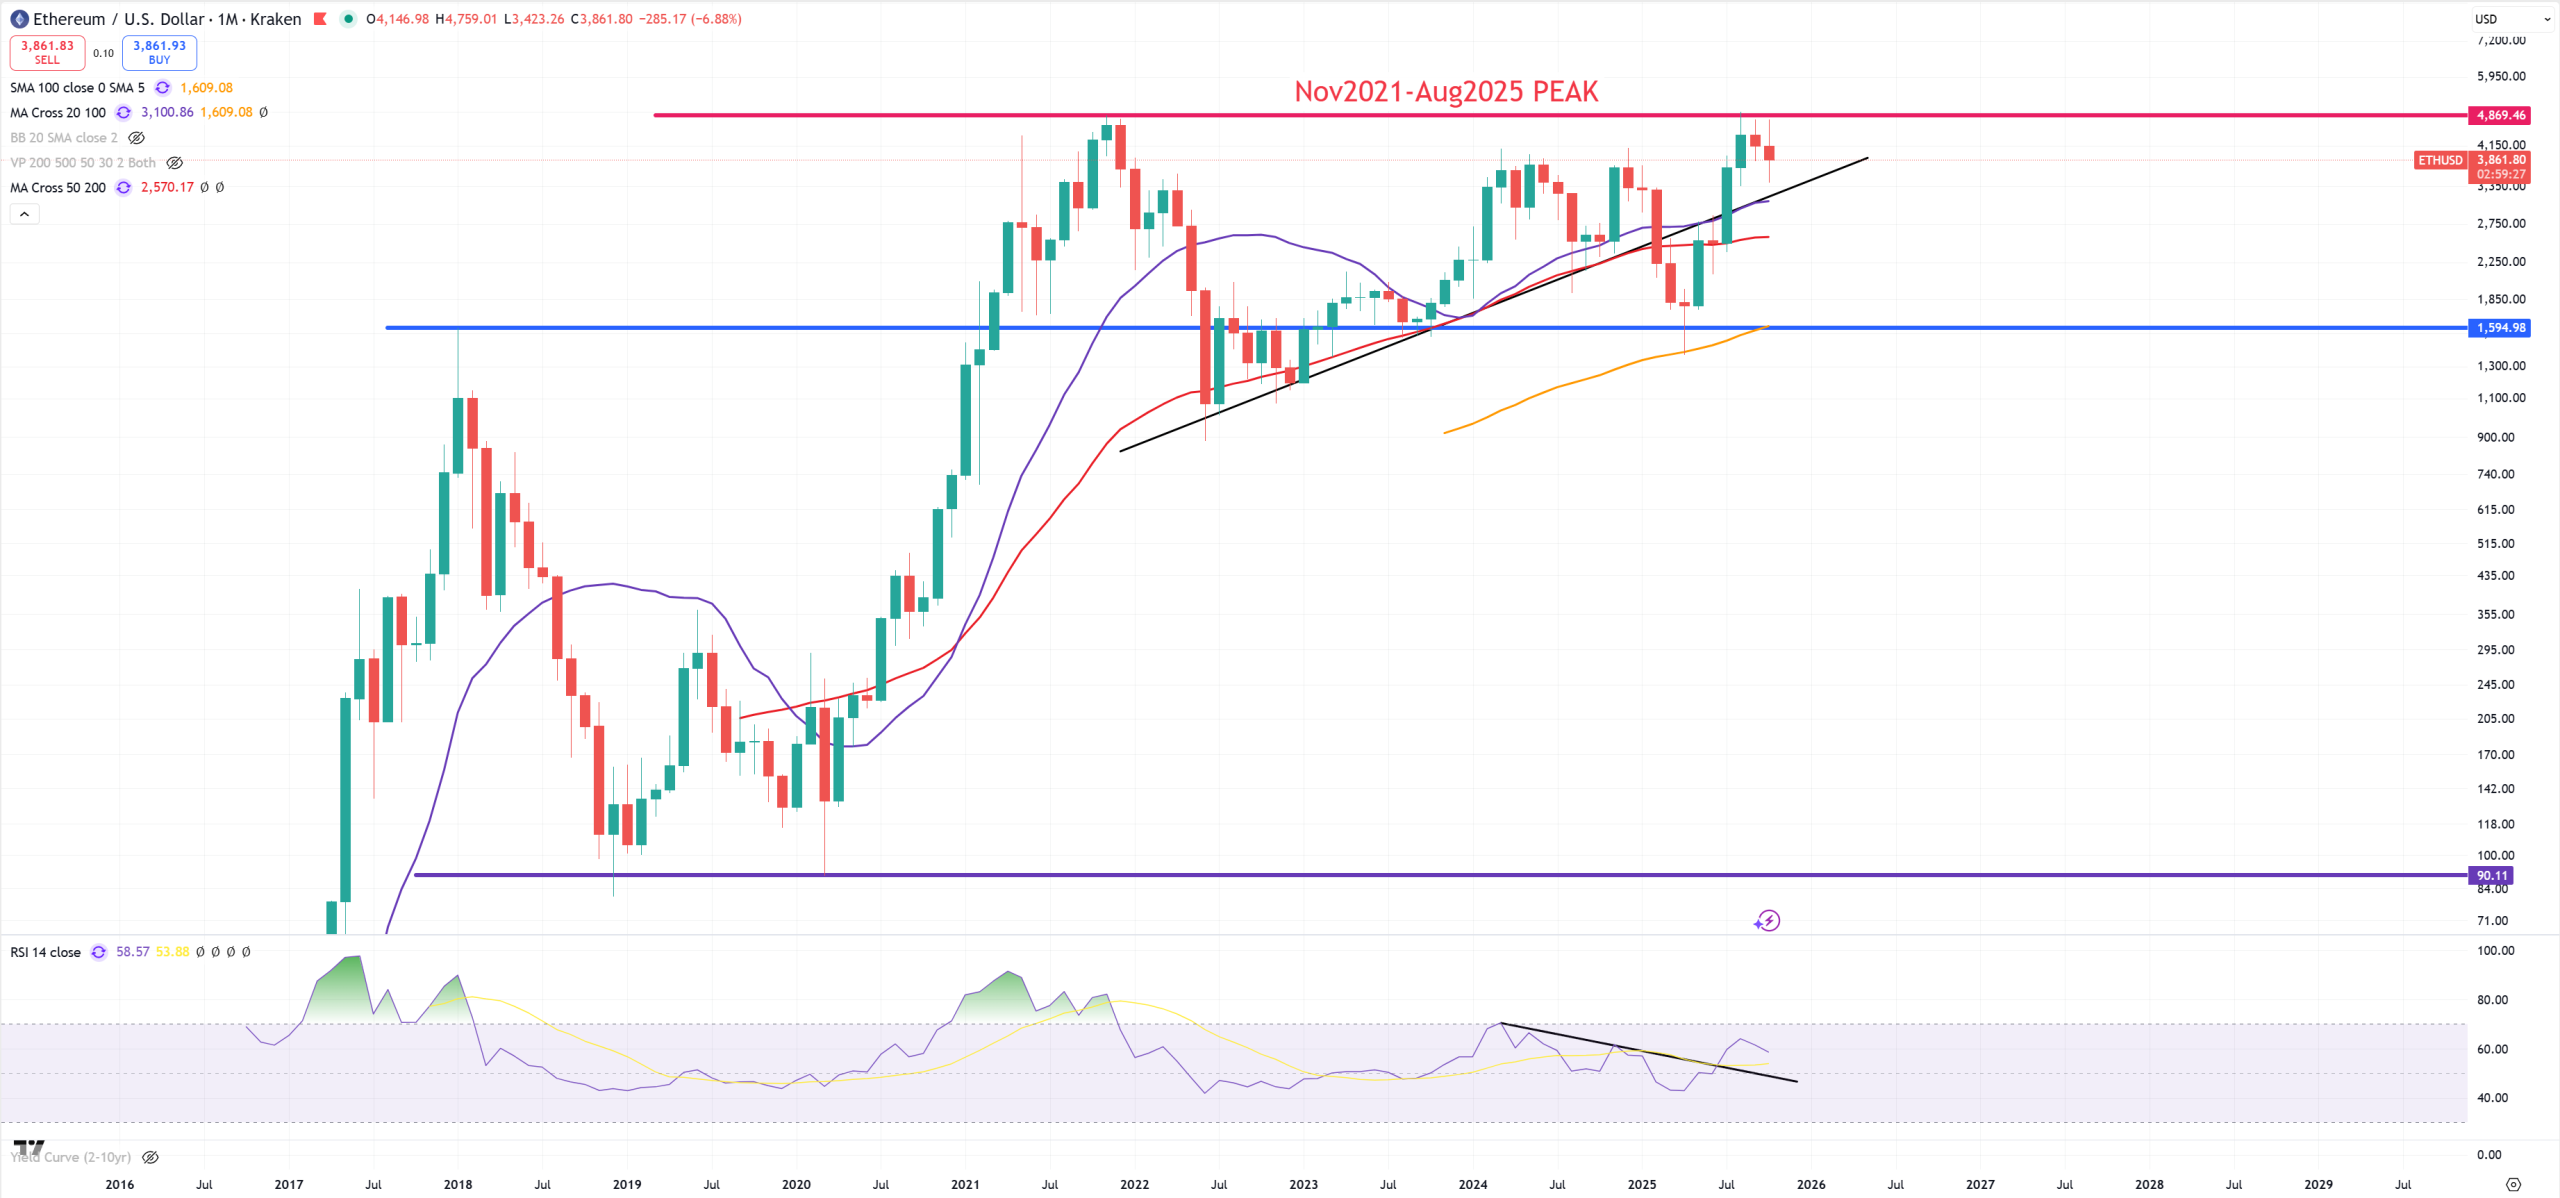
ETH – nothing to comment here. Without breaking 5000$ market will want to change the momentum.
Let’s see how other currencies look like when DXY jumps off its last 96 support, USDCNH was already mentioned.
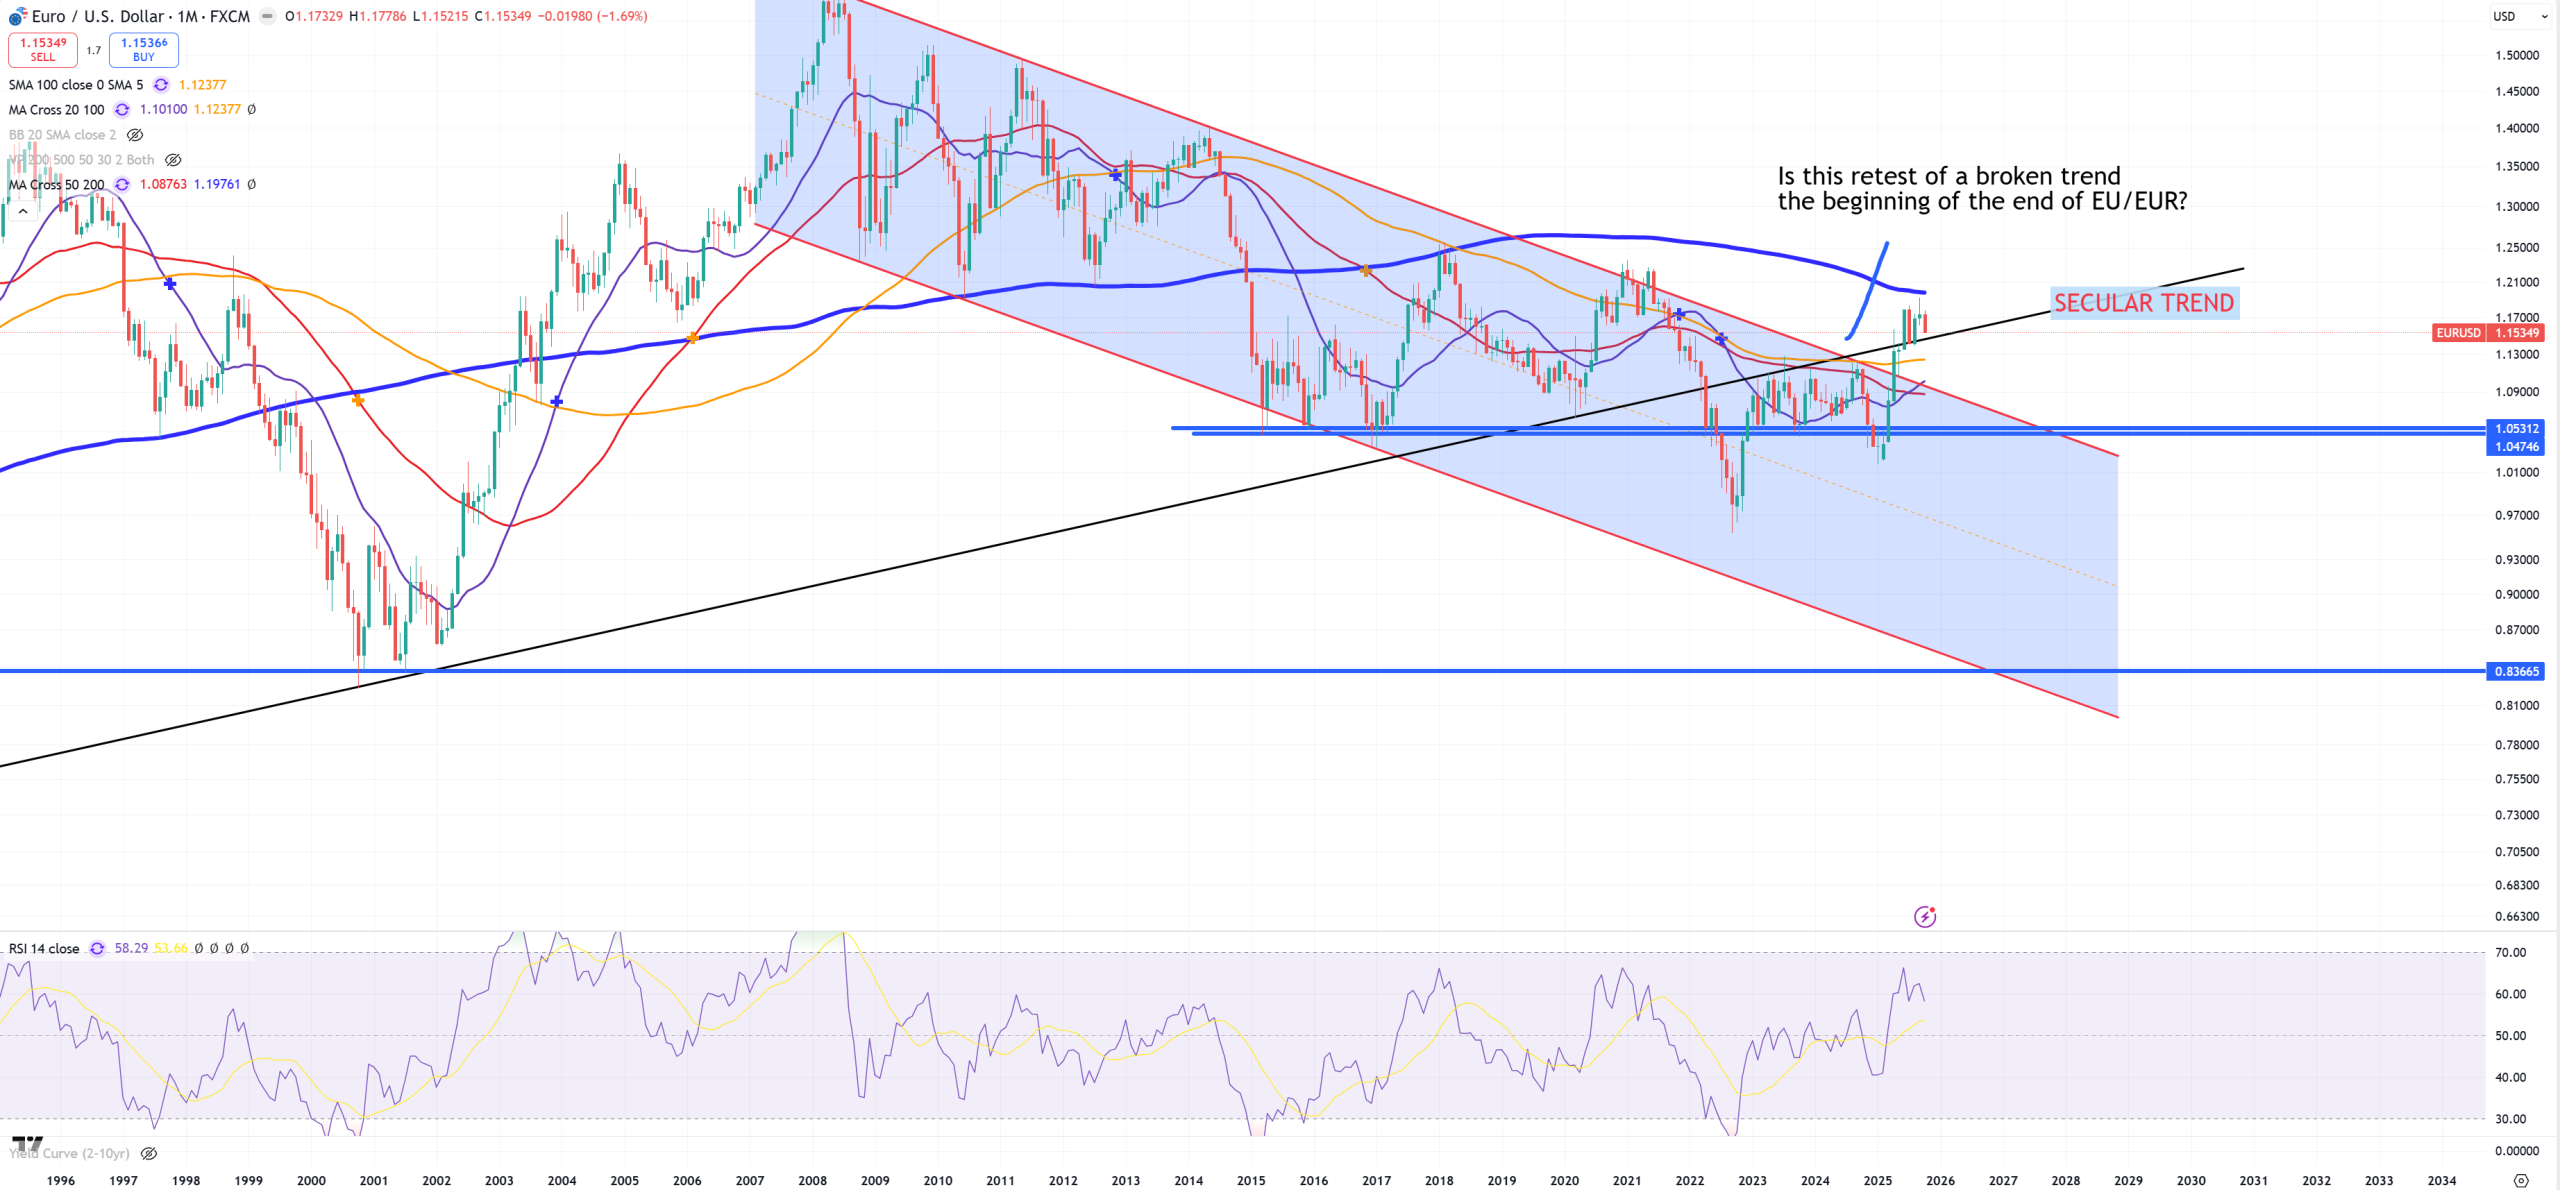
EURUSD – this is like 50% of DXY, there’s last level (M)MA200 = 1.20. I was expecting it to hold this retest of SECULAR TREND from the bottom once DXY gets towards its last level but it did not work as I expected. Maybe trend is wrong, but not going to change it. We’ll know soon
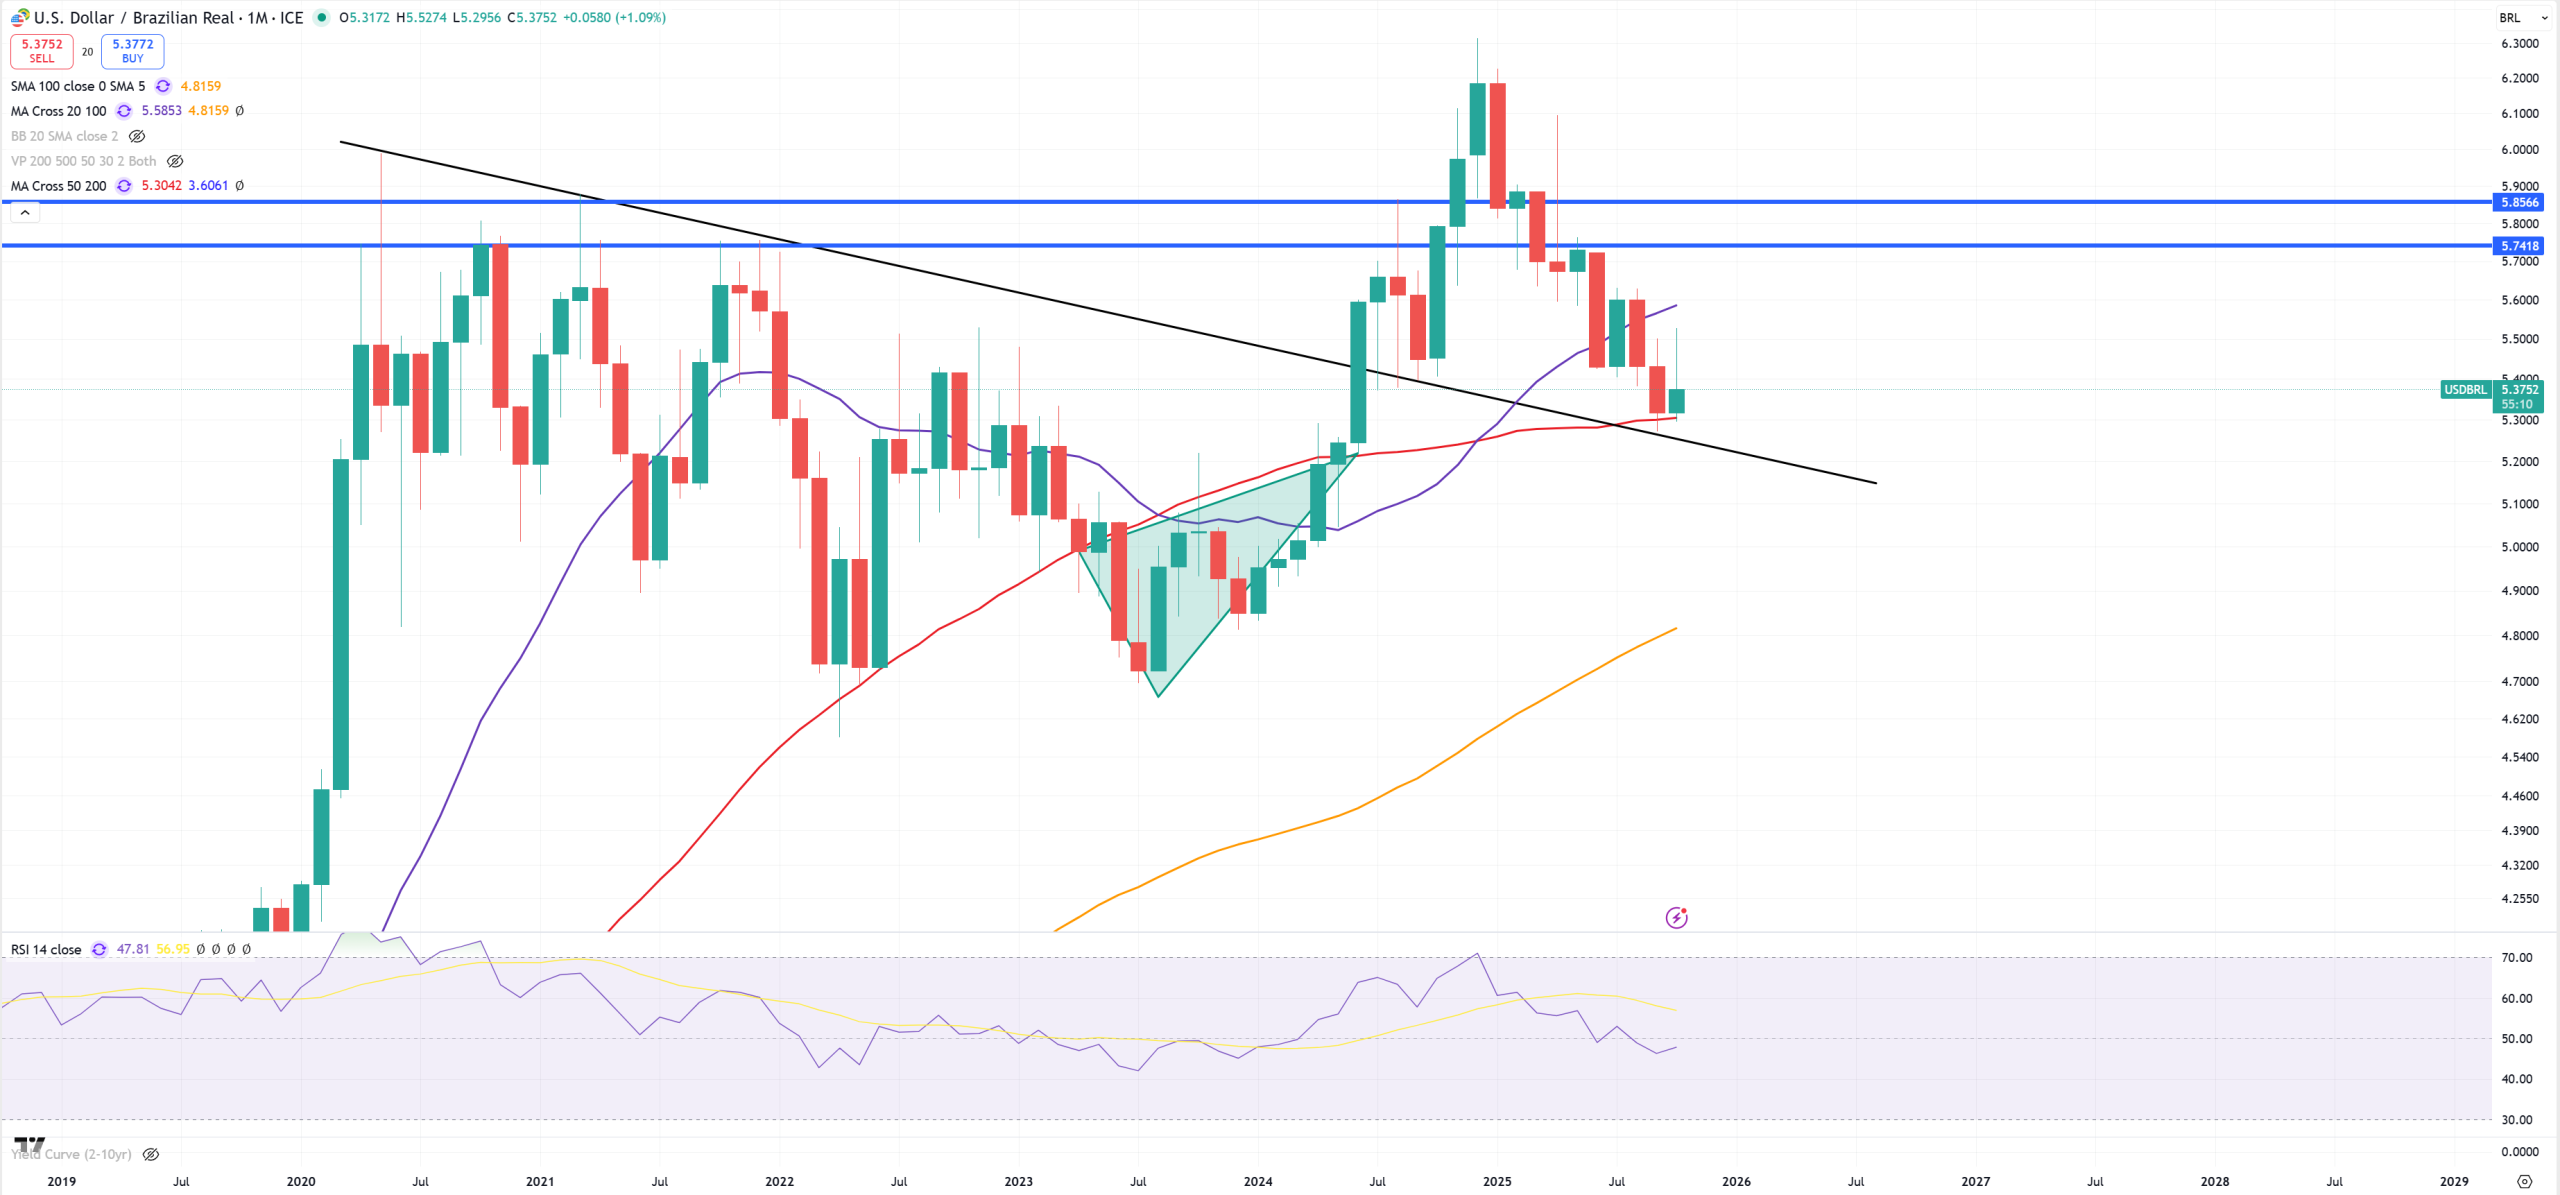
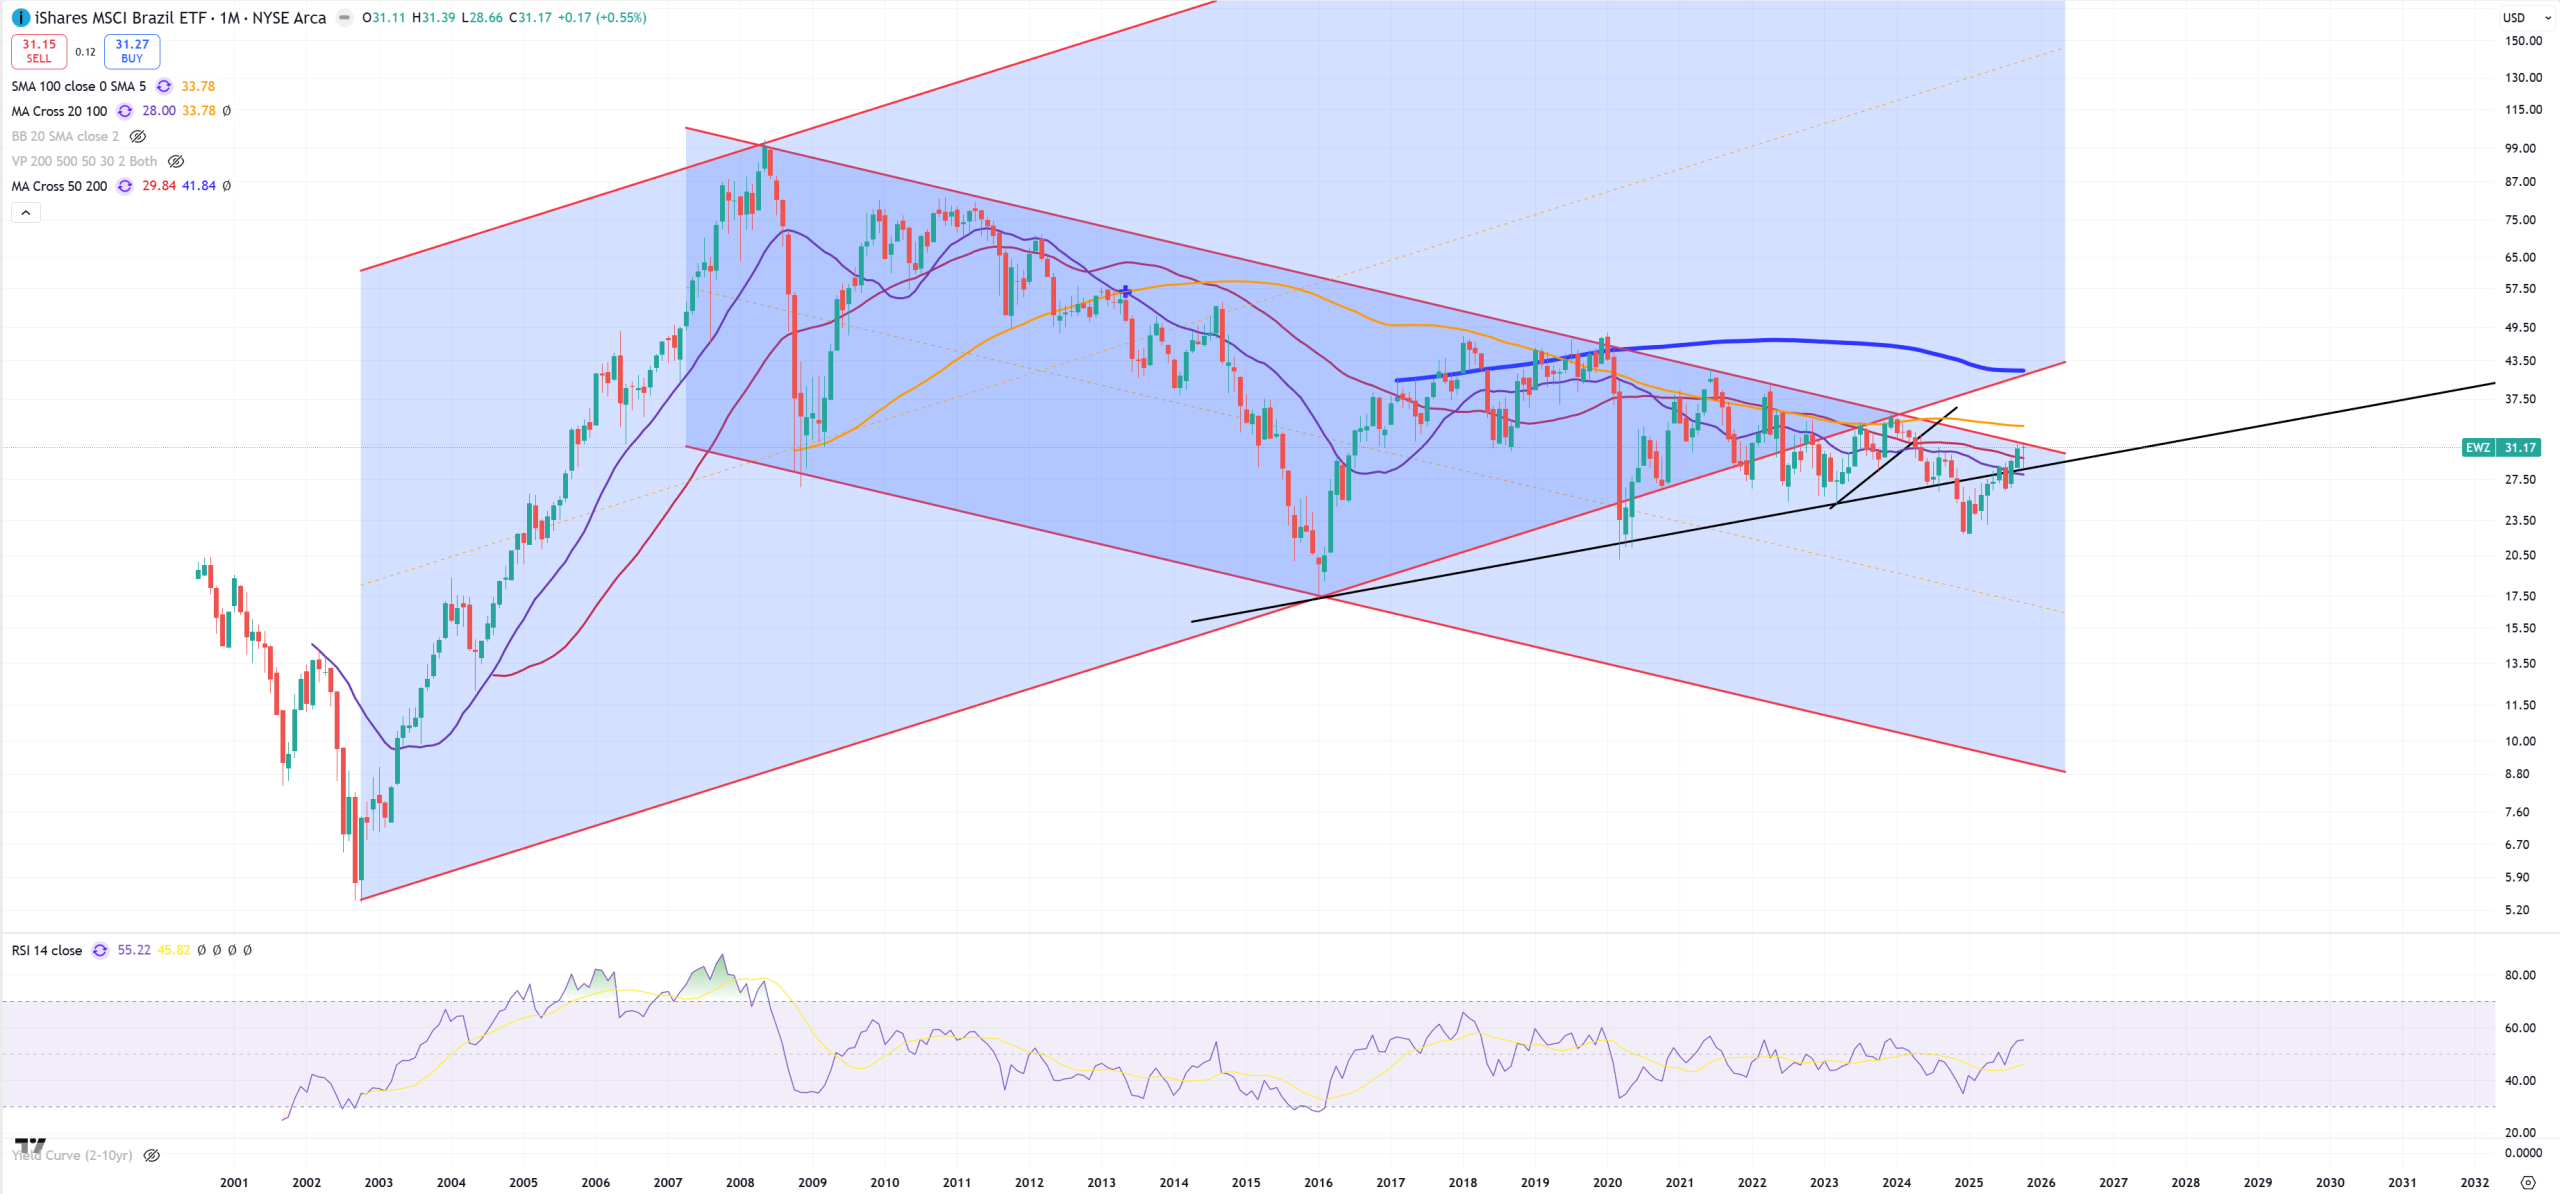
USDBRL – I expect this (M)MA50 will be hold. Have in mind how pefectly this (M)MA50 holds and matches exactly the lowest support of DXY = 96. Just in time Brazil starts to have credit blow ups as 10Y/3M uninverts.

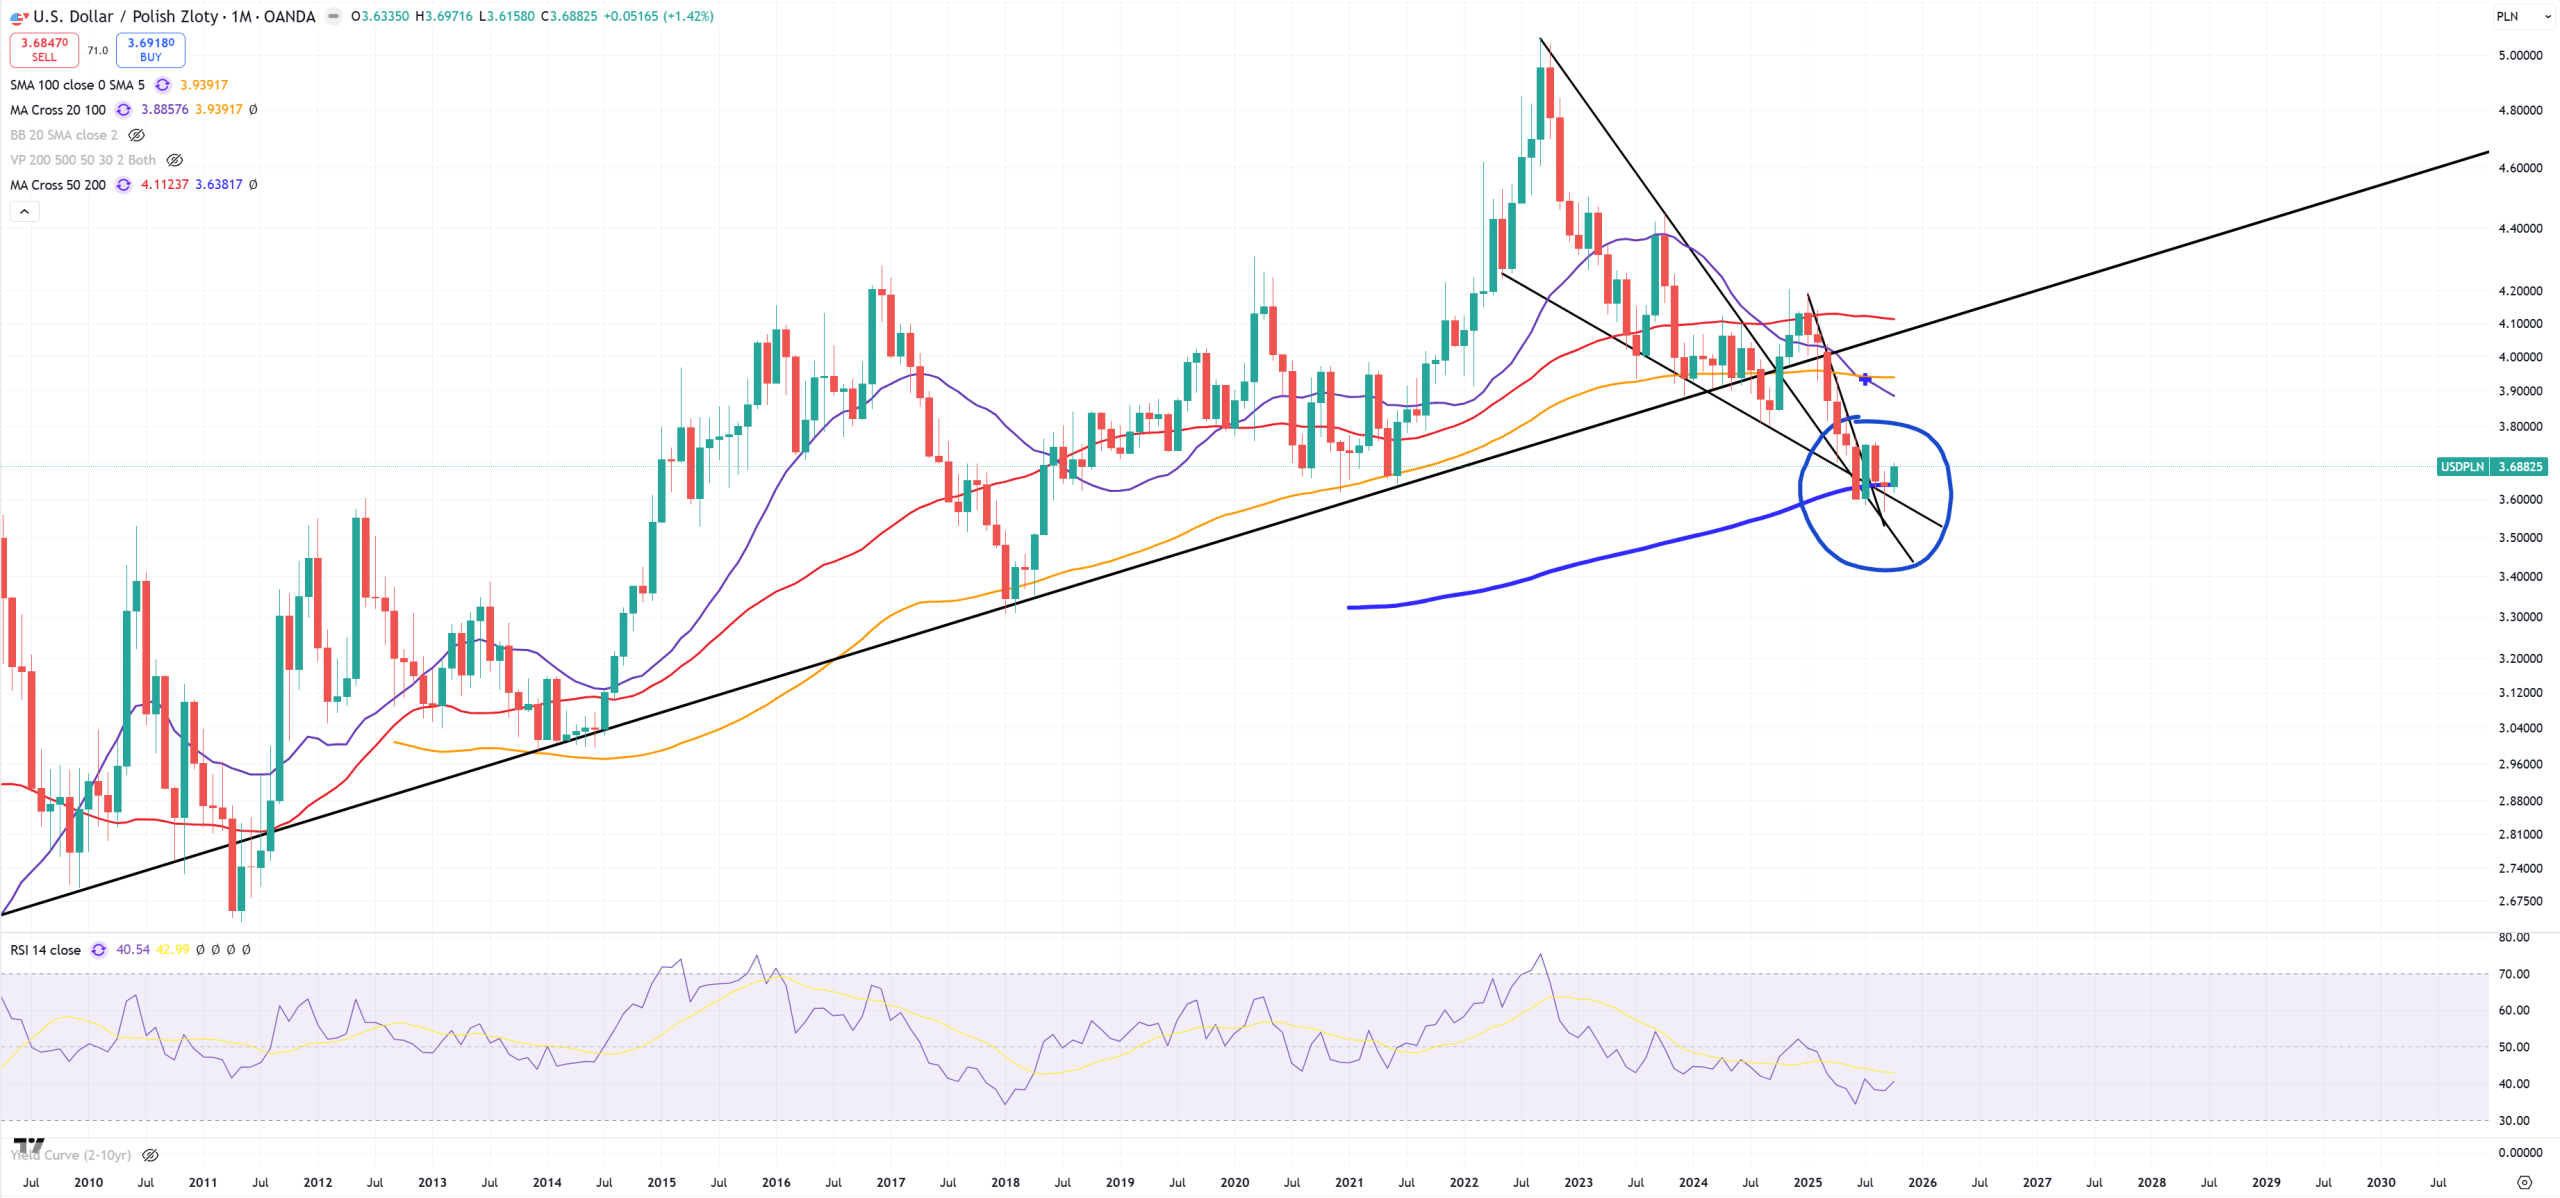
USDPLN – last possible moment is (M)MA200 = 3.60
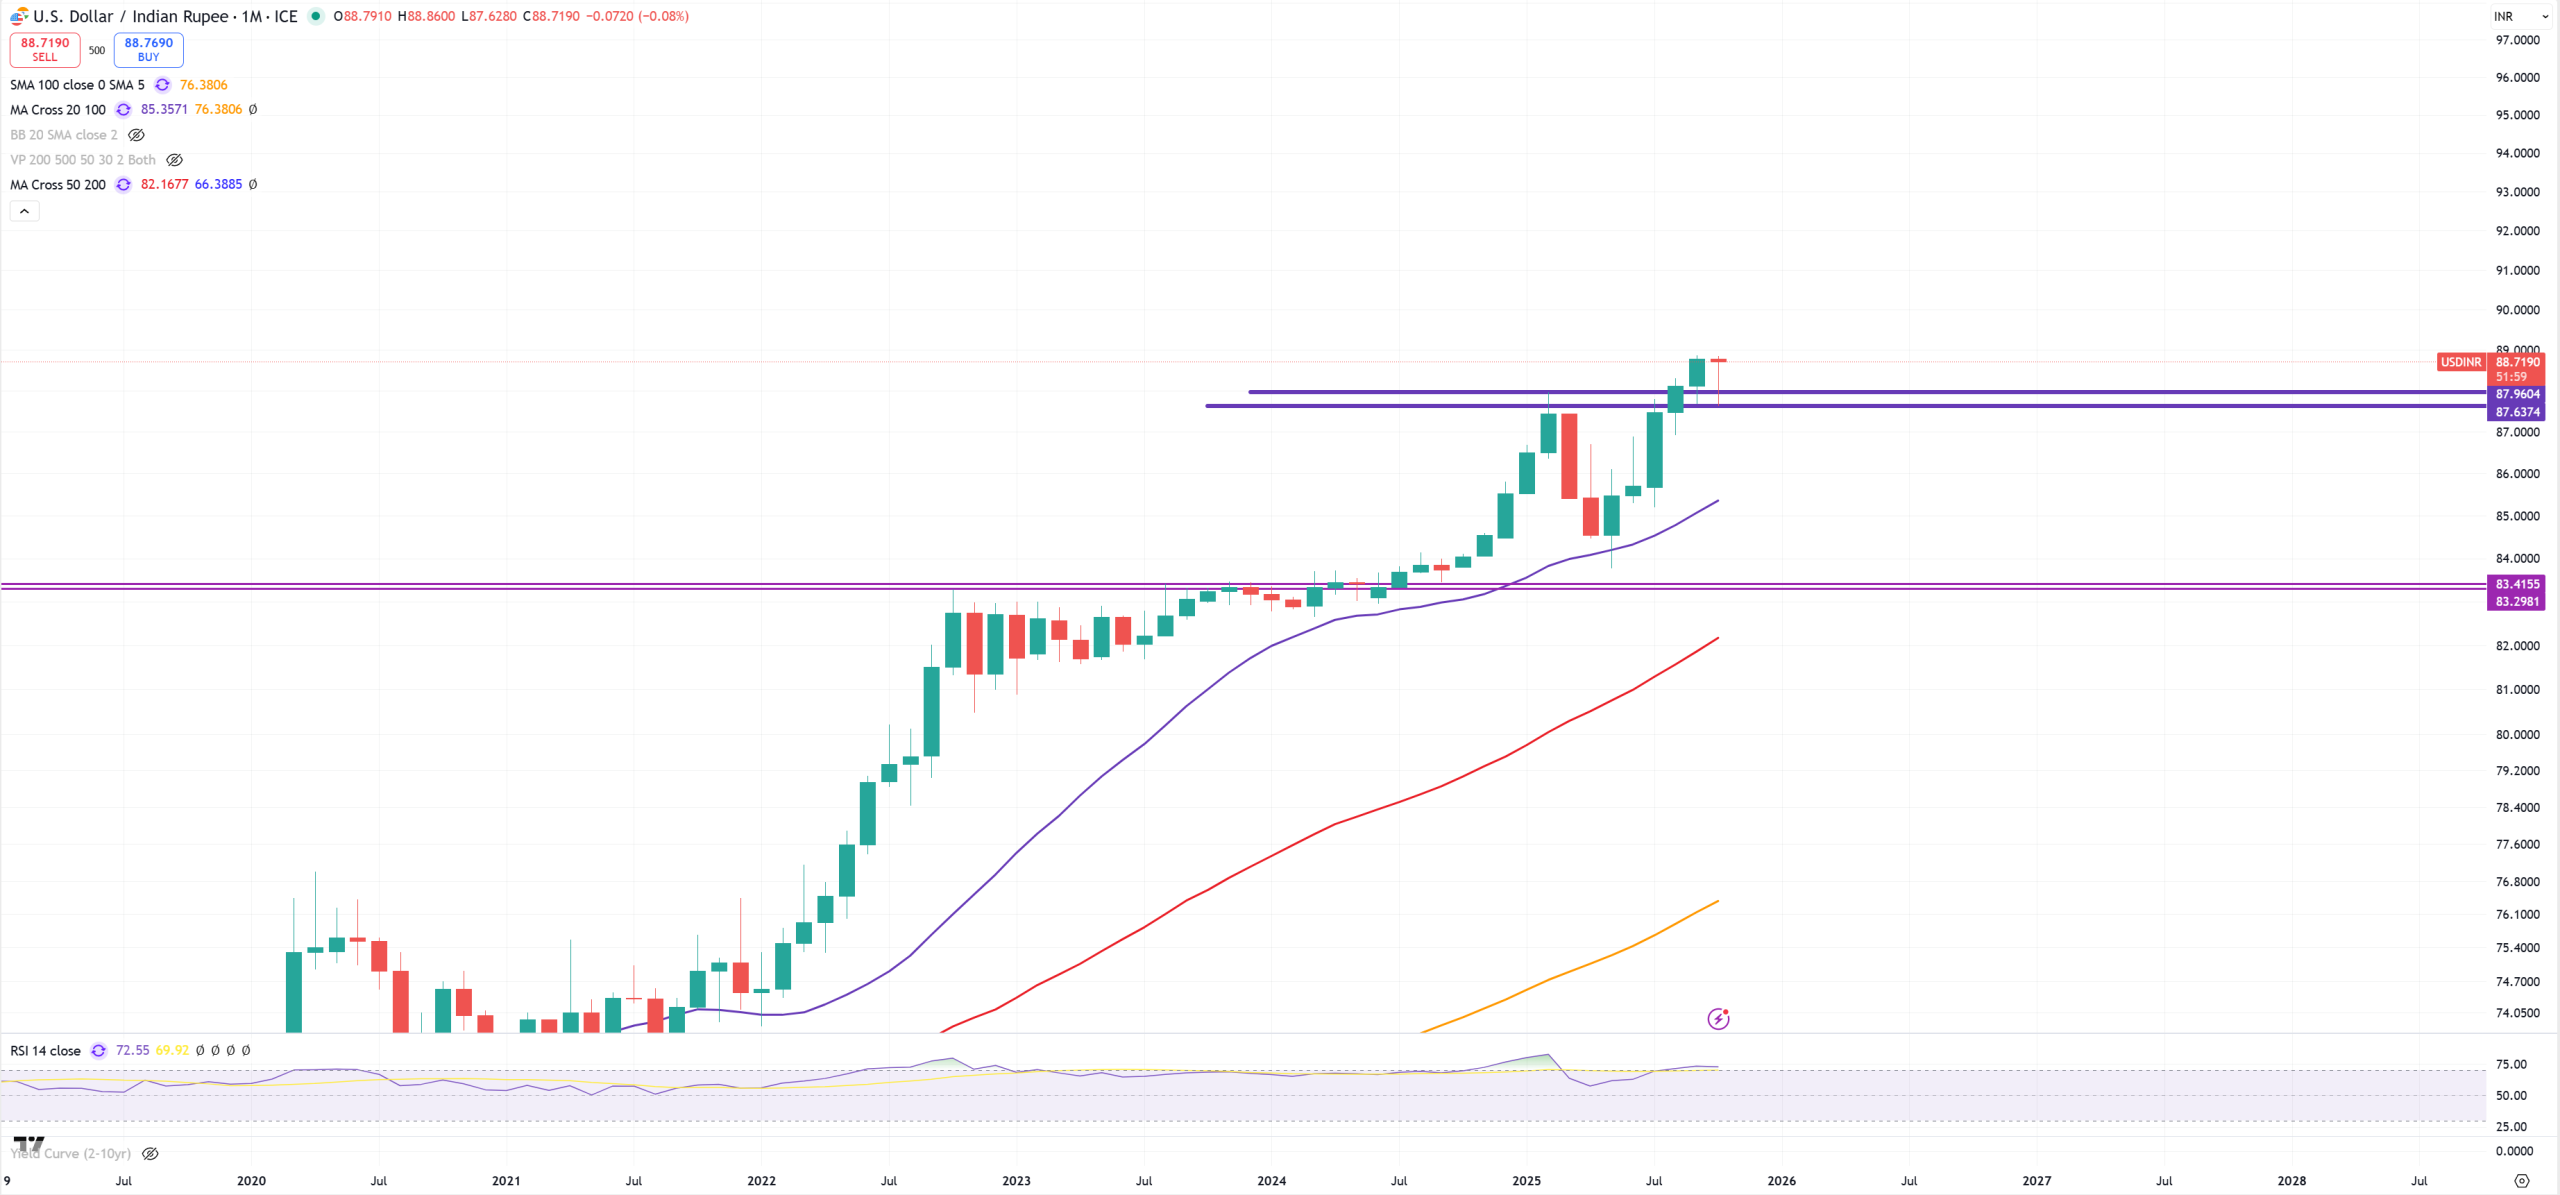
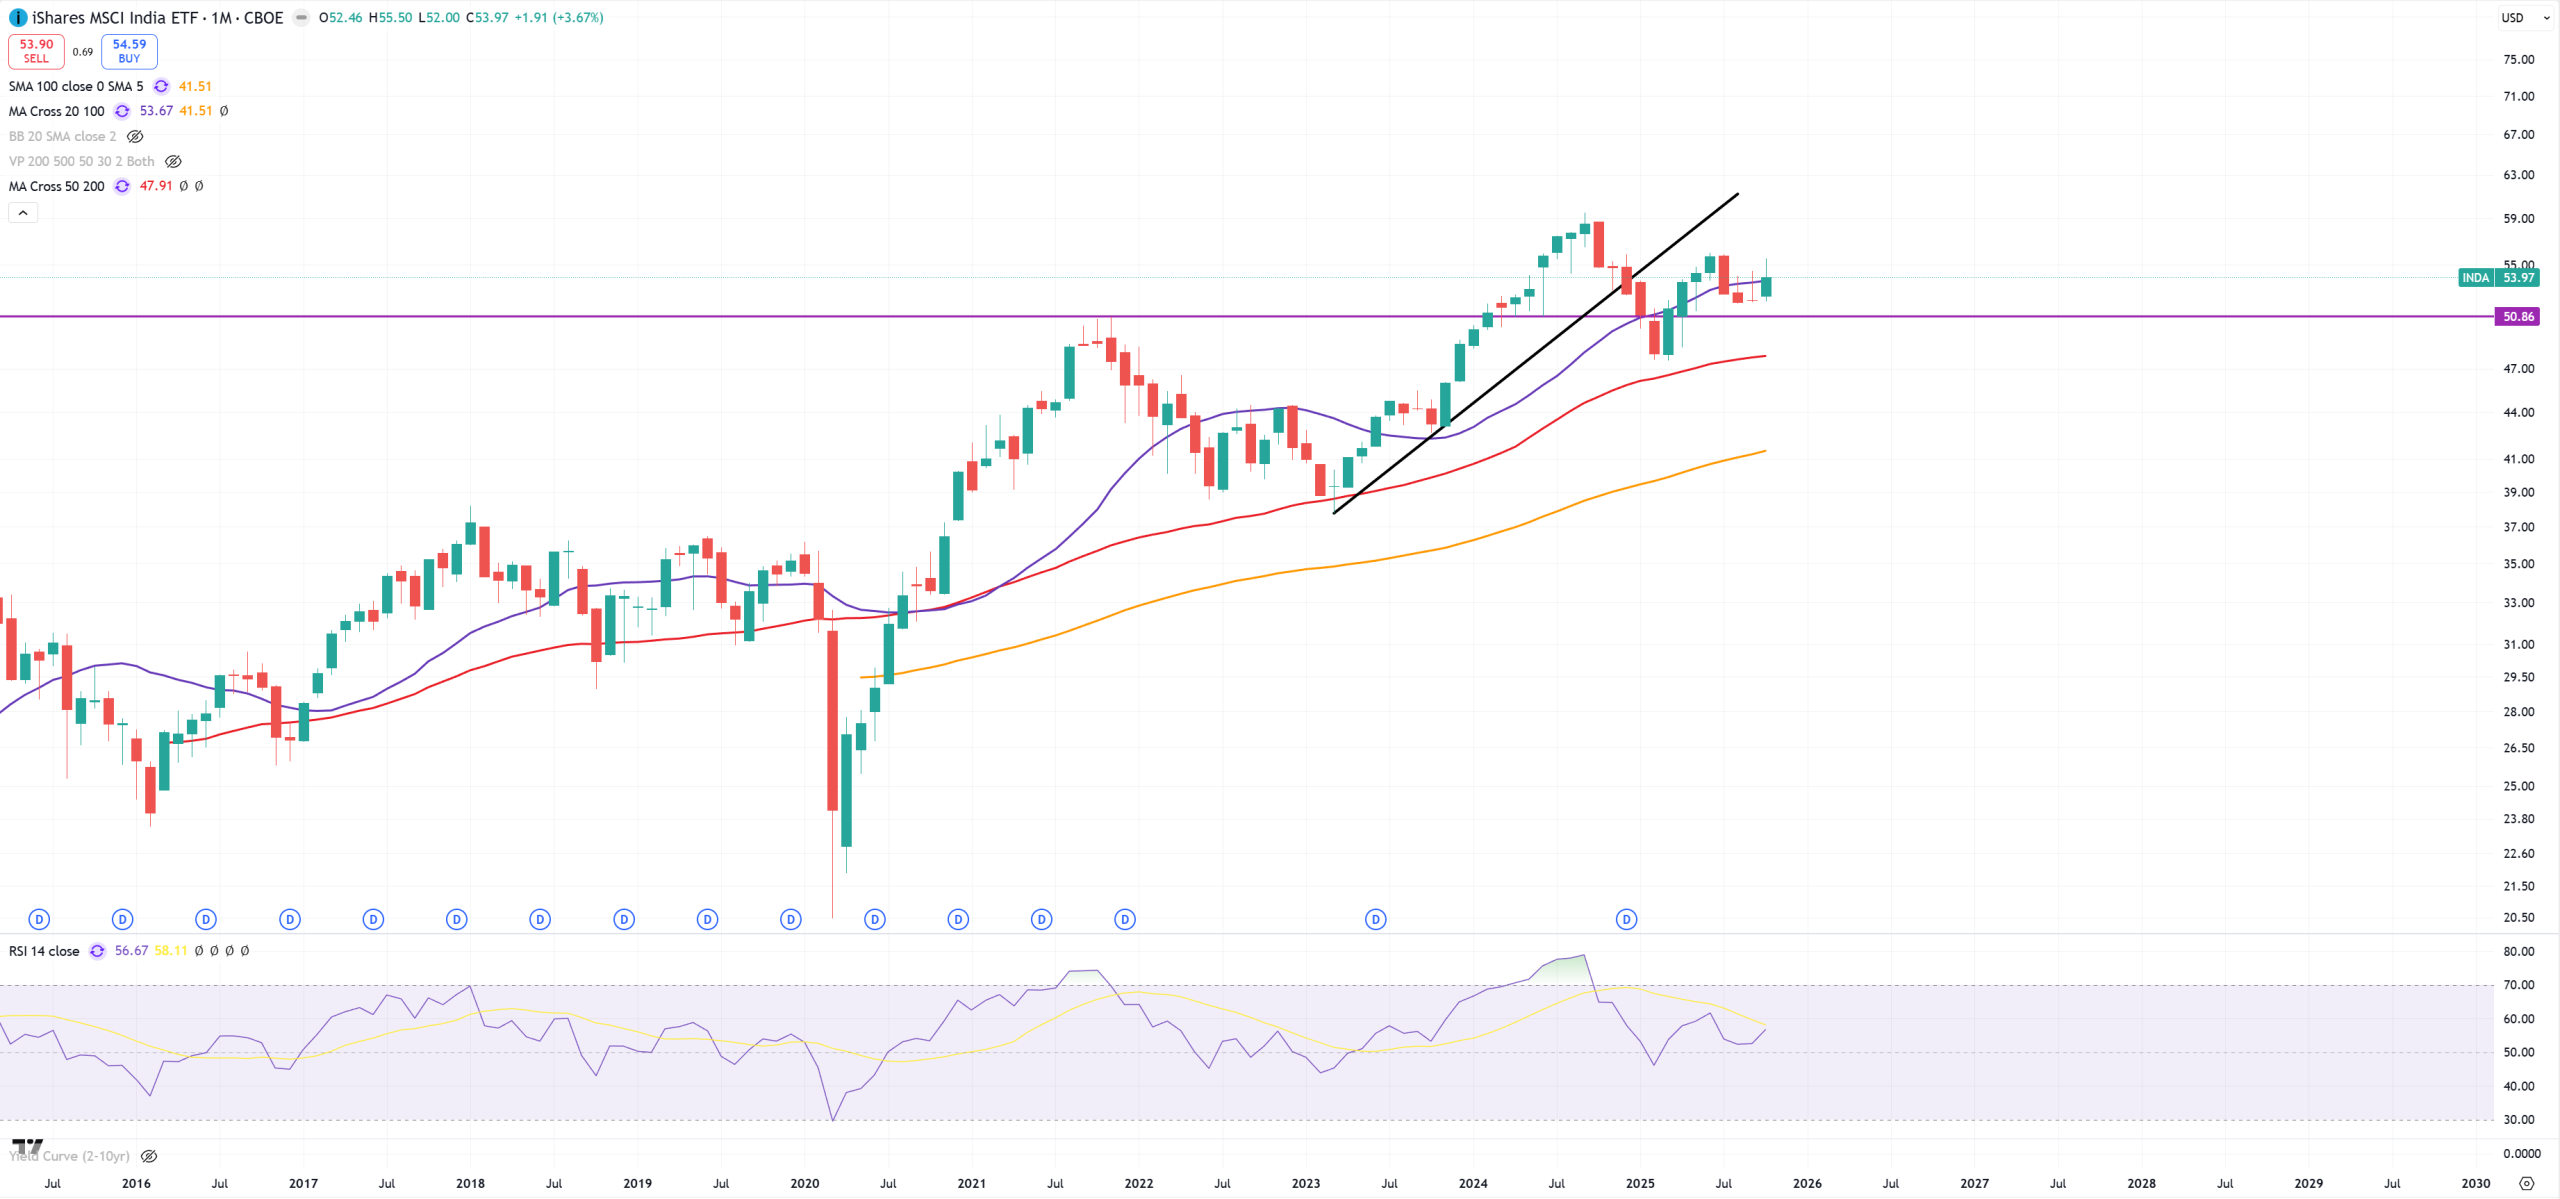
USDINR – India is about to blow up heavily looking on INR pattern :
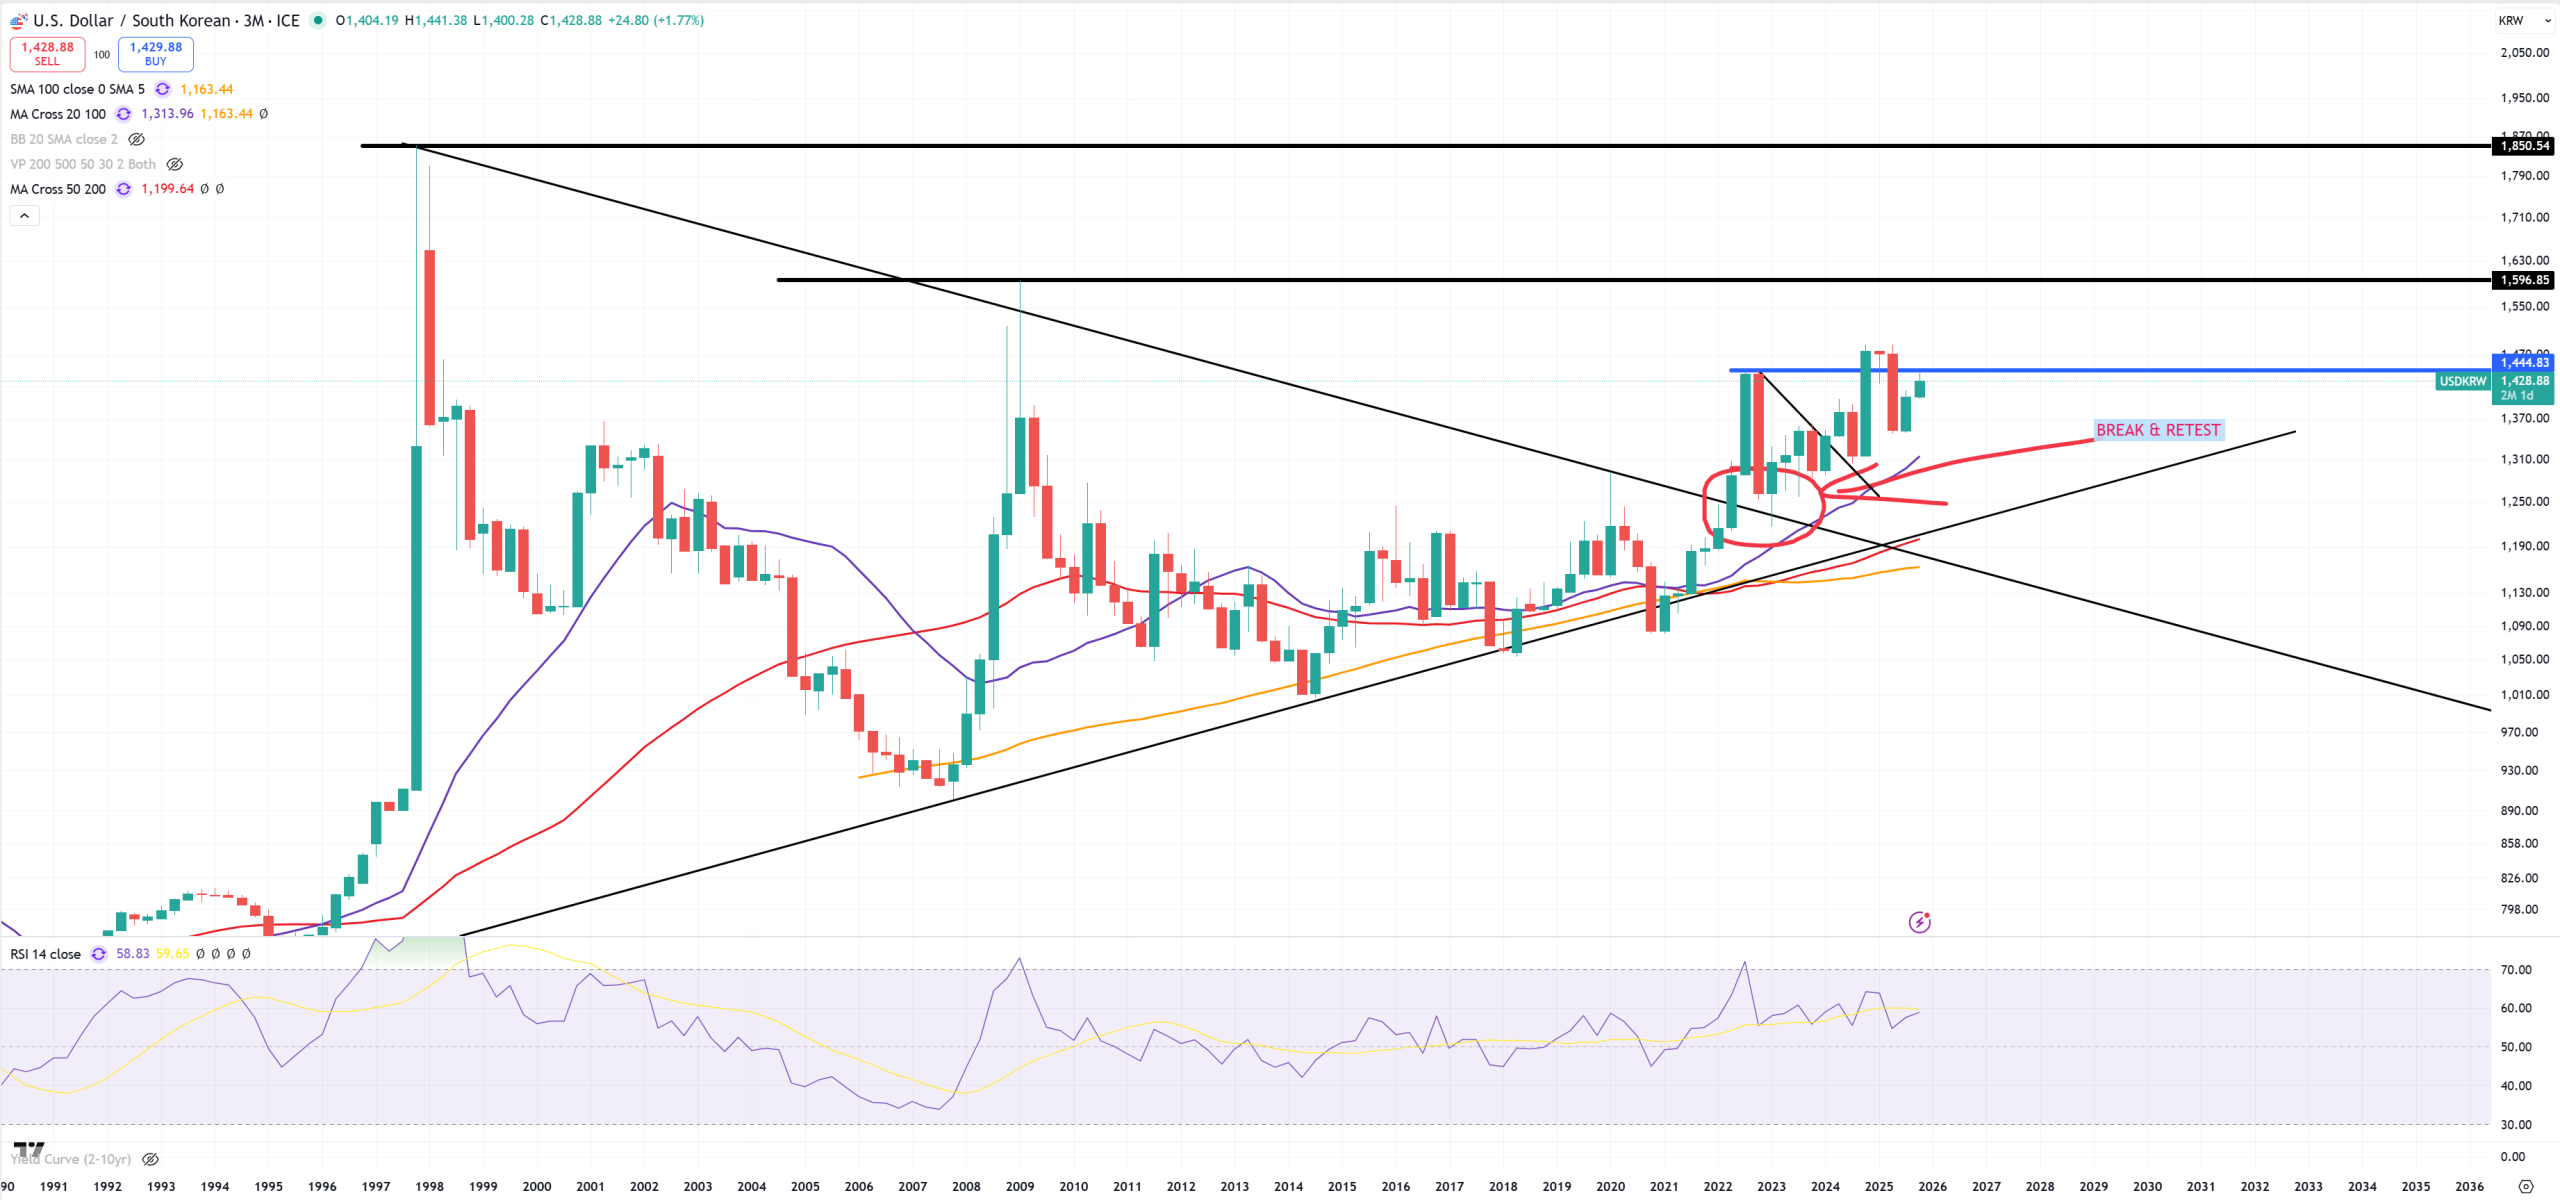
USDKRW – I expect soon to break it higher
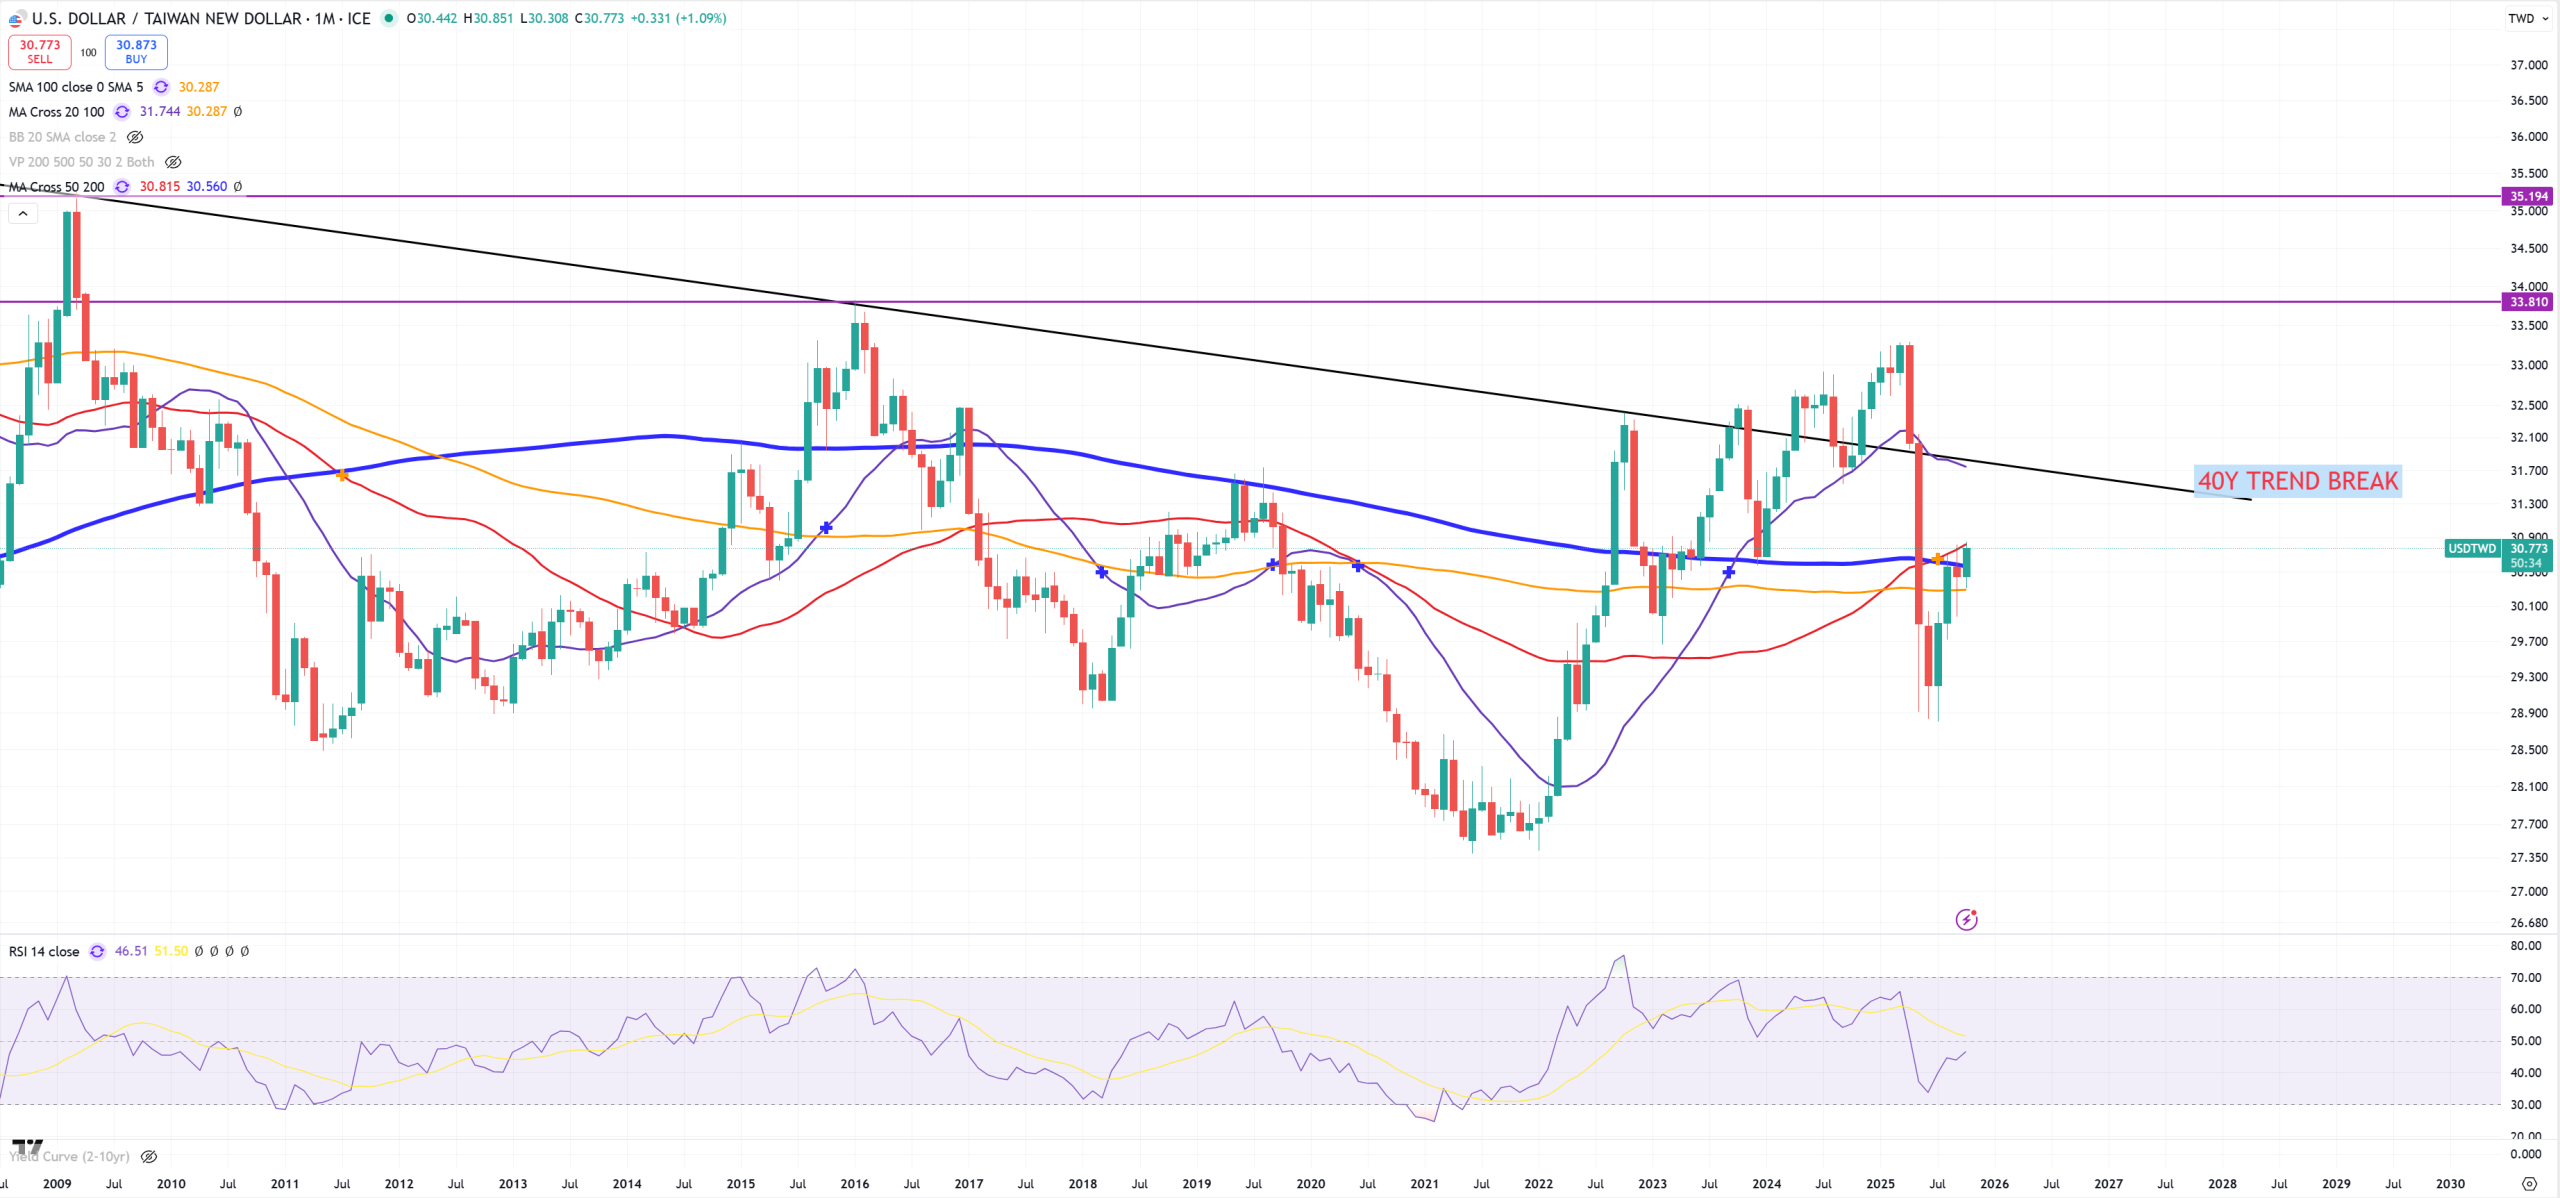
USDTWD – it’s returning, and soon it’ll be fighting again to break this 40Y trend.
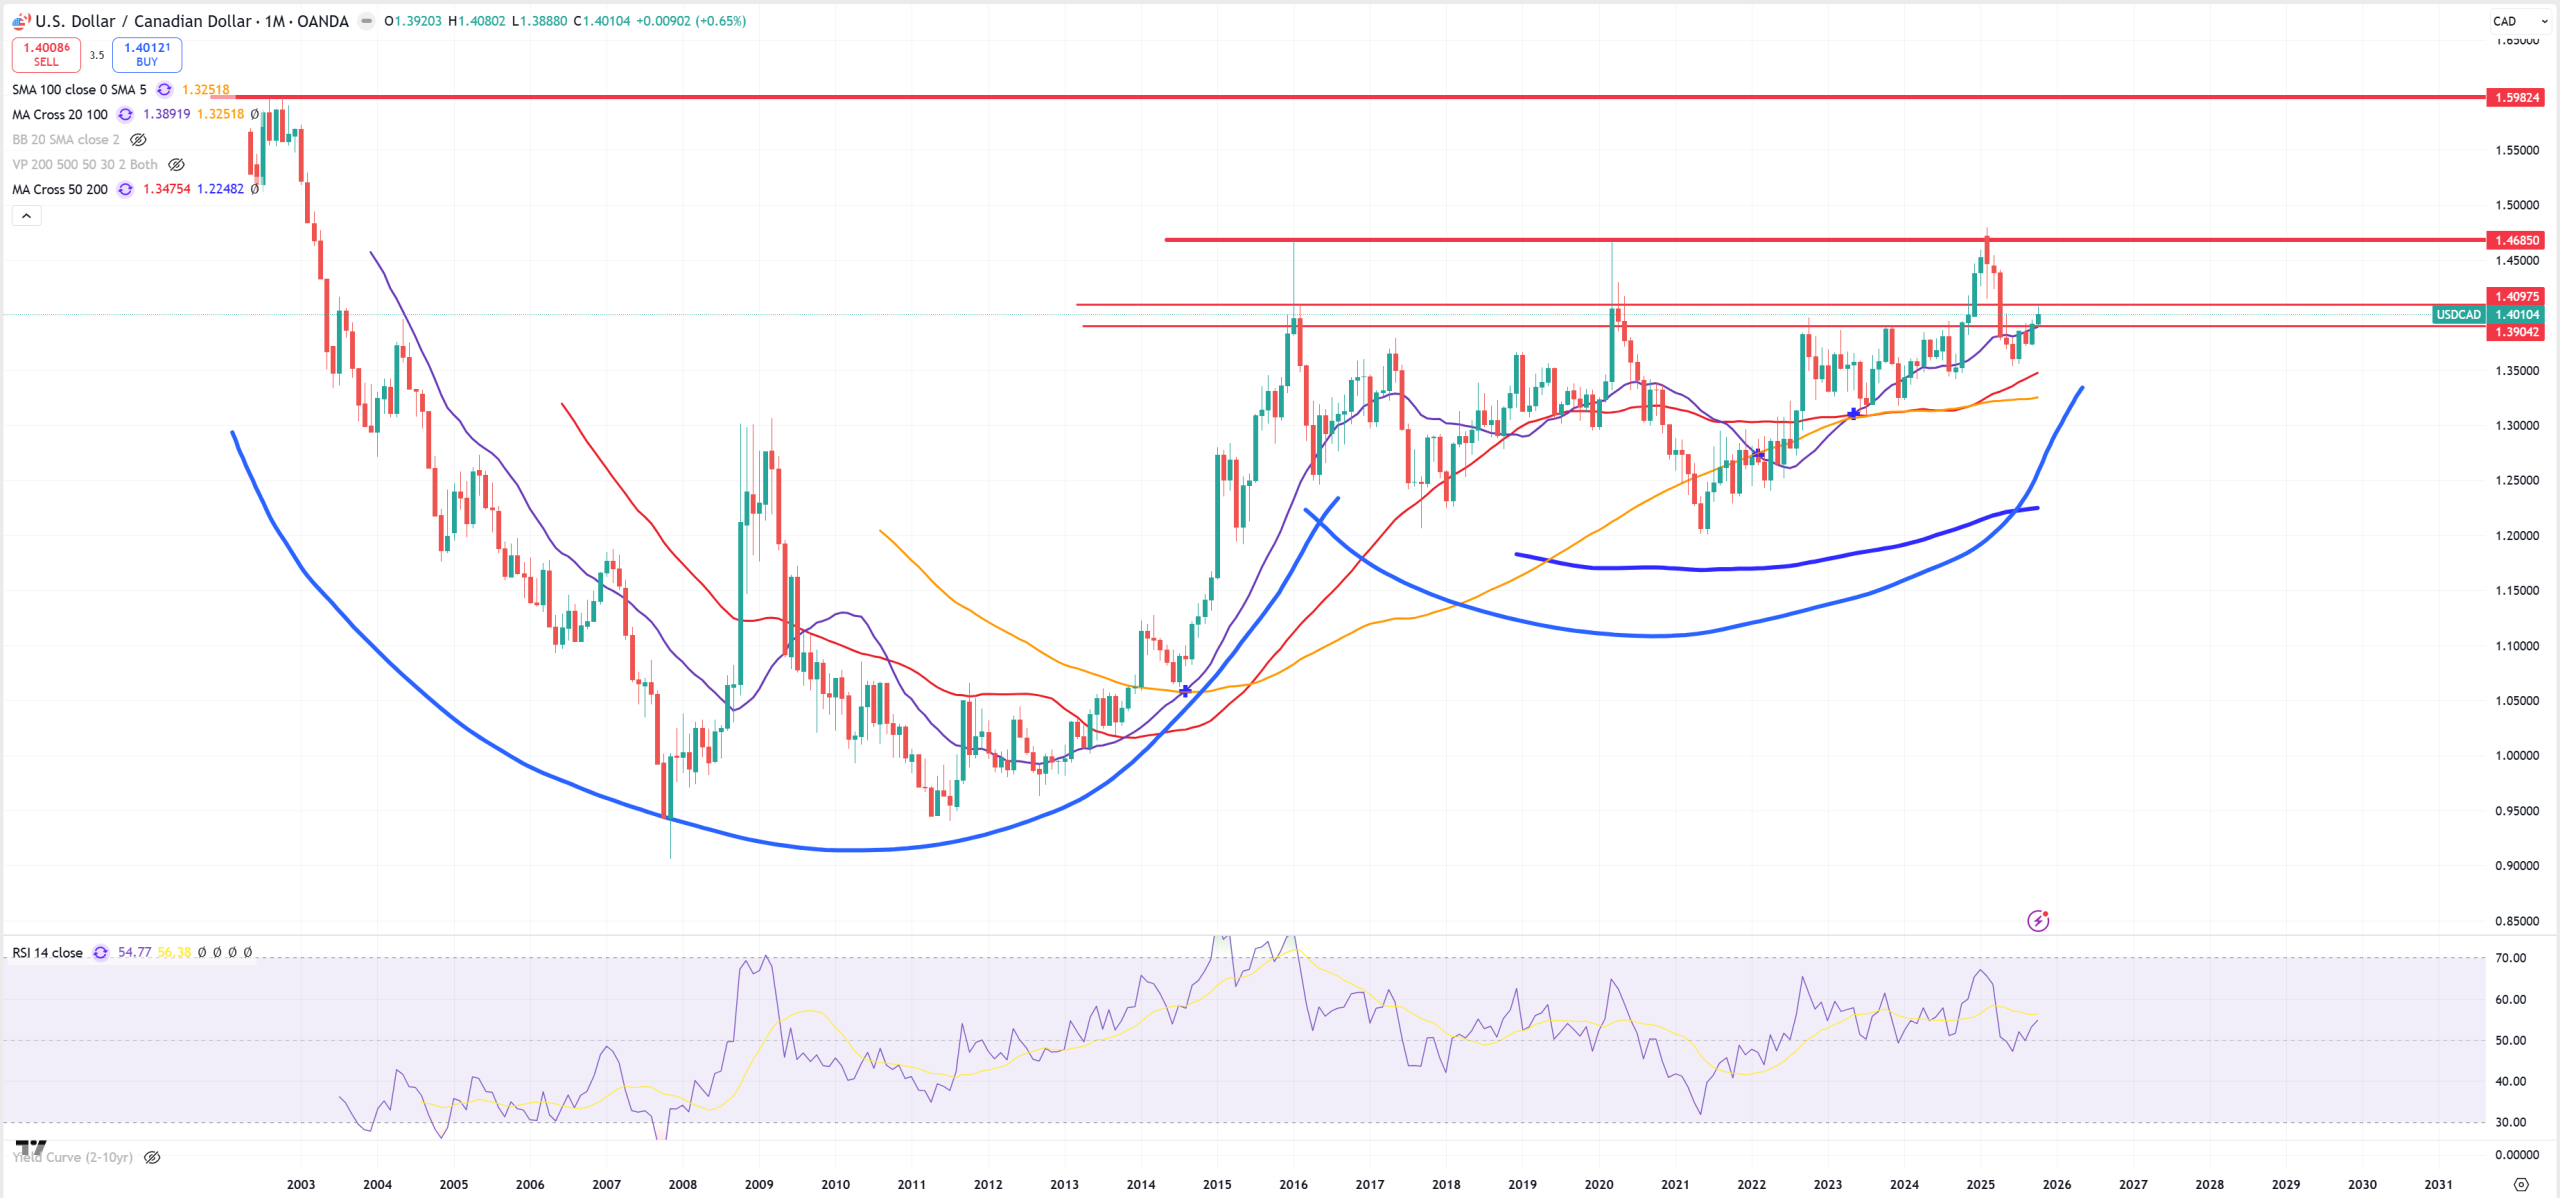
USDCAD – not much to talk so far
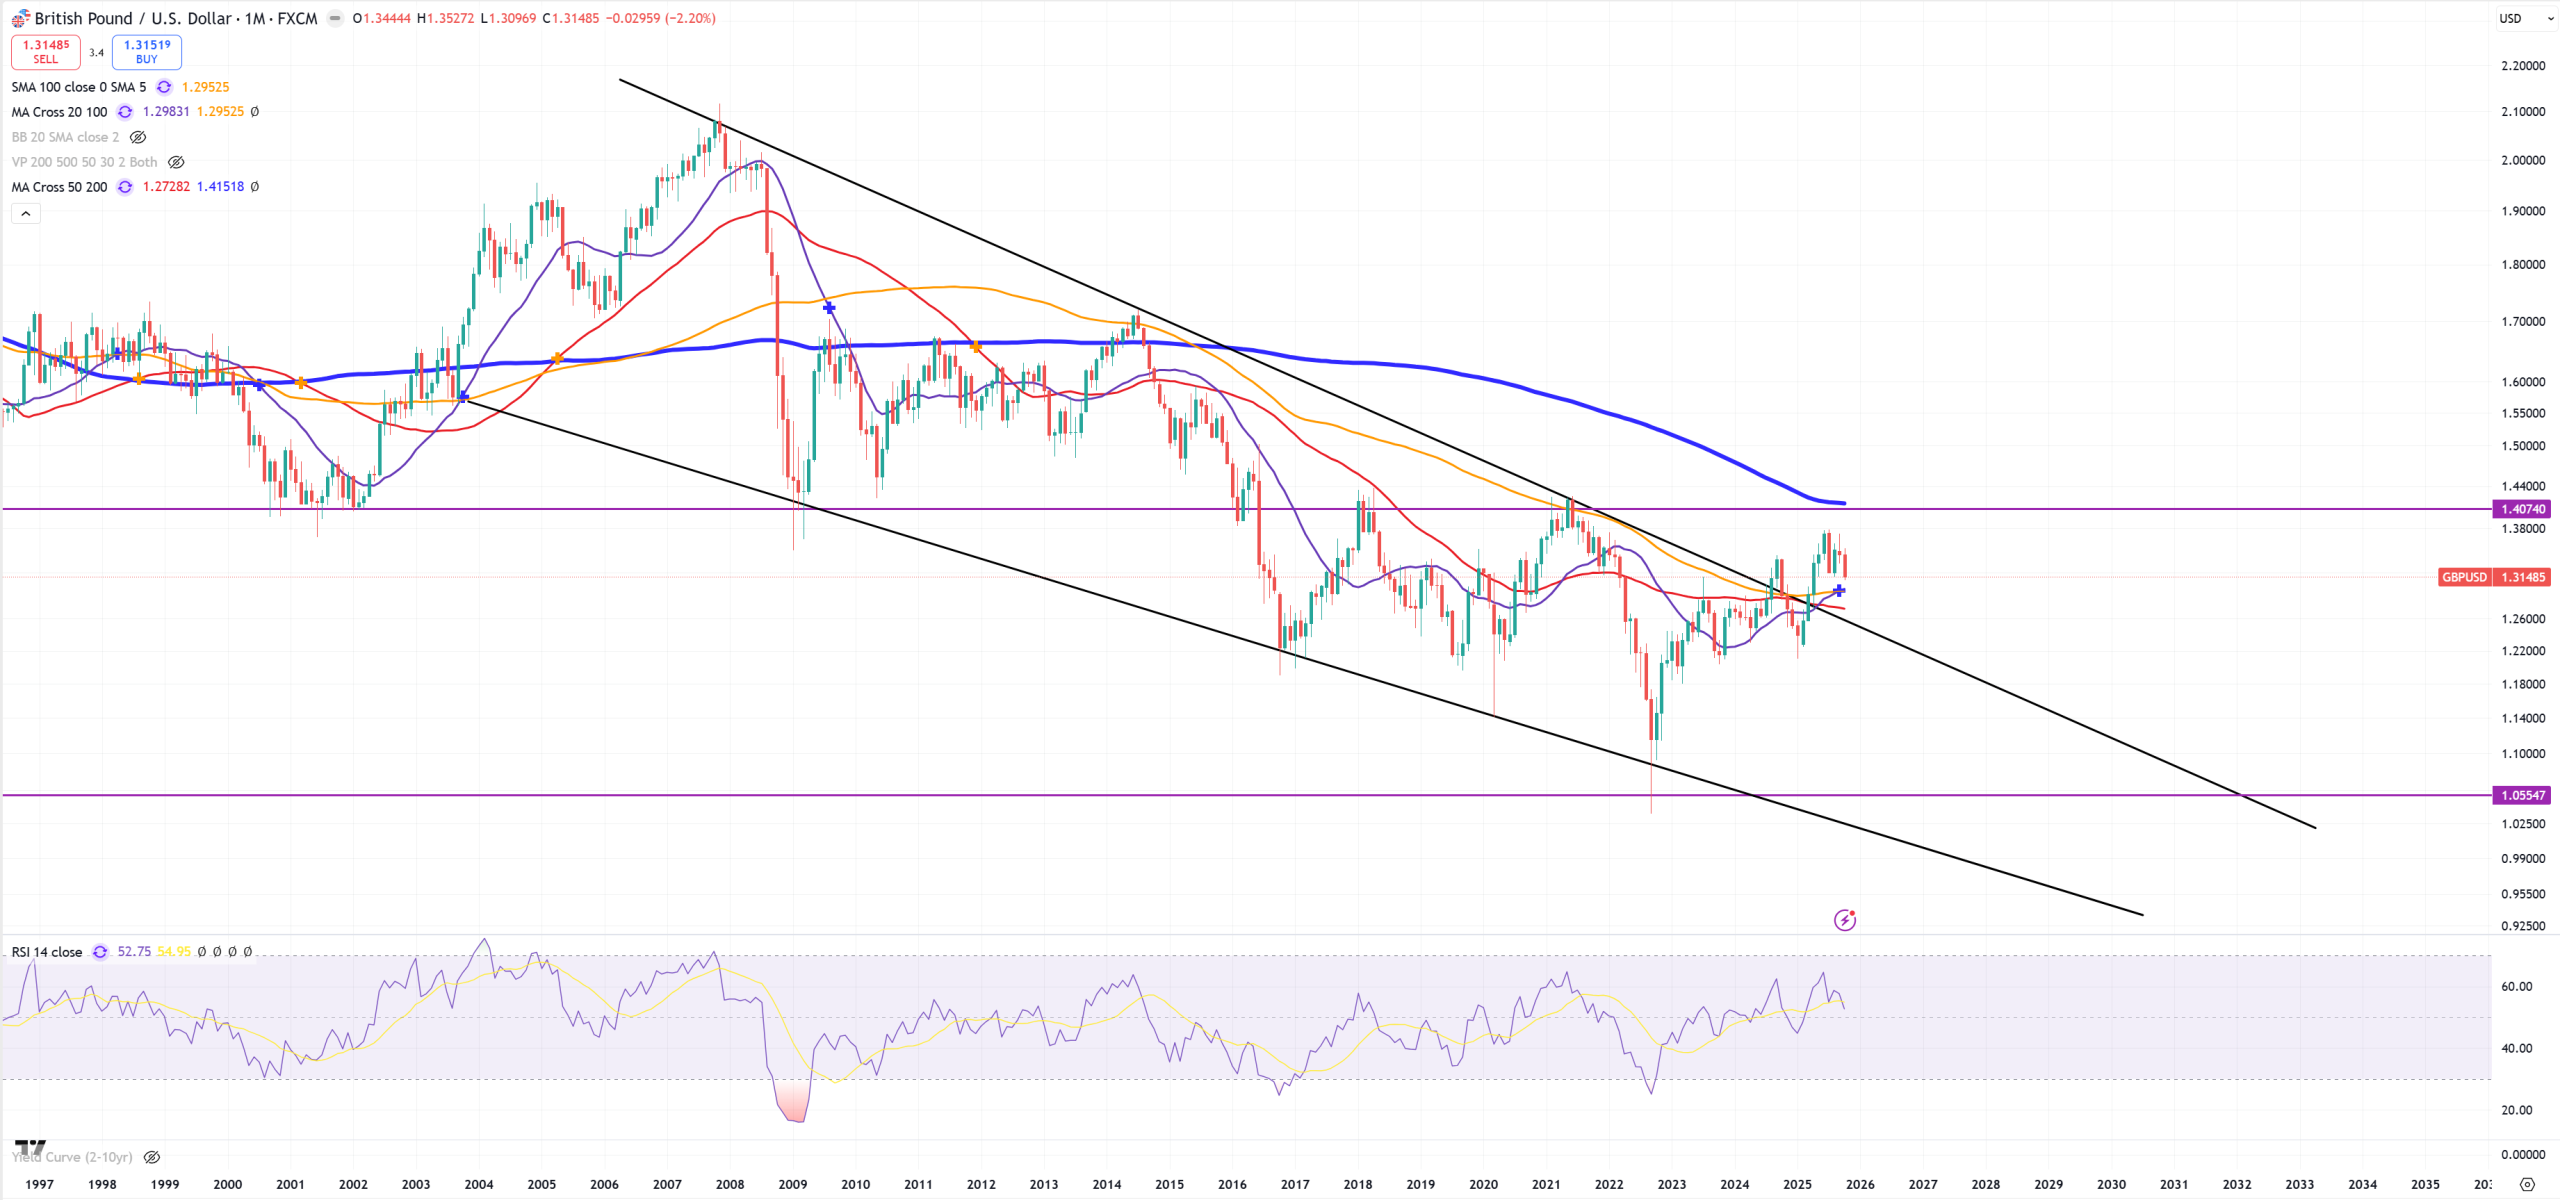
GBPUSD – this is the same example as EURUSD. Jumping above key pattern (breaking it) with huge resistance on 1.40 also covered with (M)MA200.
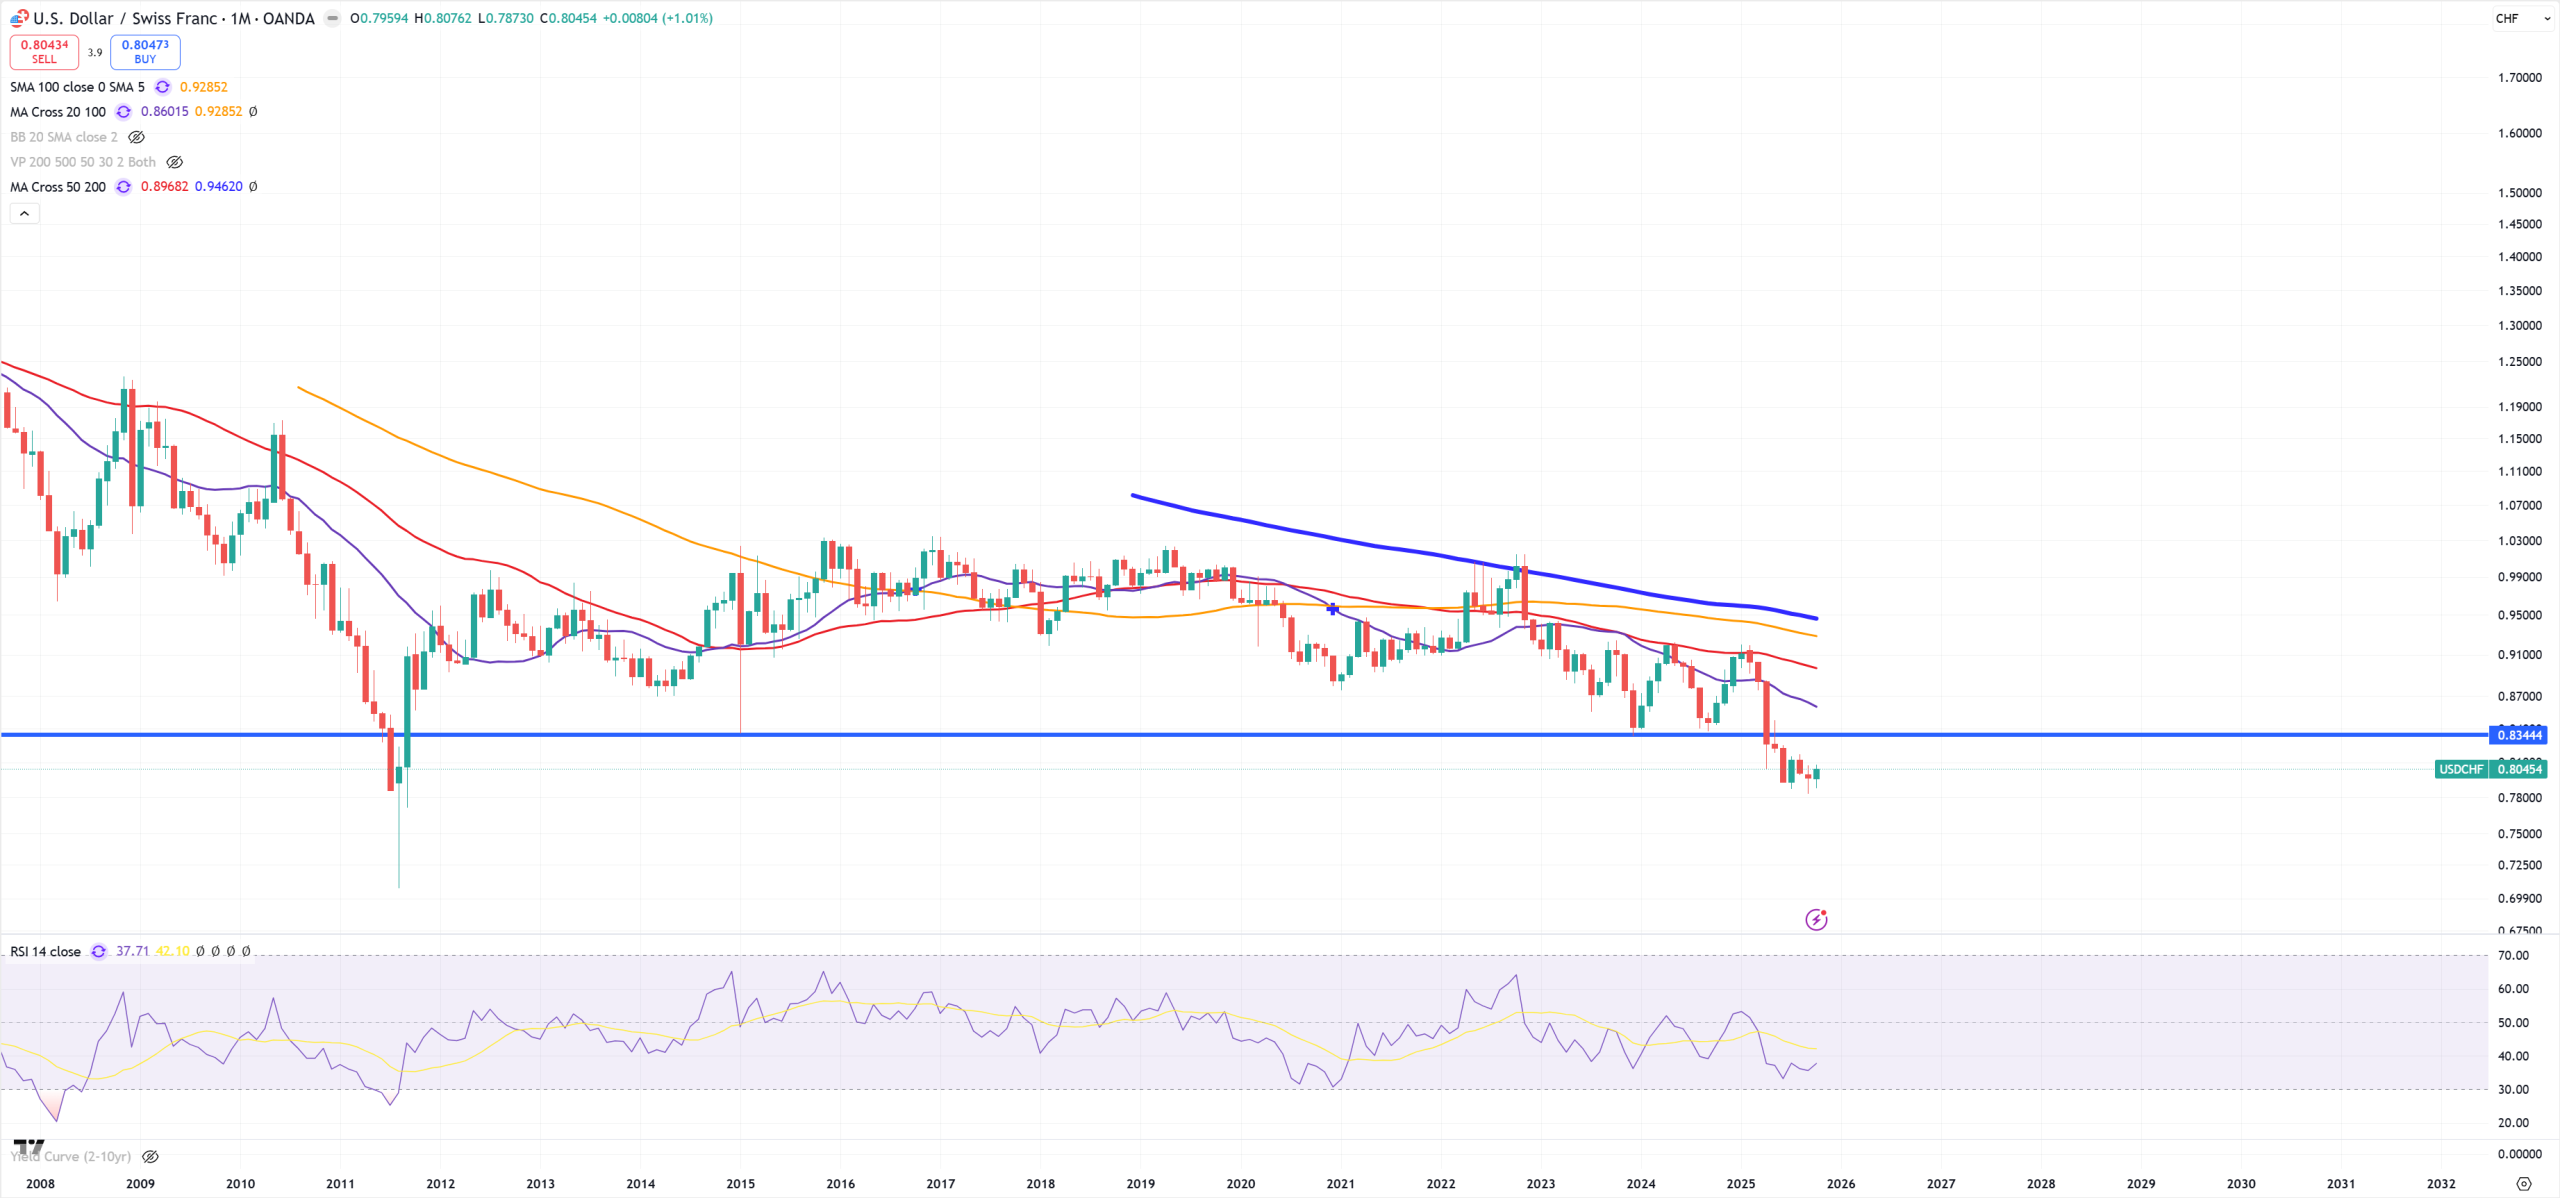
USDCHF – level 0.83 is very important, but let’s find out what’s going to happen with CHF once US03MY finally breaks (M)MA50
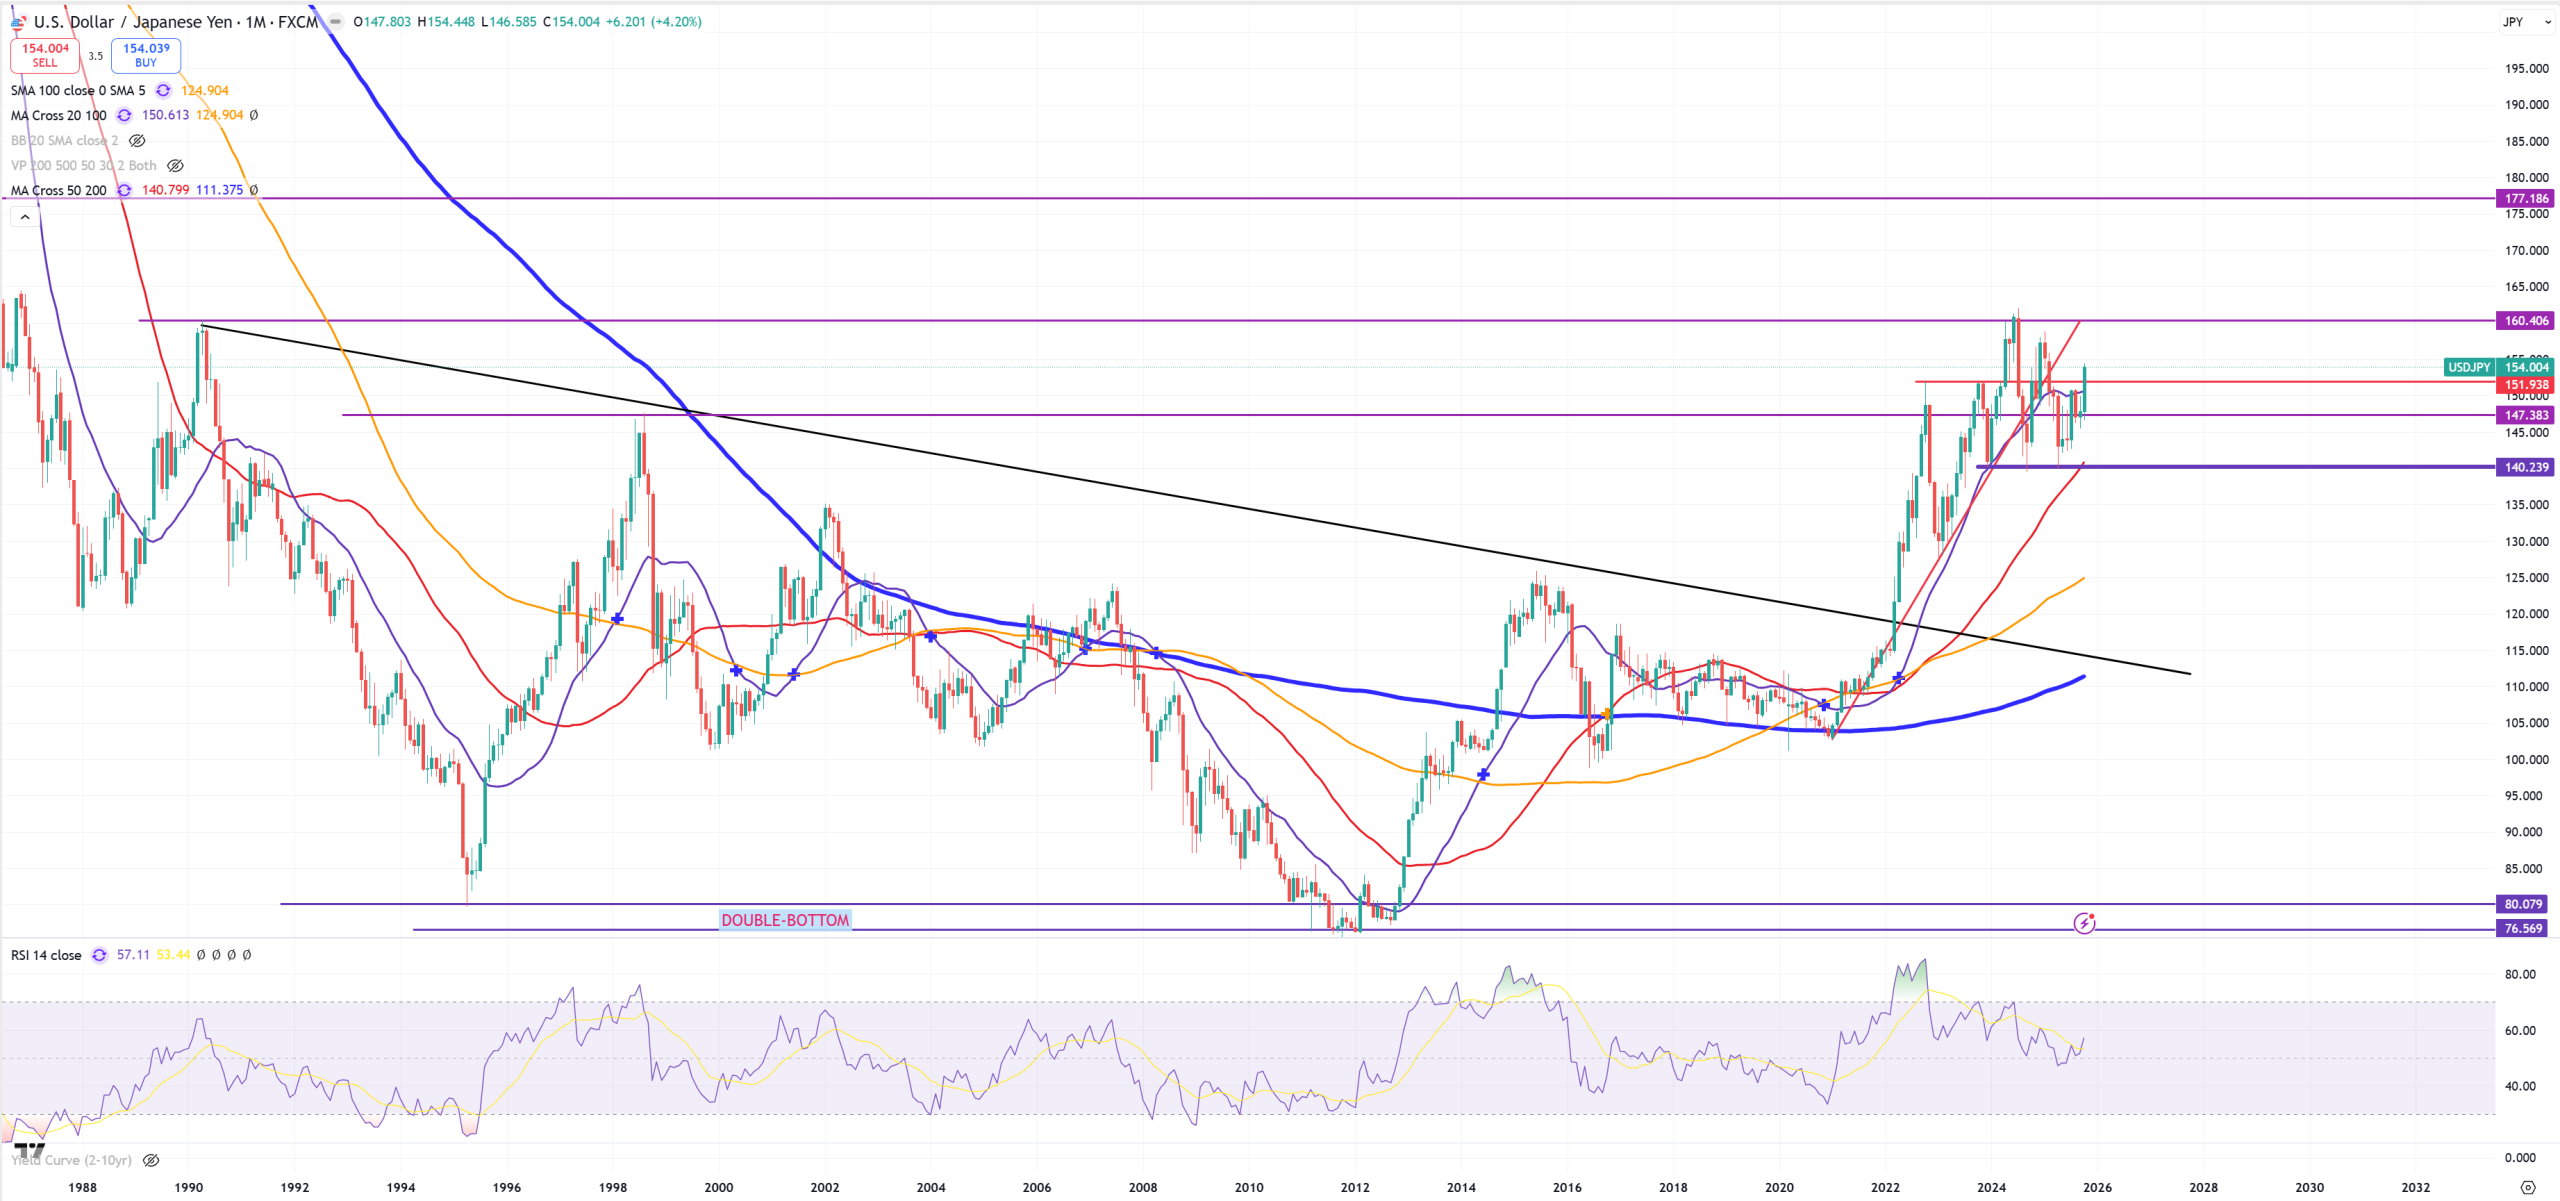
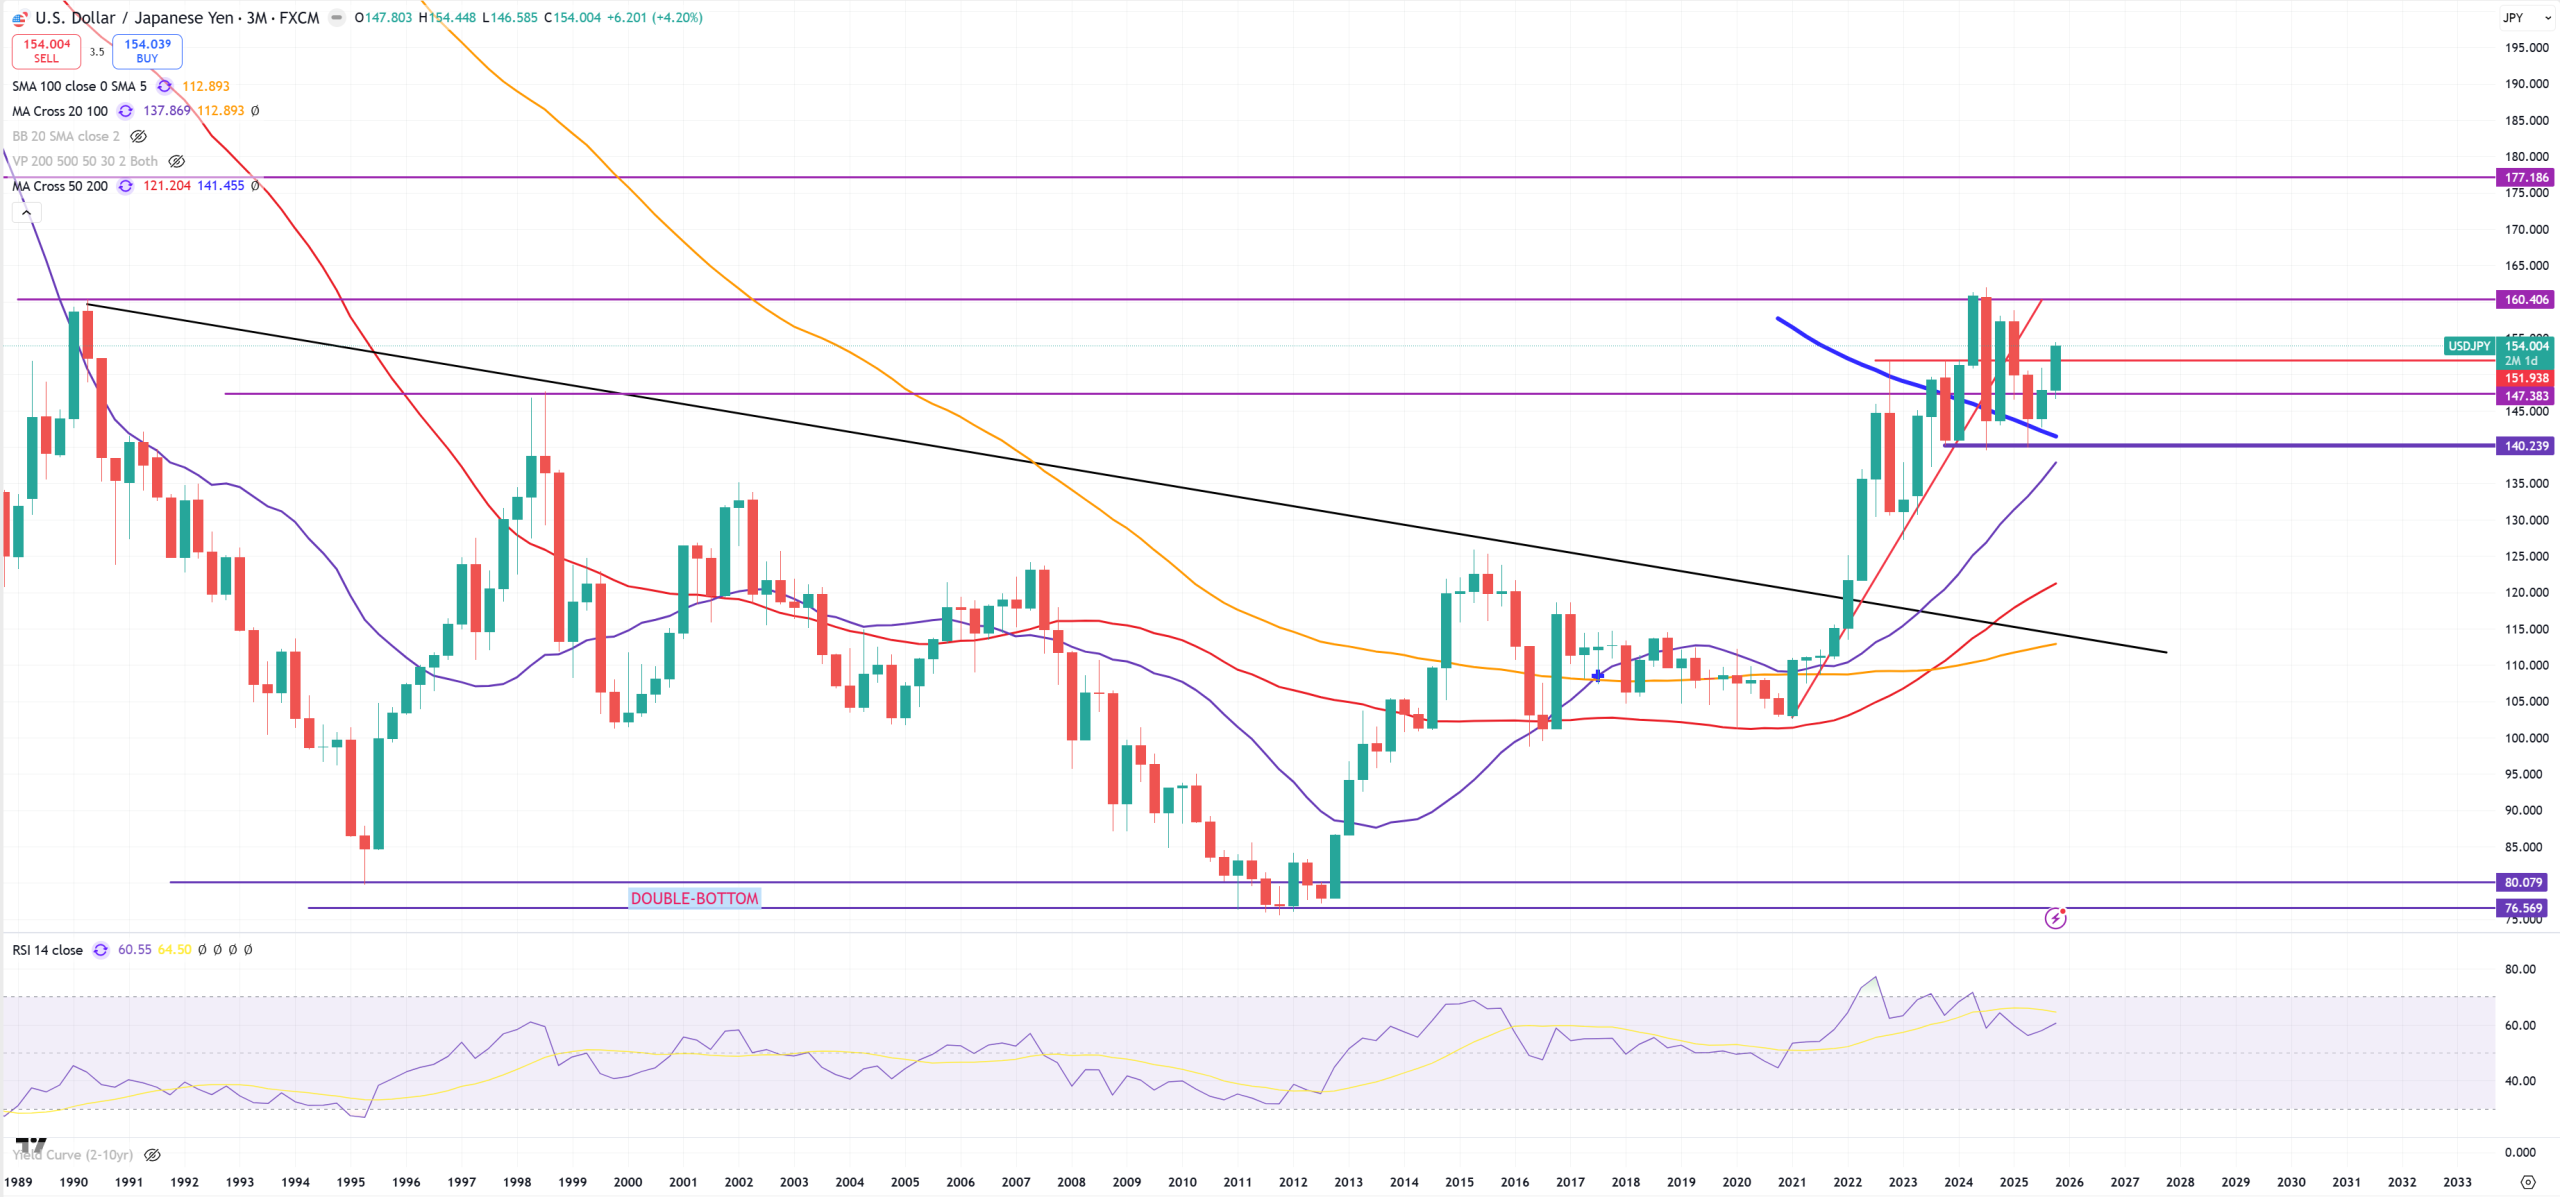
USDJPY – again wants to test 160. Japan needs to lose control over its bond market and send bond yields towards infinity. First chart is (M) second (3M). Look how (3M)MA200 is now big support (will be hard to break it)
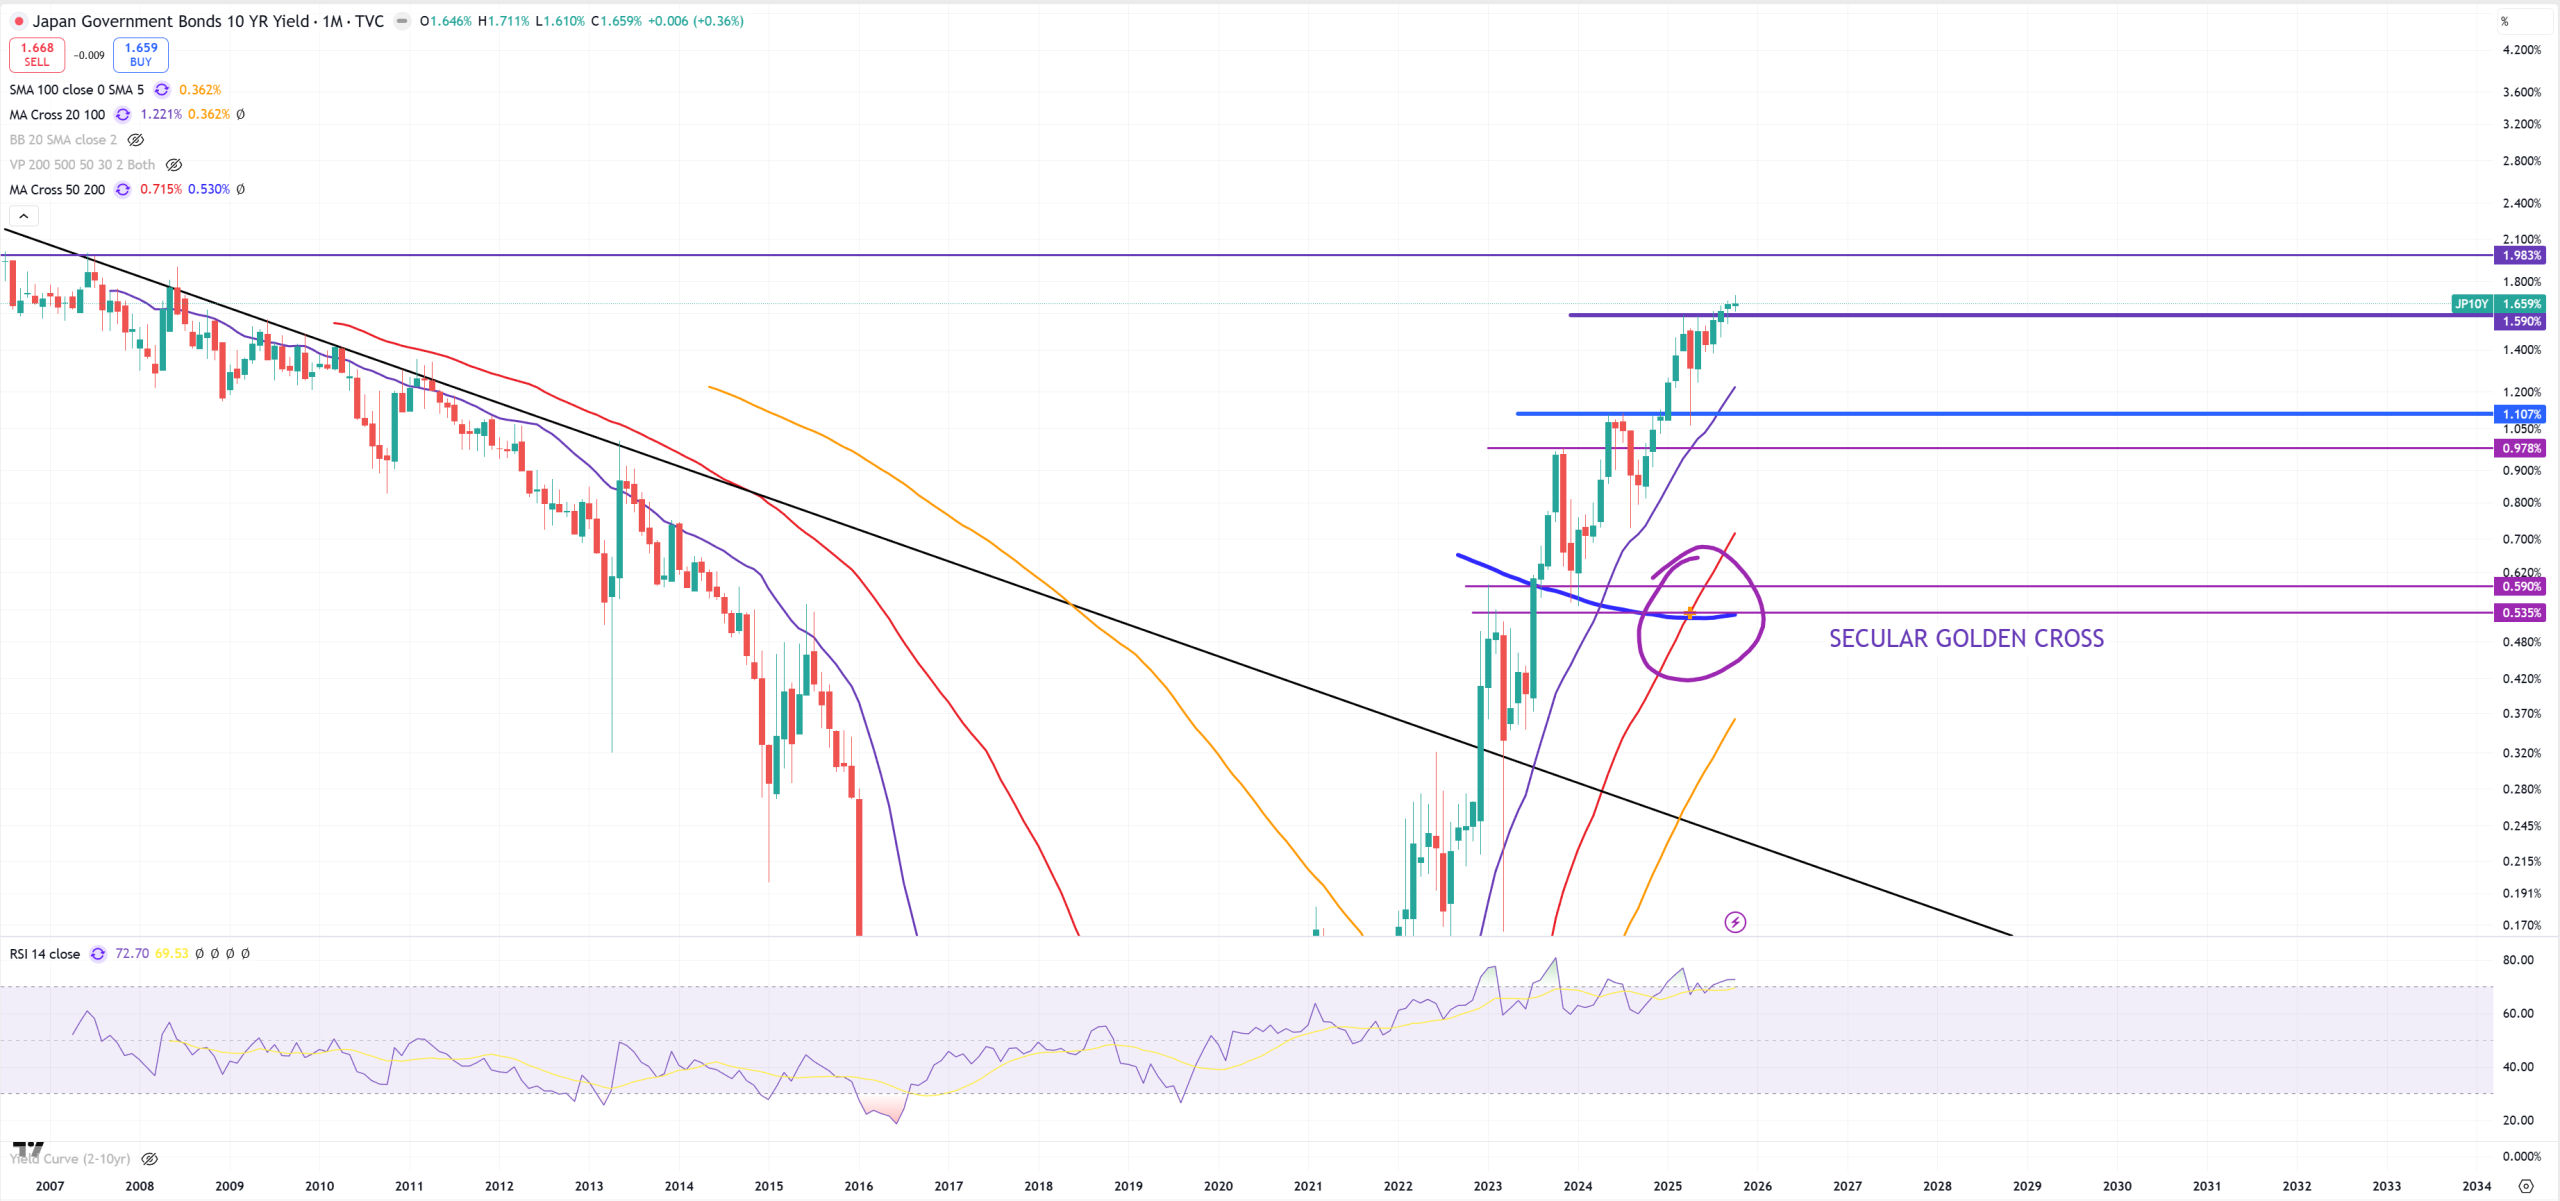
JP10Y – we can’t stop talking about Japan without looking on its bond market
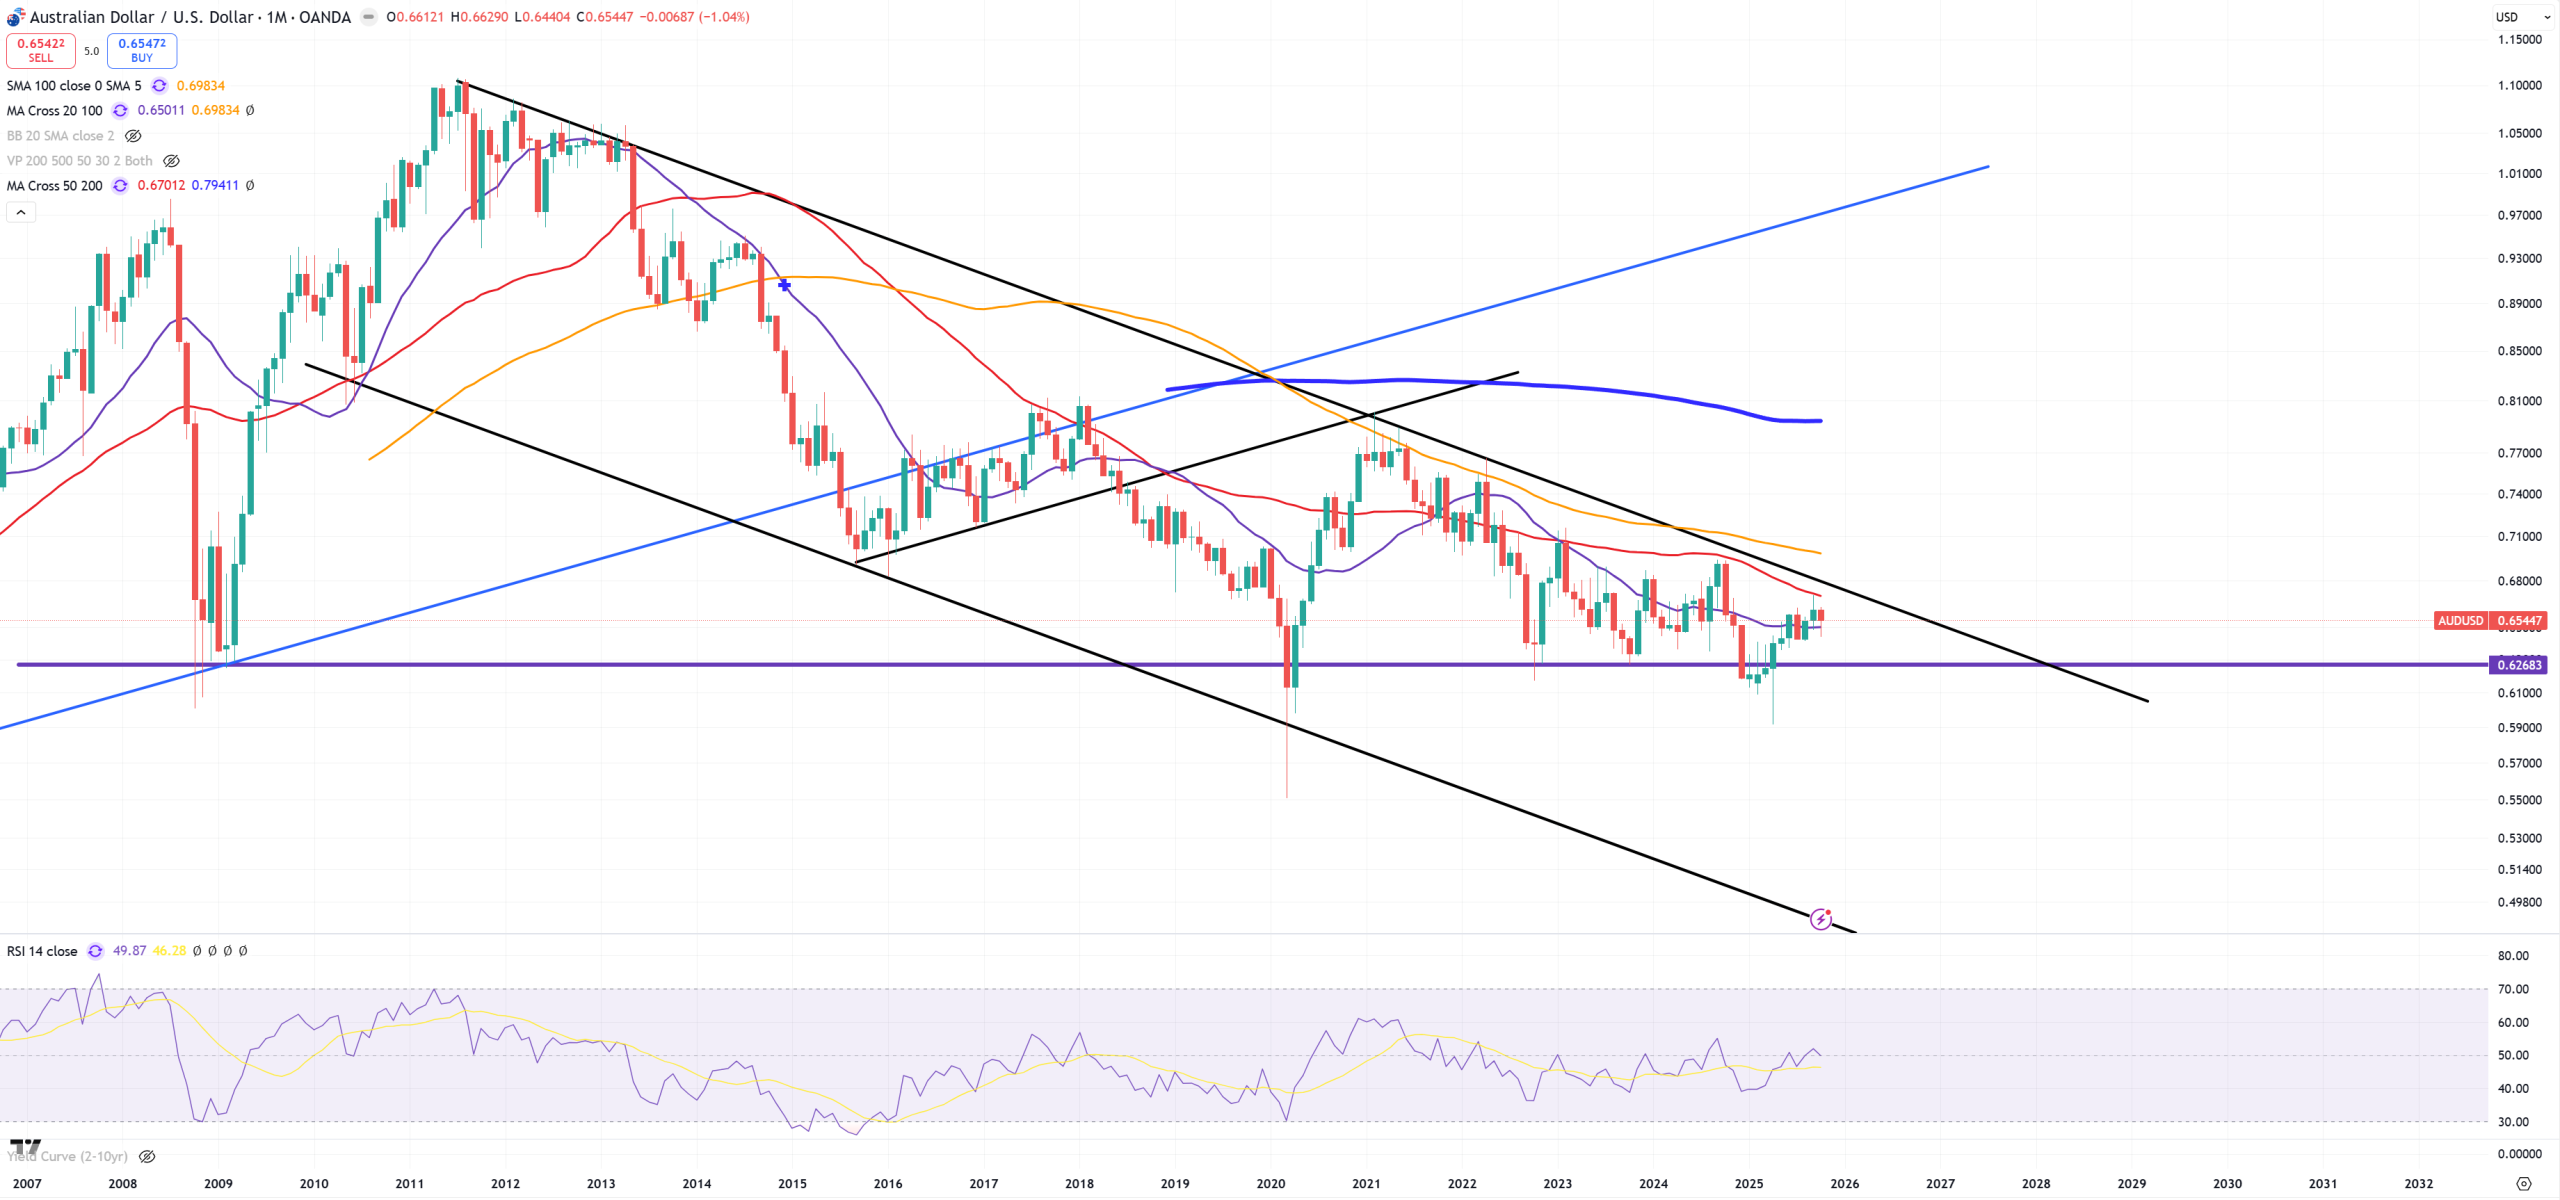
AUDUSD – this is a derivative of USDCNH. Breaking this 0.62 support will plunge AUD hard, so far it tries to avoid it at any cost (just like USDCNH tries to avoid breaking 7.40)
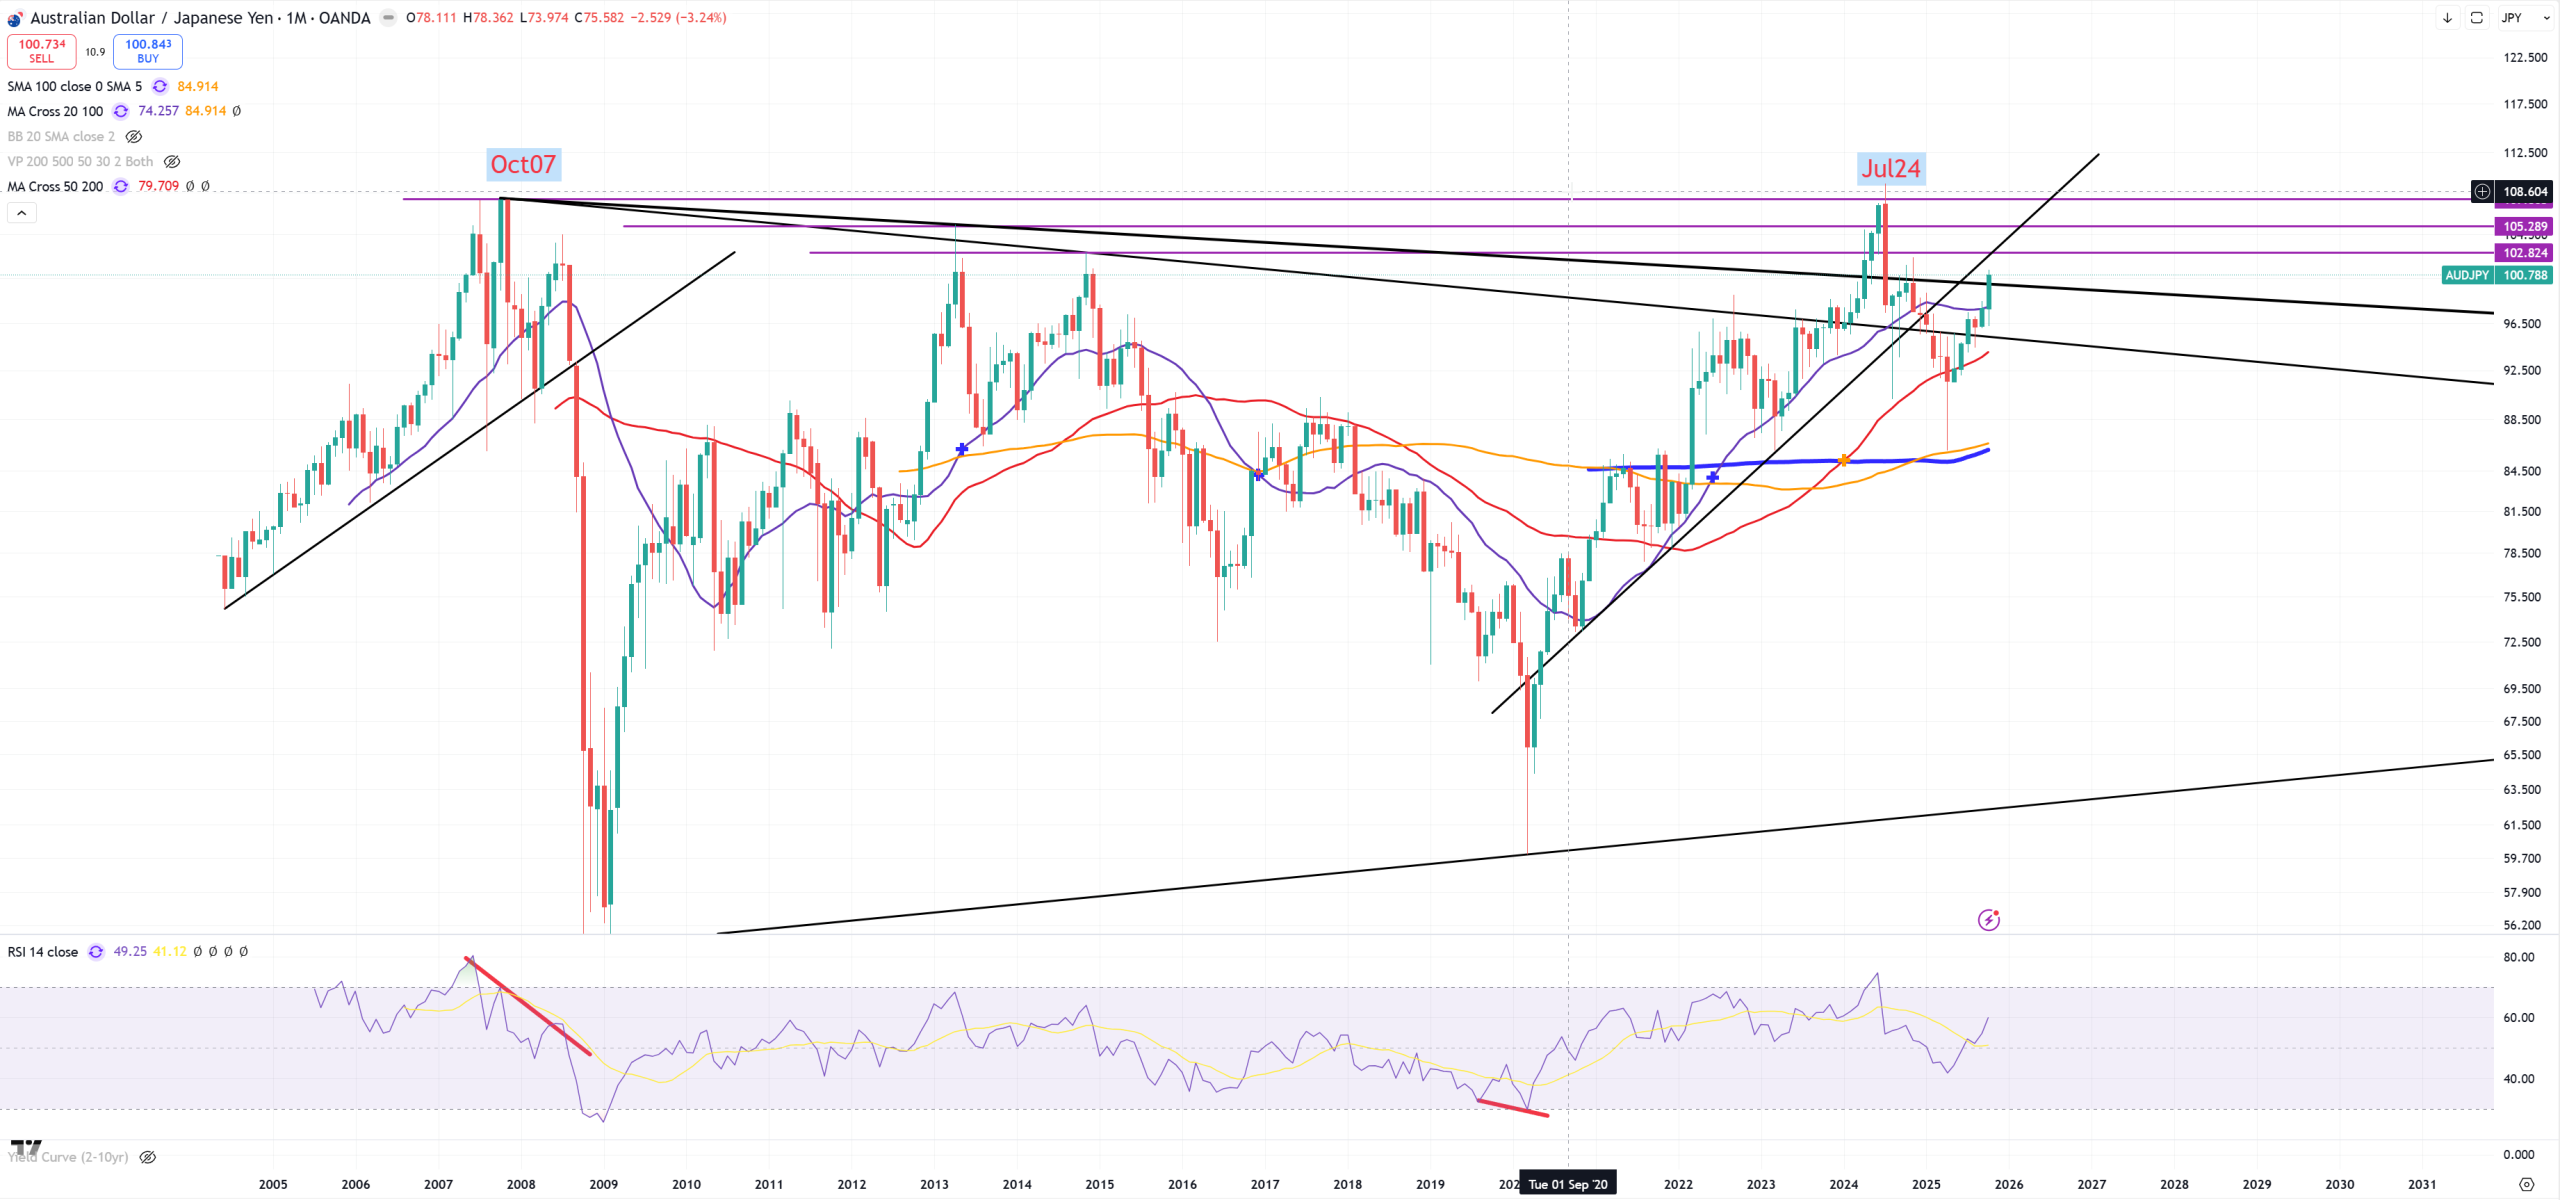
AUDJPY – the main RISK ON/OFF pair. If it goes up – stocks goes up. It can be destroyed by 2 ways : Japan losing control over its bond market, or Chinese Yuan is going to collapse (or Chinese debt gets recognition phase).
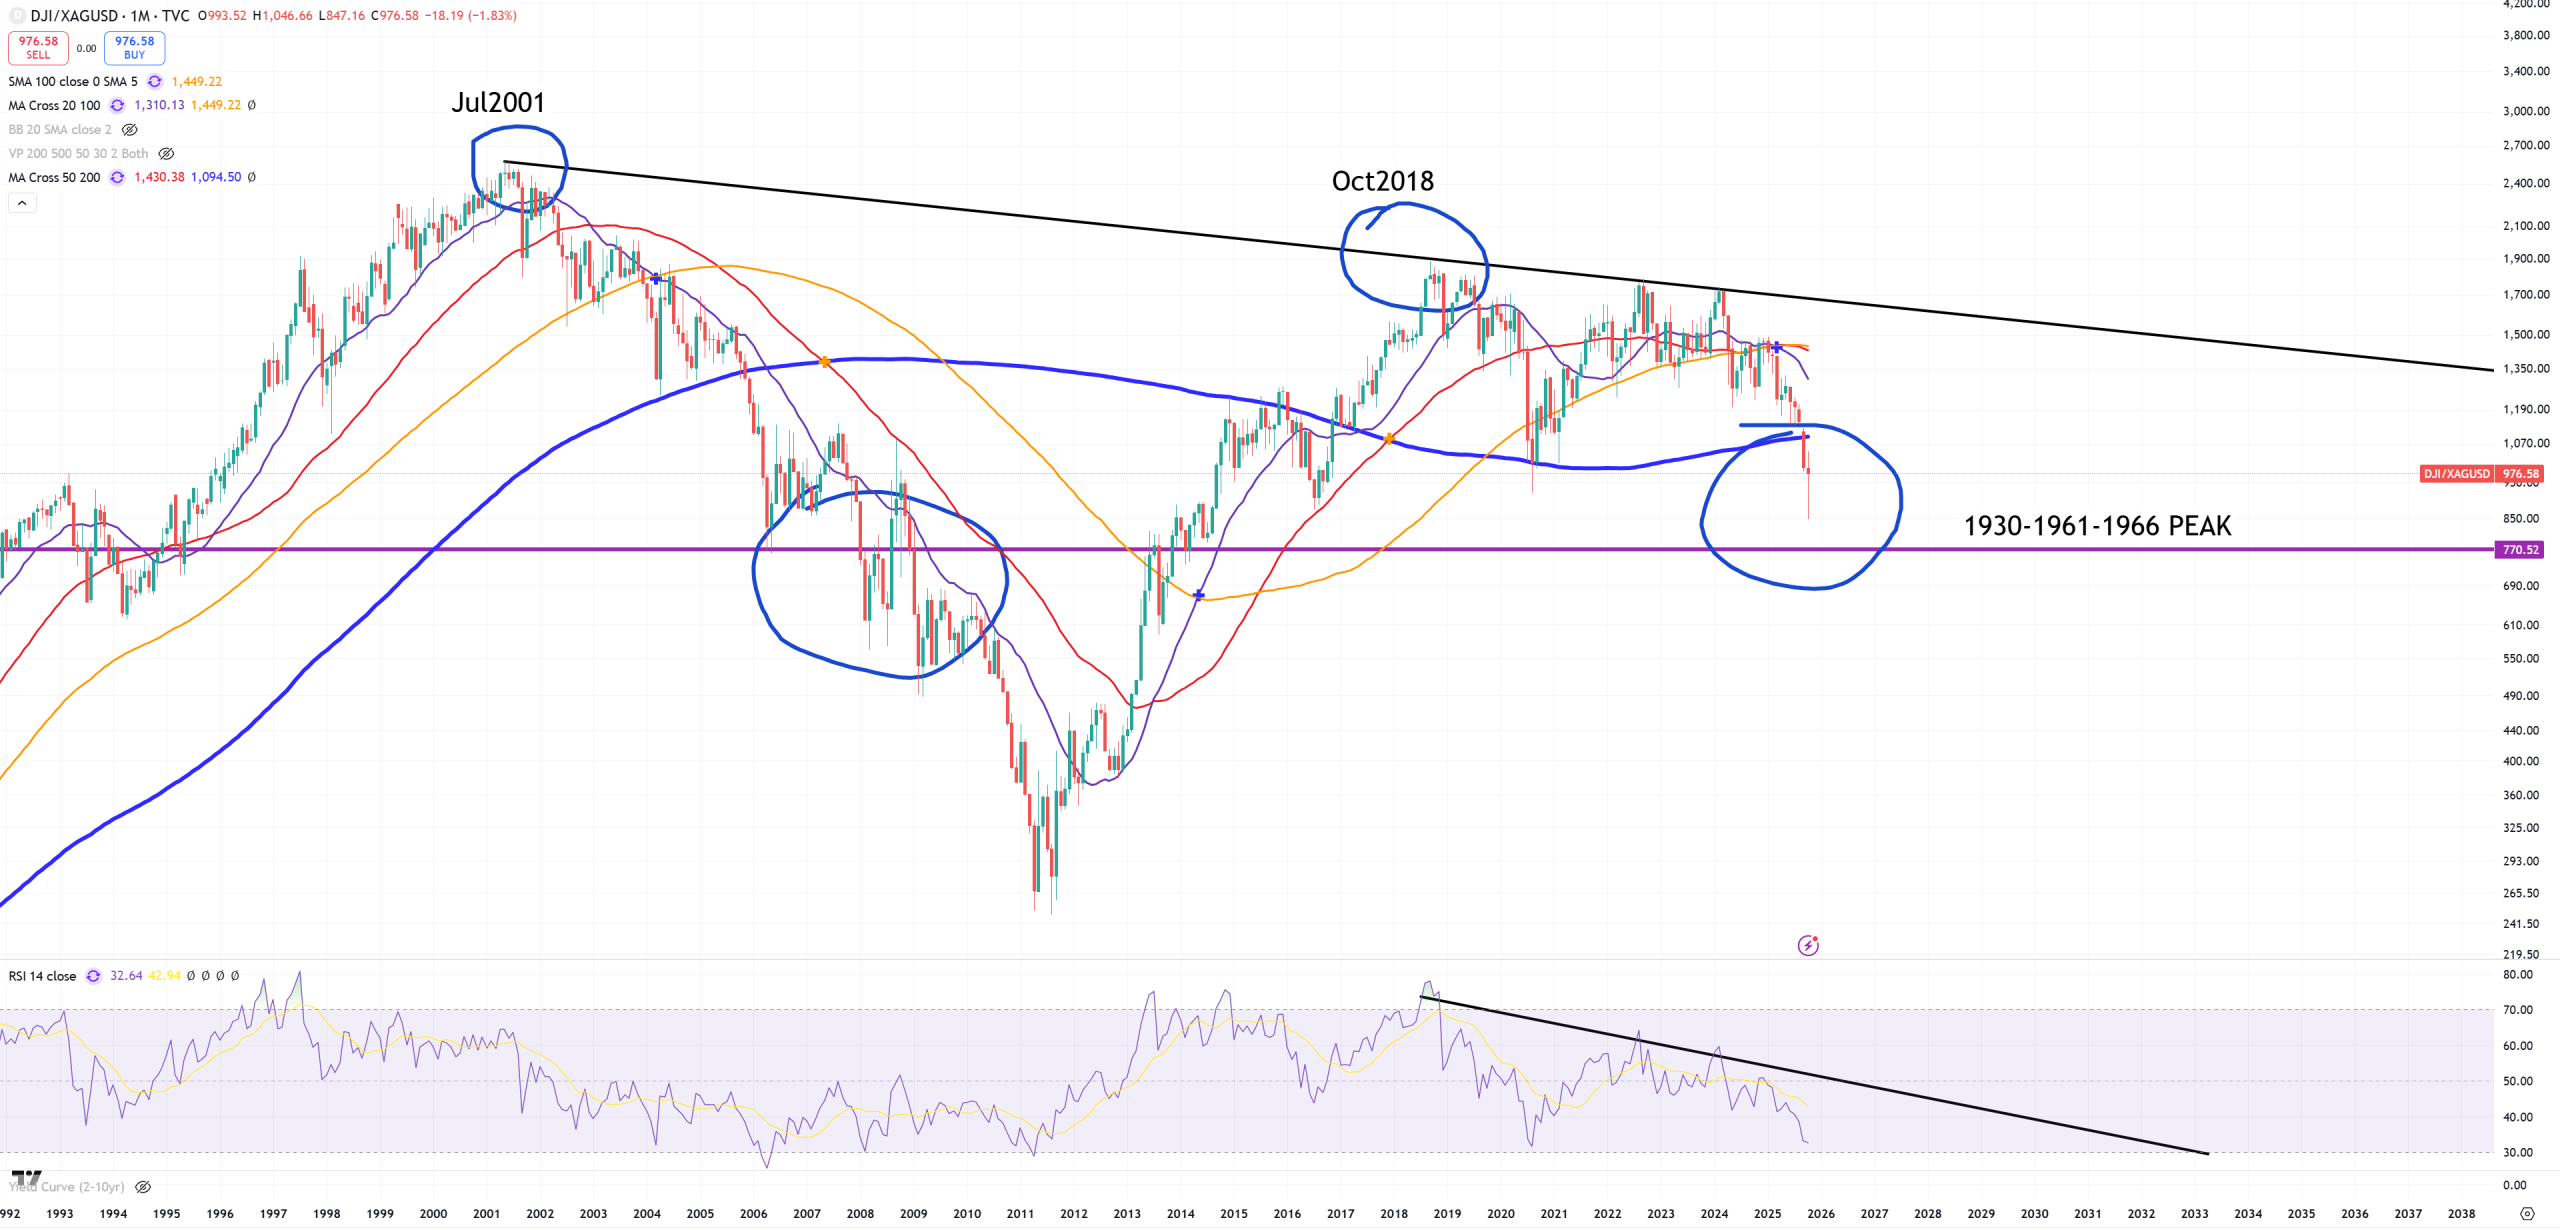
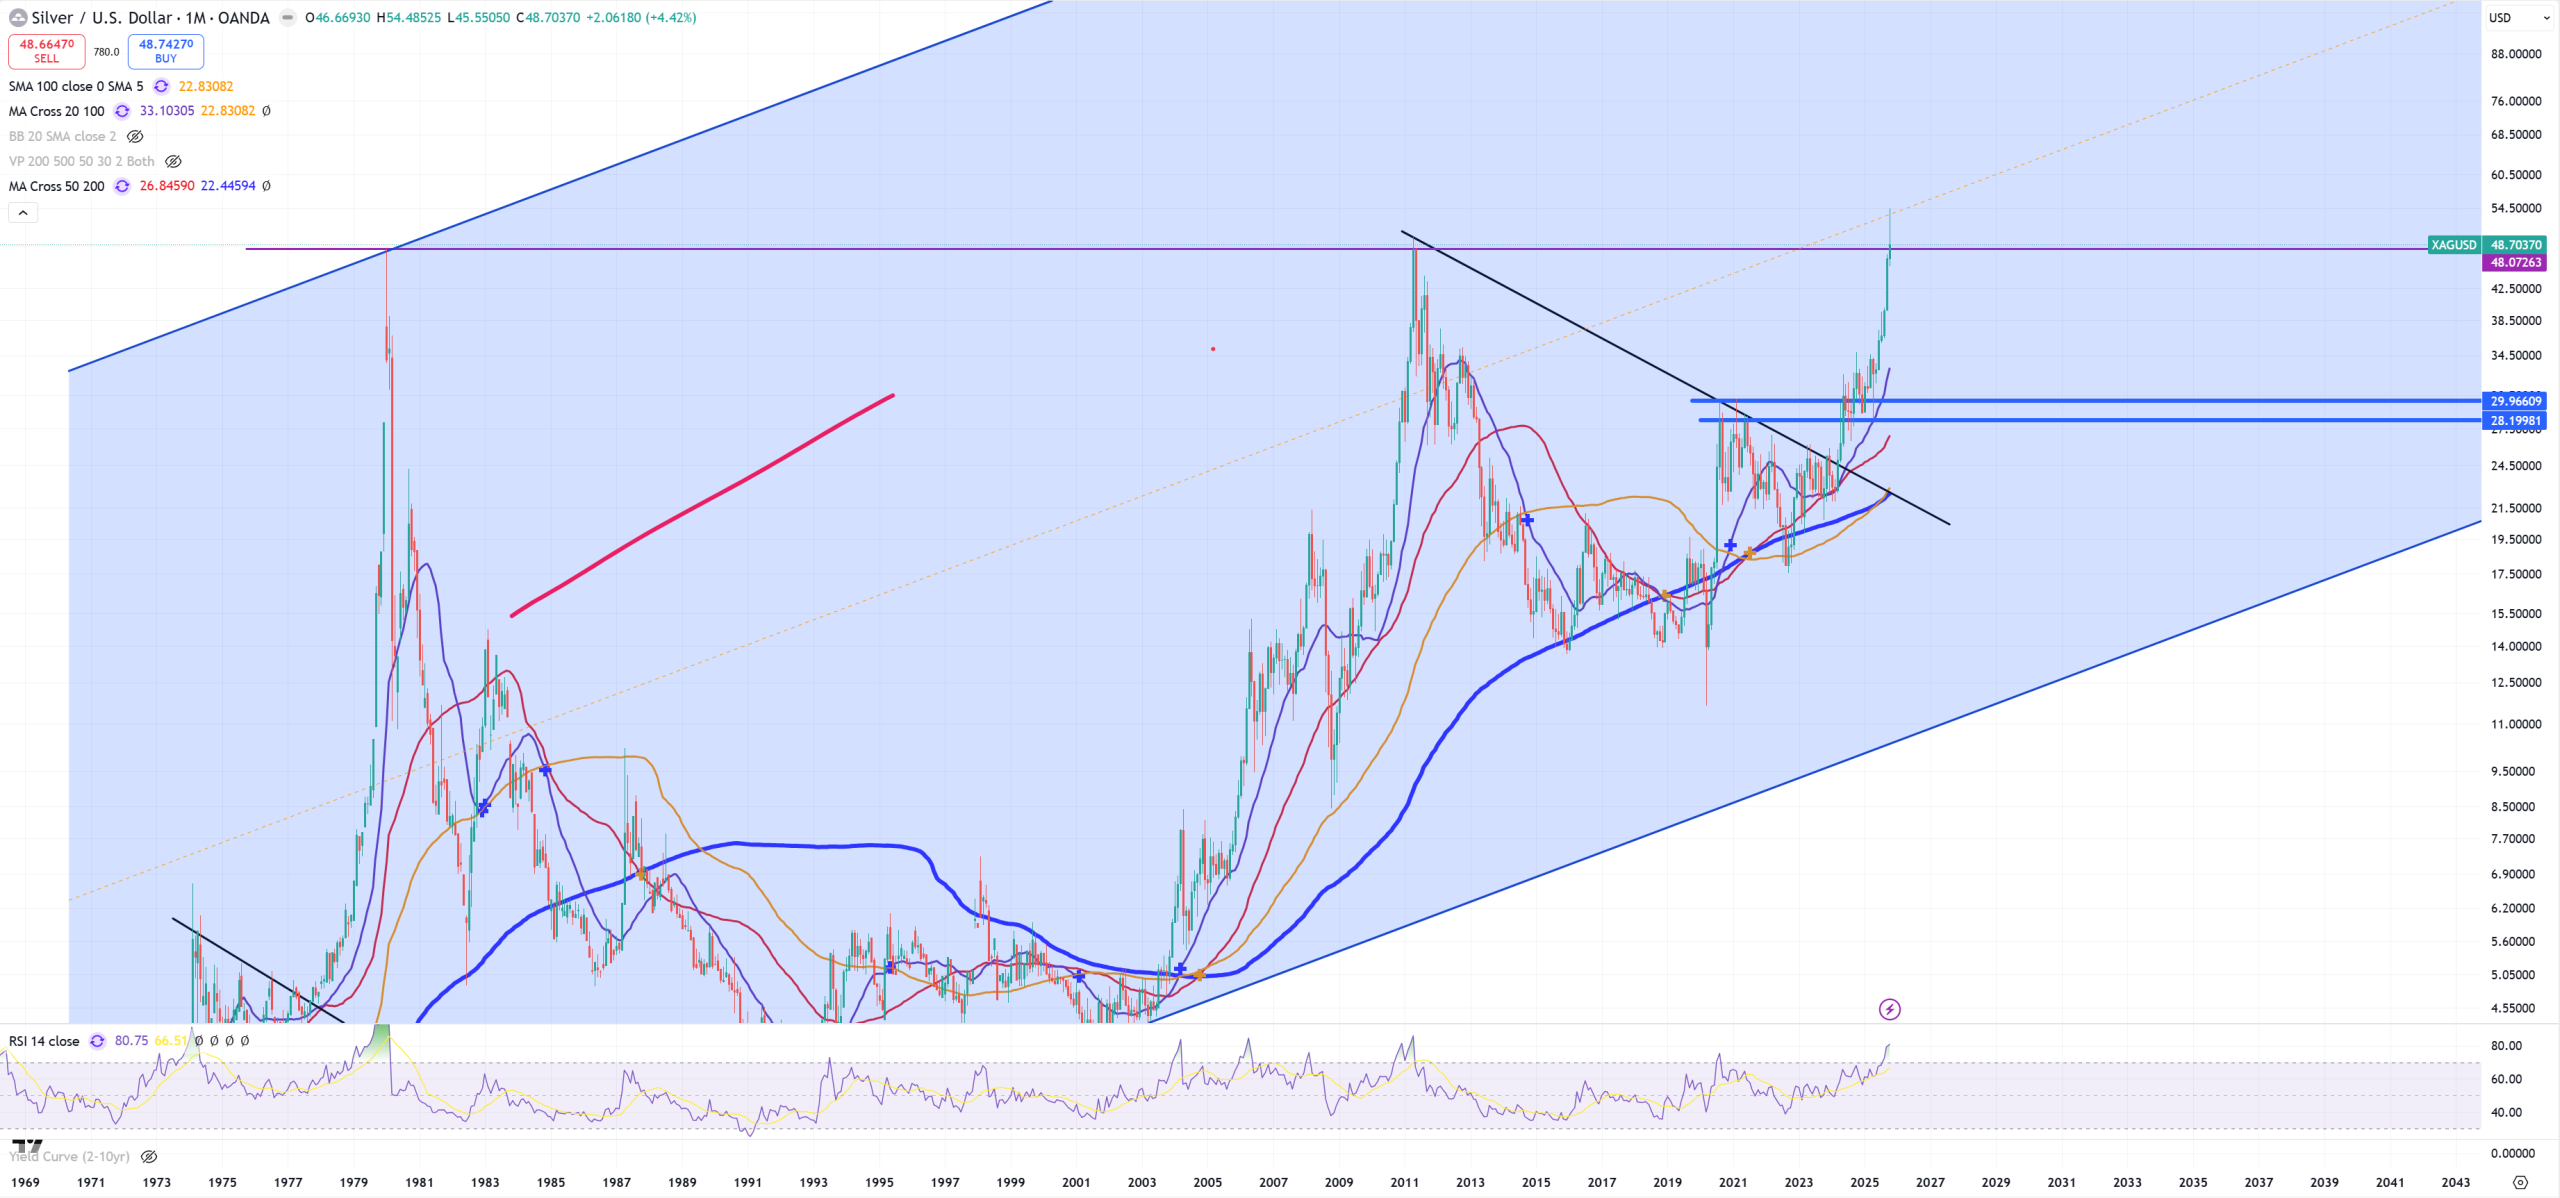
DJI/SILVER, not that important as DJI/GOLD but still 1000 and below (M)MA200. Everything above 770 = huge bubble in stocks and silver is cheap. Now it’s almost 1000.
SILVER – this key level from 1980 is broken. 48$ is now support. DJI/SILVER is 1000. Risk it’ll got towards 200-300$ is IMO way higher than it goes to 15$. DJI/SILVER another support is 140, 140 * 15 = 2100 on DJI – not really possible IMO.
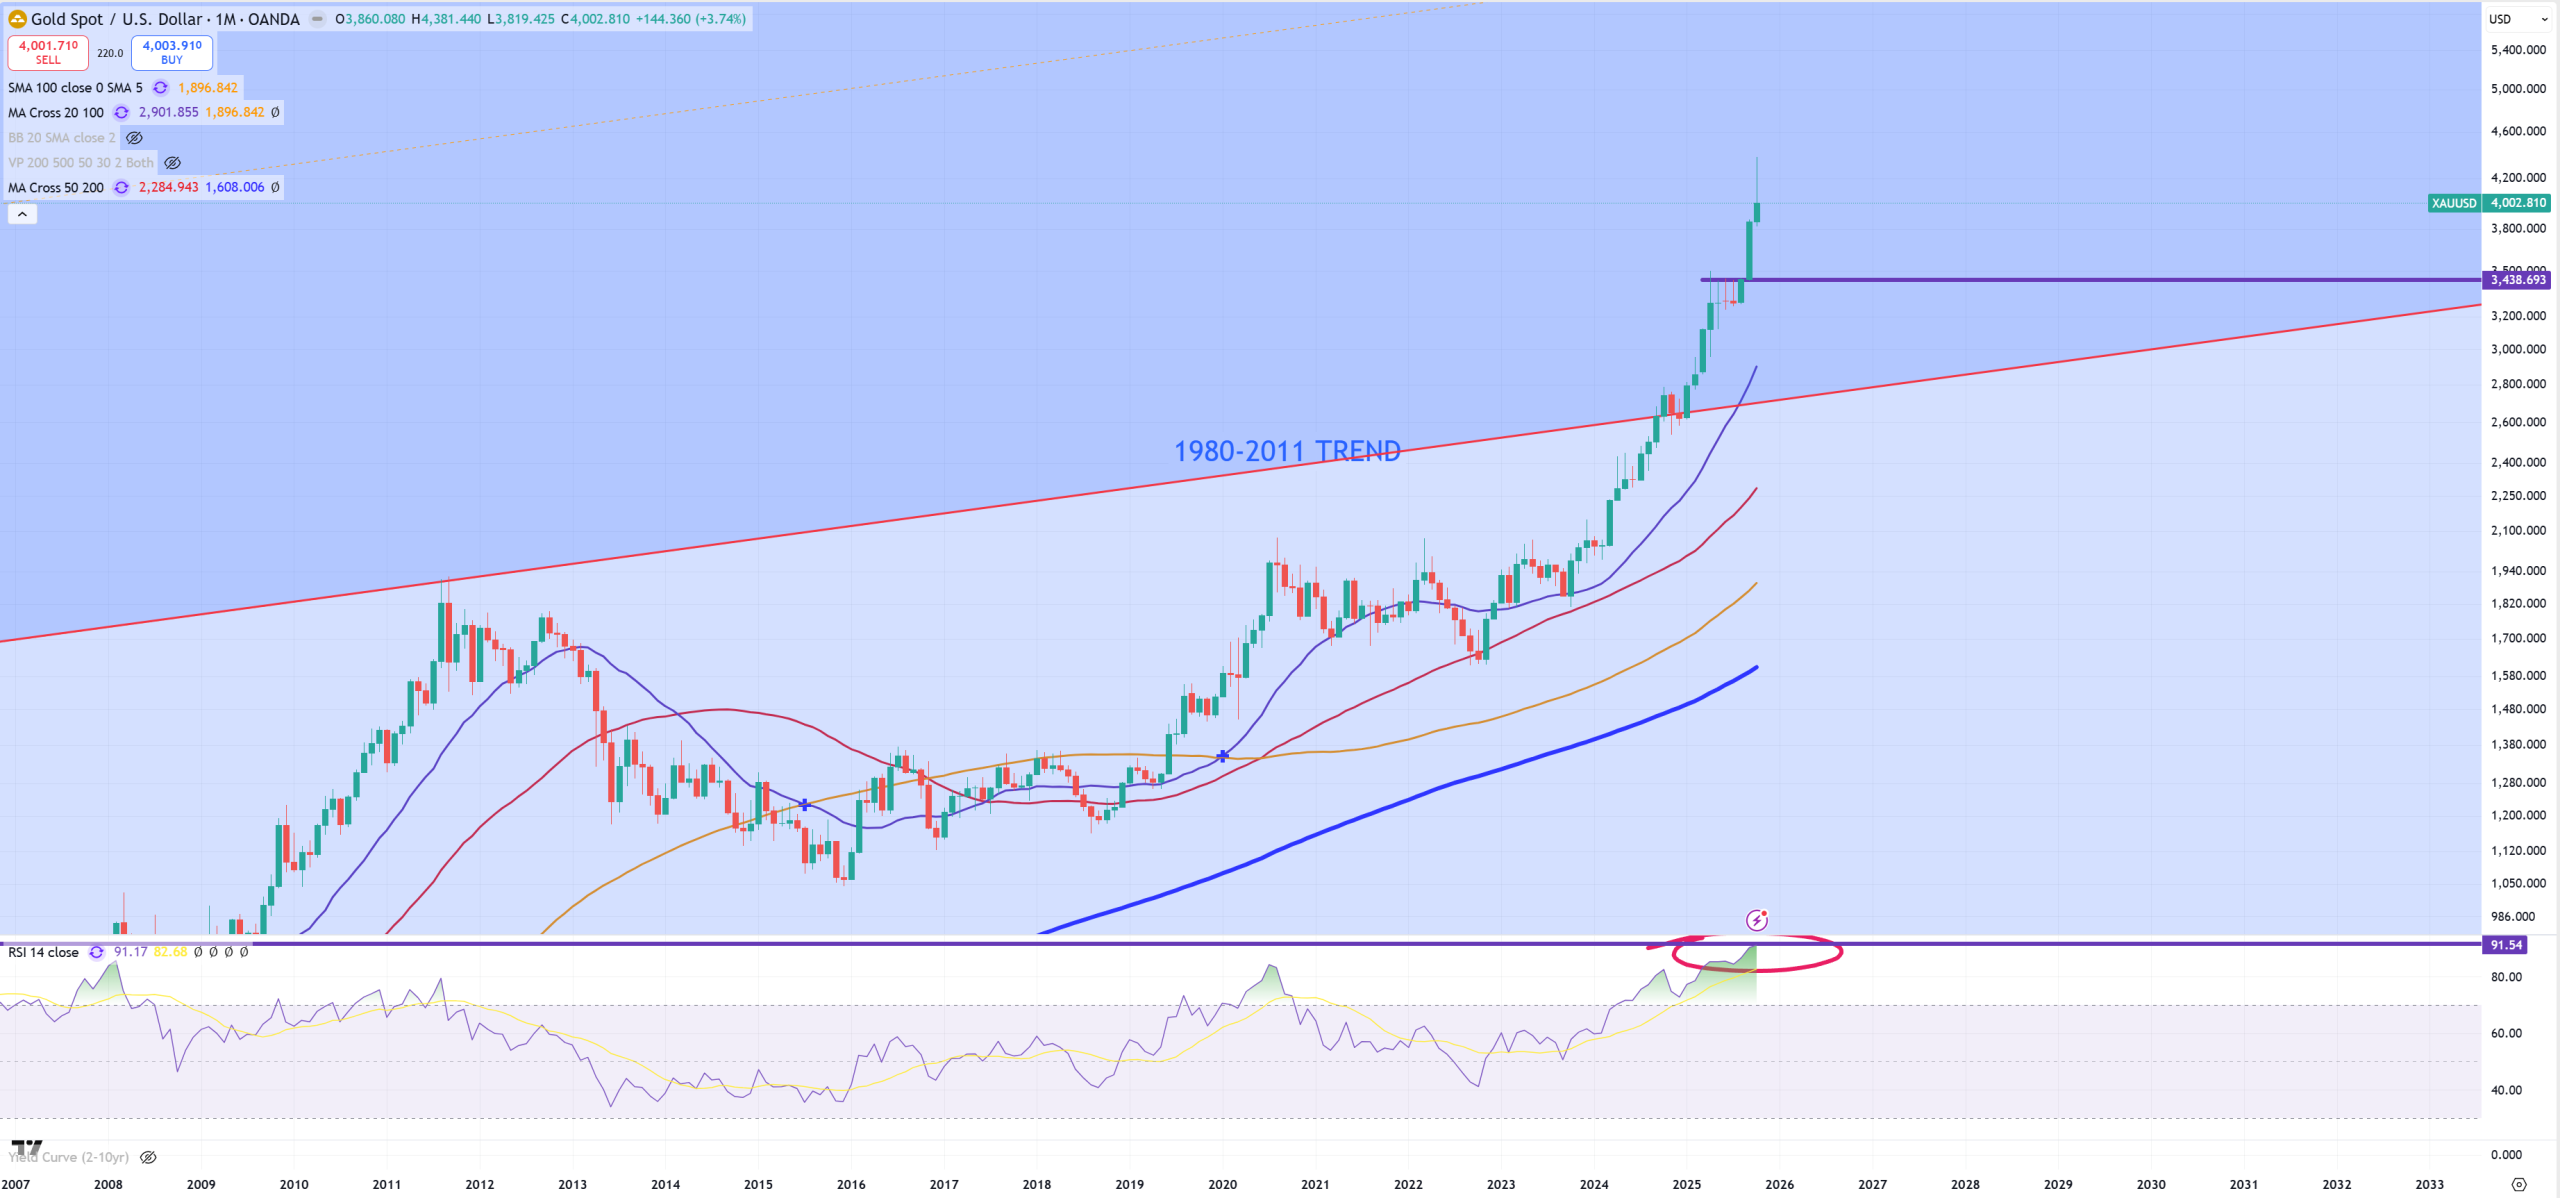
GOLD – gold by itself does not have any level until 3500$. If it starts towards this level it means DXY starts parabolic move higher and stocks about to get massive drop pushing SPX/GOLD & DJI/GOLD lower.
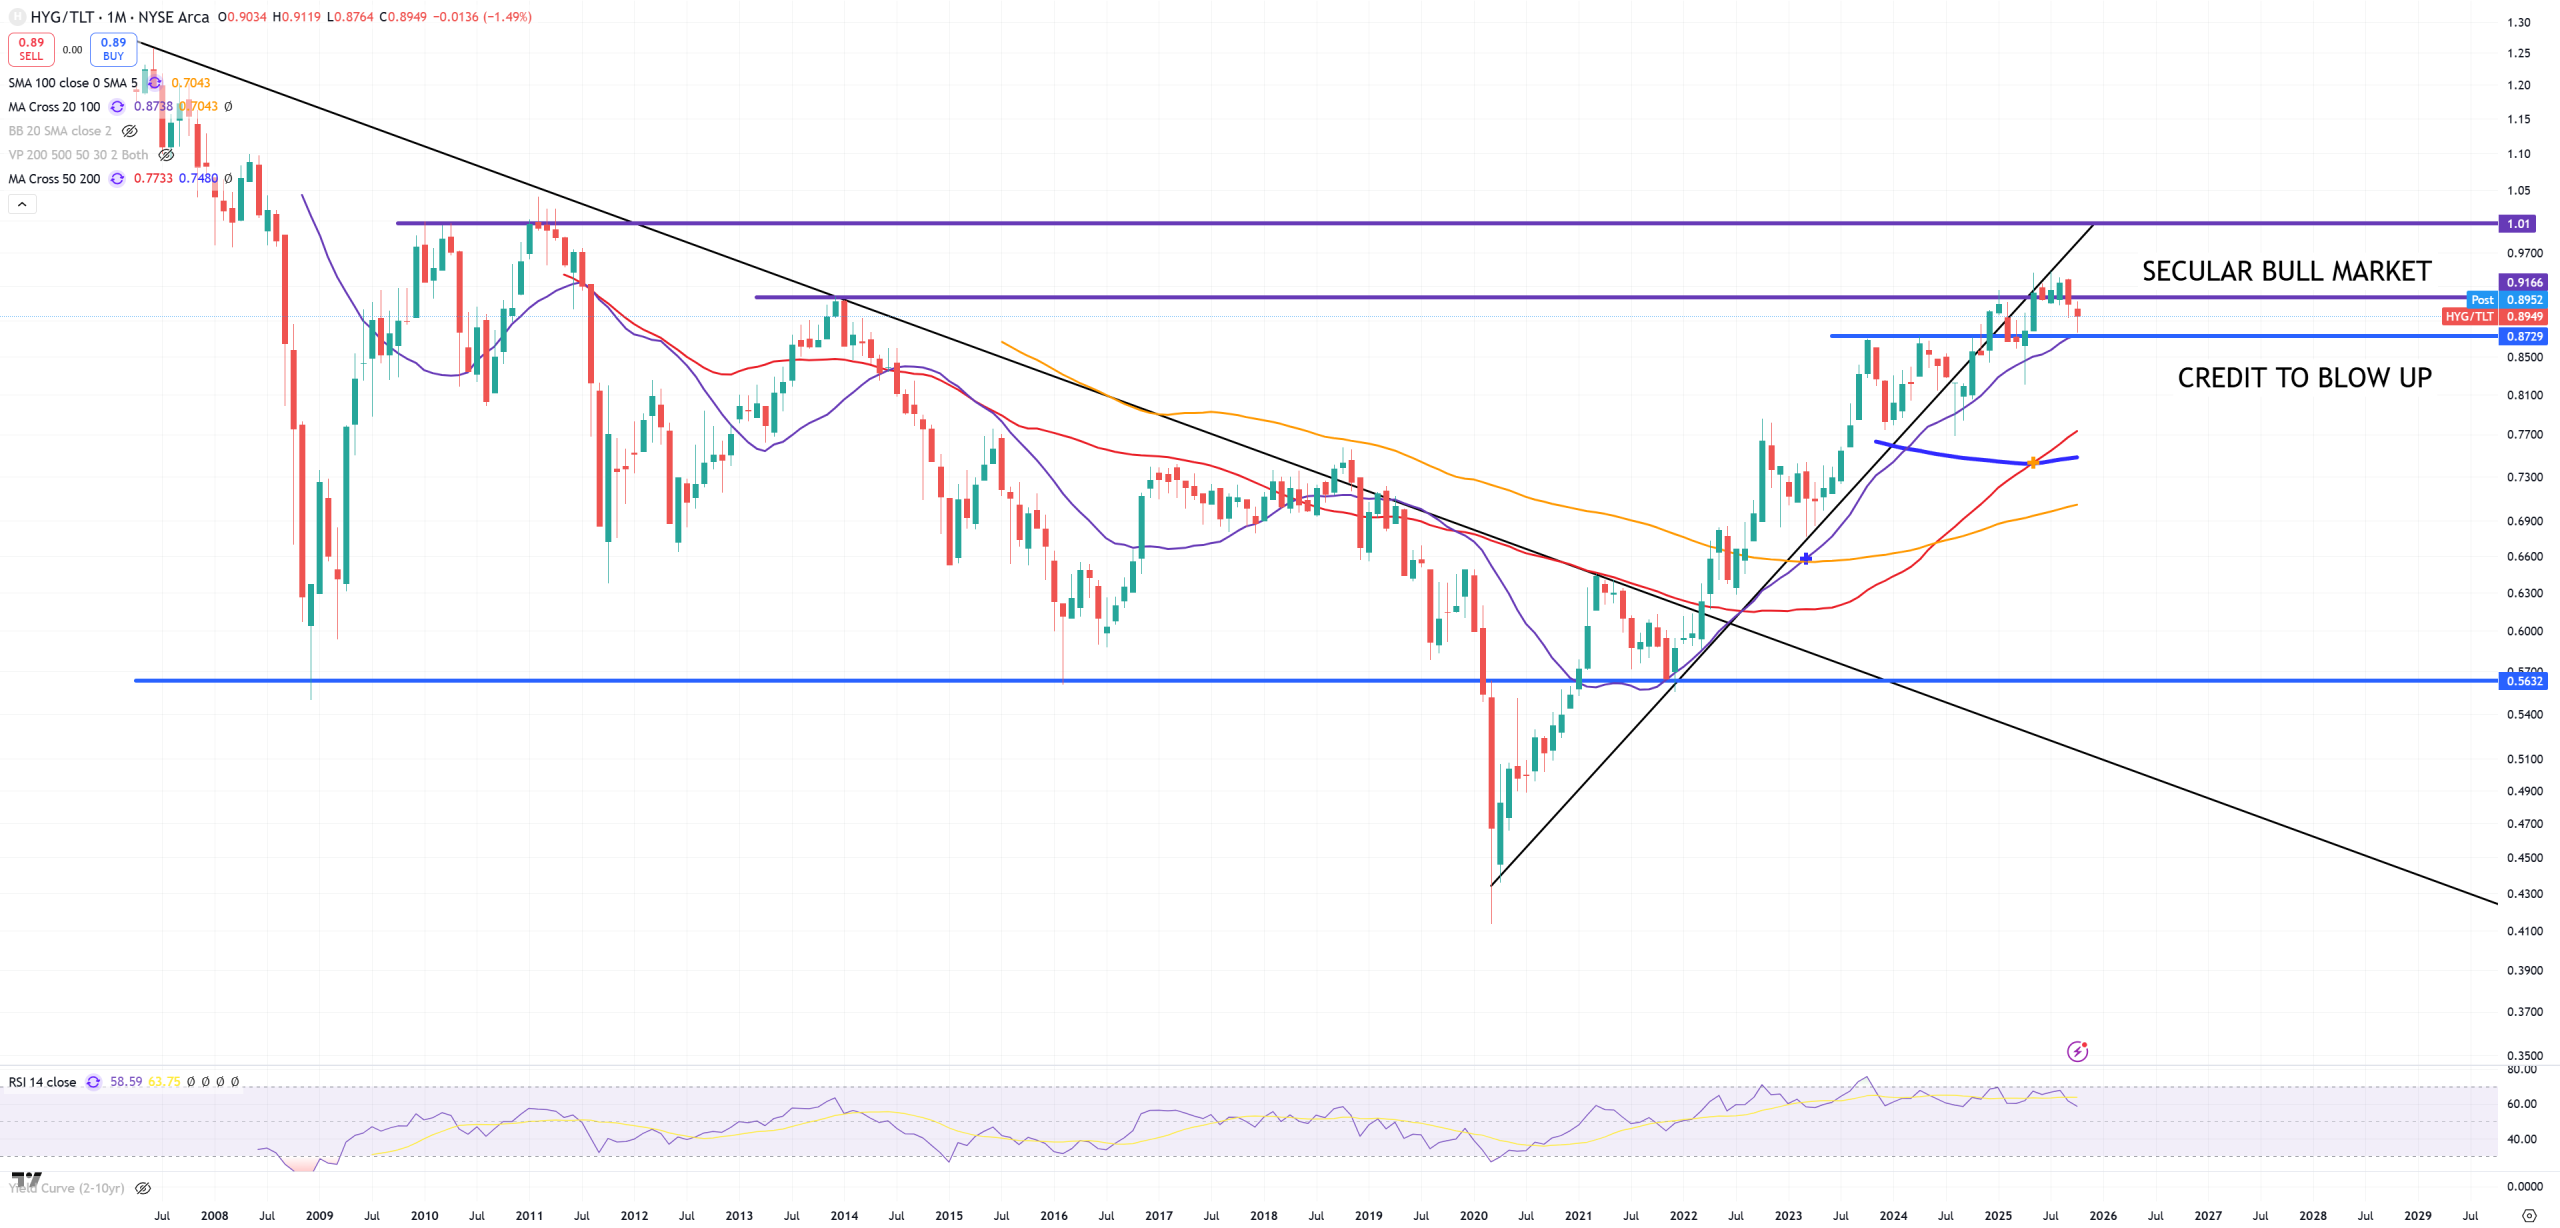
HYG/TLT – It’s a simplified credit stress ratio, especially if uninversion starts to happening
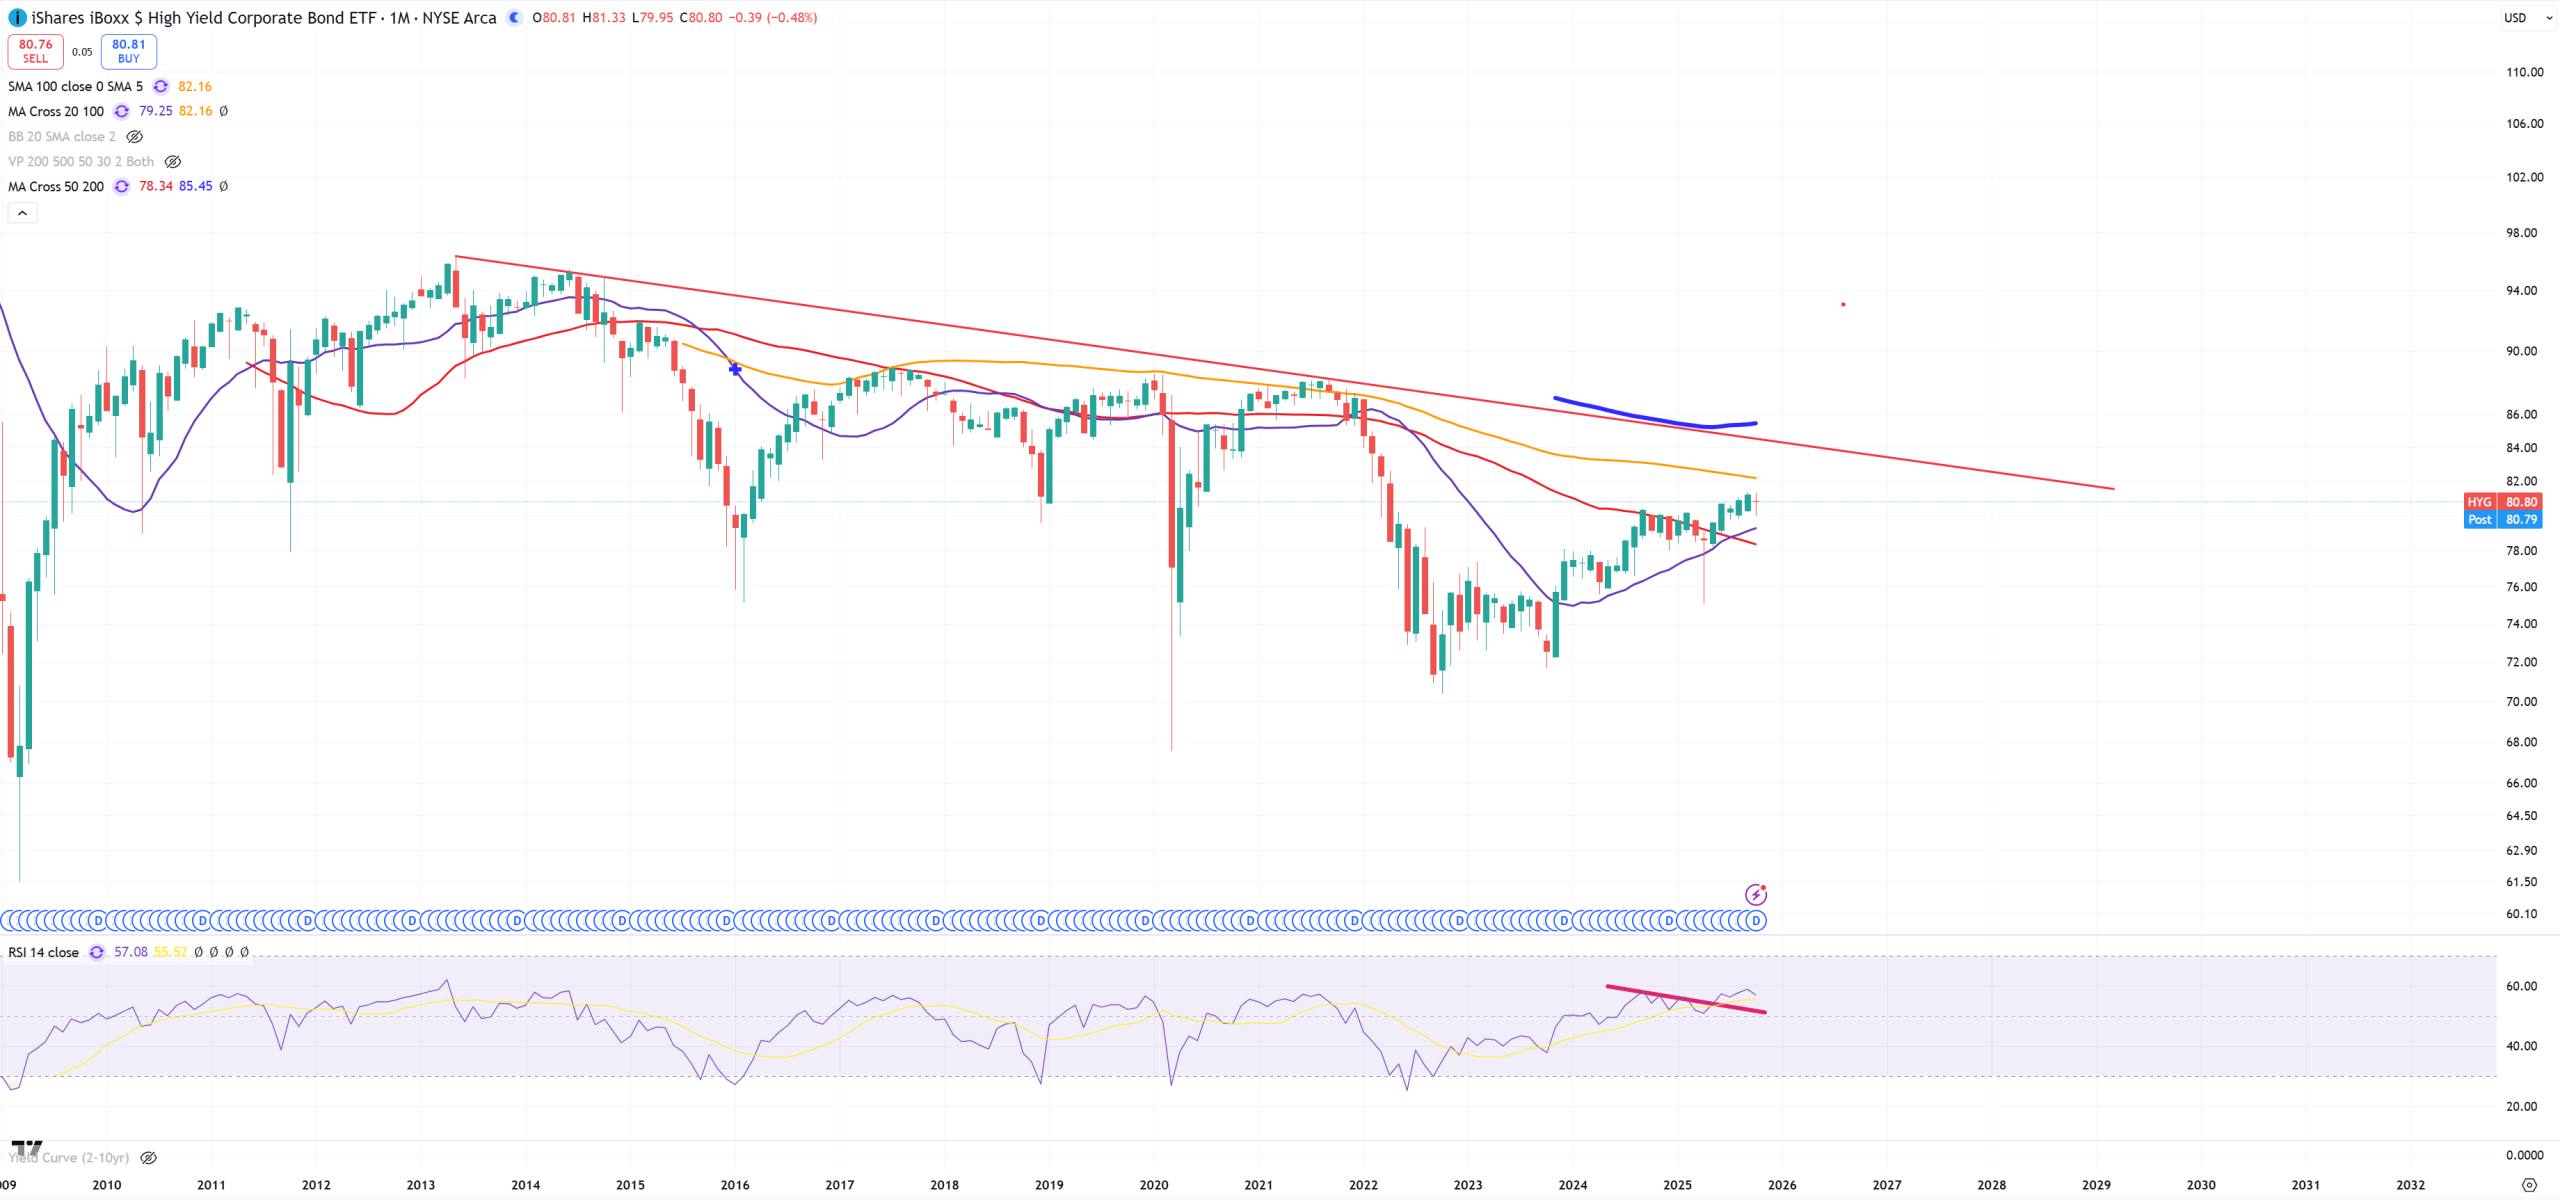
HYG – don’t even know how to comment it. Yellow (M)MA100 = level of bull trap. HYG up = USDCNH down (of course it’s a simplification). Junk bond market depends on Chinese currency which moves DXY.
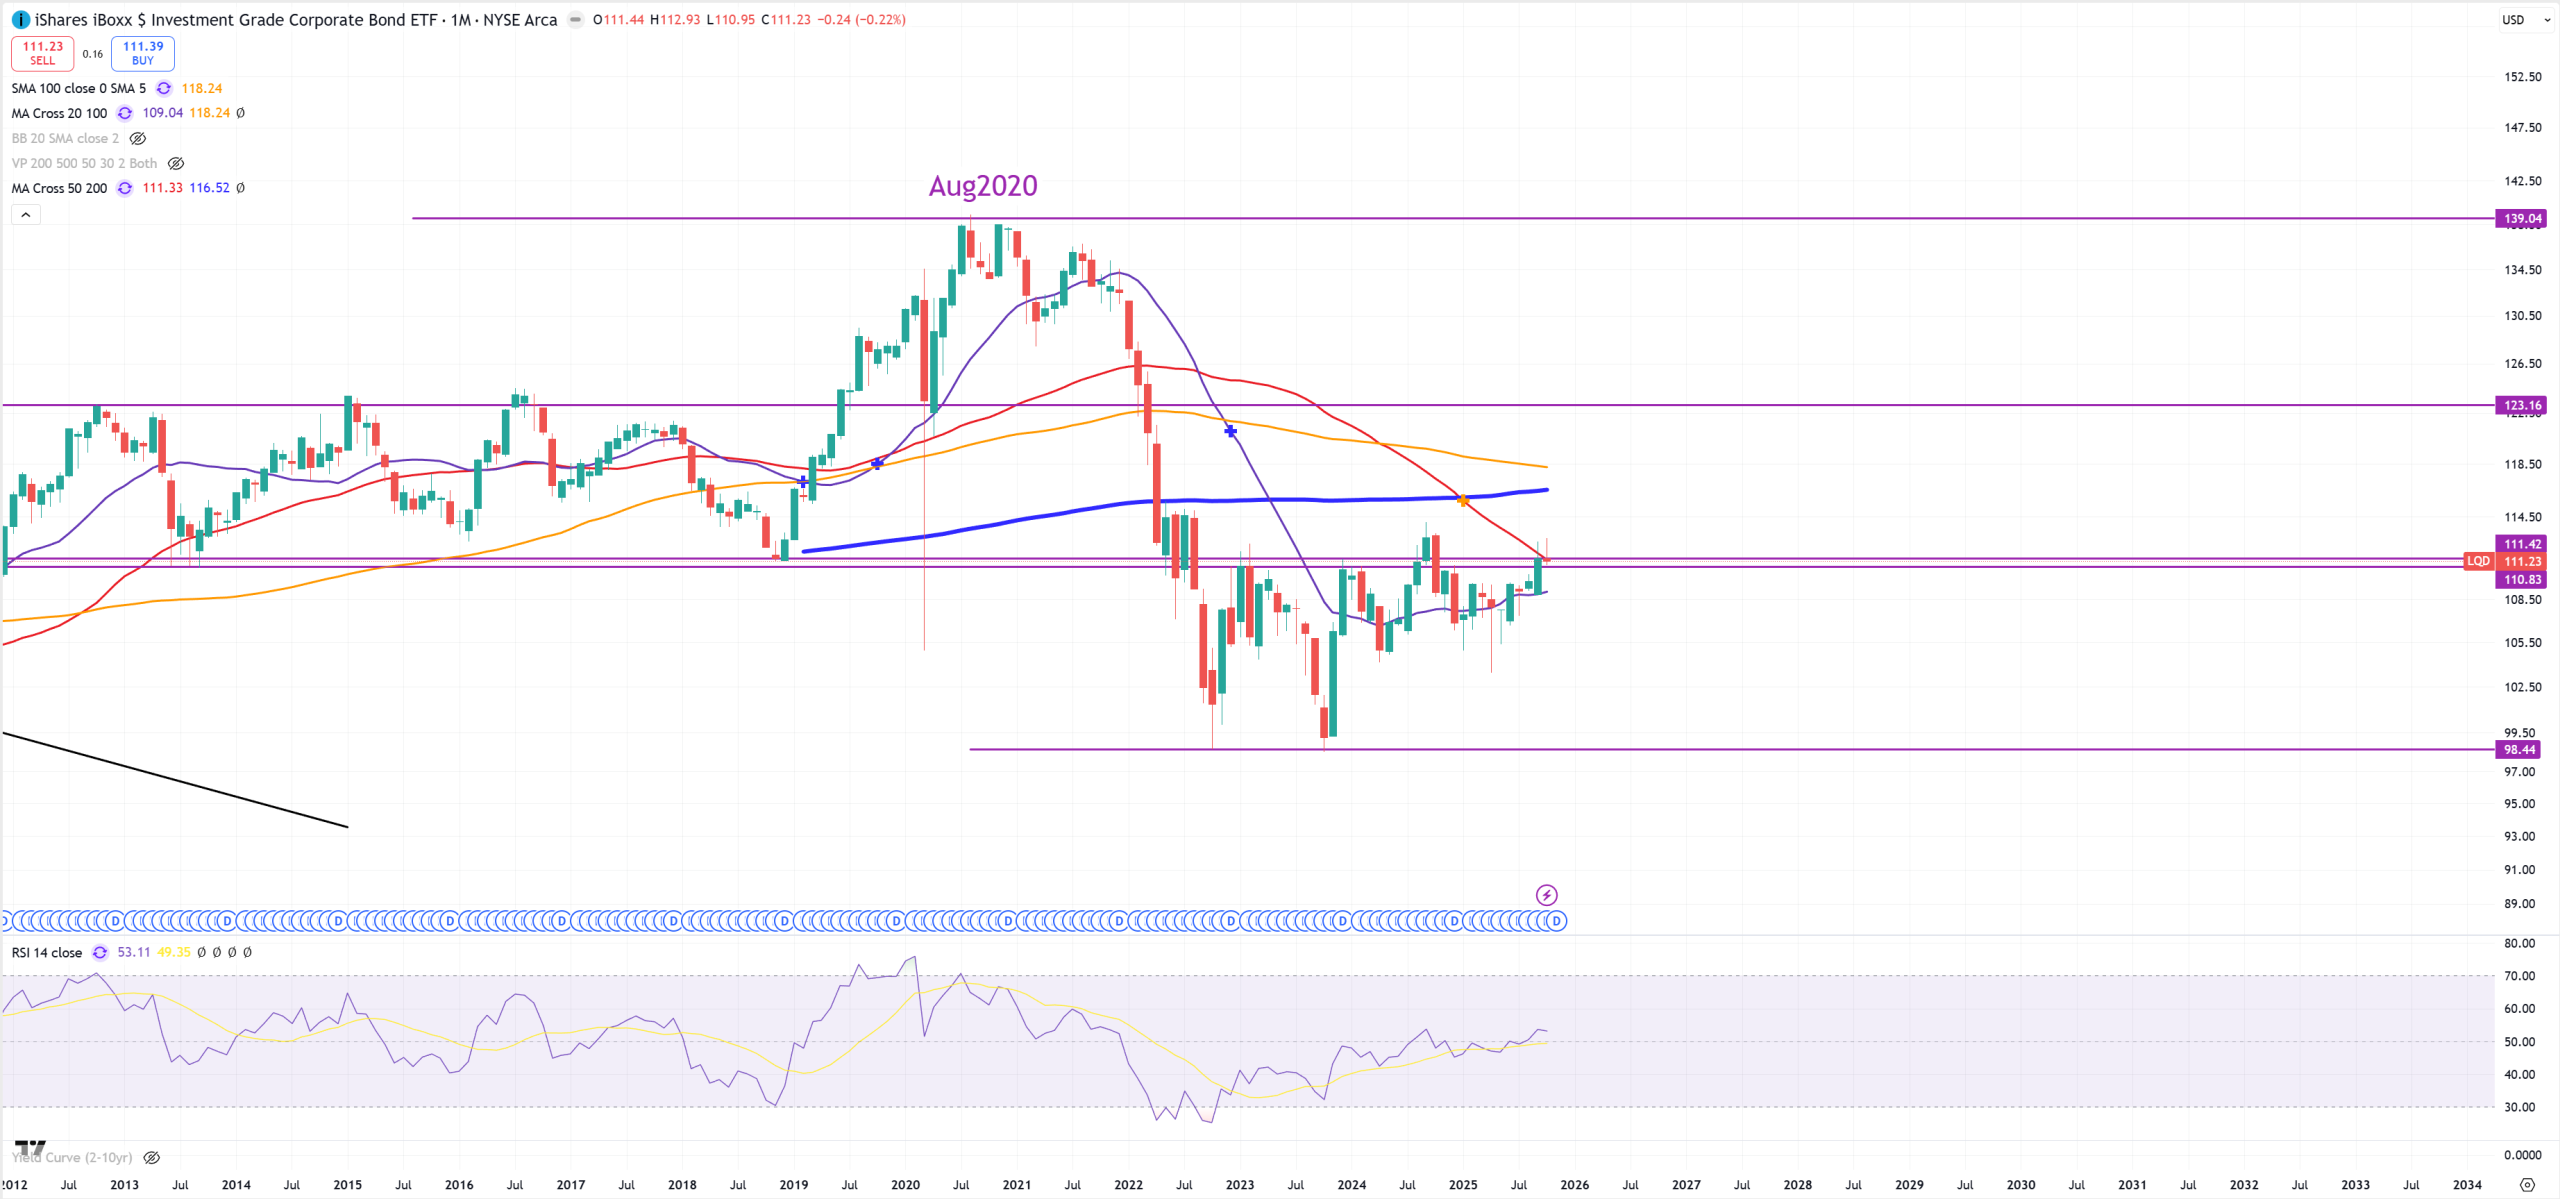
LQD – Corporate Bond Investment grade : big moment as (M)MA50 + resistance hold.
Today couple warnings how parabolic moves can end
FI – Fiserv – down below (M)MA200 – in 8 months it moved 8 years. That was a massive bull-trap from technical analysis perspective
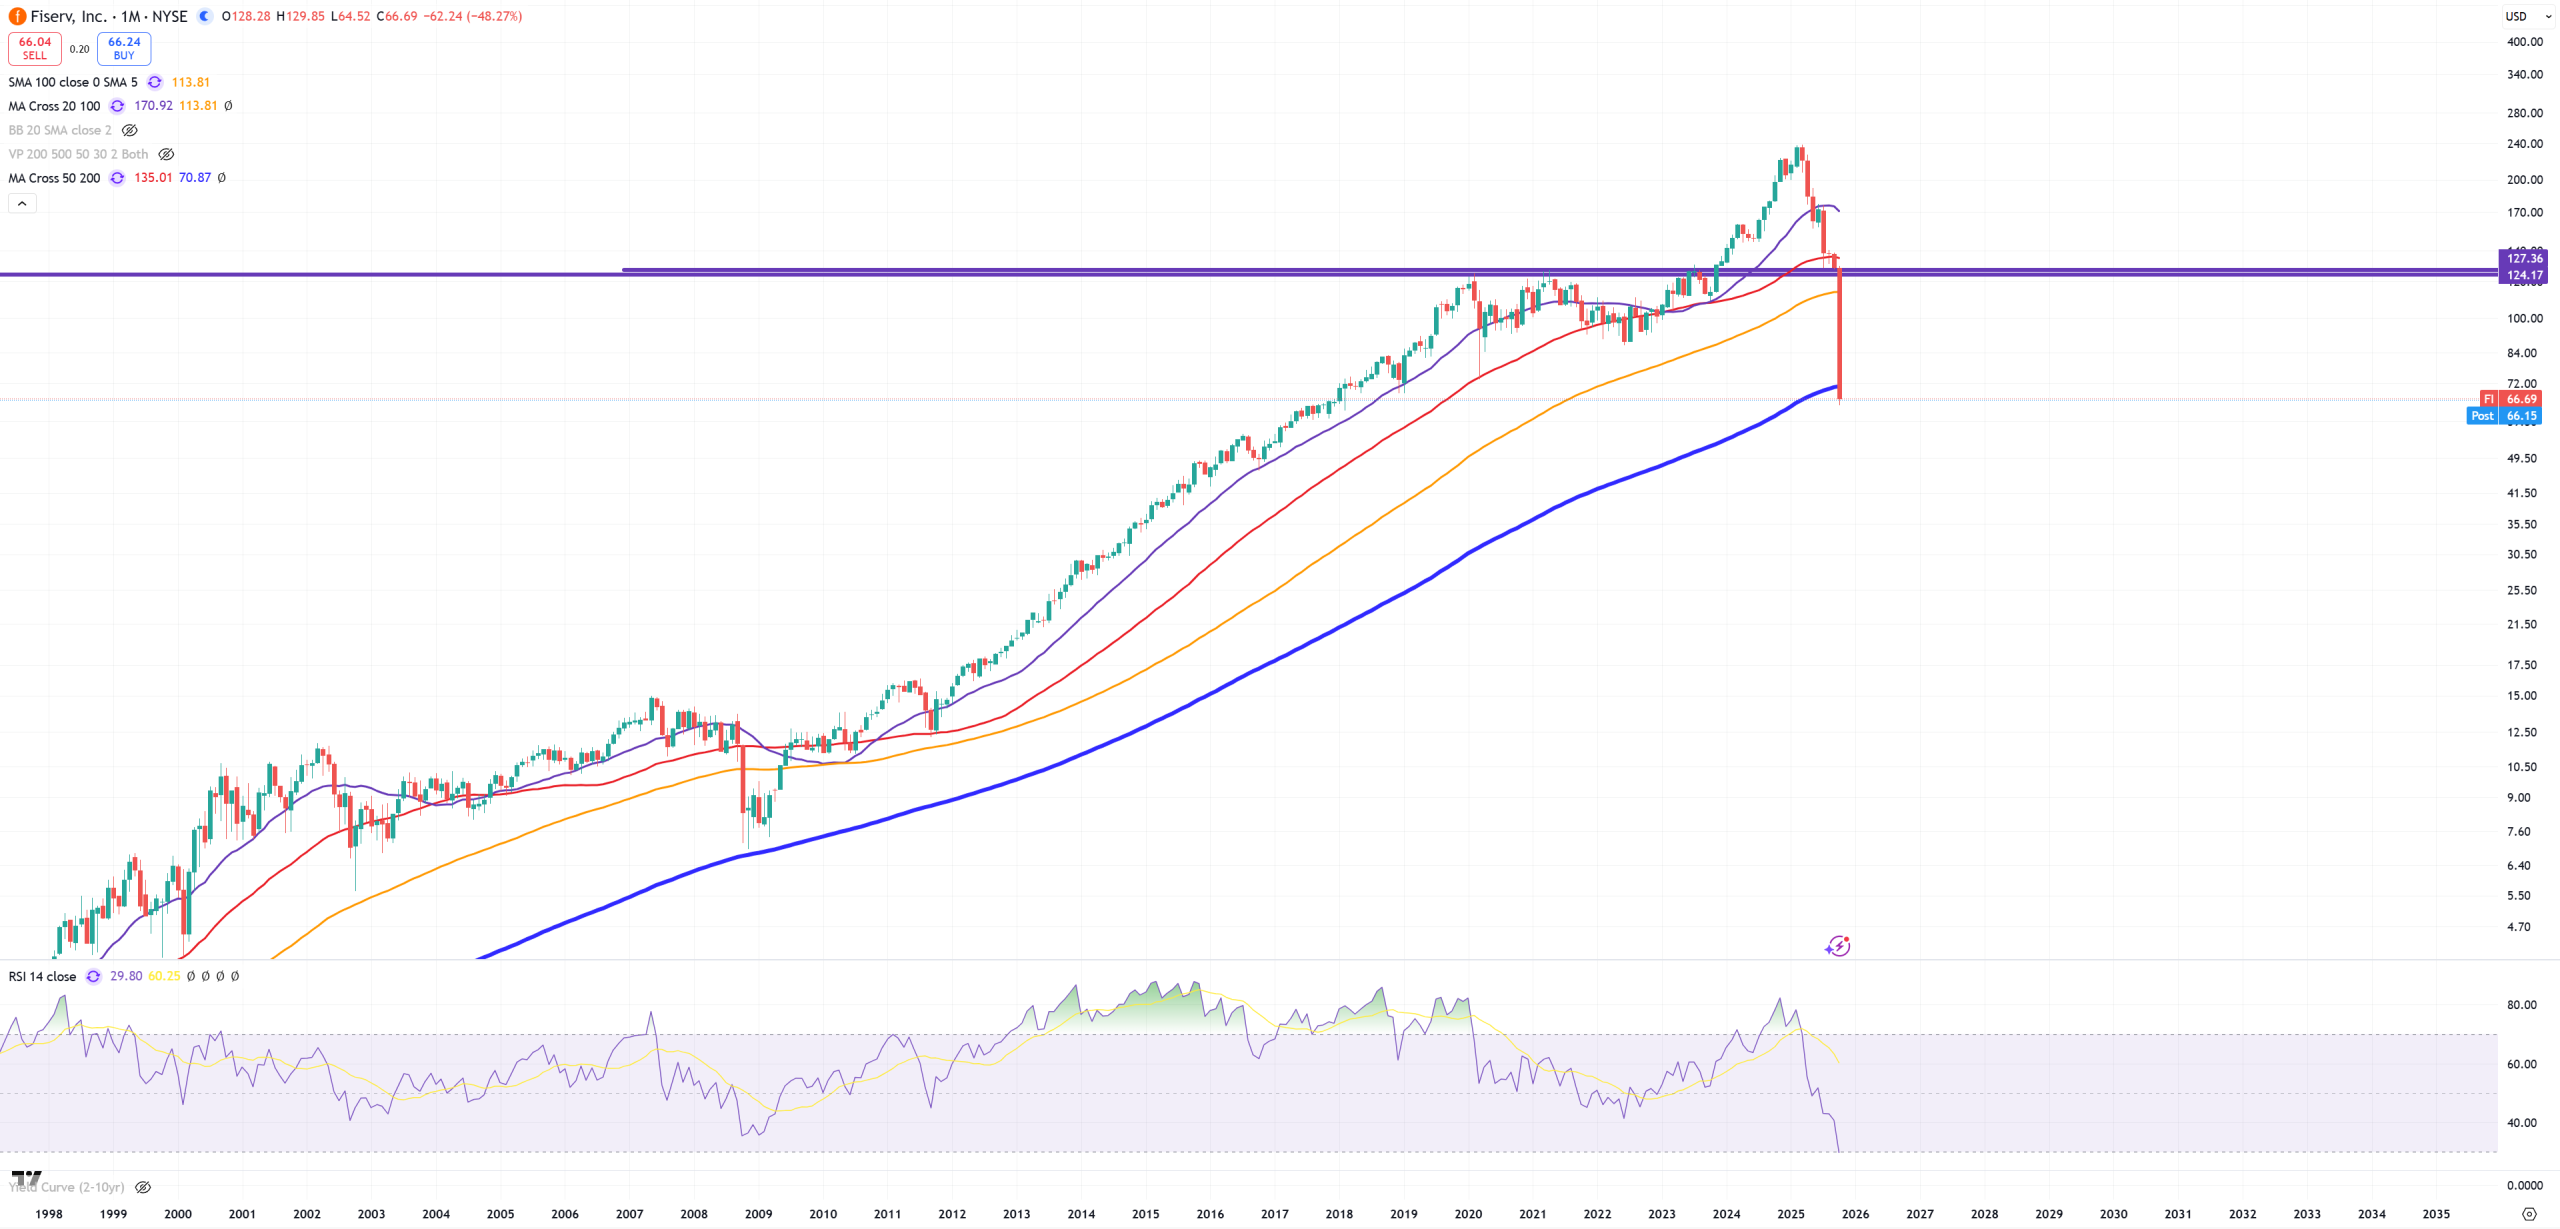
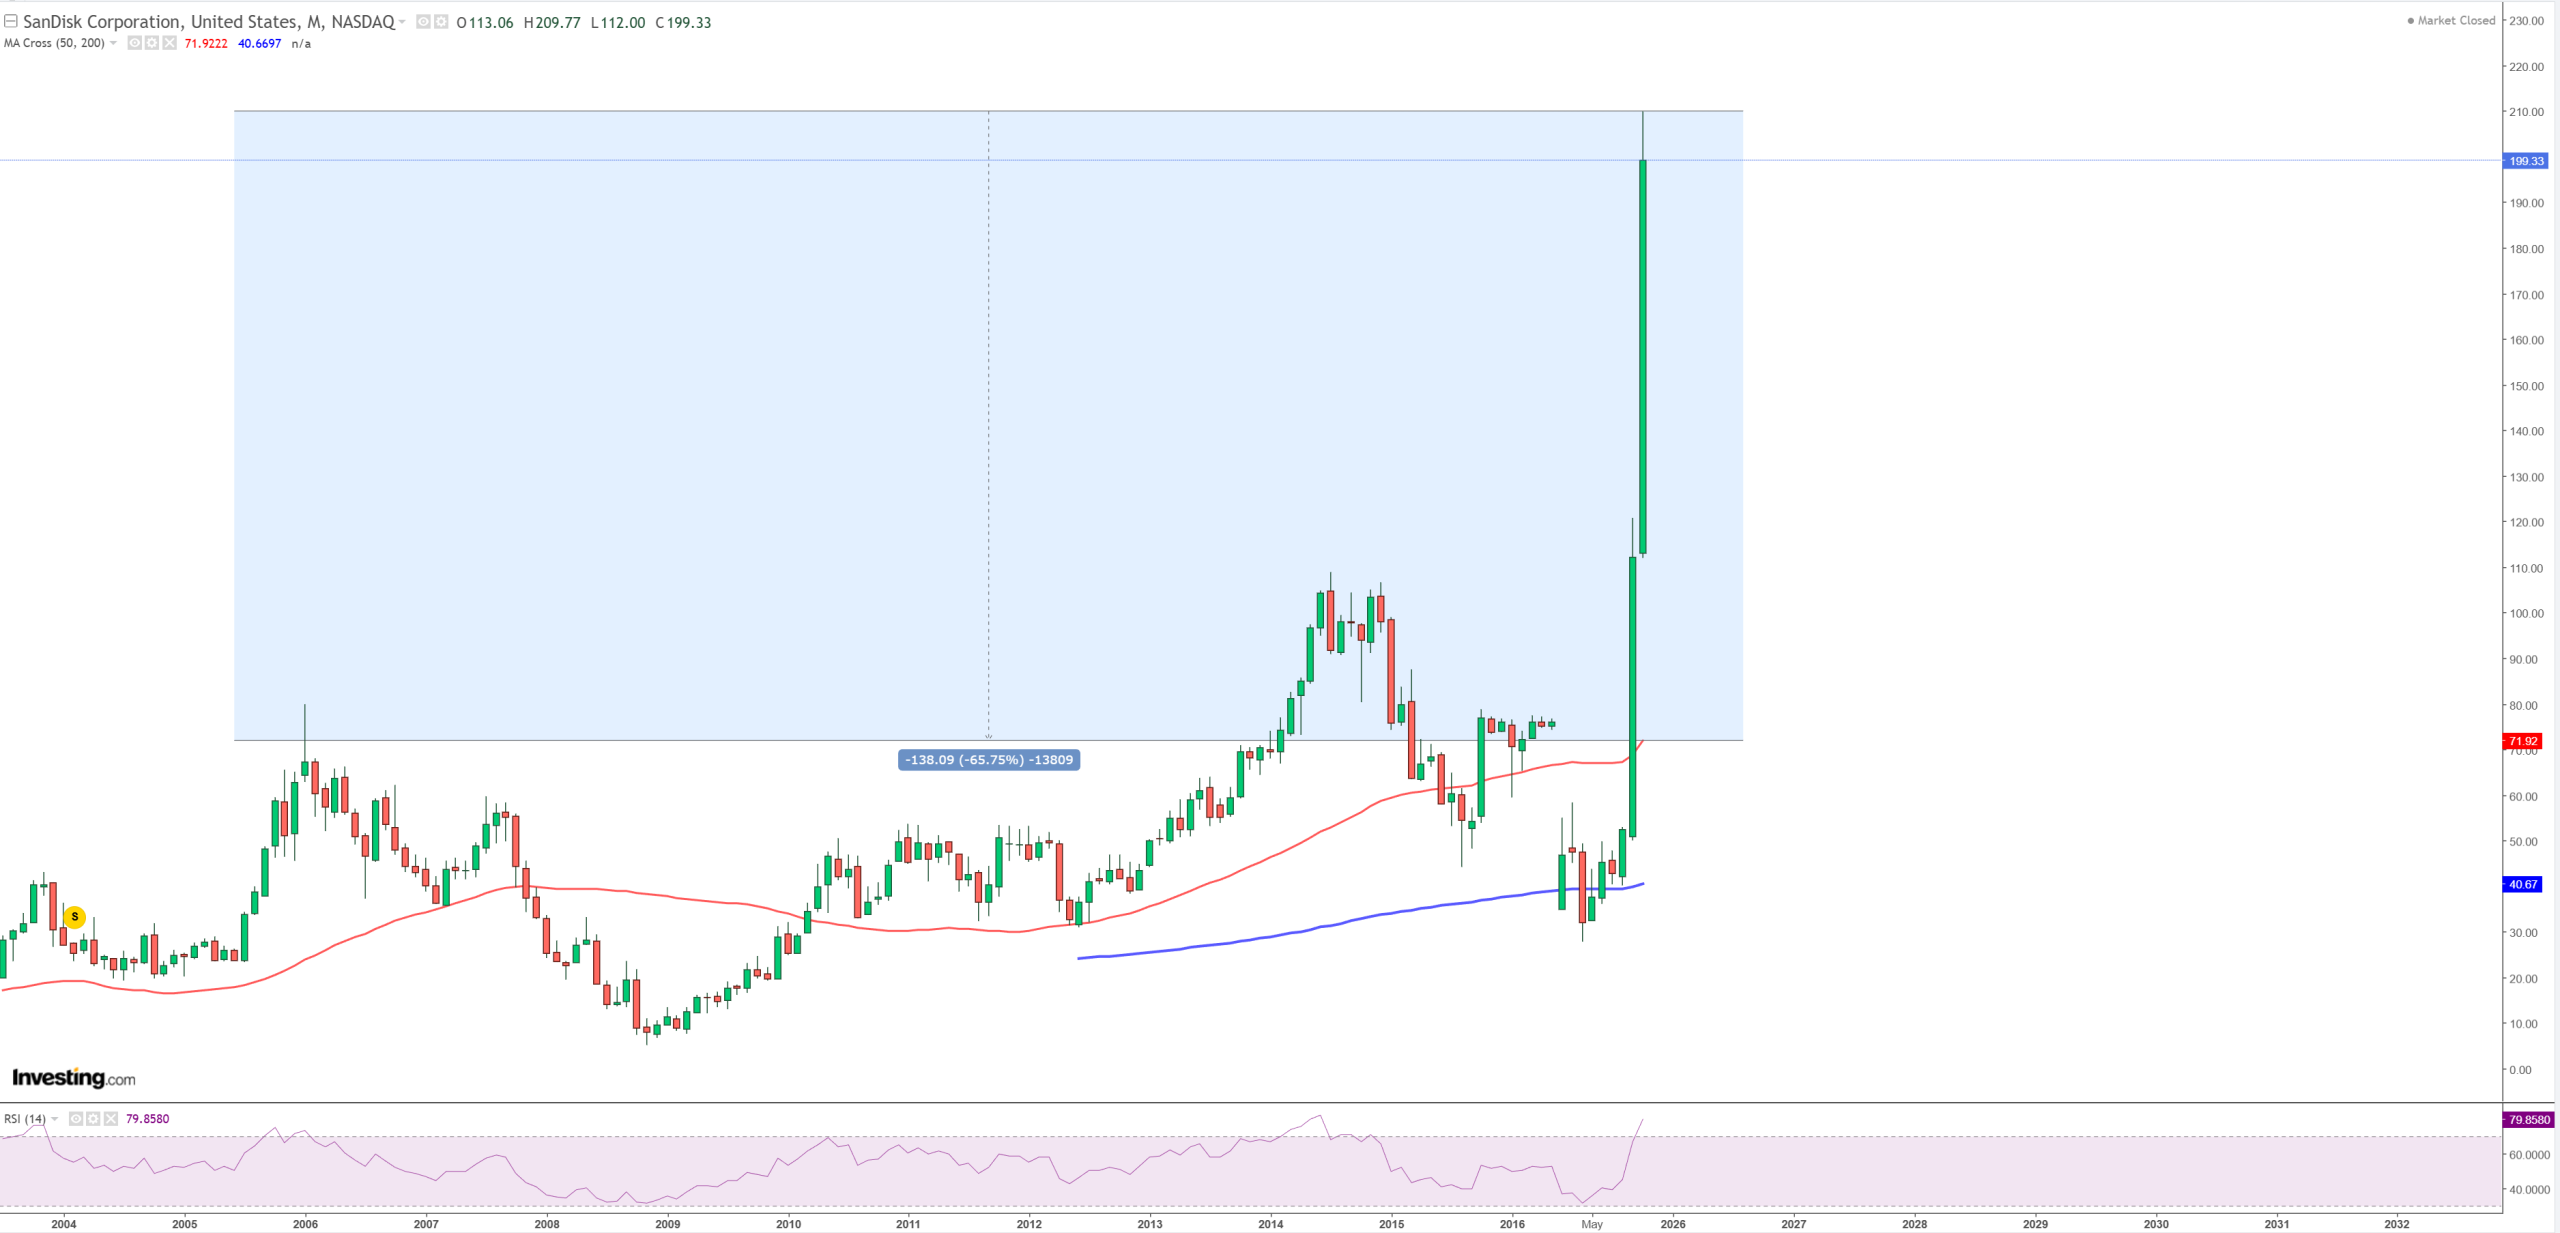
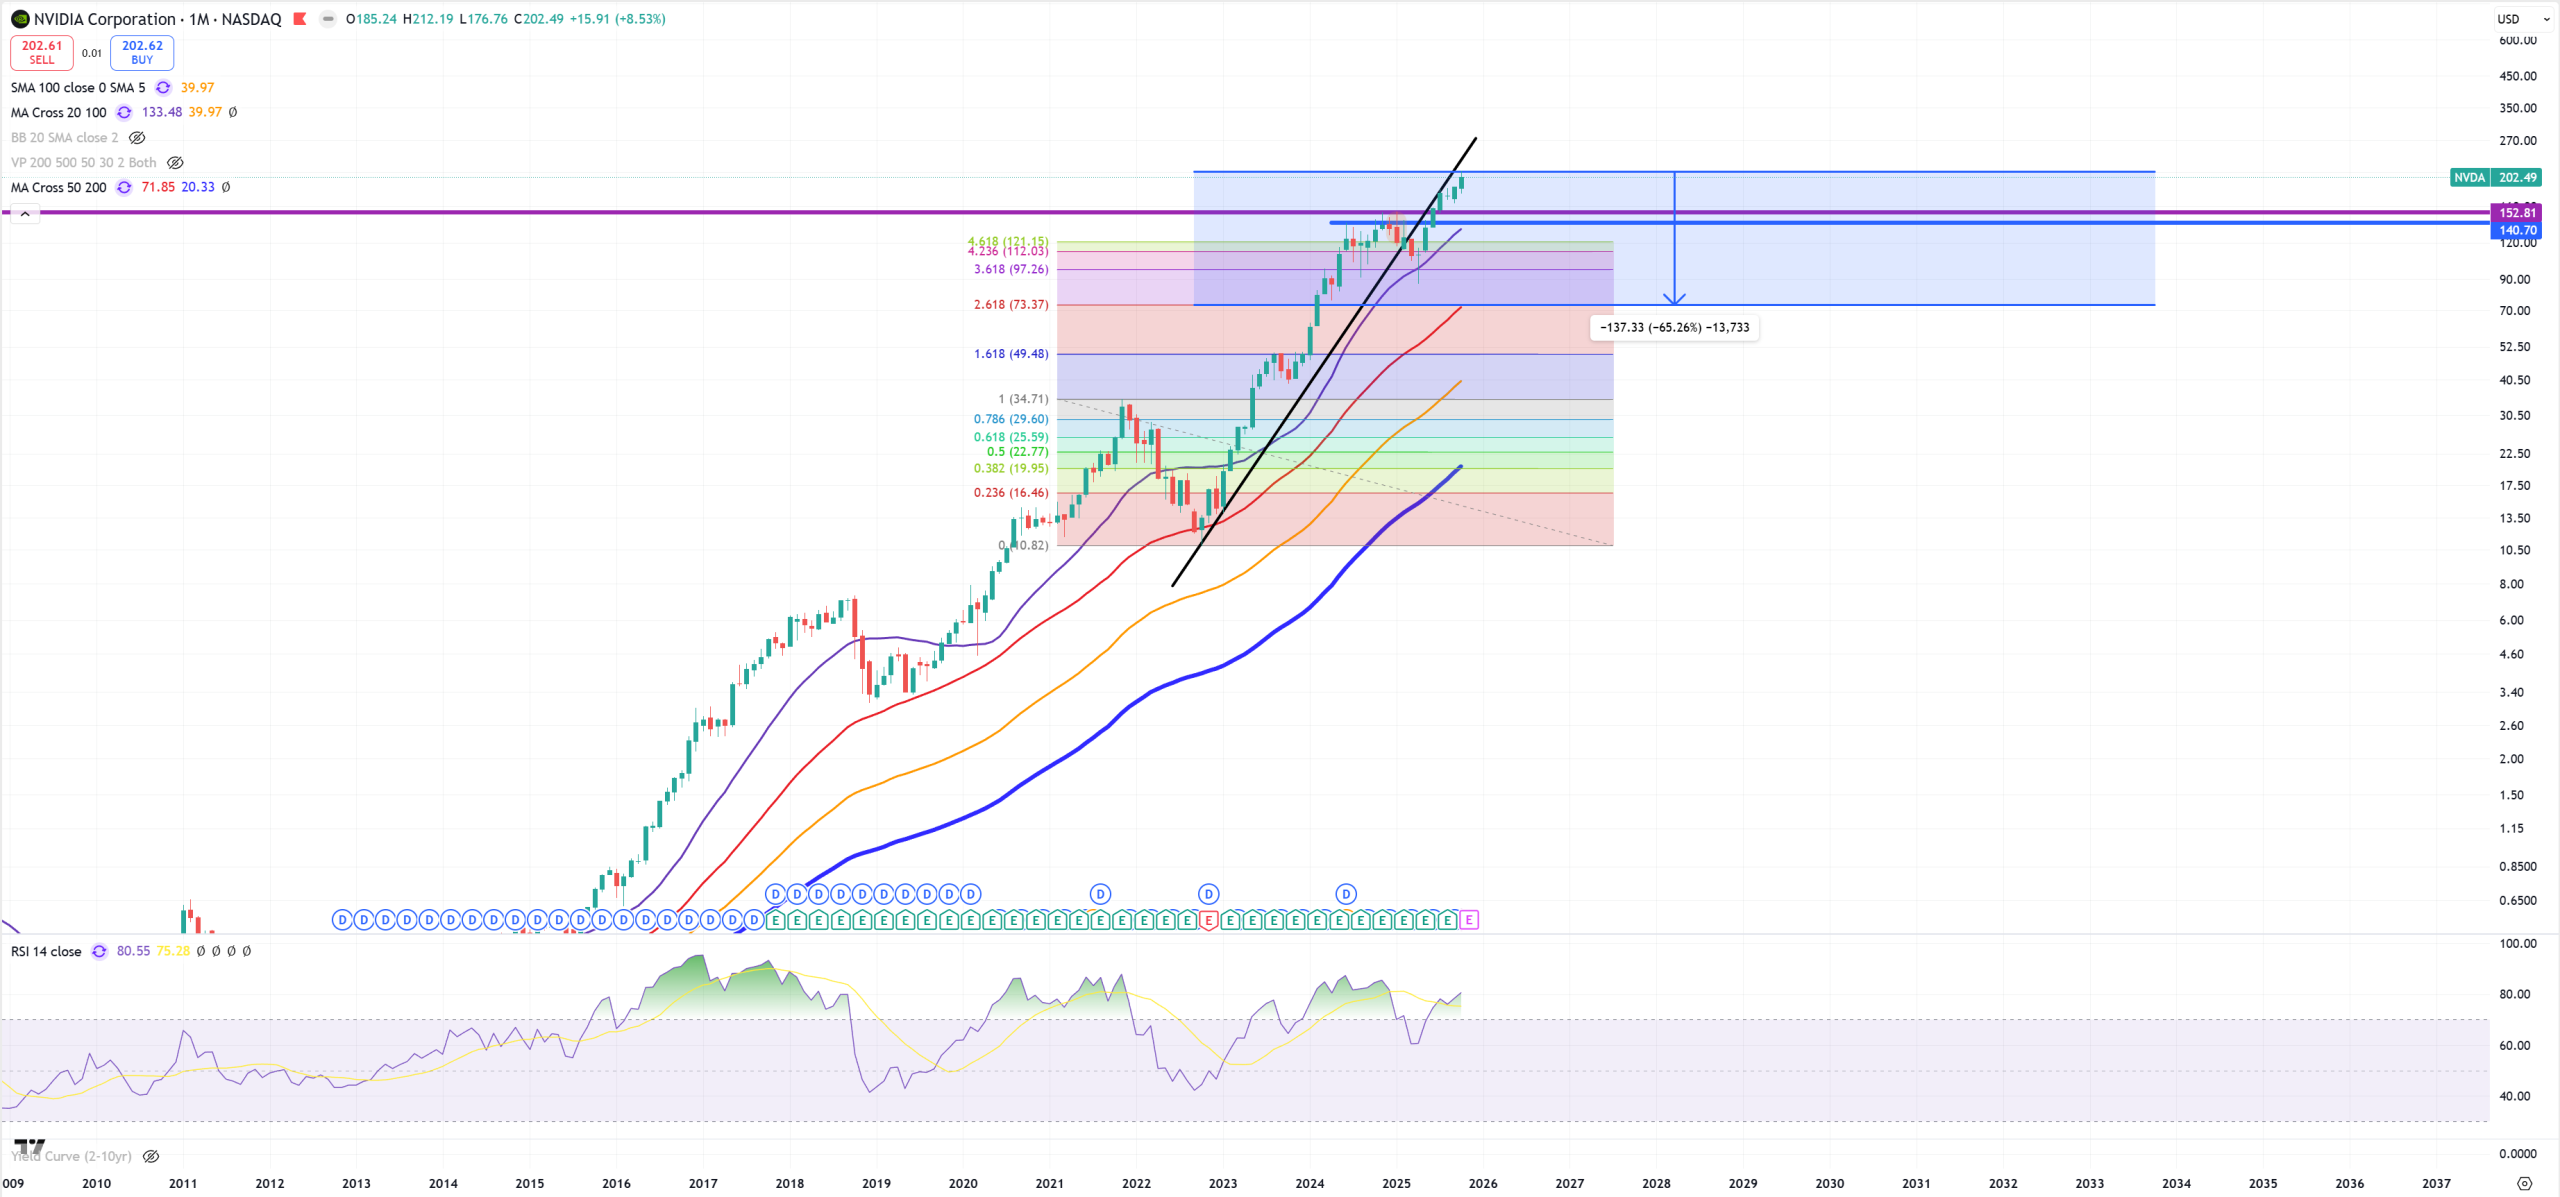
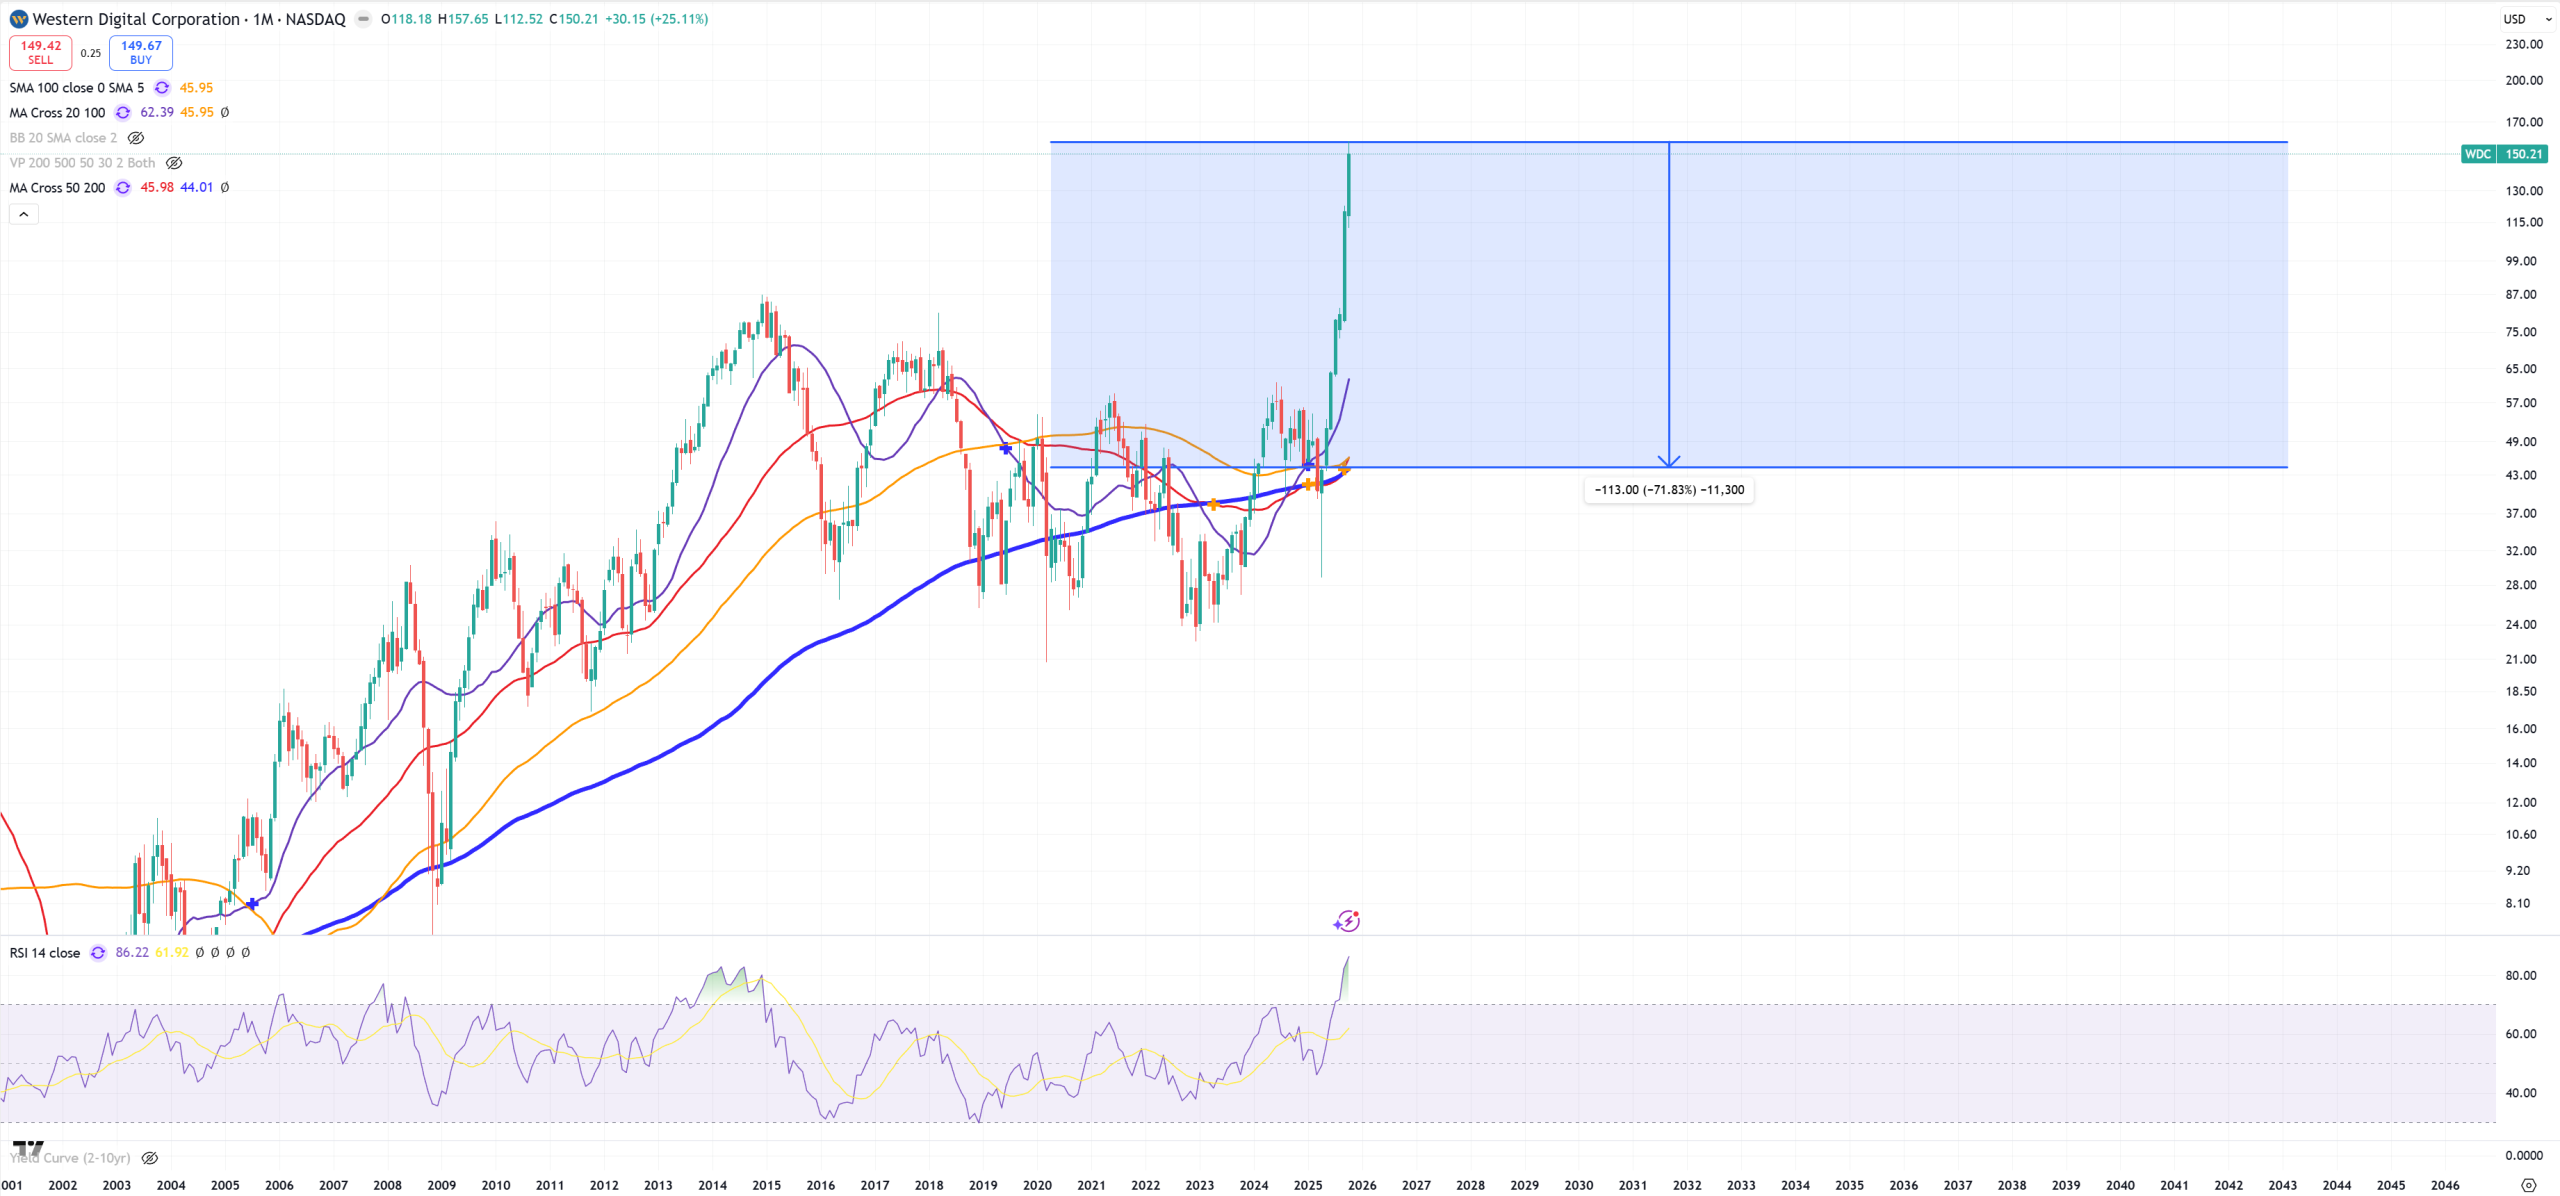
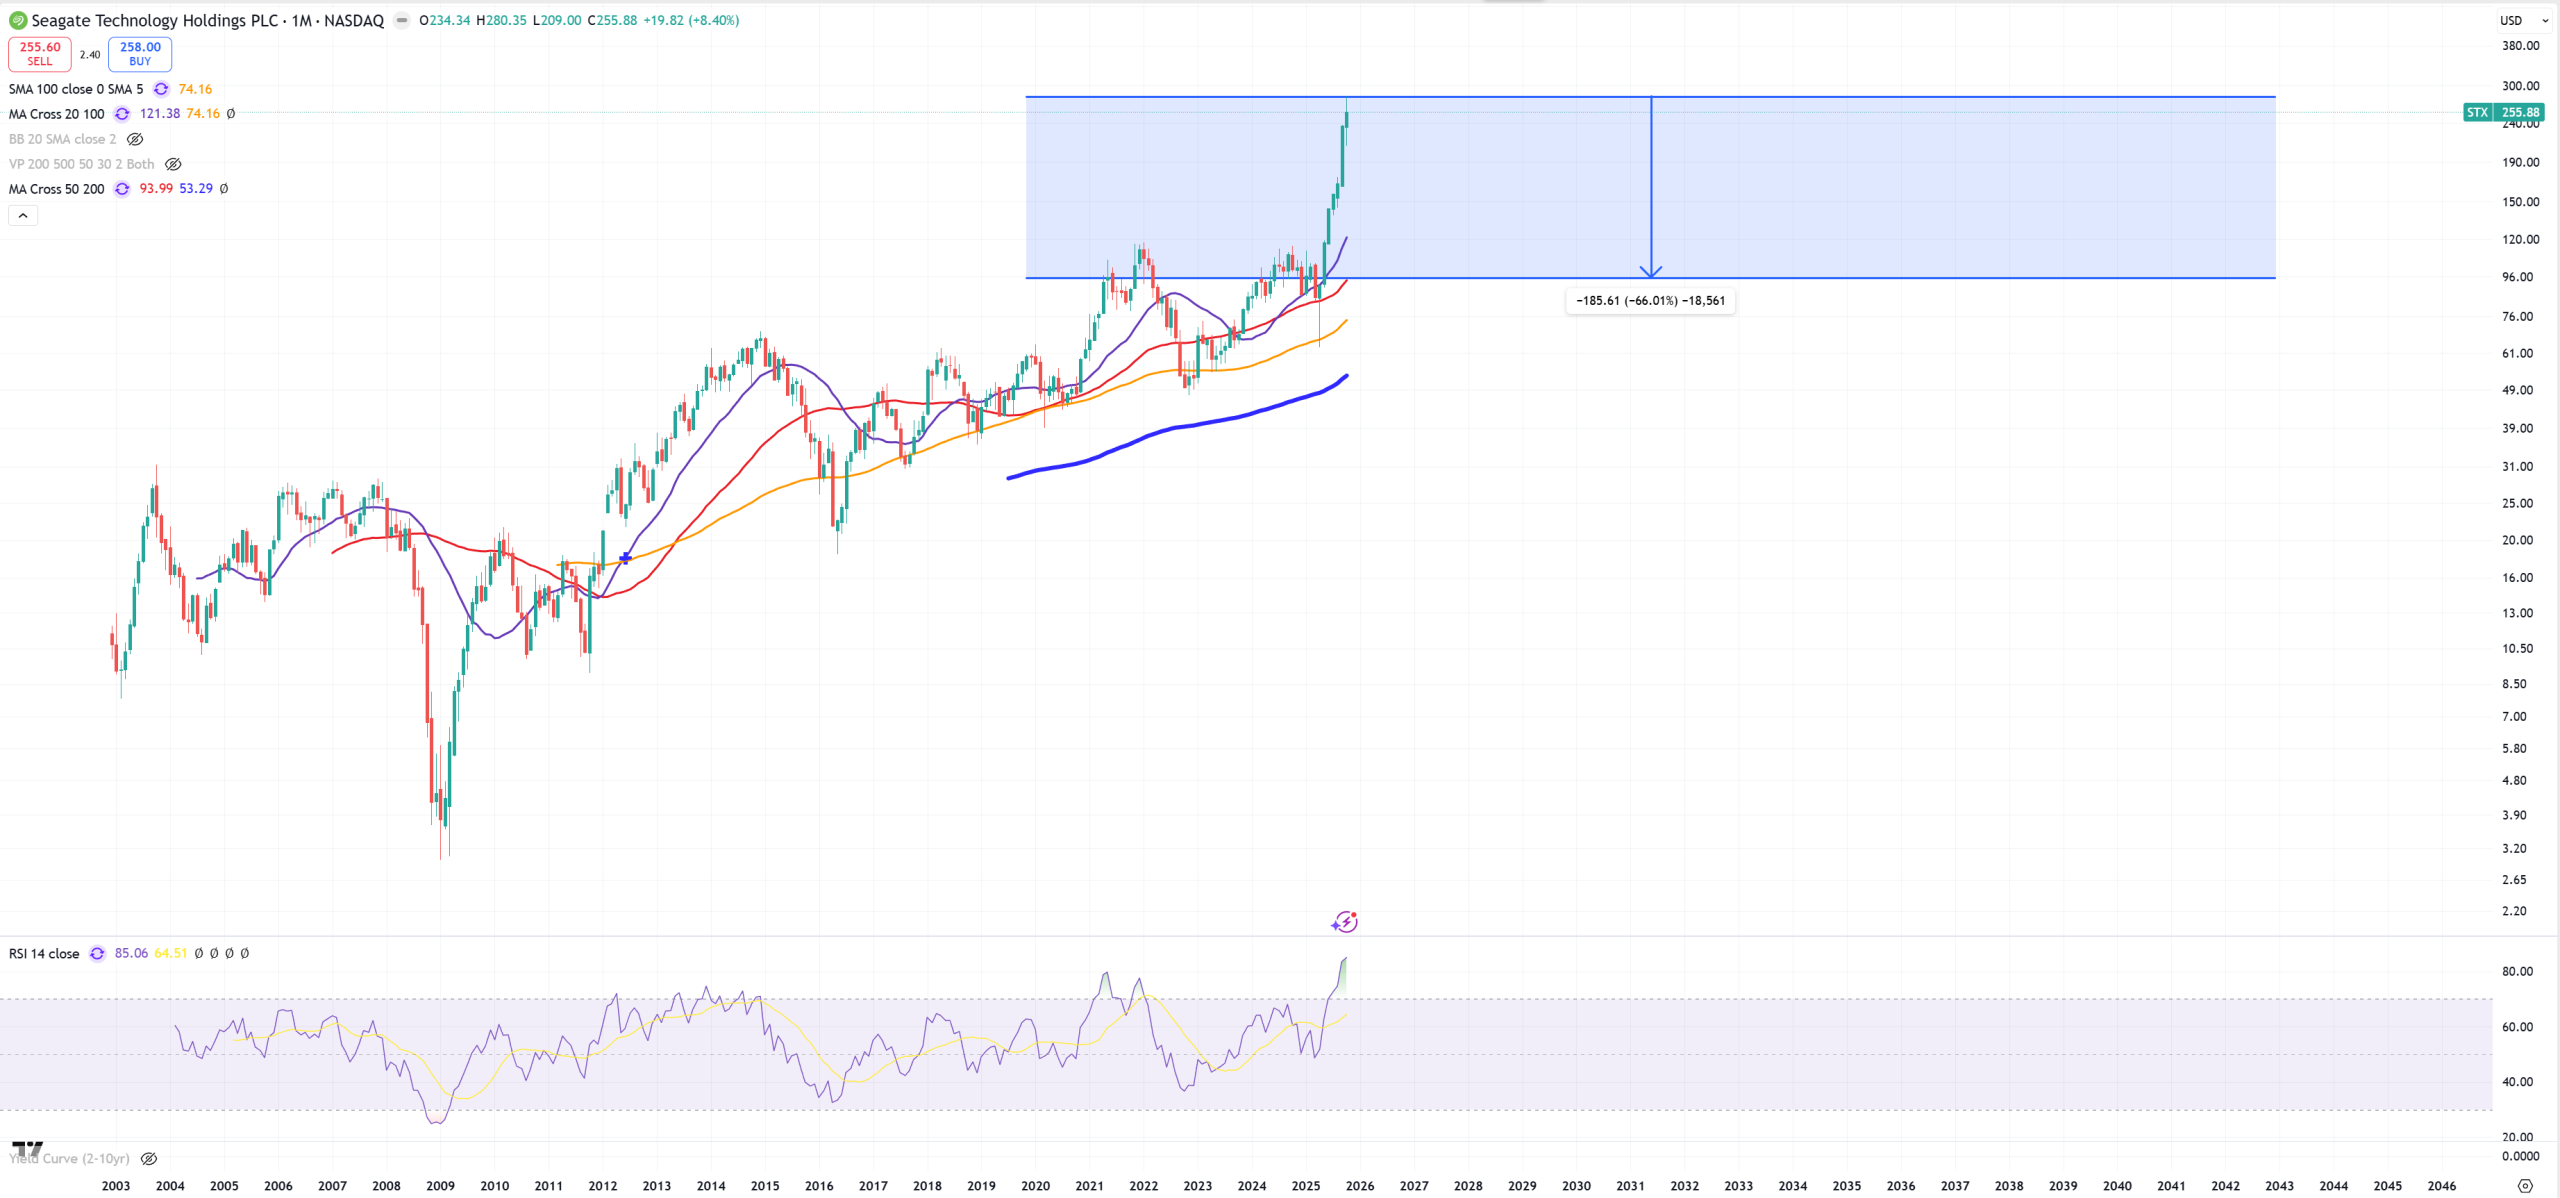
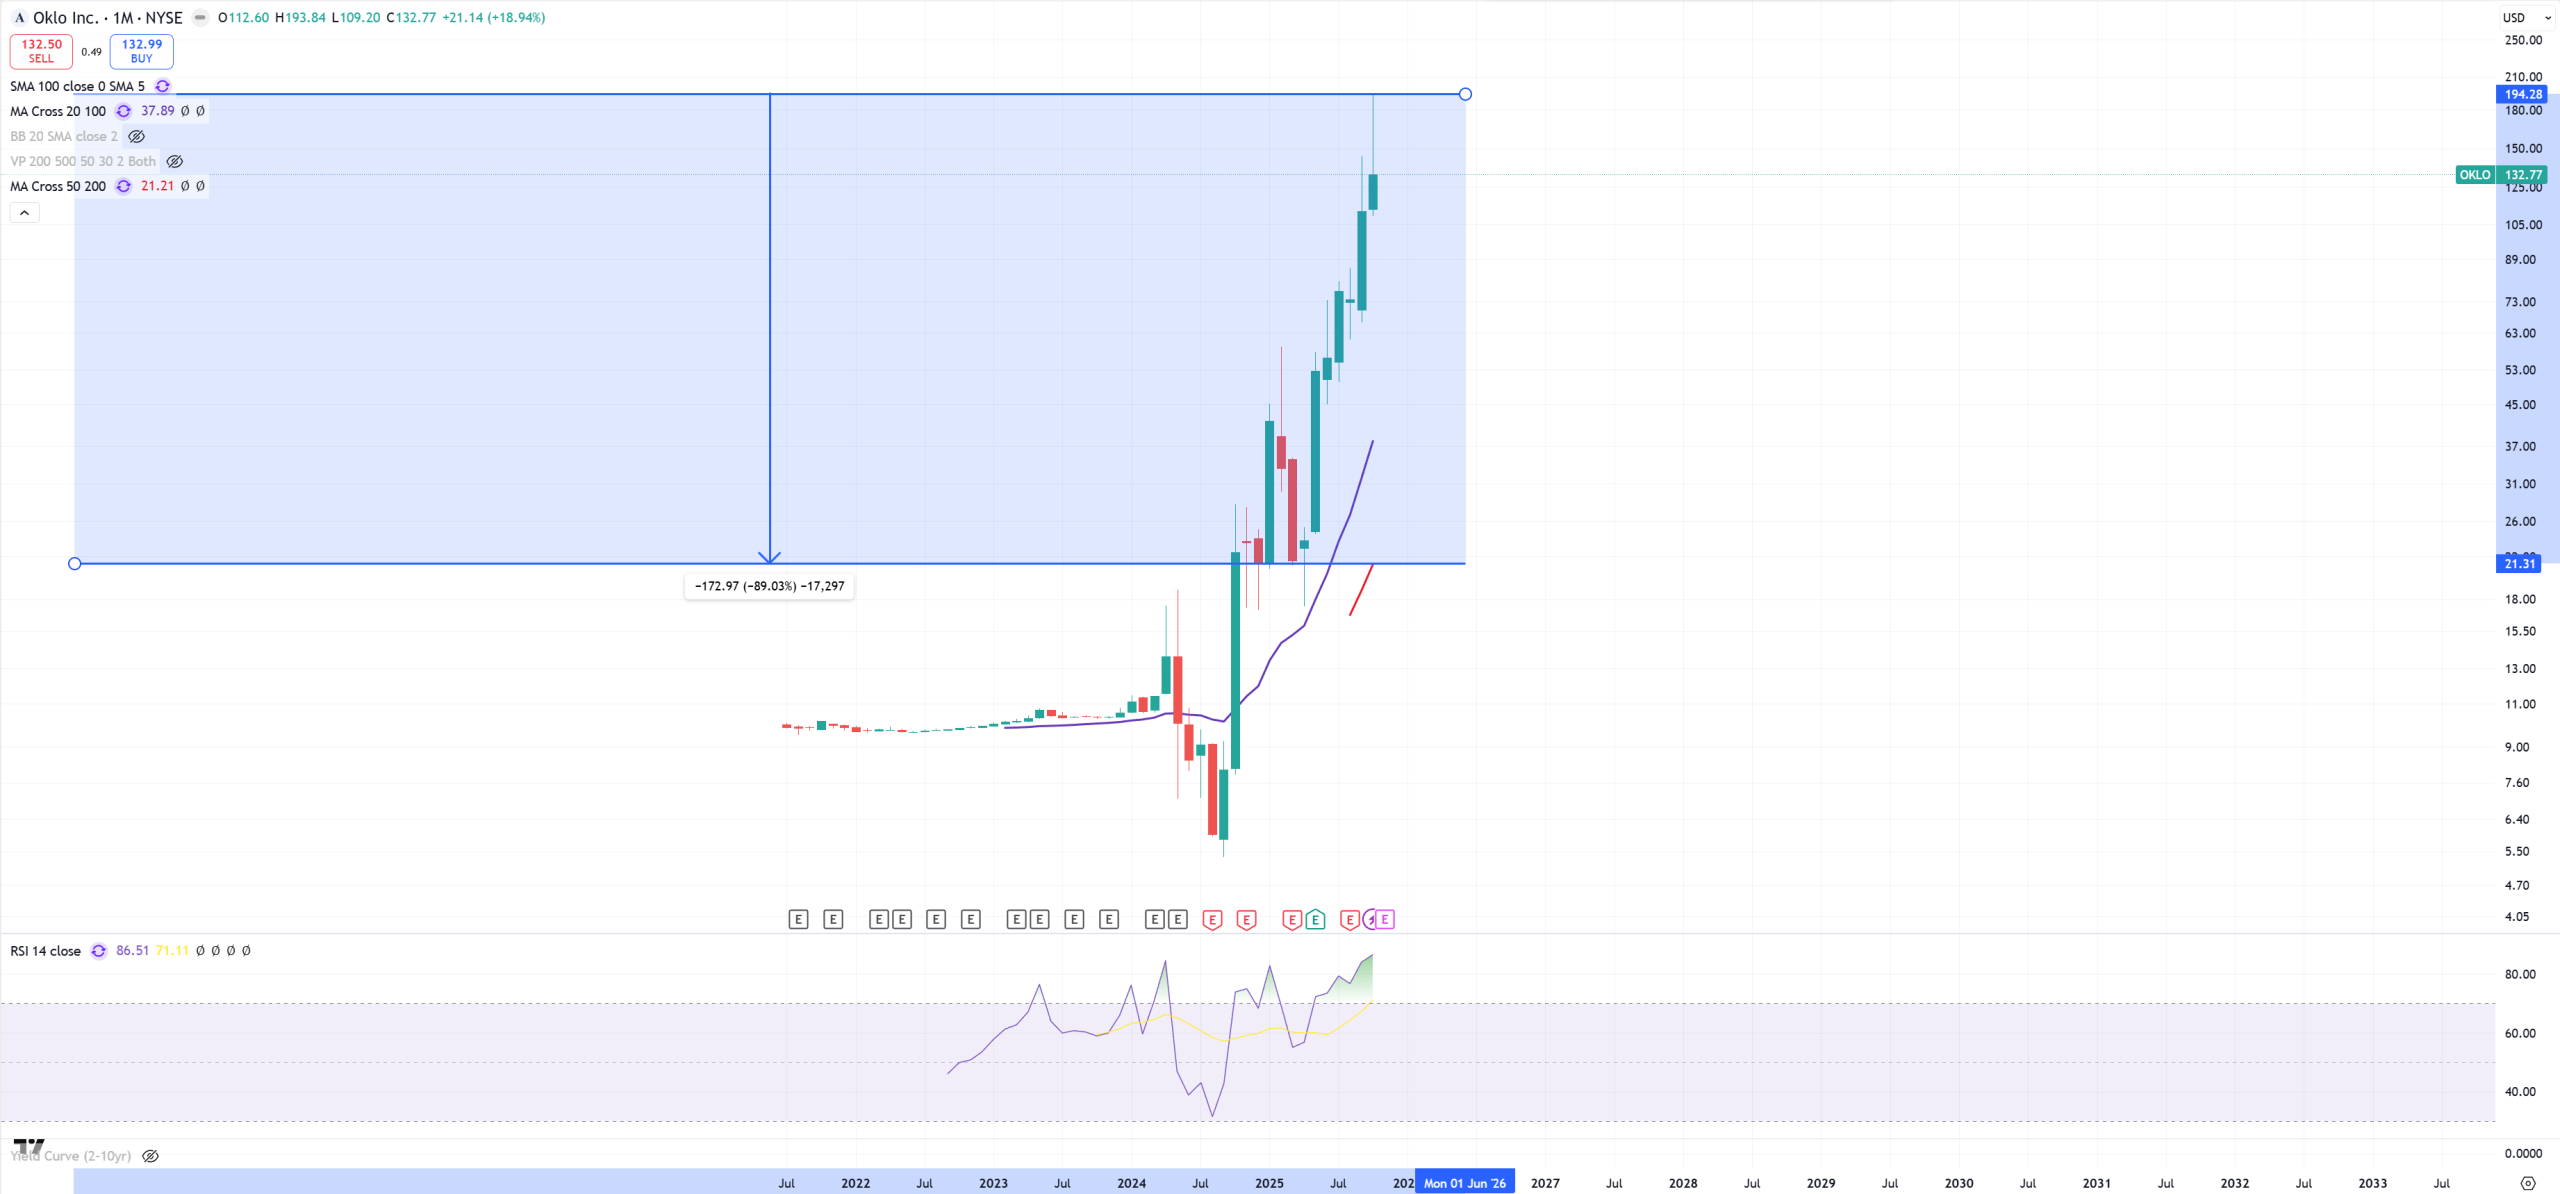
I measure how big bubble is by distance from possible peak to (M)MA50. Everything > -60% is a massive massive bubble and > -70% we can call it tulip bubble.
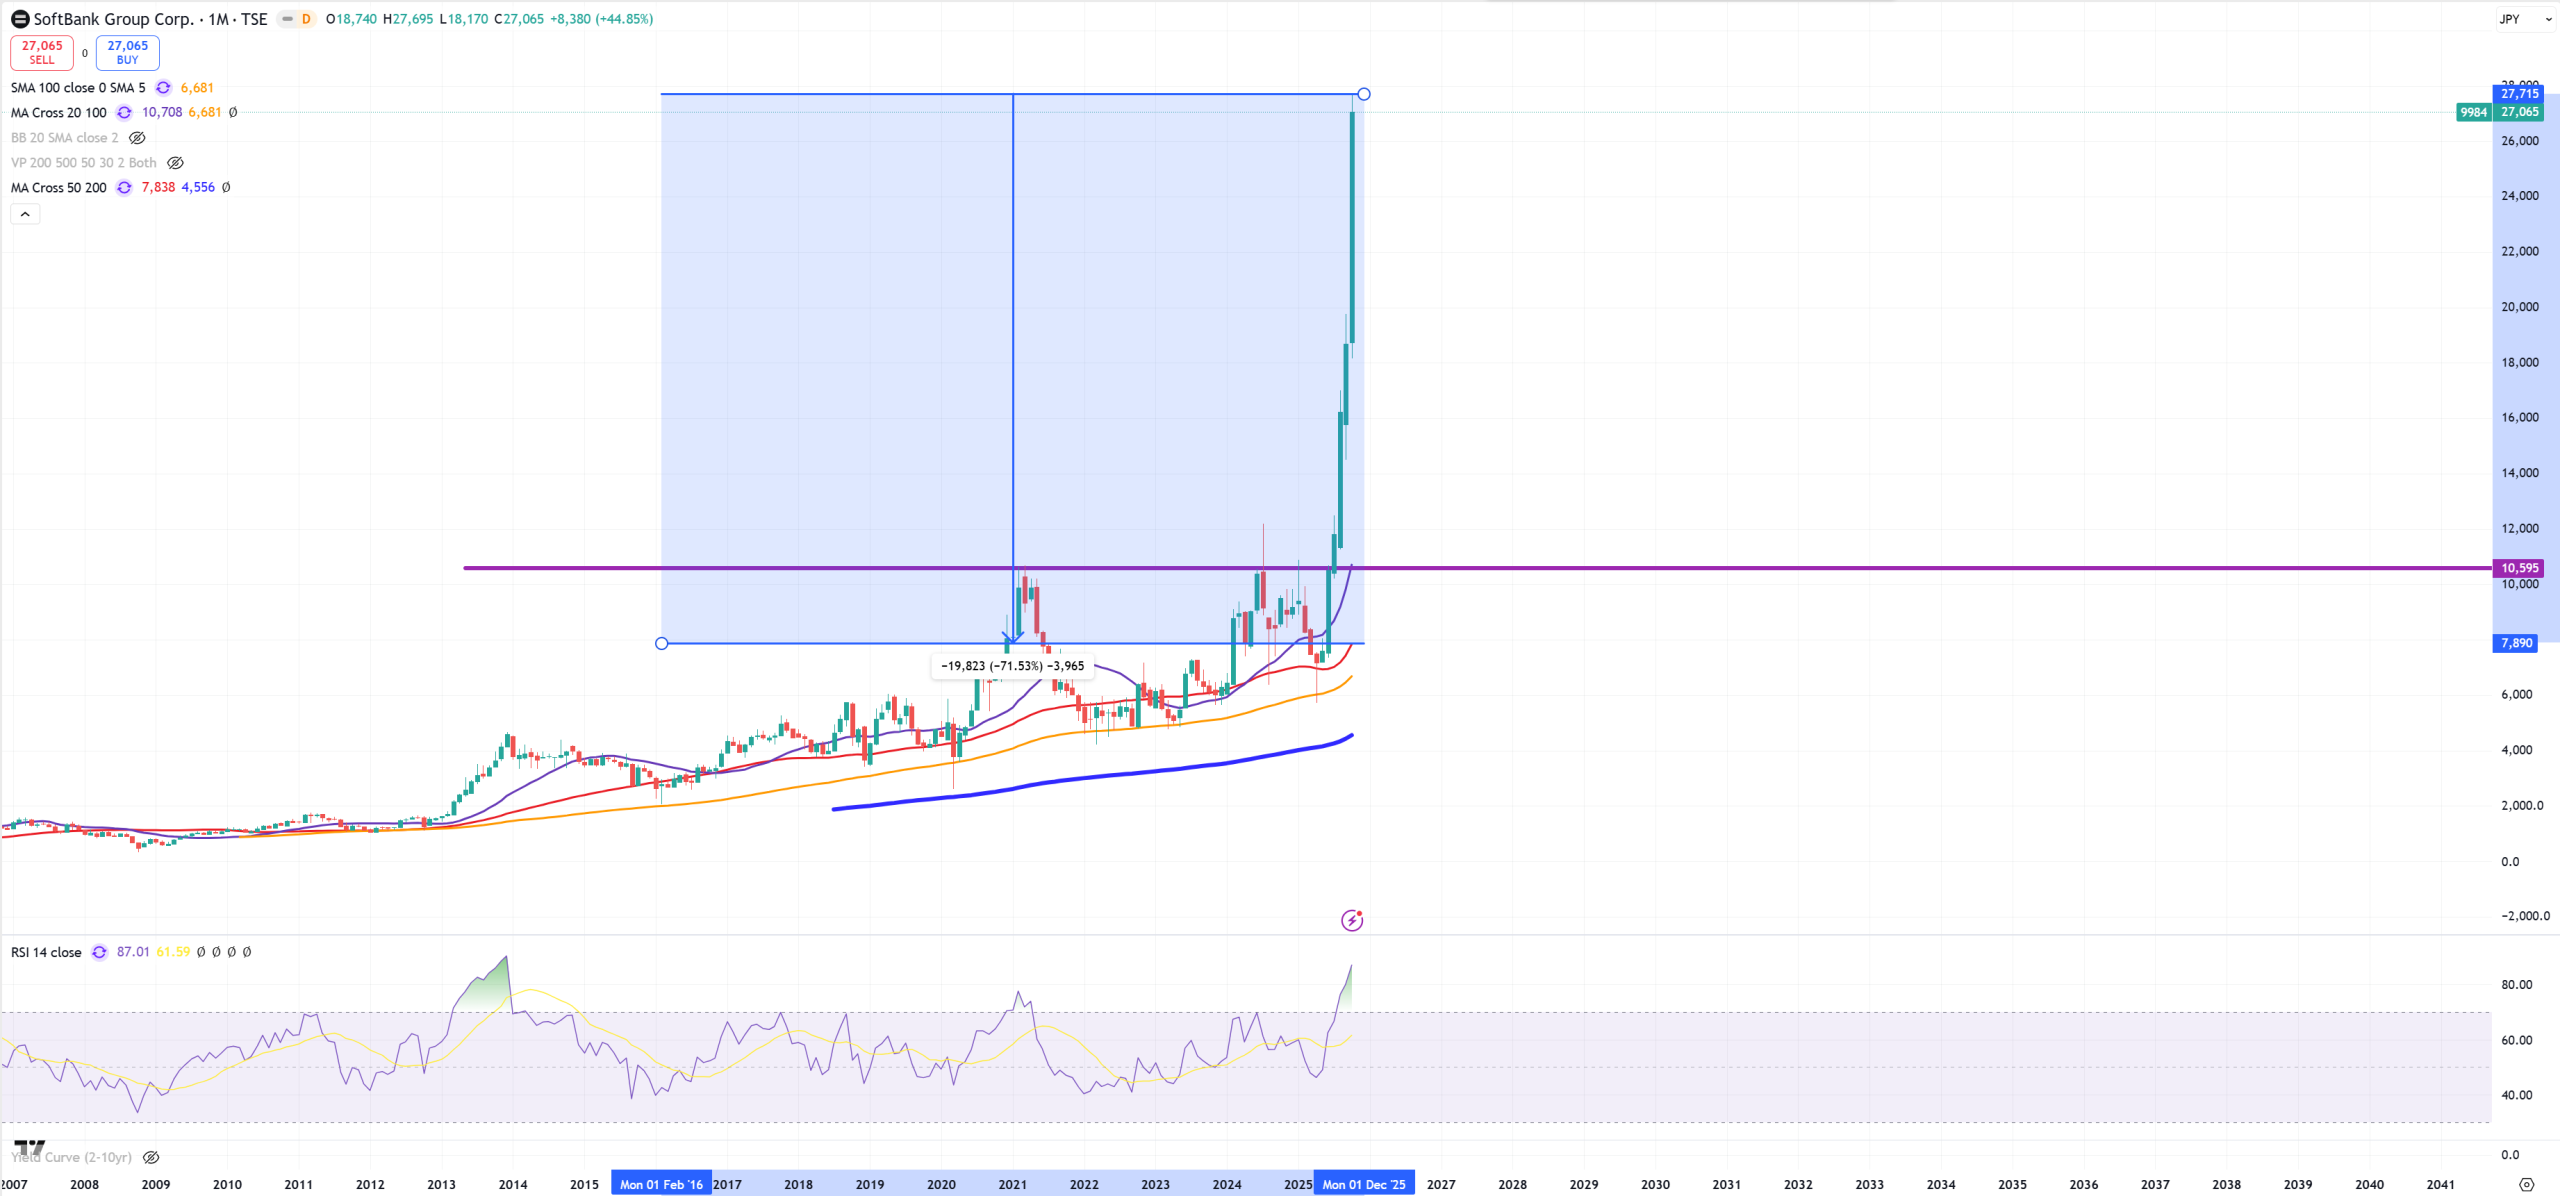
9984 – SOFTBANK and -72%. When bubble burst it burst as a mirror of its move up in most cases.
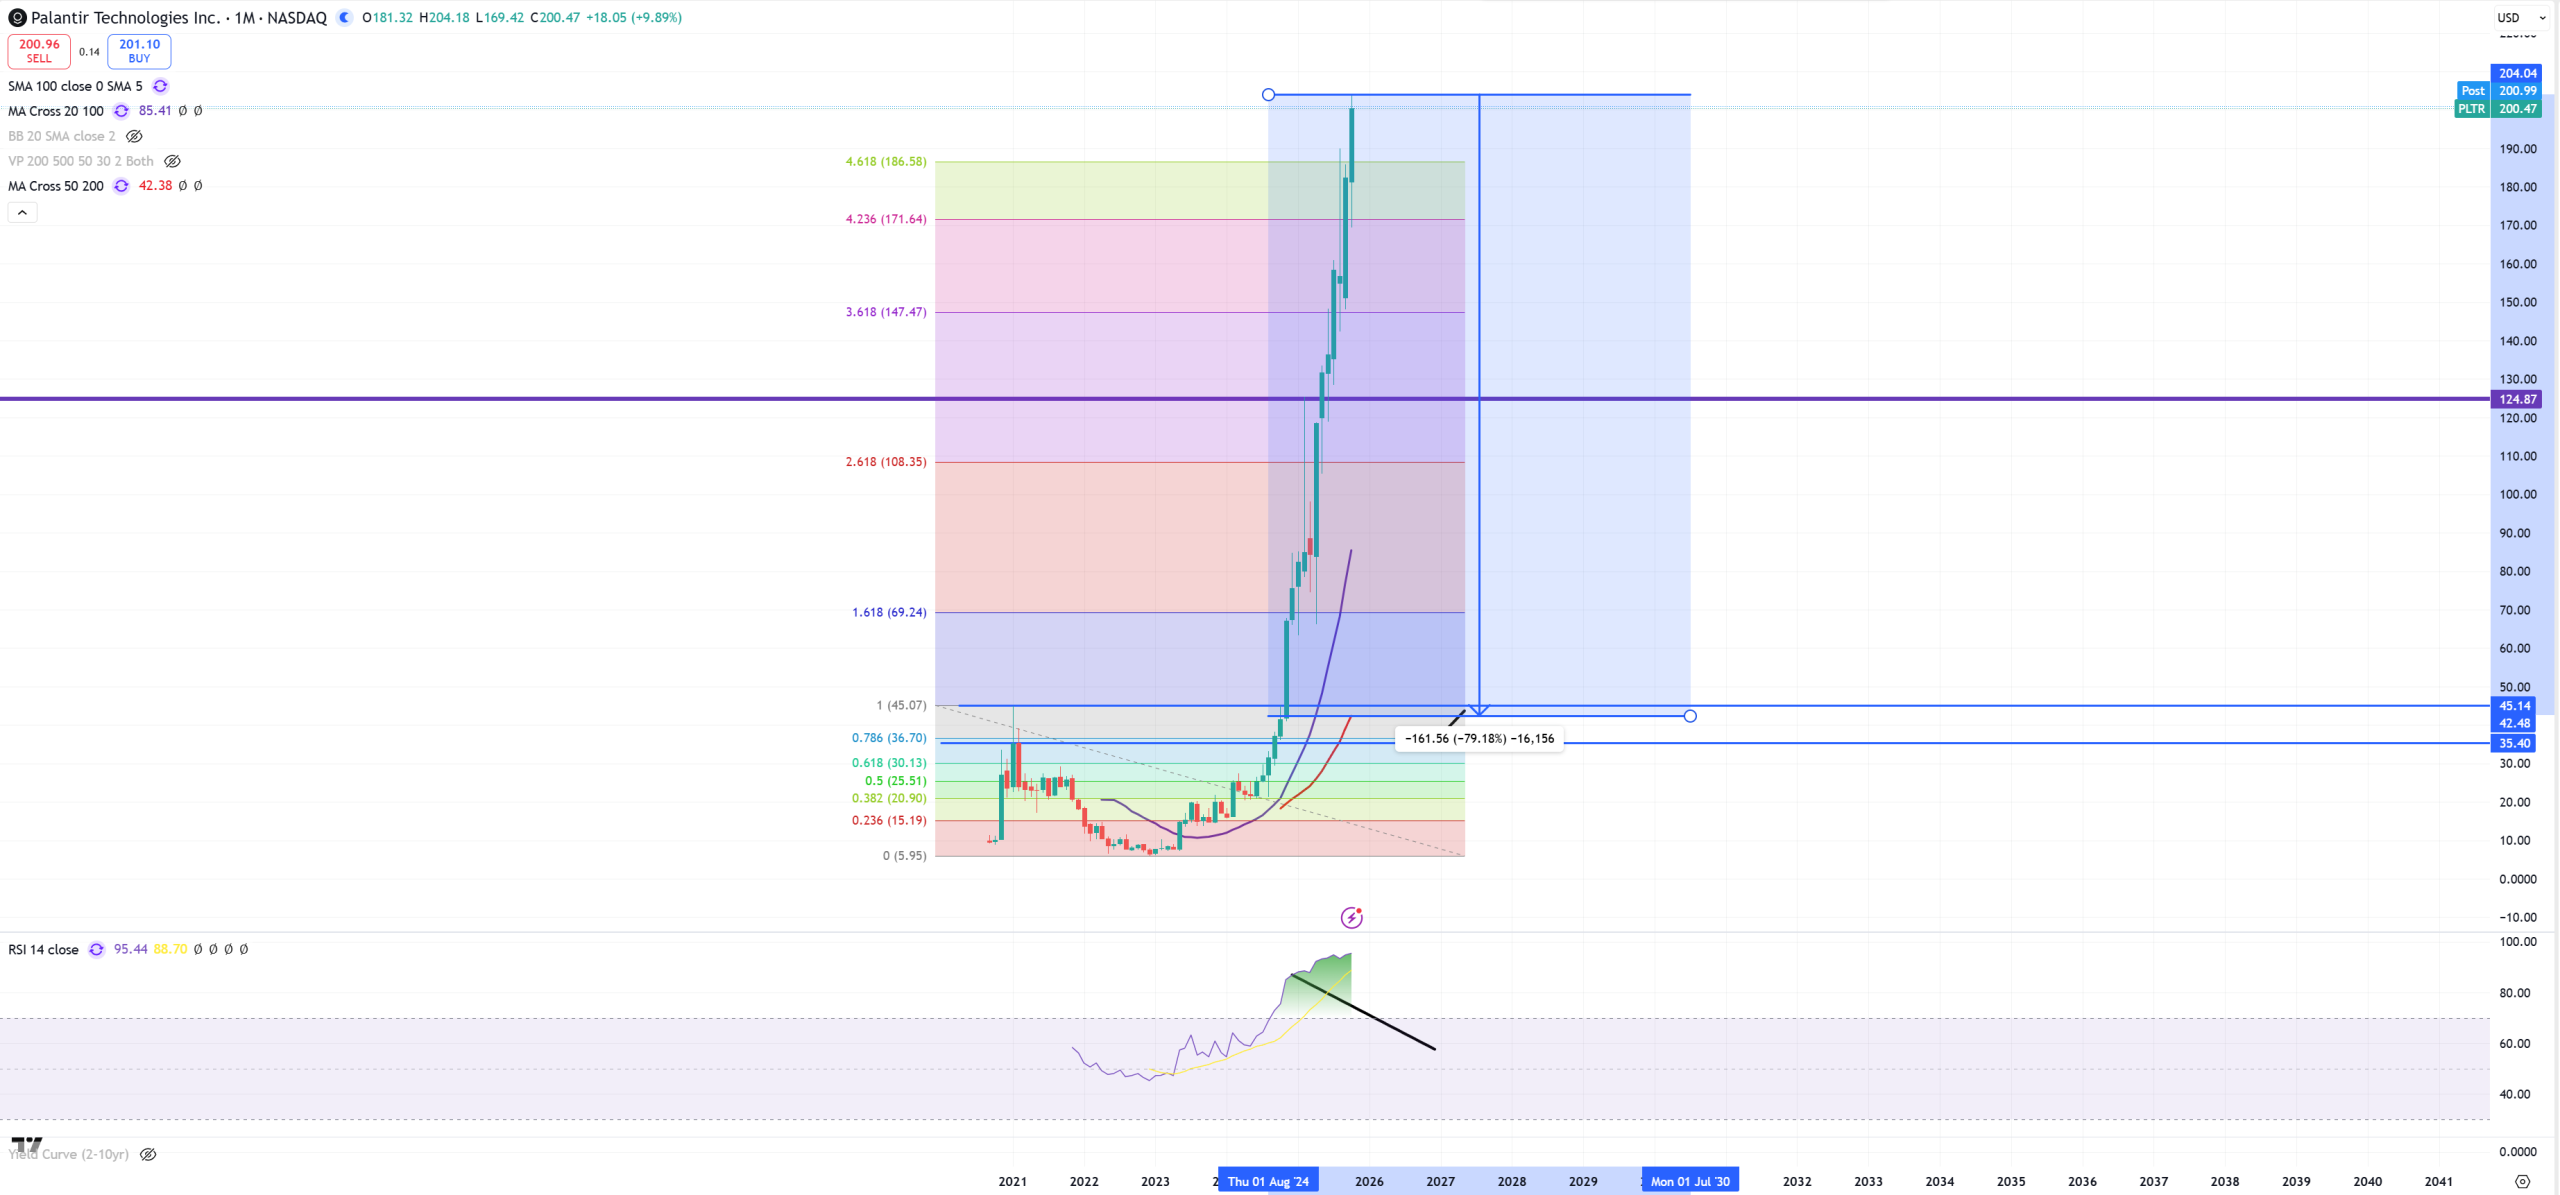
PLTR and almost -80% – this is so far the biggest hyper tulip bubble on earth, last 187 FIBO level gone, sky is the limit.
SNDK – SanDisk and -65% to (M)MA50
NVDA and -65% to (M)MA50
WDC – Western Digital and -71%
STX – Seagate and -66%
OKLO – Oklo is now the double-super-tulip bubble with -90% target to (M)MA50
Covering tech and AI/SOX stocks don’t make any sense, as most of them are trying to break. I’ll just use couple of them to give a general situation which is great, with couple examples which are well known but technical charts point for troubles.
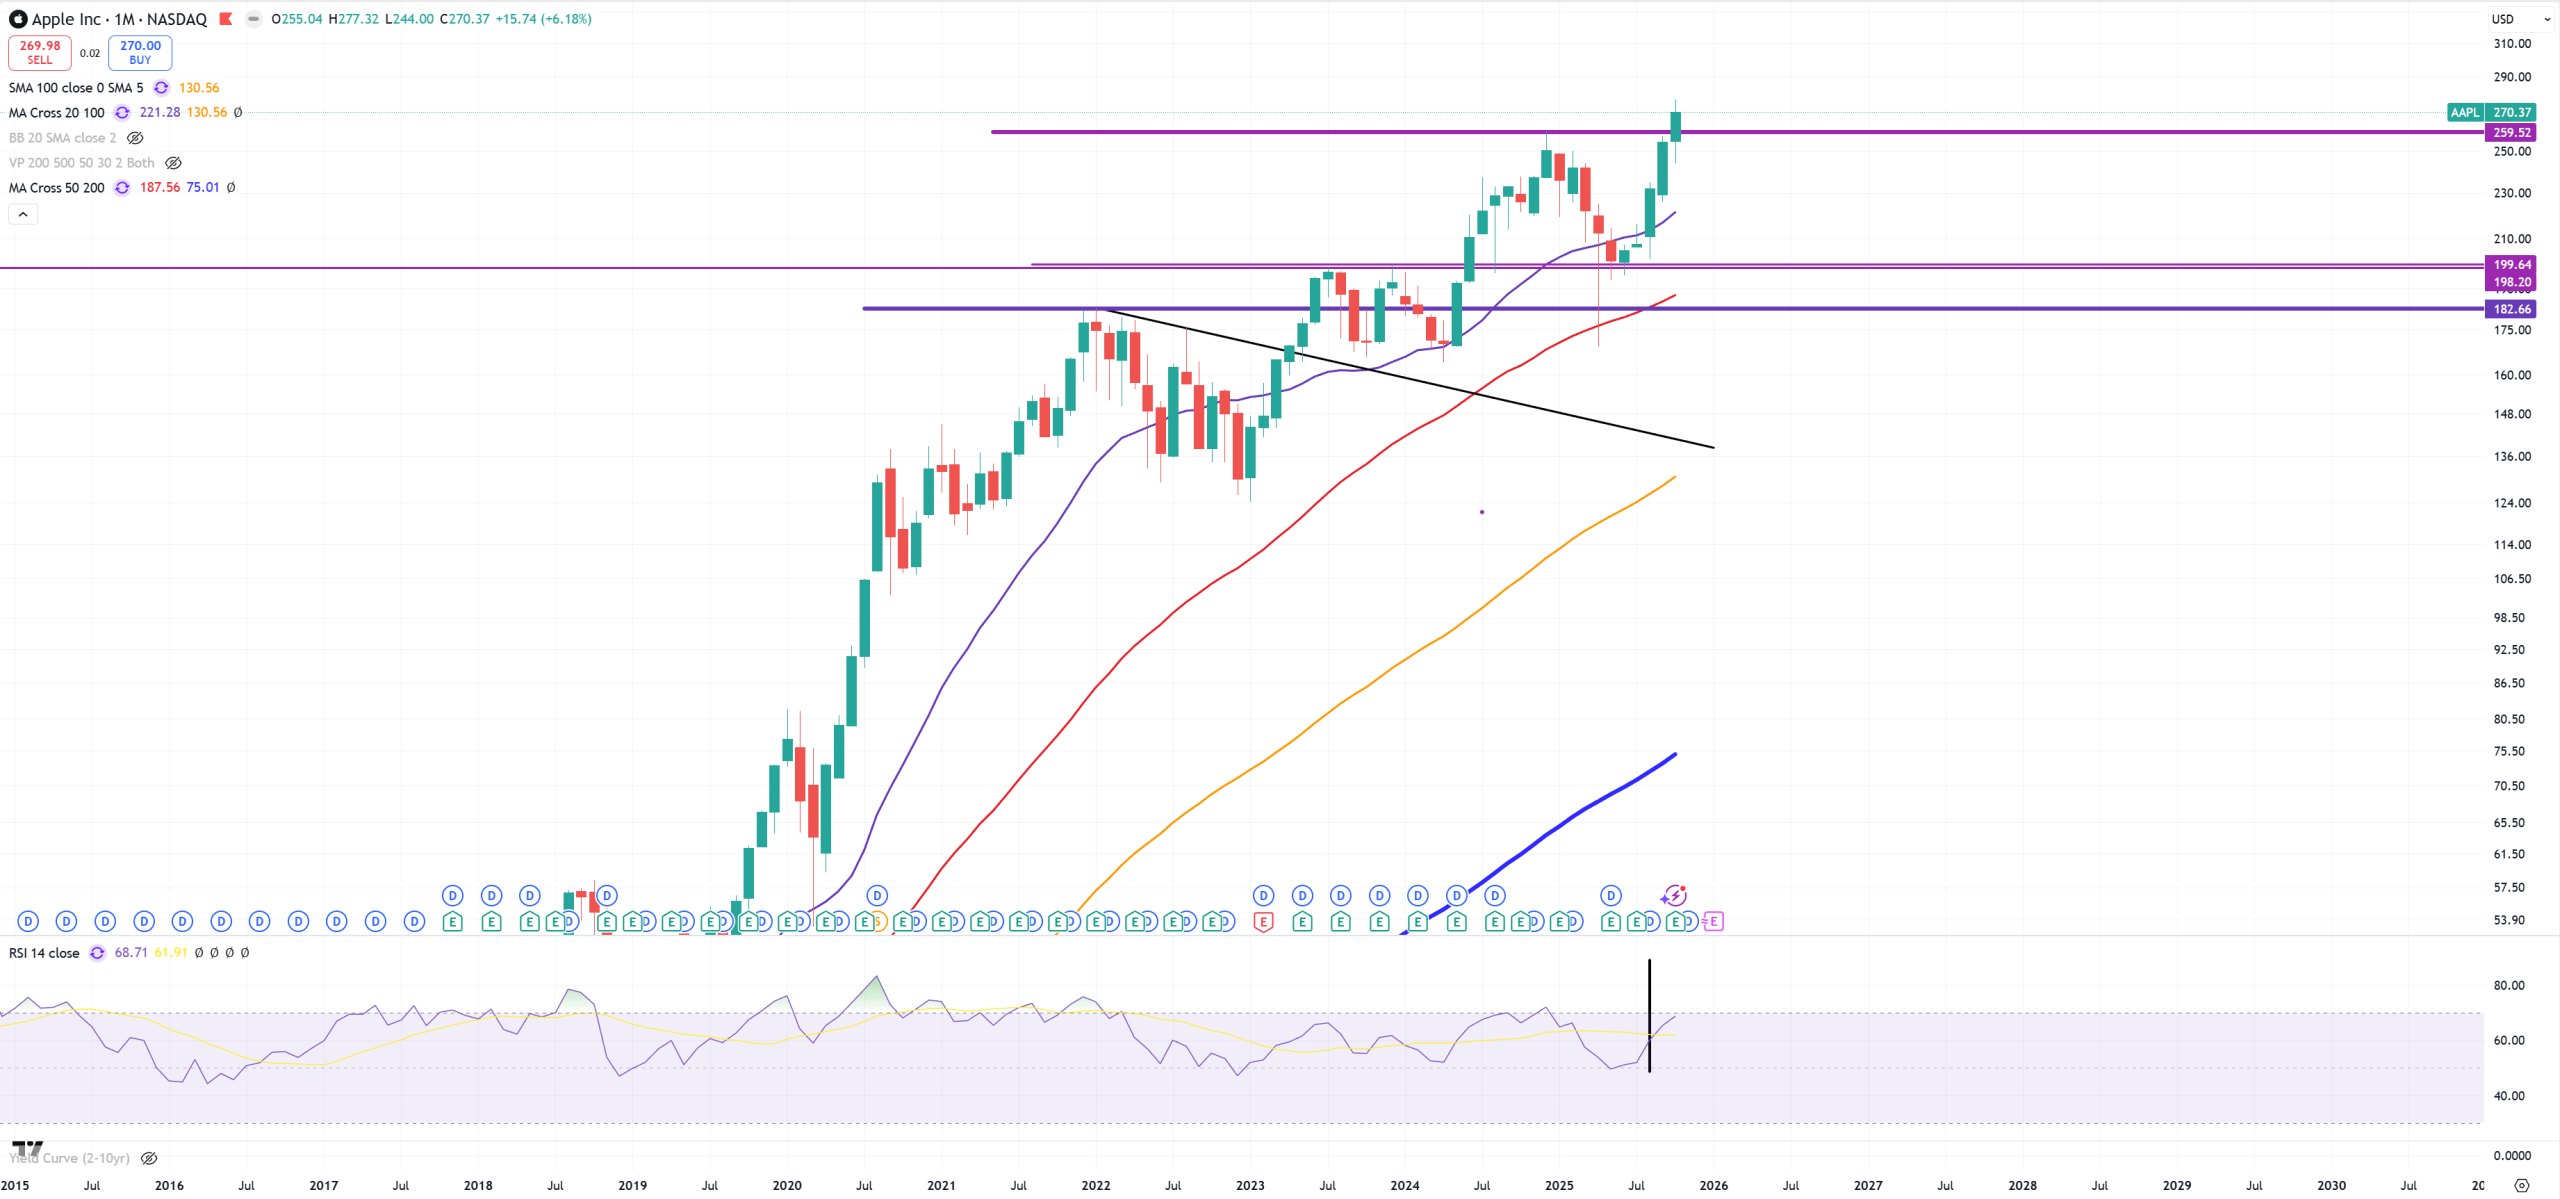
AAPL – Apple
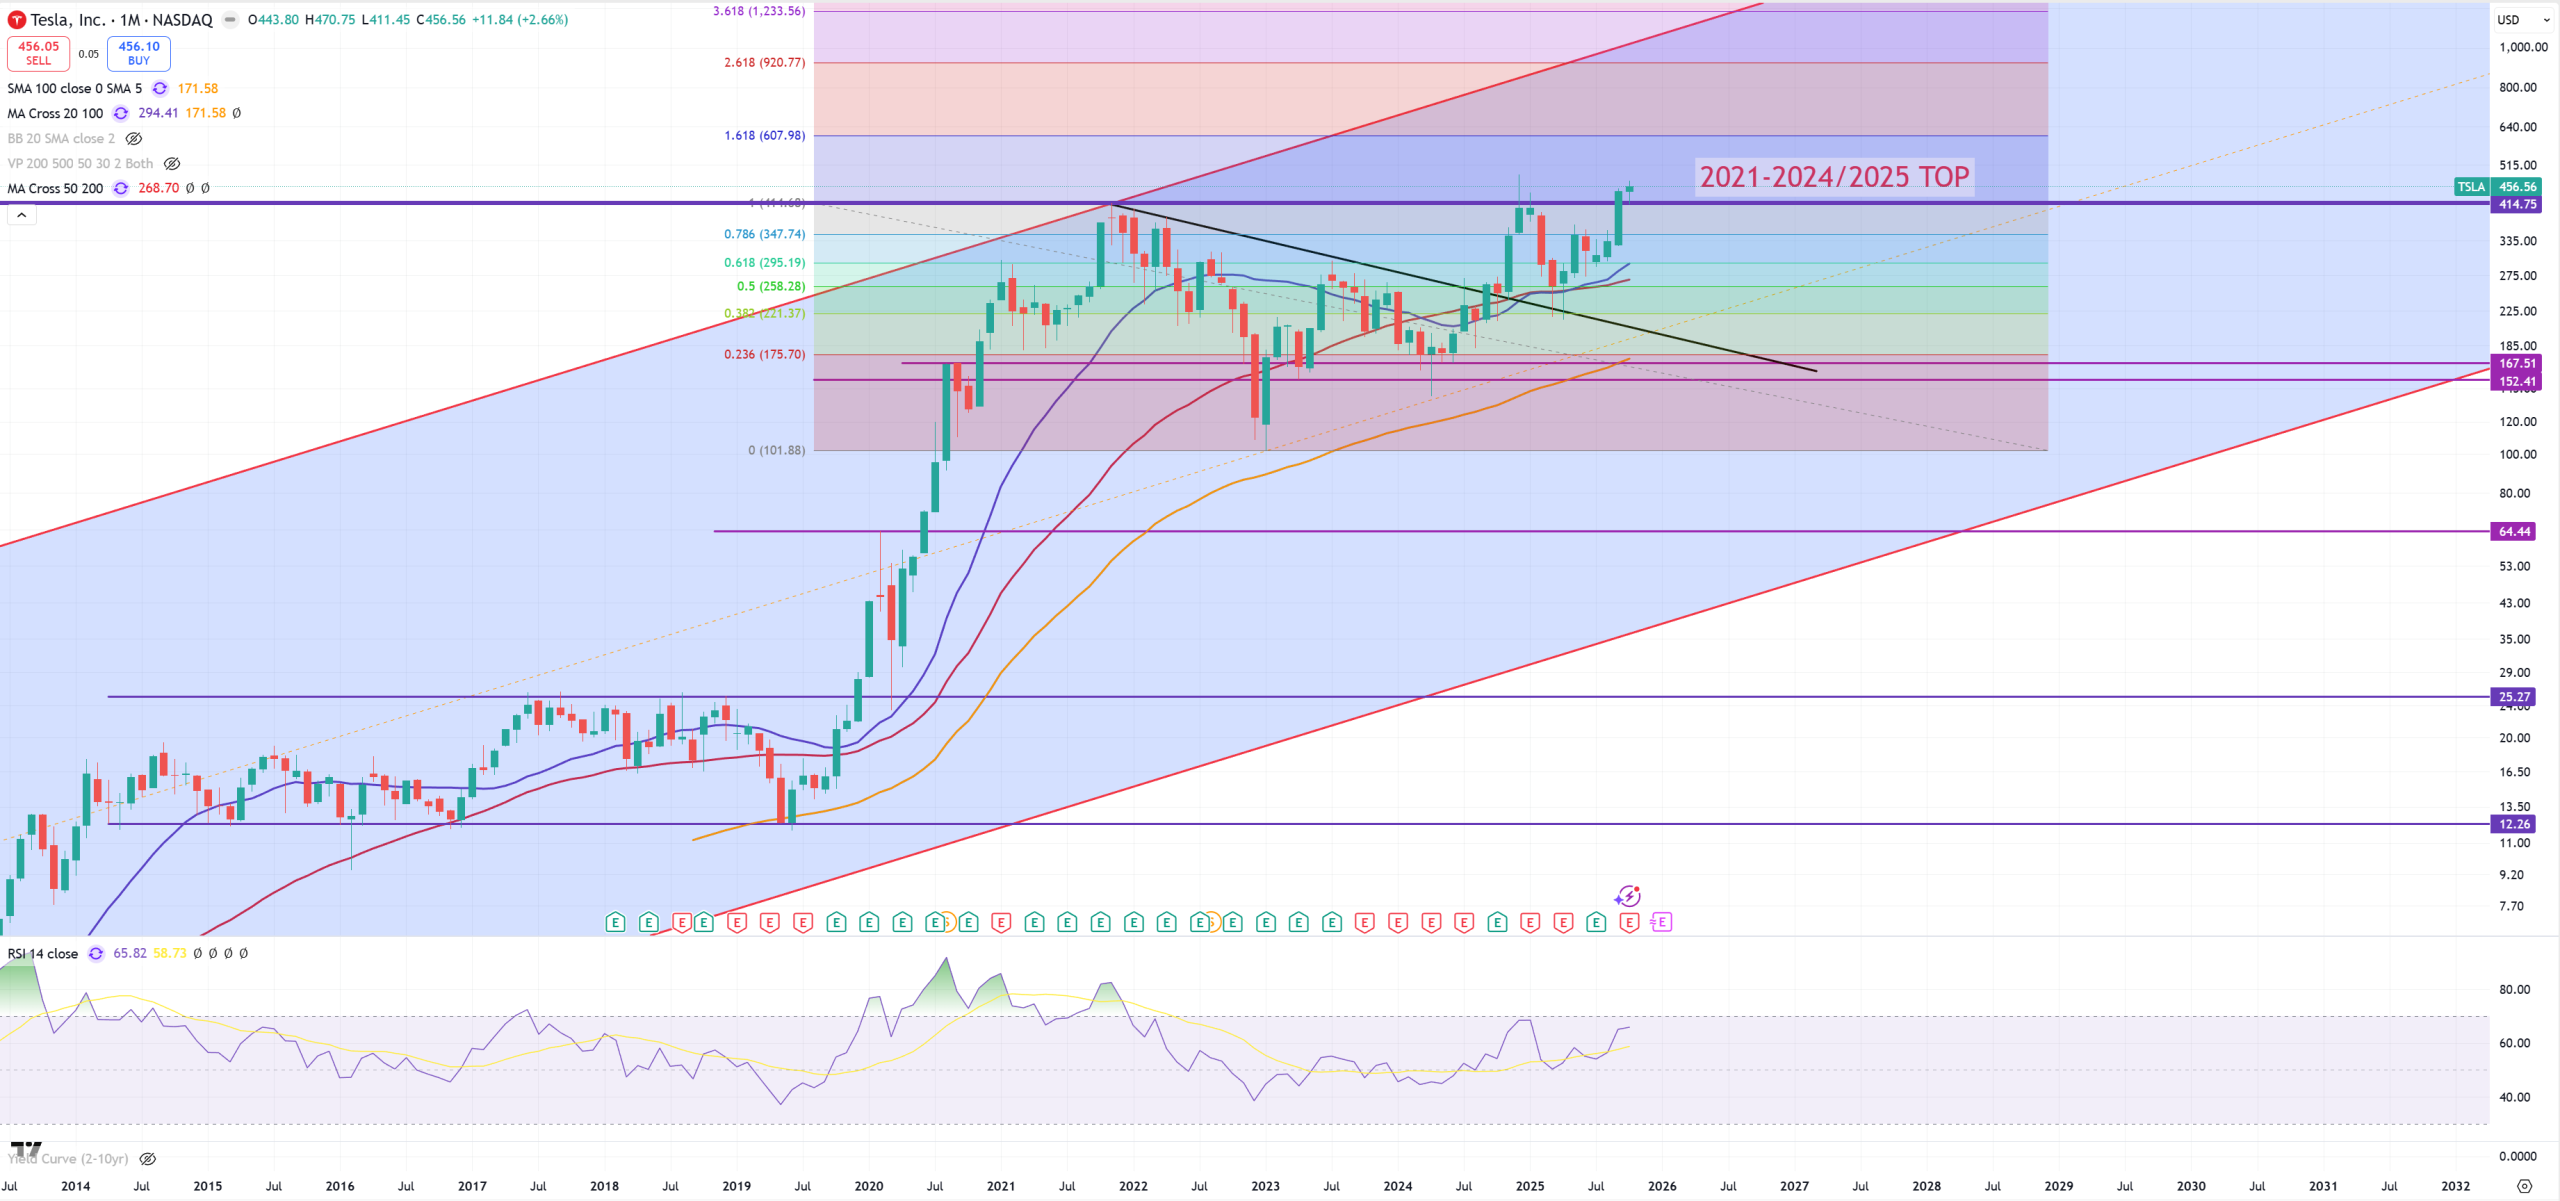
TSLA – Tesla
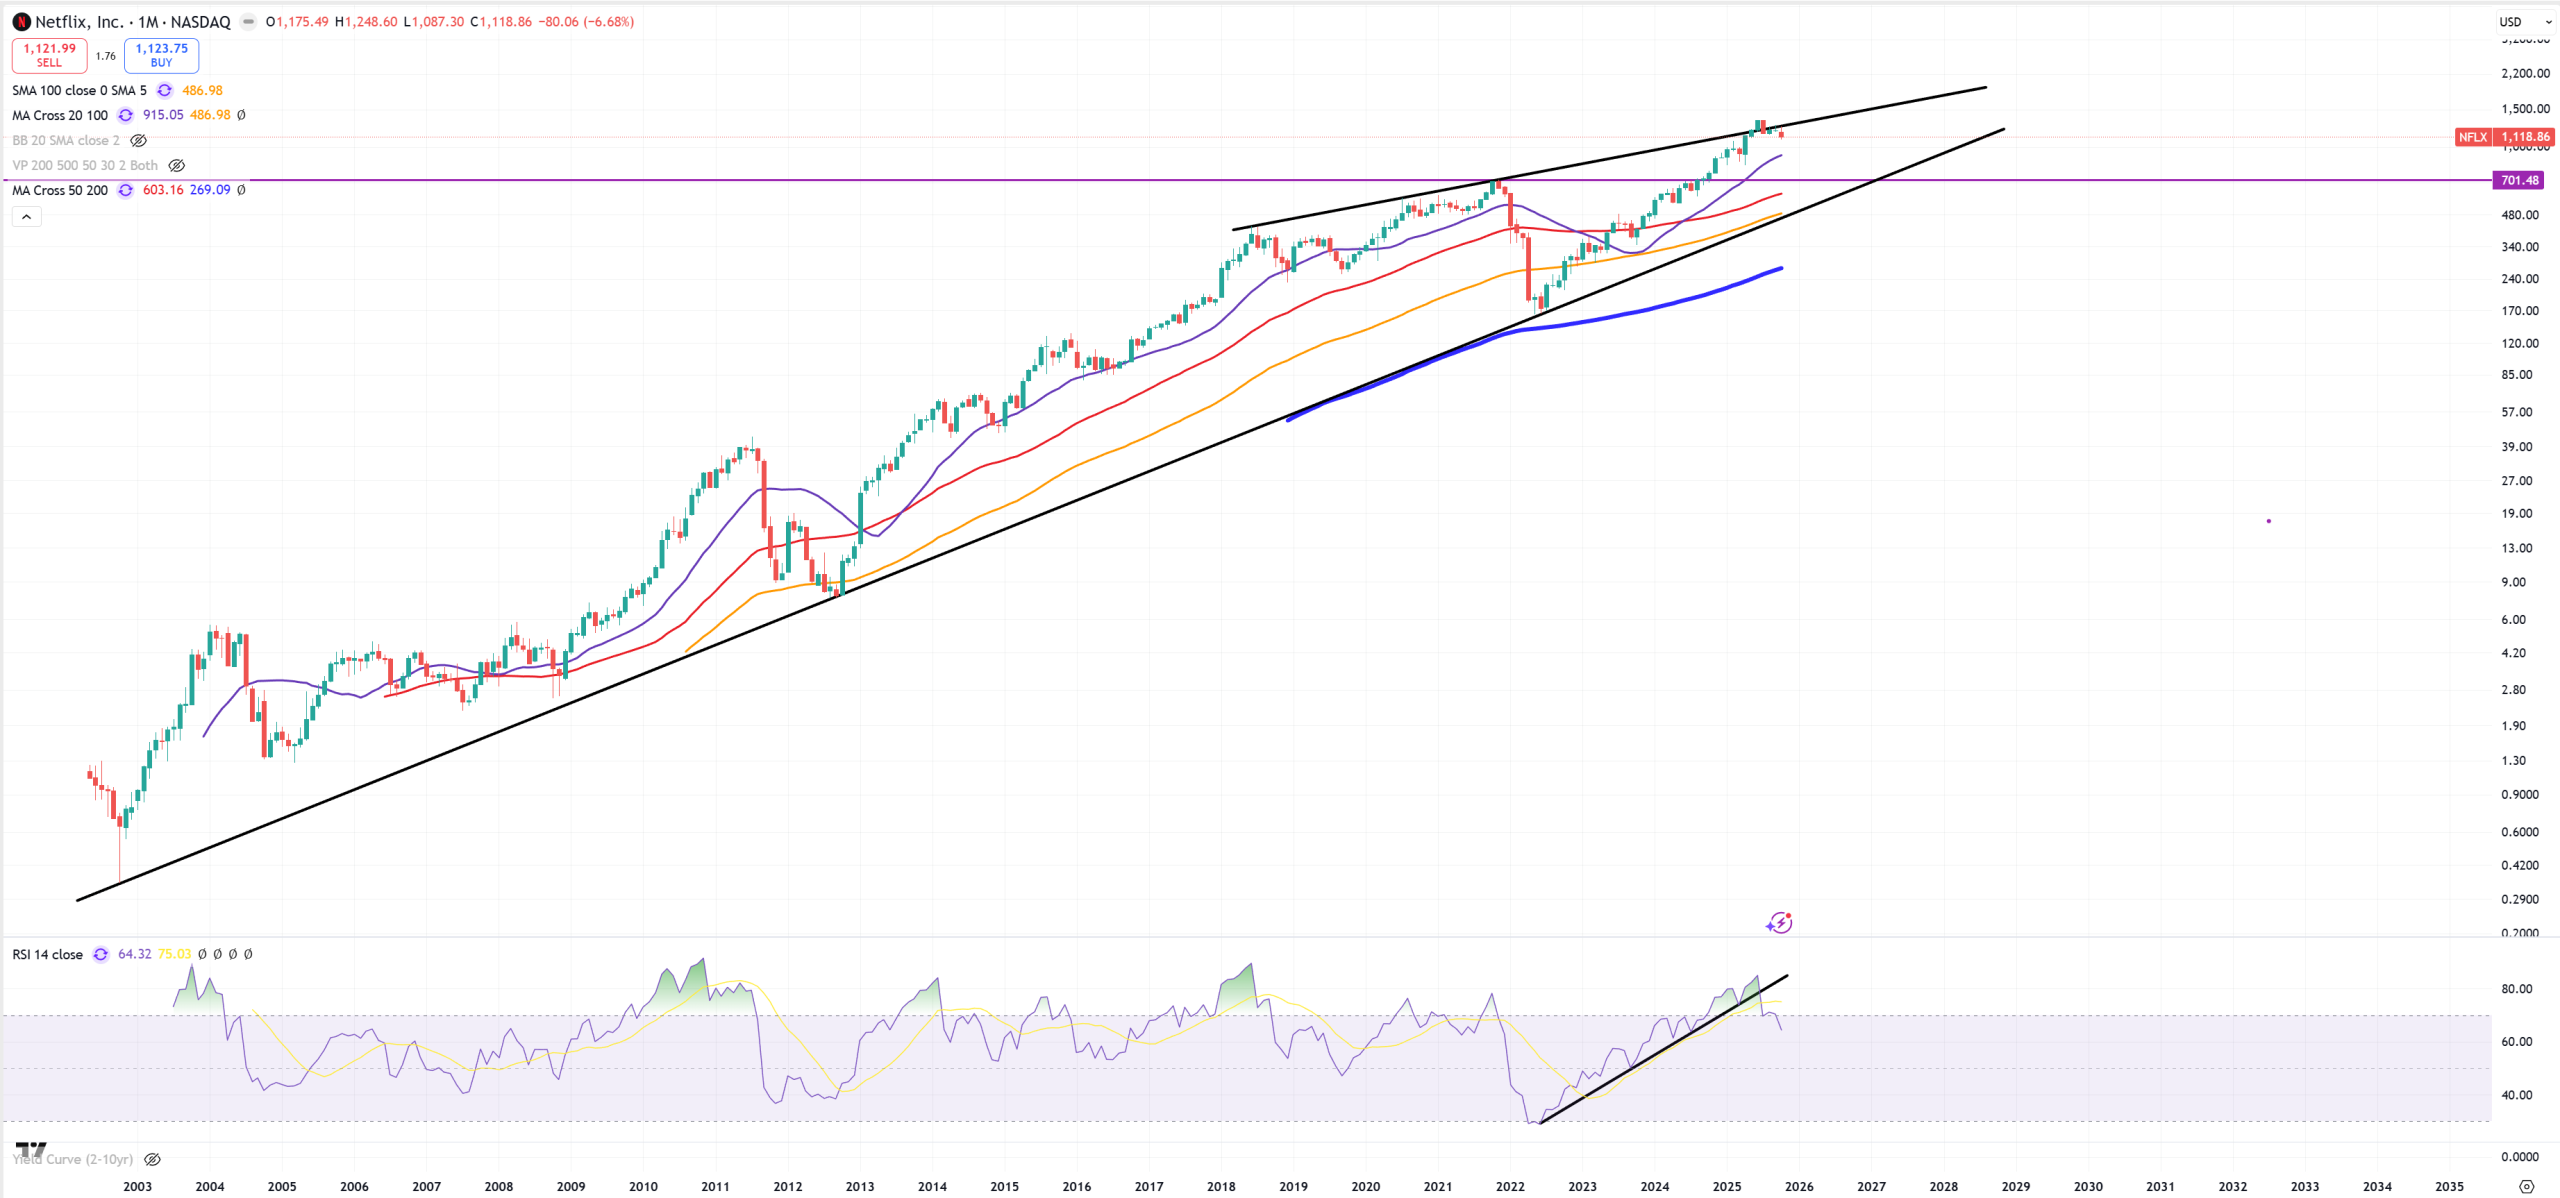
NFLX – from the other hand Netflix has really good bottom trend from 2003 and upper megaphone.
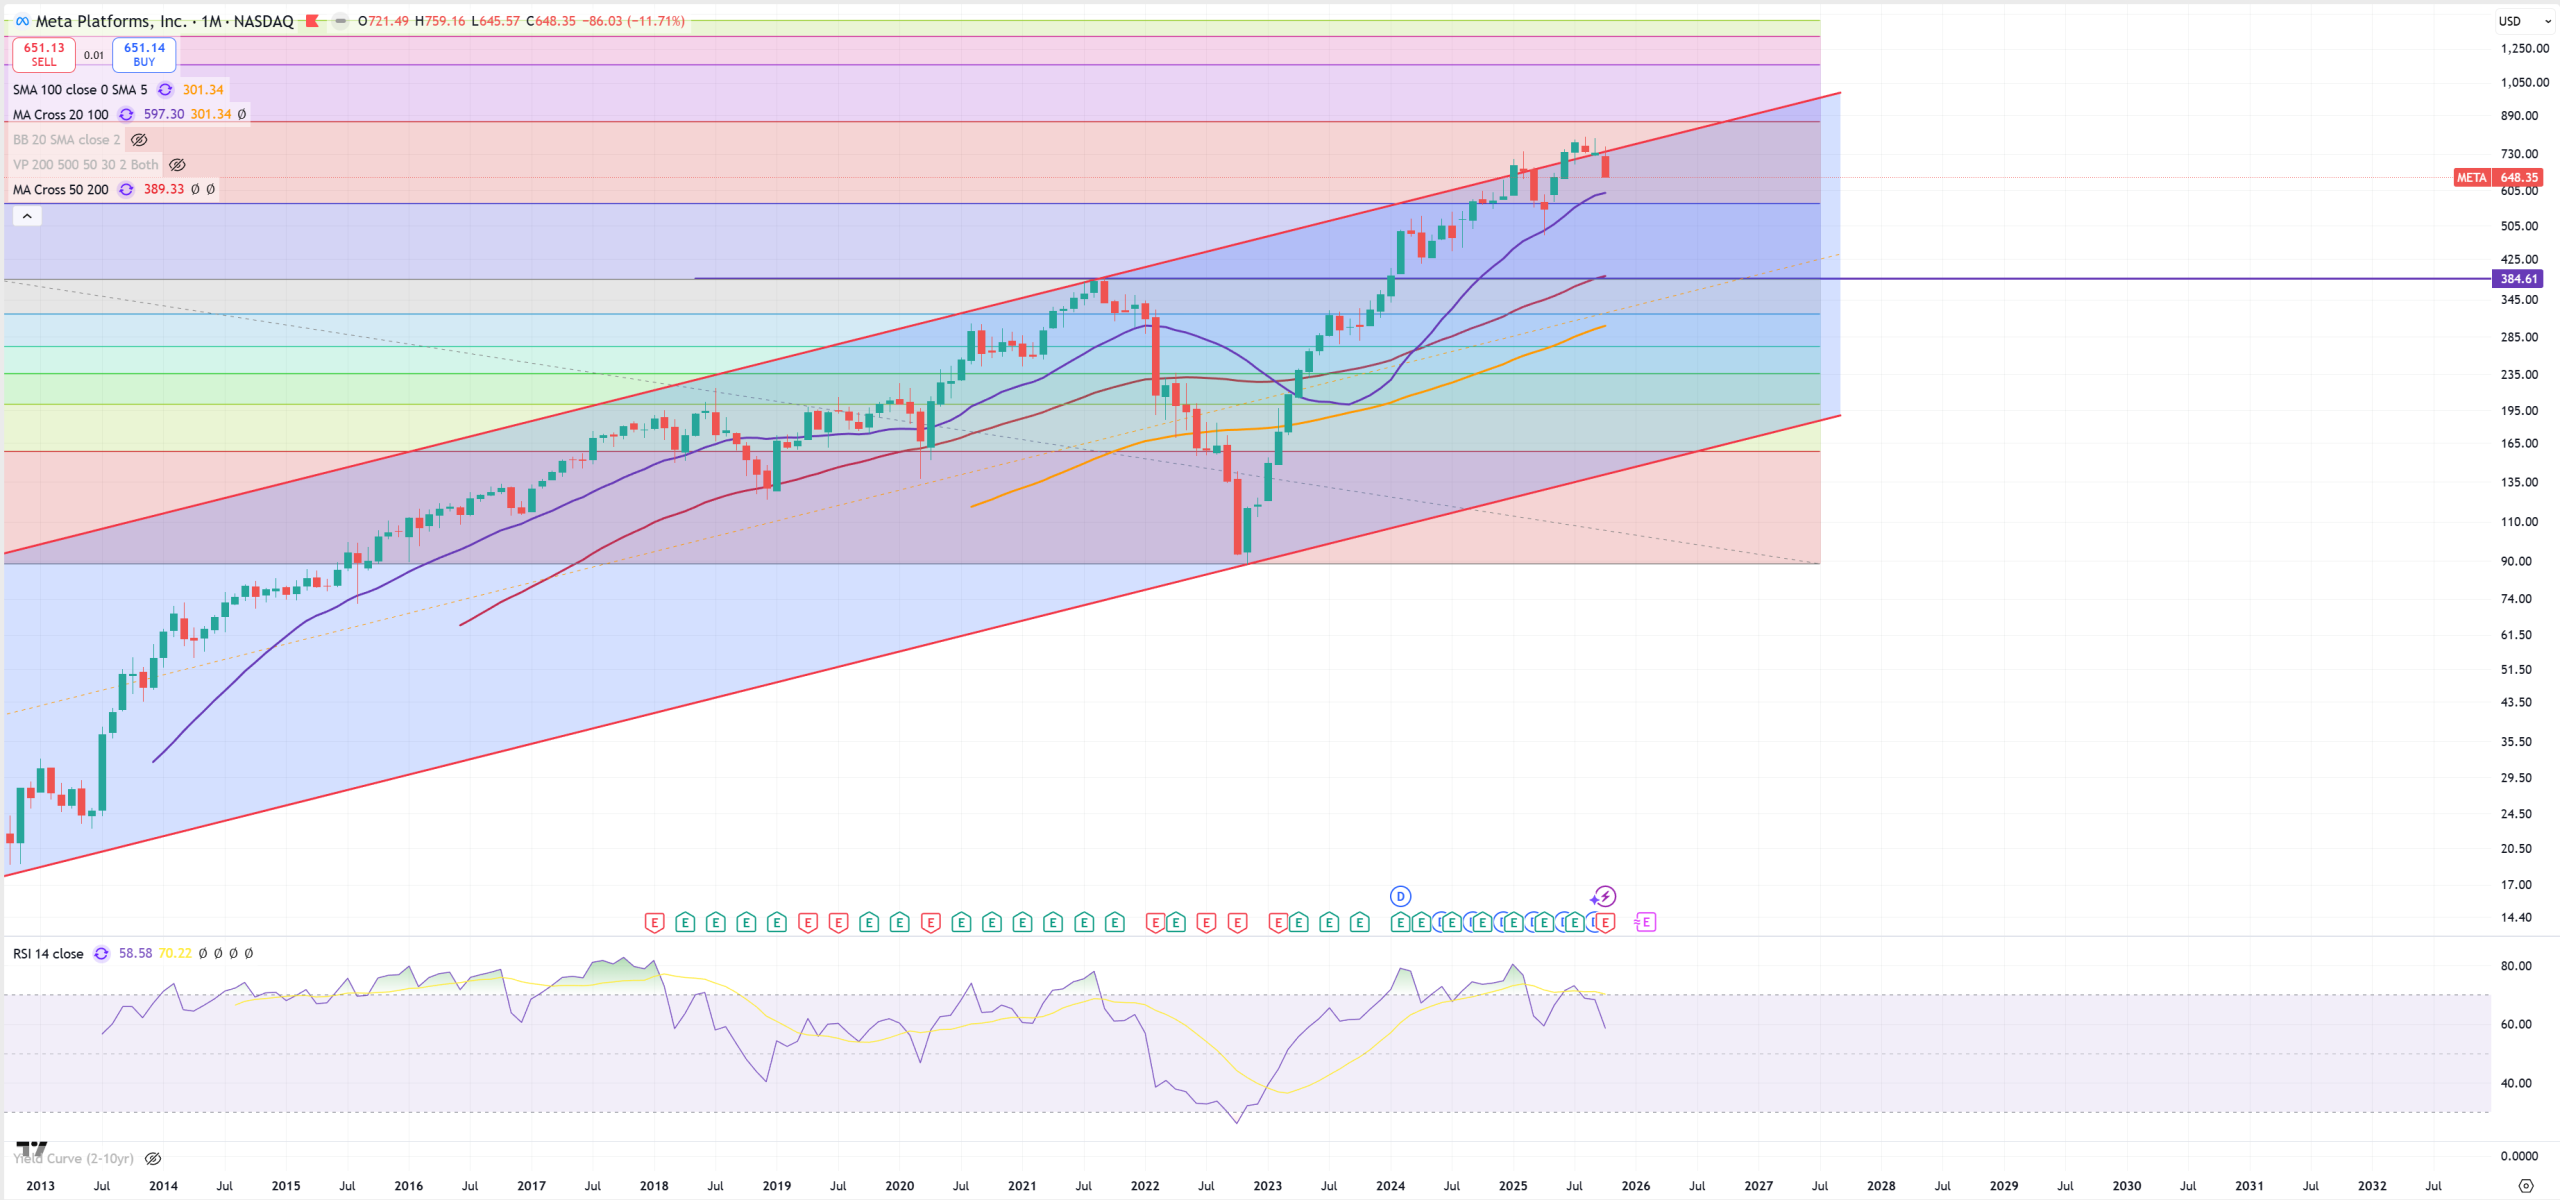
META
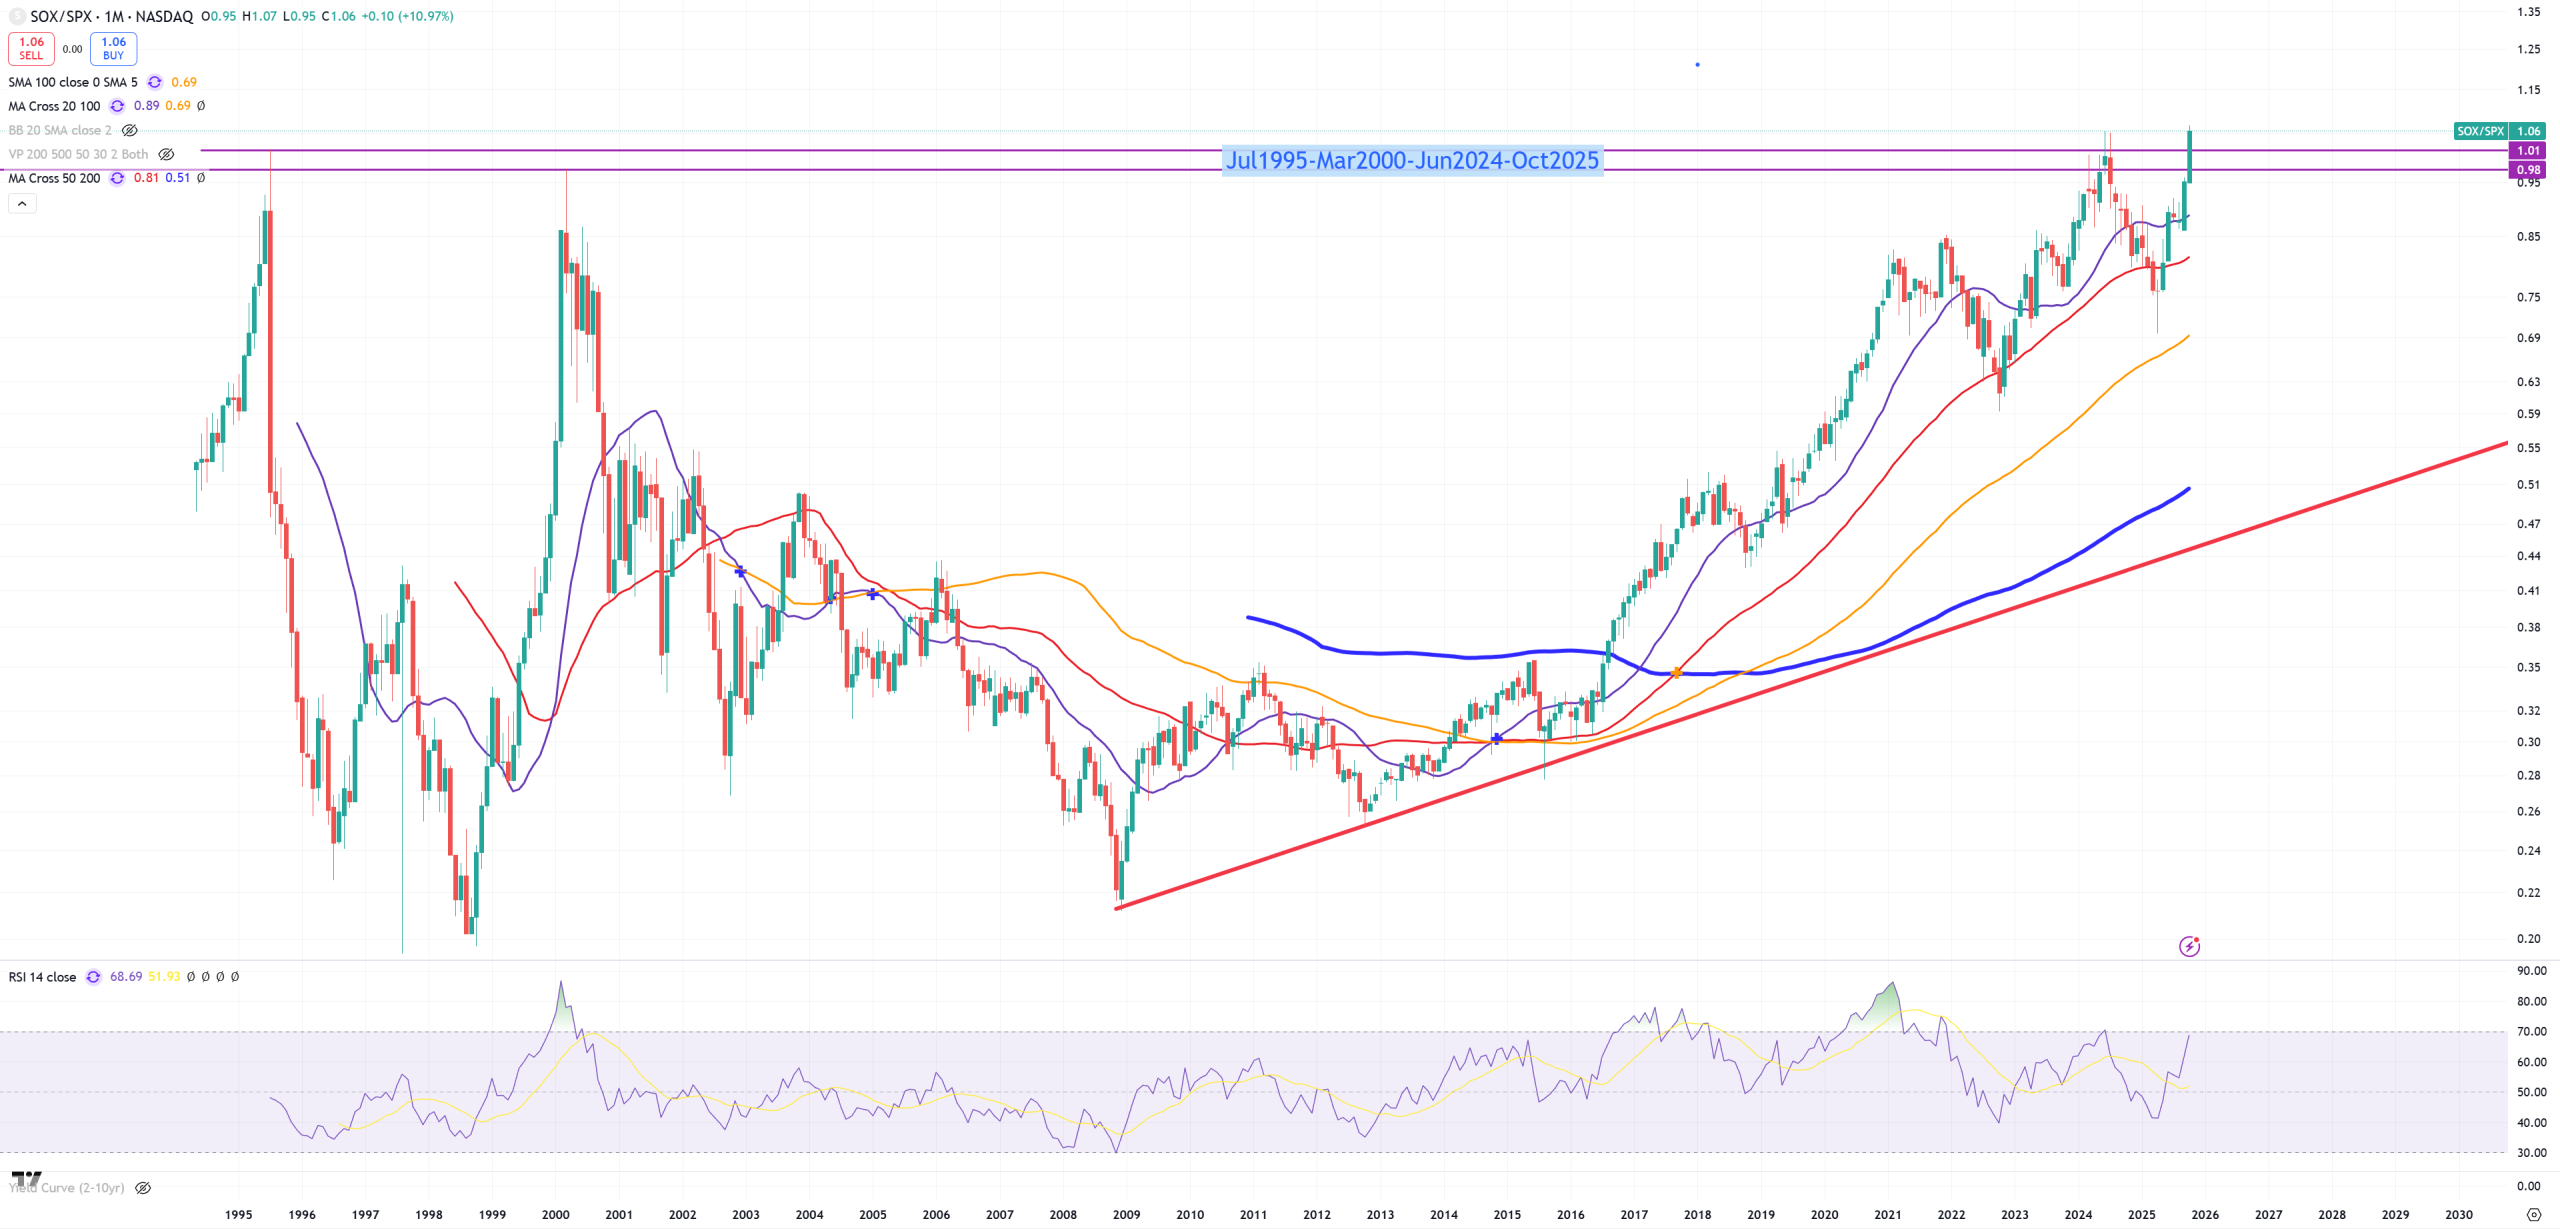
SOX/SPX ratio – I don’t believe in such breaks, and it’ll be a good test once US03MY breaks (M)MA50.
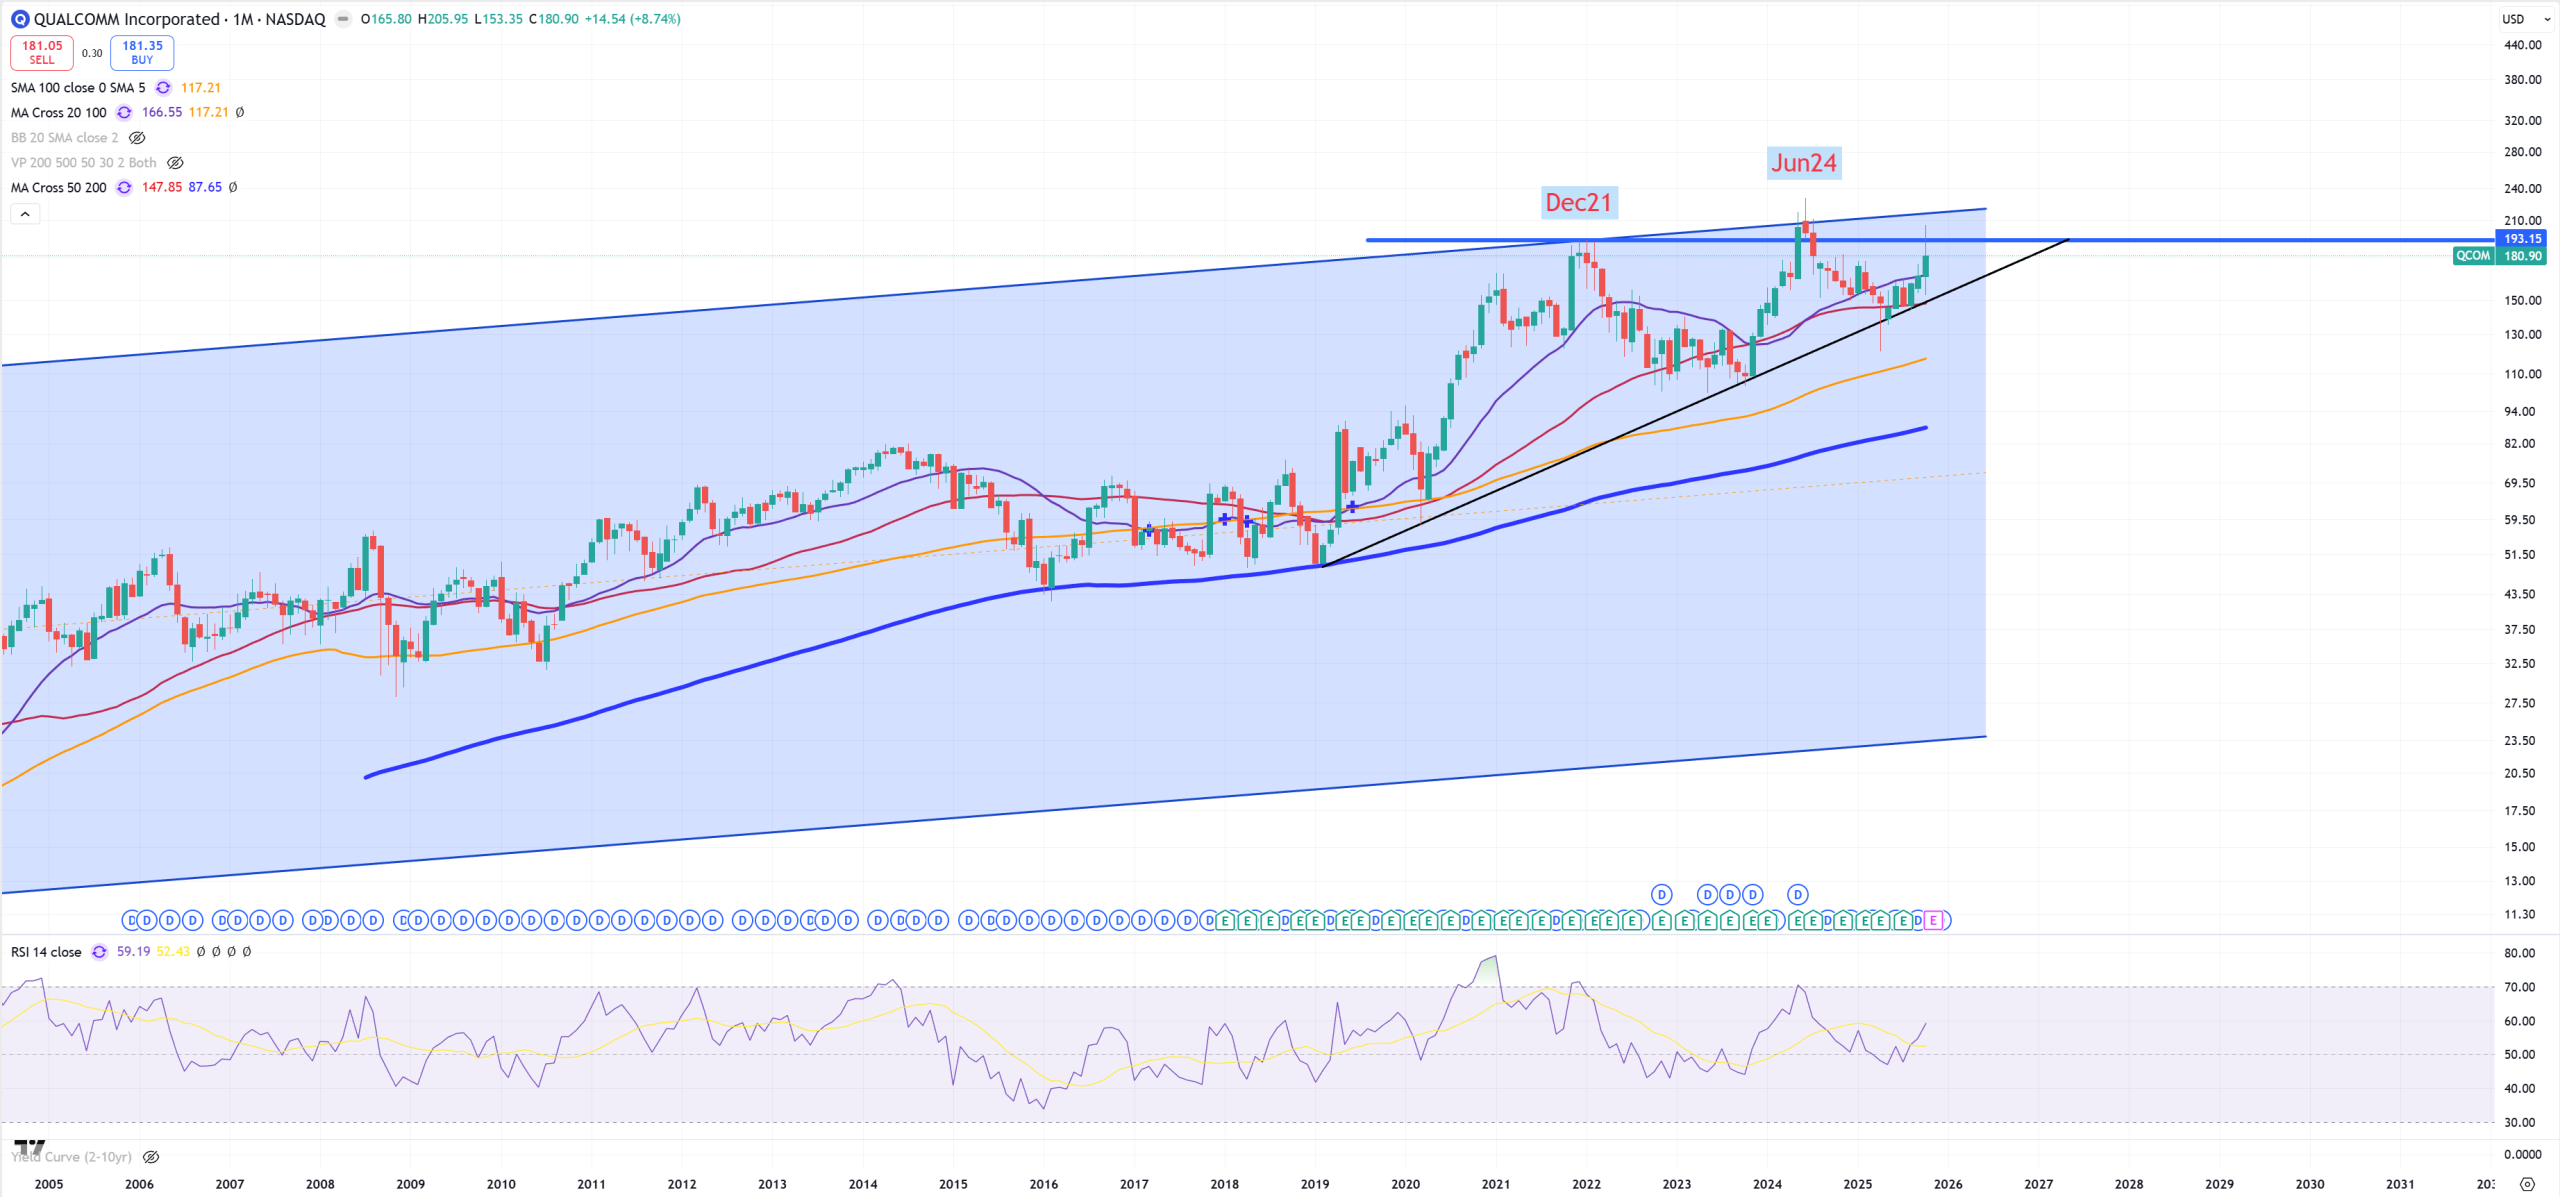
QCOM – QualComm has problems to pass 2021 peak
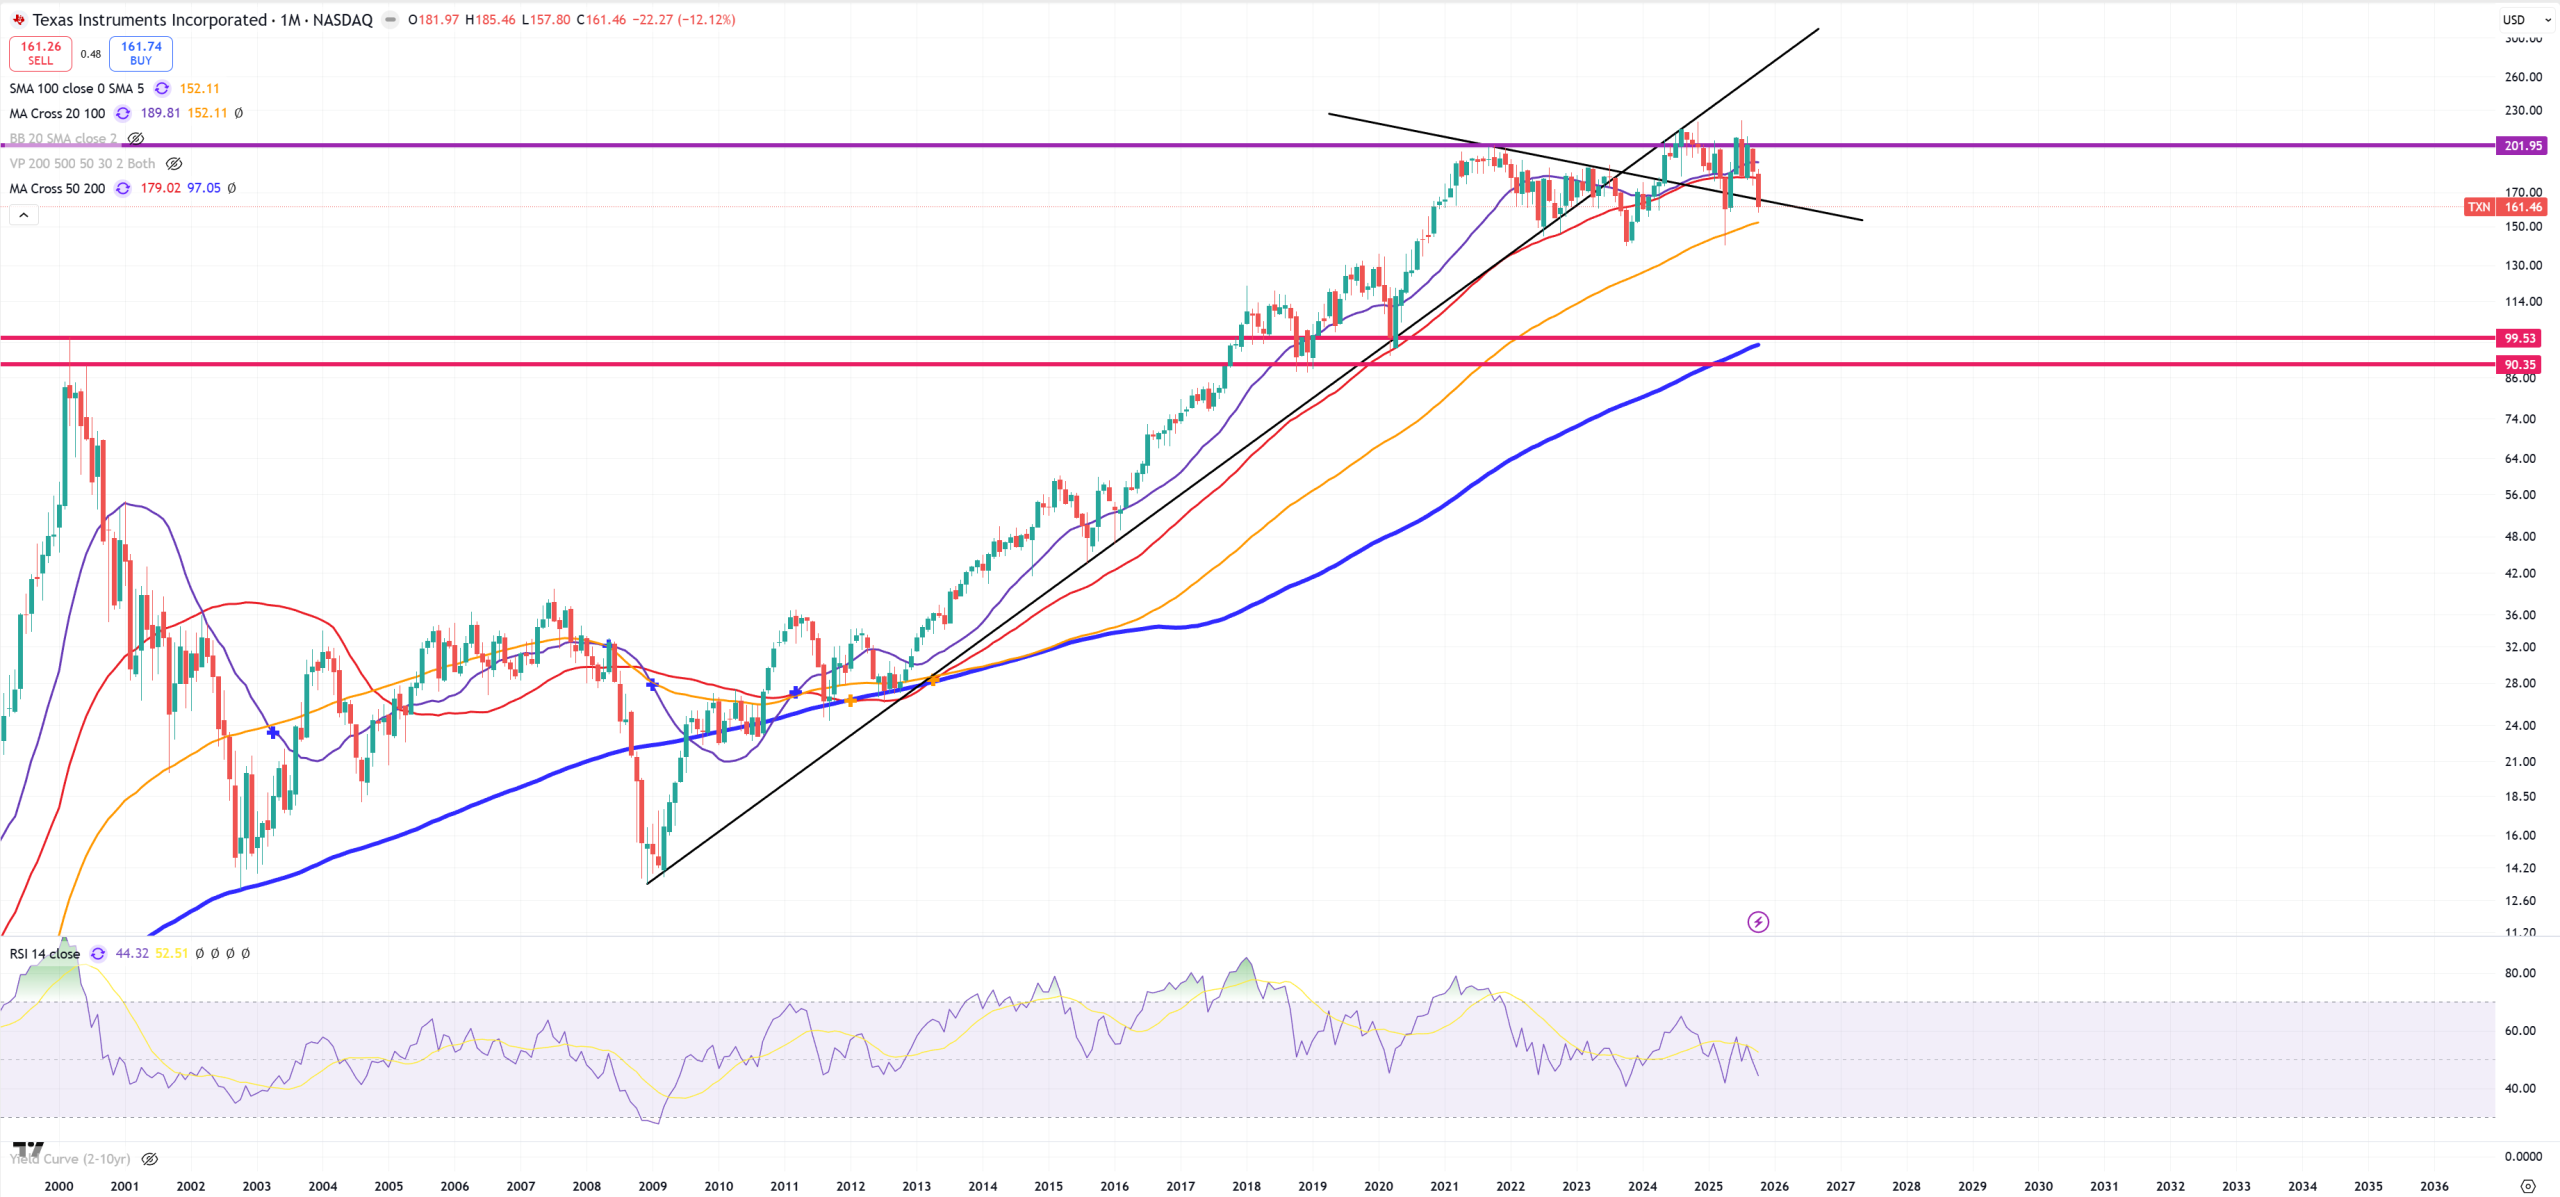
TXN – Texas Instruments – super bearish
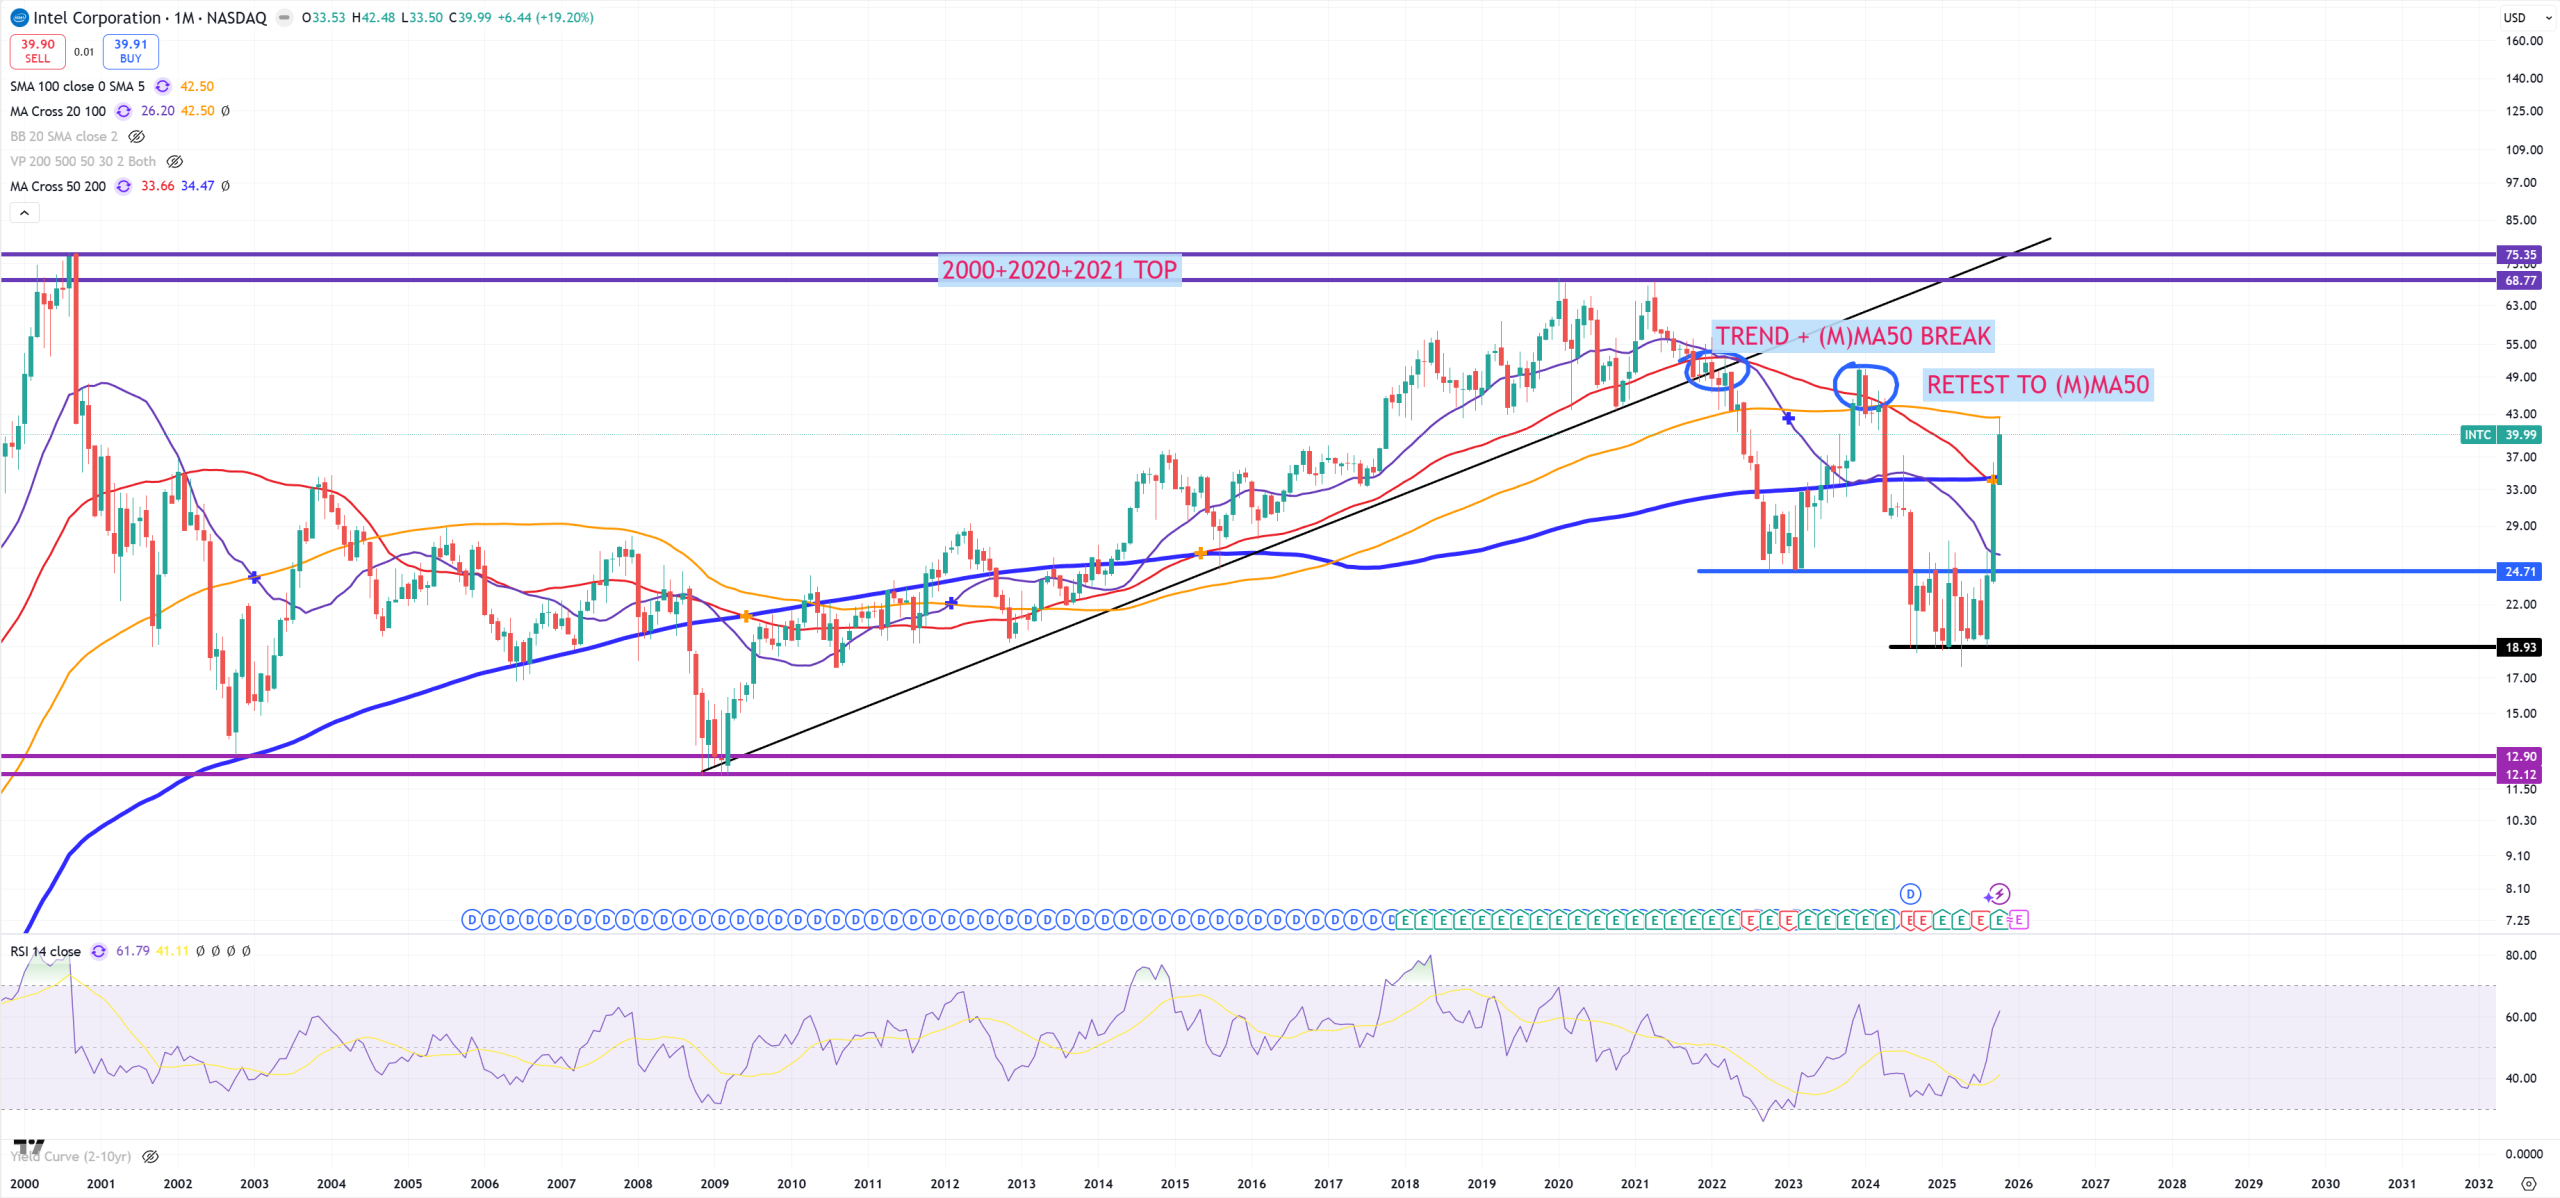
INTC – Intel and its last moment (M)MA100 typical bull trap last level. Breaking it = 75$
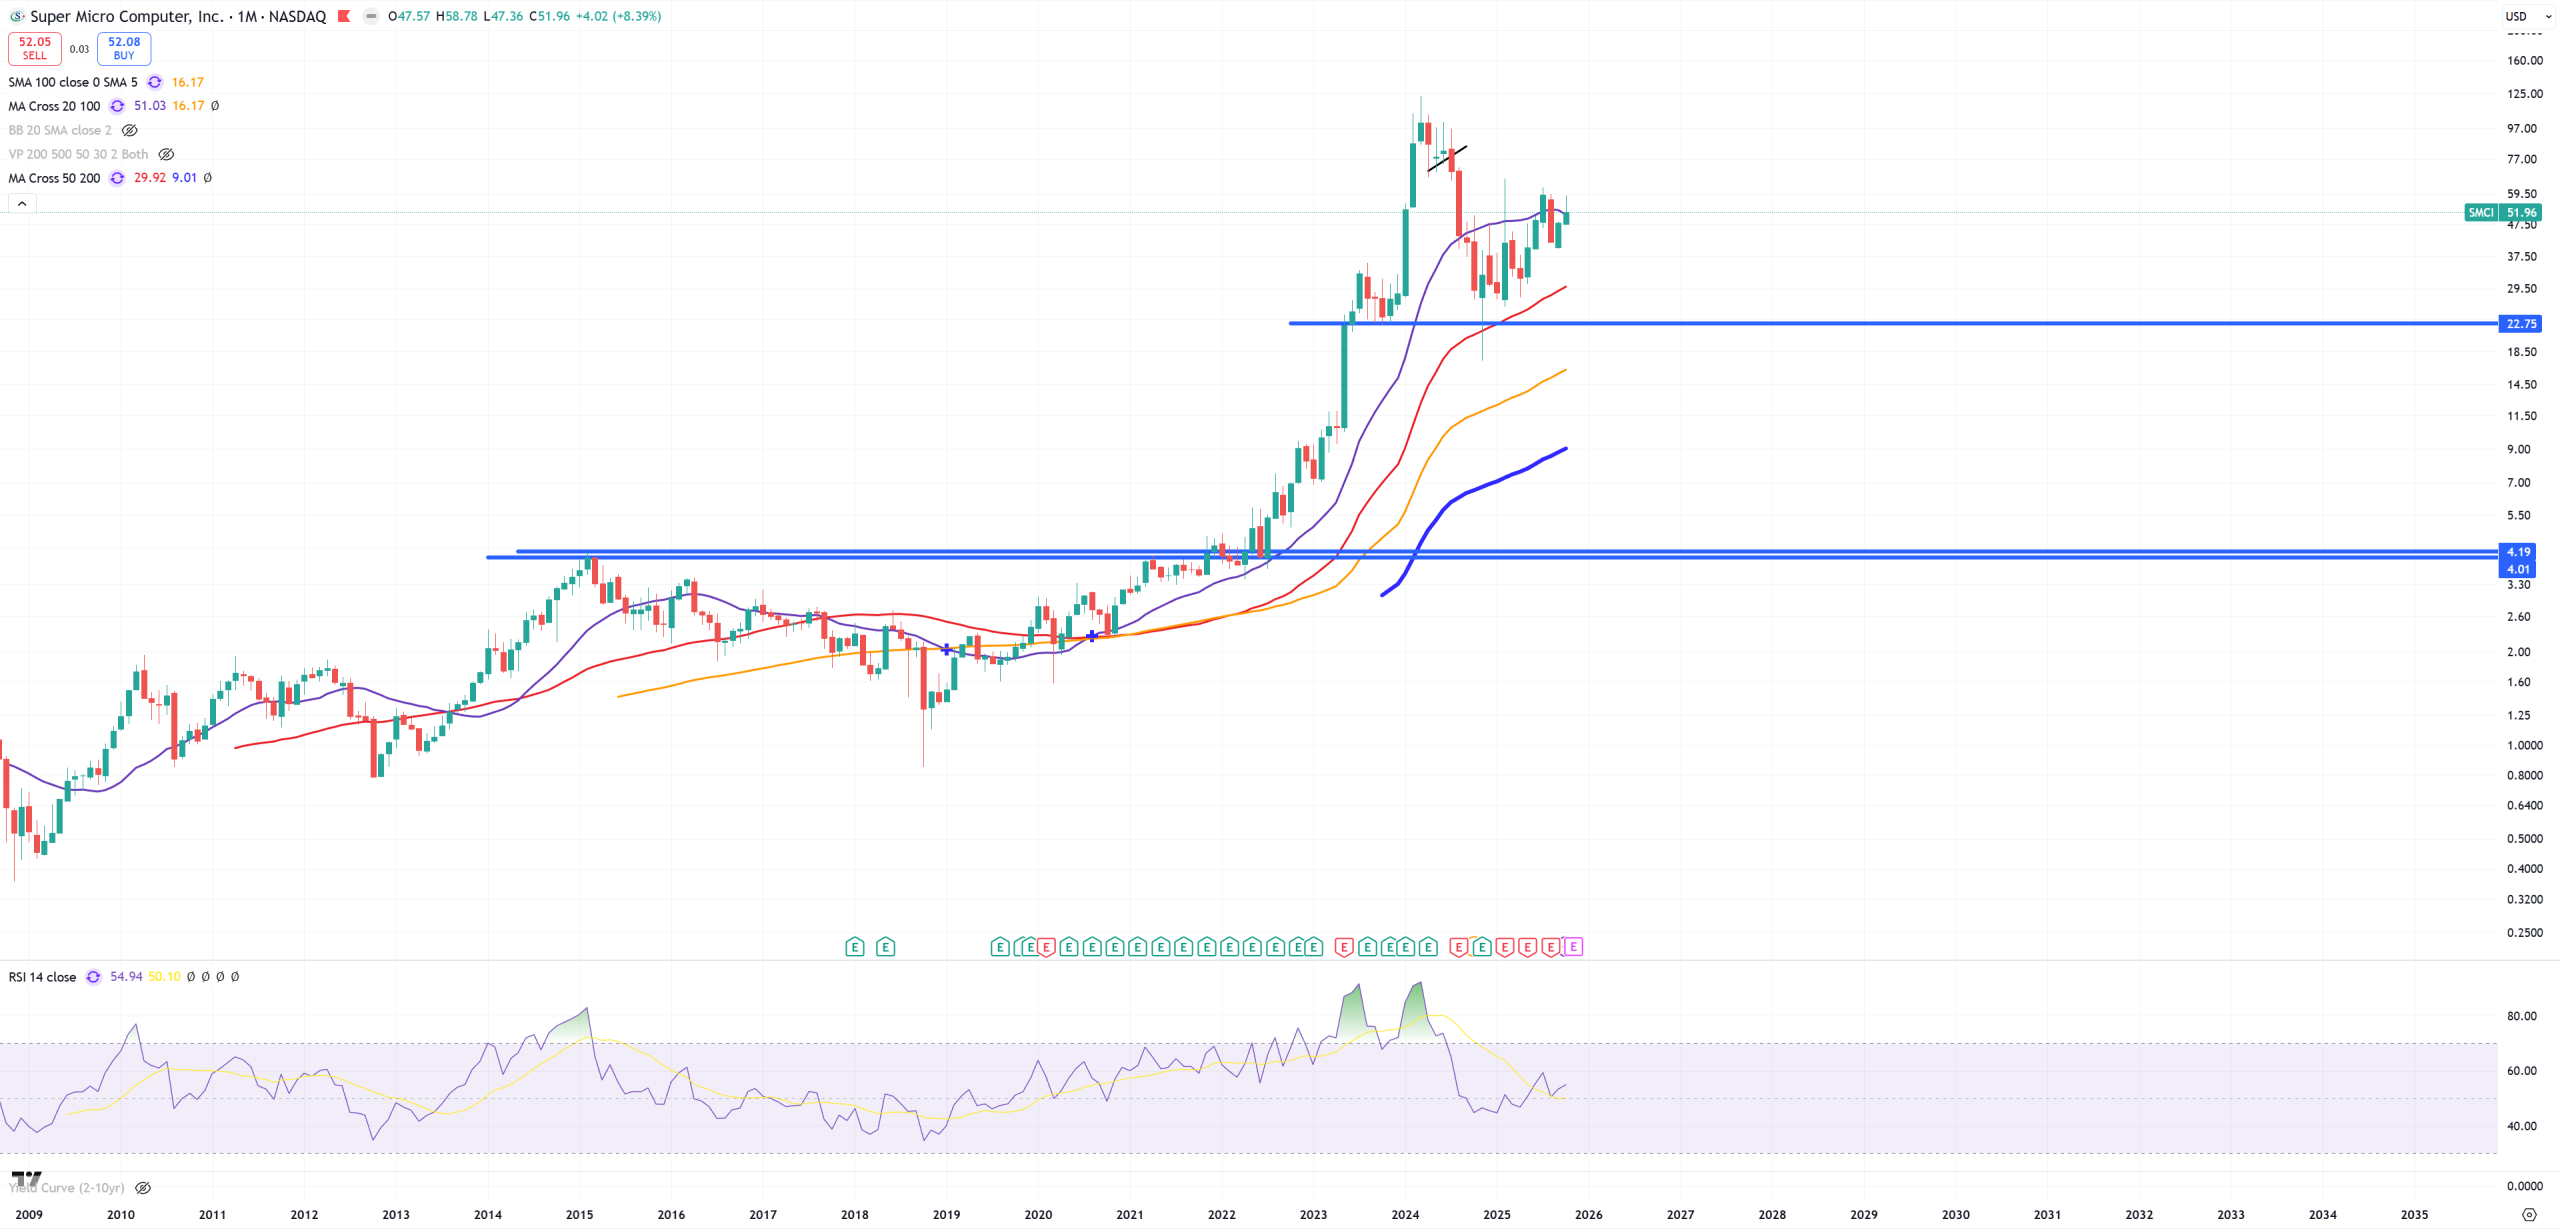
SMCI – unchanged move : (M)MA20 as a limiter, it’s also 0.618 bounce = typical dead-cat bounce until (M)MA20 will be broken.
Banking system – while companies like JPM, GS are going meme type parabolic moves, regionals struggling
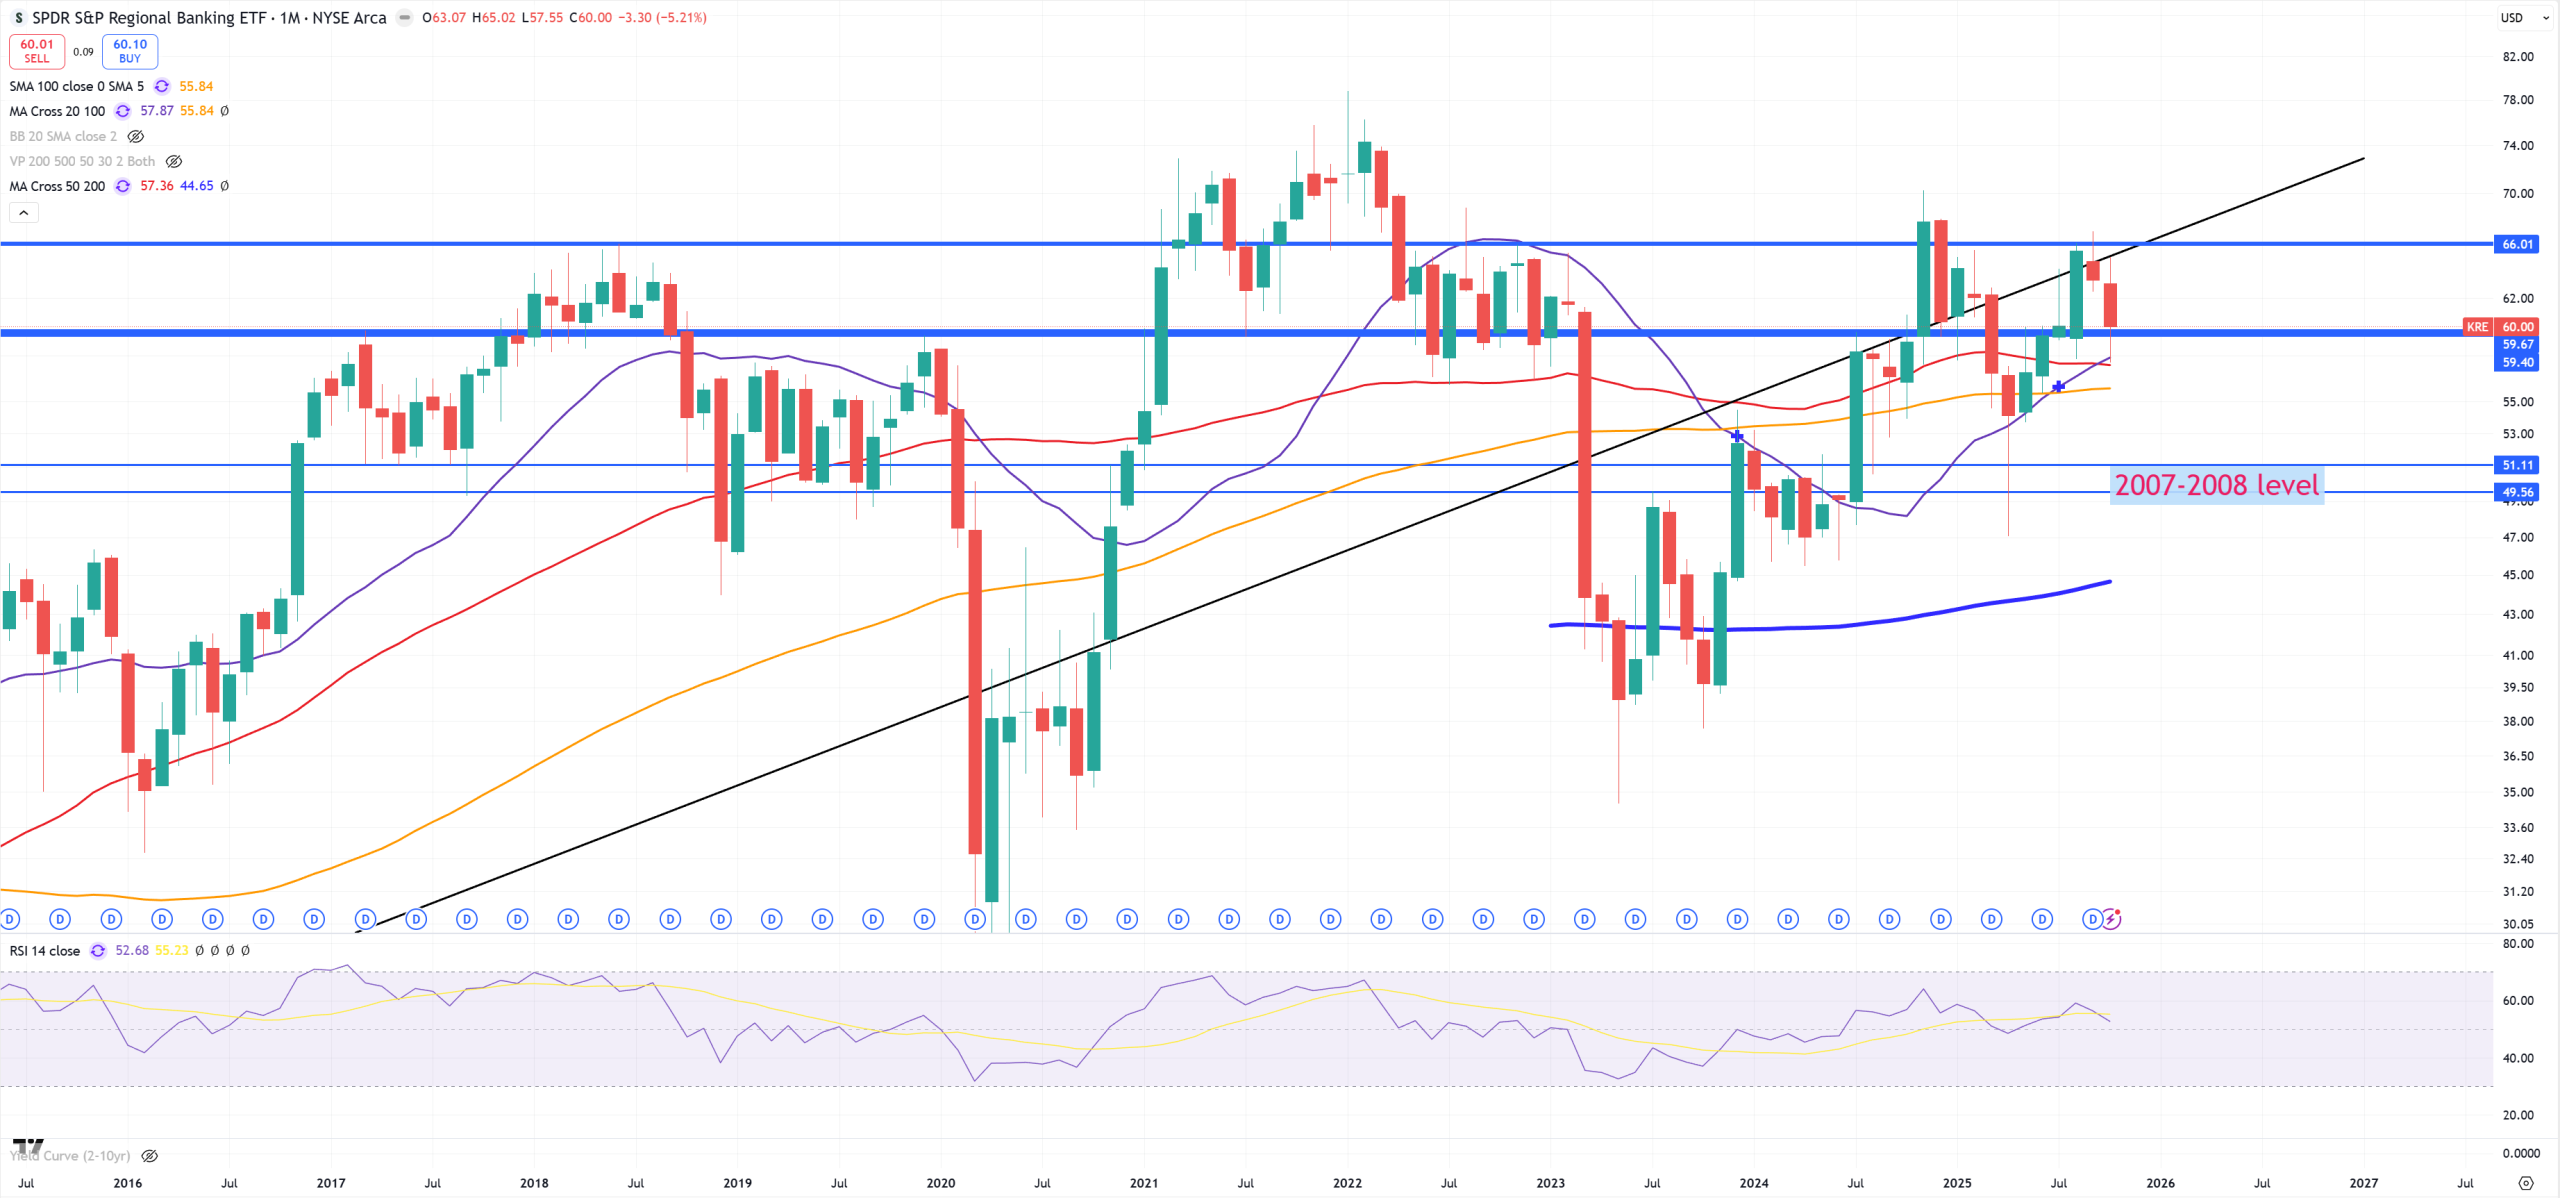
KRE – but (M)MA50 holds so far just like key support level
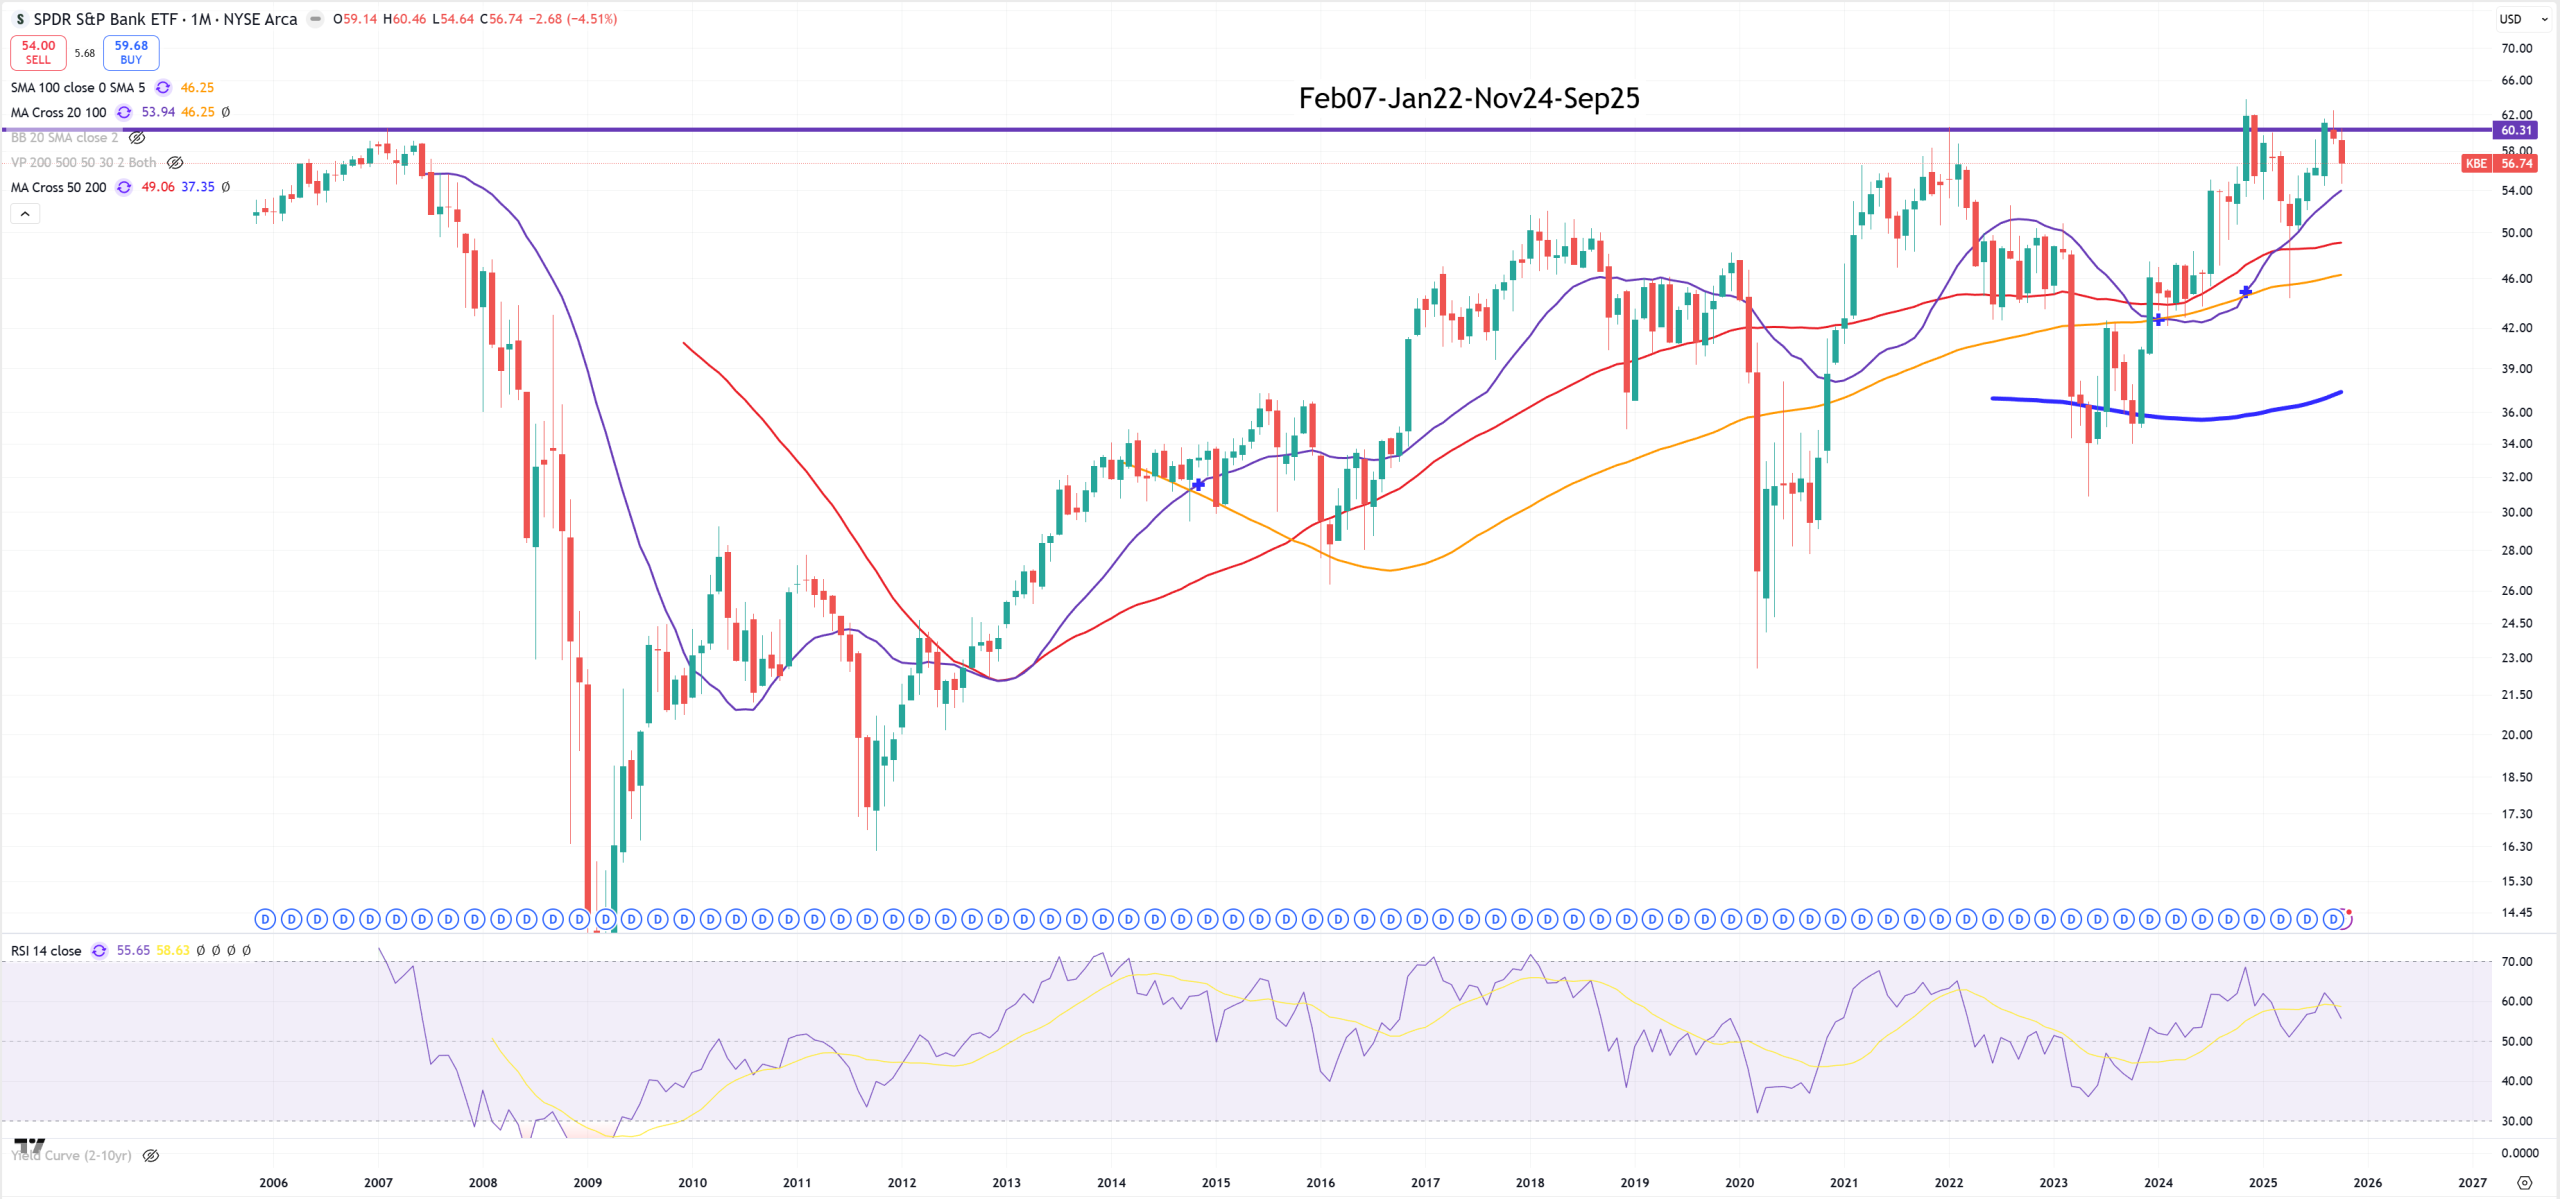
KBE – Bank ETF and no comment so far is needed.
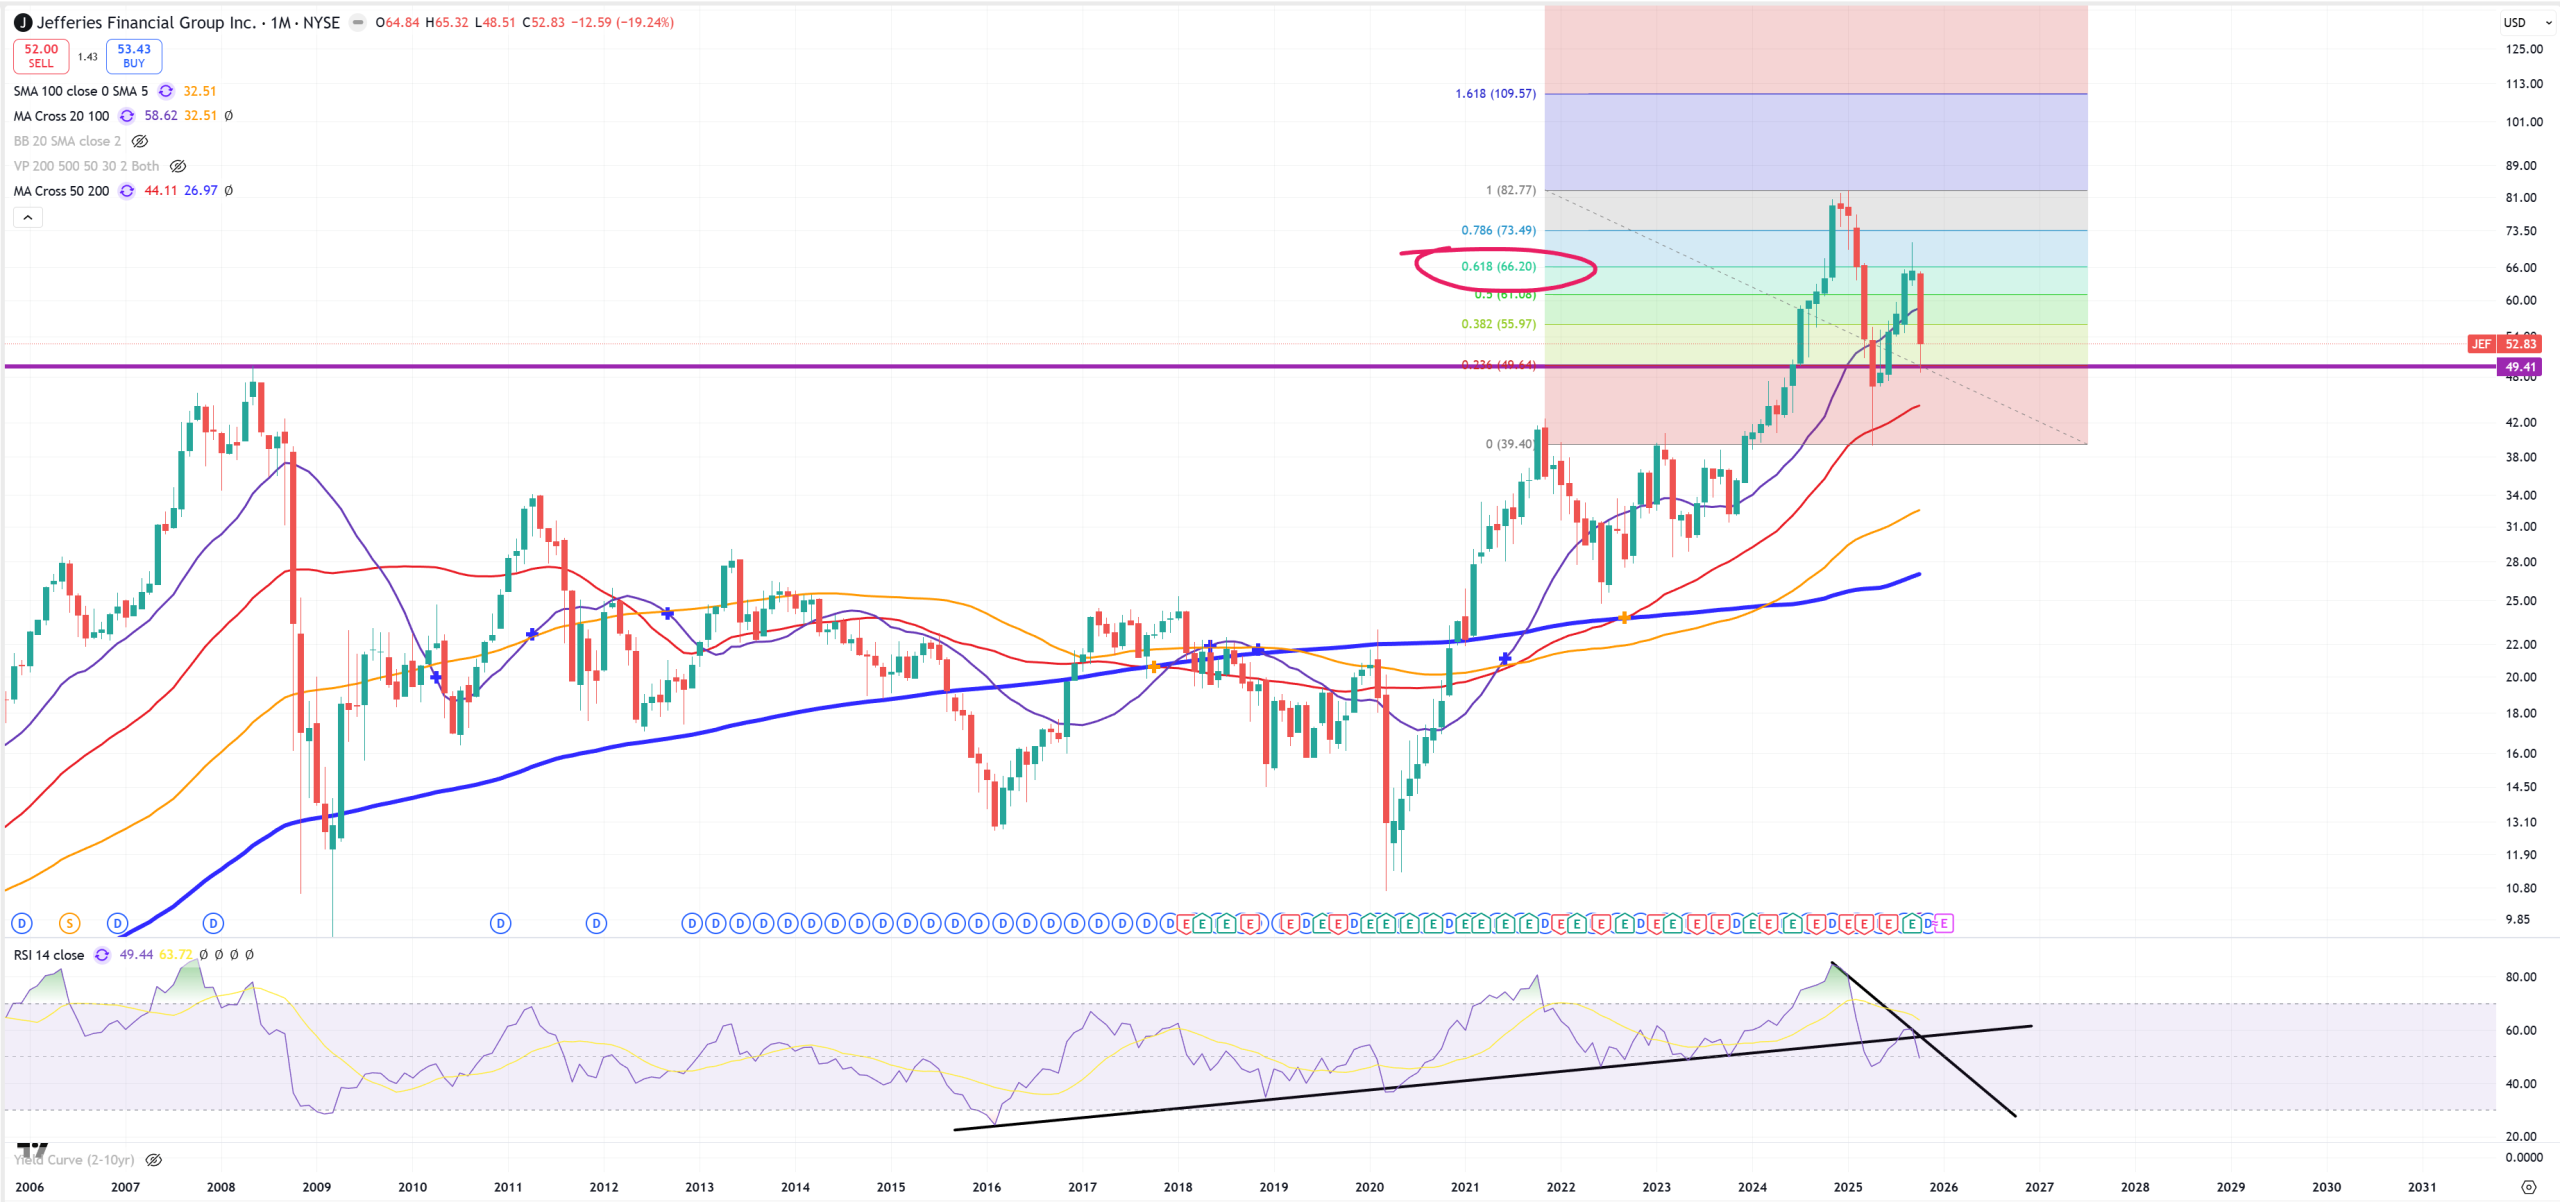
JEF – Jefferies is now a famous bank. May 2008 support holds
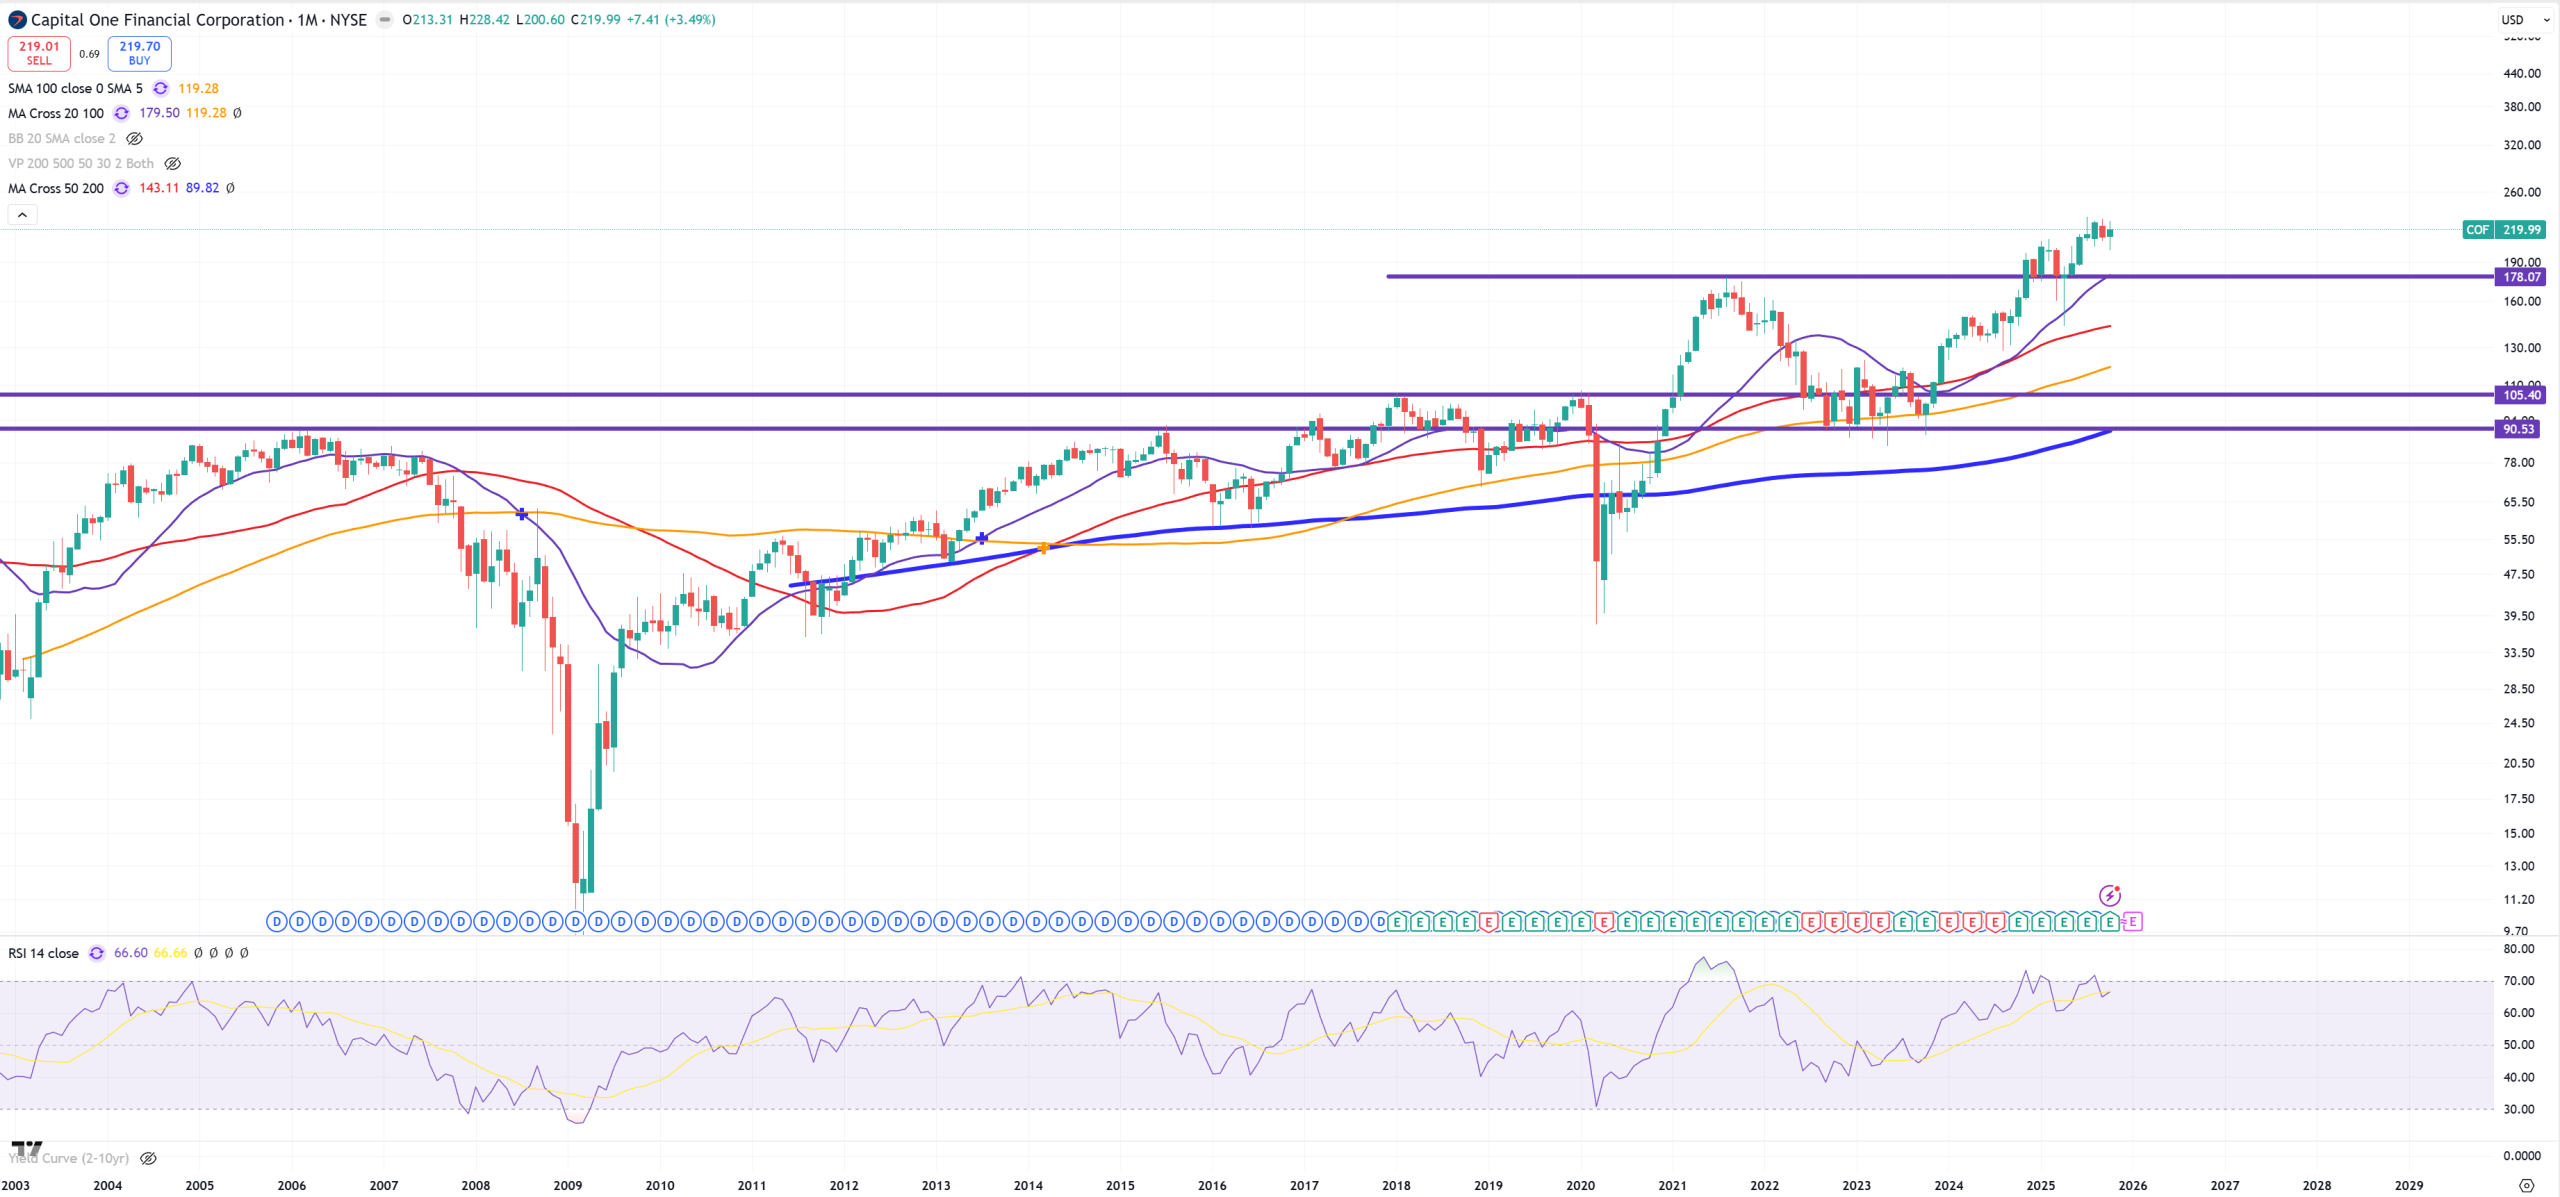
COF – Capital One is #1 I look at because of sub-prime. Nothing to see here.
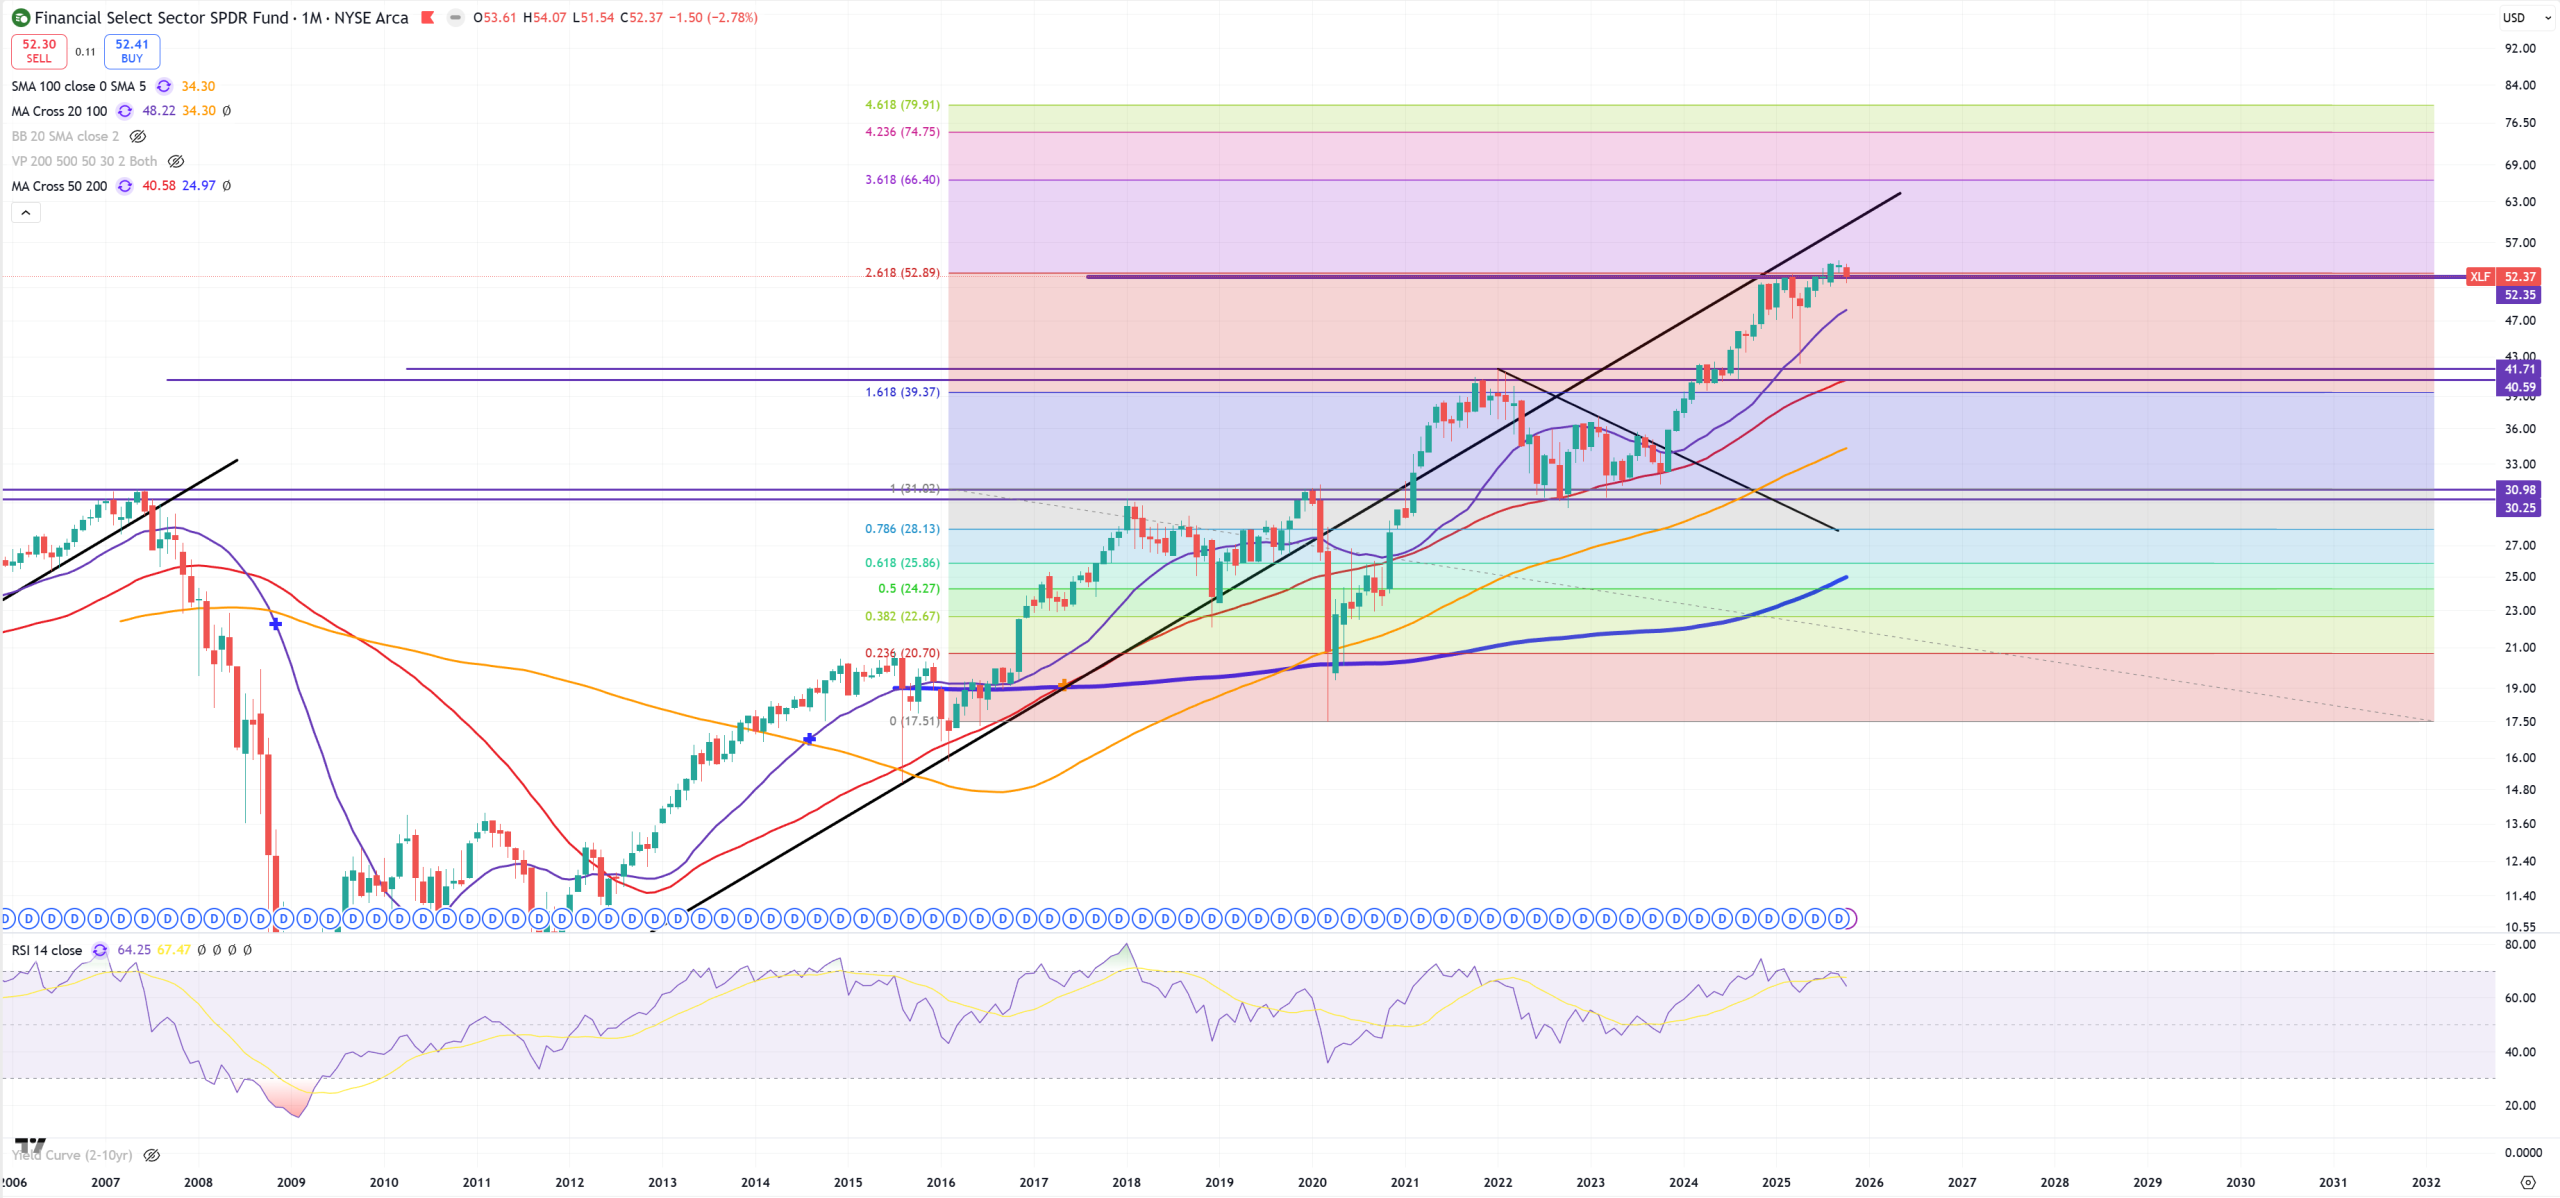
XLF – Financials ETF – on the edge.
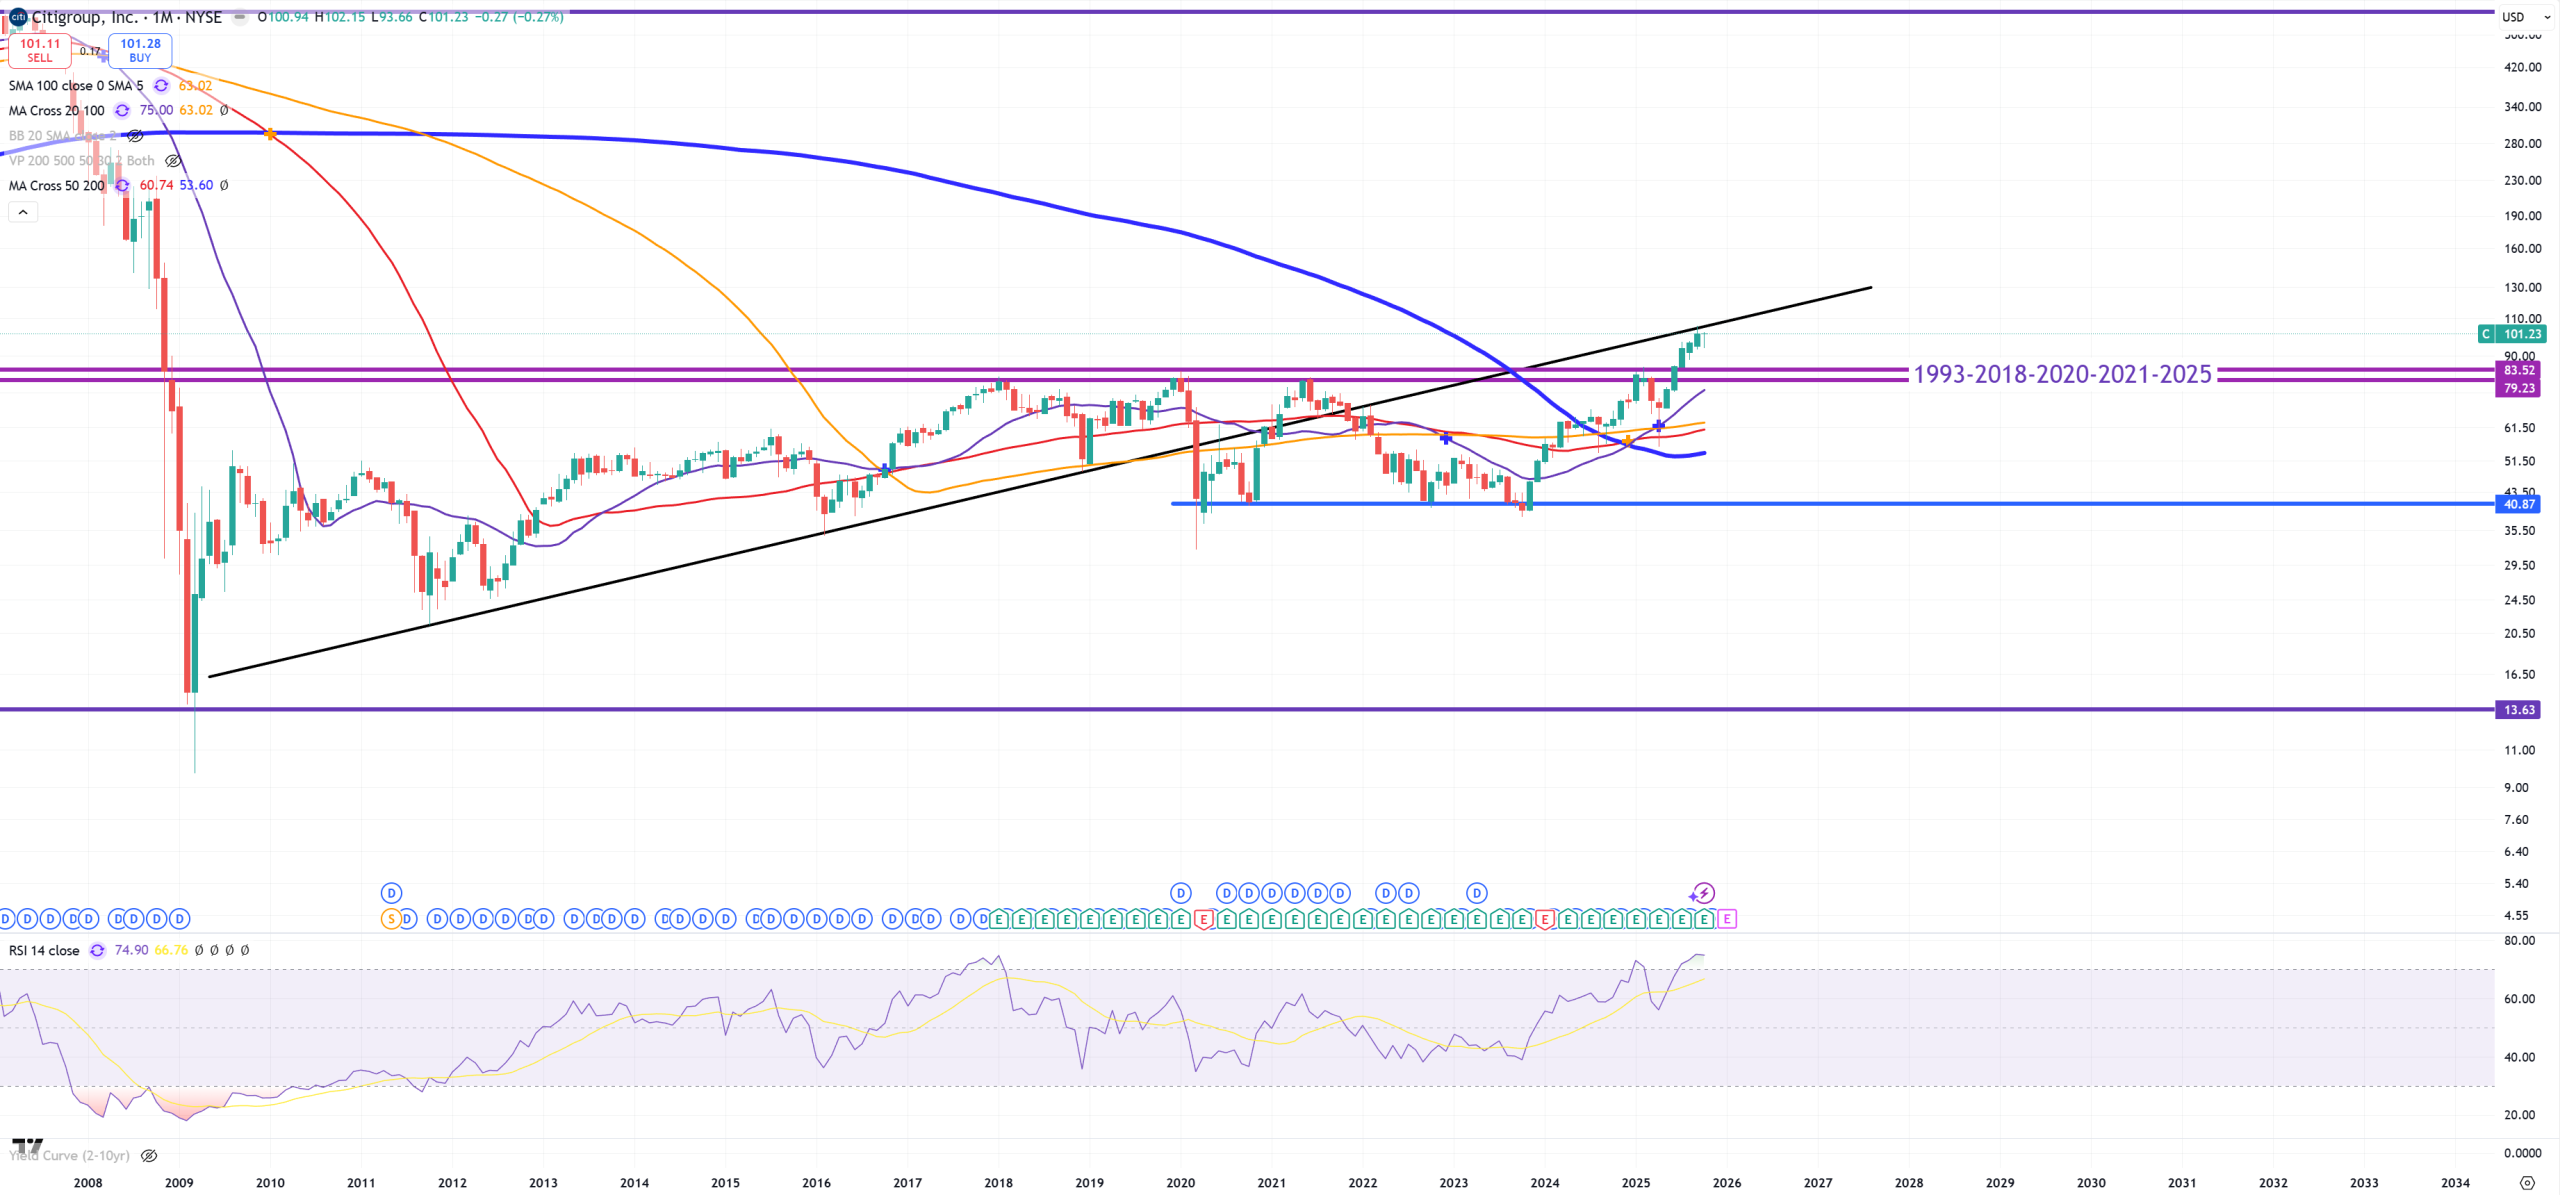
C – Citibank – this is its last moment and last moment to consider this move as a “bearish” retest of the broken trend. From the other hand It’s really big surprise this resistance 1993-2018-2020-2021-2025 was broken, but as it was written initially US03MY just now breaks (M)MA50 and 10Y/3M is far away from +60bps after inversion.
Other “country” indexes, ETFs
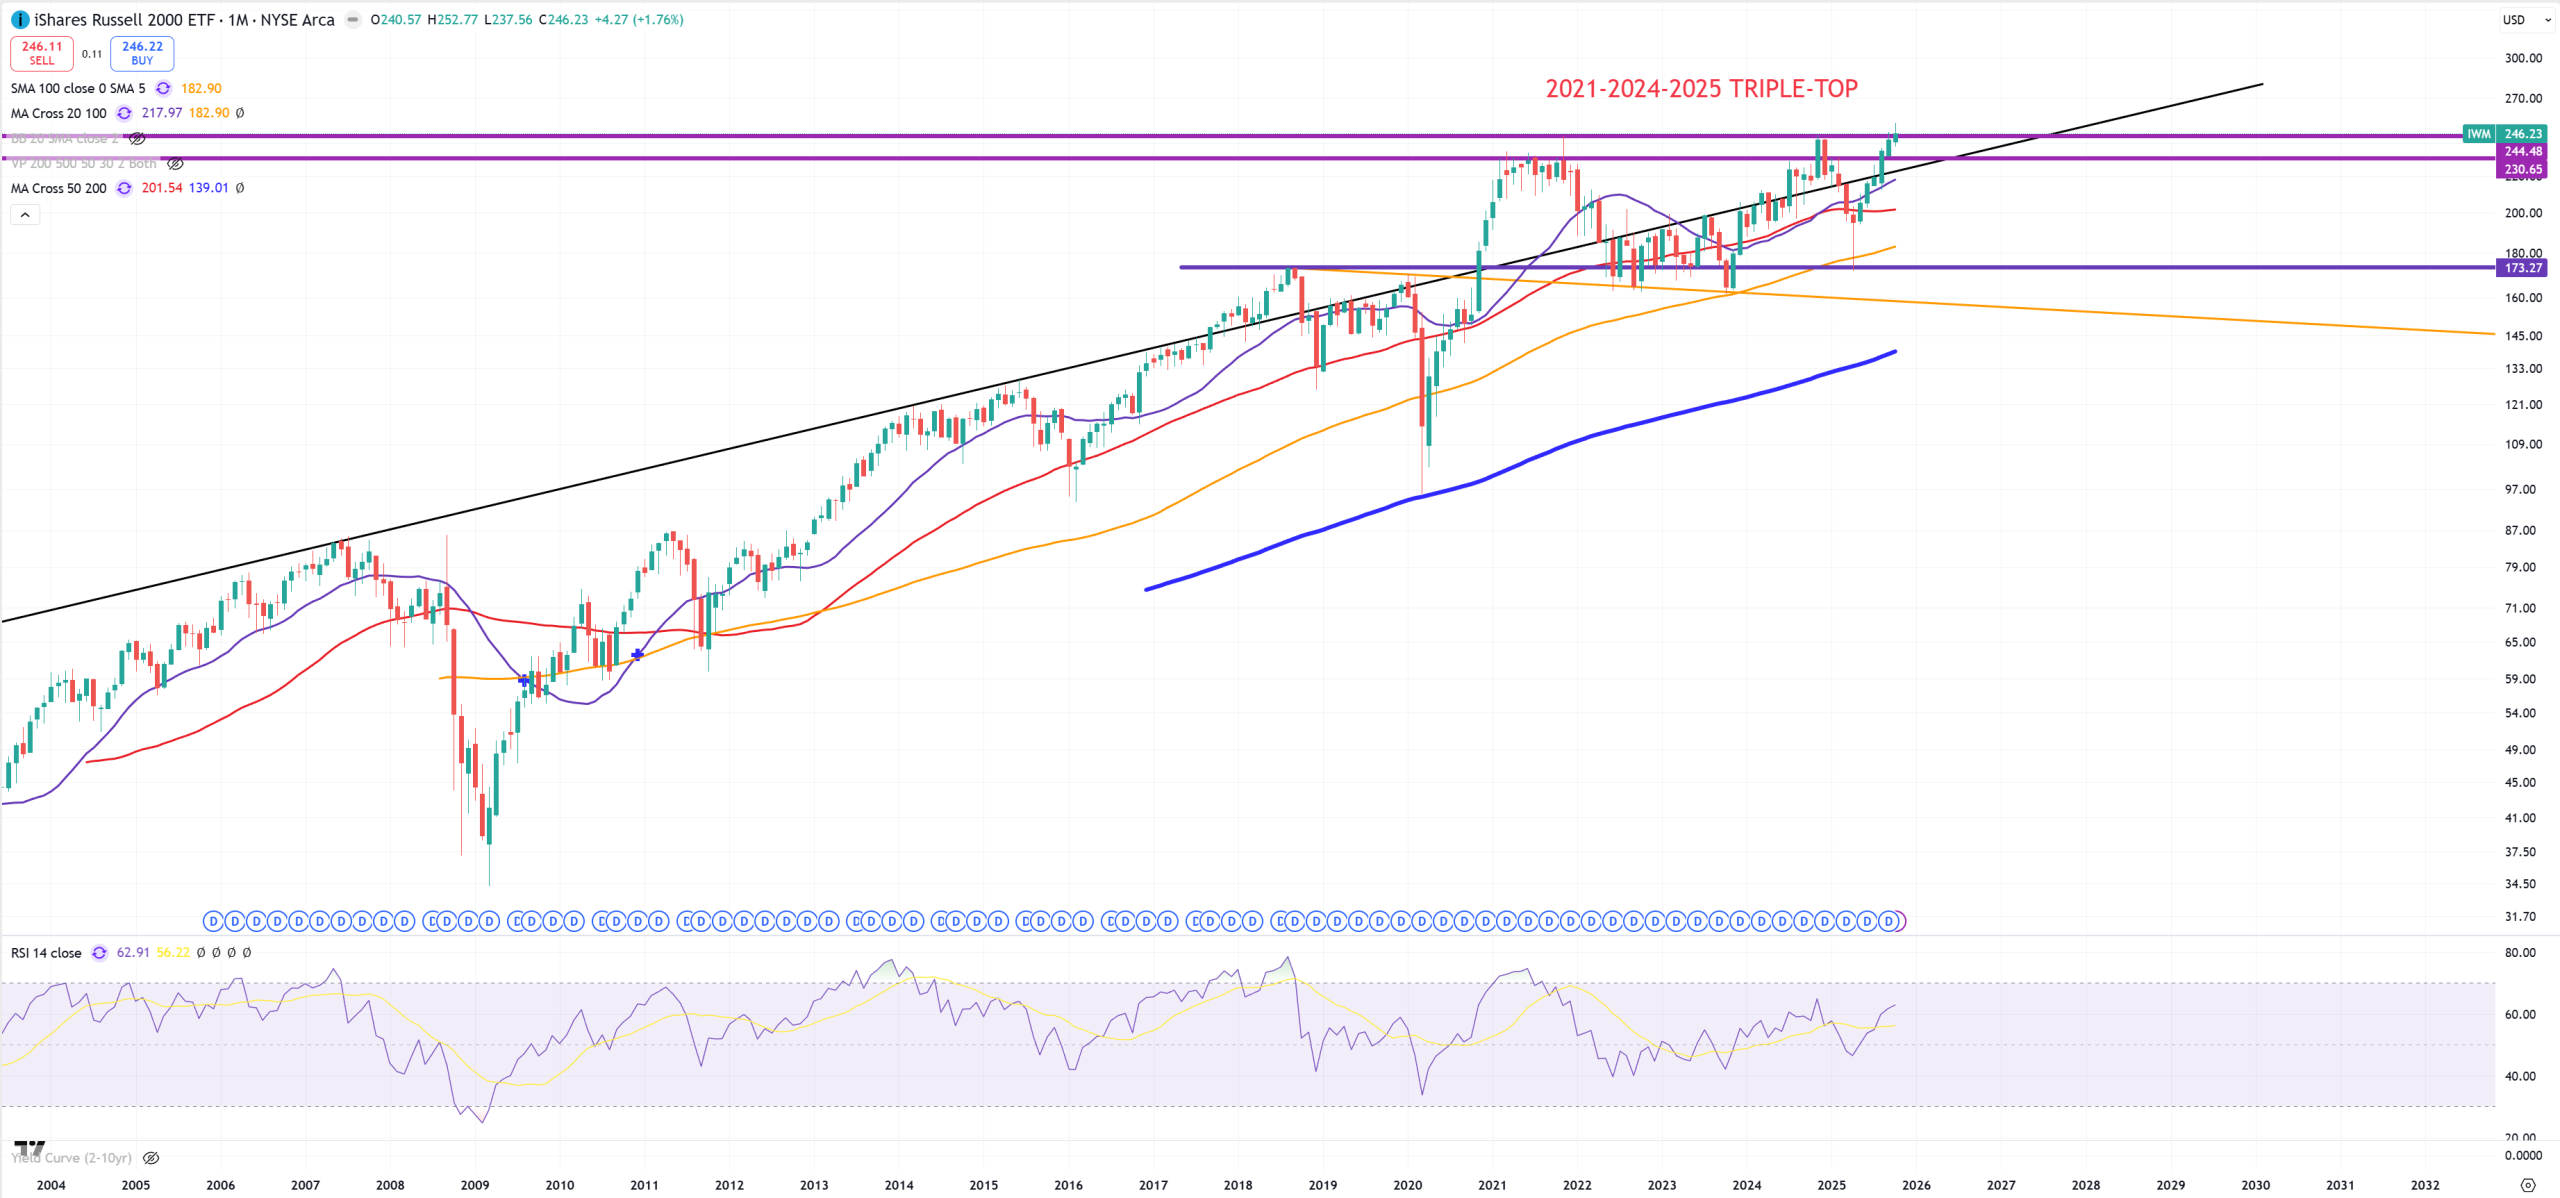
IWM – Small Caps and key resistance.
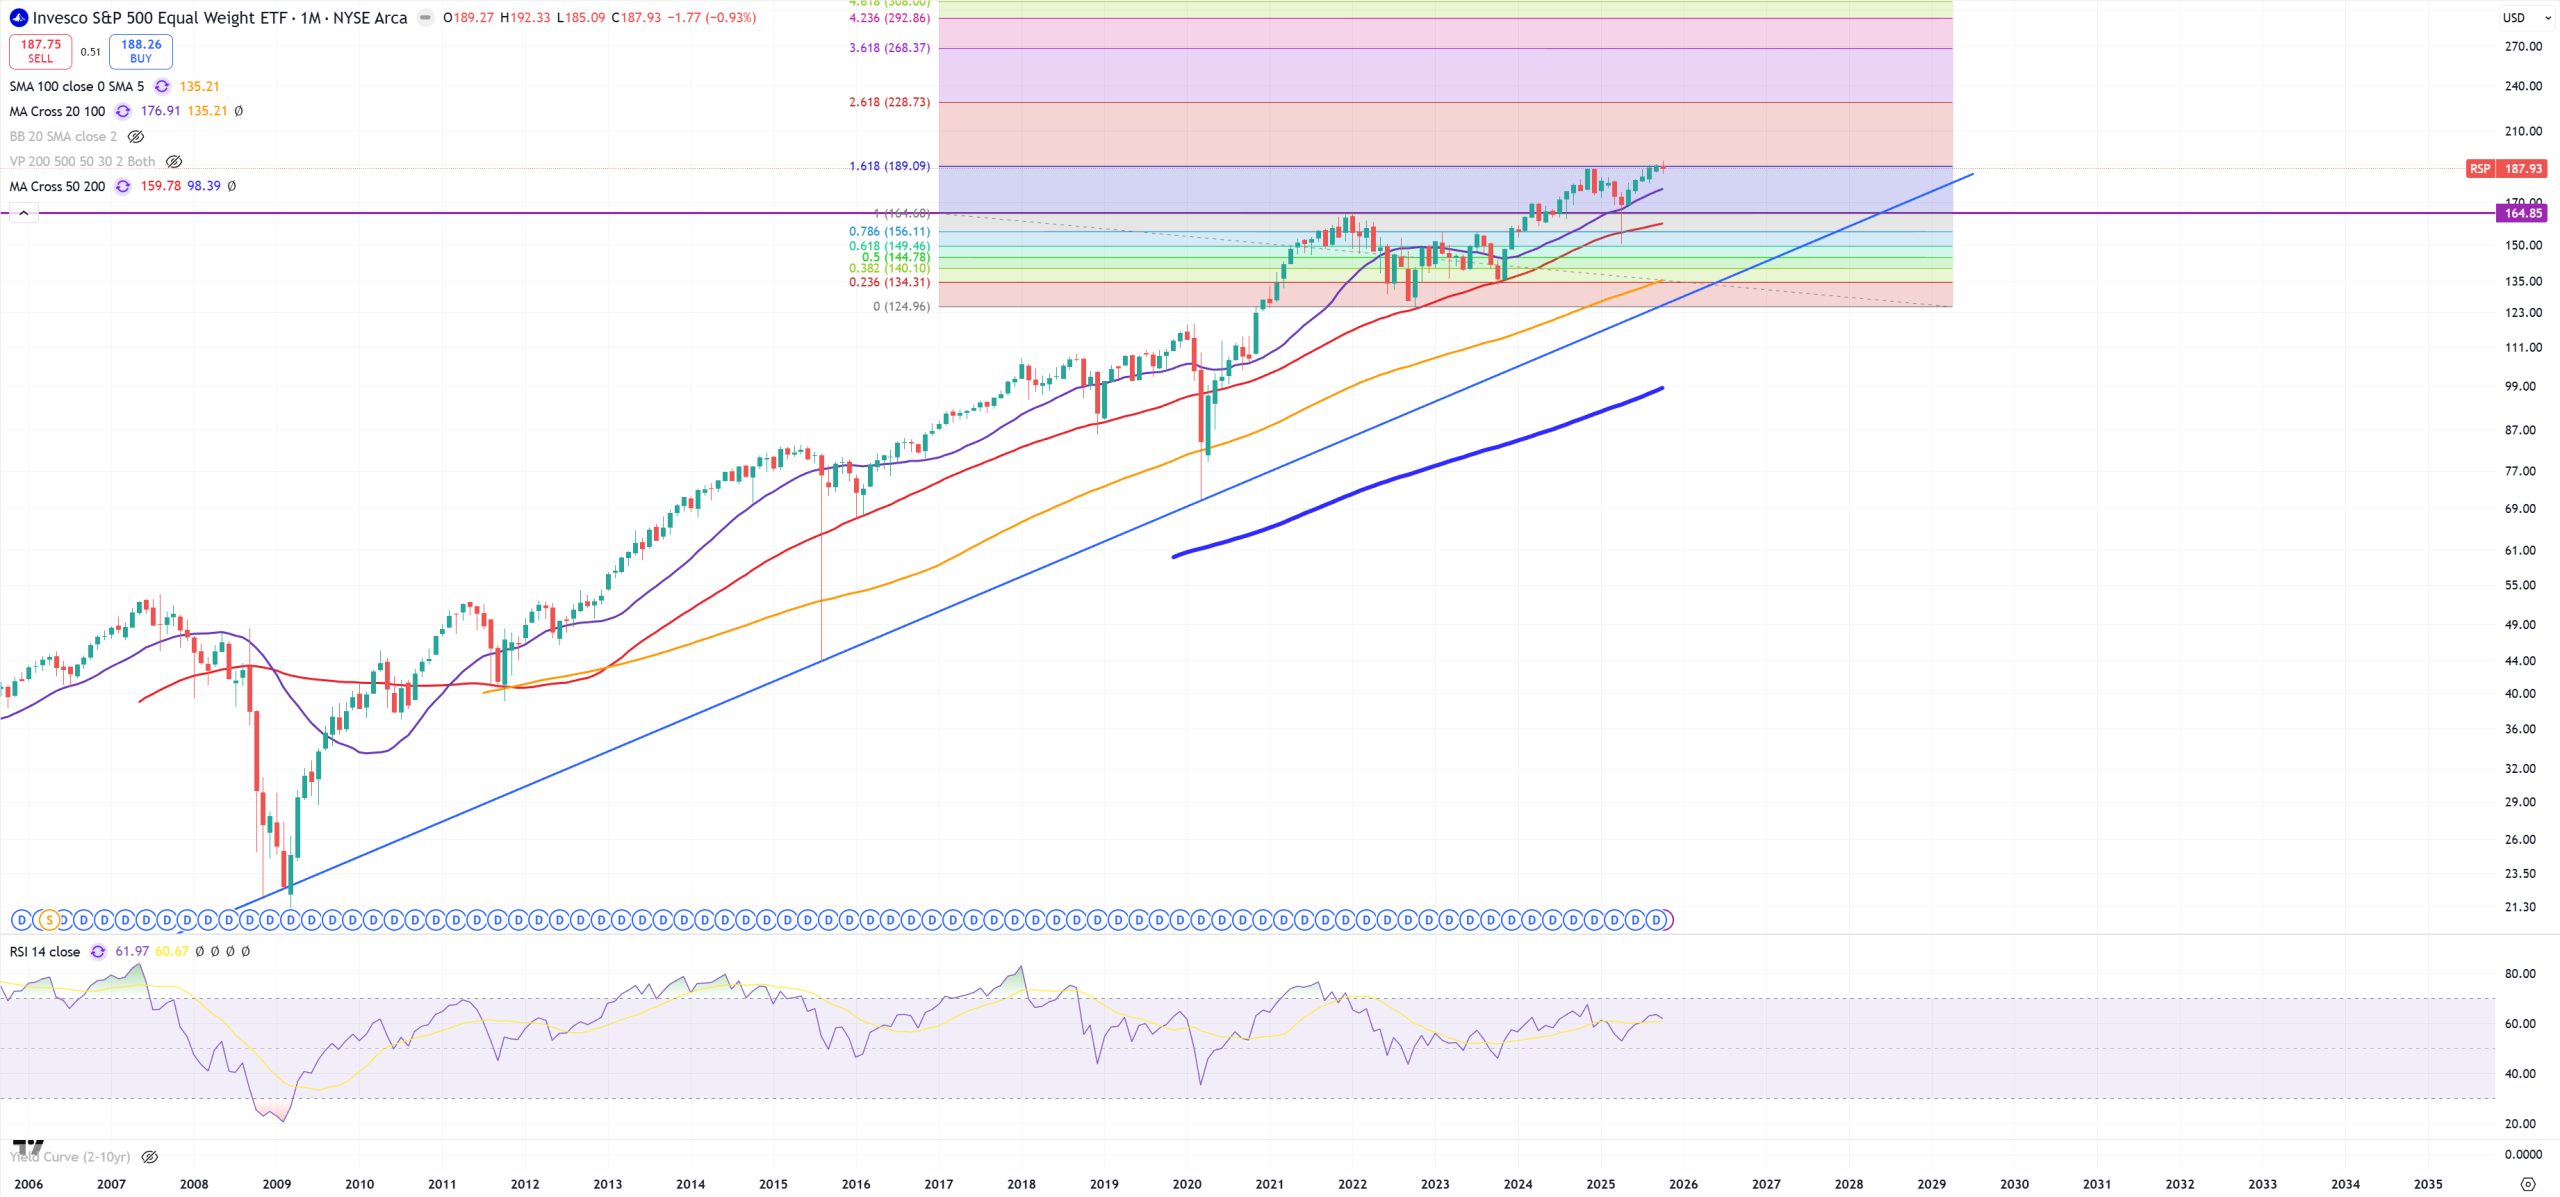
RSP – Equal Weight SP500 and possible building double-top – it all depends if my theory is valid about US03MY break that soon will send US10Y/US03MY spread above +60bps.
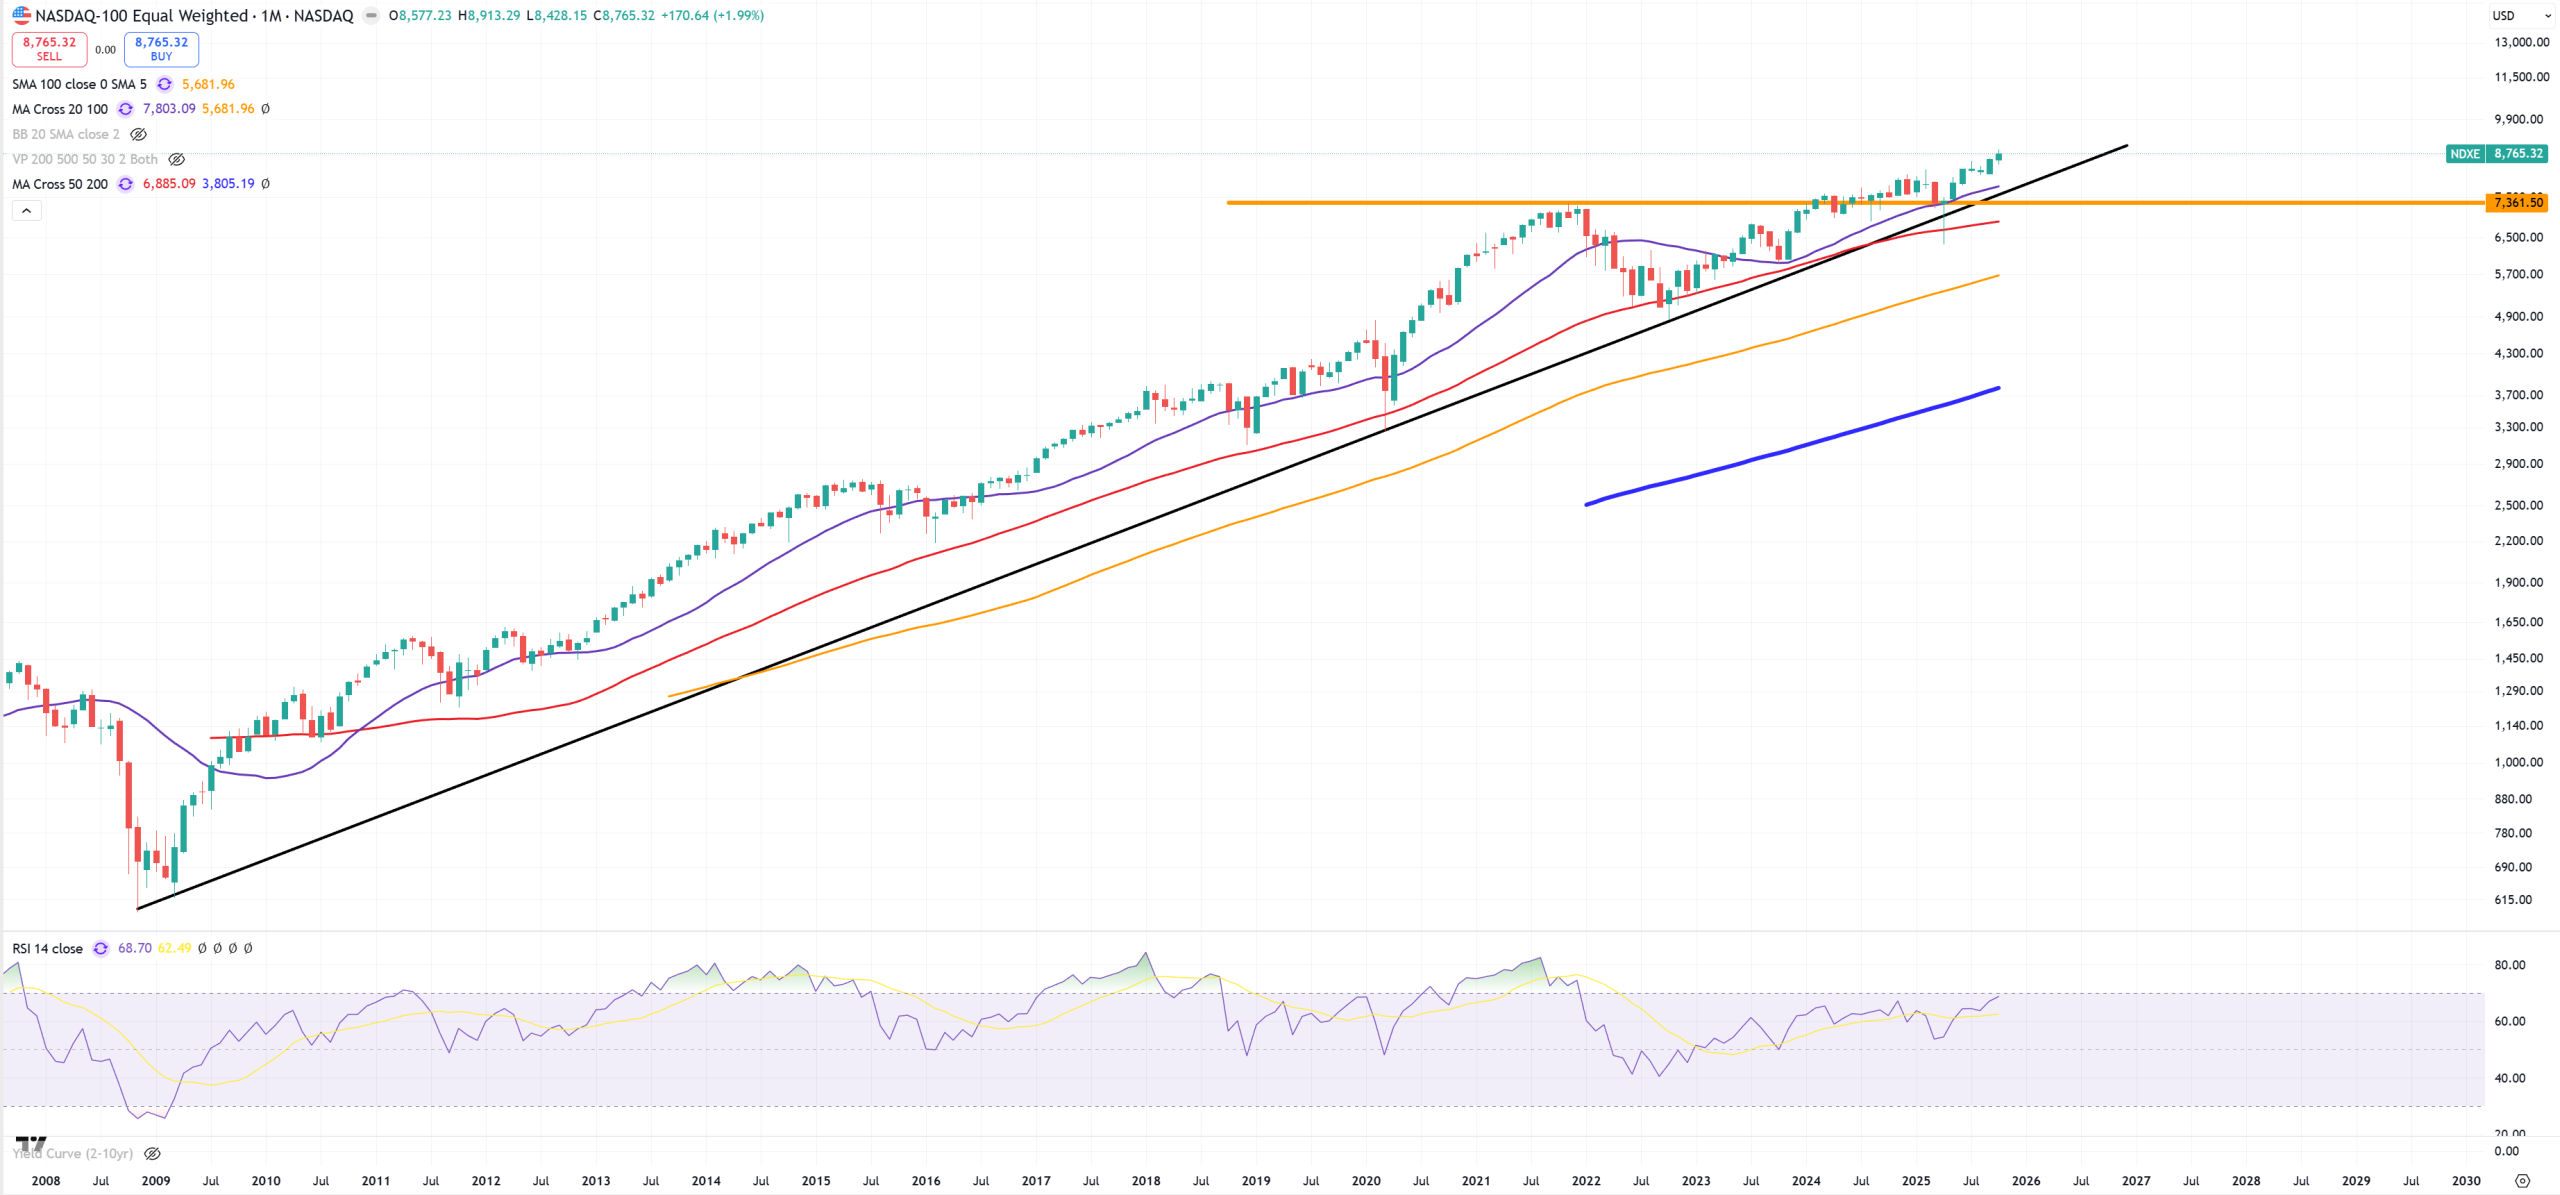
NDXE – Equal Weight NDX – Nasdaq is of course the best performer, so you shouldn’t see problems here
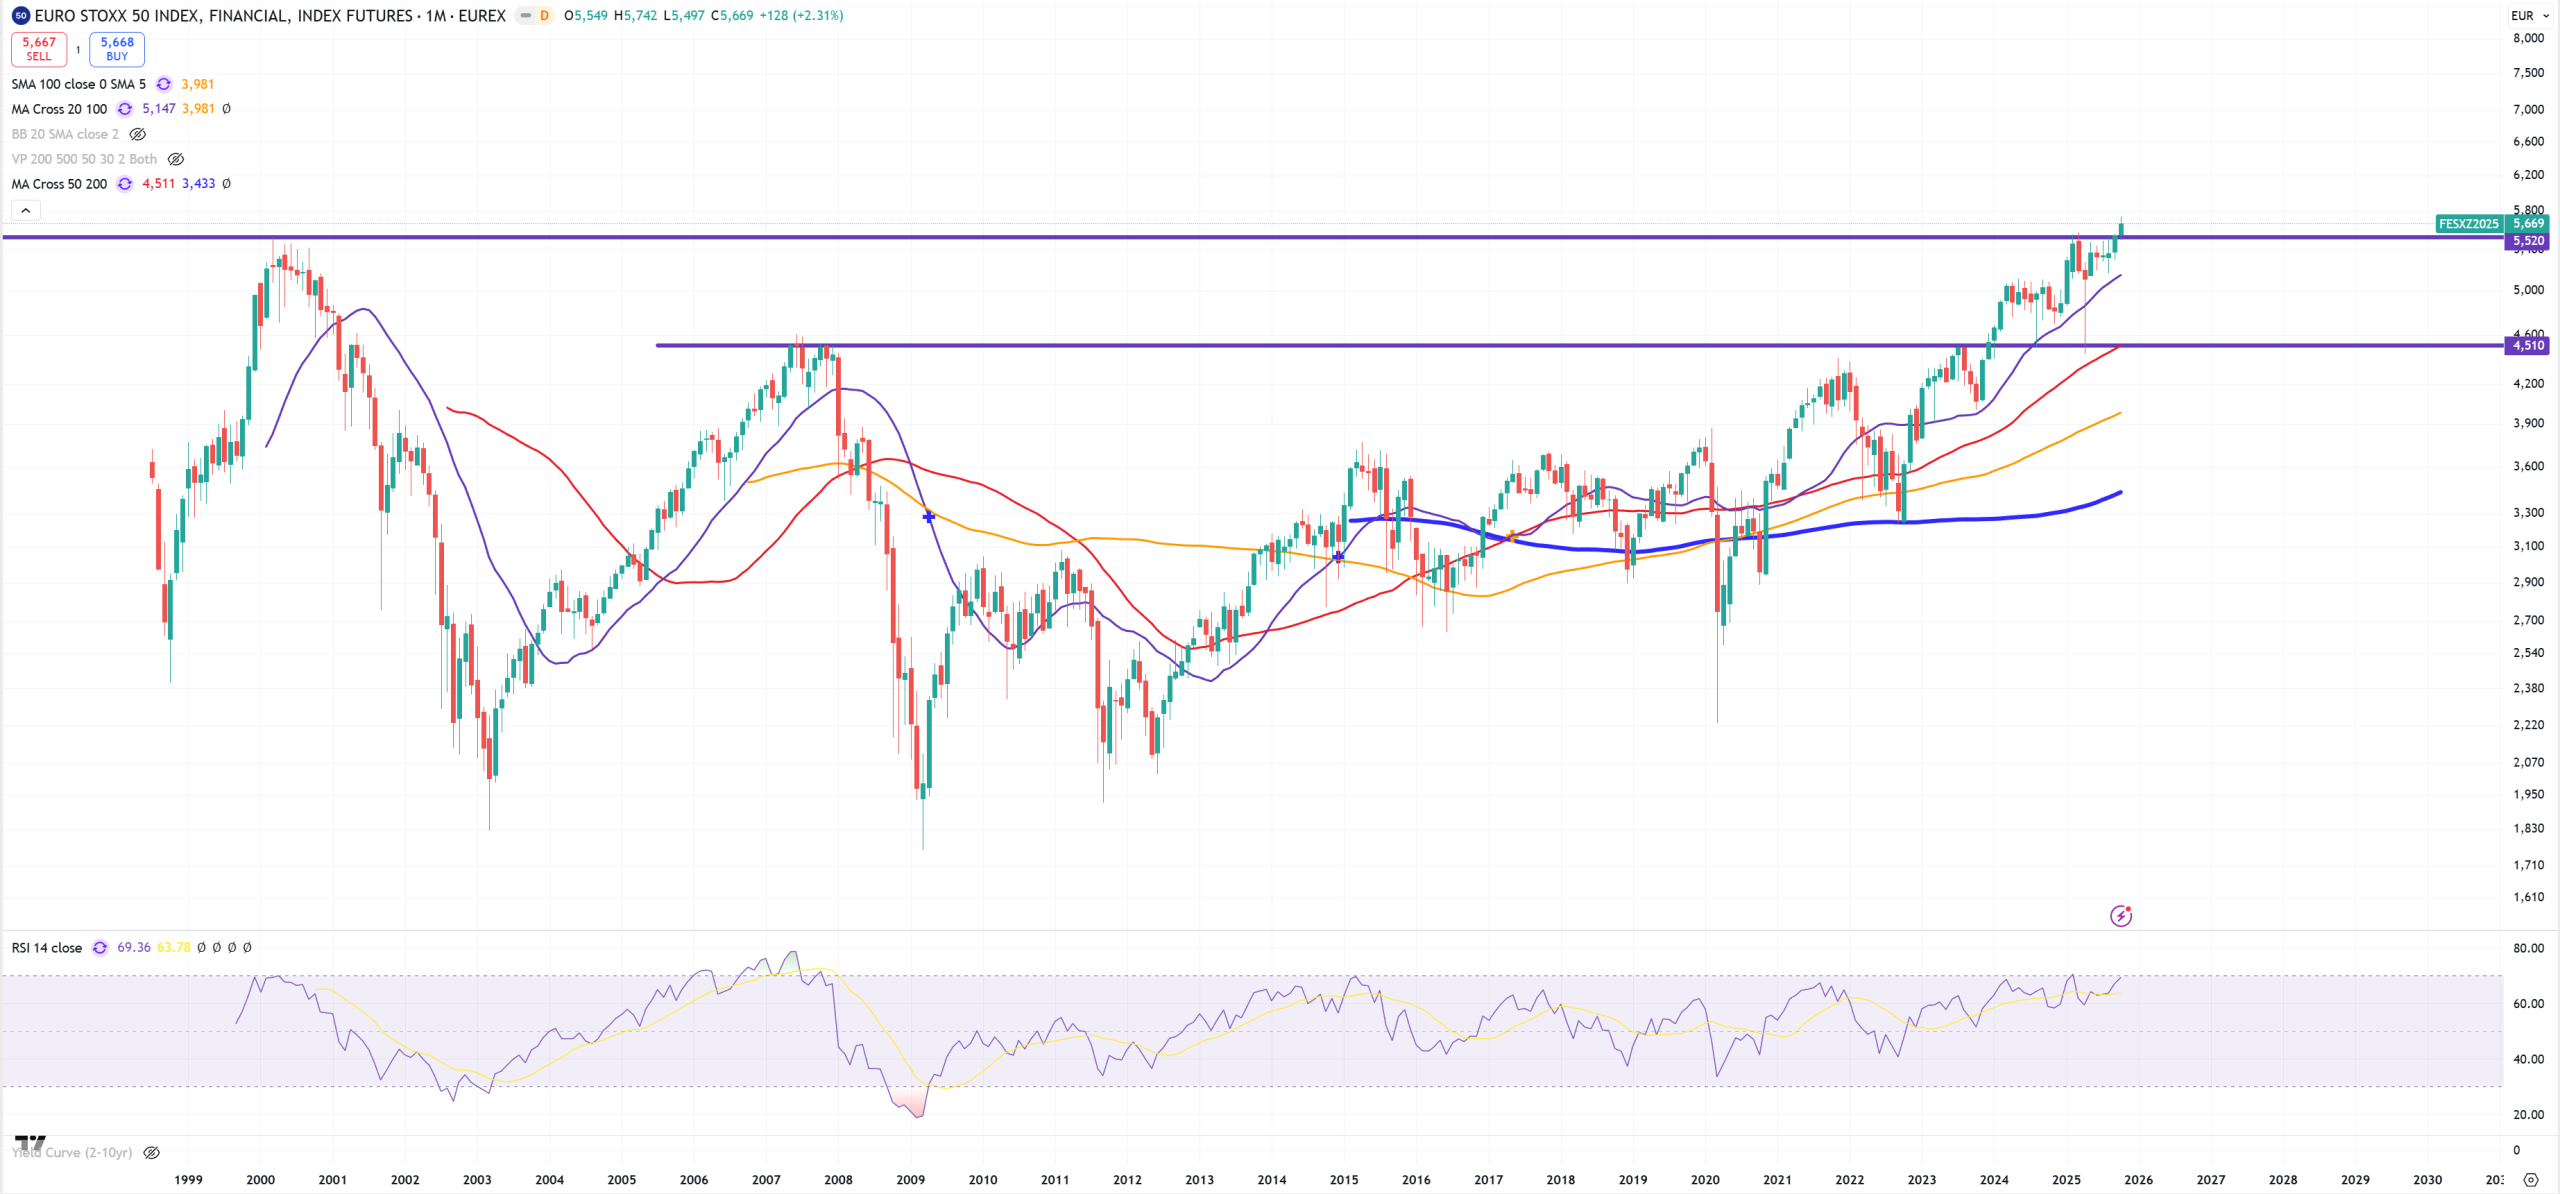
EUROSTOXX50 – big break?
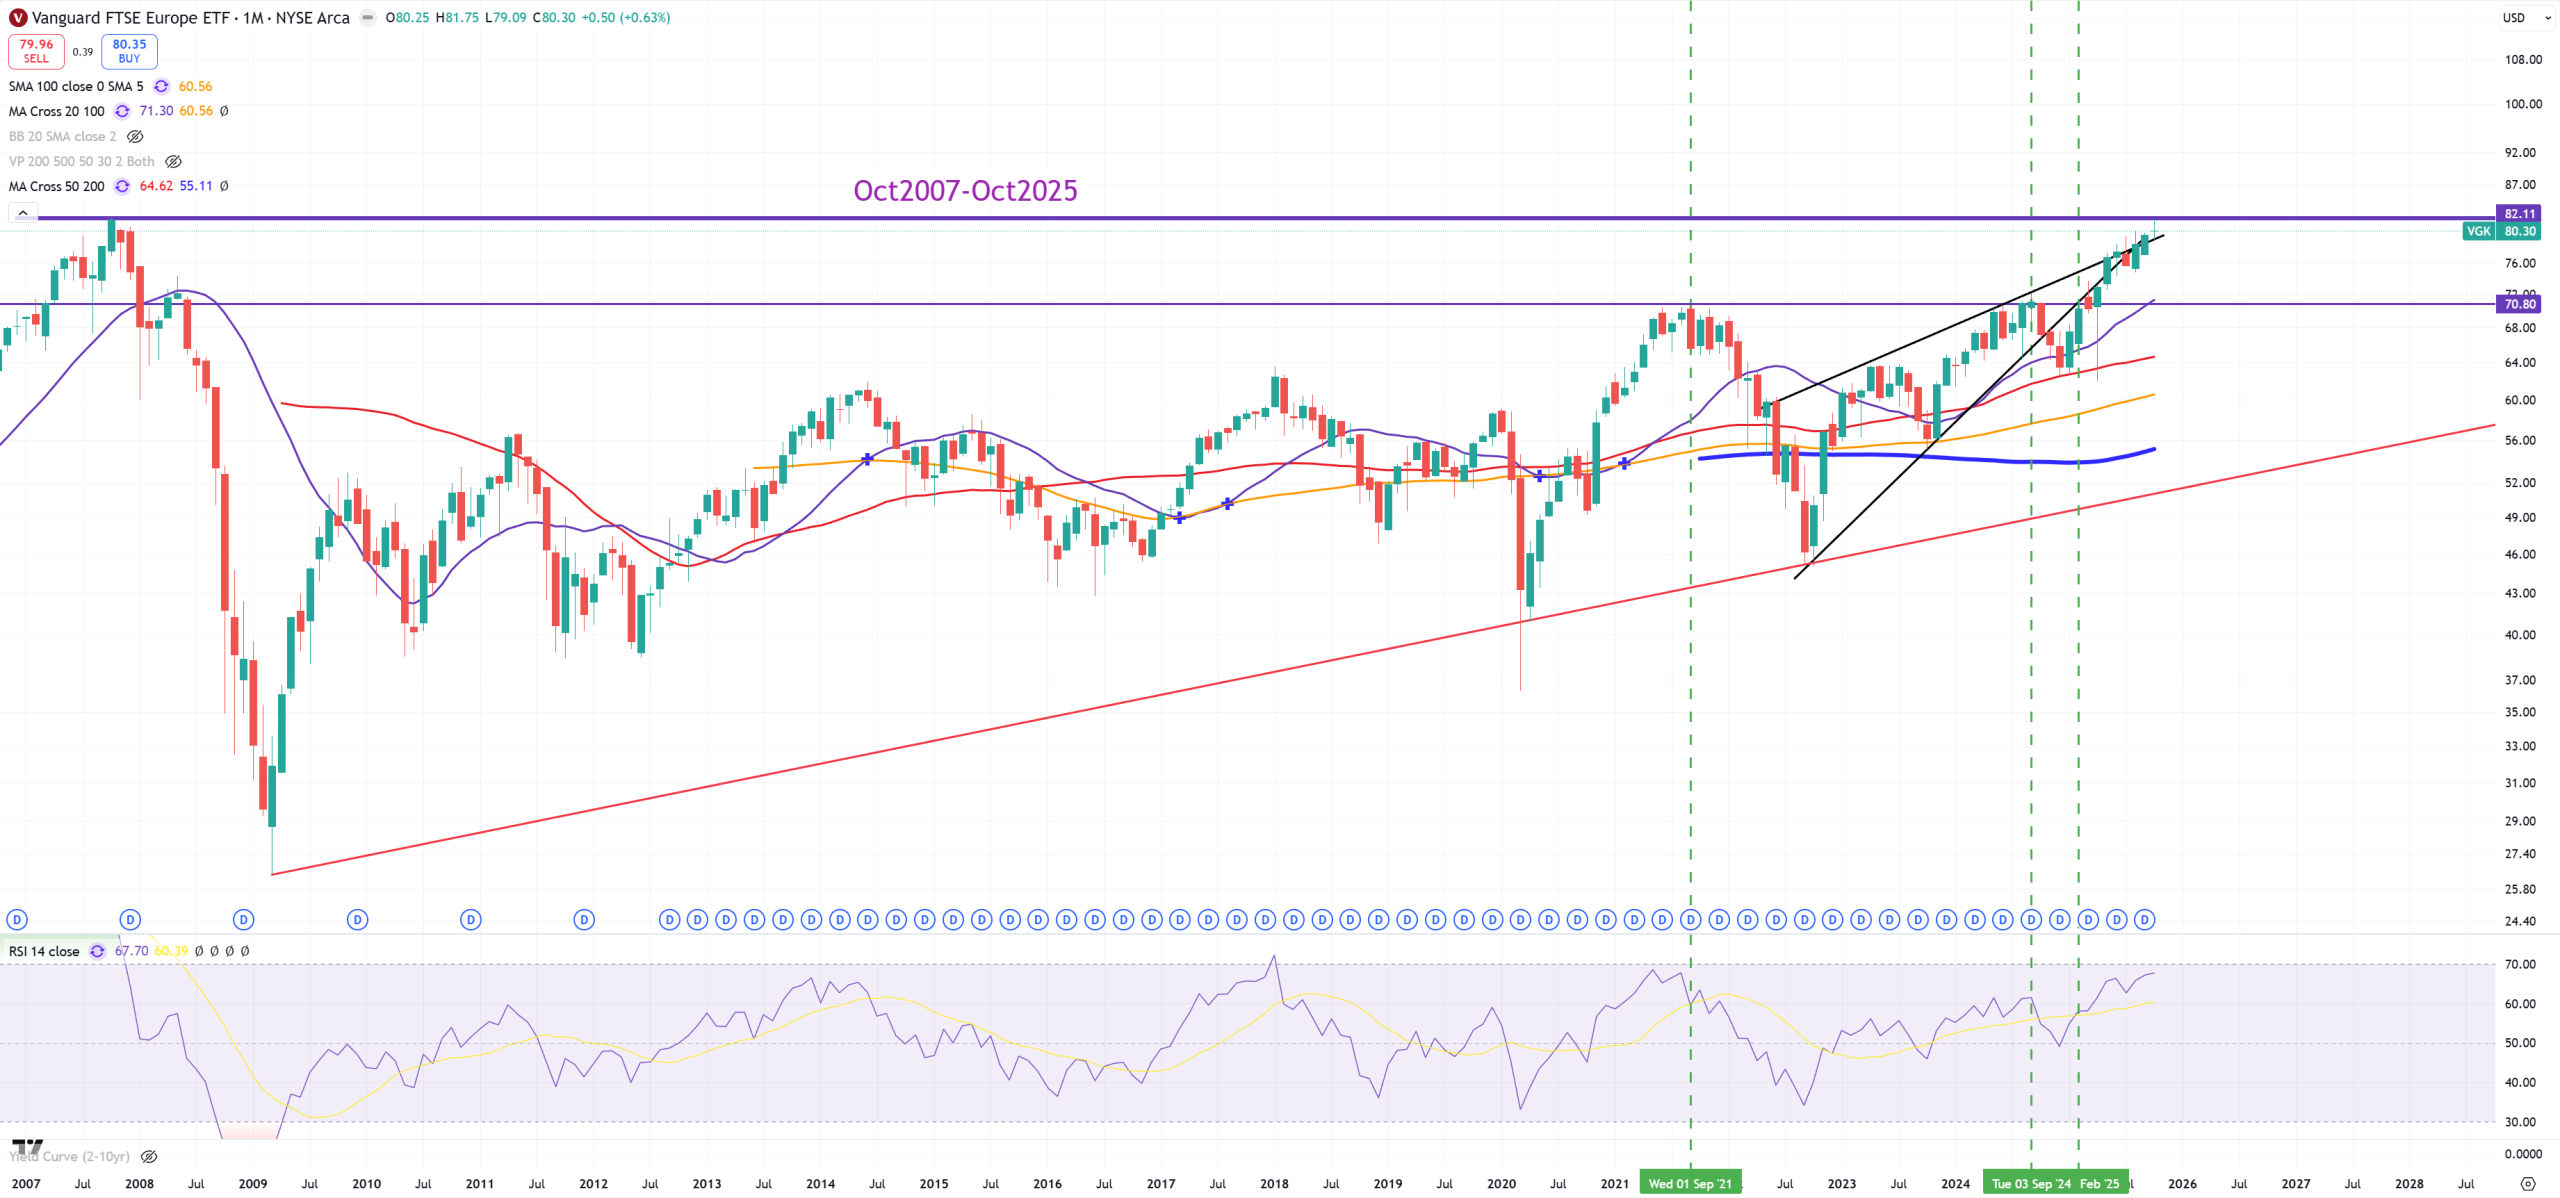
VGK – Europe ETF
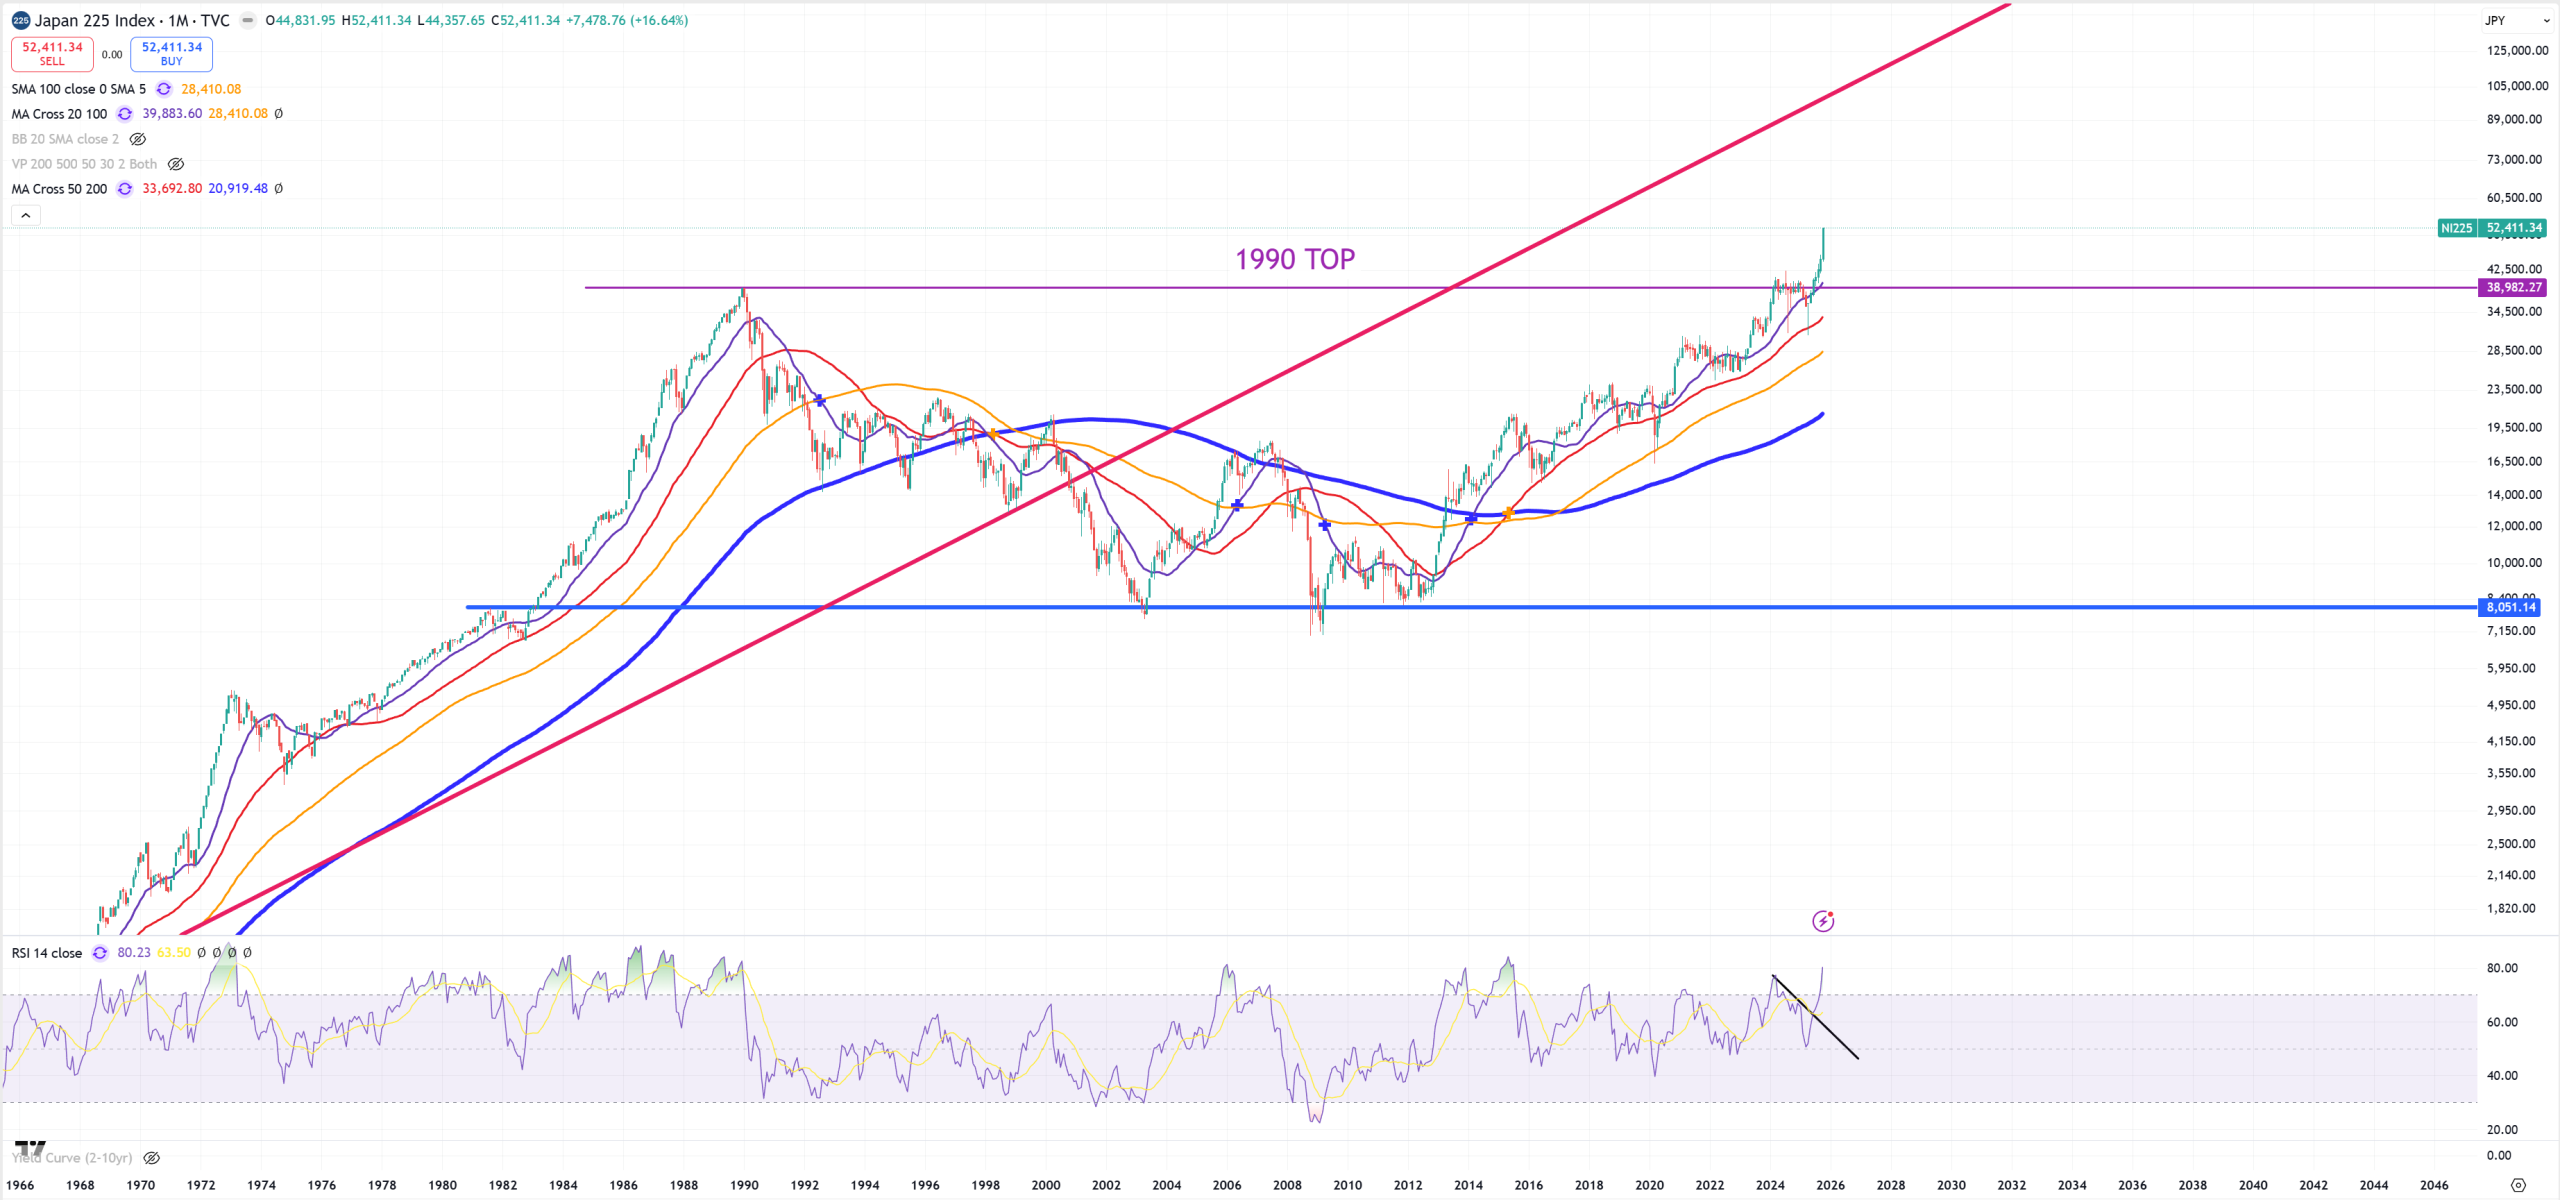
NIKKEI225 – this is unbelievable. Trend line is like 90000.
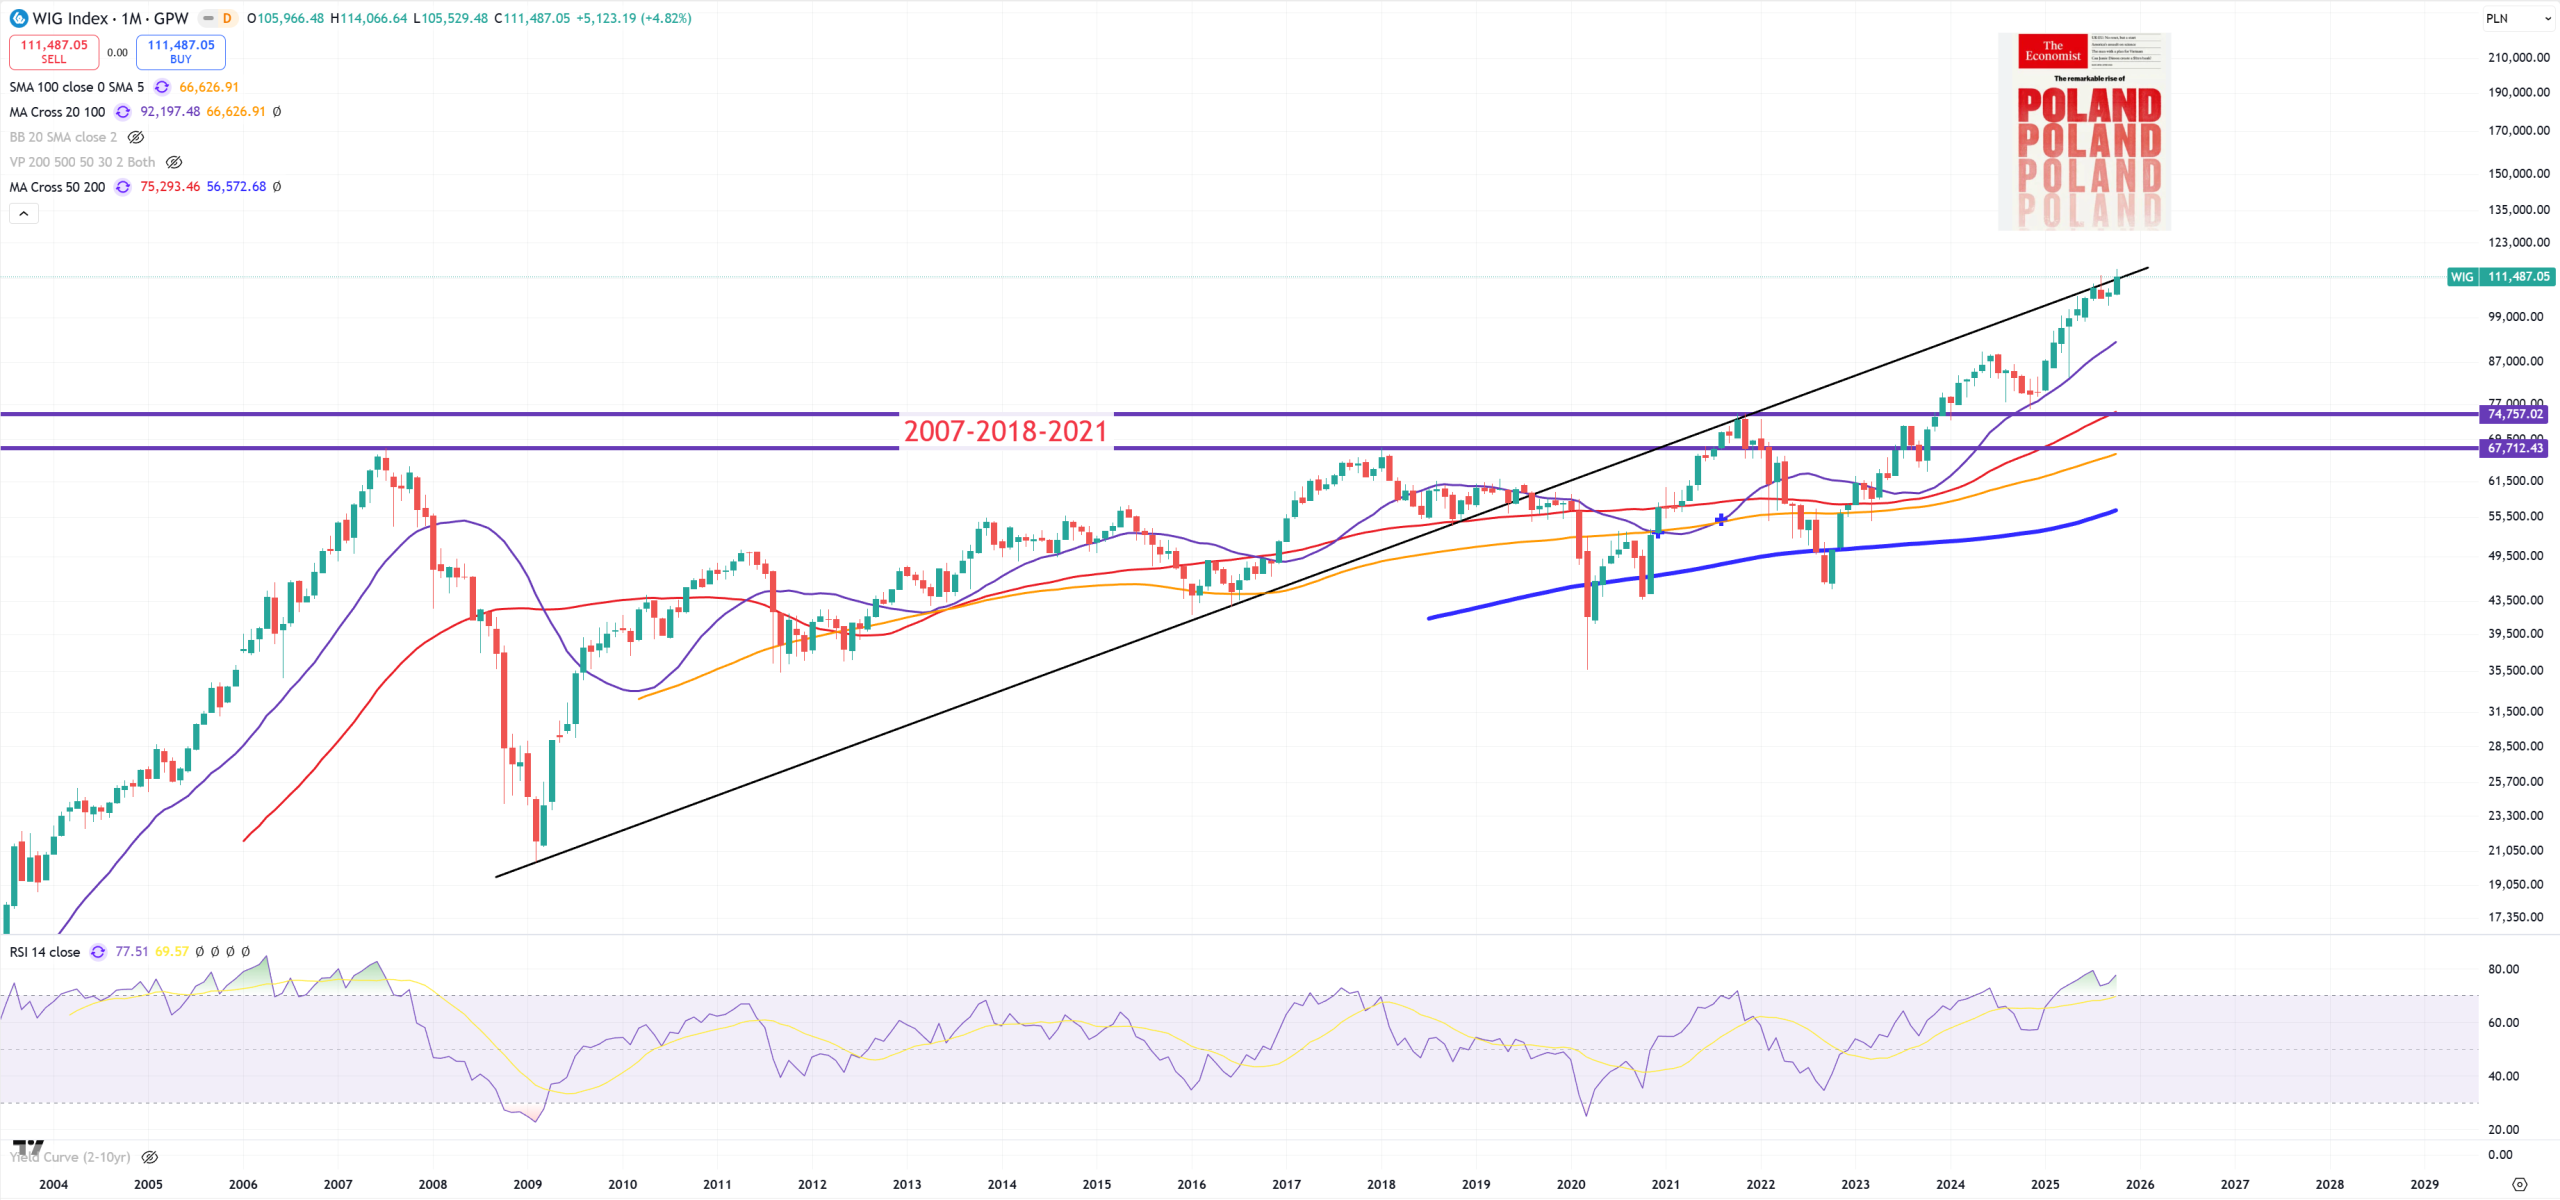
WIG – from Poland
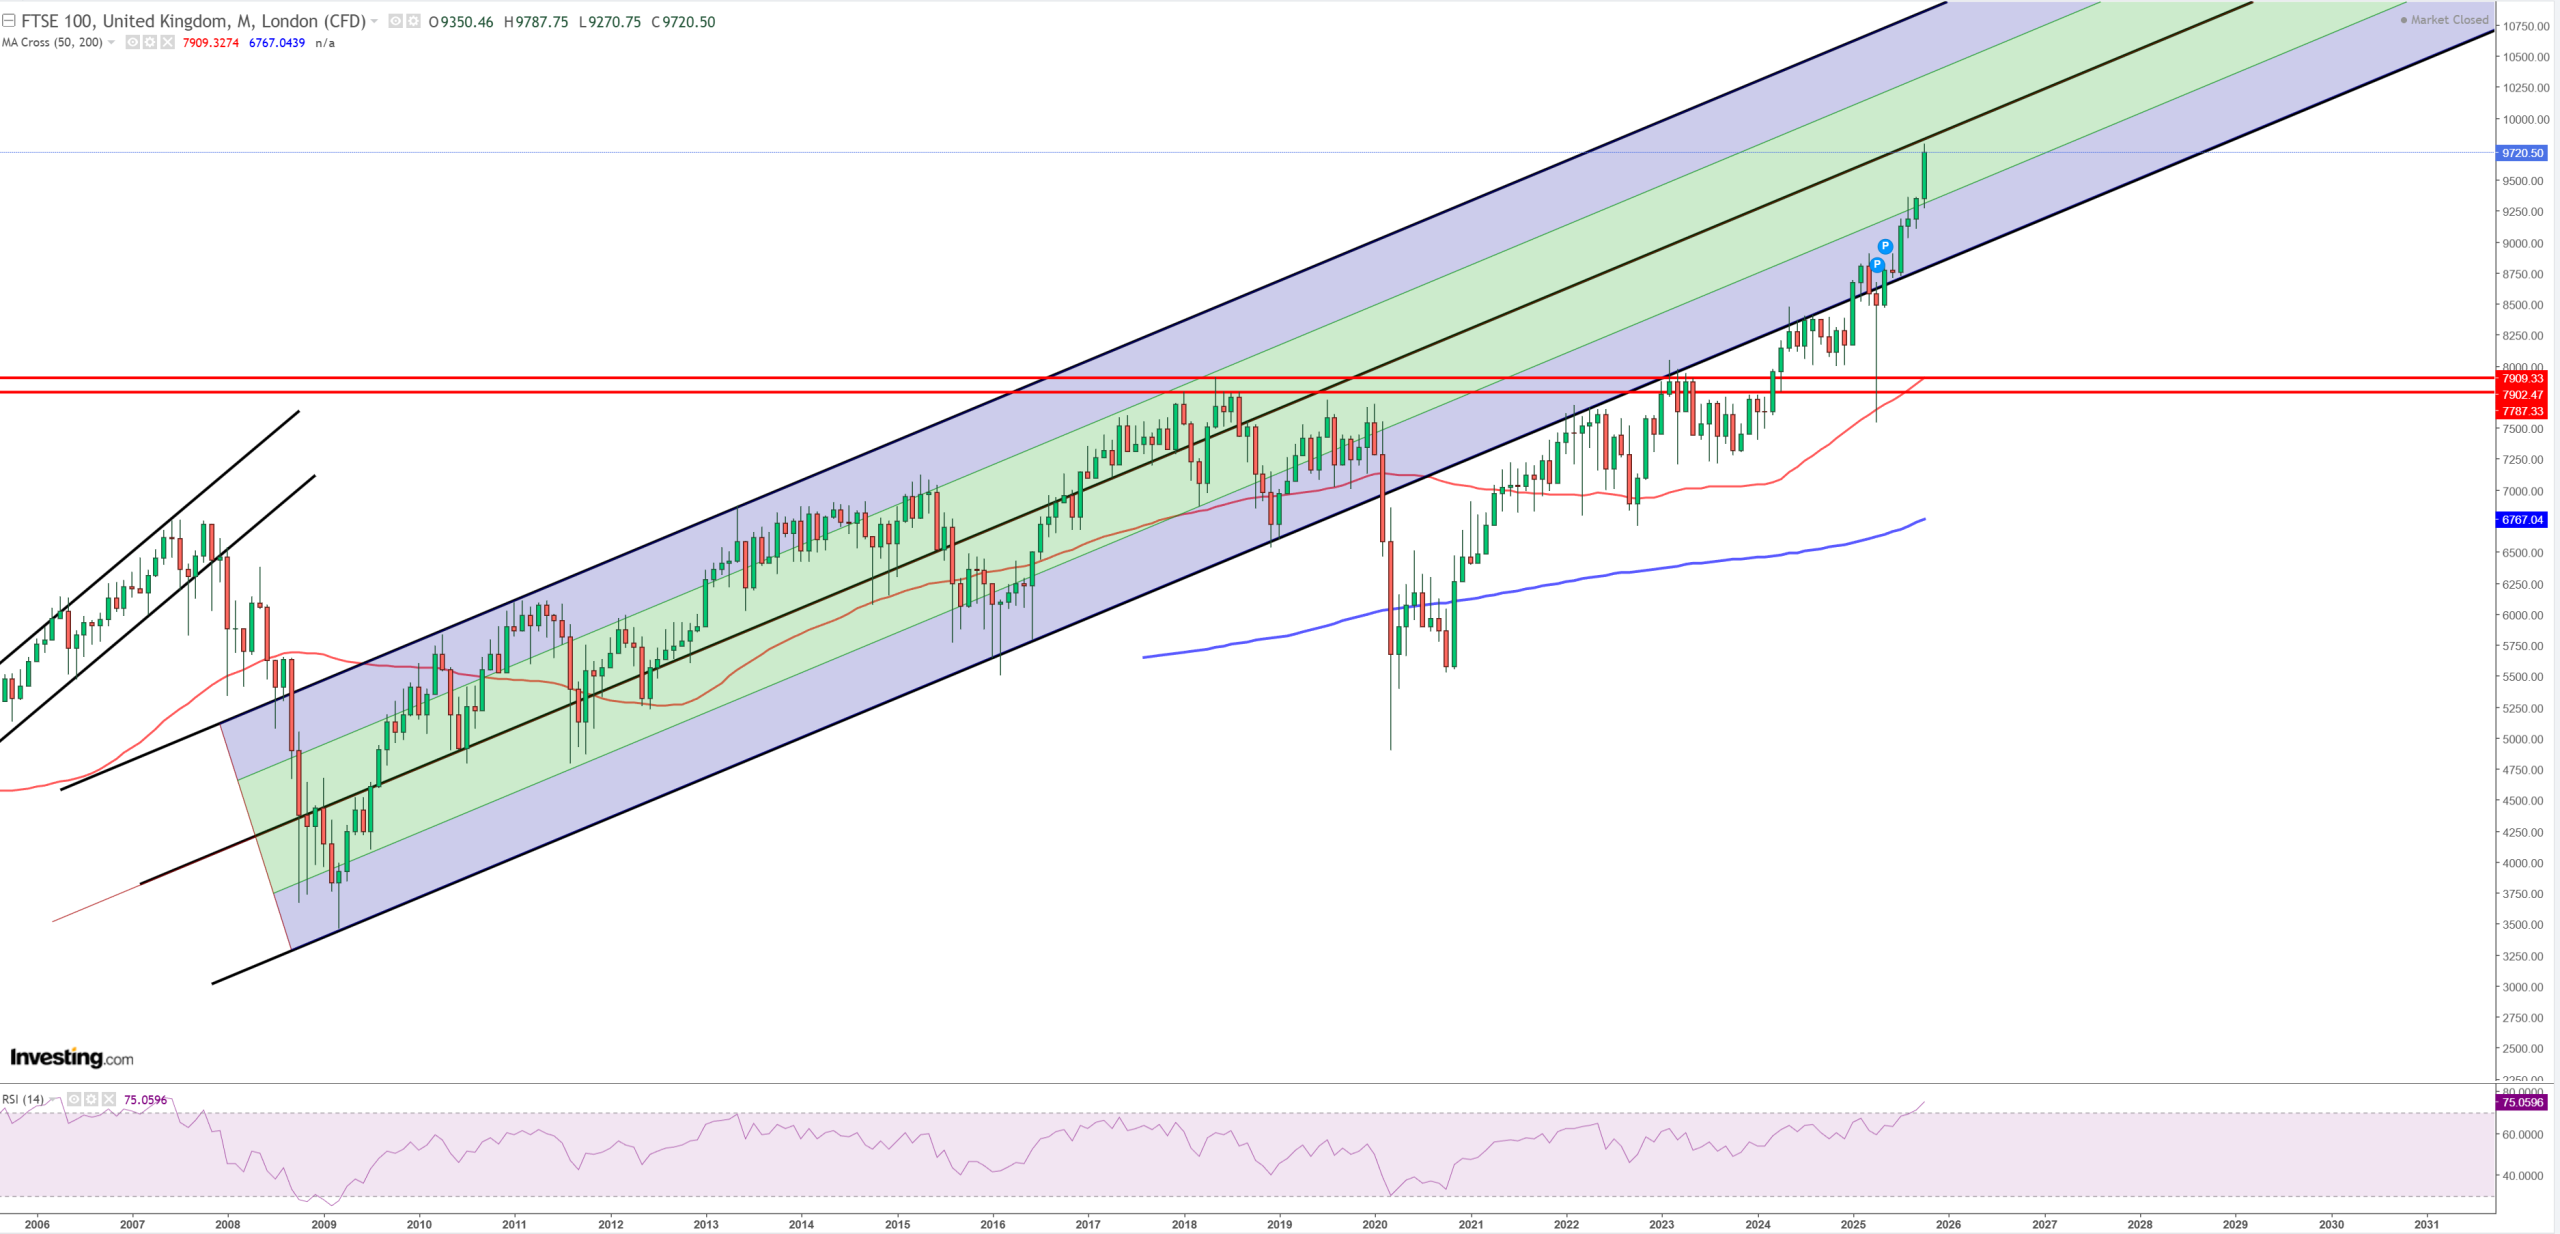
FTSE100 – one of the chart I can’t really believe
EWZ – Brazil
INDA – despite big break of USDINR, INDA so far holds above its 2021 peak
Homebuilders/Real Estate
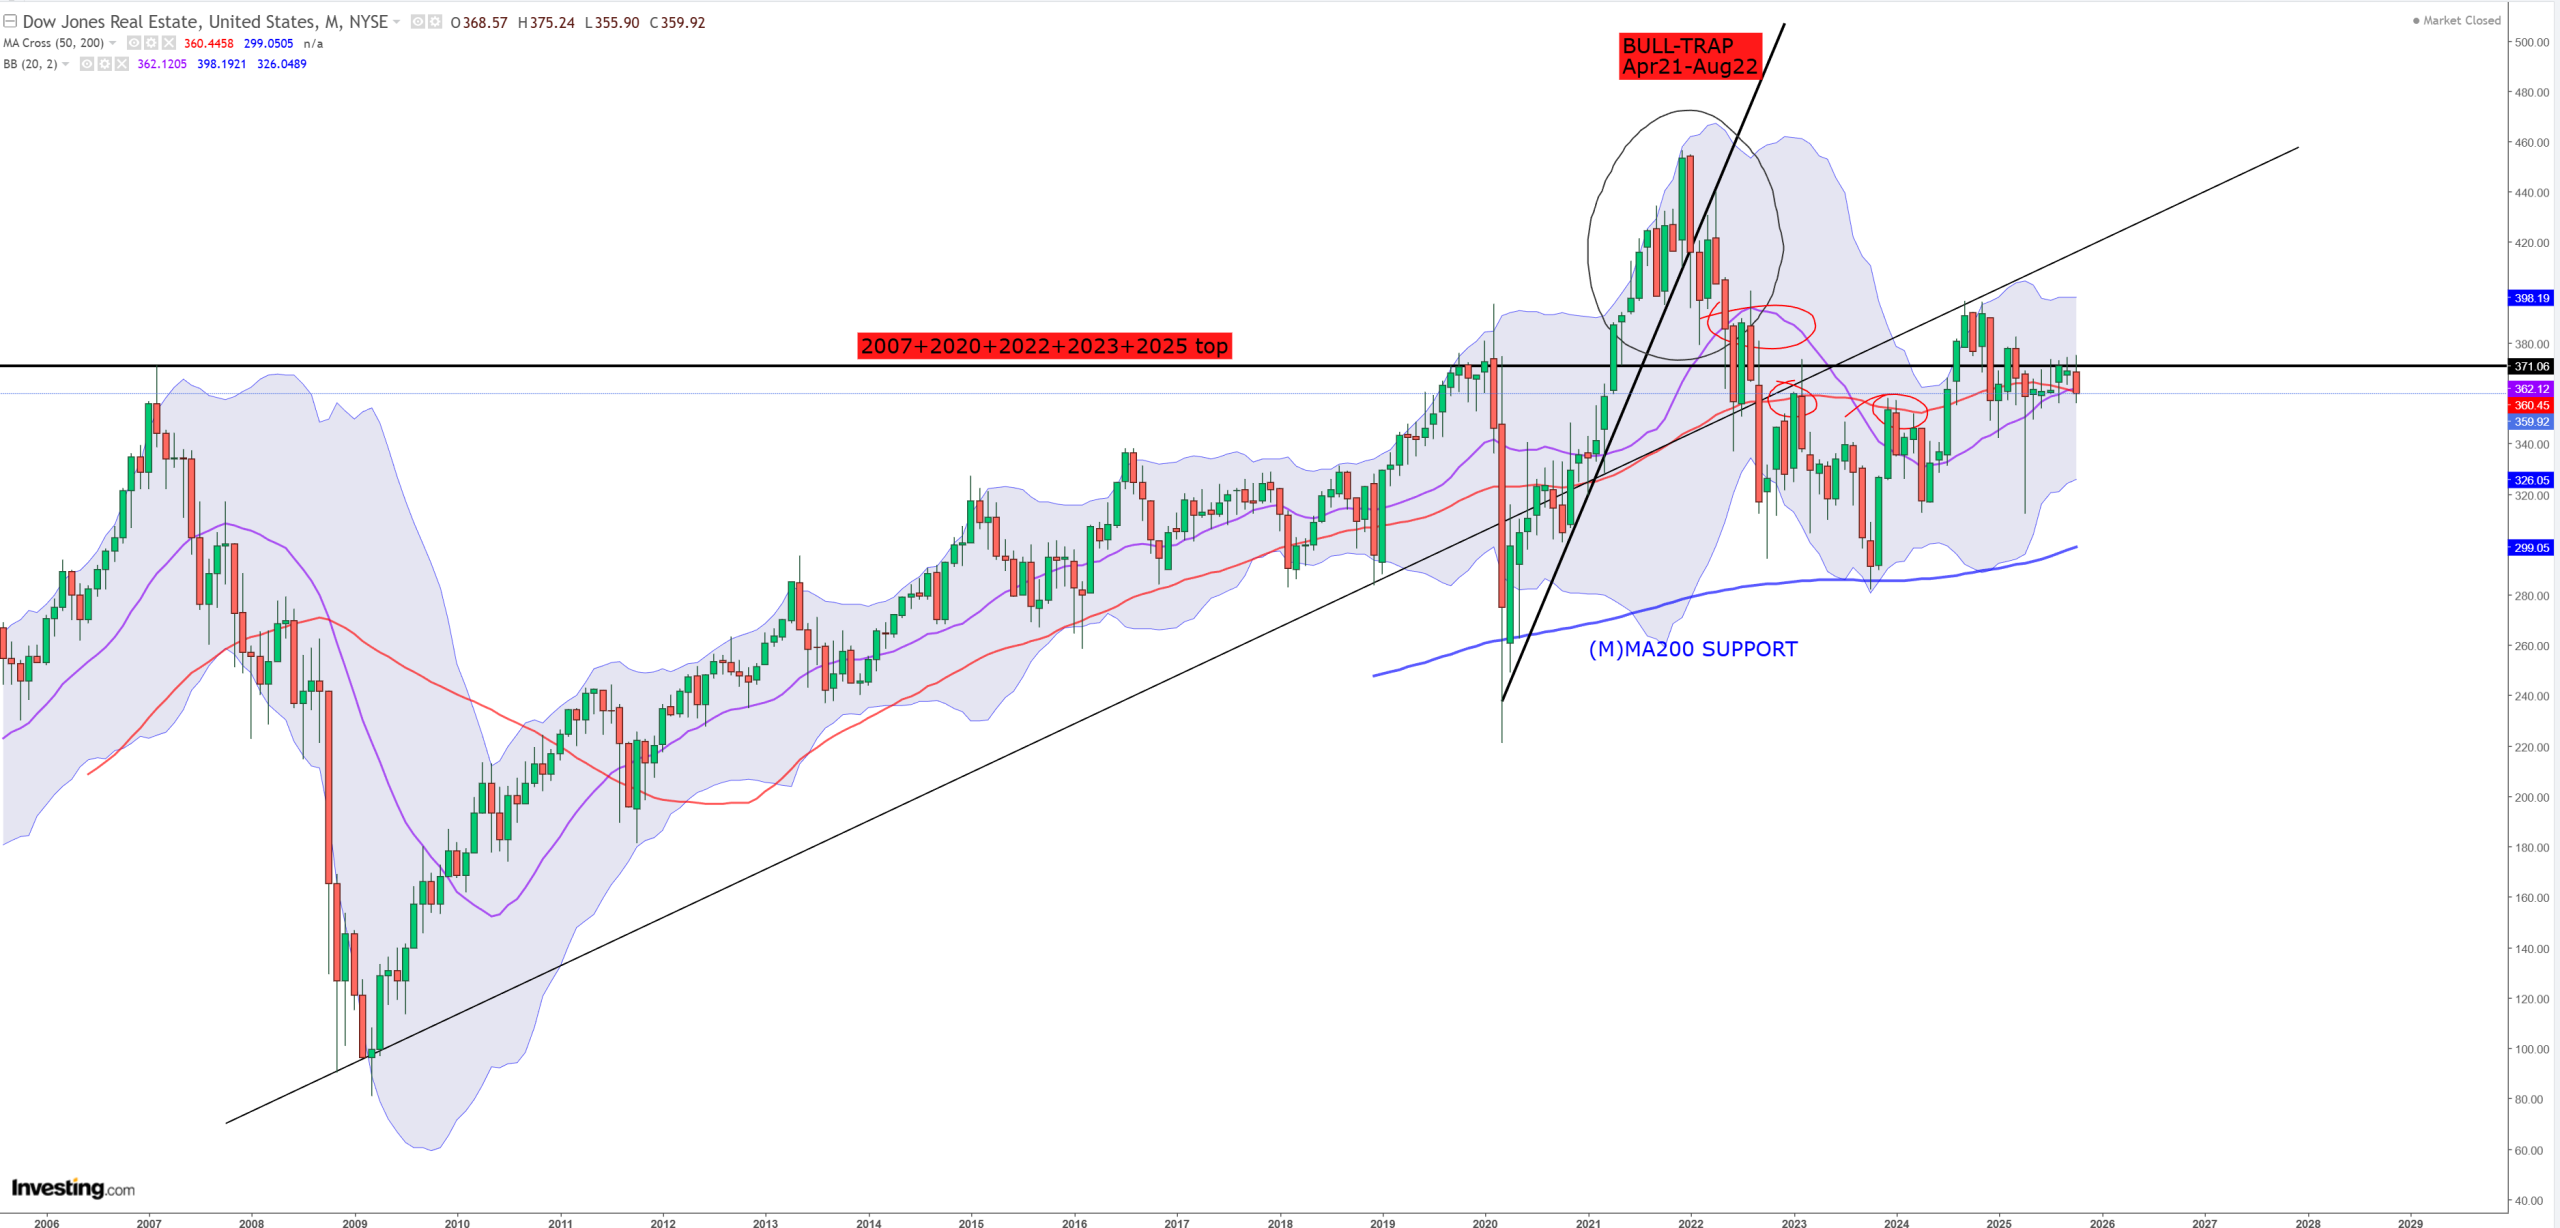
DJUSRE – Dow Jones US Real Estate Index – we can leave it without a comment
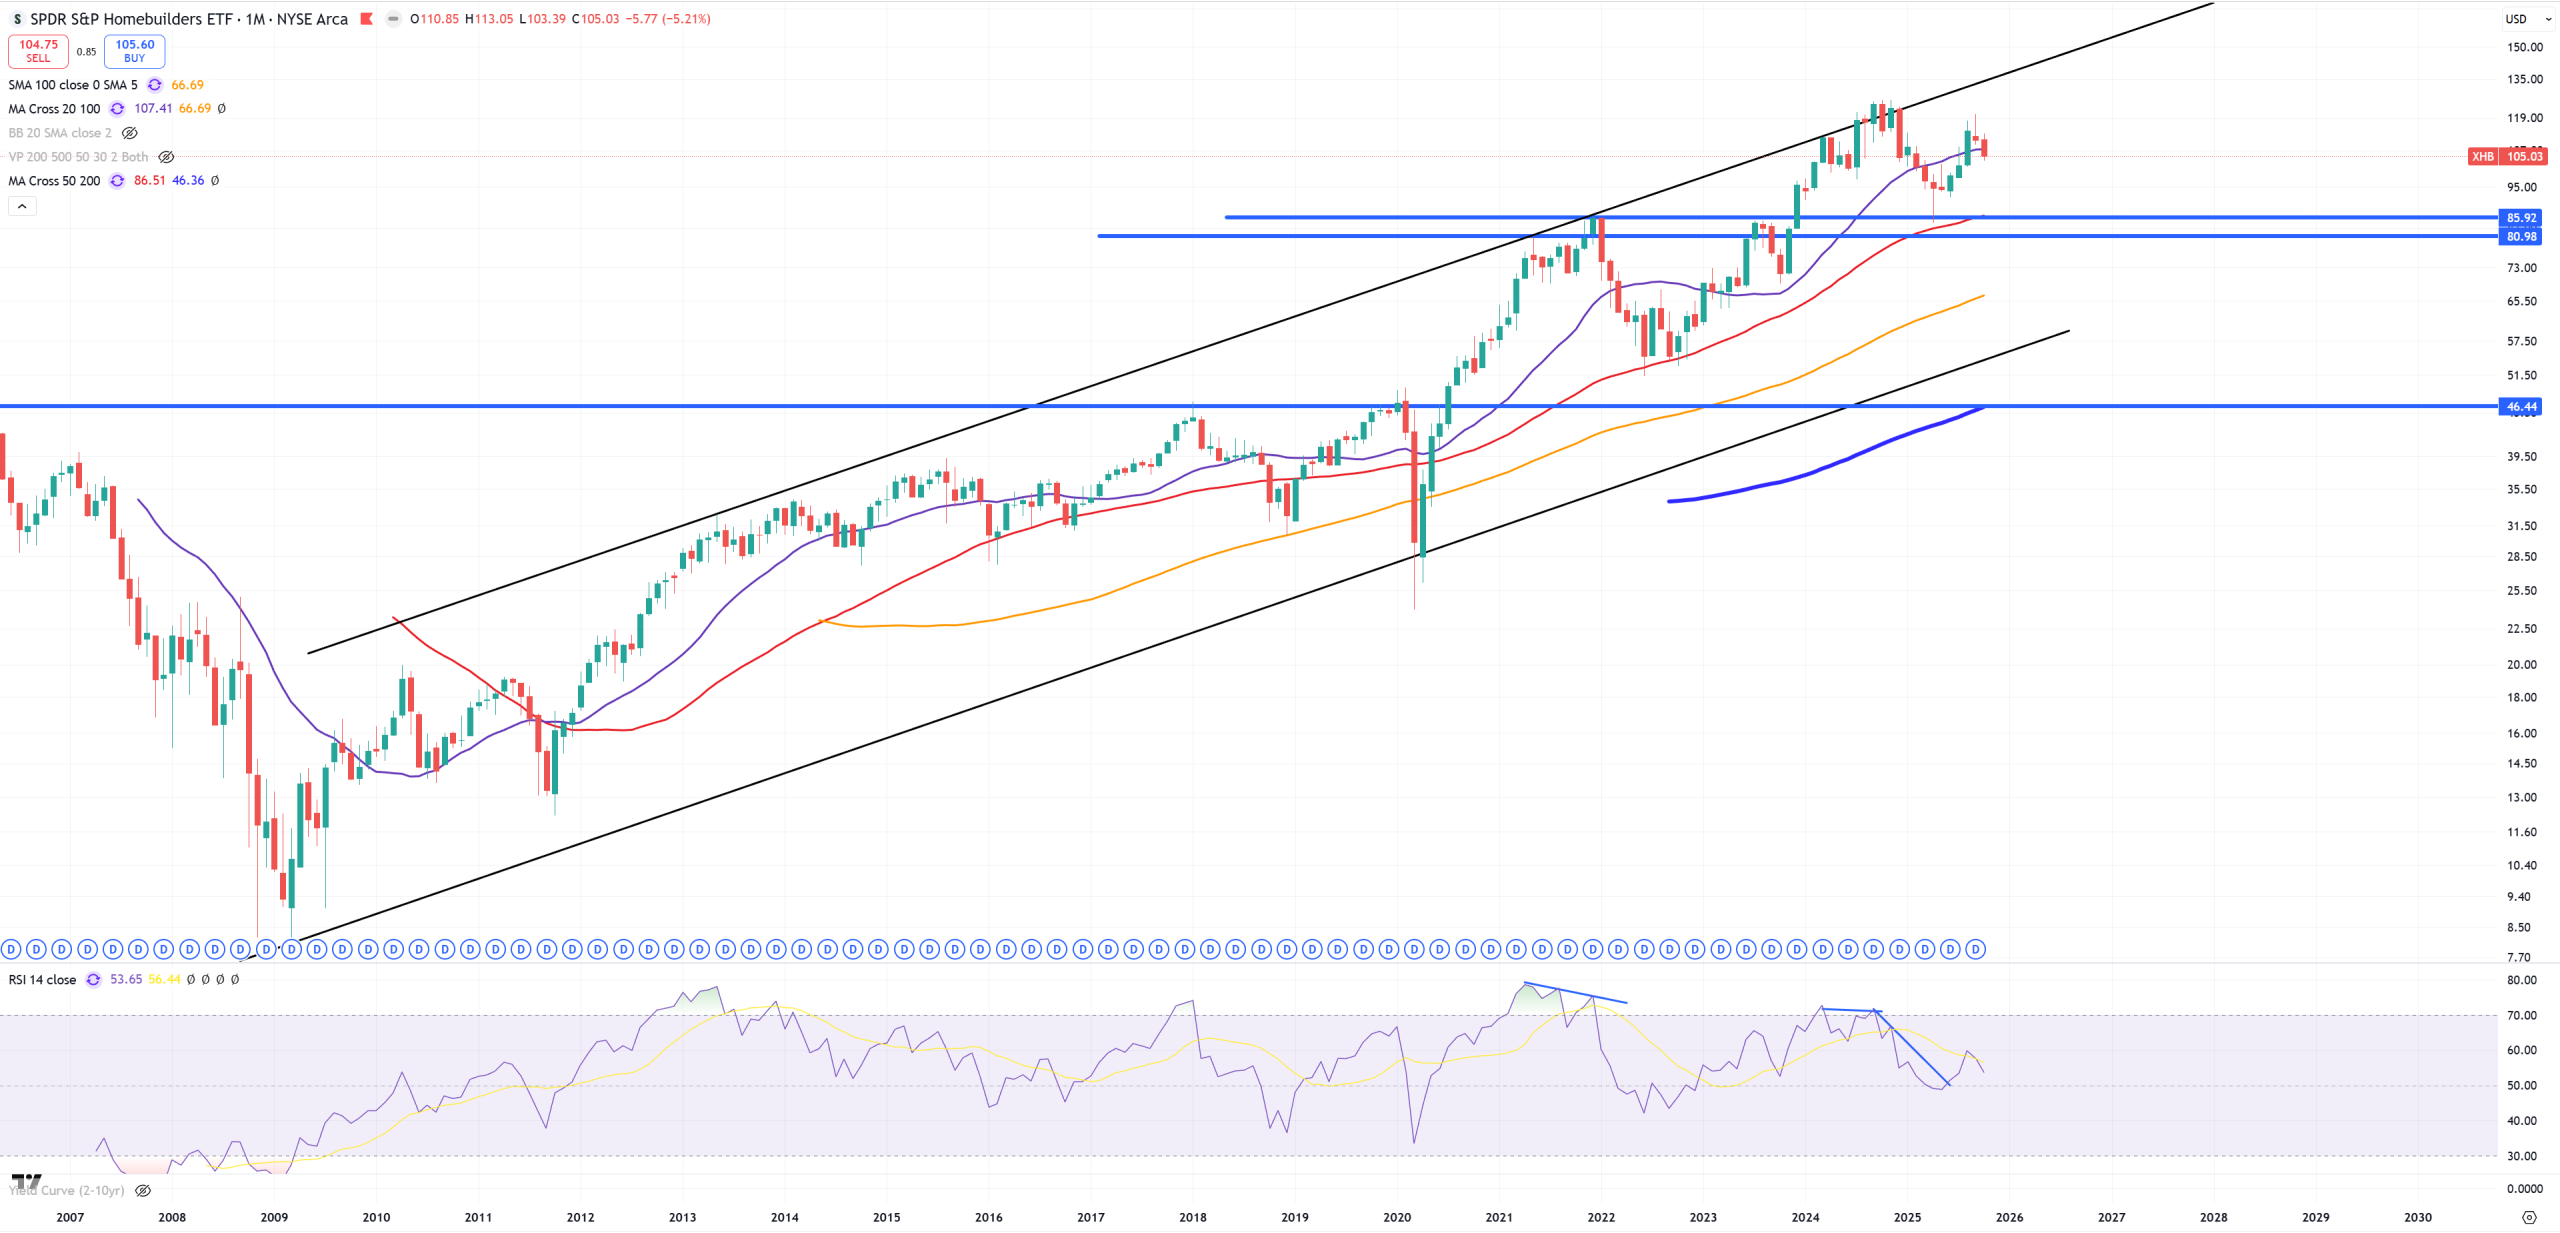
XHB – Homebuilders ETF
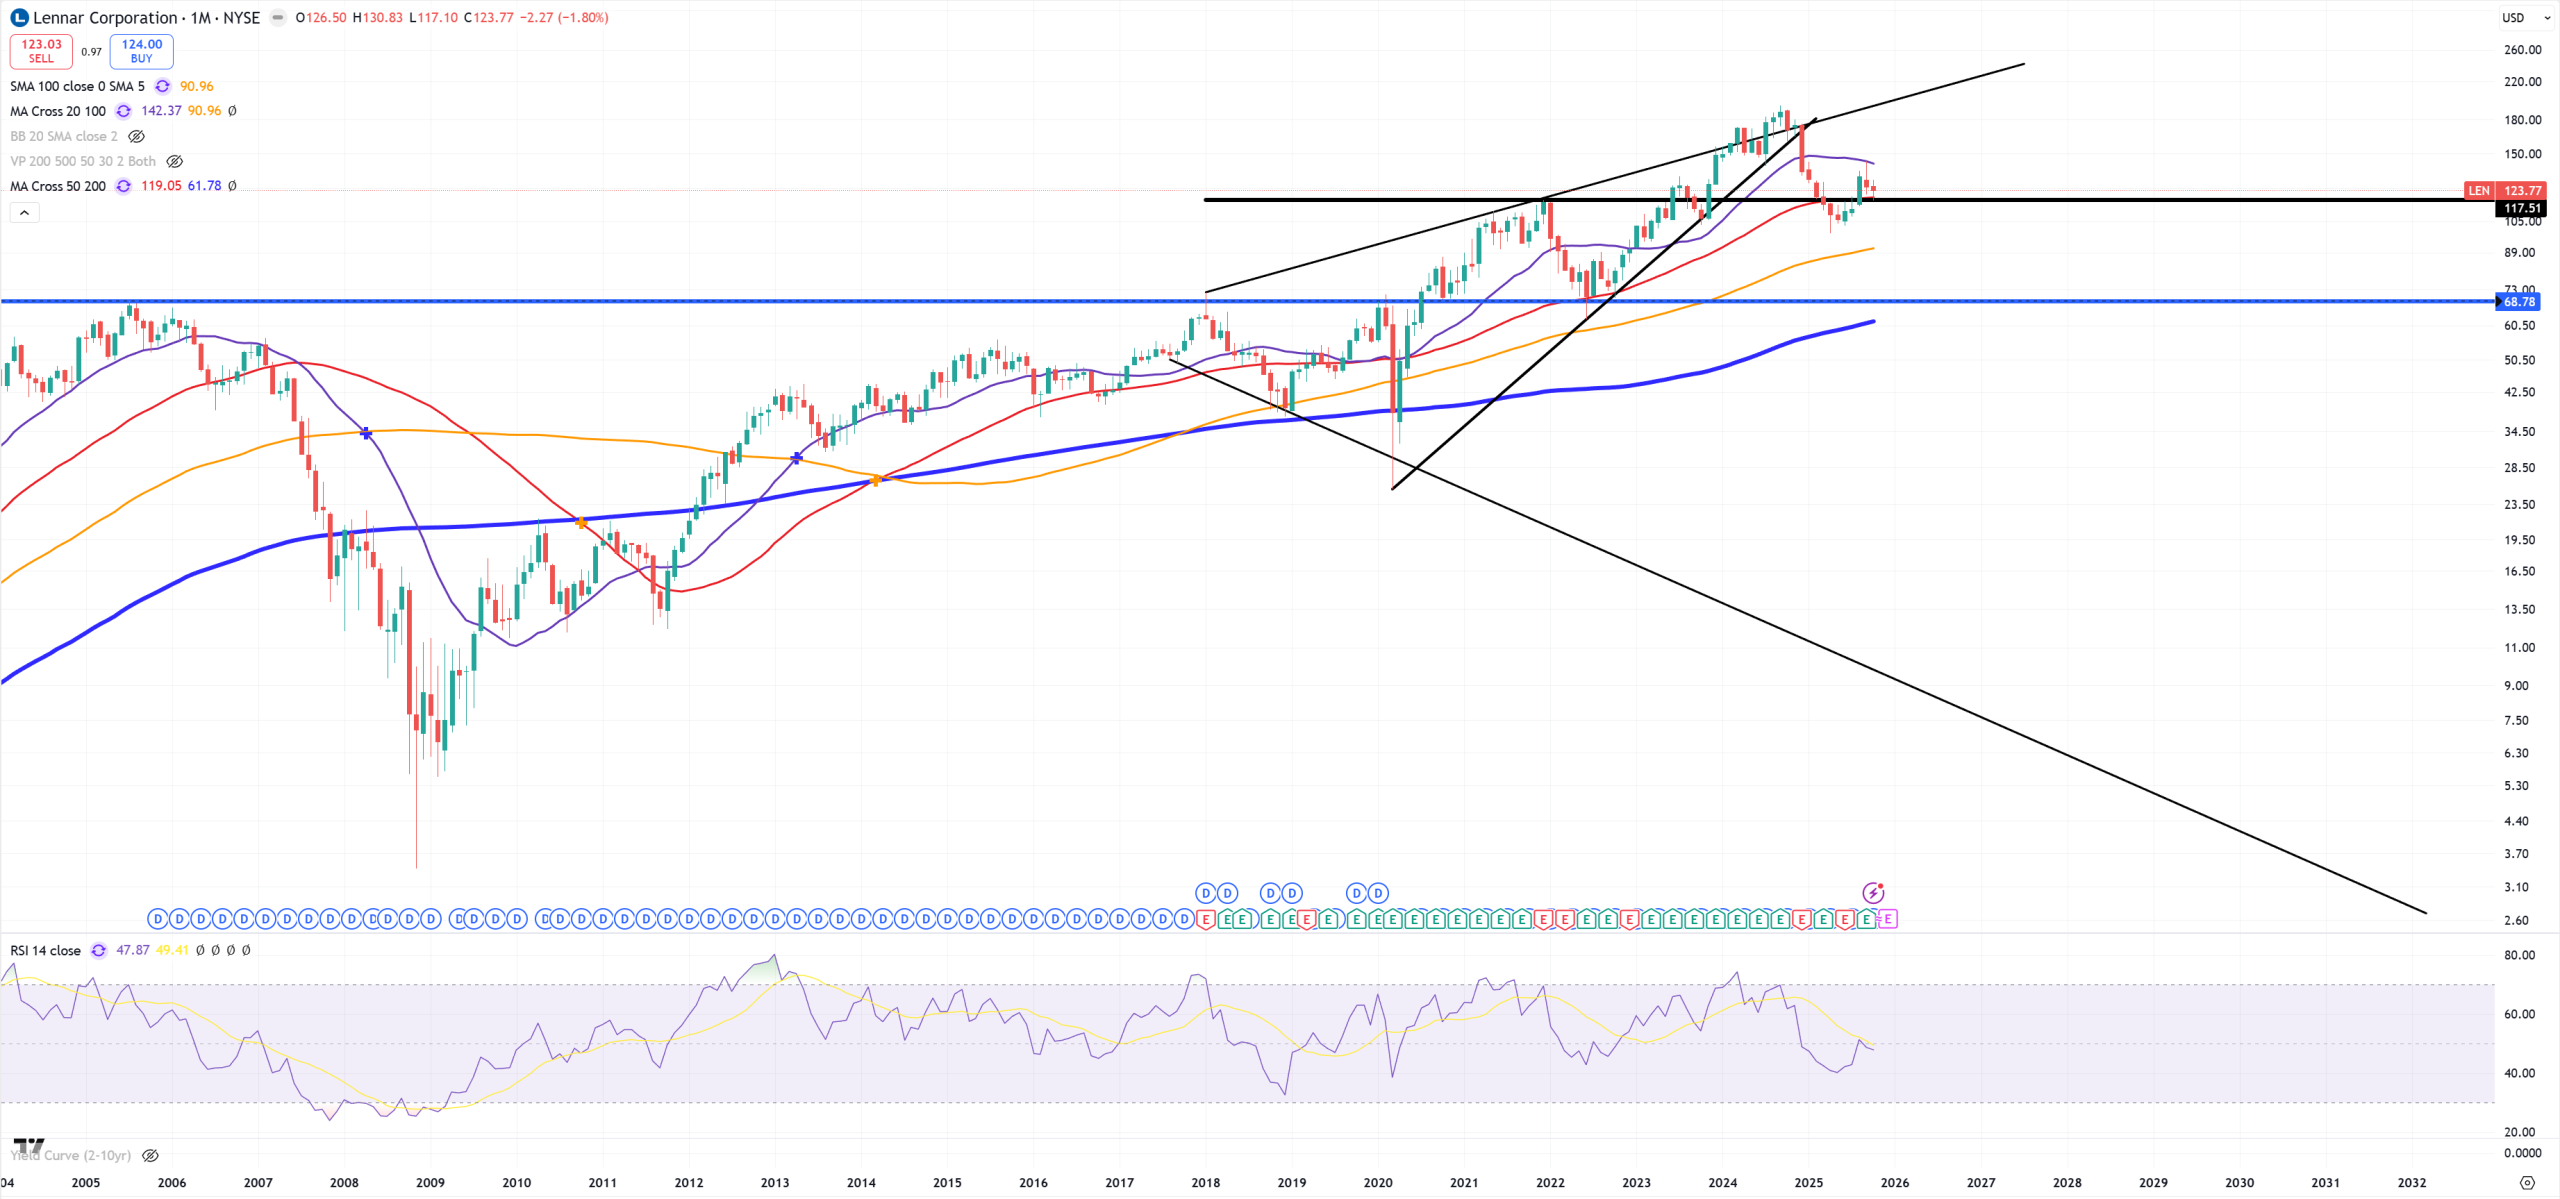
LEN – Lennar is on the edge of a break below 2021 peak
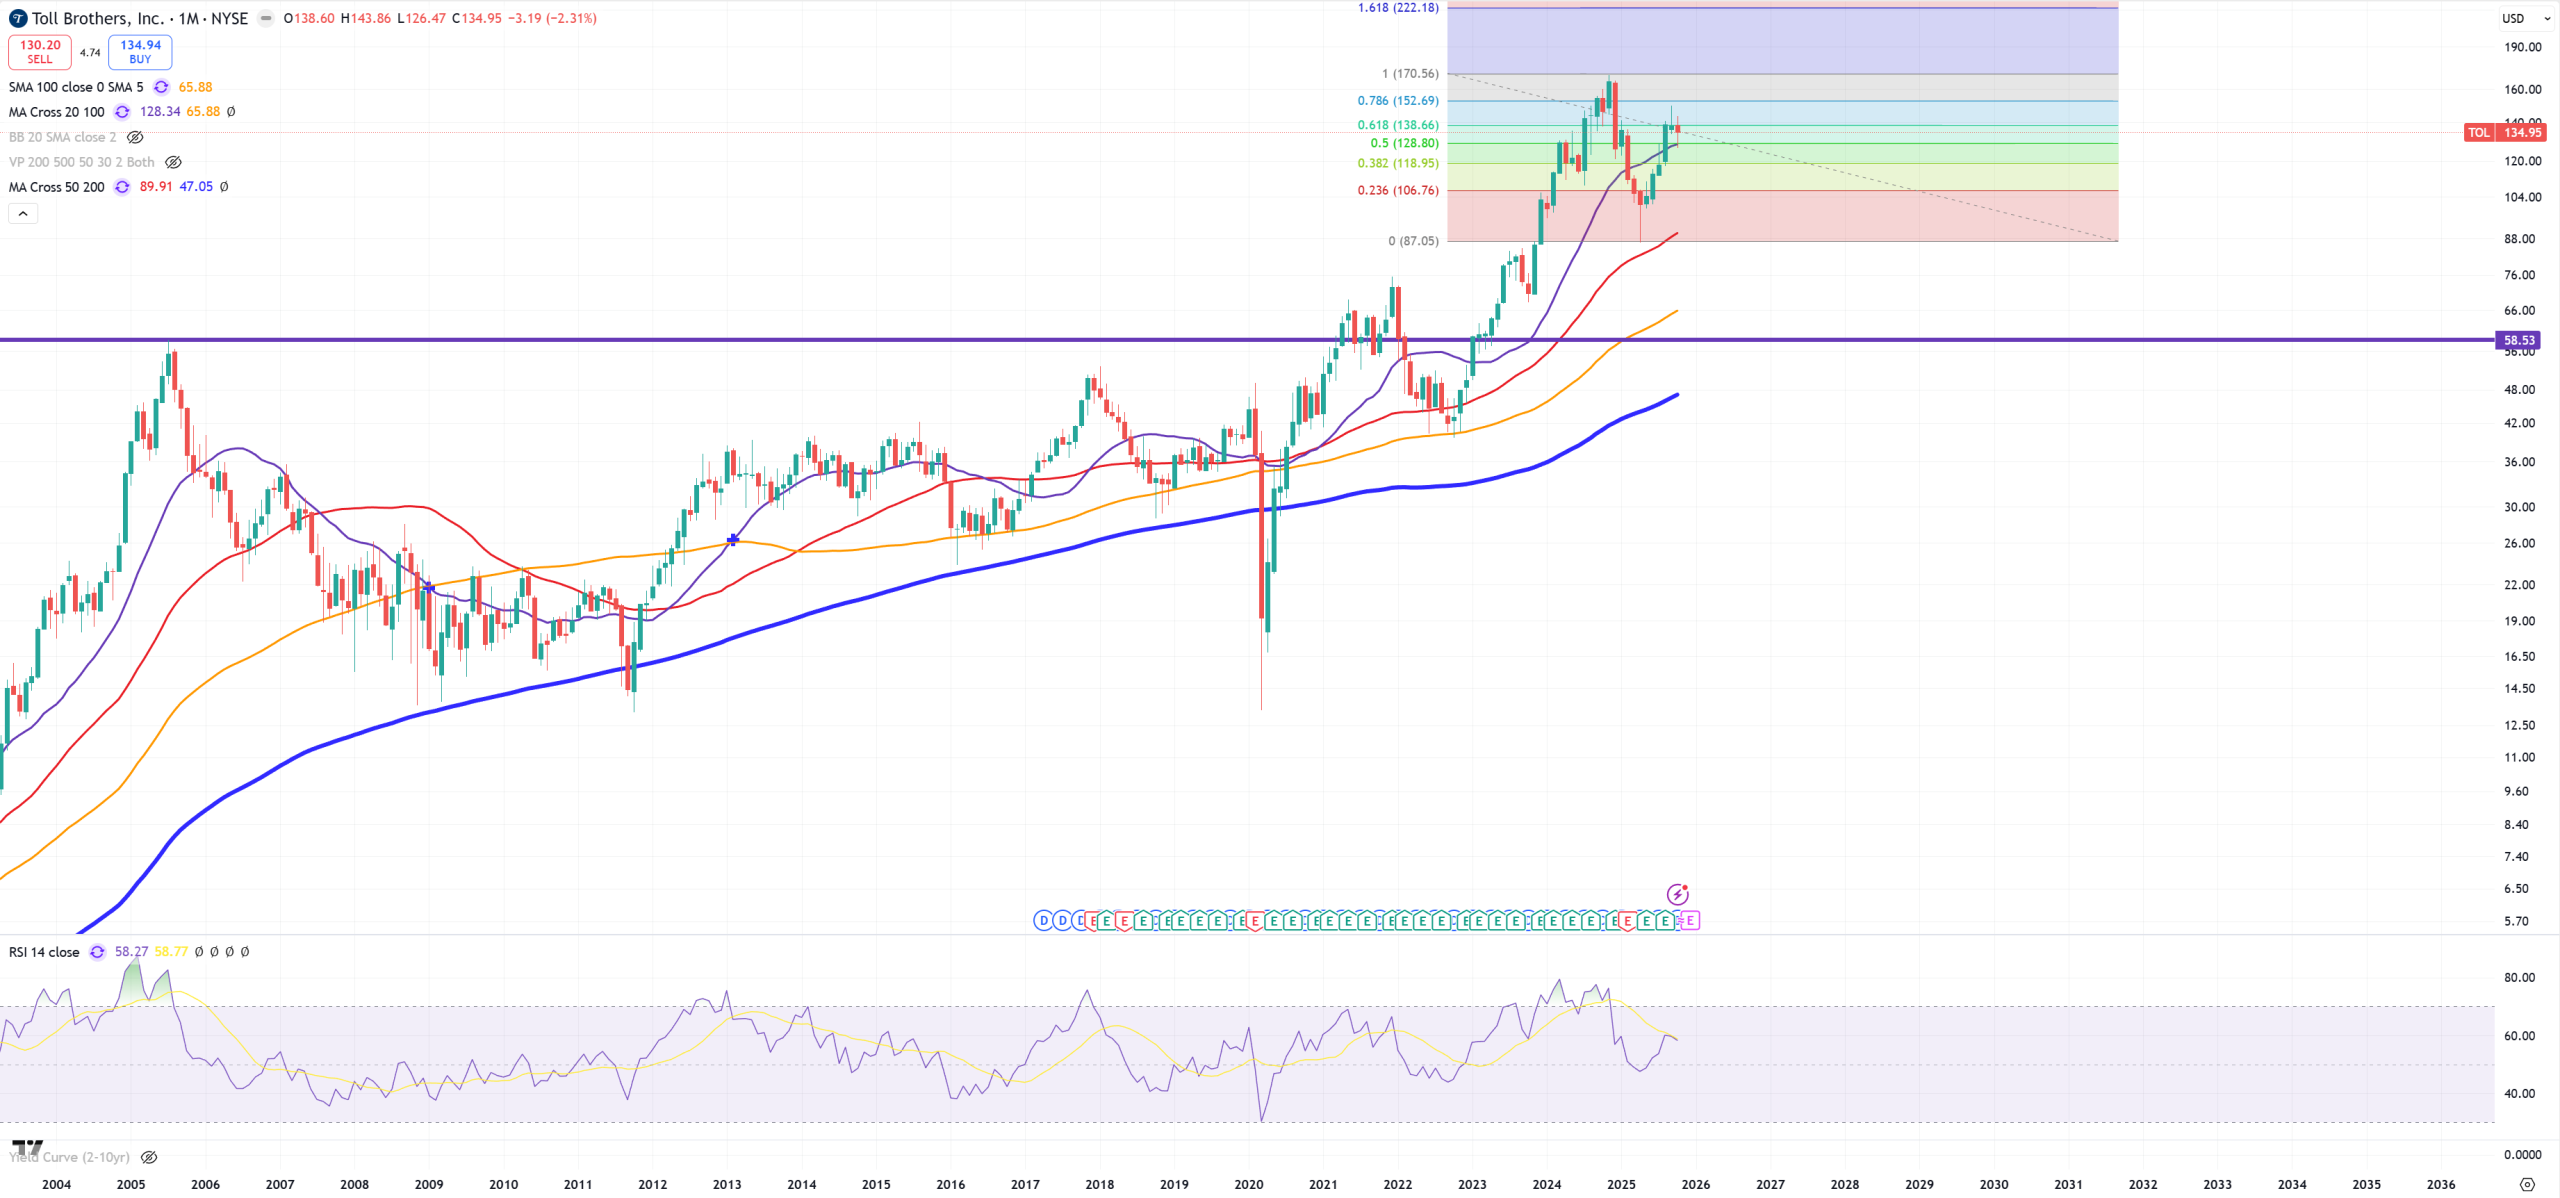
TOL – looks way better than LEN
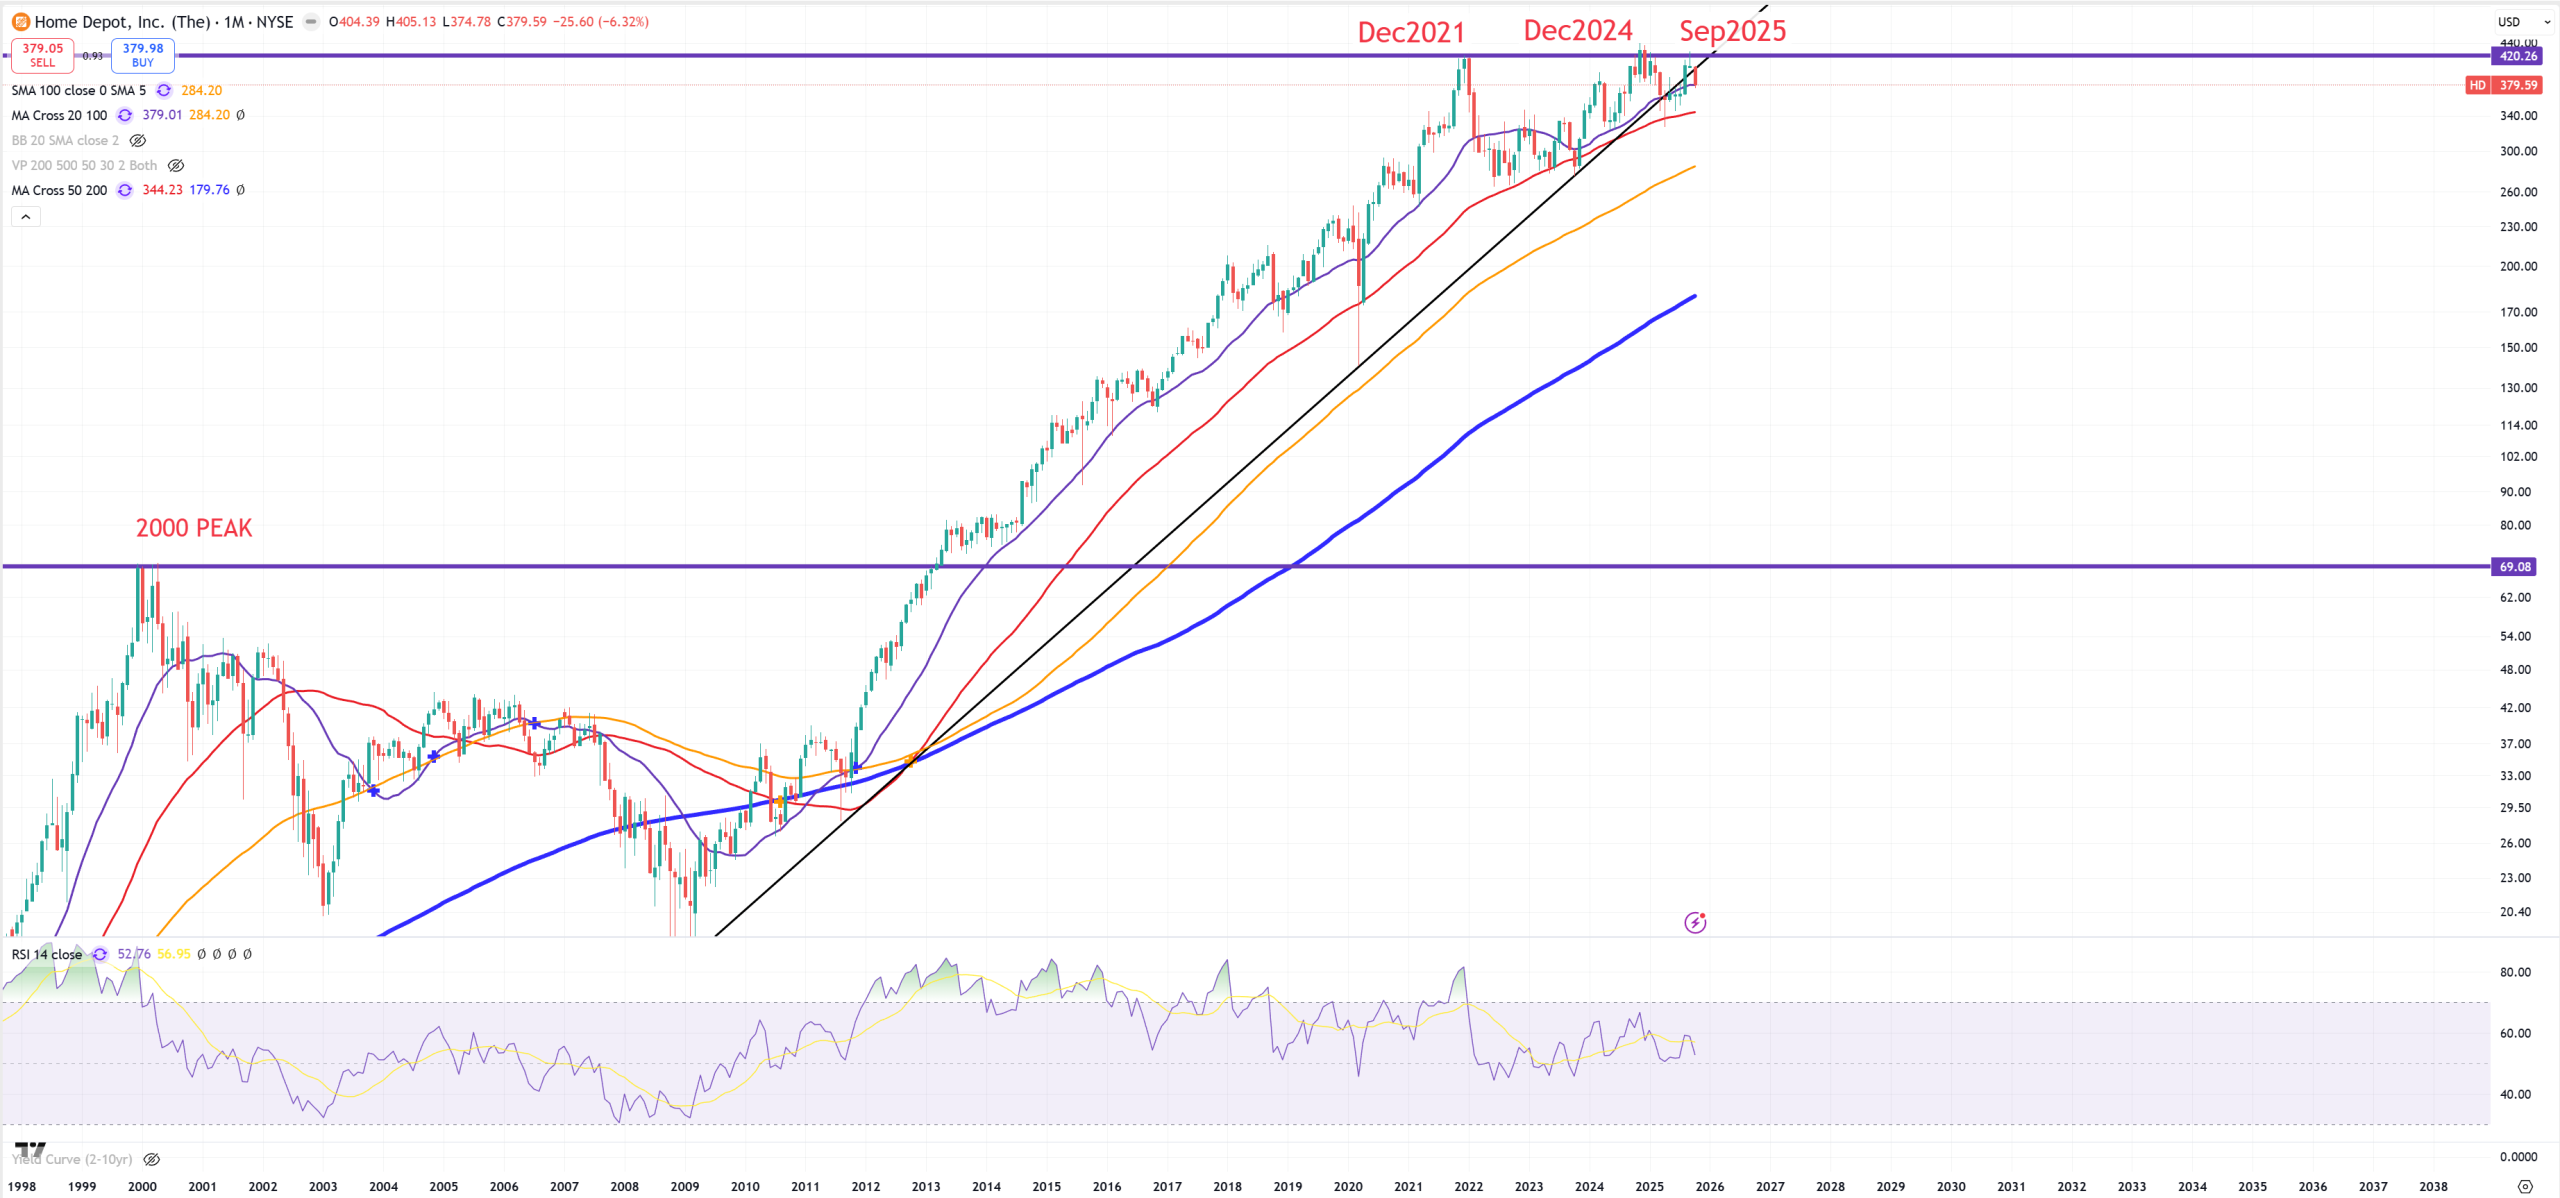
HD – Home Depot, gave up its 2009 trend
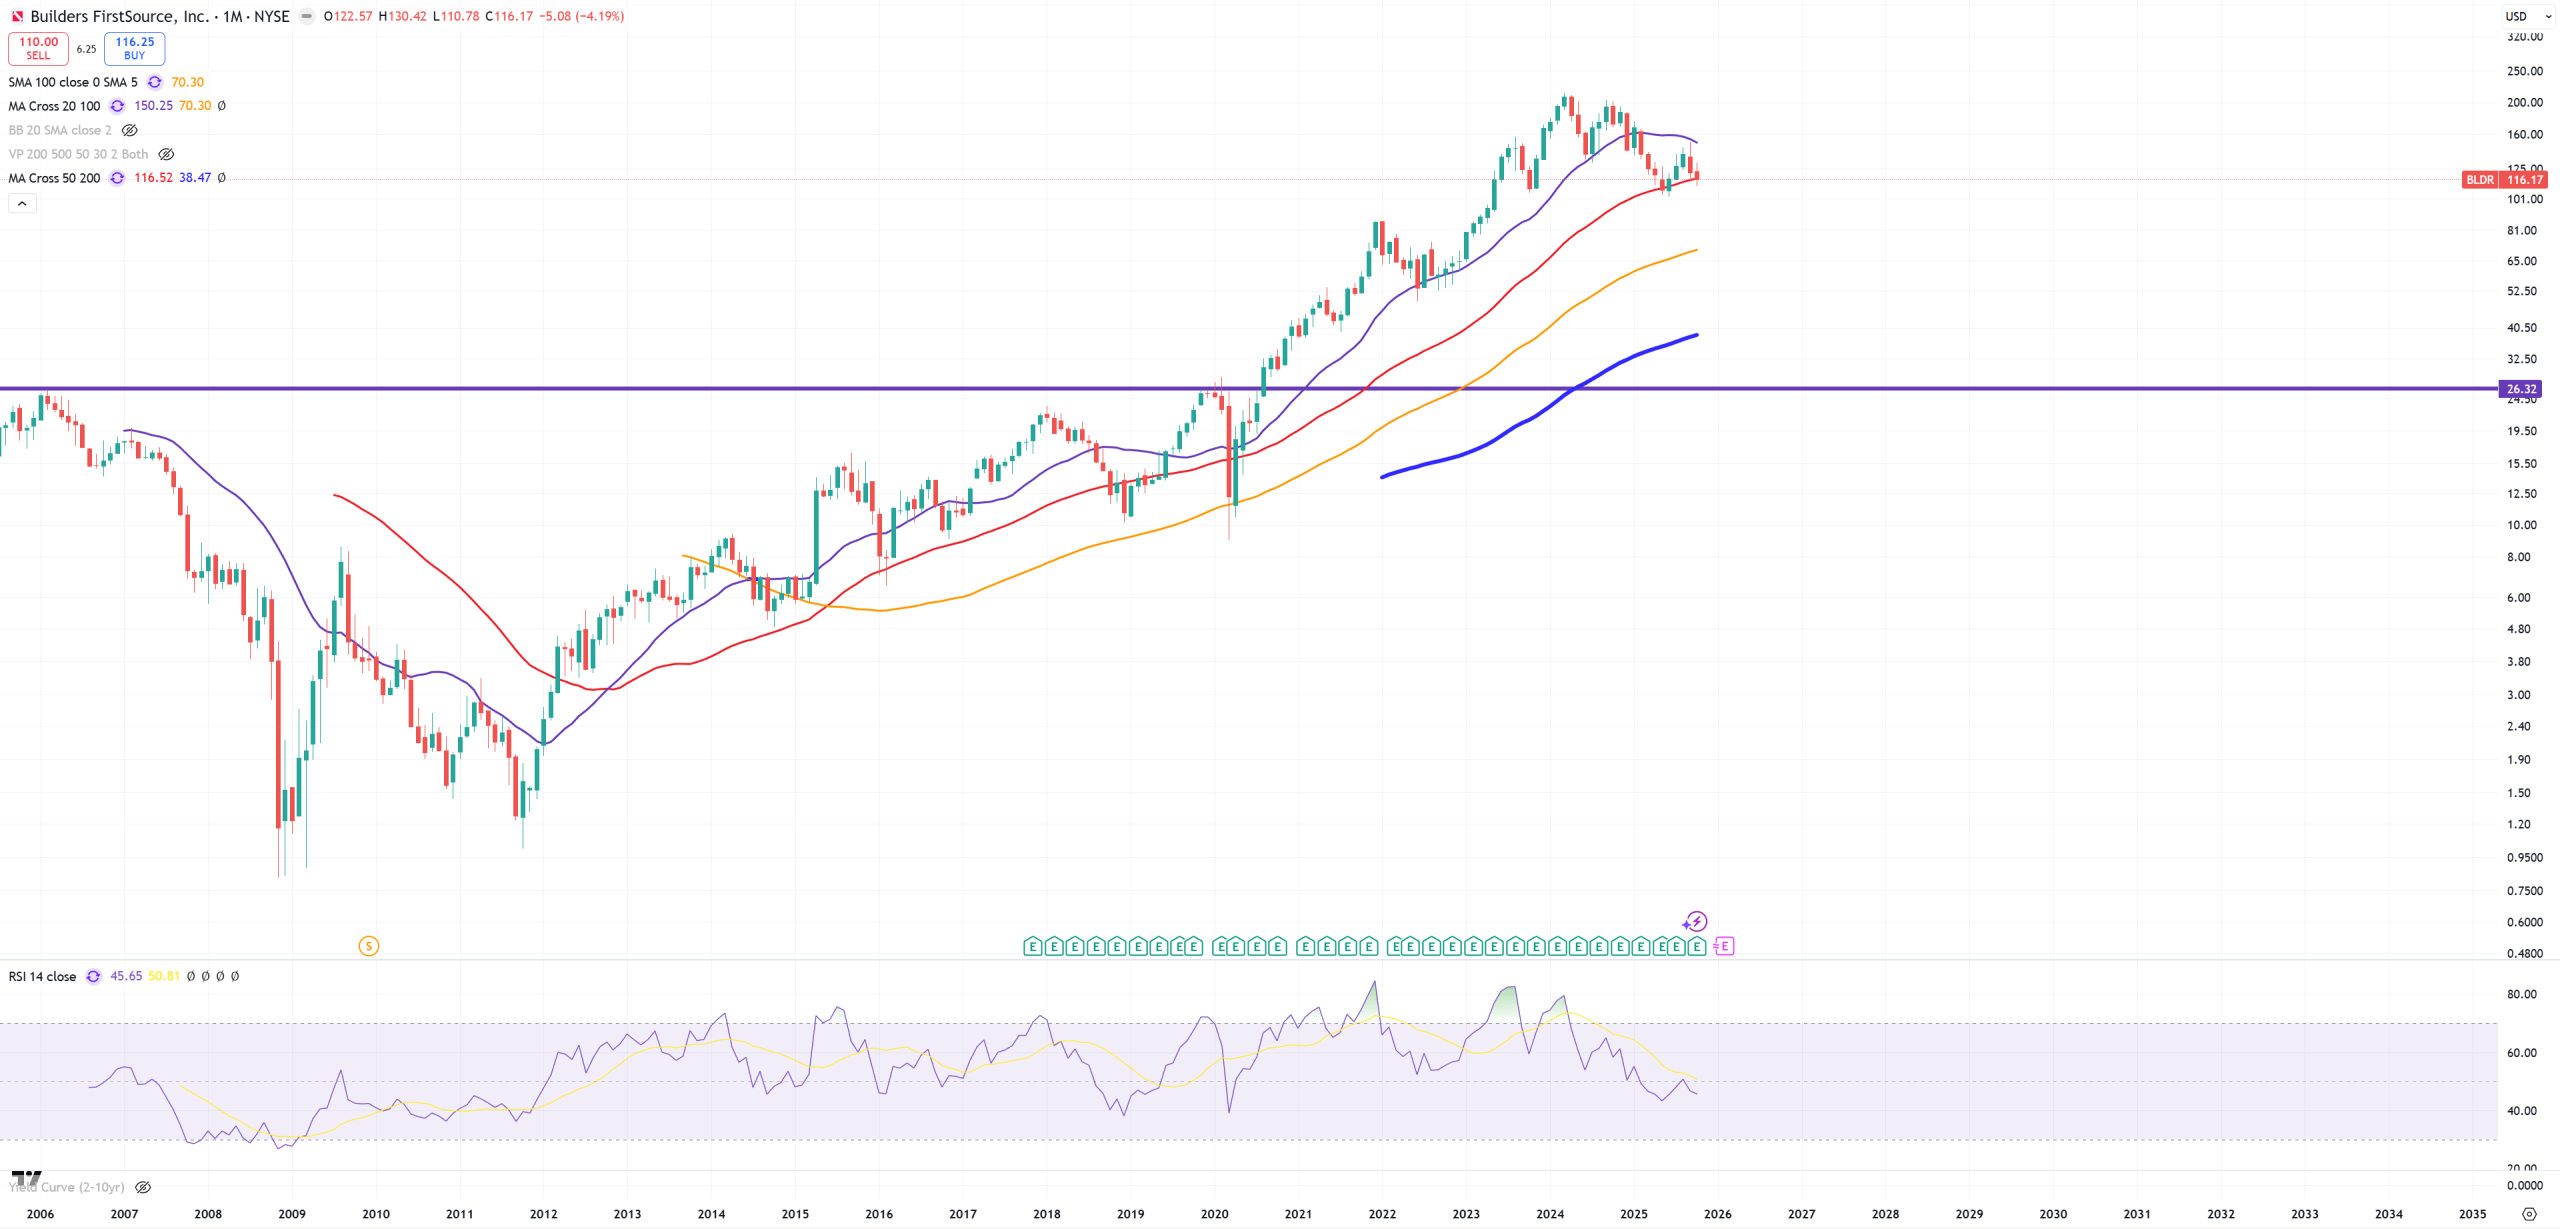
BLDR – Builders FirstSource – on the edge of breaking (M)MA50
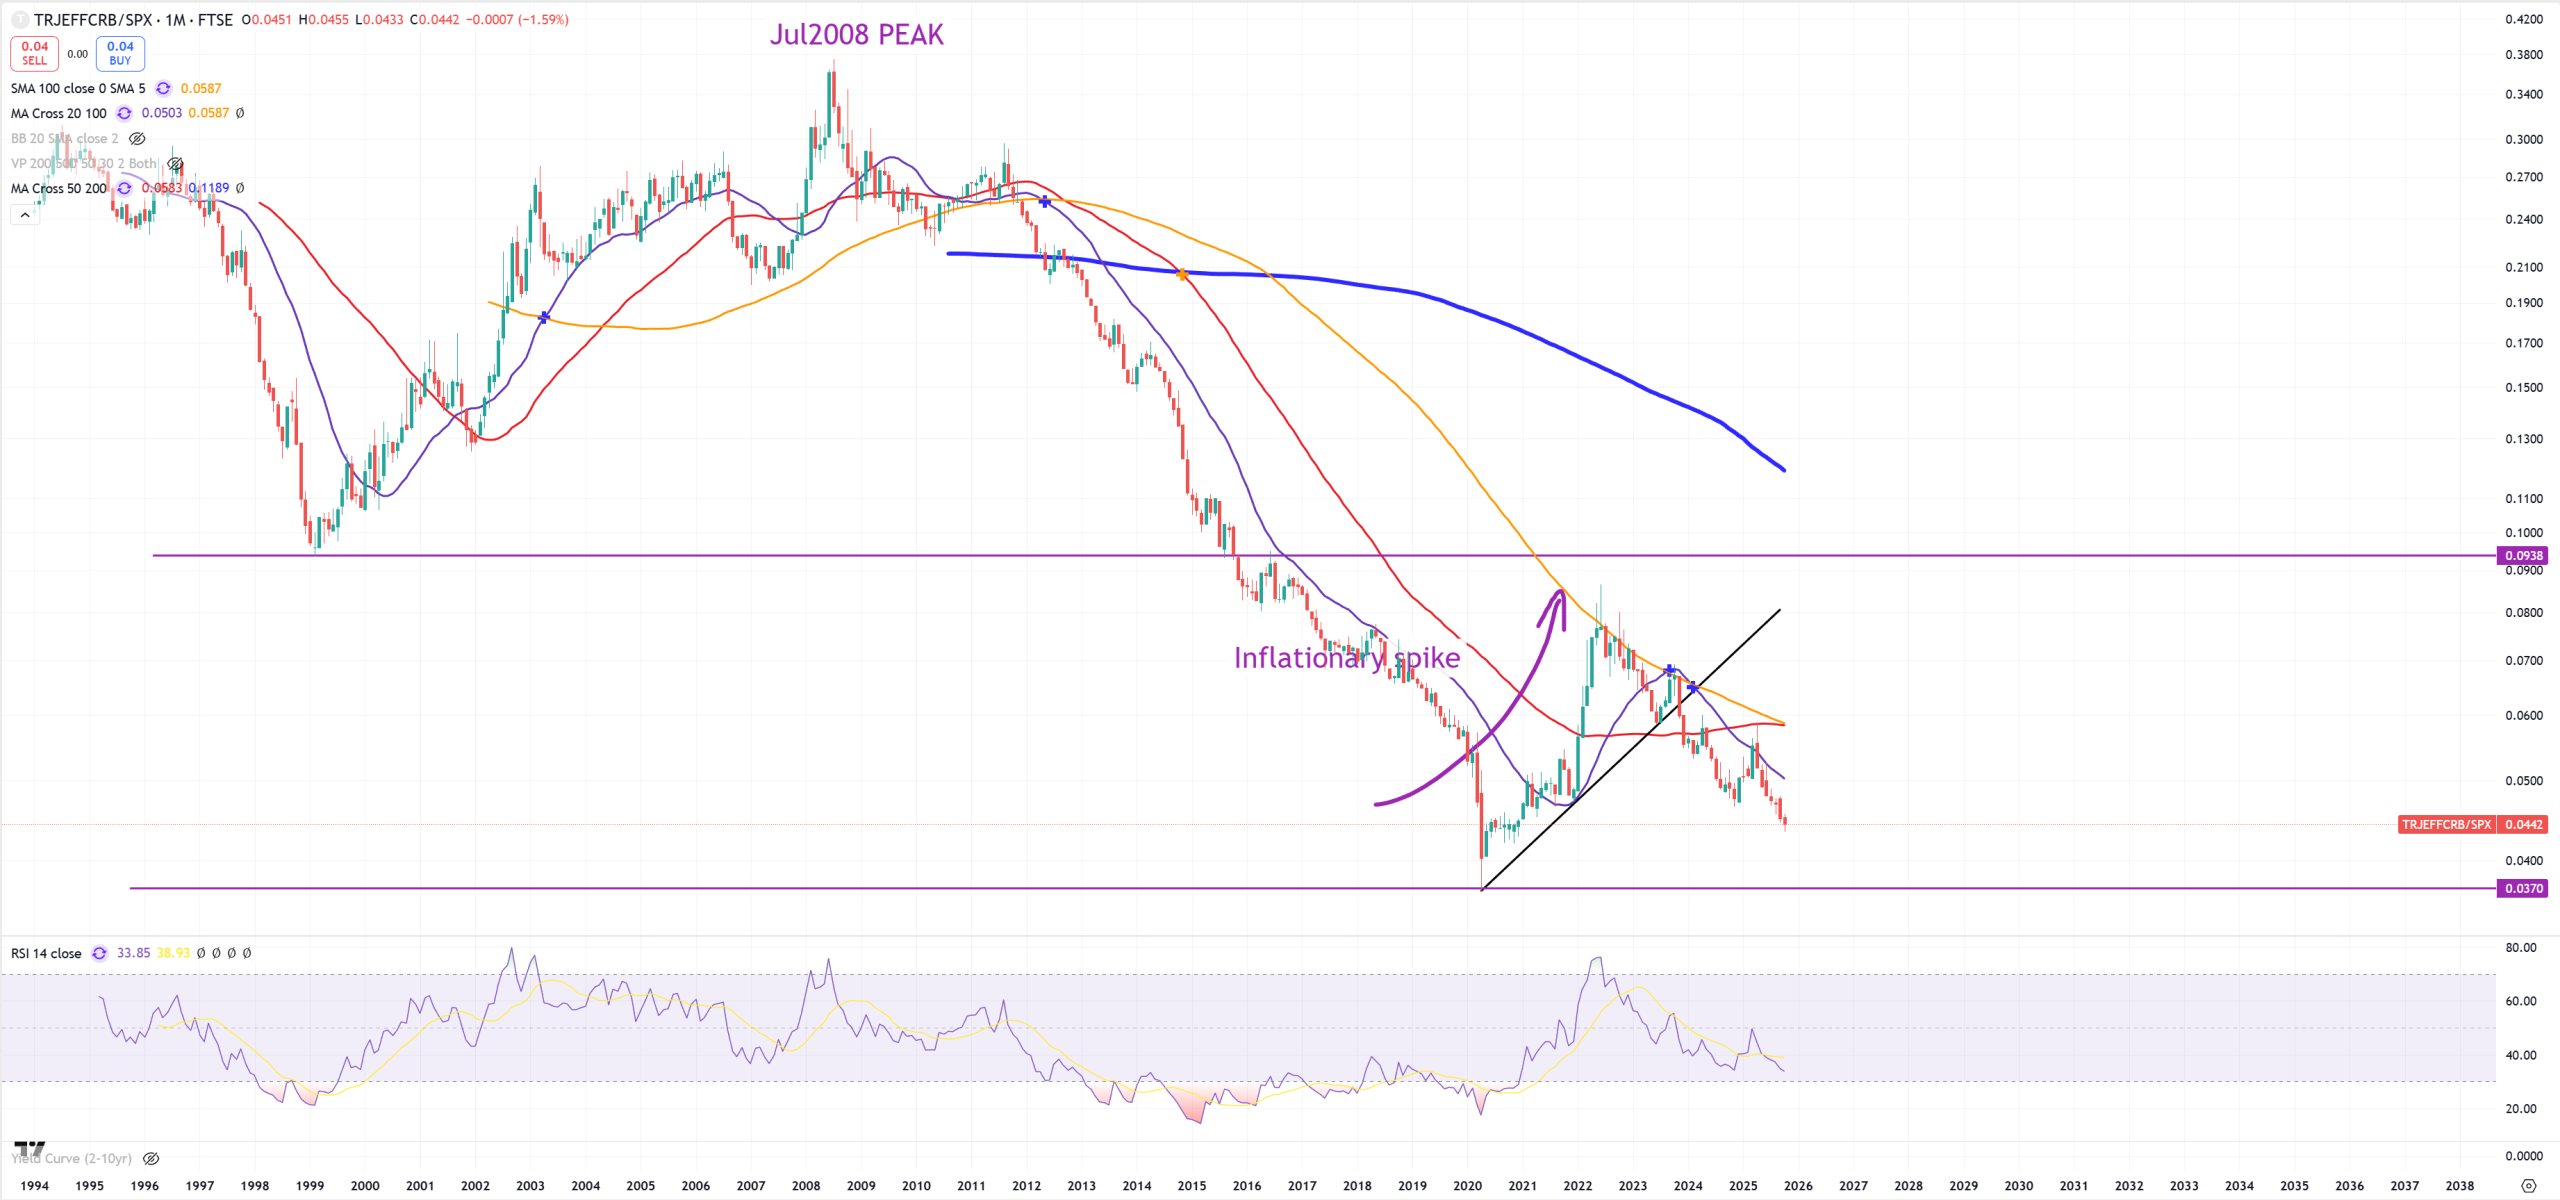
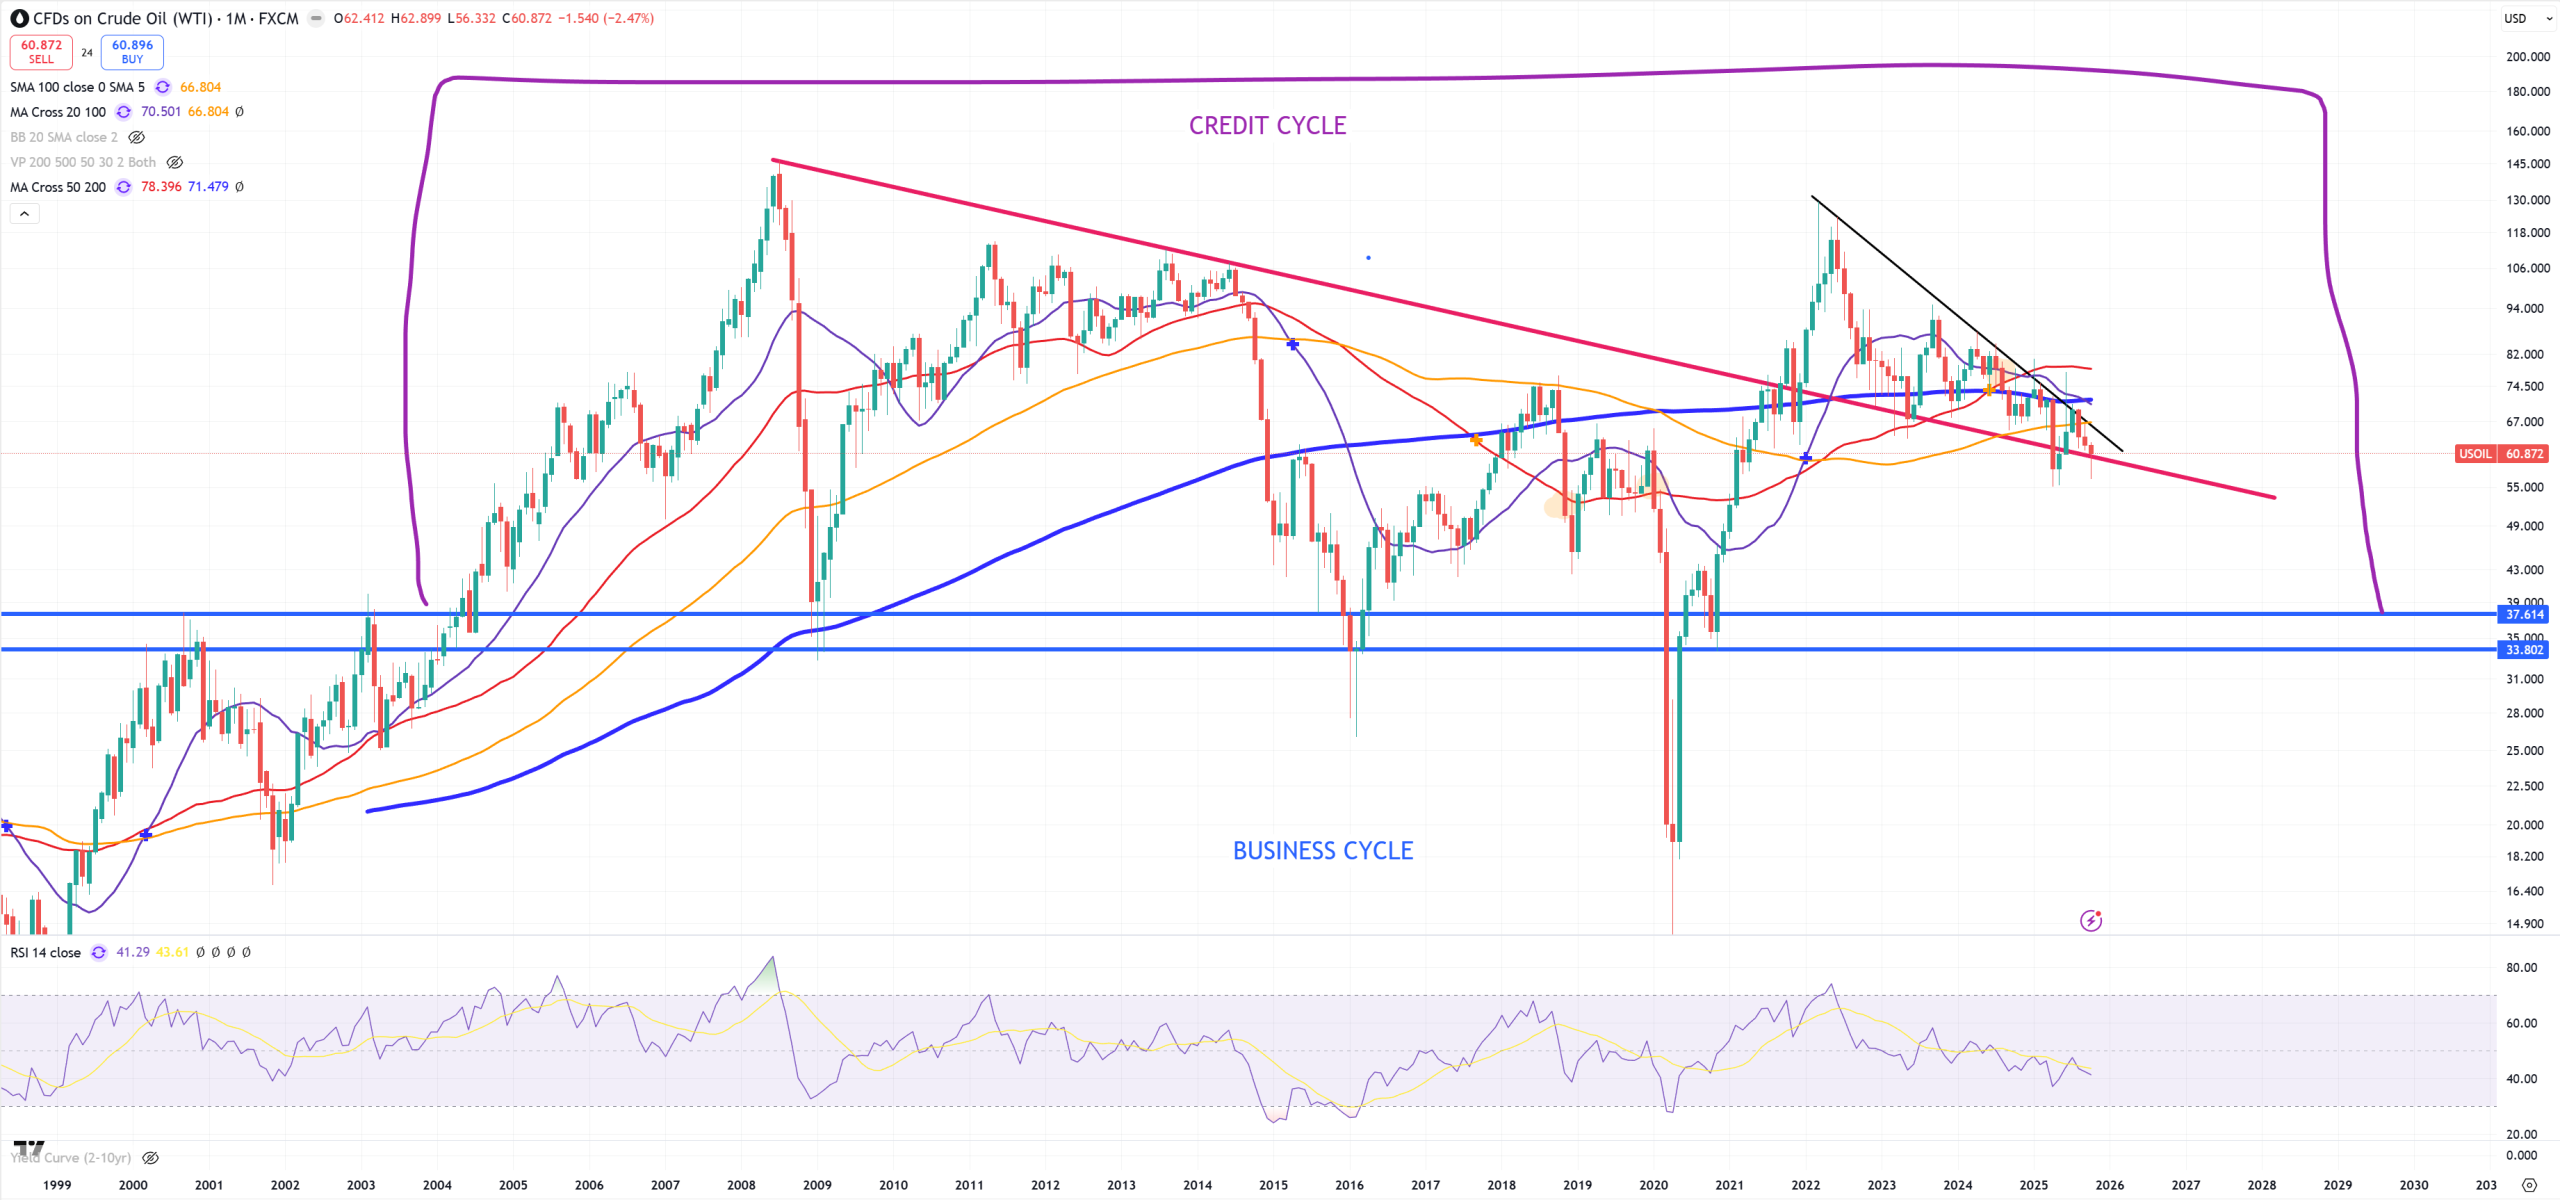
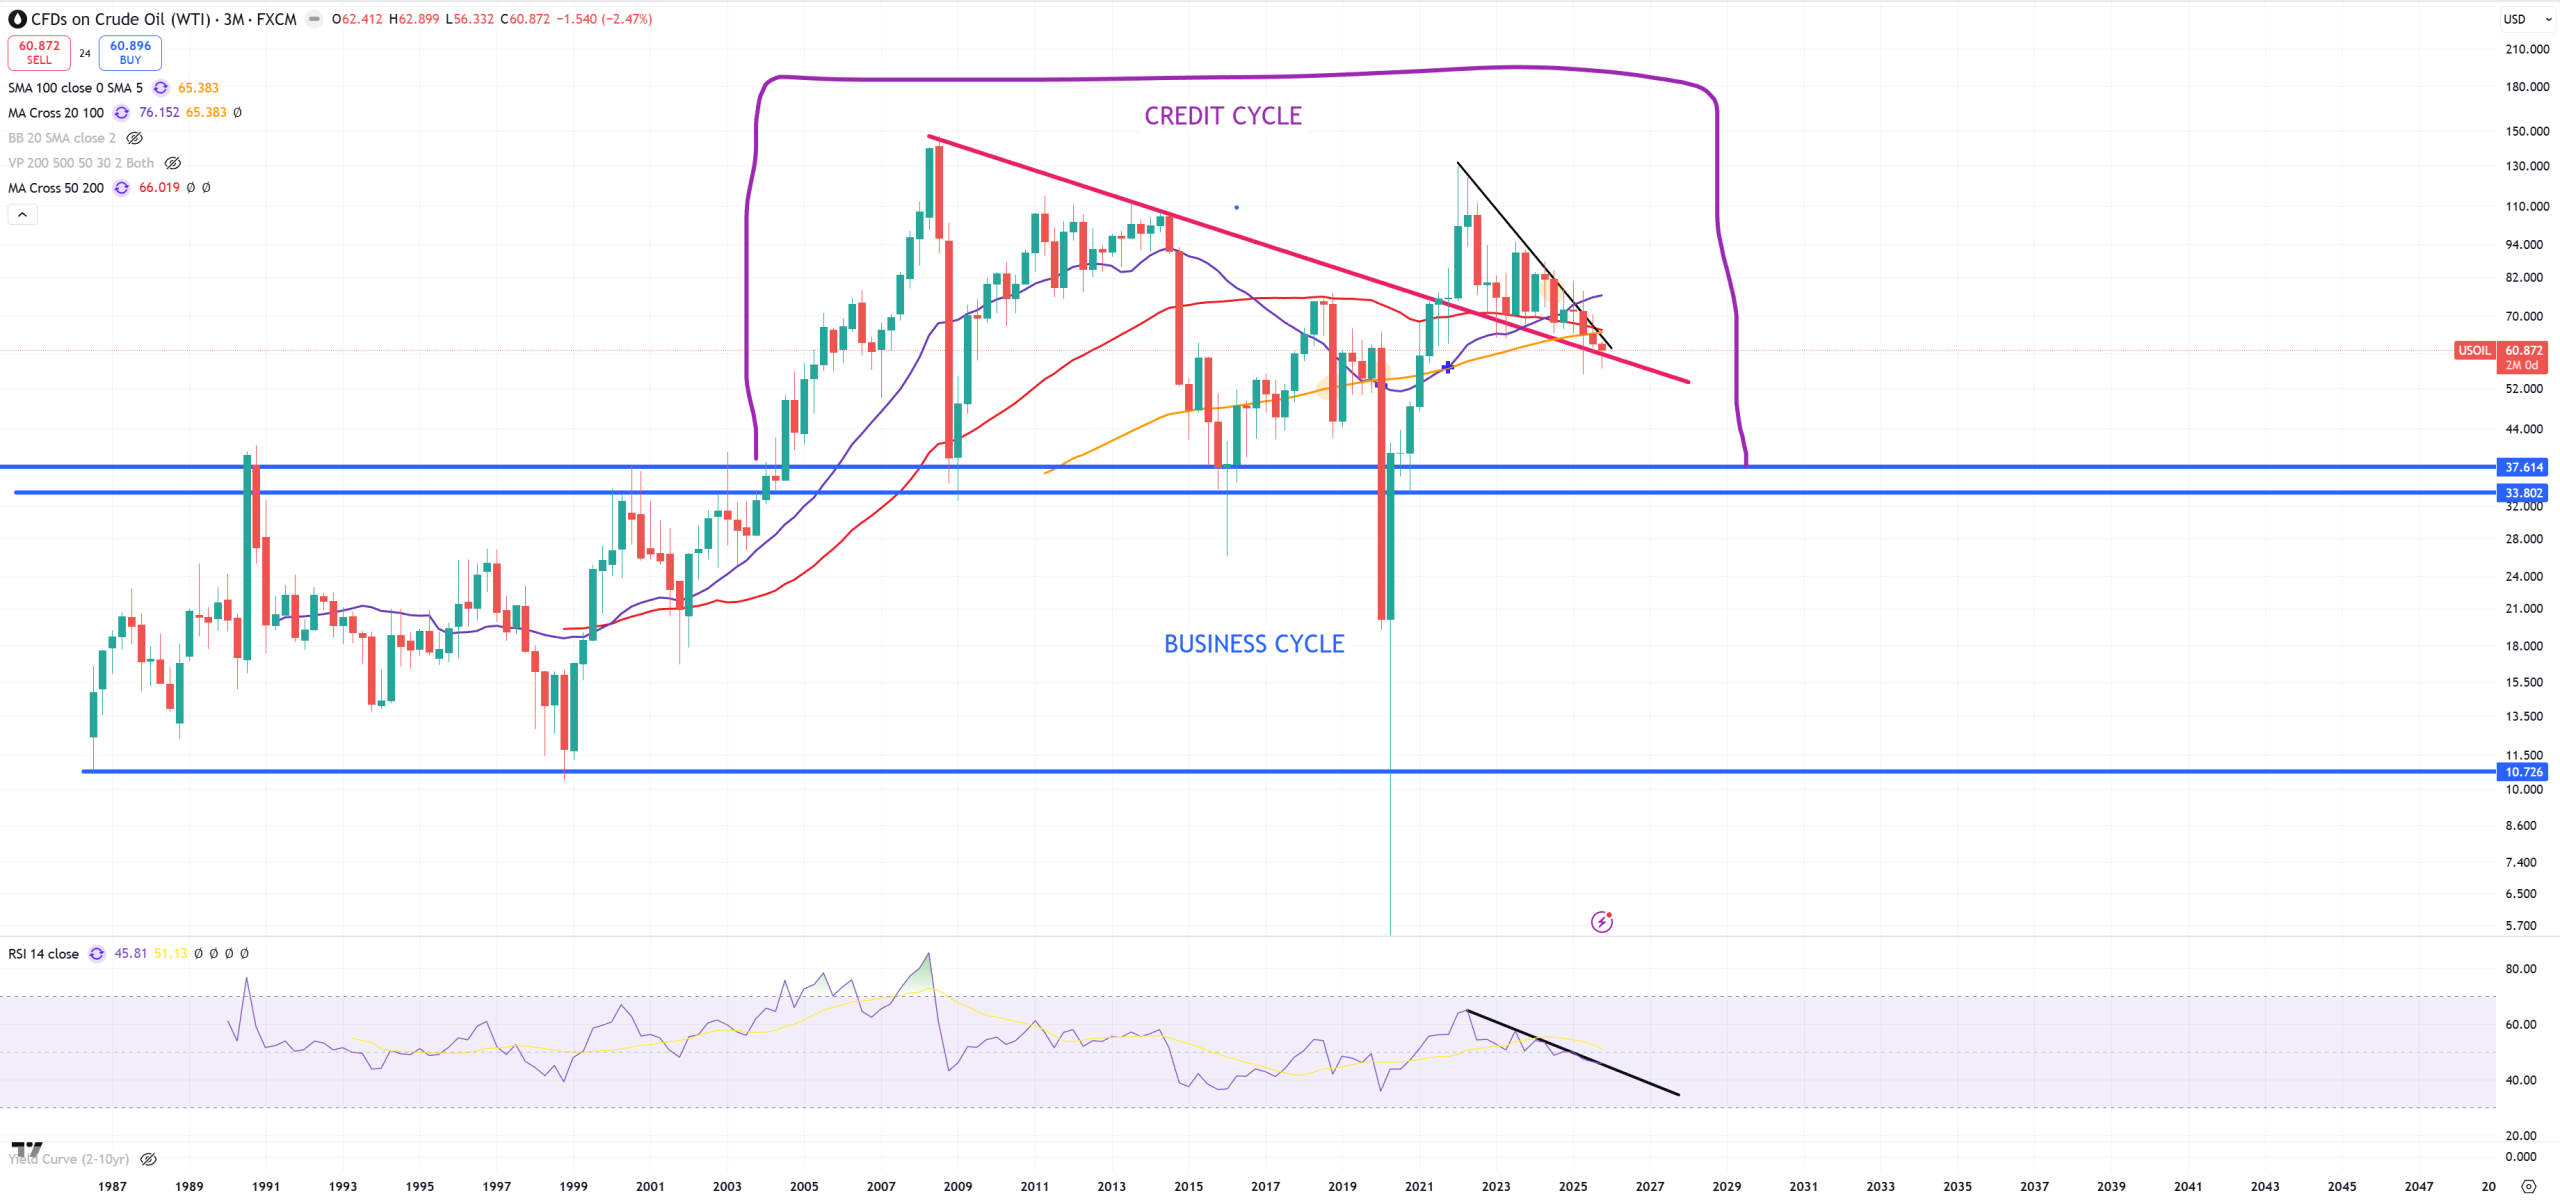
Energy sector
CRB/SPX – you see post 2020 massive inflationary spike till 2022, 1M $$$ question is if this support on 2020 will hold.
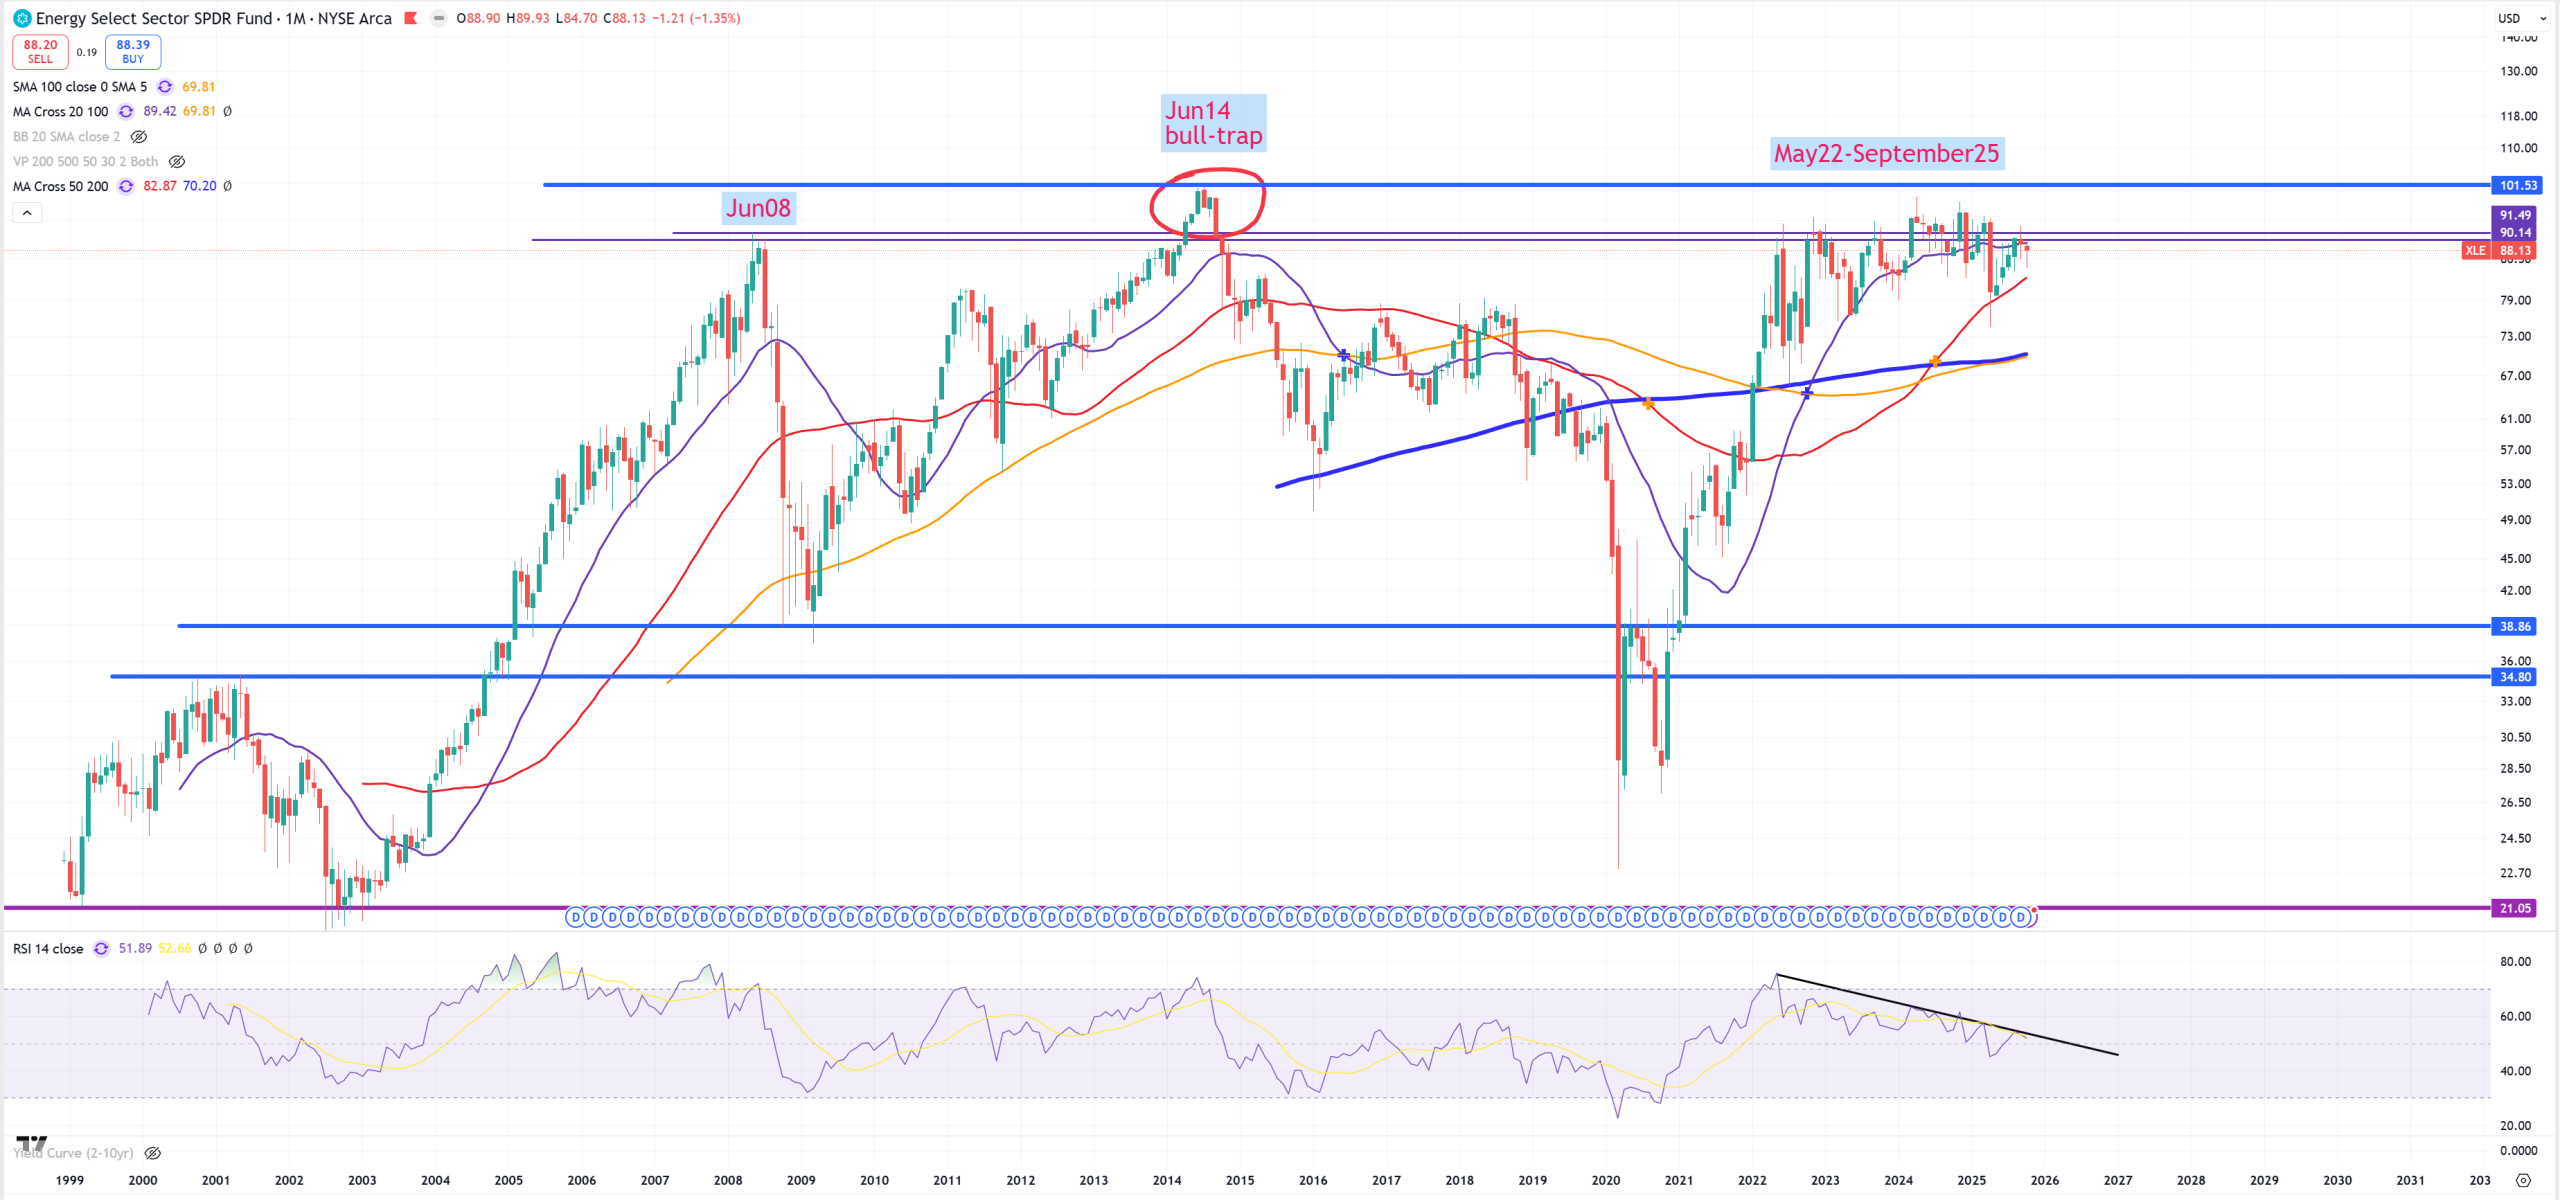
XLE – holds its 2008 resistance for 2.5Y (as 10Y/3M is inverted)
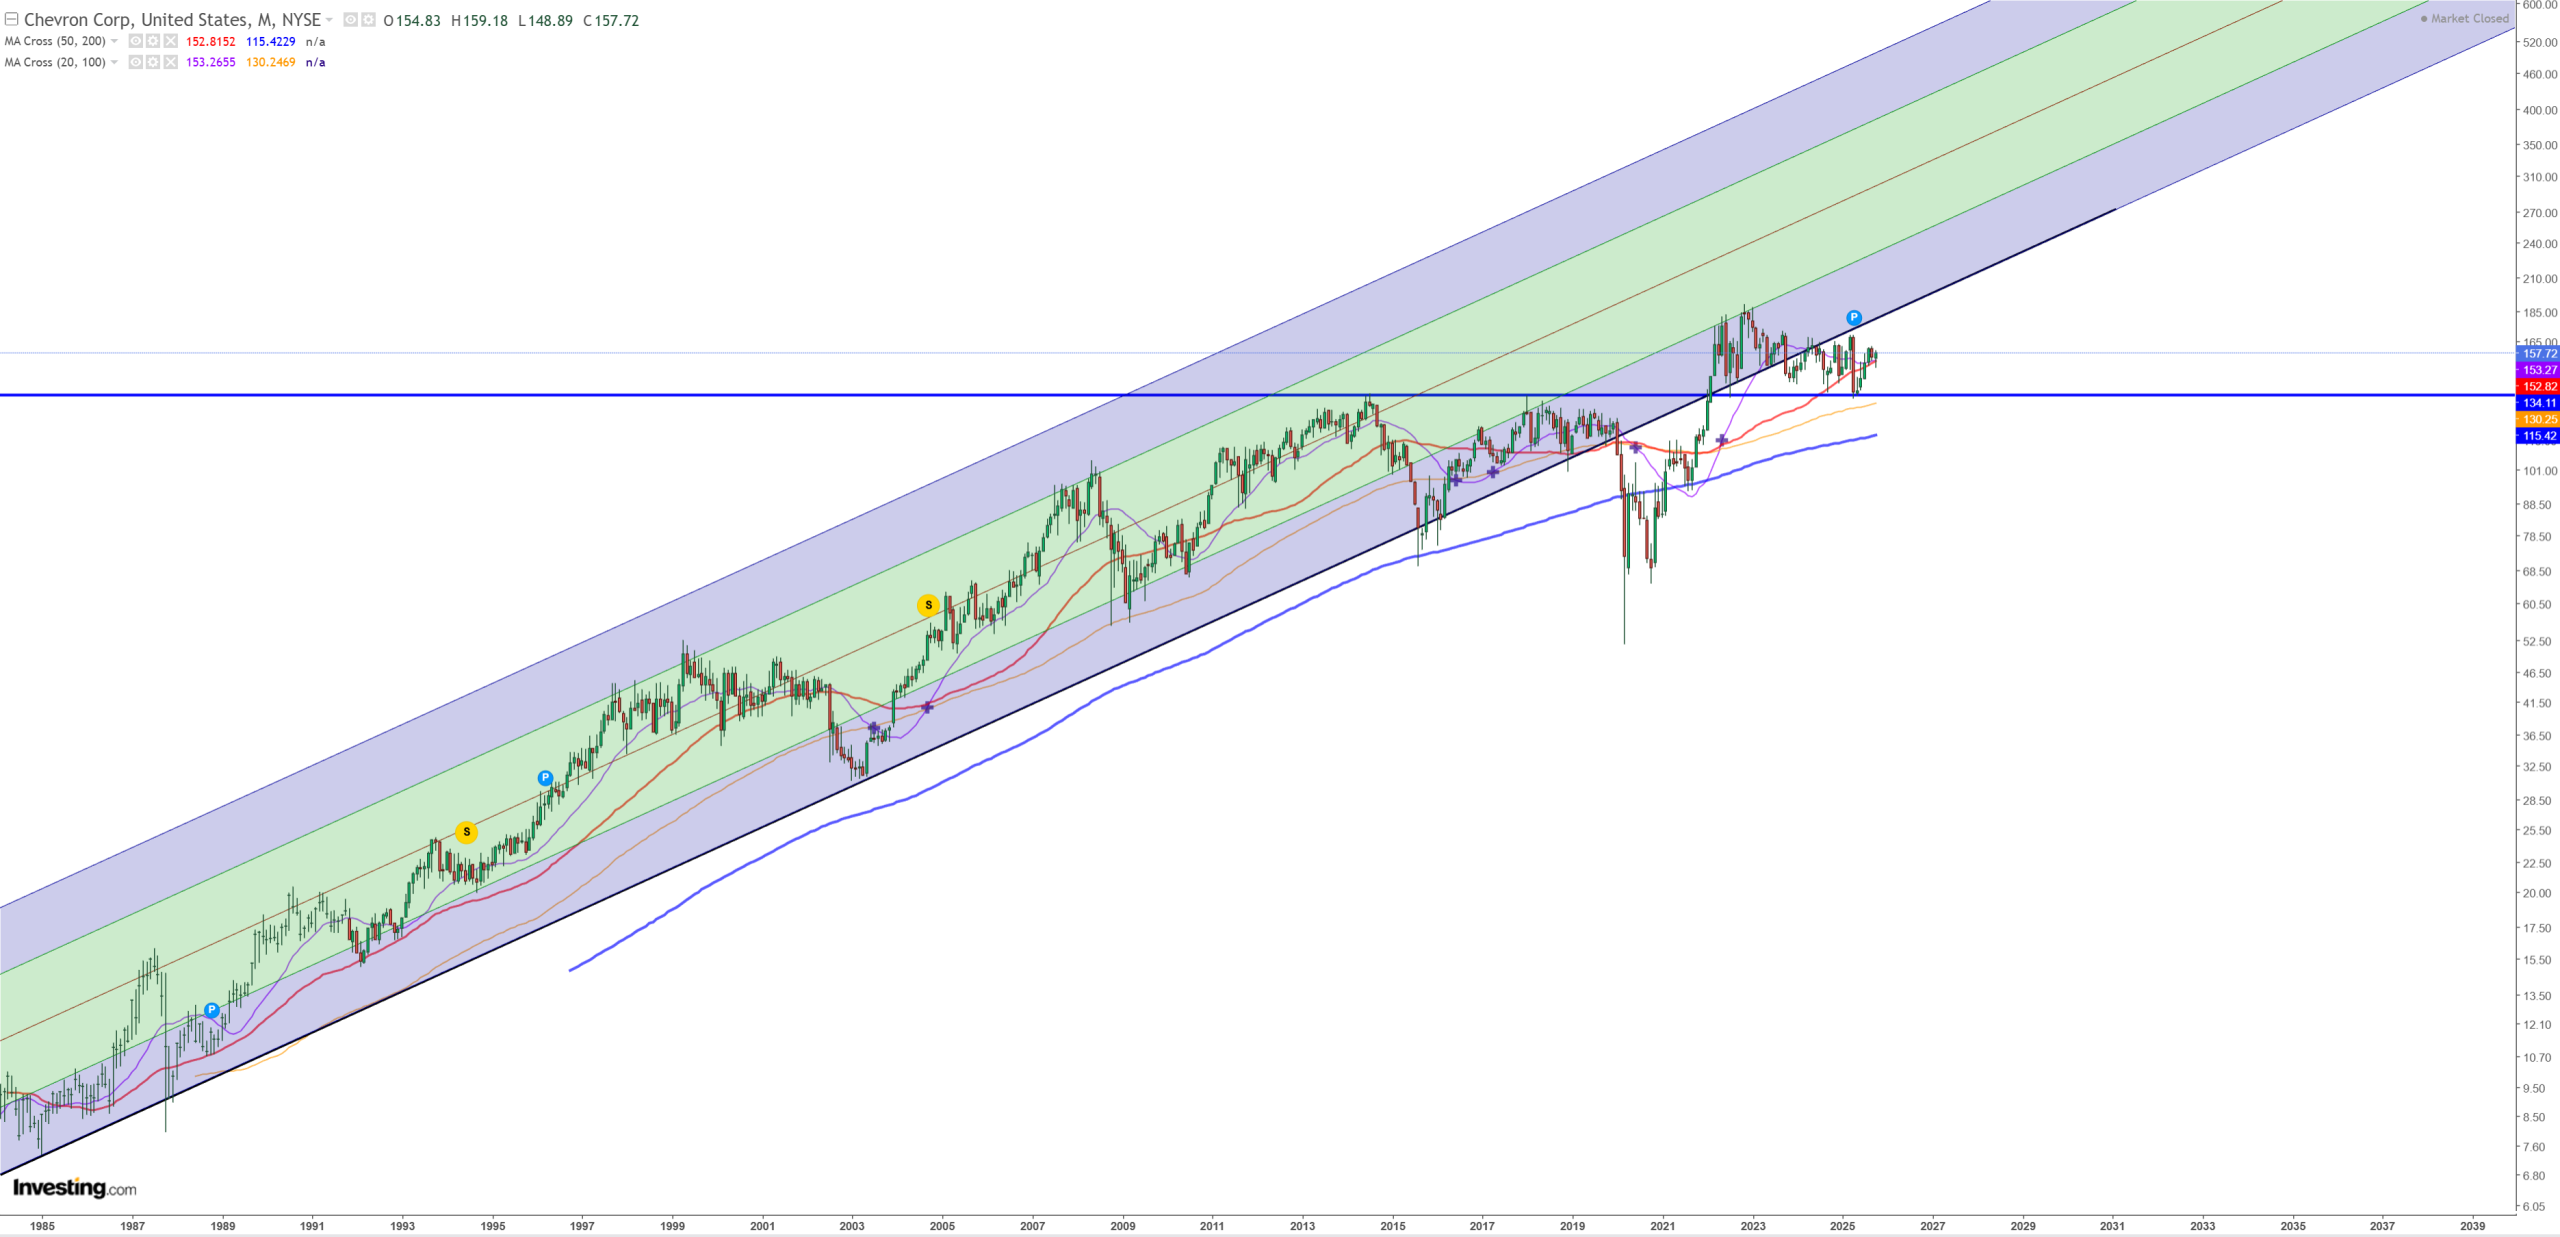
CVX – Chevron and key levels. Big moment is once this horizontal line will be broken.
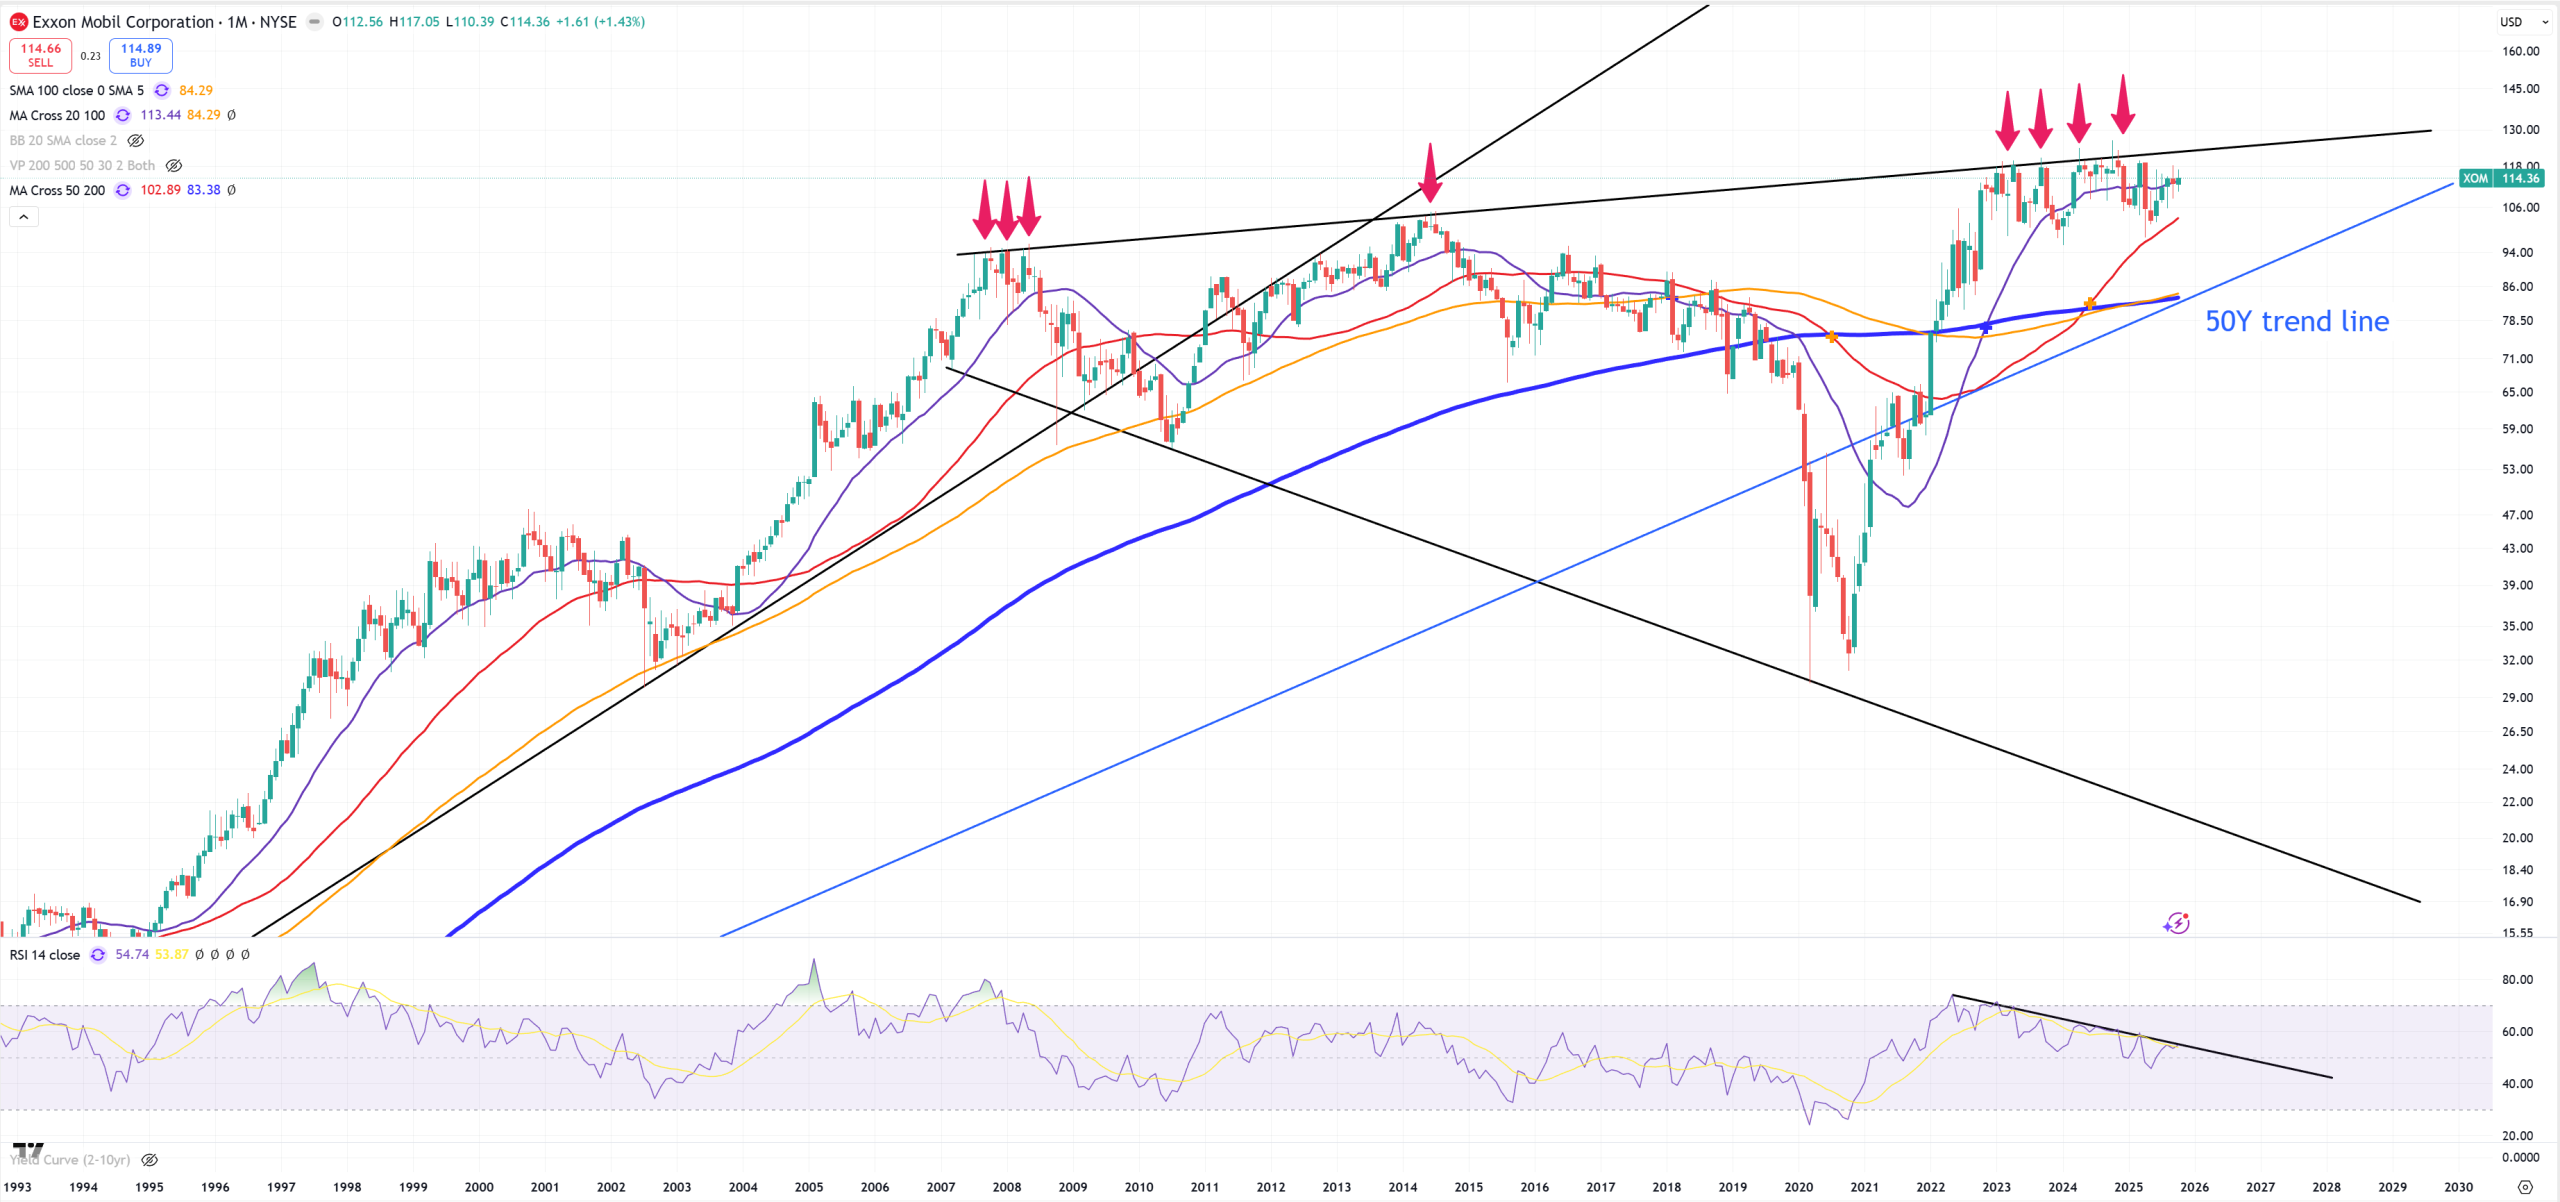
XOM – Exxon and infinite megaphone trend
OIL – you see how market trying to save oil (and in general markets). First view is (M) second is (3M). I know it sounds crazy what I’m going to say but regular oil price should be between 10$ and 30$, unless we entered into a credit cycle which ALWAYS goes bust, and oil returns to typical business cycle level. What’ll happen later is a different topic.
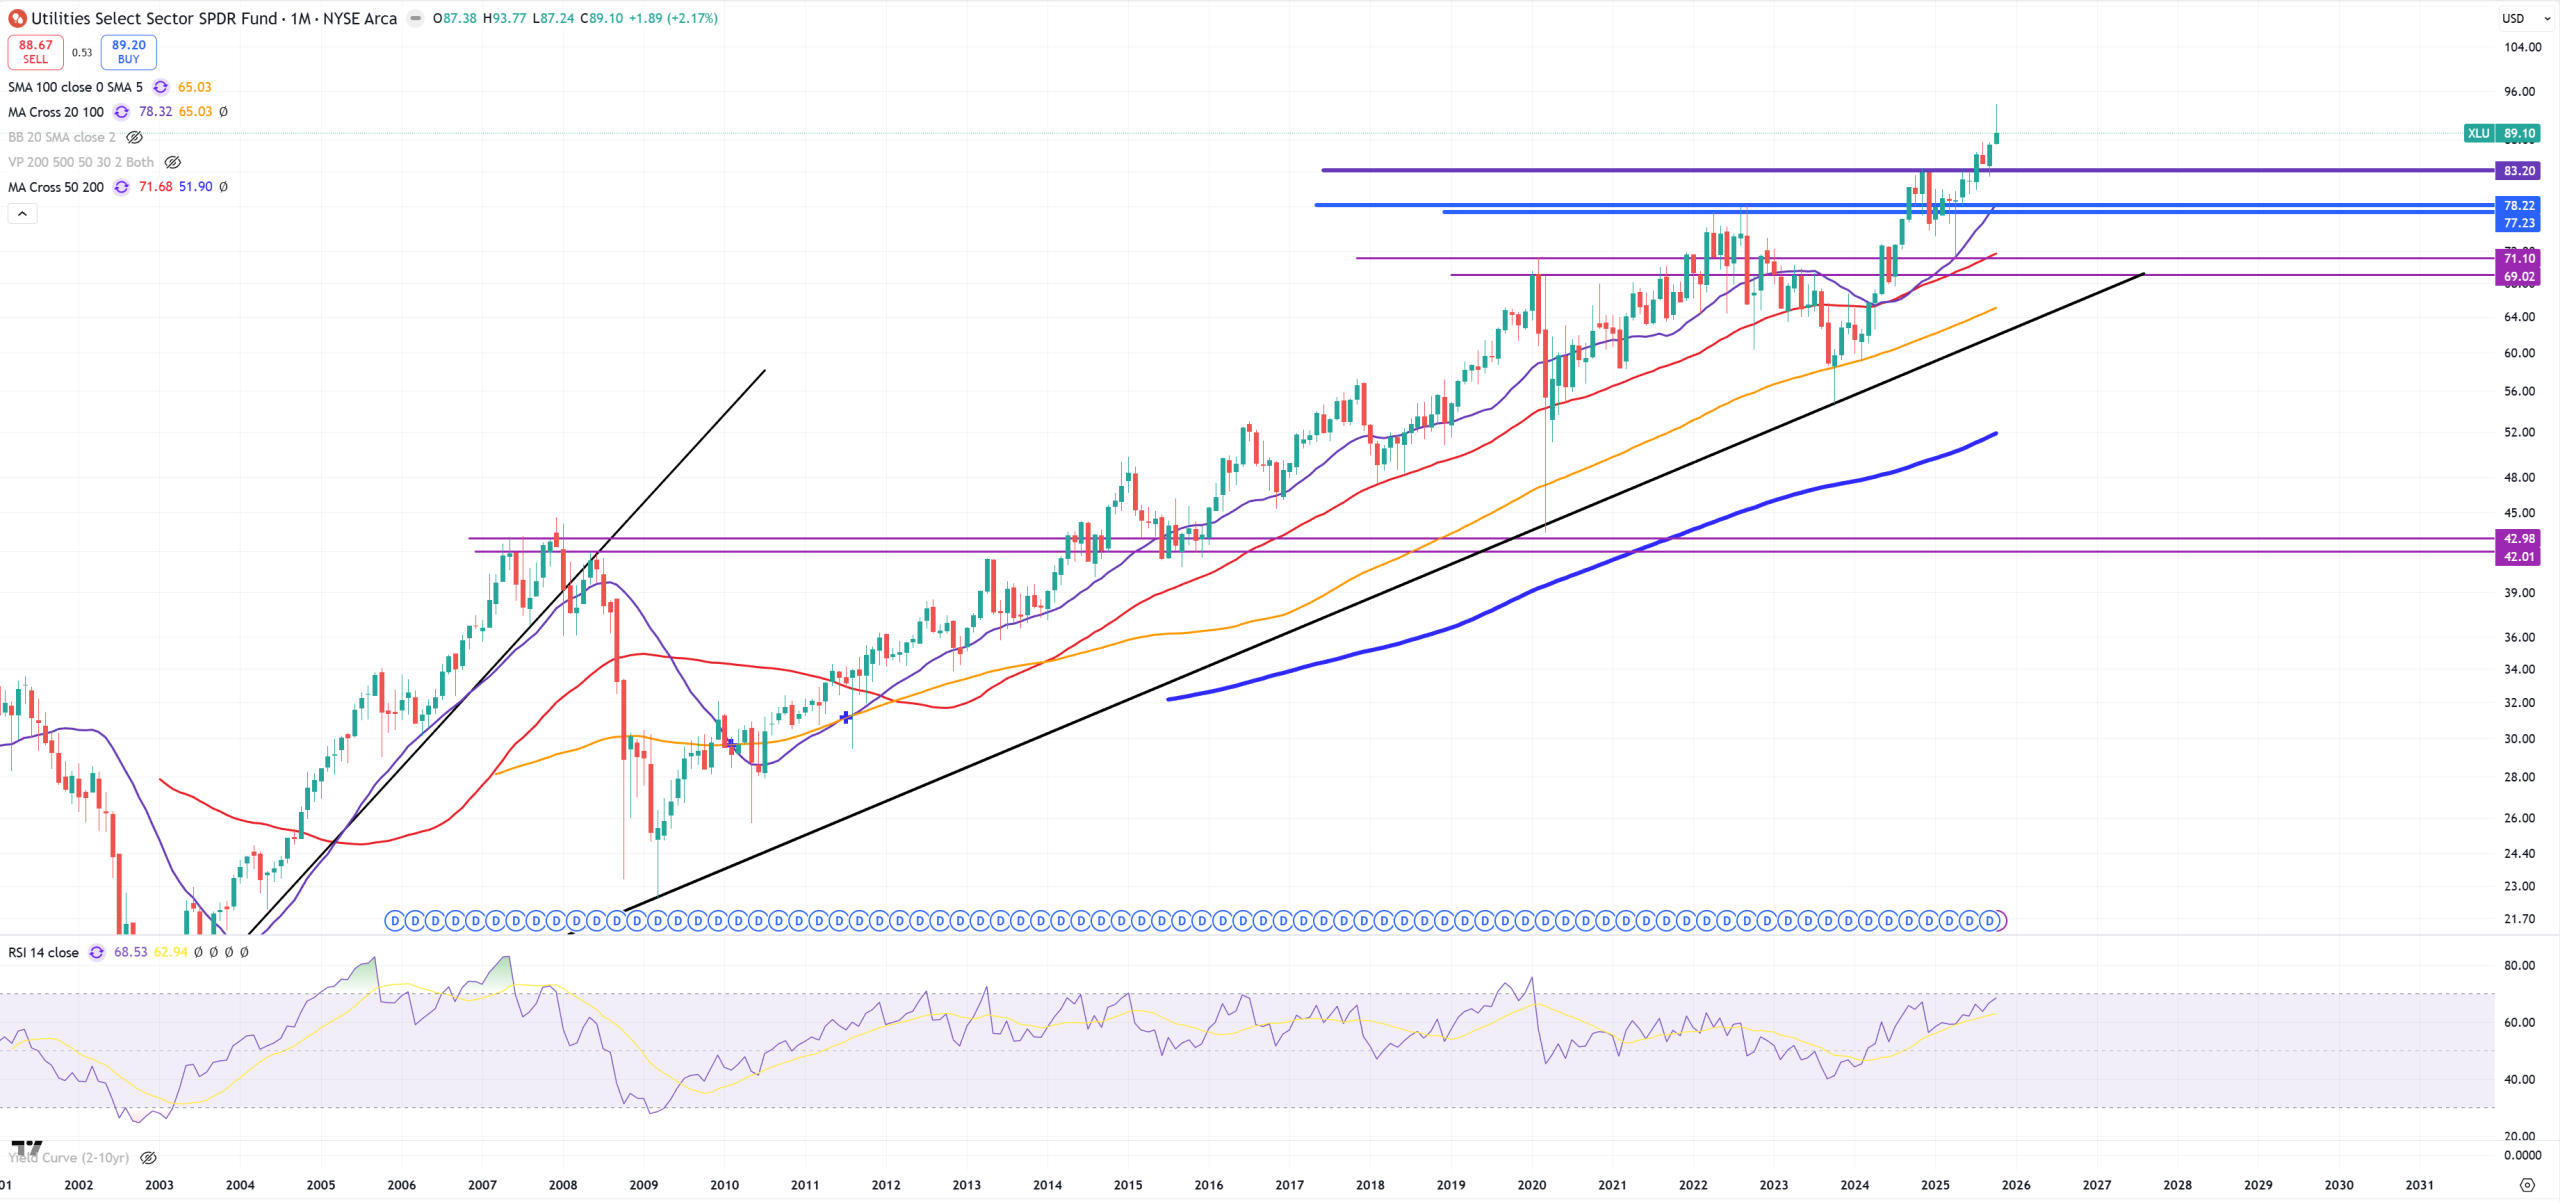
Sector ETFs
XLU – Utilities – massive break above key level
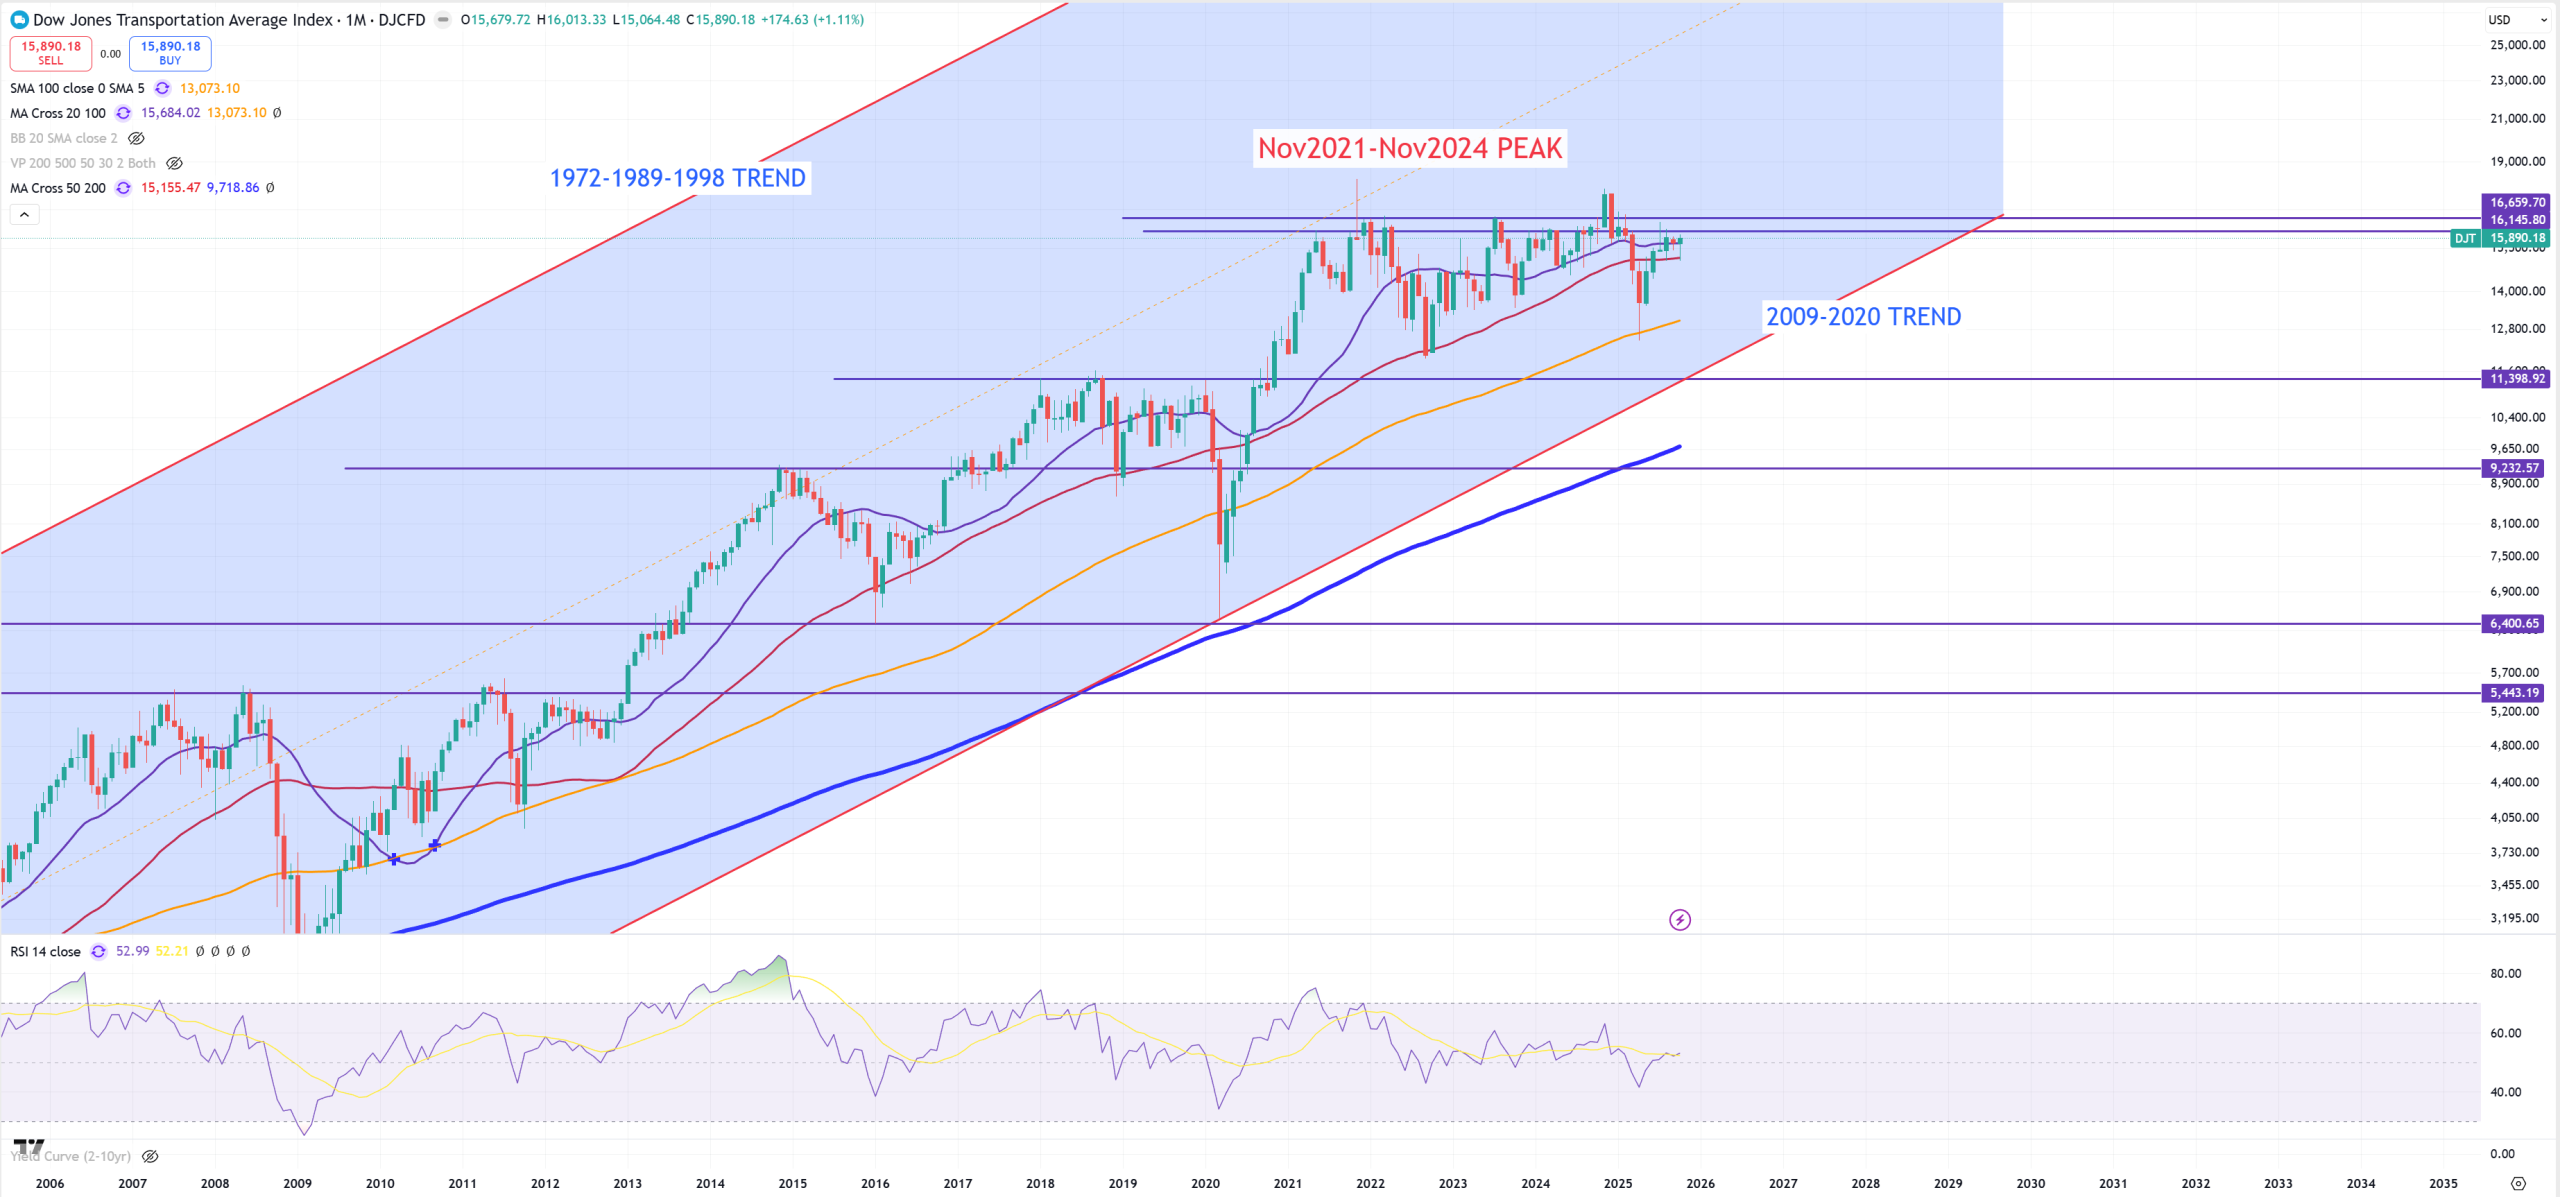
DJT – Dow Jones Transportation
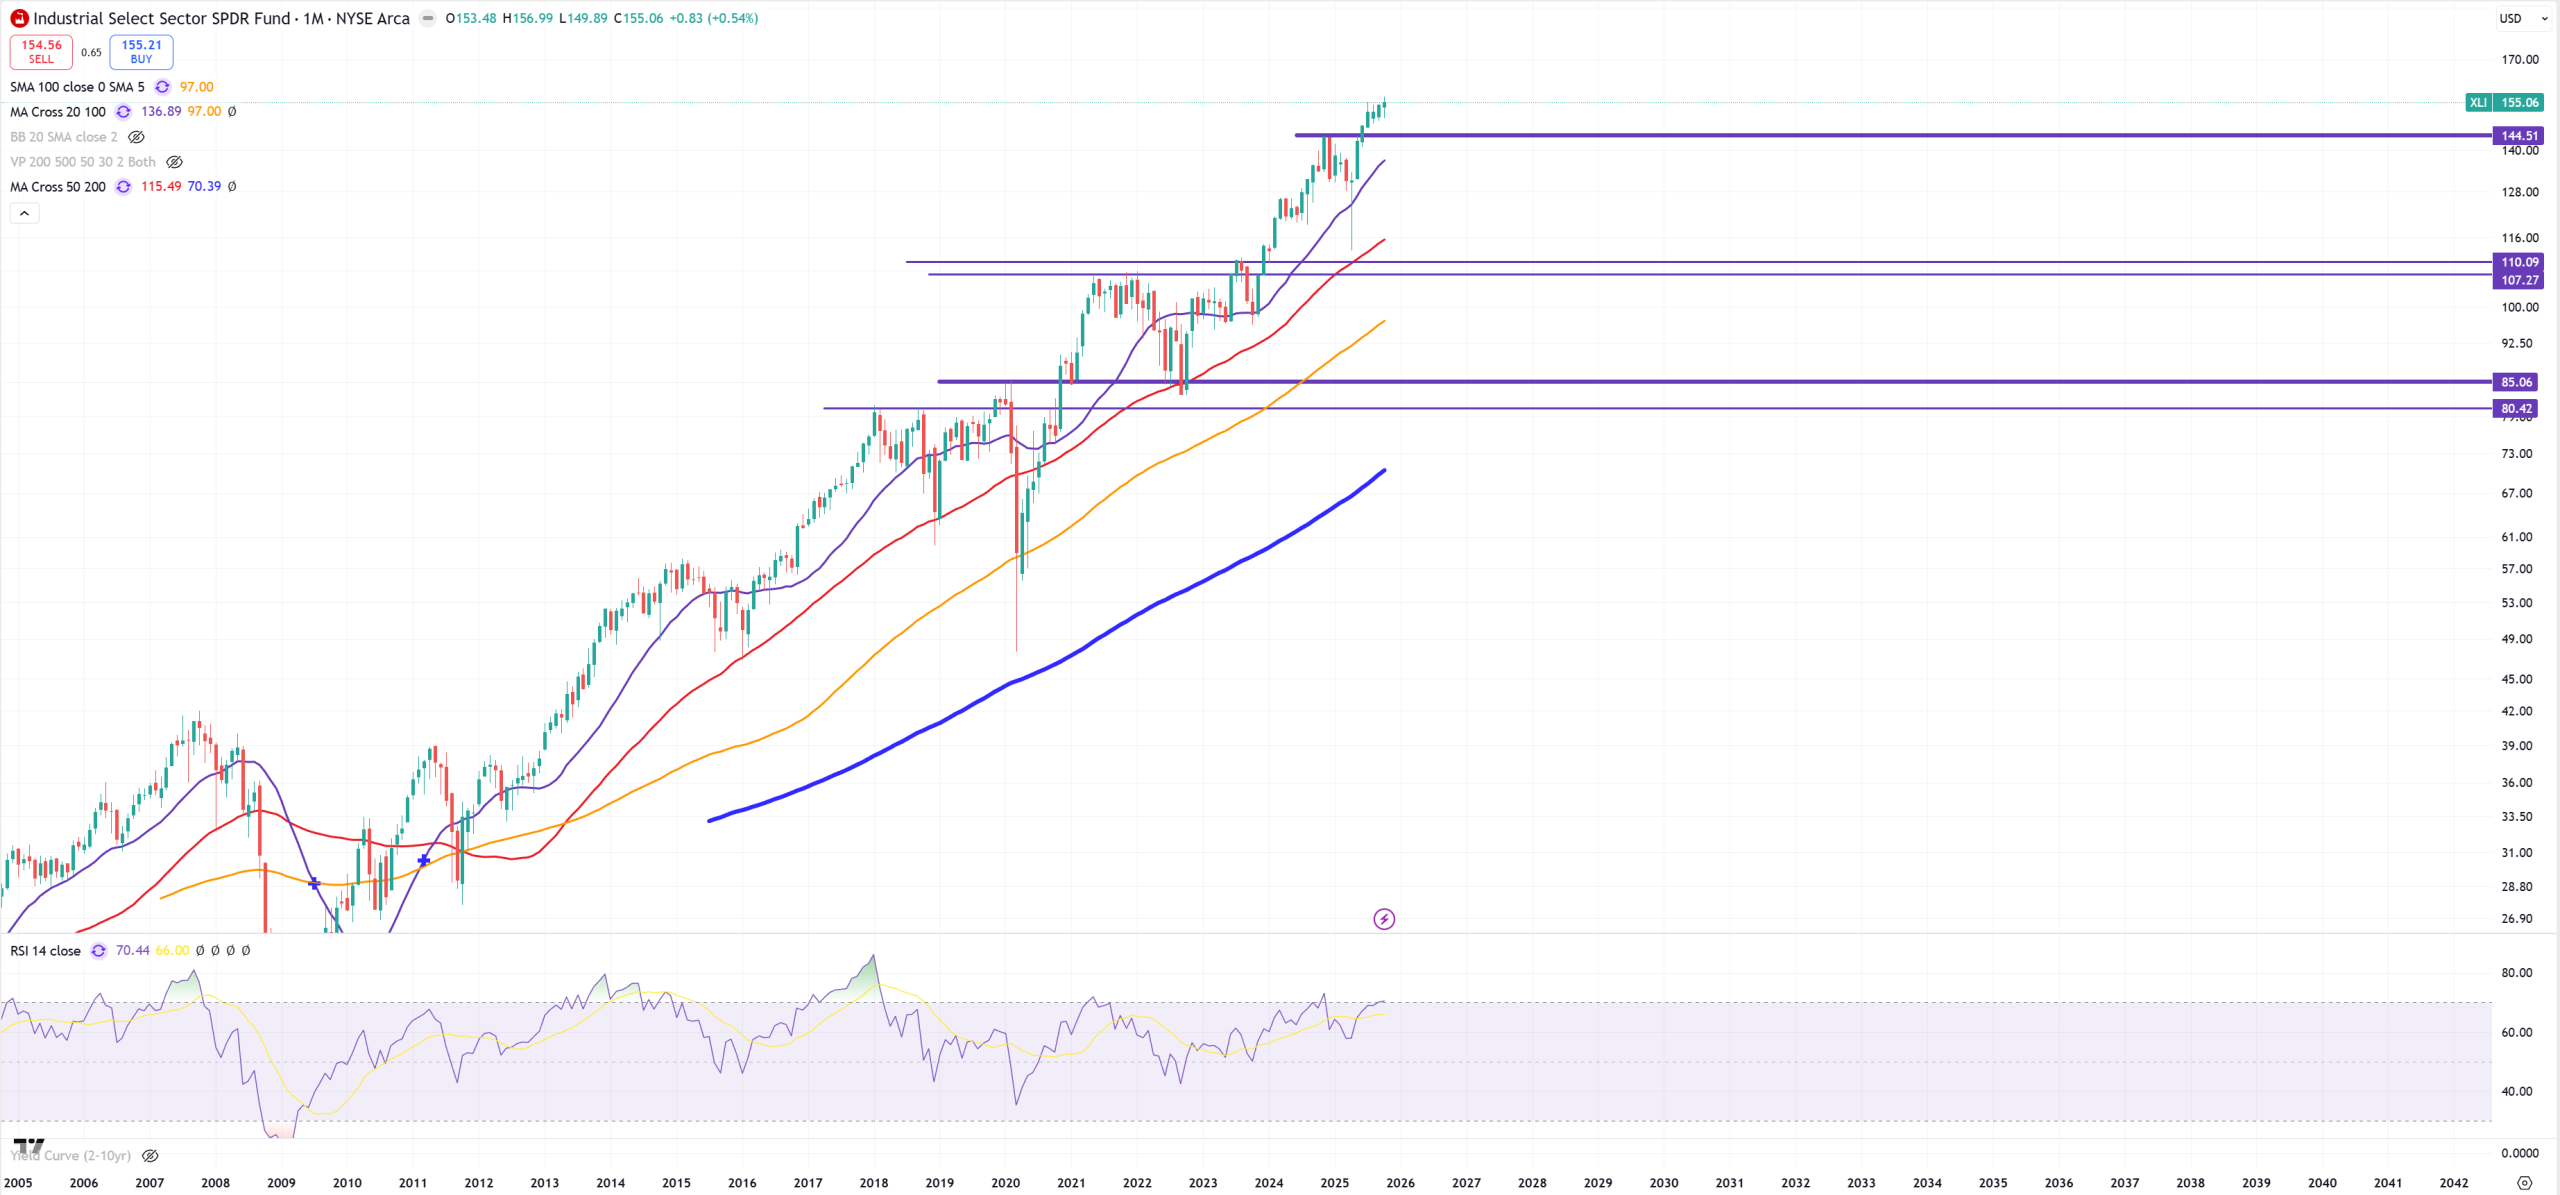
XLI – Industrials breaking higher
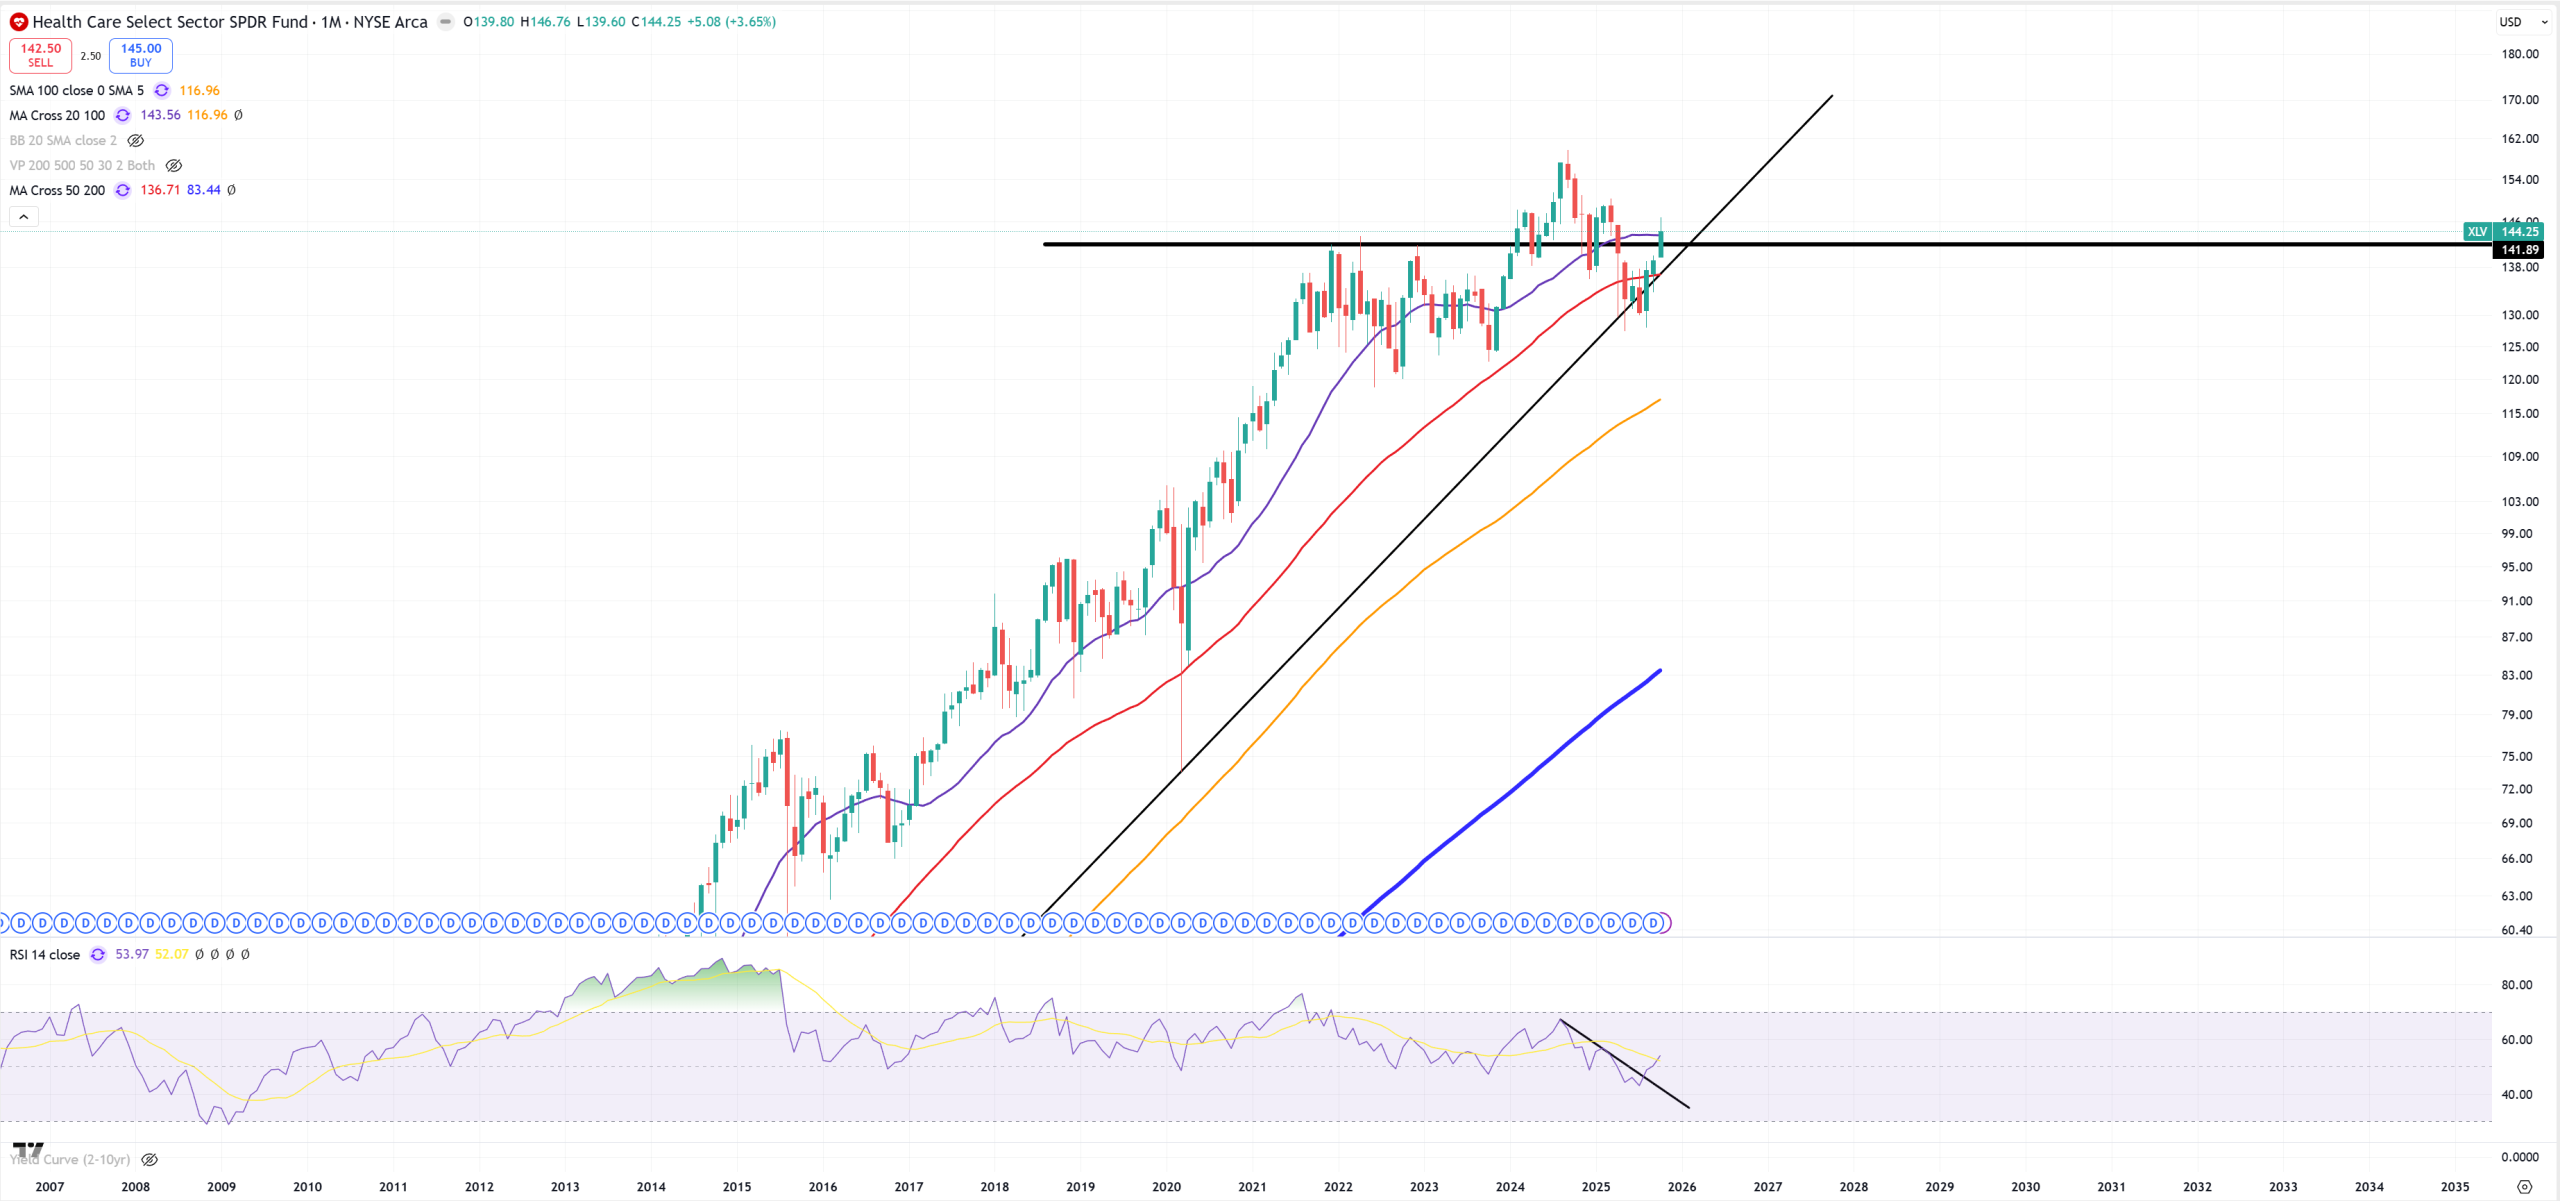
XLV – Healthcare – I thought it’ll be first which will break everything but UNH bulls managed to get out of this problem (UNH will be later).
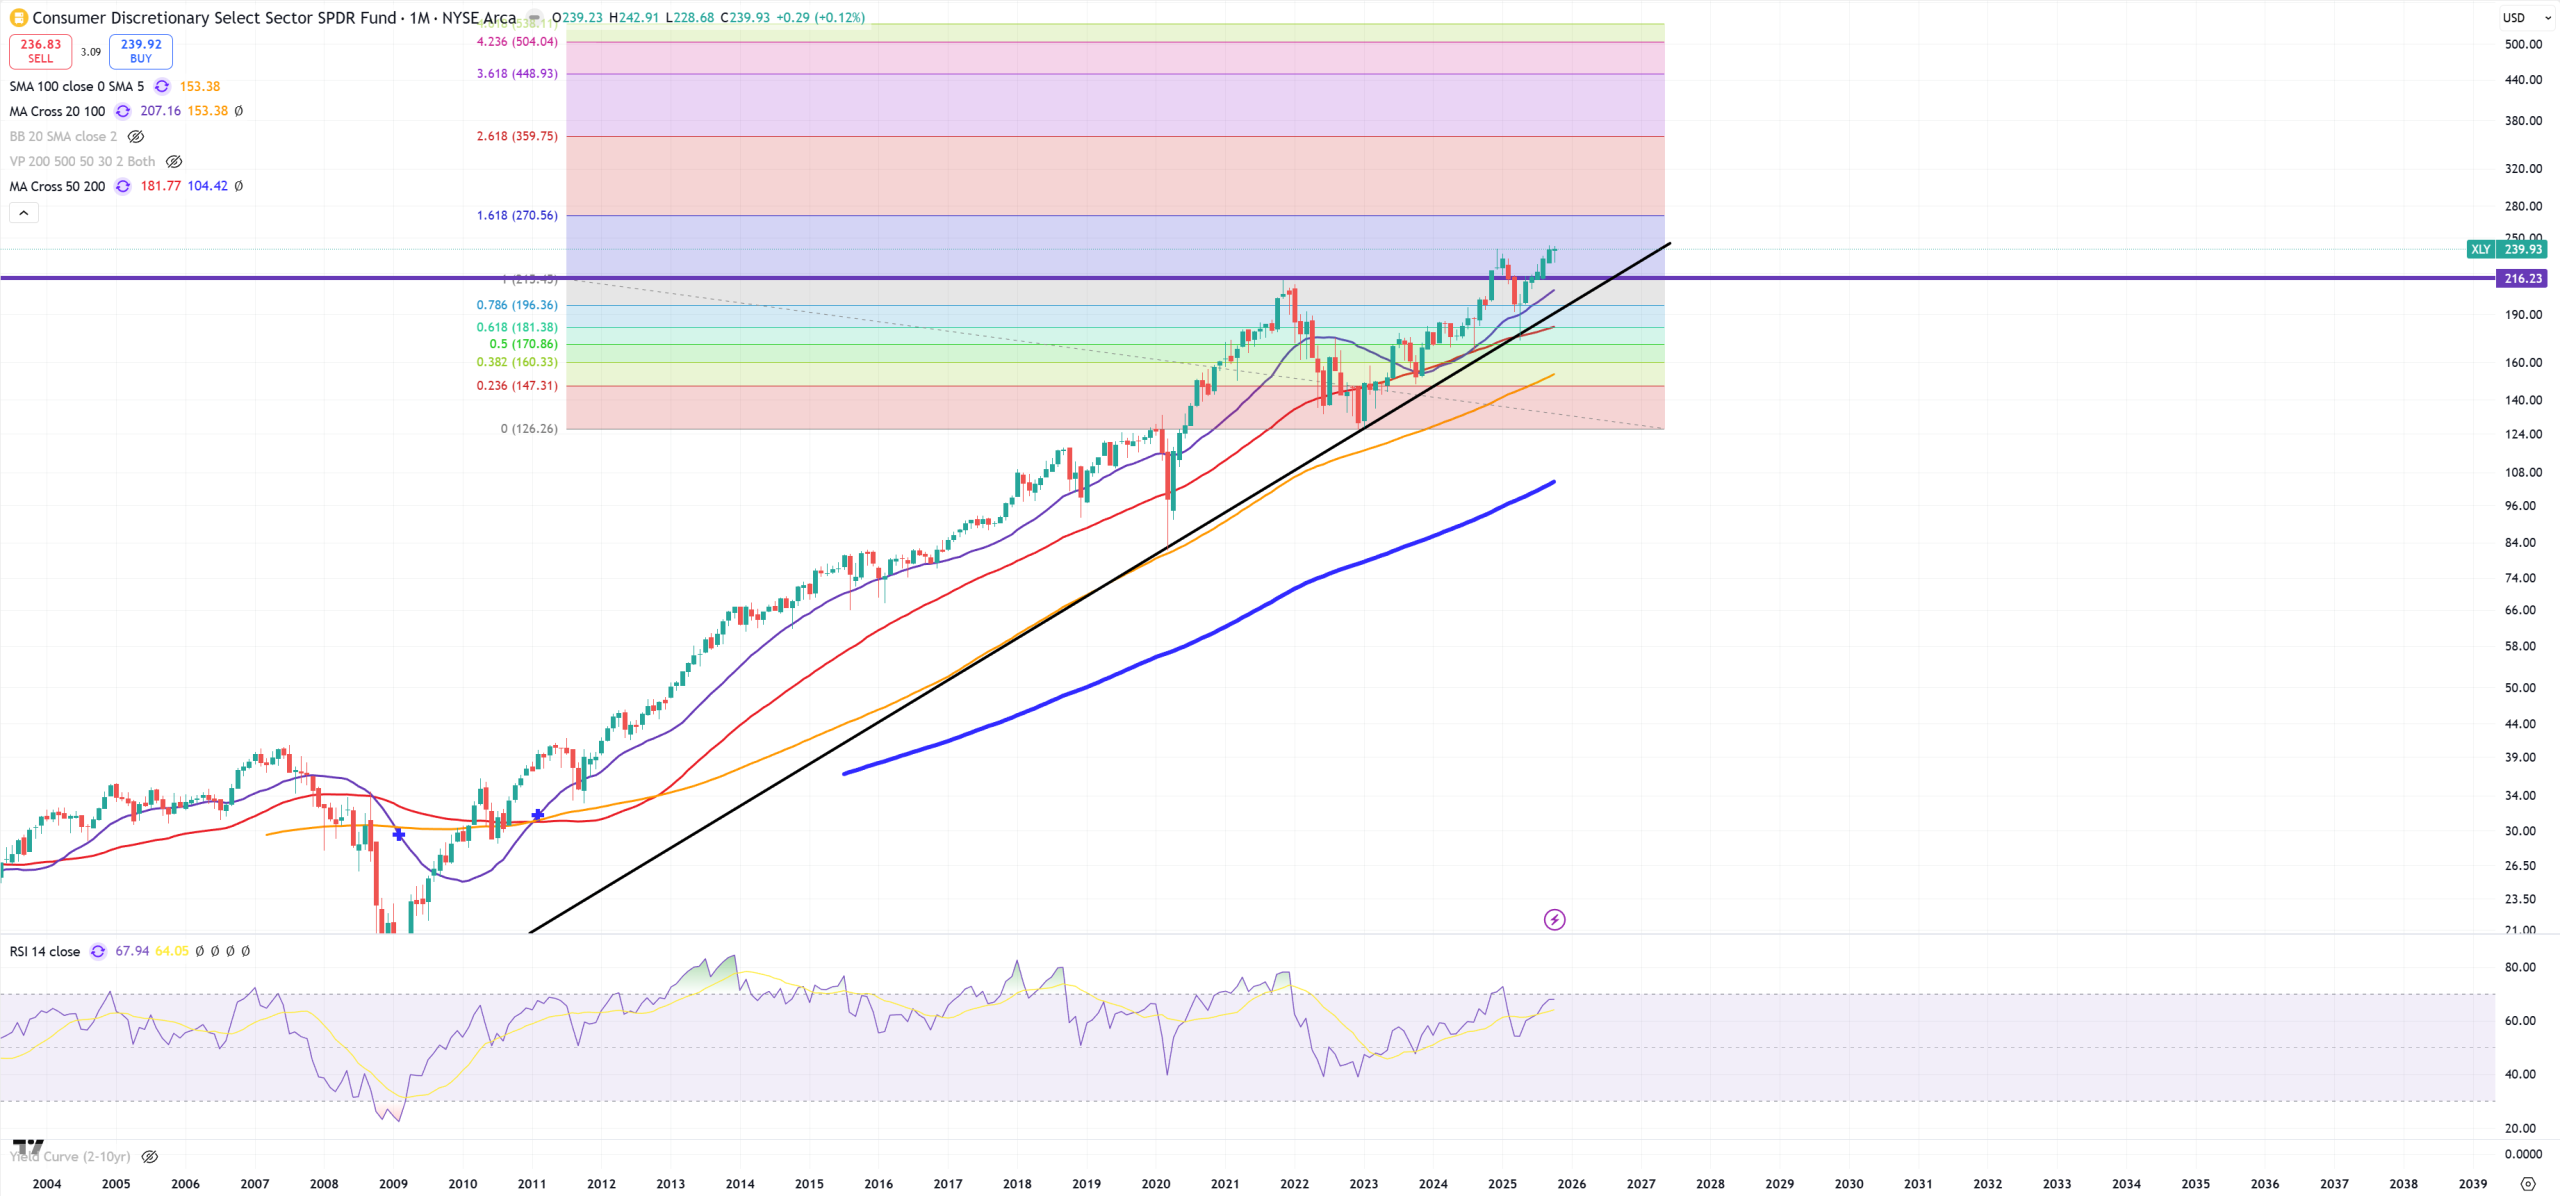
XLY – Consumer Discretionary
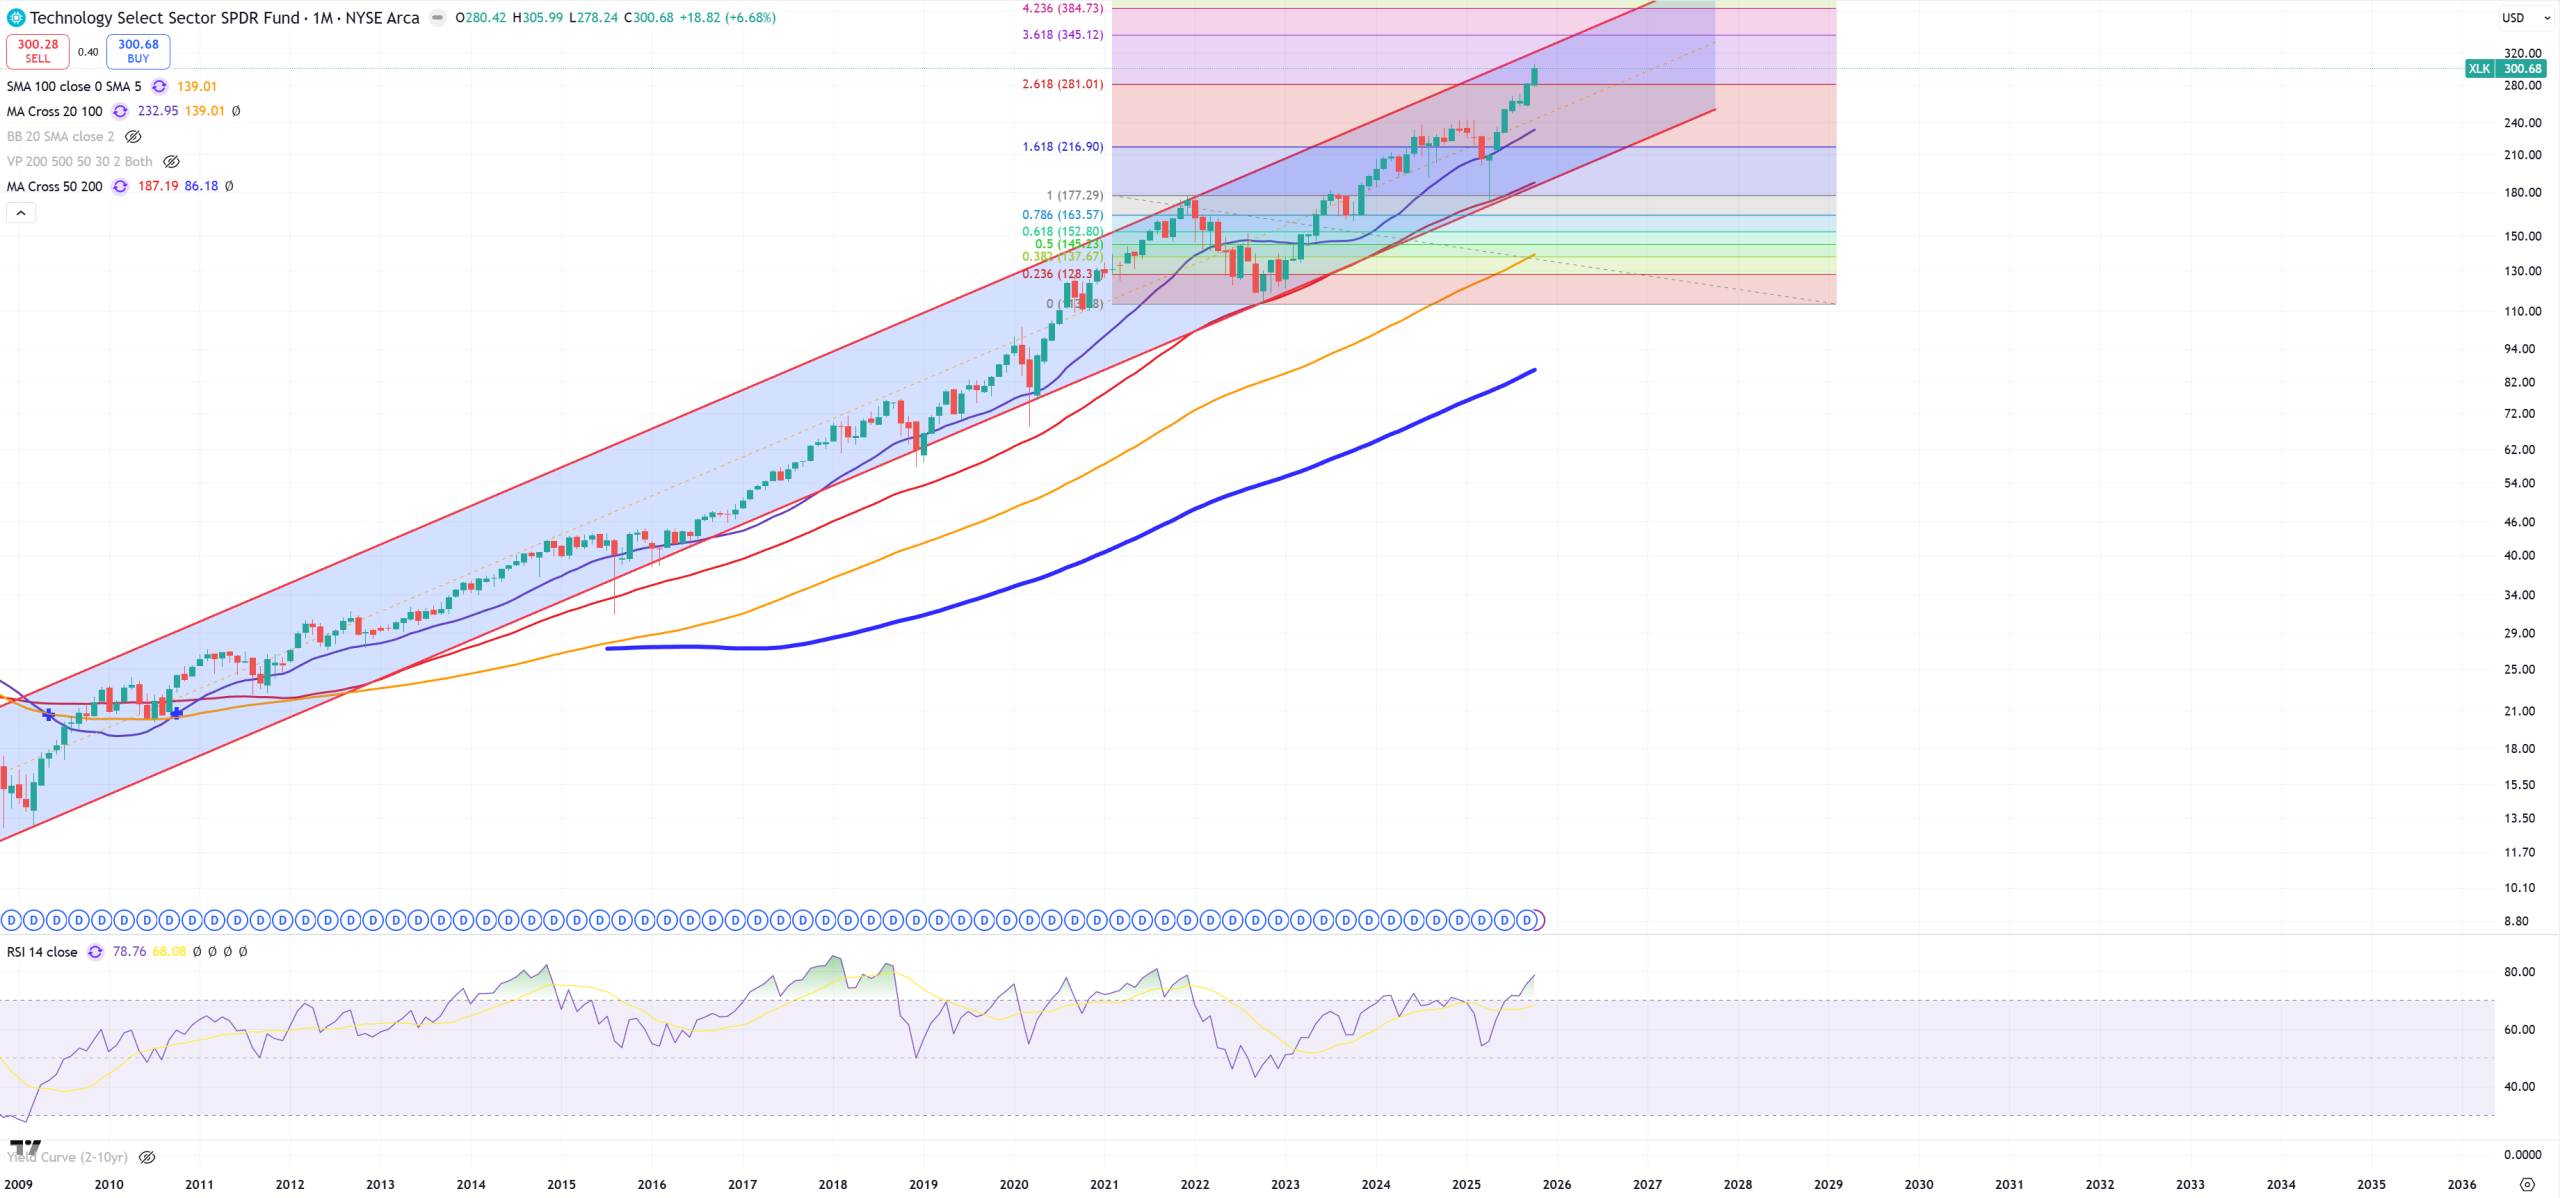
XLK – Tech
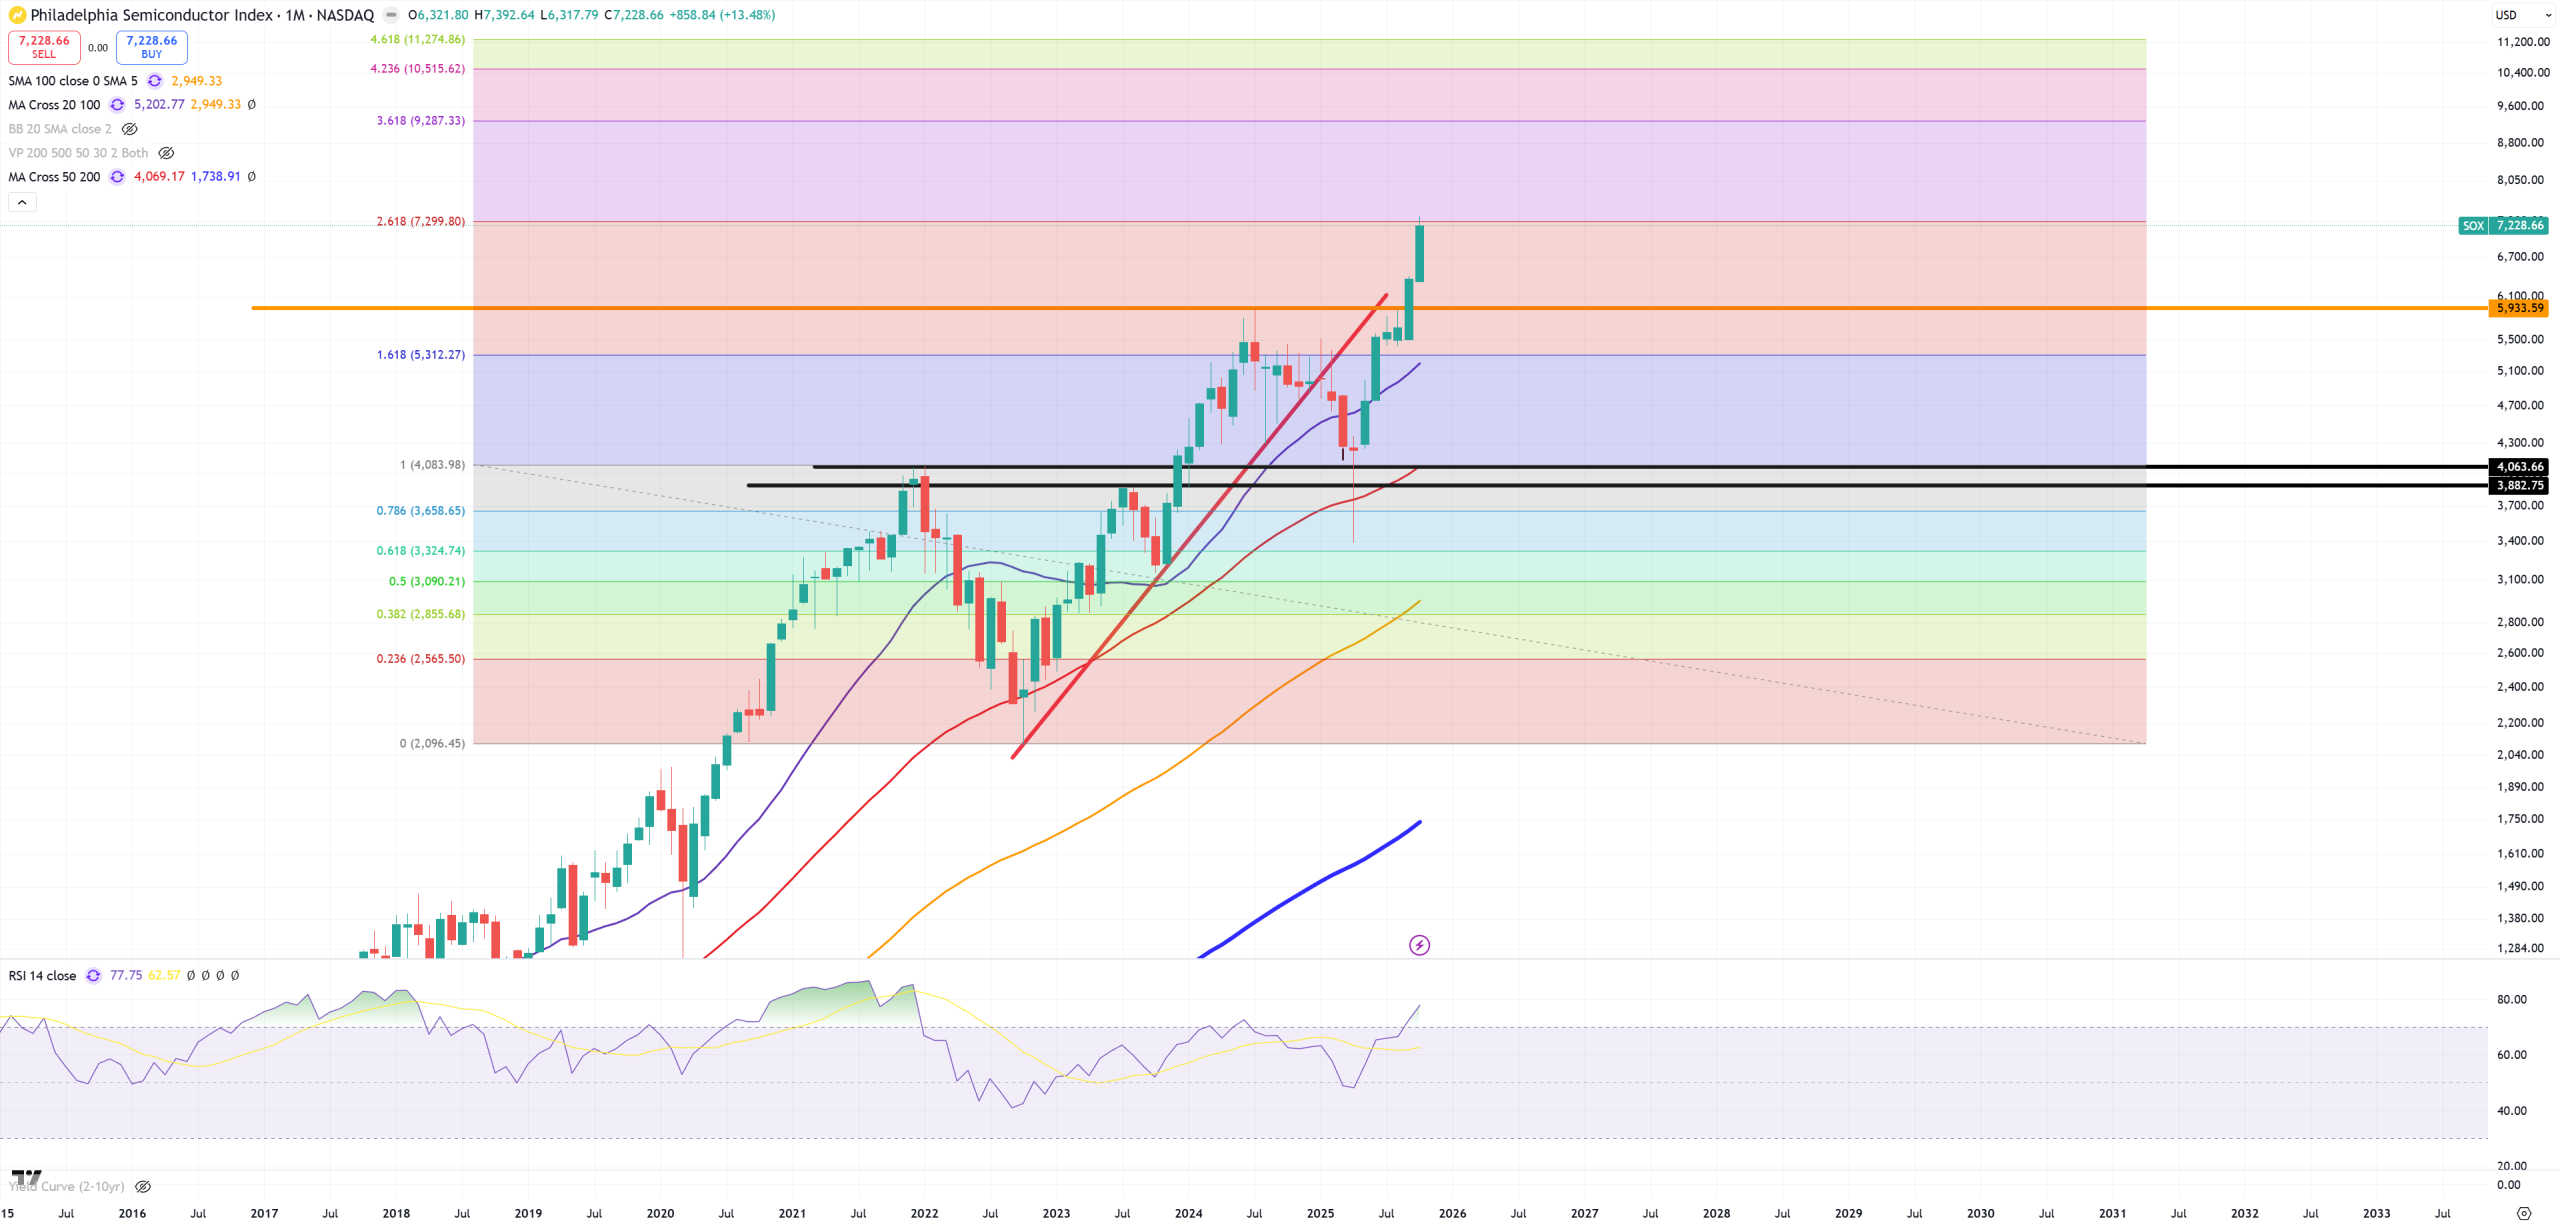
SOX – Semiconductors
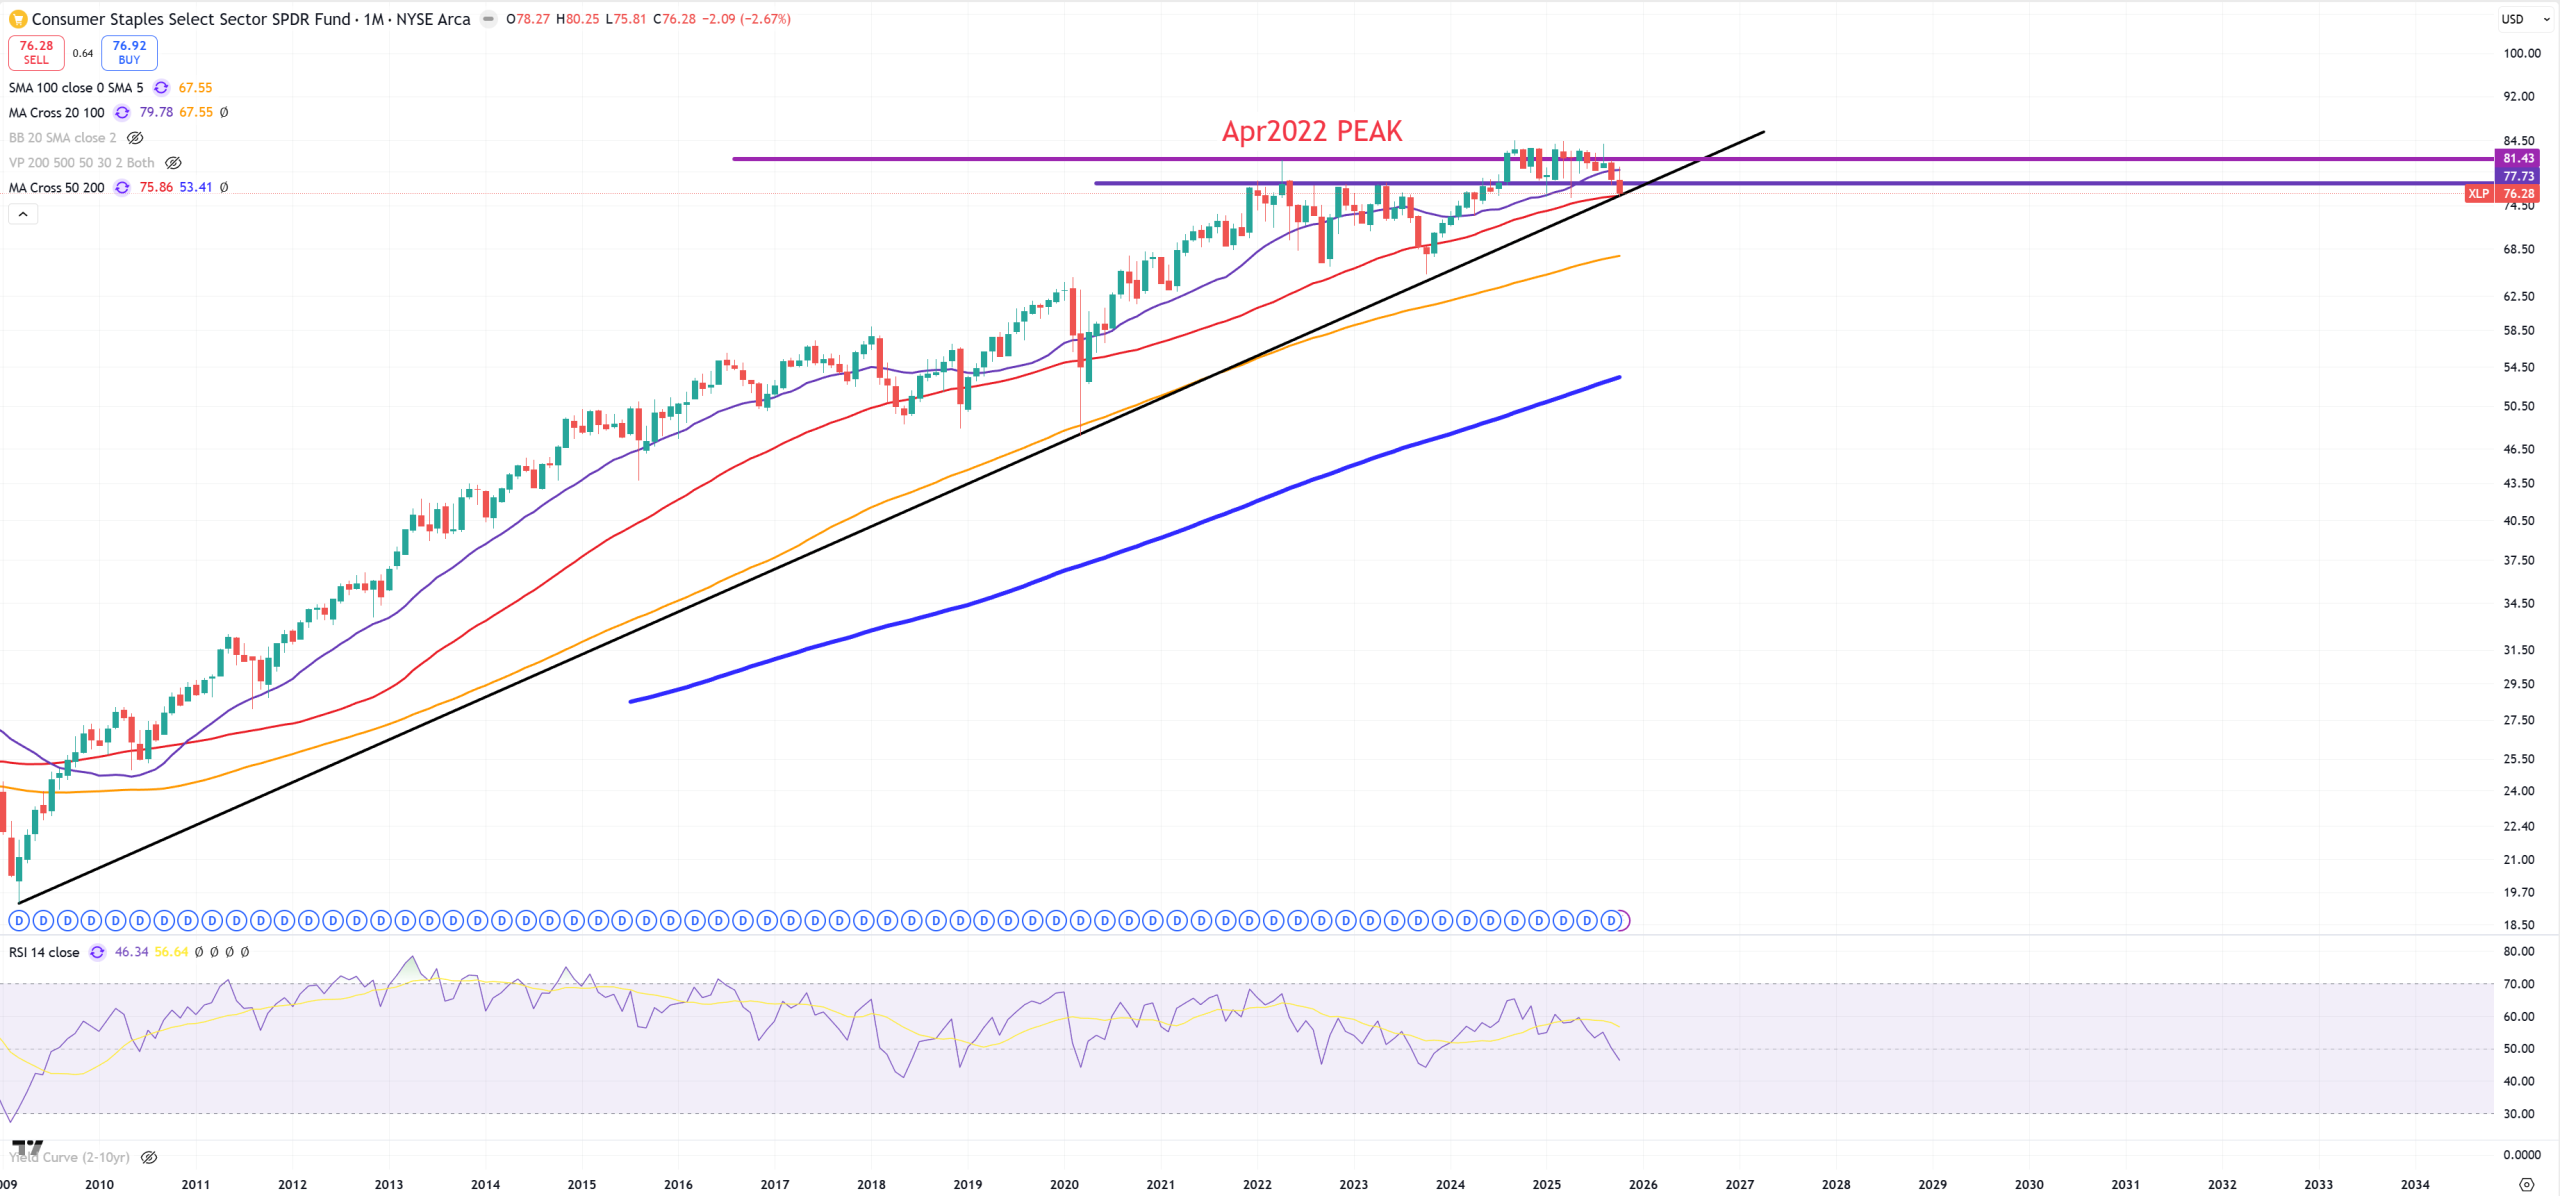
XLP – Consumer Staples so far this one looks the worst from all sector ETFs.
Random charts most of people know
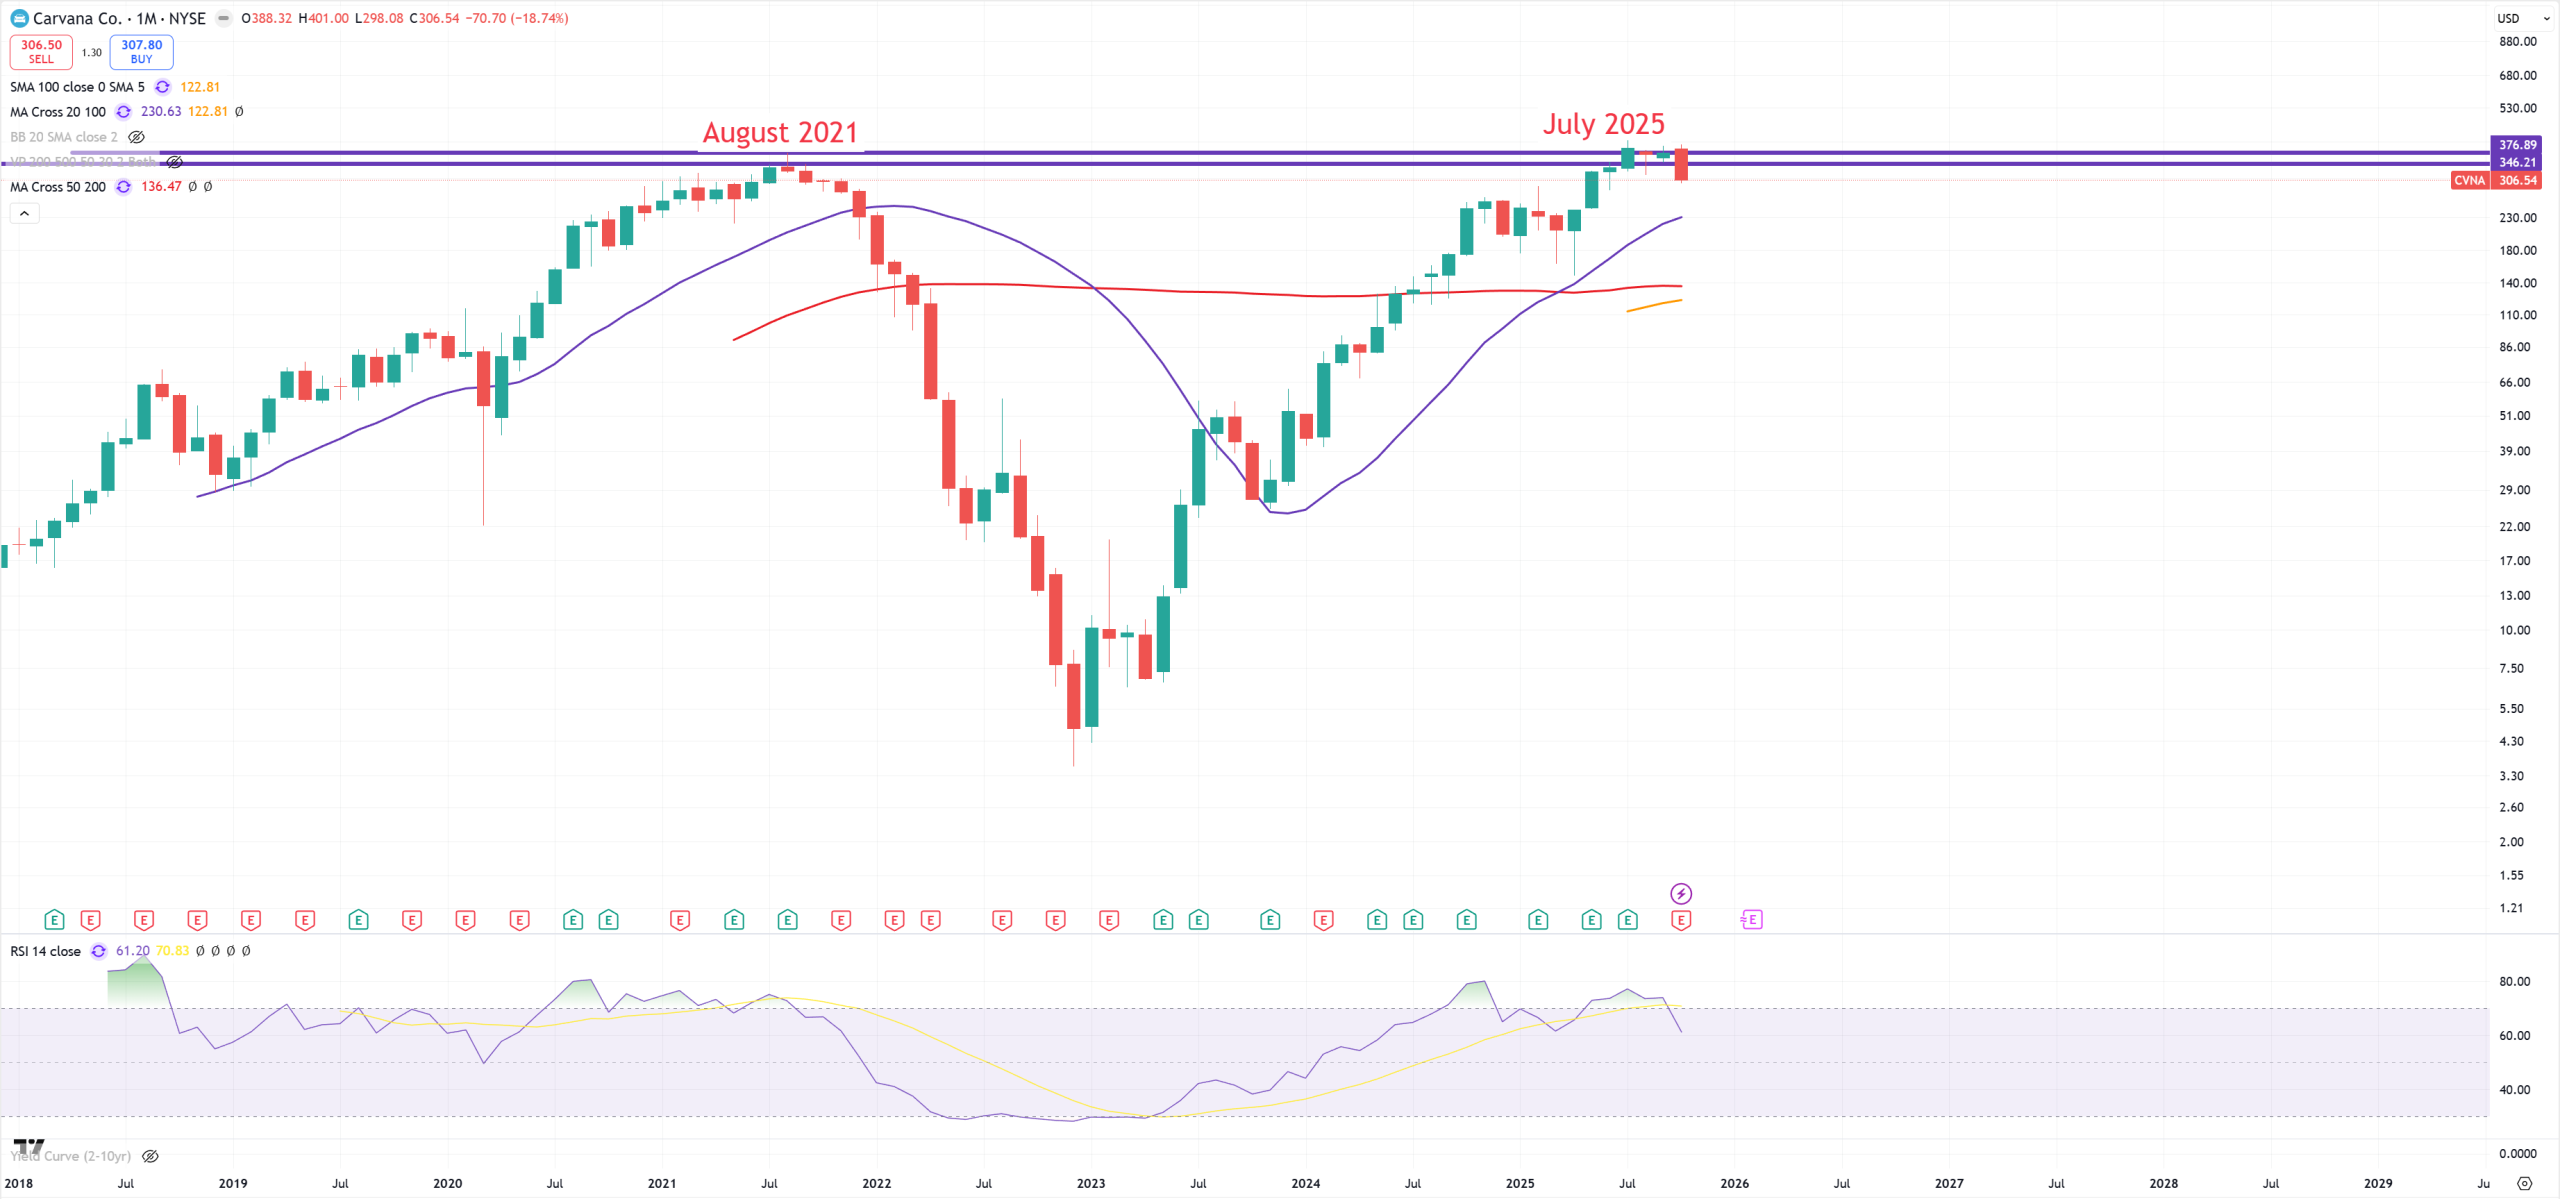
CVNA – probably another fraud of the decade
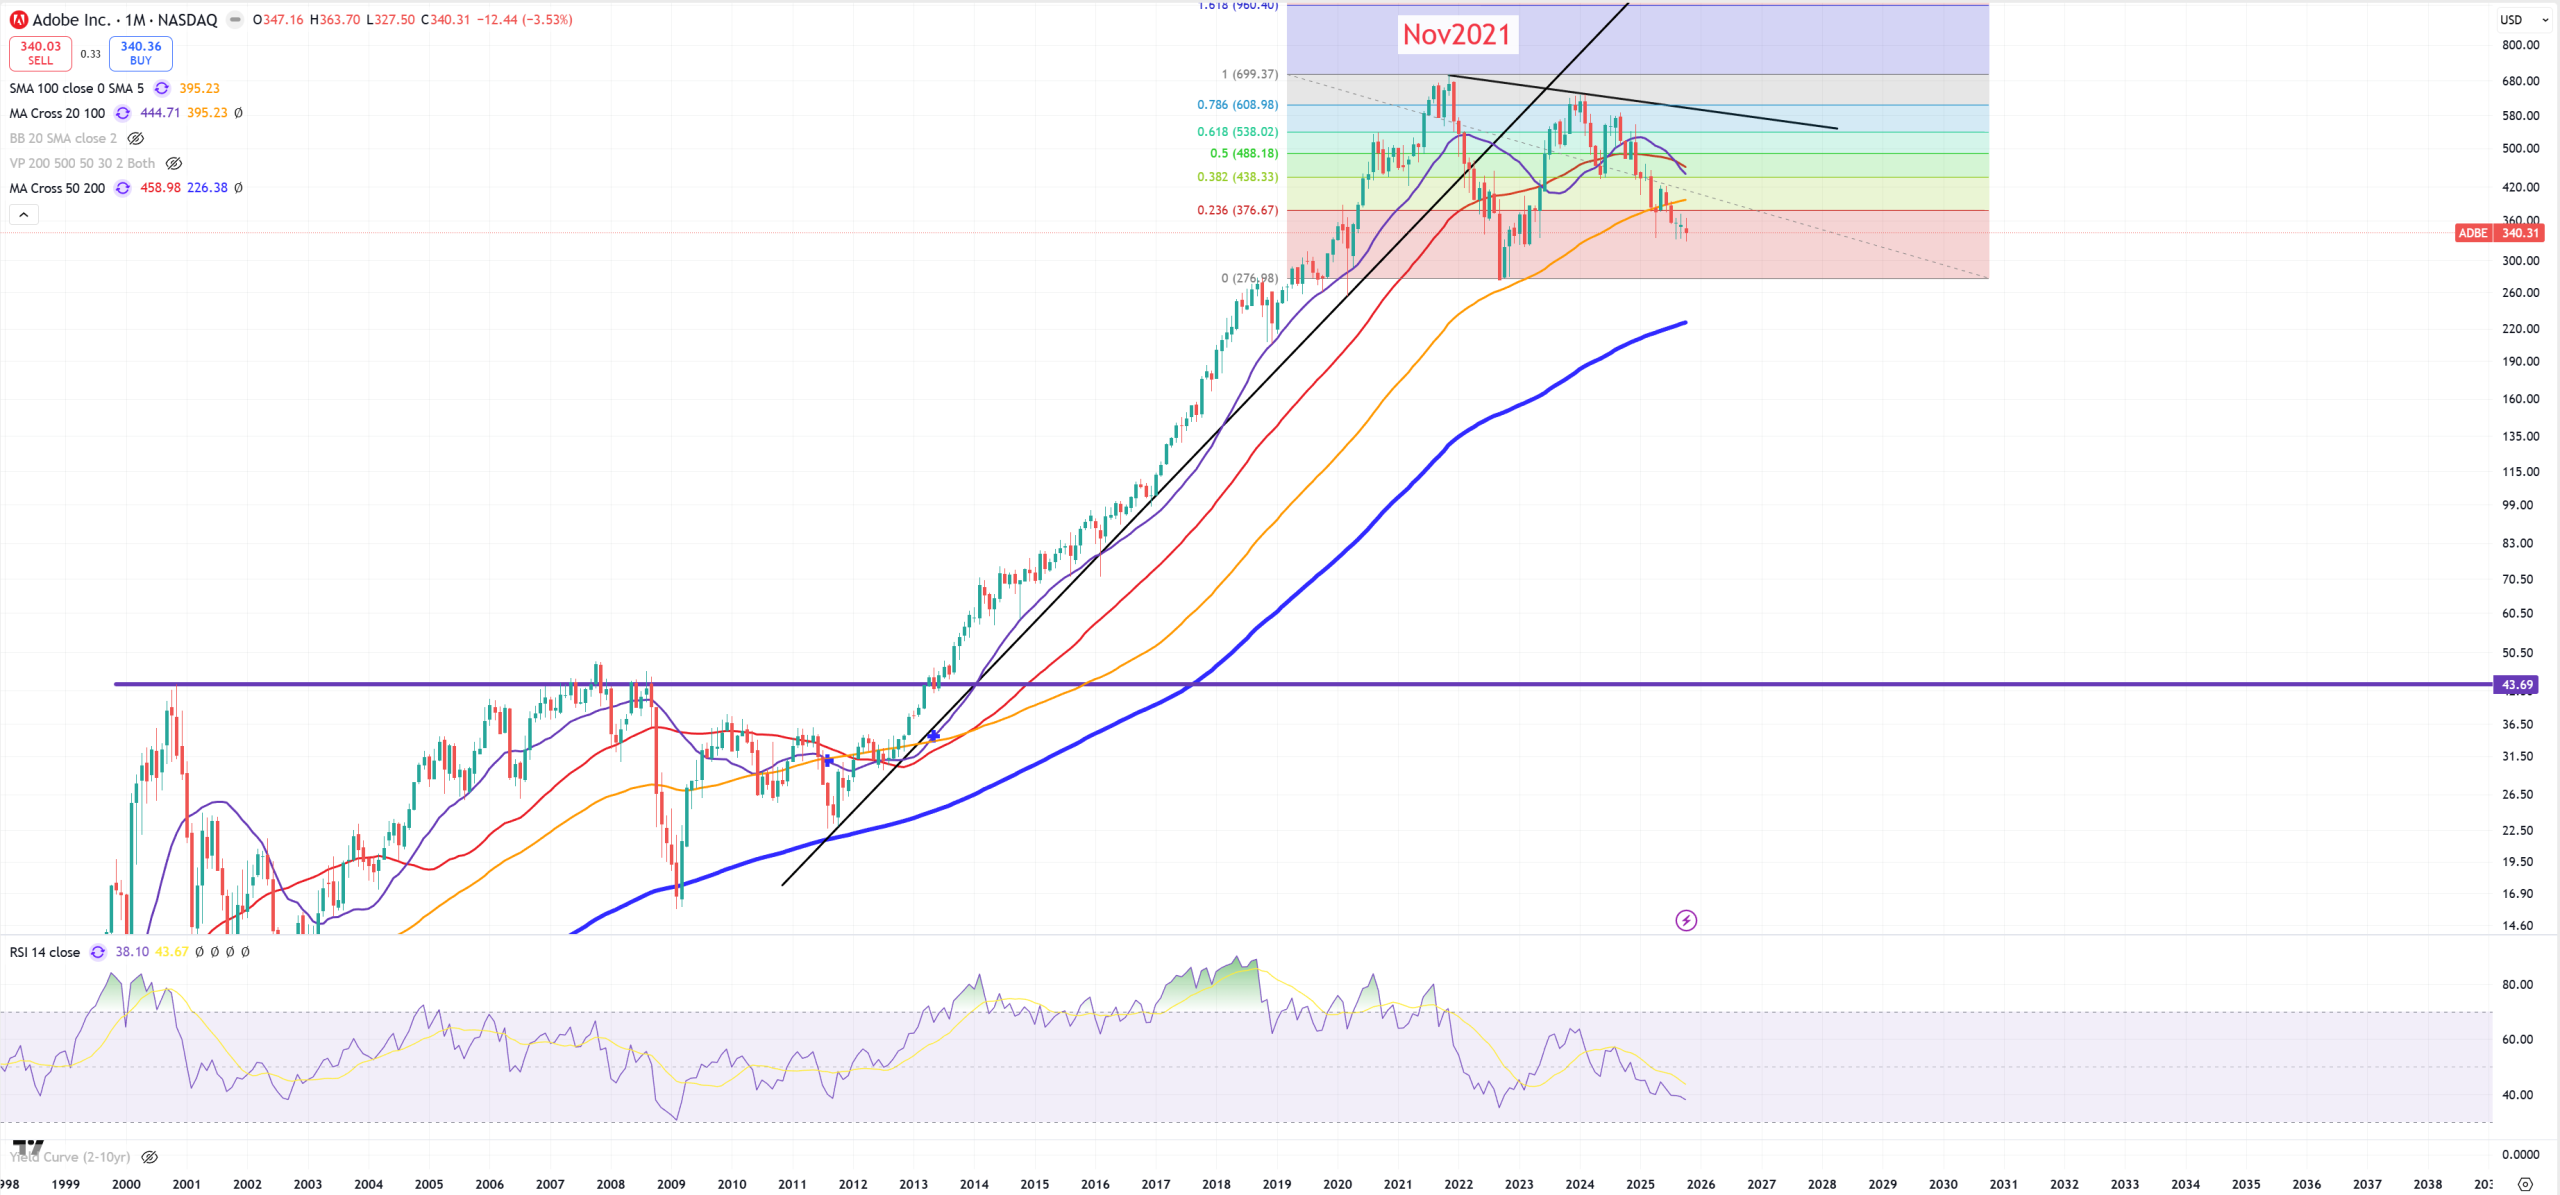
ADBE
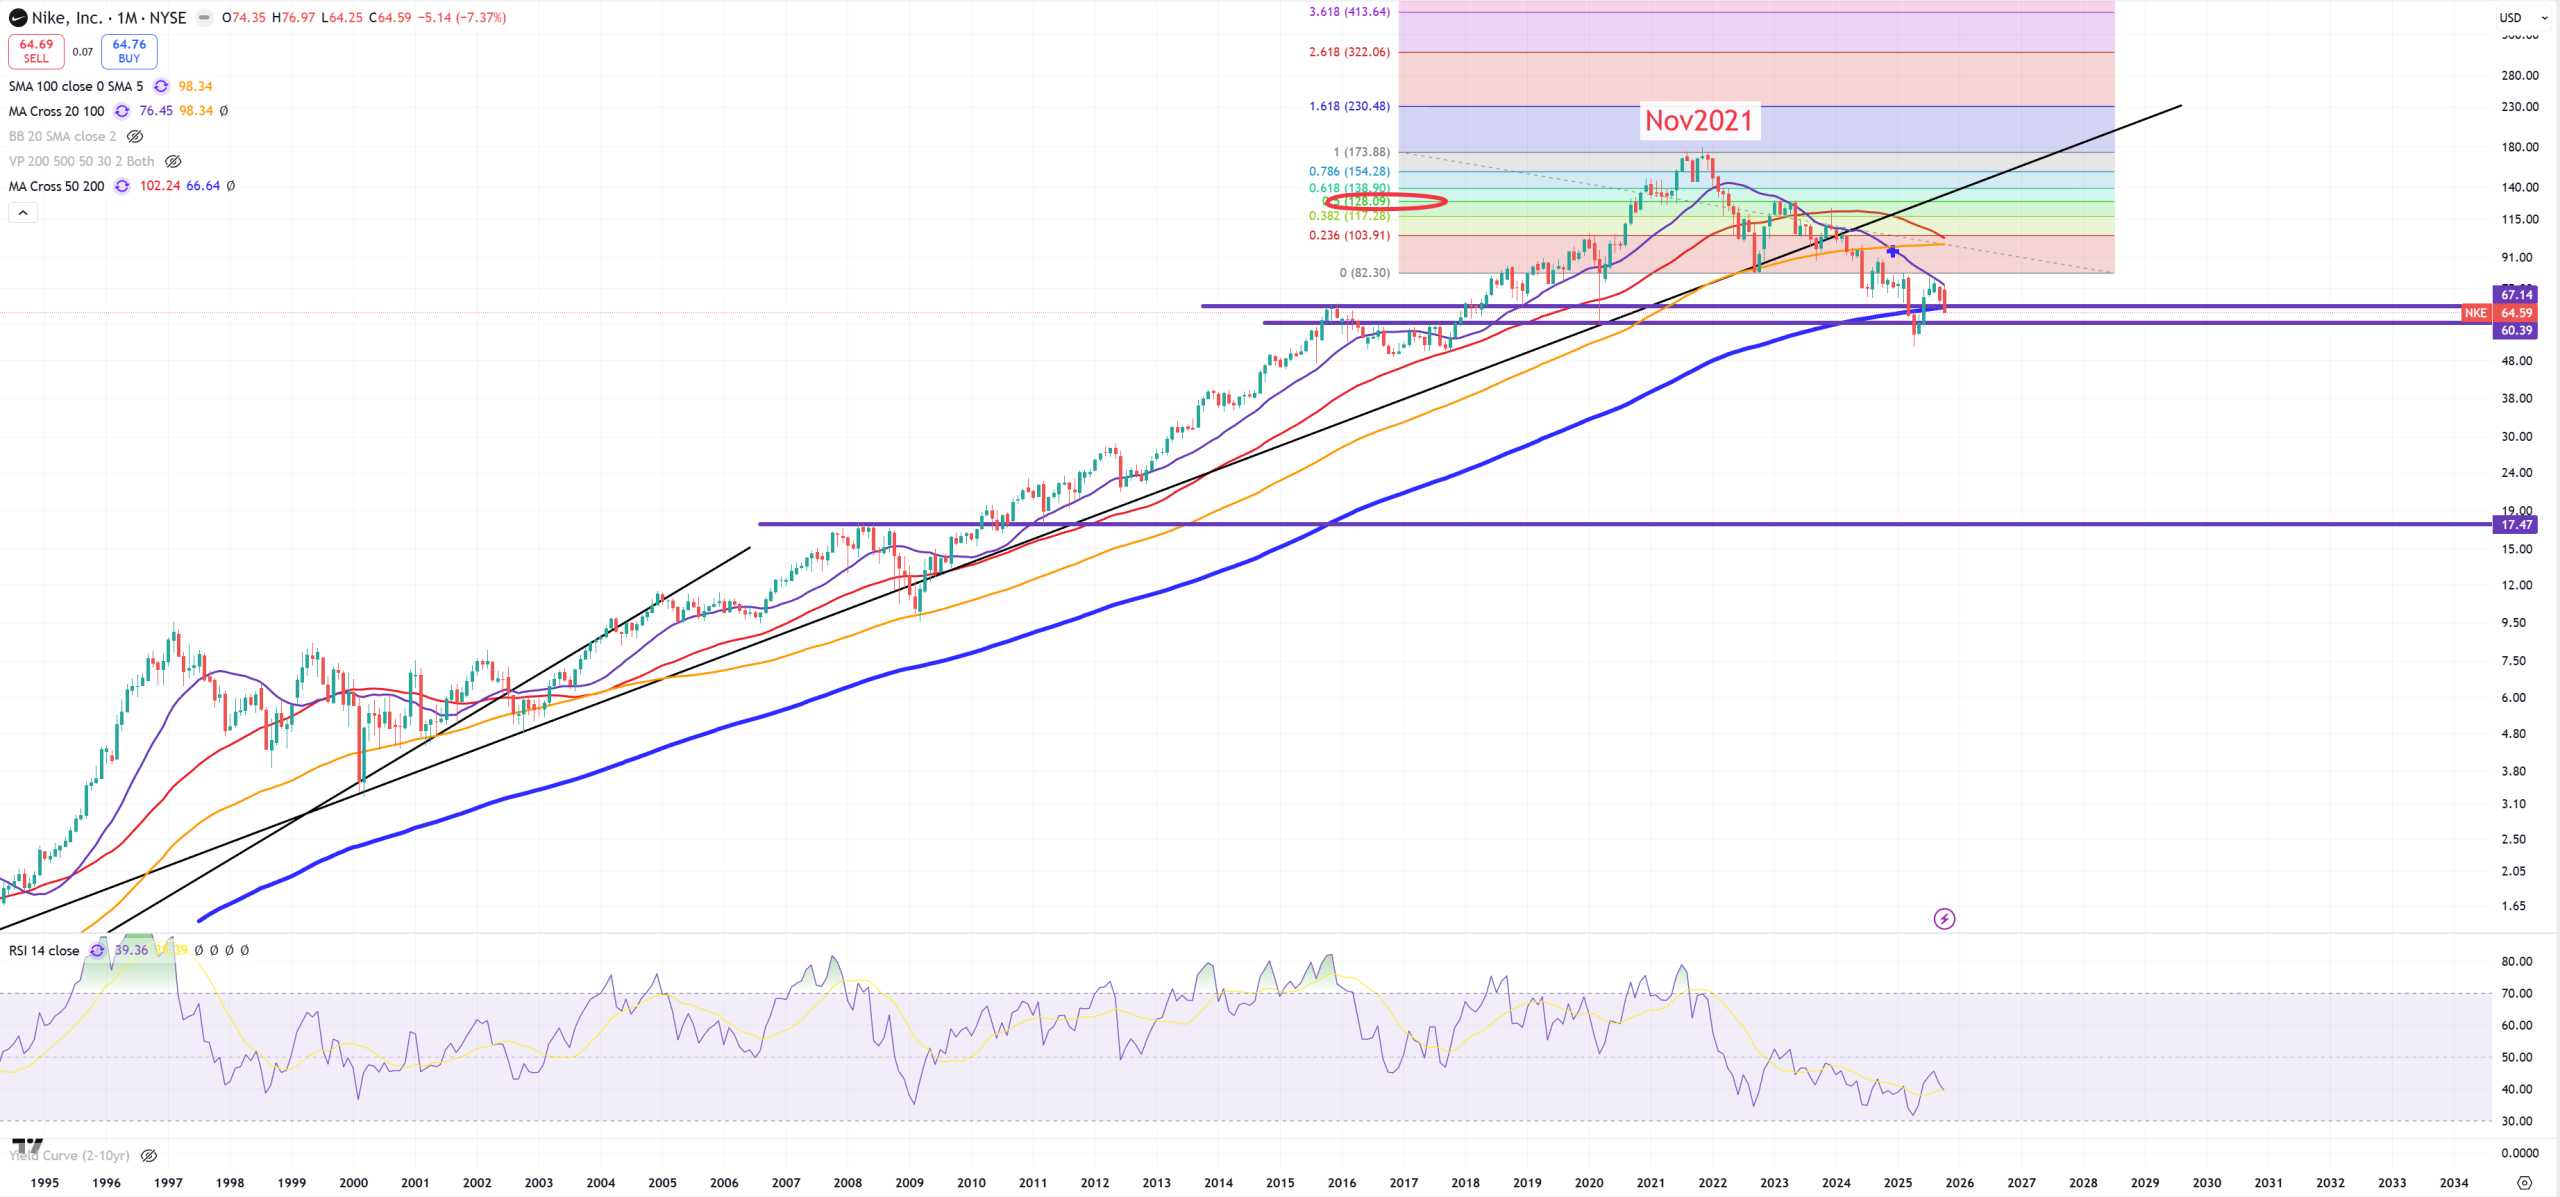
NKE – brutal moment for Nike – what is not really surprising looking how big problems bottom 90% of consumer have. (M)MA200 break for the first time EVER = possible flip towards big secular bear market, because US10Y/US03MY has not even uninverted, the path will long down once US10Y/US03MY will go up.
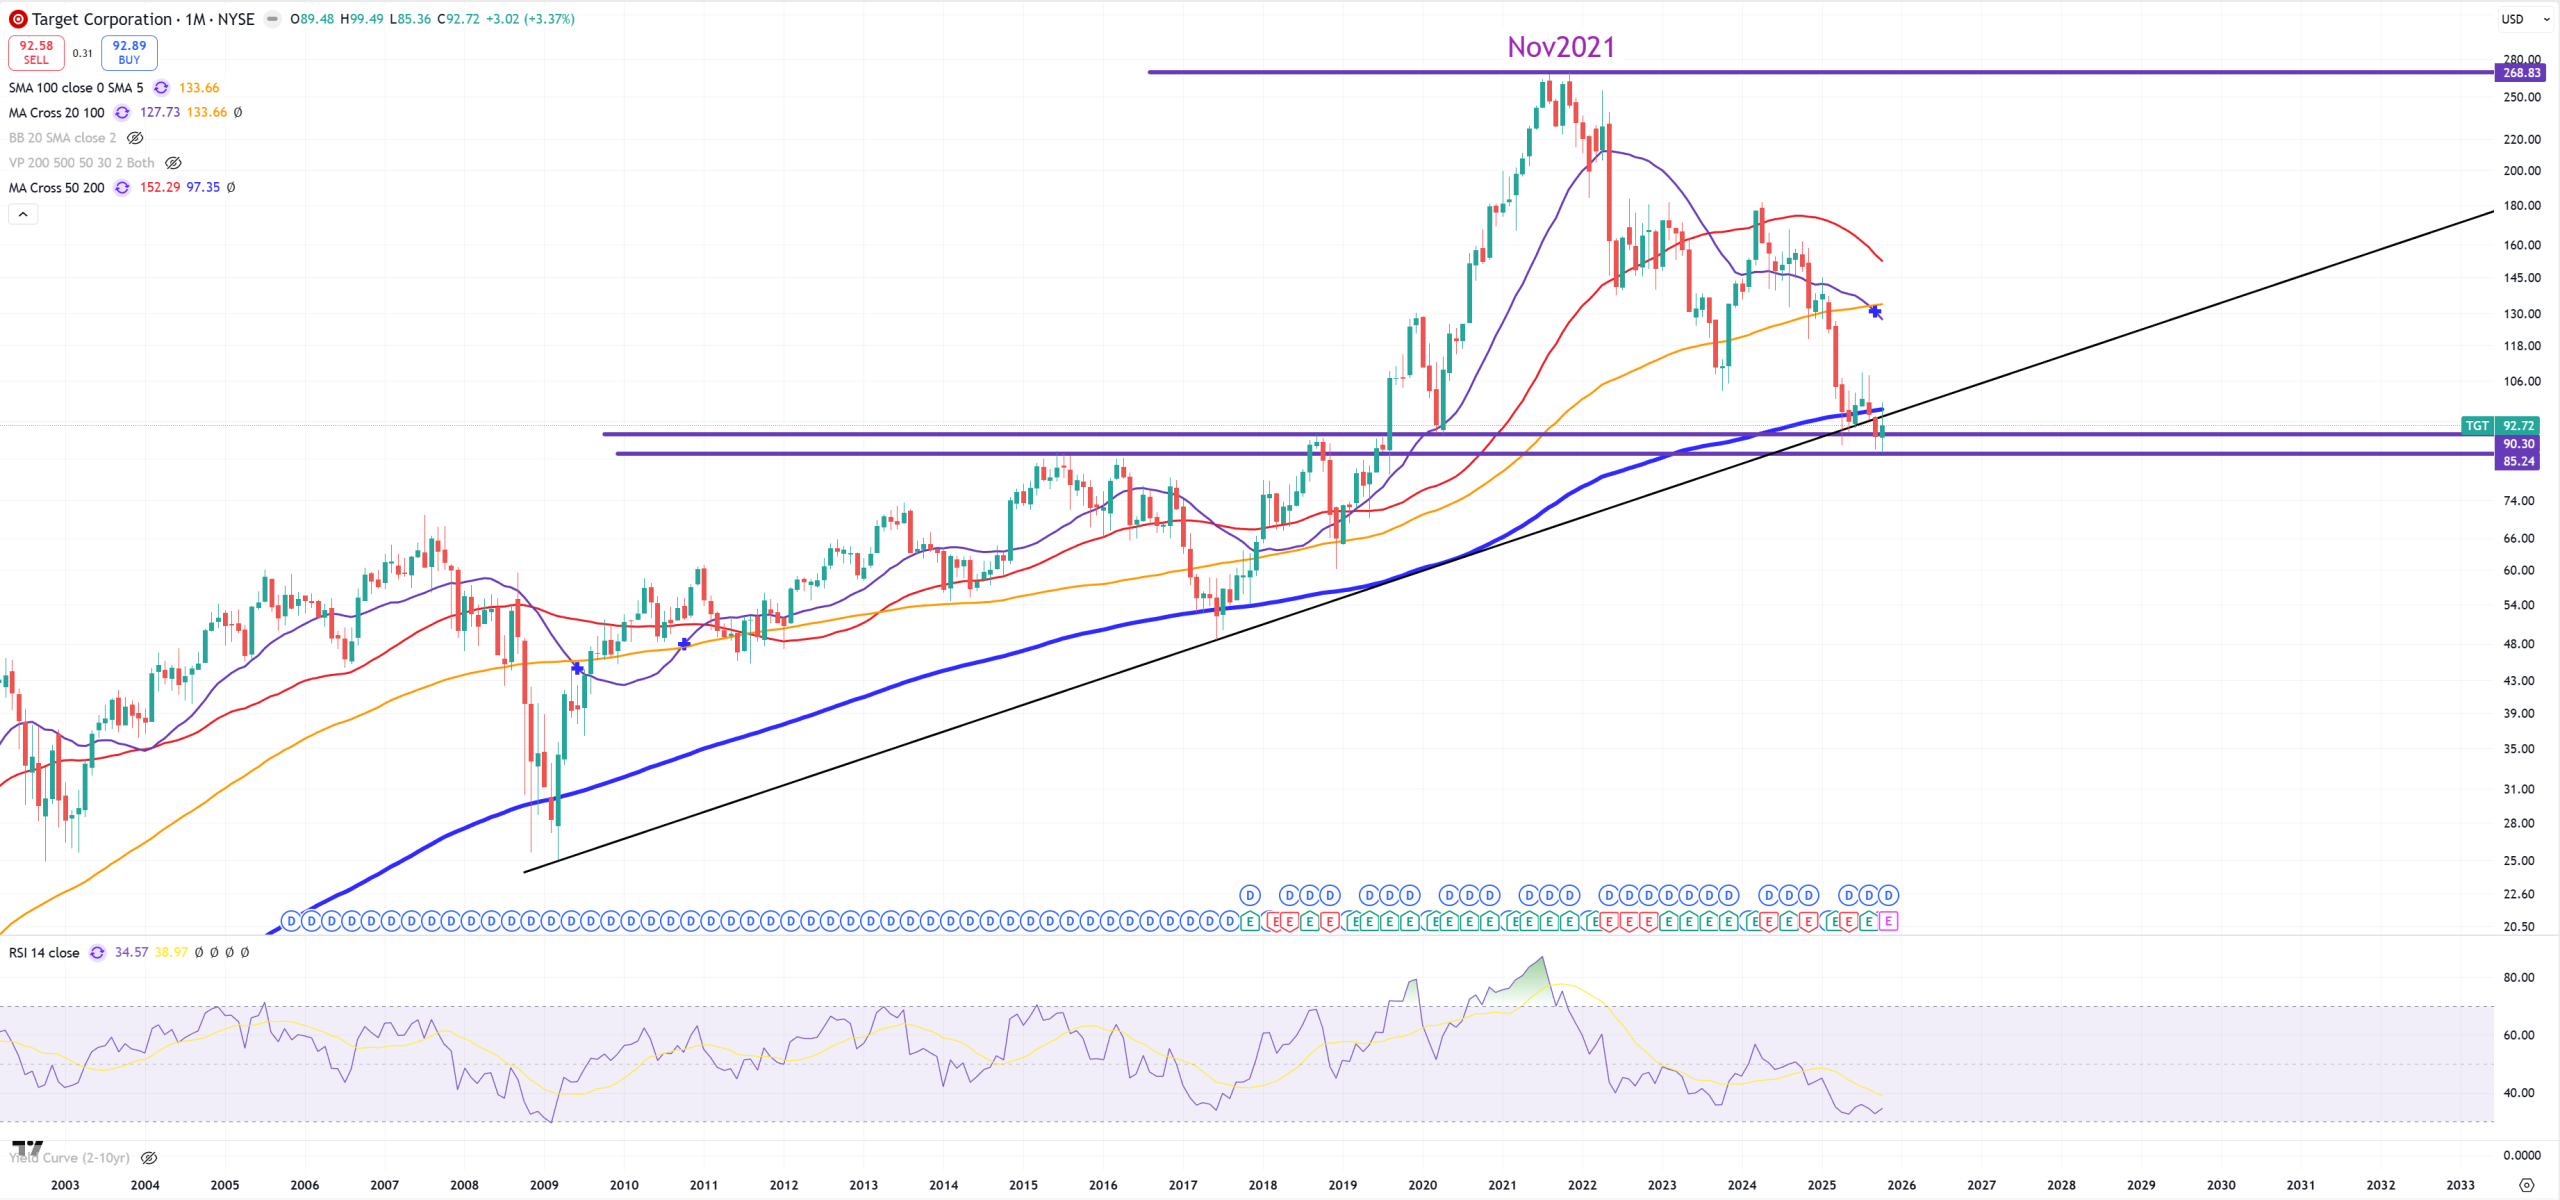
TGT – Target – same problems as Nike
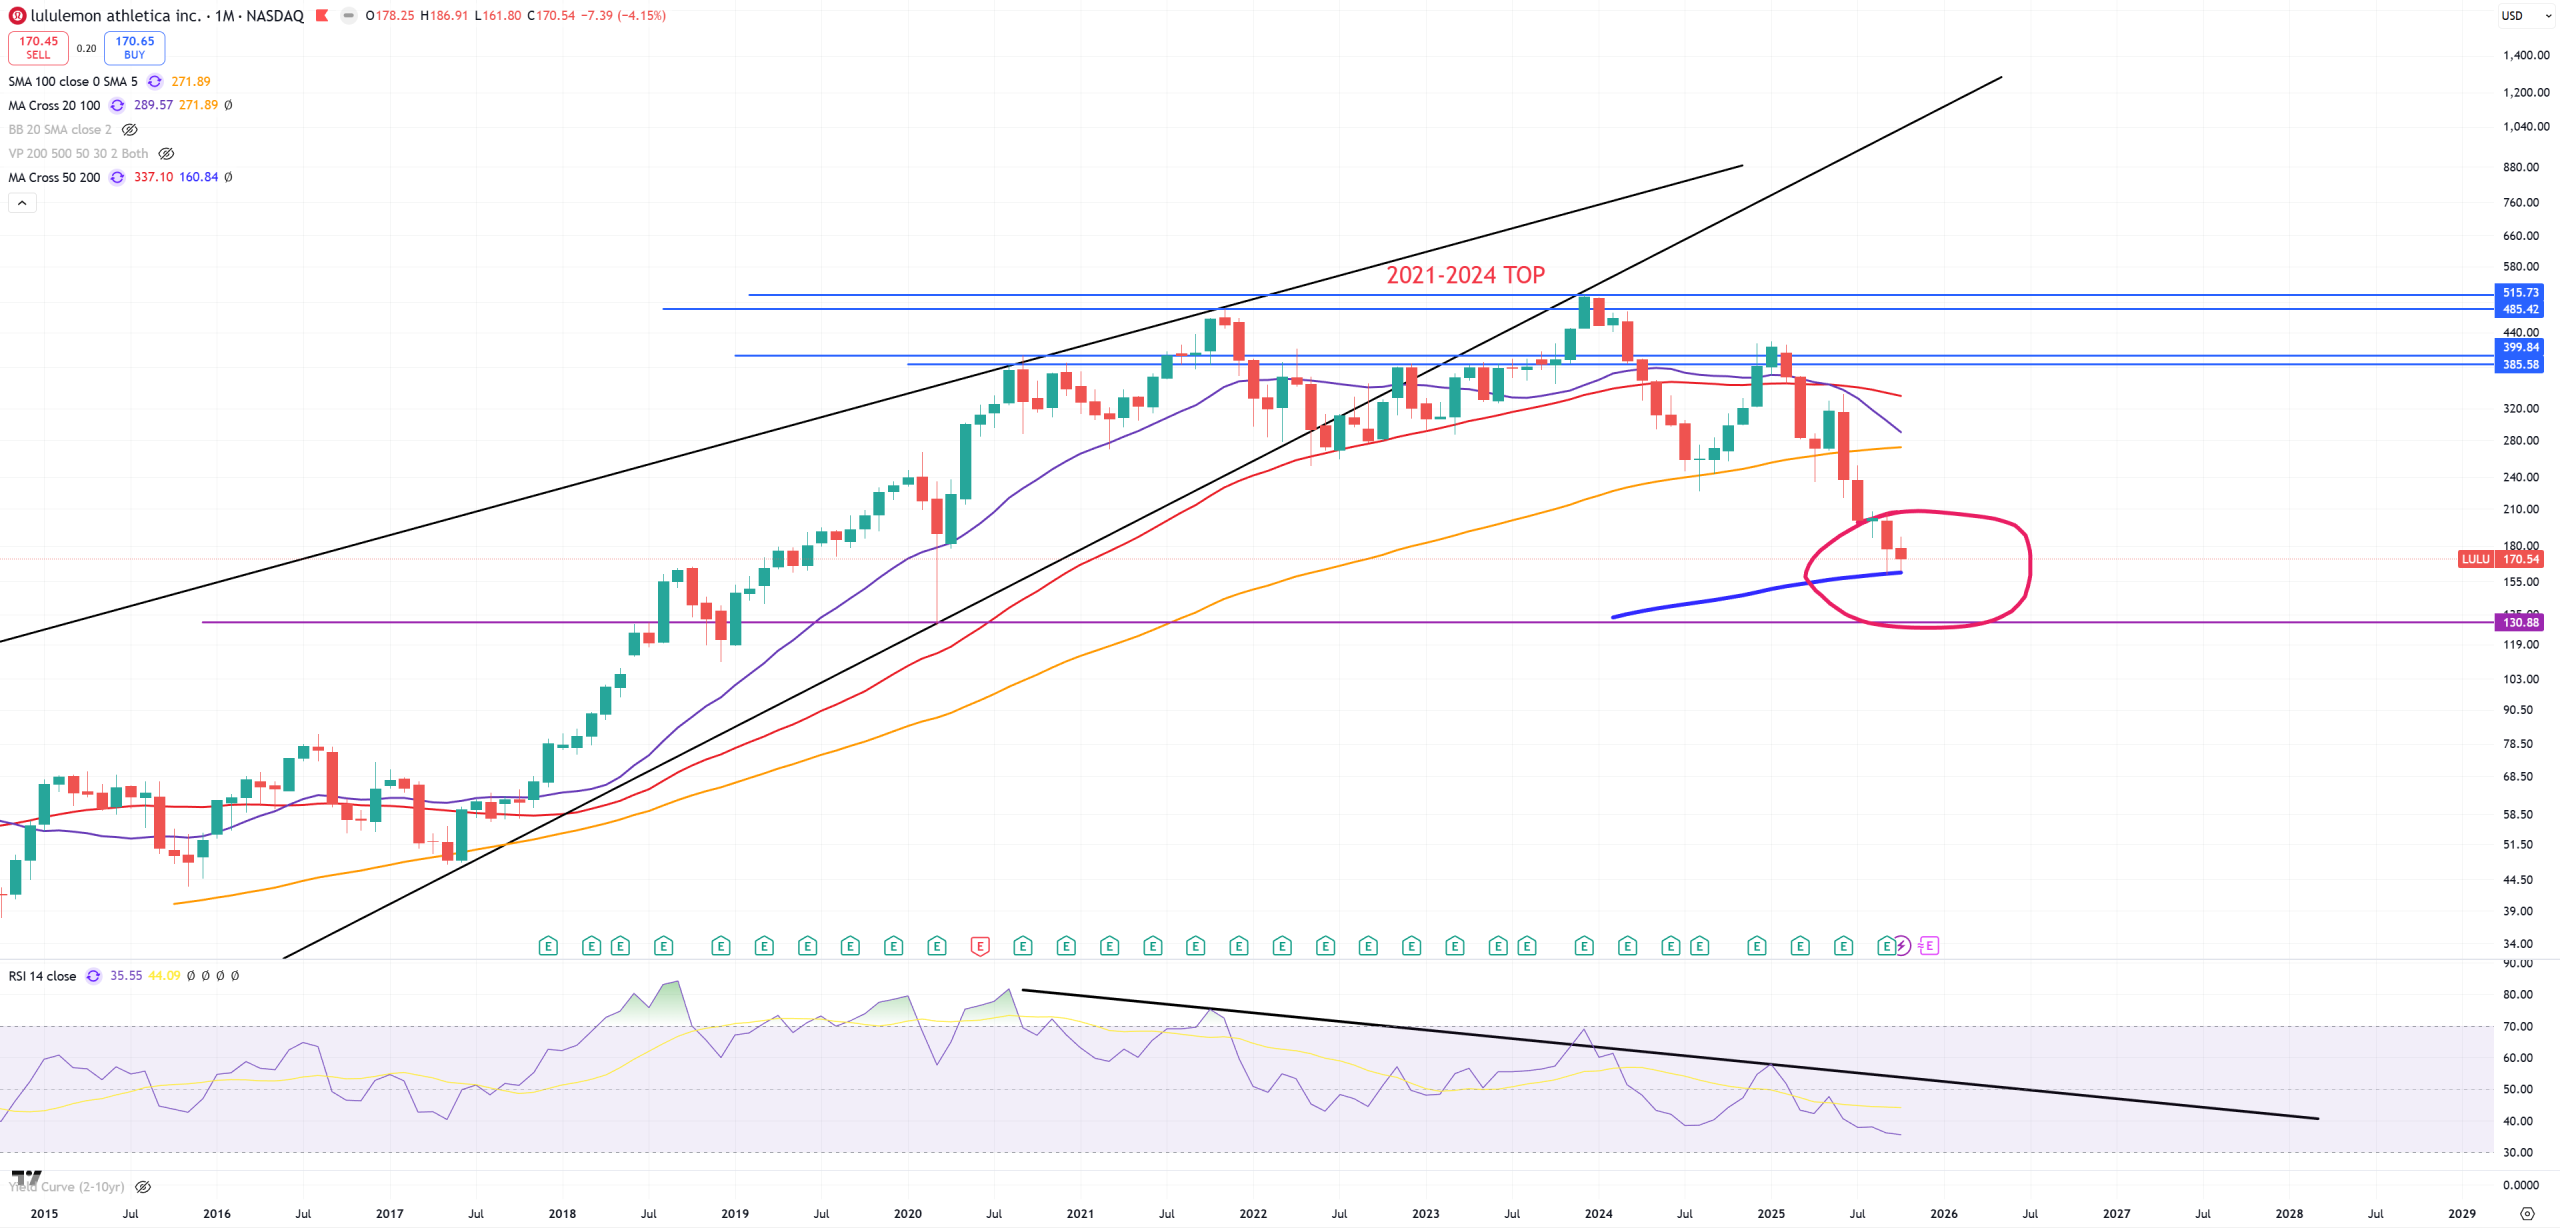
LULU – (M)MA200 so far holds
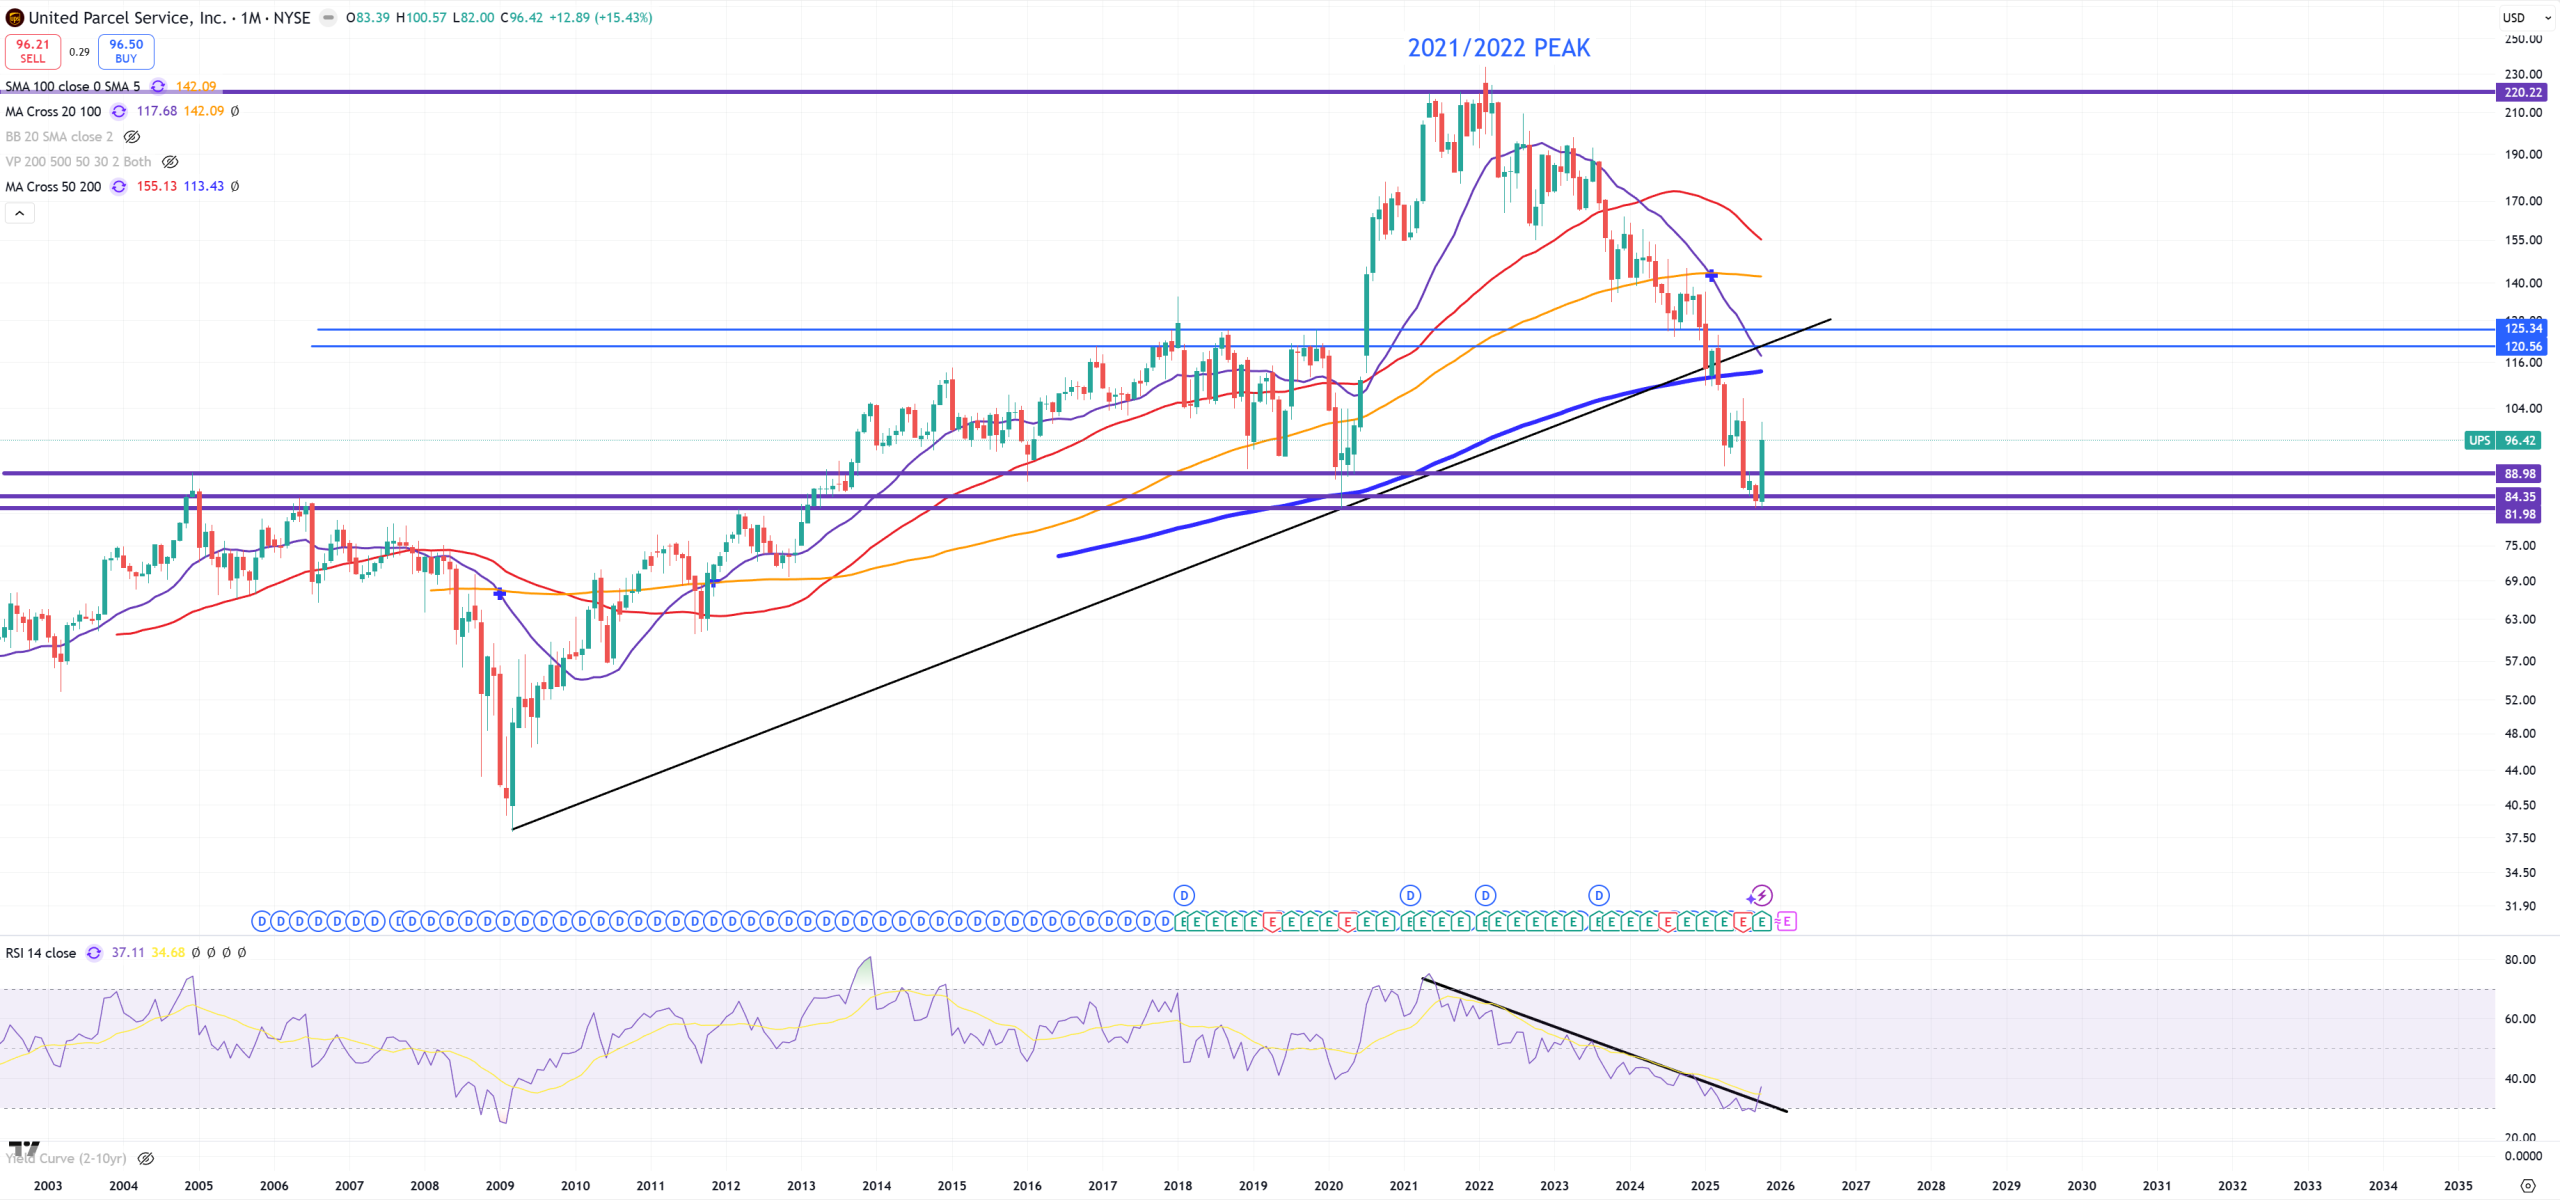
UPS – returned to 2004 level, this is support but blue (M)MA200 has gone long time ago
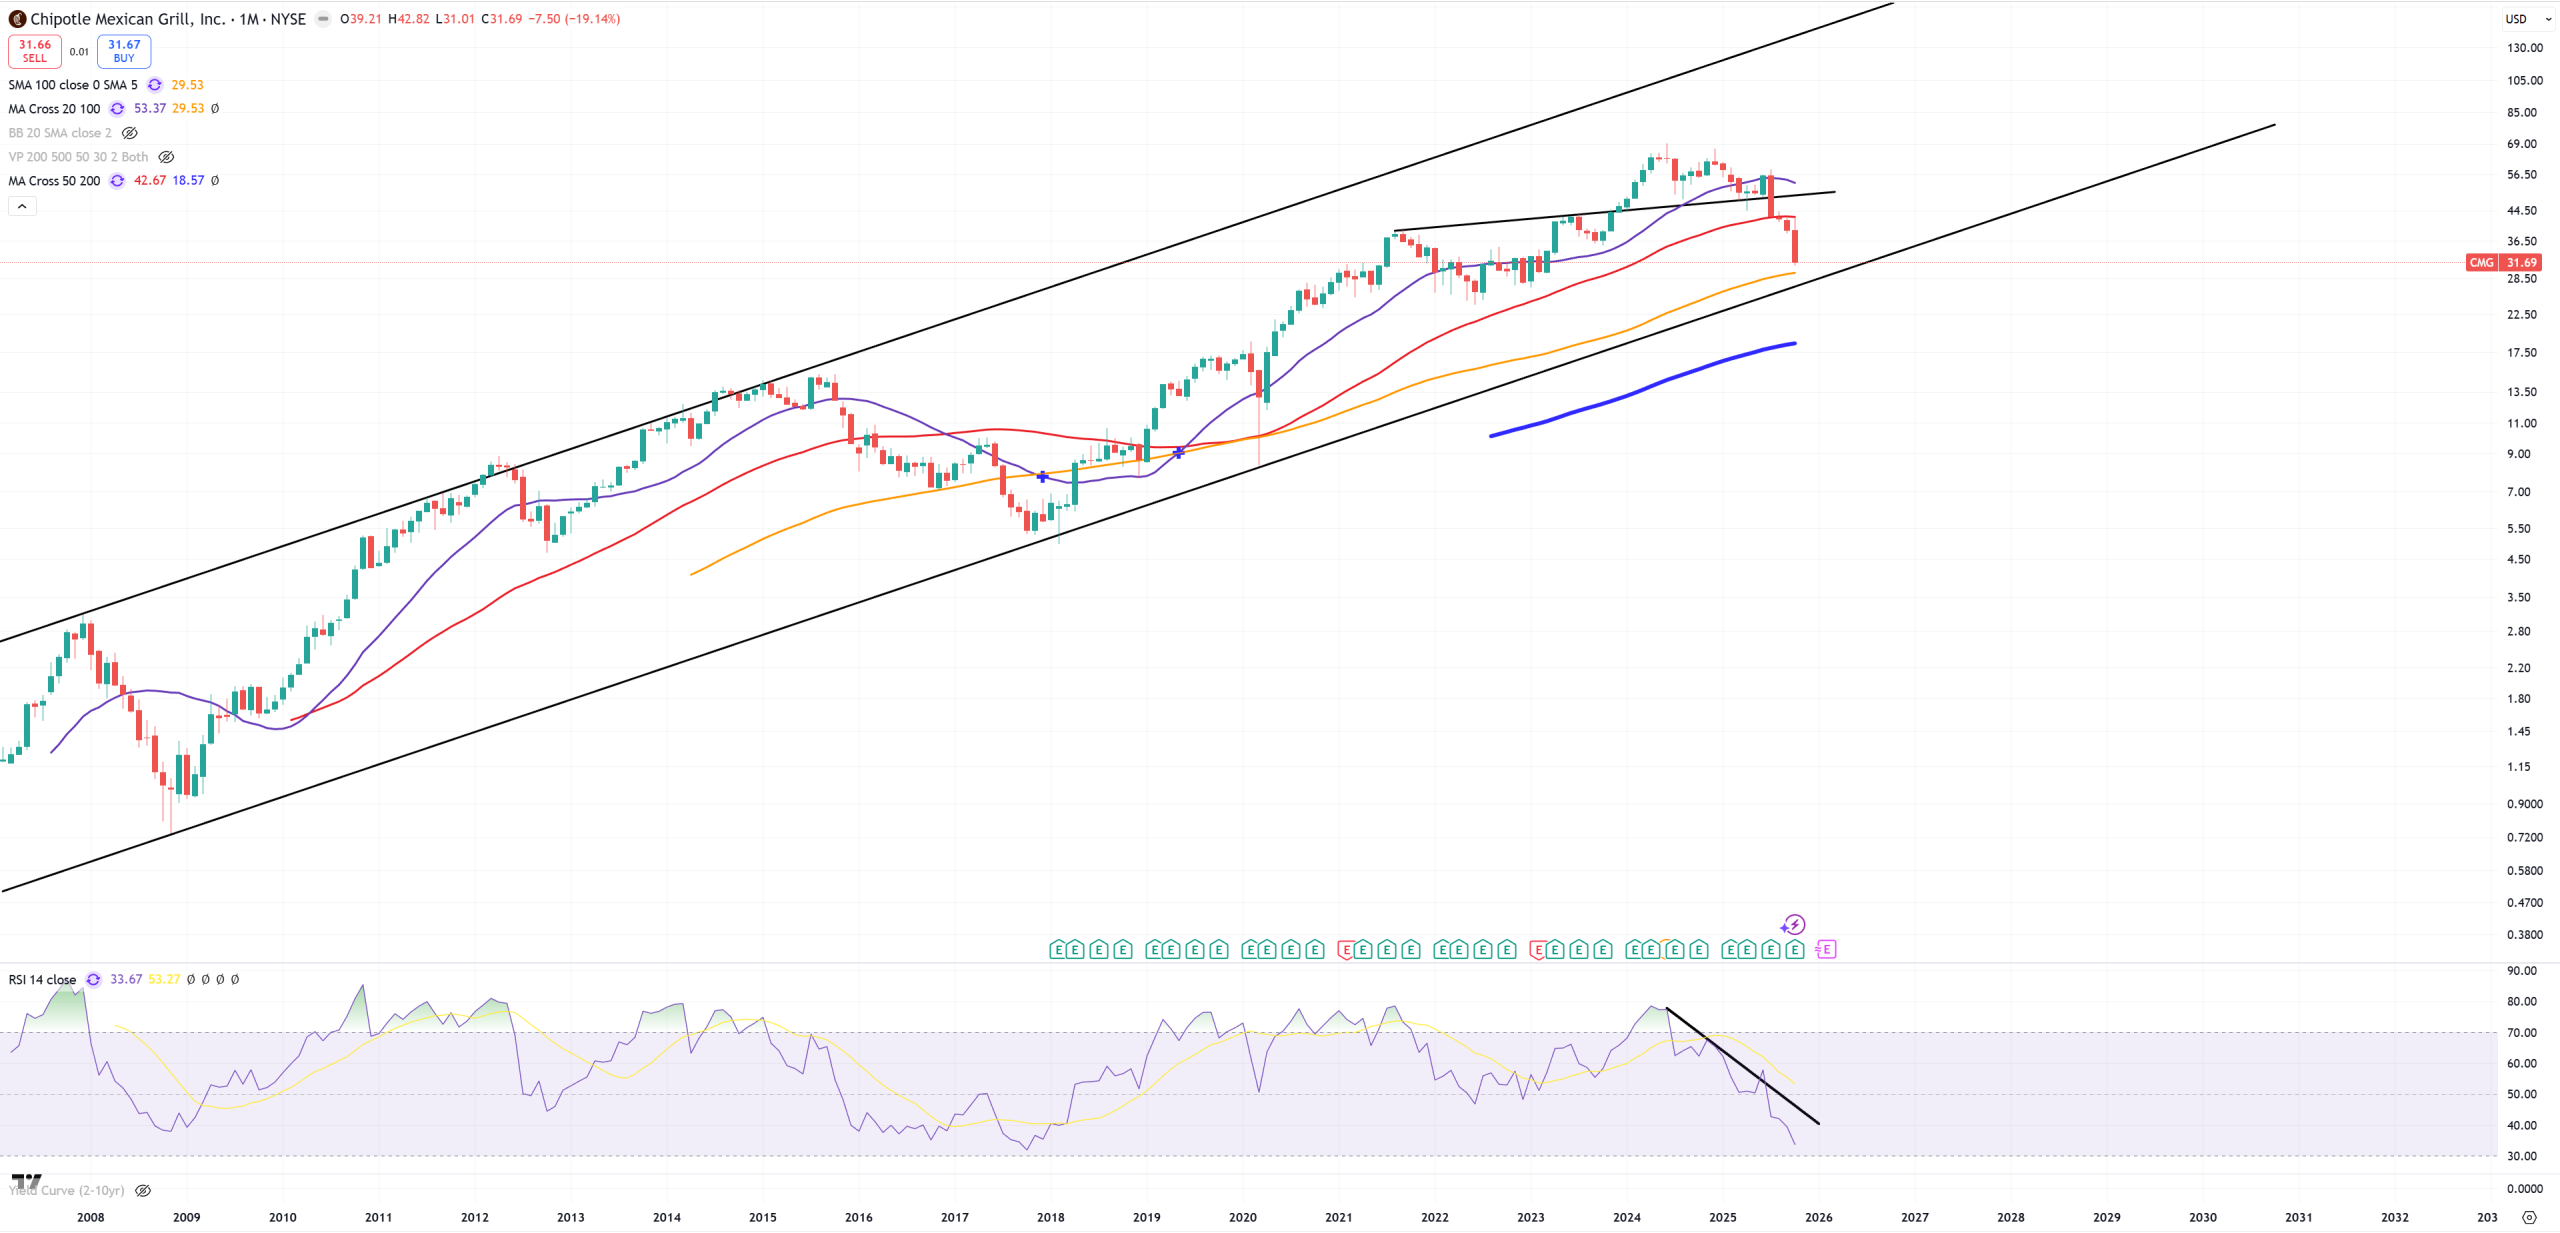
CMG – Chipotle. Crashed -20% after last earnings call. It turned out you have to earn a lot to afford buying food on CMG. Peak around middle 2024.
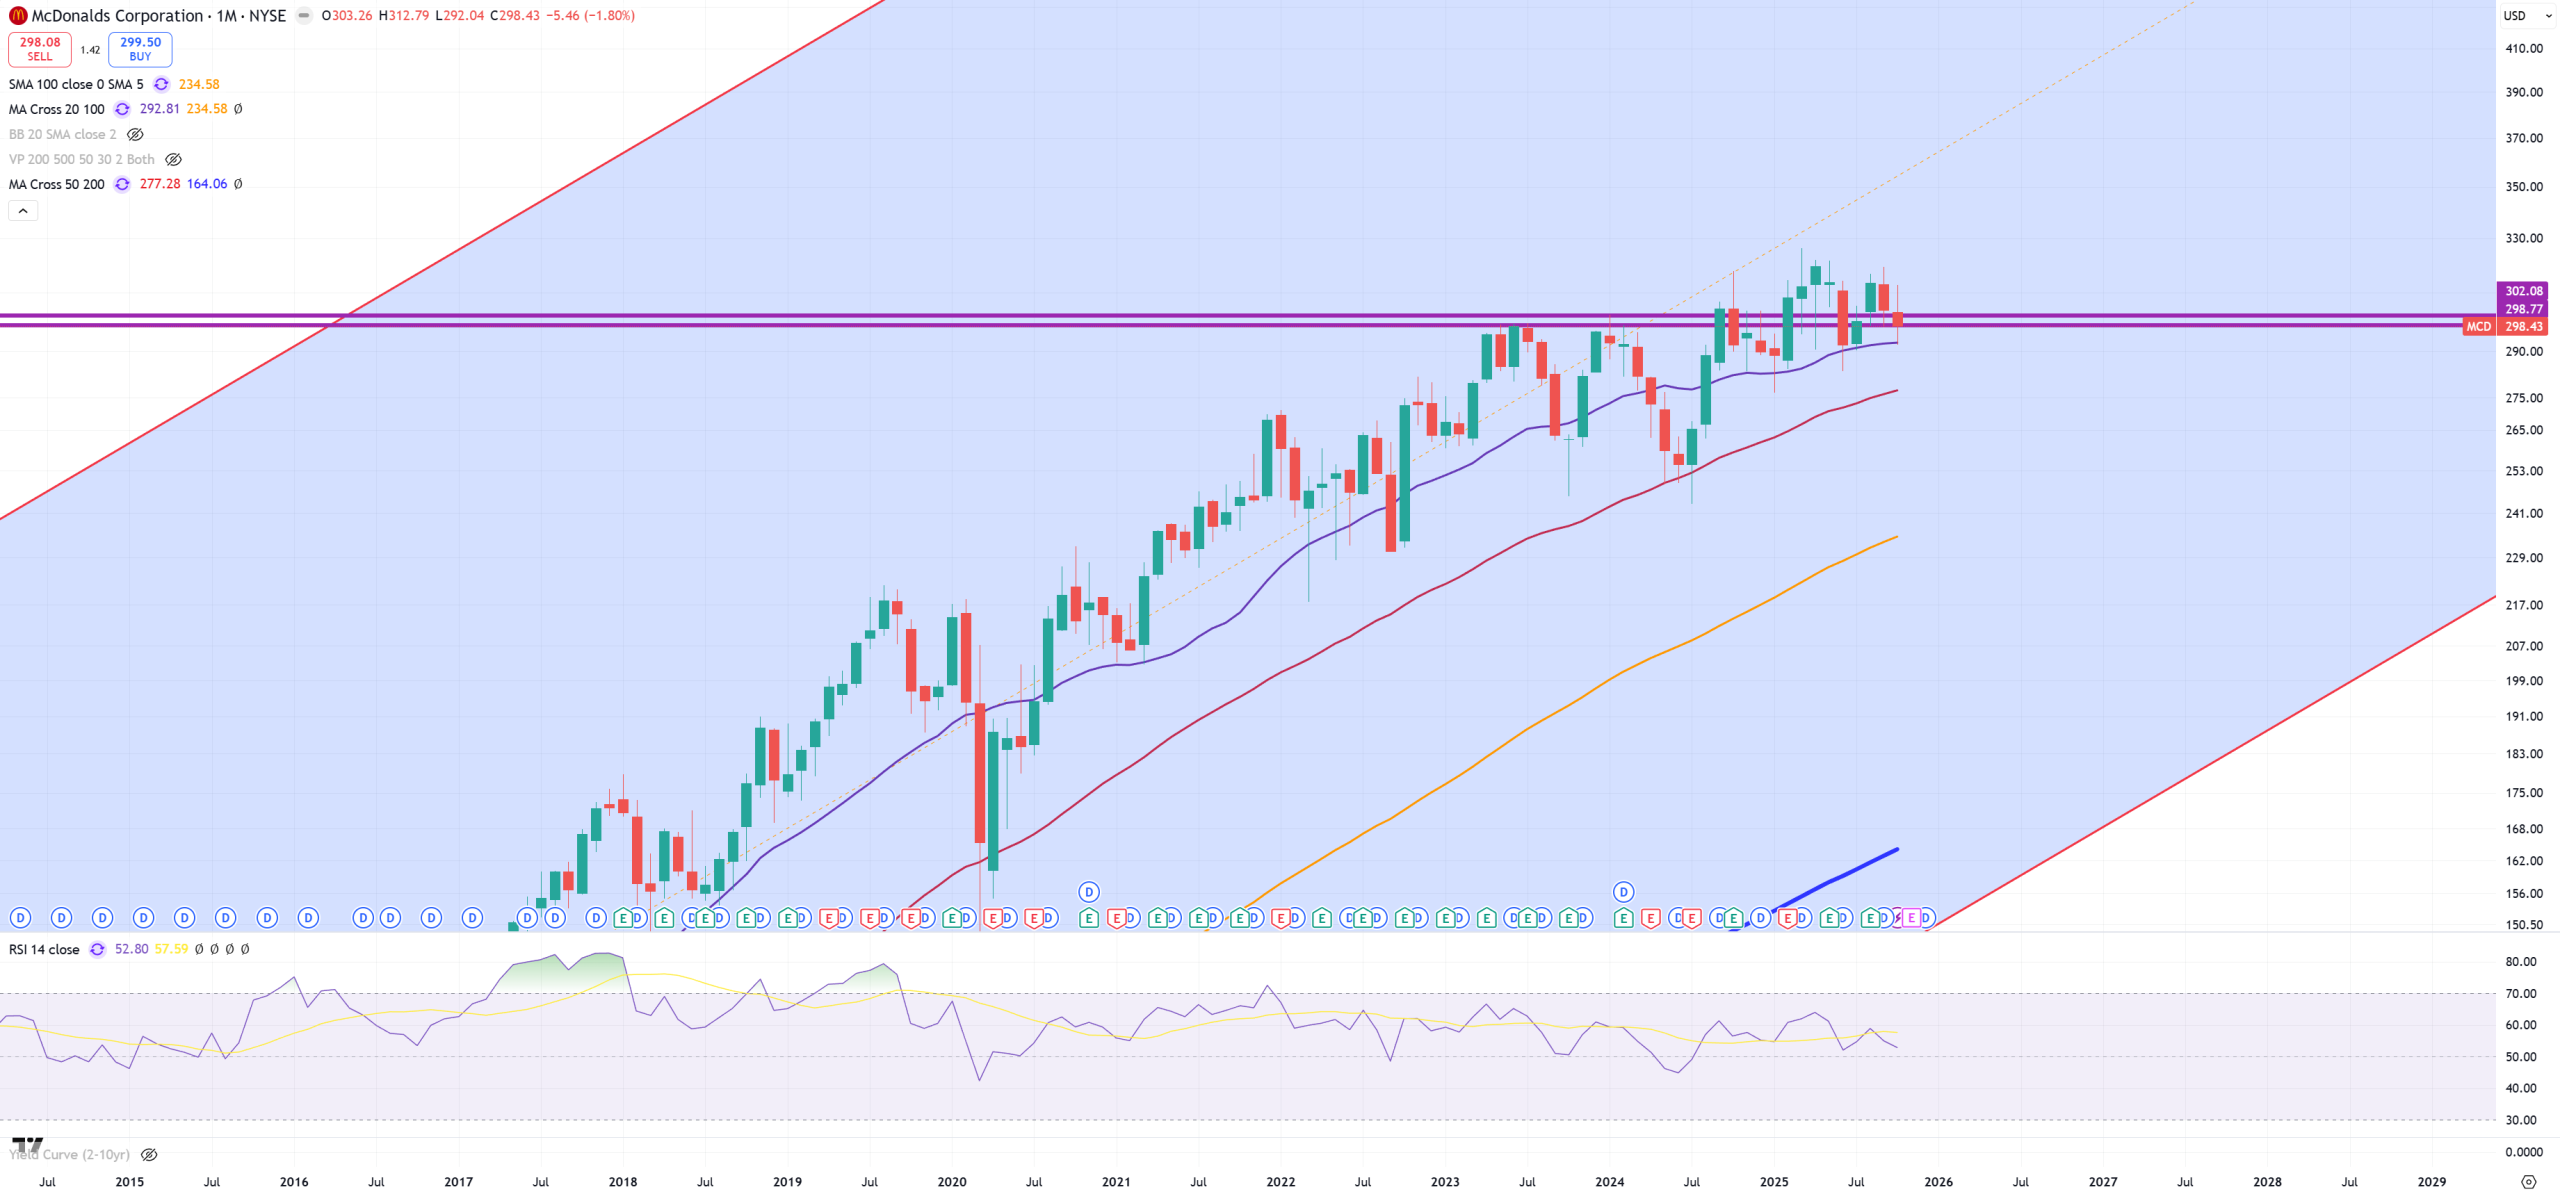
MCD – McDonalds can’t really break key level
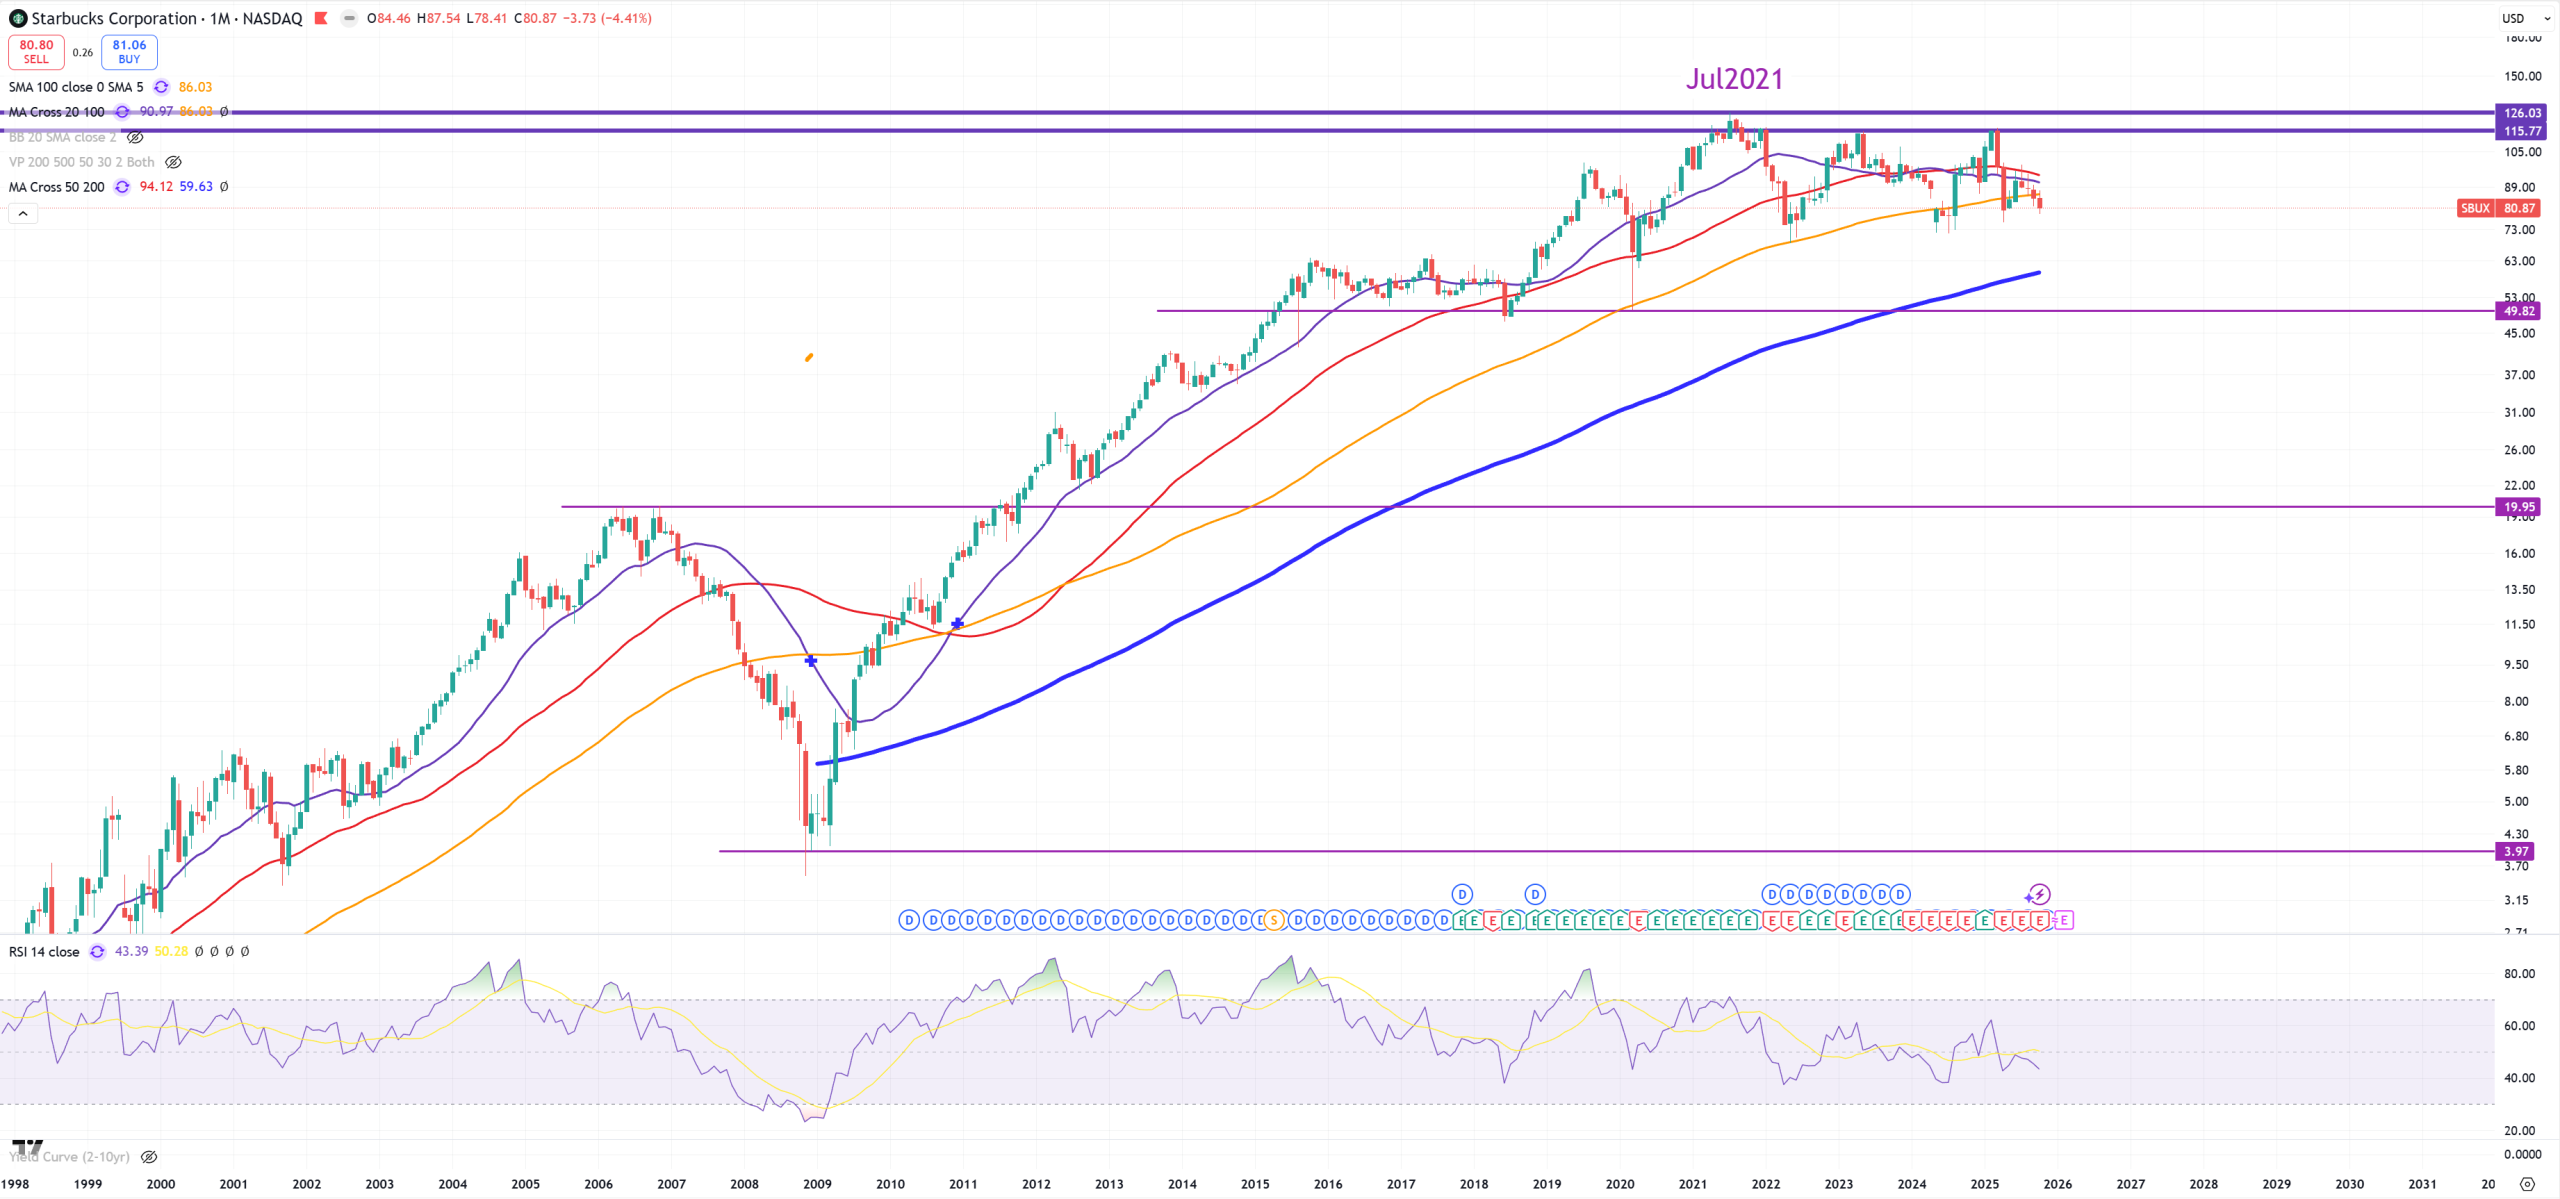
SBUX – Starbucks – unbelievable it says so high so long. Oh wait you know why. Anyway so far below (M)MA100

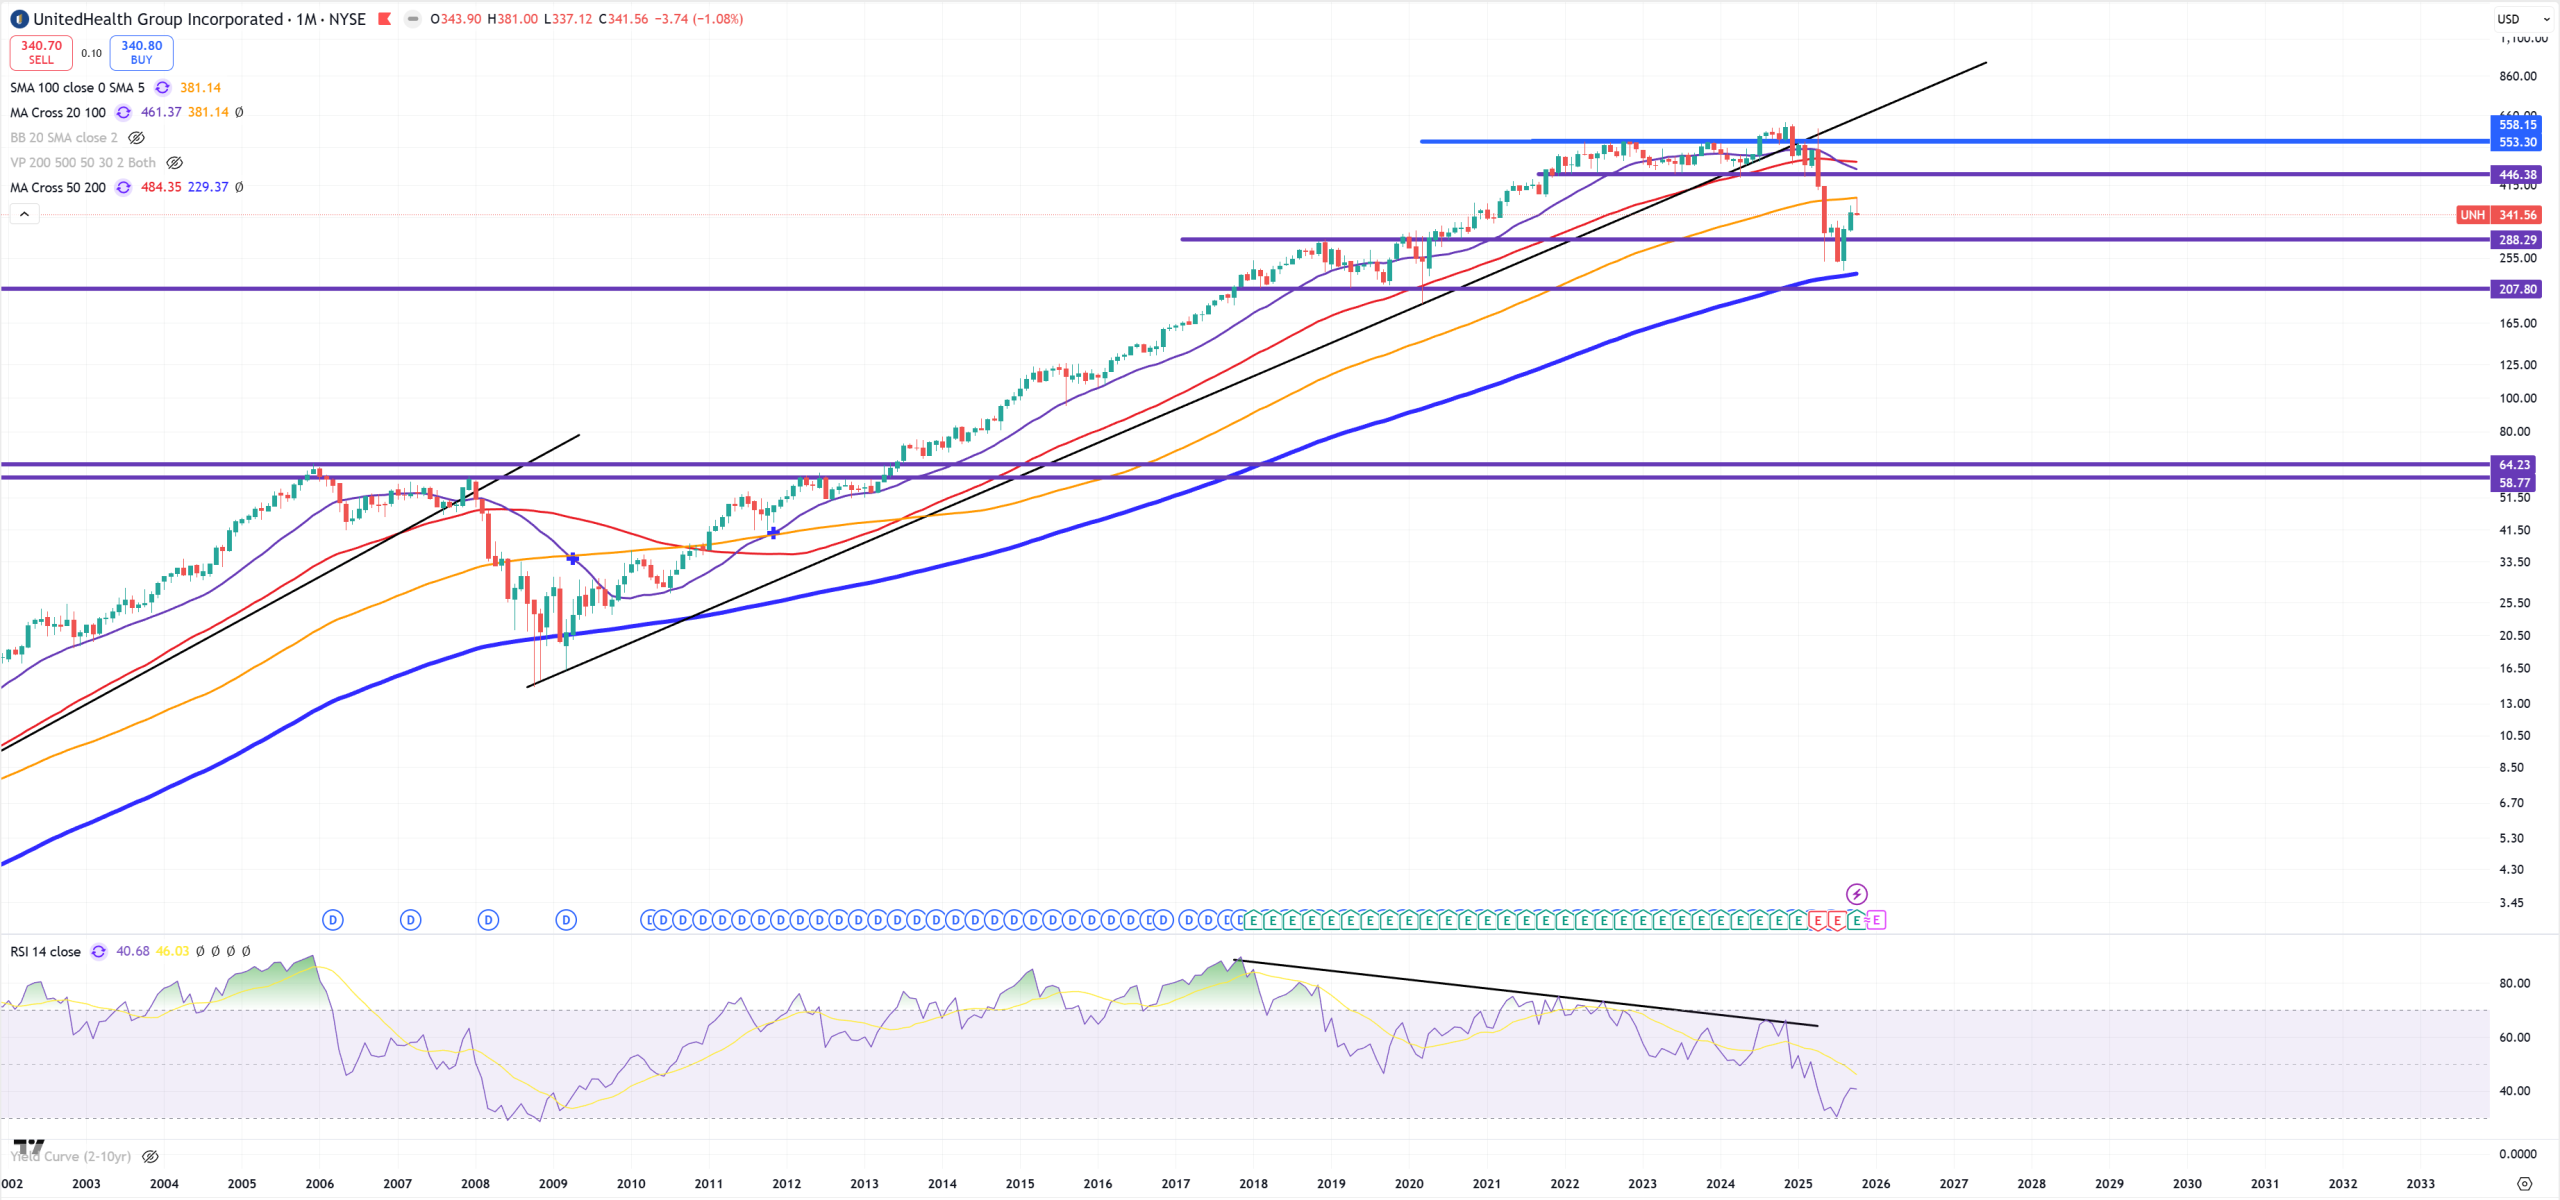
UNH – United Health, will be hard breaking blue (M)MA200 for the first time, but now it rejected (M)MA100 (typical bull/bear trap level).
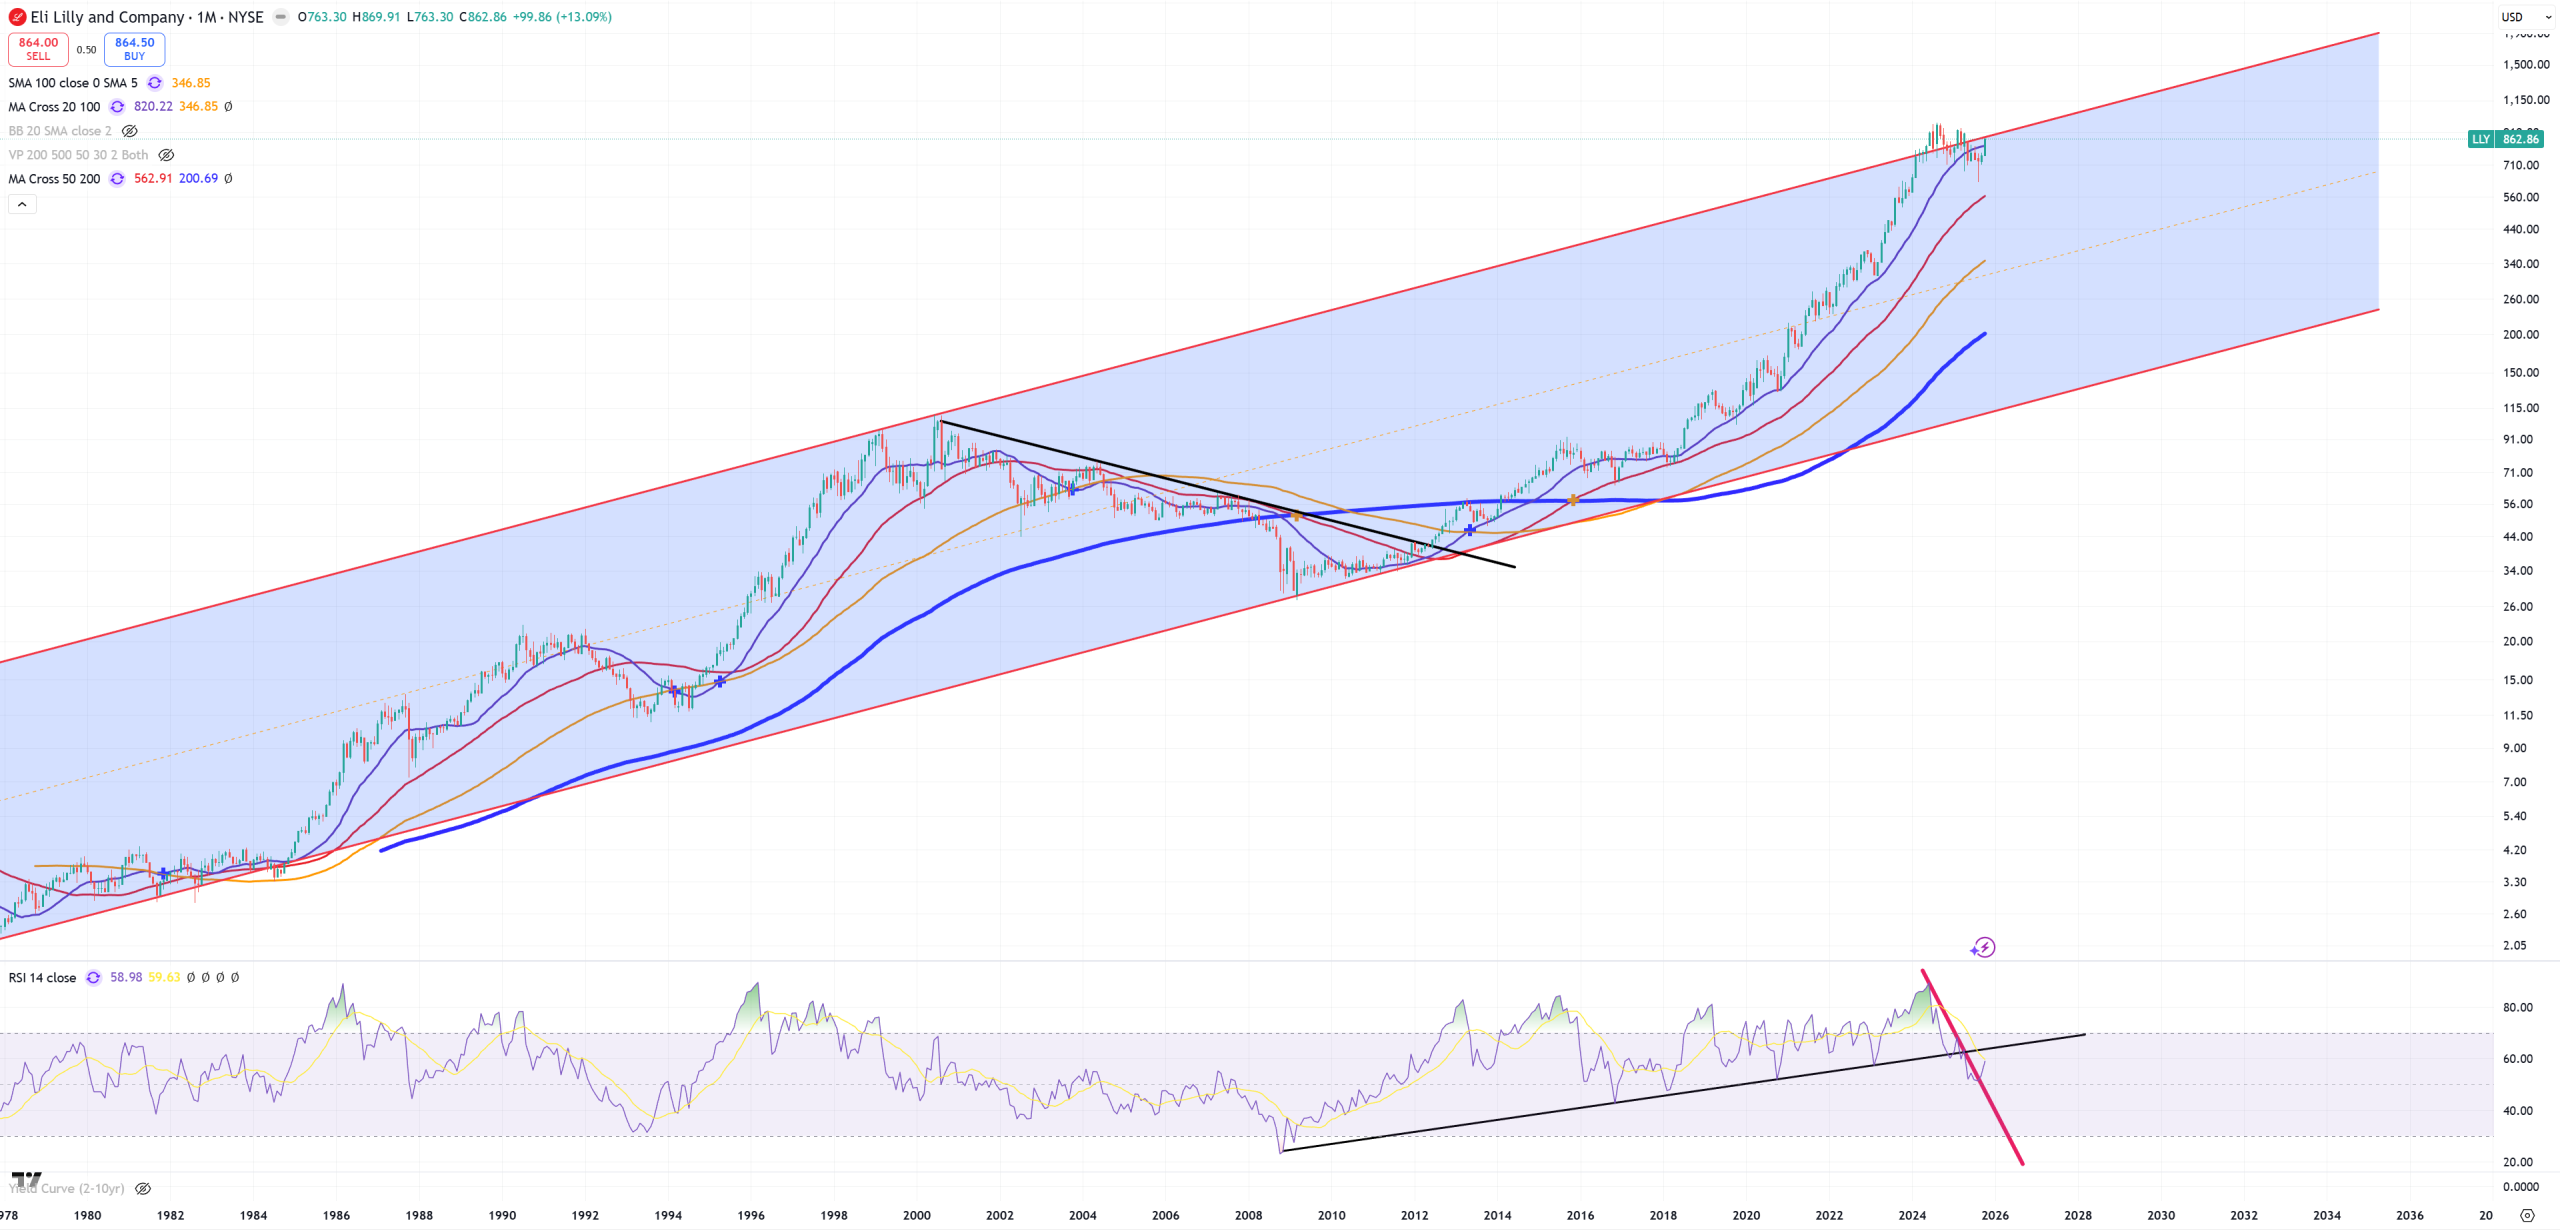
LLY – Eli Lilly
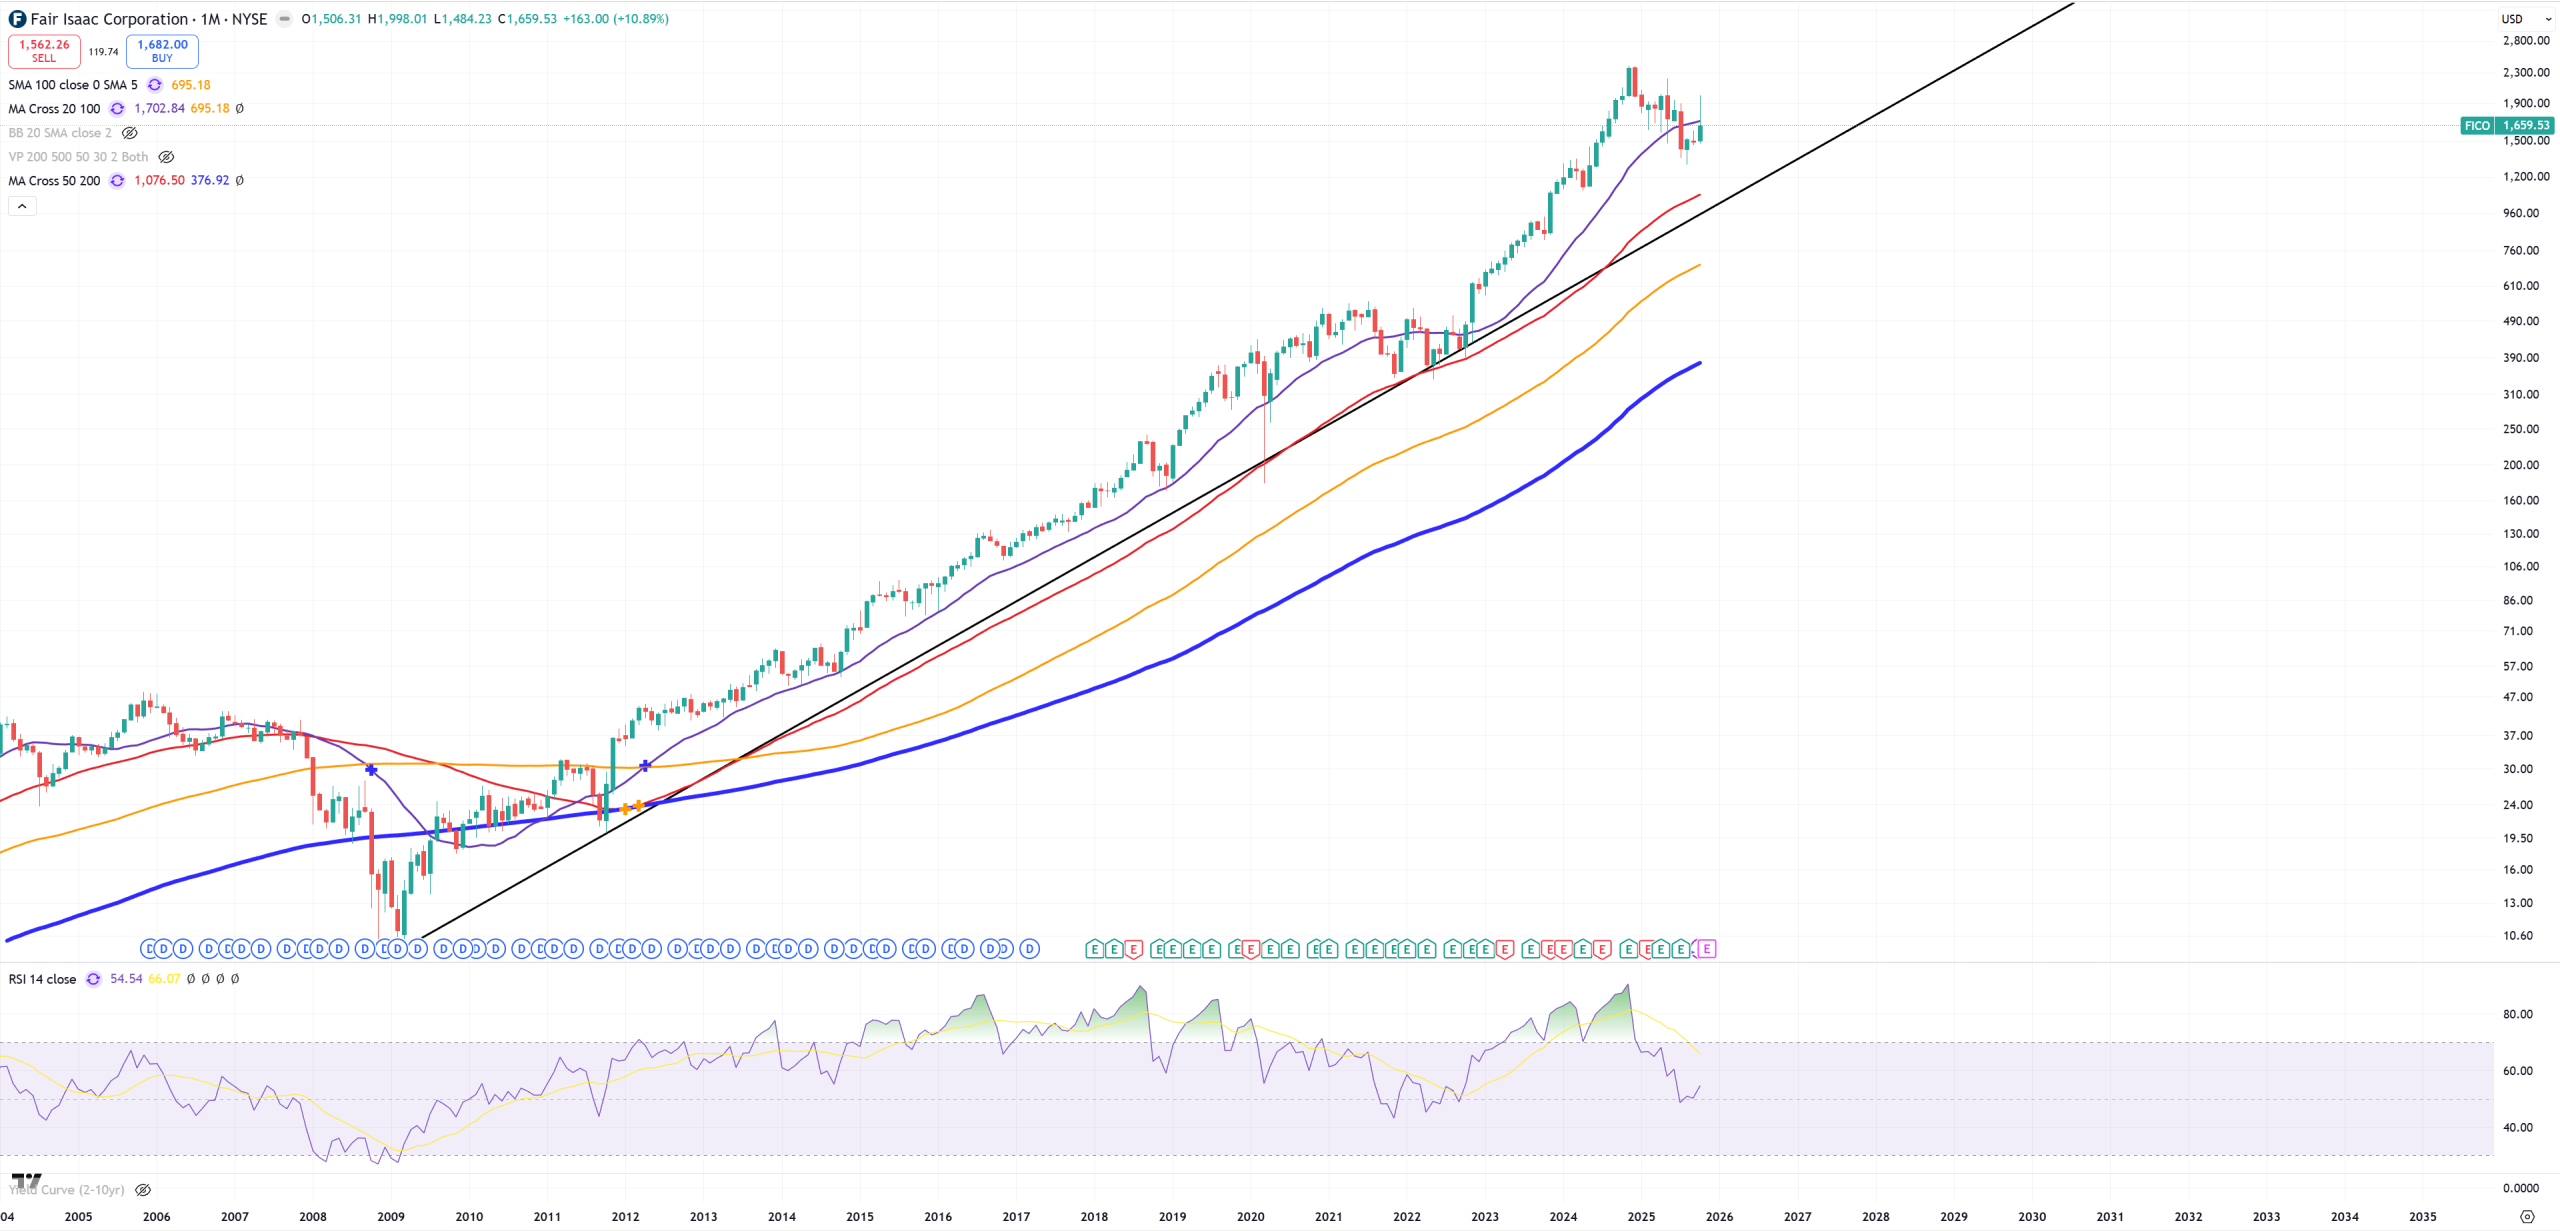
FICO – needs to be watched as (M)MA20 is being rejected
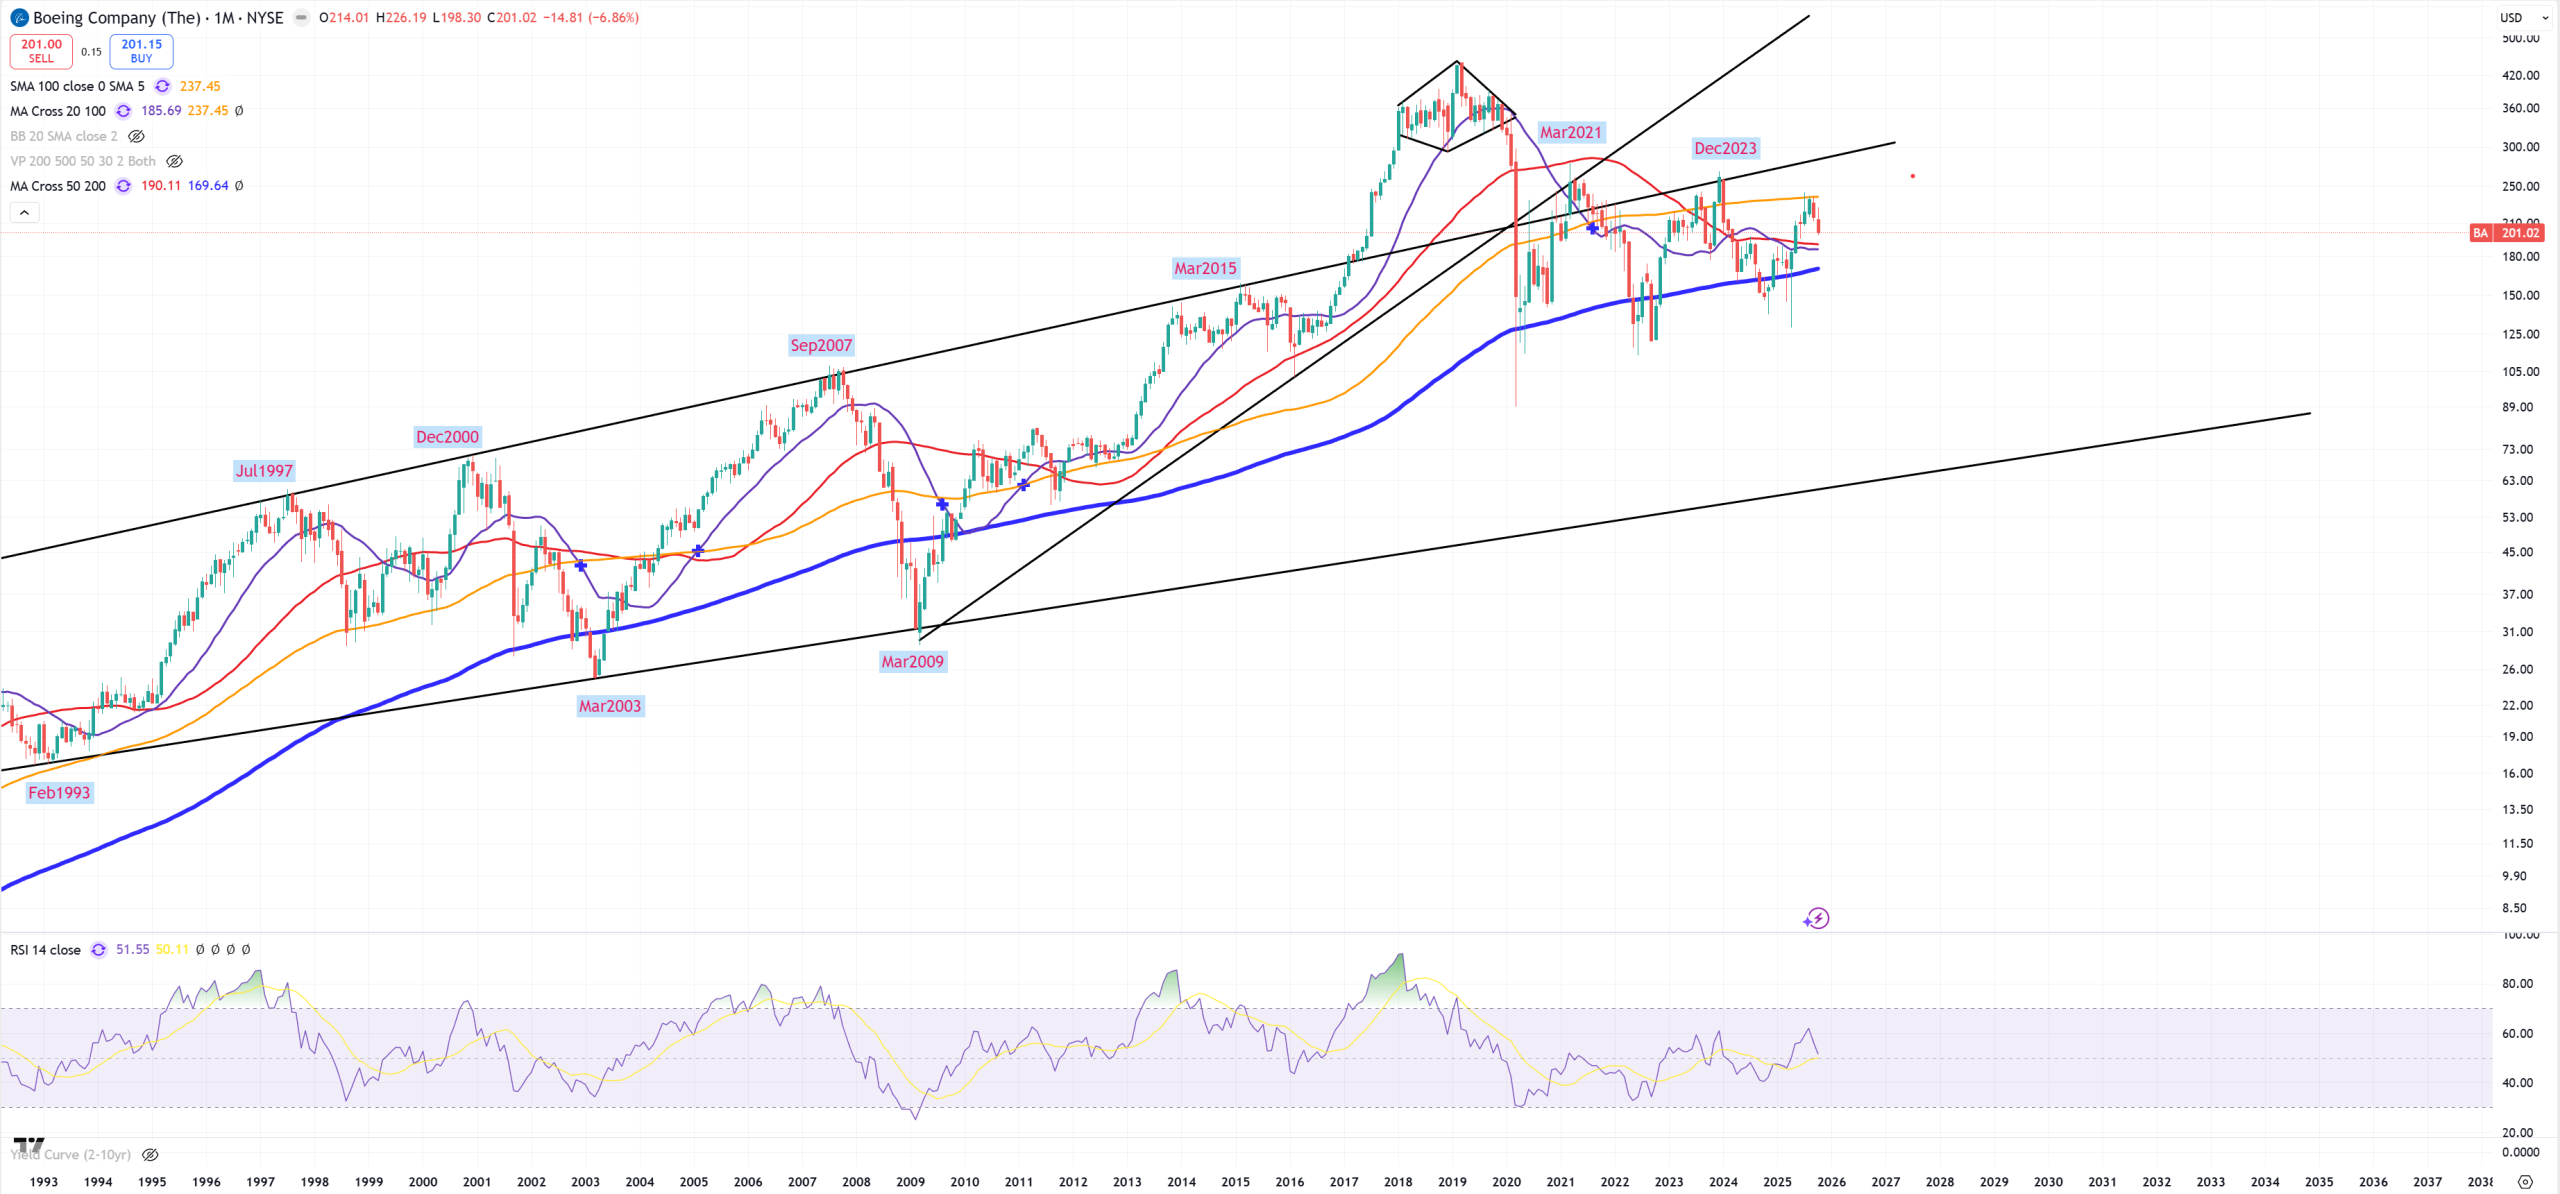
BA – Boeing’s (M)MA200 represents how many times market was trying to blow up and drop to lower trend = 50$ but support holds. Now again (M)MA100 rejection (typical in this case bull trap?).
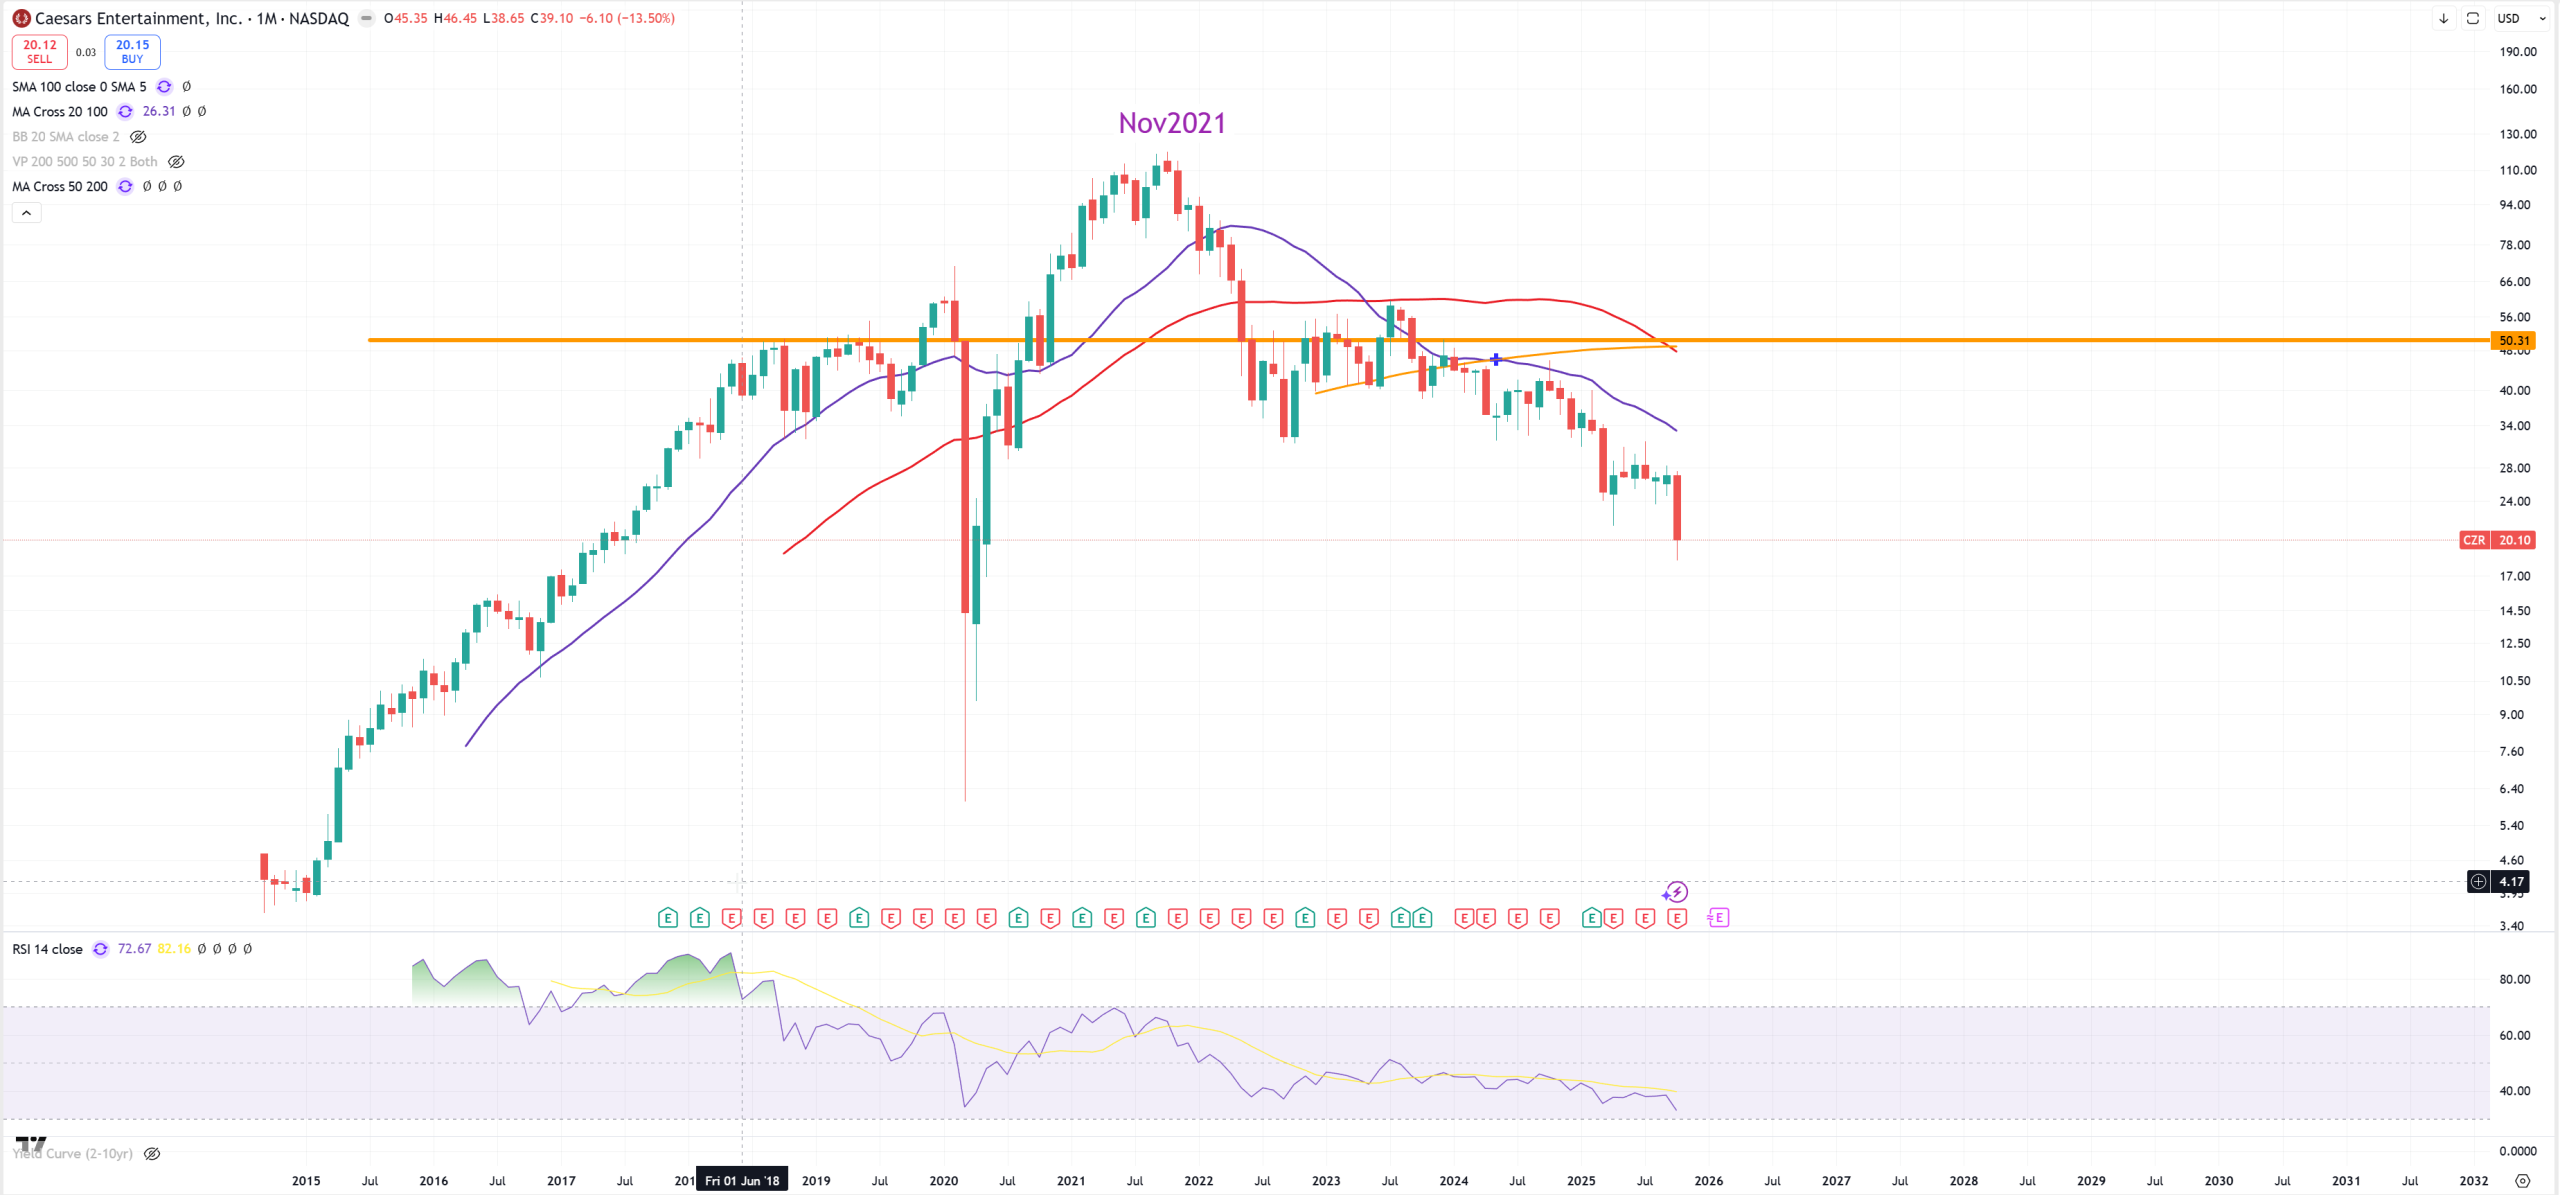
CZR – Caesars – seems to be gone. Vegas in full collapse mode.
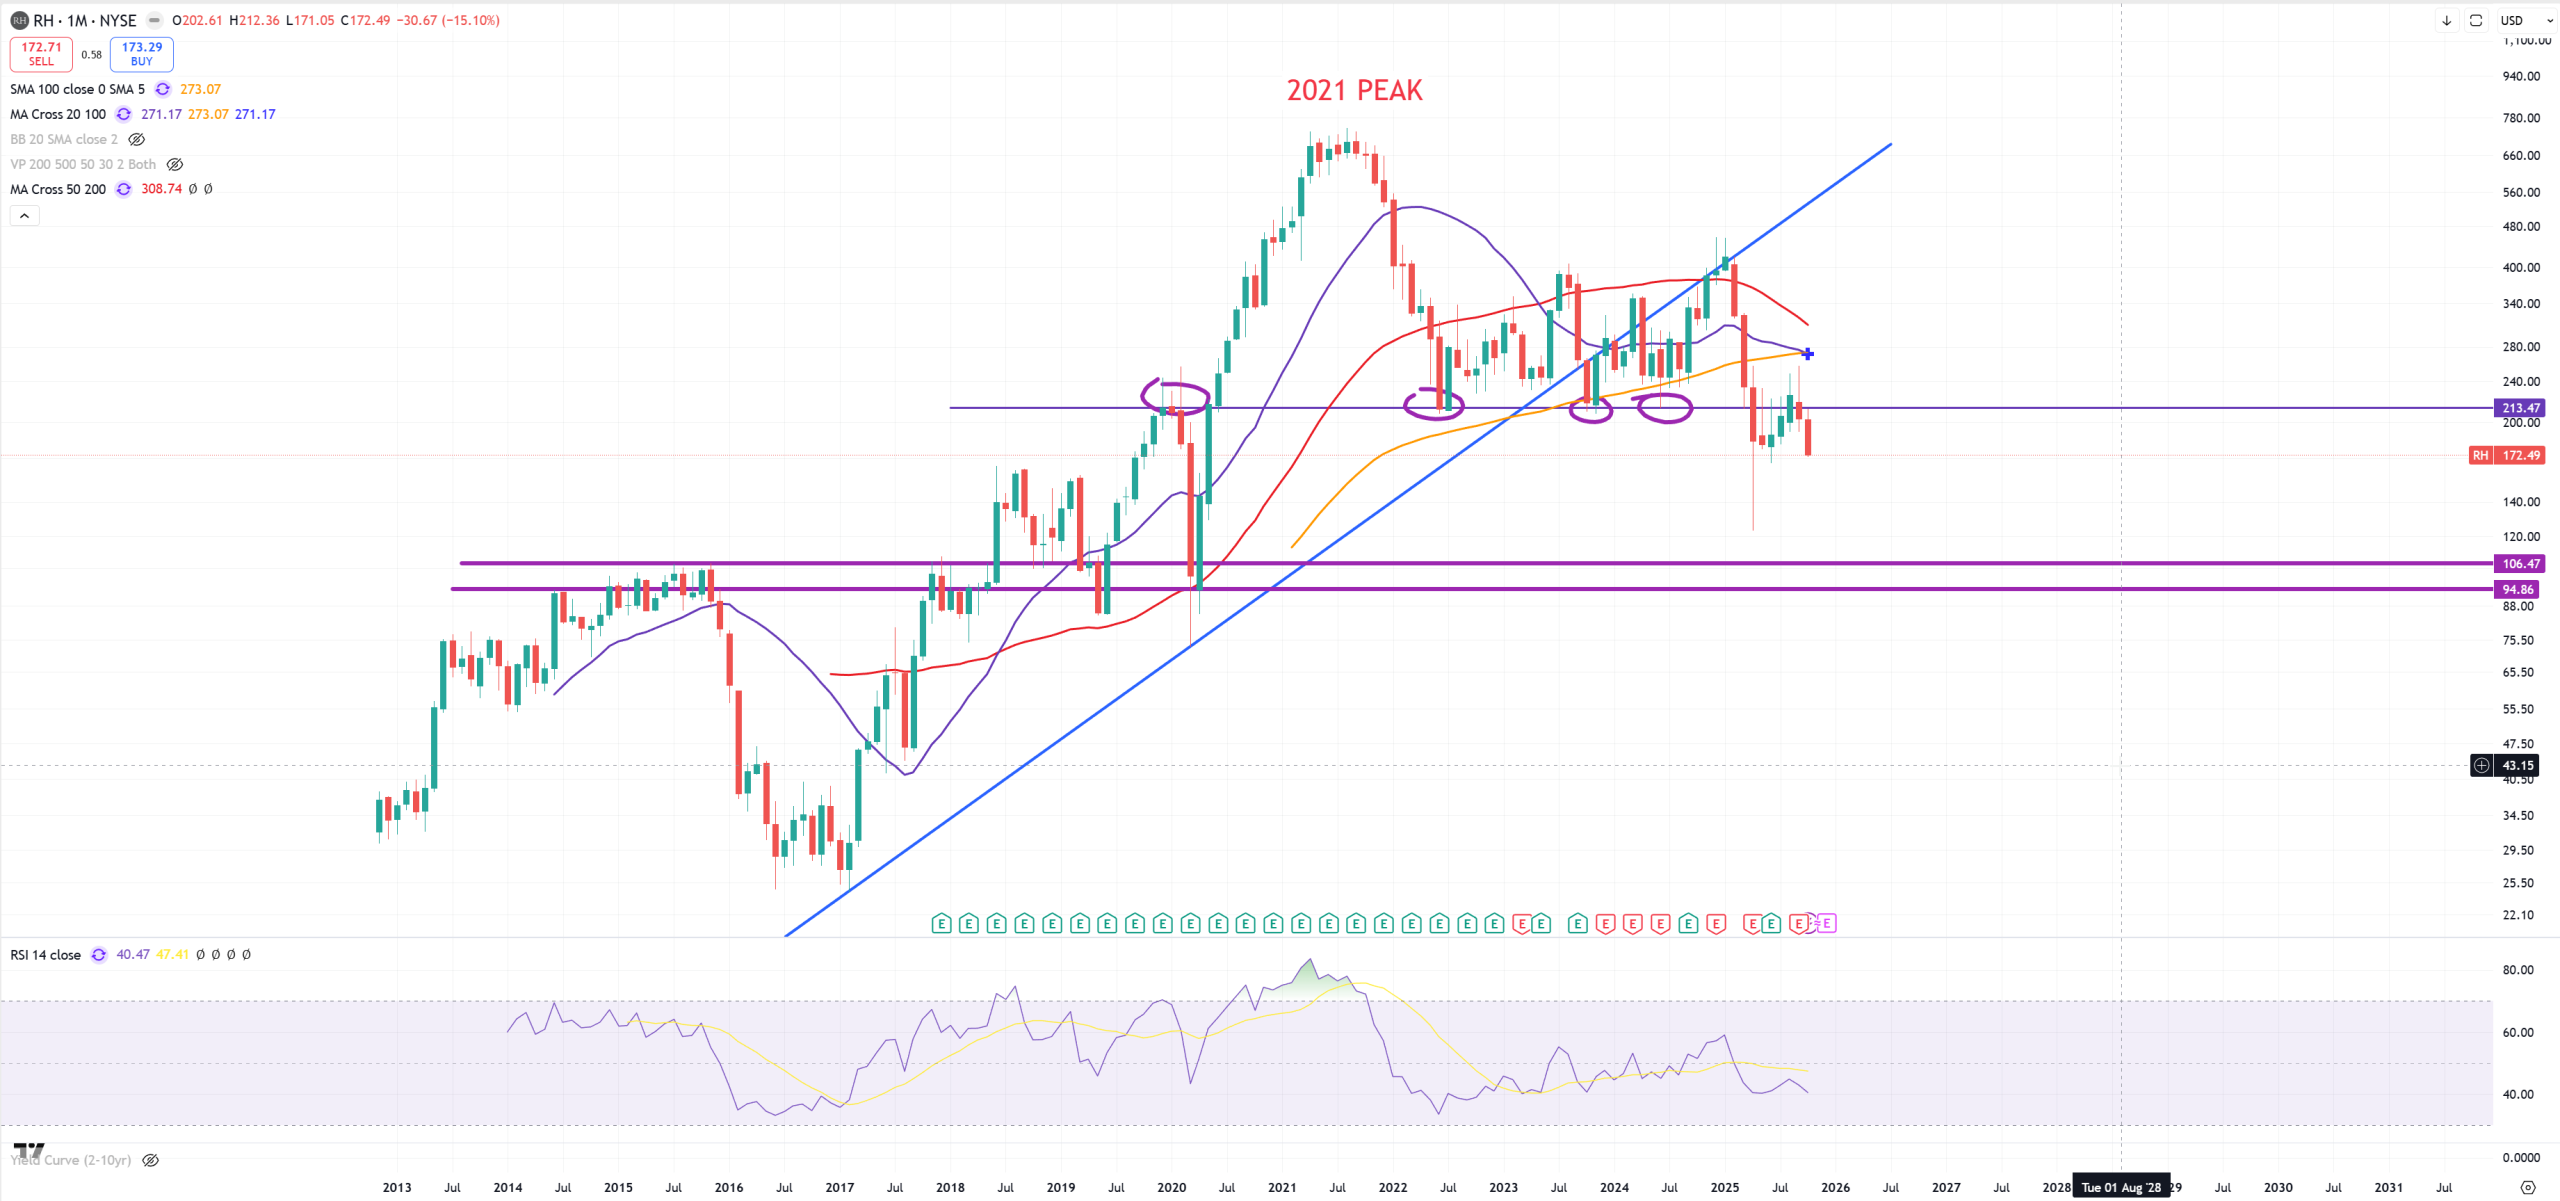
RH – Restoration Hardware looks done.
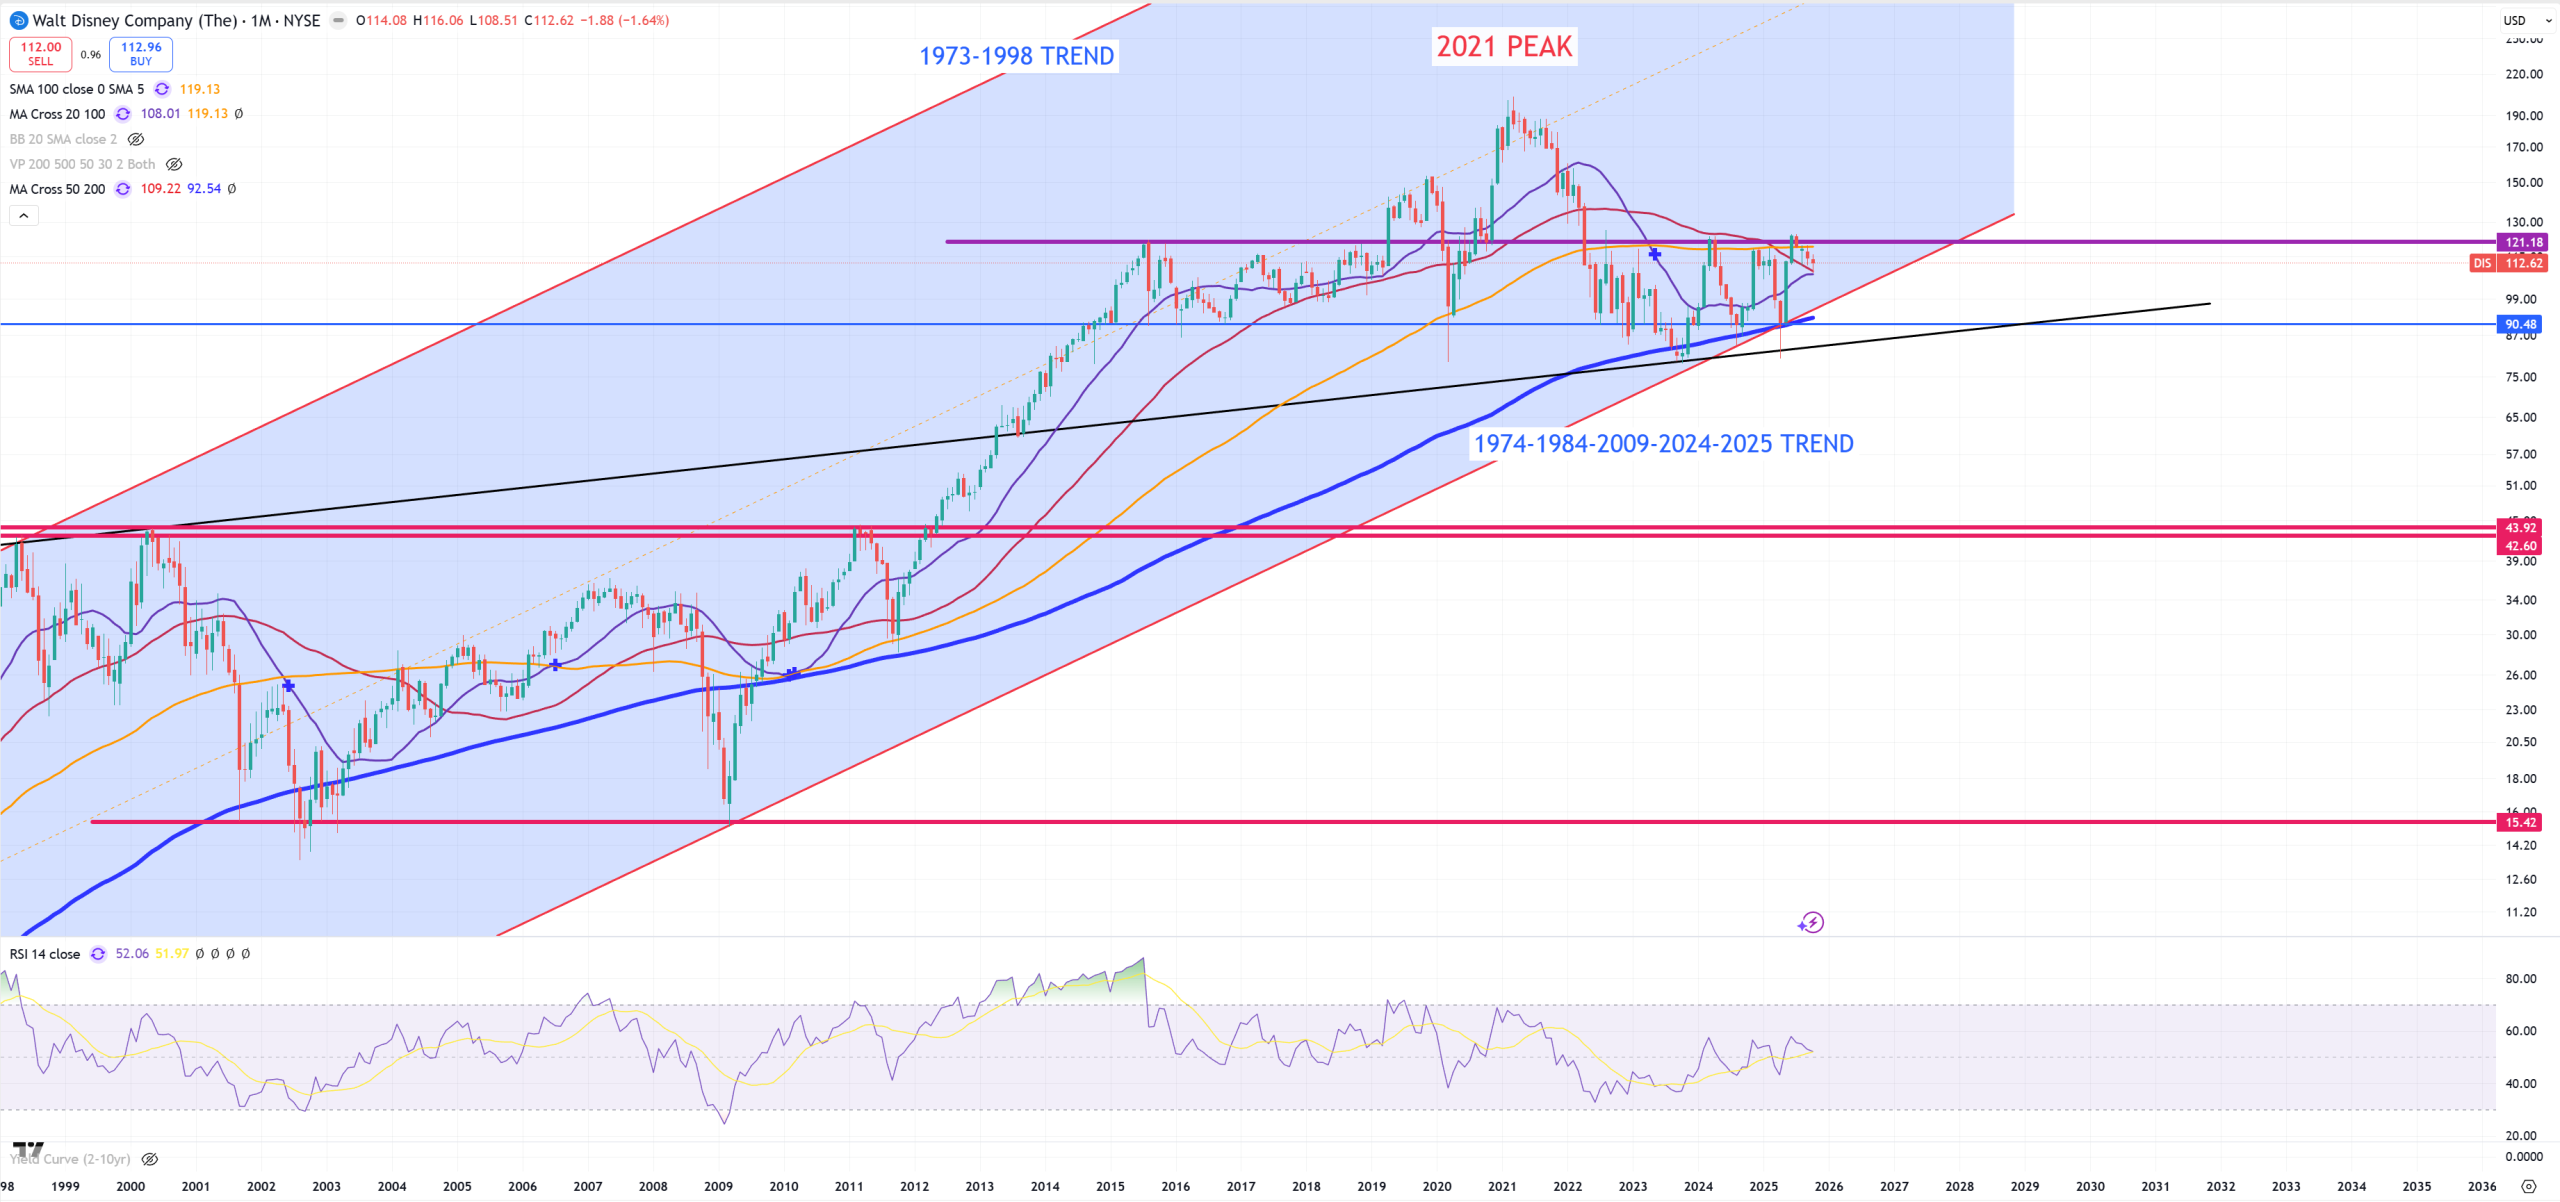
DIS – I’m really shocked people still can afford on Disney. 2021 peak, and if we consider it as a bull trap we can say mostly 2015 level holds. Big moment down as couple trends + (M)MA200 + channel TREND are now support.
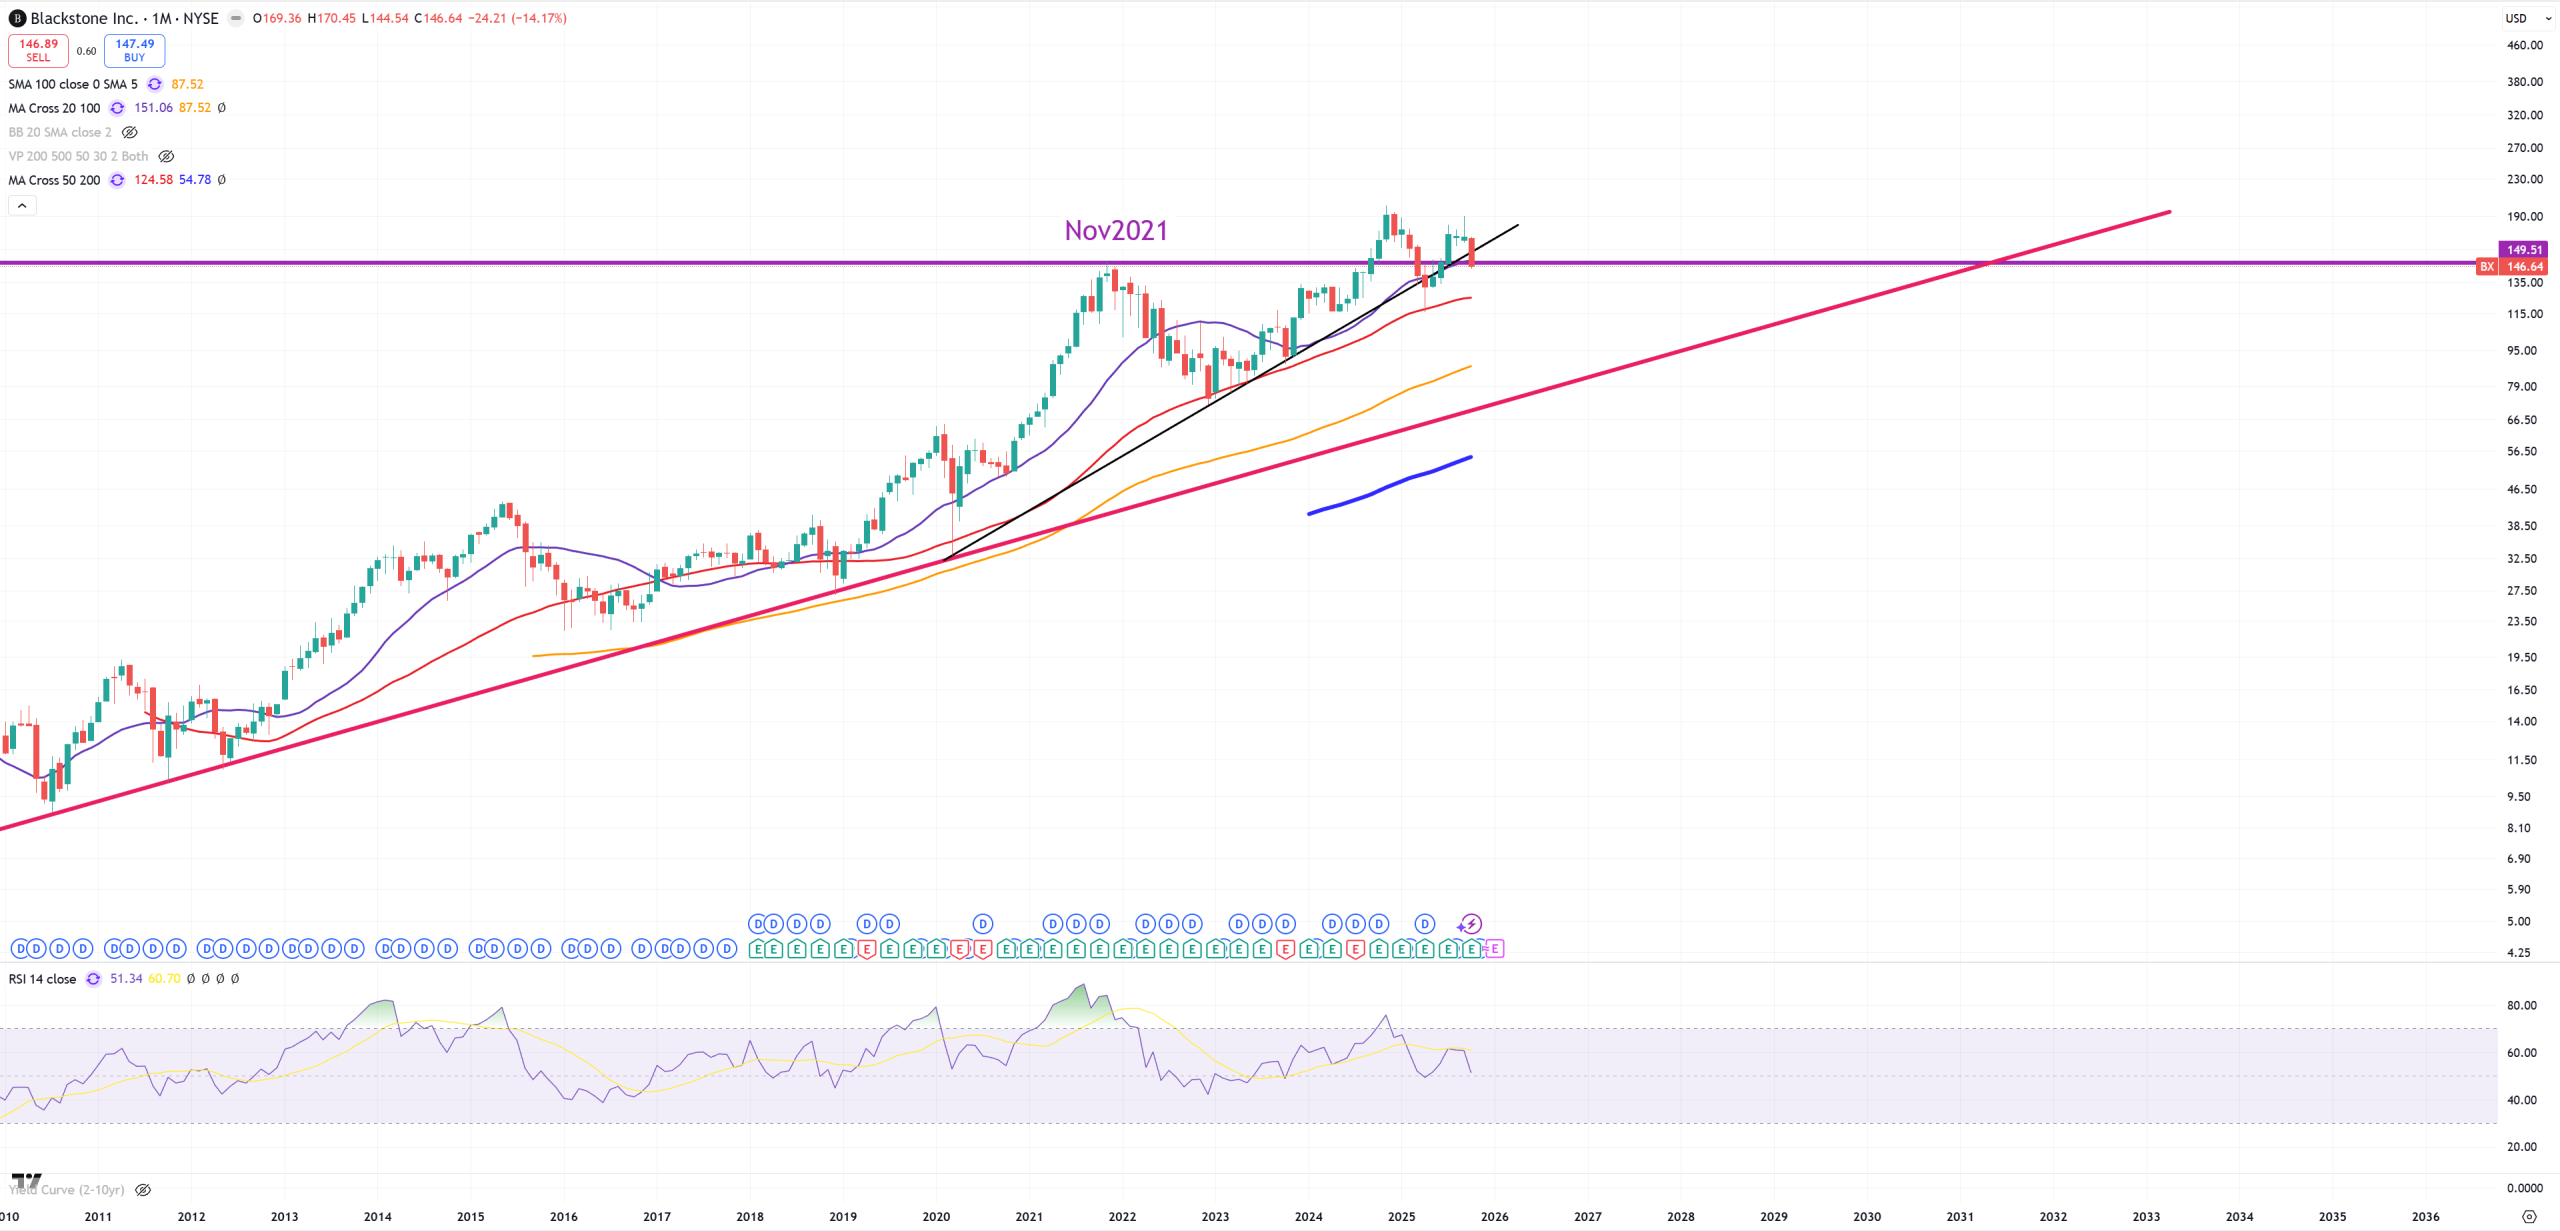
BX – The king of private credit finally below 2021 level.
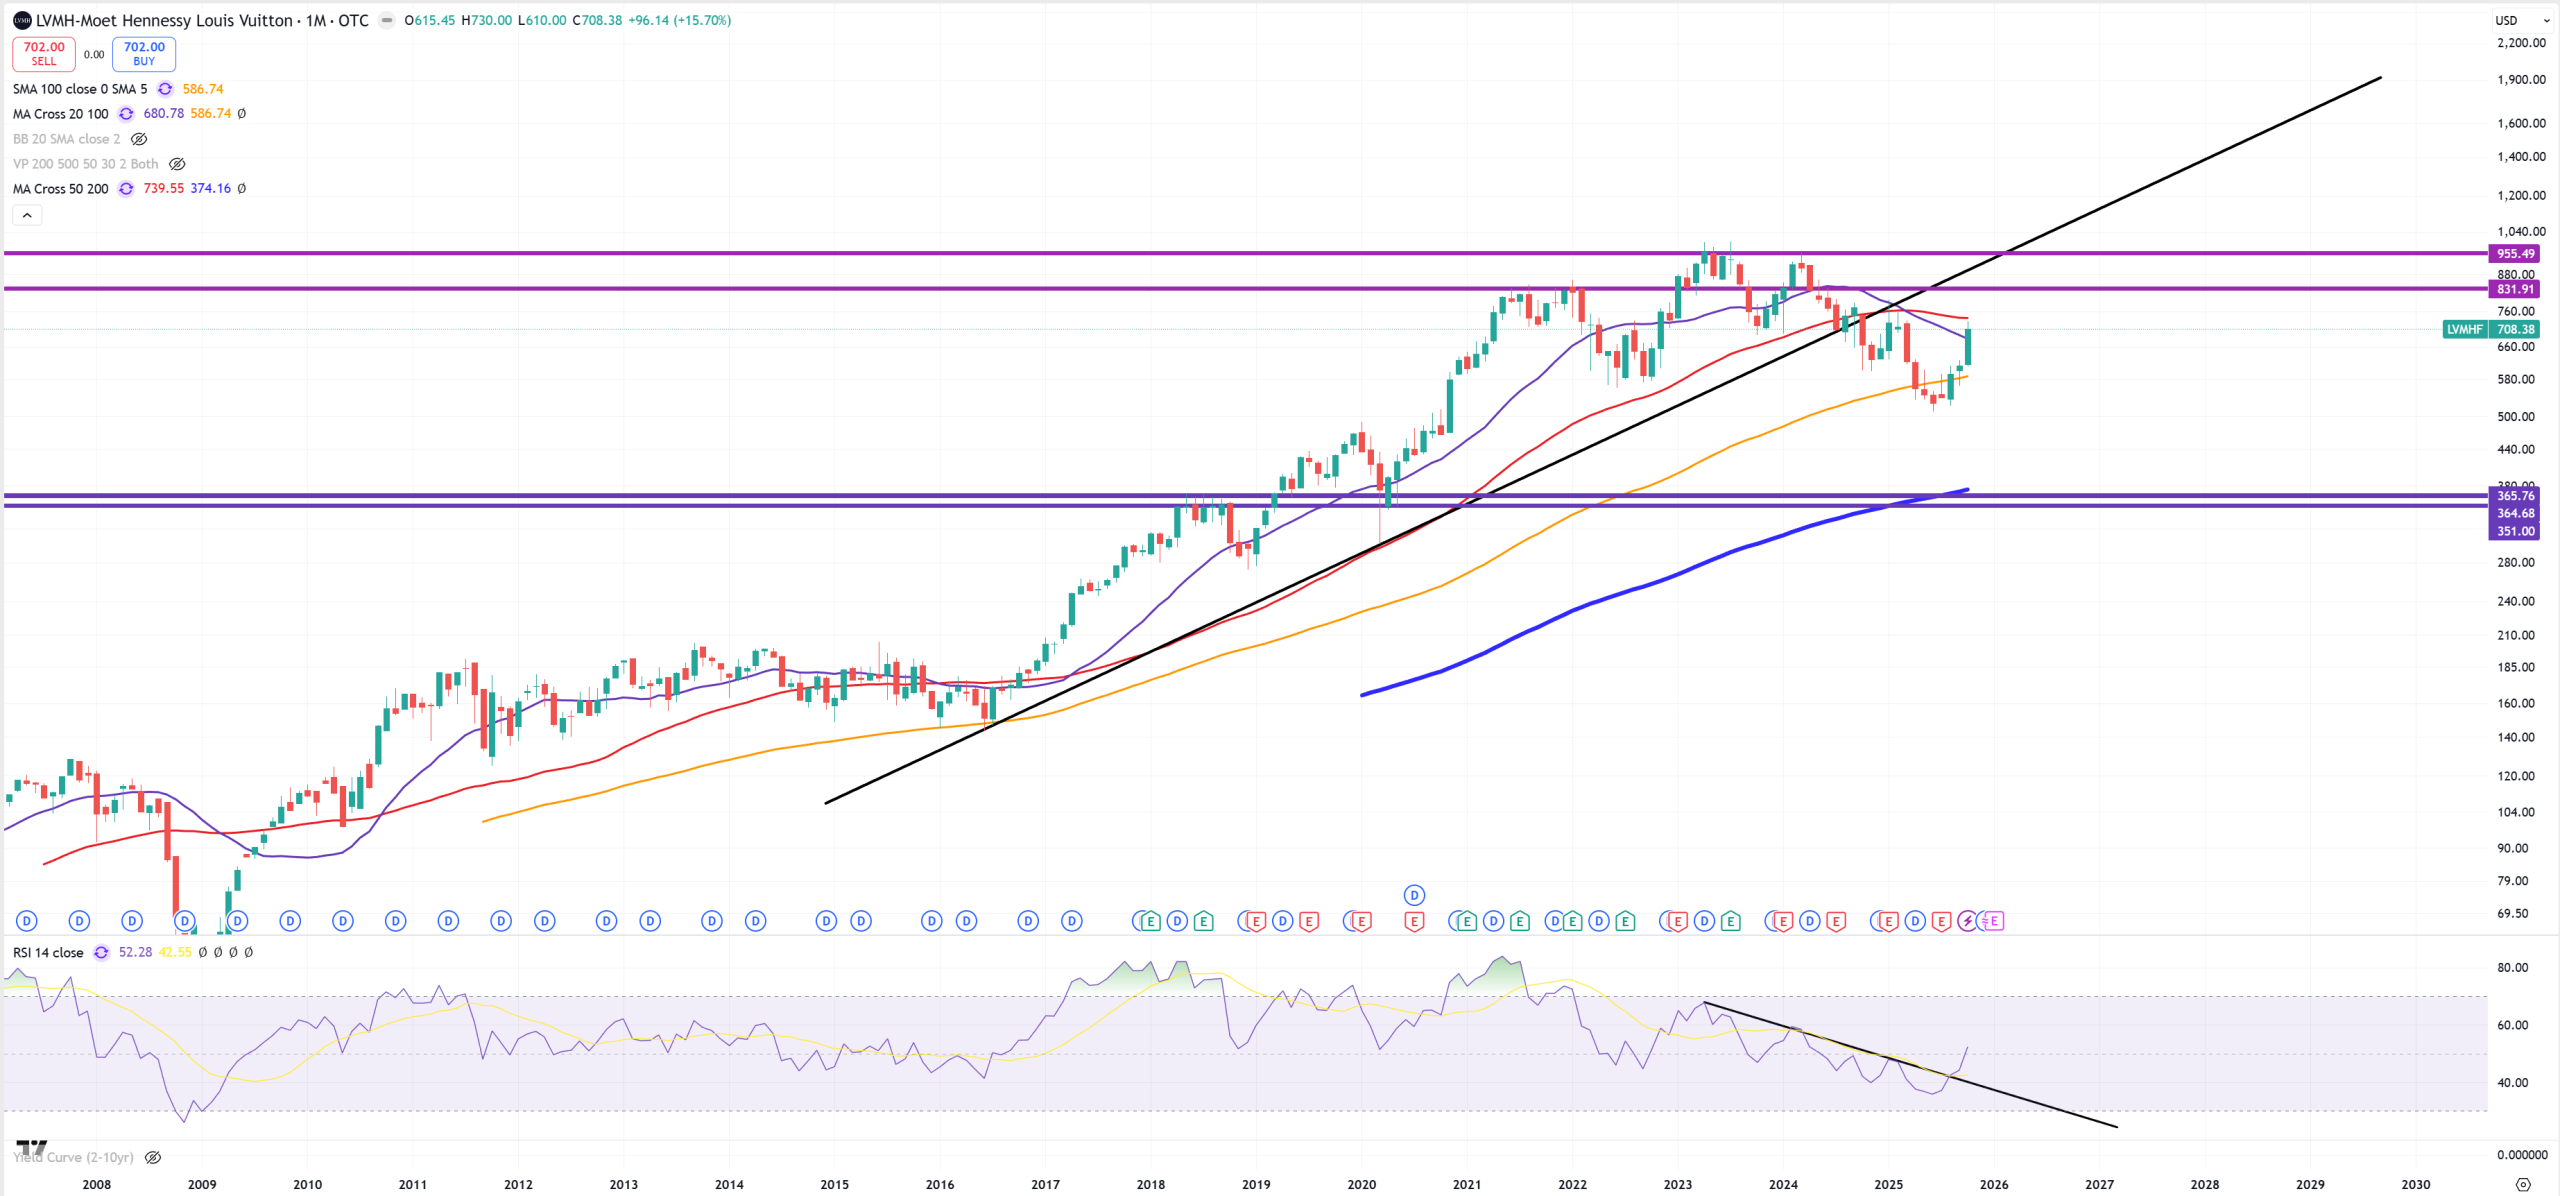
LVMH – Louis Vuitton – so far this (M)MA100 break did not hold as it jumps towards (M)MA50
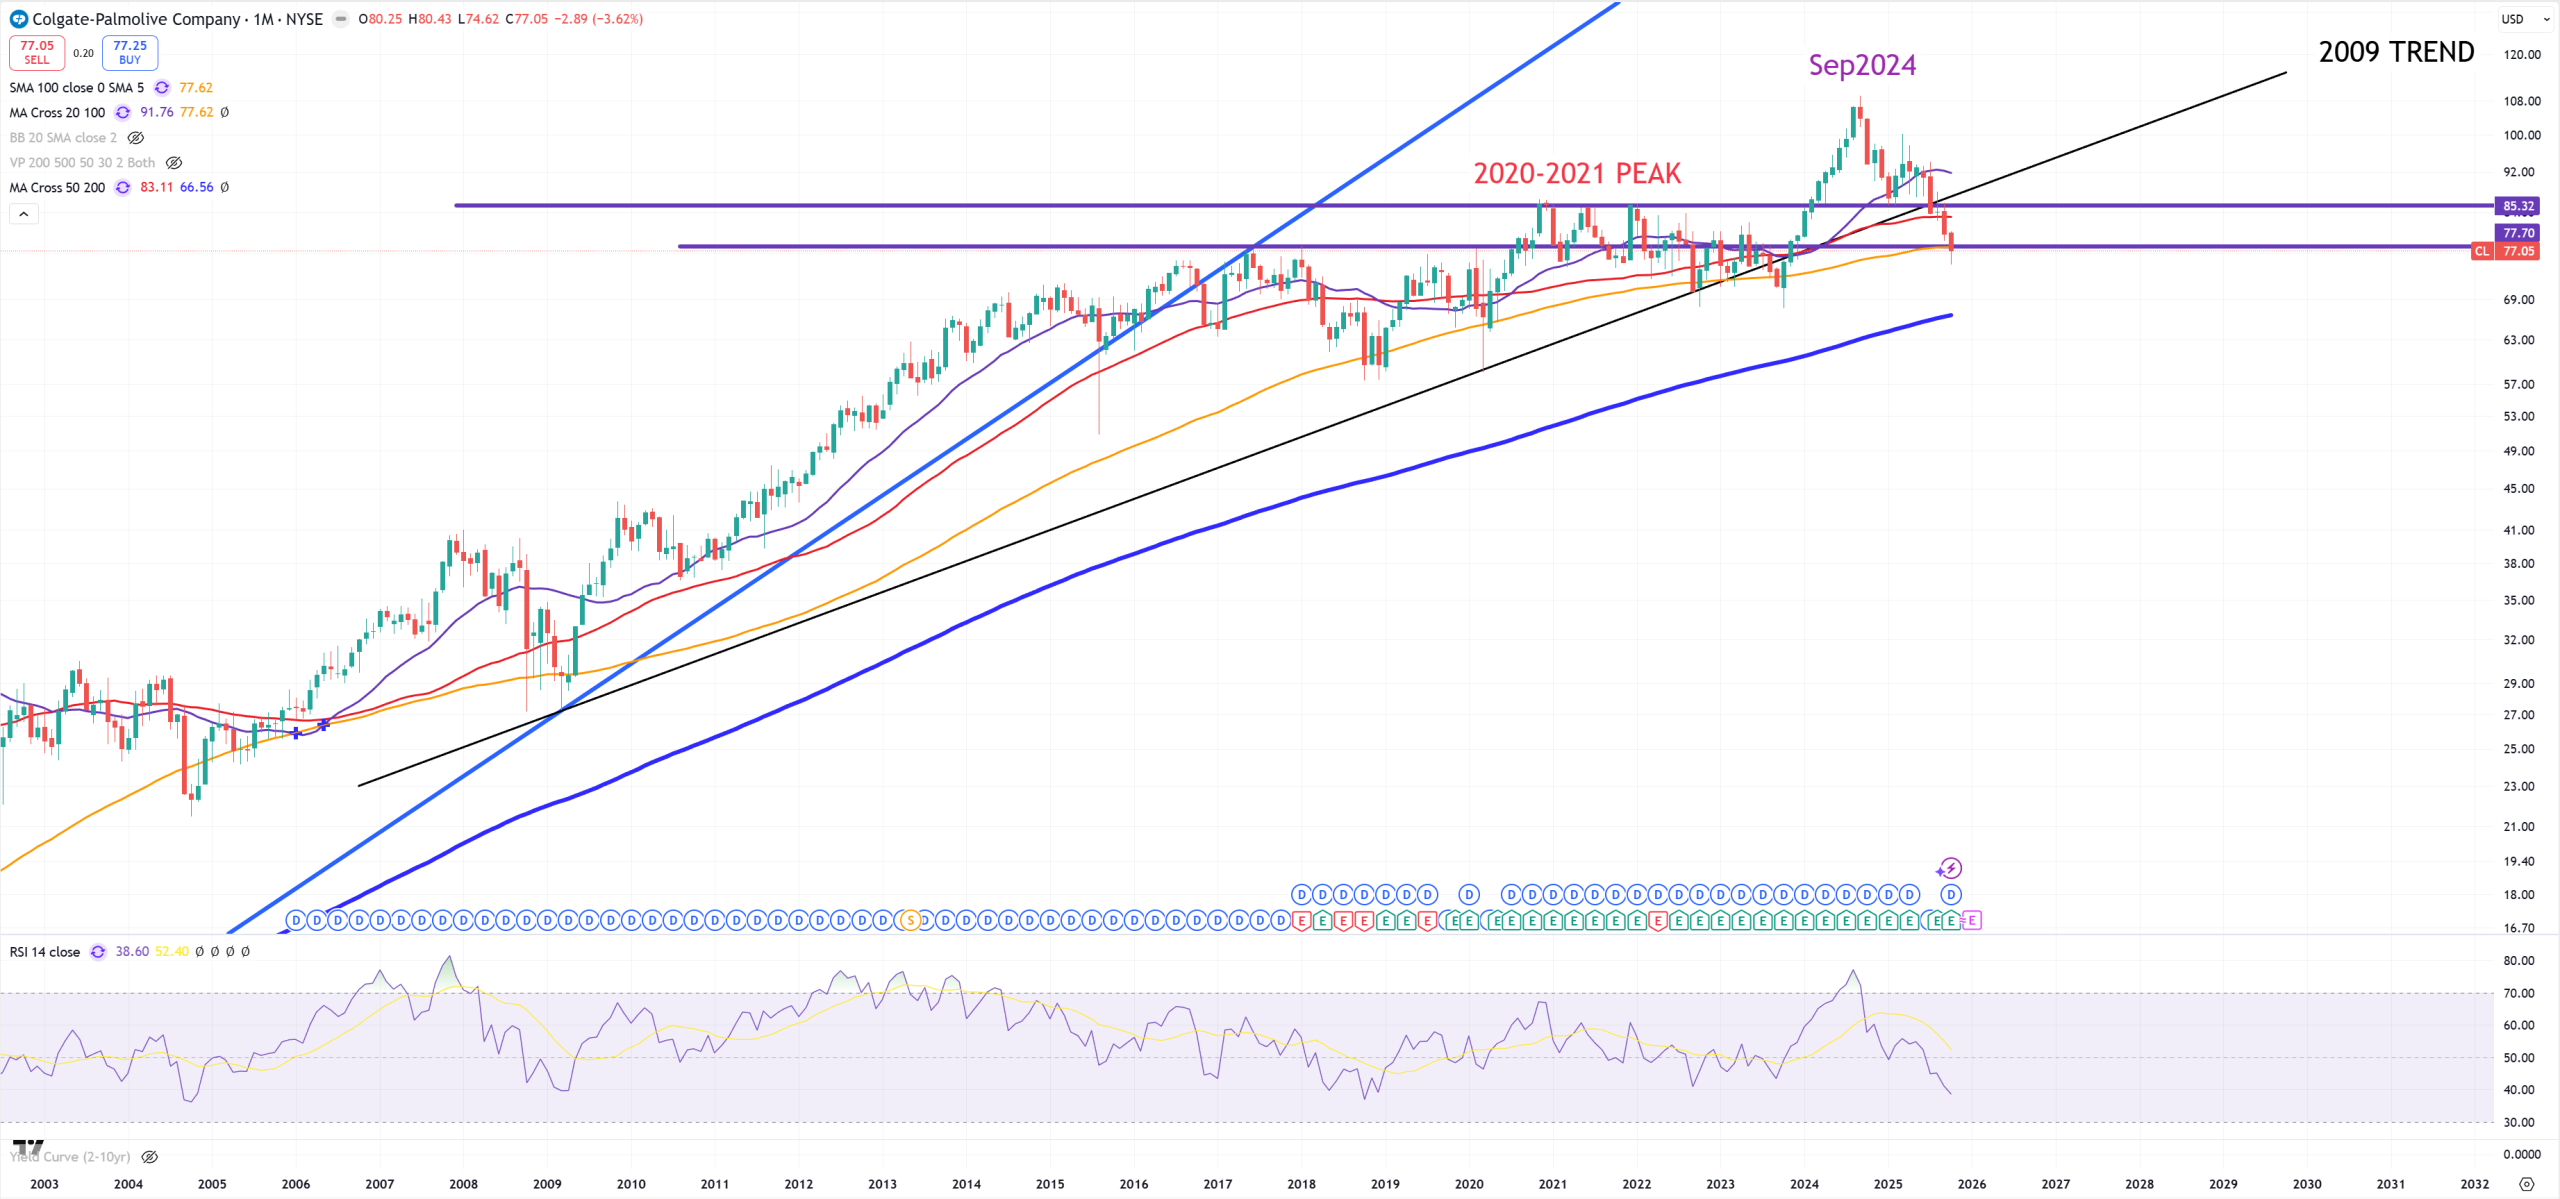
CL – Colgate – very brutal chart, big, even huge bull trap with Sep2024 peak
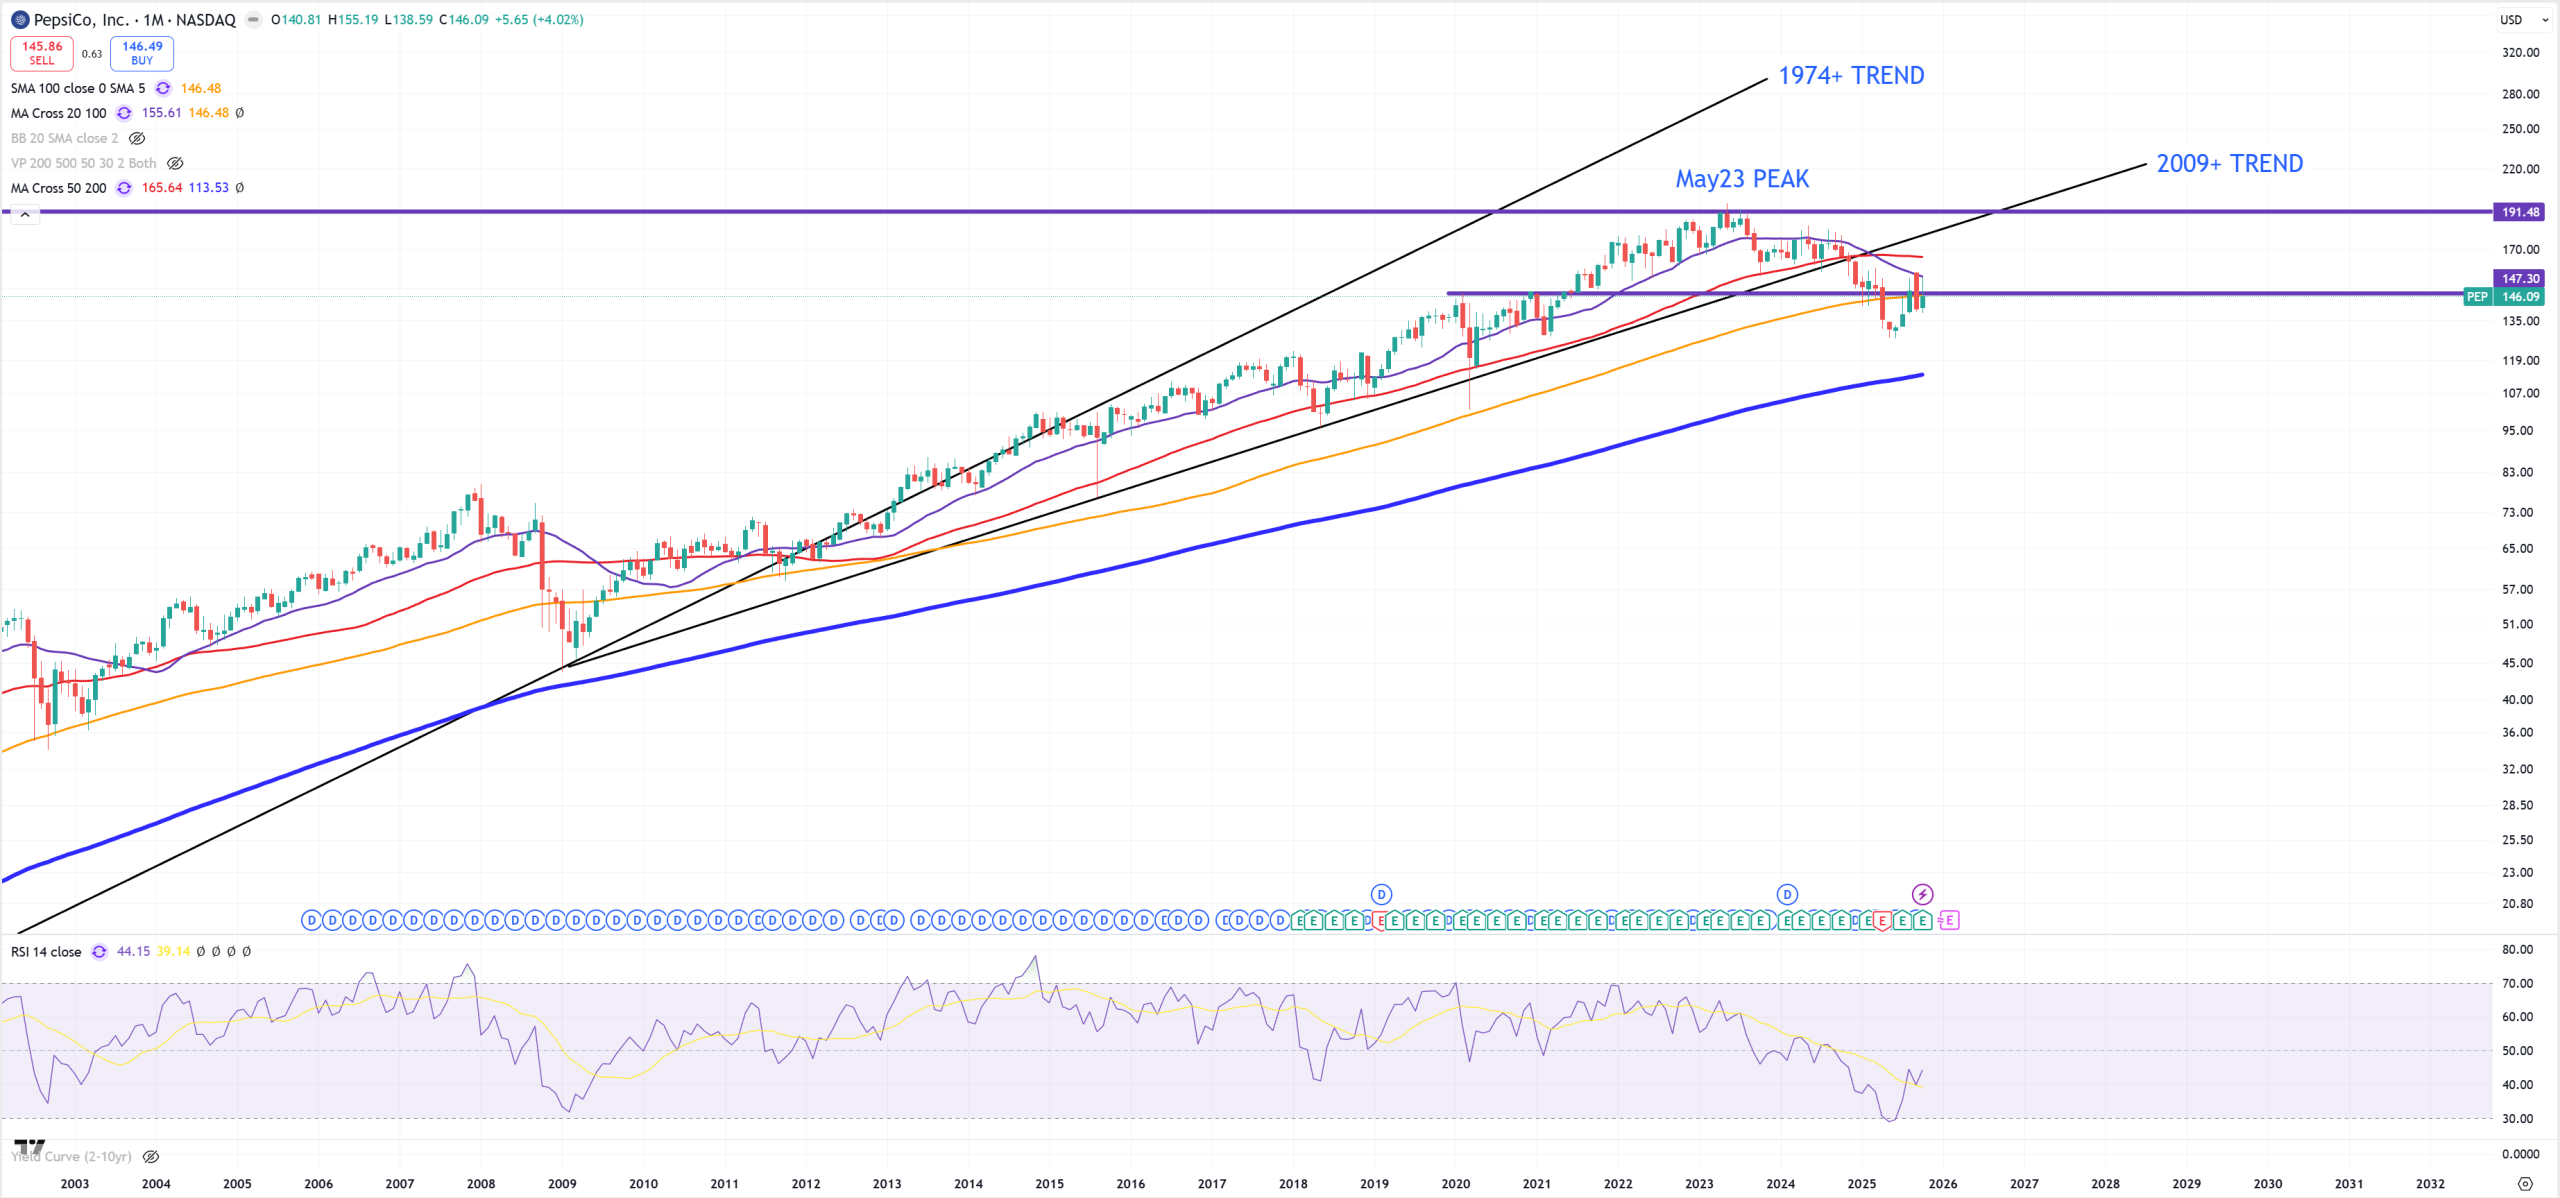
PEP – Pepsico looks like it’ll crash
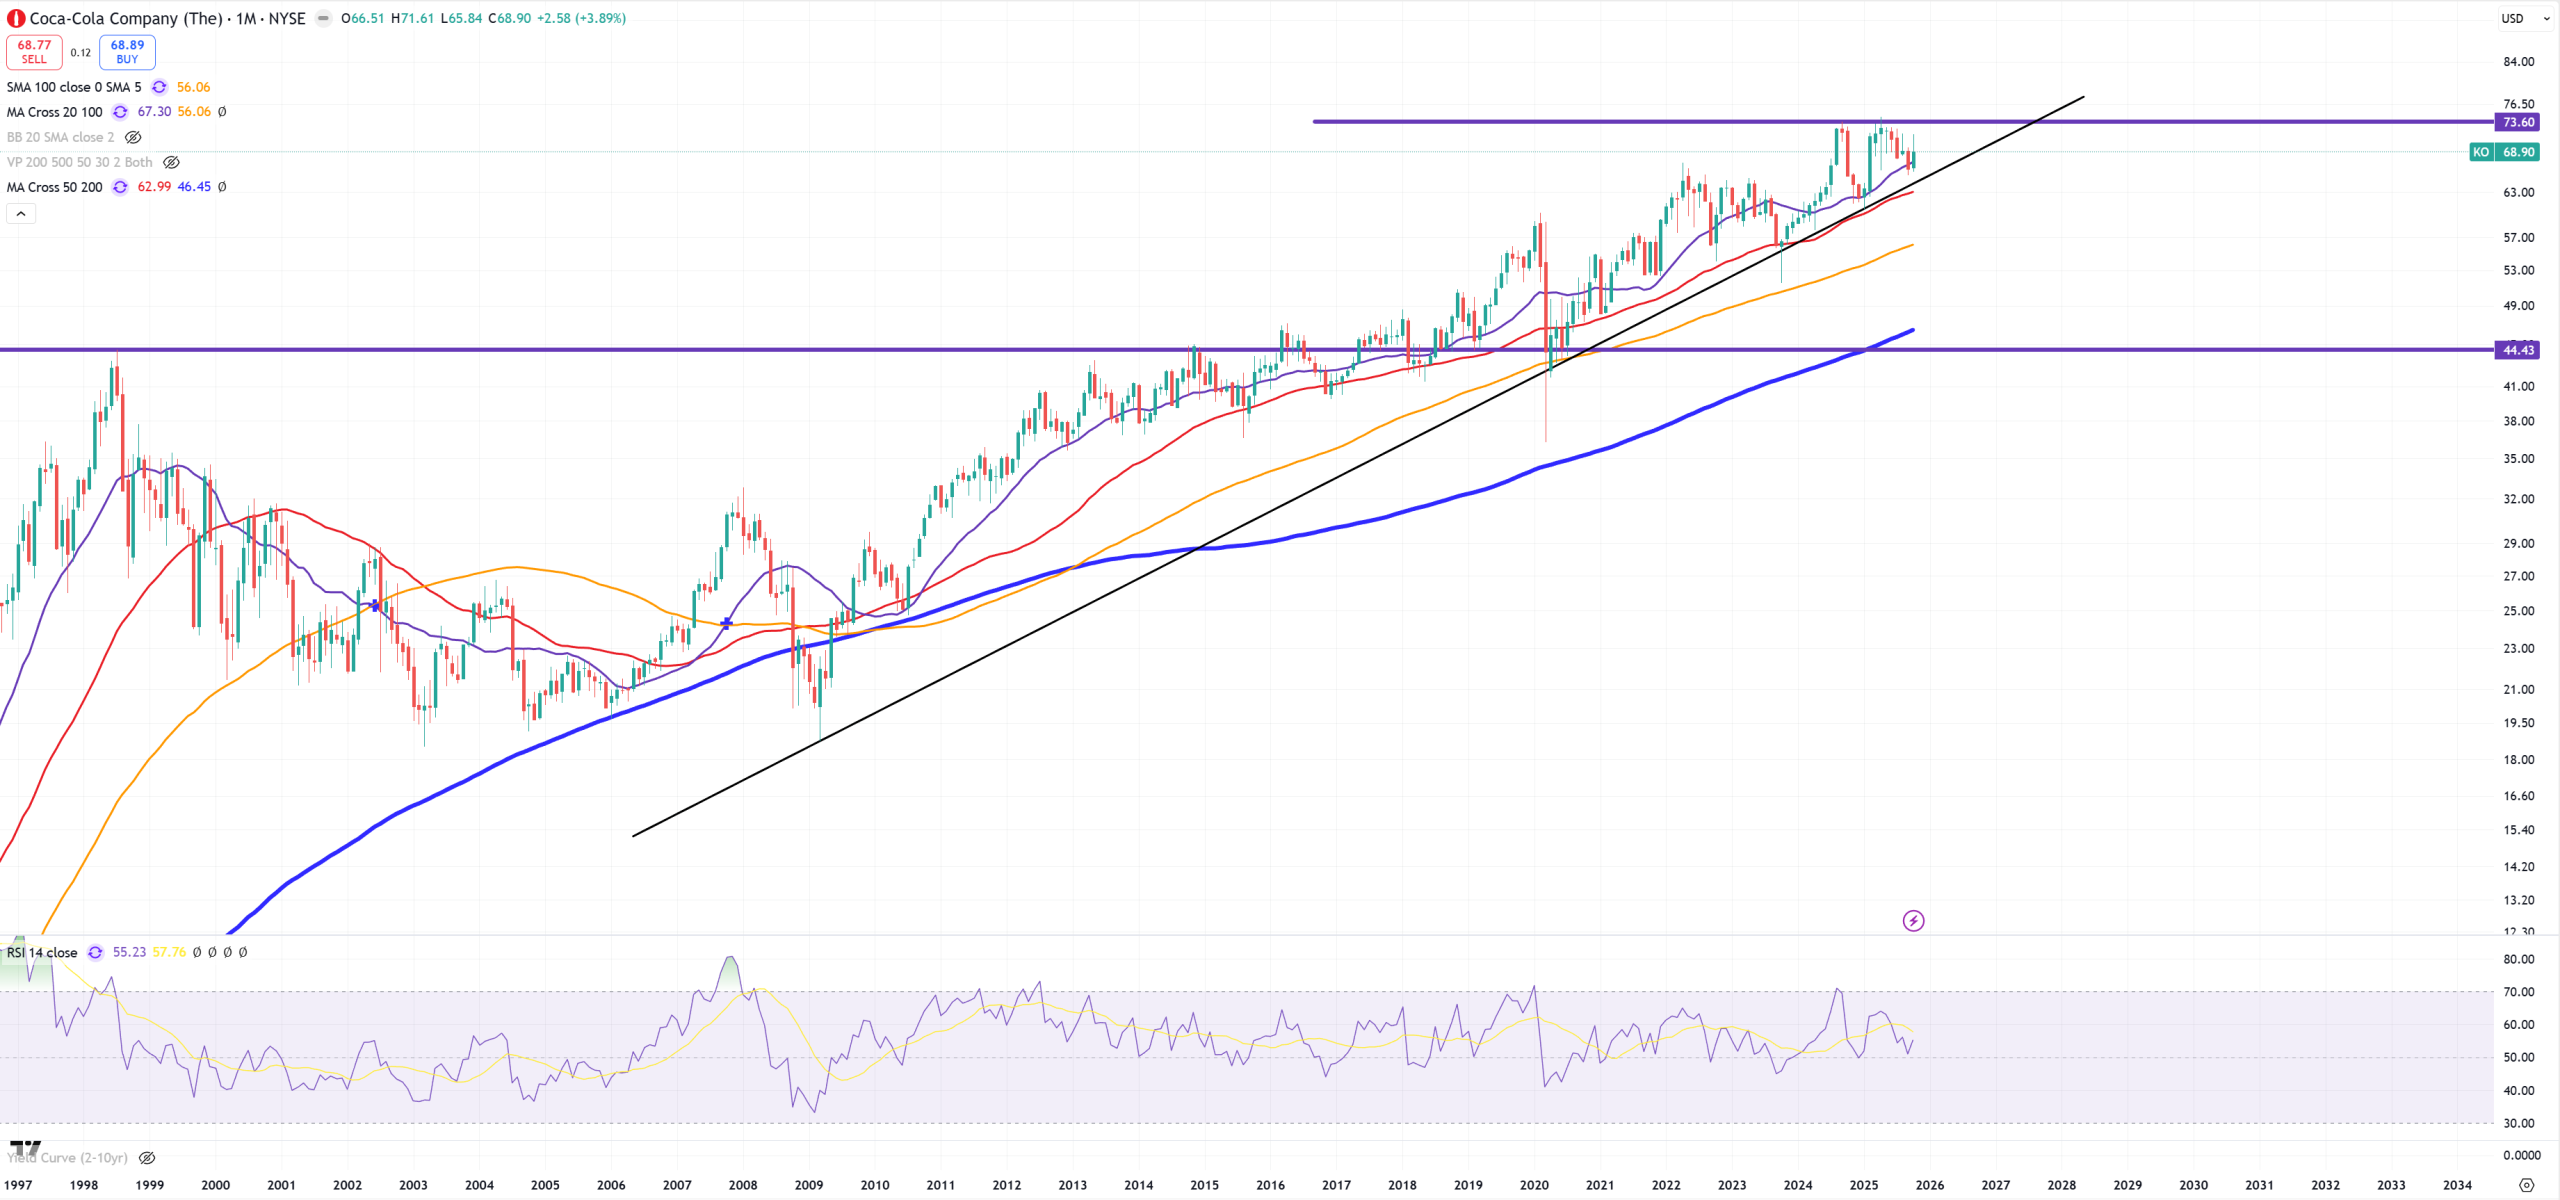
KO – Coca Cola looks way different than PEP, not sure why.
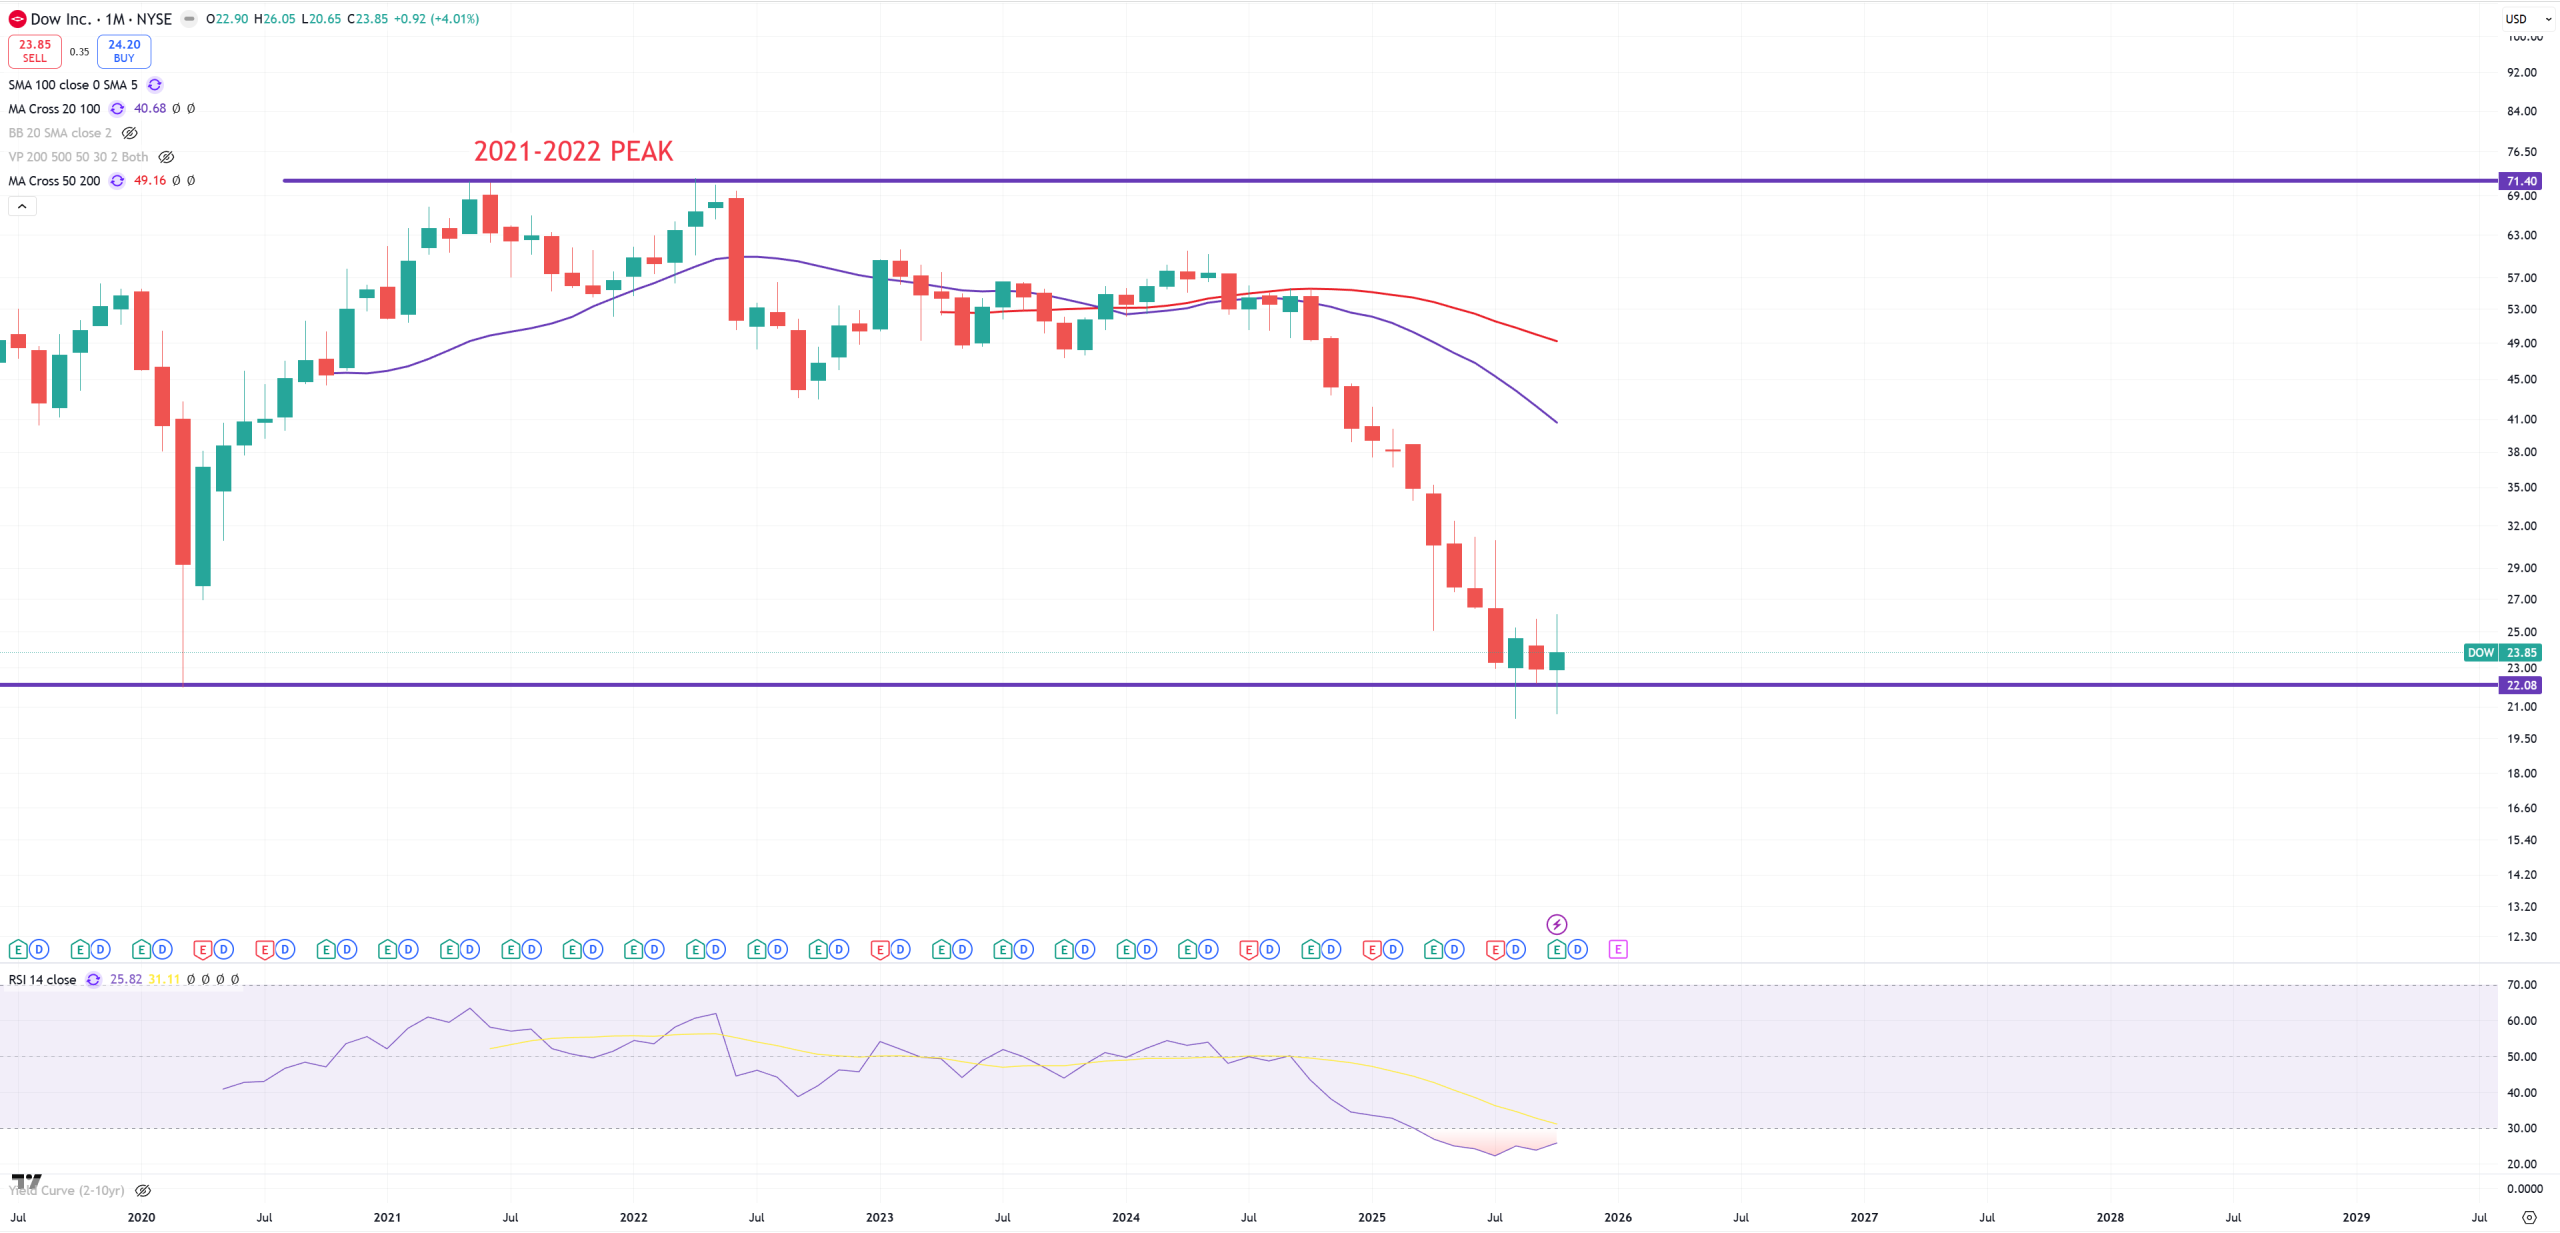
DOW – is dow trying to find a bottom here? OK, but if US10Y/3M wants to go higher I doubt that’ll be a bottom
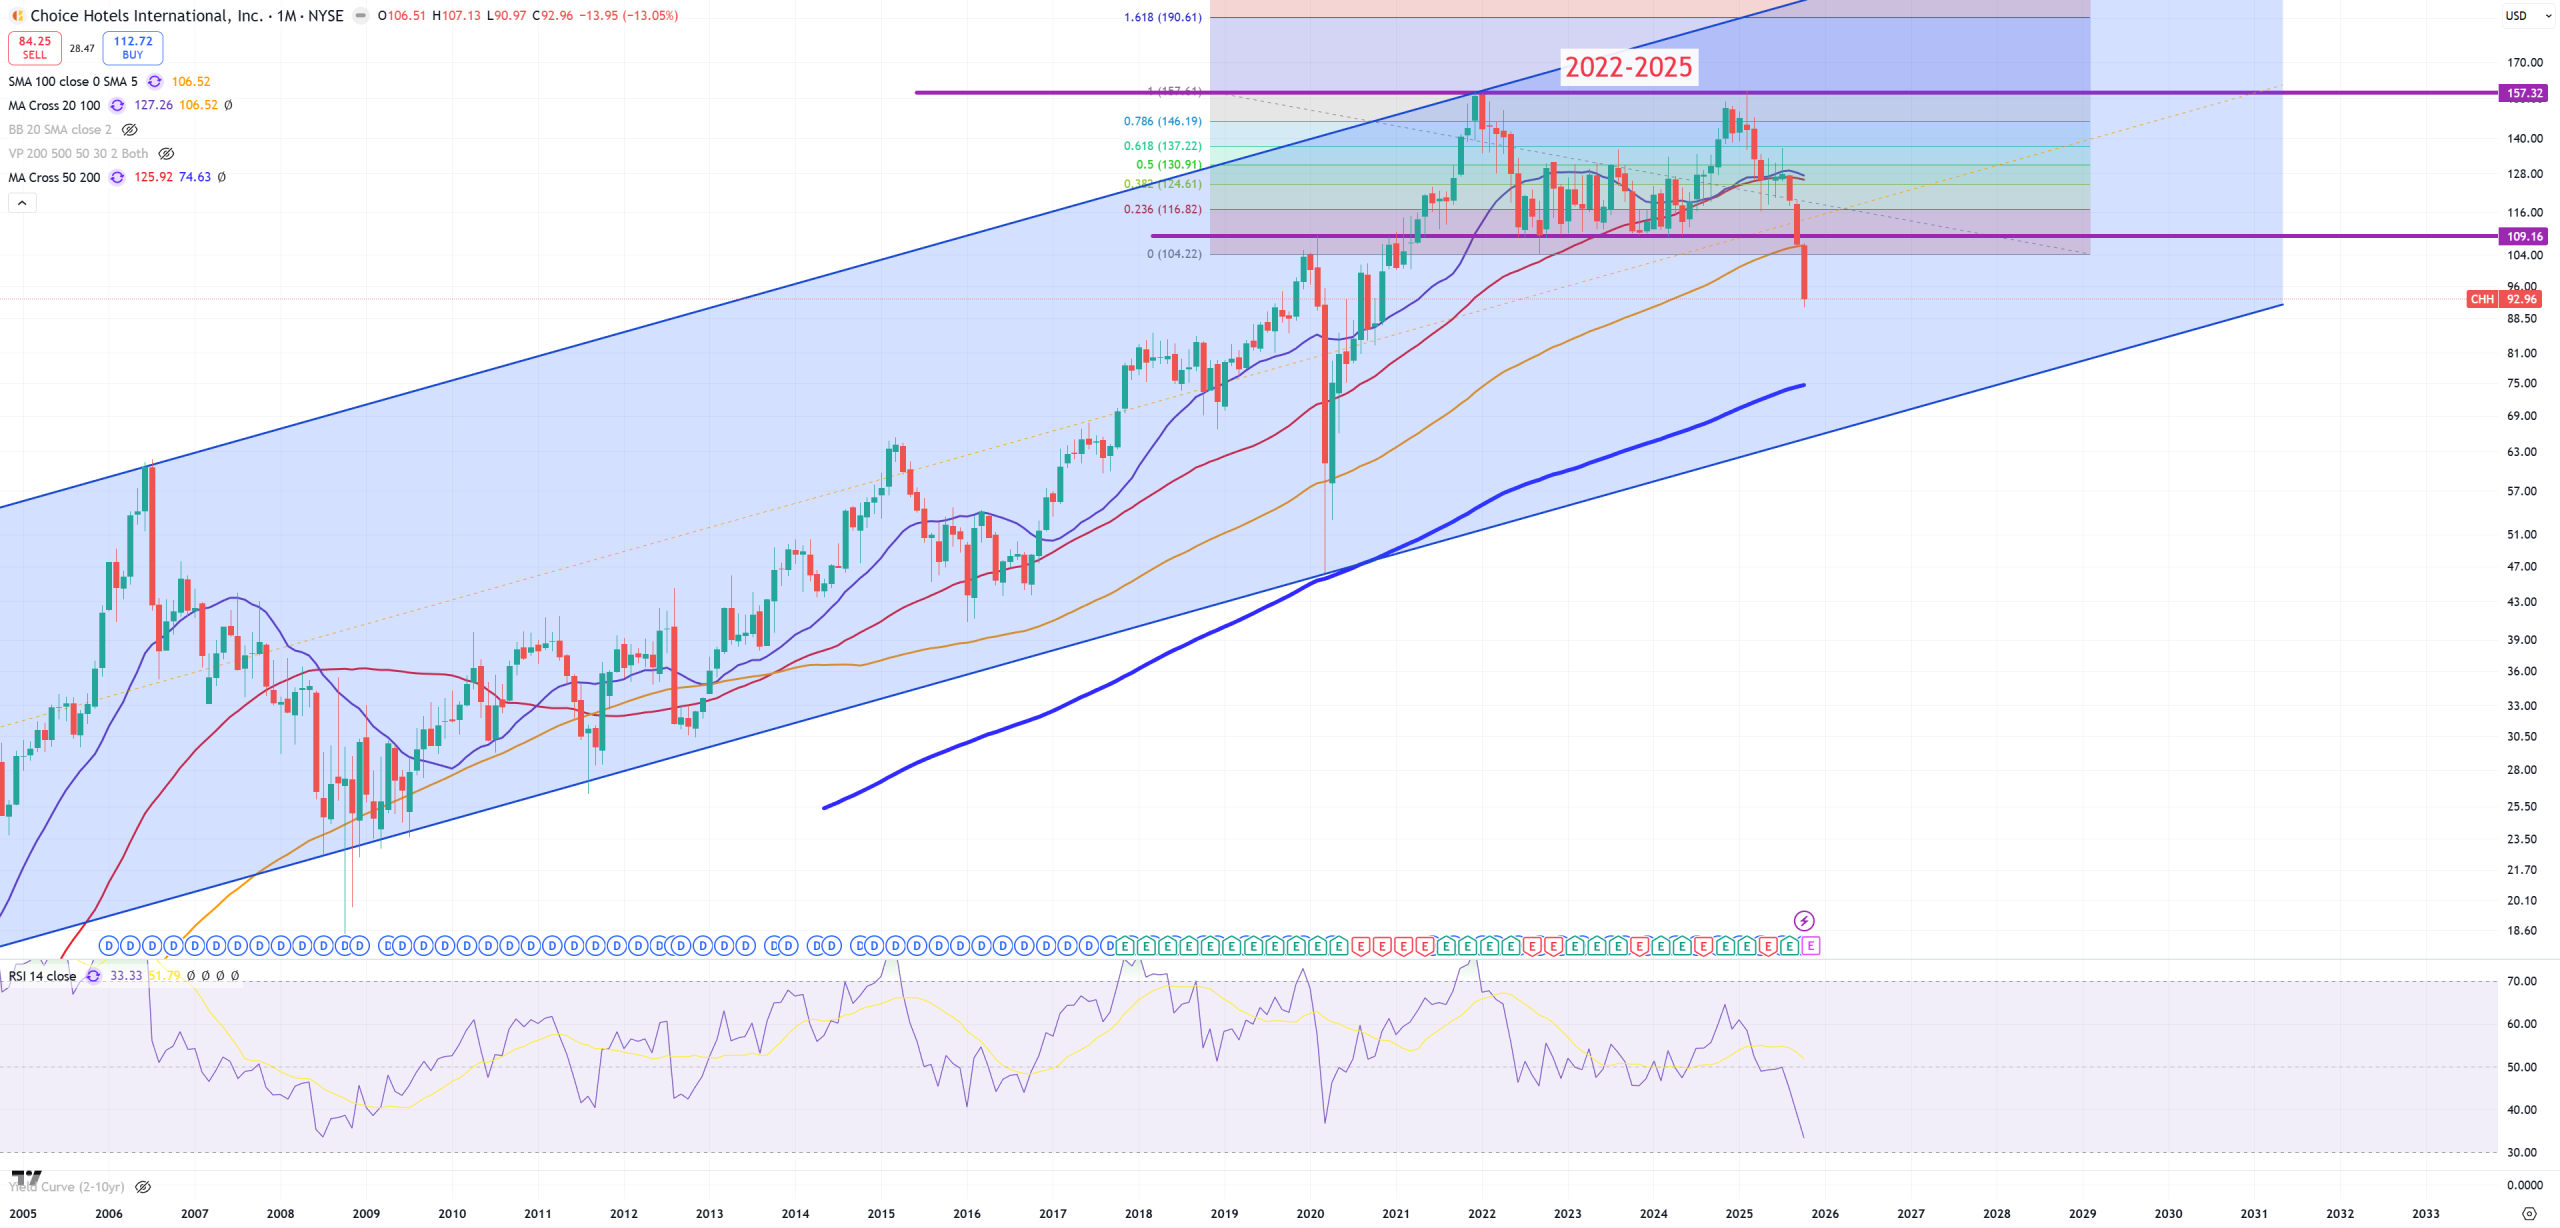
CHH – Hotels in general started to feel the pain
DAL – Delta – so airlines
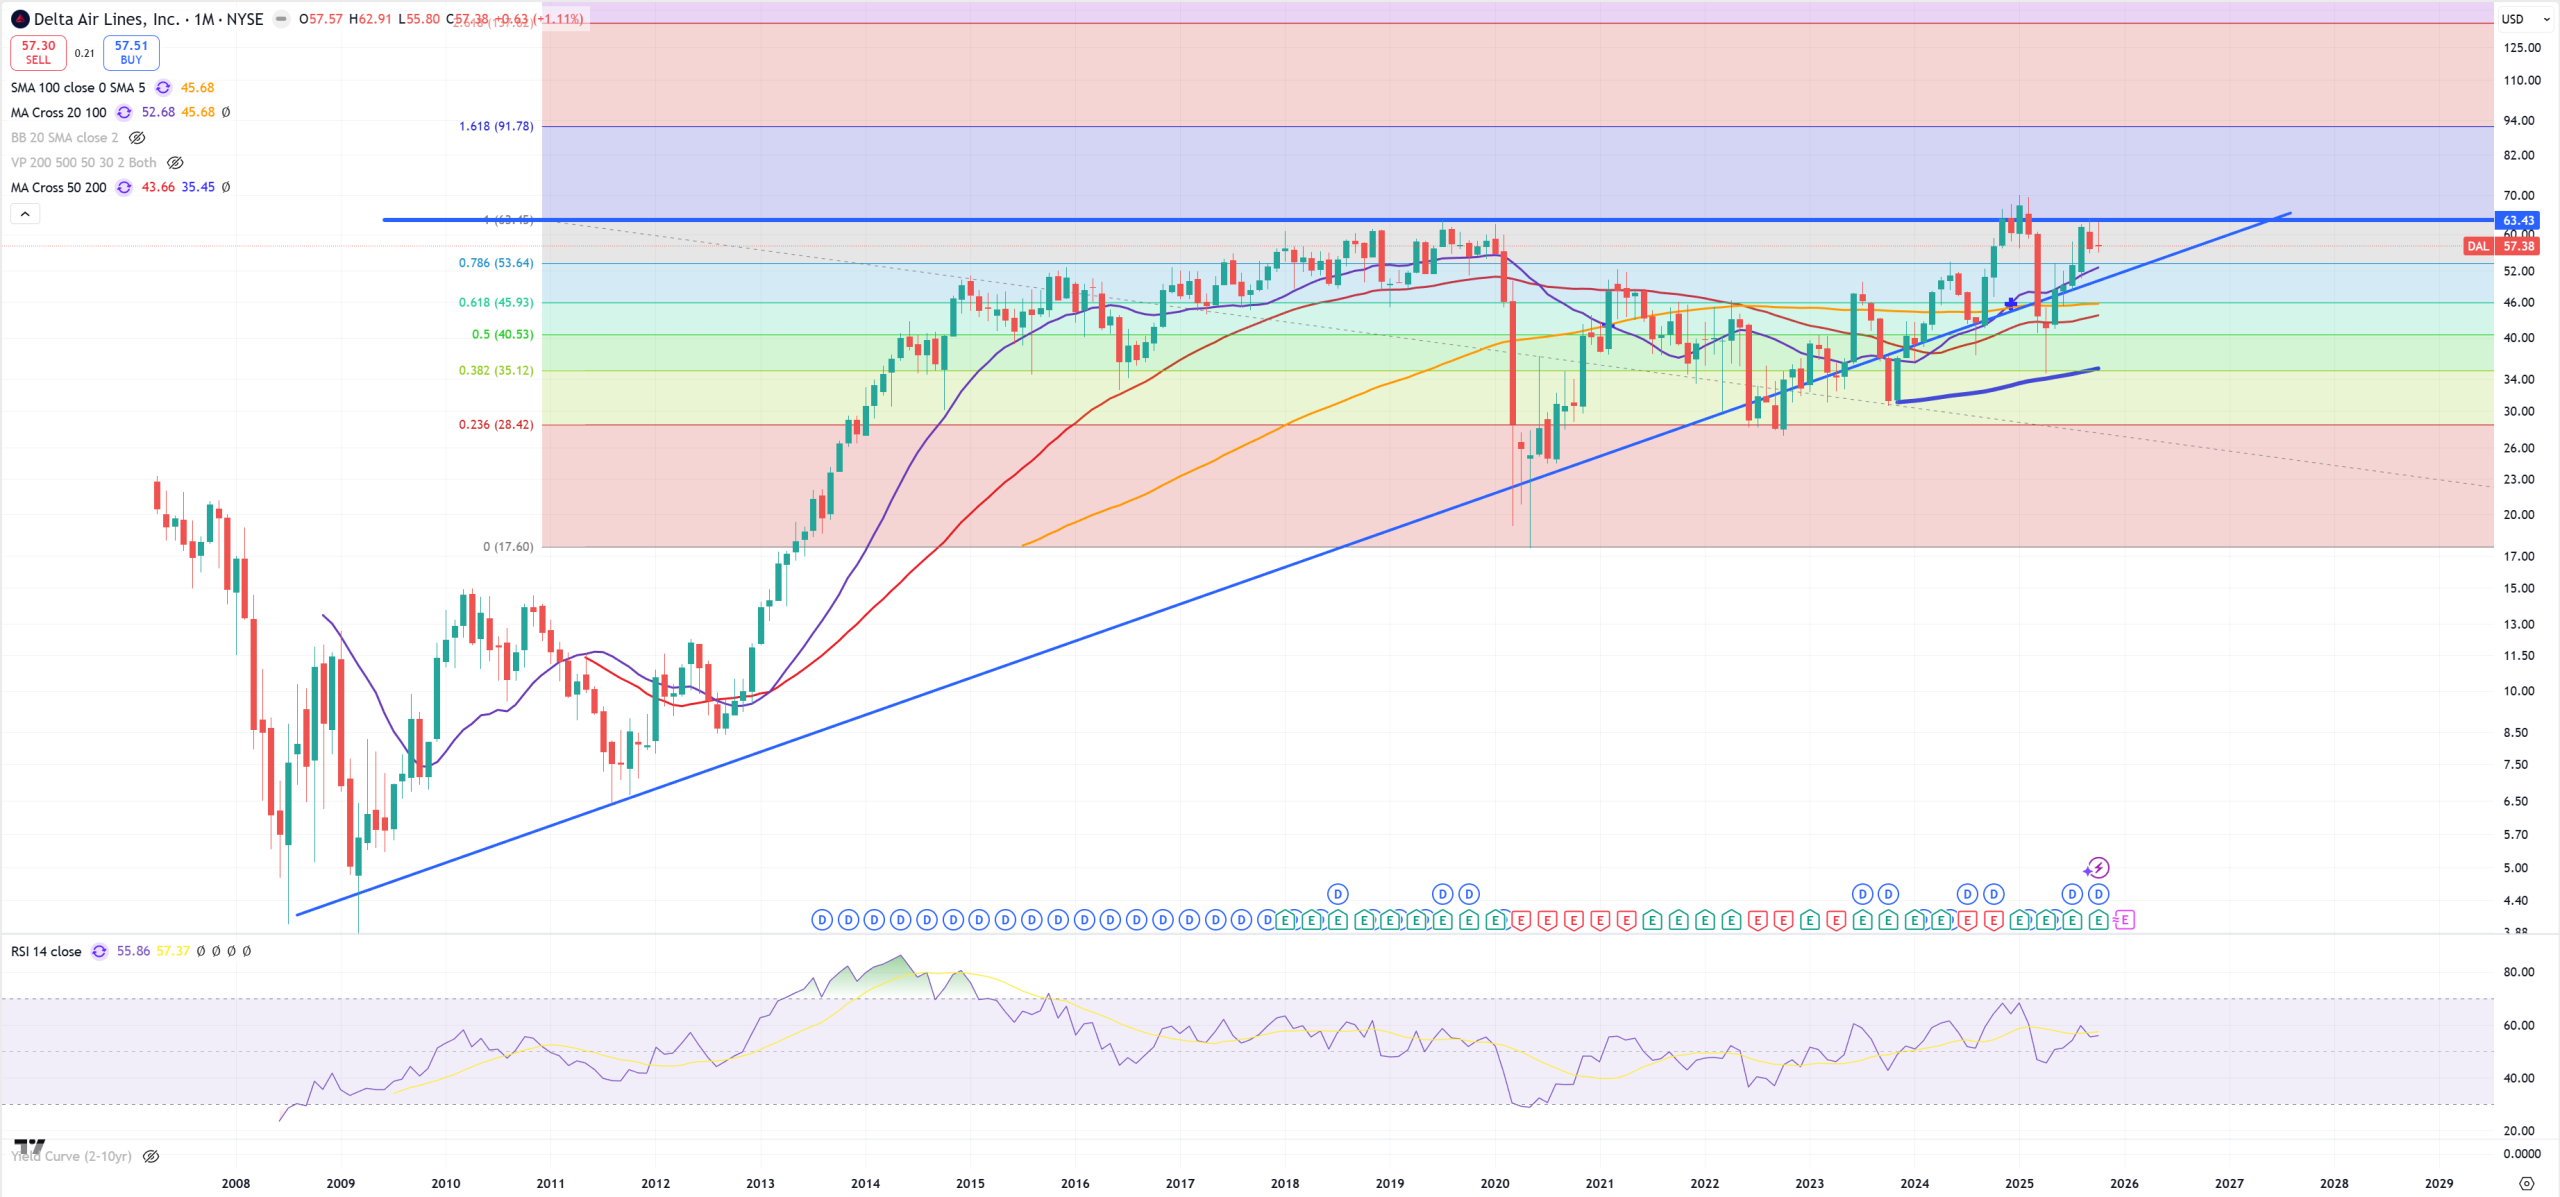
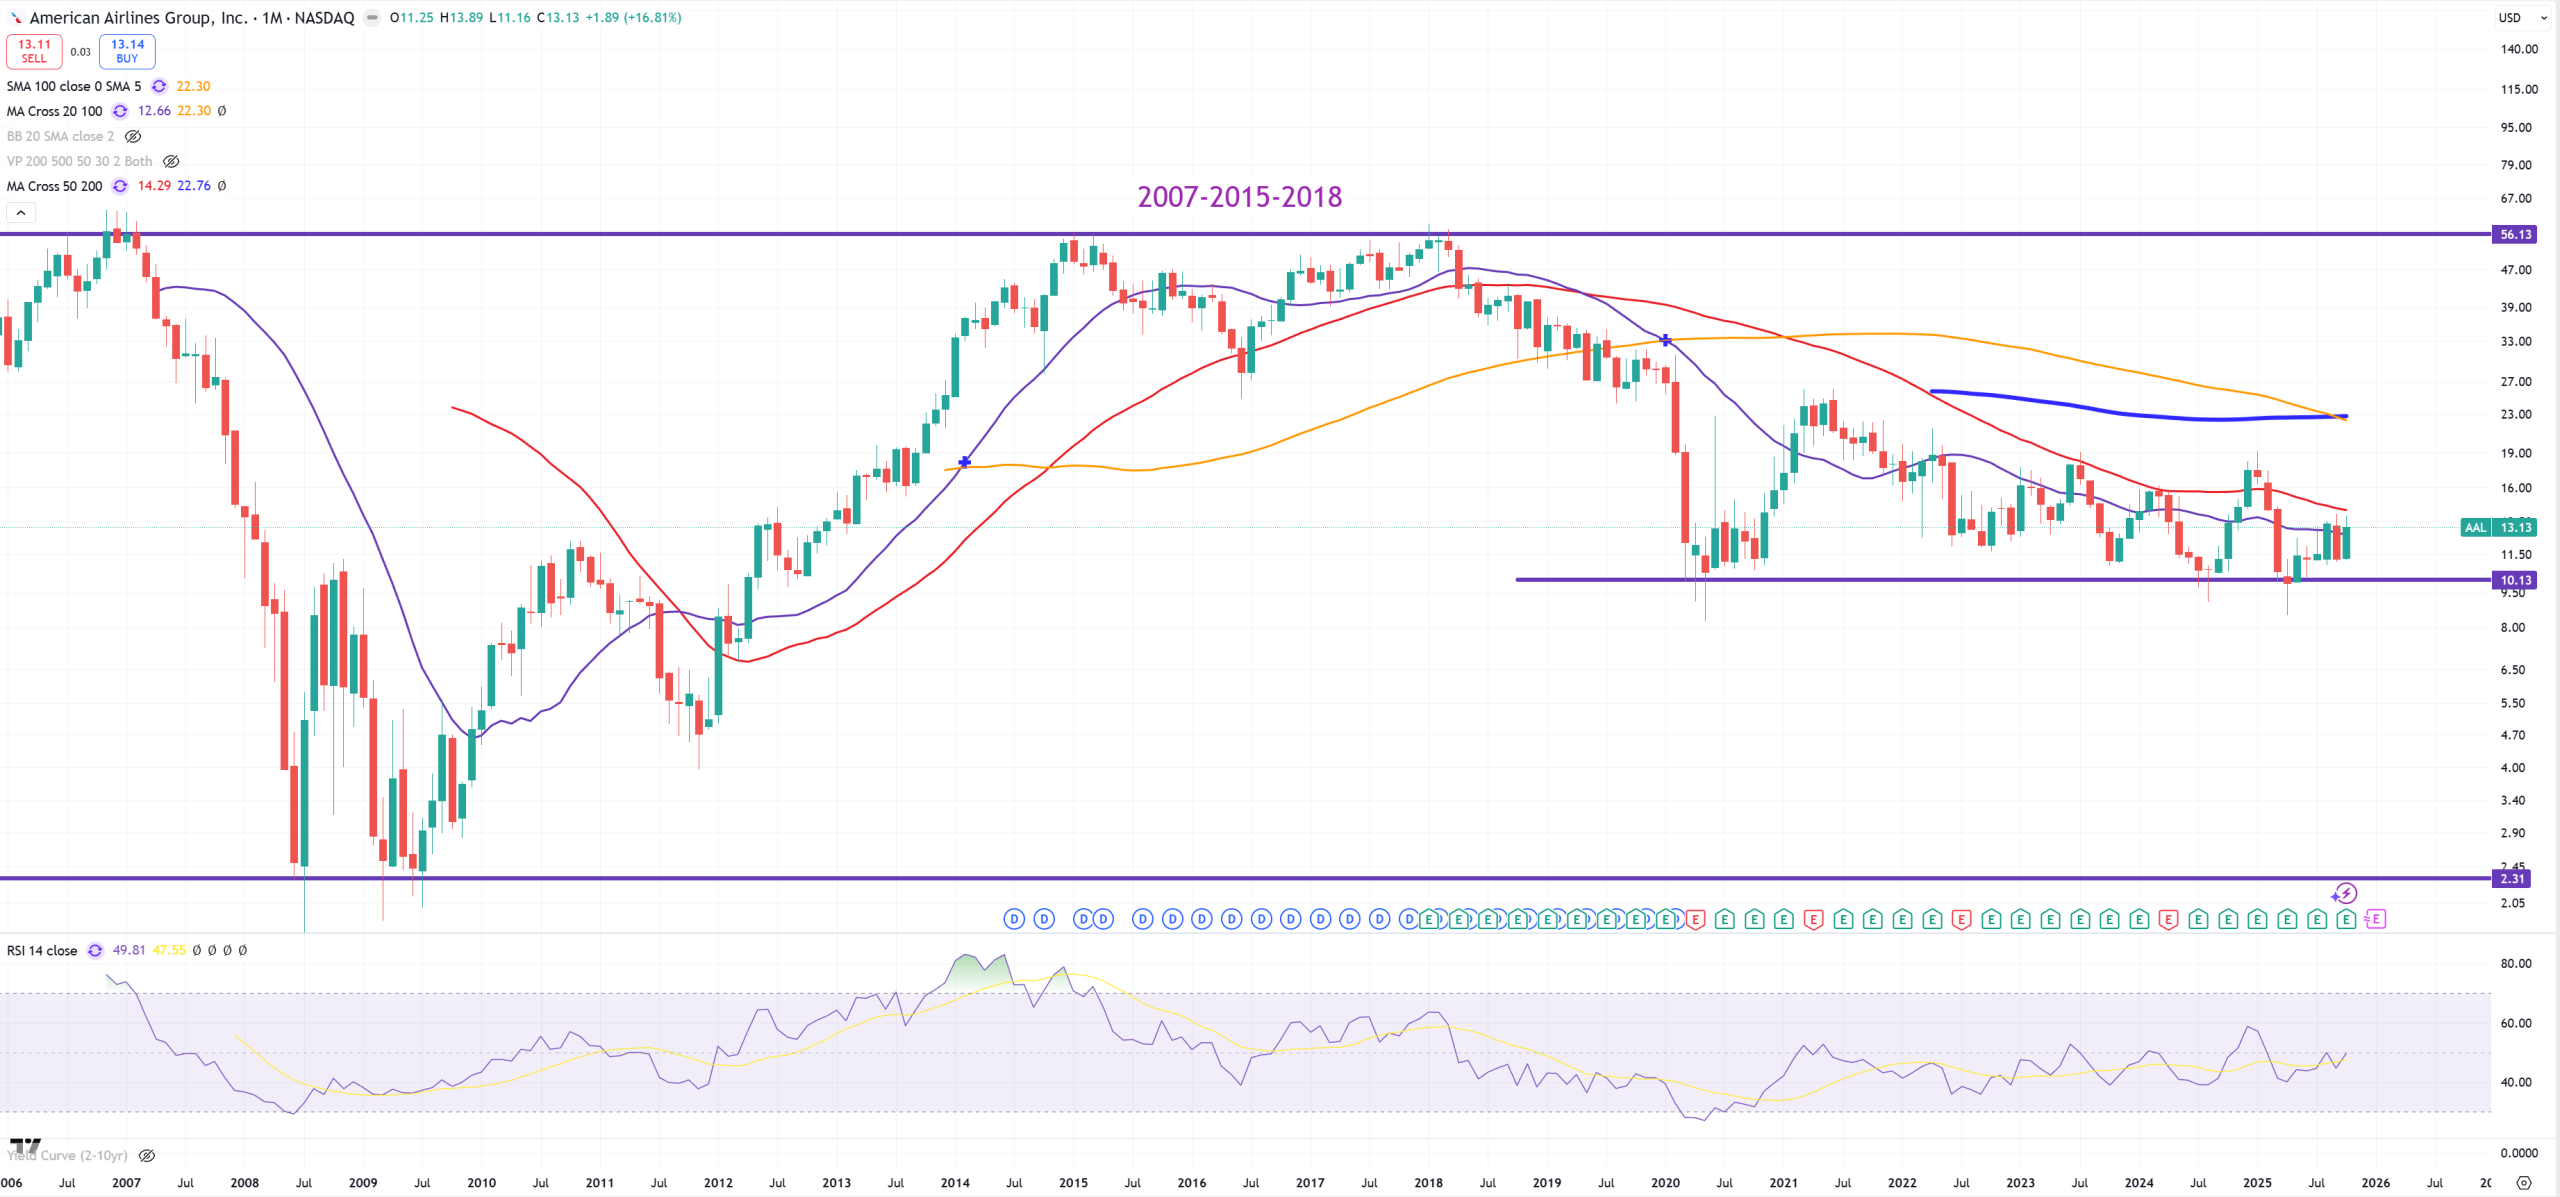
AAL – American Airlines looks way different than DAL
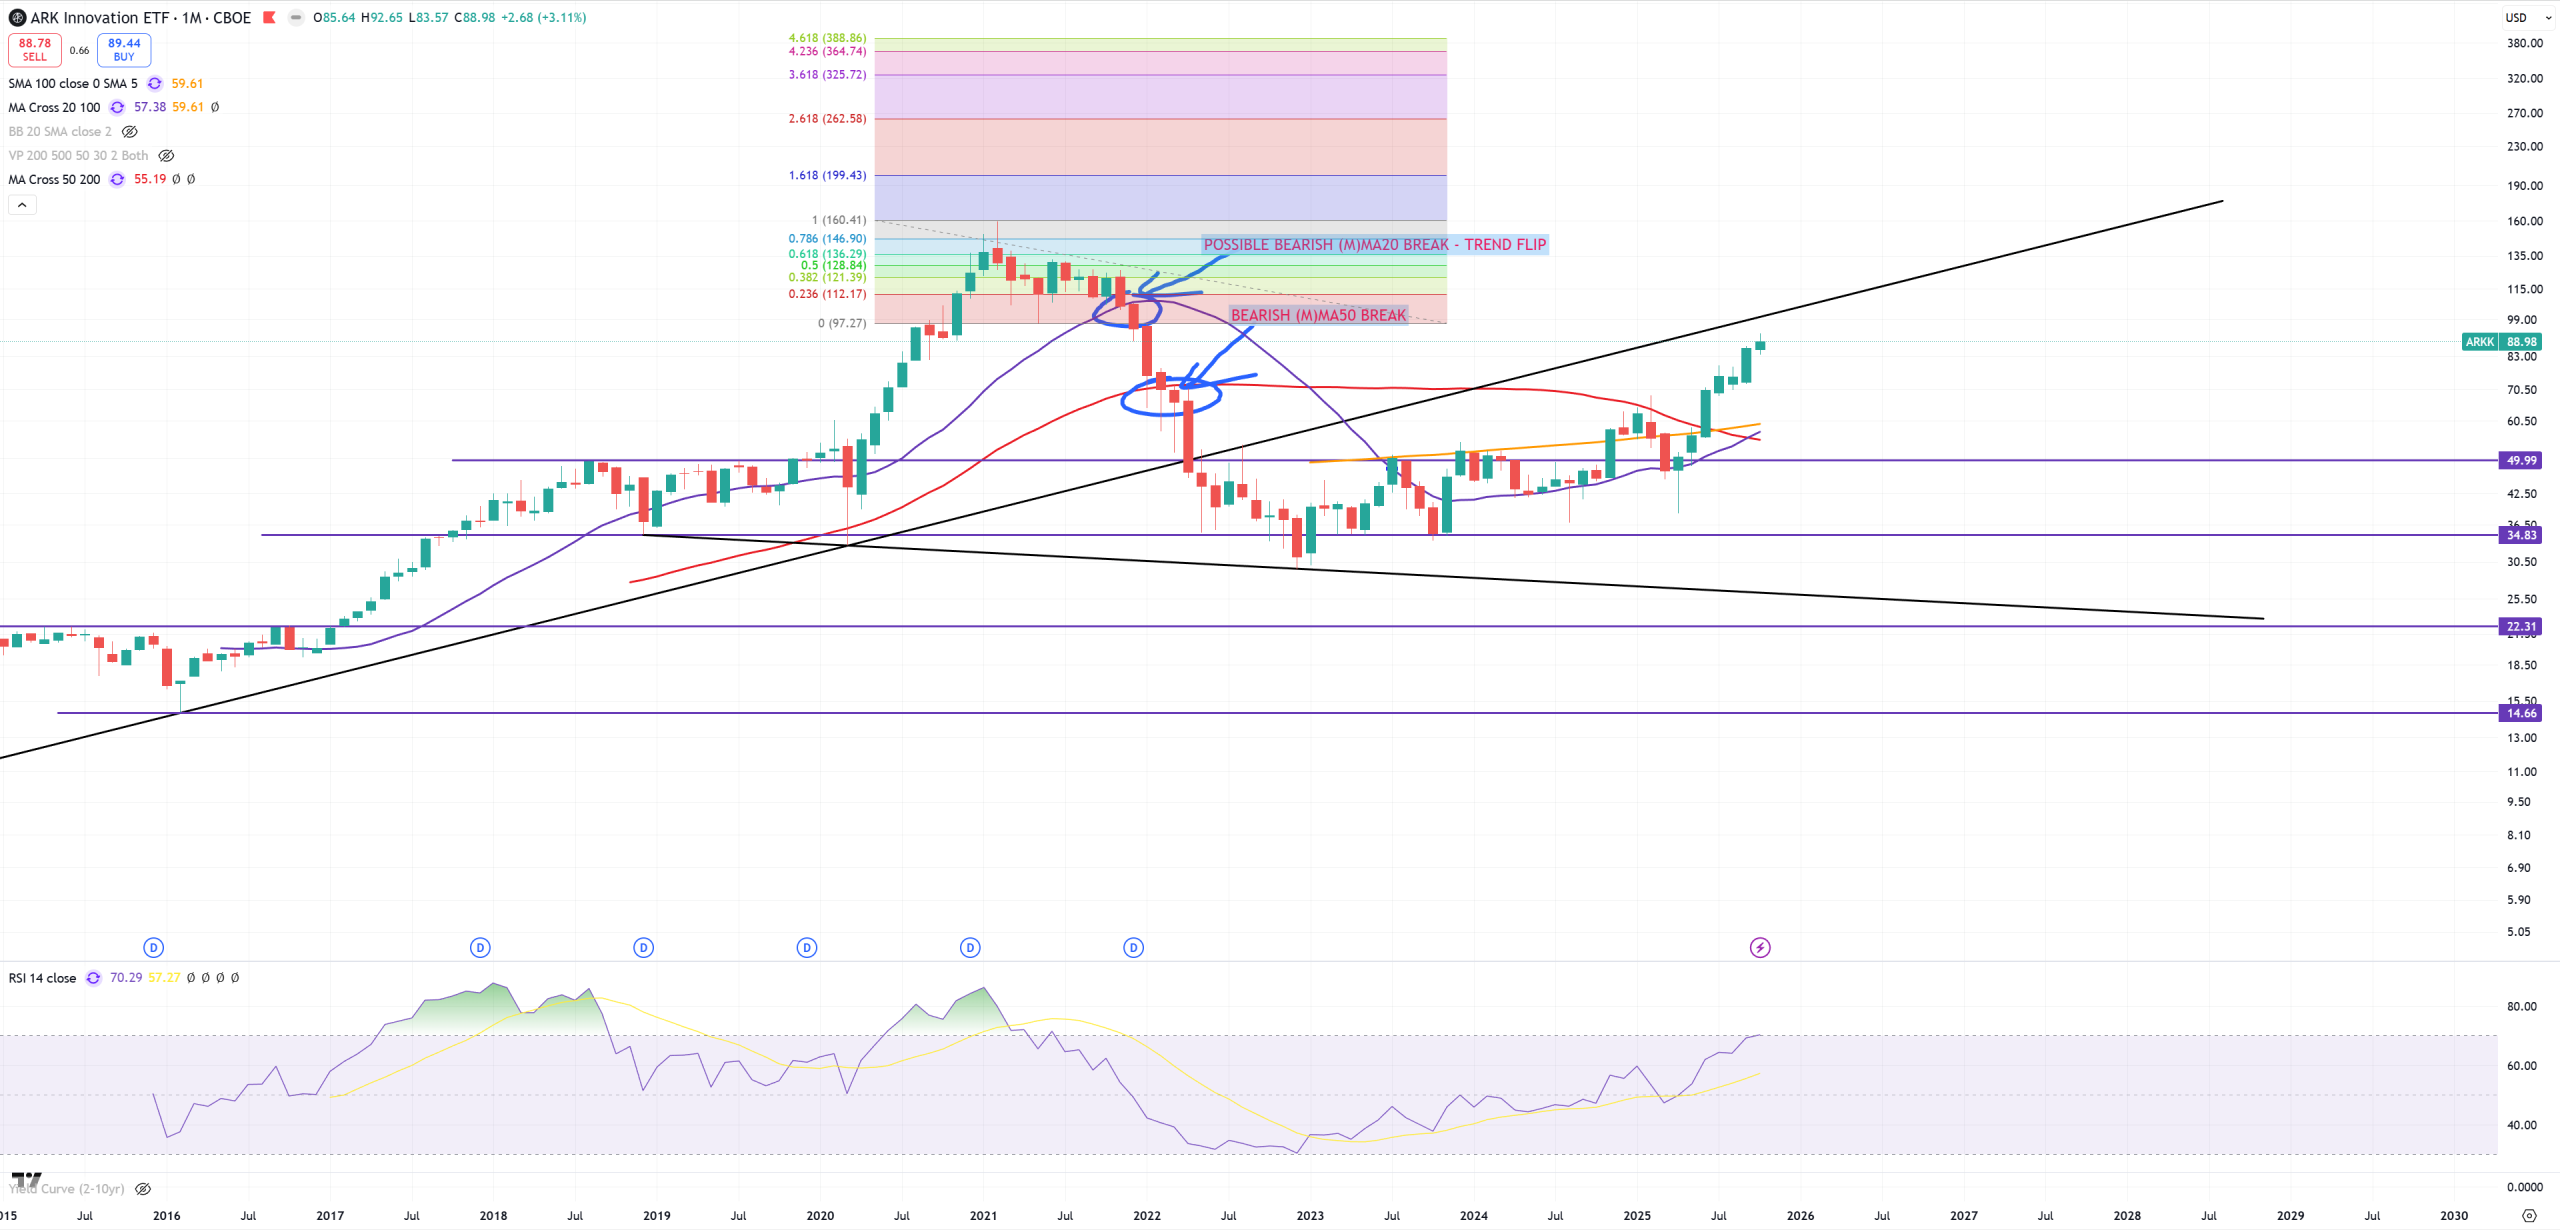
ARKK – last bearish moment is retest to trend around 100$.
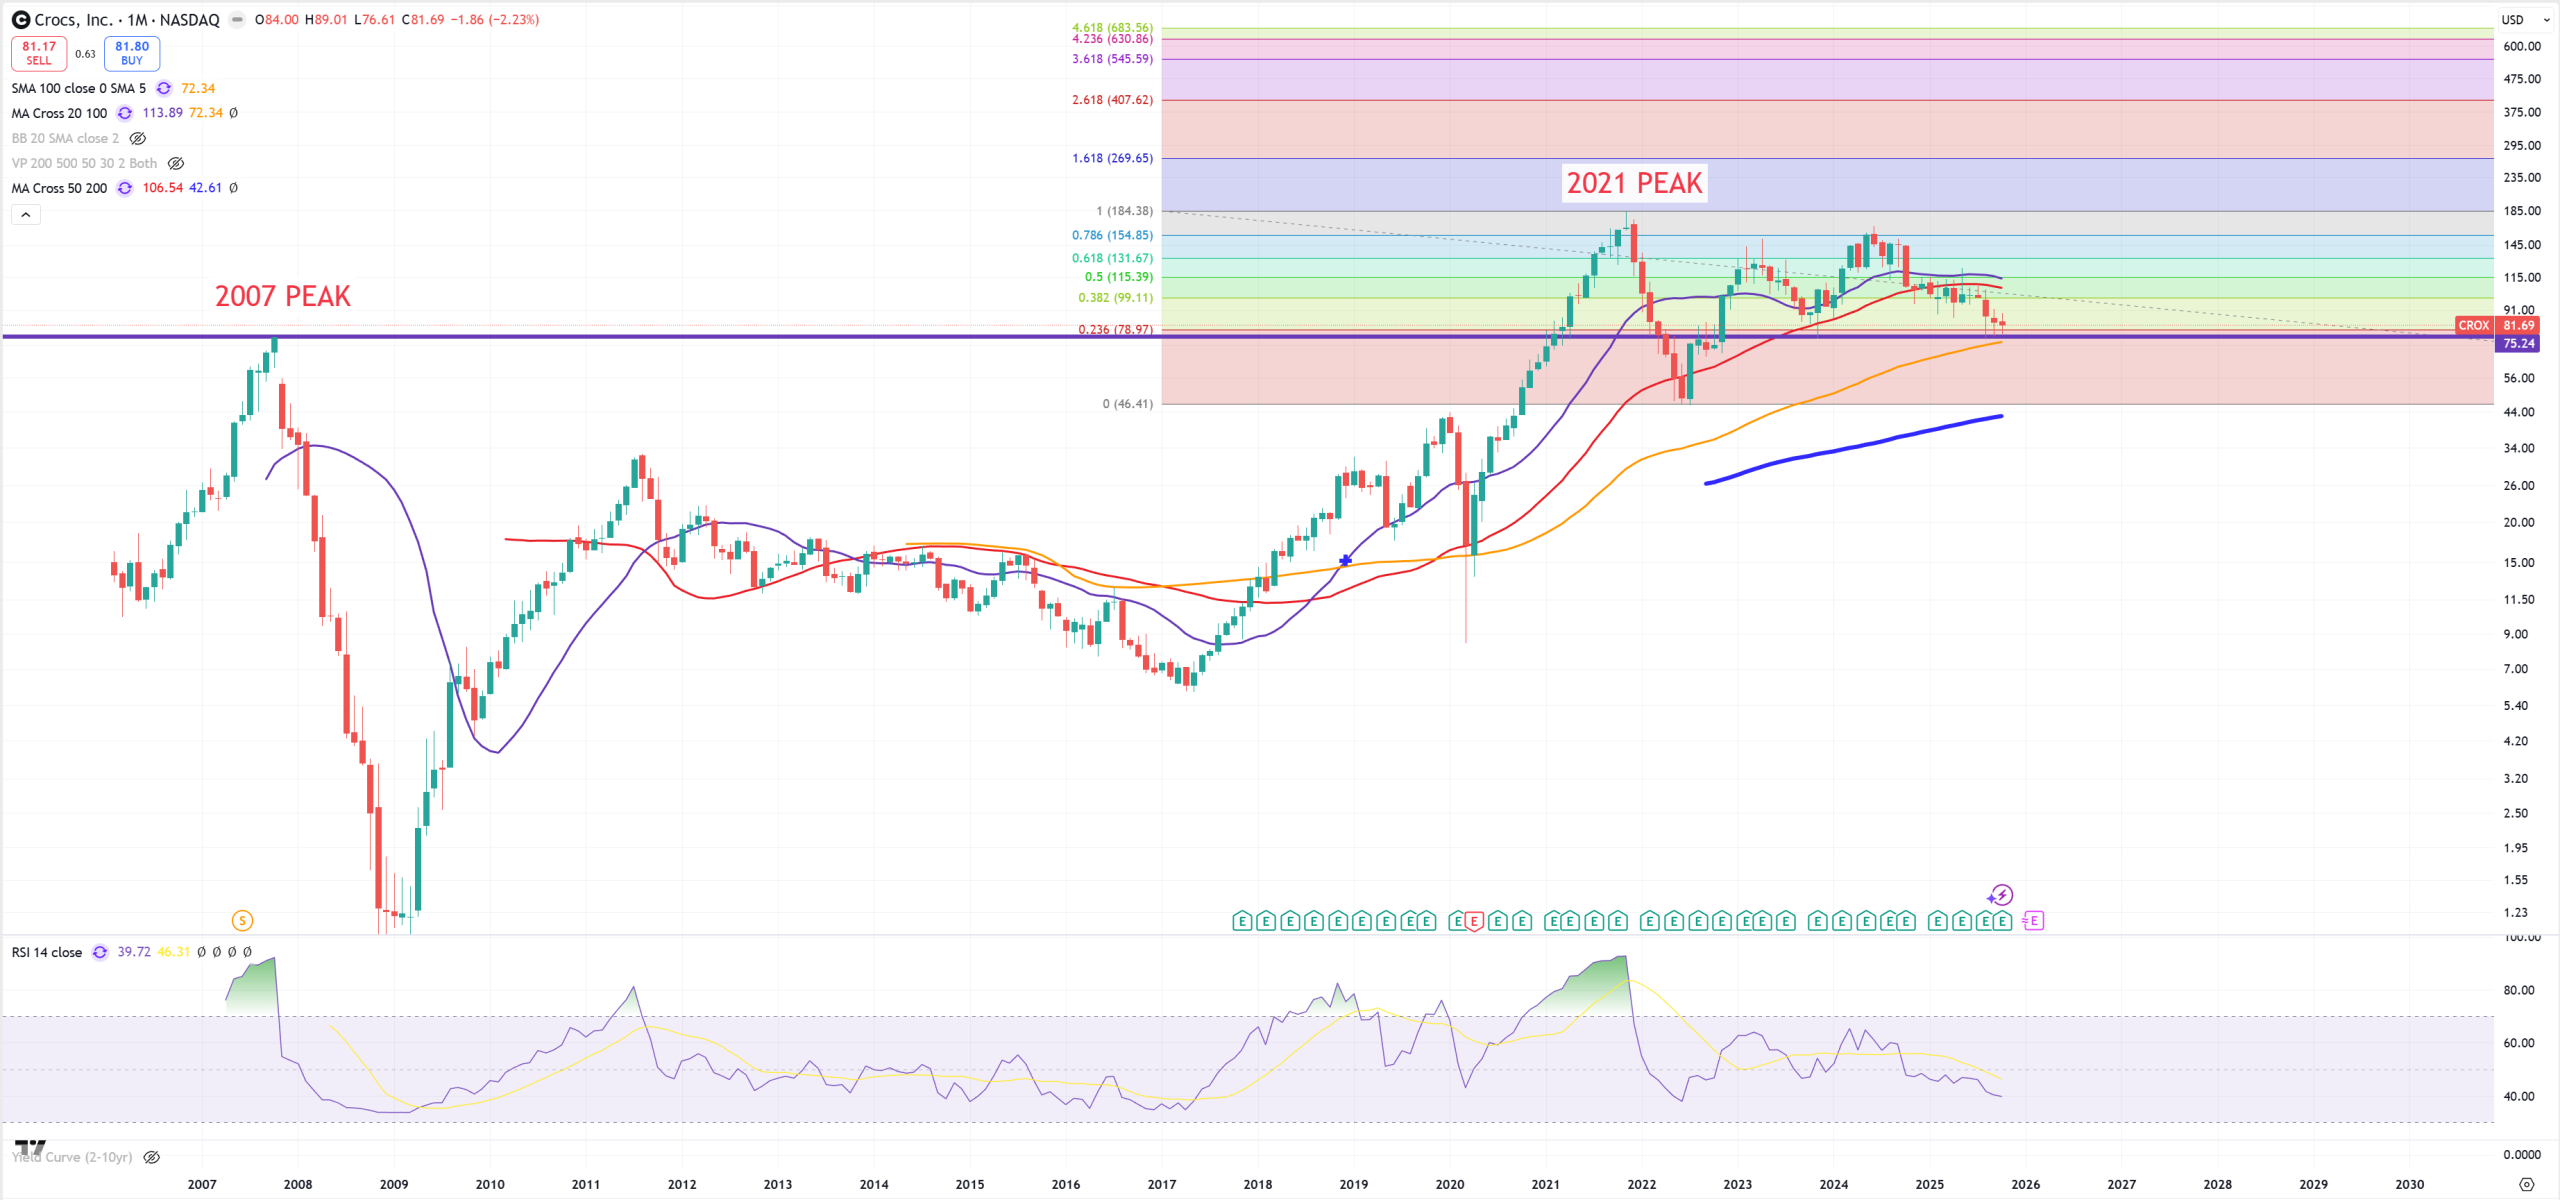
CROX – big moment
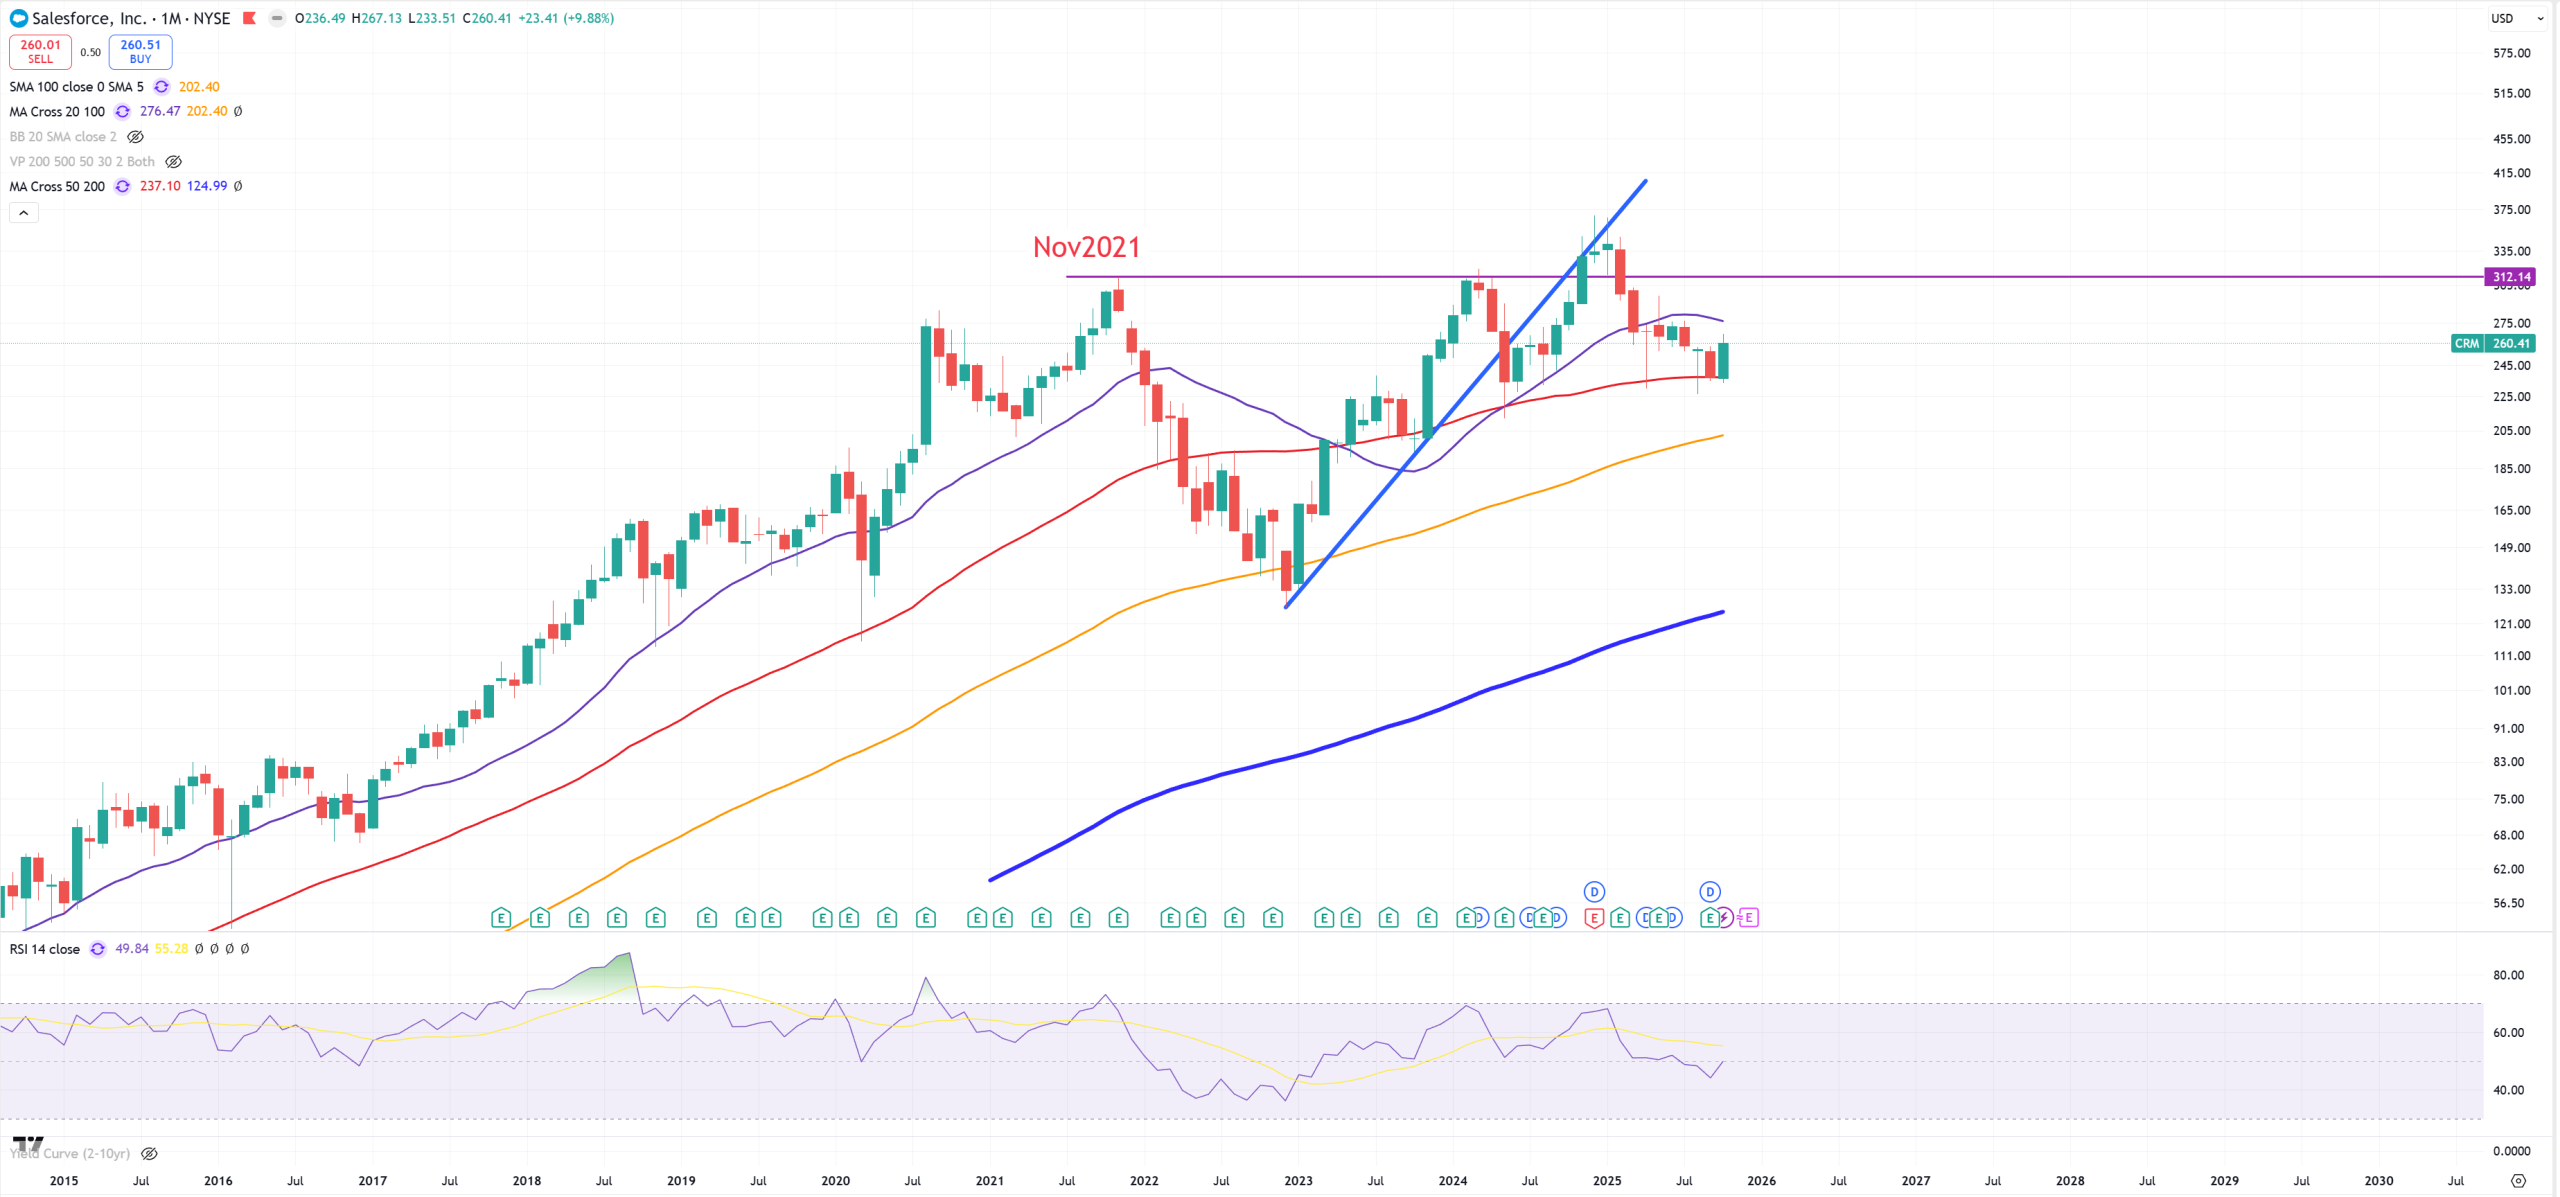
CRM – Salesforce, holds (M)MA50