1999 of the current cycle. Which year it probably was? Technical analysis.
November 22, 2025
We hear all the time about 1999 repeat, but today let’s analyze this magical year and we’re going to try to judge which year in current cycle could be this magical 1999.
Based on my 5 indicators : US03MY, US10Y/3M, DJI/GOLD, SPX/GOLD, SPX we try to decompose 1999 year.
Let’s start from big cycle :
Dotcom bubble cycle
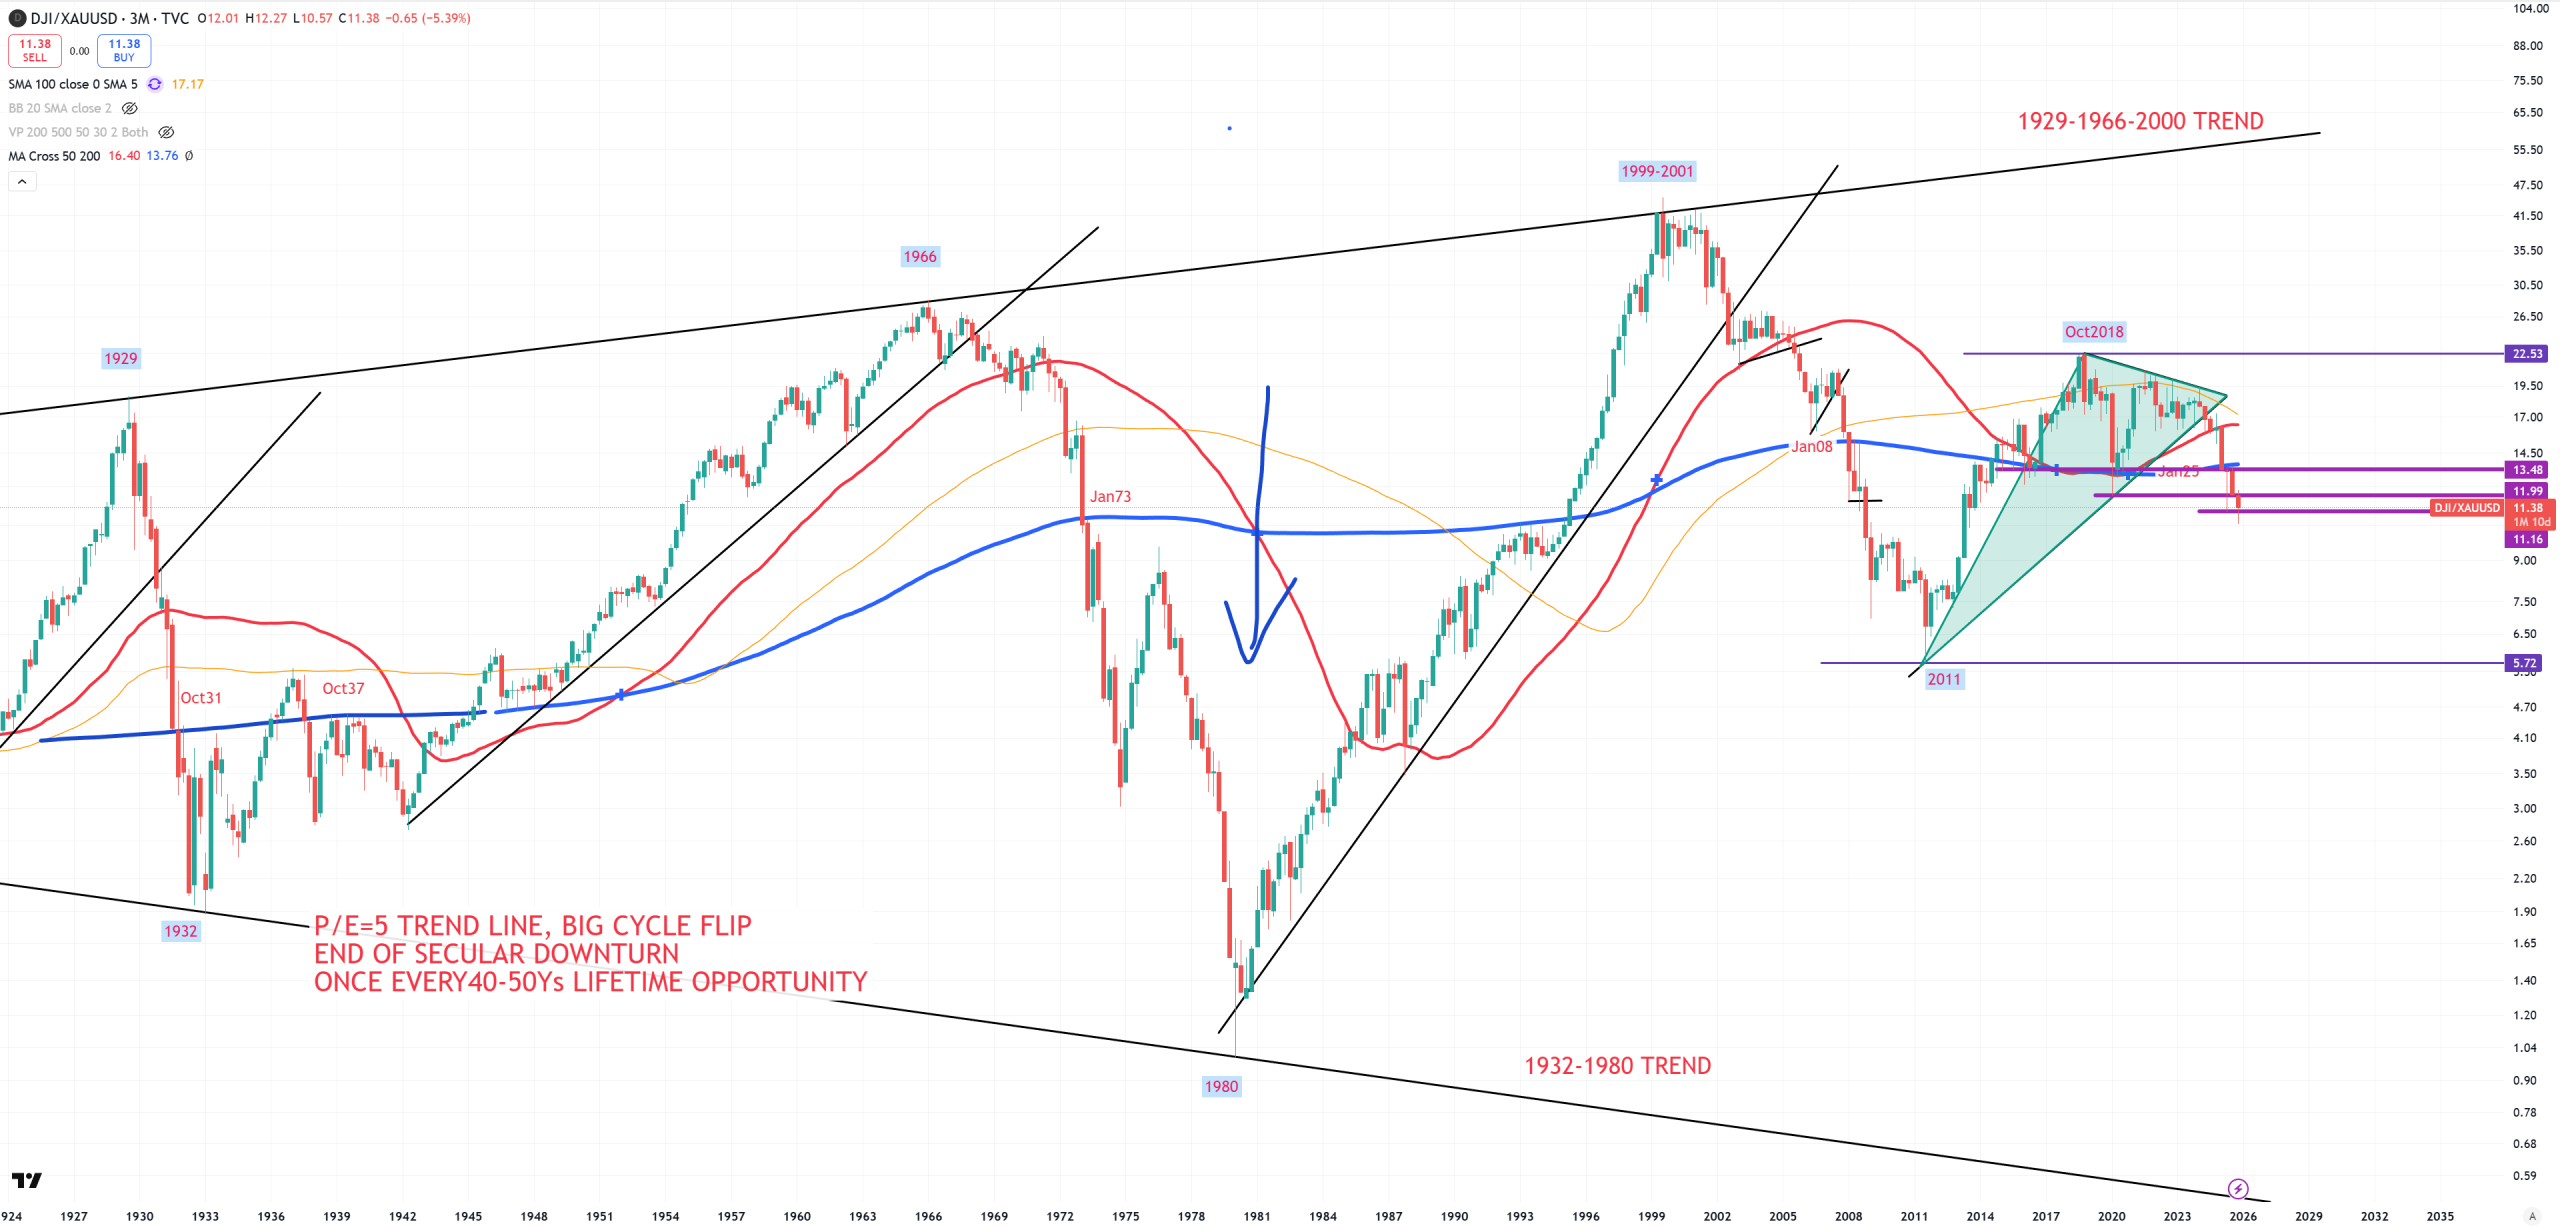
DJI/GOLD – 1929-1966 trend was hit in April 1999 – so we can clearly point that 1999 was the beginning of a cycle end. Cycle end <> peak in stocks. I said that many times, but that’s a green light to get out of stocks and rotate into mostly defensive bonds & gold.
It took a while, because DJI/GOLD was banging to the 1929-1966 resistance till April 2001. So 2 years cycle was reversing.
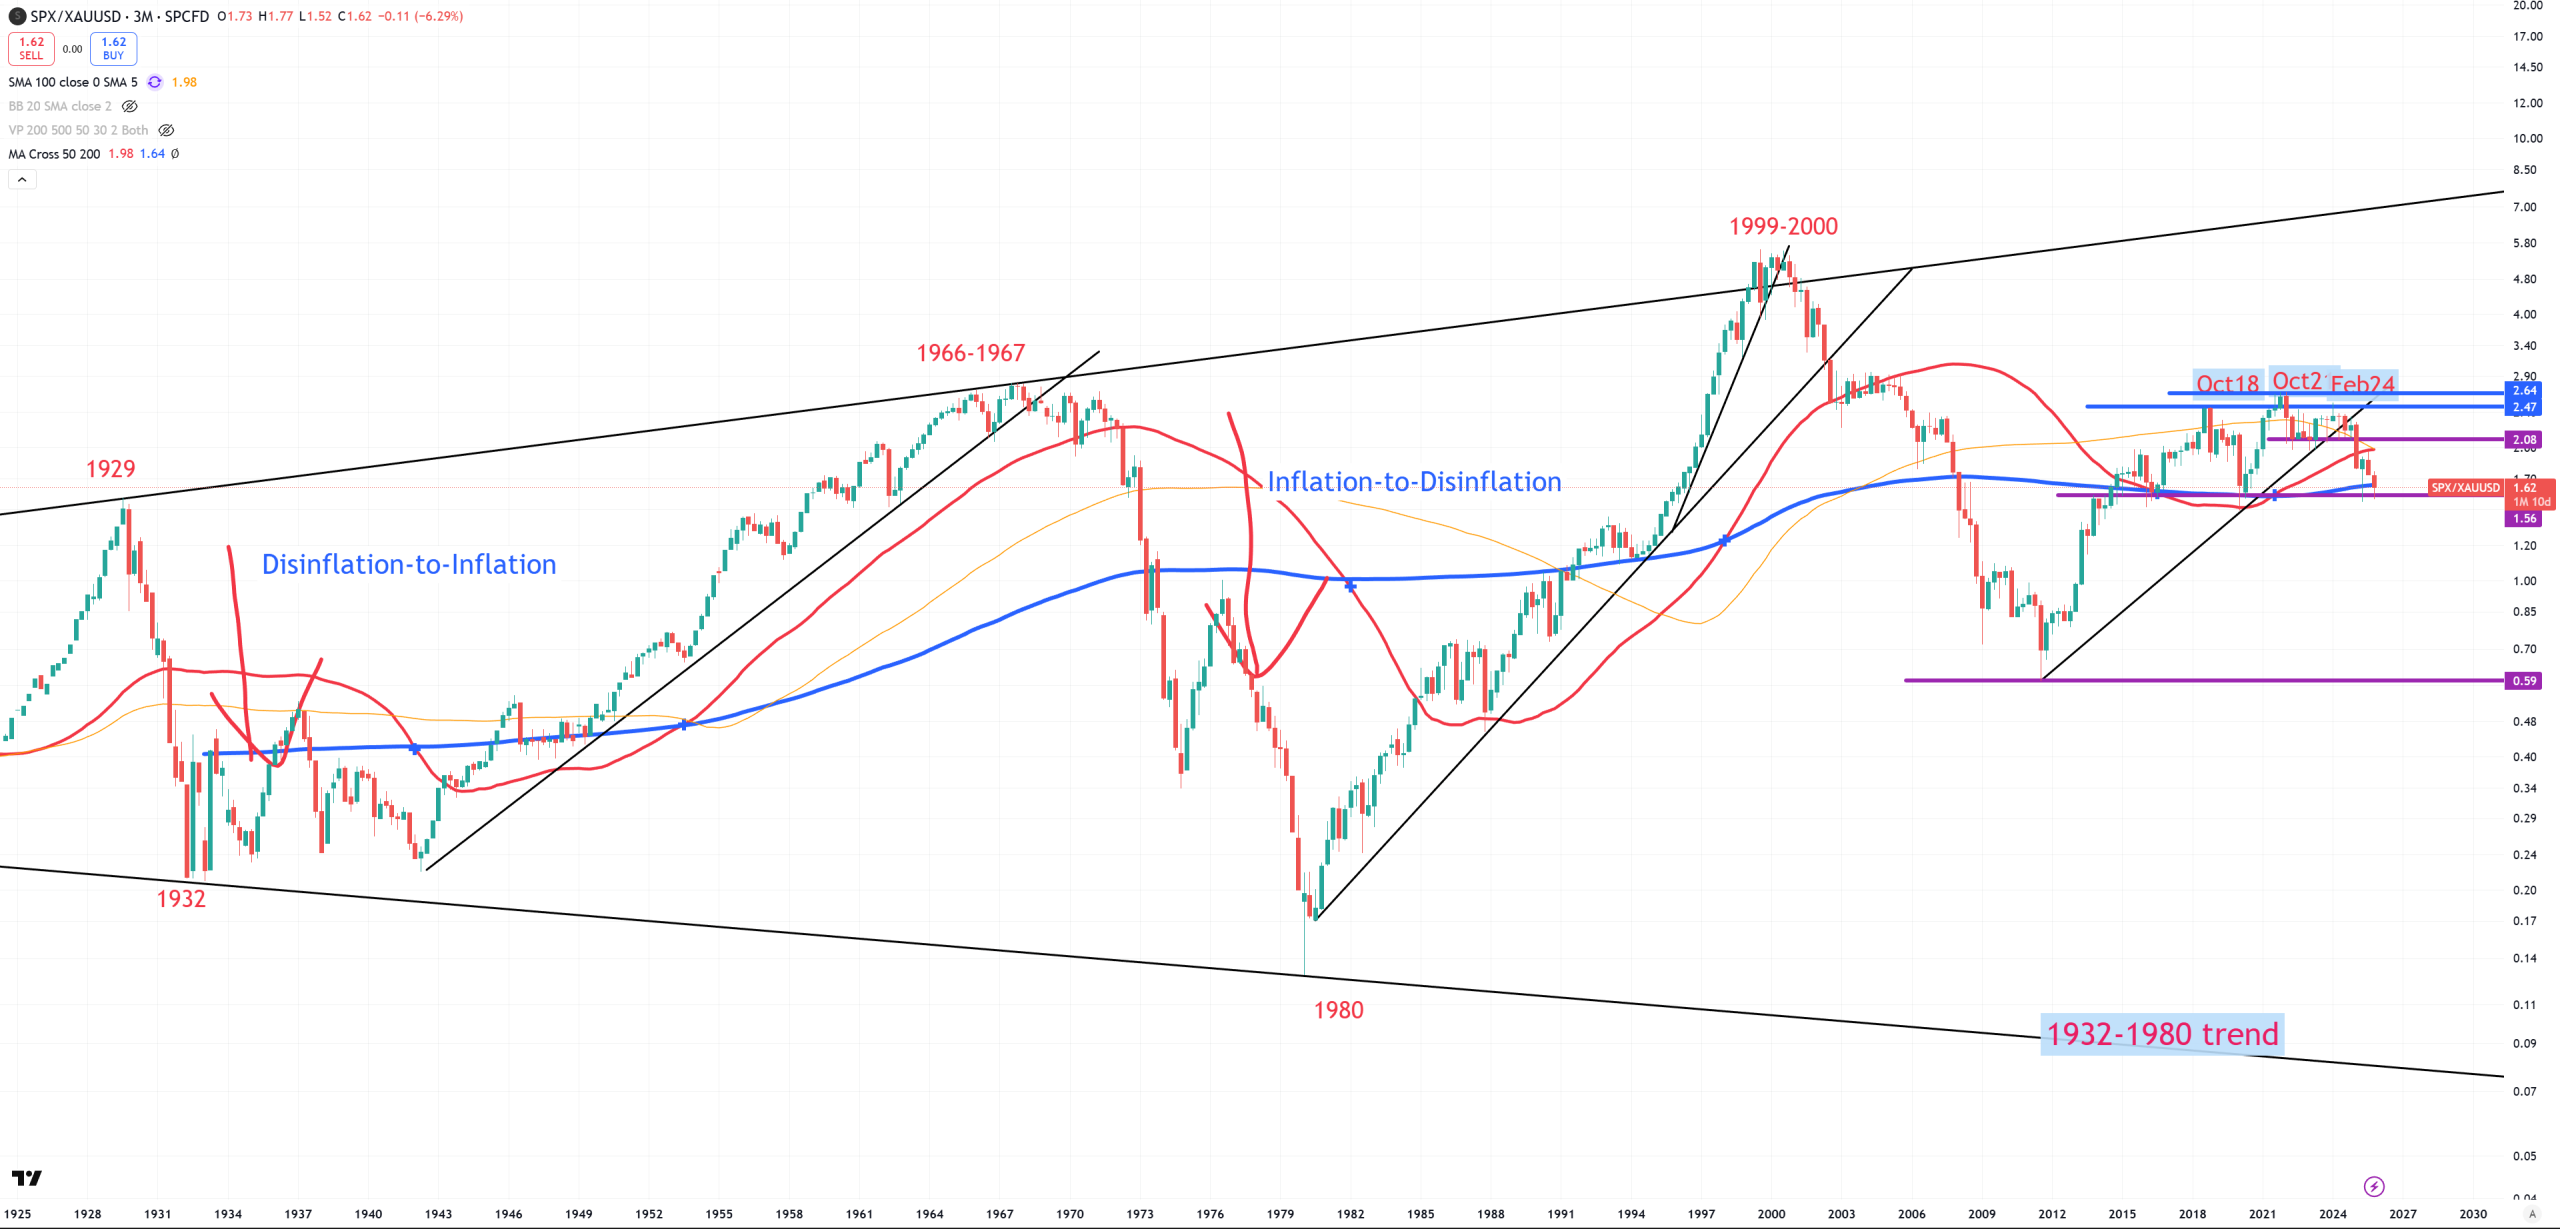
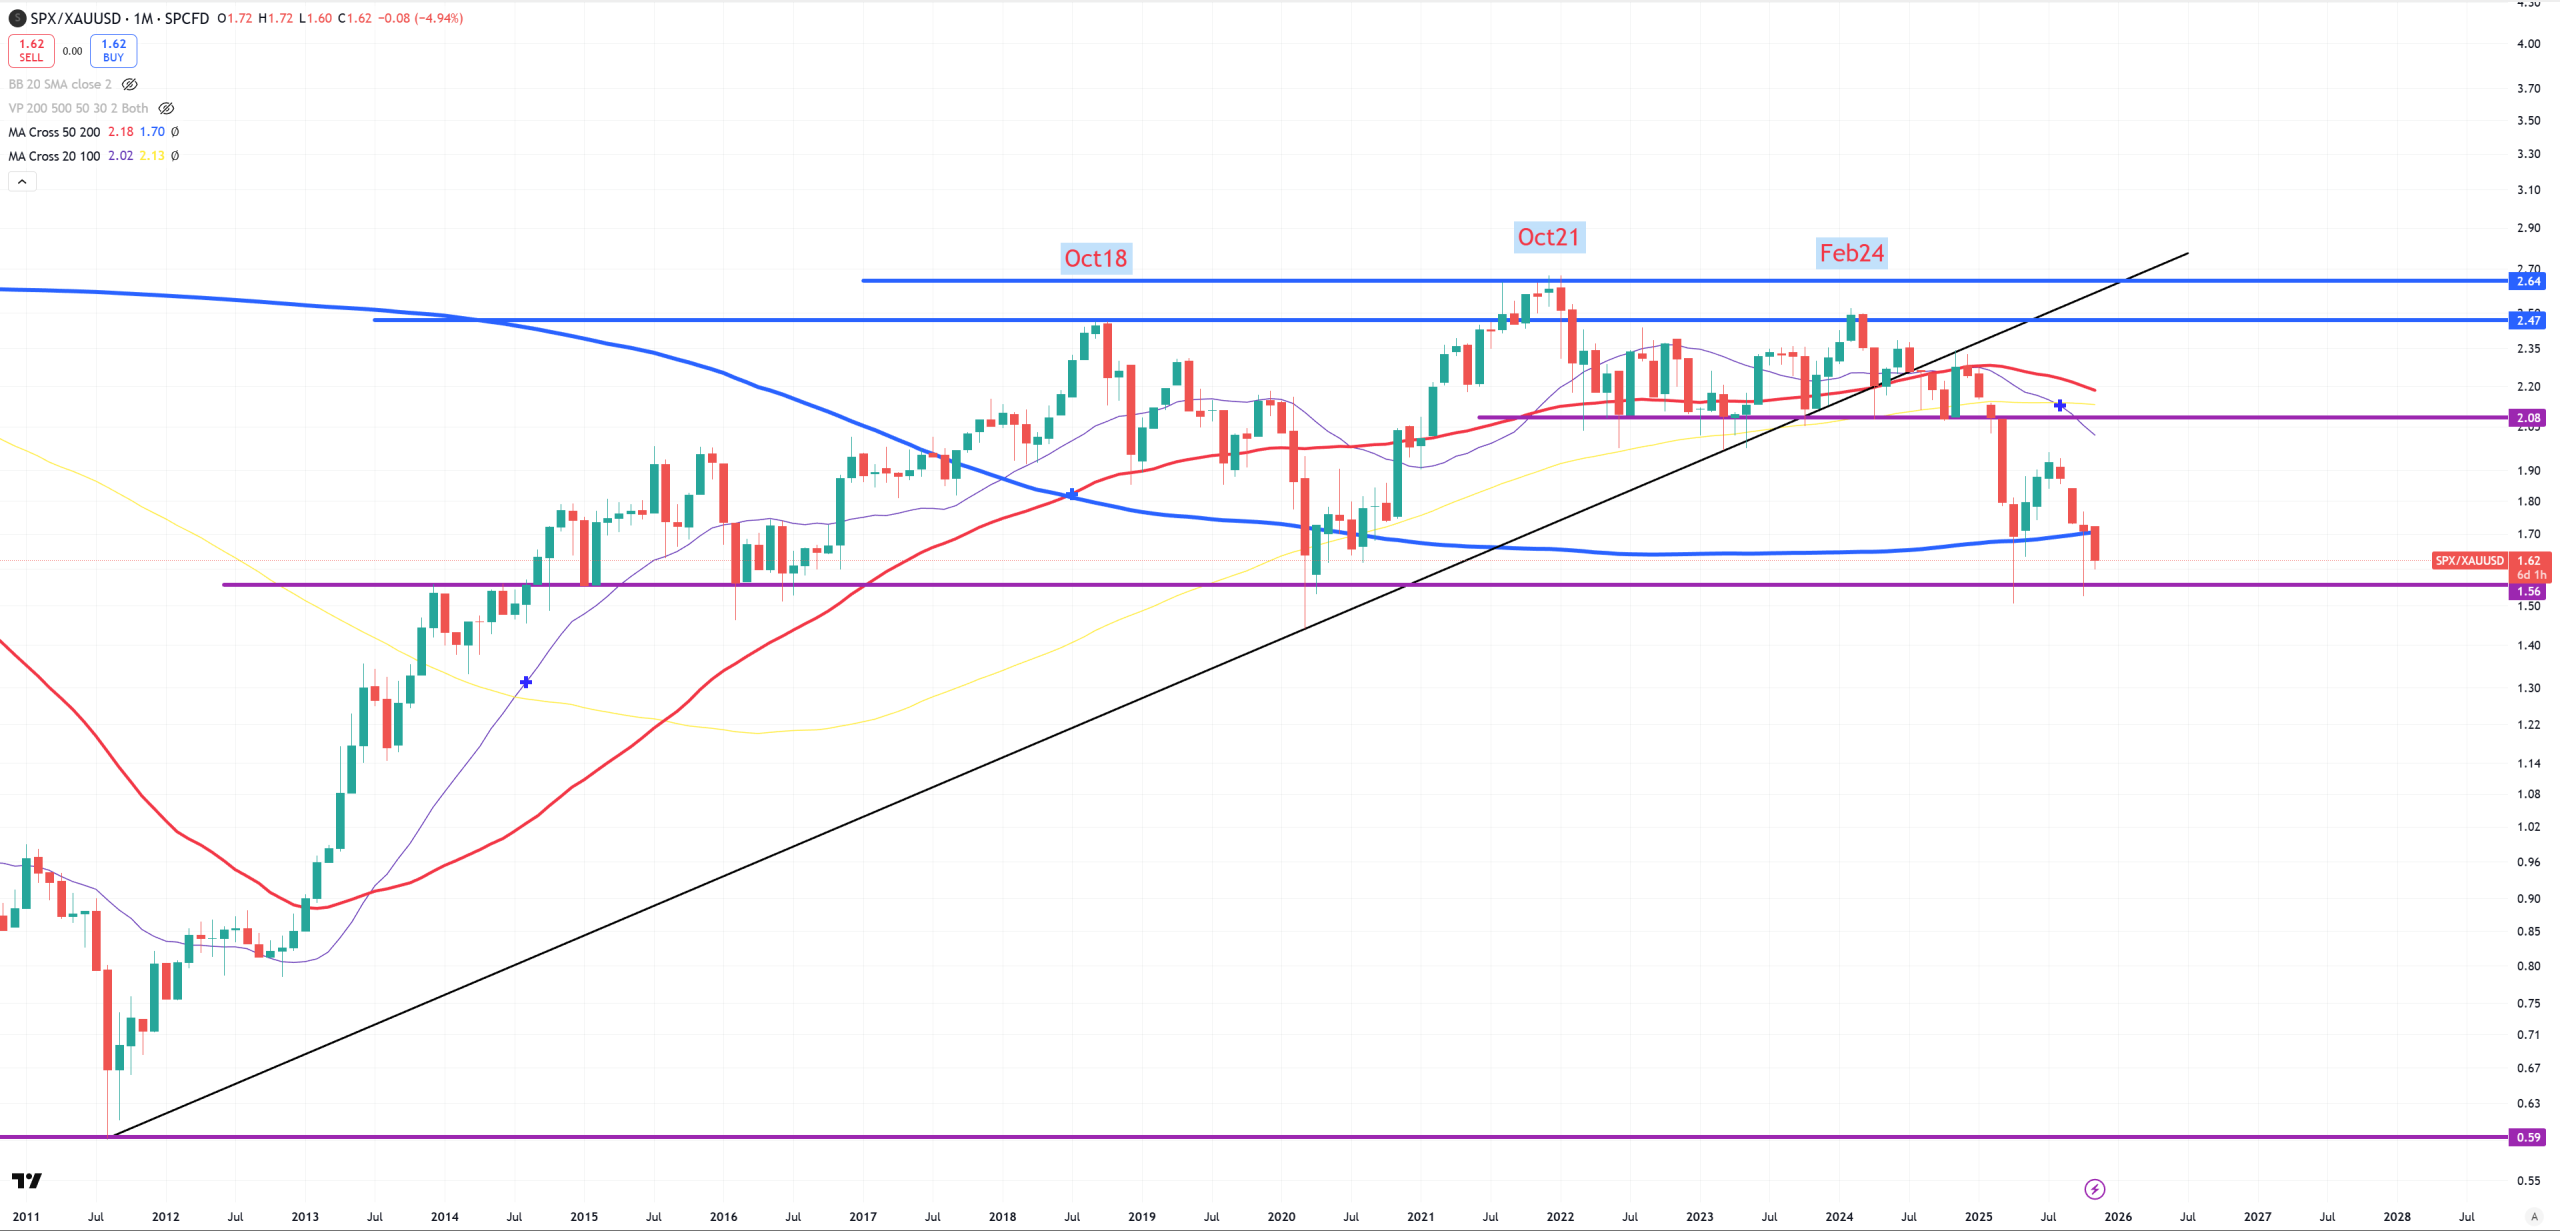
SPX/GOLD – almost similar as DJI/GOLD. Cycle peaked between June 1999-September 2000 a bit shorter signal than DJI/GOLD.
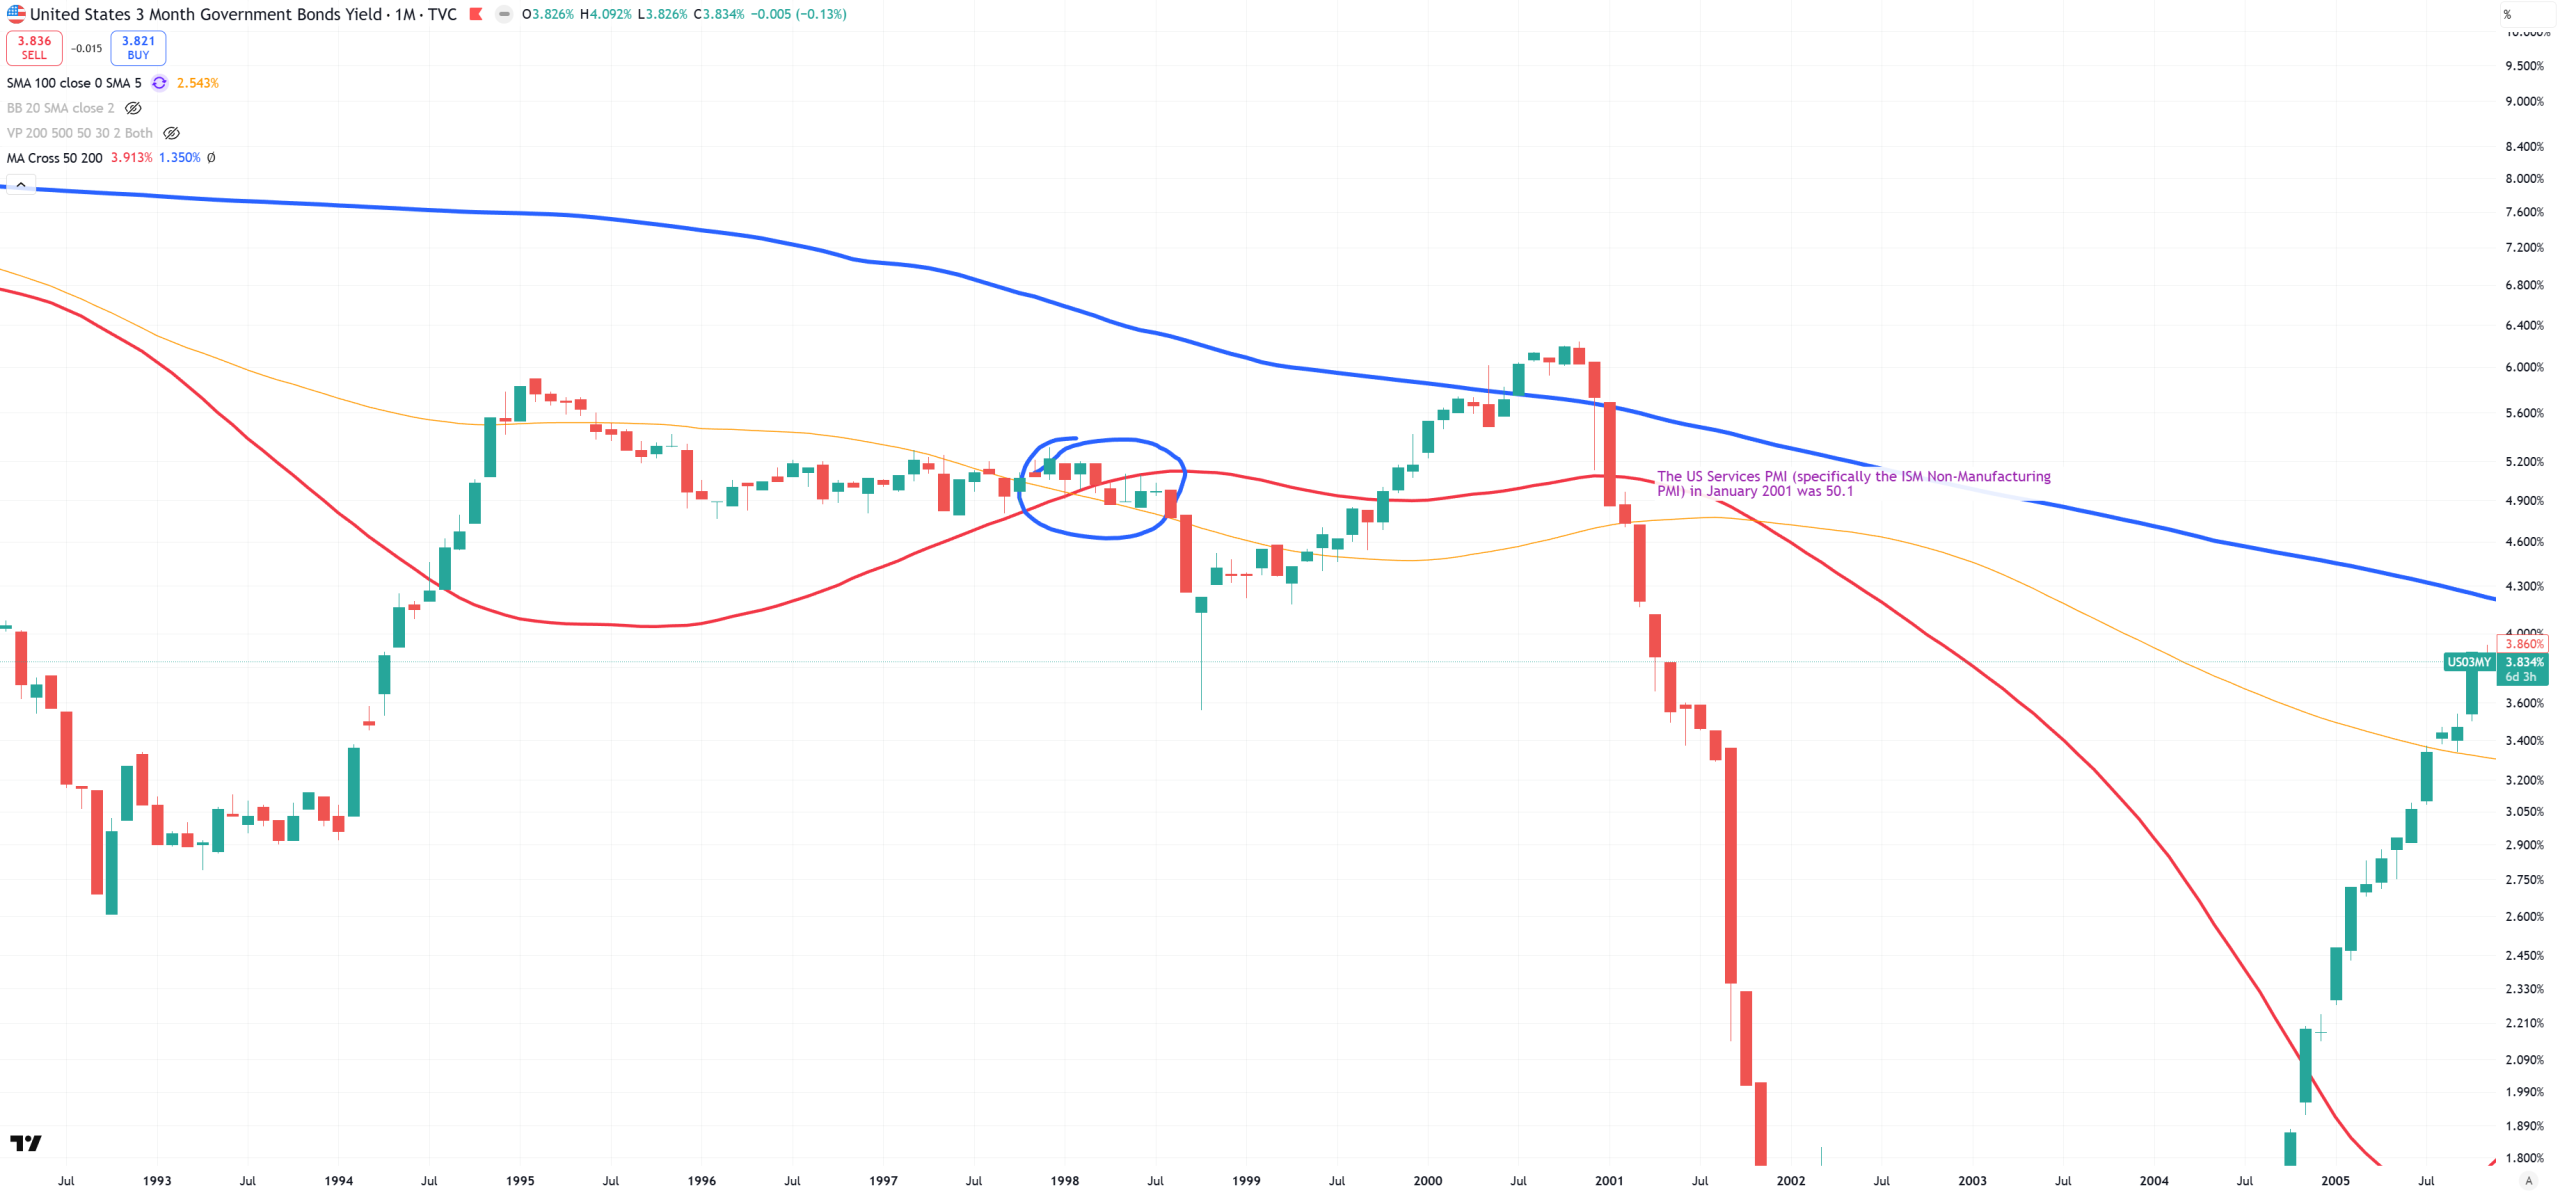
US03MY – so main indicator about stocks peaking. Crossed down (M)MA50 in April 1998, and stayed flat for 5 months. Later it recovered above (M)MA50 in October 1999 signalling continuation of a bull market.
US10Y-US03MY – on (M) we can’t even see ANY inversion here. That’s a key indicator economy was not getting any gravity that moment. The lowest value in that period of time of 10y/3m was like -1bps. Steepening till June 1999, consolidation till January 2000 and crashed finally into true inversion.
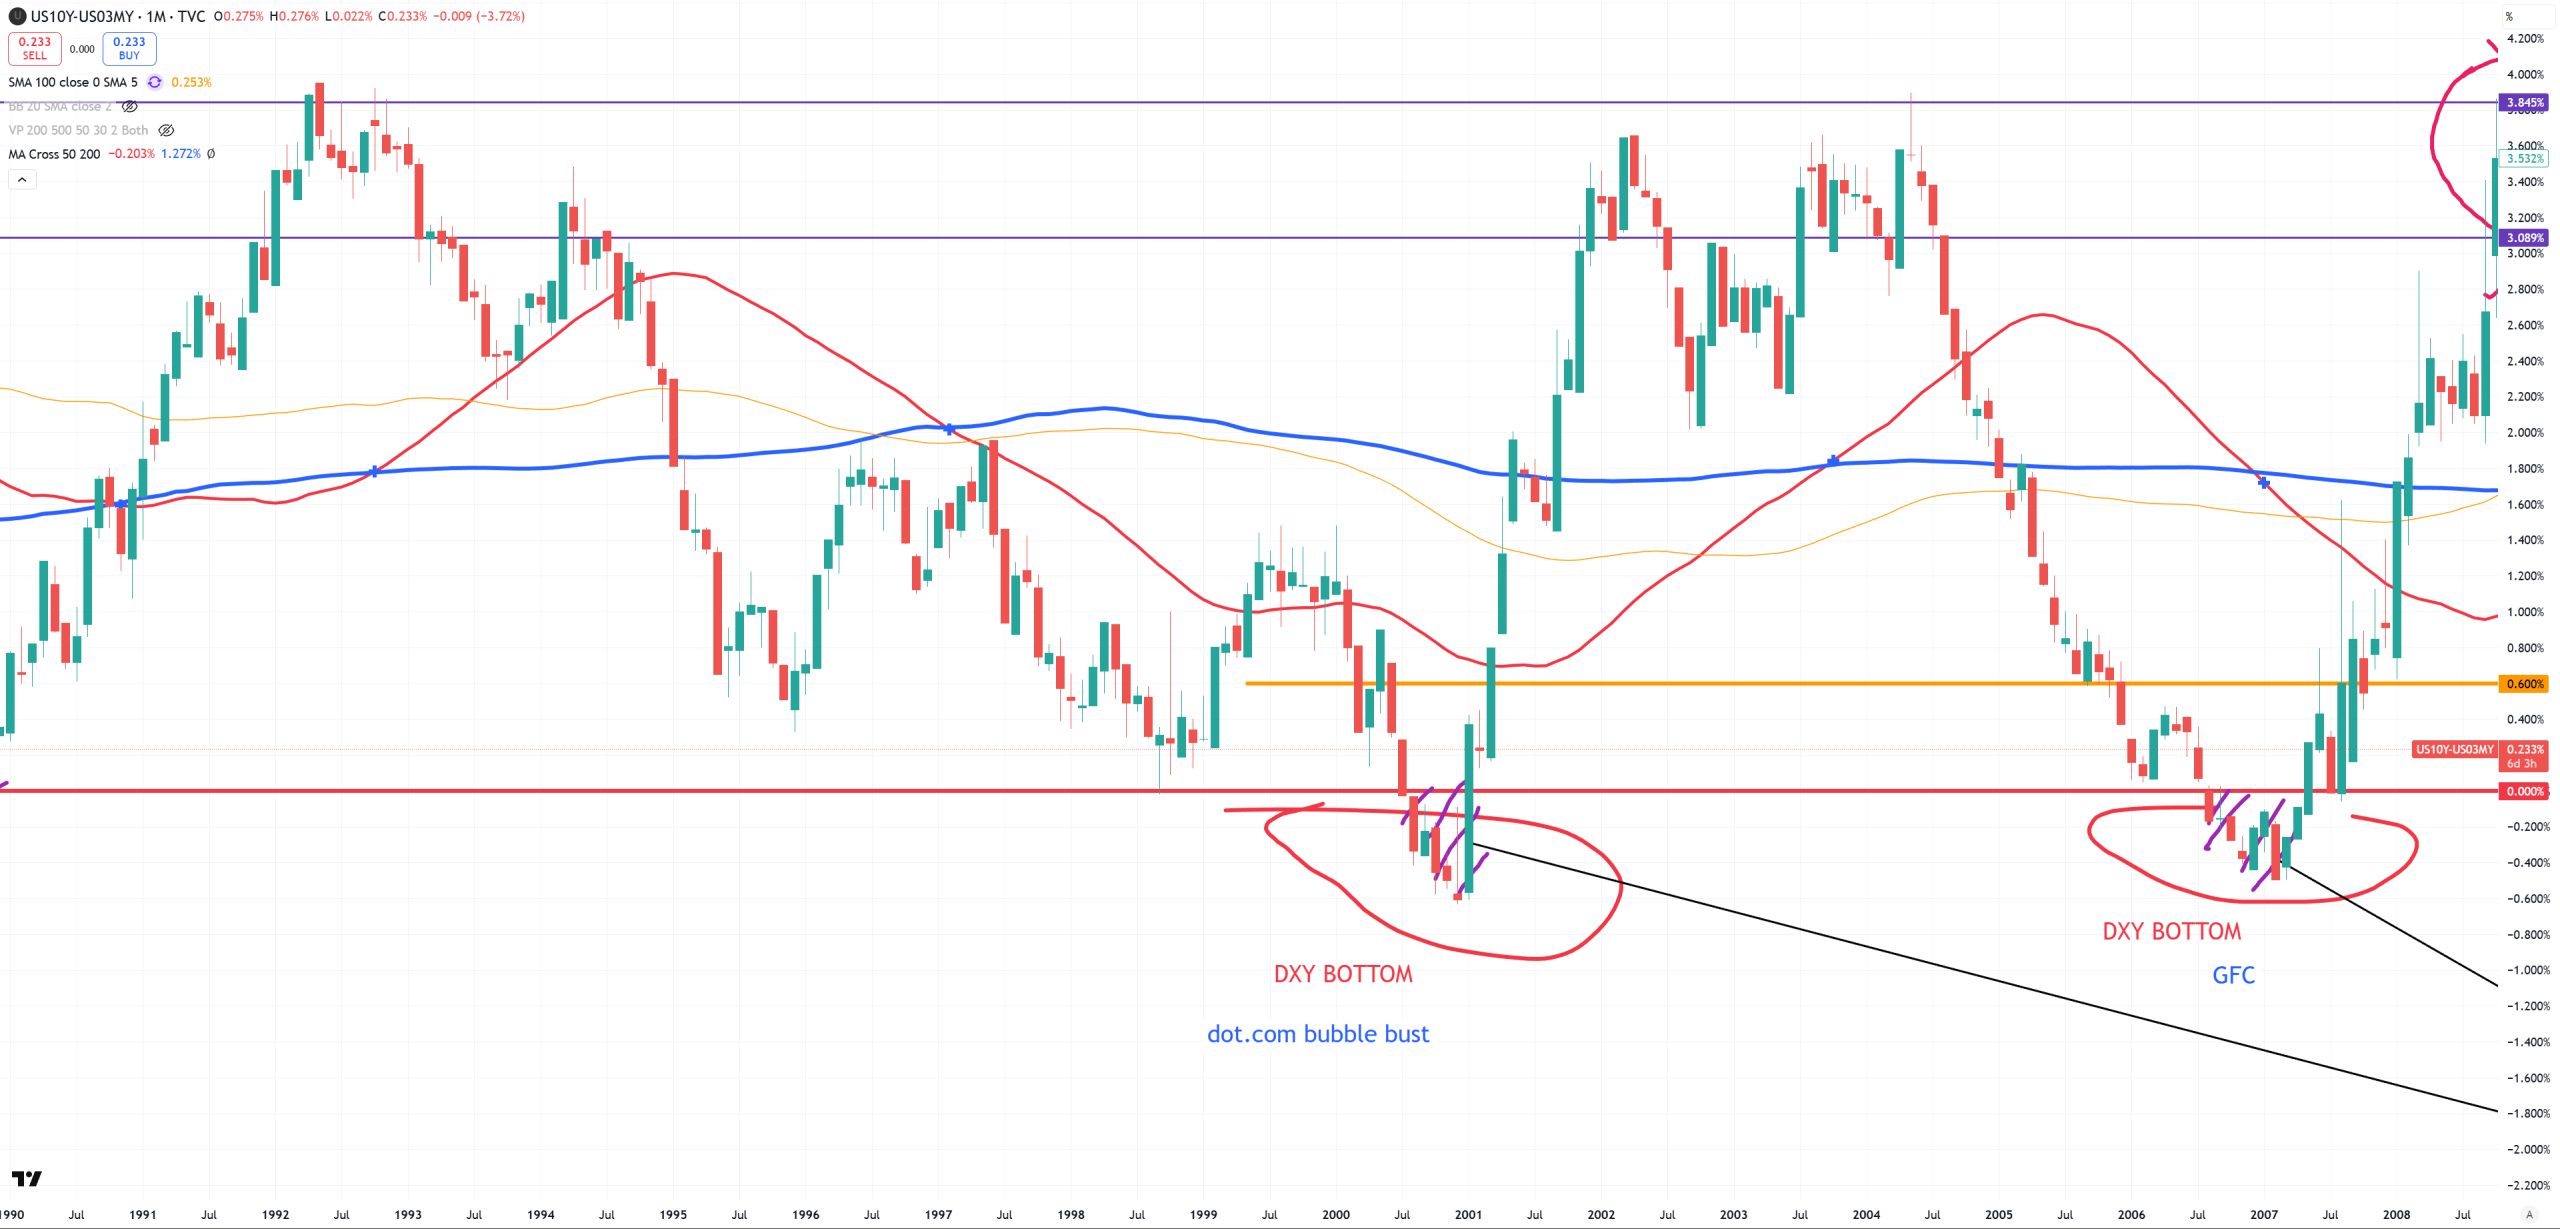
SPX – April 1998 is marked on the chart below. The moment US03MY crossed down (M)MA50. That wasn’t exactly peak but that was a peak if we EXCLUDE all wicks on (M) candles.
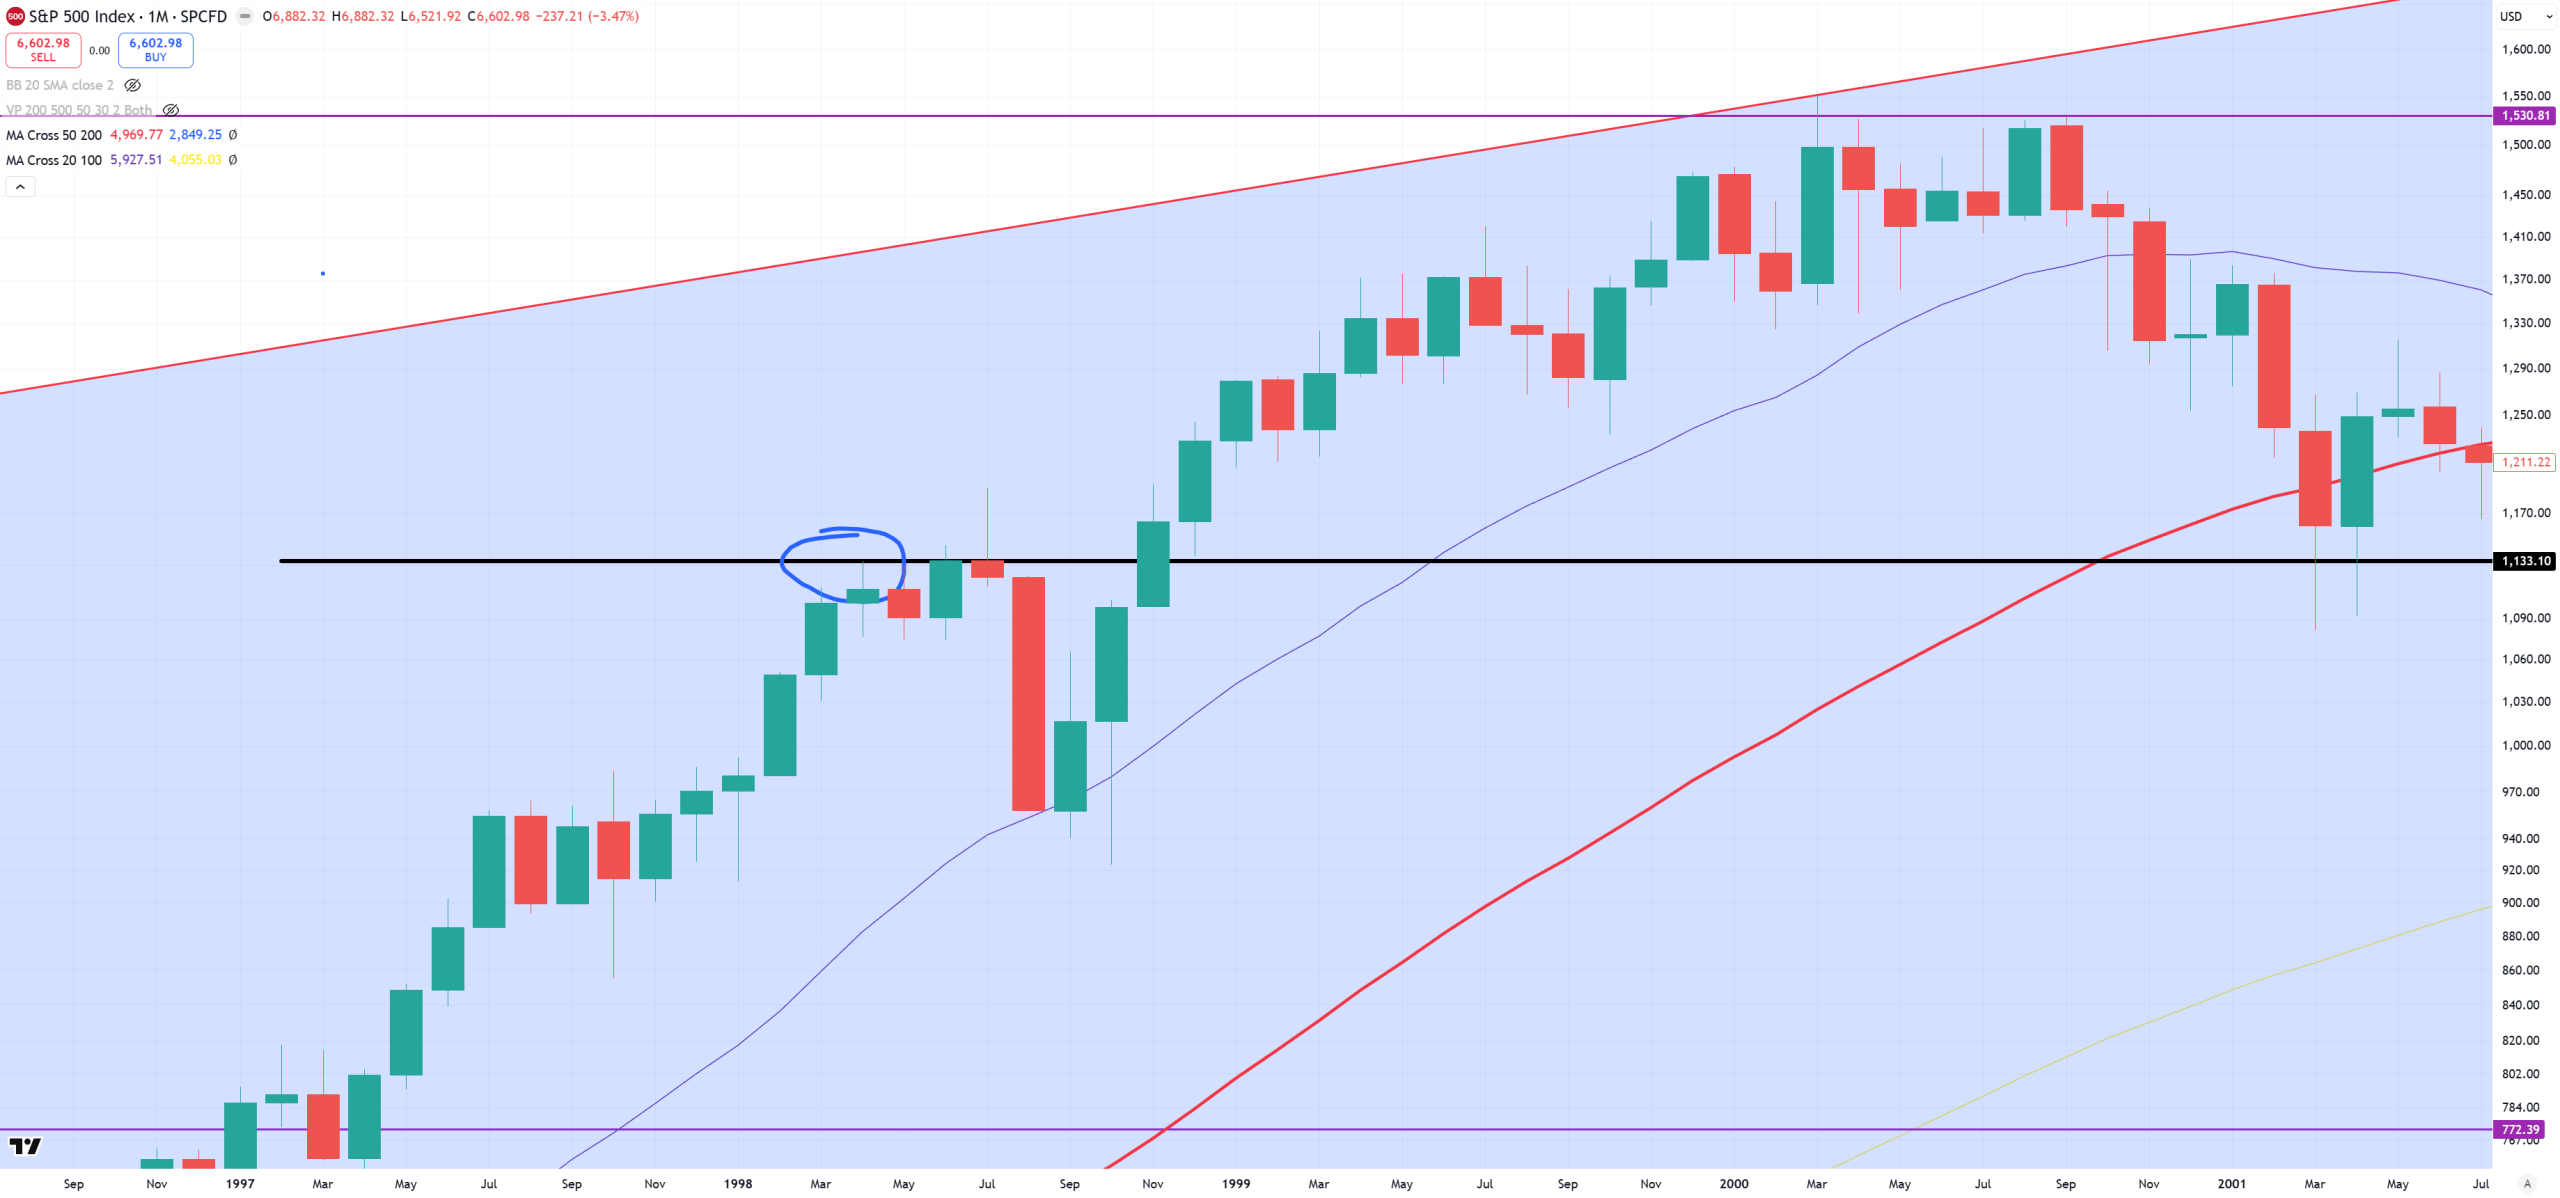
In reality market made +5% above this April 1998 level in July 1998 and crashed till the end of 1998. Look that in reality we did not have ANY touch to red (M)MA50. Just violet (M)MA20. We need to remind my intepretation of key (M)MAs from a long term investment thesis :
violet (M)MA20 – high momentum bull/bear market, possible trend flip once broken
red (M)MA50 – border between bull/bear market
yellow (M)MA100 – middle point – often a bull/bear trap last level
blue (M)MA200 – secular bull/bear market.
In 1998 crash we just hit (M)MA20 – that was just a very minor correction if we just reached (M)MA20.
Summary and current cycle
So 1999 was a moment where the market managed to save the cycle almost at the end of it. We see that on just -1bps on 10y/3m that cycle was coming to an end, and we see that on DJI/GOLD & SPX/GOLD and 1929-1966 trend touching. Market was far from (M)MA50 touch on both SPX and NDX and just hit violet (M)MA20 signaling still high momentum bull market. From the other hand DJI/GOLD & SPX/GOLD was flashing red that the cycle was coming to an end.
So can we find 1999 year in current cycle? And can 1999 year be still ahead of us? Let’s try to answer using exactly same methodology.
First we need to find late cycle. We all know from DJI/GOLD & SPX/GOLD that between 2018 (DJI/GOLD peak) and late 2021 (SPX/GOLD peak) cycle started to peak. While its way more easy to see this permanent peak on DJI/GOLD, SPX/GOLD was mostly flat between 2018 and even 2024!!! That’s like 6 years. During 2000 peak this ratio was peaking like 2 years on DJI/GOLD from April 1999 till April 2001.
When 10Y/3M was close to inversion (or in relatively minor inversion), the same time US03MY crashed below (M)MA50?
We can see that late 2019-2020 we see small inversion. It’s of course much higher than during 1998 before the crash and the start of famous 1999. During that period of time COVID crash occured :
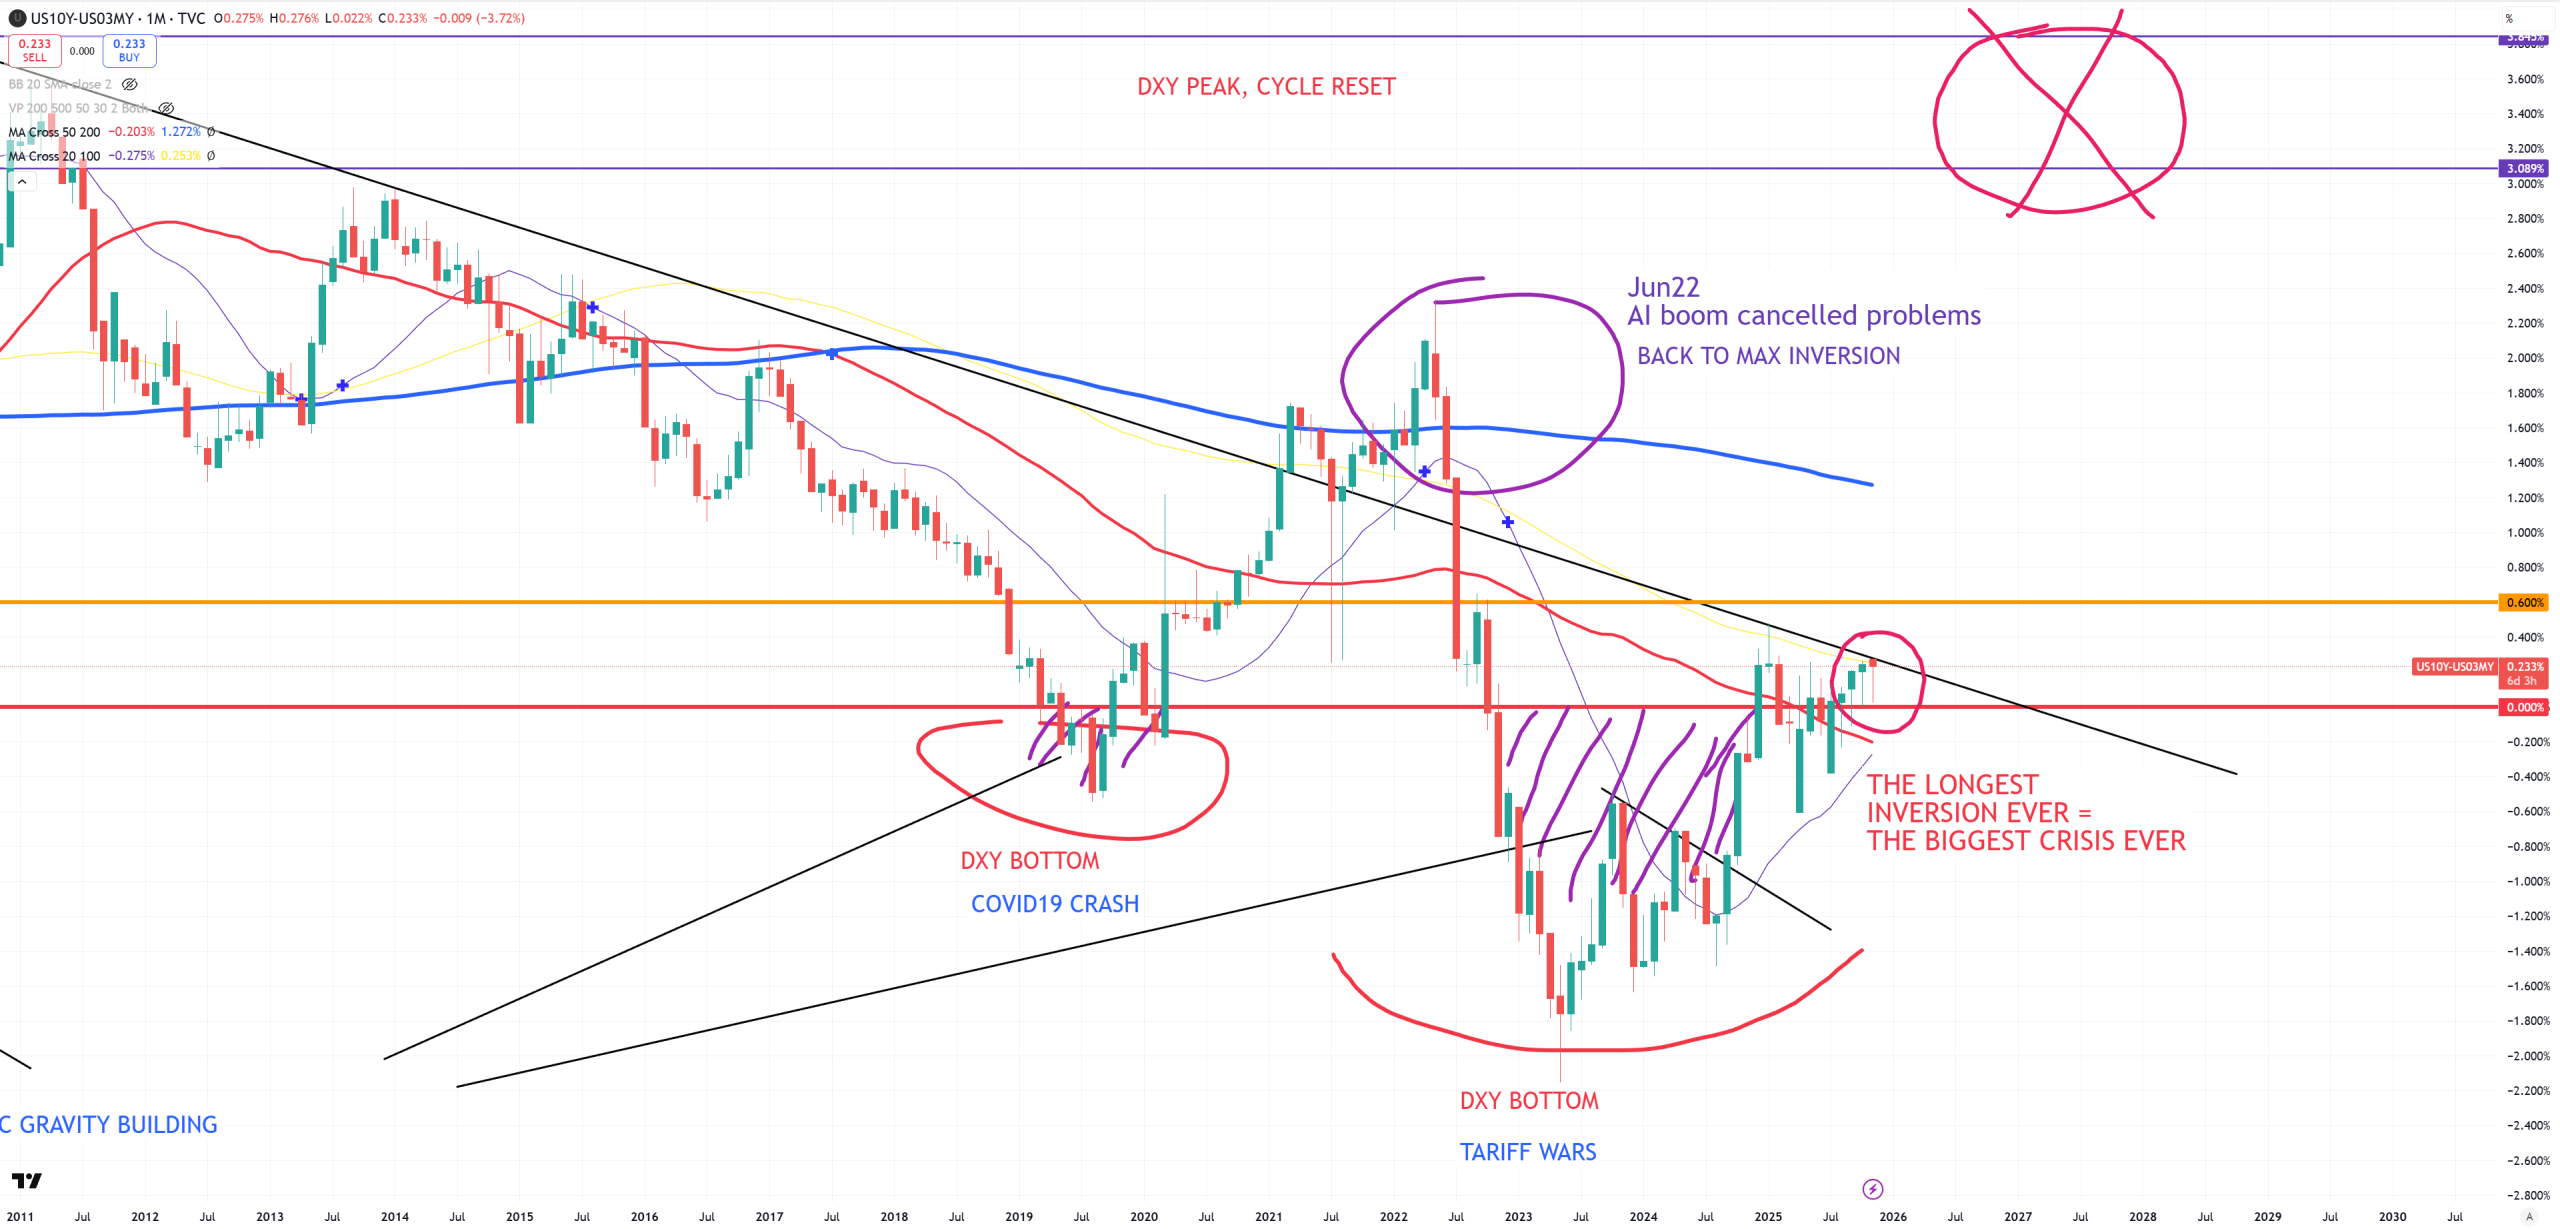
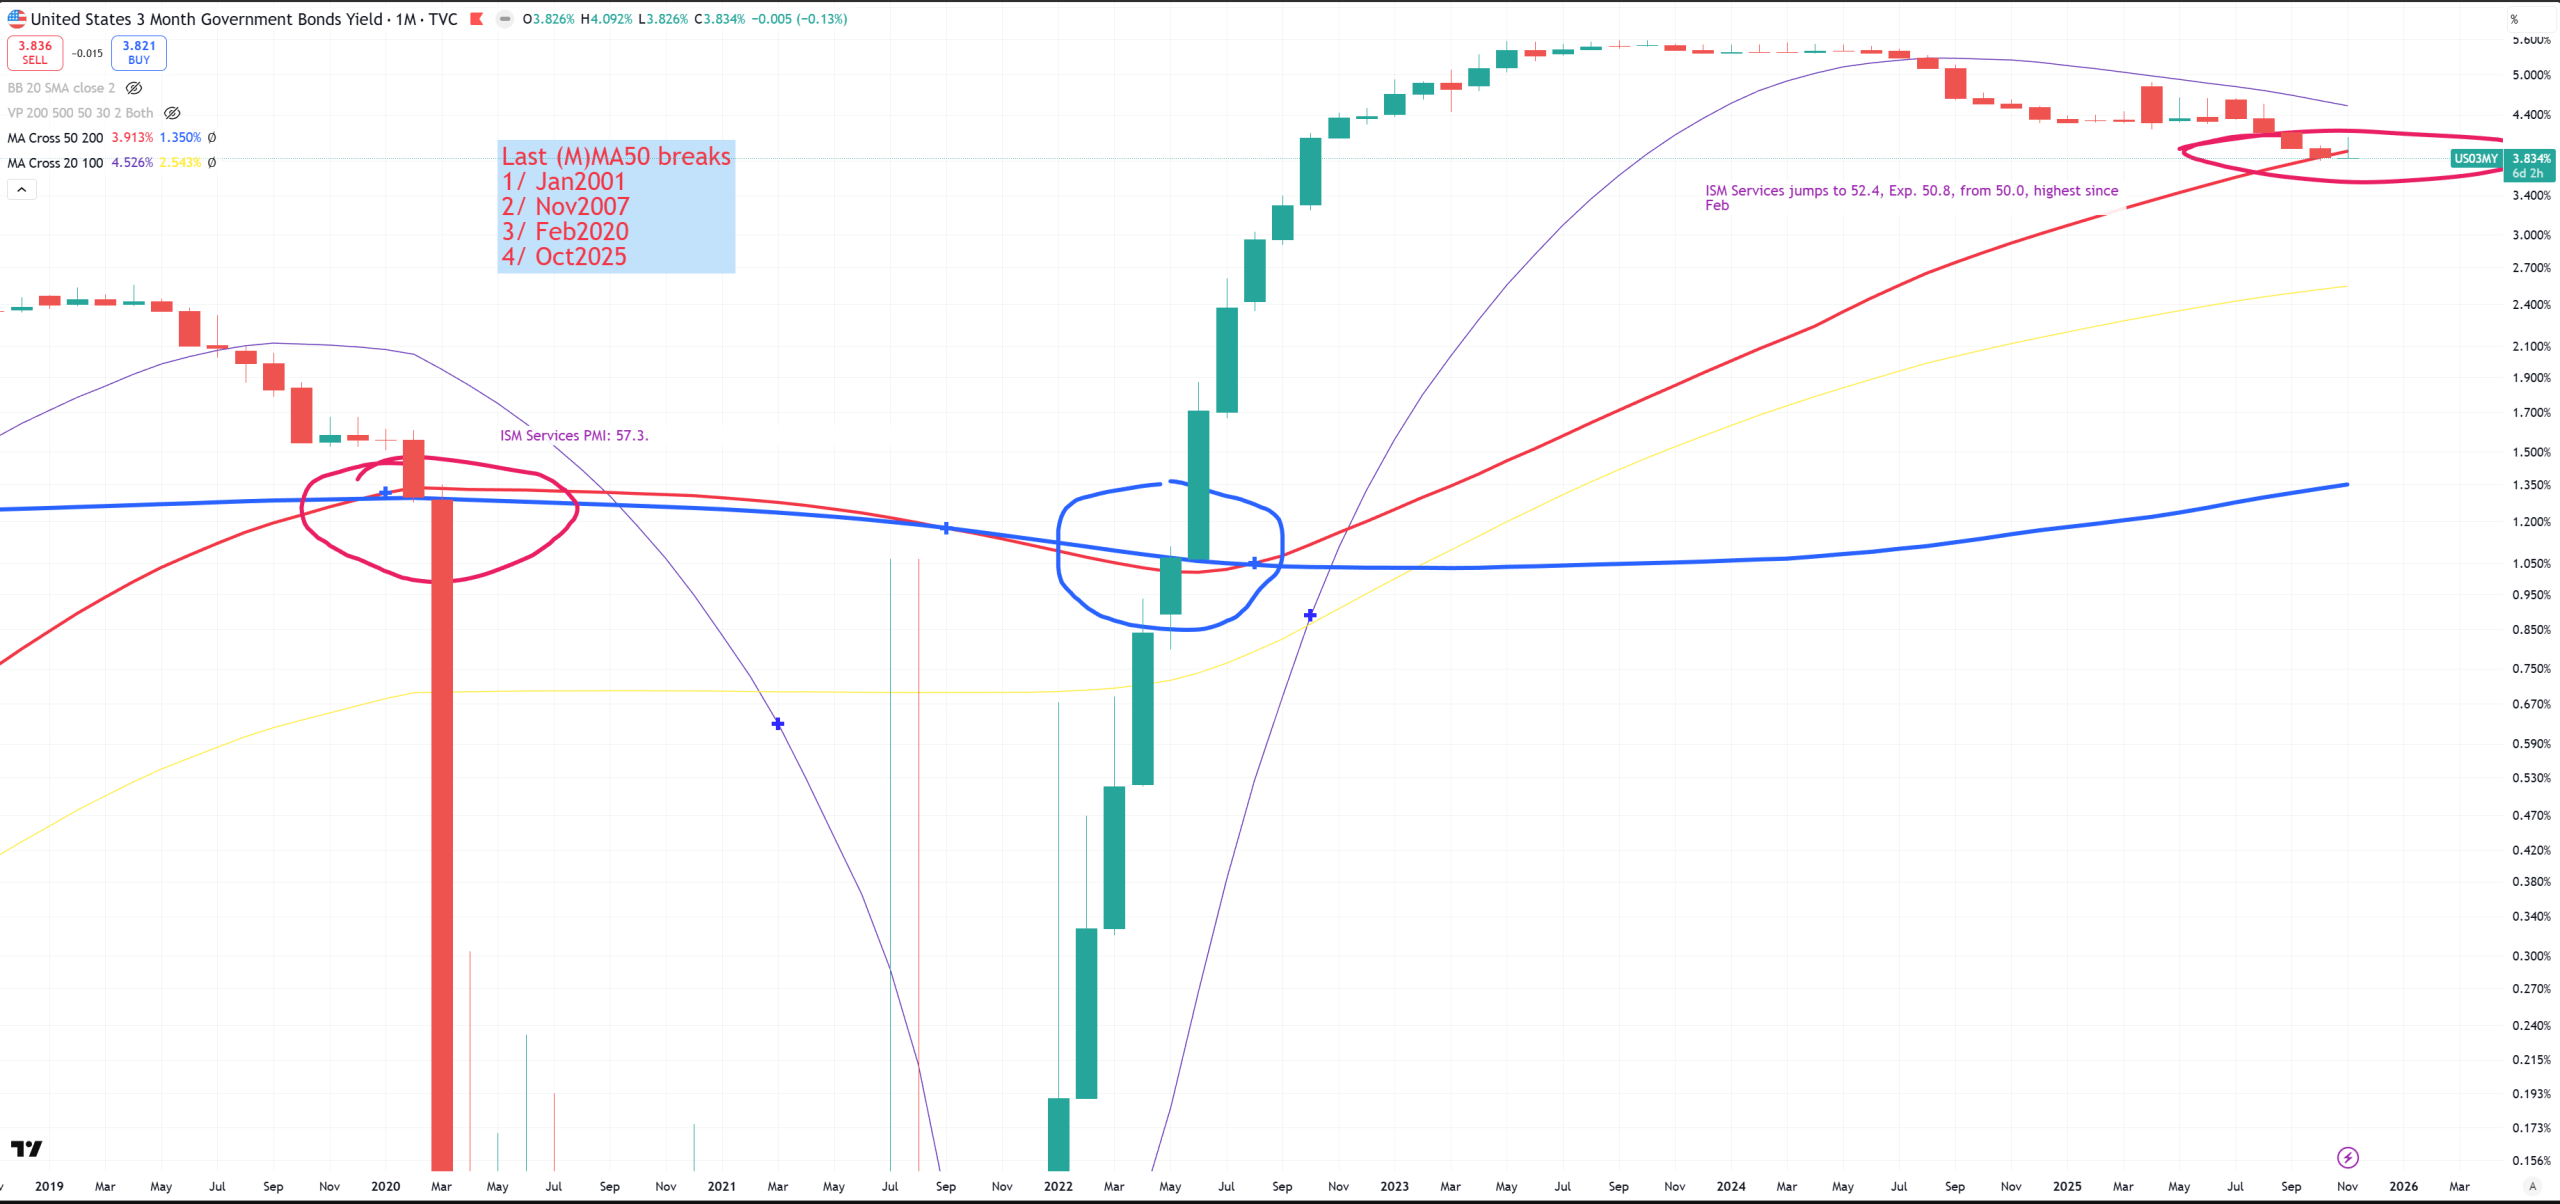
Let’s check US03MY – February 2020 is the moment we crossed below (M)MA50.
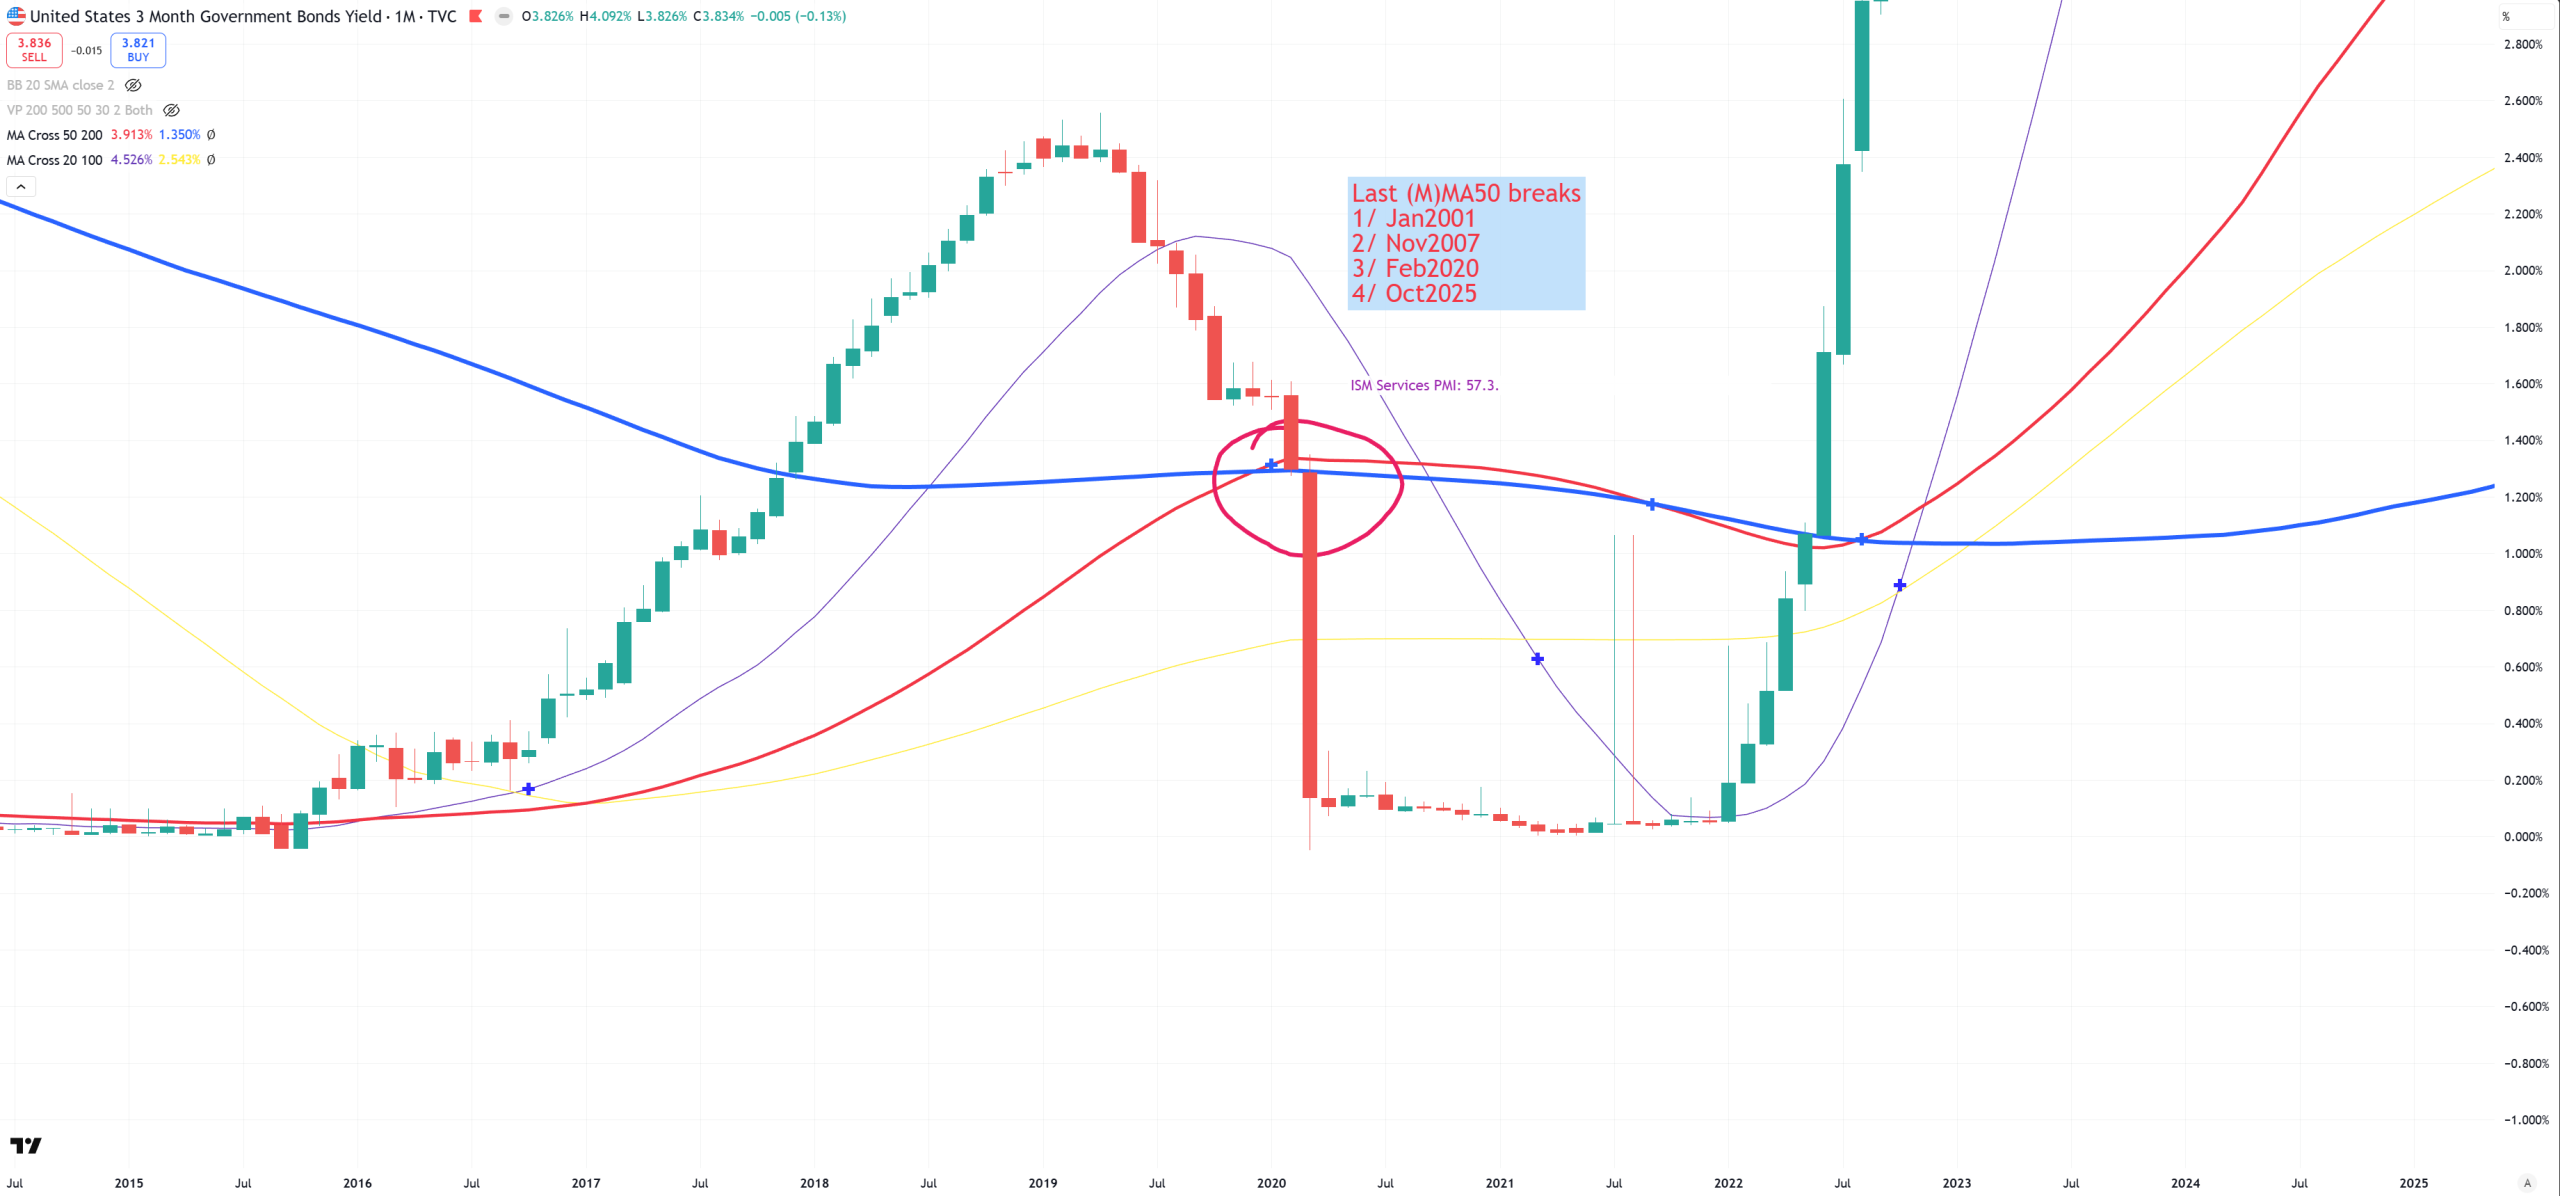
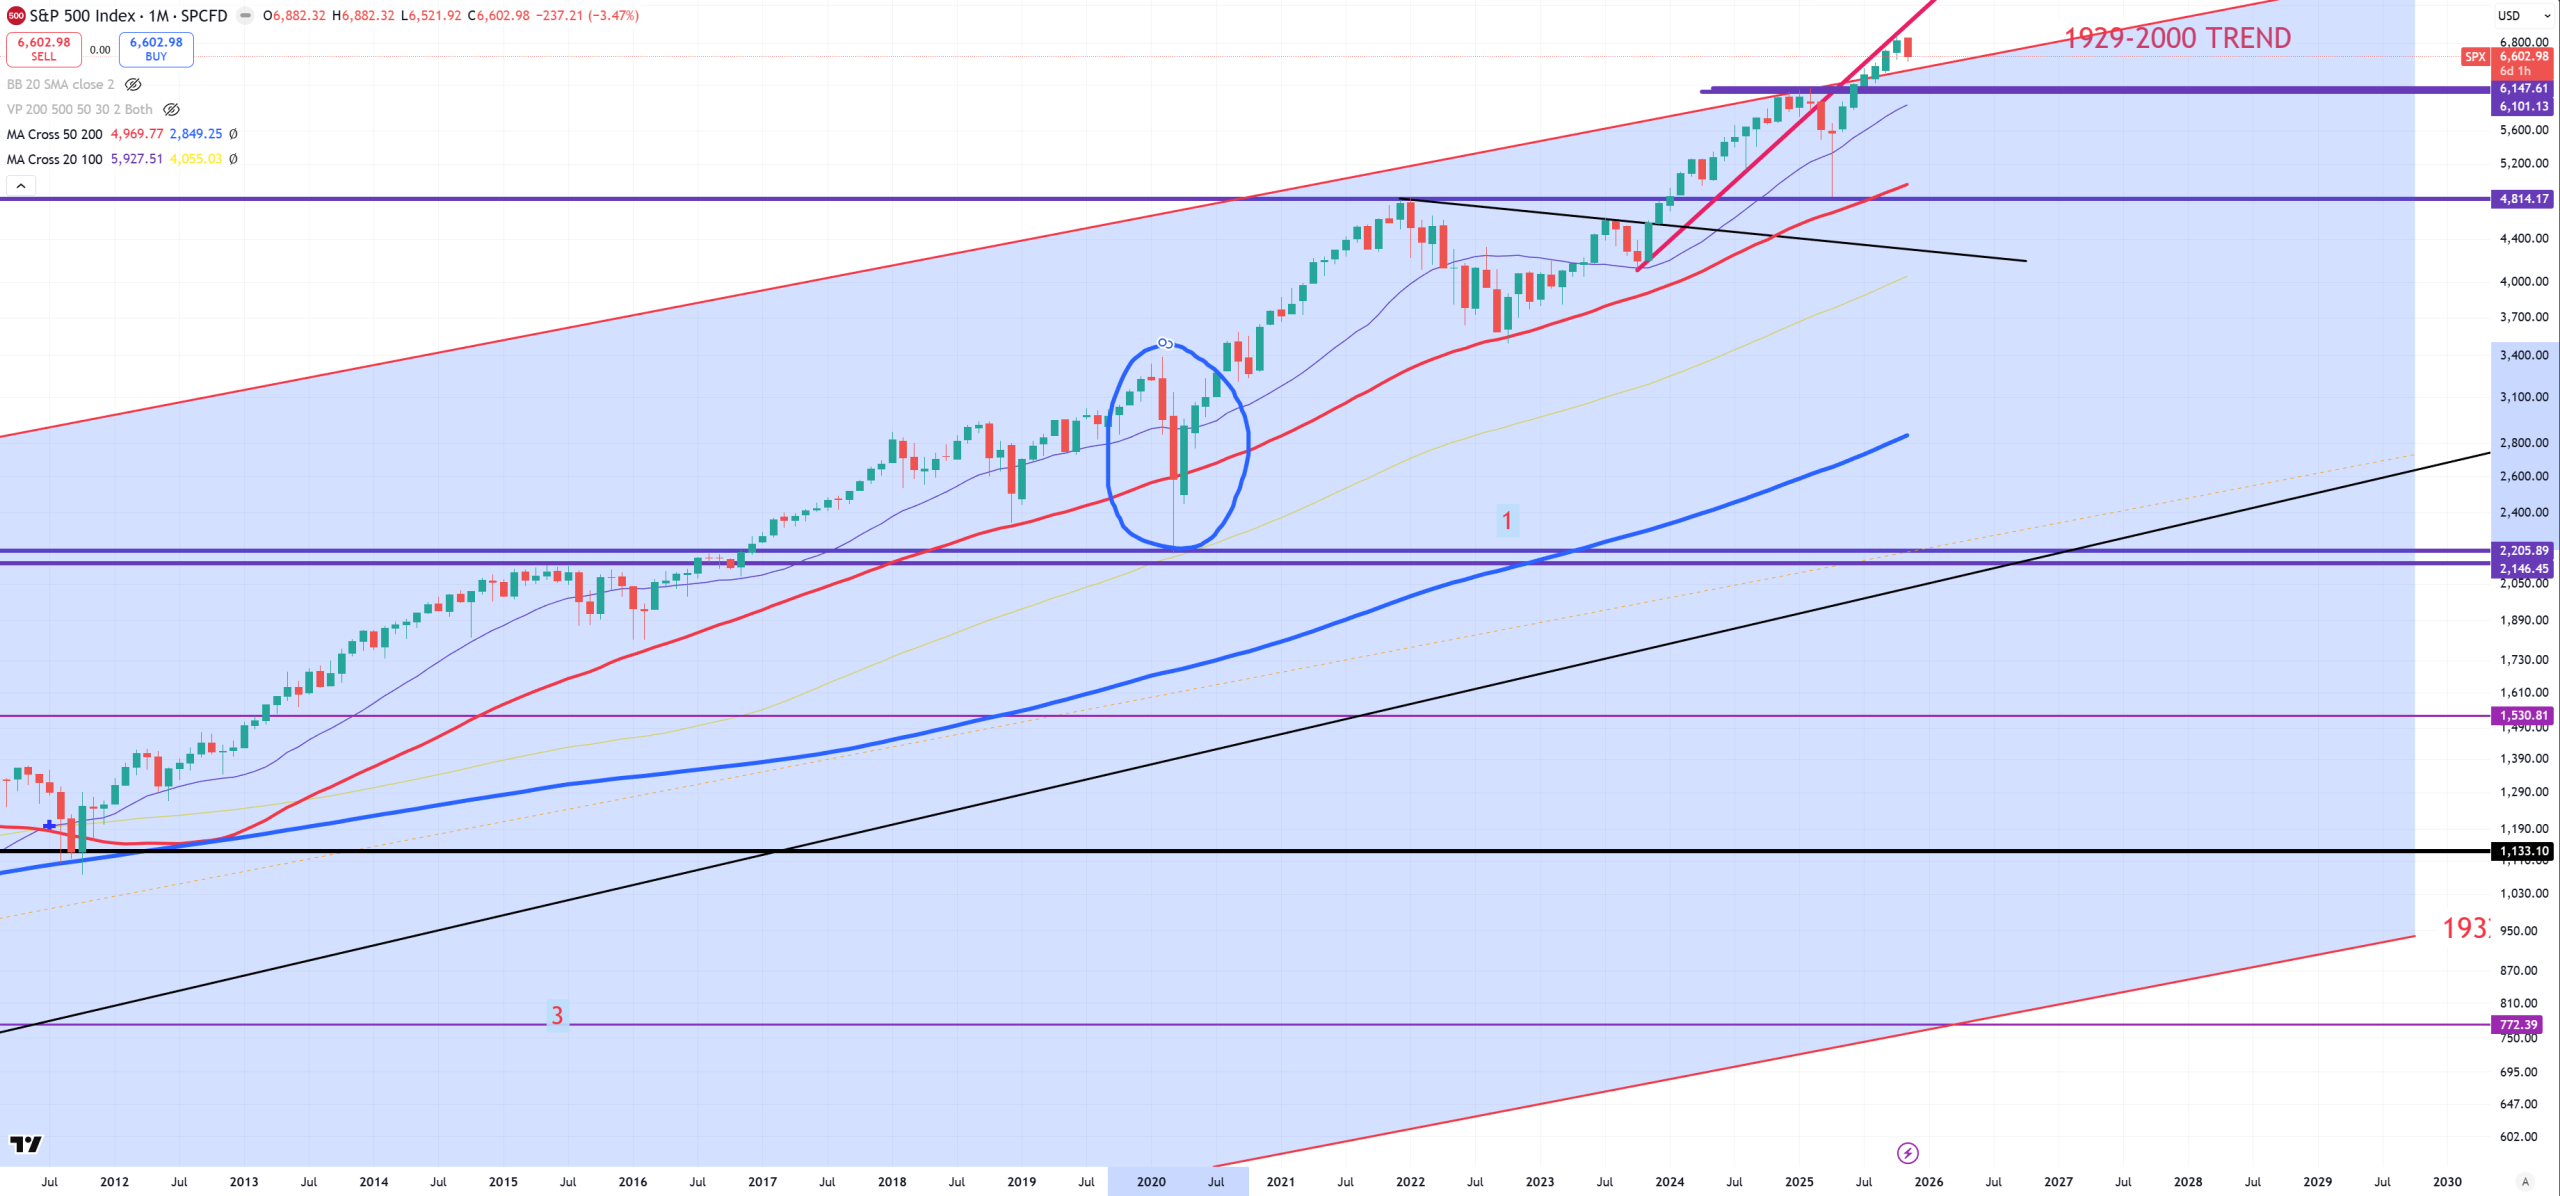
During that time SPX managed to tank to red (M)MA50. So correction was way deeper than during 1998. This level was hold. Bull market structure was hold.
In June 2022 US03MY crossing up (M)MA50 signalling bull market back again :
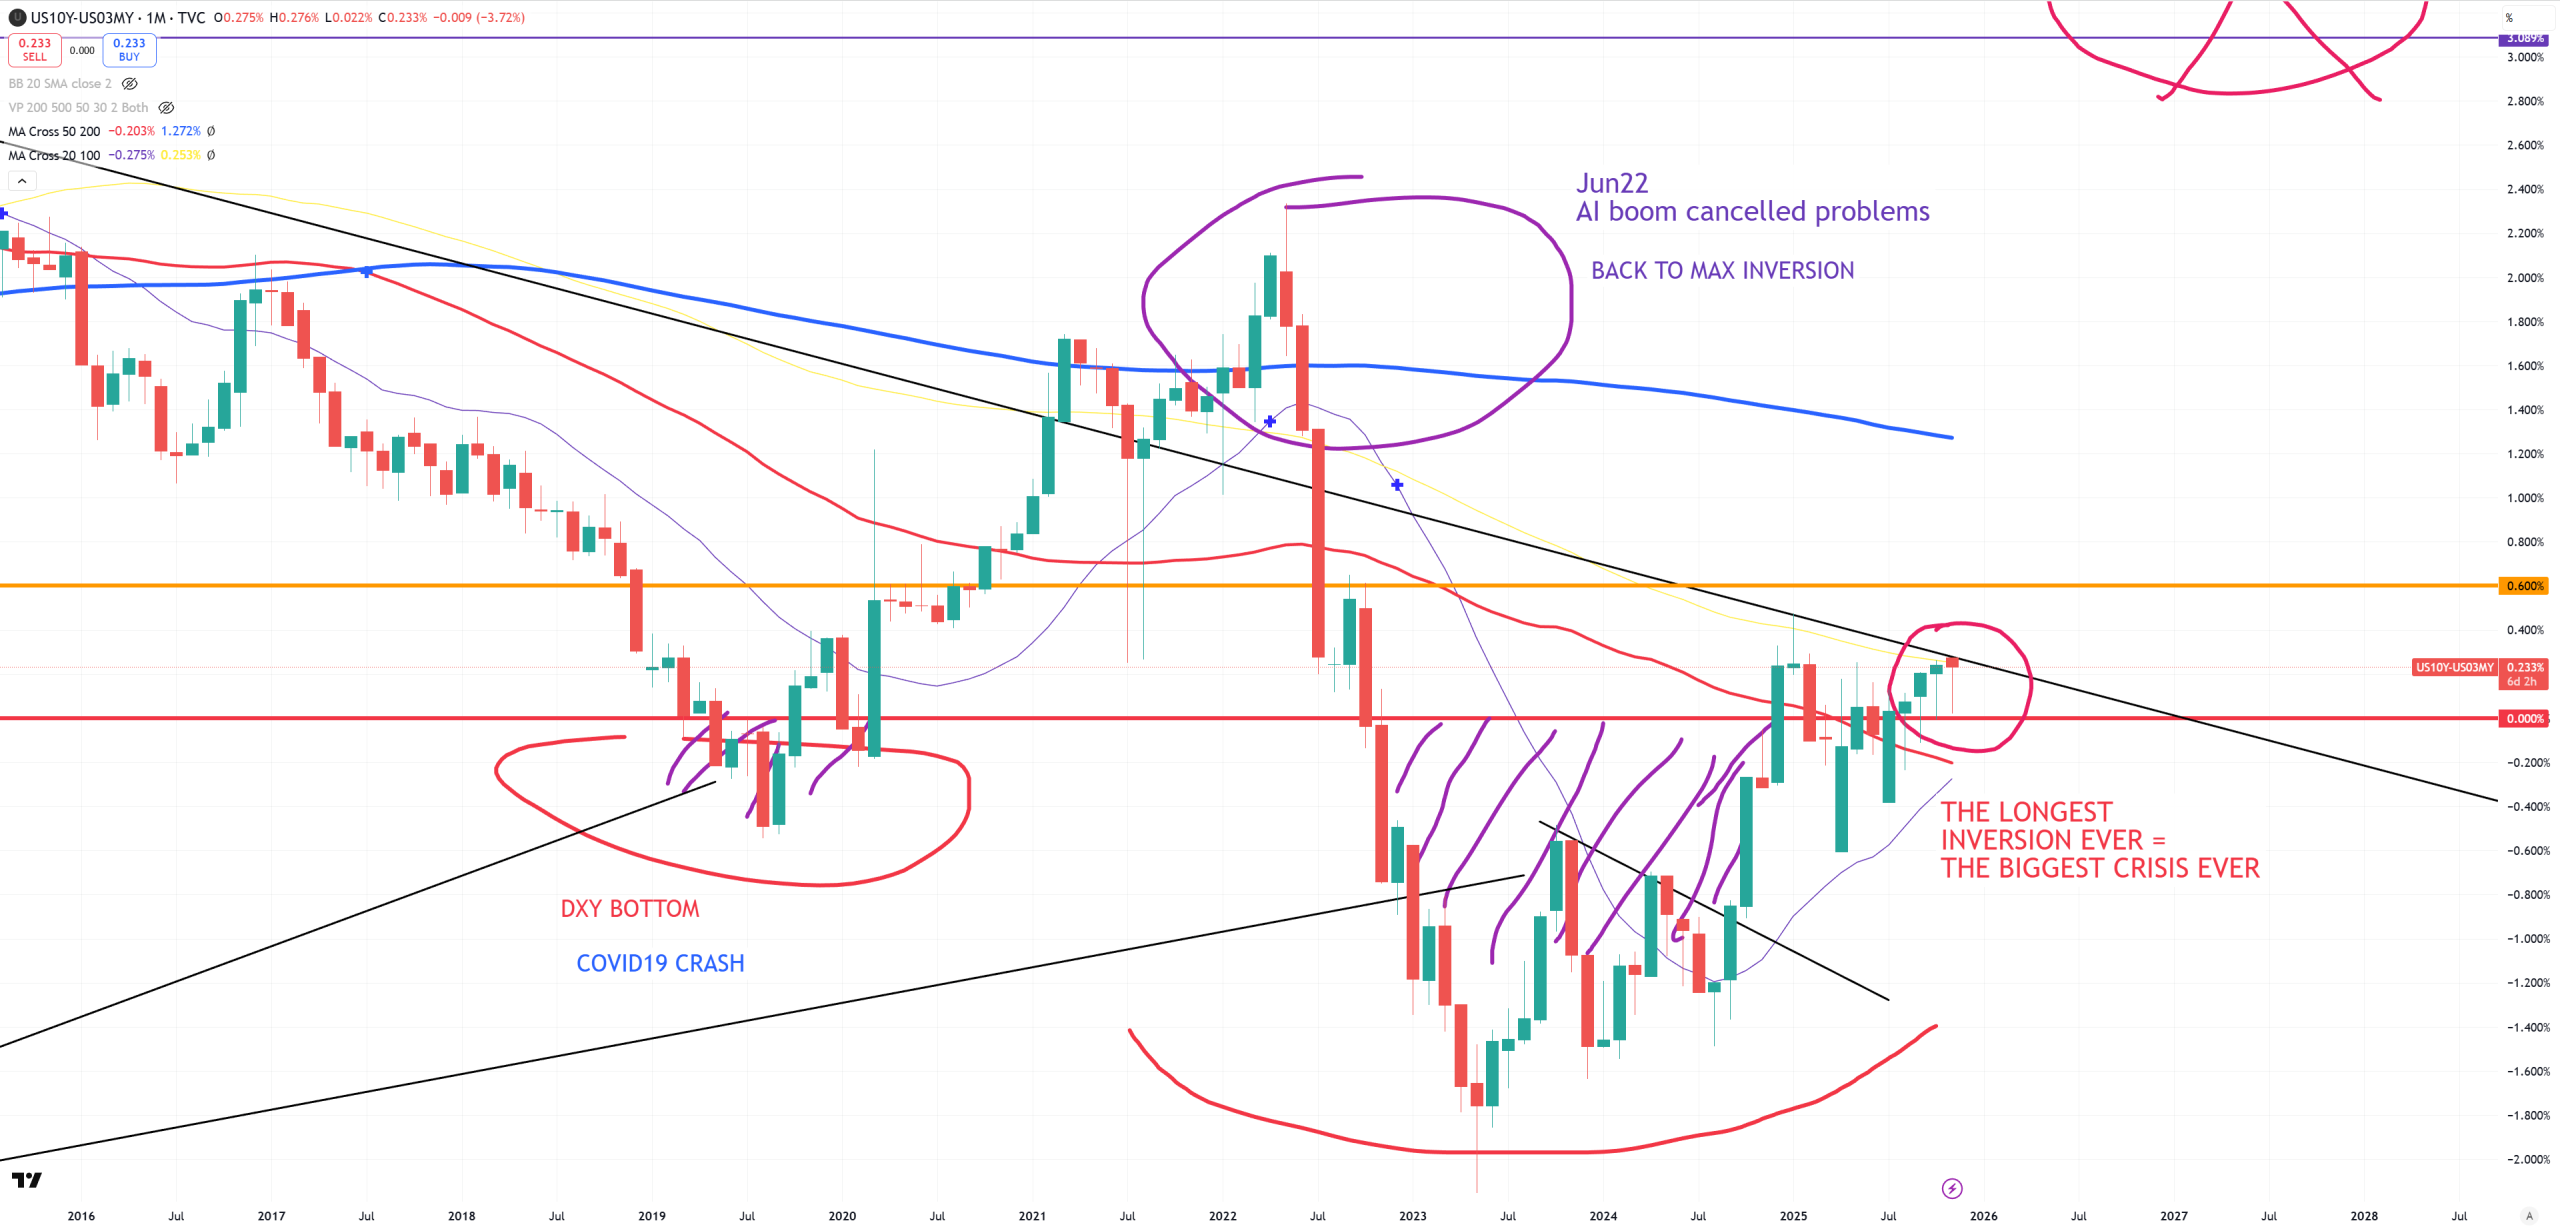
And the same time 10Y/3M crashed back to bigger inversion as AI boom cancelled the problems.
Lets call 2020 as 1999
So comparing 1999 to current cycle can’t be done in 100% mostly because of very small 1998 correction to just (M)MA20, but we can clearly make an assumption that 1999 year in current cycle is … 2020. All signals are the same with just one difference. 1998 was way weaker correction in the same bull market than 2020, but both 1998 & 2020 might have led to bear market without some kind of magic “save” to push US03MY back above (M)MA50 and crashing 10Y/3M back to inversion. Can we get another save? Of course we can, but my assumption is the longer 10Y/3M remains inverted or around being inverted the more gravity we add to the economy. With 1100 days around inversion not crossing +60bps we have already beaten 1929 record with 700 days. We will need a big miracle to save the cycle this time.