Gold is approaching to a massive 50Y momentum break. Can we predict the price of gold based on technical charts? We’ll try.
January 14, 2025

Once again I’d like to remind you a main thesis that gold plays the game when big cycles are about to change. Gold plays the same main role when cycle flips from secular inflation to secular disinflation (through secular stagflation) as a flip from secular disinflation to secular inflation (through deflation).
You can see that on lots of big charts, starting from my favorite Kondratiev cycle, you see in both quarters which are considered “transition period” : Deflation and Runaway inflation there’s gold as a main best return asset.
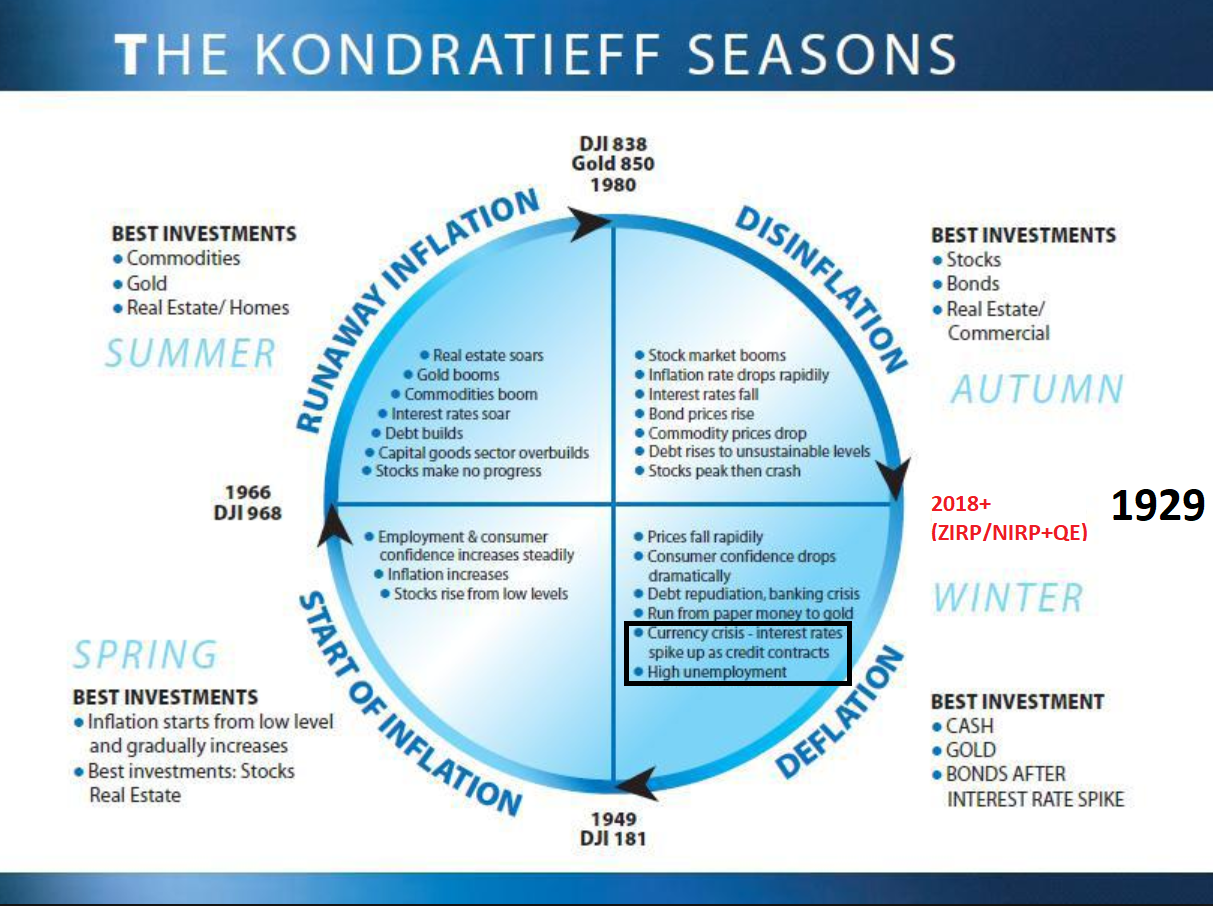
But not only this chart says that, let’s take a look on key ratios like SPX/GOLD (DJI/GOLD points for the same).
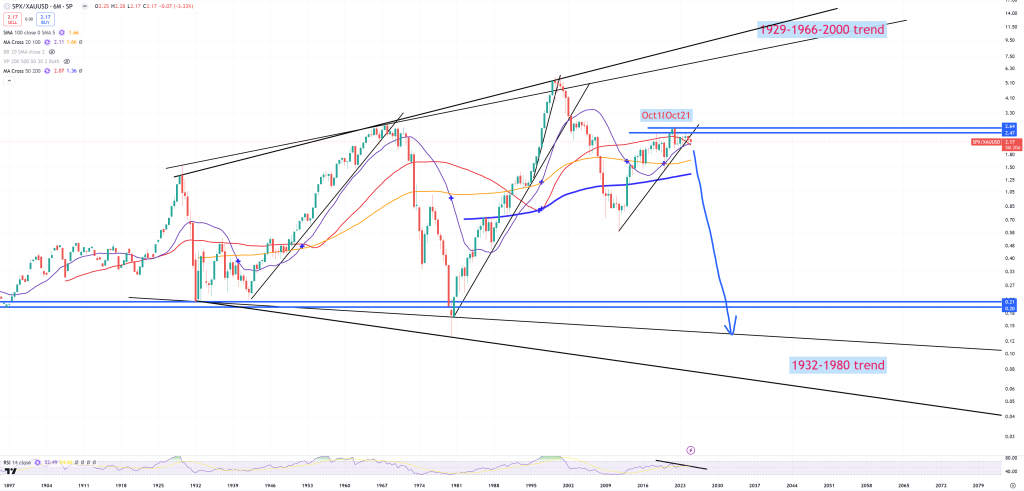
SPX/GOLD
So far we’re interested in lower possible point of the 1932-1980 trend line. The worst case points to 0.07 (bolded black trend line), later 0.14 (black trend line) and 0.21 support. Those differences in ratios are huge. We see that in 2011 where ratio stopped going down from 2000 peak probably without tons of QE we would have gone directly to lower trend as economy would have collapsed and big cycle would have been restarted. QE reversed the collapse and bought so far a bounce in SPX/GOLD towards ~2.5 value resistance level which was “peaking” between 2018-2021 and in 2024 it broke the trend. Have in mind that lower trend 1932-1980 in 2011 was much higher than in 2024 what gives us a hint that the longer we go the worse it will be unless we consider flat support level = 0.21. 0.07 and 0.14 are not flat levels, so the longer we go the lower they are in time = bigger problems.
Based on this assumption and logically thinking the longer we go and more we print it should be even worse so this 0.21 level probably isn’t valid (for now) and we’ll take it out from our consideration for a moment. So we left with two possibilities 0.07 or 0.14.
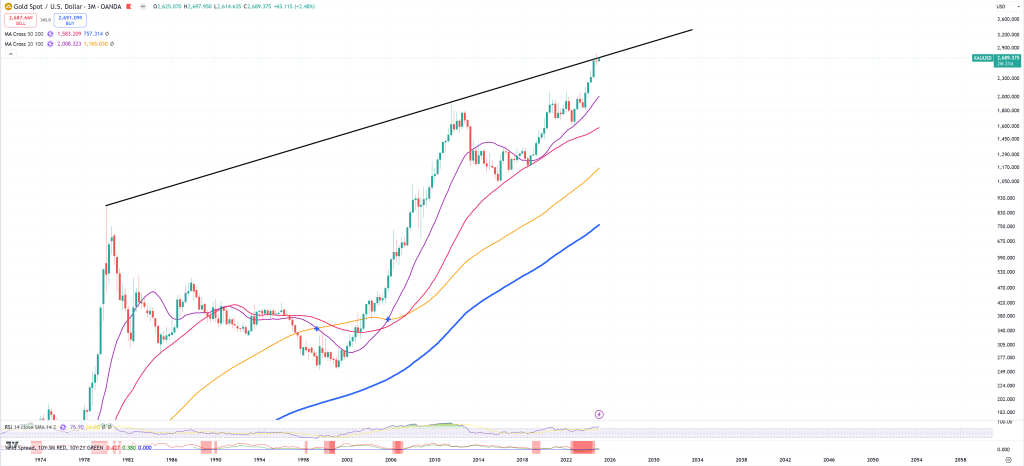
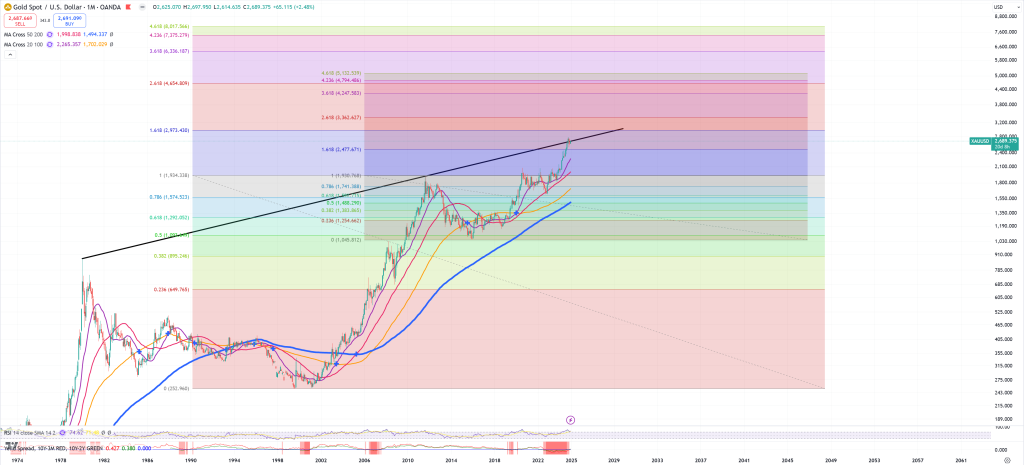
GOLD
Here we have a massive trend line on 1980-2011 peaks and in 2024 we hit this trend line too. Have in mind that SPX/GOLD broke the trend what gives us high probability this GOLD secular trend will be broken, as at some point of time SPX/GOLD will revisit 0.07/0.14 level. The problem is I can’t really find any good valid channel for gold, so this trend line is super important.
SPX
SPX channel is very obvious, if we take 1929-2000 peaks and make a symmetric channel, we’re going to see the bottom line of the symmetric channel also finds a perfect match of two bottoms : 1932 and 1942 years in red circles :
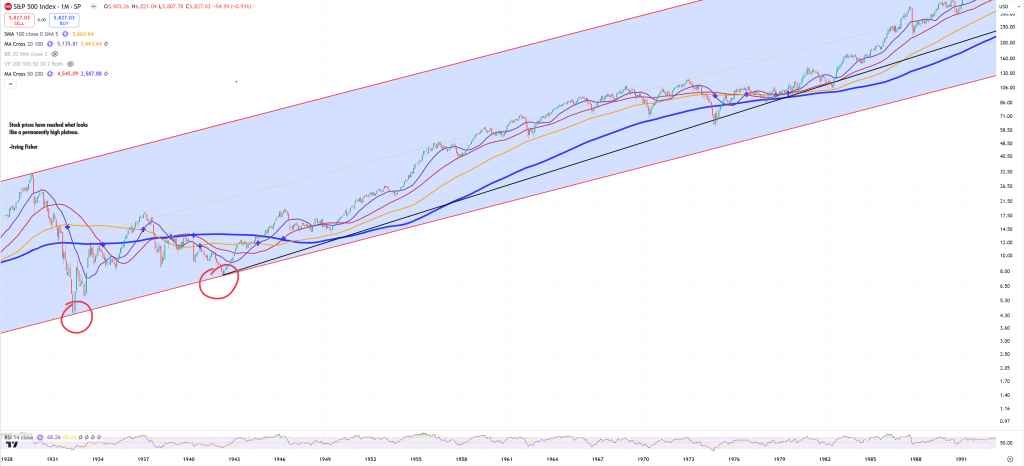
We need to say here that in 1980 where we had a 2nd point of a trend from SPX/GOLD, we don’t have any meaningful point in this year on SPX chart, but in 1980 we had a massive break of resistance which was holding the market since 1968. So when SPX/GOLD was making a bottom in 1980, SPX was breaking its secular resistance from 1968 (12Ys resistance) (Kondratieff “Runaway inflation” point : Stocks make no progress example) :
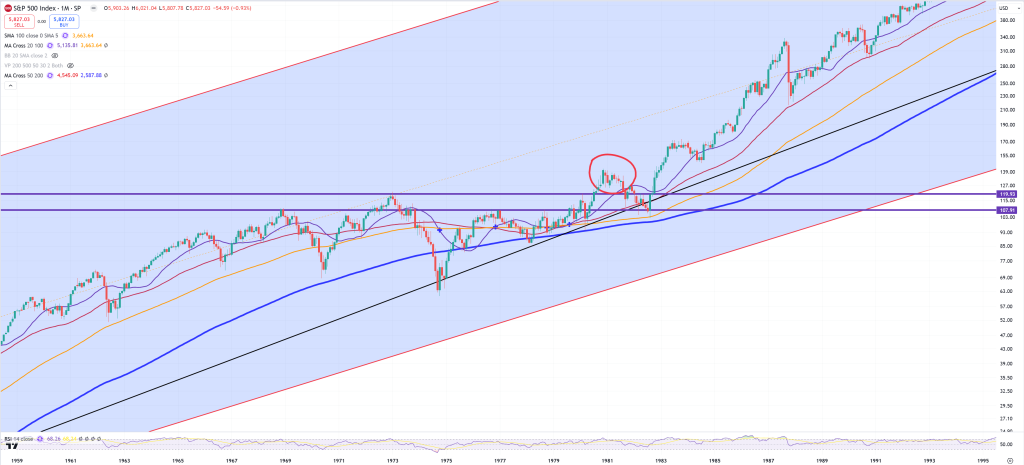
Later we had a retest and new secular bull market where red (M)MA50 was not broken until 2001. From time perspective we can say since 1980 we hade a massive bull market (based on technical definition) and first true bear market kicked in 2001 when market broke (M)MA50 (red circle below) :
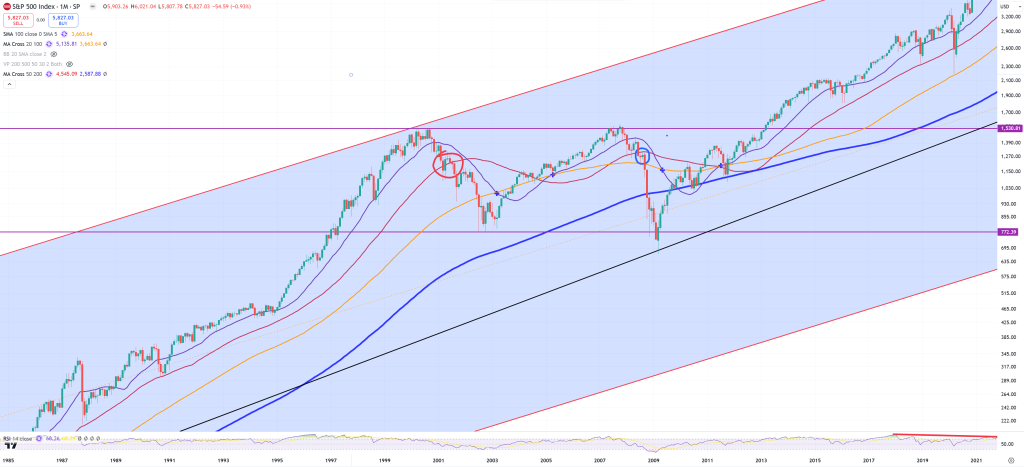
Today market is caught by 1929-2000 trend line exactly around 6080. You see that once (M)MA50 was broken up in 2011 (the same moment SPX/GOLD found a bottom) market still runs in the same technical bull market as (M)MA50 was never broken, but looking on this chart below we need to set some key points/support levels and I think all of them are easy to be seen :
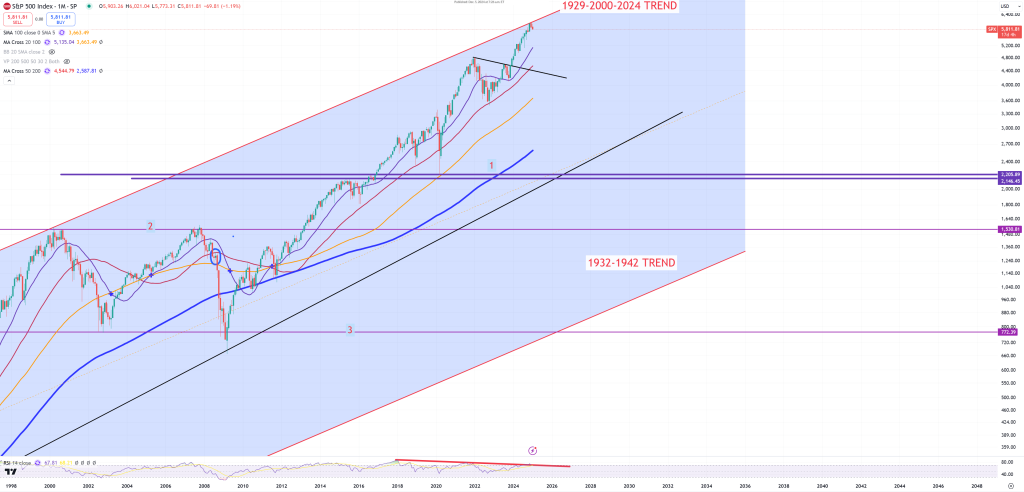
#1 First point is blue (M)MA200 and 2 horizontal dark violet lines support (which is also 2020 bottom and 2015 support), #2 second in support on 2001-2007 peaks and the third is the most hardcore one is #3 1932-1942 trend which is also crossing with possible triple bottom from 2002-2009 lows.
Let’s read the values, so in reality we have 3 vertical violet levels to be considered, so
- 2200
- 1500
- 800
Math
Now let’s do the math.
- 2200 / 0.07 = 31500$, 2200 / 0.14 = 15700$
- 1500 / 0.07 = 21500$, 1500/ 0.14 = 10800$
- 800 / 0.07 = 11500$, 800/ 0.14 = 5700$
Let’s even consider 0.21 level which we eliminated on the beginning
- 2200/0.21= 10500$
- 1500/0.21 = 7150$
- 800/0.21 = 3800$
Let’s take gold chart back and try some FIBO levels, the most IMO reliable one is this between 2011 peak and 2015 bottom. Highest 4.618 points towards ~5200$, but the one FIBO from 1999 bottom to 2011 peak points even up to 8000$
So let’s remove the lowest and highest values, so 3800$ and 31500$ are out and we’re back between 5700$-15700$ level. Considering the fact we’re now at 2700$ level that gives us something like +100% and +600%. Anyway it’s of course impossible to give an exact number, but we can clearly prove that gold might have a really nice possible longer term gains ahead.
[…] Gold is approaching to a massive 50Y momentum break. Can we predict the price of gold based on techn… […]