05/2025
April 30, 2025
Reminder about my interpretation : violet (M)MA20 = high momentum MA, red (M)MA50 = natural border between bull/bear technical moment, yellow (M)MA100 = some kind of middle point and junction, often a level of bull/bear trap level, blue (M)MA200 = secular bull/bear technical level.
You’ll see that a lot of stocks can’t really pass period between 2018 & 2021 level. They peaked around this level, what is mostly related to my SPX/GOLD and DJI/GOLD indicators which peaked between 2018-2021 level too and crashed in 2H2024 breaking the 2011 trend. Of course there’re stocks that making new ATHs after this period, but its rather a minority.
If you want to get a bigger view of the chart, you need to right click on it and open image in new window.
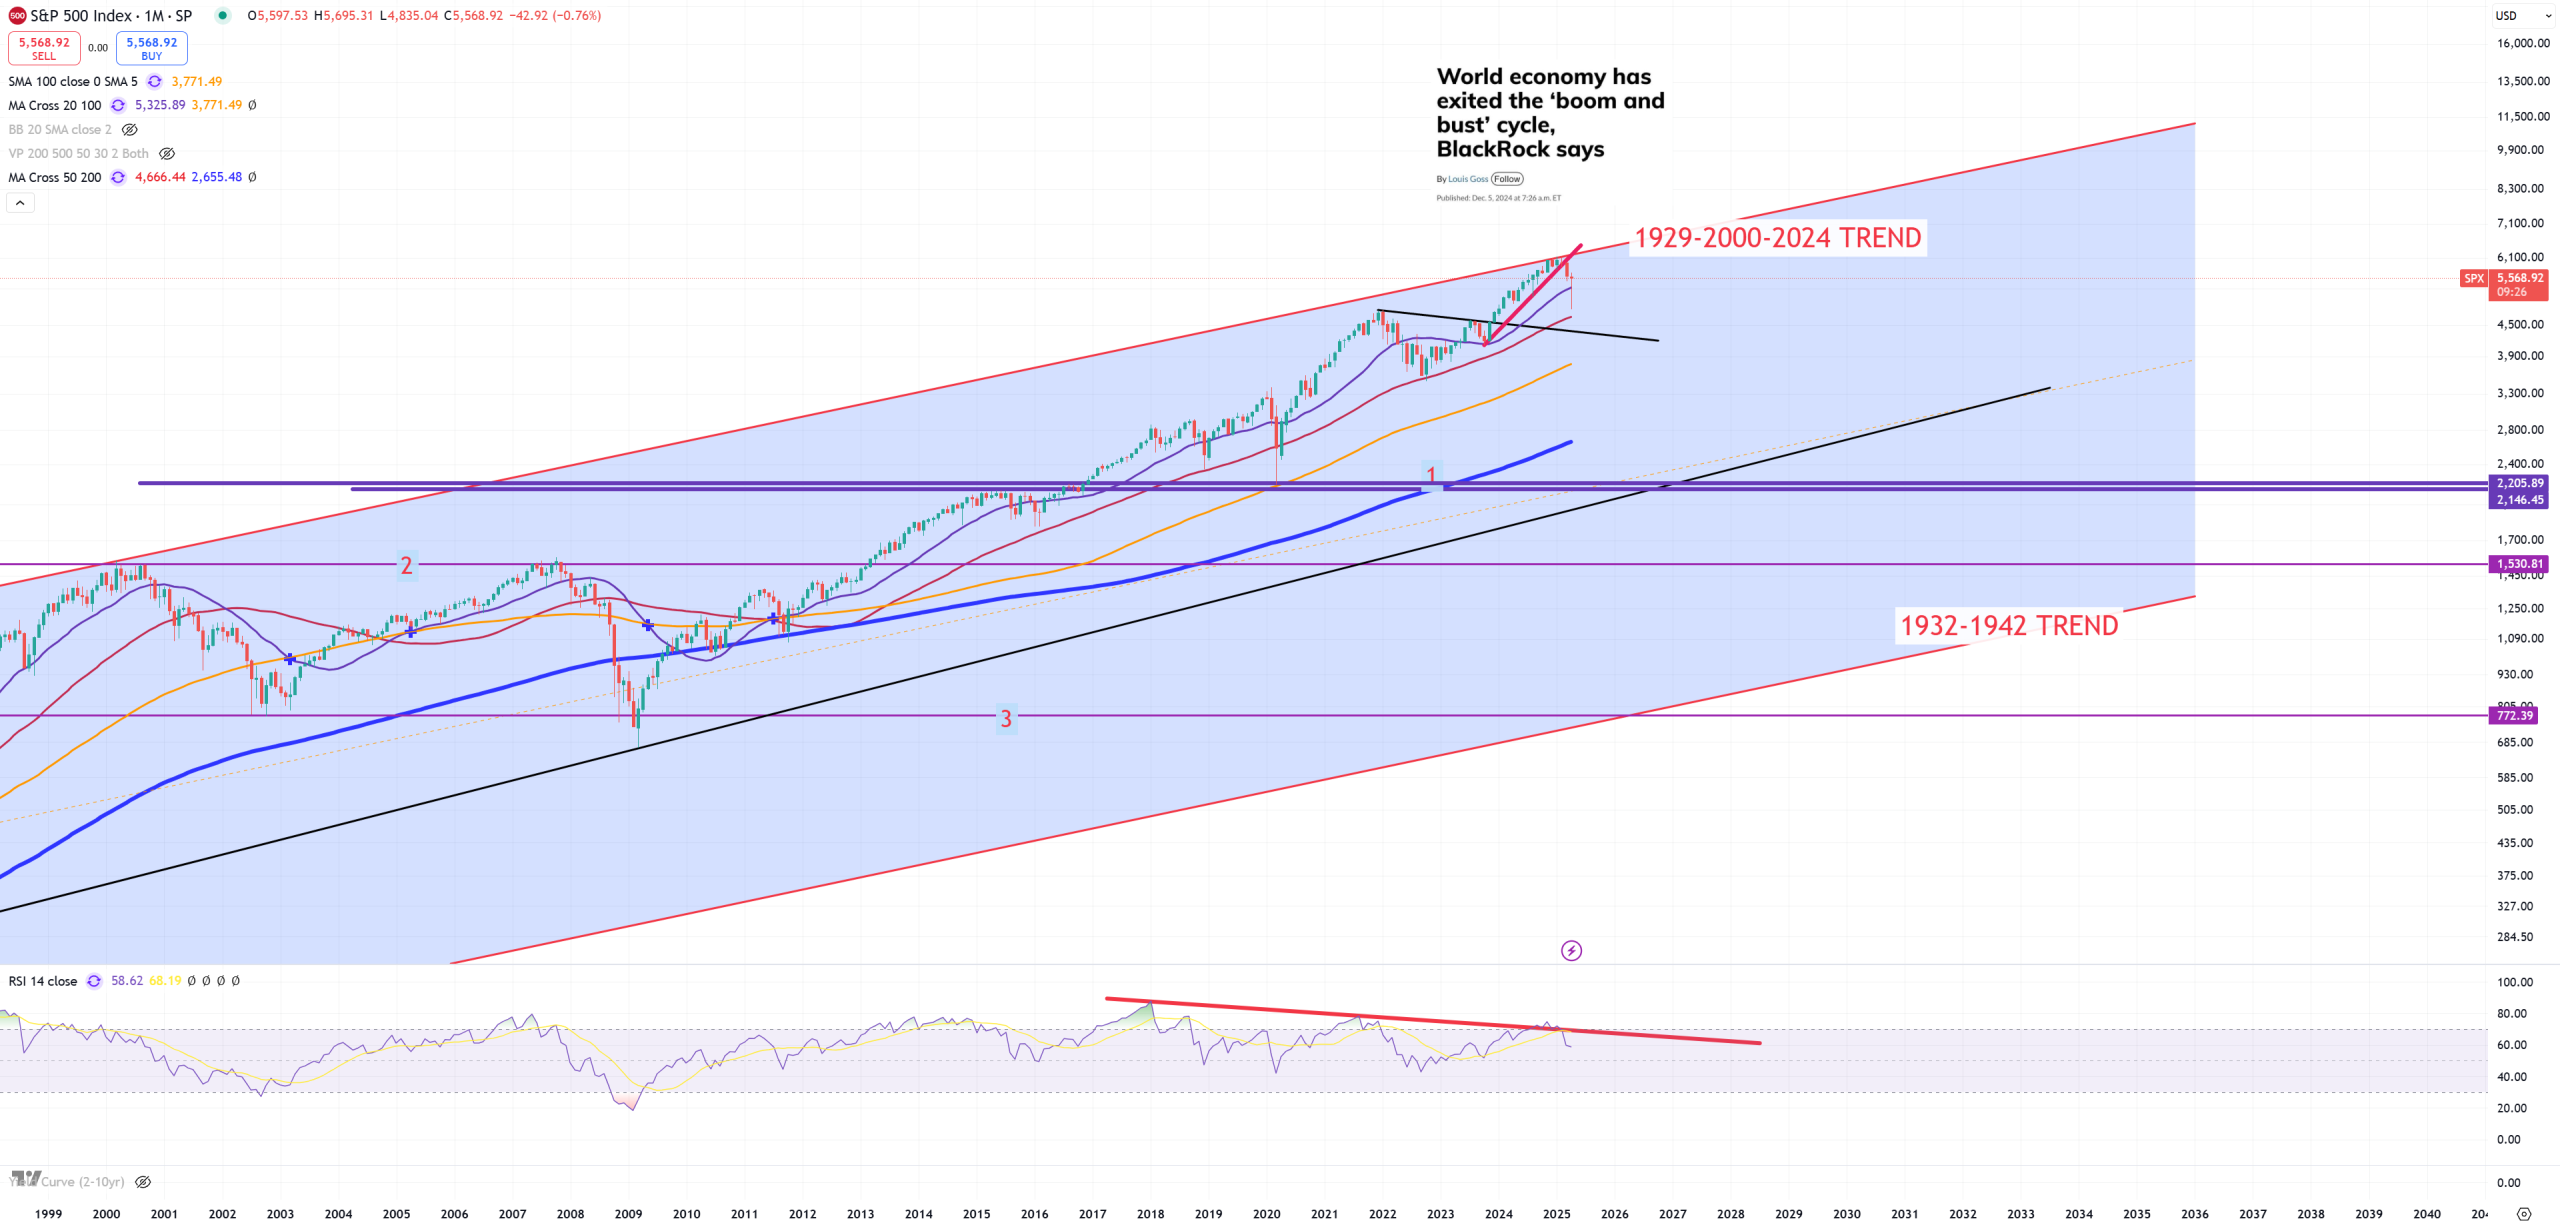
SPX – holding (M)MA20
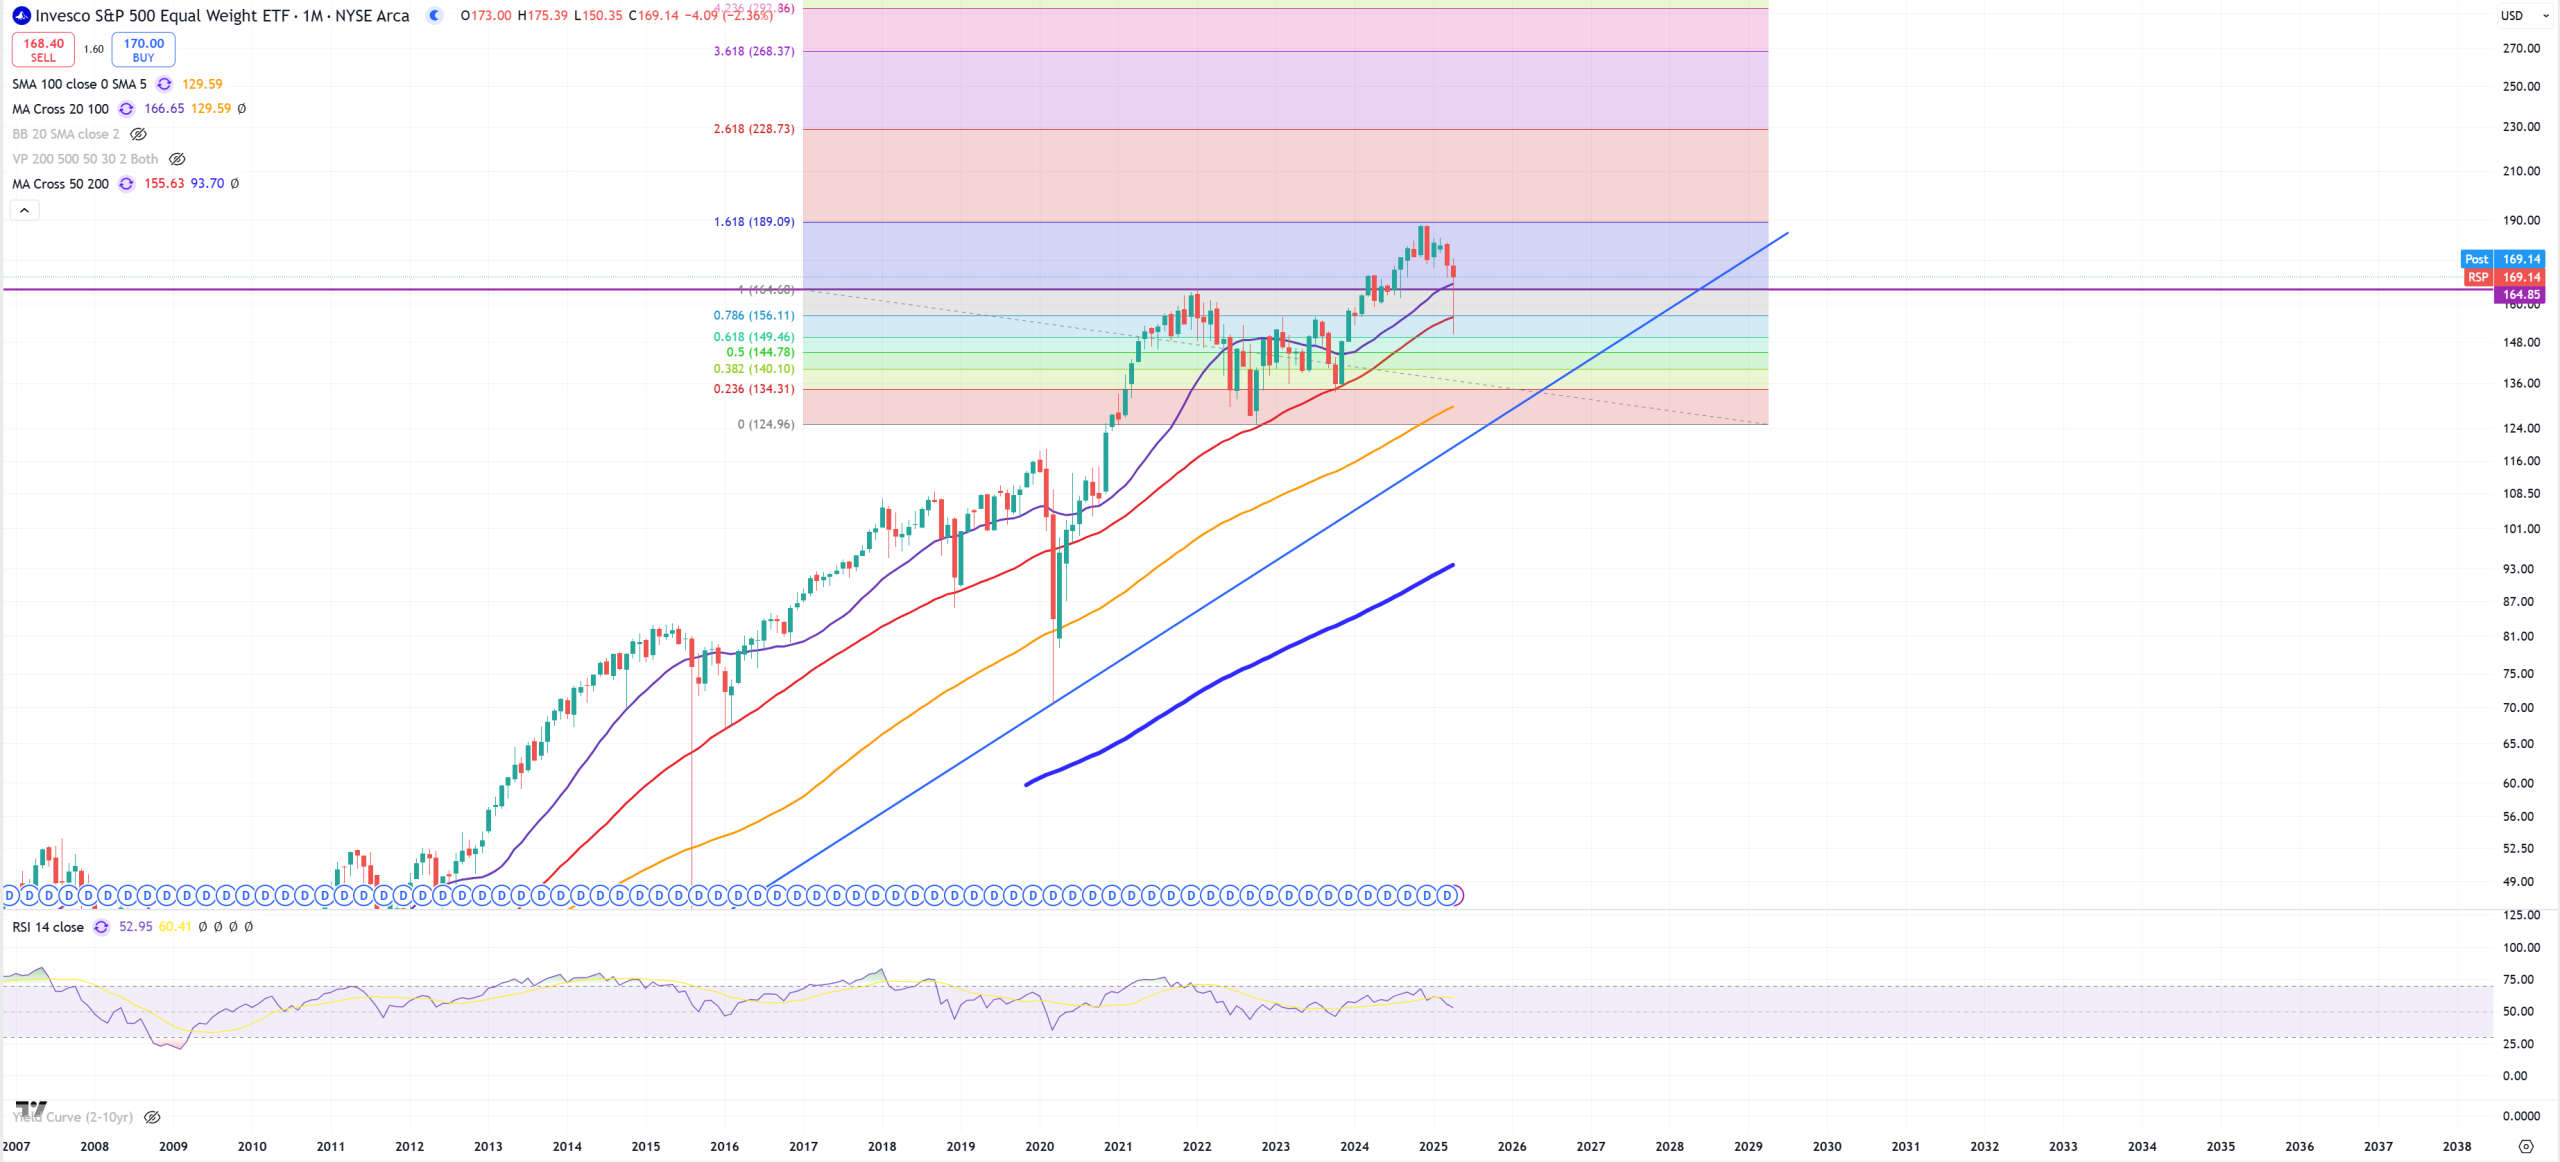
RSP – Equal Weight ETF, we see (M)MA20 & (M)MA50 and support – it holds
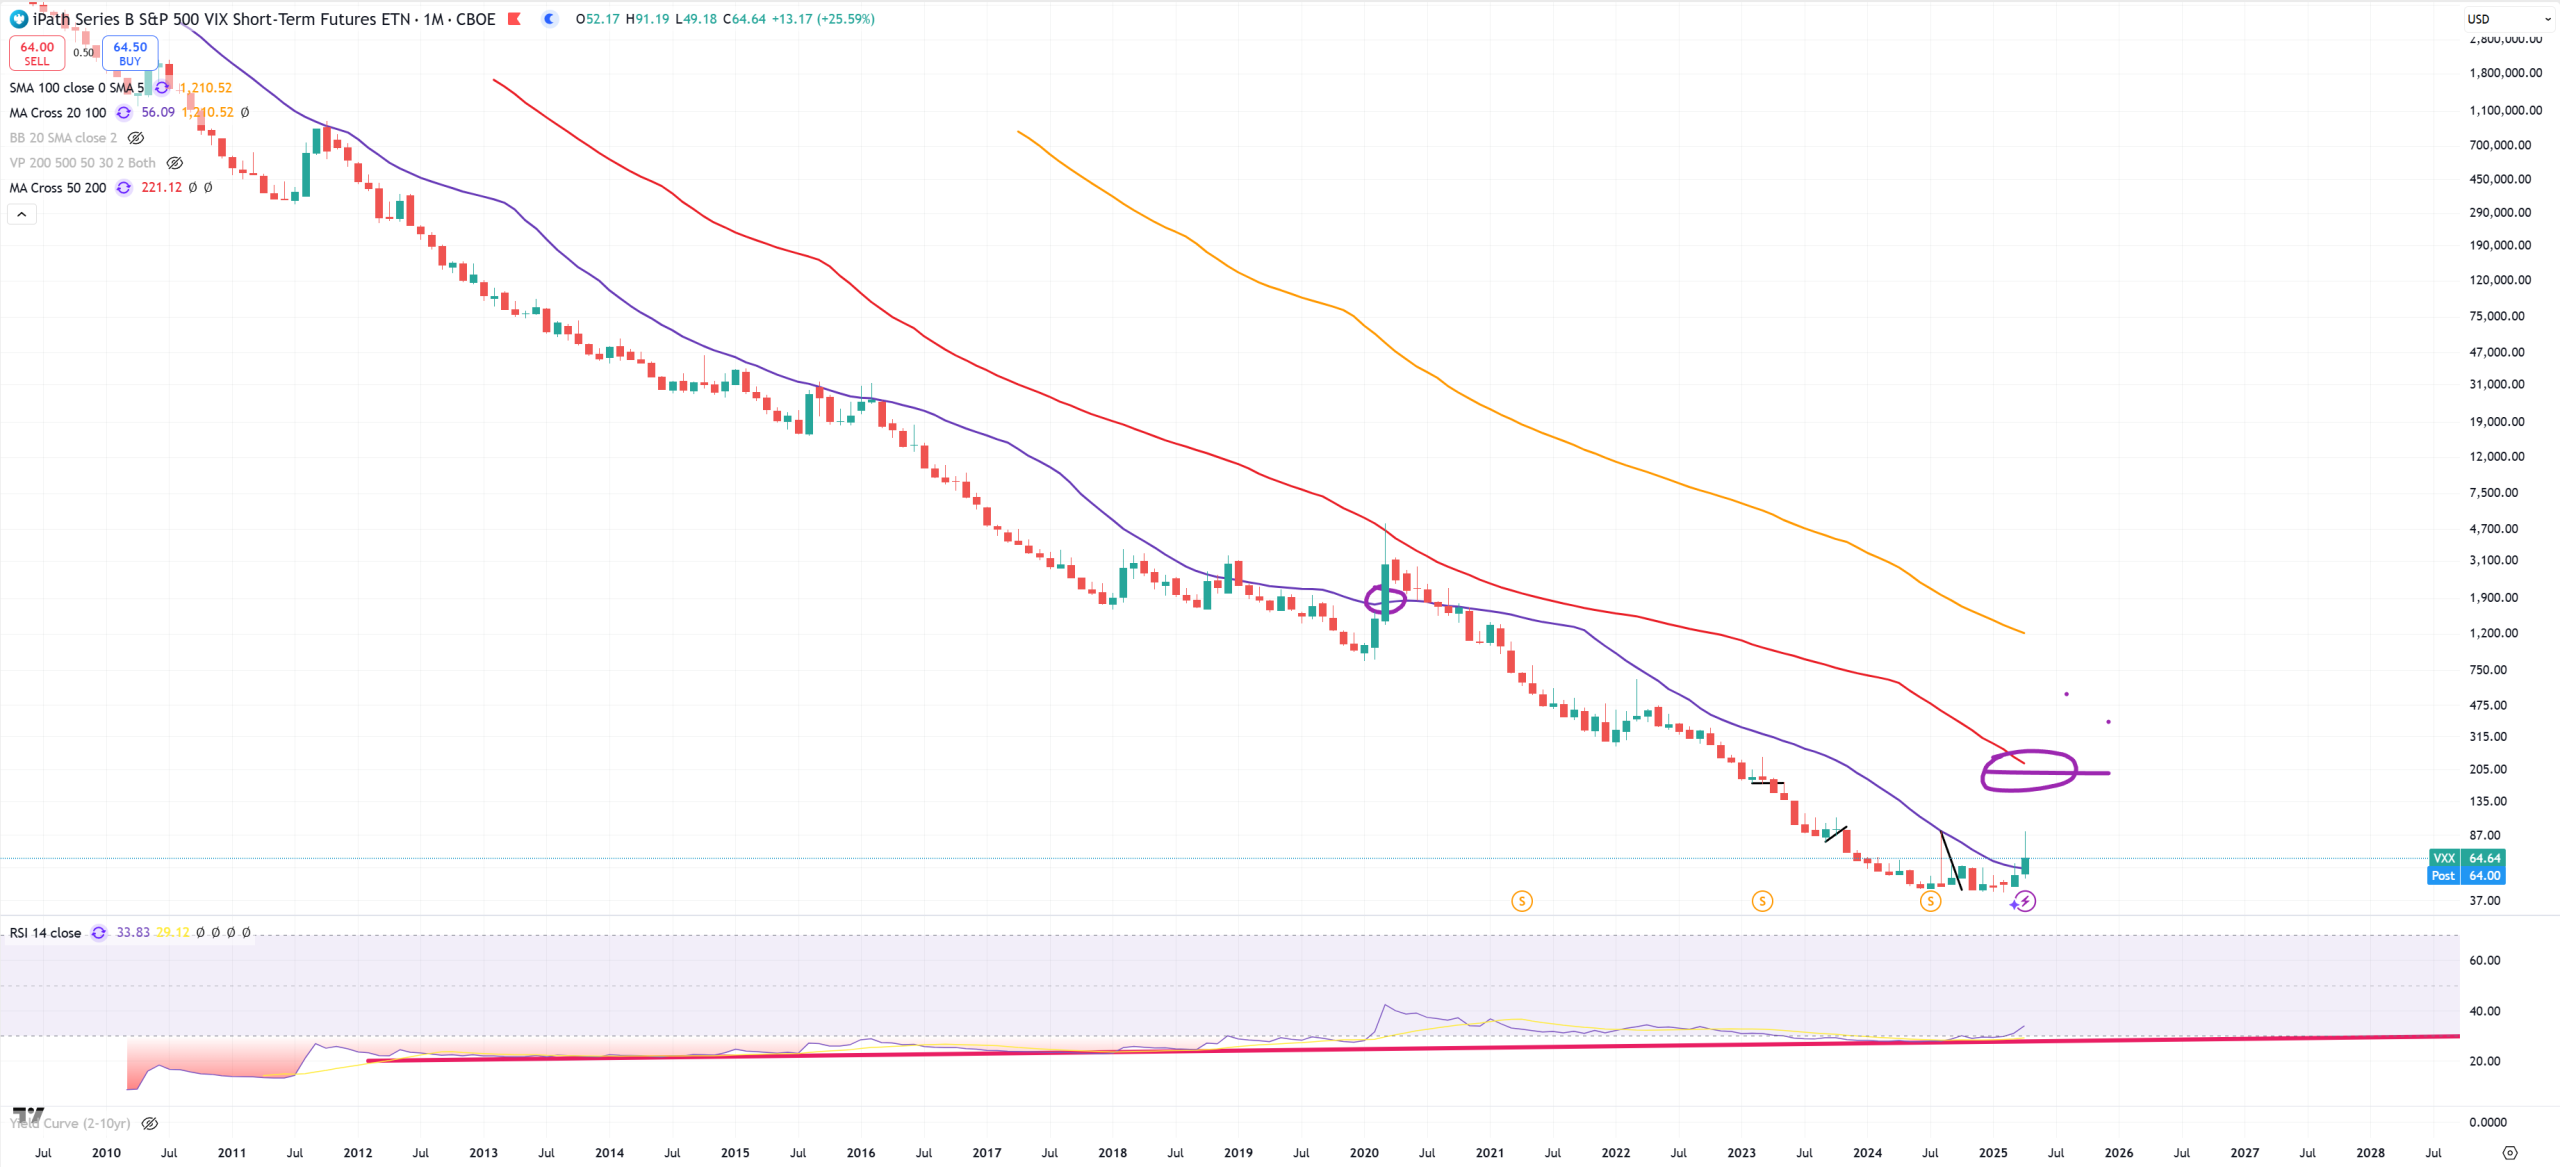
VXX – for the first time since 2020 we managed to close above (M)MA20
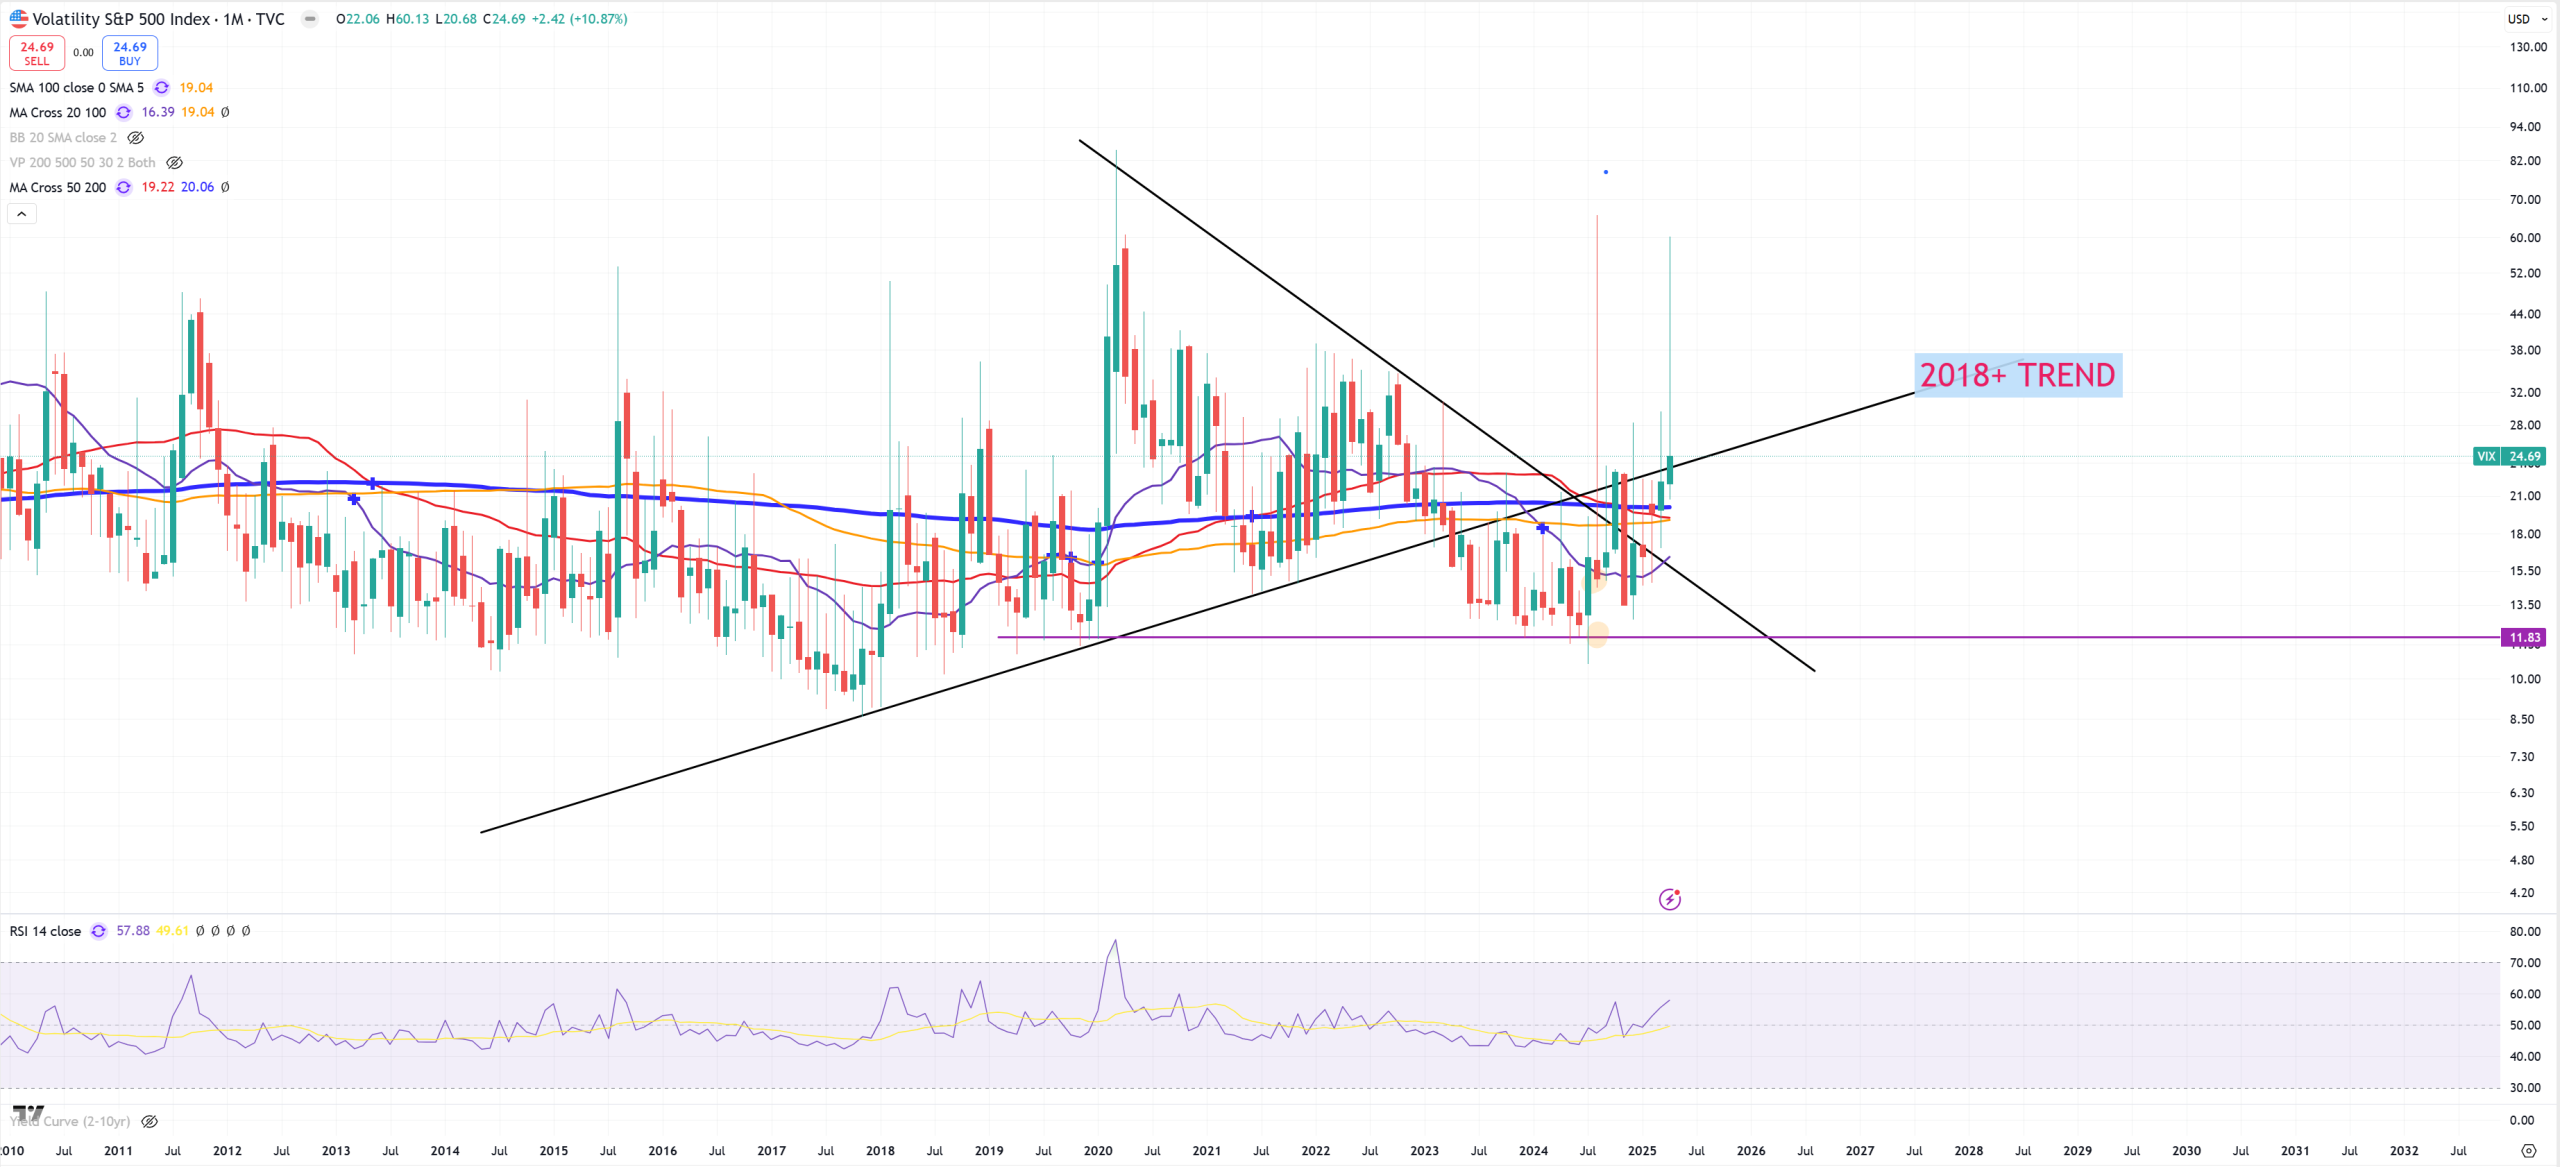
VIX – holds above its 2018 trend above all (M)MAs
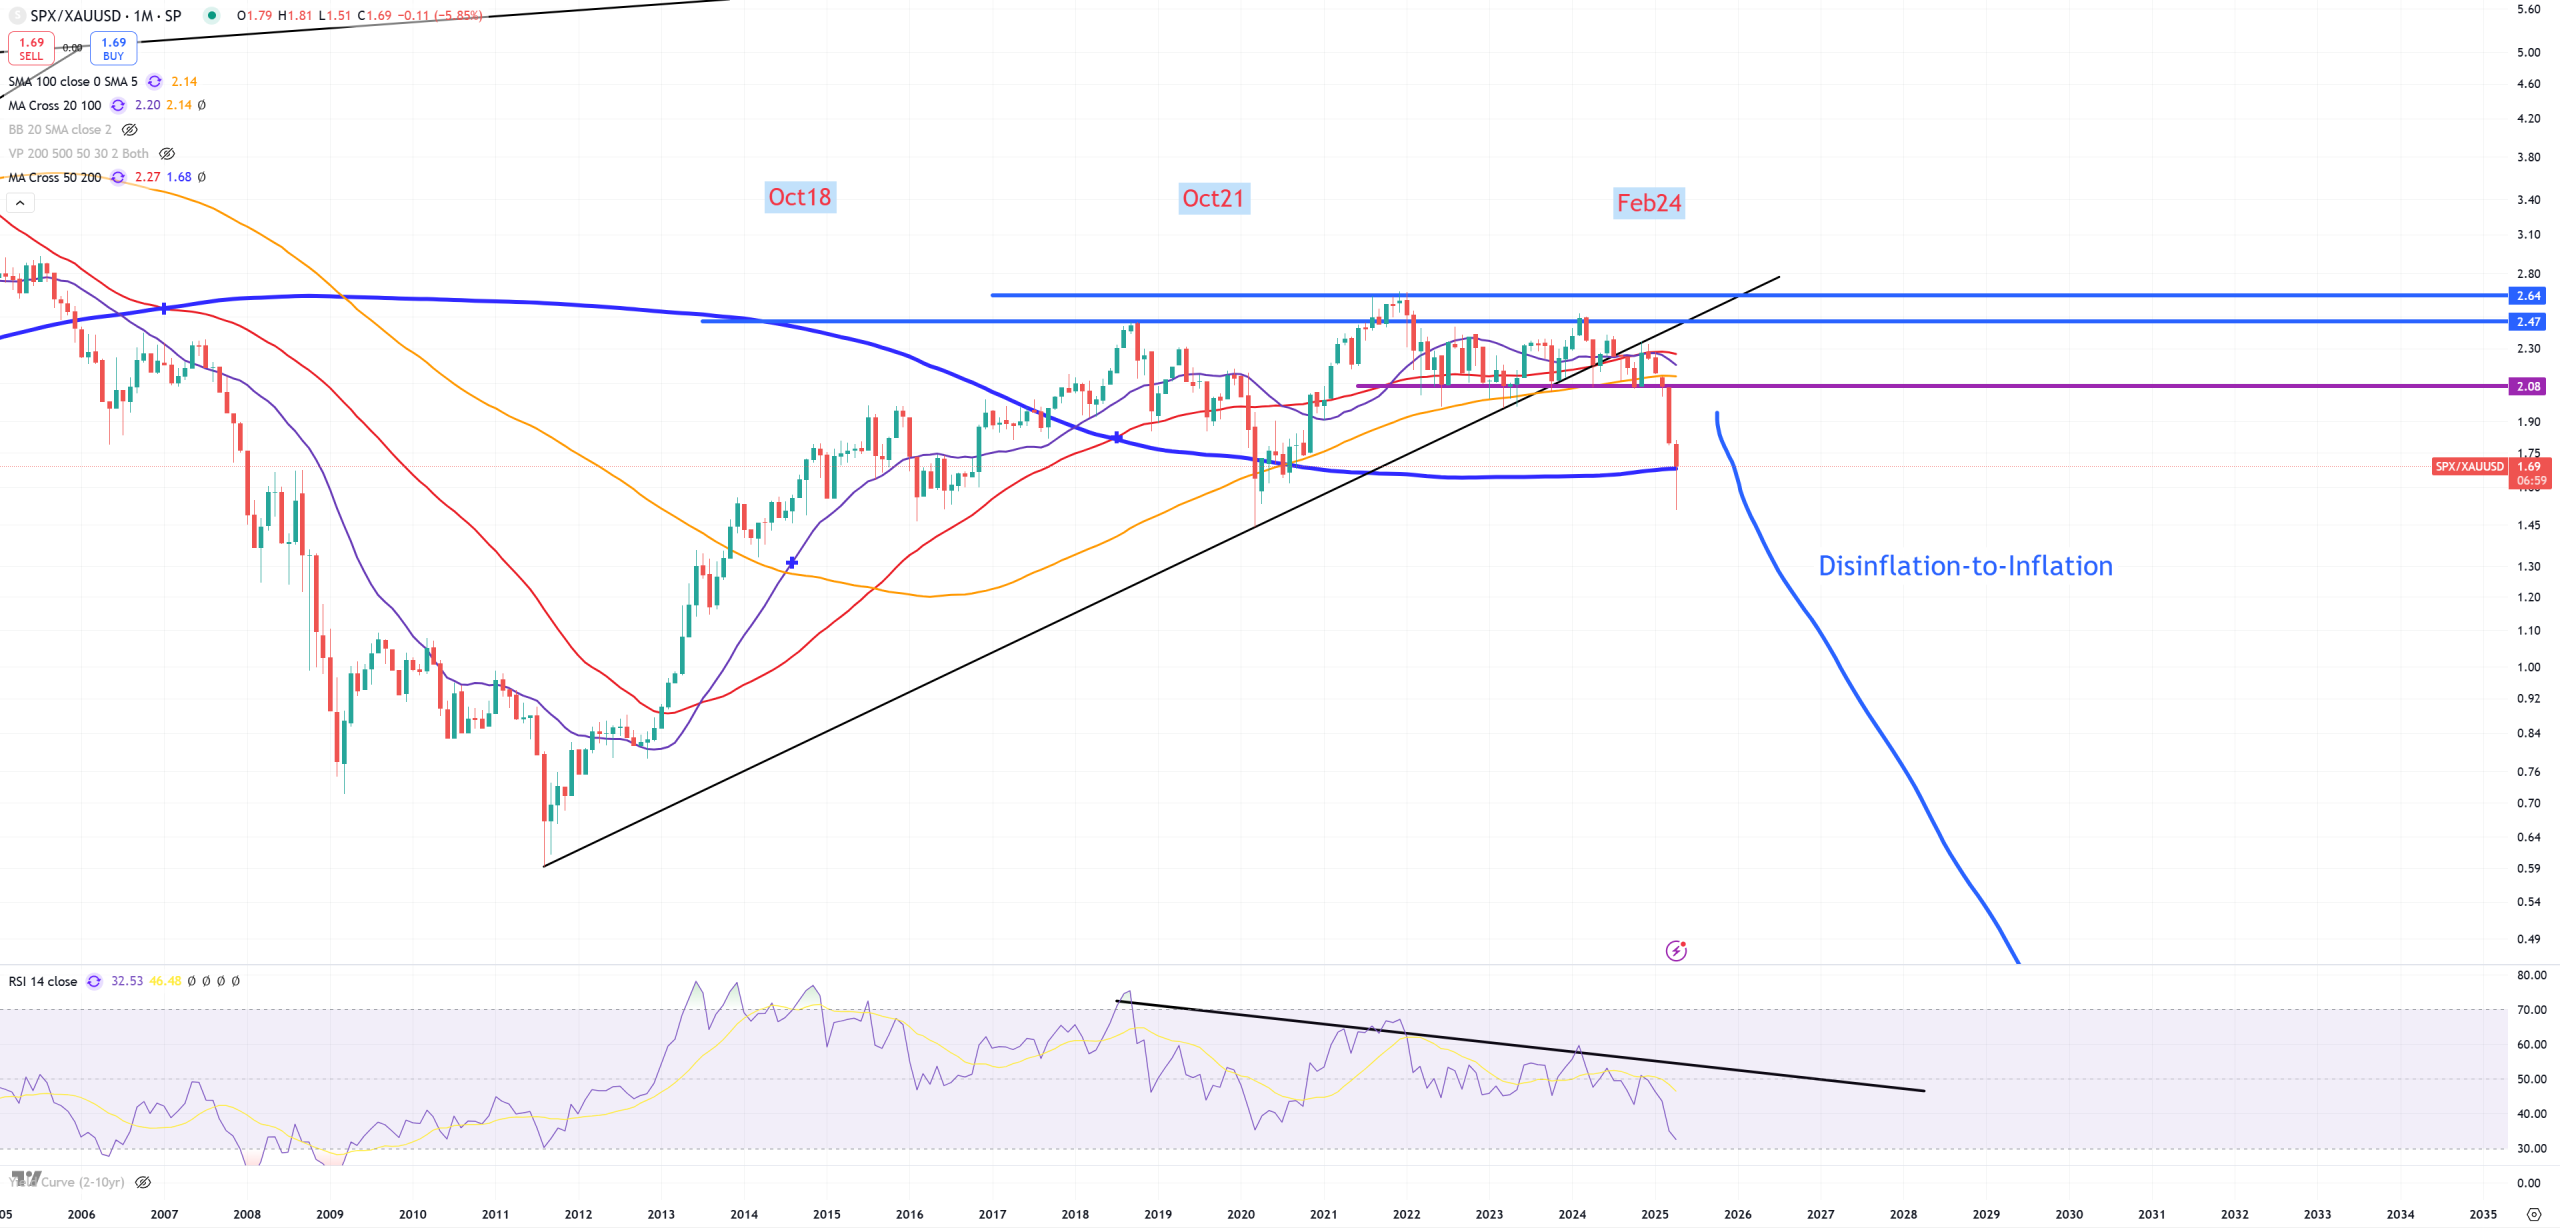
SPX/GOLD – (M)MA200 holds, question how we’re going to open next month. Usually when there’s such precised close on the “trend” or on the key MA it’s important next open. In April 2024 it broke its 2011 trend. Highest point October 2021.
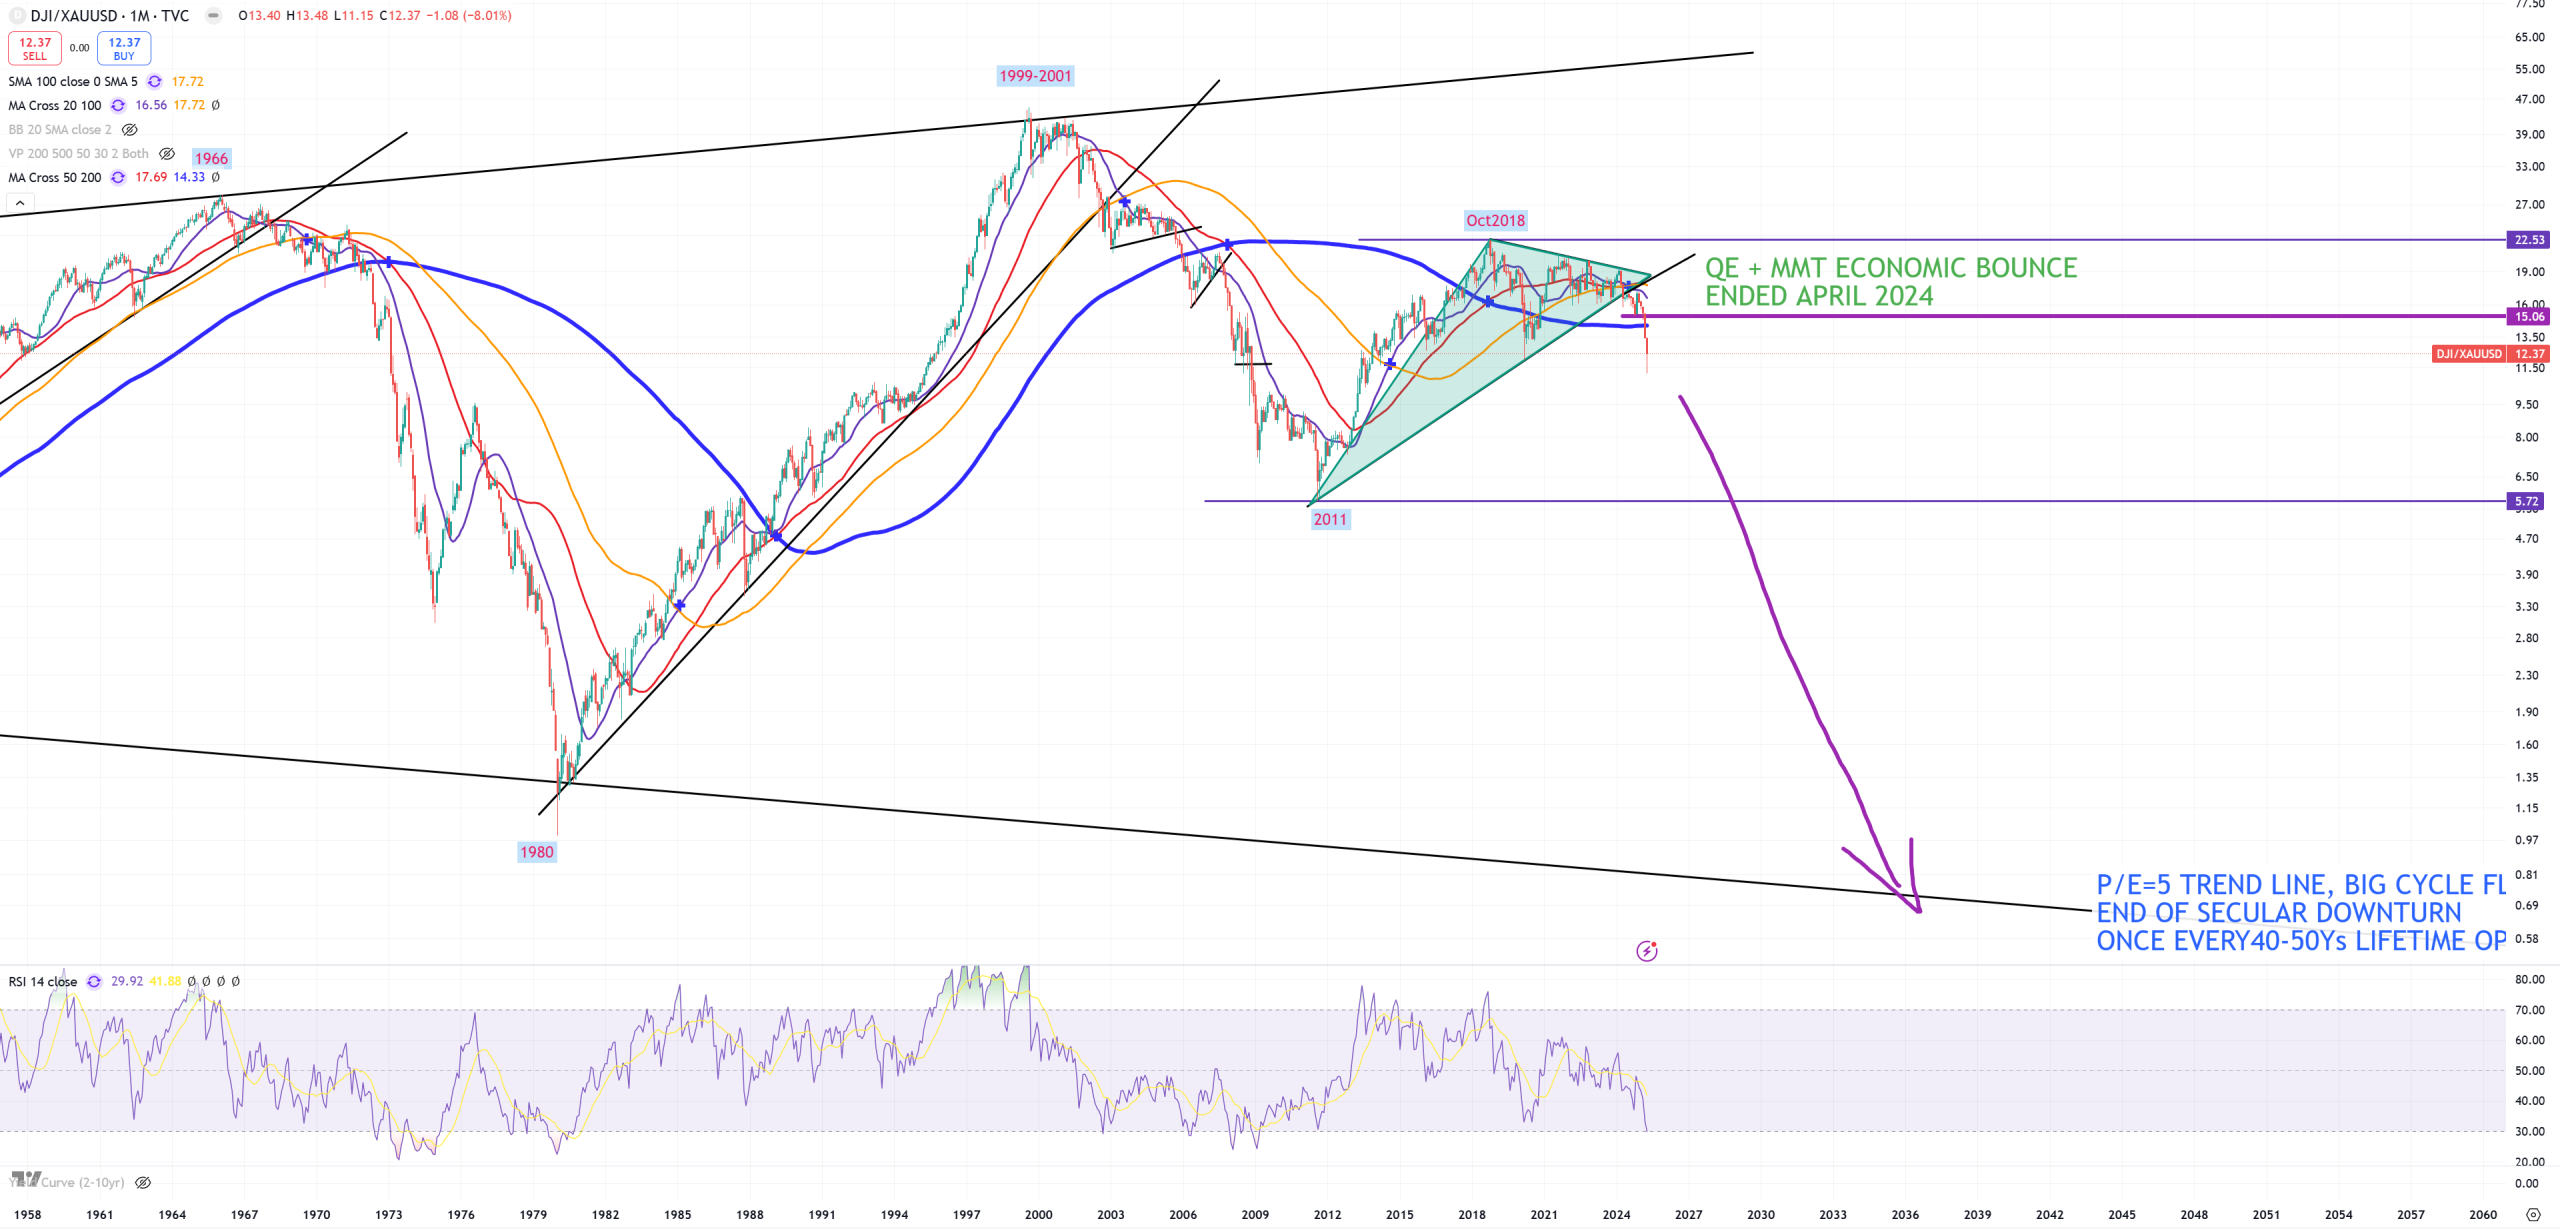
DJI/GOLD – this one peaked in October 2018. (M)MA200 broken. Trend broken in April 2024.
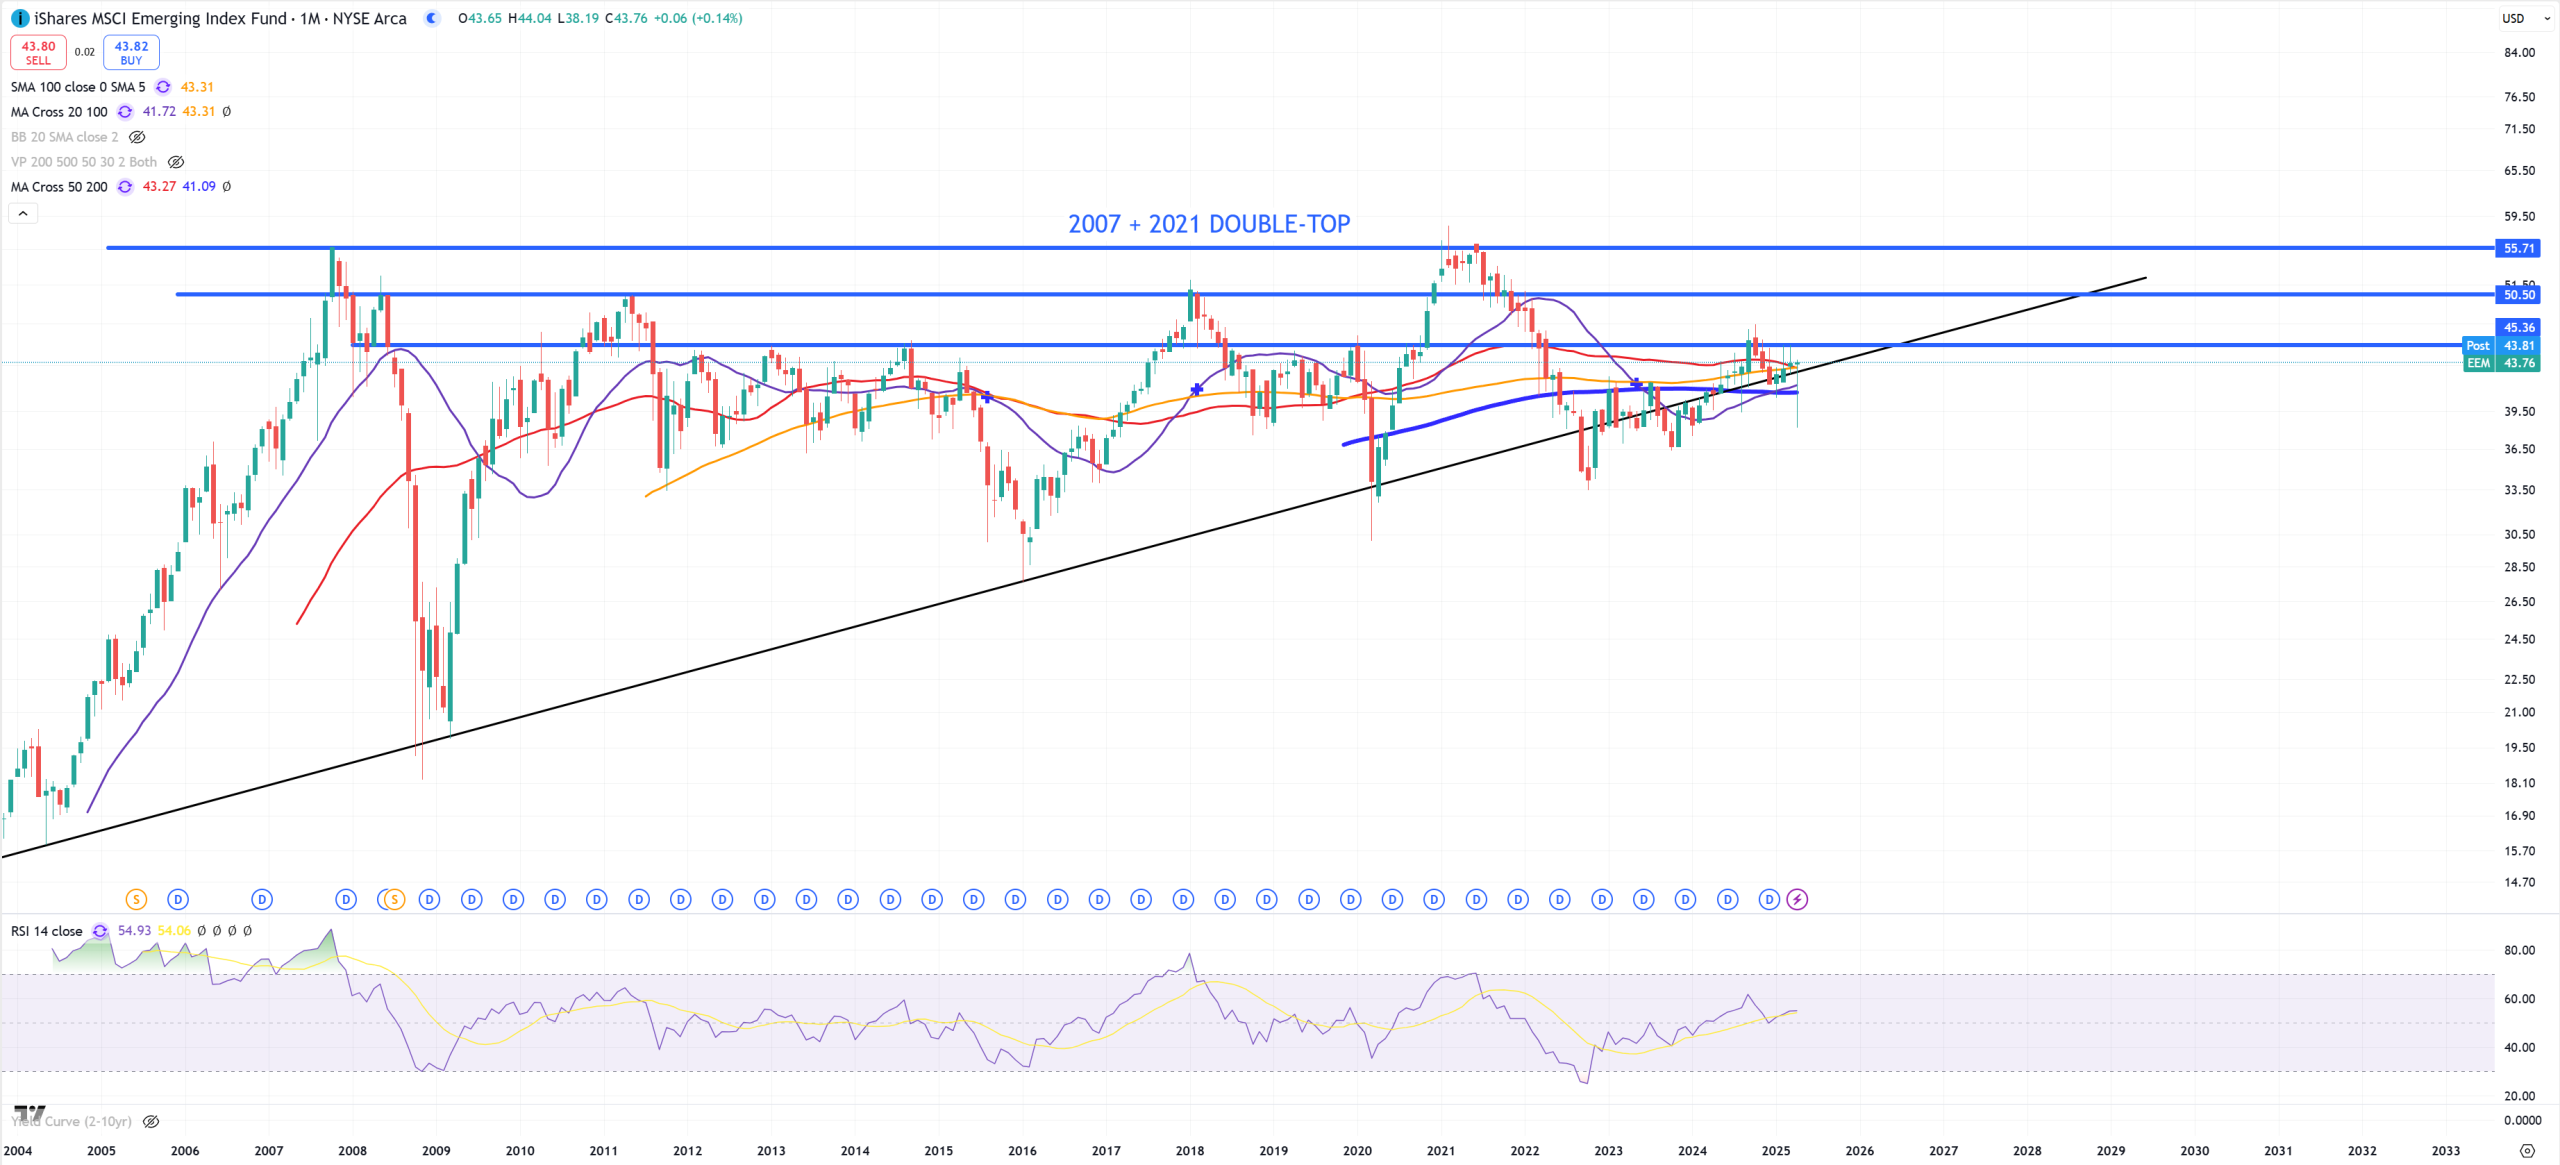
SPY/EEM – also (M)MA20

EEM – wants to hold as much “bullish” as possible.
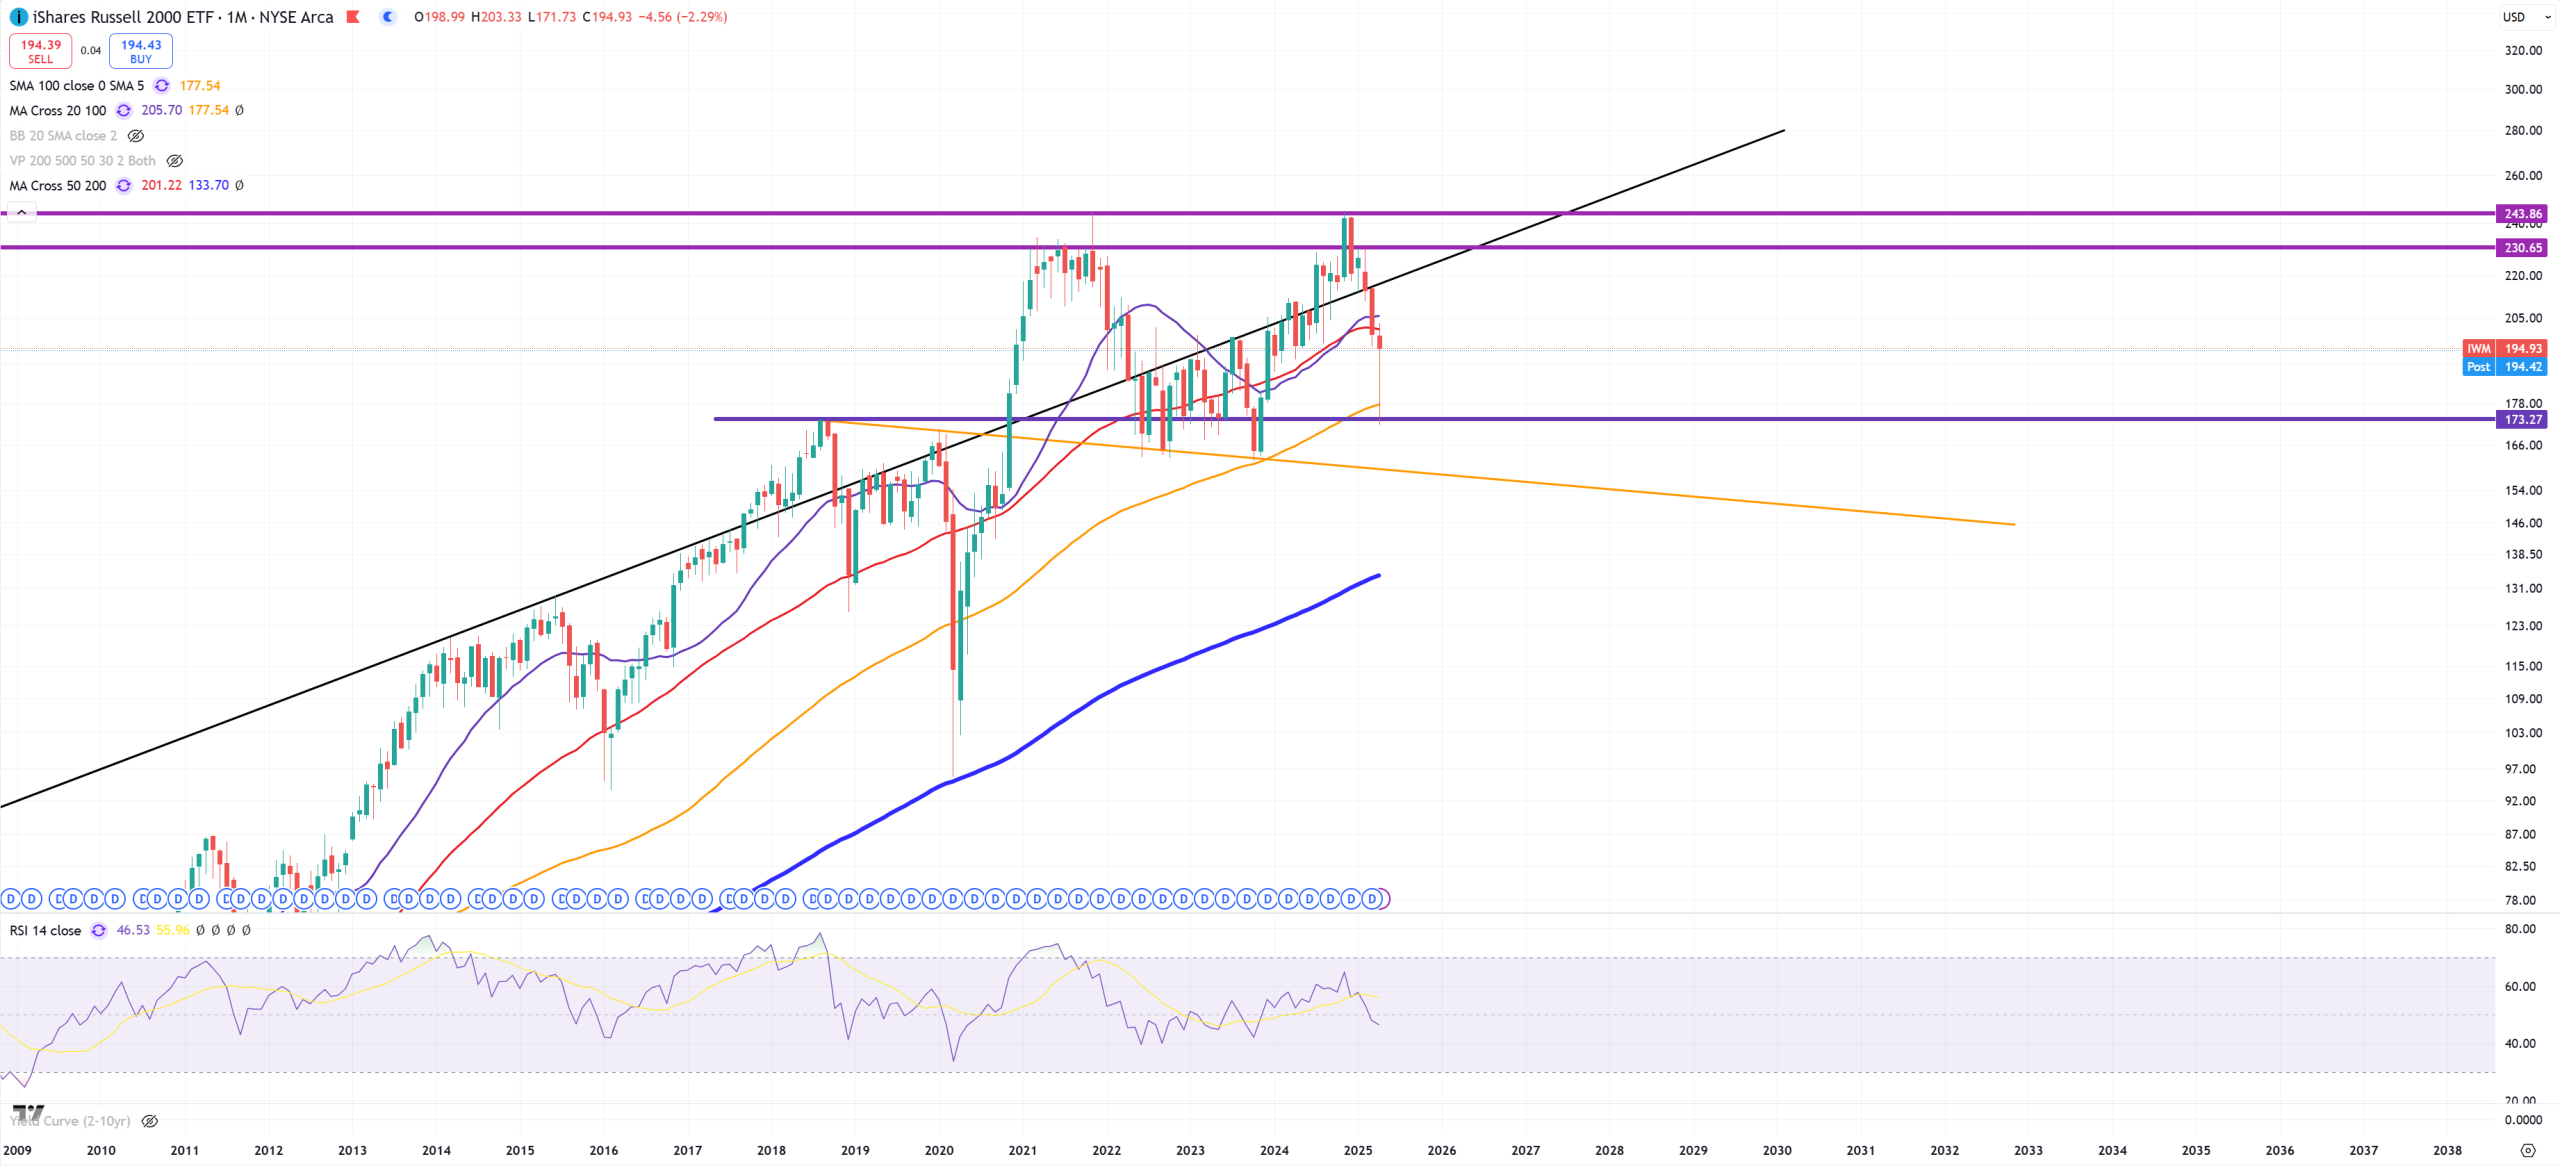
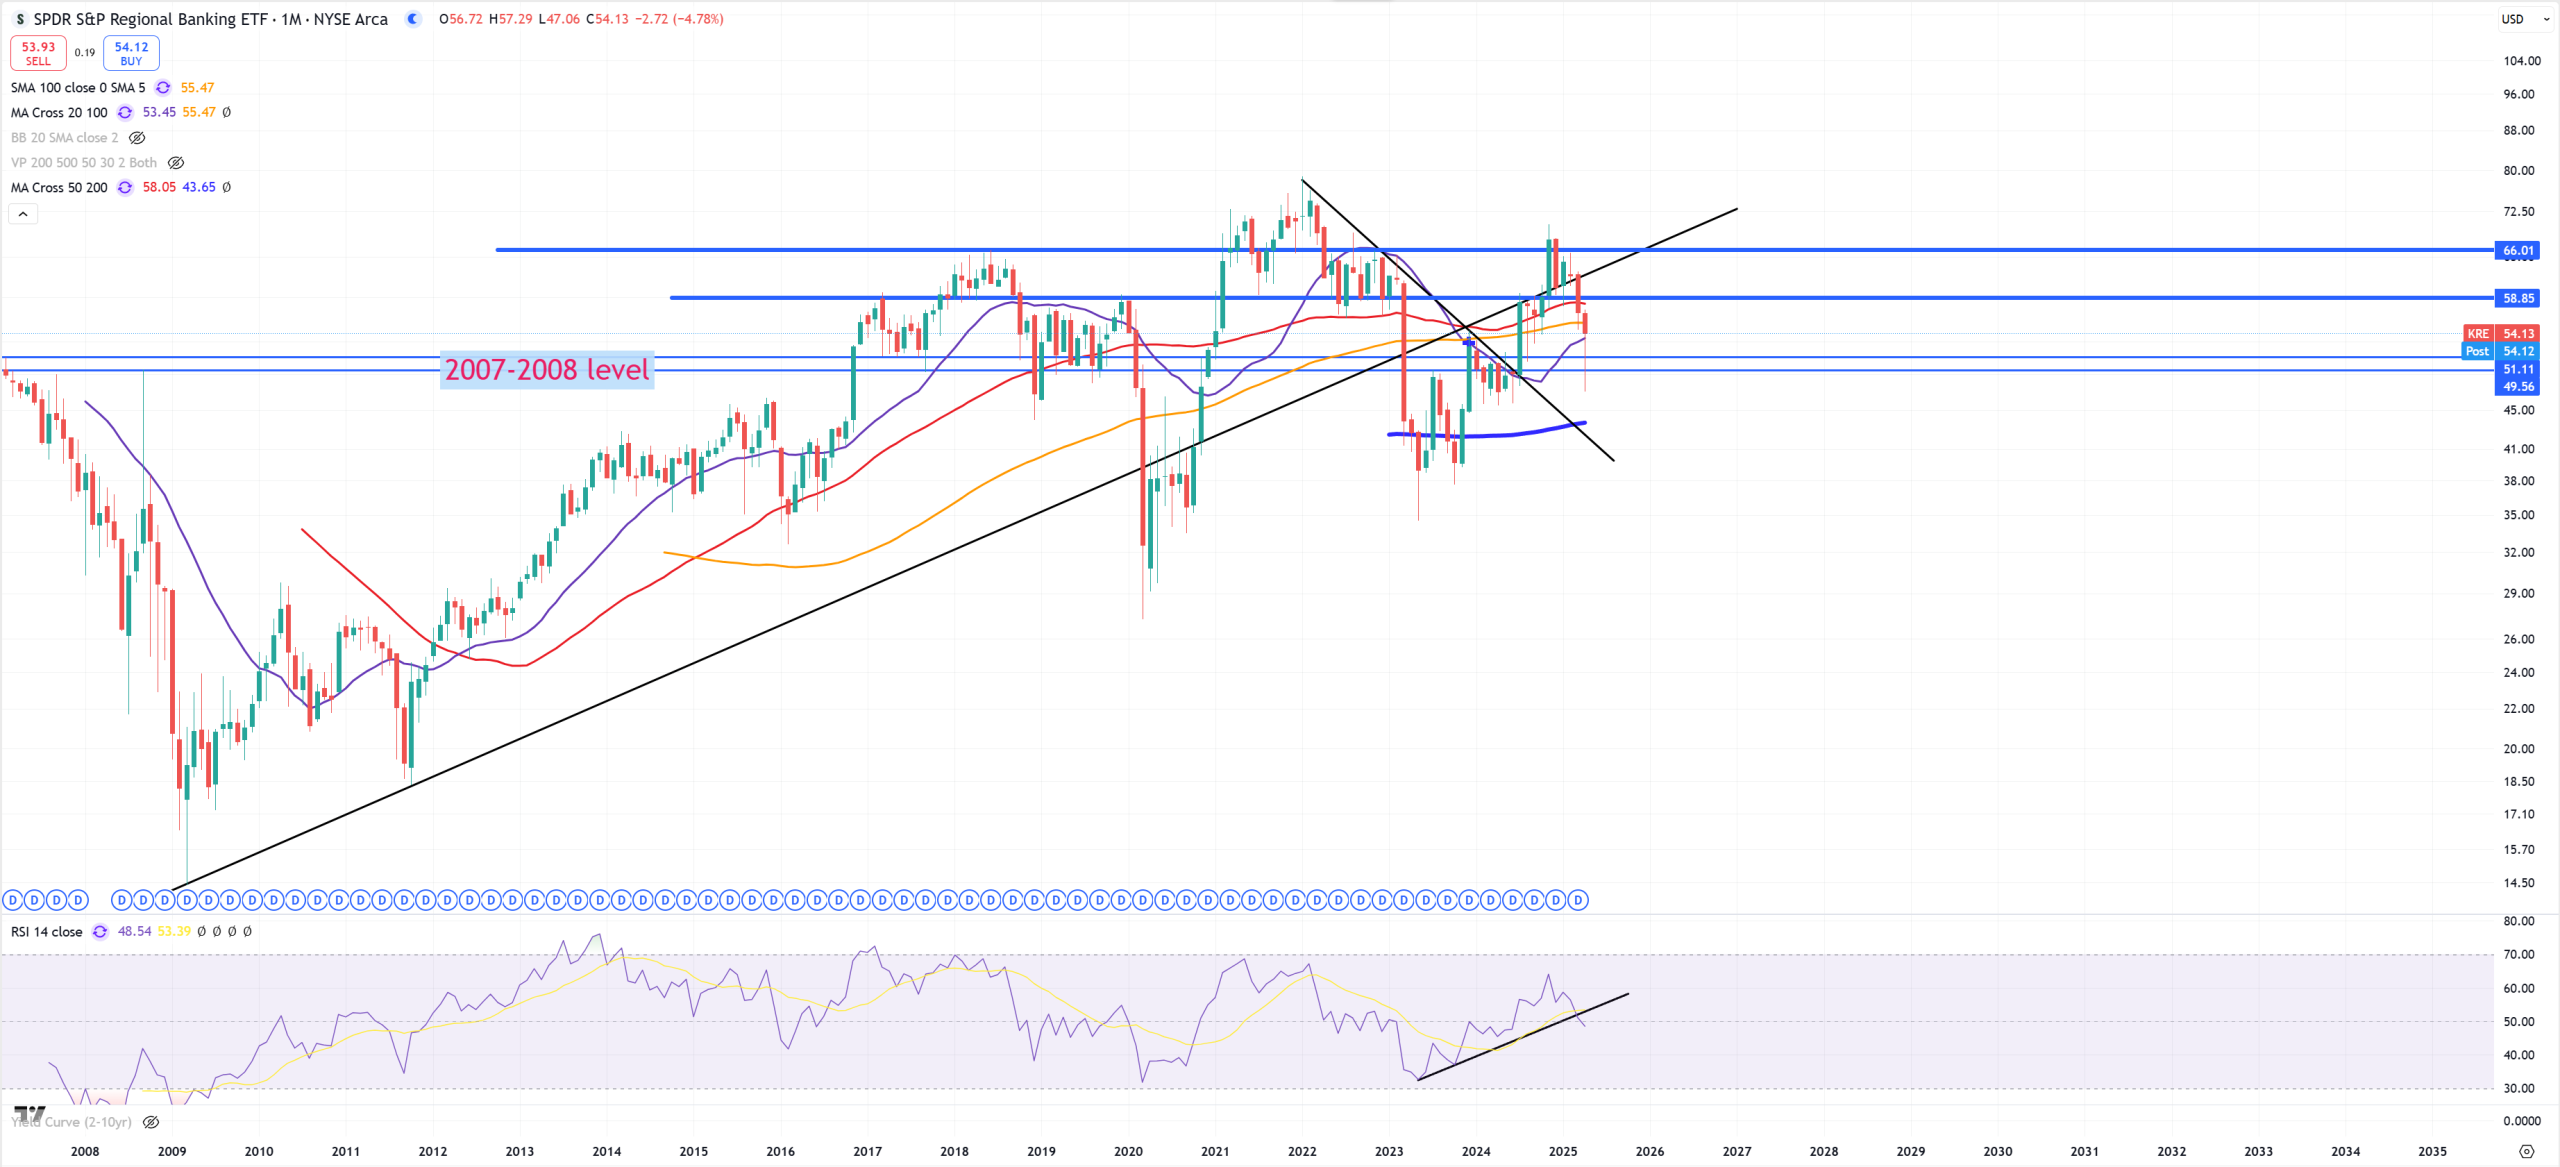
IWM – still DOUBLE-TOP + now fight between (M)MA50 and (M)MA100 + support on 173$ level
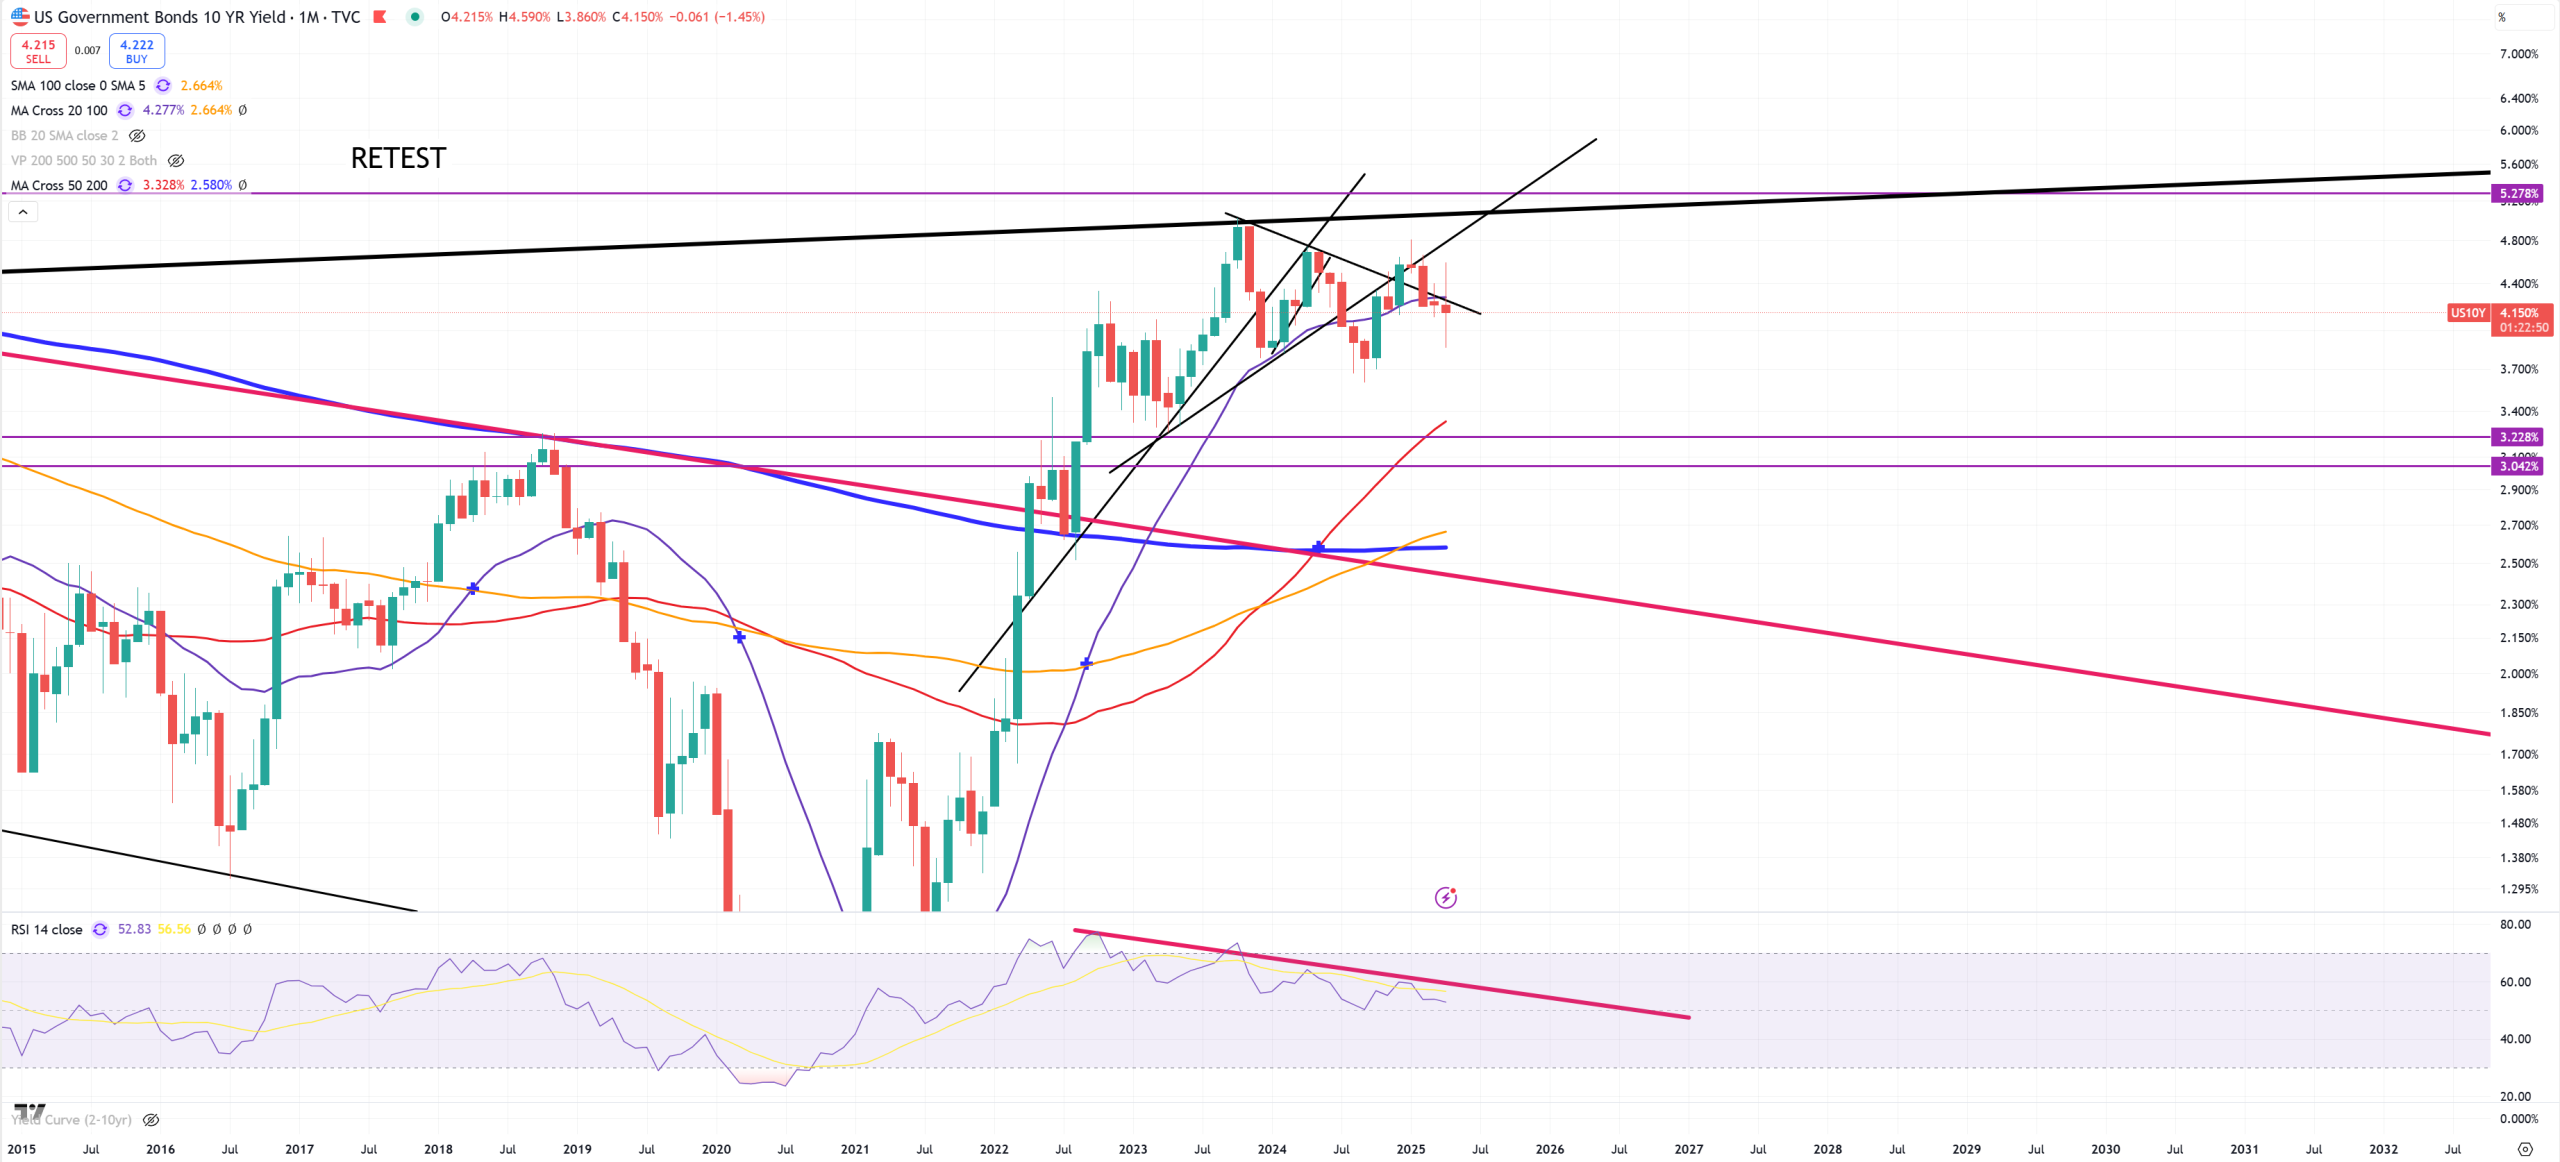
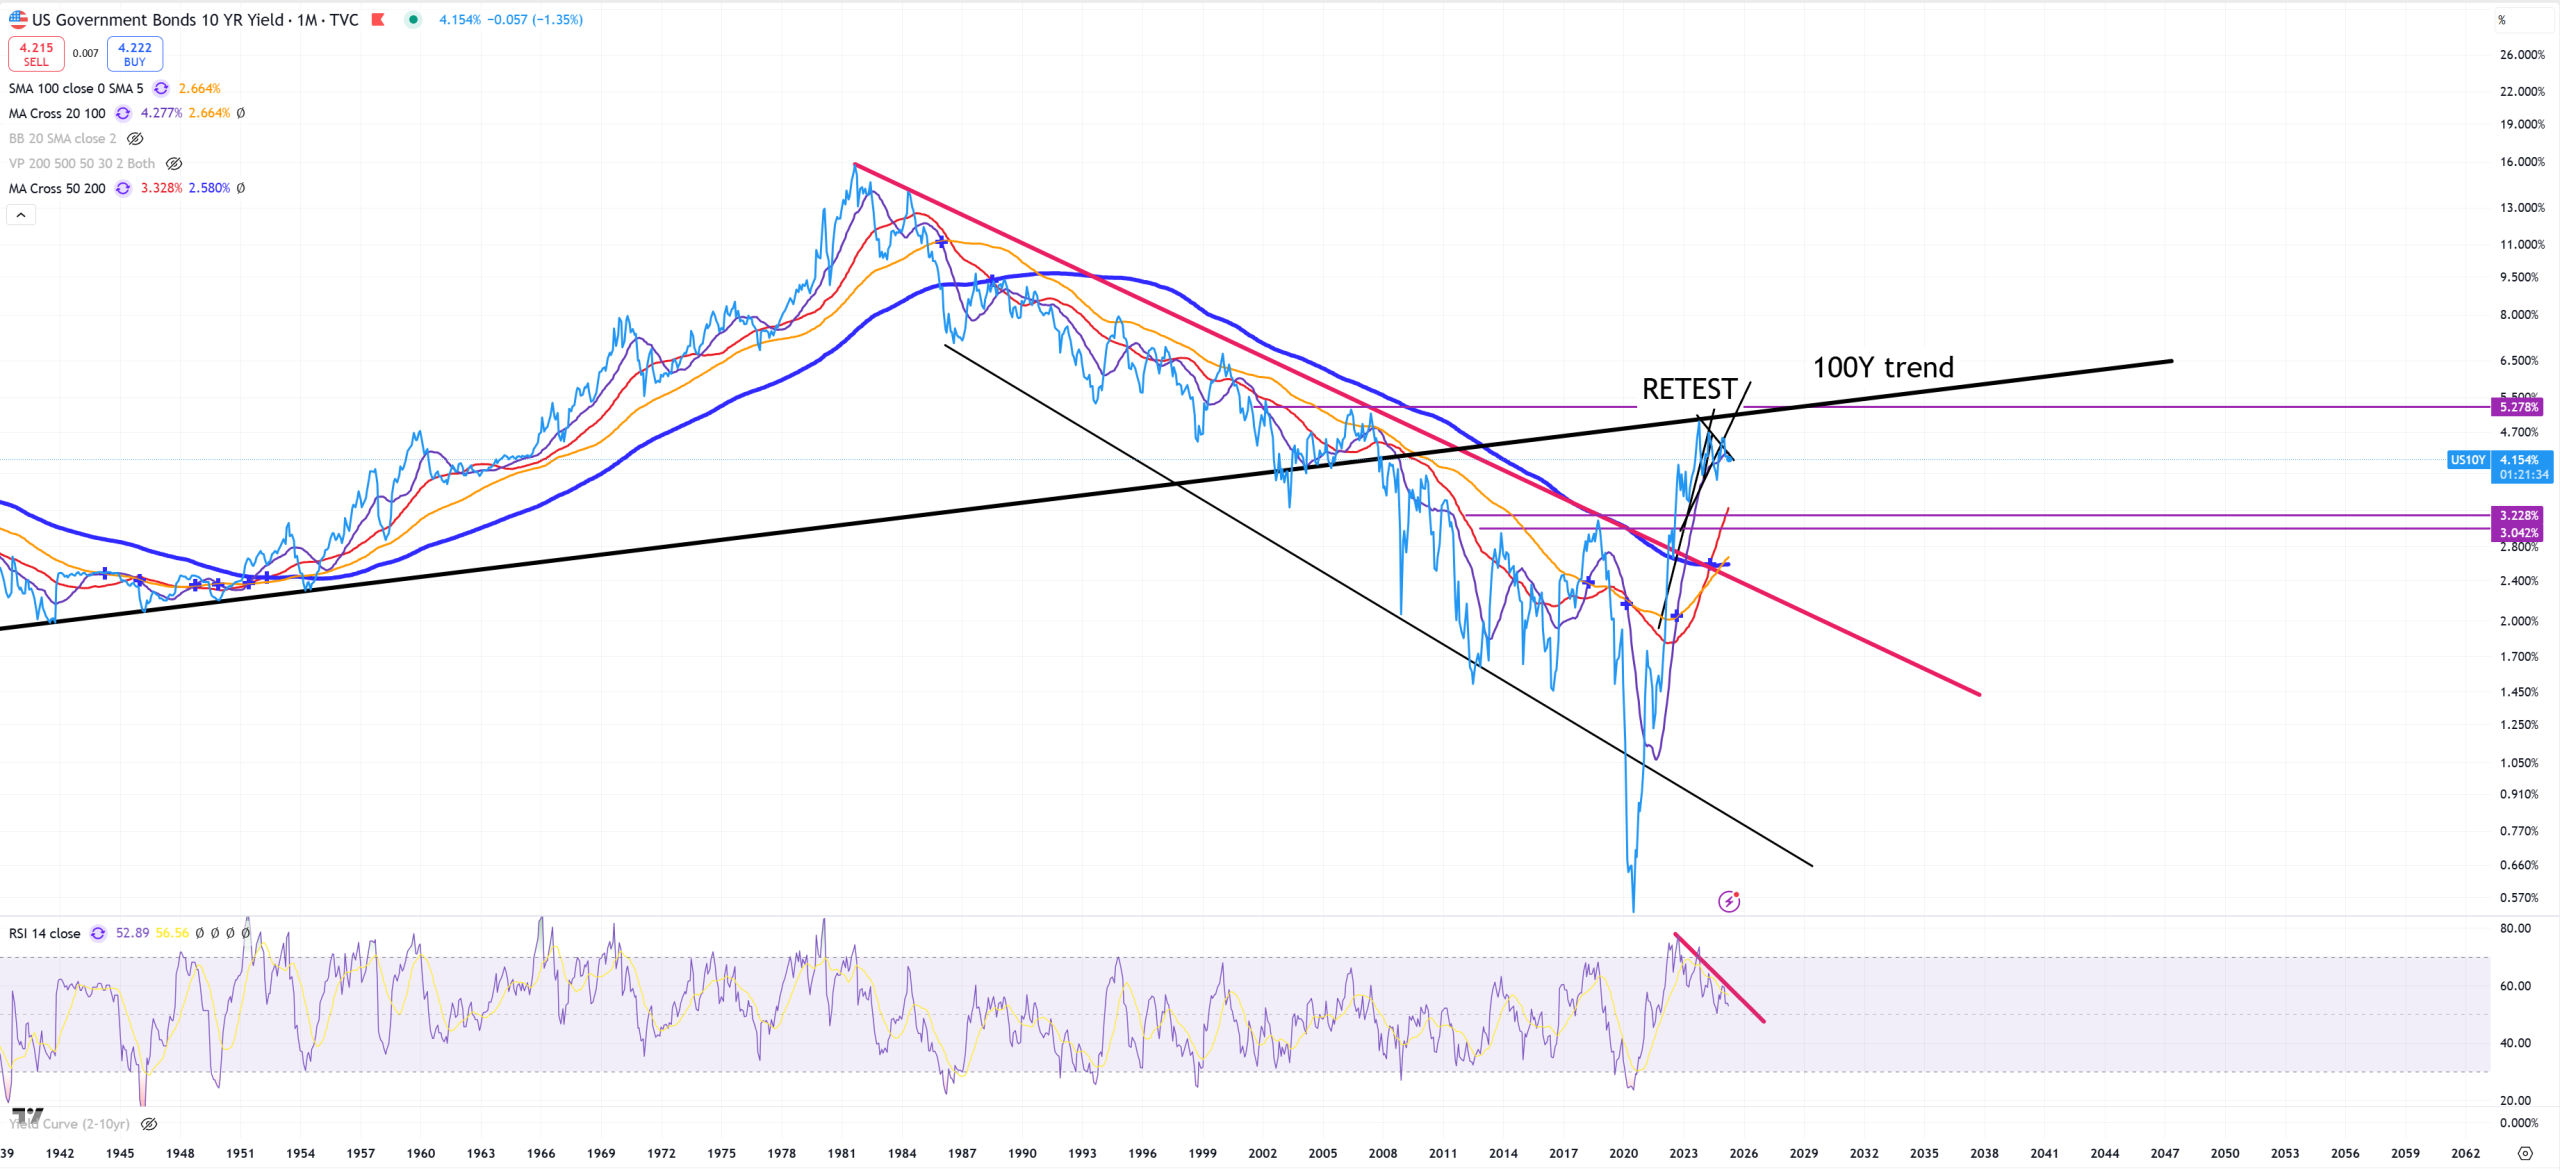
US10Y – detailed view shows back below the trend + below (M)MA20, but larger long term view shows : if that’s a retest you’ll not see 5% on US10Y for a long time
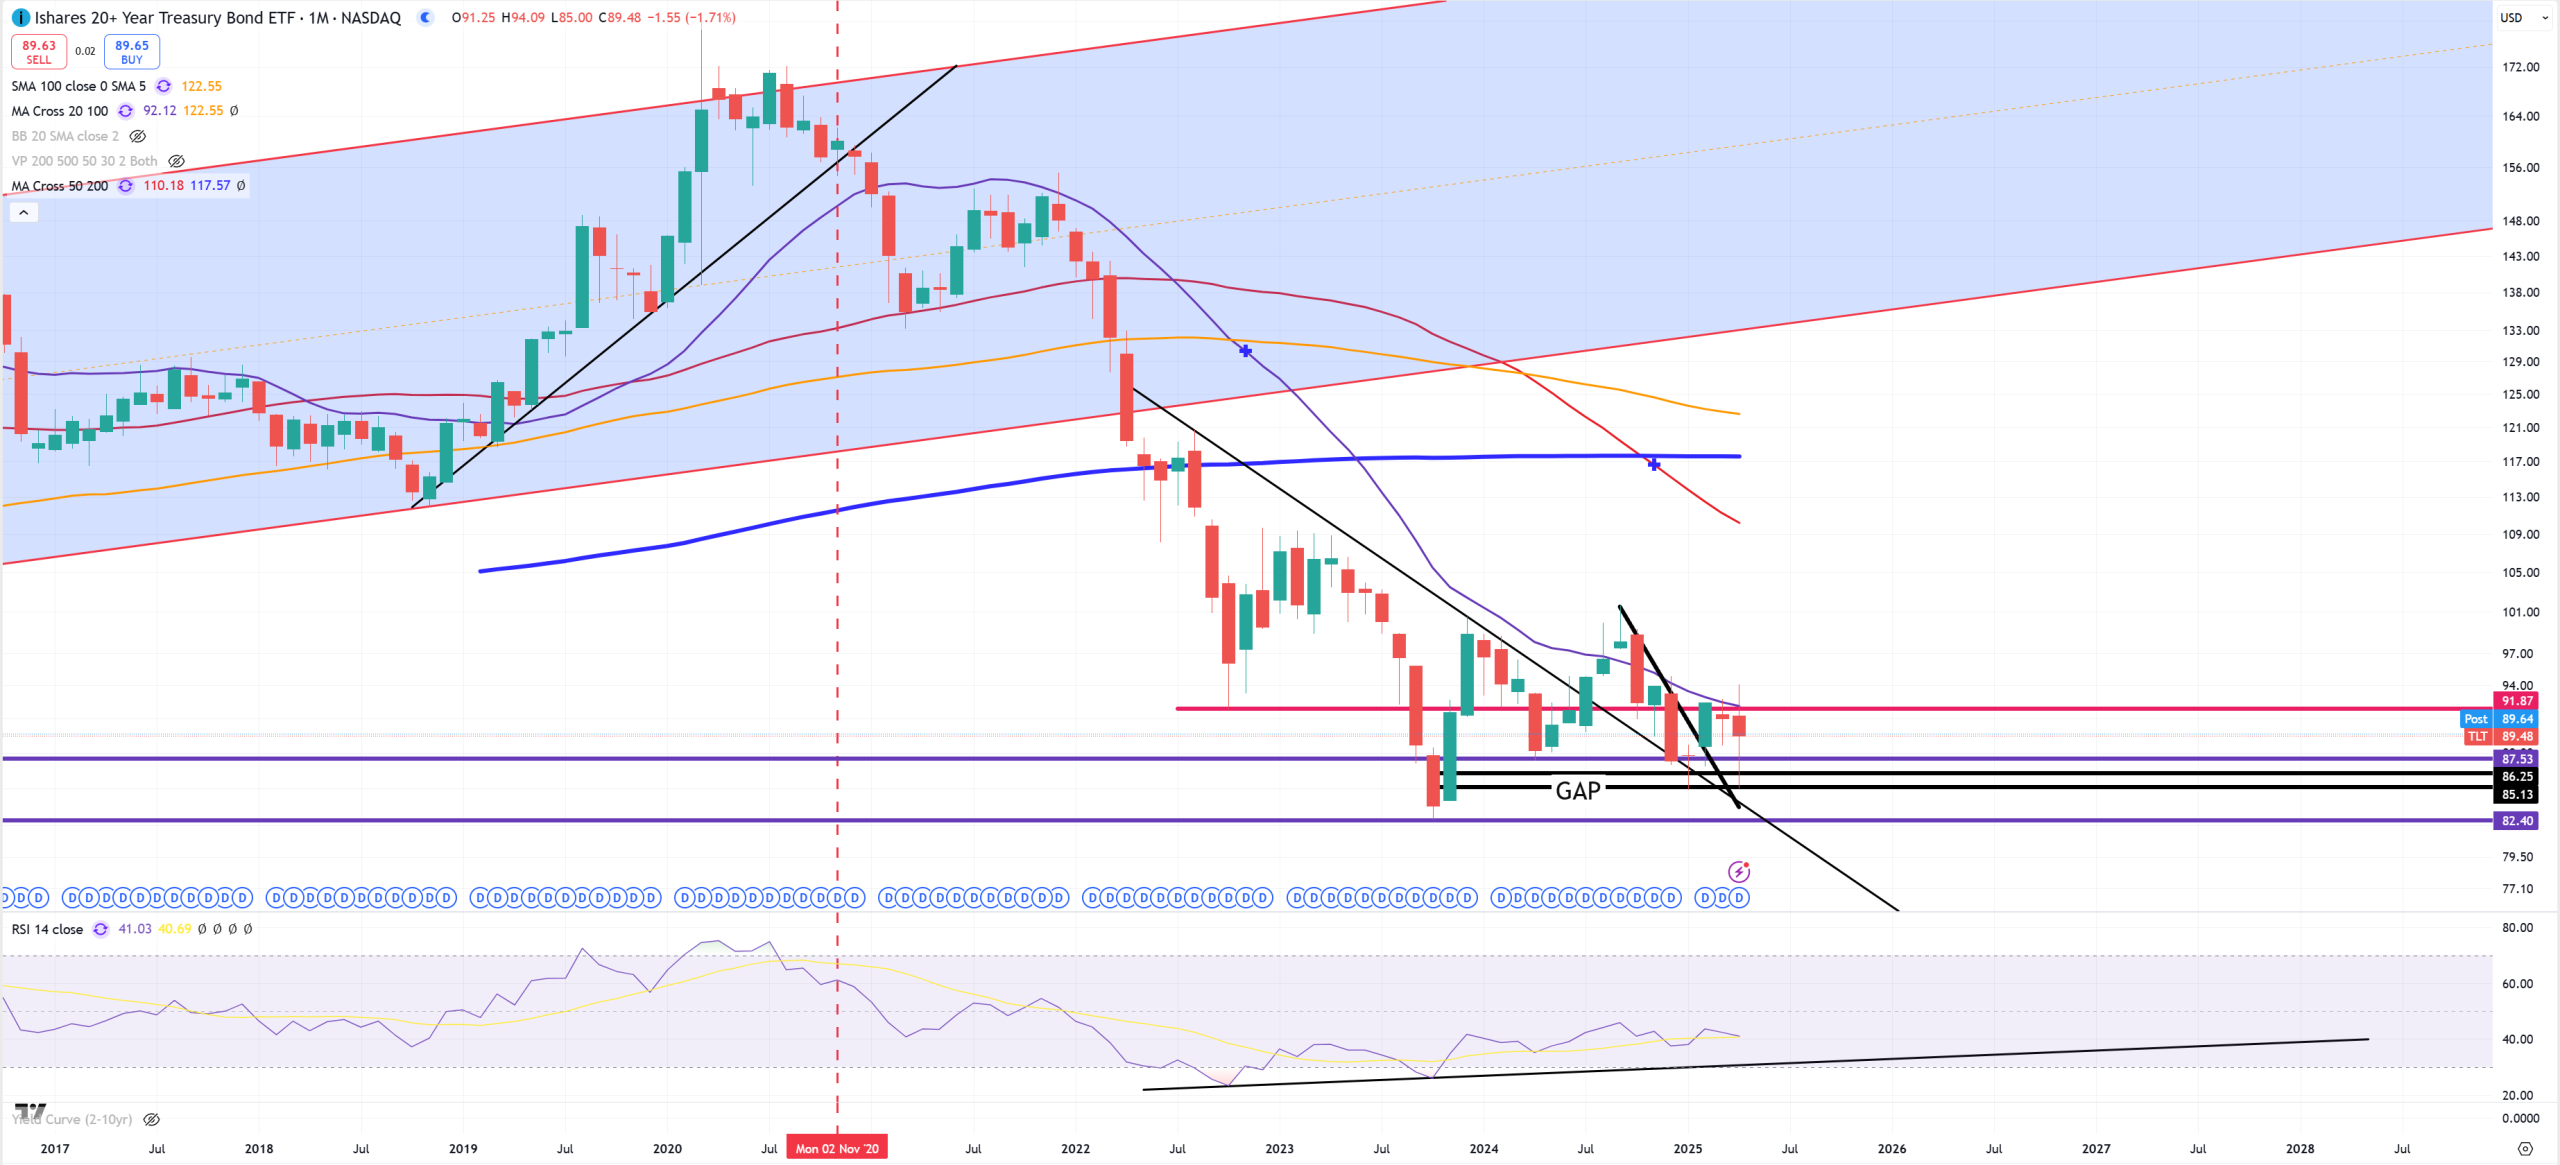
TLT – still can’t really break (M)MA20 and resistance level = 92$, but I sustain my bet 82$ ultimate low + 85$ second higher low.
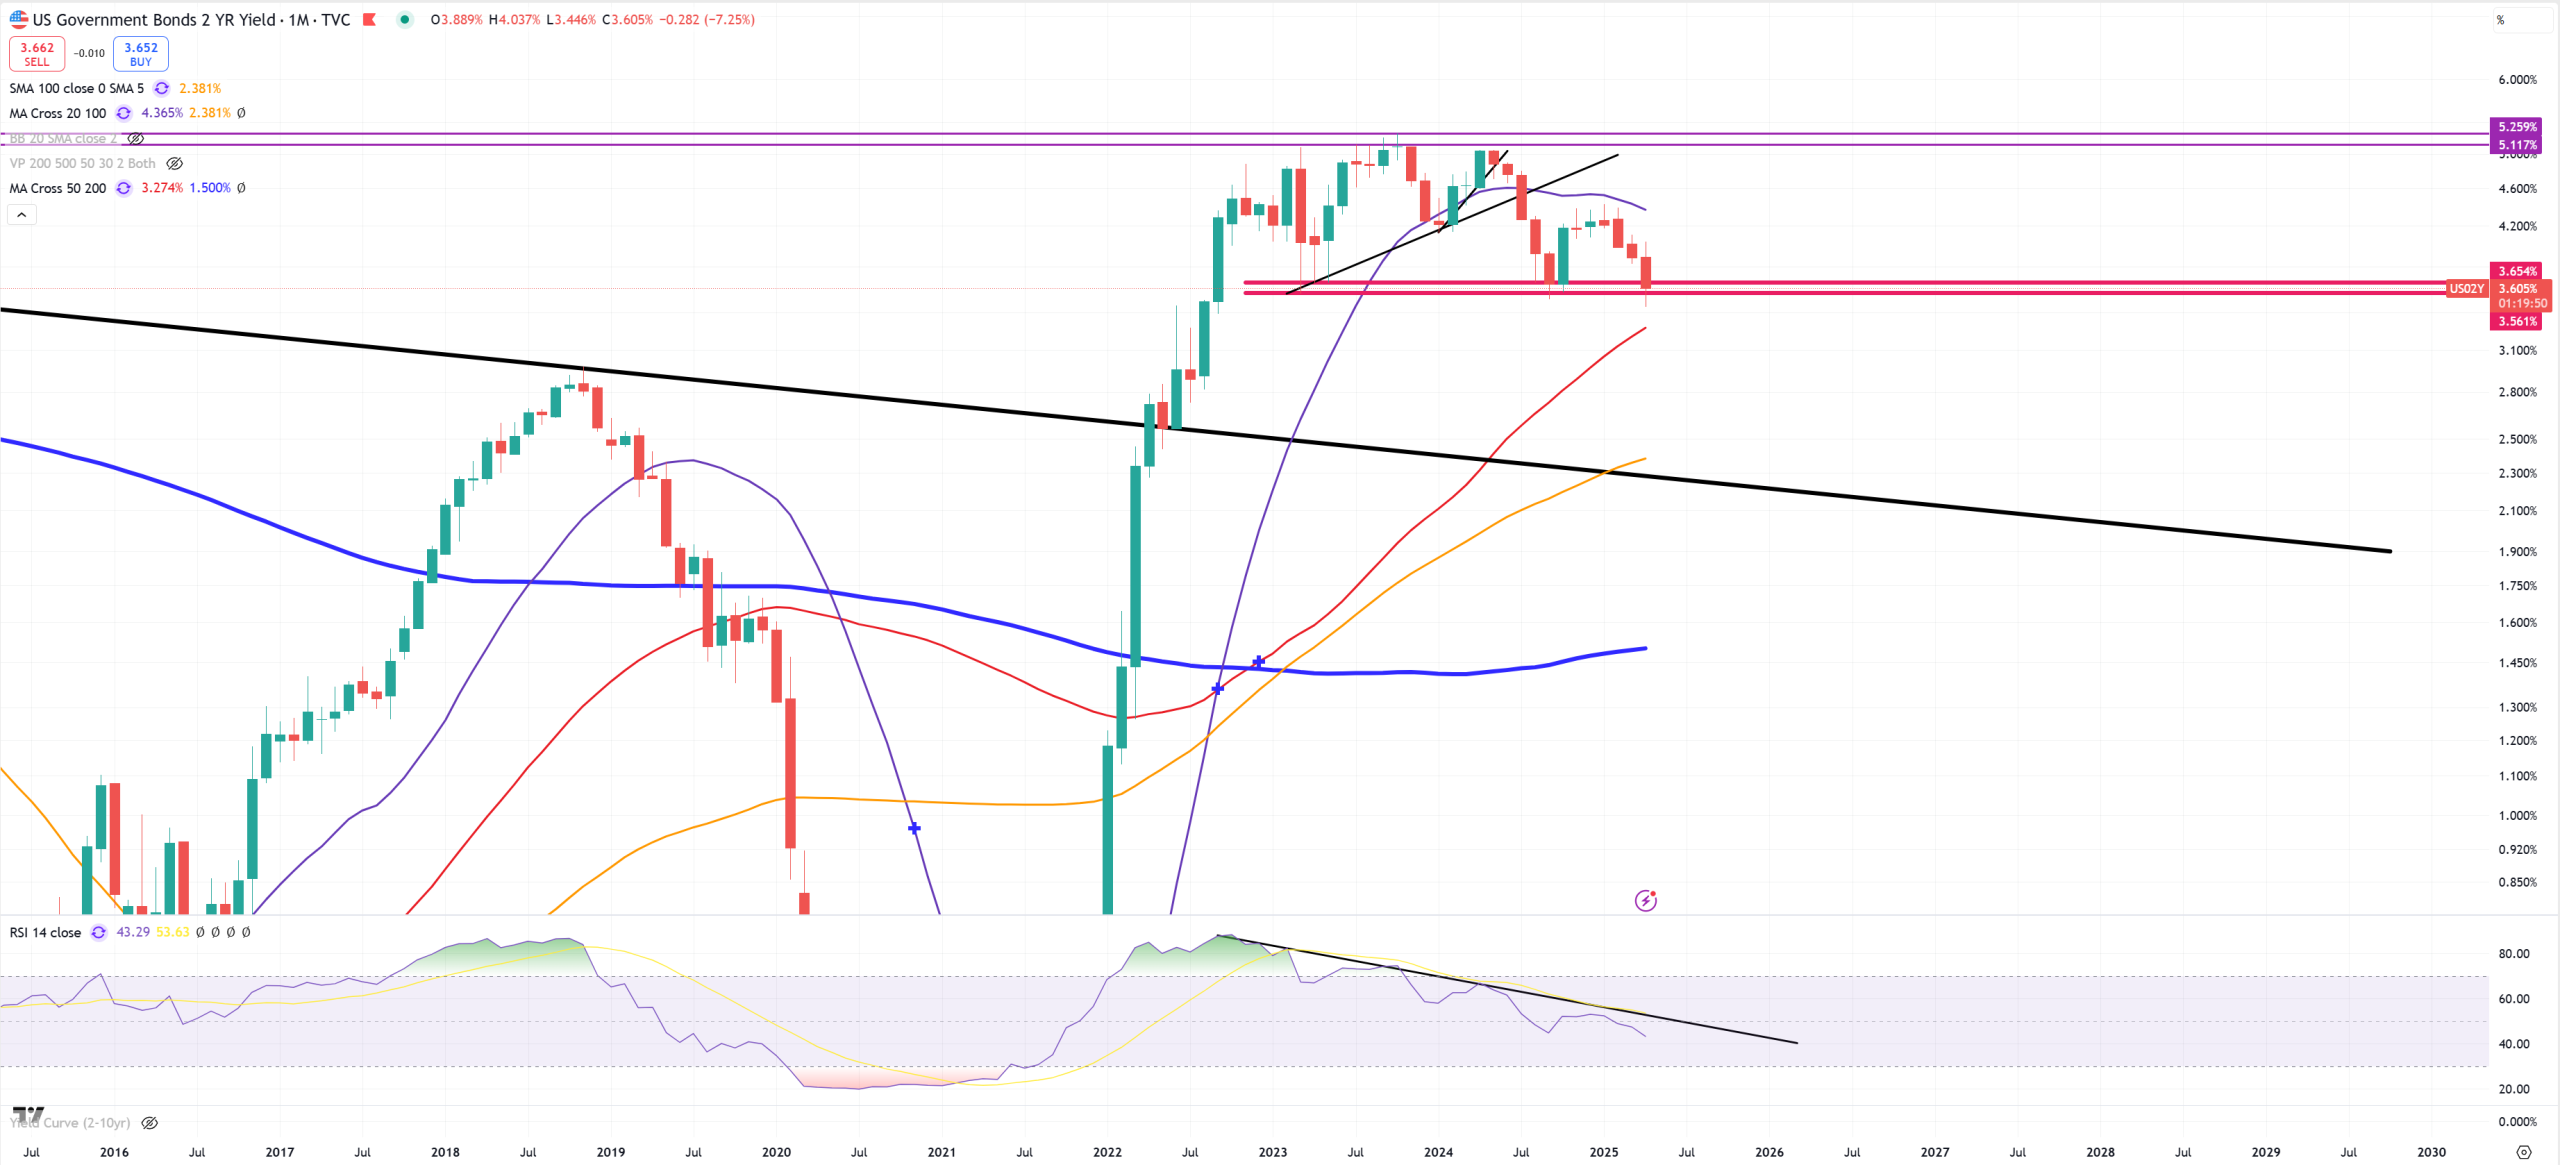
US02Y – if we break this support around 3.60% and later (M)MA50 = 3.25% we’ll land on 2-2.25% quickly, so something like 200bps cuts coming.
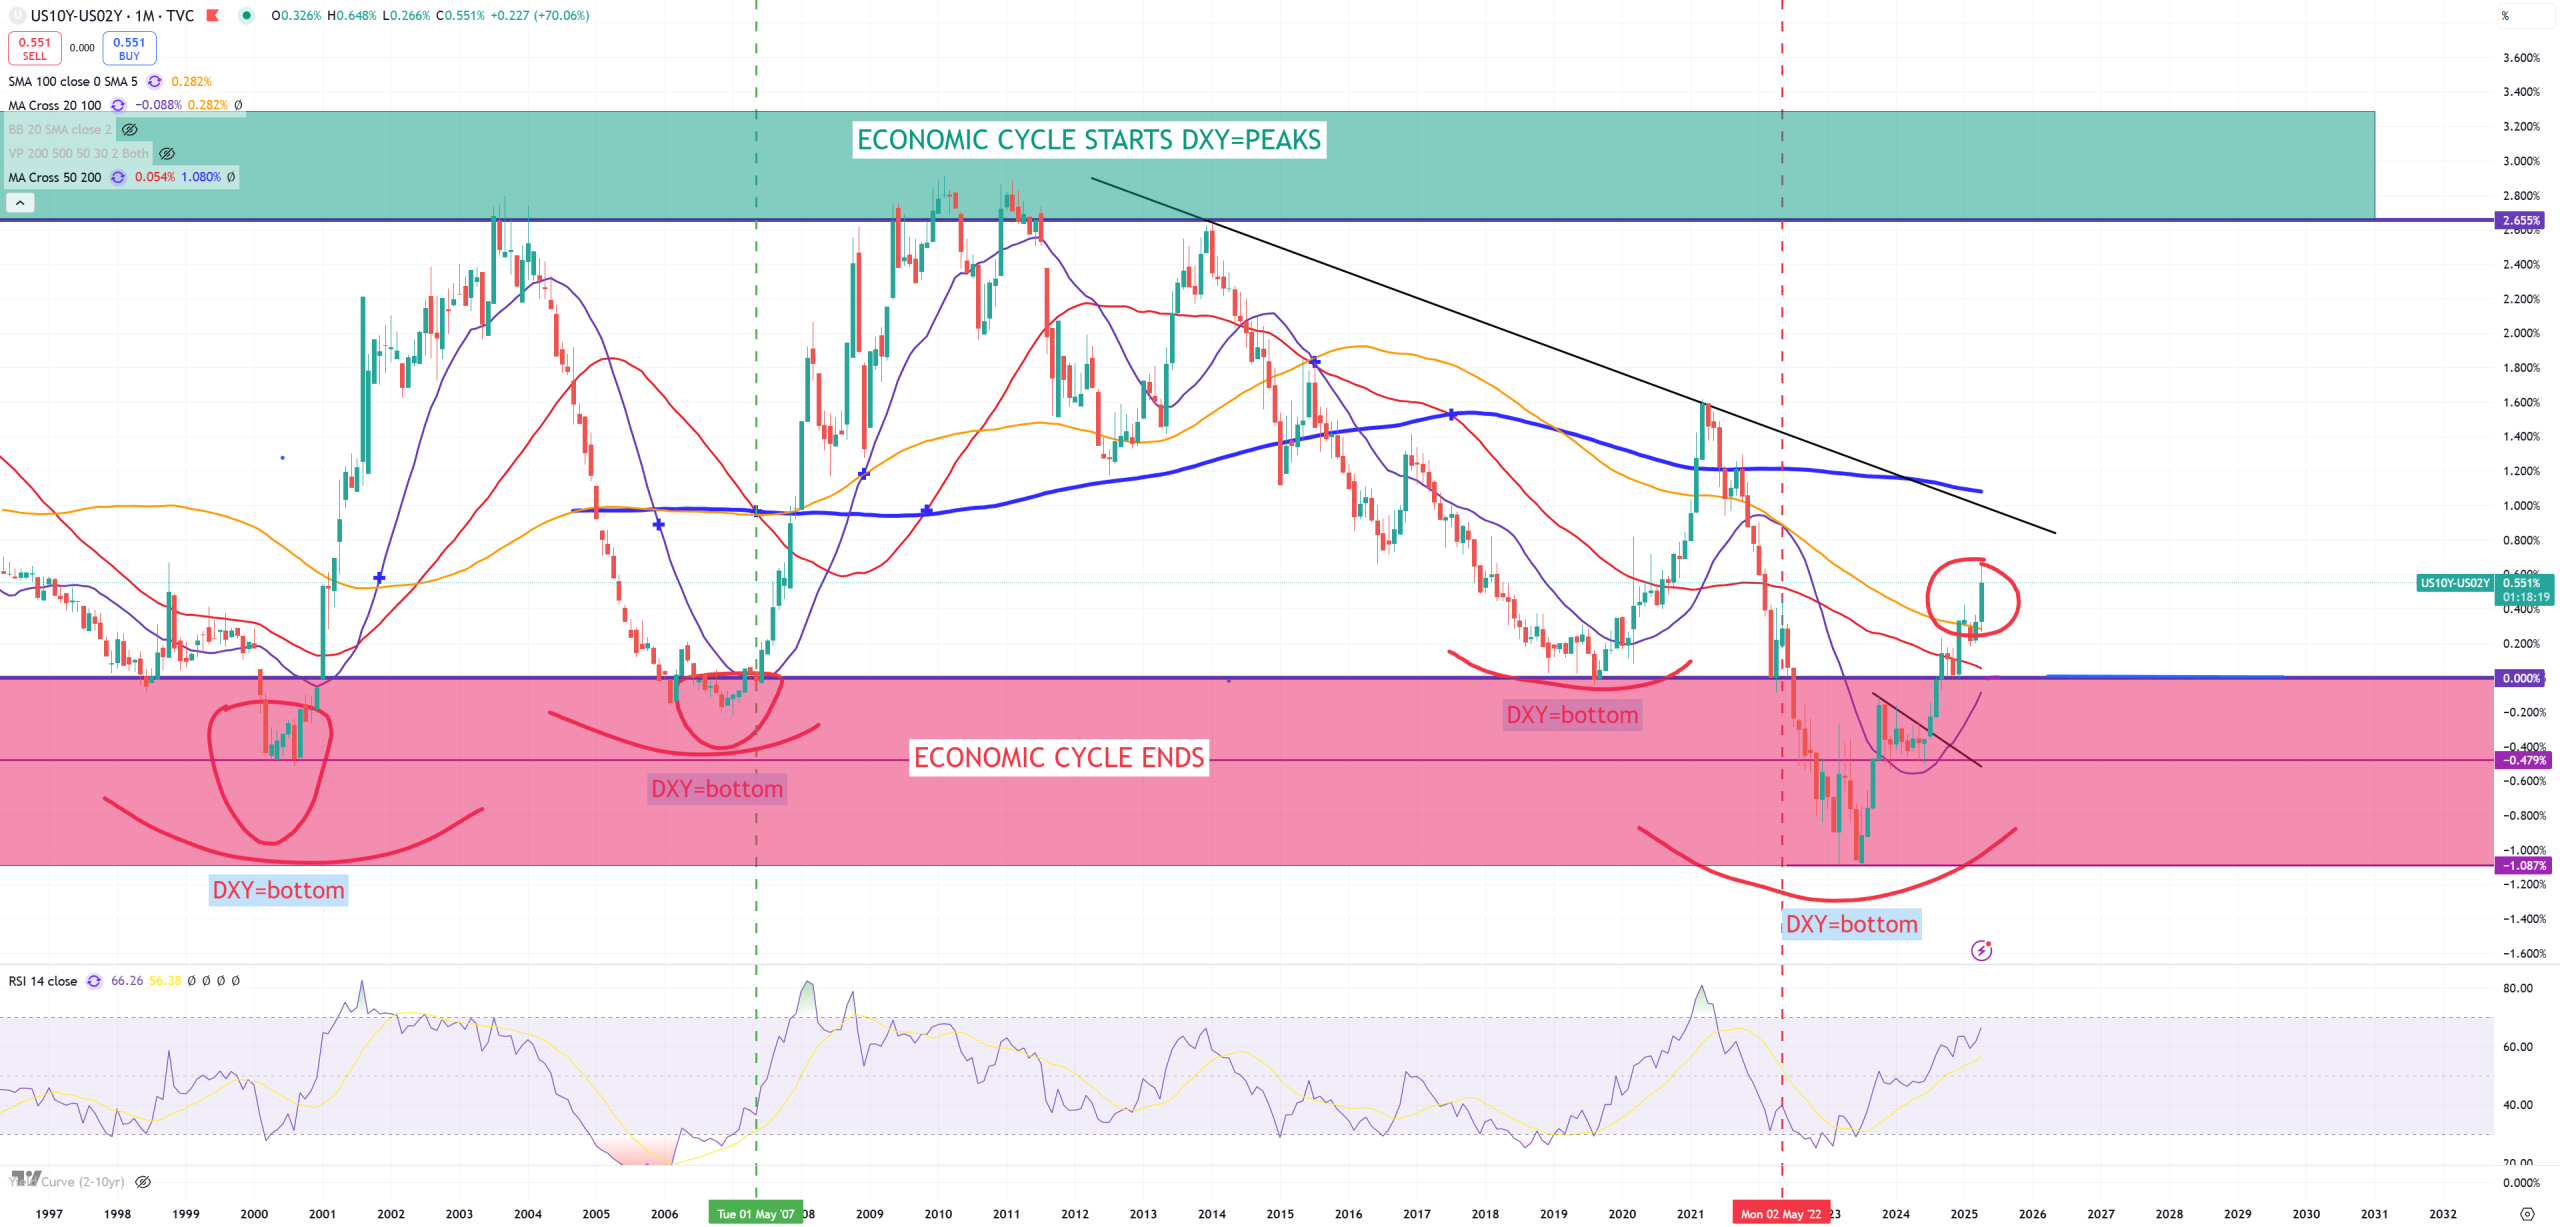
US10Y-US02Y – (M)MA100 I think is finally support – ripping to +55bps
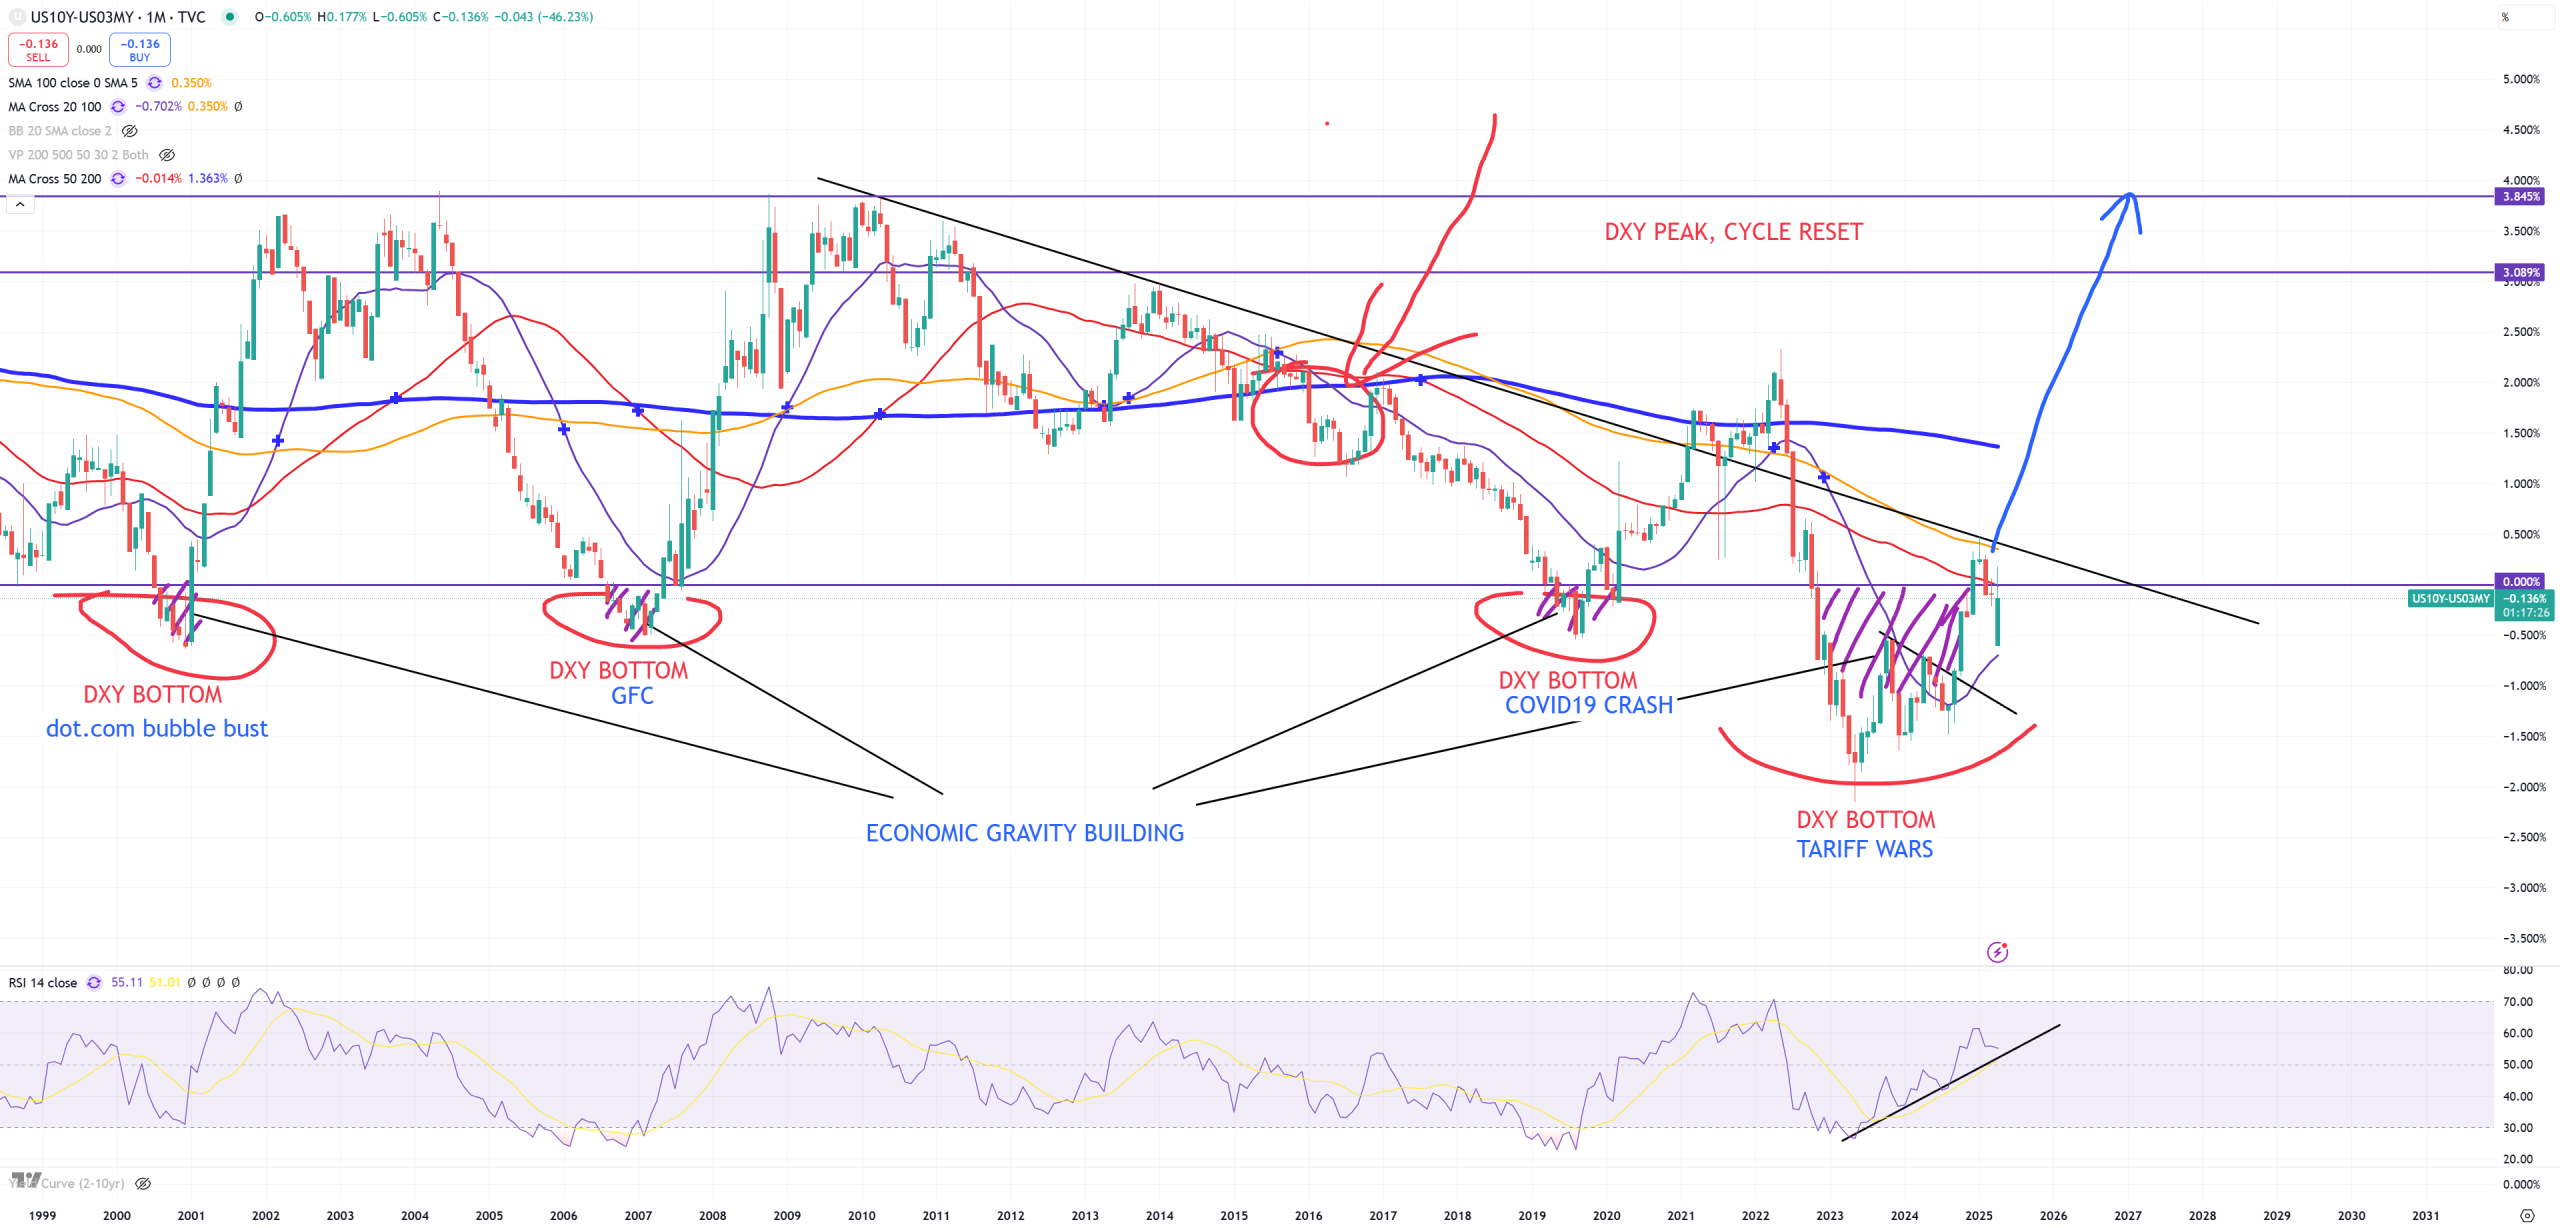
US10Y-US03MY – lagging 10Y-2Y by almost 70bps what is enormous level. Below (M)MA50 with positive divergence and the question when it’ll start chasing 10Y-2Y. As long as it’s not coming out fast from inversion, stock market will be dancing, because we can simplify that : when this pair is UP post inversion, the $$$ is going higher. Market is finished when this spread jumped finally post +50-60bps (so joining 10Y-2Y).
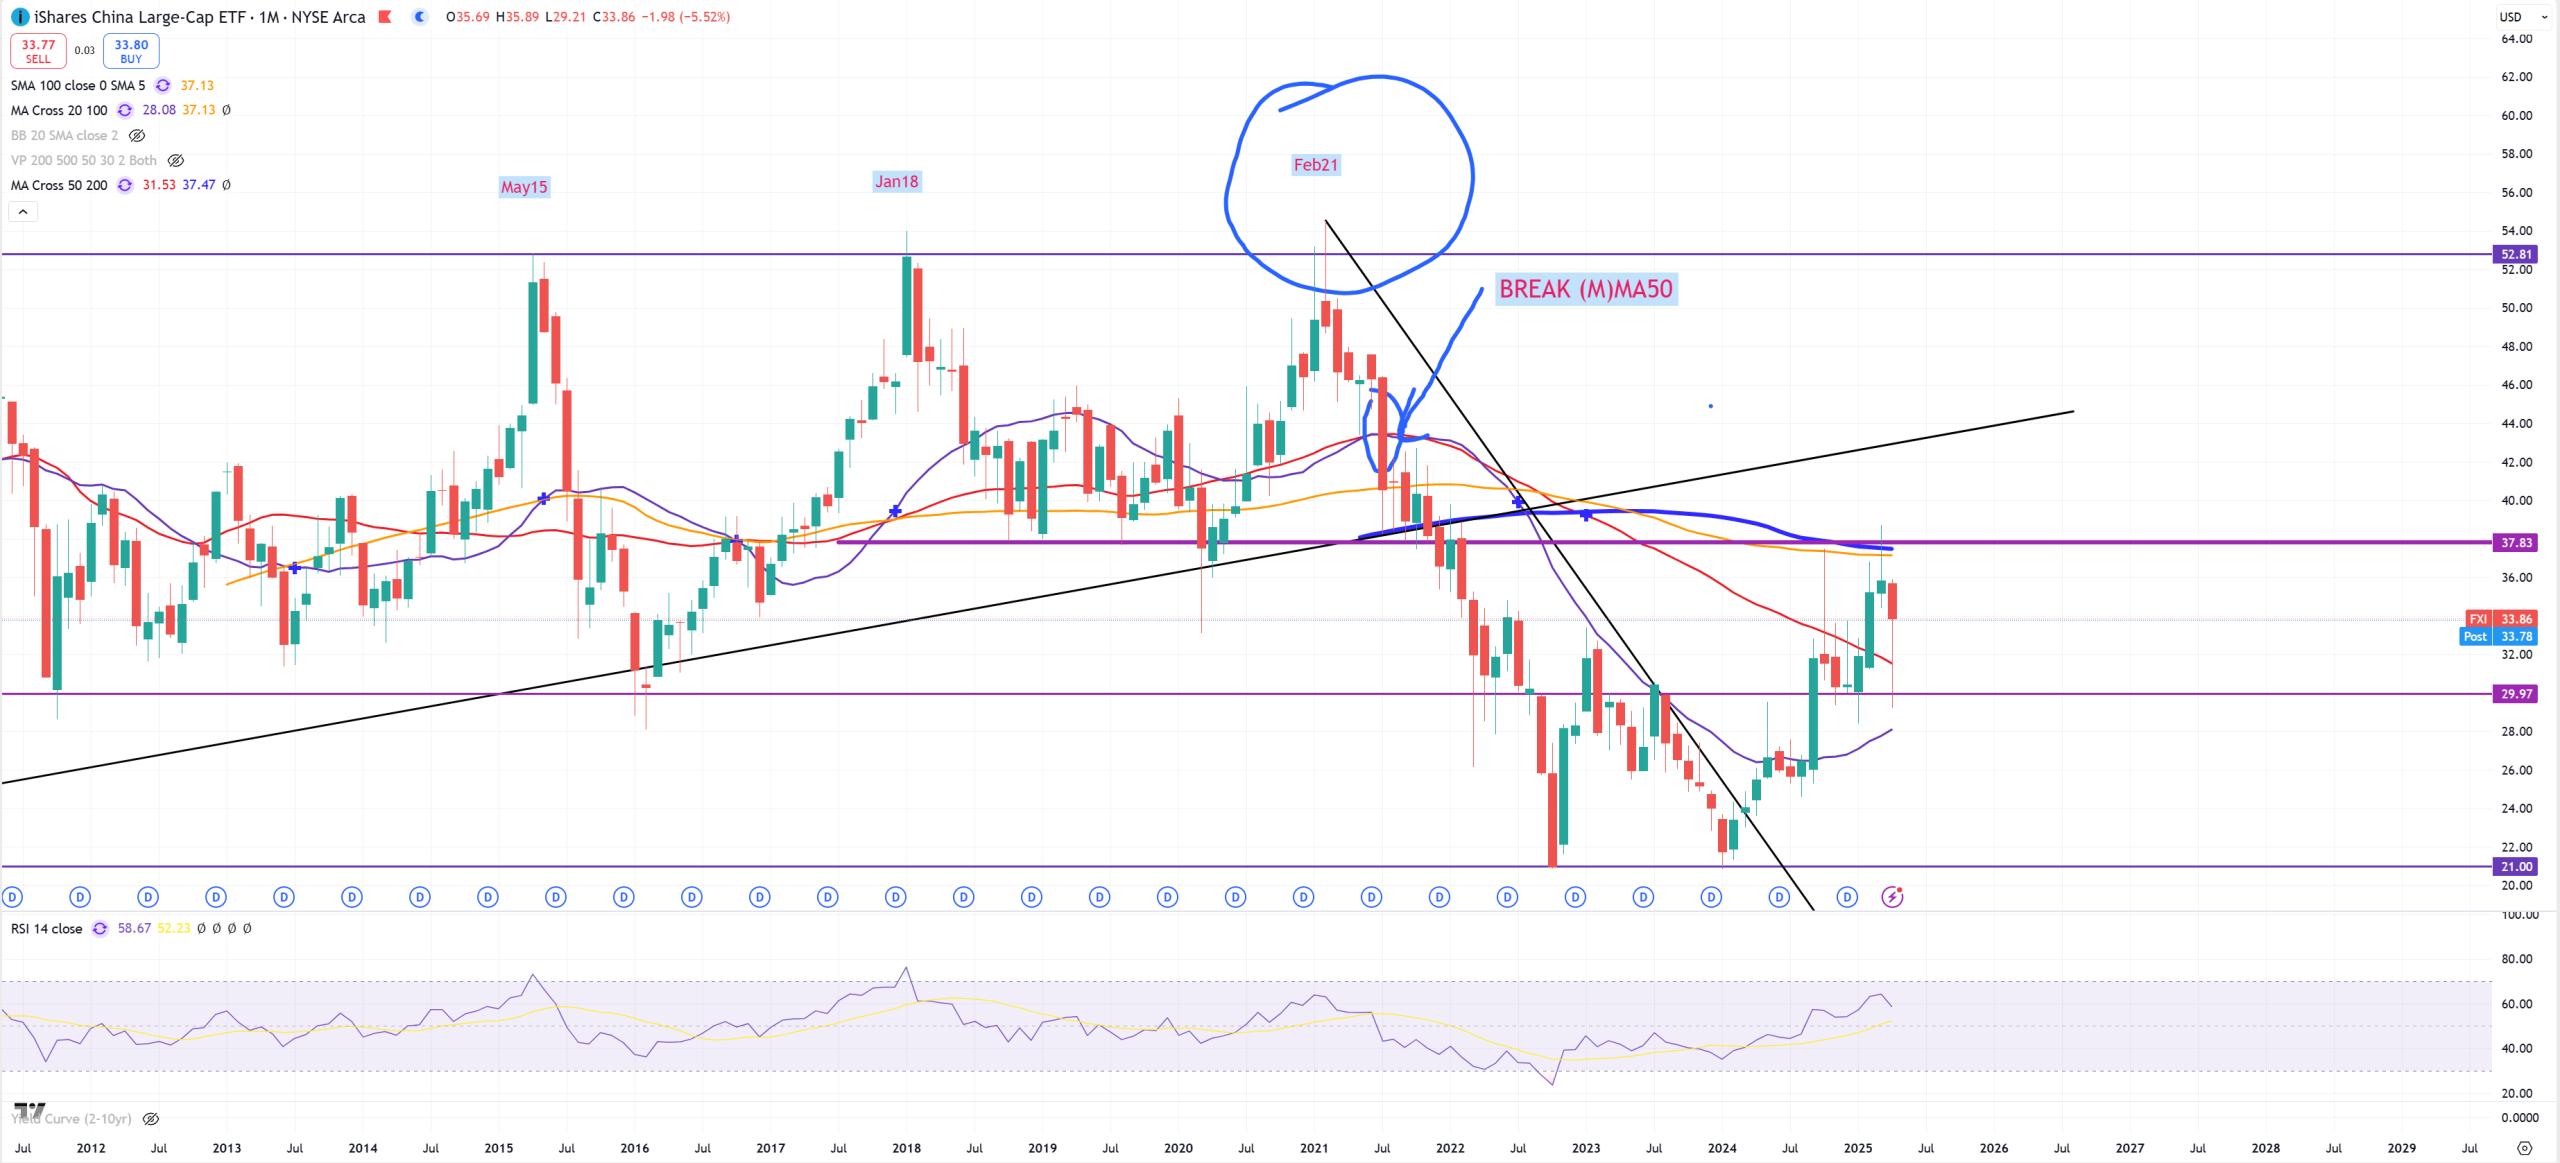
FXI – China tries to get towards last (M)MA200 and failed trying to stay above (M)MA50. I doubt it’ll hold because I think 10Y-3M will be rapidly raising at some point of time.
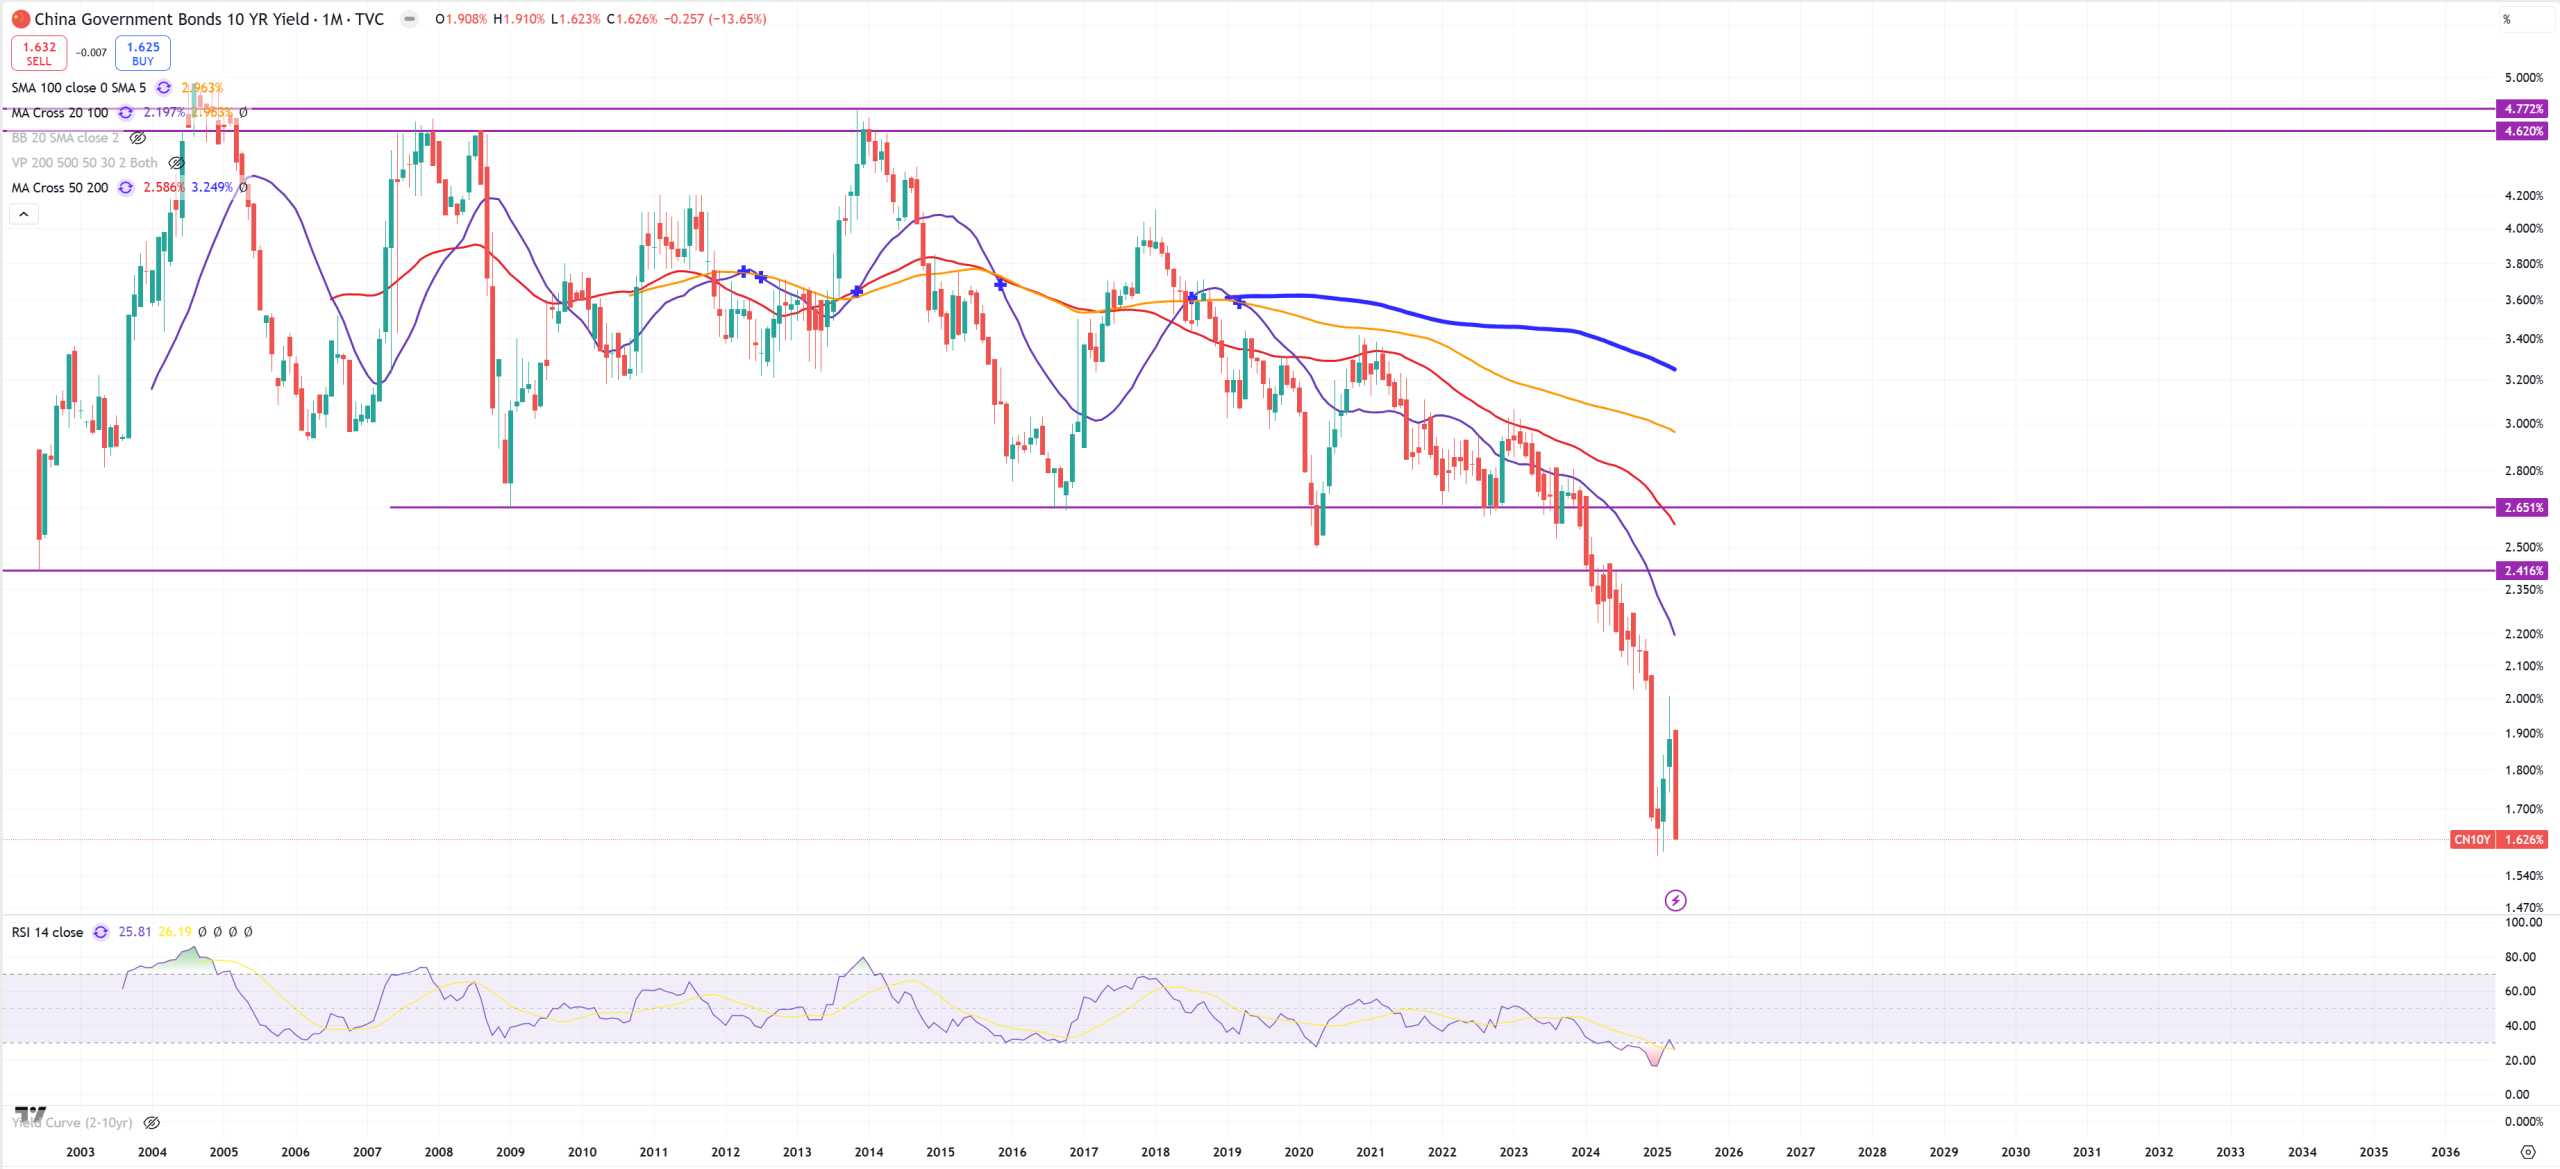
CN10Y – look on RSI. I think at some point of time we’ll start to see a flip. CN10Y will start going up while US10Y will start going down. That’ll be the same problem like Japan so economy is going to adjust the value of Yuan and trust in it.
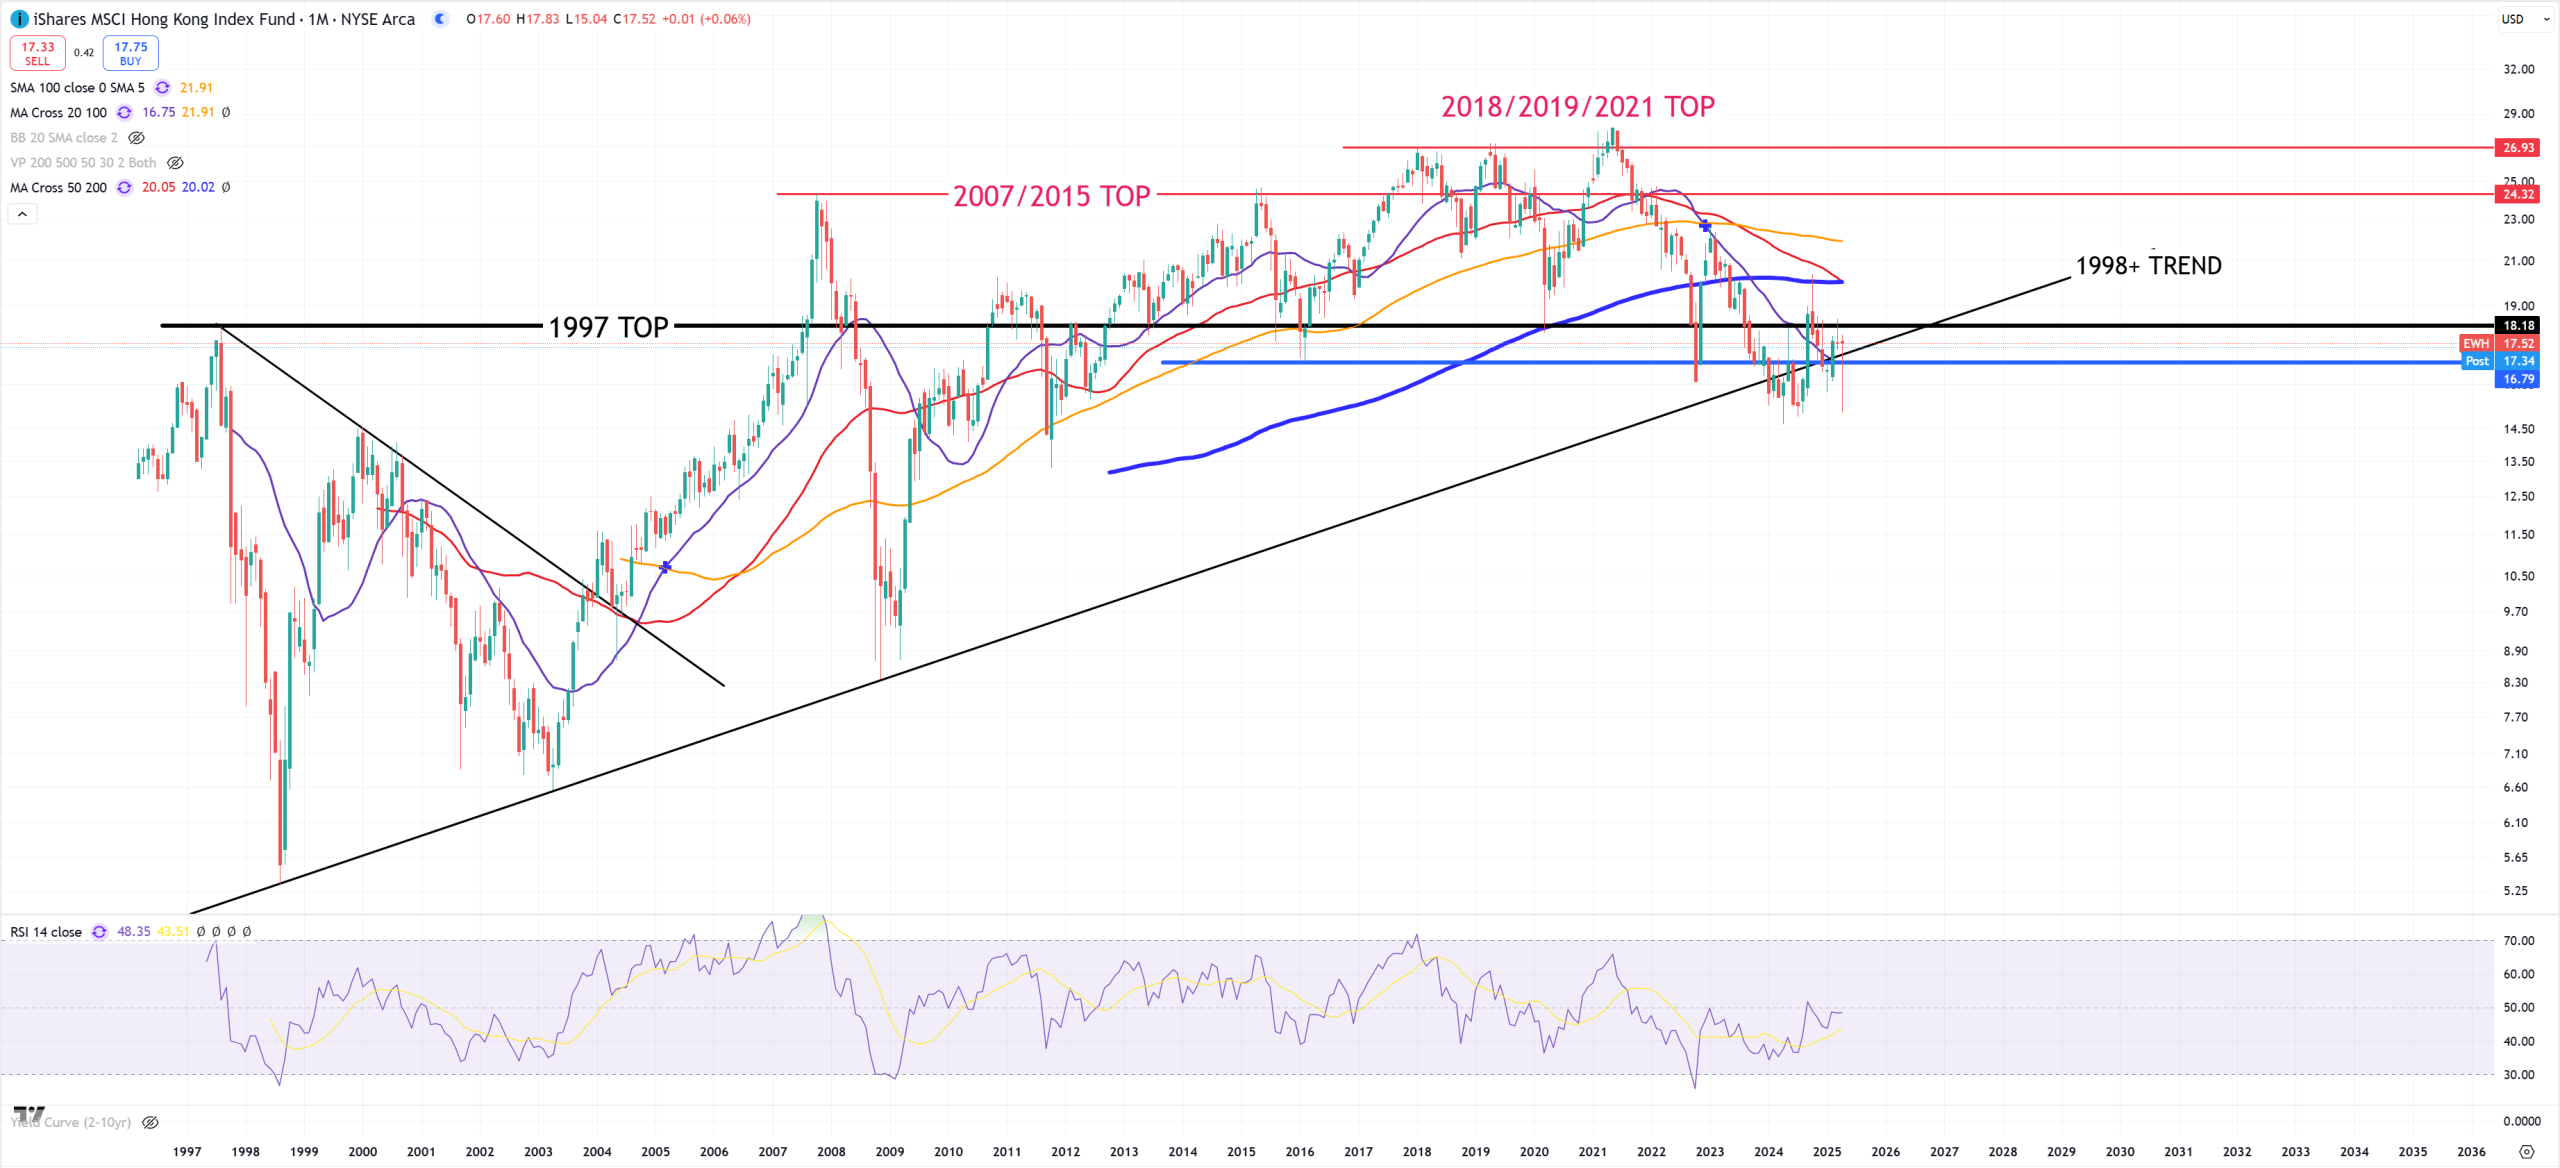
EWH – very similar chart to EEM fighting till the end. Why I don’t believe it’ll be saved? Because of 10Y-3M = -15bps and 800 days of inversion.
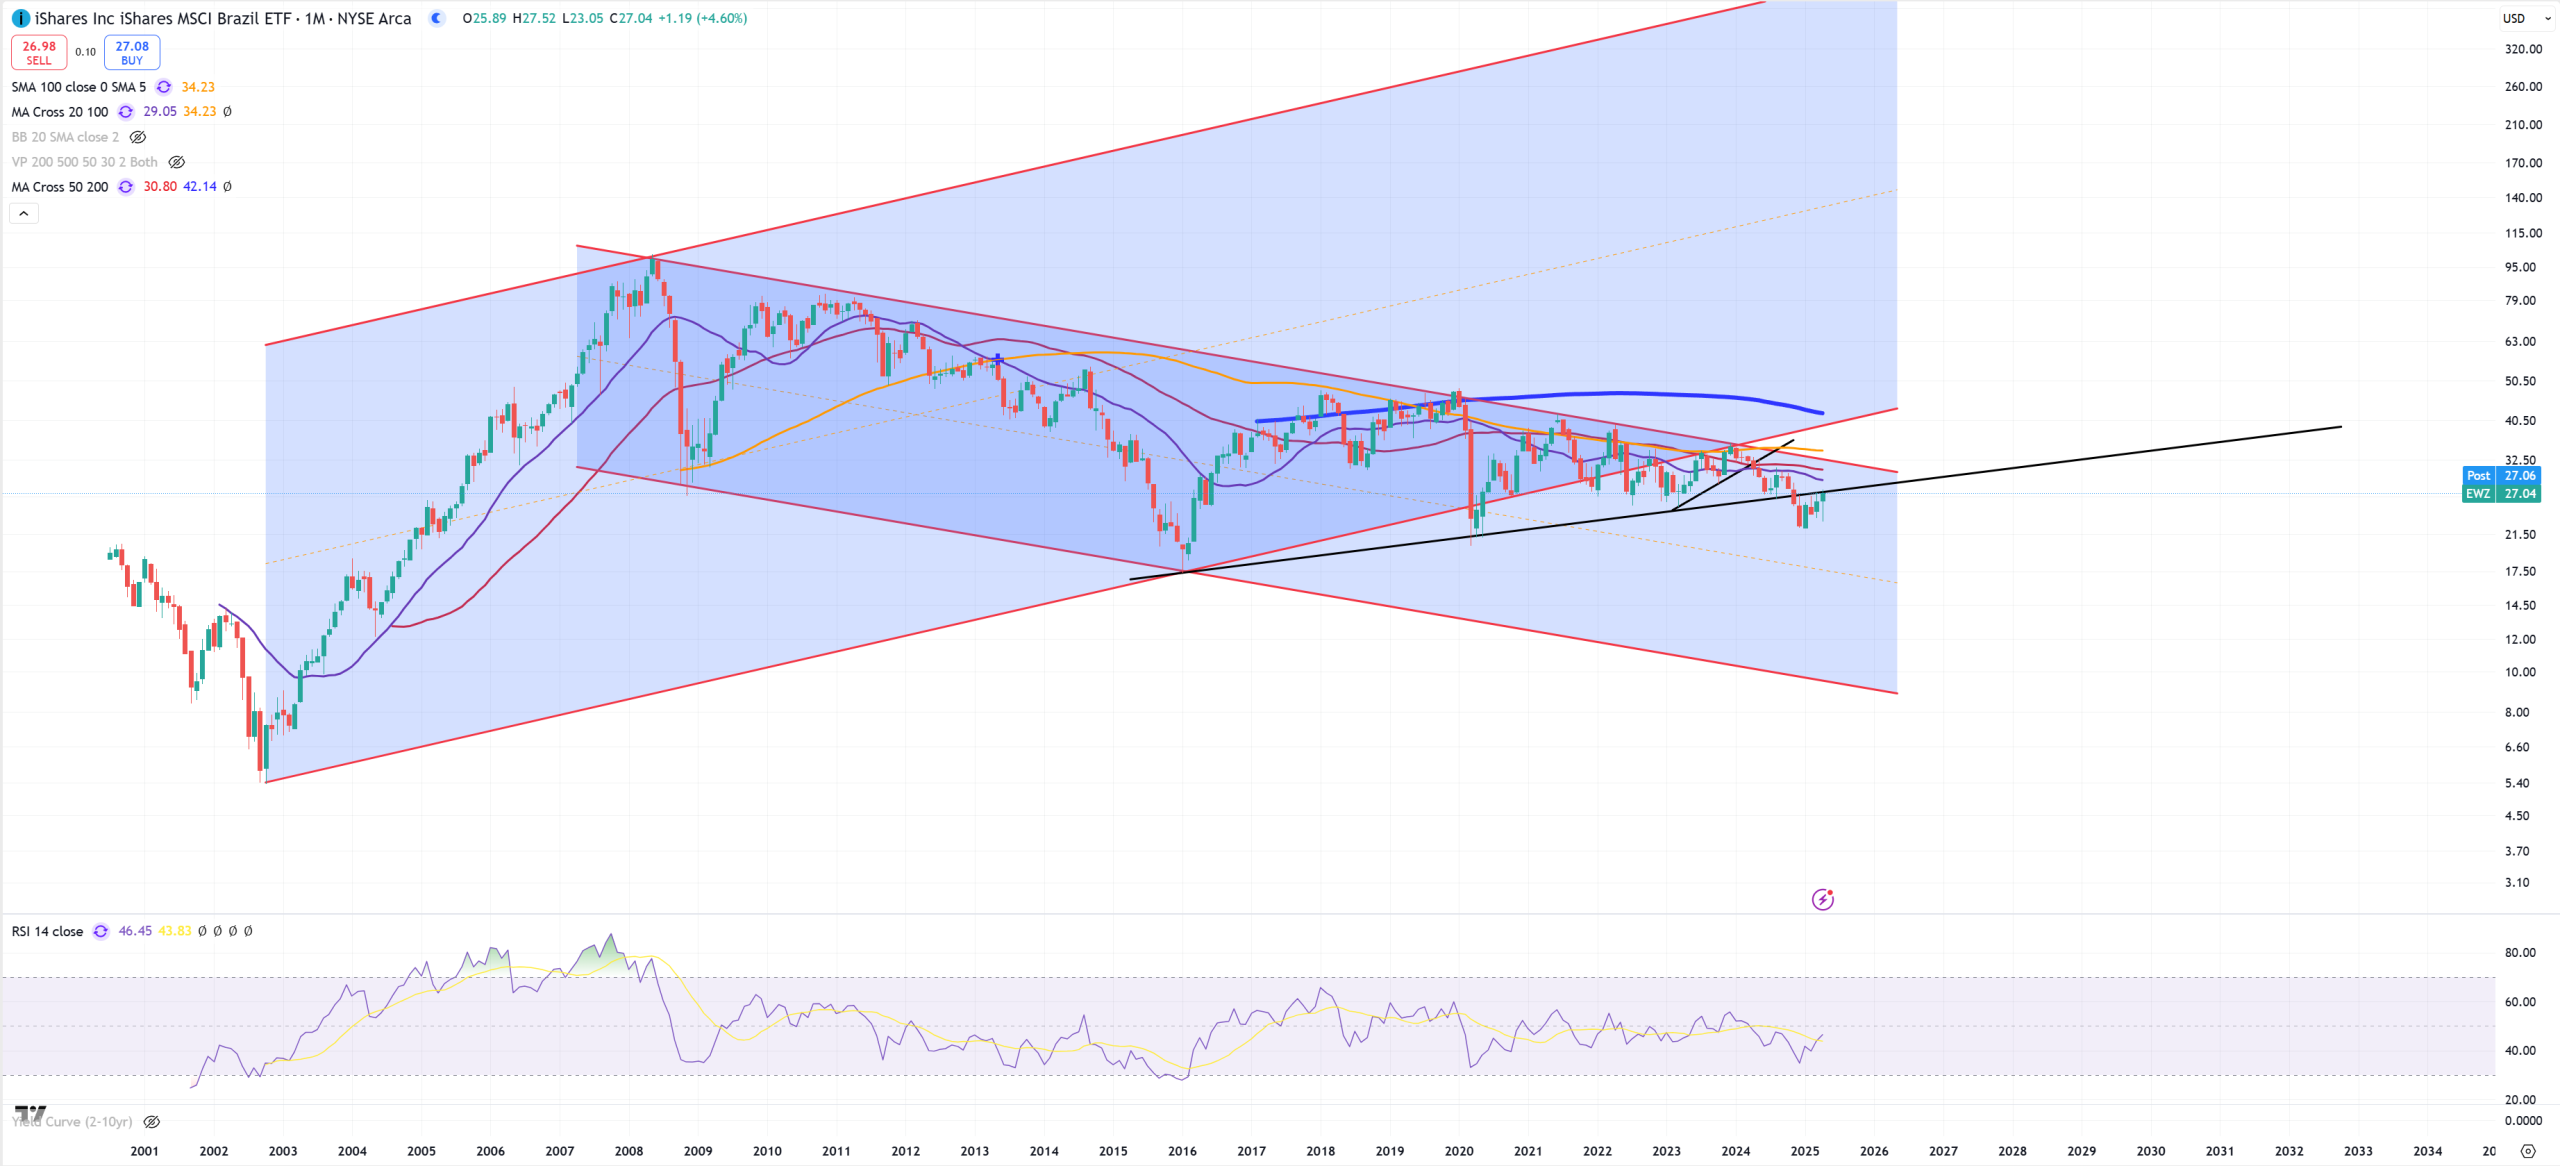
EWZ – Brazil needs to decide from this level what to do. I bet it’s just a retest.
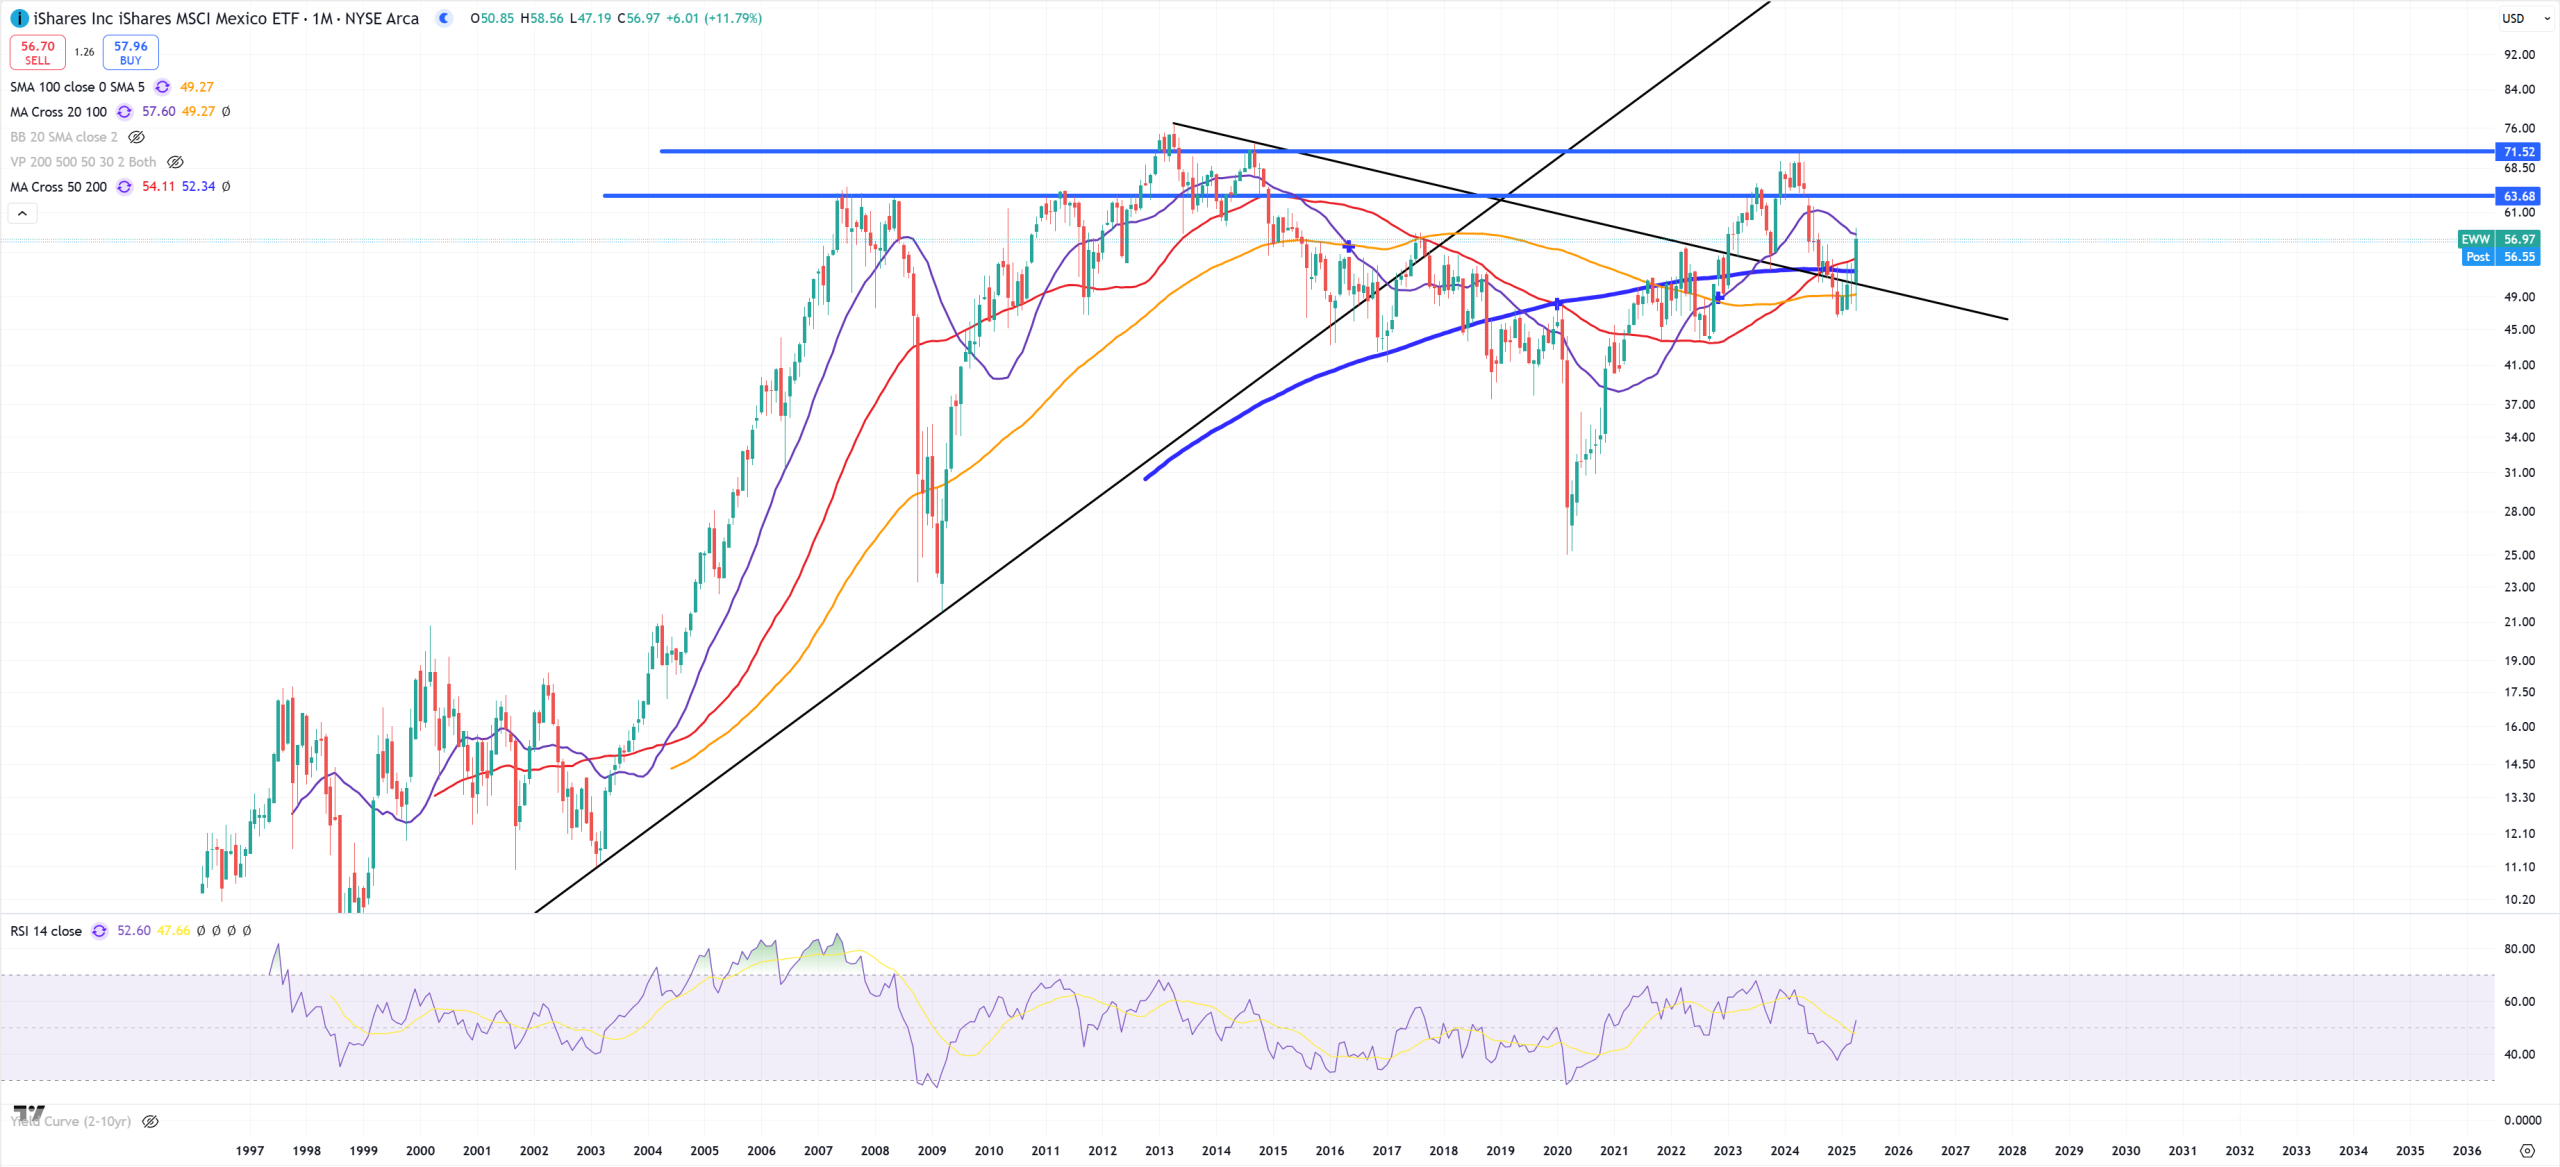
EWW – also fights till the end. Those bounces on those Emerging Markets are mostly caused by $$$ drop.
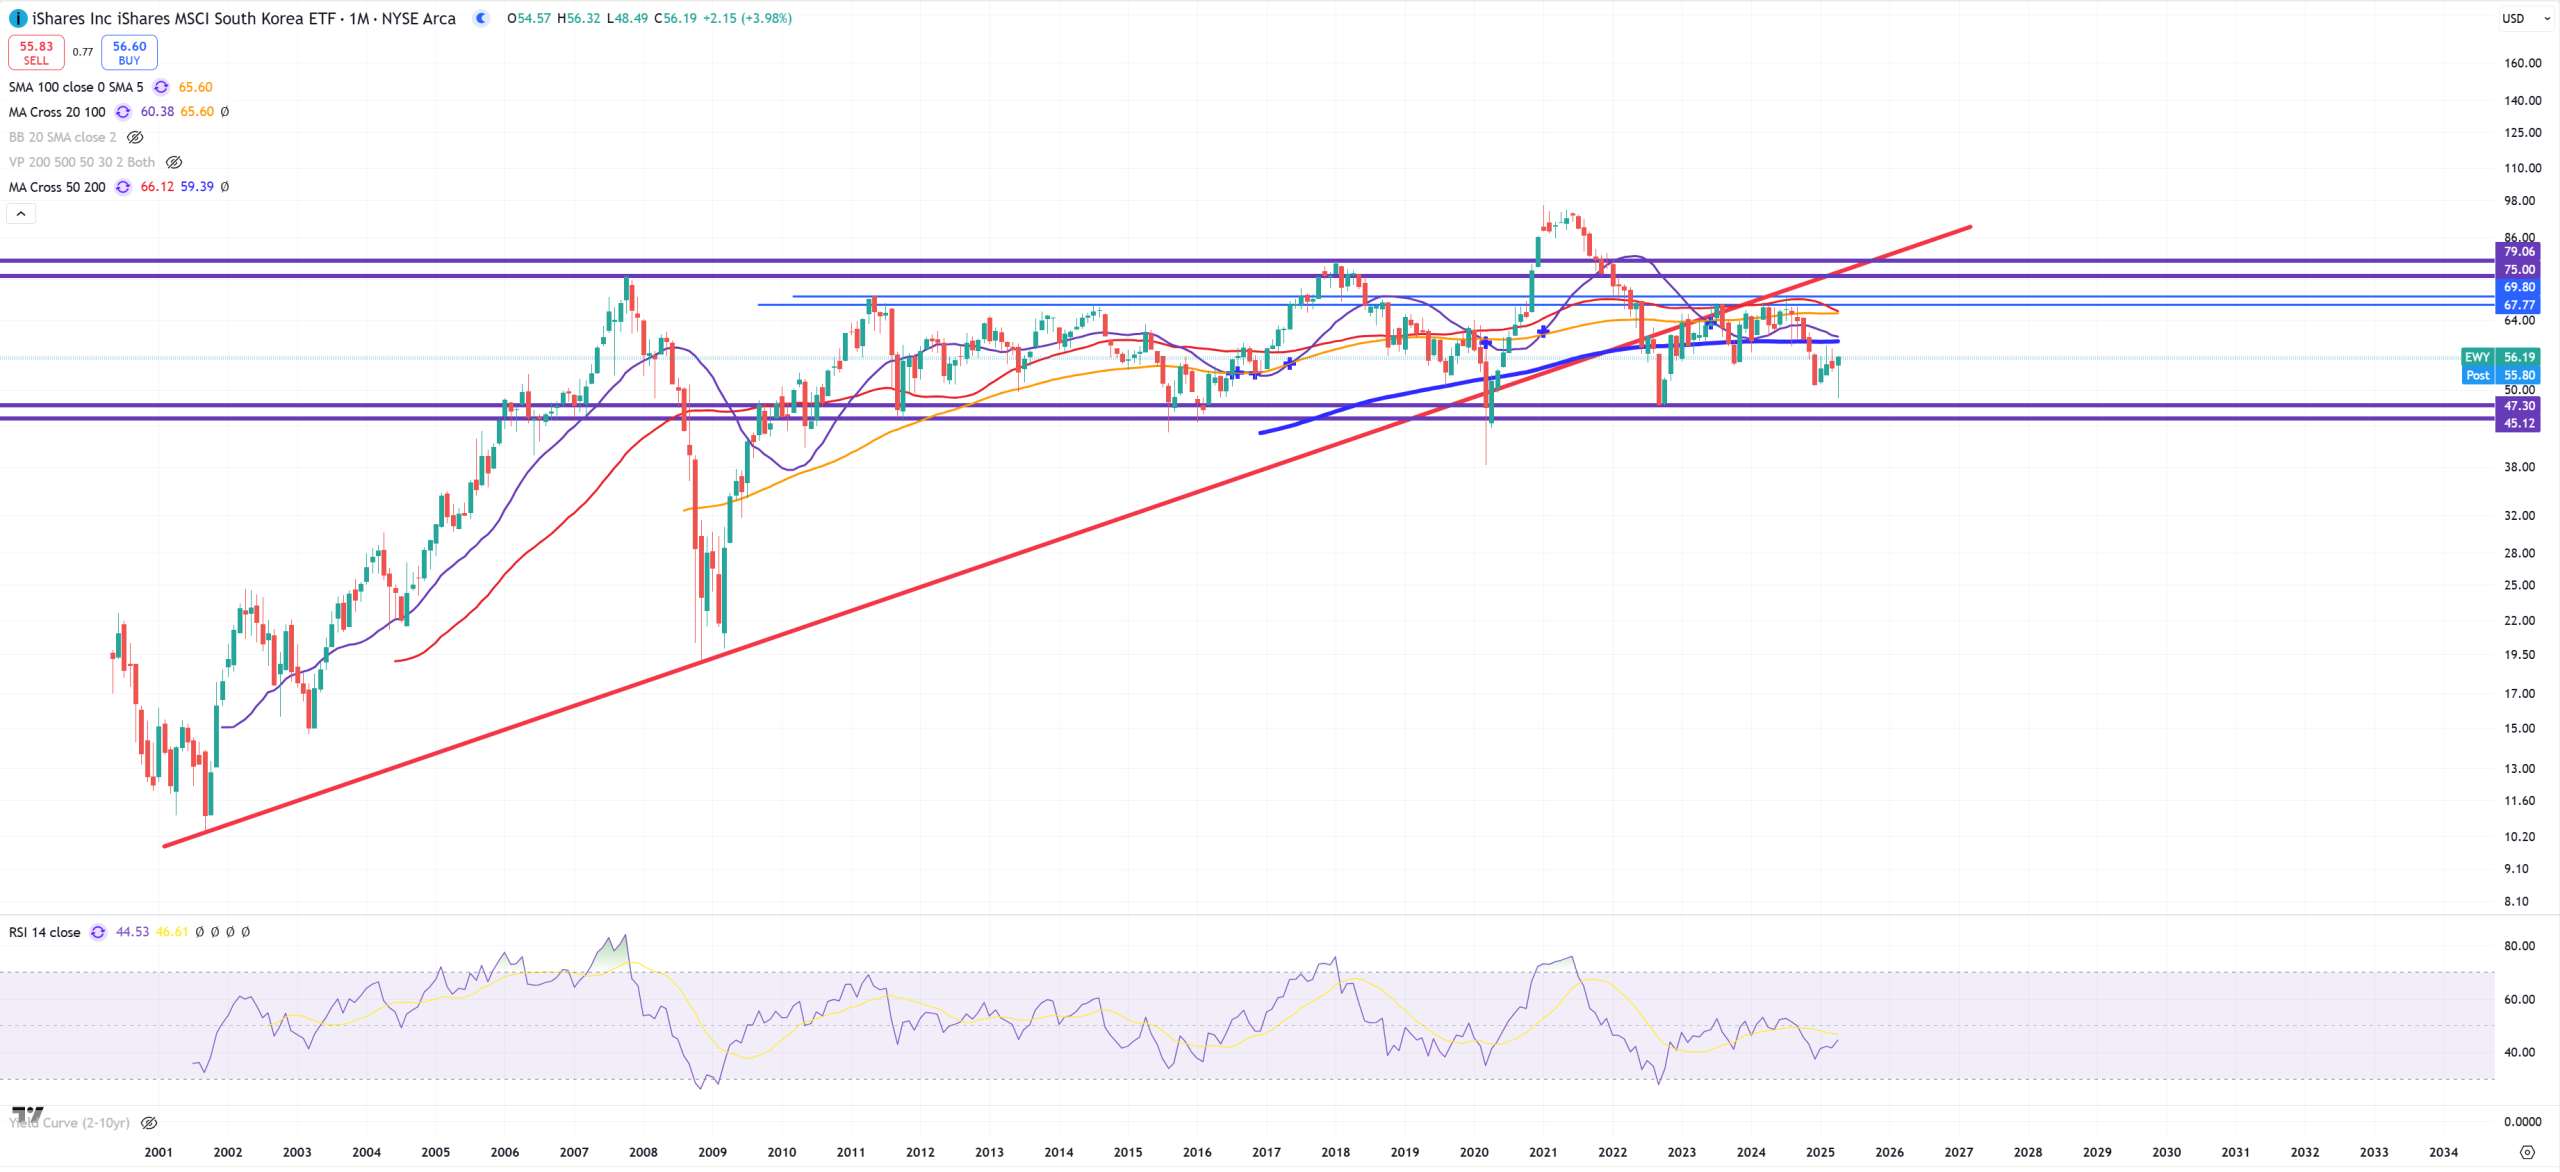
EWY – South Korea and no need to comment.
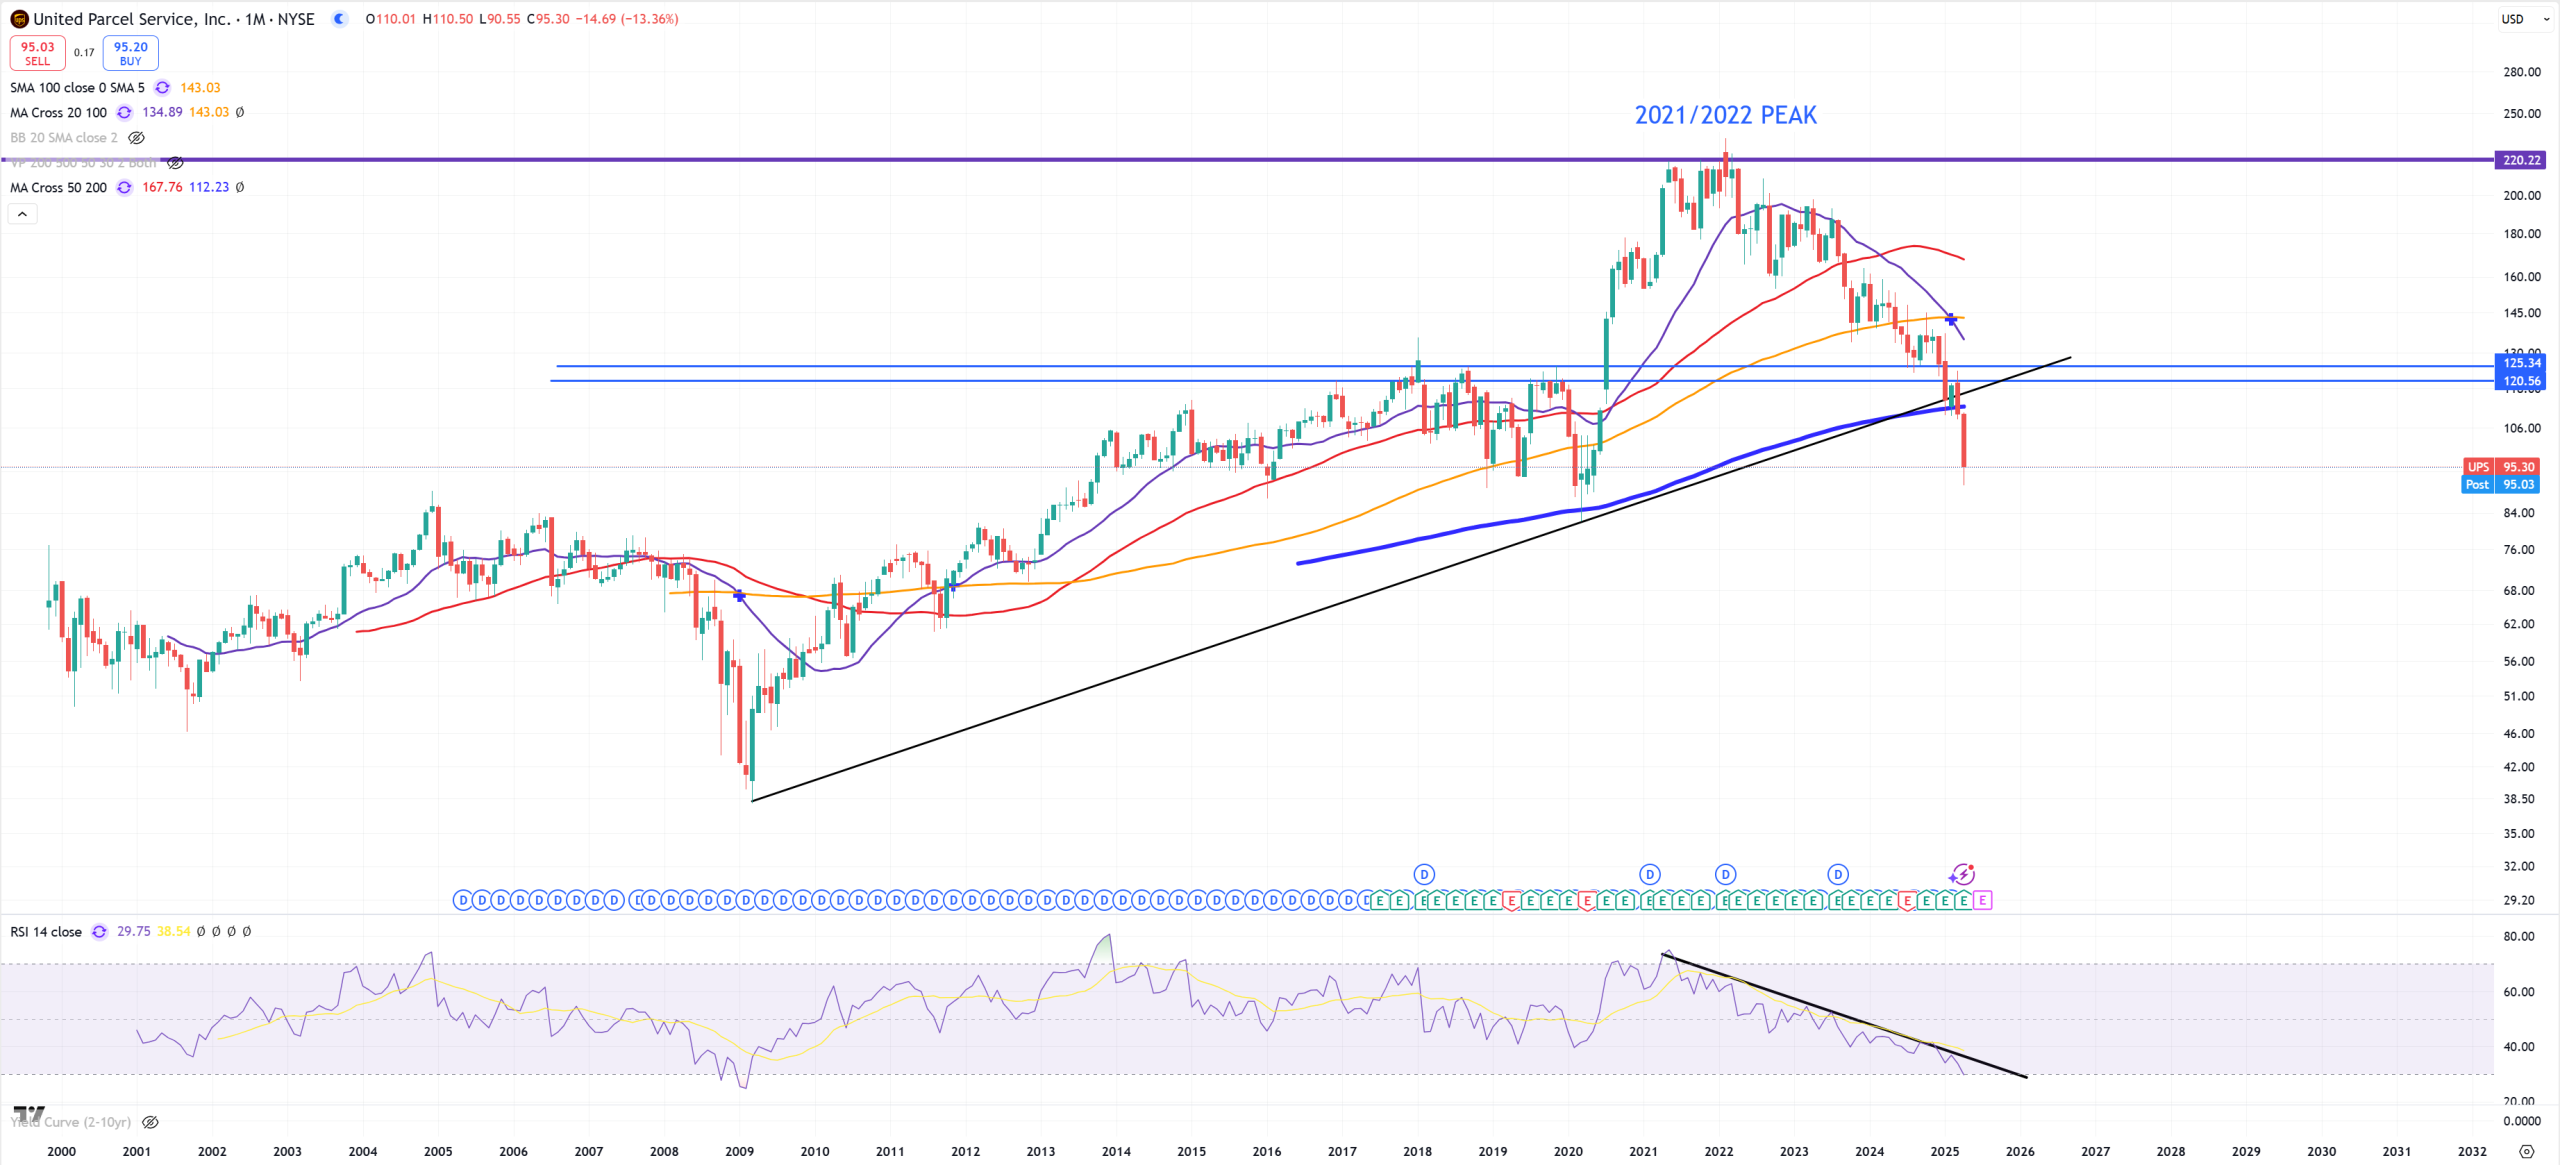
UPS – breaking the trend and (M)MA200 – looking very bad, peak between 2021 and 2022, mostly where inflation peaked and started its move down.
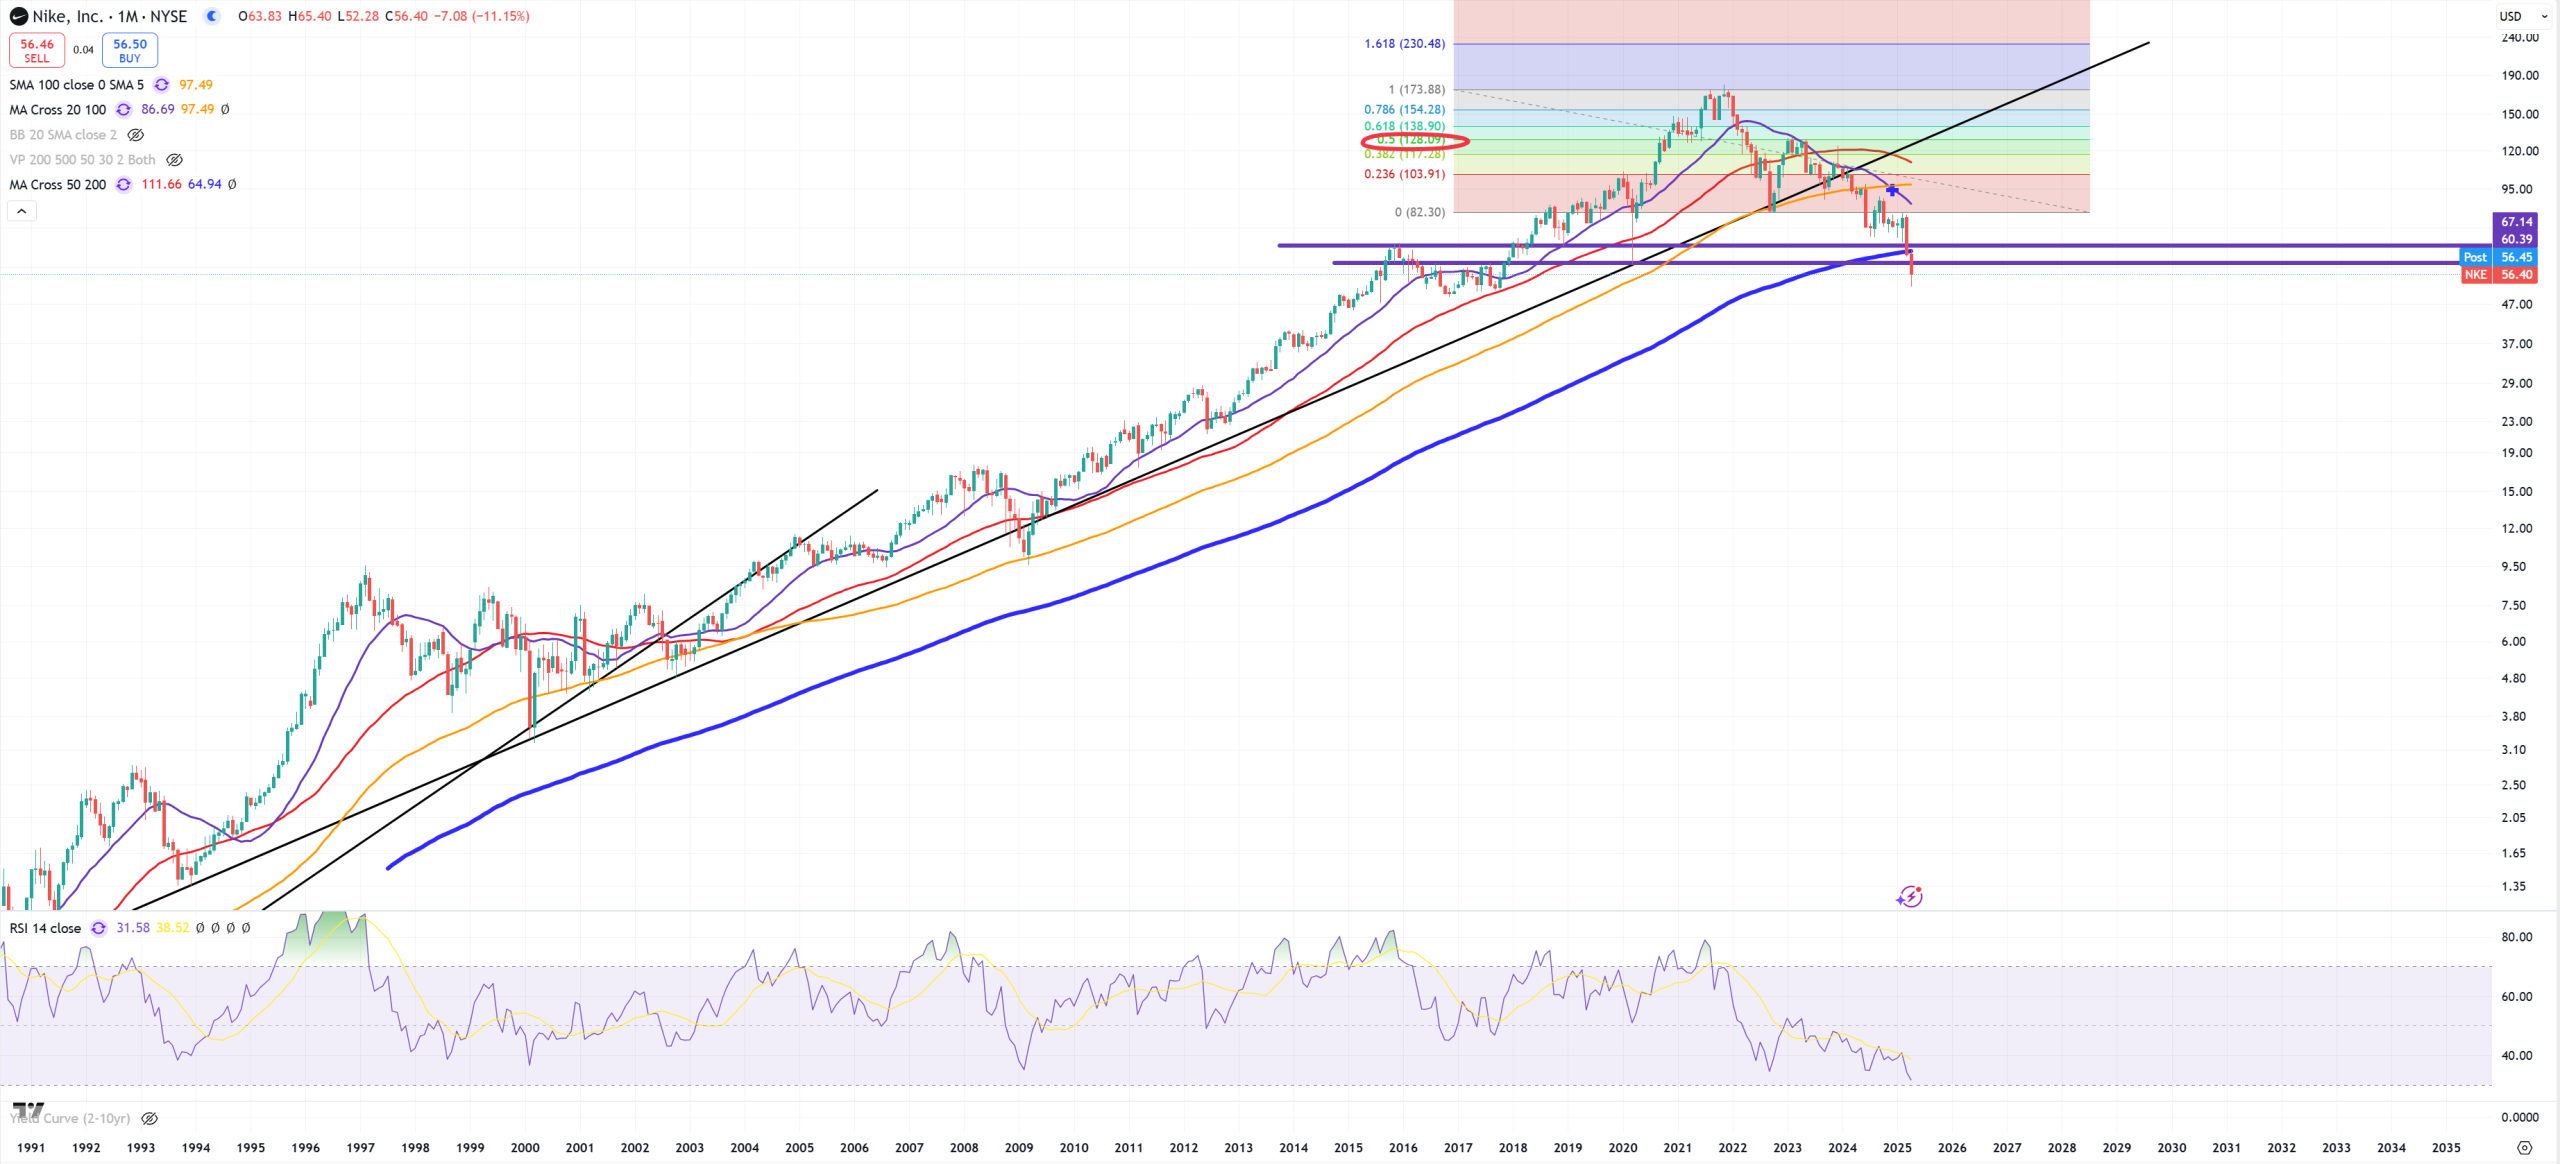
NKE – just as bad as UPS and same style. 2021 peak and crashed below (M)MA200. We can interpret that that those stocks follow inflation path. As inflation peaked in 2021 they both peaked
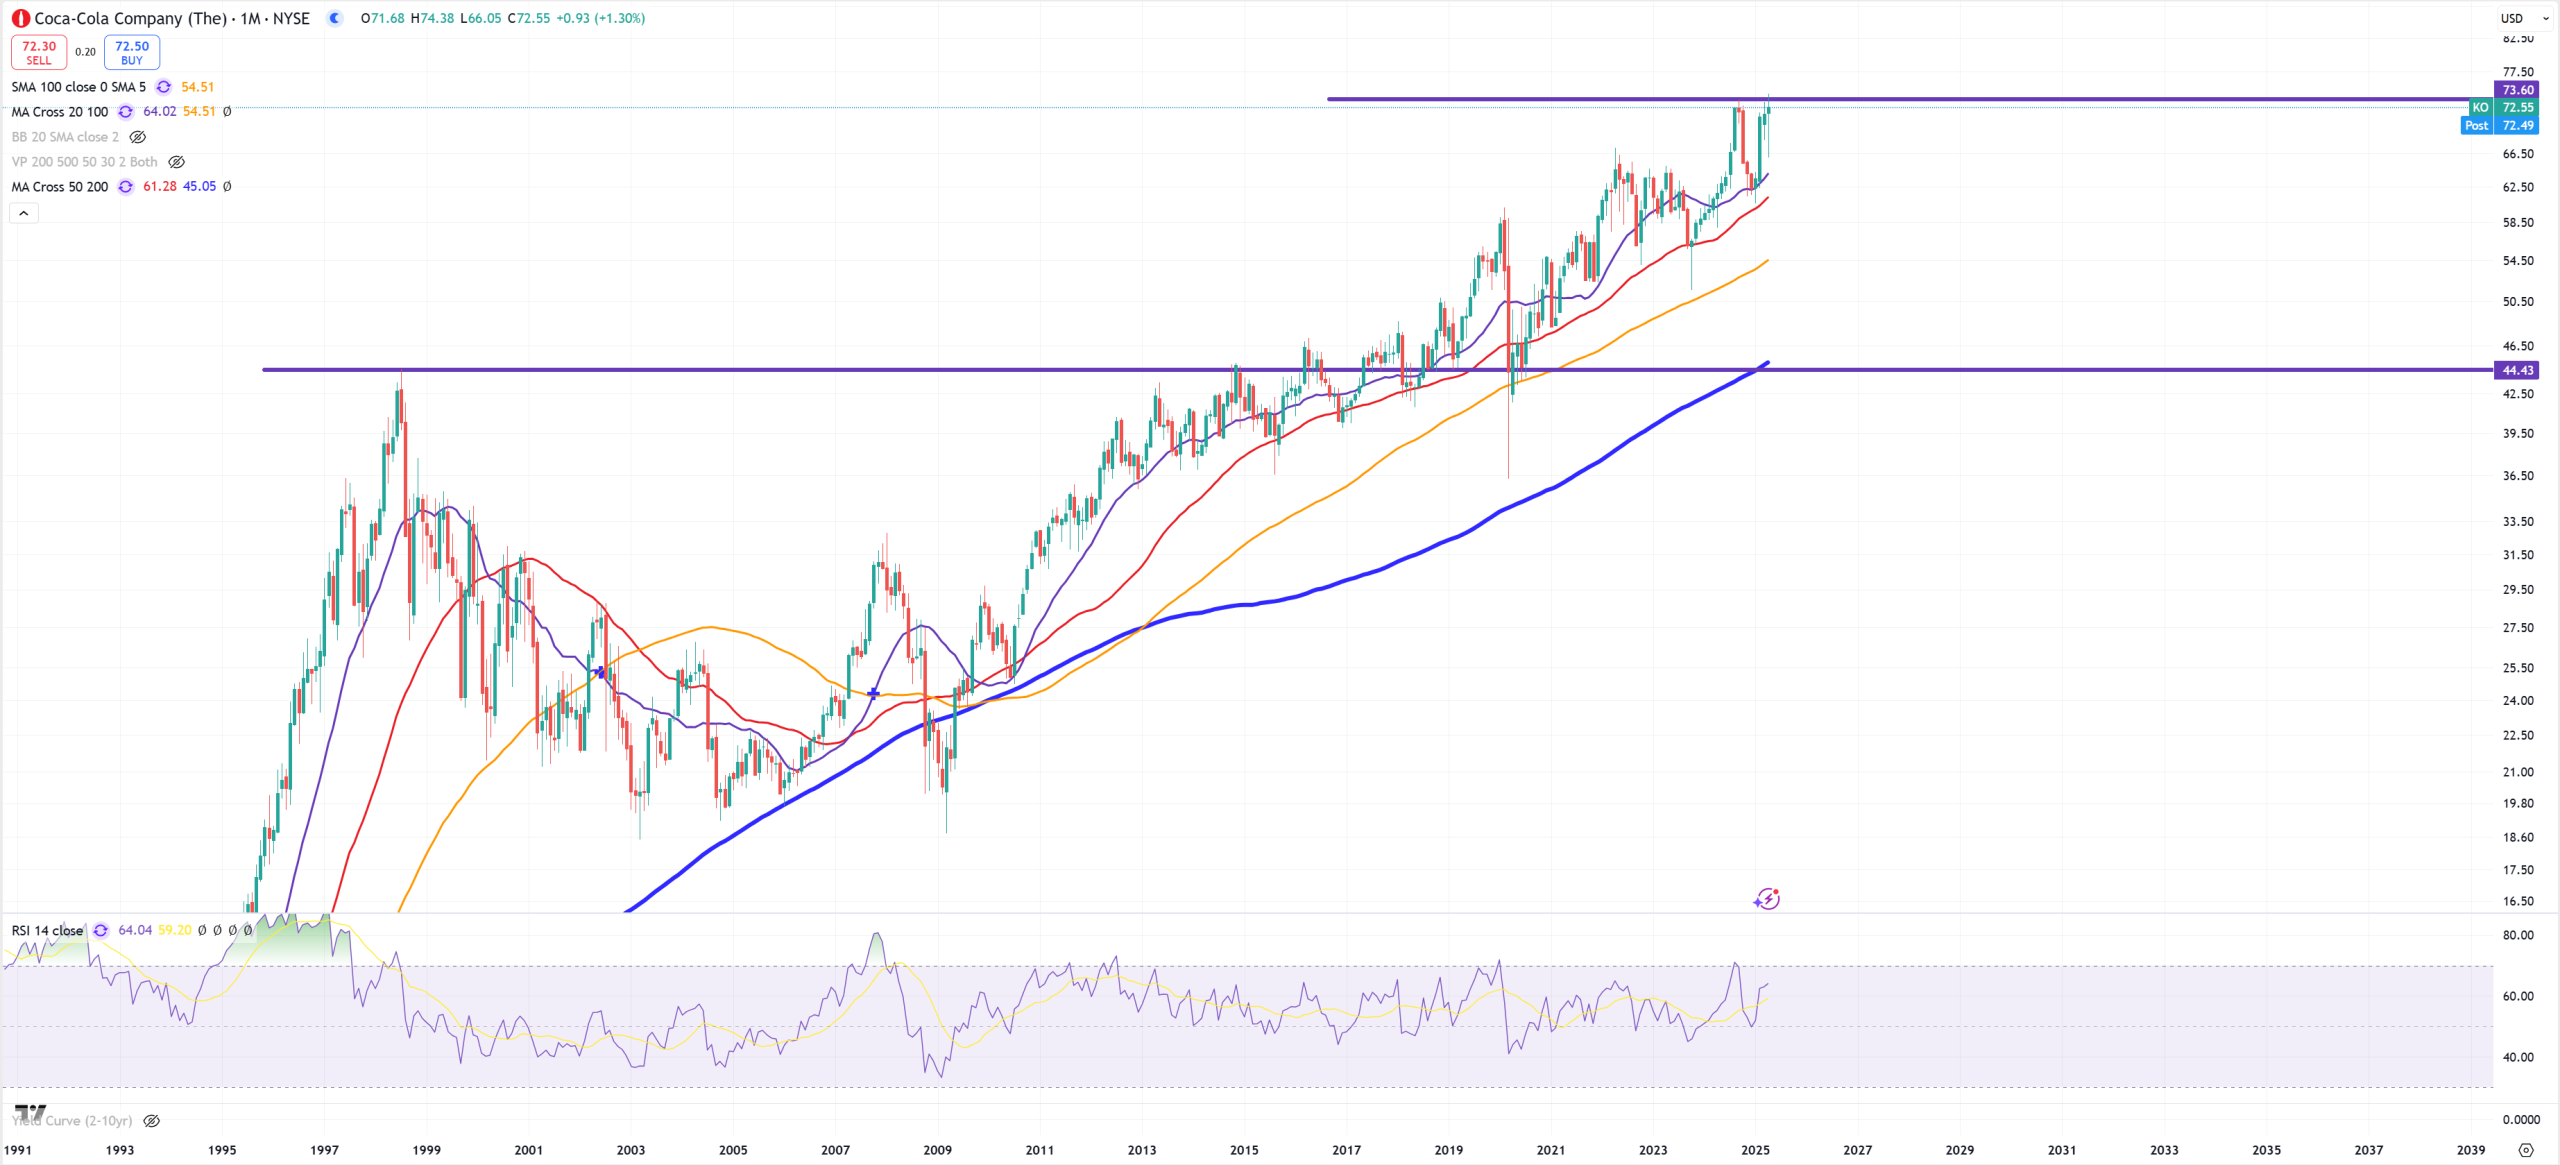
KO – Coca Cola – hard to believe why KO is always bigger “safe-heaven” than PEP
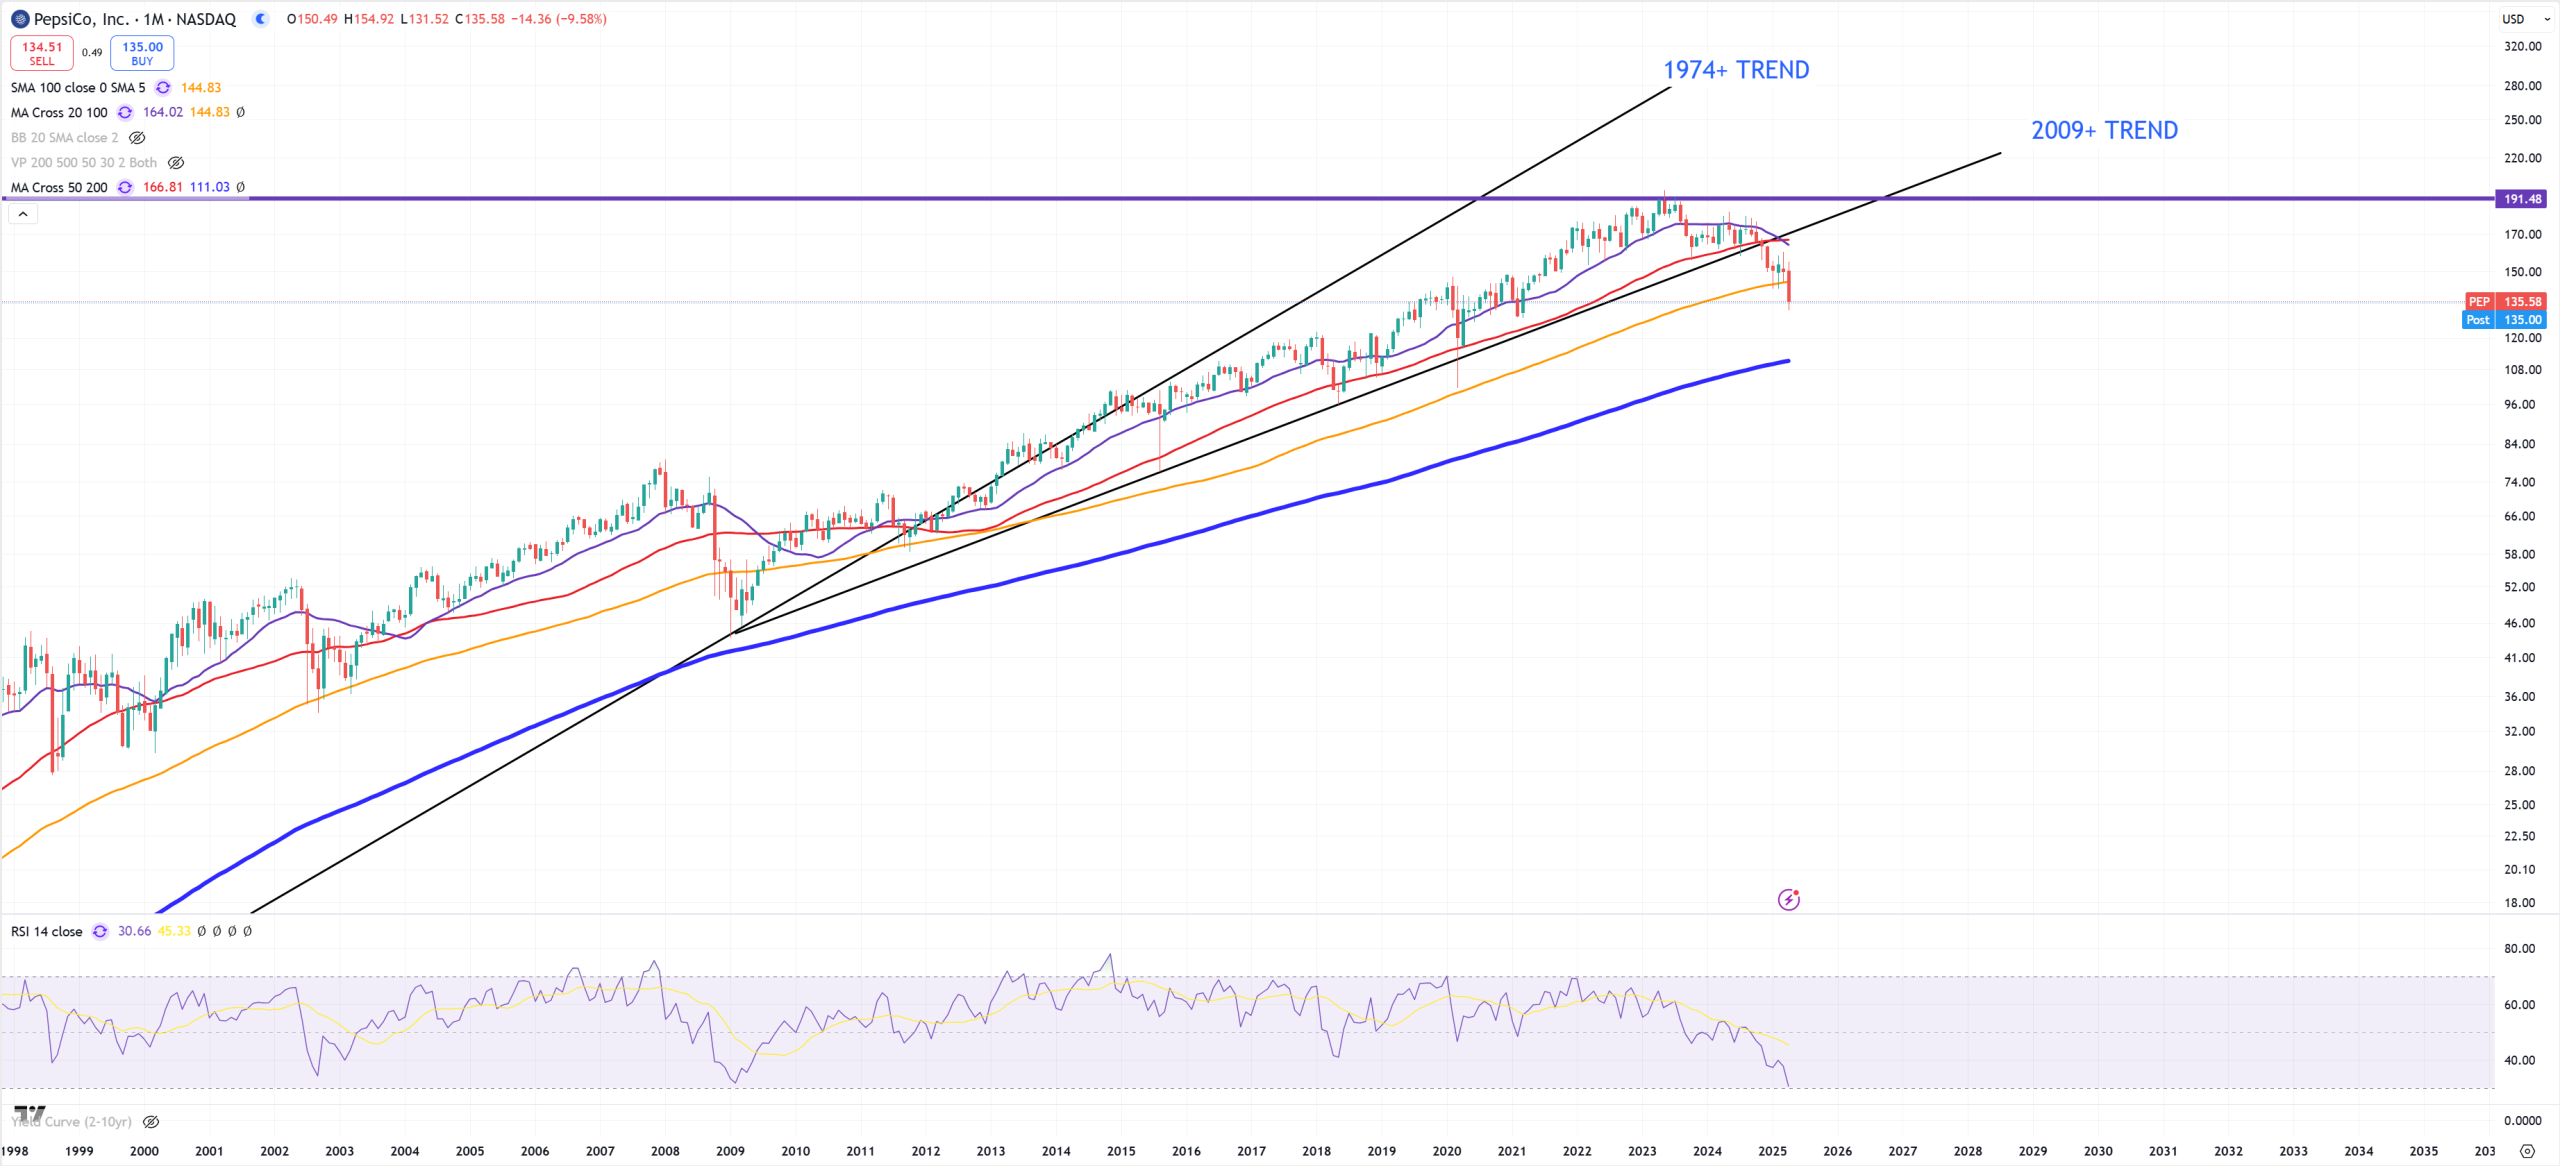
PEP – Pepsico is crashing like NKE and UPS peaking in 2023
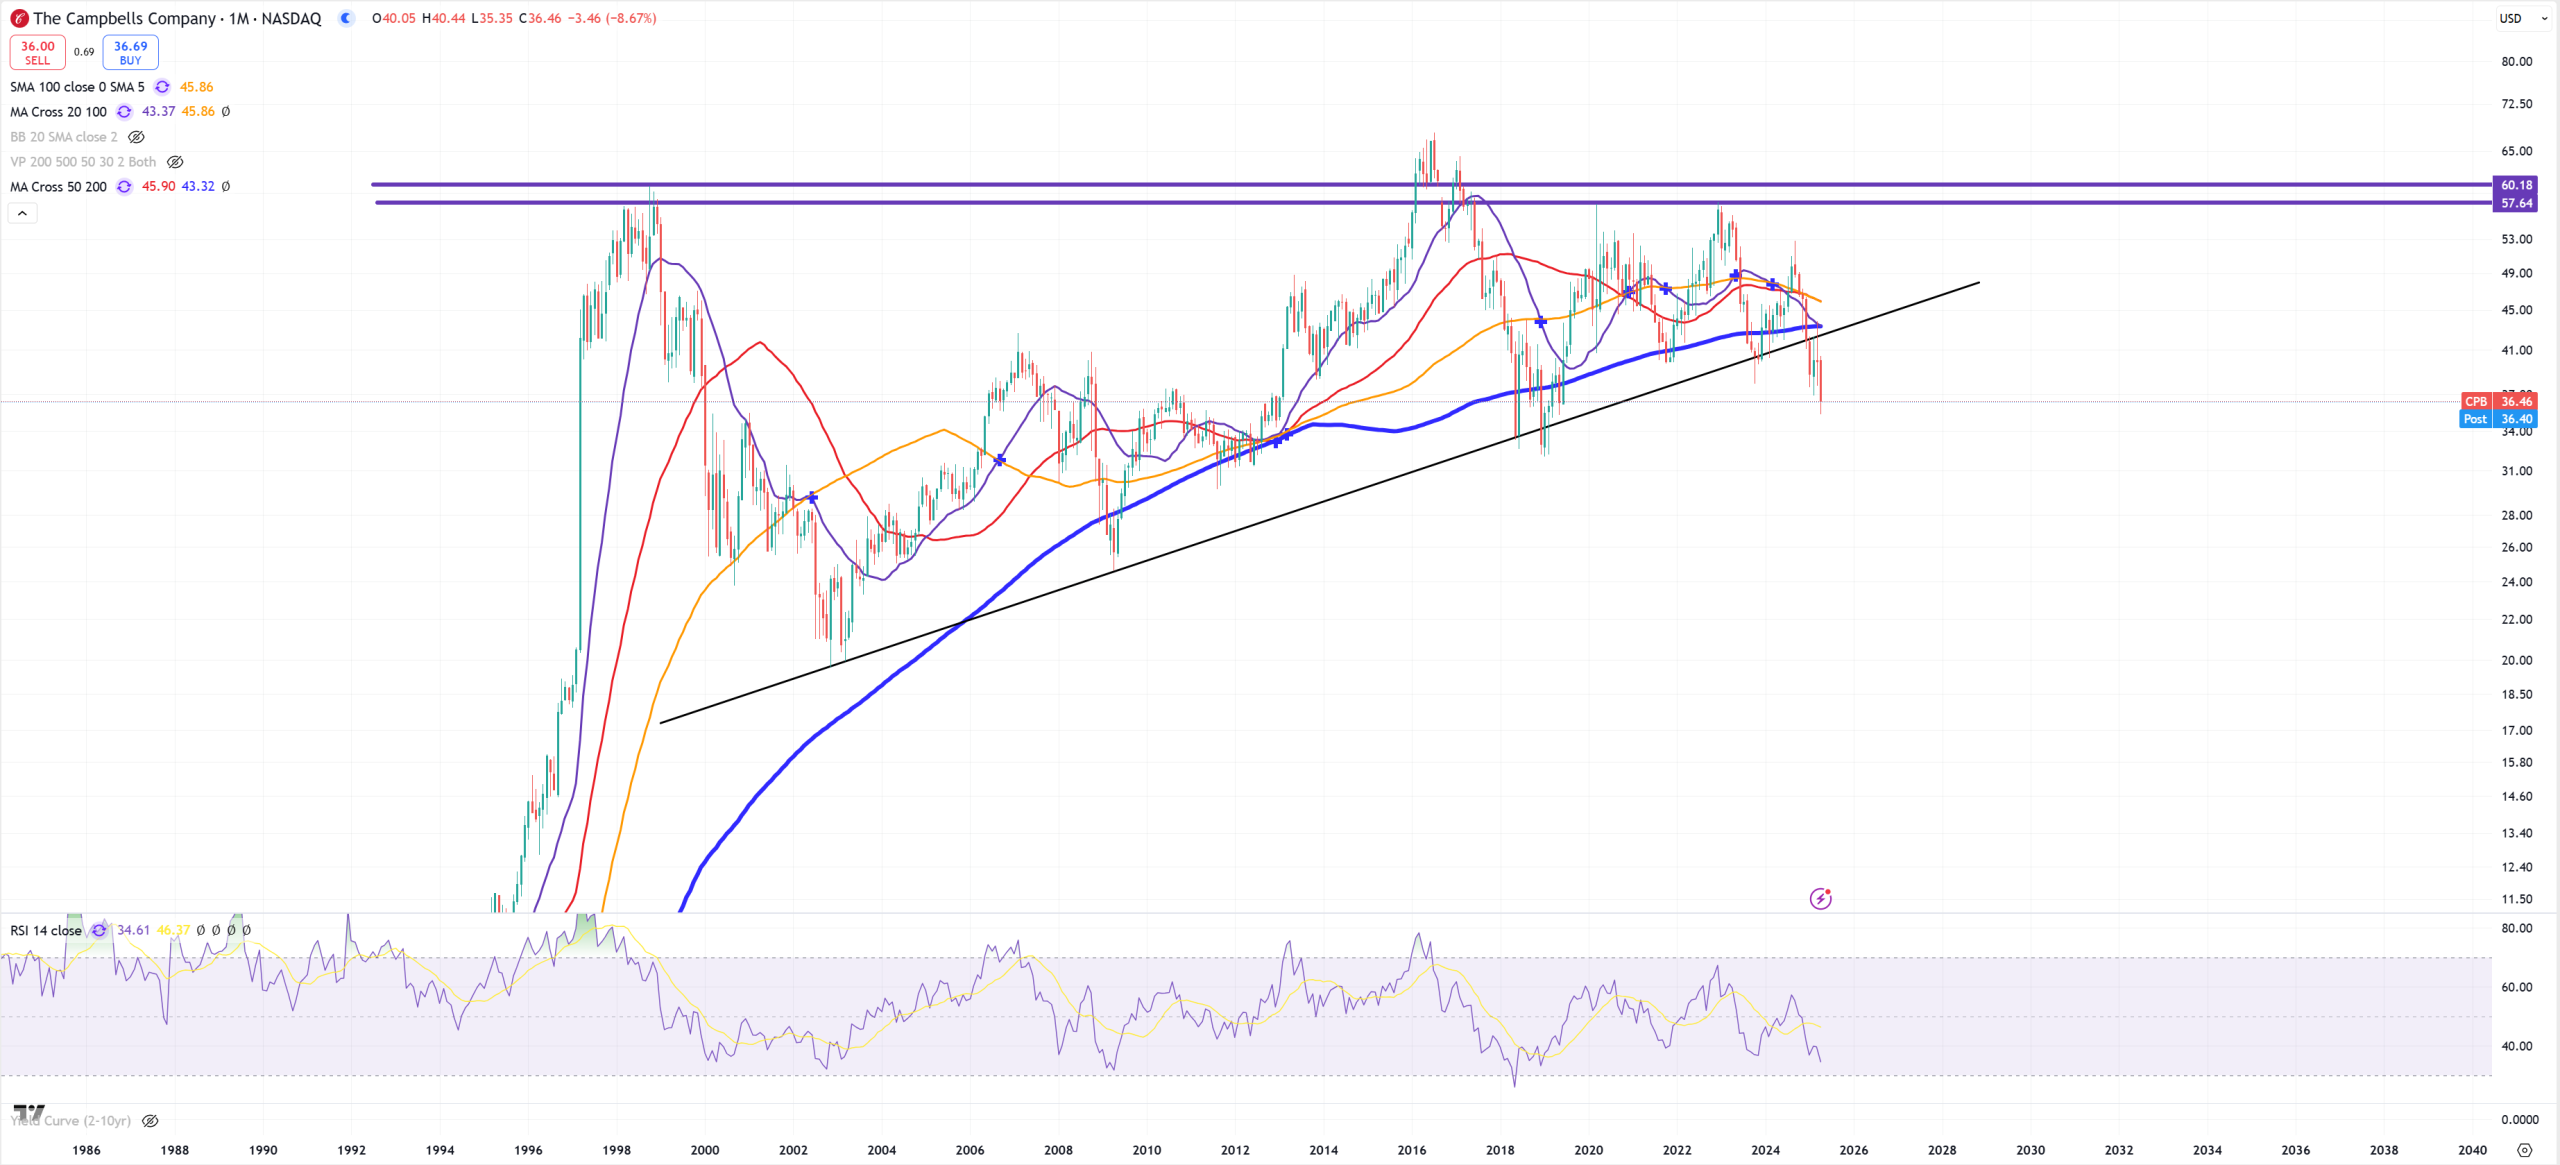
CPB – Campbells Company – 20Ys trend gone & (M)MA200
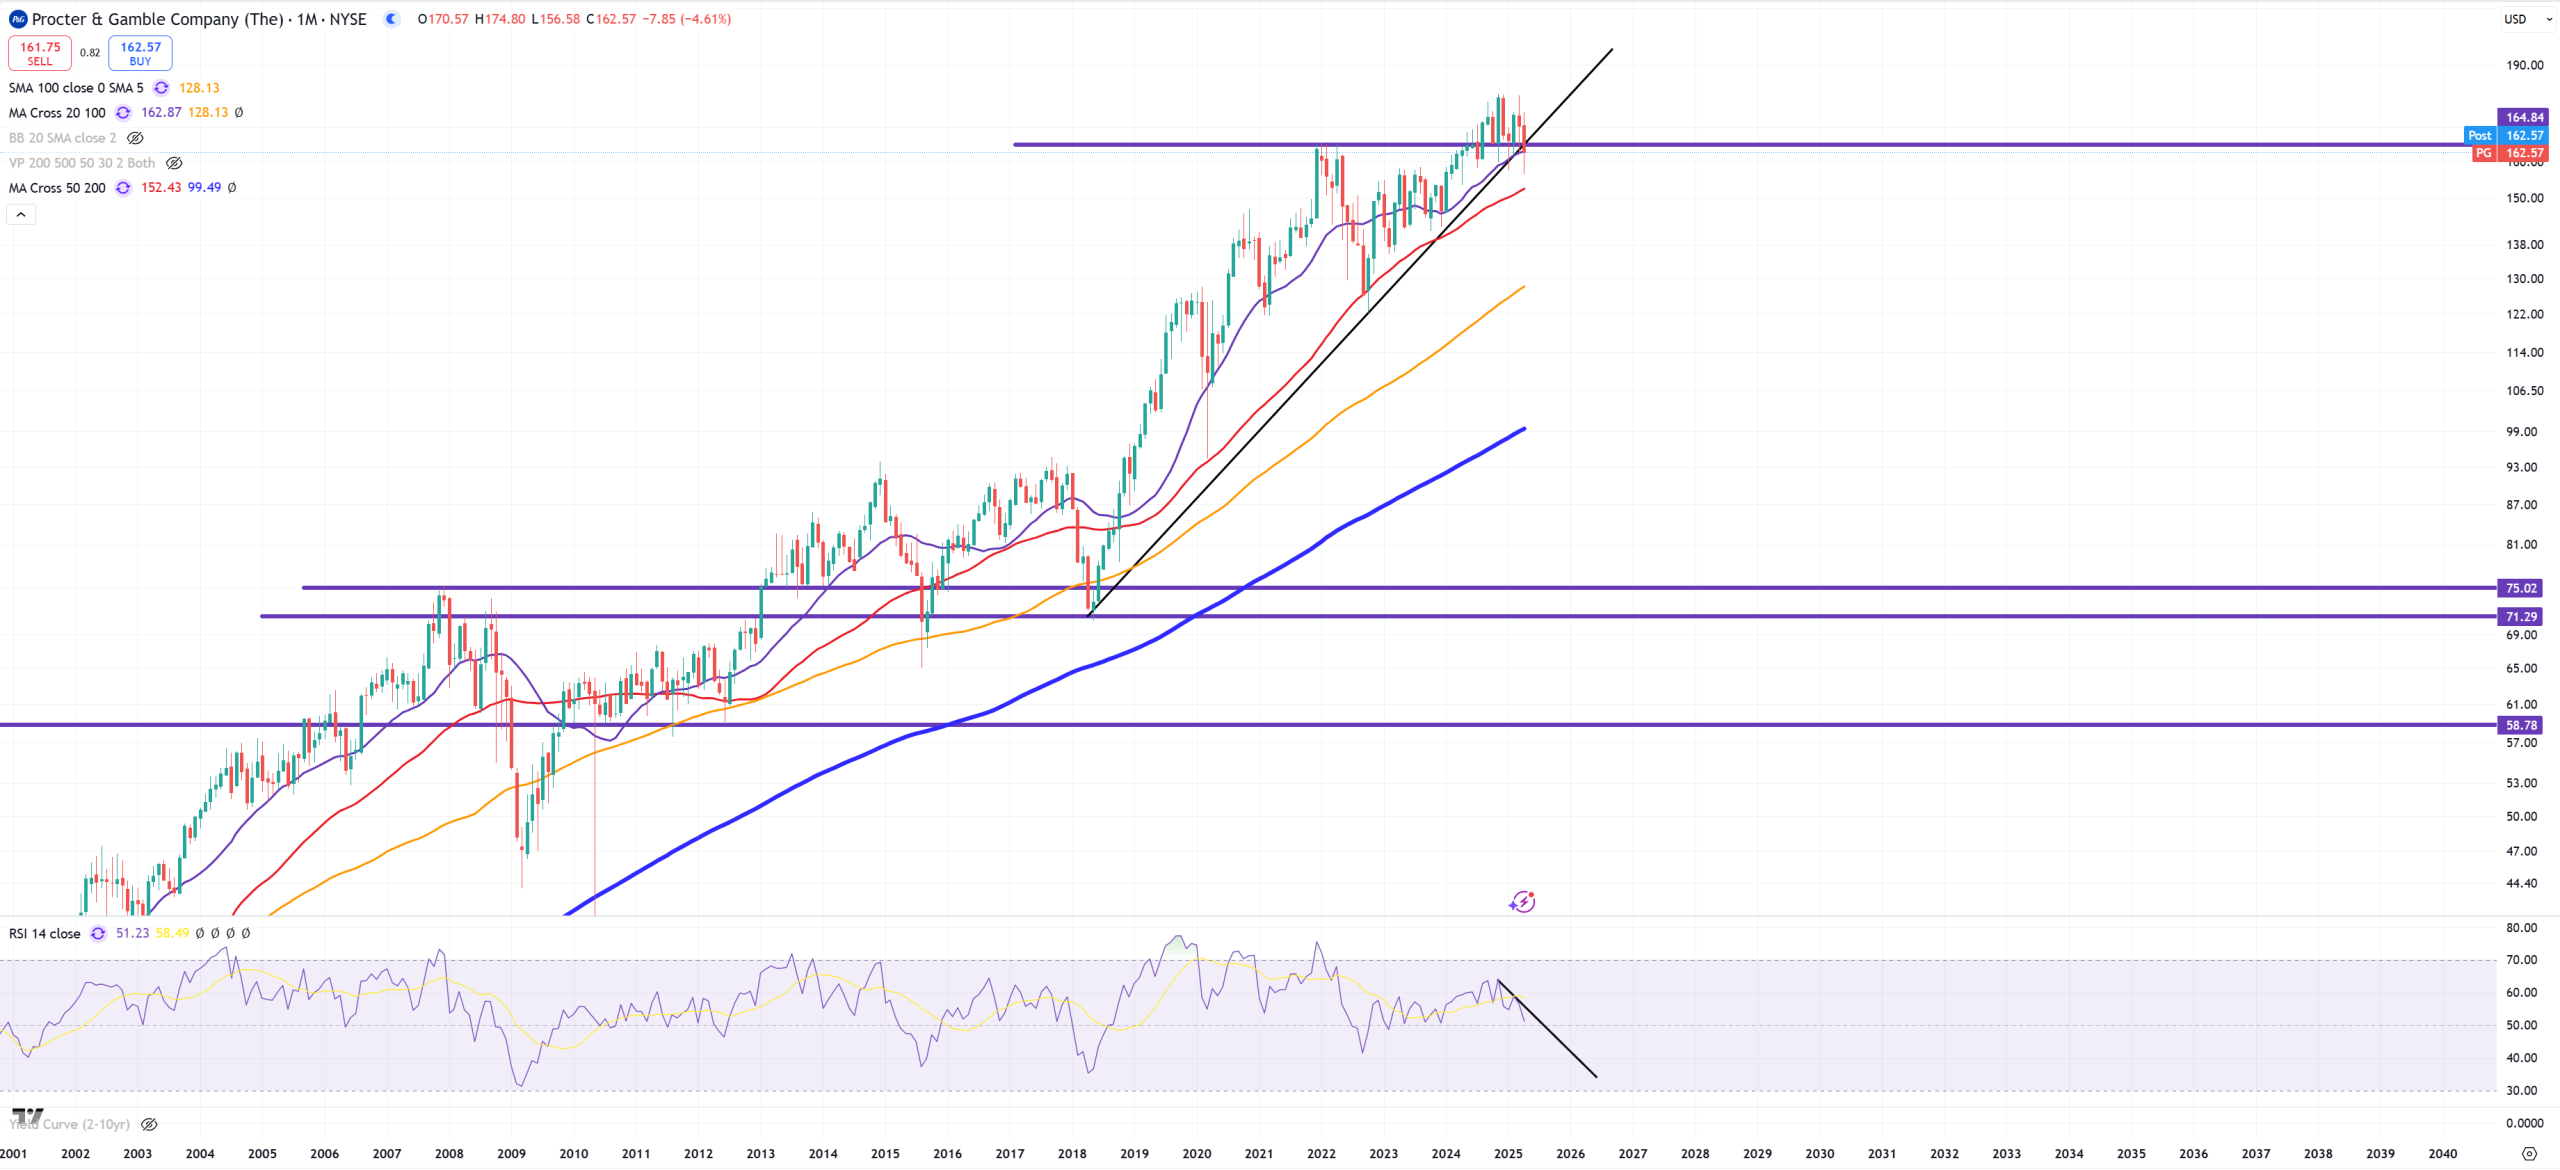
PG – Procted & Gamble – jumping below 2021 peak
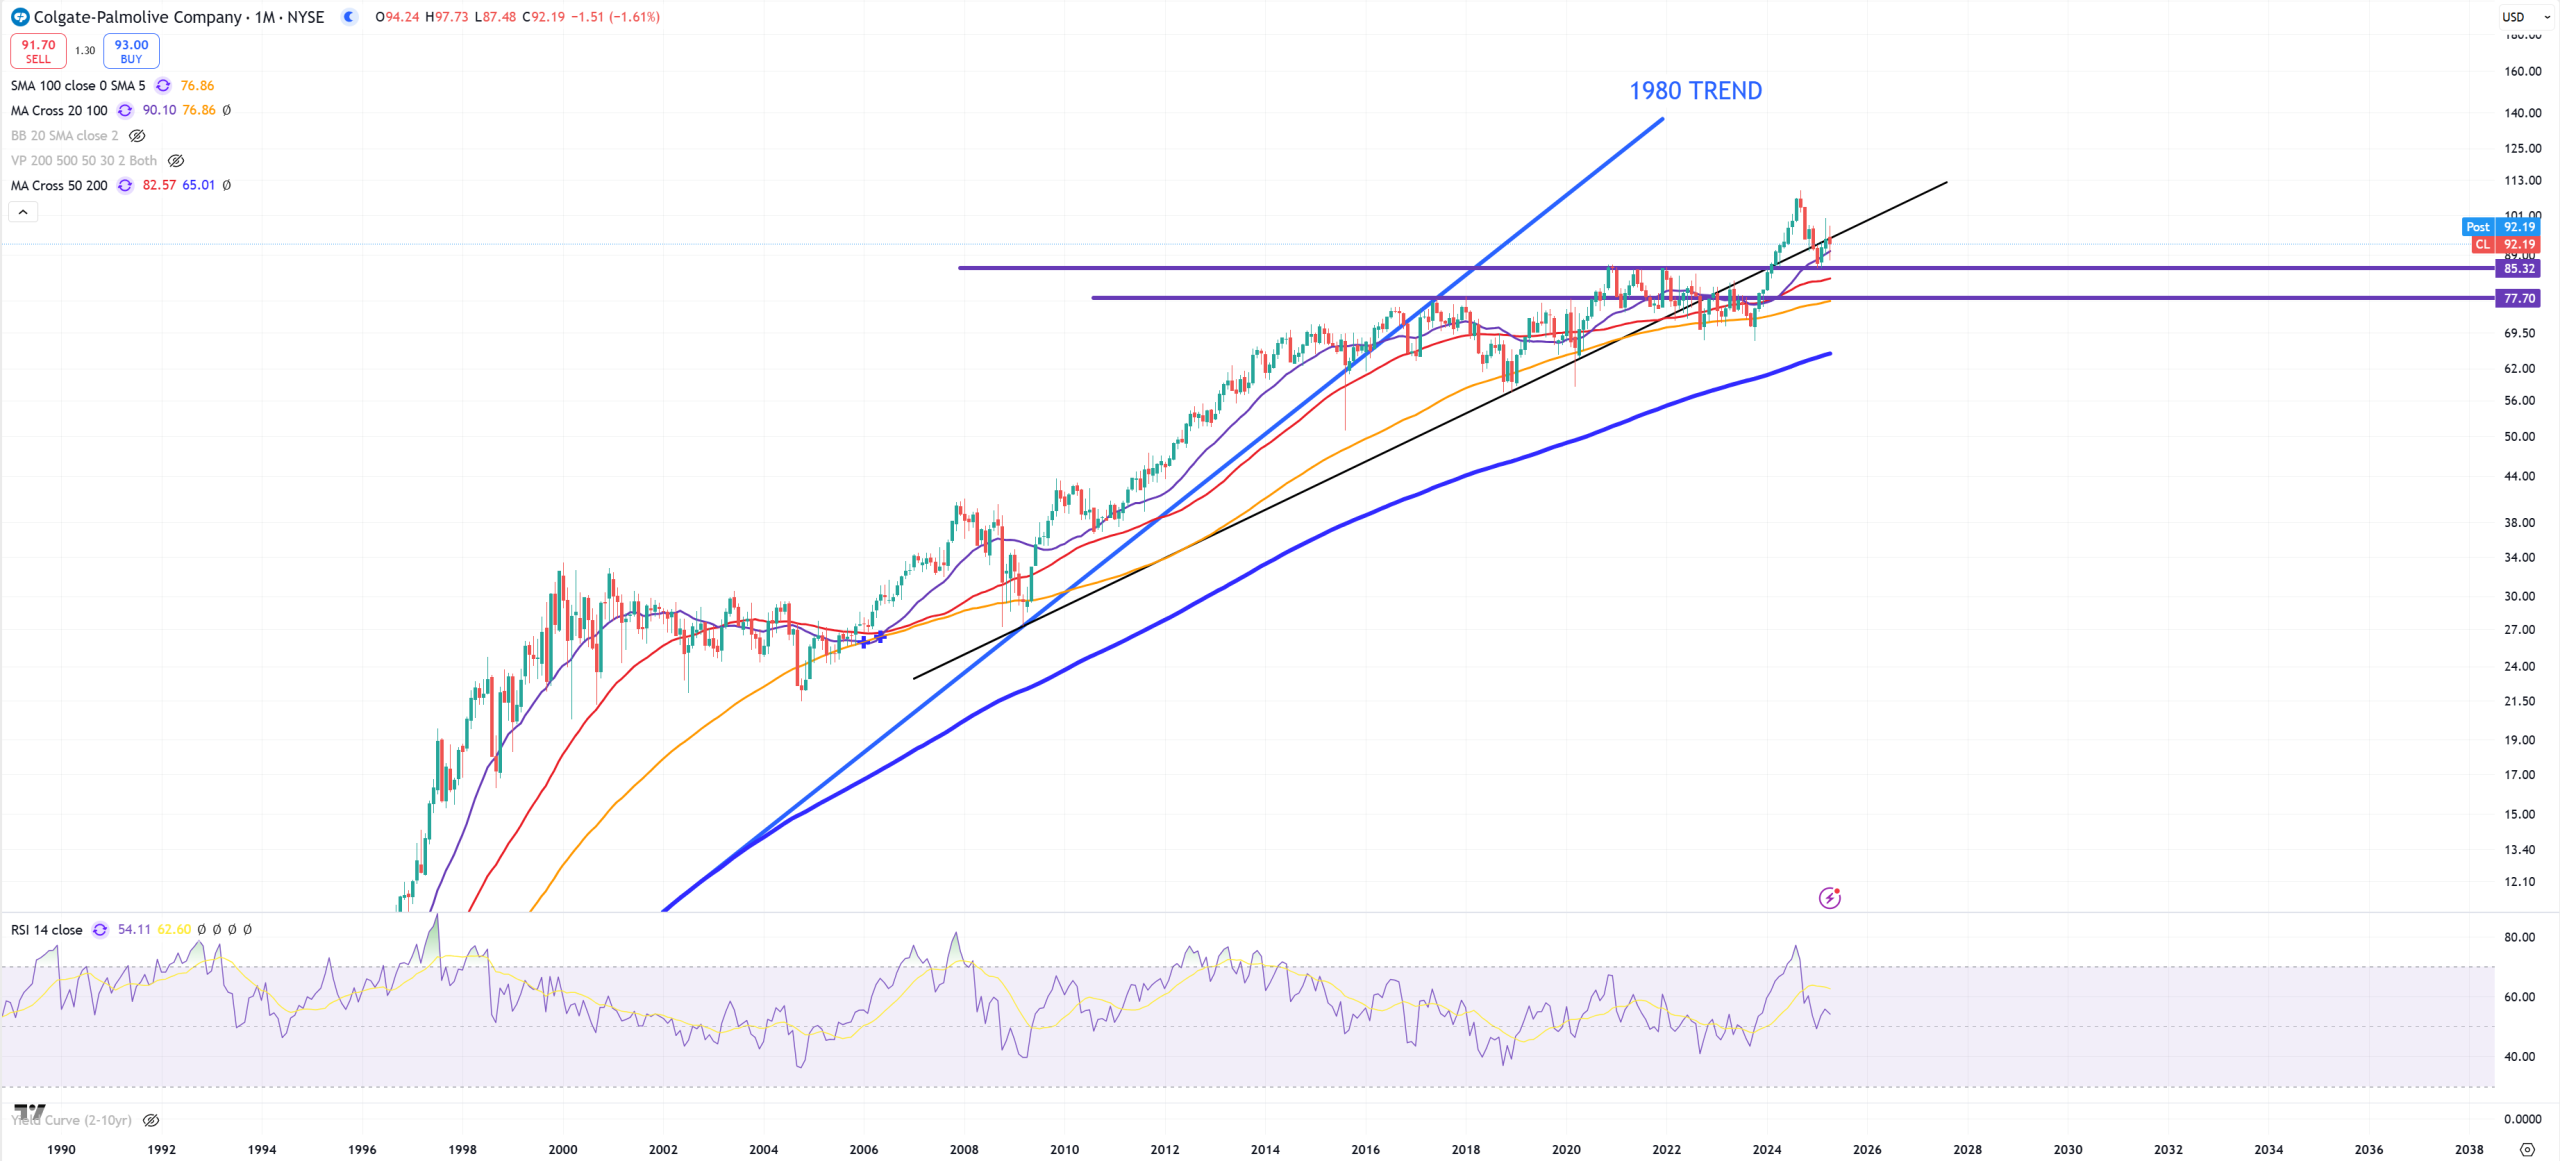
CL – Colgate – big spike above 2021 peak but now it’s support
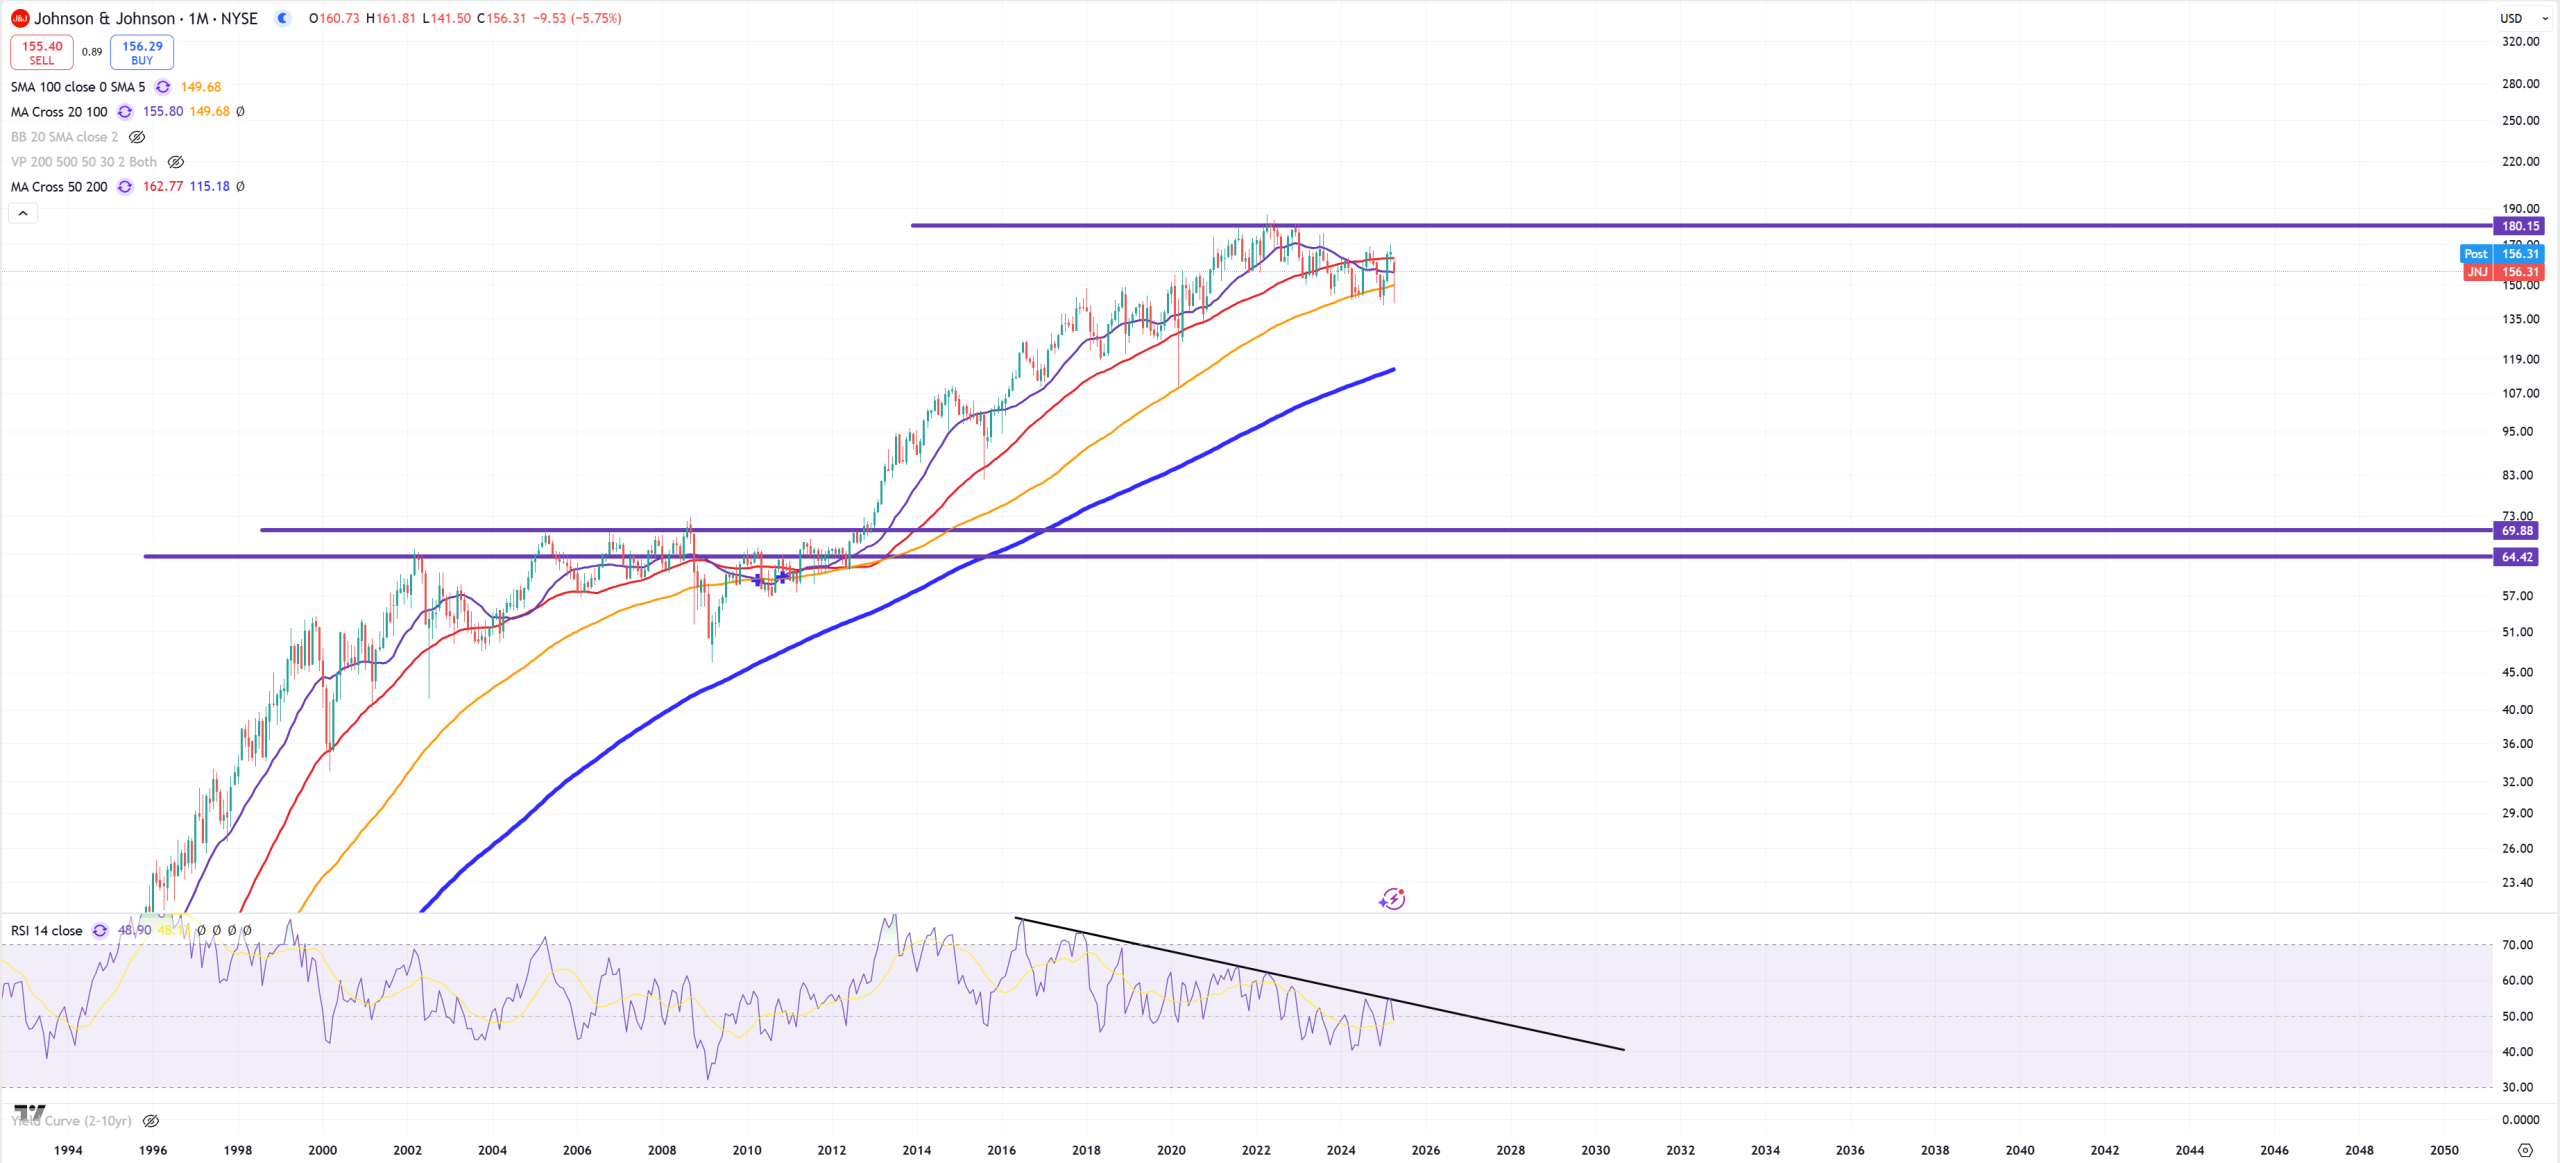
JNJ – Johnson & Johnson – peaking between 2021-2023
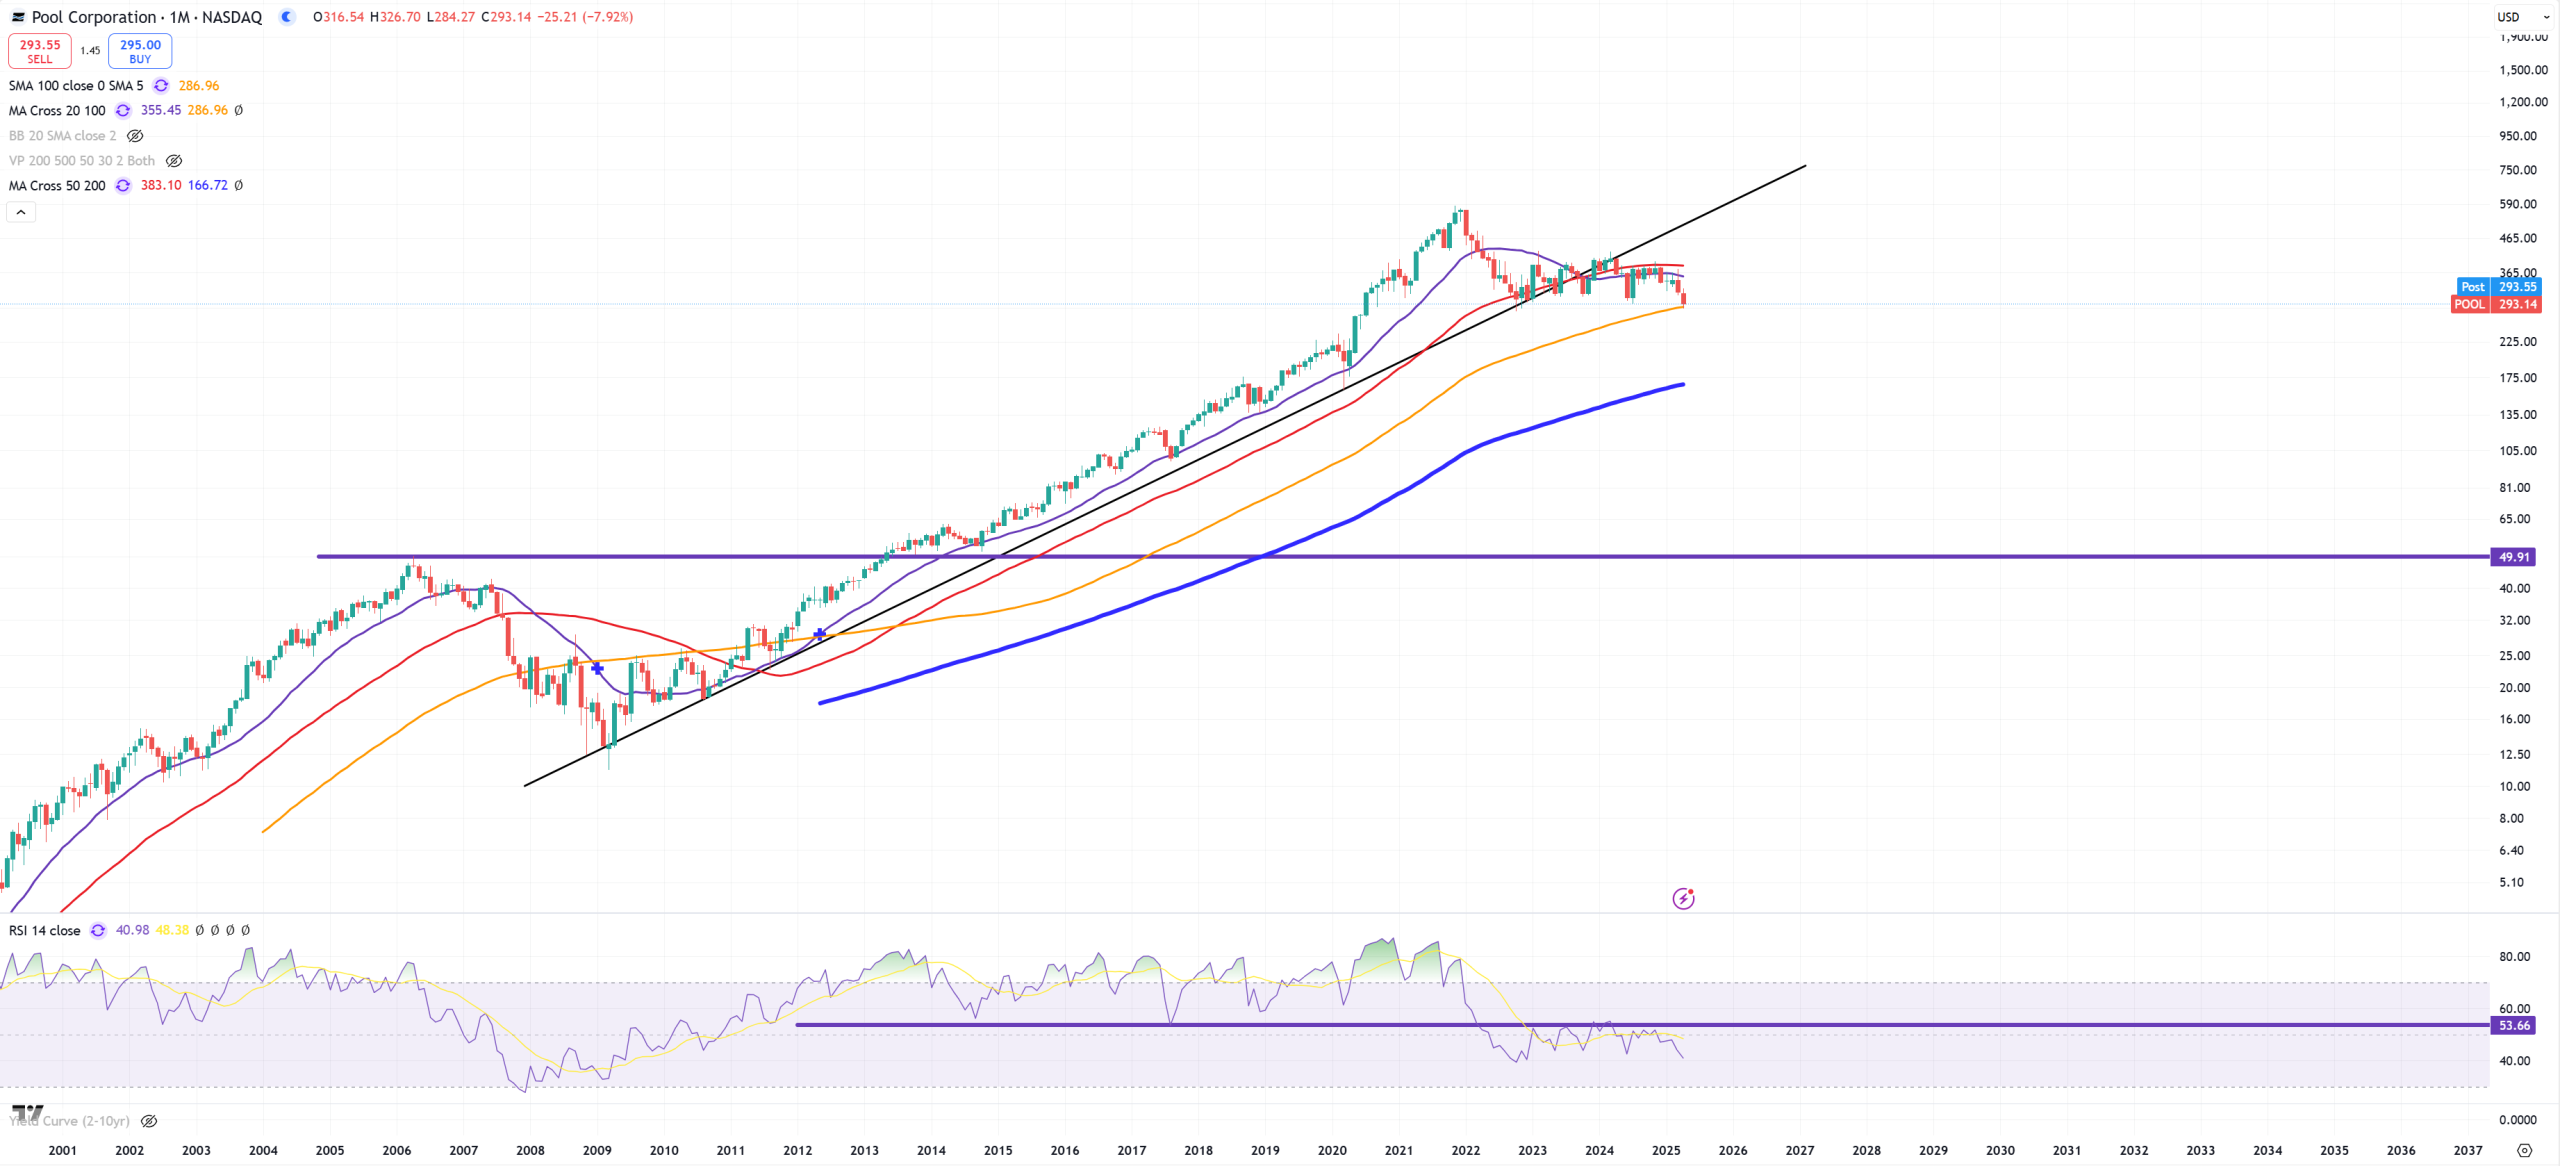
POOL – Pool Corporation – just look how (M)RSI has flipped, also very weak and 2021 peak.
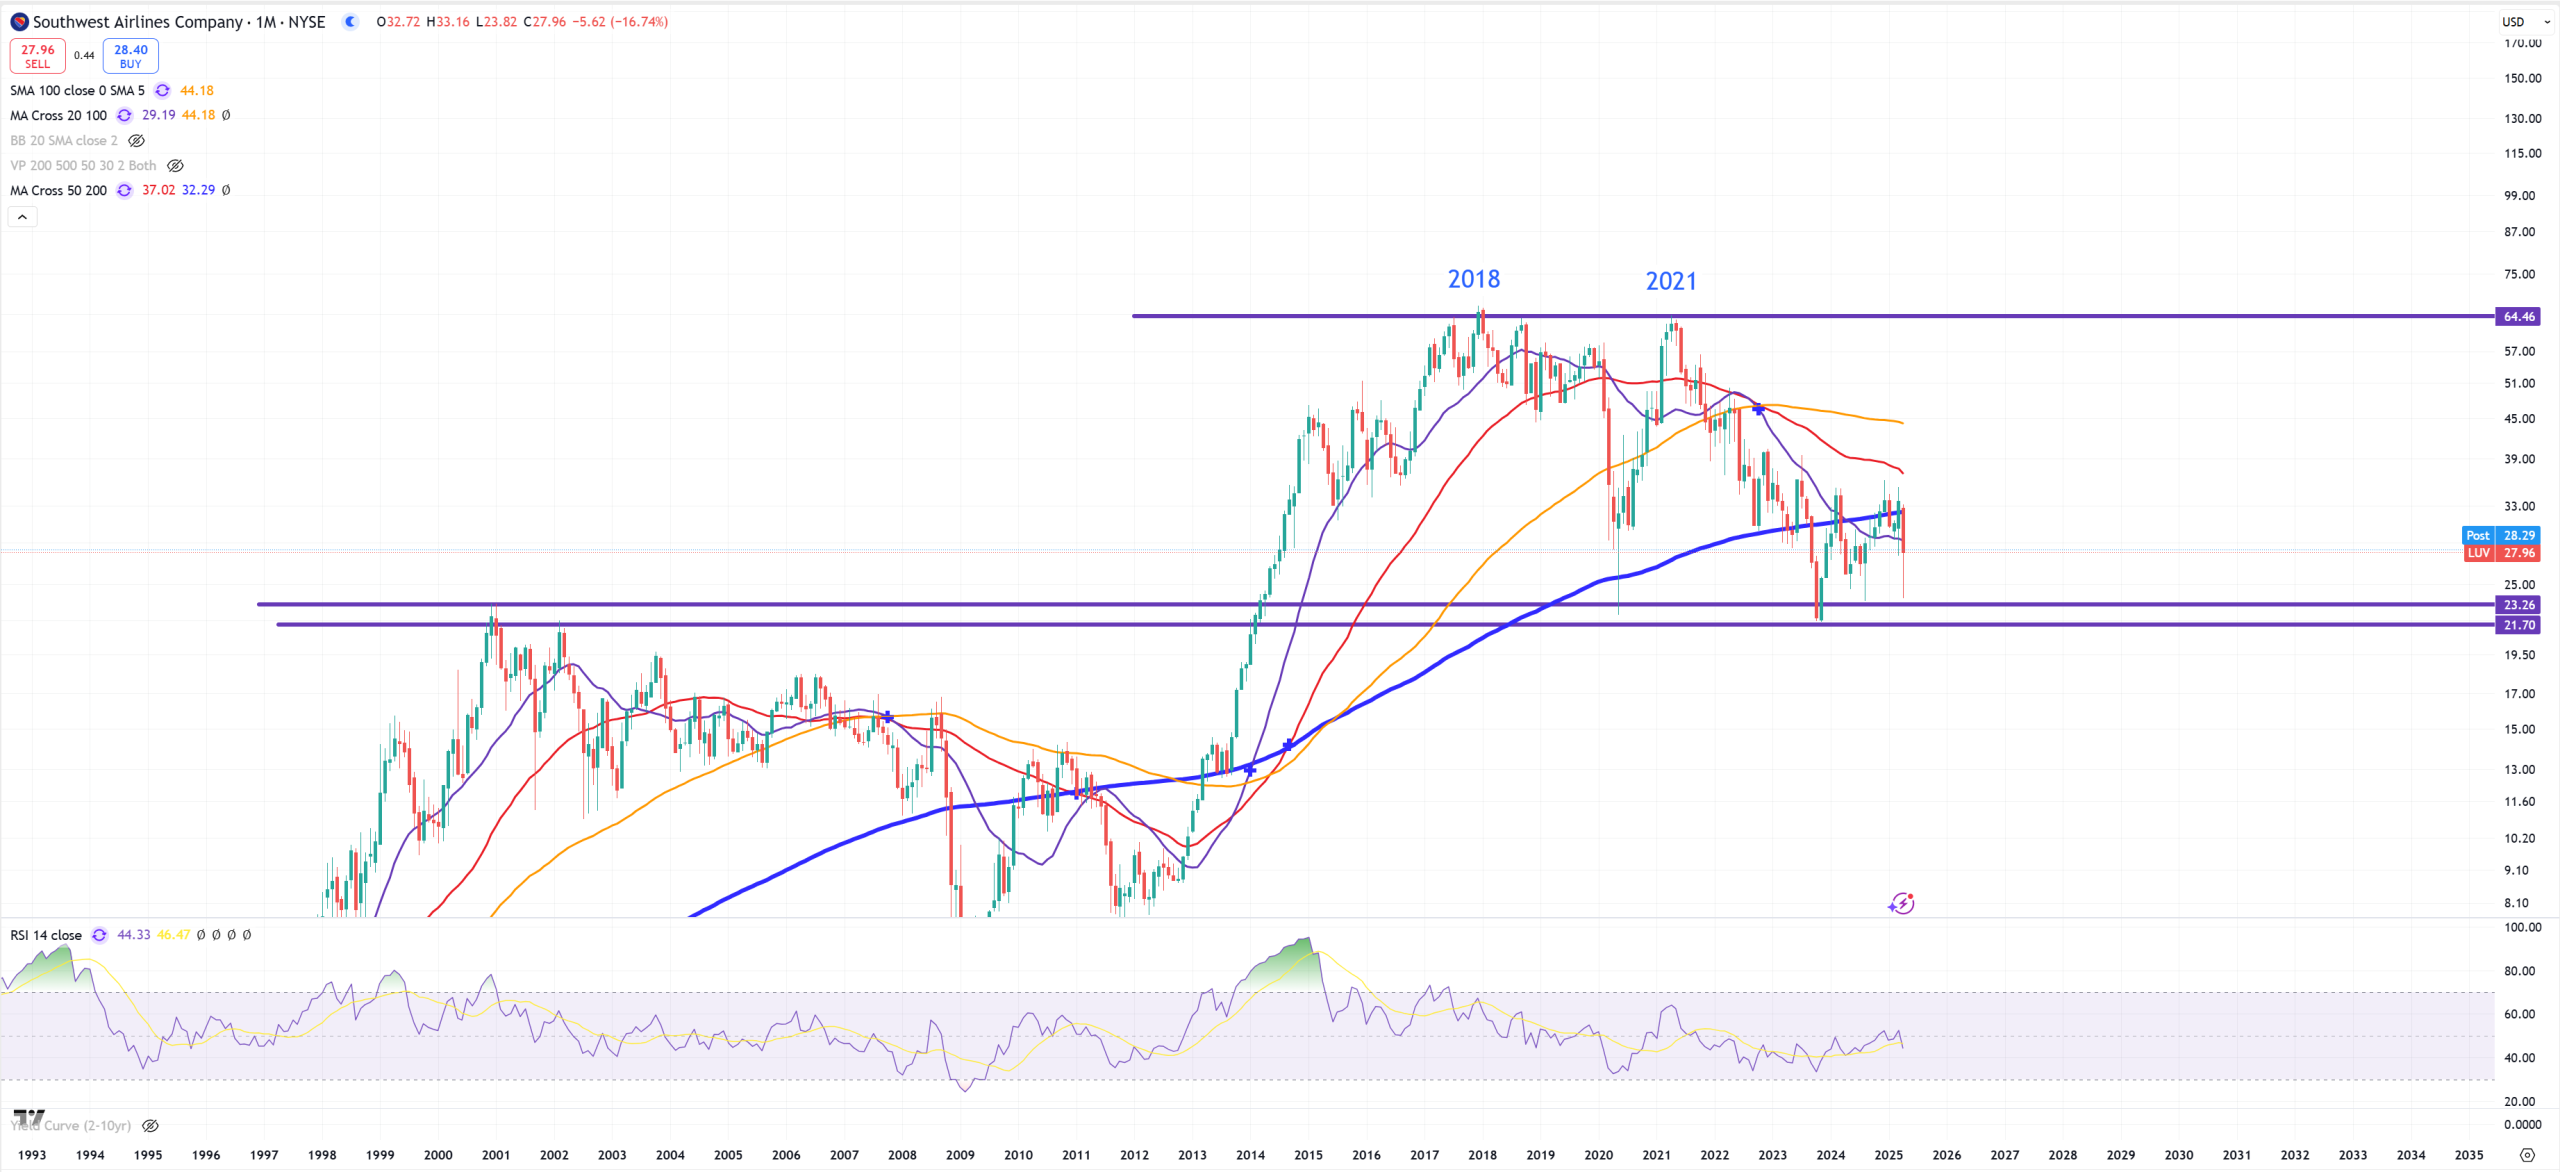
LUV – Southwest Airlines. Double-top 2018/2021 and now below (M)MA200 + support around 20$
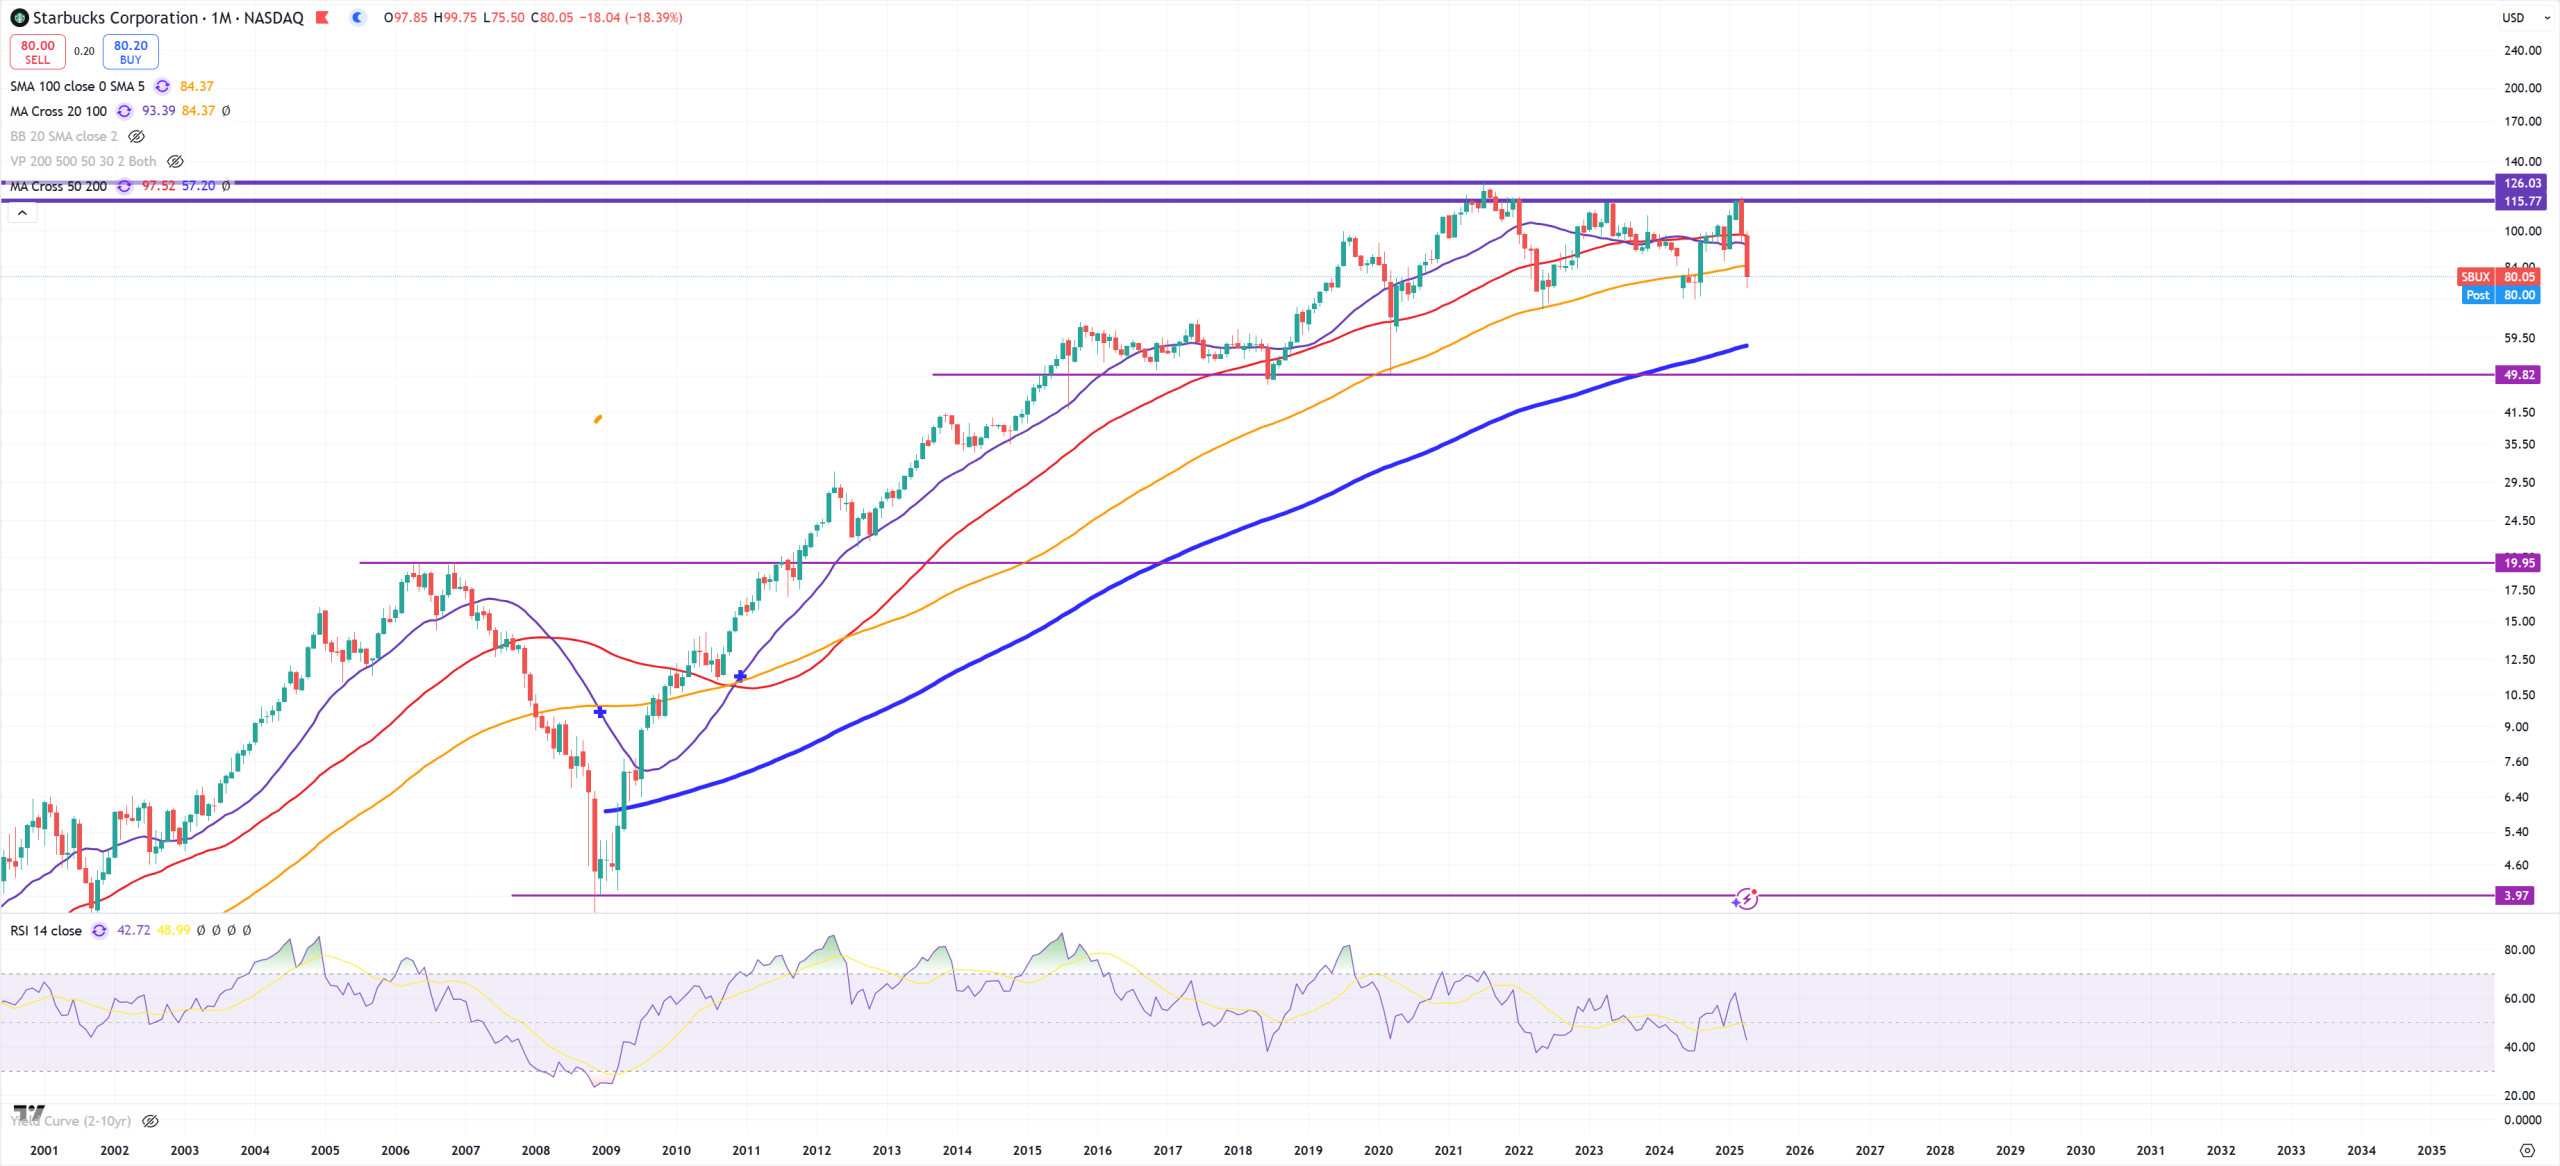
SBUX – Starbucks – multiple top with highest point in 2021, now trashing (M)MA100, next support (M)MA200.
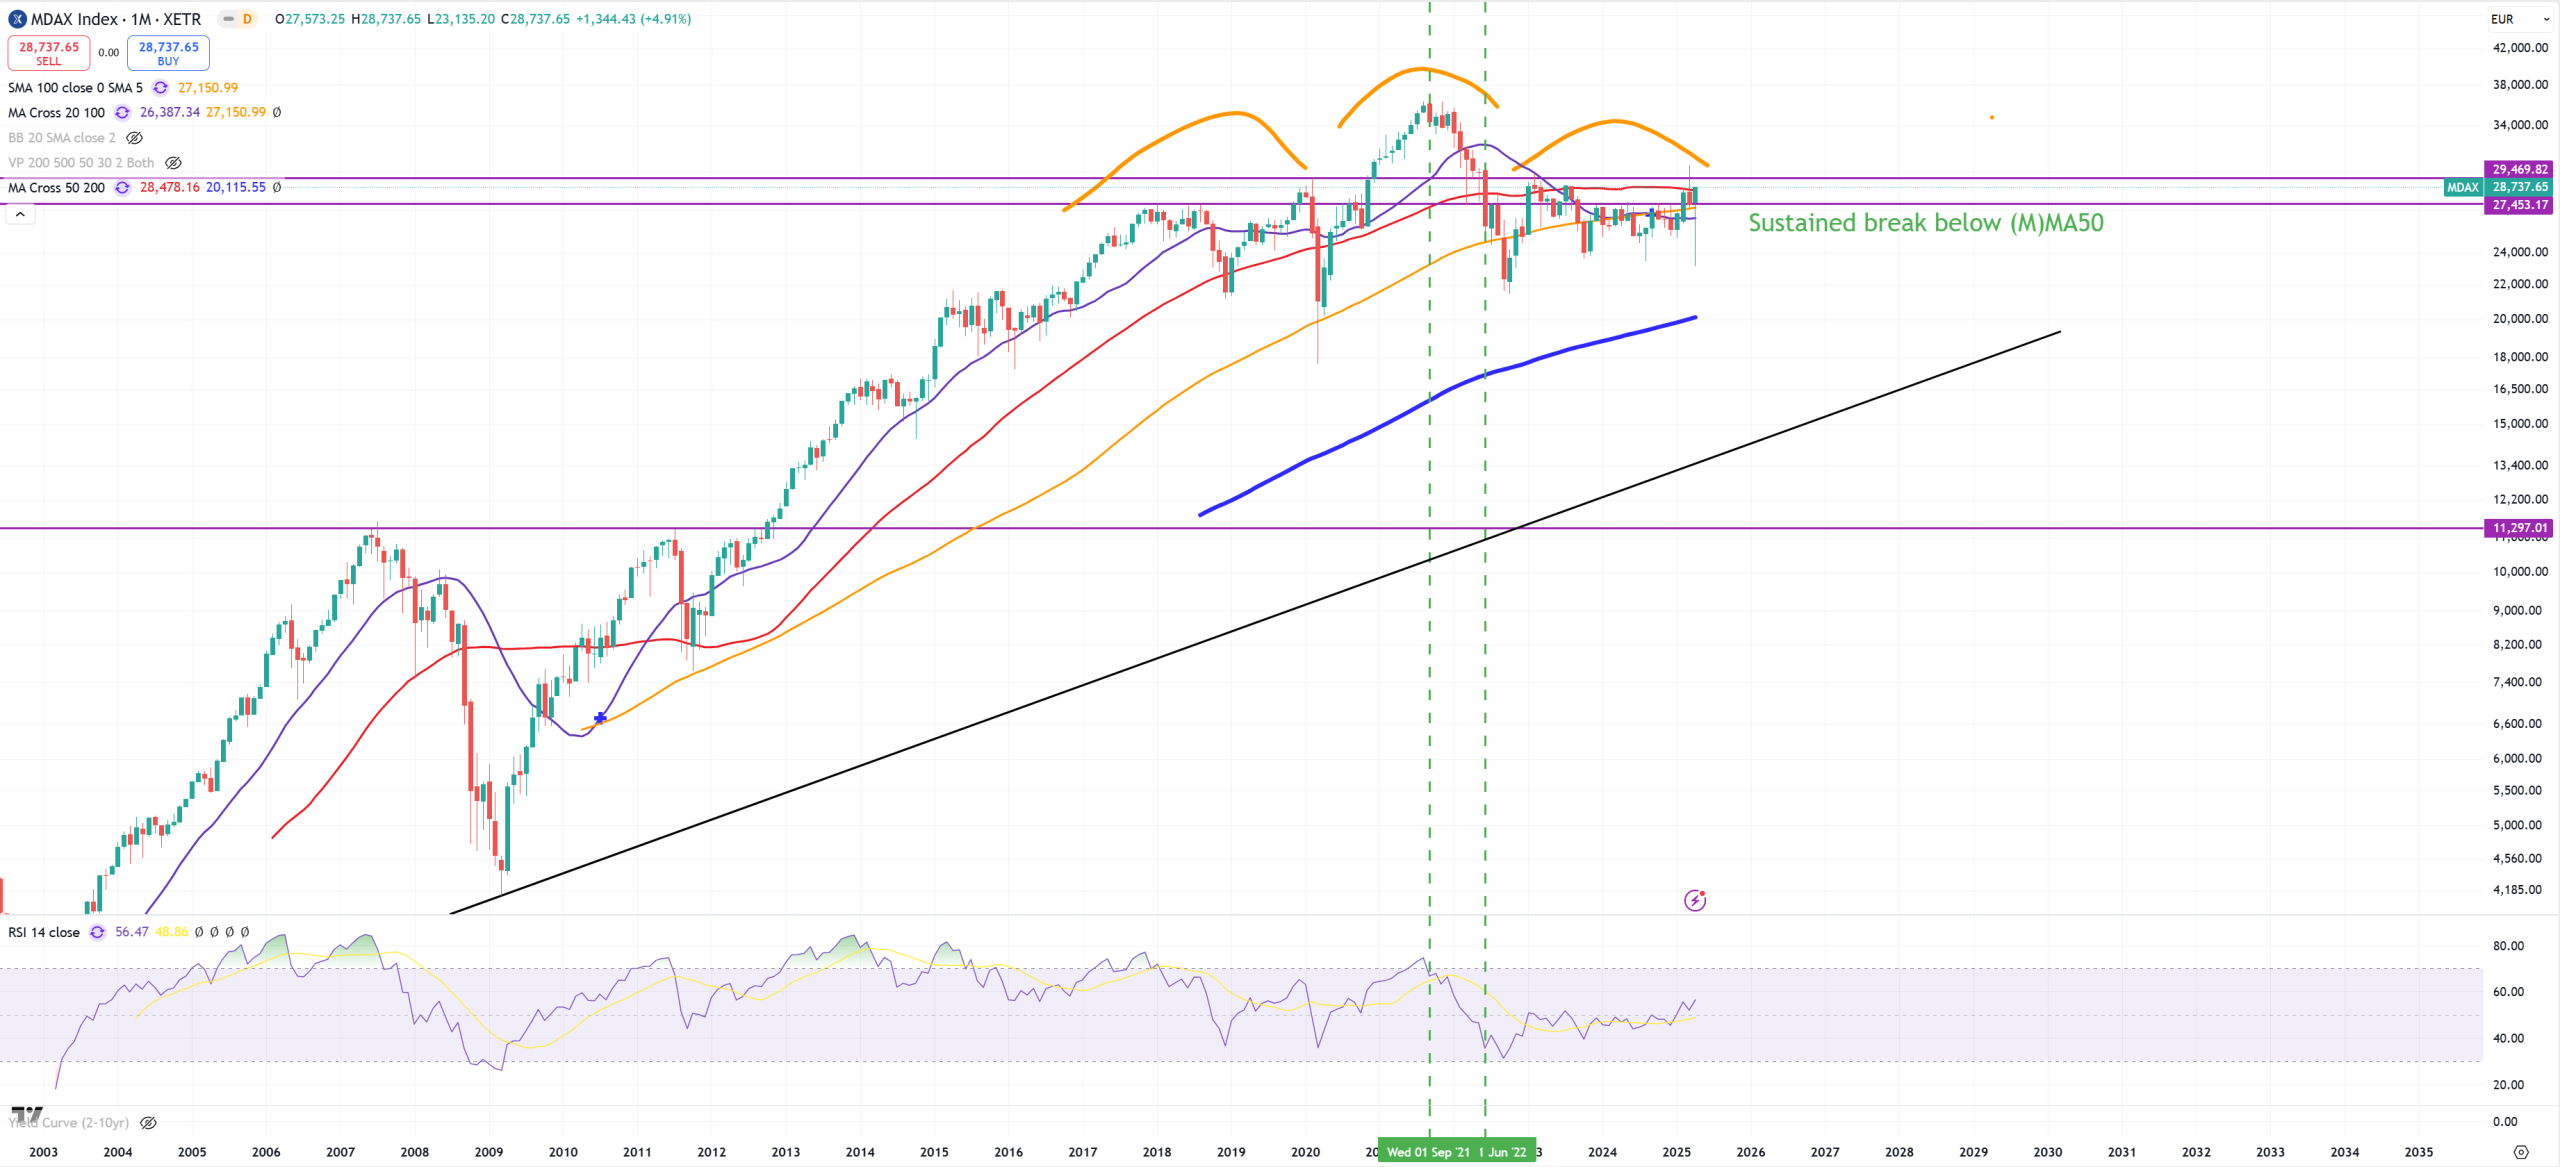
CMCSA – Comcast – highest point 2021 – reminds me very much mDAX
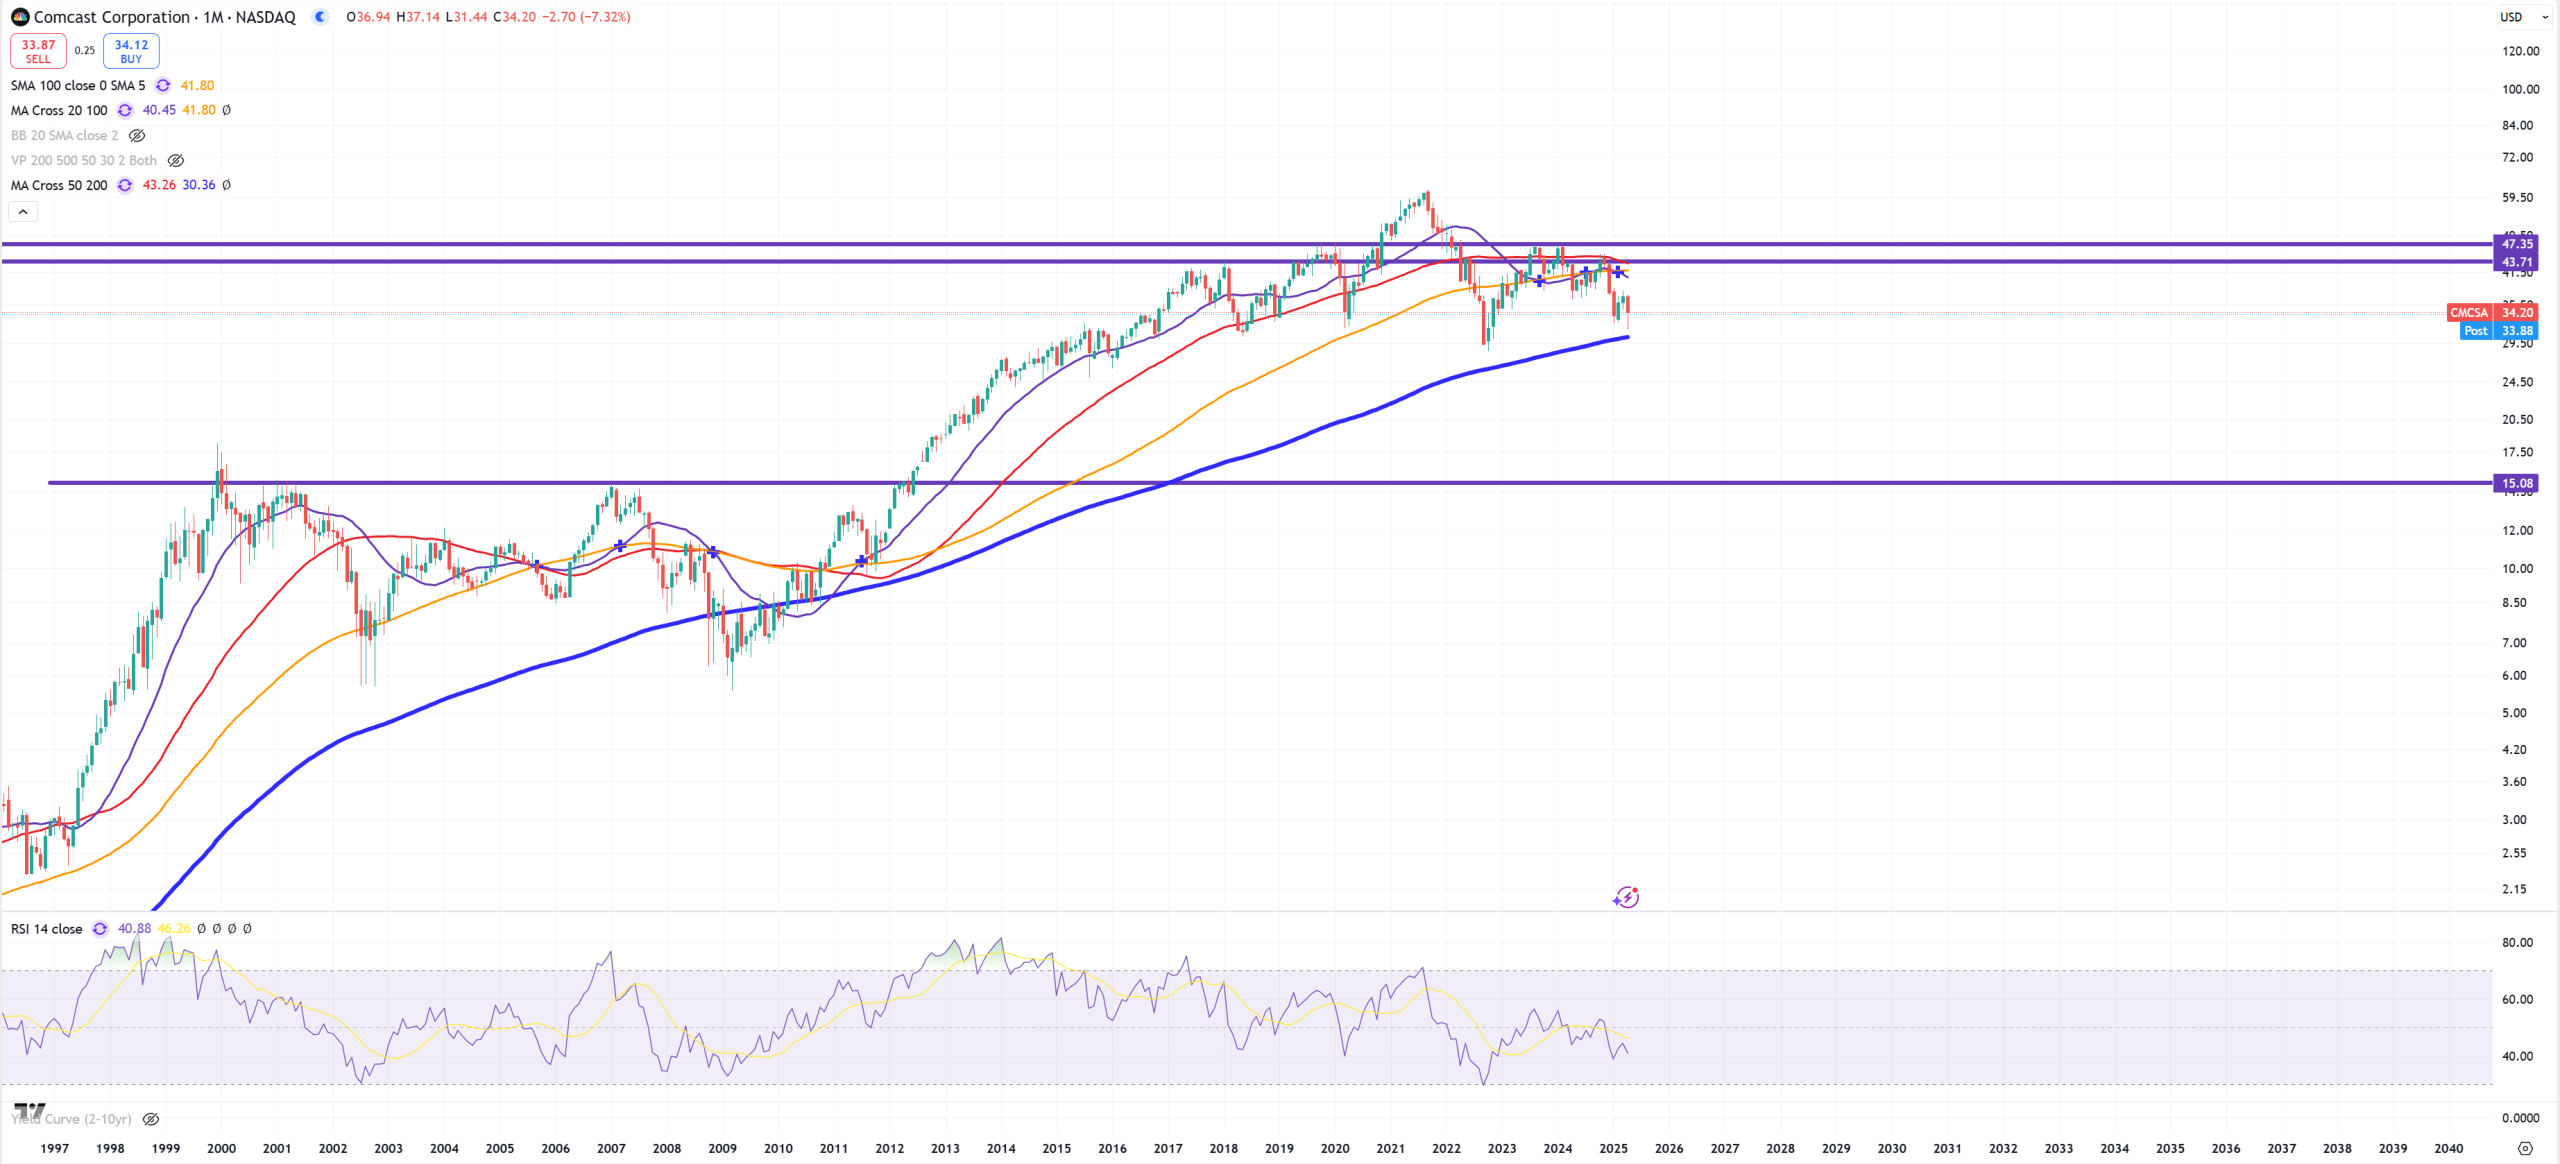
mDAX – same as CMCSA – peak in 2021 and couple years fighting around (M)MA50.
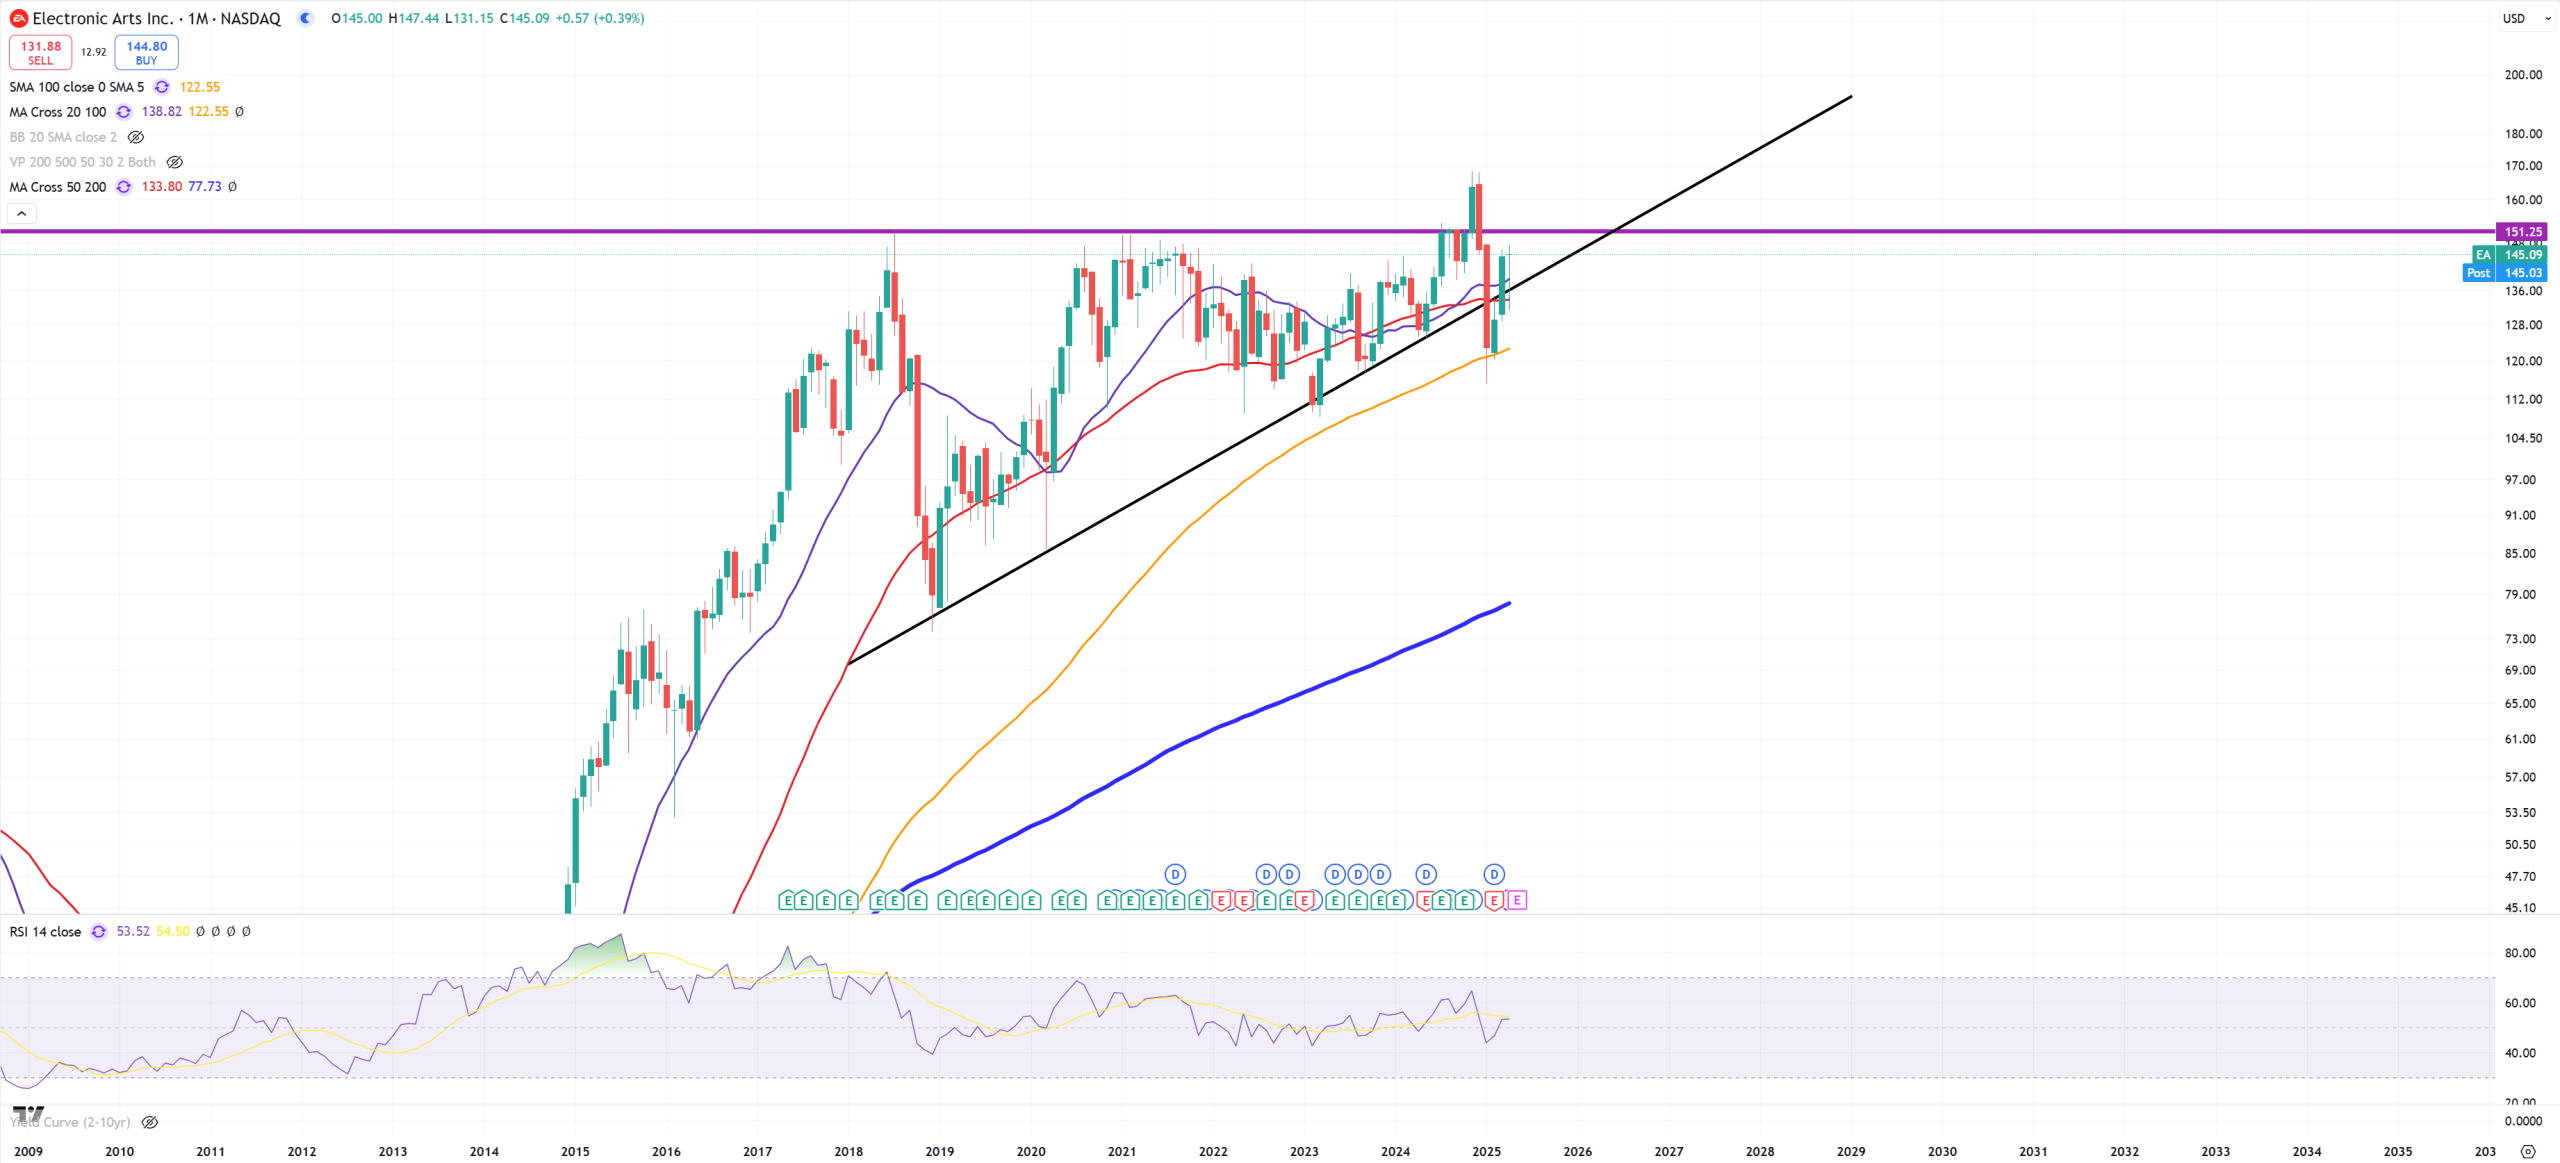
EA – dead money since 2018
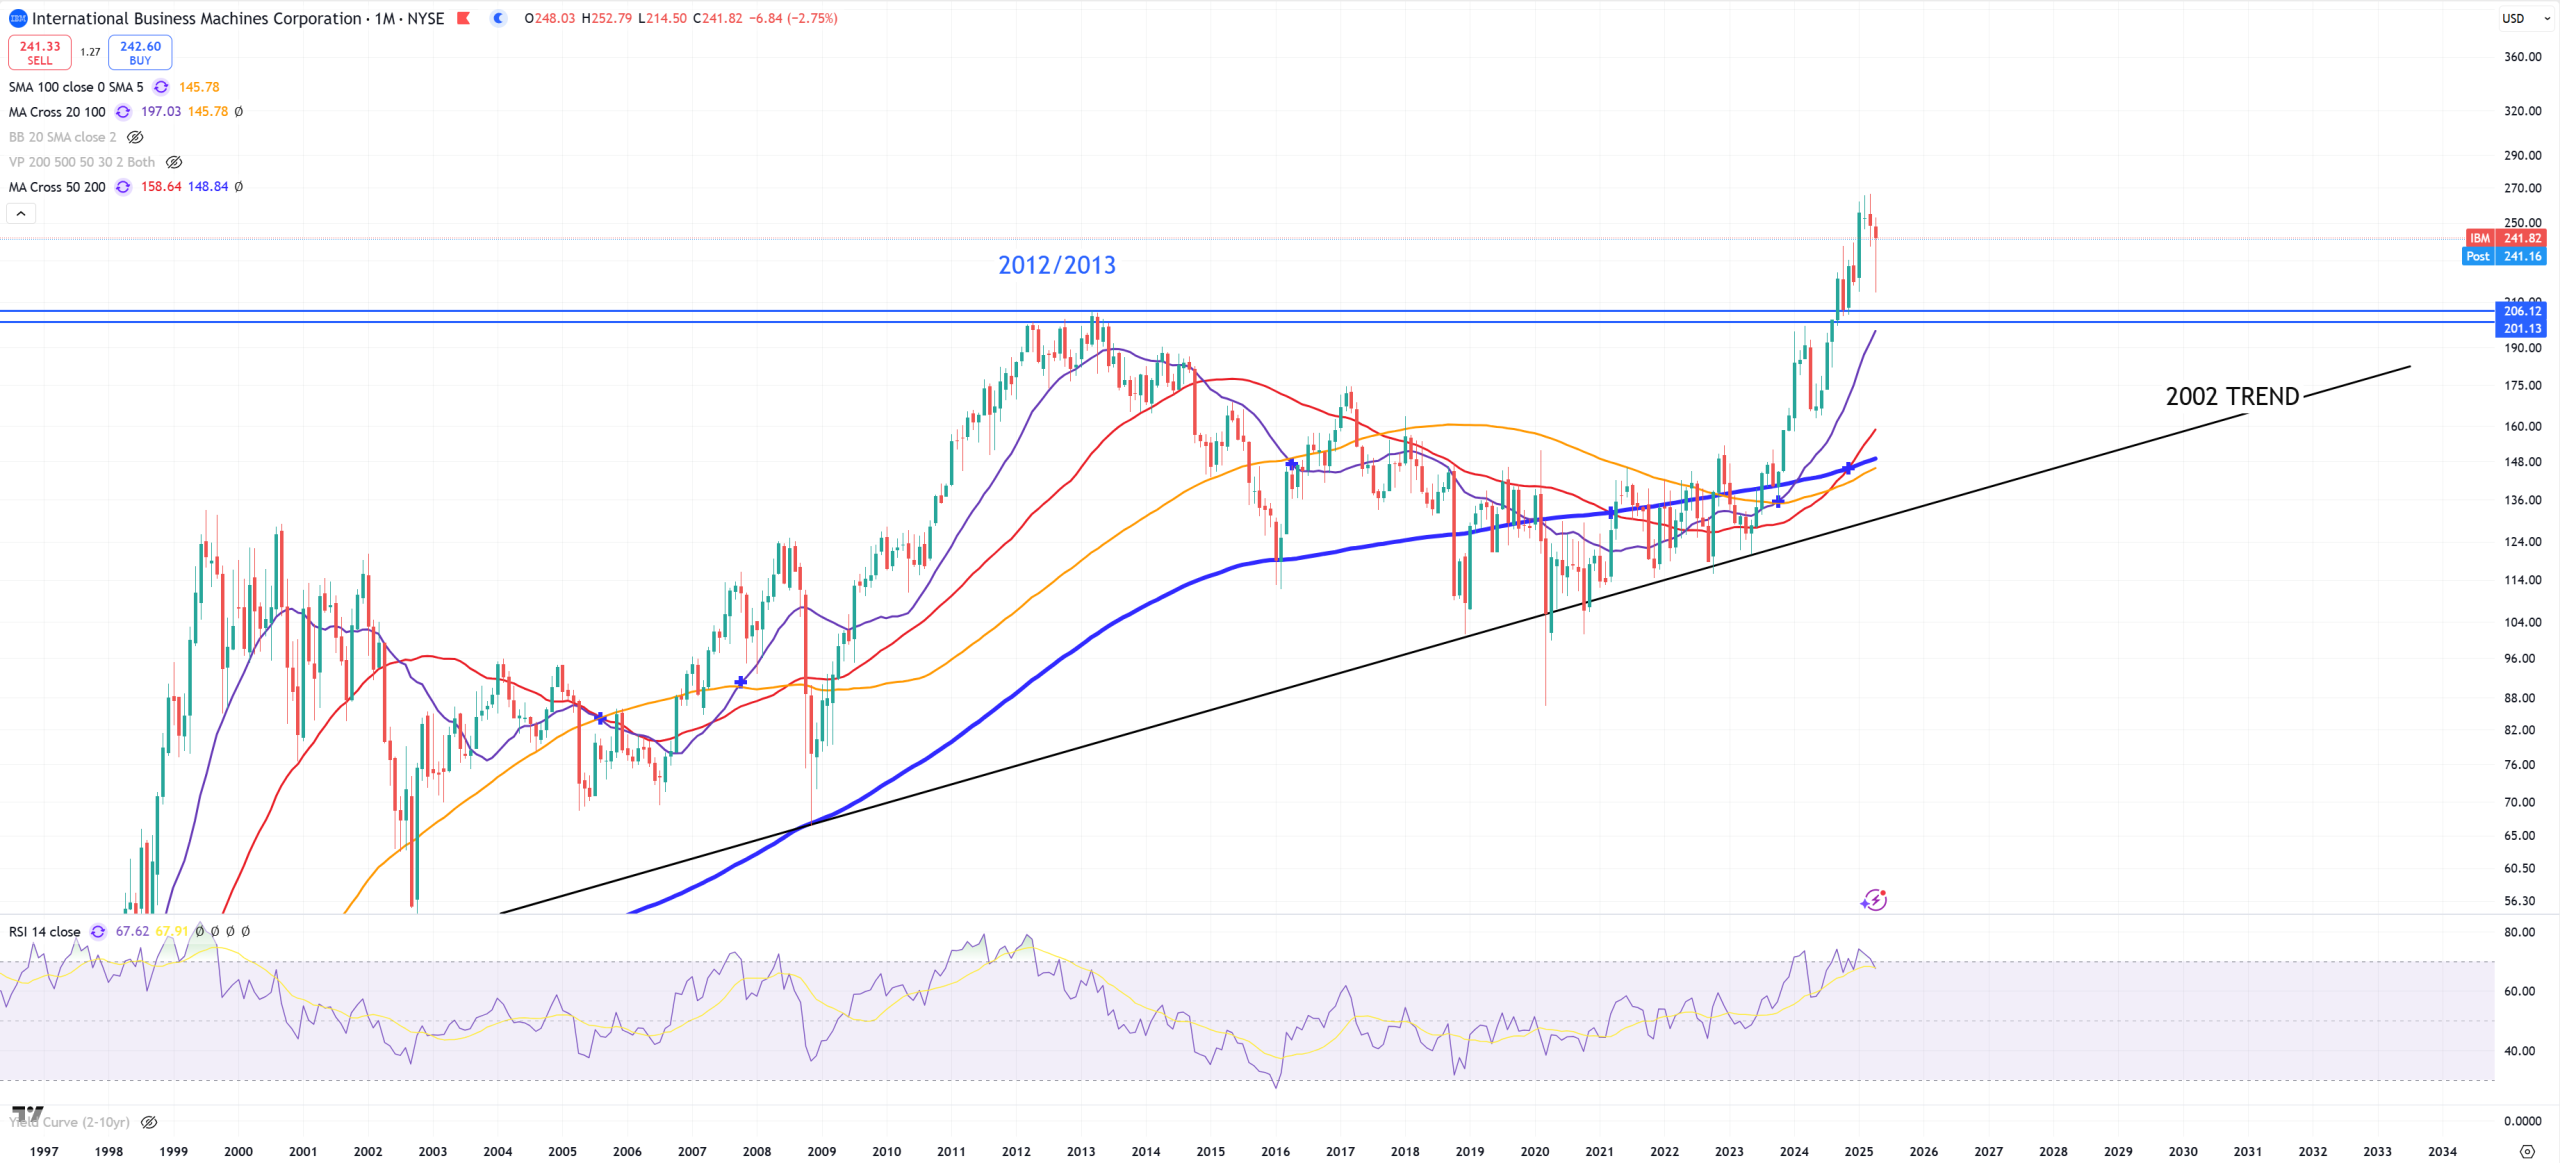
IBM – it’s better not a trap
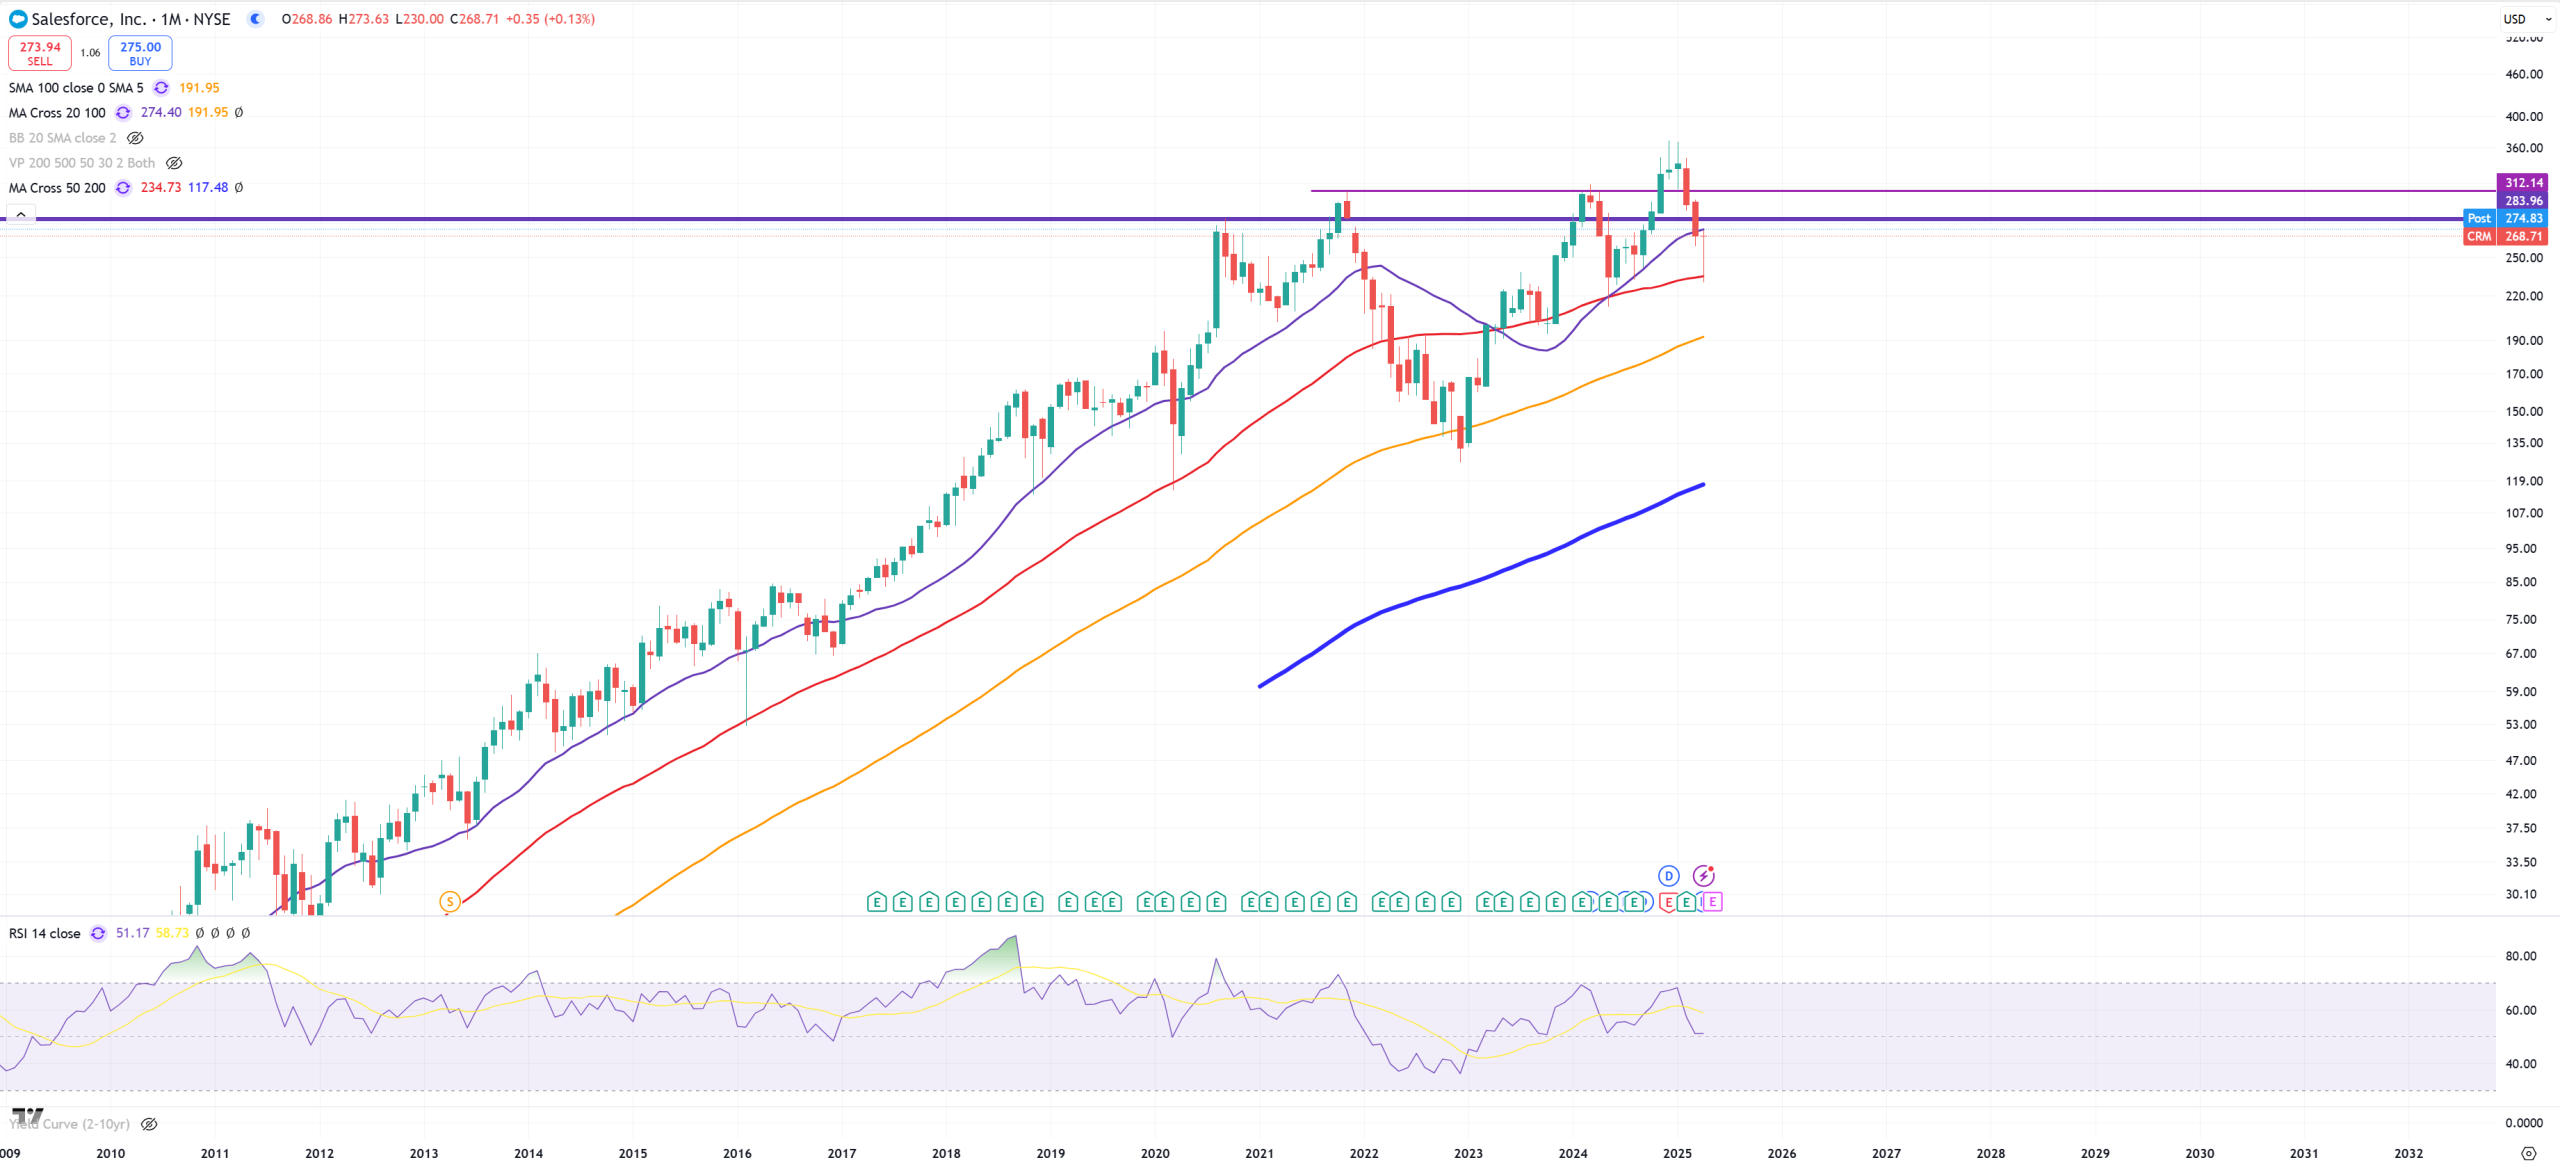
CRM – (M)MA50 holds, but below (M)MA20 and multiple resistance. We can call it 3xTOP.
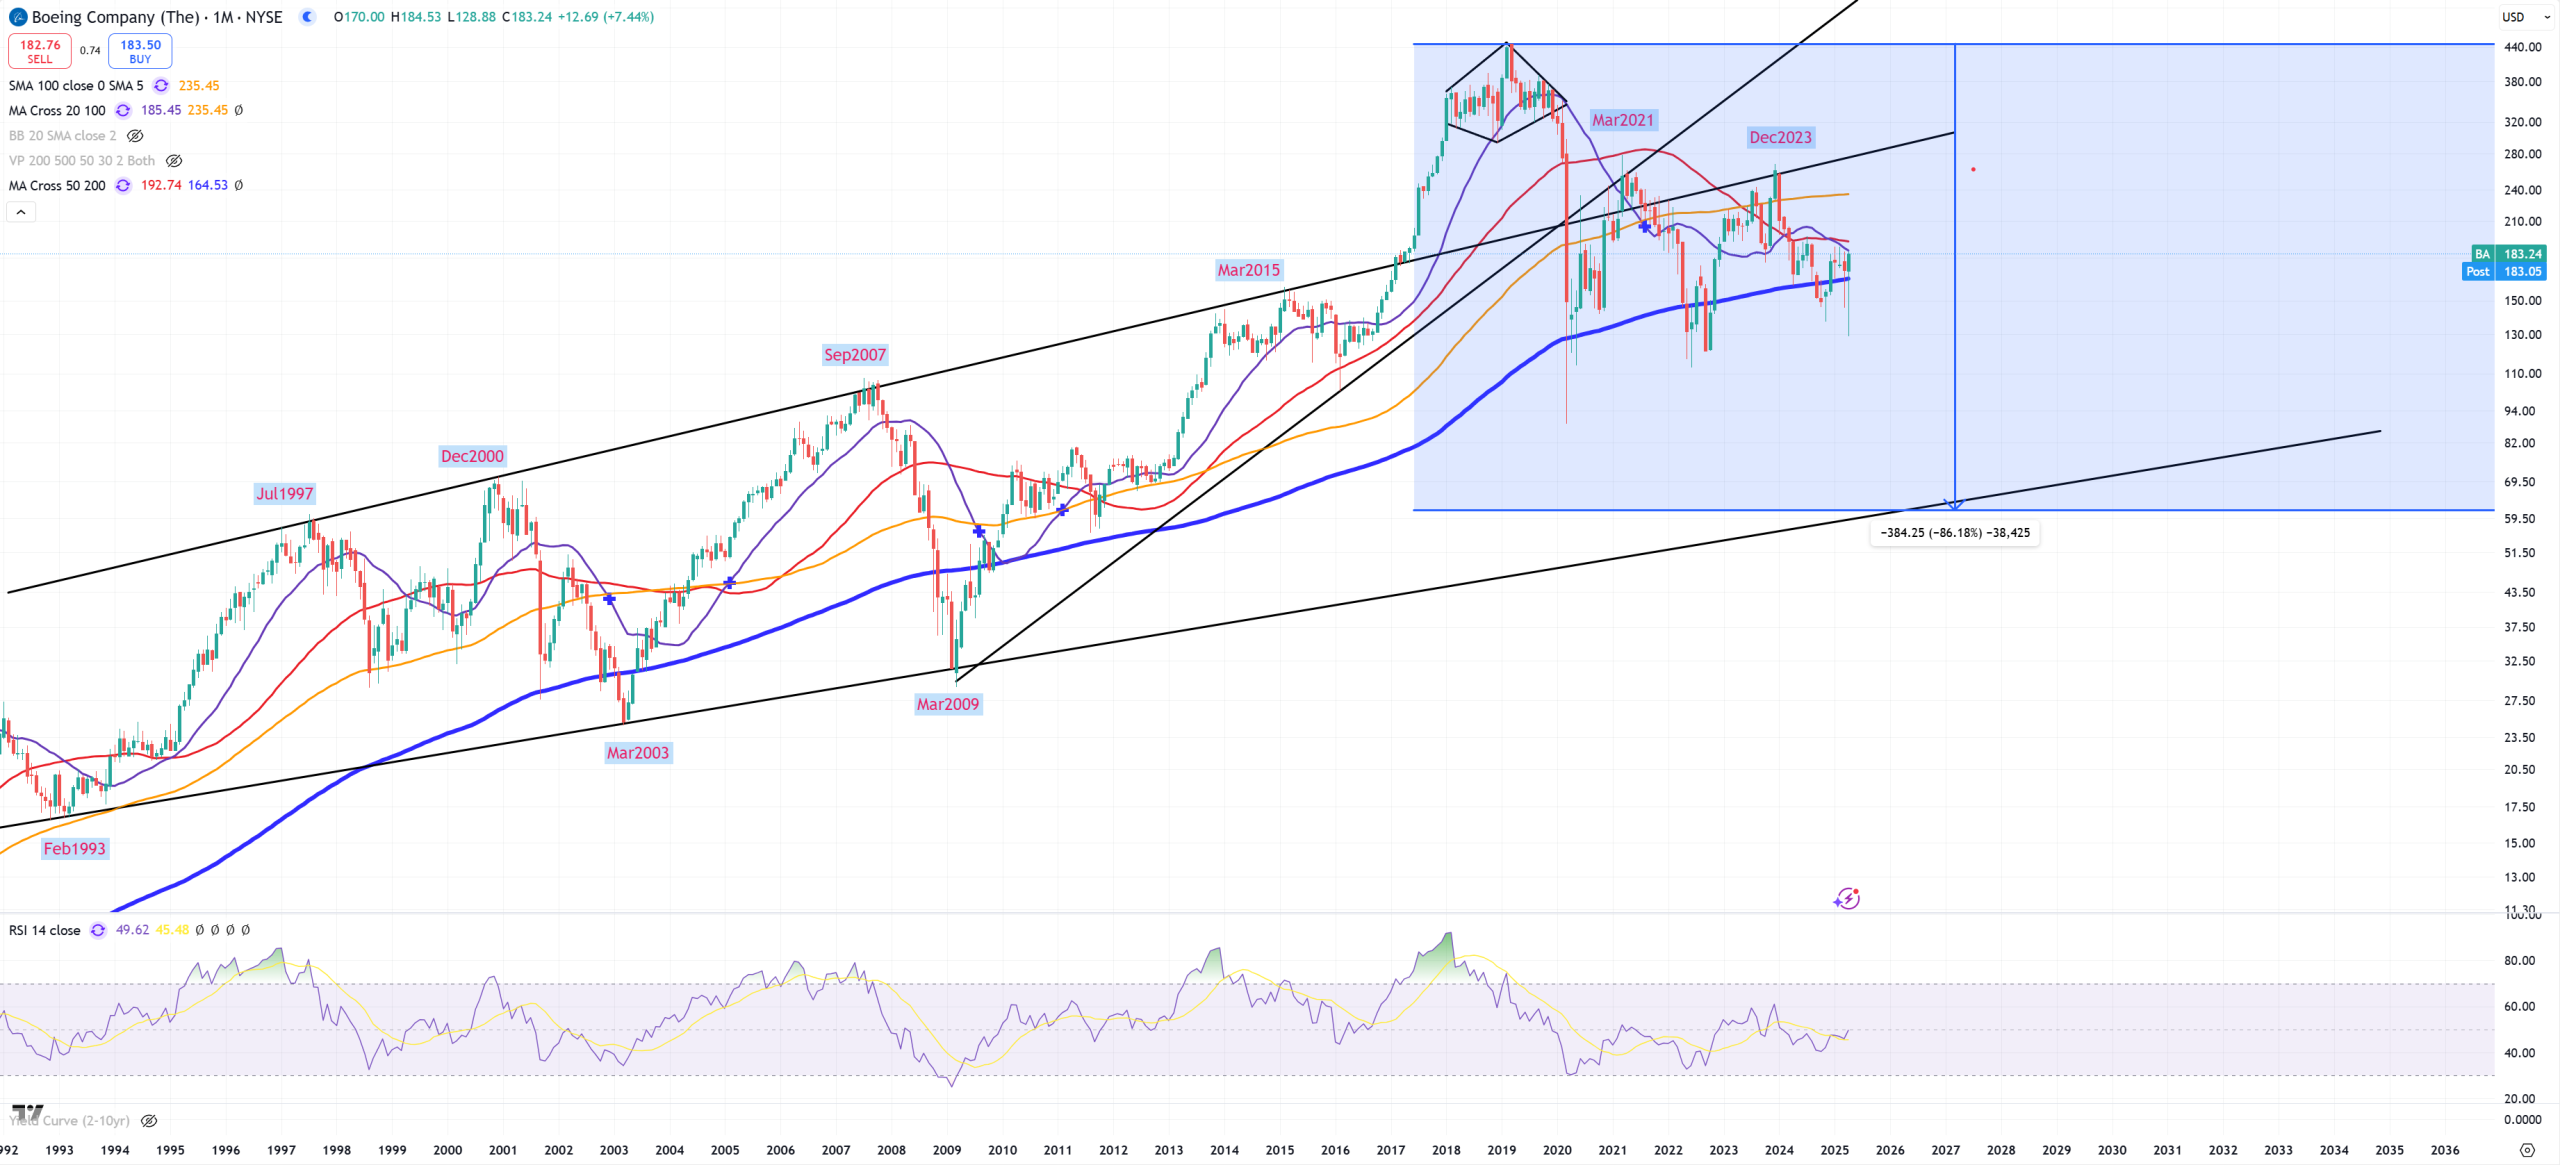
BA – fights for (M)MA200 not to hit it’s key trend around 50-60$ what will point to -90% drop from its peak, but I think it’ll go there and it’ll be well deserved, just give a moment for 10Y/3M pair to jump higher.
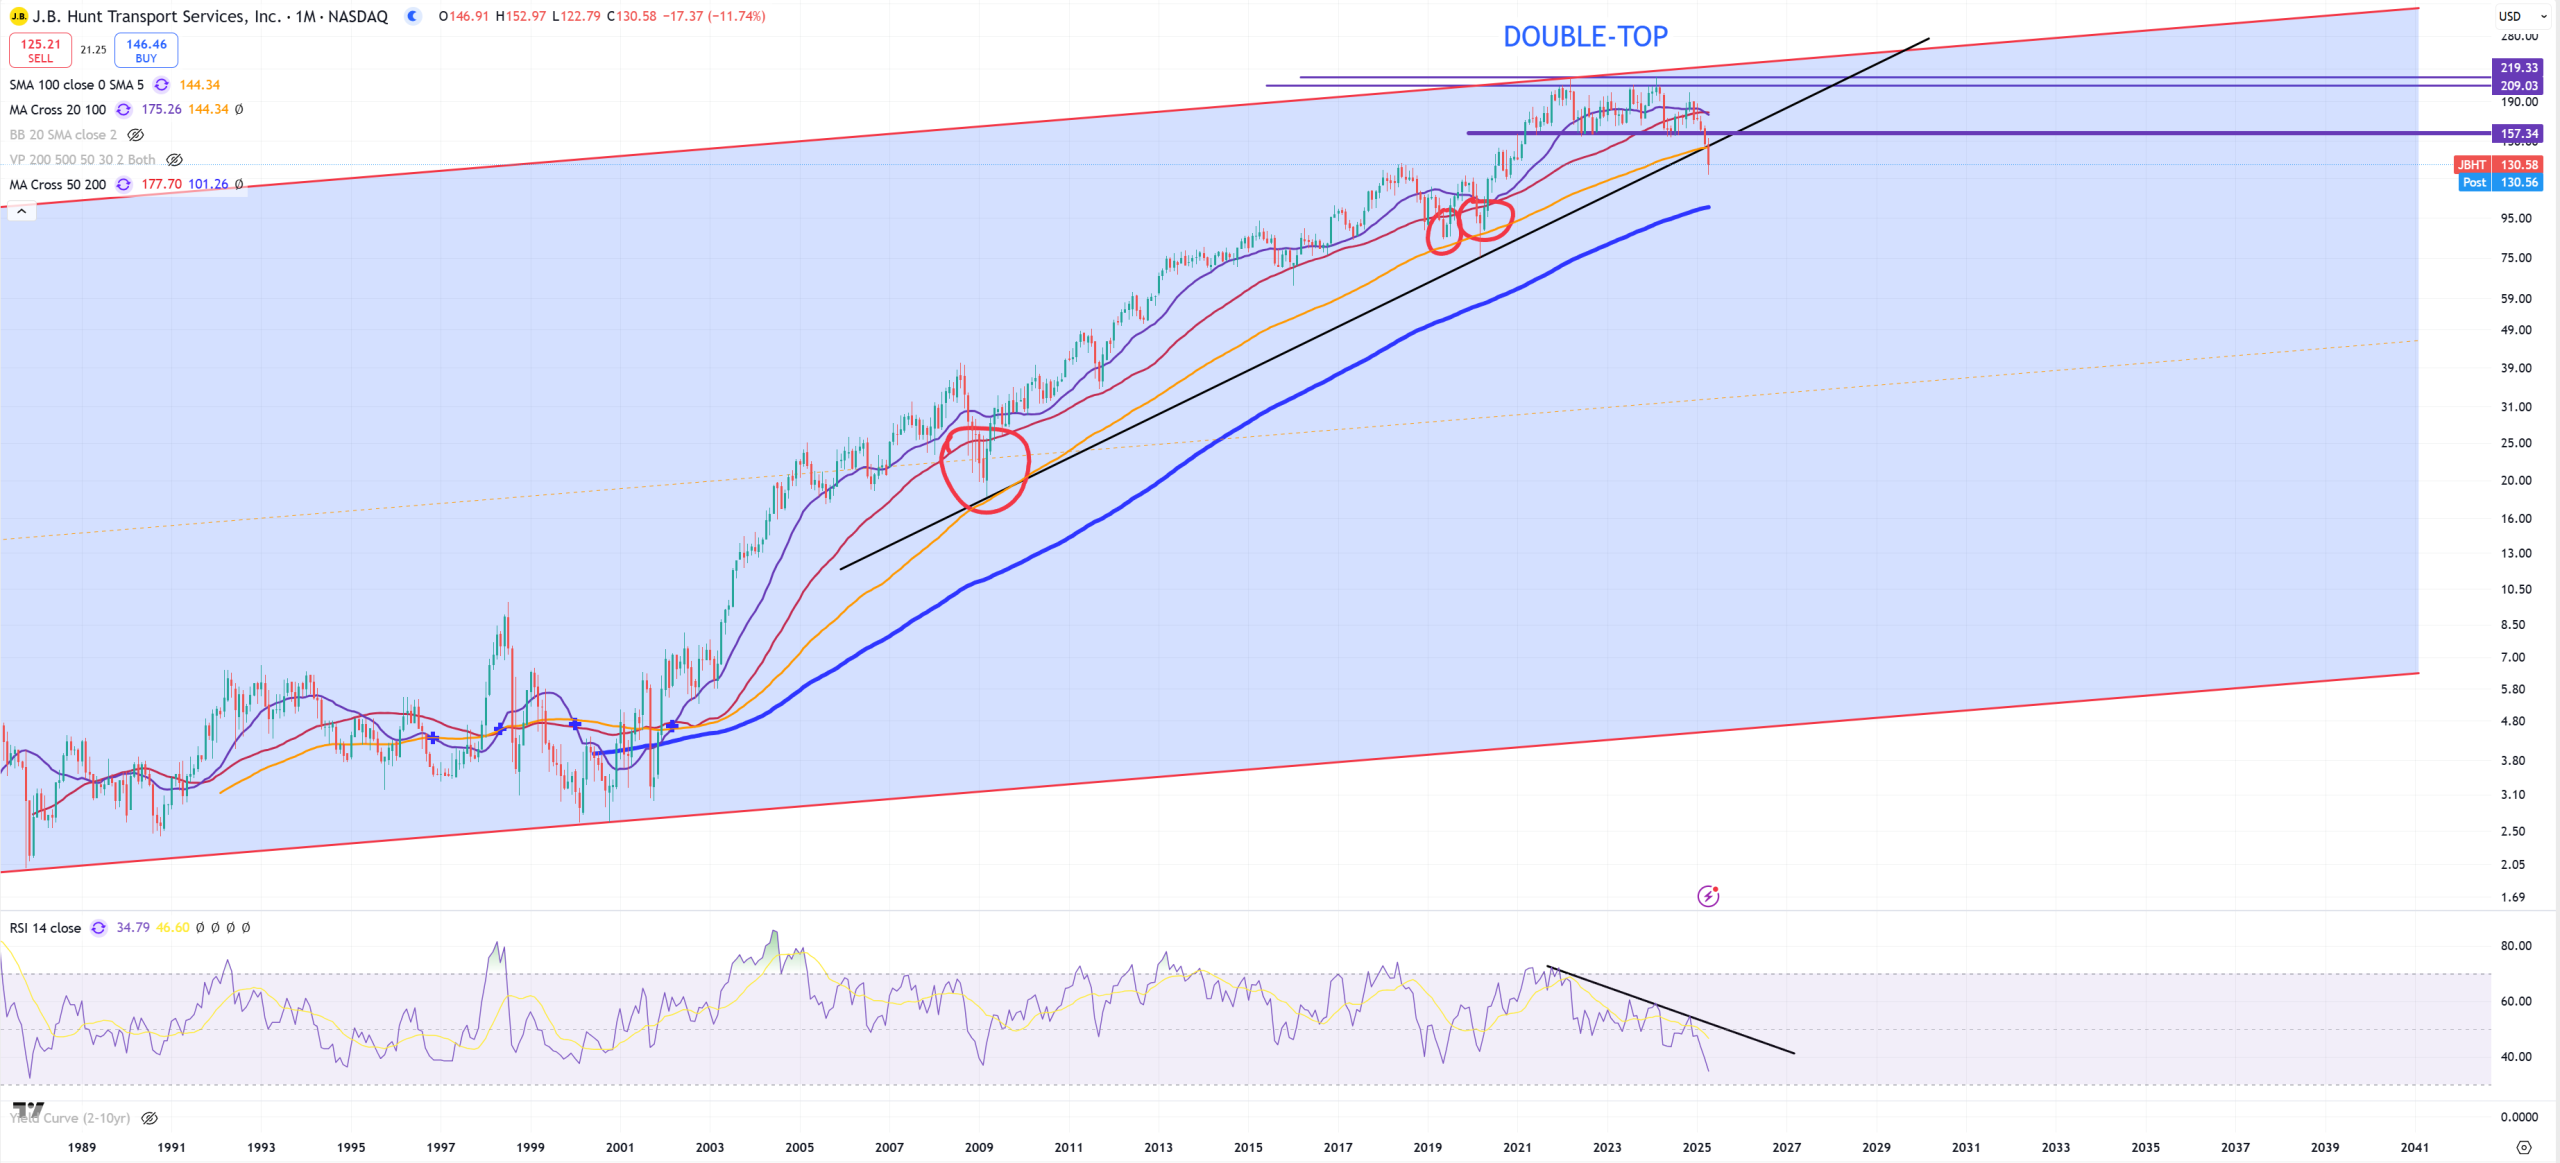
JBHT – that’s almost the same as Dow Jones Transportation. We can say RIP. 2022 & 2024 DOUBLE TOP.
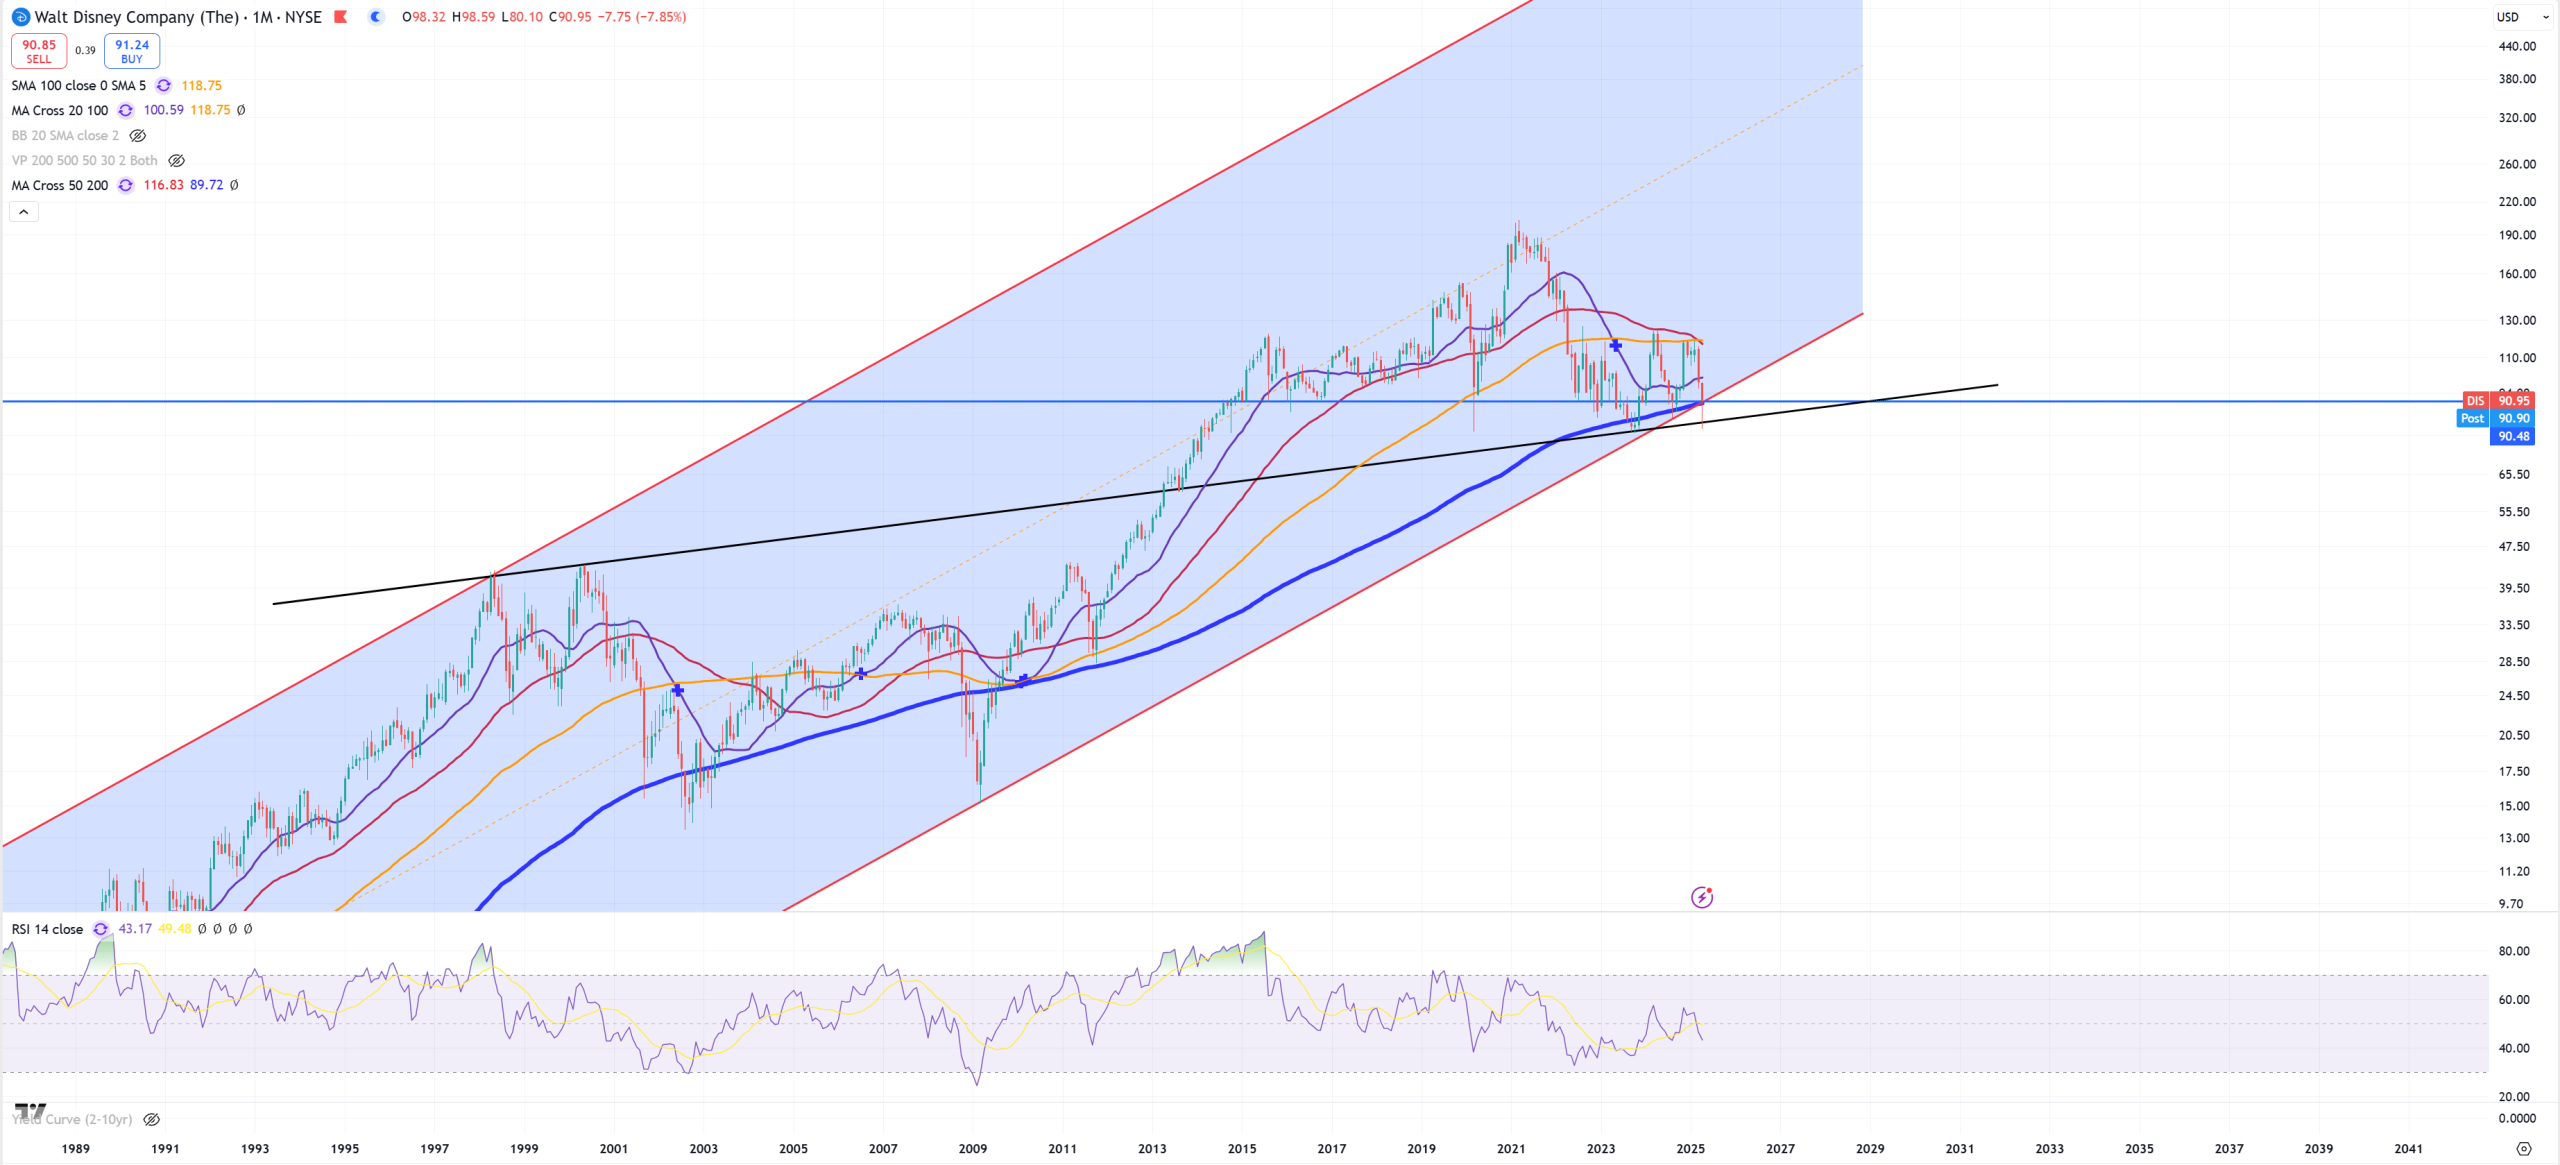
DIS – the lower line of the channel is a trend from 1974. Now multiple support + (M)MA200. I love to say when such super long term precision channel finally breaks company is going out of the business.
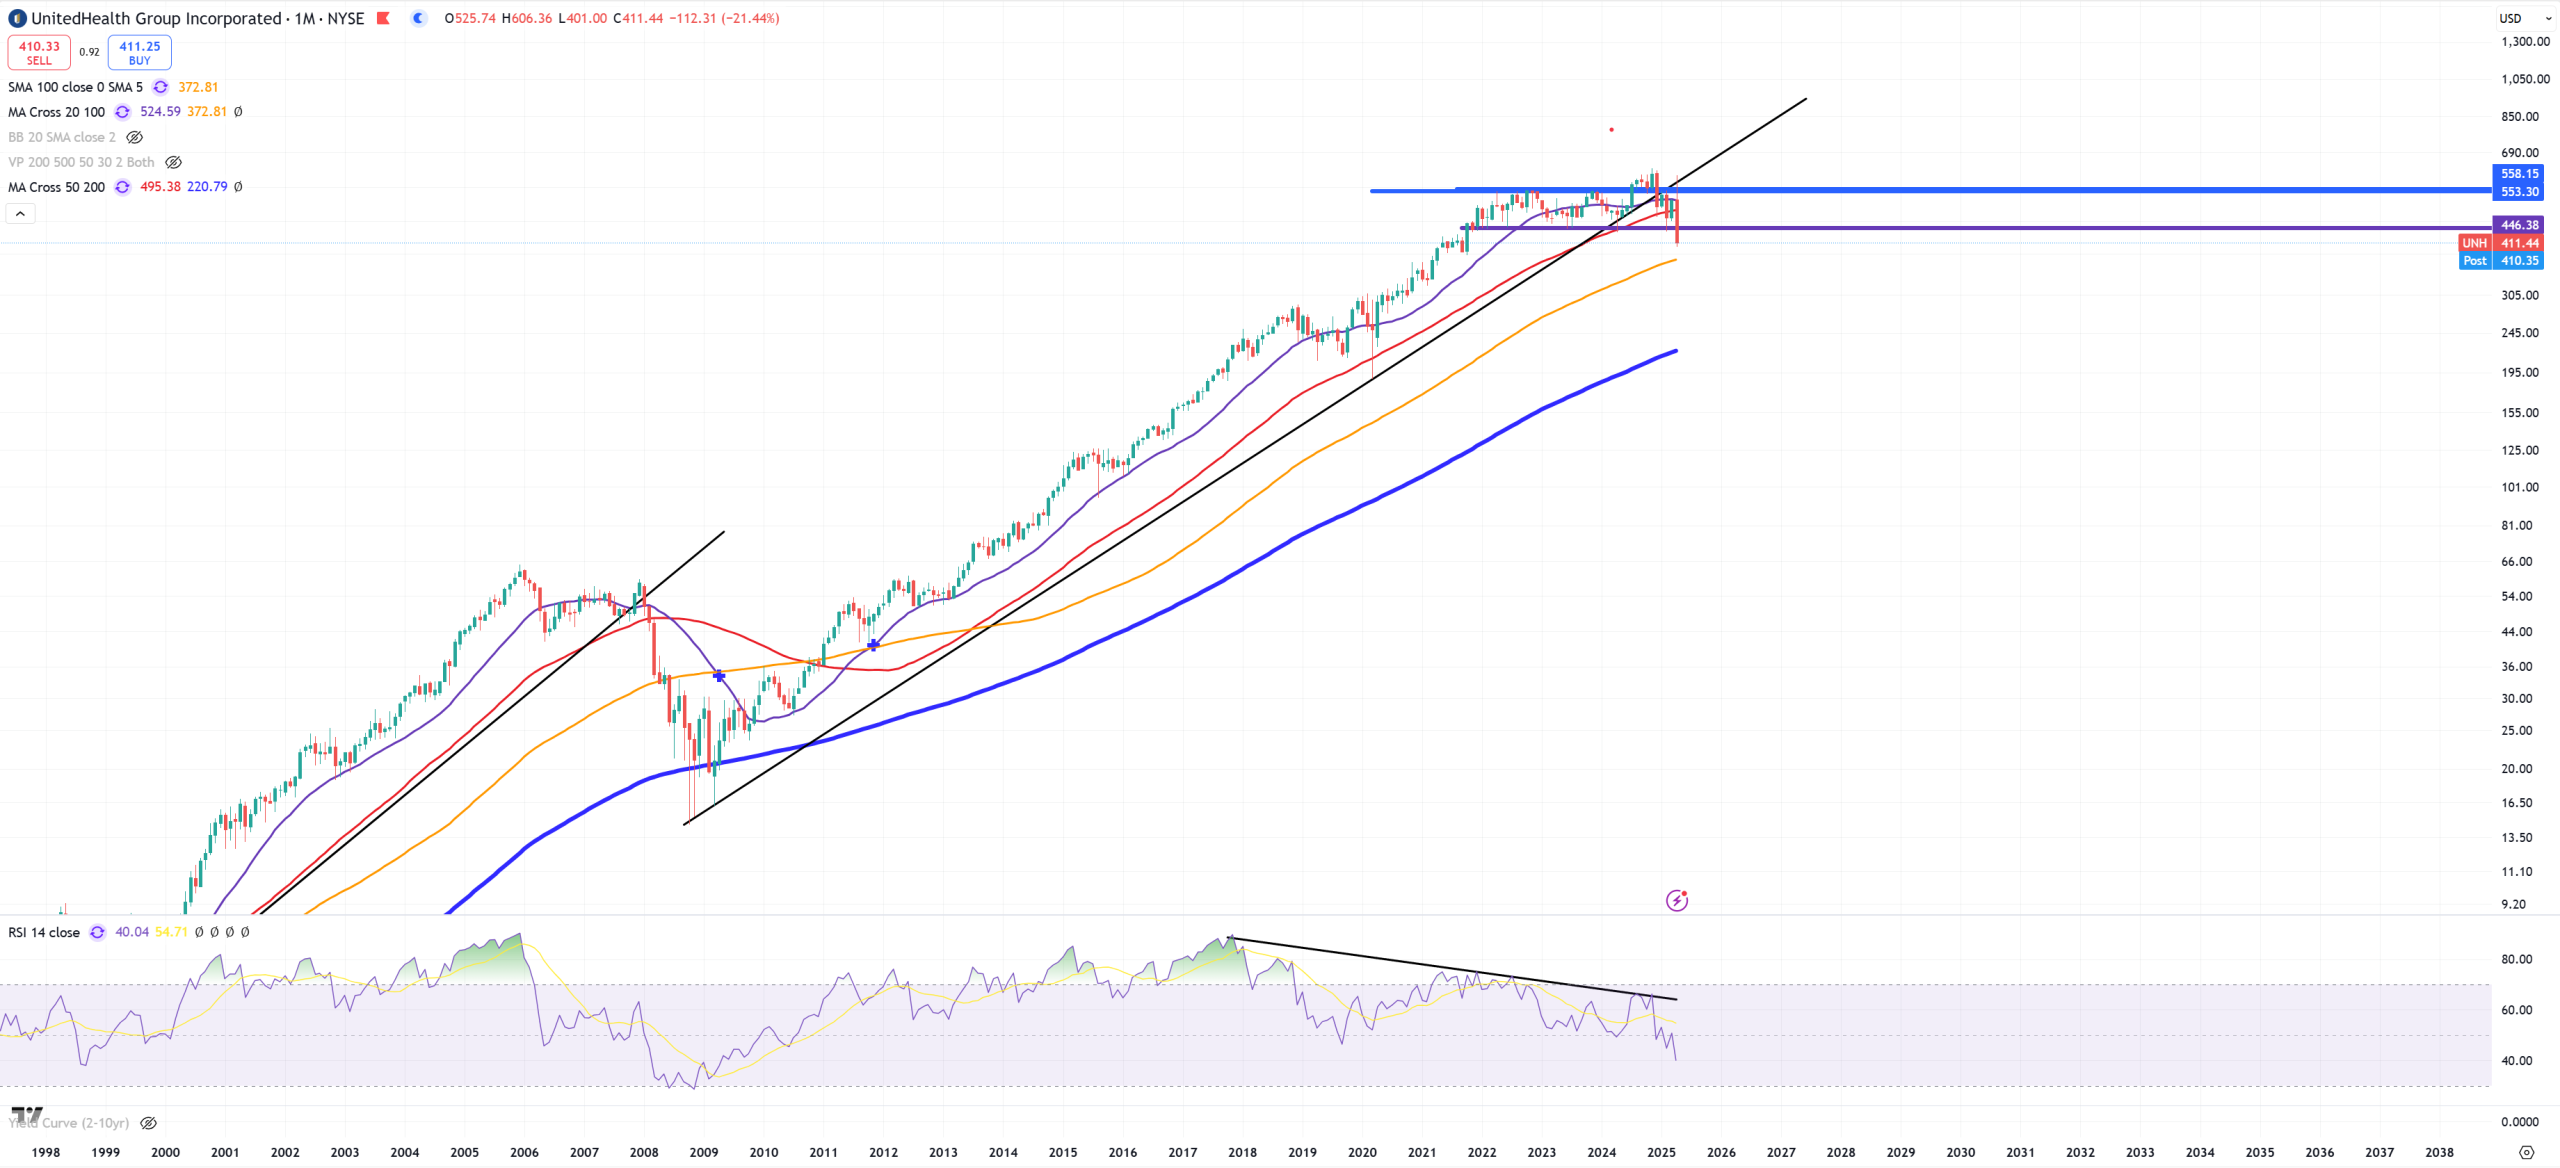
UNH – topping from 2022 with a small bull trap and crashed. Breaking 2009 trend + (M)MA50 and support.
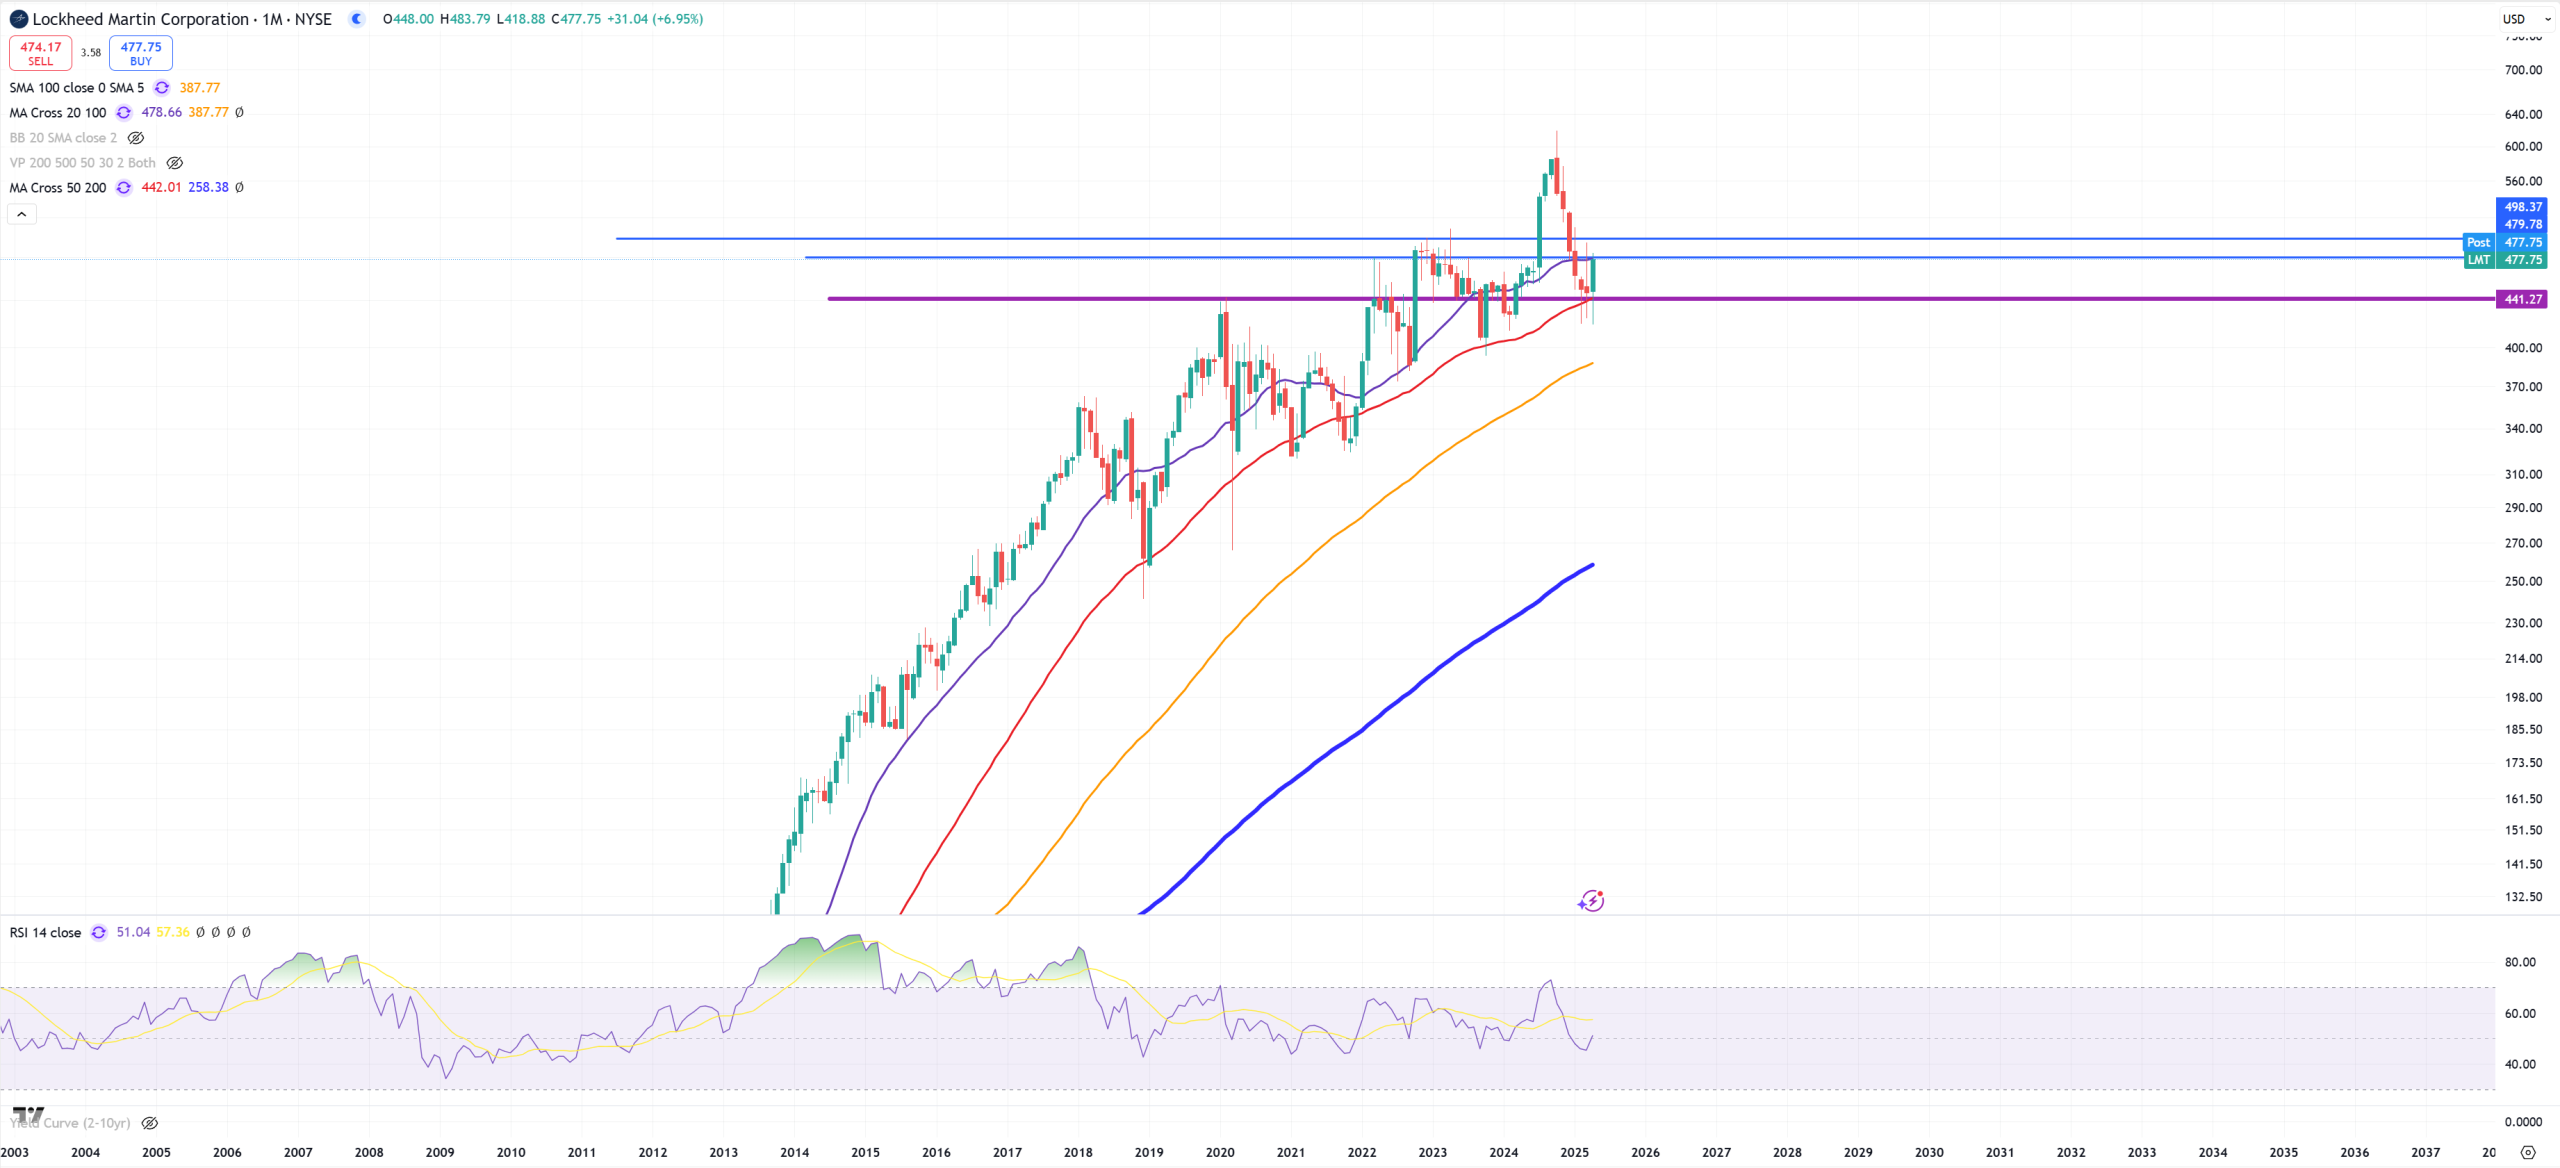
LMT – so Lockheed and defence sector. Something doesn’t add up here – retesting (M)MA20 + resistance after (M)MA50 + support was defended. This spike to 620$ I bet it was a massive bull-trap.
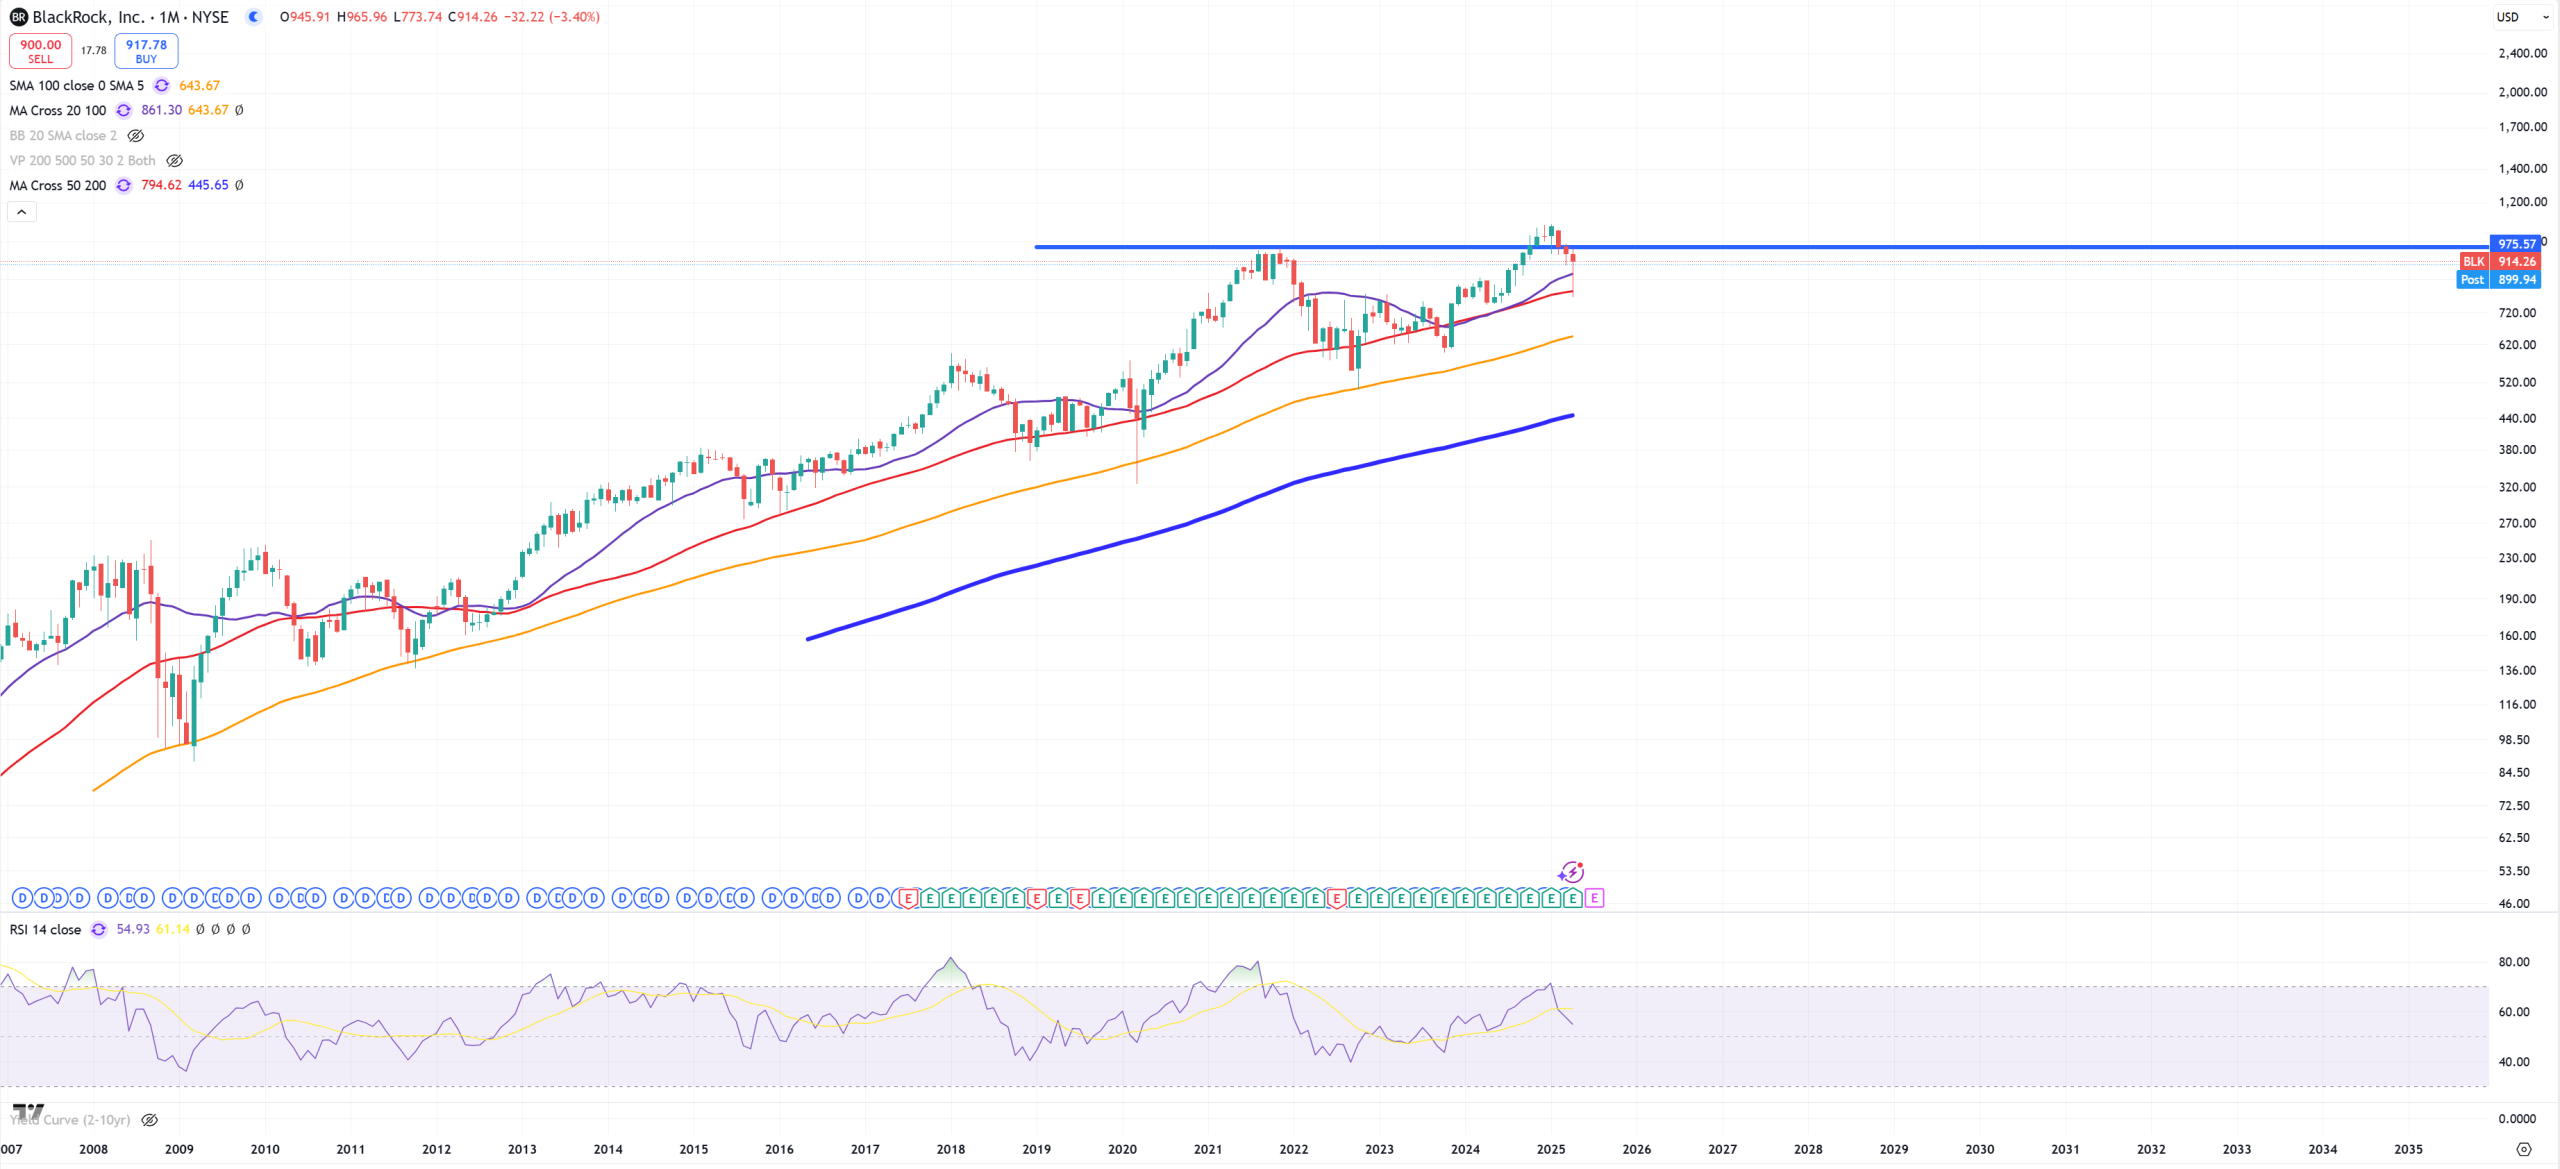
BLK – BlackRock – first peak of course 2021, second with a small overshooting in January 2025. Defending (M)MA50. Let’s see if this 2021 peak level is now a massive resistance.
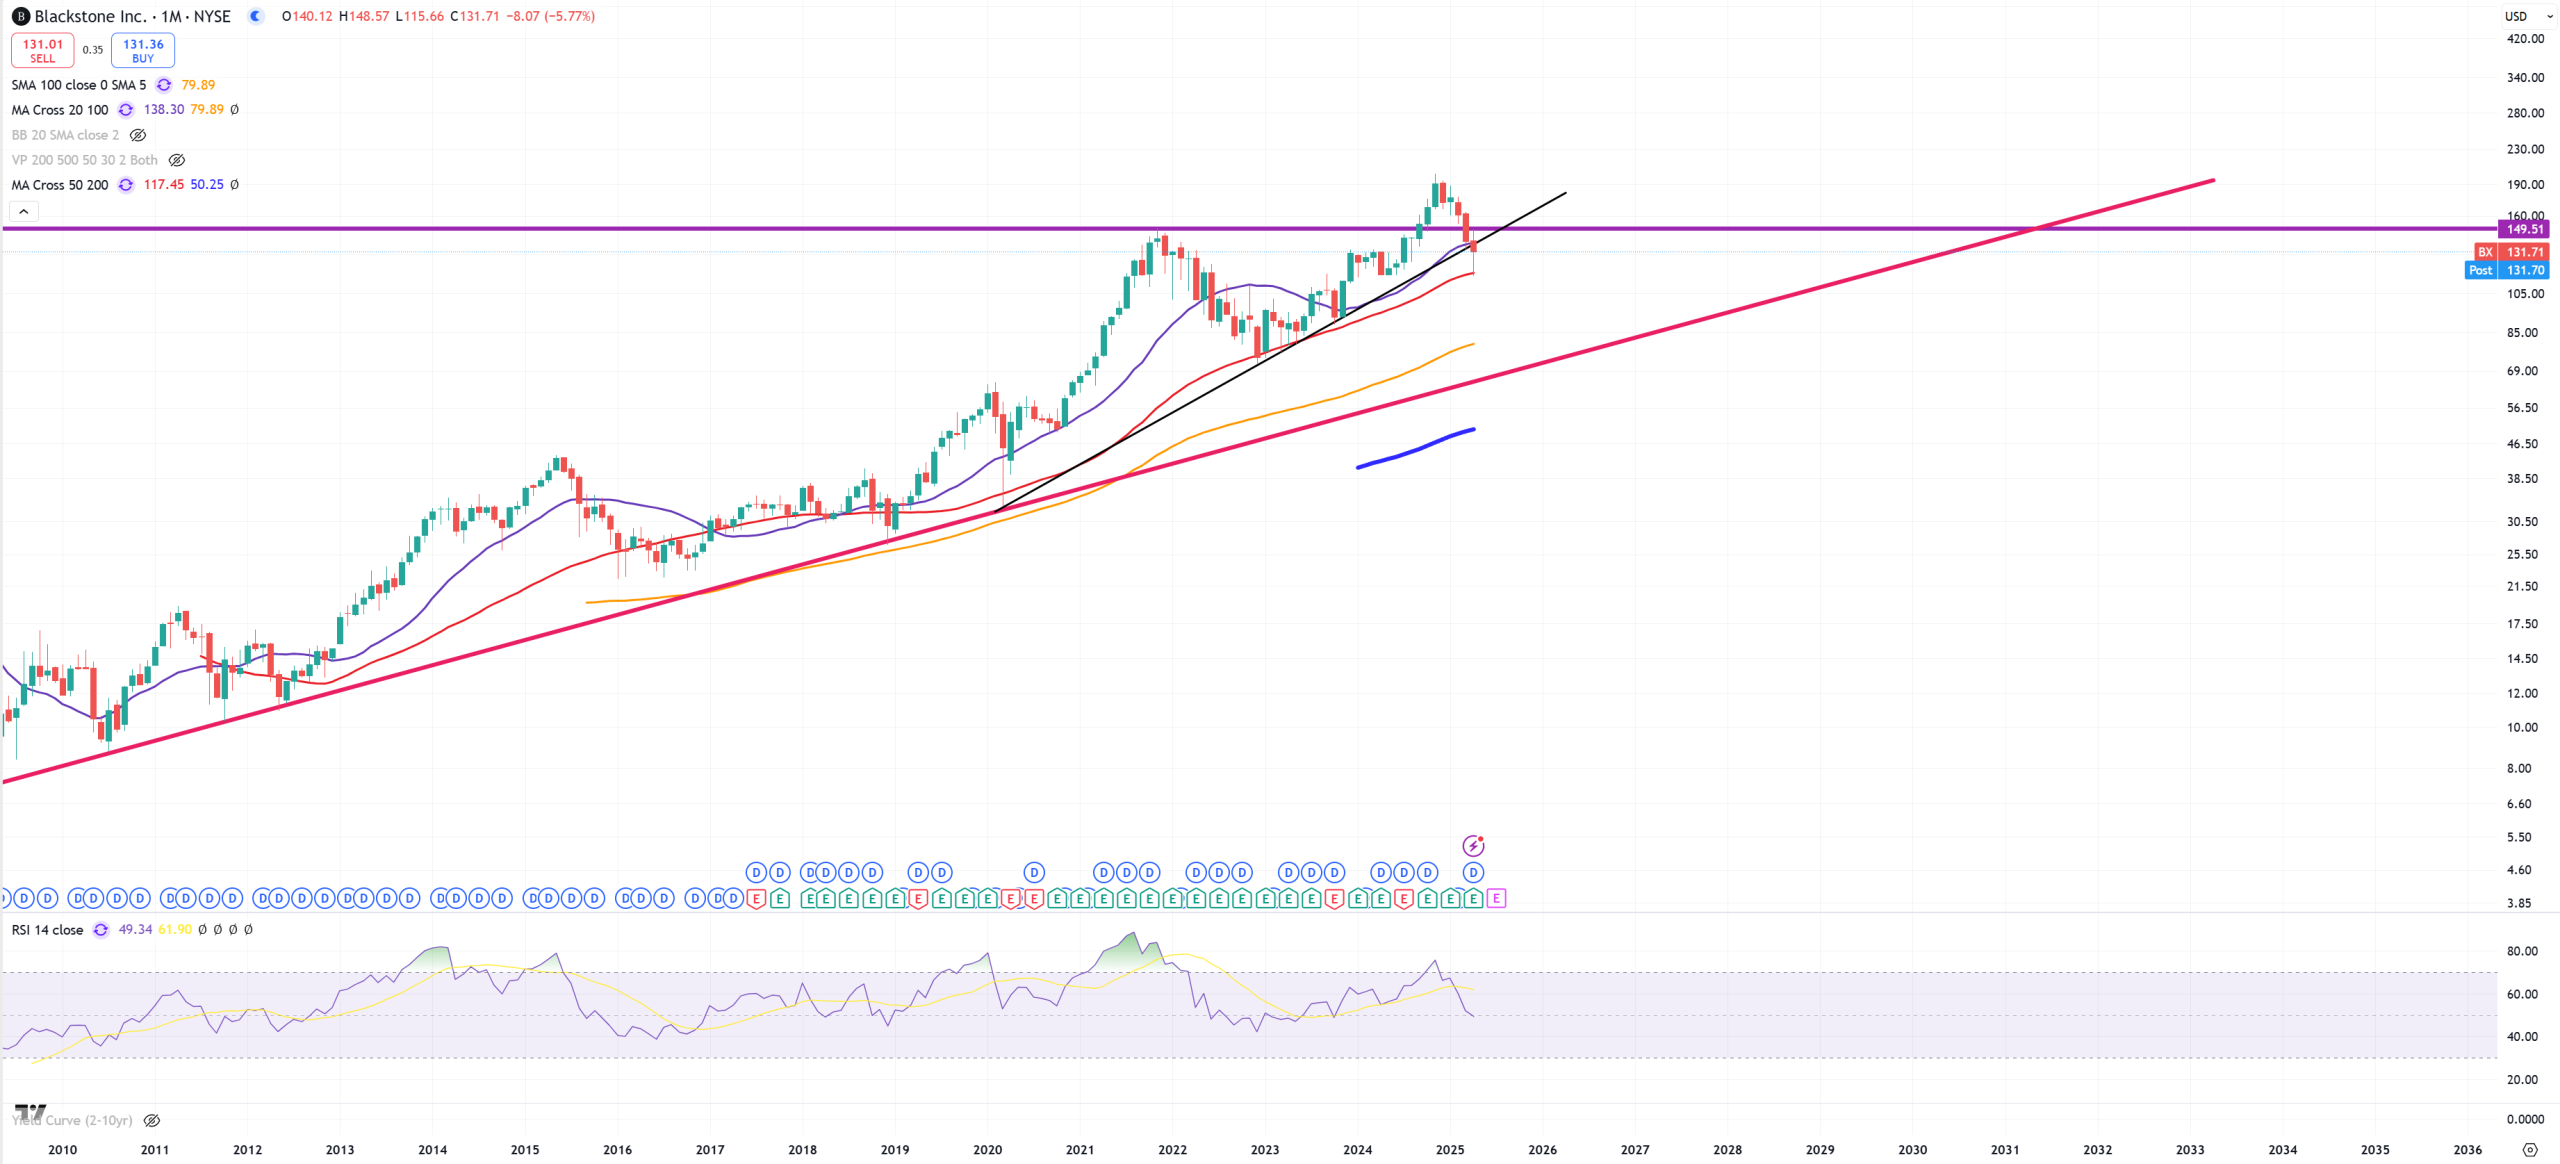
BX – Blackstone – so CRE – saying short RIP, first peak of course 2021, second bull-trap in Nov 2024. Trend broken (M)MA50 support, below (M)MA20.
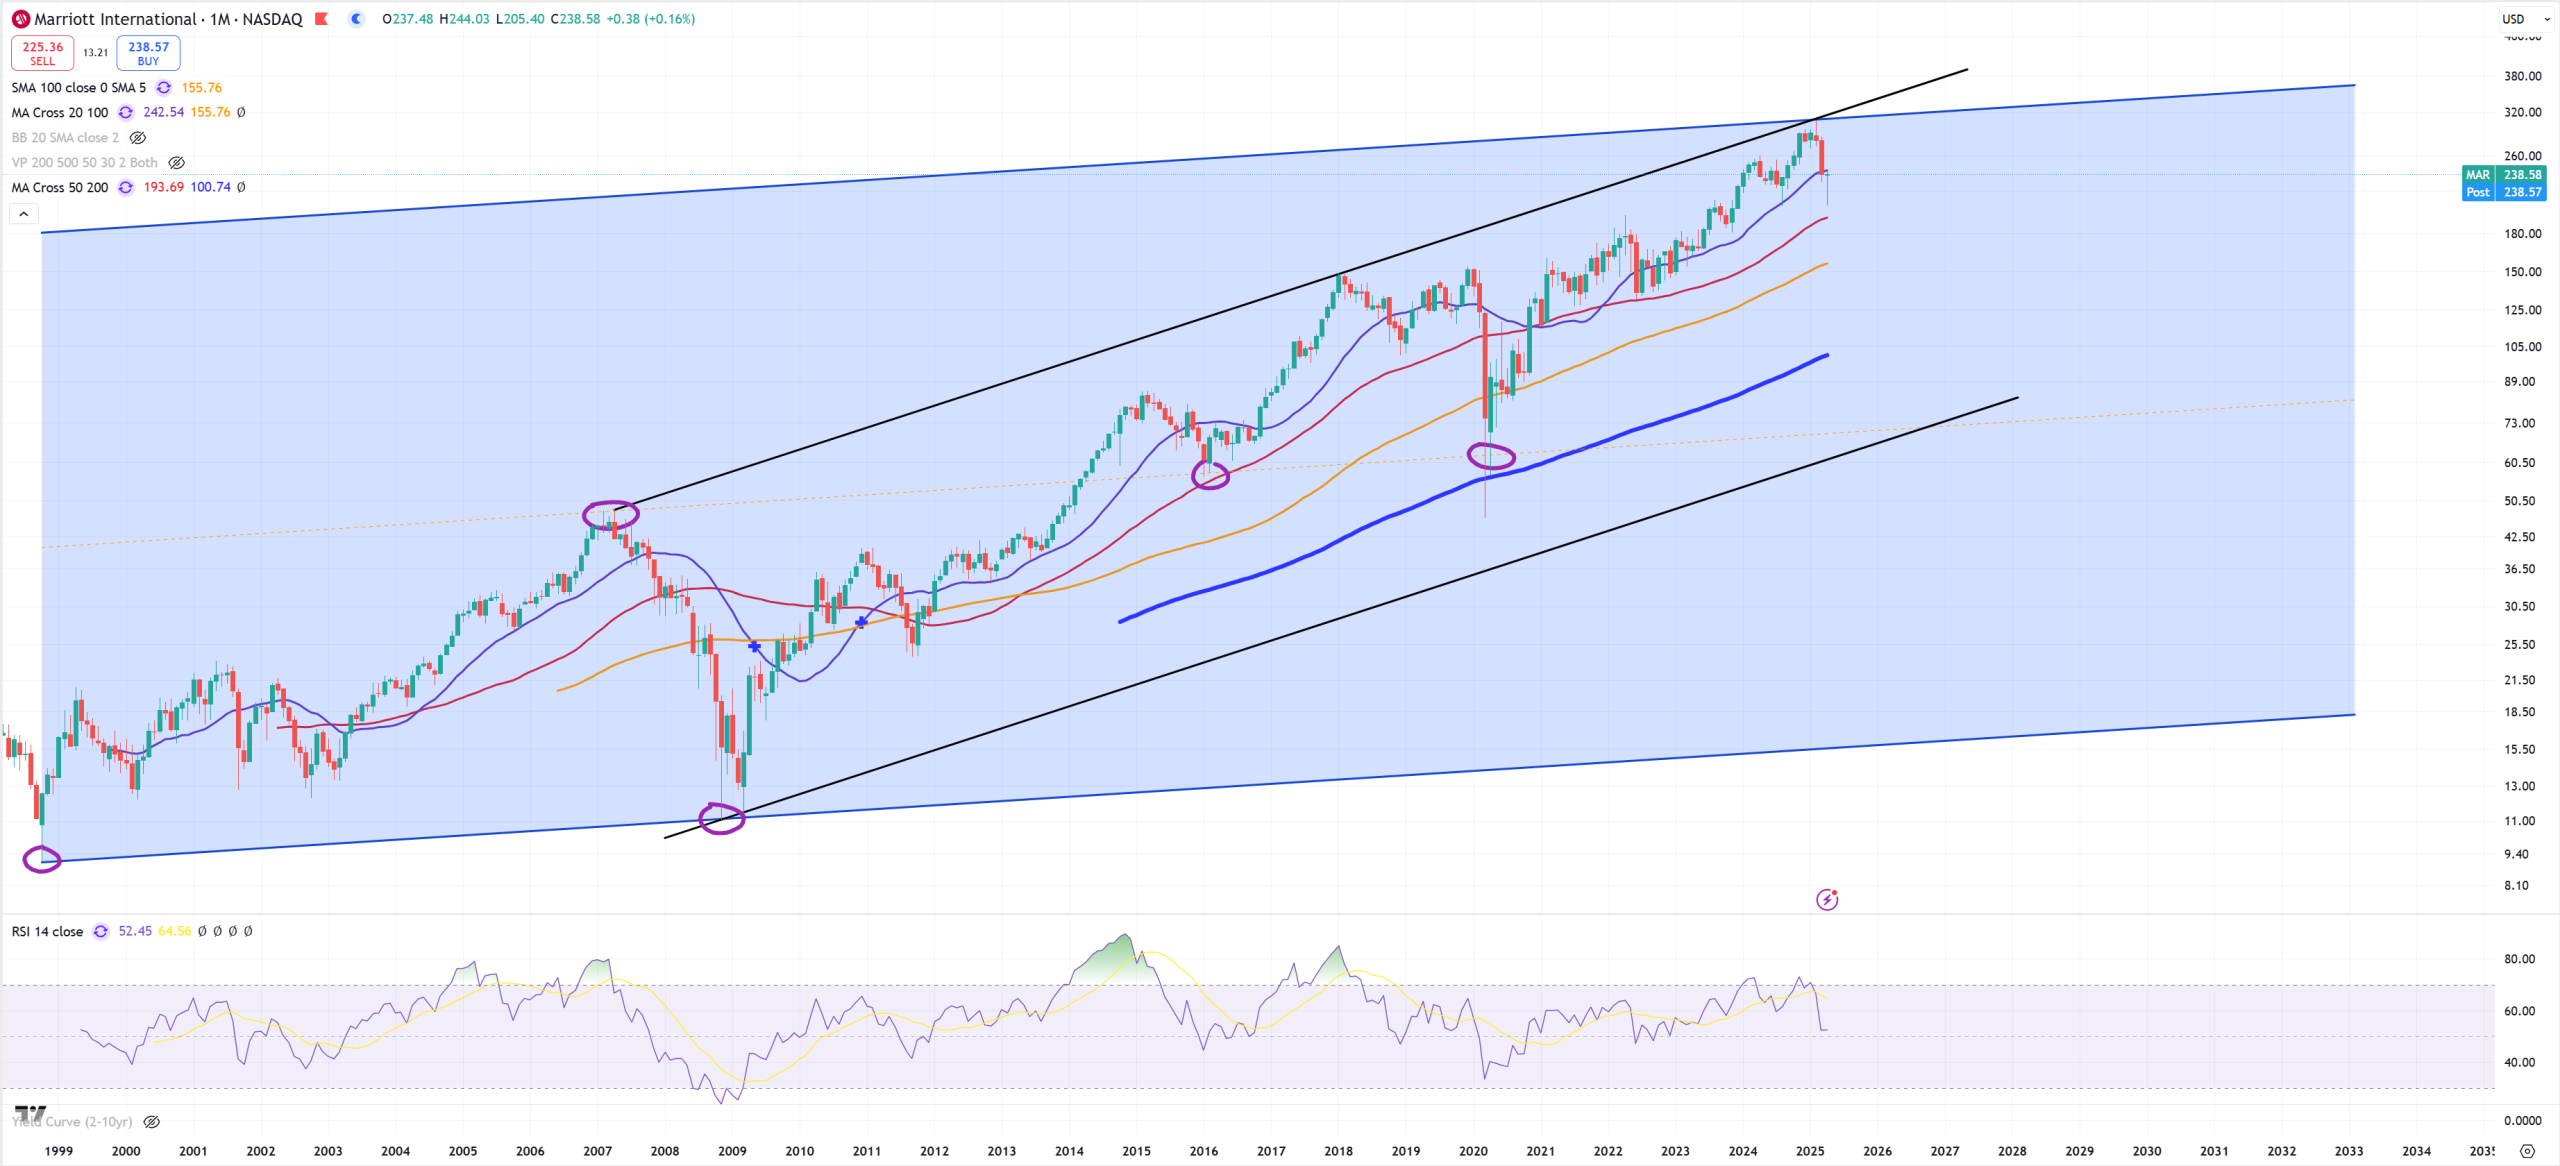
MAR – Martiott you see the full chart here. It’s like double channel. Below (M)MA20.
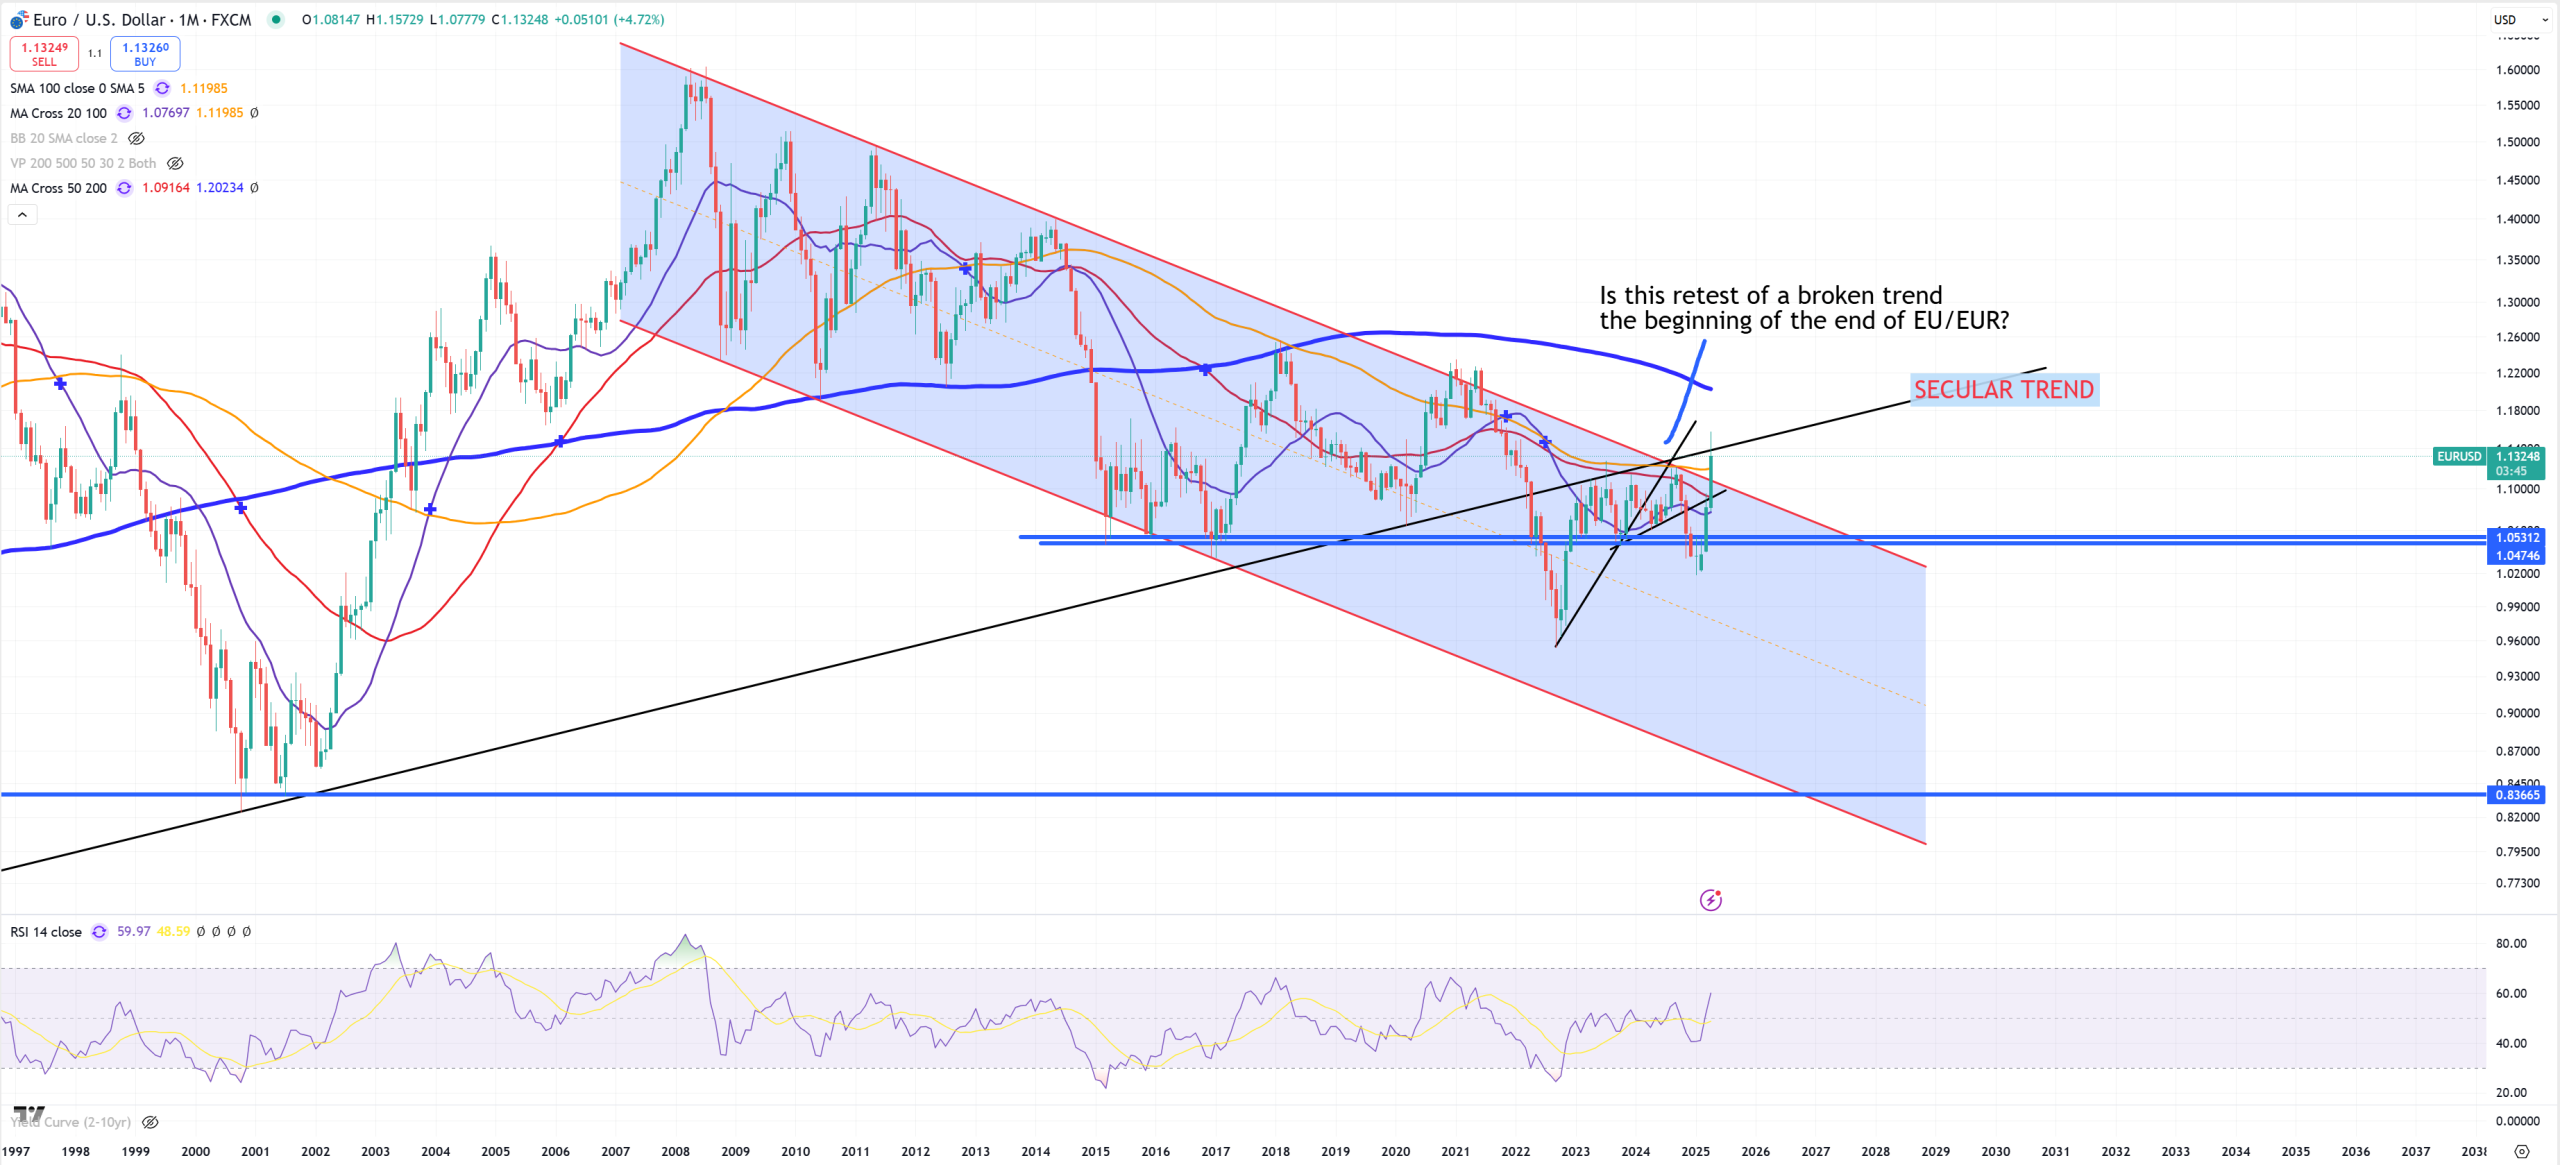
EURUSD – My last border 1.14 was hold and rejected
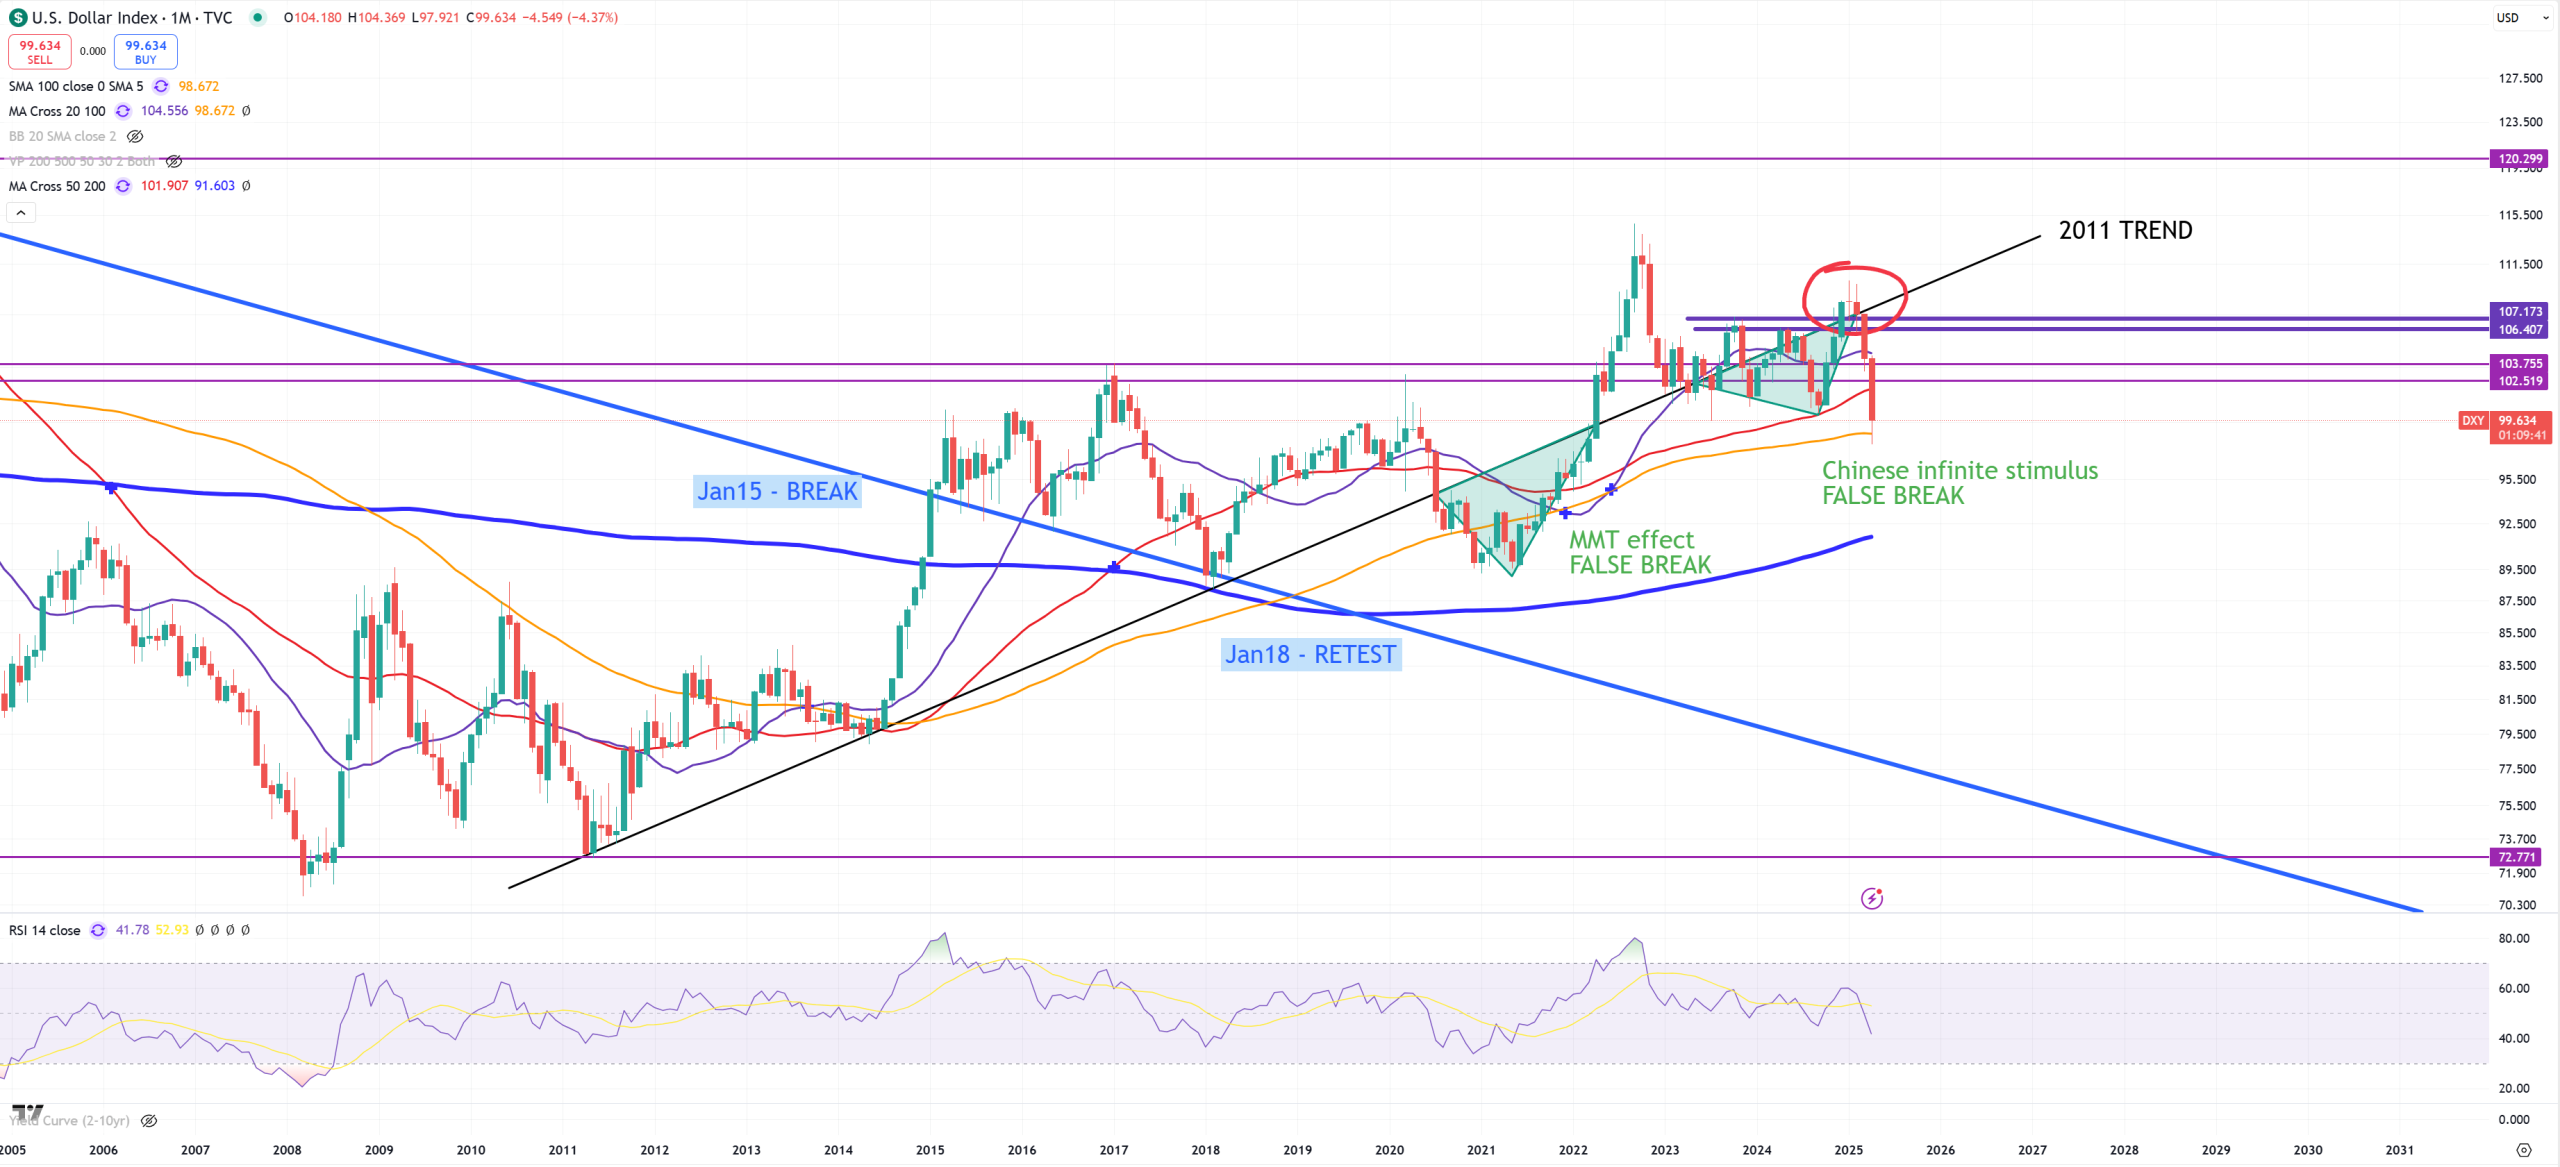
DXY – so equivalent of EURUSD mostly. Deviation to (M)MA100, my bet about 103 being hold on (M) is lost, but middle point (M)MA100 so far holds while EURUSD rejects its secular trend. Let’s see how it’ll be played once finally we uninvert 10Y/3M.
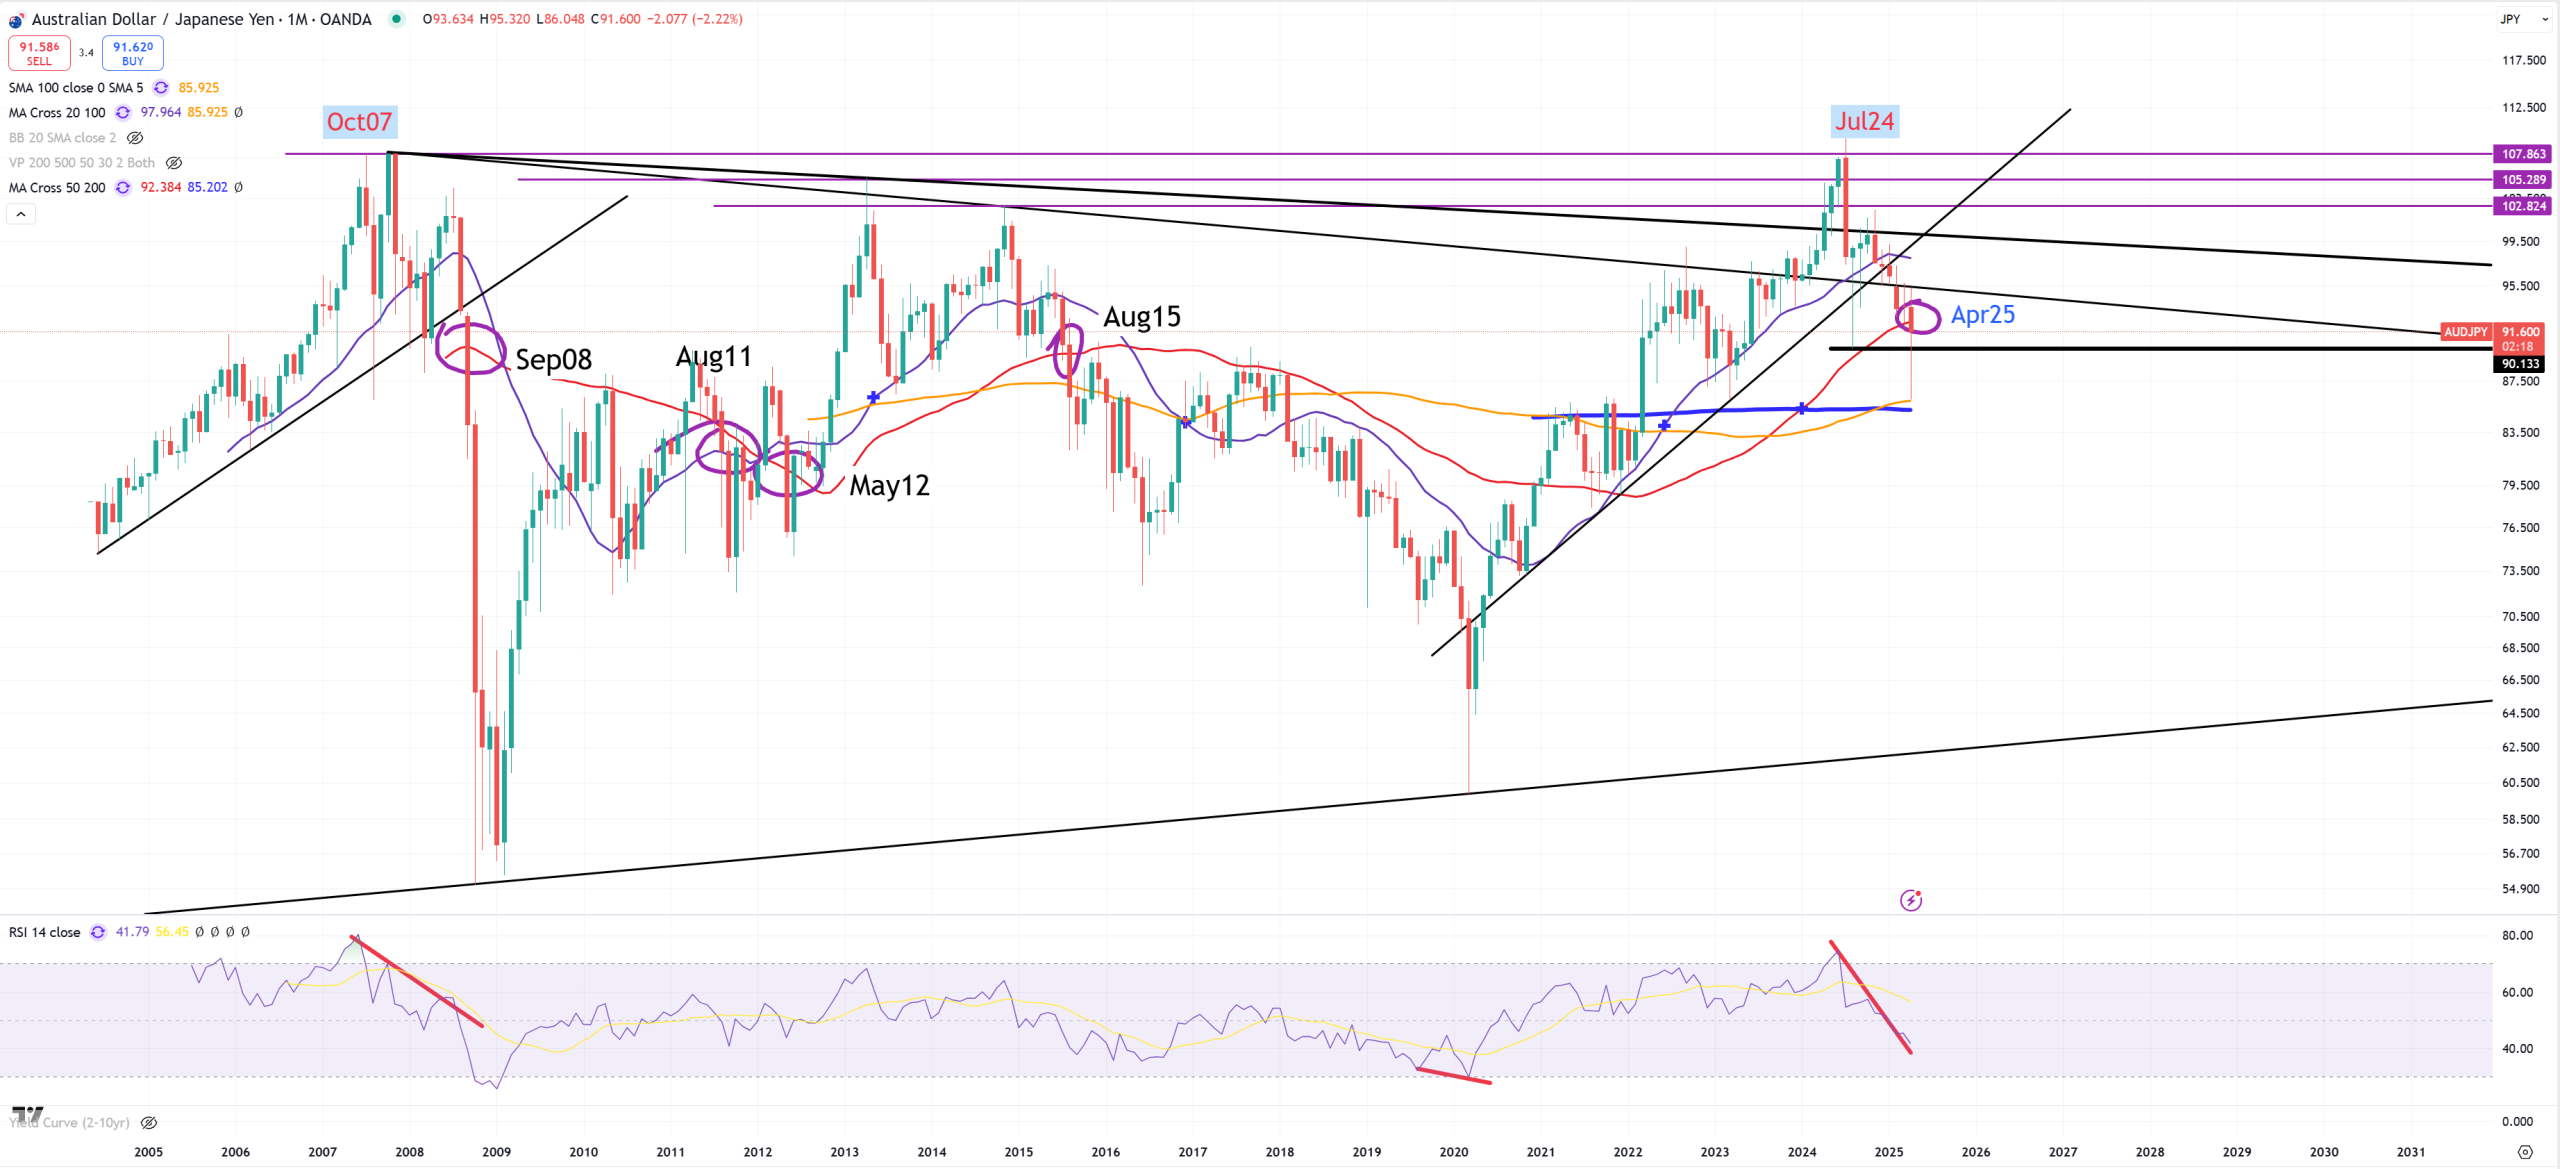
AUDJPY – main pair which drive the stock market. In reality I bet it’s a bit related to USDCNH. Finally I can put another circle, when we closed below (M)MA50. Peak in Jun24 and big double top with Oct07 level.
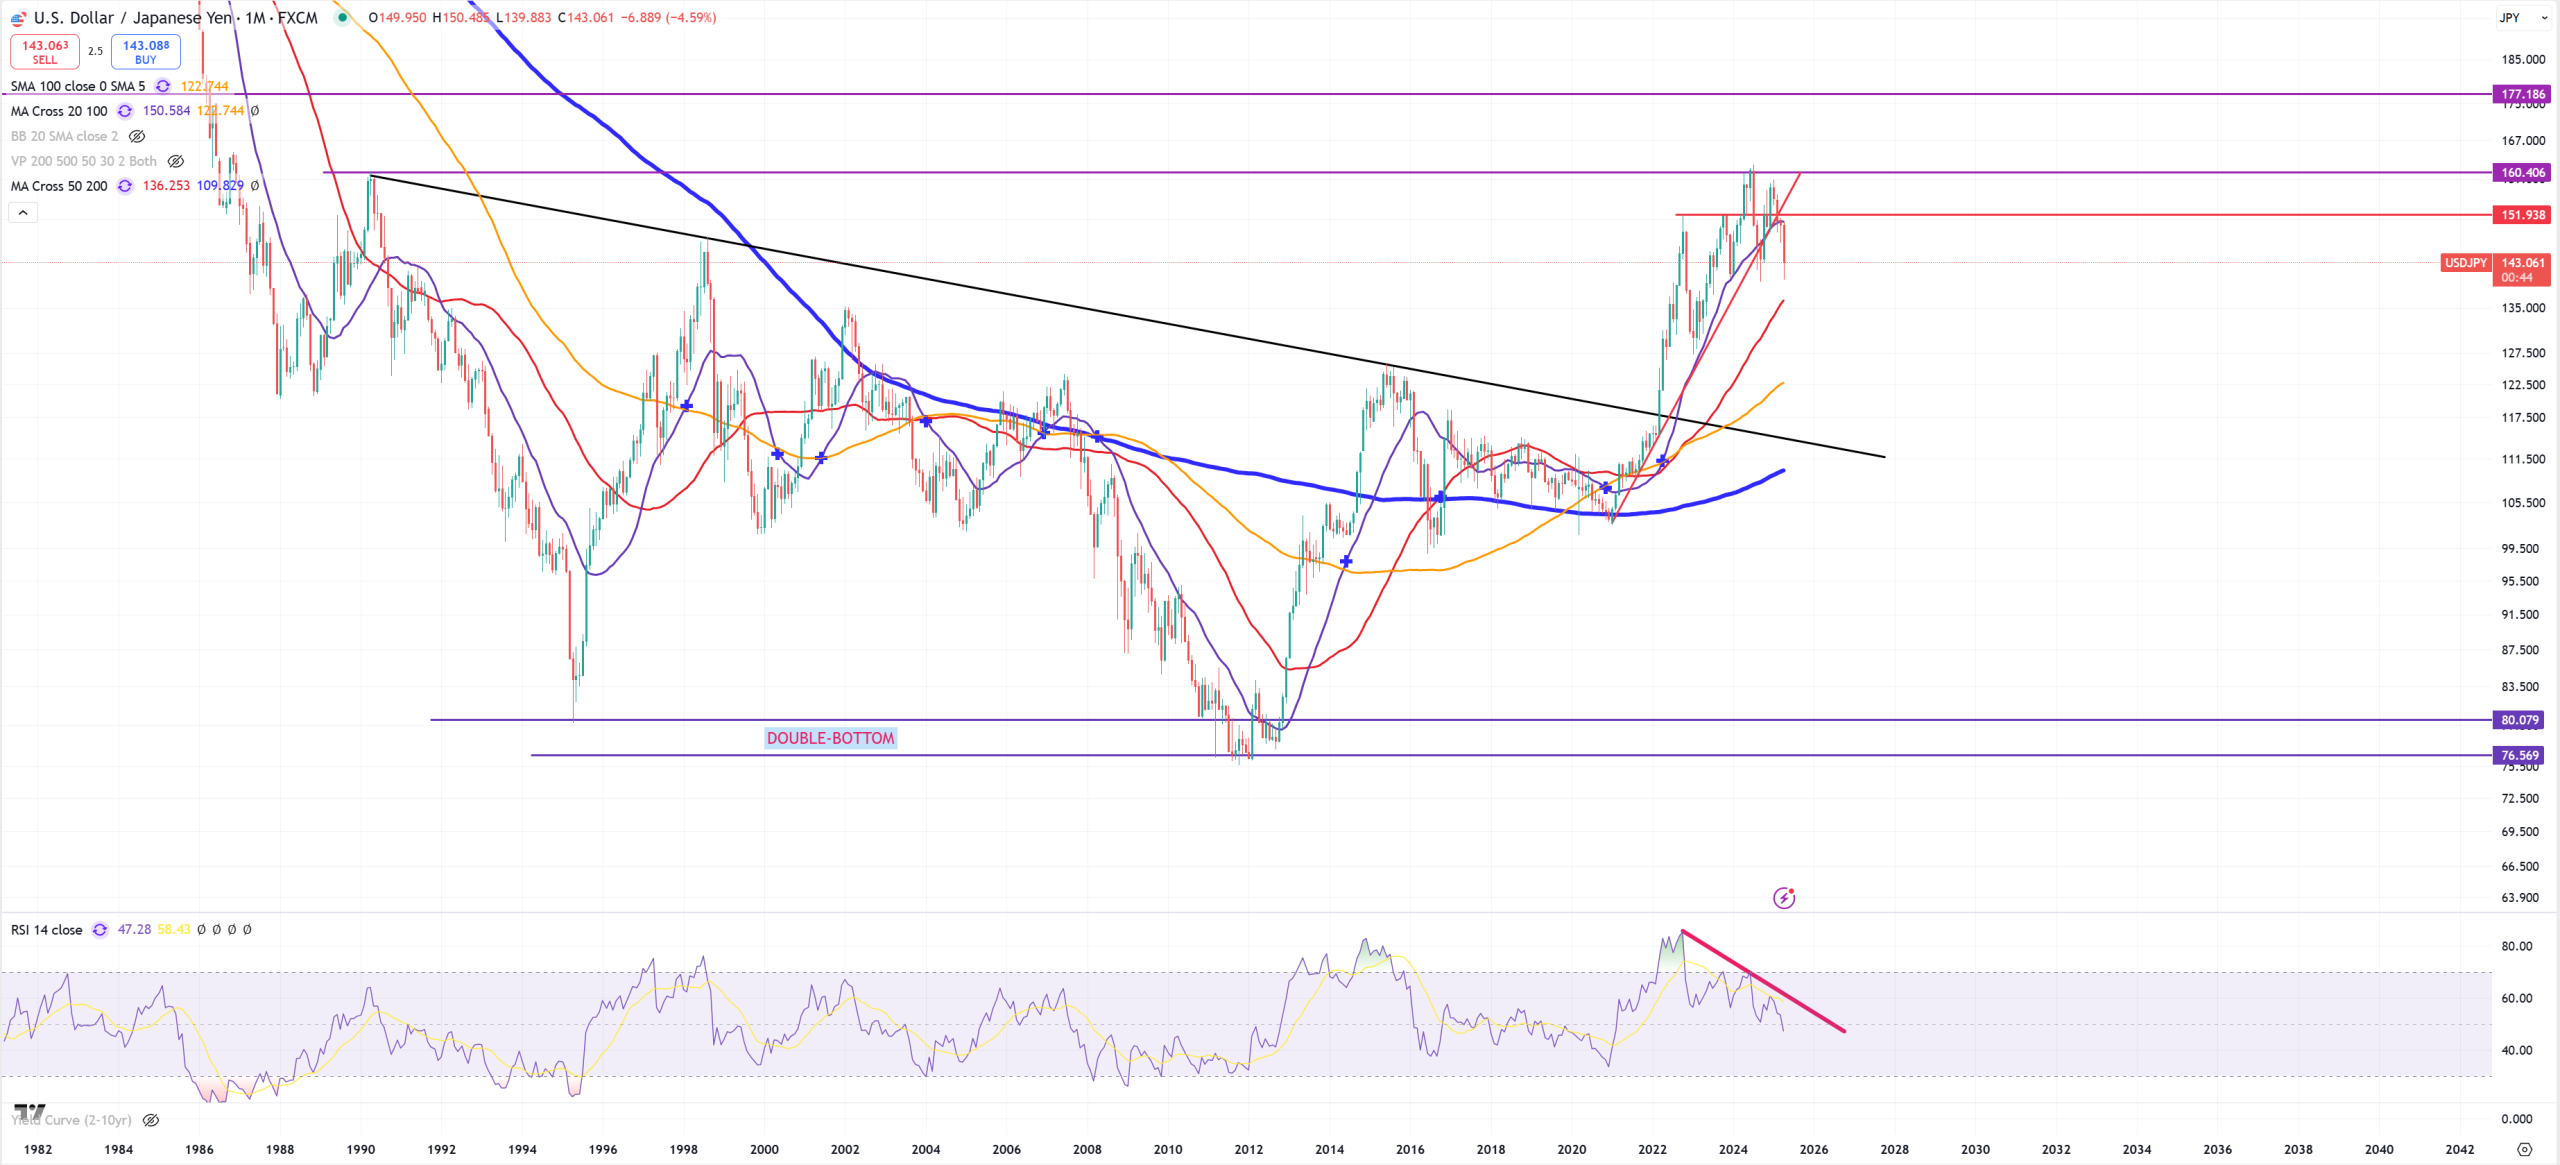
USDJPY – so 160$ is the peak retest to 112 (trend + (M)MA200) or 80 coming (TRIPLE-BOTTOM)
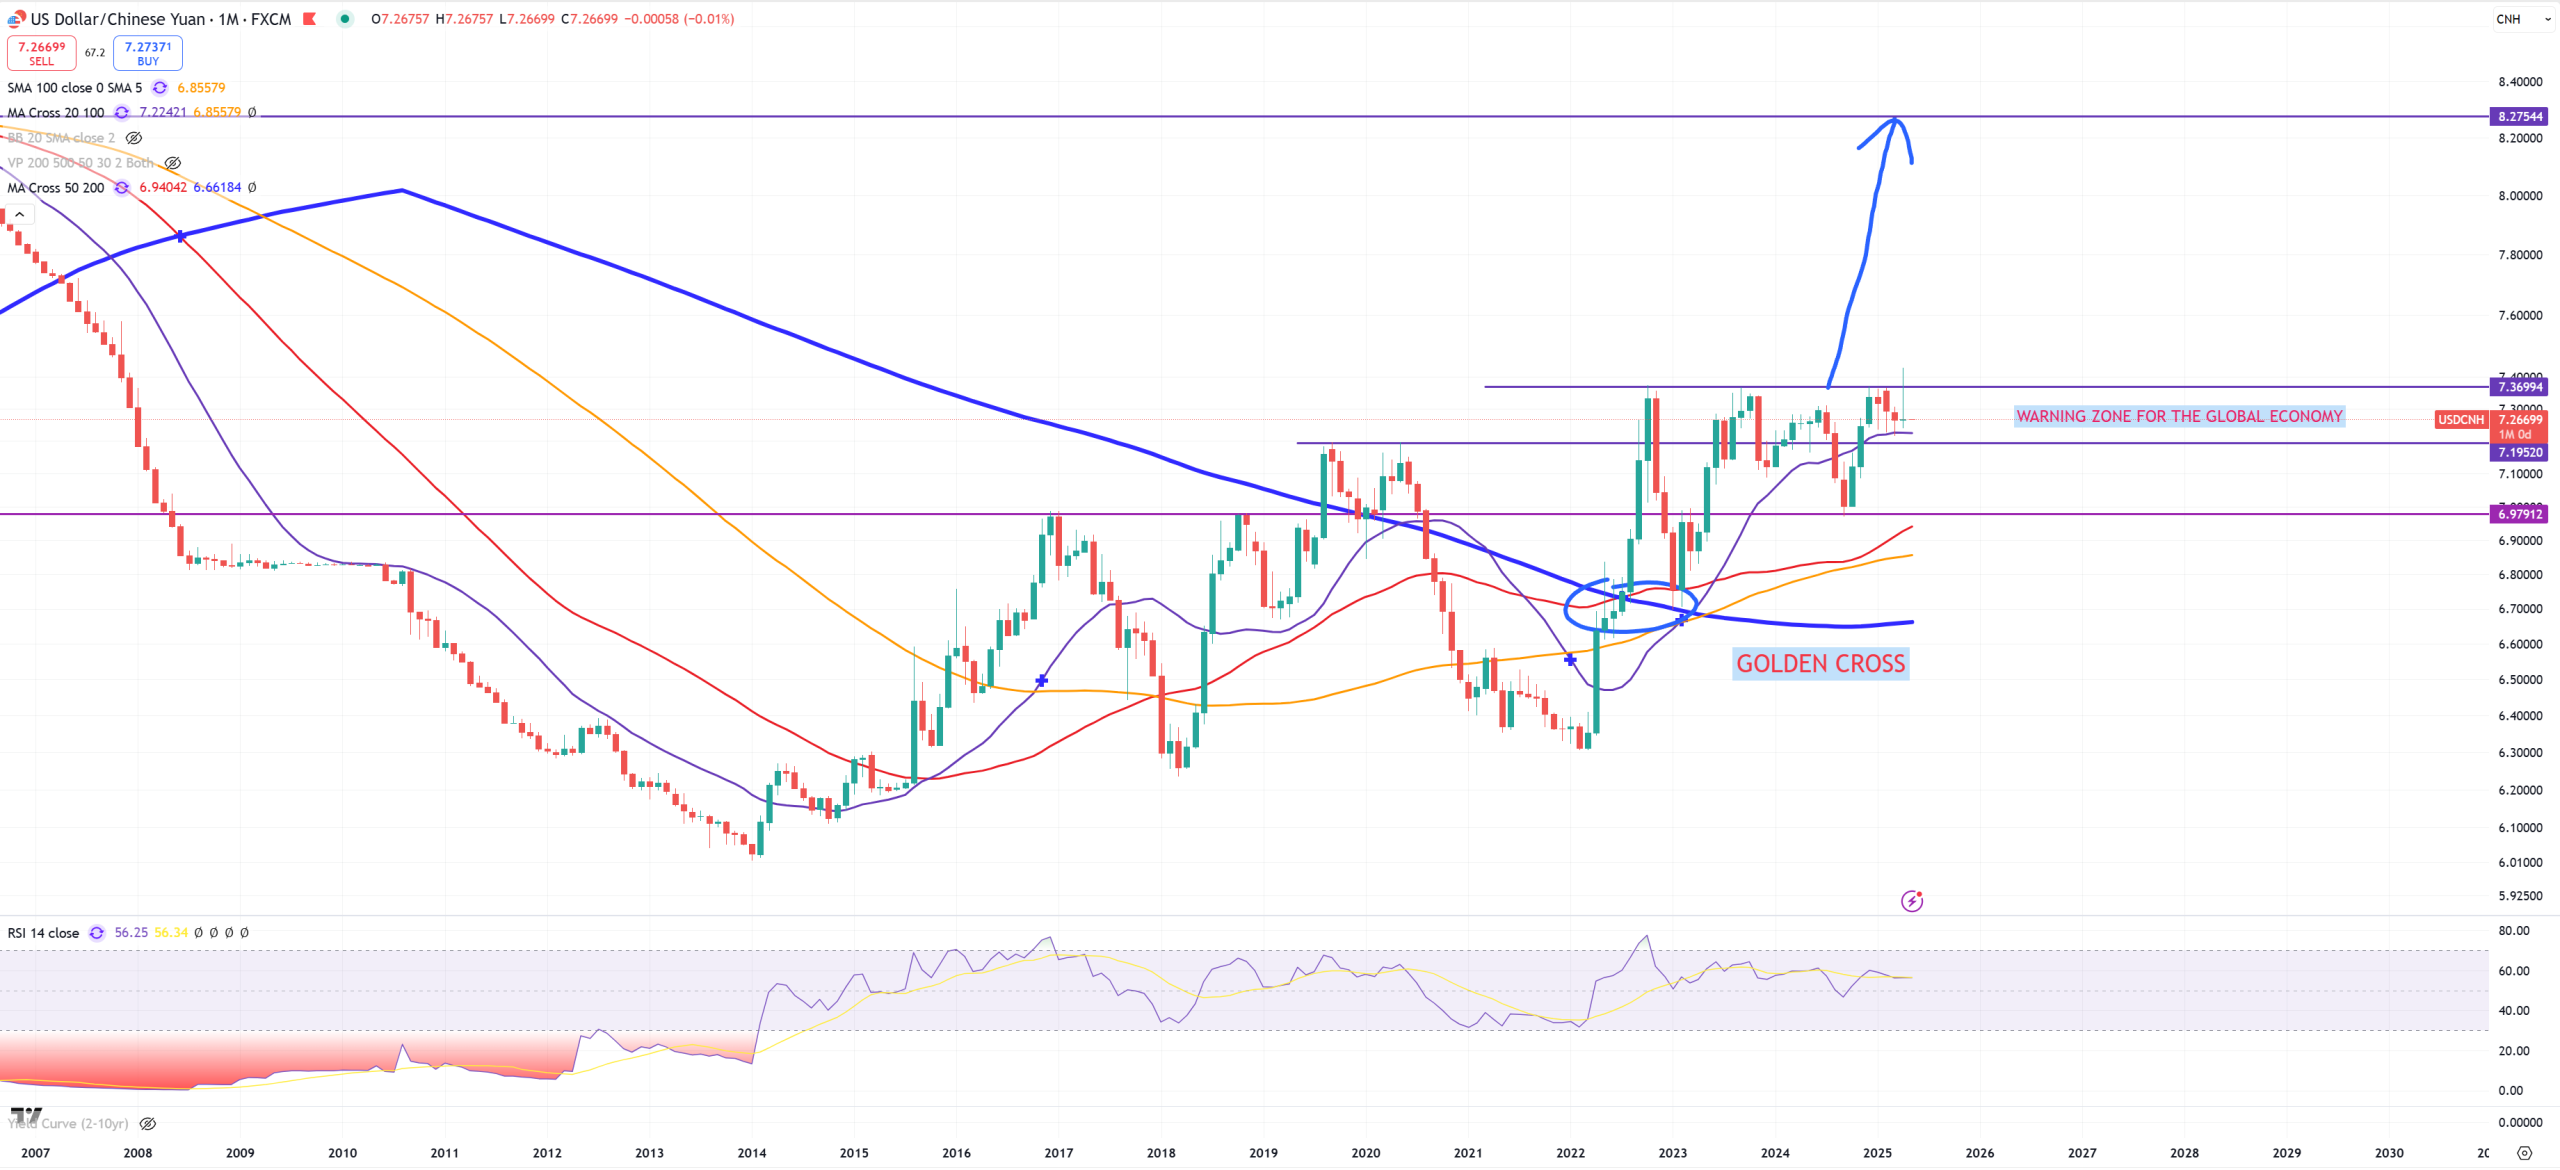
USDCNH – that’s why you see AUDJPY going this way. As China is cut from export its currency is getting stronger. That’s a typical Chinese miracles, anyway I still think this 7.37 level will be finally broken and China will enter “The Great Depression” as a key disinflationary engine of the world in this cycle. So far nothing to see here.
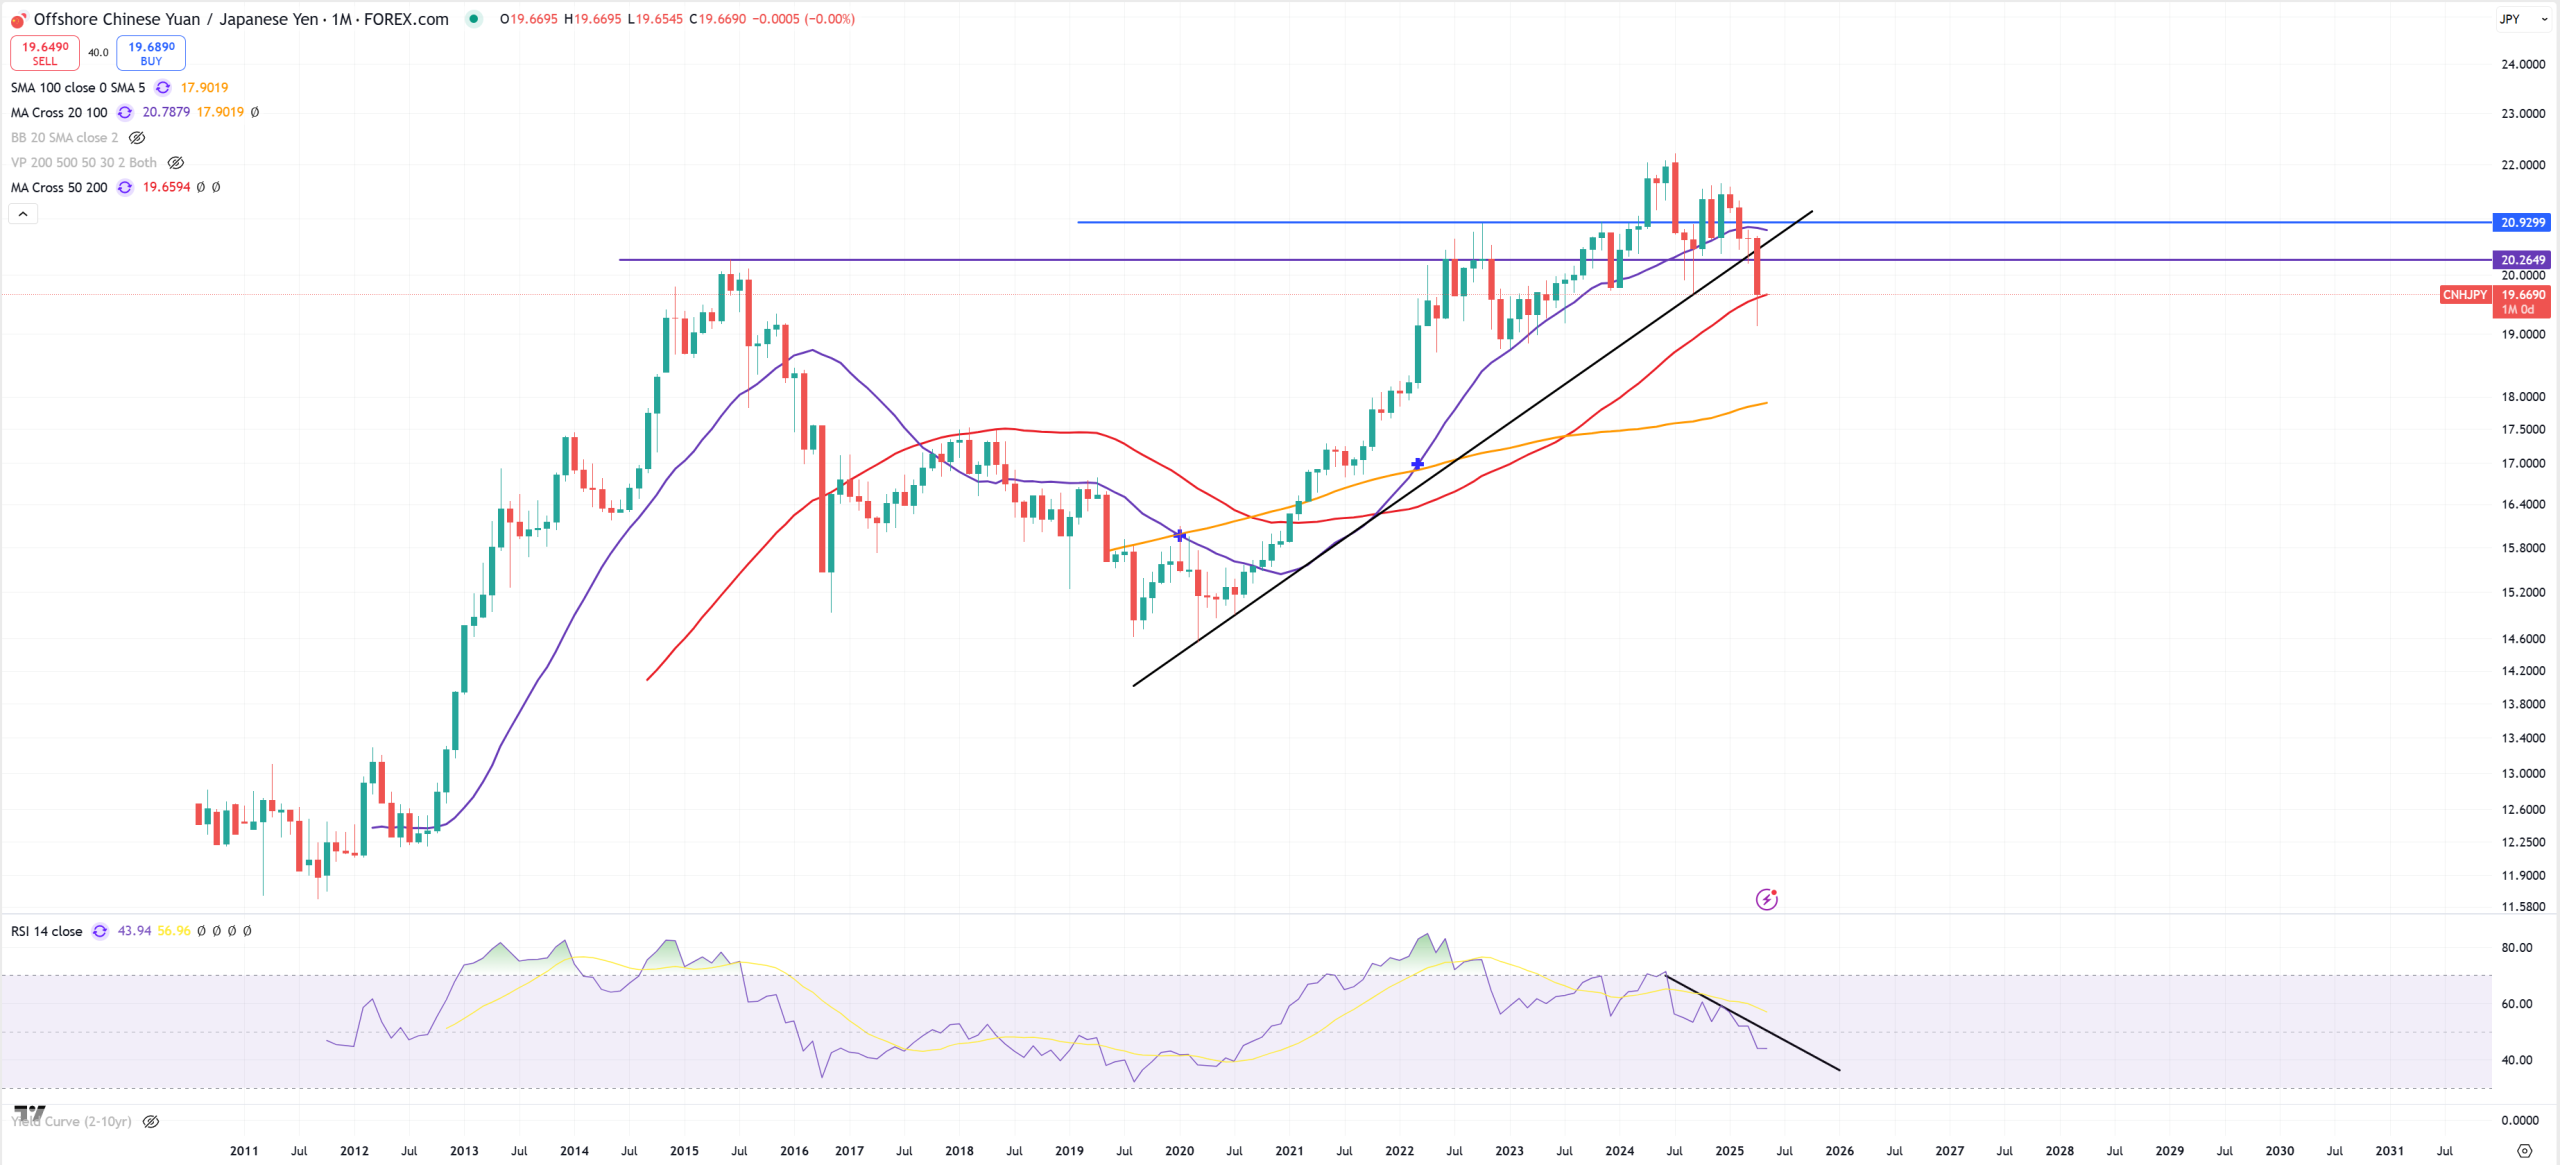
CNHJPY – this pair shows that dominance of CNH against JPY gone and now it’s flipped. JPY rules CNH. (M)MA50 holds peak in Jul 2024 – so the same as AUDJPY. In reality let’s tread CNHJPY and AUDJPY the same what means AUD = CNH, not really but AUD loves to track Yuan.
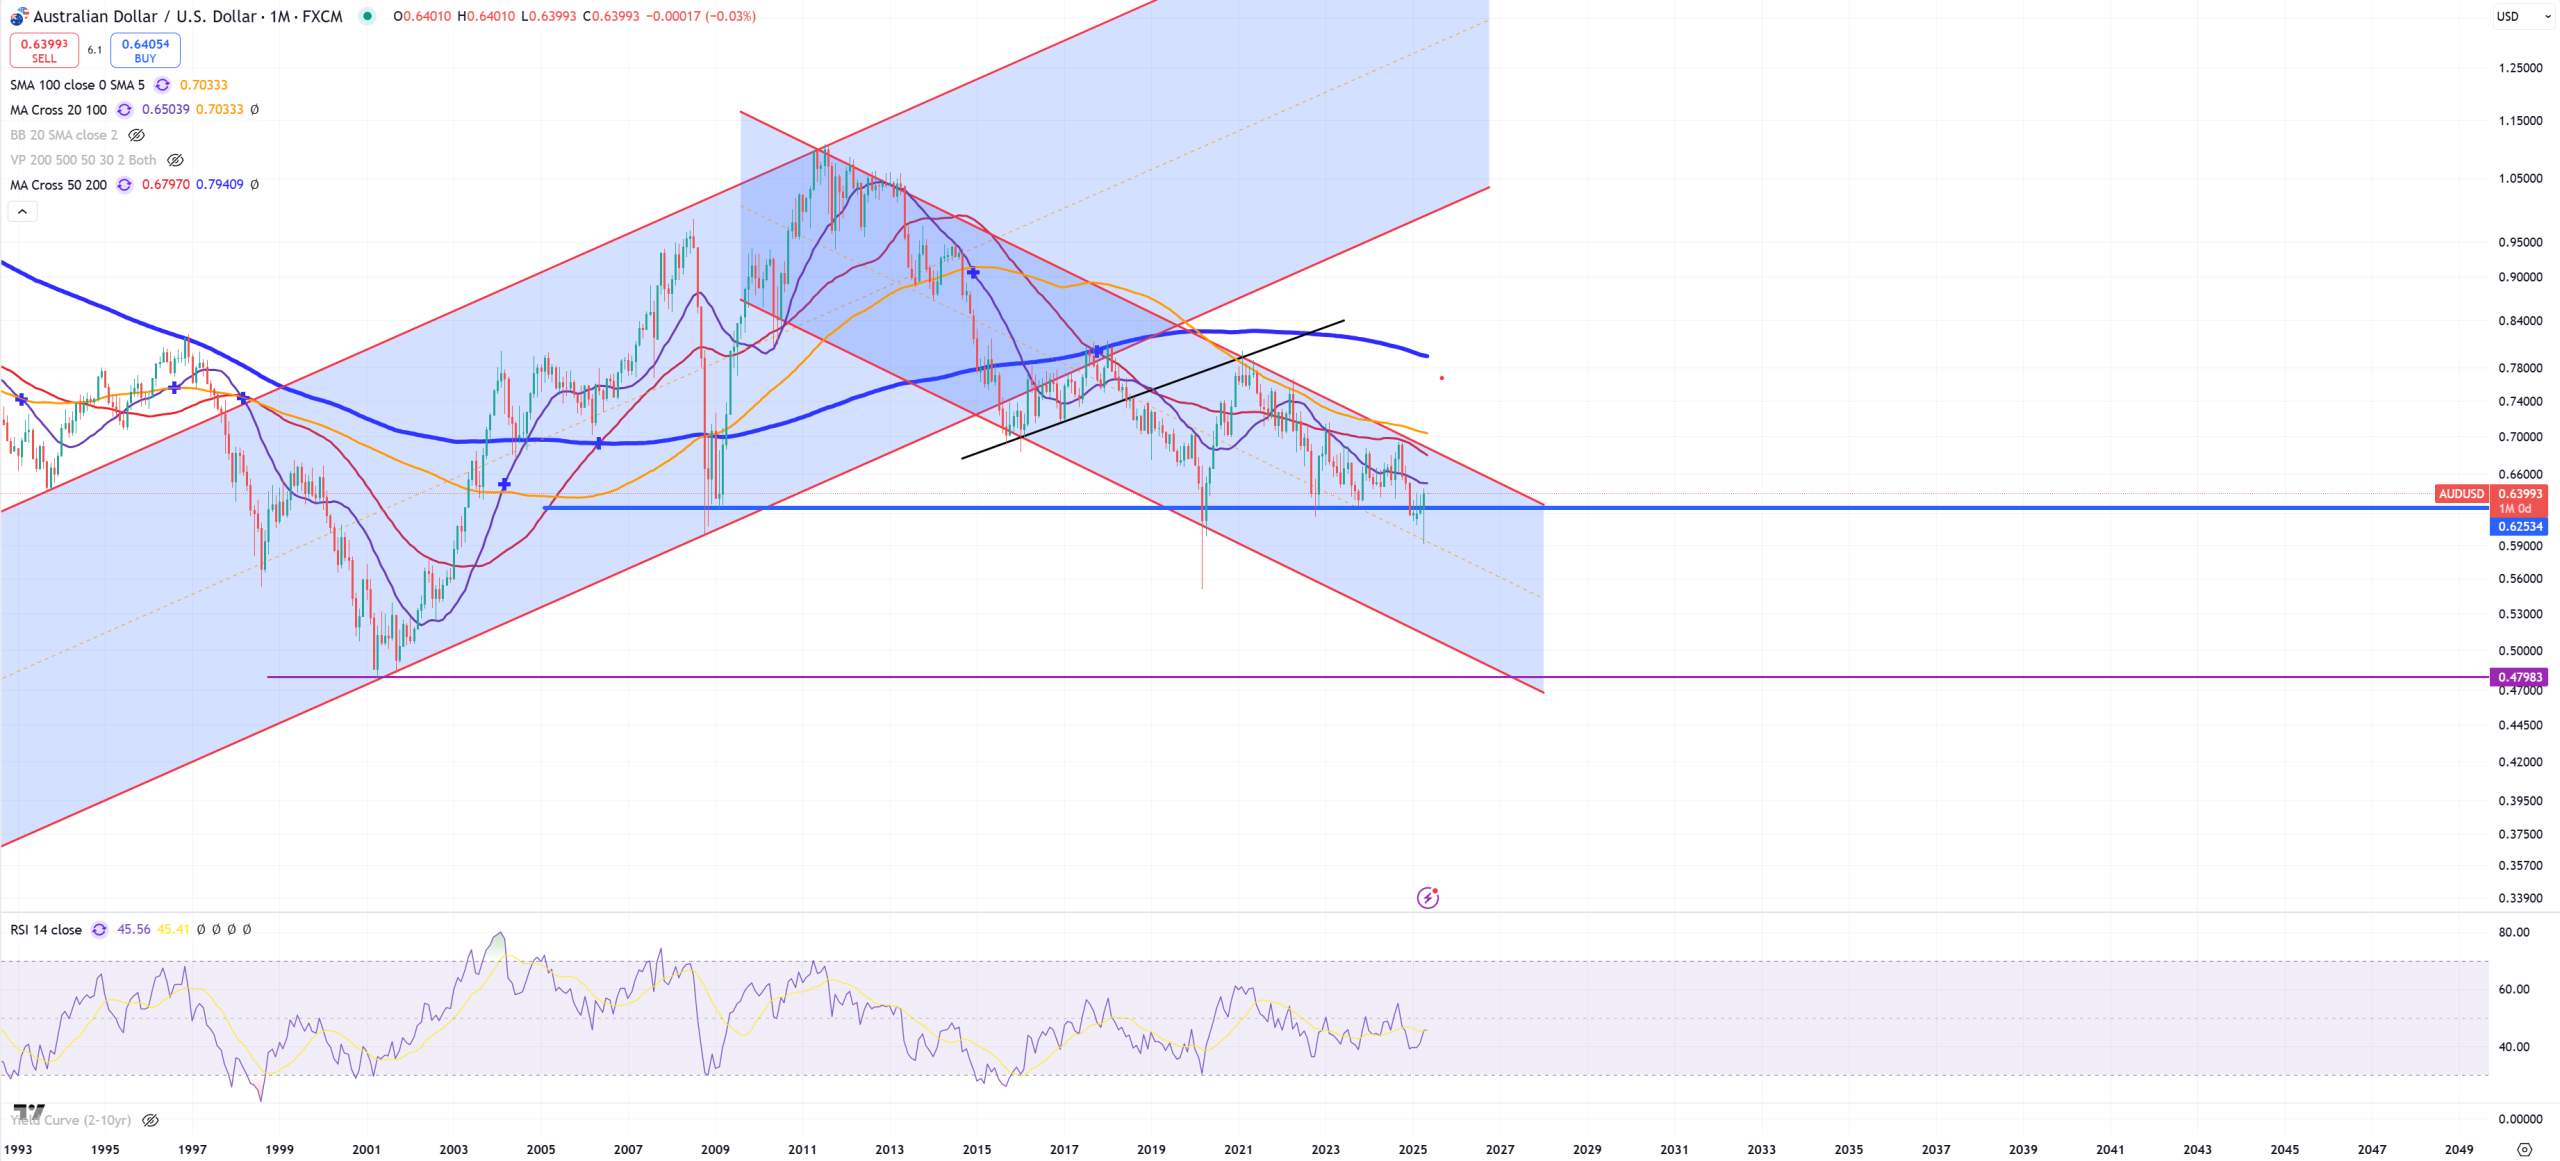
AUDUSD – fights not to crash below this support because it’ll land on 0.45.
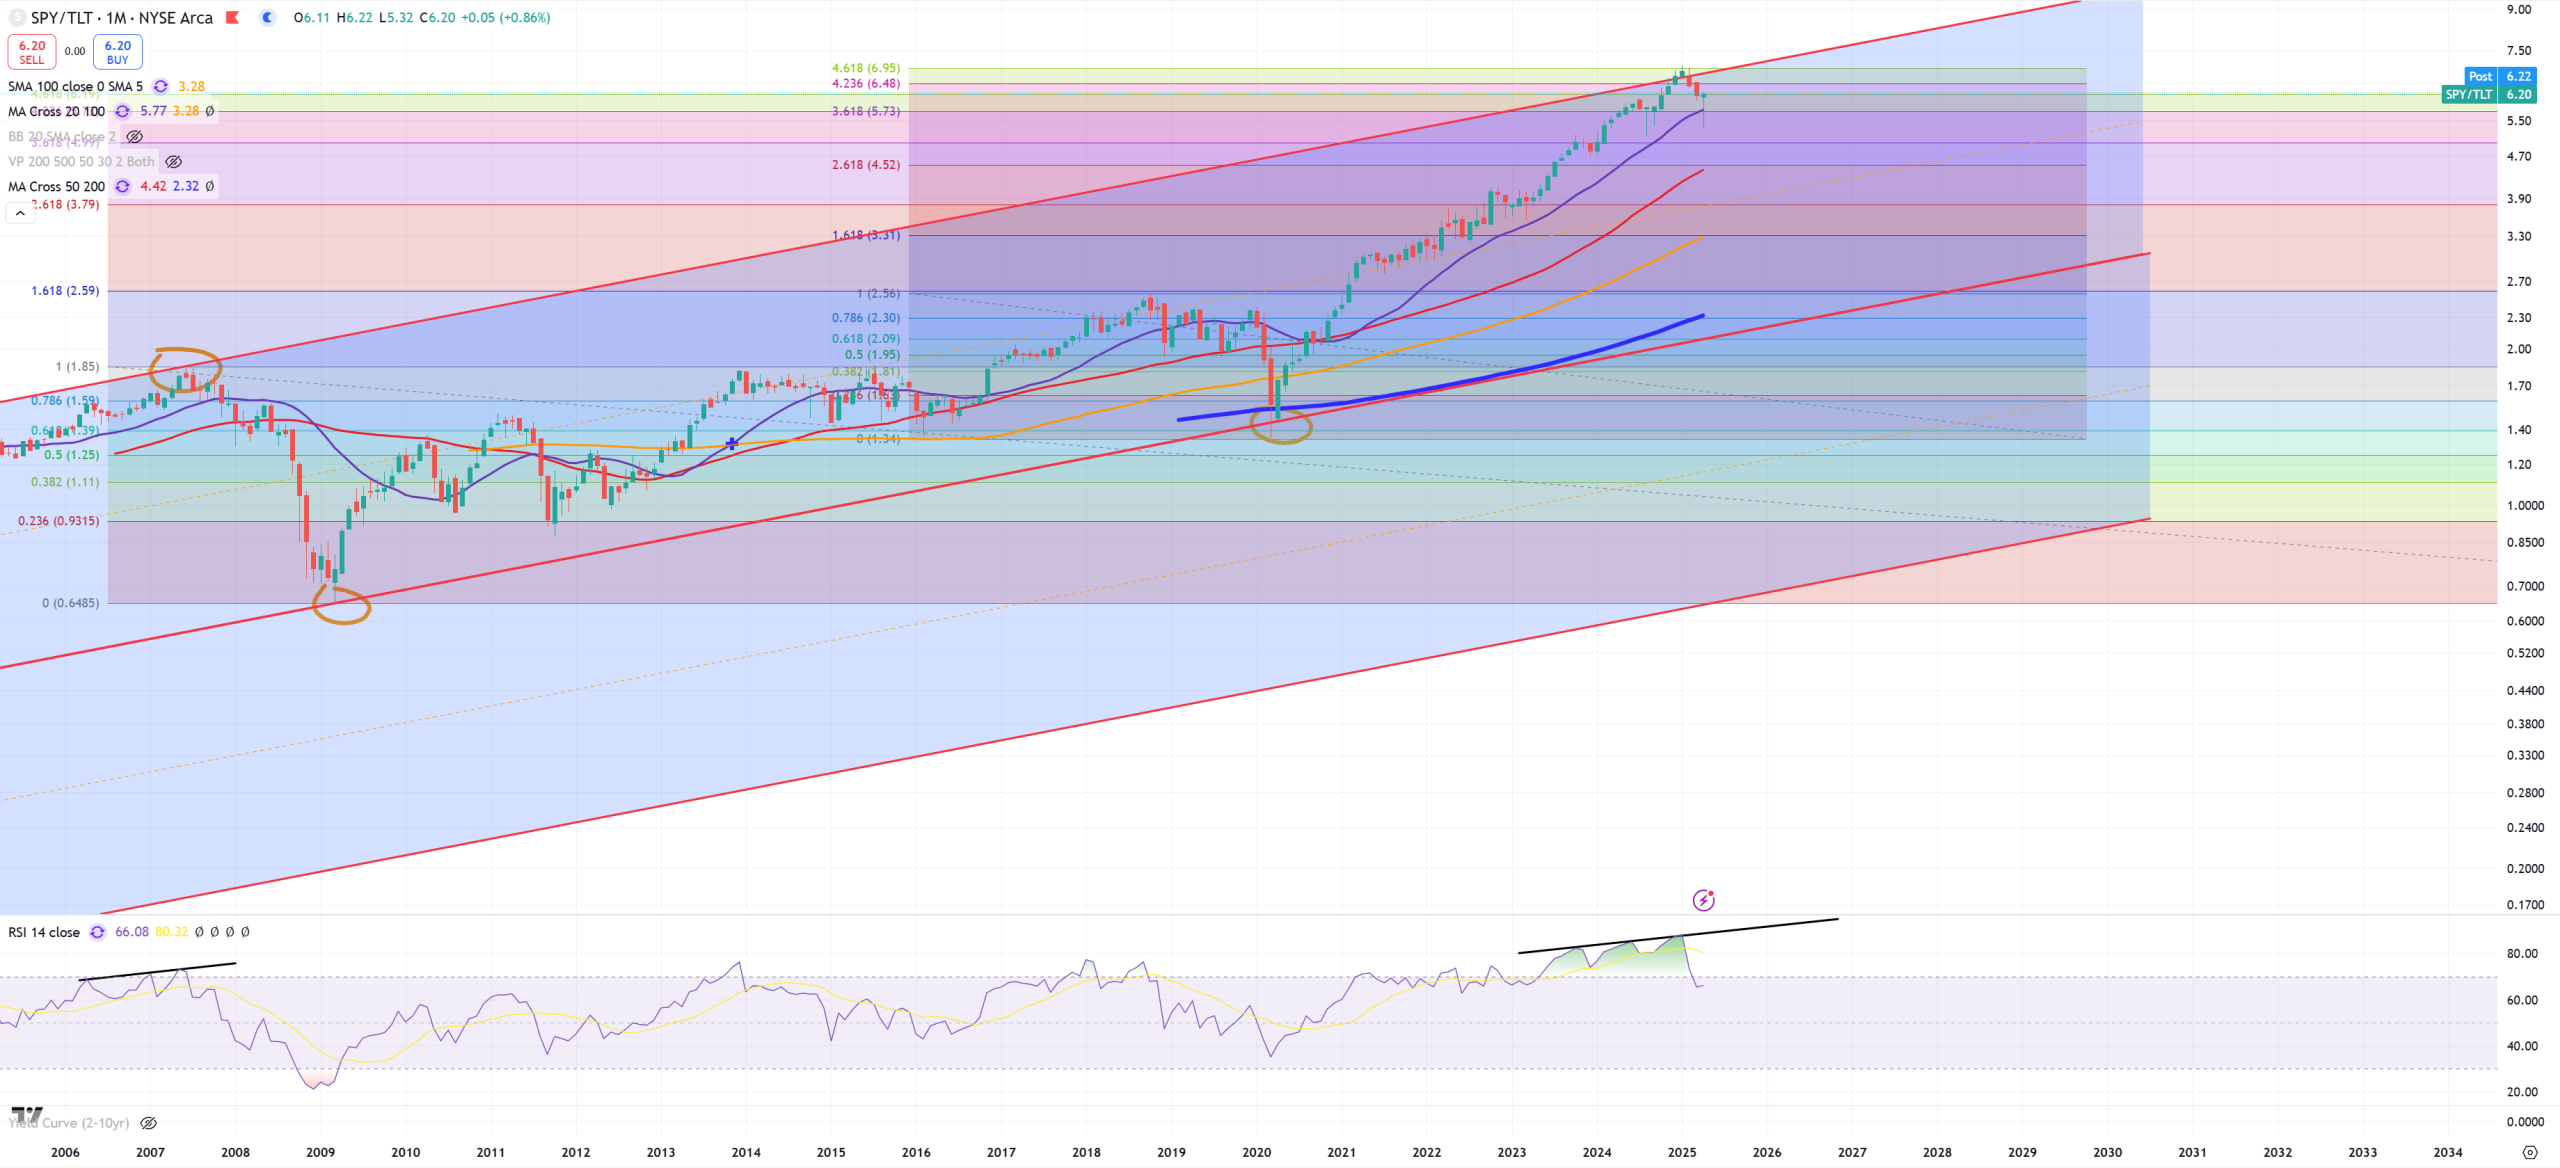
SPY/TLT – market defends (M)MA20
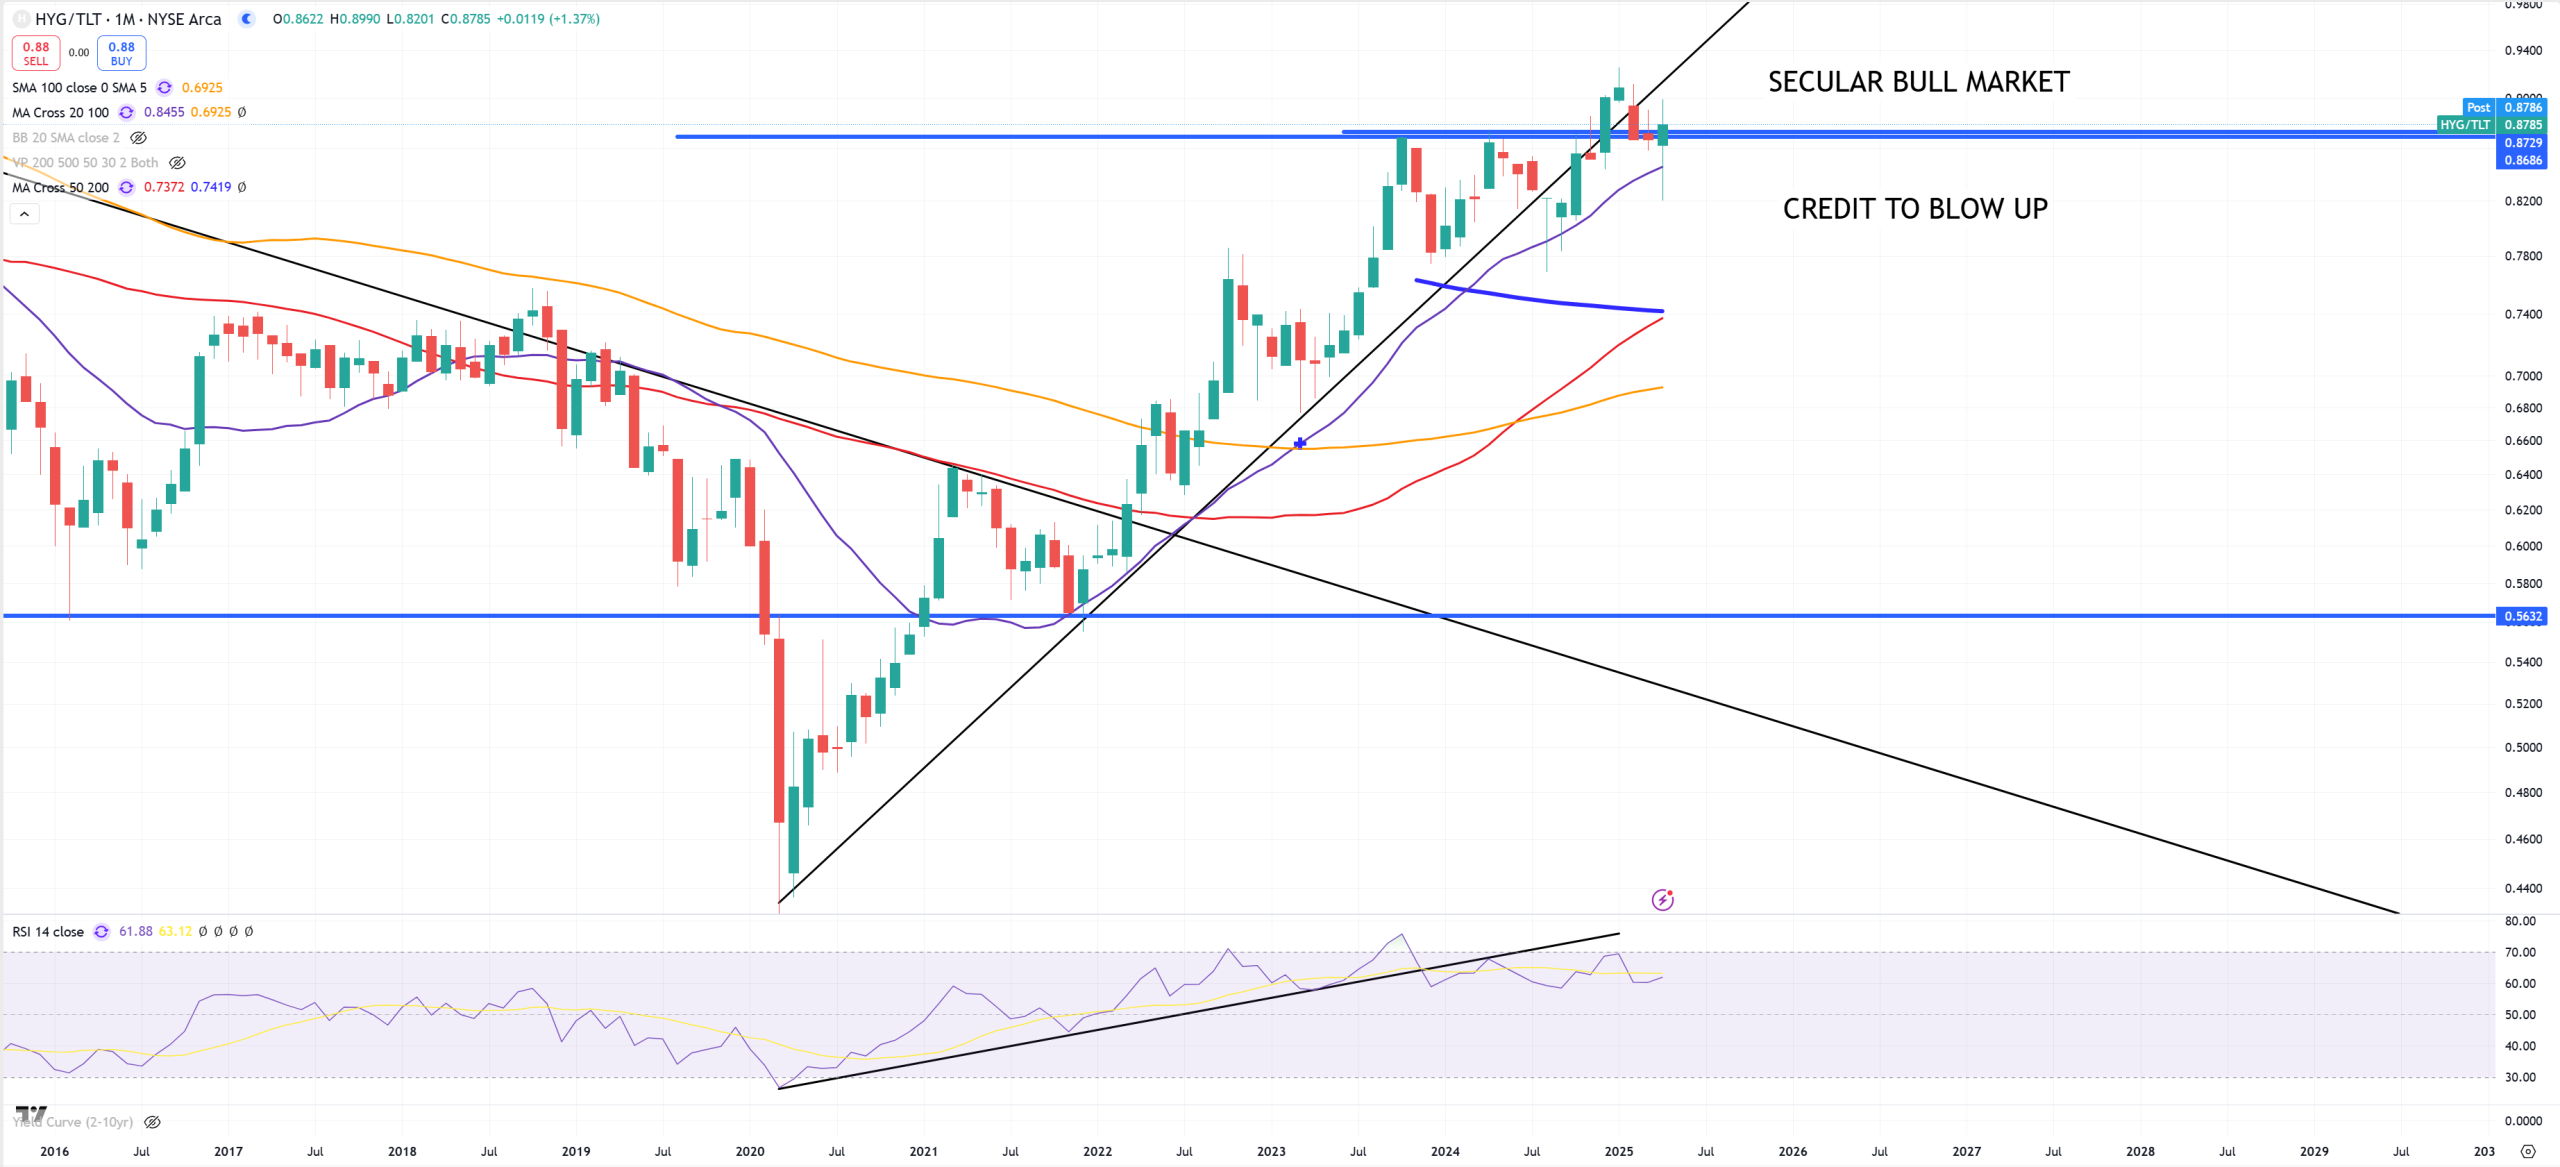
HYG/TLT – my simplified level when credit is going to blow up. So far nothing to see here, it fights for key level and it’ll be hold as long as 10Y/3M won’t uninvert.
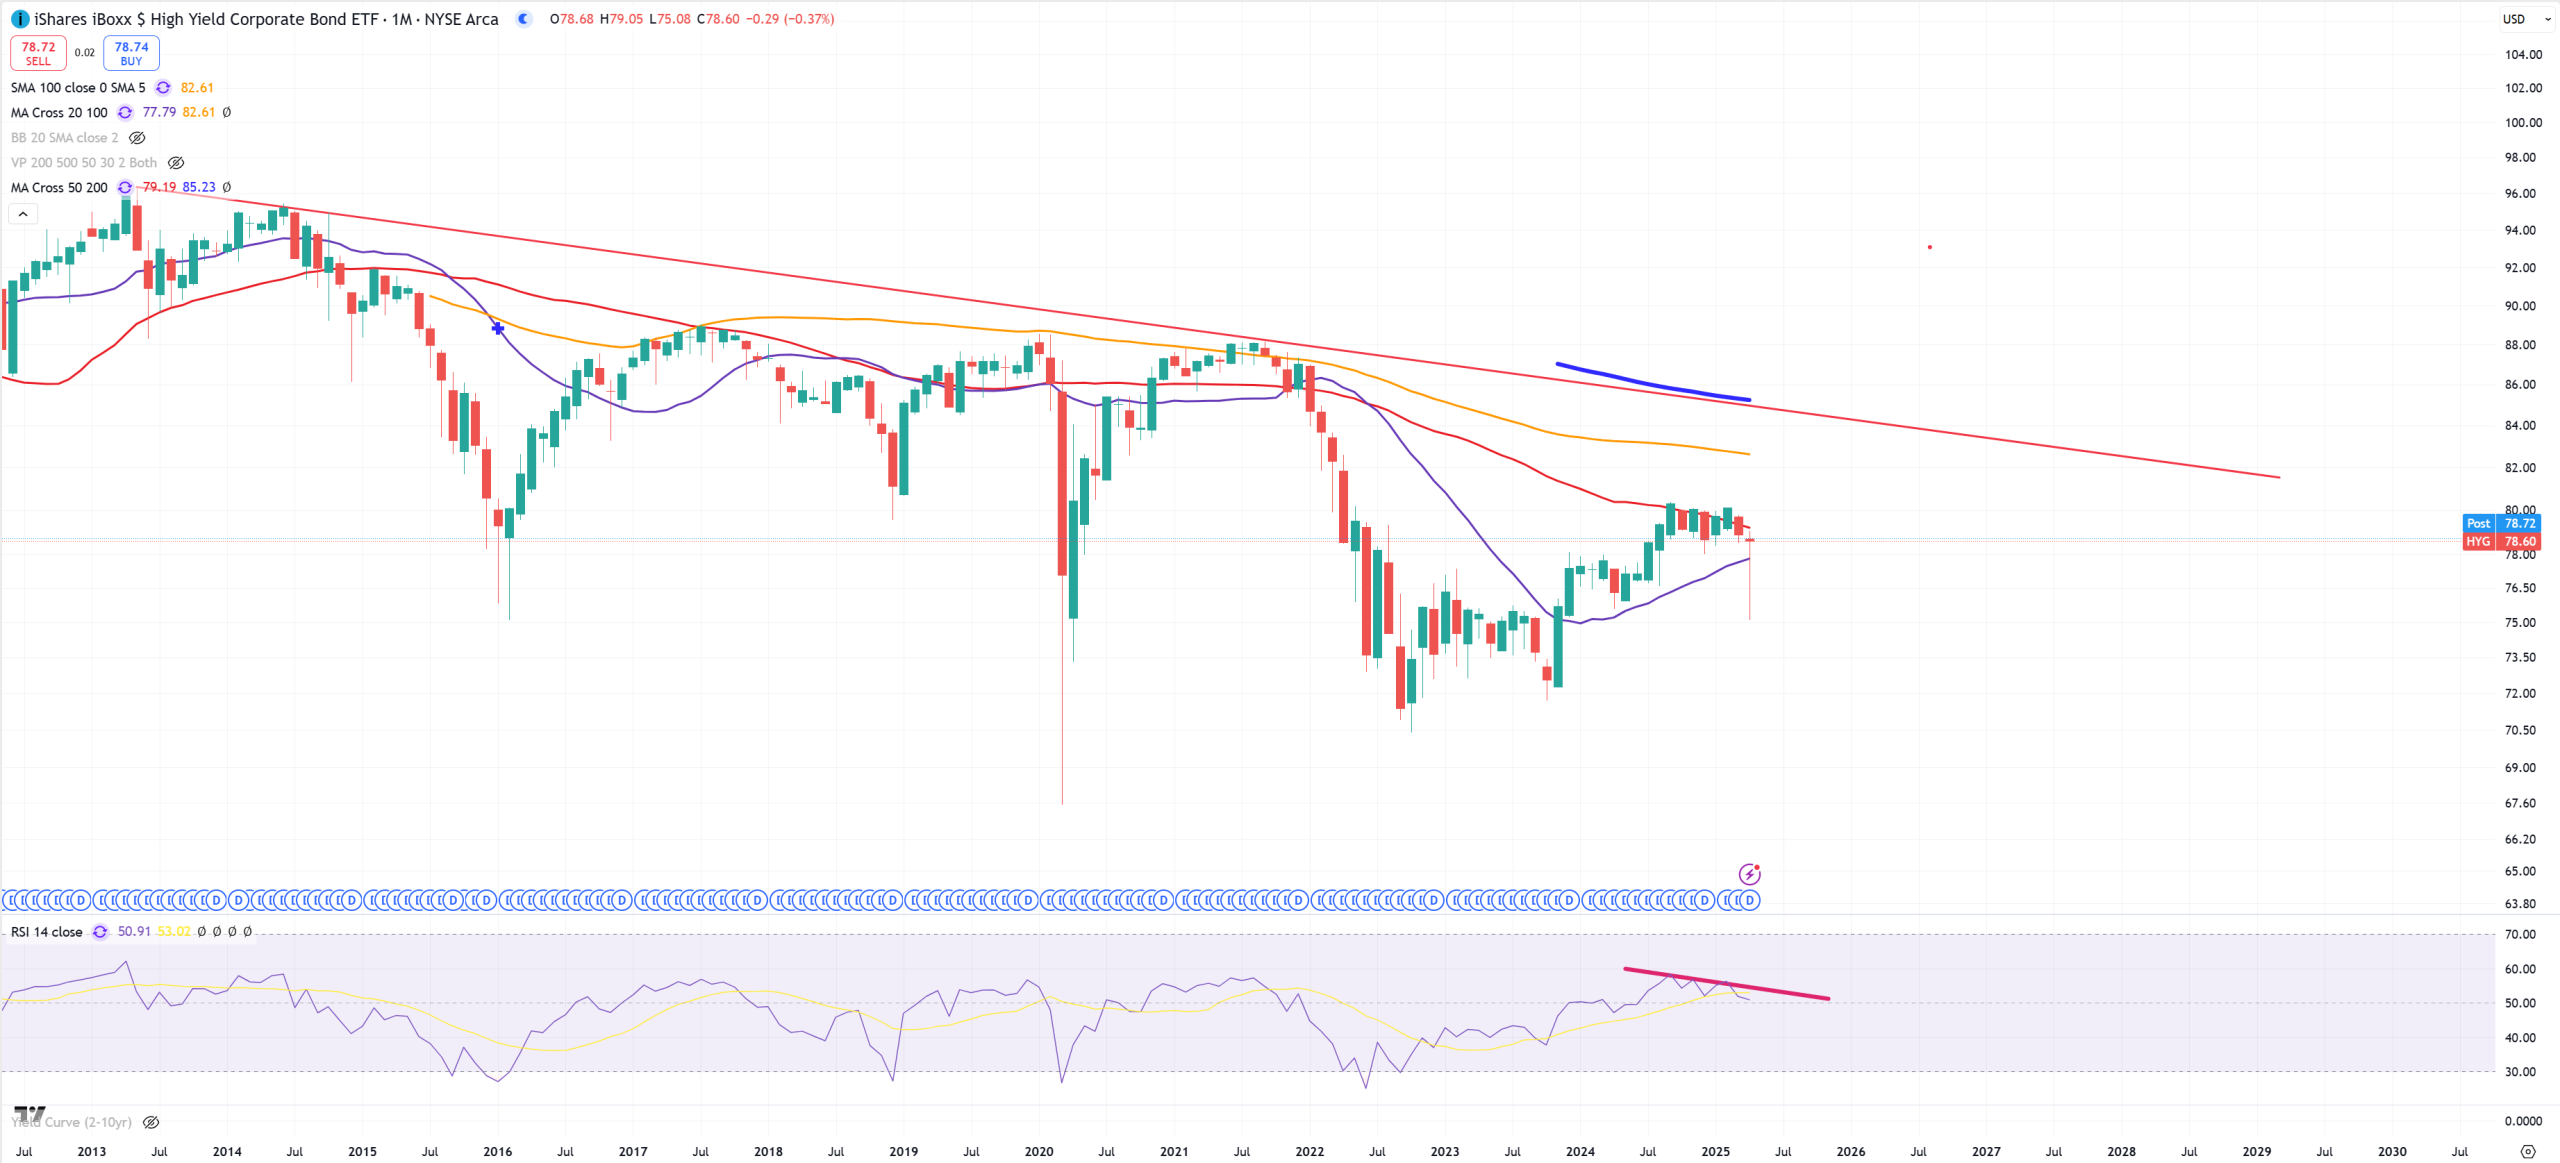
HYG – 8Ms retesting (M)MA50 with negative divergence on (M)RSI
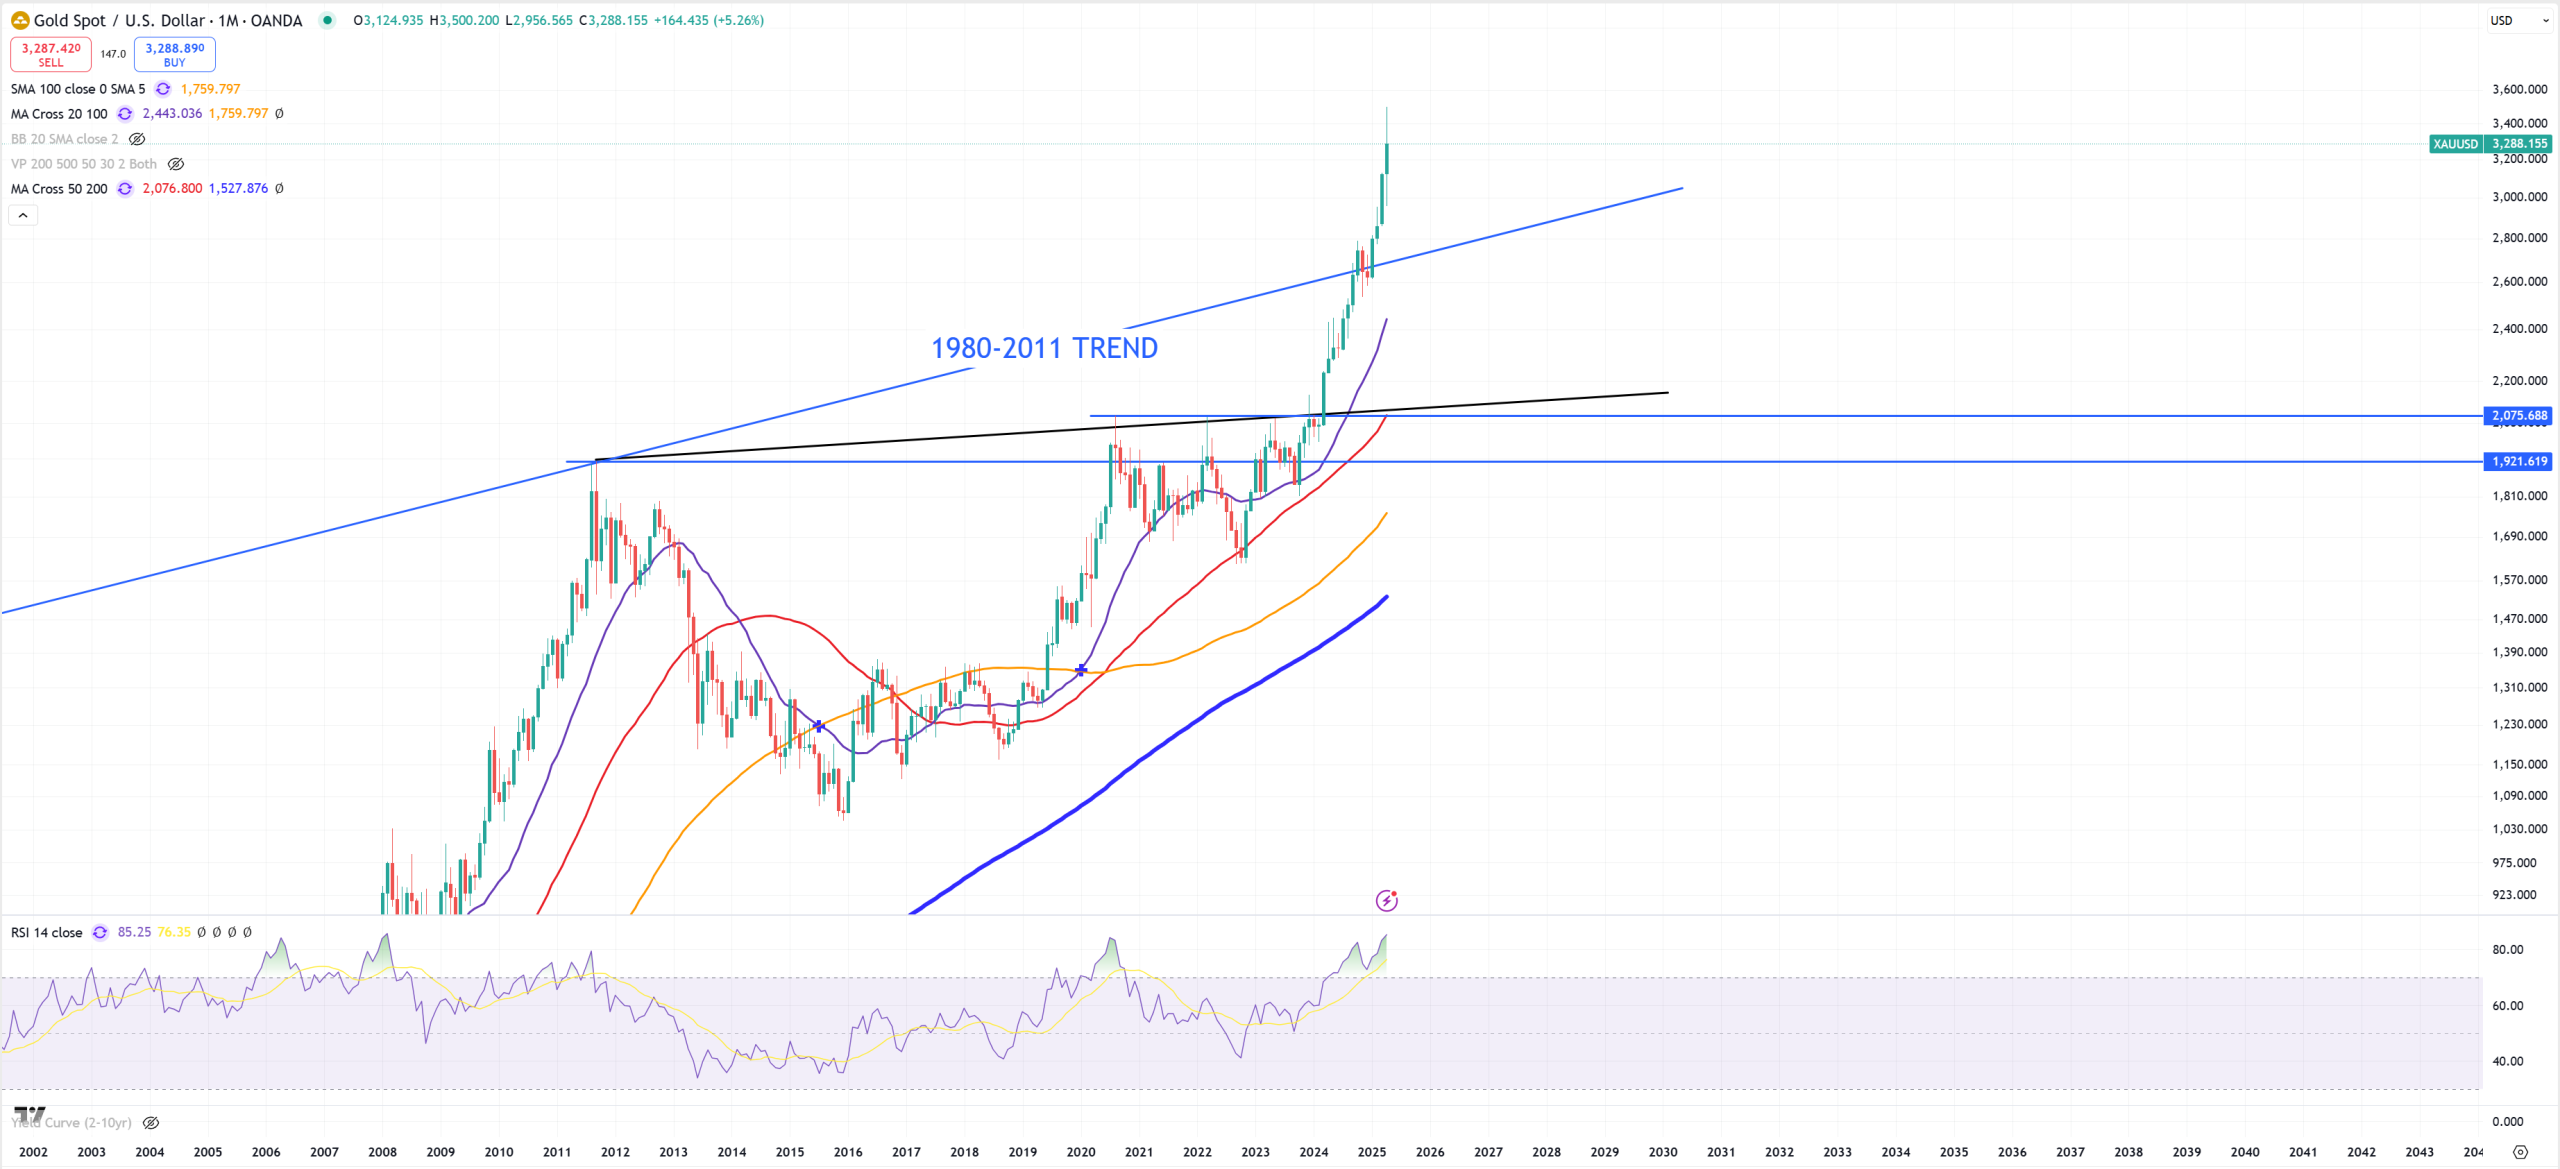
XAUUSD – trend is broken (M)RSI = 85, at some point of time it’ll retest this 1980-2011 TREND IMO so 2700$ level. Have it in mind. Because SPX/GOLD is broken and GOLD trend is broken too I expect it’ll be going way higher, but not in one line.
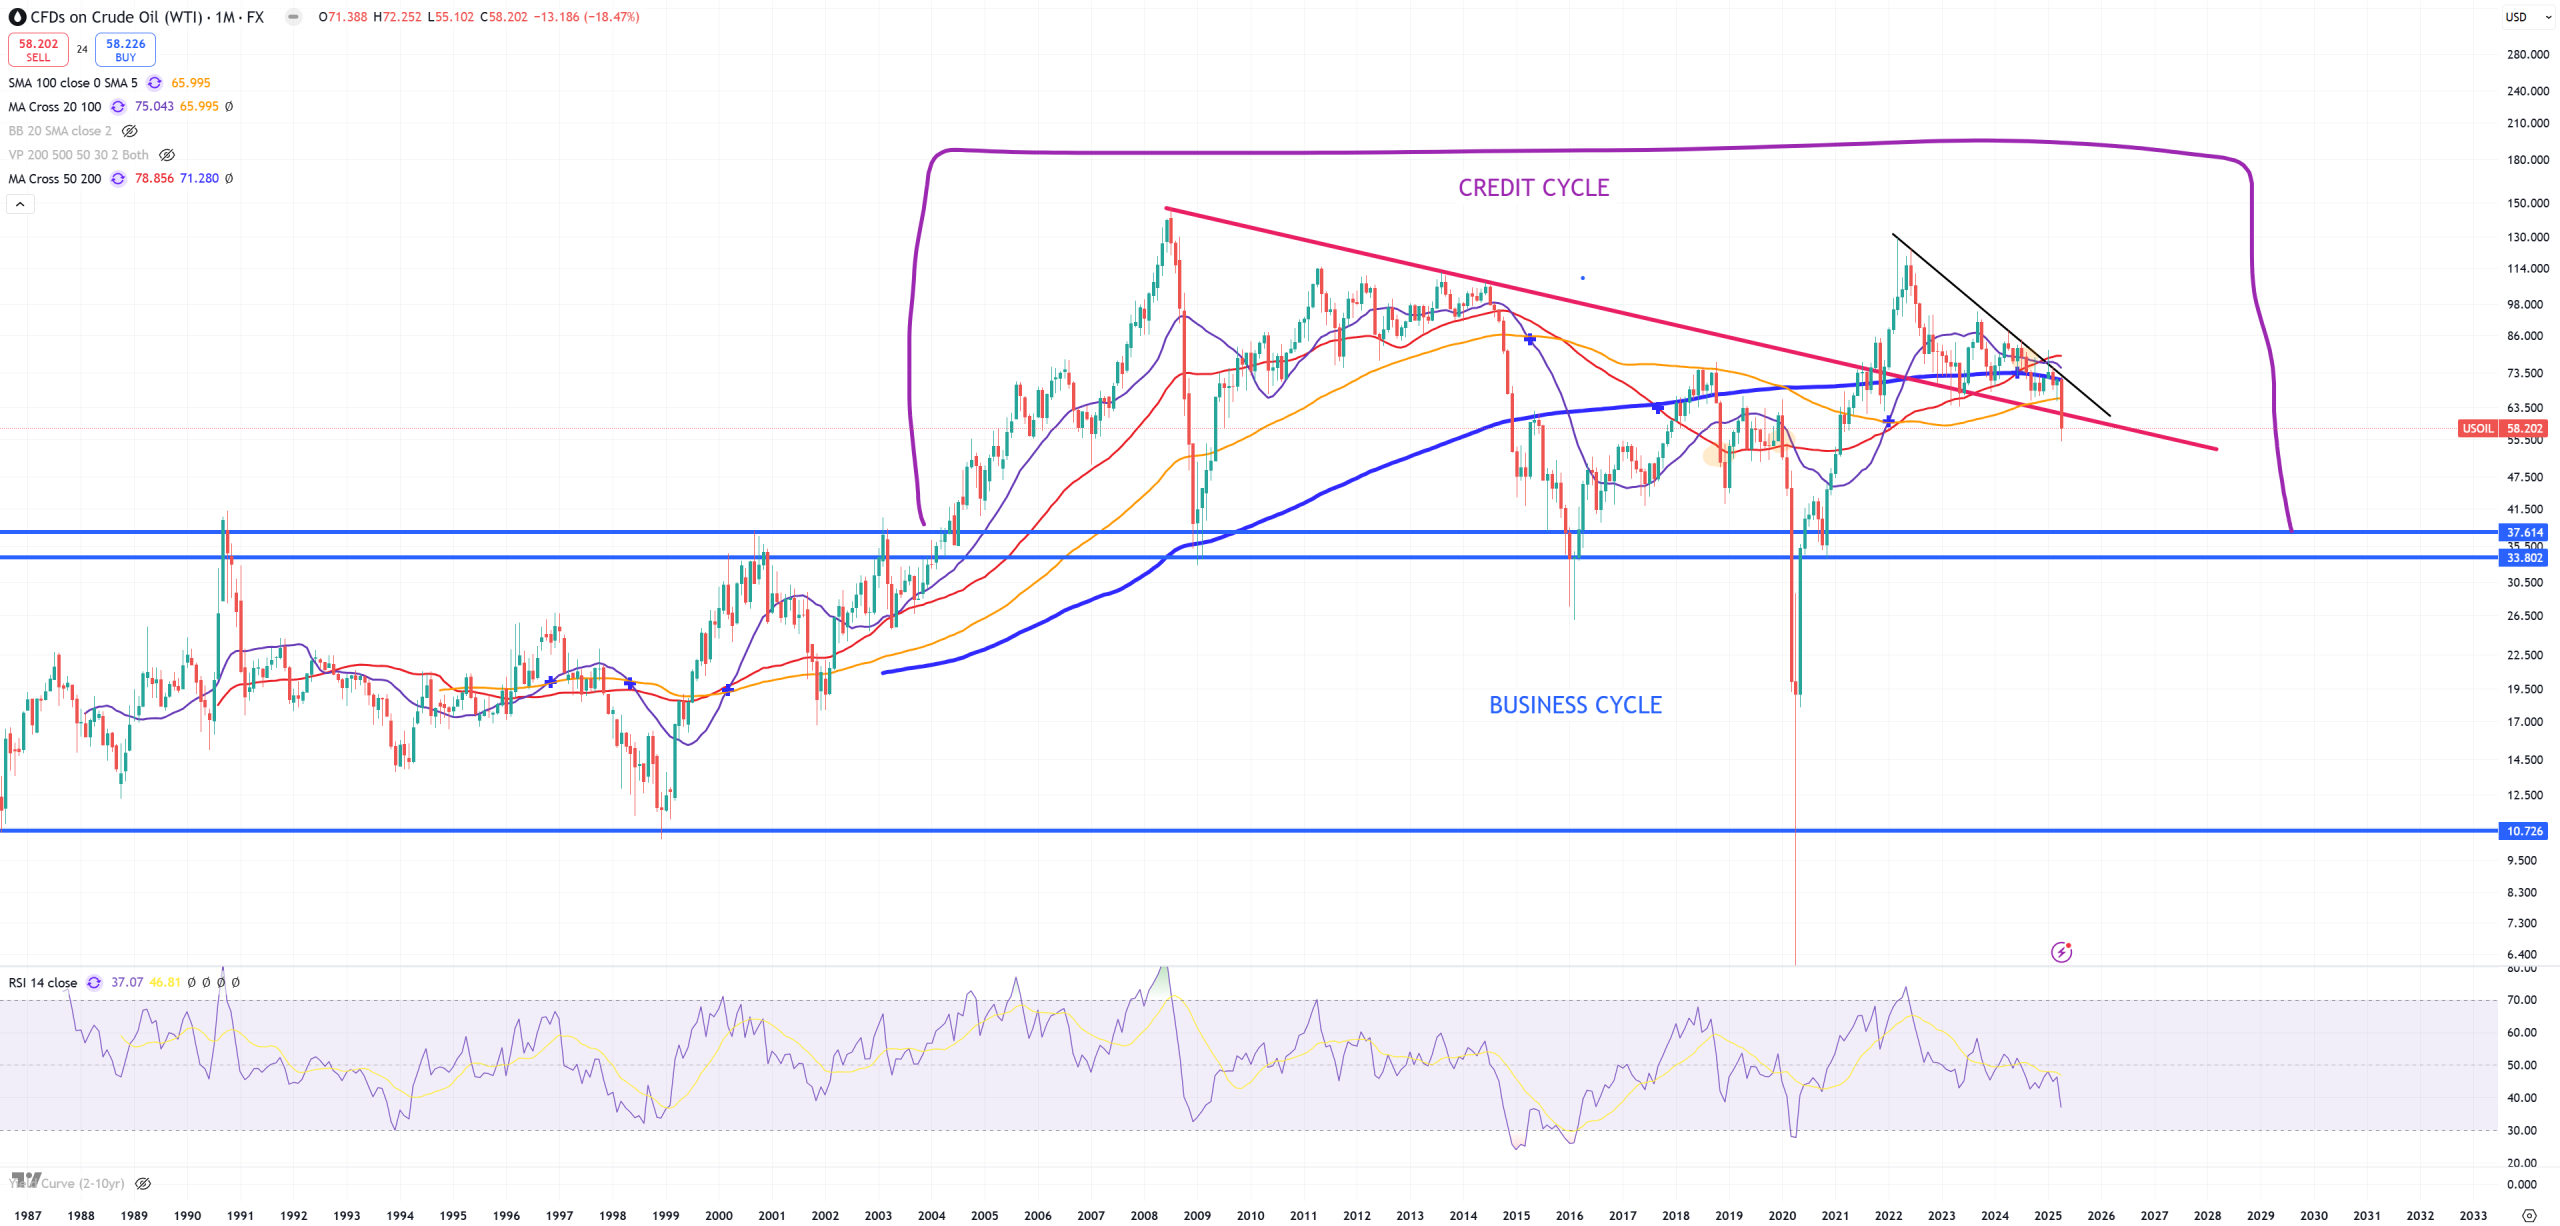
OIL – we can say RIP inflationary cycle. That was just a spike which exacerbated deflationary spiral, looks like 30$ coming.
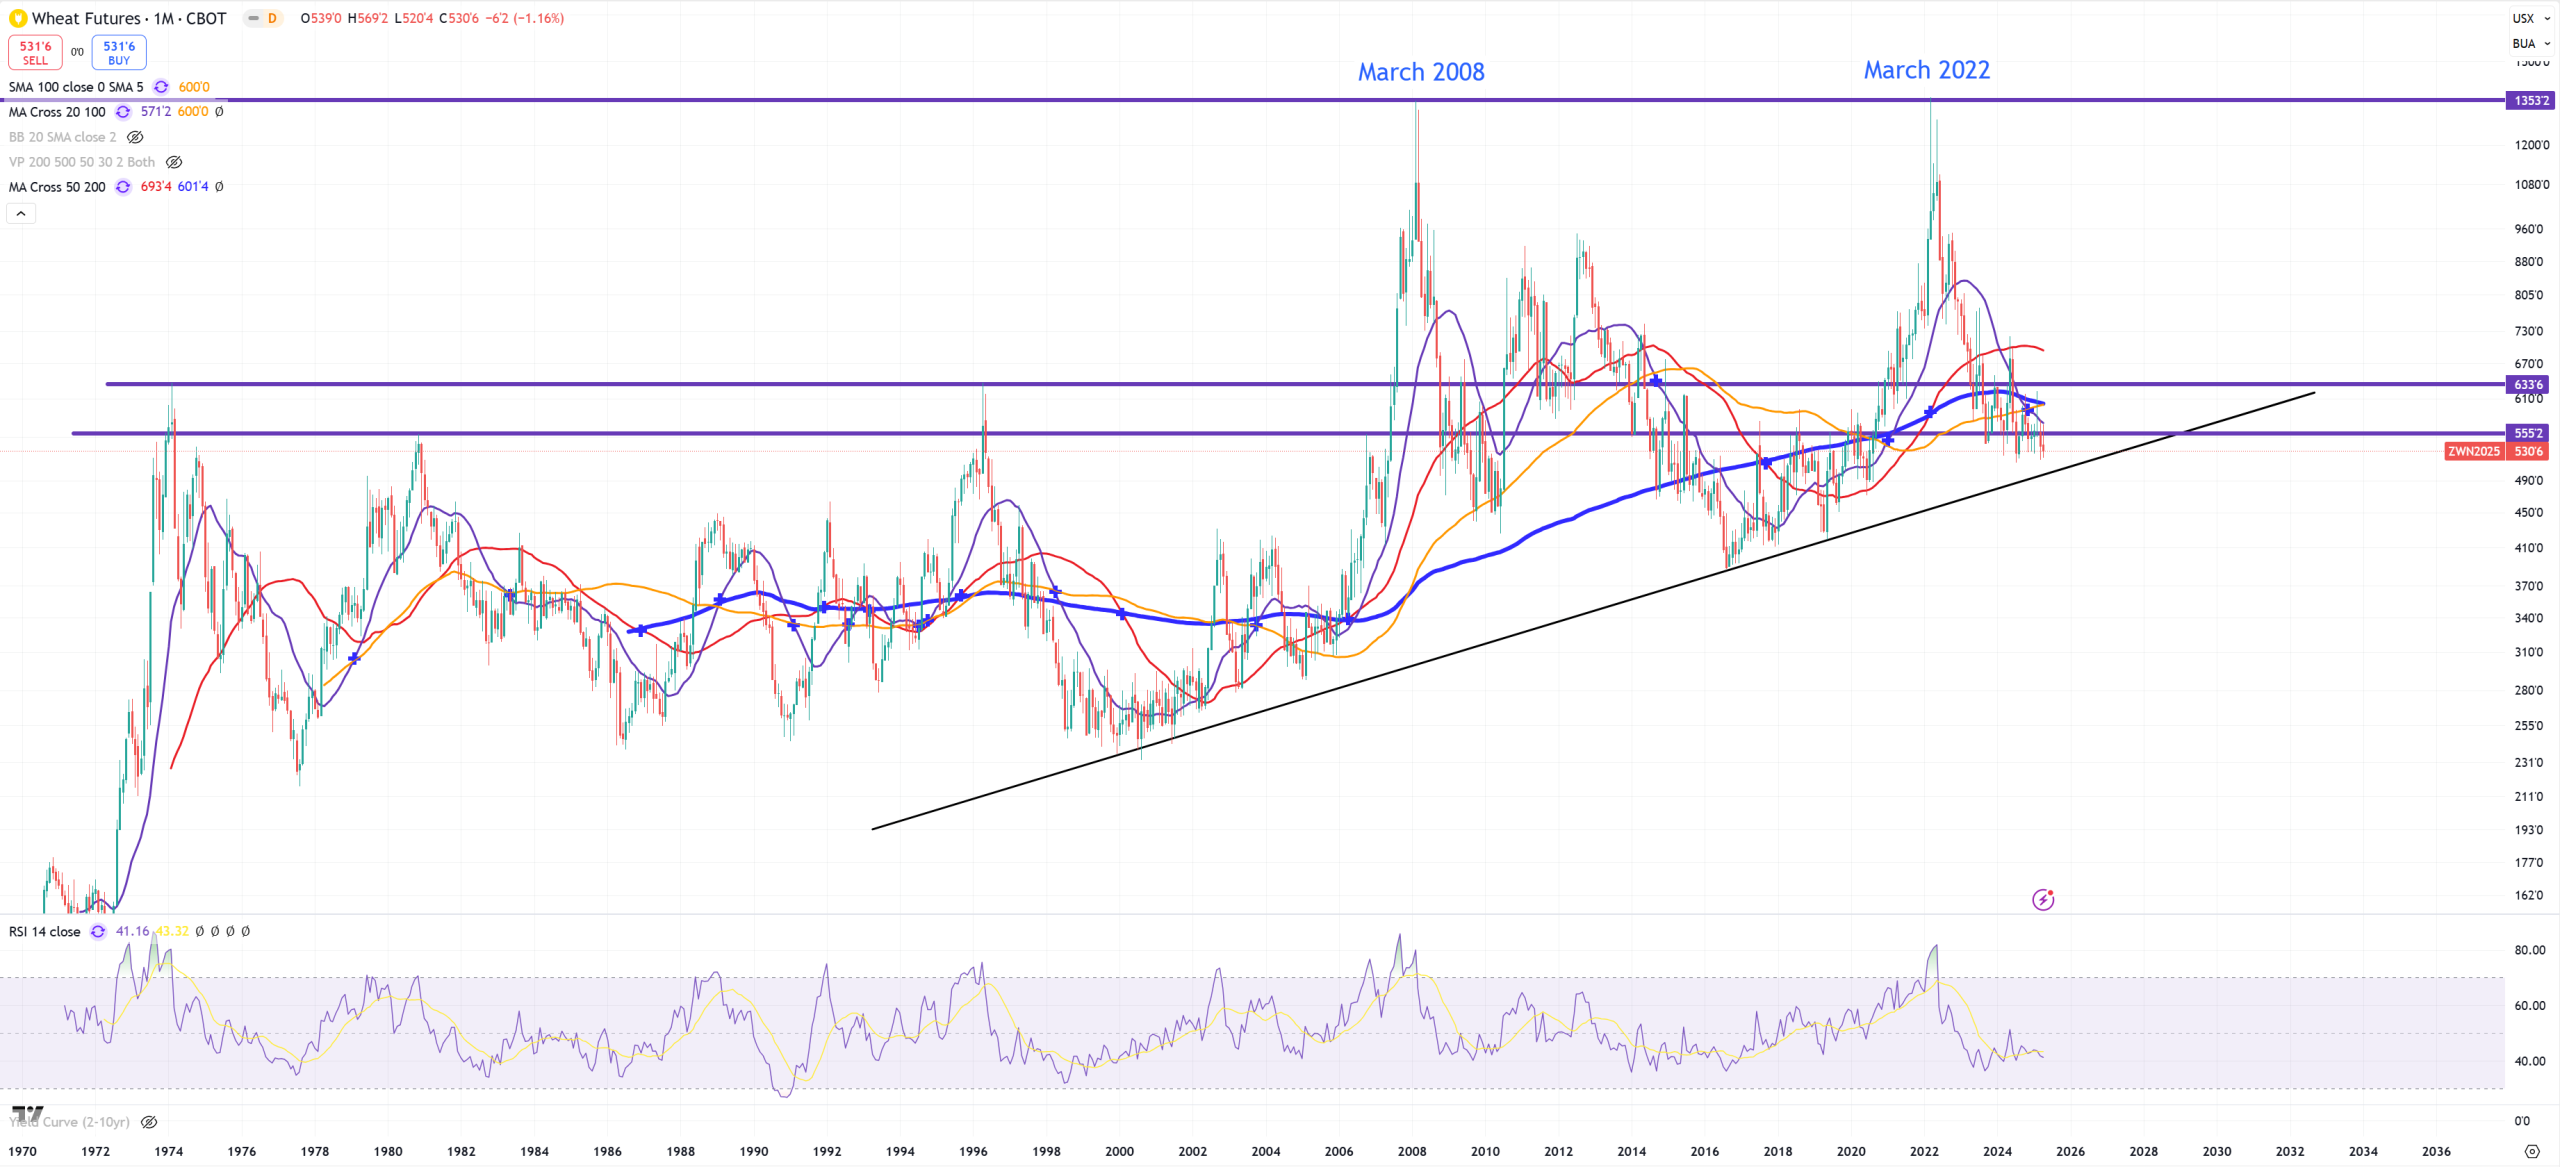
WHEAT – massive DOUBLE-TOP and now below key resistance again. Have it in mind prices of wheat are the same as they were in 1974?
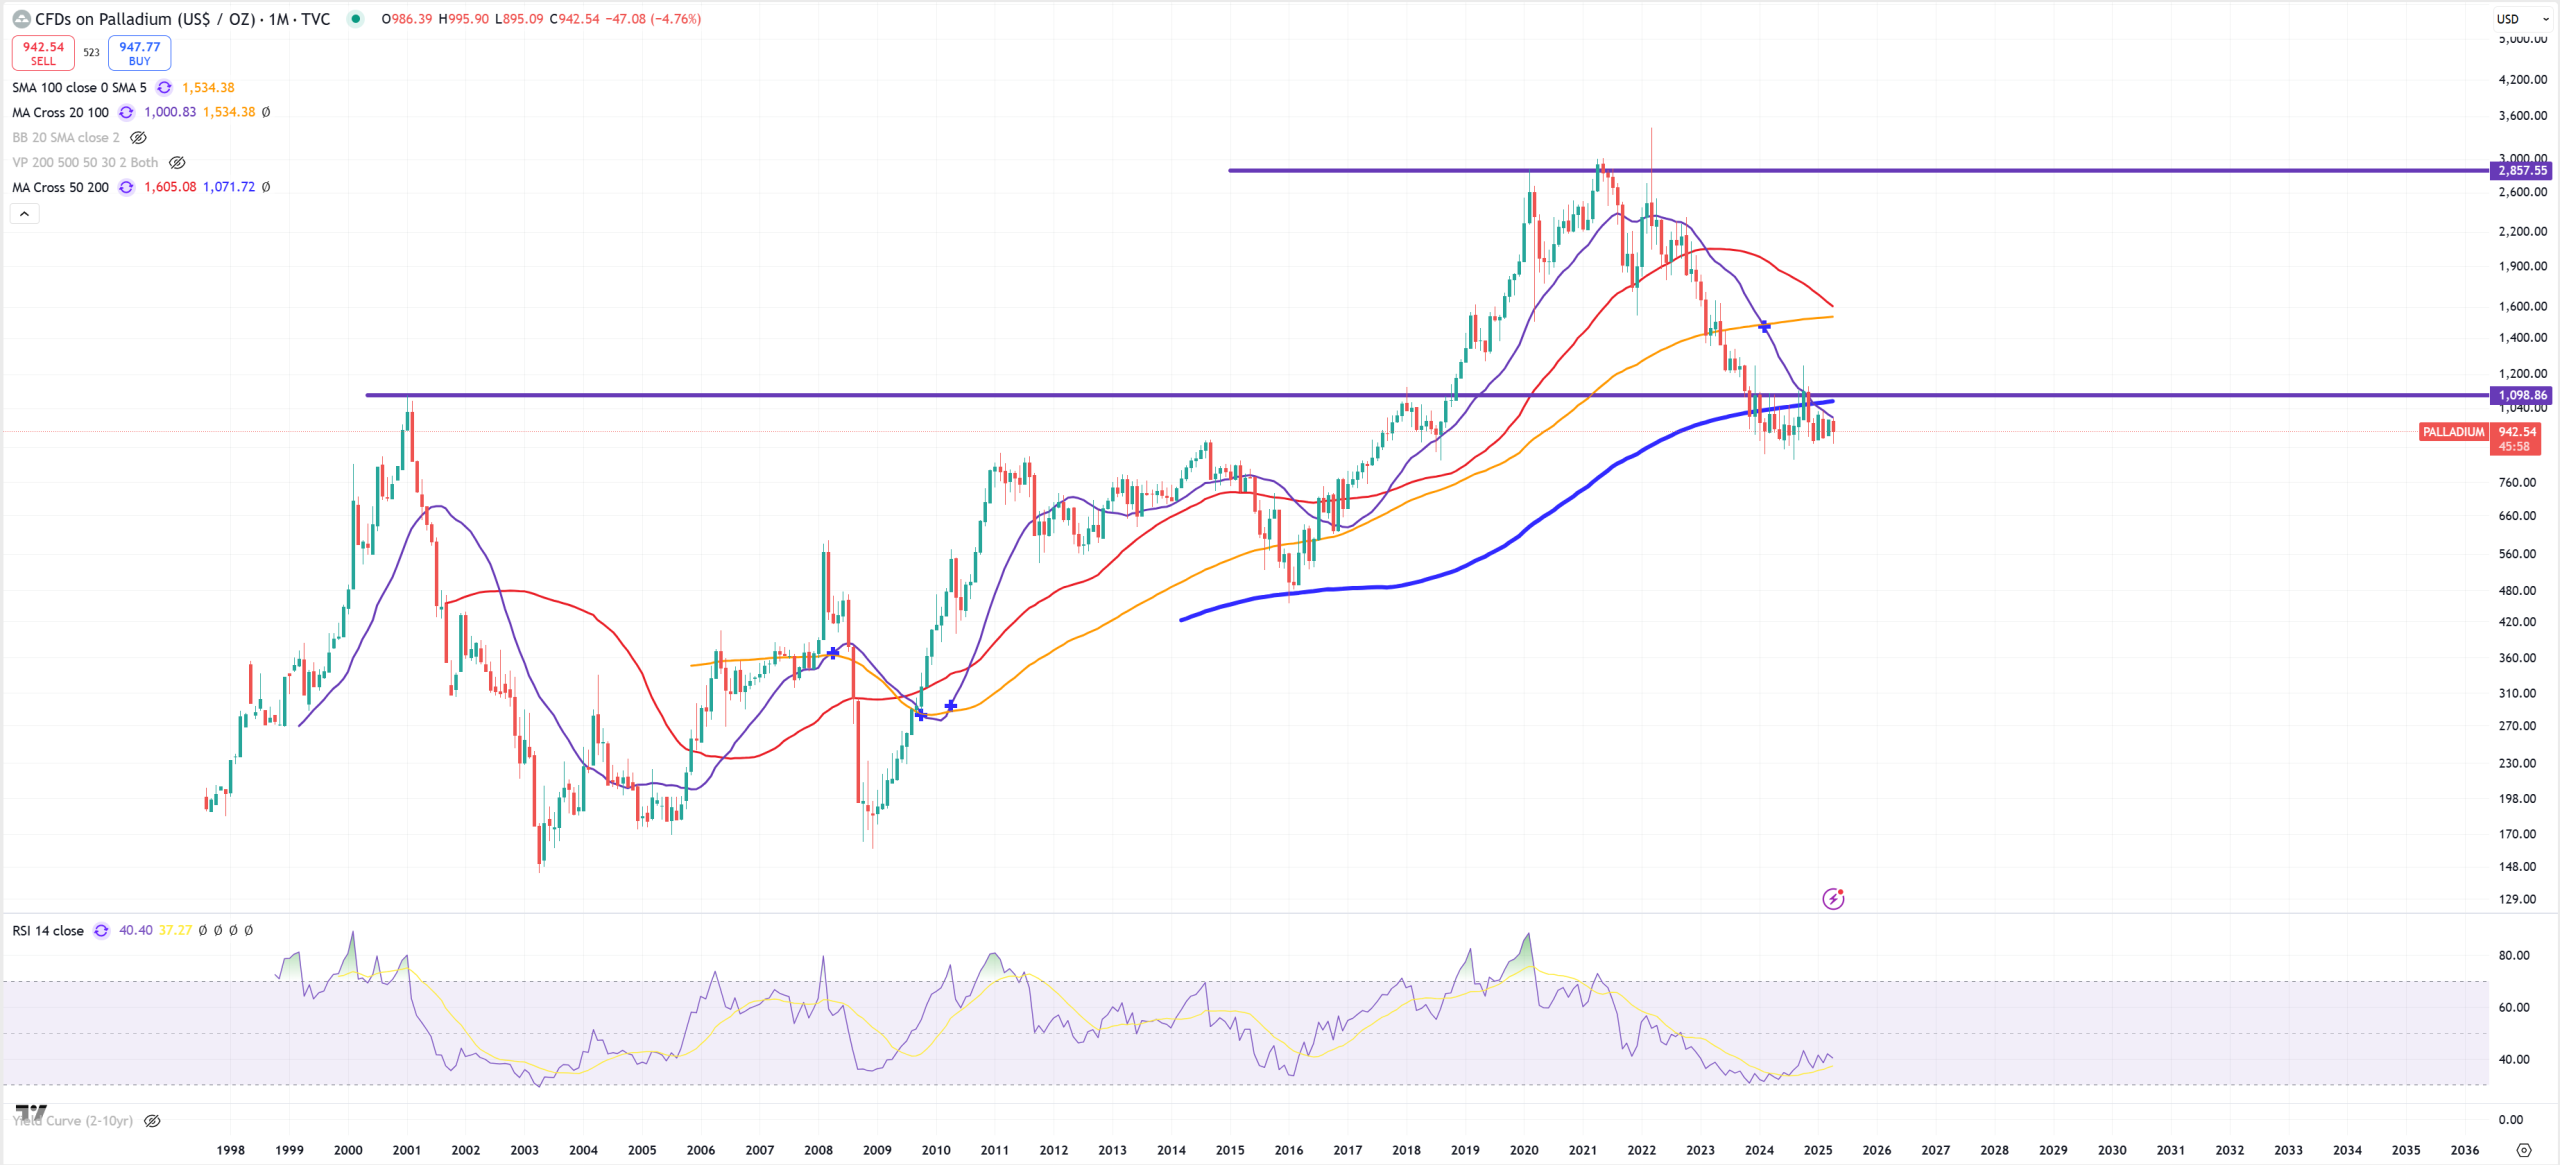
PALLADIUM – peaked between 2020 & 2021 & 2022. Crashed – now below (M)MA200 for years and massive resistance on 2001 level. It looks like deep shit because it’s being used in car manufacturing mostly.
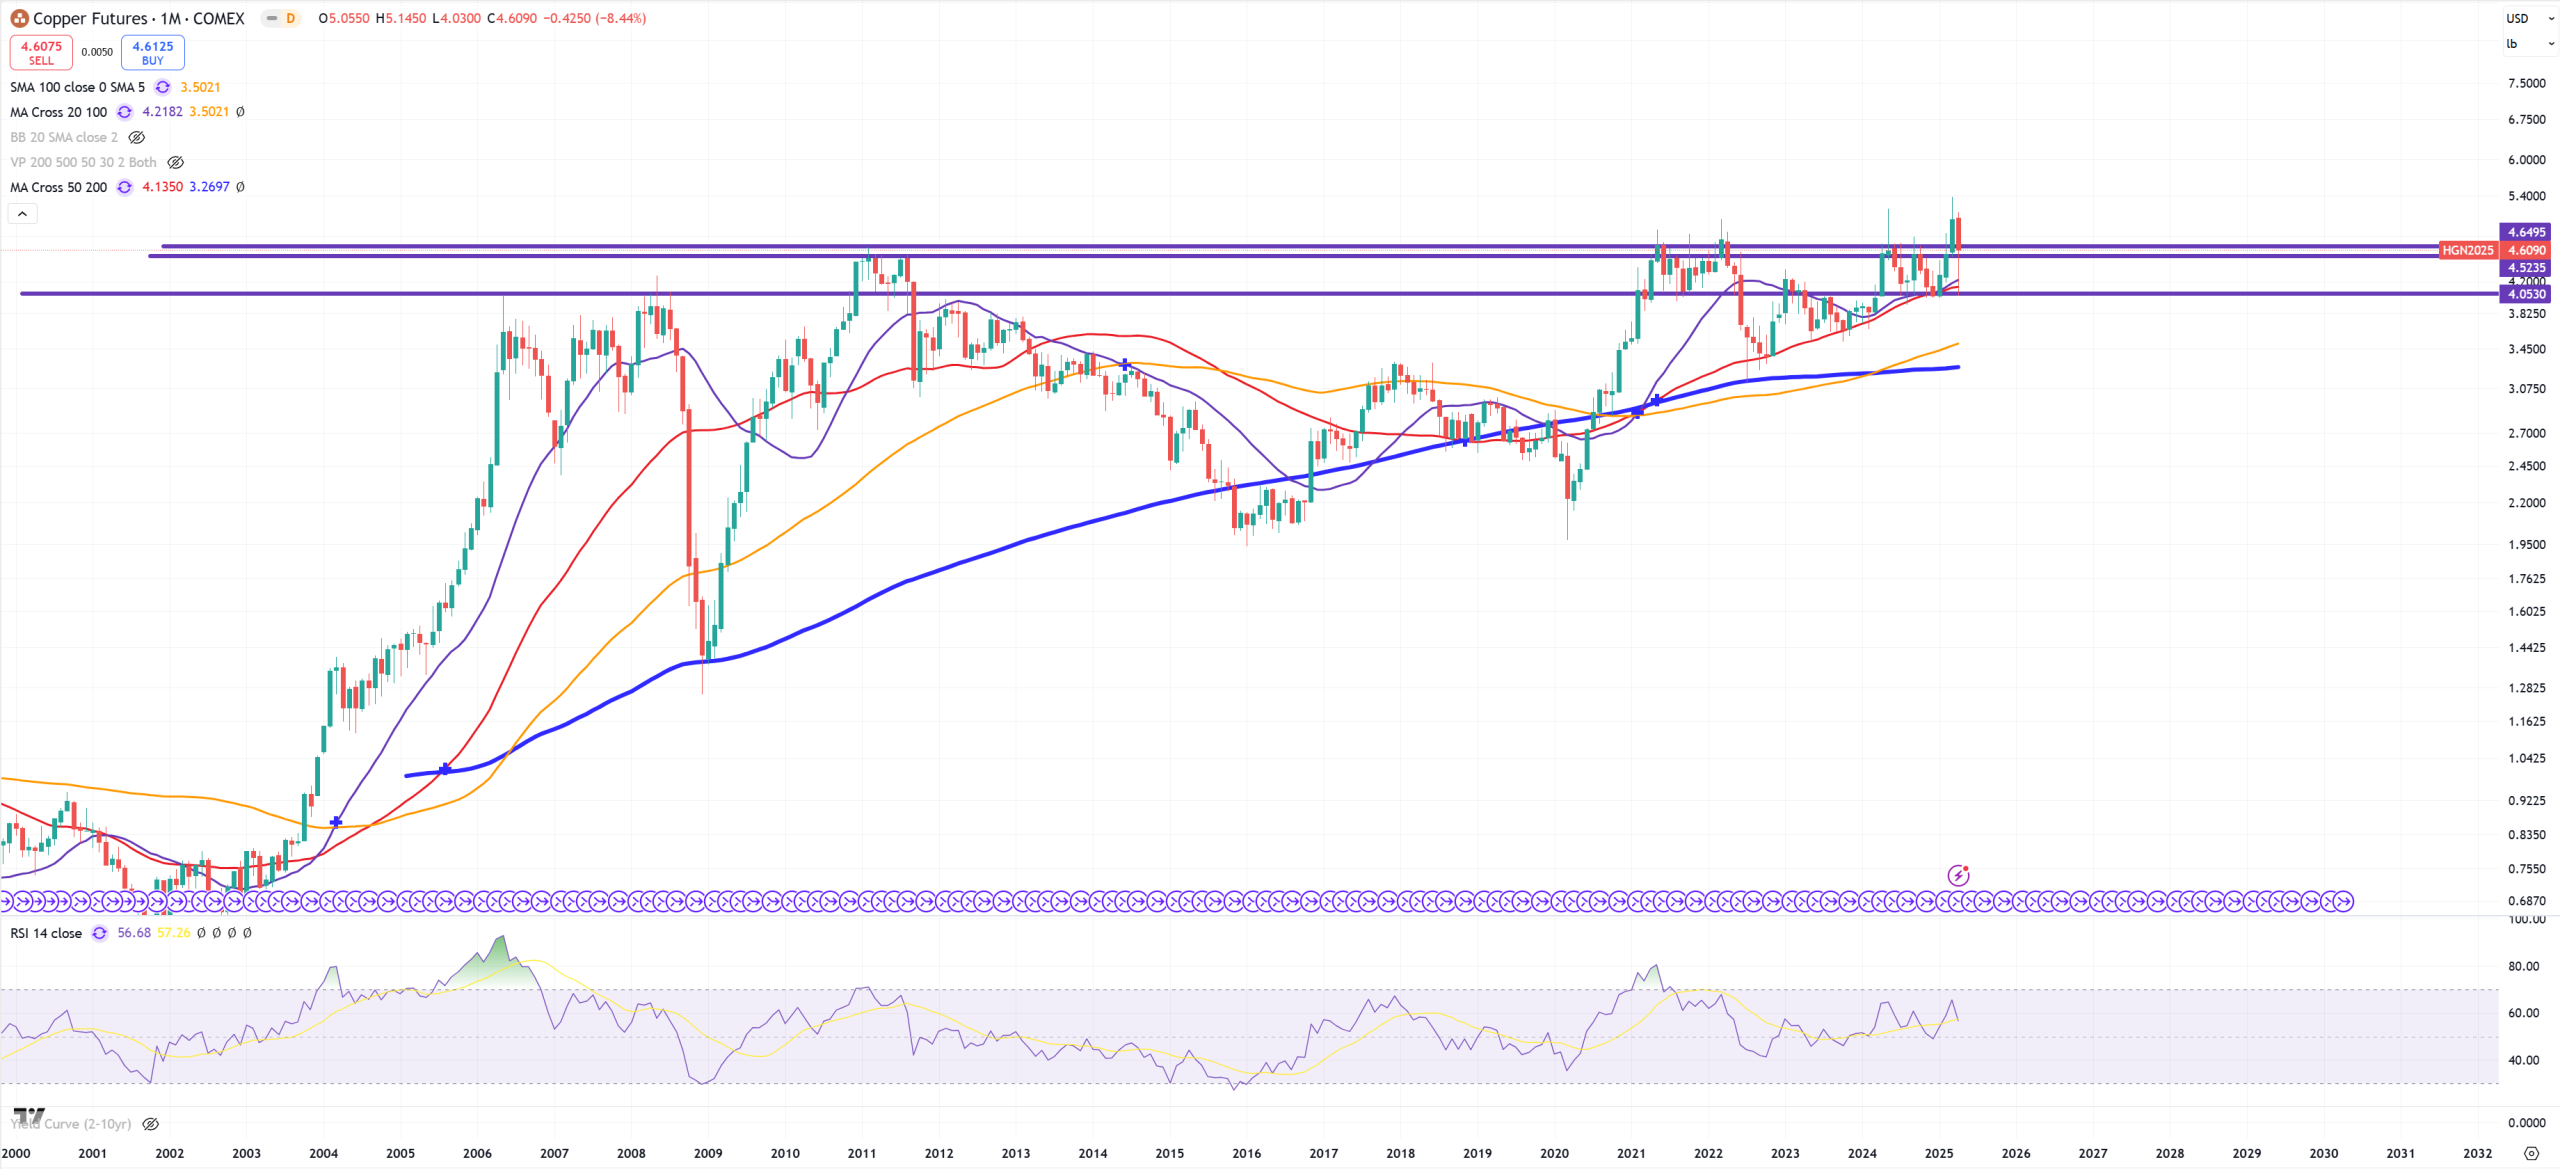
COPPER – if I have to tell what is the biggest stupidity I observe without a doubt I’d say COPPER, but it closed below 2011 key resistance trying to defend (M)MA50.
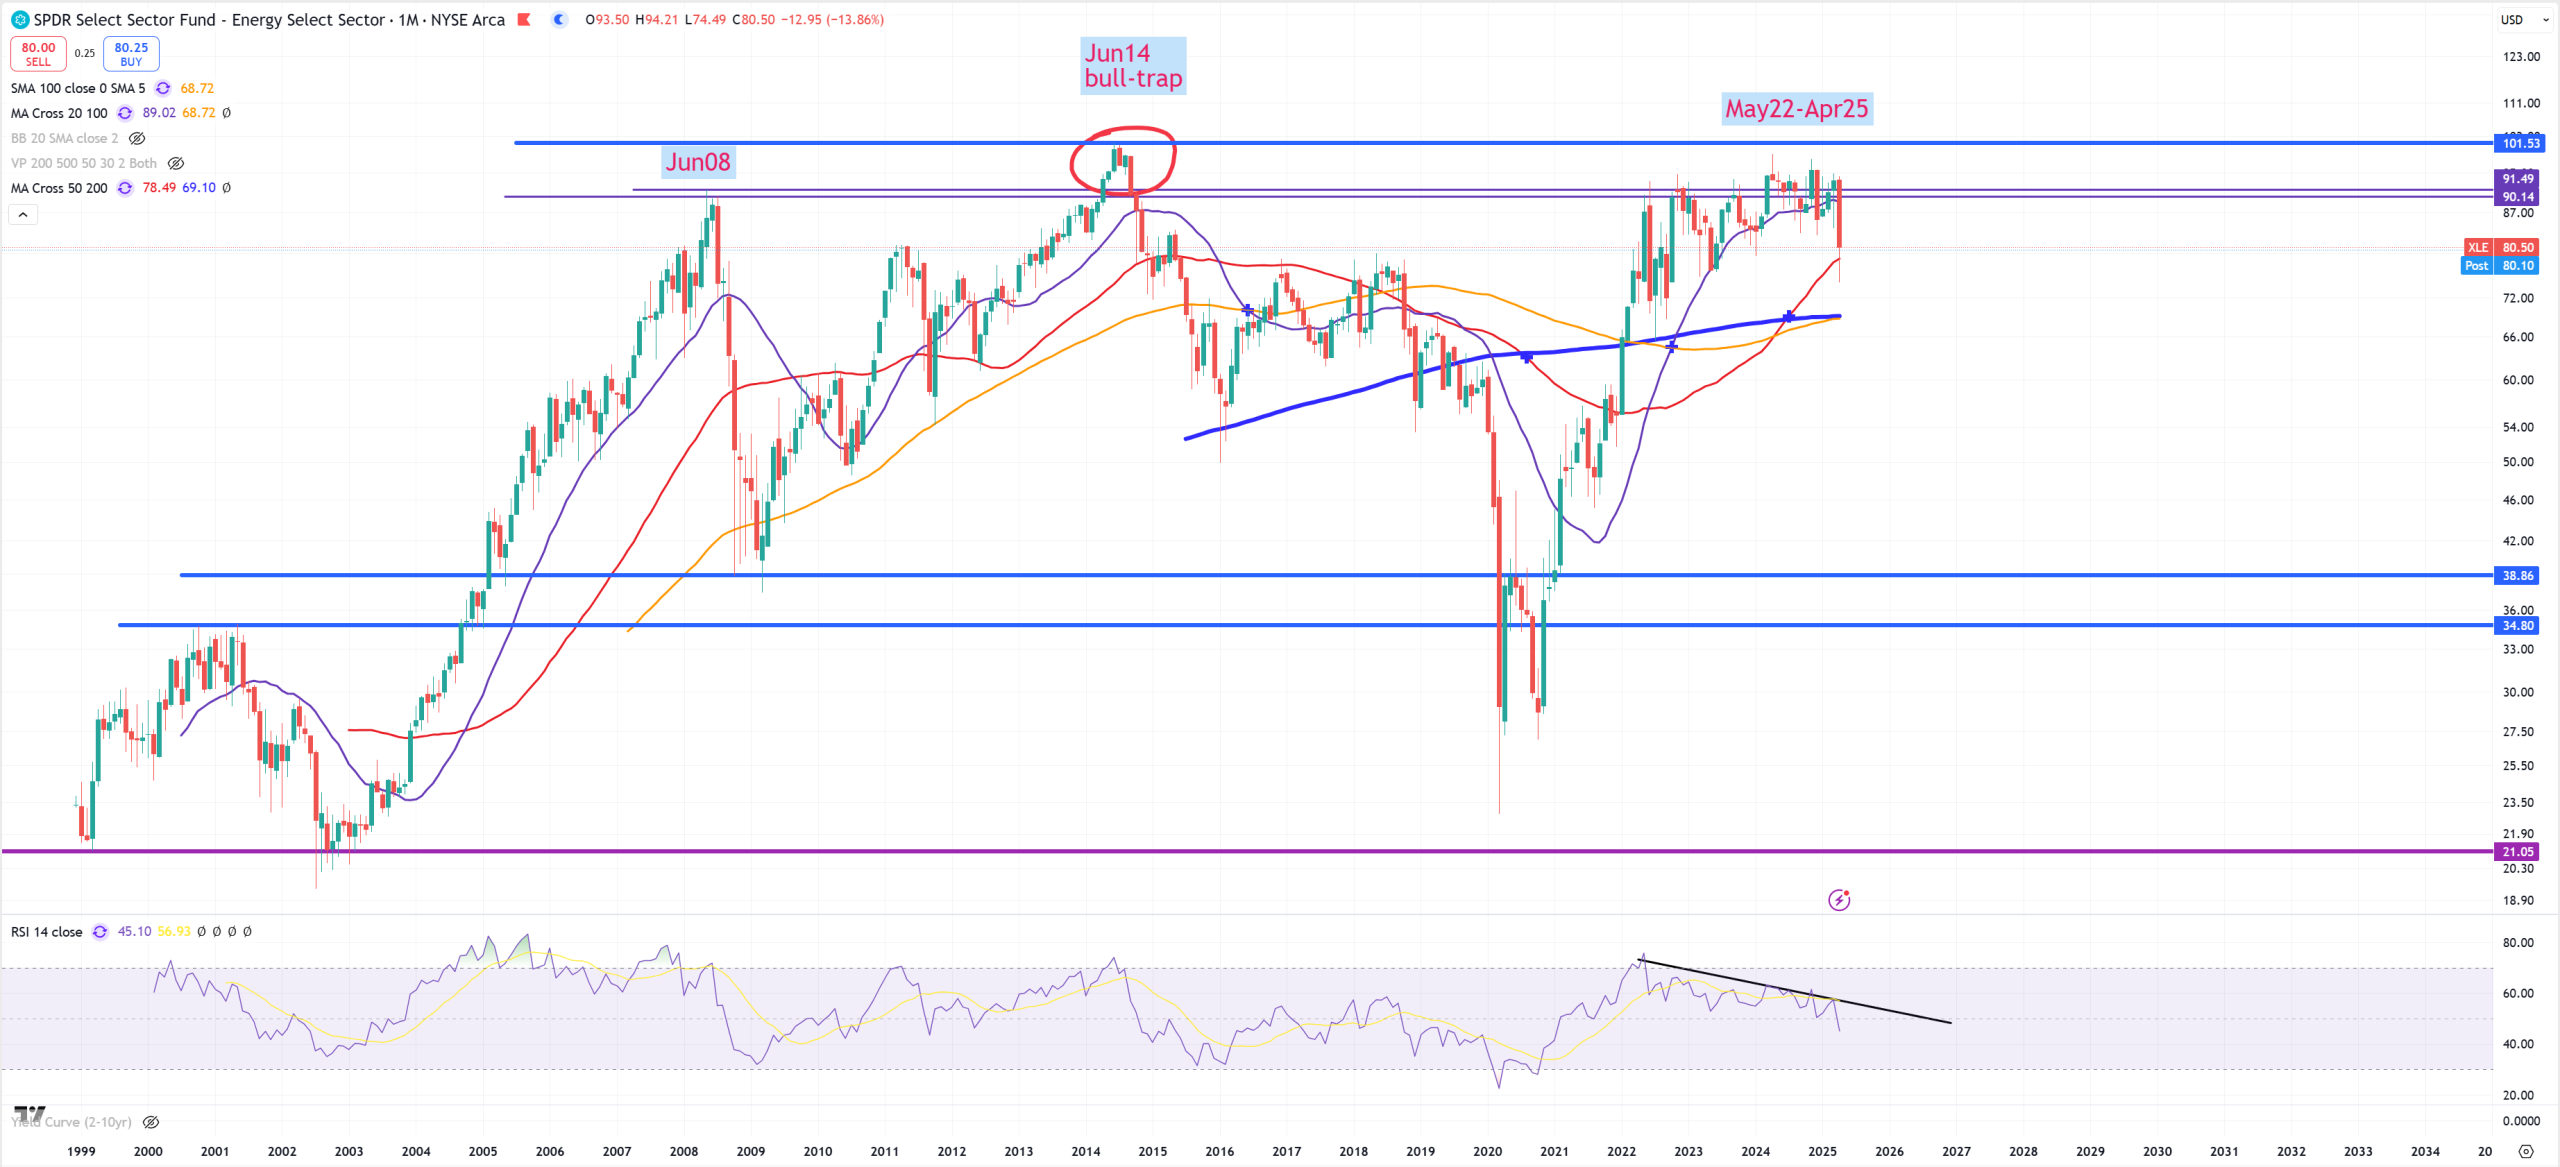
XLE – Energy. This crap rotates for almost 3 years with massive negative divergence, defending (M)MA50. Never seen anything like that – 3 years topping.
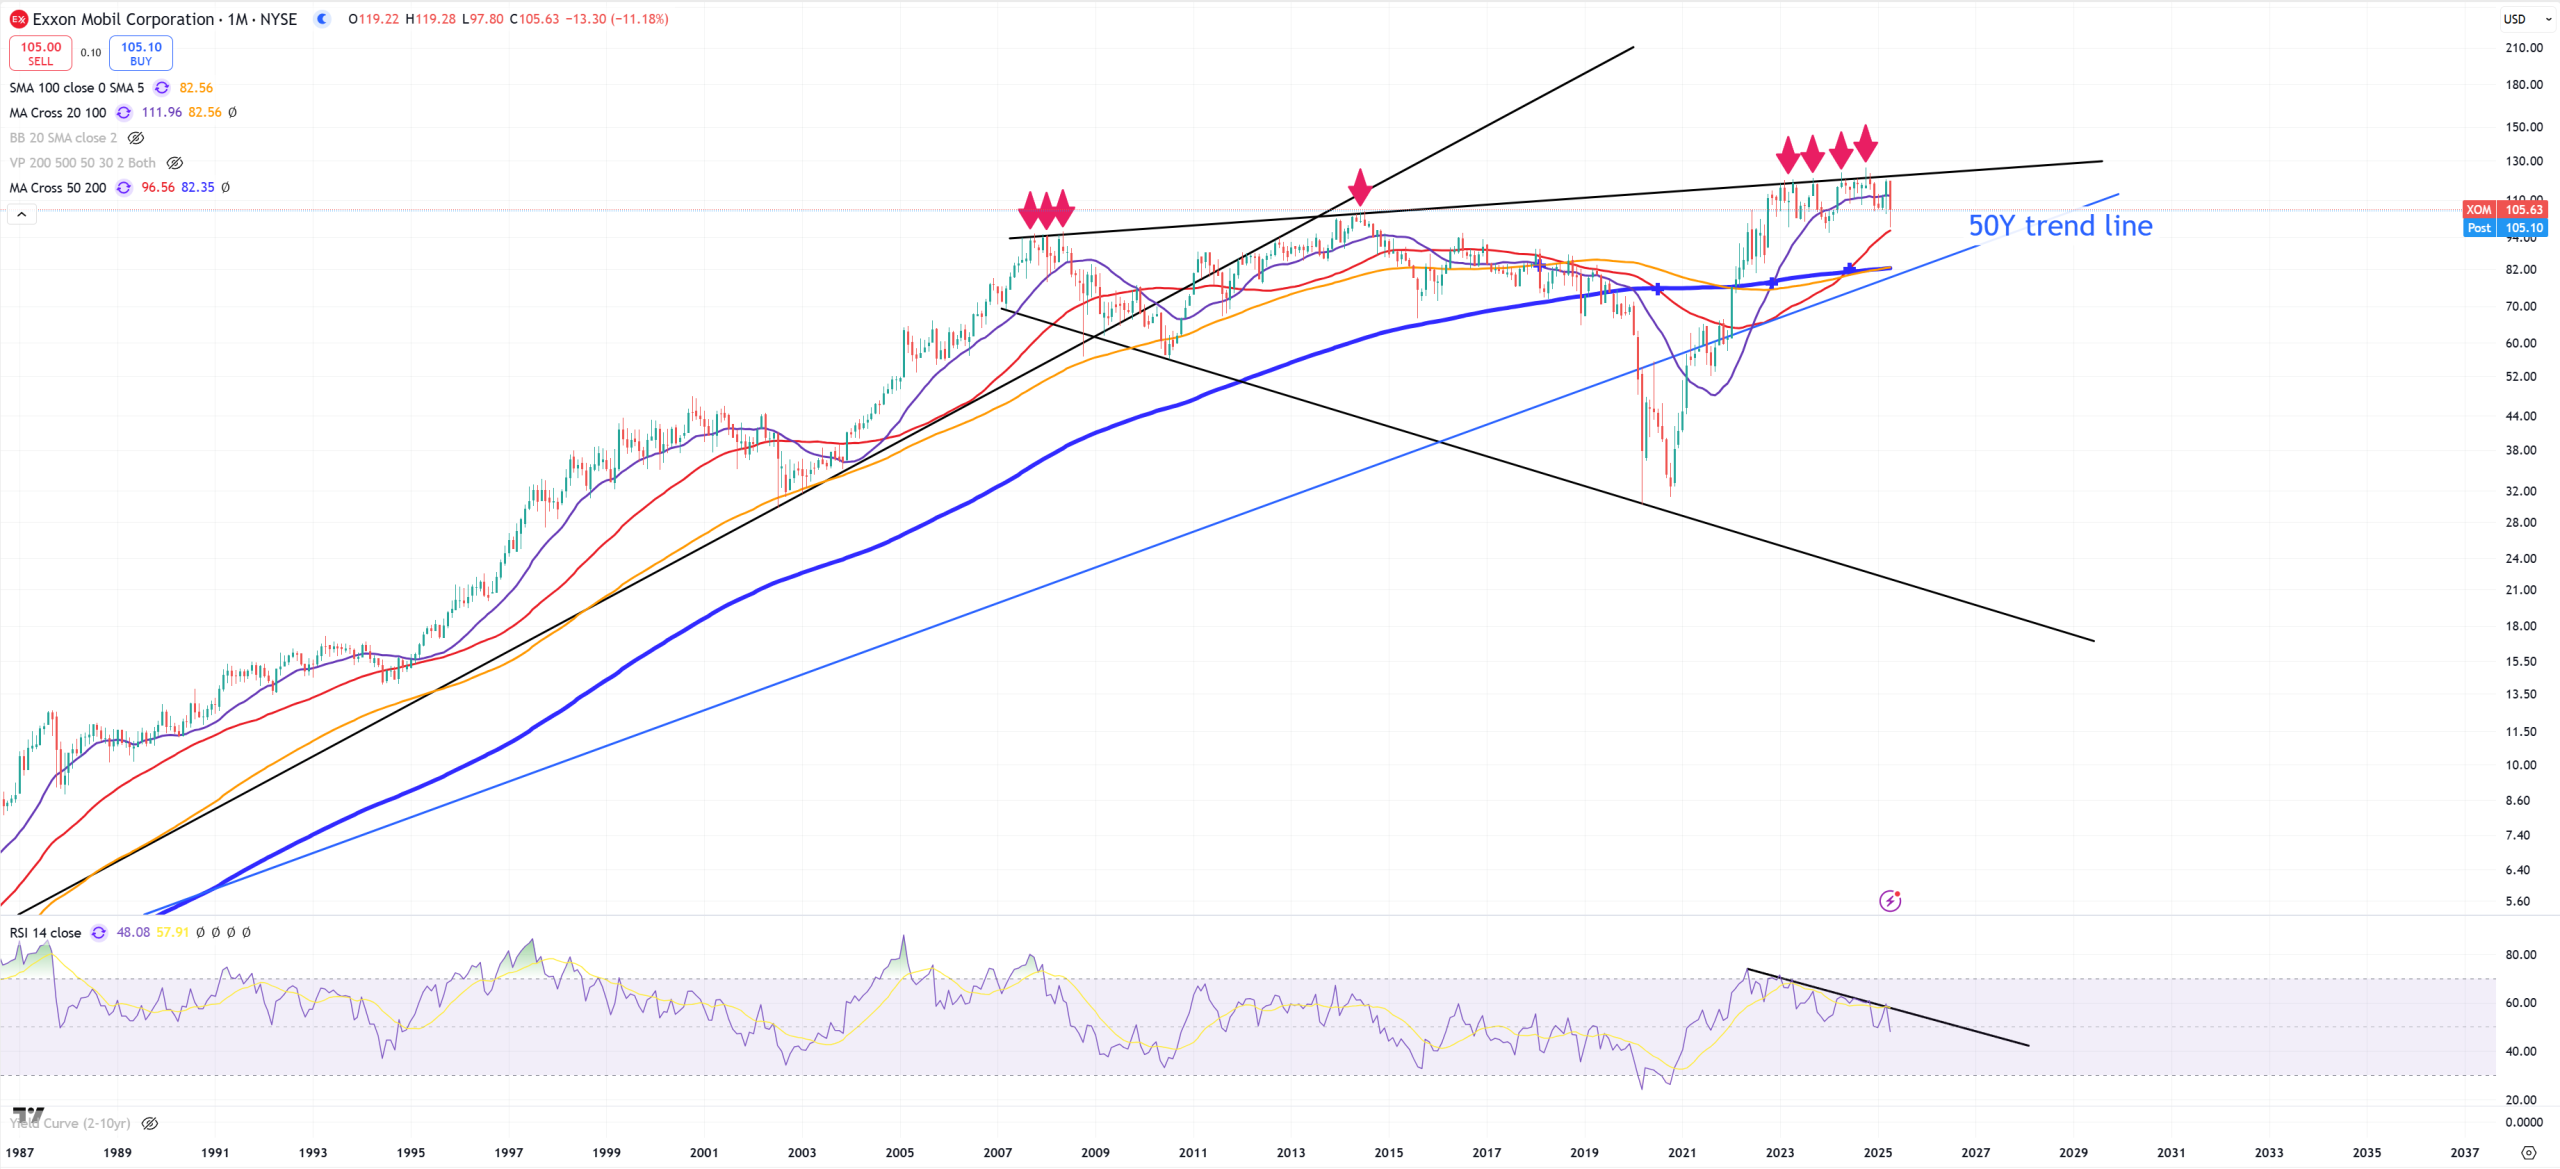
XOM – Exxon – and without a comment. I believe it’ll break this 50Y trend line, but lower megaphone trend is around 20$ – sounds crazy I know.
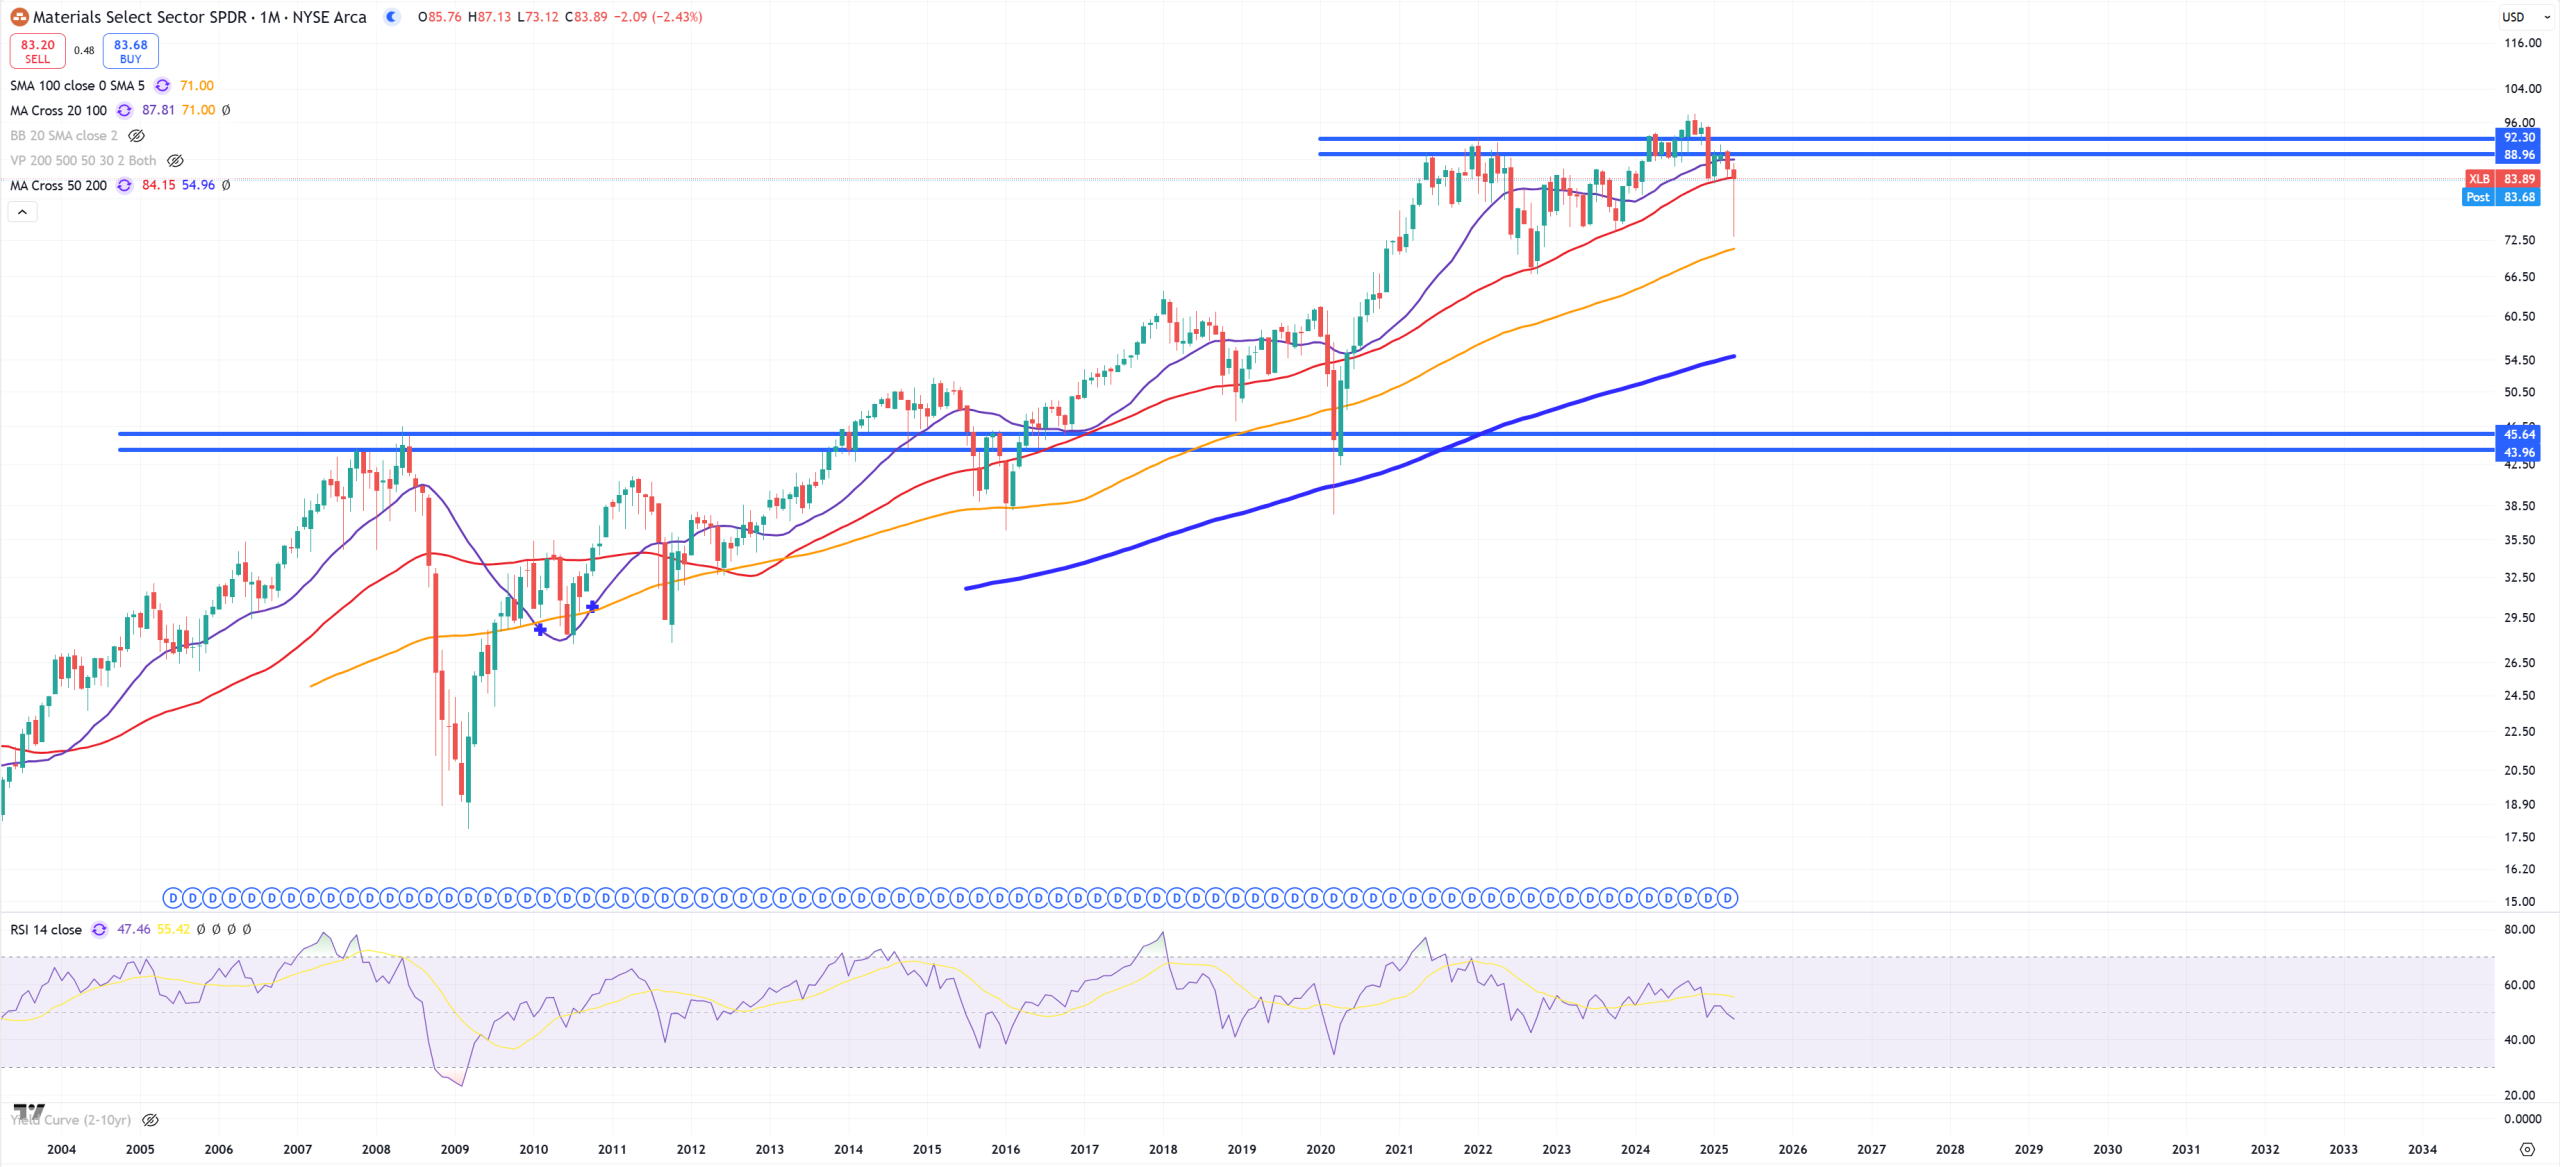
XLB – Materials sector – 2021/2024 peak – defending (M)MA50. Resistance vs entering bear market level.
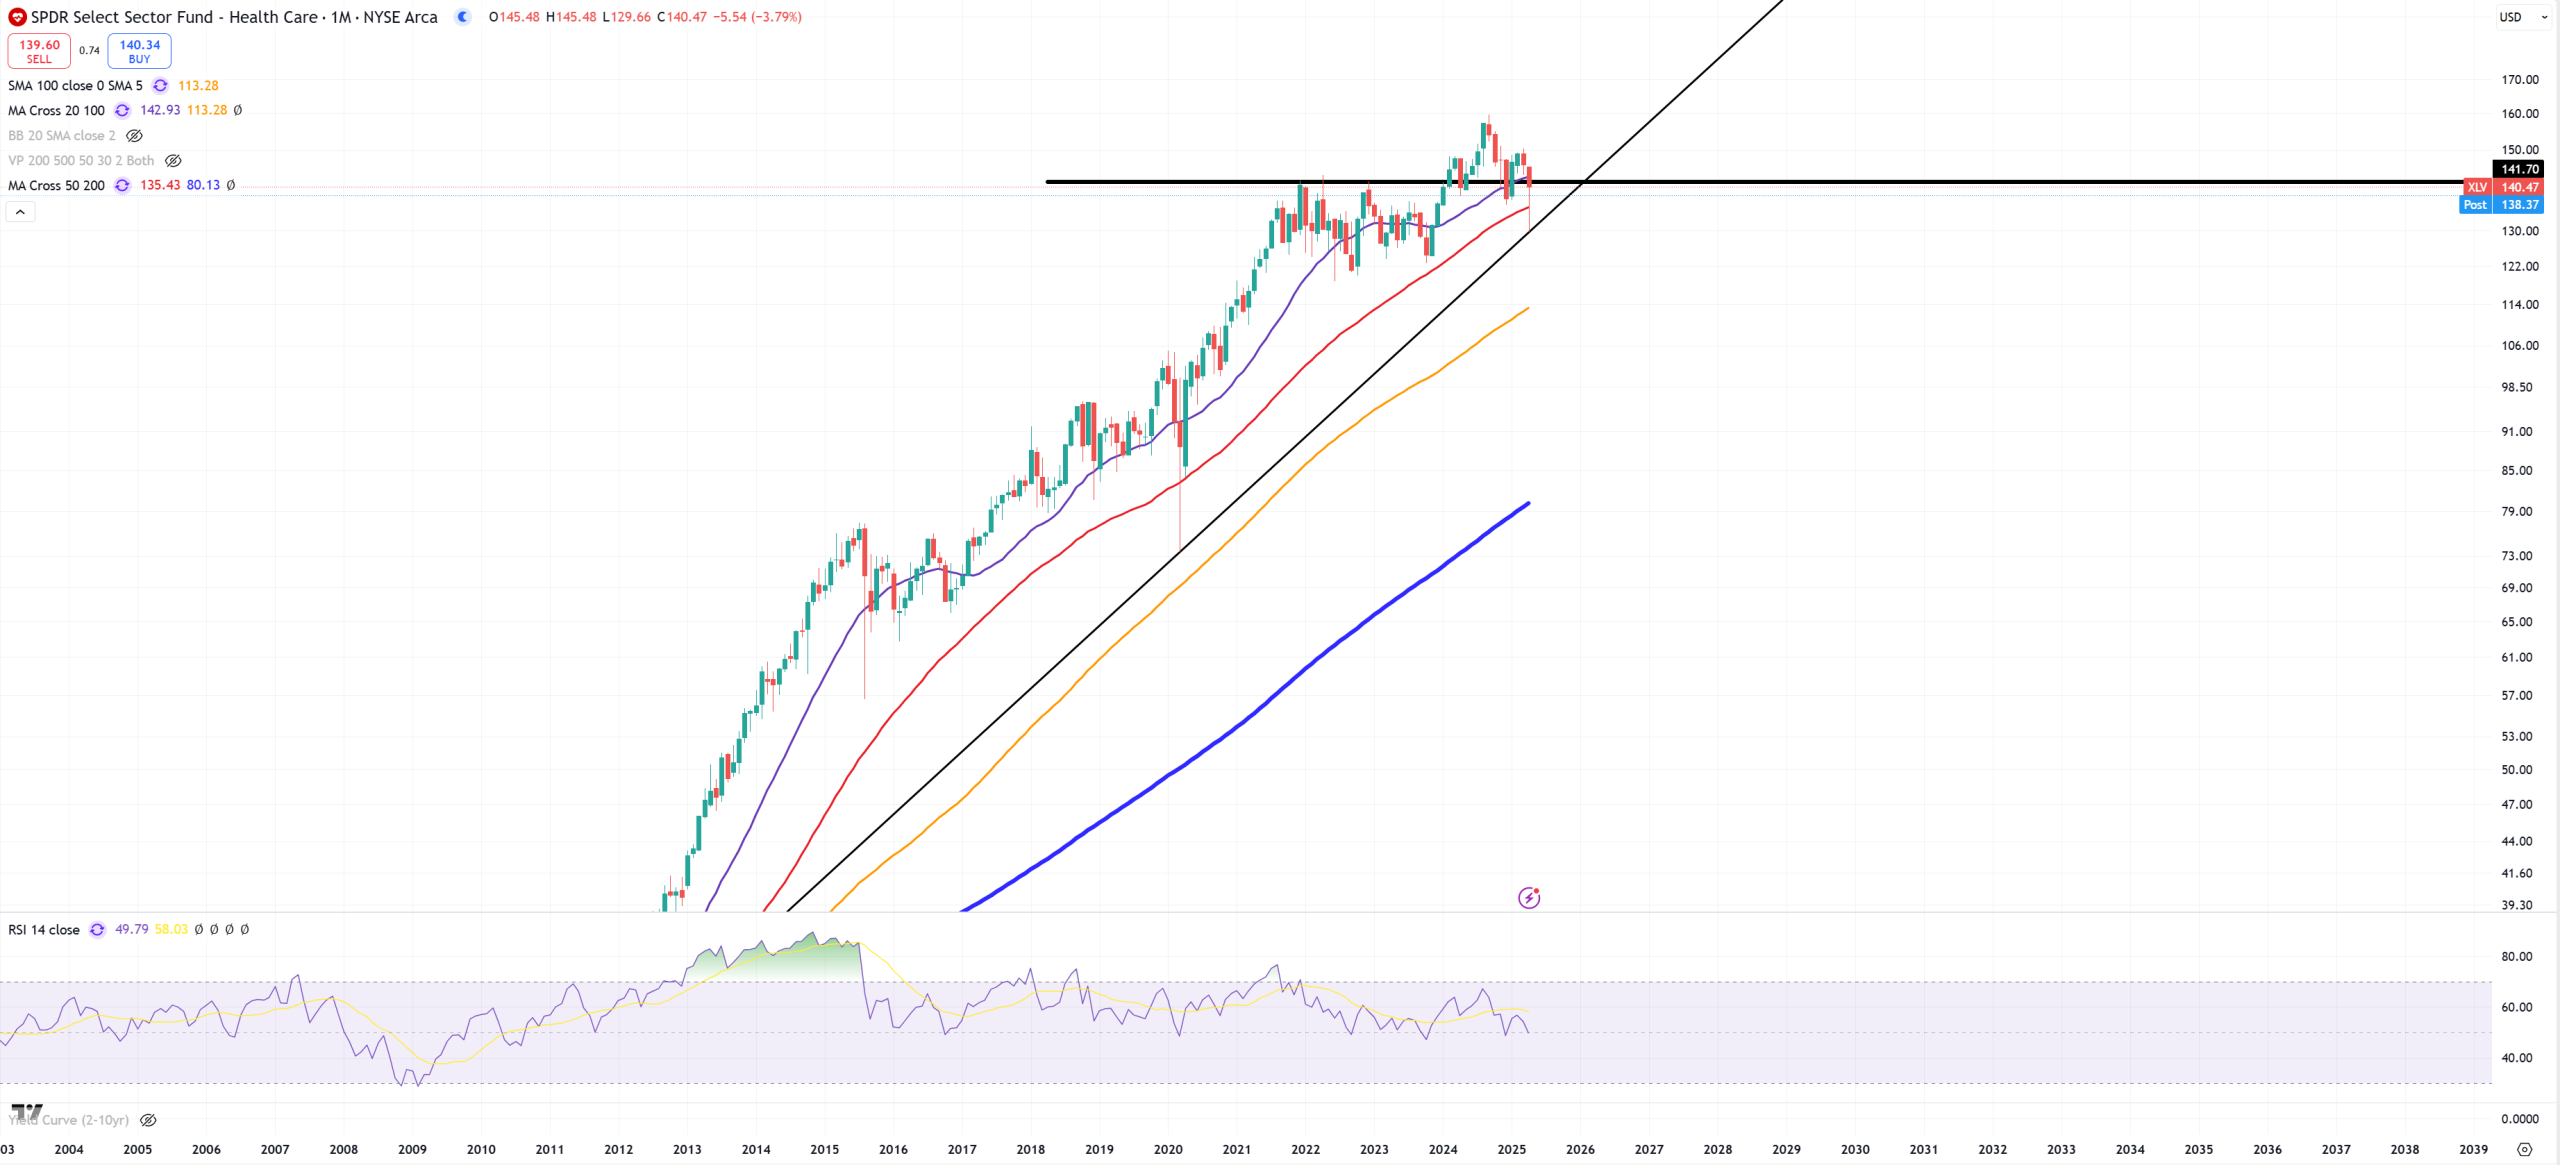
XLV – Healthcare fighting also 2021 peak with false bull-trap, (M)MA50 saved.
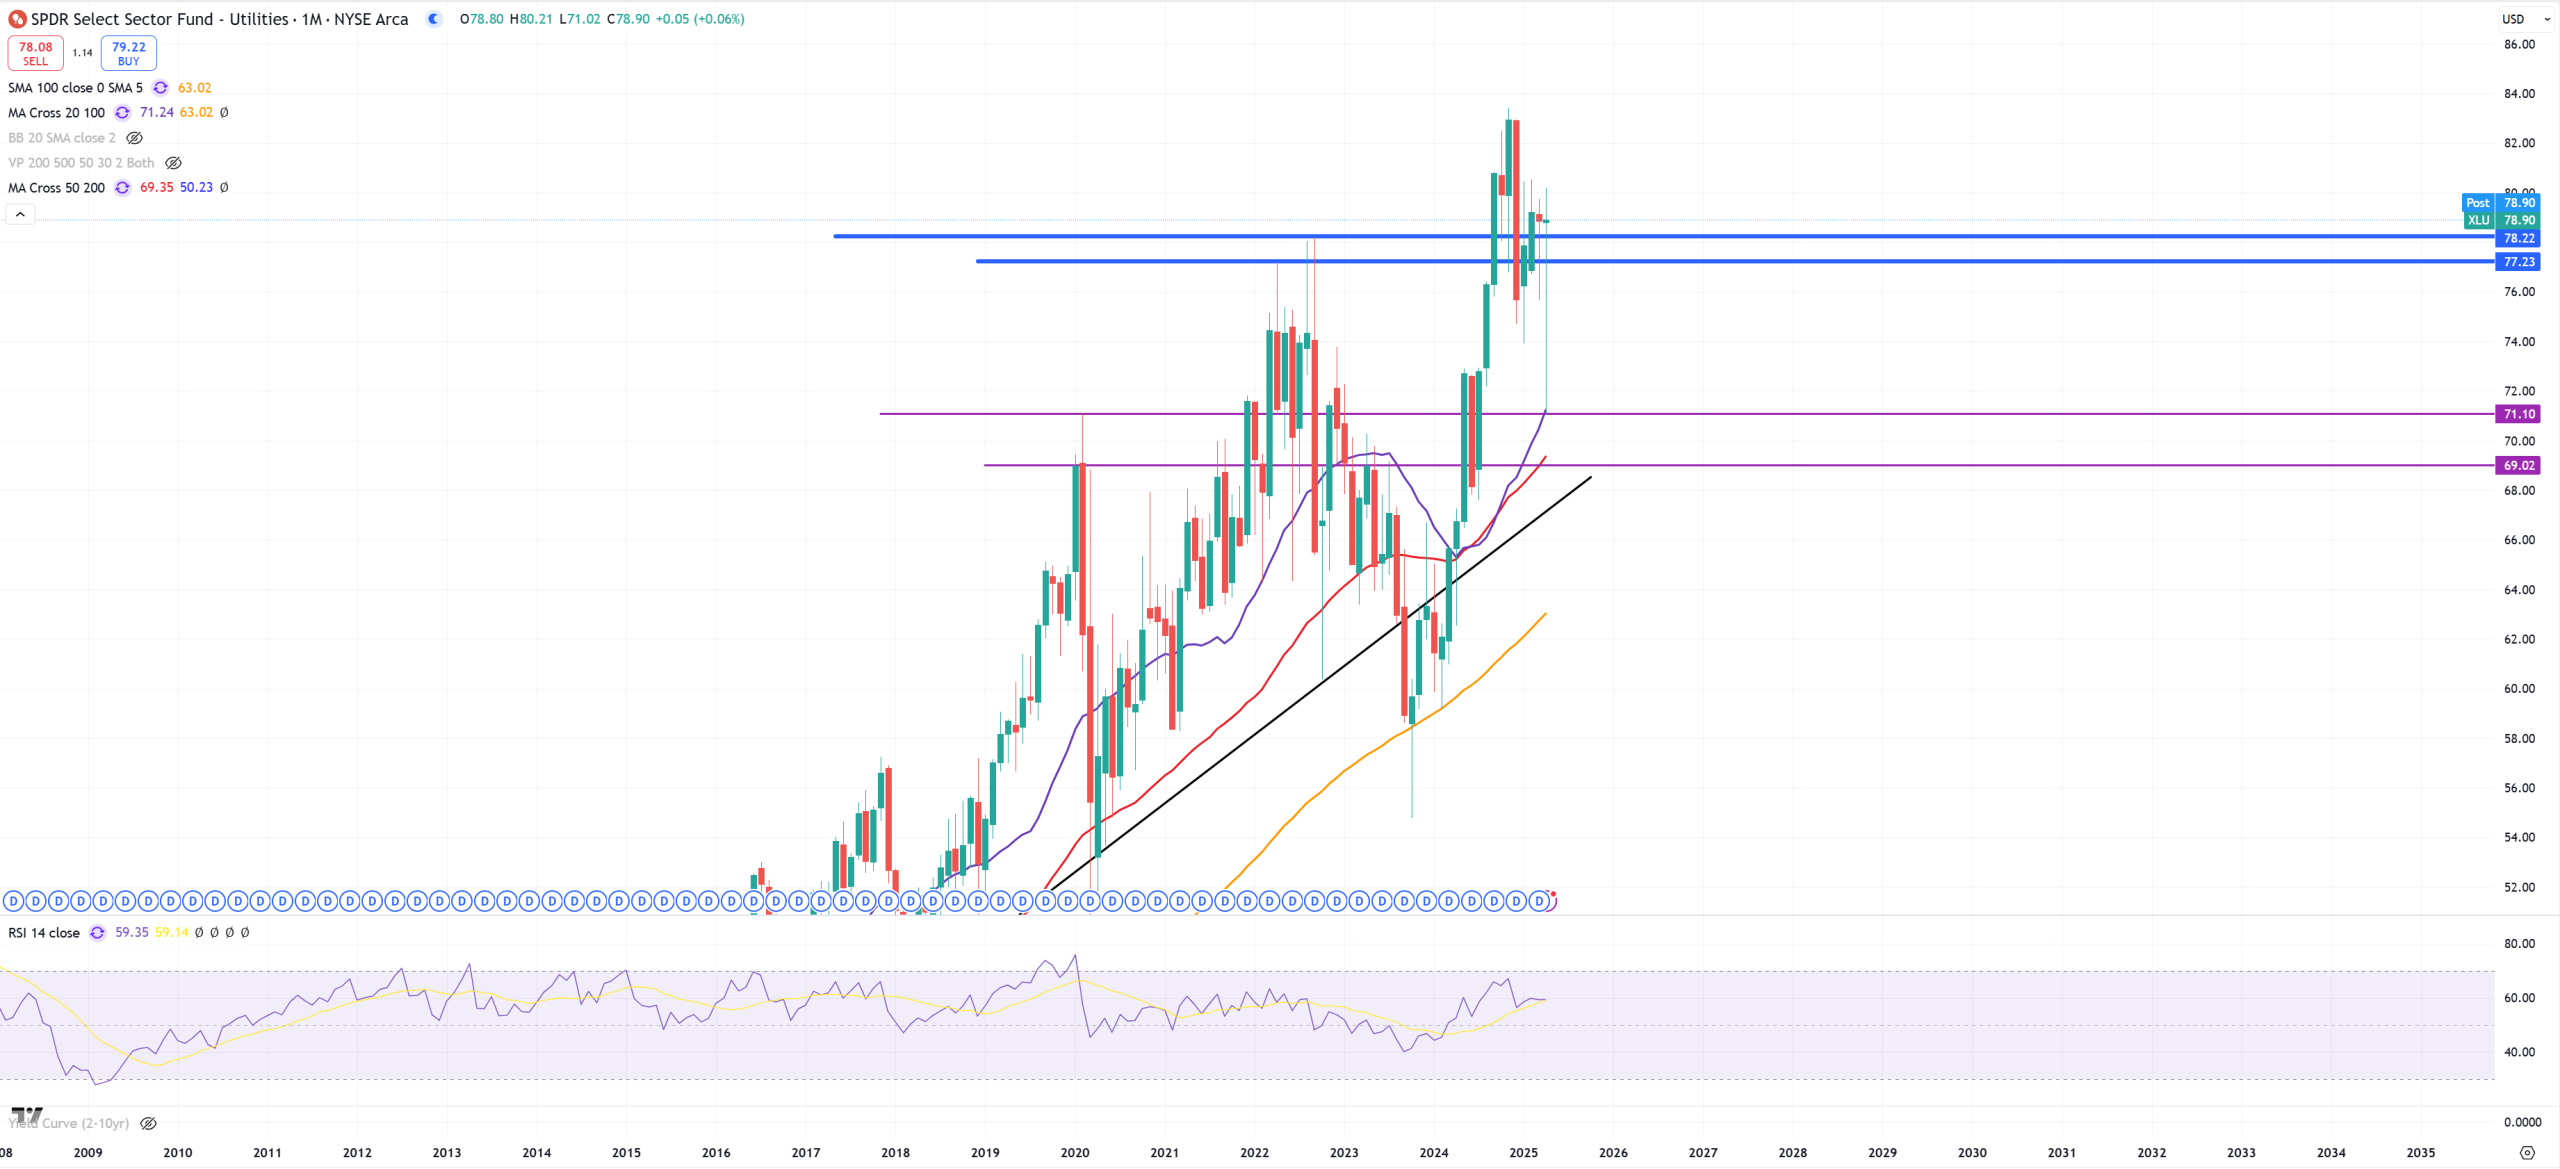
XLU – last safe heaven saved.
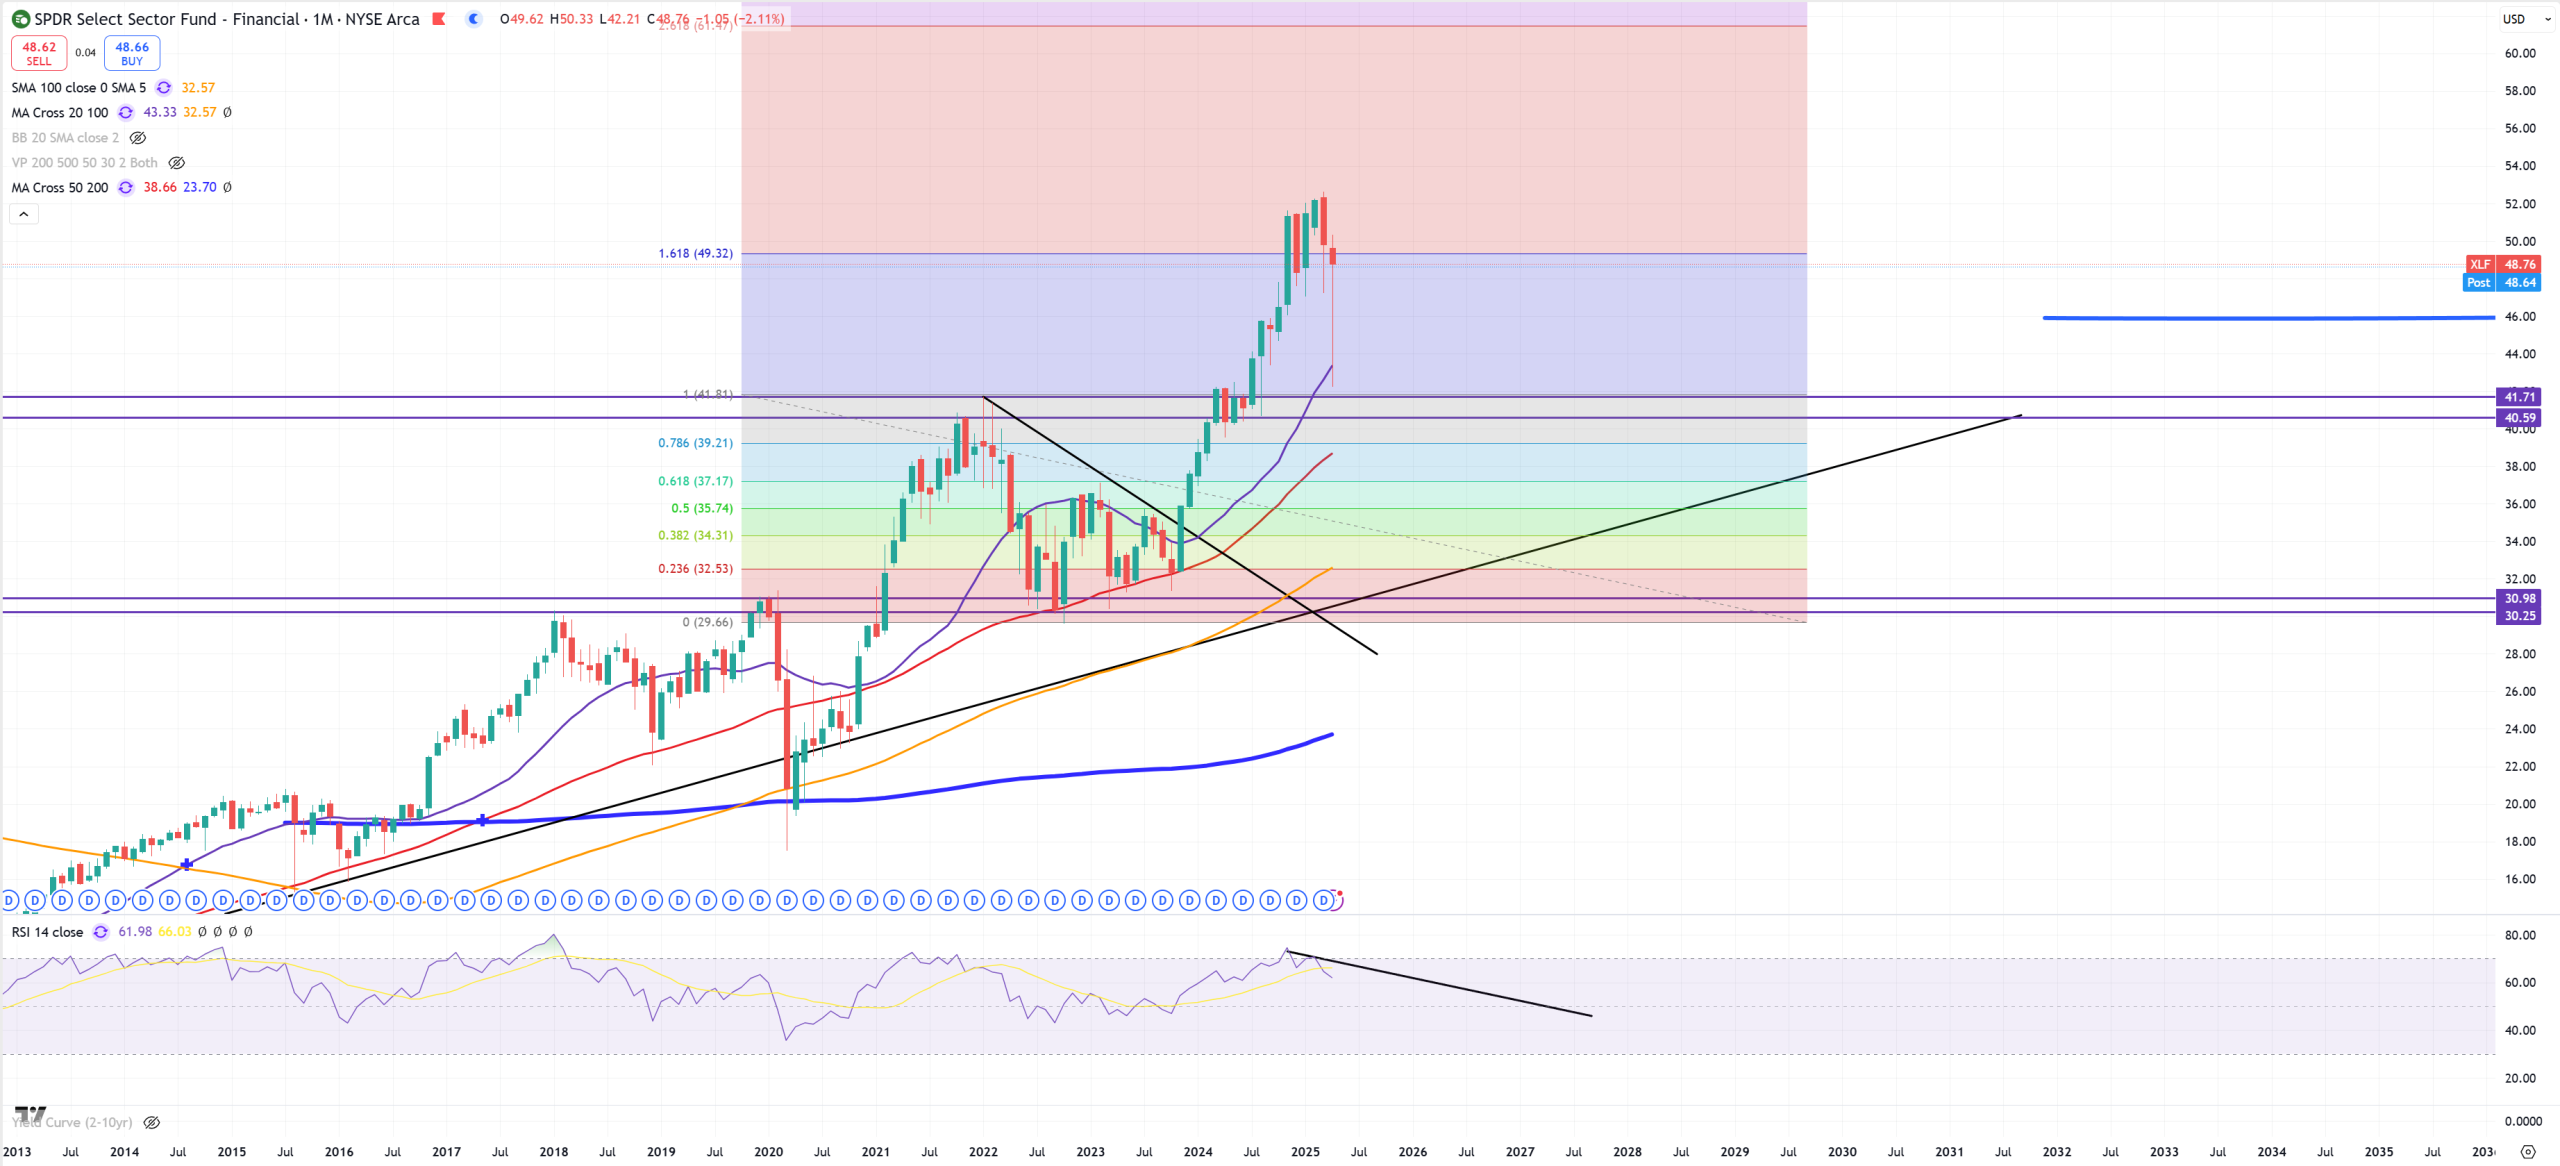
XLF – nothing to comment here. Let’s see this 1.618 level
KRE – Regional Banking – reminds in many ways IWM chart, peak in Jan 2022, now below (M)MA50/(M)MA100 and support on 2007-2008 level.
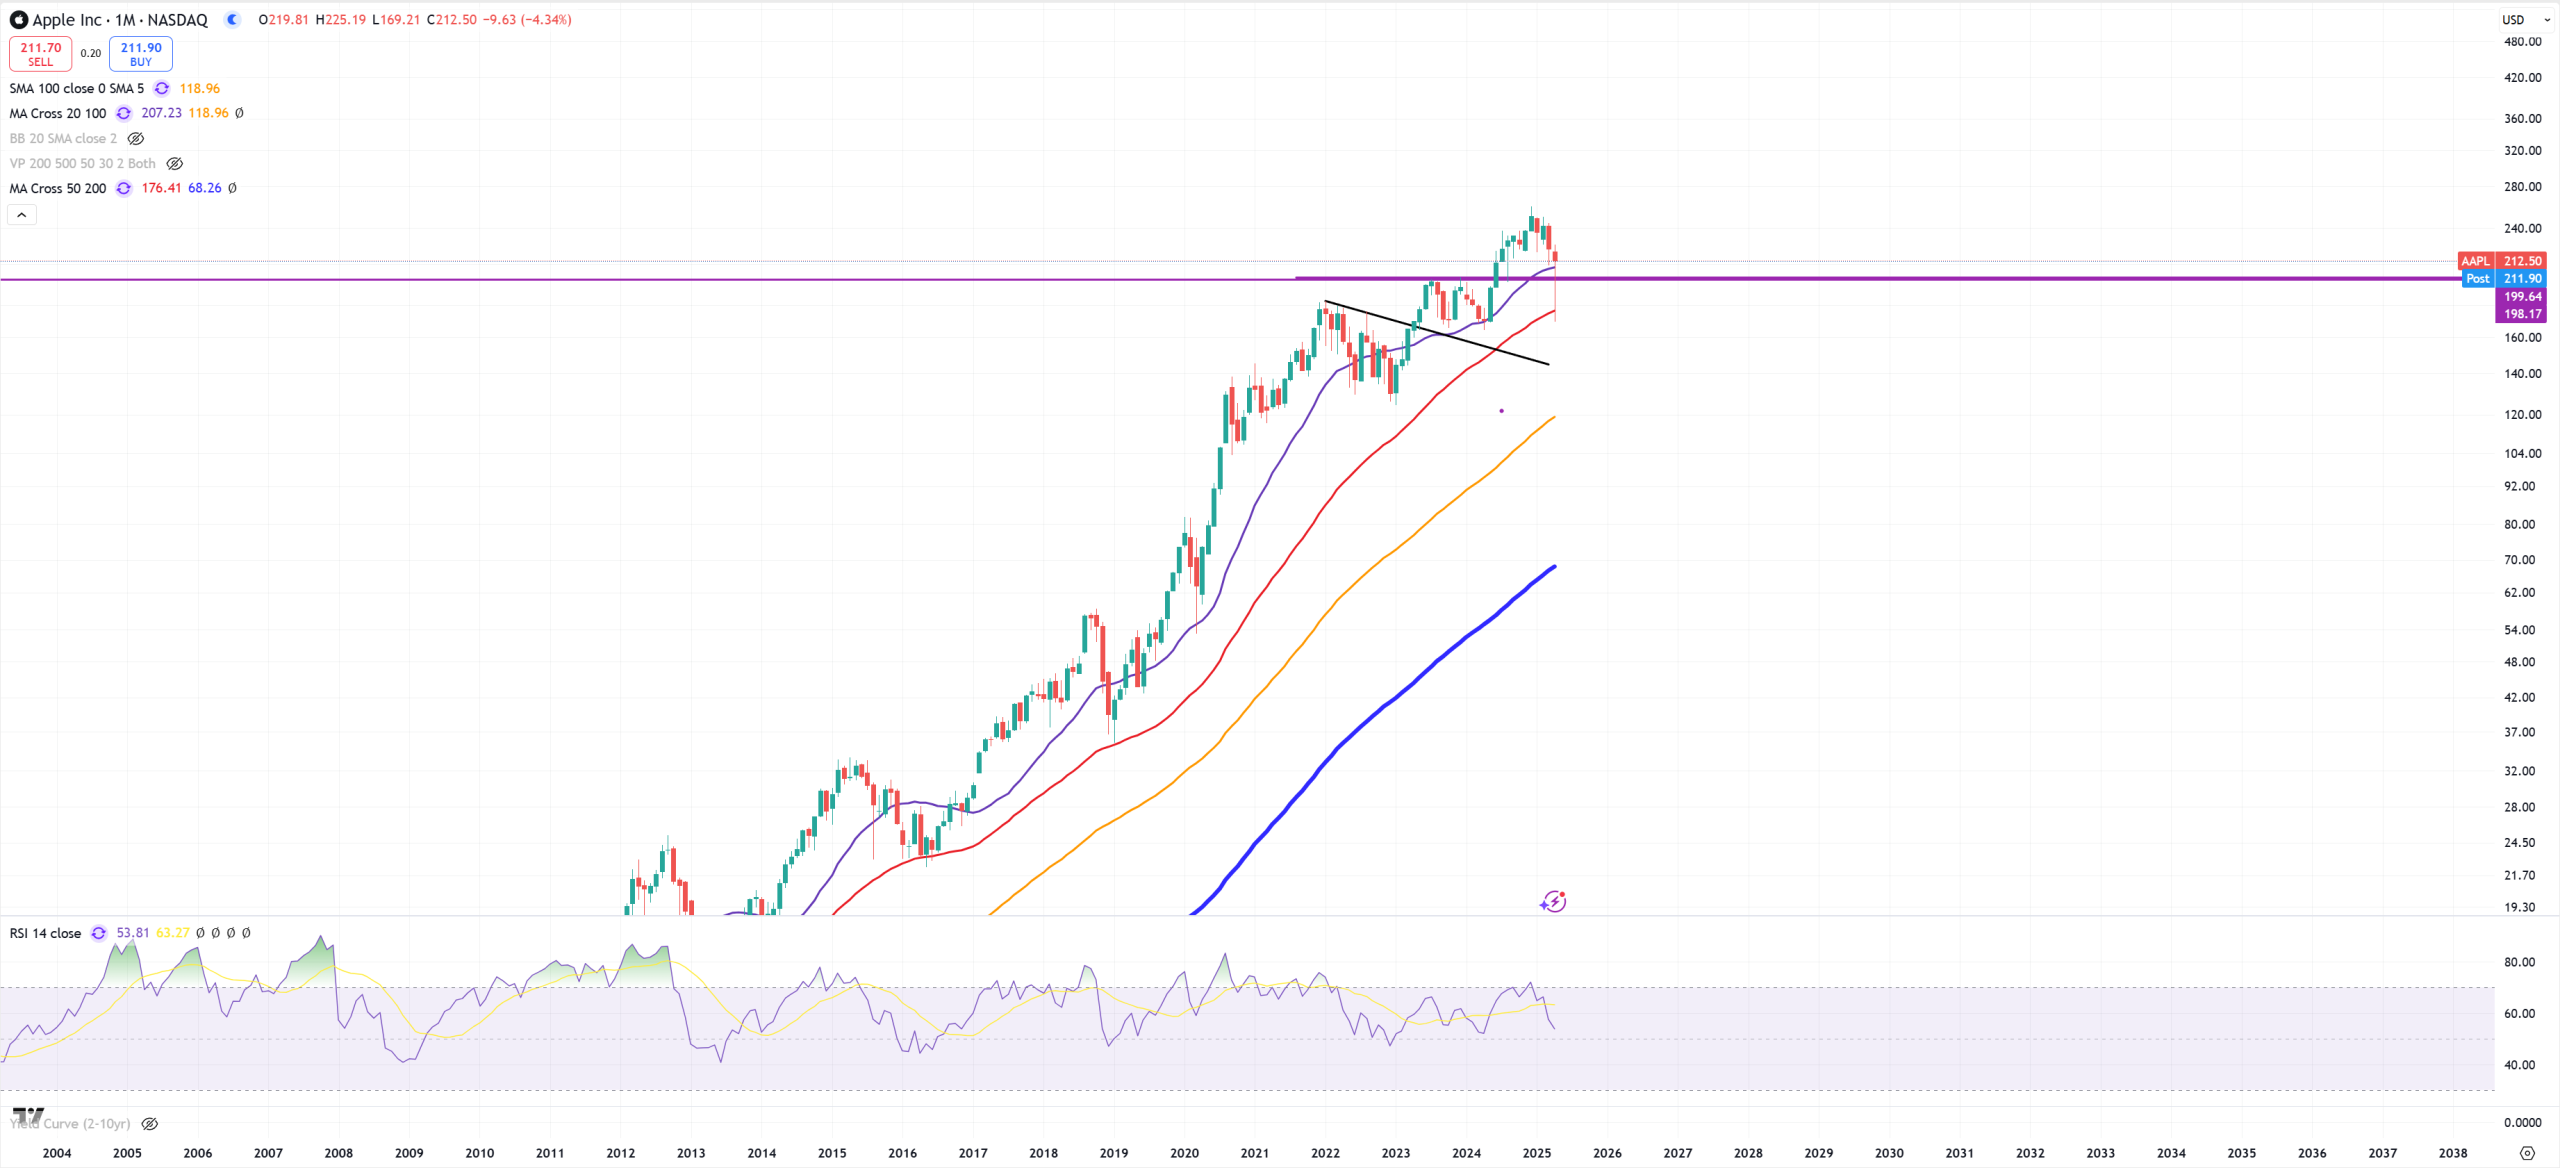
AAPL – Apple – so far saved, they better not dissapoint
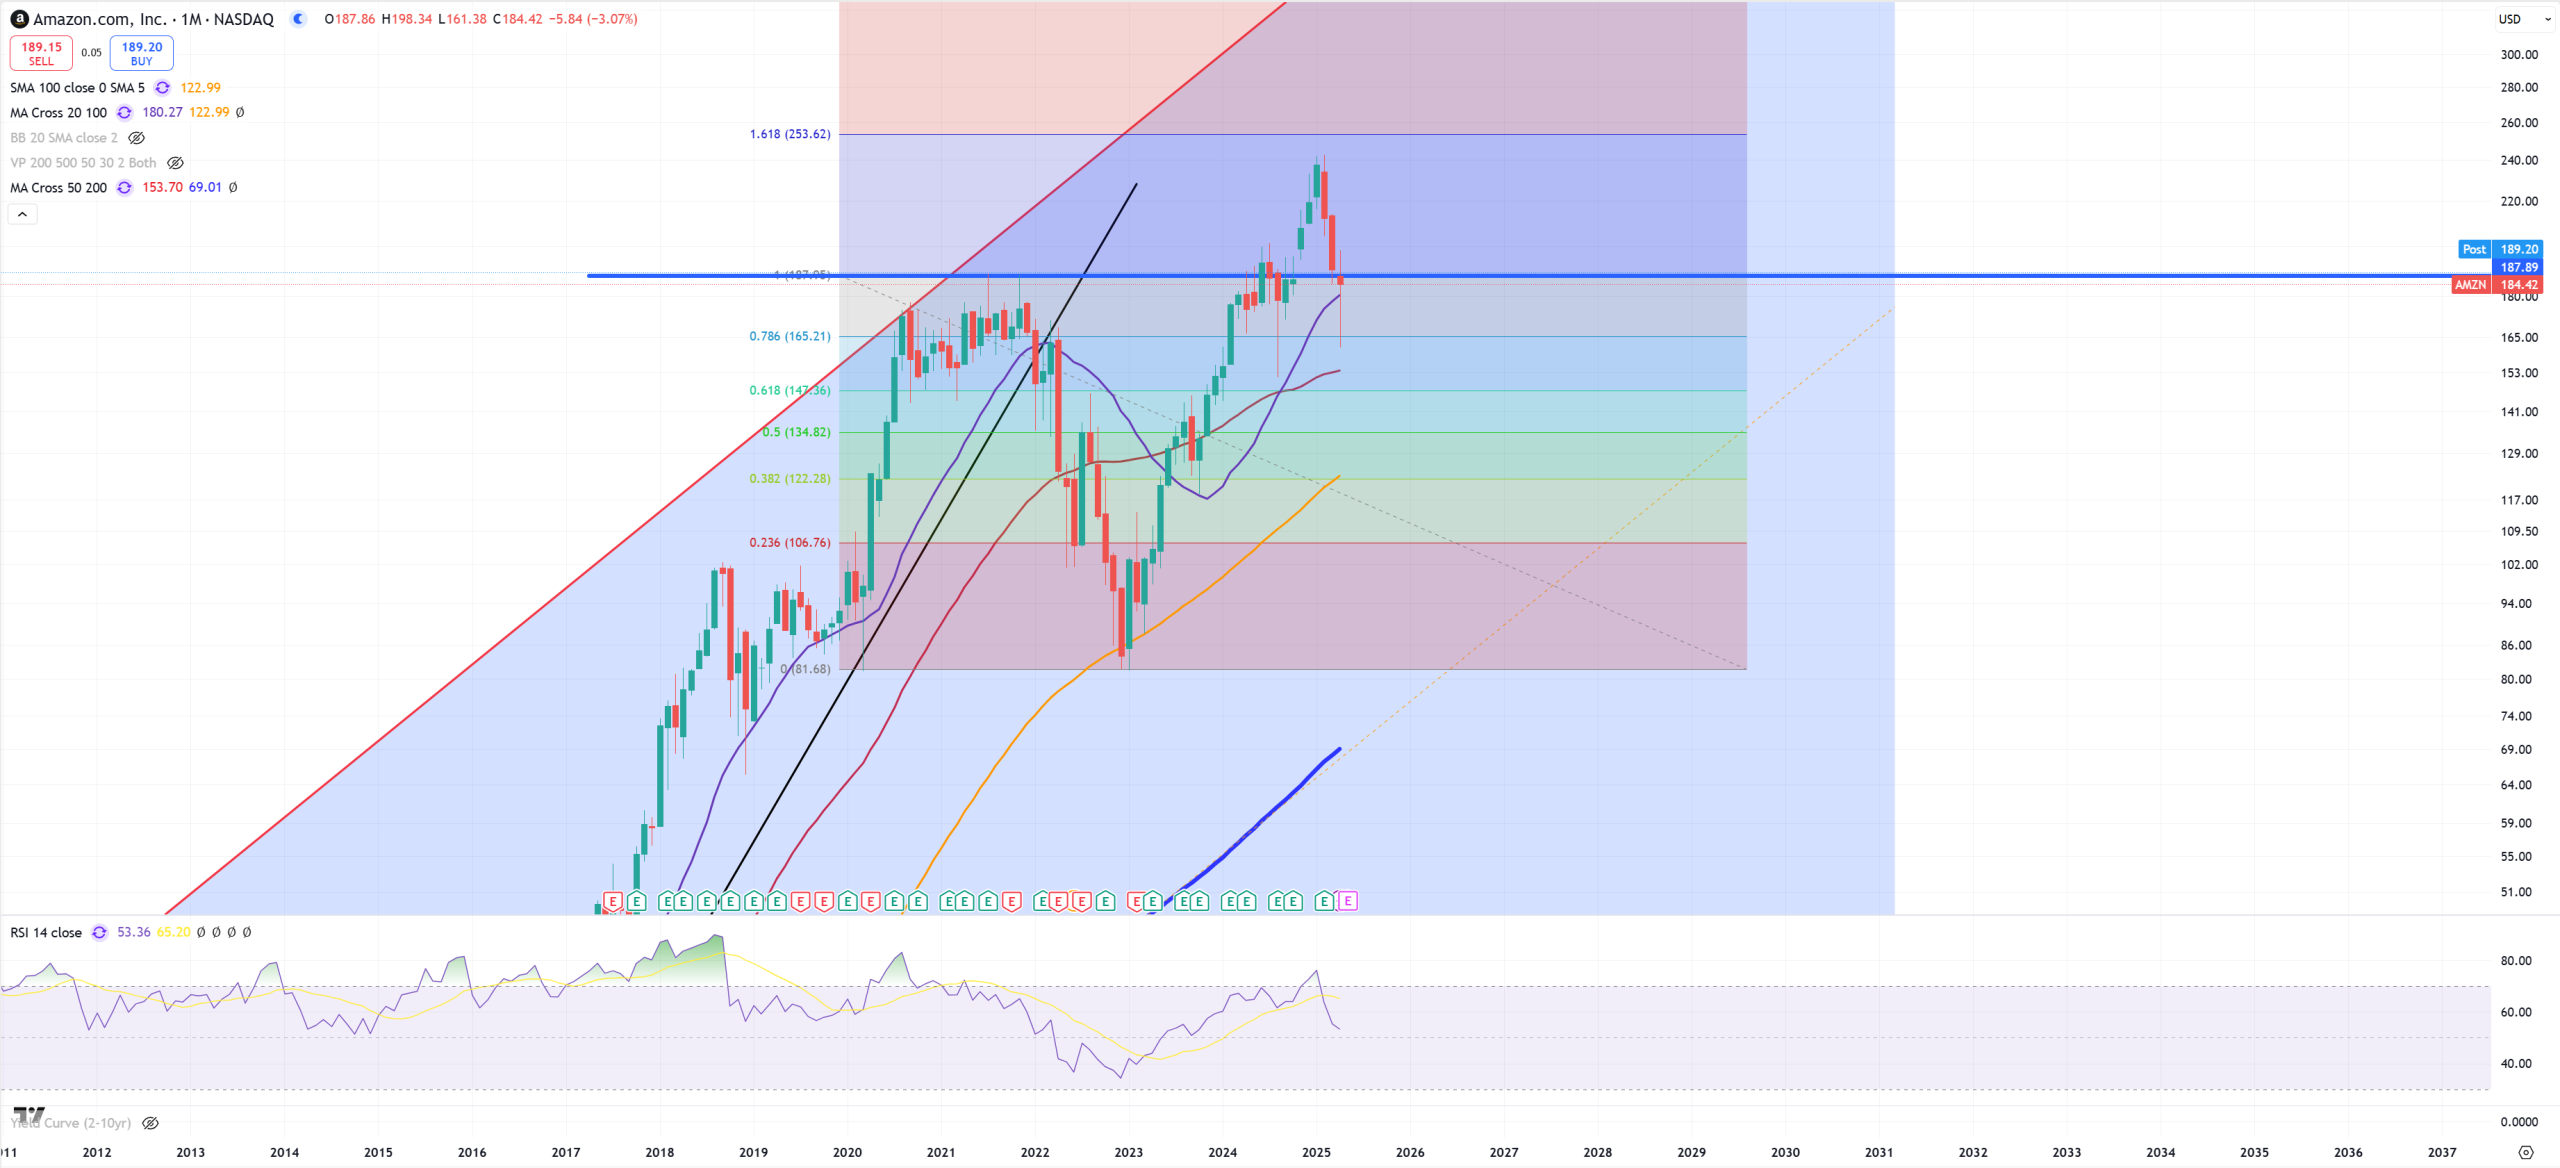
AMZN – Amazon – closed below key support, earnings I think tomorrow.
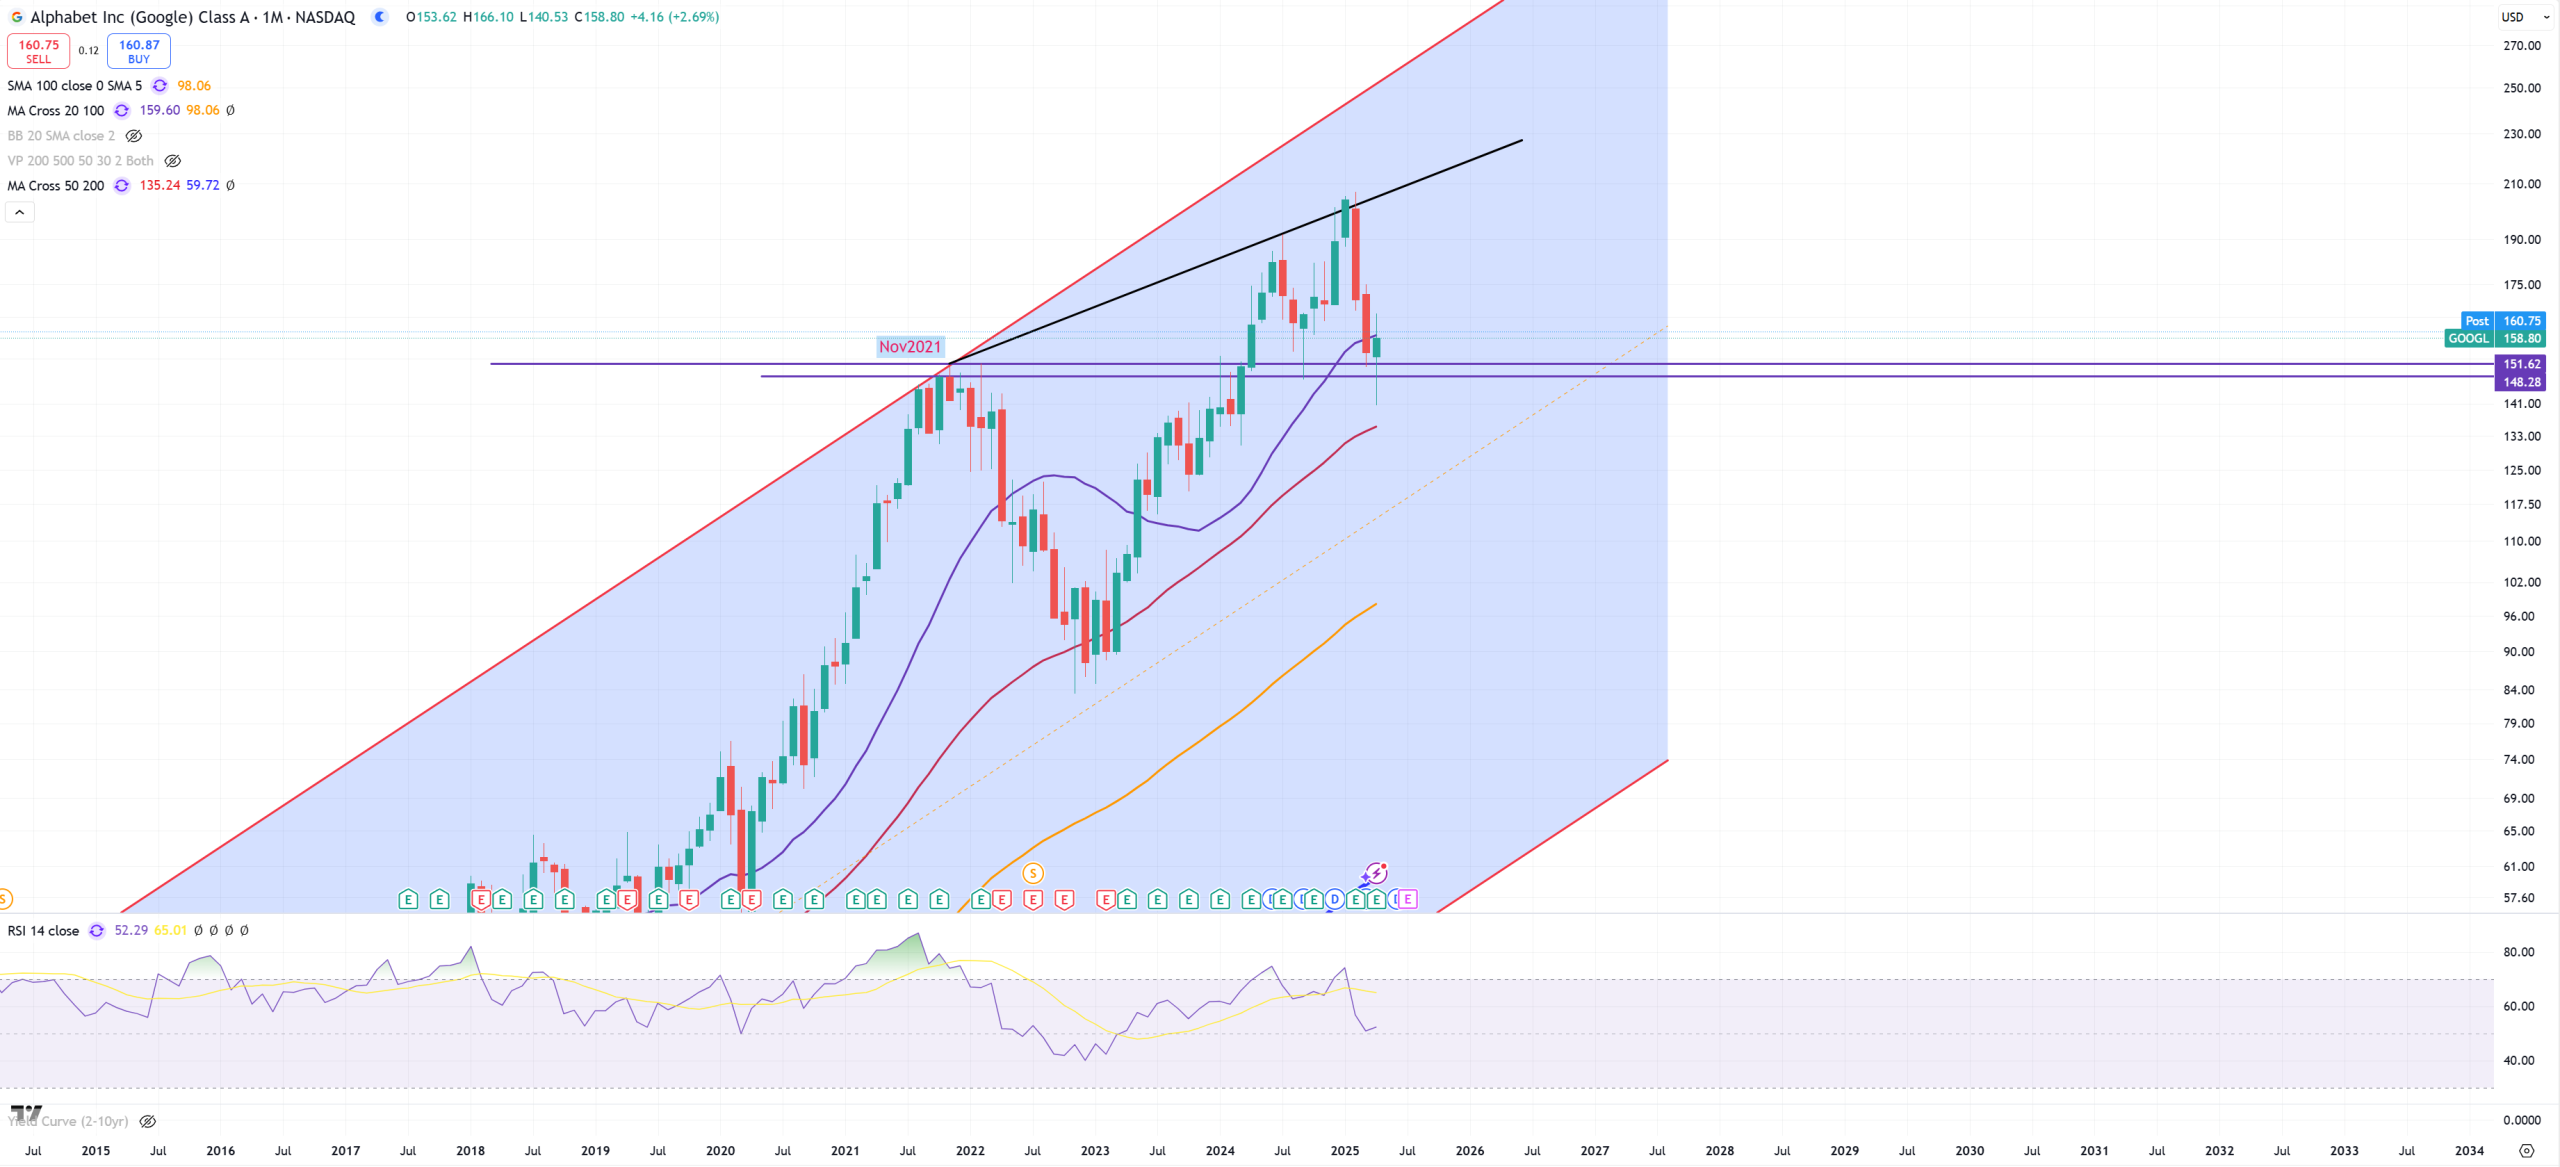
GOOGL – support holds but (M)MA20 from the upper side.
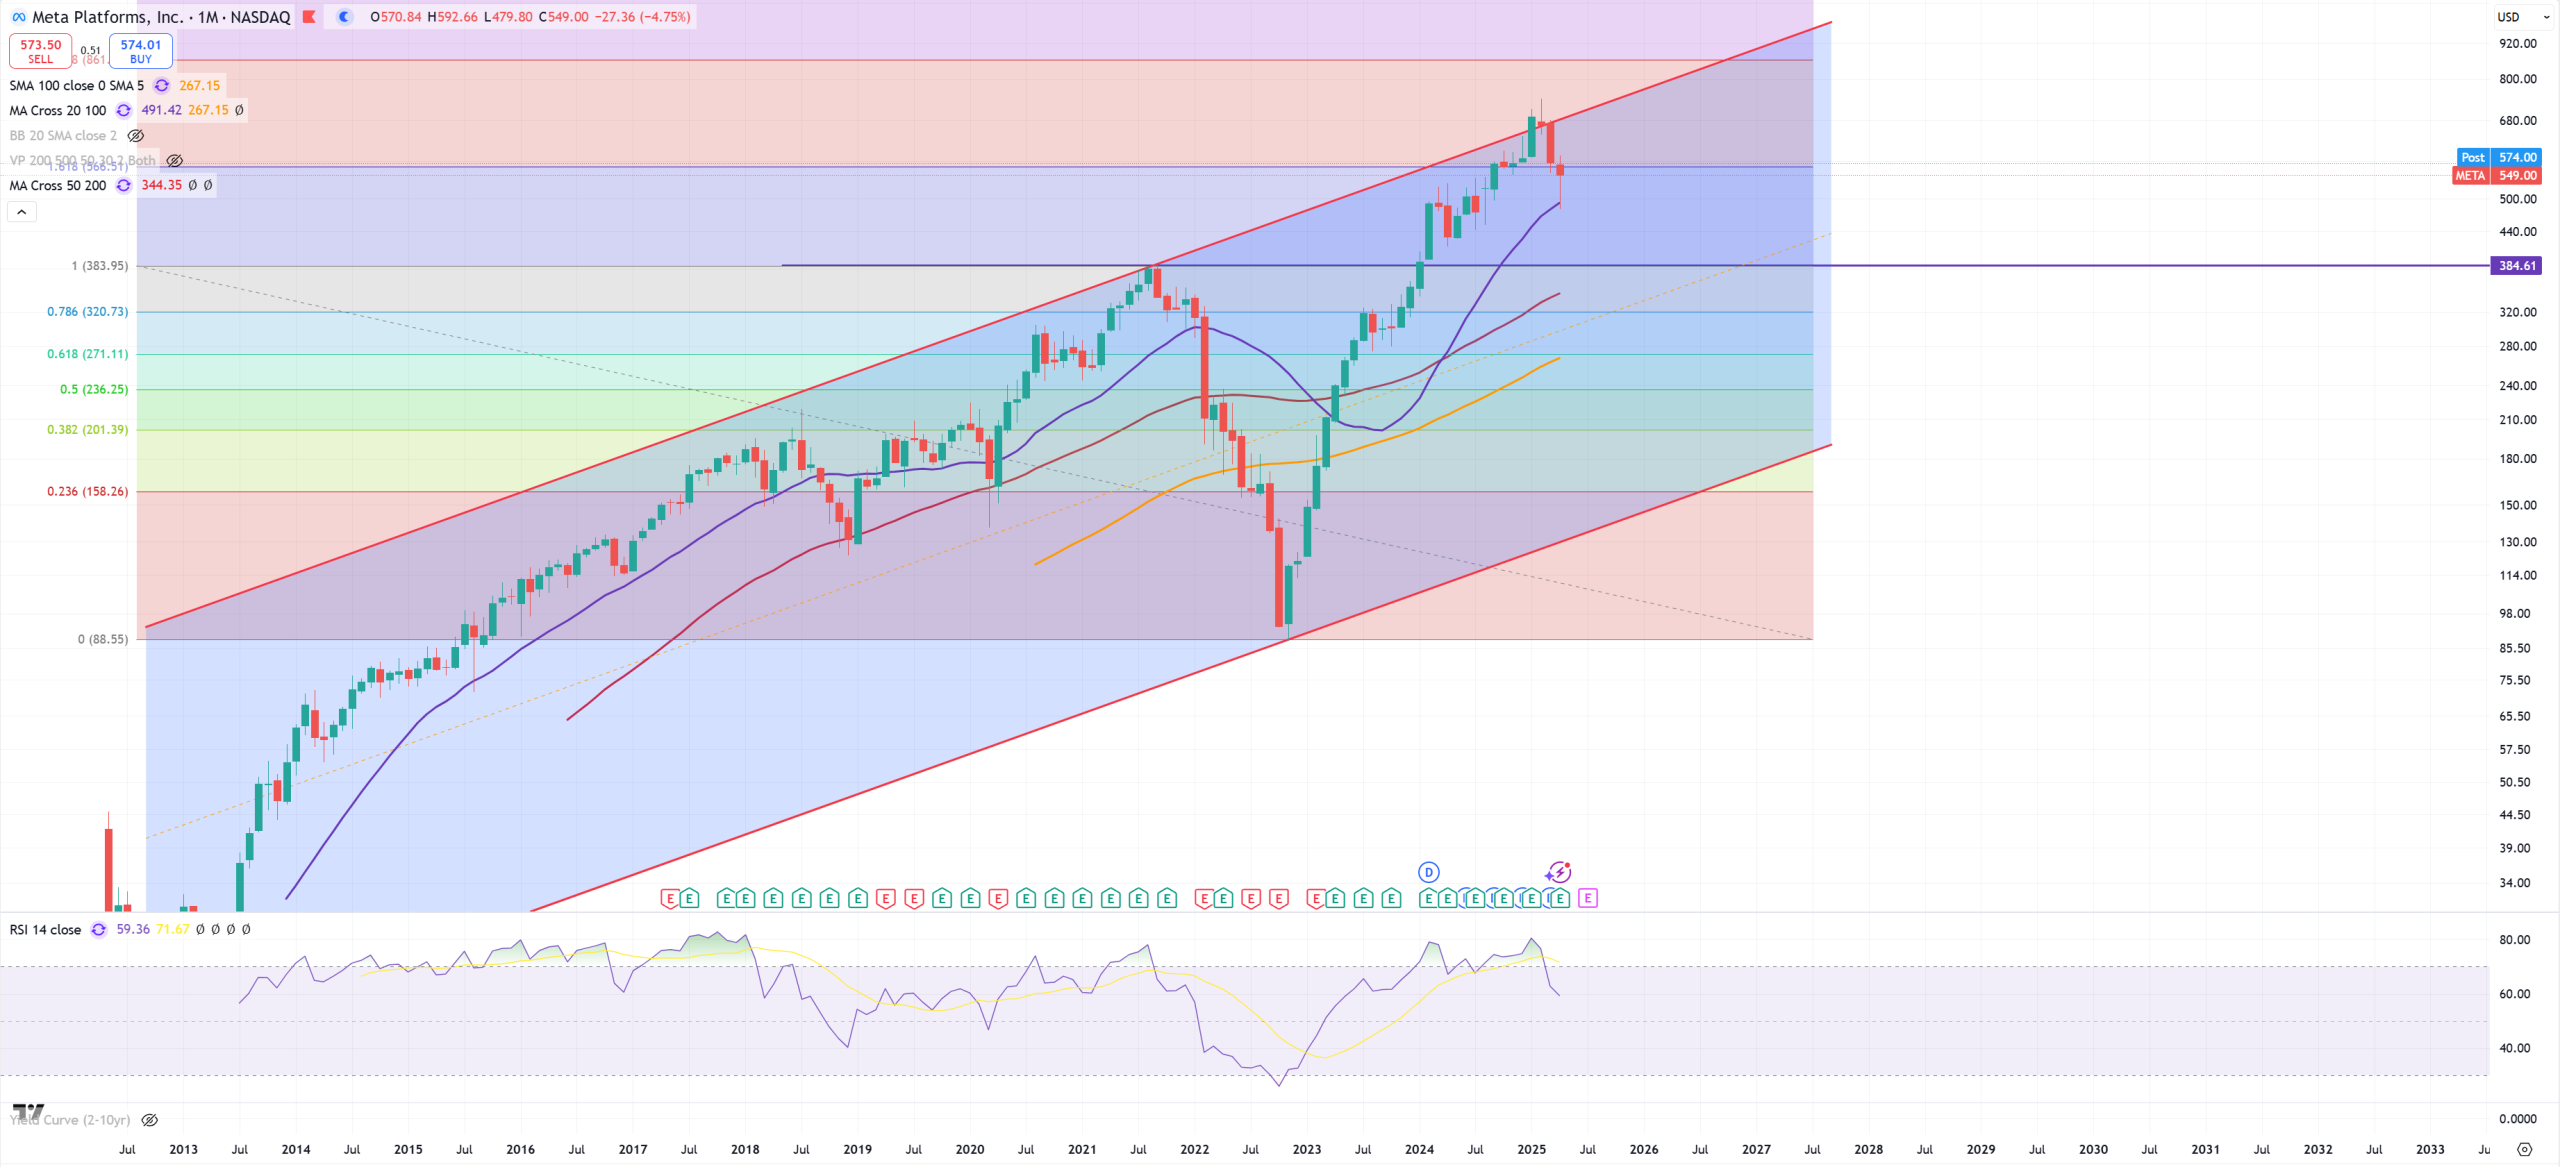
META – this chart is the most bullish from all Mag7
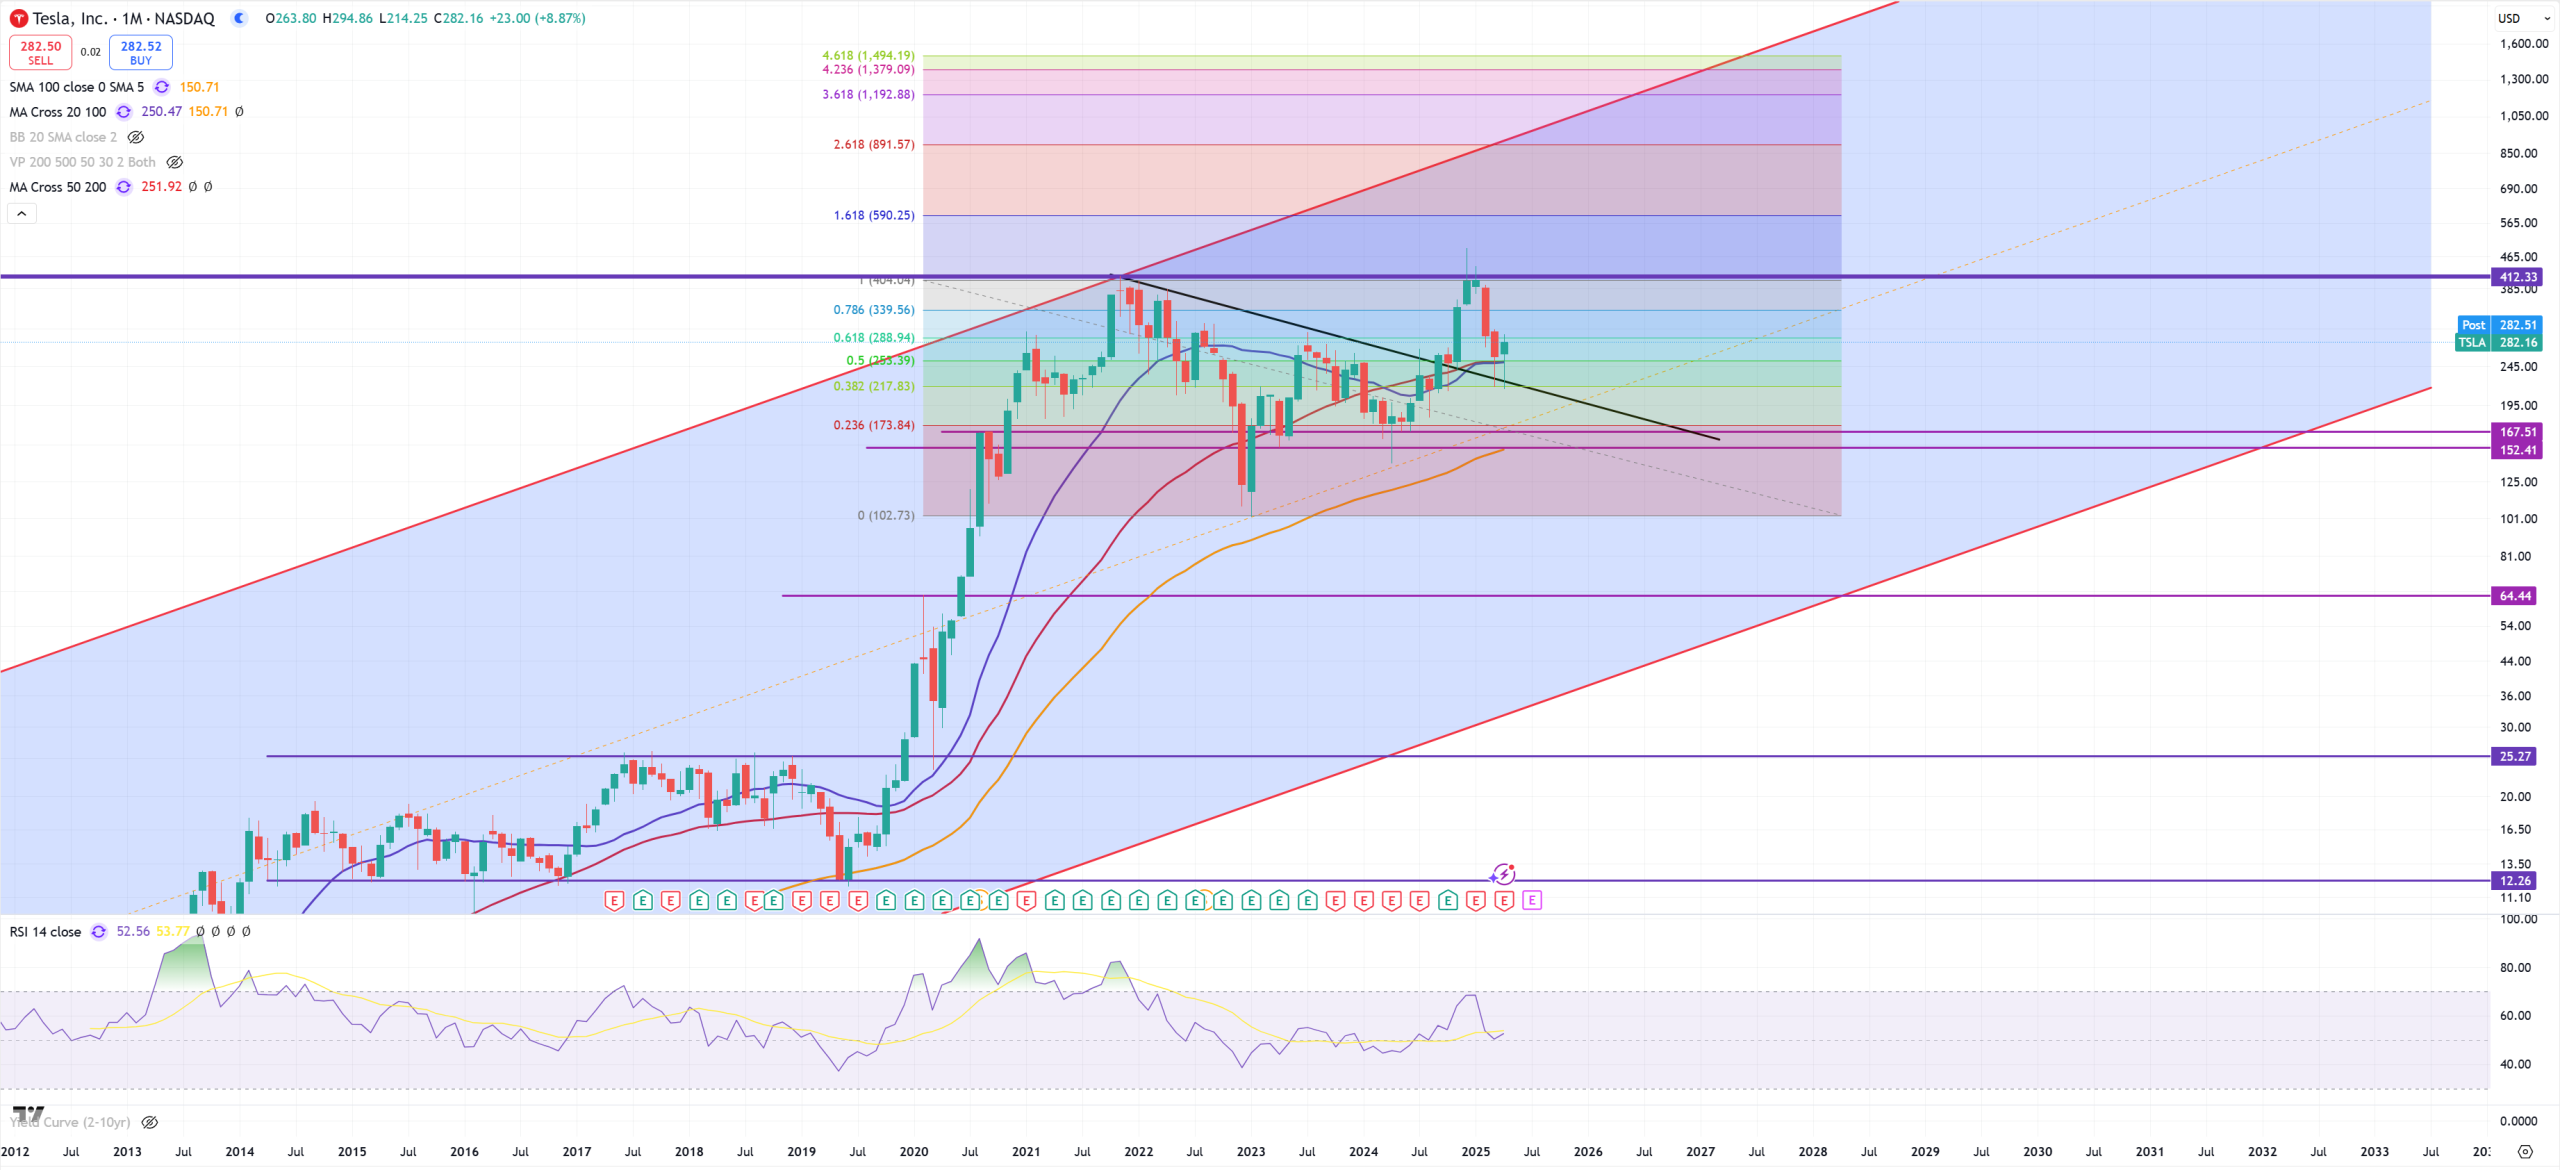
TSLA – their earnings were a disaster, but as usual Elon kicks the can with “robotaxi” and “optimus” fake admitting they won’t produce optimus (but not on earnings calls) because of rare earth metals problems. Anyway it’s clearly technical defence od (M)MA50 + trend.
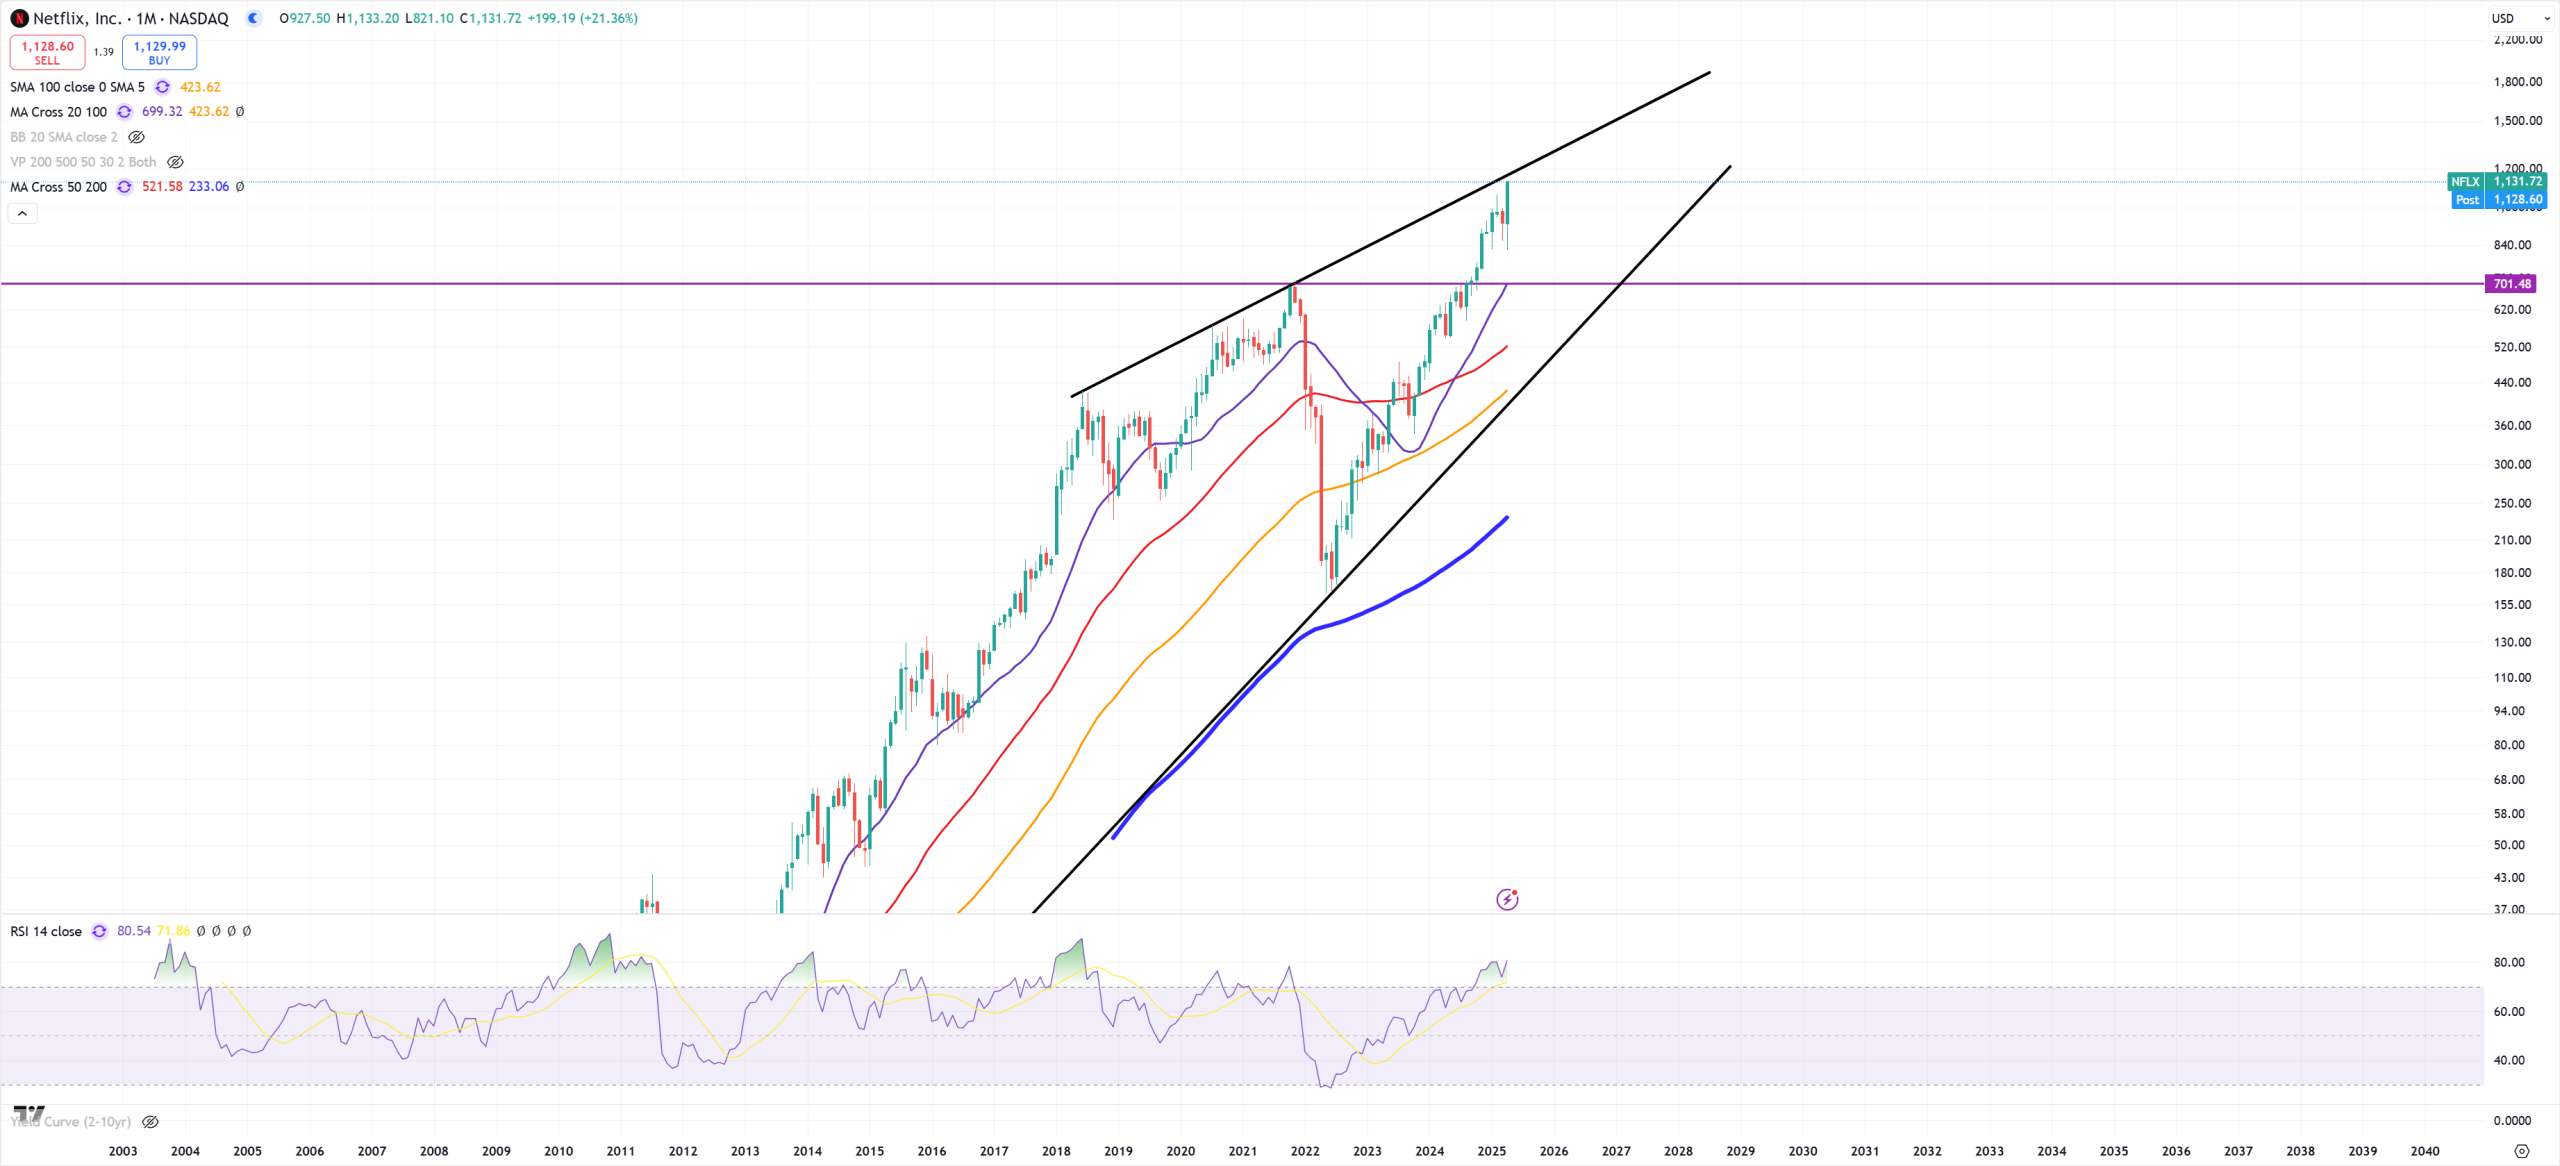
NFLX – we’re almost at the 3rd point.
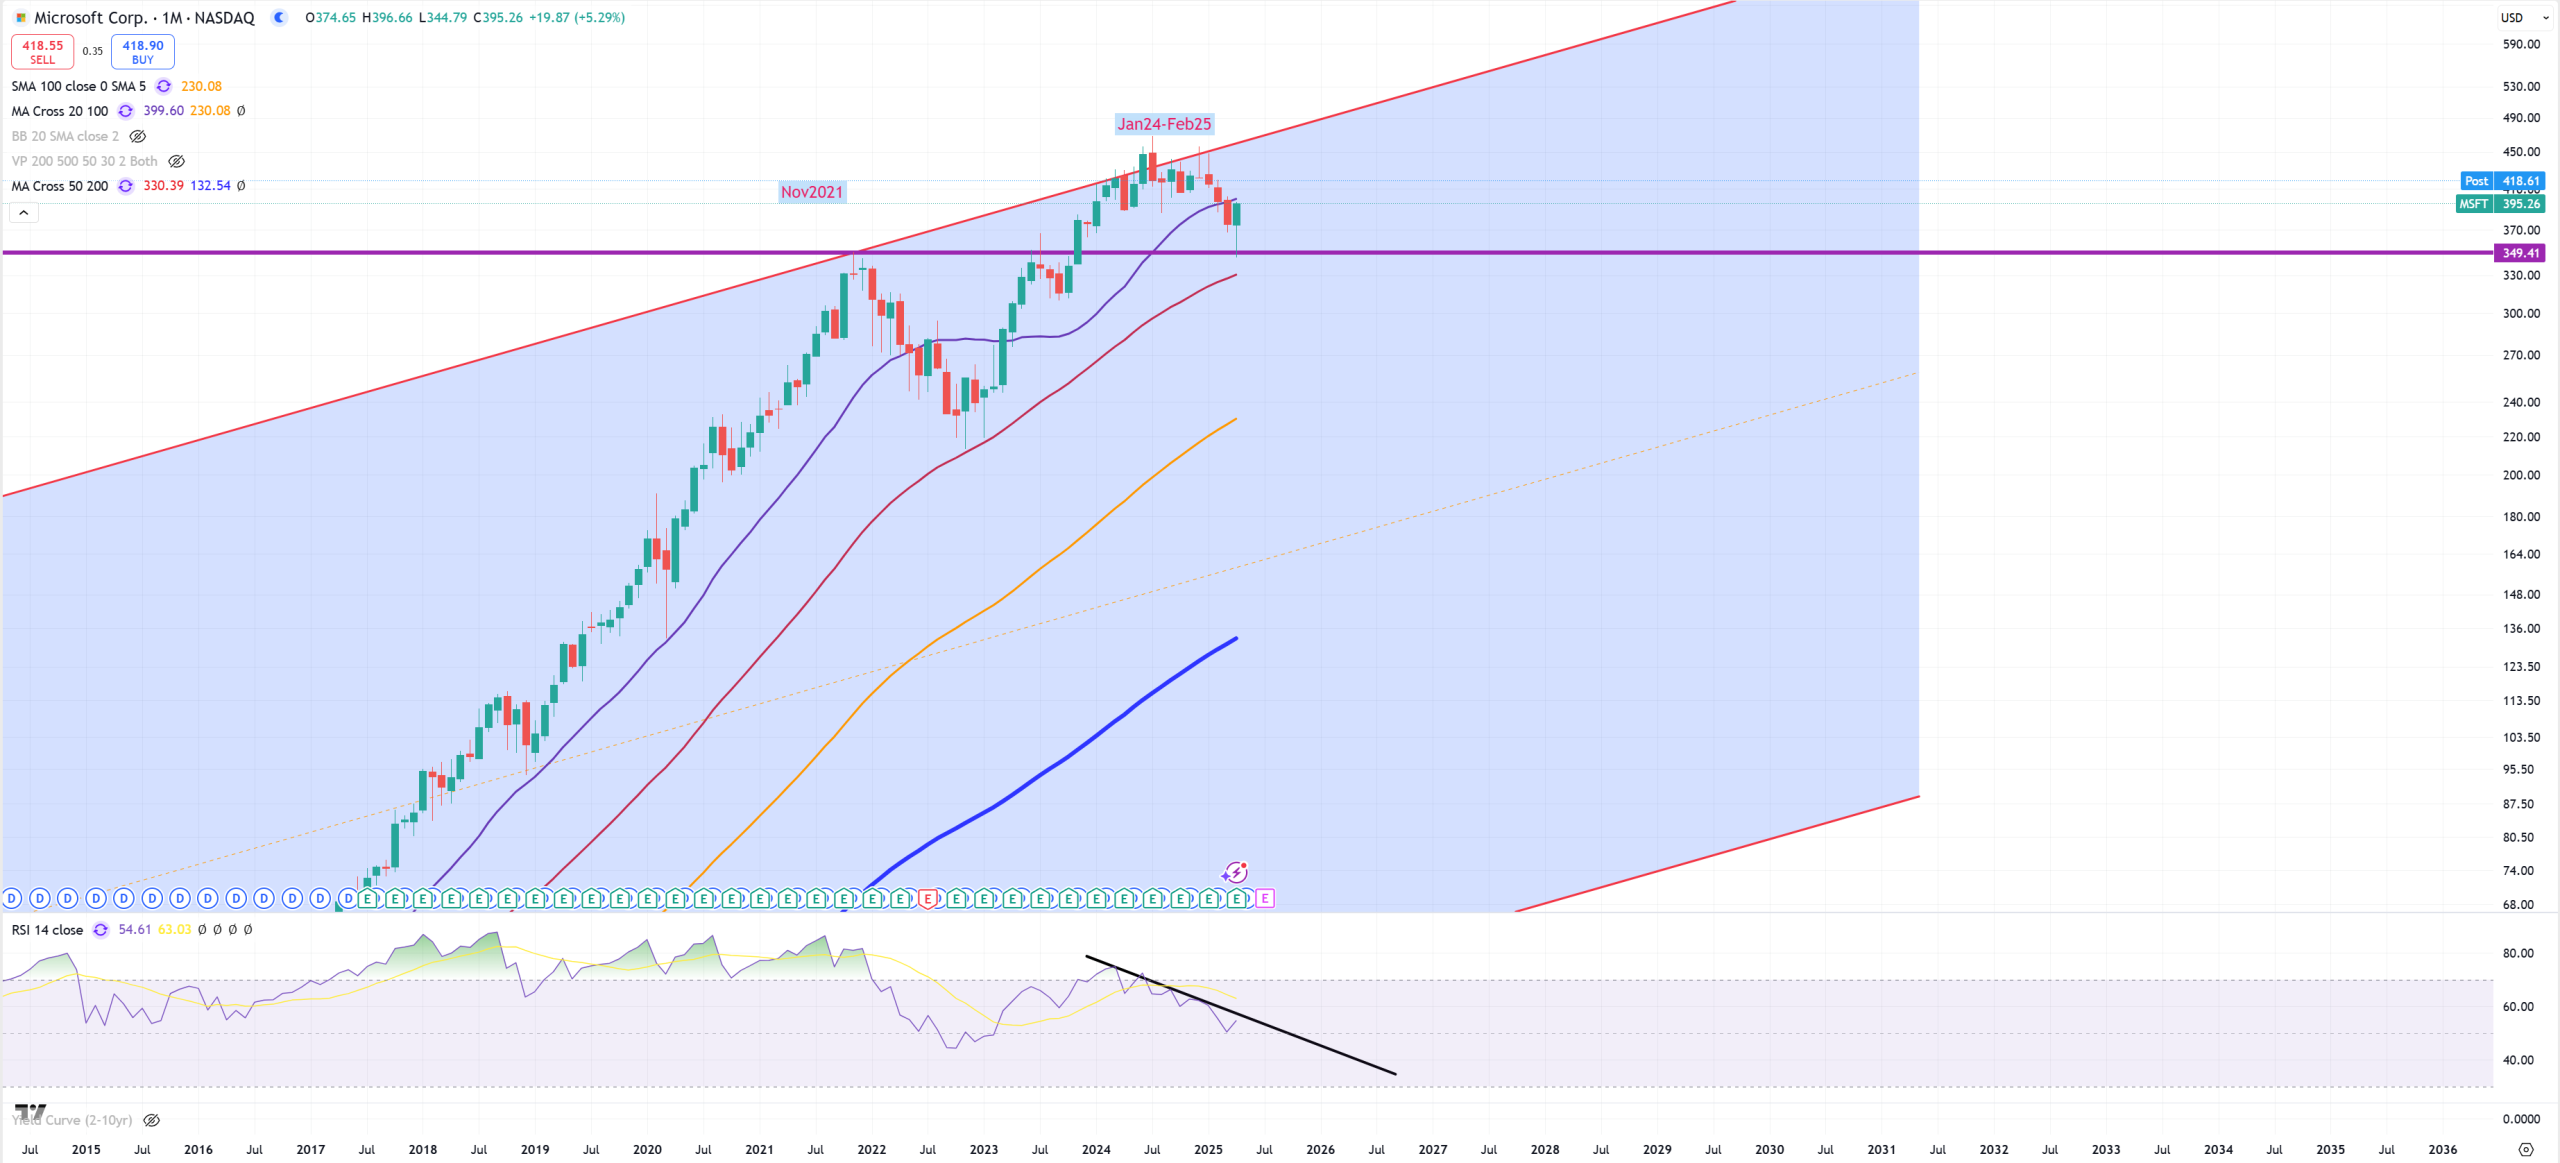
MSFT – good earnings but it’s not changing anything.
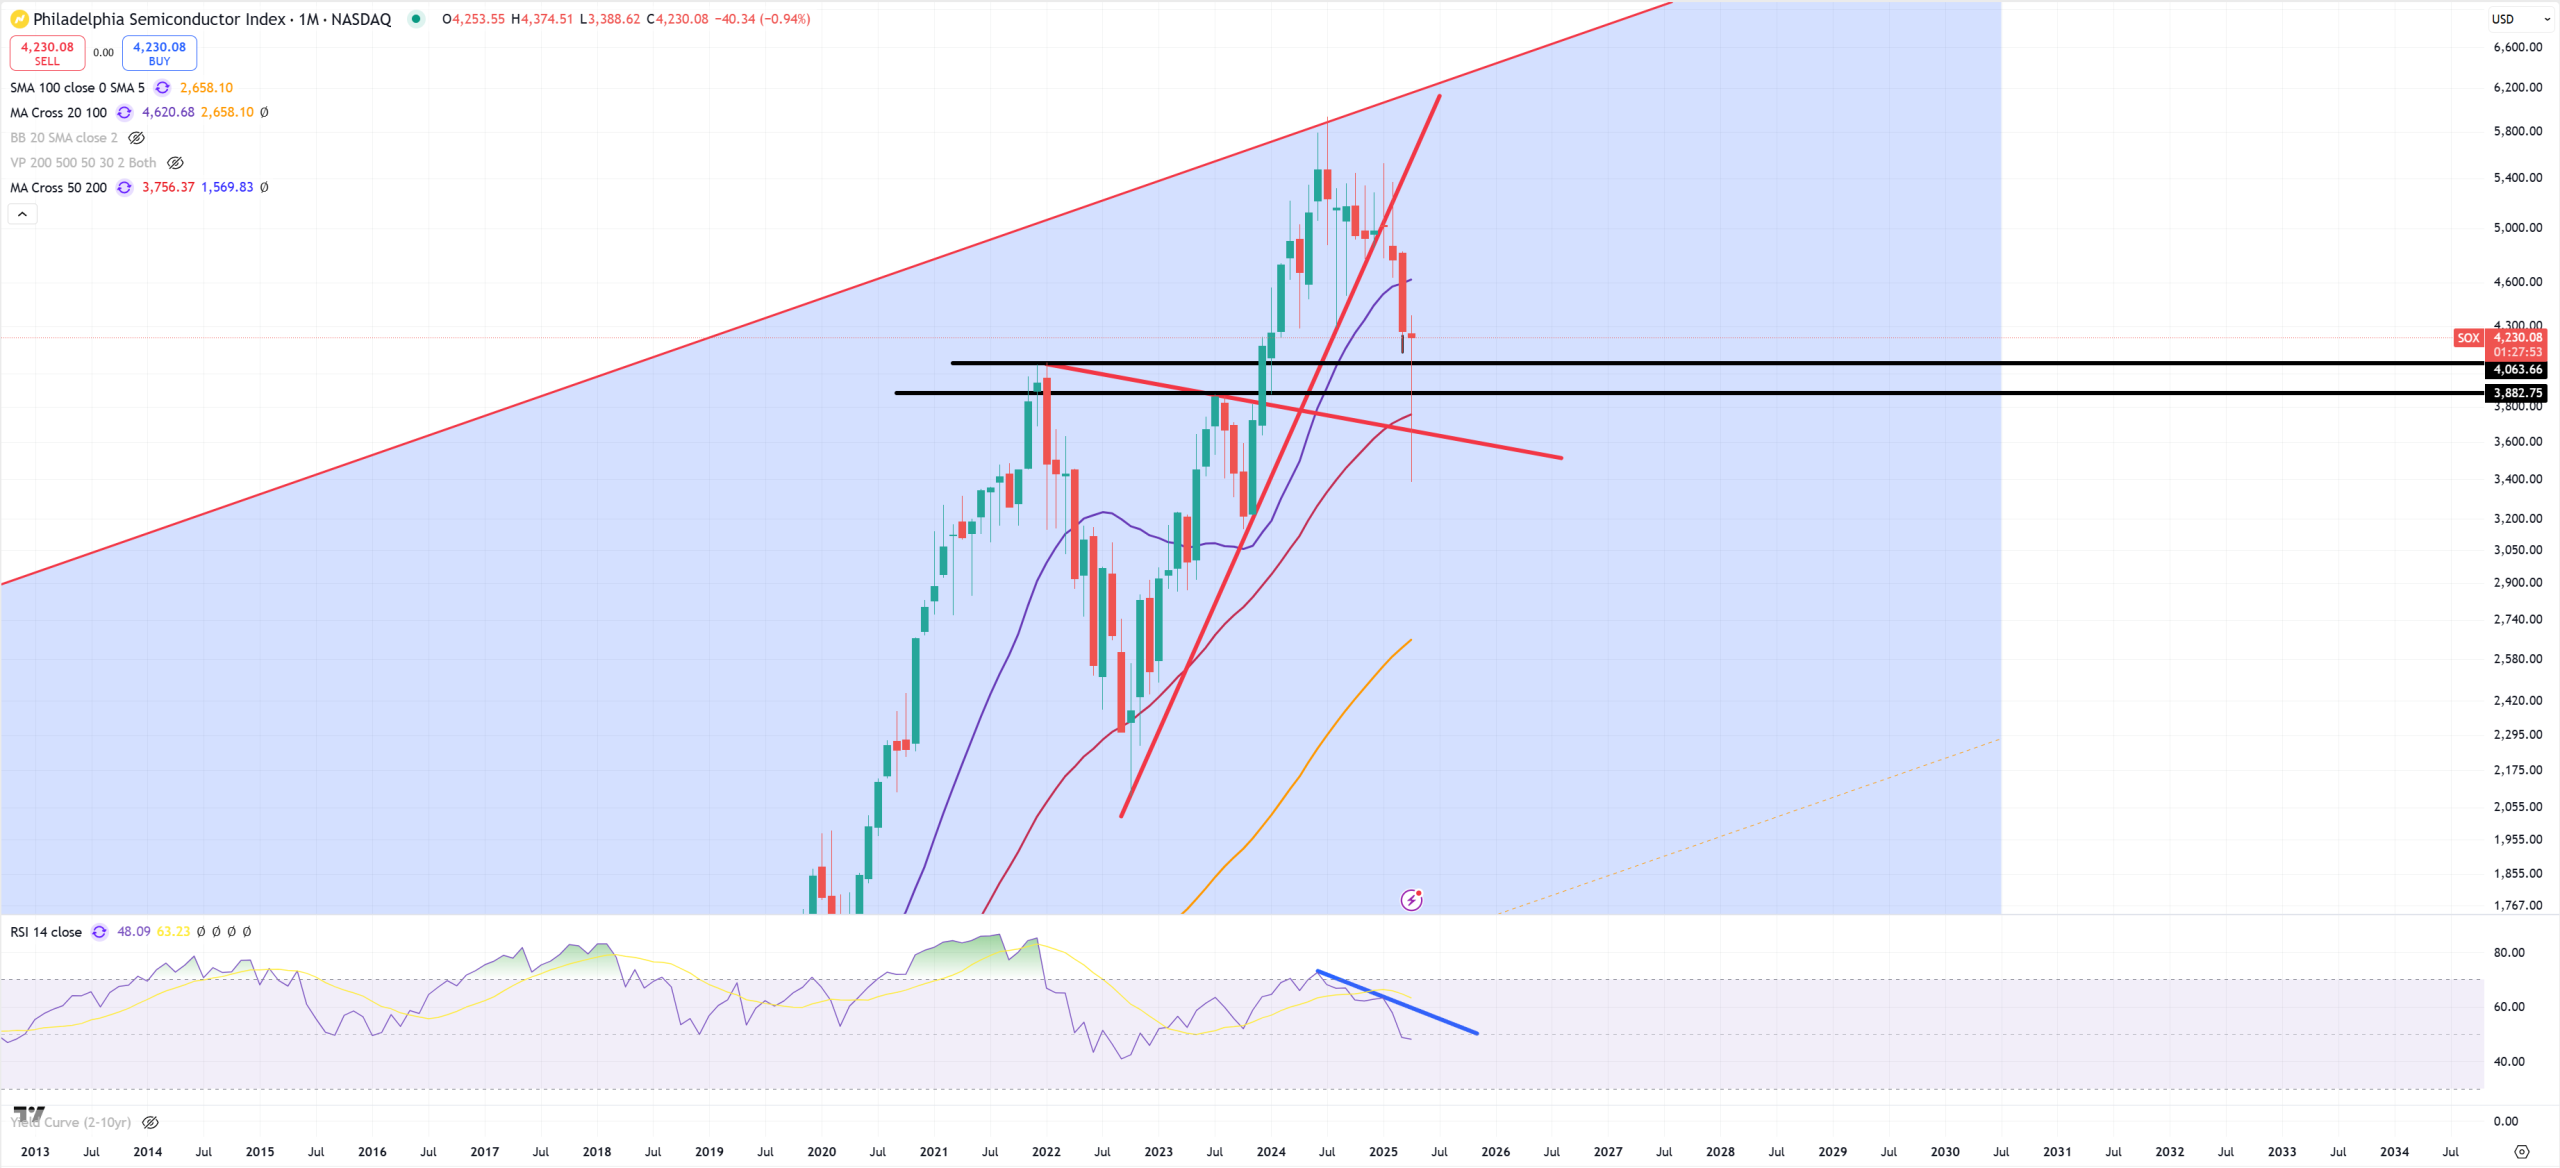
SOX – saved, but negative divergence is with us.
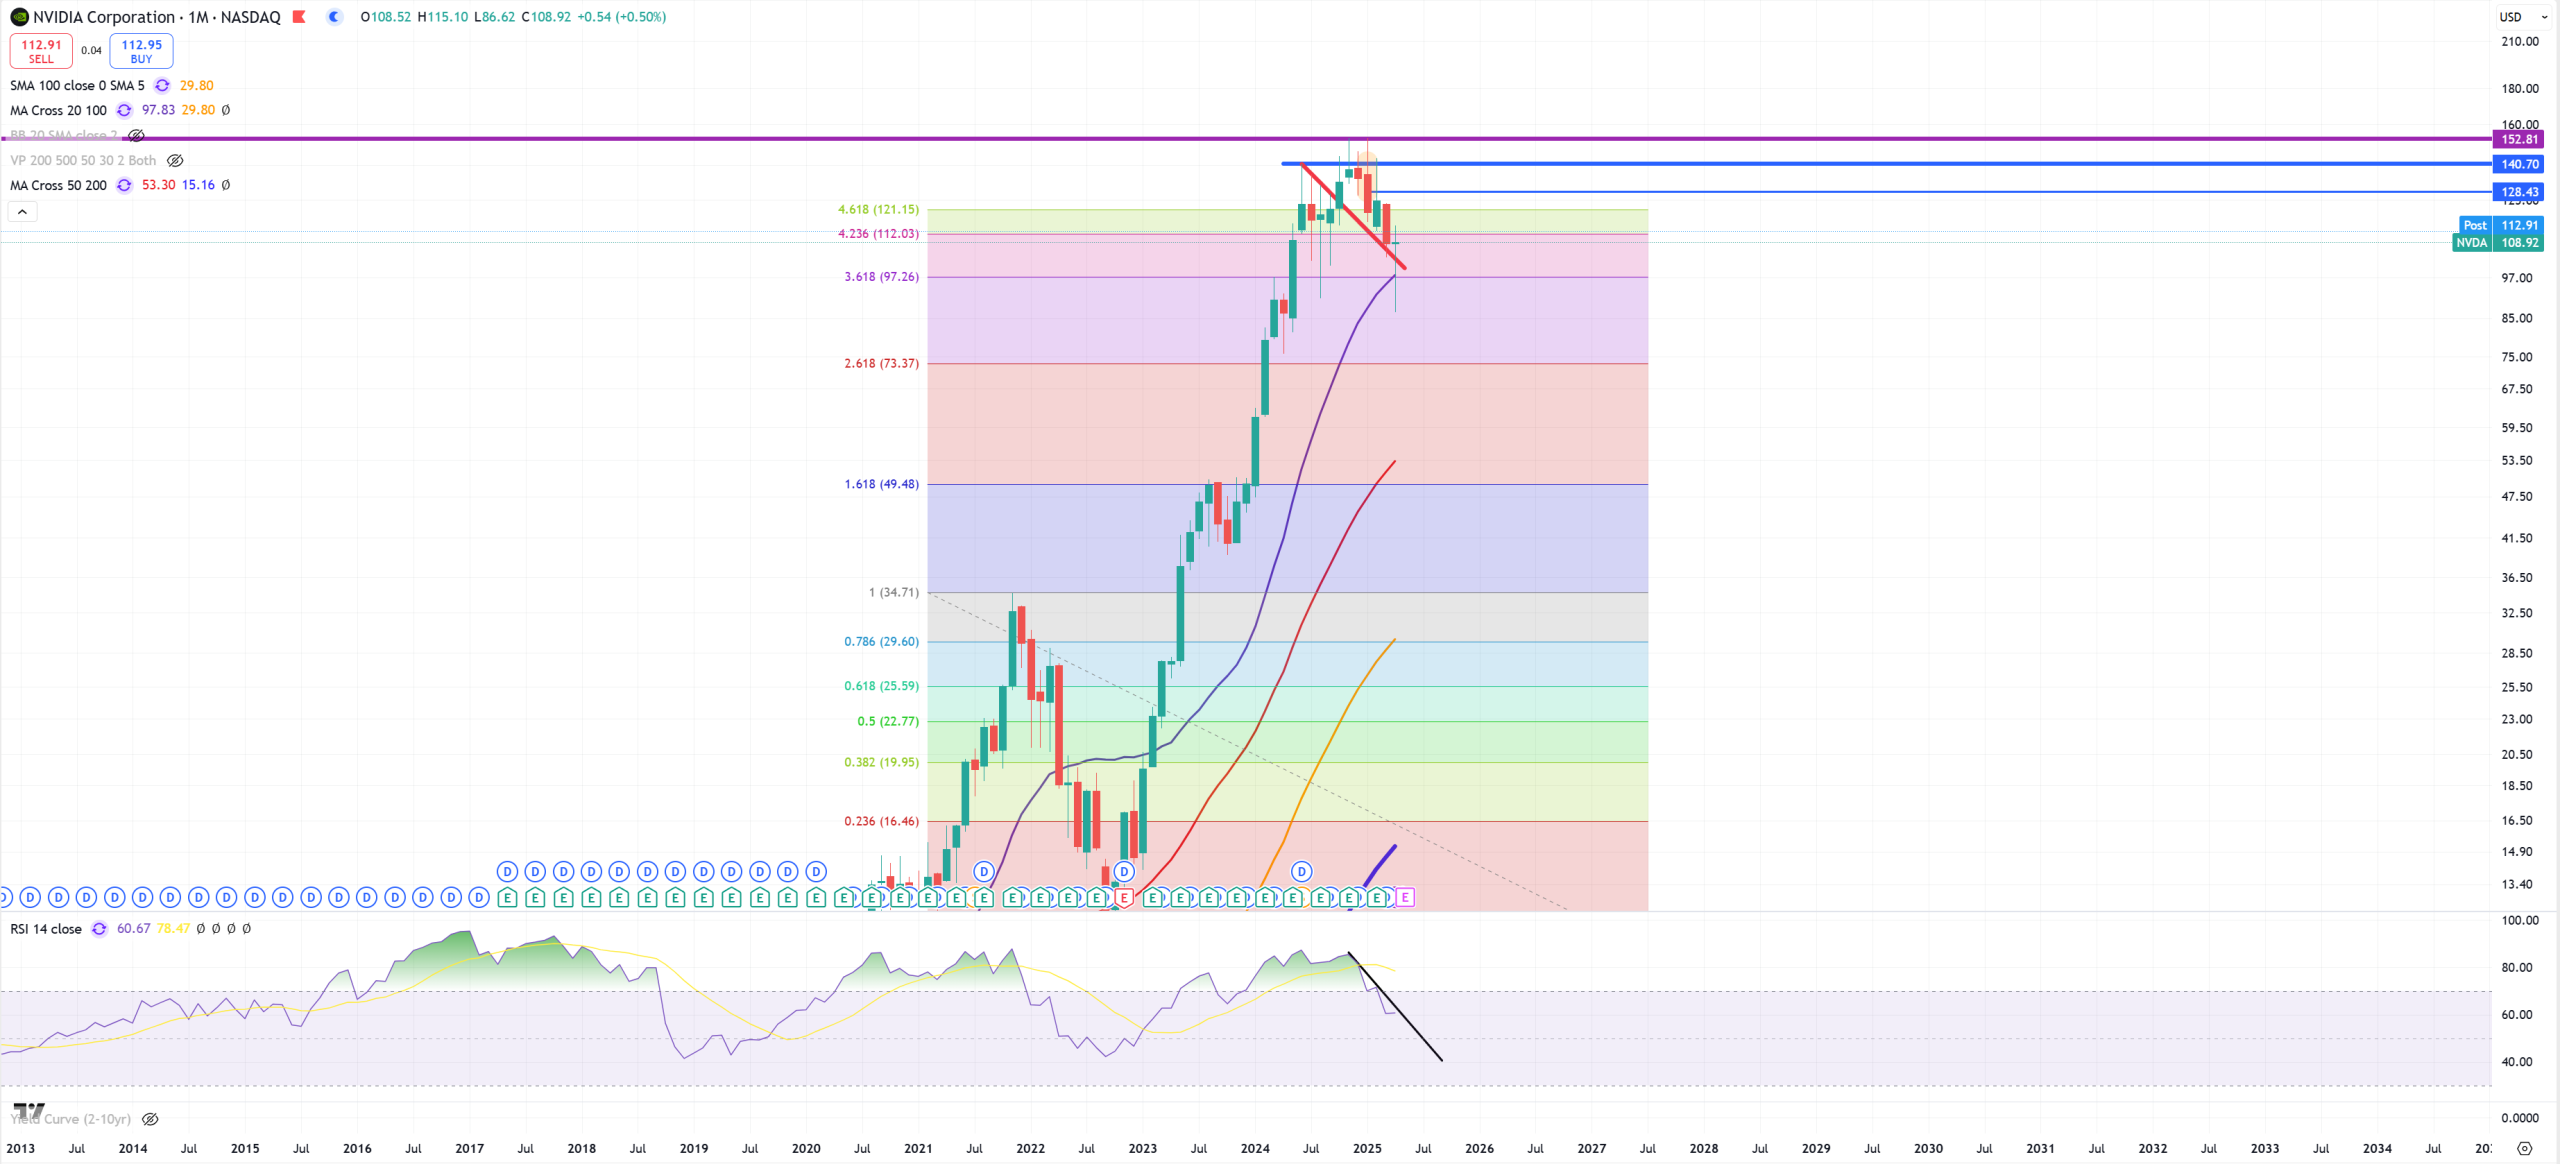
NVDA – 152$ is so far the top, (M)MA50 = 54$, trying to hold (M)MA20 at any cost, because once it’ll be done it’ll tank to (M)MA50.
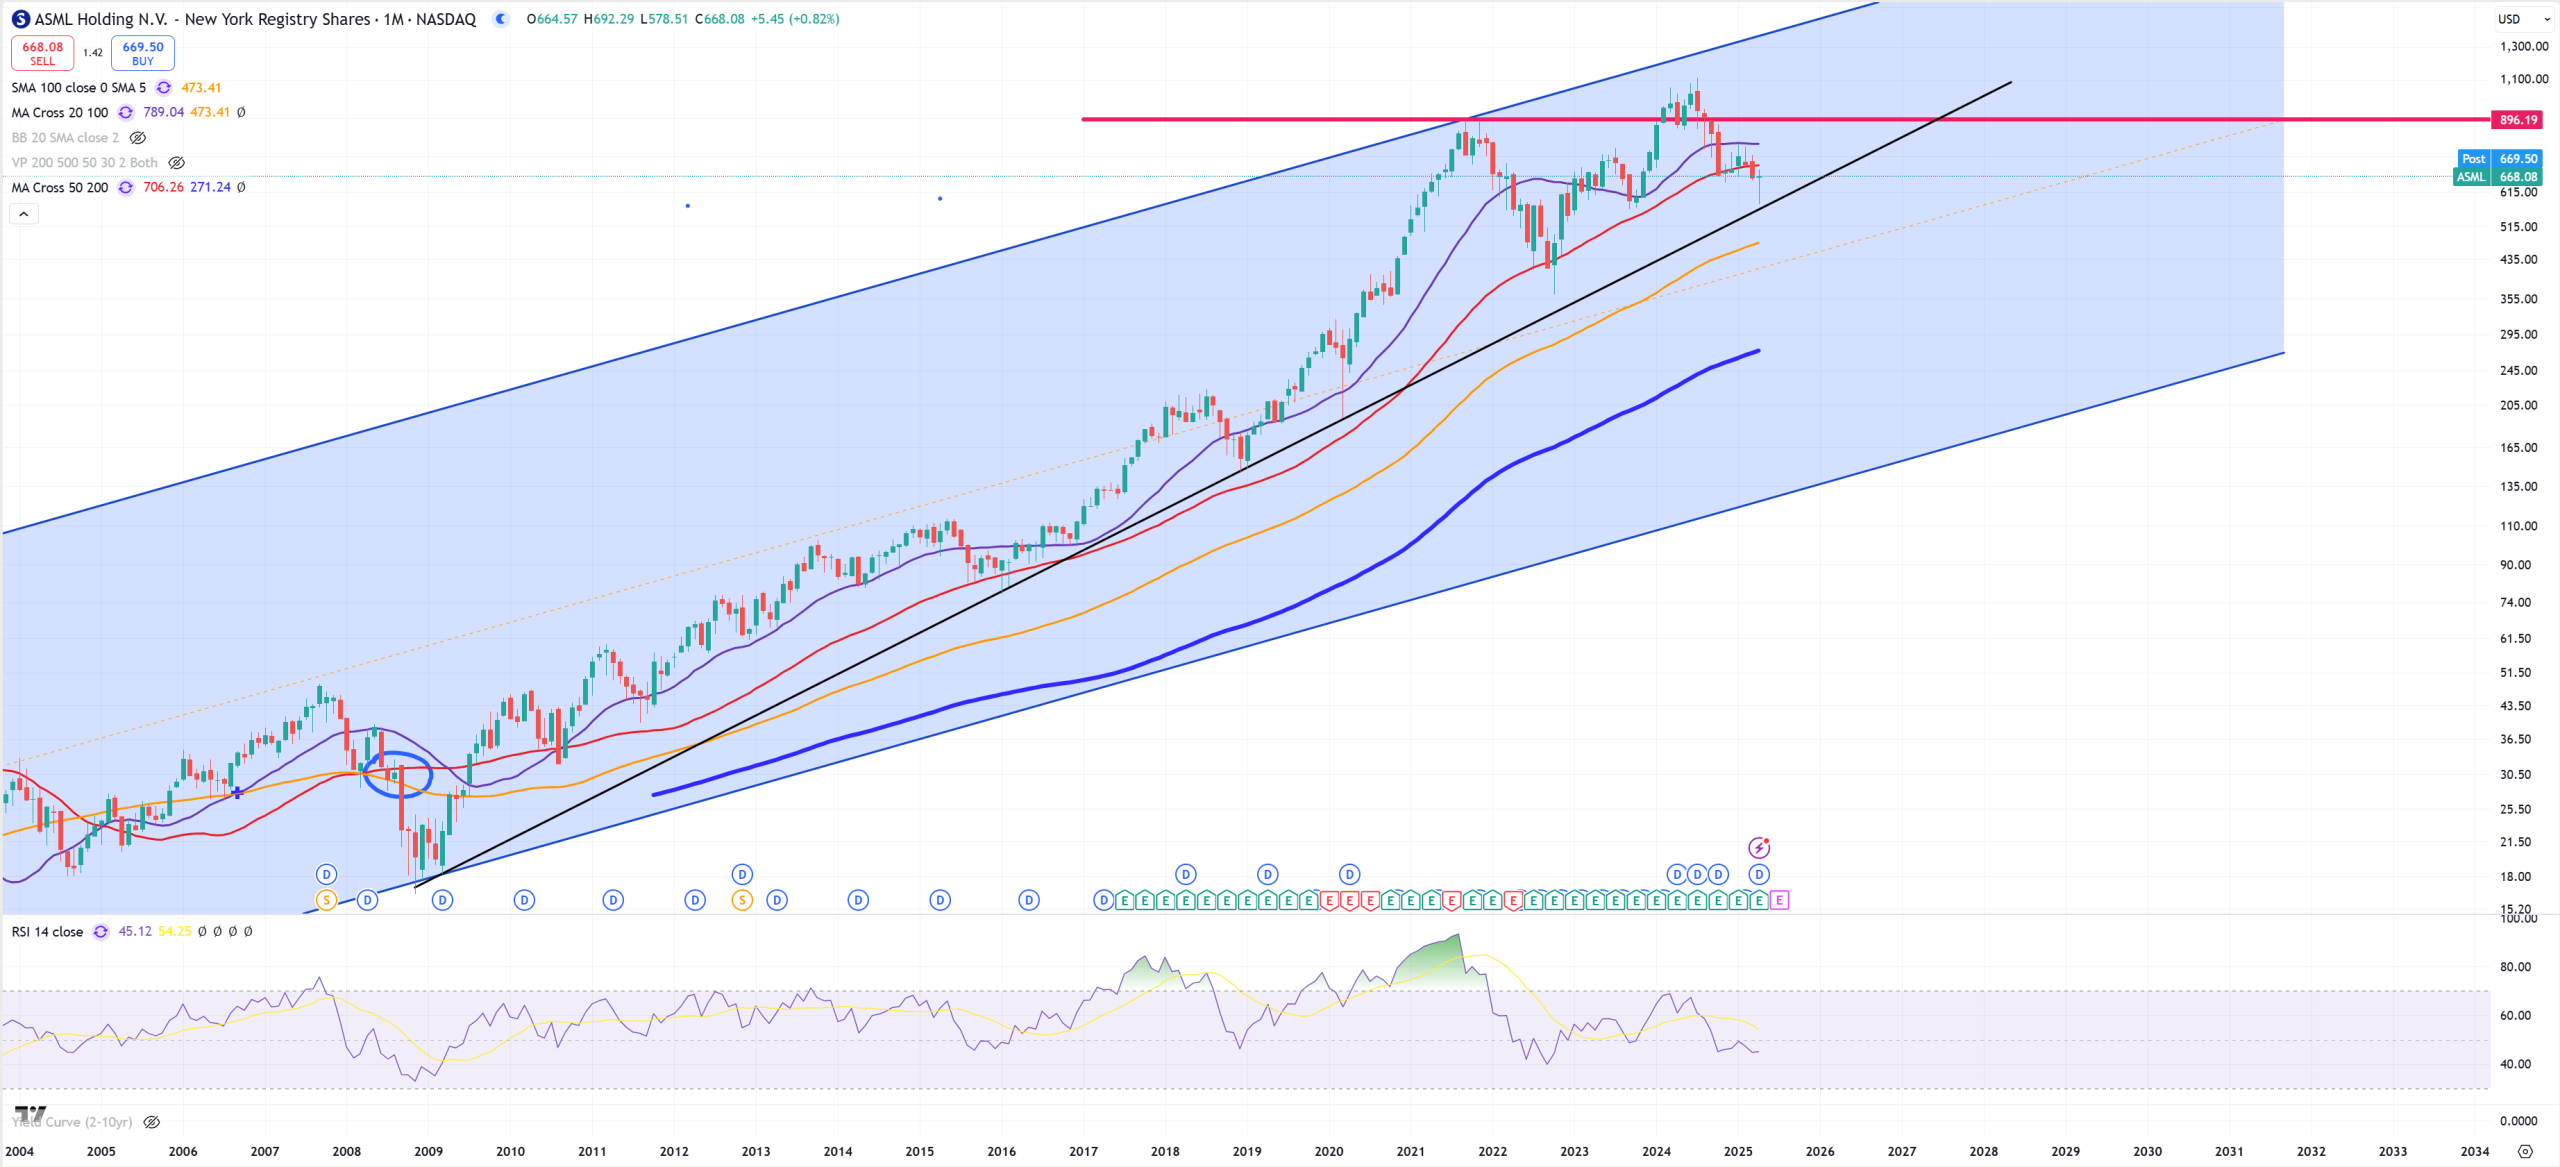
ASML – of course 2021 first peak, later bull trap and now finally below (M)MA50 for the first time since Jul 2008.
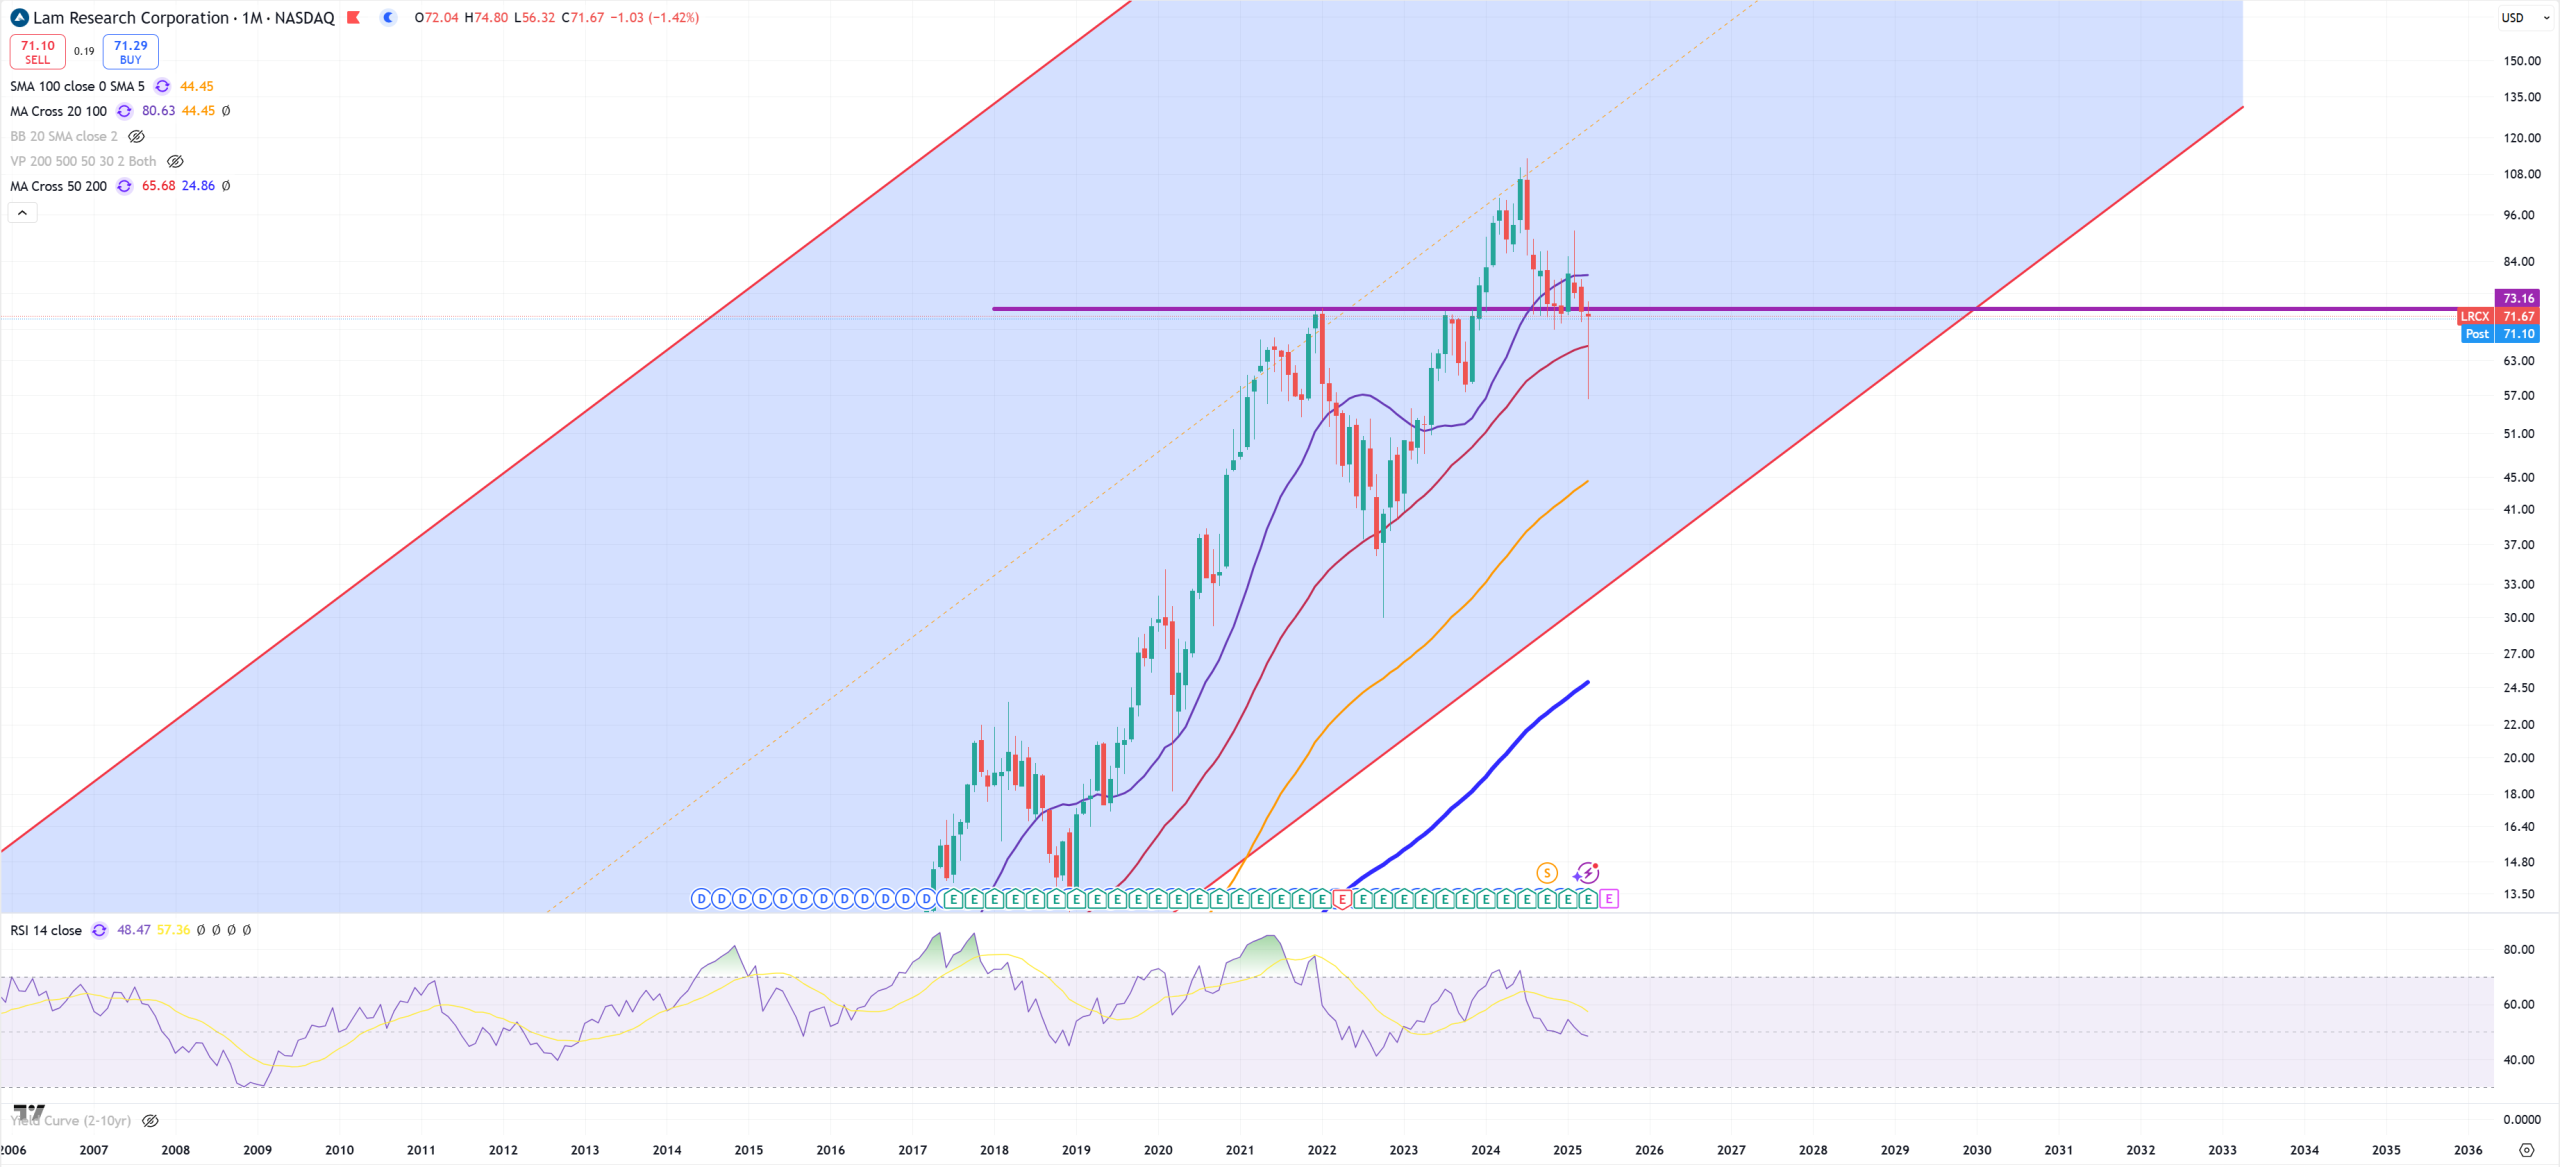
LRCX – first top 2021 and now resistance.
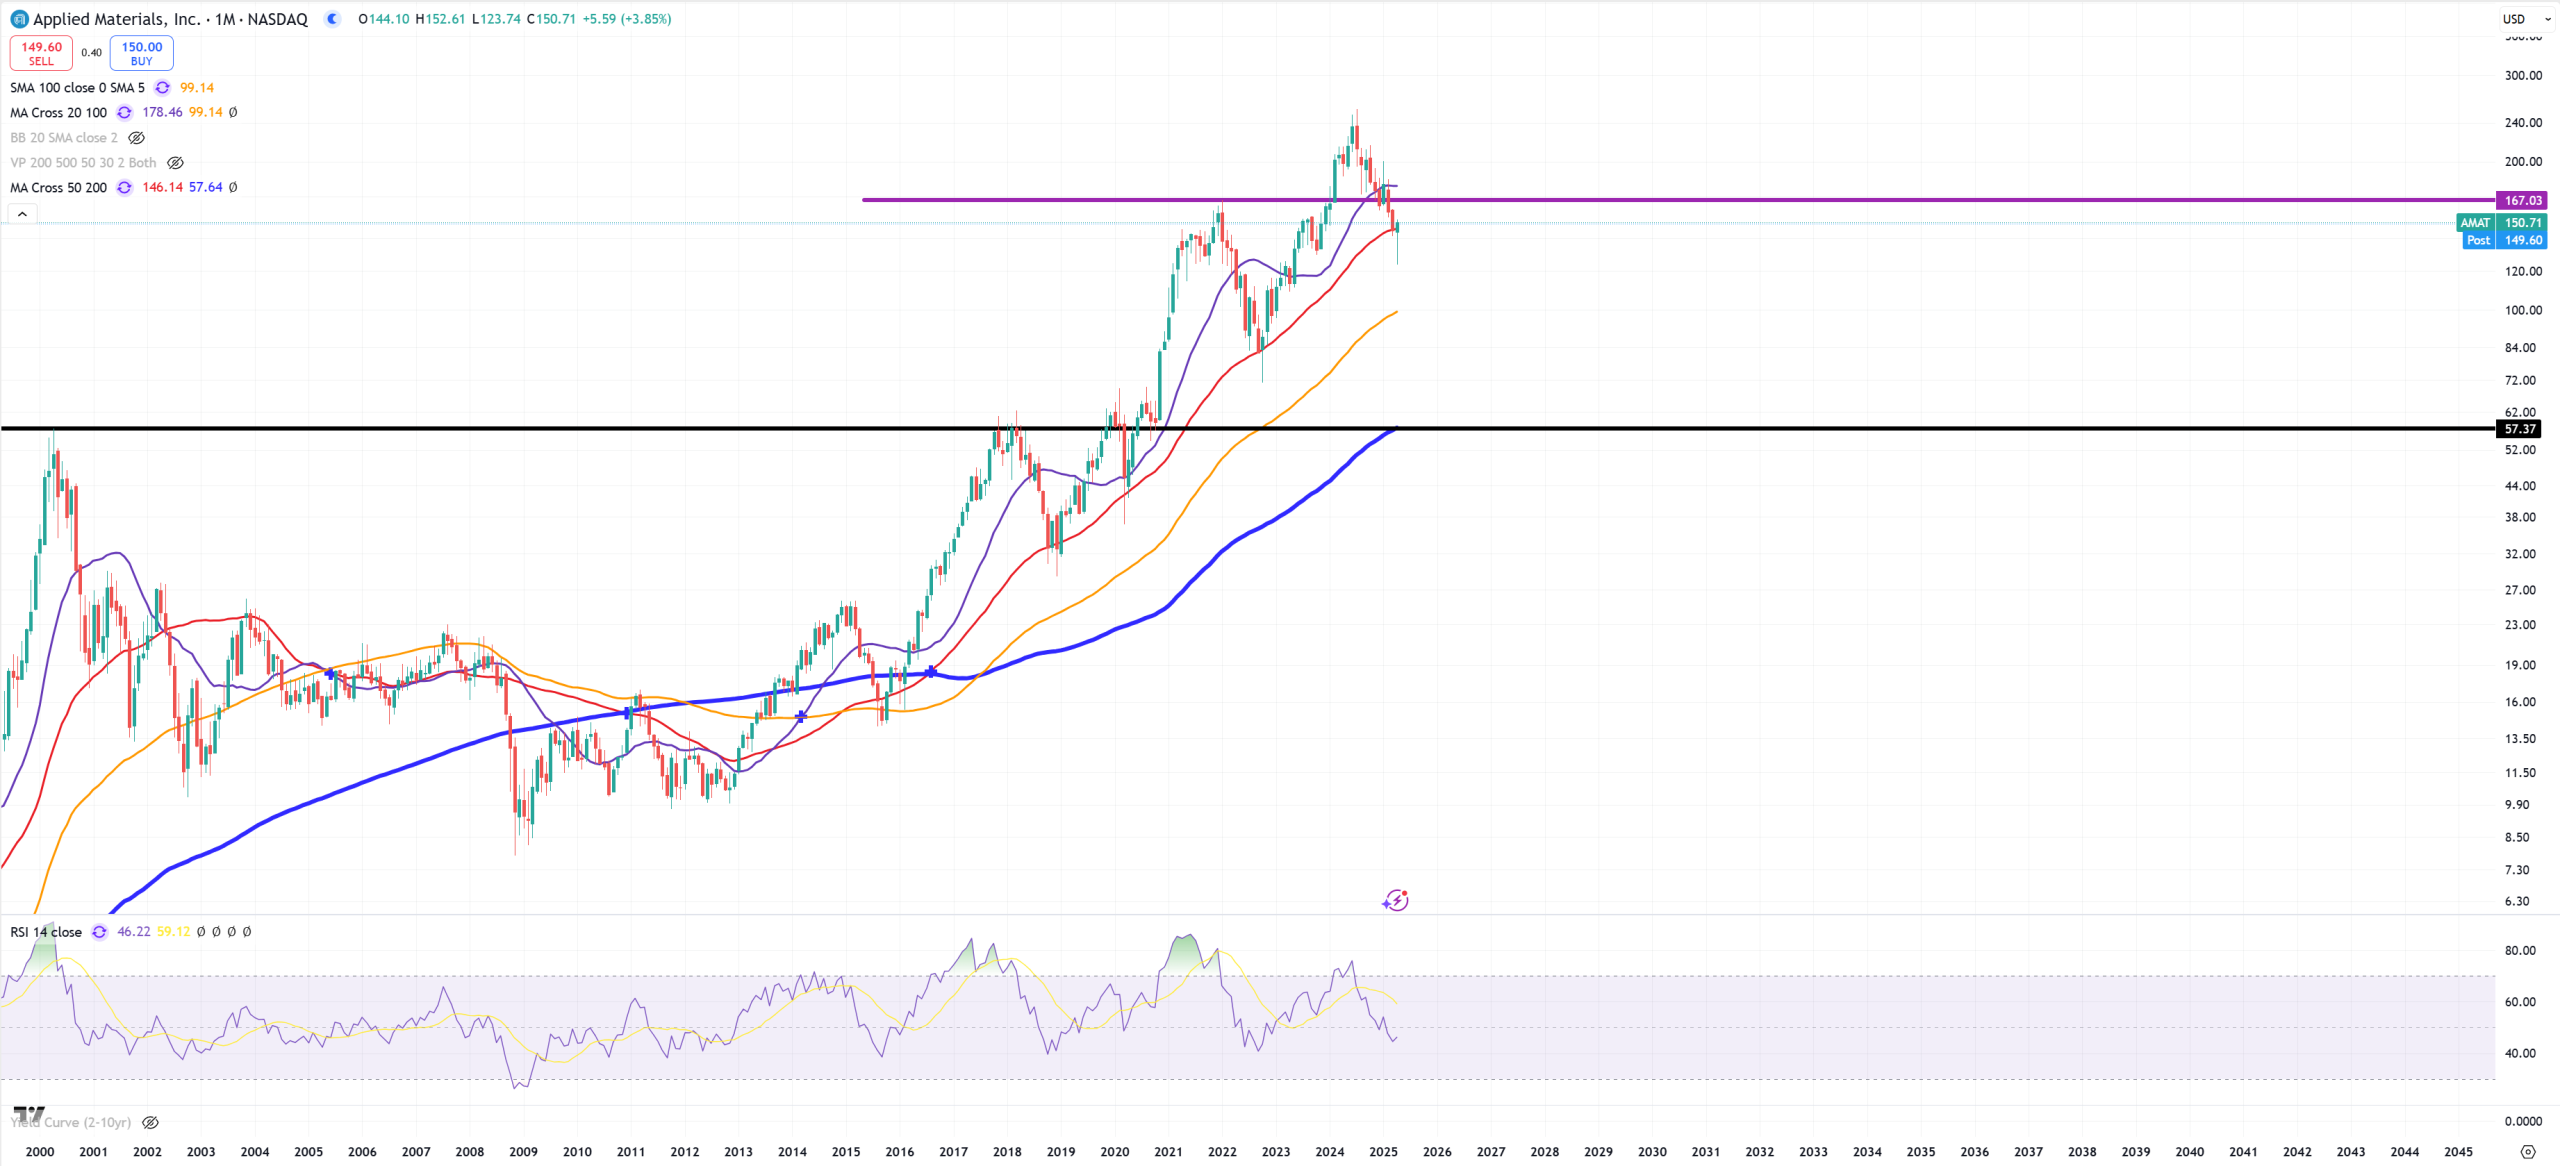
AMAT – this distance to 2021 peak is now a big one. Fighting not to tank below (M)MA50. Key support 58$ which is also (M)MA200.
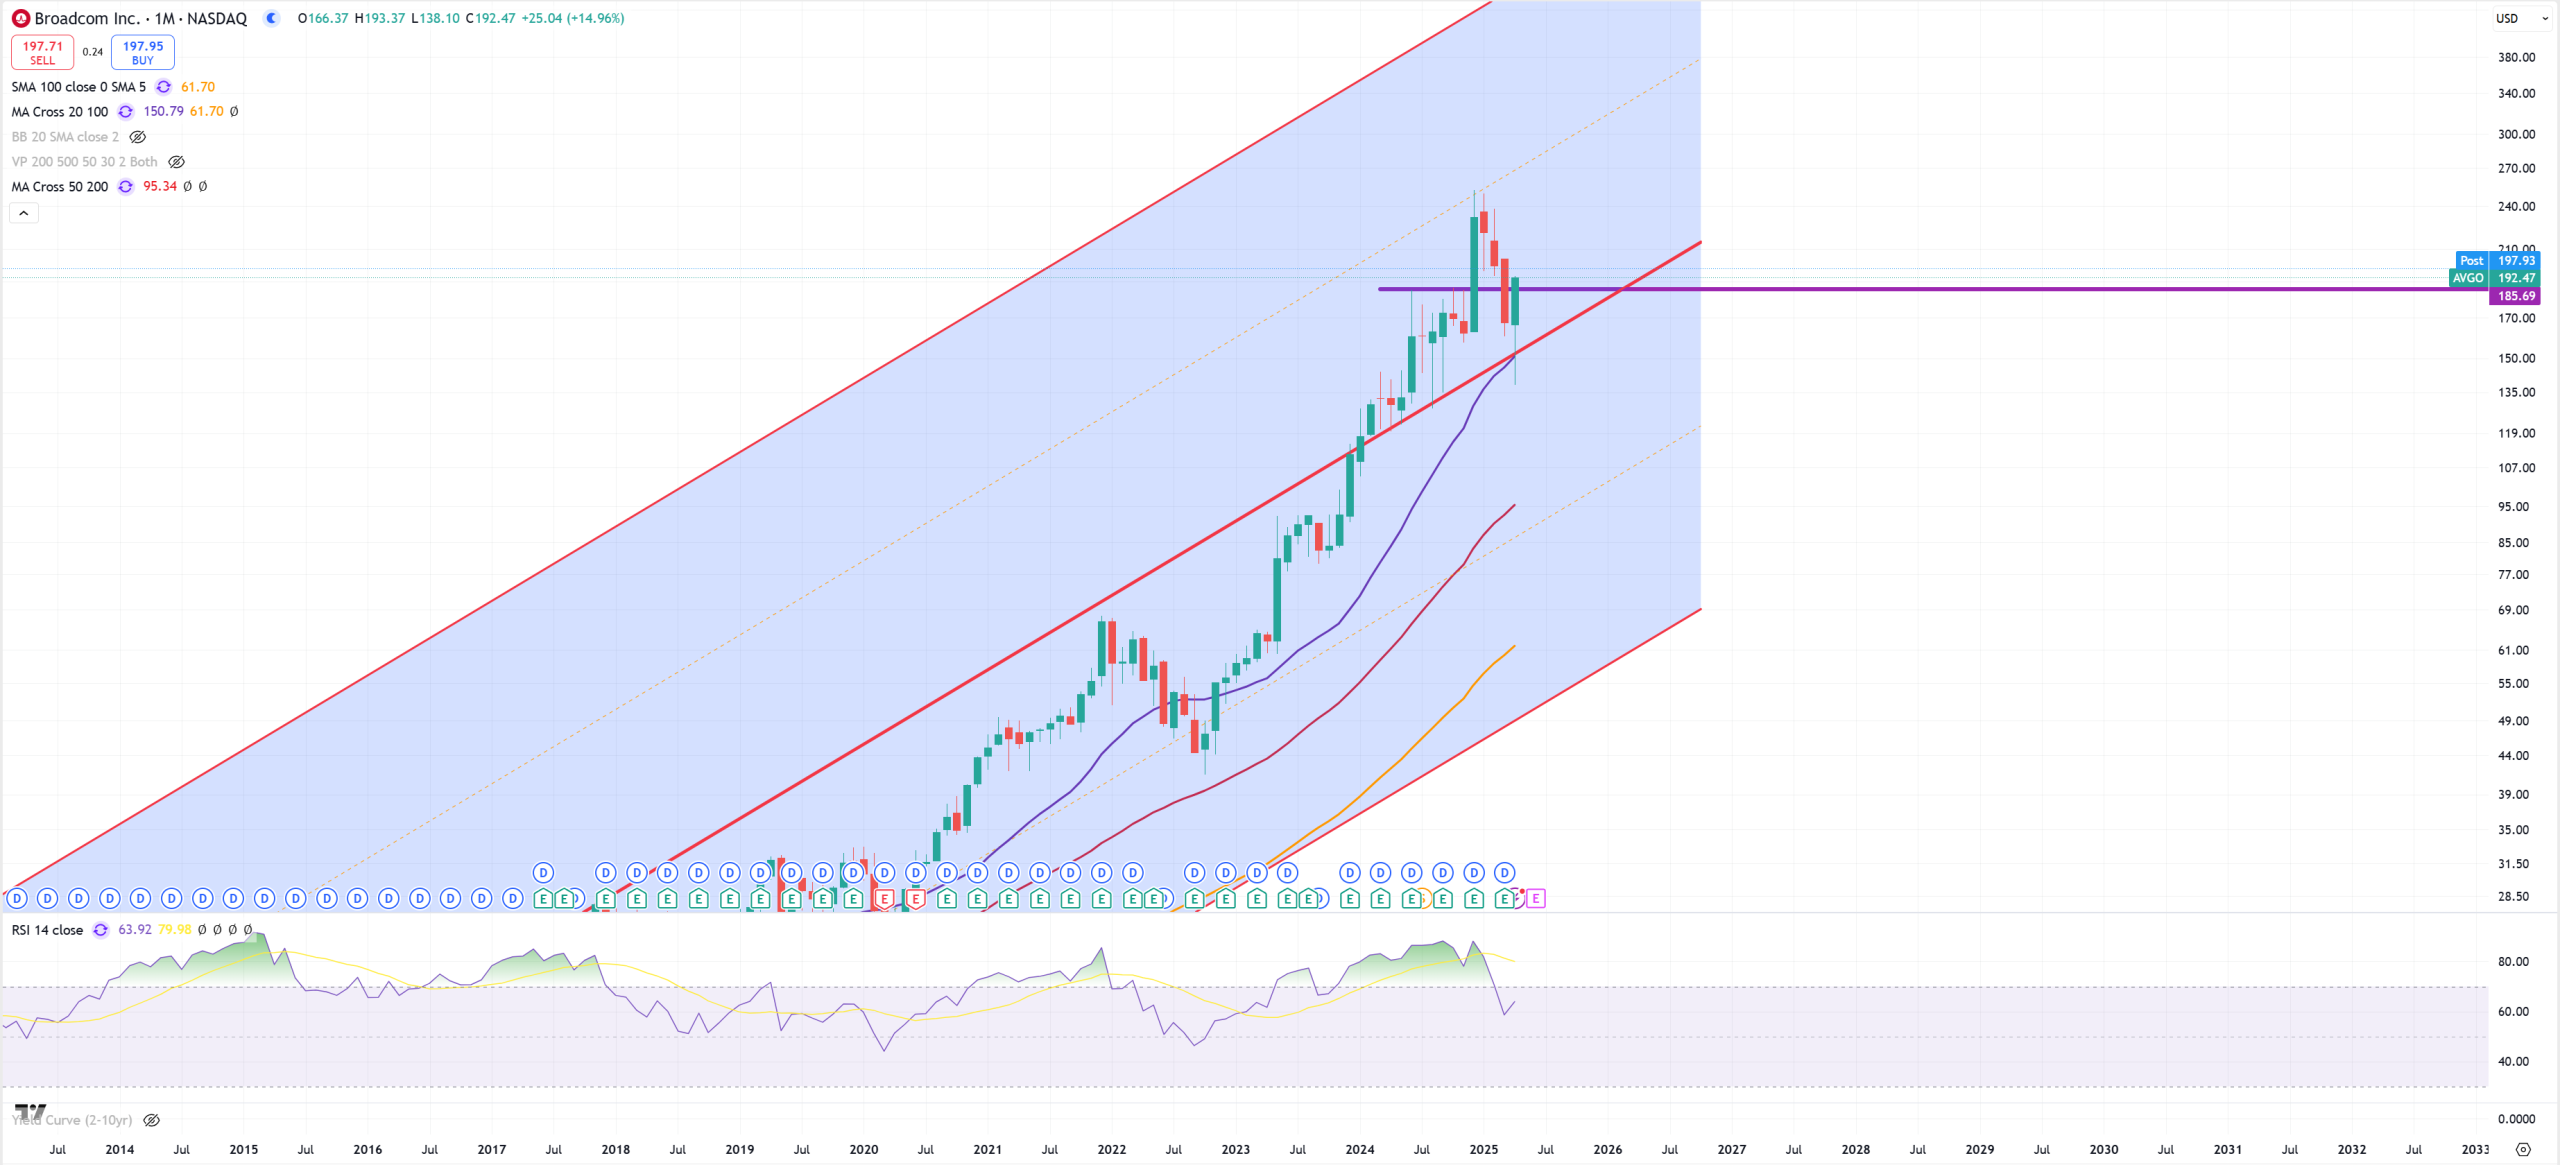
AVGO – Broadcom belongs to a rare group of SOX which doesn’t have 2021 peak point.
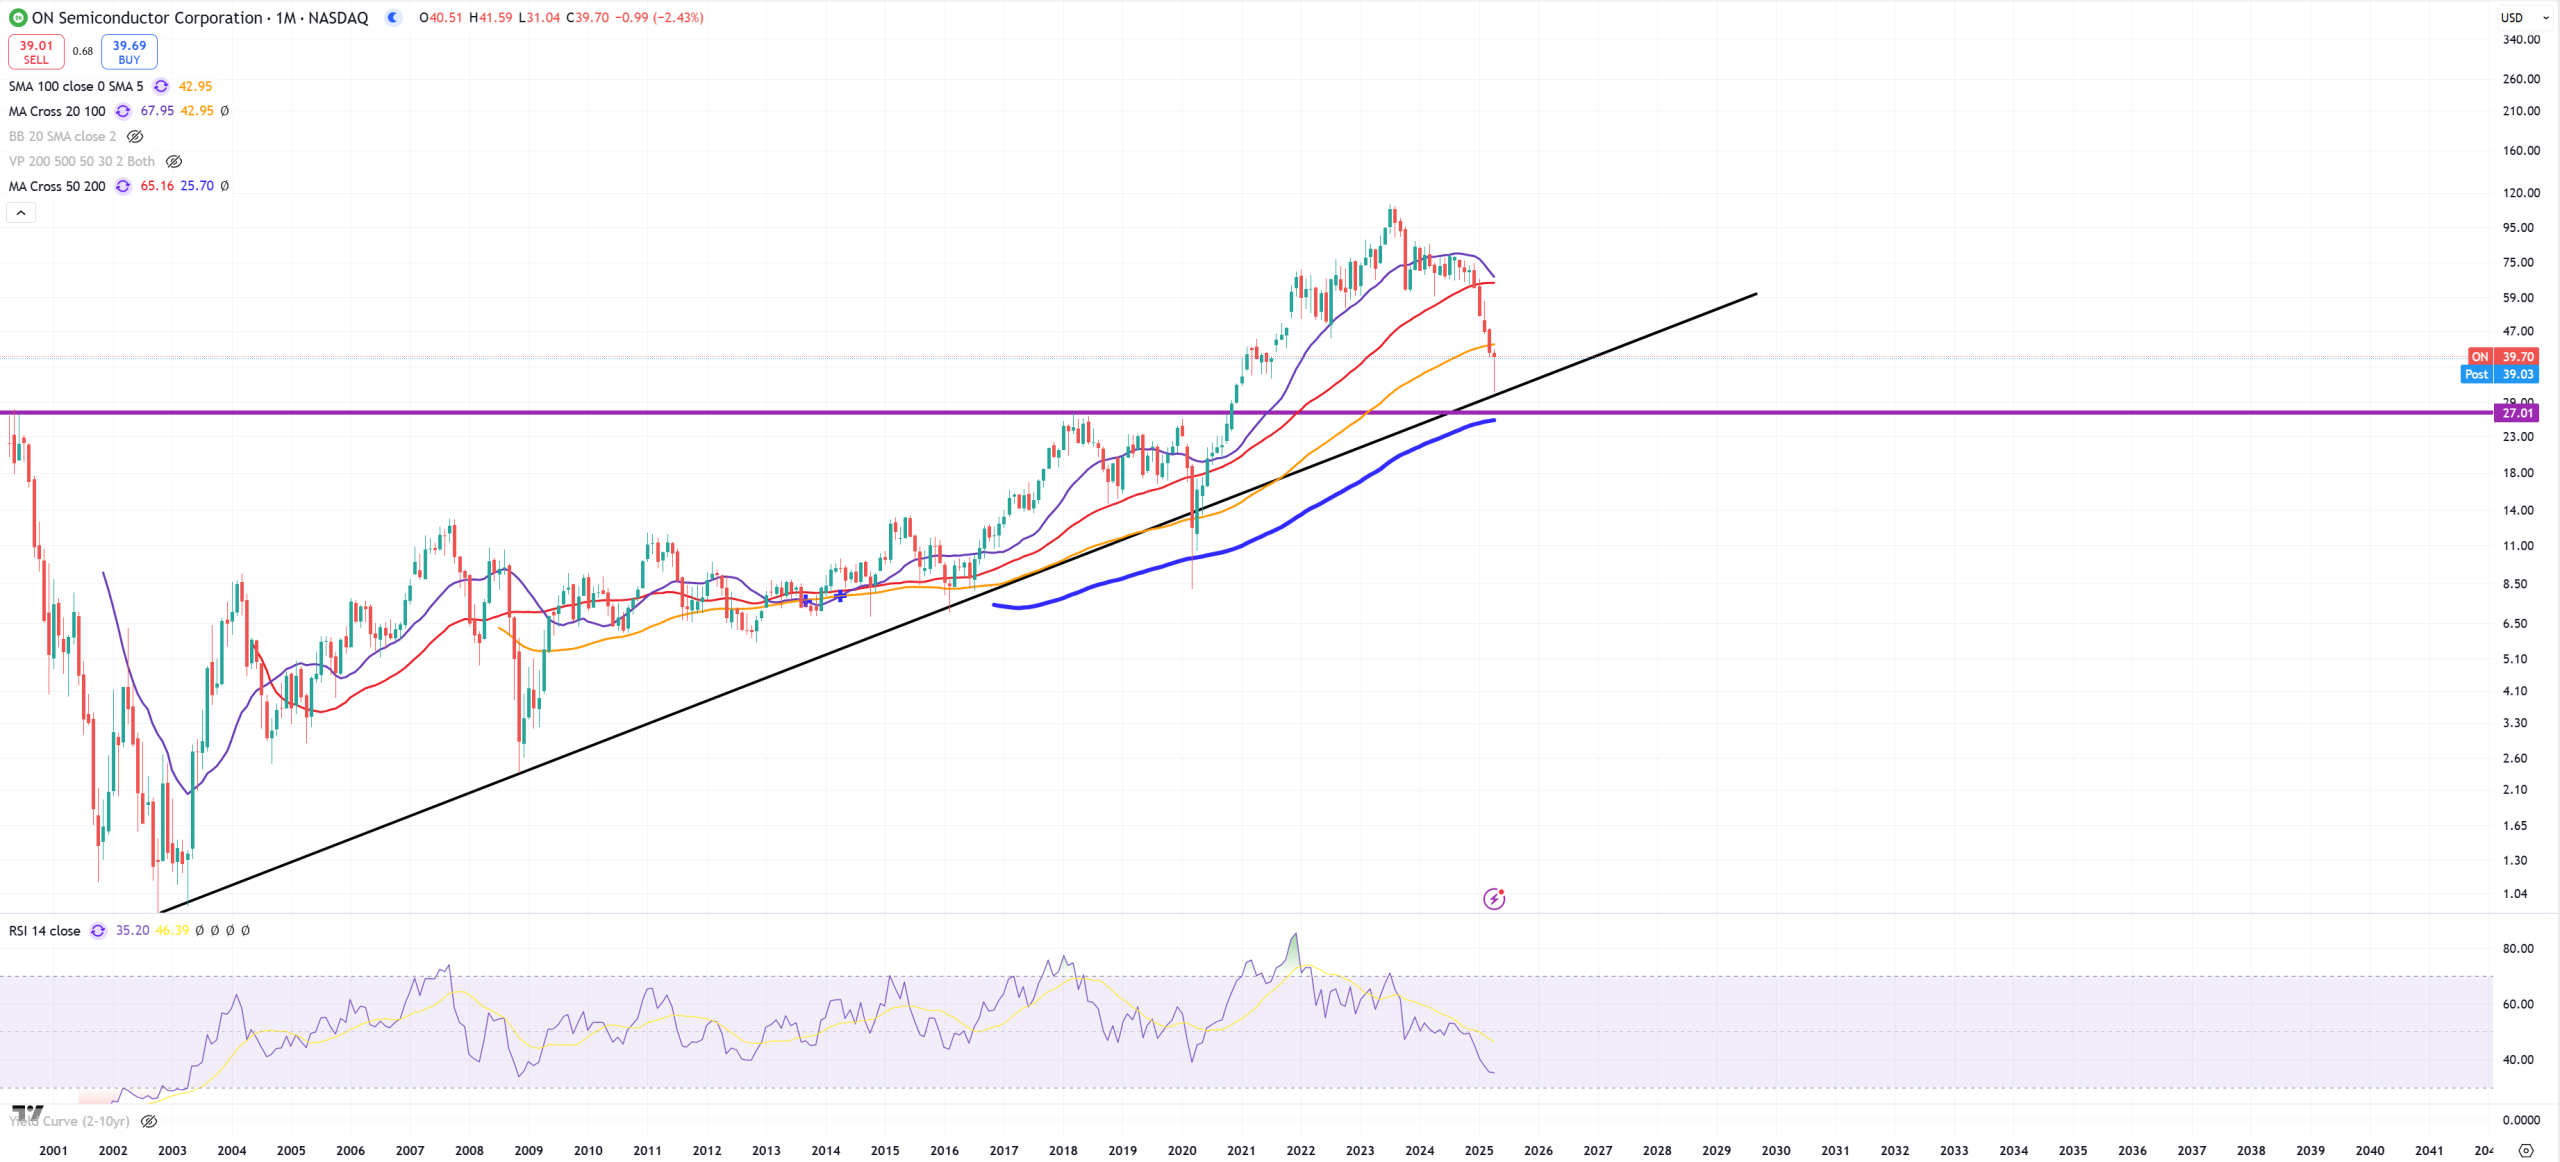
ON – peaked in 2023, now approaching to trend + (M)MA200 + support :
TXN – Texas Instruments and 2021 peak. Now below (M)MA50 – big support on (M)MA200 & 2001 peak = 90$.

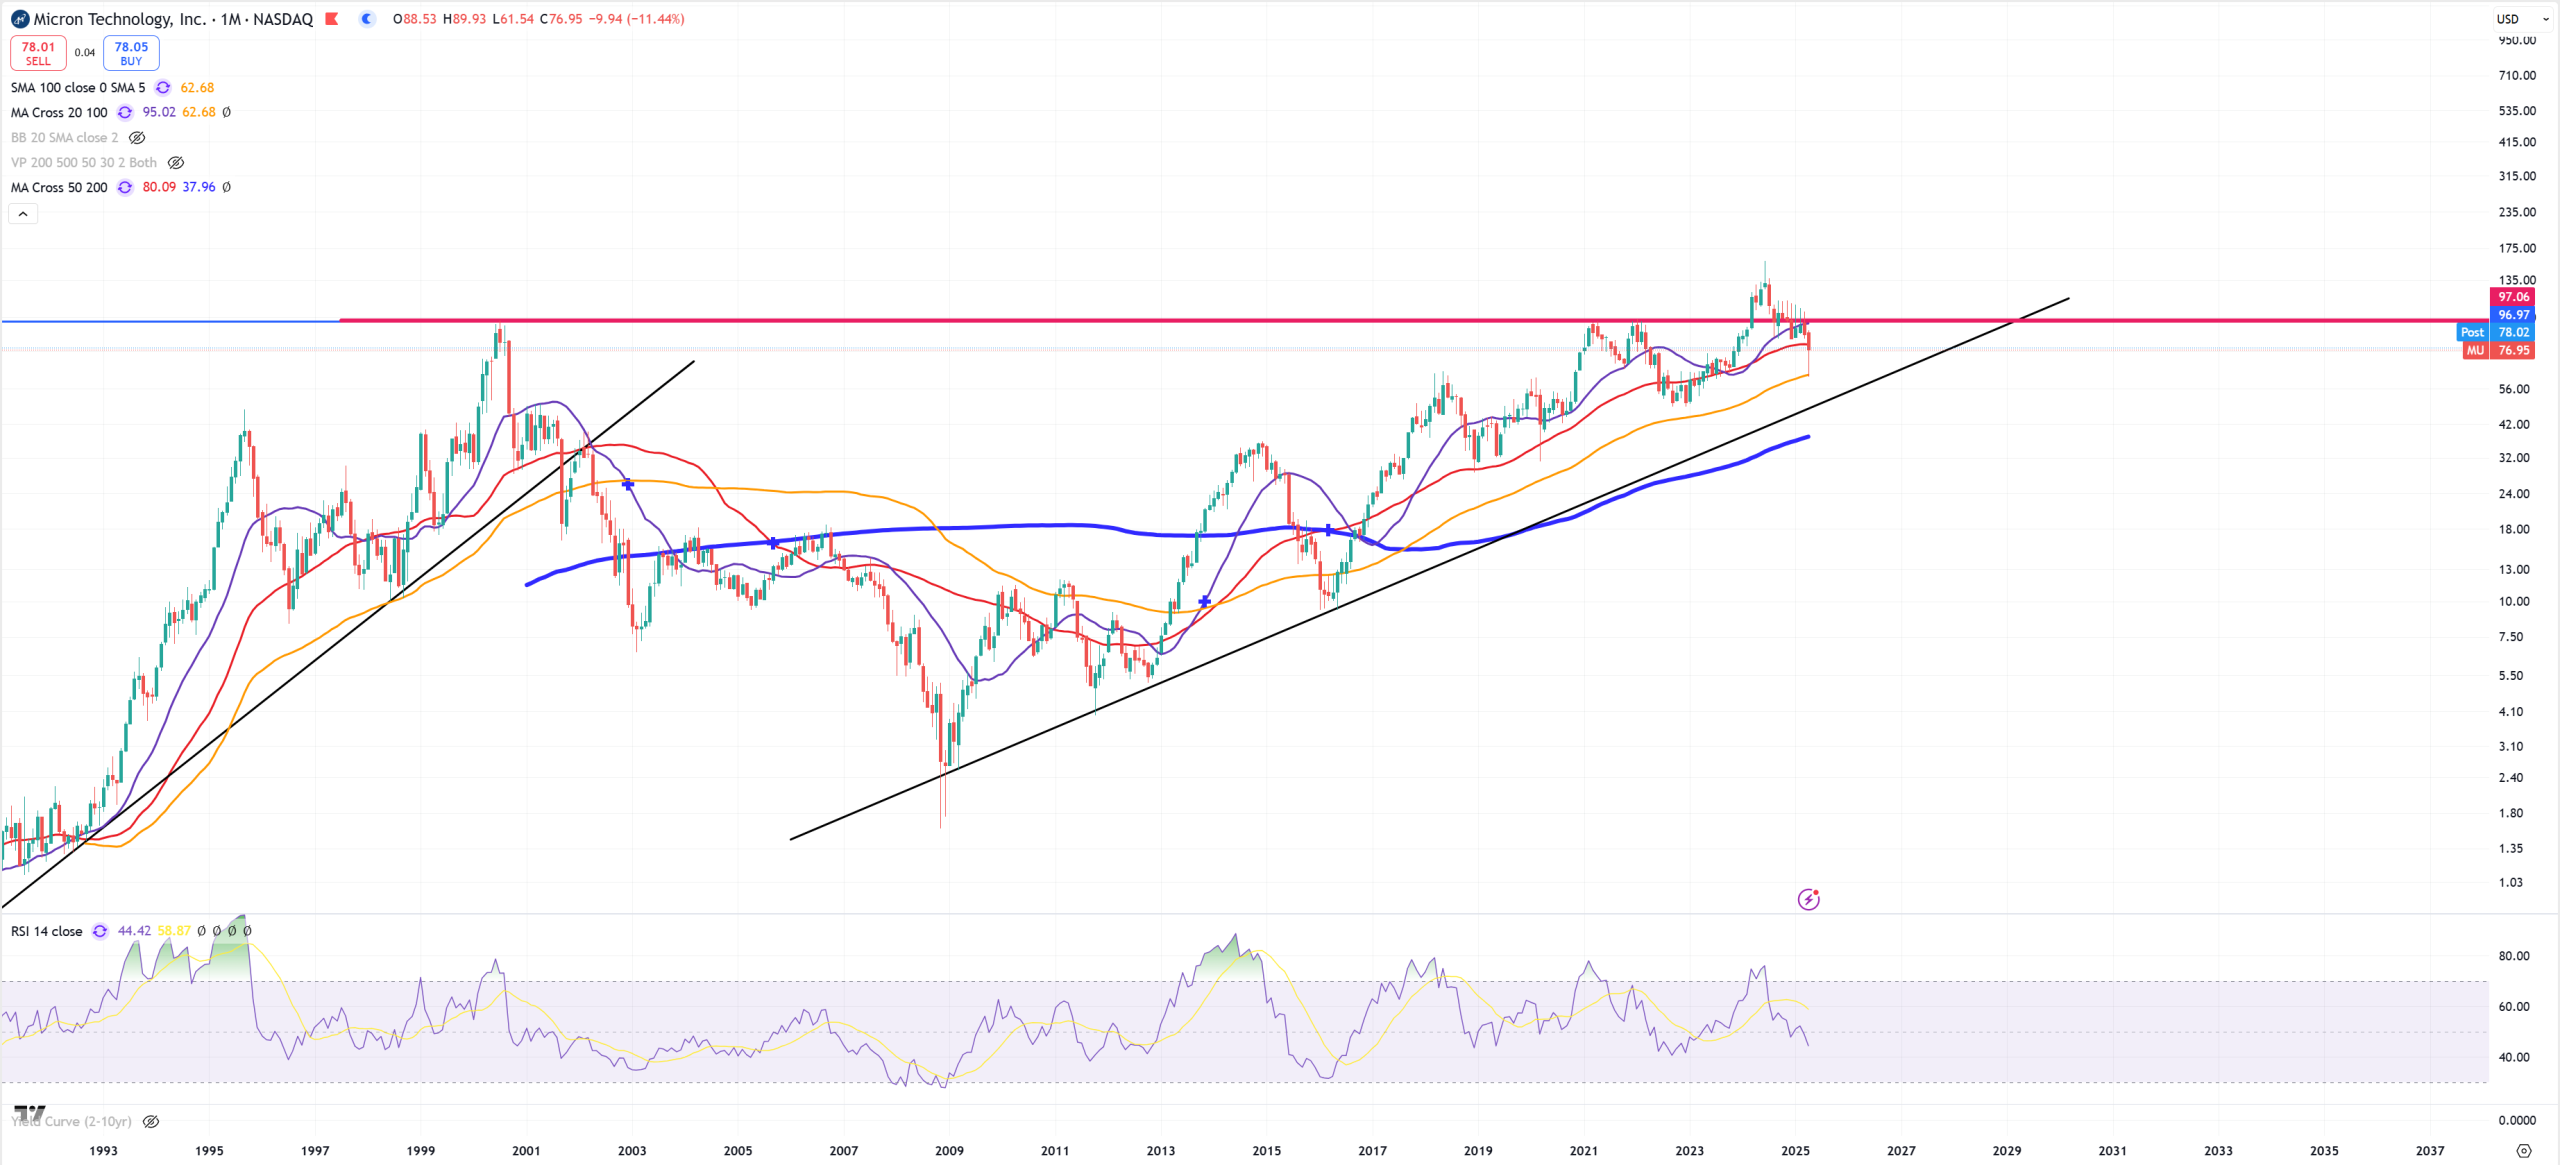
MU – dot.com bubble peak point + 2021 is the same resistance, (M)MA50 broken.
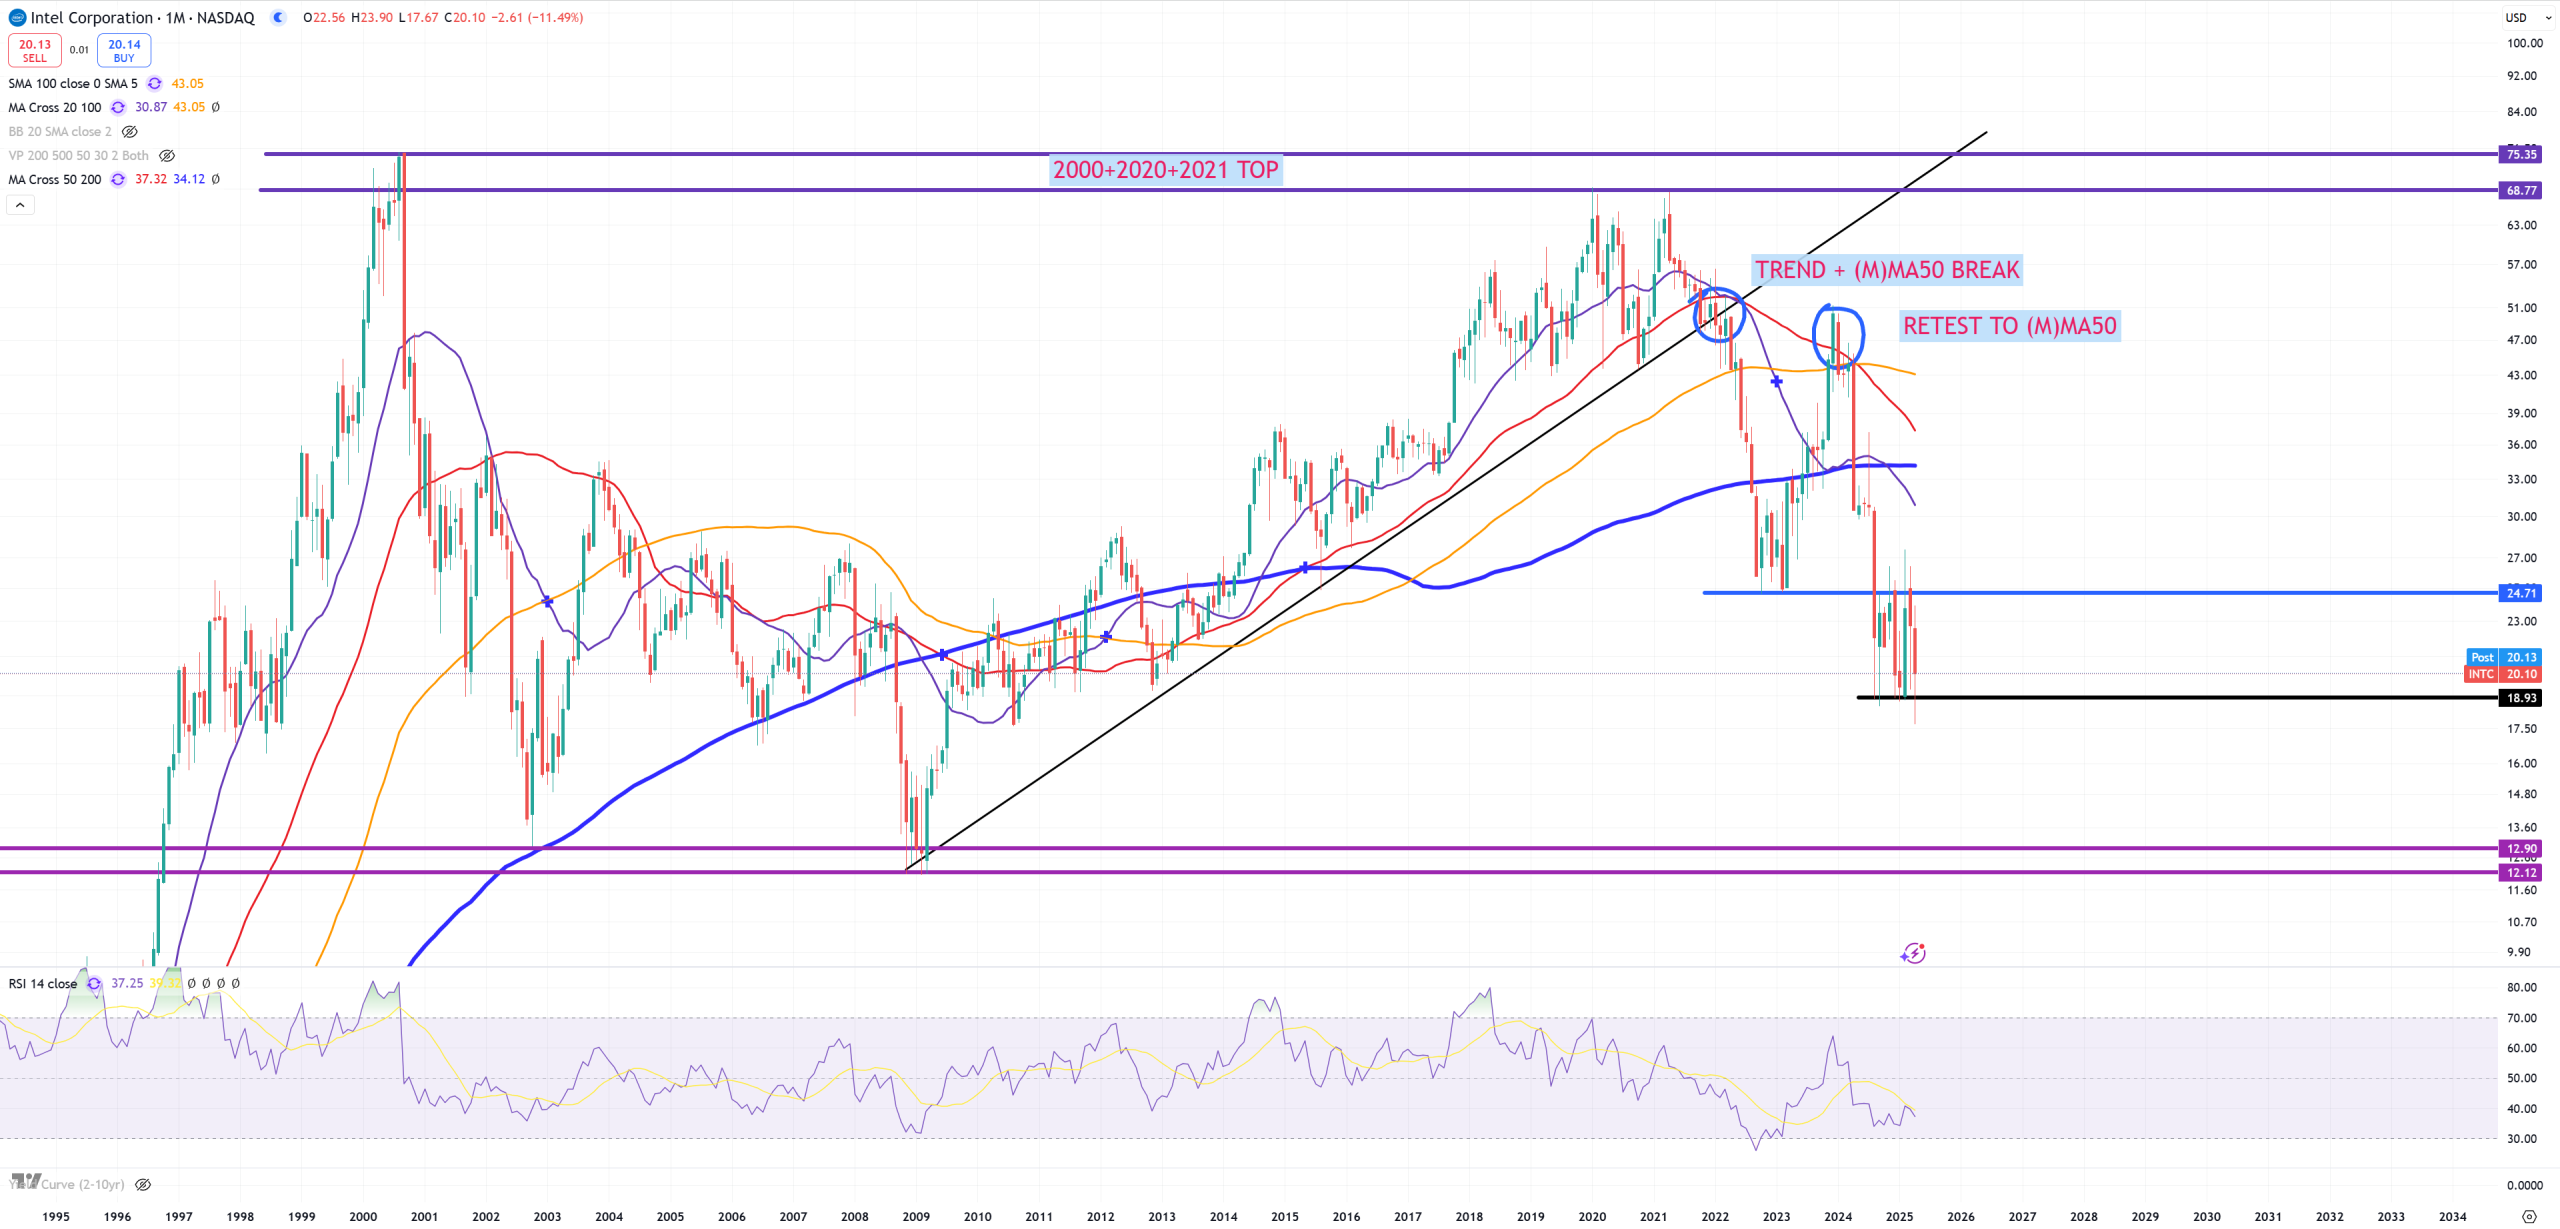
INTC – Intel – that’s going to 12$?
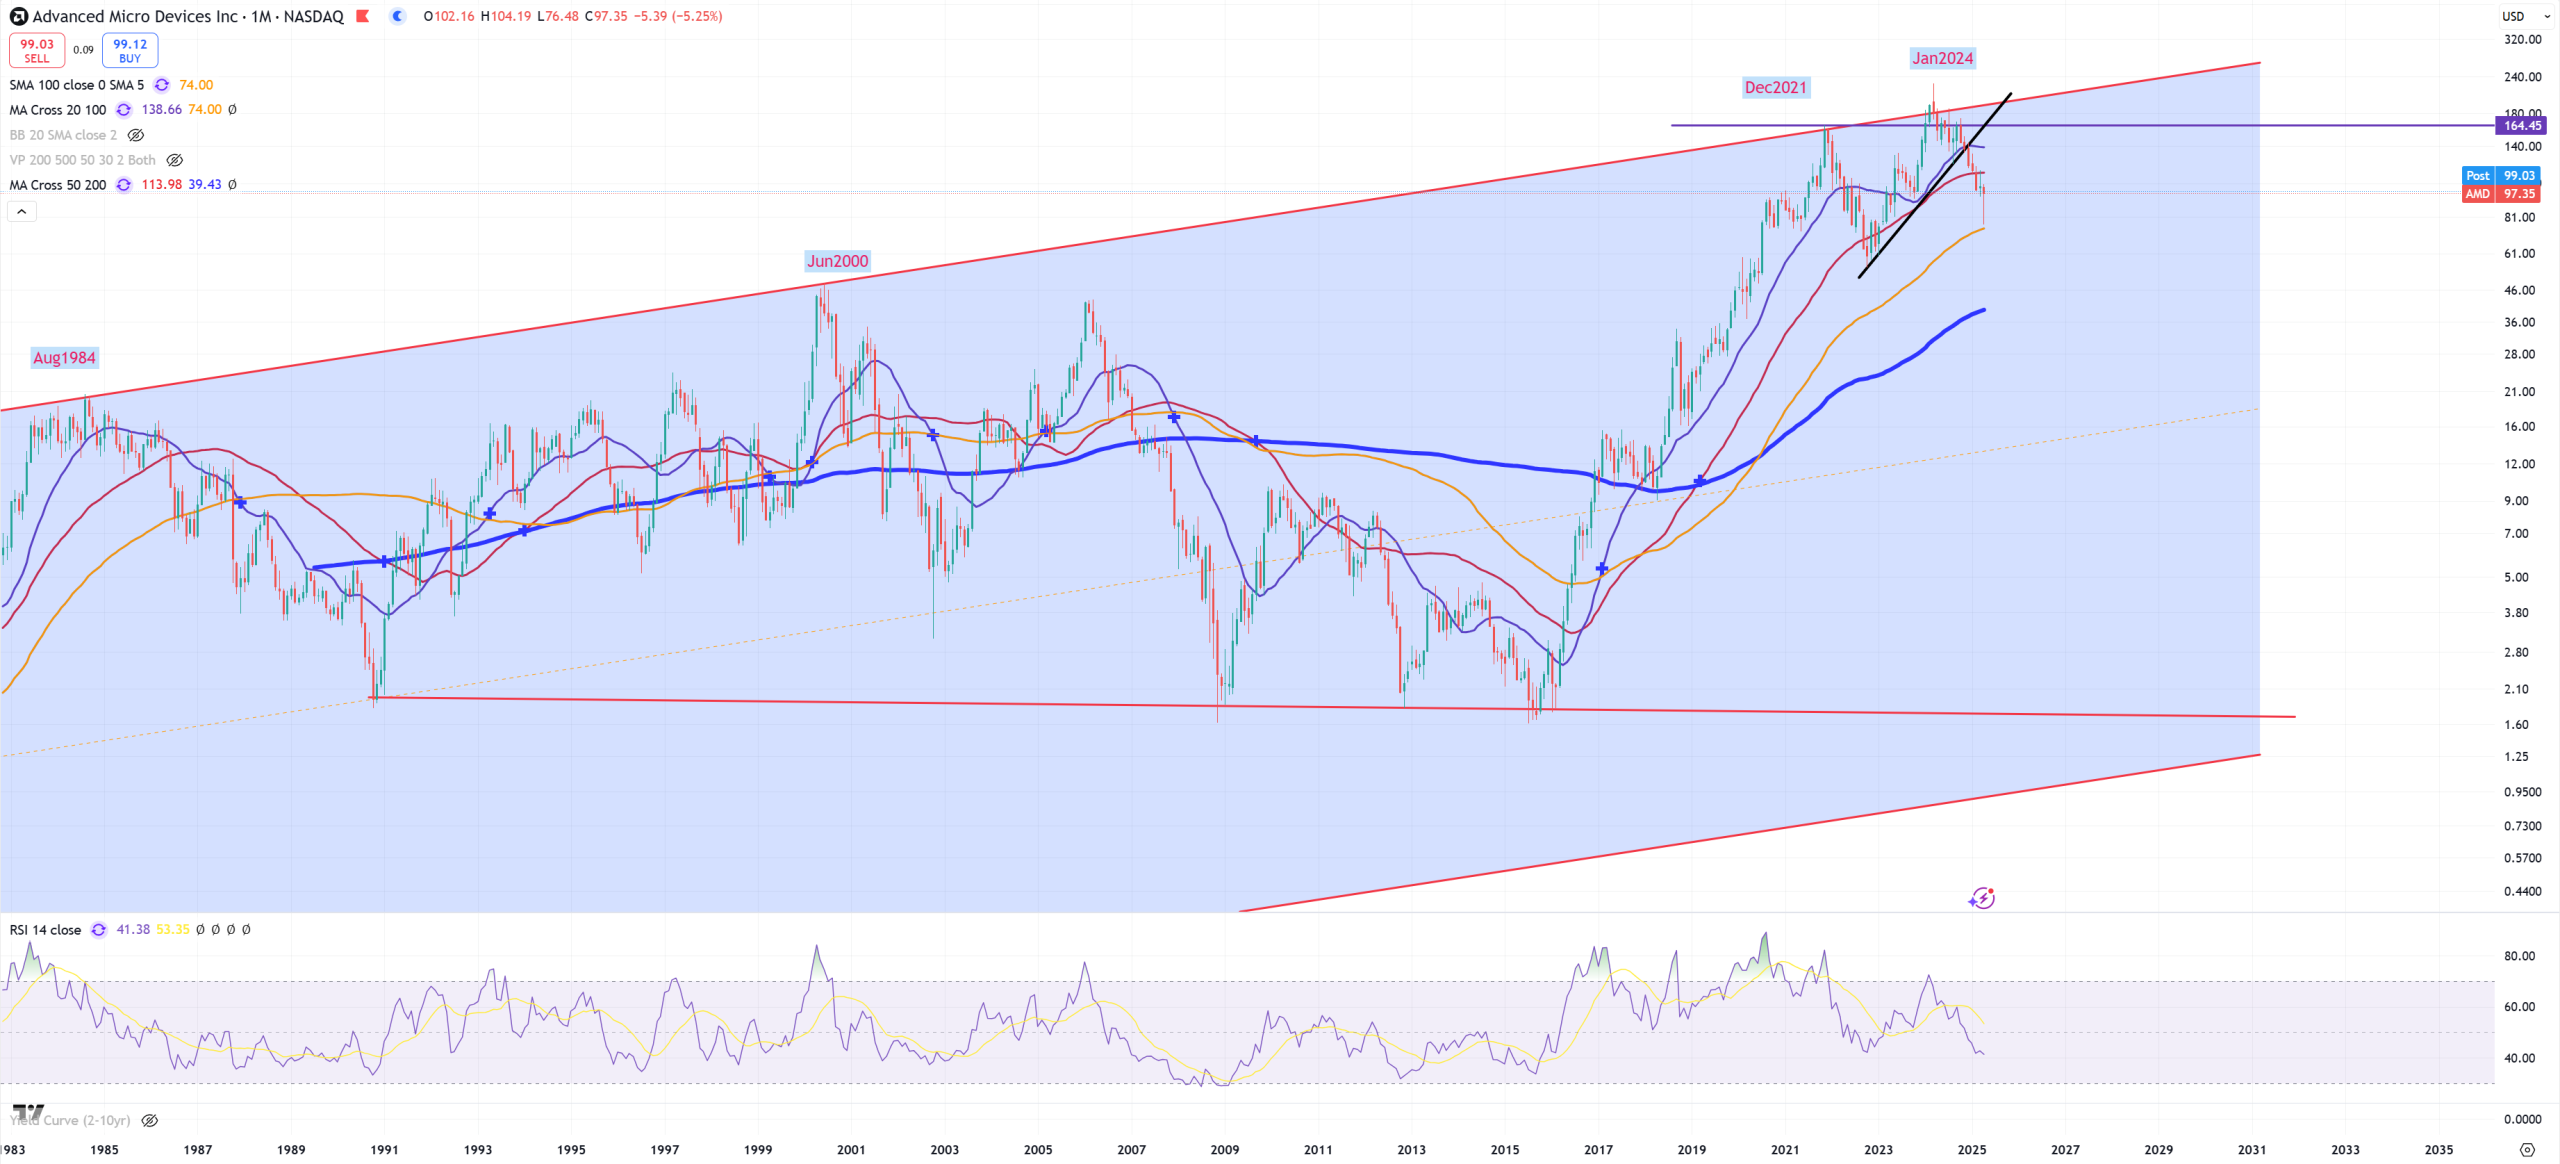
AMD – below (M)MA50 first peak 2021.
GOLD/BTC – (M)MA20 resistance = GOLD drops, BTC up.
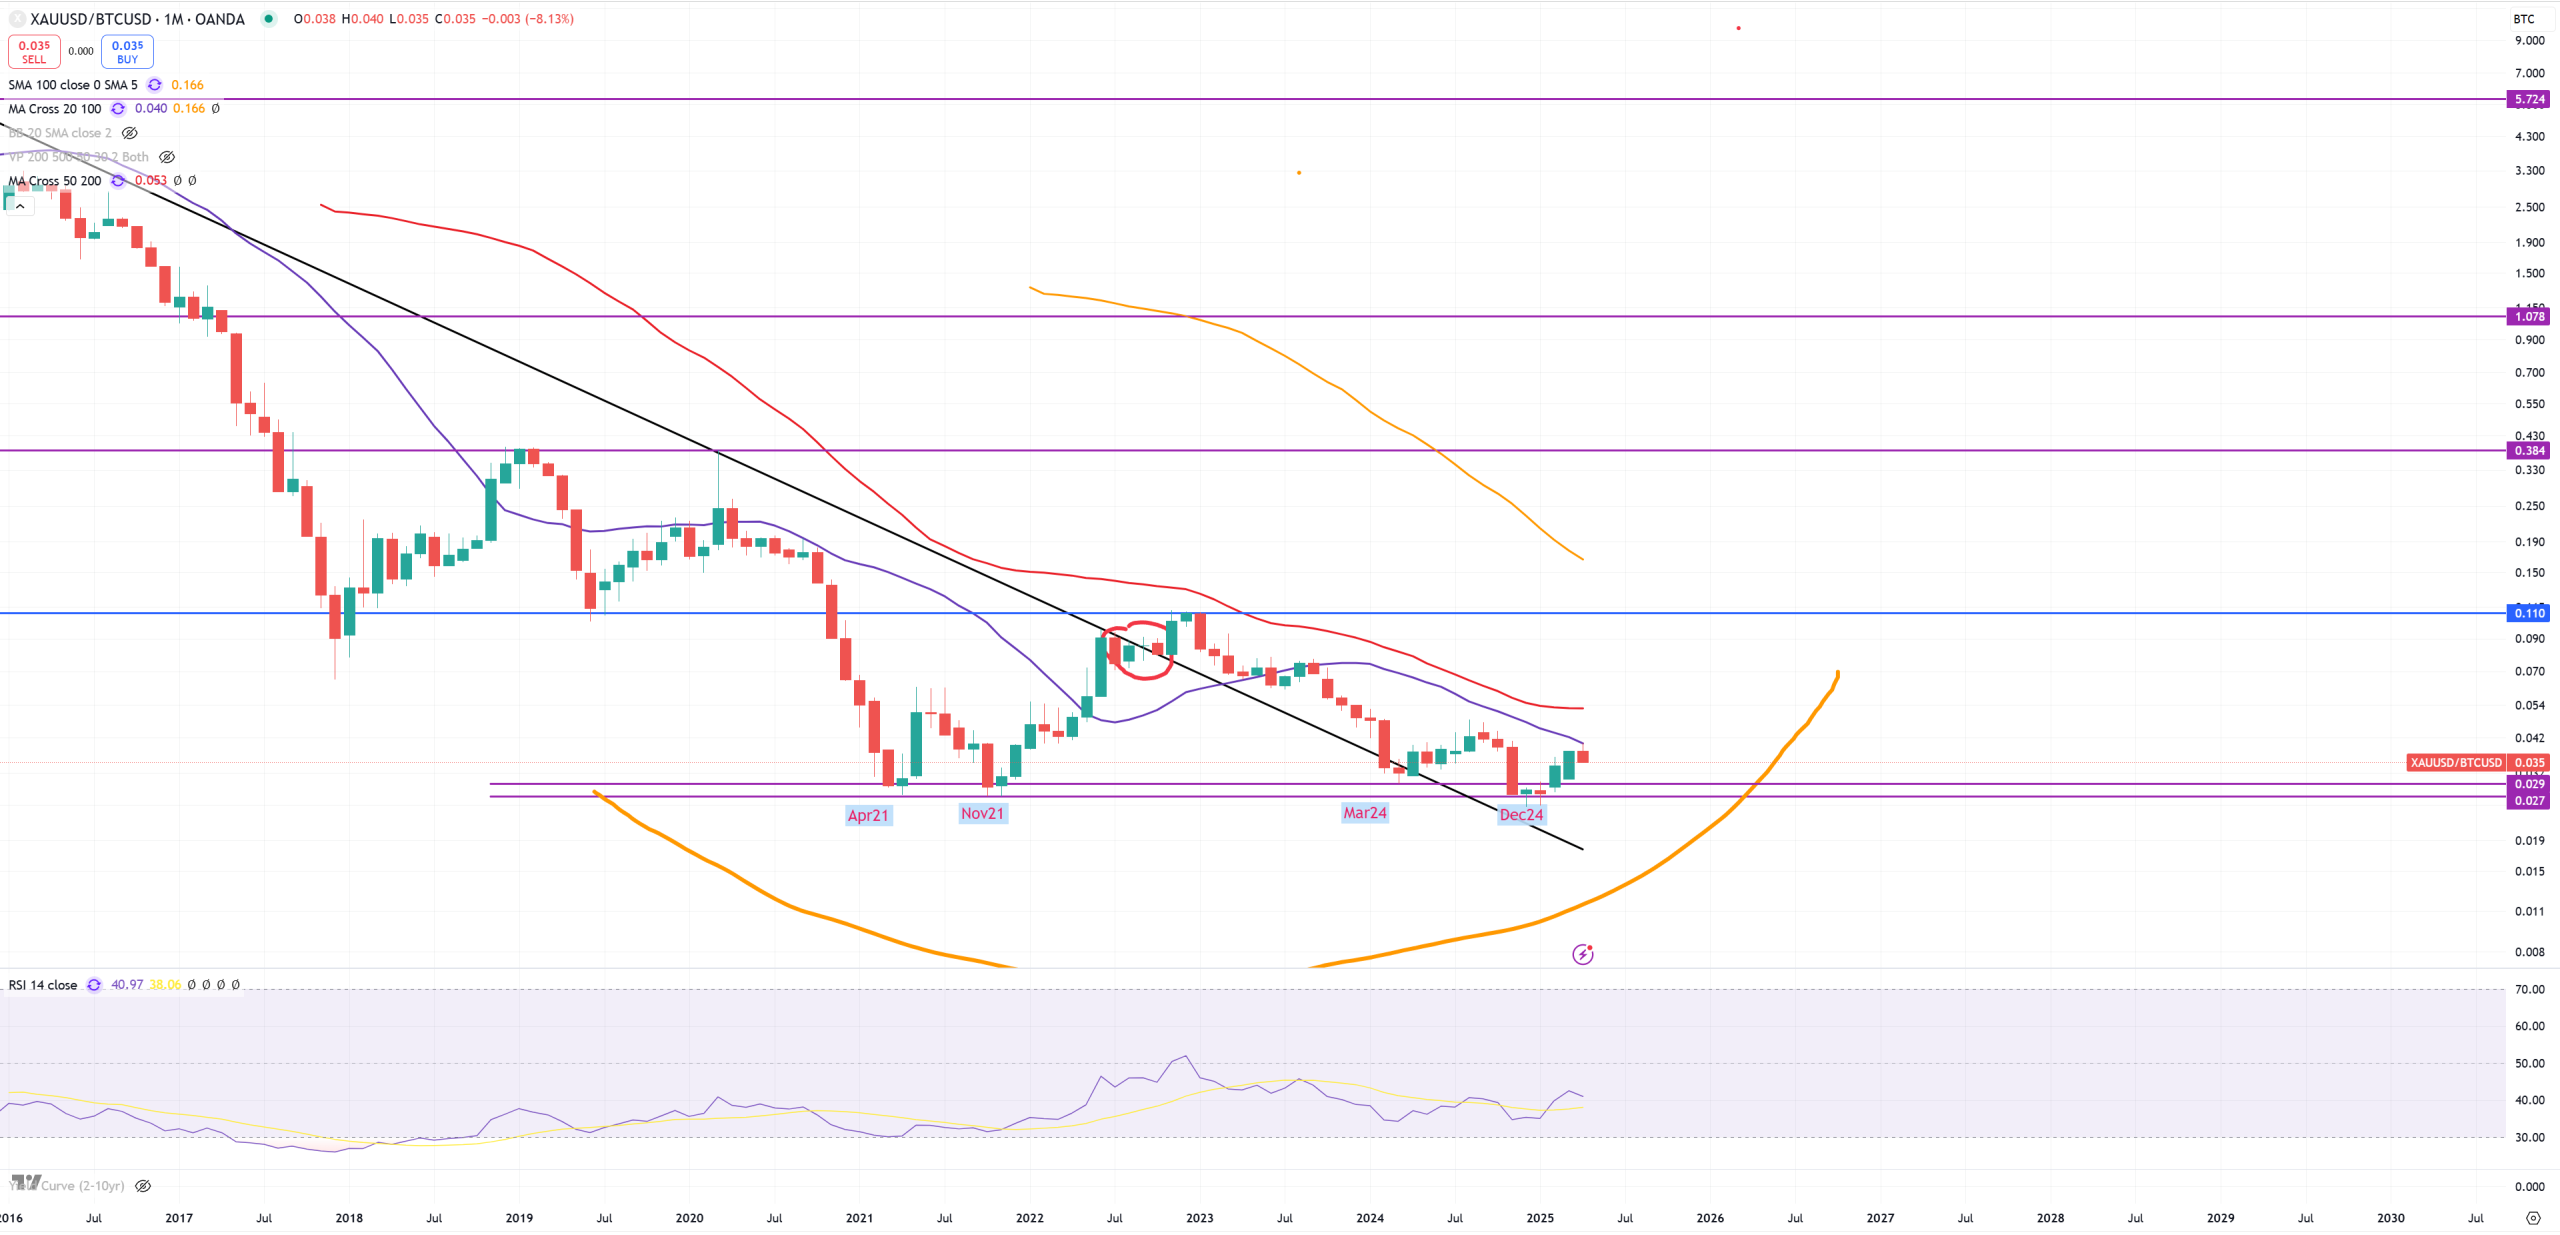
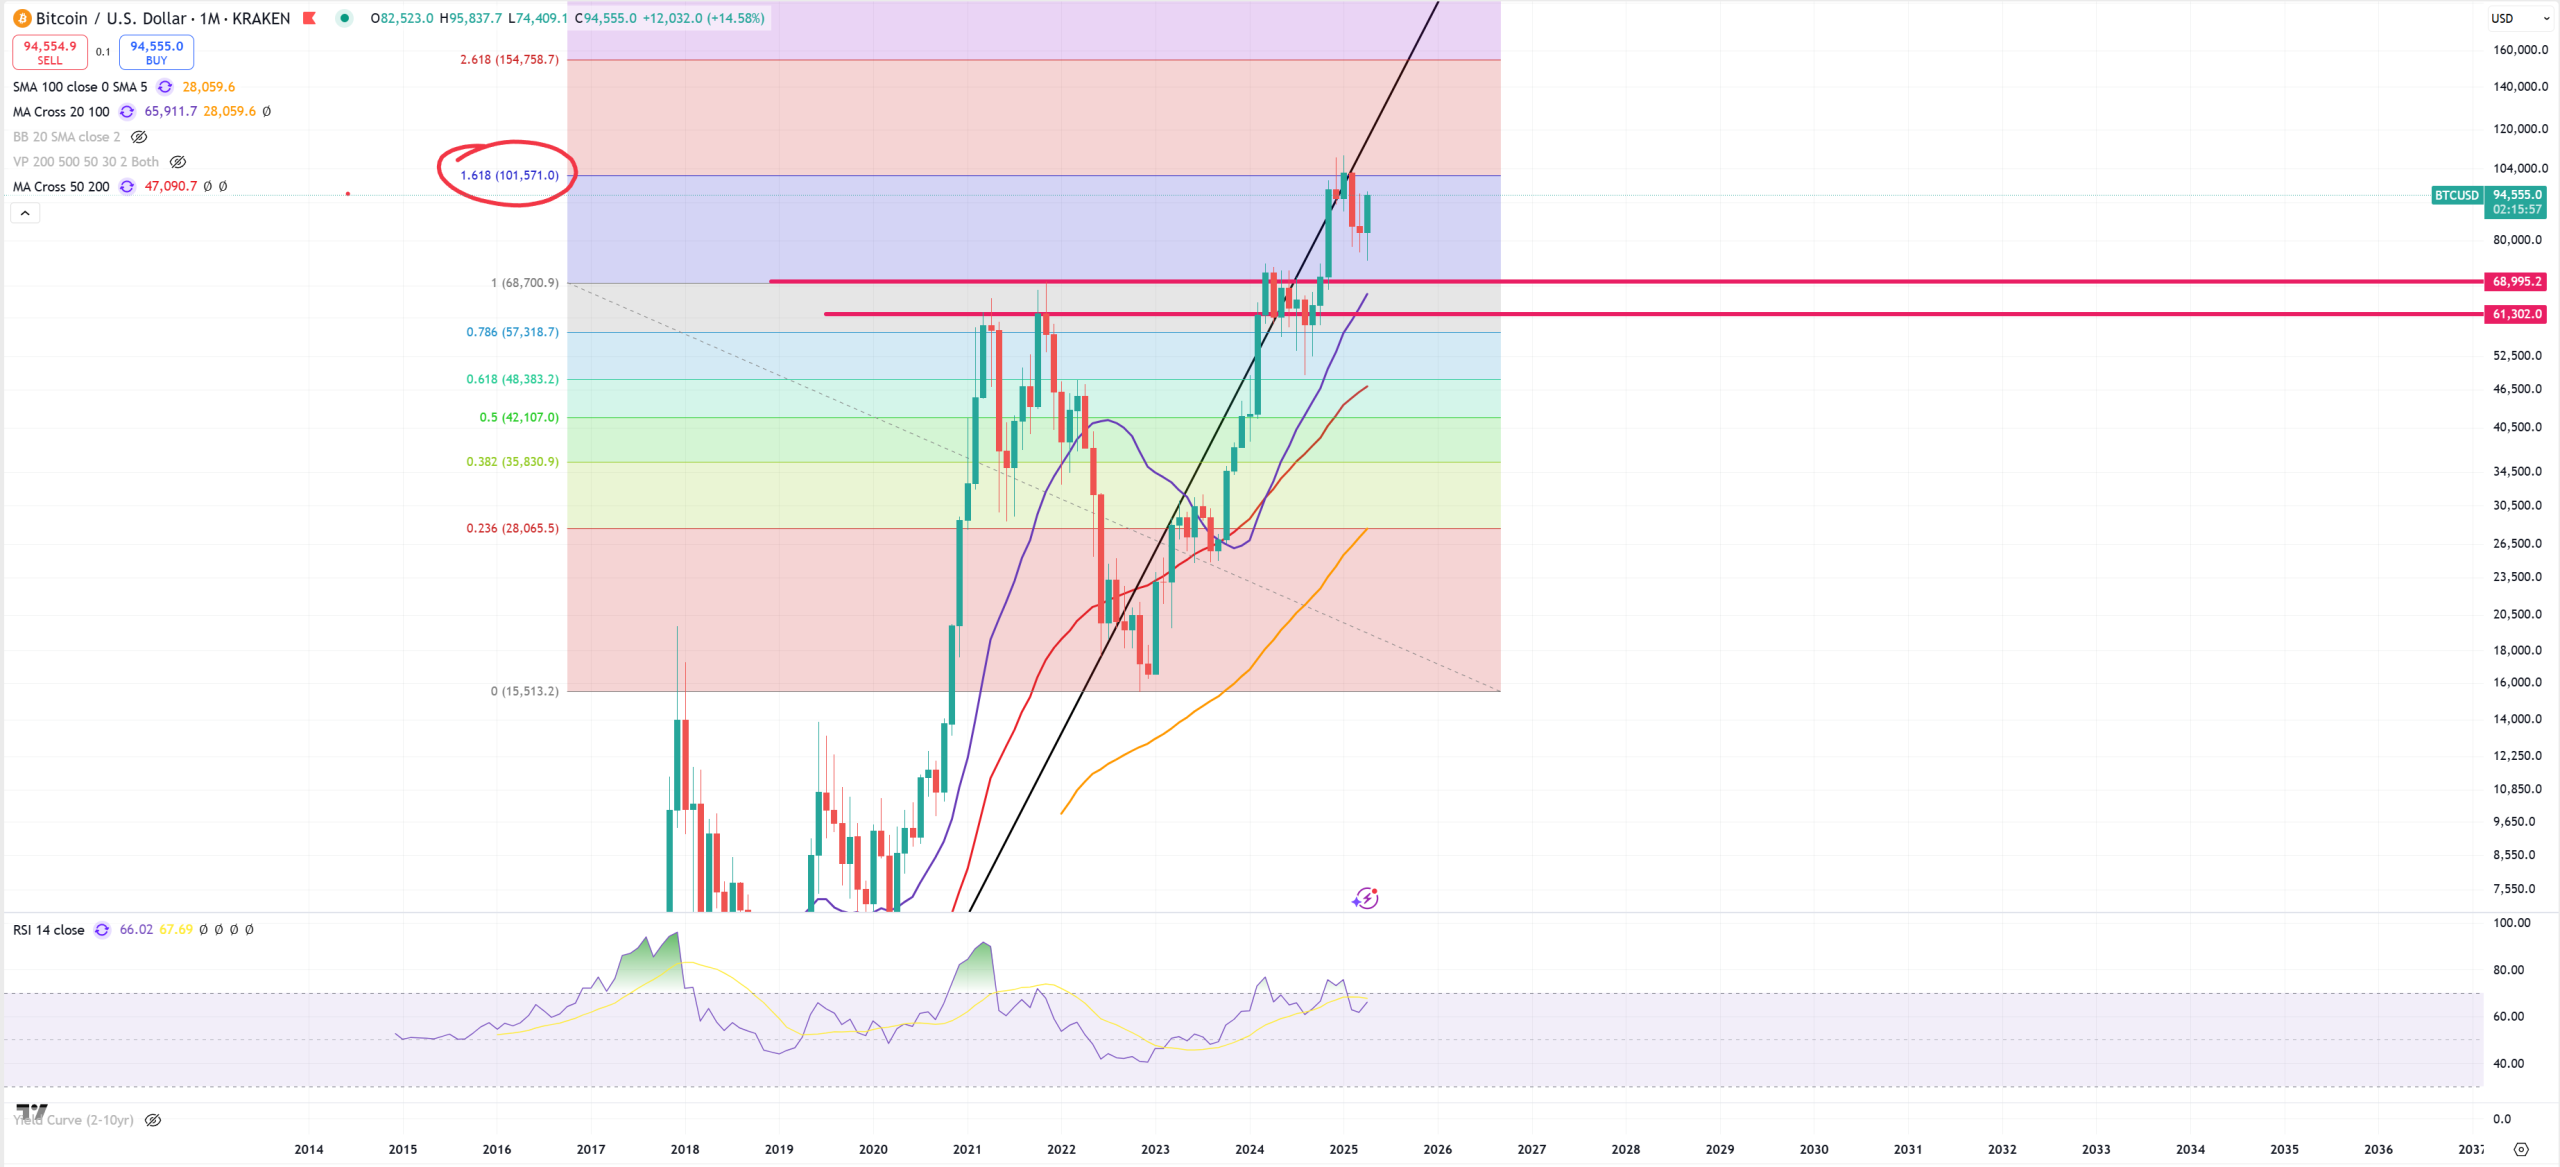
BTC – as long as GOLD/BTC goes lower it’ll be going higher
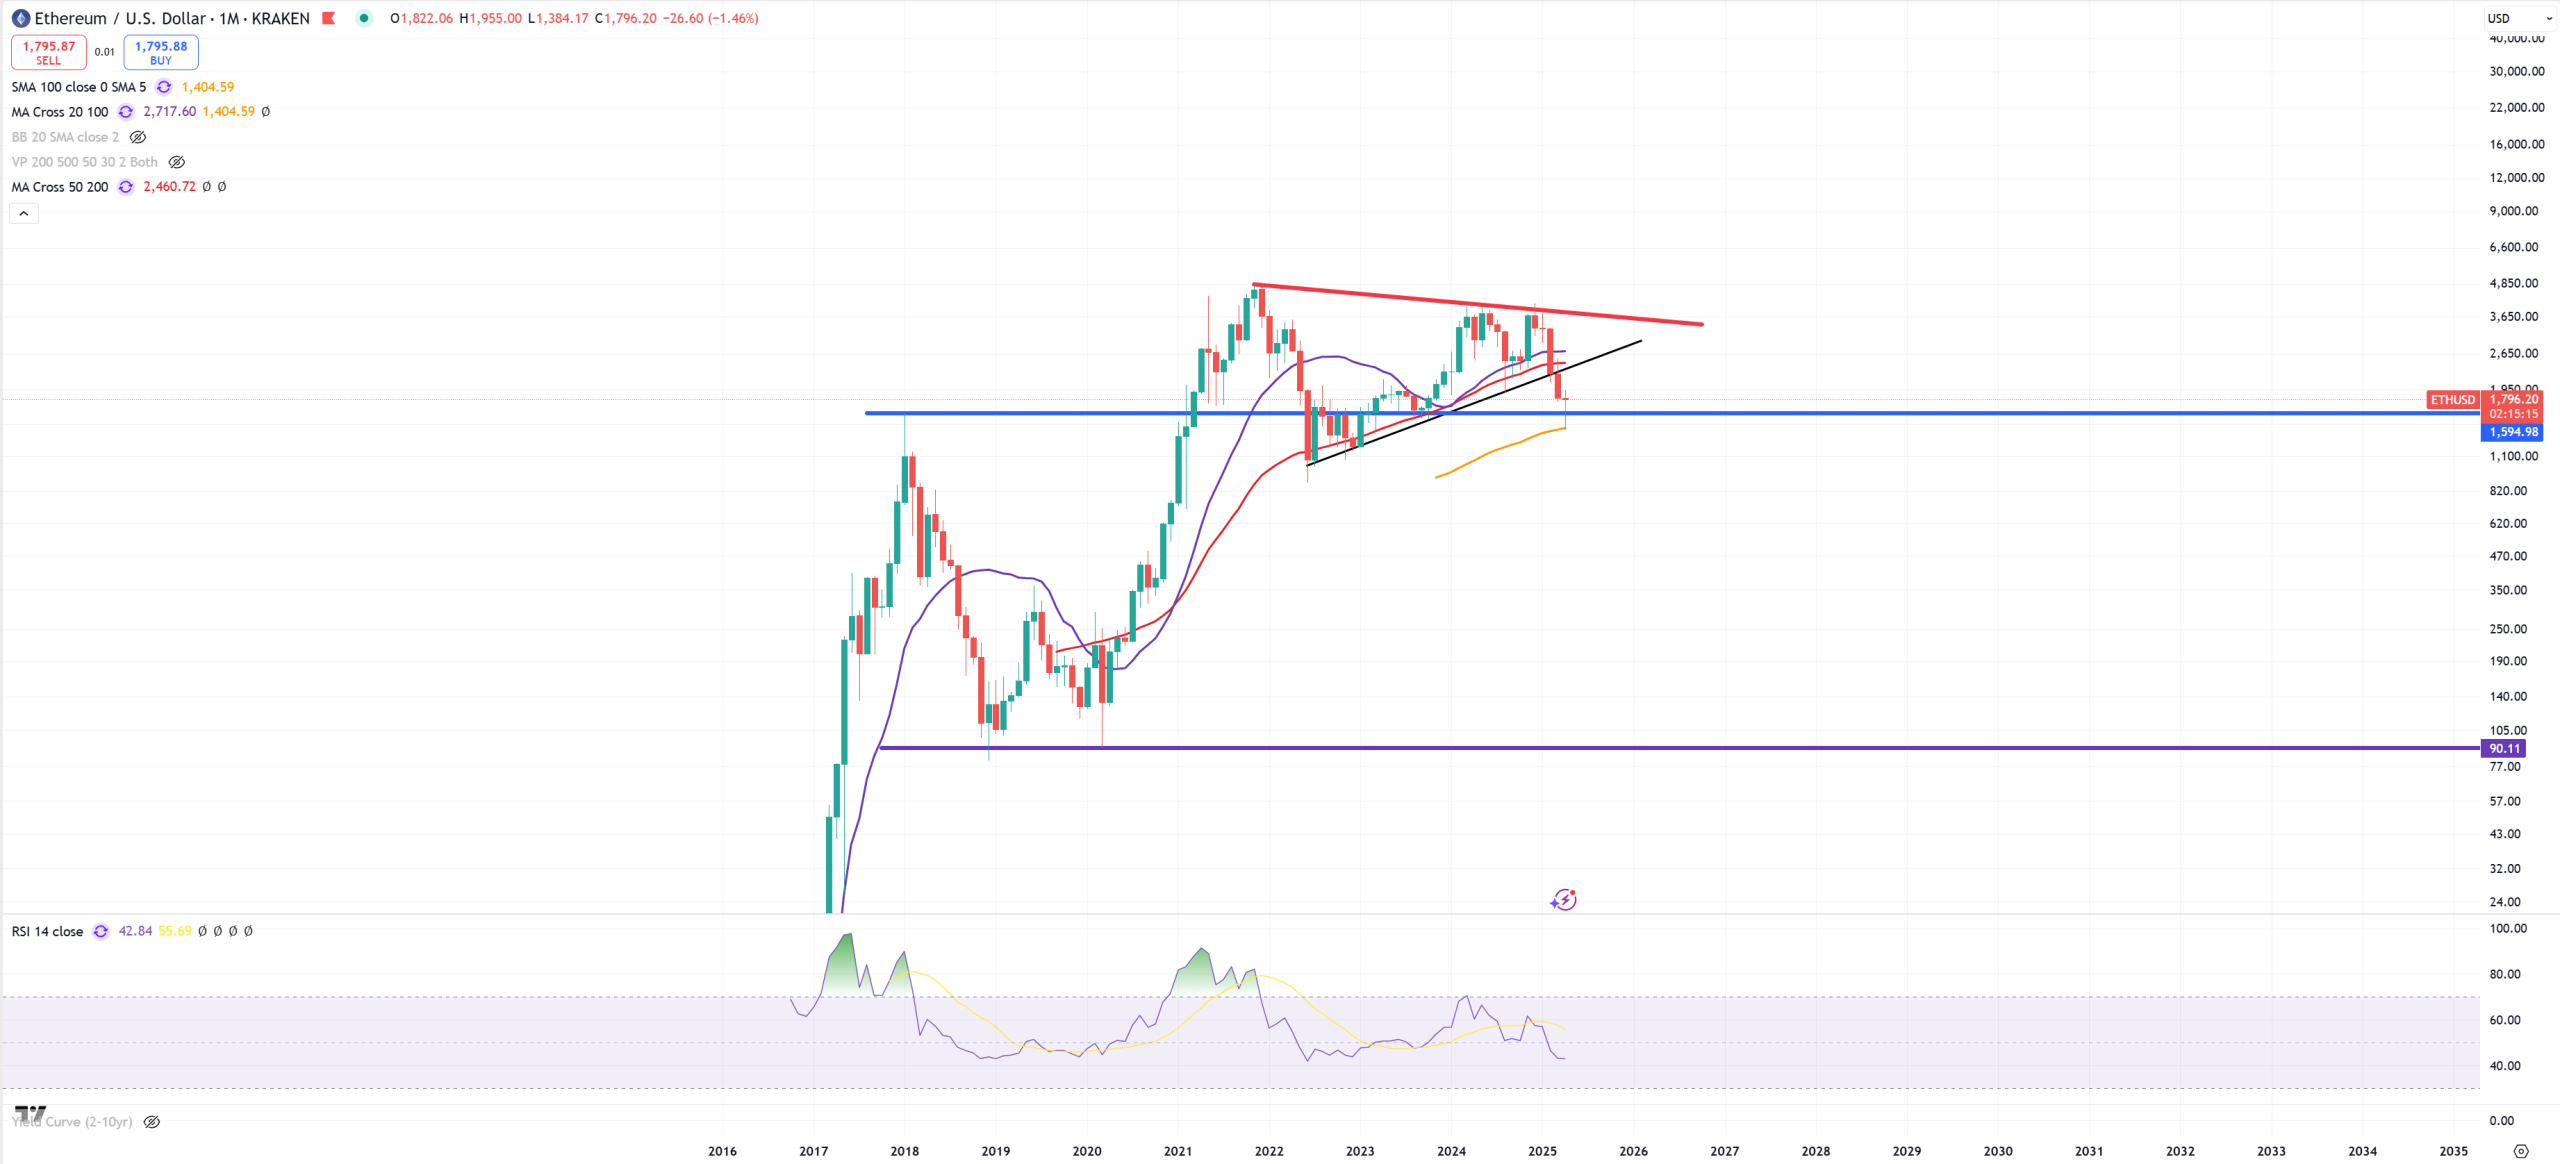
ETH – fights for support and (M)MA100 because once it’ll lose it 90$ coming.
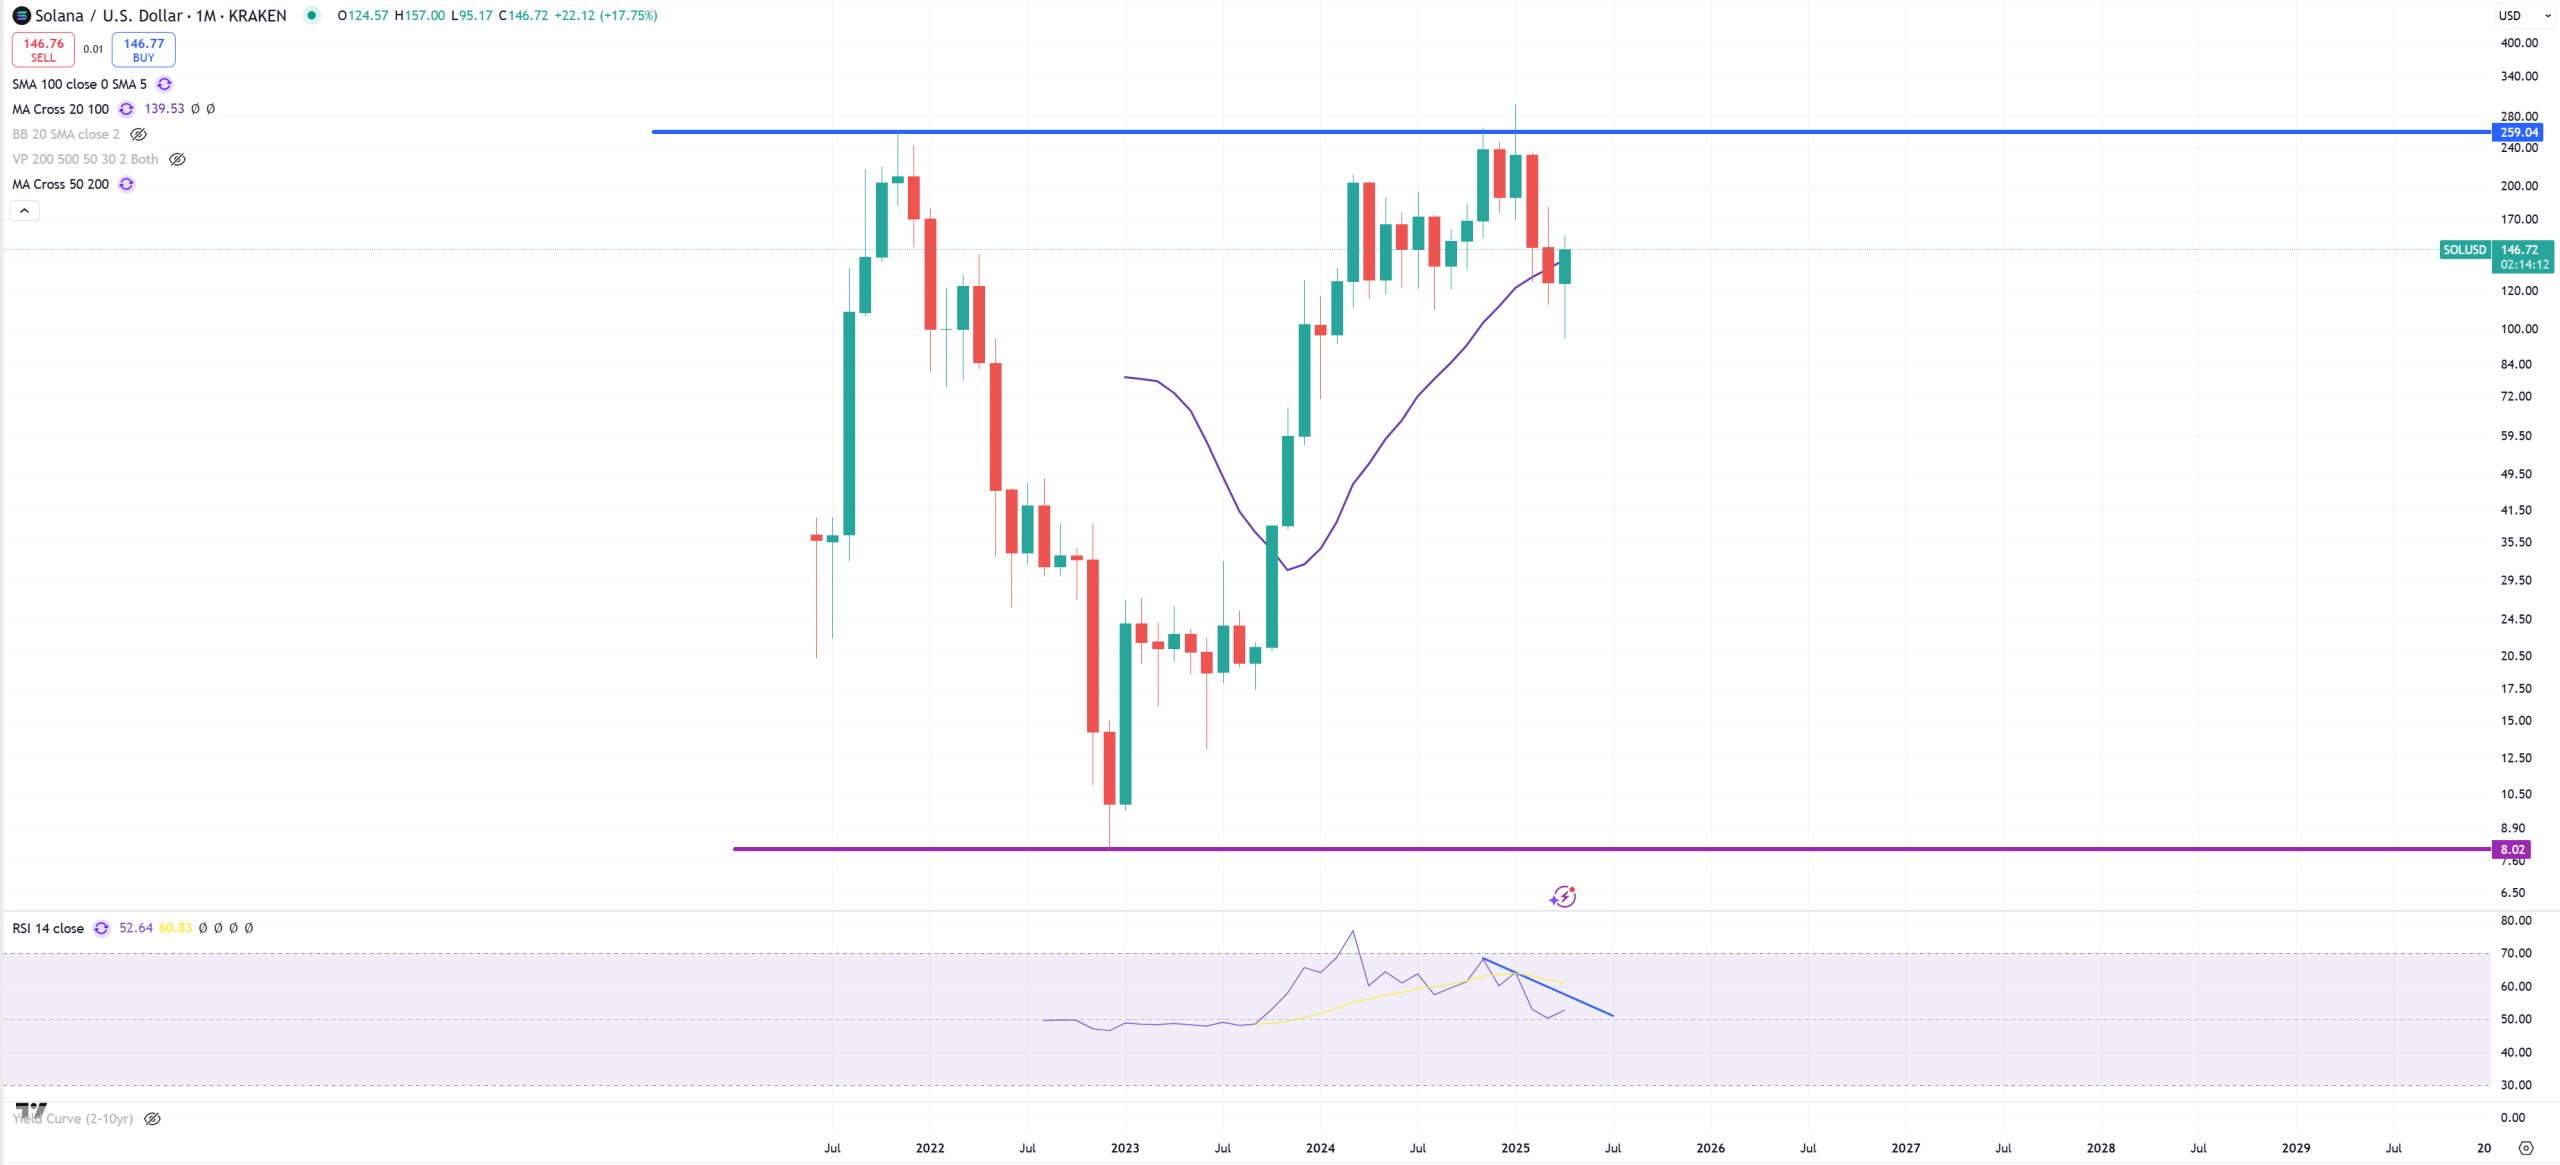
SOL – double-top (first 2021) and now fights for (M)MA20 not to crash back to 8$.
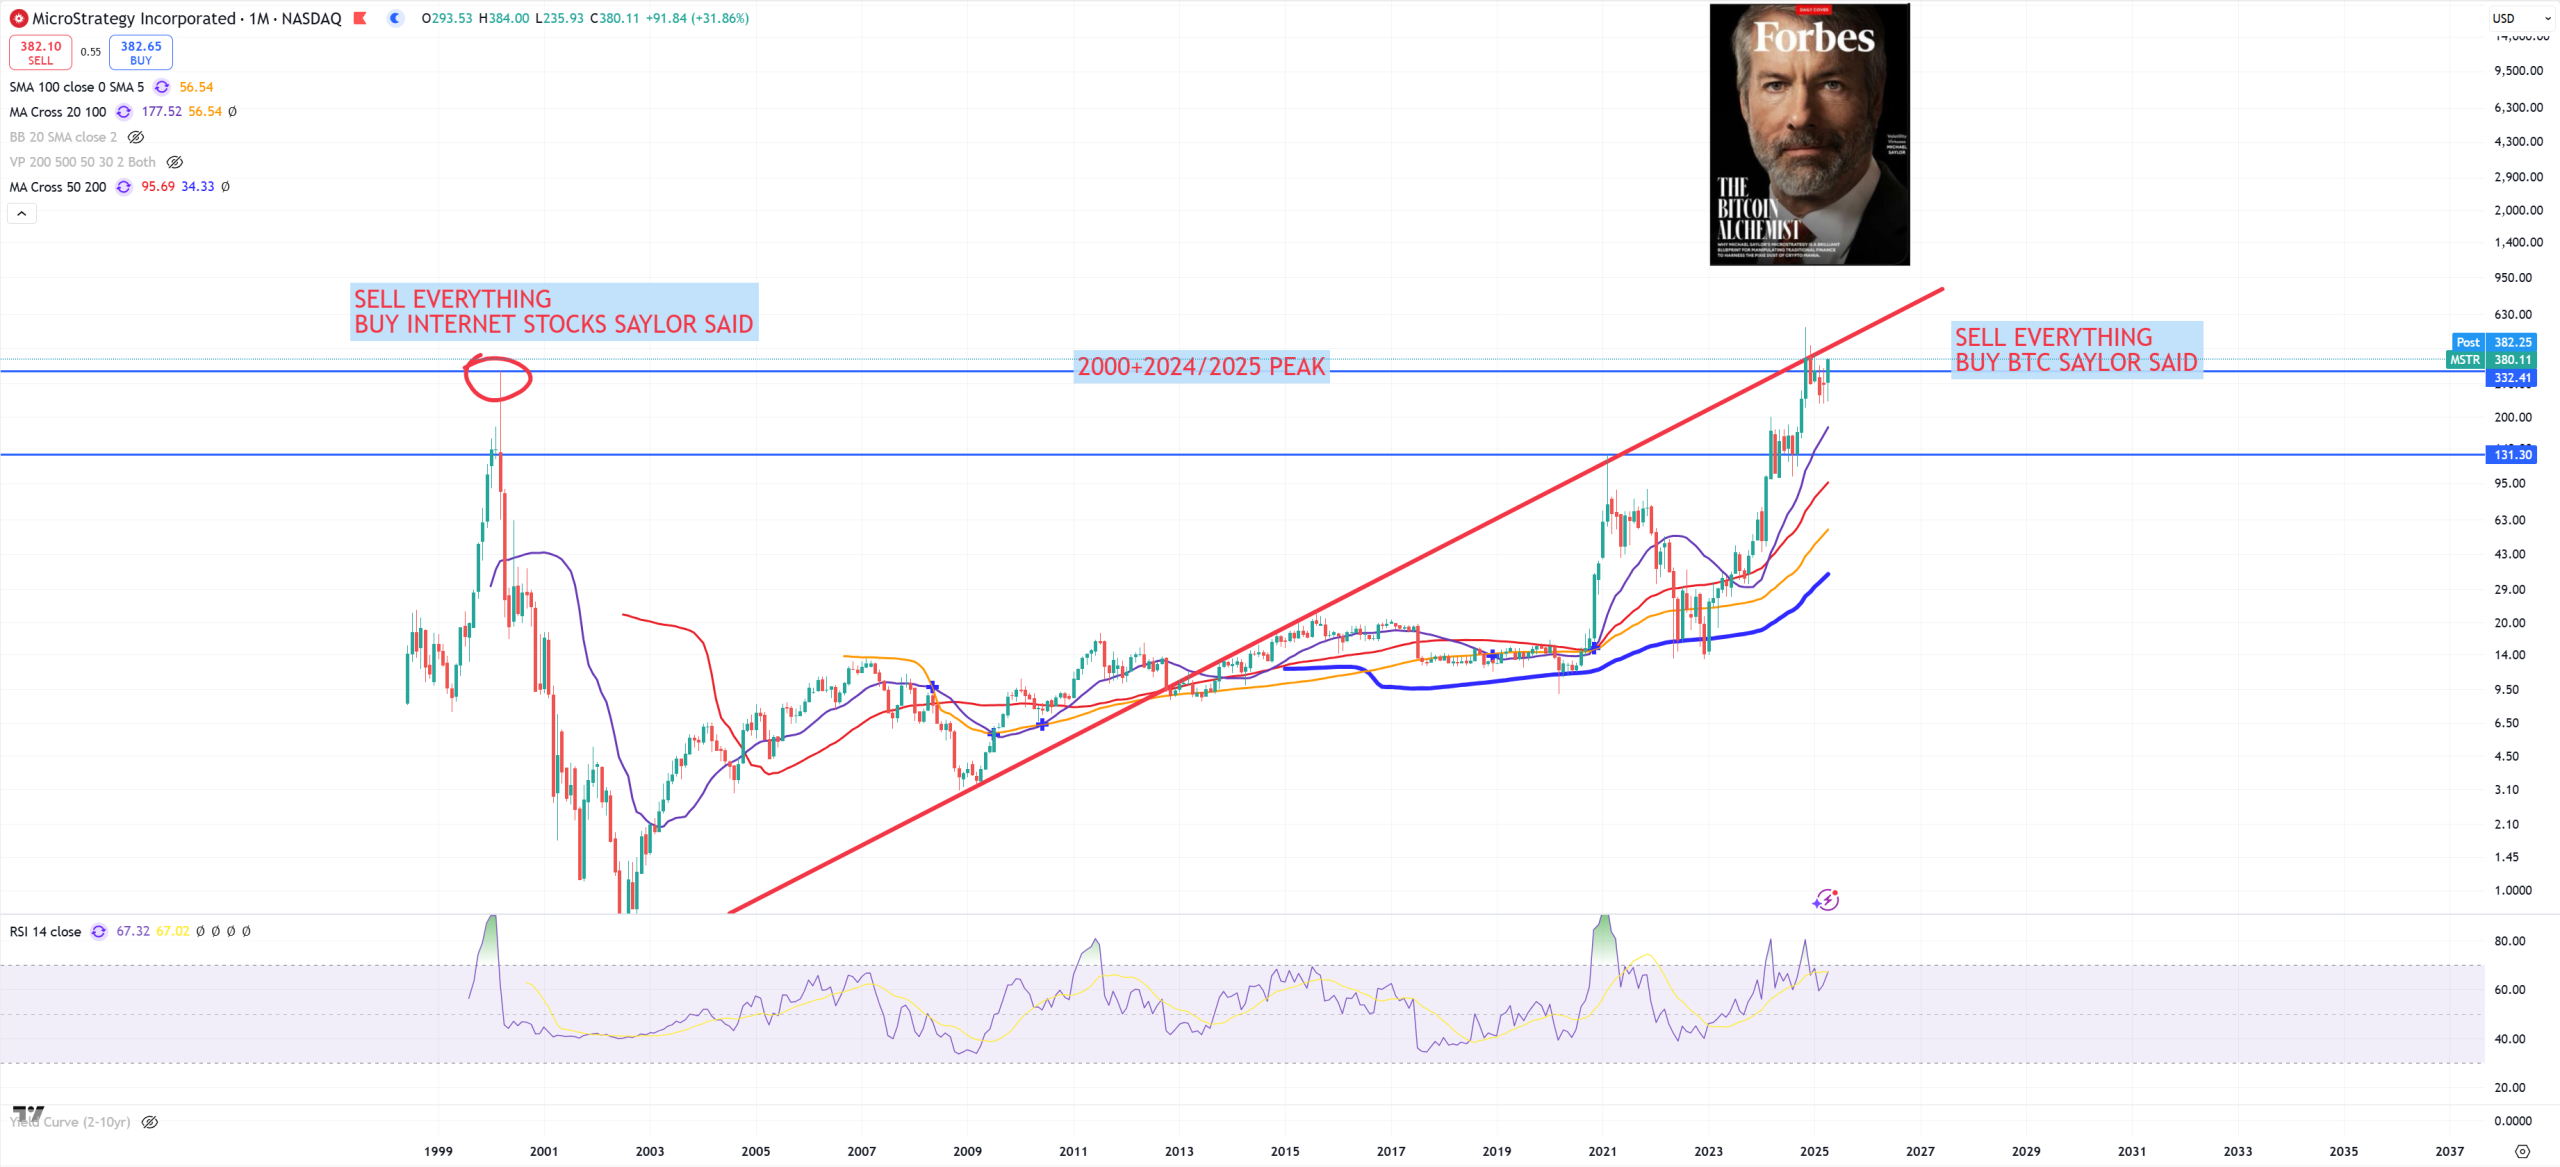
MSTR – Saylor is a bit levitating above this key resistance