The crossroad – market needs to decide what to do as it is heavily cracked.
May 4, 2025

As market turns down crashing from 1929-2000 SPX trend a moment later when SPX/GOLD and DJI/GOLD and even NDQ/GOLD rejected/broken the trends, it’s time to ask a question where are now. Before we’ll answer this question, we need to look all three ratio charts to gold and couple more charts to see a technical situation on the market right now until we reach $ crossroad.
DJI/GOLD and (3M) view and (3M)MA200 – this chart points to a fact that it’s all busted.
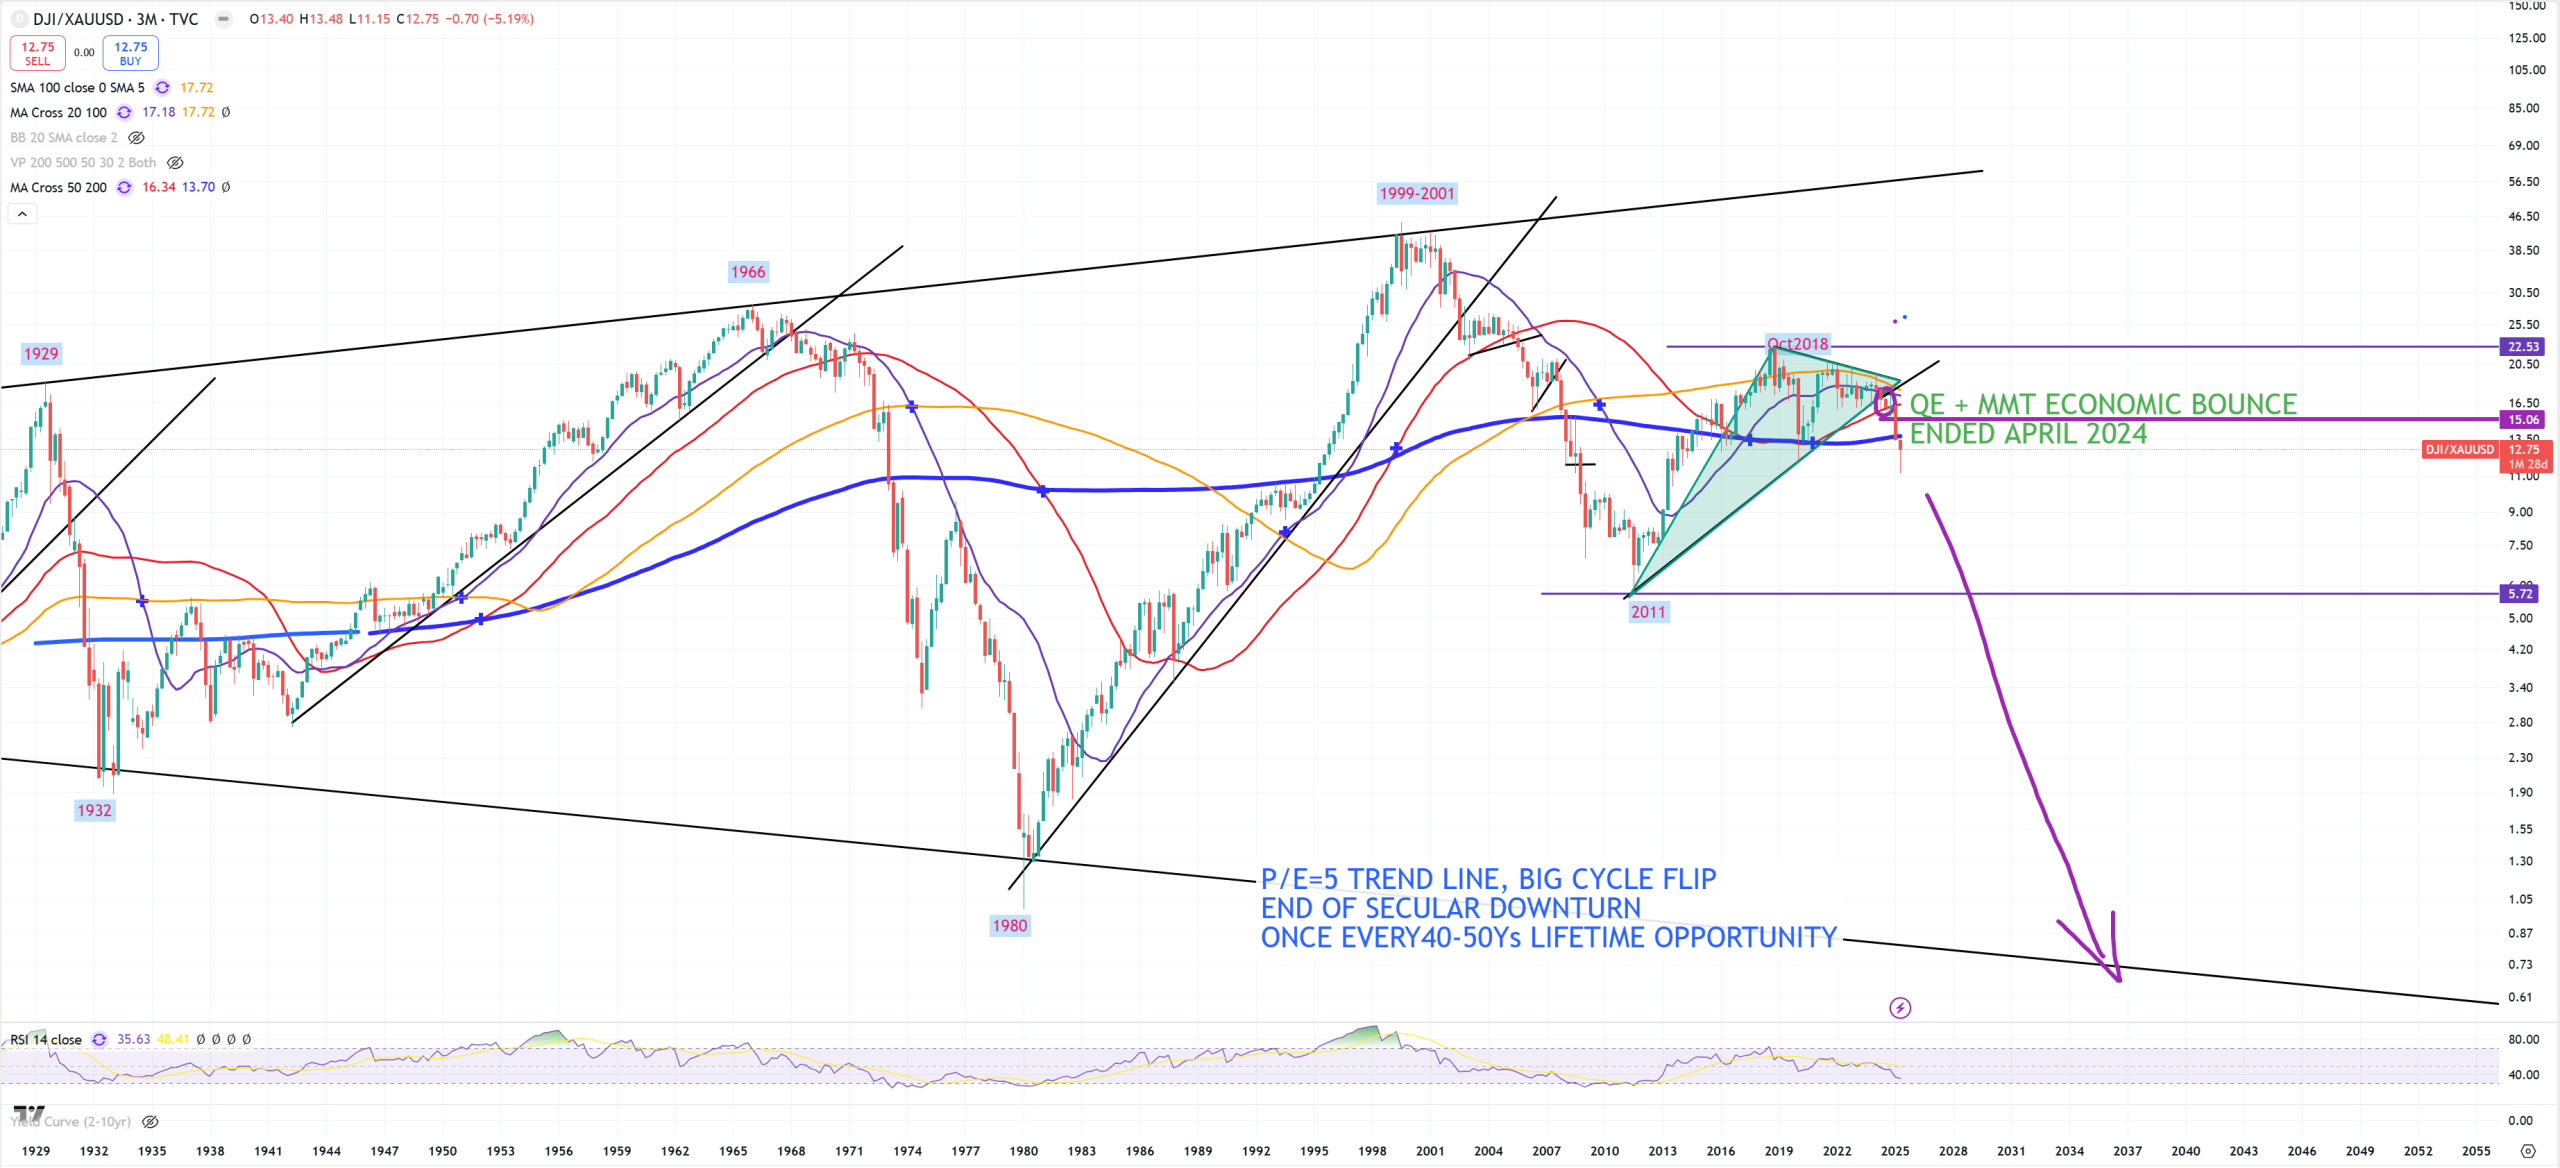
(3M)MA200 was busted down couple times during last 100Ys. 1931, 1973, 2008 and 2025. Those dates are not accidental, because each date confirmed big cycle change :
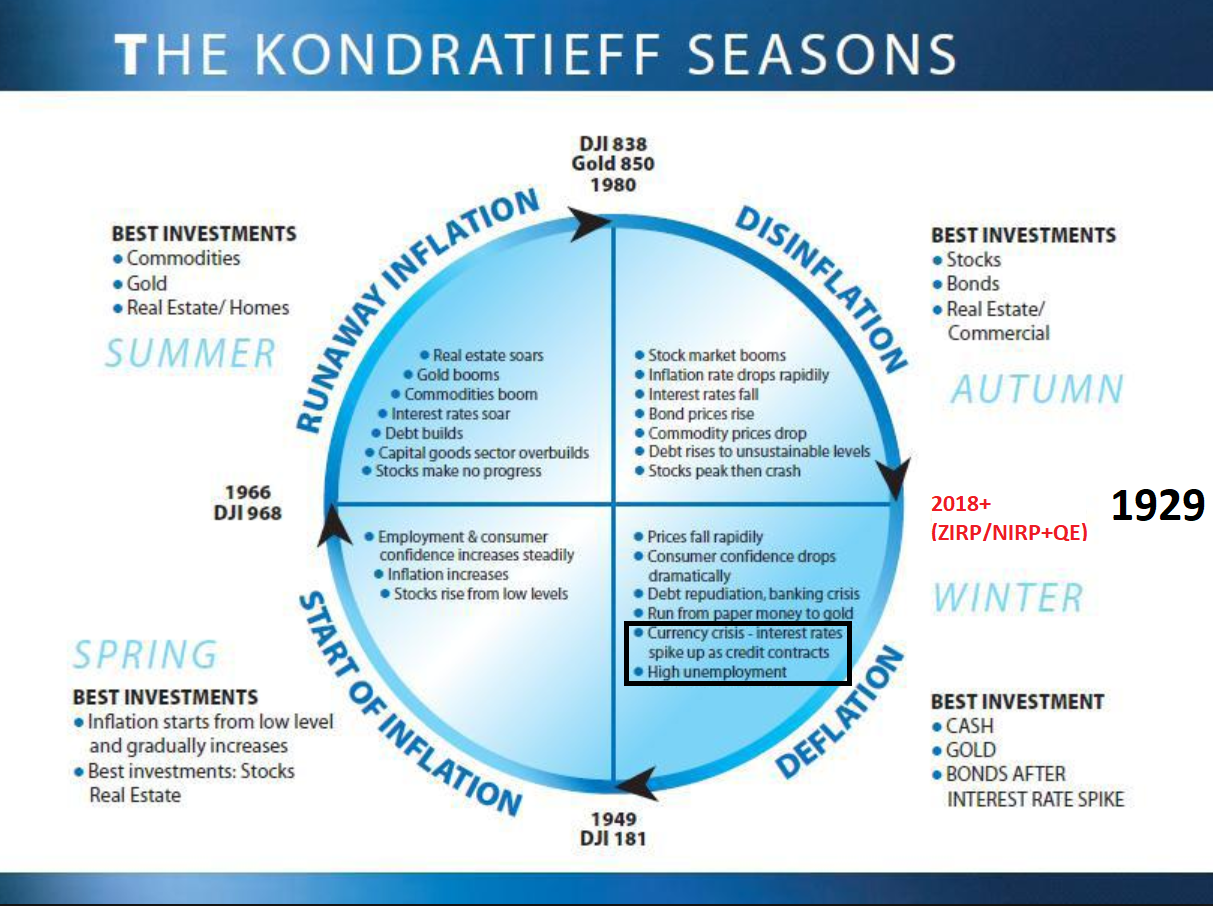
1931 – told us we started to end disinflationary period, 1973 – told us we started to end stagflationary period, 2008 – also disinflationary period end, but new monetary tools managed to get us out from this for full 16 years once we broke again this (3M)MA200 and I treat it as a continuation of 2008 break because we have not touched lower 1932-1980 megaphone trend line on DJI/GOLD.
Both DJI/GOLD and SPX/GOLD are some kind of cycle indicators and how the economy keeps moving. We clearly see that bounce post 2011 was in reality weak, leaving 2000 level much higher. Summary is : QE isn’t creating a big recovery in the economy in general. Worth to be noticed that post 2018 we made here only lower highs what we can interpret that since 2018 economy has started rotating. So funny to say but : any form of stimulus in reality has killed this economy post 2018 – that’s a valid statement analyzing those ratio charts. If you seriously think tariffs blew it up – you are totally wrong. Tariffs moments we’ll see probably in a year from now.
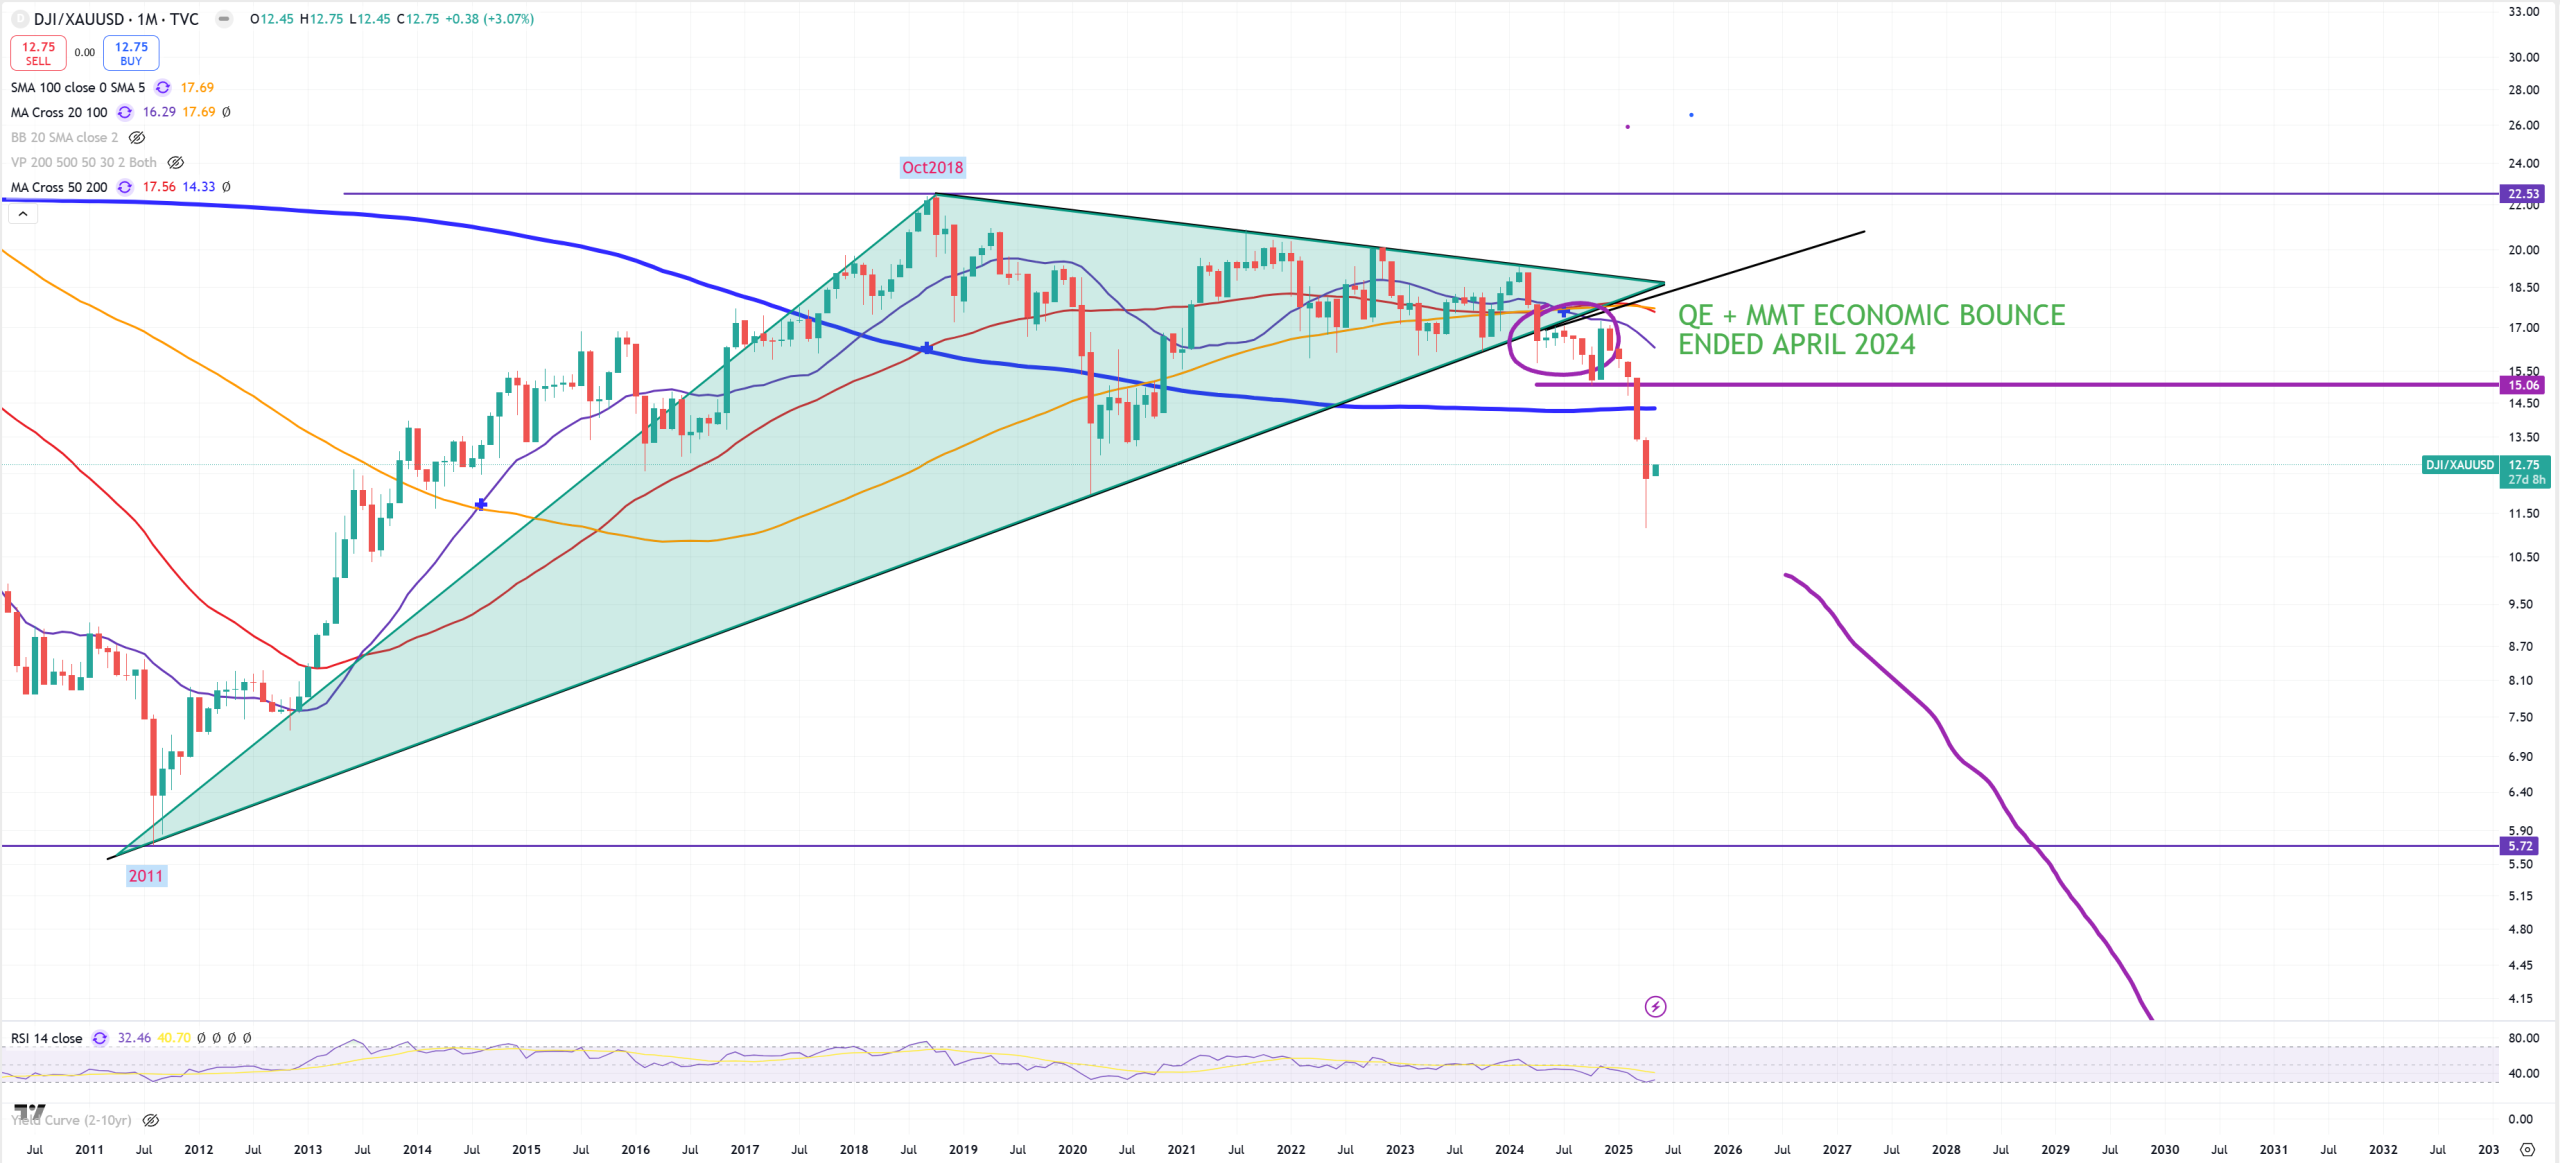
DJI/GOLD on M view and (M)MA200 – here looks a bit different than (3M). We broke down (M)MA200 during : 1931, 1937, 1971, 2006, 2020, 2025.
So we can say (M)MA200 here is a bit earlier while (3M)MA200 is a done deal.
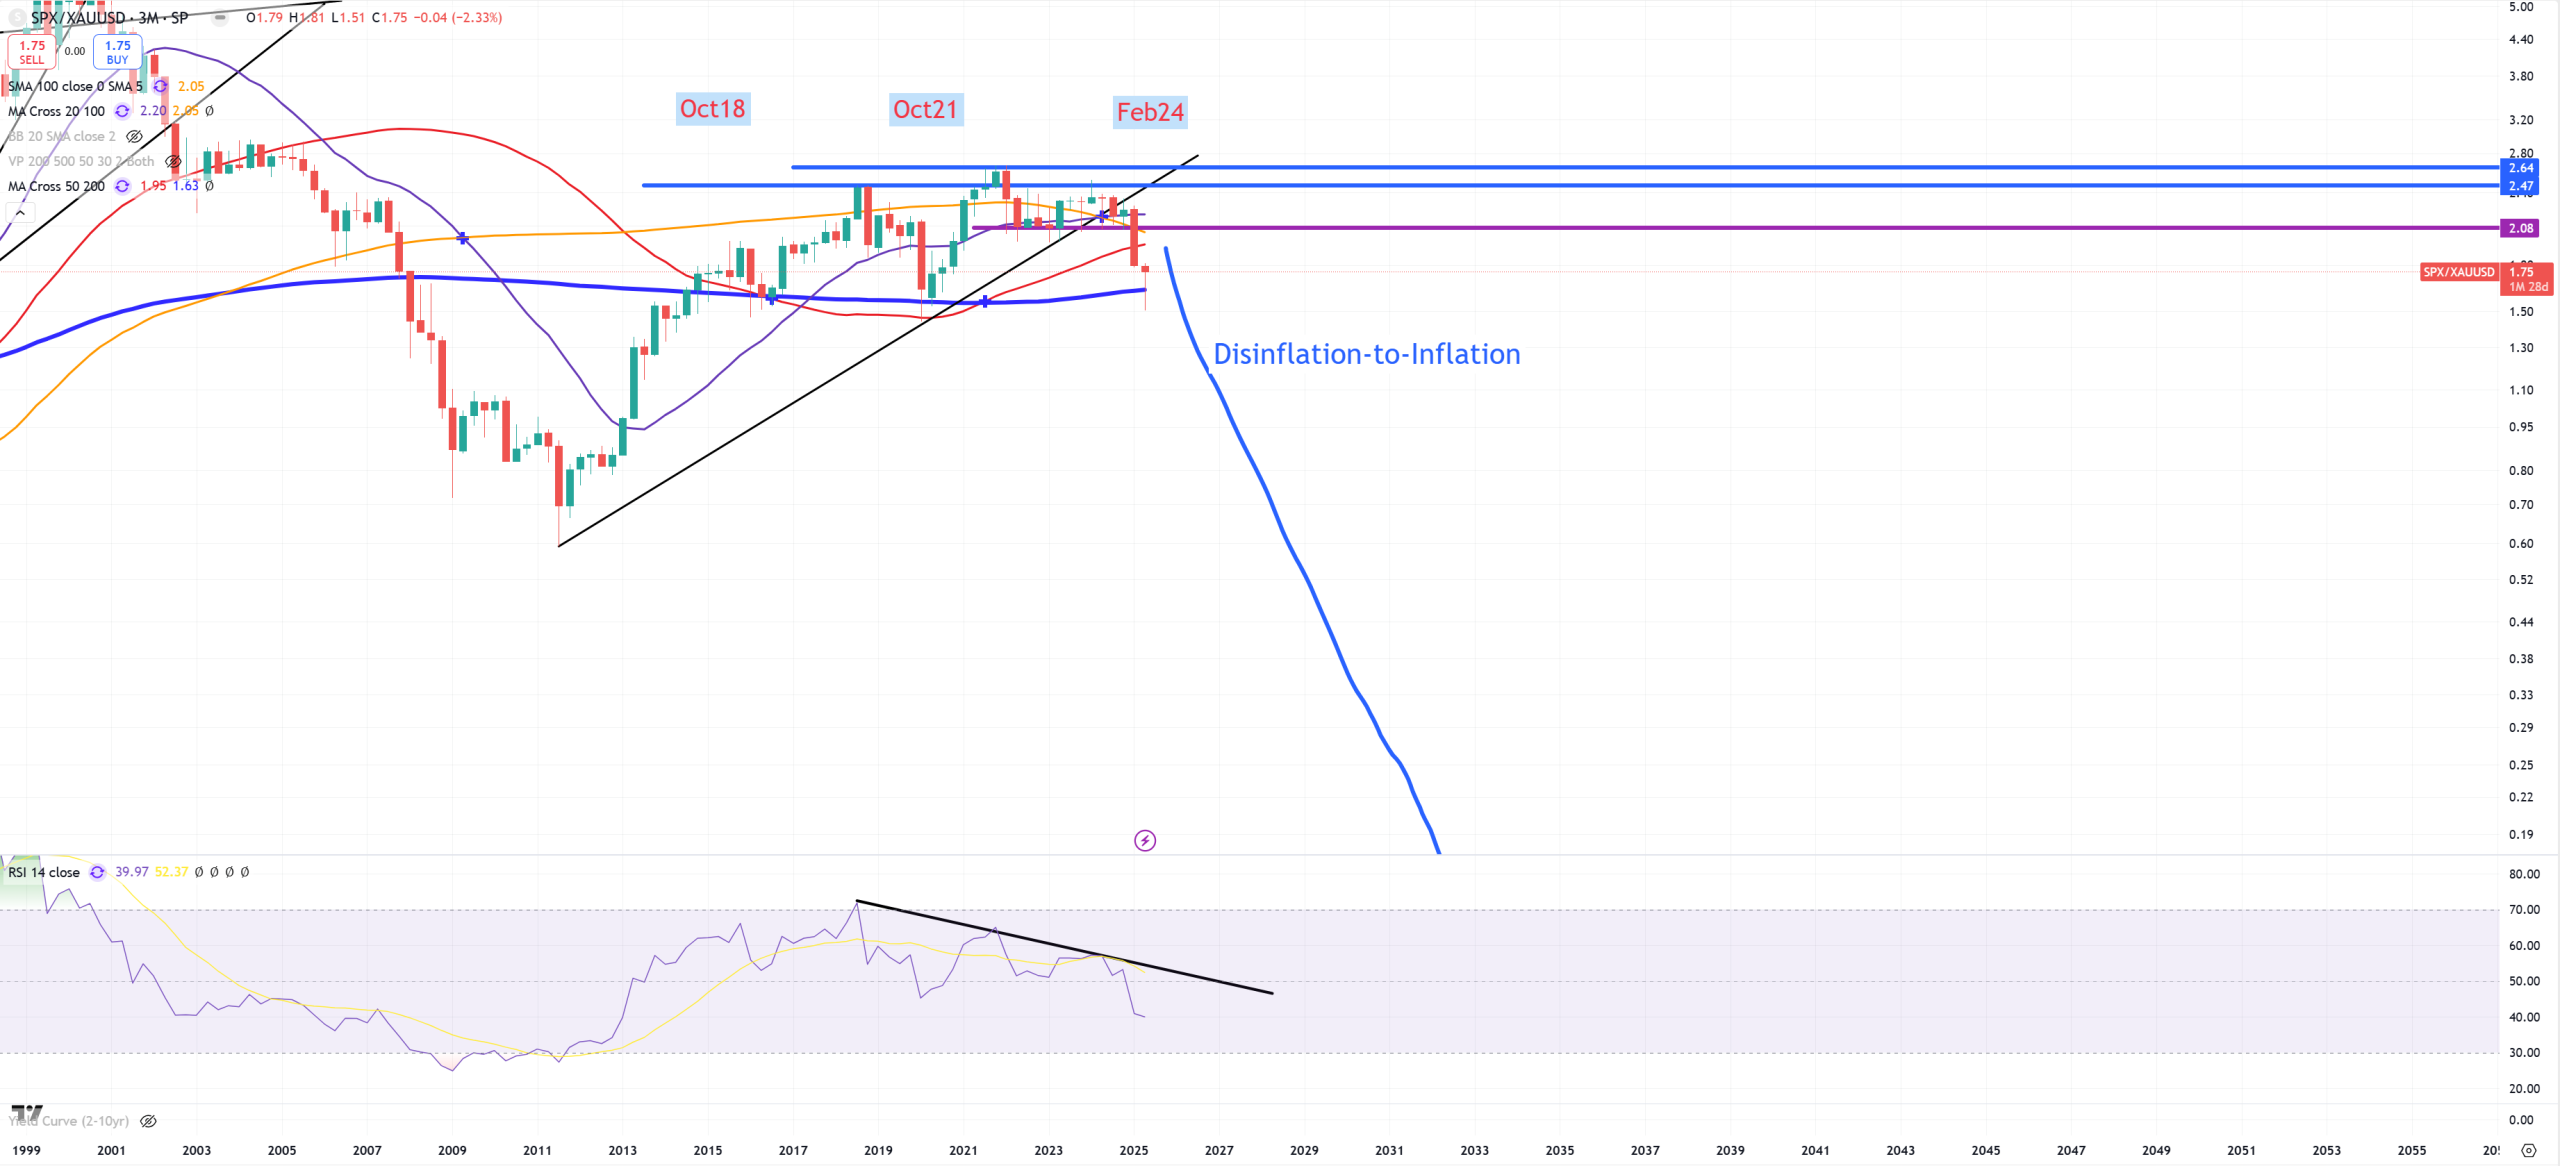
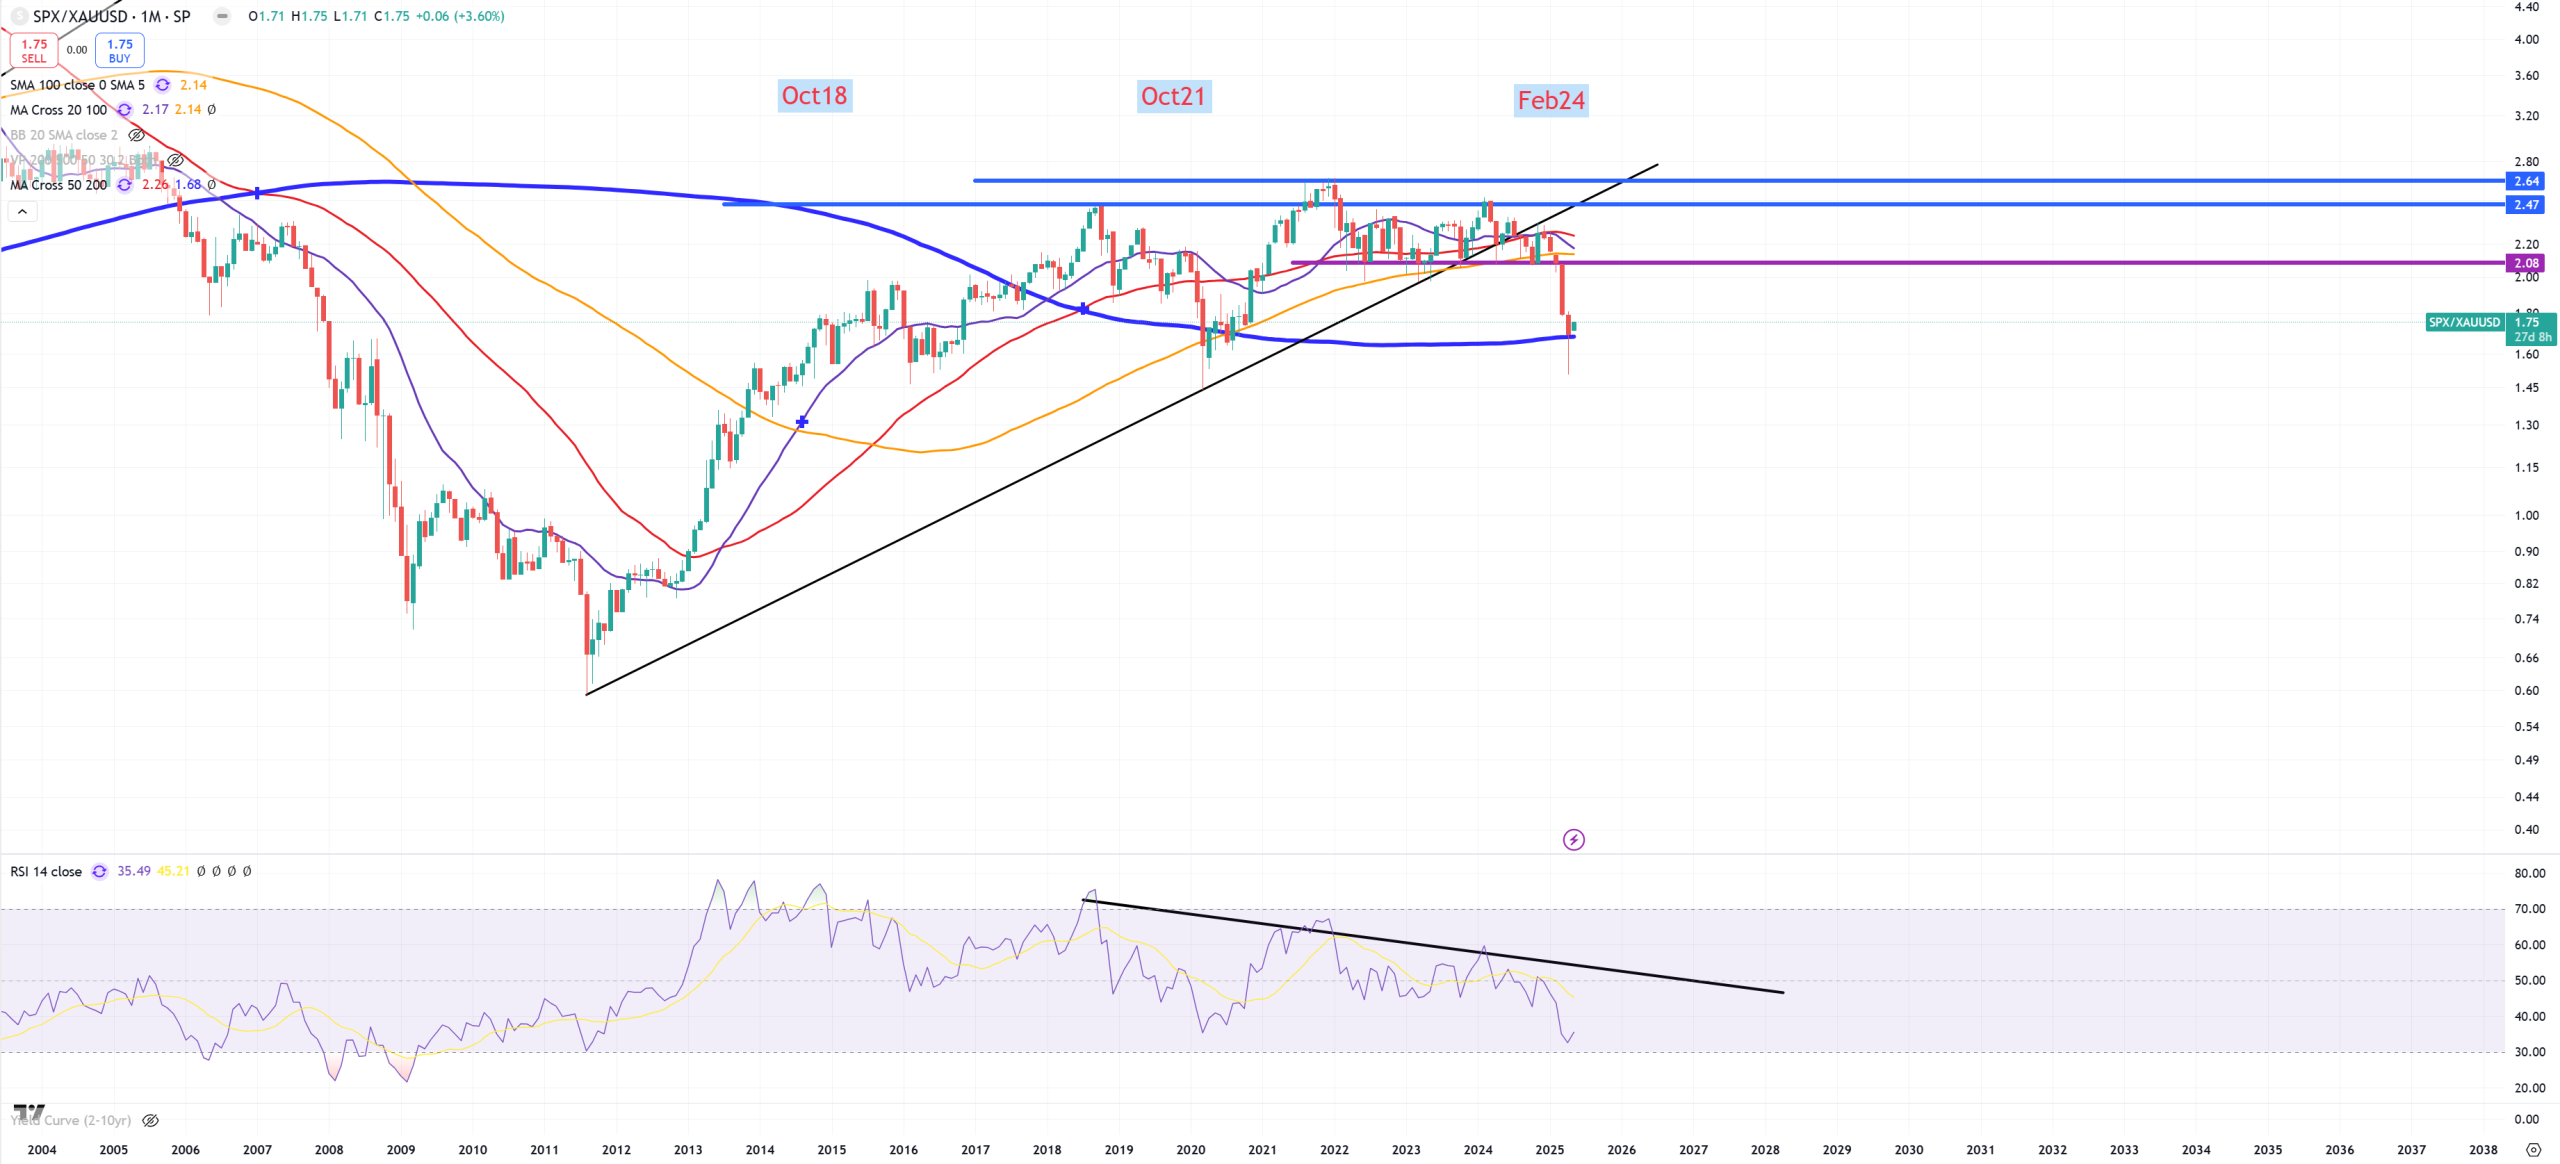
SPX/GOLD and (3M) view isn’t a done deal like DJI/GOLD here. Peak in October 2021 and started going lower. When last time we broke down (3M)MA200 here : 1931, 1937, 1973, 2008. I don’t count 1947 as it was sliding on the edge of this MA. Big negative divergence on (3M)RSI :
SPX/GOLD on M view. Support here holds on (M)MA200, last breaks down of this MA : 1931, 1972, 2006, 2020 (for a “moment”).
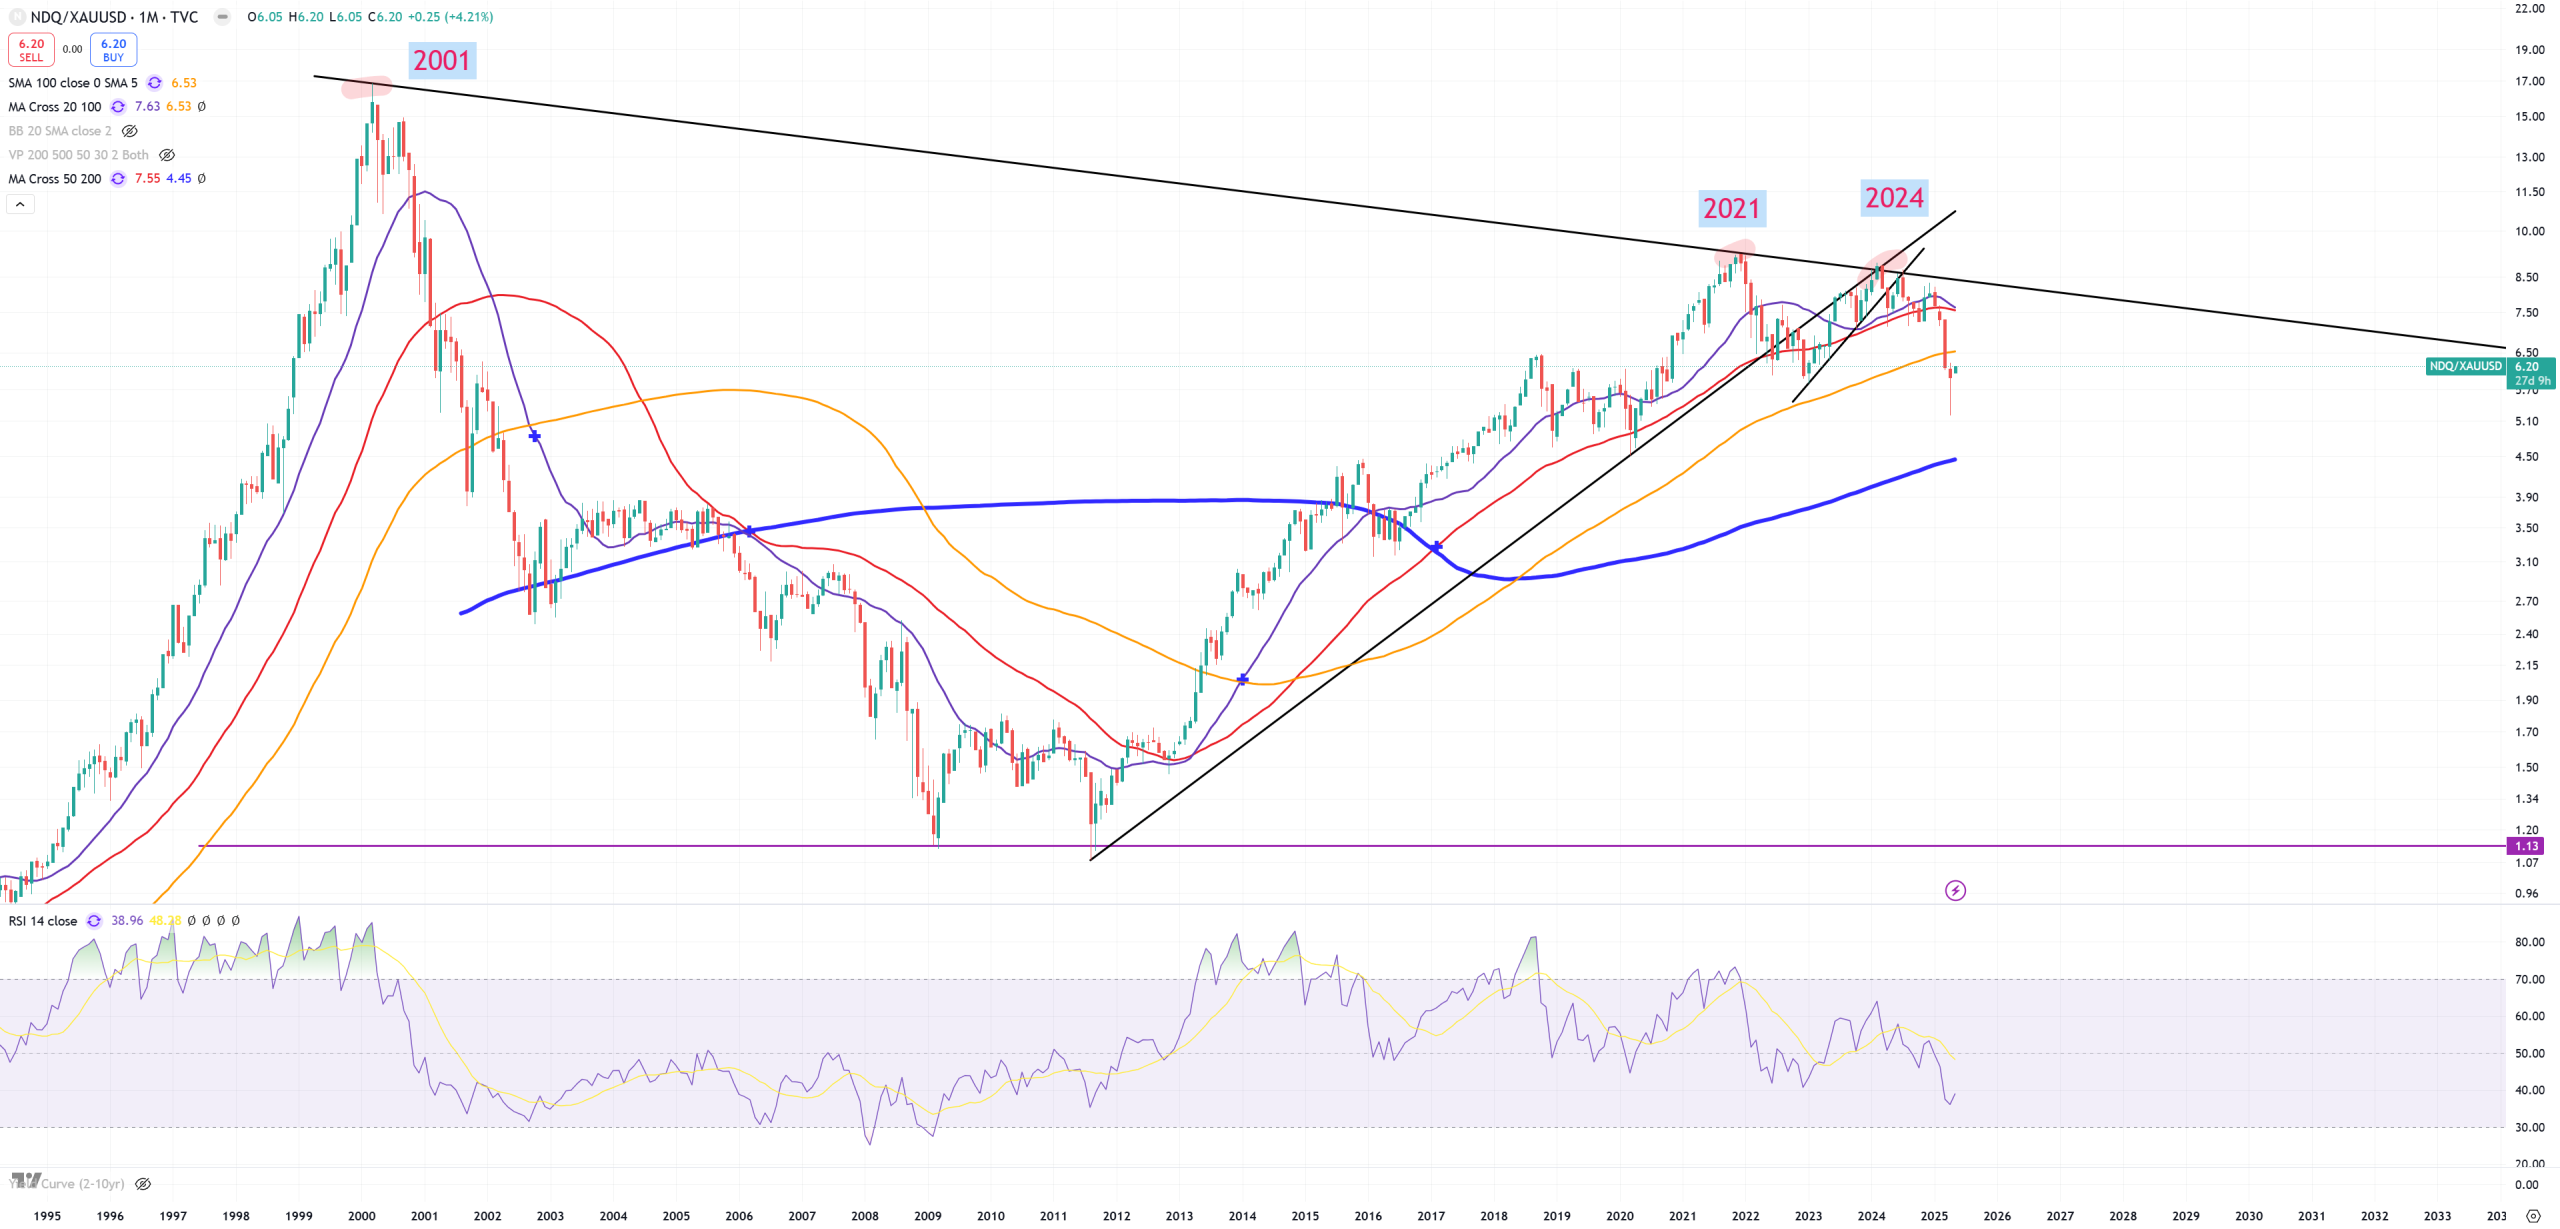
NDQ/GOLD and M view. Last touch to 2001-2021 trend happened in Jul24. This ratio is too short to analyze it, but you clearly see we broke (M)MA20/(M)MA50 and (M)MA100
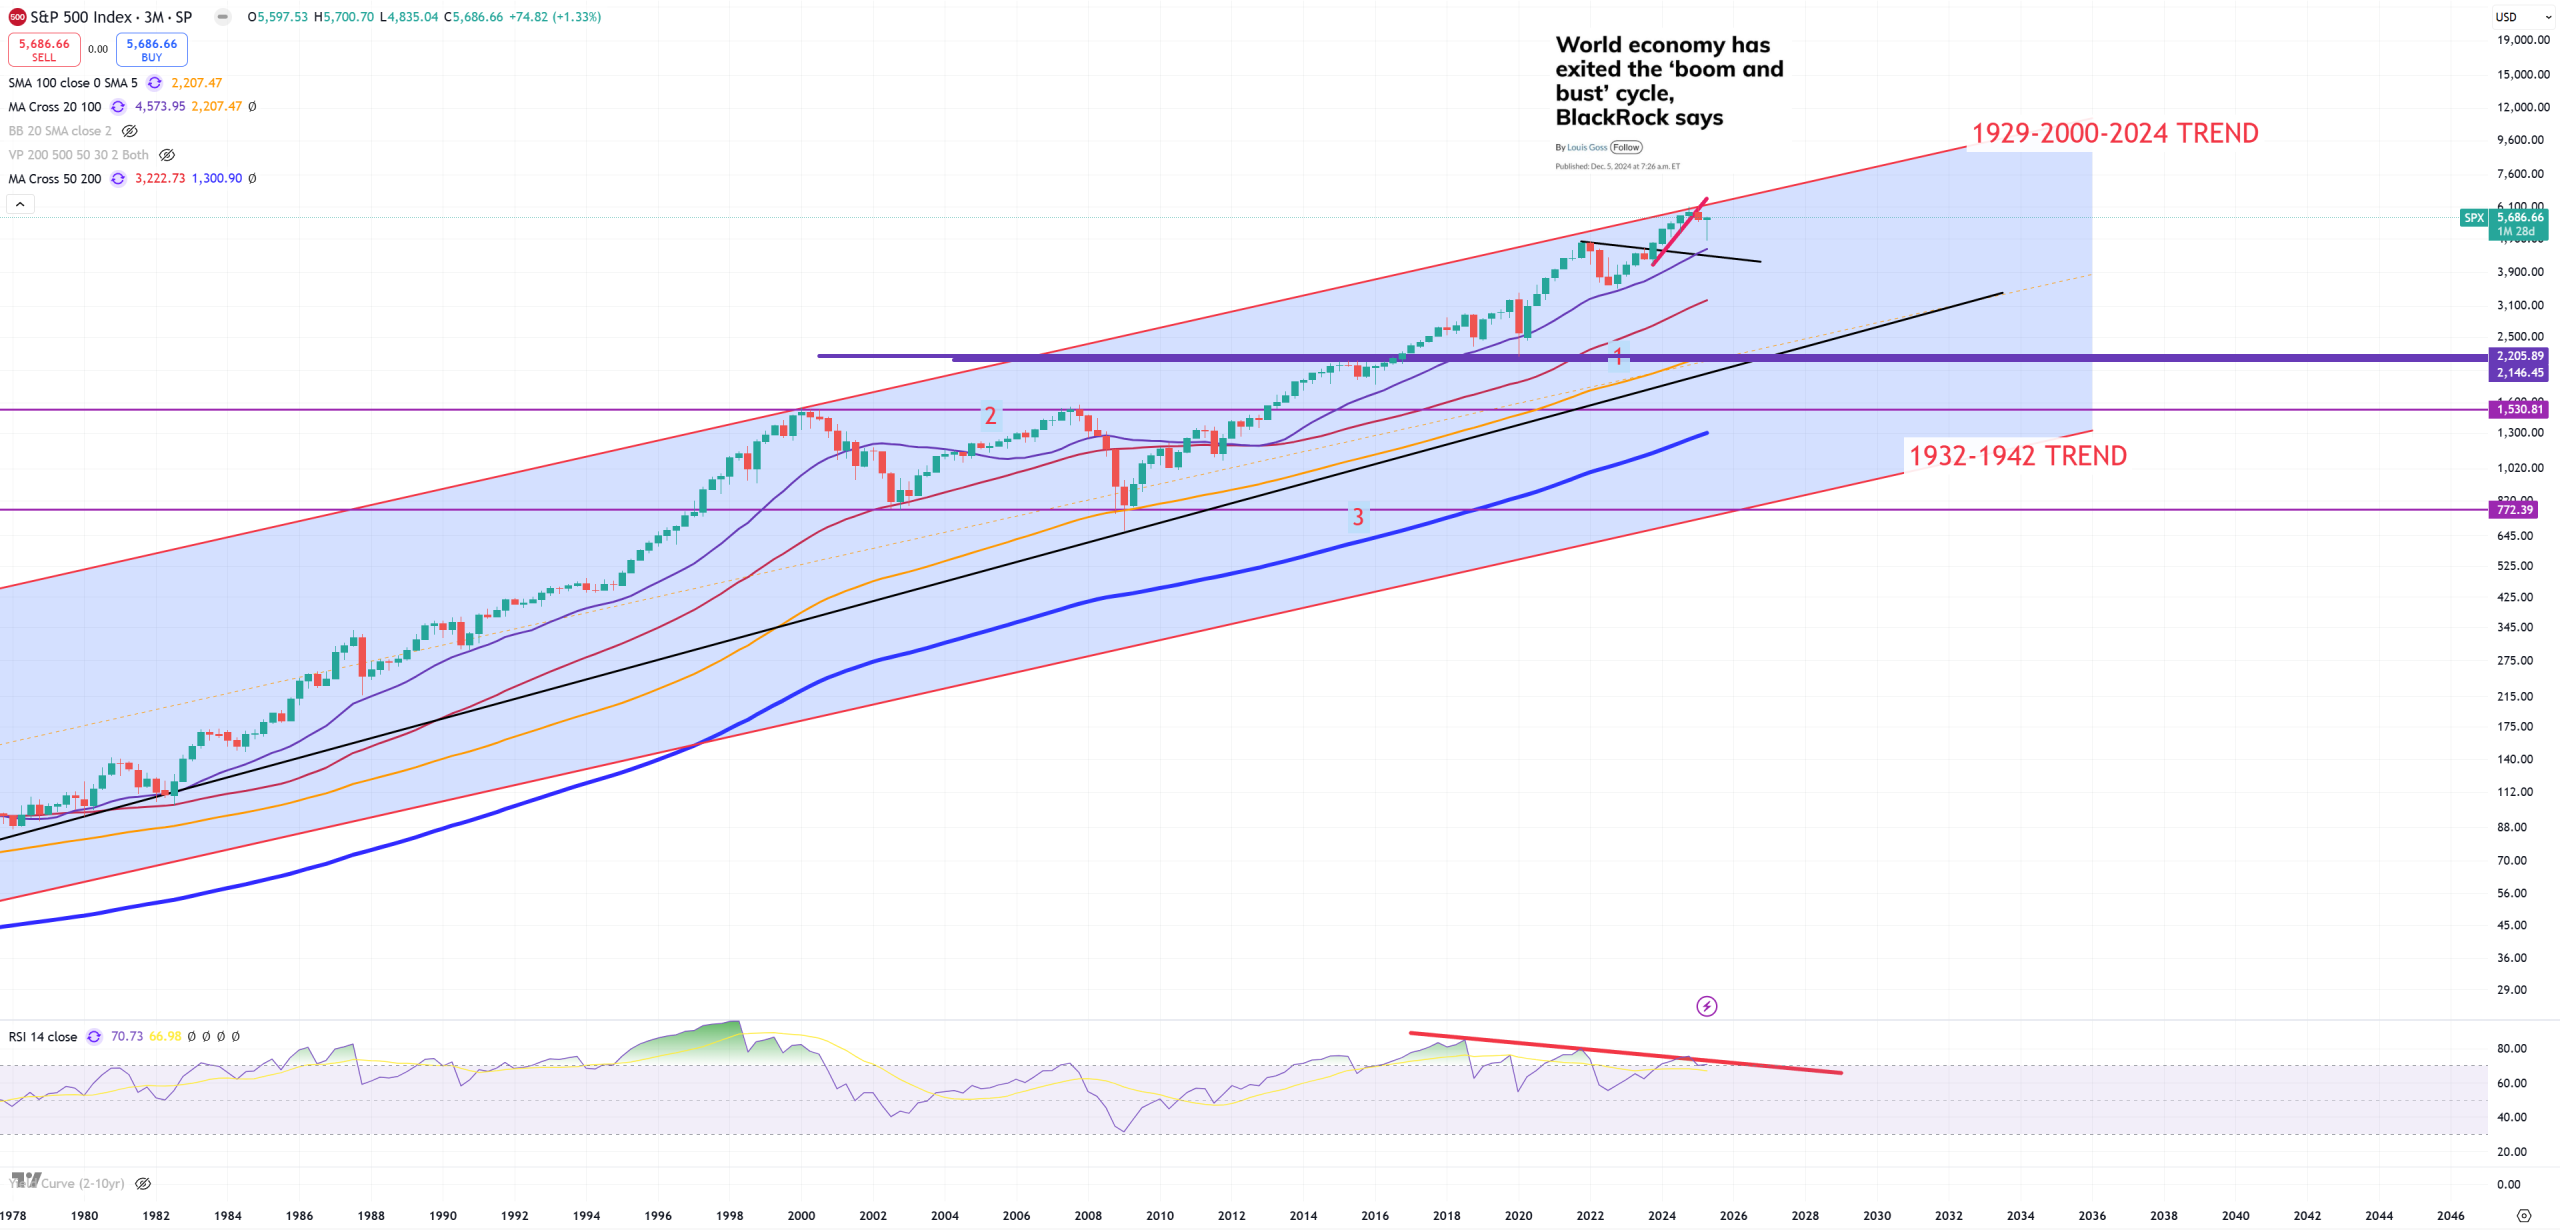
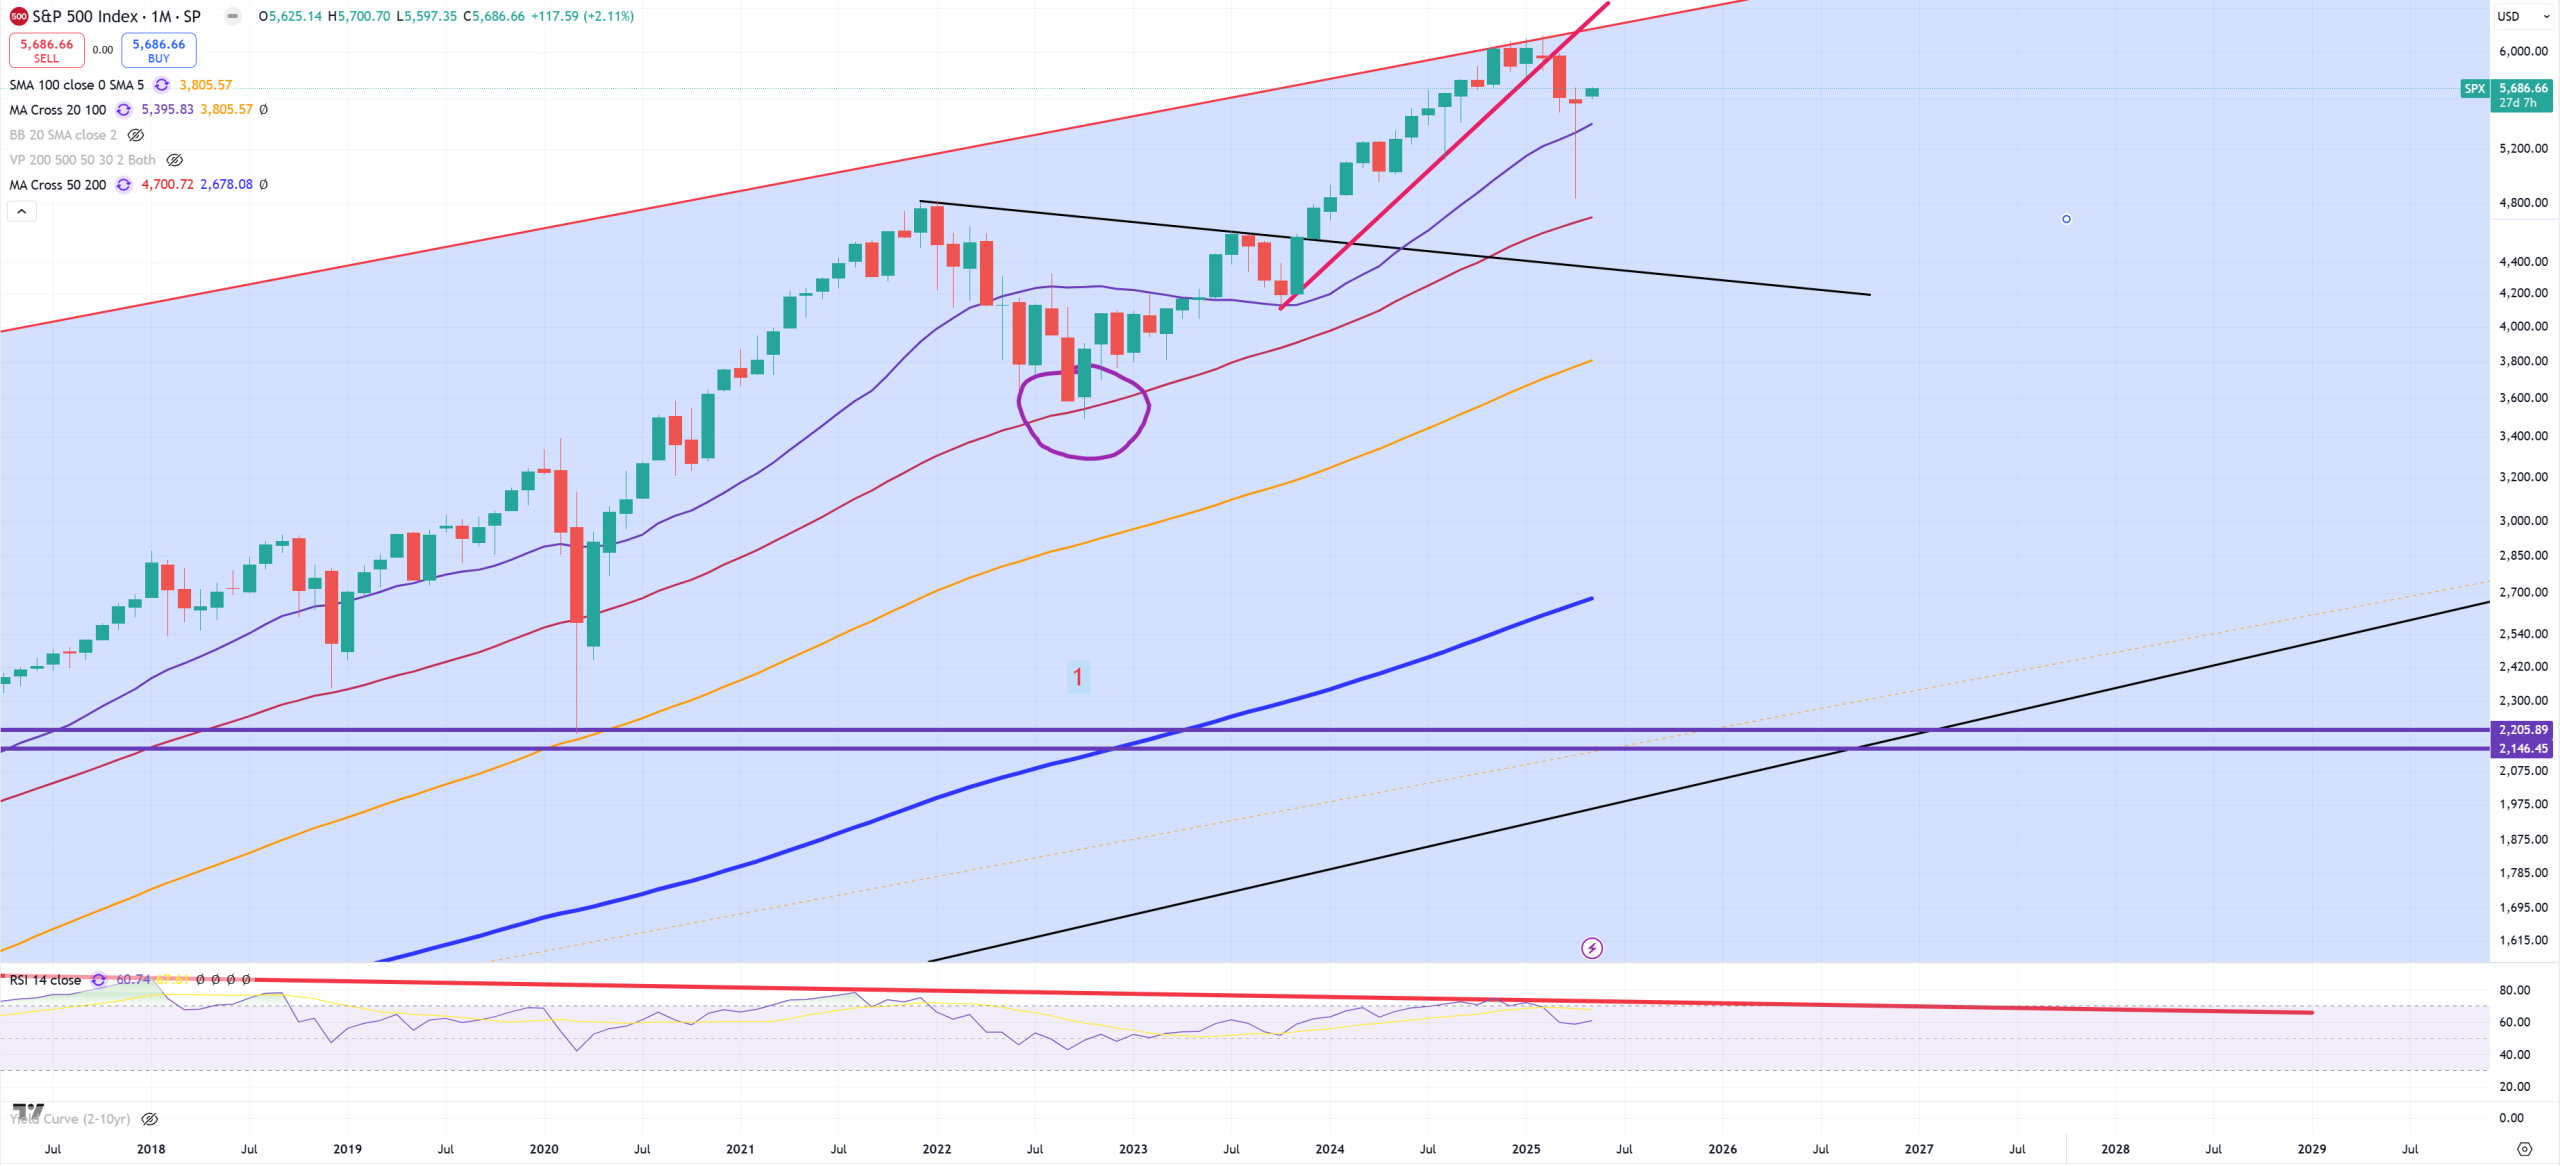
All those ratio charts warned us in 2024 allowing SPX to reach its 100Y trend. The current value of upper resistance is 6250.
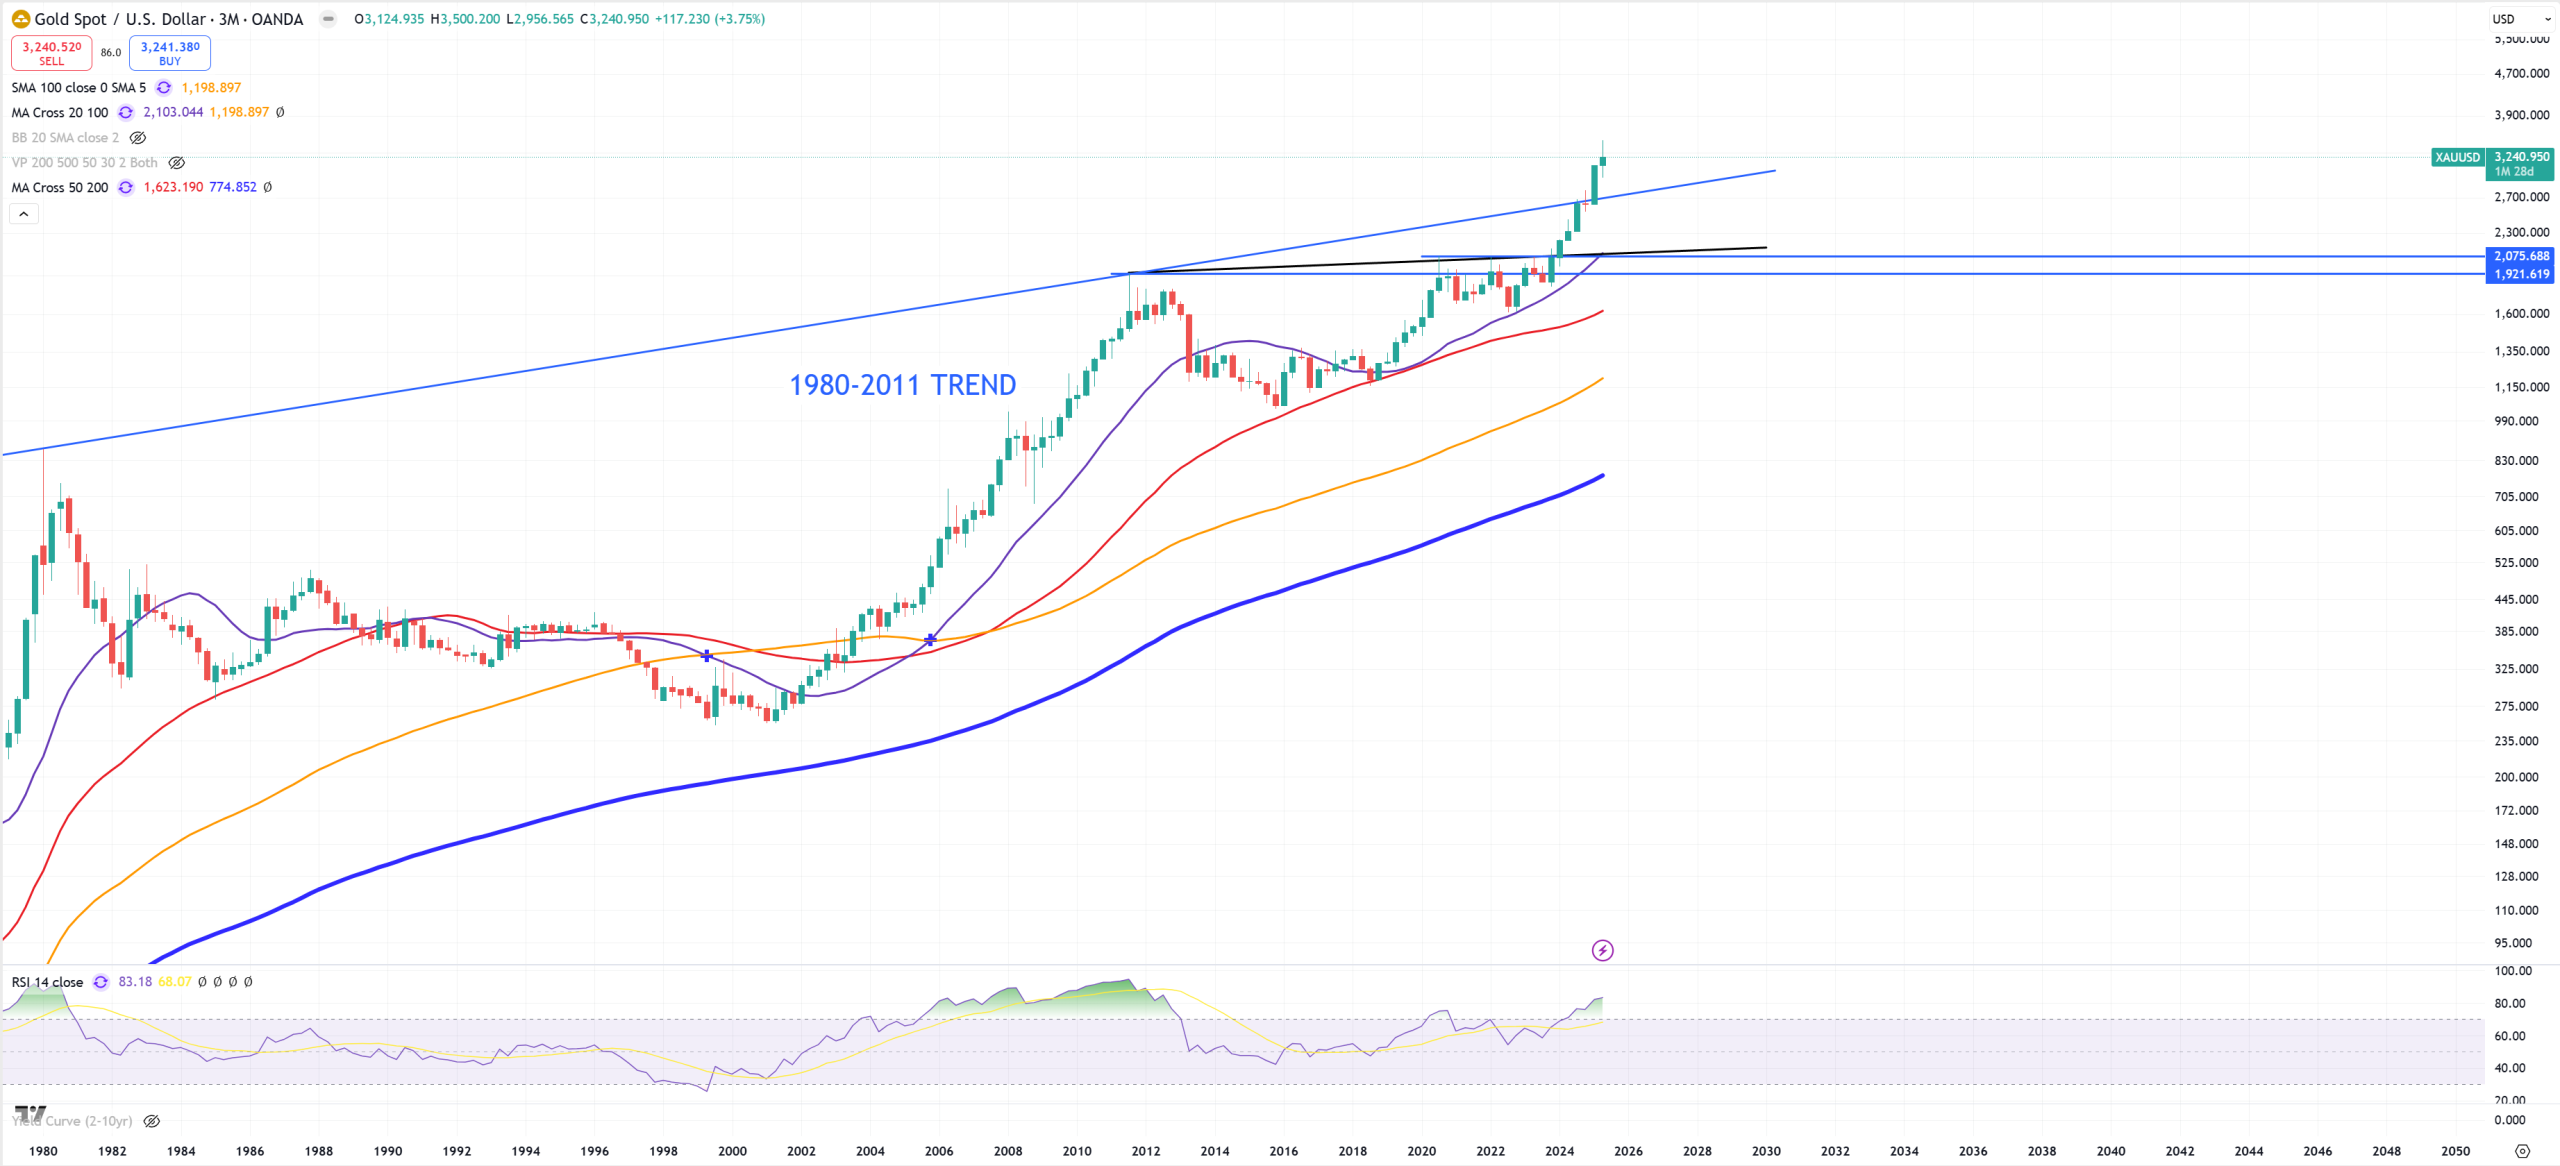
Once DJI/GOLD and SPX/GOLD and NDQ/GOLD ratio plunged, GOLD broke its 45Y trend :
Gold in (3M) view
We also need to look on SPY/TLT ratio, which bought here (M)MA20 with possible limitation around 6.80.
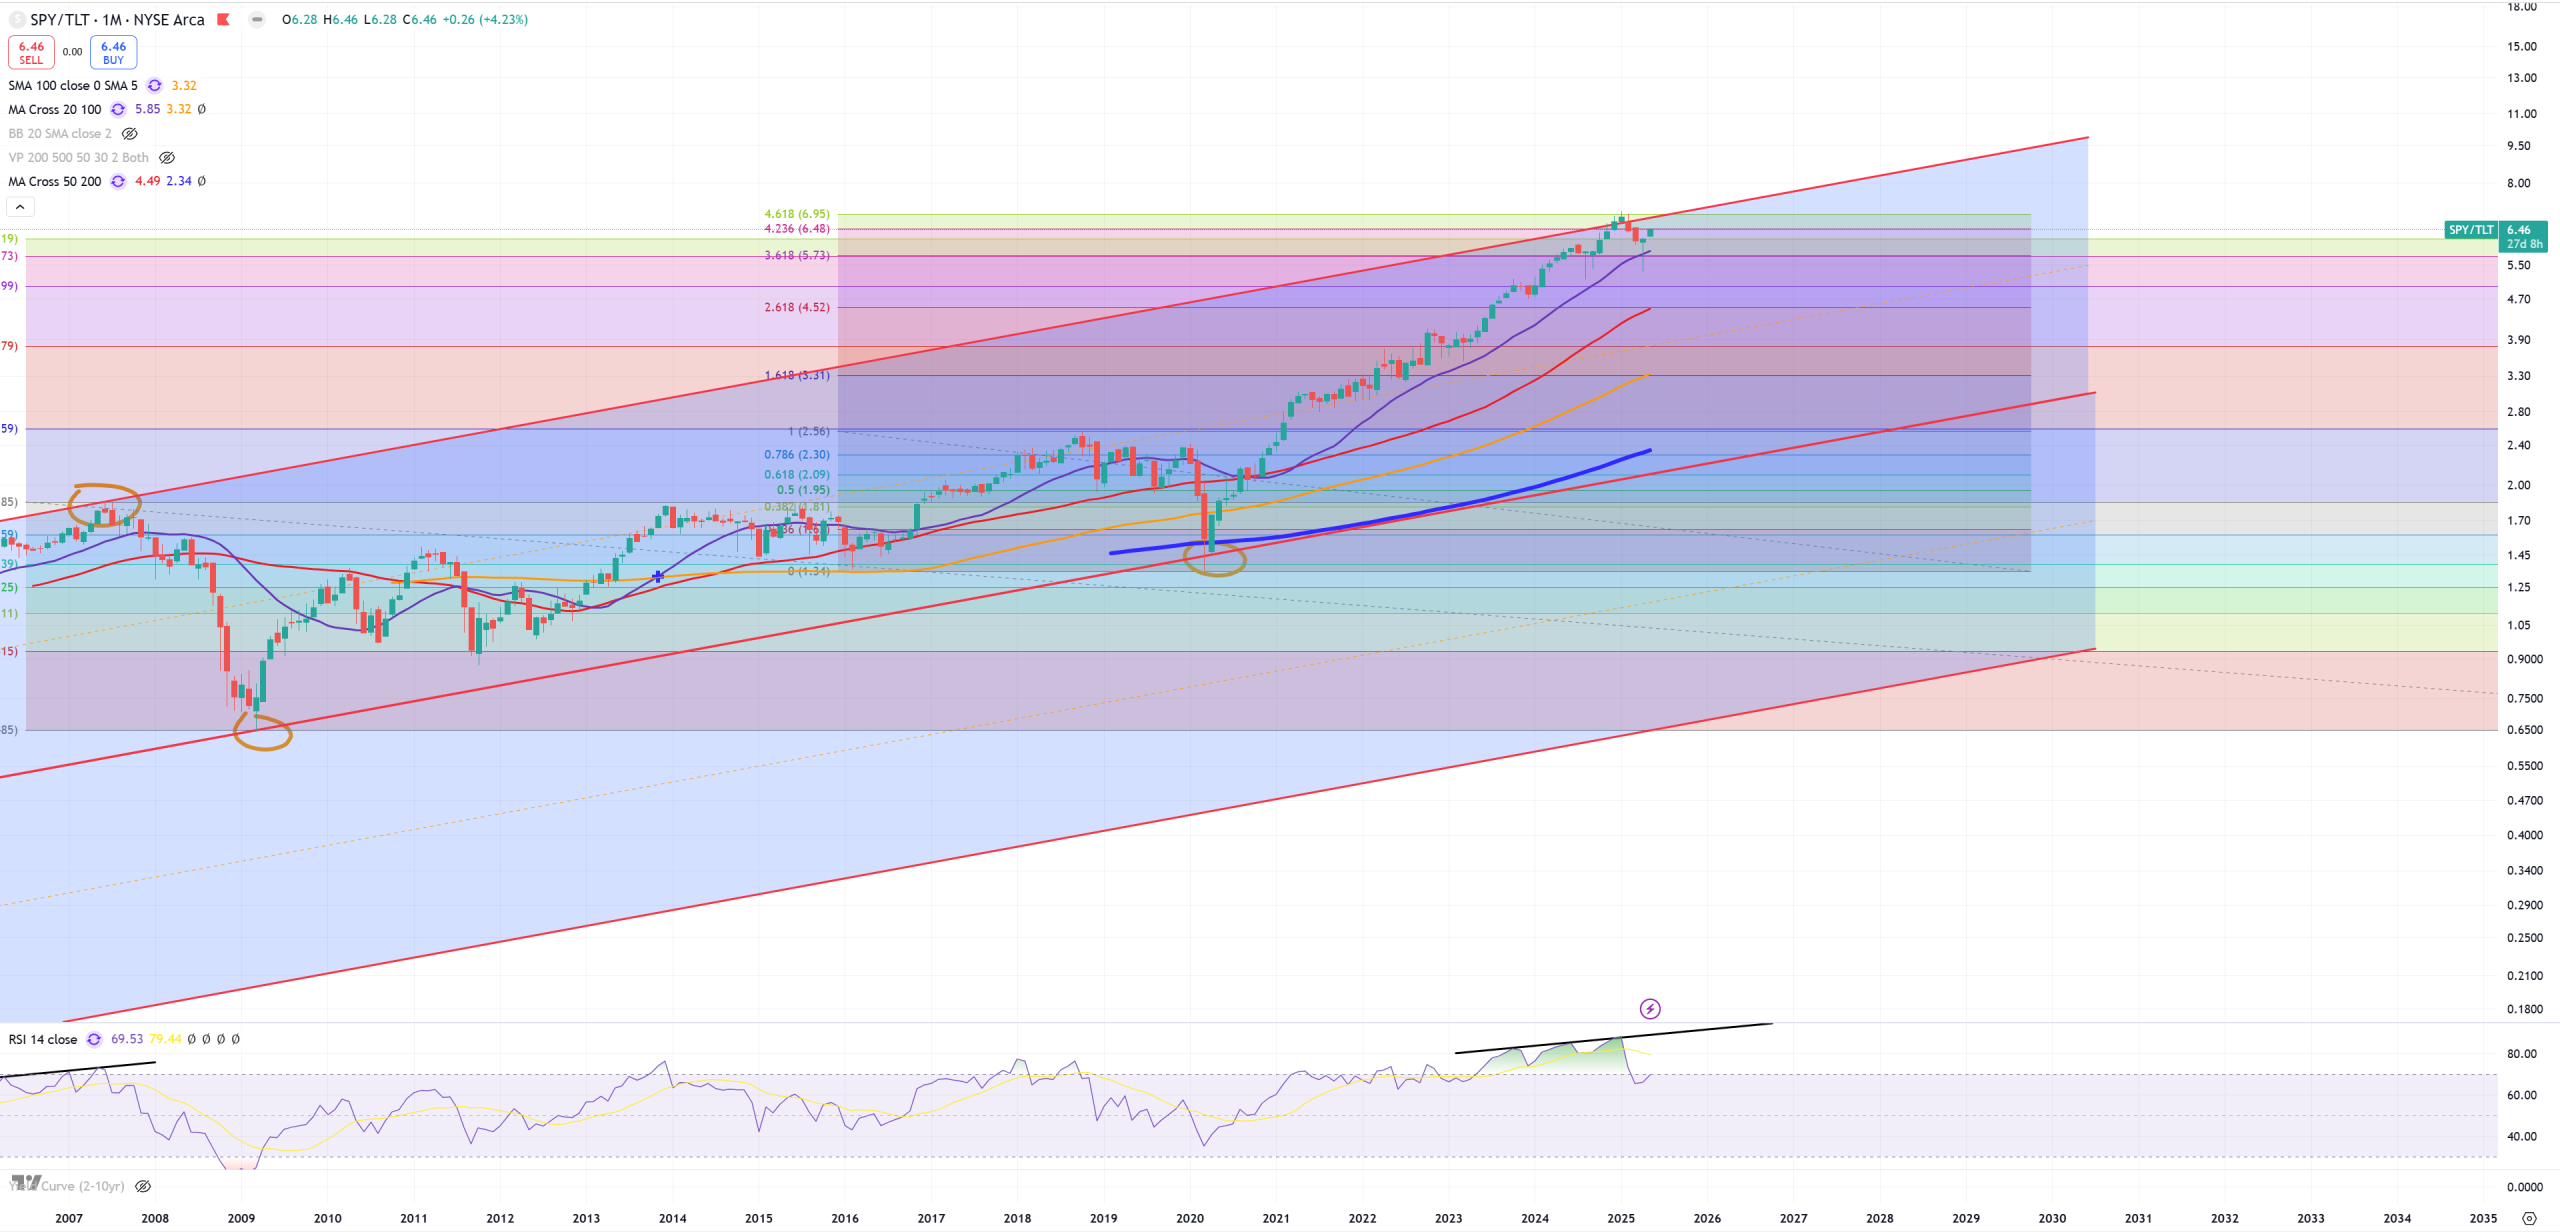
So the problem here is very mixed. DJI/GOLD seems to be DONE on M and 3M sending a super strong signal, but SPX/GOLD is not done on M and 3M. SPY/TLT bought here the bull market continuation, what we still see on 10Y-3M which is 0bps and can’t uninvert for 3Ys. Anyway it’s fair to say market is cracked based on DJI/GOLD break, but it’s not a lost game for the bulls. As 10Y-3M can’t jump higher so does the $$$, which we talk about later. Upper resistance here is 350bps what always signalls the beginning of a new cycle and yes you can see that since 2009 we never had a true technical bear market because 10Y-3M has never jumped to 350bps (and SPX has never broken (M)MA50).
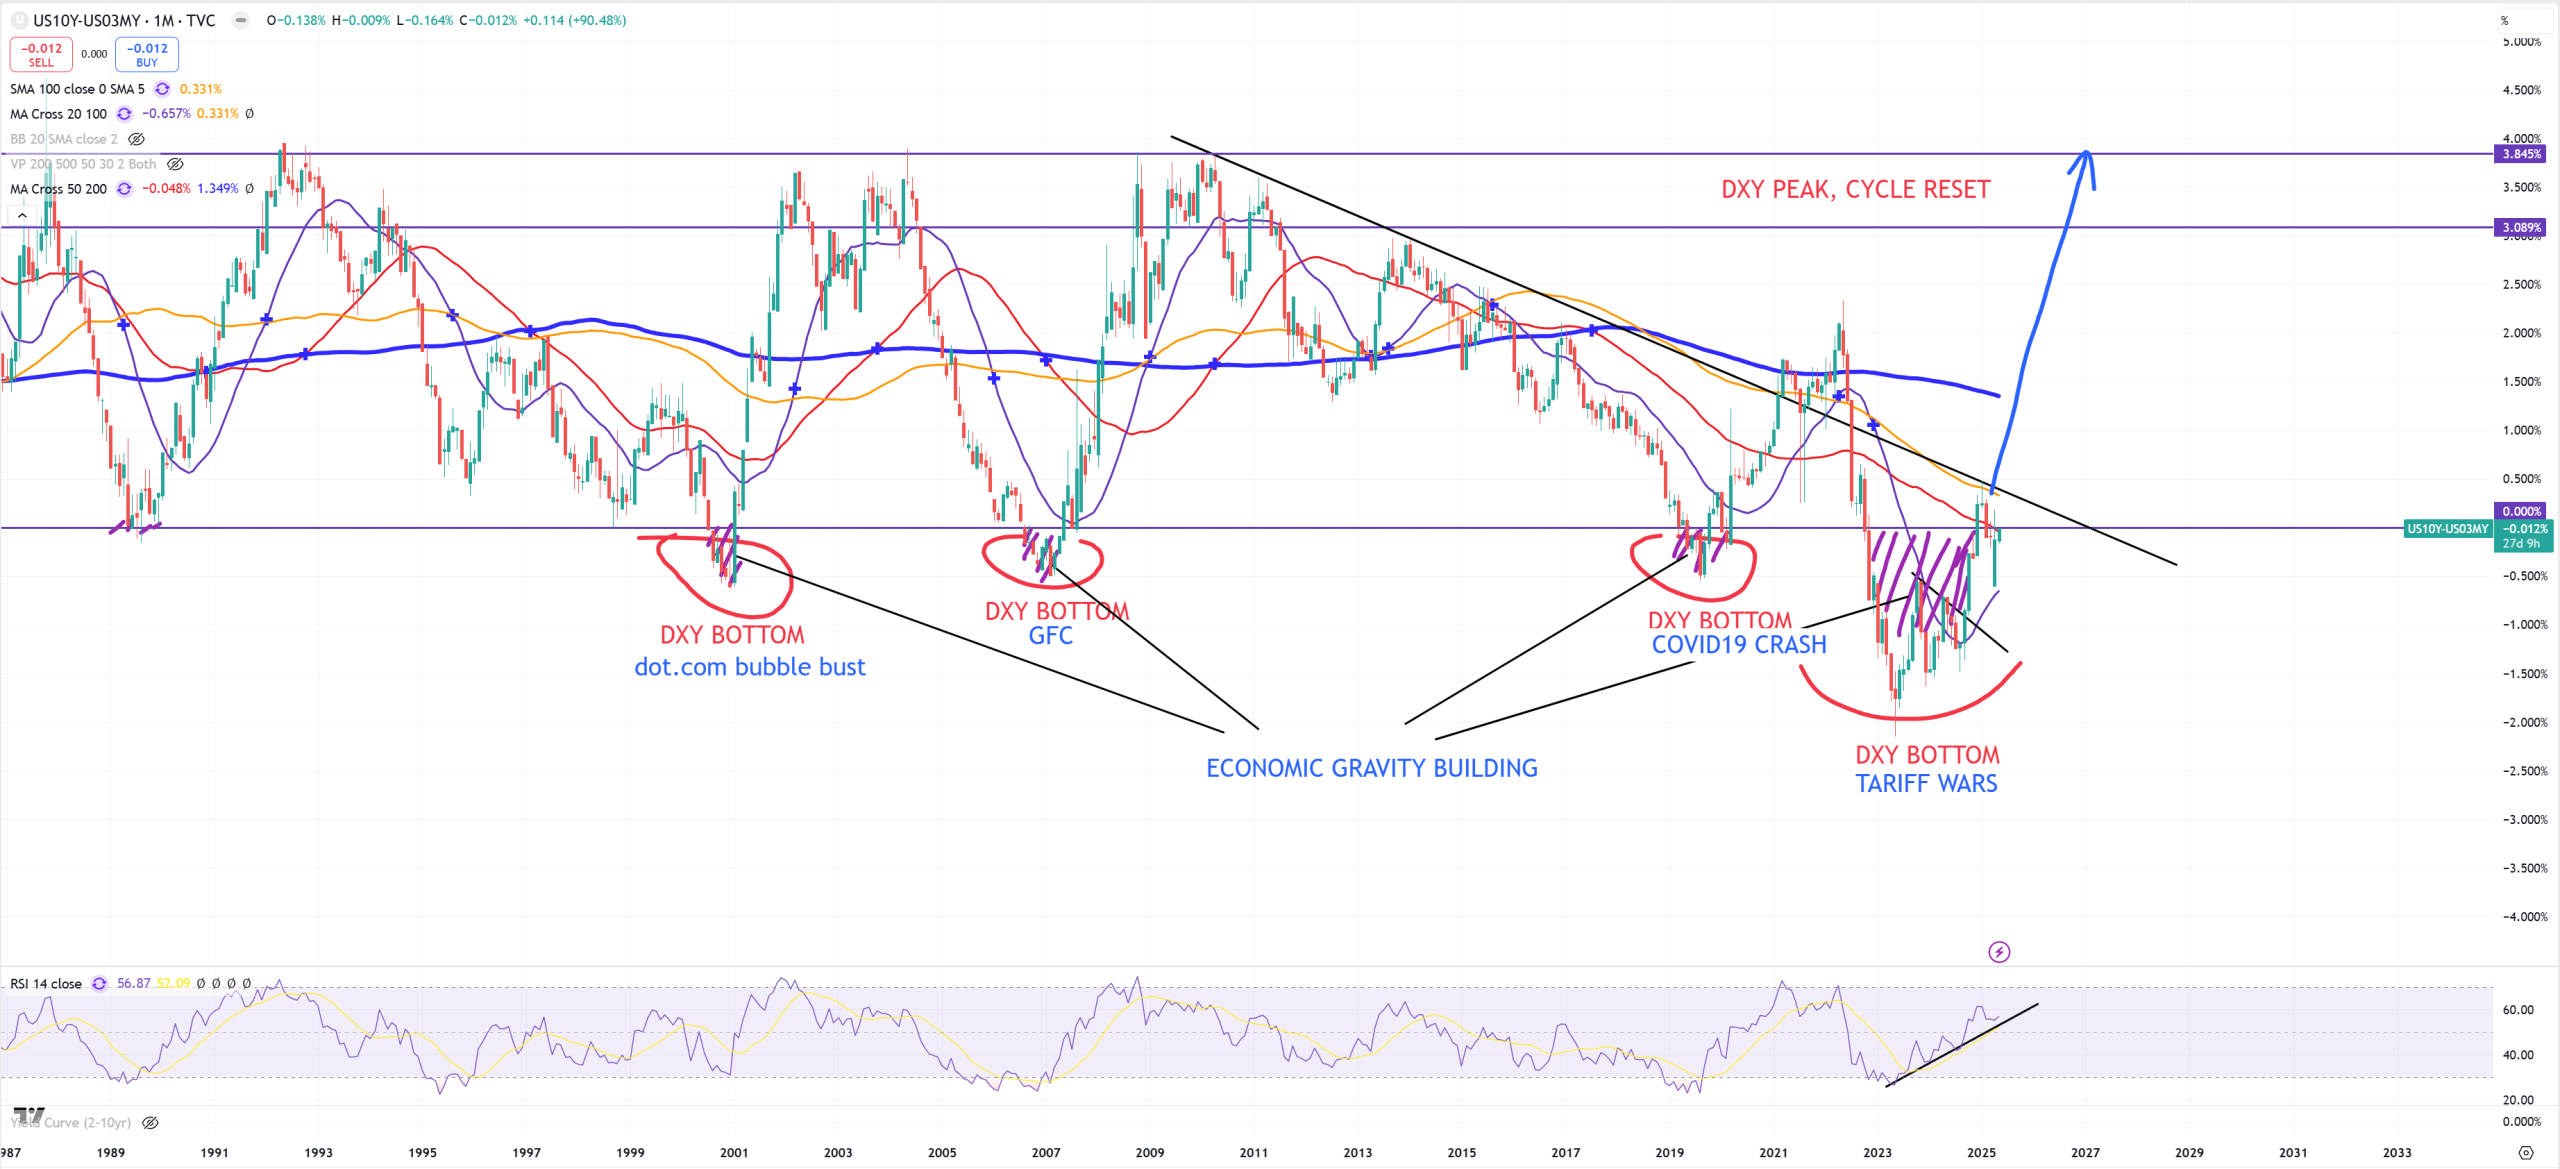
Because 10Y/3M is longer and deeper inverted than previous record 1929 we see that here – we also see 2018 as a peak which is the equivalent of DJI/GOLD peak this chart isn’t surprising at all. What is worse is that it will be going lower.
Stocks are not the economy. True, until…
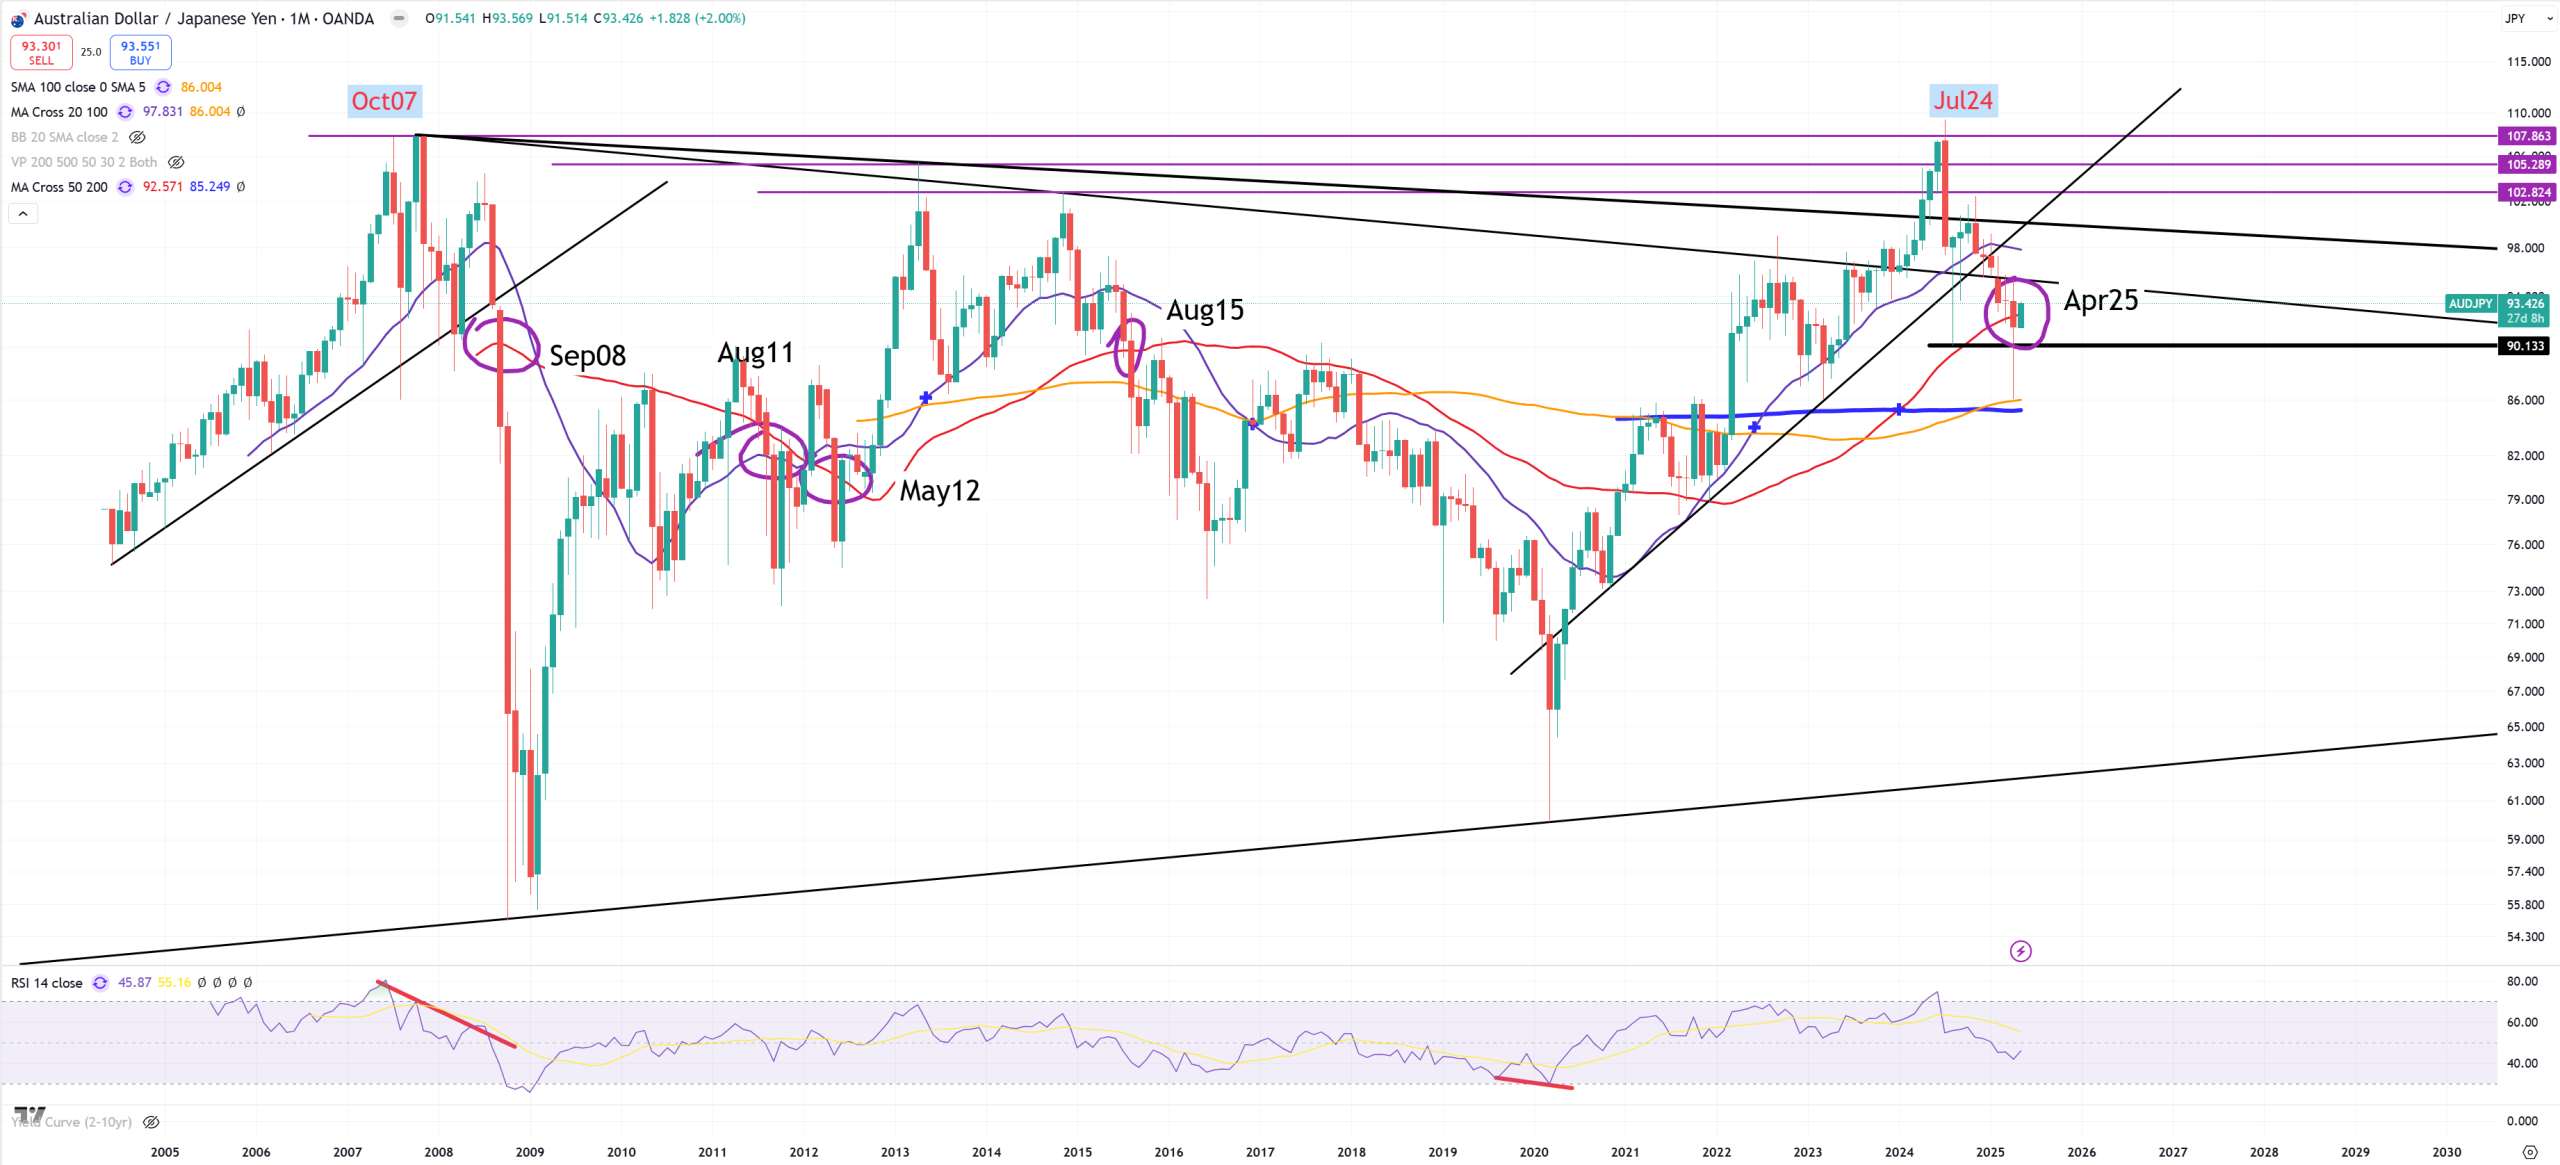
But the problem for stocks appears here on AUDJPY – risk on/off pair which keeps moving the stocks. July 2024 is the date worth to be remembered. While DJI/GOLD and SPX/GOLD broke 2011 trend in Apr2024, it took 3 months for AUDJPY to start tanking breaking (M)MA50 for the first time since Aug2015 technically capped by Oct2007 peak.
Gravity of all GOLD ratio charts has arrived here to stocks
If SPX/GOLD will break its (M)MA200 and (3M)MA200 I bet AUDJPY will also reject this (M)MA50 with possible trend touch around 95 overshooting during a month. It looks like stocks joined the economy once key ratio chart broke their 2011 trend. We’ll get full confirmation once SPX/GOLD is going to lose its (M)MA200 and (3M)MA200, while AUDJPY rejects its (M)MA50 = 93.
The market will capitulate only when 10Y-3M will jump above +50-60bps. History shows once this level was broken post inversion capitulation in bull market always arrived. The weirdest period was 2020, when suddenly during uninversion of a curve when SPX hit its natural border between bull/bear (M)MA50, curve after half process of uninvering crashed back to enormous inversion avoiding SPX breaking (M)MA50 in 2022 :
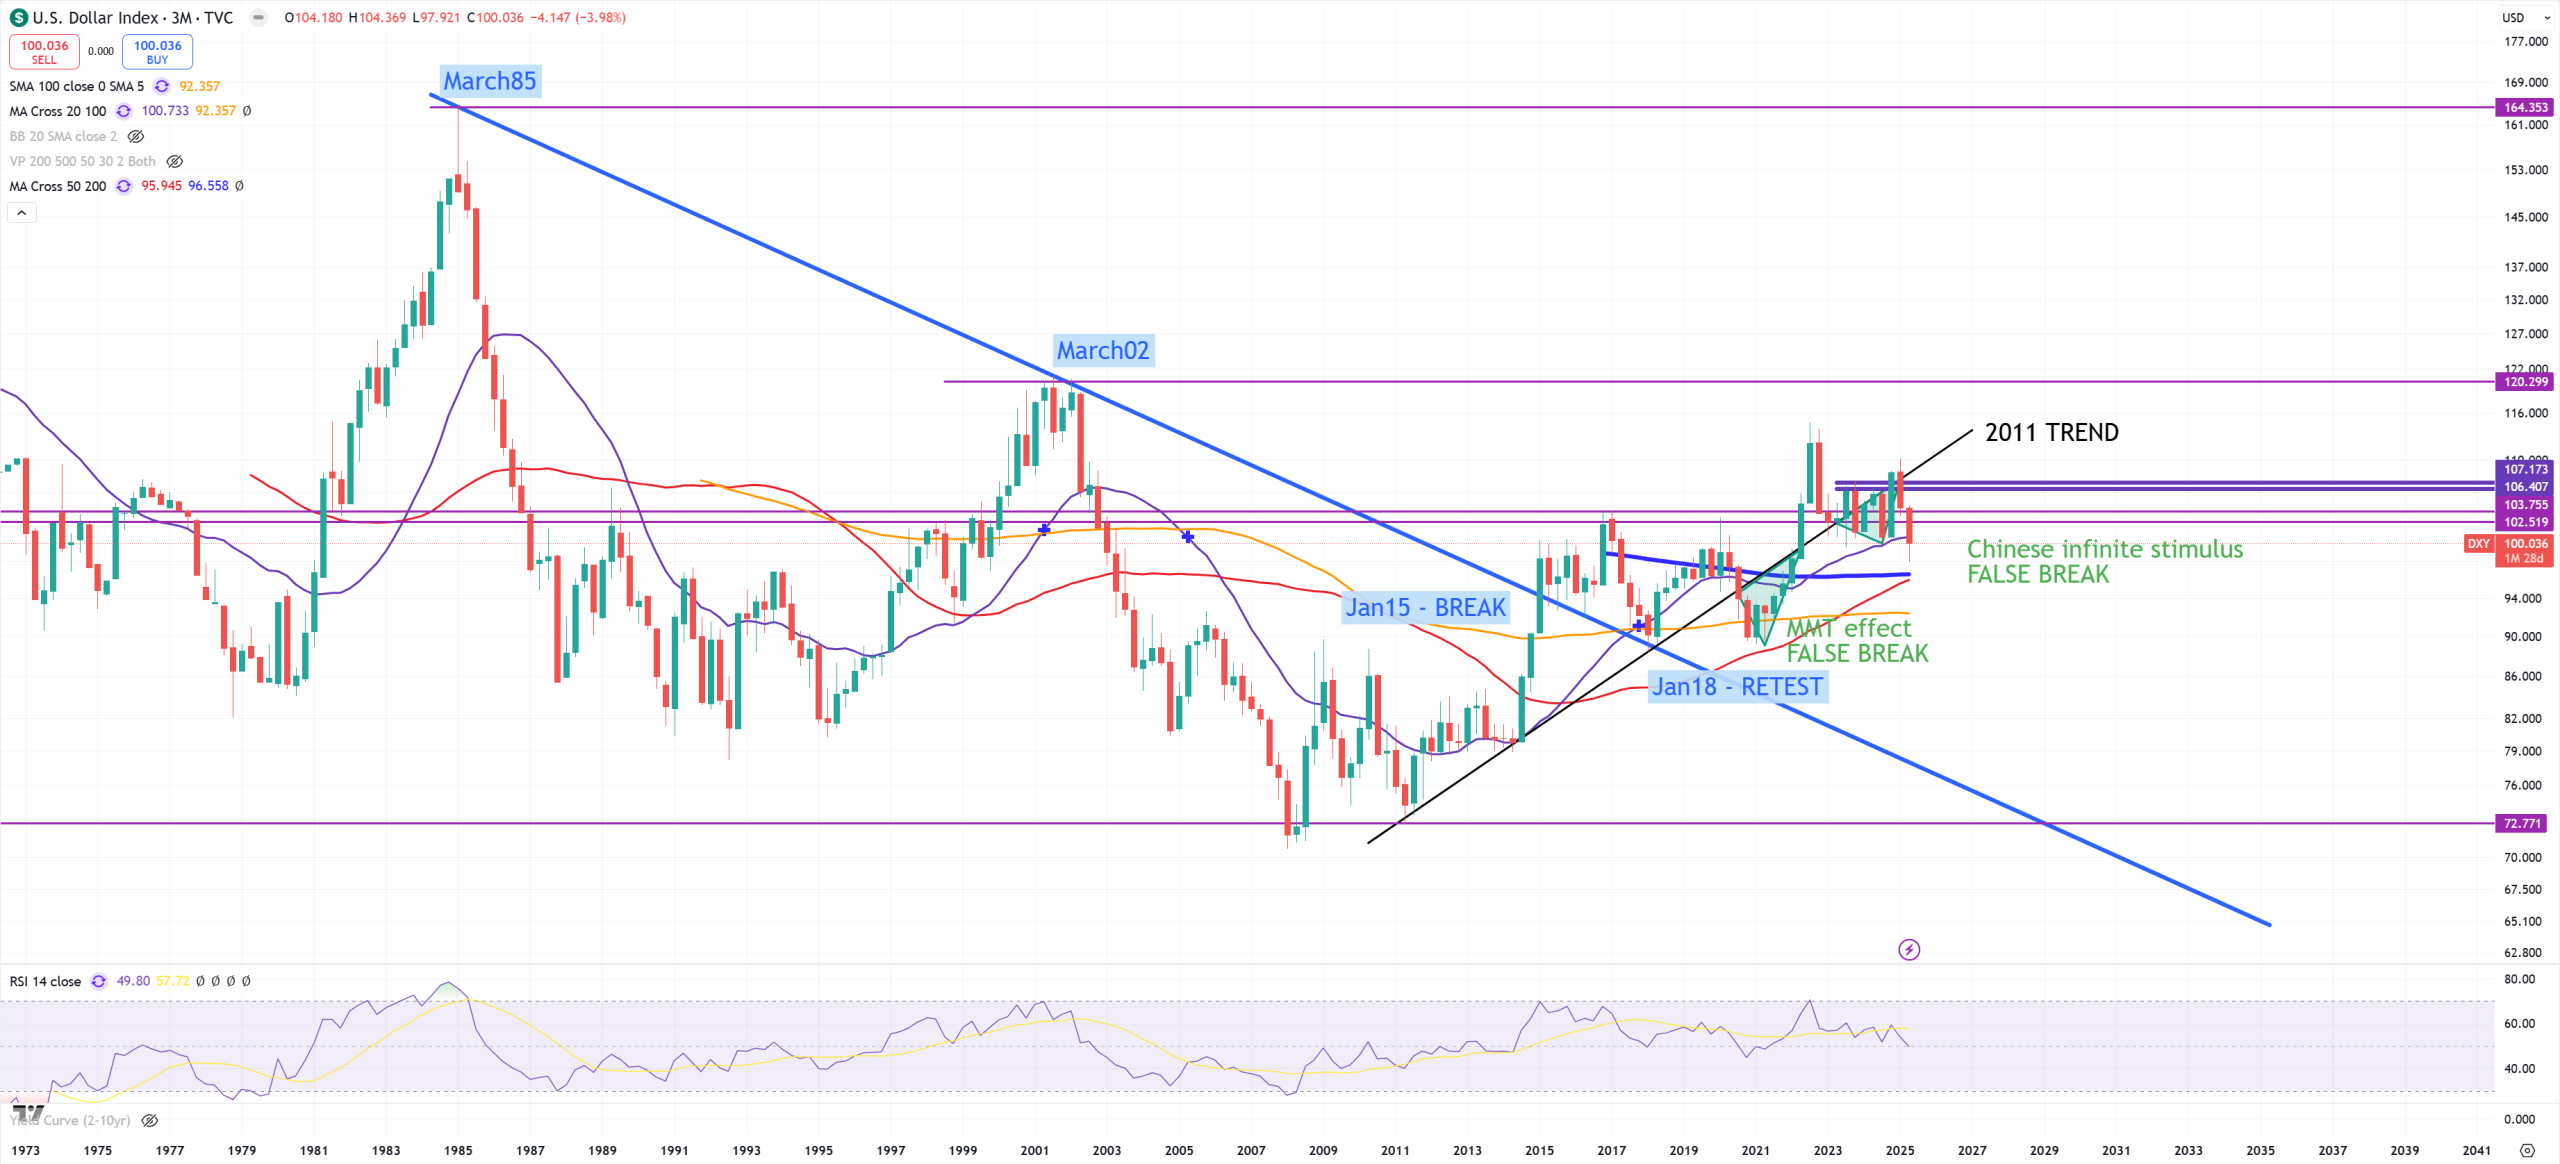
So it’s all about the $$$. Clearly showing DXY chart isn’t the $$$ problem in general because DXY is almost 50% just EURUSD pair, but we have to use it because everybody uses it.
If we take a look on 3M view we see enormous GOLDEN CROSS so (3M)MA50 is about to cross higher above (3M)MA200. You clearly see how DXY tries here to move higher but it can’t just like 10Y-3M can’t uninvert. That’s the same IMO trade which now takes 3 years. This market aggresively tries to hold this 102-103 support, but without a doubt so far it failed. I think this 102-103 level is your border when market is going to capitulate in “bullish” thesis same time all other indicators like SPX/GOLD and 10Y/3M will get broken.
This market isn’t easy like in 2008. The level of overshootings, bull/bear traps blowing key levels/MAs so easily it’ll make every analysis super hard.
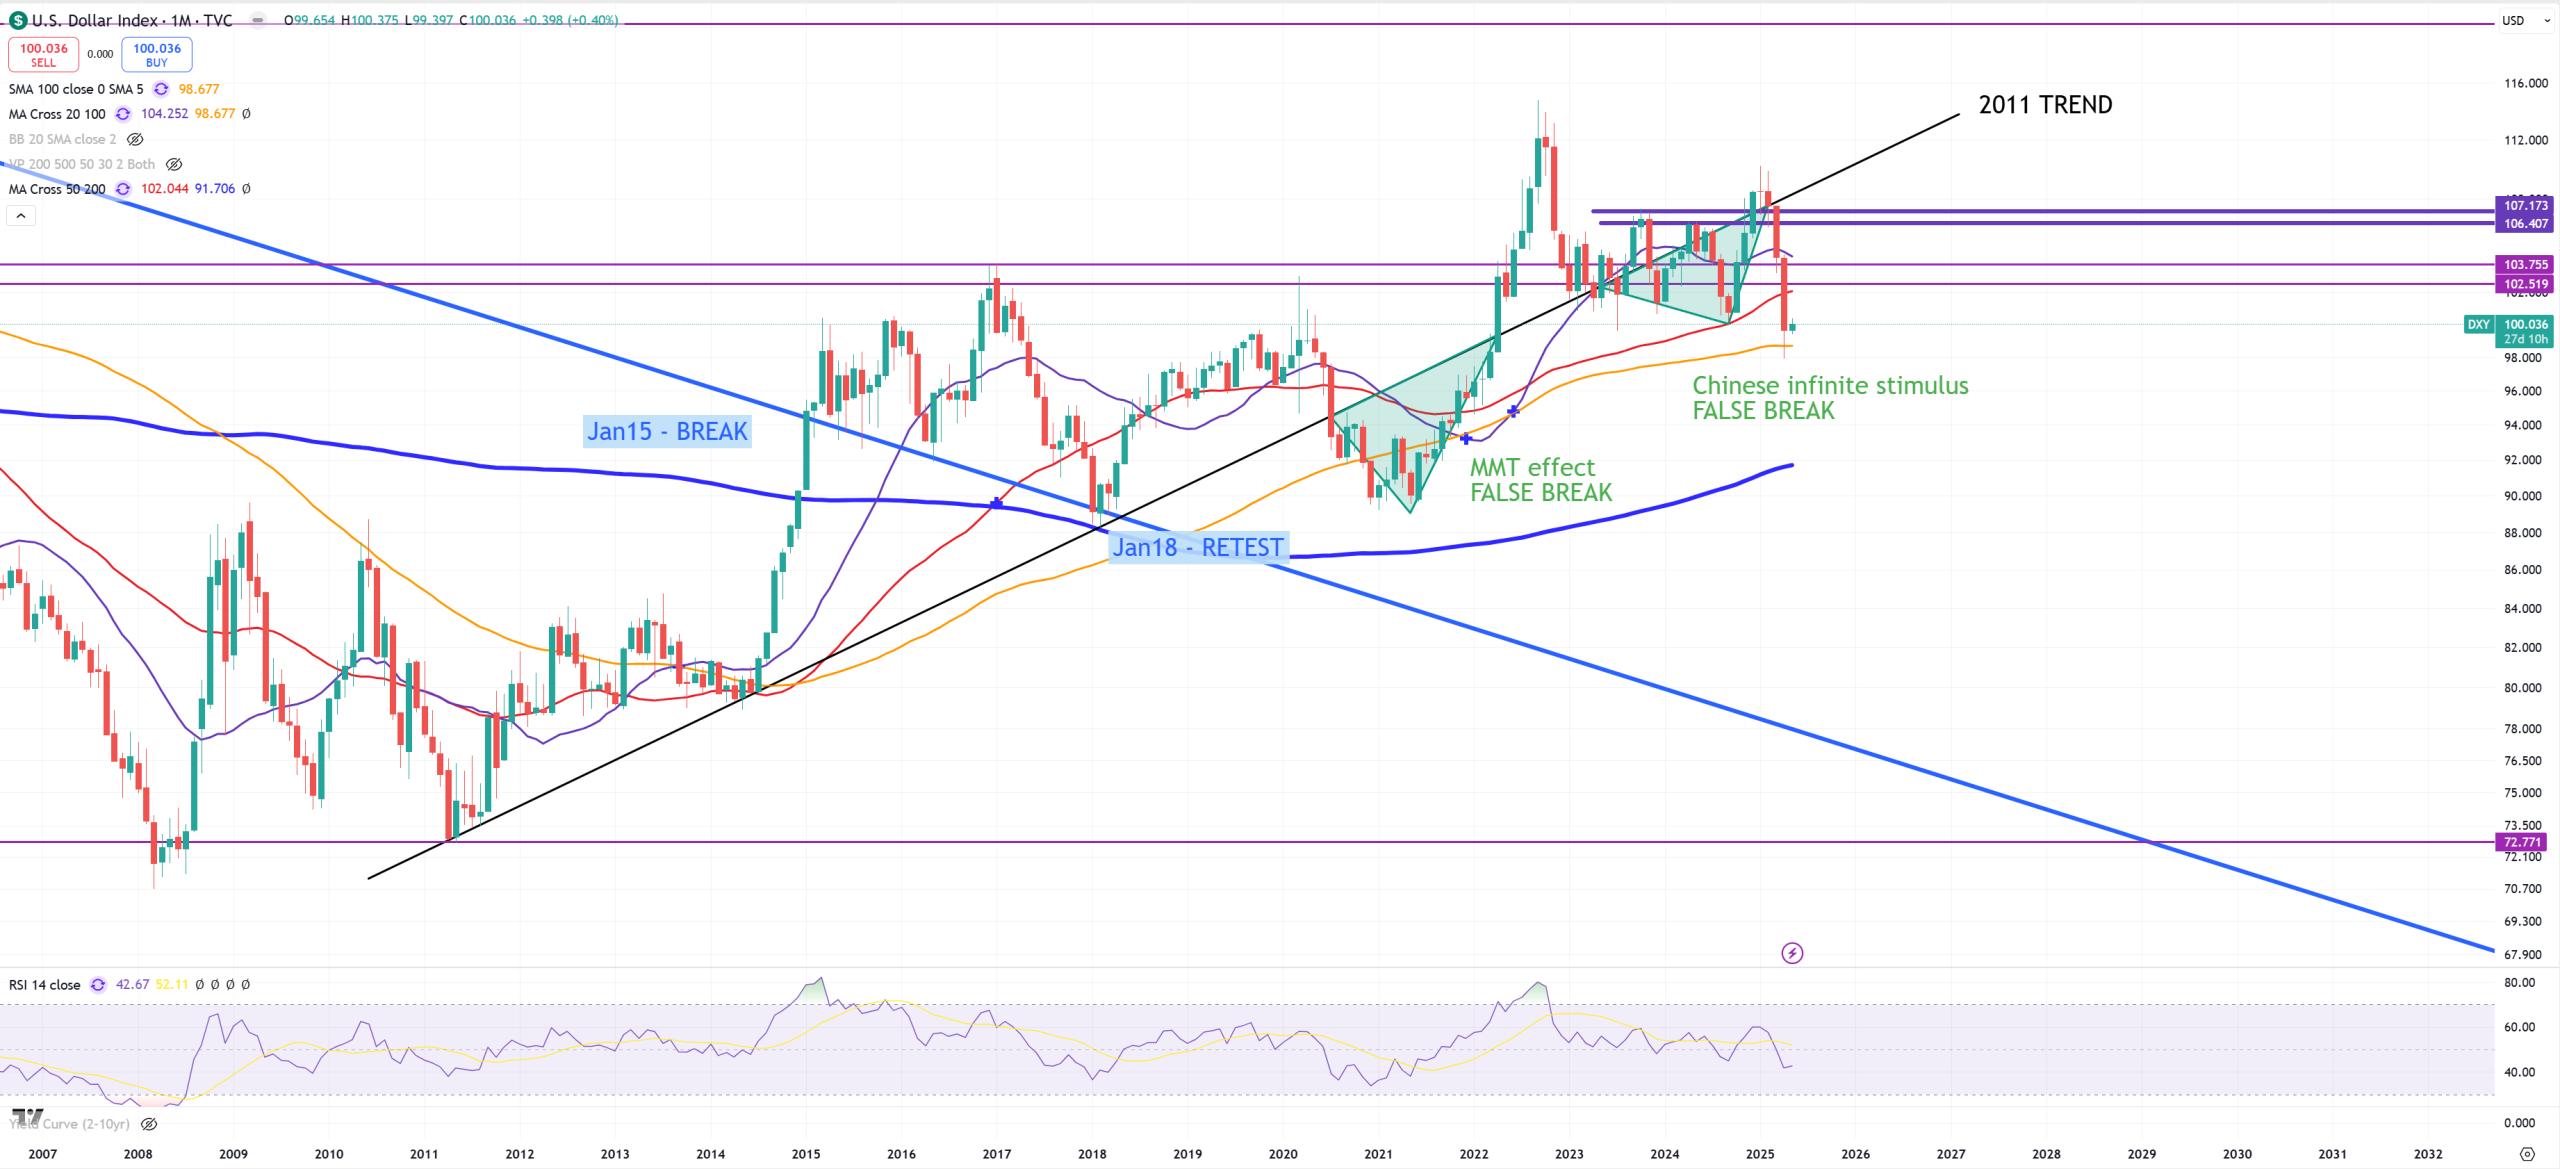
Considering DXY on (M) view we see the moment where (M)MA50 breaking down holding (M)MA100 which is a typical MA for possible bull/bear traps and overshooting. It is enormous fight between the gravity of the economy and some kind of liquidity to stop this gravity, but in reality holding 10Y-3M longer in inversion is just adding the gravity overall for the economy.
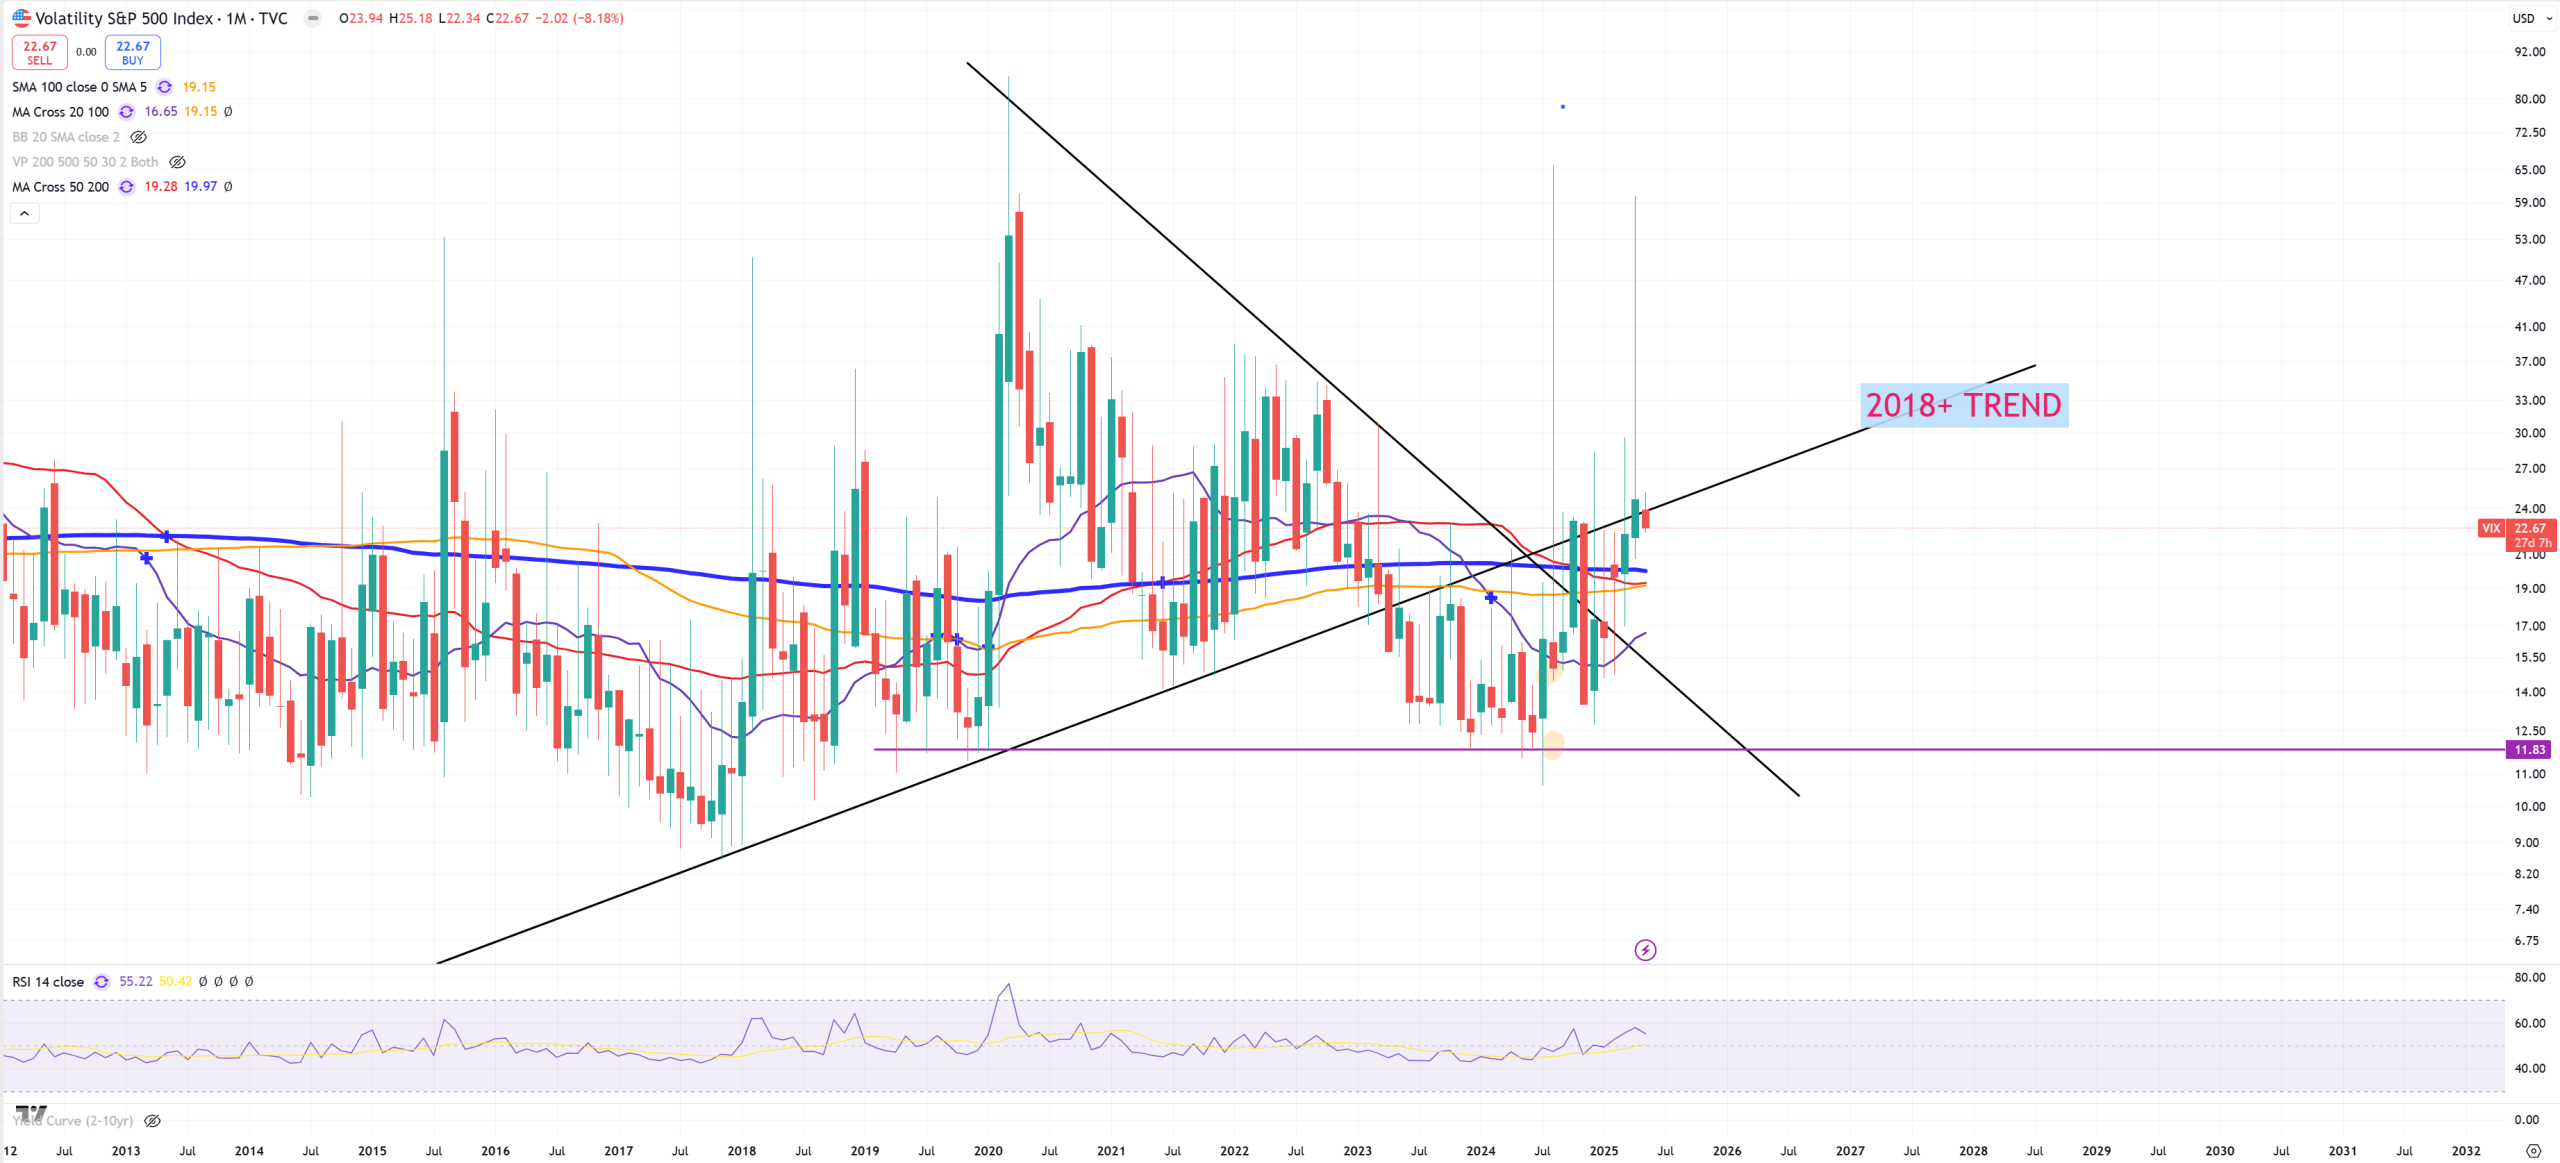
So let’s end with Volatility and bond market. You clearly see the raising trend in volatility since 2018. This date is already known from DJI/GOLD peak. We clearly see a break in 2023 which was related with crashing 10Y-3M back to huge inversion, but DJI/GOLD is broken = gravity is releasing and volatility wants to return to its key trend and it did. April 2025 was the first time when we closed above the 2018 trend. A lot of support on mix of 3 key MAs : (M)MA50/(M)MA100/(M)MA200, but month has just started.
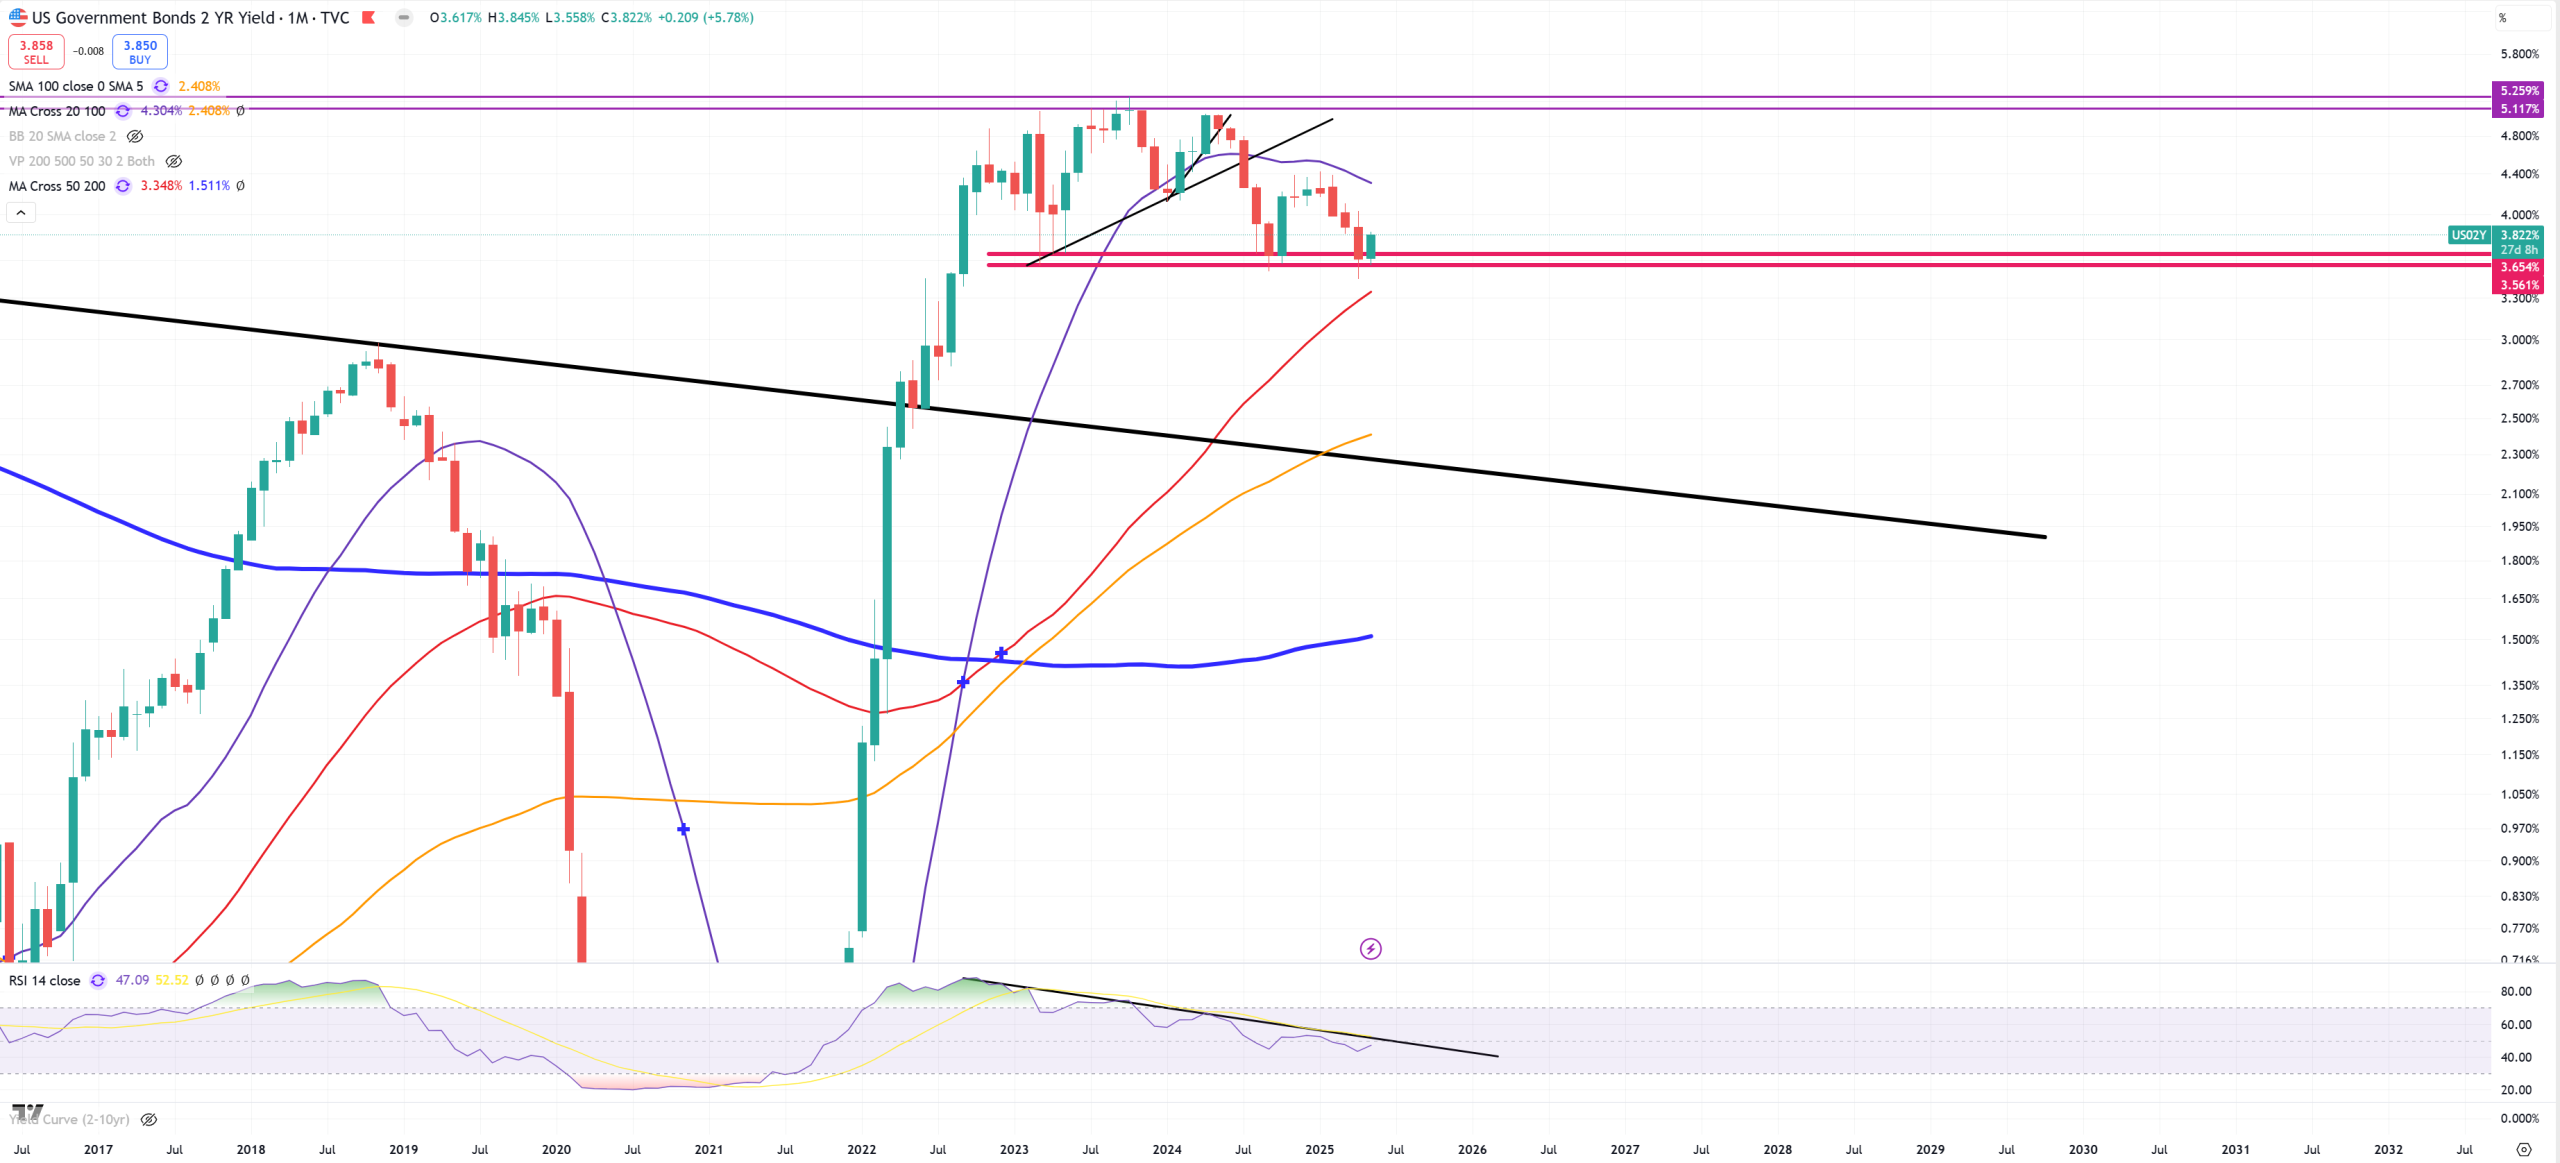
And so the bond market. Considering 10Y-3M must be above +50-60bps to cook the markets, that’ll be a moment when we’ll see bull steepening. The problem is technically this market is IMO really close looking on US02Y, so far support holds and it must hold for the bulls. Huge resistance around 5.2% which is 2006-2007 peak in US02Y. So if market wants to go higher we need to push yields higher, but once we push yields higher we’ll cap the stock market and that’s the game we’re playing.
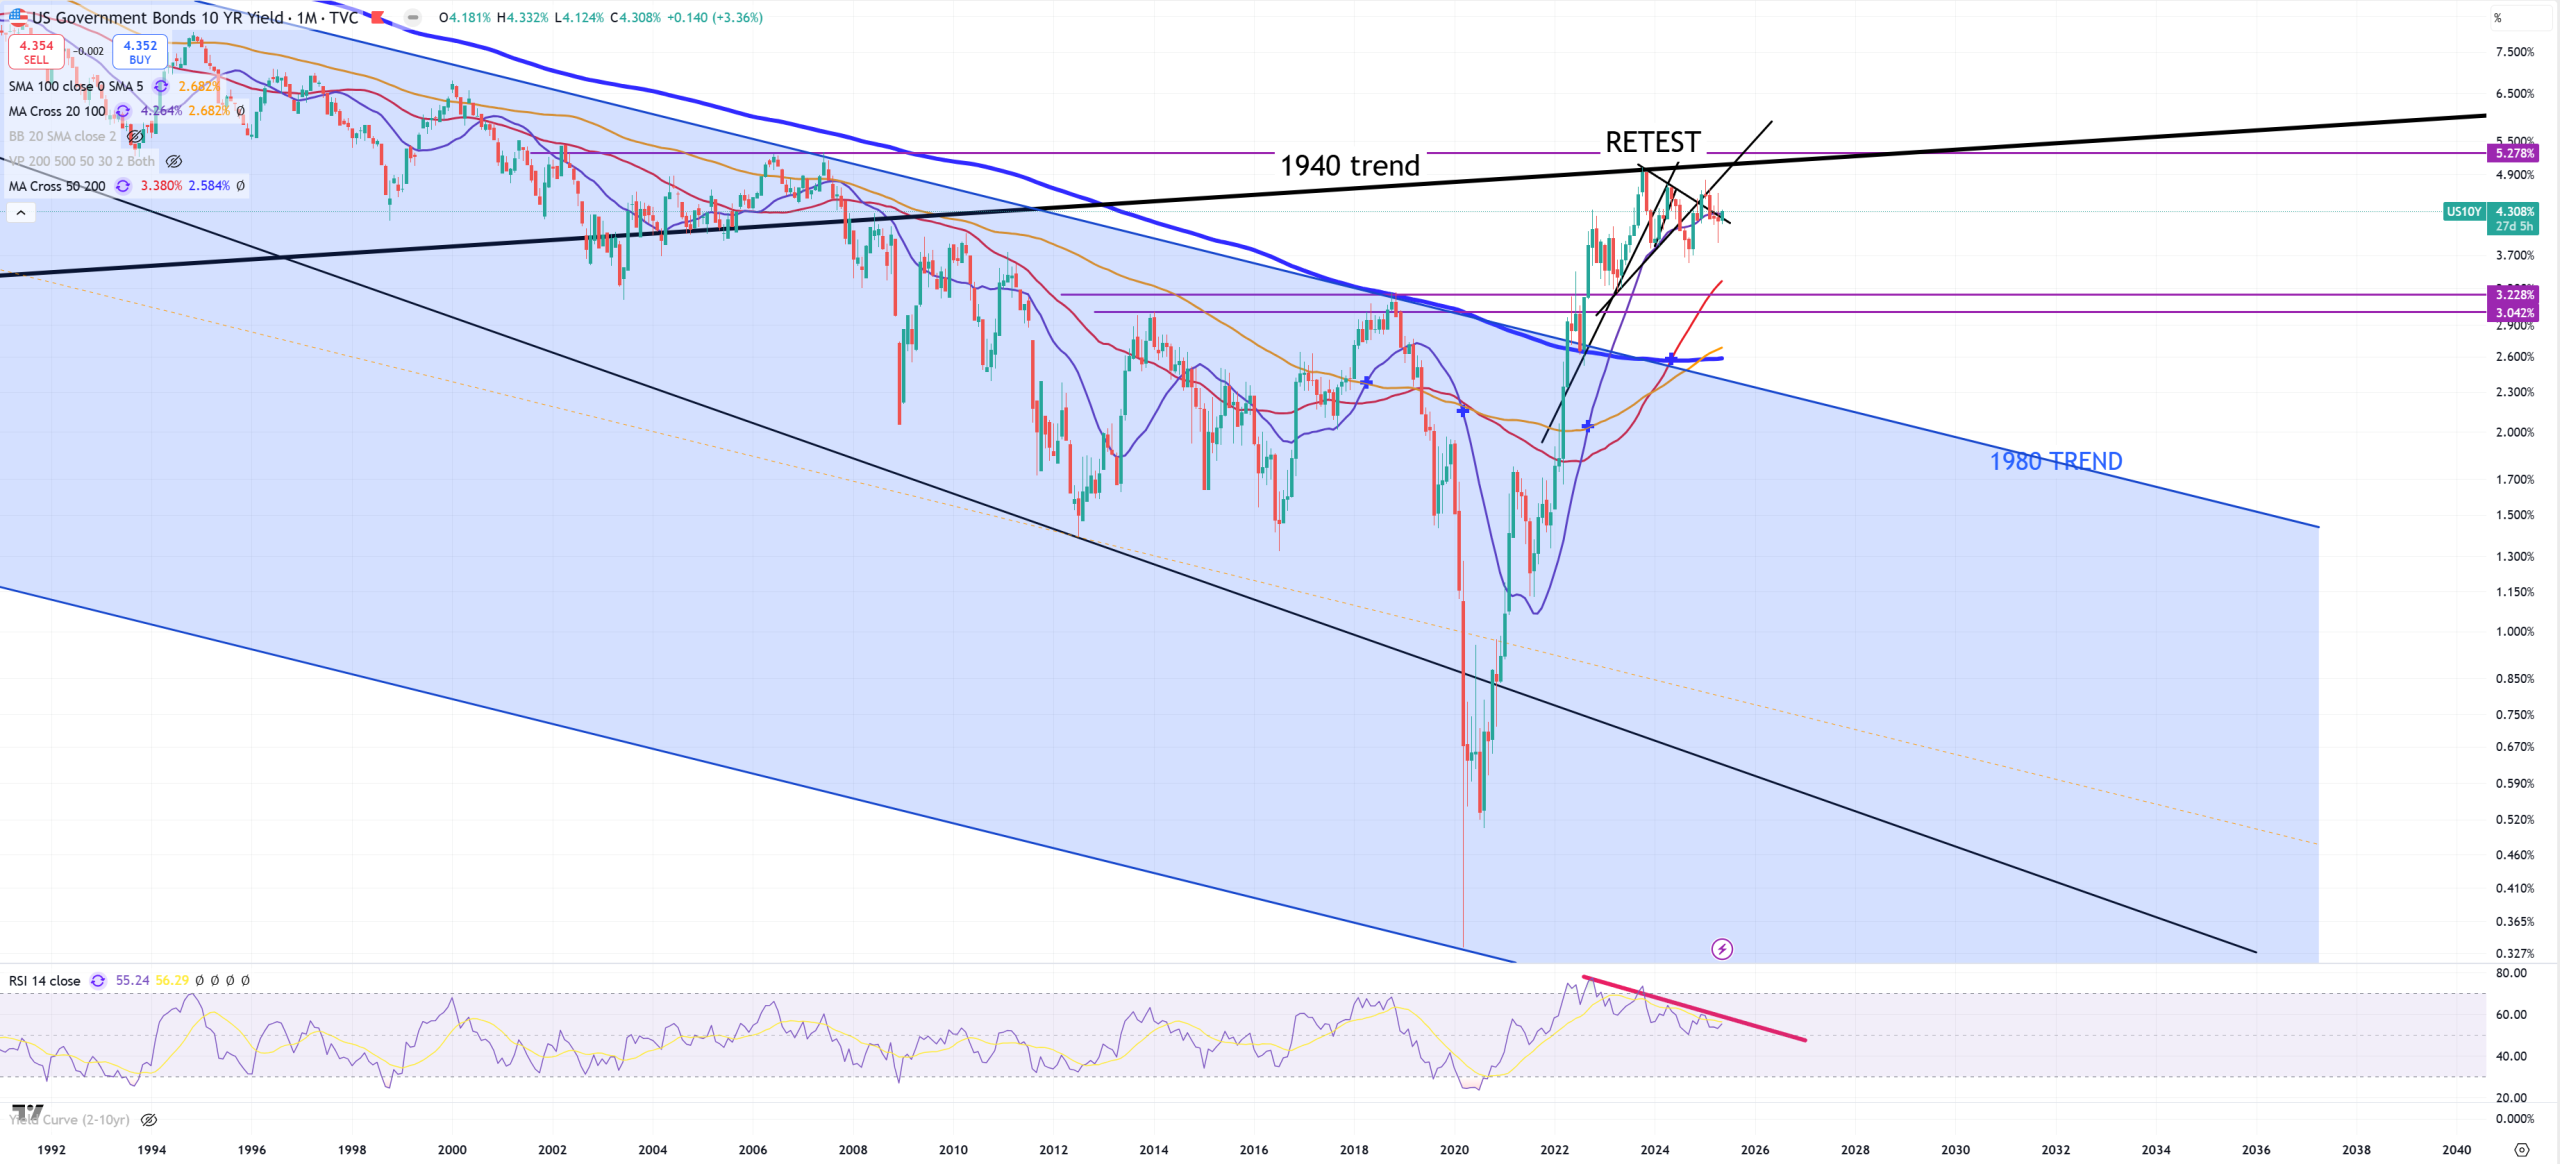
Longer end let’s take US10Y has retested 1940 trend, but big secular golden cross appeared as (M)MA50 crossing from down to up blue (M)MA200. We are above 1980 TREND but rejected 1940 TREND. So this junction of (M)MA50/(M)MA200 crossing is also connected with 1980 TREND and it’s now a natural technical level to retest = ~2.5%.
We are in the middle of (M)MA20 and this is very neutral chart, but with massive negative (M)RSI divergence still. Breaking back below 1980 TREND will push bond market to new ATHs.
Summary : Market is heavily cracked, but not destroyed.
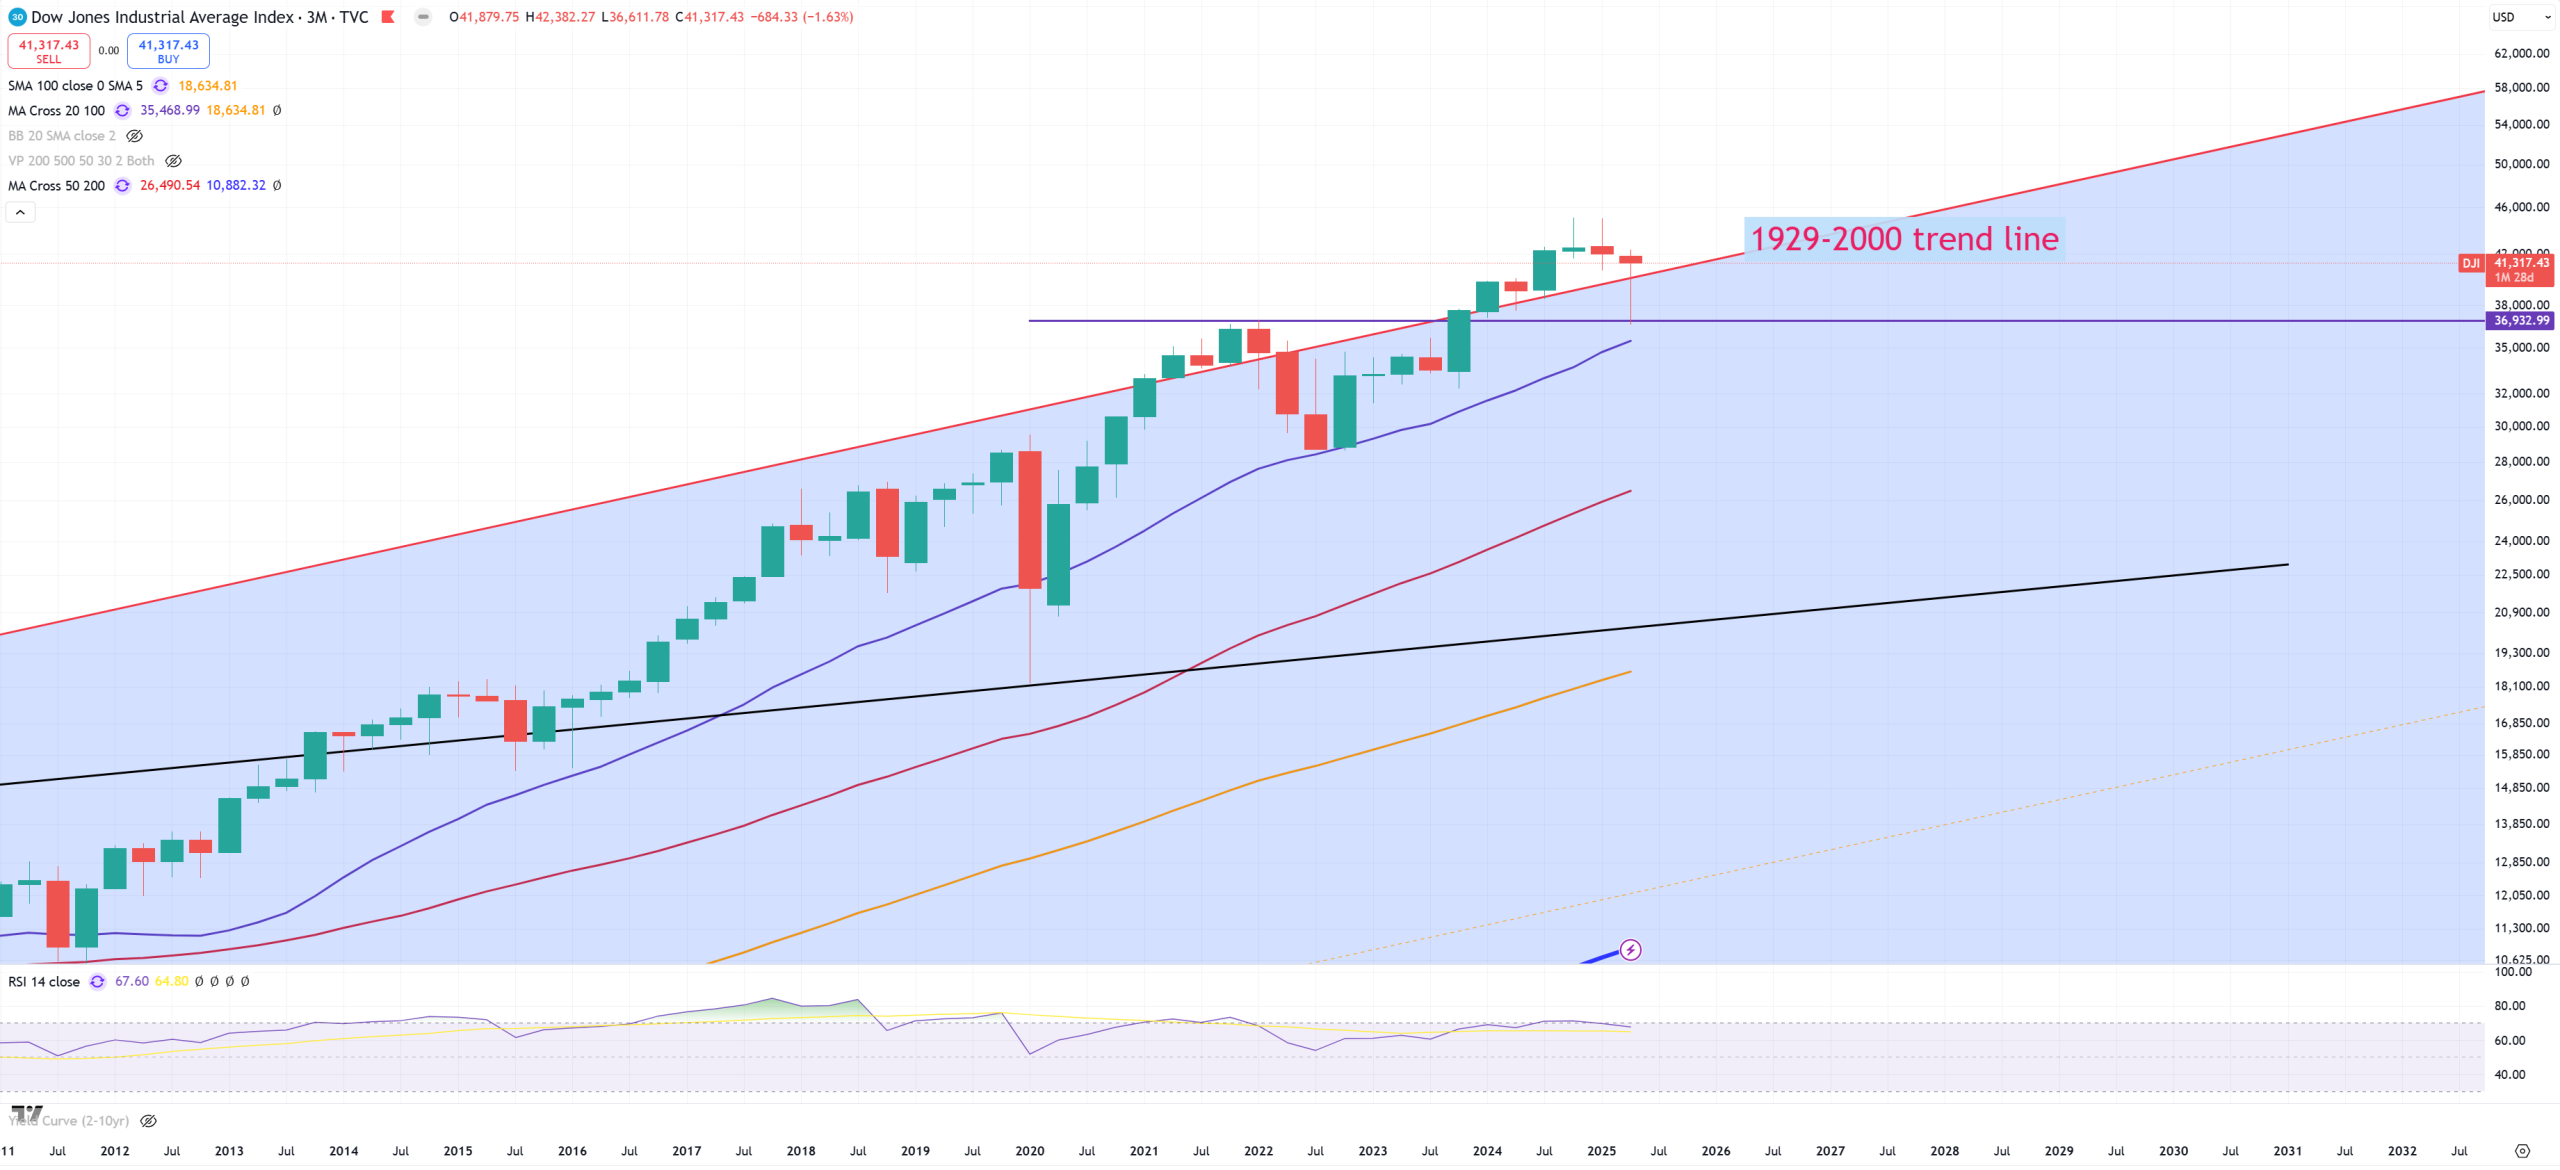
While SPX / QQQ / DJI jumping to (W)MA50
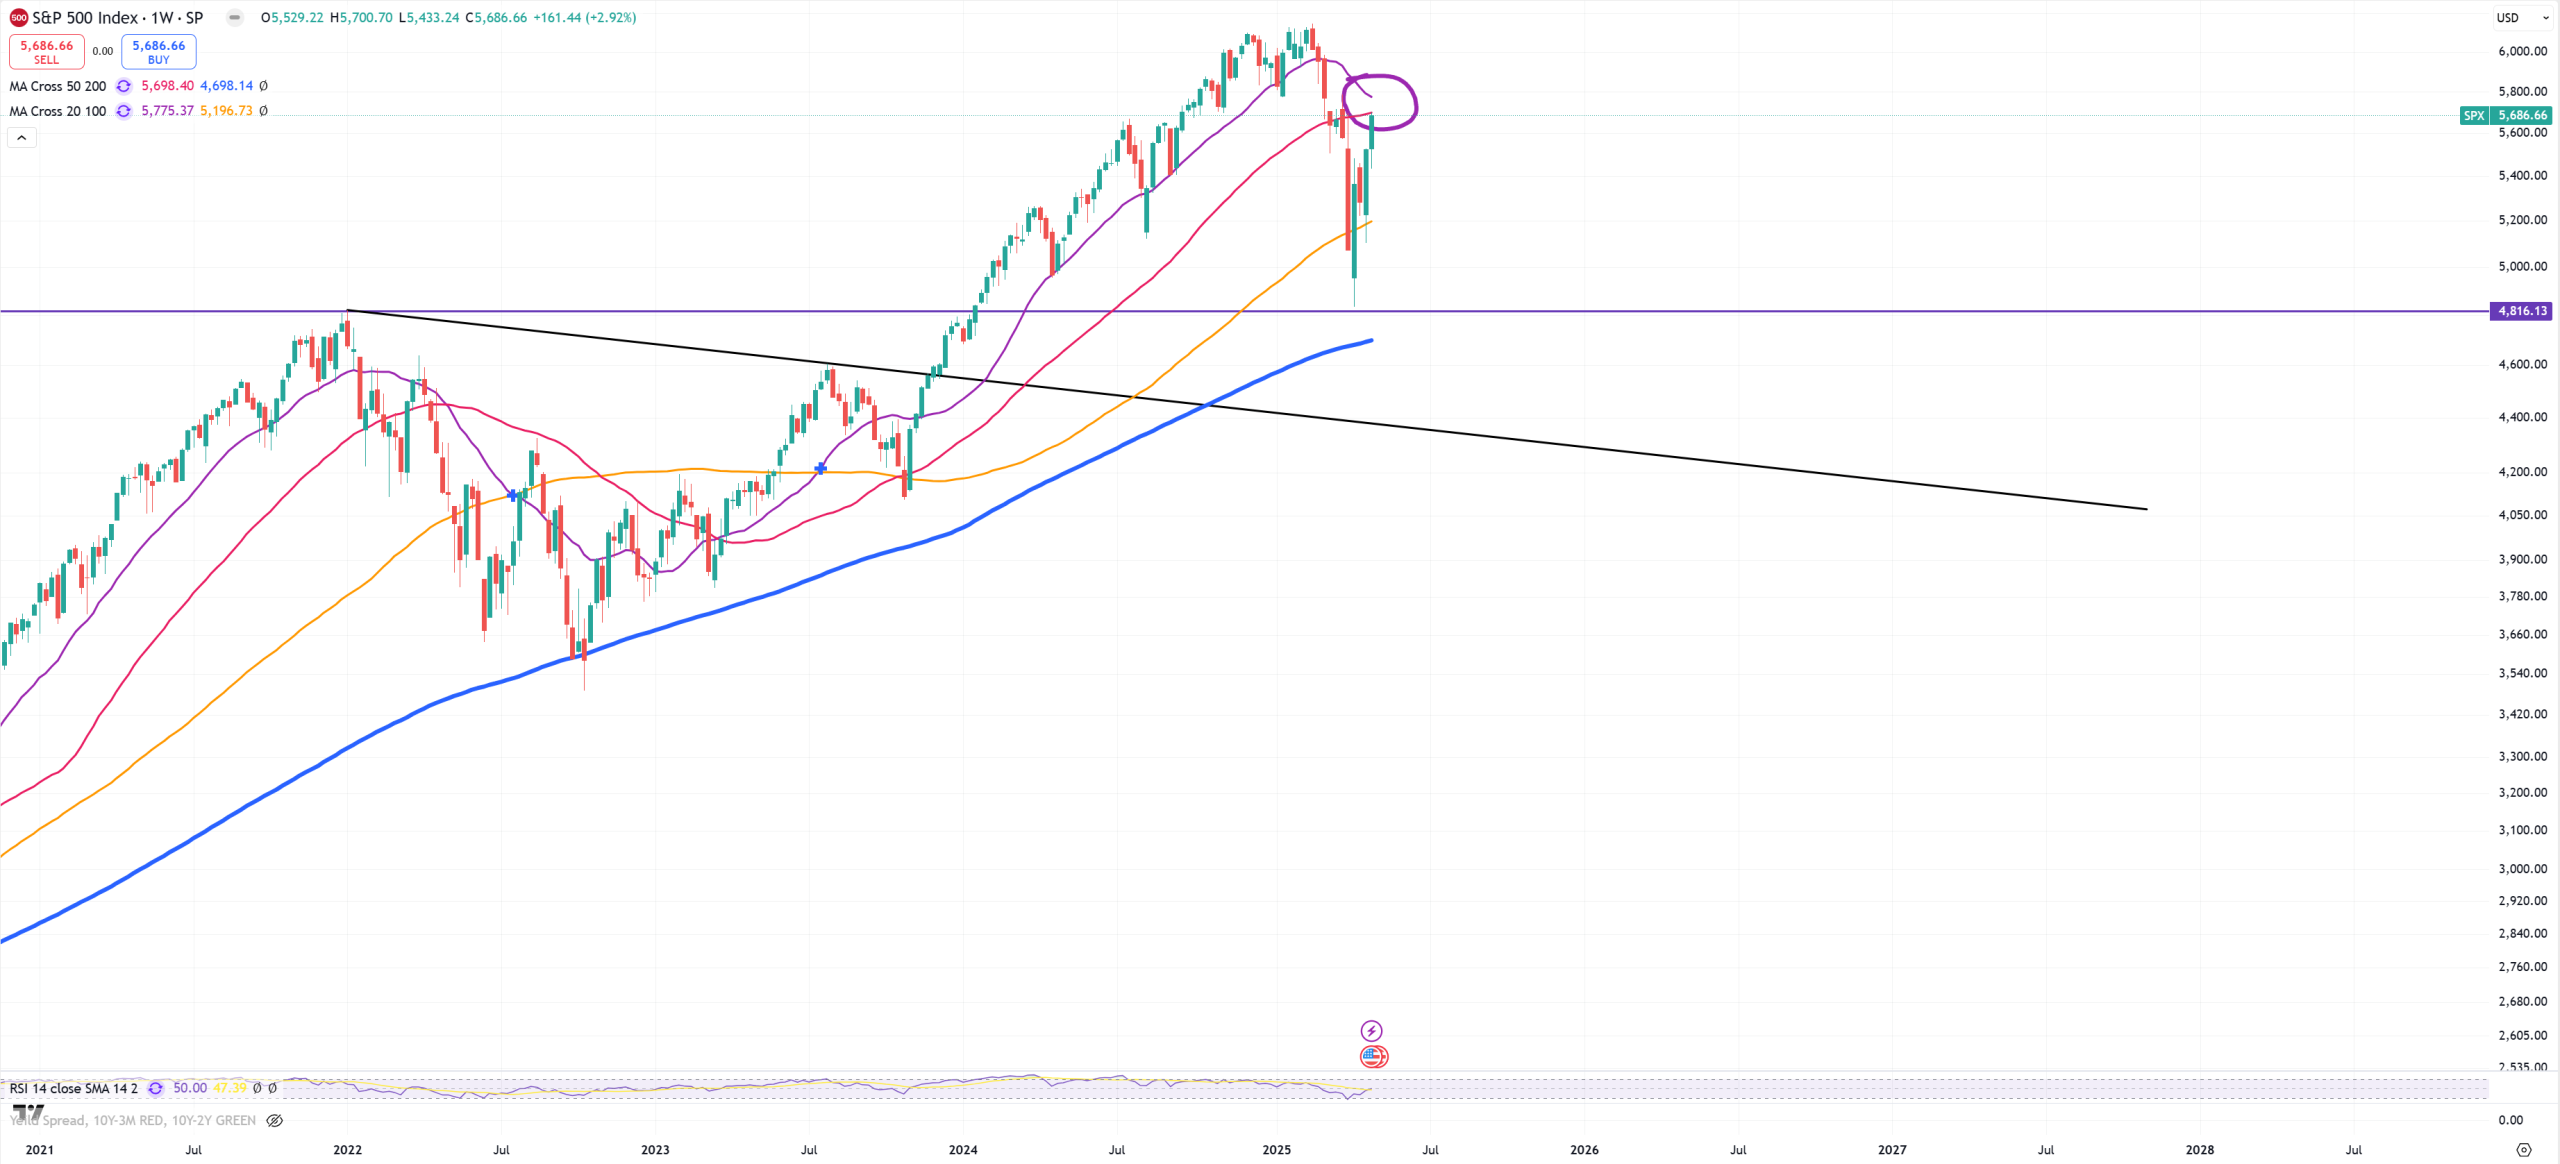
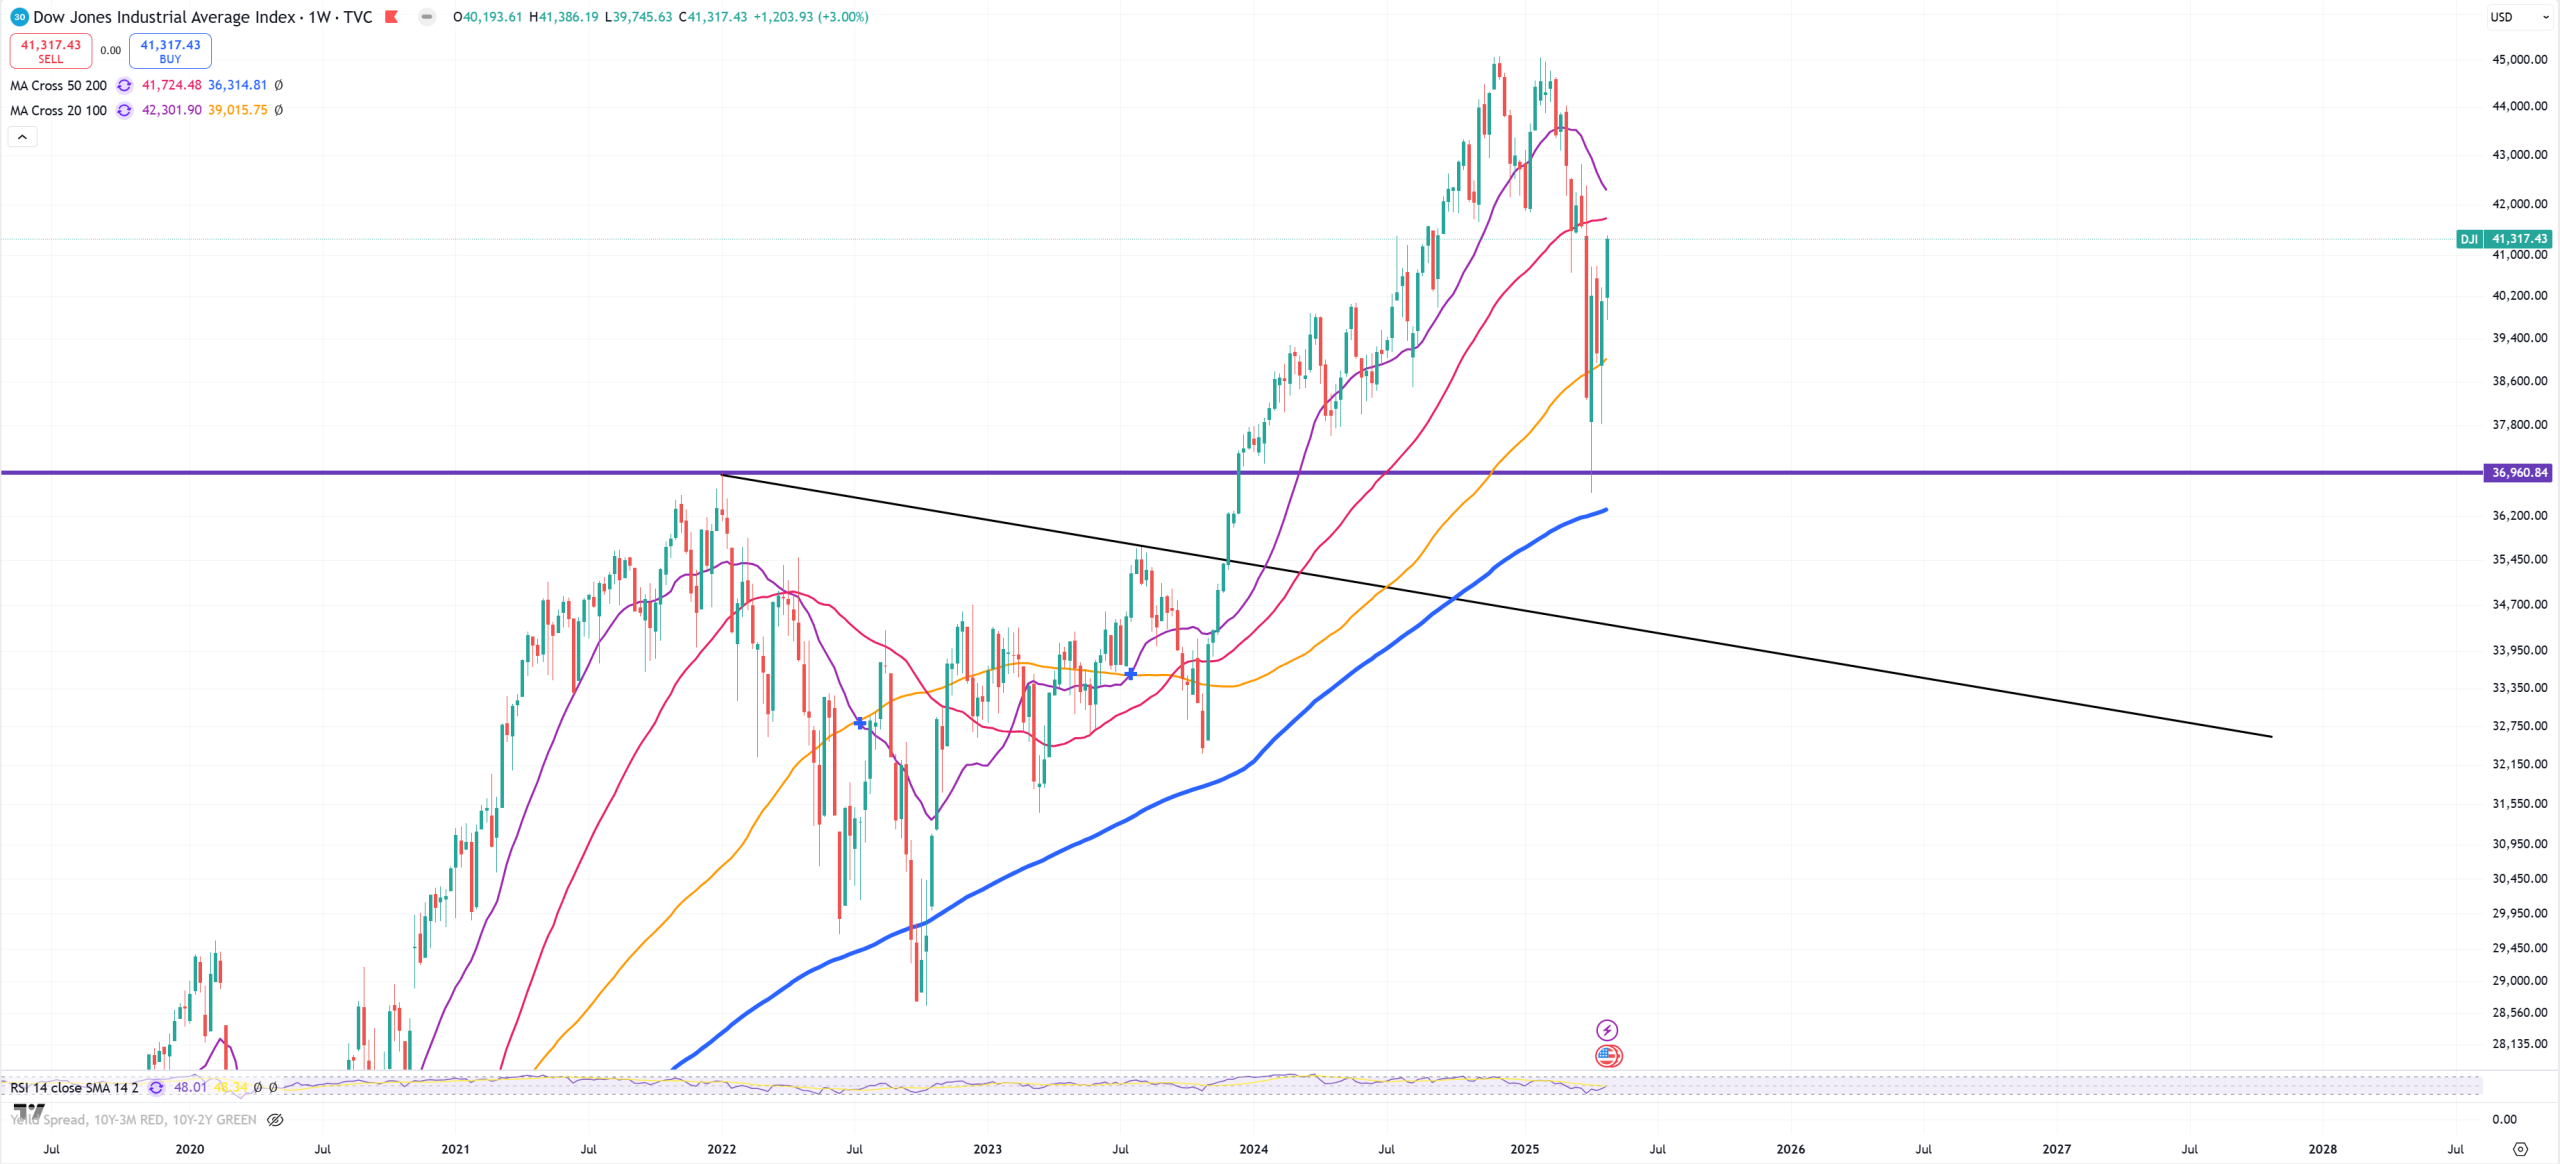
DJI fights for a big moment looking on a wider scale. I don’t believe in breaking long term 100Y trends to be honest, especially when DJI/GOLD said bye-bye to (3M)MA200, but it tries sliding here for years (just like 10Y/3M tries to slide in inversion for 3 years).
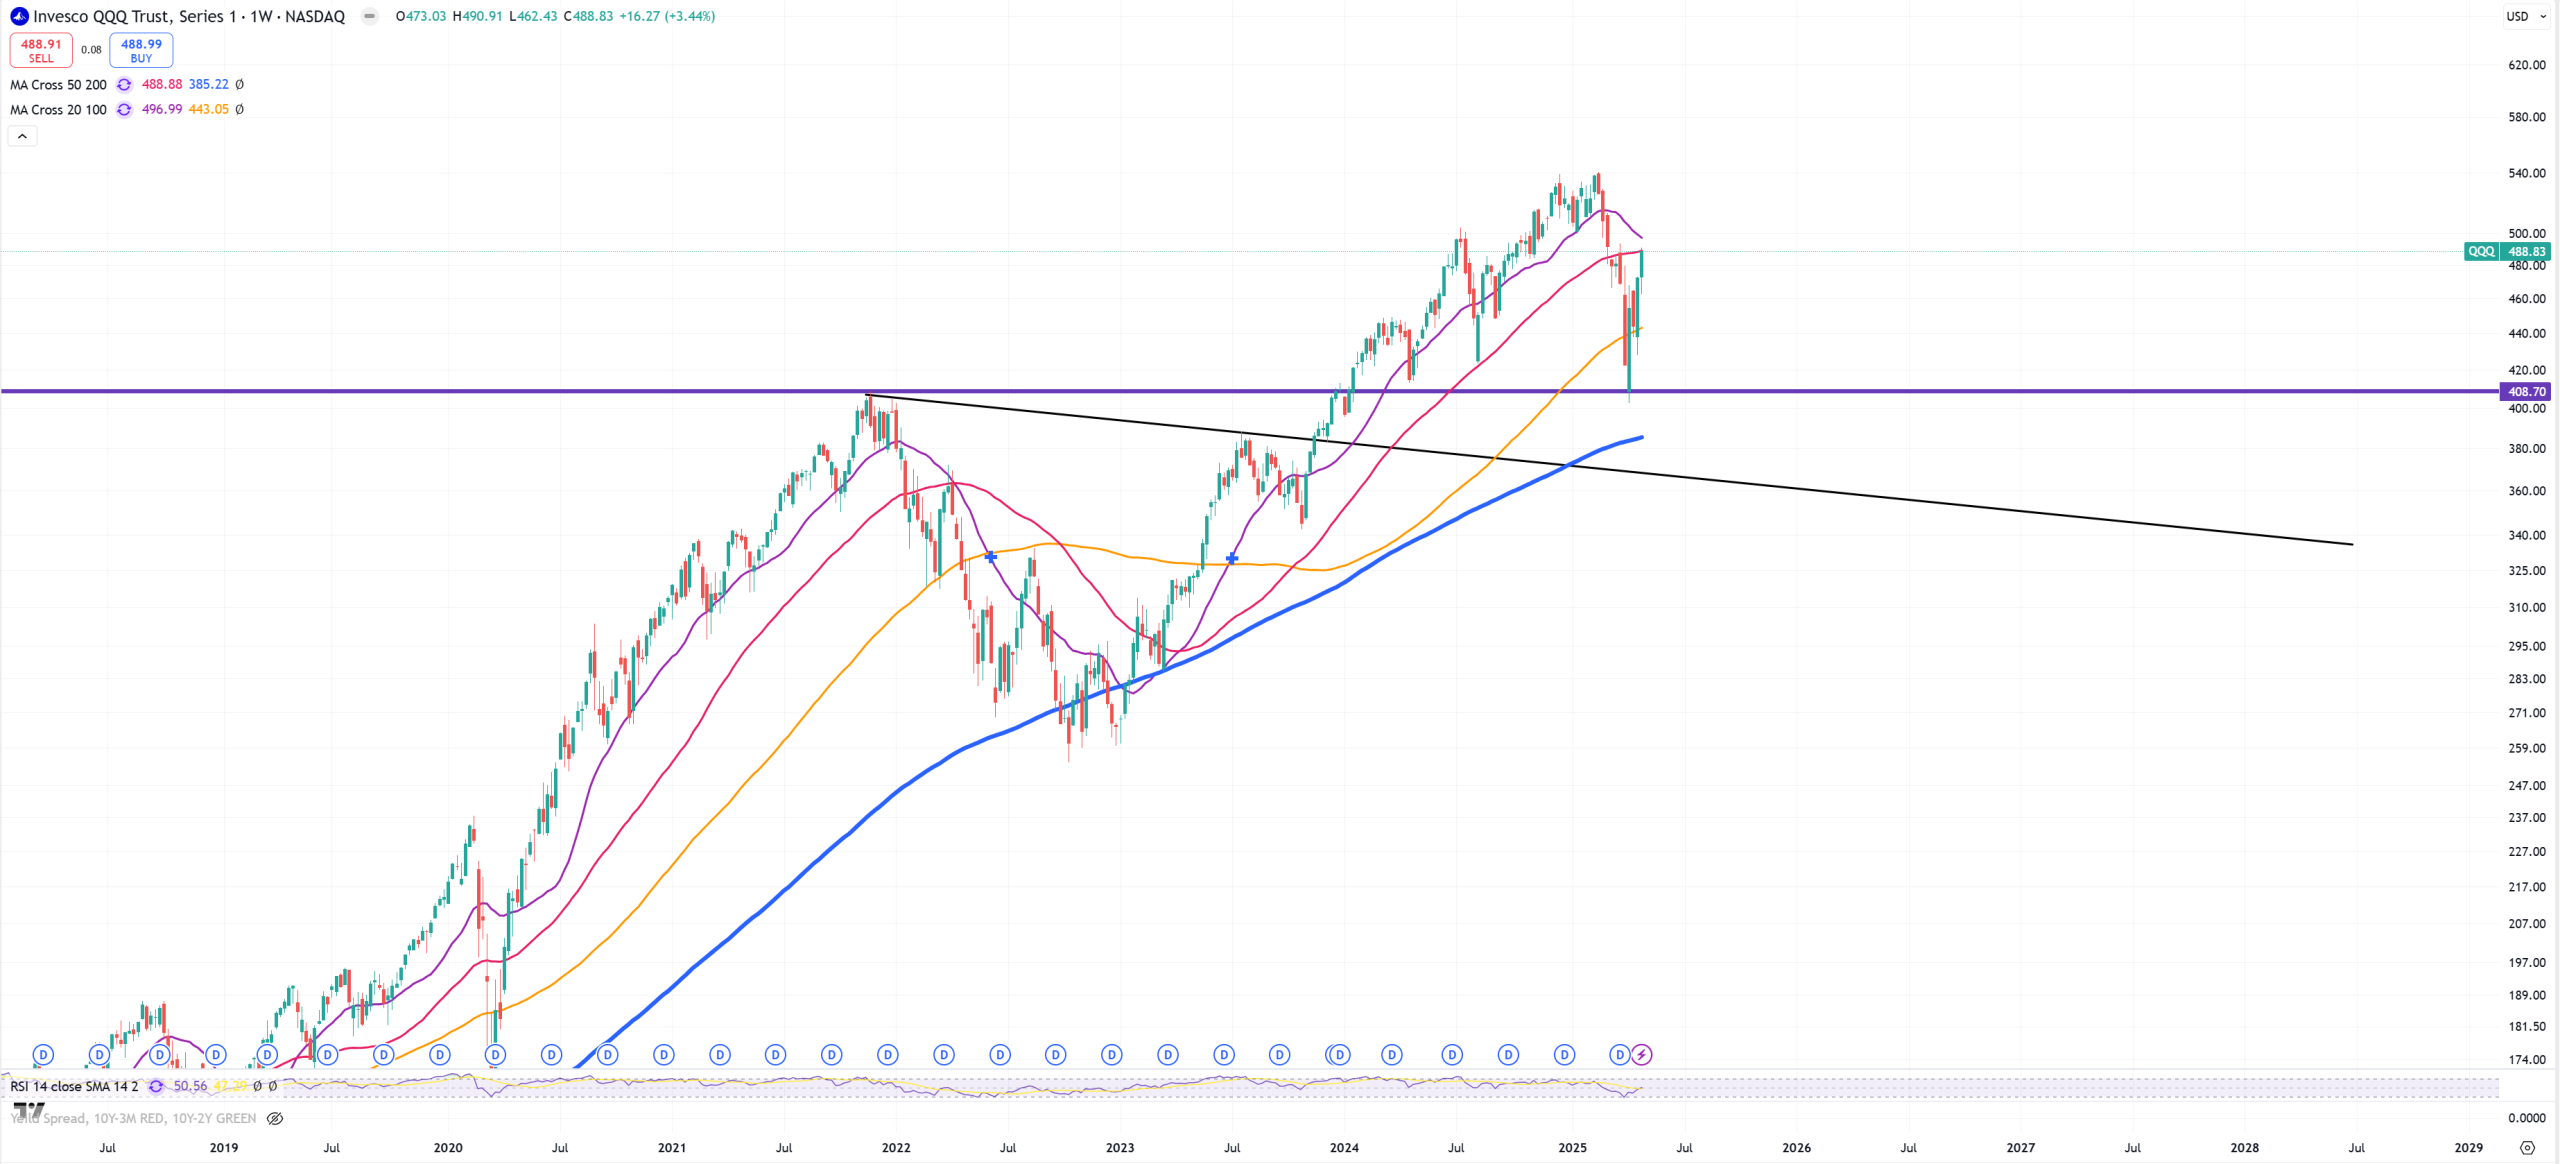
QQQ also getting towards its 2000-2021 trend
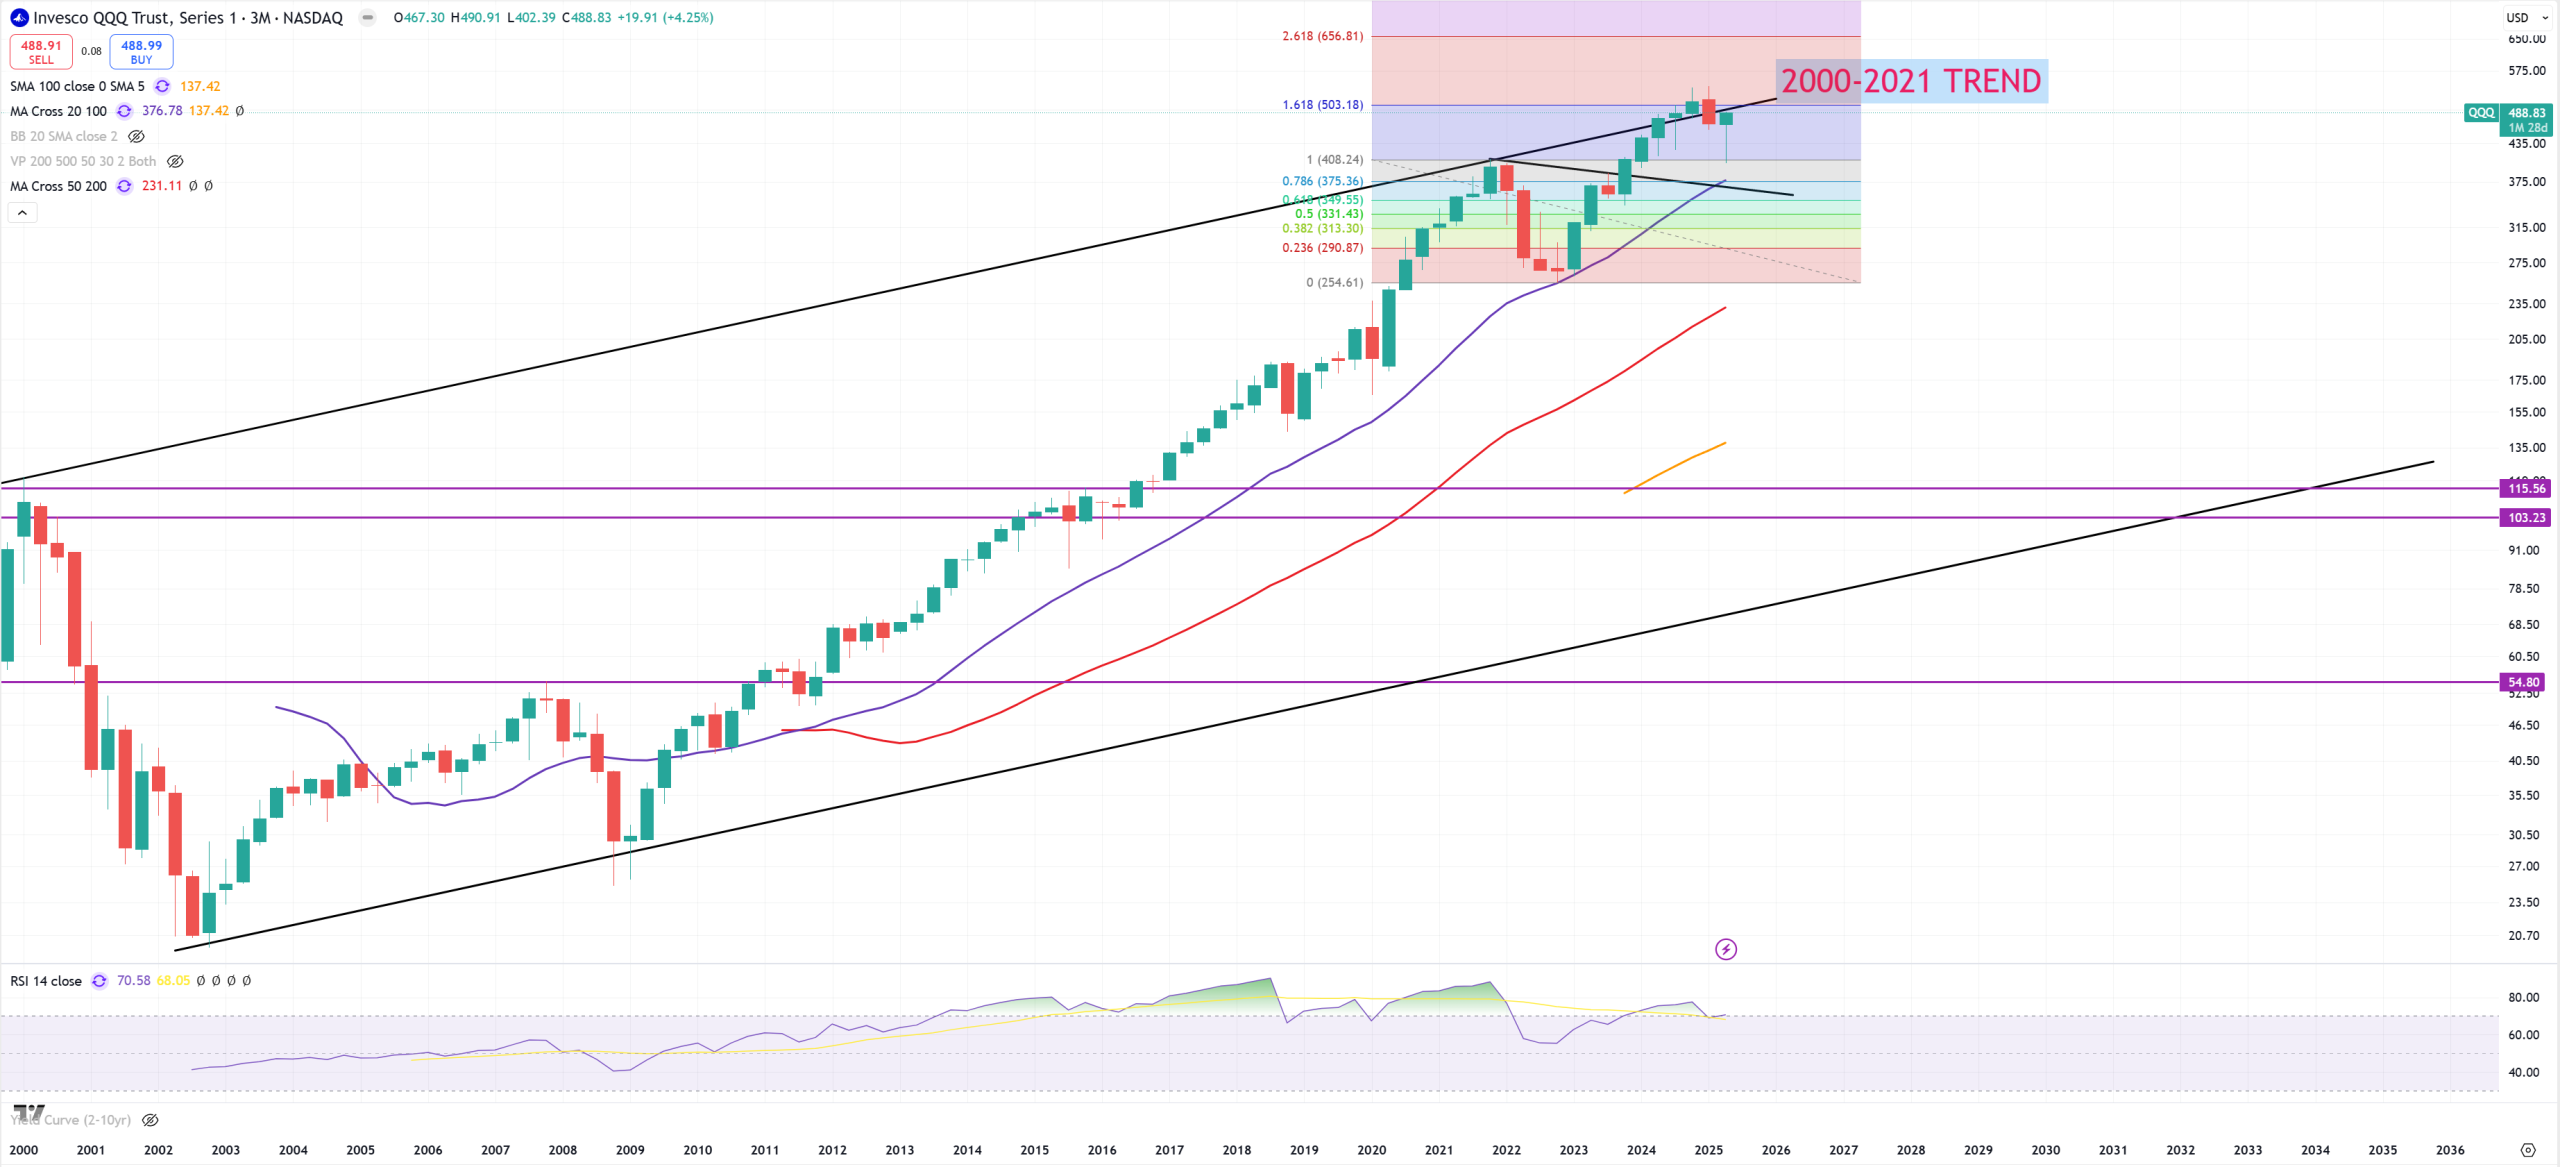
The fight will continue. If bulls manage to break (W)MA20/(W)MA50 this market has a chance to get to 6250 on SPX to retest 1929-2000 trend. To make believe in that I’d love to see DJI/GOLD getting above (3M)MA200 & (M)MA200 and AUDJPY breaking above 95. If SPX/GOLD will break (M)MA200 and (3M)MA200 and DJI/GOLD will be kept below those MAs still we can start to say market from cracked is getting into destroyed moment once 10Y/3M will join to the party blowing +50-60bps level.