06/2025
May 31, 2025

In general this month was really interesting. We can split actual stock patterns into 3 categories. 1st – Retesting mostly 2021 peak, 2nd – Retesting broken (M)MA50 from the bottom, 3rd – Fighting with some longer trends + above 2021 peak, while still some typical cycle placement charts like SPX/GOLD hanging on big support
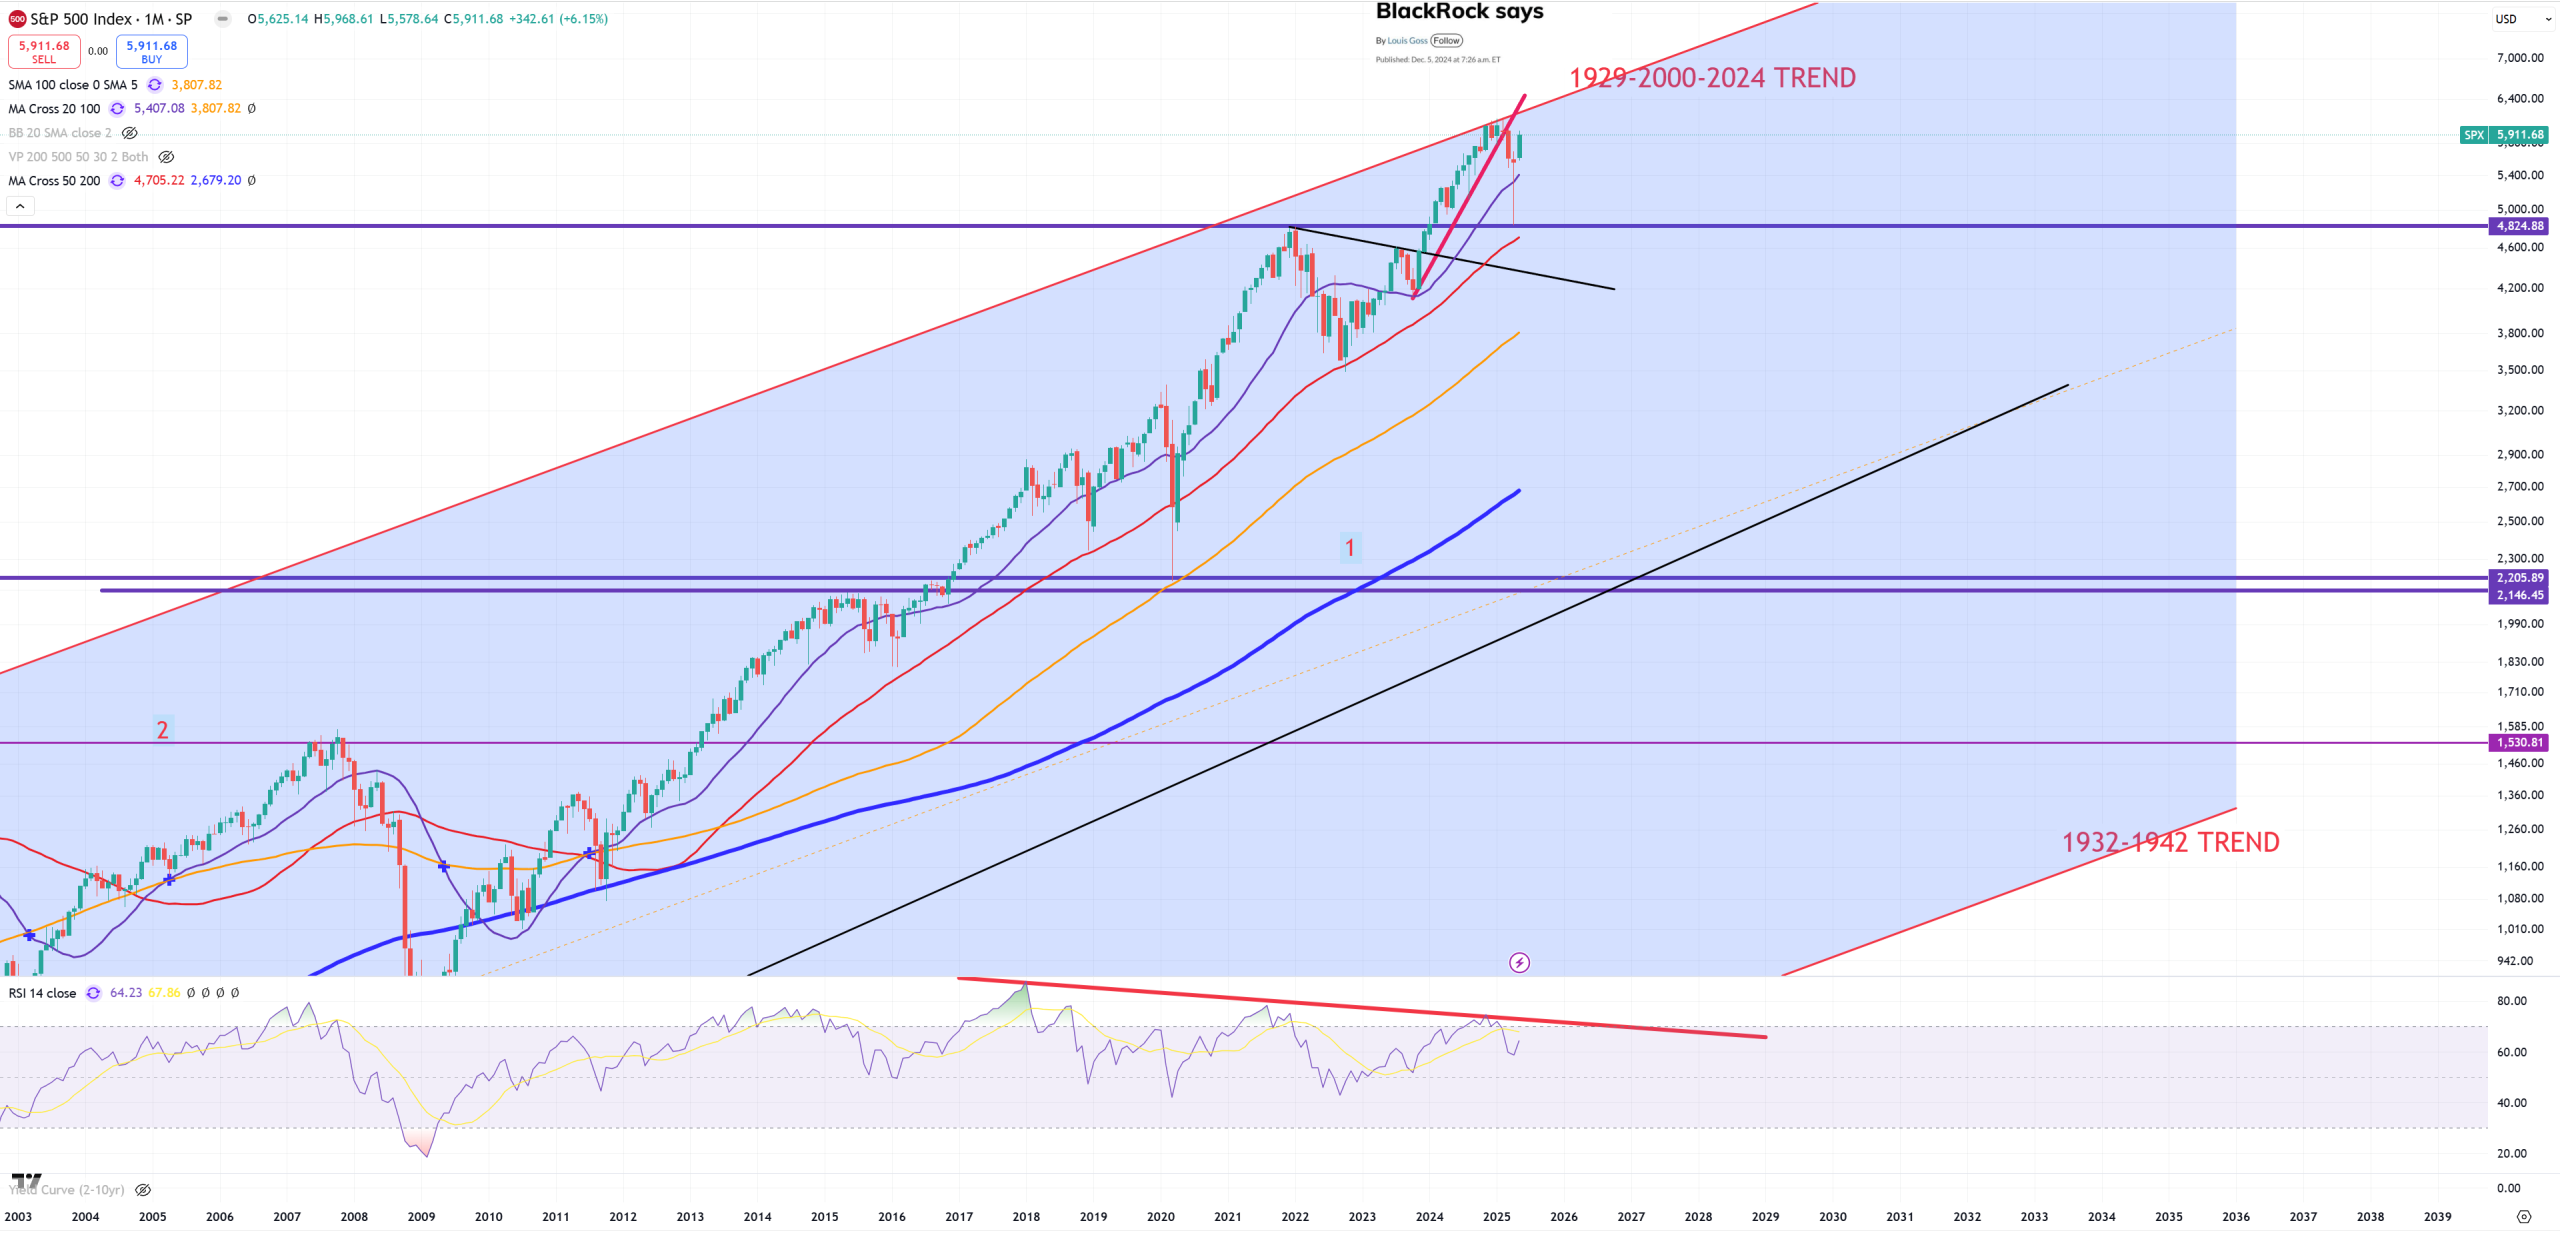
SPX – as long as 1929-2000 trend holds, market is trying to breach (M)MA20, upside limiter is the trend = 6250, while still huge negative divergence
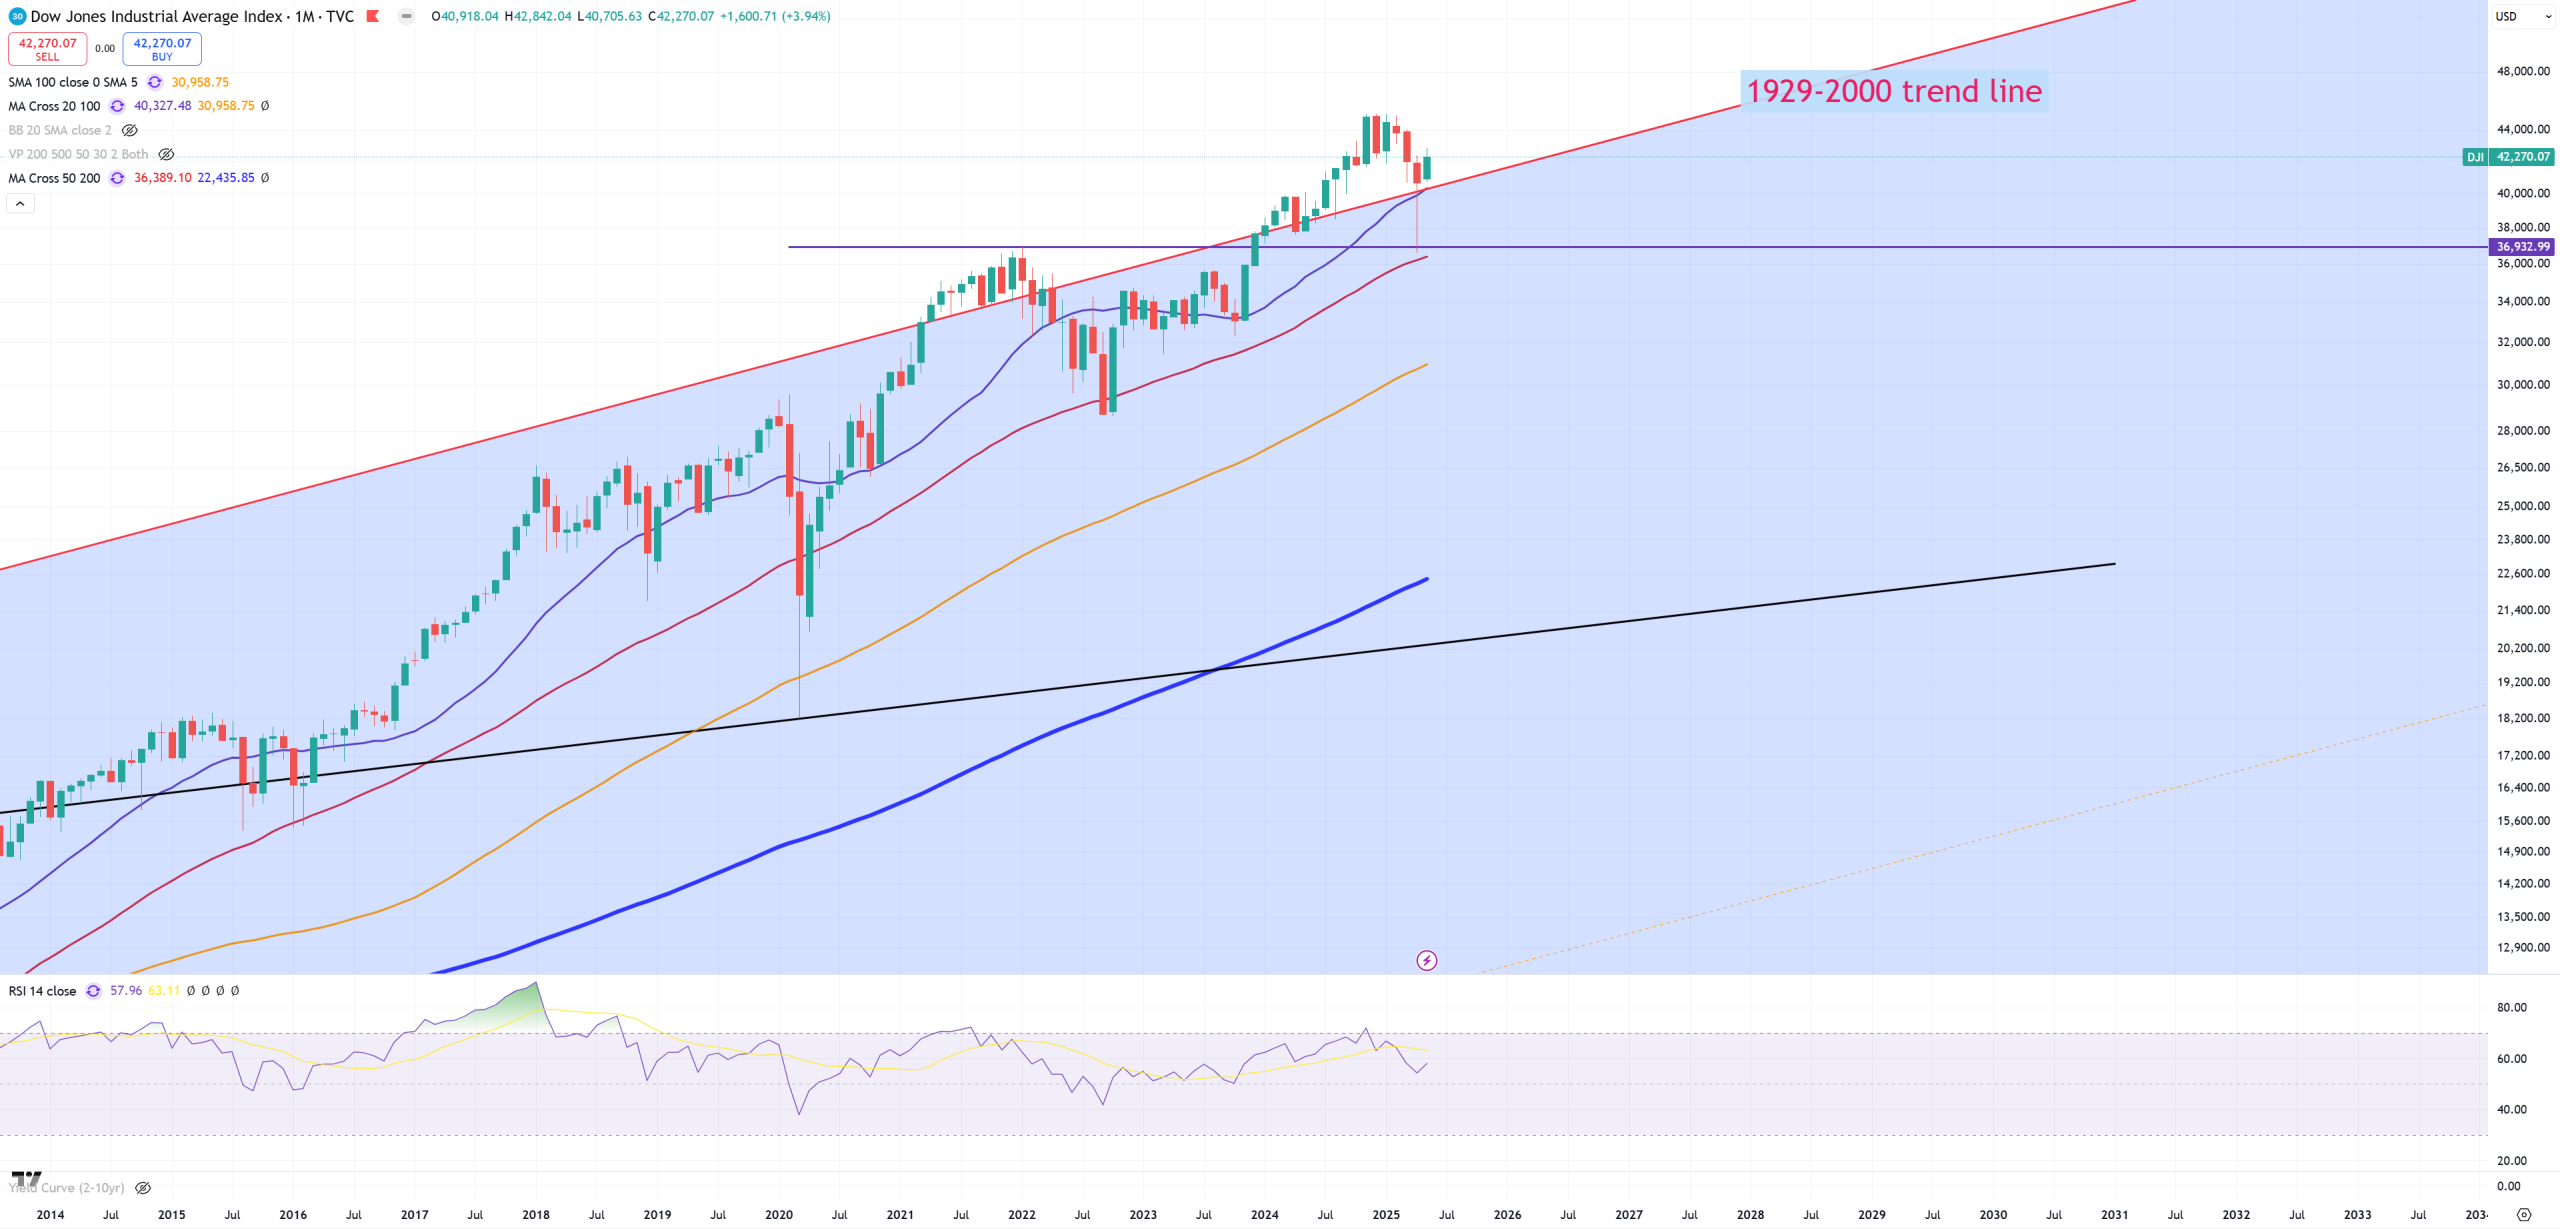
DJI – as I’ve been saying 2000 wasn’t a bubble for DJI, but we need to keep the same trend as SPX, so in reality DJI tries to get support on 1929-2000 trend
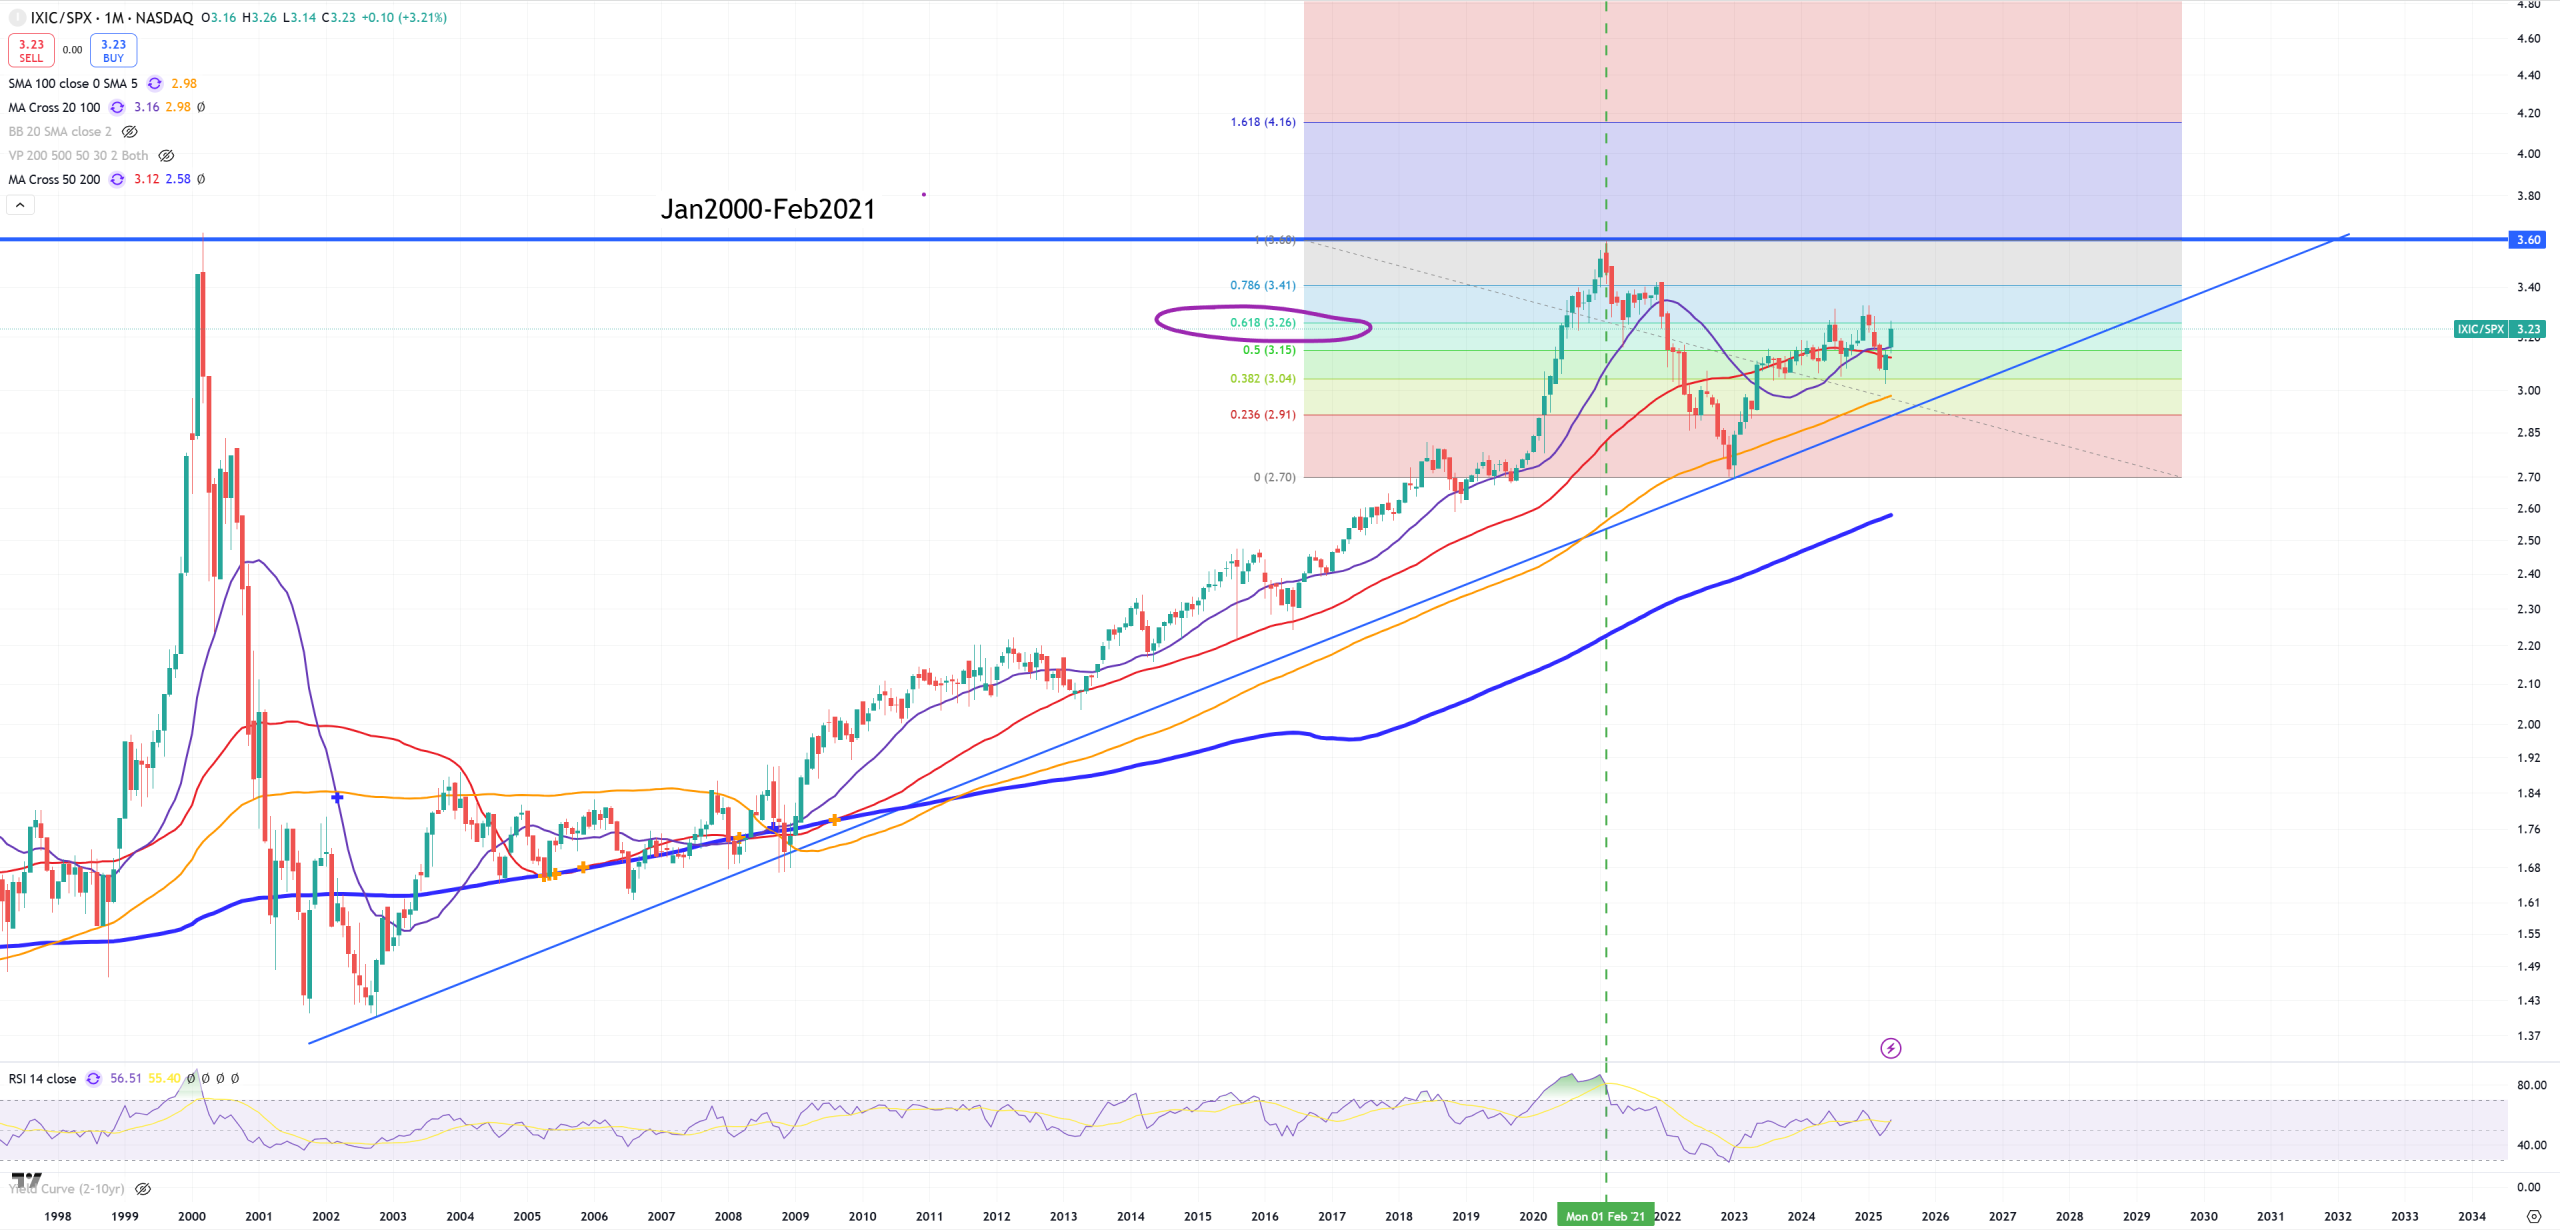
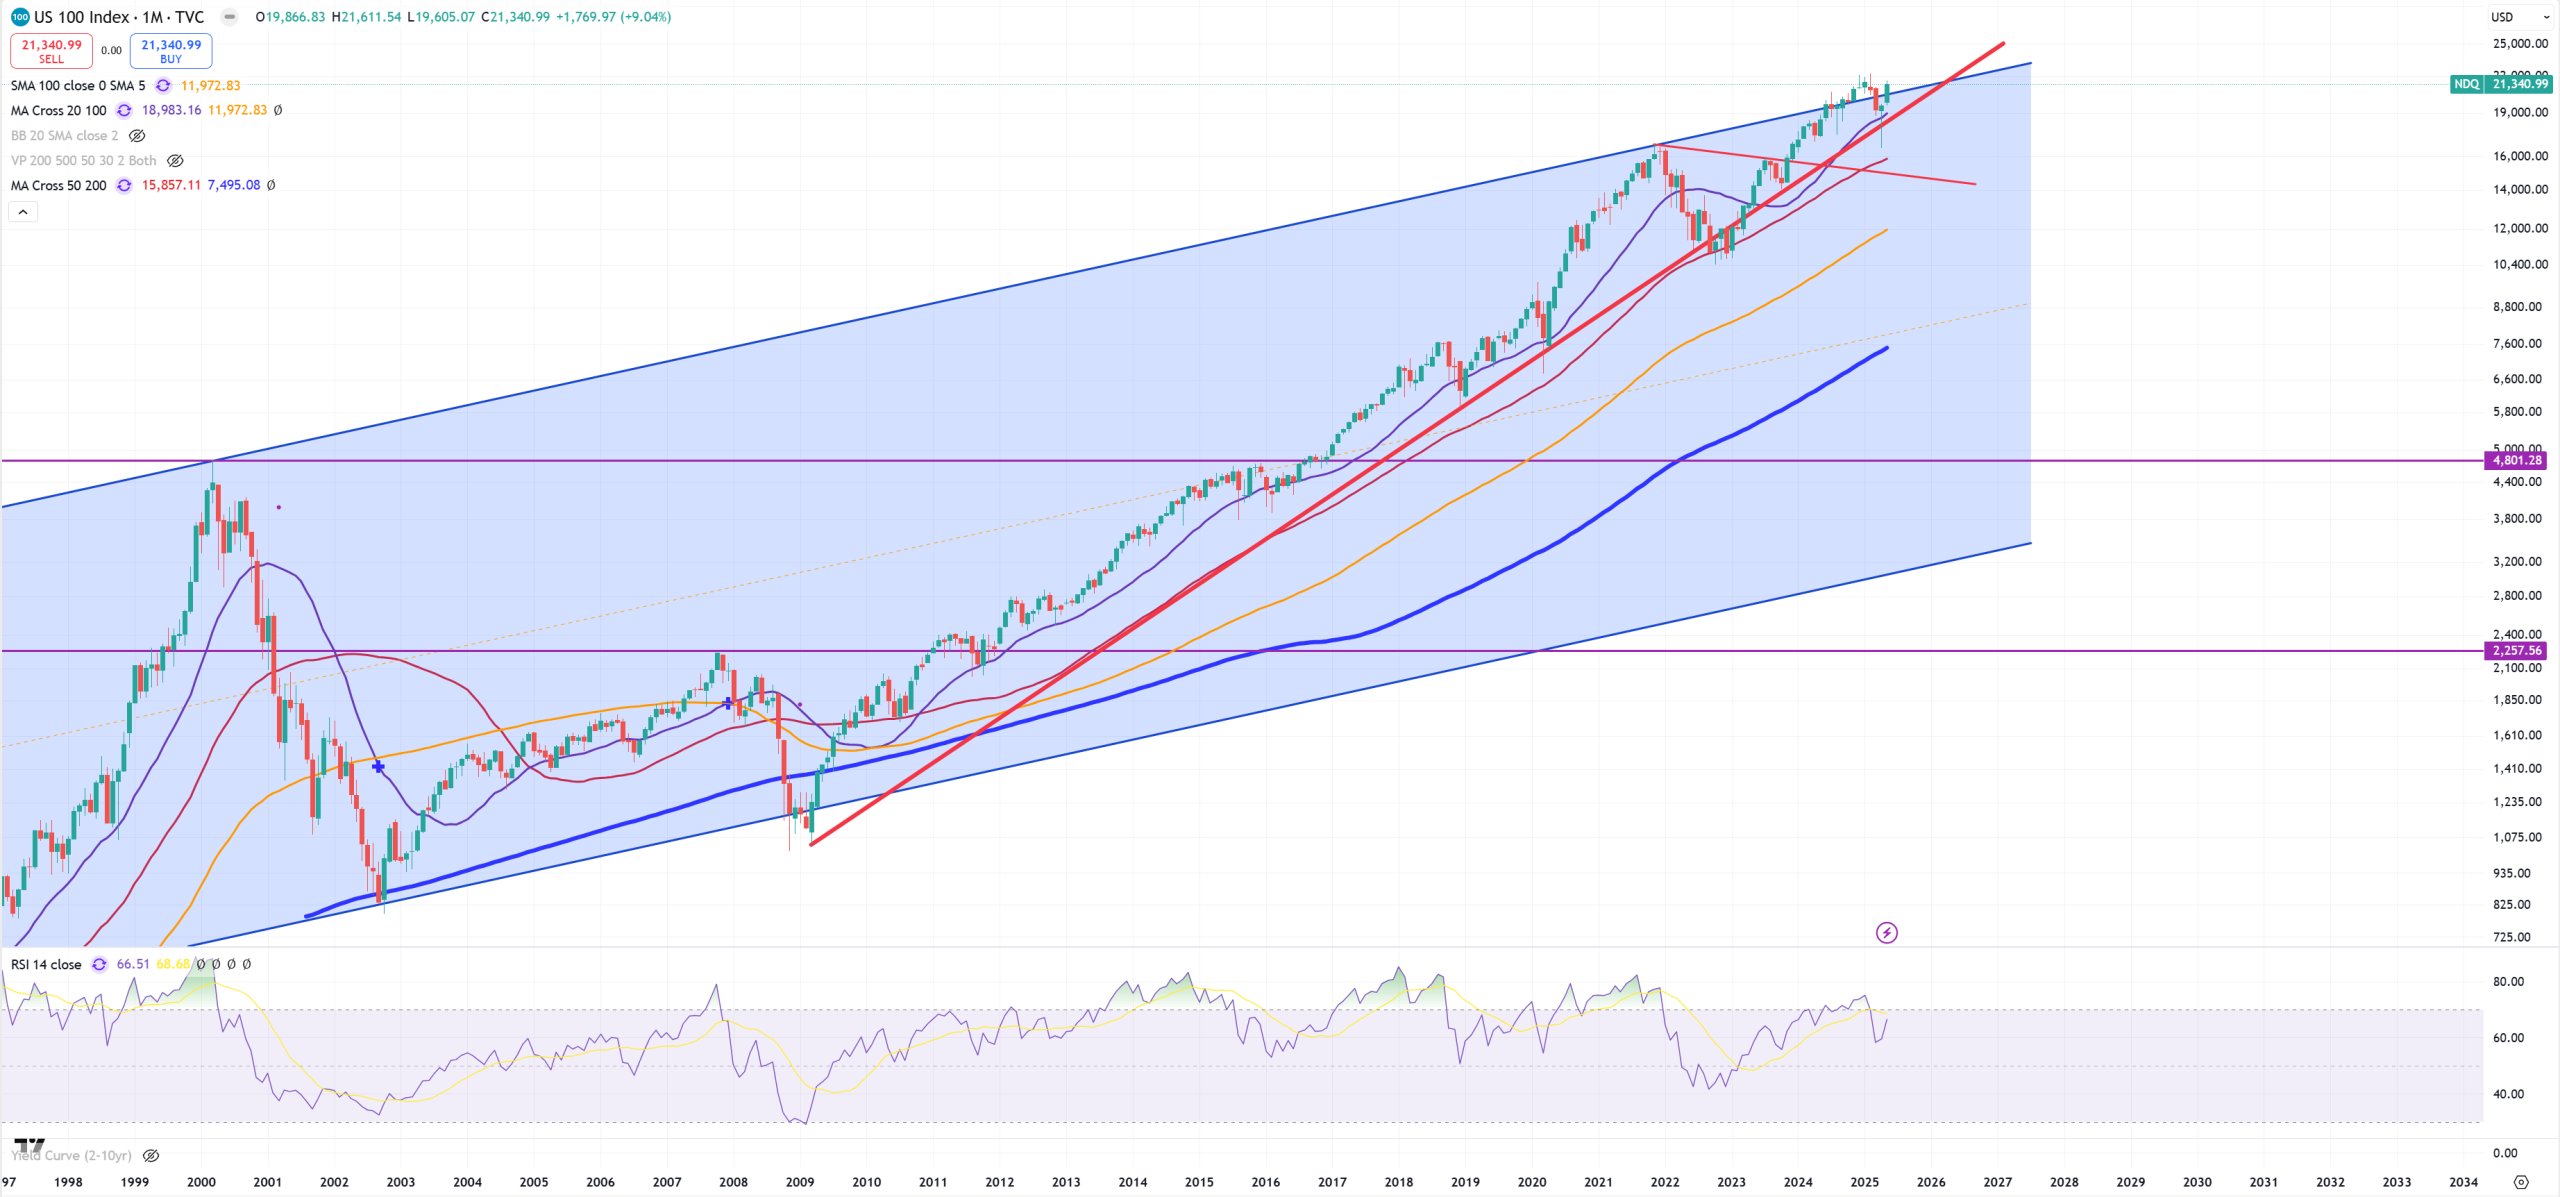
NDQ – Nasdaq 100 keeps fighting with 2000-2021 trend
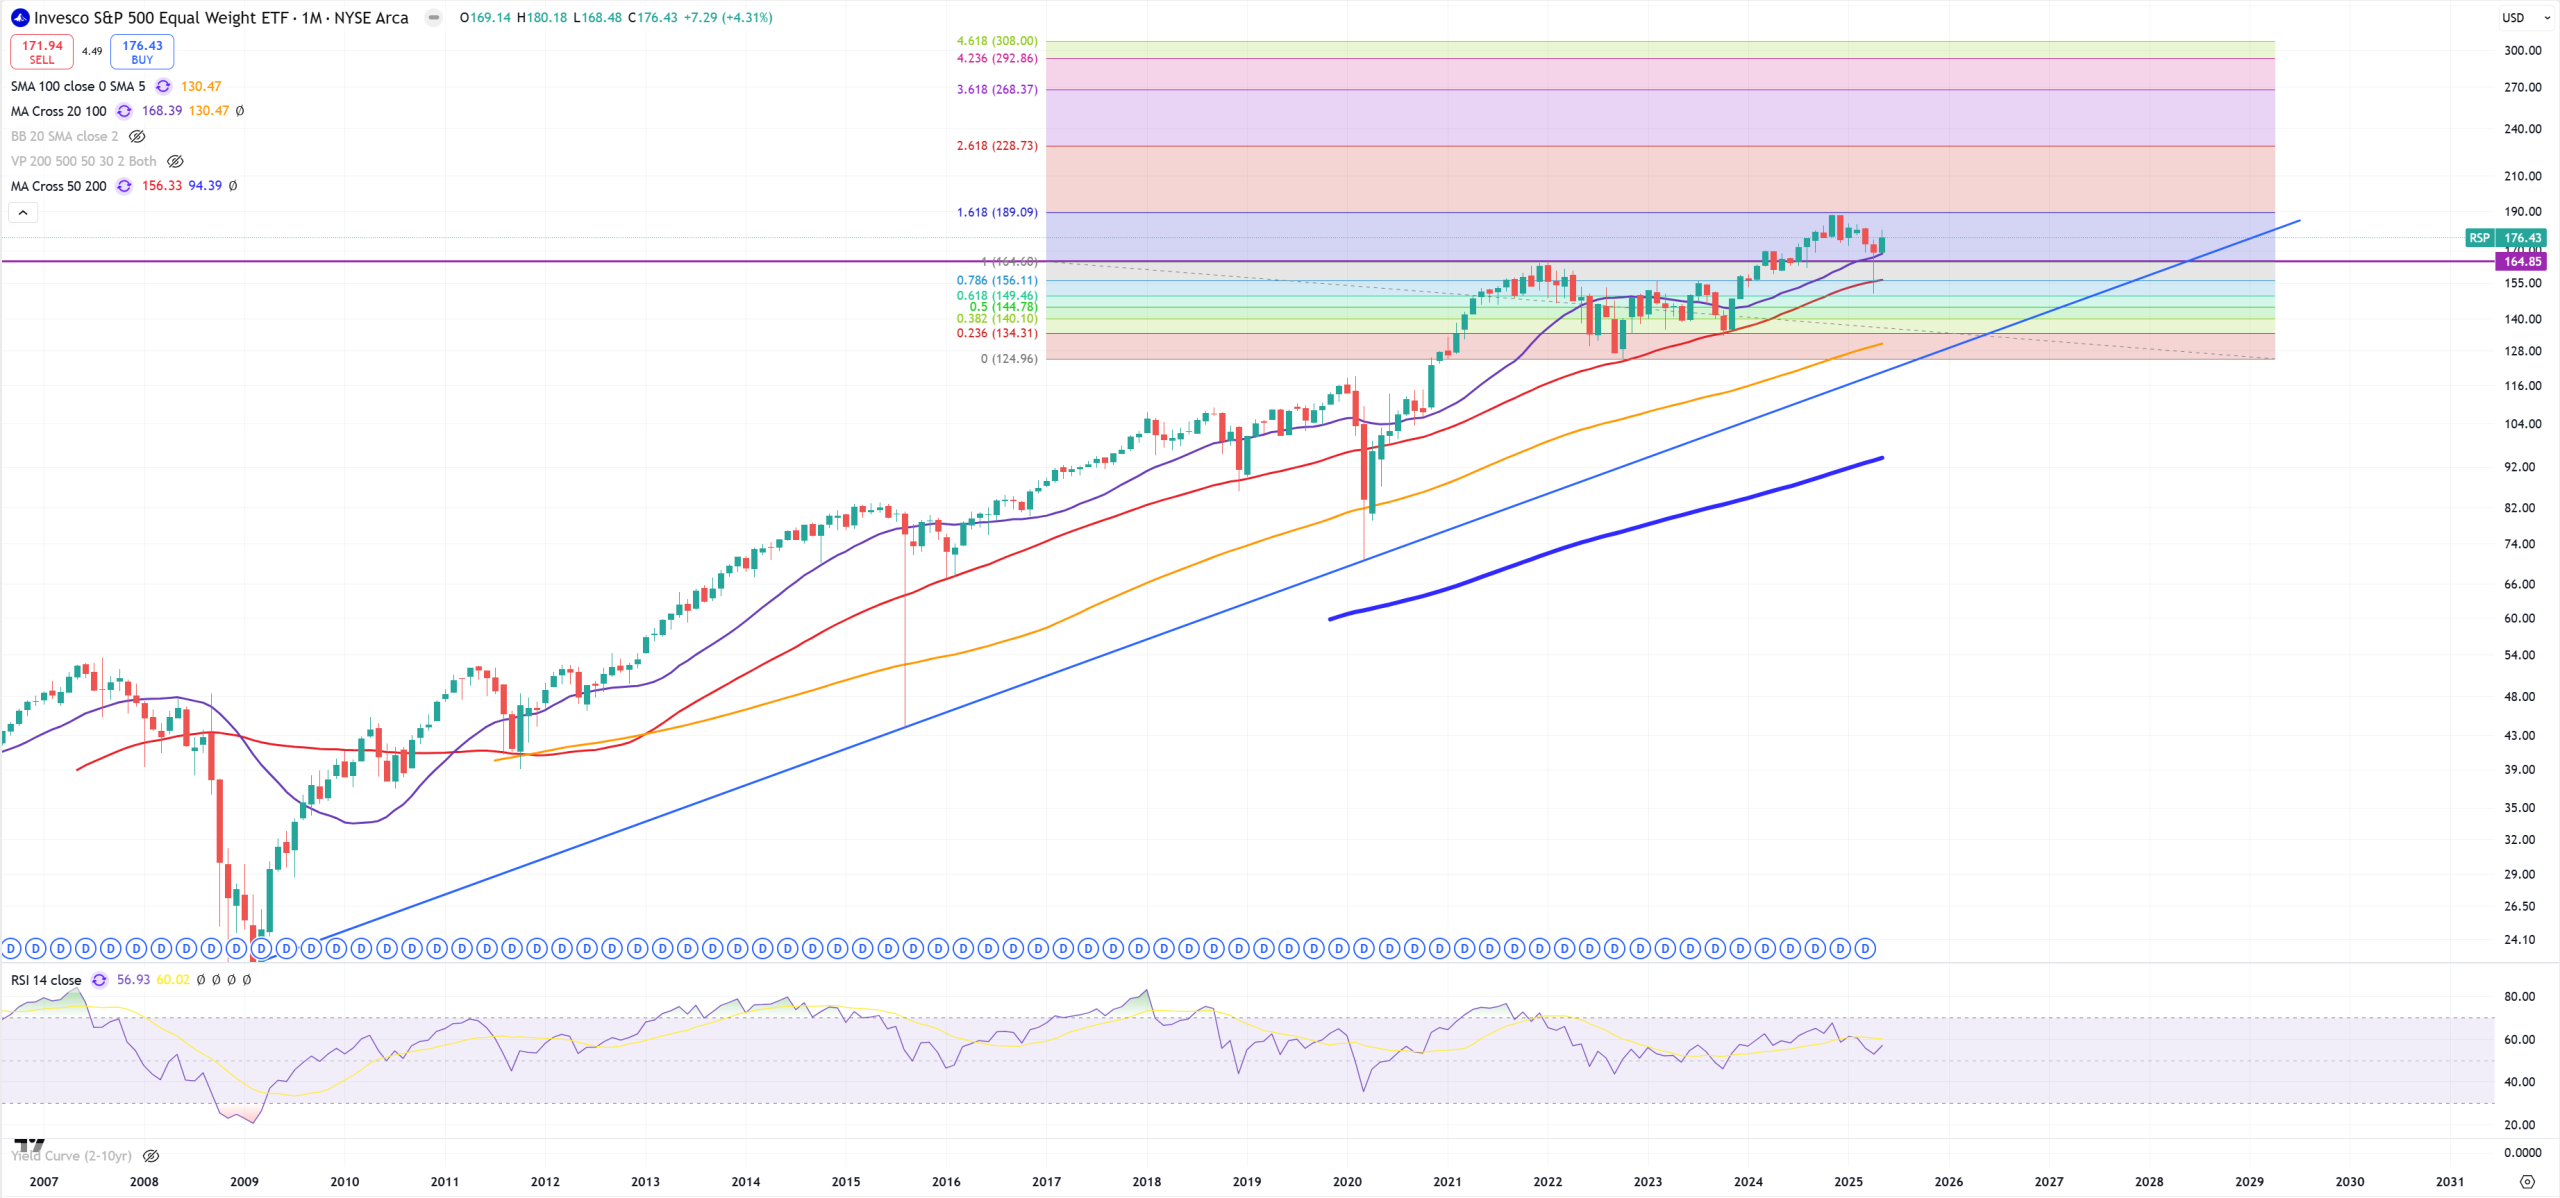
RSP – so Equal Weight : 2021 level holds
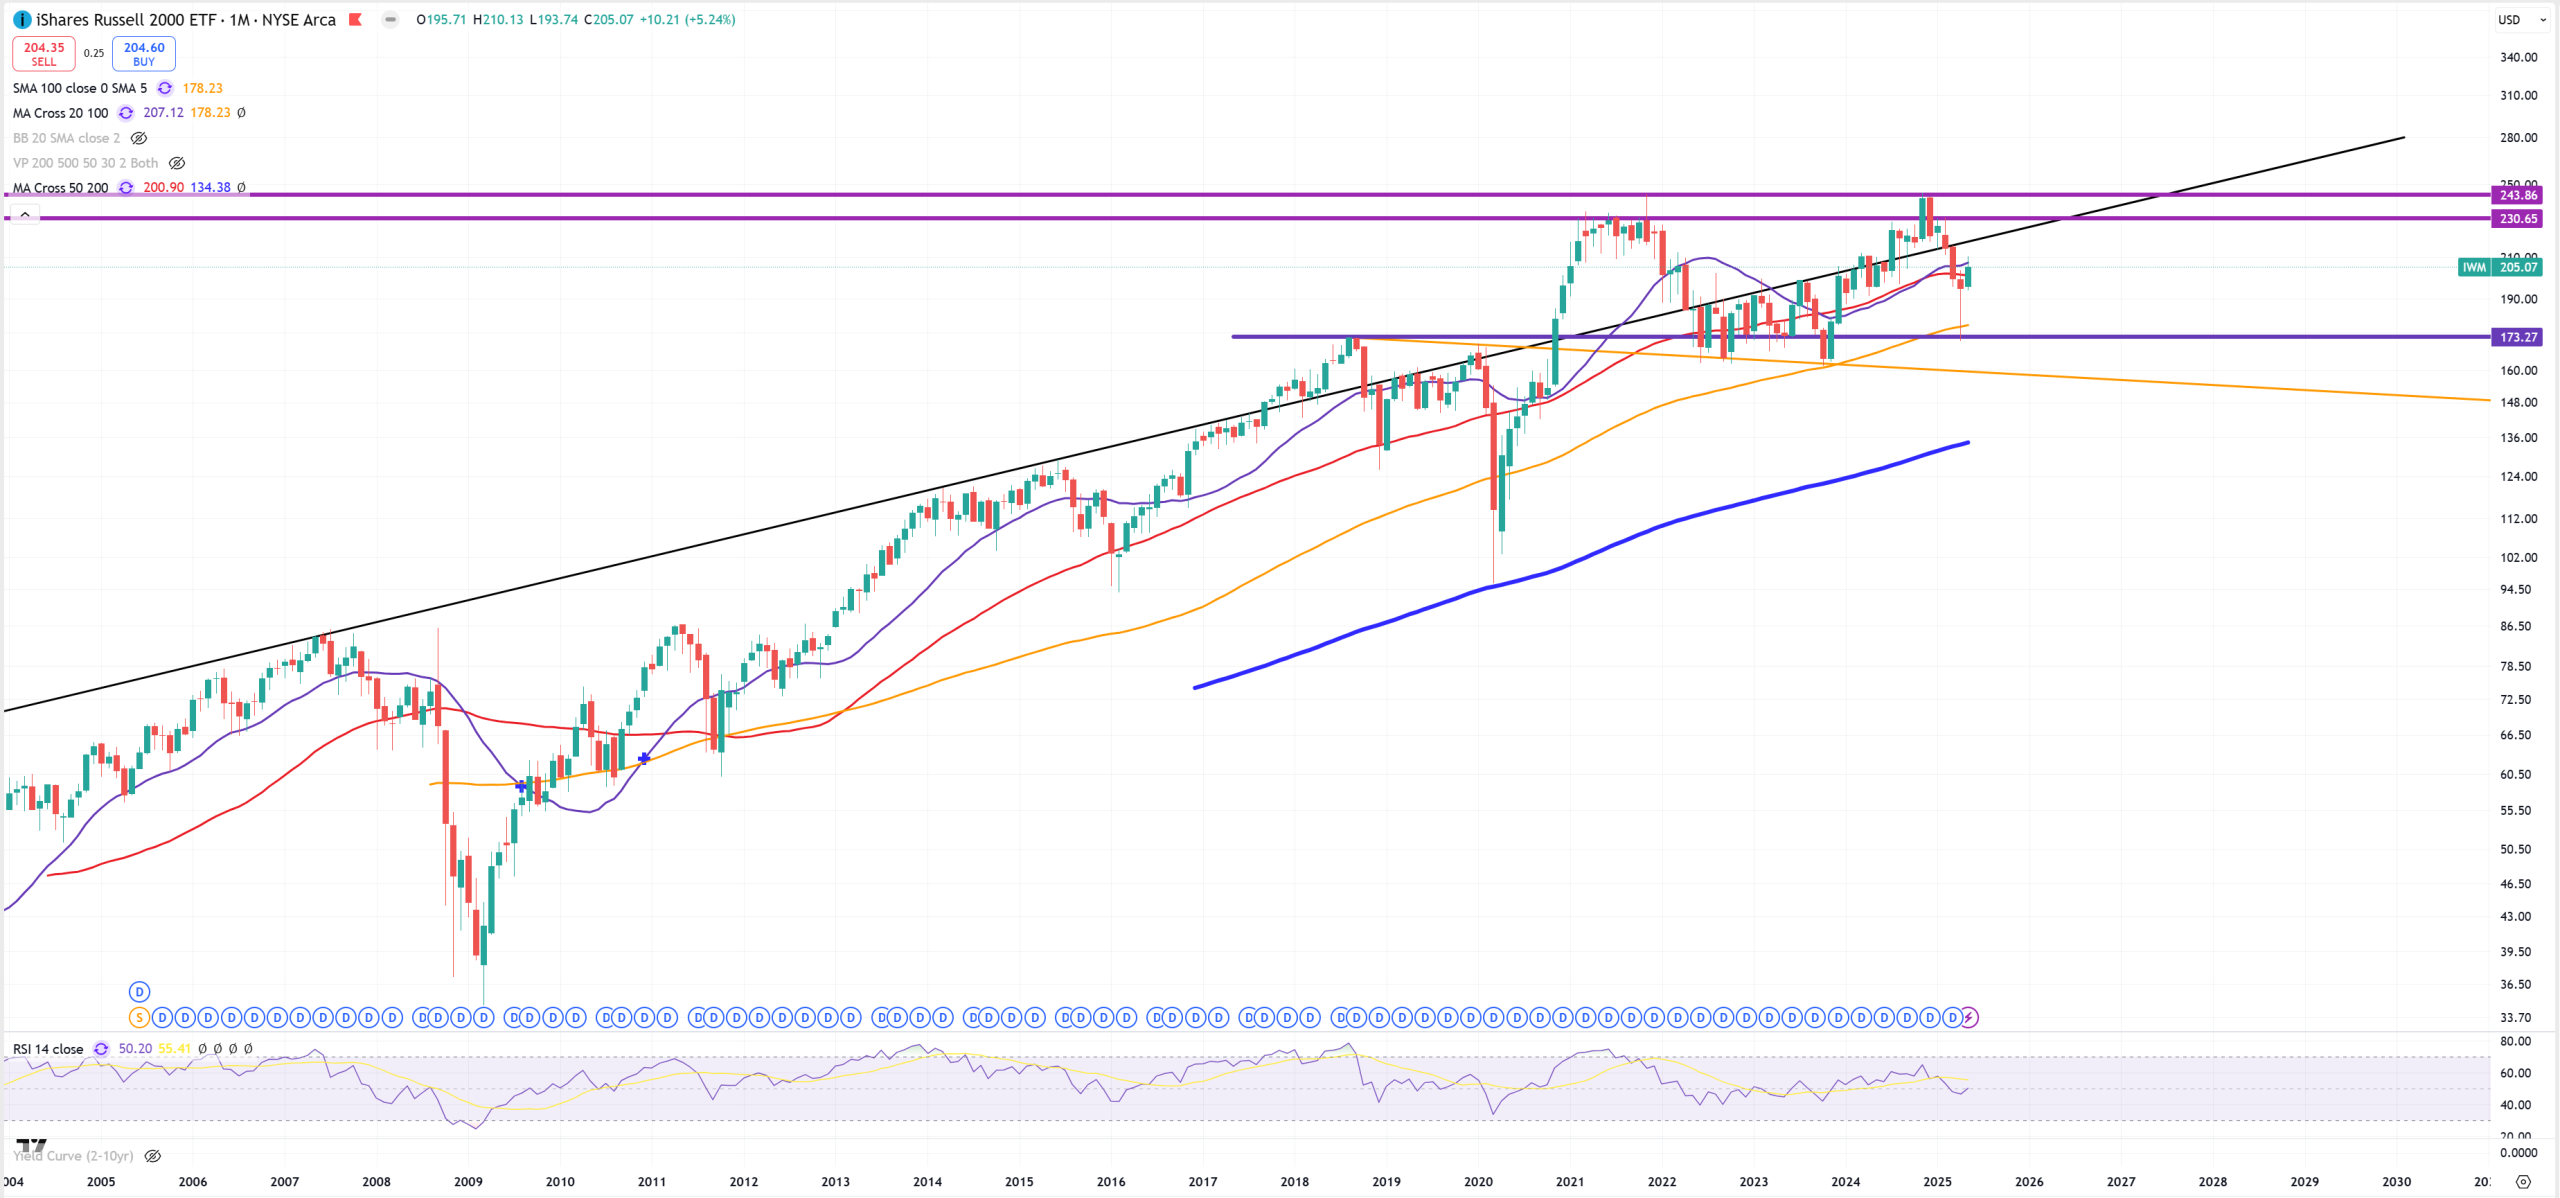
IWM – Small Caps – couple years of levitation :
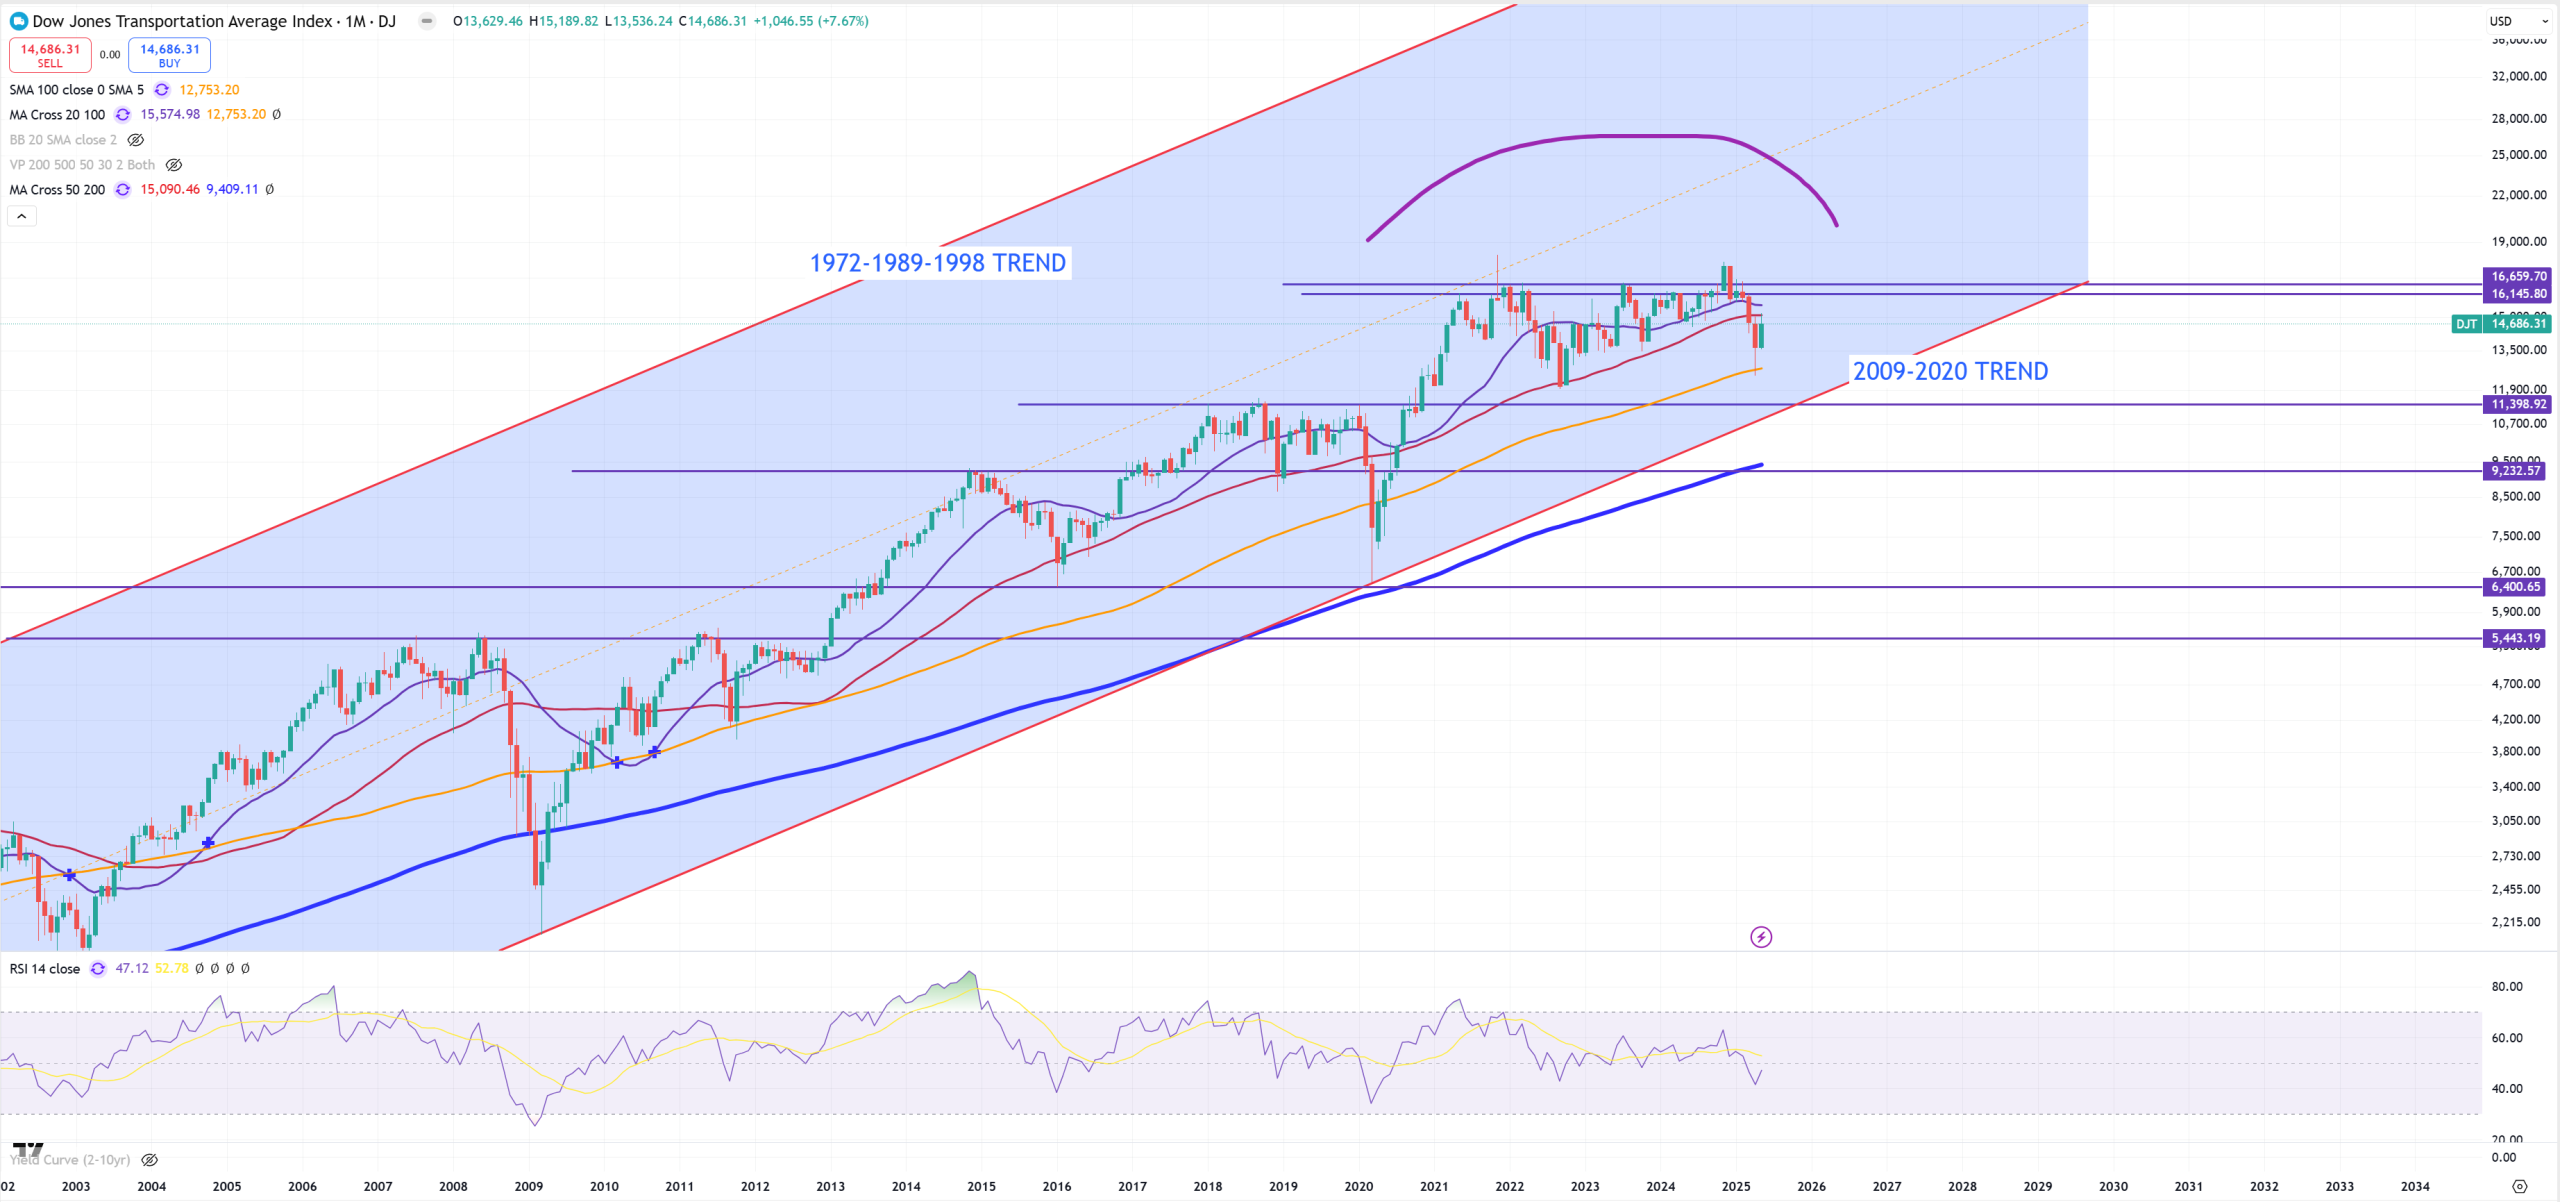
DJT – Transportation is below (M)MA50 and it moves in channel. We clearly see 2021-2025 topping pattern so far and finally we are below (M)MA50
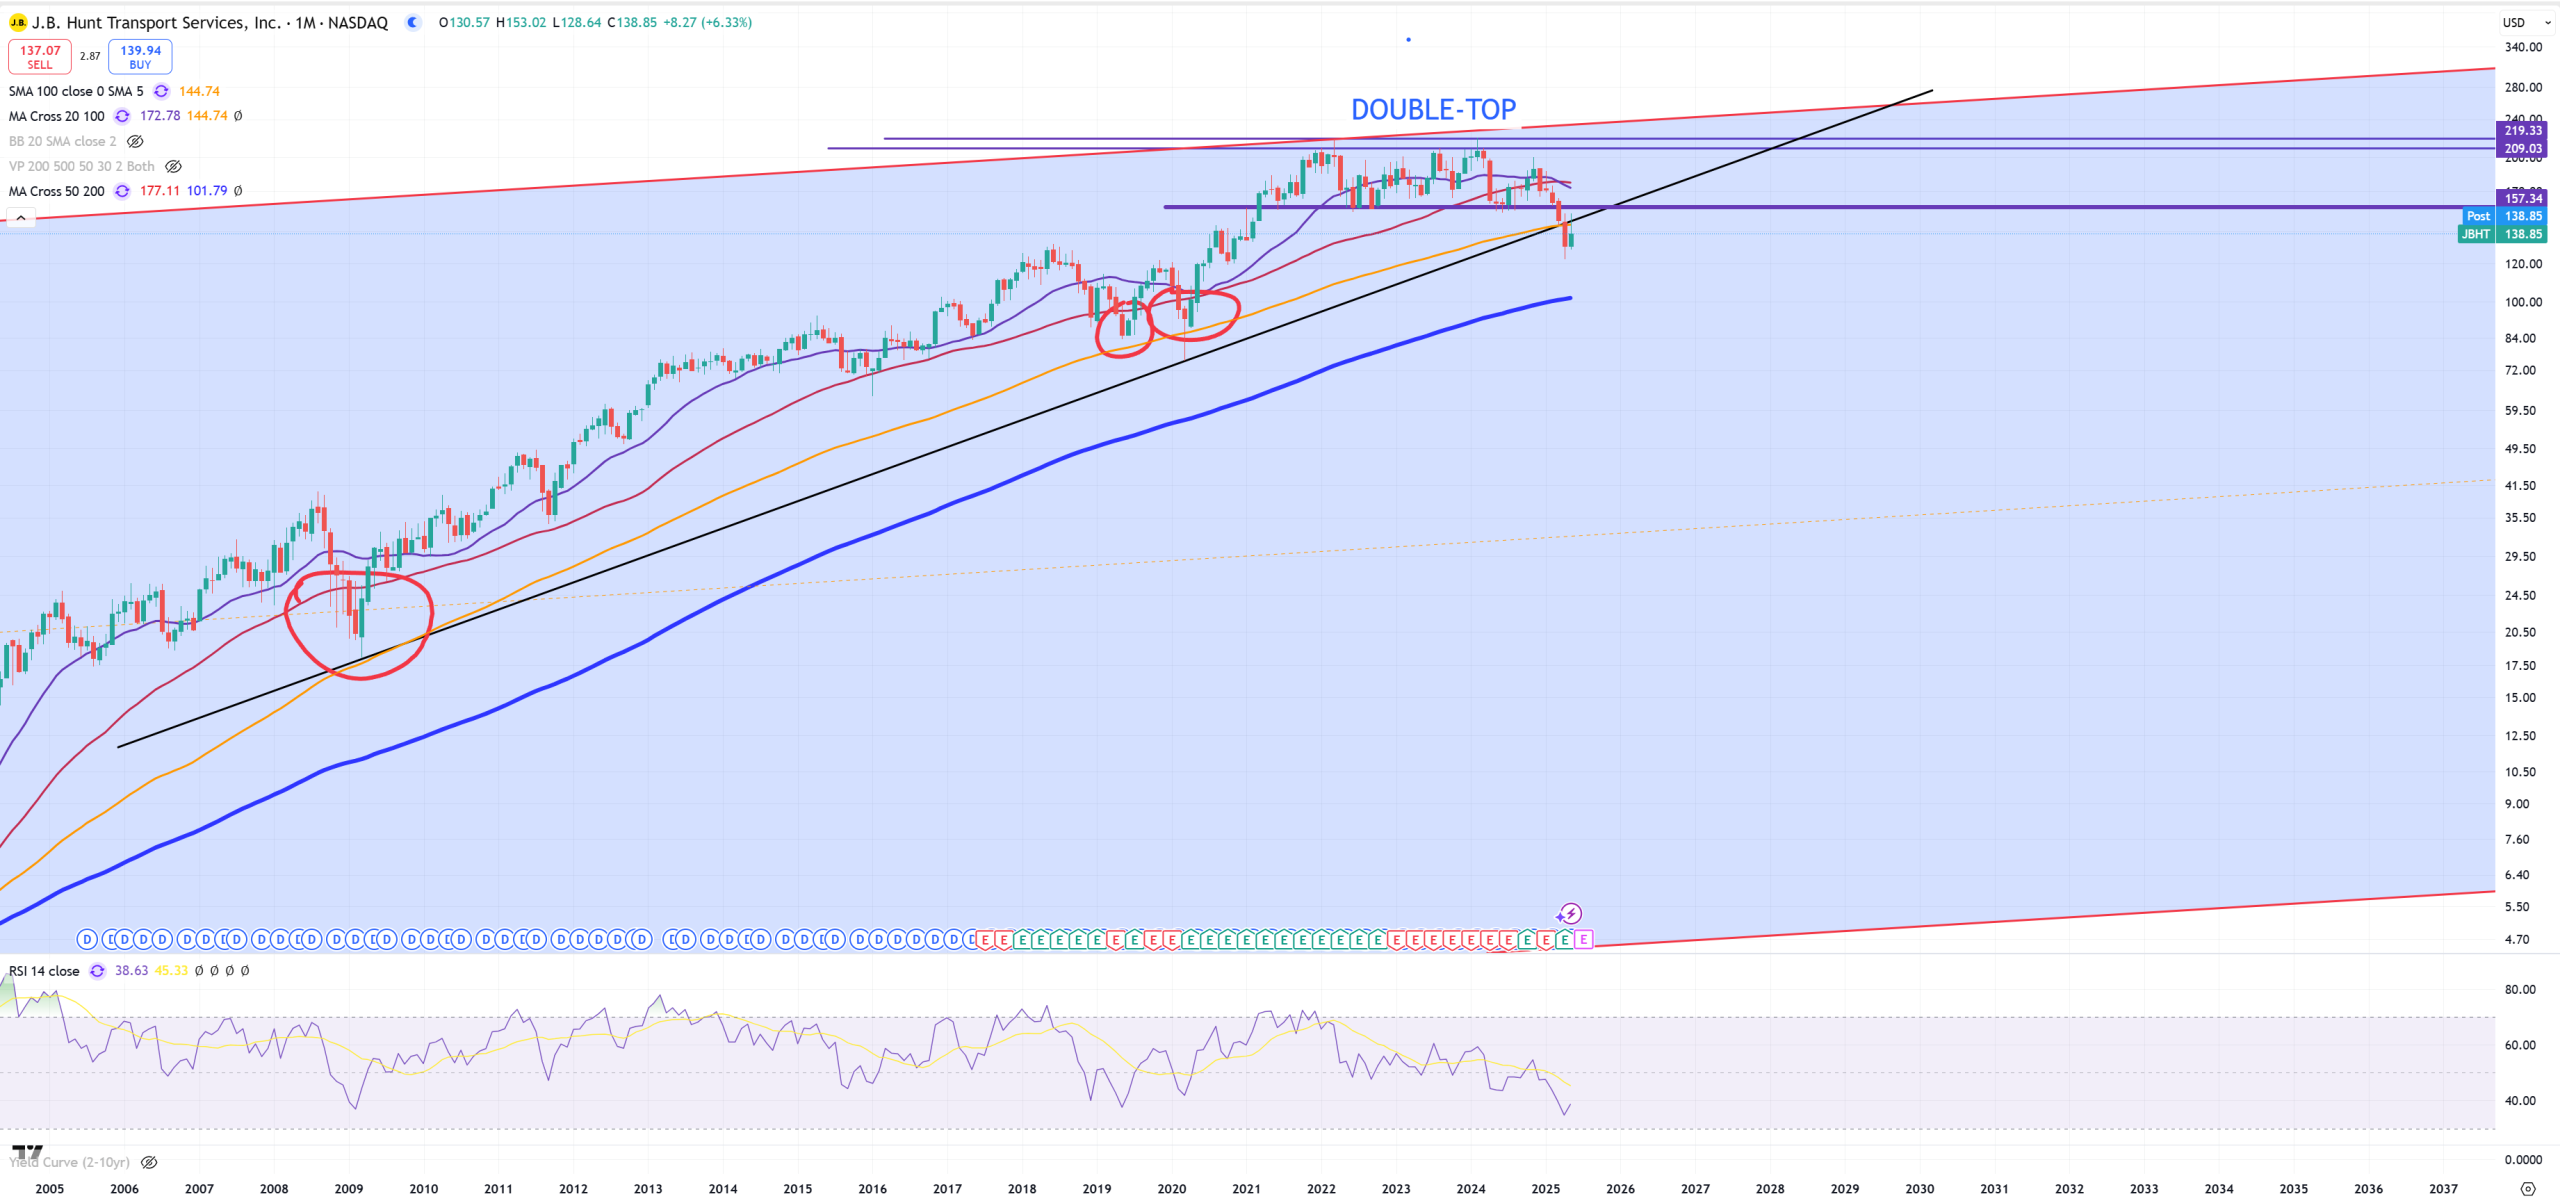
JBHT – so transportation company looks awful – double-top – Mar2022 and Feb2024, broken everything
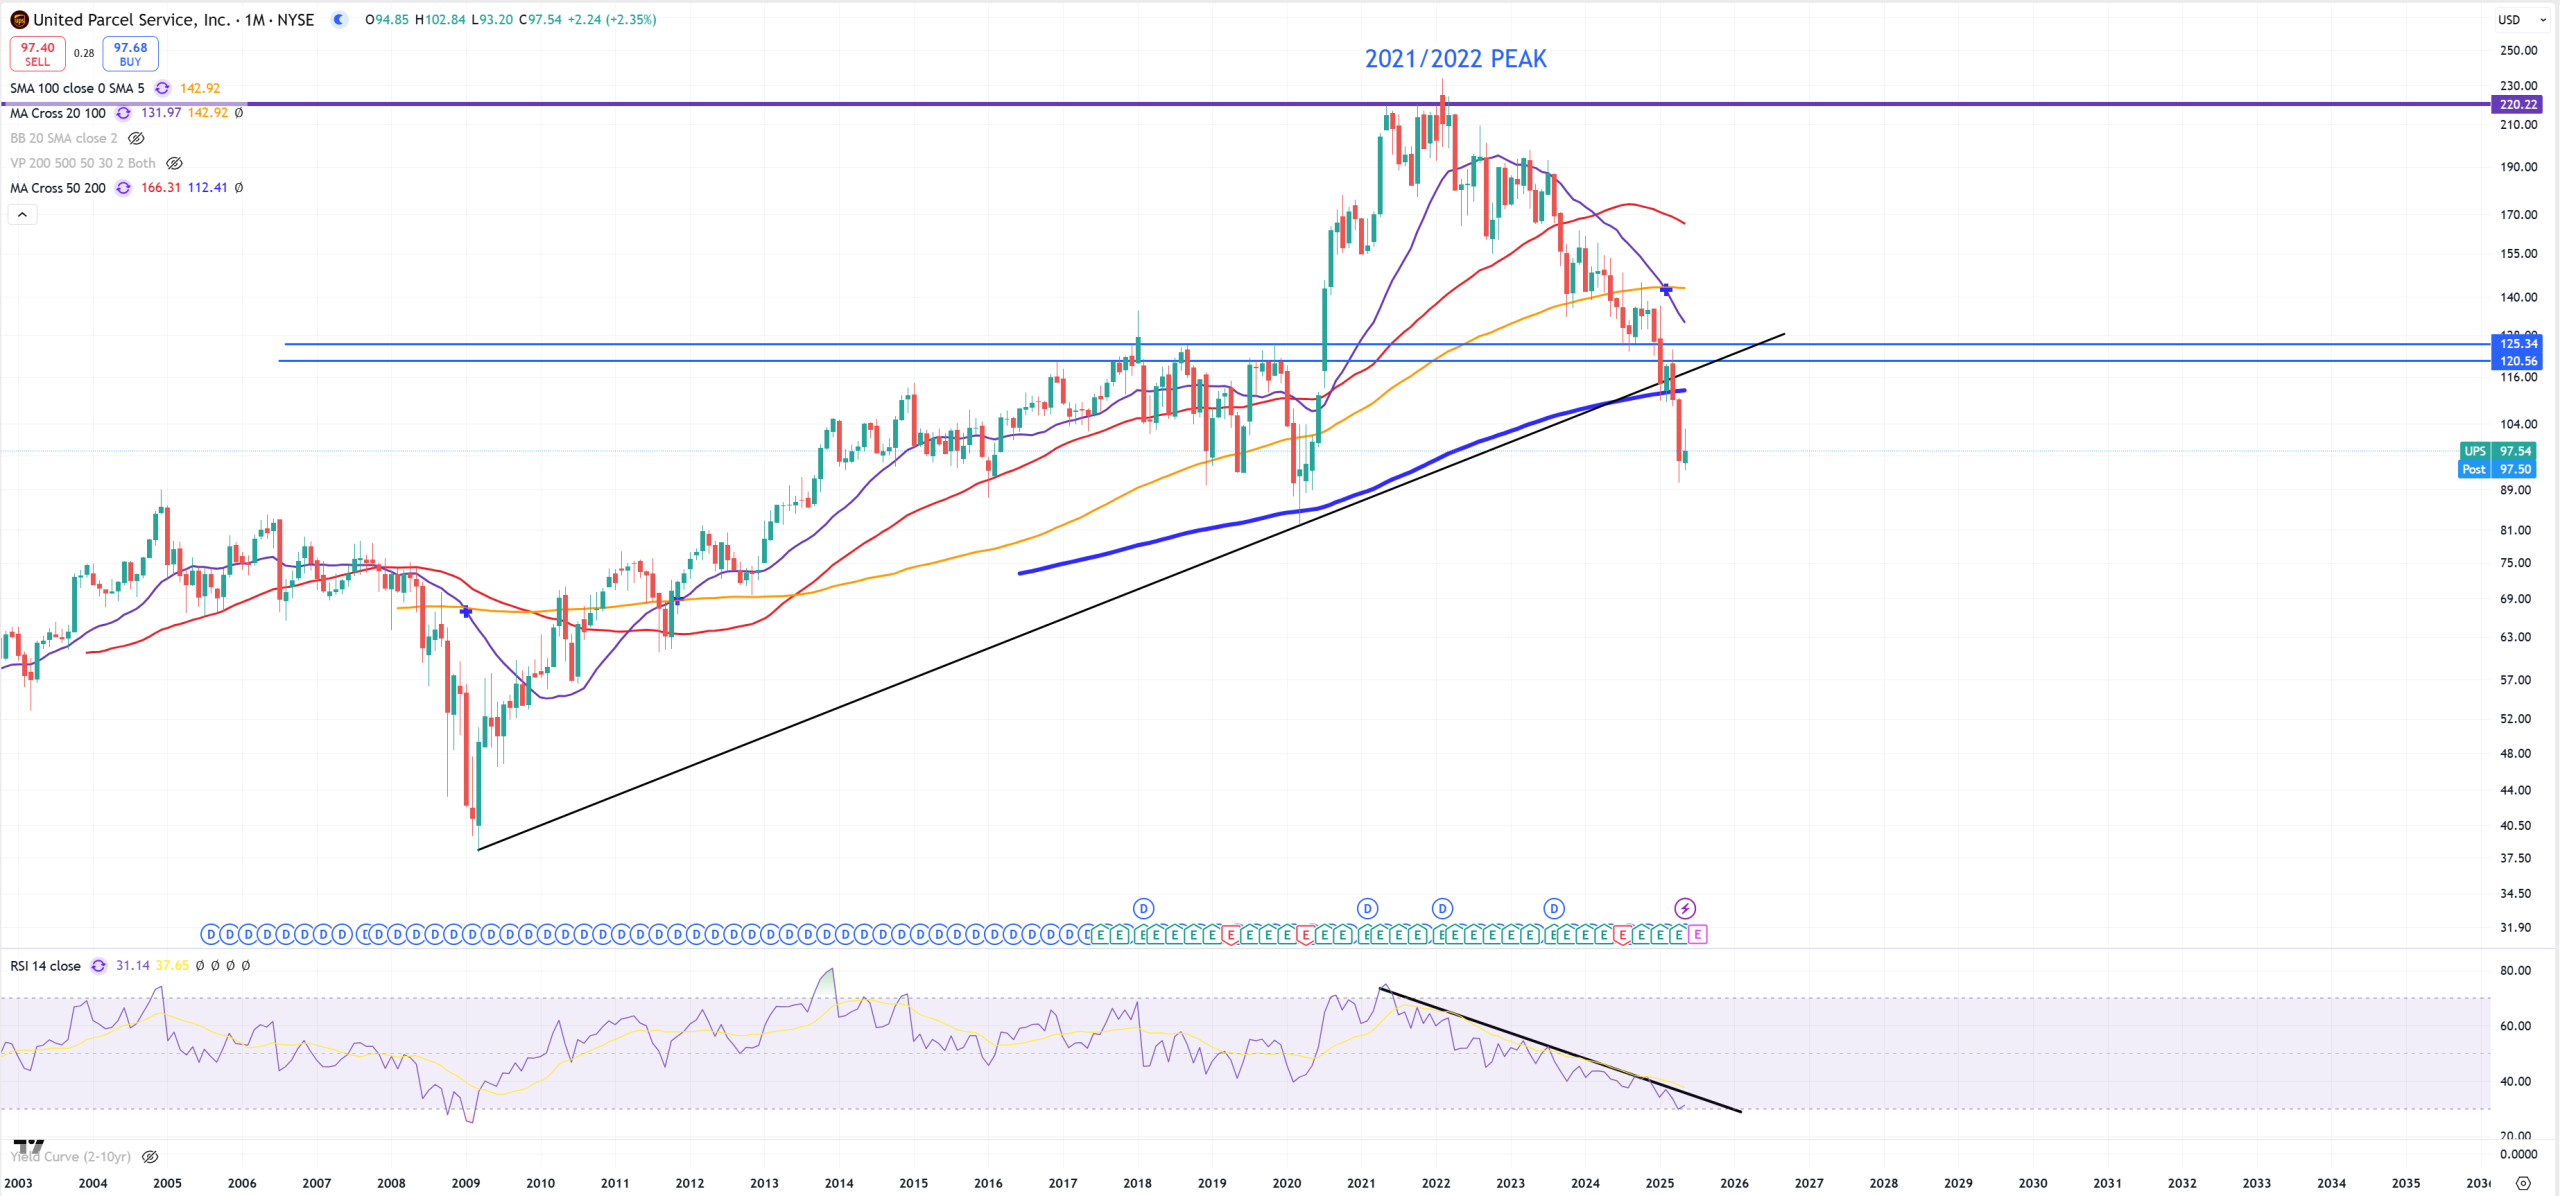
UPS – a disaster
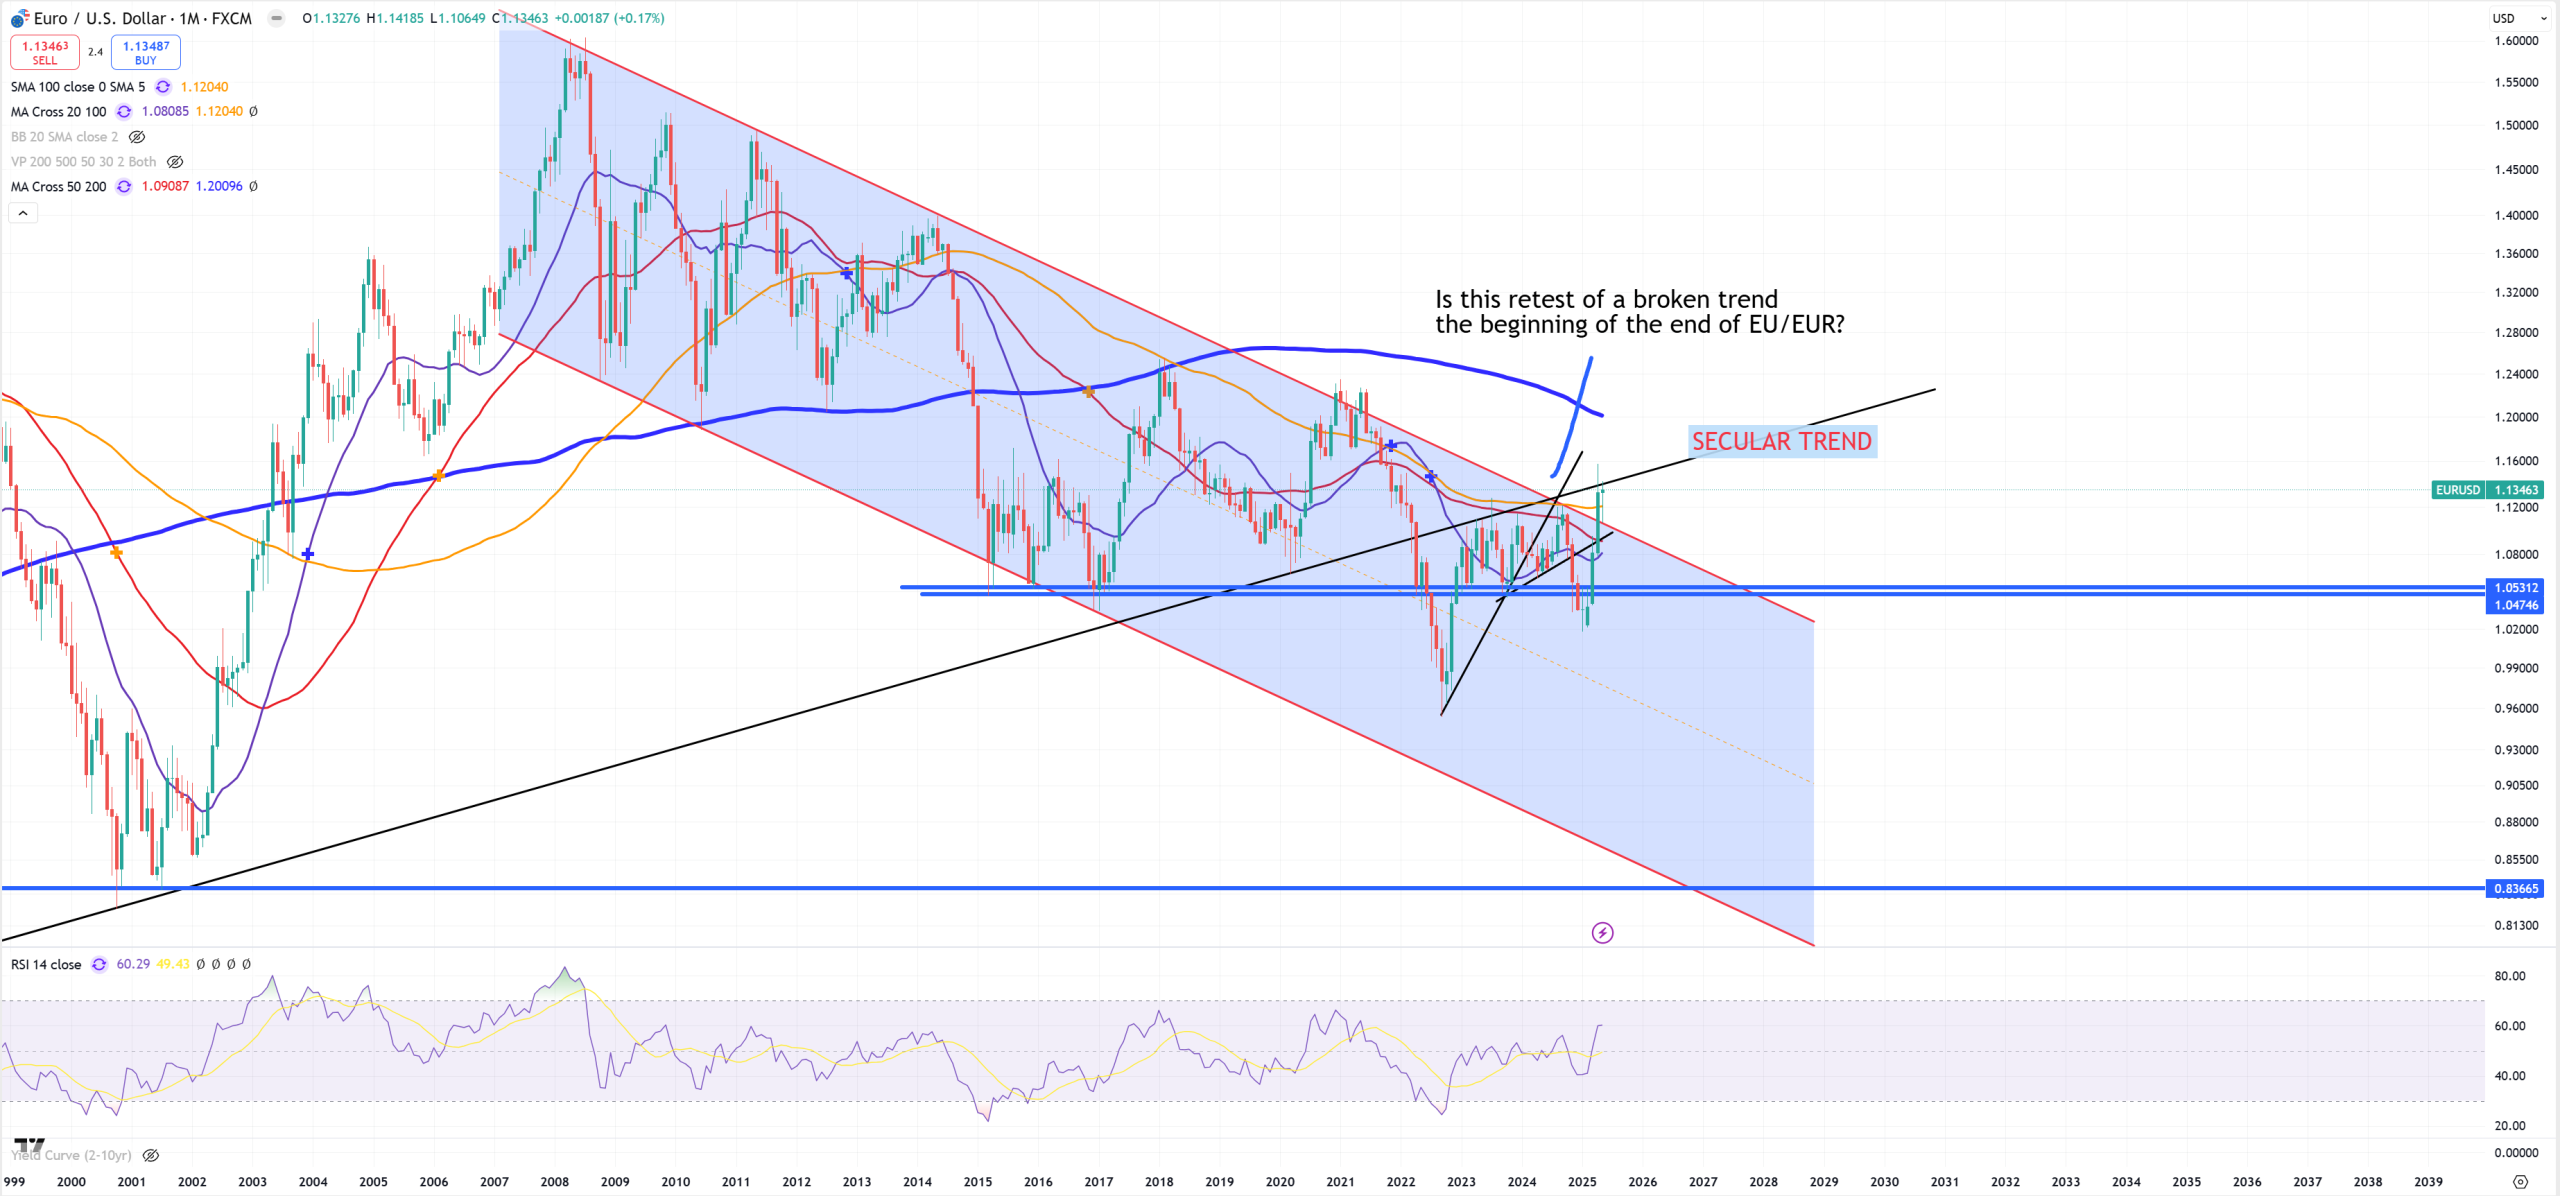
EURUSD and critical 1.14 secular trend retest
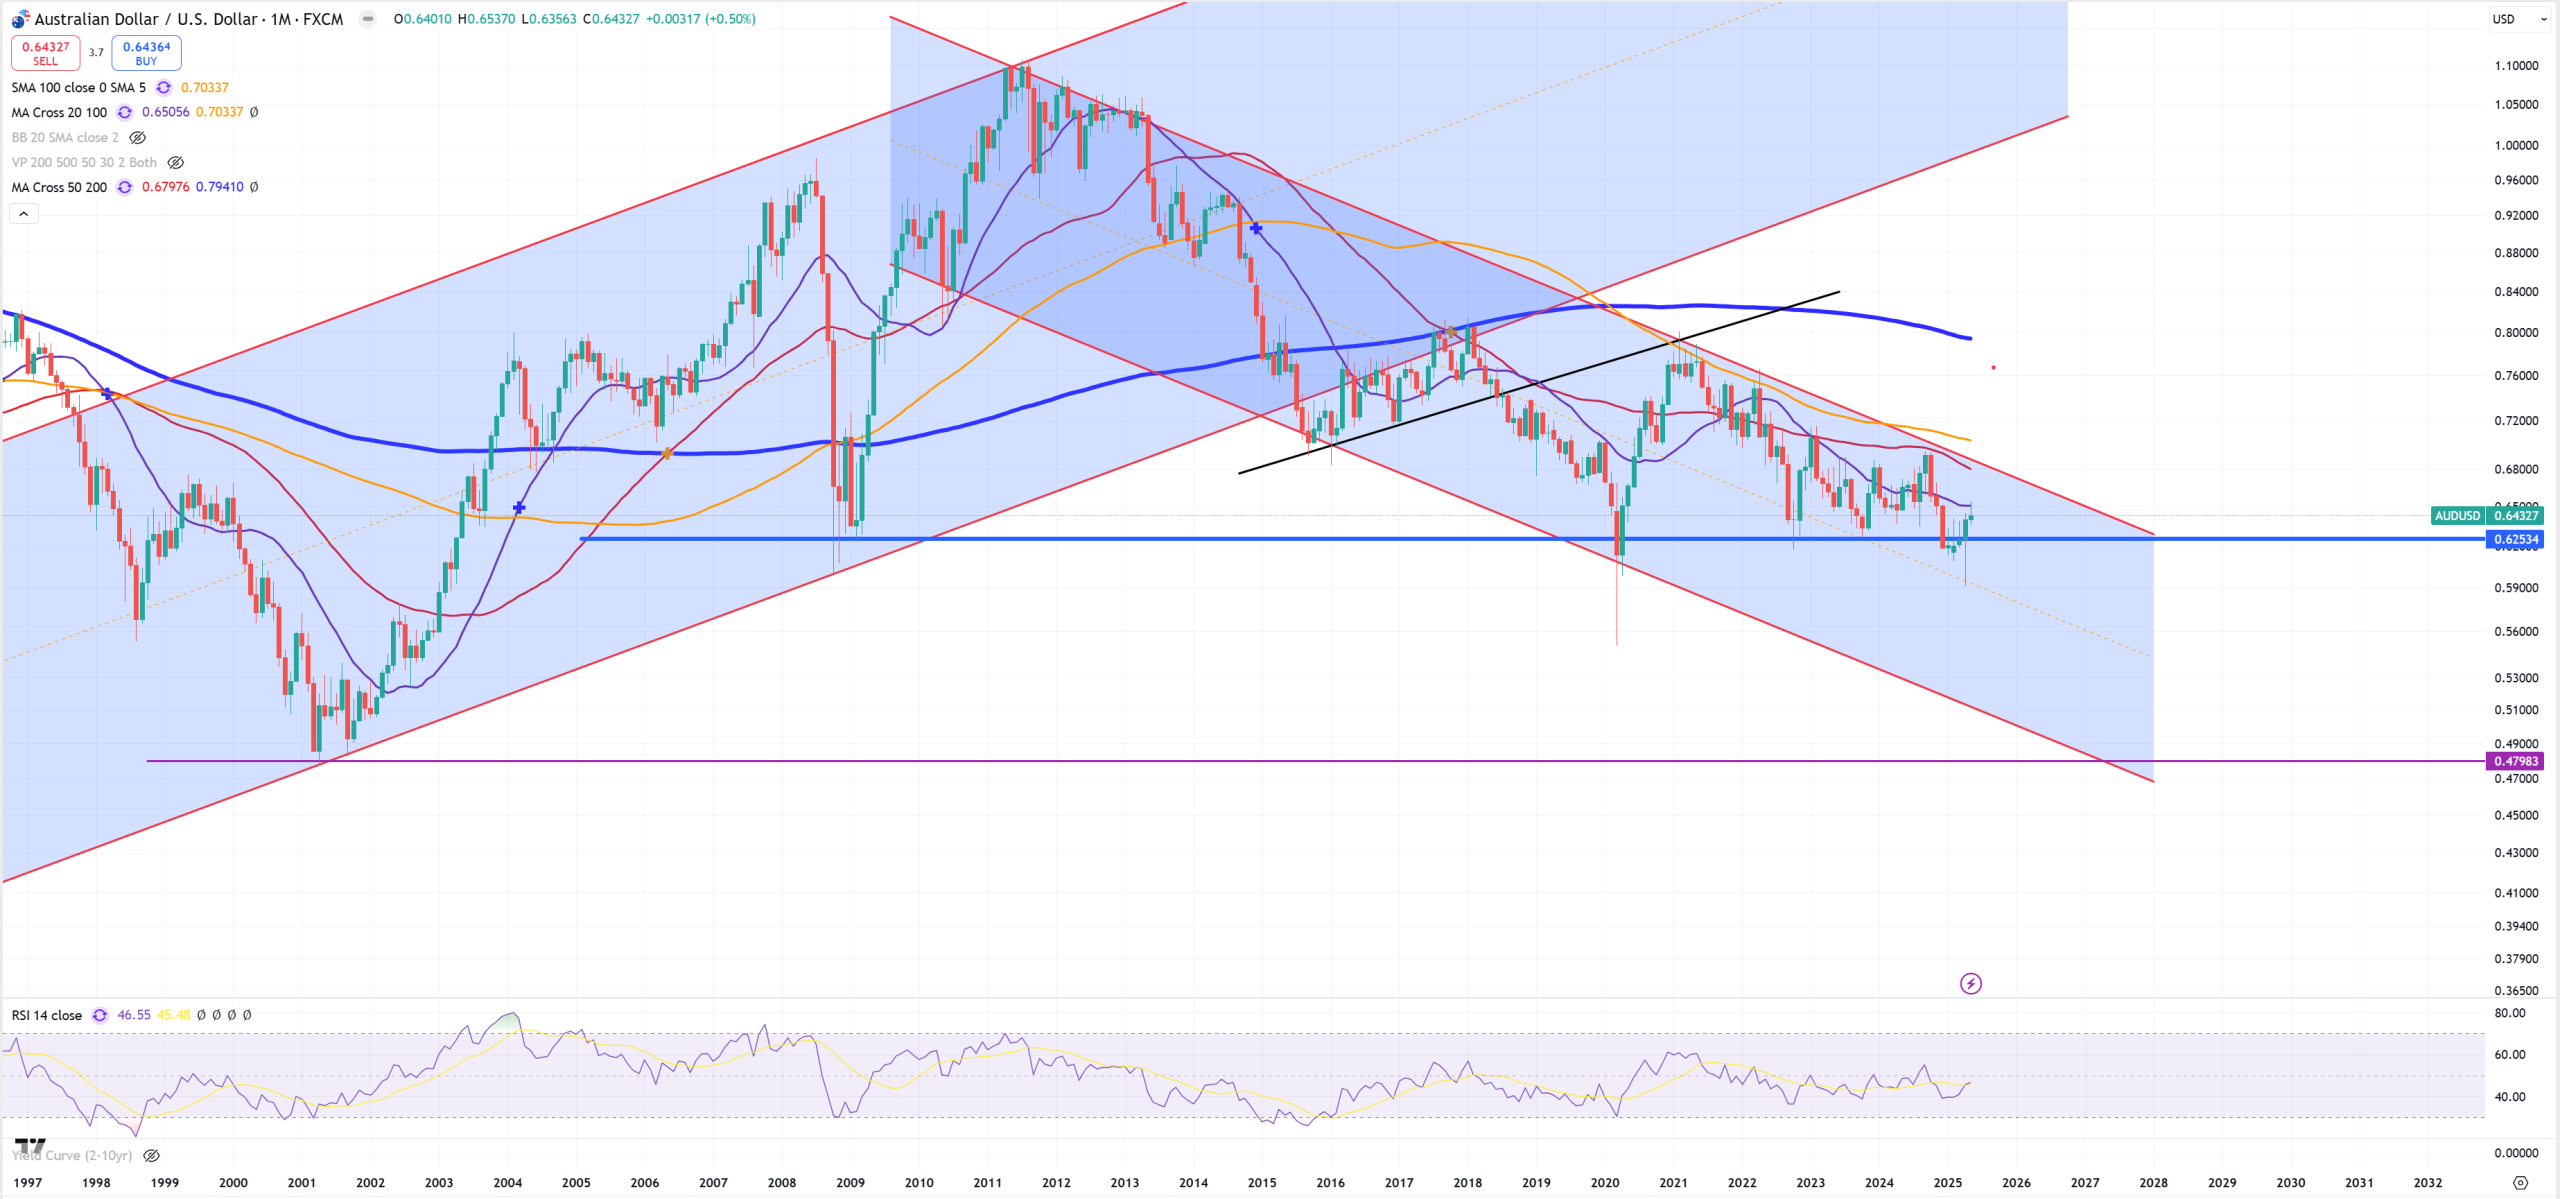
AUDUSD – this currency follows mostly Yuan and I’m really annoyed by this pair the most. (M)MA20 retest again.
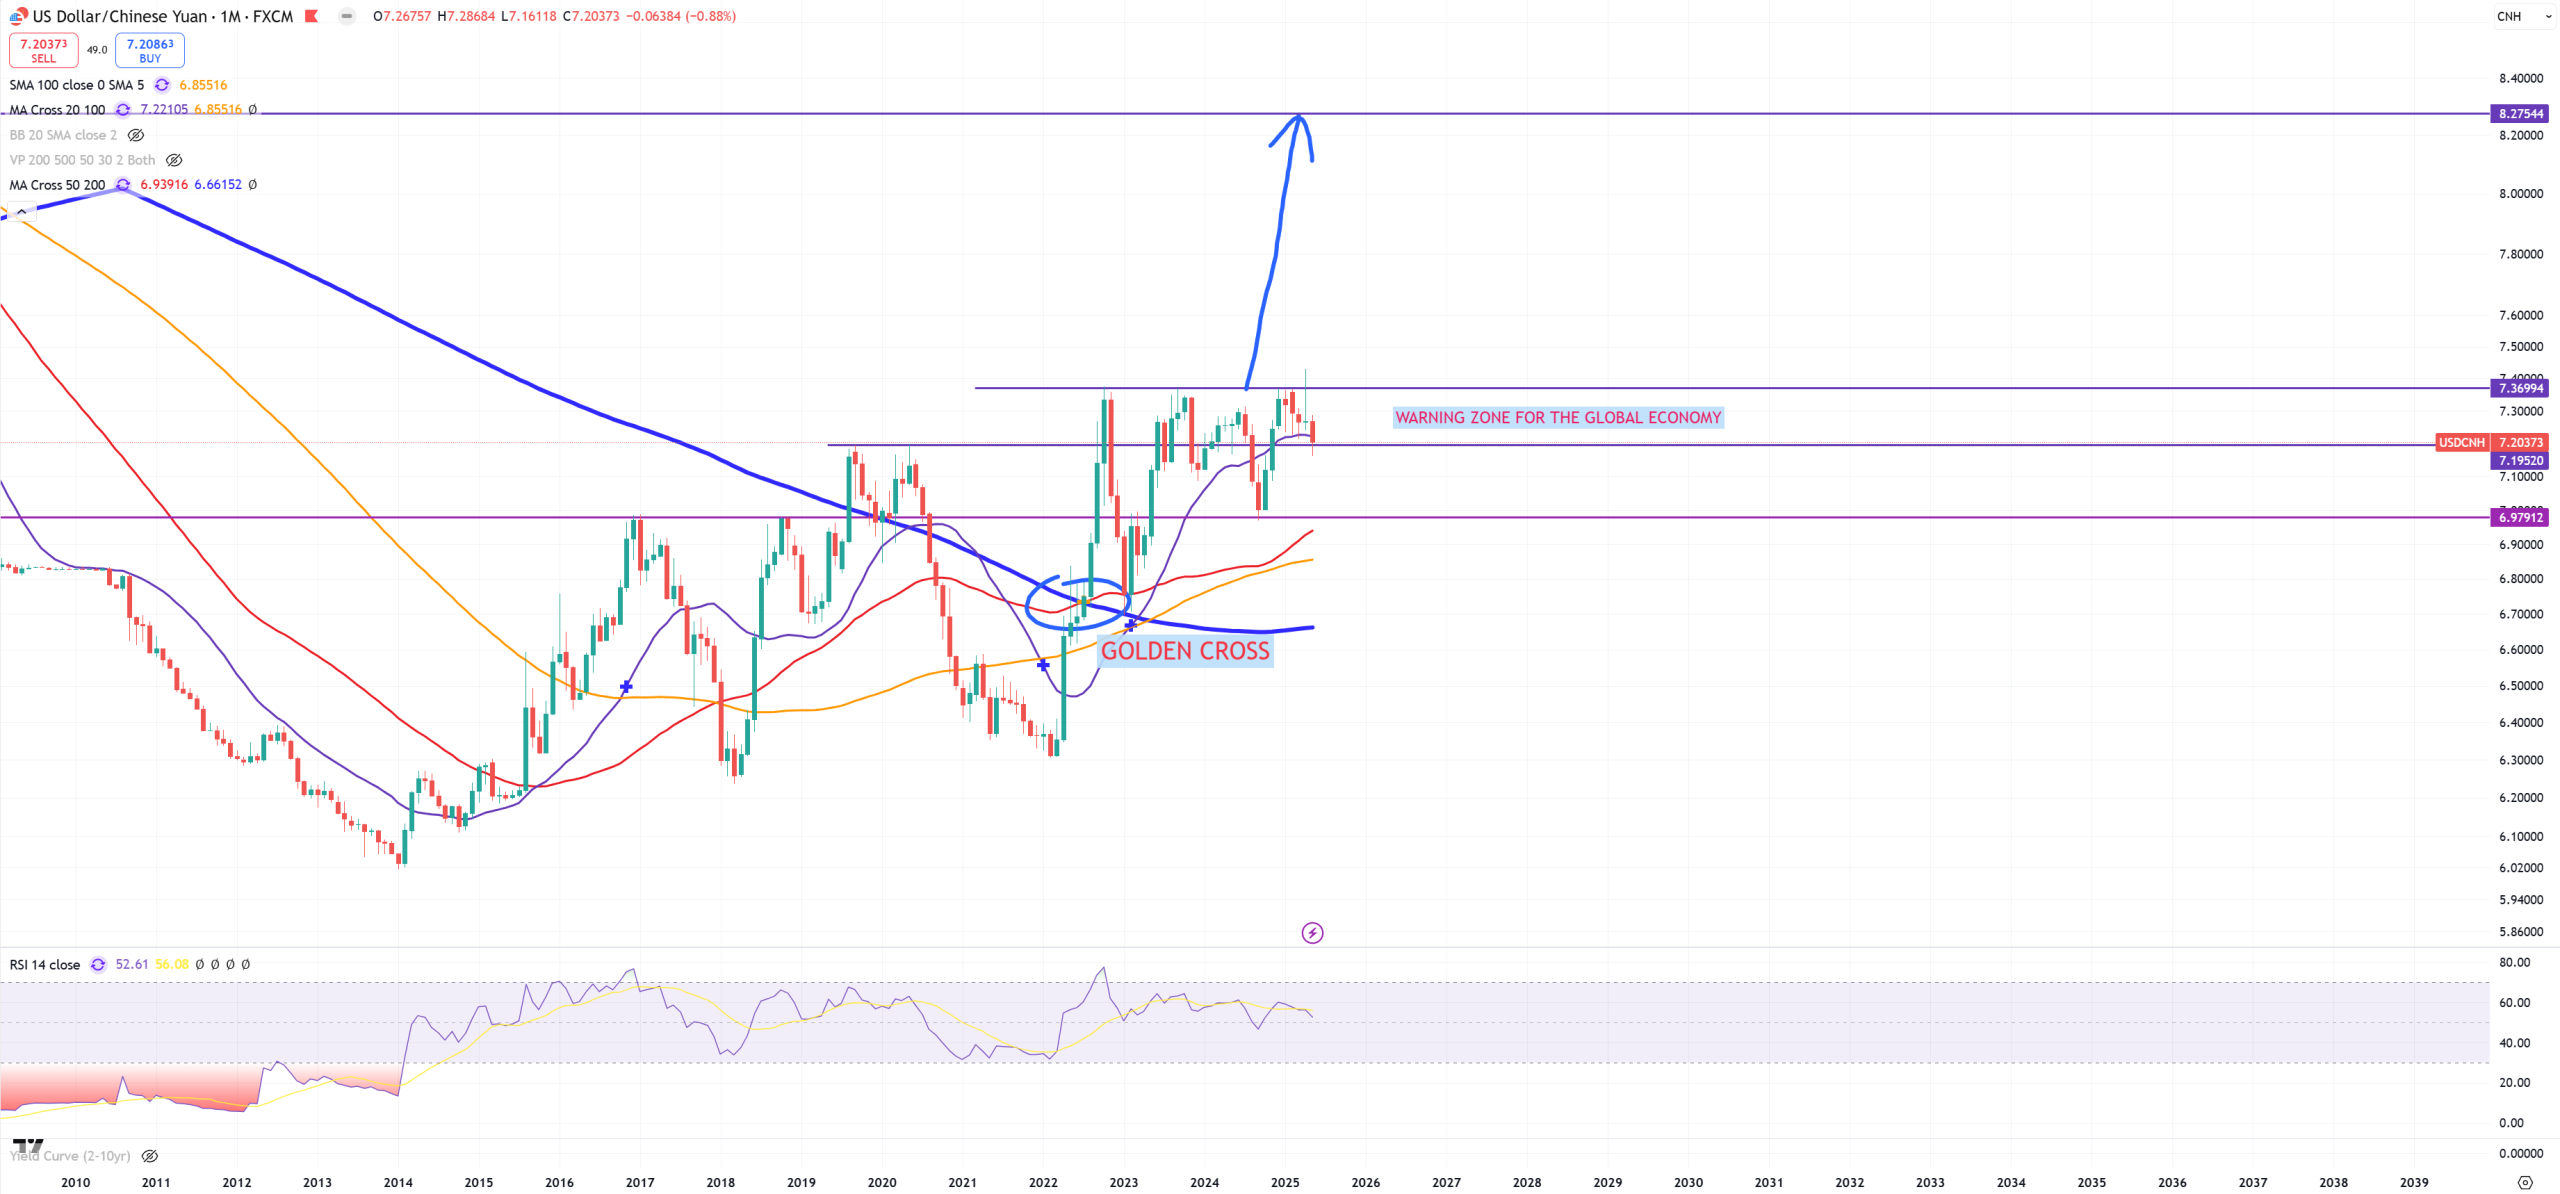
USDCNH – despite massive deflation China can’t allow Yuan to weaken to they will get bigger deflation. Weird logic but that how it works, but 7.20 support holds, USDCNH up = $$$ up.
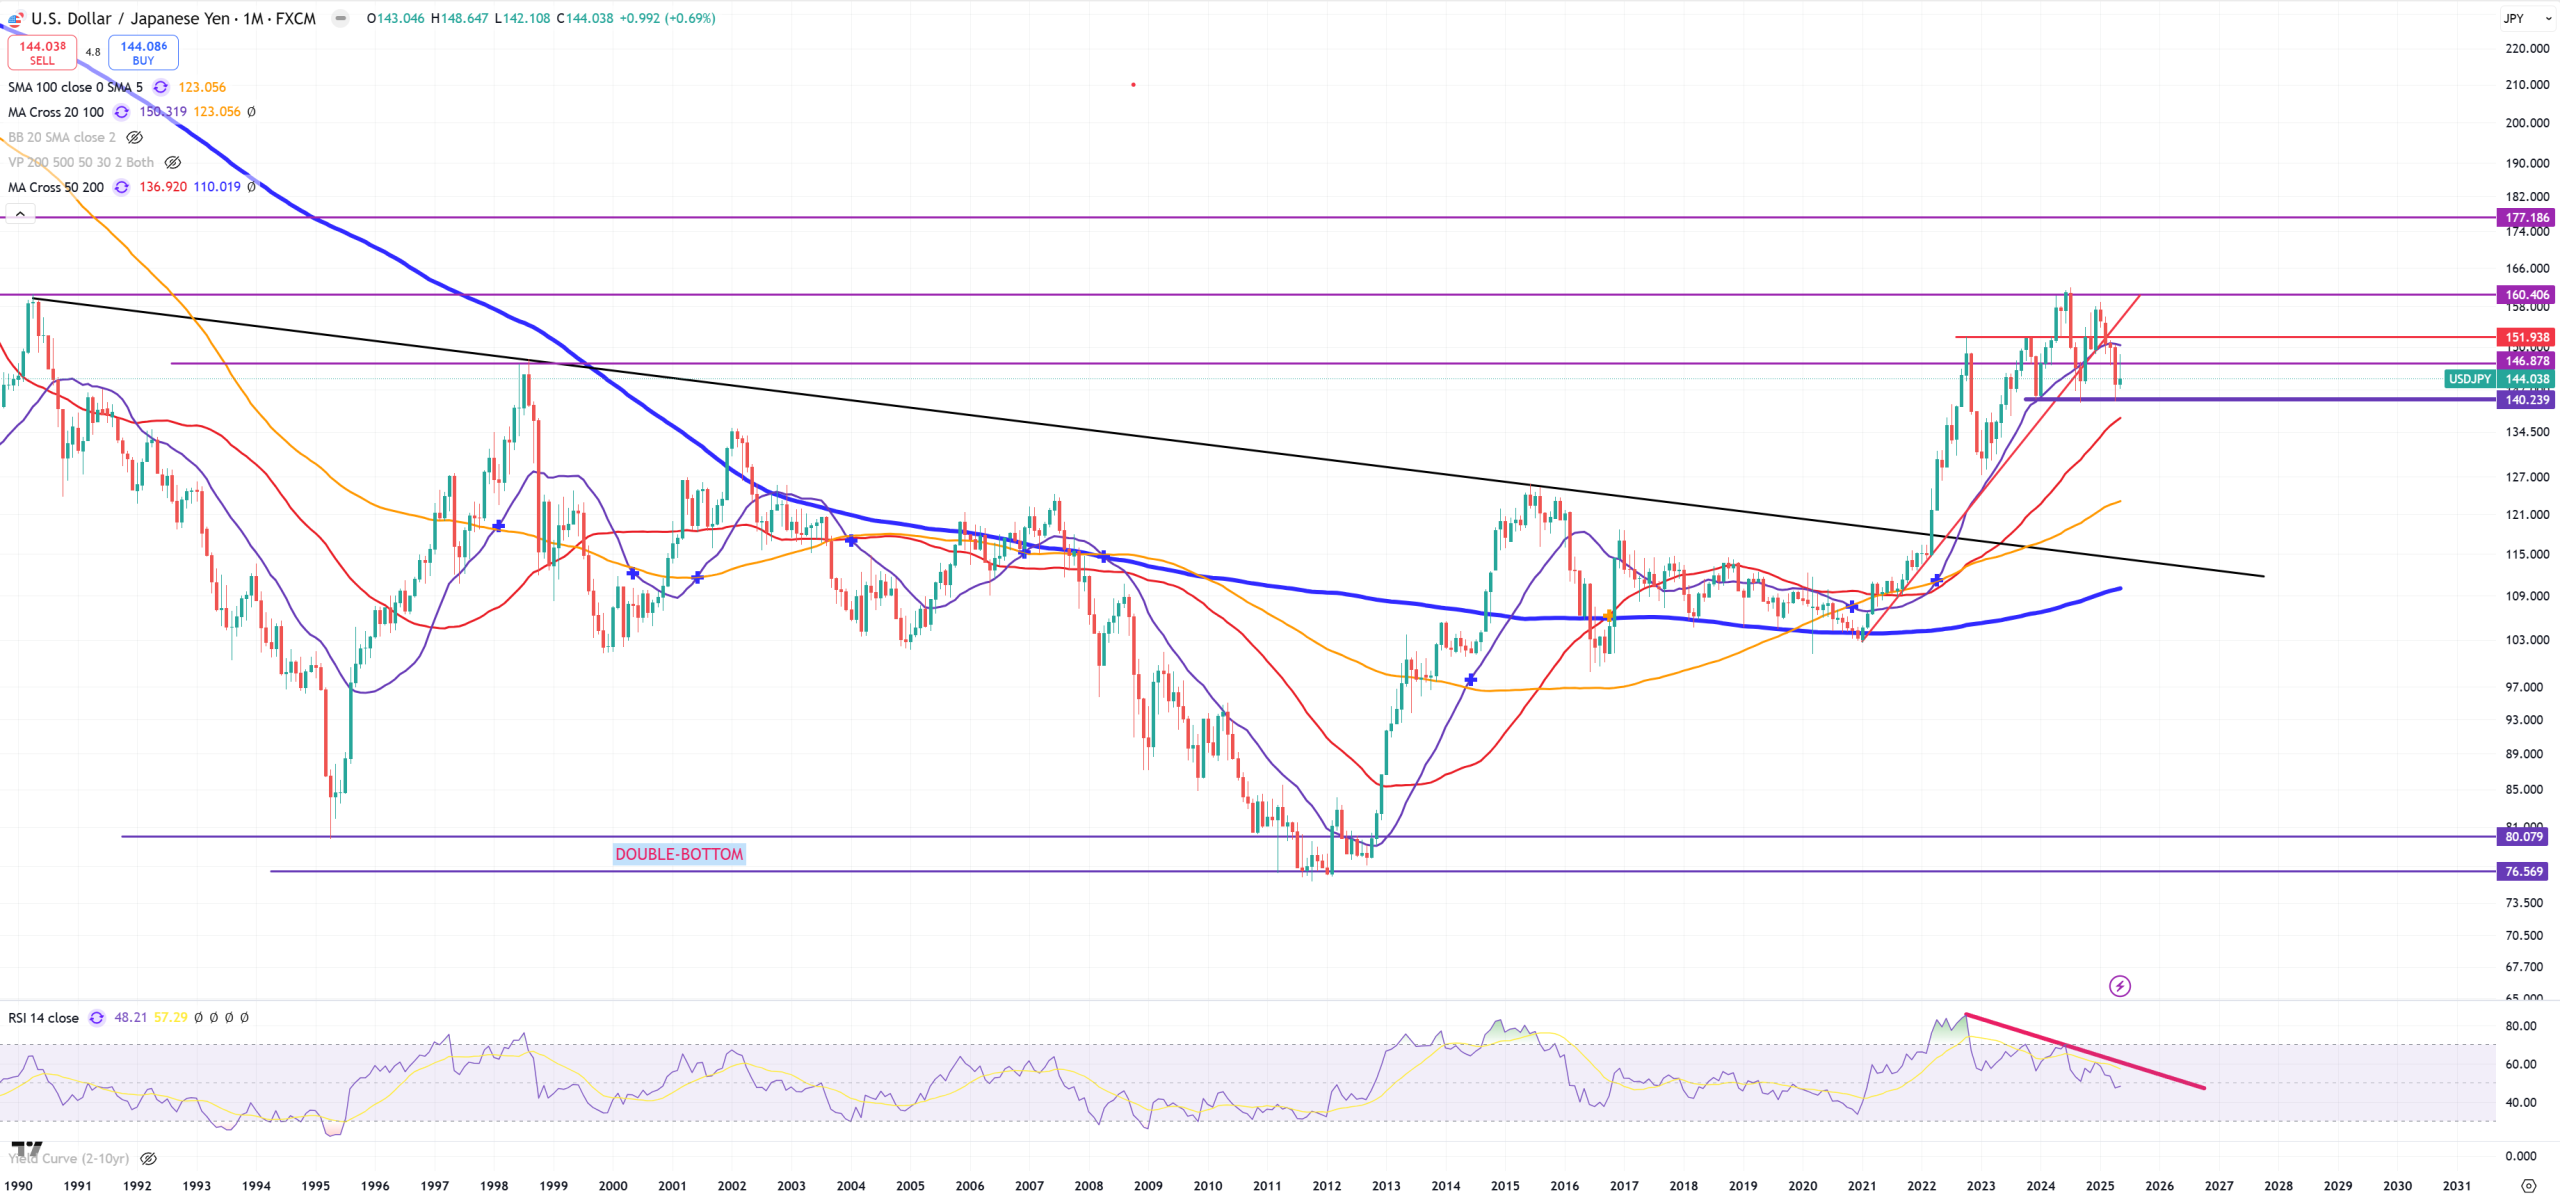
USDJPY – Yen is getting stronger, because BoJ lost a game with its bond market. 140 is a key support
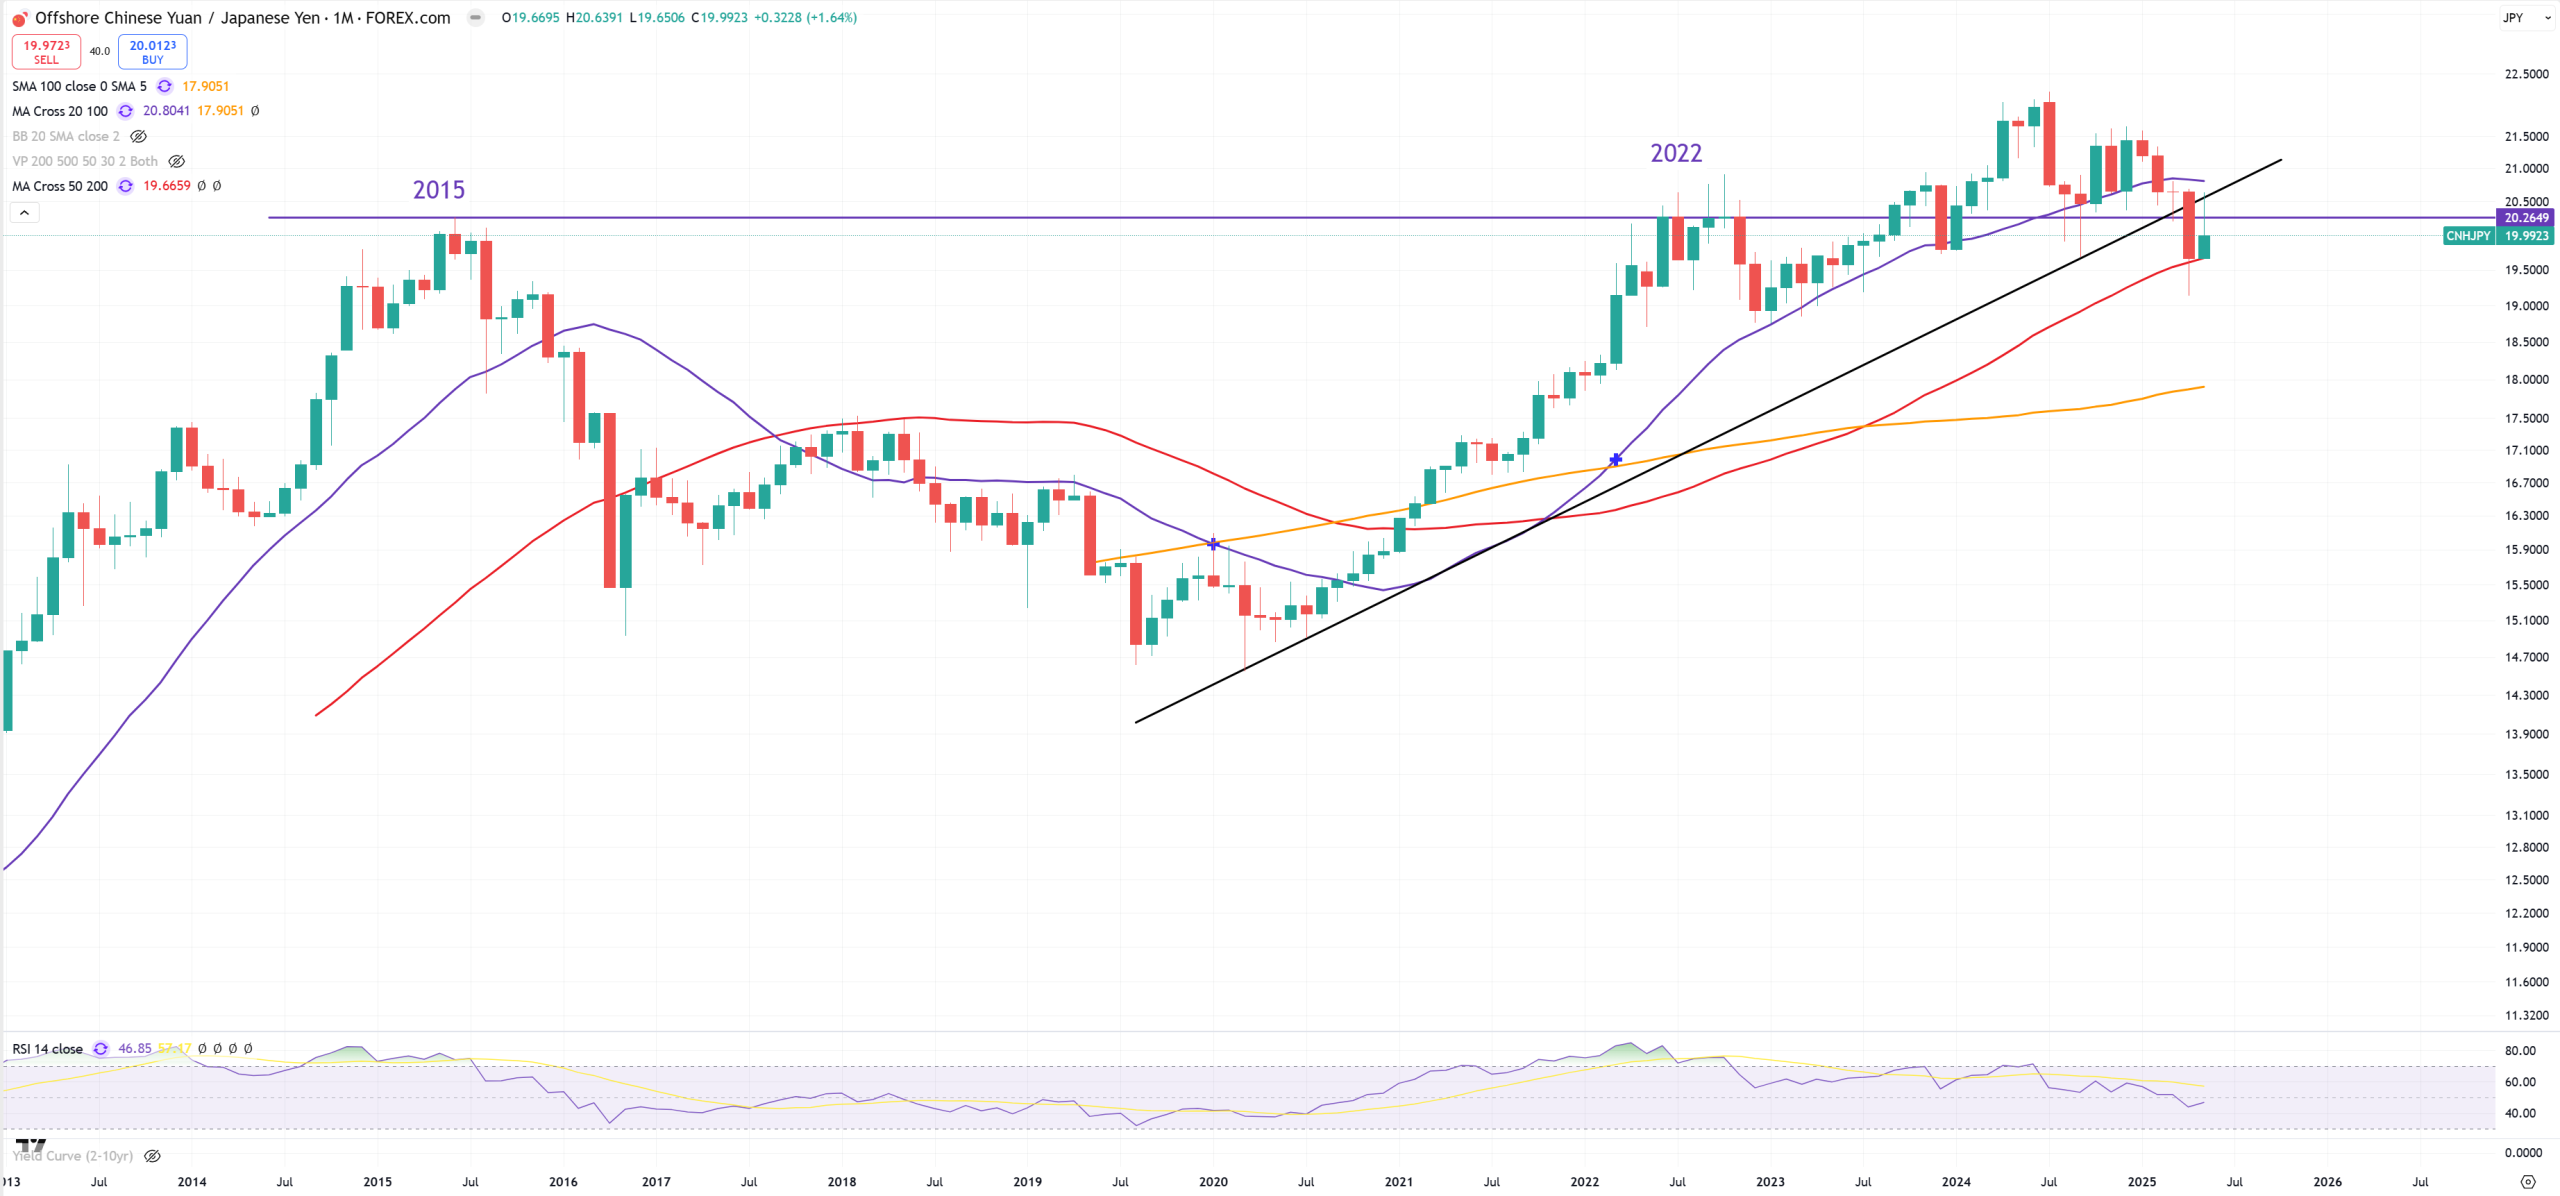
CNHJPY – good pair showing blow up in China once it is going down
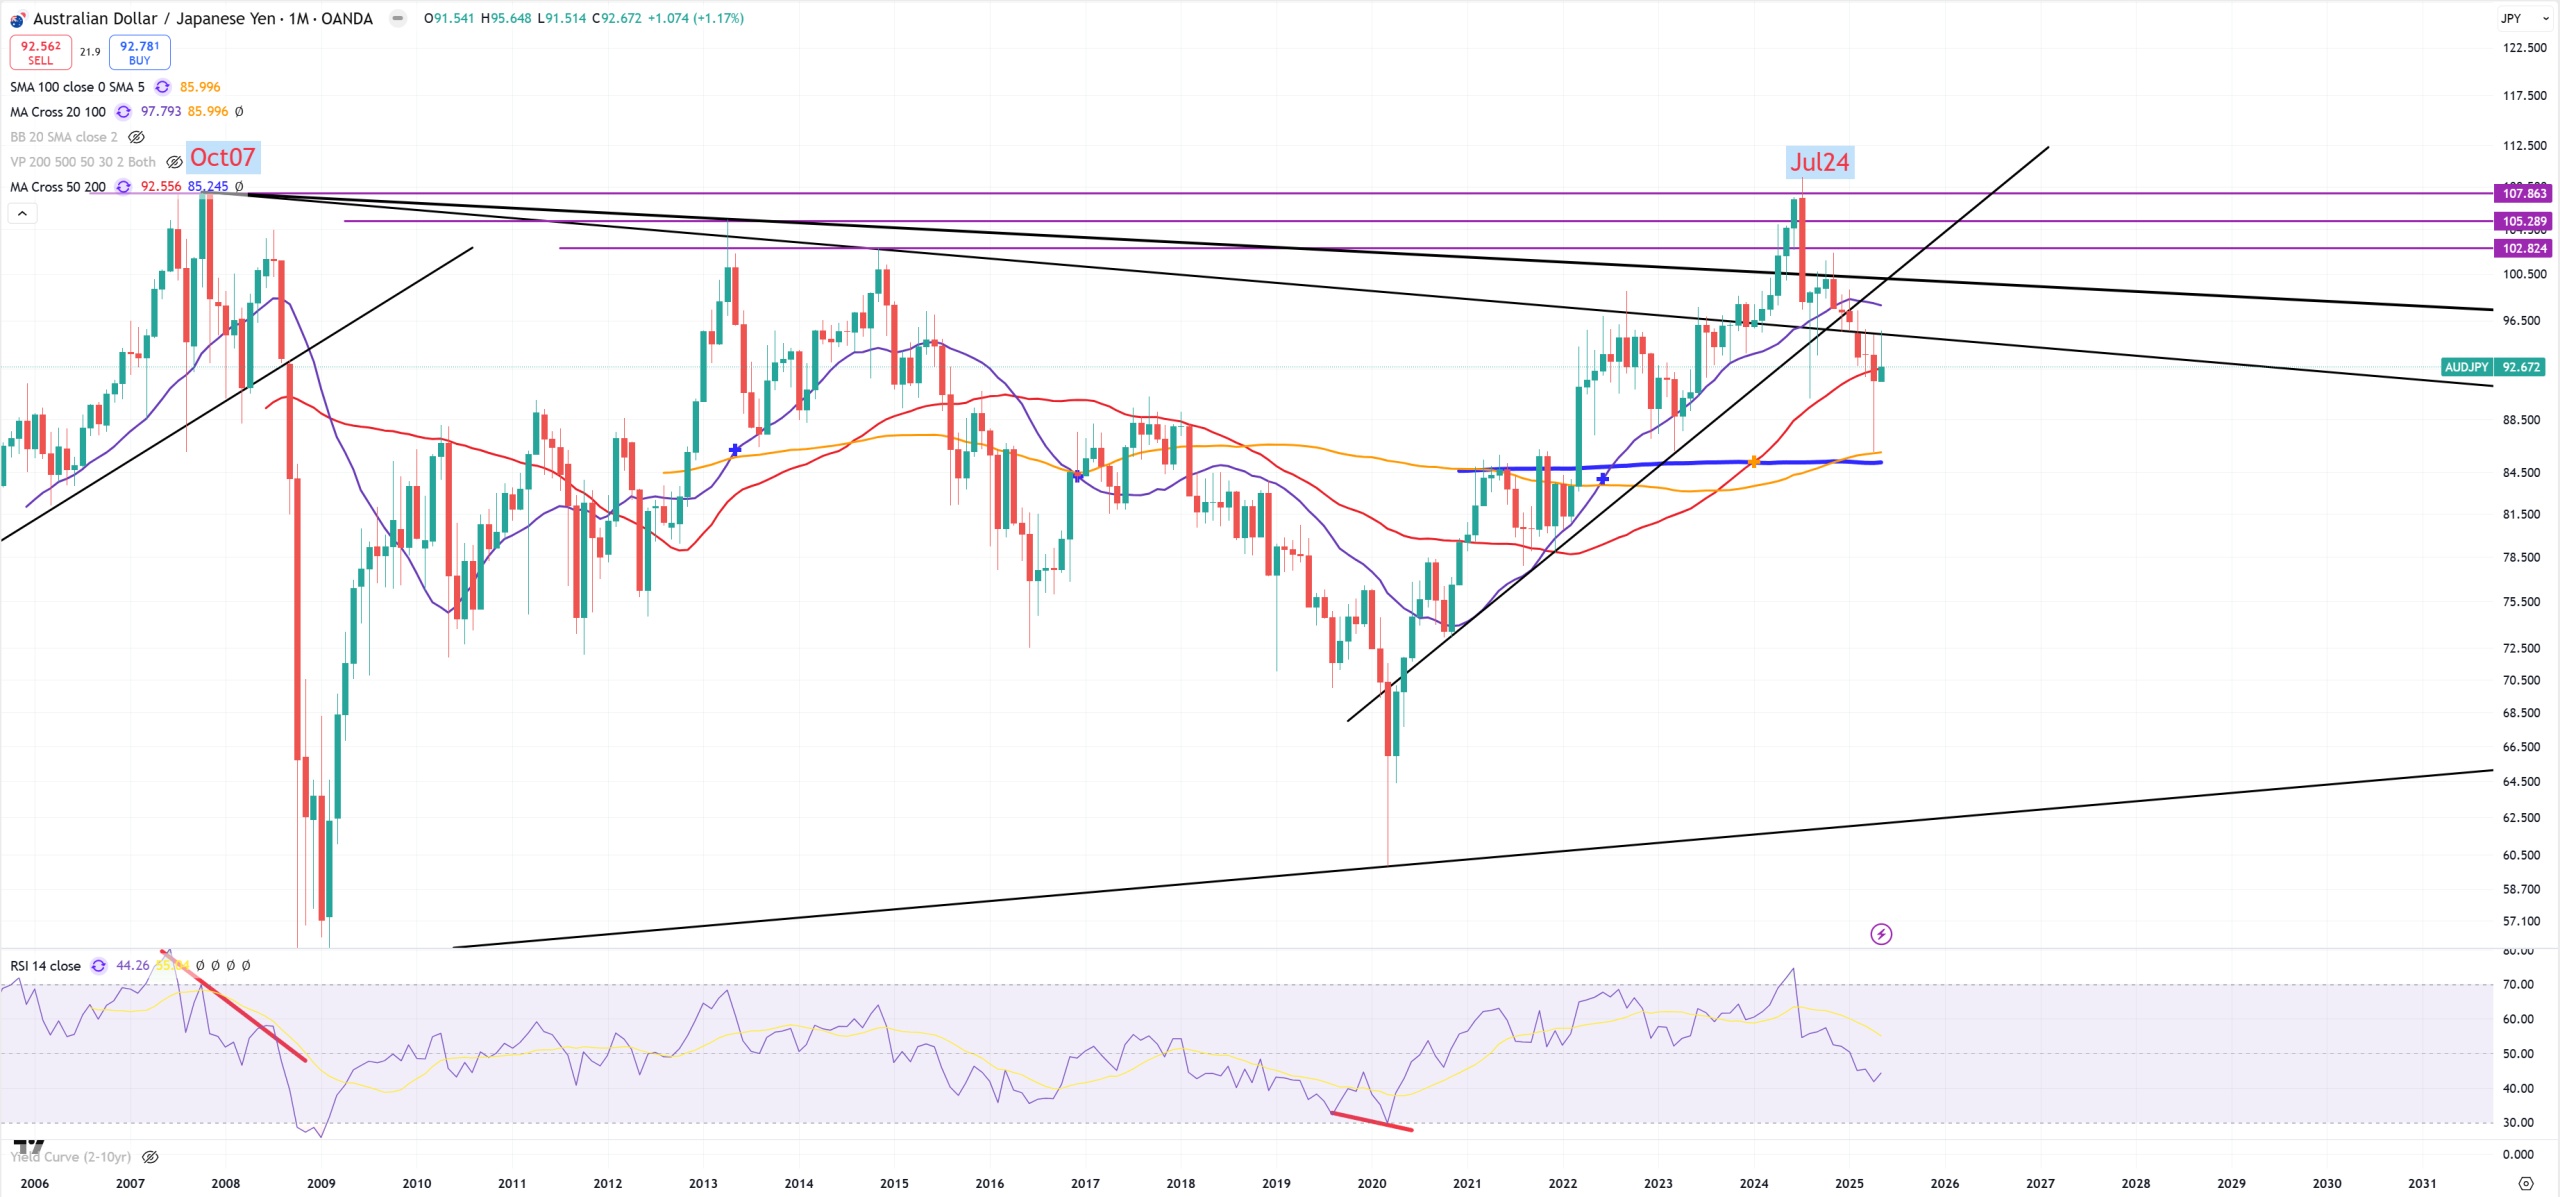
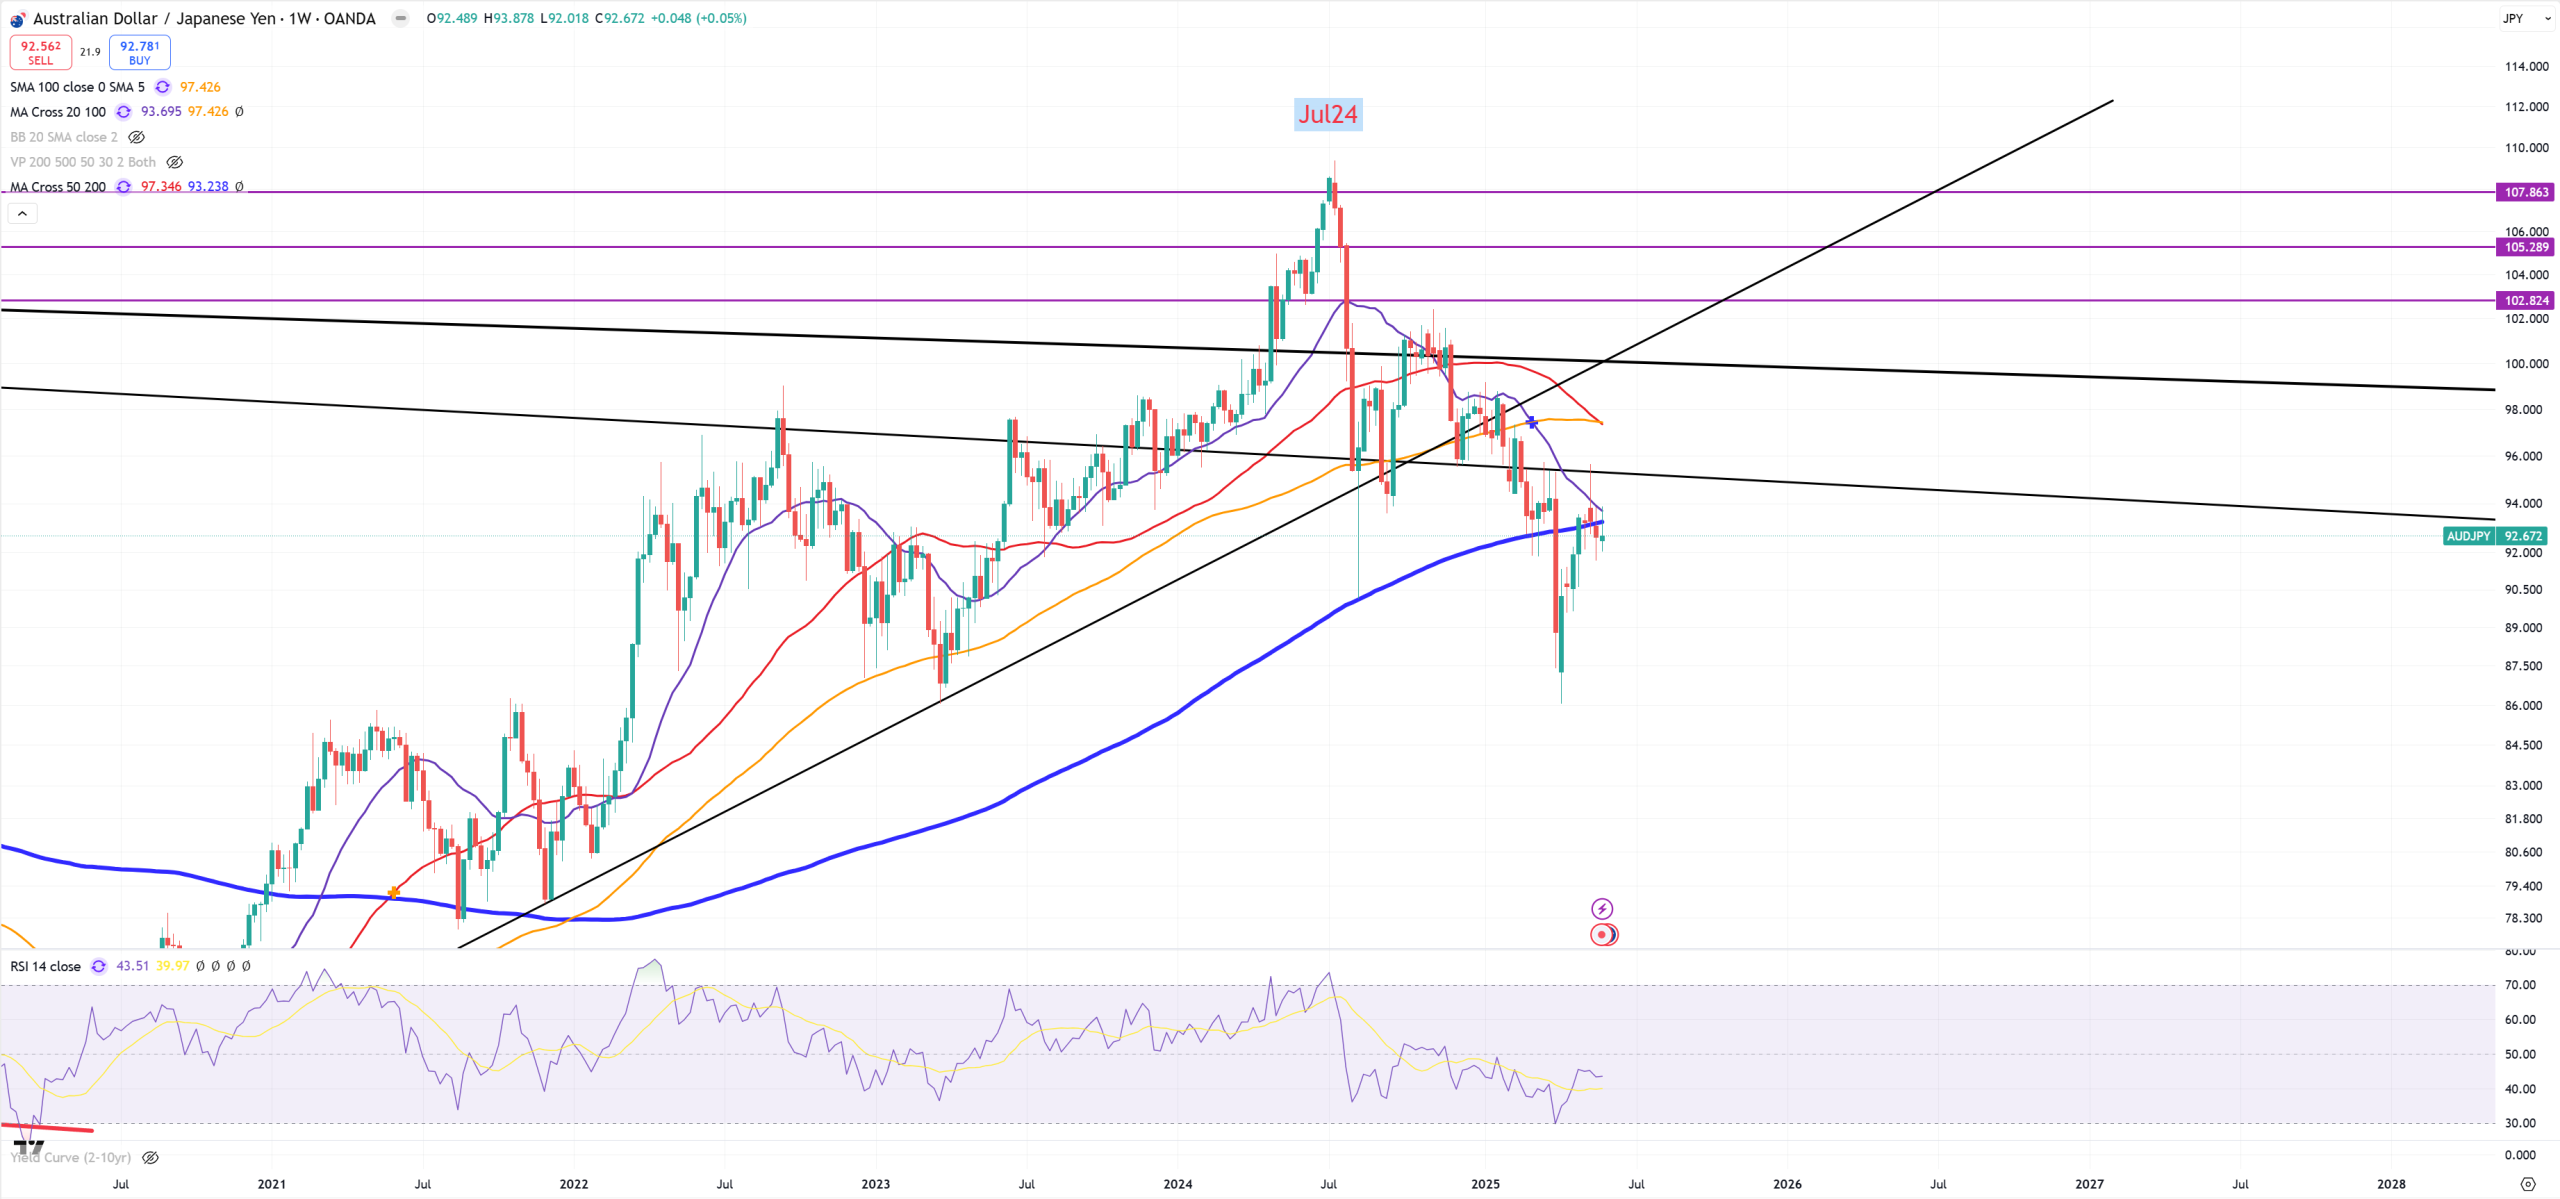
AUDJPY – my #1 indicator about stocks going down/up closed on the edge on (M)MA50, a micro move above, but I must put also (W) chart here as (W)MA200 is heavily lost. It’s really important to know that biggest moves down in stocks happen when (W)MA200/(M)MA50 is broken and retested from the bottom. Remember this technical moment, and watch other technical moments of different charts which are alligned to this thesis which are not.
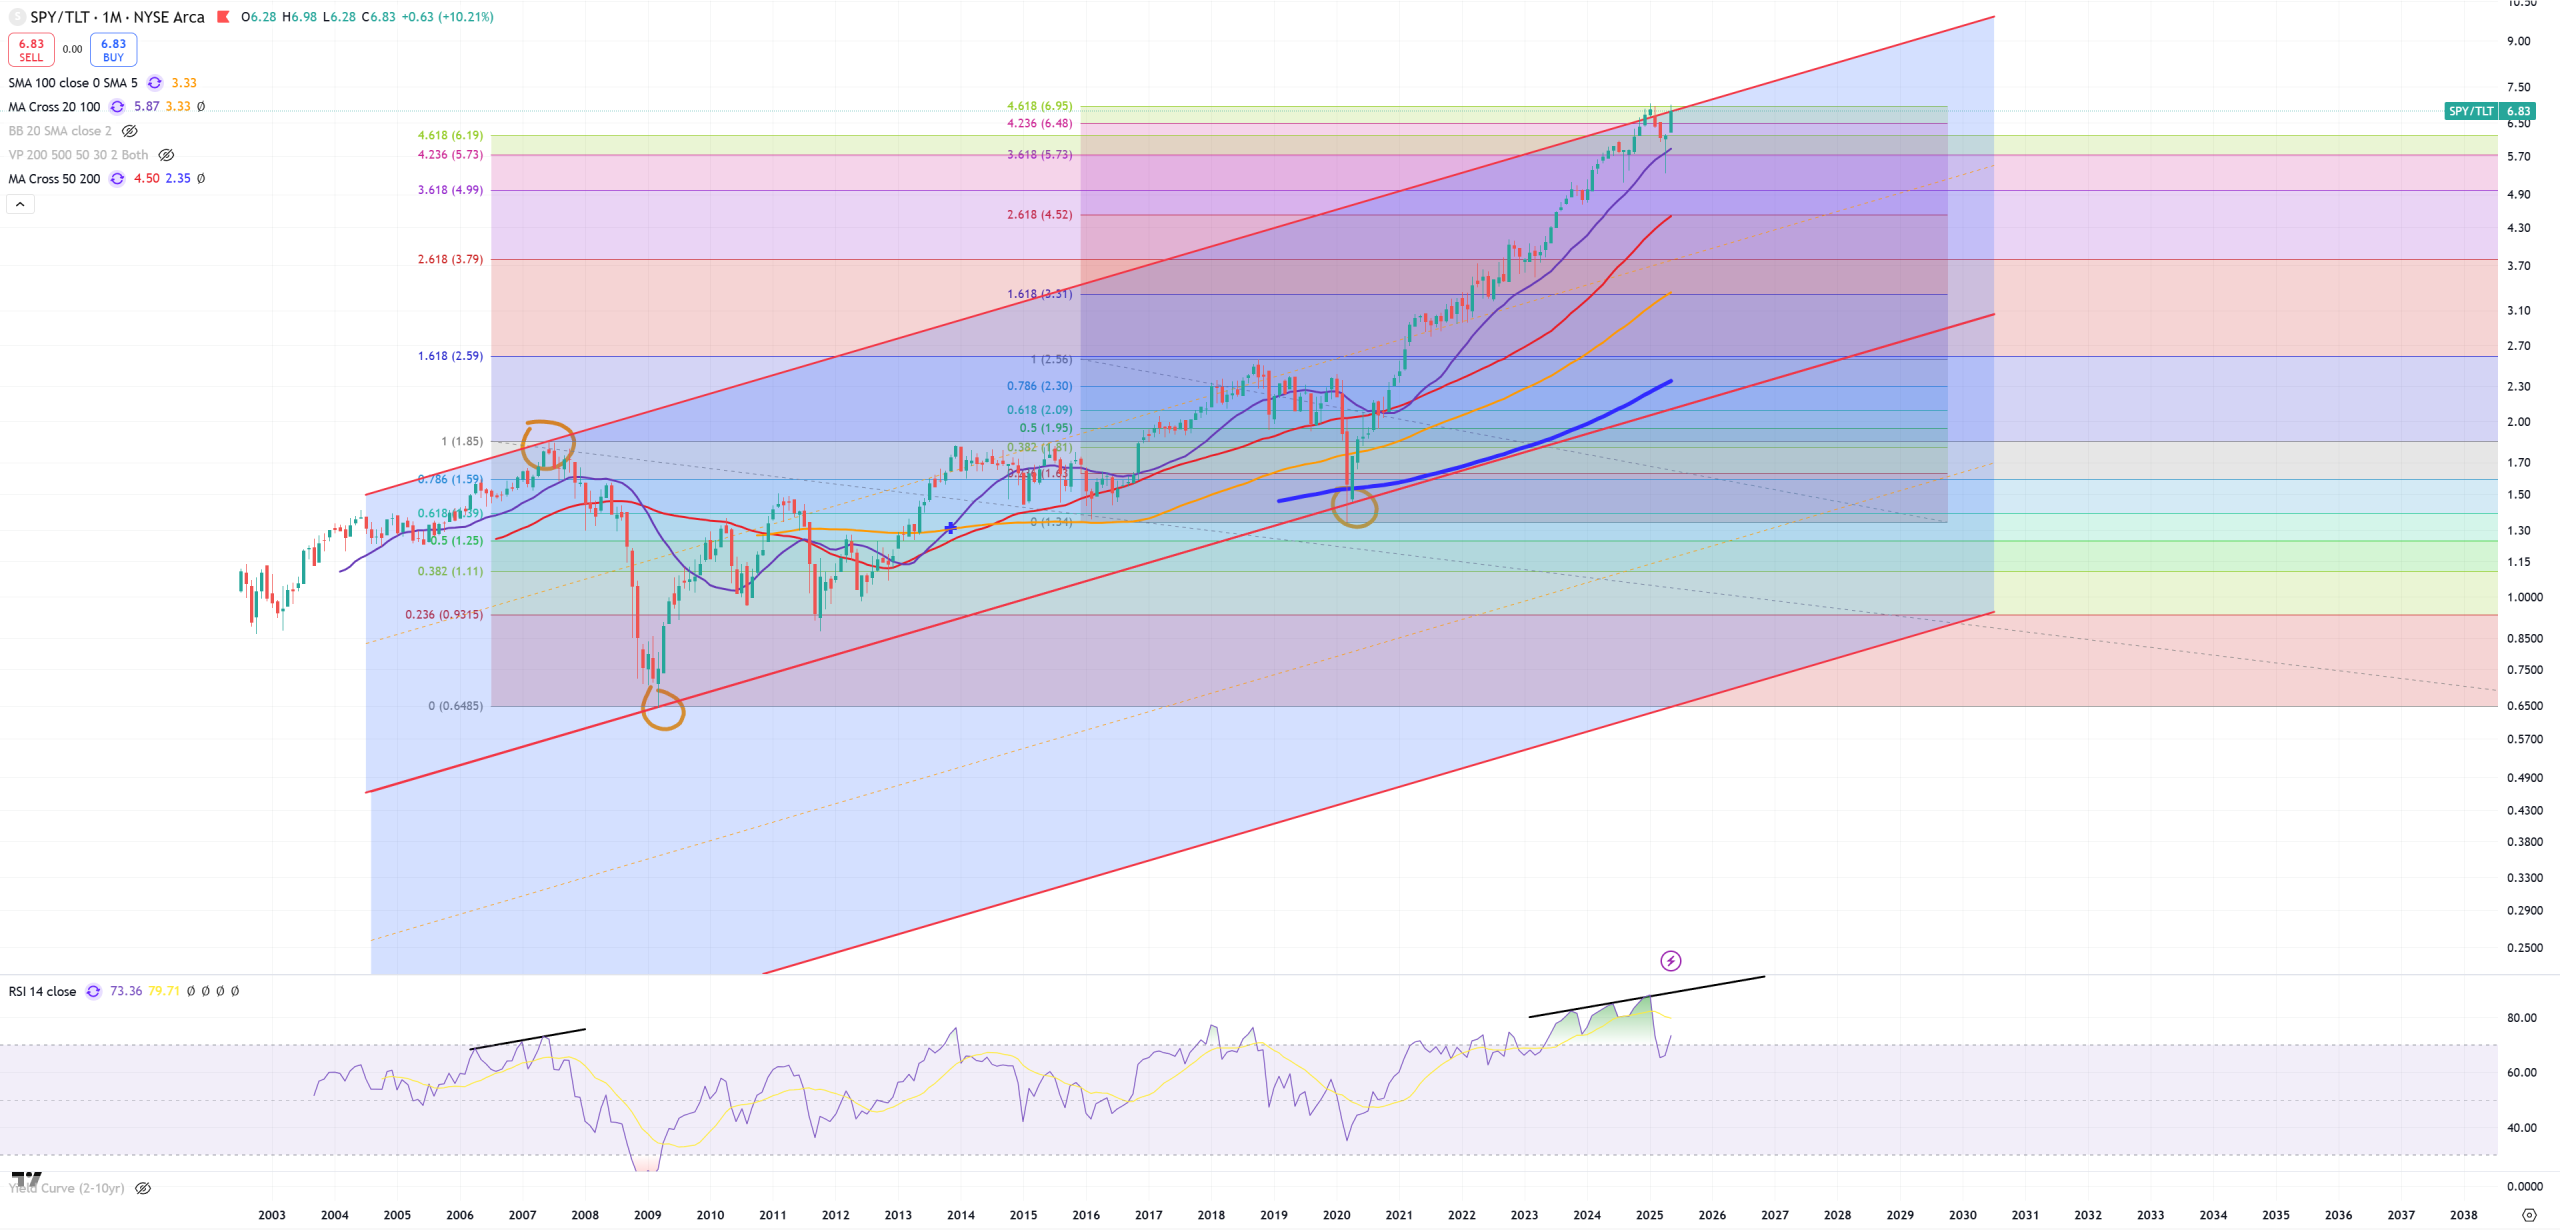
SPY/TLT – my #2 chart related to stocks hangs on a key trend, what we can see that (M)MA50/(W)MA200 on AUDJPY = SPY/TLT trend
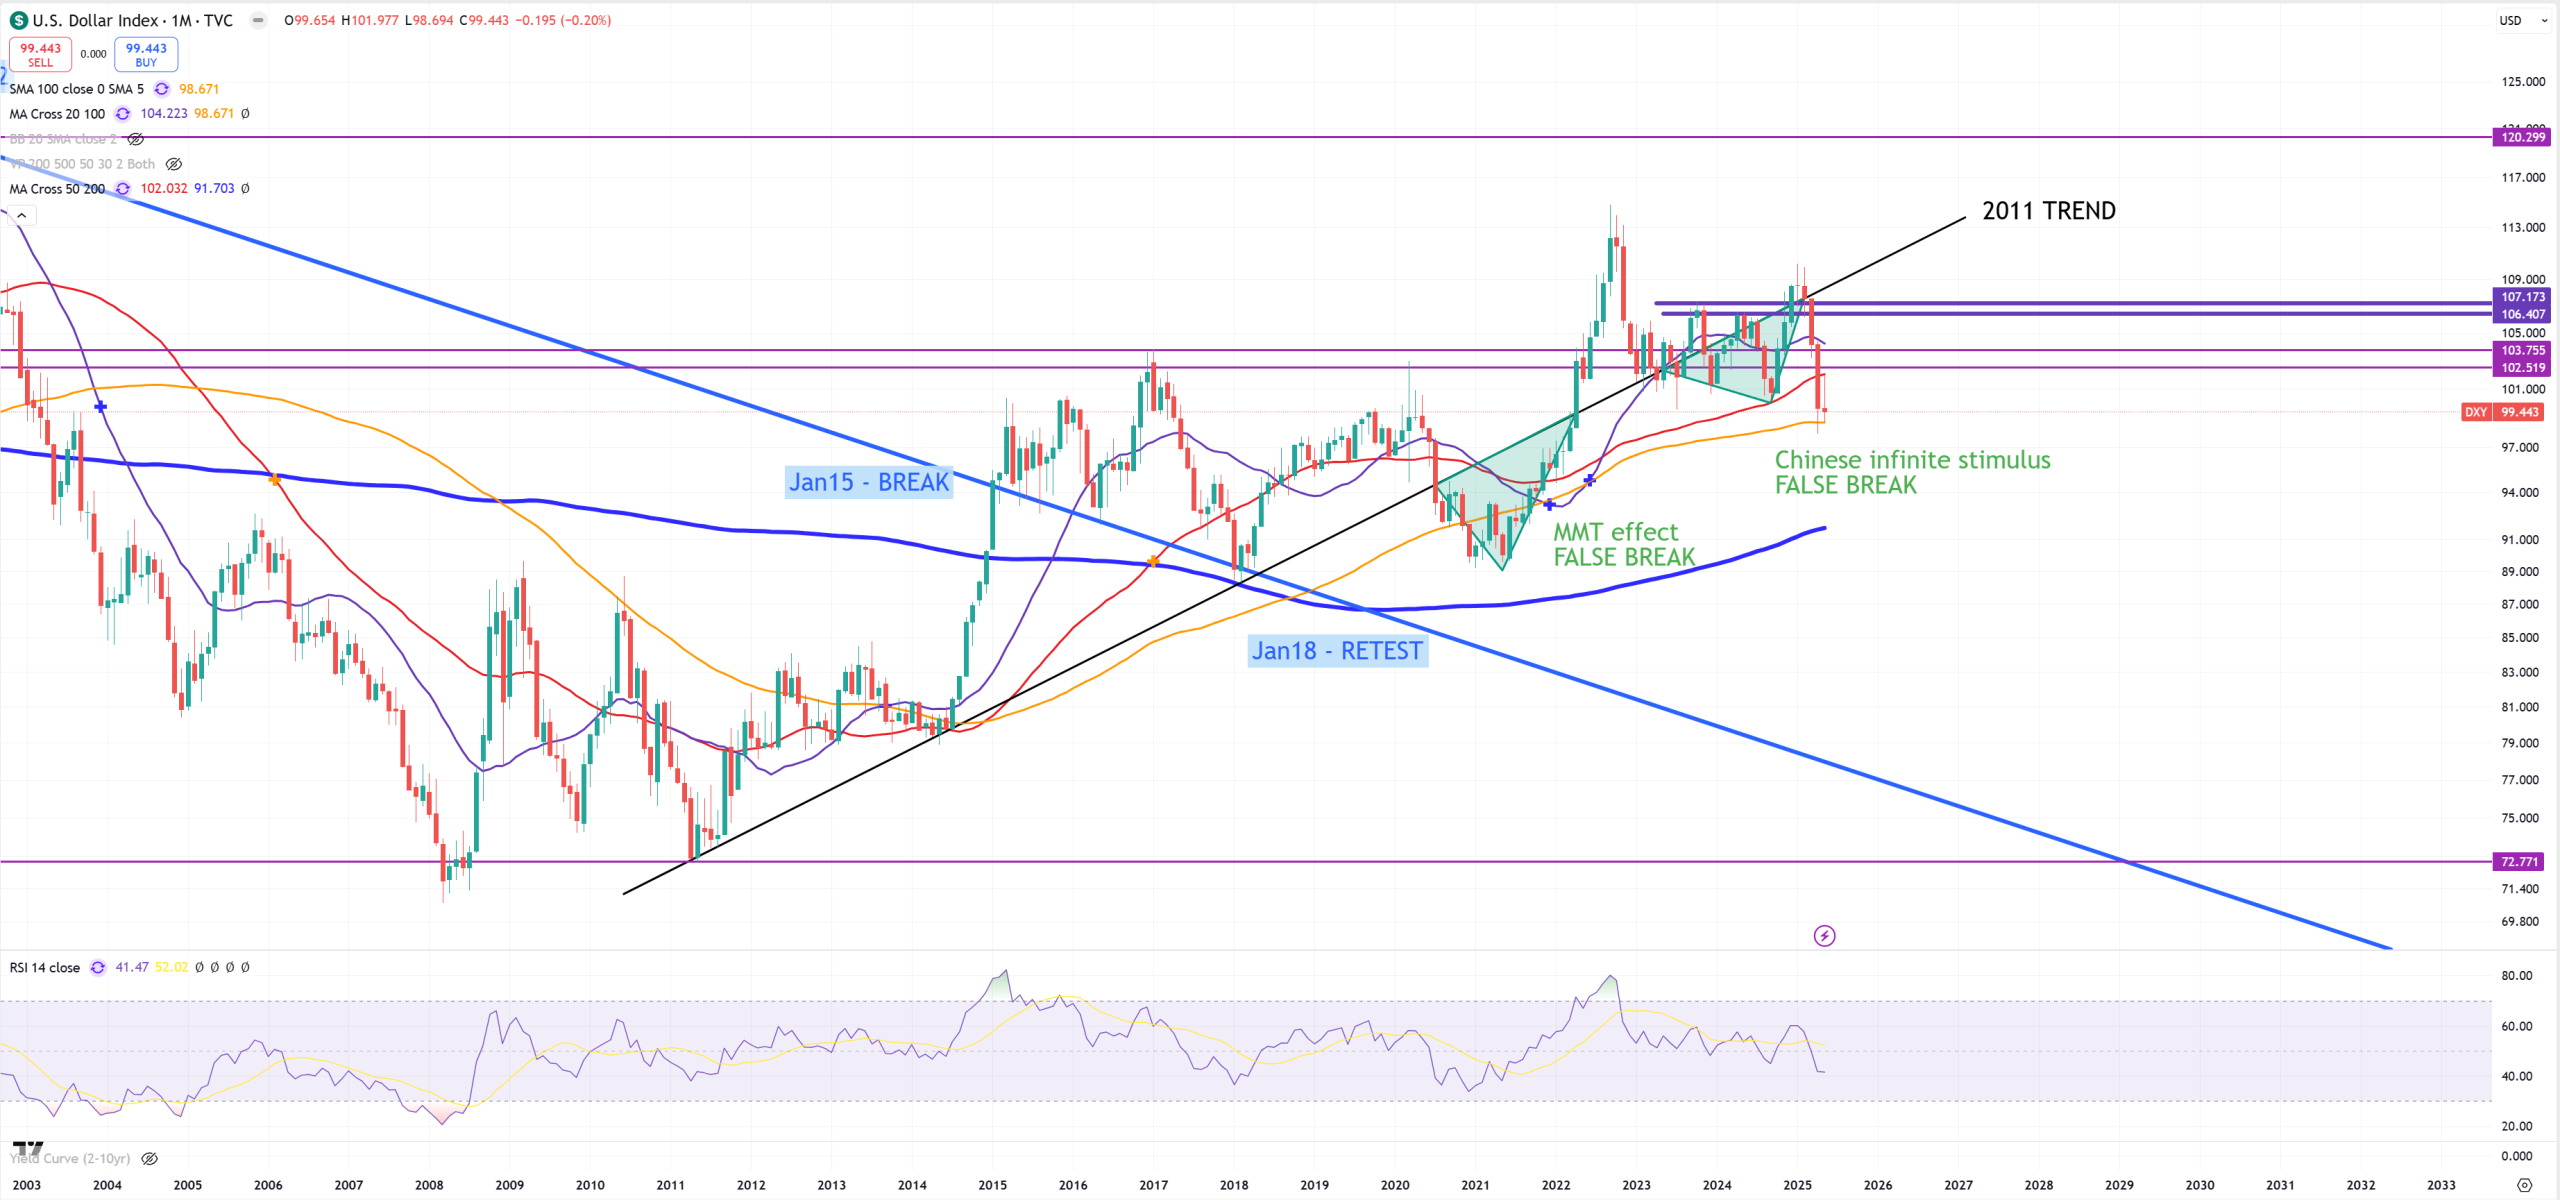
DXY – and as a summary of all – got stuck below resistance 102-103, which is also (M)MA50, now holds on (M)MA100 which is a typical middle point often related with bull/bear trap levels. Because USDCNH finds a bottom around 7.20, DXY should find a bottom on (M)MA100 as those 2 charts are alligned this way : 7.20 Yuan support now = (M)MA100 DXY.
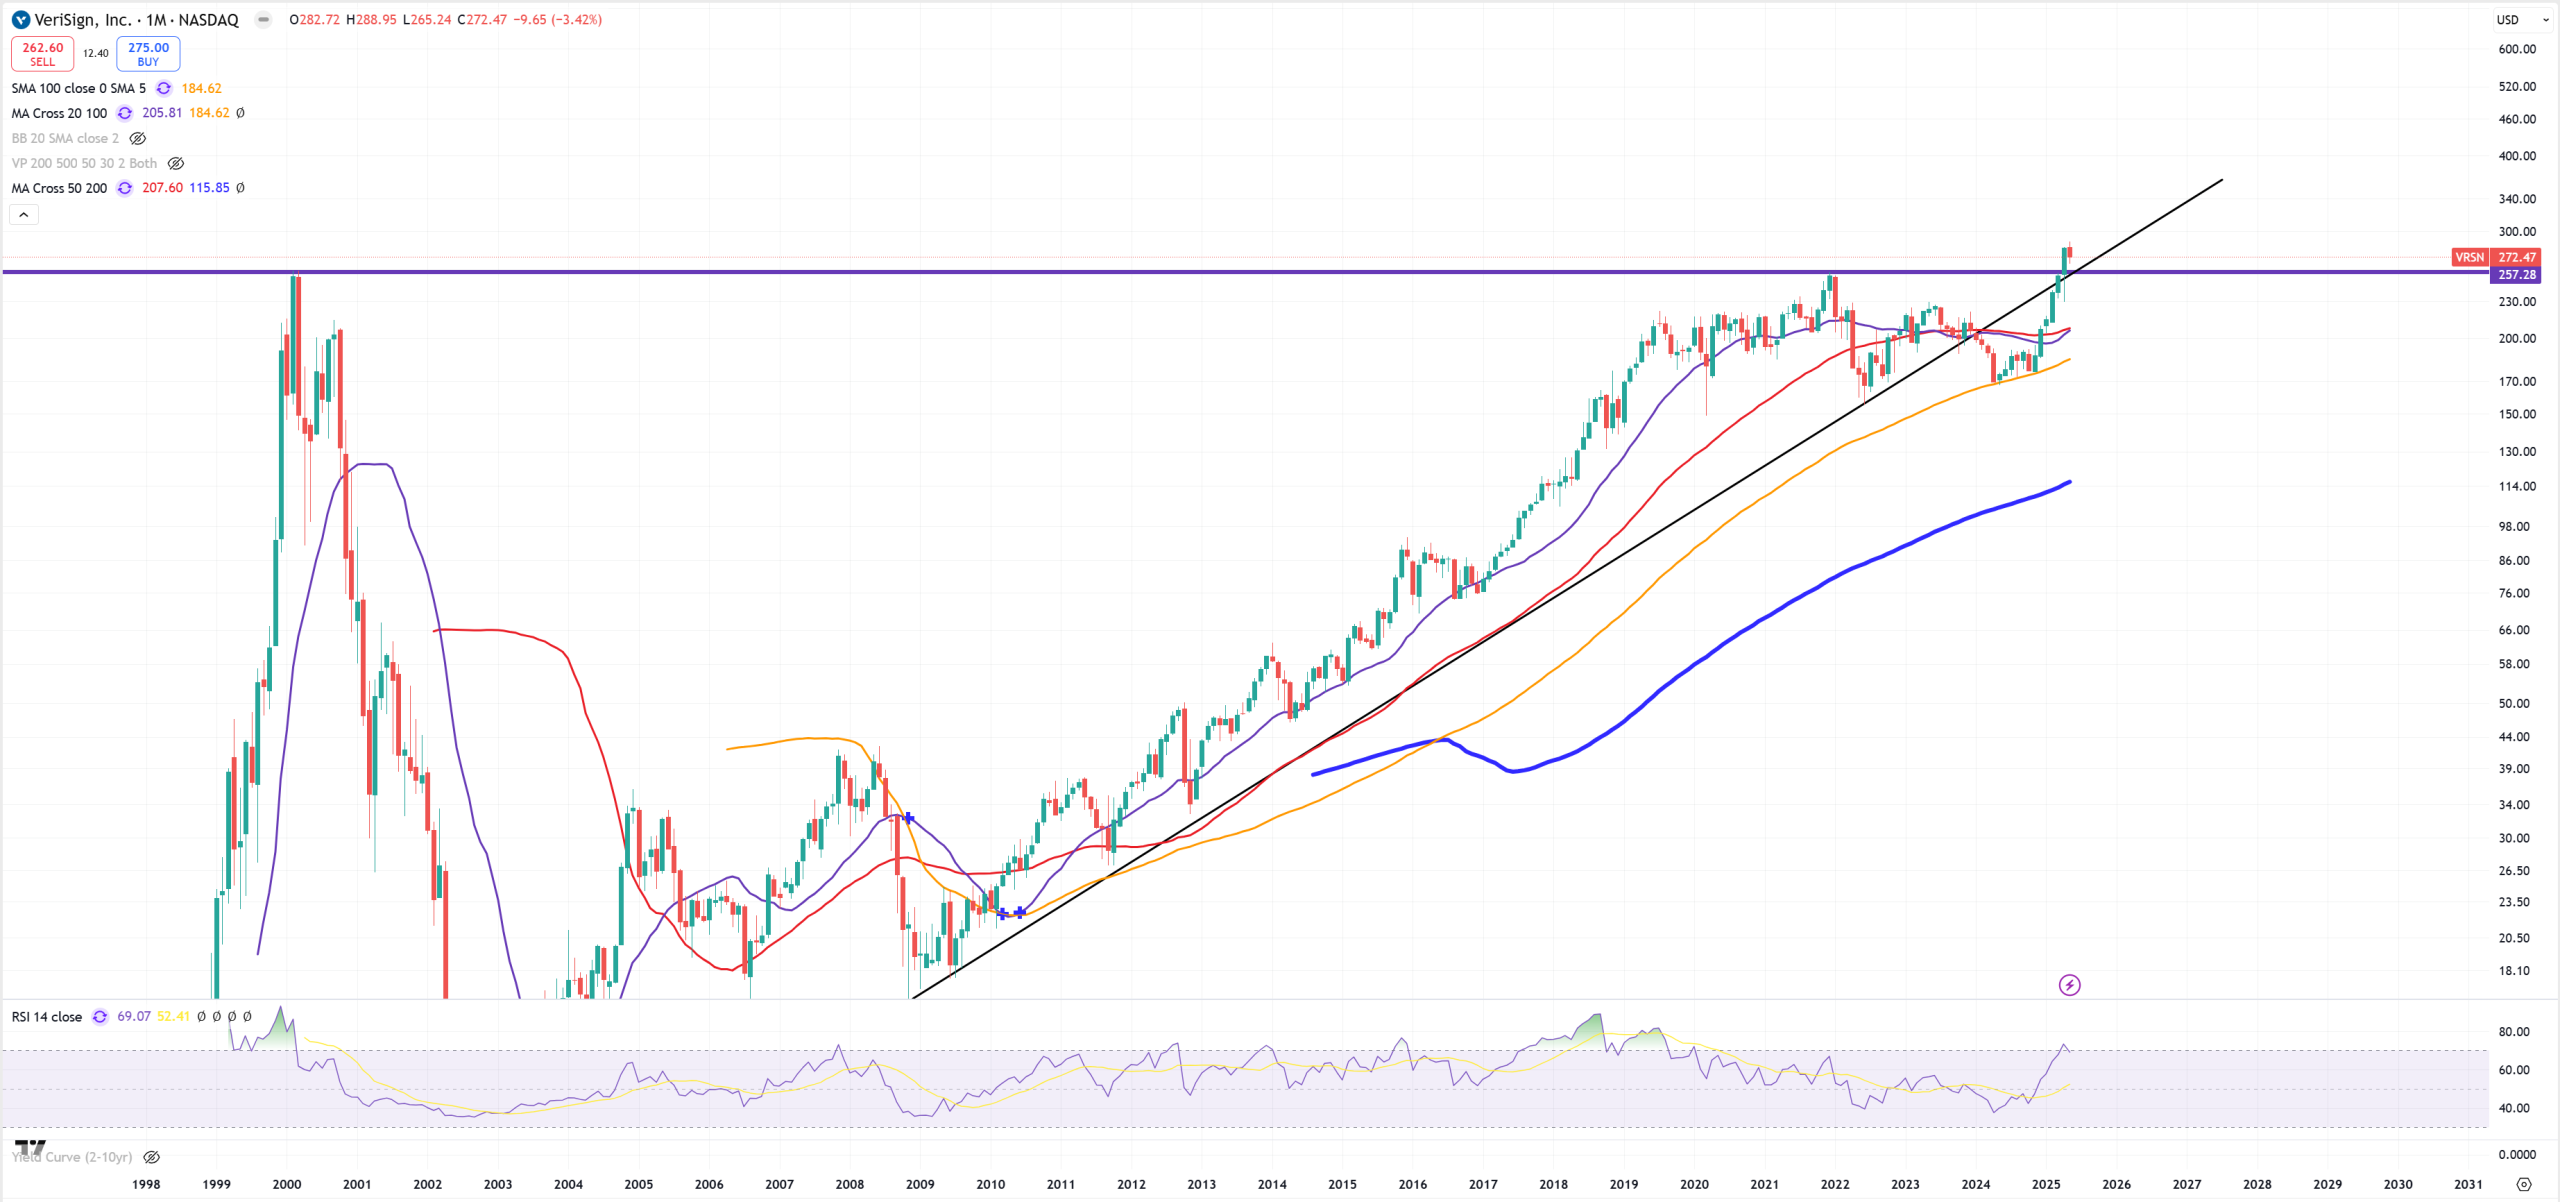
VRSN – Verisign- not really believe in this 2000 peak break, but it’s a break
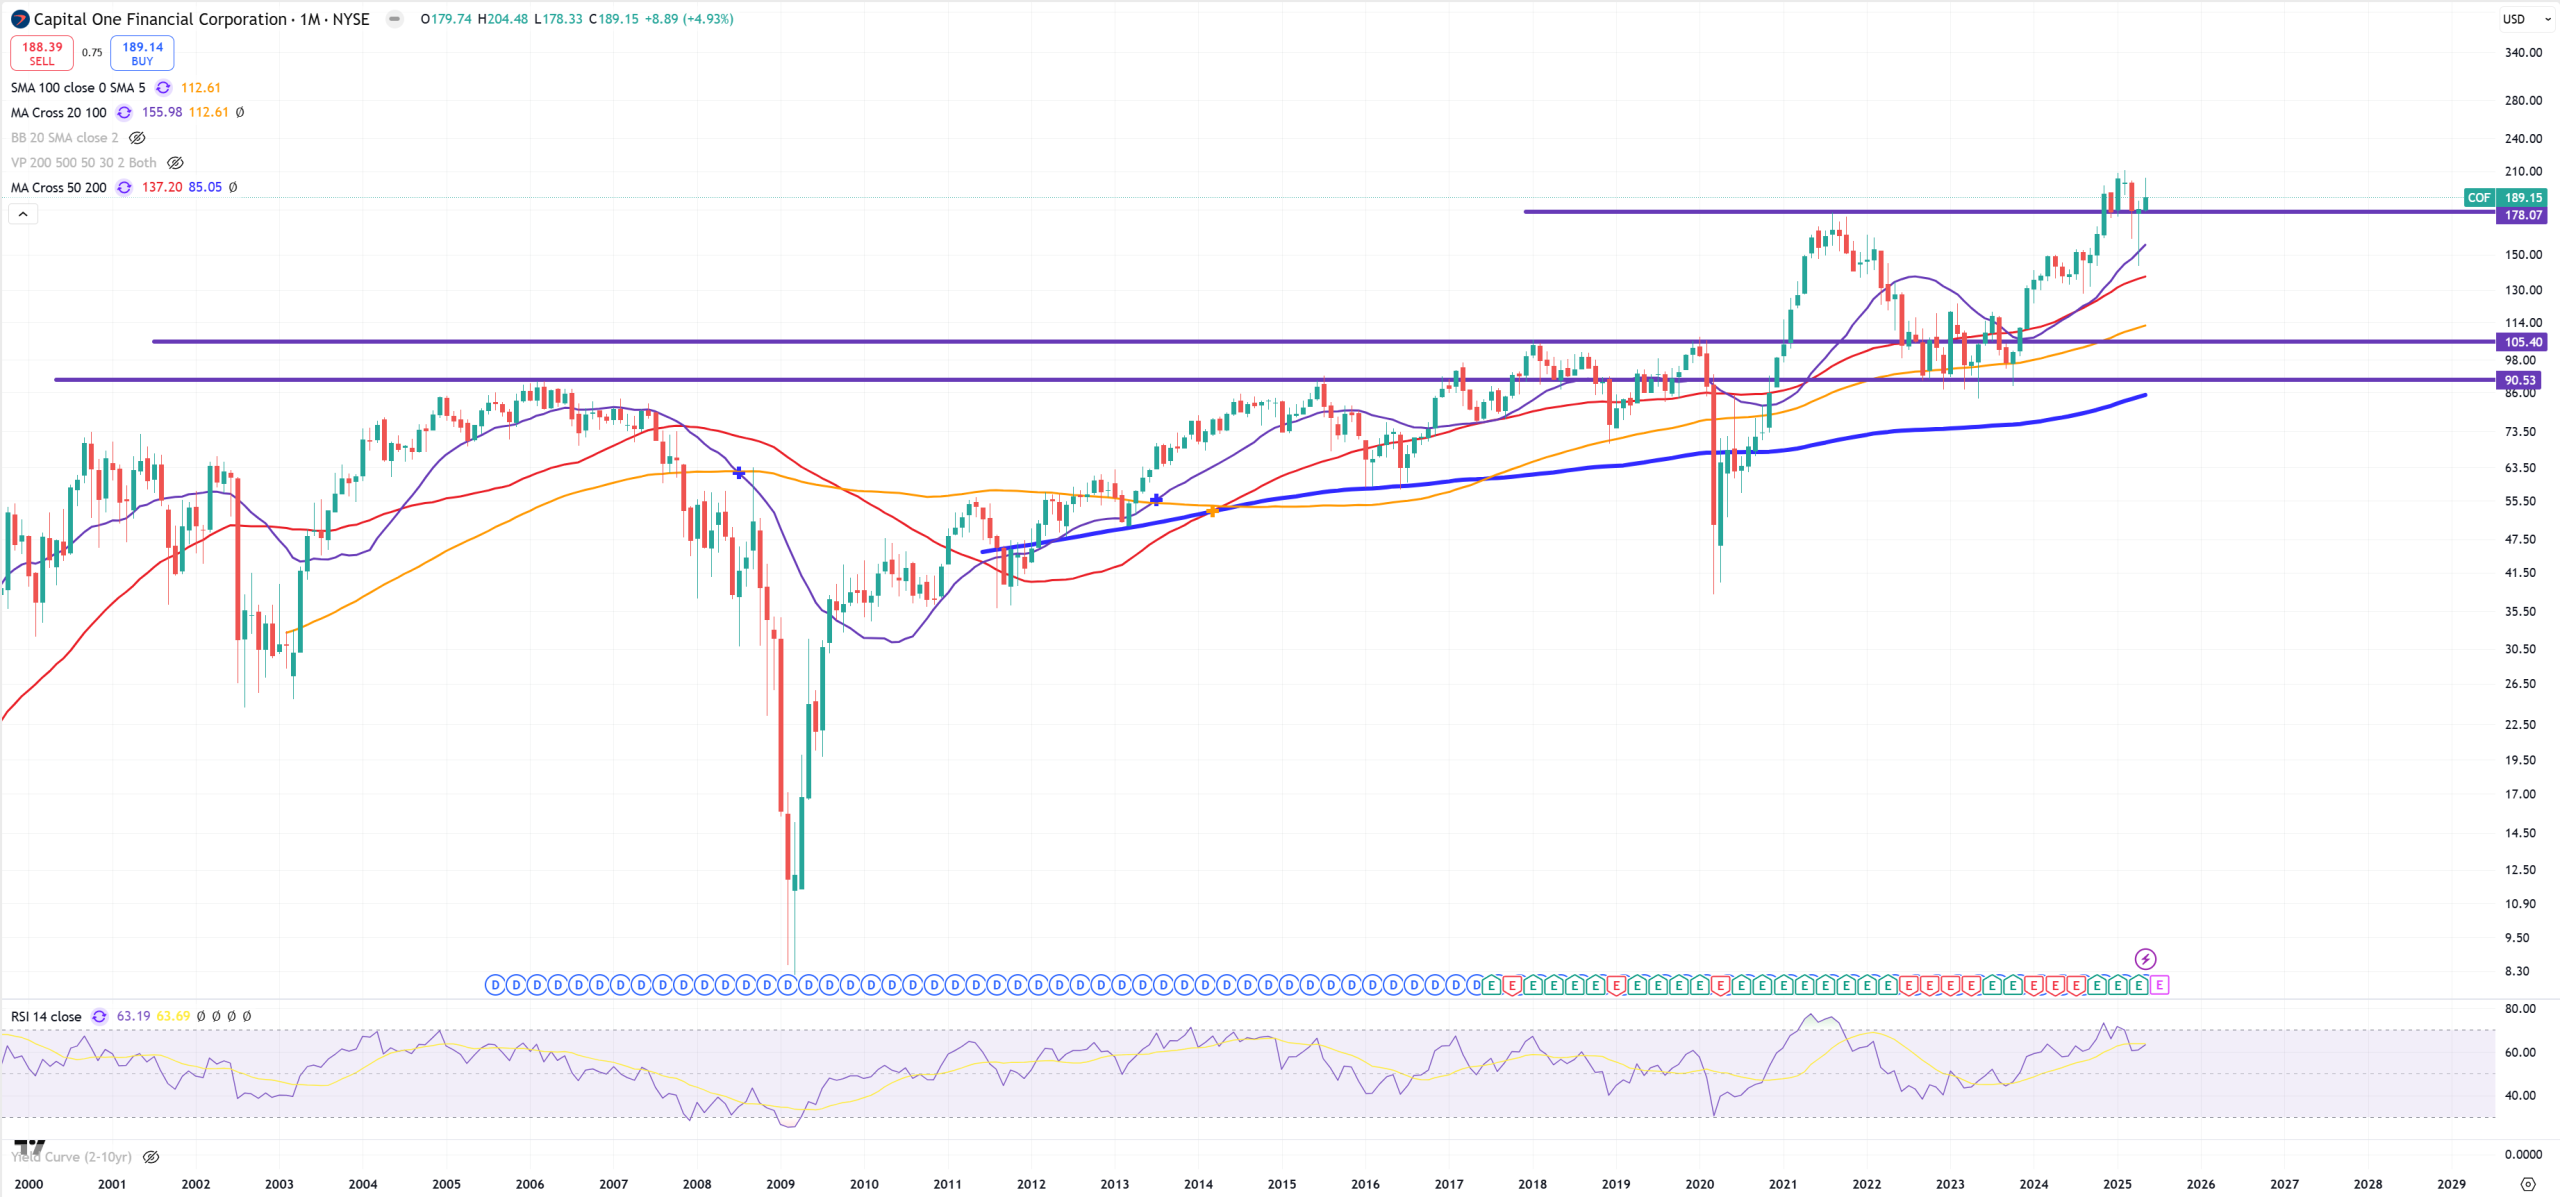
COF – also 2021 support holds
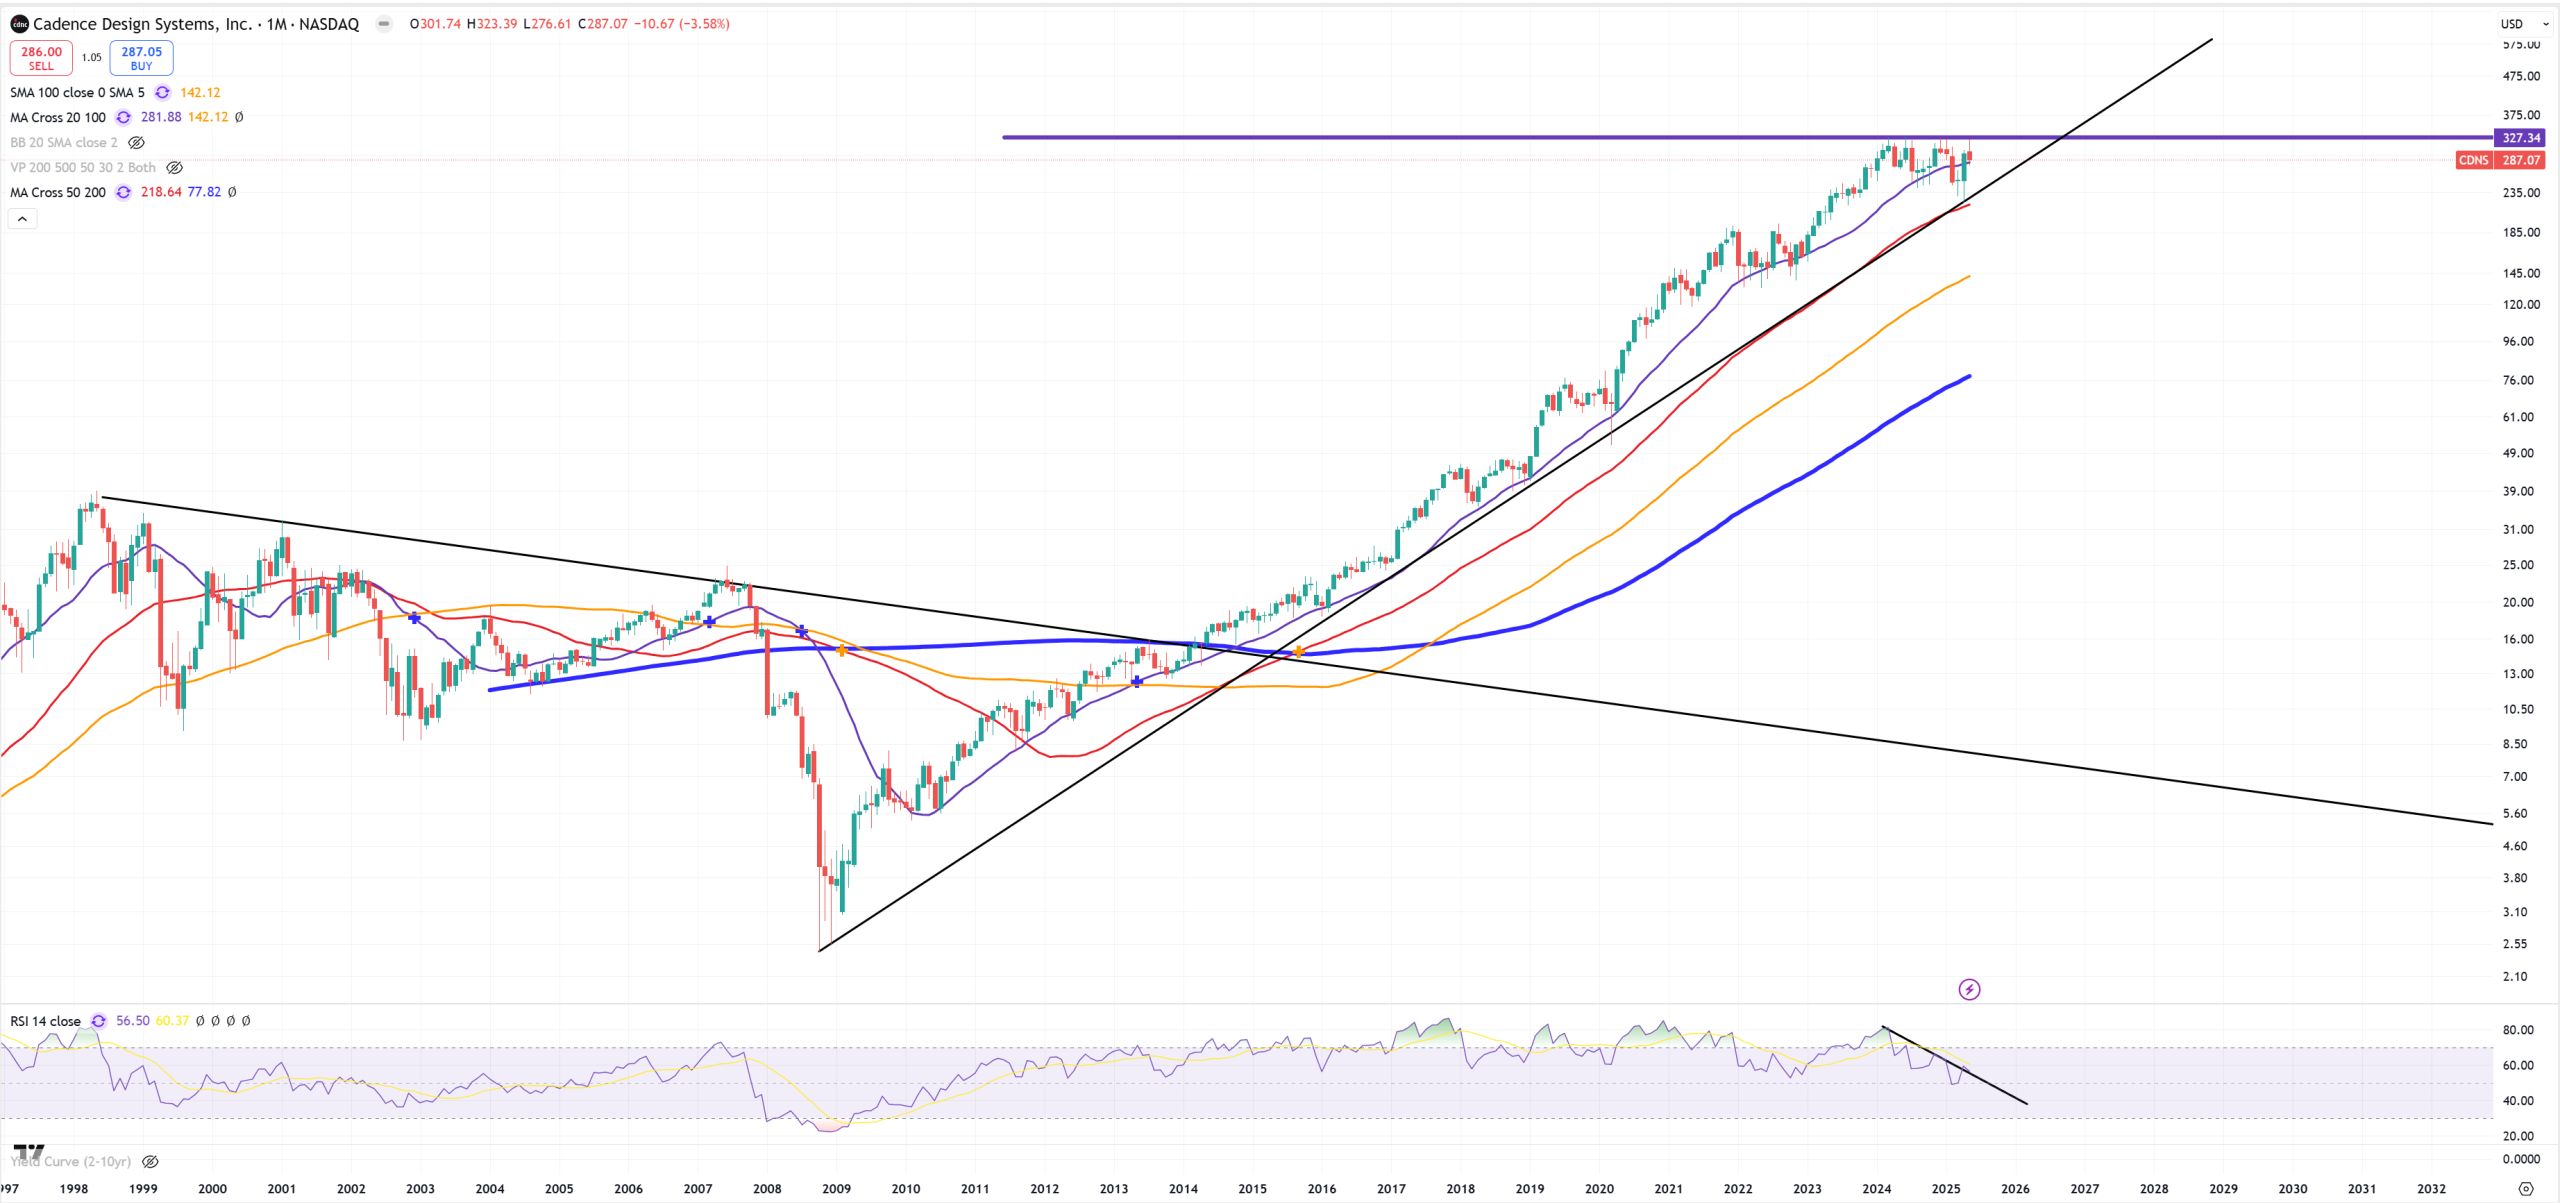
CDNS – multiple resistance
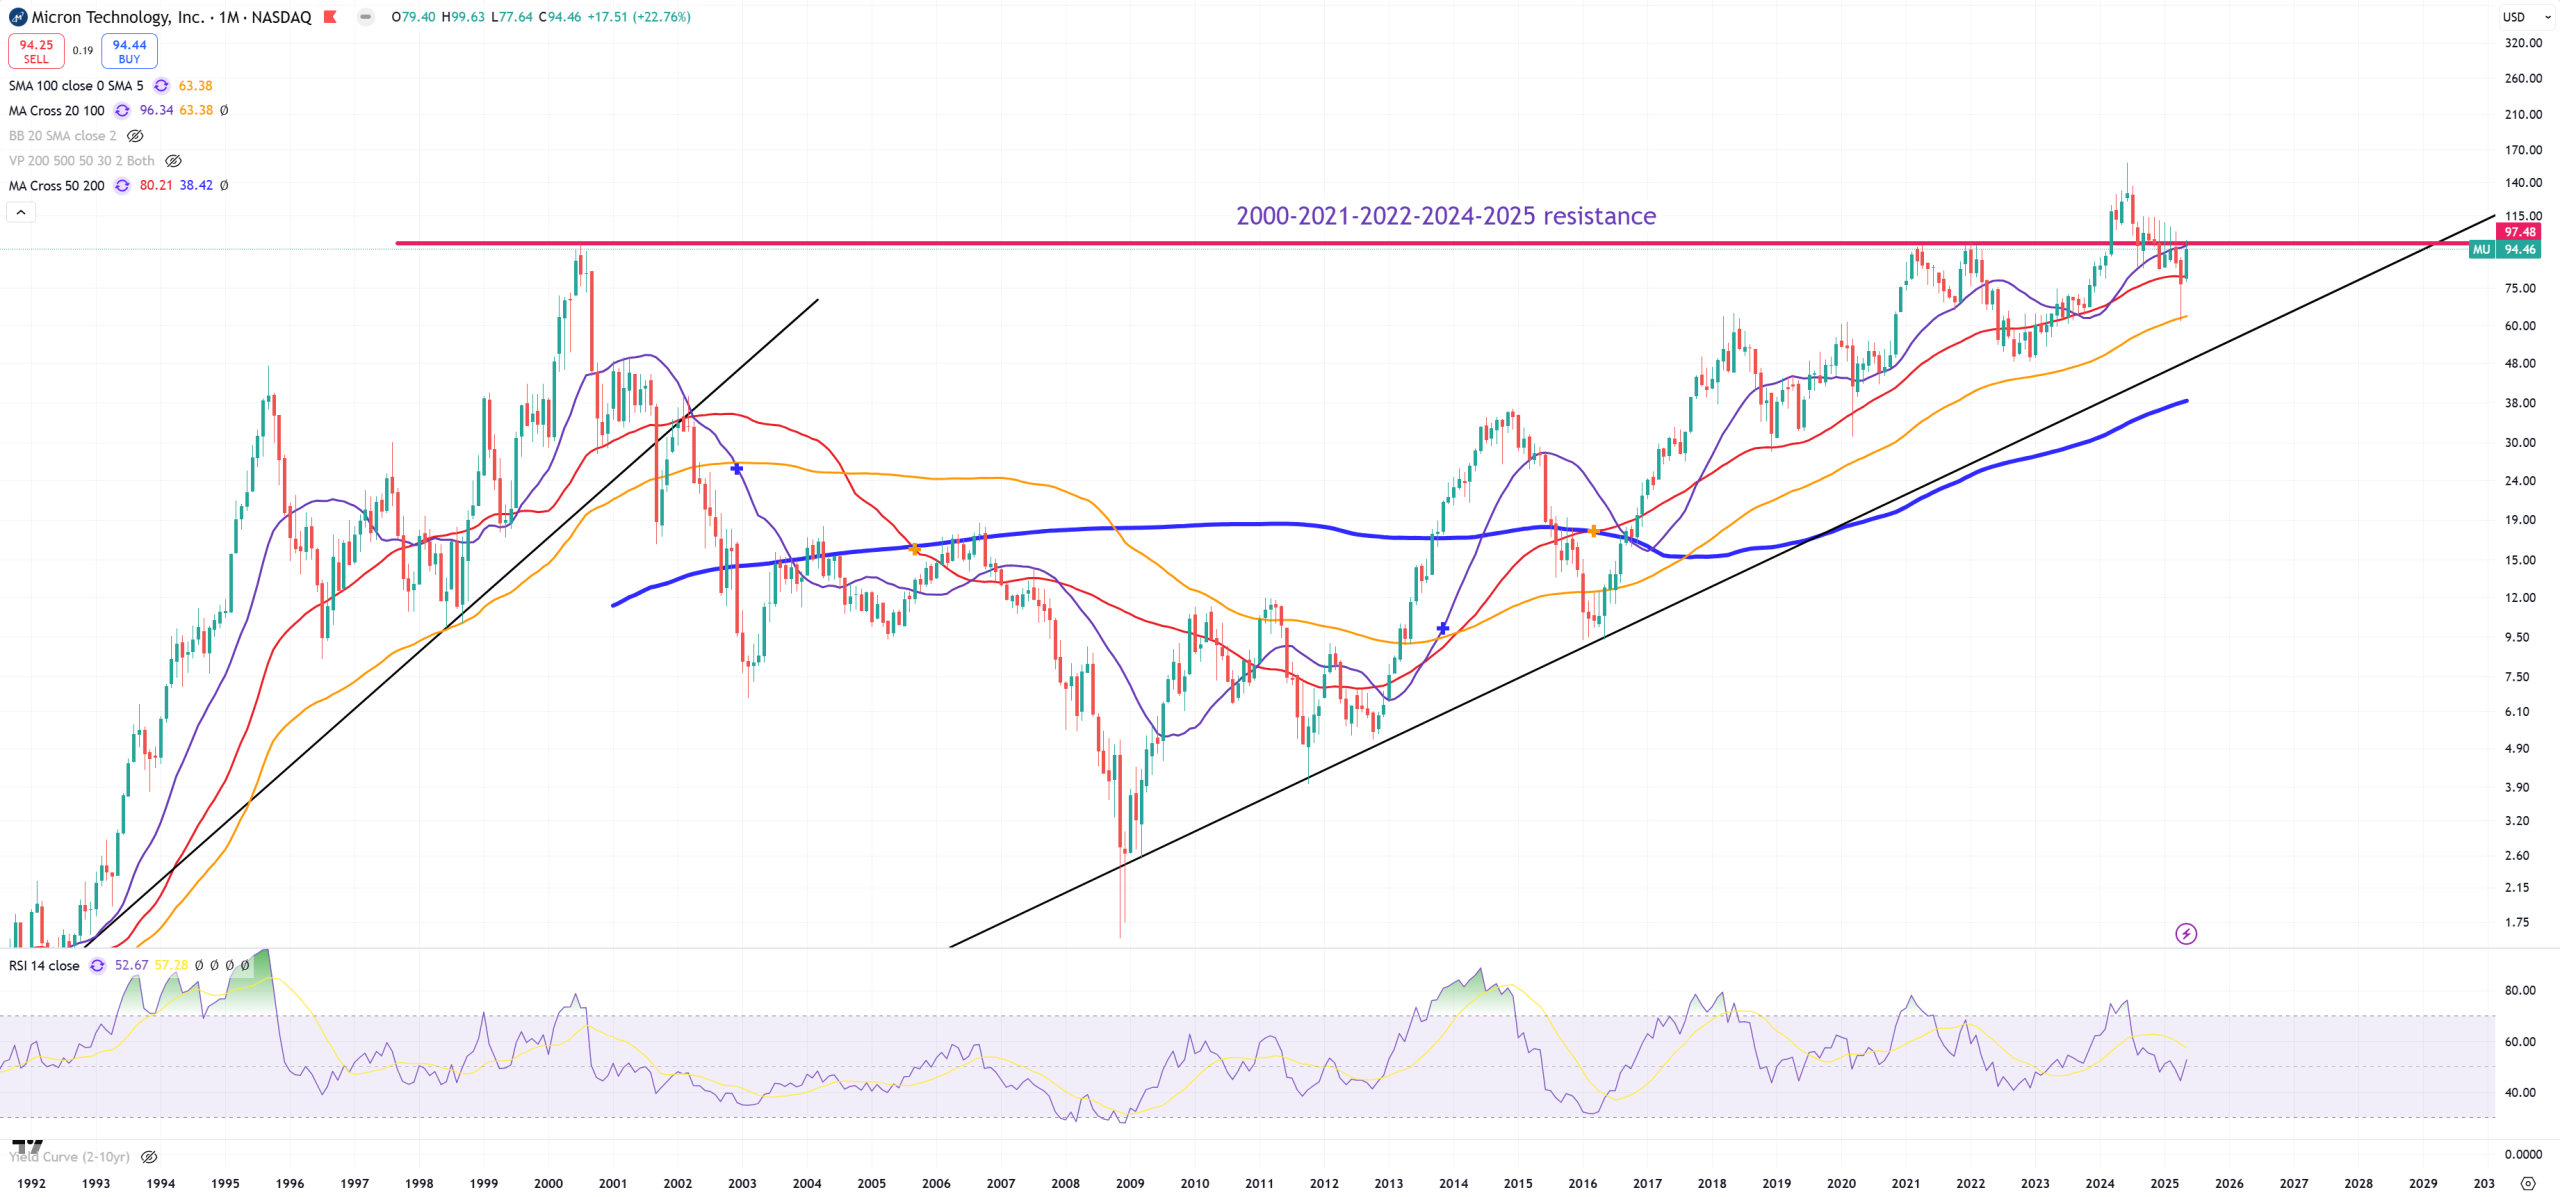
MU – holds 2000 resistance
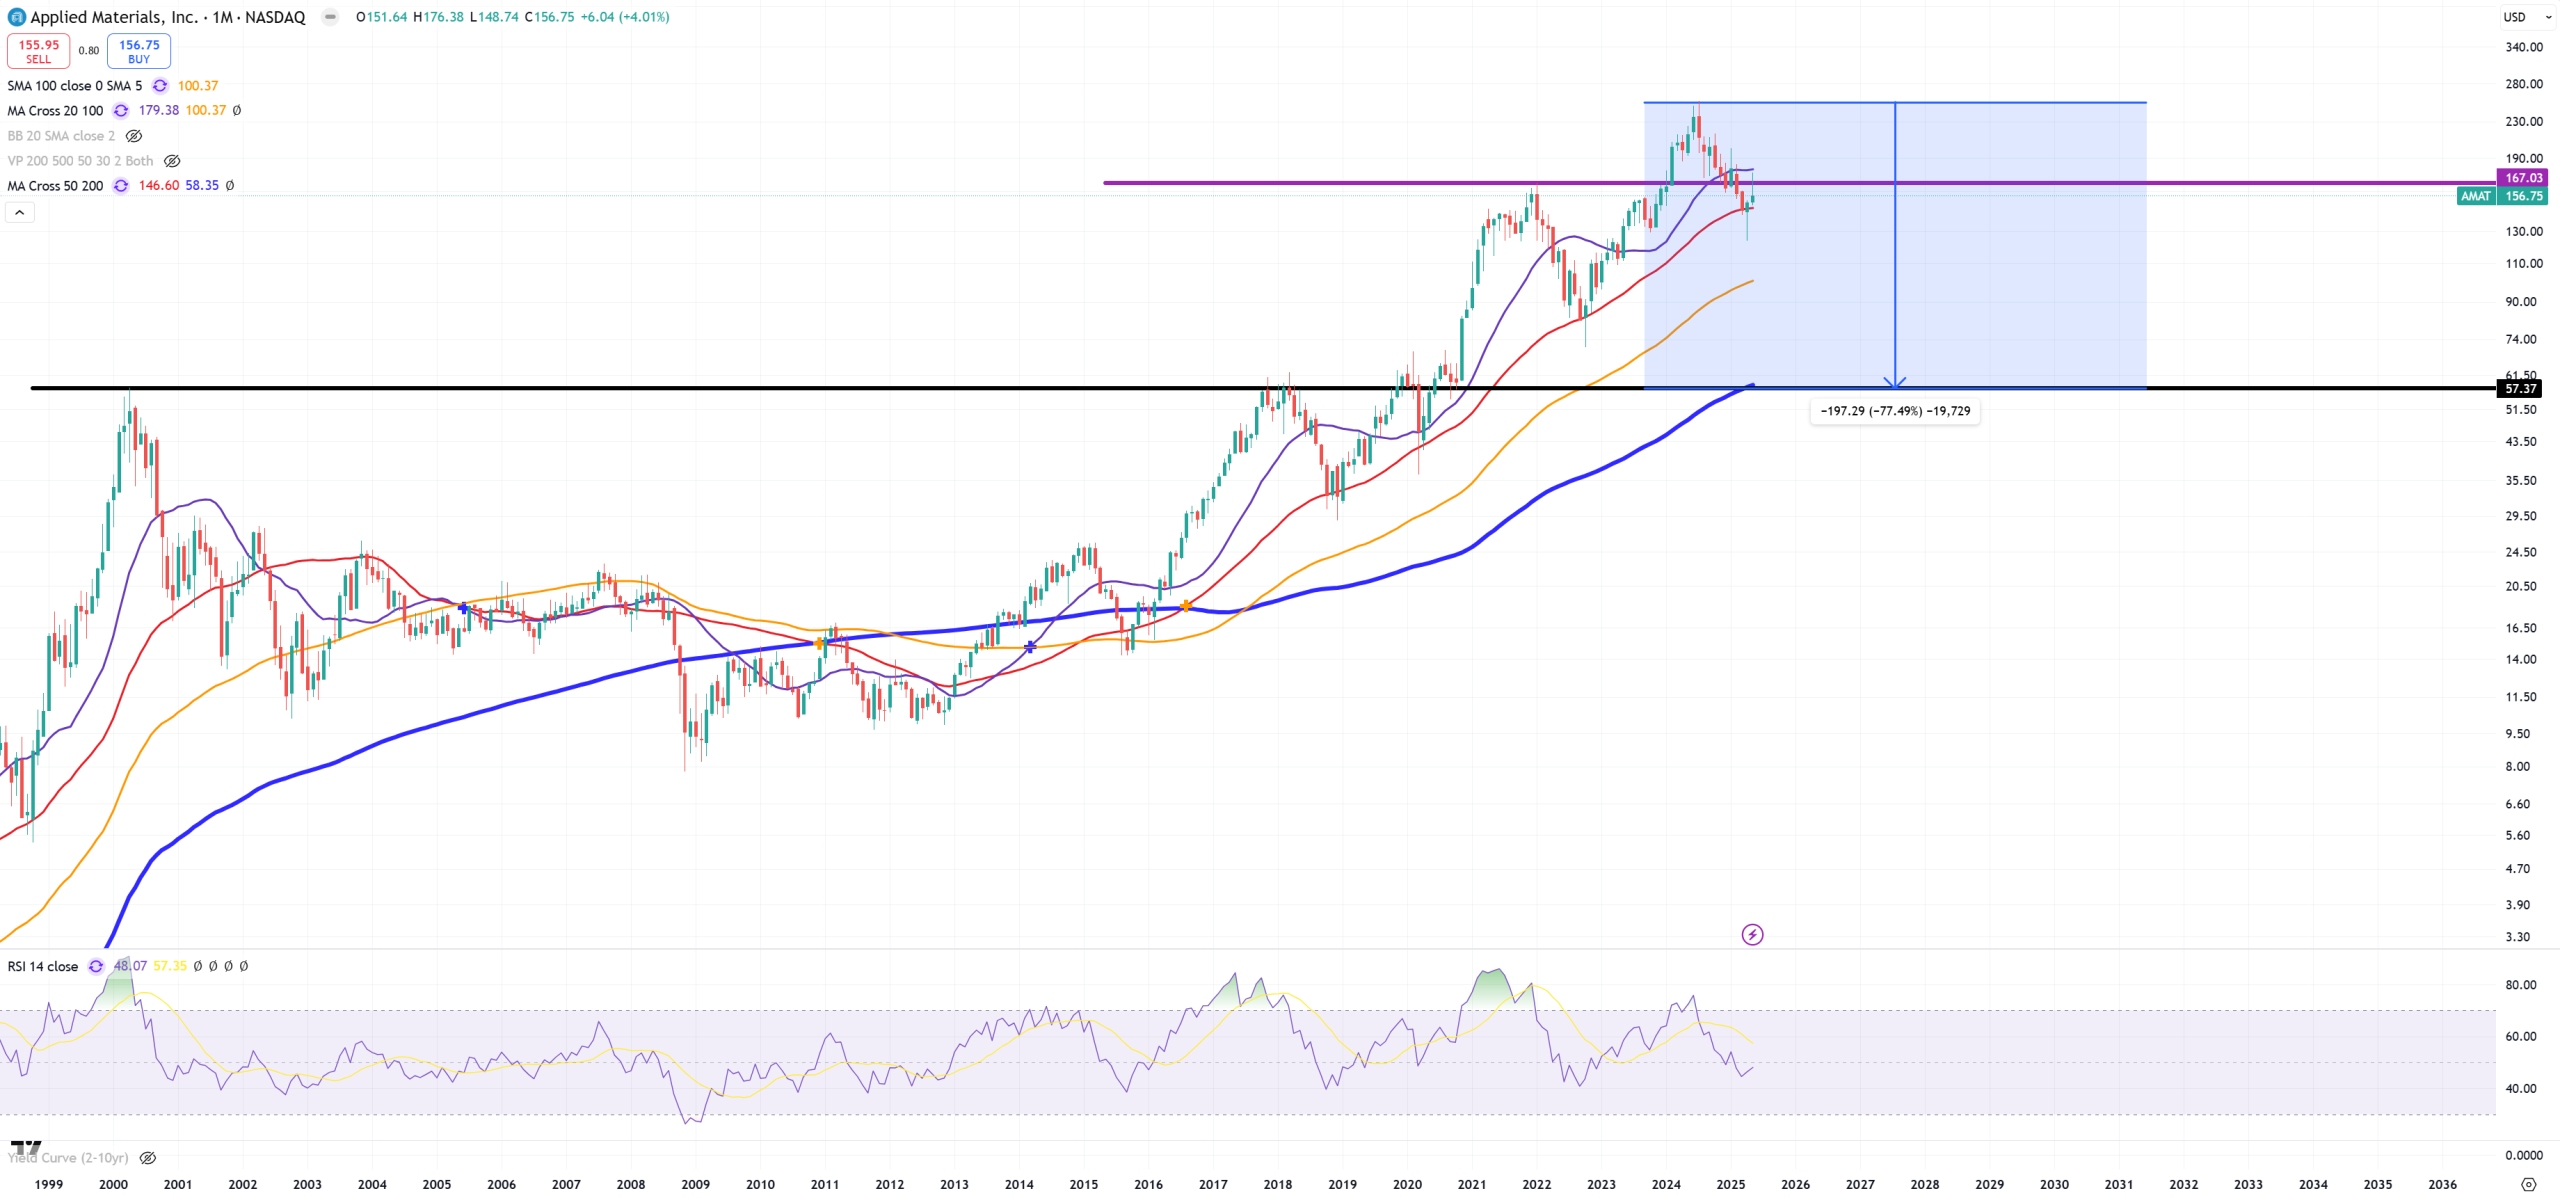
AMAT – also below 2021 level
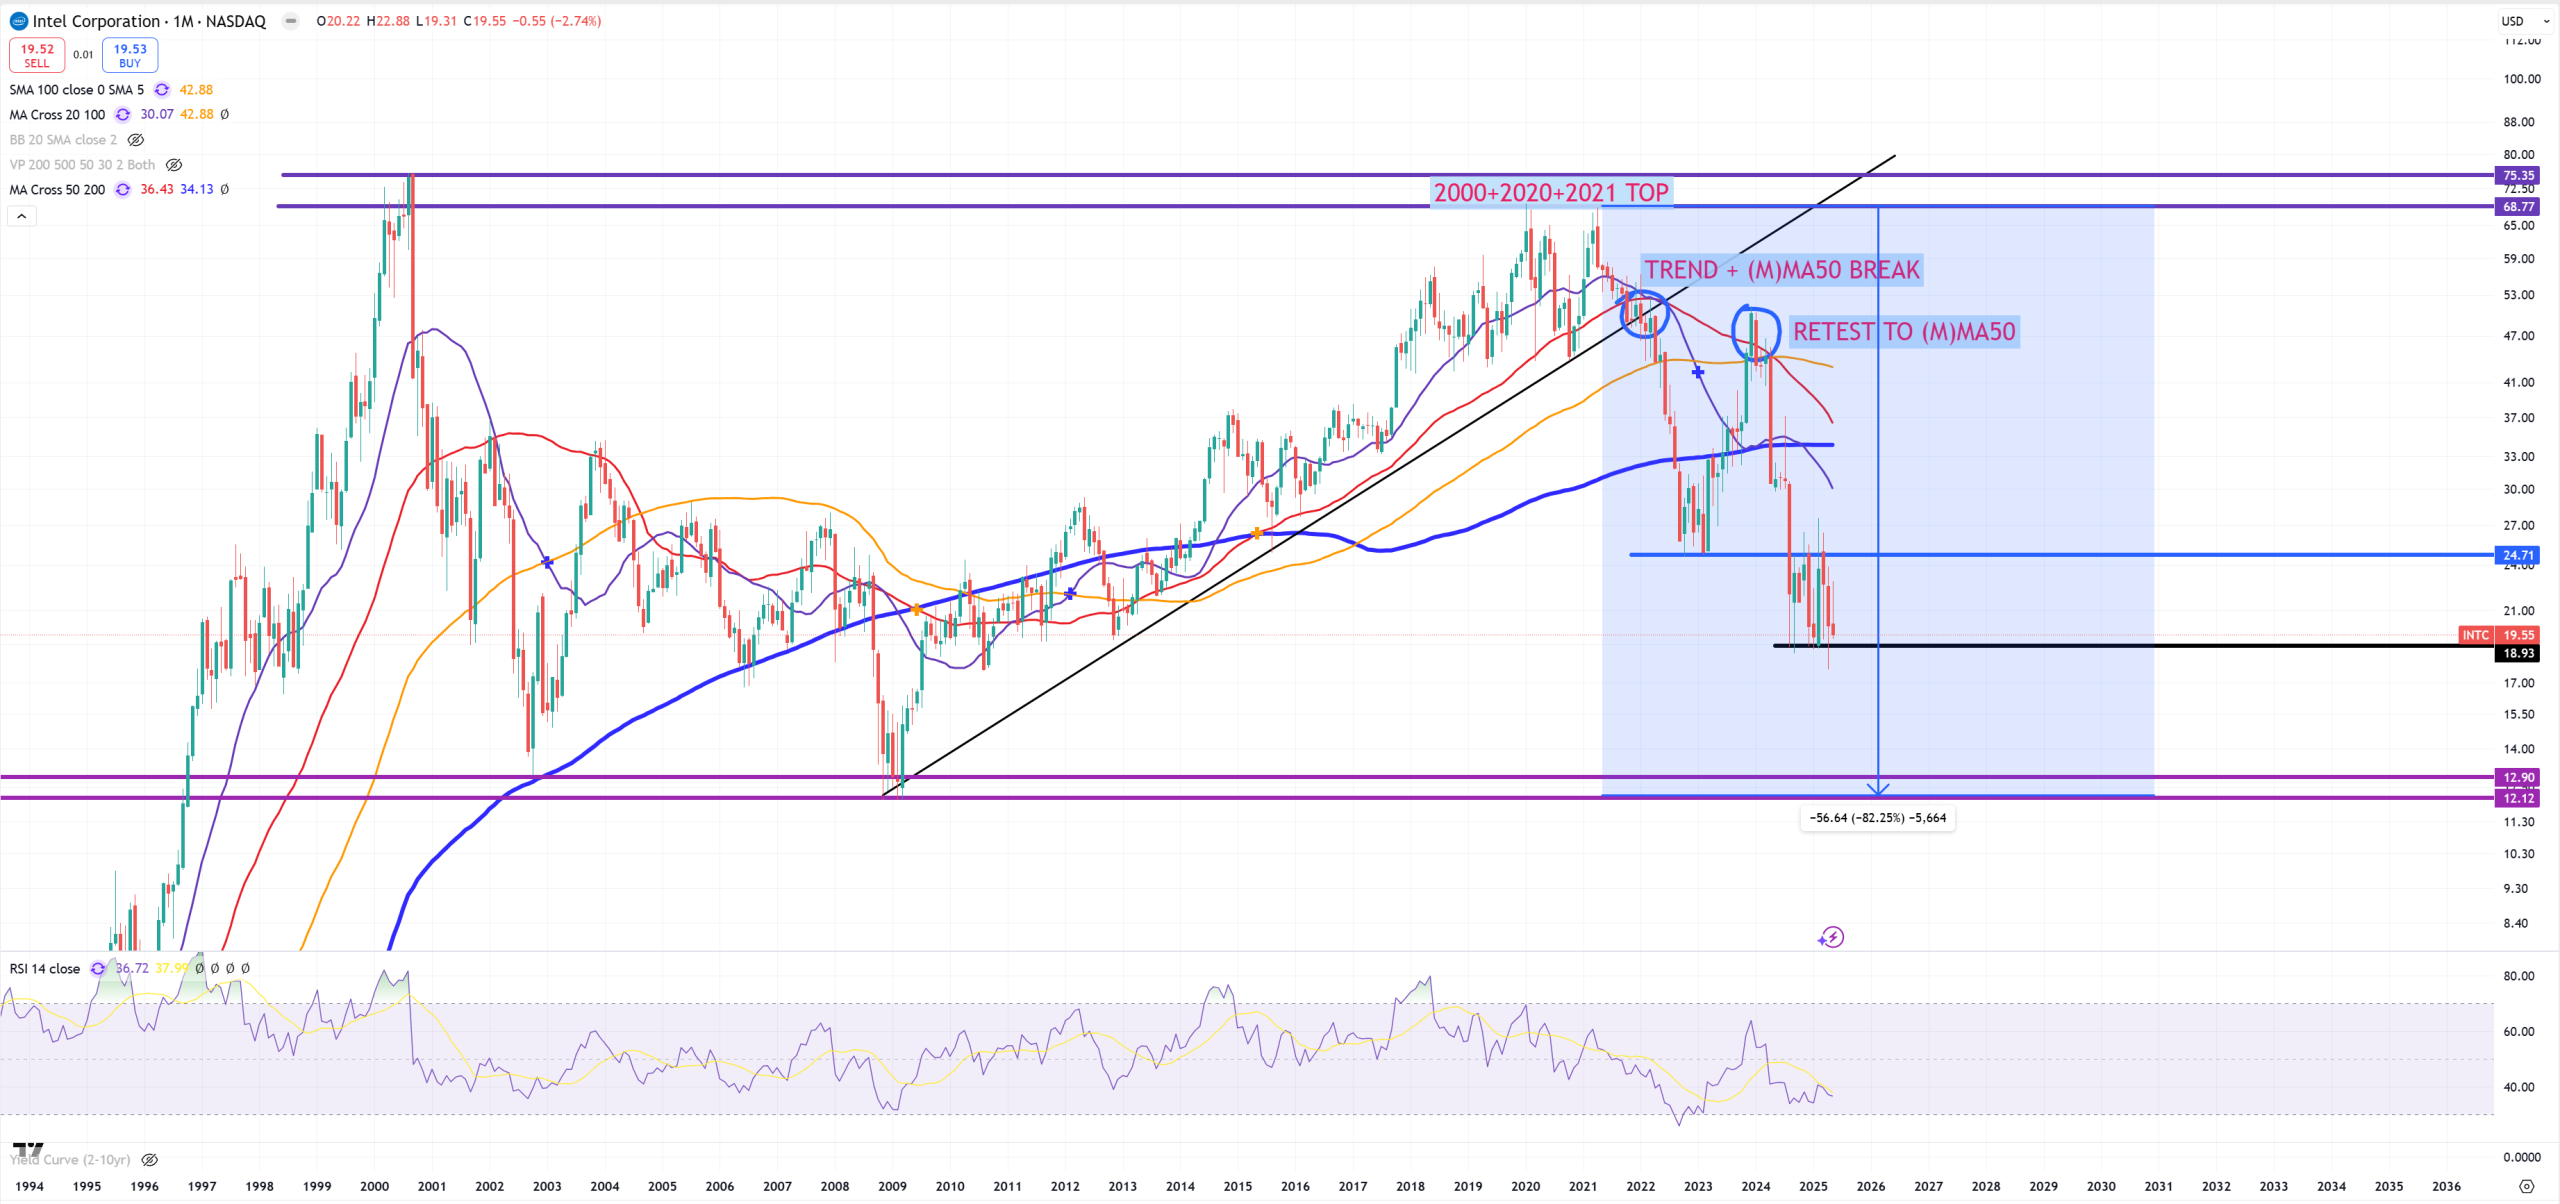
INTC – this is still 12$ magnet
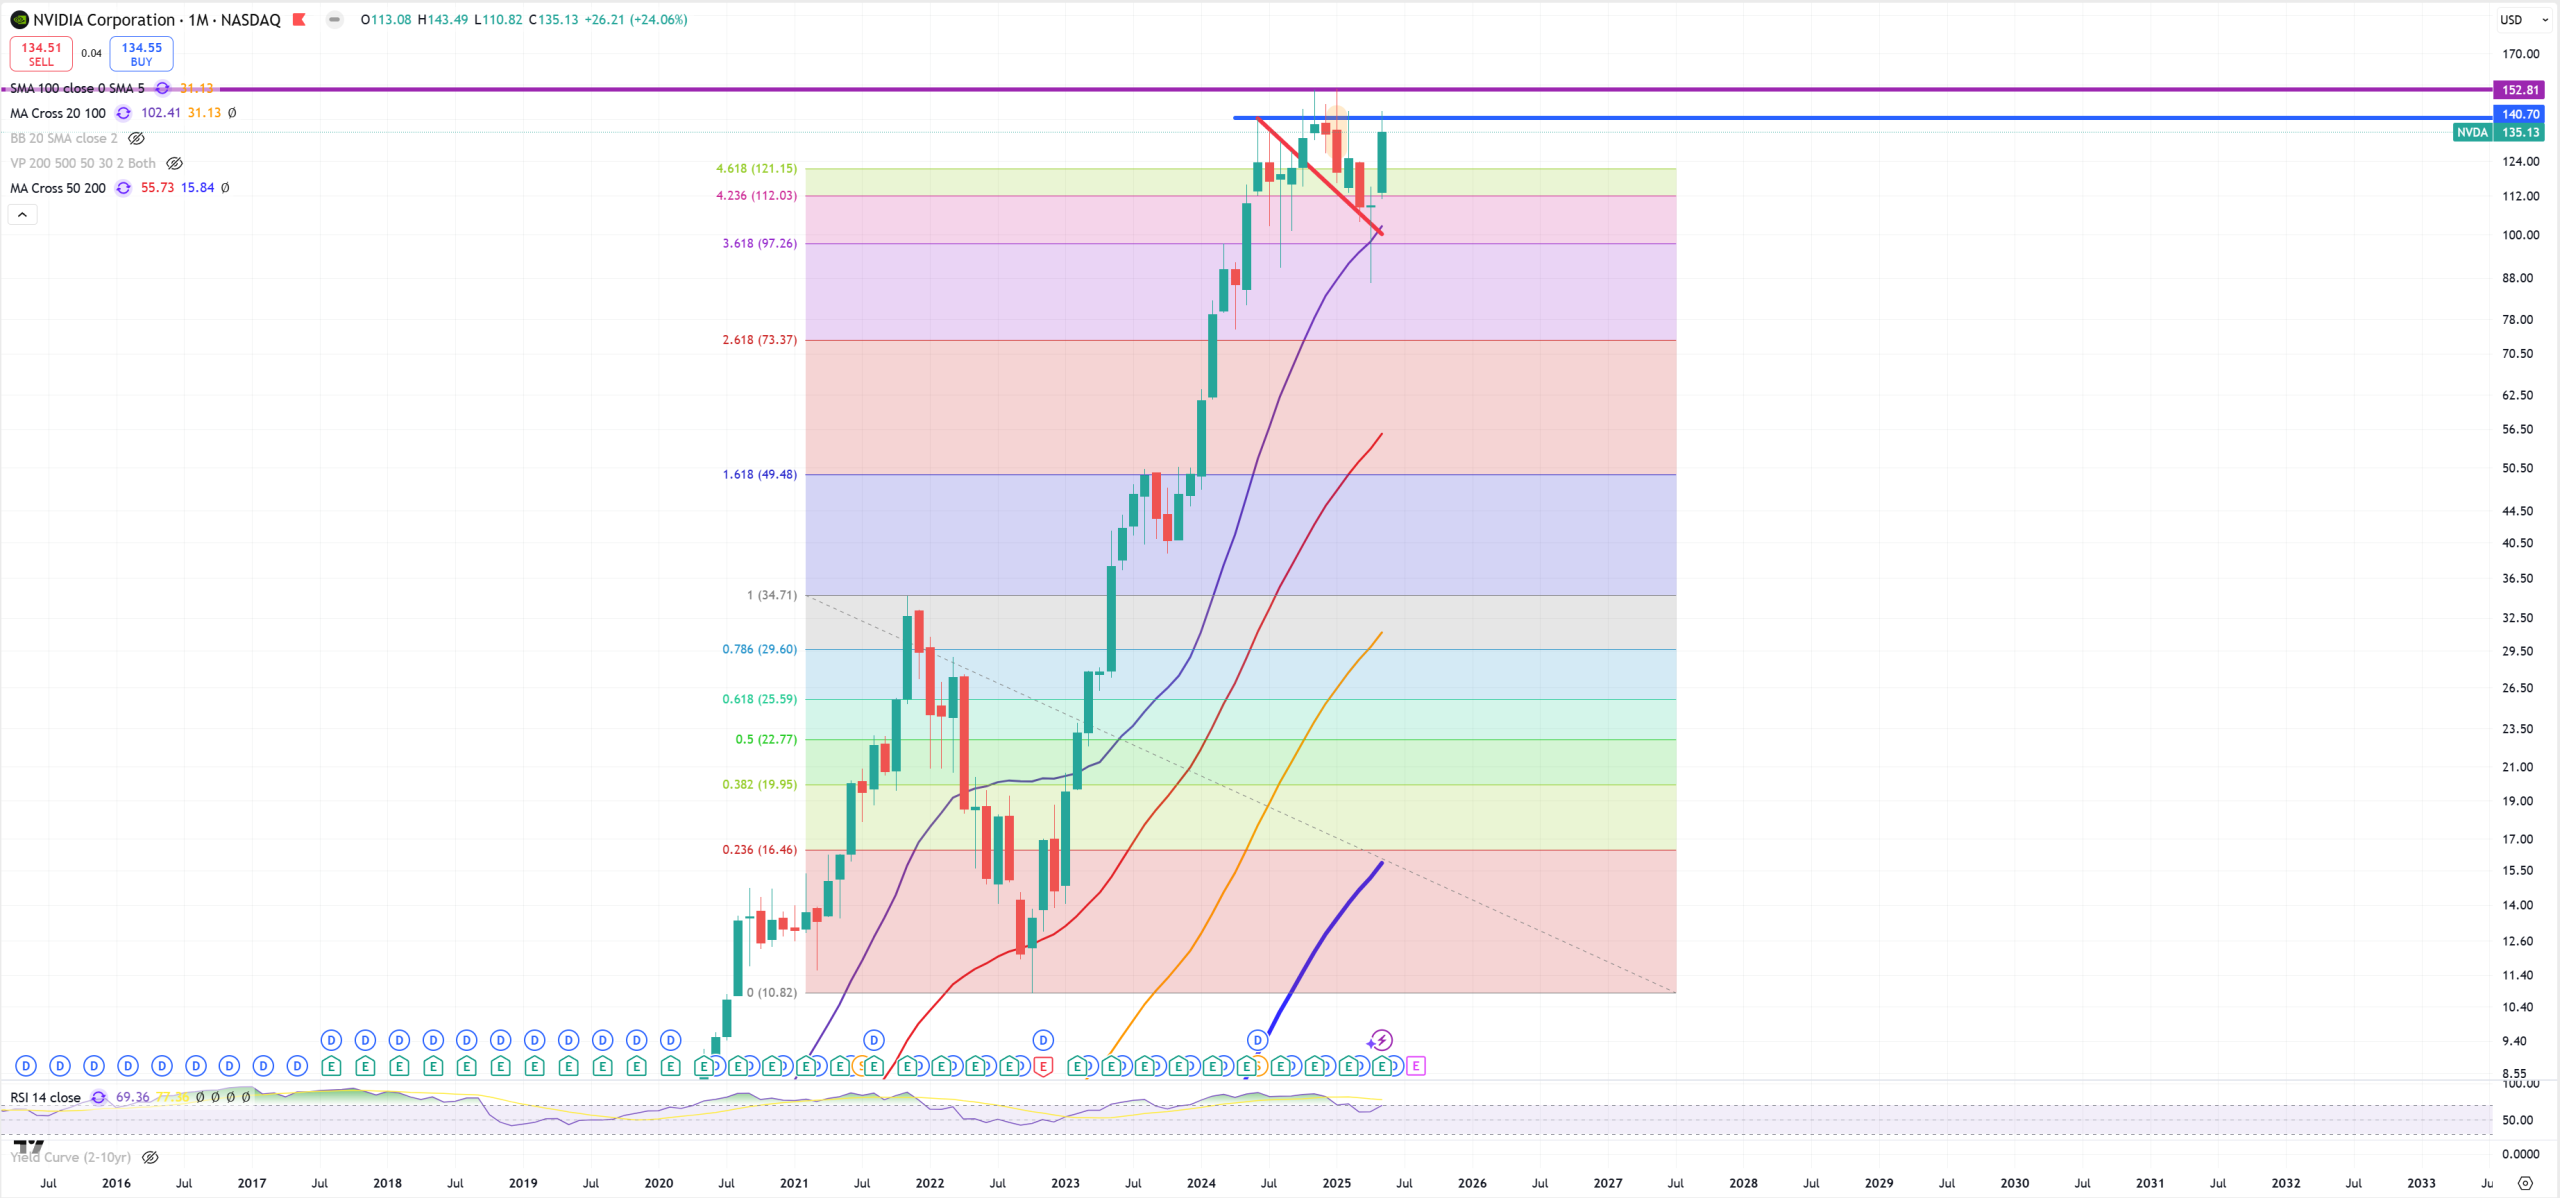
NVDA – and its ~140$ level as a key resistance. (M)MA50 is 55$, (M)MA200 is 15$ – this is a massive technical bubble. I mean really massive.
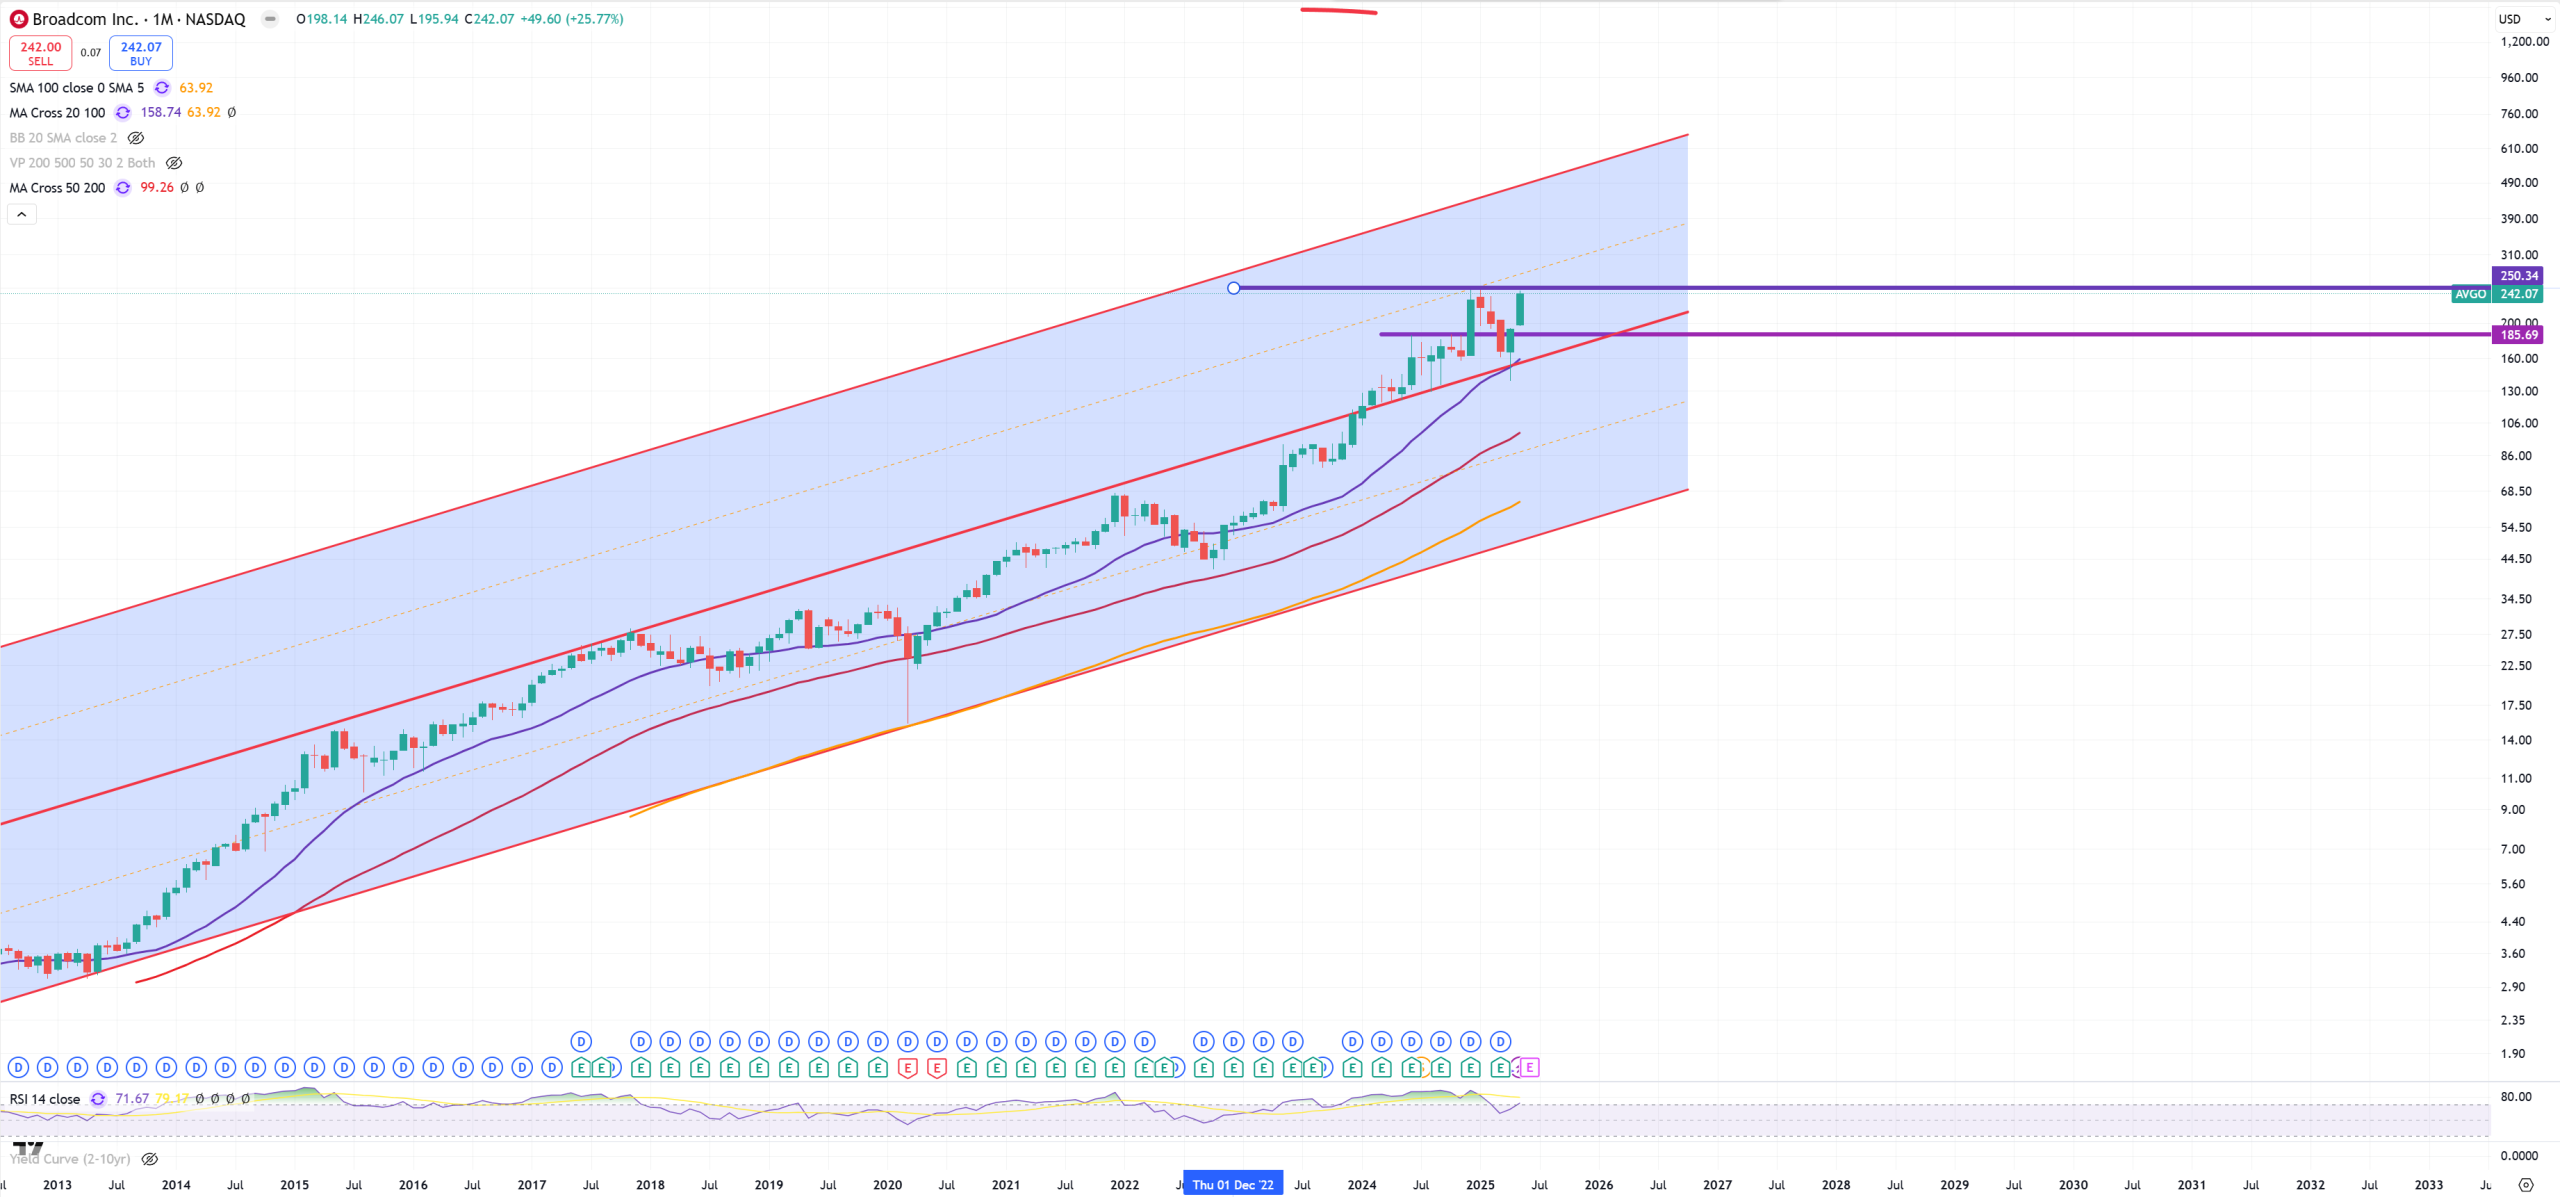
AVGO – 250$ is a key resistance
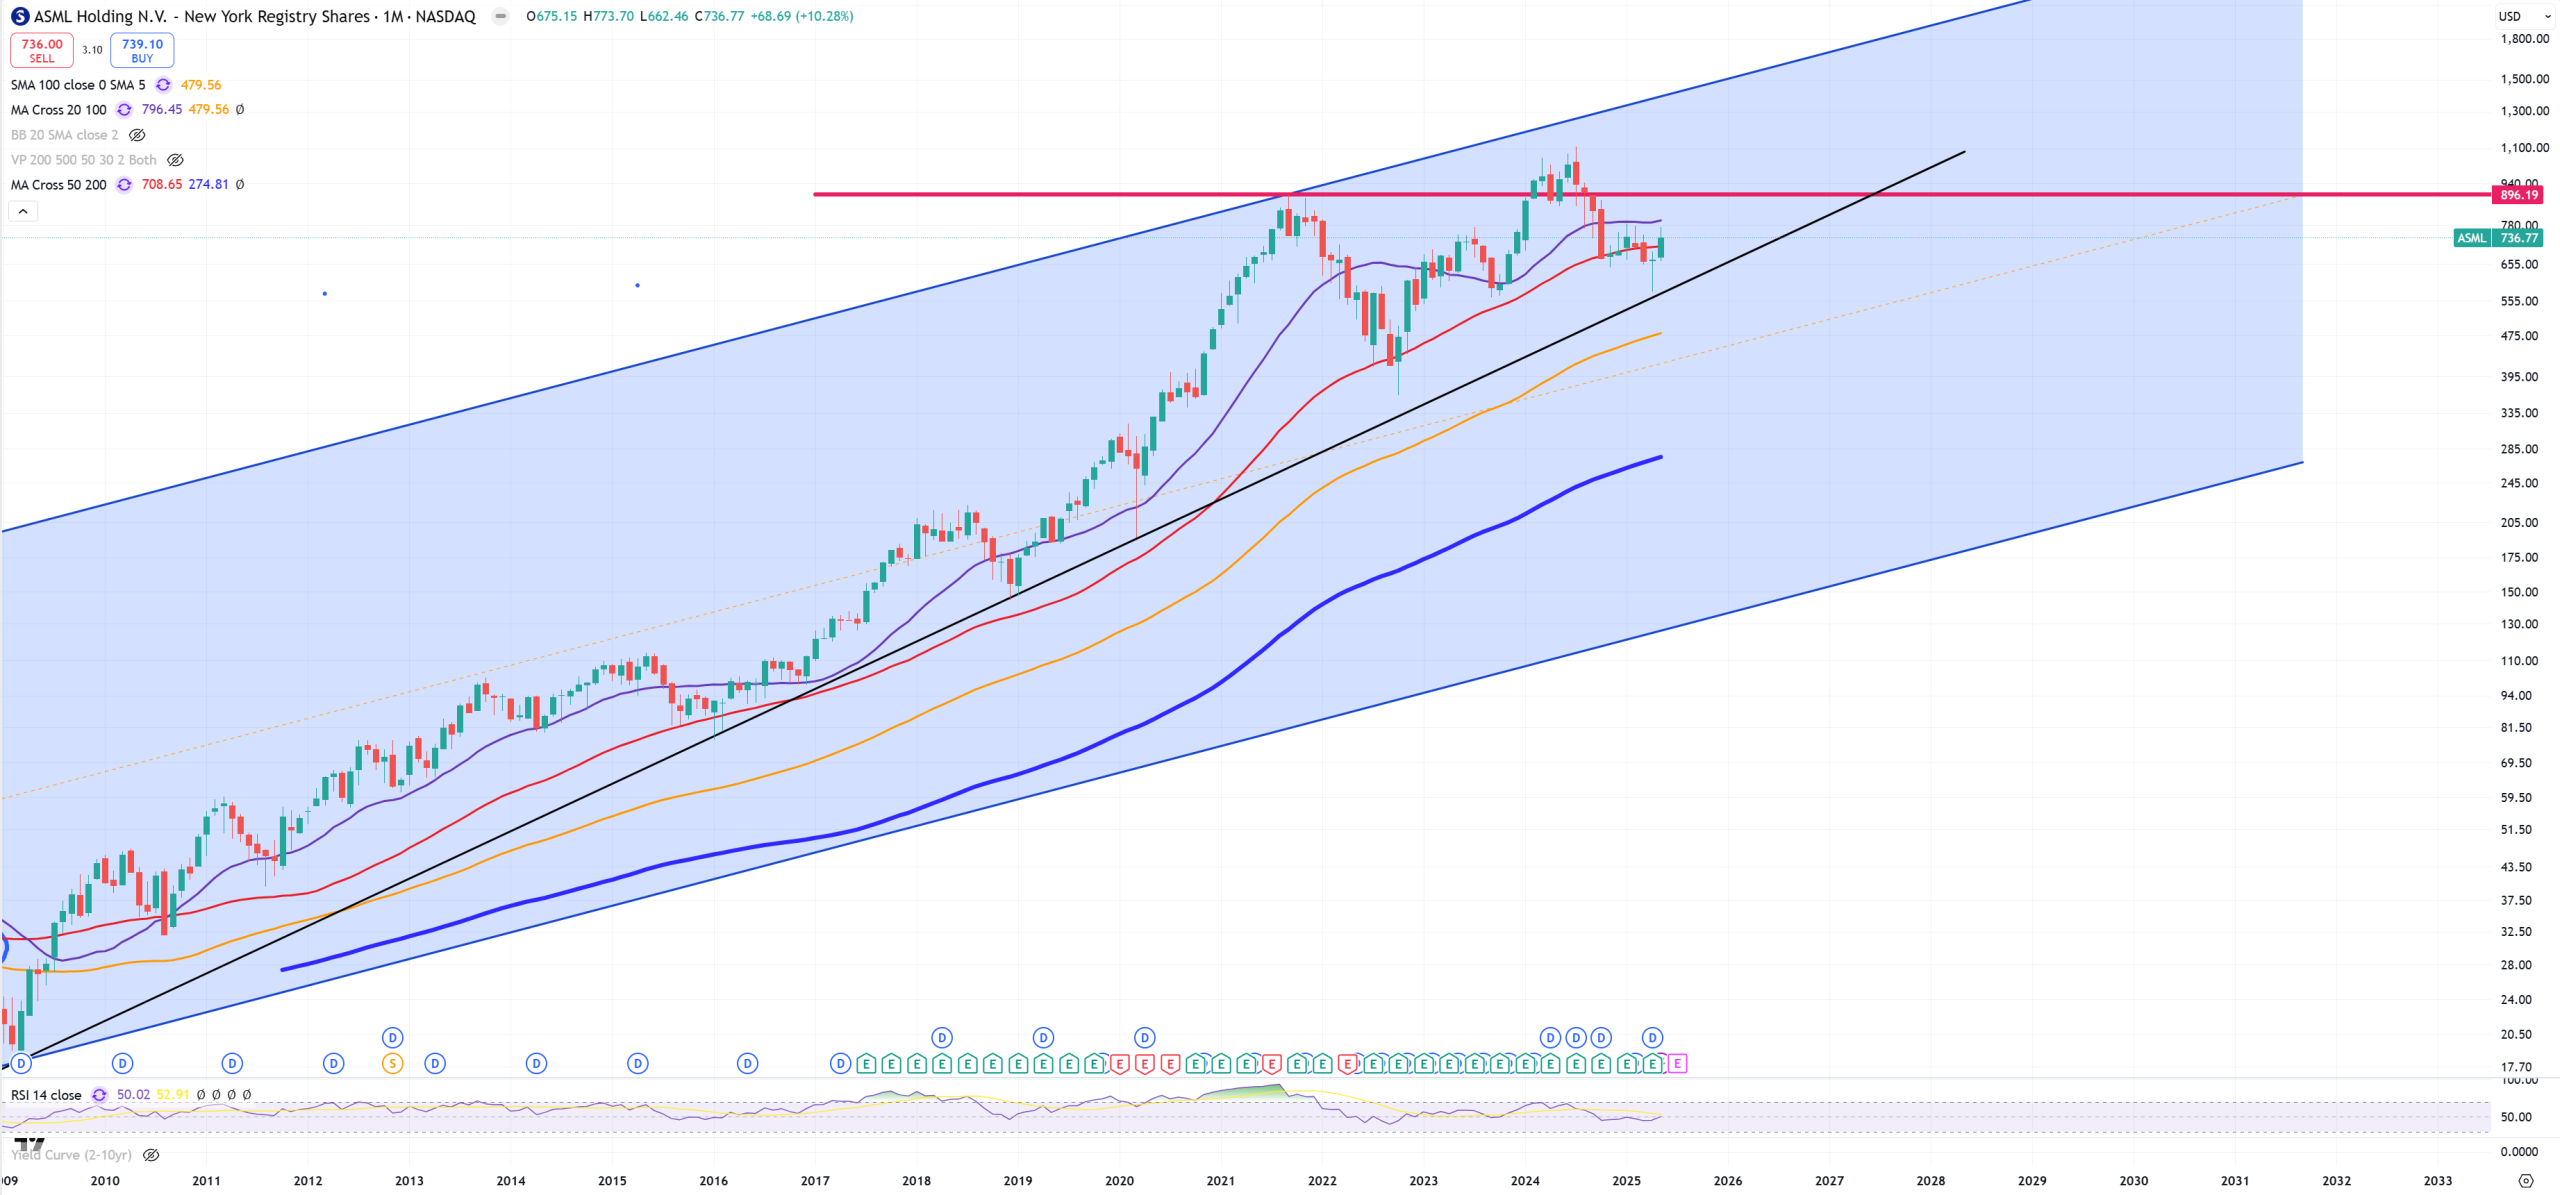
ASML – holds (M)MA50
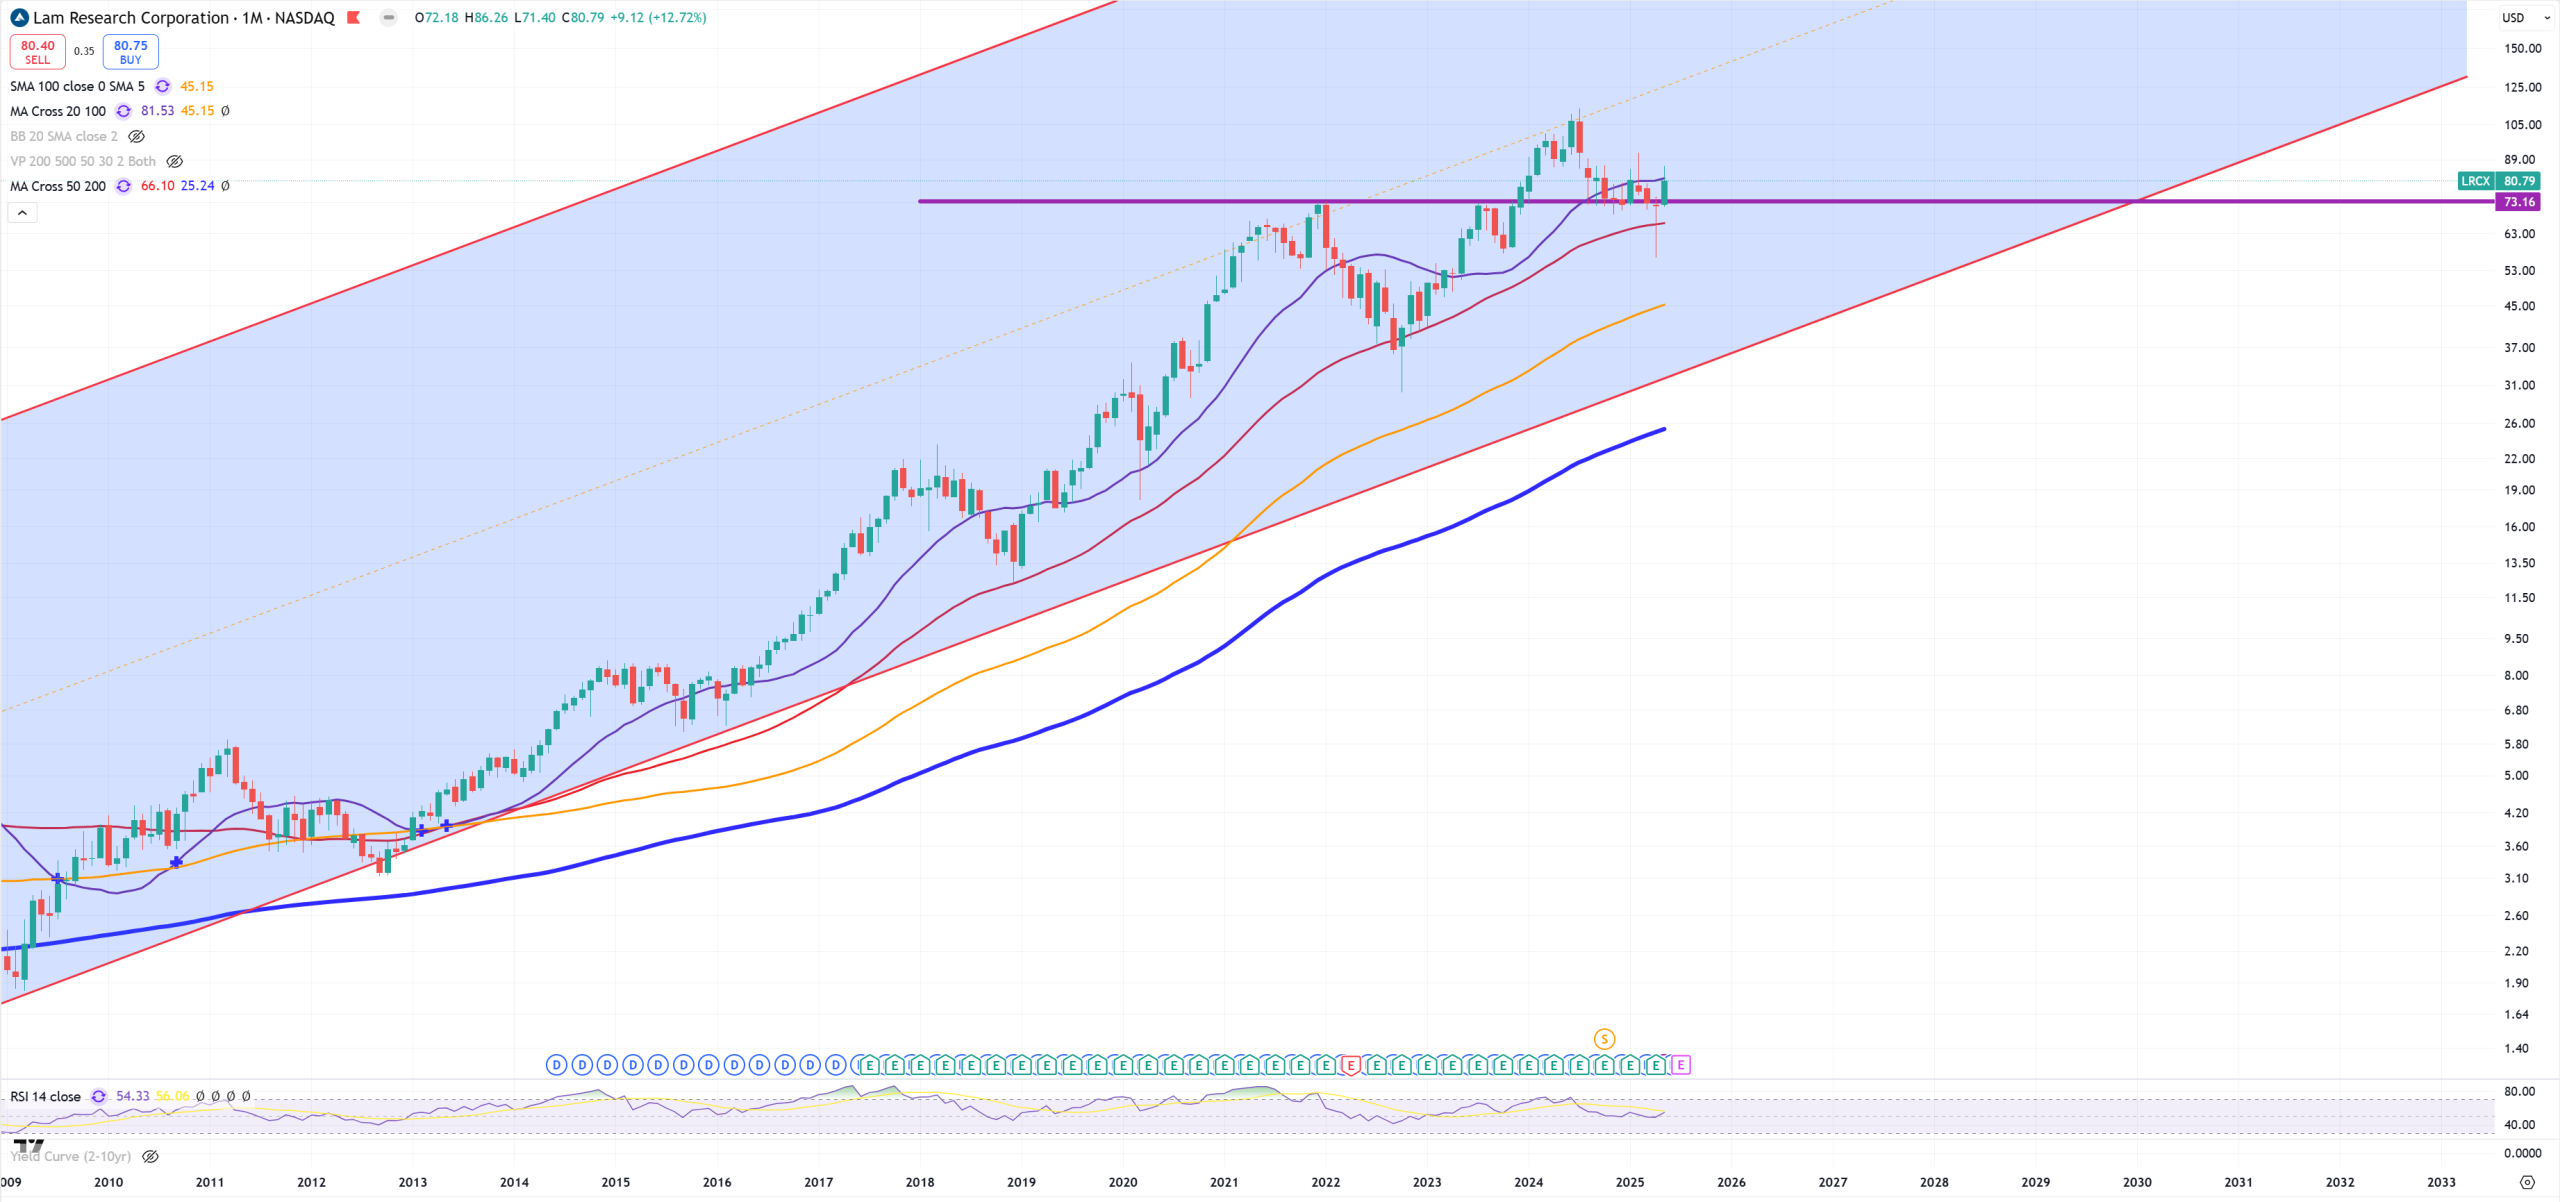
LRCX – tries to hold above 2021 support
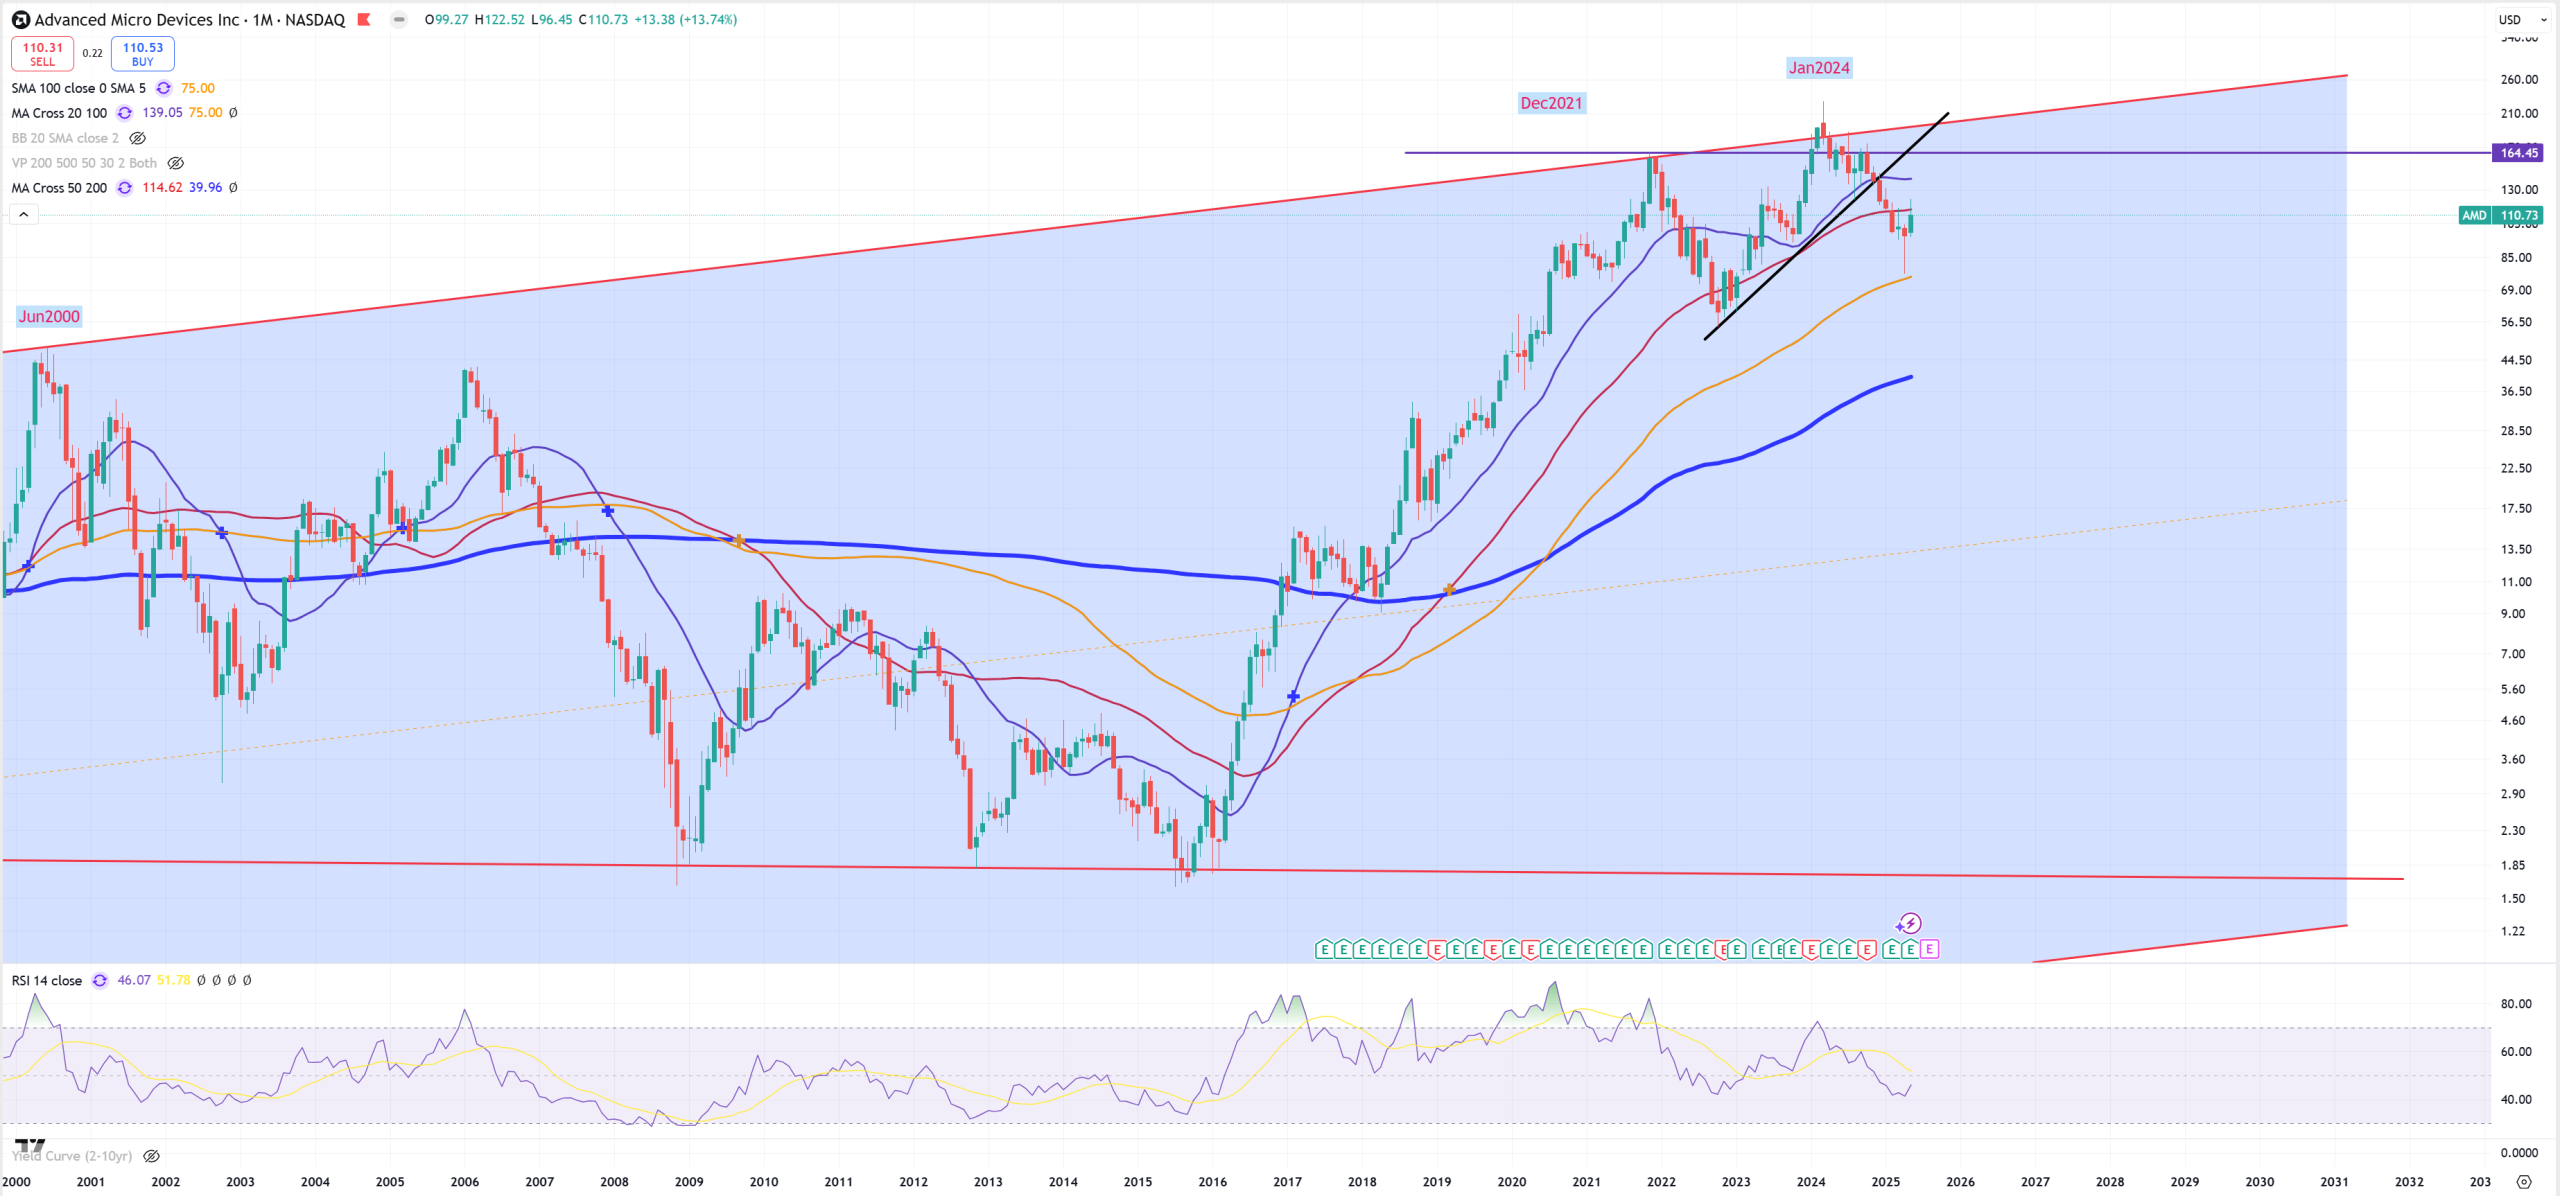
AMD lost (M)MA50 so far, but in 2022 it was trying to do the same, turned out to be a big bear trap.
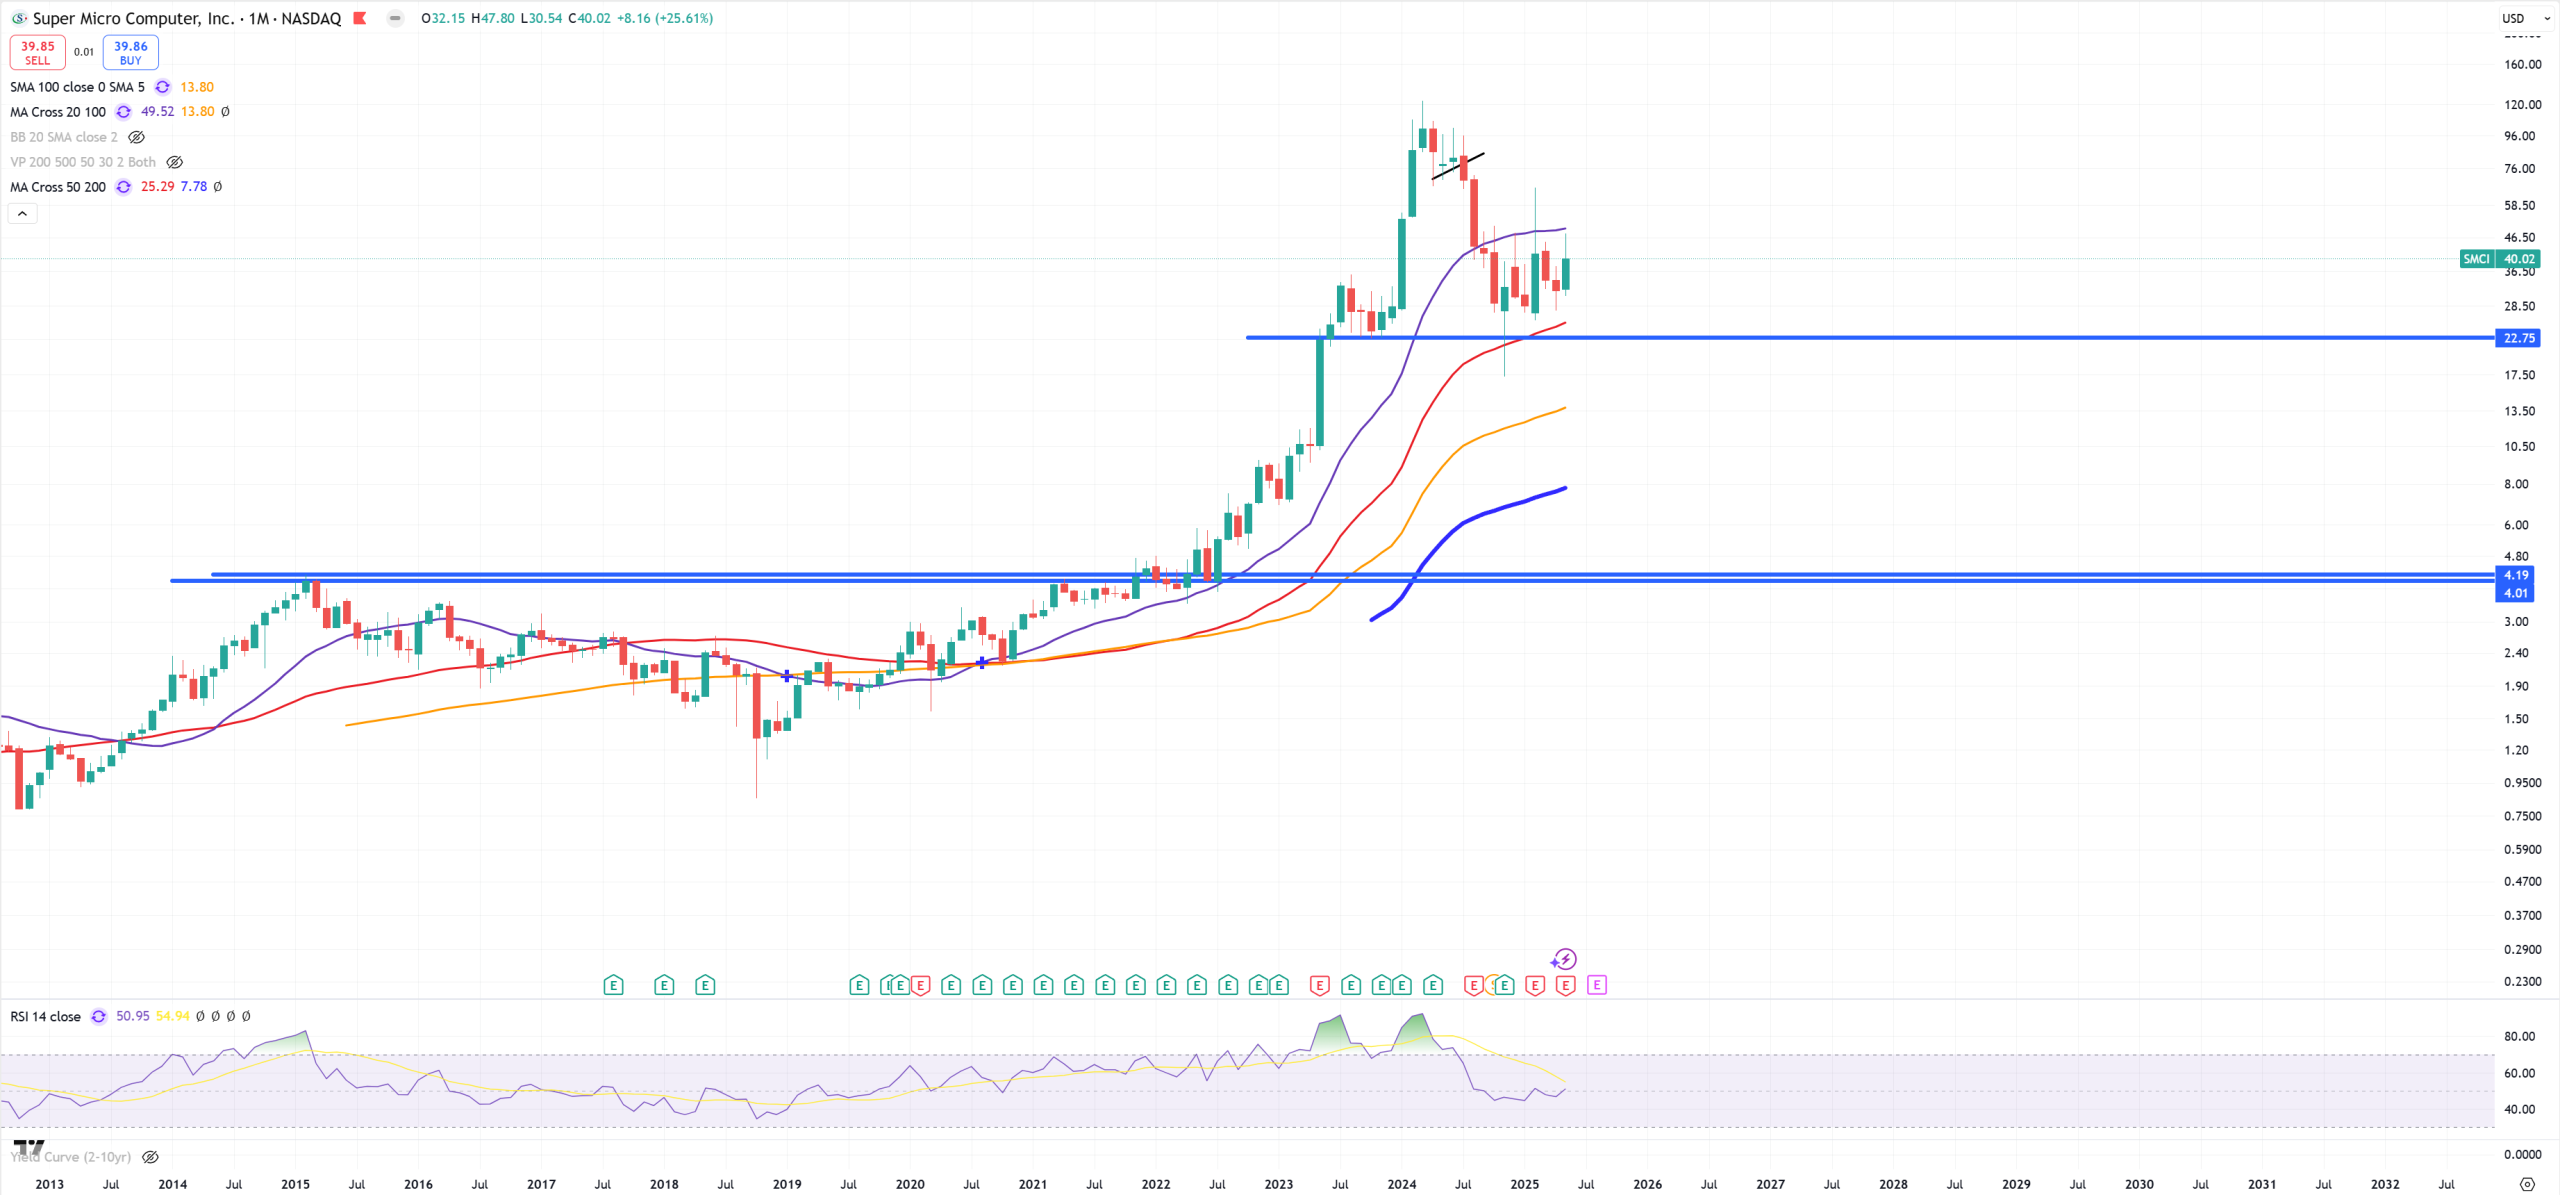
SMCI – it consolidates between (M)MA20 and (M)MA50
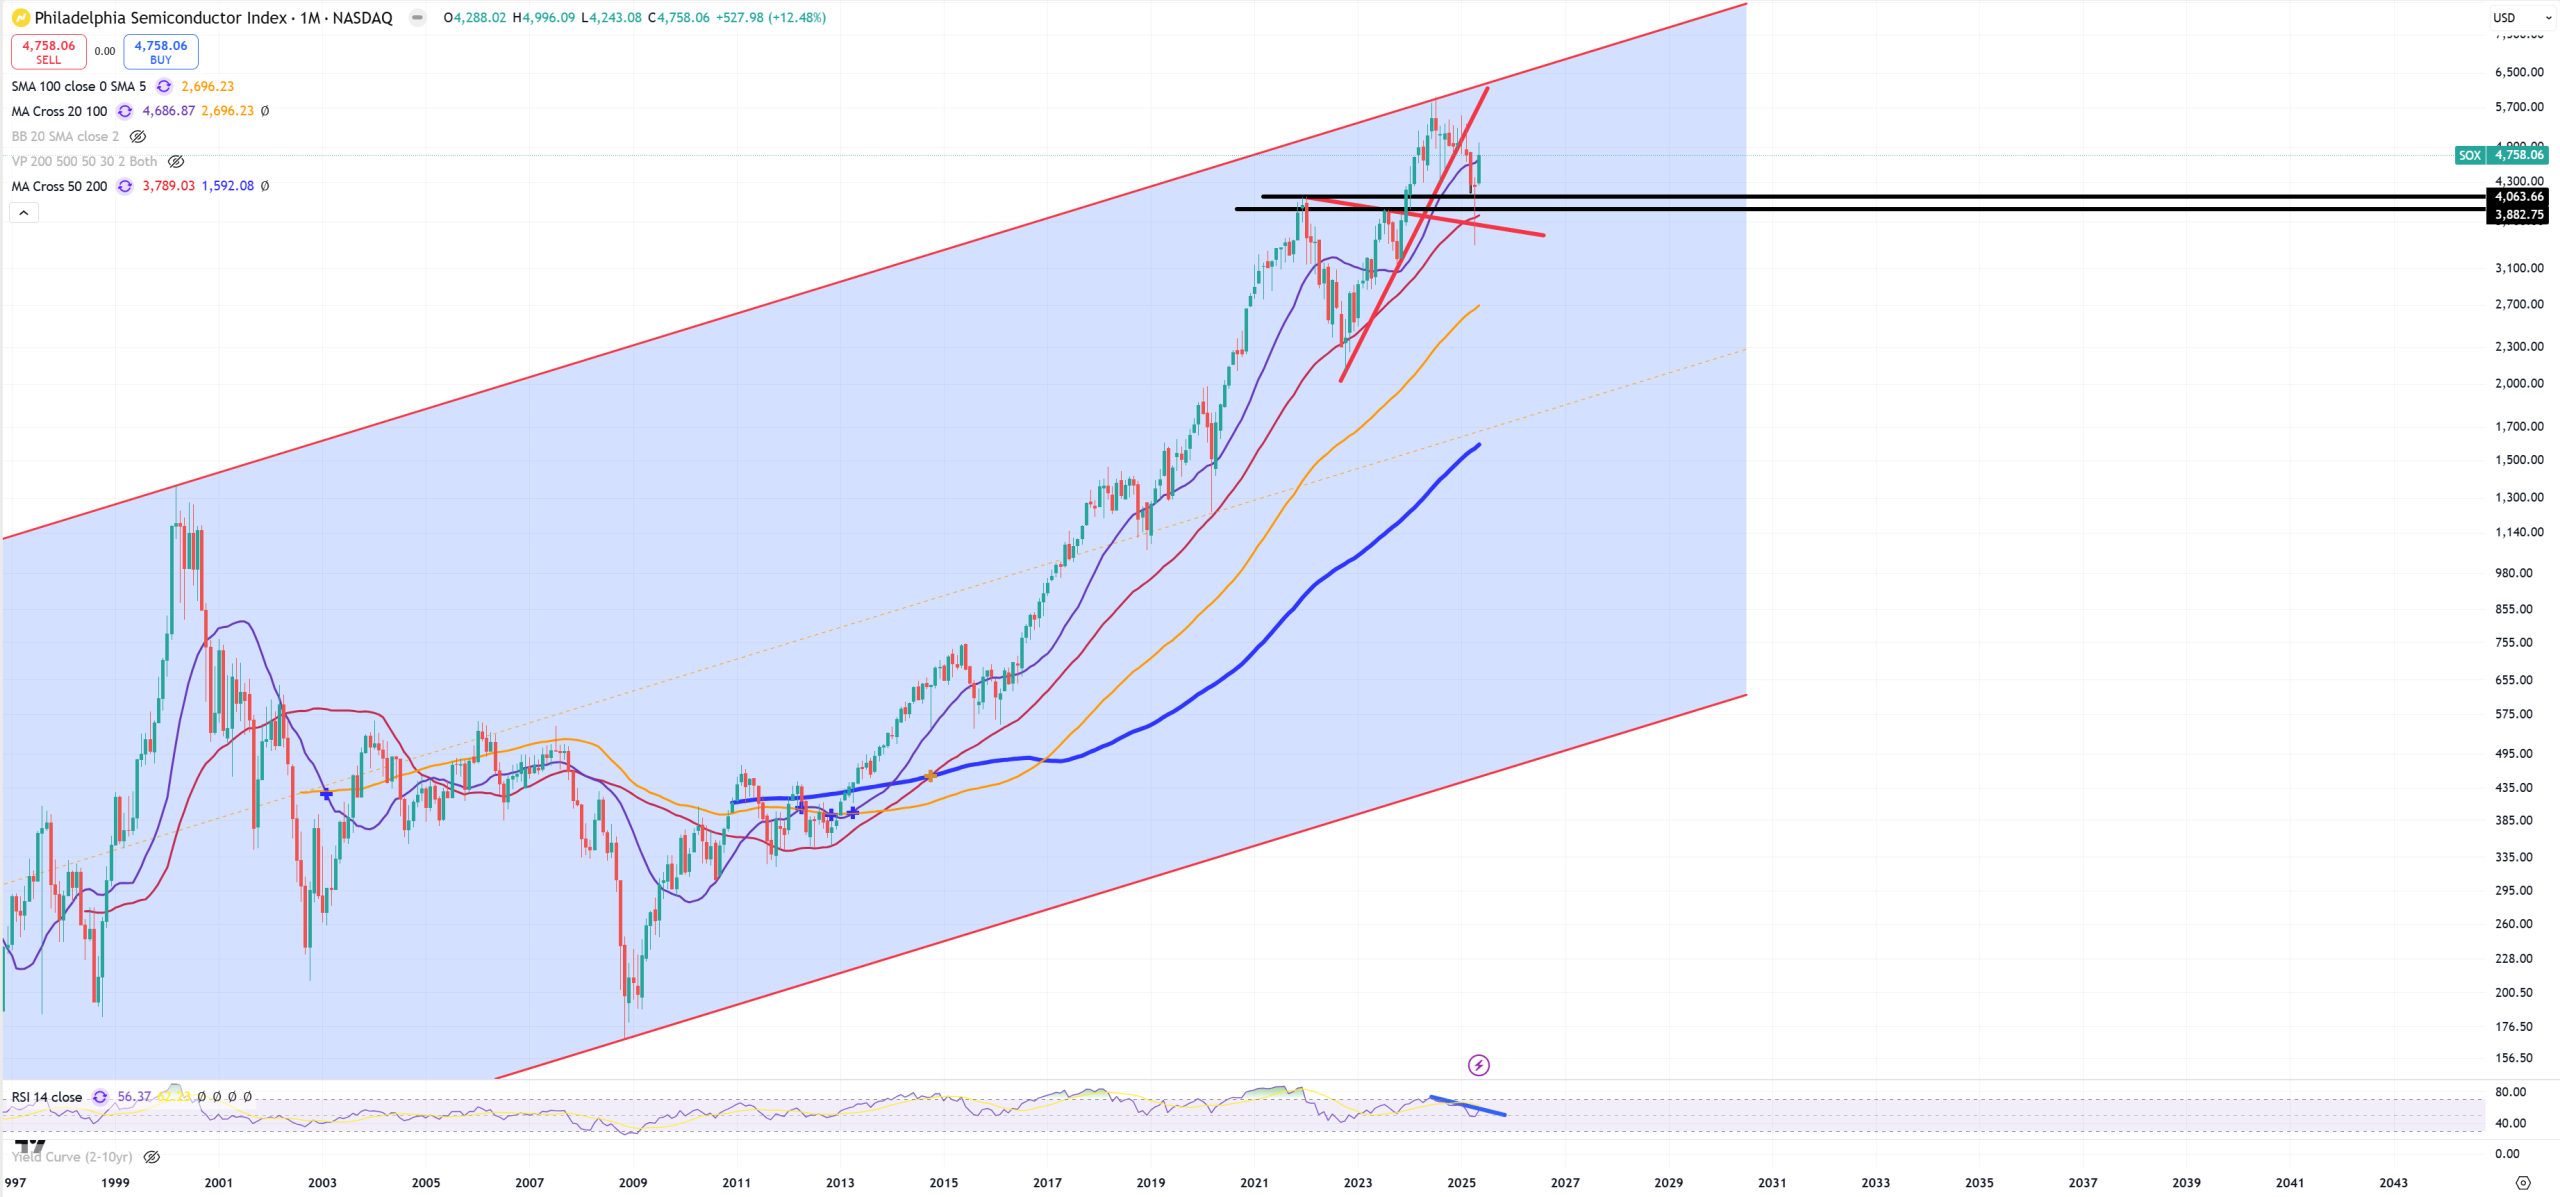
SOX – in general 2021 level holds
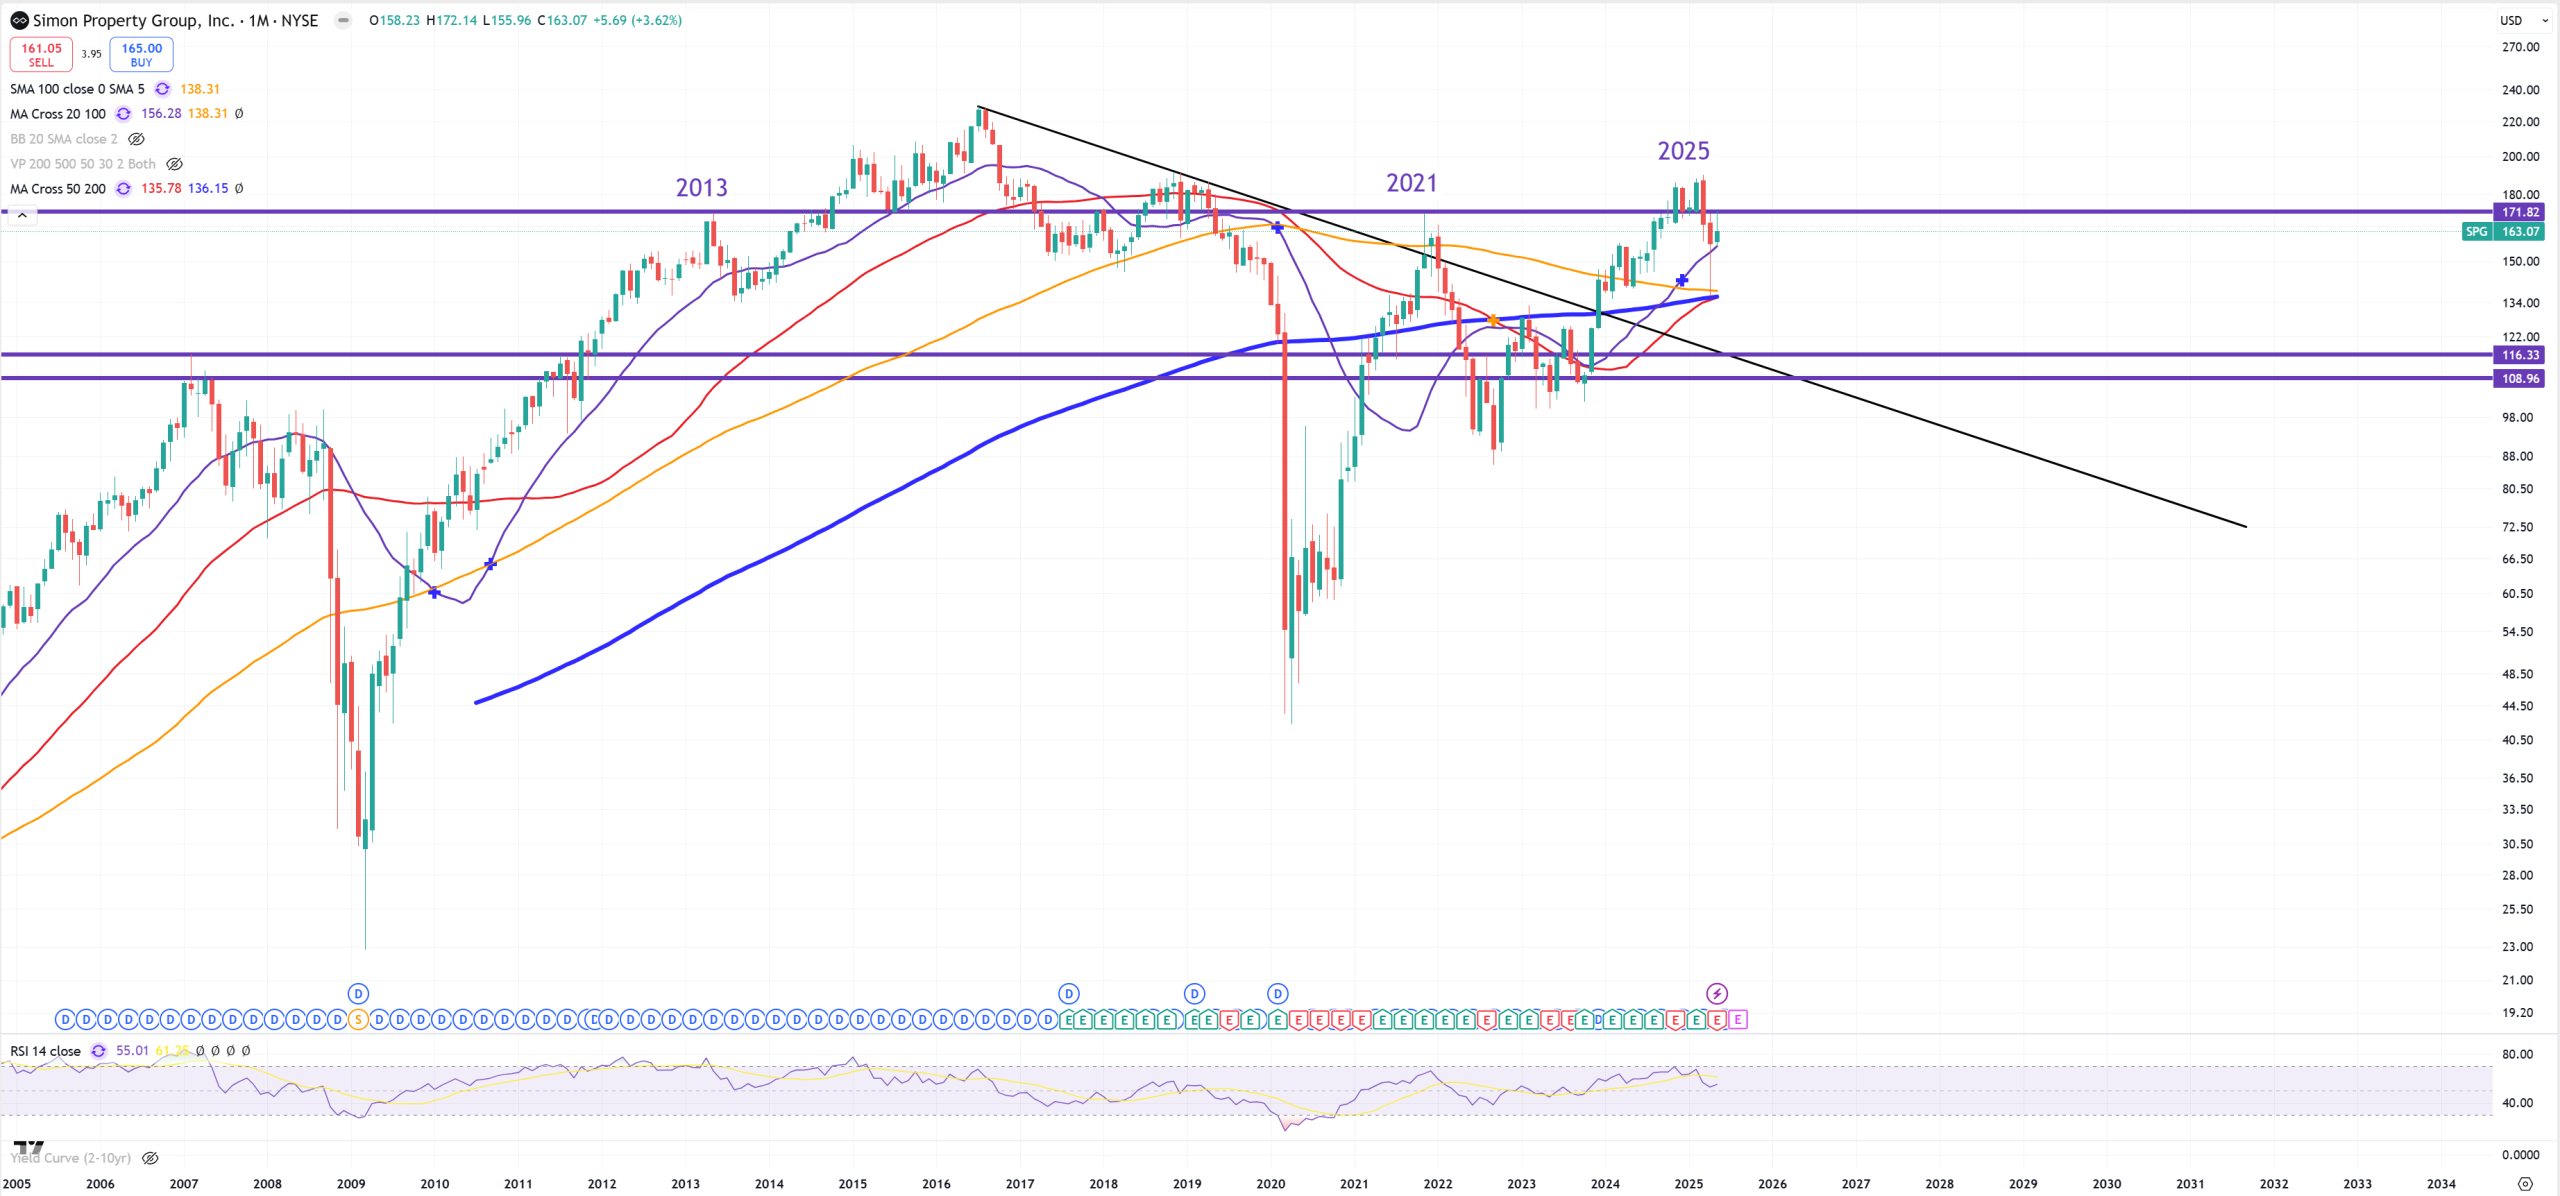
SPG
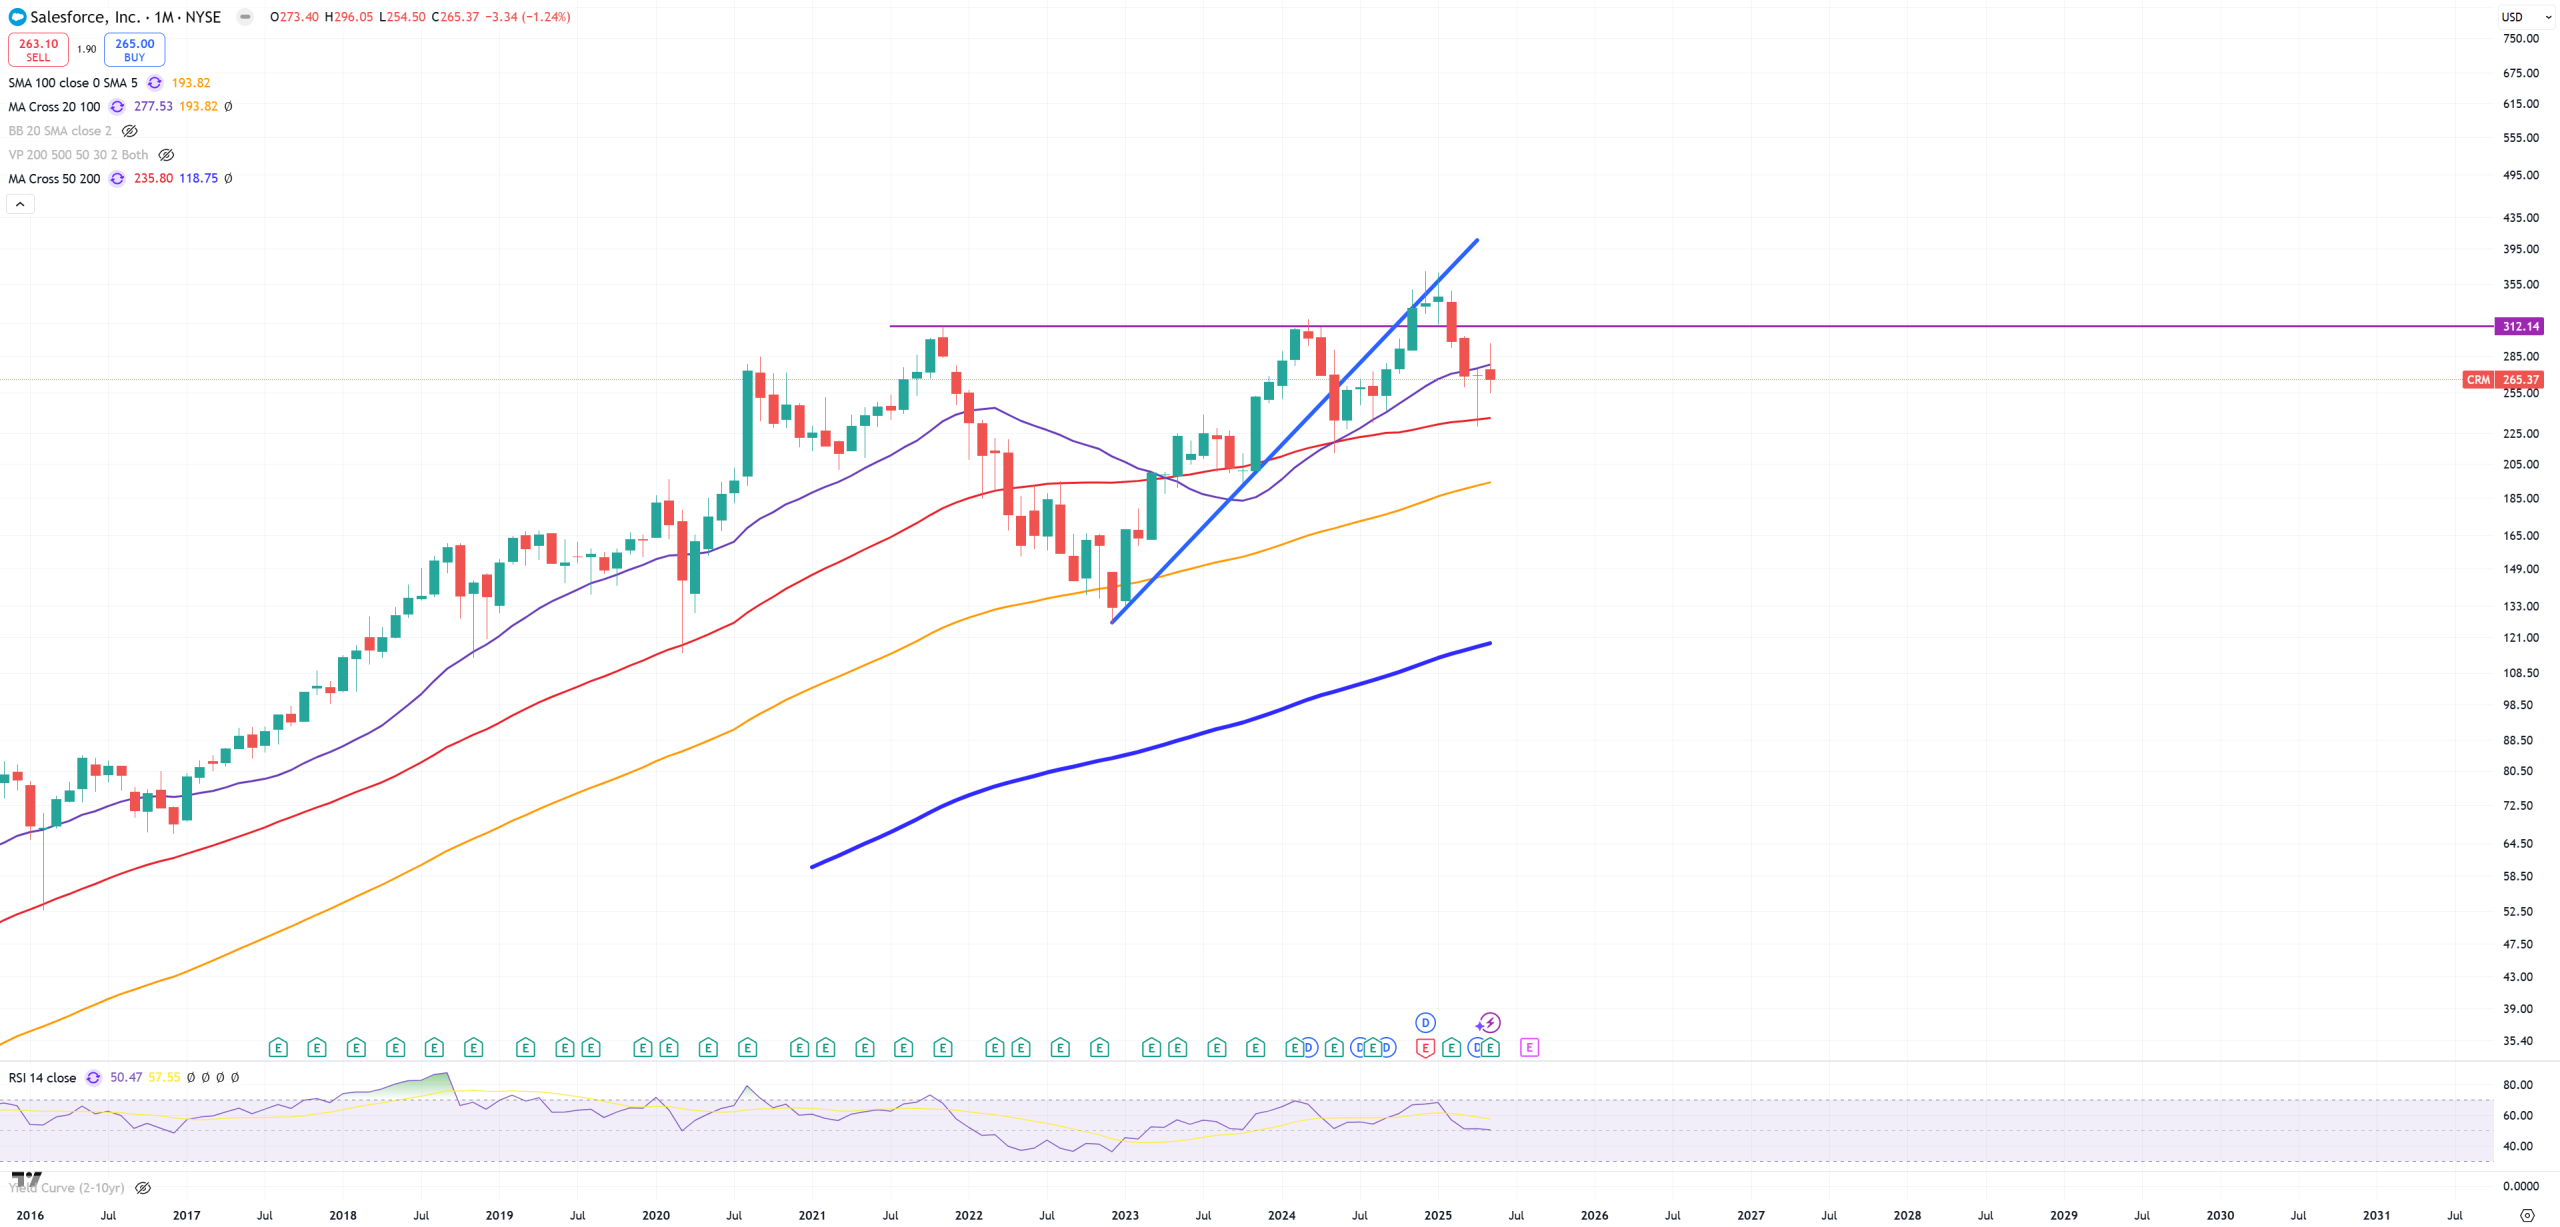
CRM
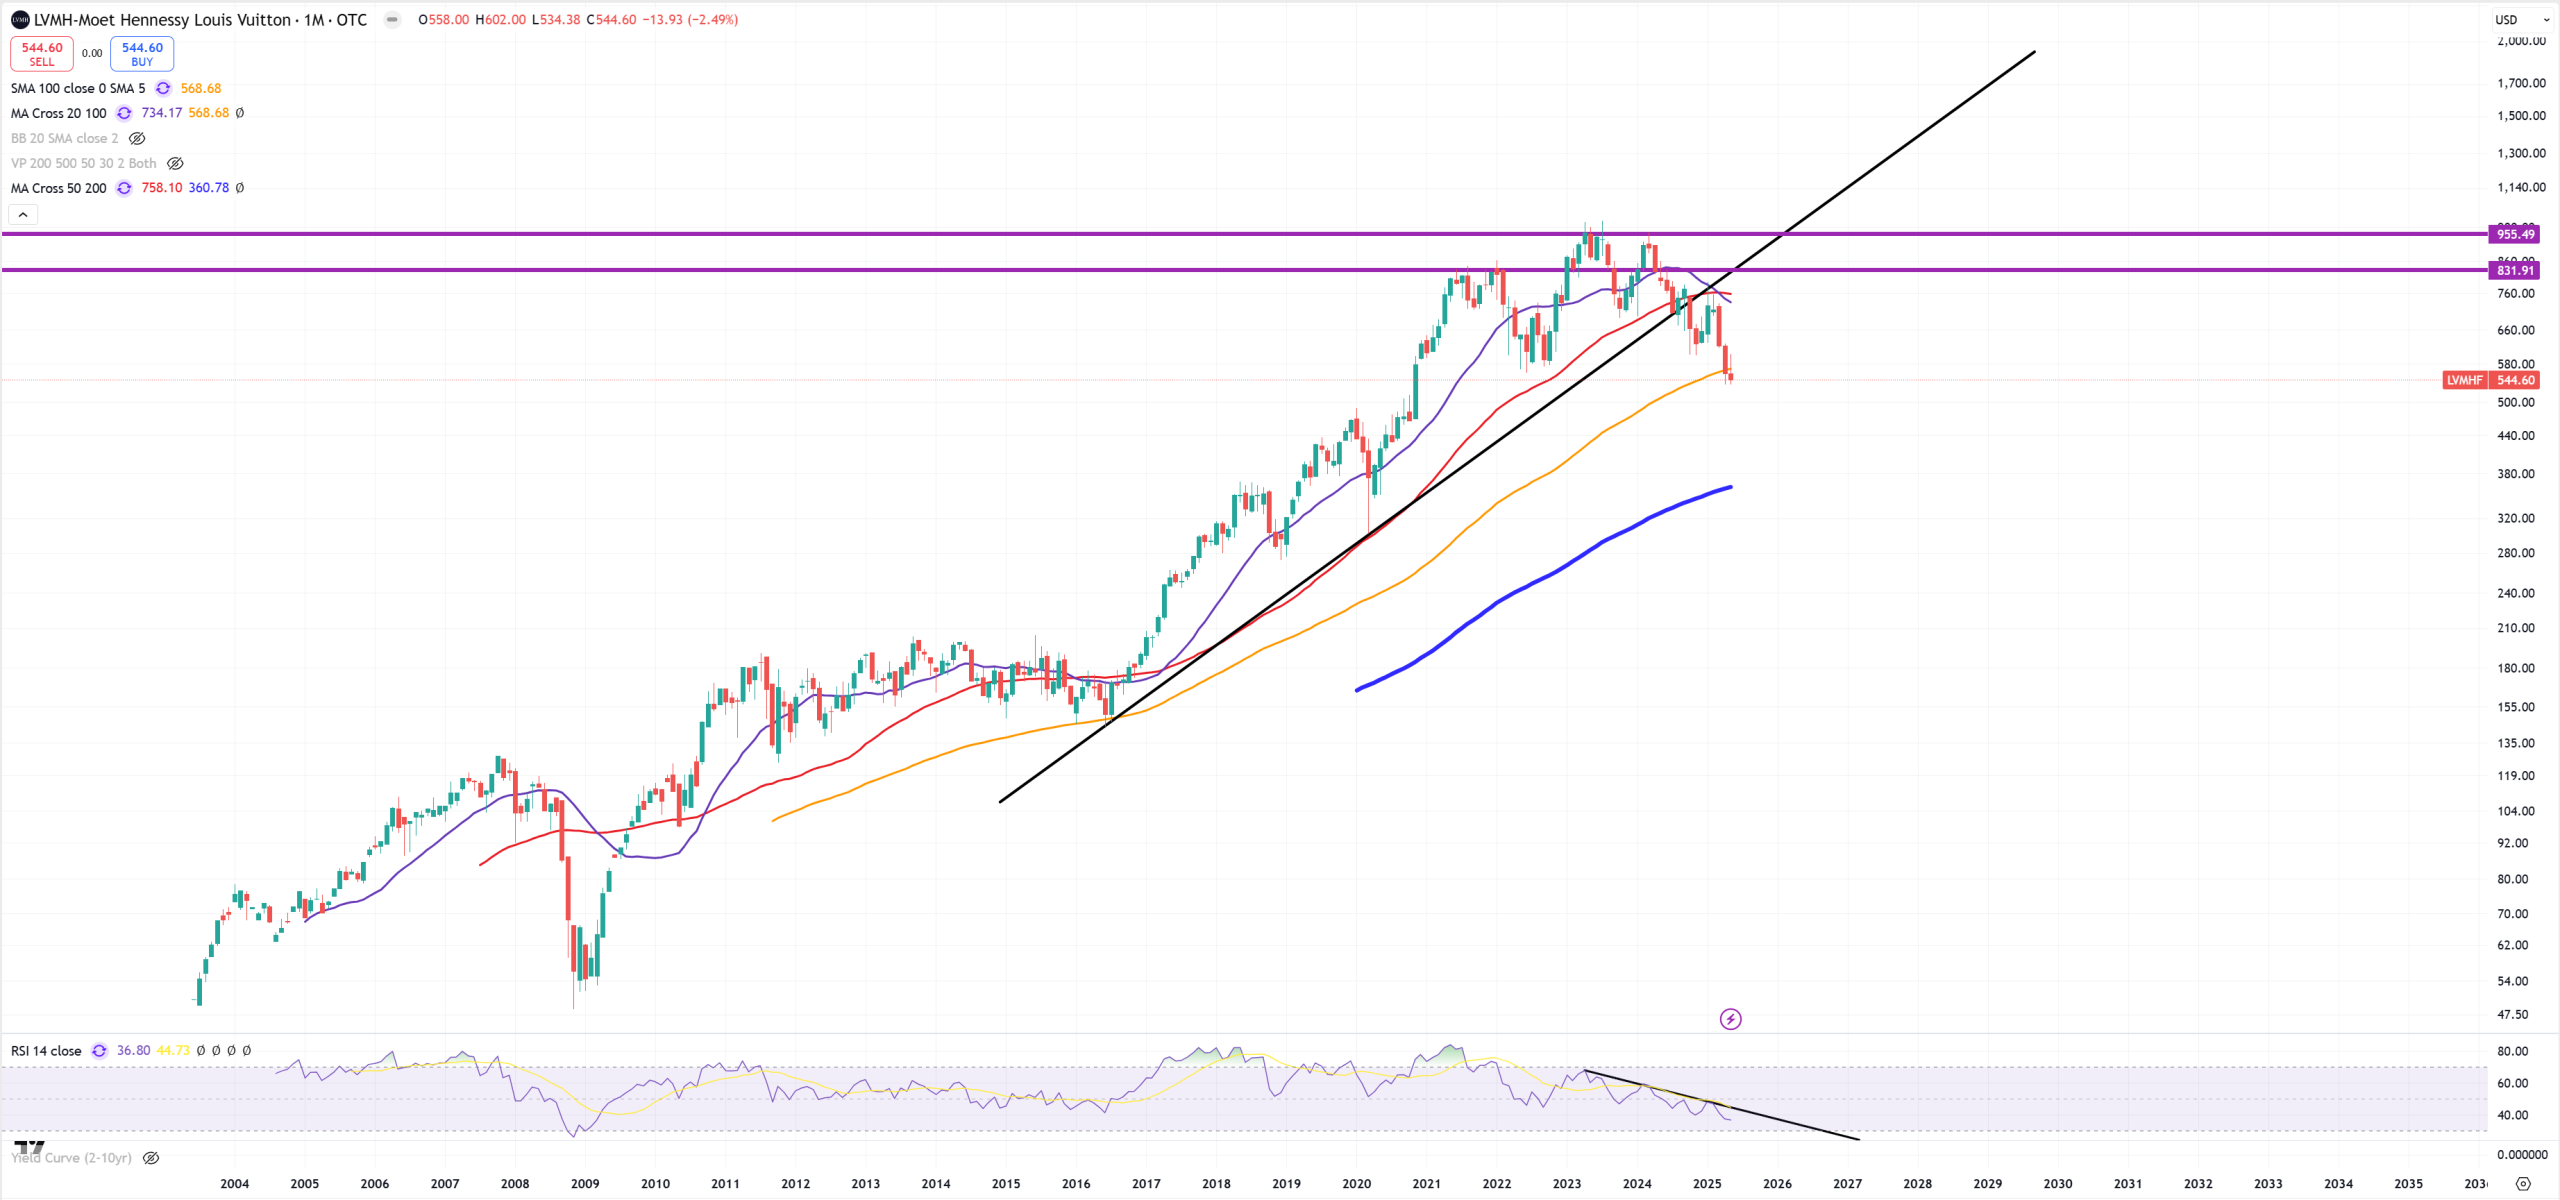
LVMH
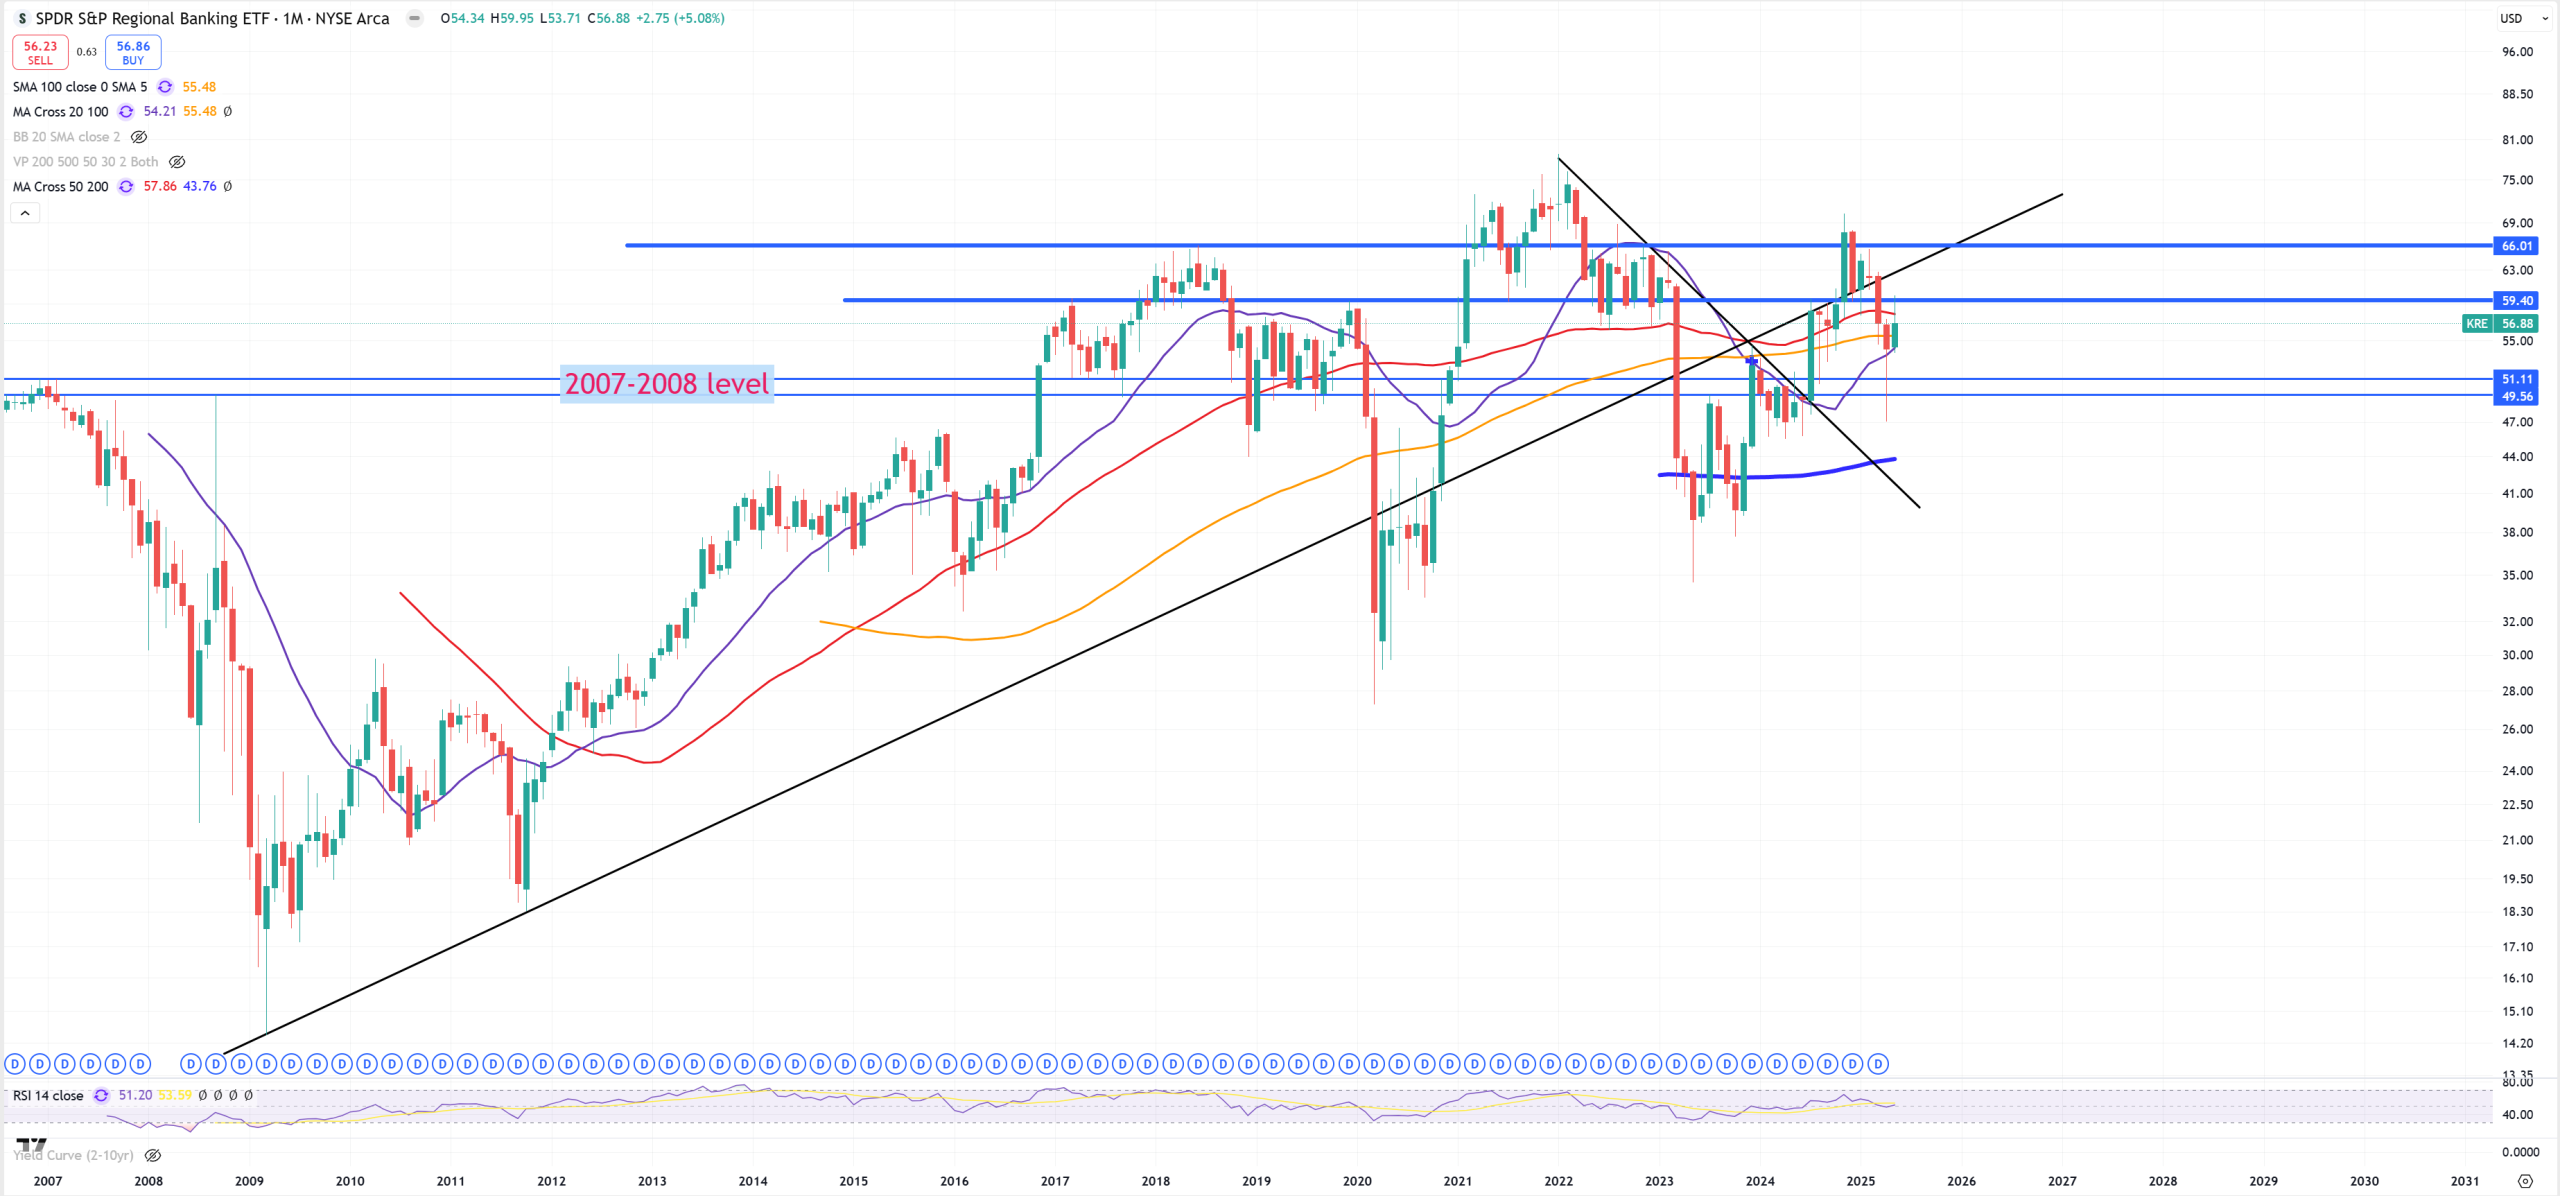
KRE – lost key support 59,40$ (which flips to resistance), trend and (M)MA50
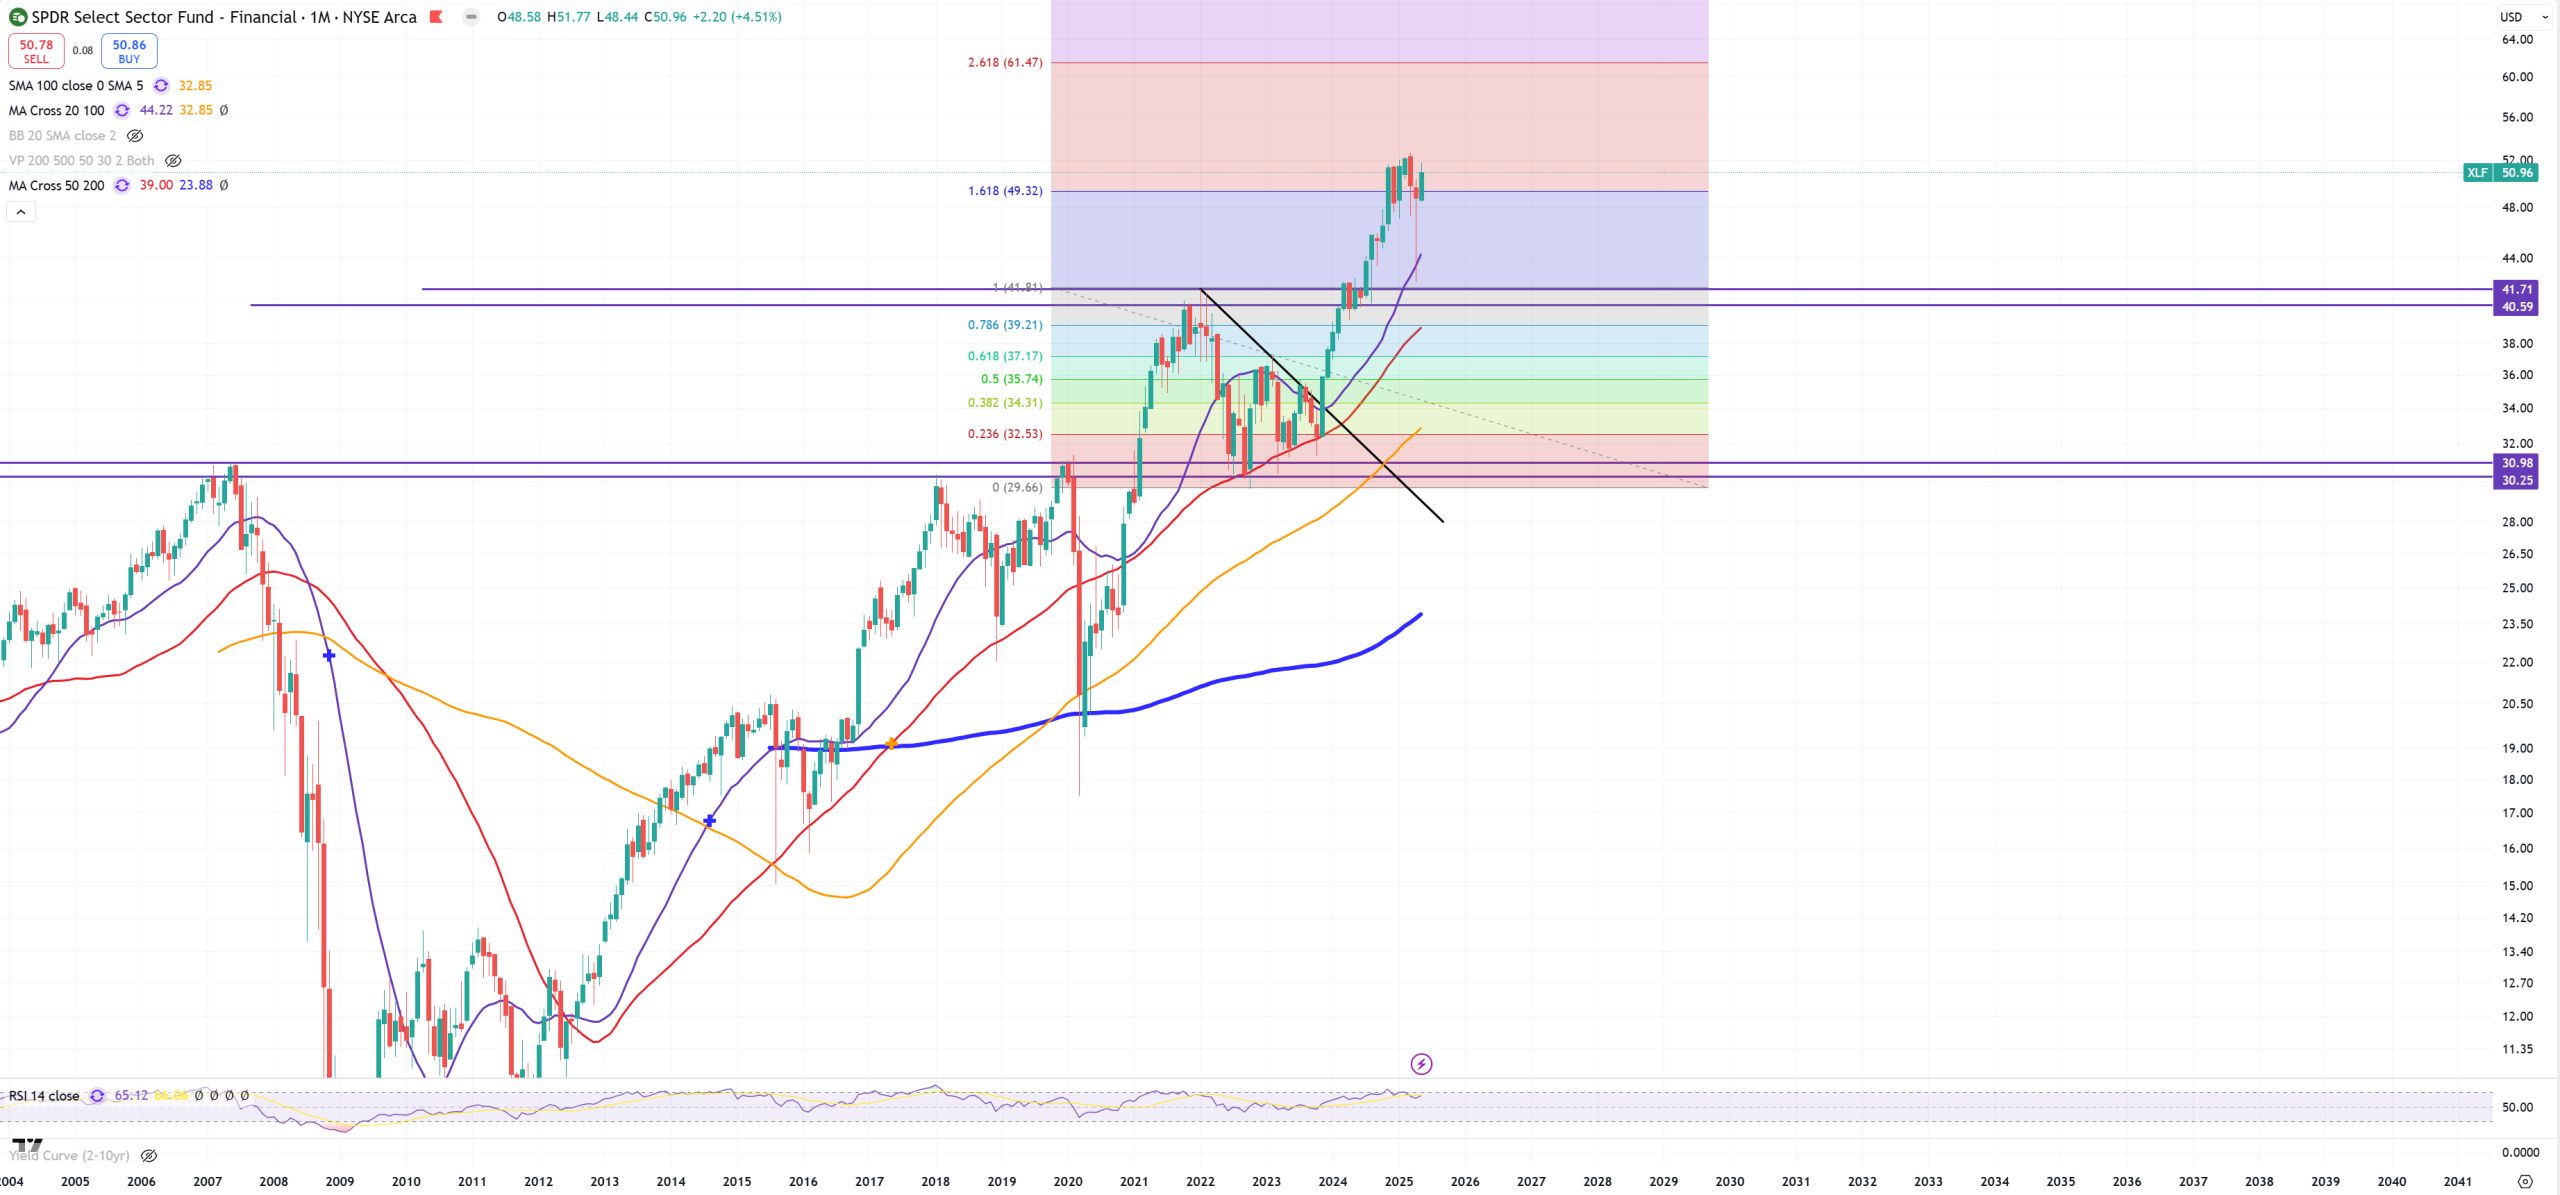
XLF – this still fights with 1.618 level
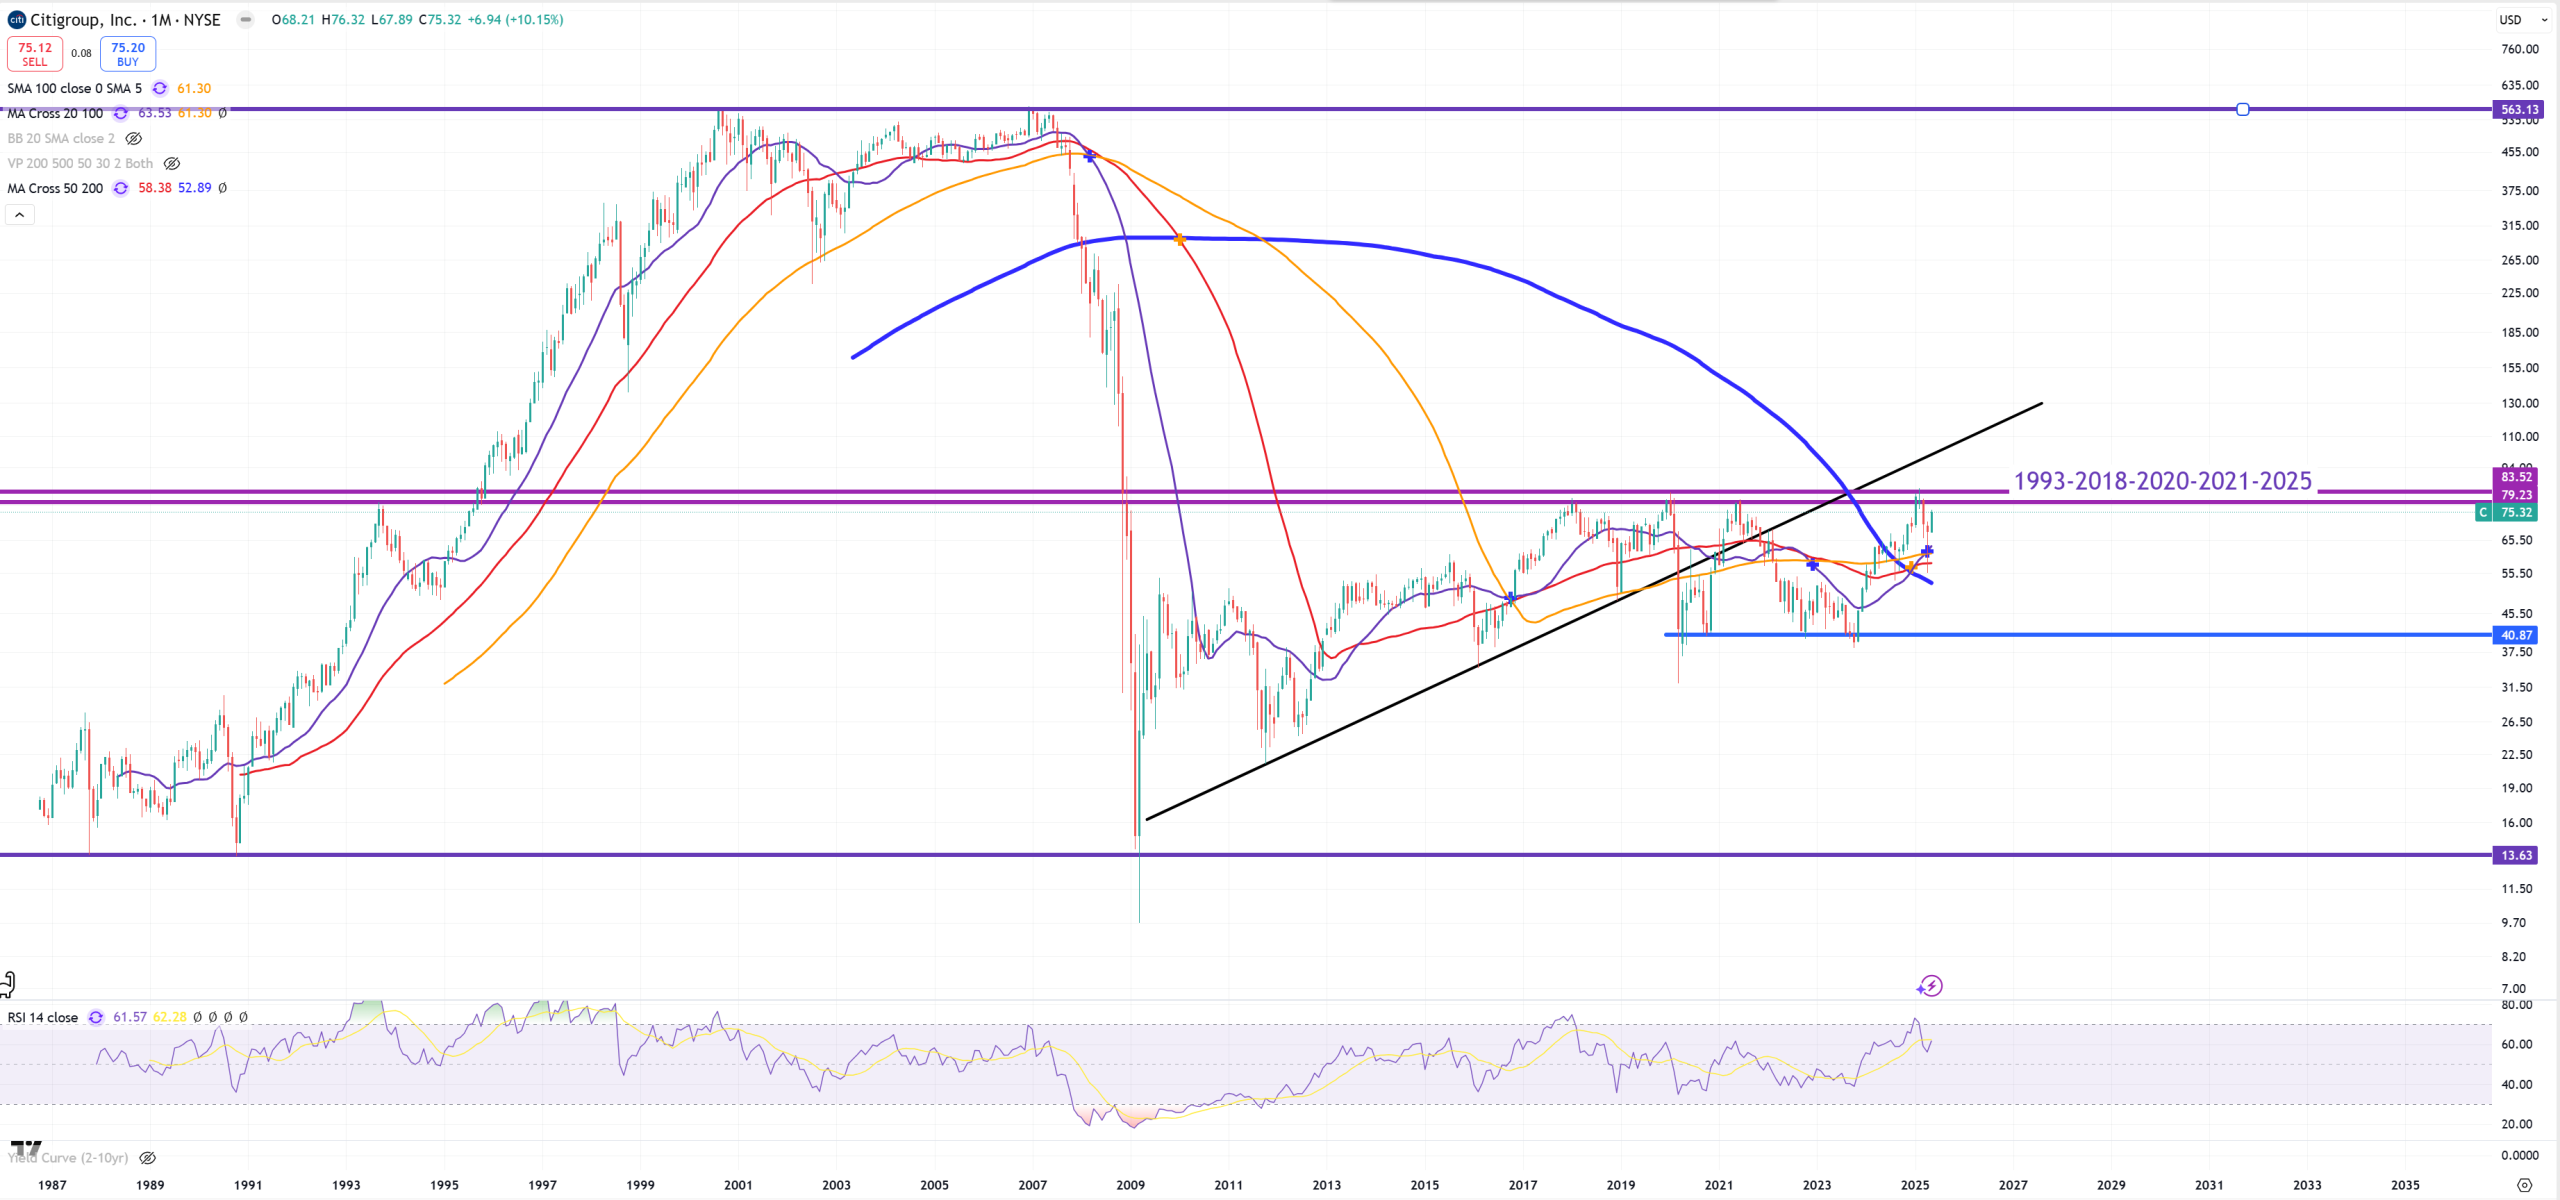
C – Citi
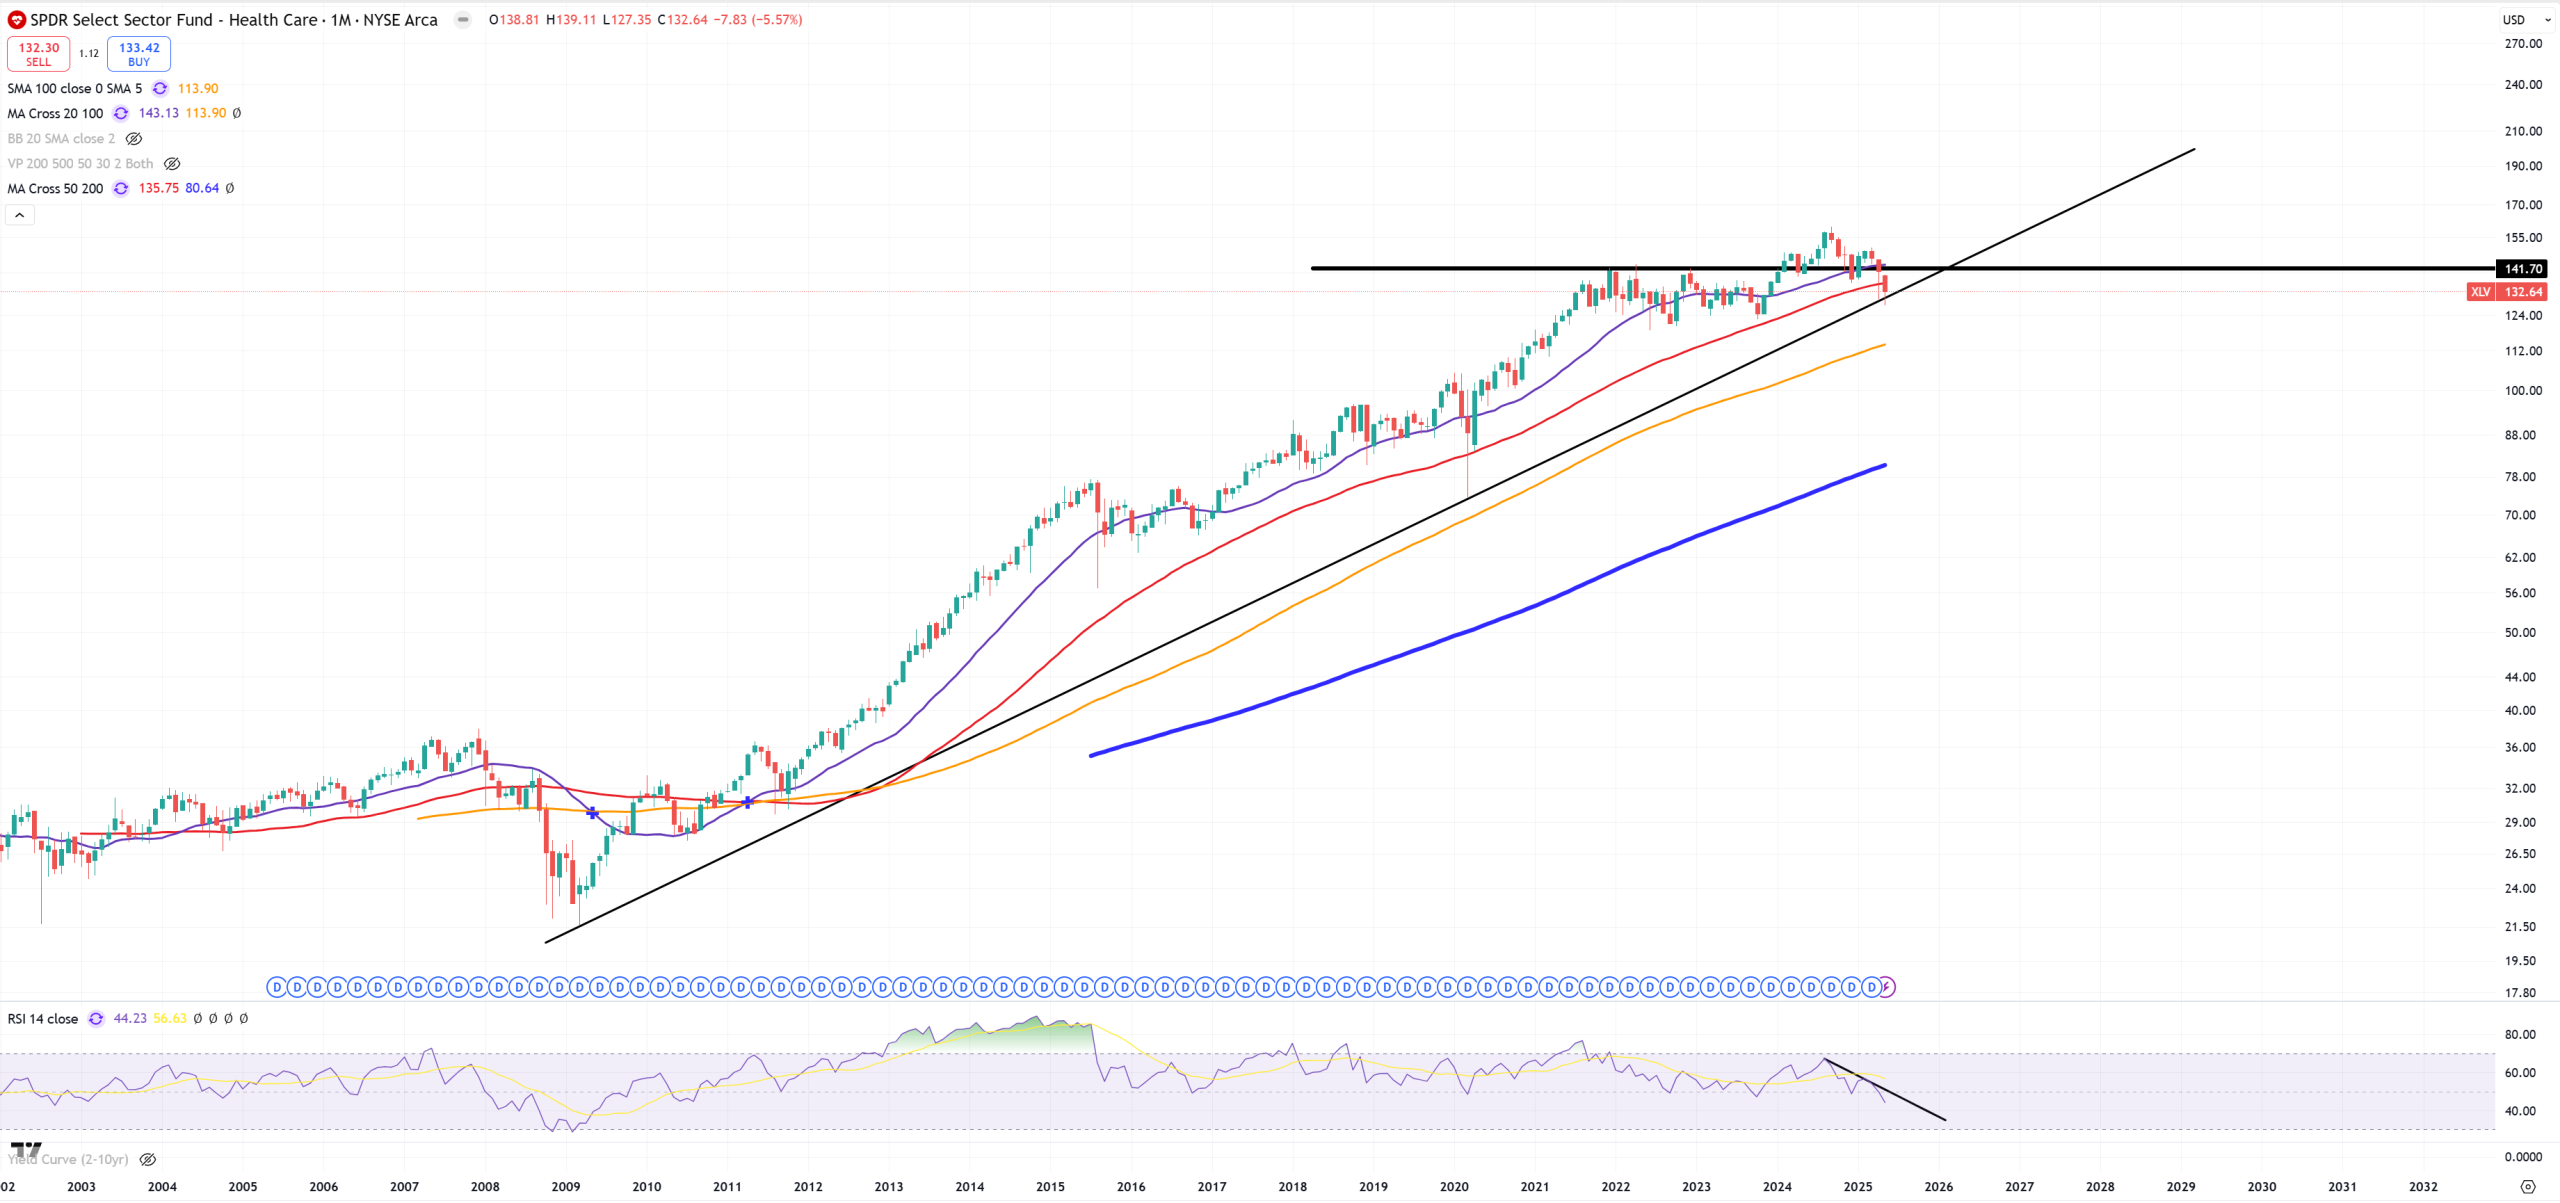
XLV – big moment
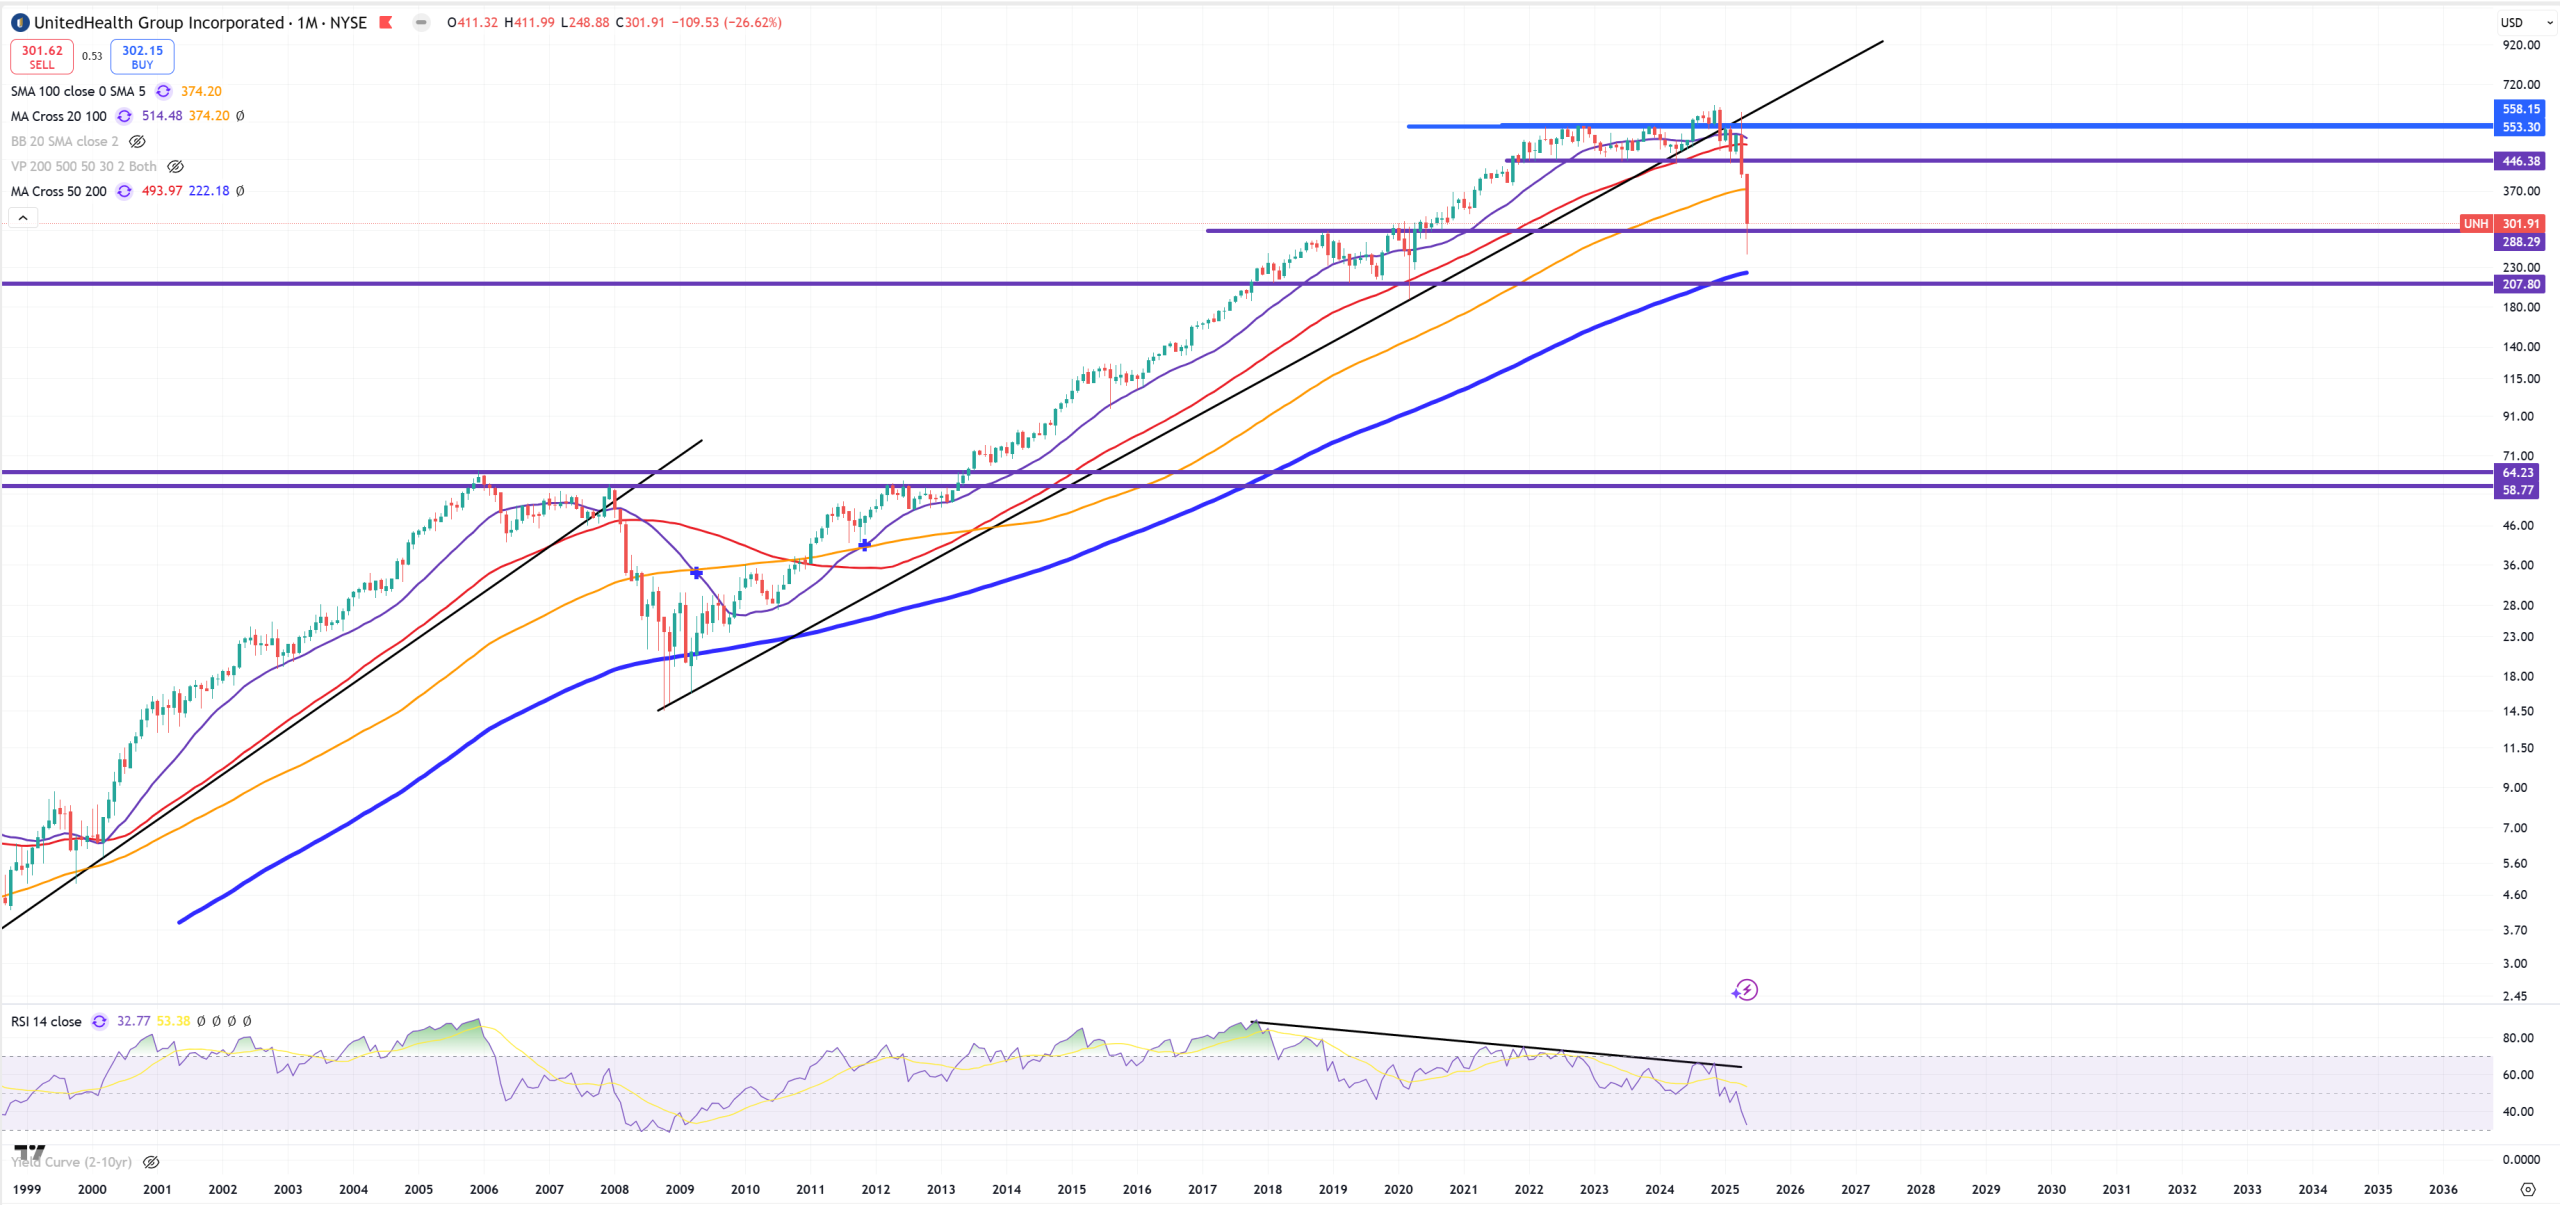
UNH
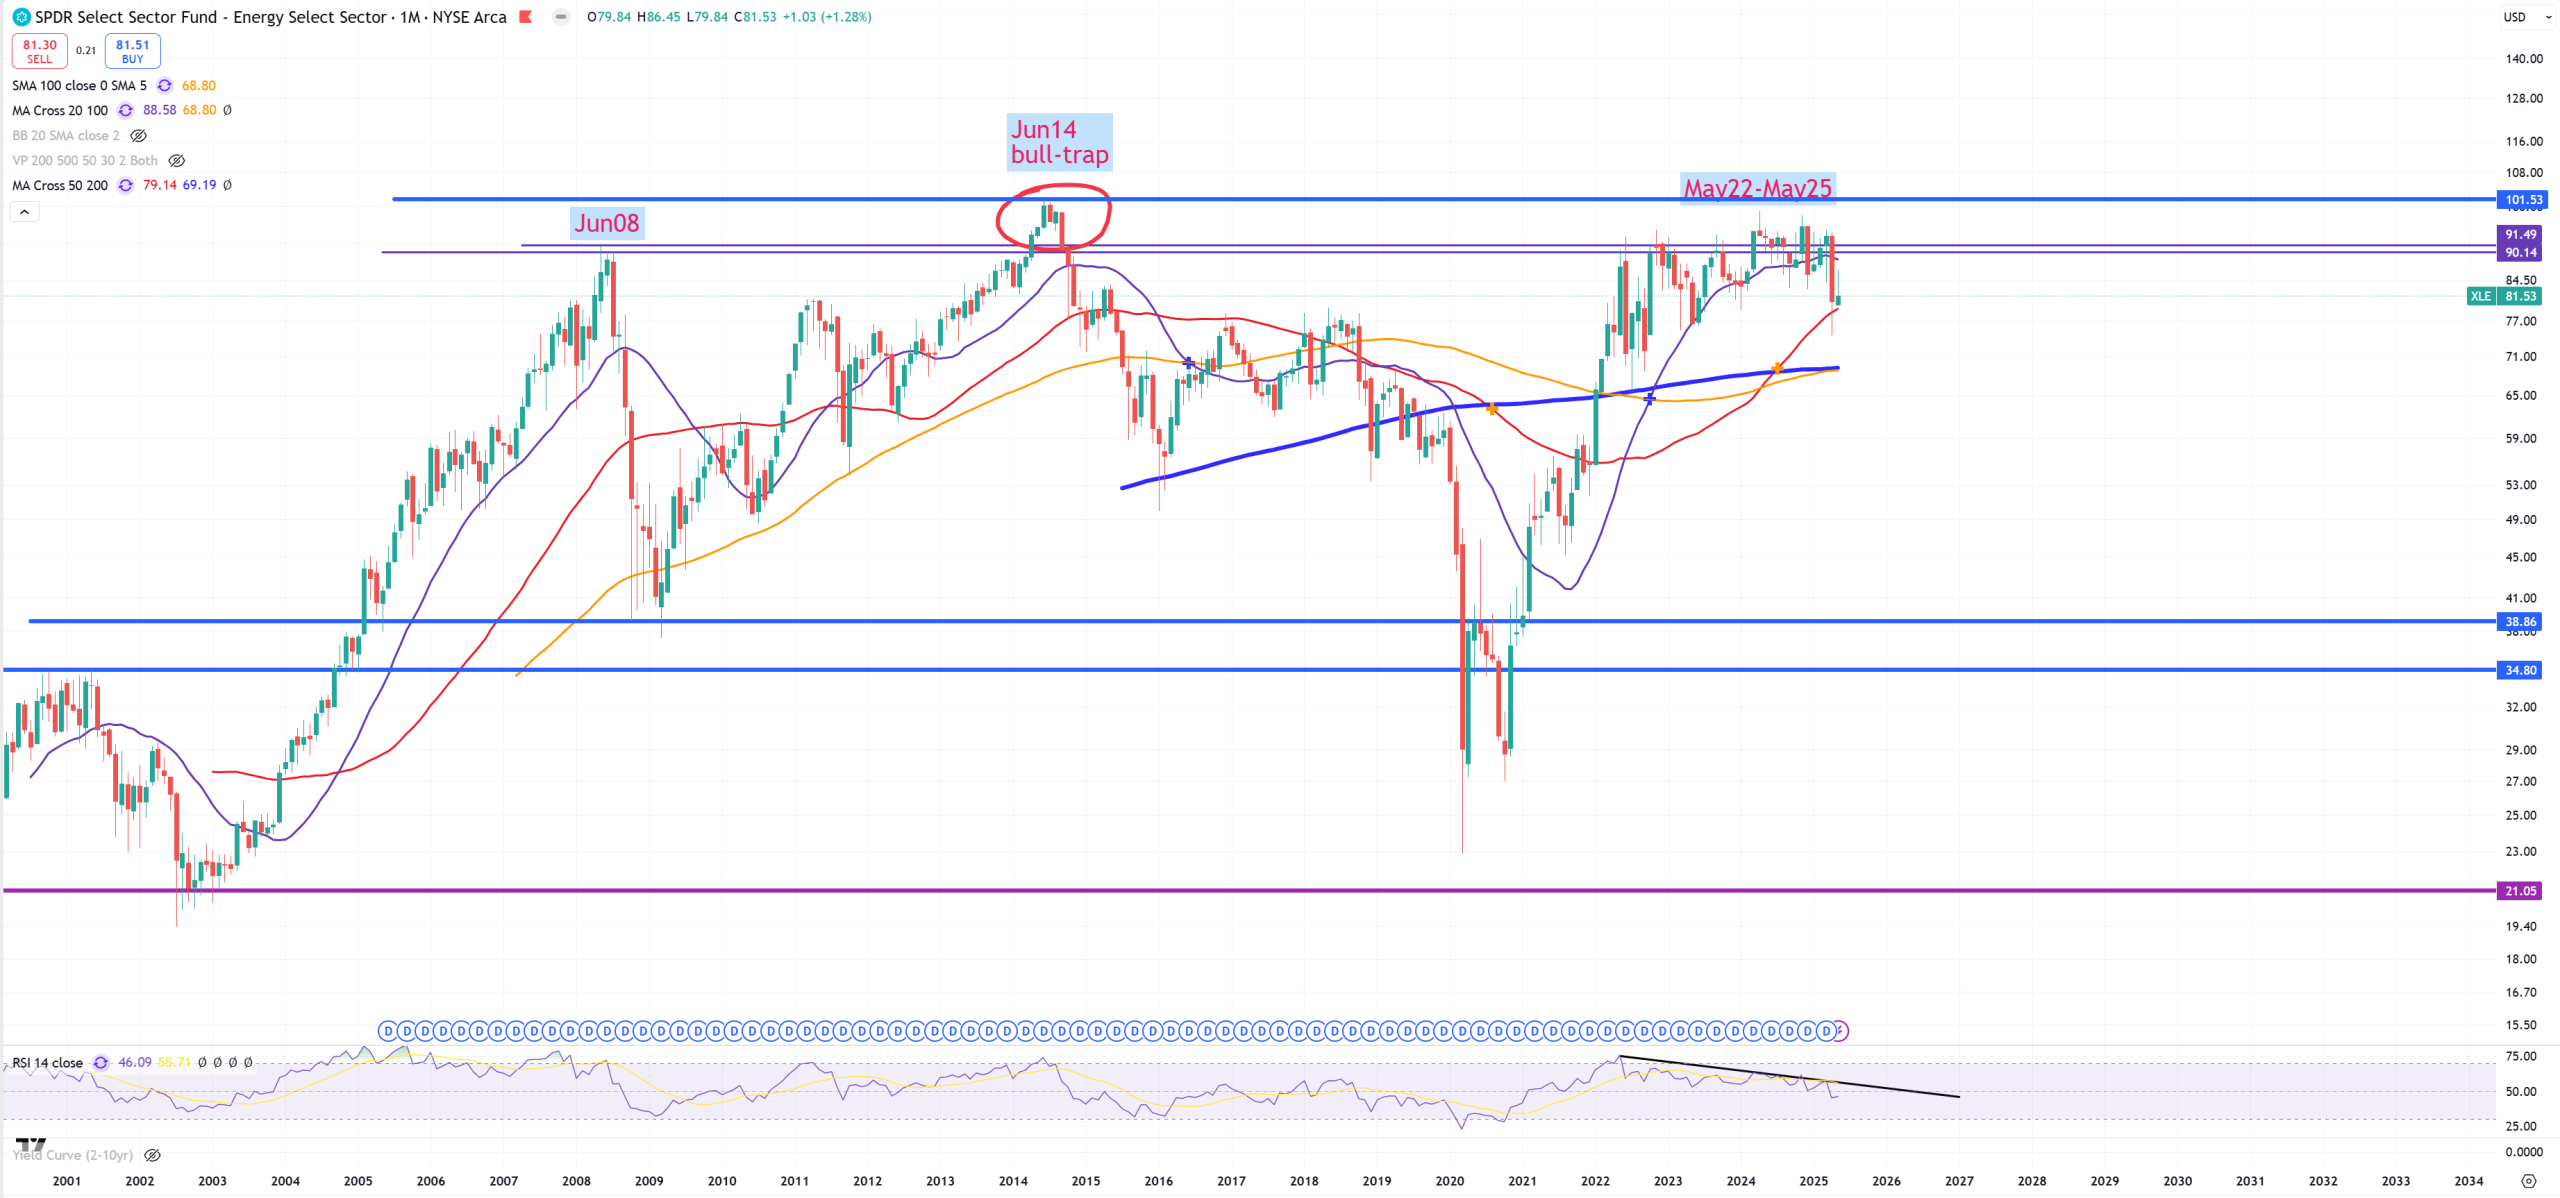
XLE – looks a bit bad, but not very bad
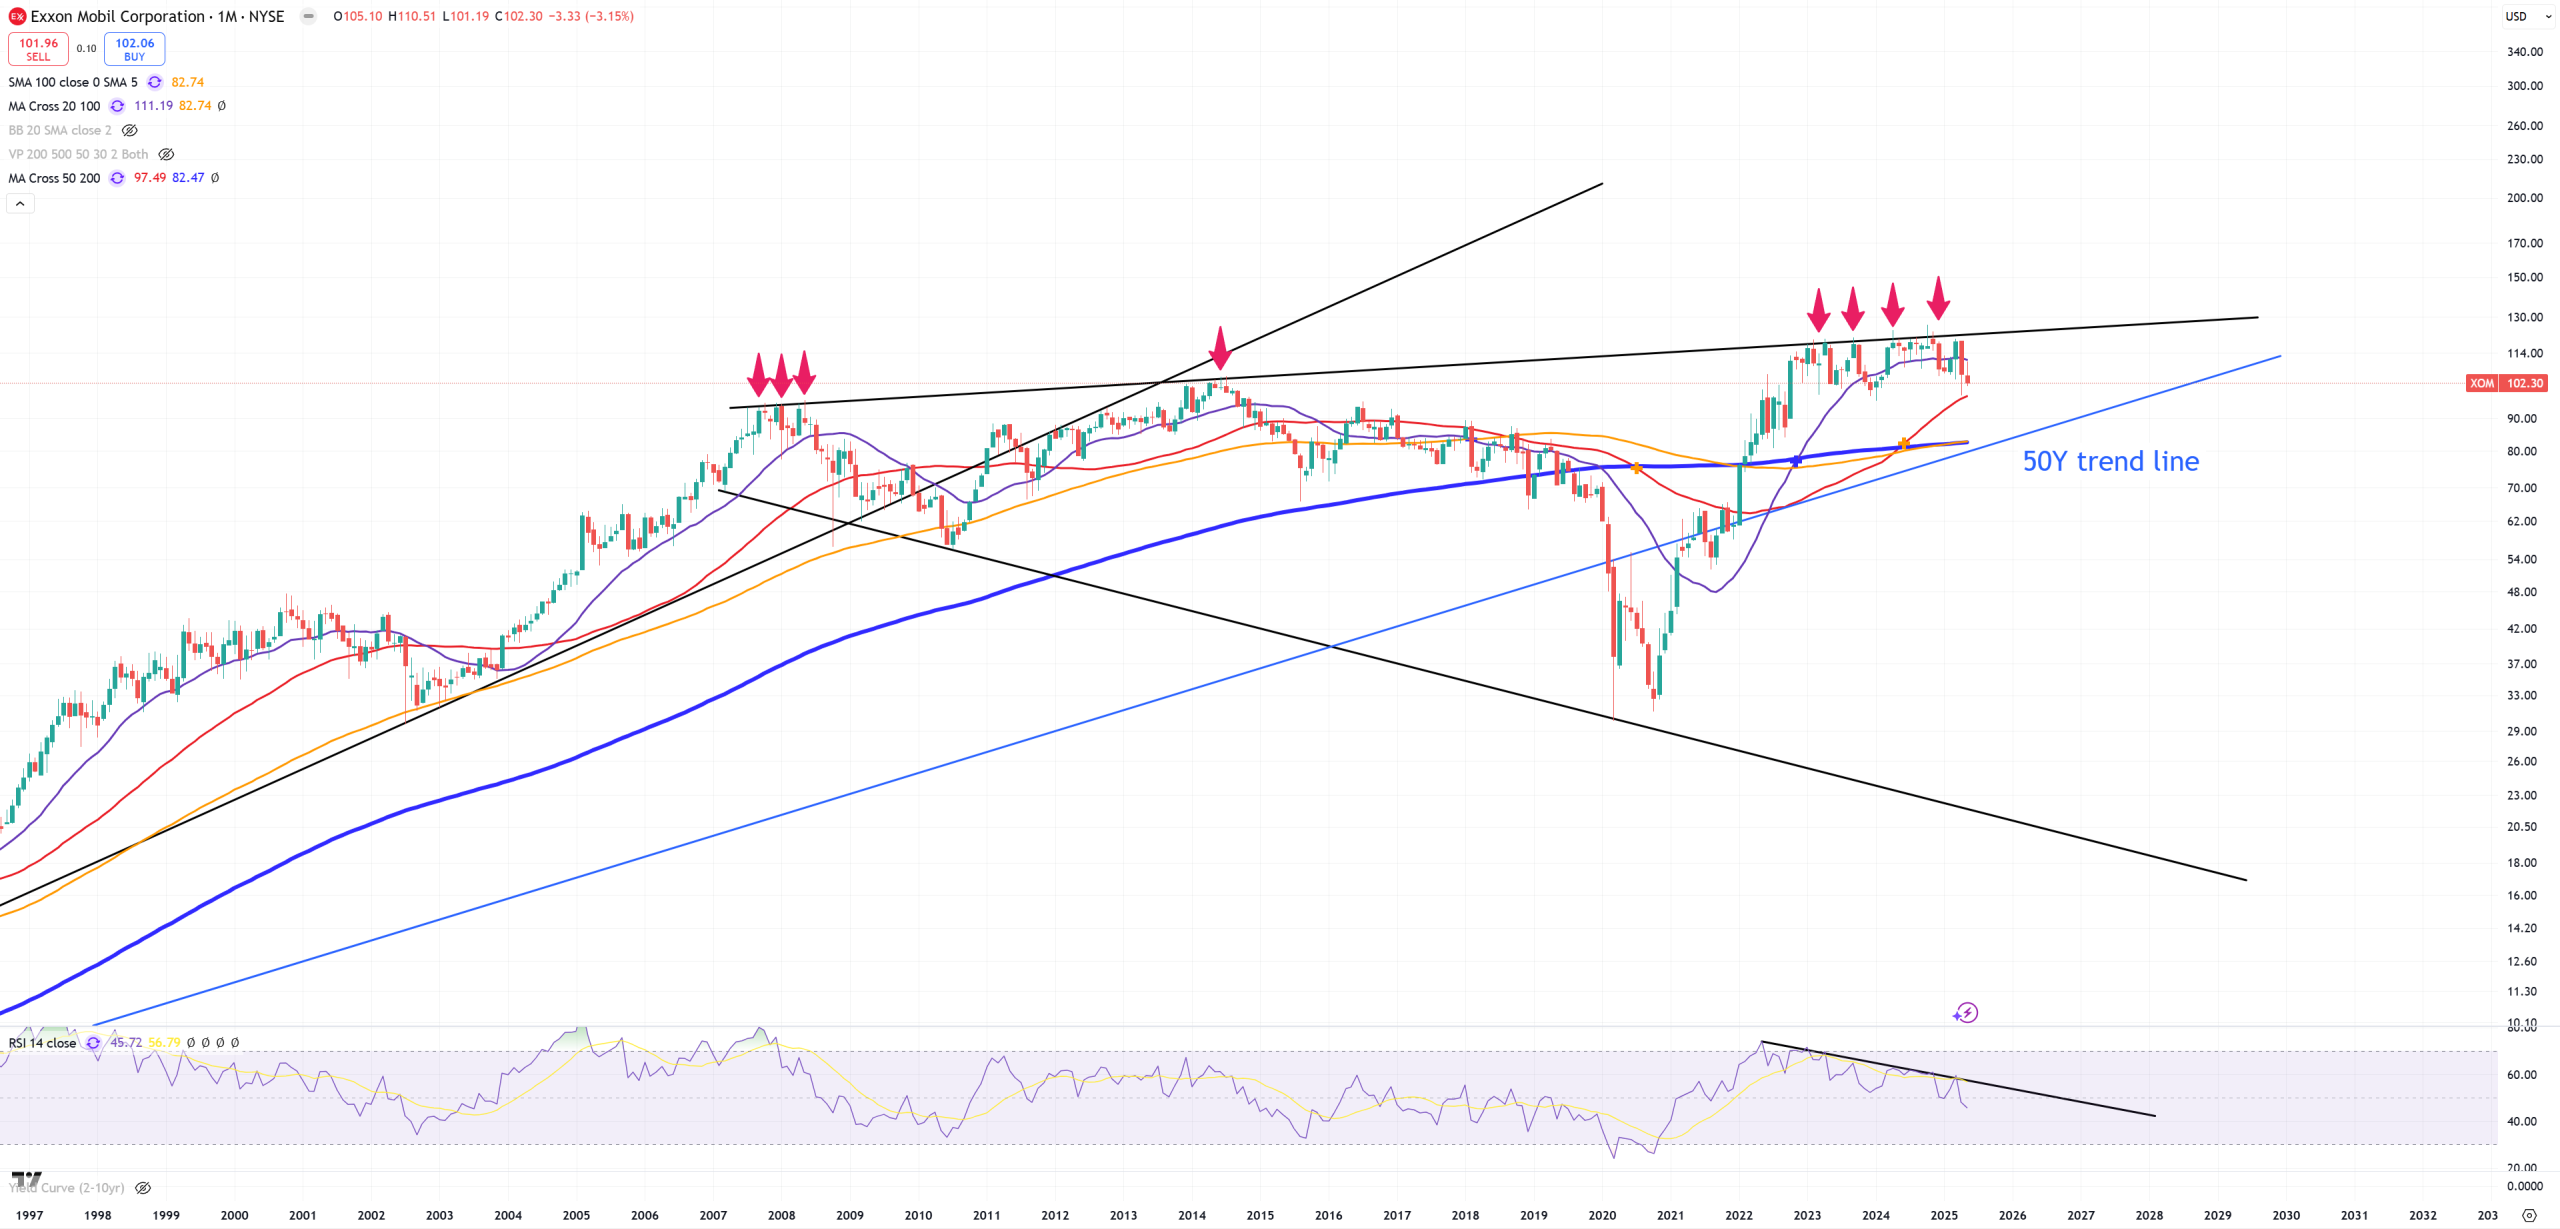
XOM – no comment
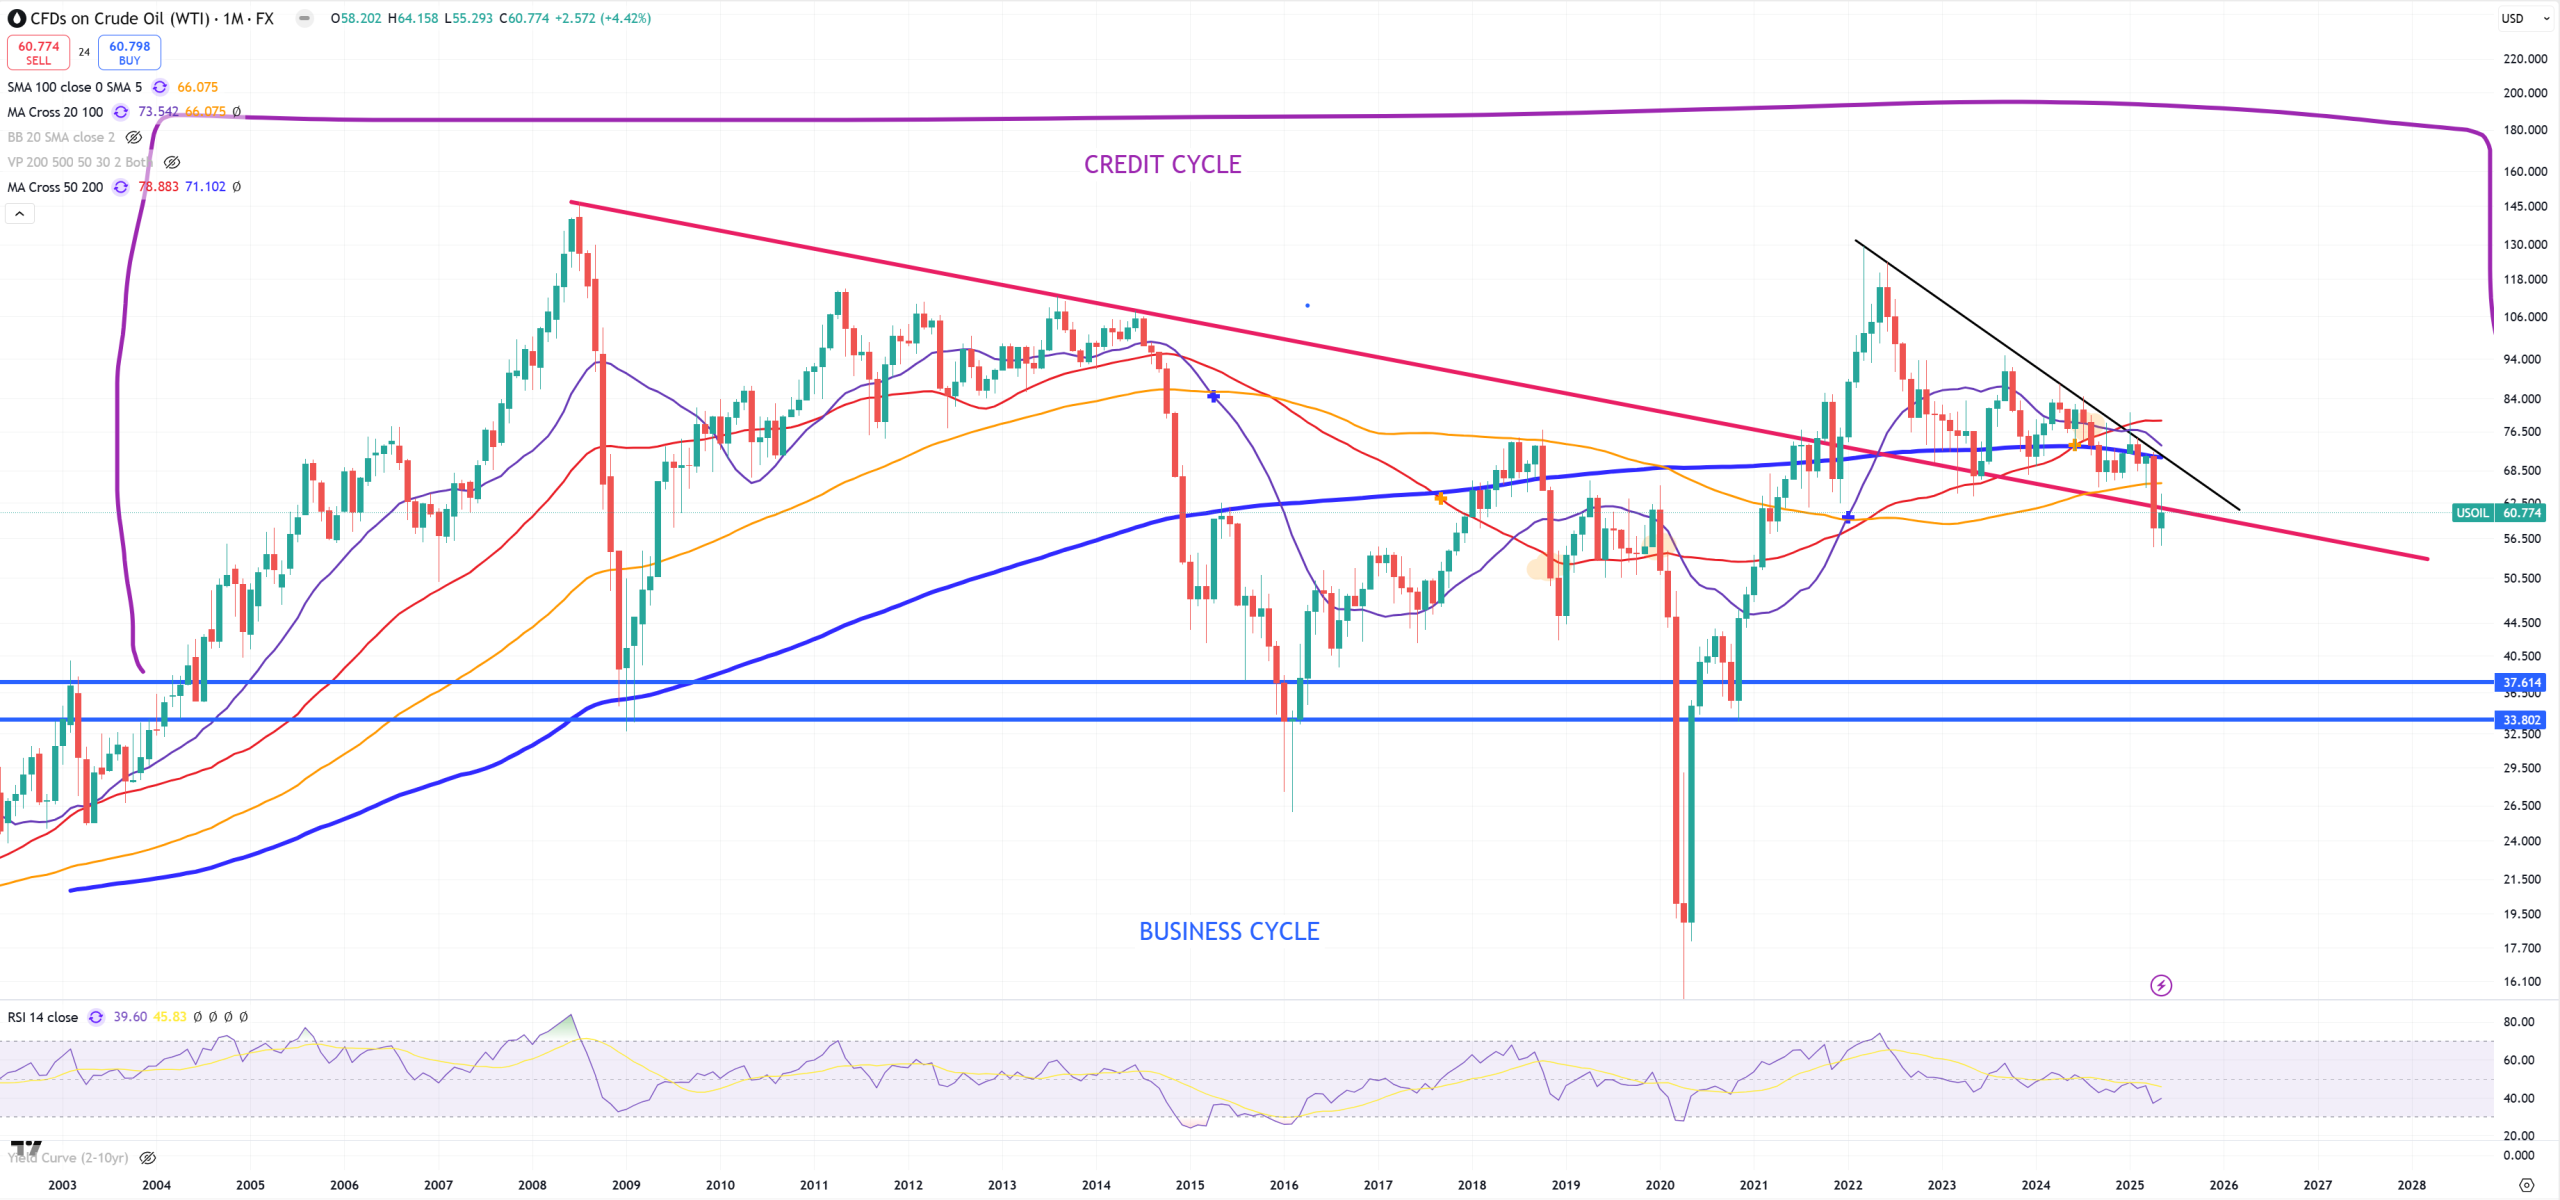
OIL – also no comment
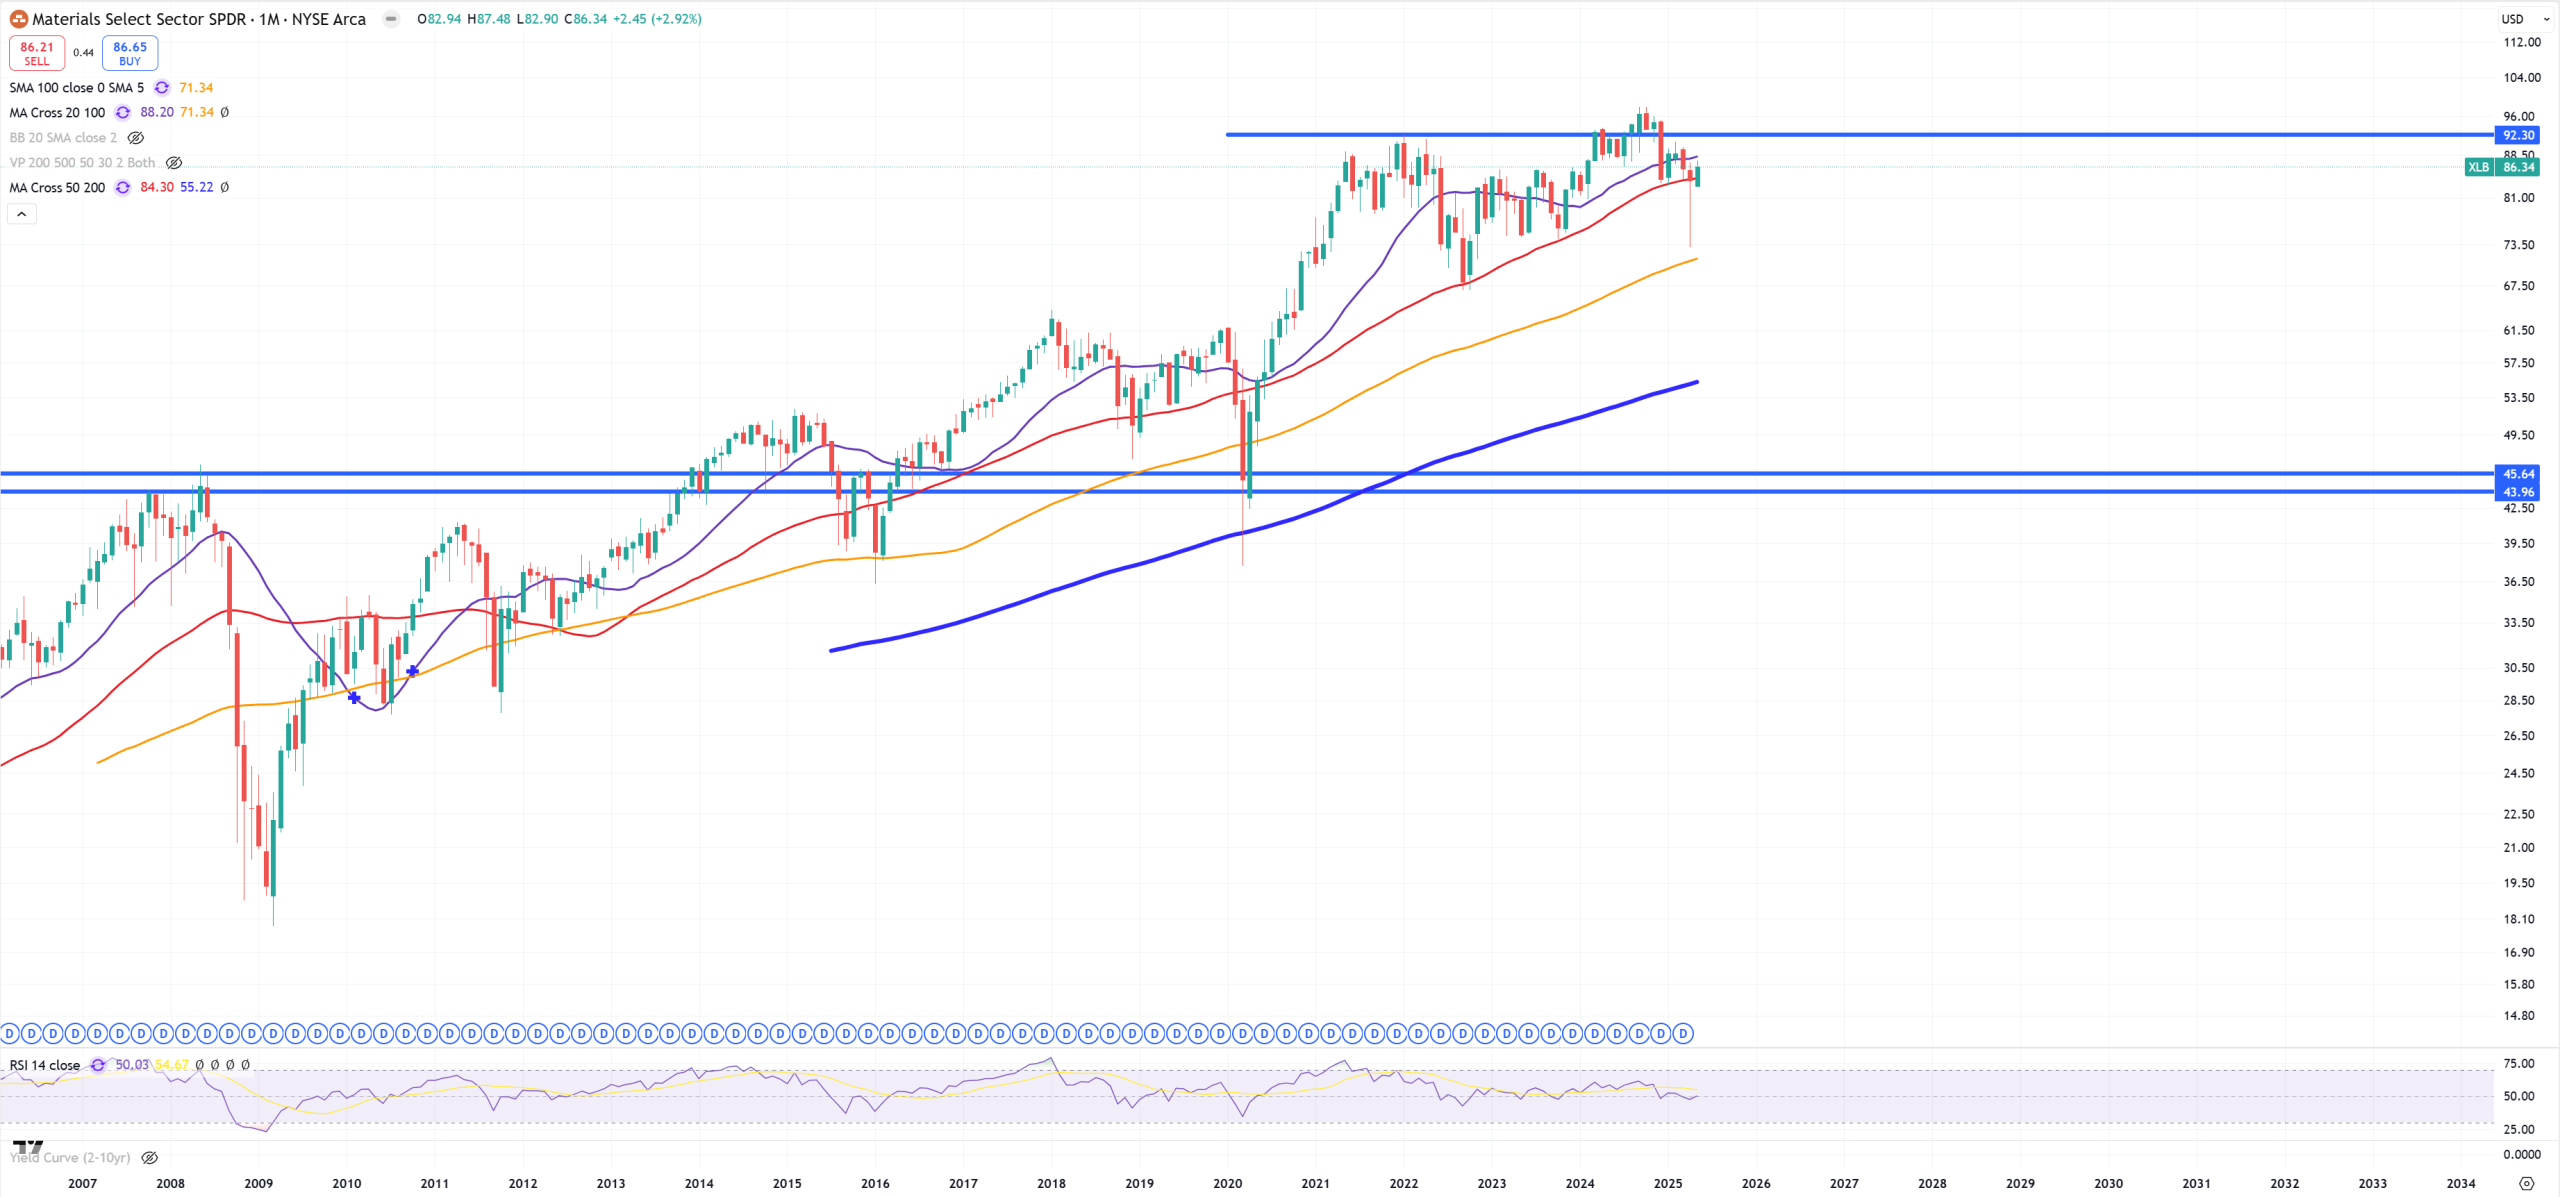
XLB – 2021 peak holds
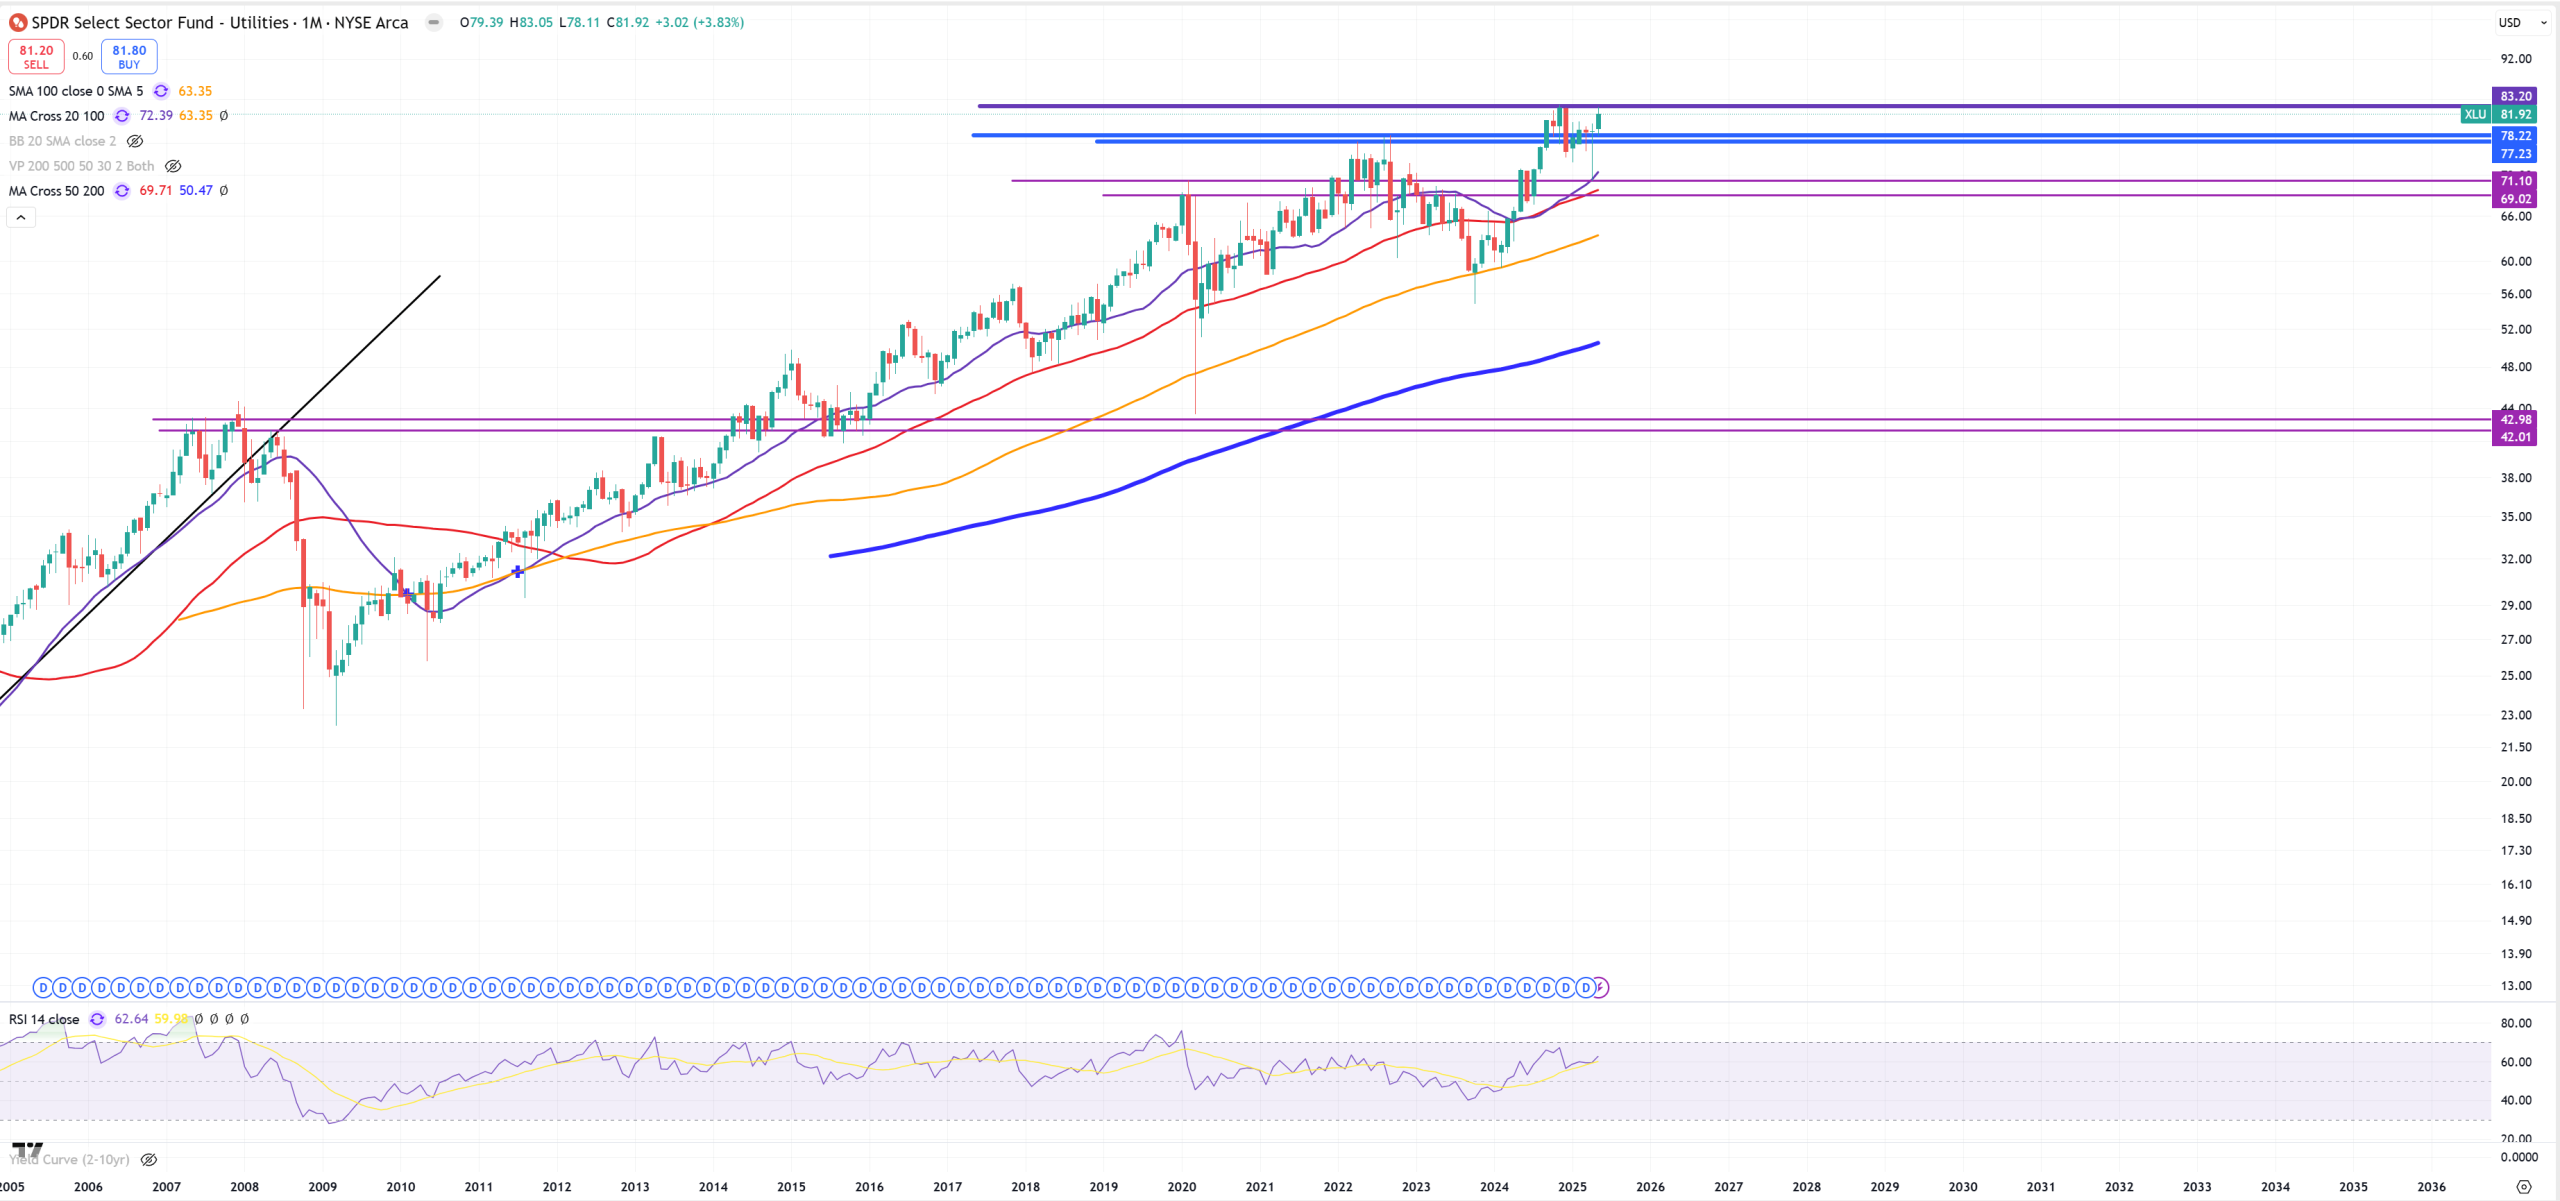
XLU – The biggest safe-heaven
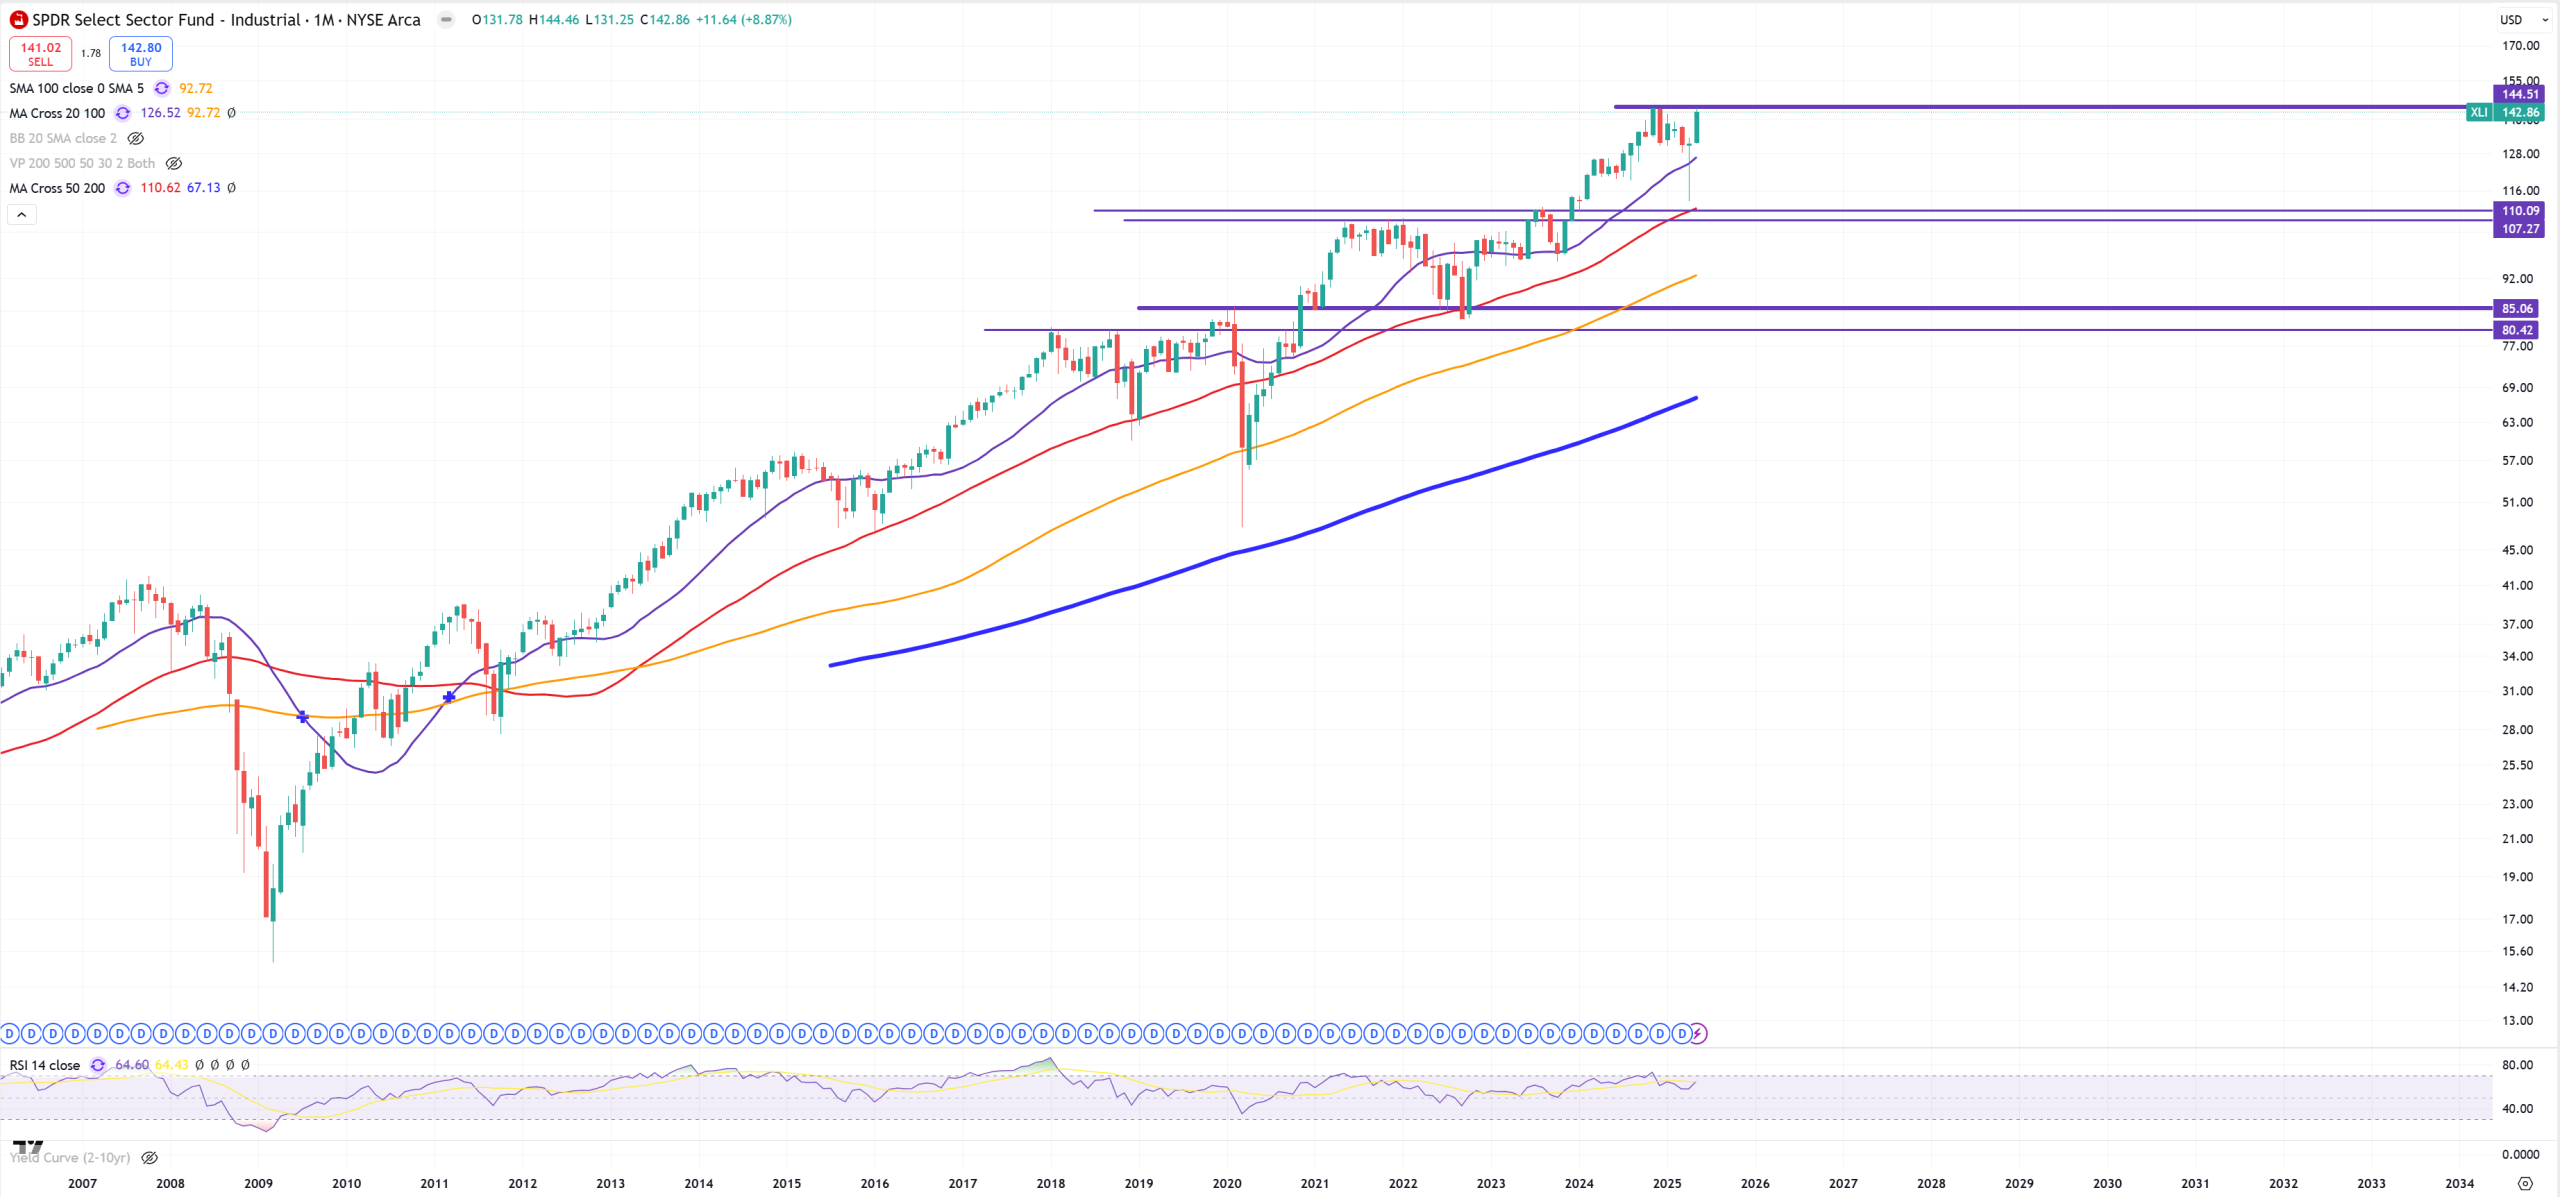
XLI – key level ahead
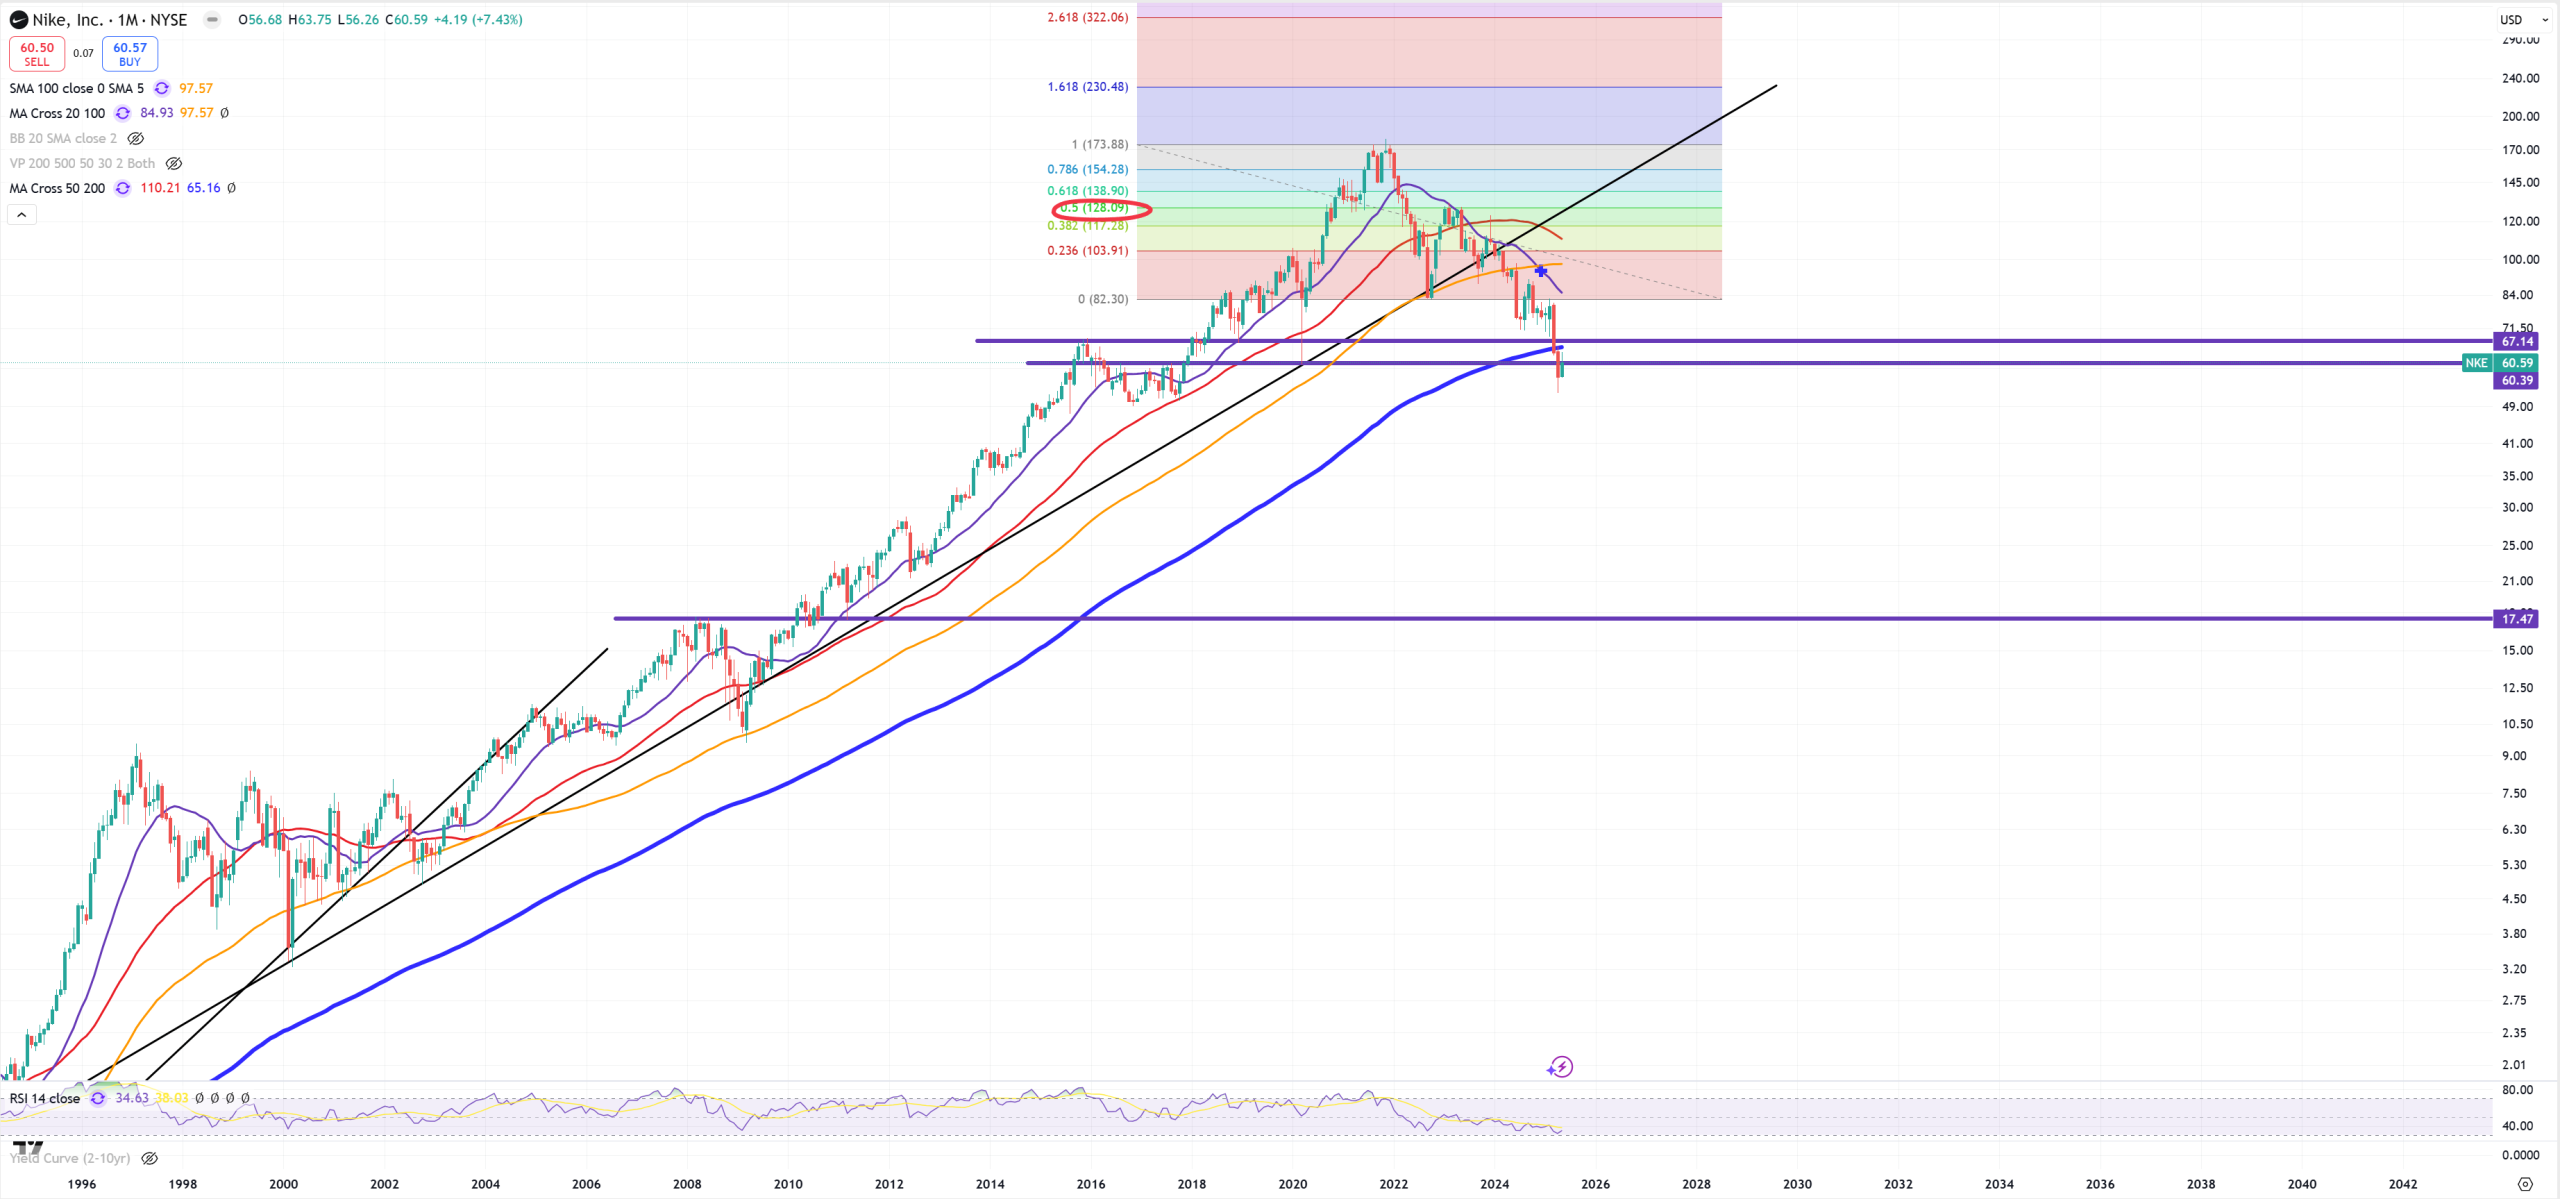
NKE – looks terrible still
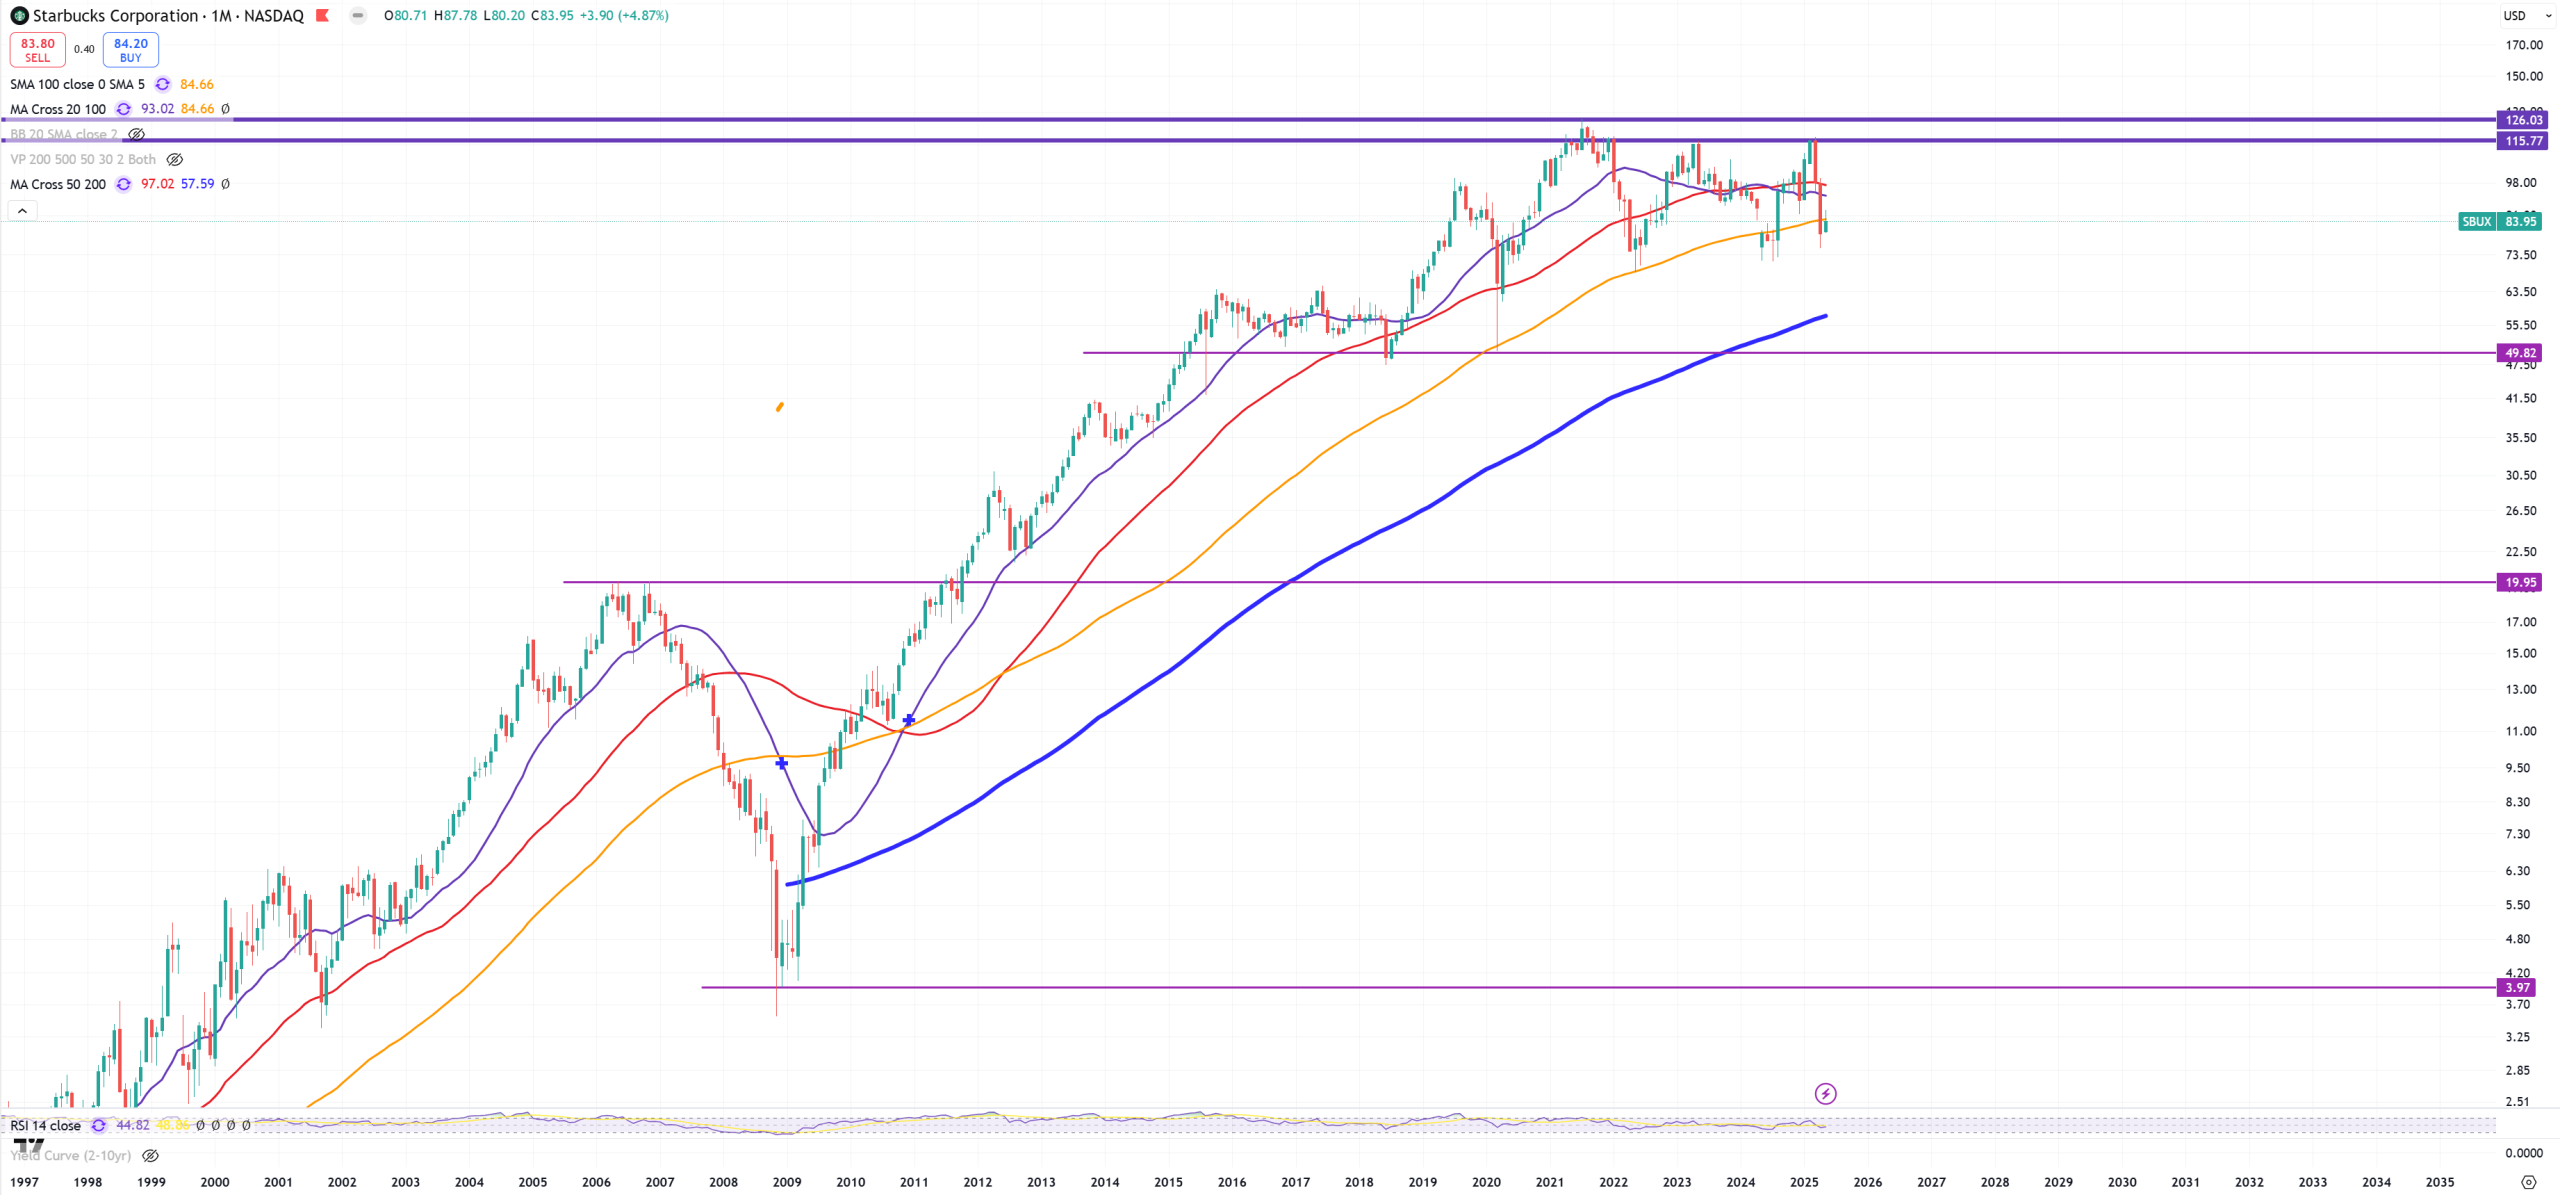
SBUX – again hangs below (M)MA100 – people wil be driking 20$ shitty coffees?
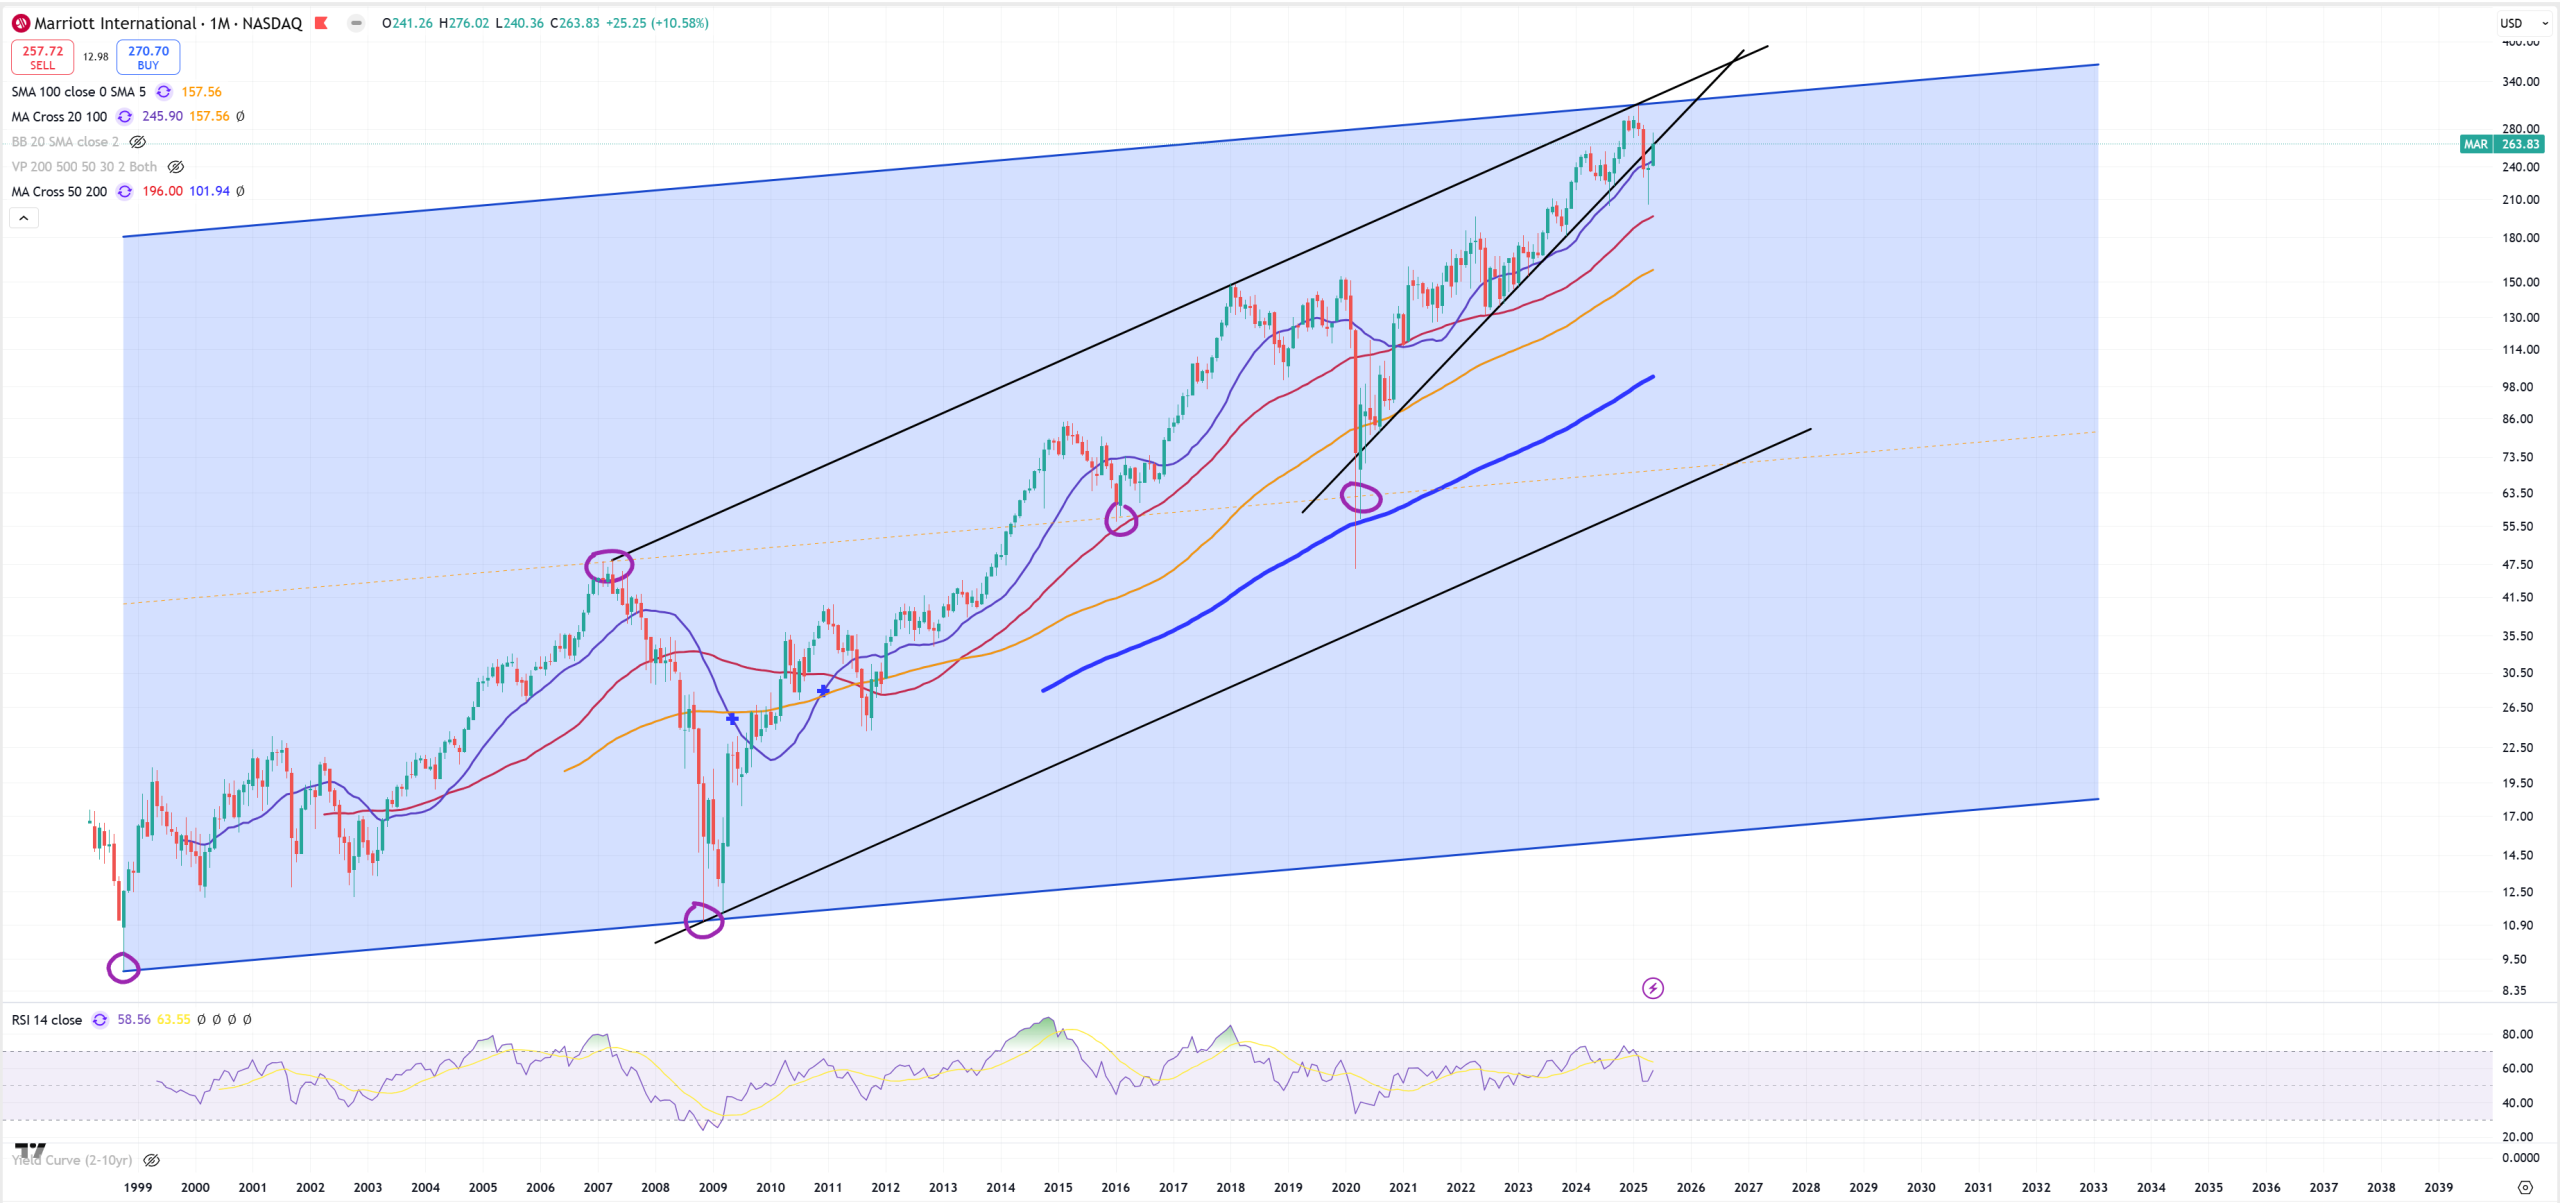
MAR – Hotels got first crack
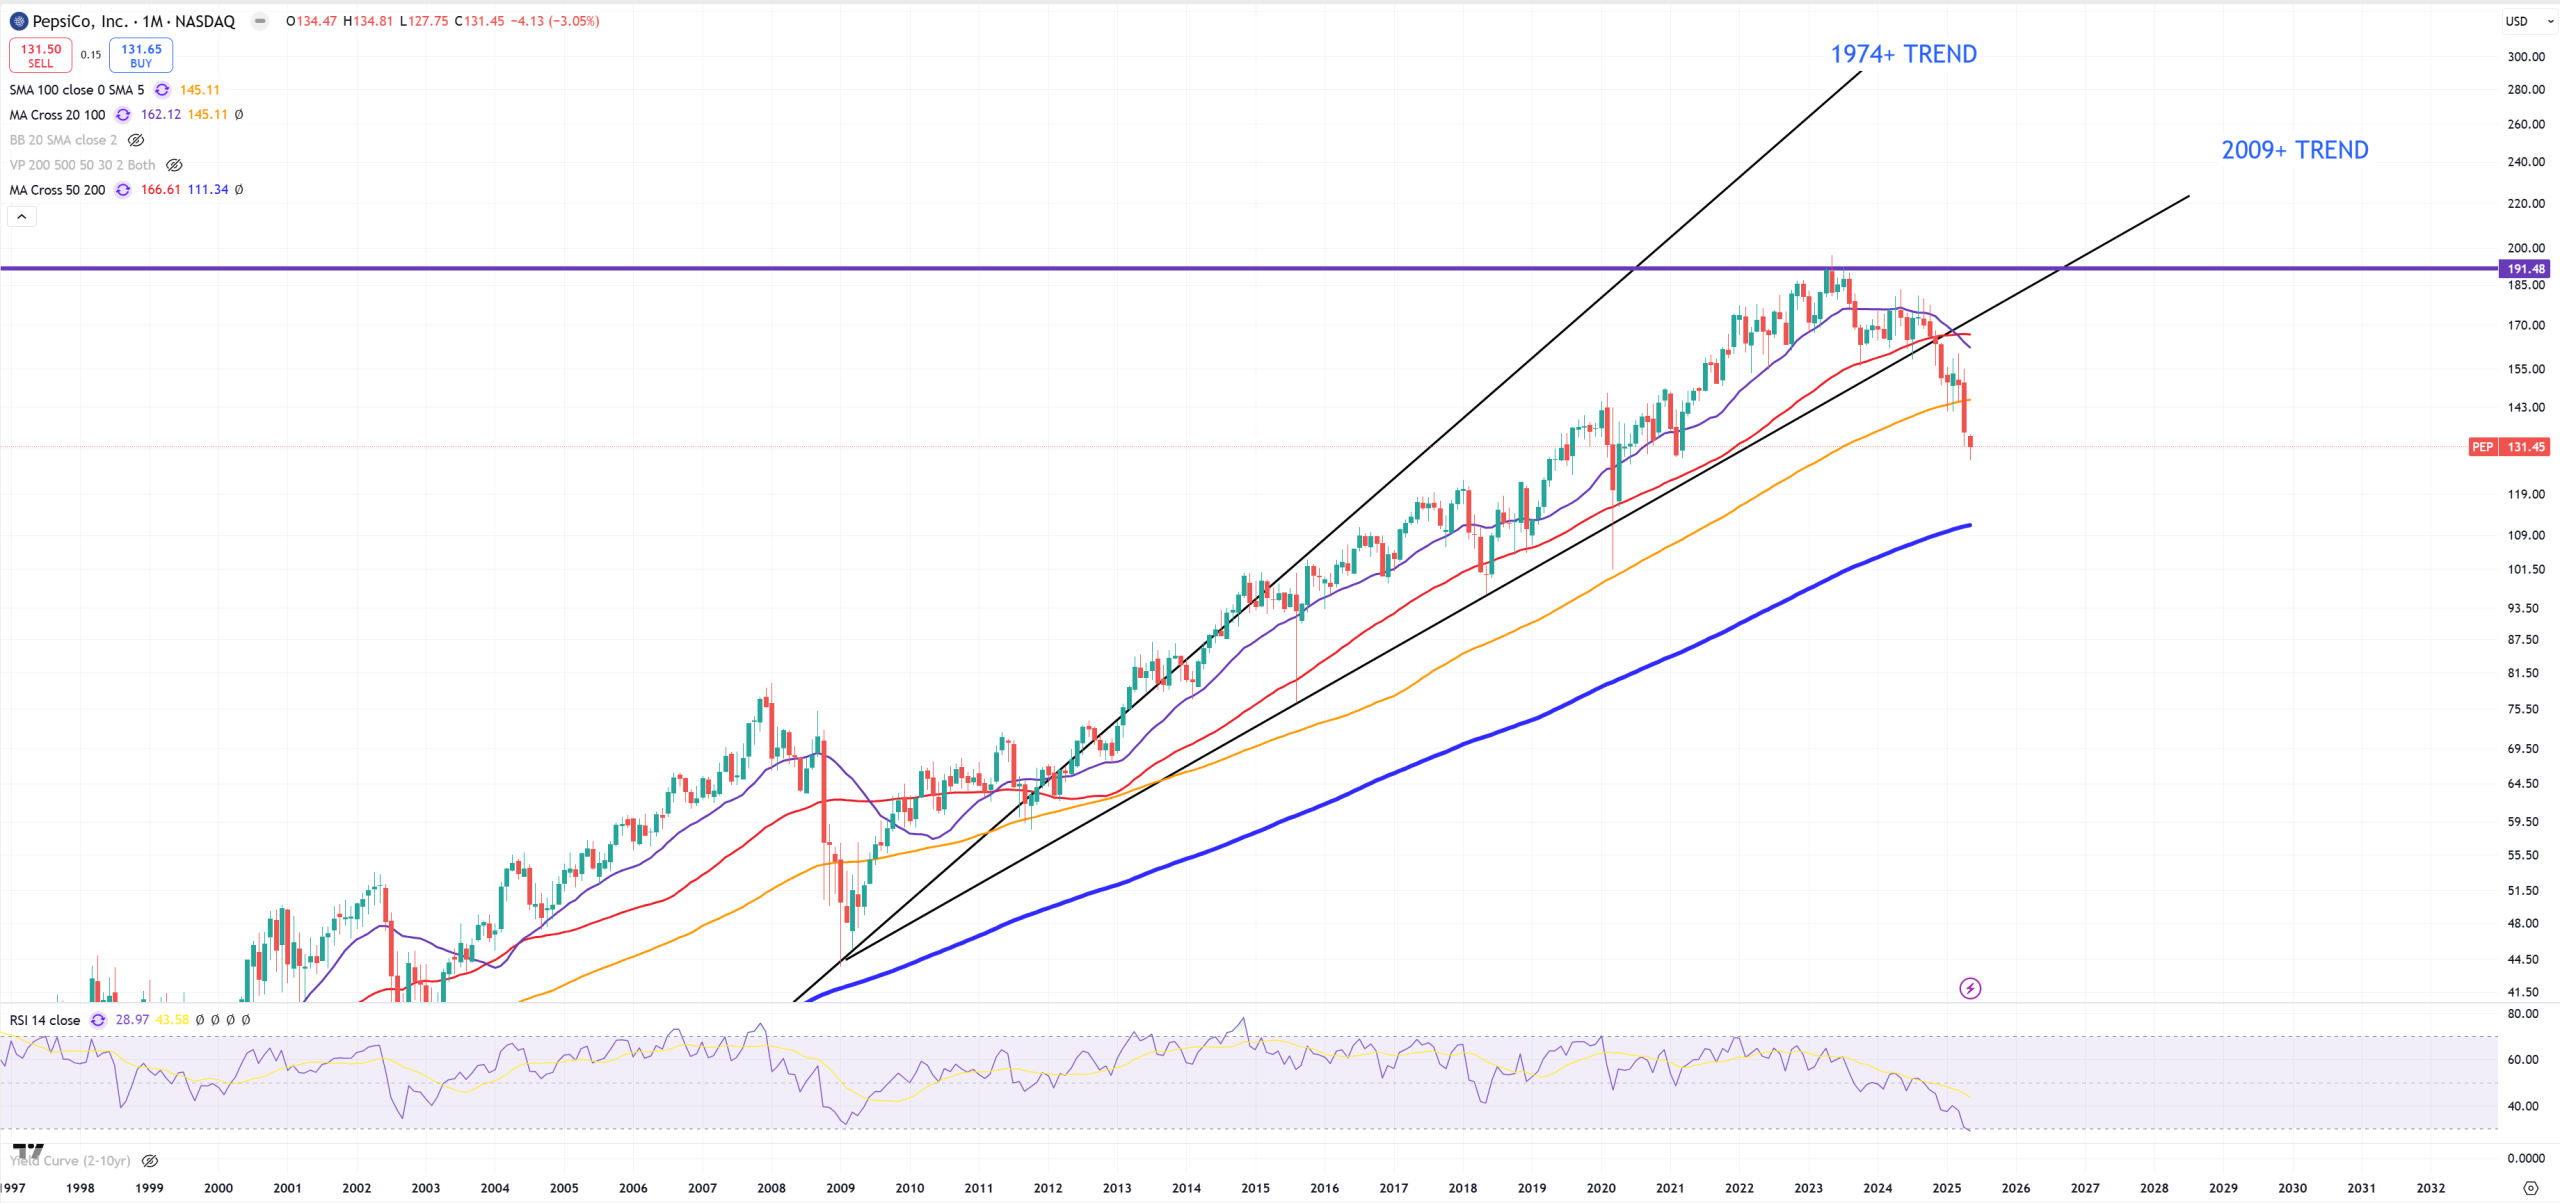
PEP – looks also terrible, but not as much as NKE
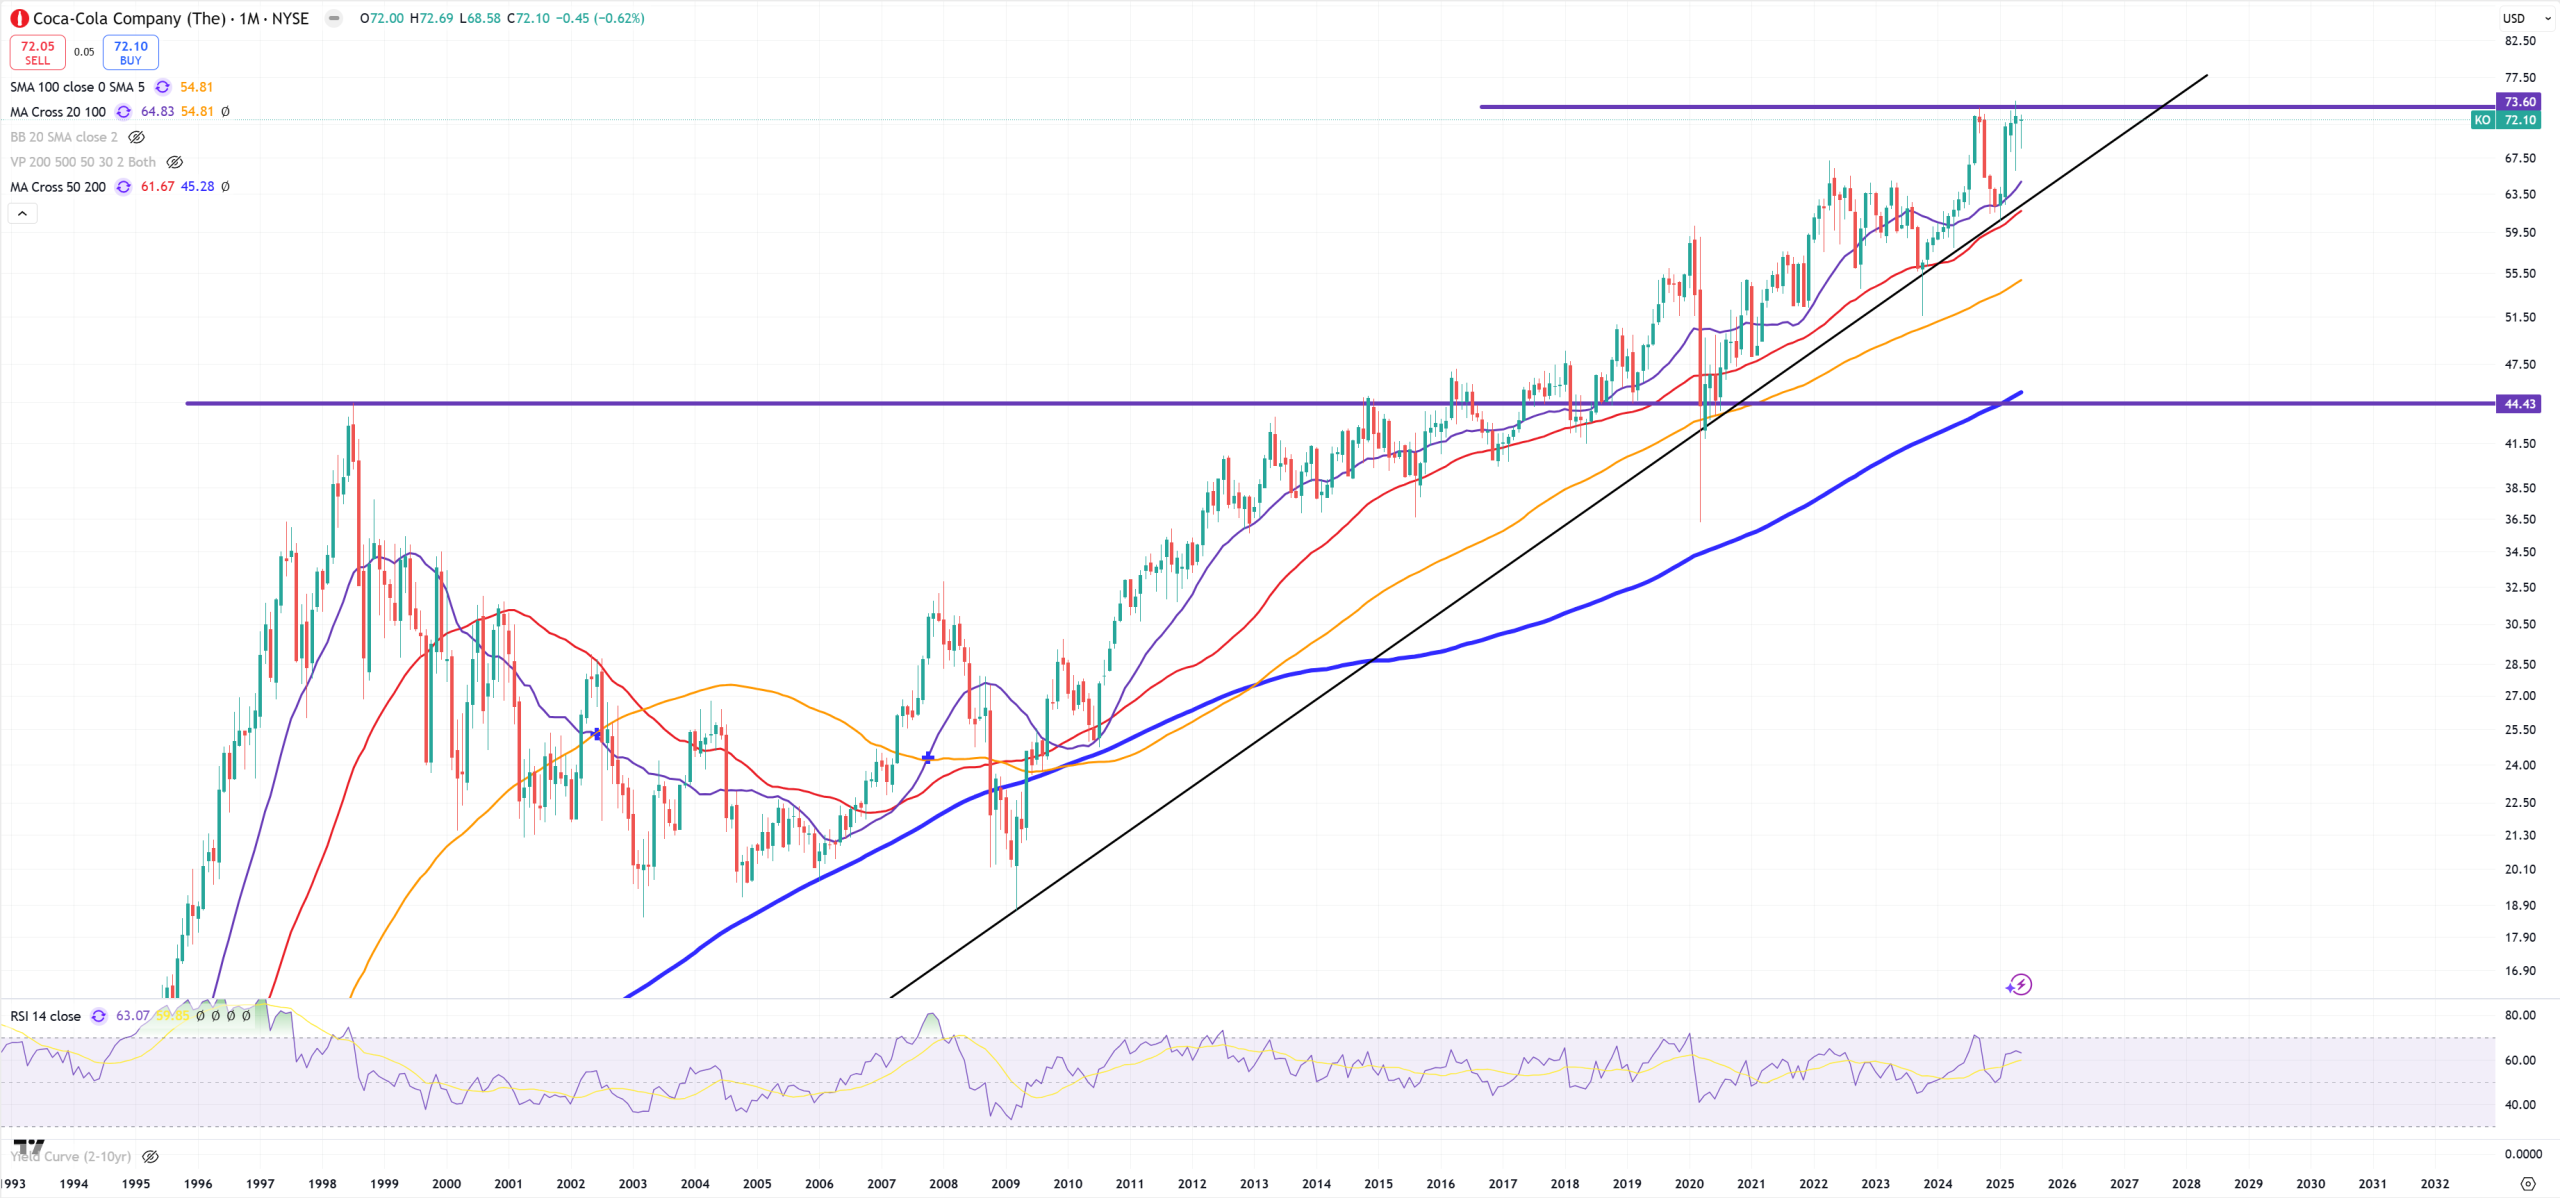
KO – looks totally different than PEP
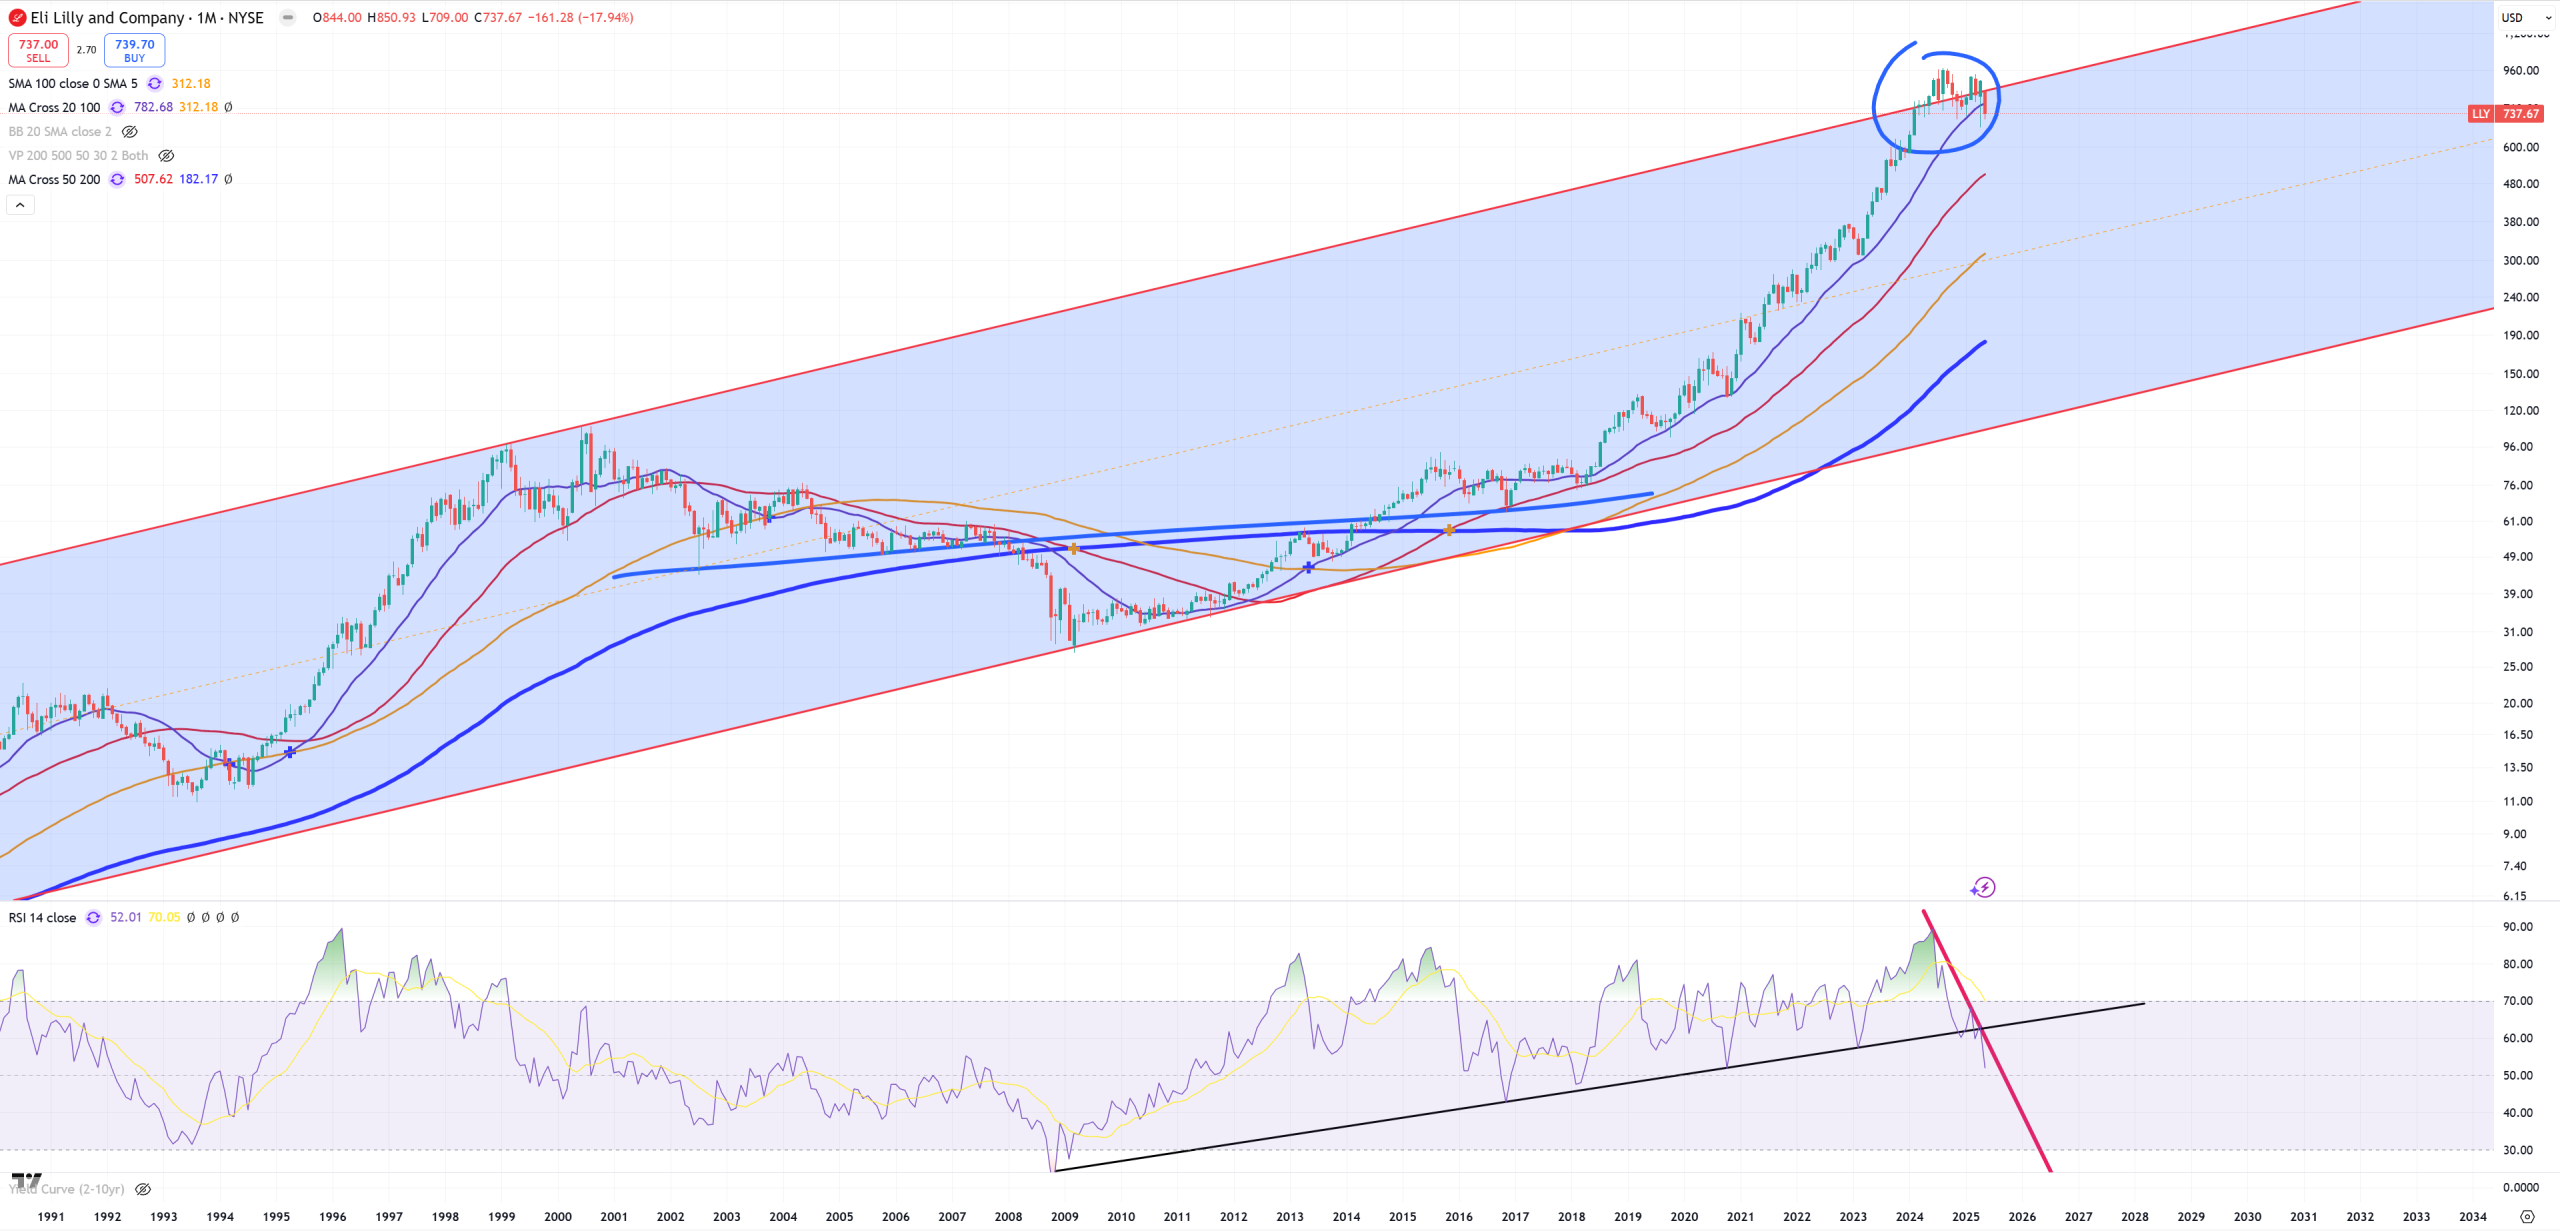
LLY – reversing after a false break, also (M)RSI trend broken
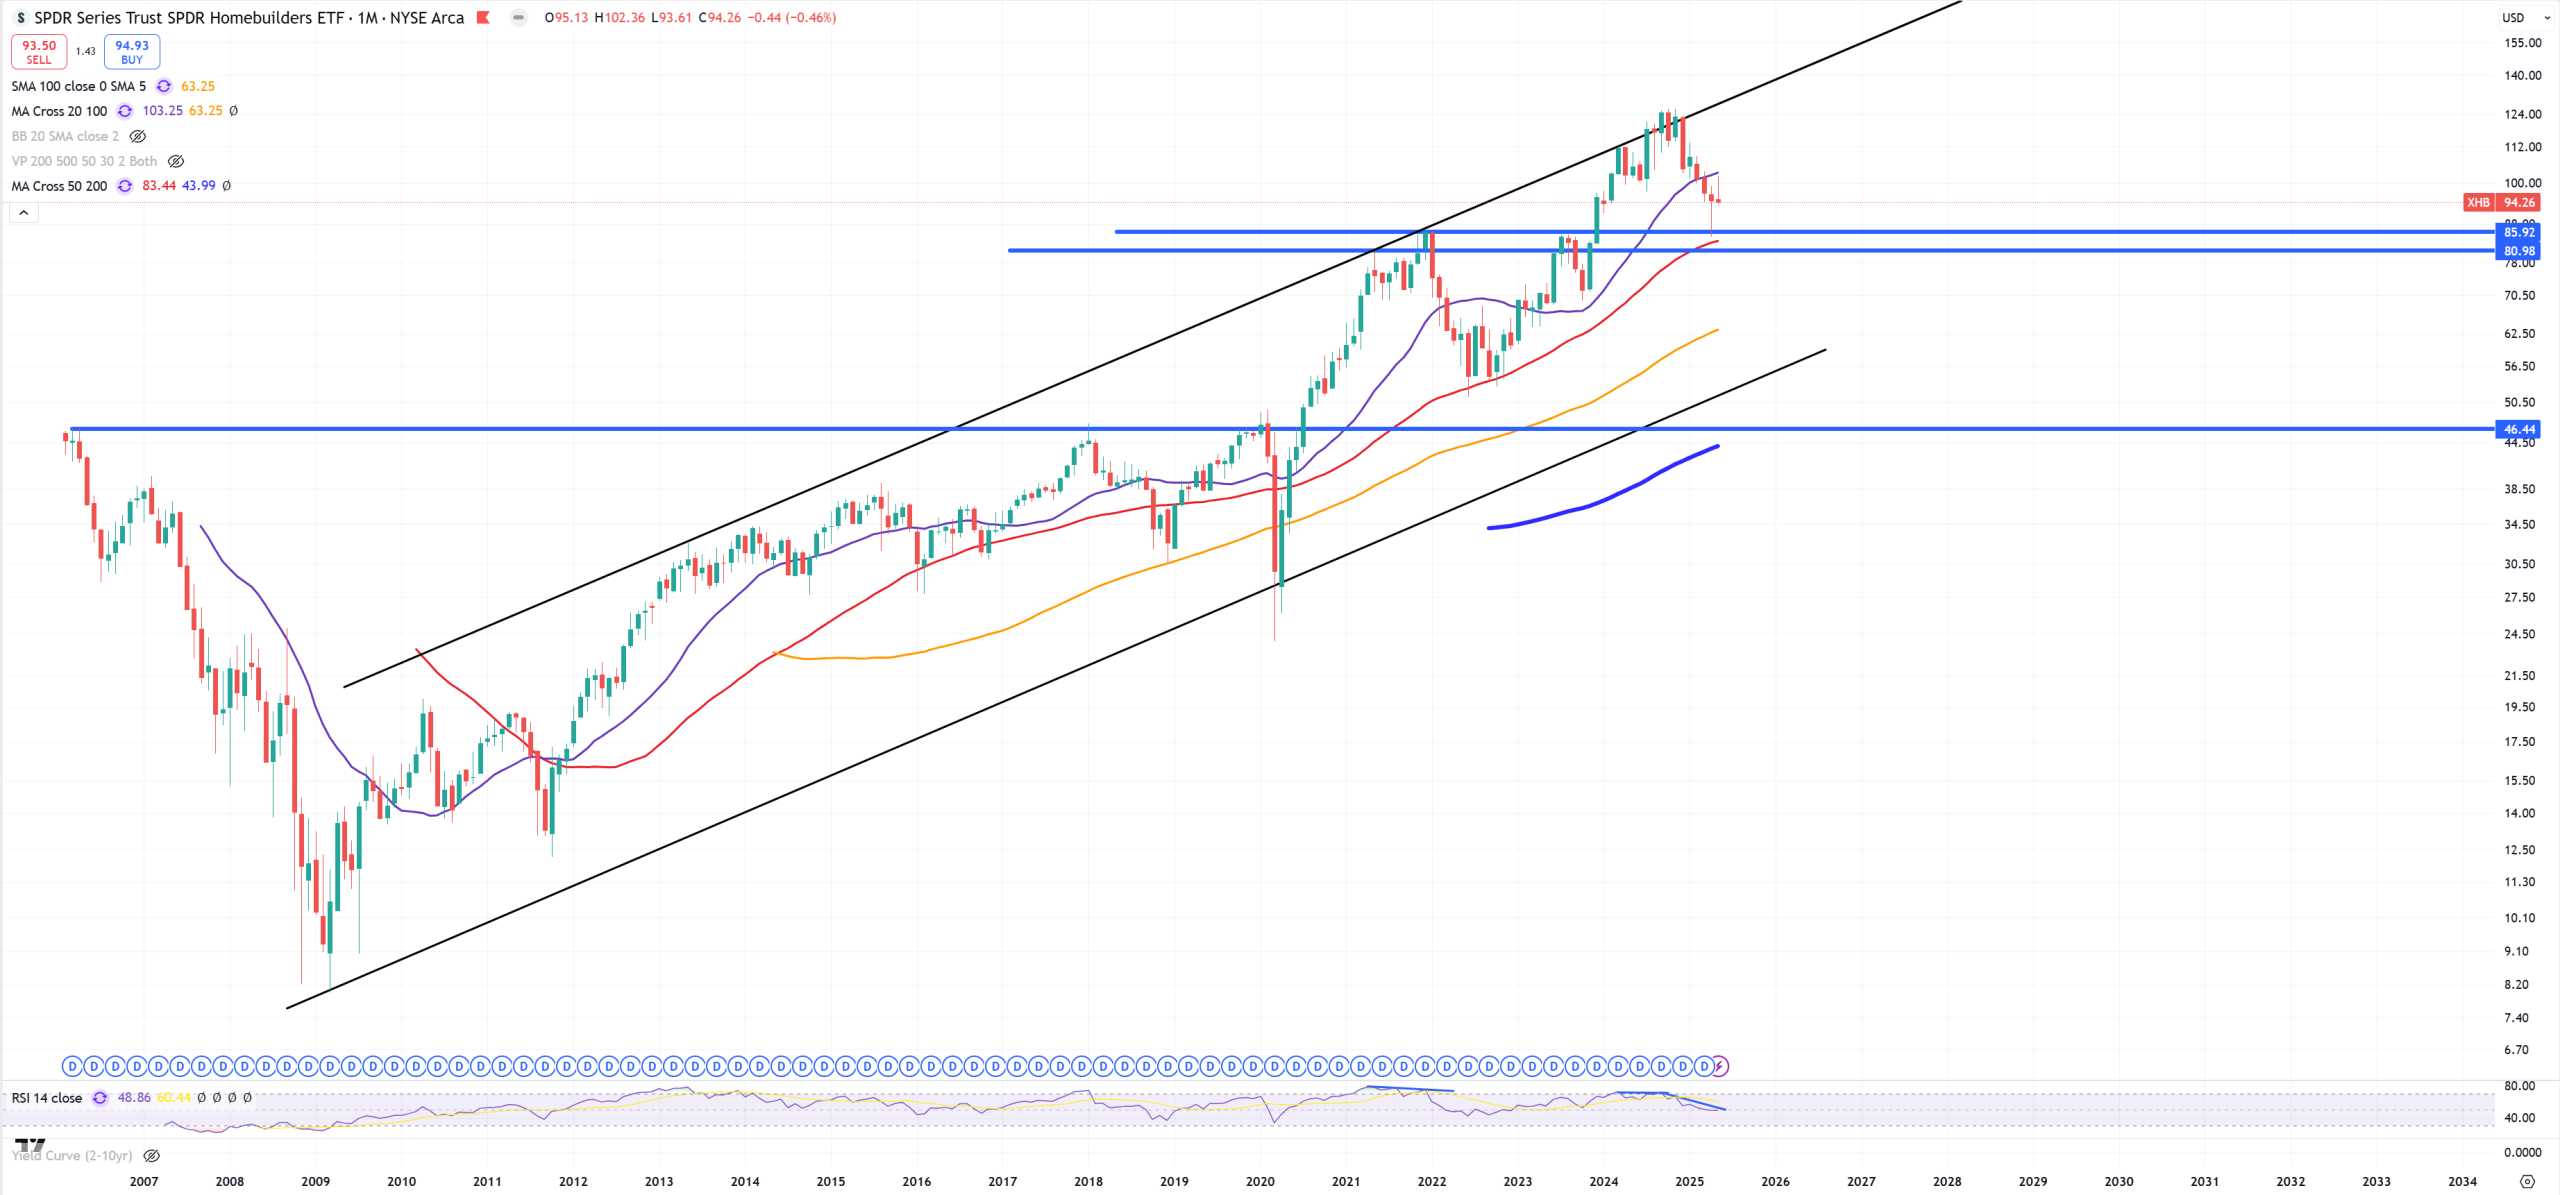
XHB – Support from 2021 level is also (M)MA50
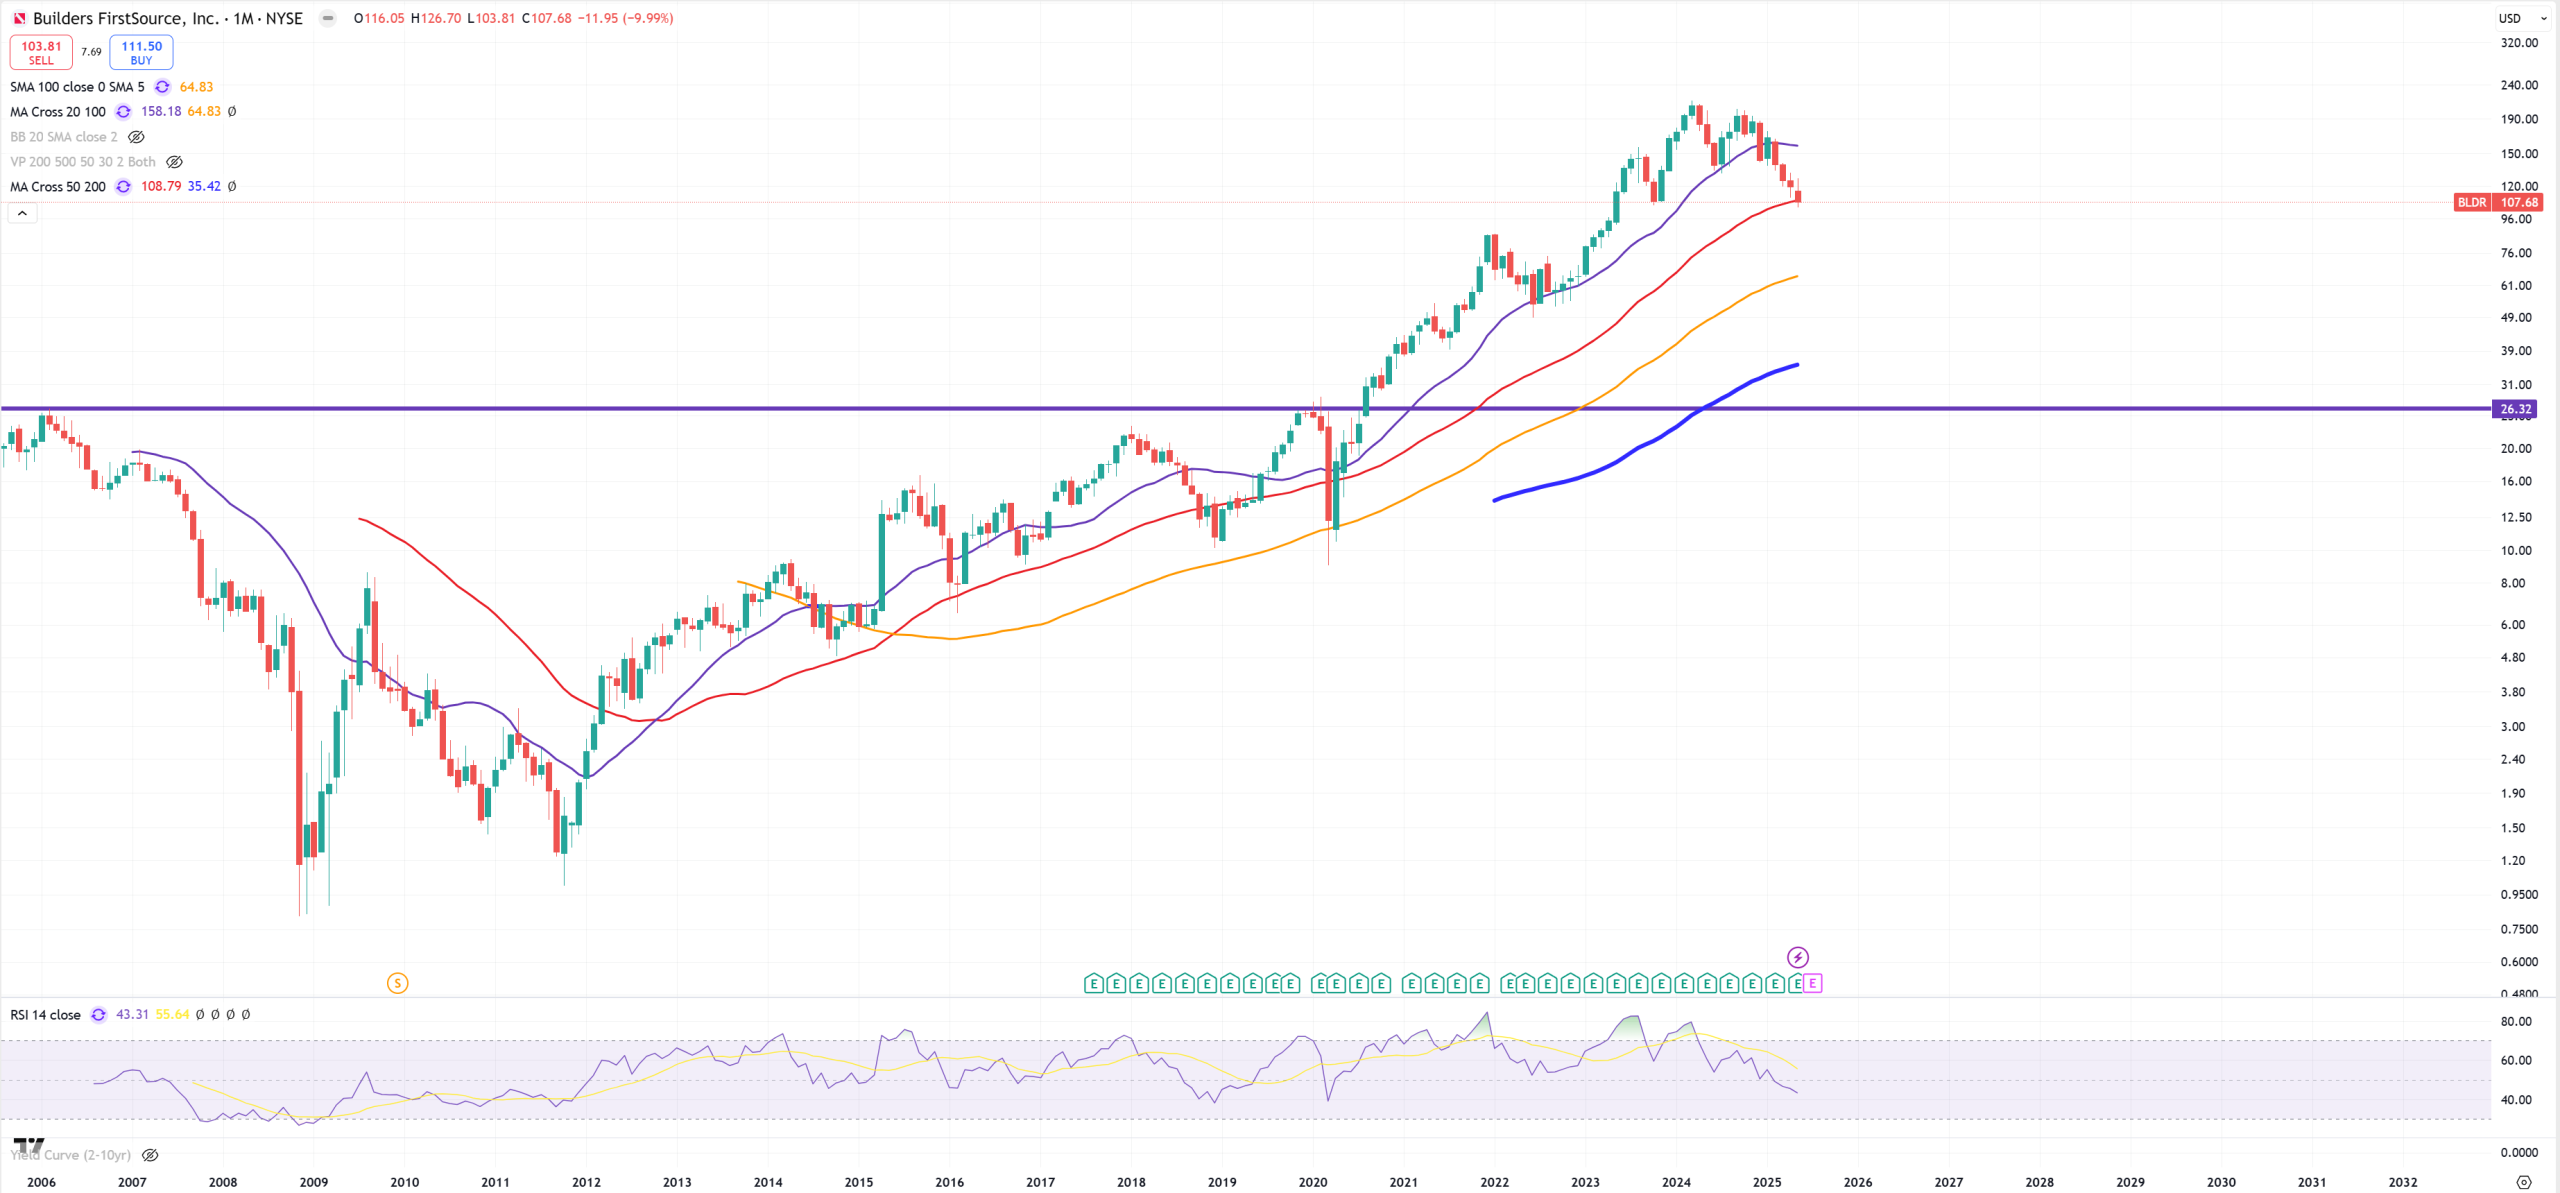
BLDR – also first break of (M)MA50 since 2020
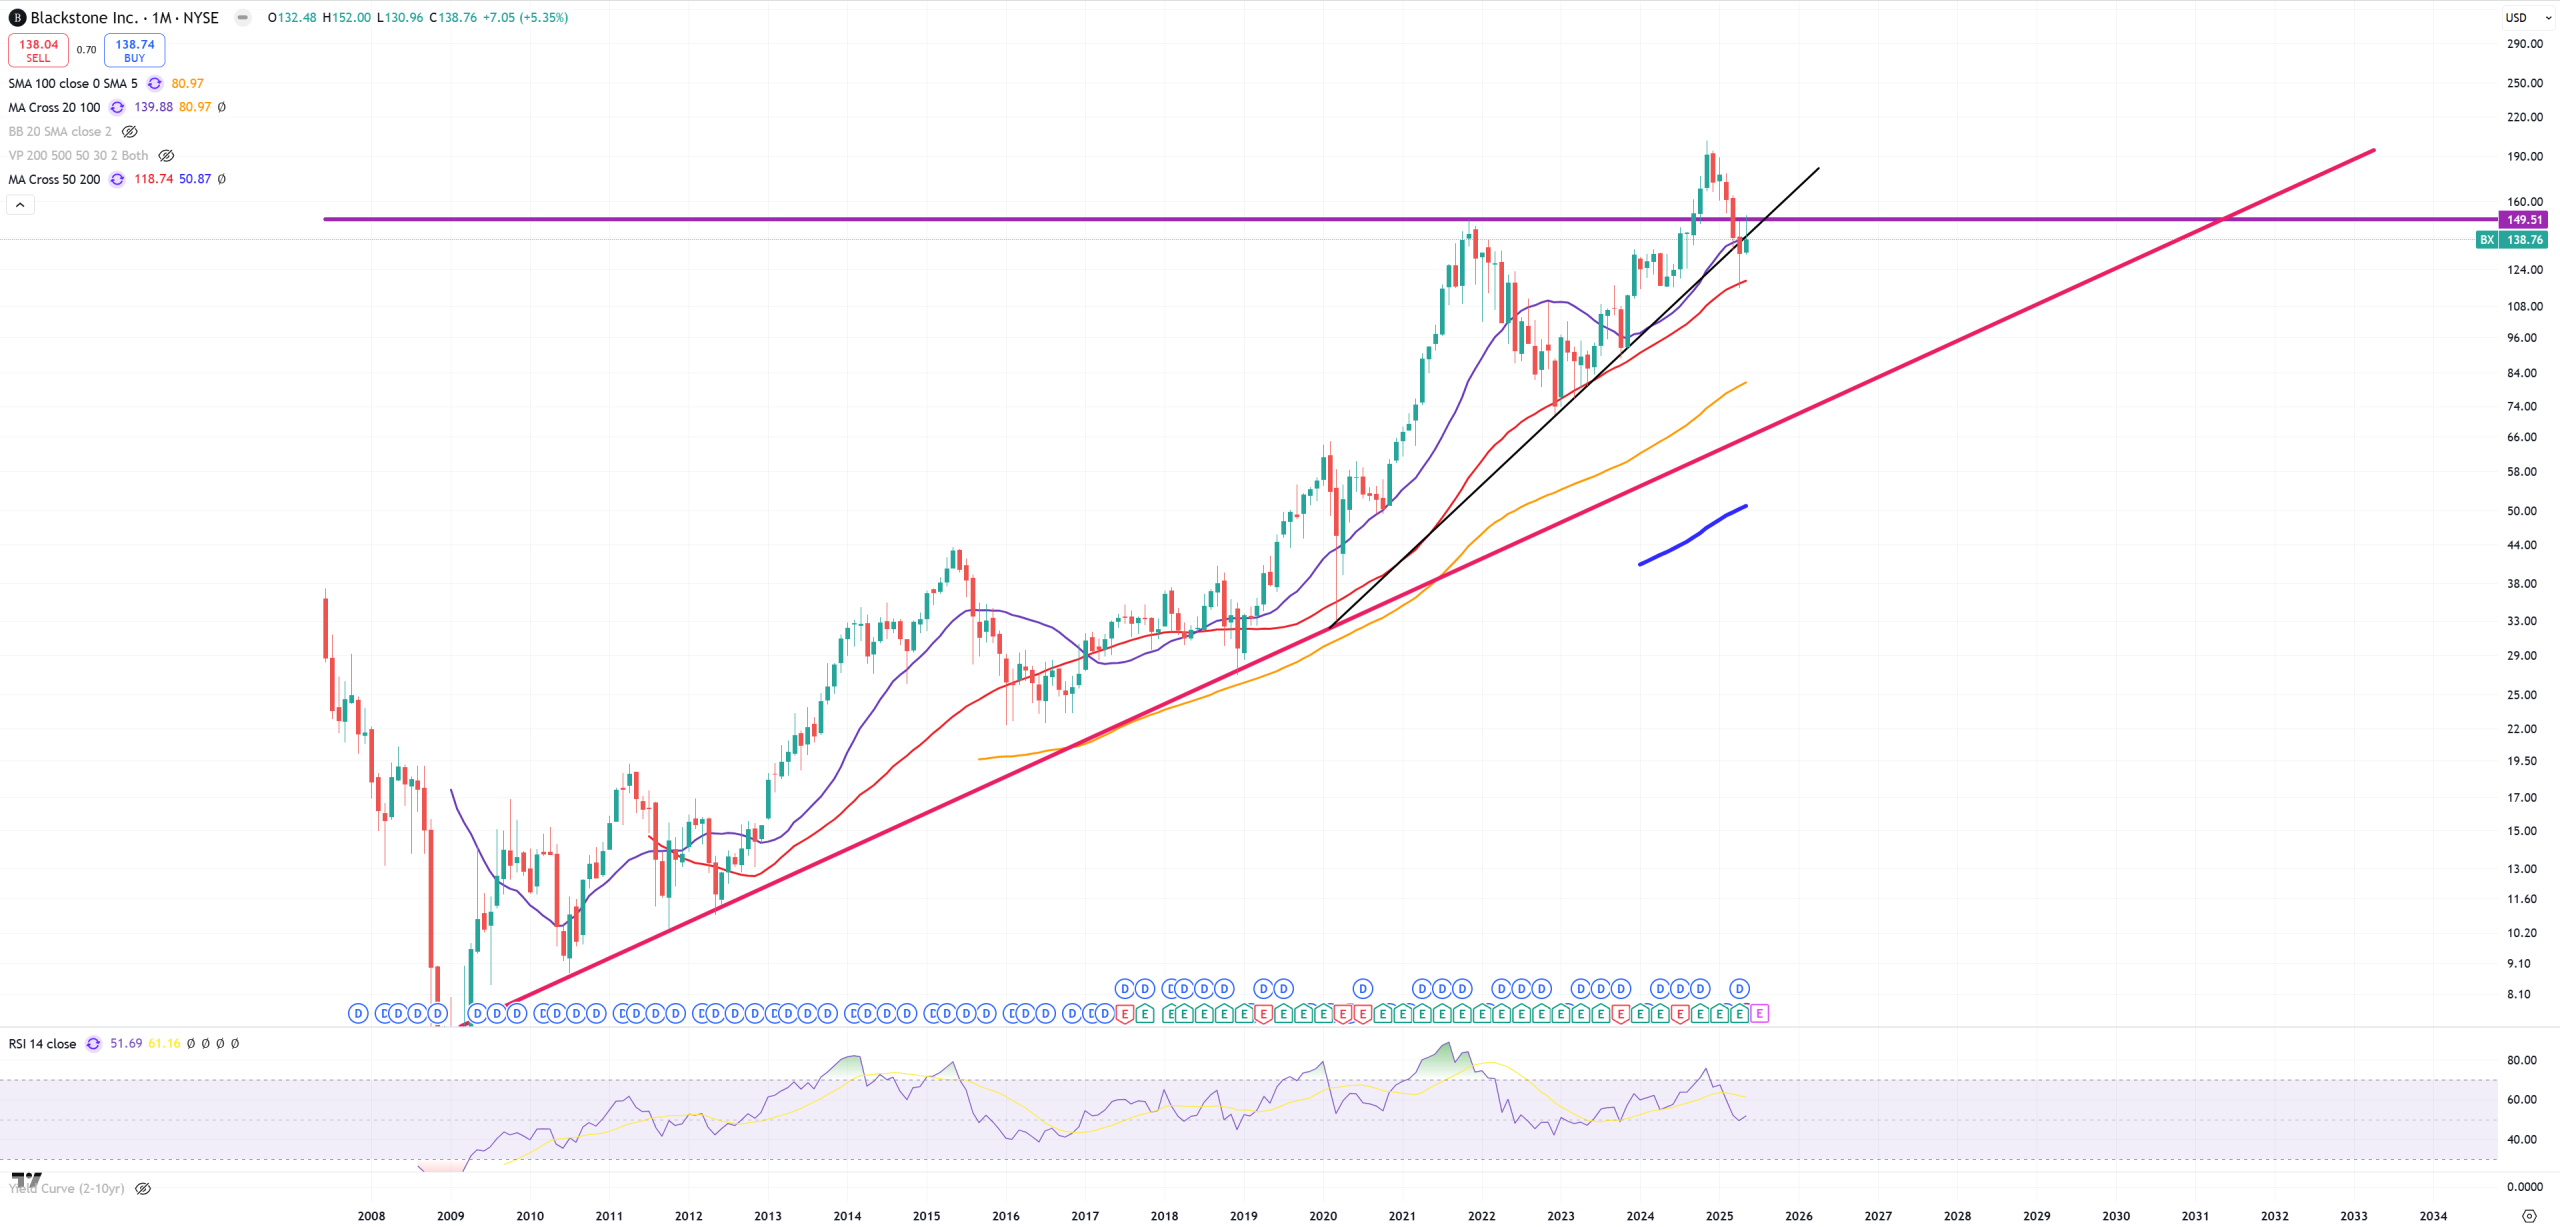
BX – Blackstone
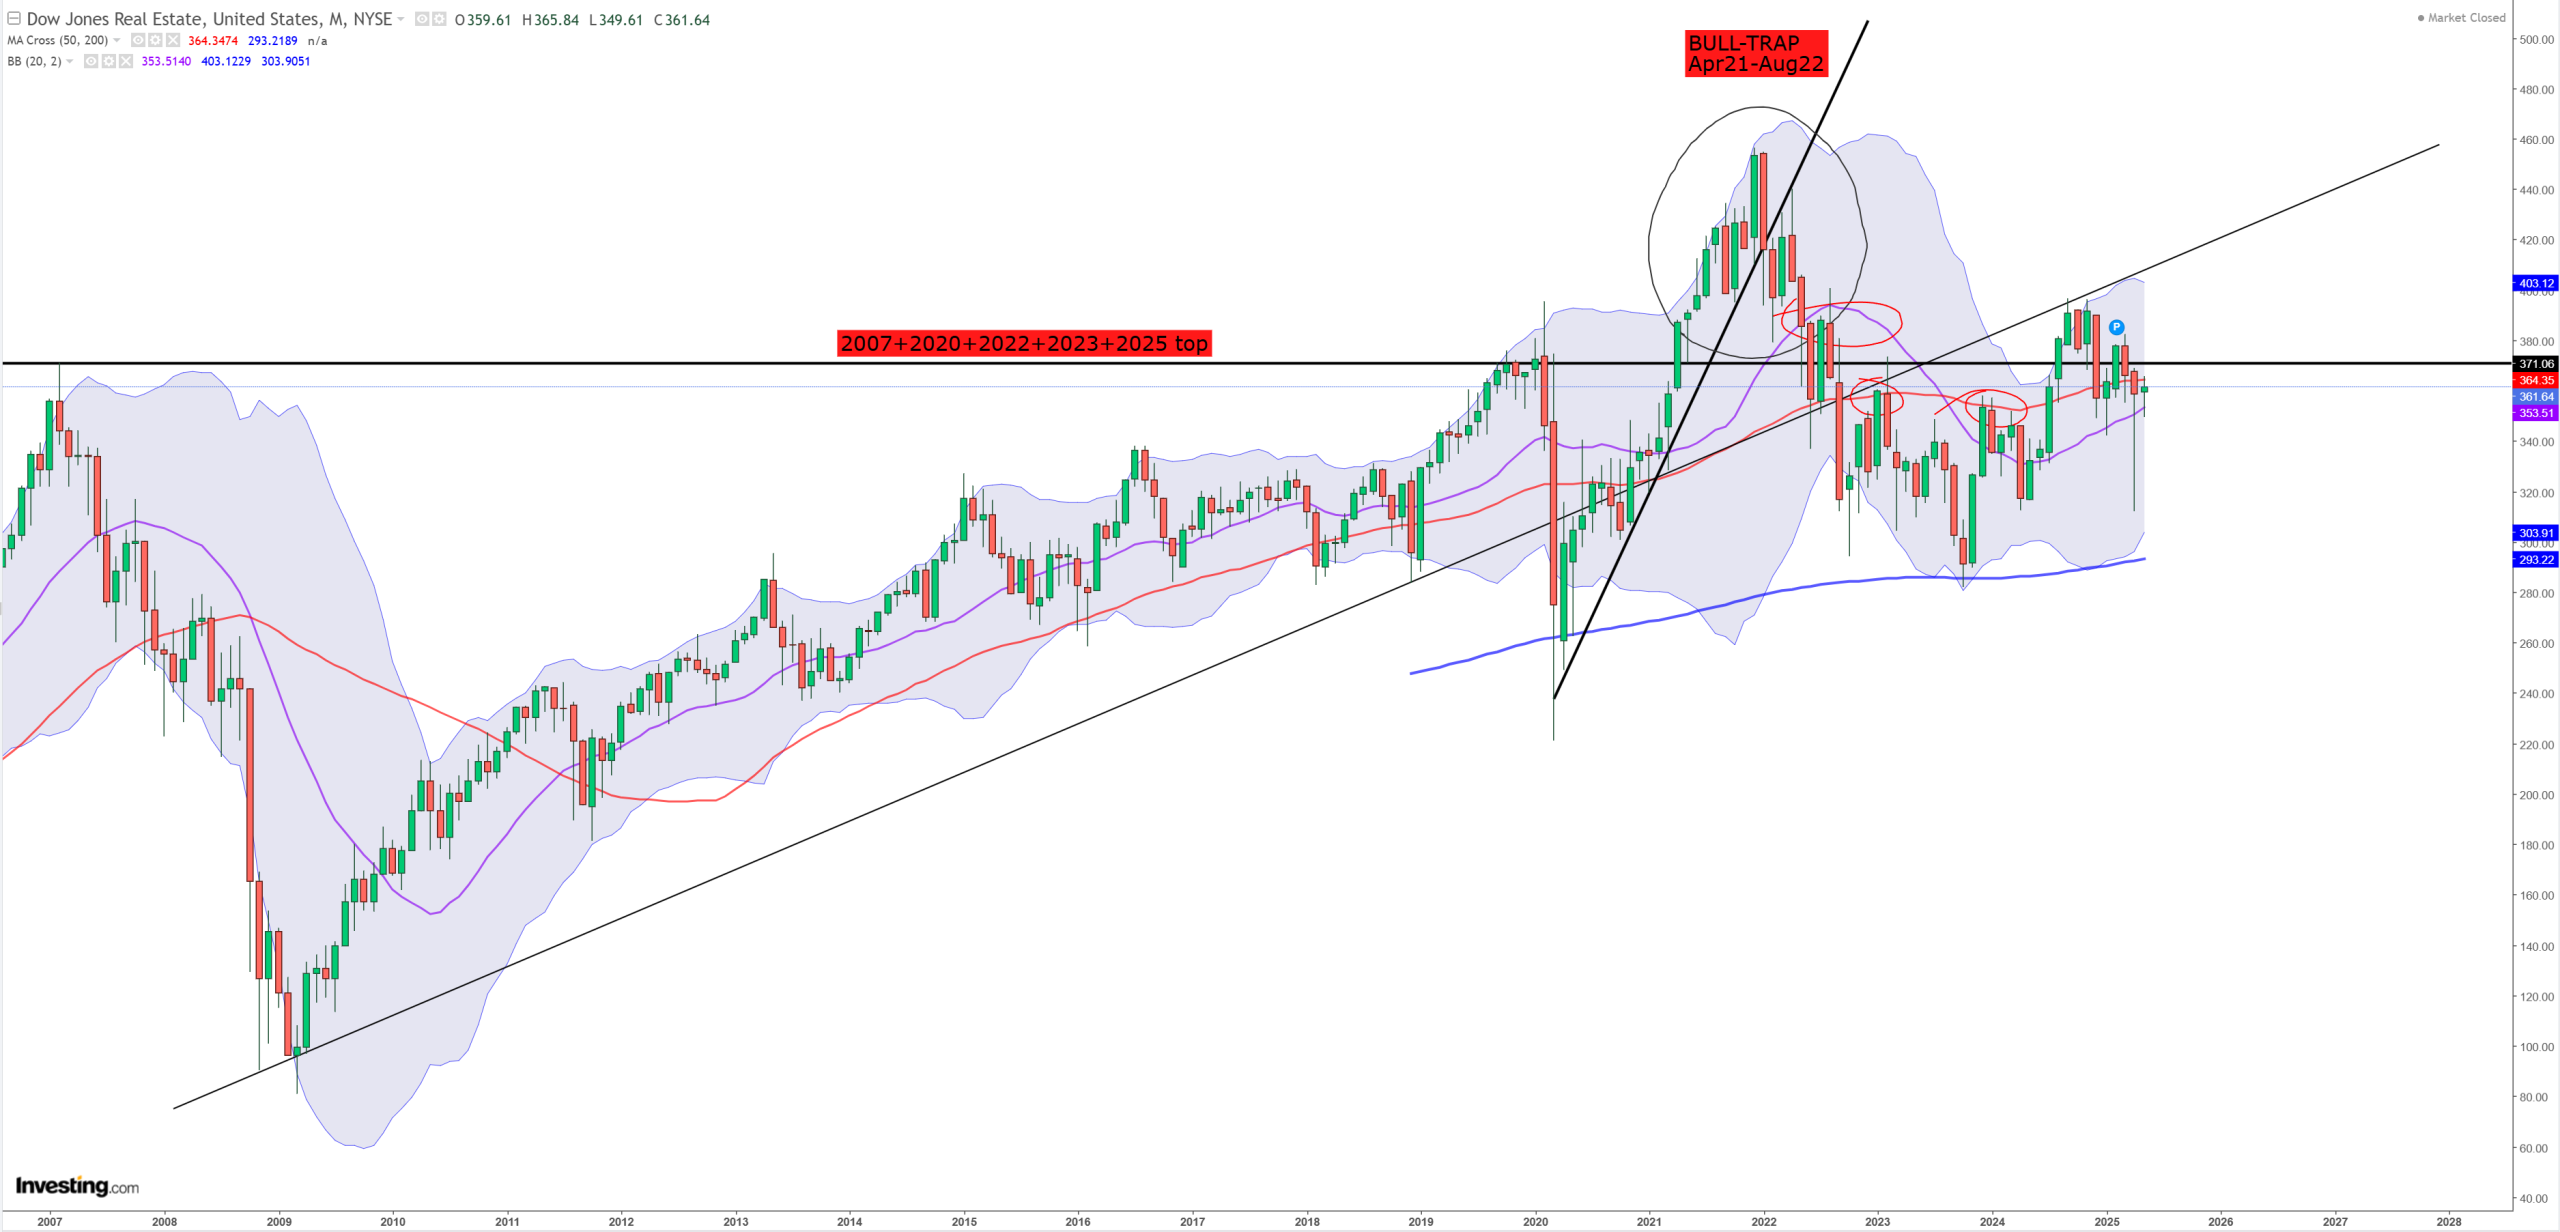
DJUSRE – Dow Jones Real Estate
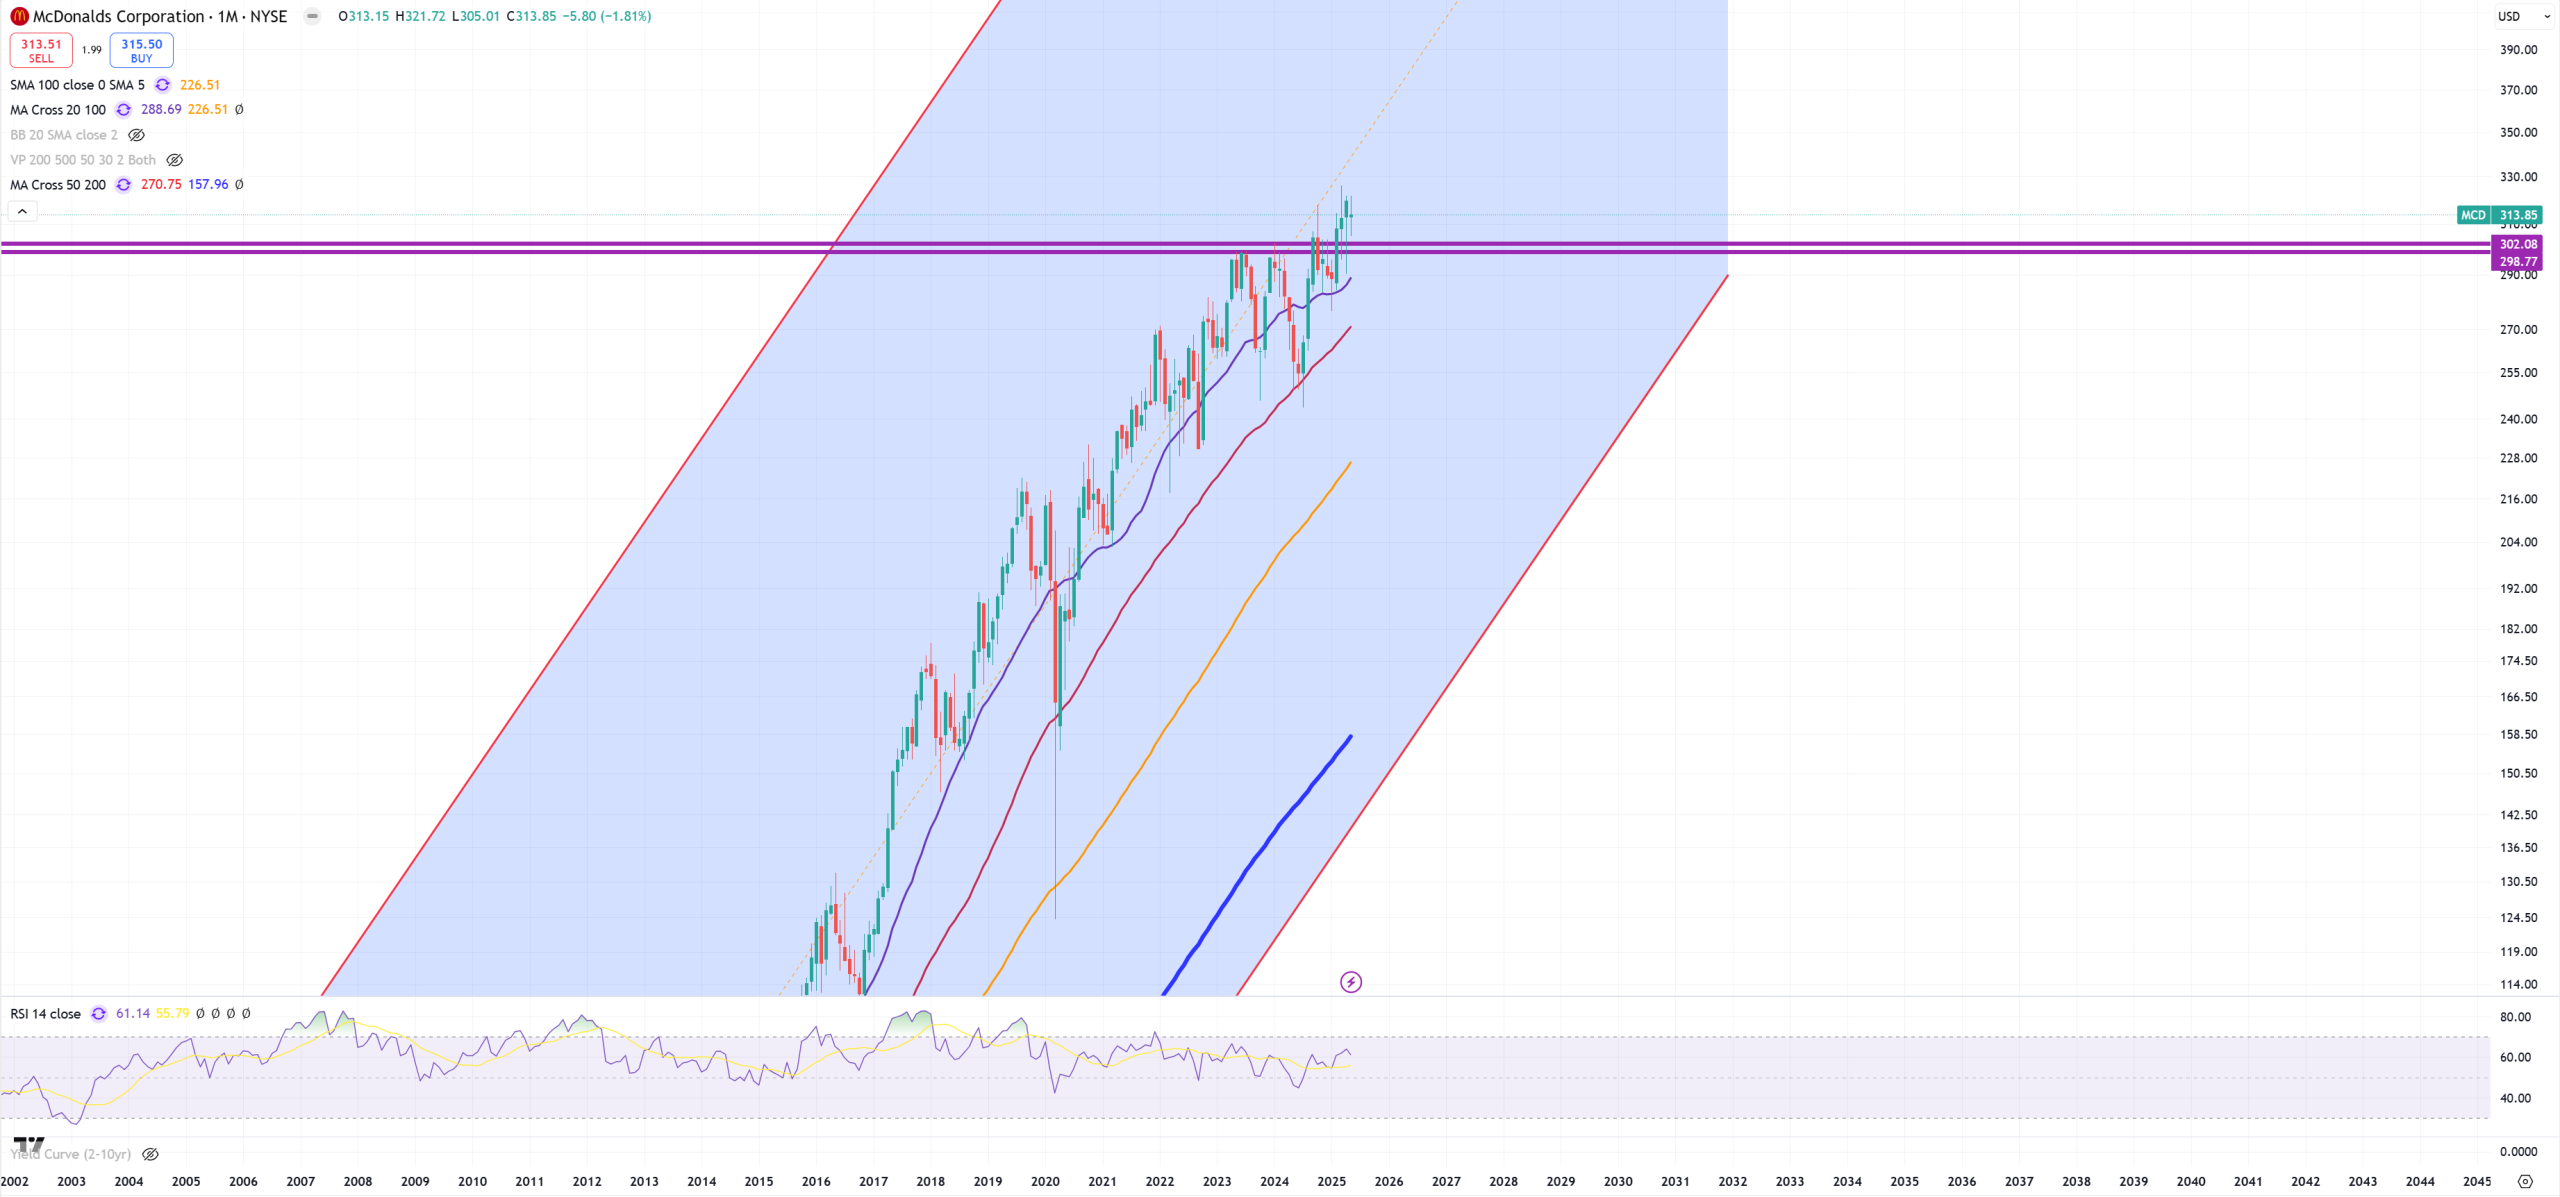
MCD – is above critical support/resistance level. Let’s see how long
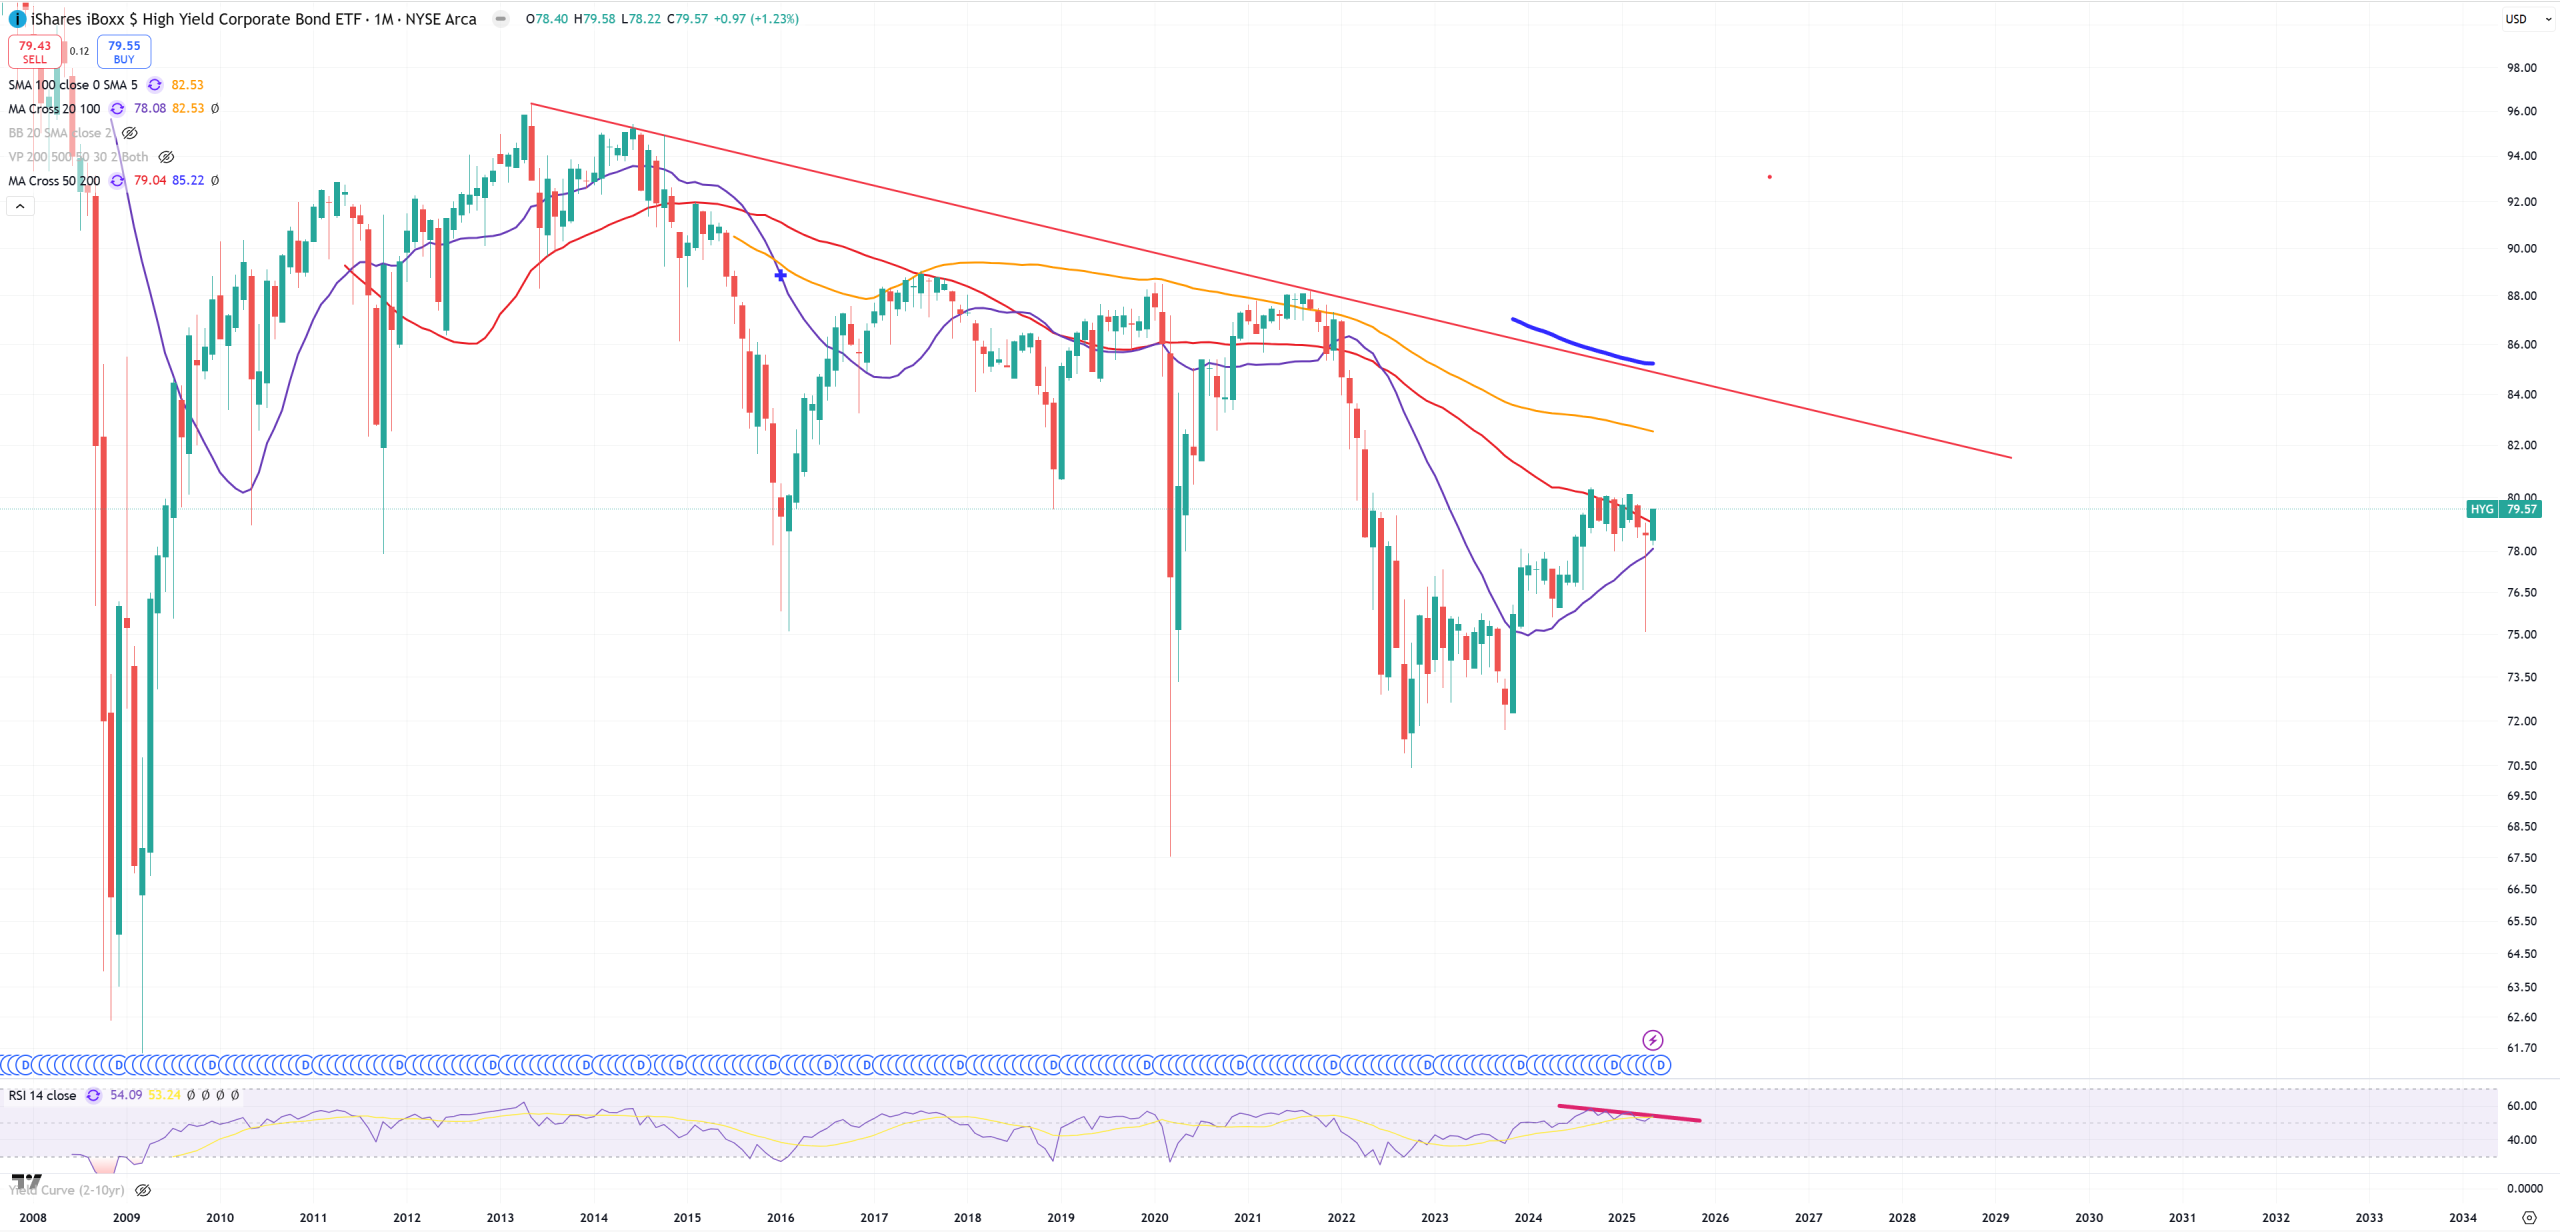
HYG – tries another month fighting against (M)MA50 – fighting to save the shittiest credit.
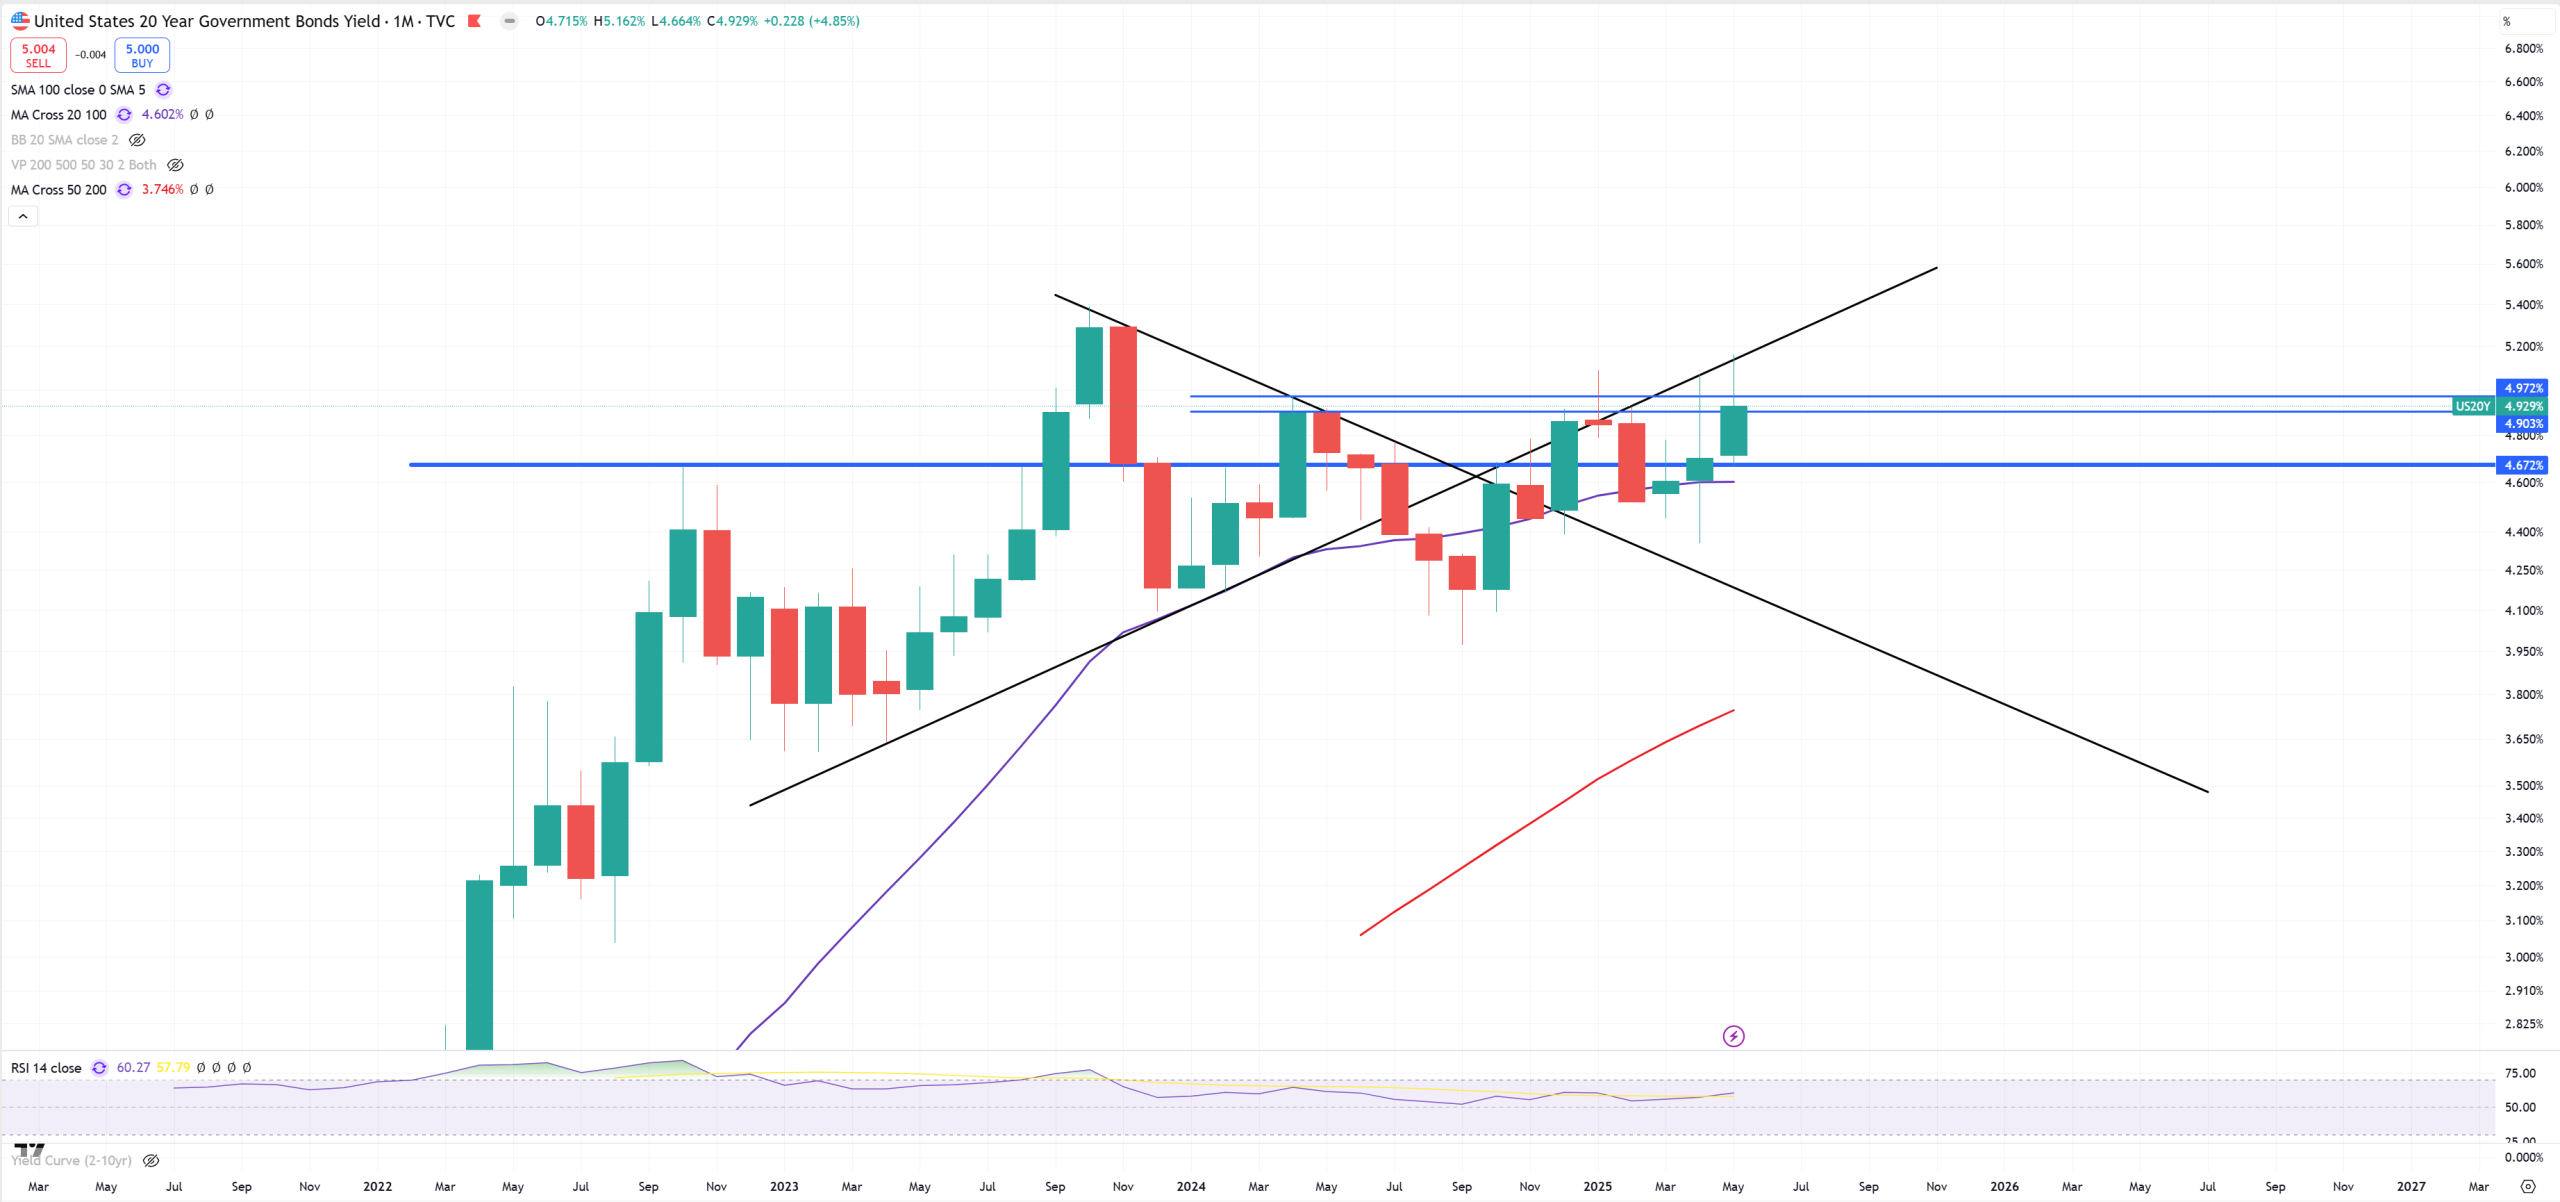
US20Y and 5% holds as a resistance
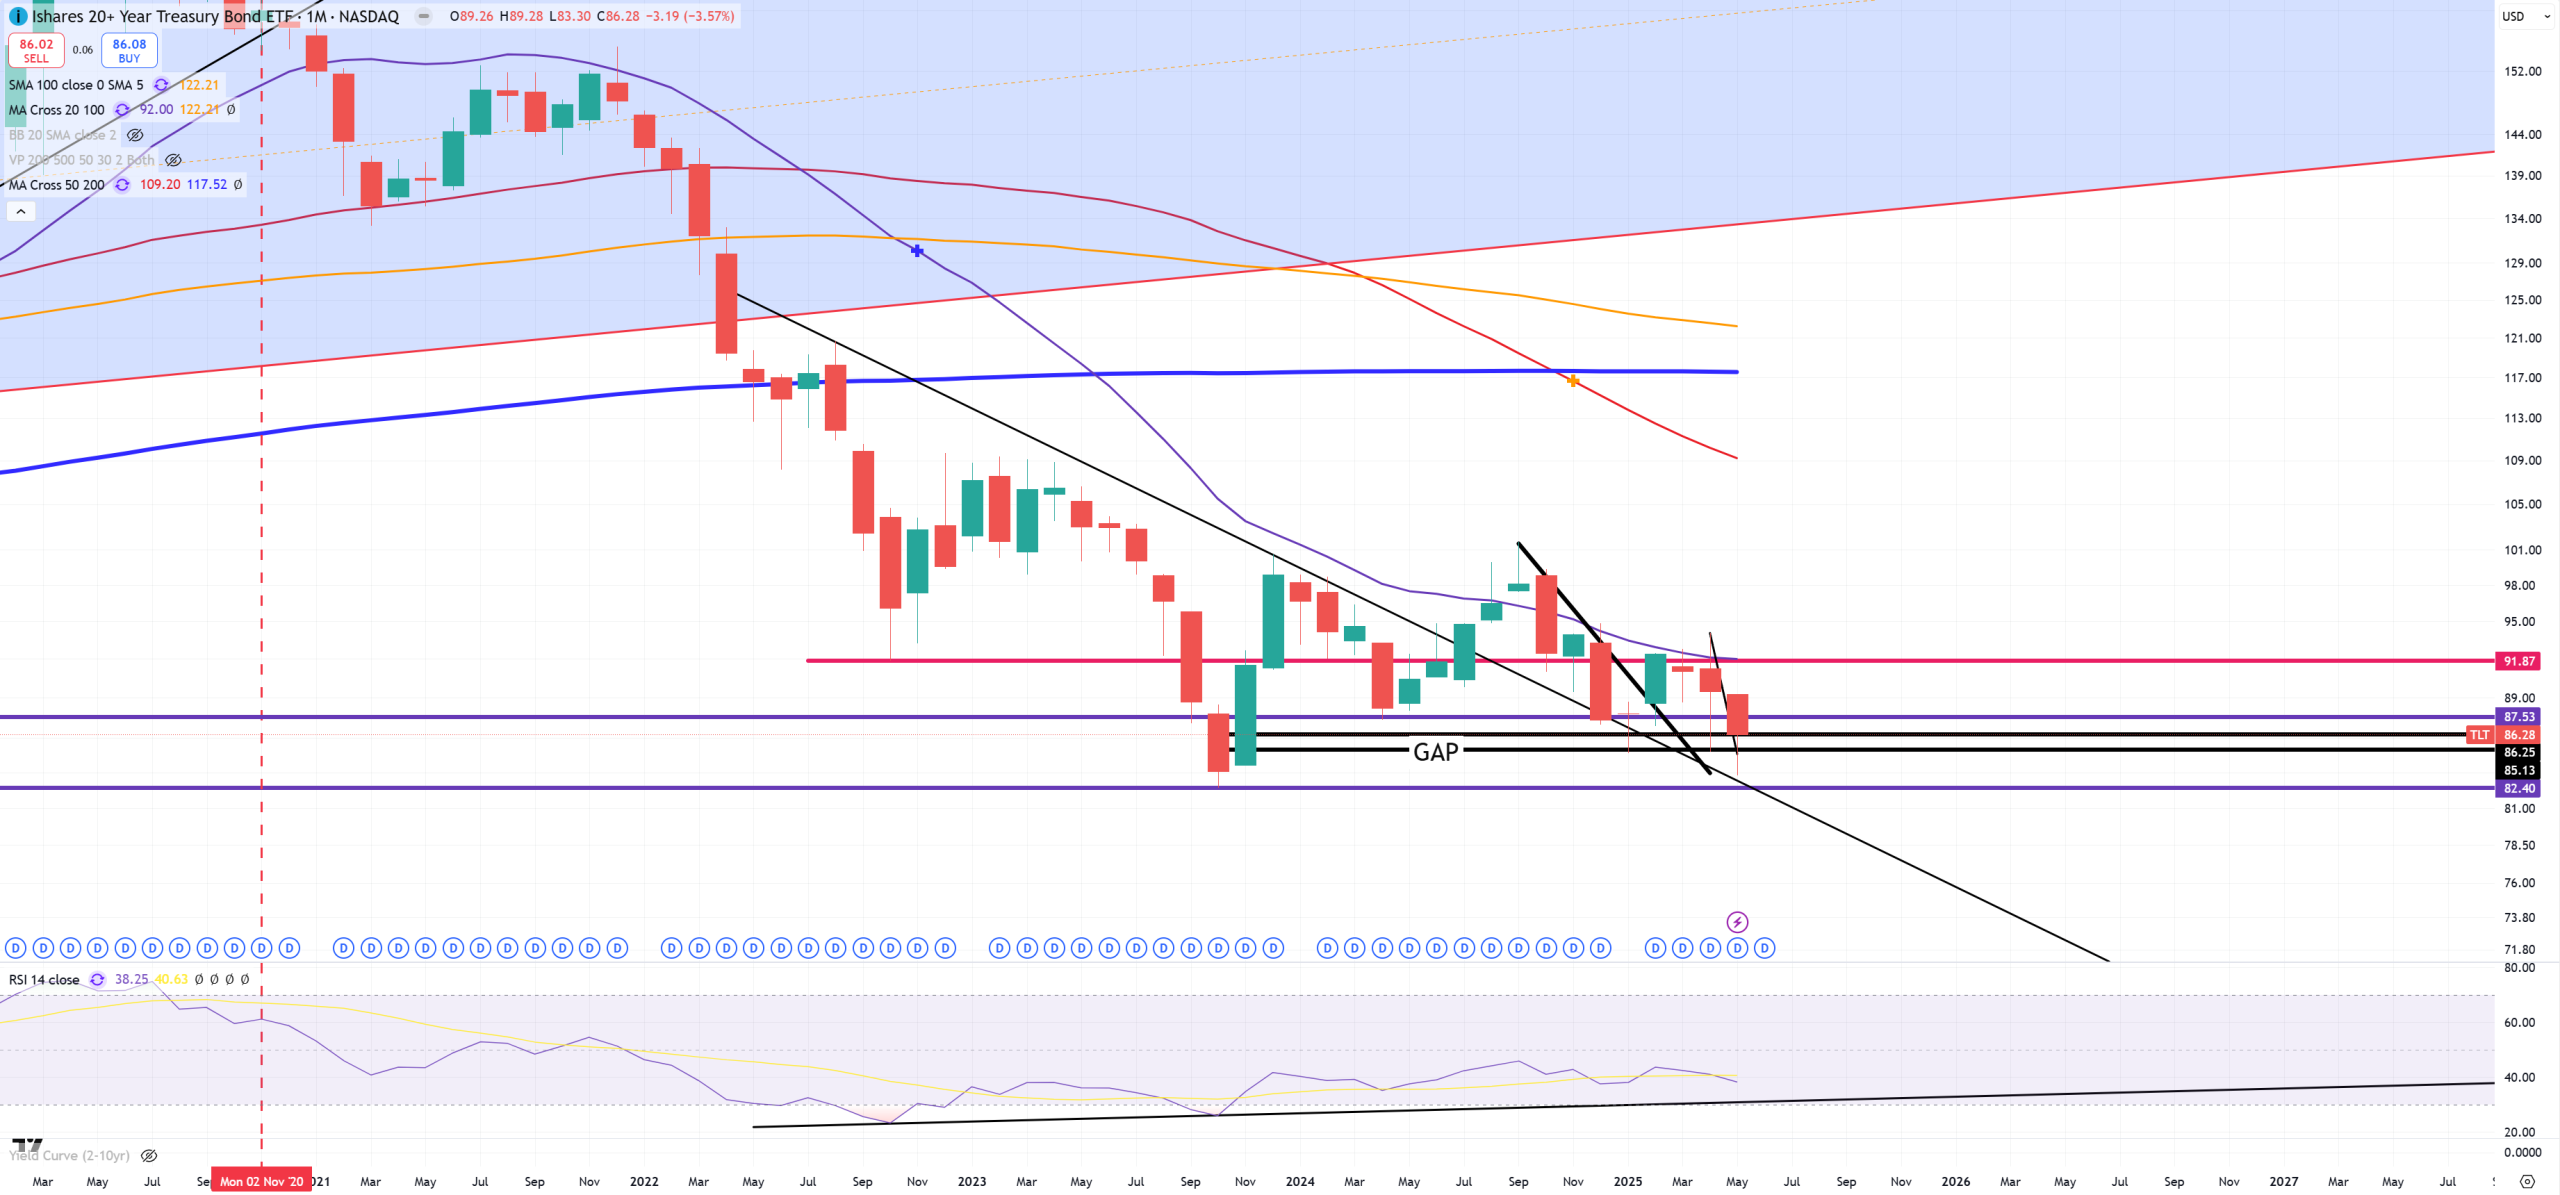
TLT – Just like US20Y – 5% is 85$ level
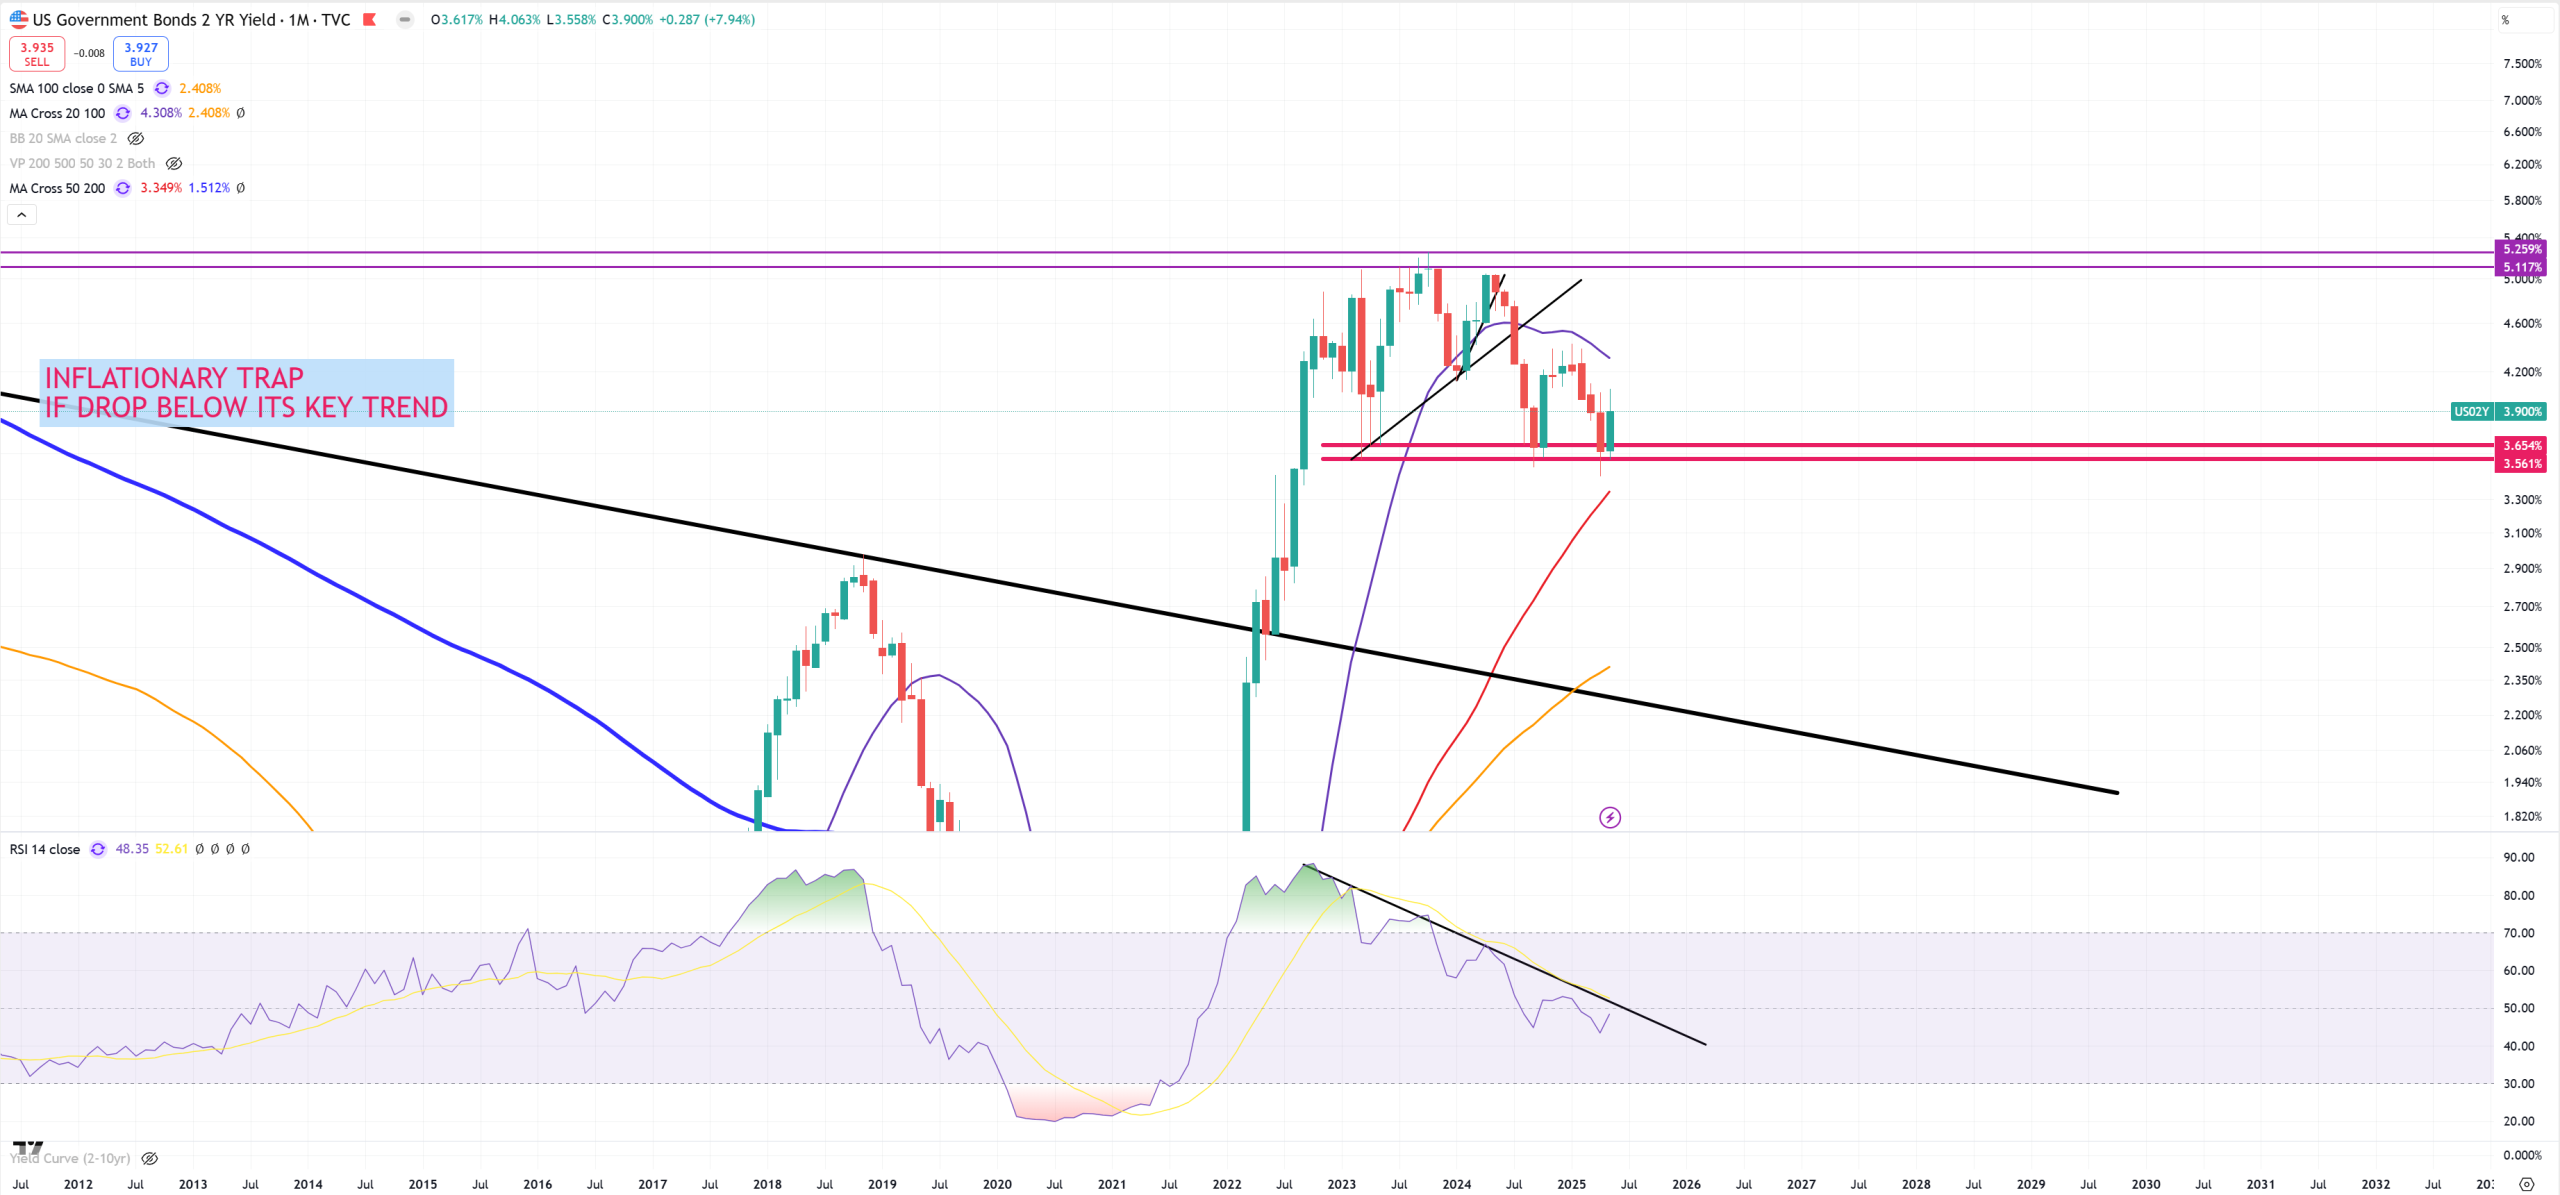
US02Y – this 3.50% is a massive level
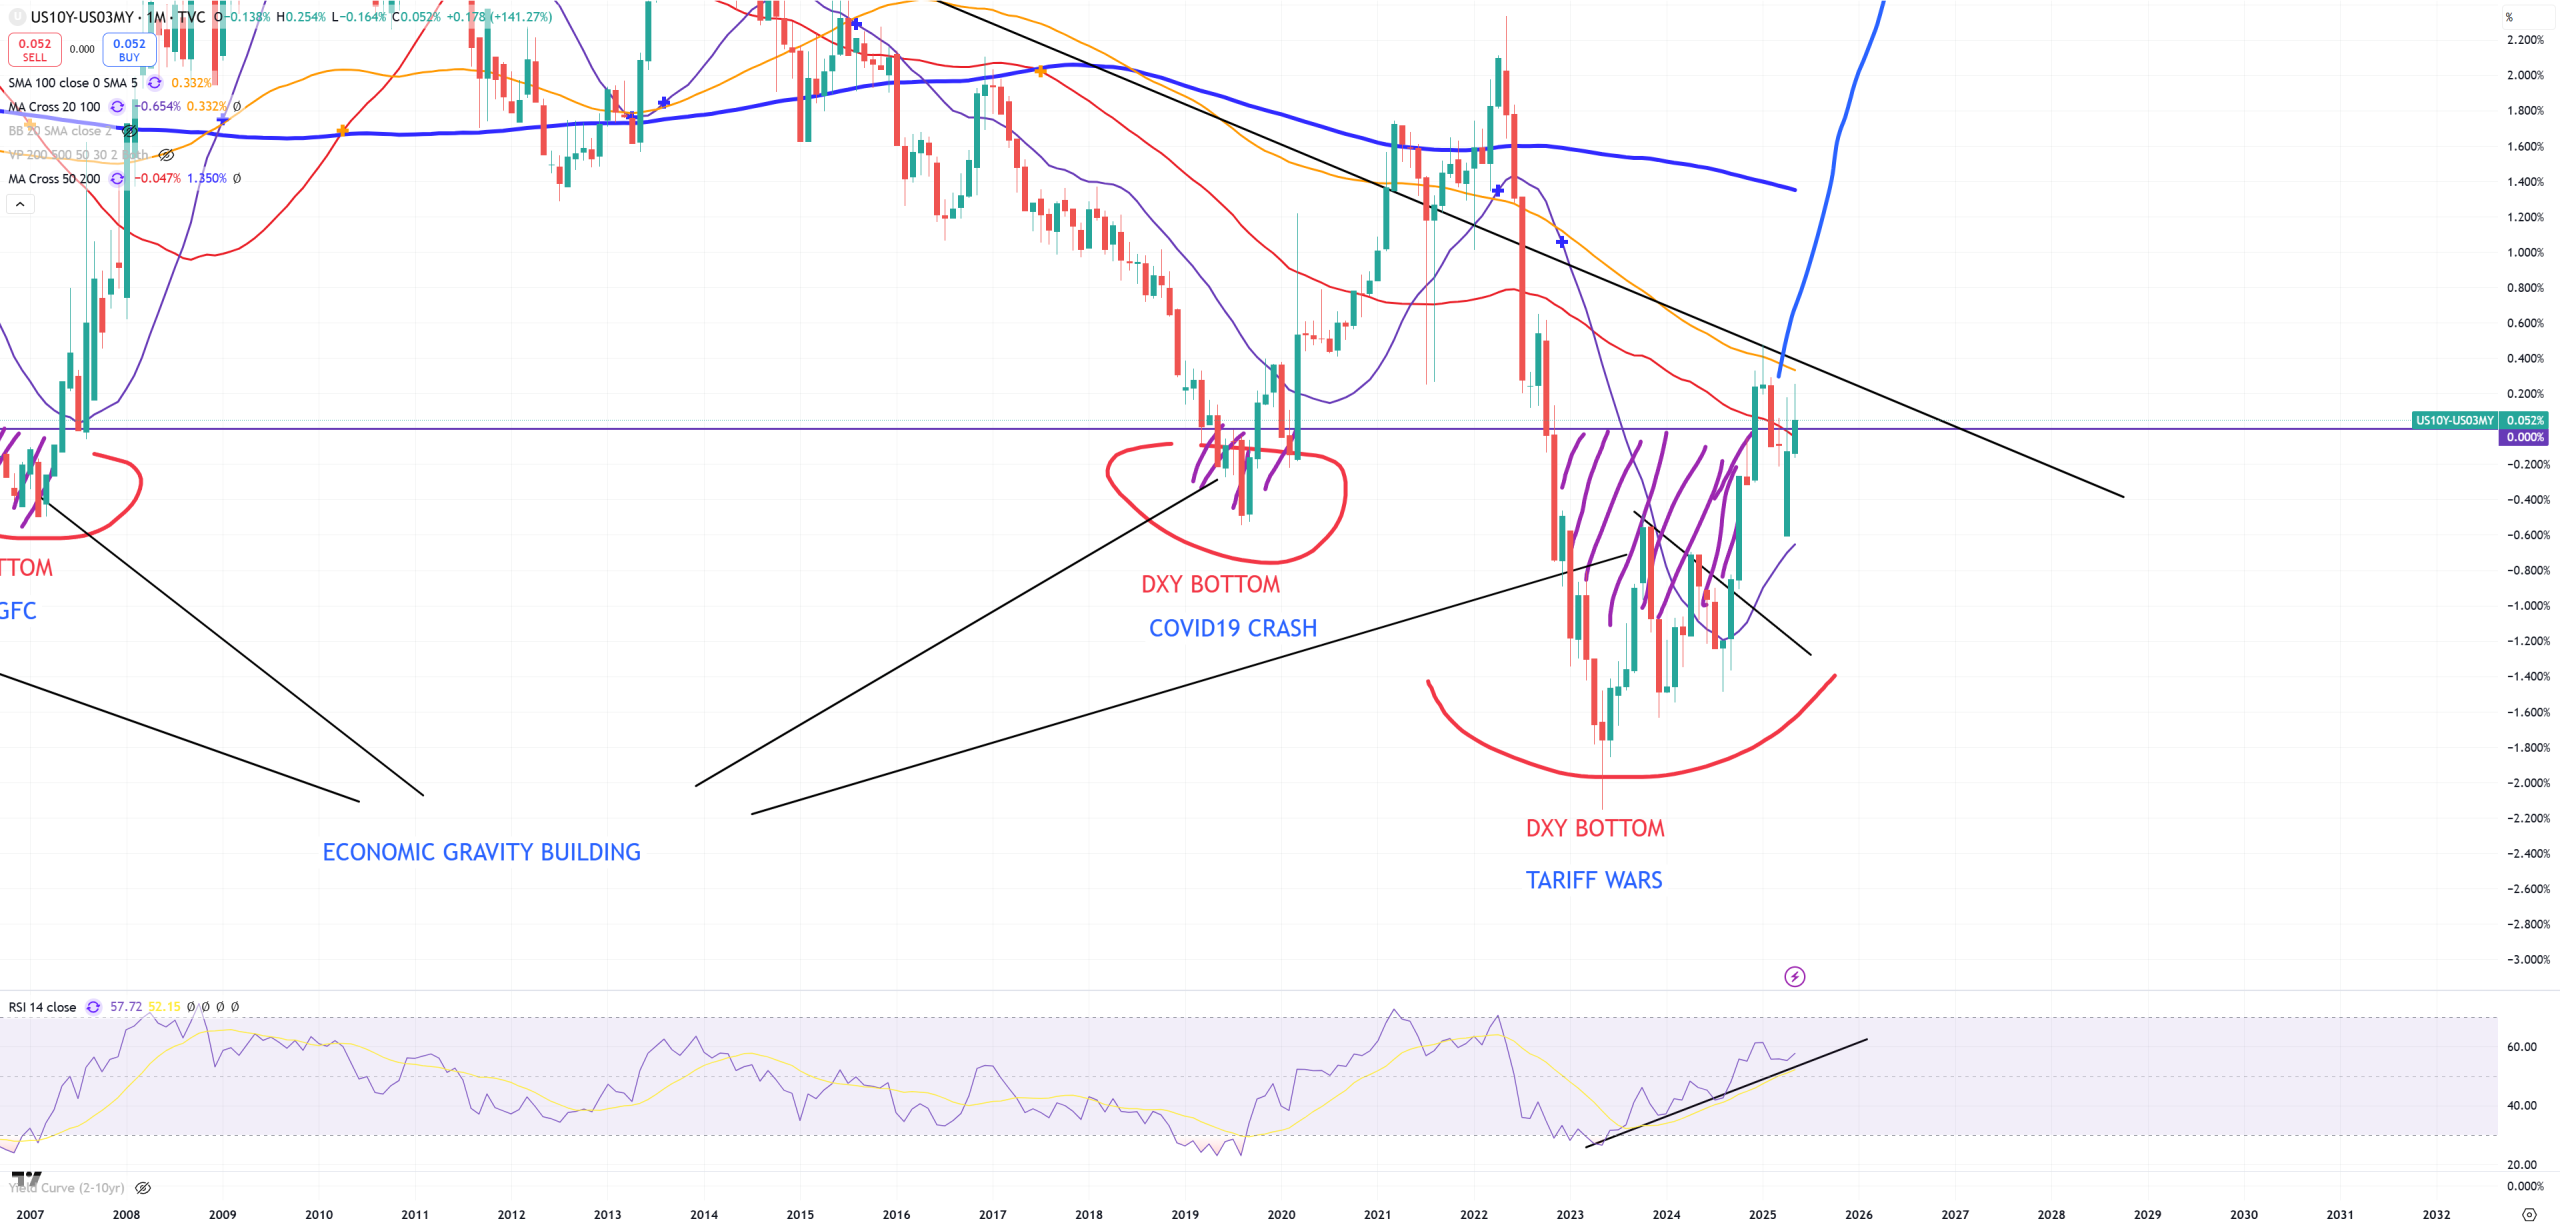
10Y/3M just +5bps but above (M)MA50 another time. Breaking +50bps will end the hopes. Keeping it inverted = adding gravity to the economy.
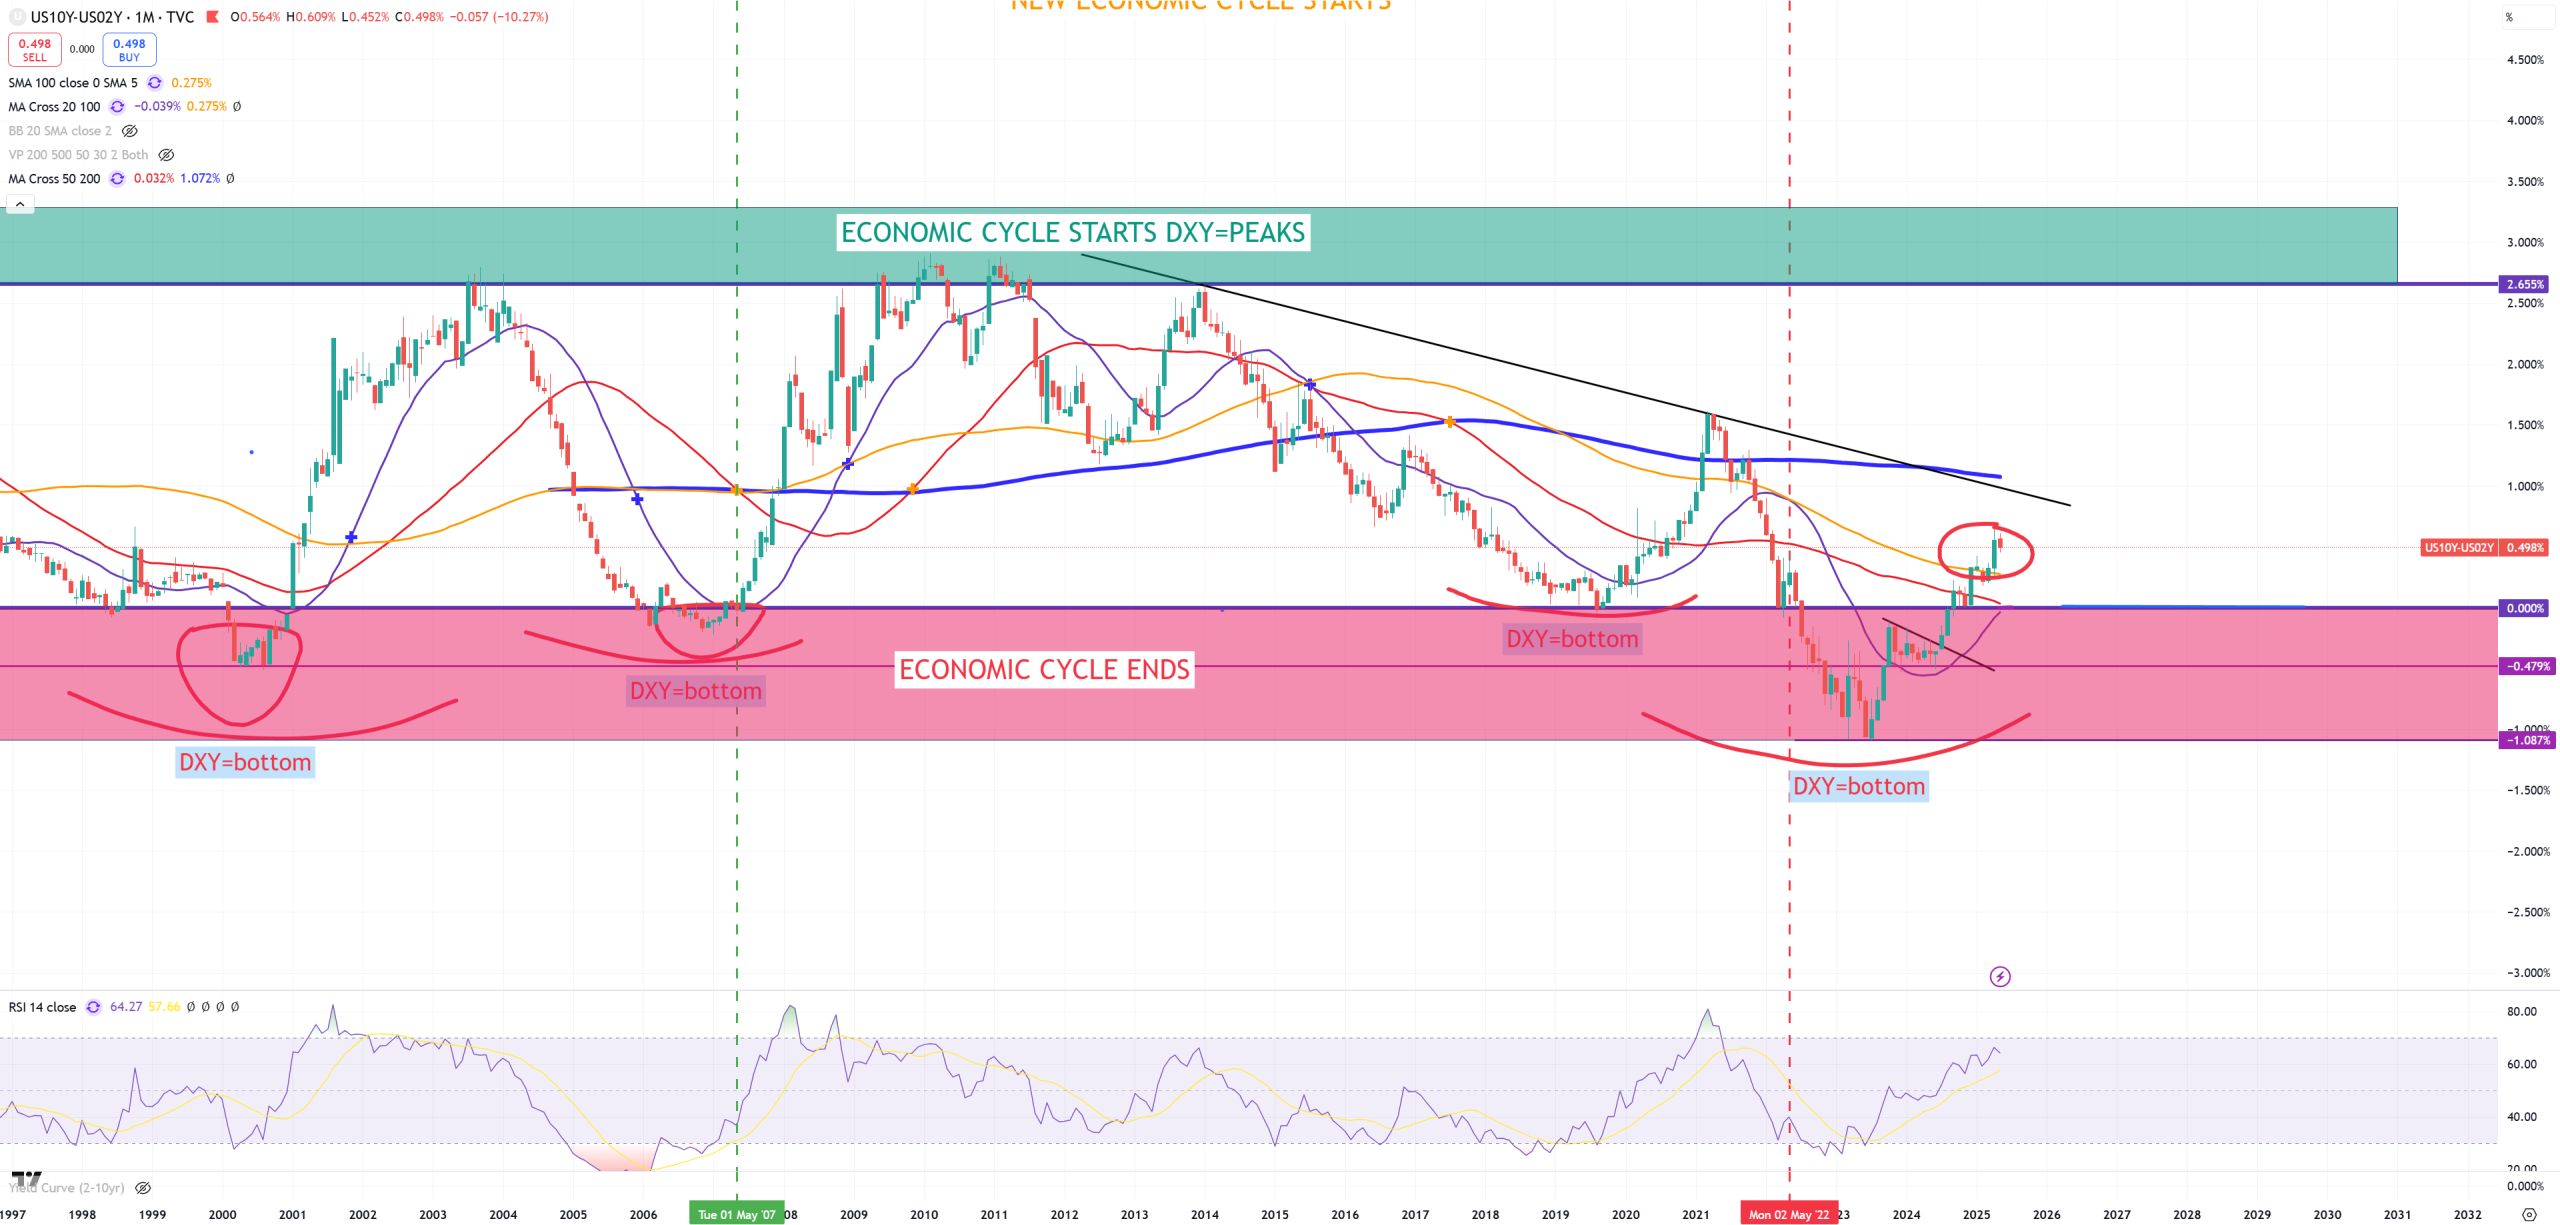
10Y/2Y – +49bps – this shows us the path for 10Y/3M with some unknown period of lag. 10Y/3M is way more important than 10Y/2Y.
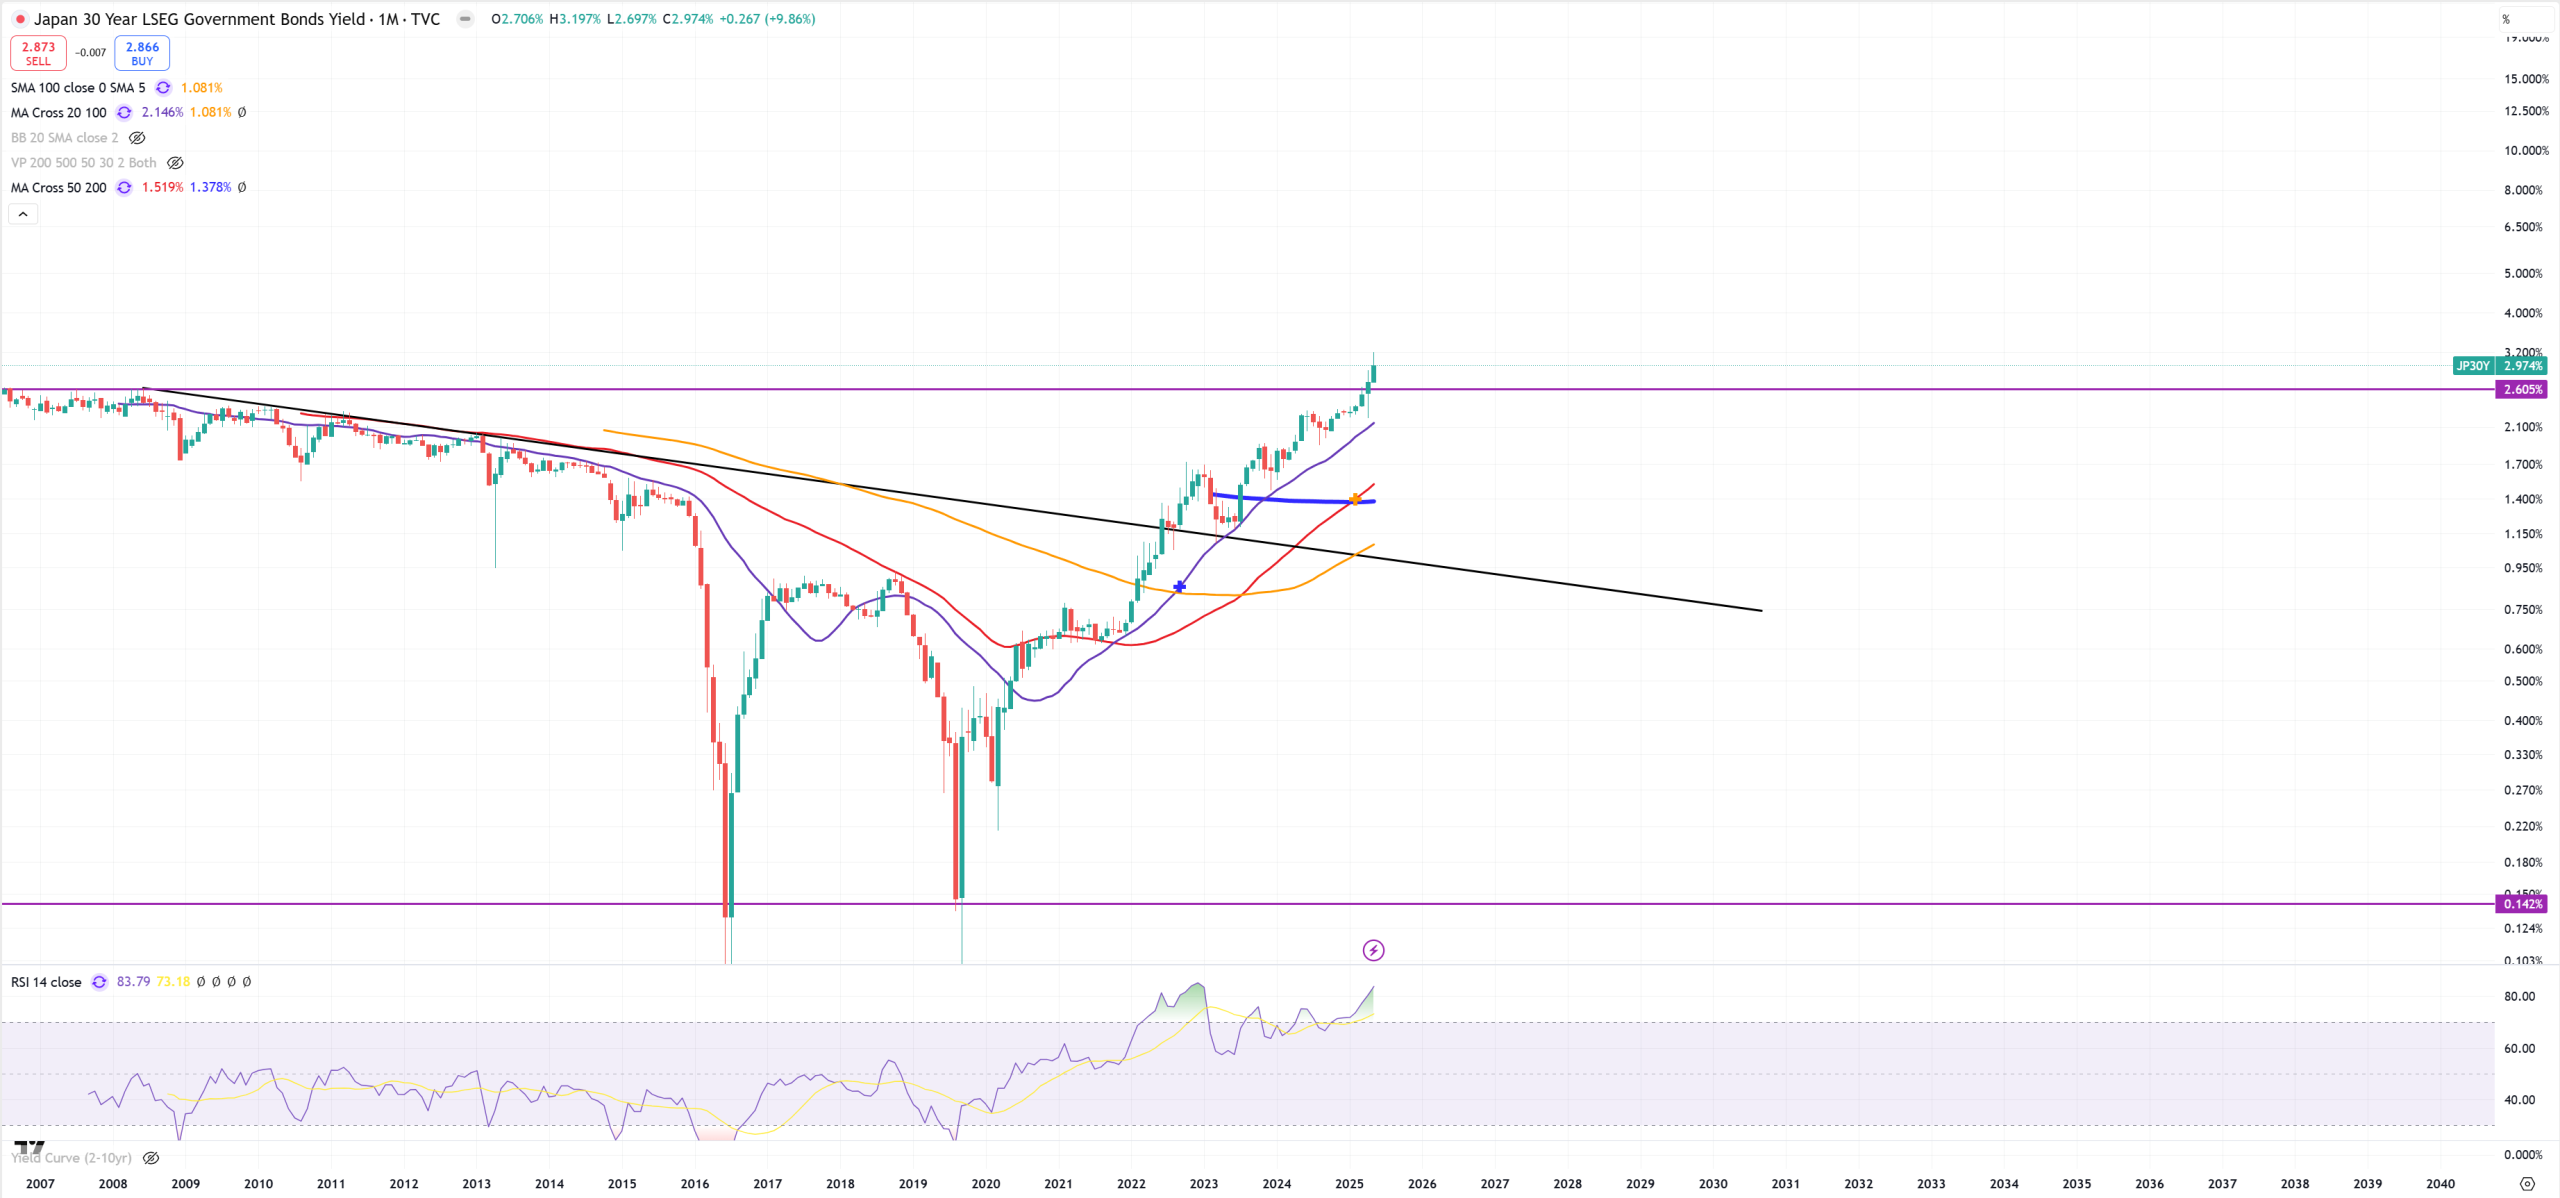
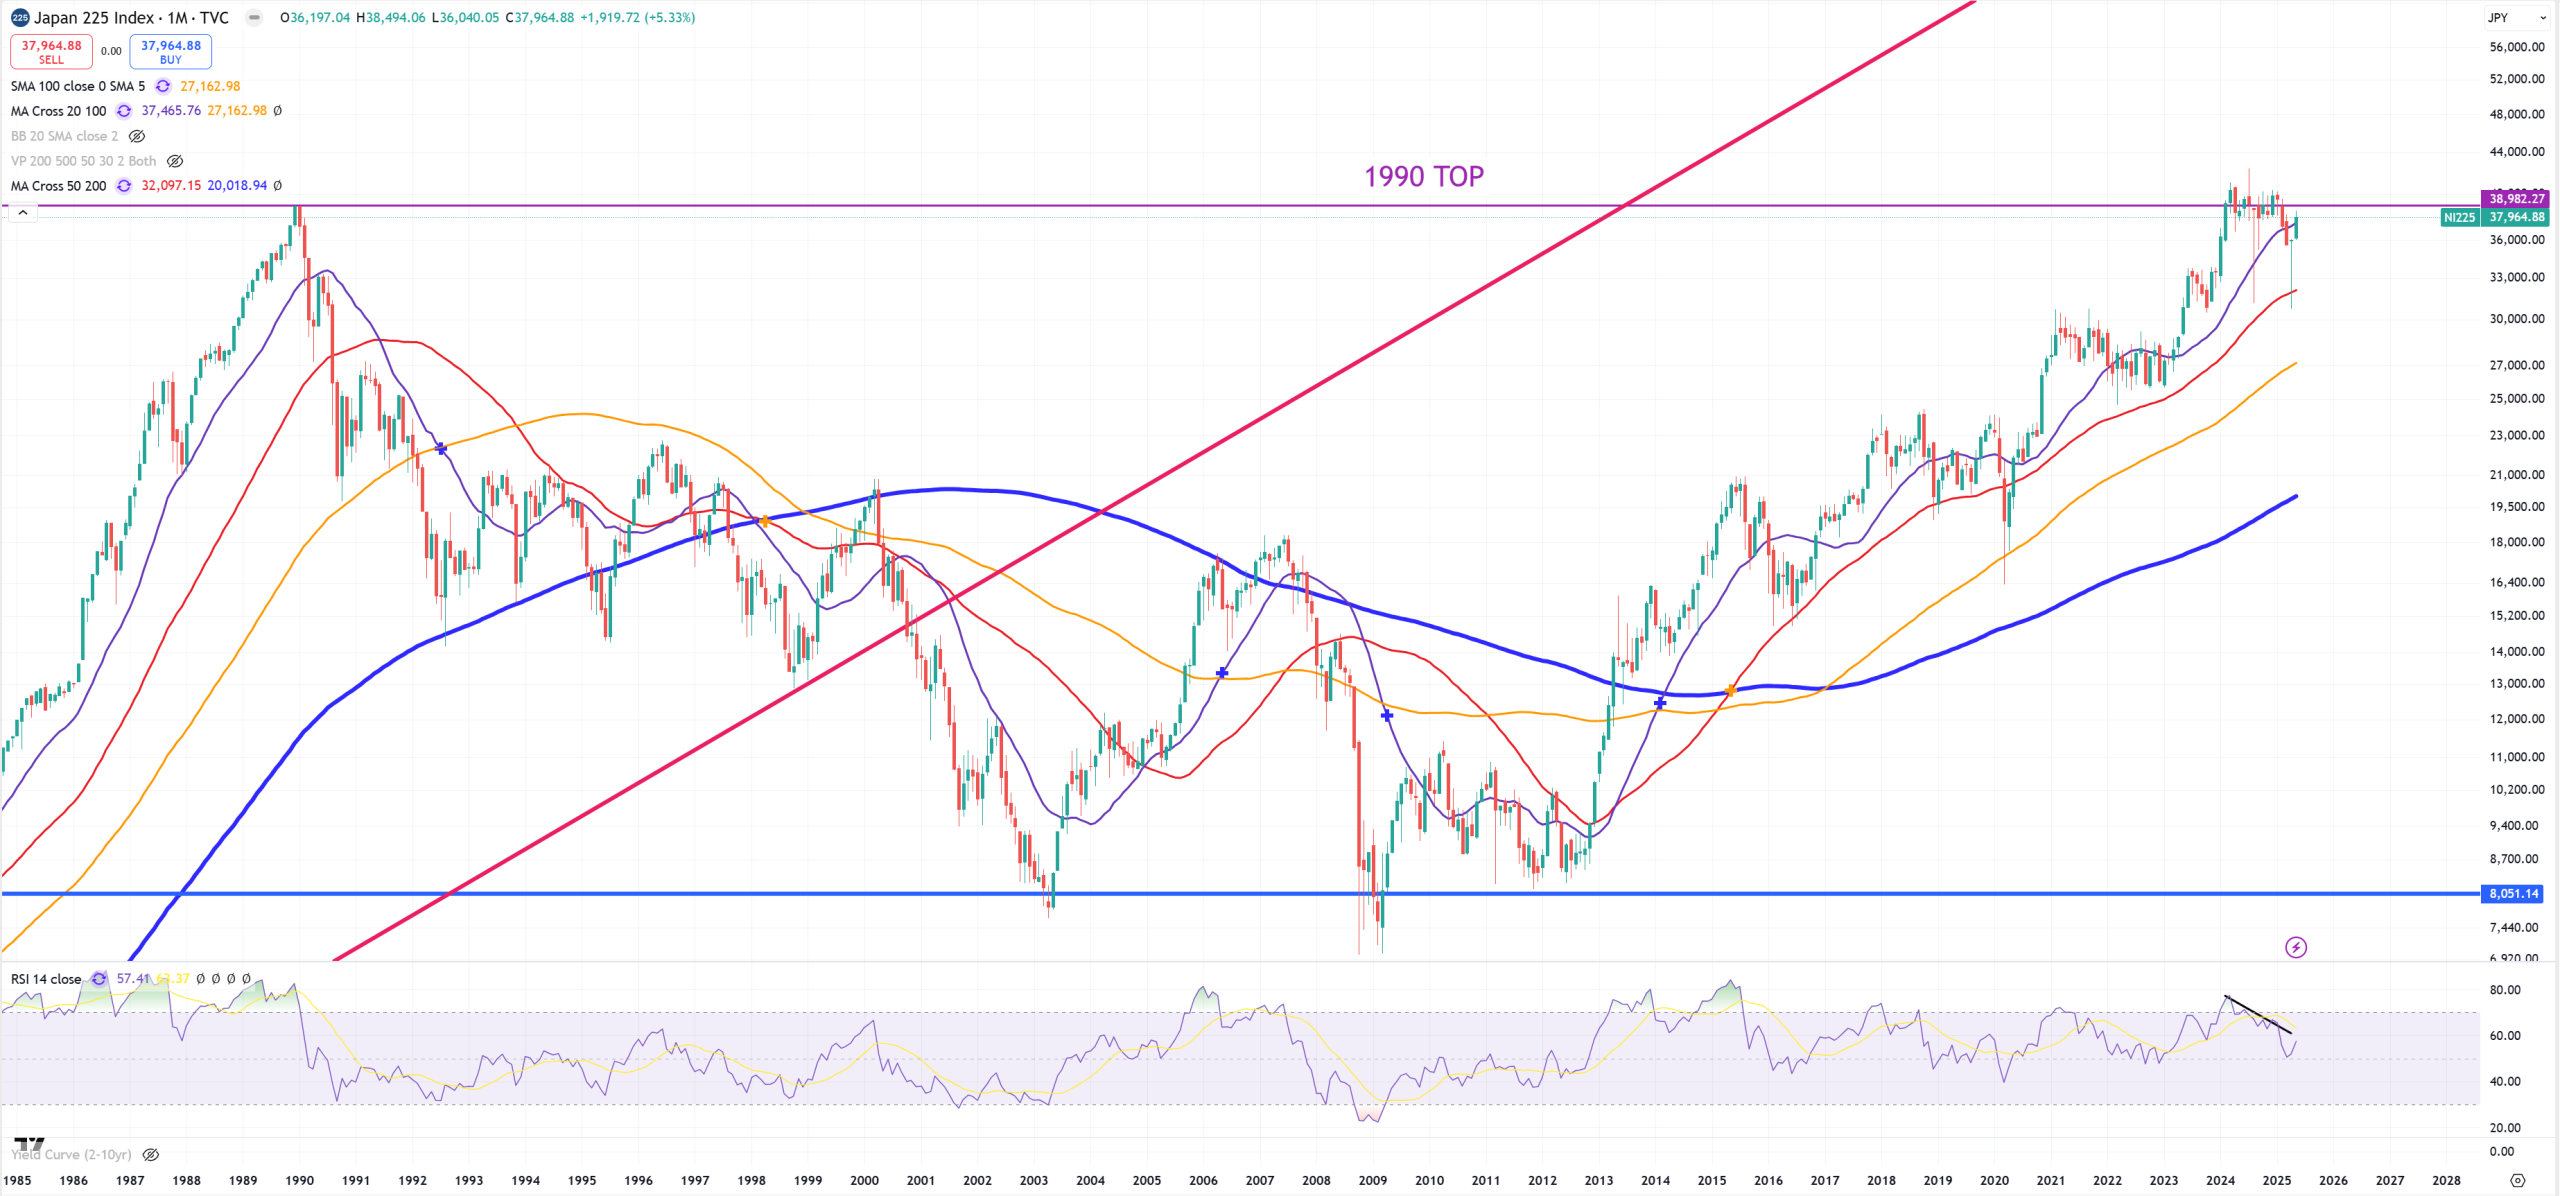
JP30Y – well deserved break. Is it a true or false we’ll find out, I bet it’s a valid true break, as something needs to wipe out Japan for their decades of stupidity.
NIKKEI225 – not much changed.
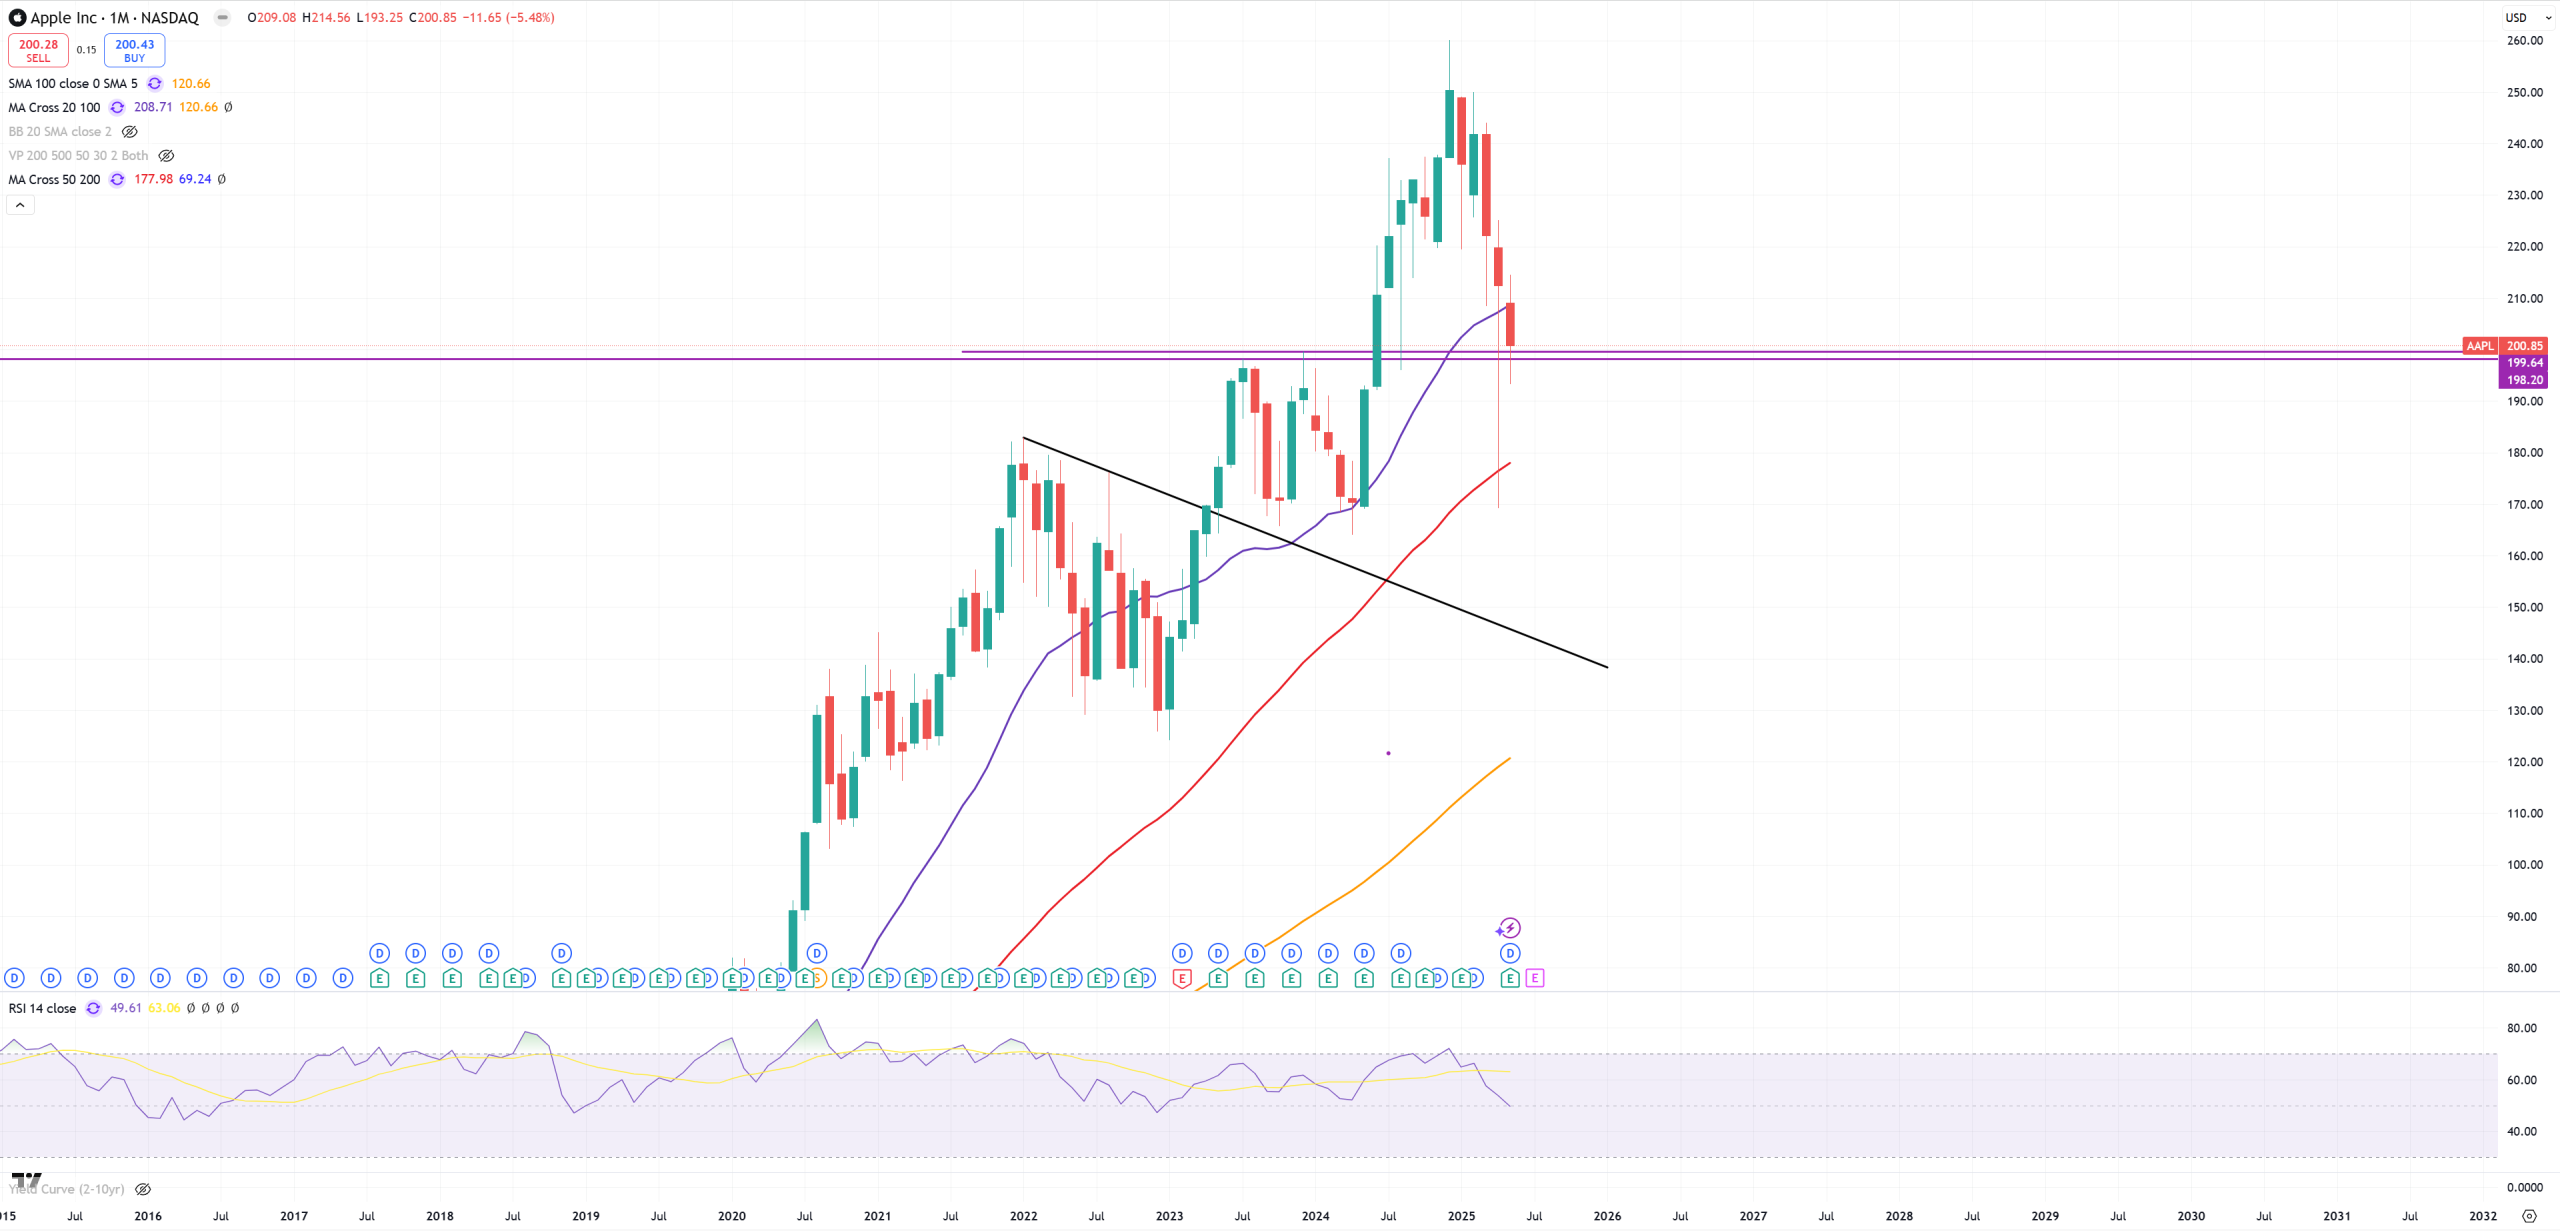
AAPL – Apple and key 200$ level
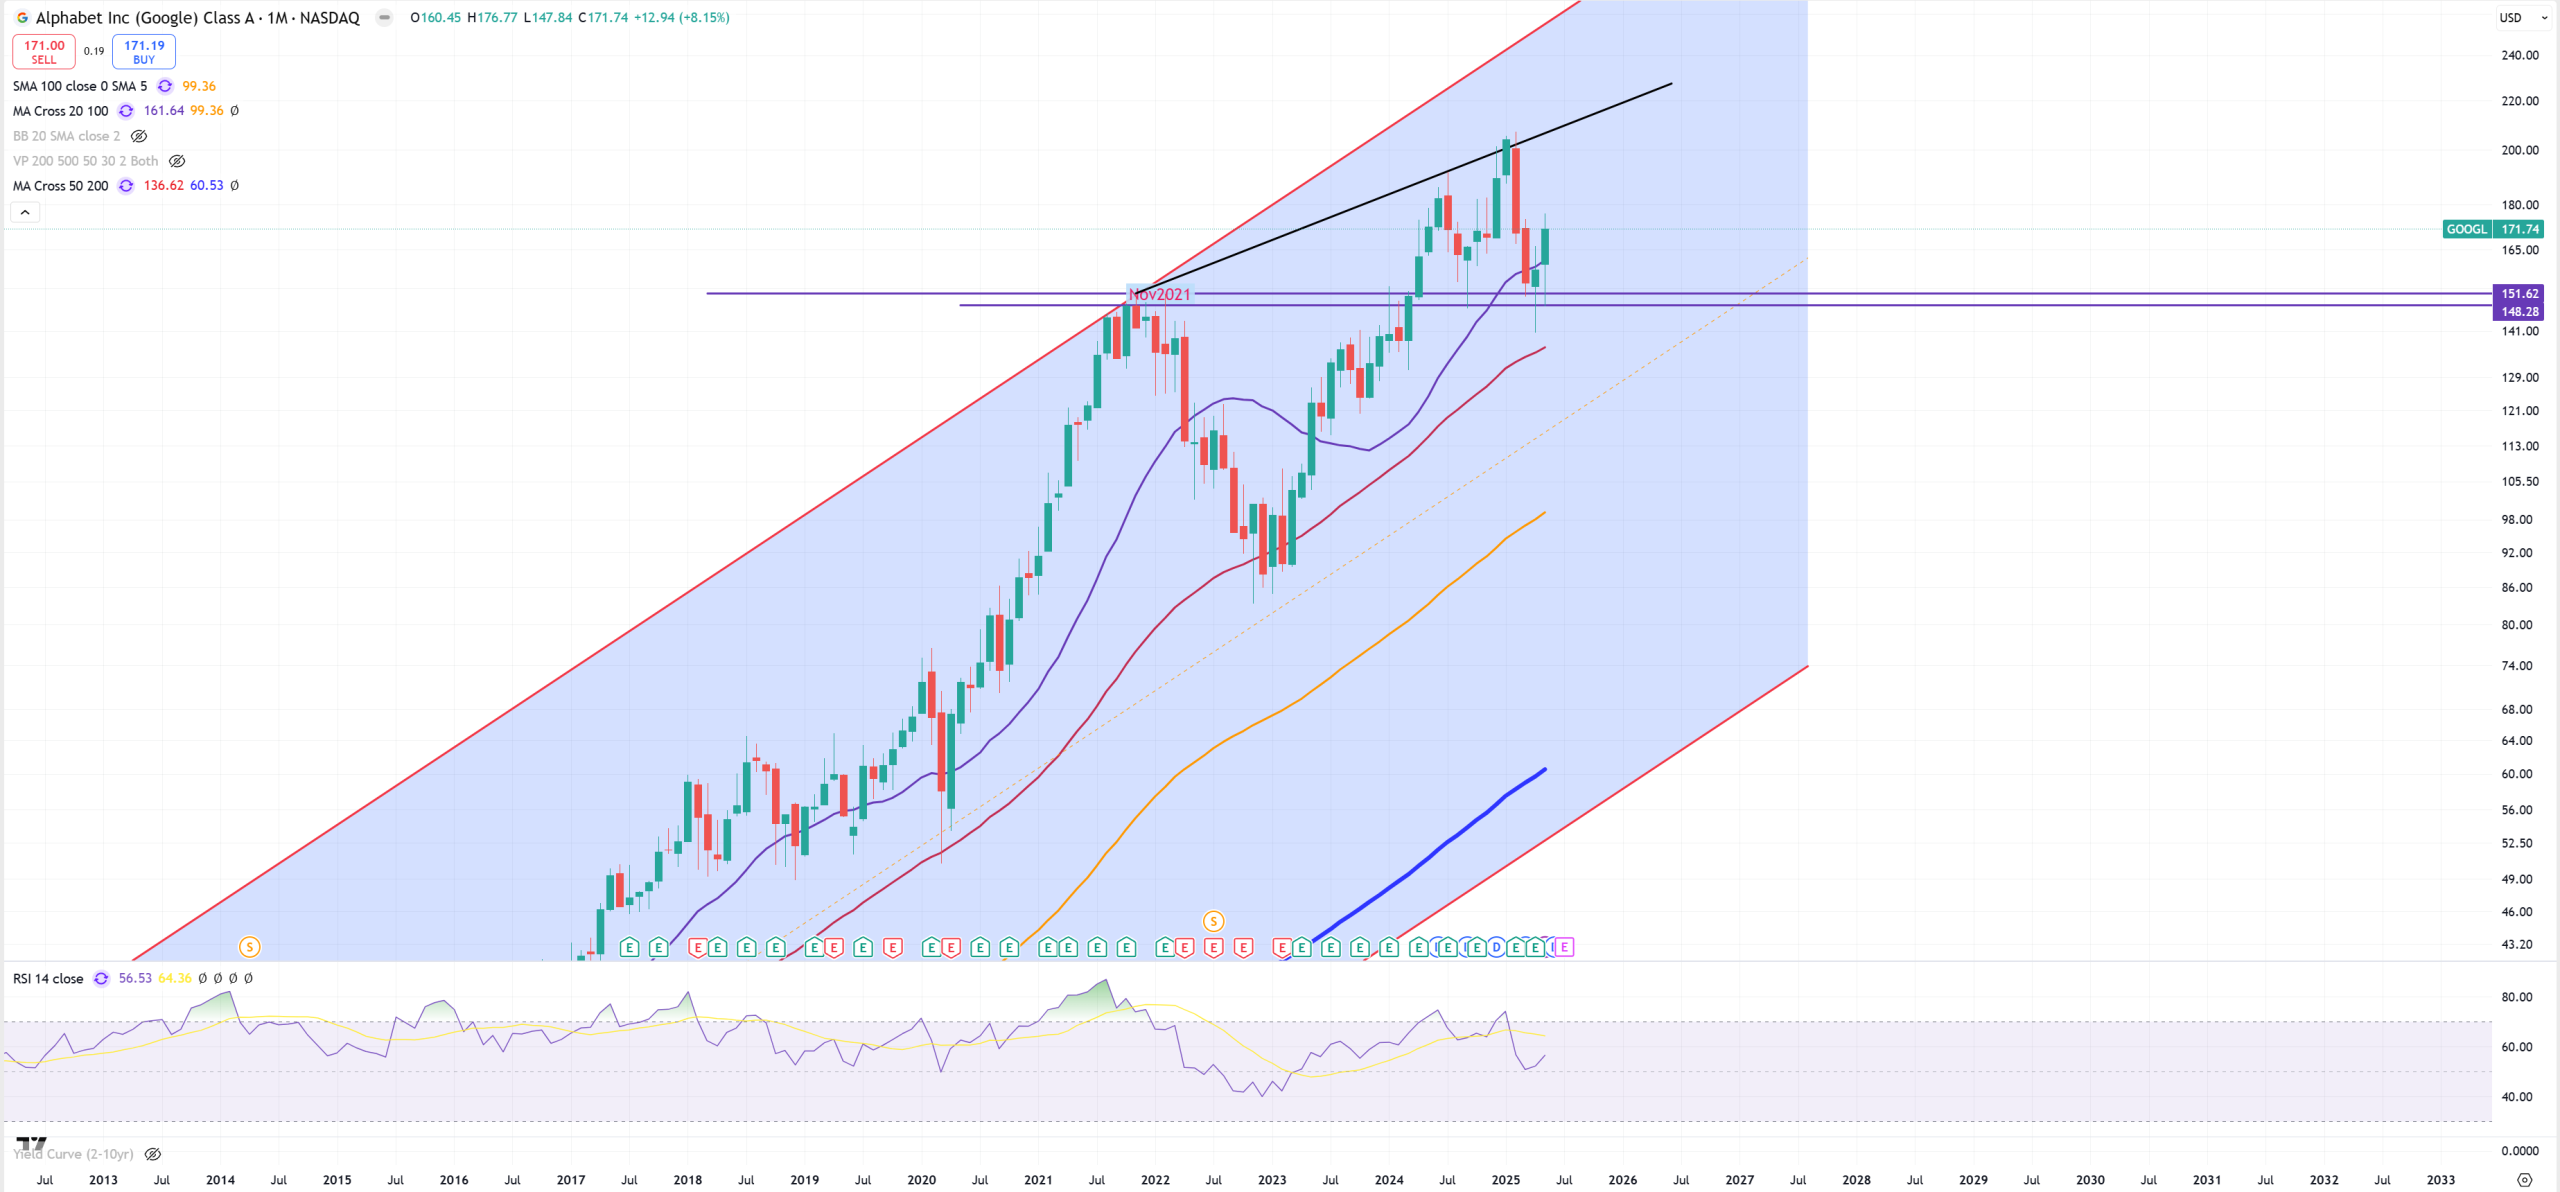
GOOGL – similar pattern
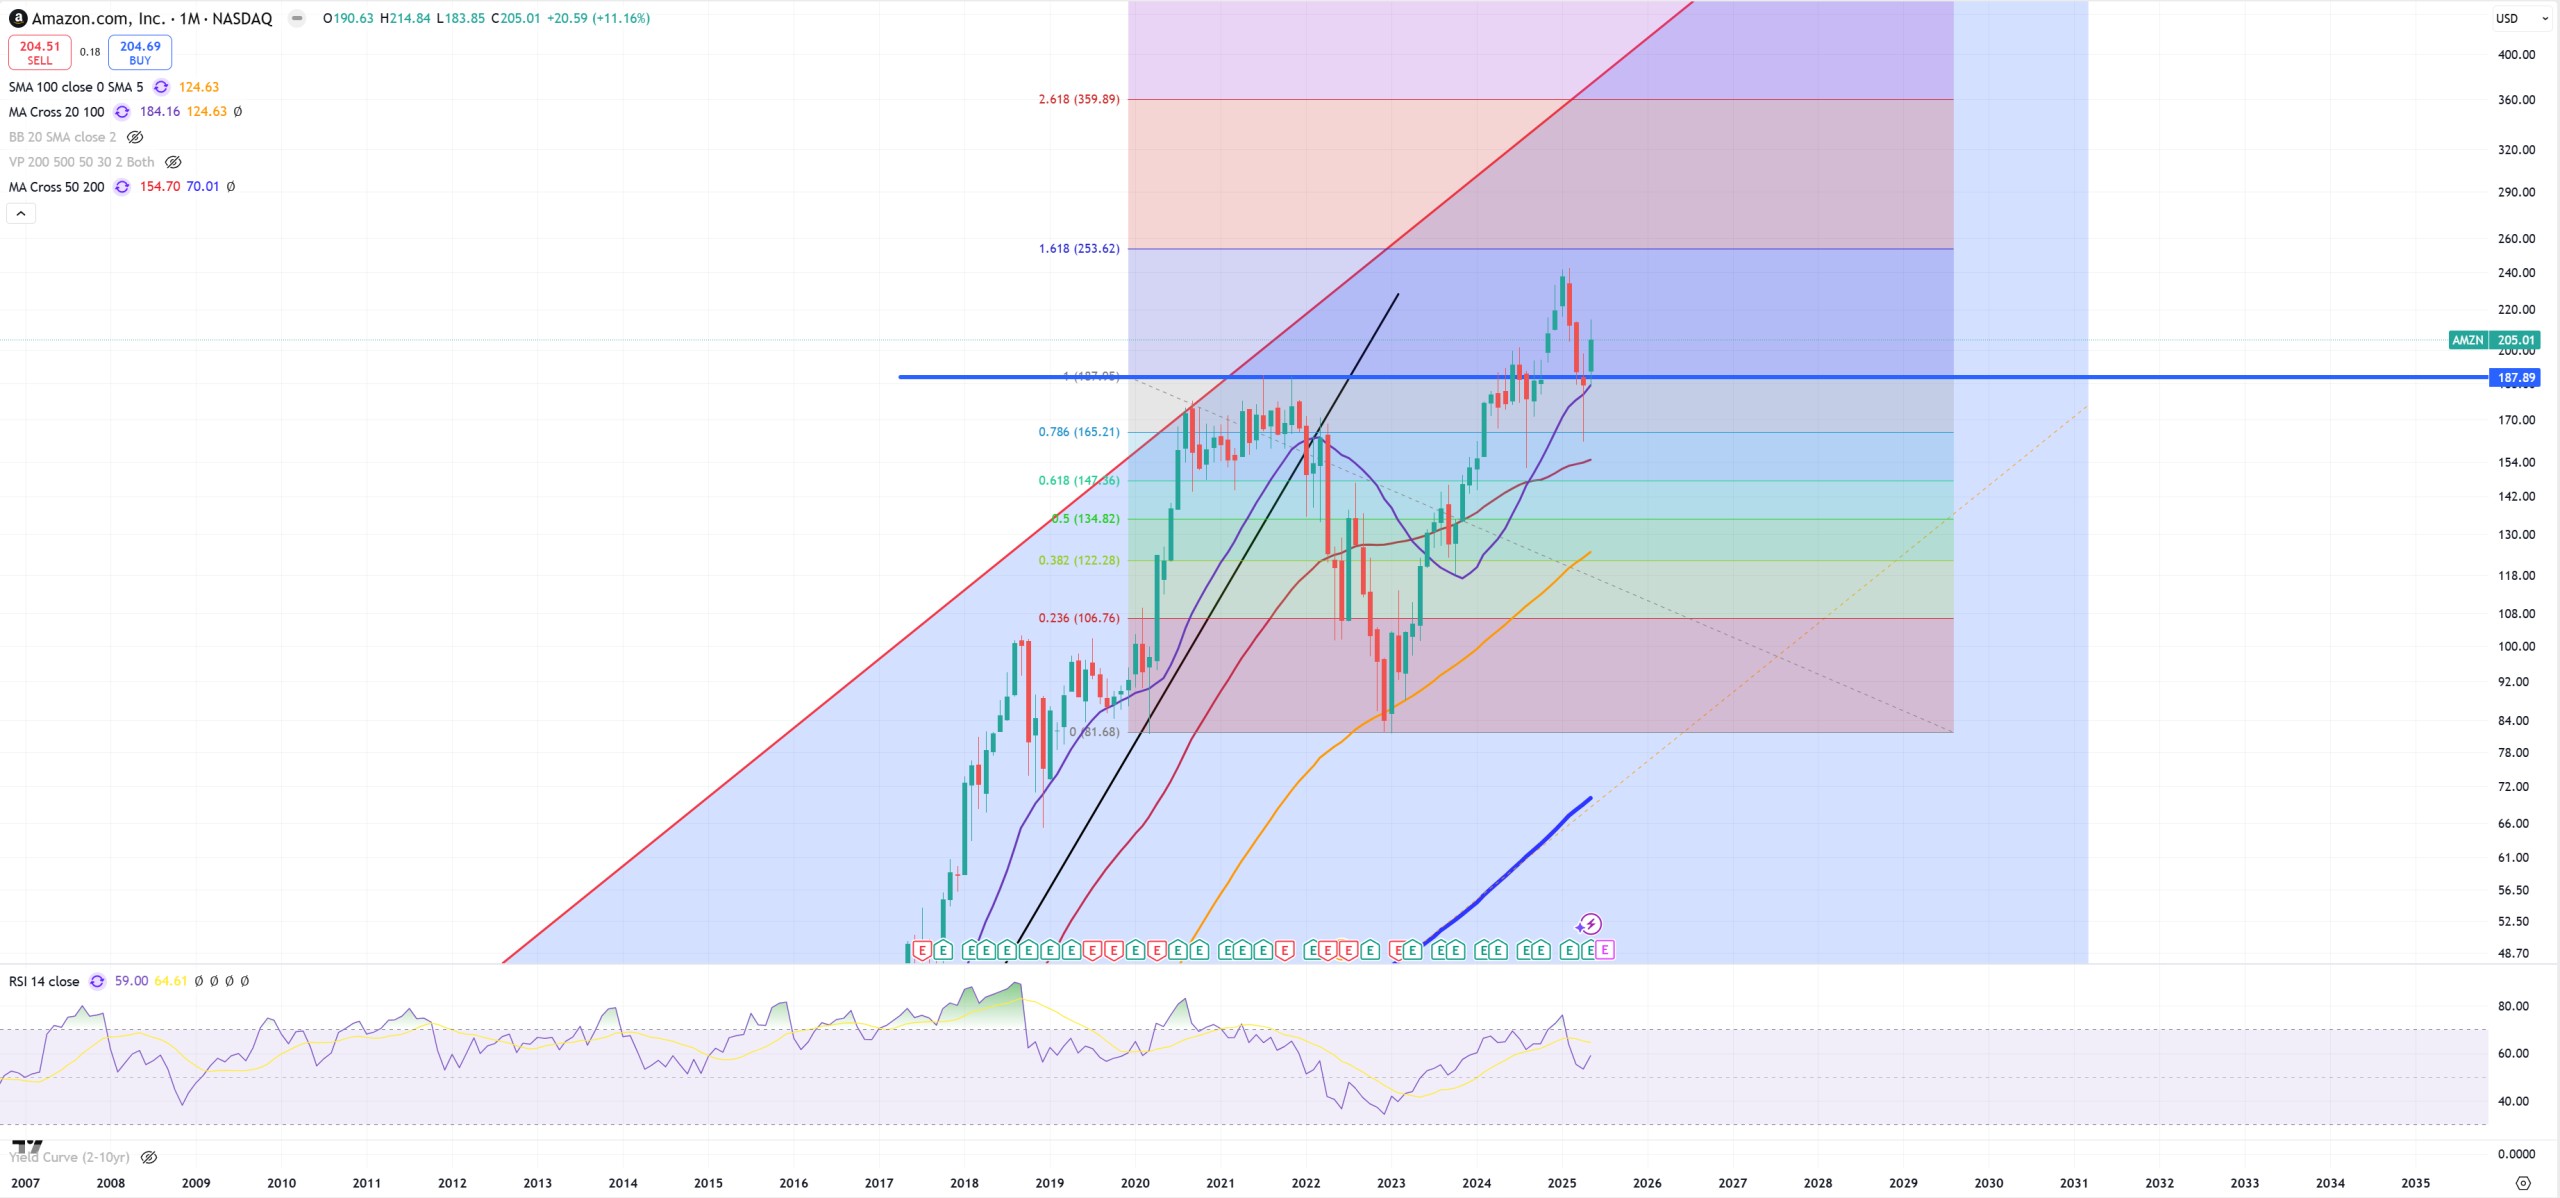
AMZN – also the same
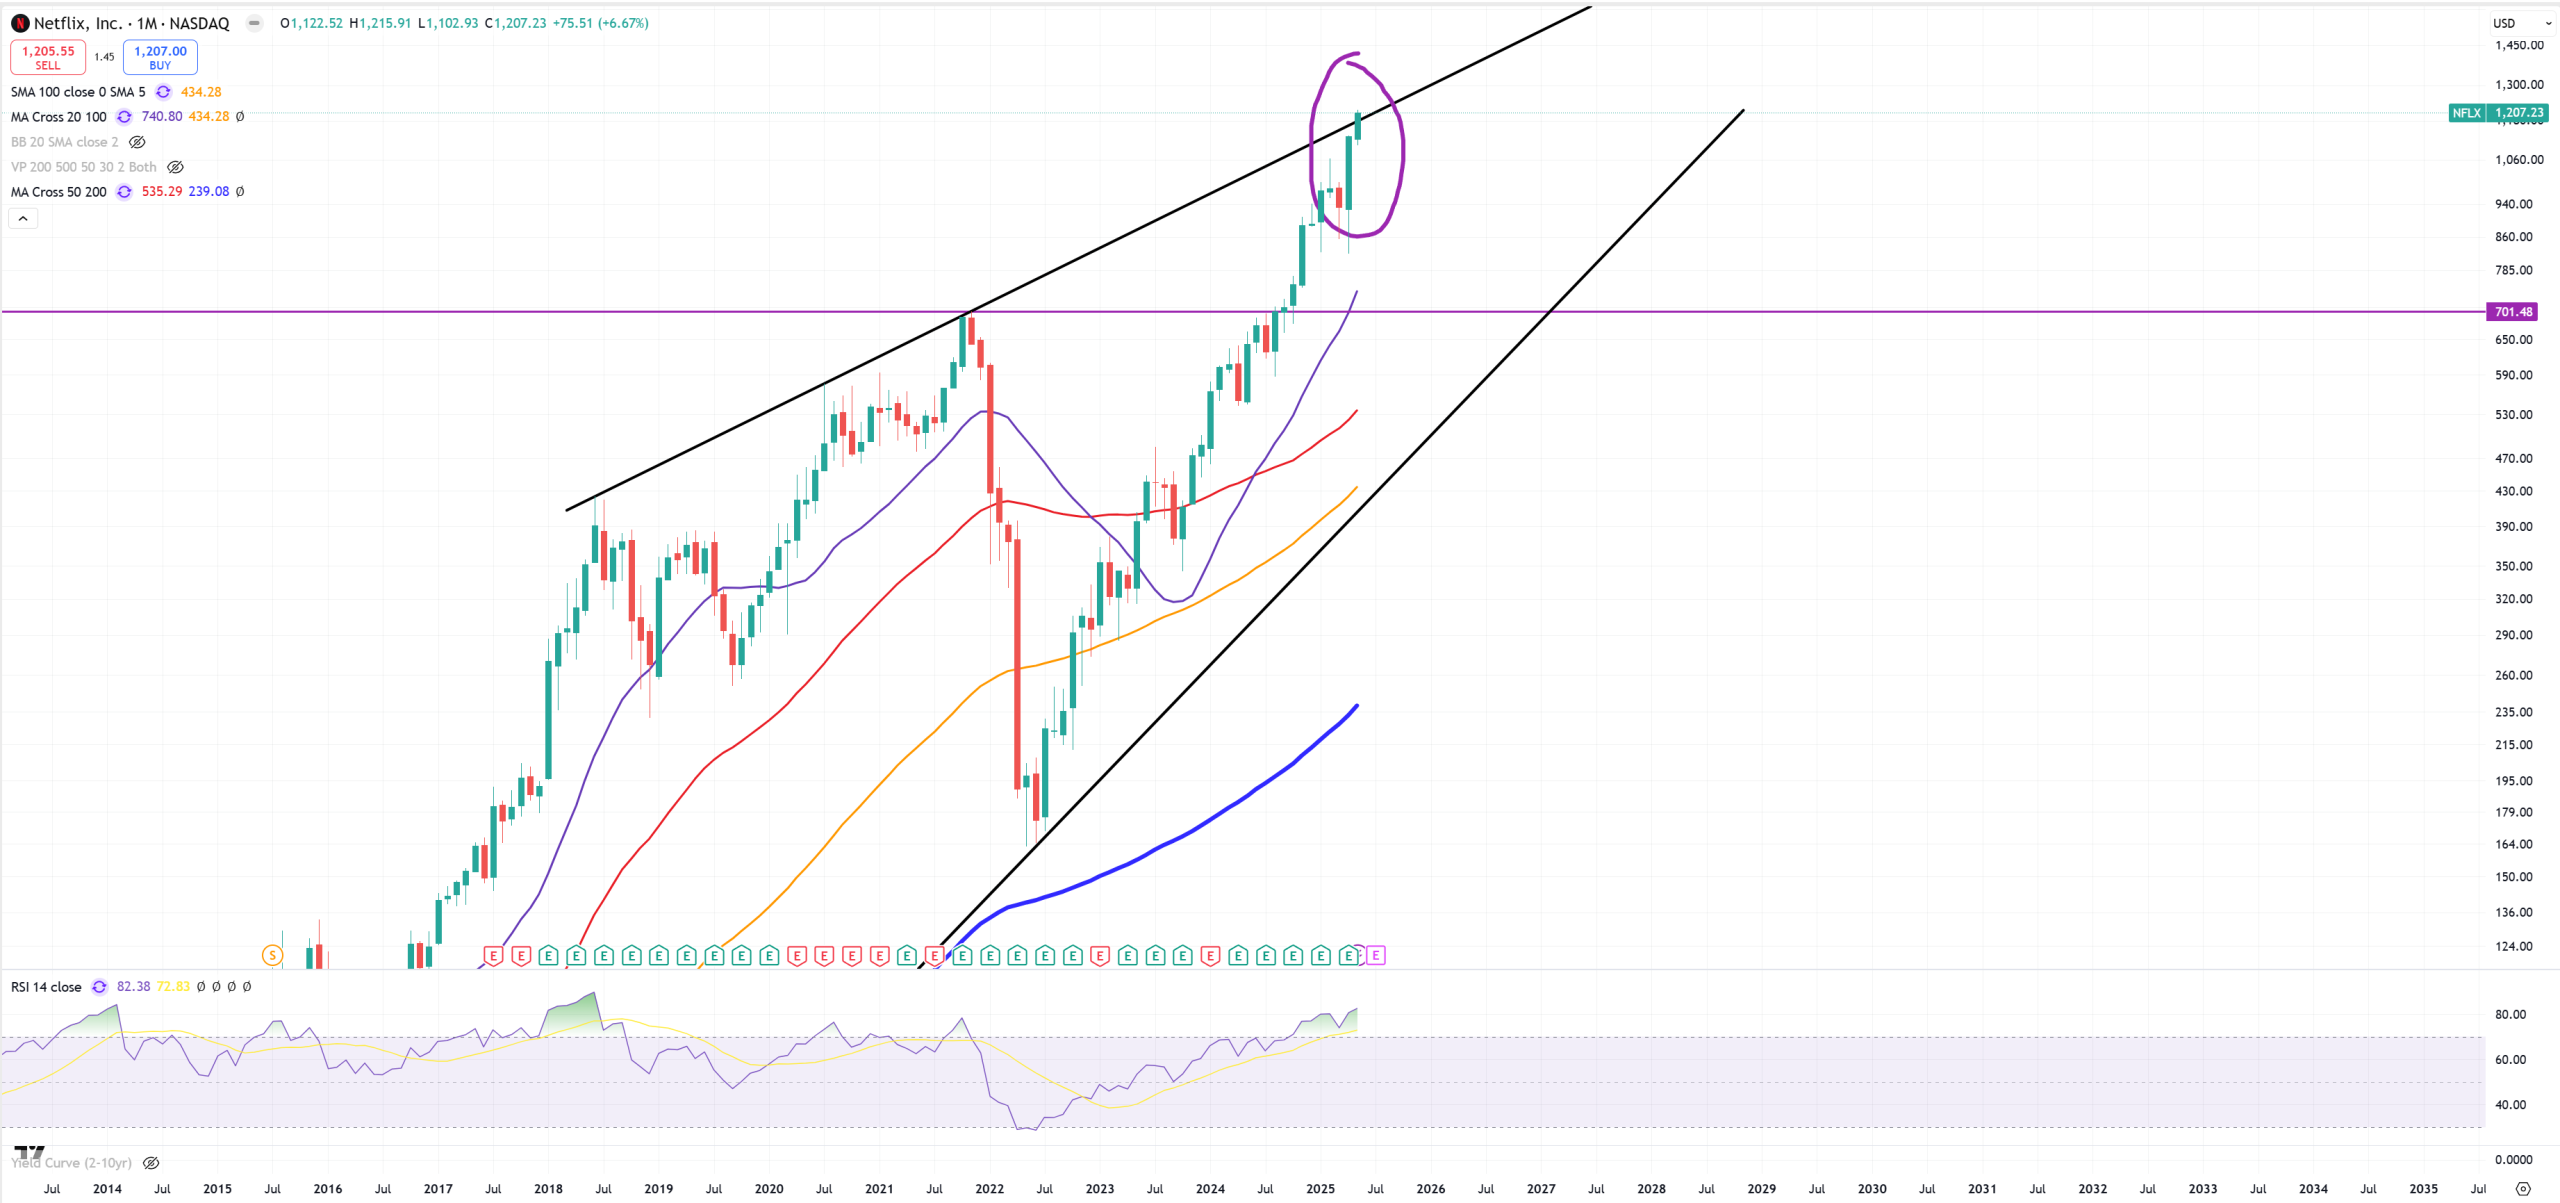
NFLX – has a bit different setup, probably megaphone with key level around 1180$
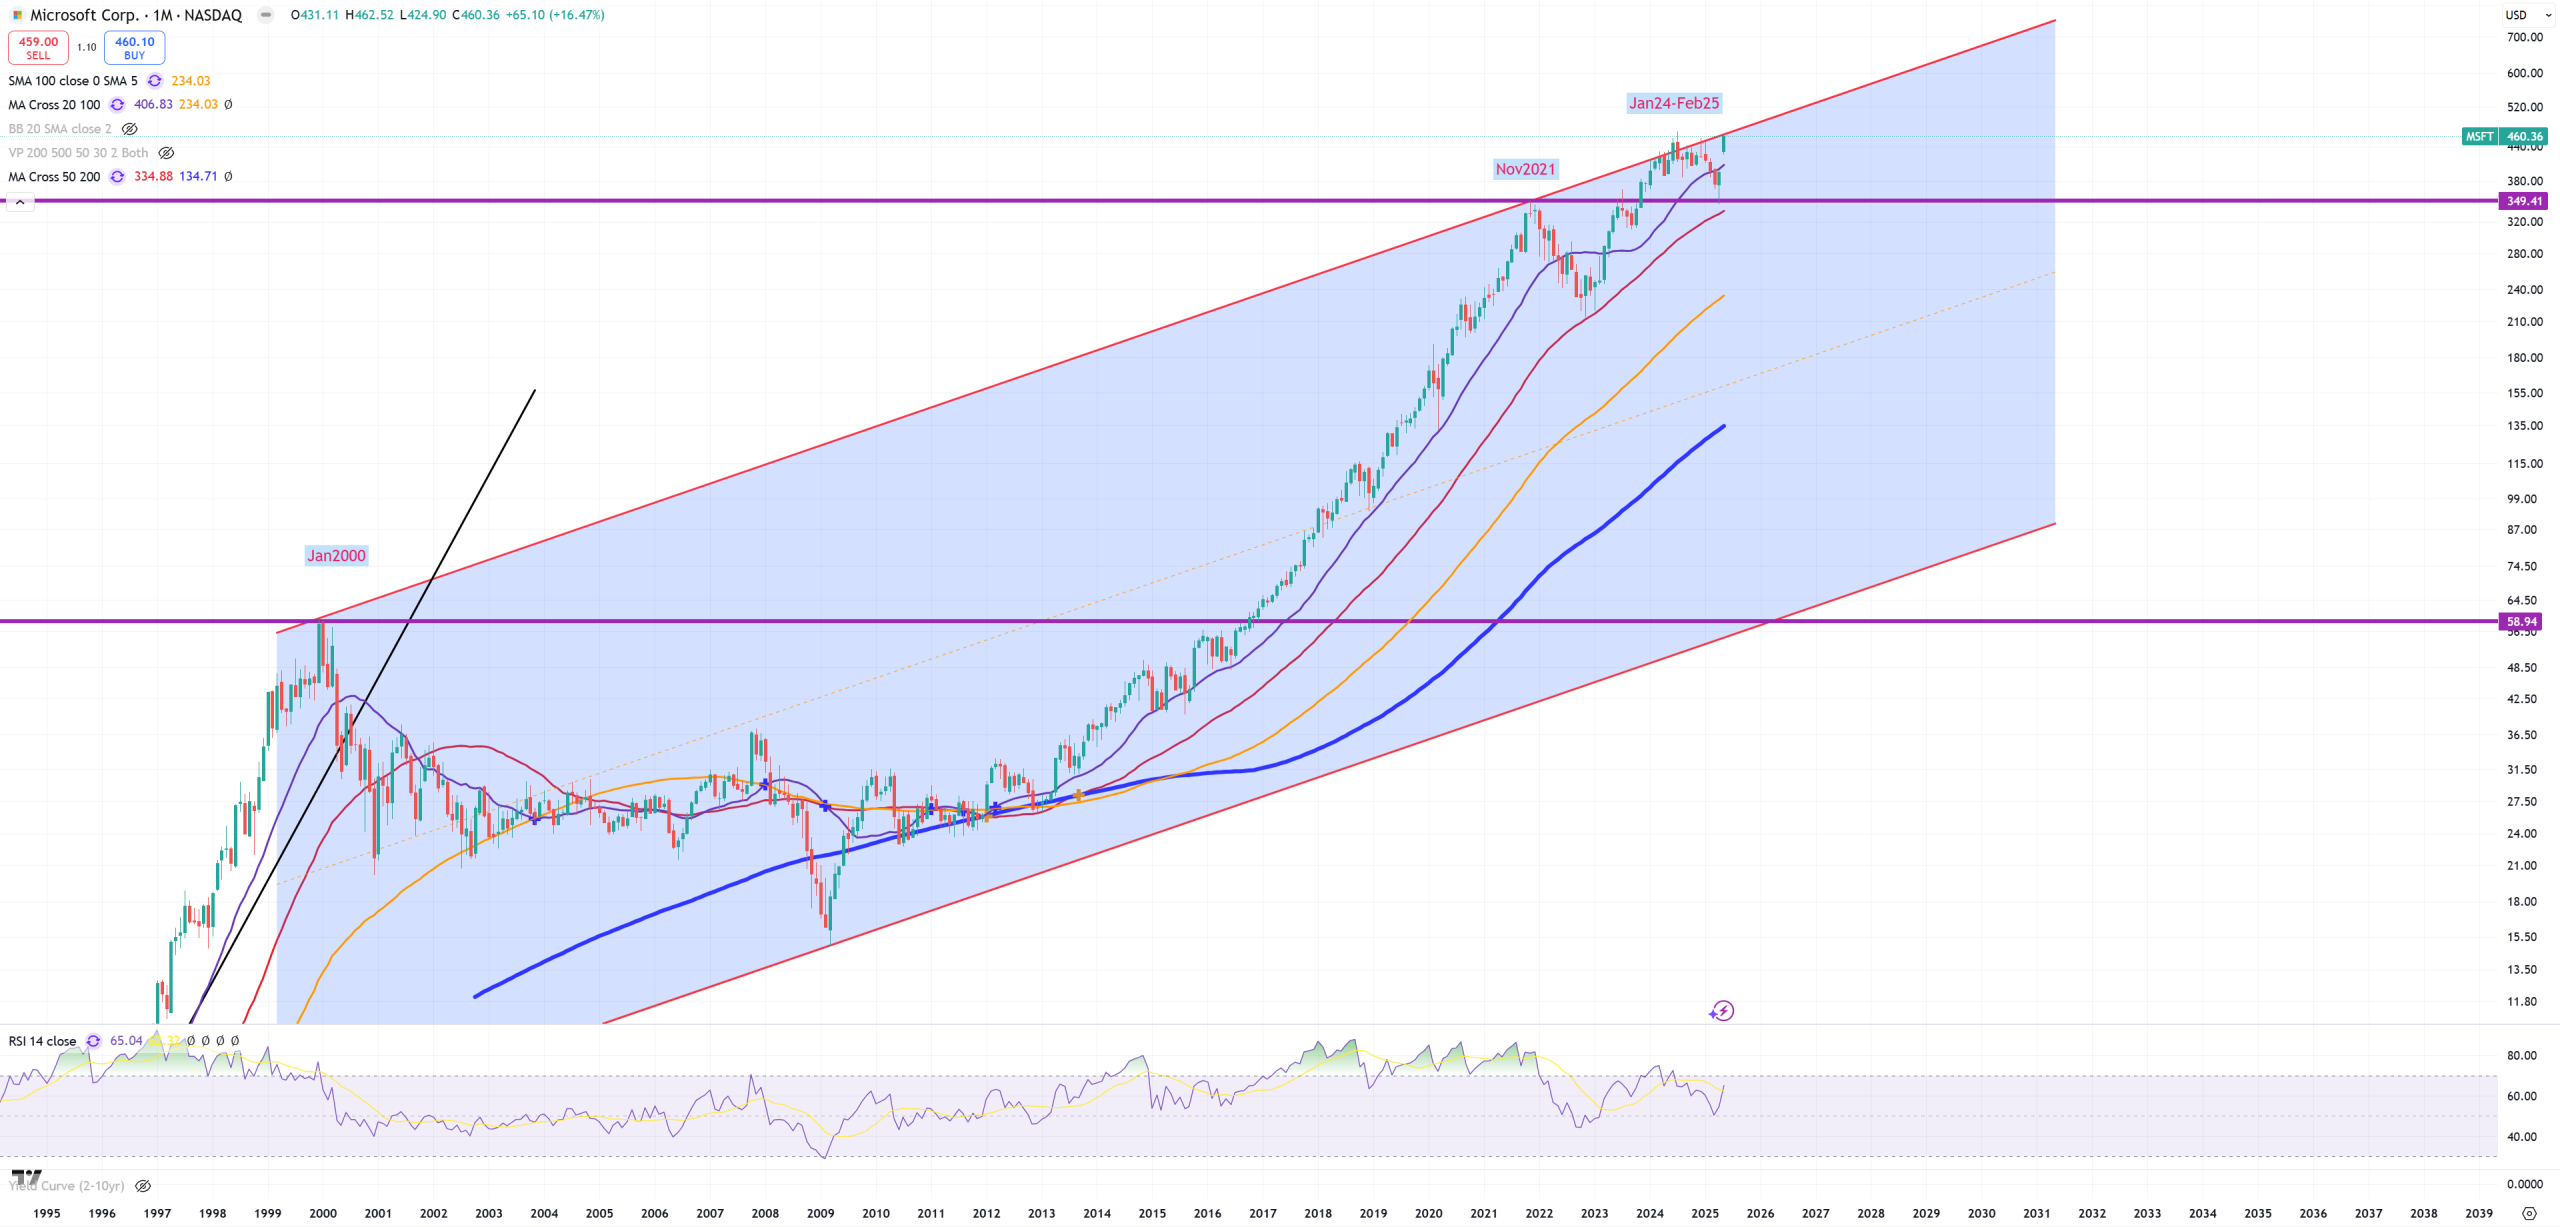
MSFT – retest to key trend
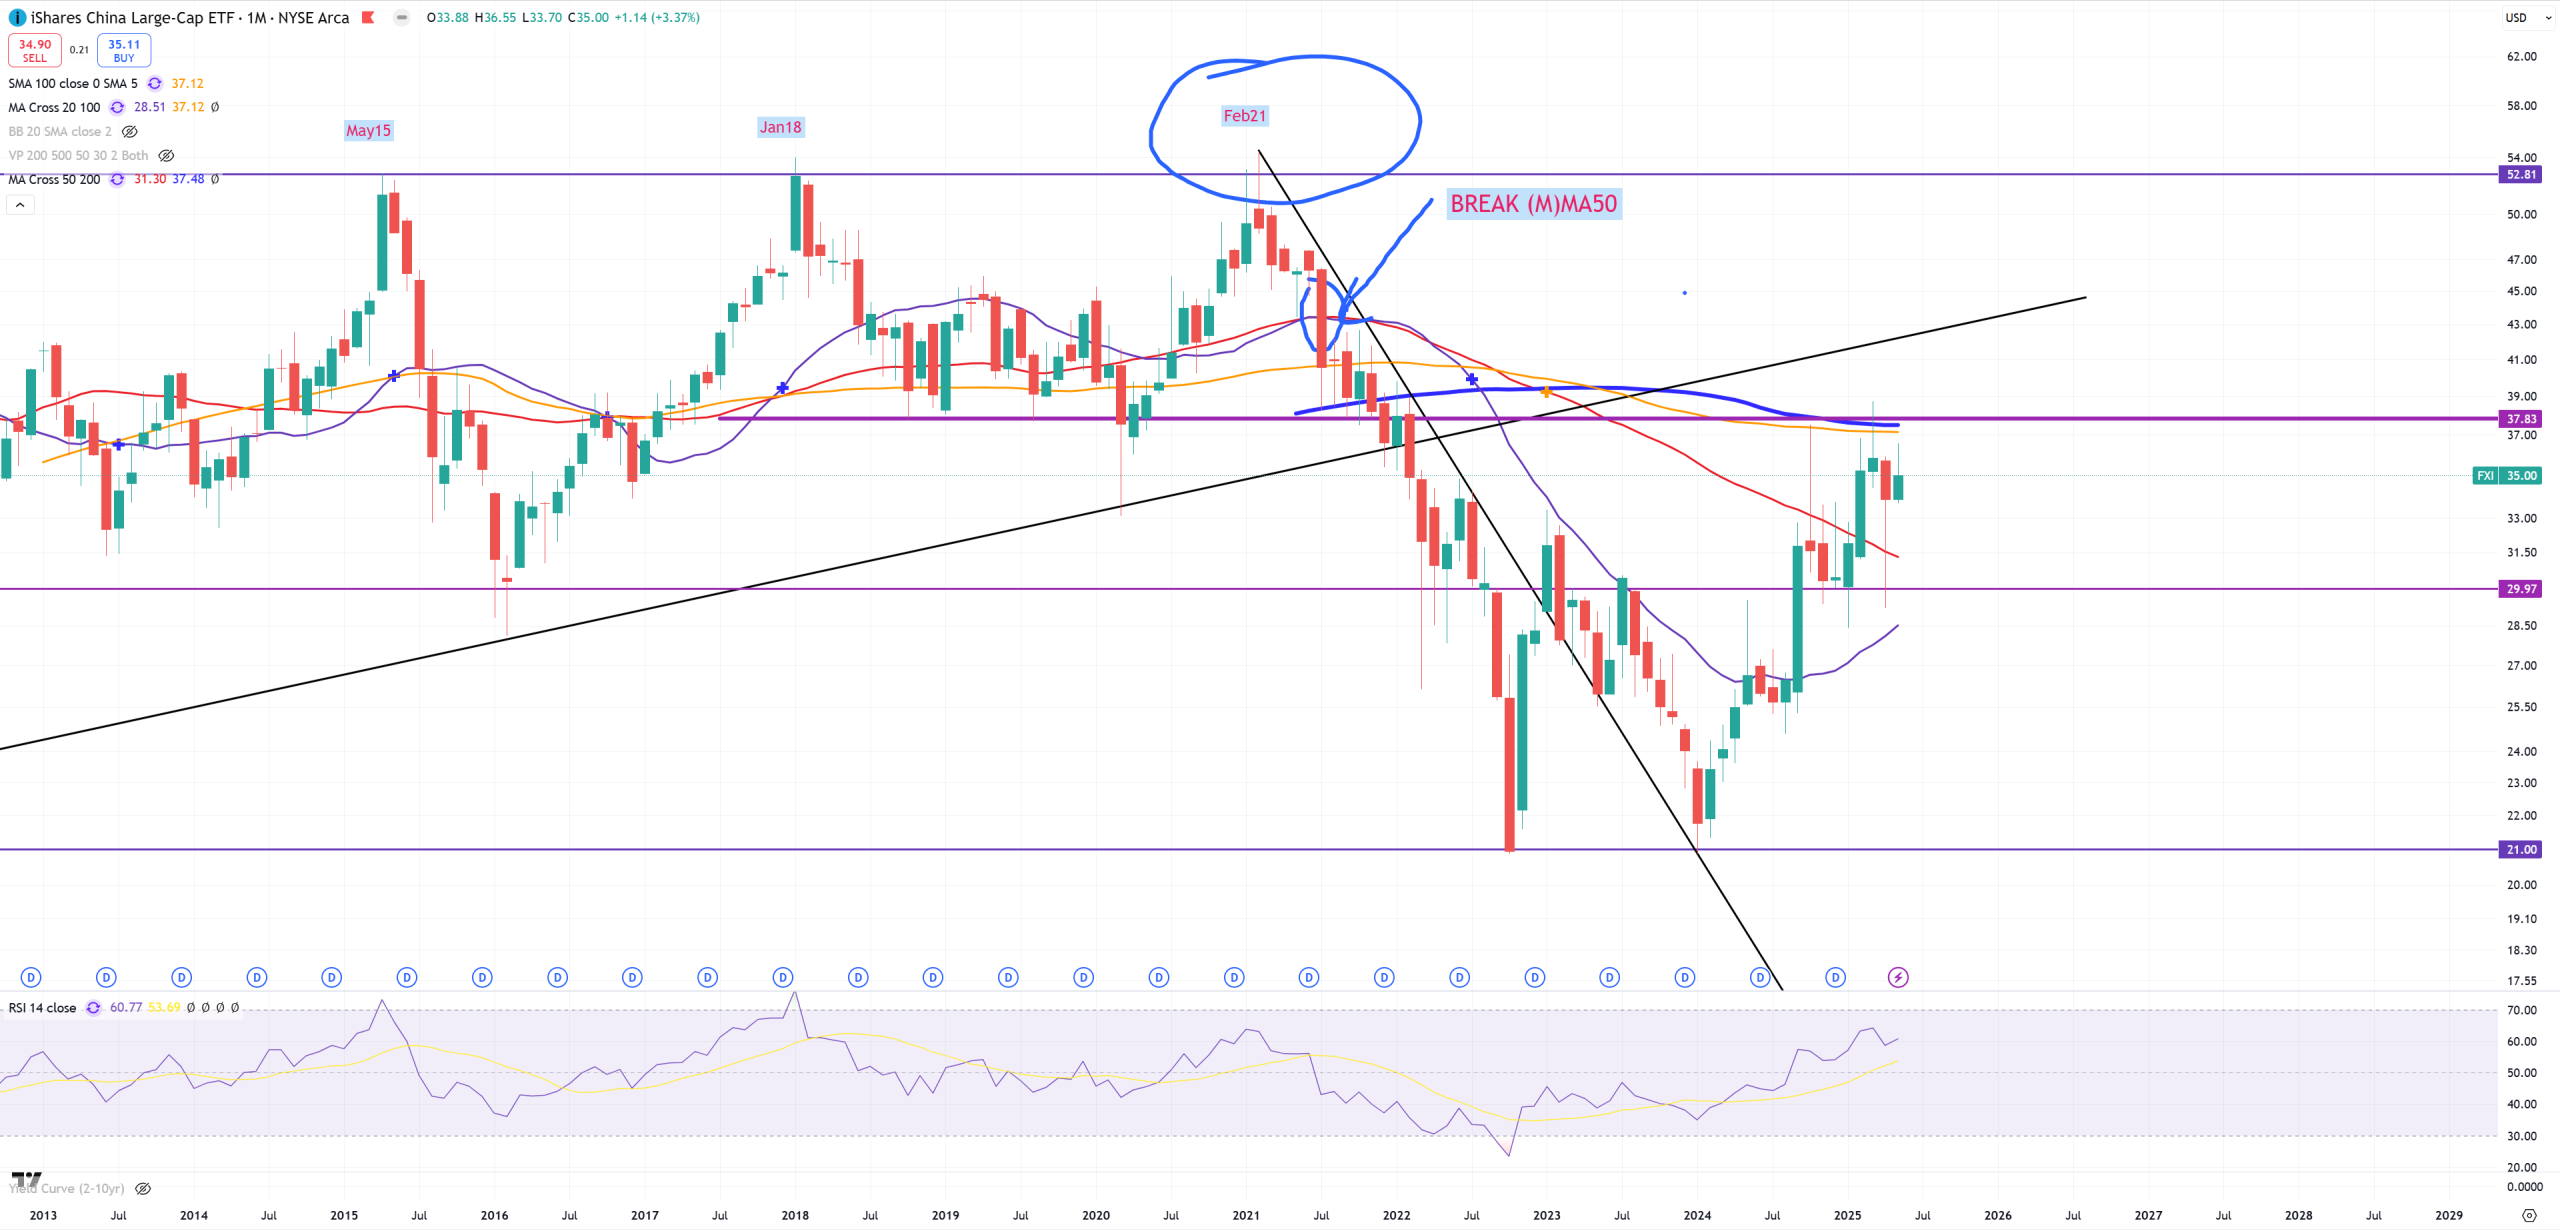
FXI – China
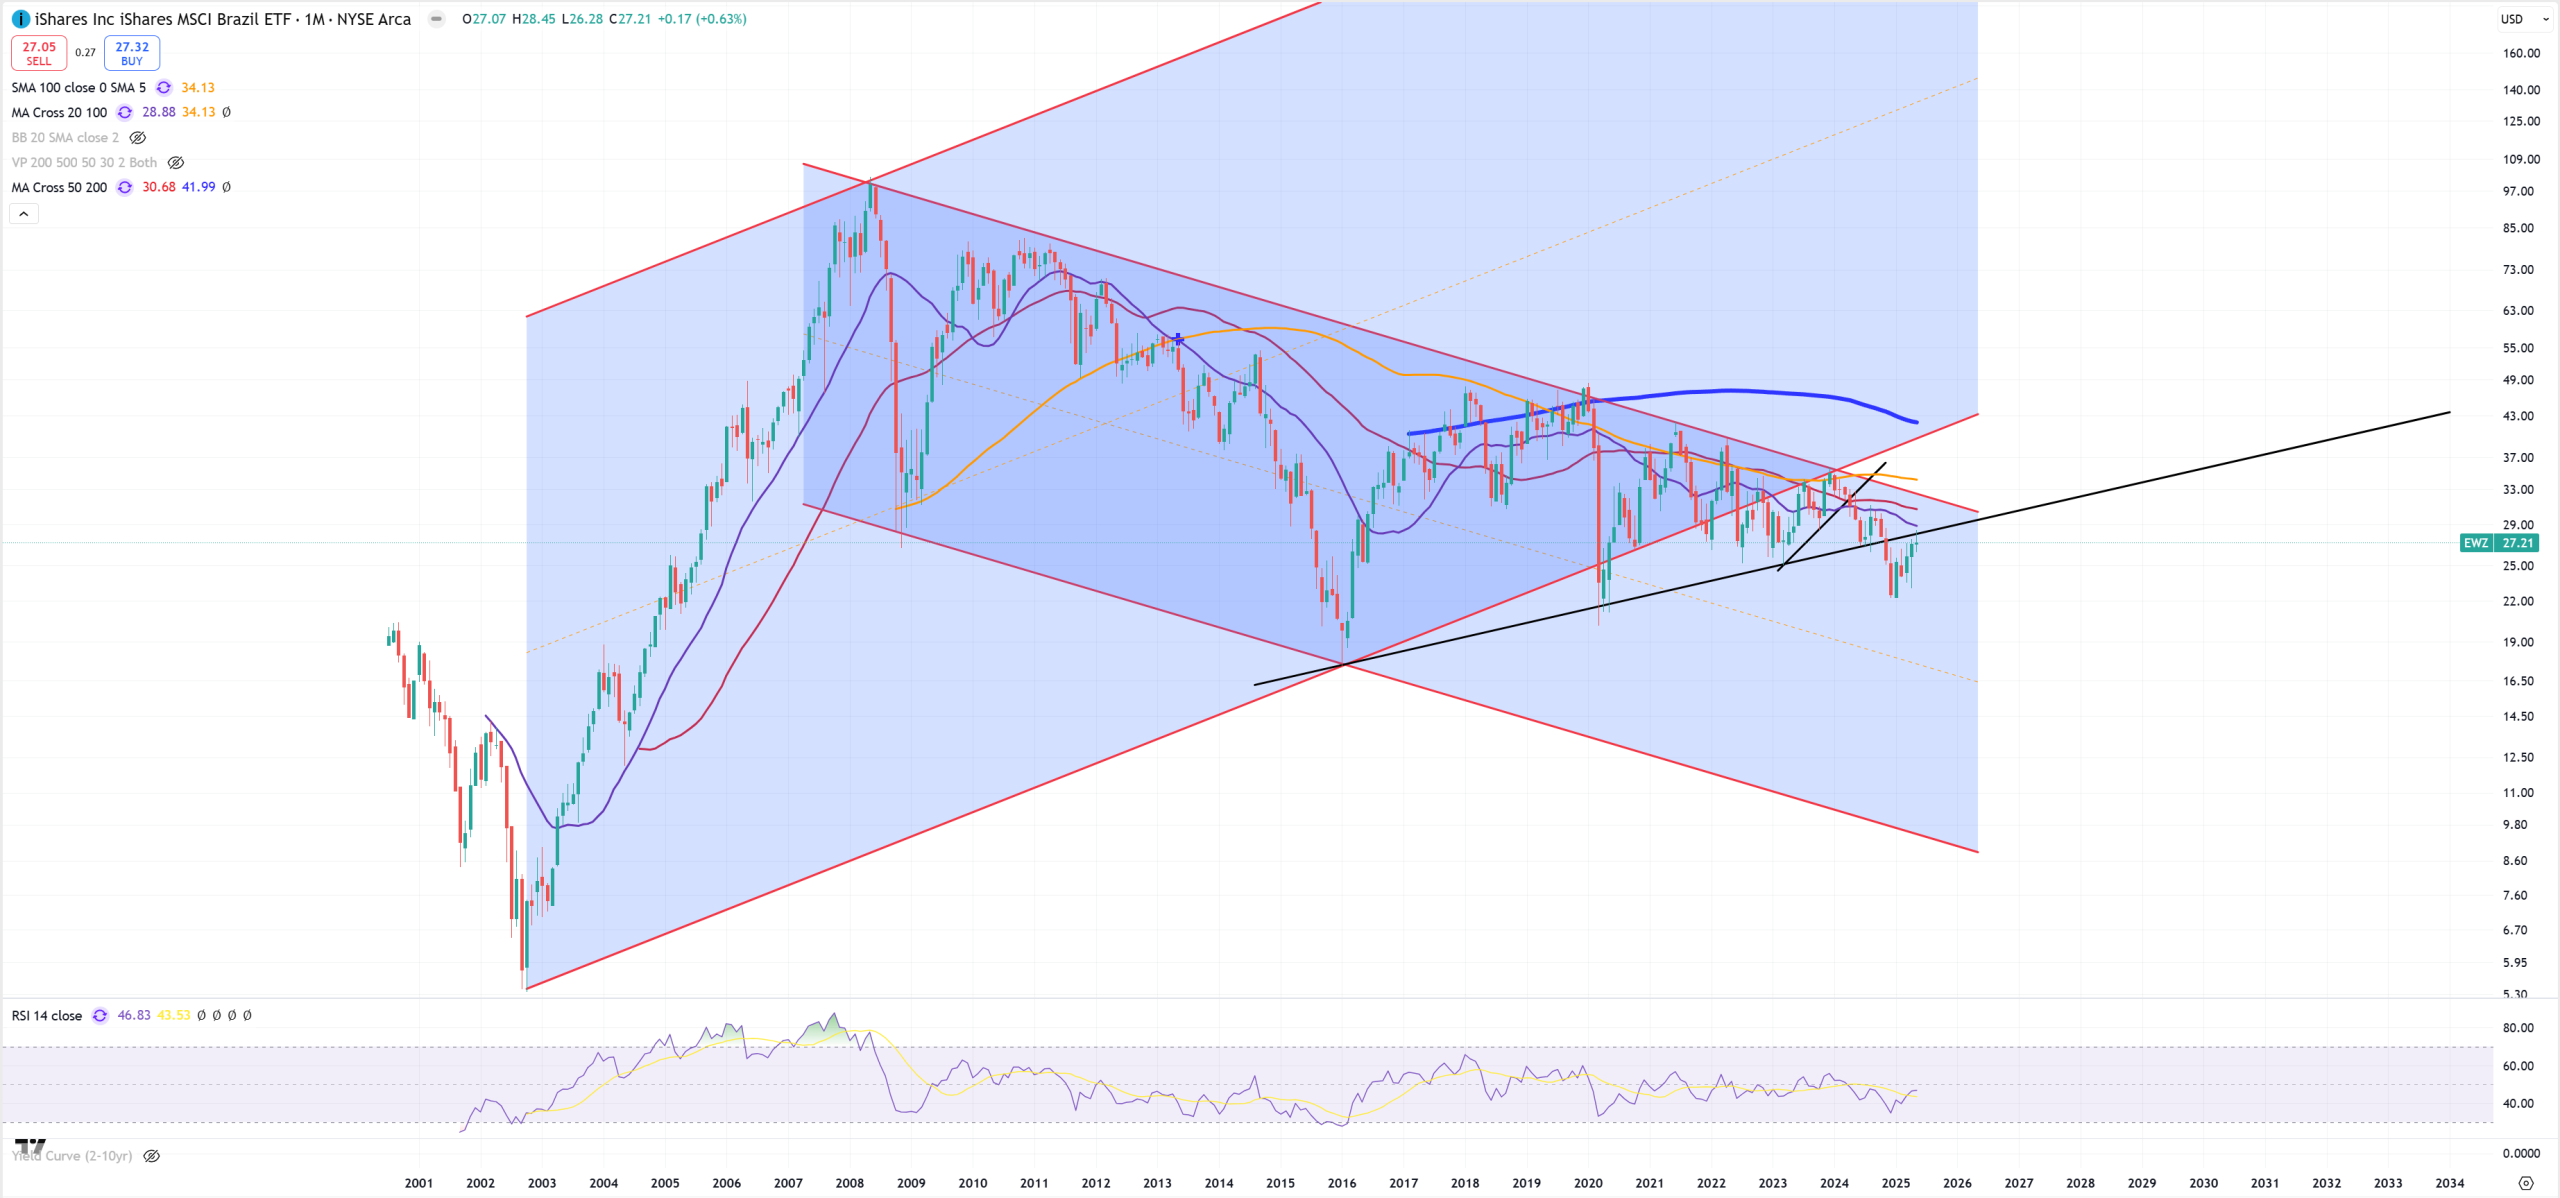
EWZ – Brazil
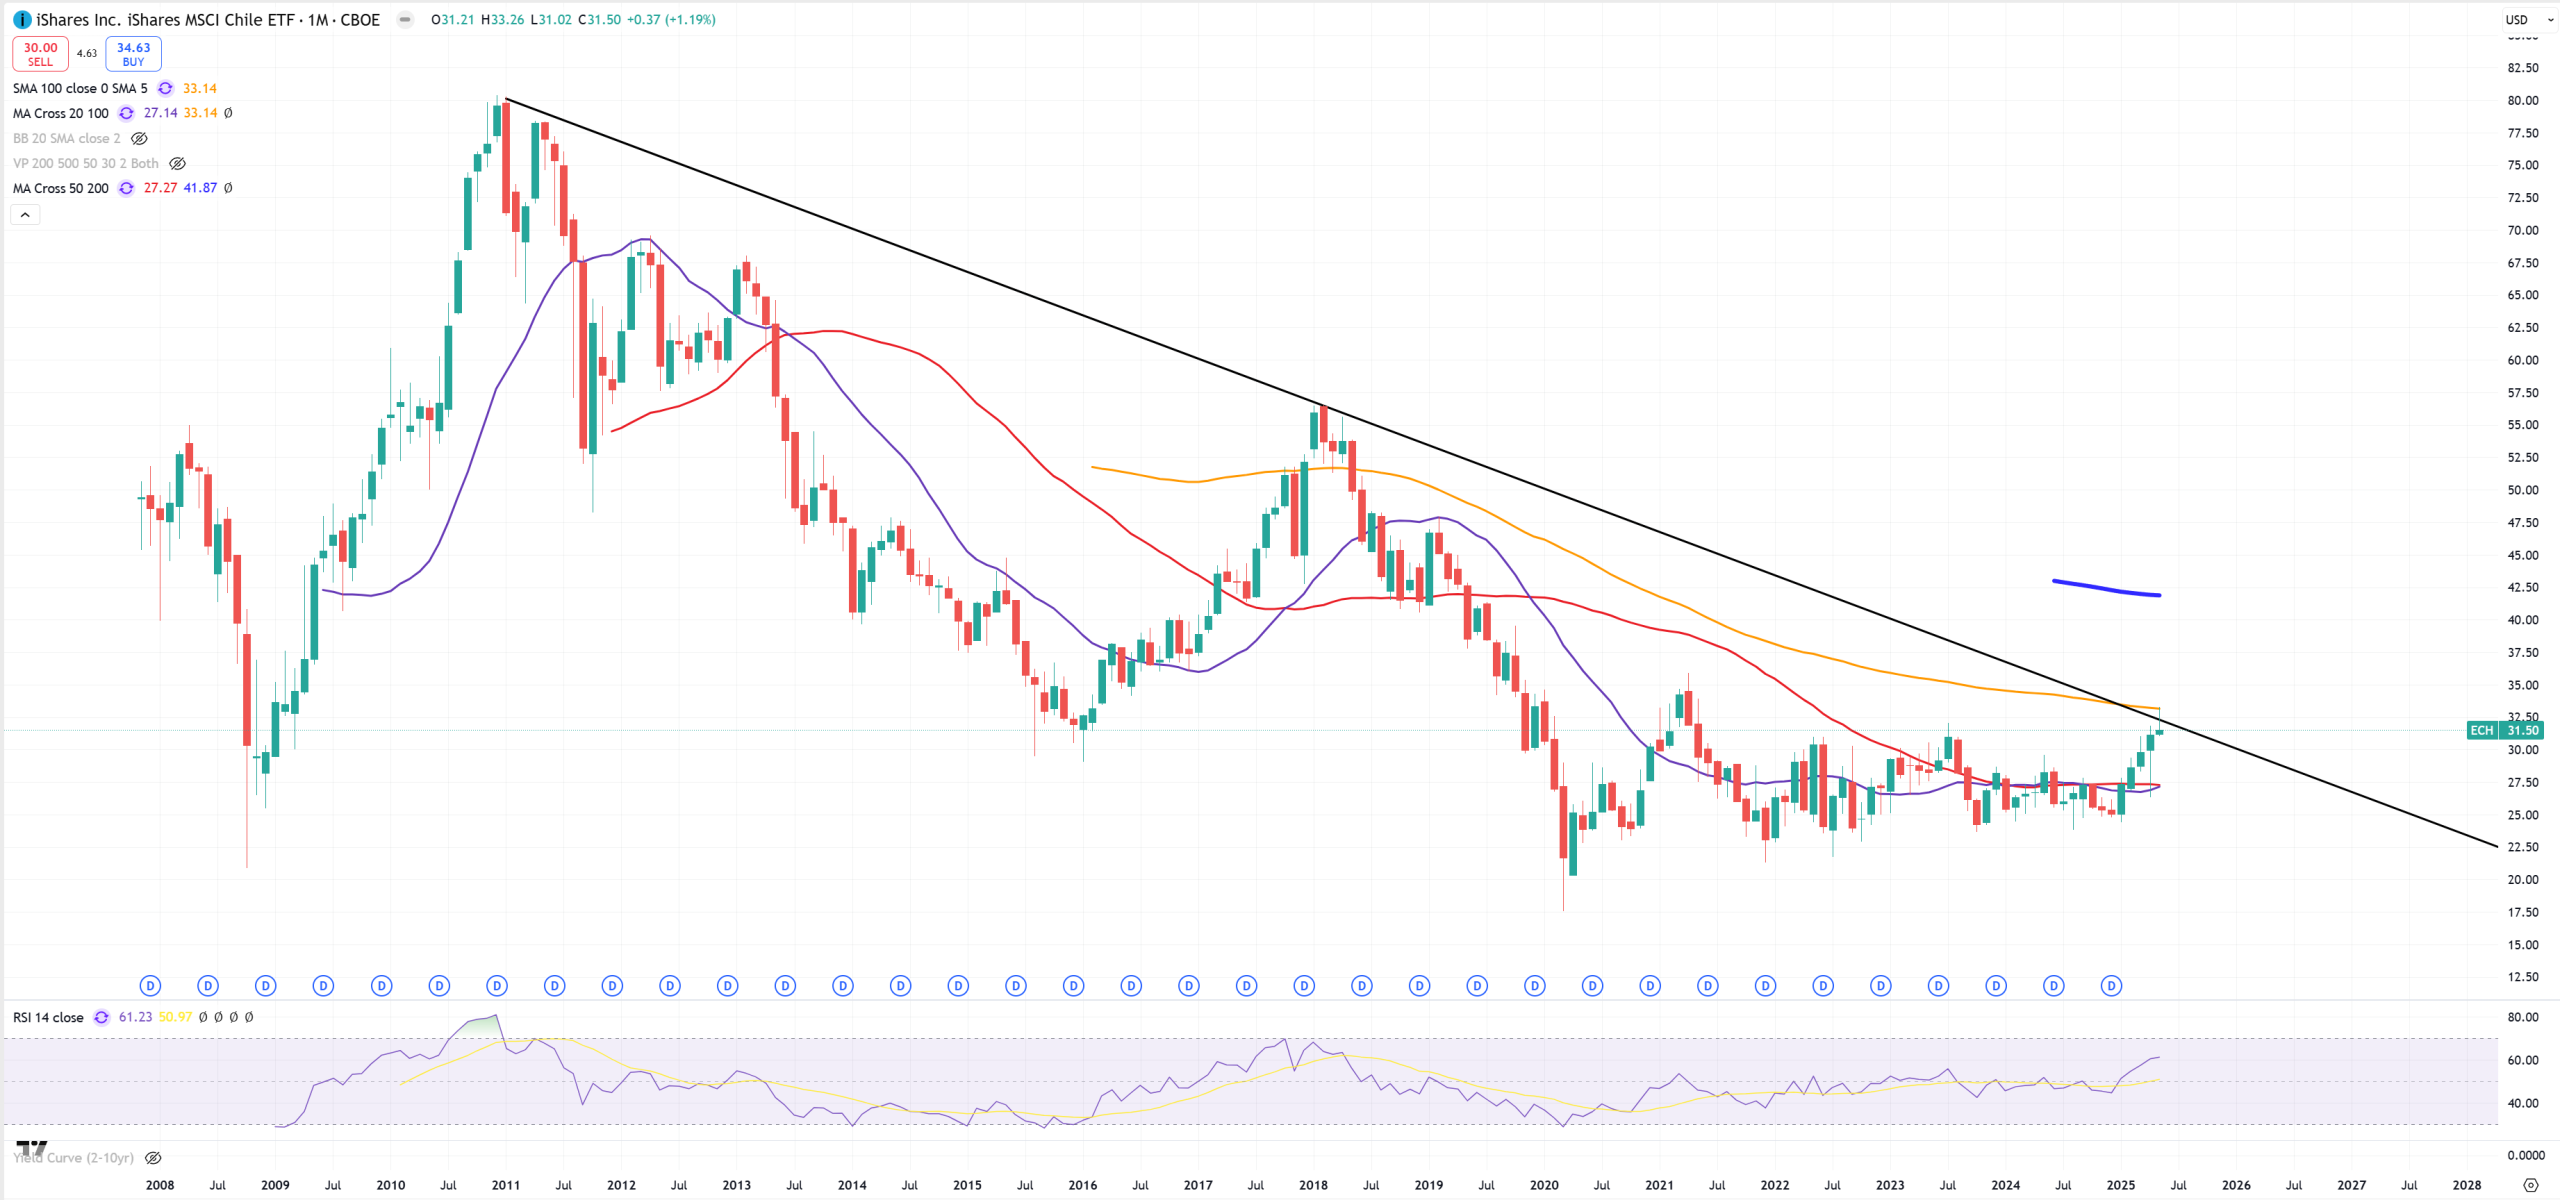
ECH – Chile
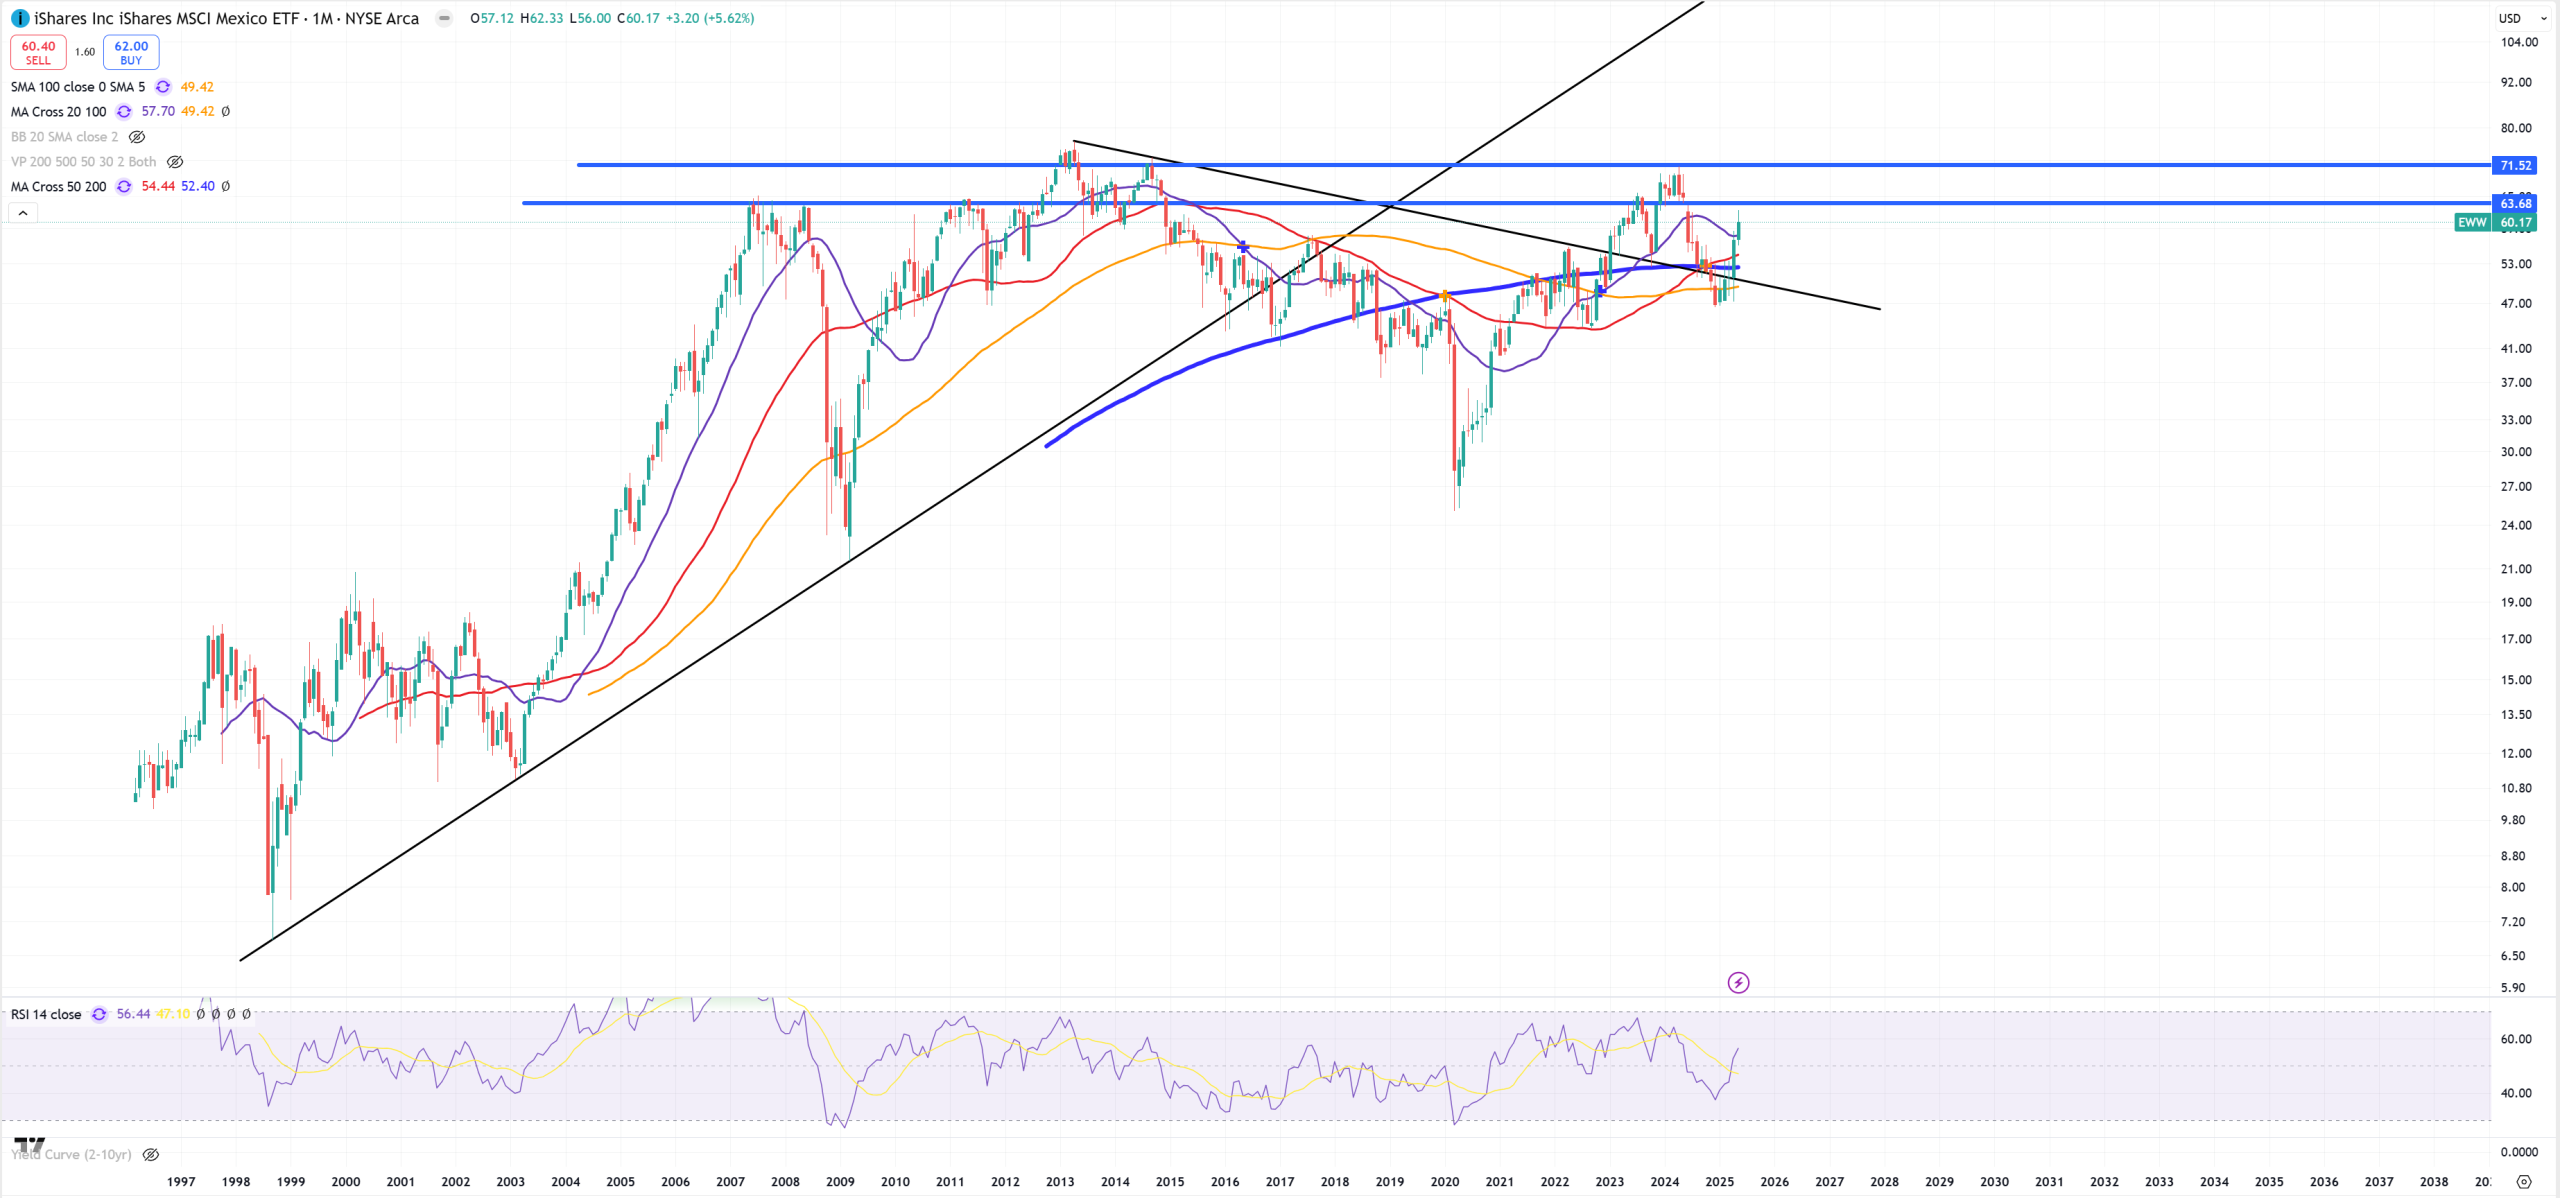
EWW – Mexico
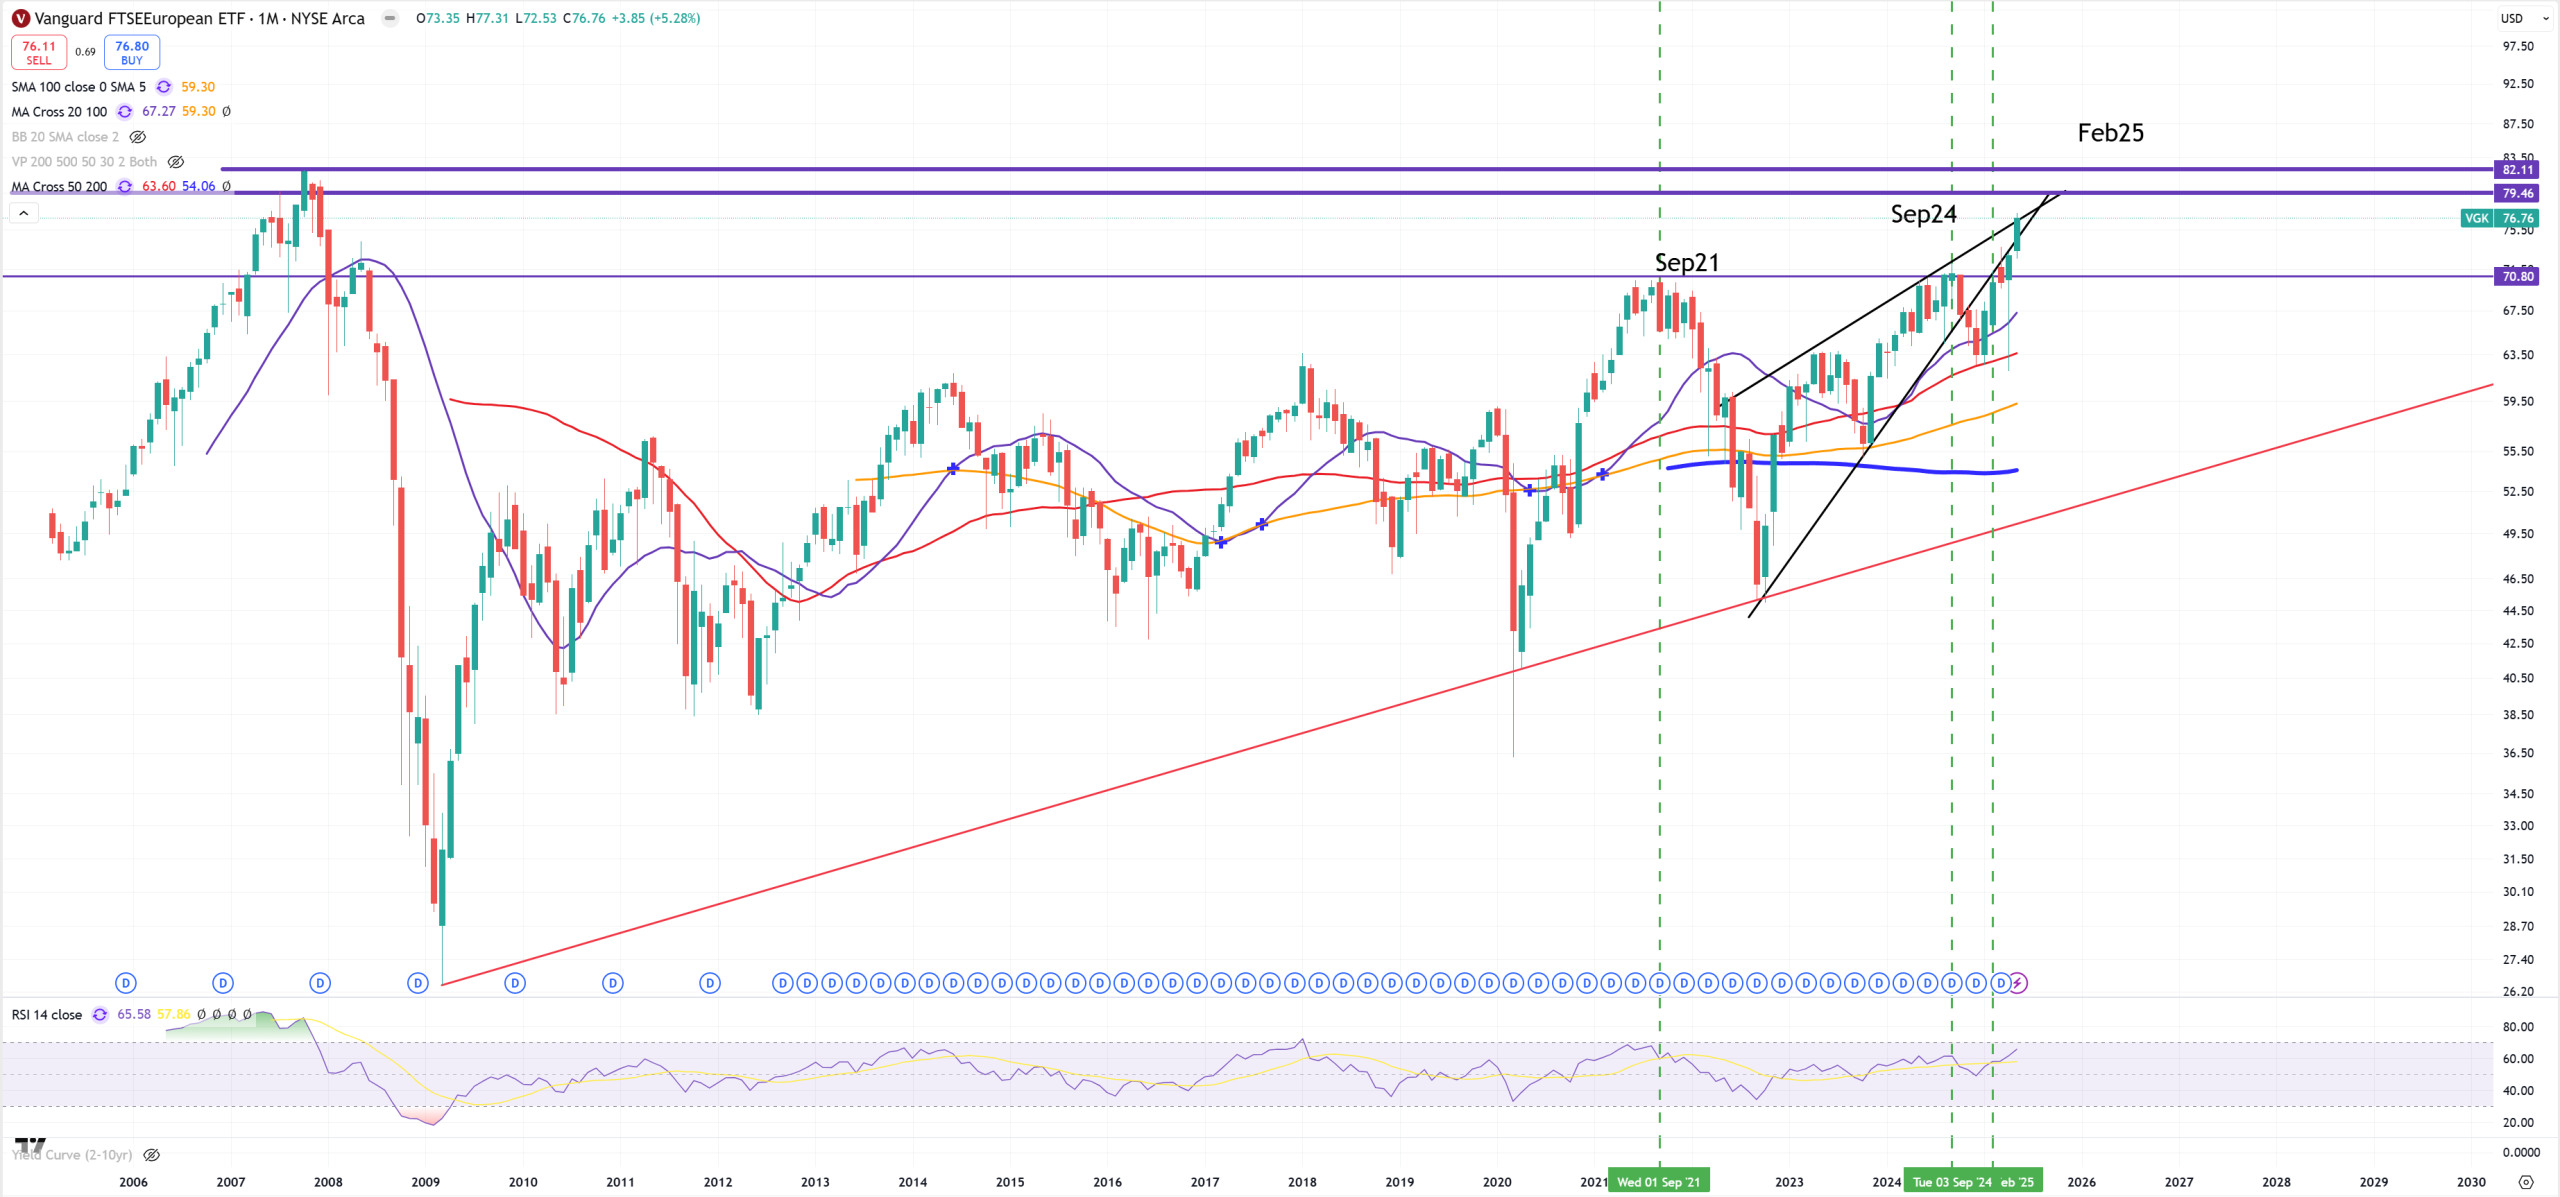
VGK – Europe
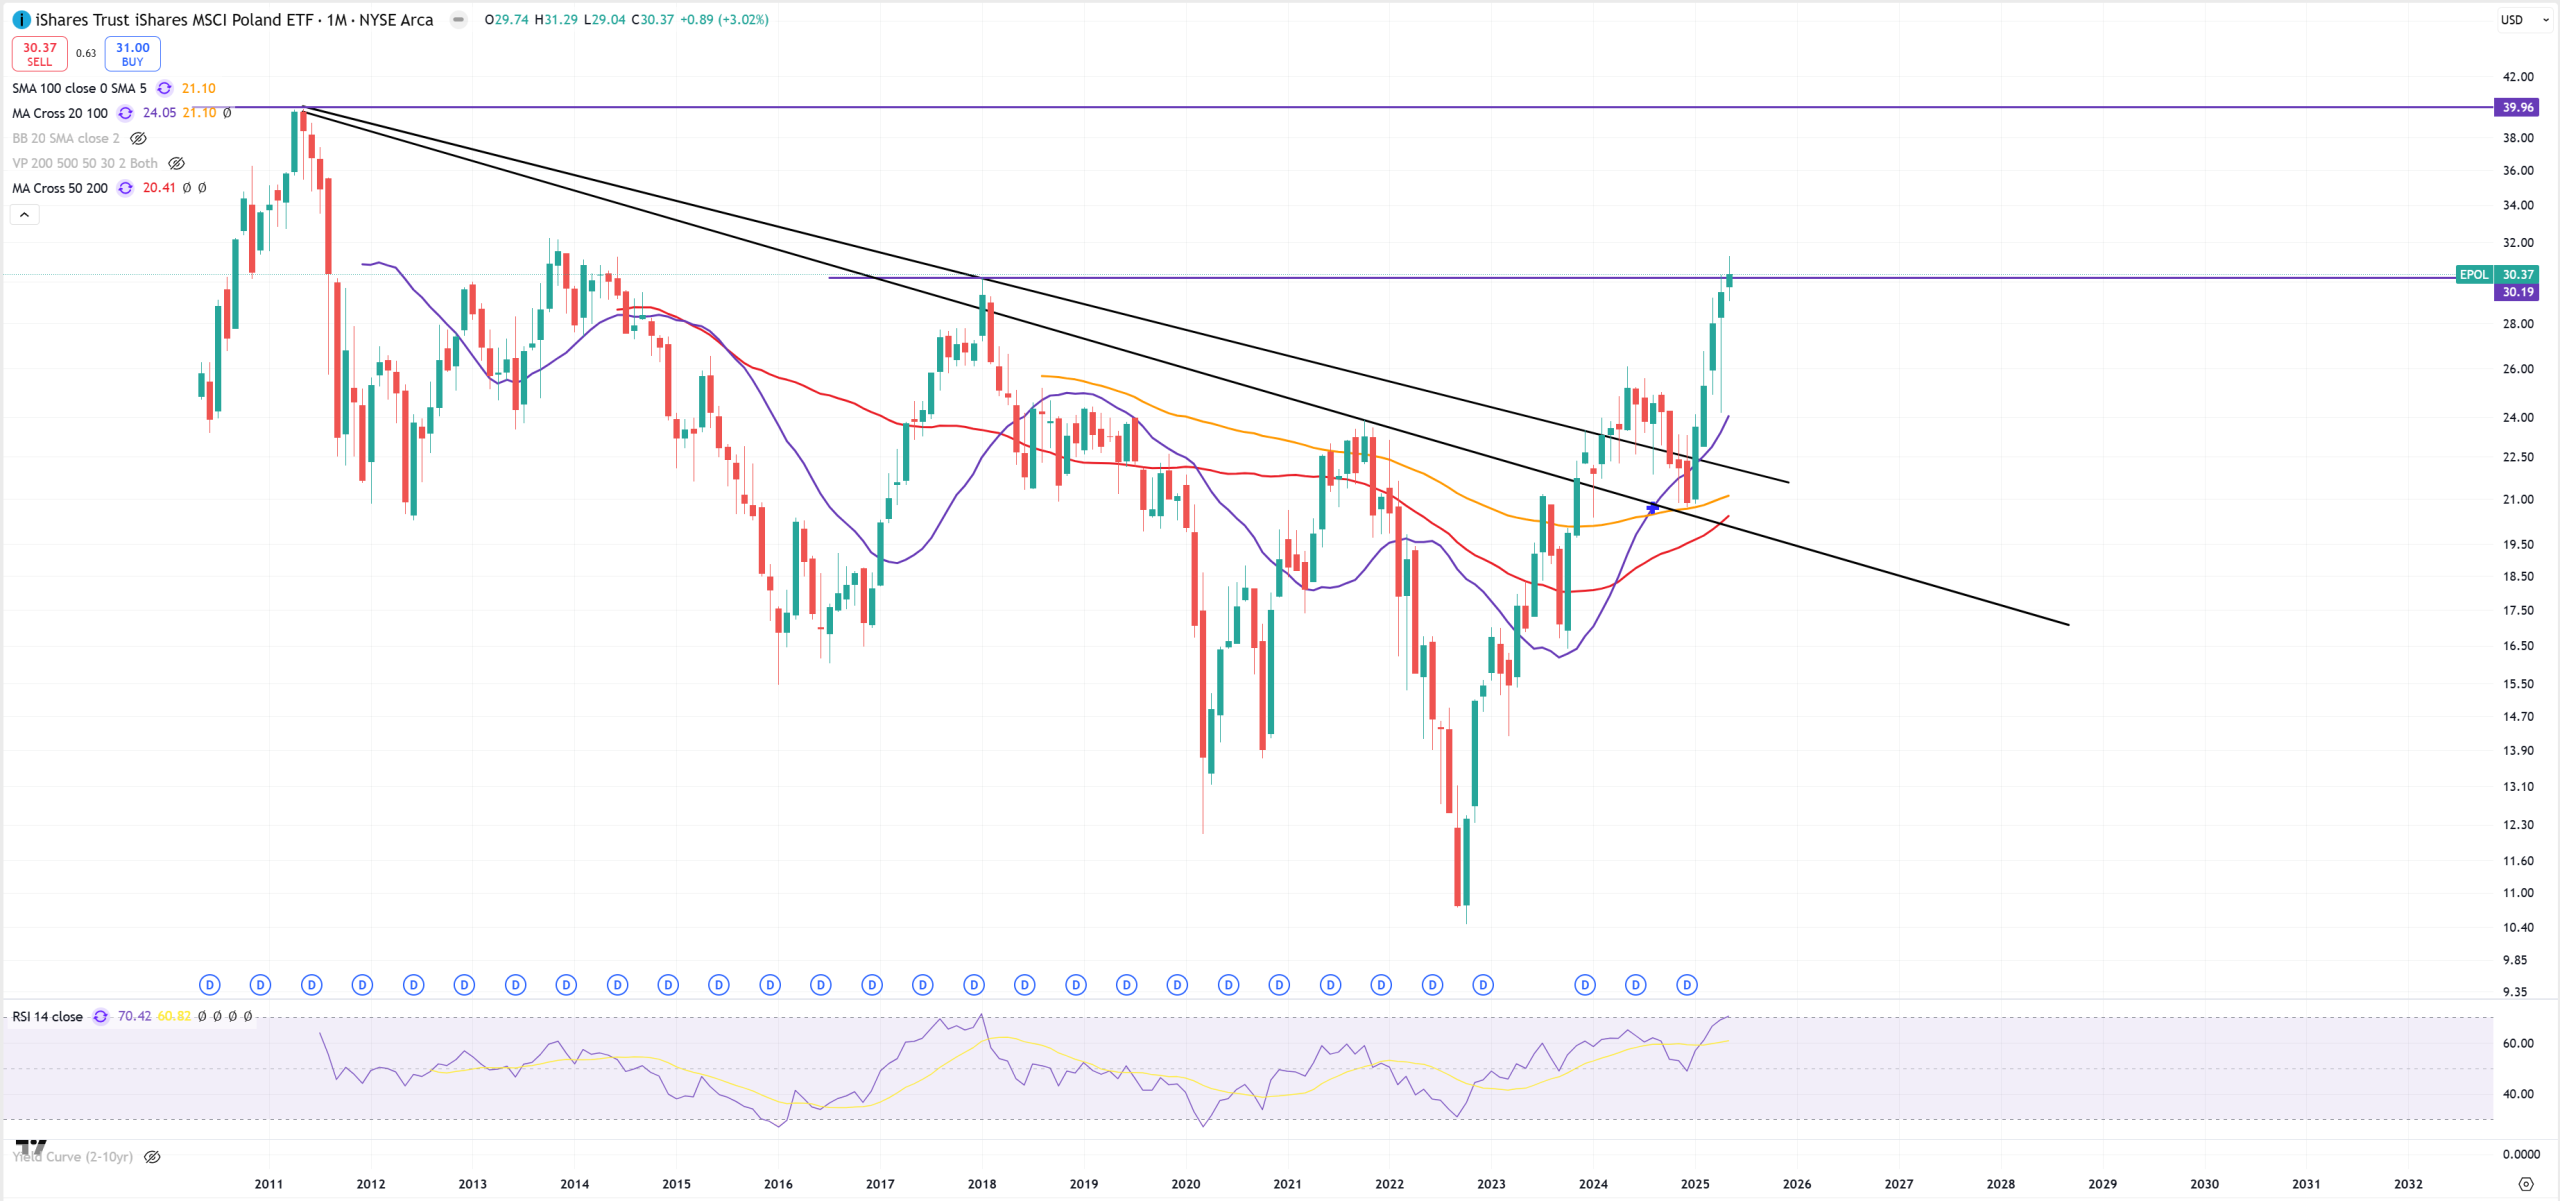
EPOL – Poland
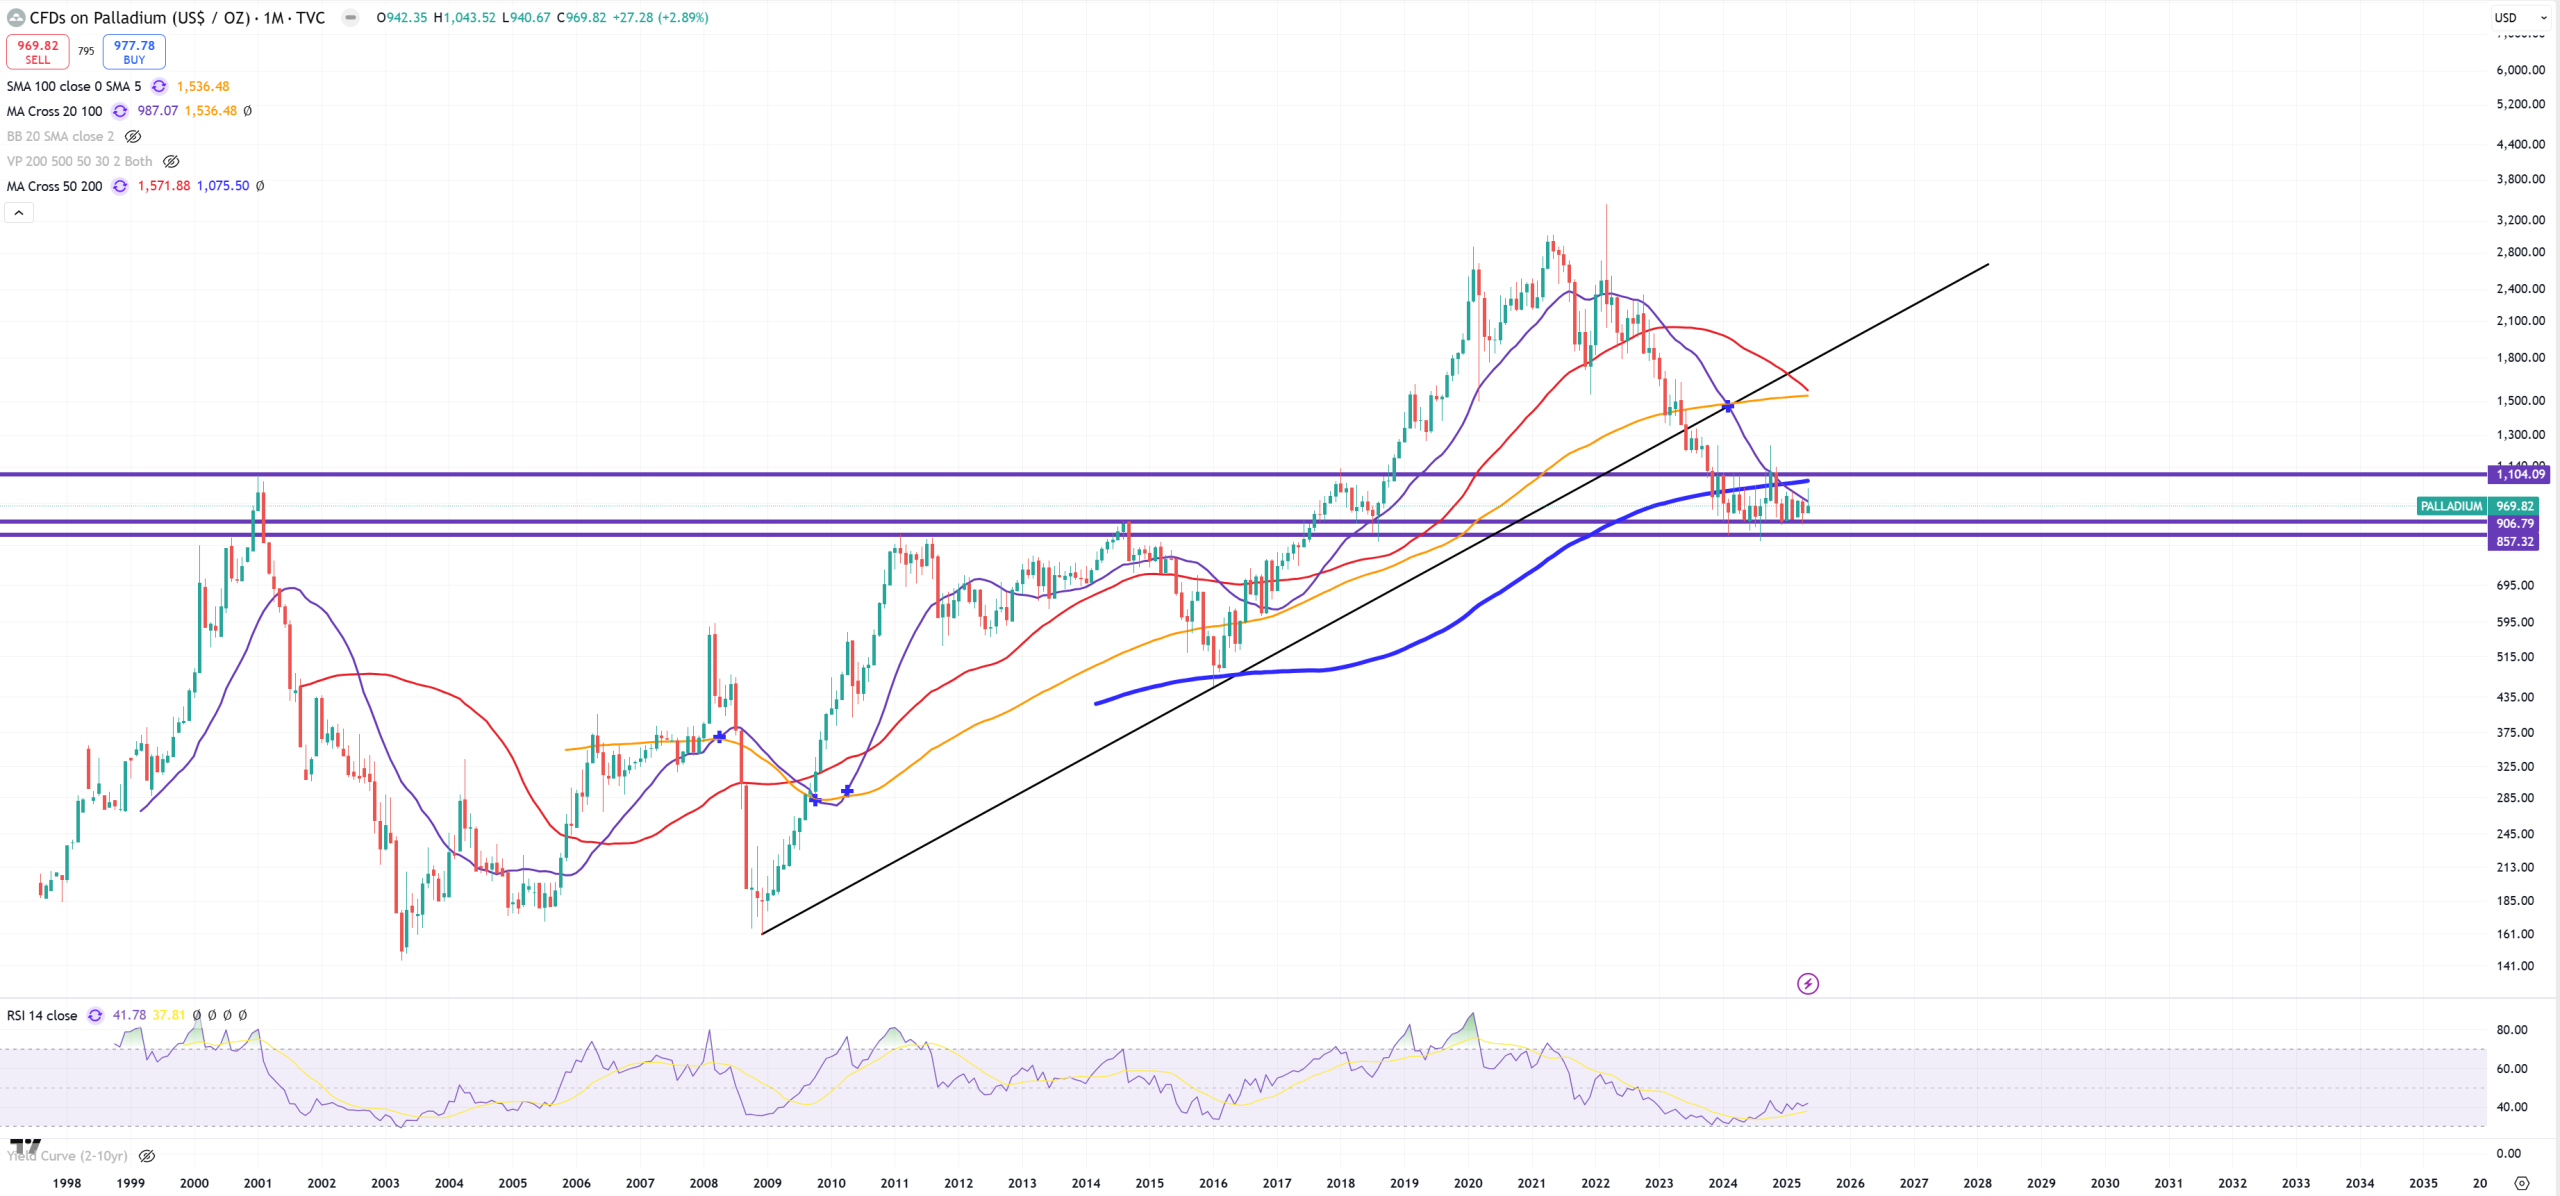
PALLADIUM – big consolidation
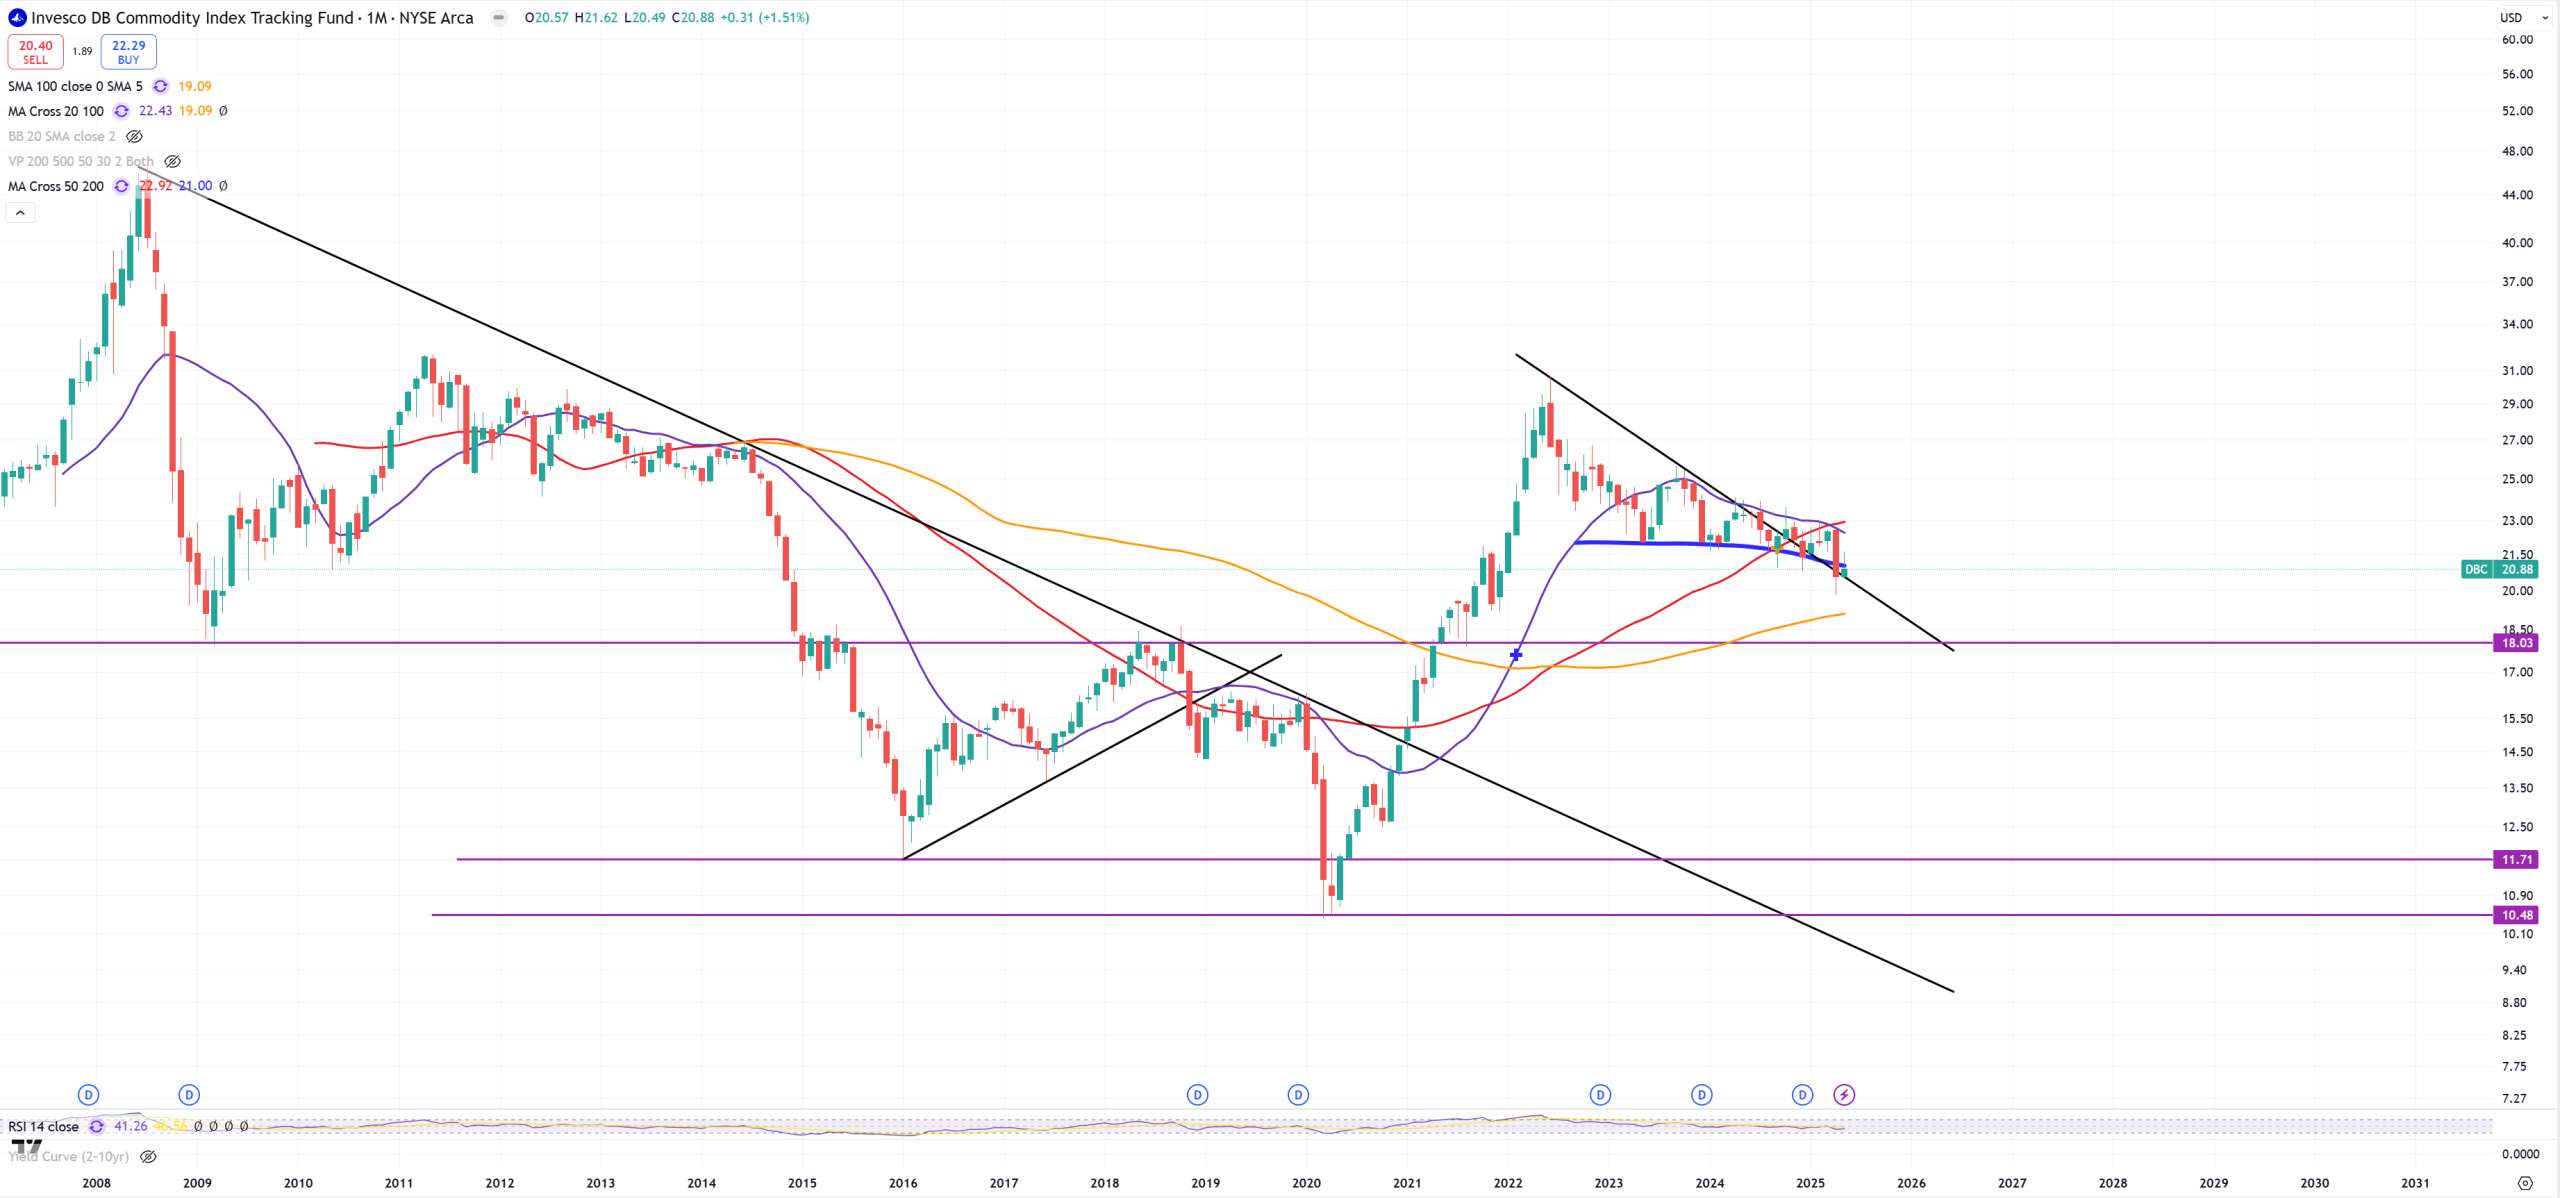
DBC – Commodity ETN – below (M)MA200 :
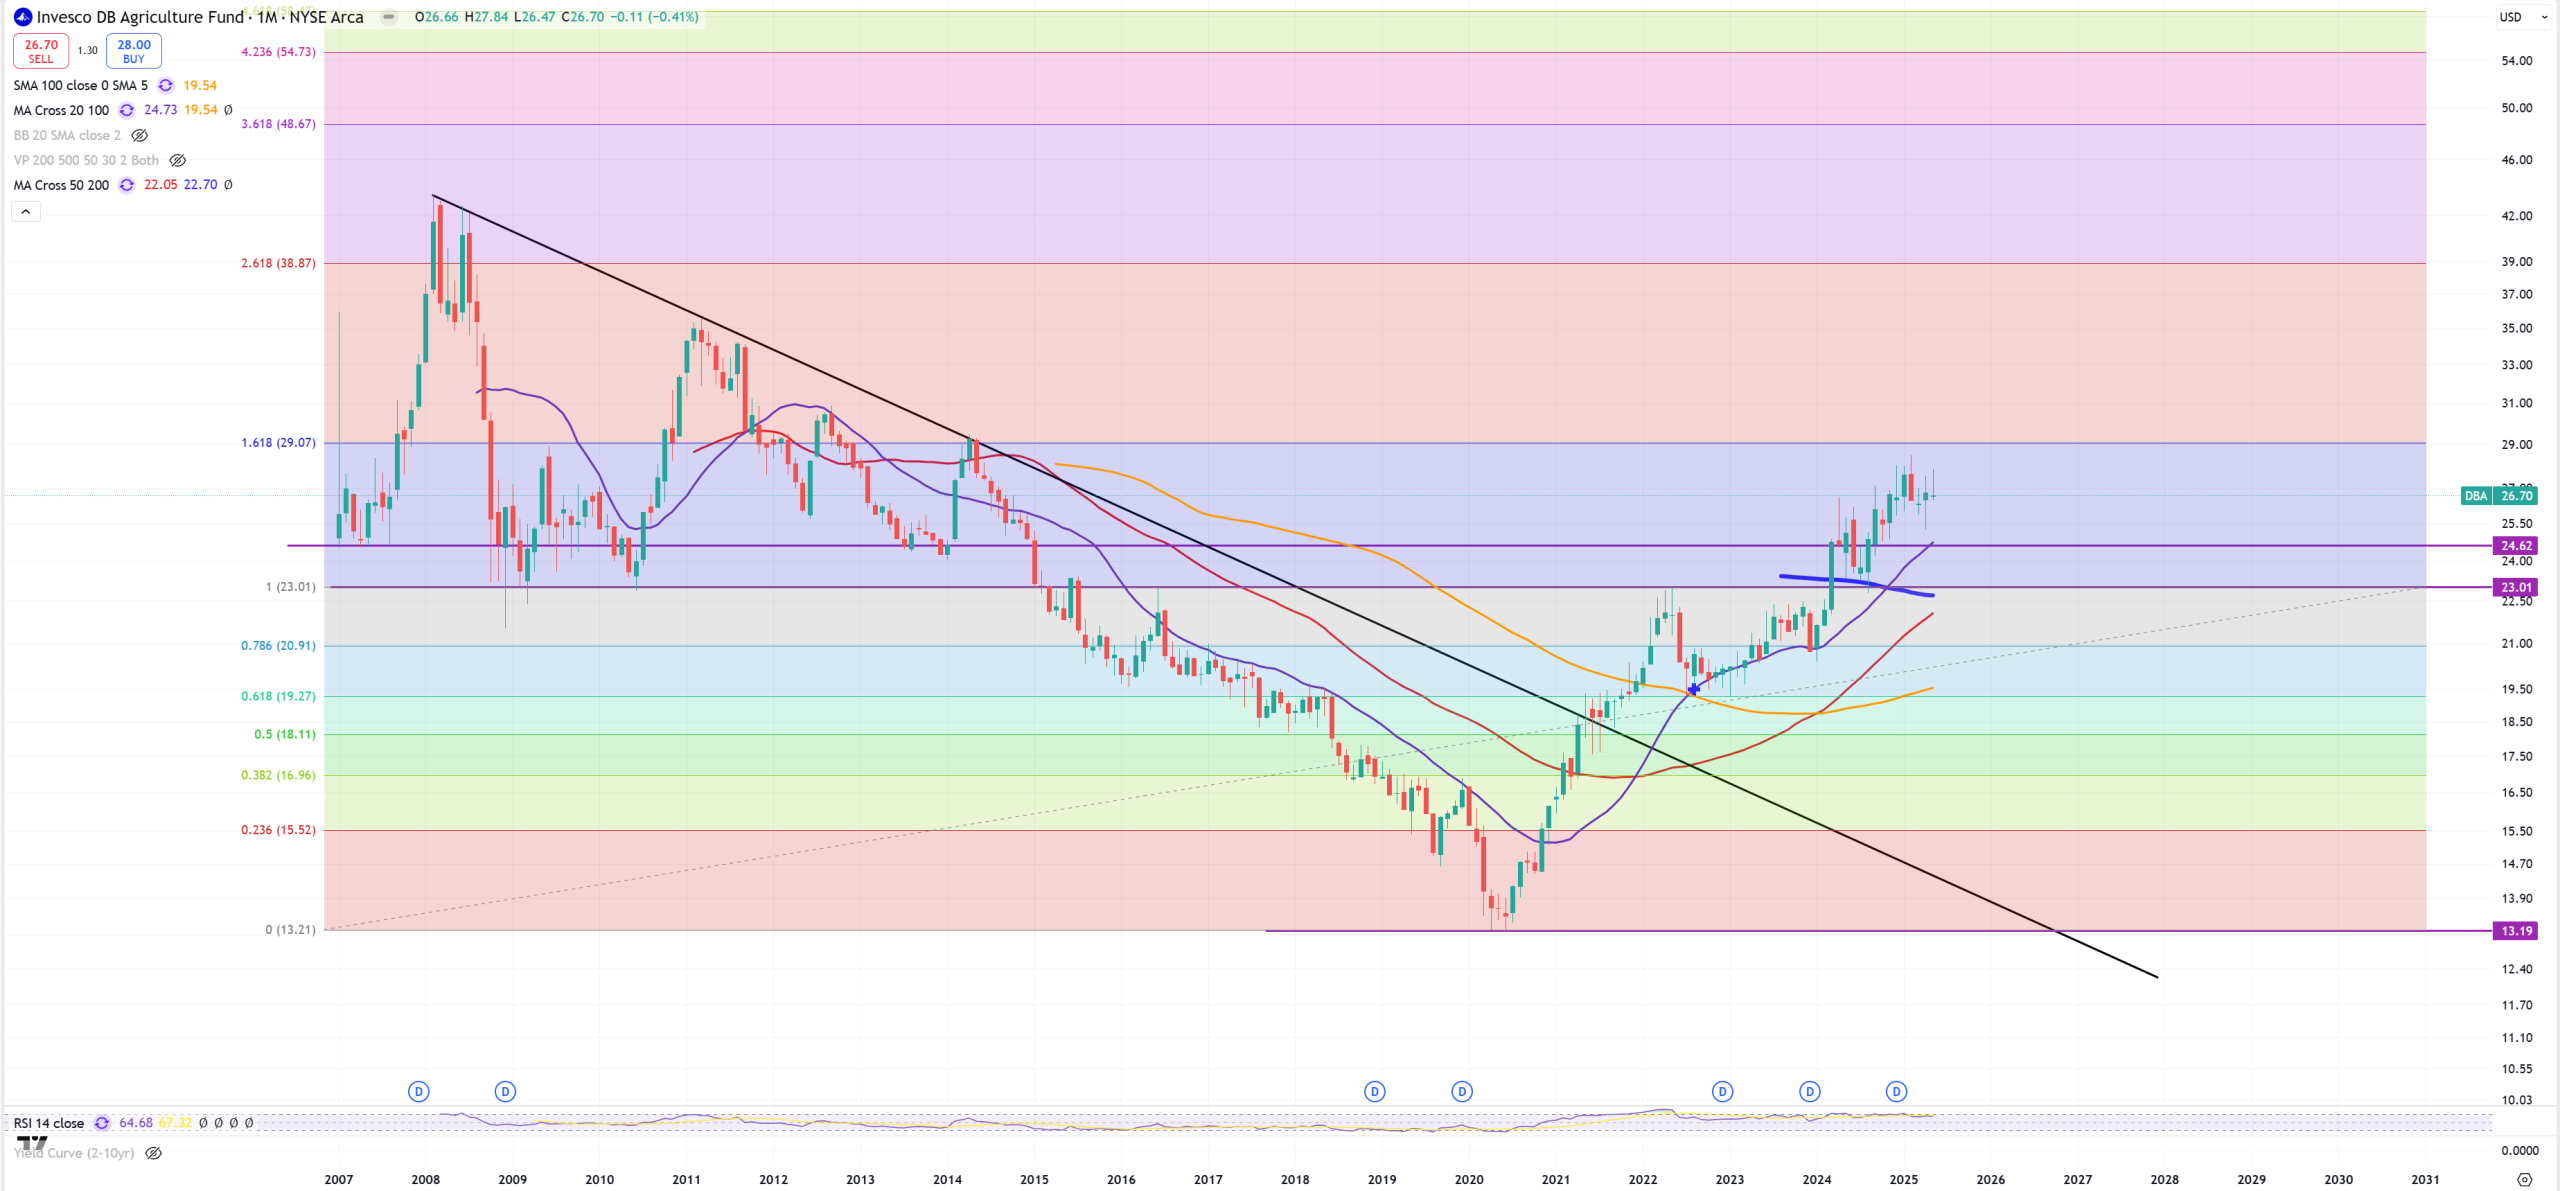
DBA – Agruculture ETN – food inflation is still on fire
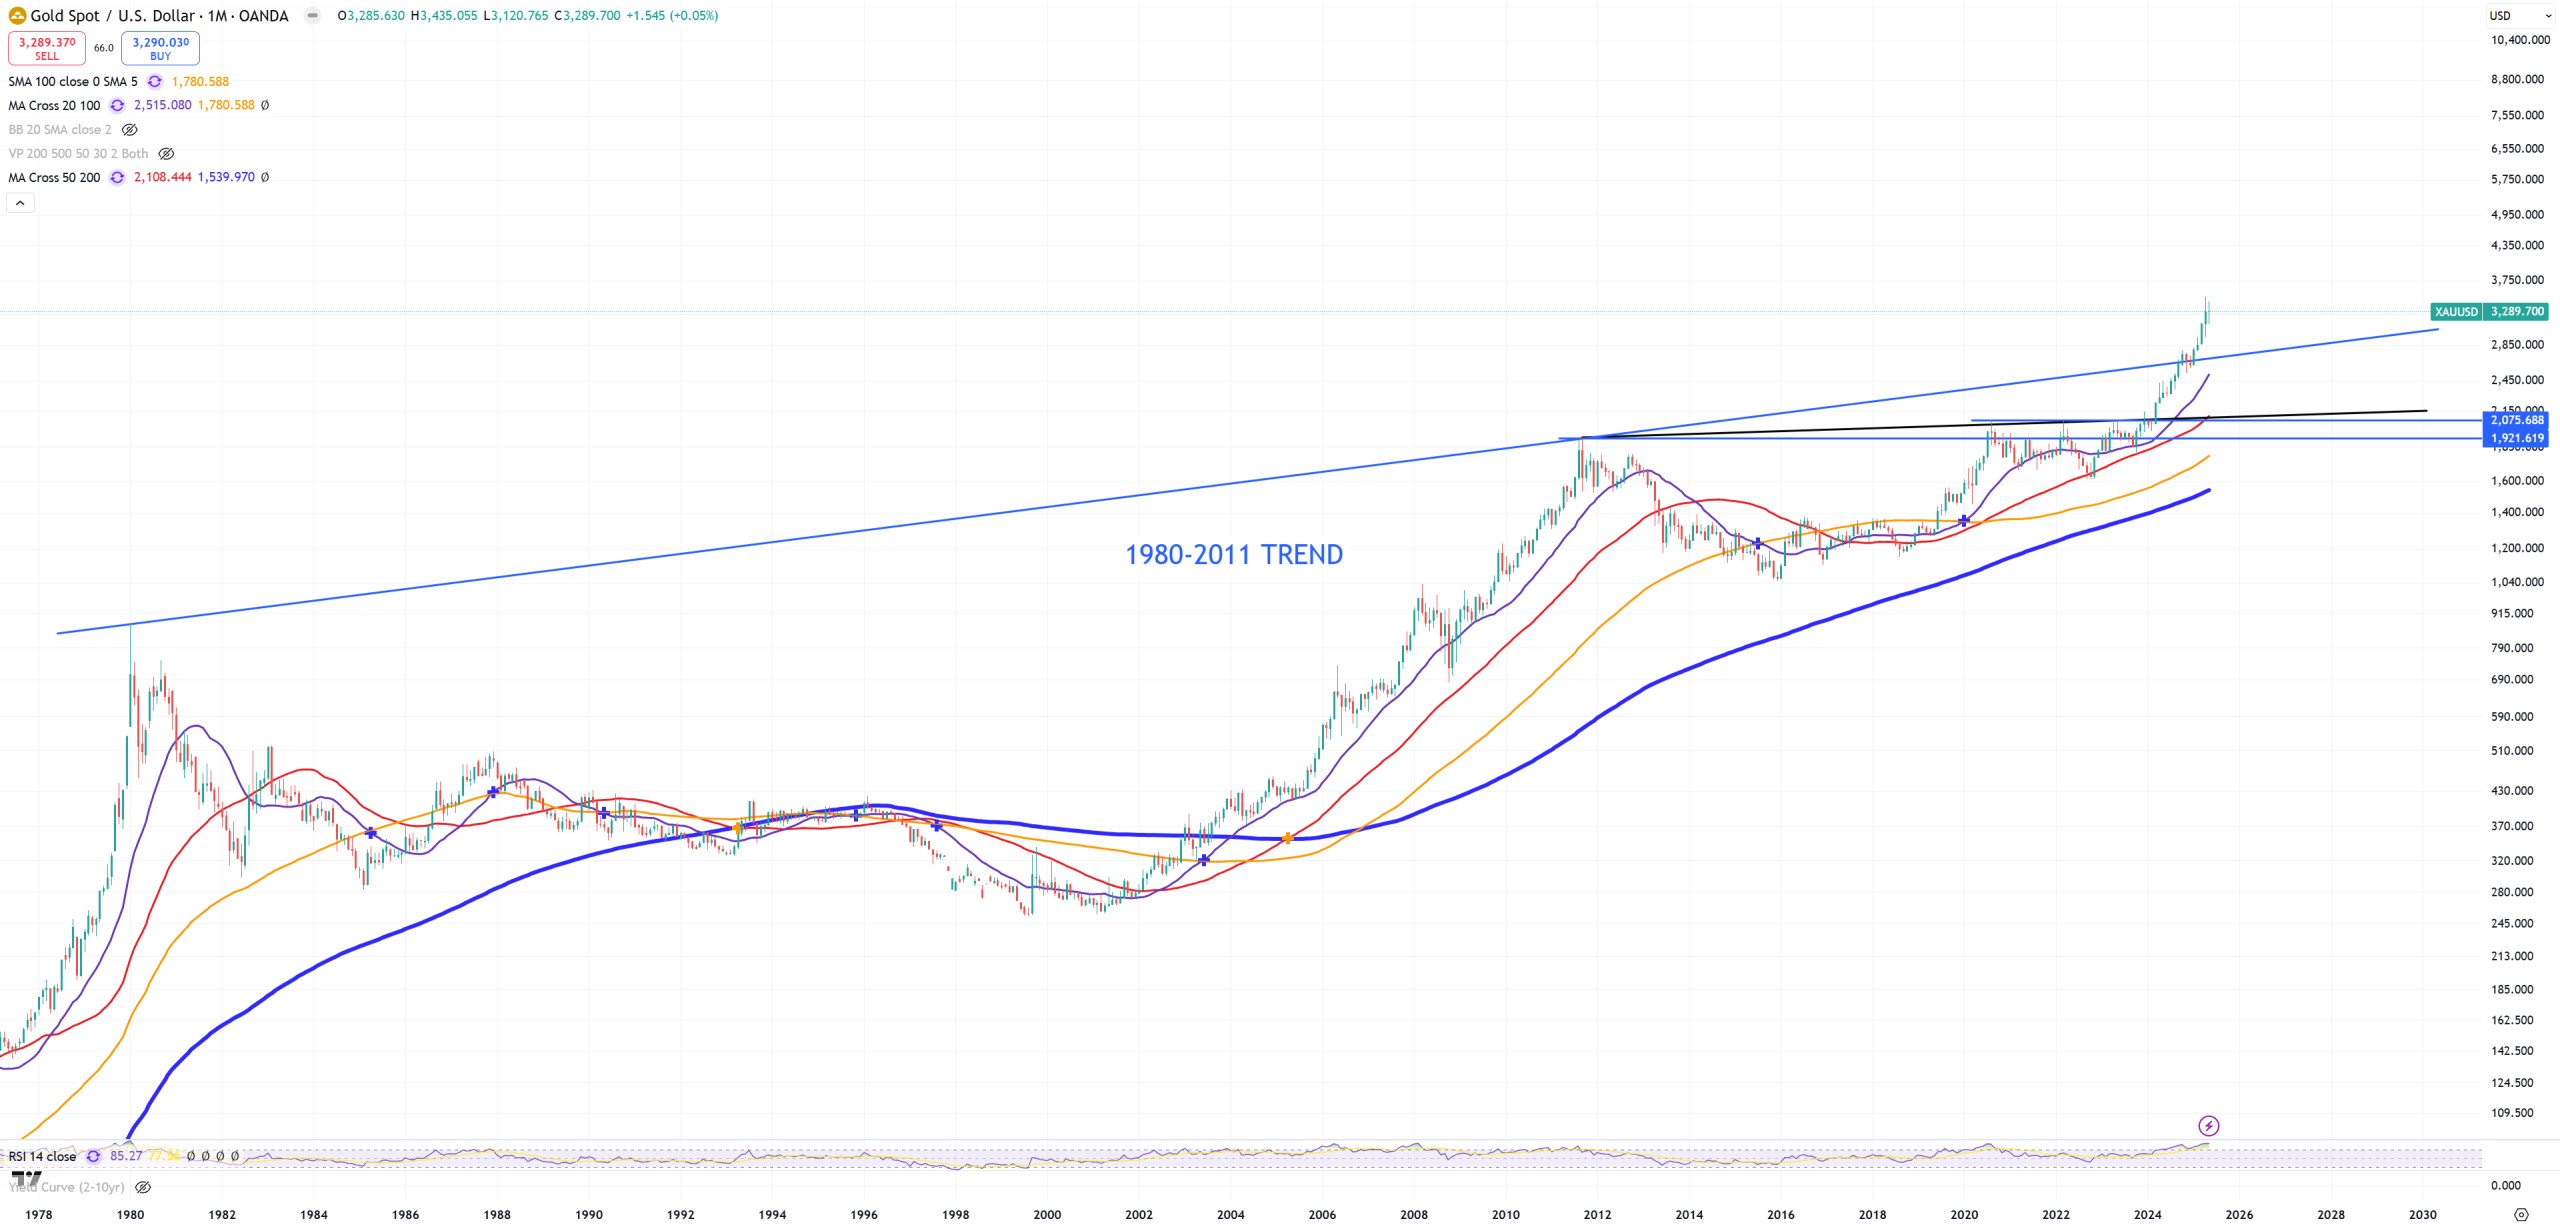
XAUUSD – Gold
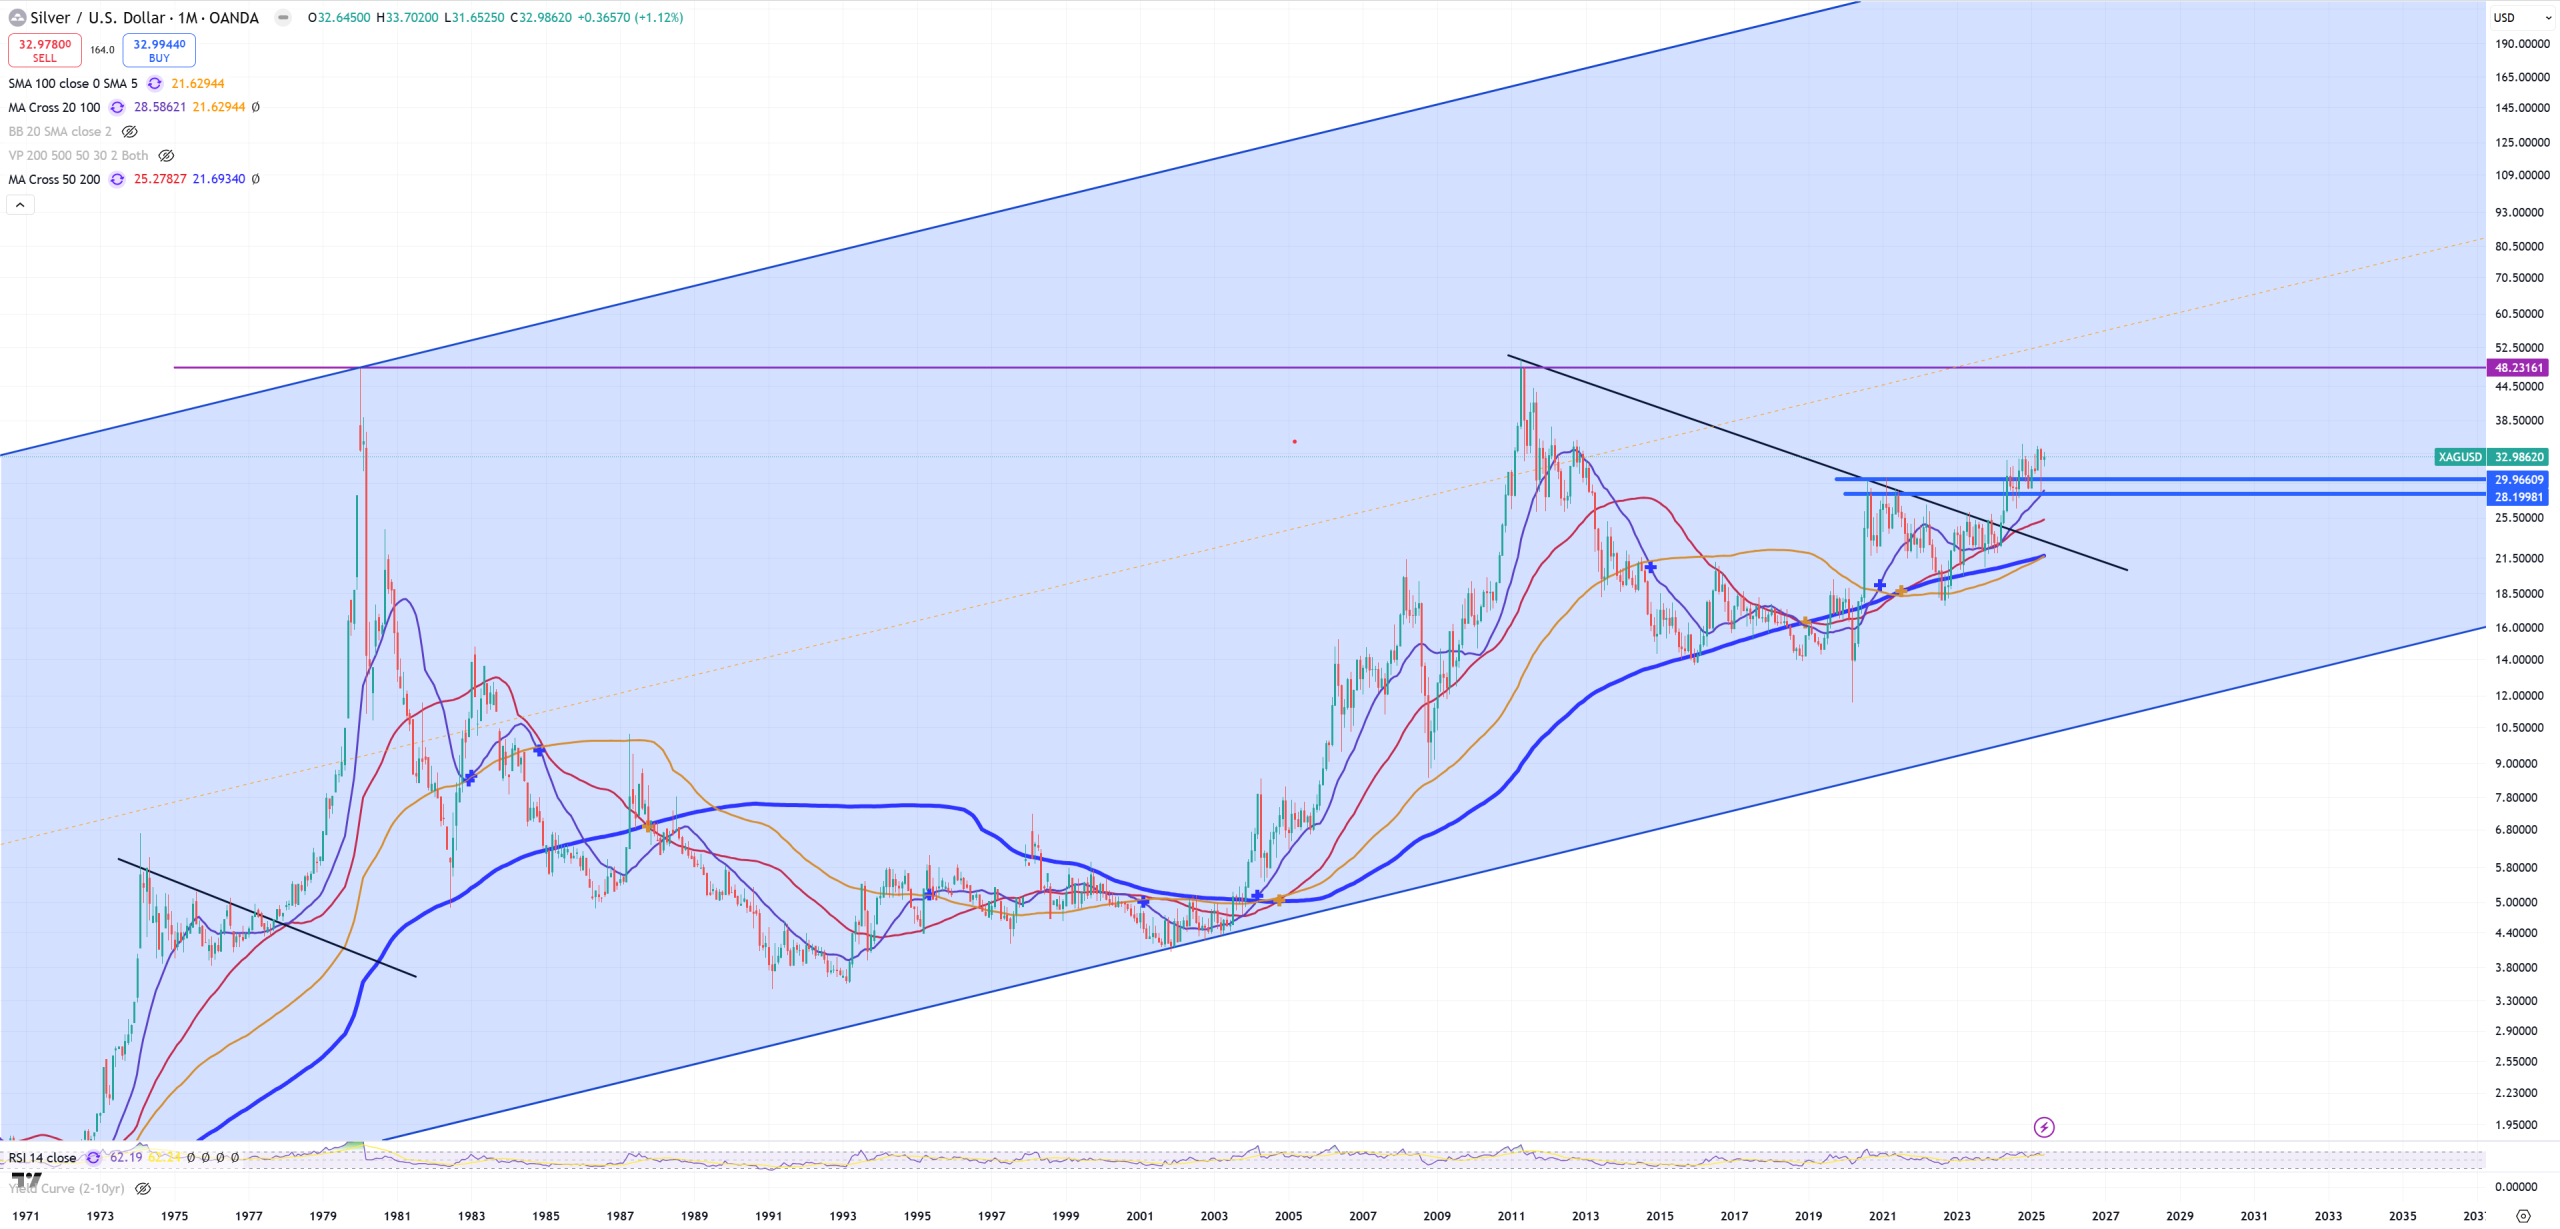
XAGUSD – Silver
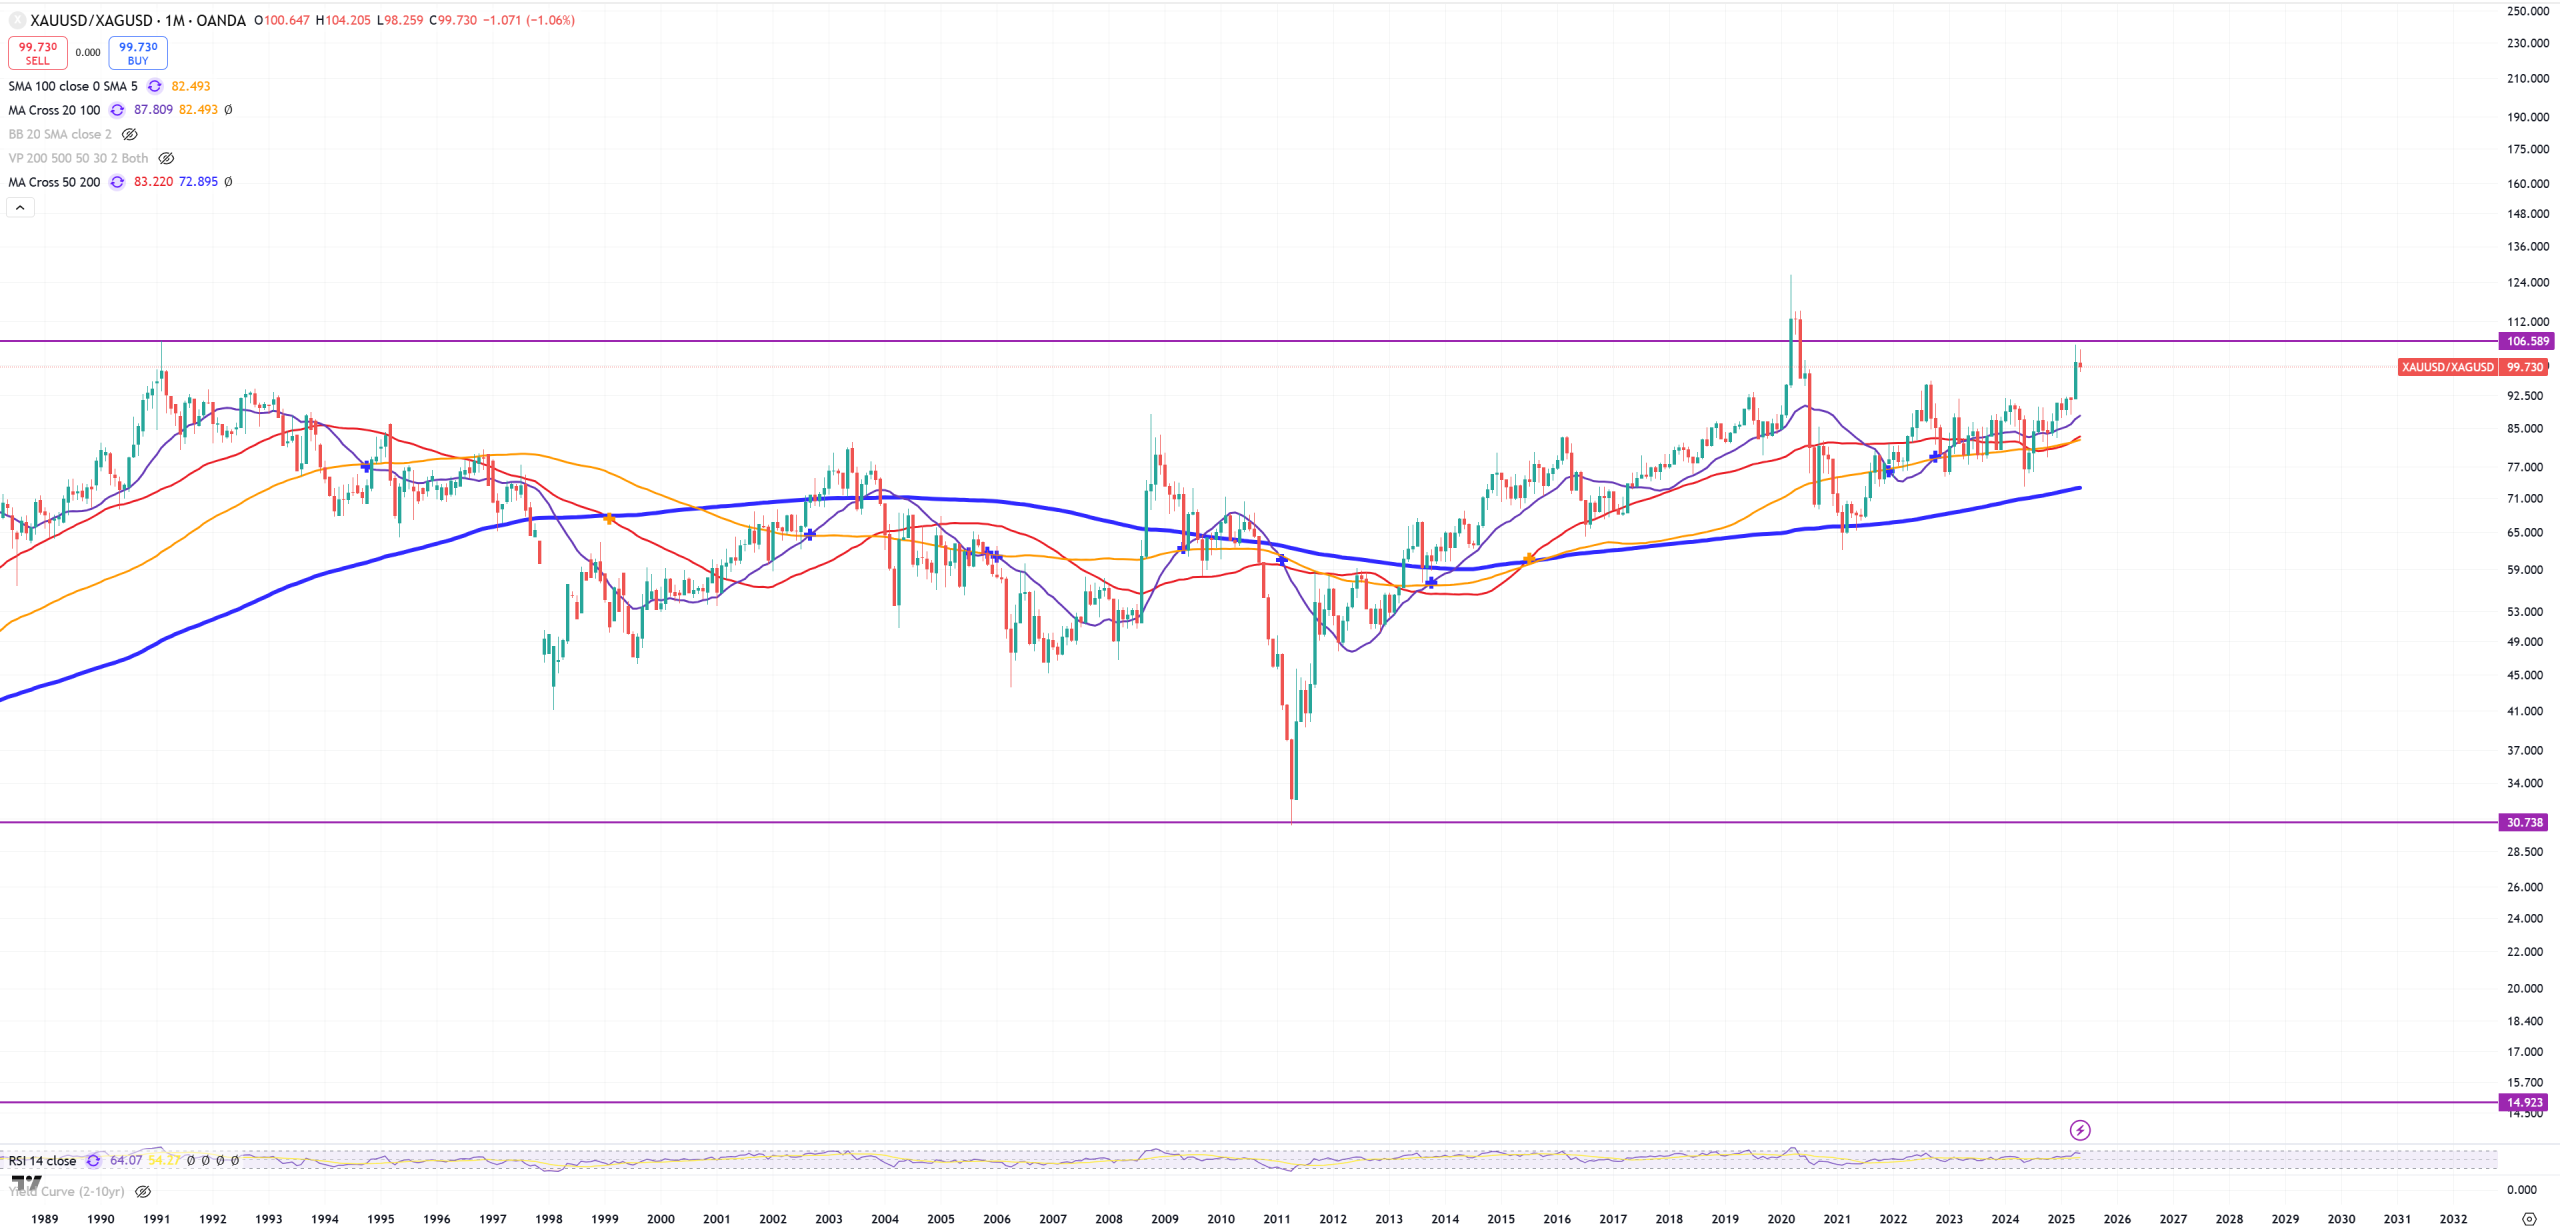
GOLD/SILVER ratio
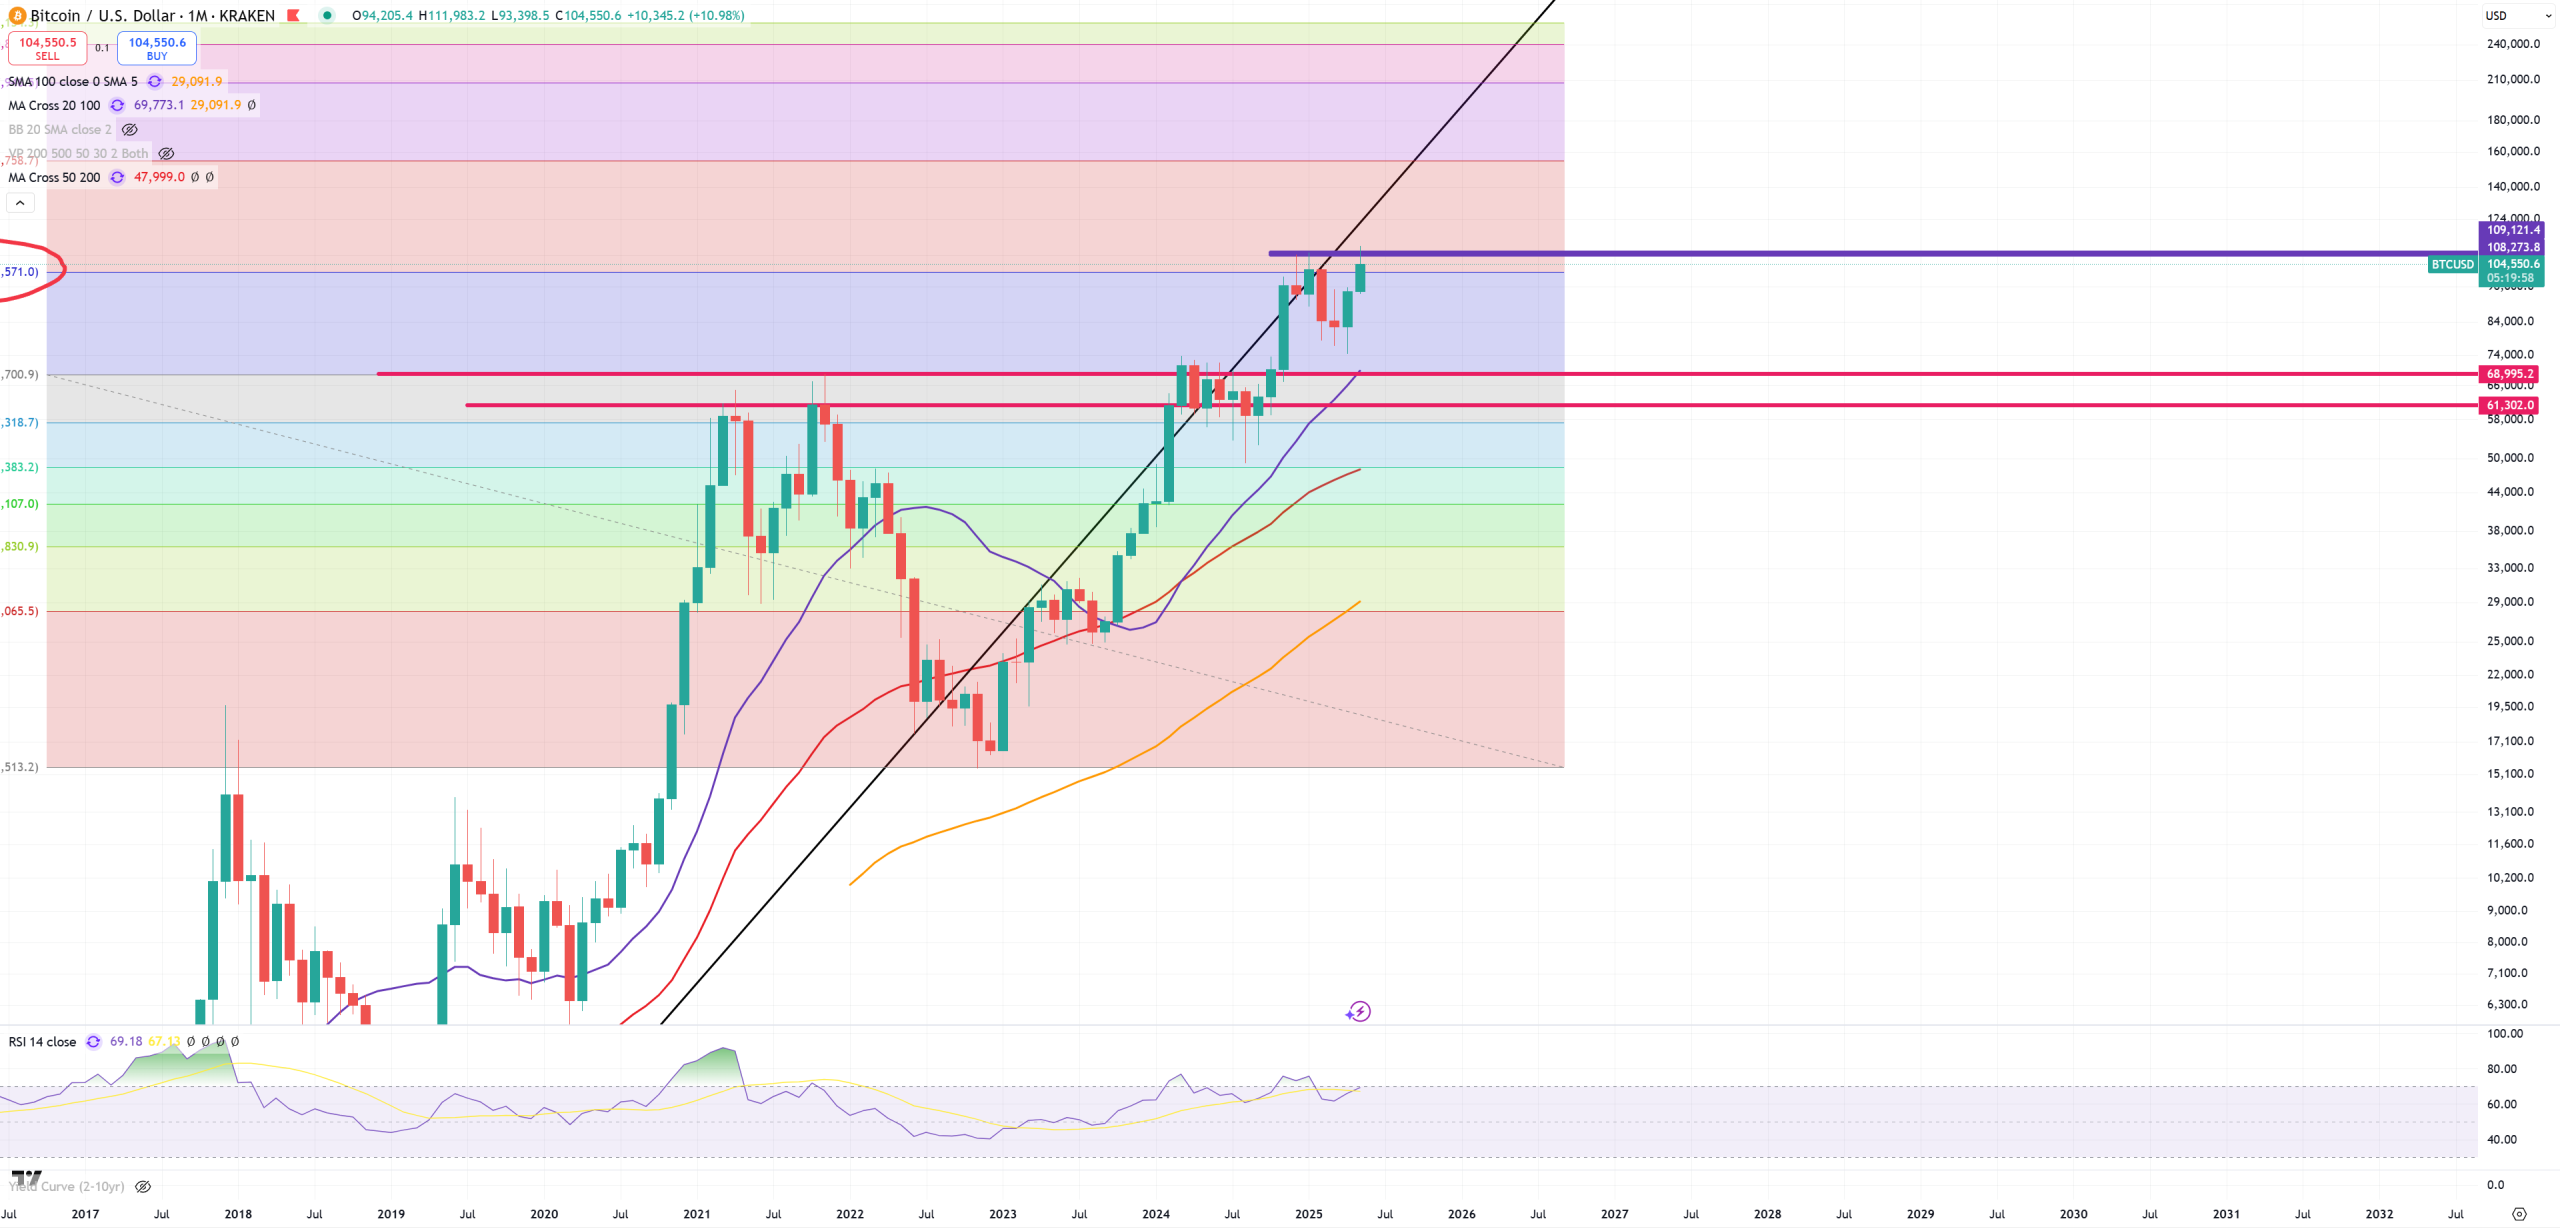
BTC
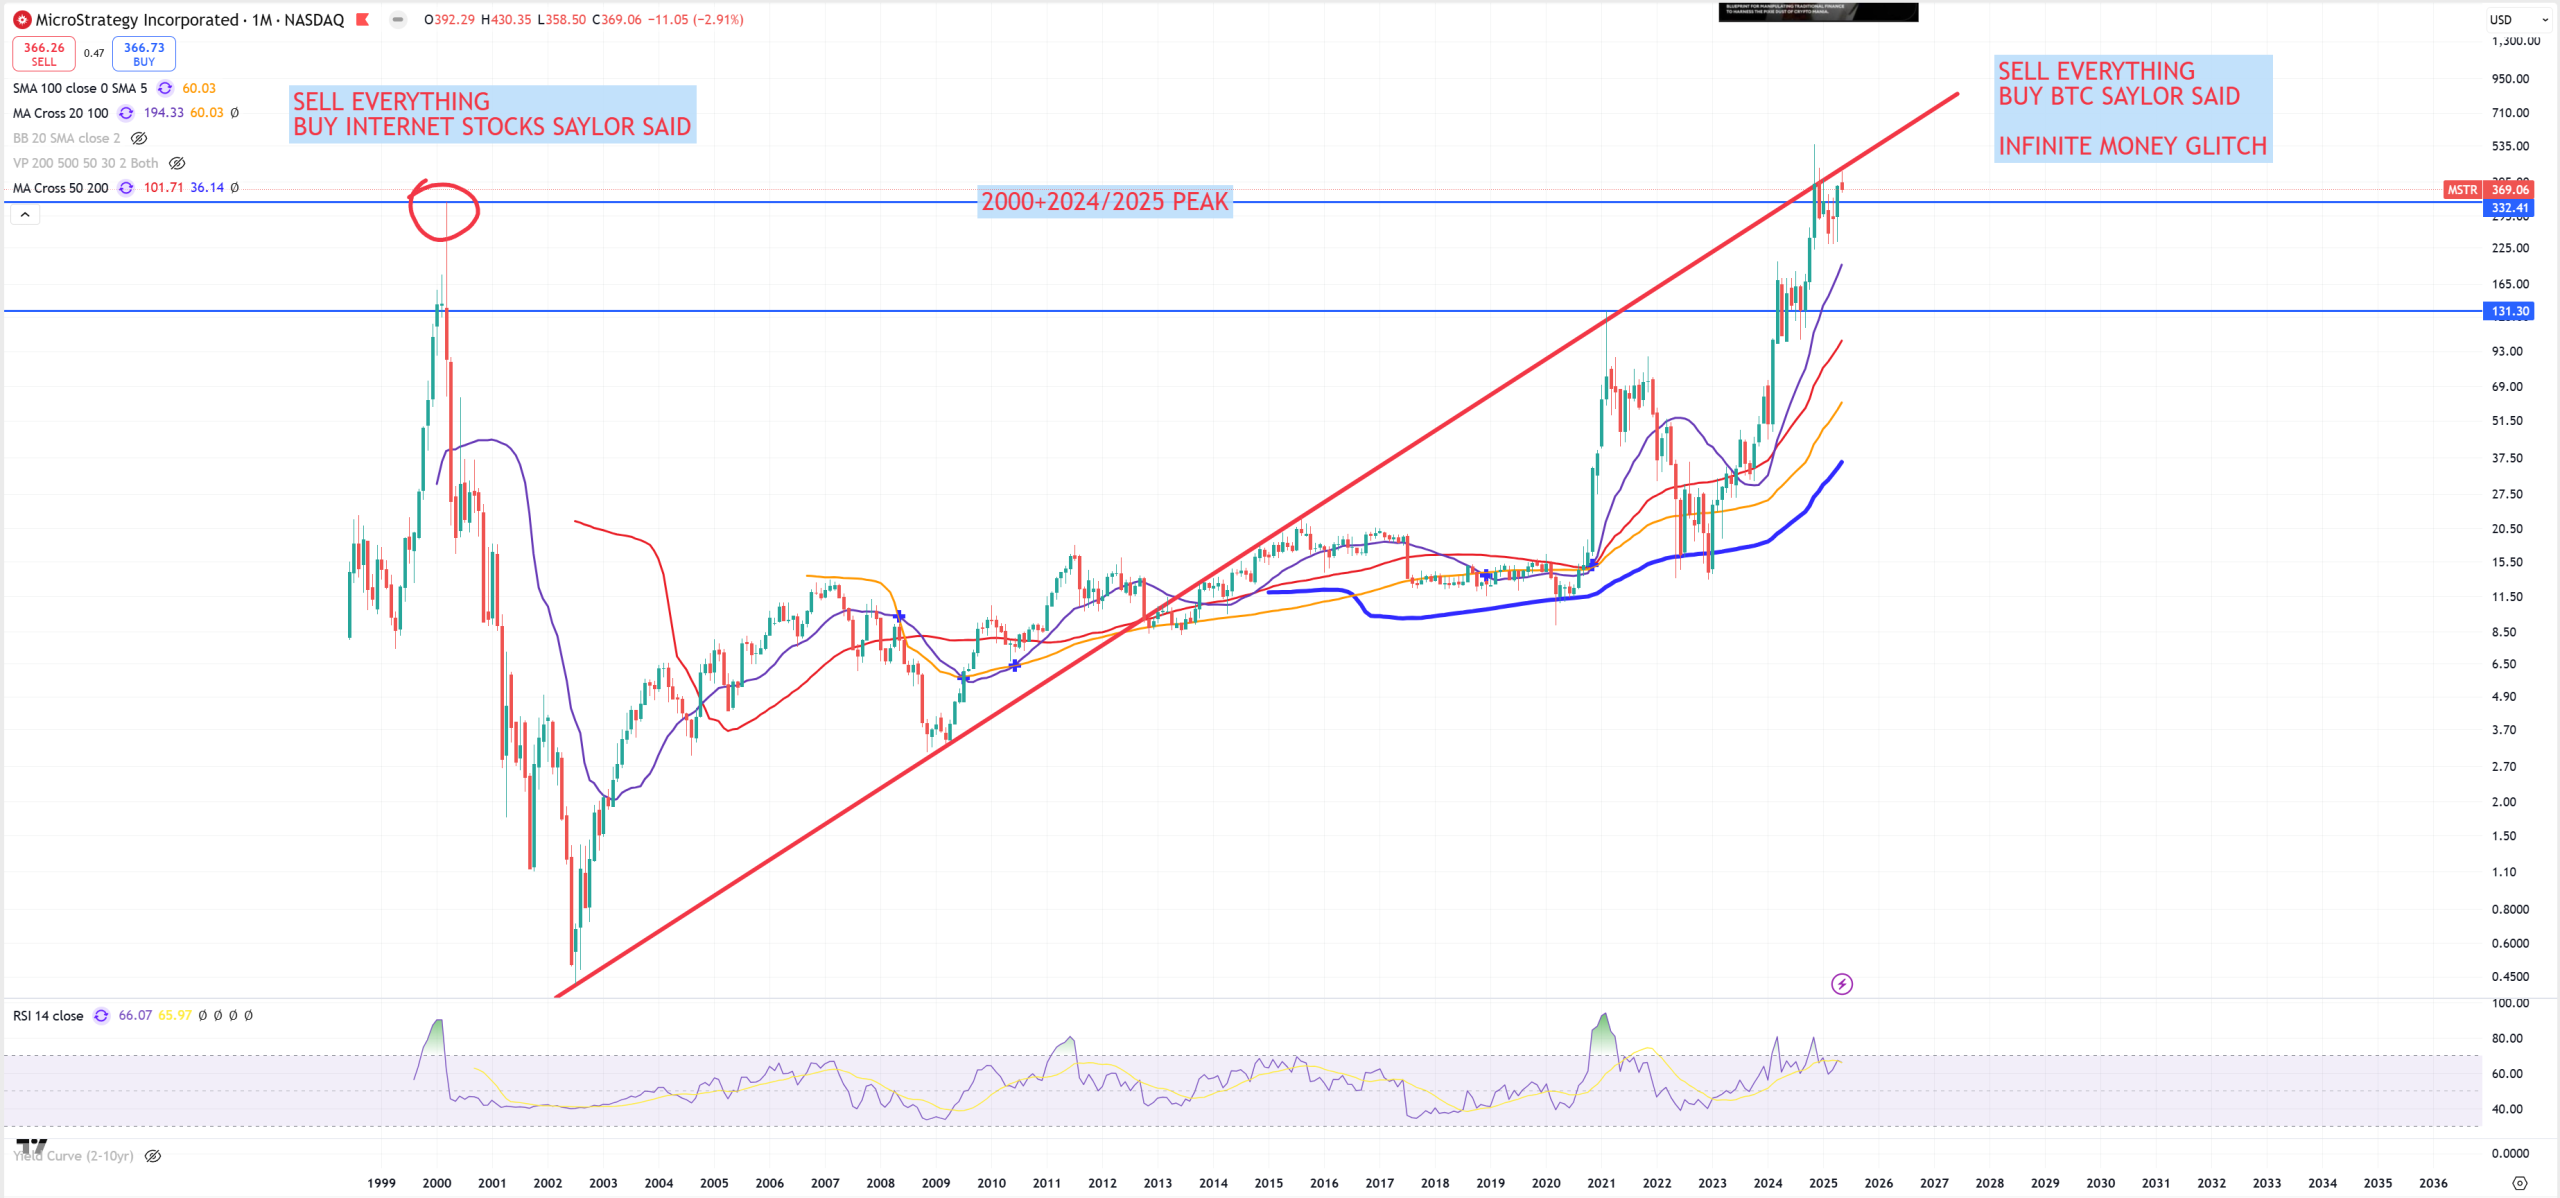
MSTR – I still believe in this 2000 peak
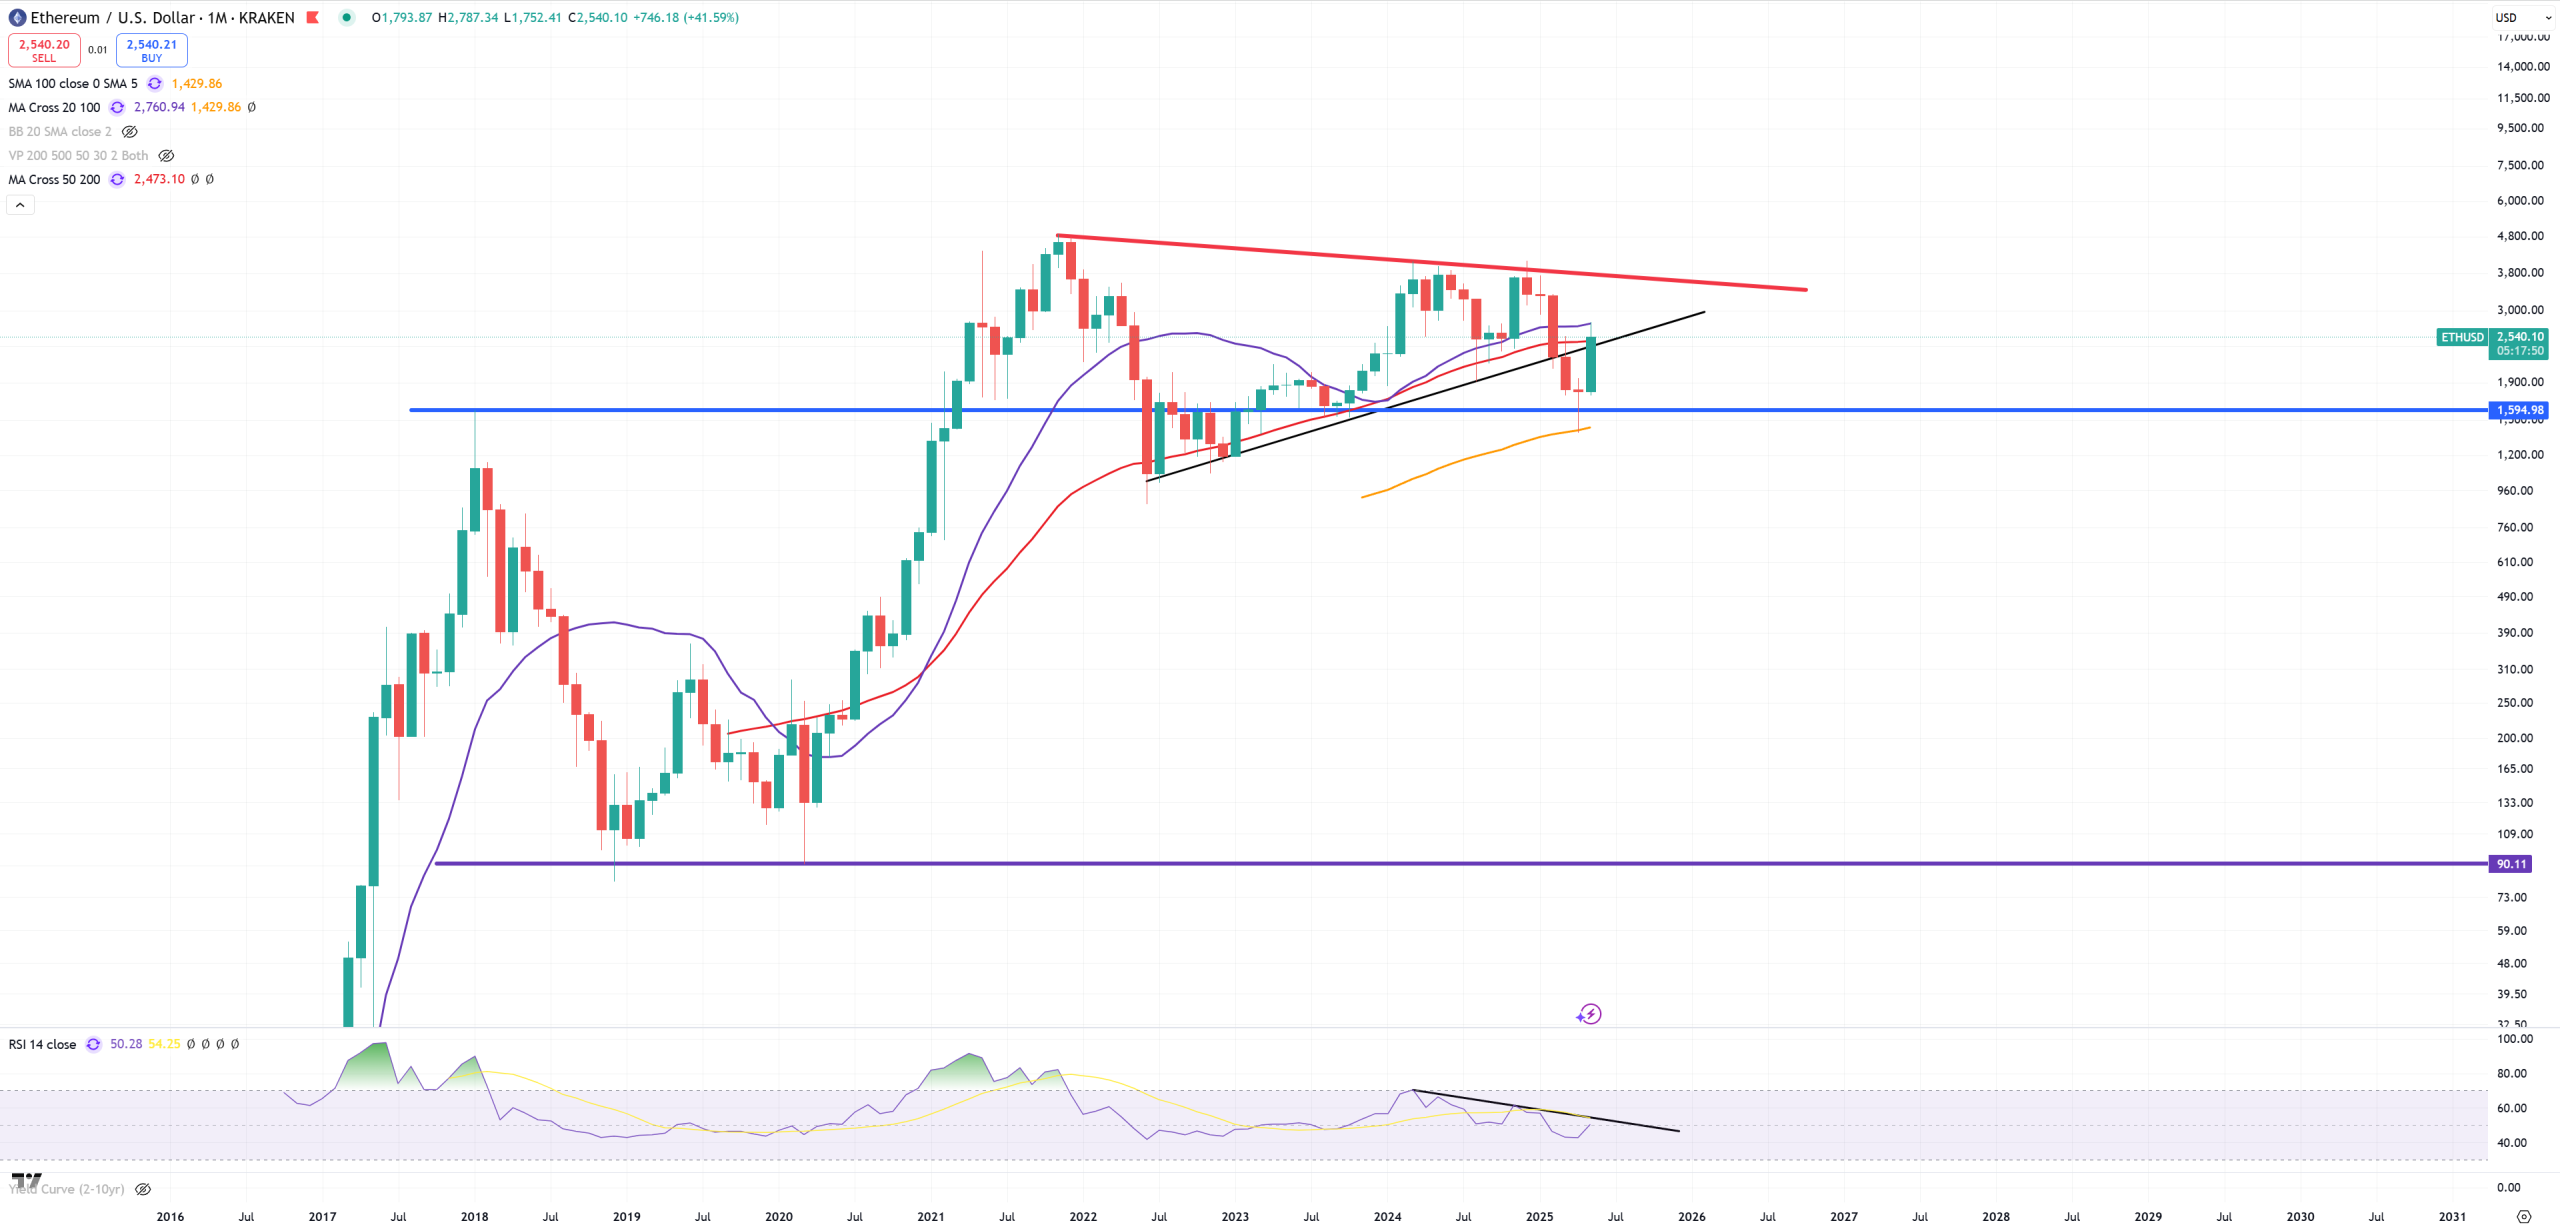
ETH – it’s all about 1600$ support
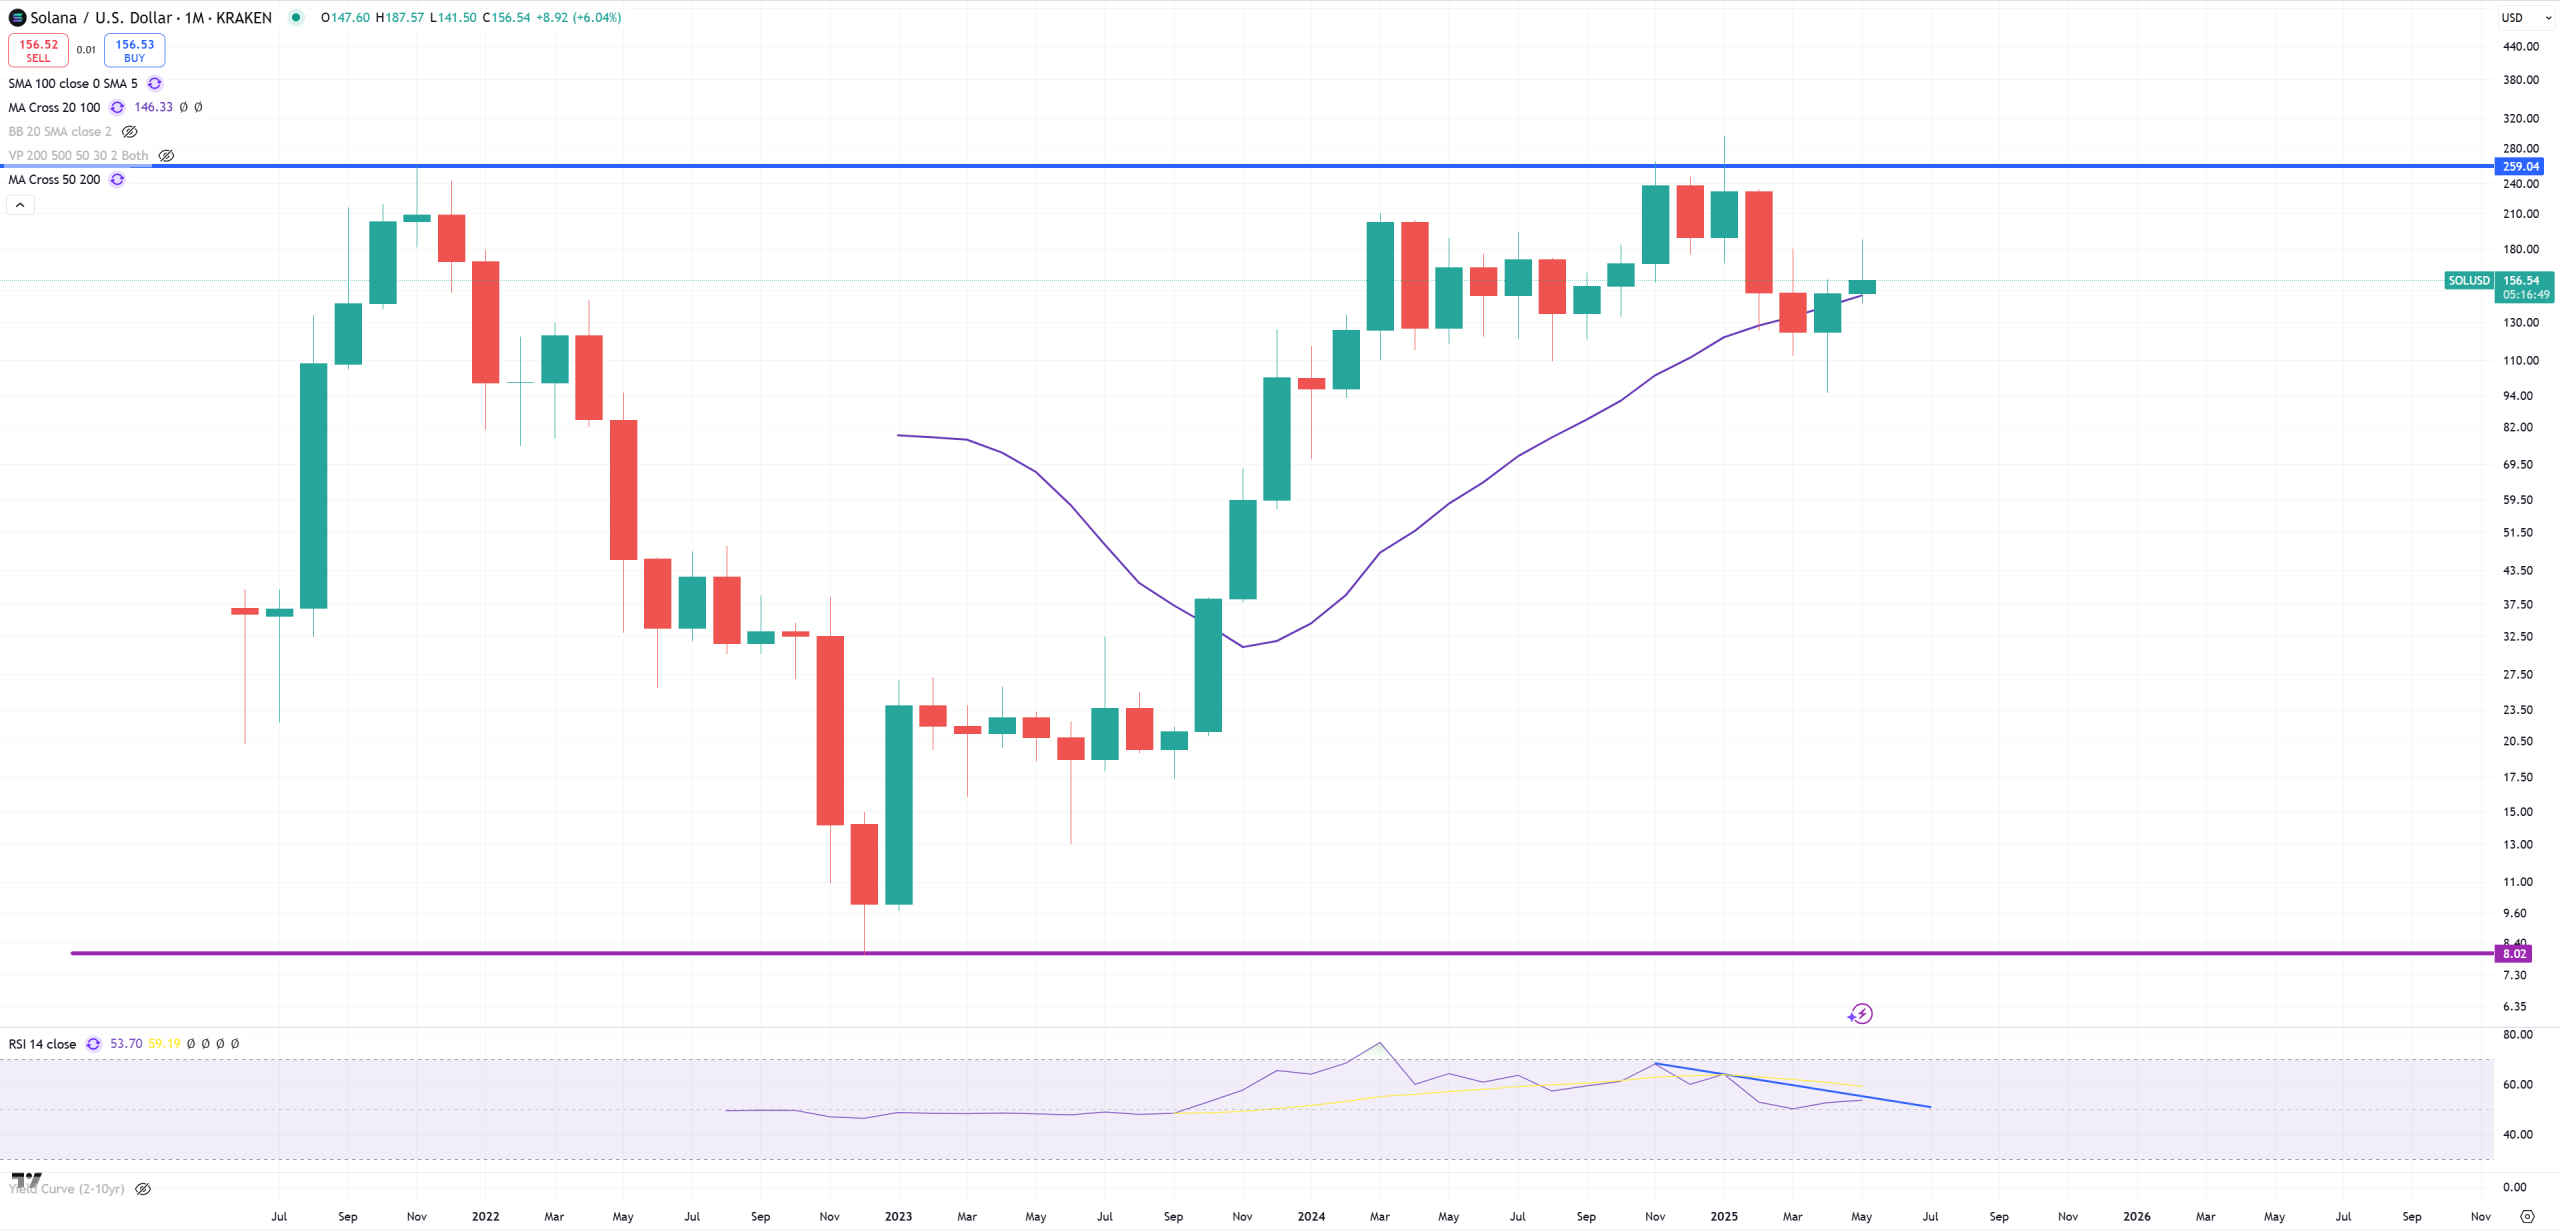
SOL
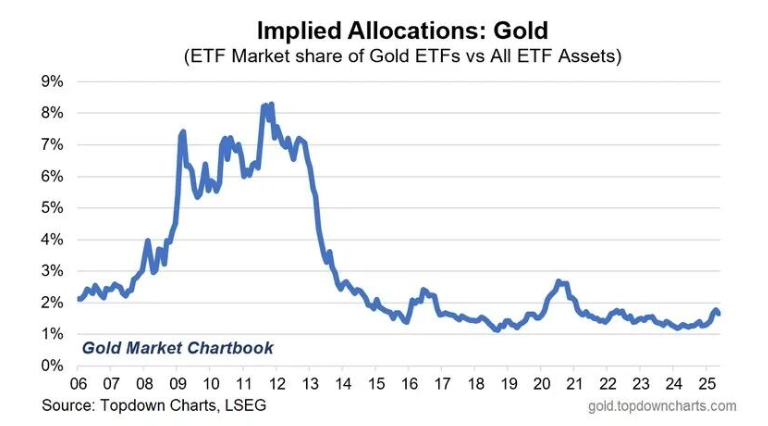
Cycle indicators and ratio charts – nobody uses gold.
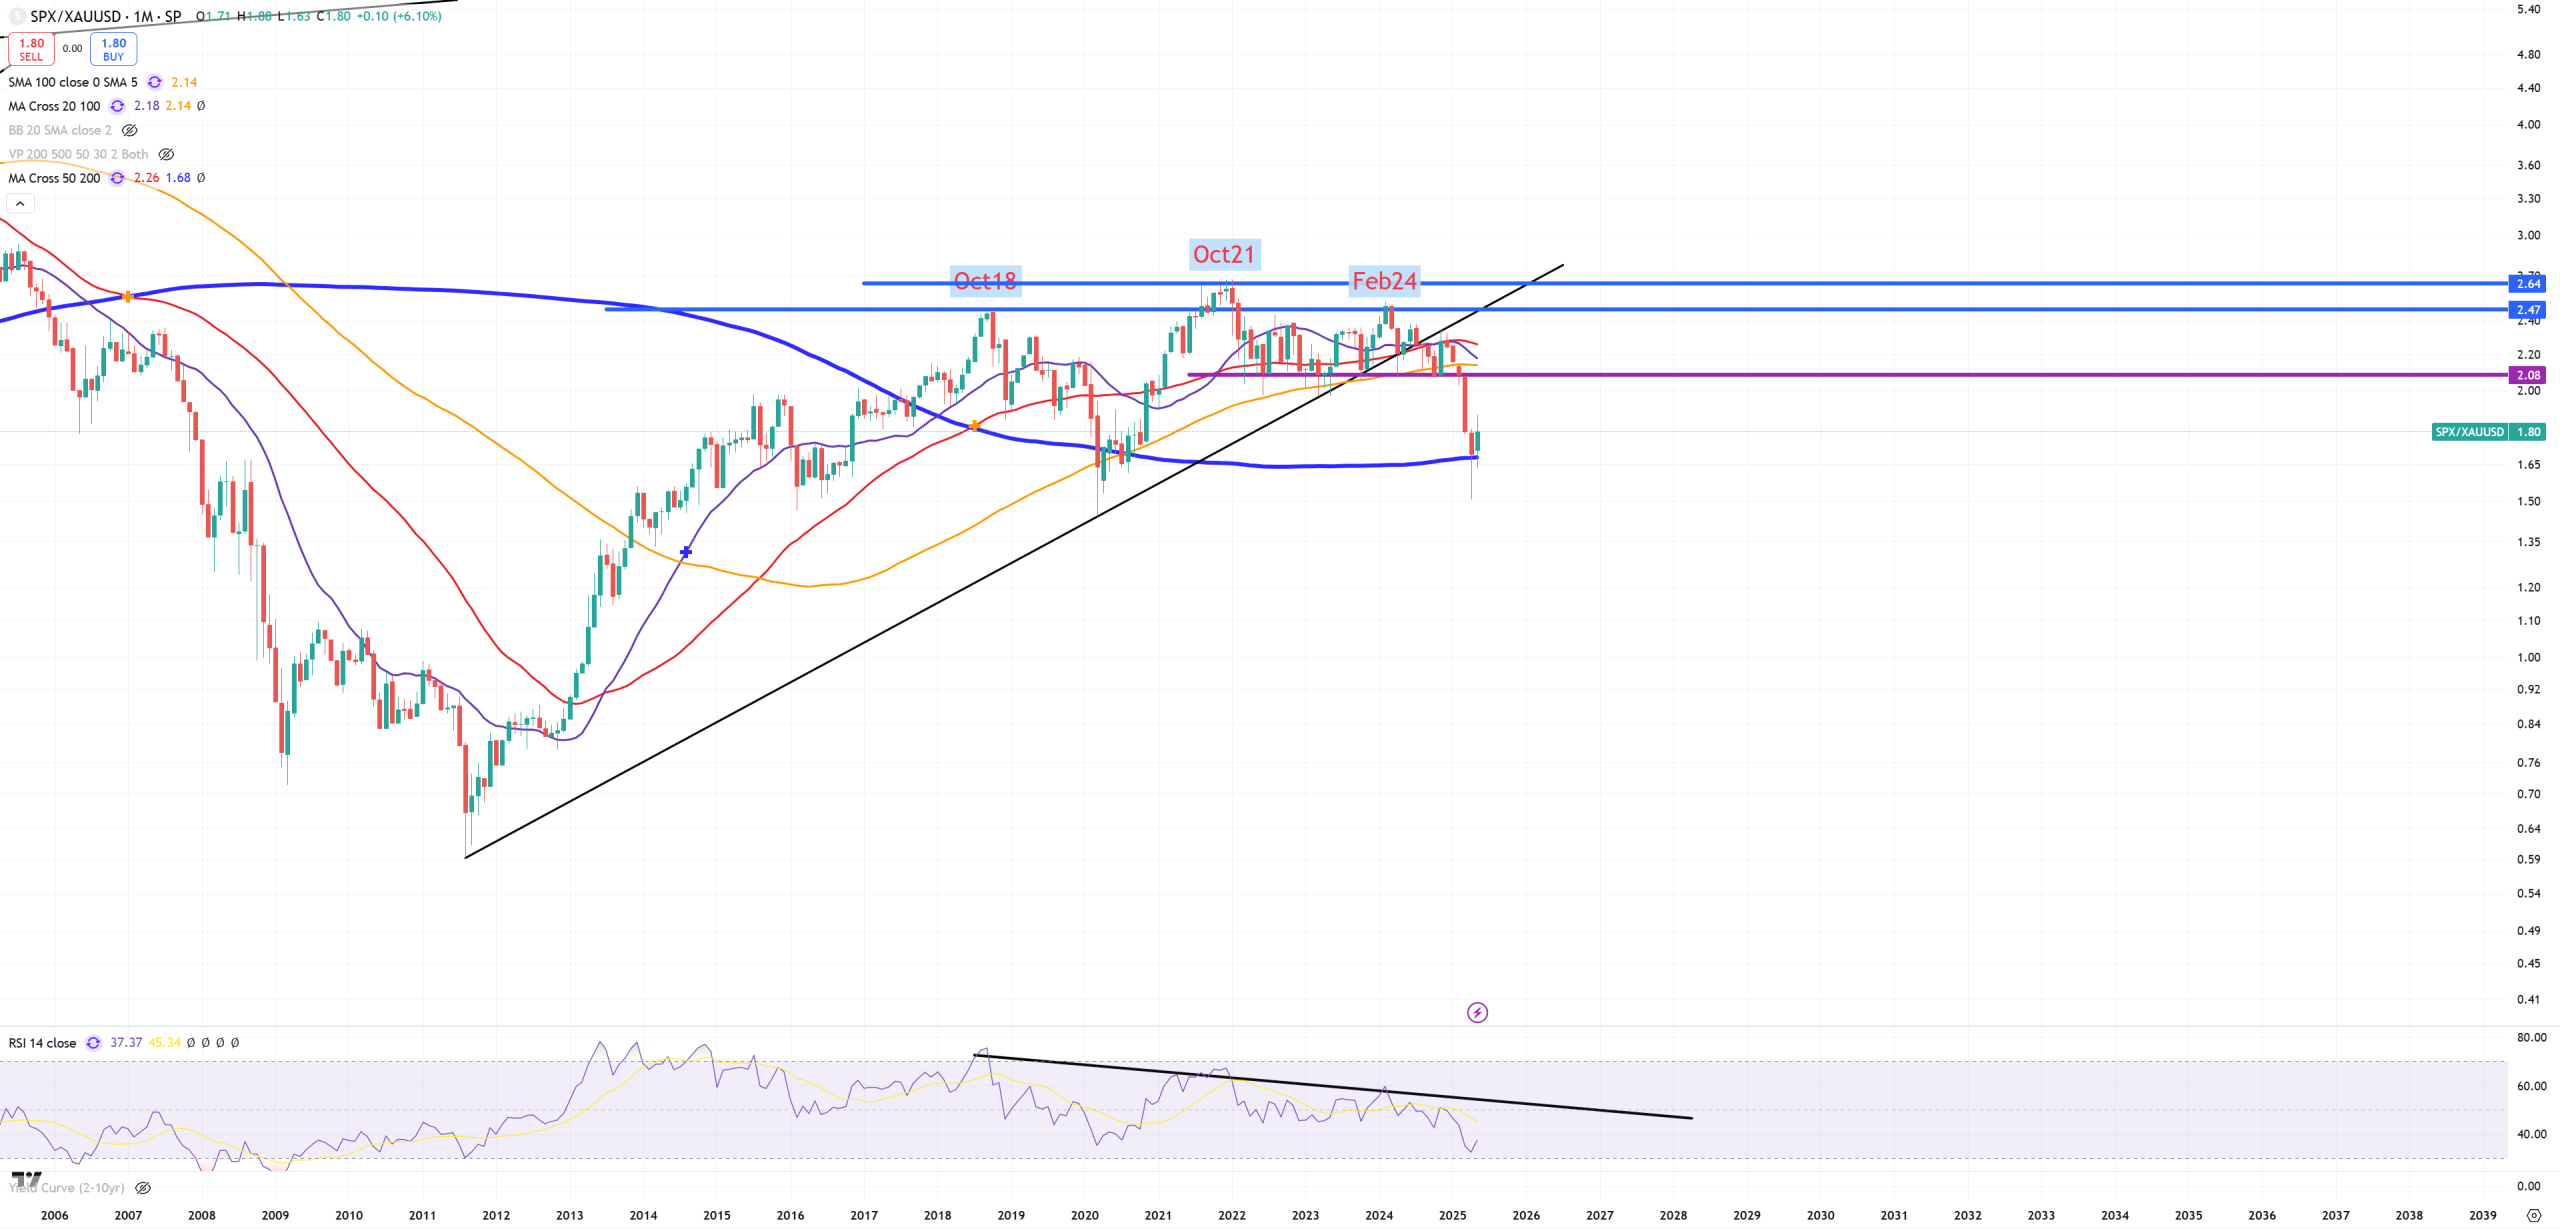
SPX/GOLD – support of (M)MA200 holds
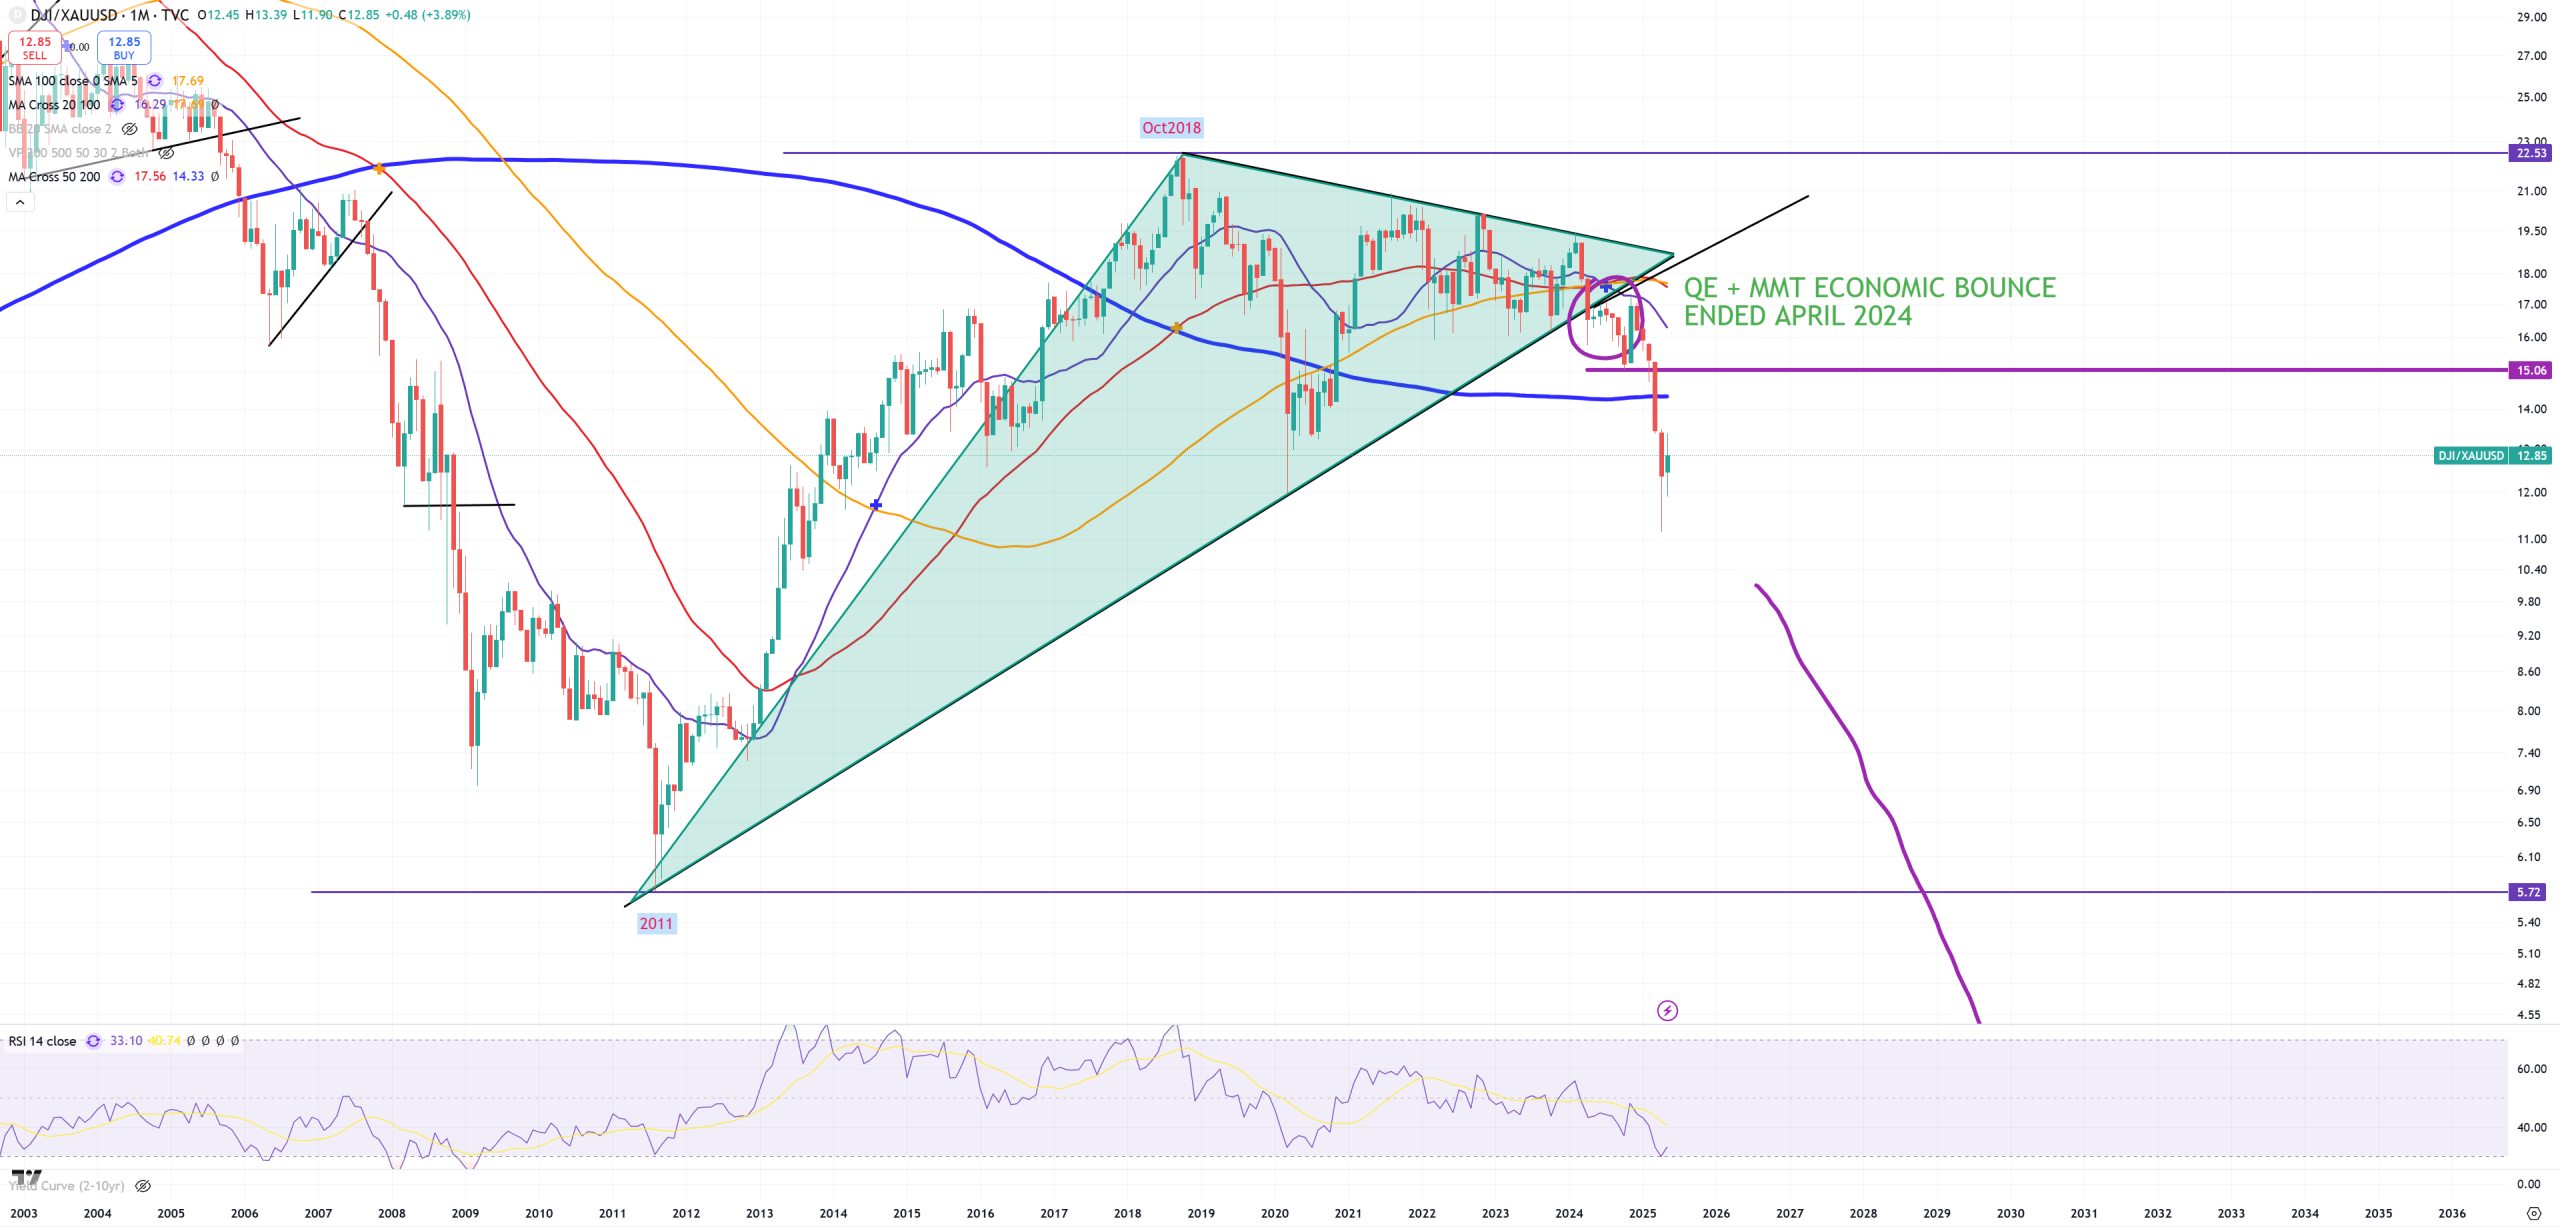
DJI/GOLD – this one still looks terrible. DJI is very weak index related to GOLD
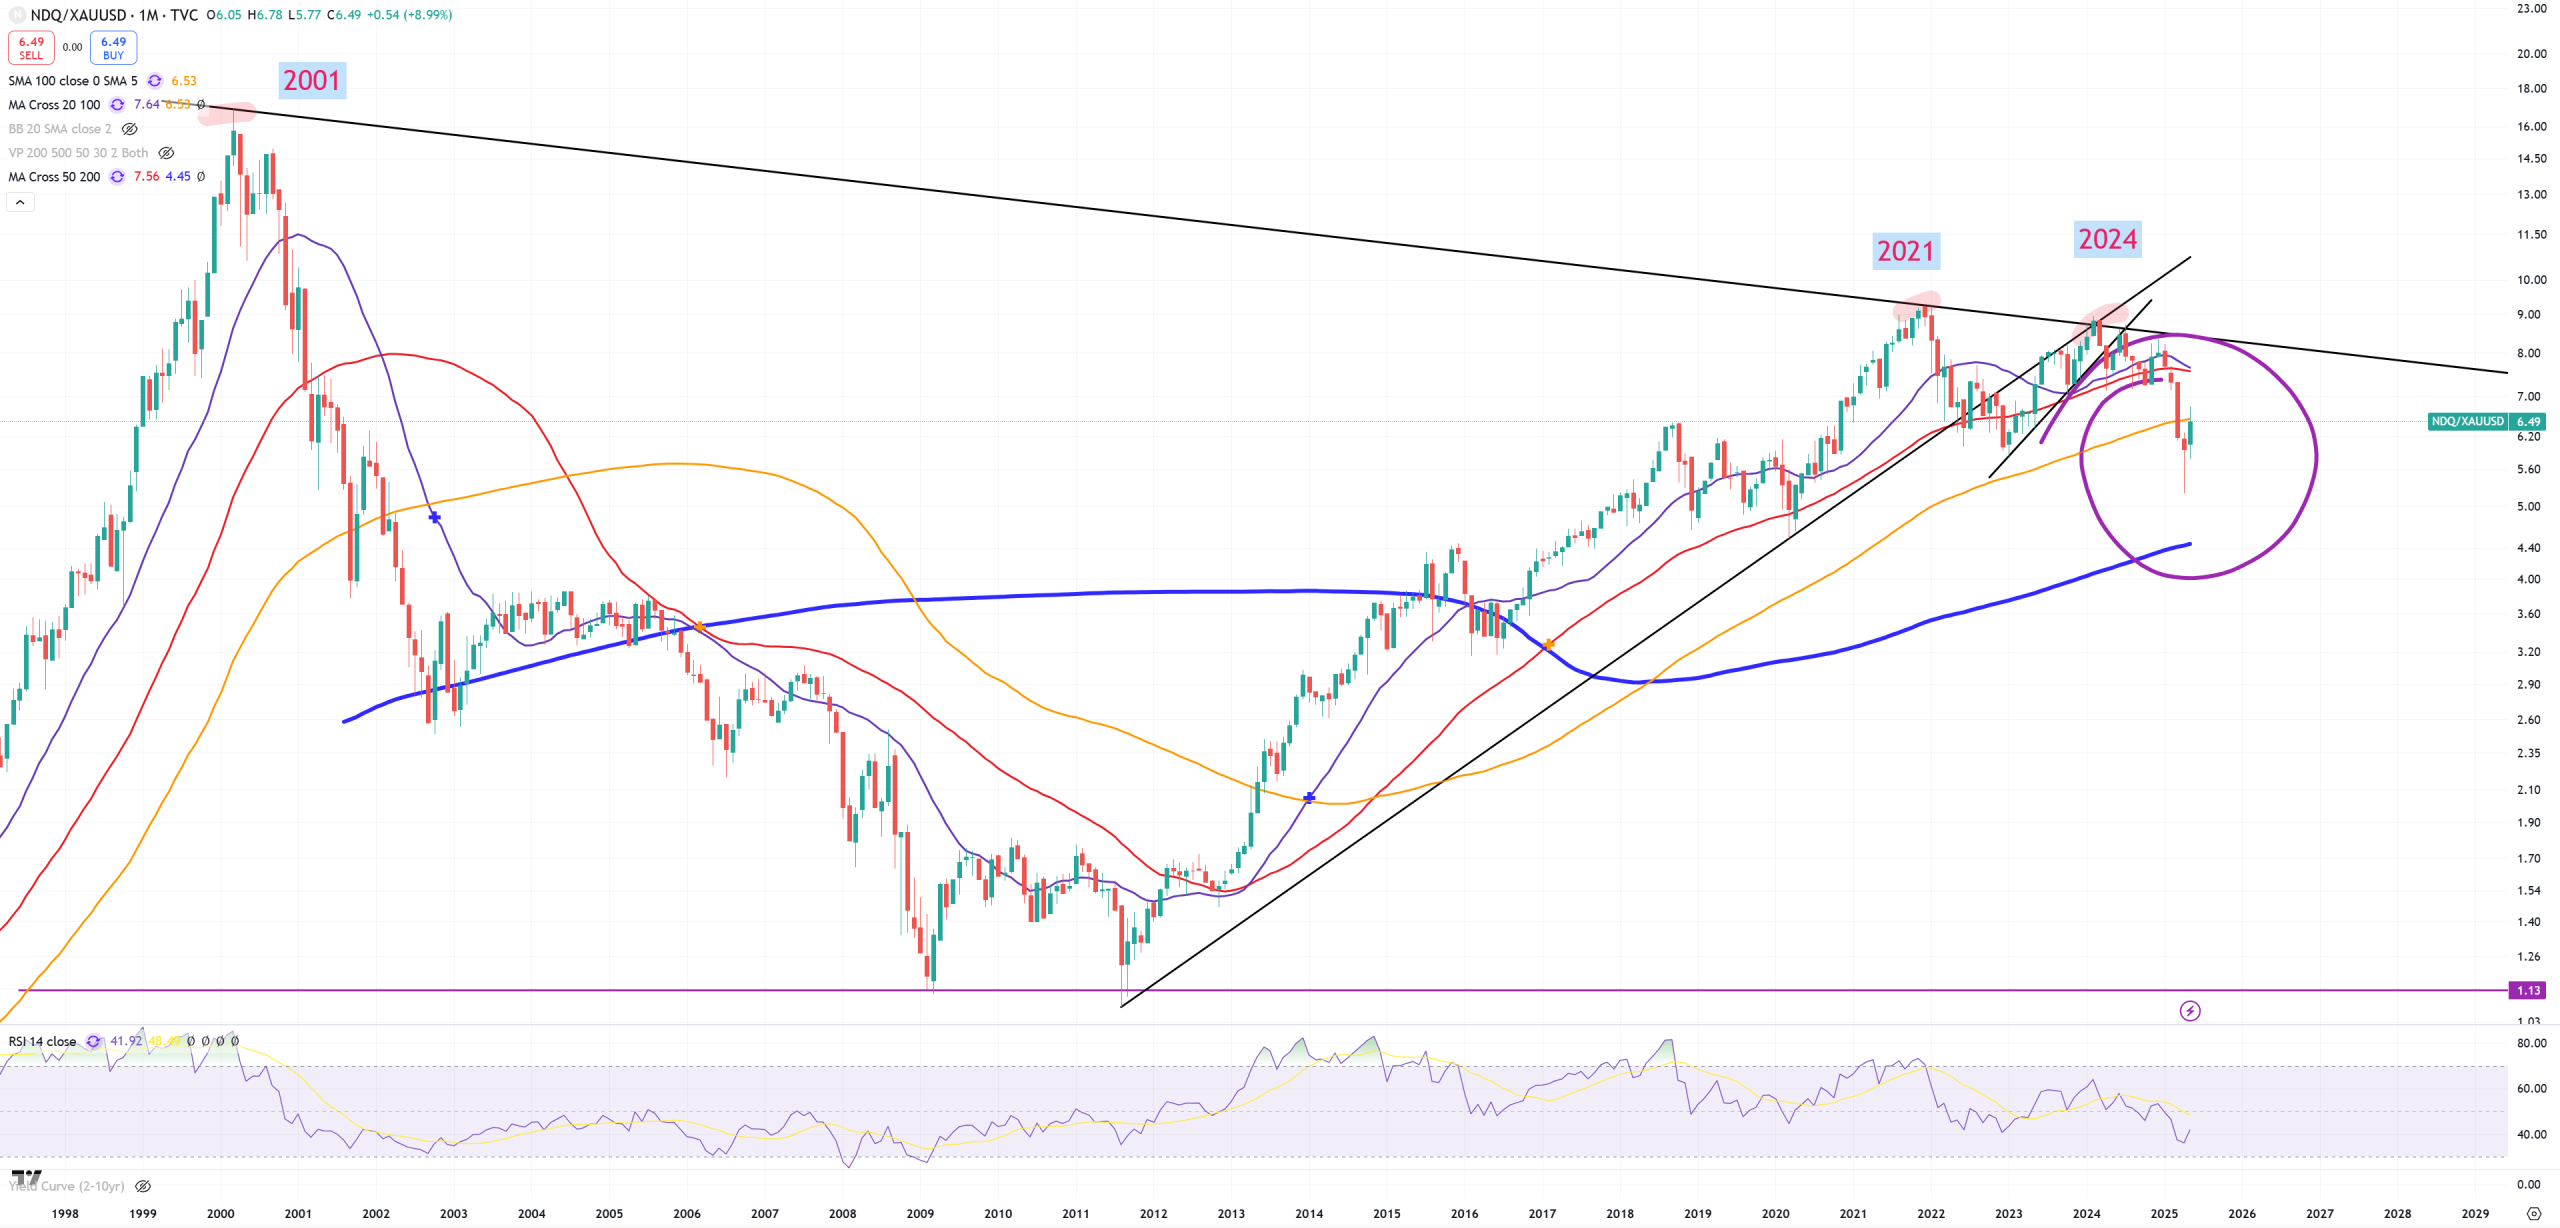
NDQ/GOLD – also looks bad once (M)MA100 was not broken
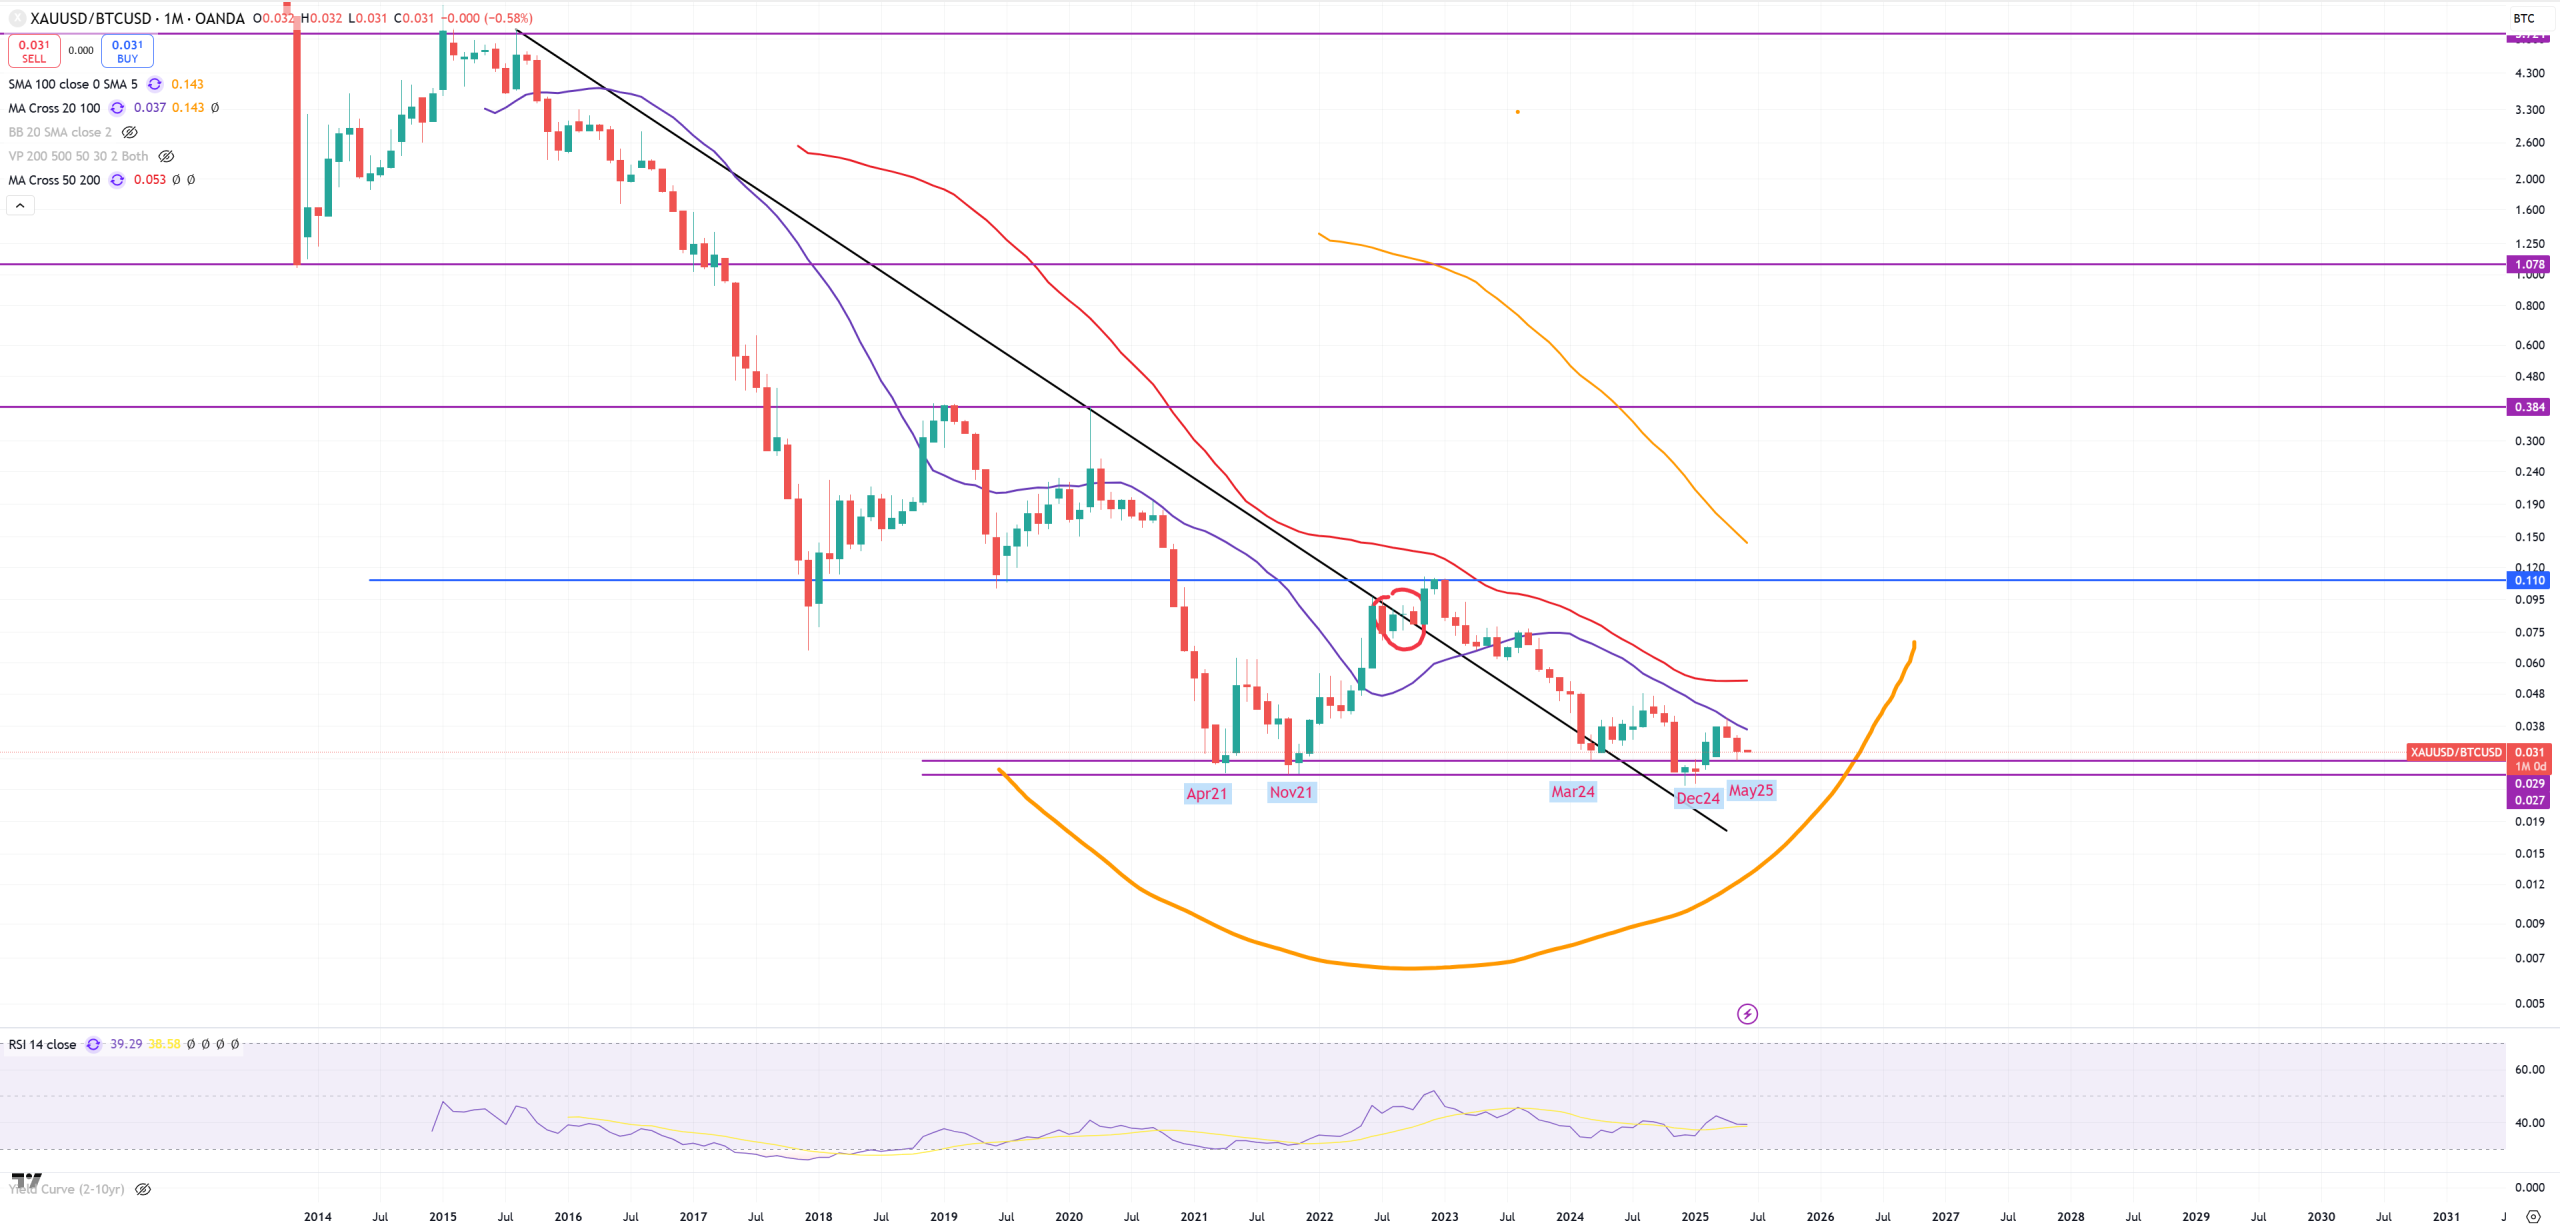
GOLD/BTC – in May we touched support and BTC peaked
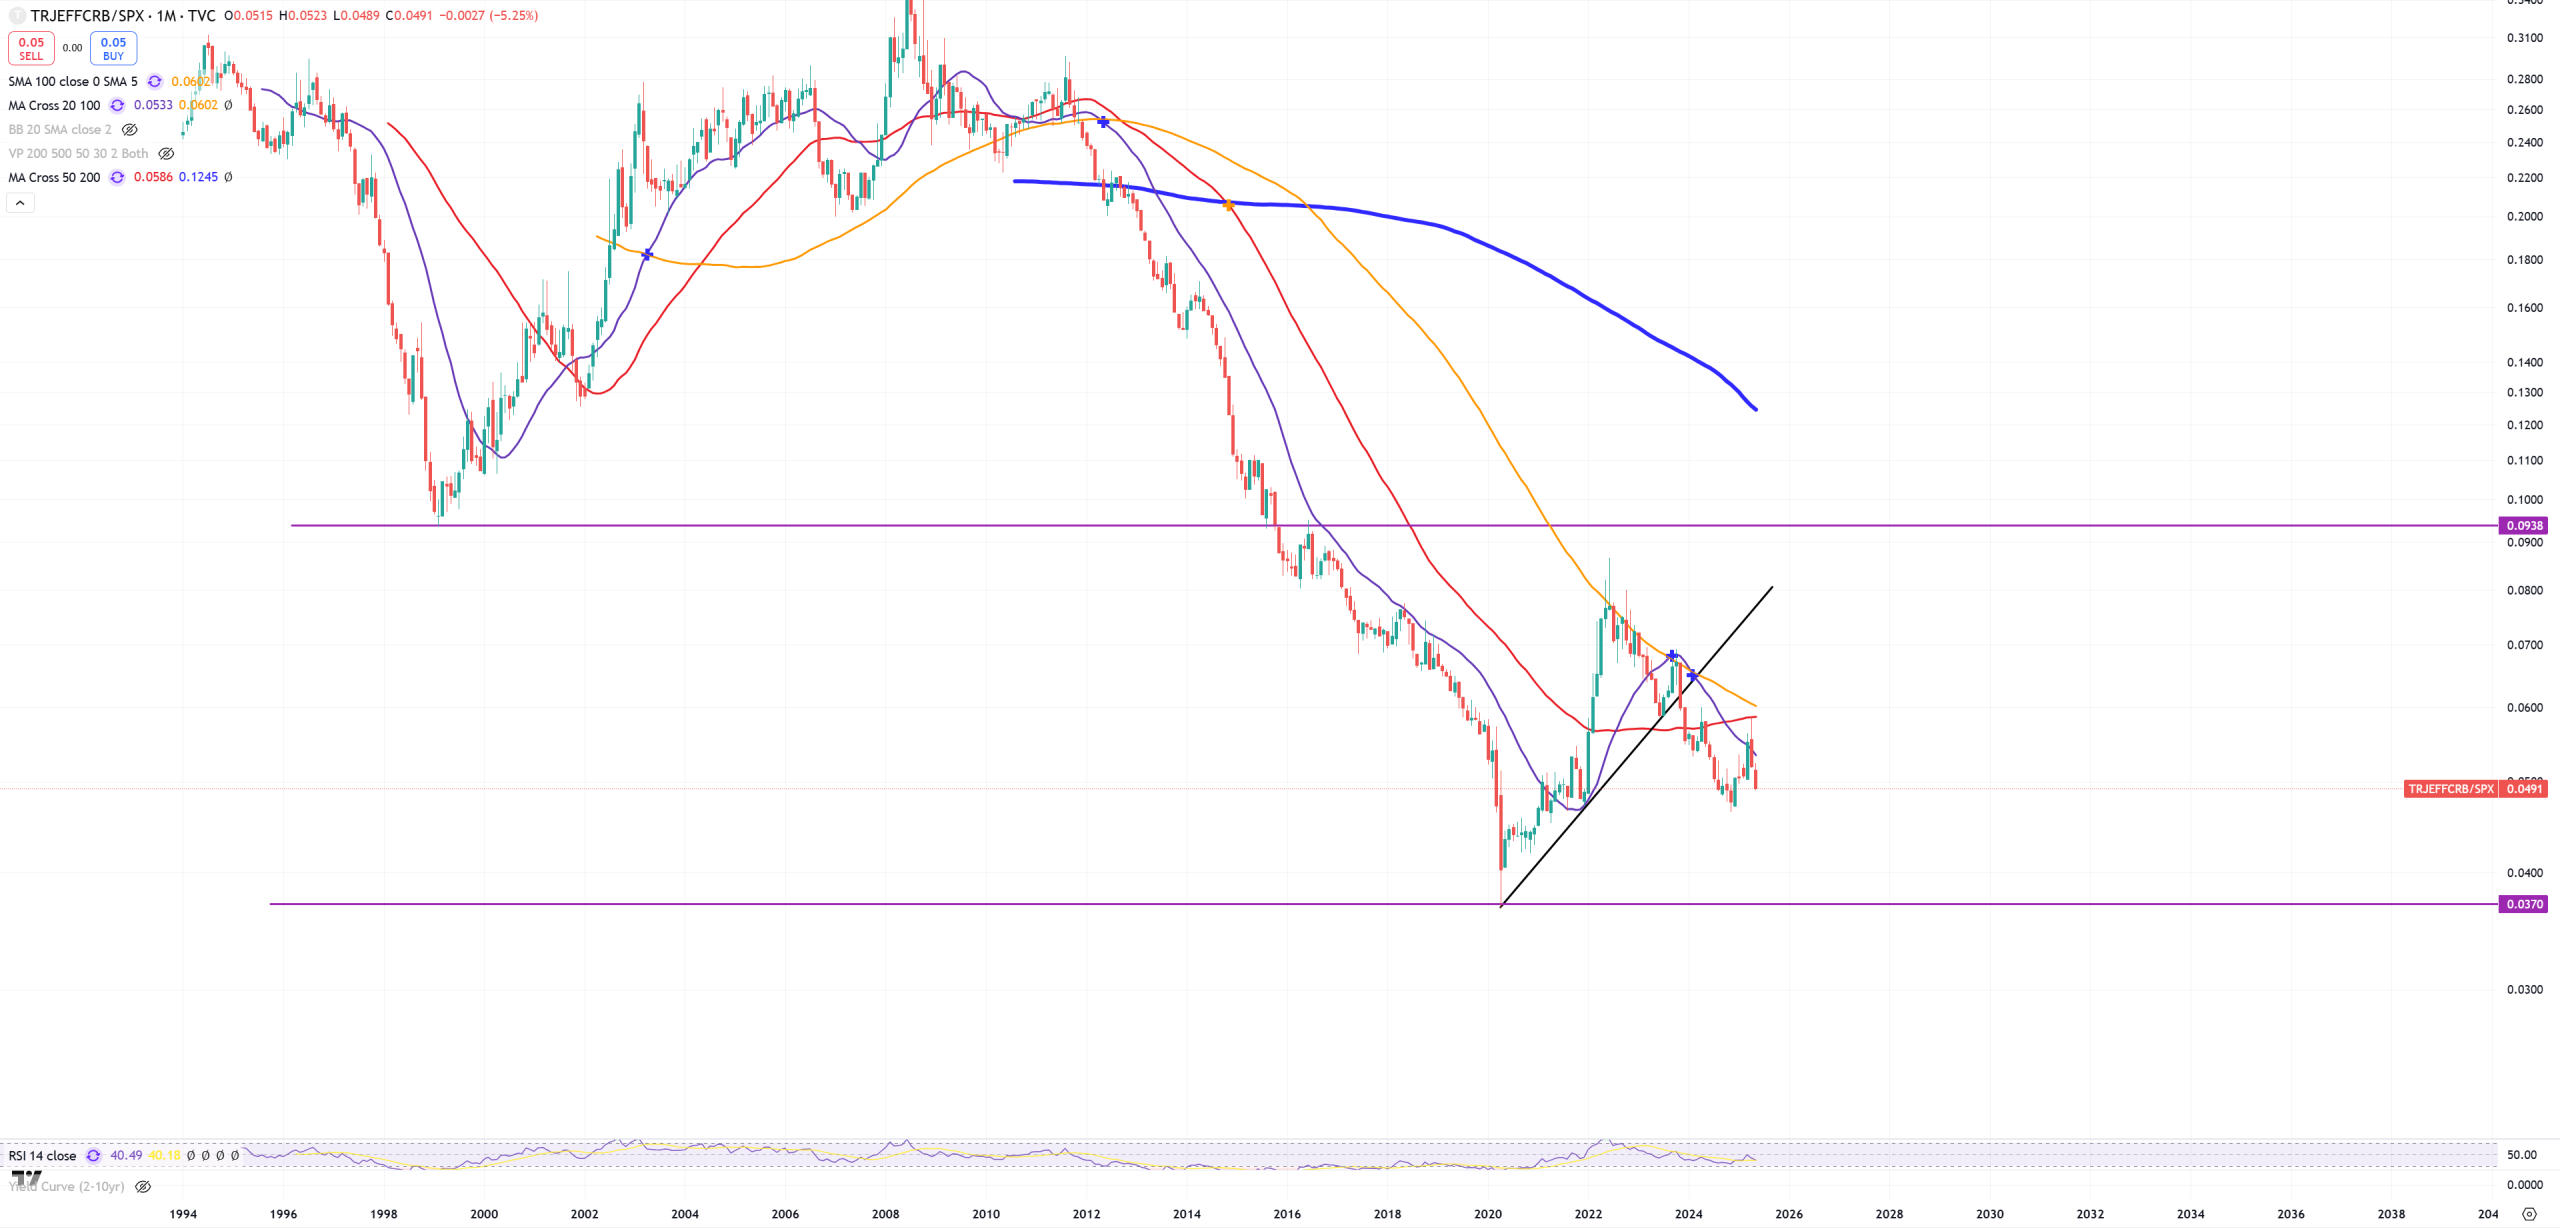
CRB/SPX – we see this inflationary spike post 2020, but it seems we’re going to place double-bottom here
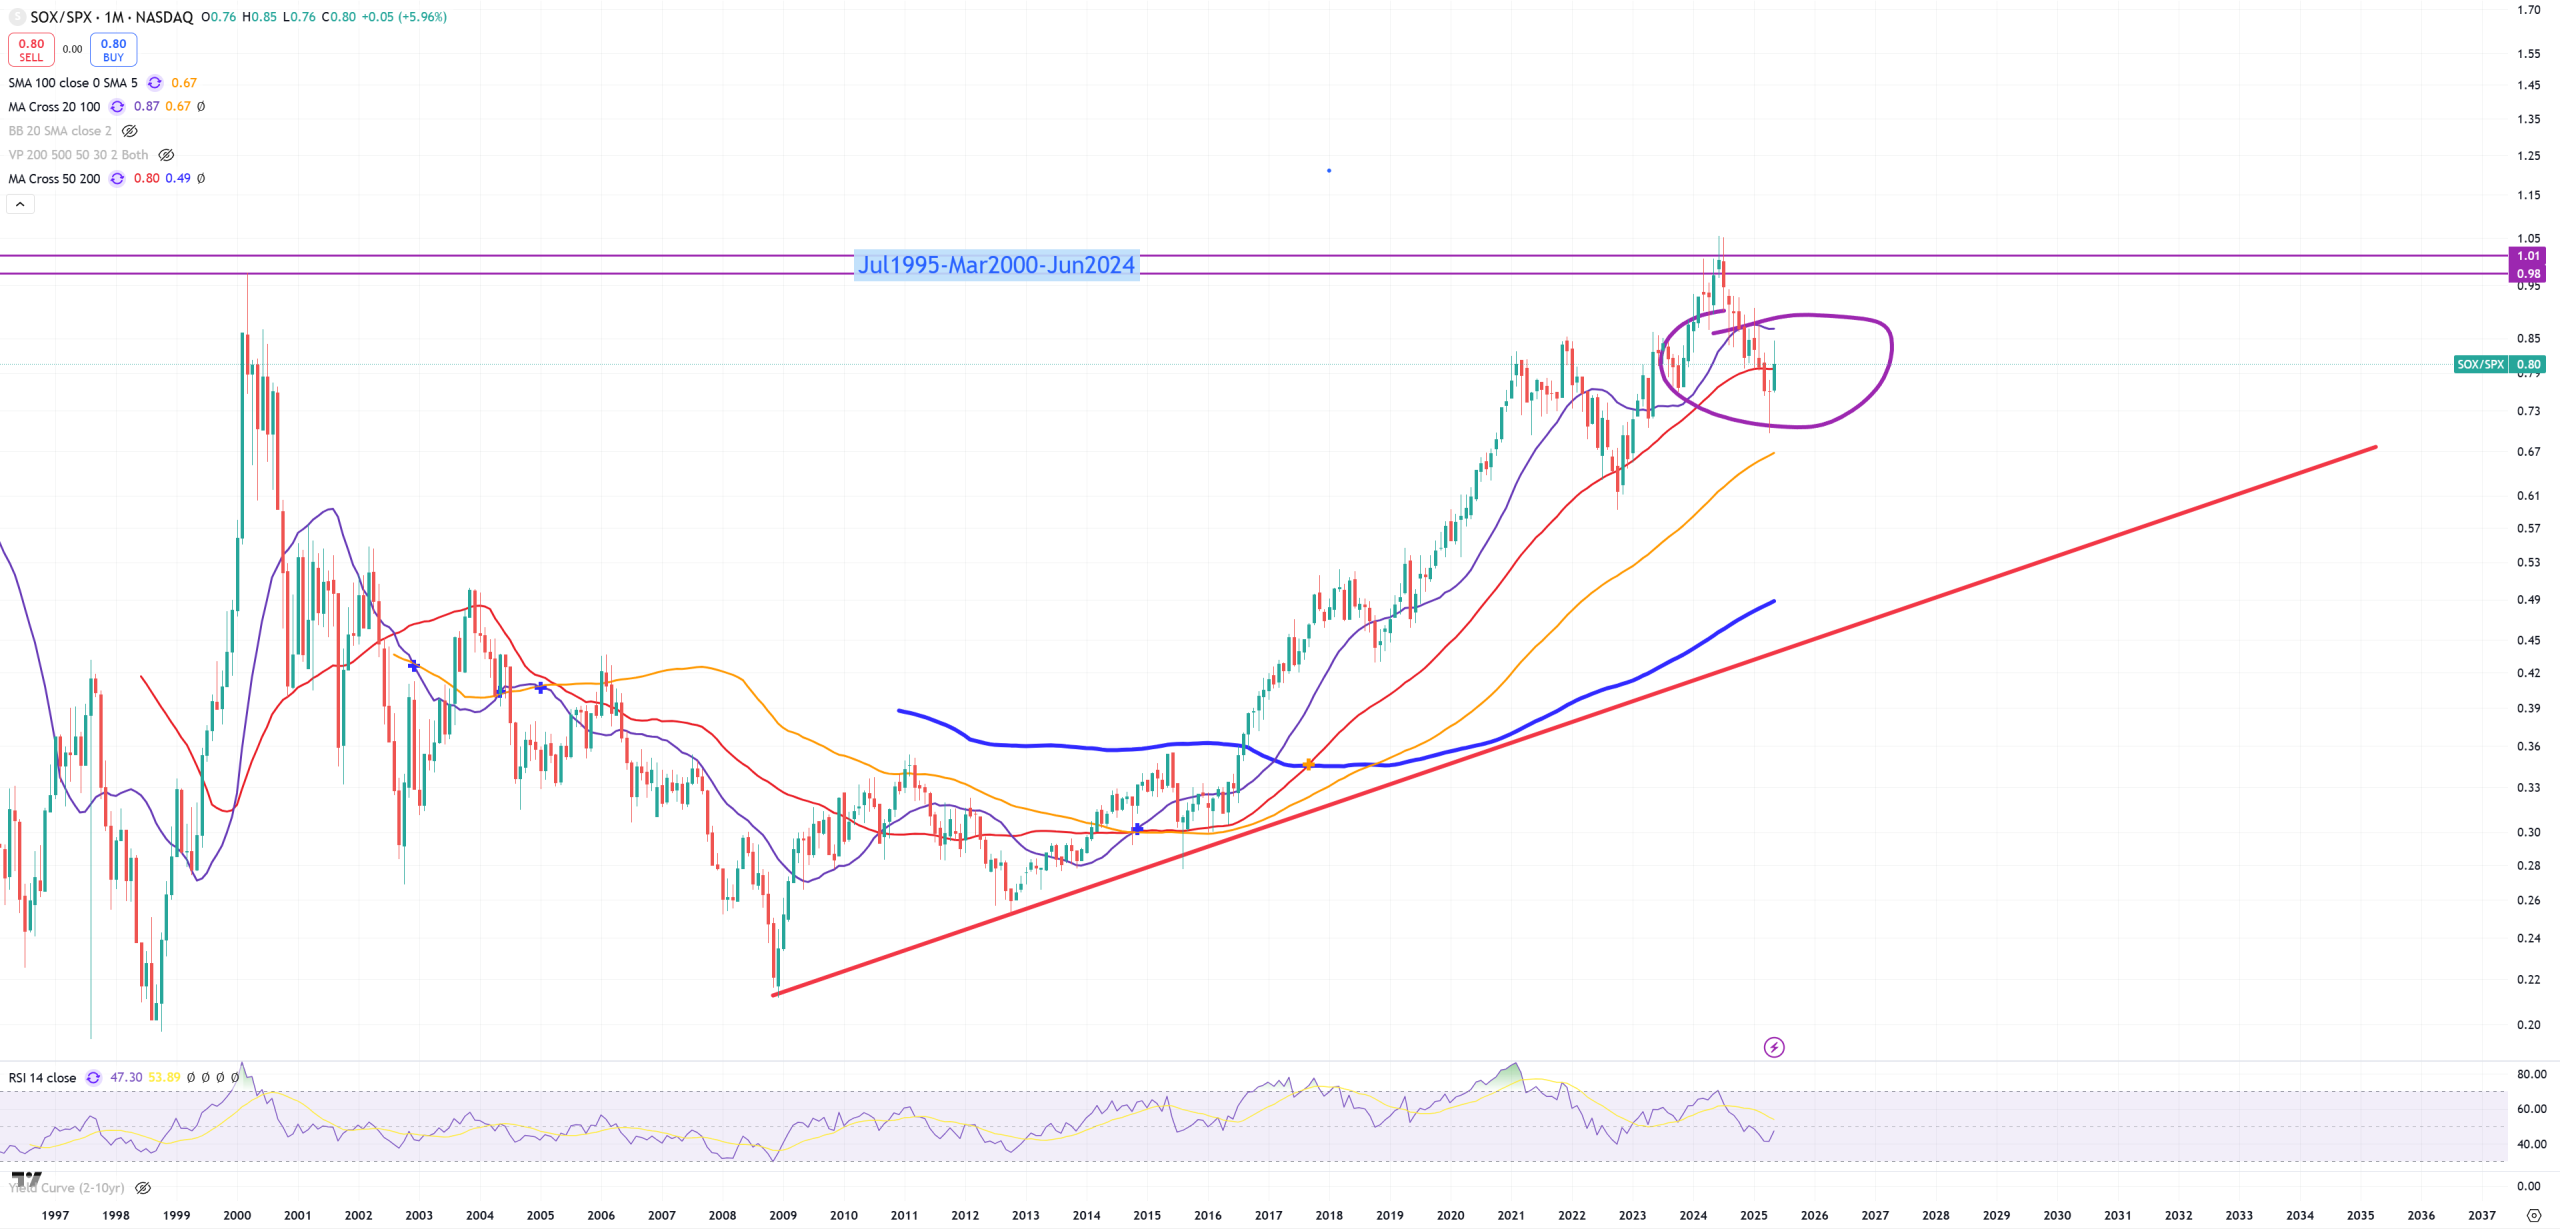
SOX/SPX – tries to fight again with (M)MA50 from the bottom.
IXIC/SPX – Nasdaq Composite/SP500