04/2025
March 31, 2025

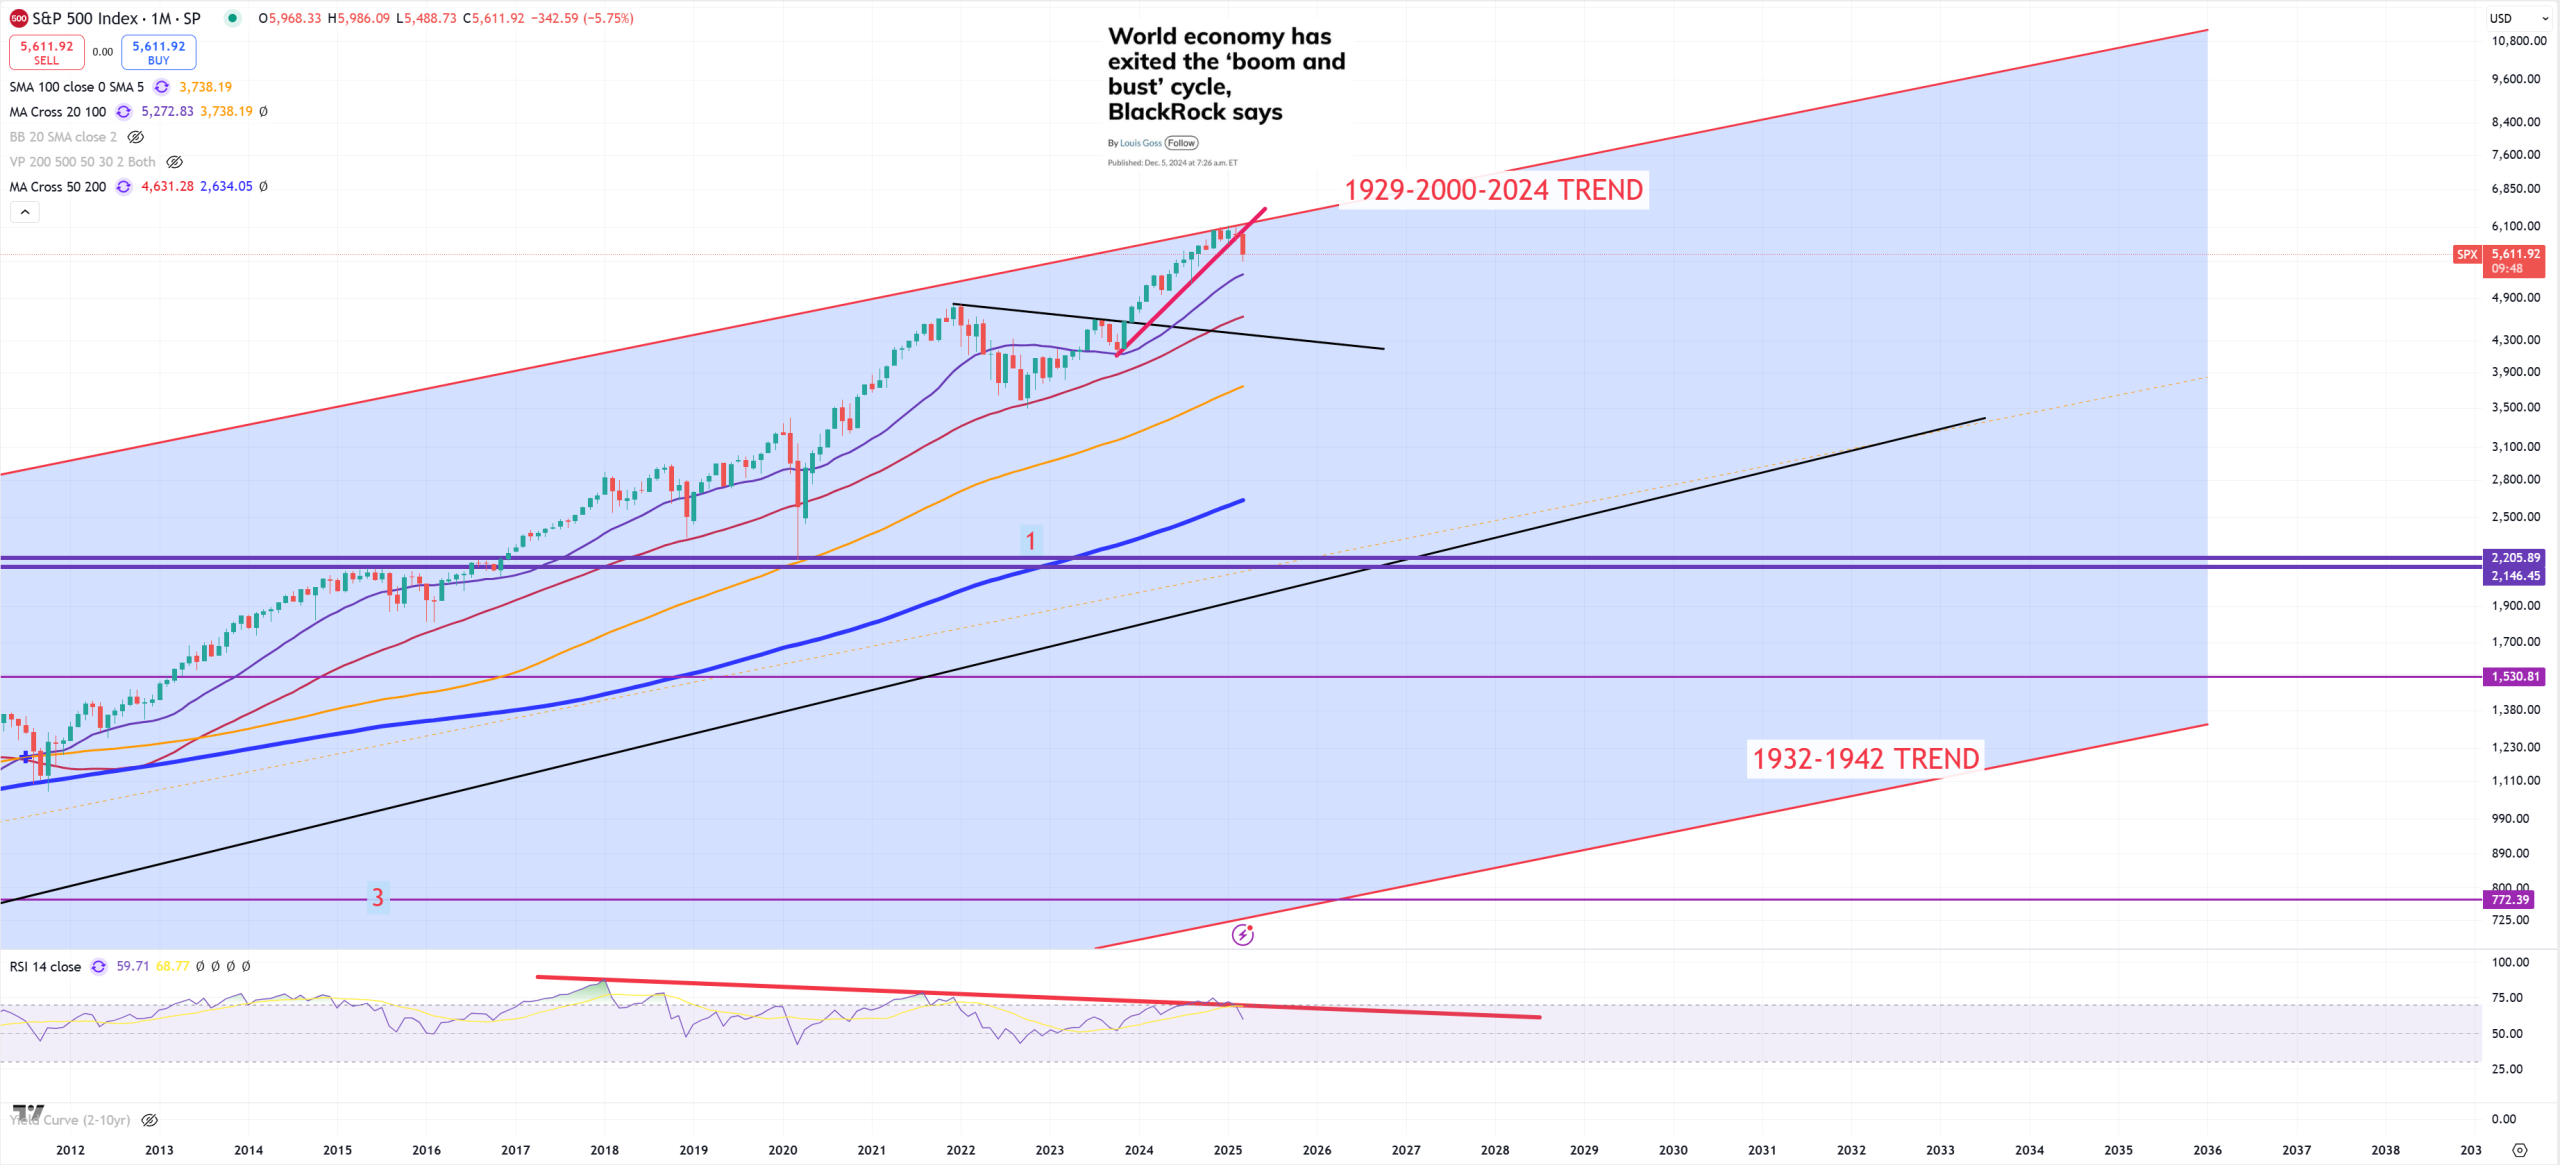
SPX – its 1929-2000 trend is super valid, from montly perspective it’s being limited by 1929-2000 trend and next (M)MA20 is 5270, so nothing important here. Shorter term (W)MA50 limitation on 5687, but on (M) analysis that’s not really important. Huge negative divergence since 2018
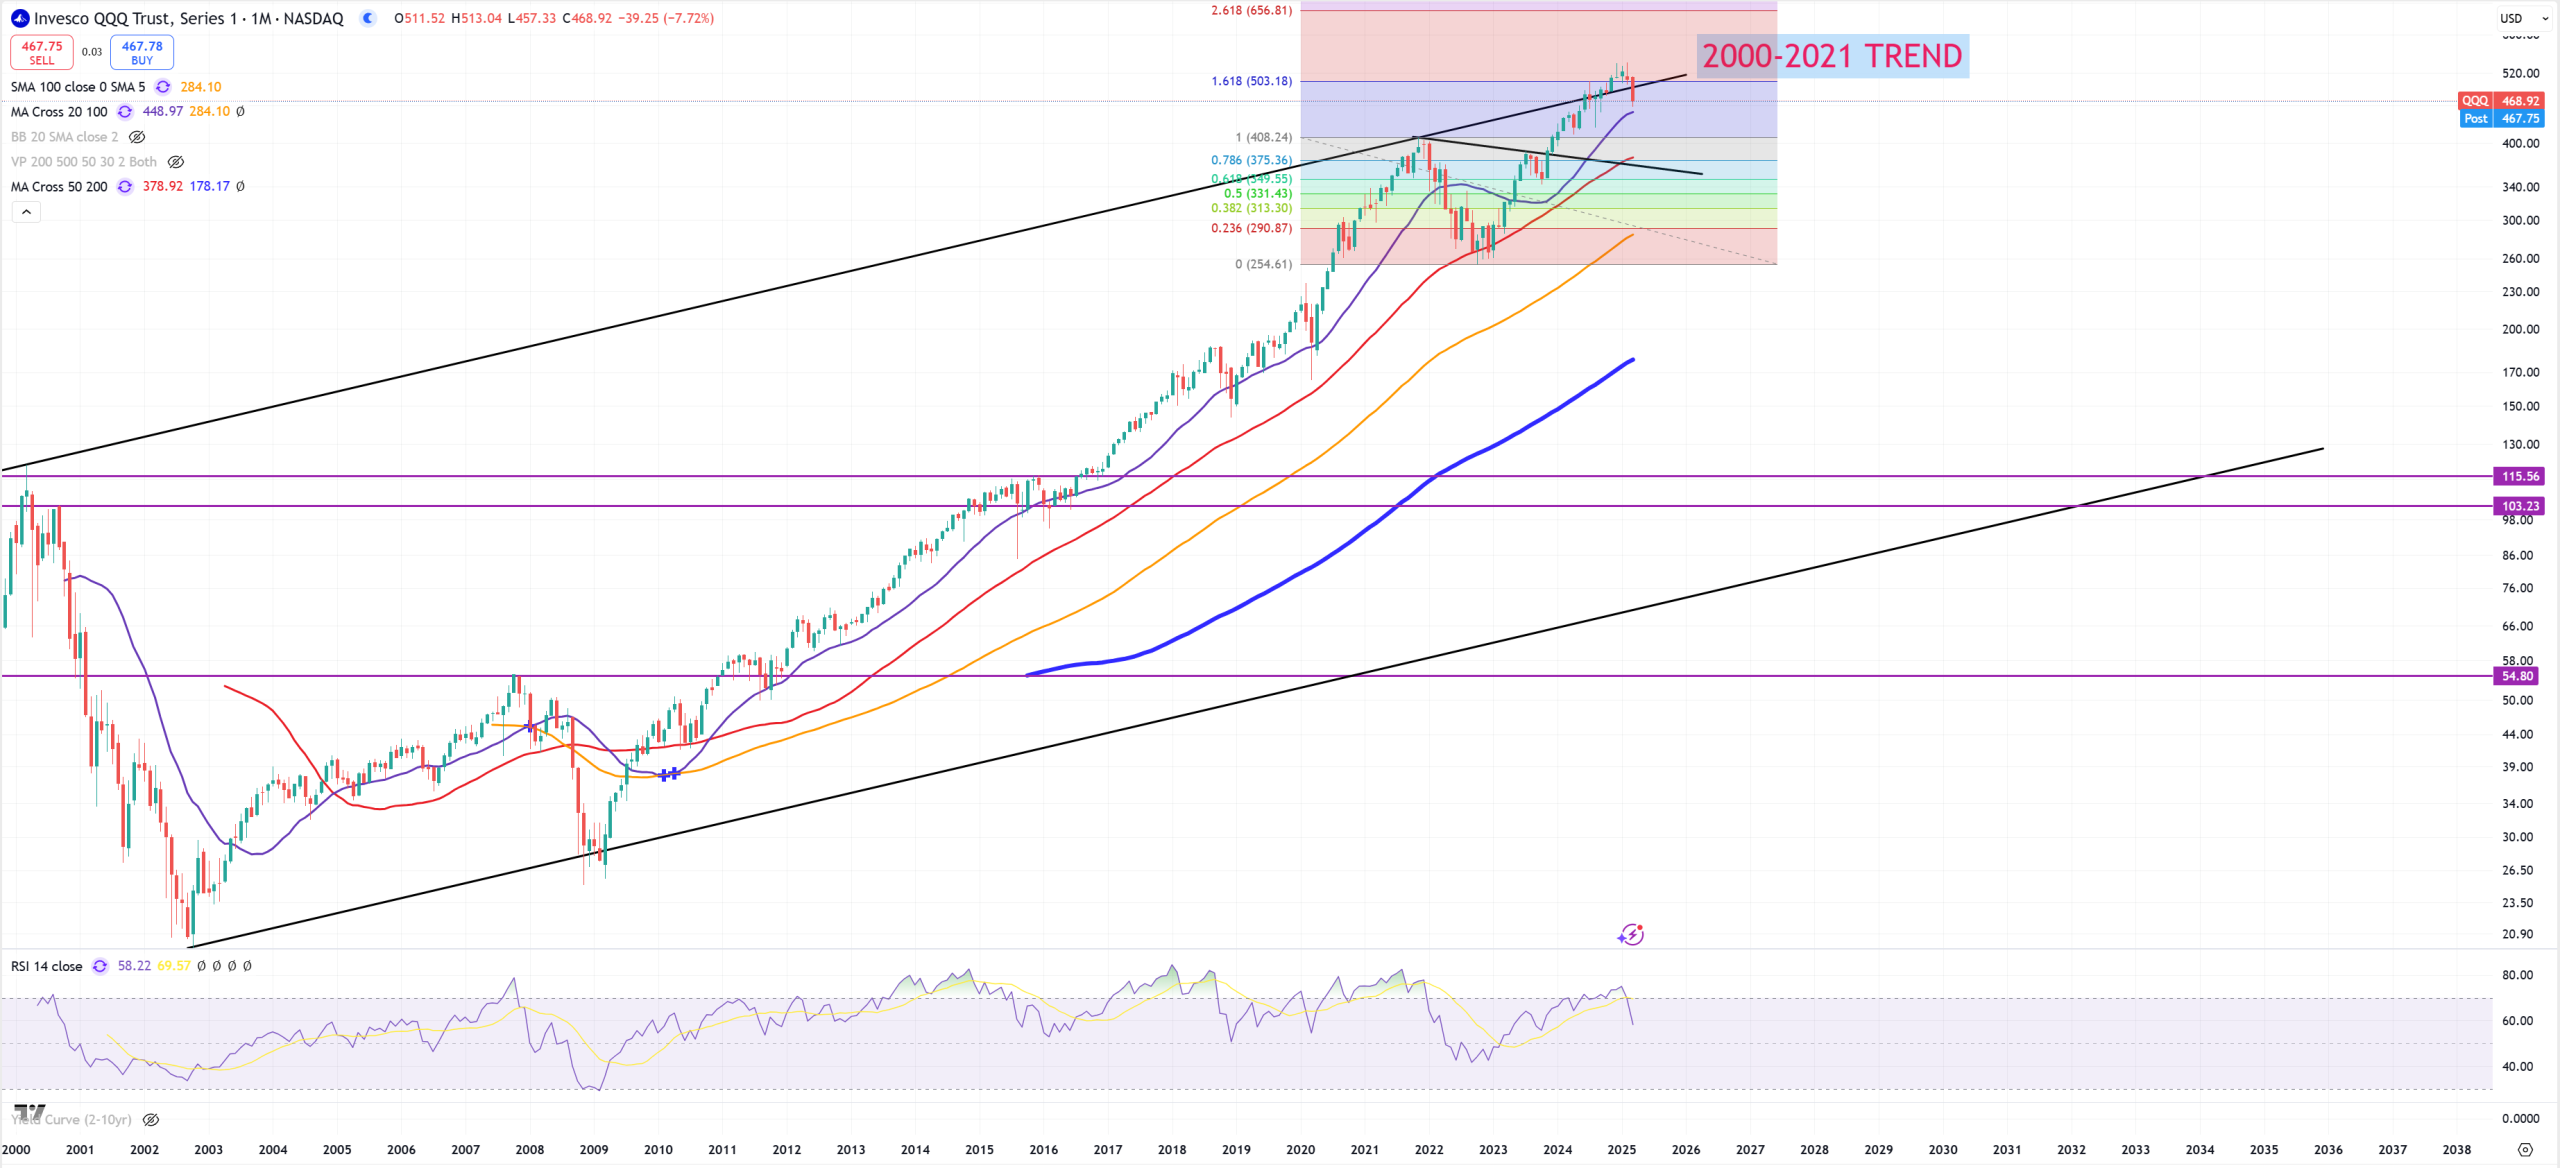
QQQ – trend using 2 points is set between 2000-2021, last spike seems to be a false one
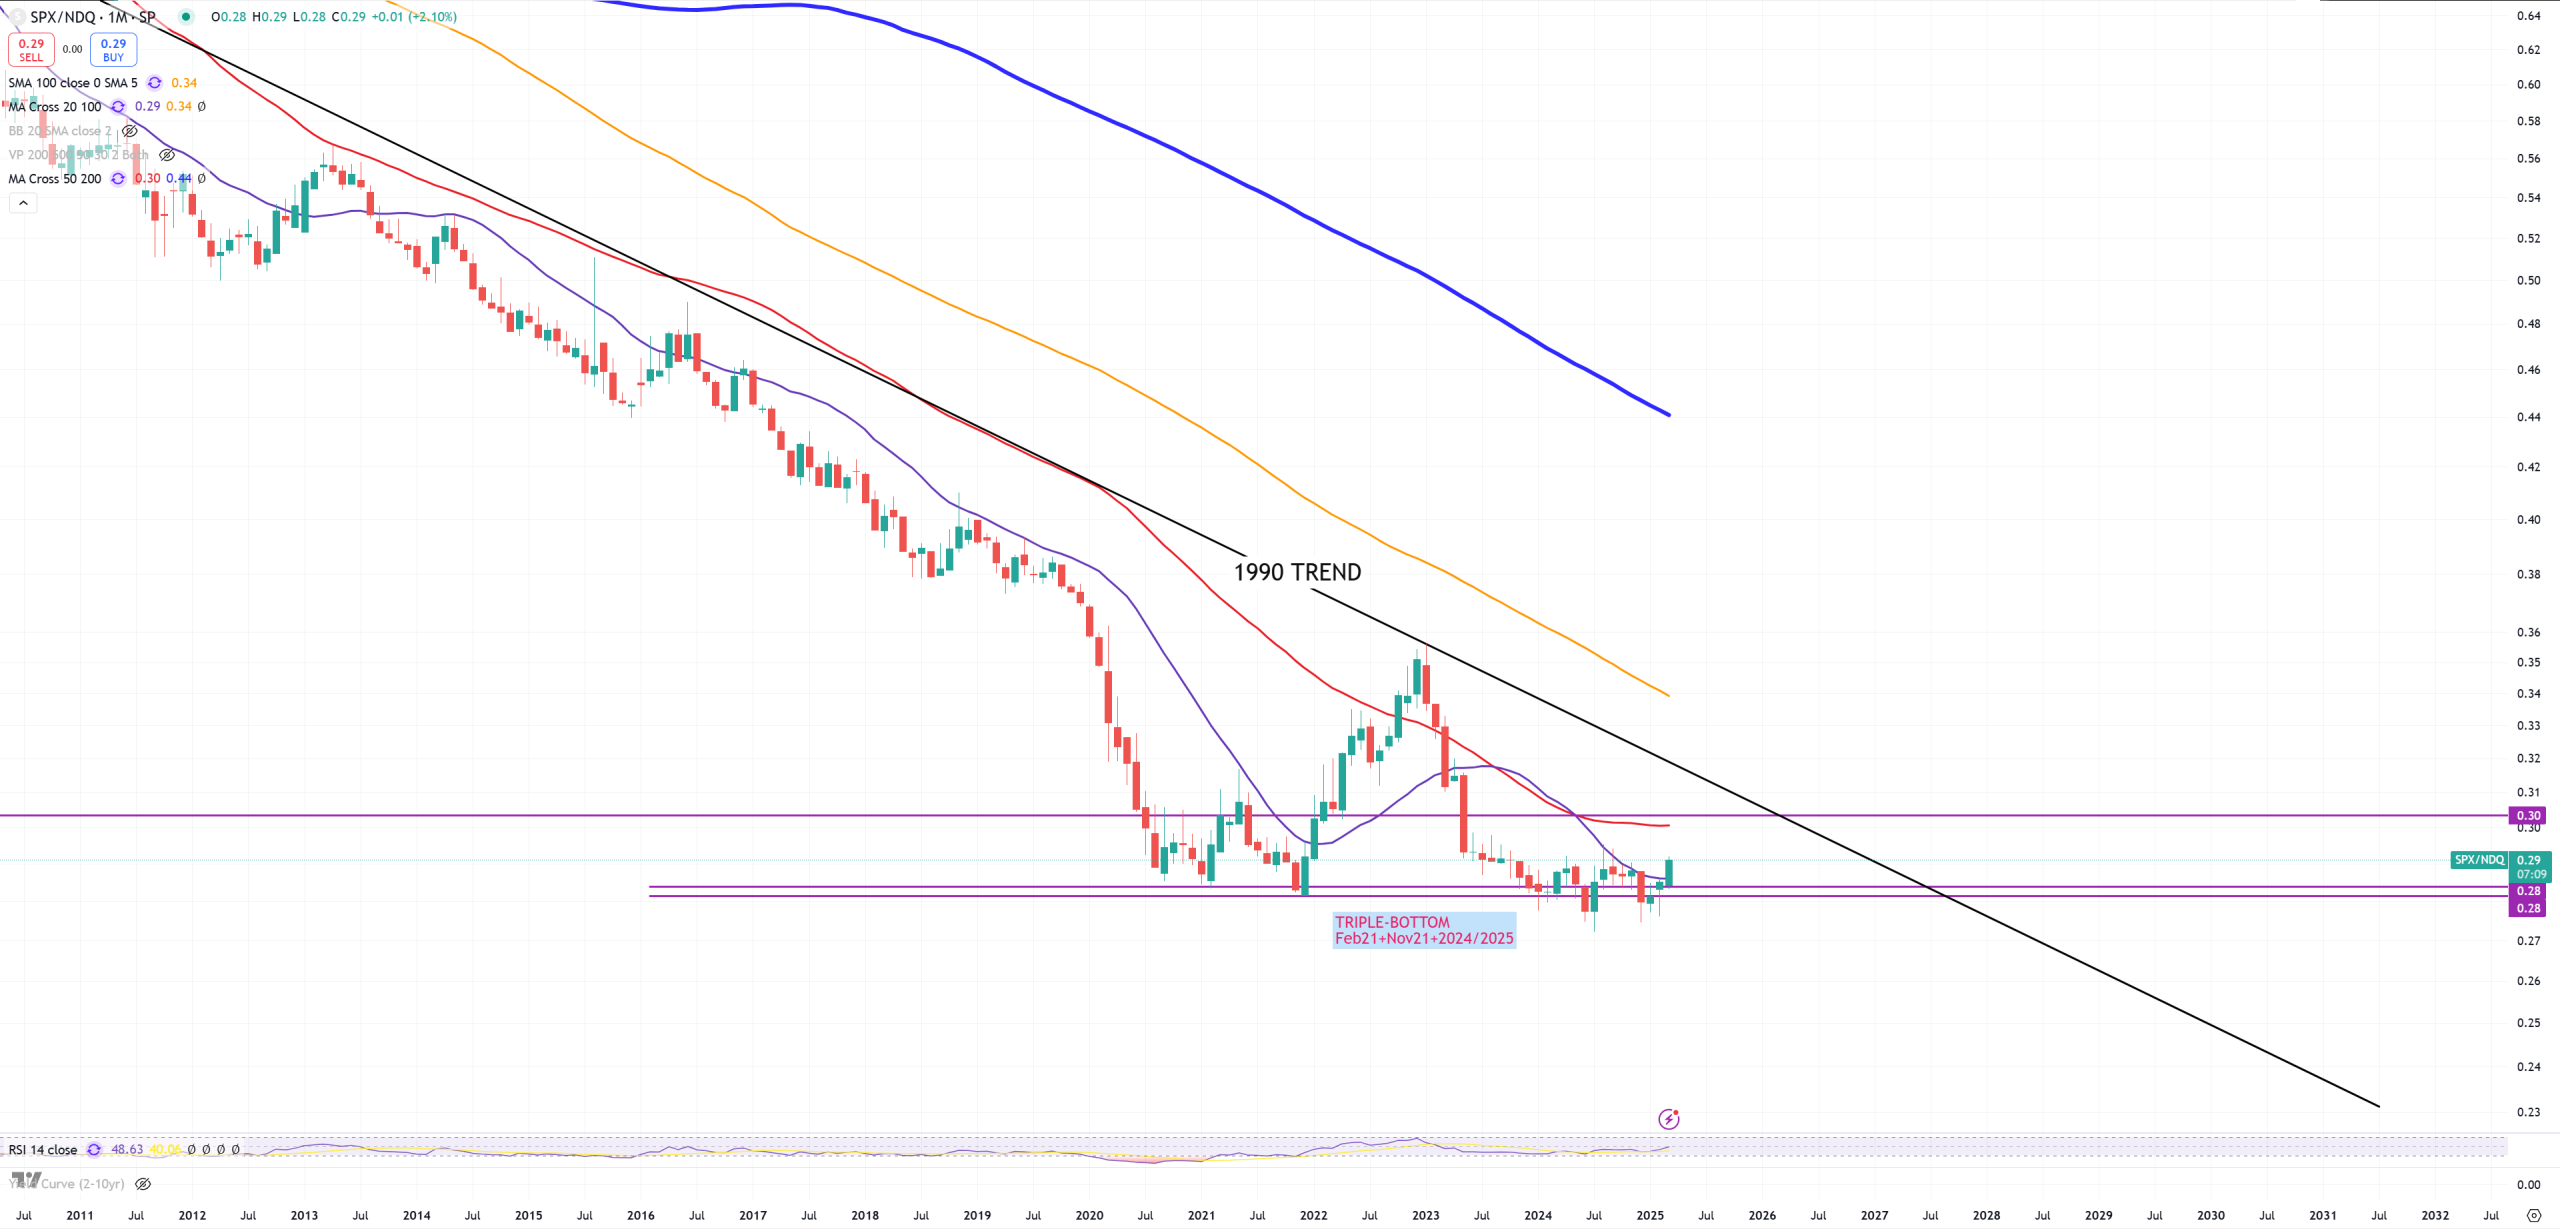
SPX/NDQ what is the same as SPX/QQQ – we might see here 1990 TREND. Break of this trend will confirm the death of Nasdaq, but as a first step this support let’s call it TRIPLE-BOTTOM can’t be broken down.
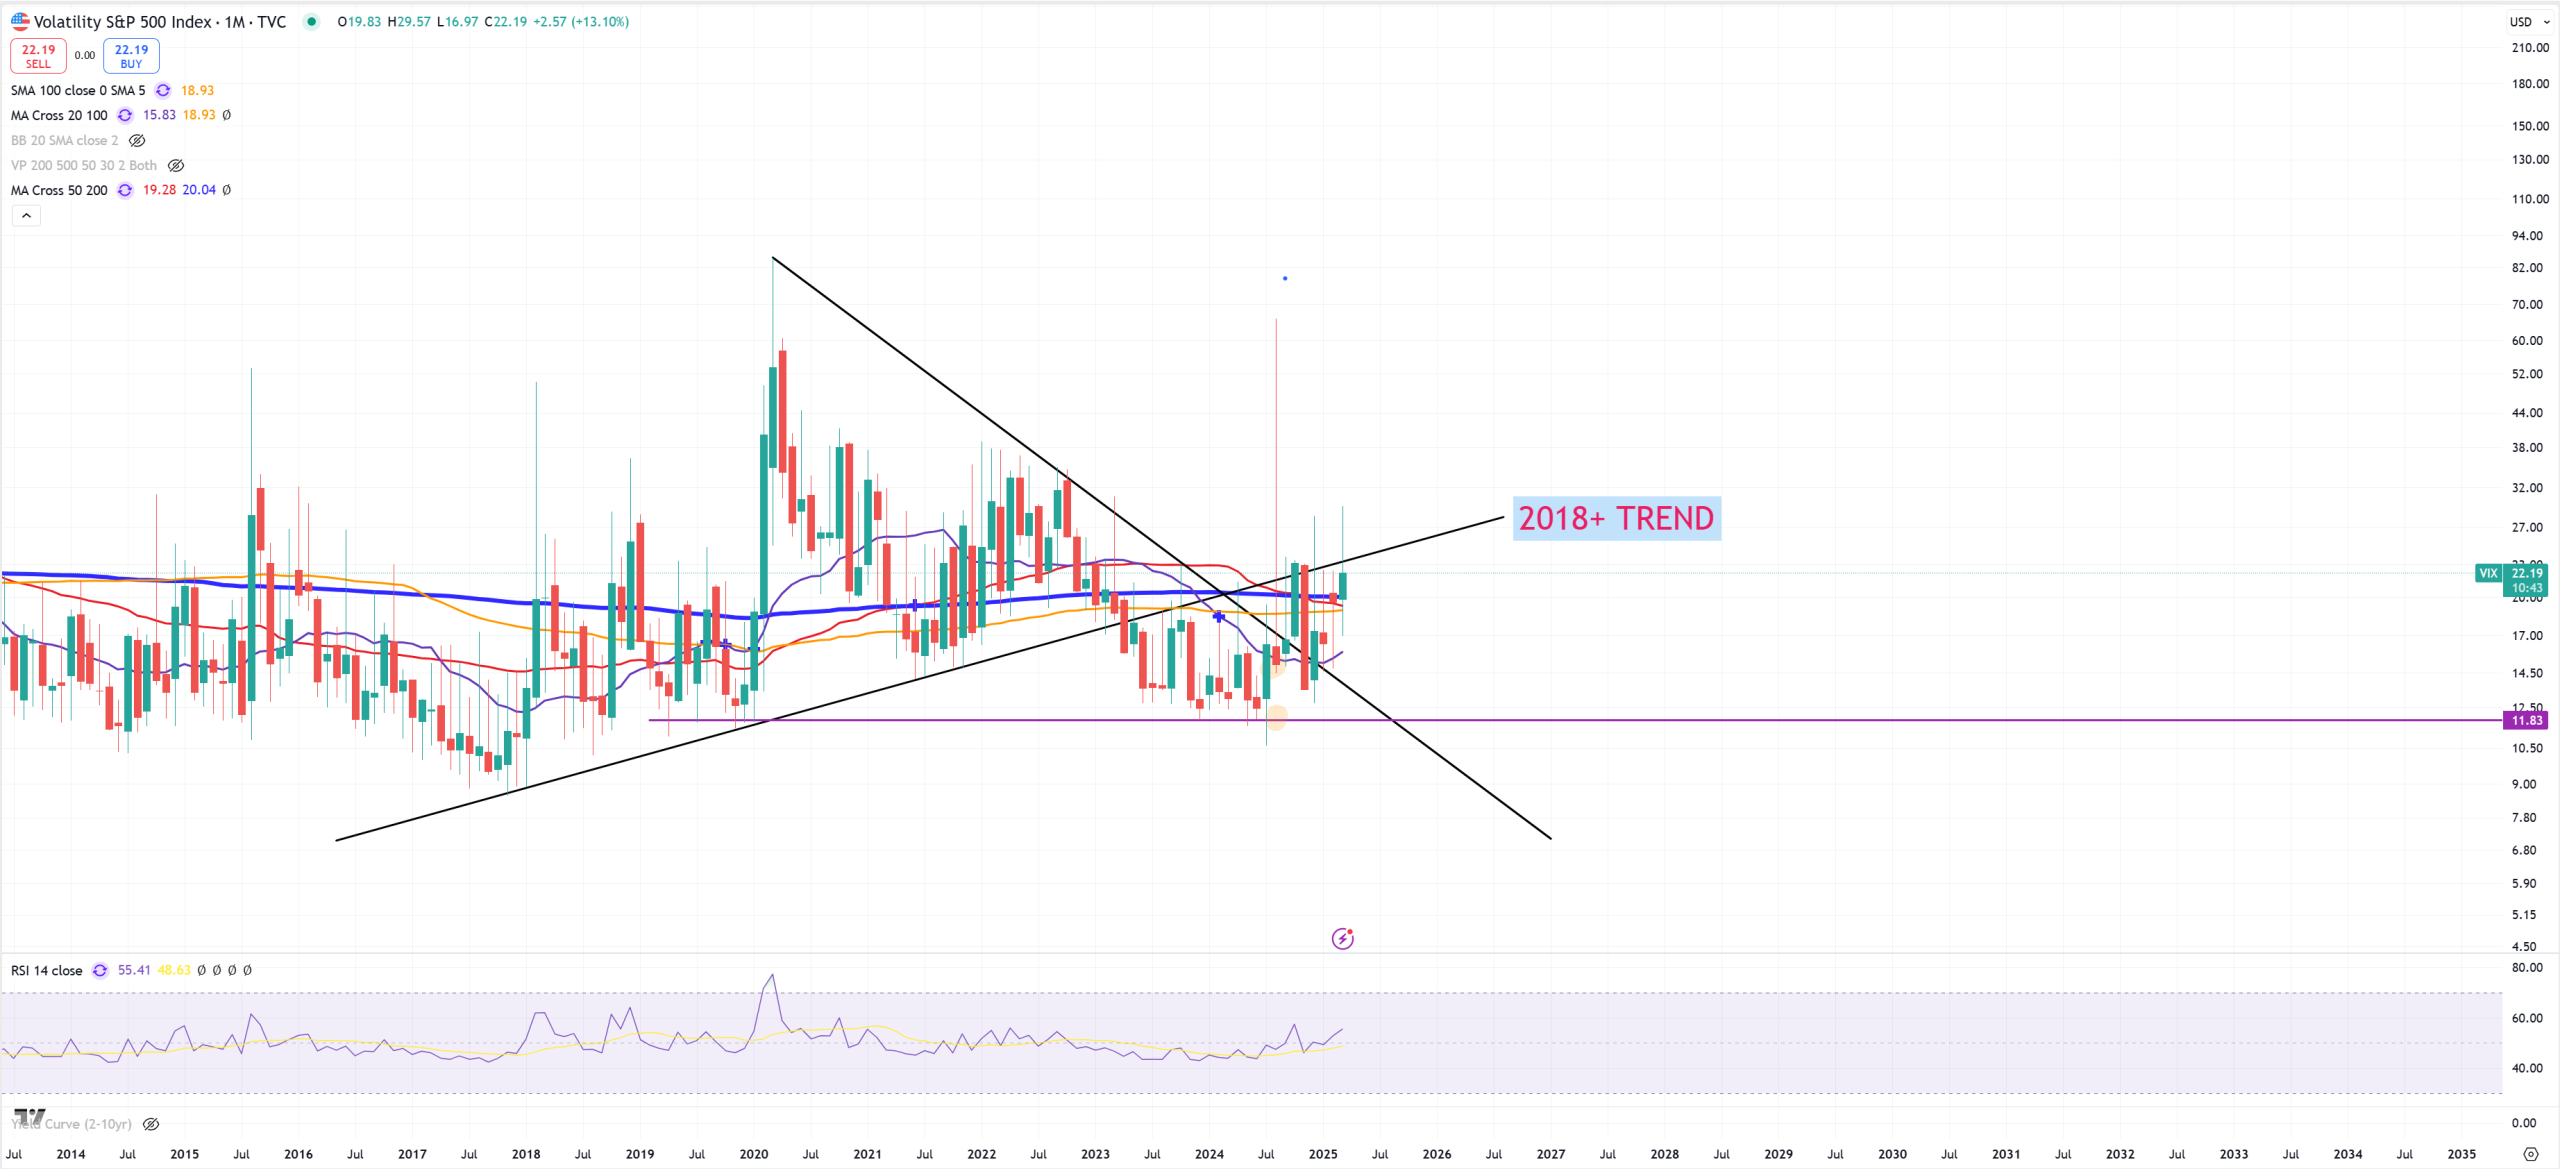
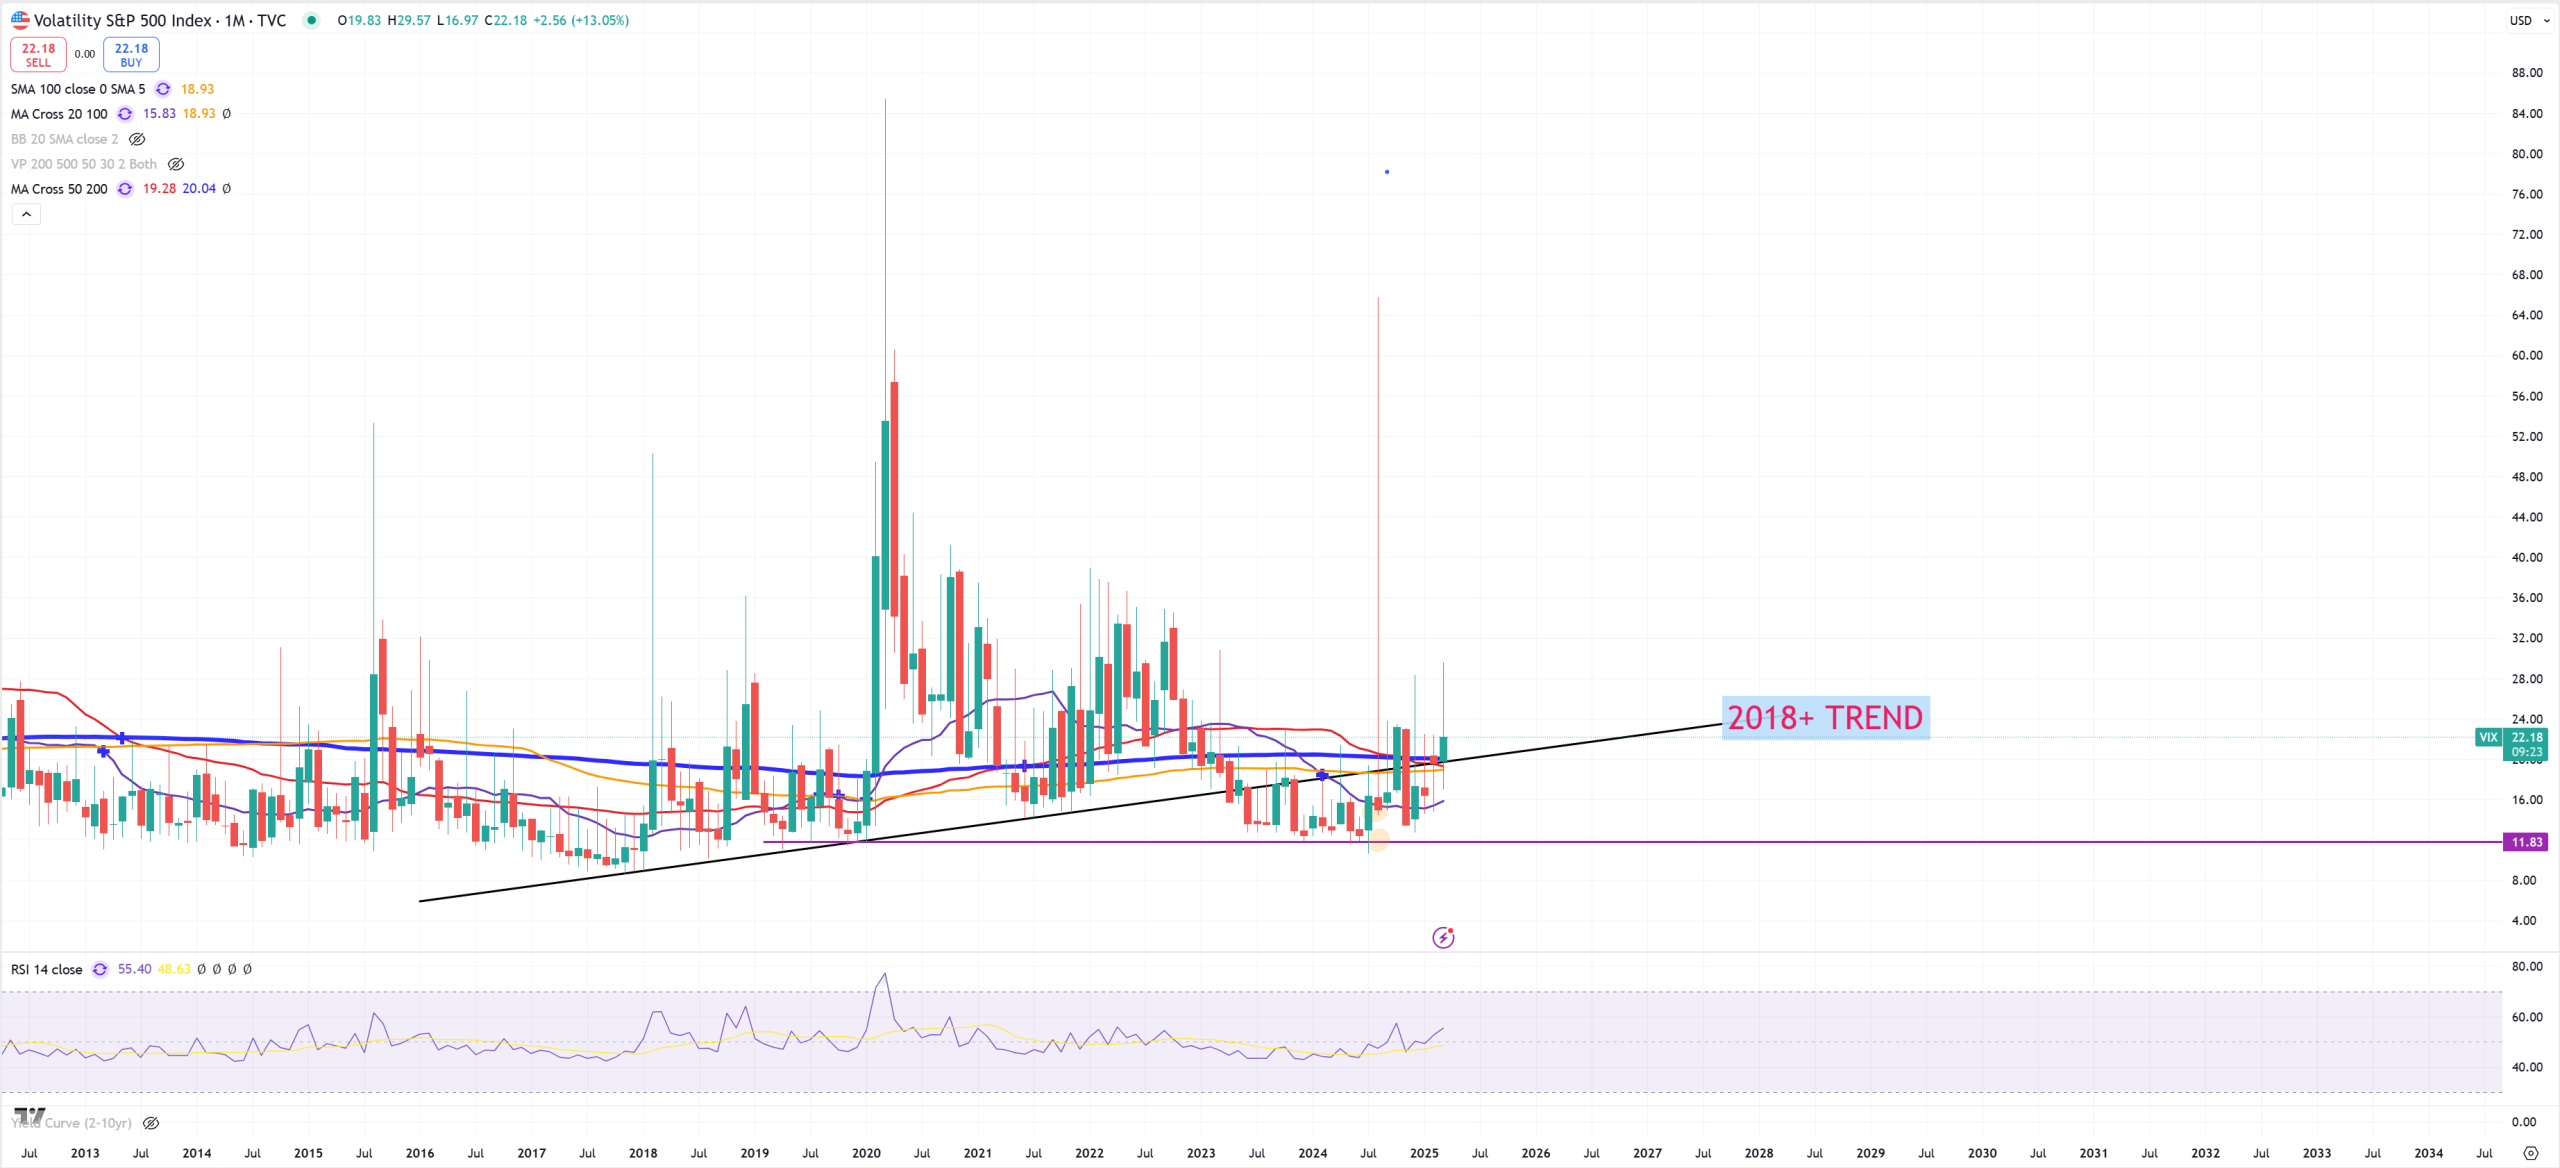
VIX – VIX is very short term chart just from 2018, so I’m going to show log and non-log chart, one thing is sure. (M) closed above all important (M)MAs. Once again remember this 2018 moment, because it’ll be very important on SPX/GOLD and DJI/GOLD key cycle indicators.
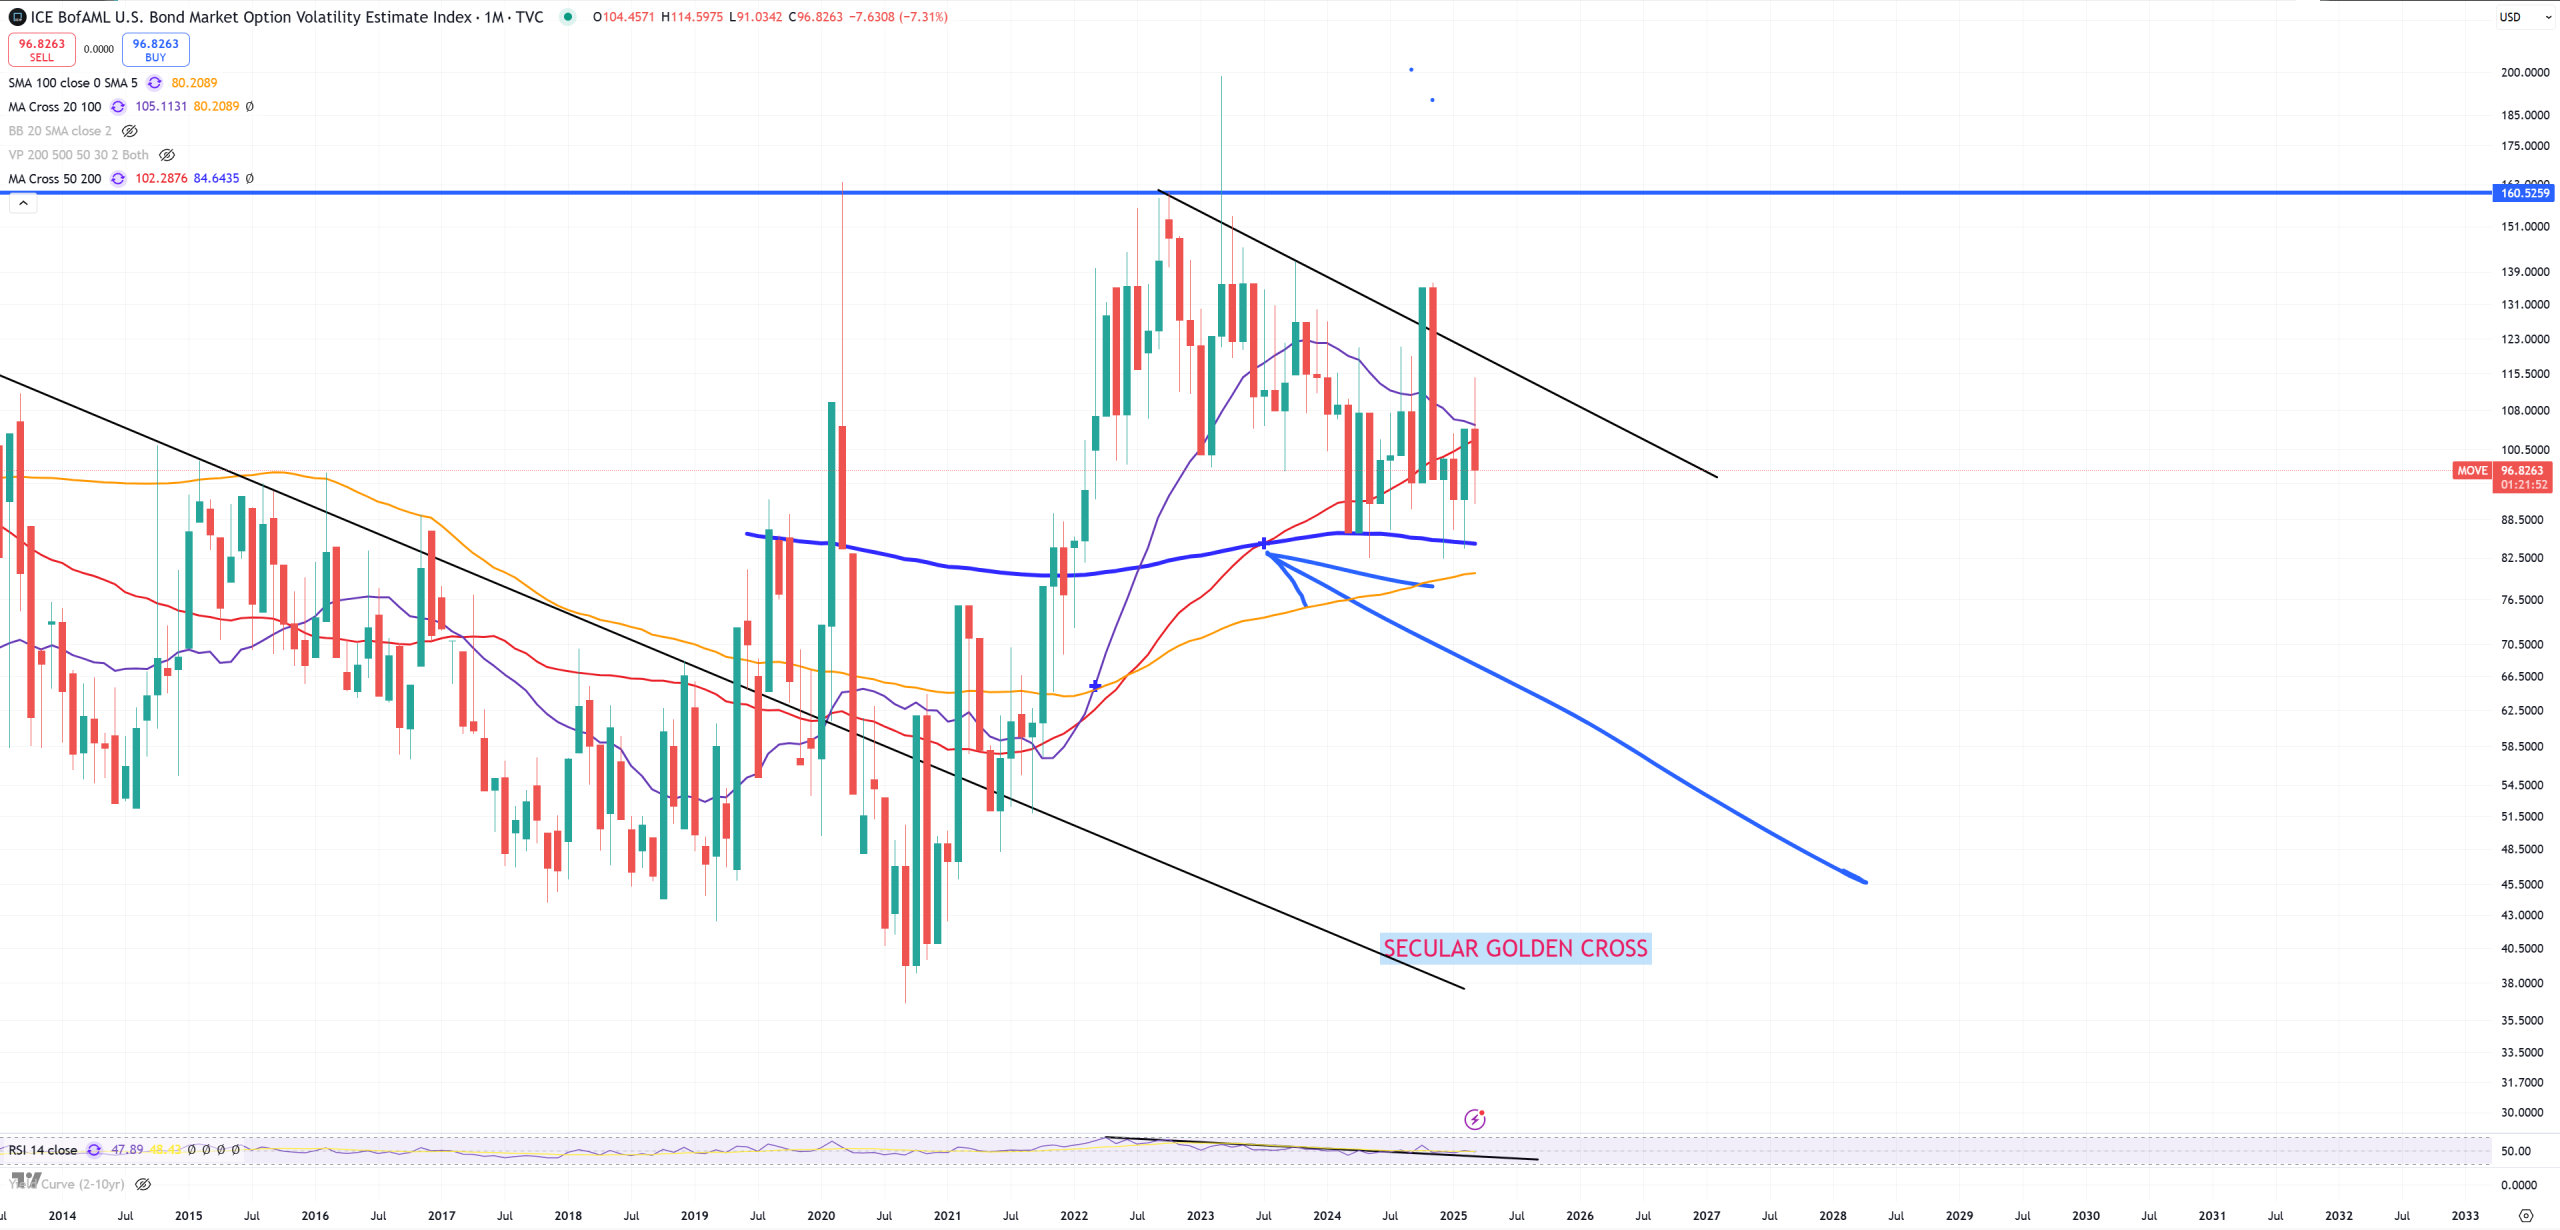
MOVE – Bond market volatility got stuck on the last (M)MA200. This (M) below (M)MA50, but secular golden cross is in
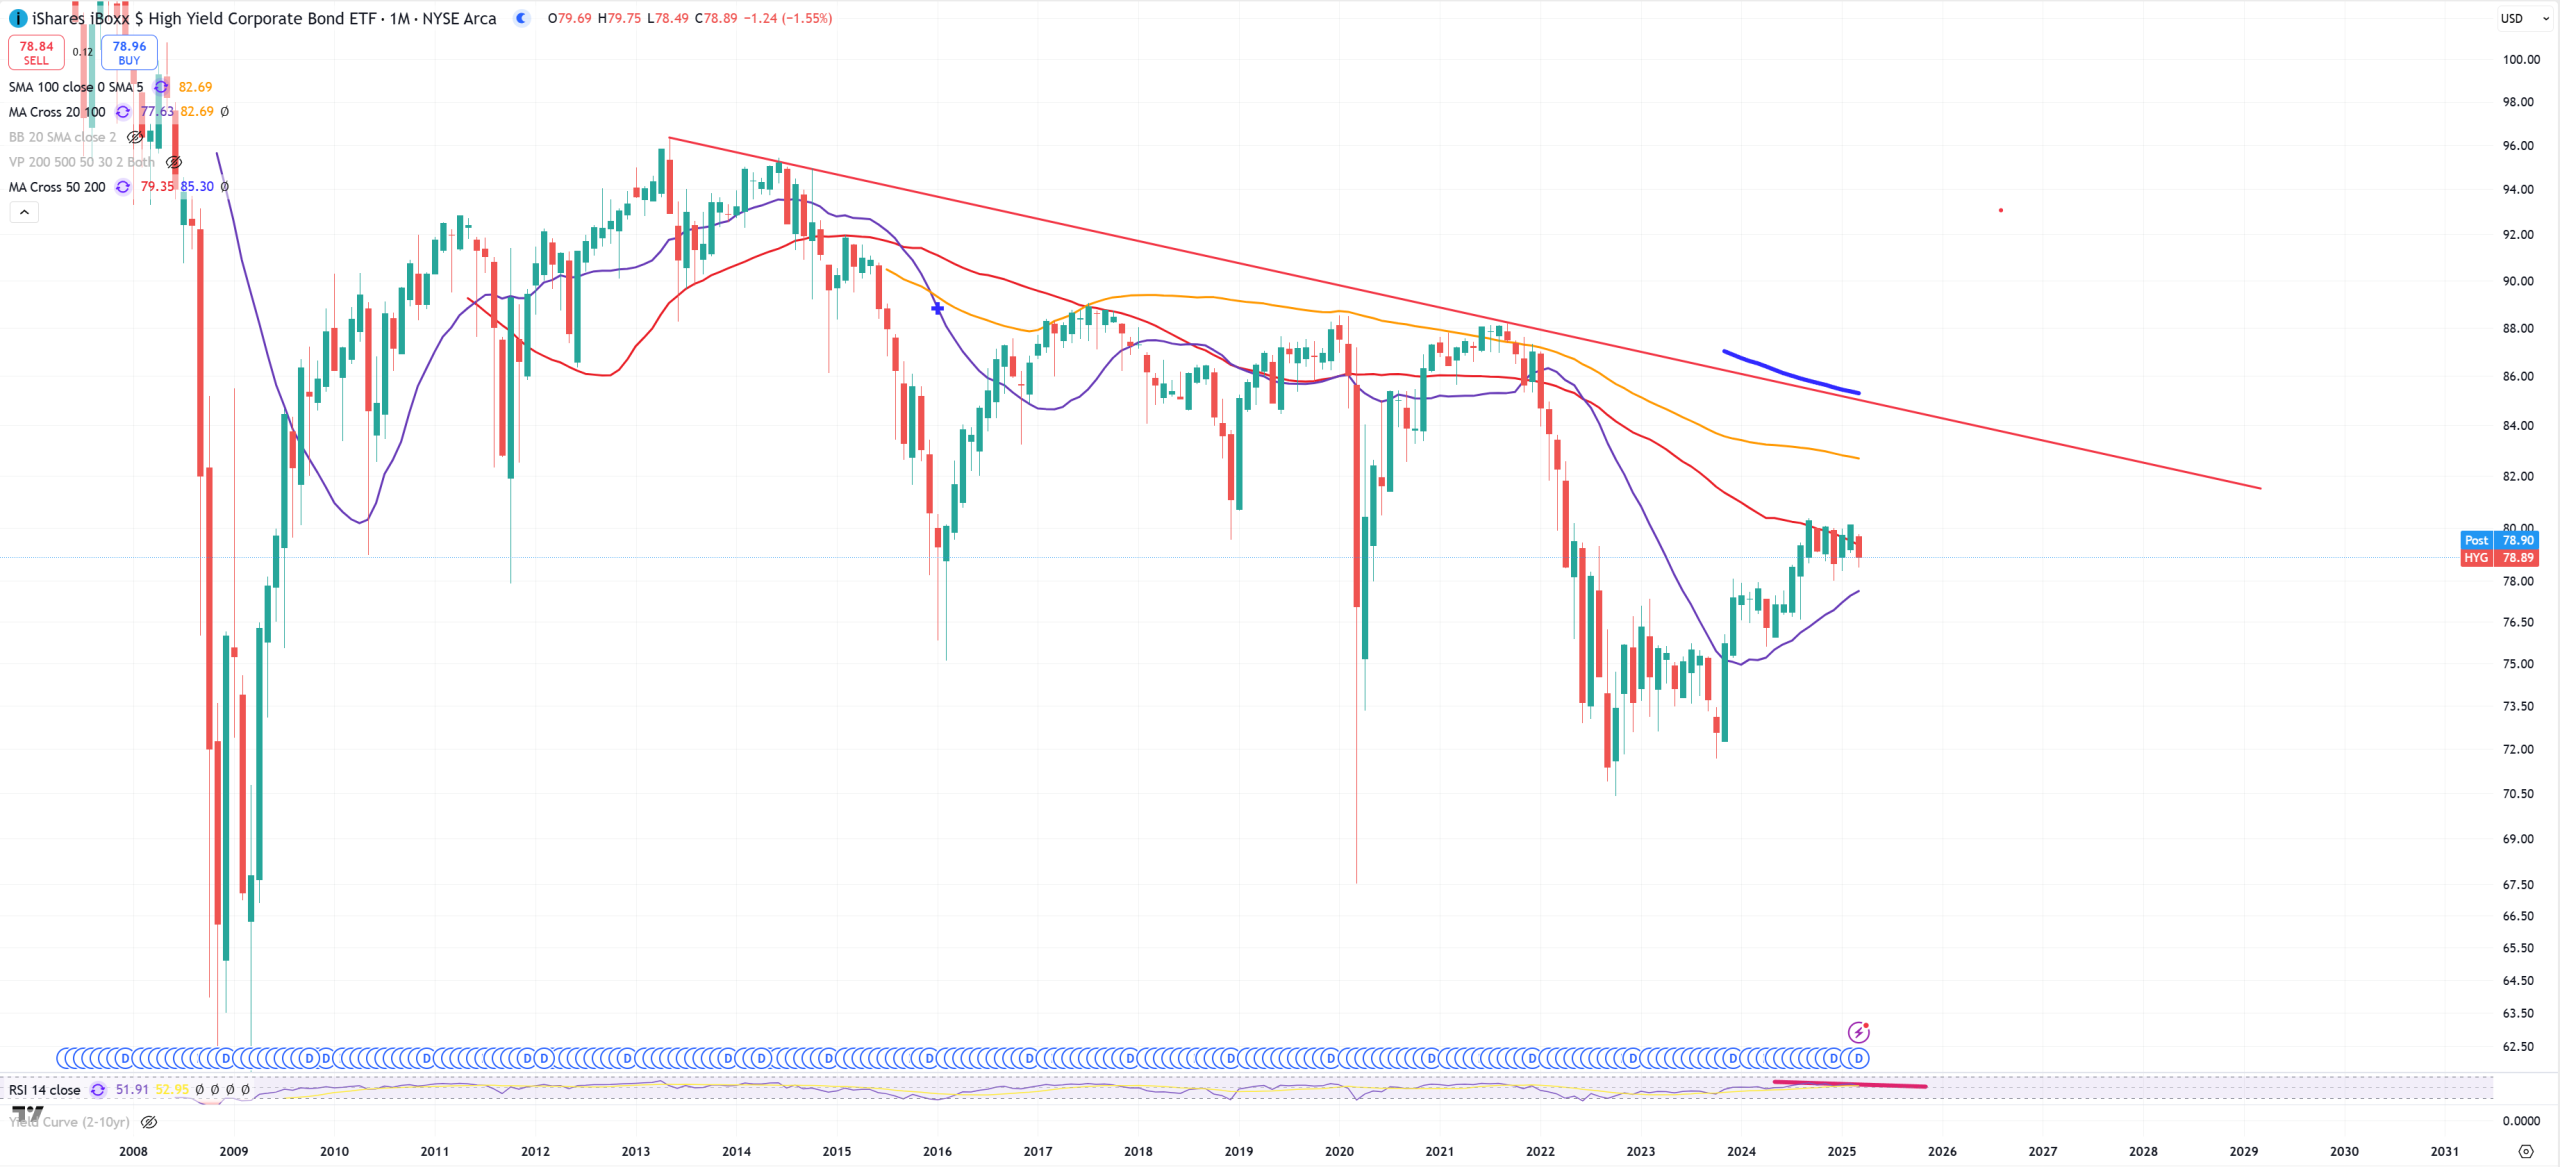
HYG – without any trends just look on (M)MA50 rejection. 7th month
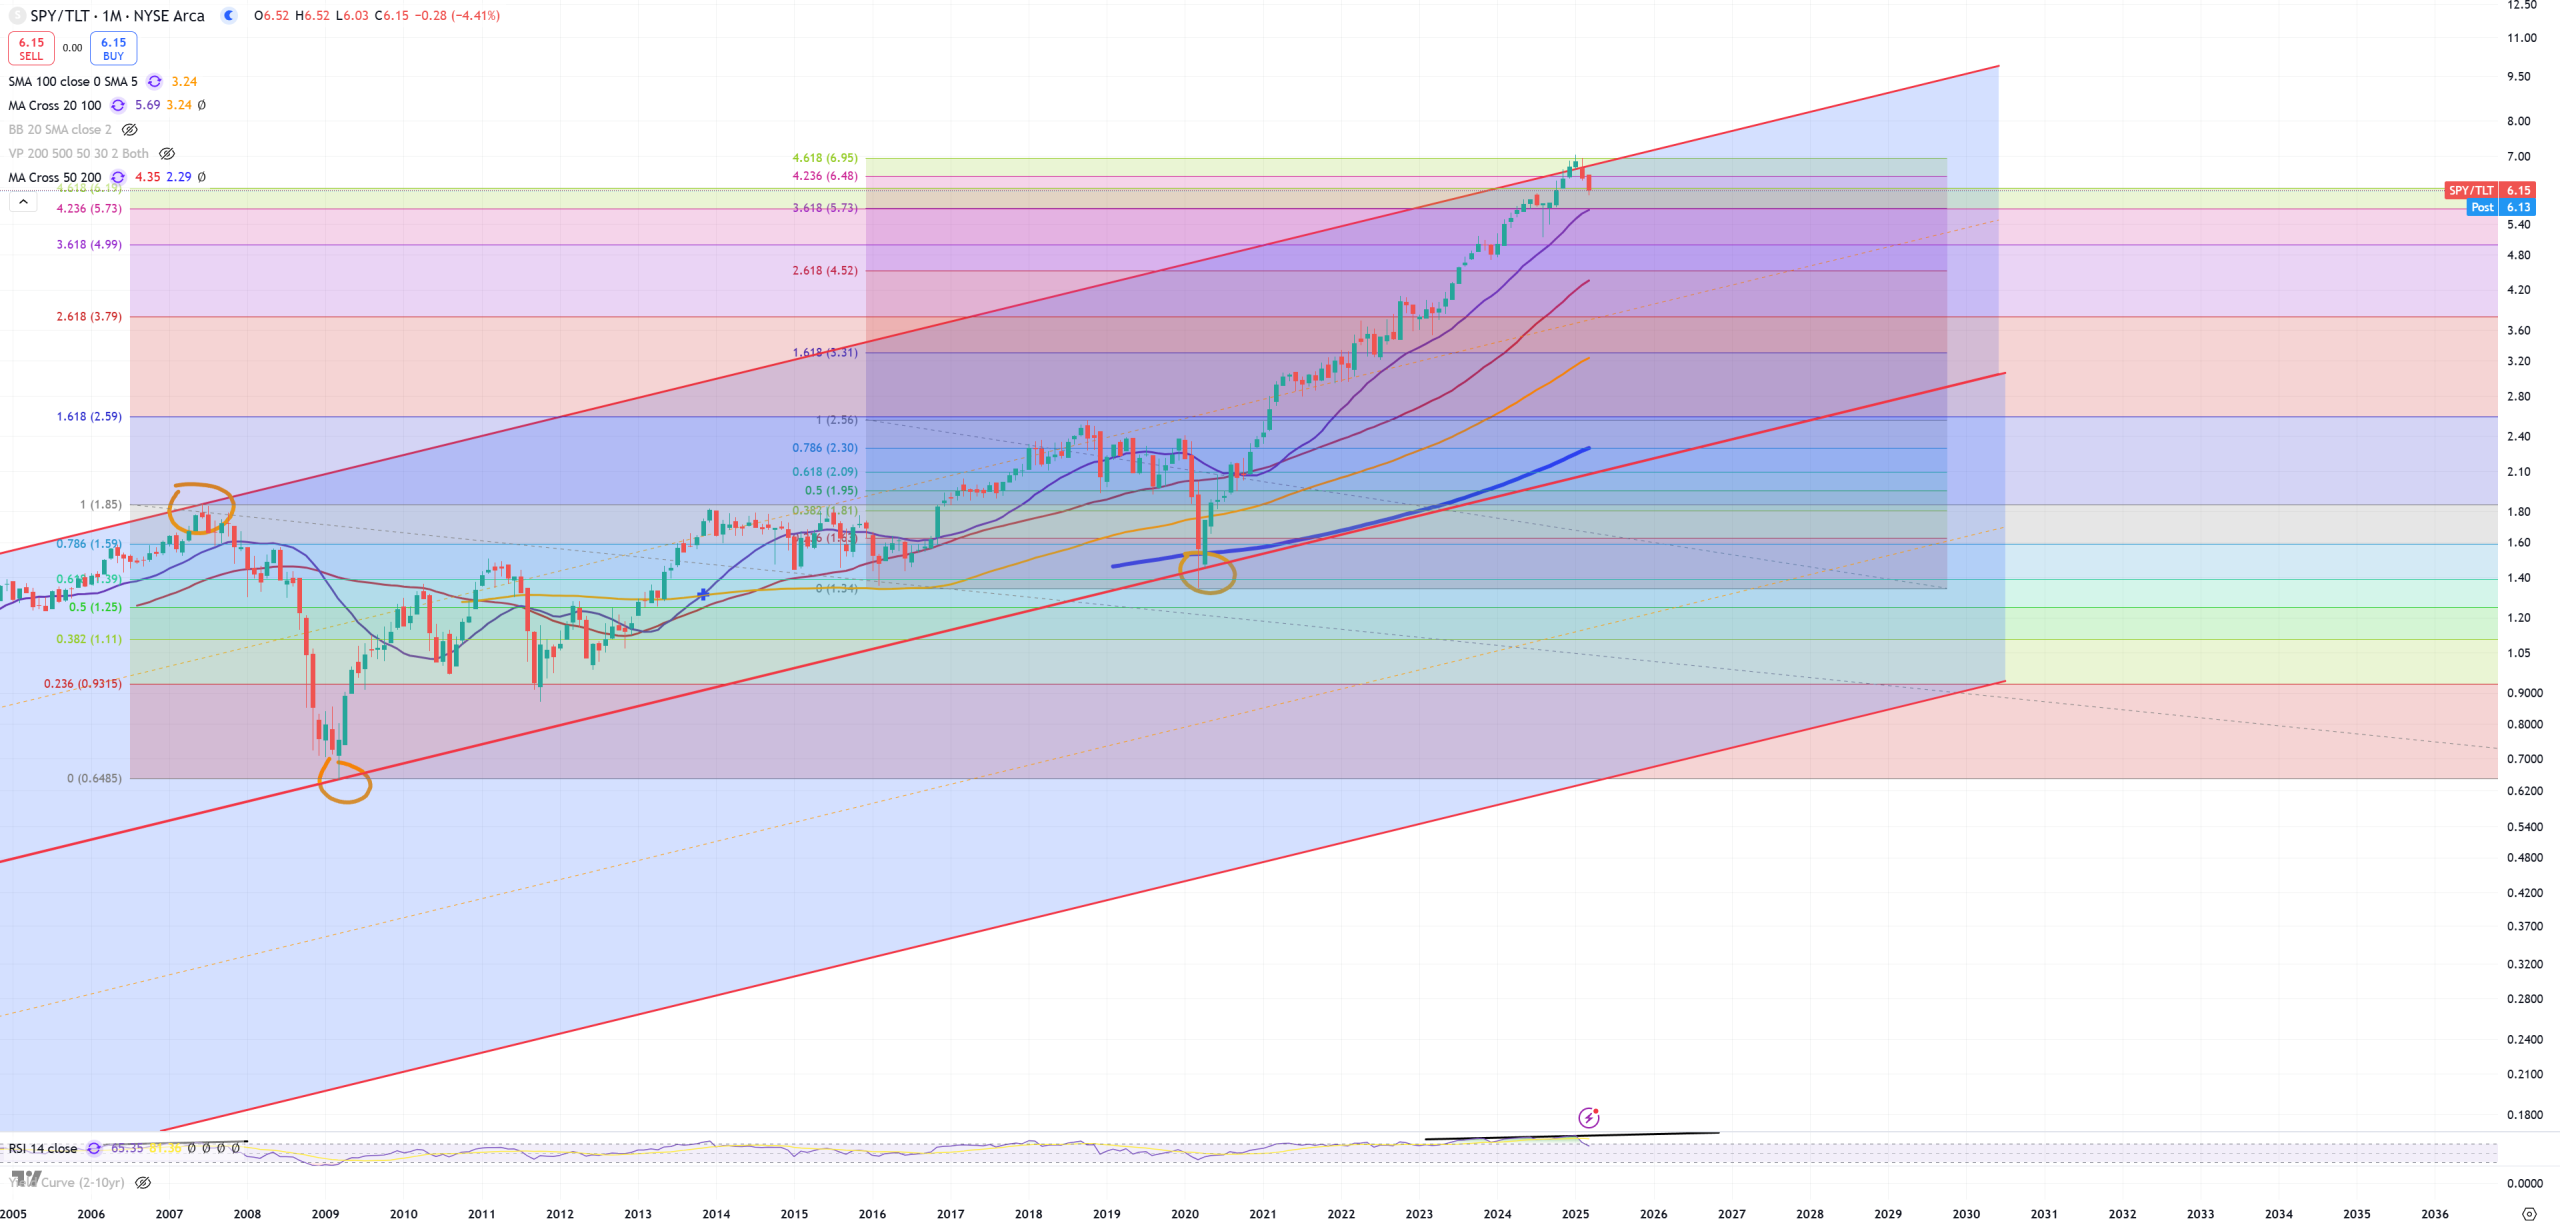
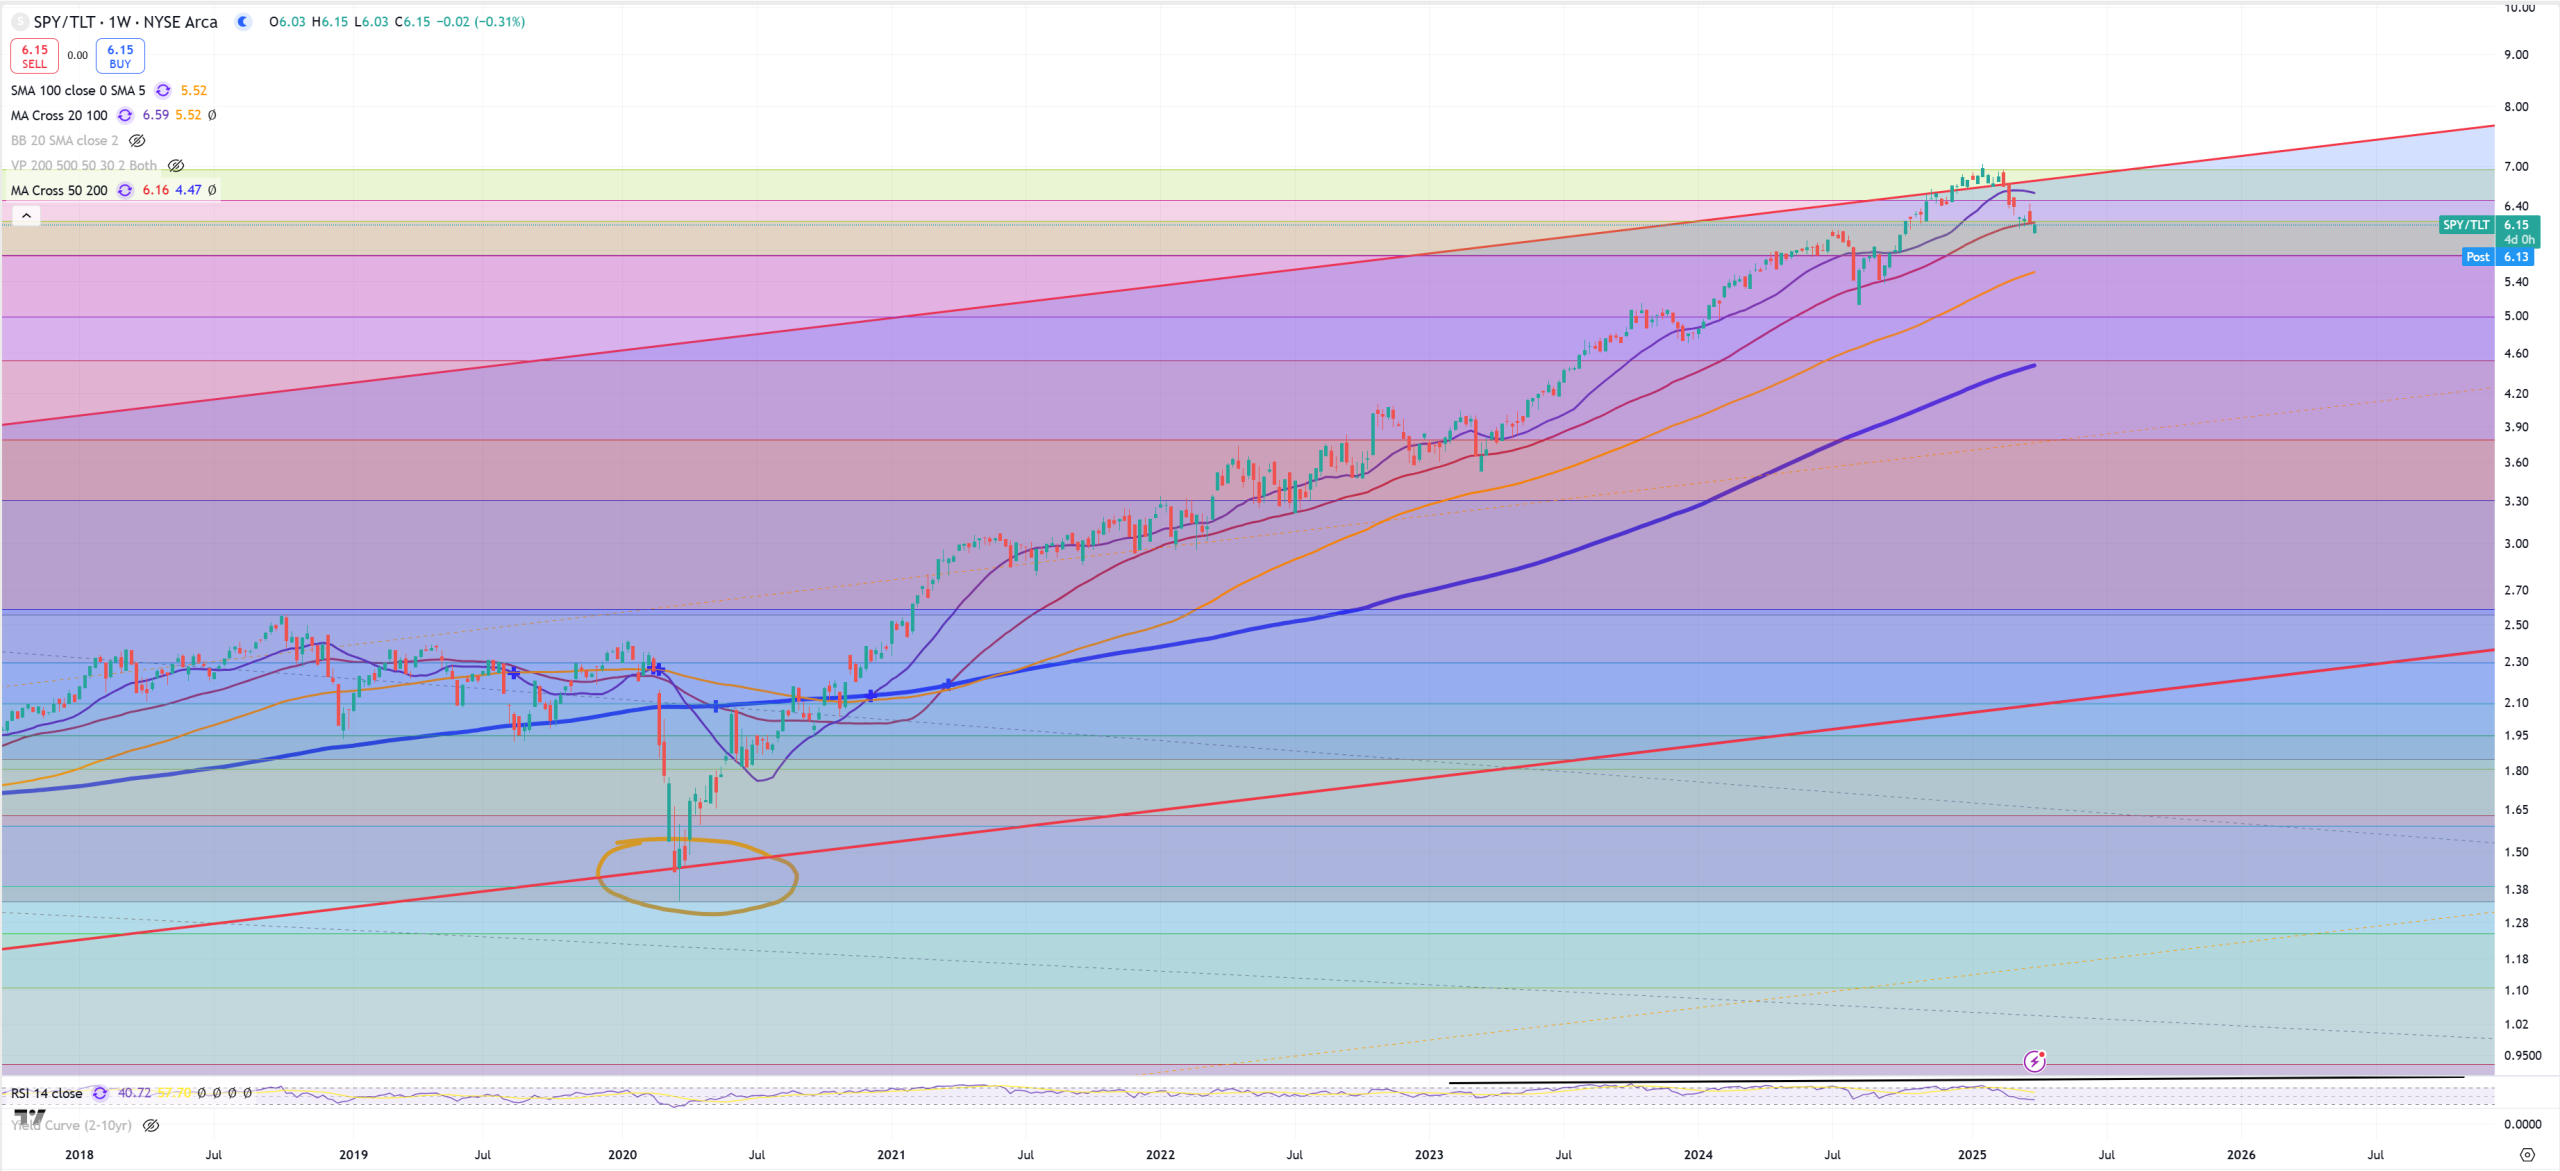
SPY/TLT – massive reversal from the trend, maybe on (M) isn’t something weird, but if we look on (W) you’ll see (W)MA50 moment. If you take a look when last time (W)MA50 made a sustained break on SPY/TLT you’re going to see February 2020.
(M)onthly
(W)eekly
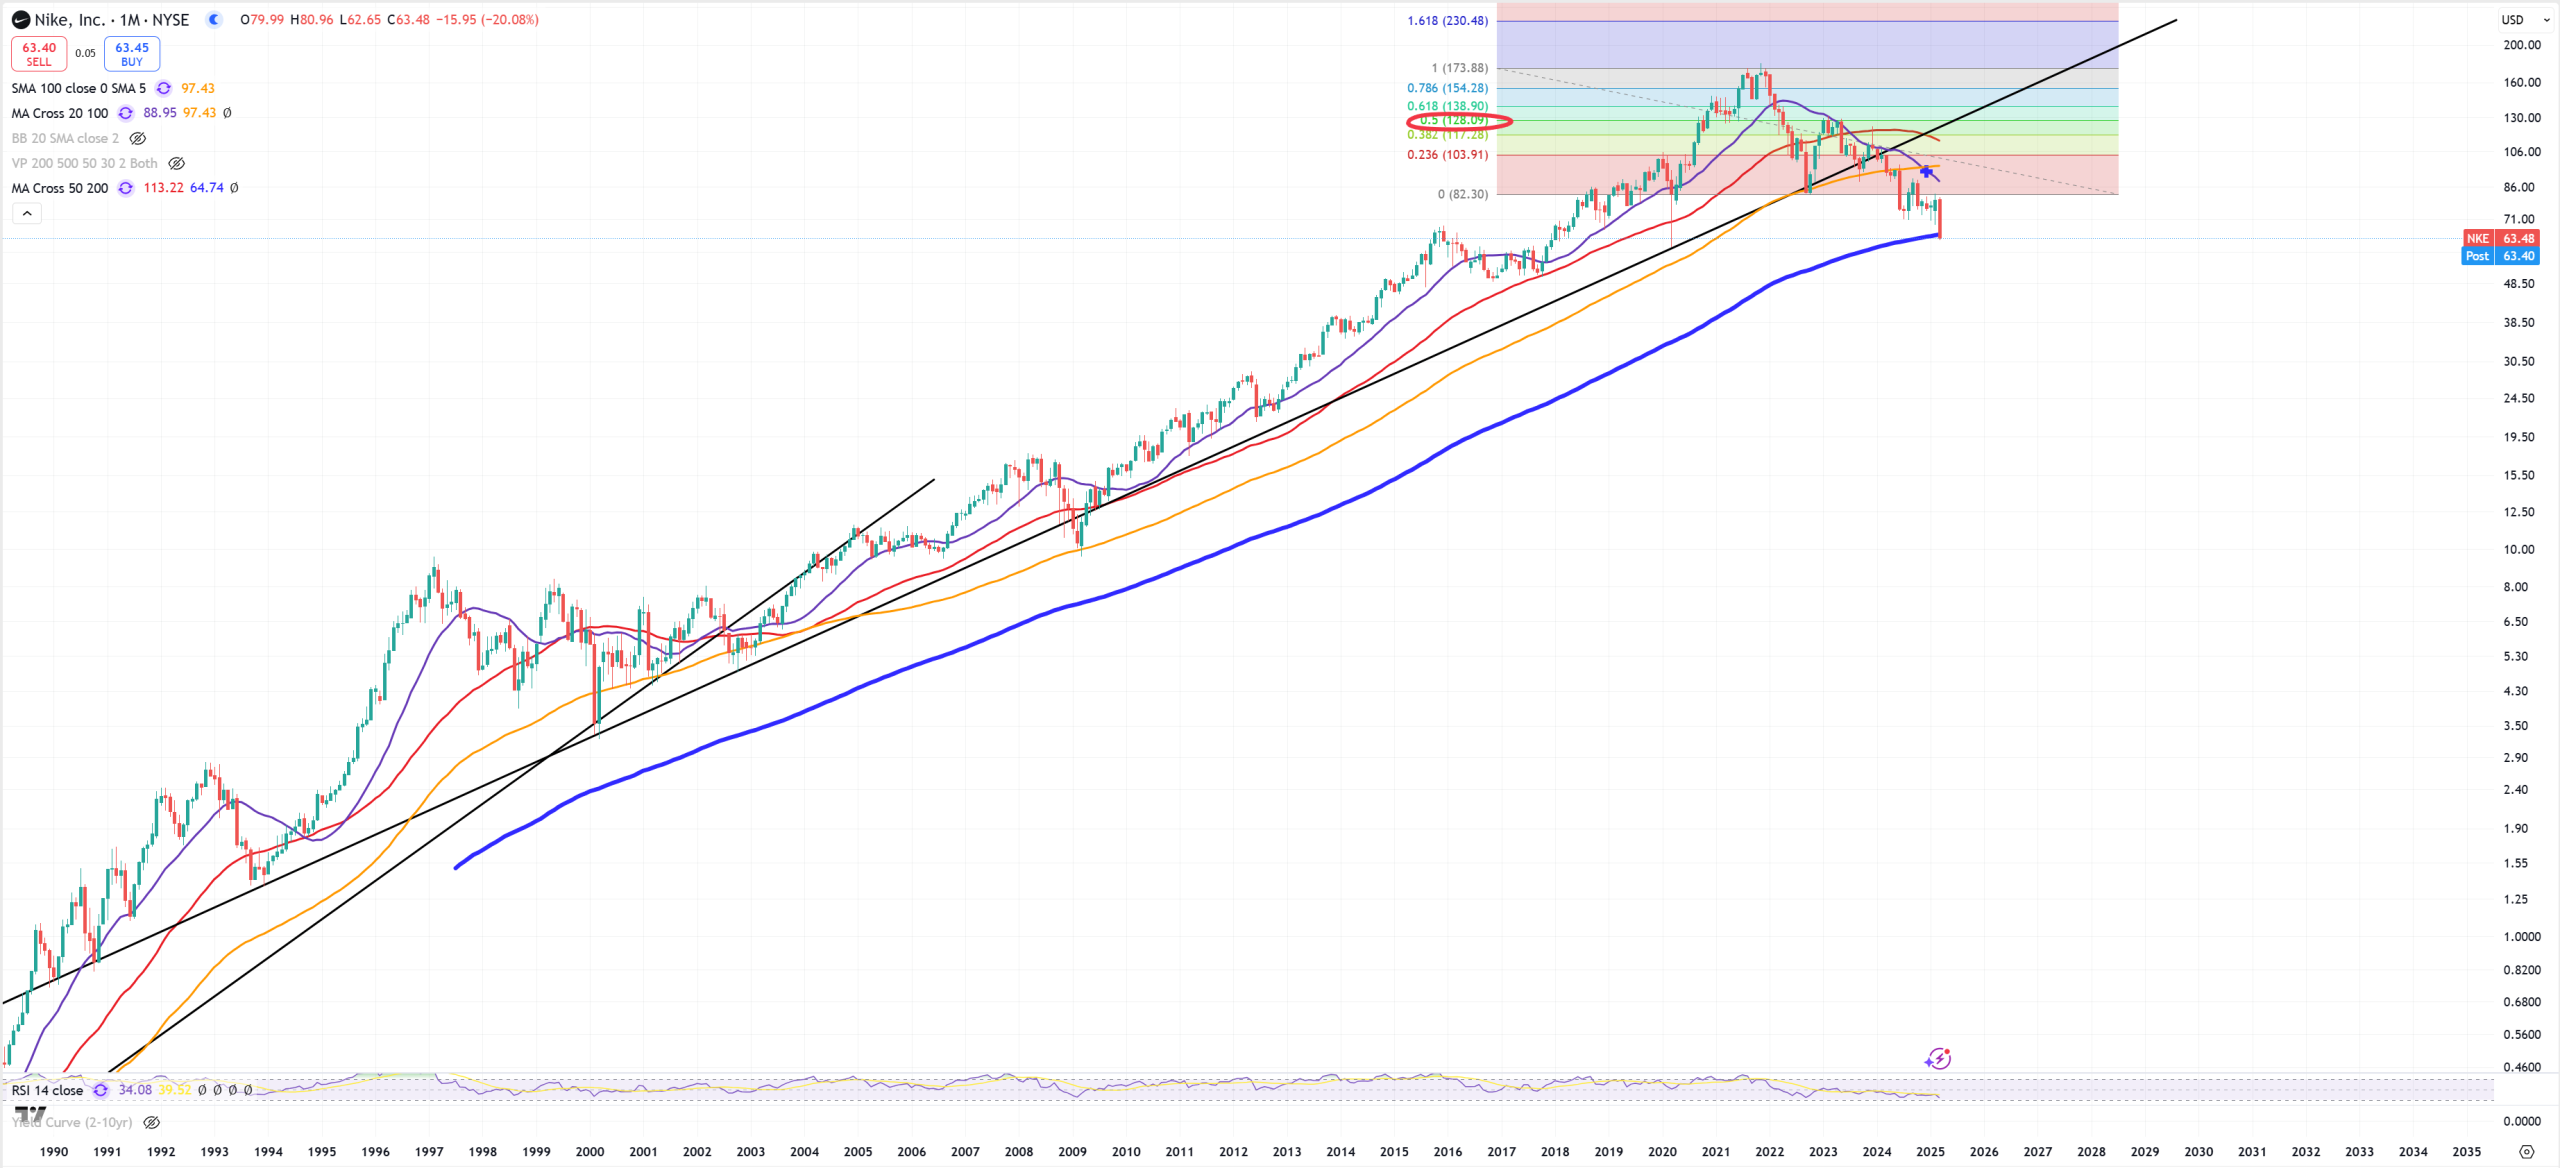
NKE – Nike broke (M)MA200 for the first time ever plunging into secular bear market. Let’s see if it’ll try to fight against this MA in upcoming months. This is a very good indicator about sentiment of consumers.
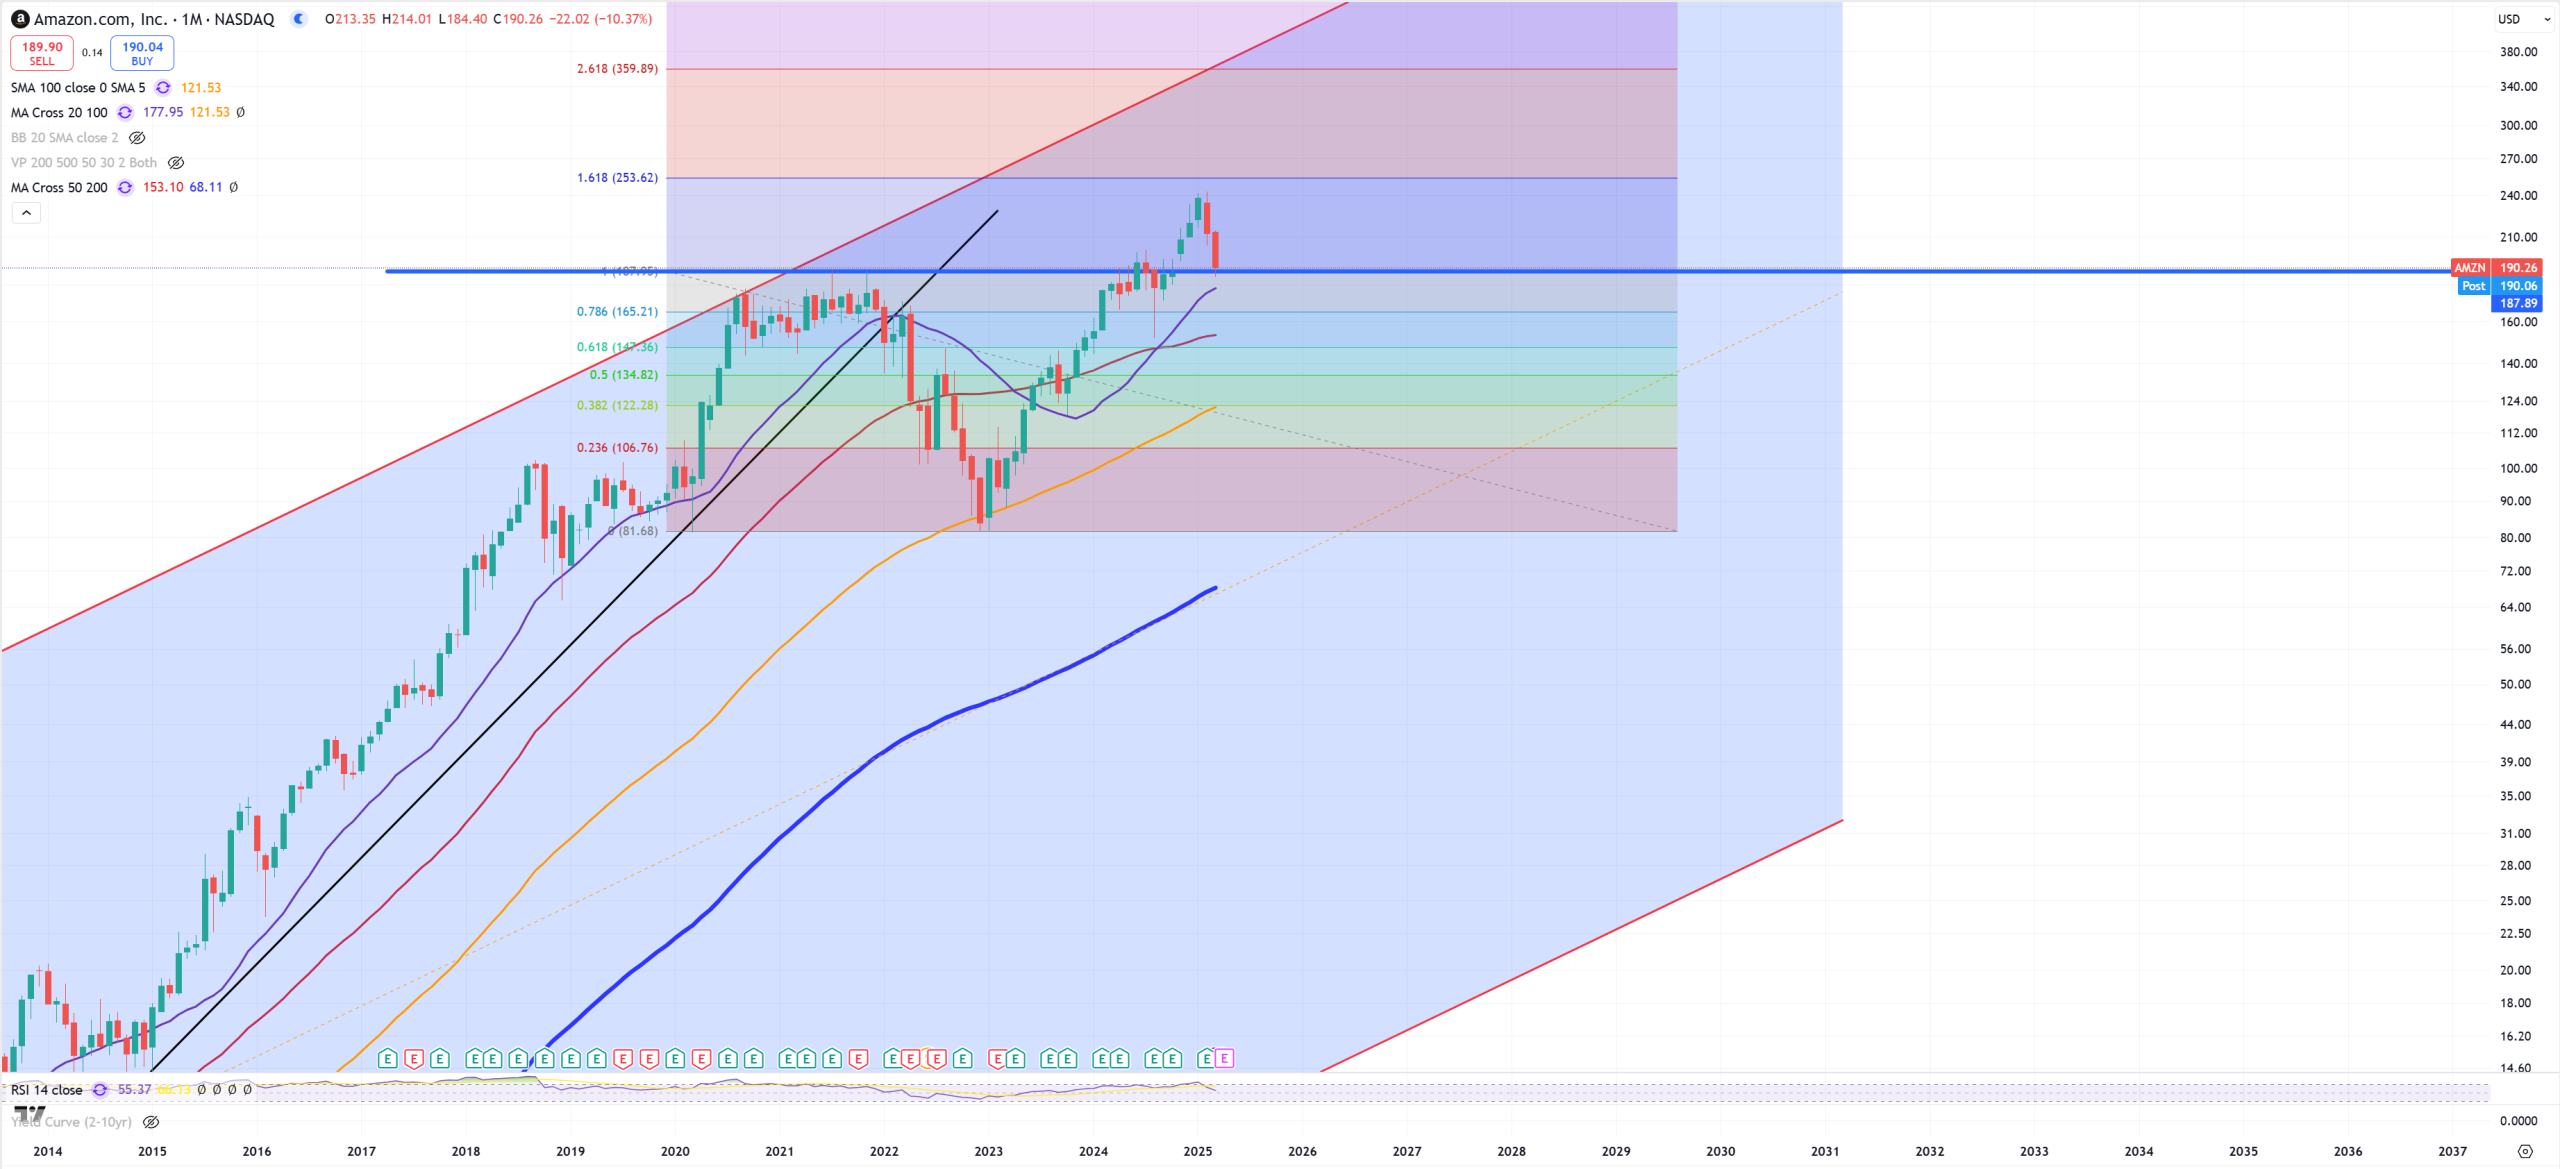
AMZN – tries to defend this support. Gap down on April candle might be important for the bears
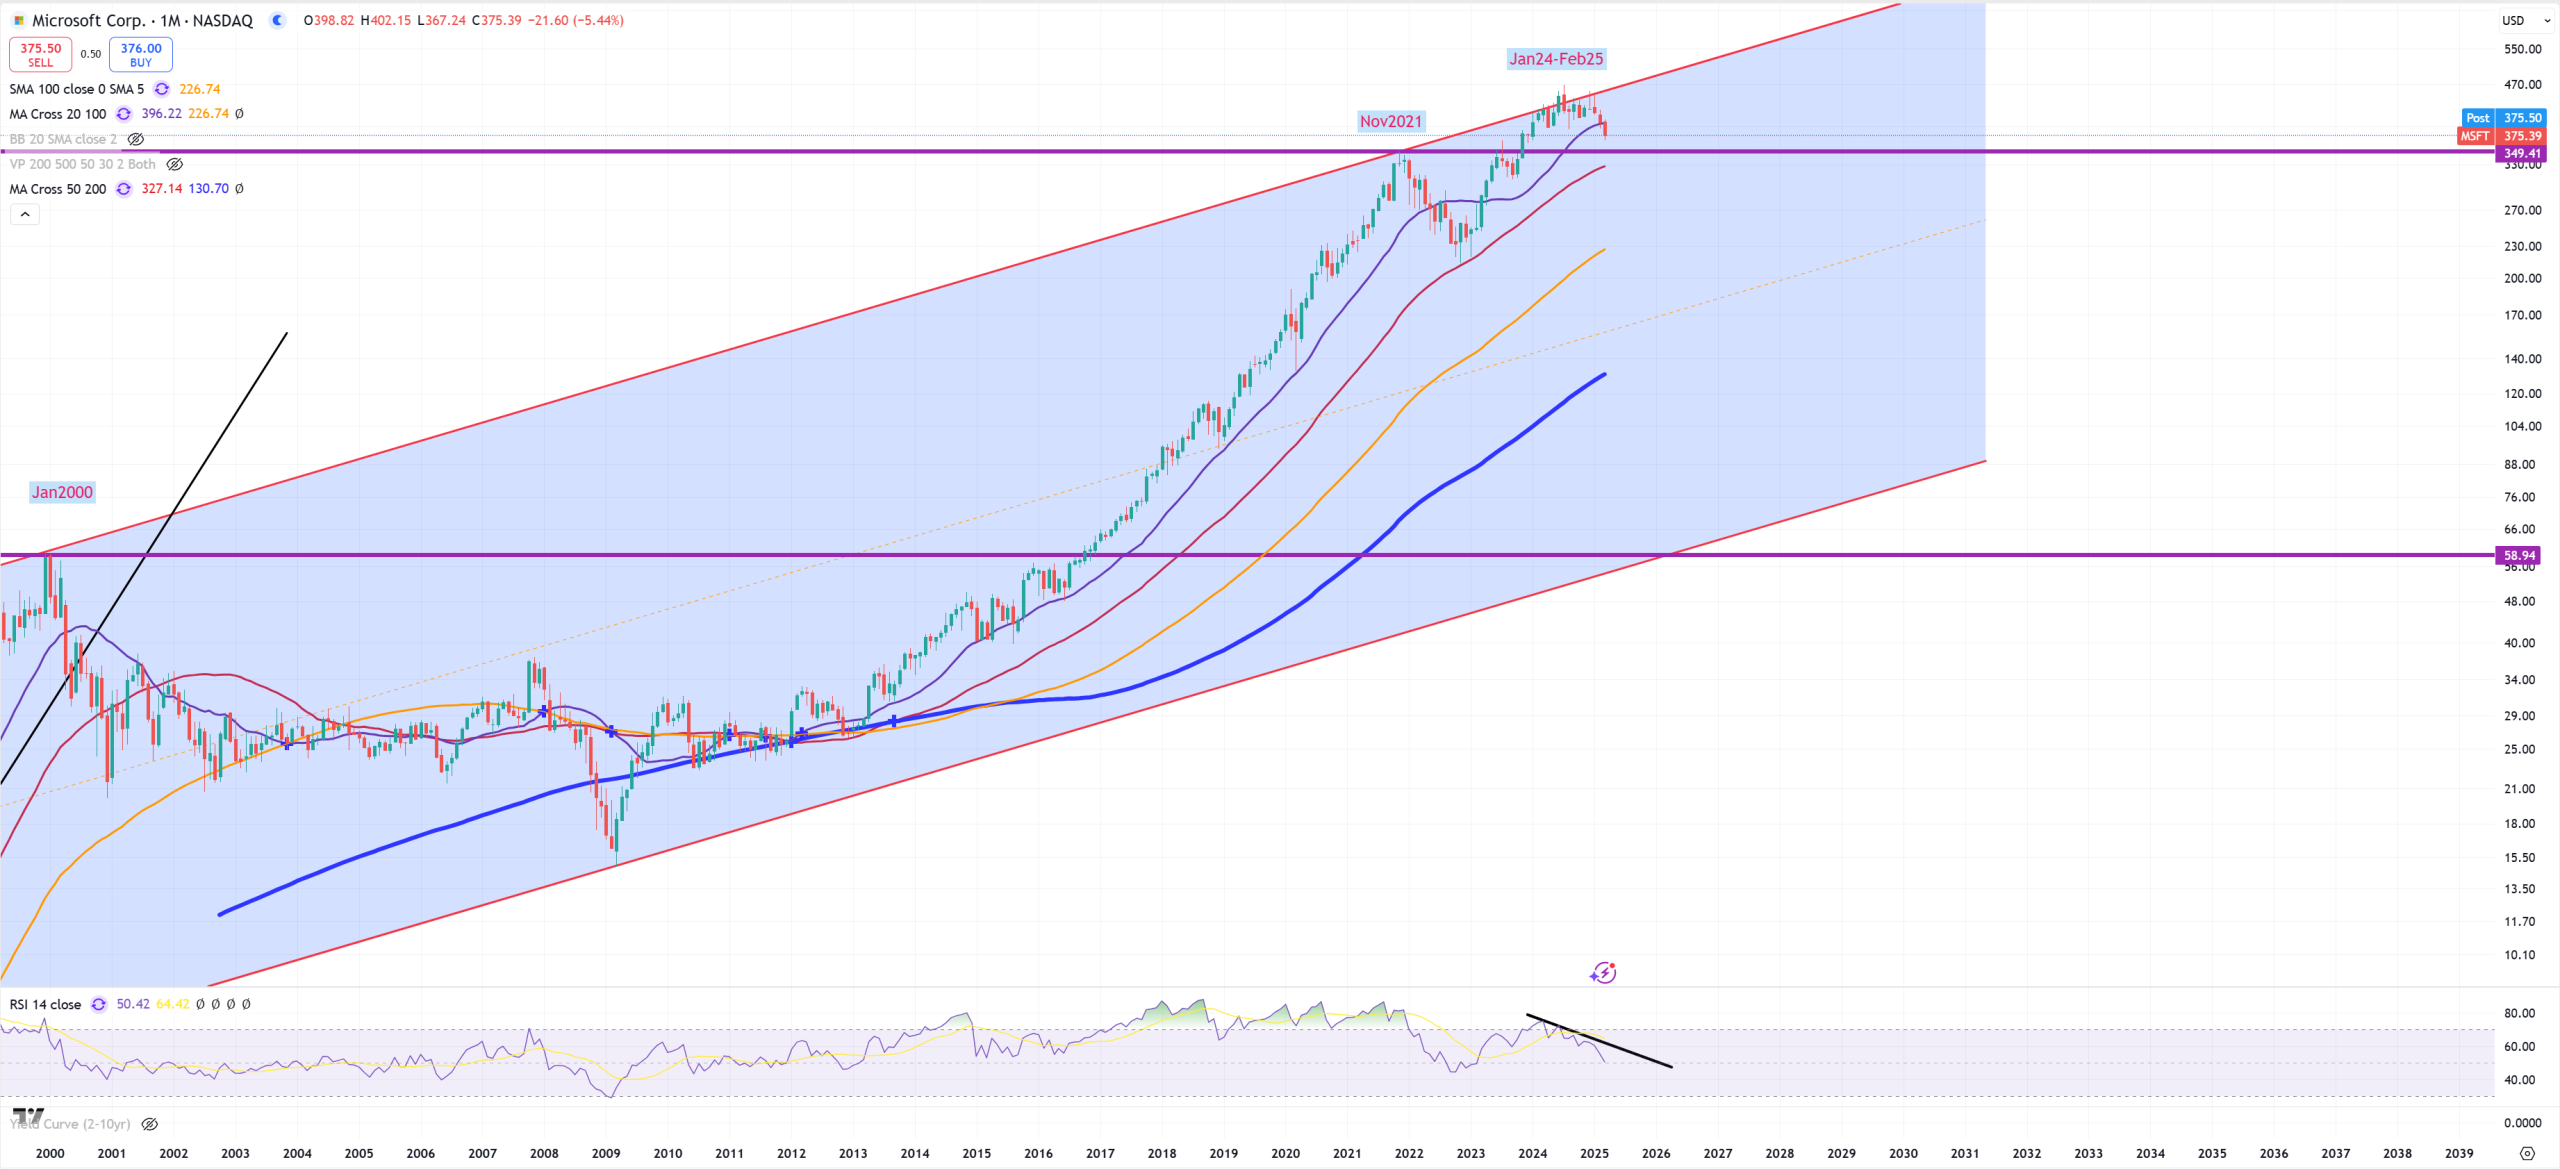
MSFT – its key channel rejection, just like QQQ it’s trend is 2000-2021 too. (M)MA20 broken, so retest of the support which will be also red (M)MA50 will be important
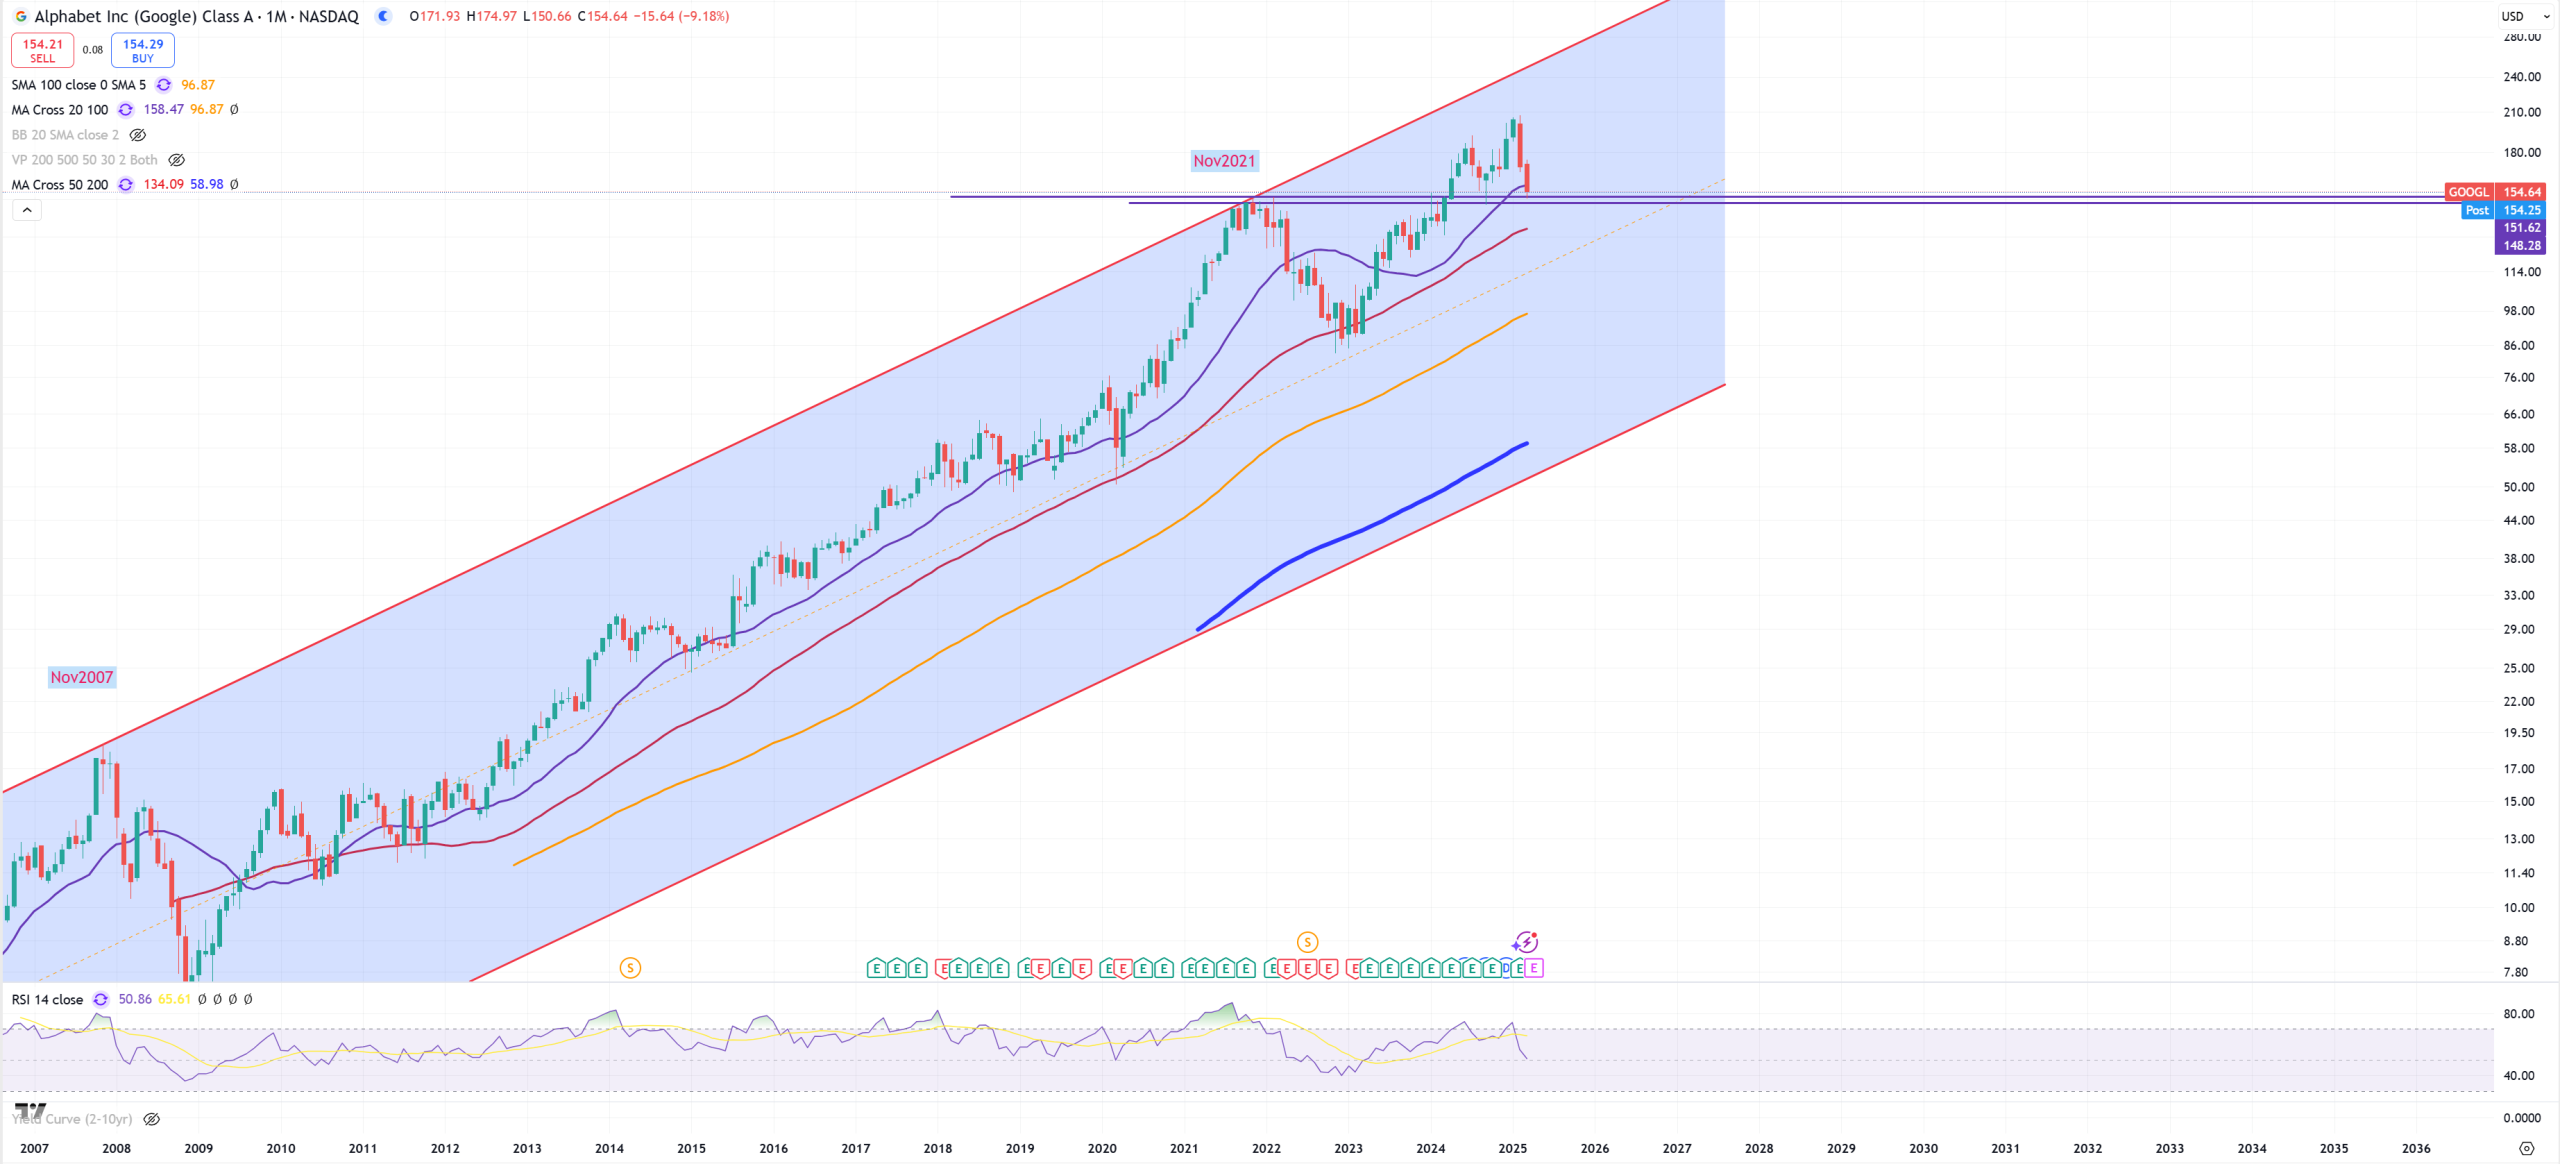
GOOGL – not really different than AMZN – identical setup
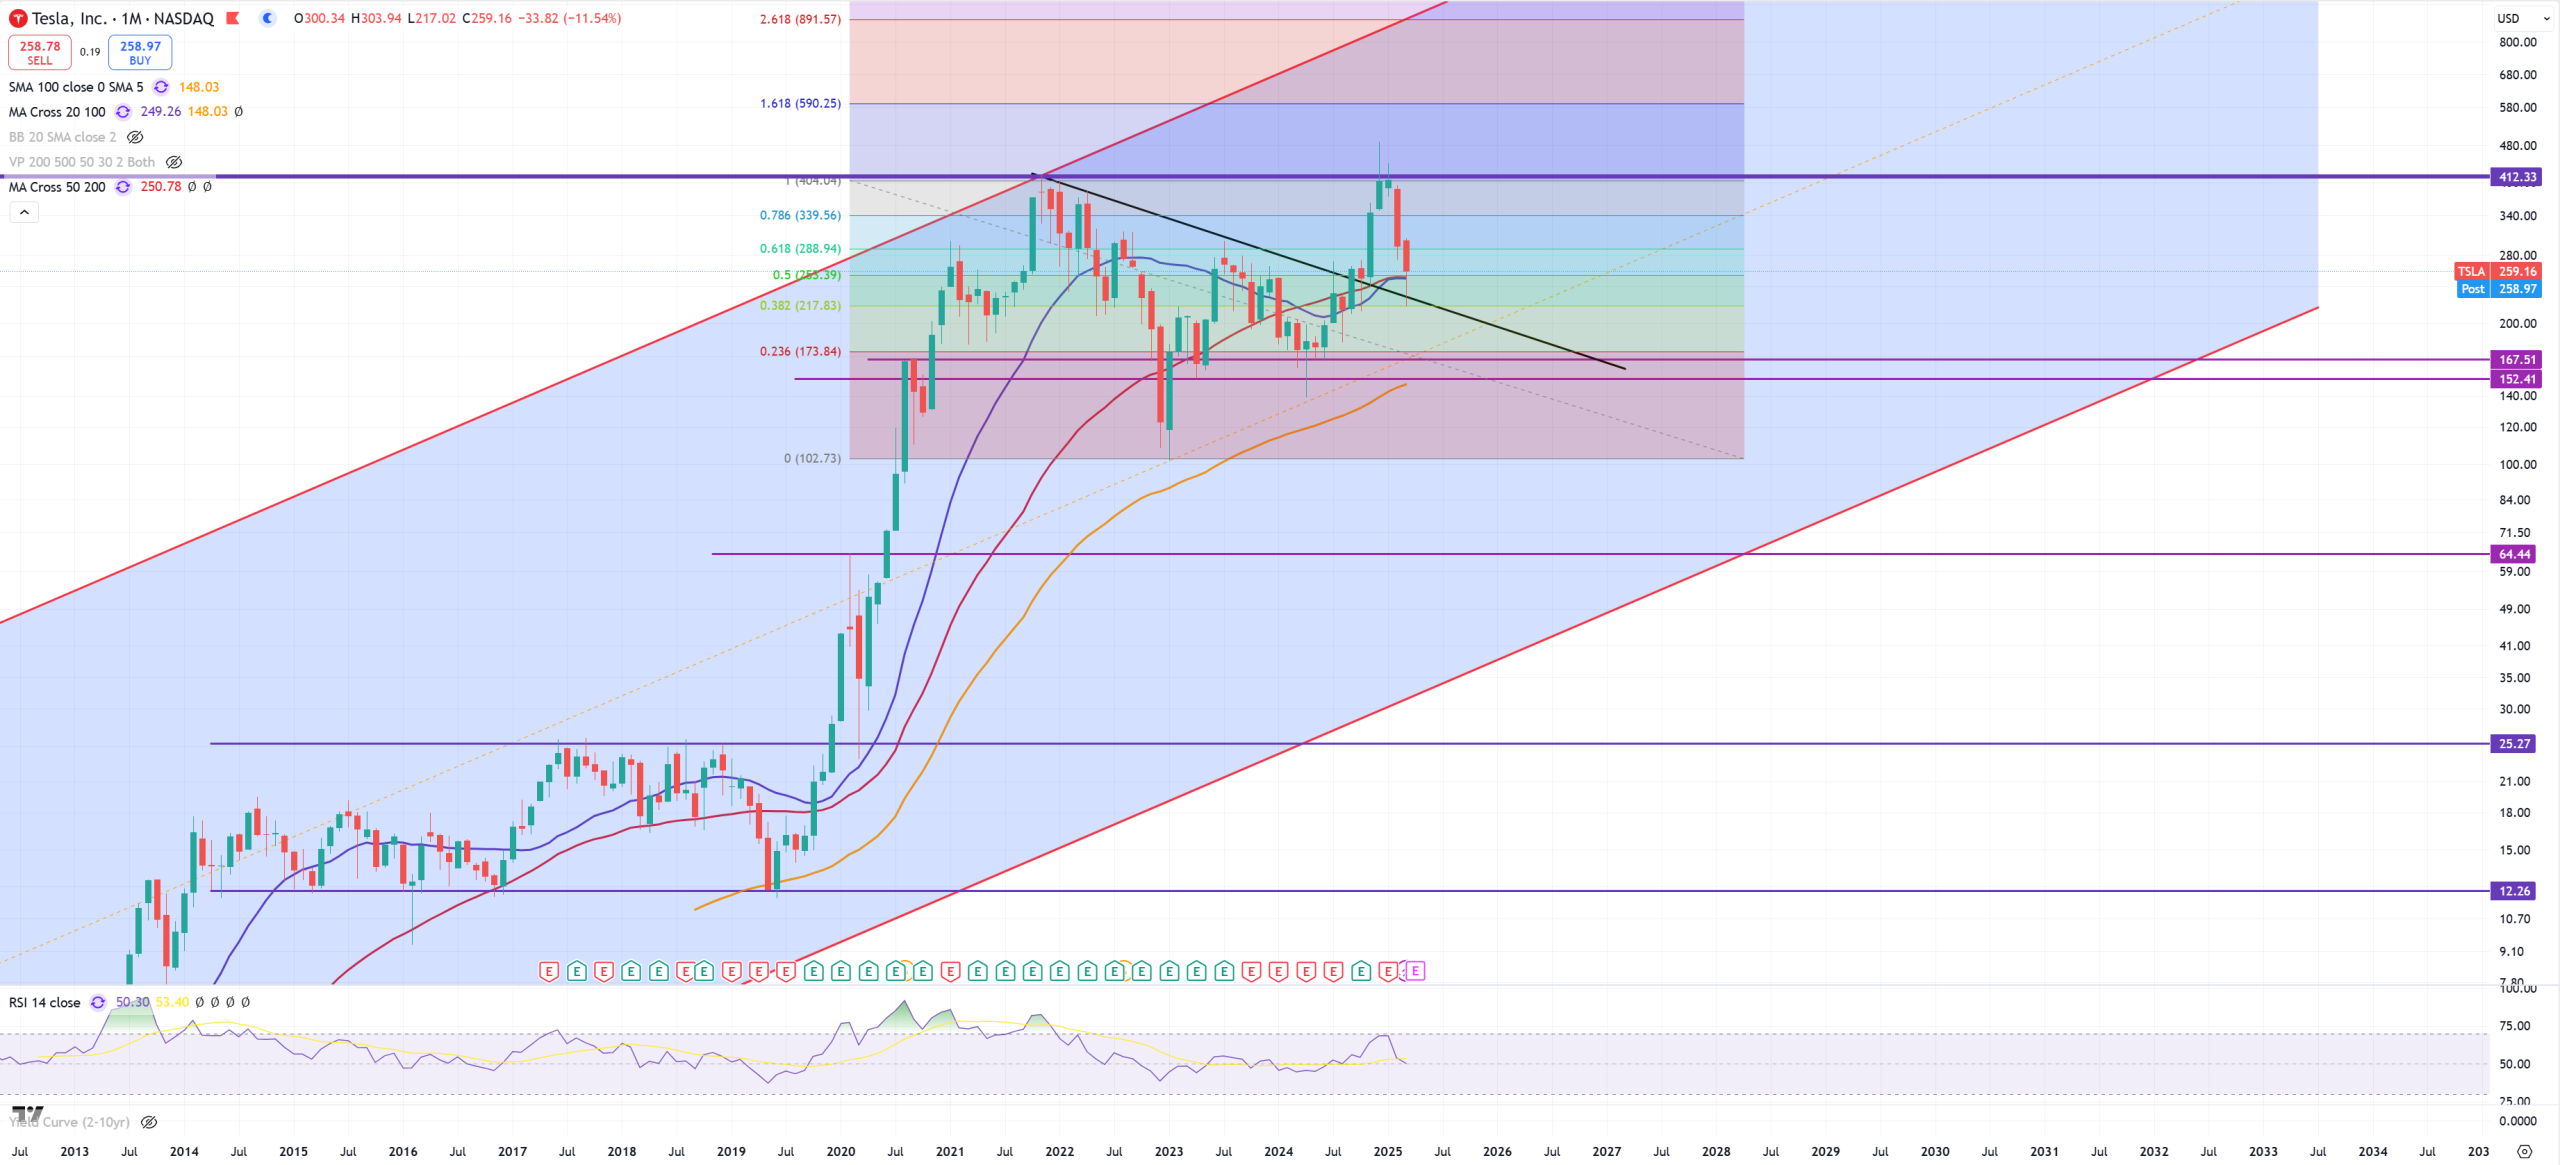
TSLA – fights against trend and (M)MA50 – saved
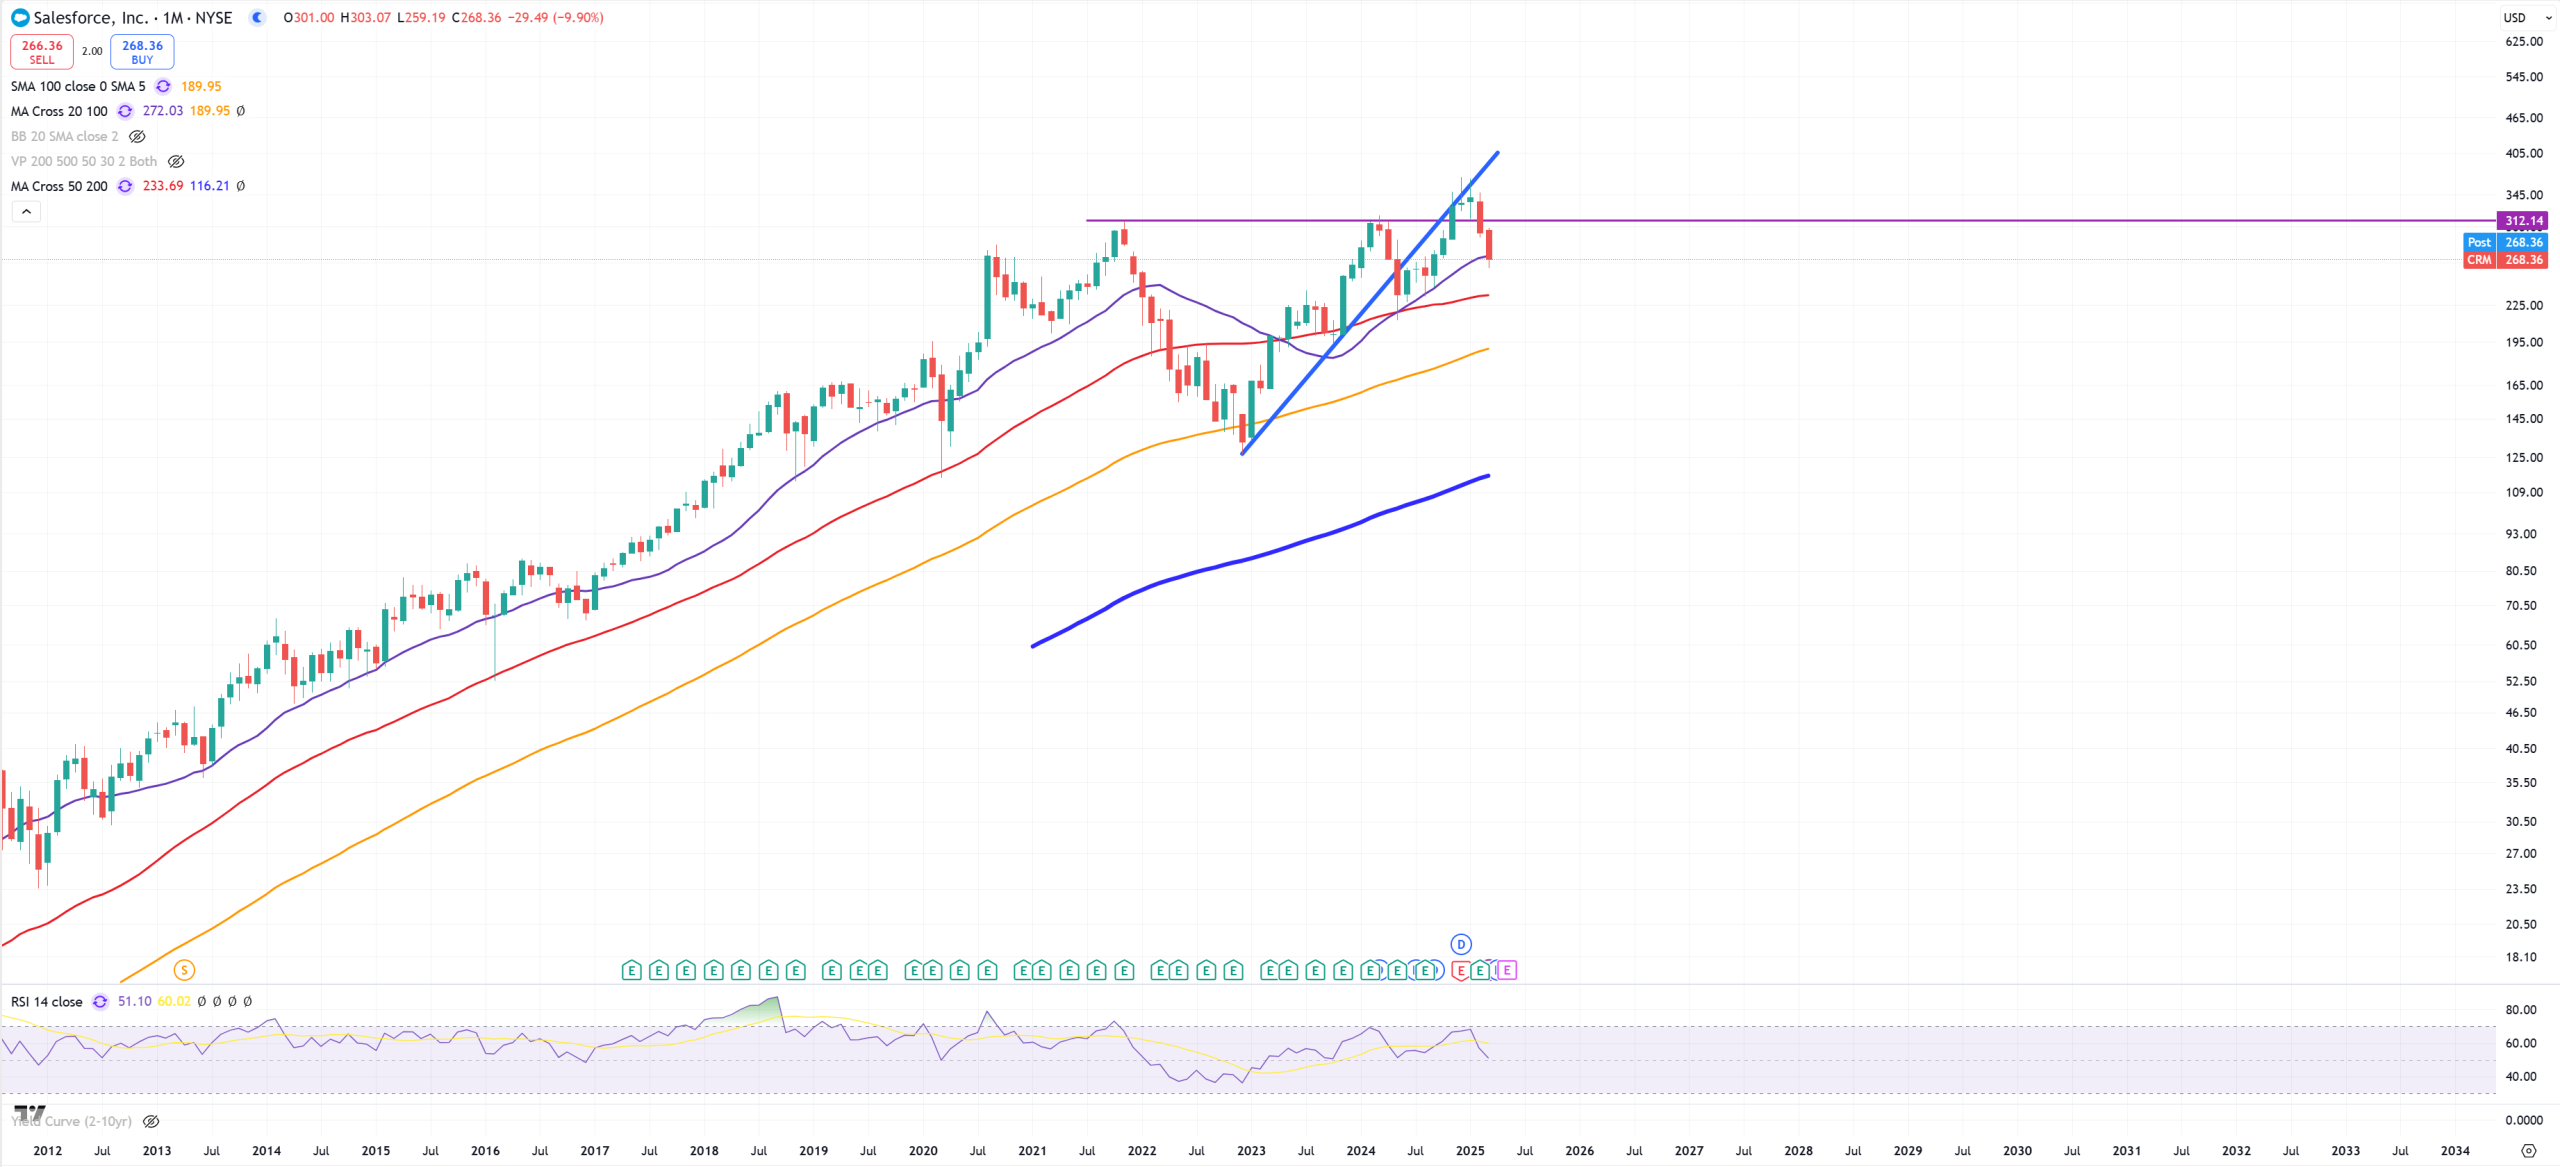
CRM – another type of false break
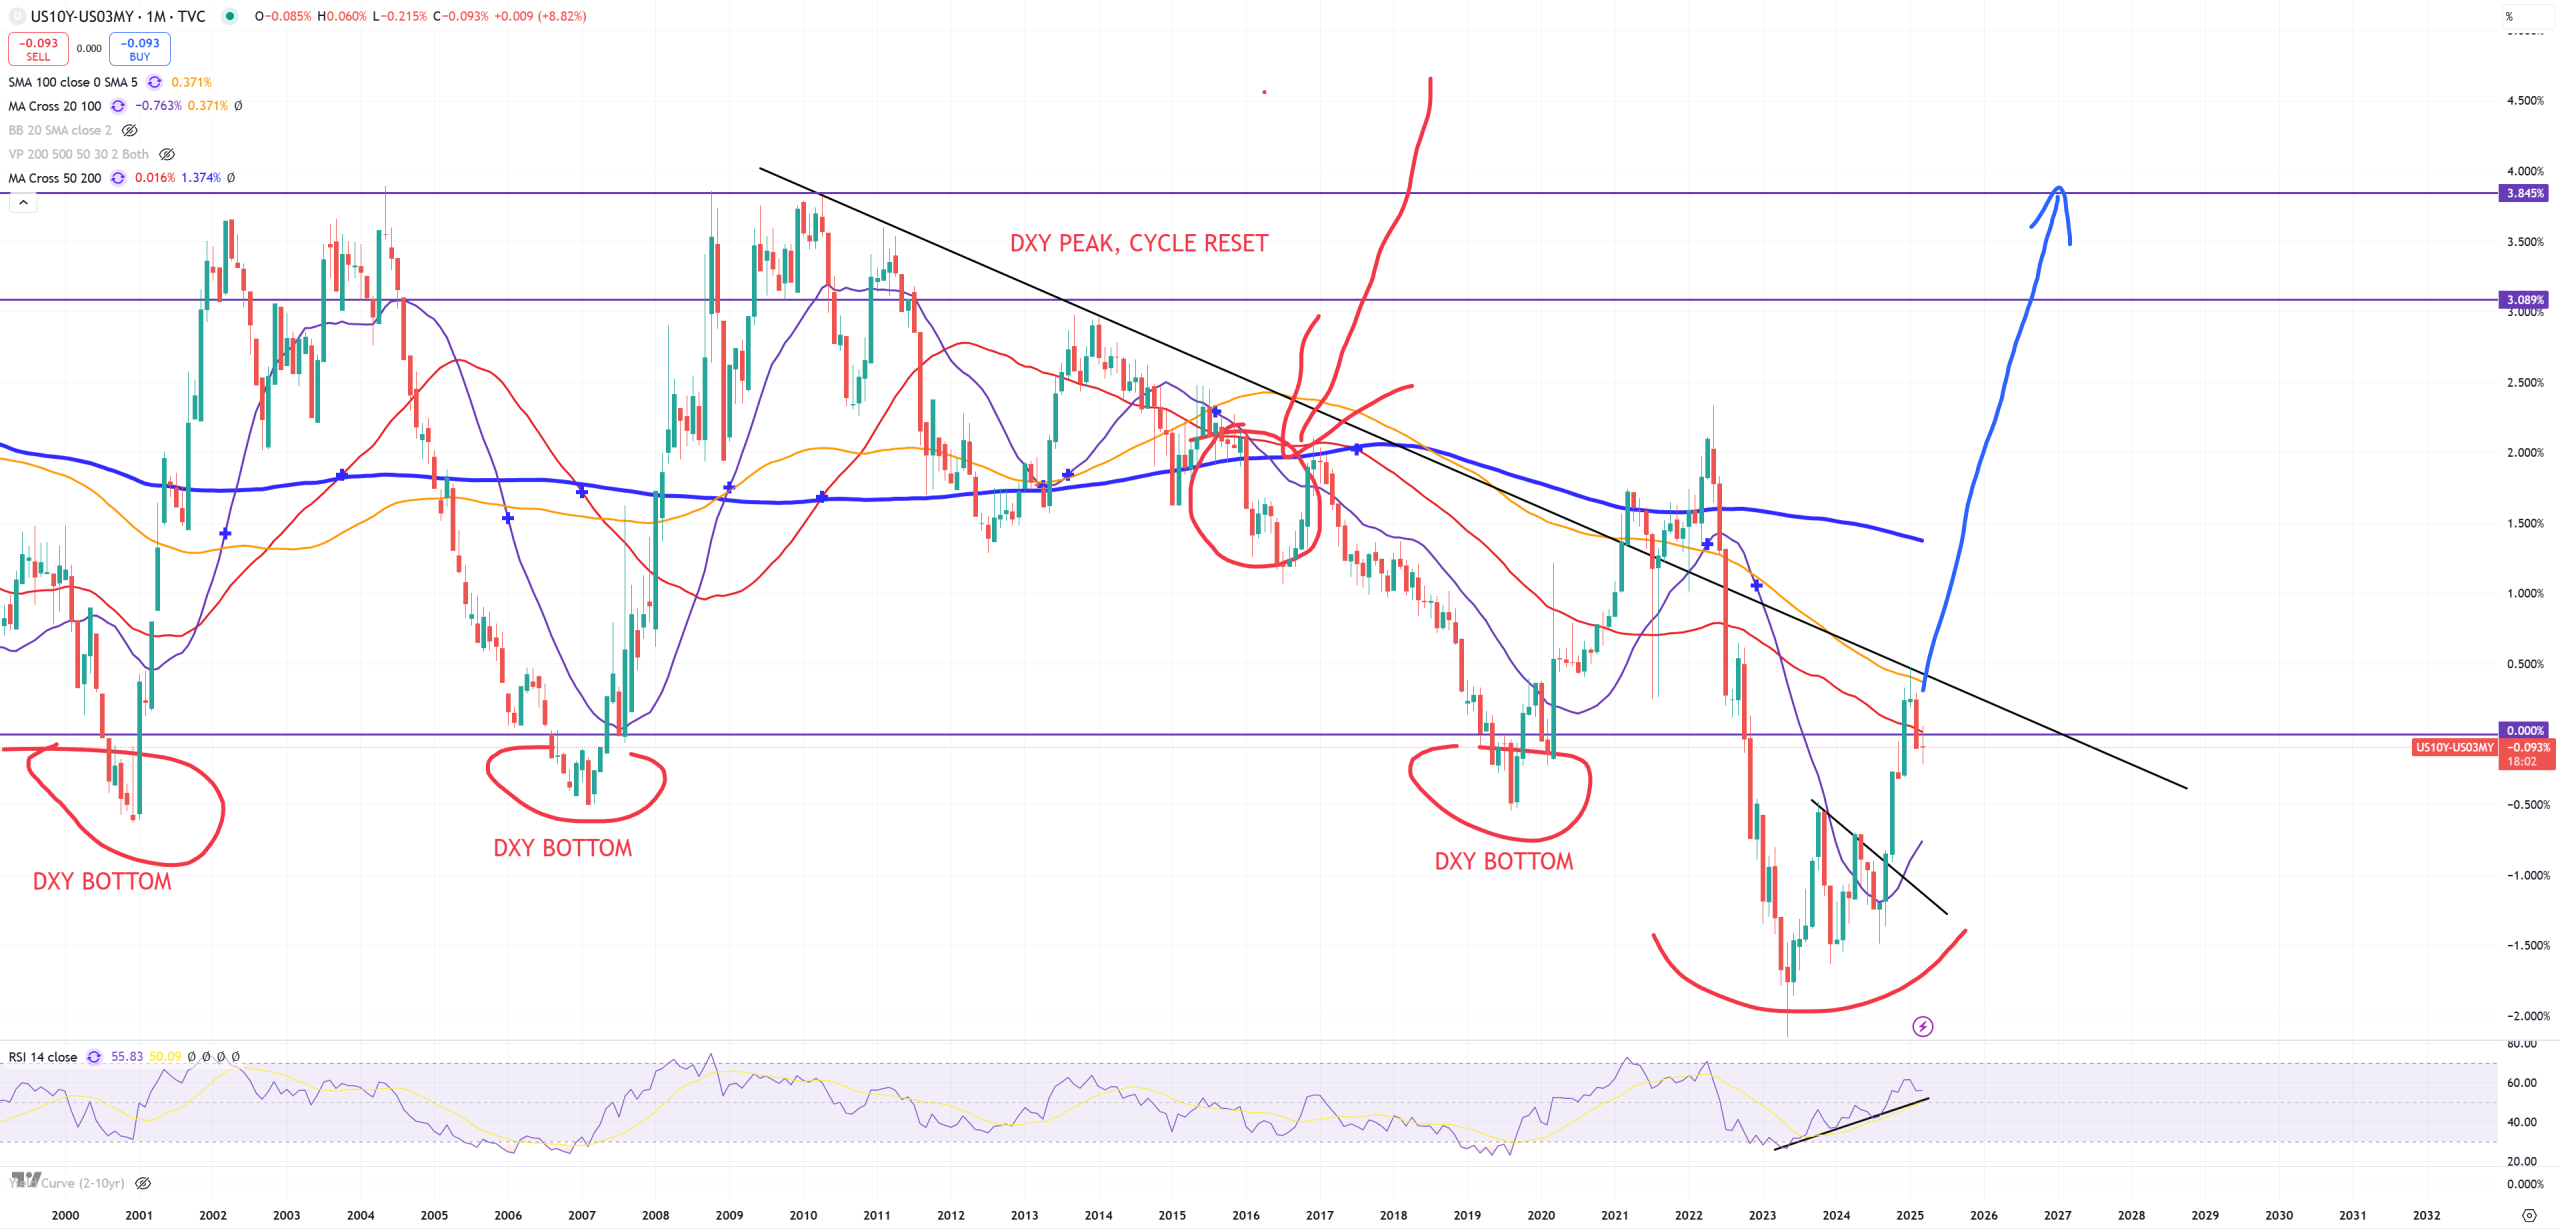
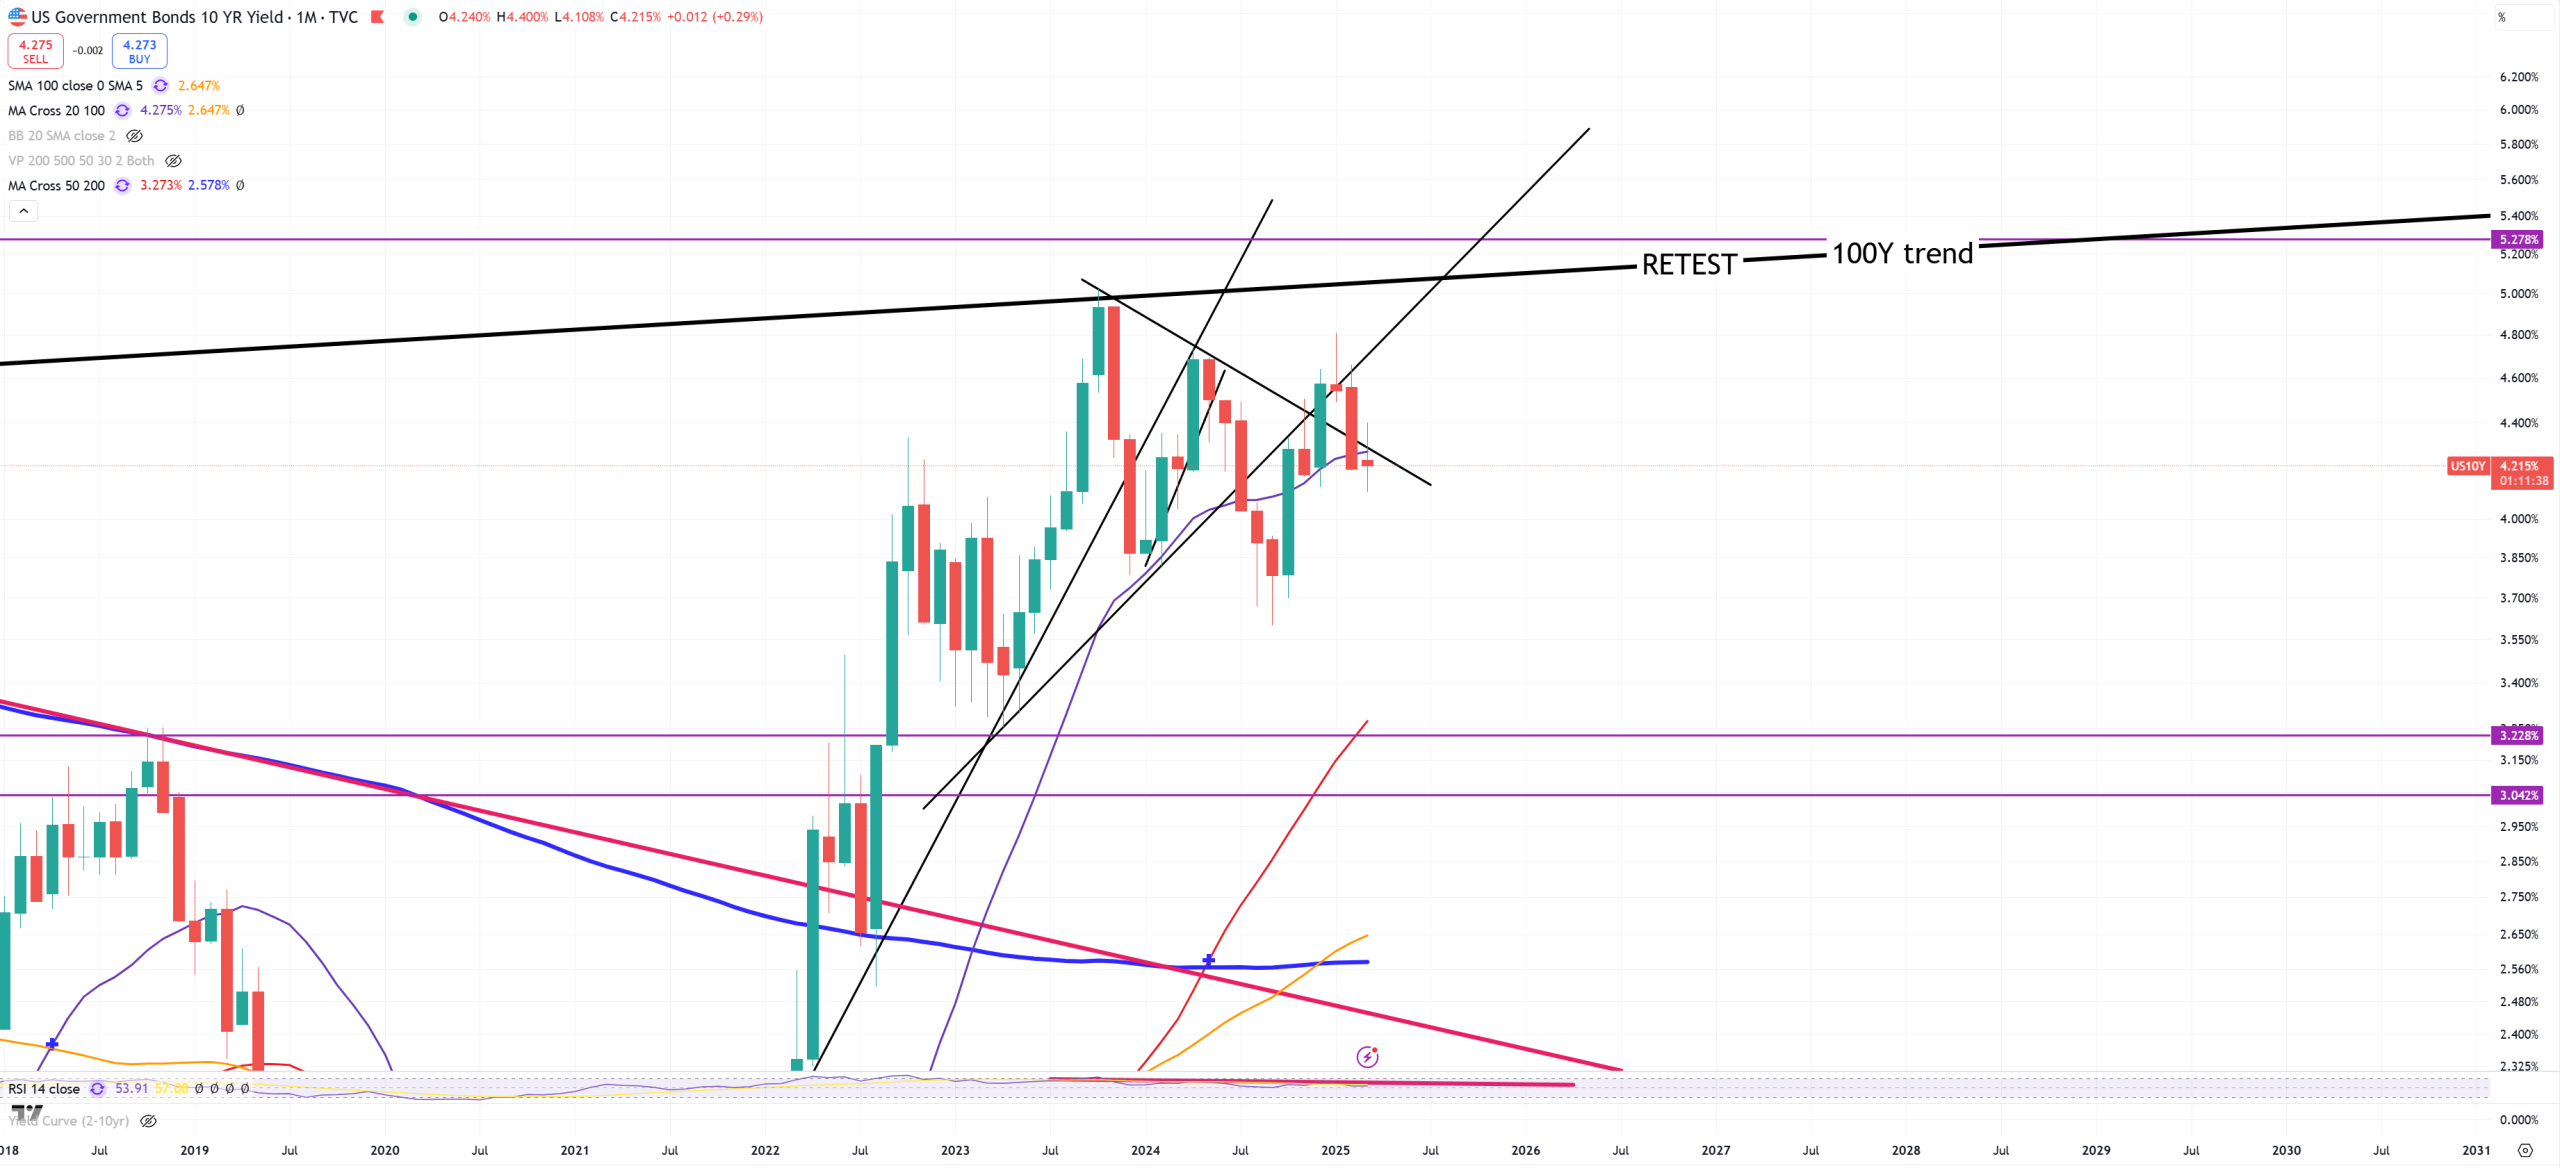
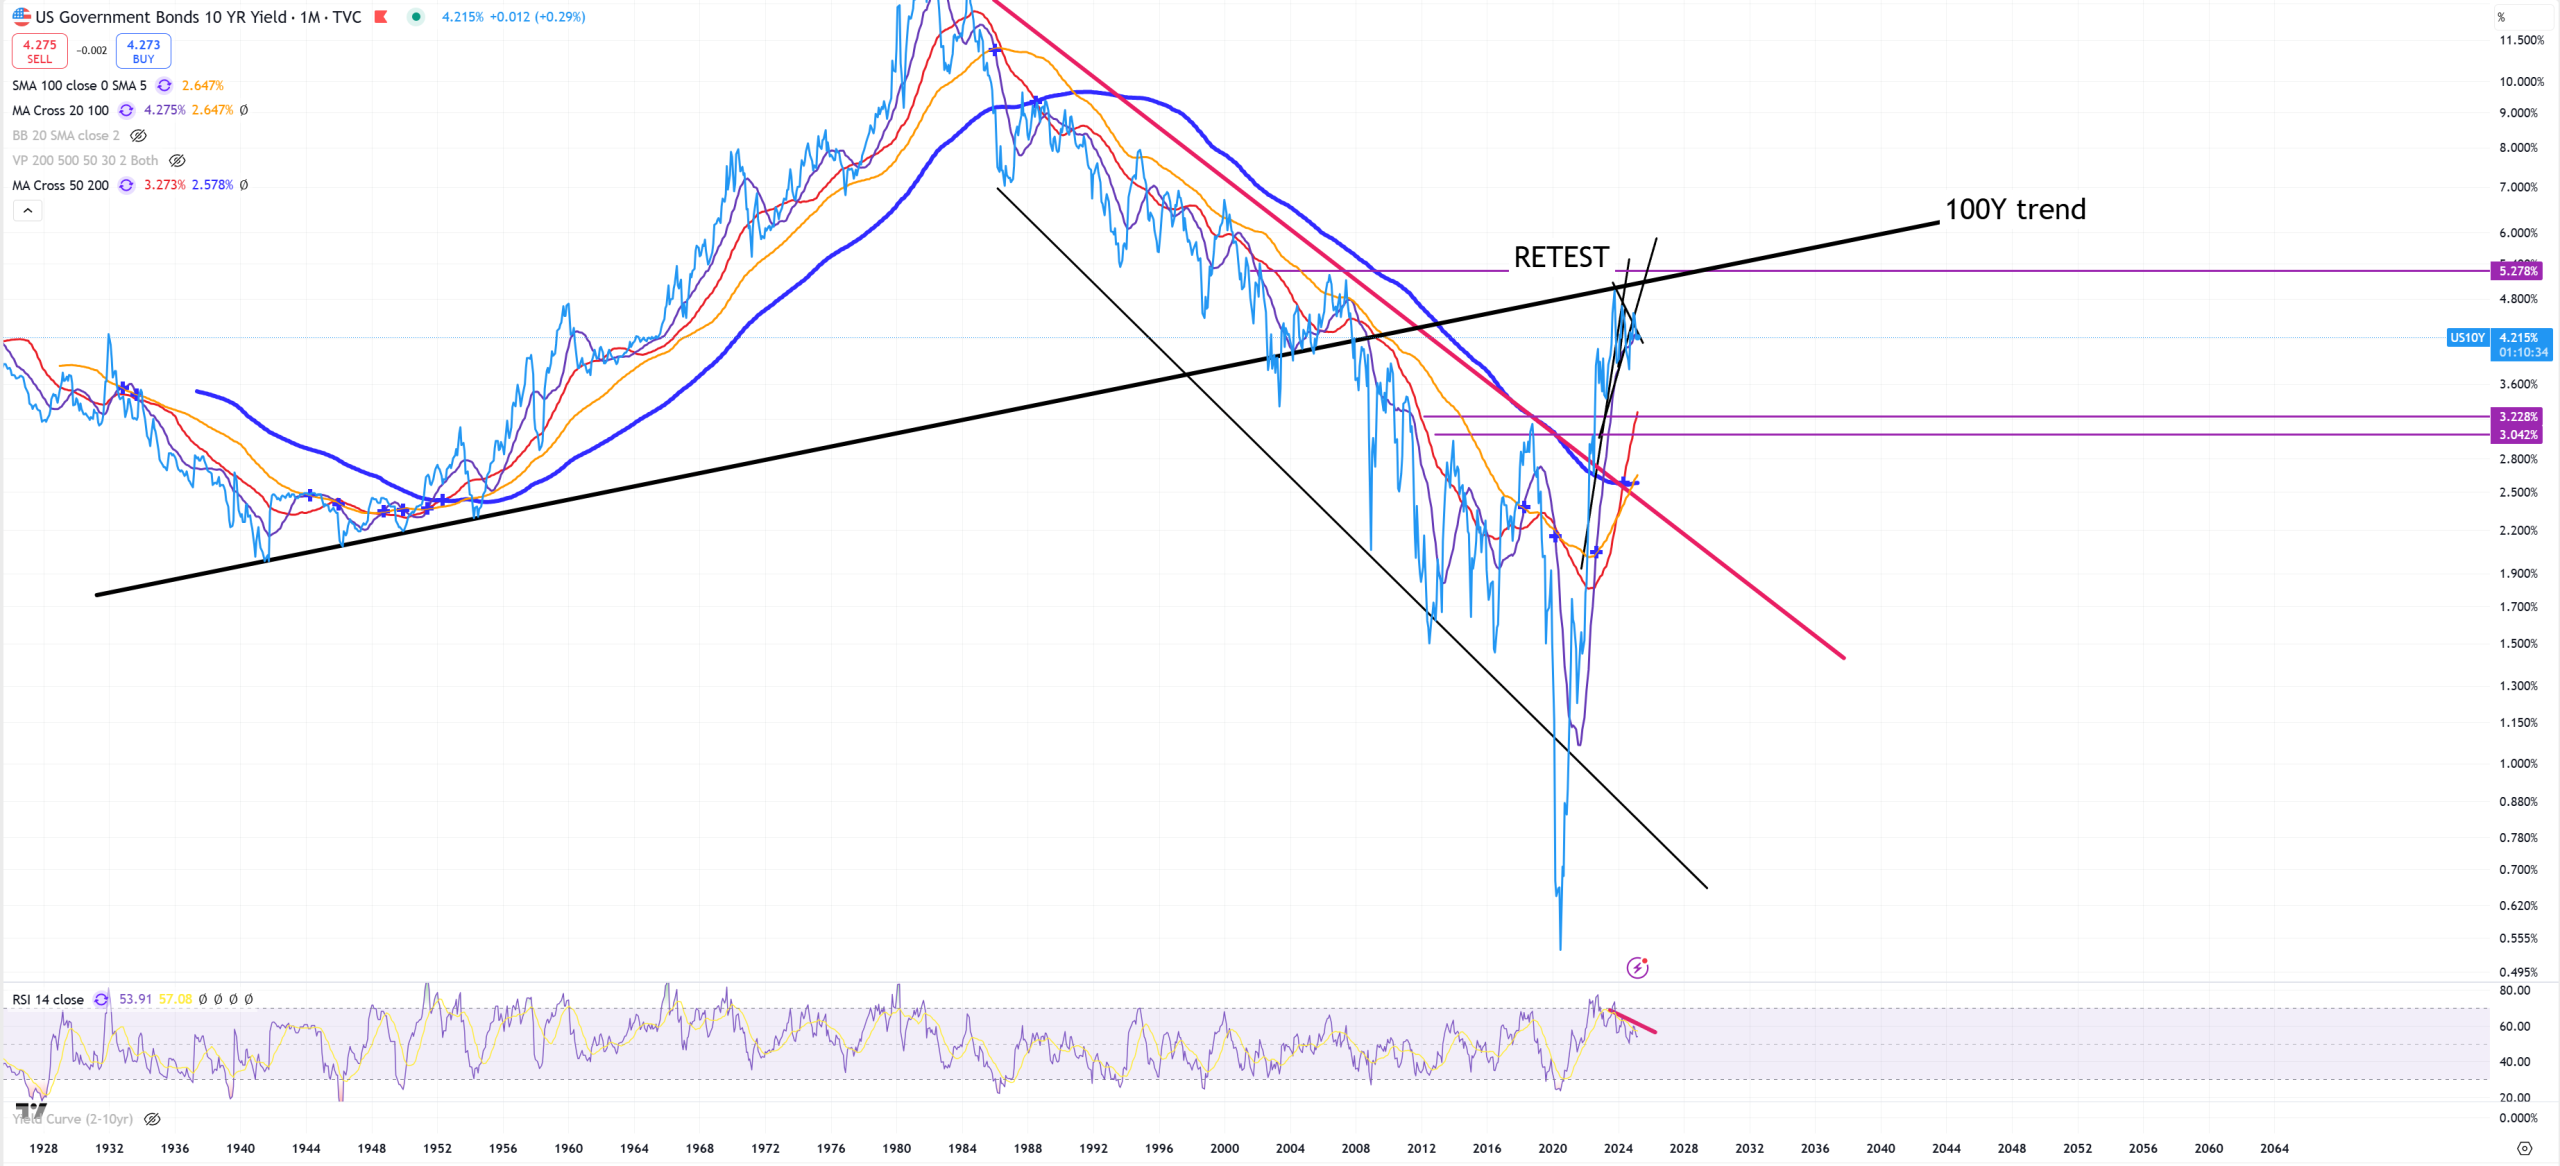
US10Y – after 100Y trend retest it’s getting rejected and now below couple trends + (M)MA20, in reality I simplified this 100Y trend as it’s a trend since 1940, so 85Ys in reality
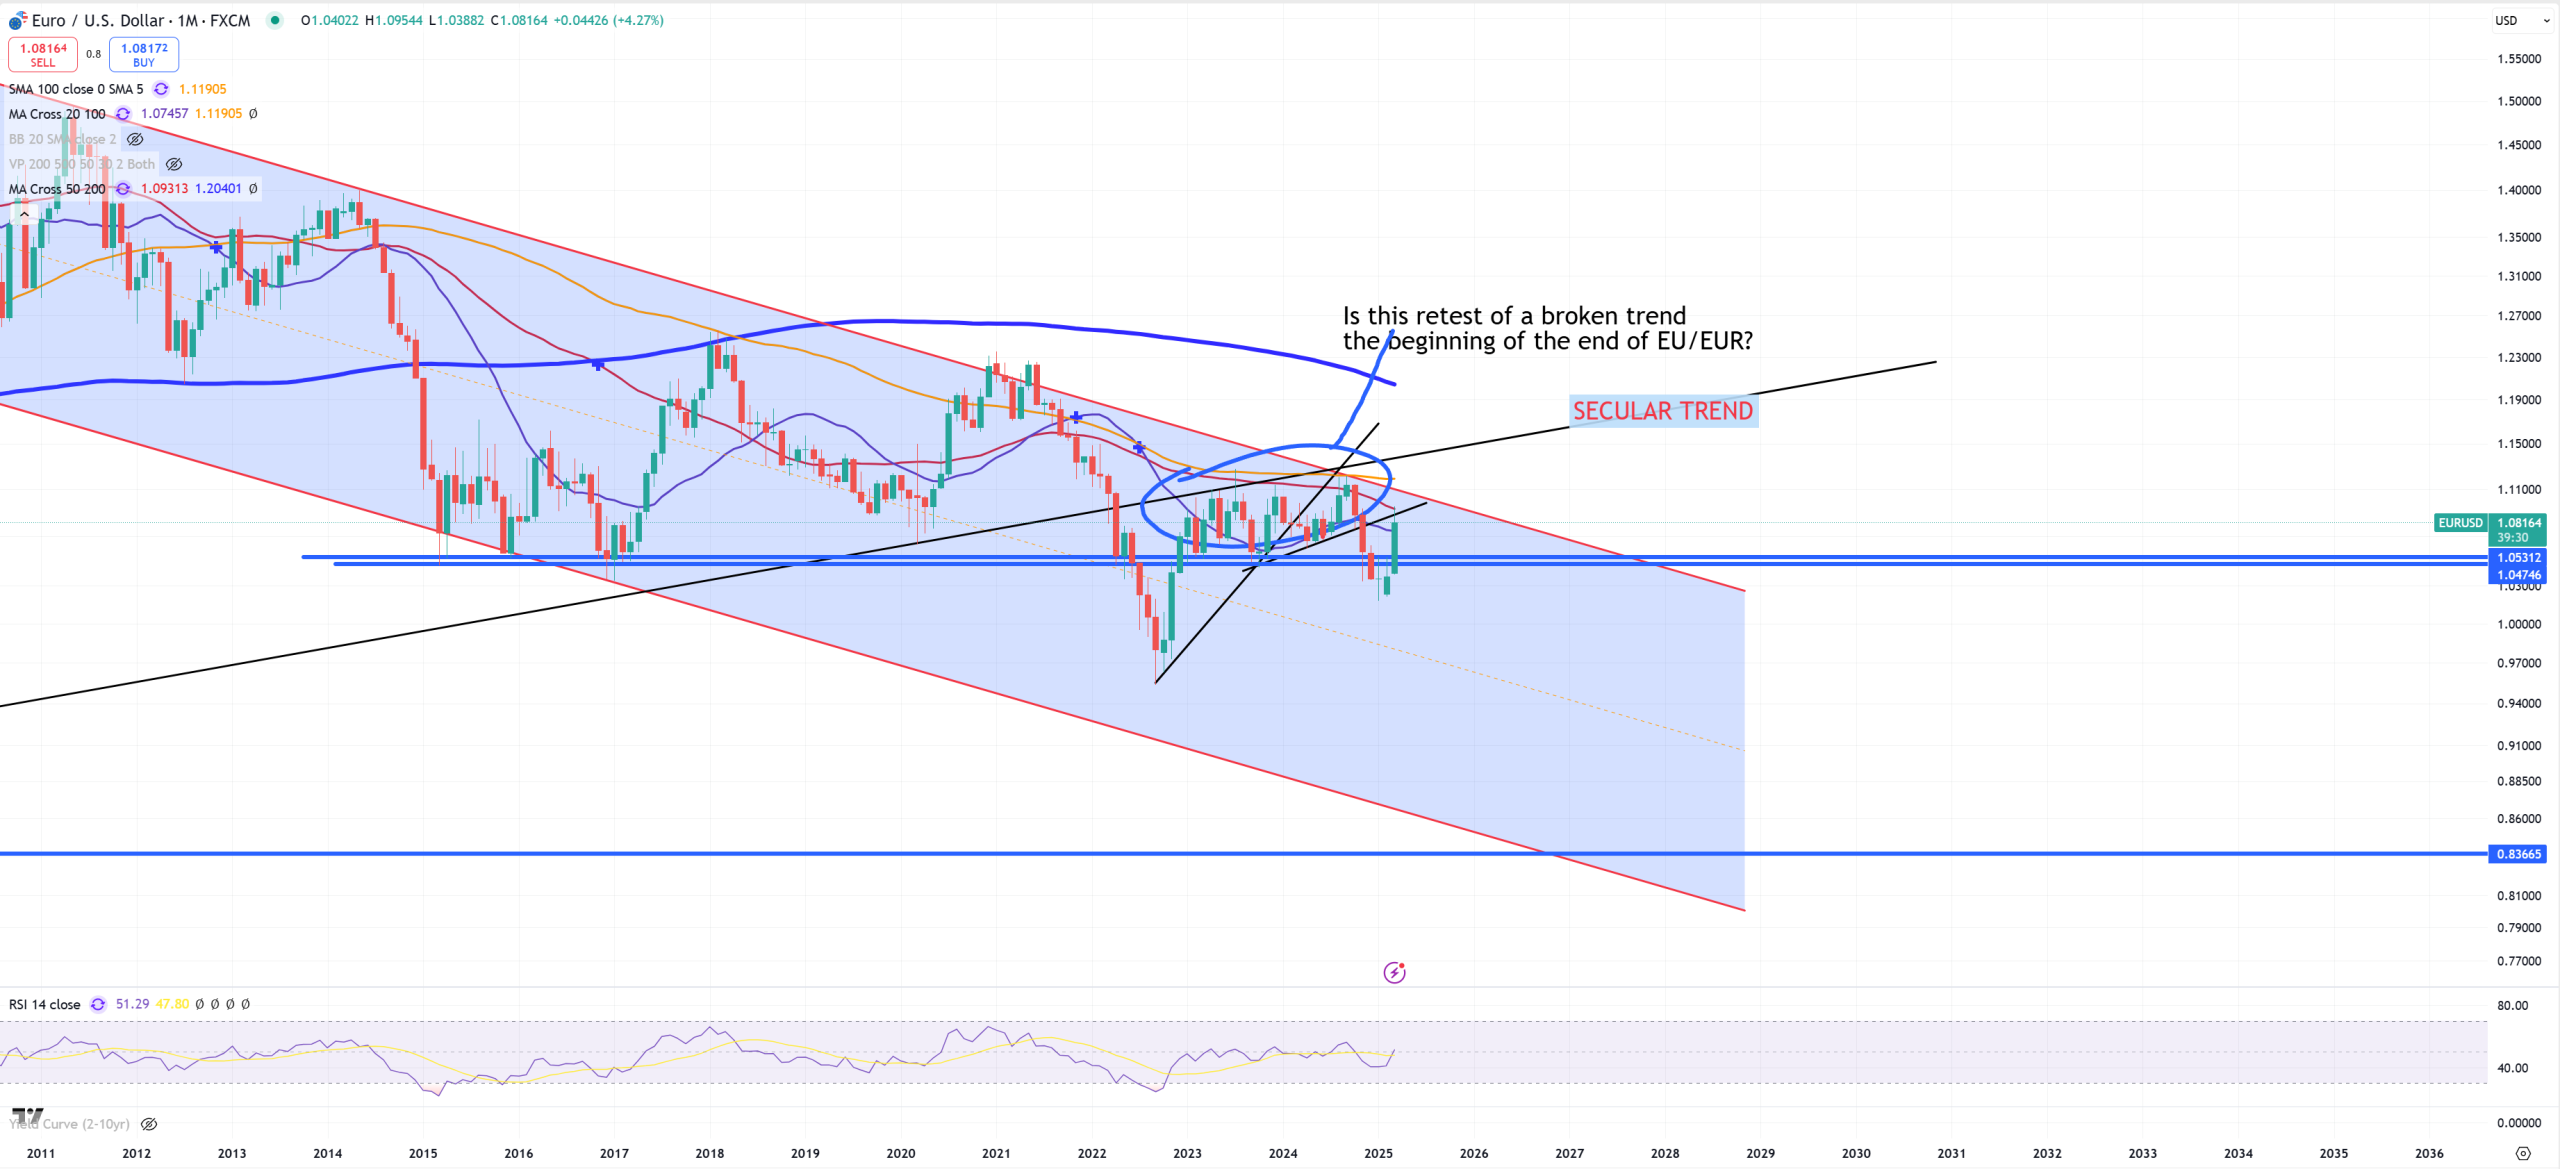
EURUSD – and its 1.09 (M)MA50 retest also to the trend has been rejected, 1.05 is still critical level
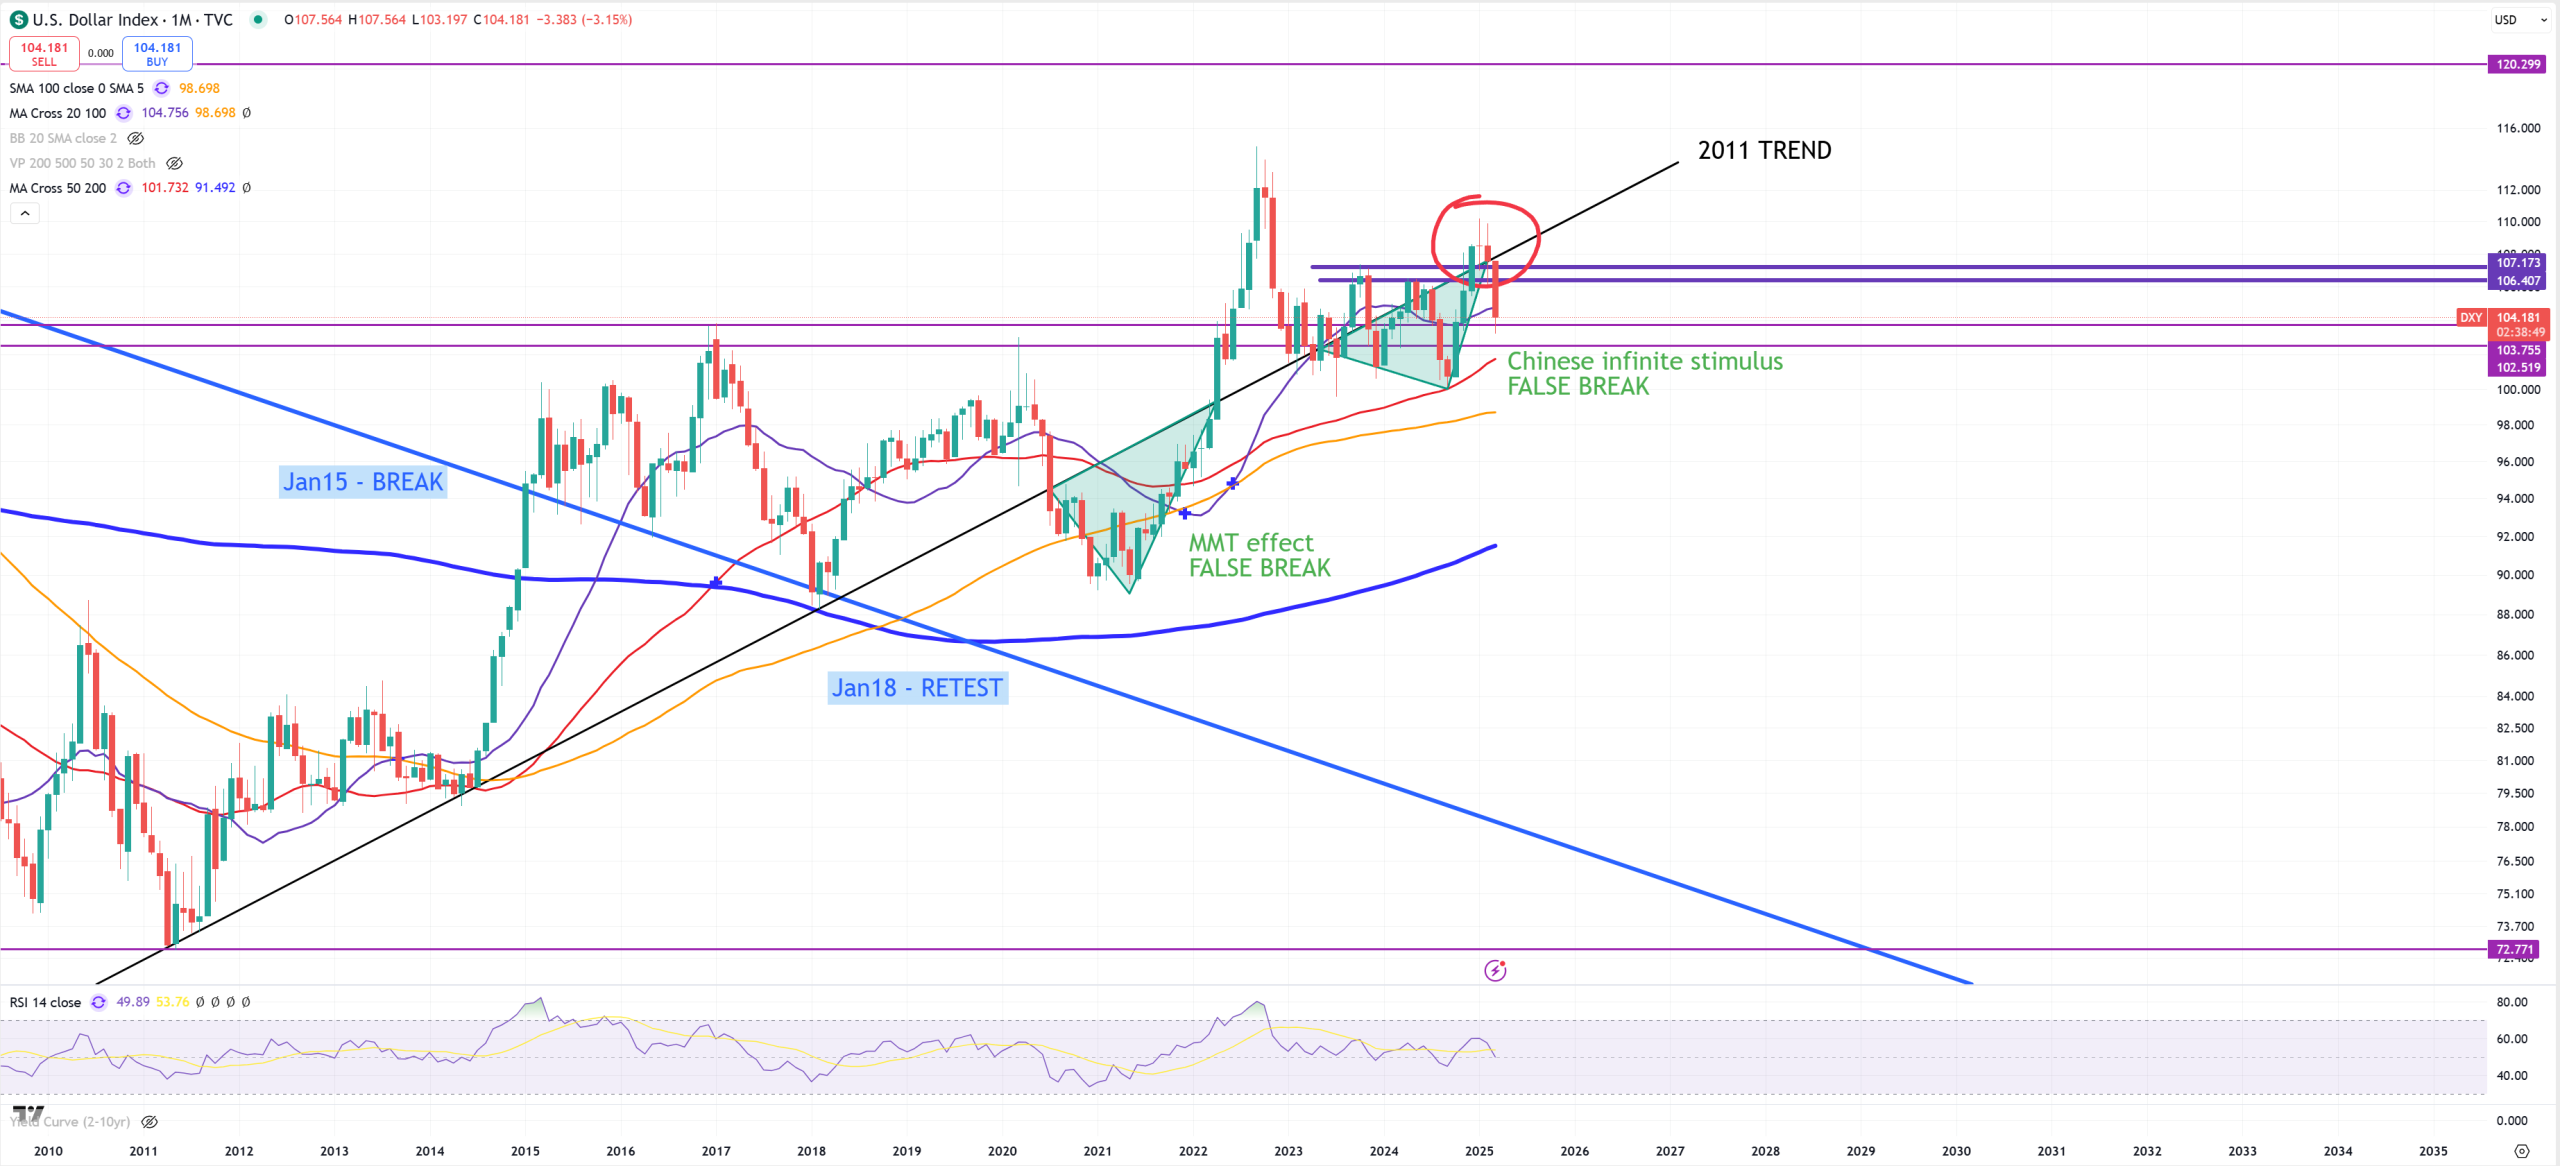
DXY – on its key 103 level, once again market tries at any cost igniting “recovery” going below 2011 trend
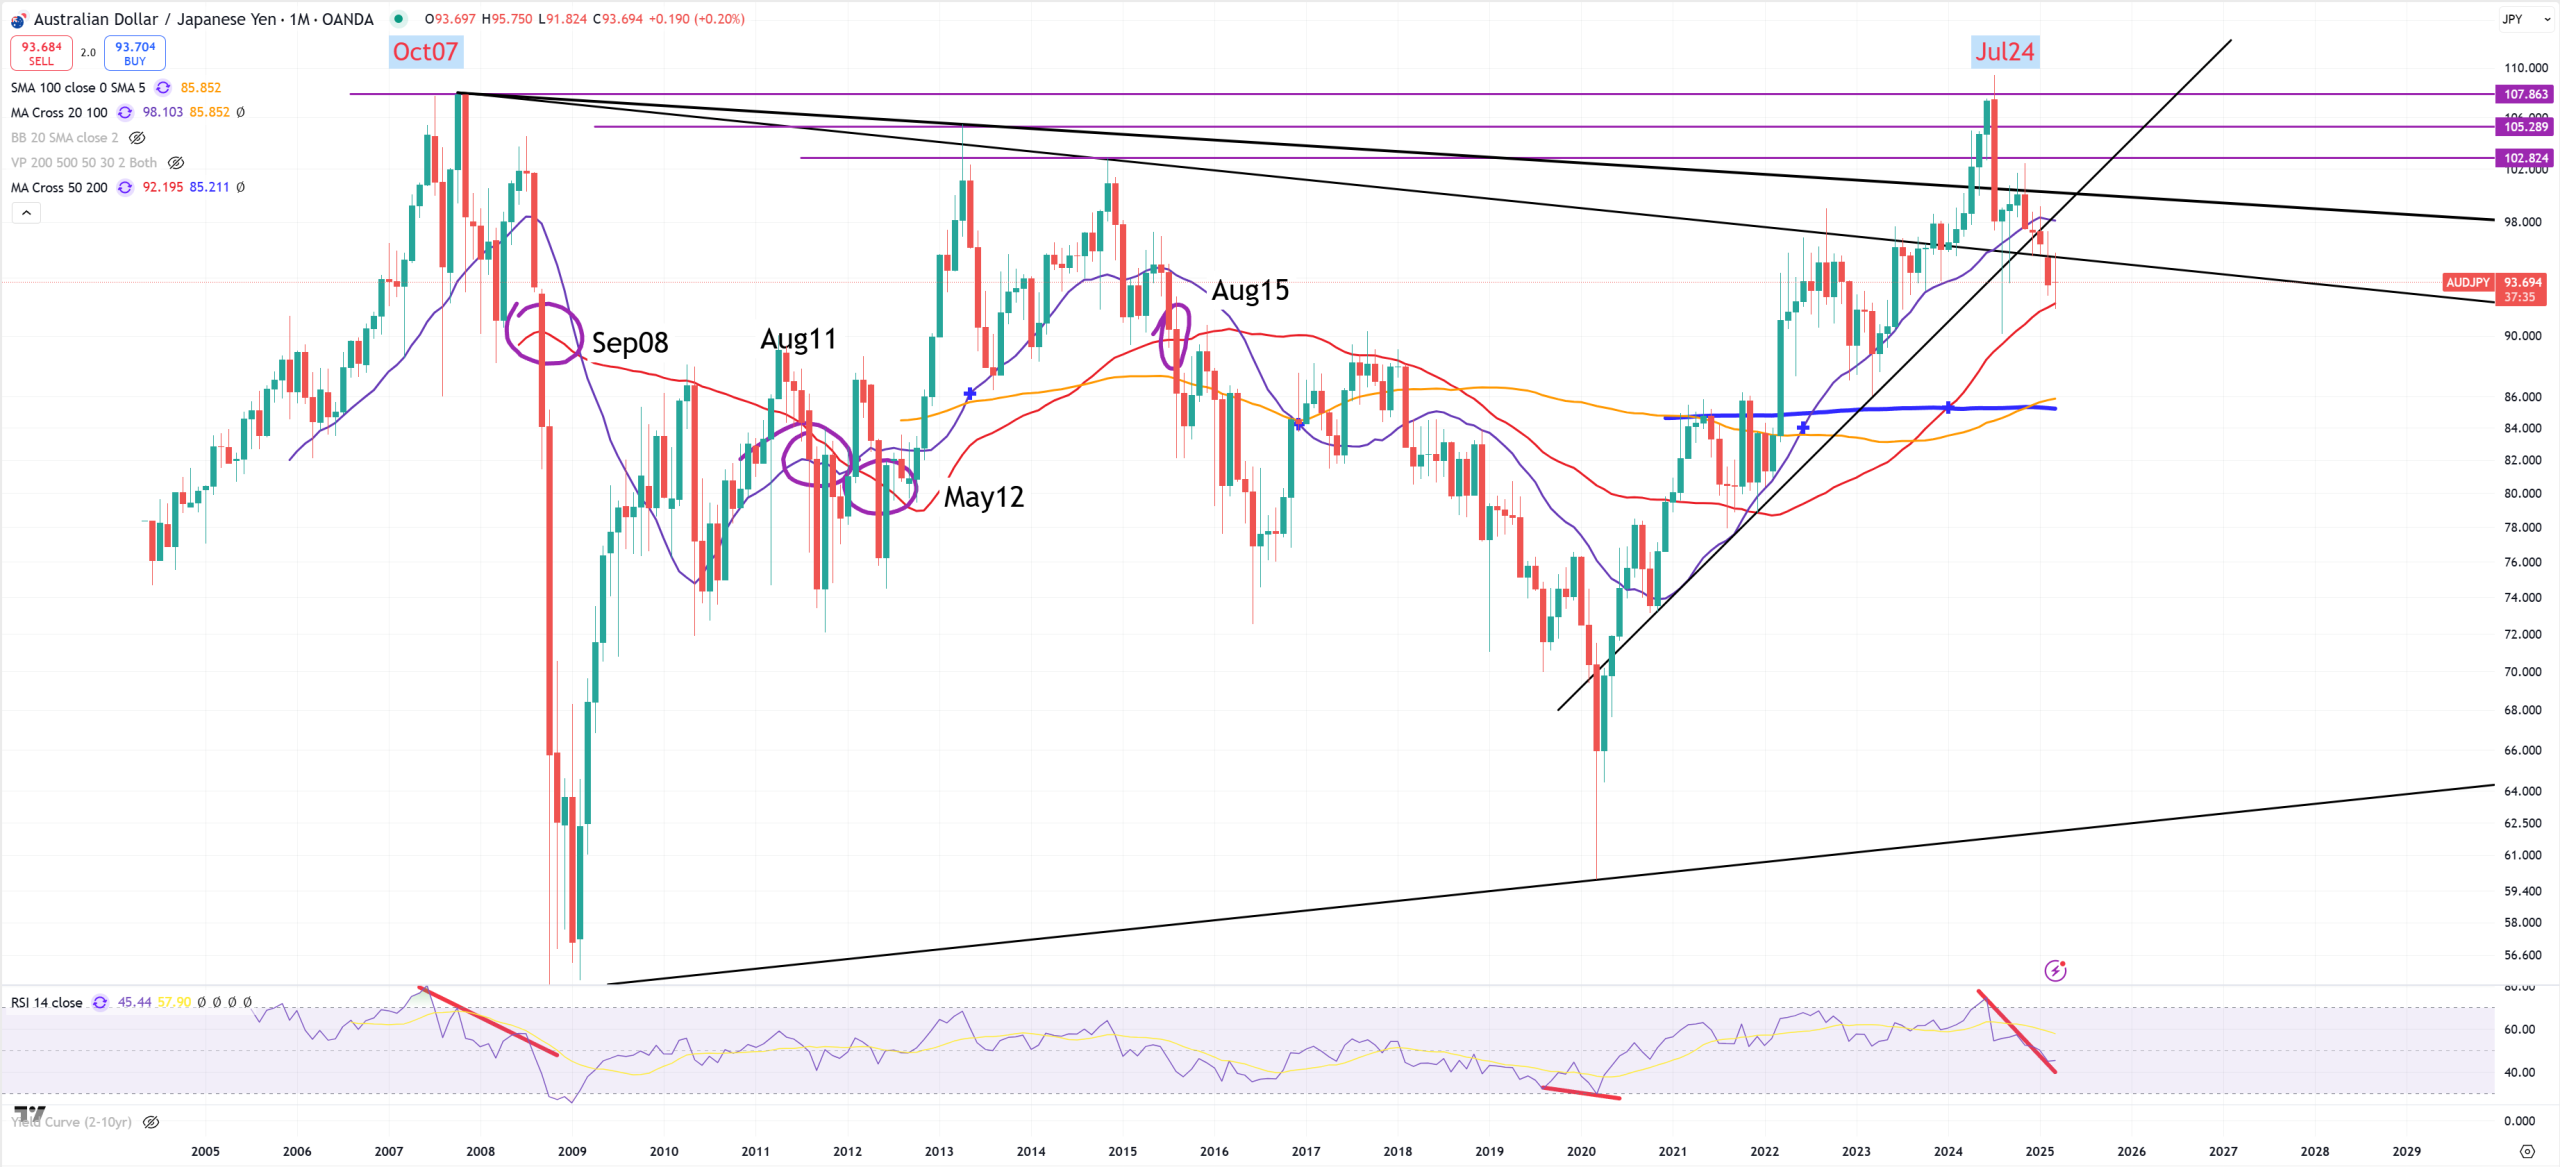
AUDJPY – when (M)MA50 breaks – it leads to very powerful drops on the market and market crash. Boucing between 95.5 and 92.2. Breaking 92.2 will probably lead to massive drop in the stock market.
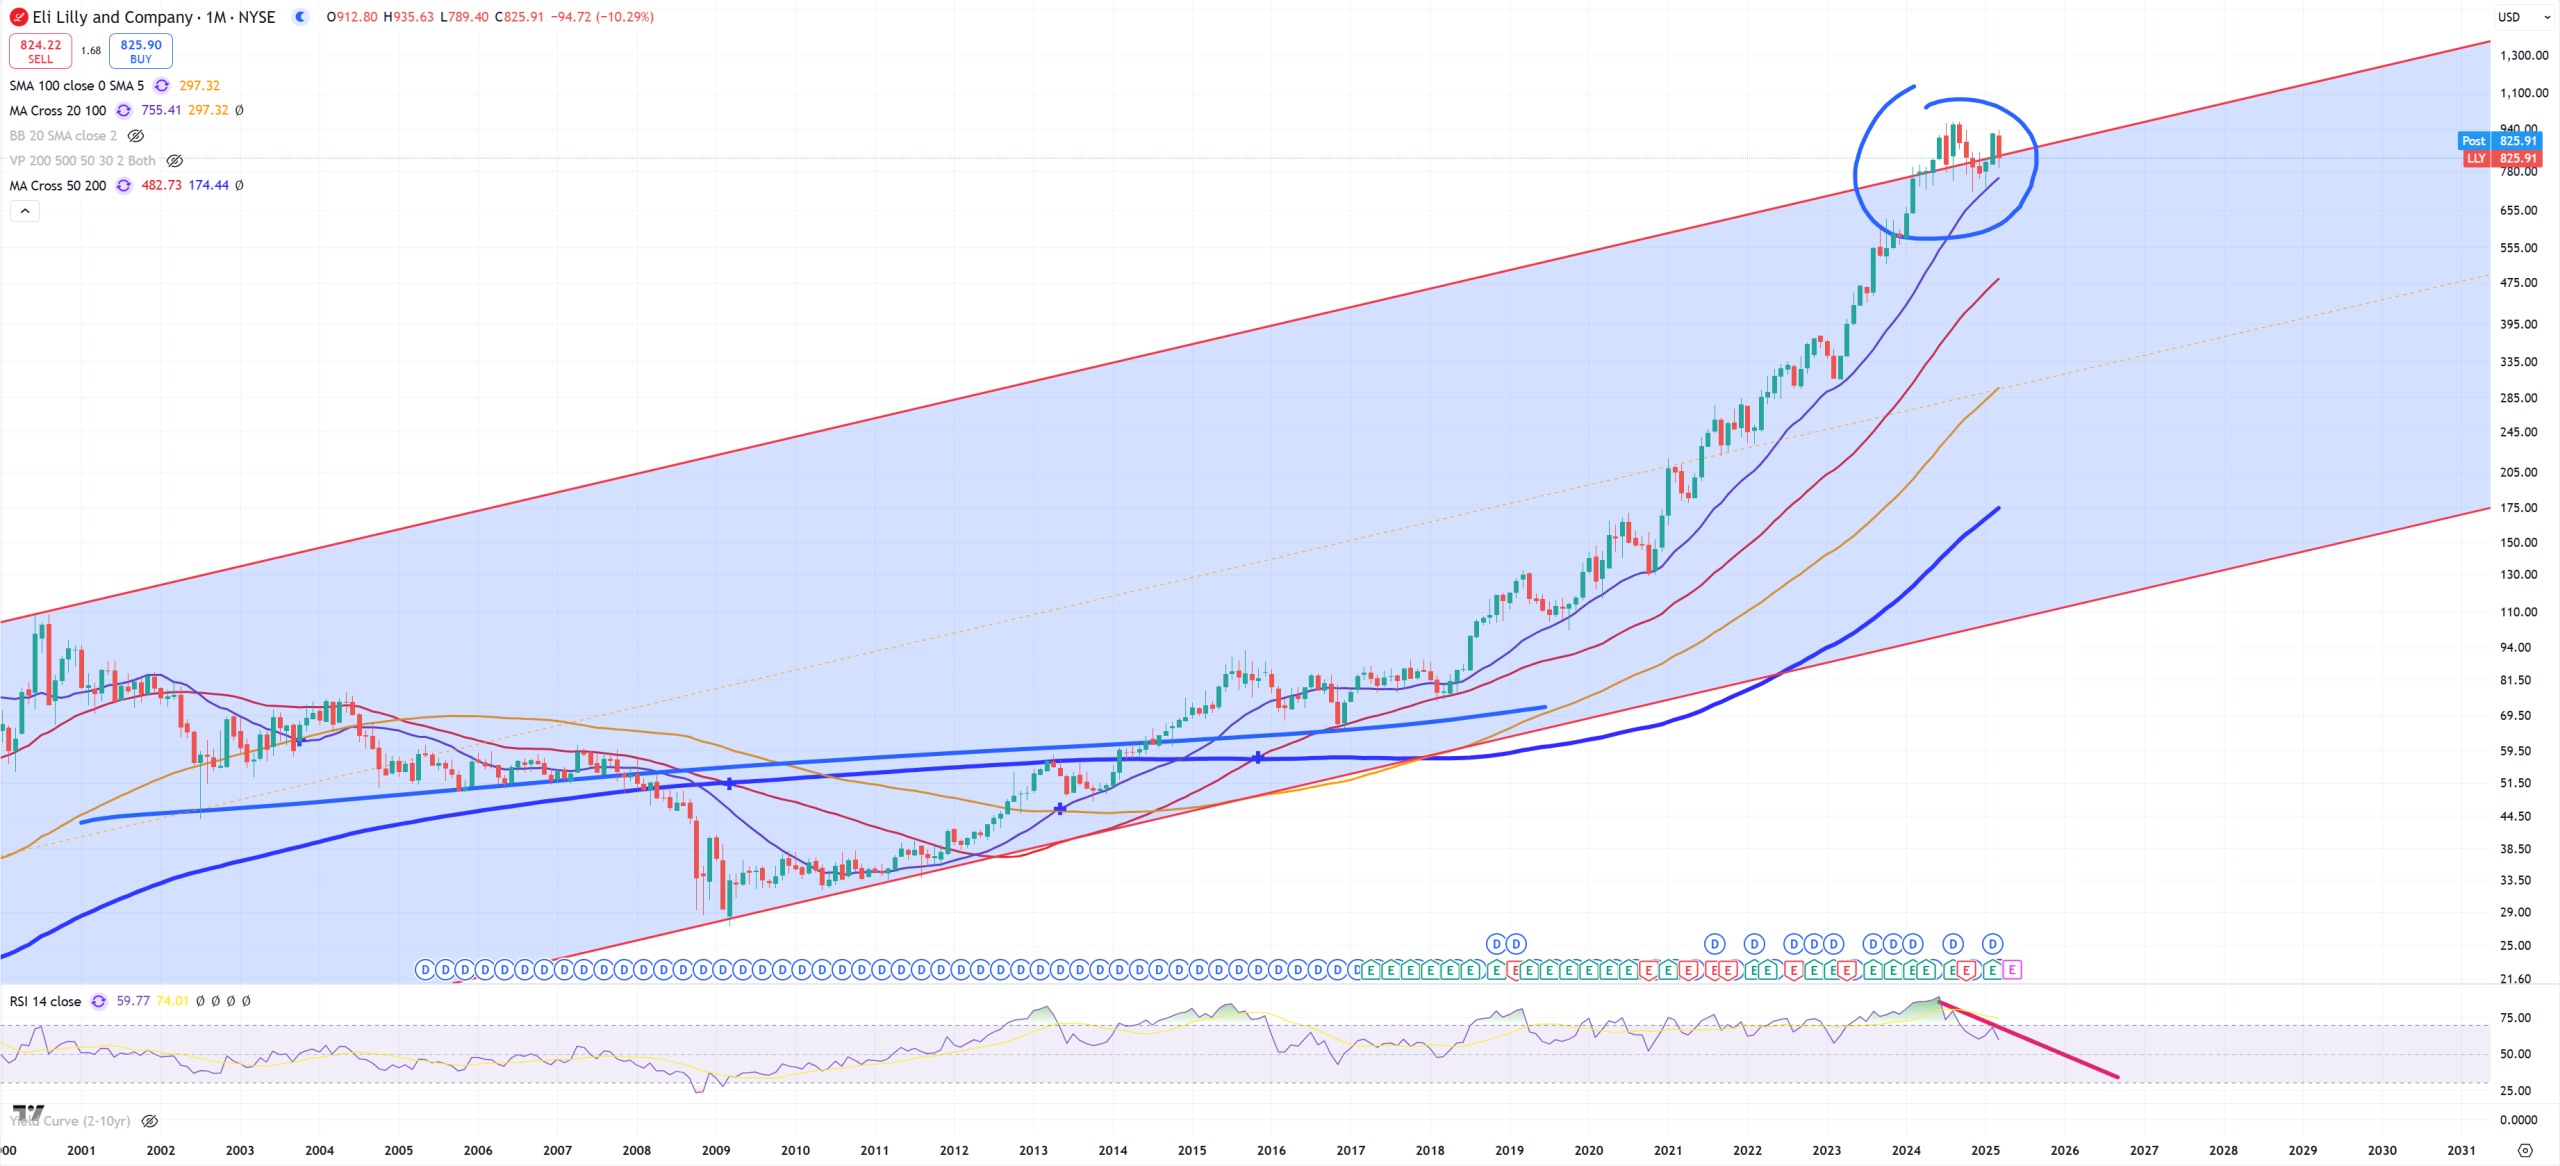
LLY – and its big channel
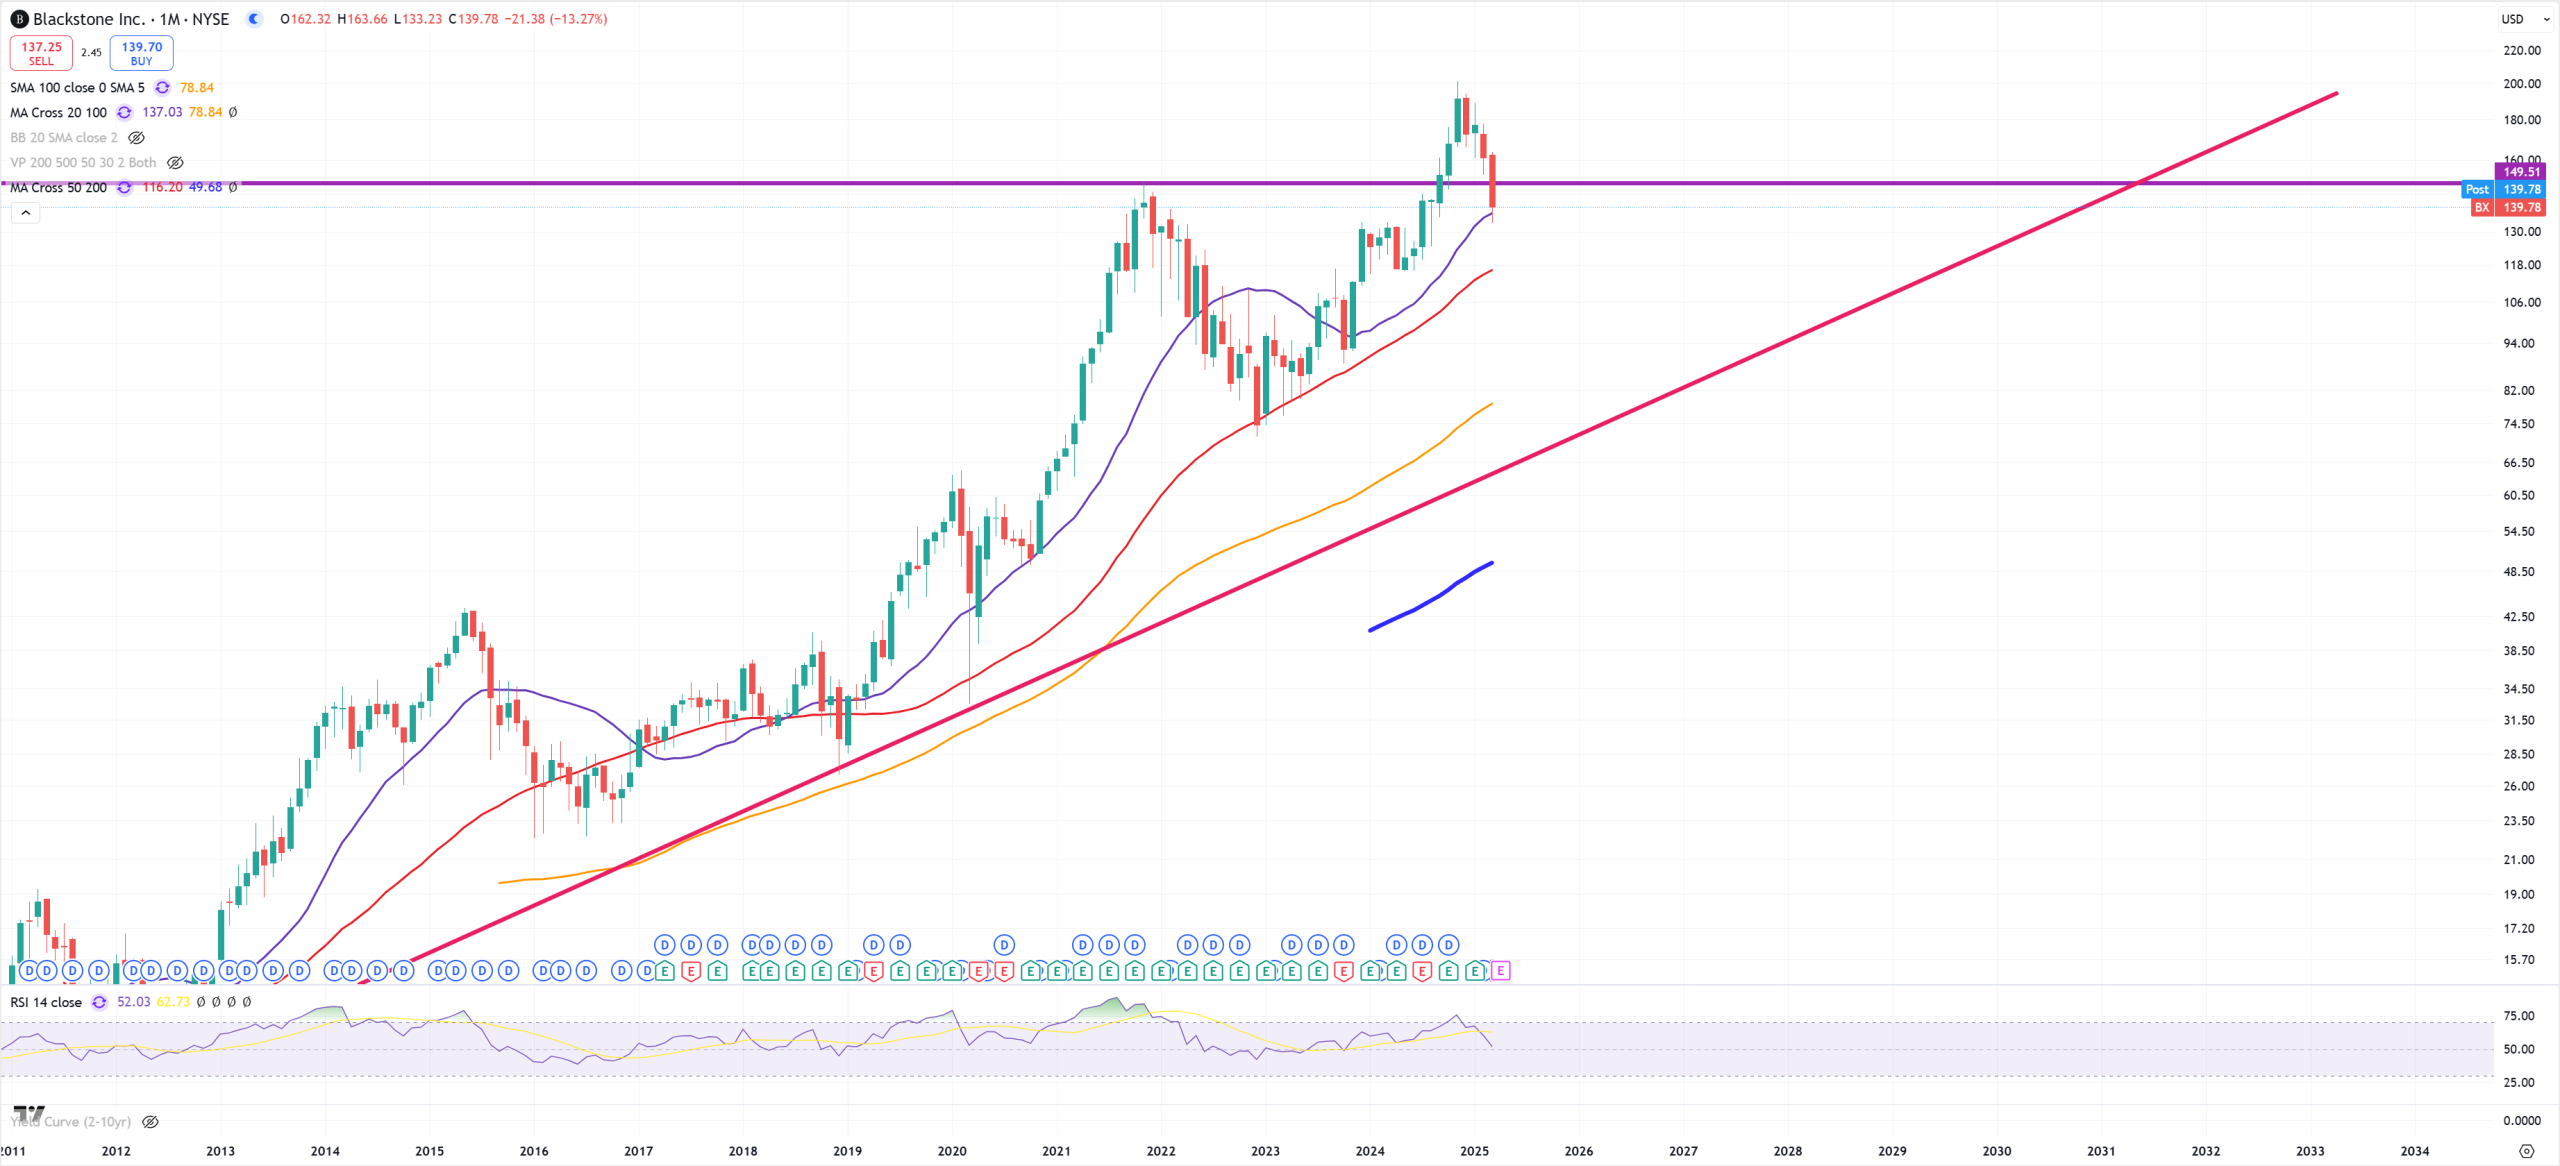
BX – False break, so are we finally getting commercial real estate melt-down?
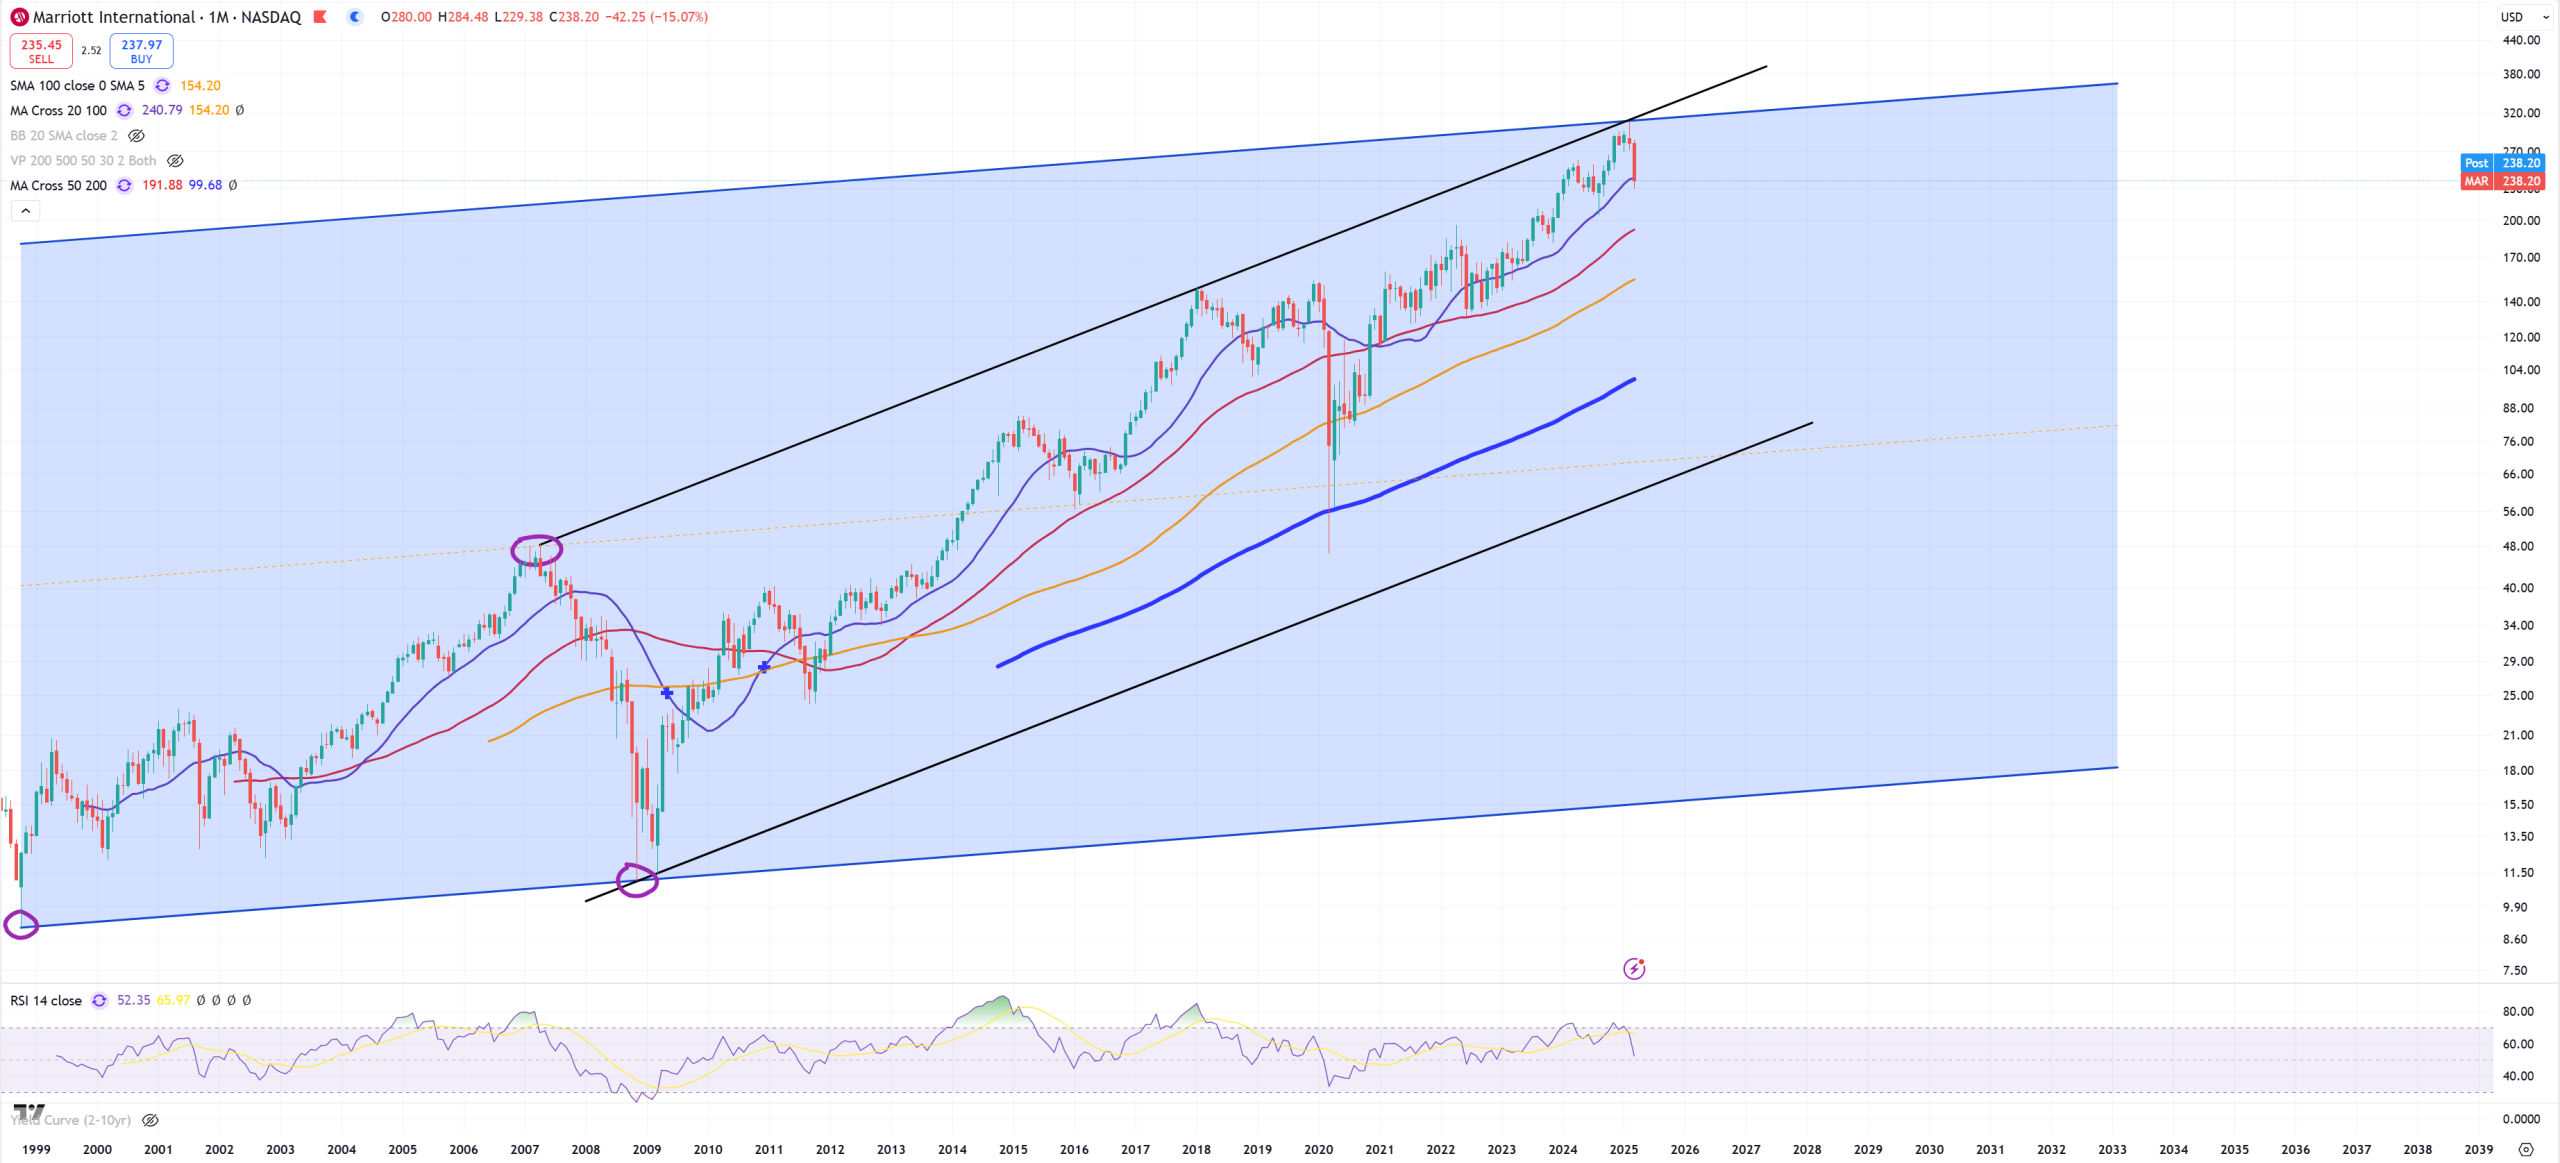
MAR – I was looking of MAR for a longer period of time, and came to conclusion its chart is this one. These are 2 channels. The first one is based on 1998-2008 points, upper one on 2007 peak. Second is a symmetrical clone of this one to the upside, pointing for 308 level. (M)MA20 broken.
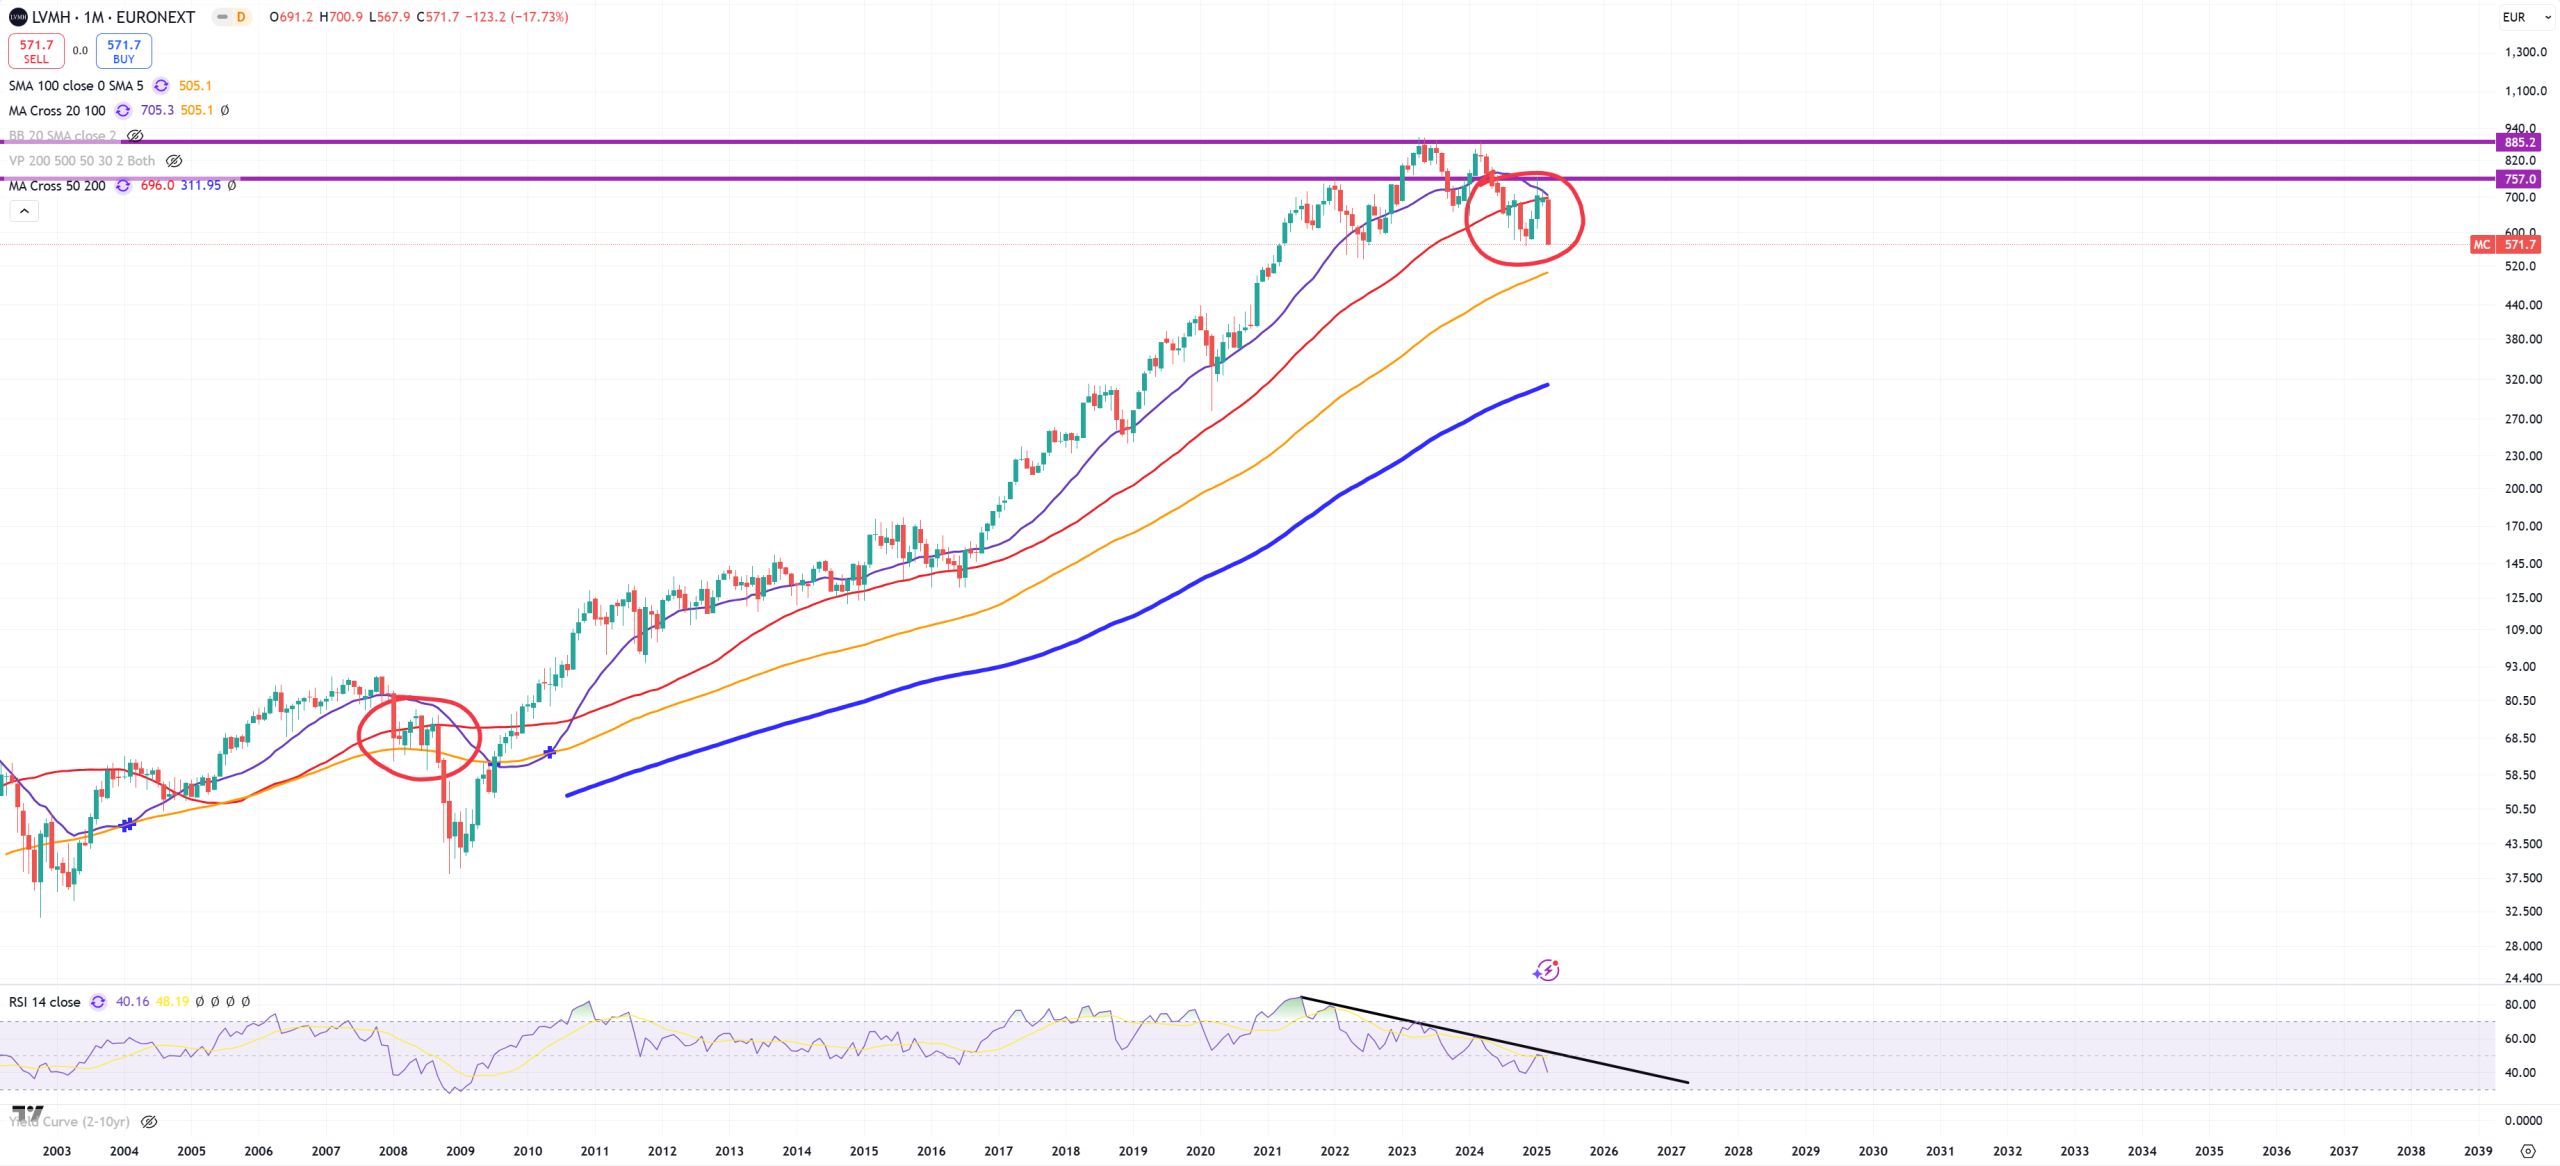
LVMH – This chart looks like a disaster. Huge negative divergence, (M)MA50 broken after DOUBLE-TOP, retested and failed. We’ve seen this pattern before.
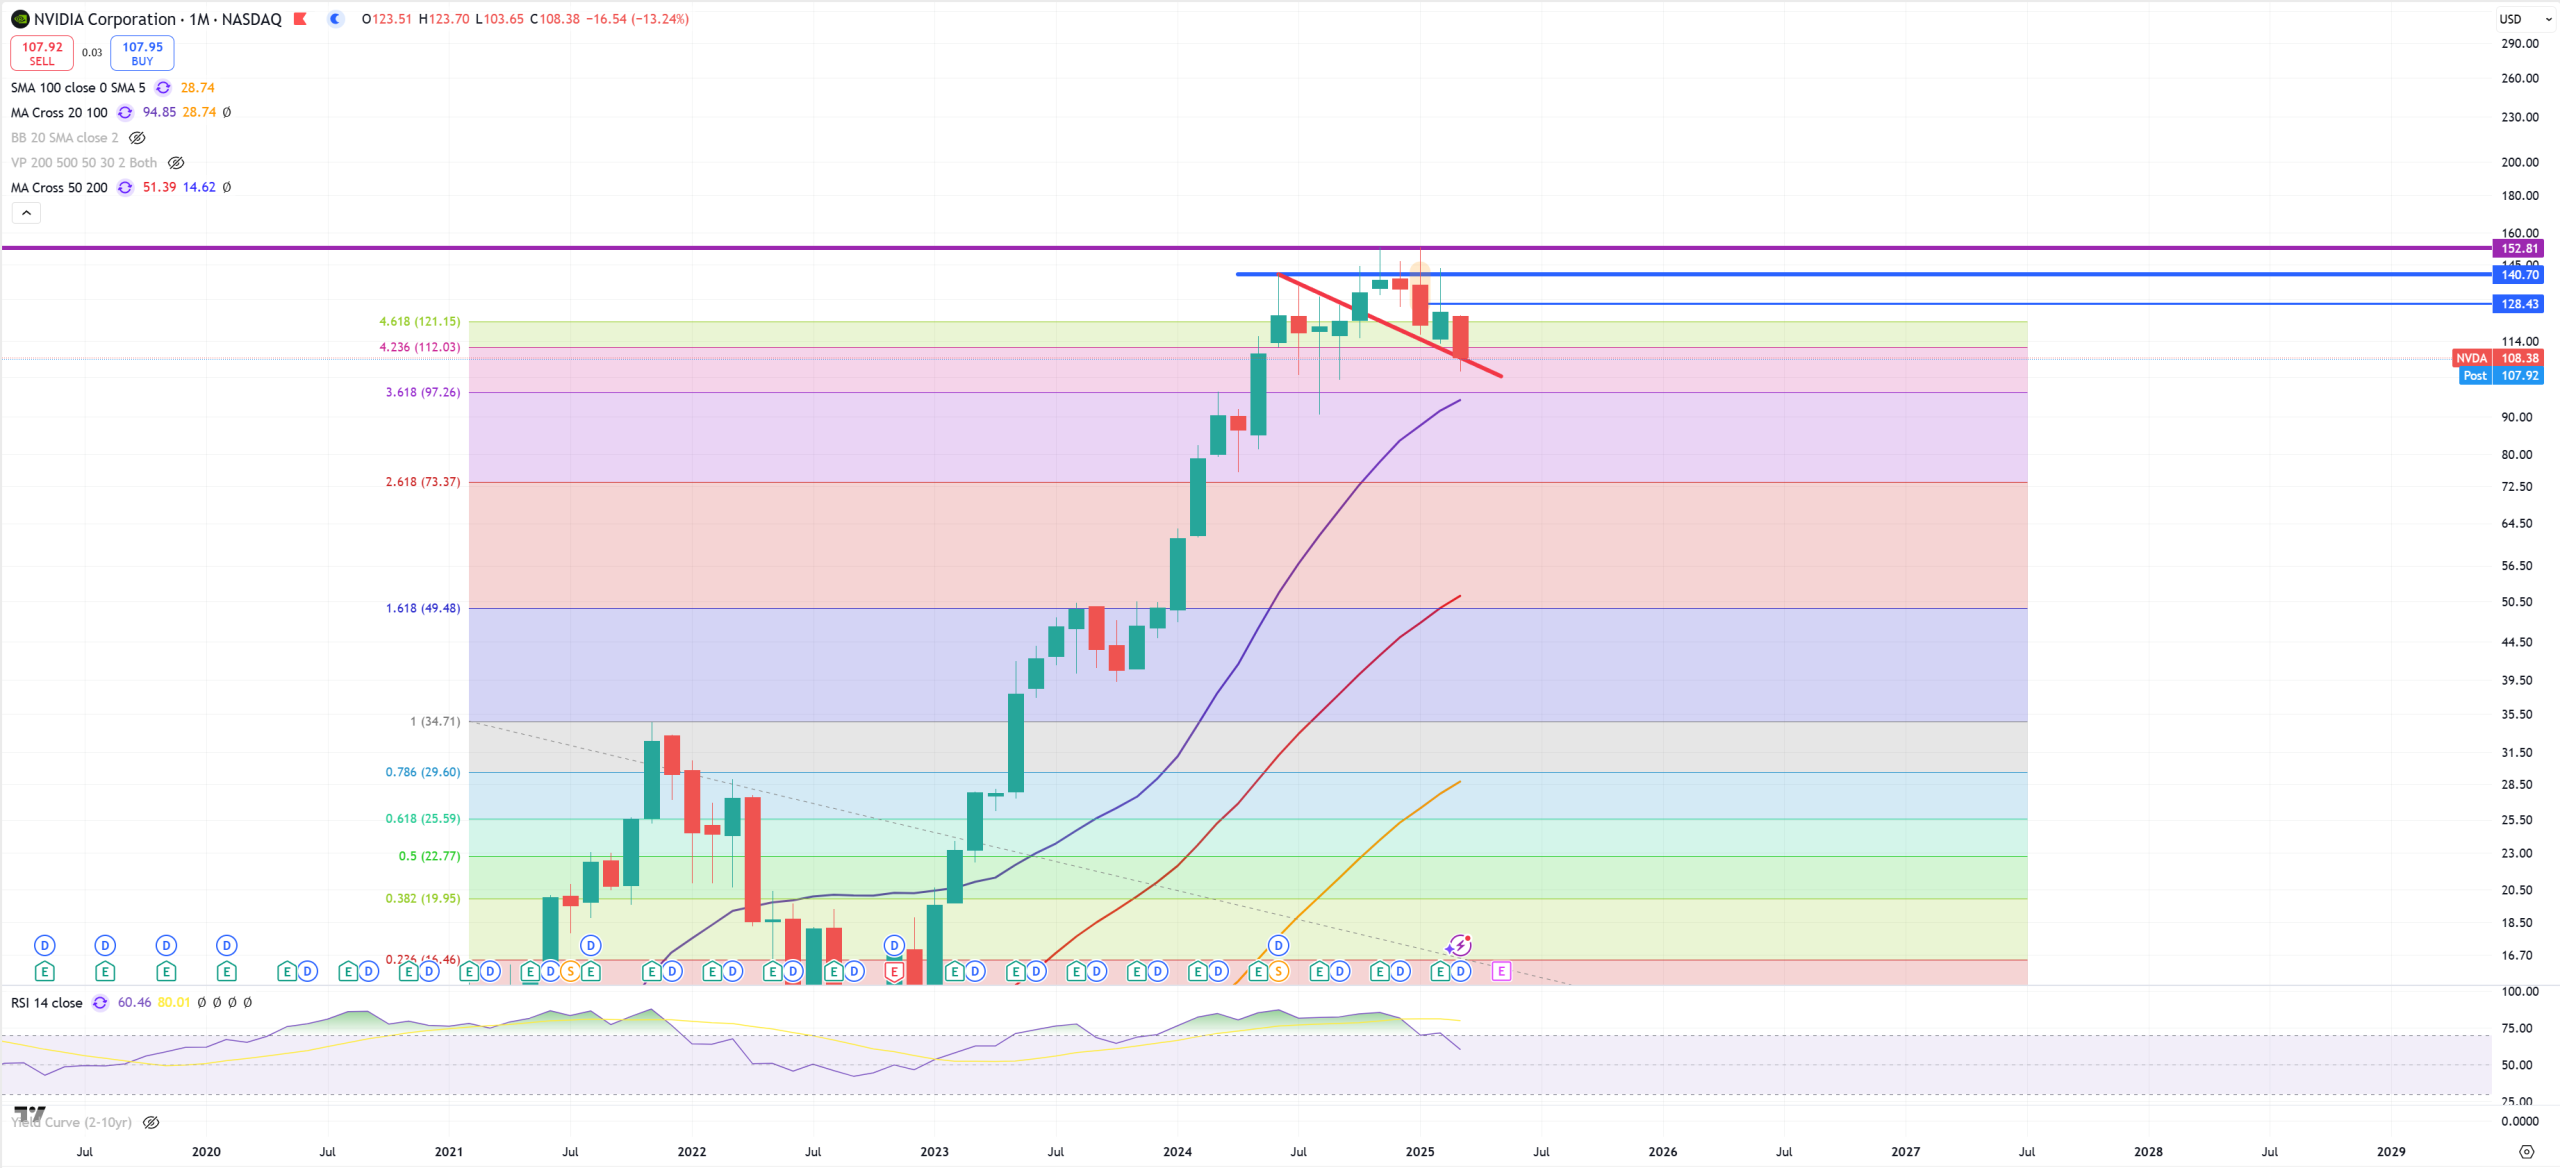
NVDA – Saved the possible break of red trend line, but later you’re going to see that SOX in general seems to be busted.
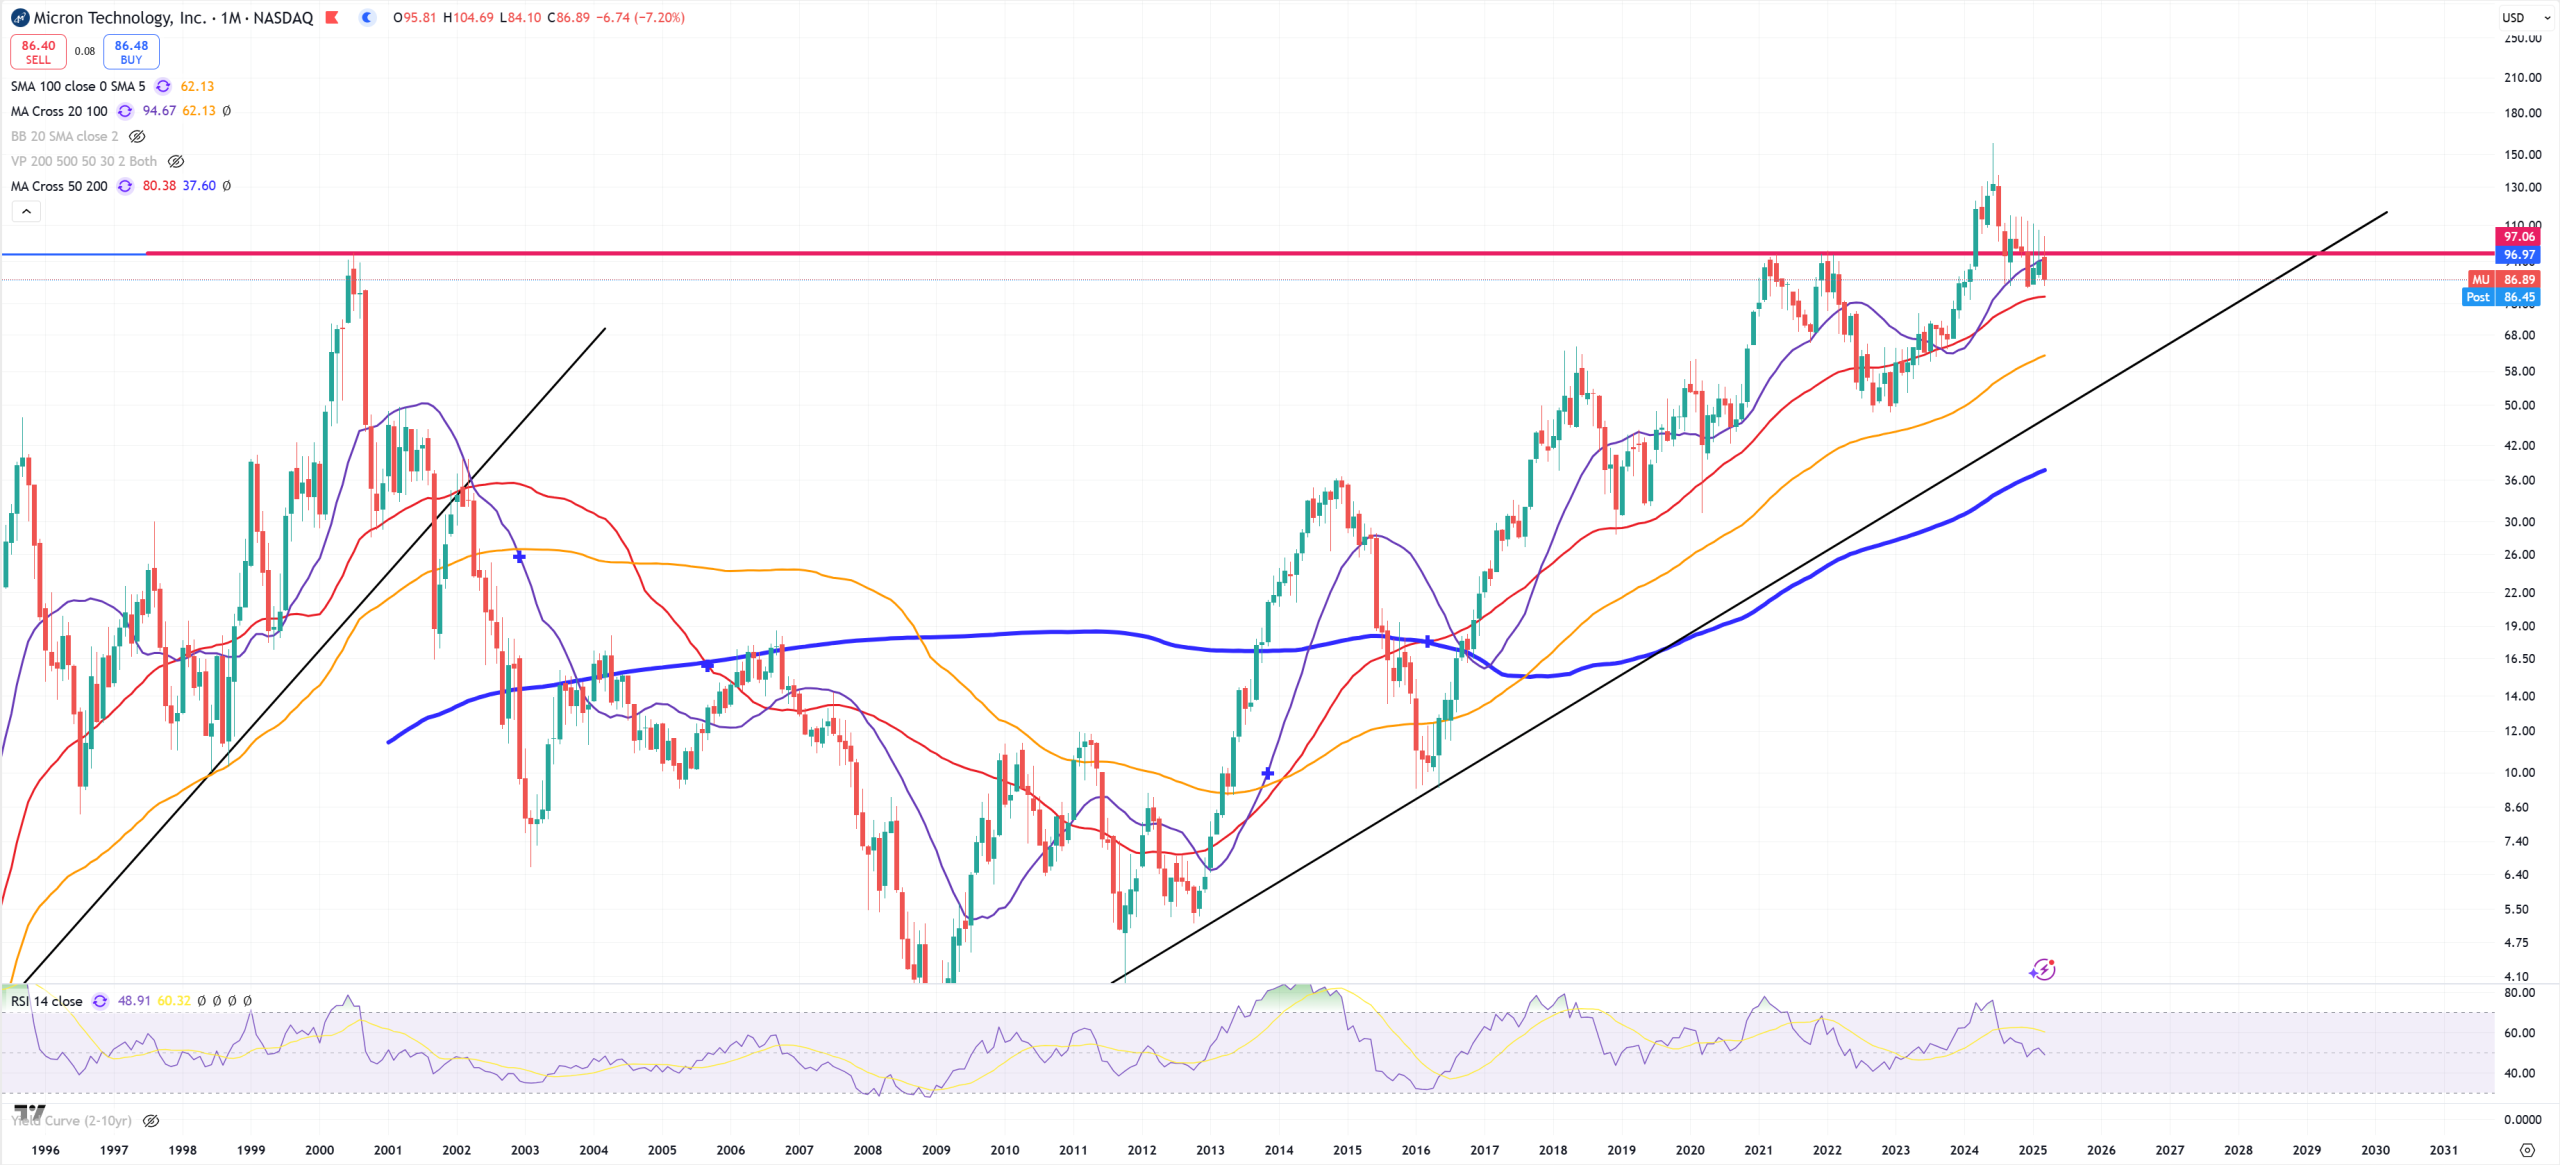
MU – again vibes from 2000 peak. Small false bull trap, failed, and now below (M)MA20 and red horizontal line is super big resistance
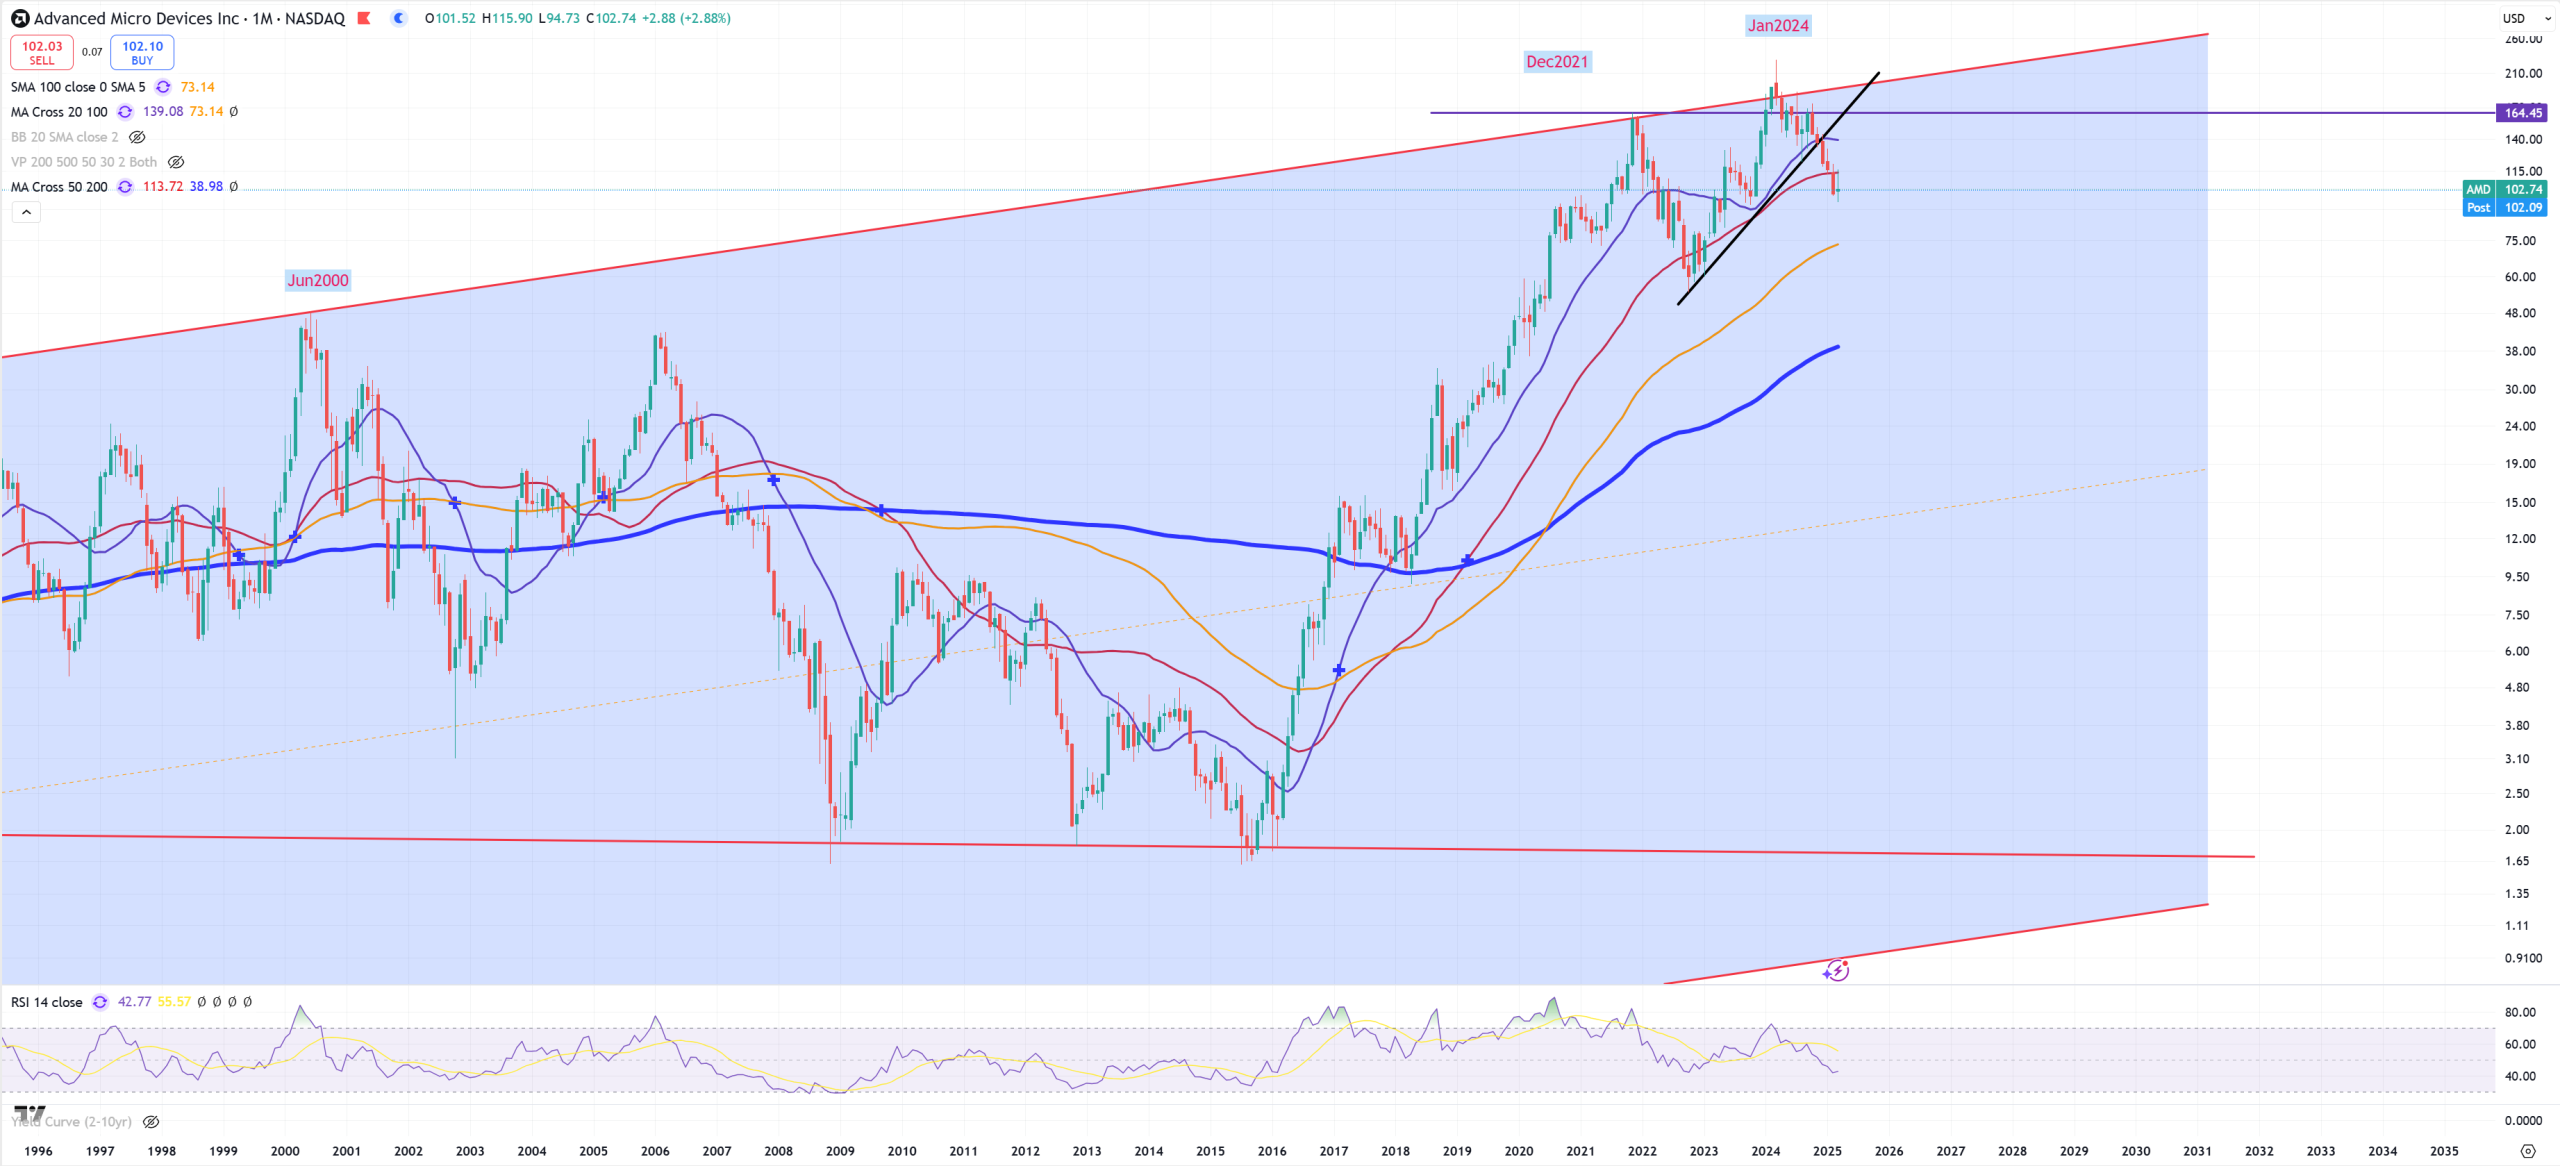
AMD – (M)MA50 rejection. Upper trend is on 1984-2000 peaks
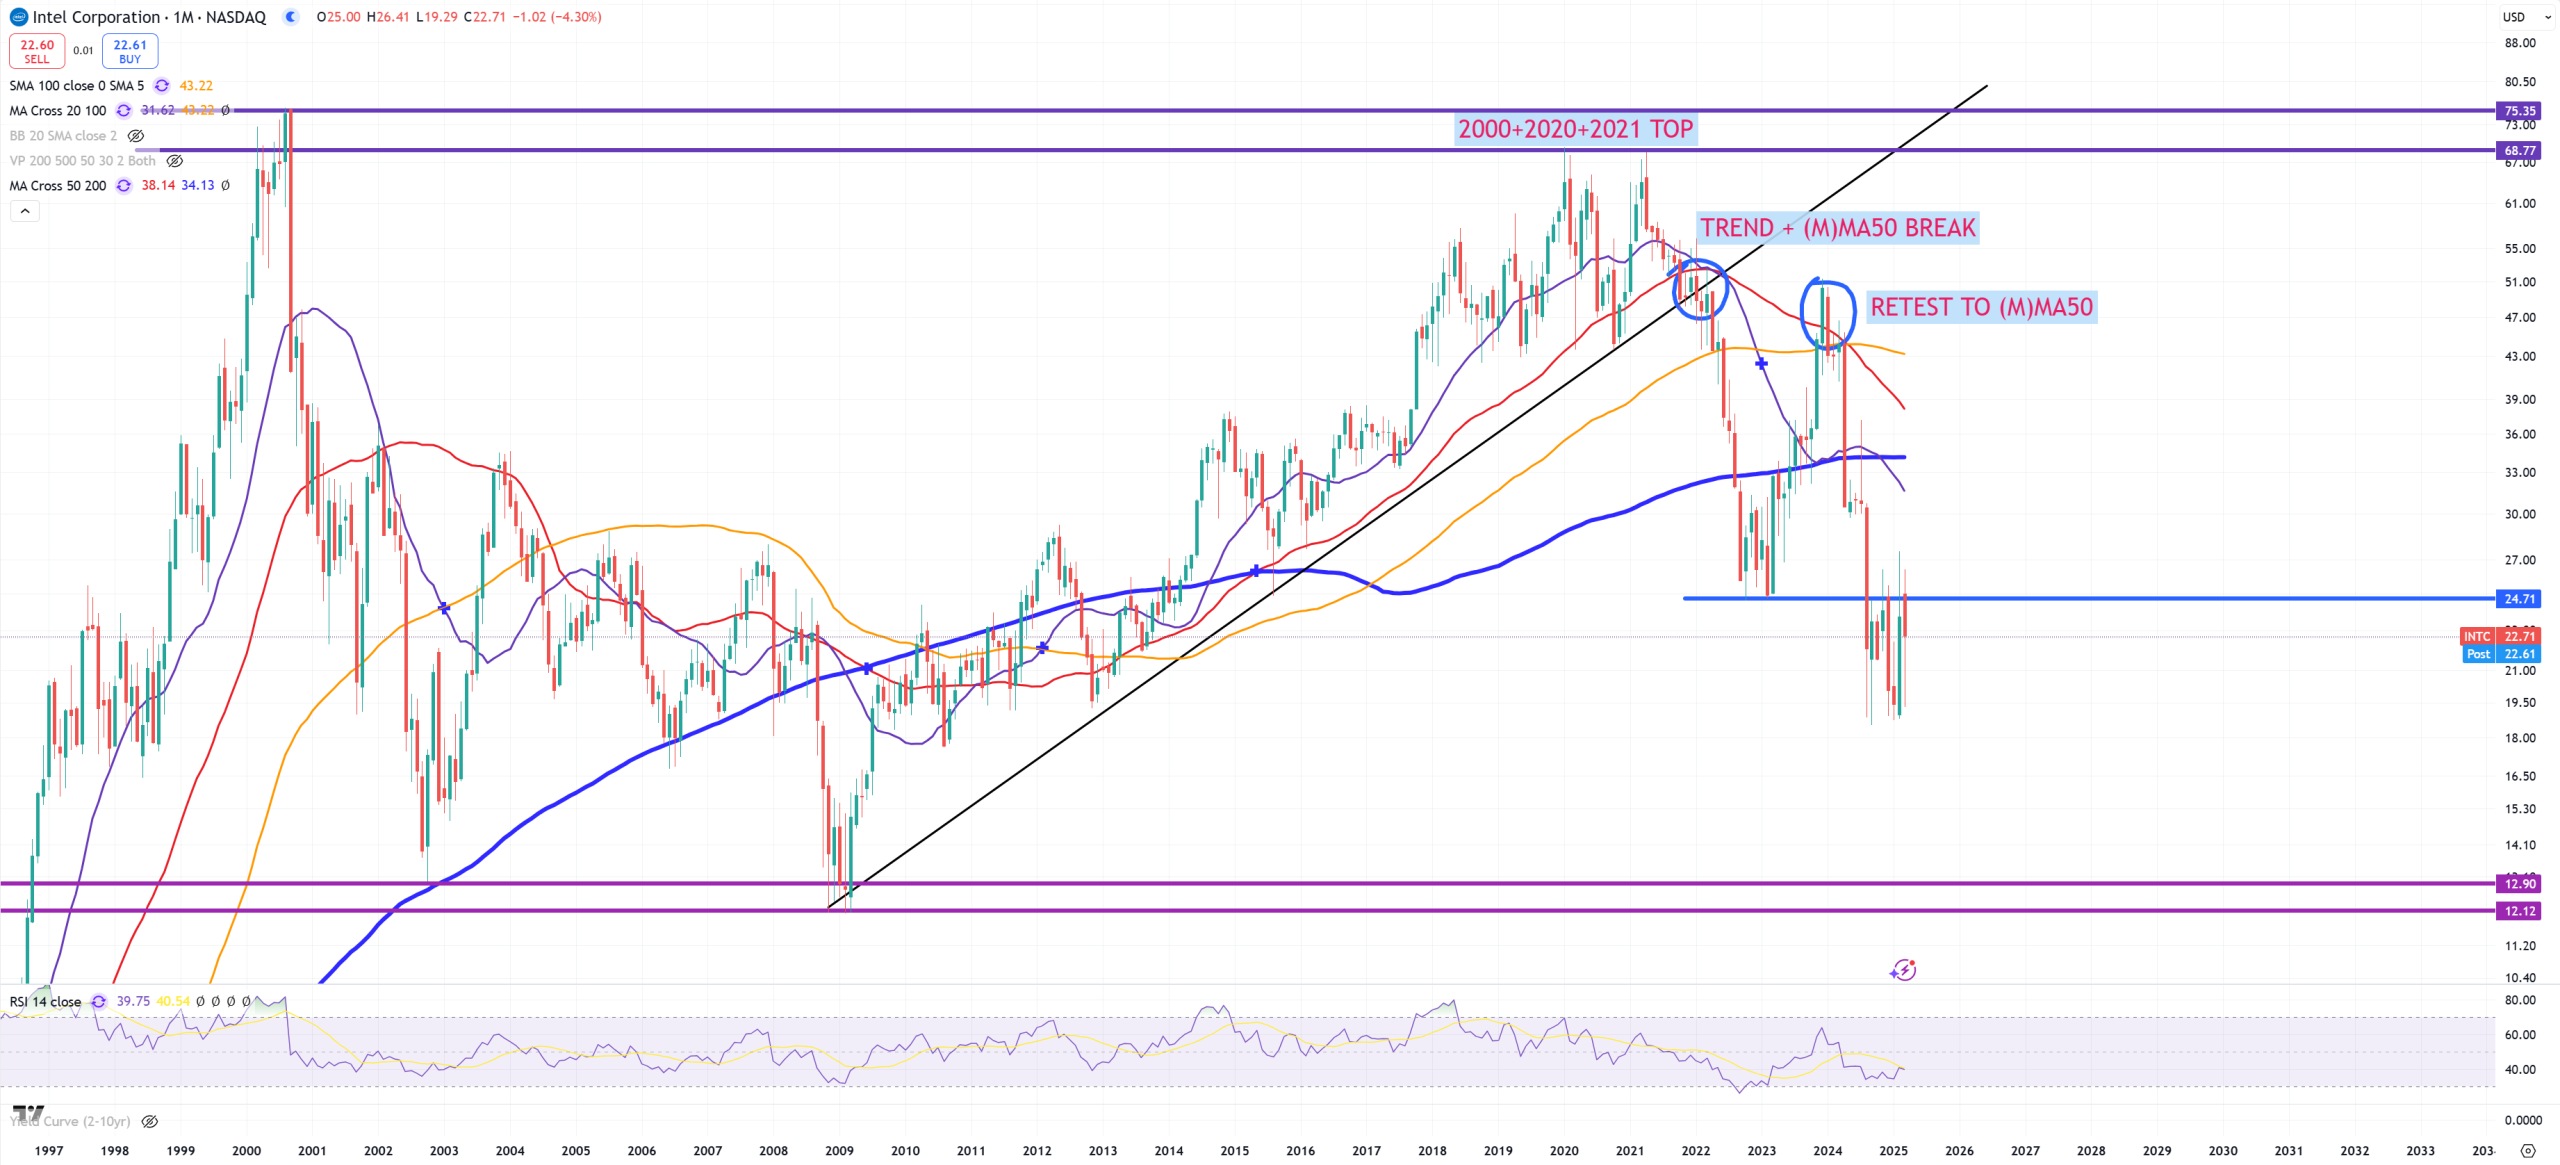
INTC – it’s very weak. This 26$ level can’t be broken (what is not surprising looking how weak SOX is) and 12$ is tempting.
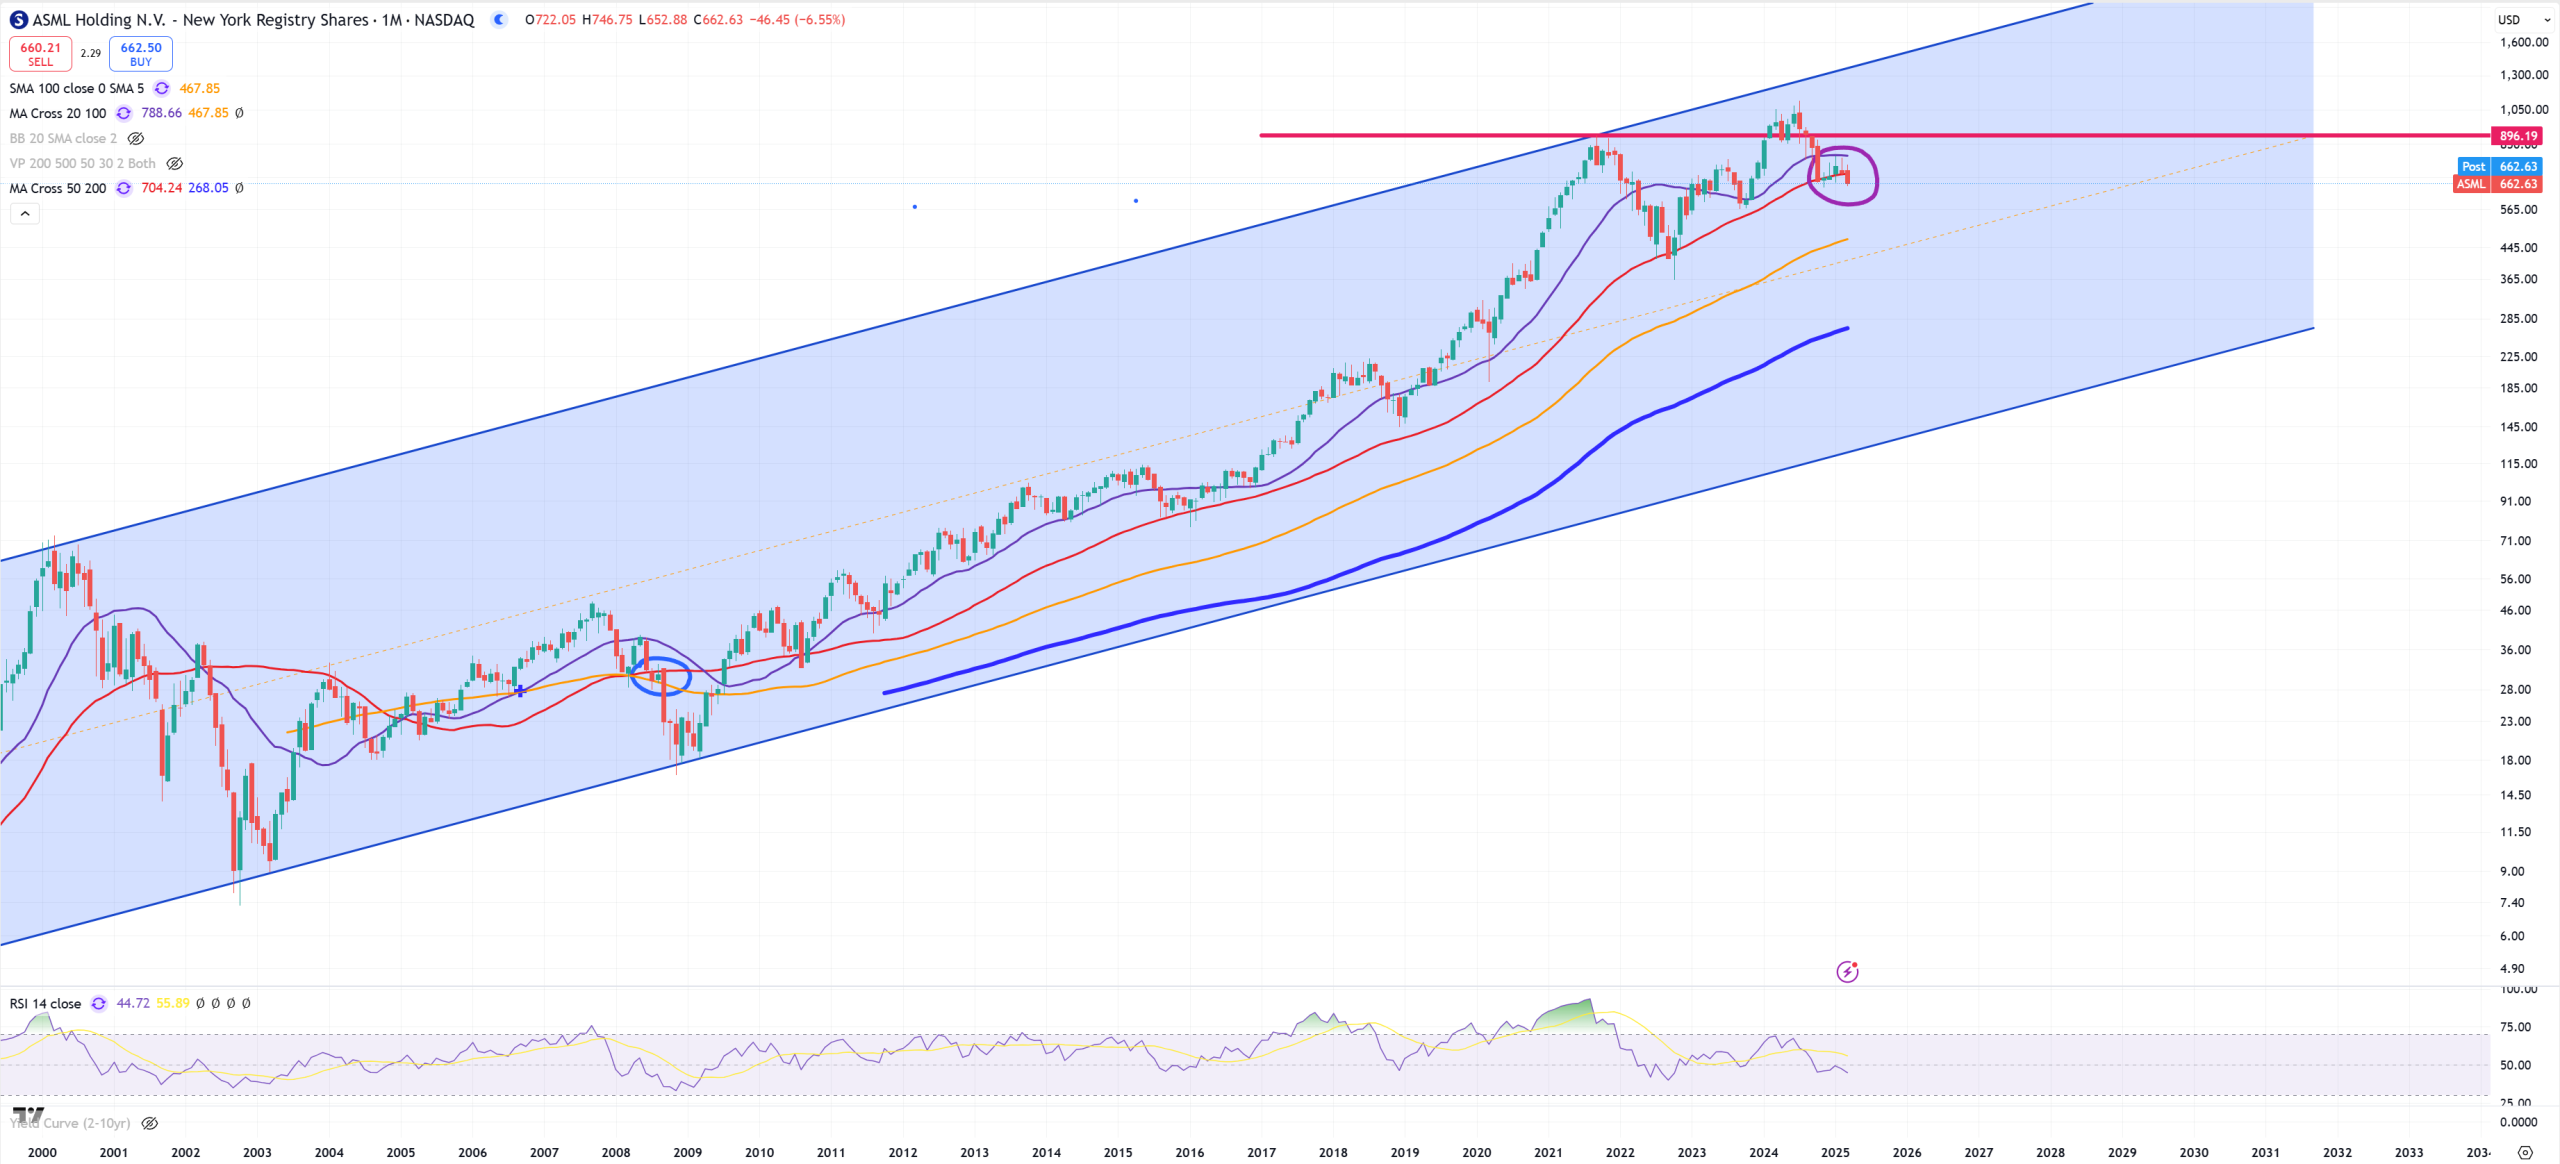
ASML – first close below (M)MA50 since 2008. No additional comment needed
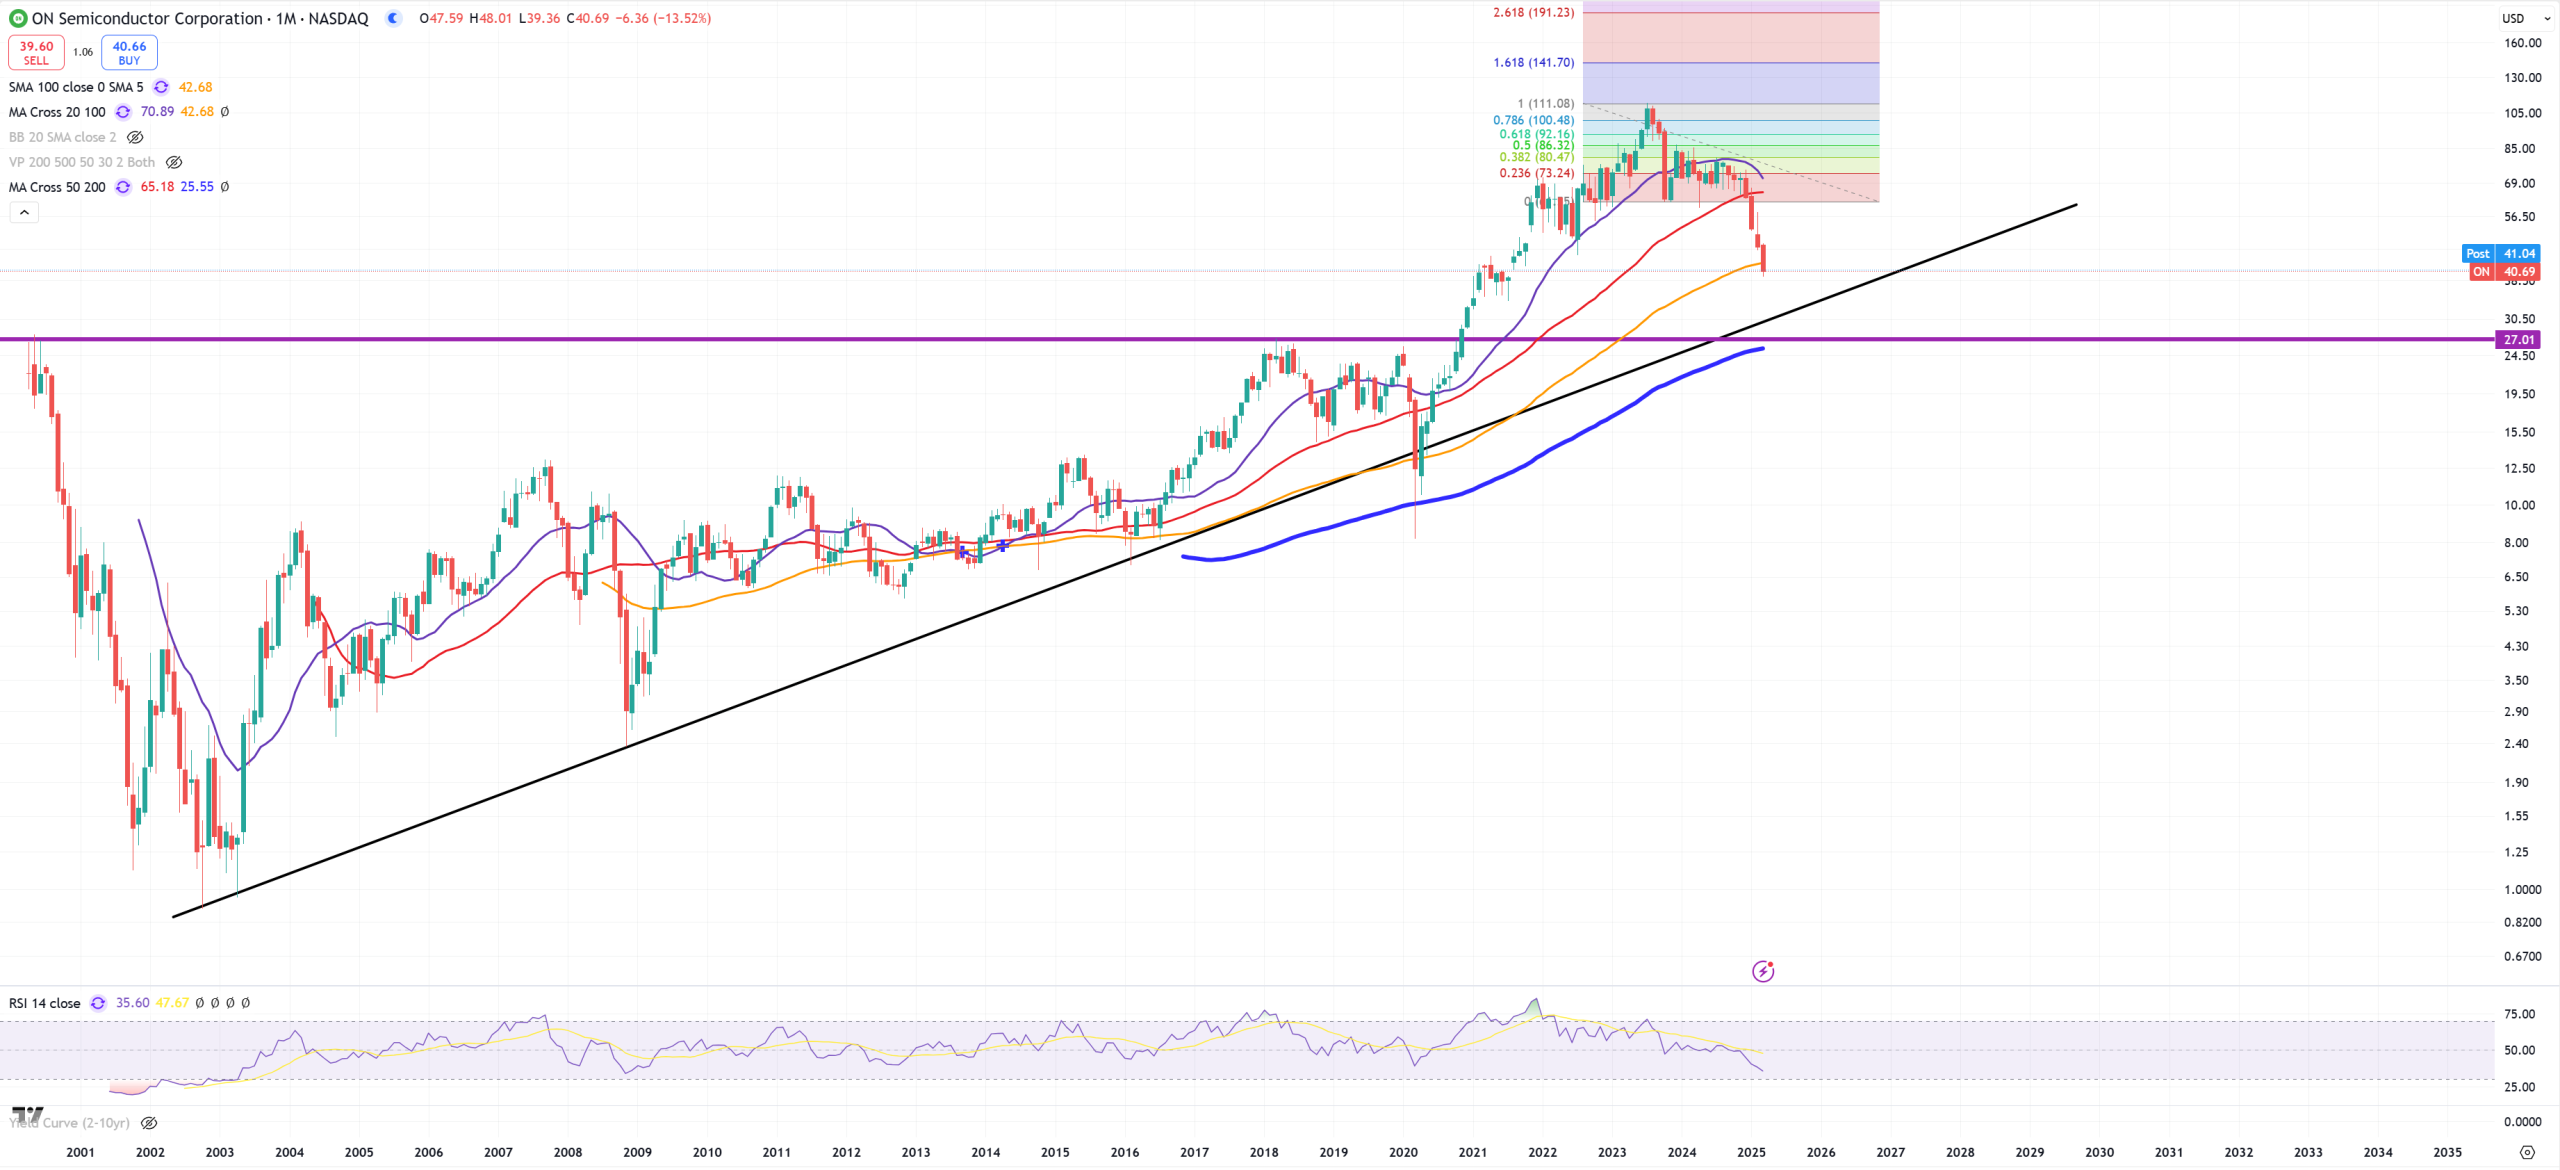
ON – This is a typical dead-cat bounce chart. Last time on (M)MA100 we had support this time we’re going towards 25$ which is 2000 dot.com bubble peak level
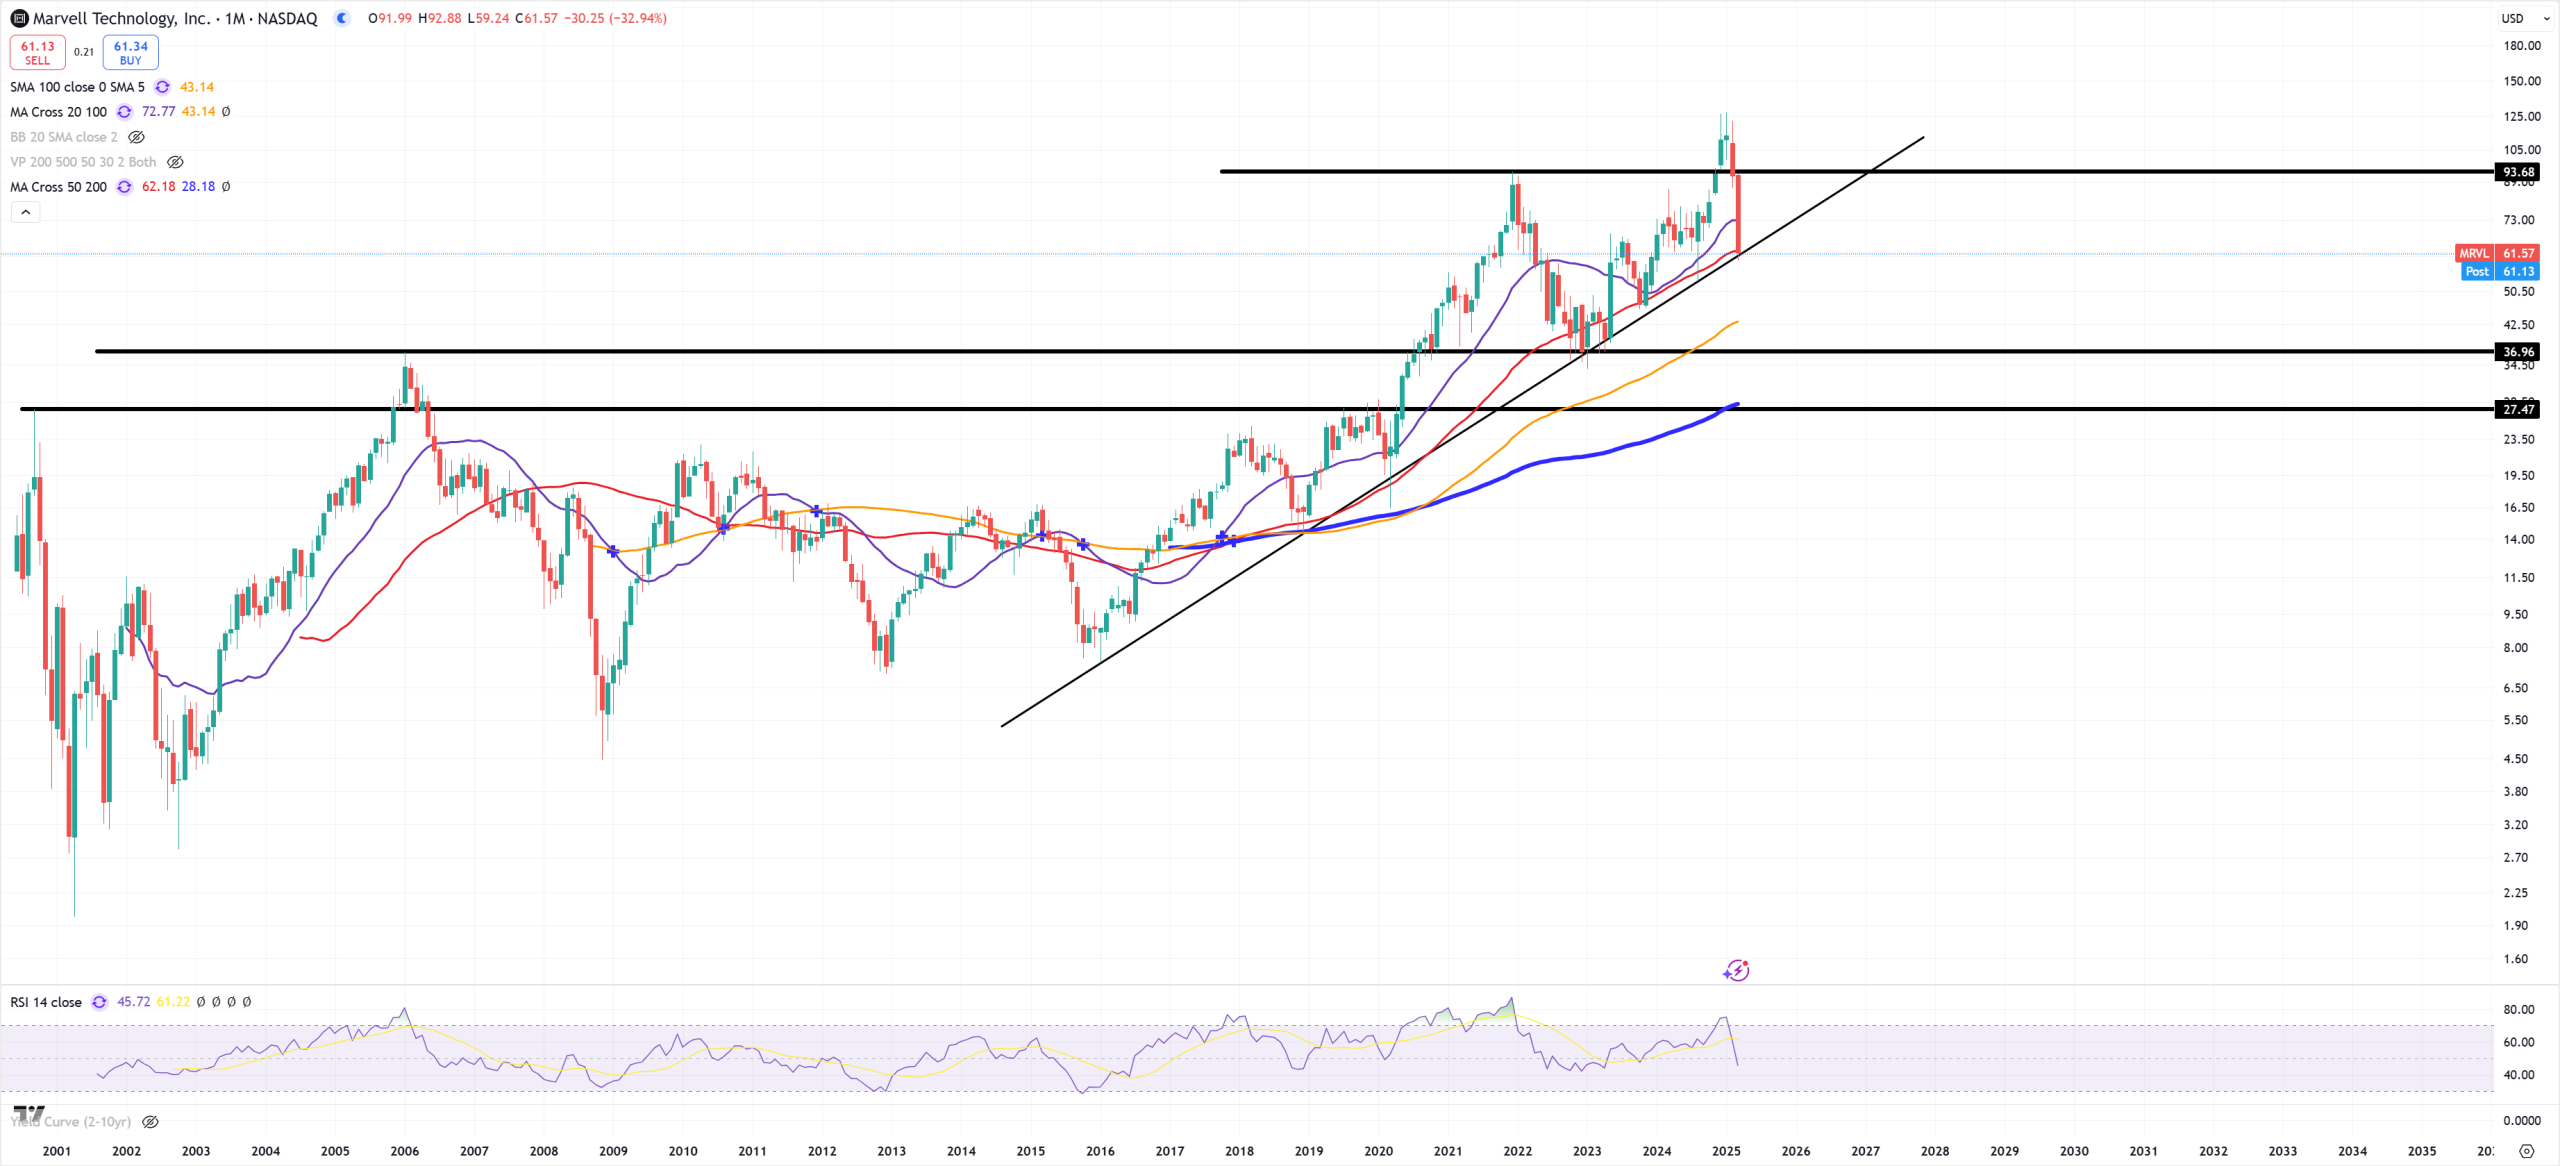
MRVL – looks like it all depends what’ll happen from now on. DOUBLE-TOP and false spike now (M)MA50 + trend
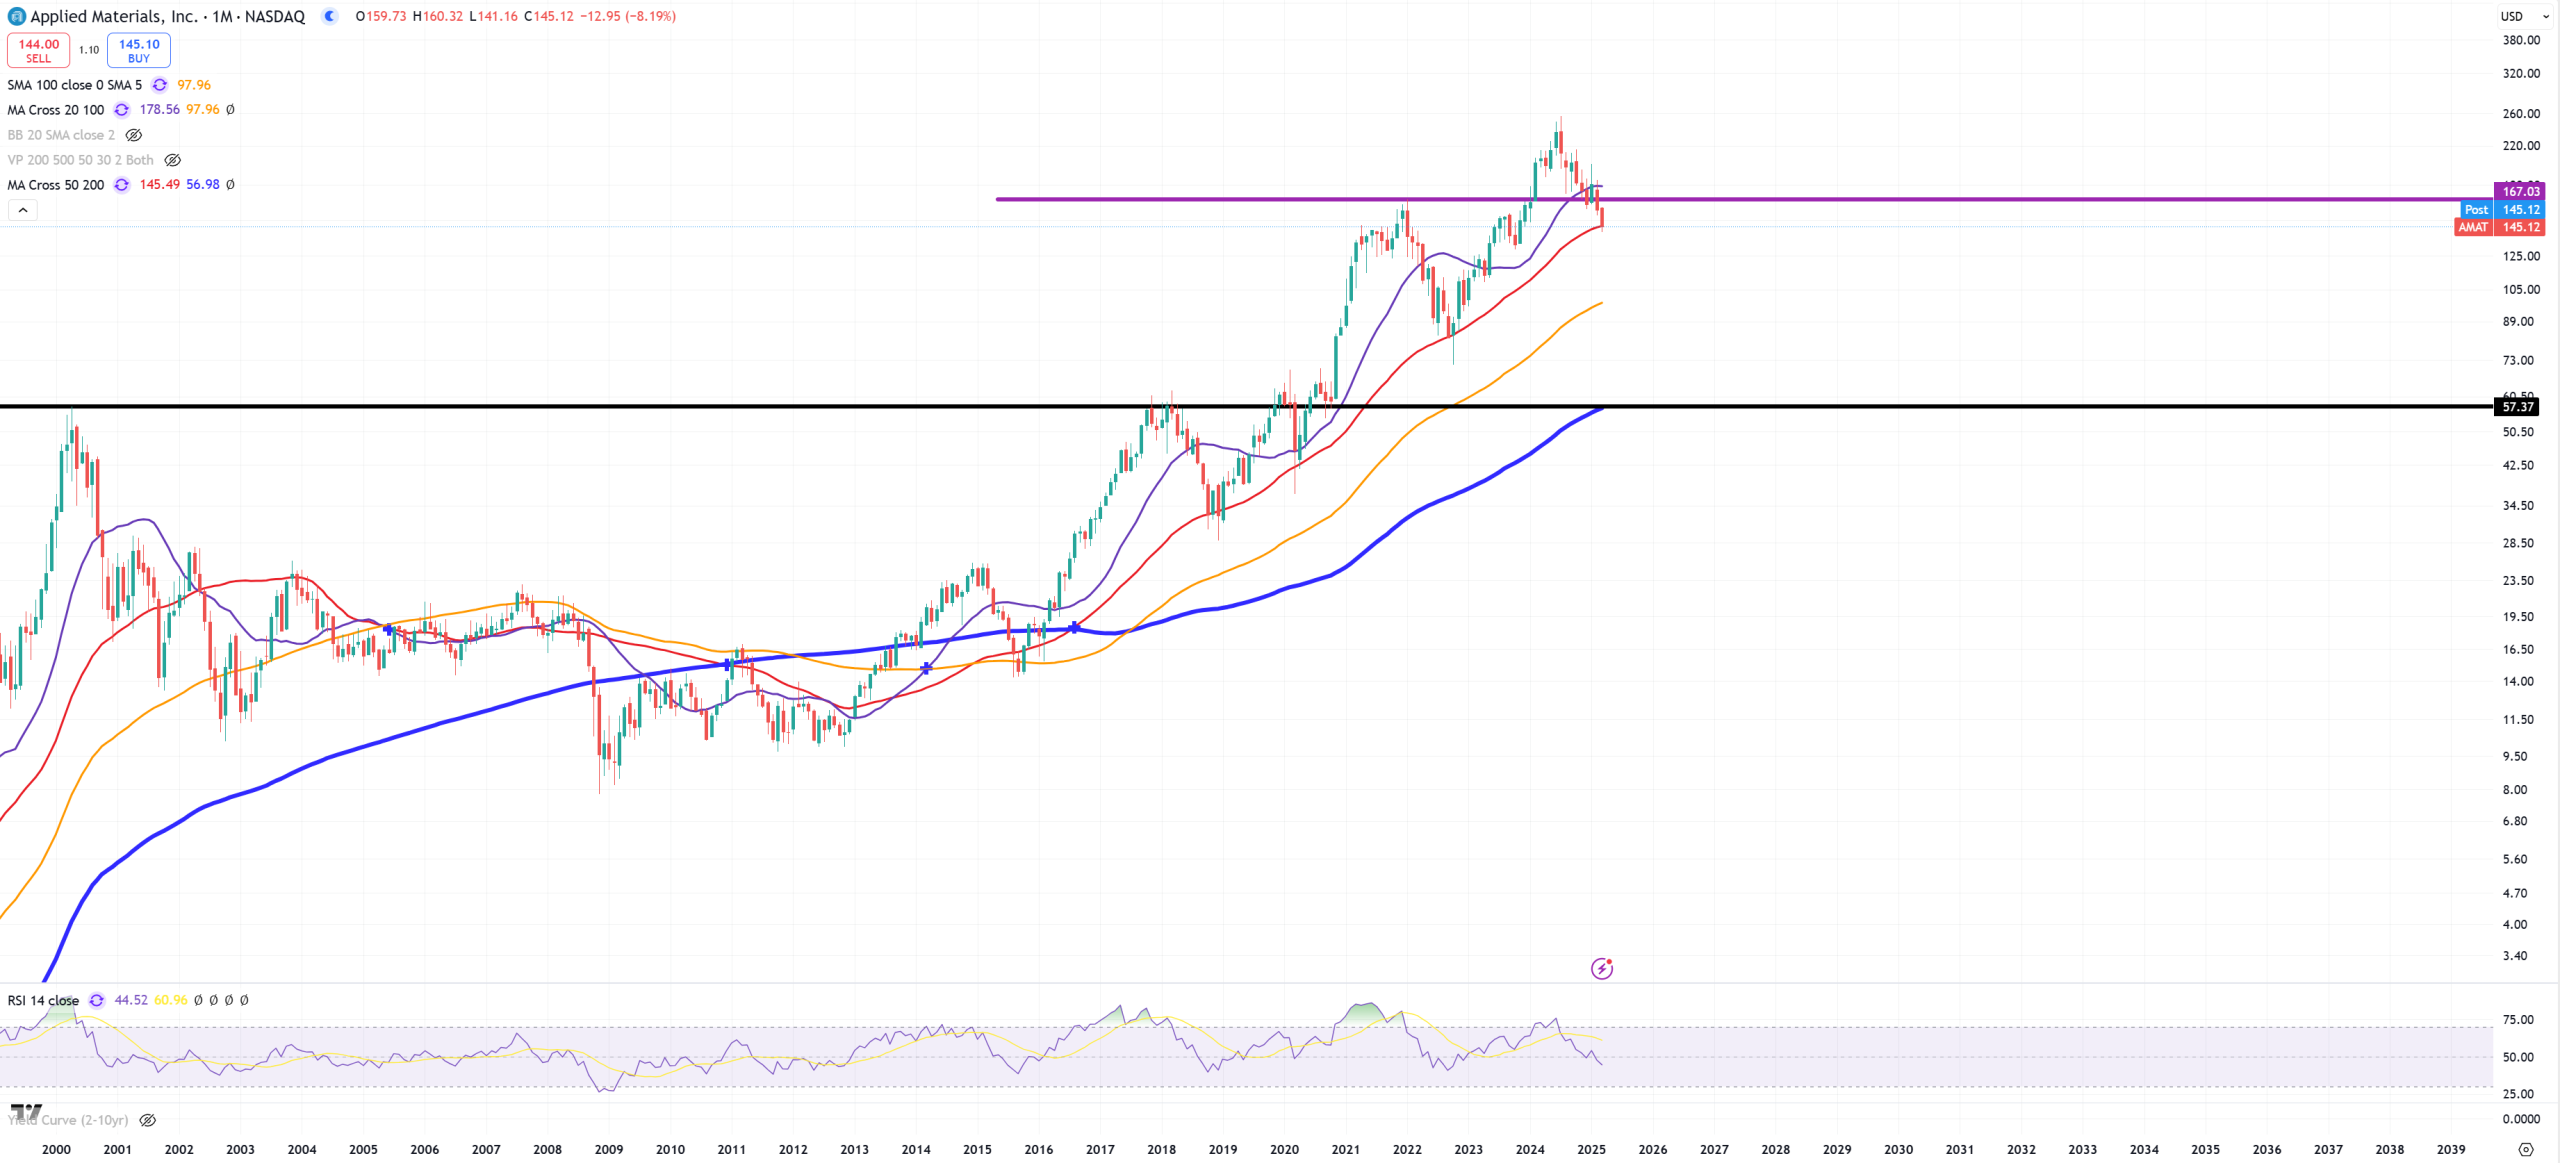
AMAT – same moment as MRVL – (M)MA50 and possible DOUBLE-TOP
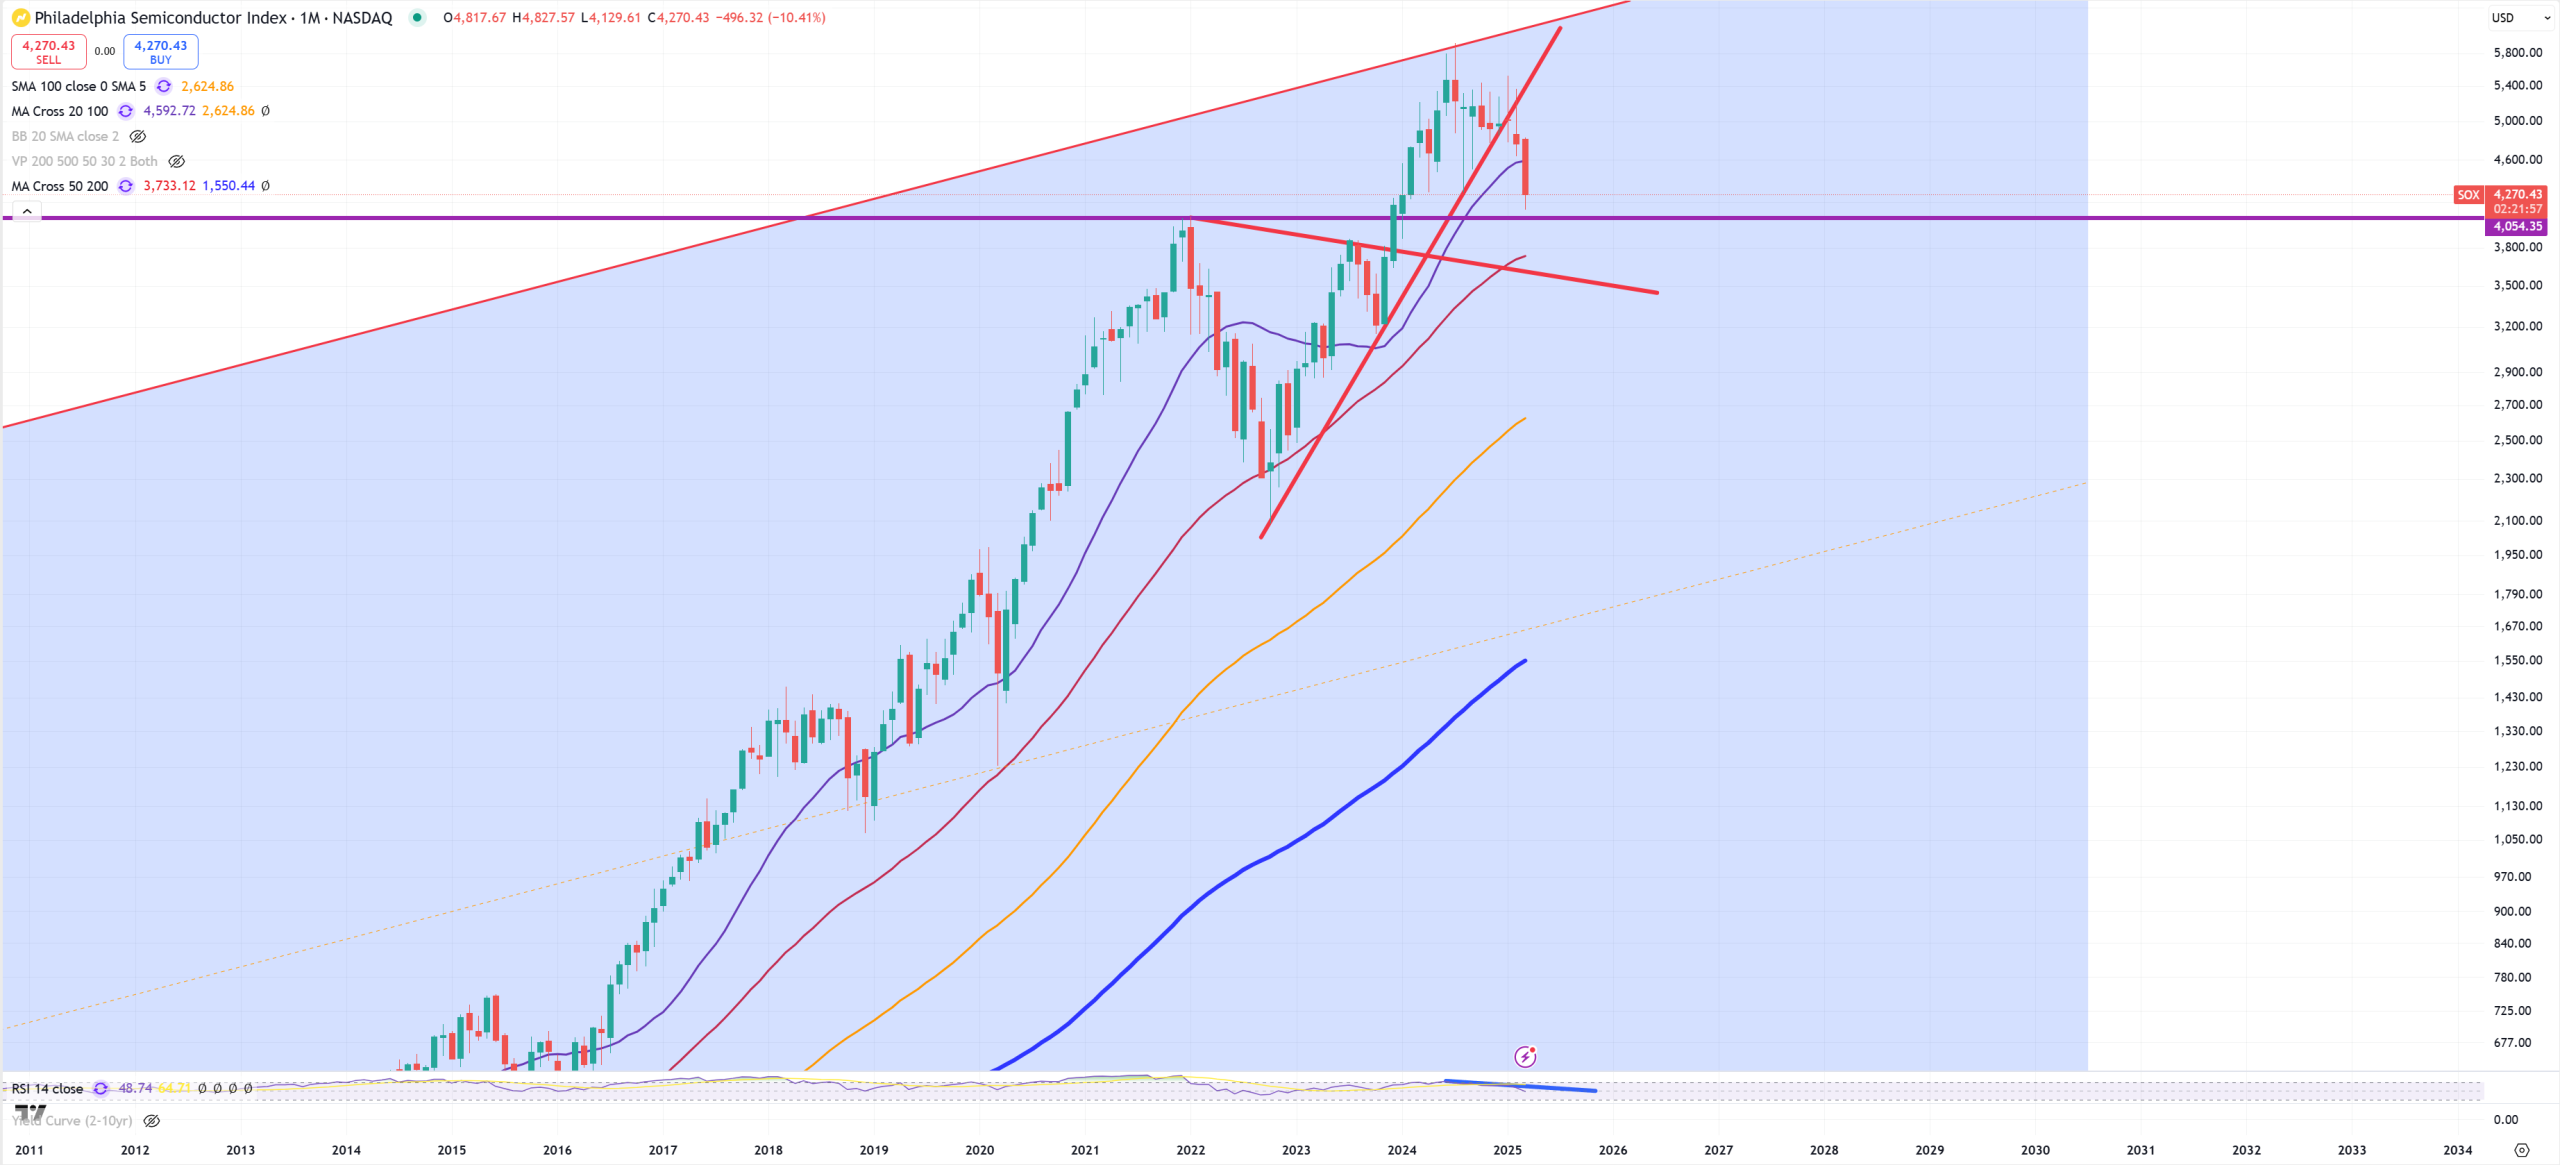
SOX – so finally SOX in general, 4050 is important level
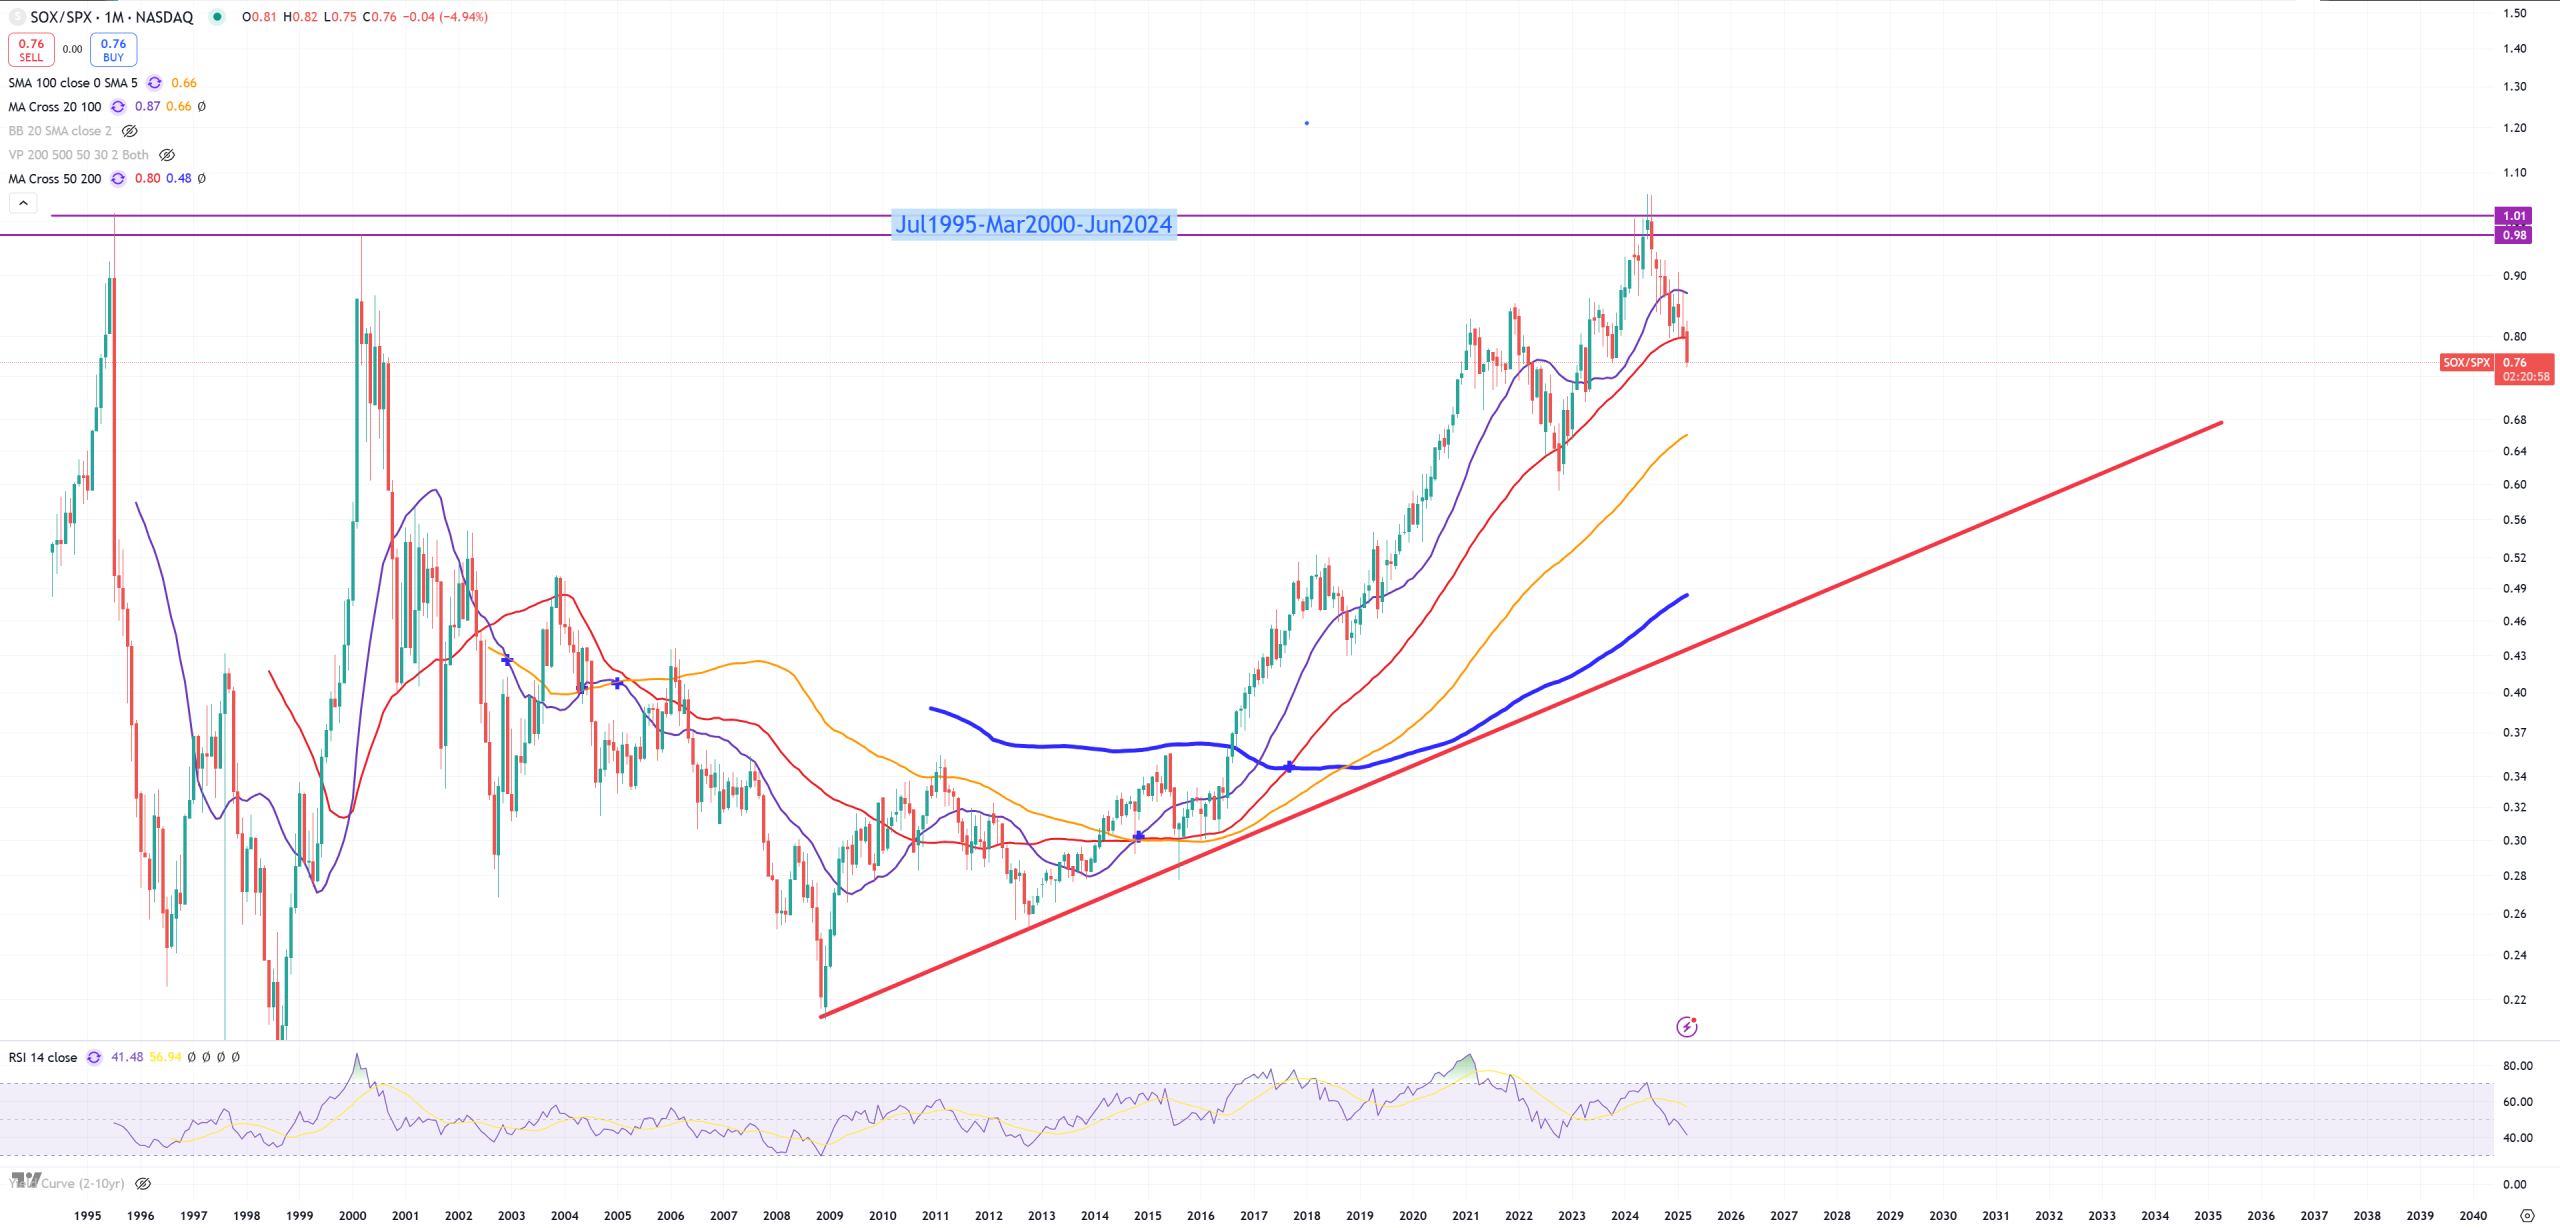
SOX/SPX – this ratio points to SOX bust, have in mind Jun2024 was a moment where AUDJPY placed DOUBLE-TOP with October 2007 level
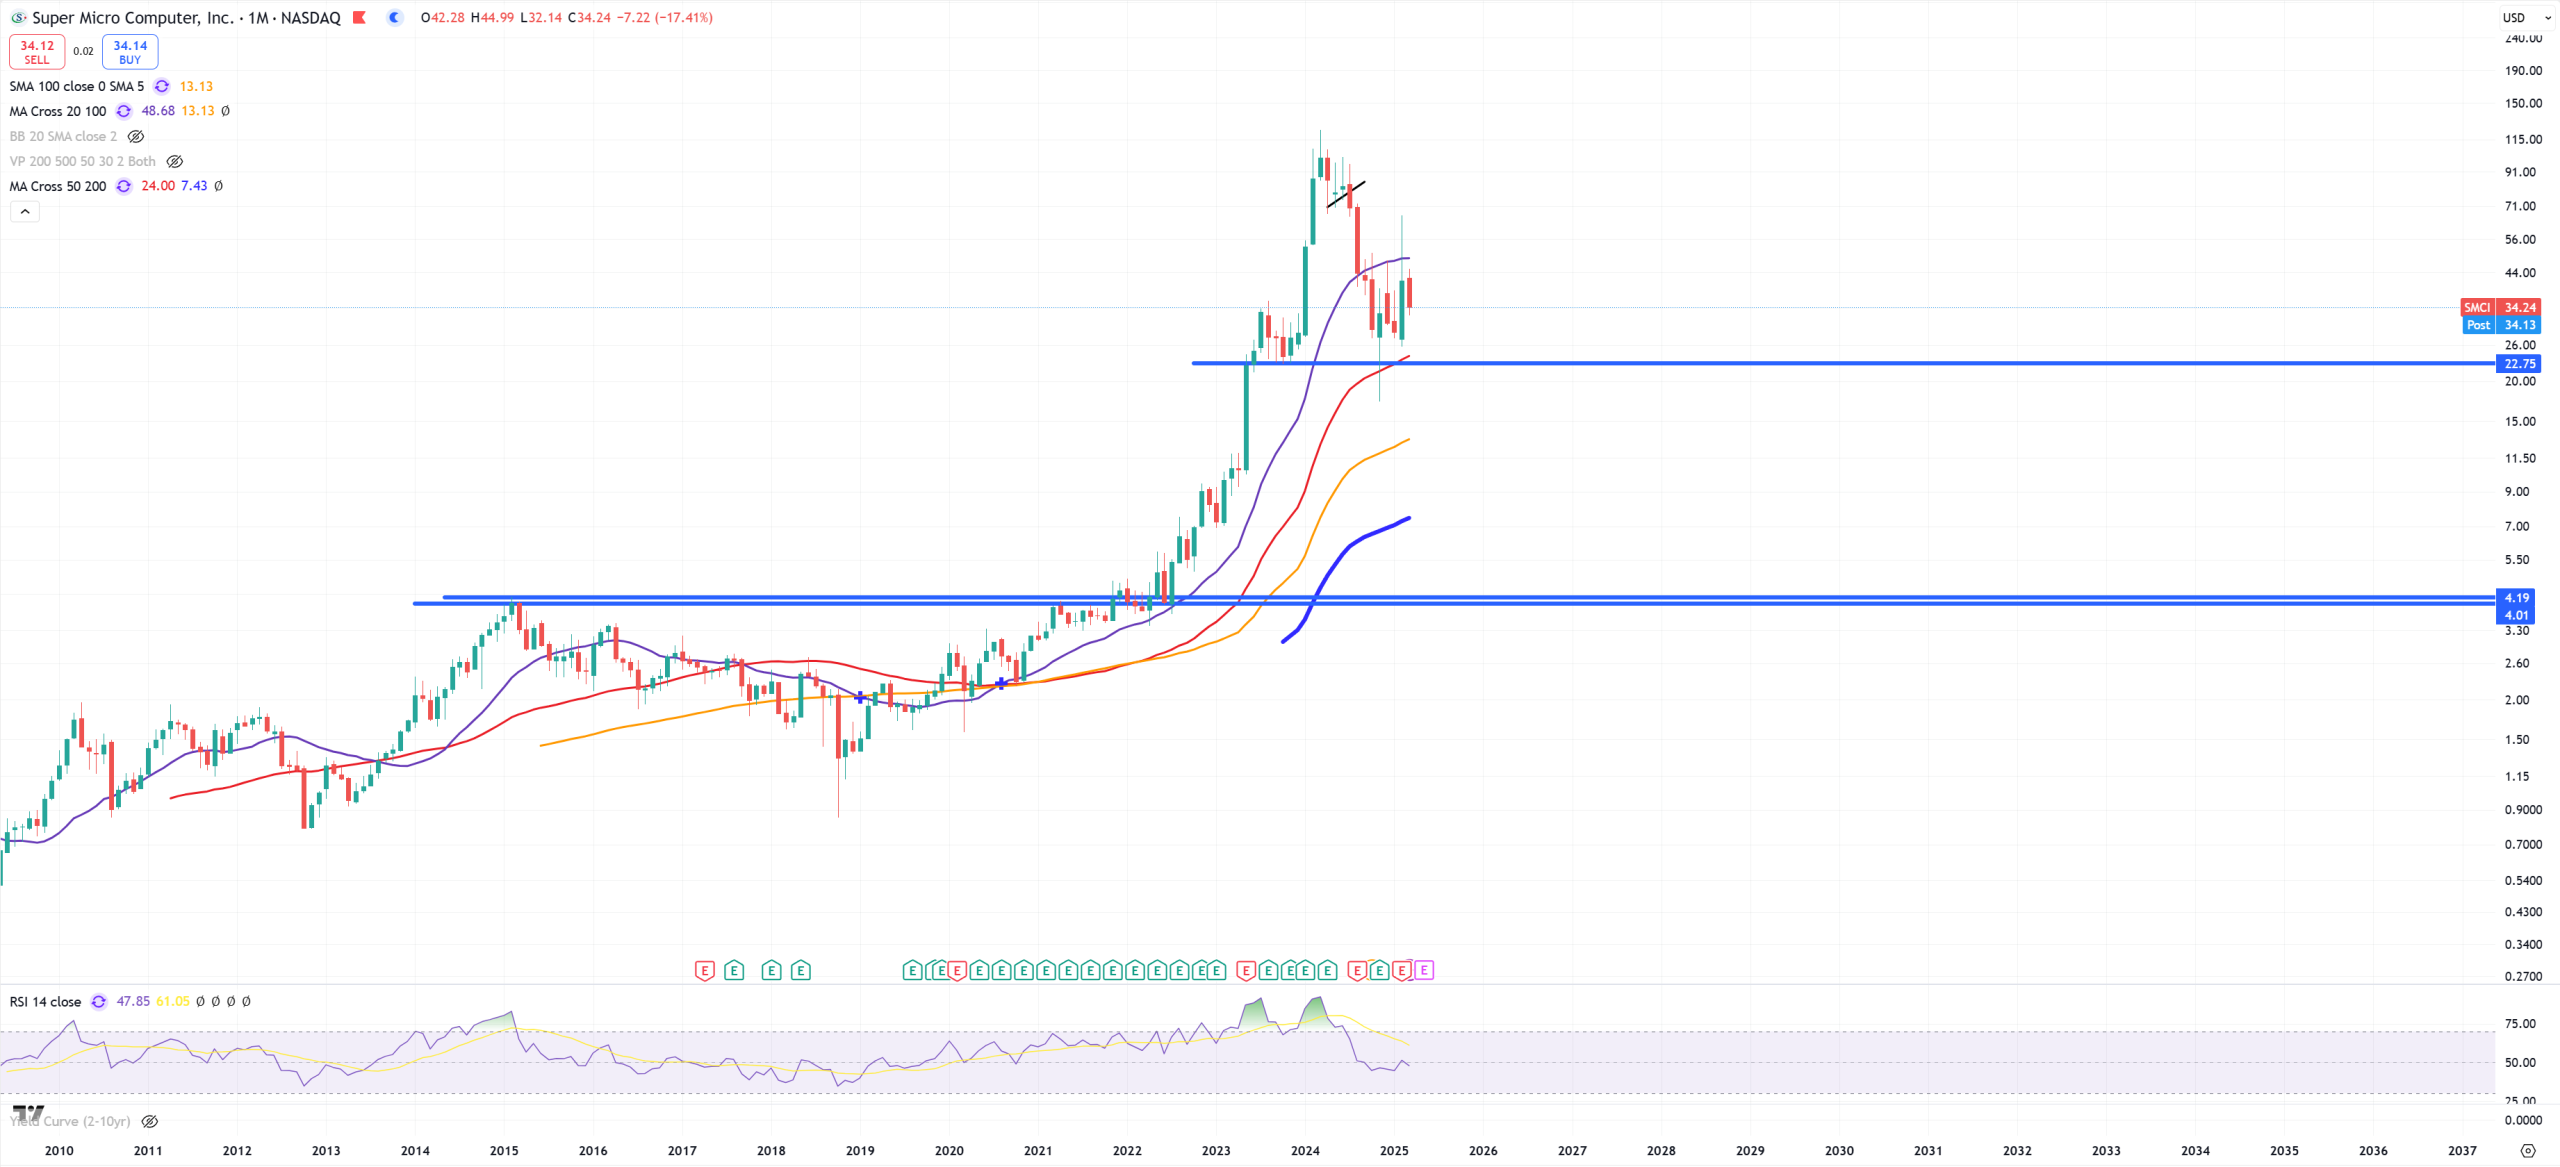
SMCI – bounce from (M)MA50 to (M)MA20, if it’s still acts as a dead-cat bounce. Once (M)MA50 will be broken 4$ target
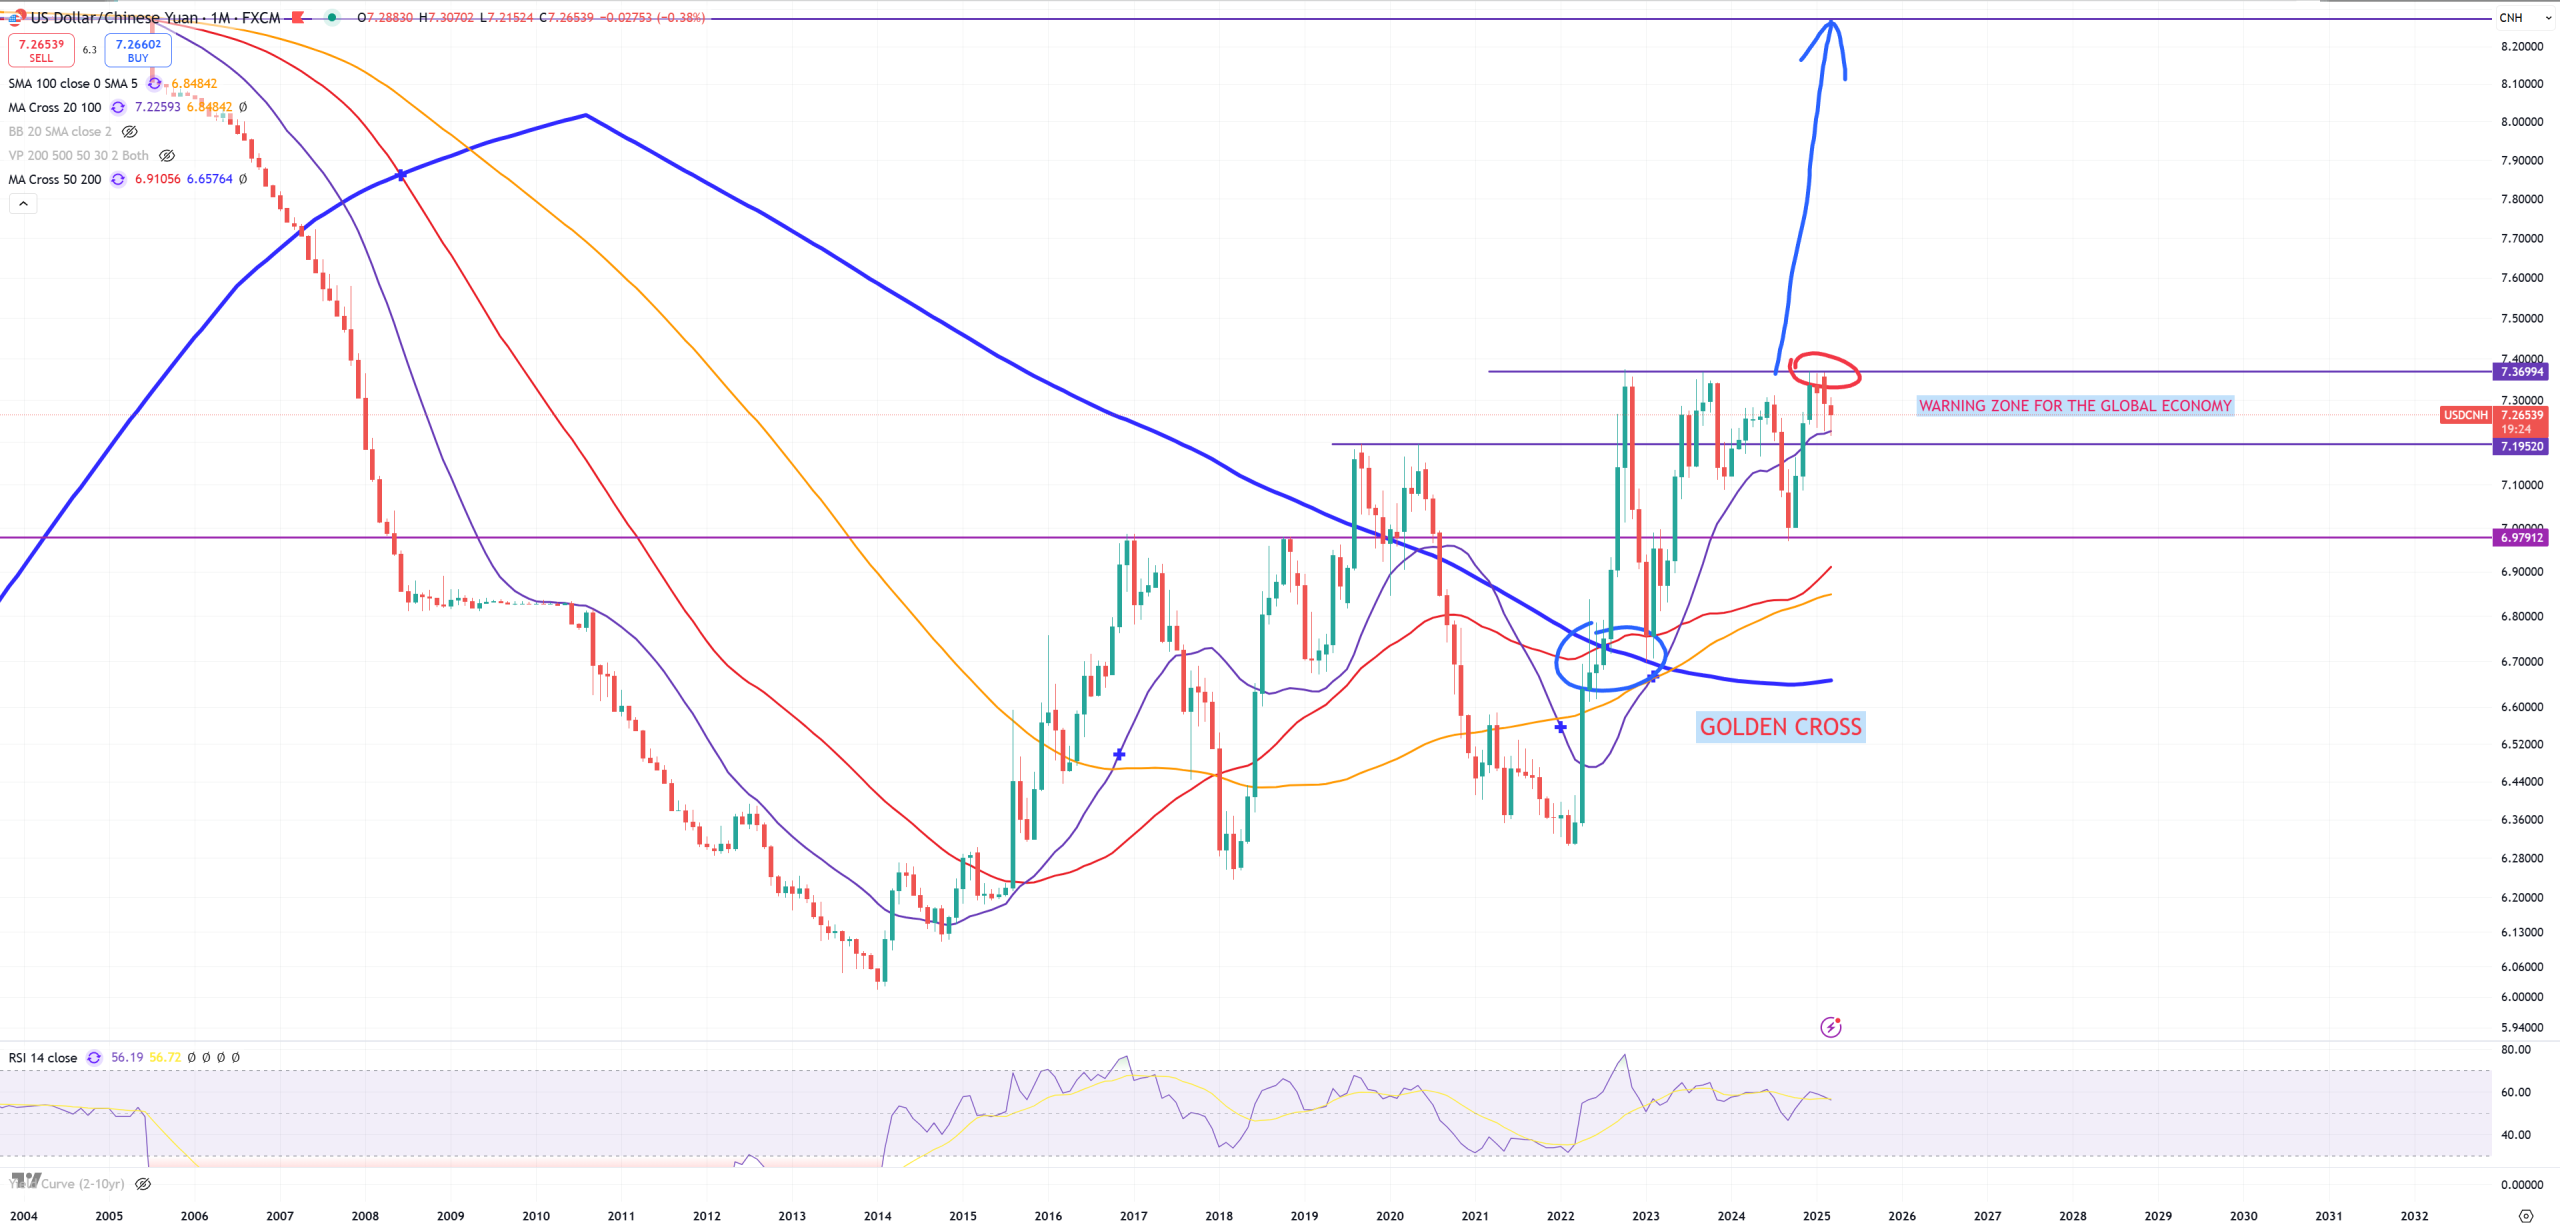
USDCNH – Yuan is supporting (M)MA20
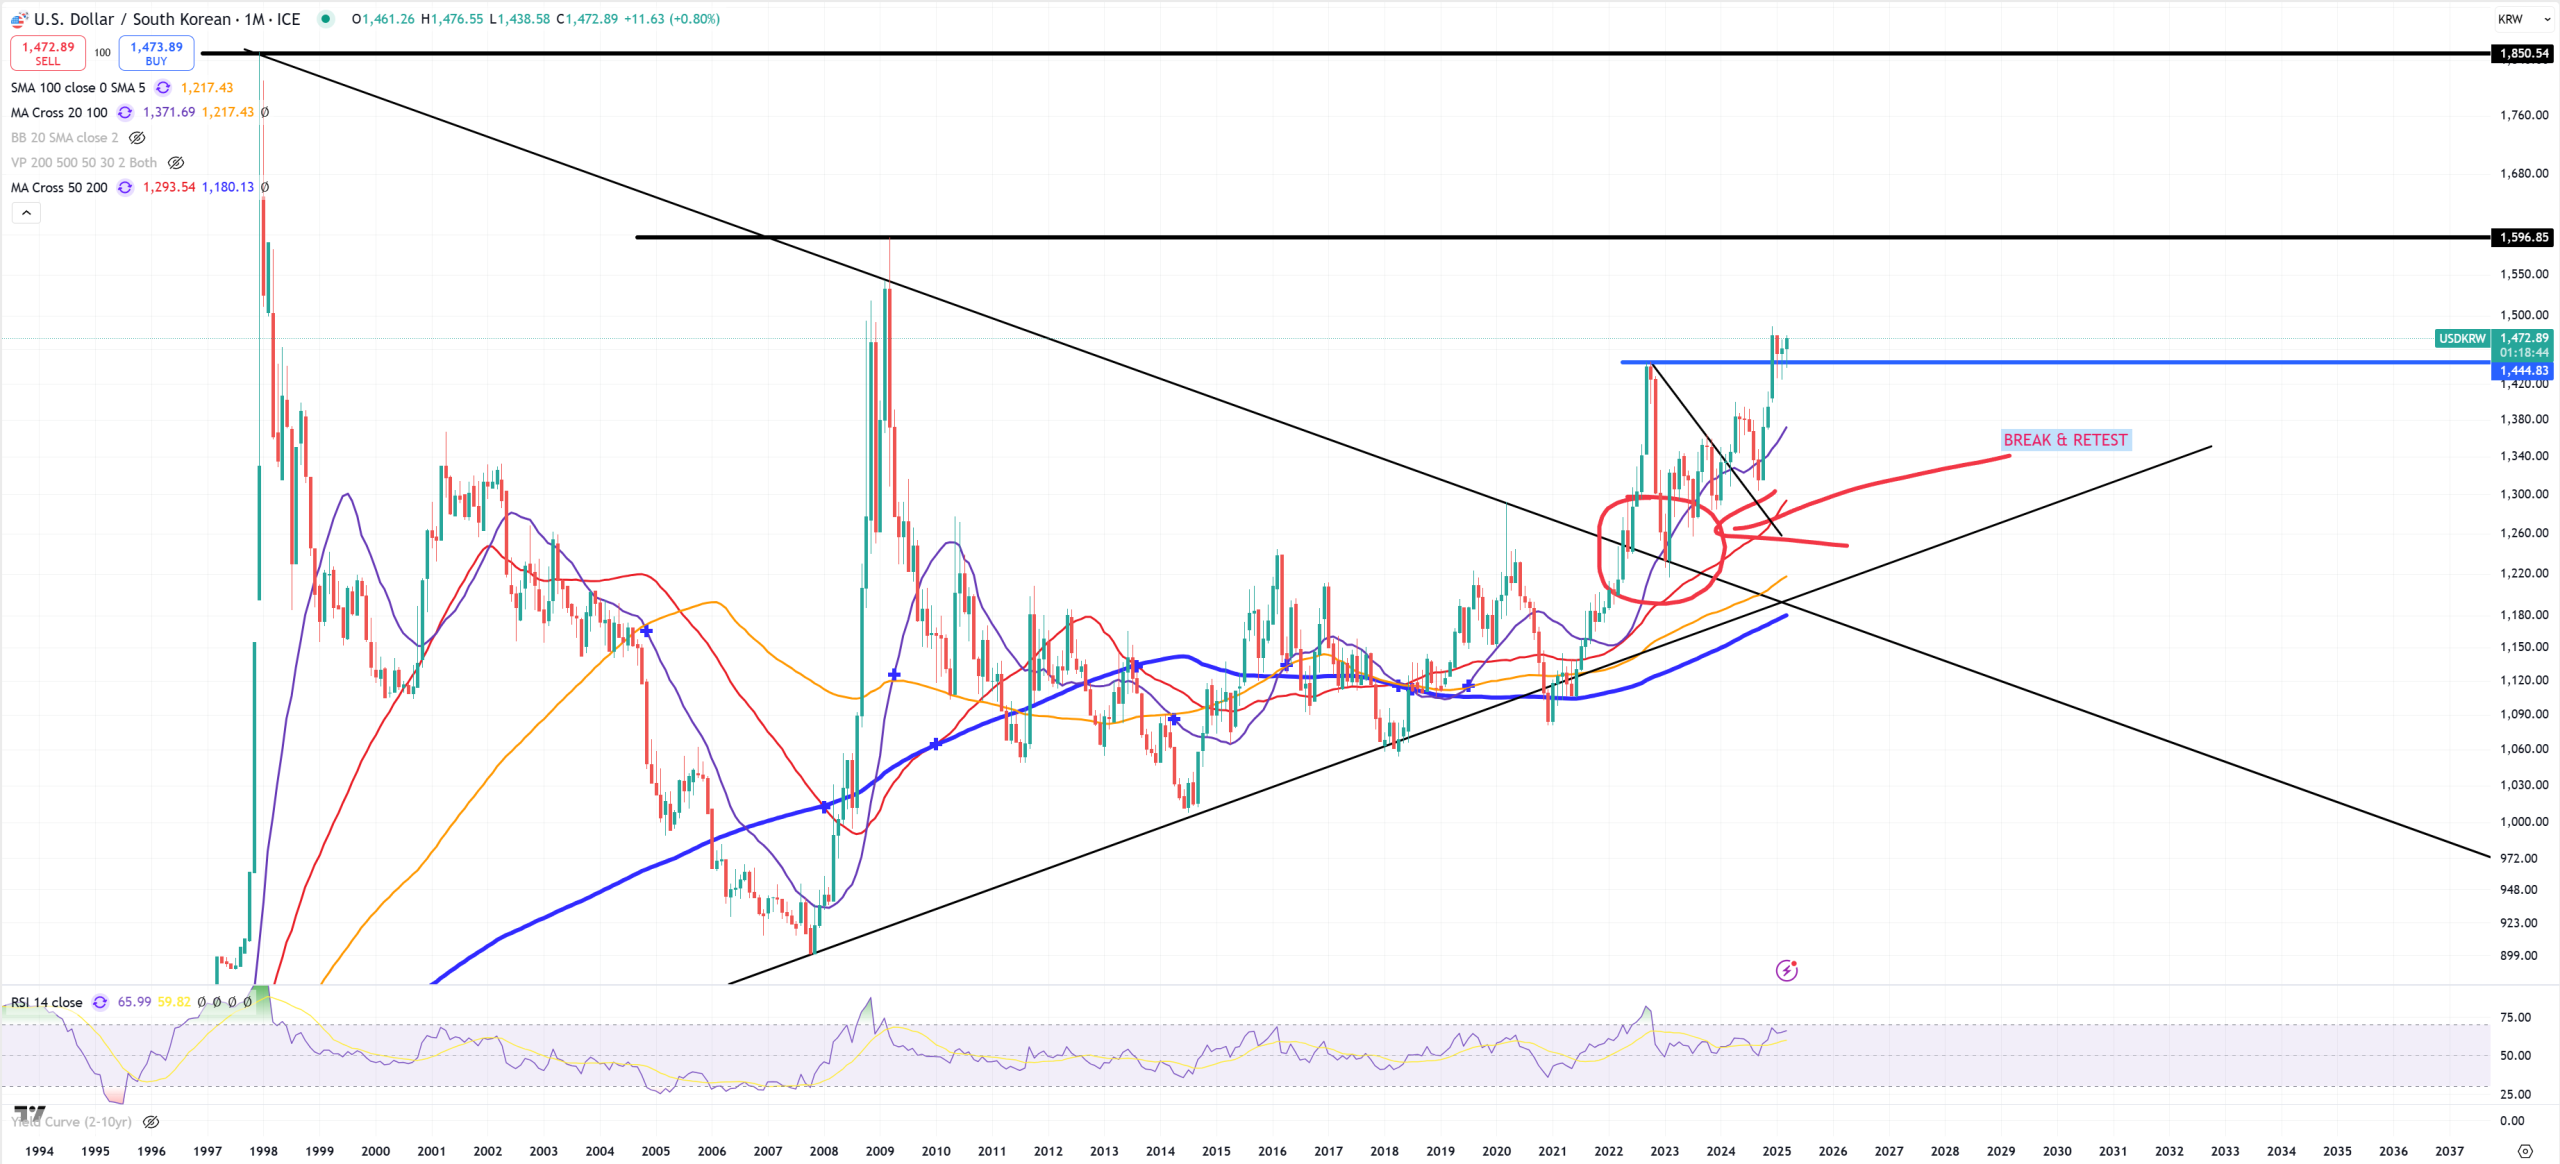
USDKRW – Korean Won – support holds
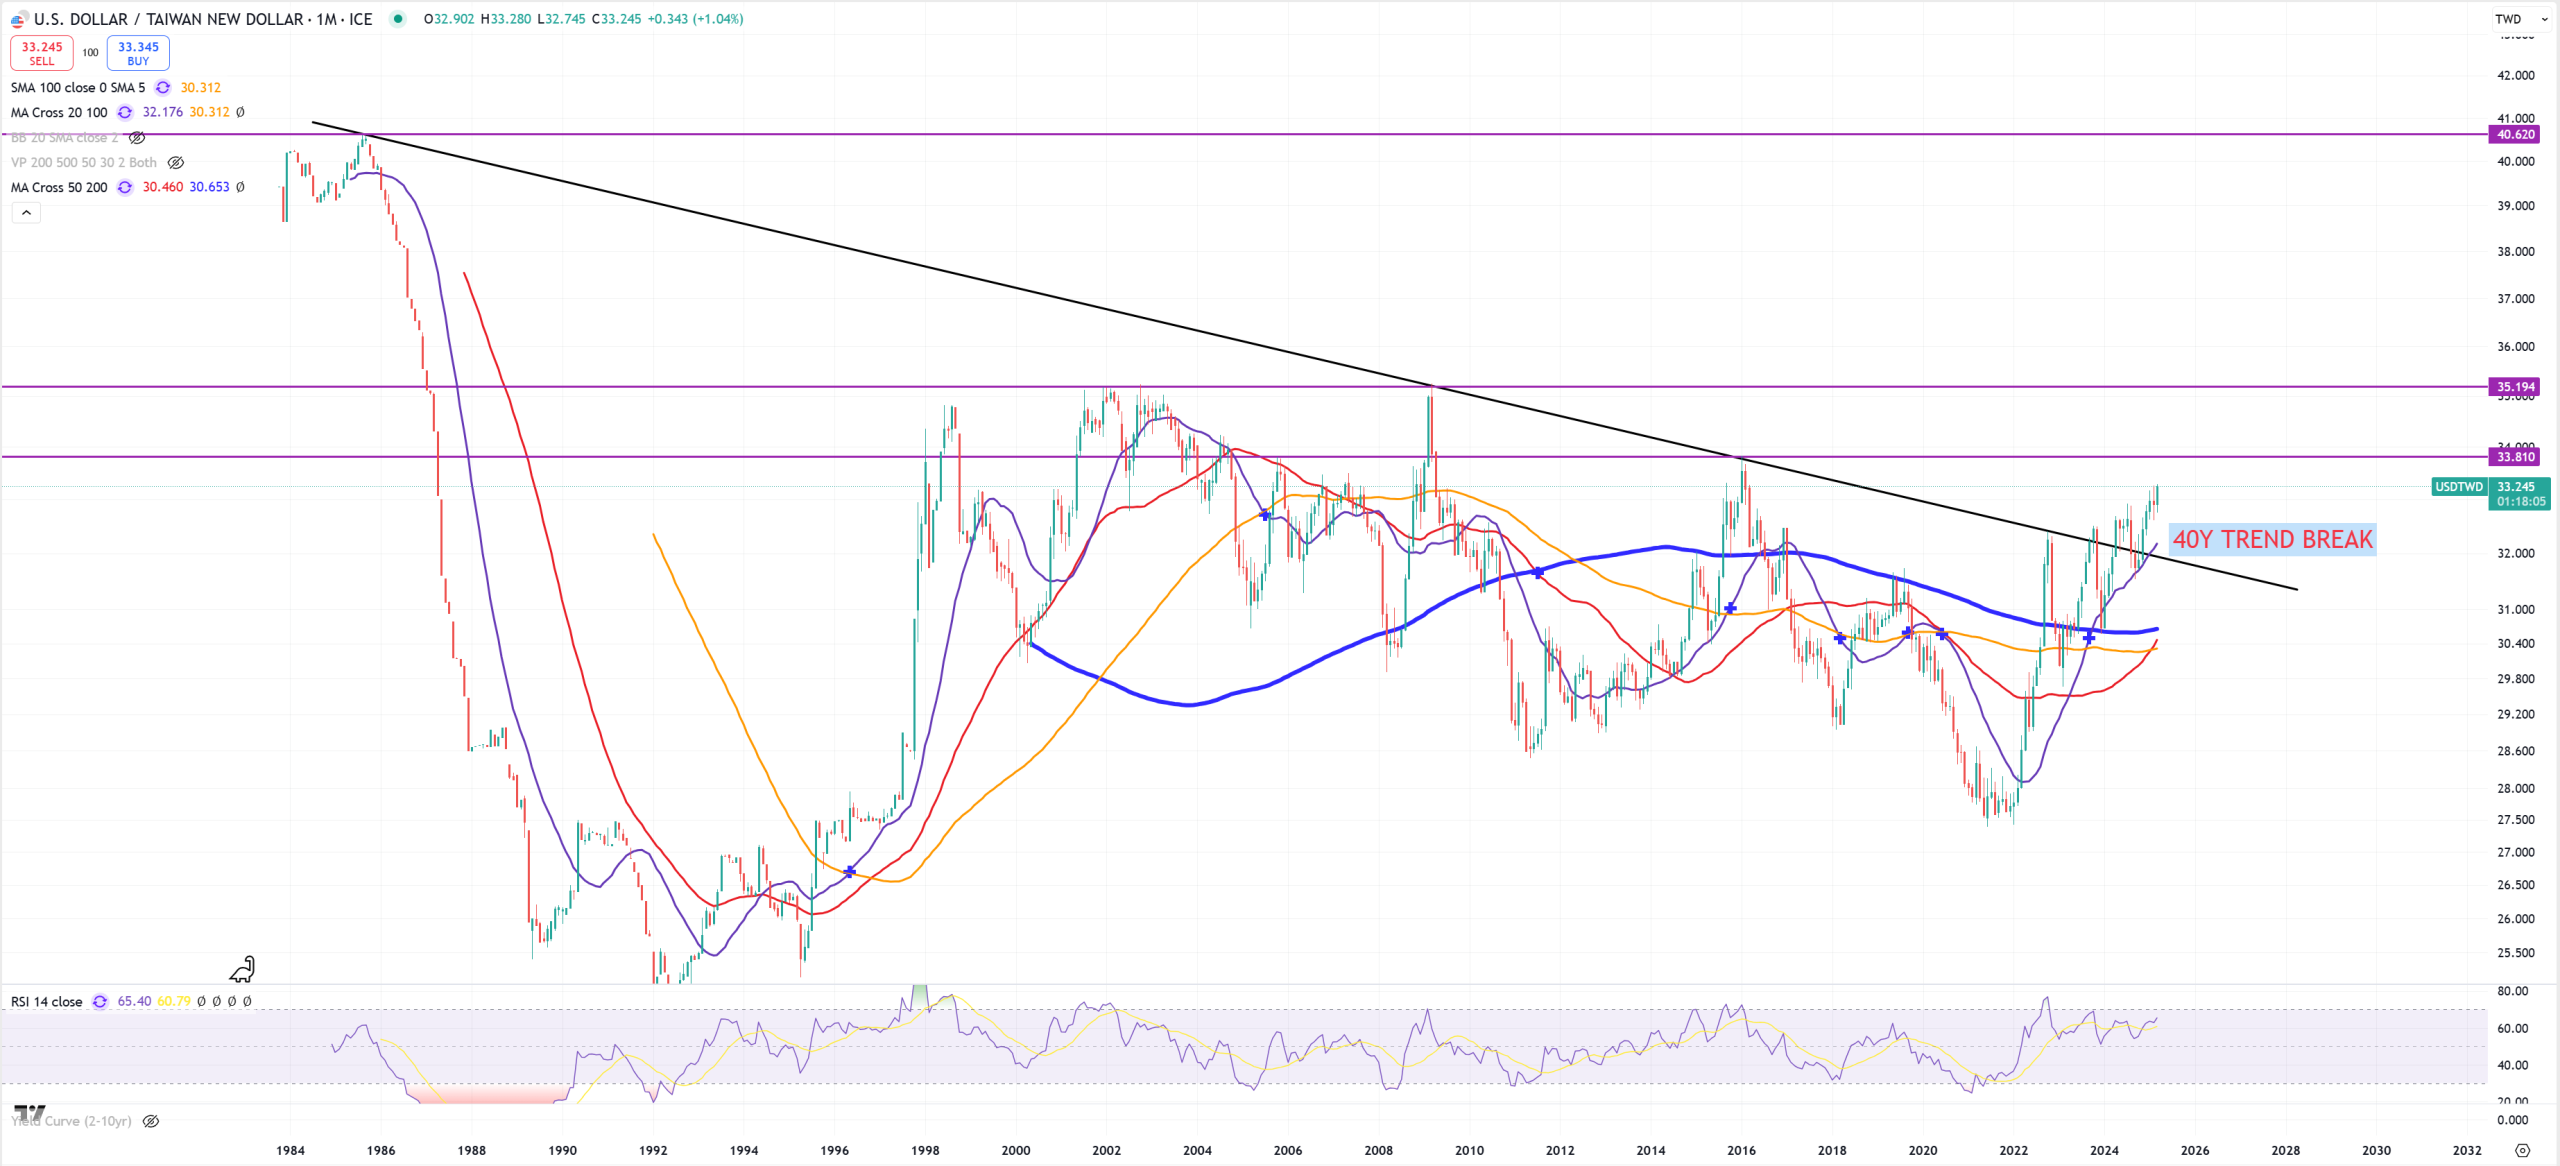
USDTWD – Taiwan $ and huge break. I think once USDTWD broke the main trend = SOX peaked
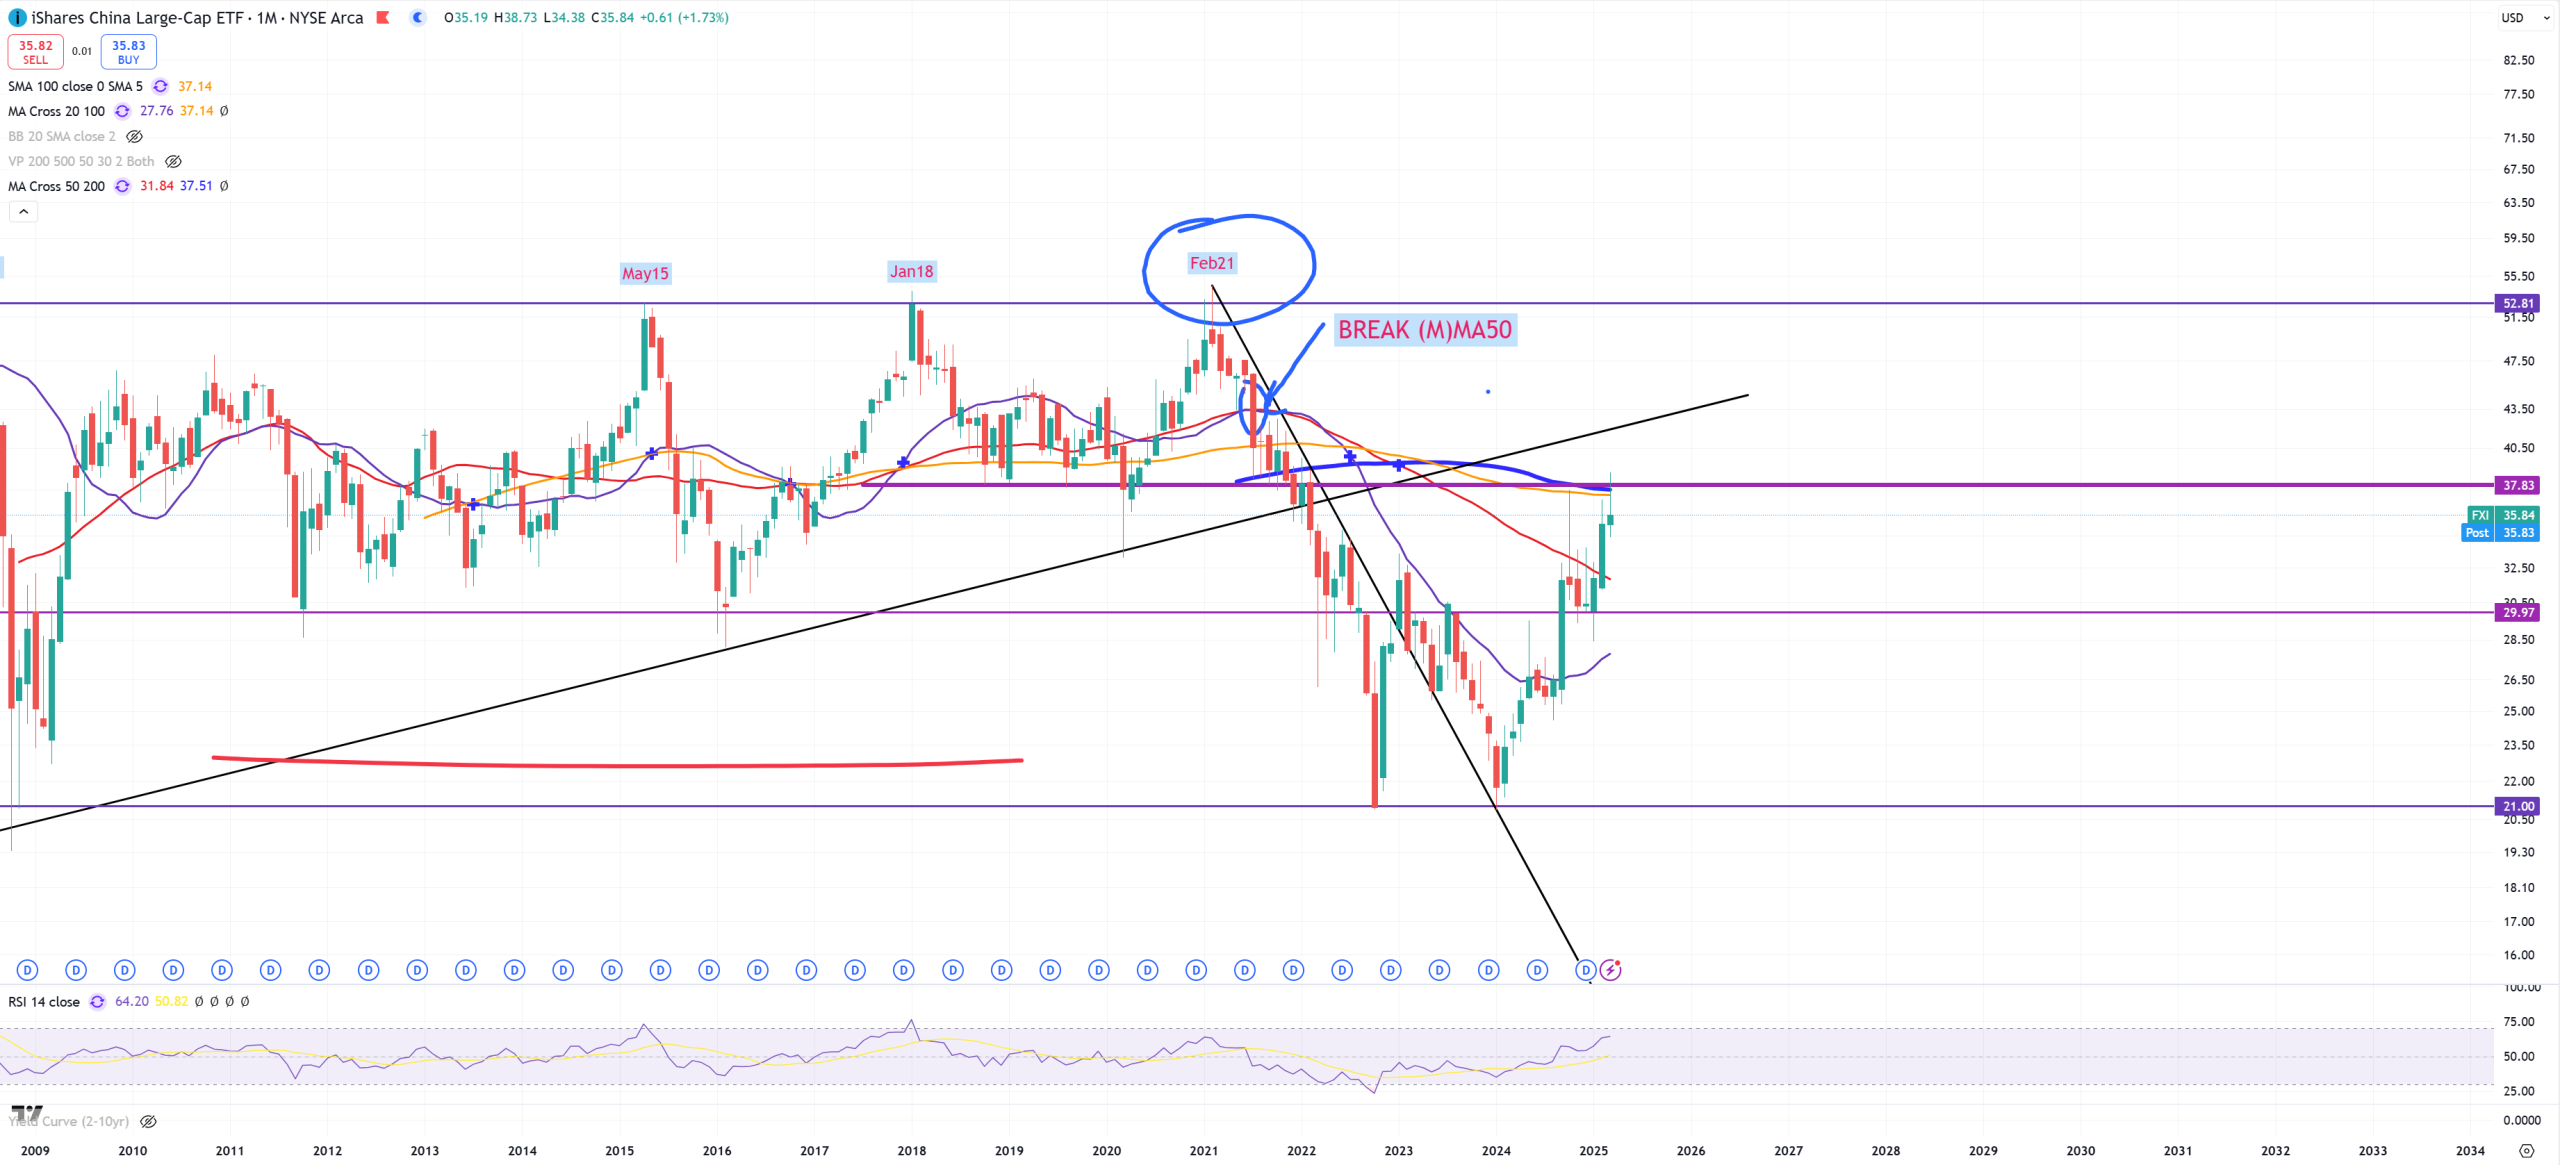
FXI – China and its (M)MA200 secular bear market rejection
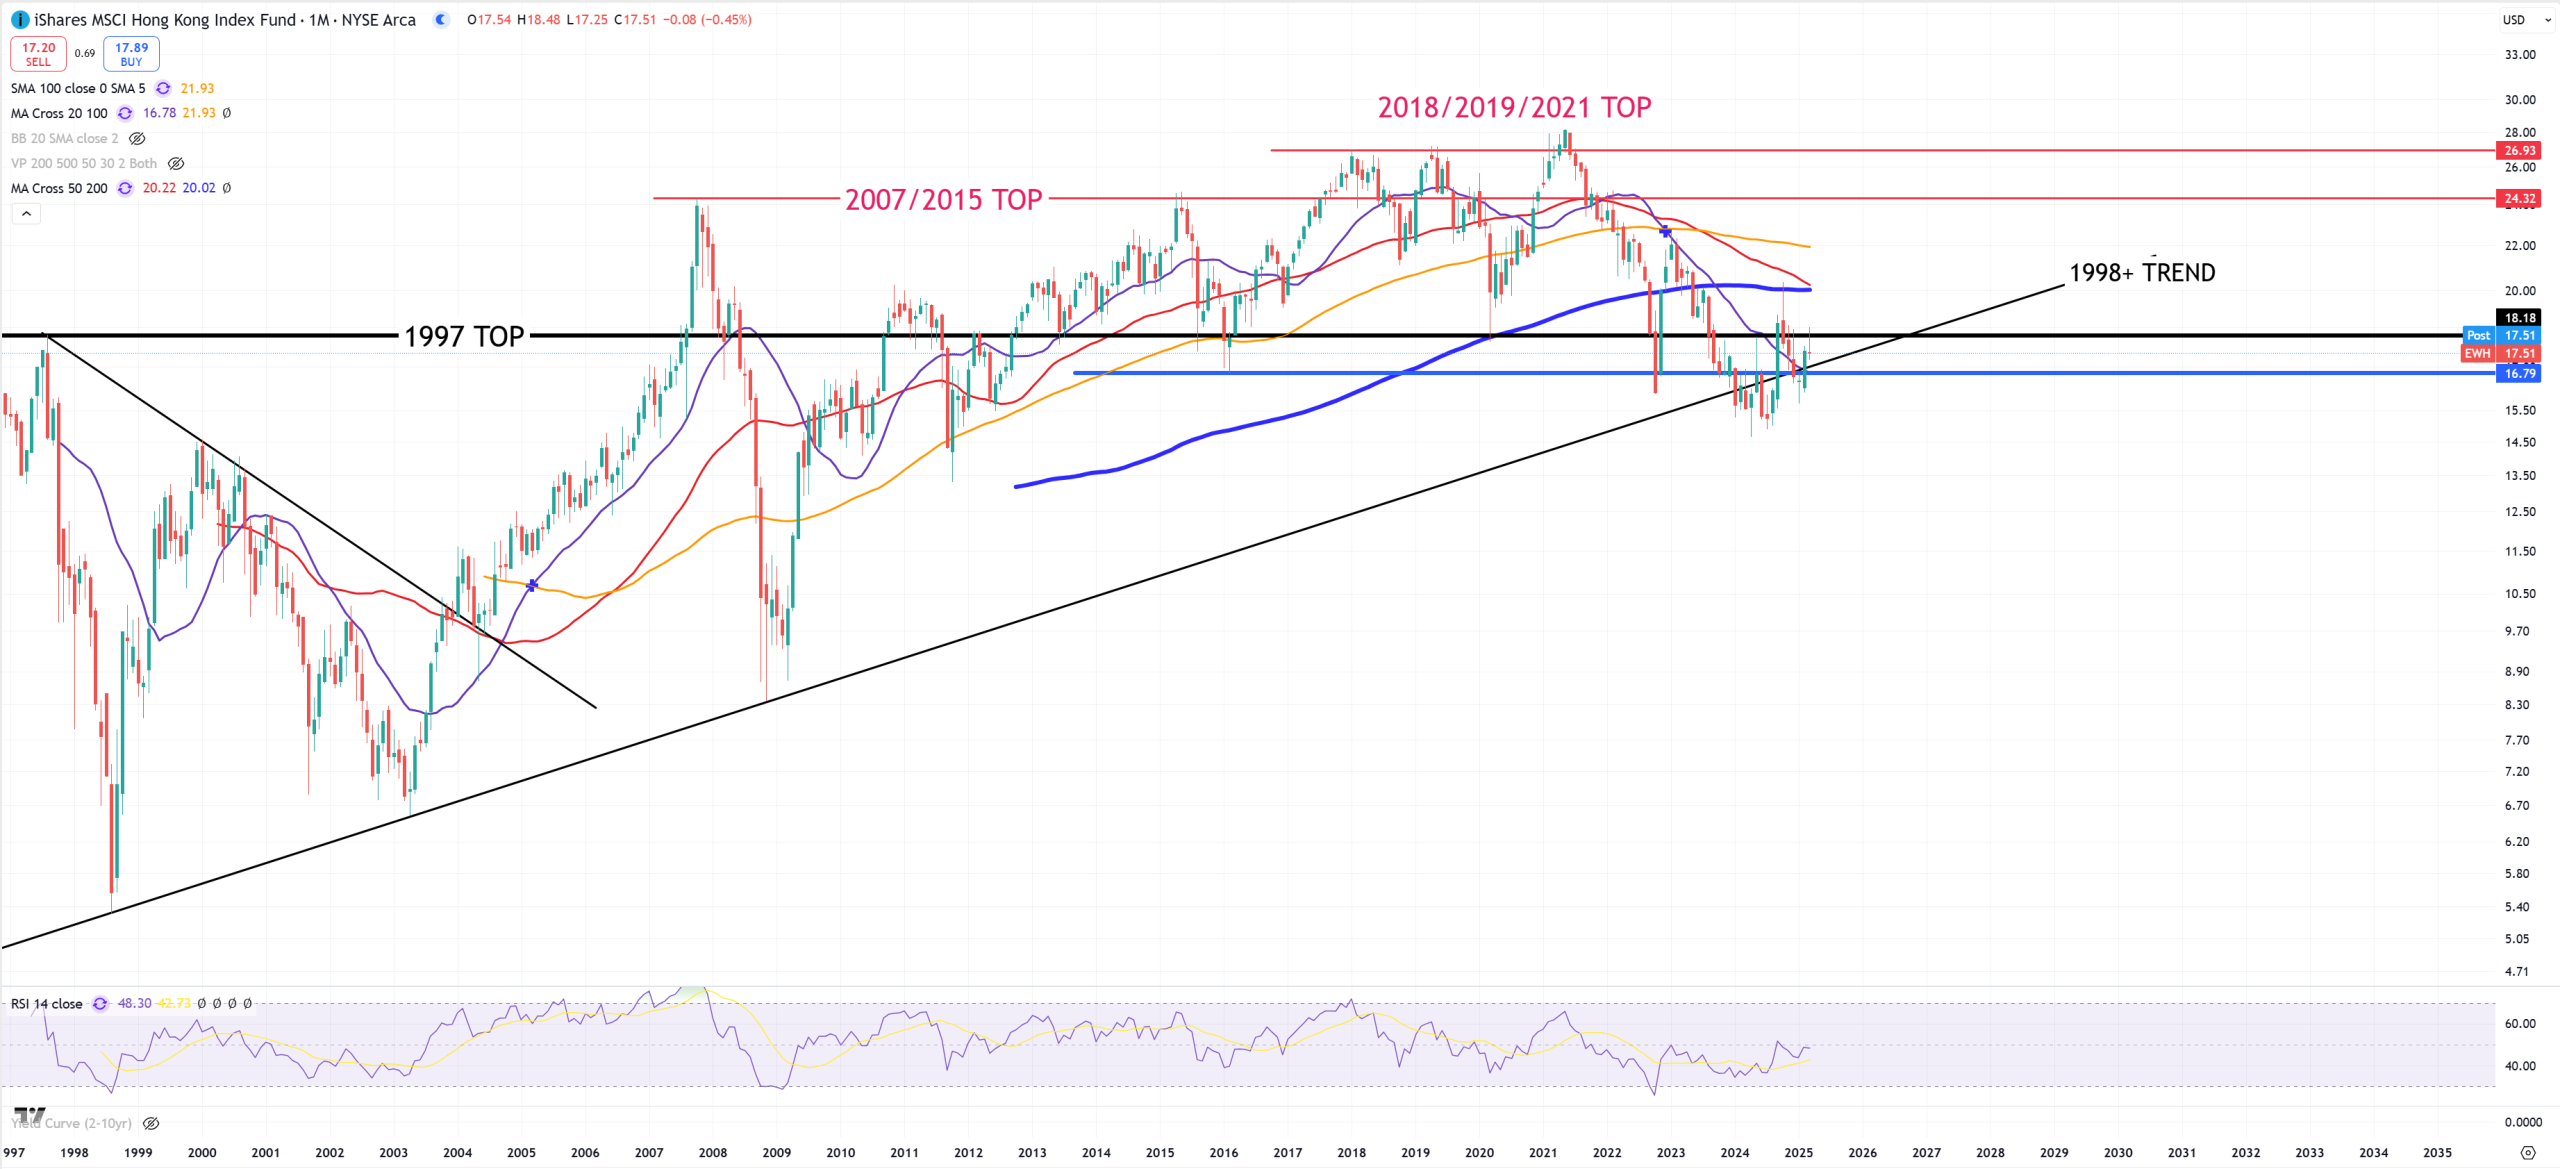
EWH – still fights against the main 1998+ TREND
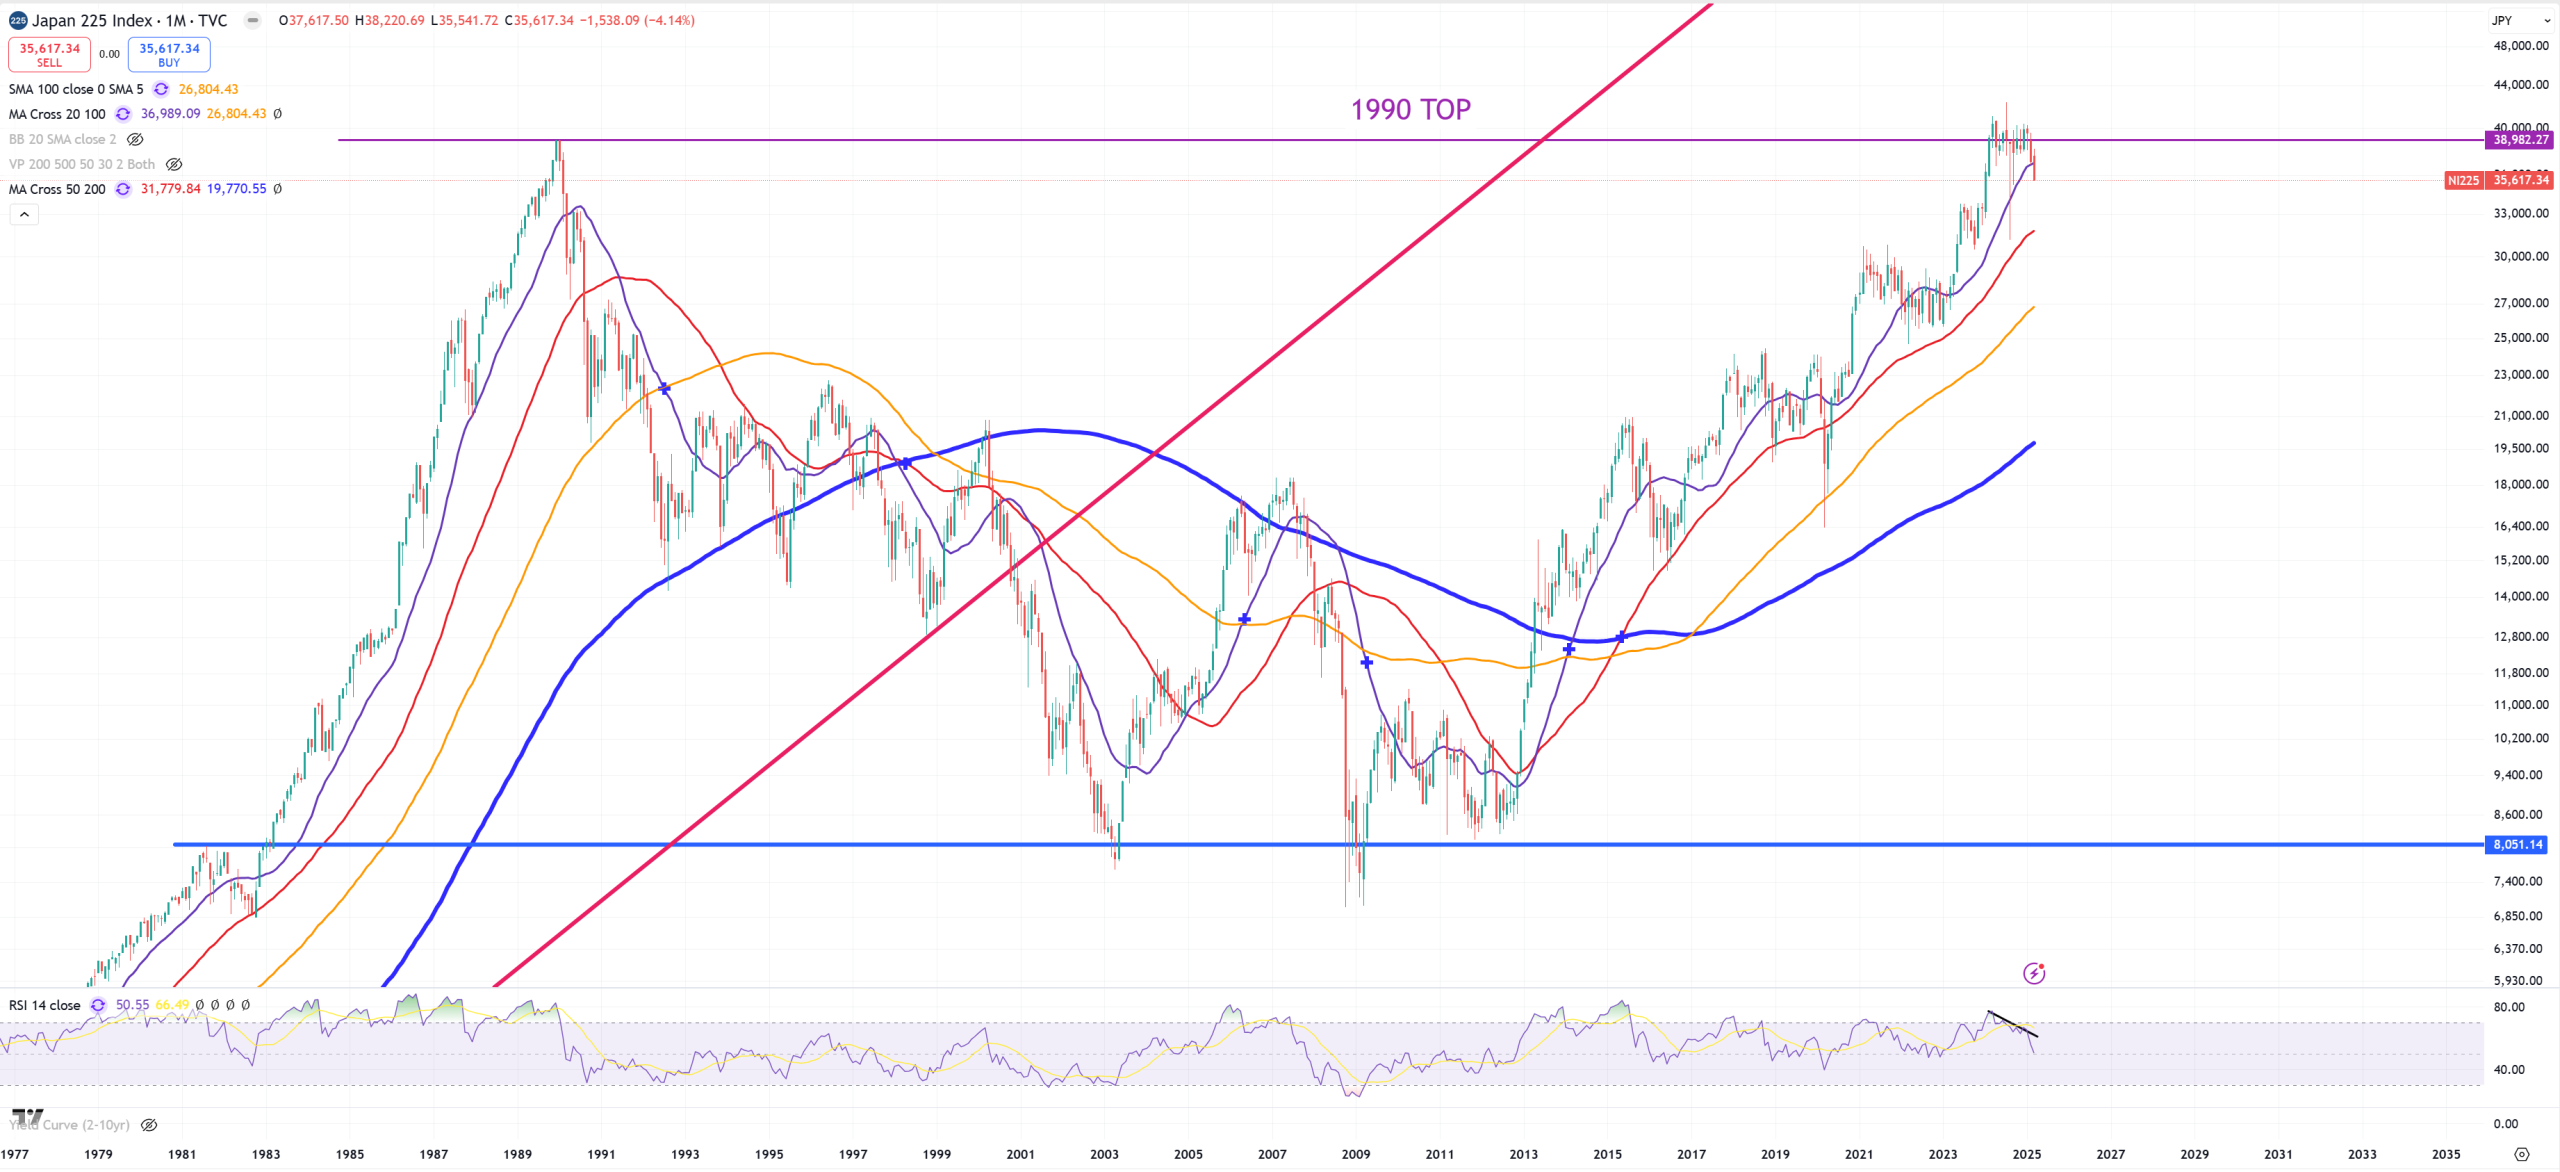
NIKKEI225 – big DOUBLE-TOP, (M)MA20 broken
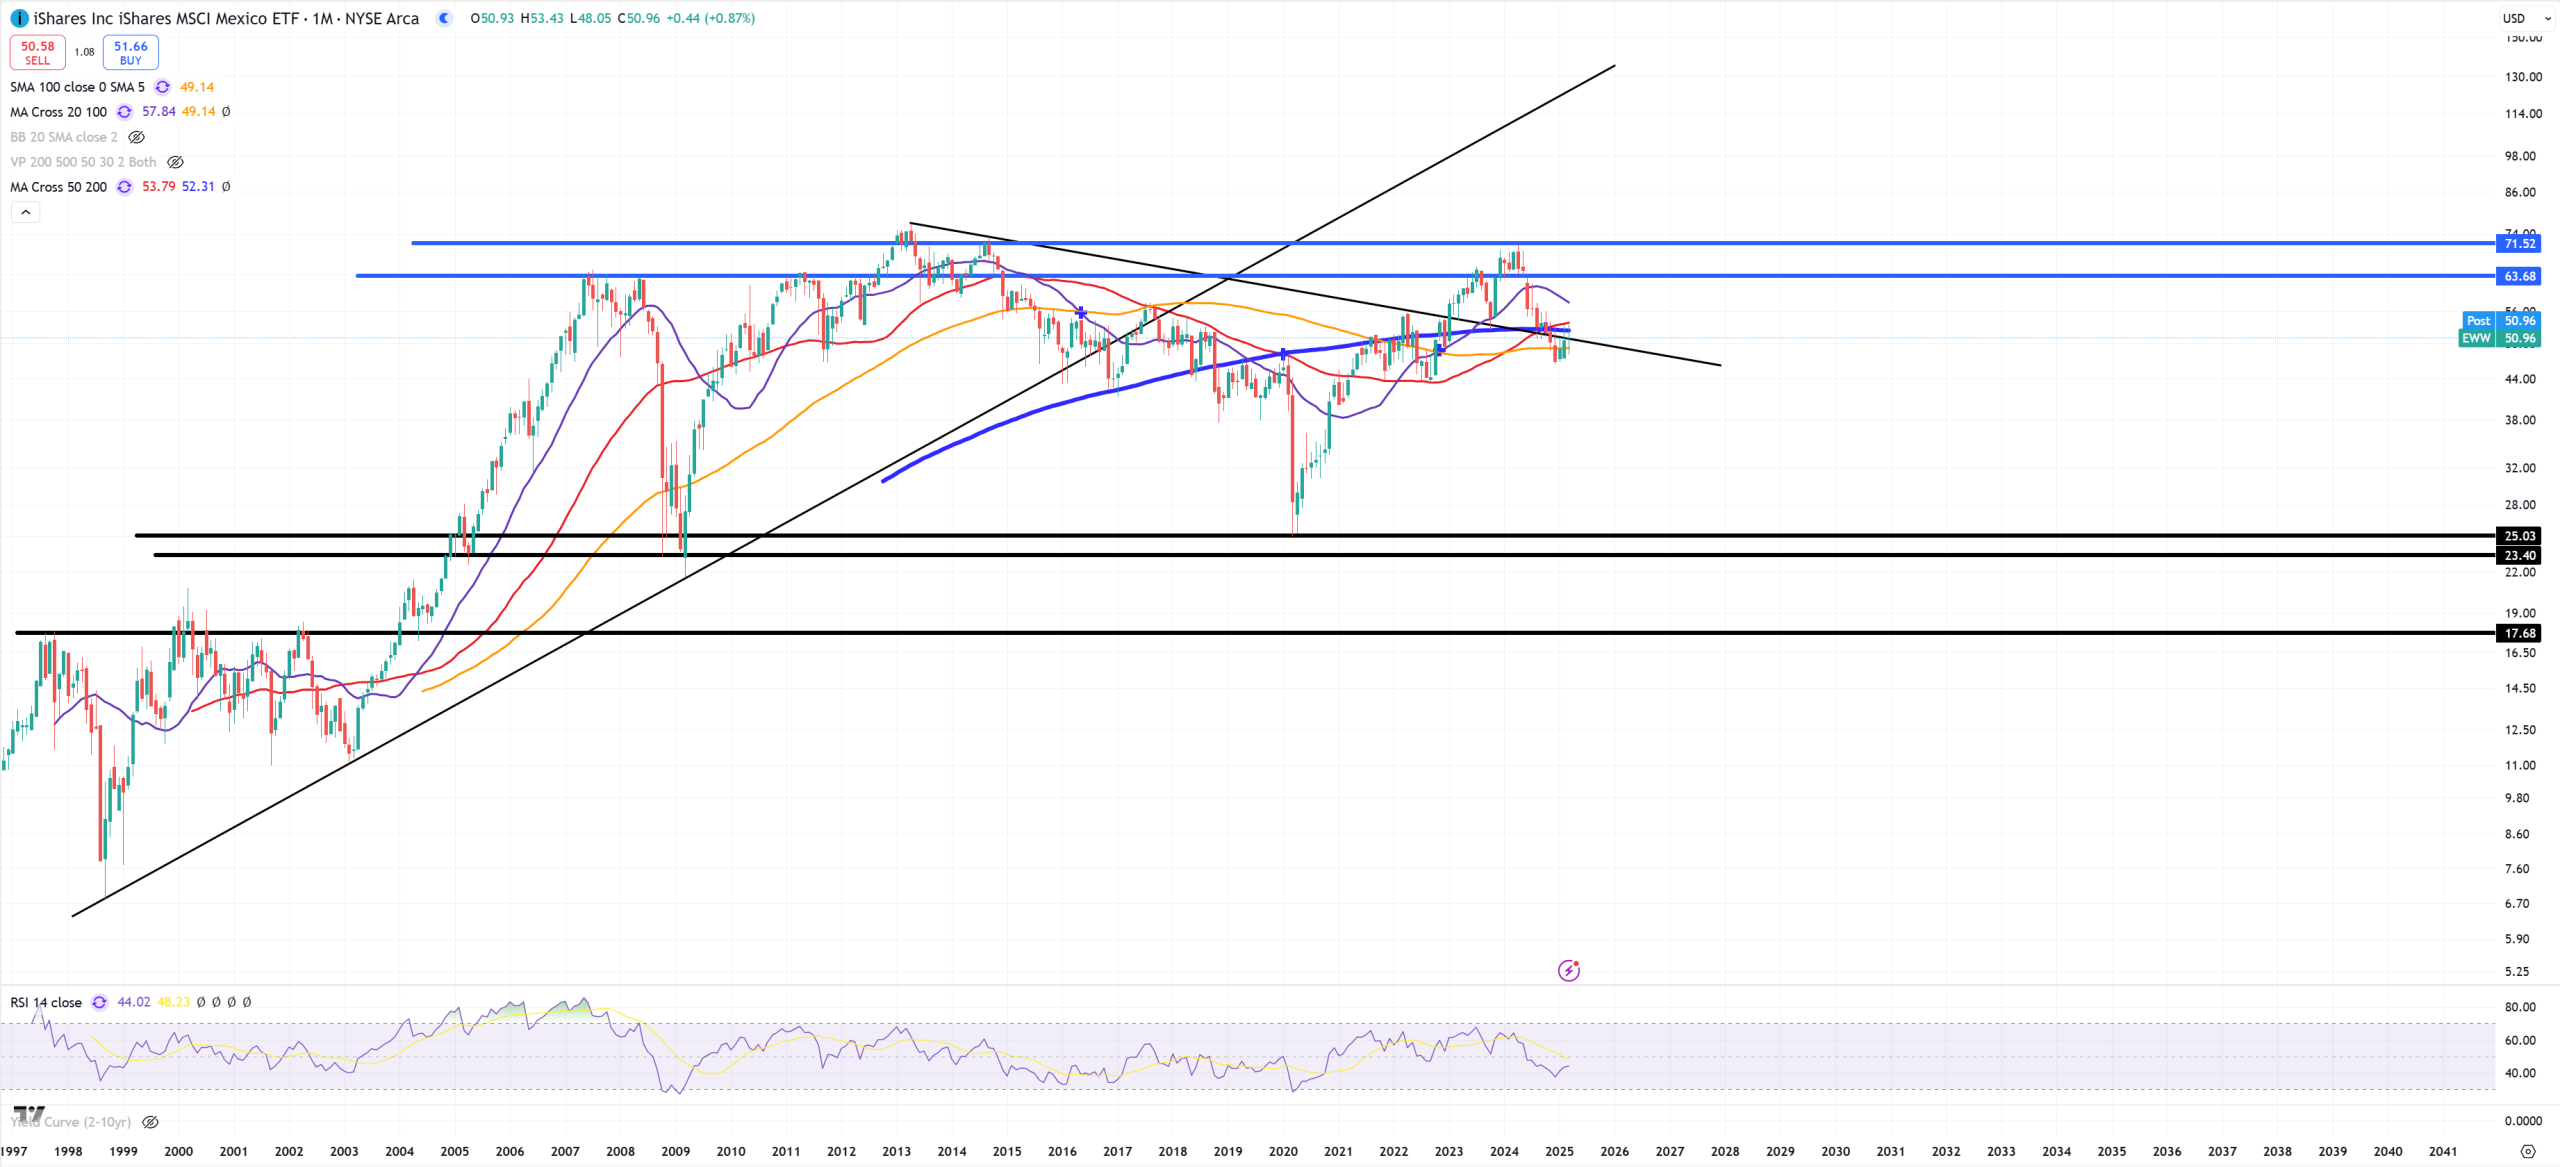
EWW – Mexico – no need to comment, on critical trend line, below key (M)MA50/(M)MA200
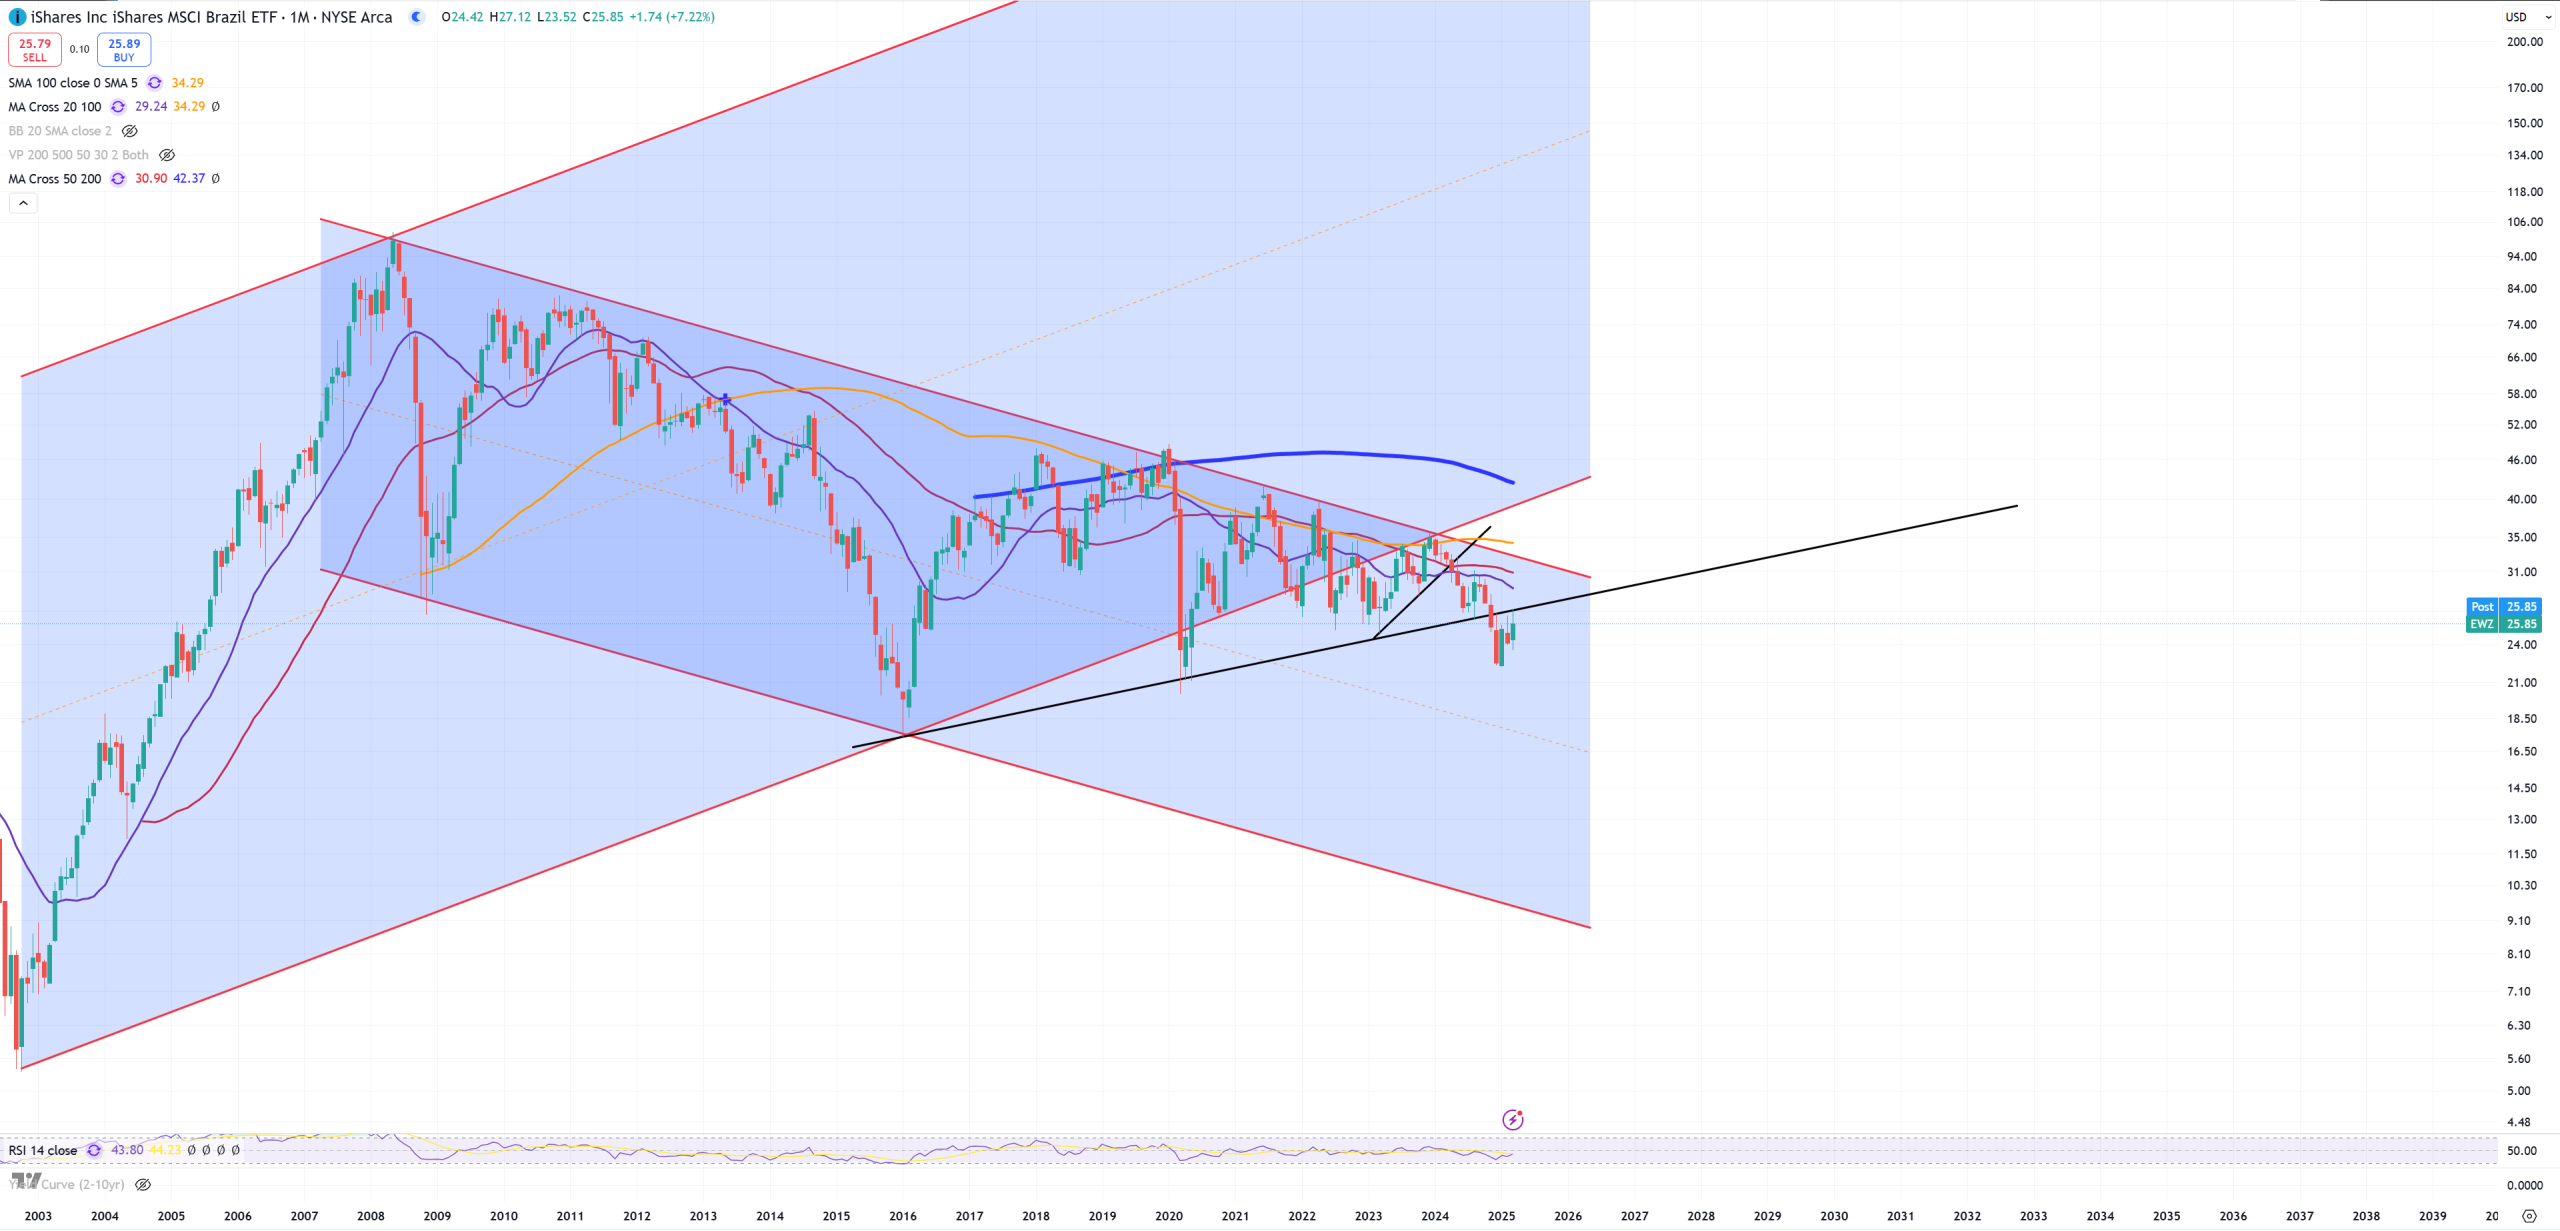
EWZ – Brazil – RETEST
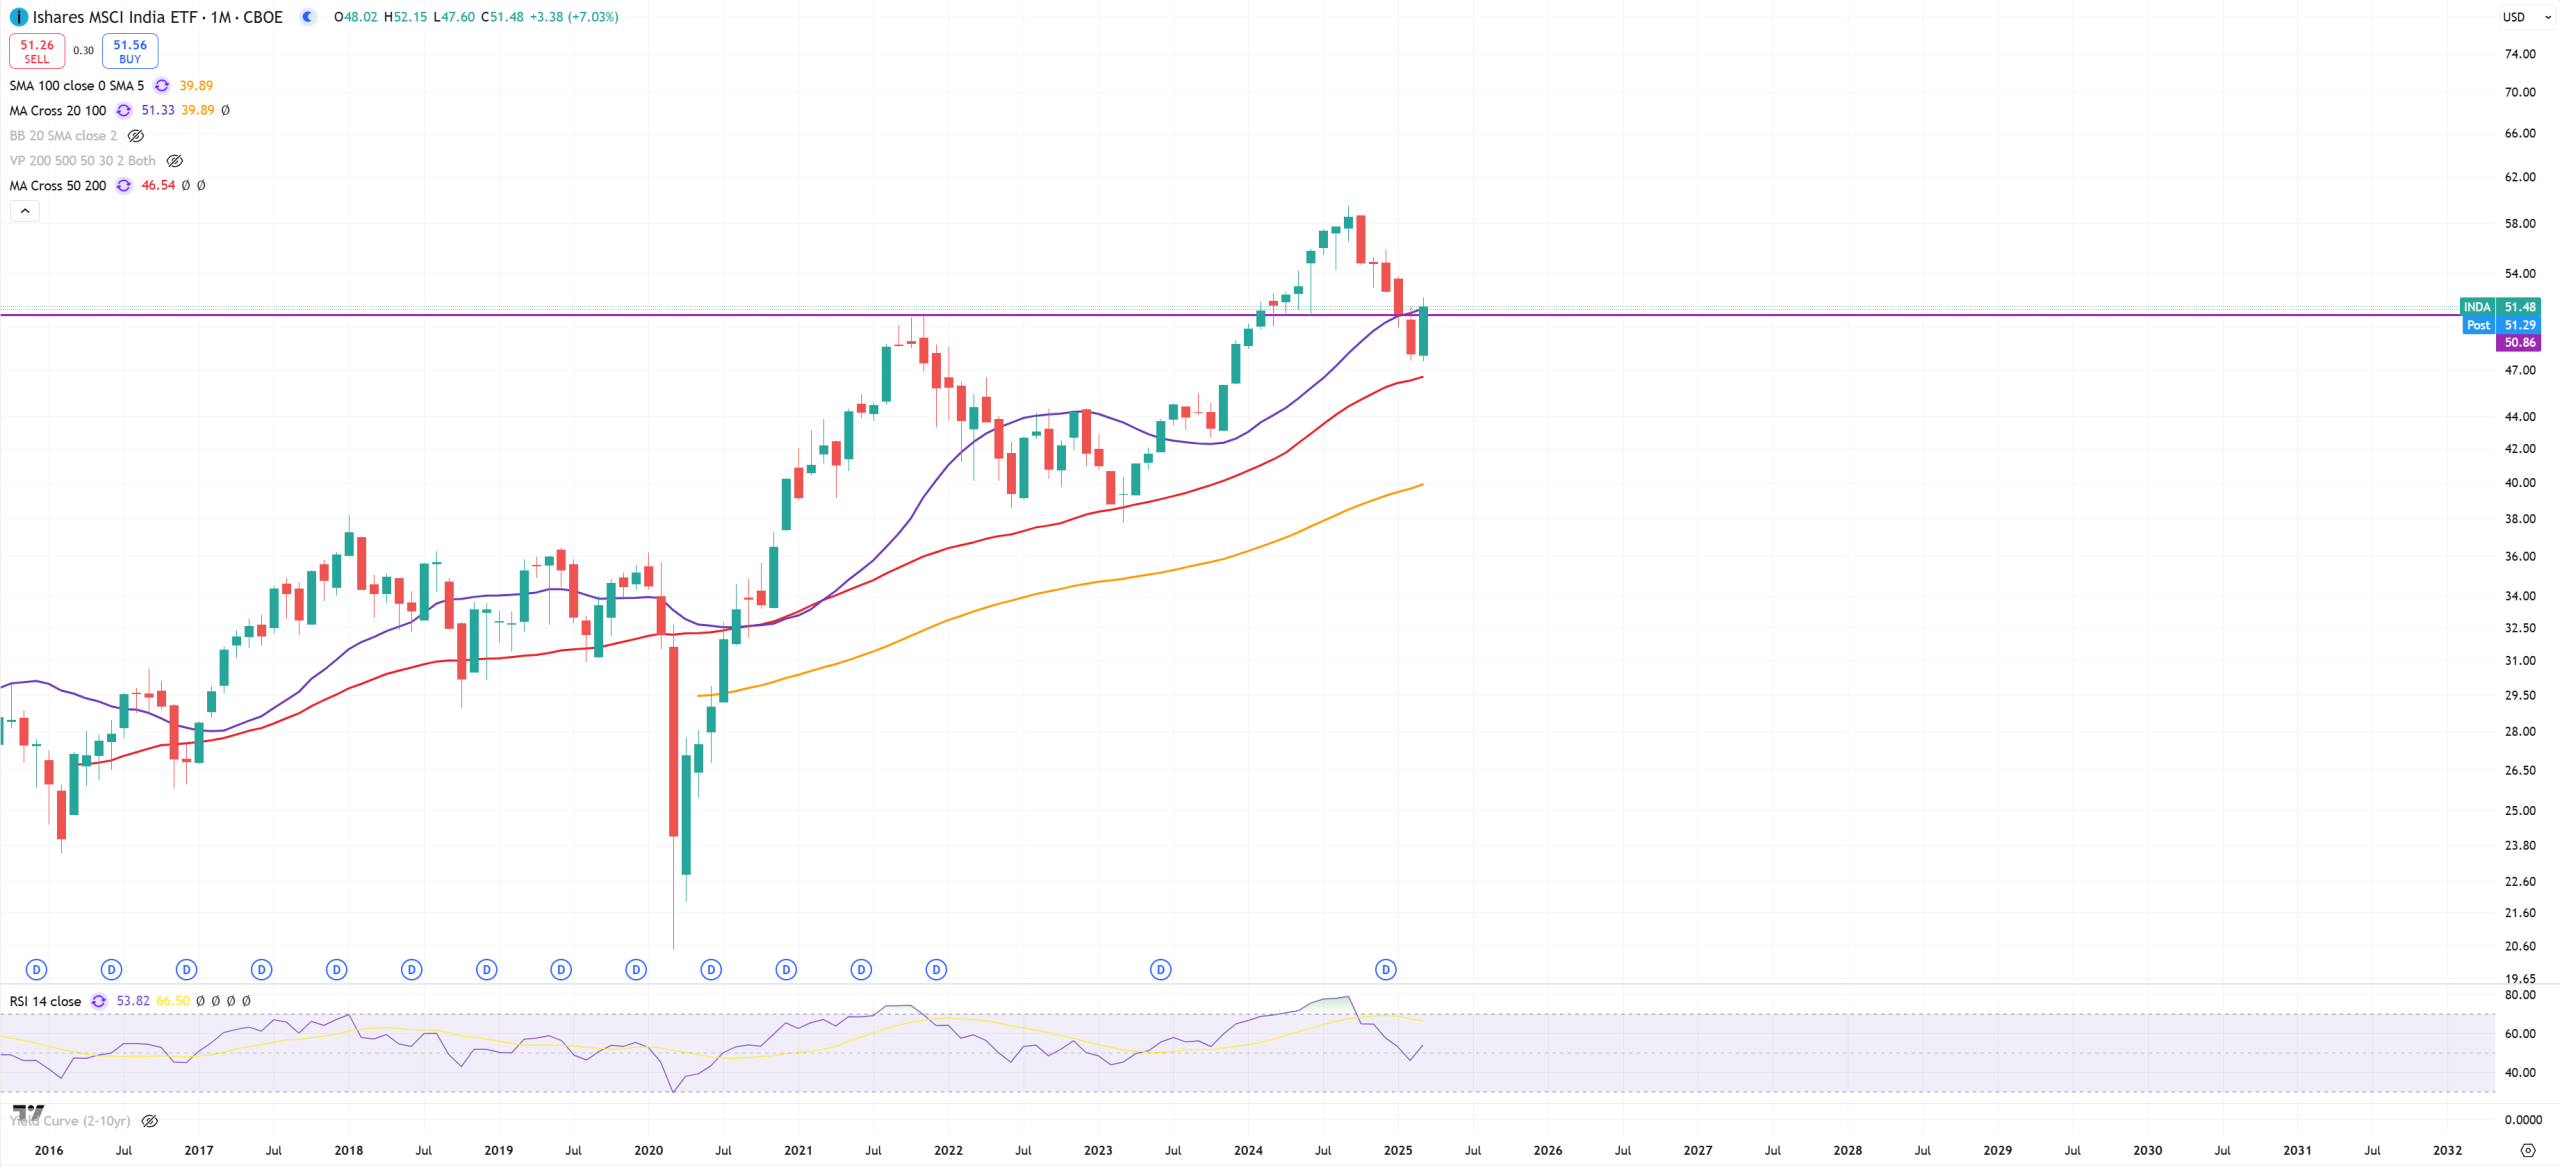
INDA – India – still fighting
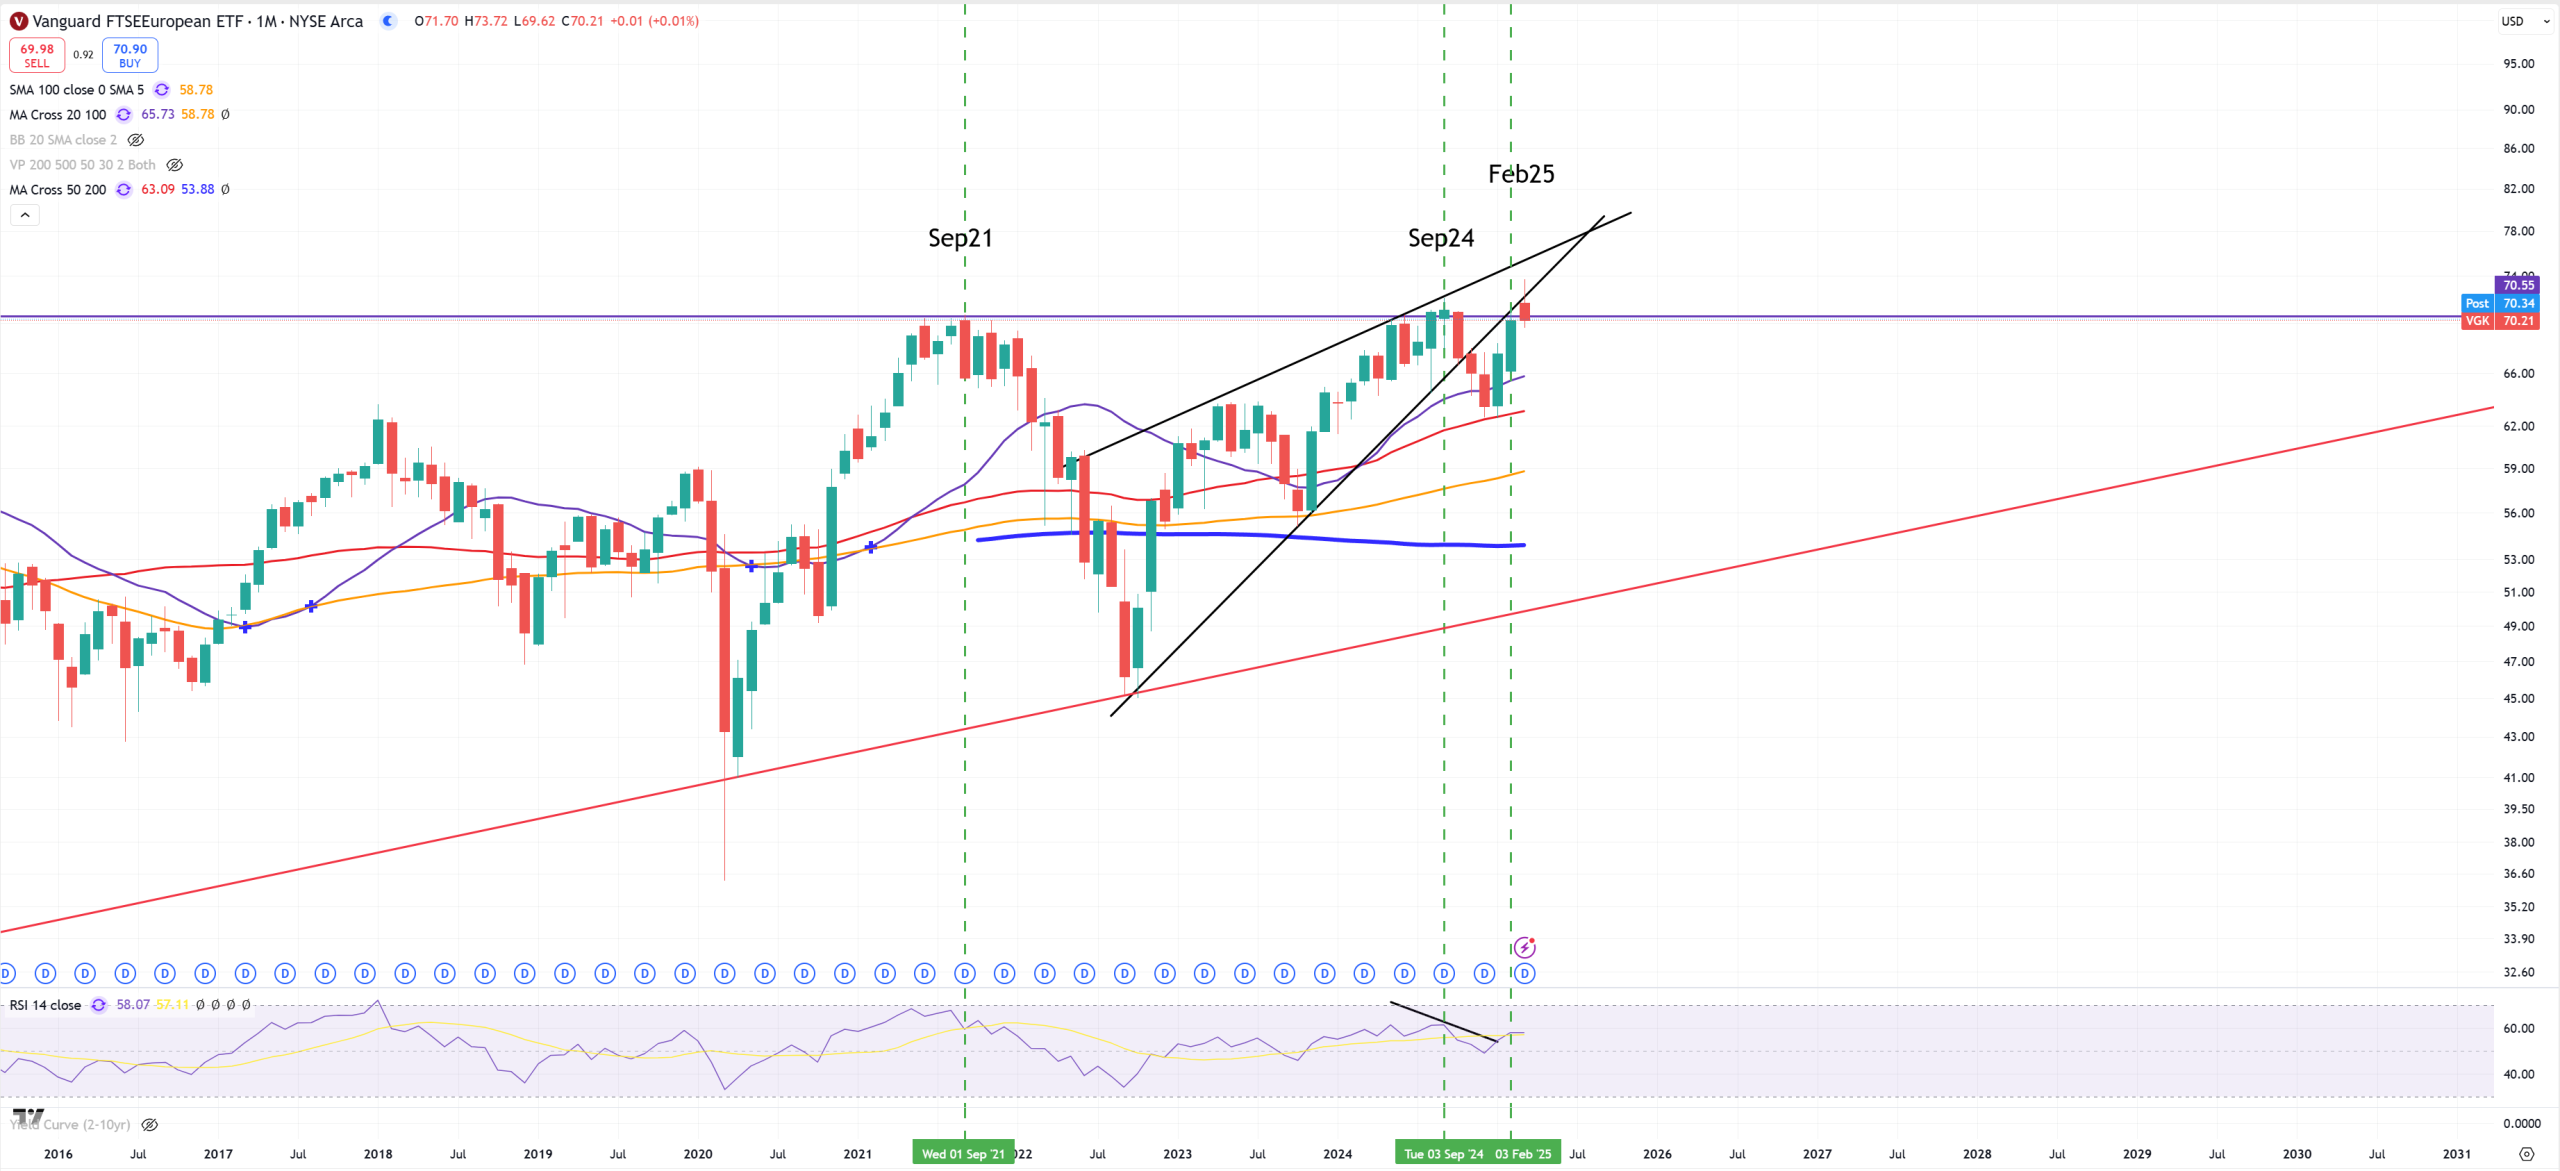
VGK – Europe – break-(M)MA50 bounce-retest
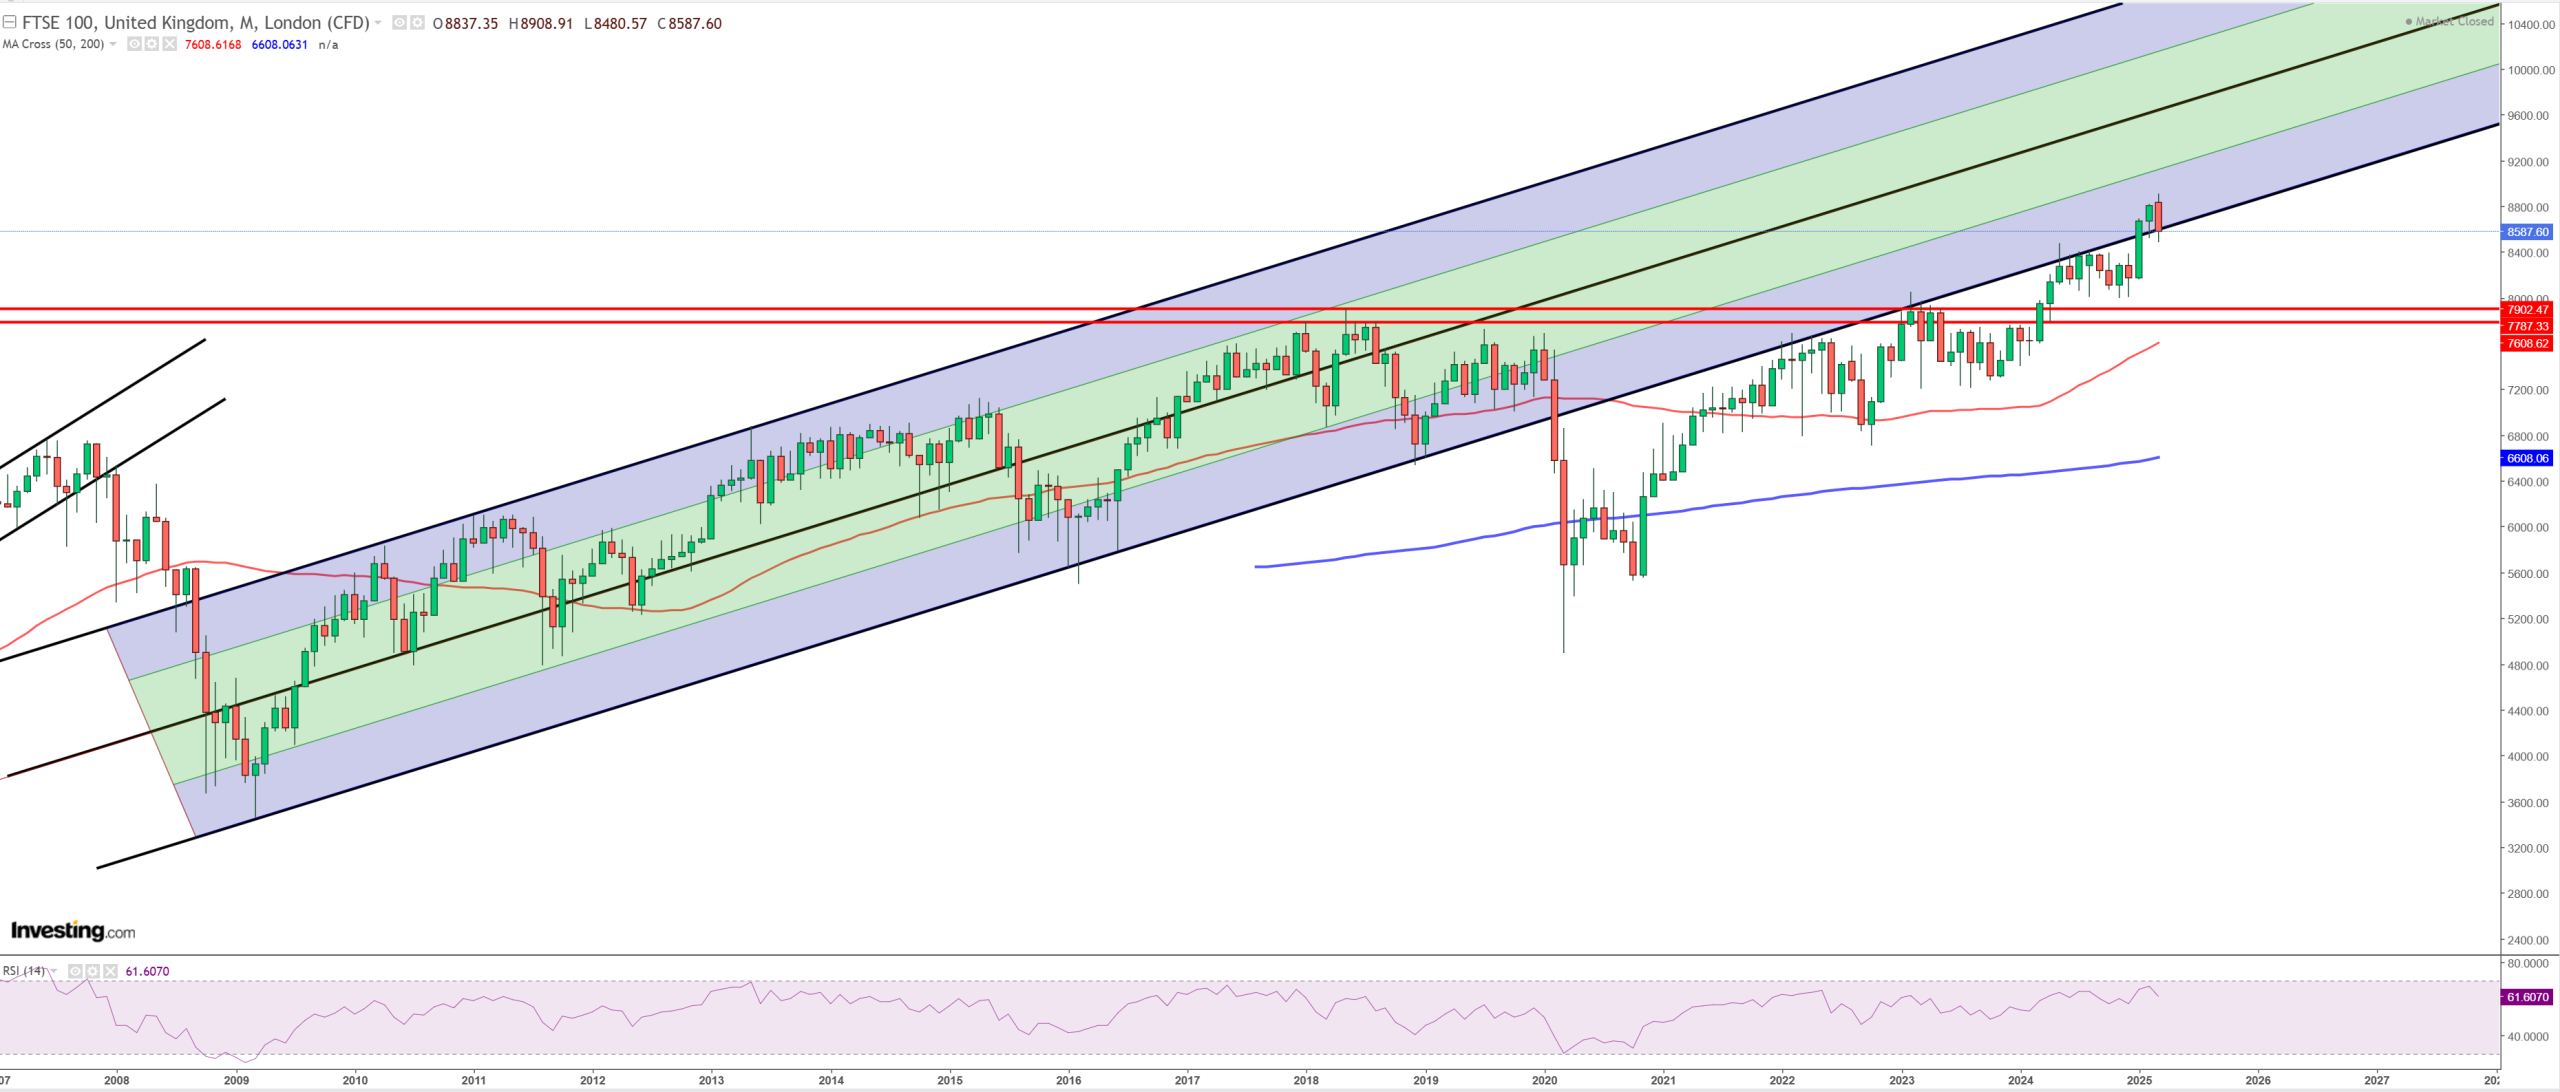
FTSE100 – UK probably failed to close above the channel. It’s been trying and trying
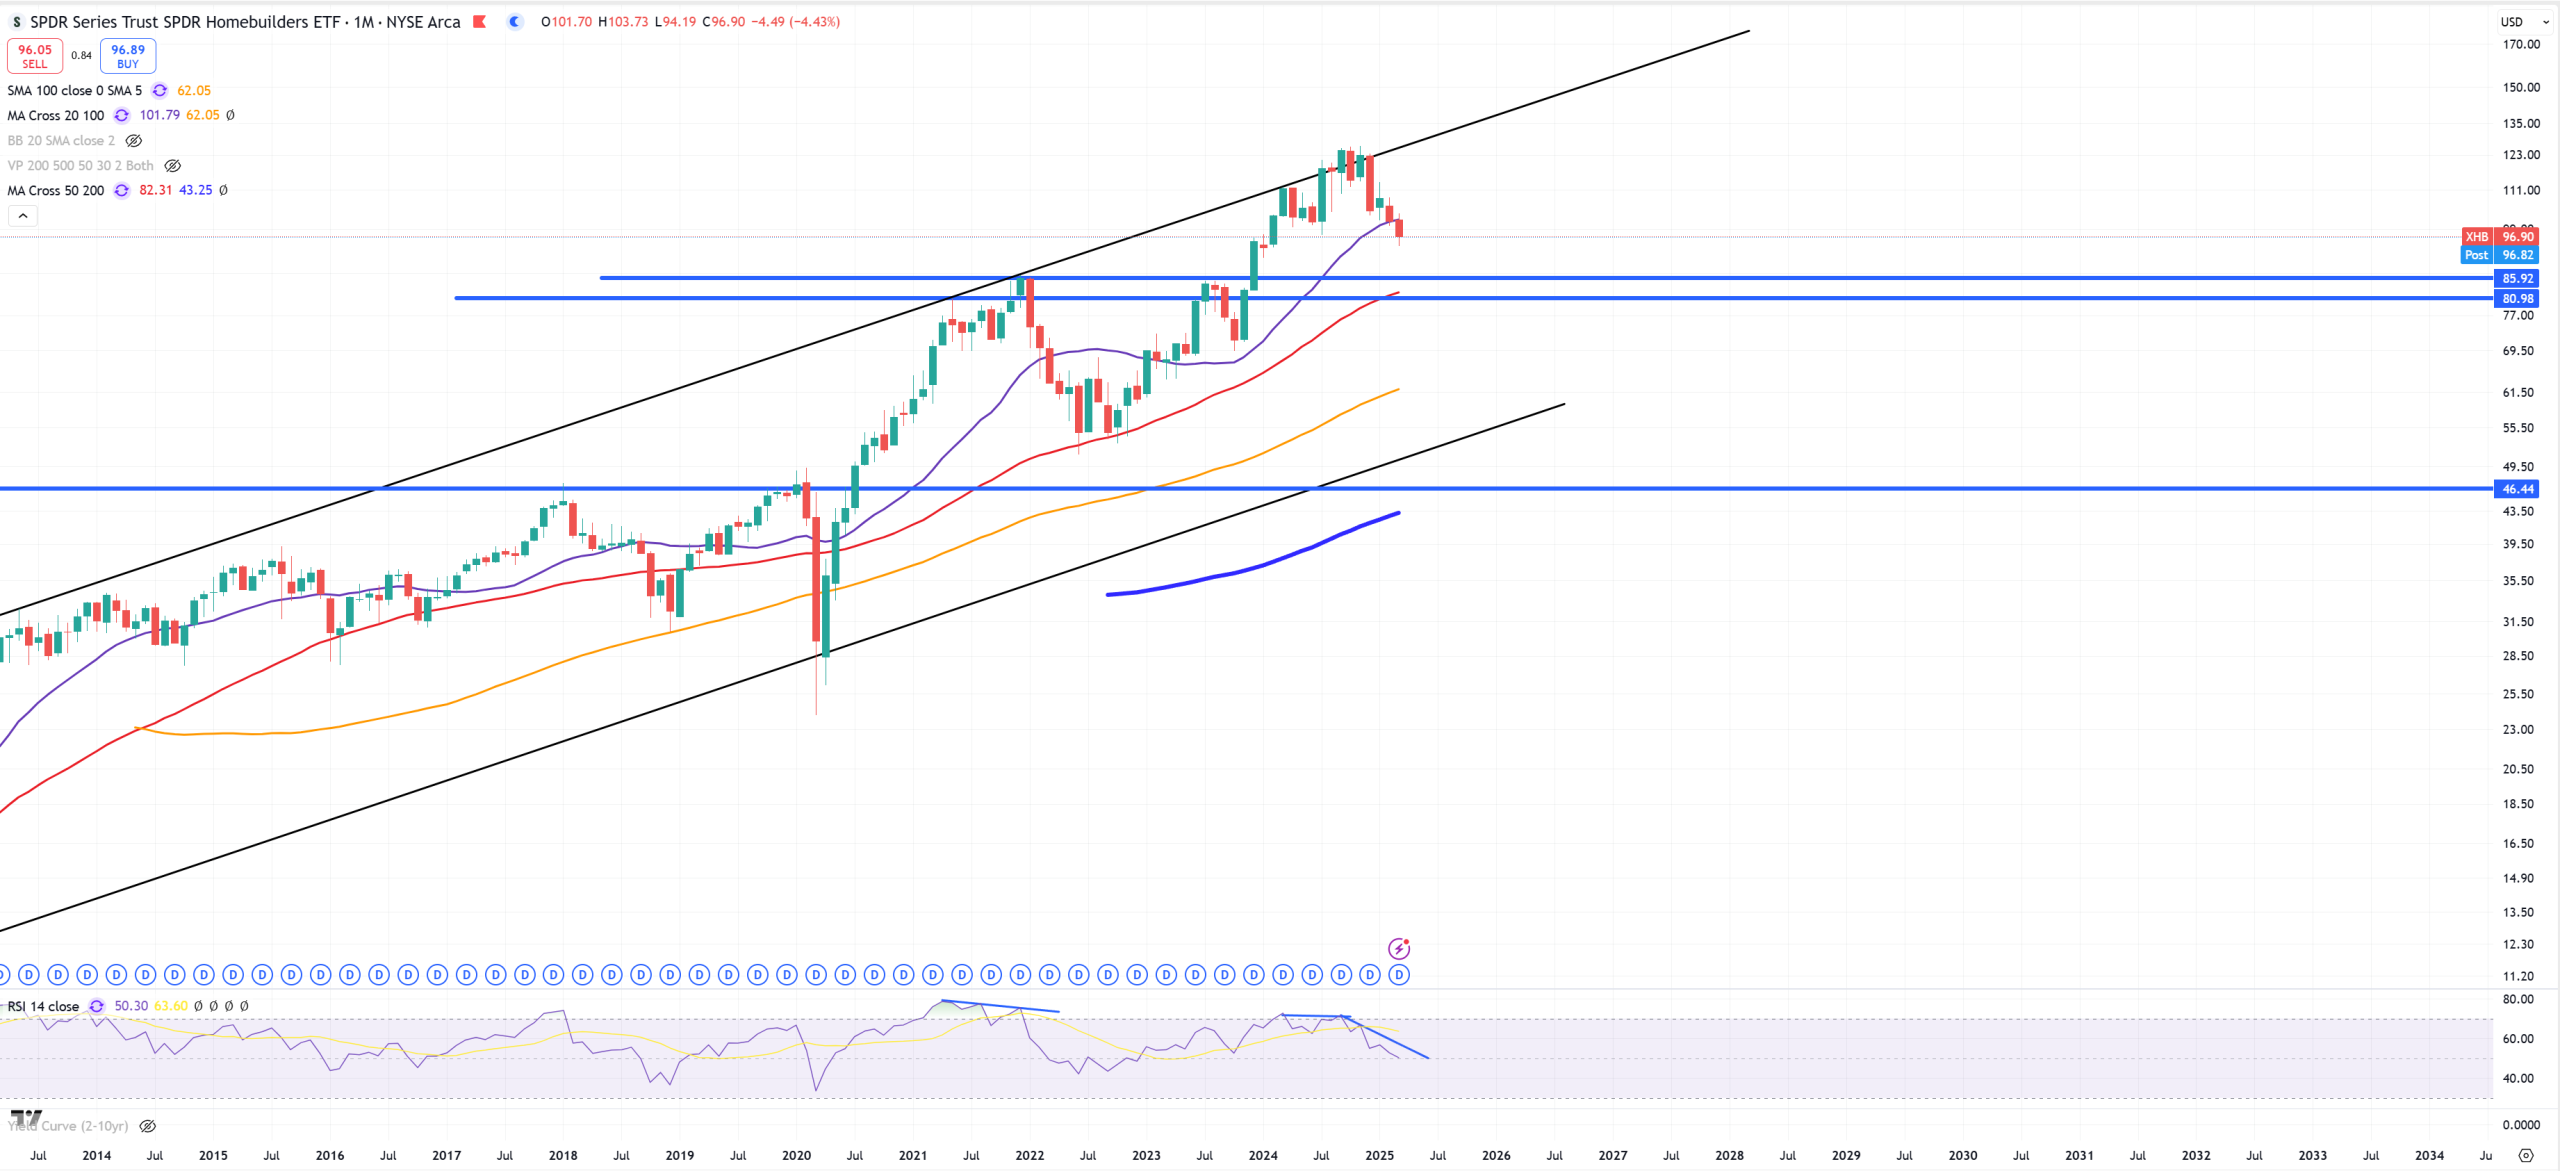
XHB – Homebuilders and its channel rejection
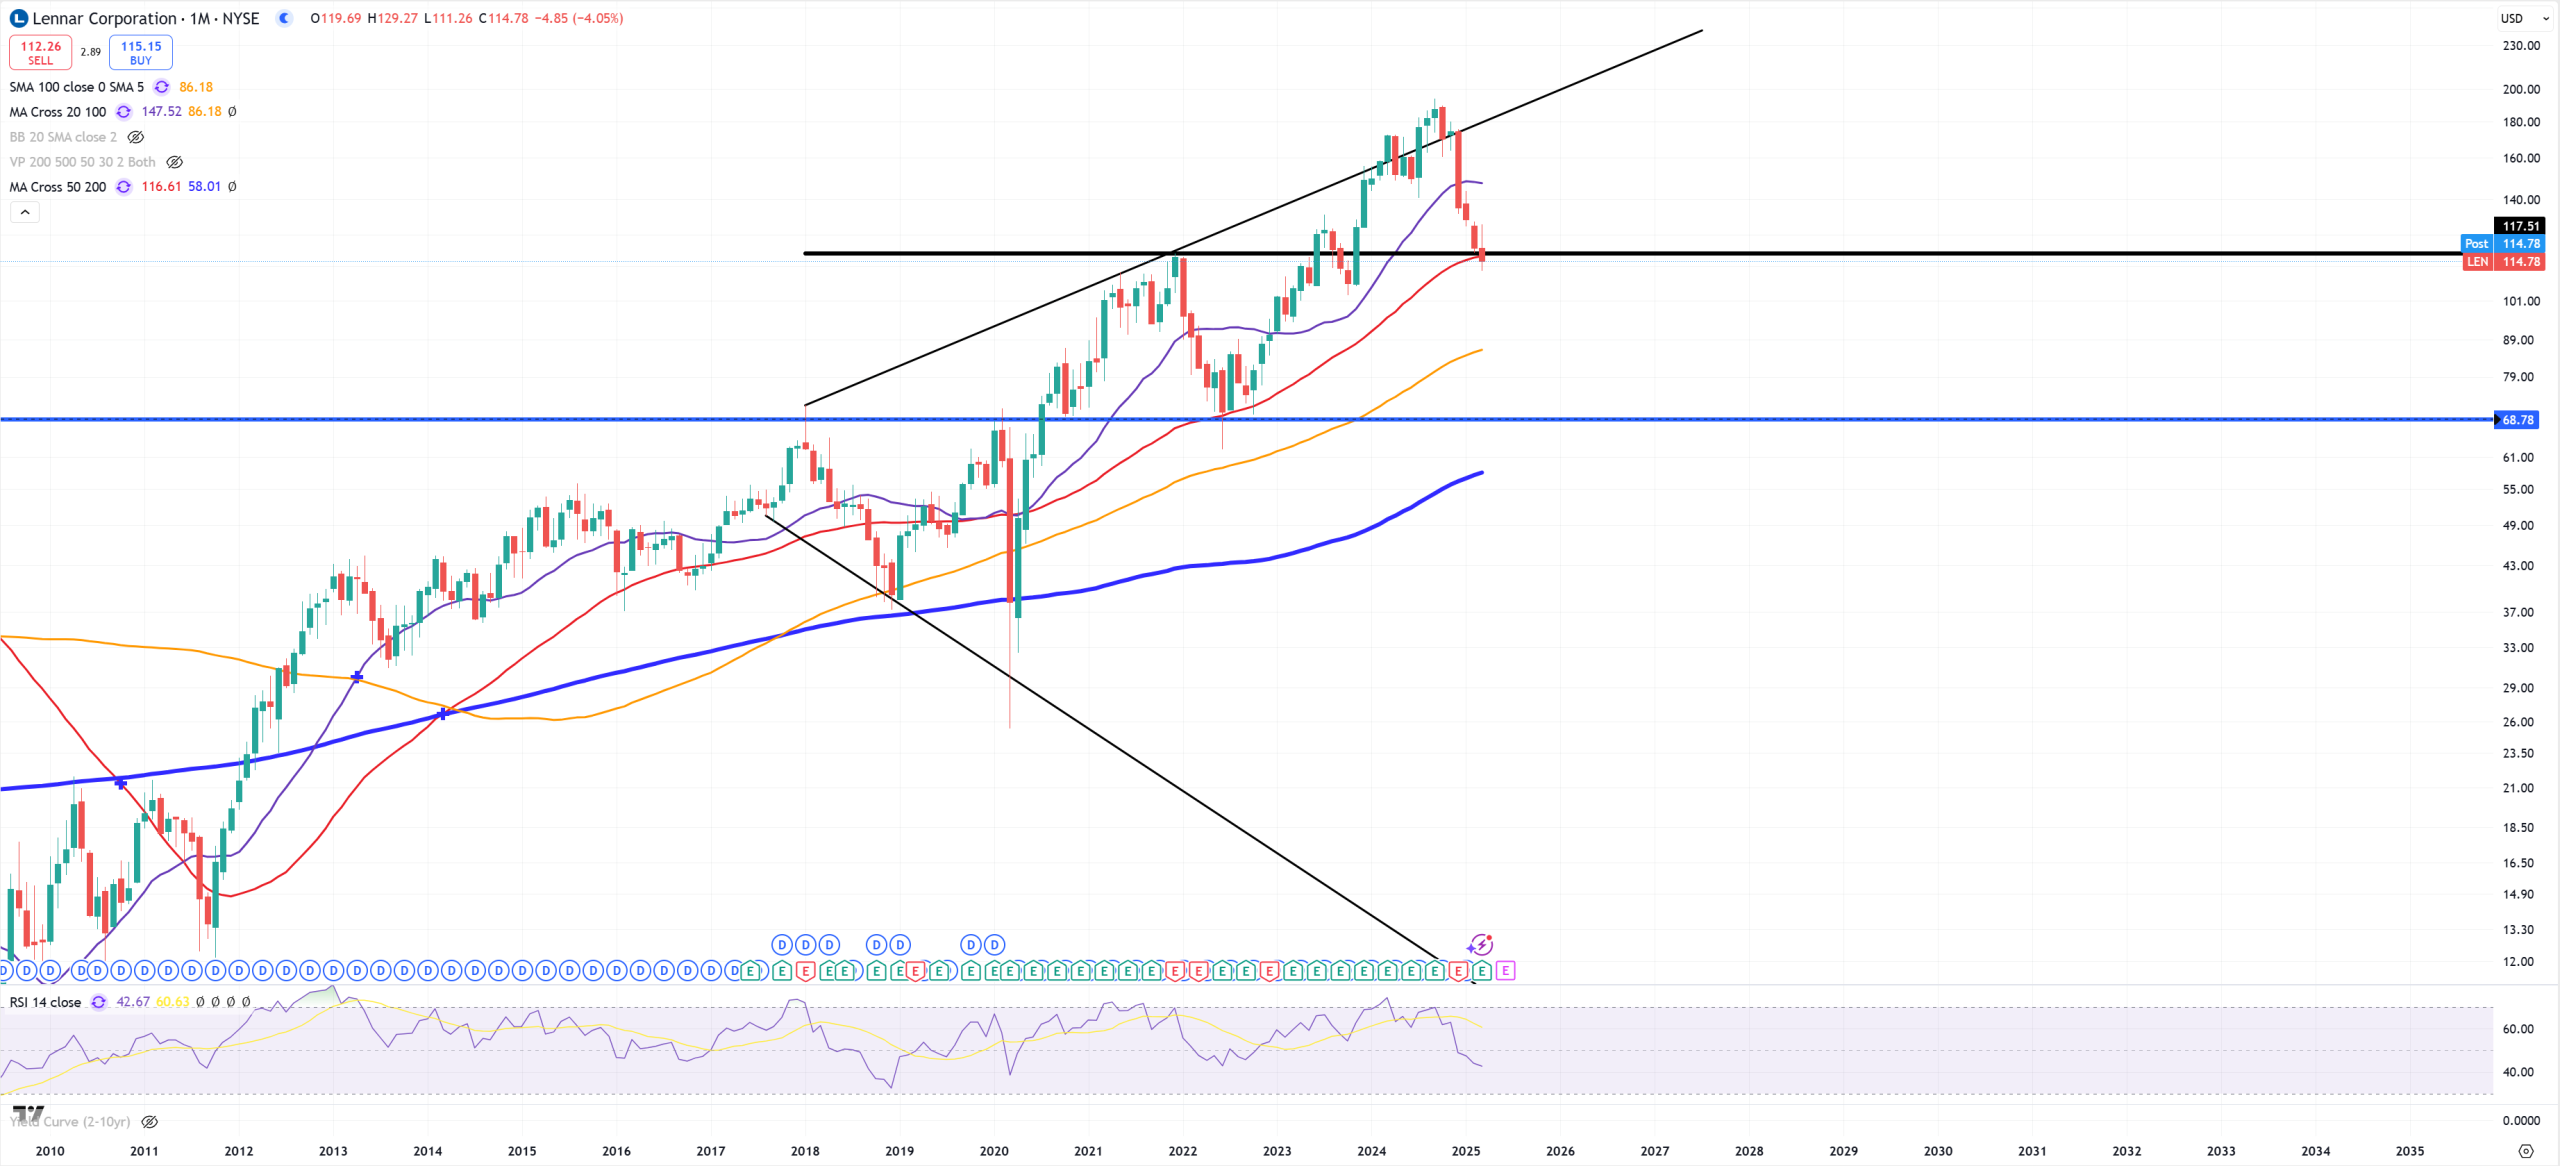
LEN – probably false spike
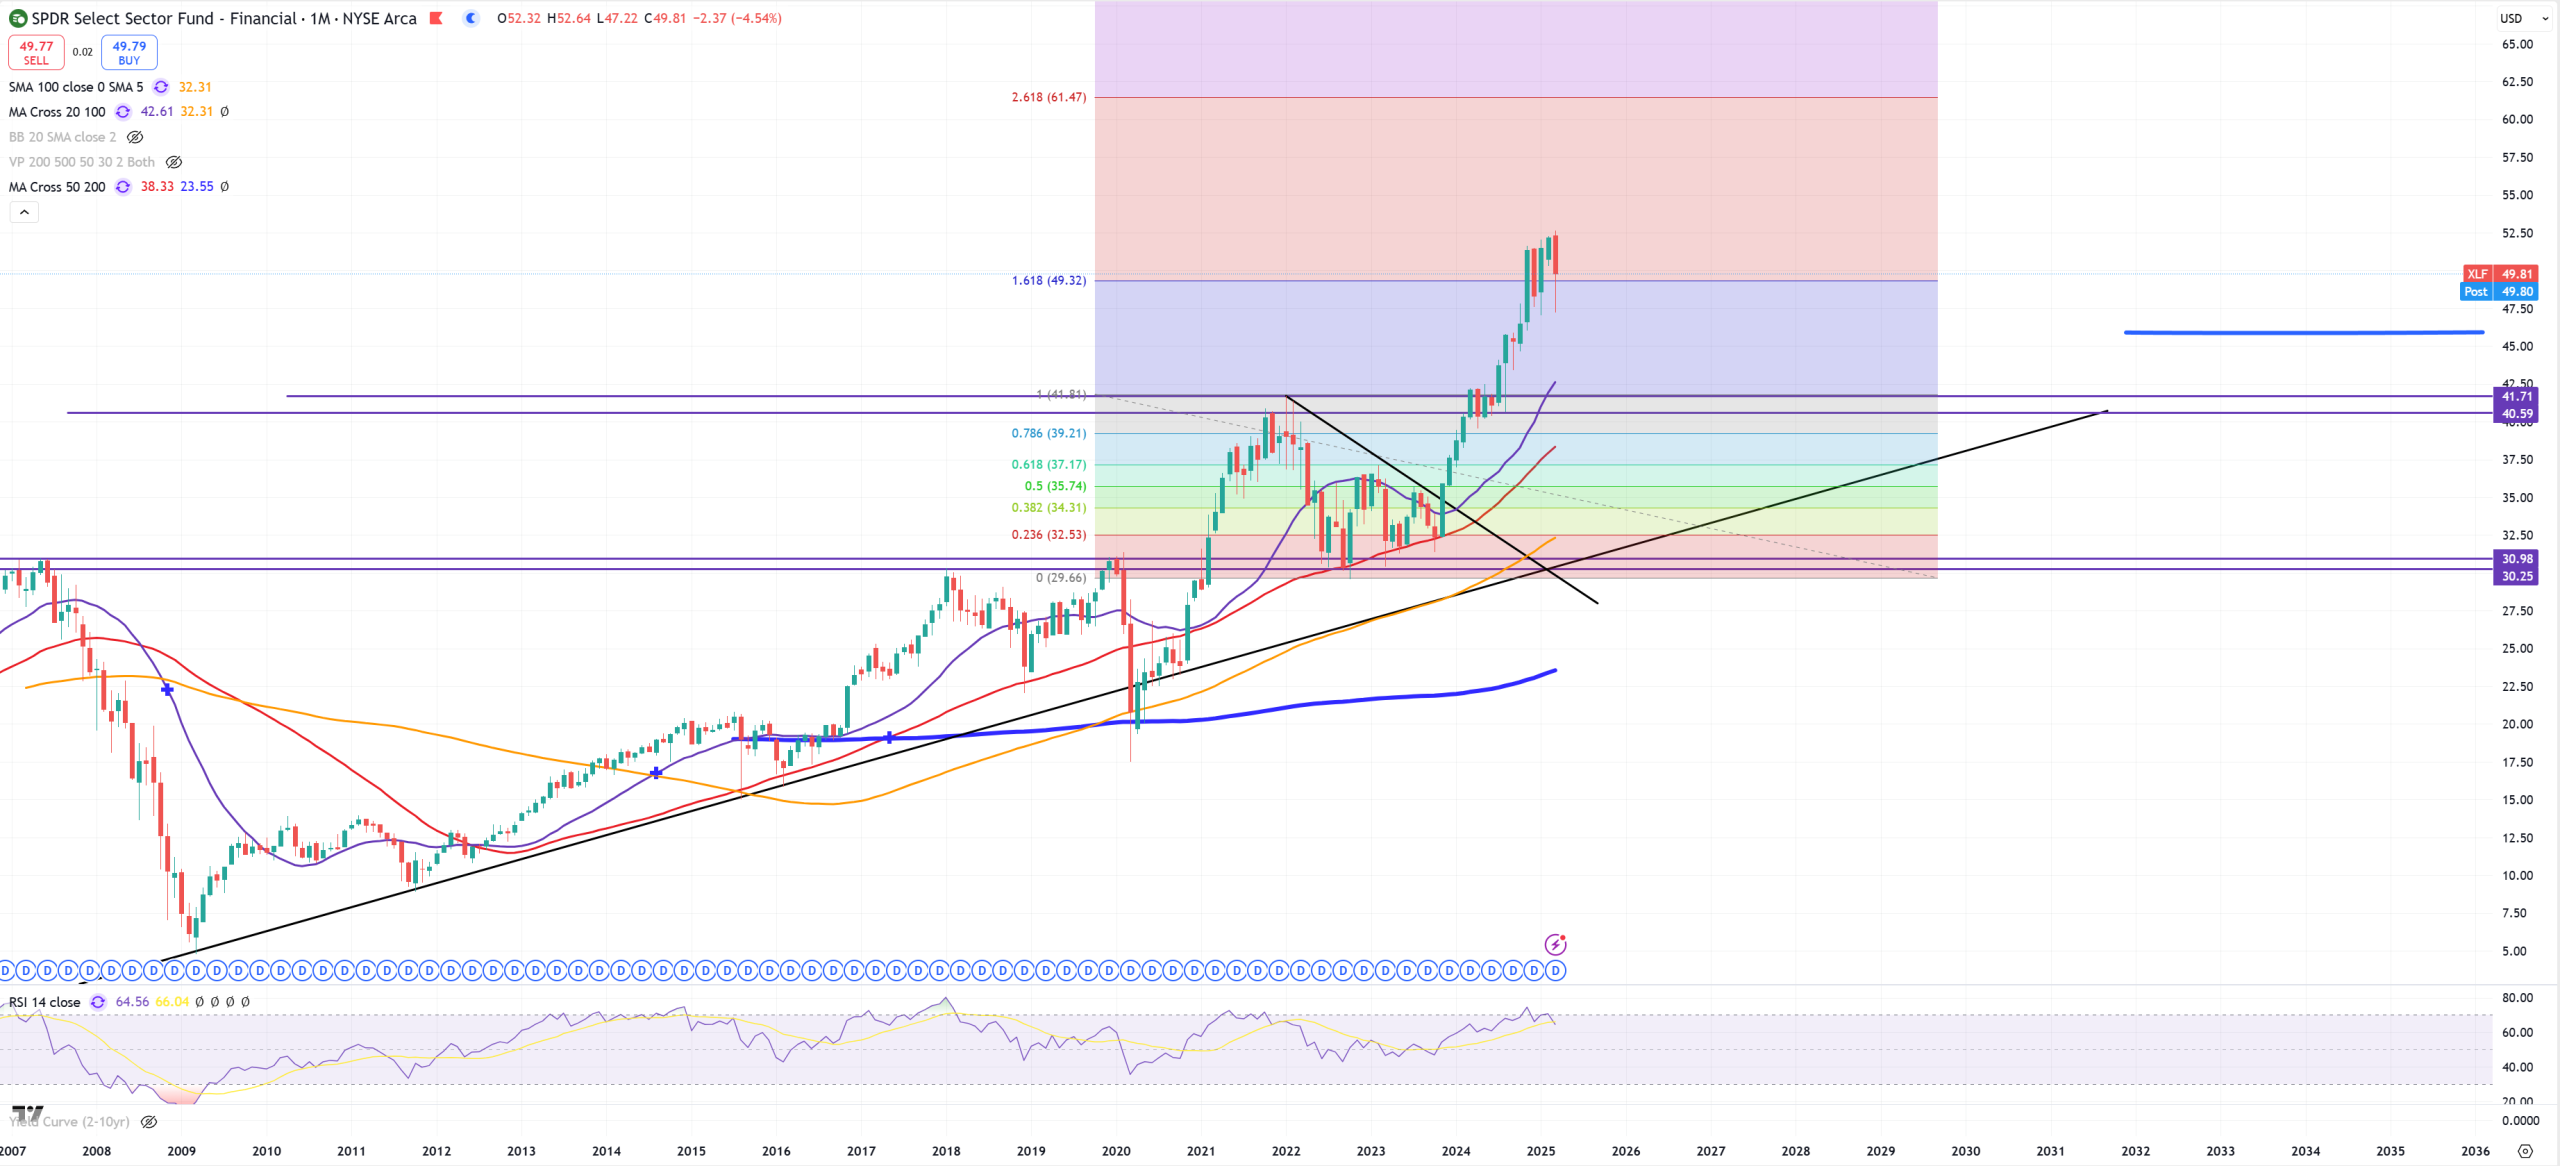
XLF and its FIBO 1.618 fight
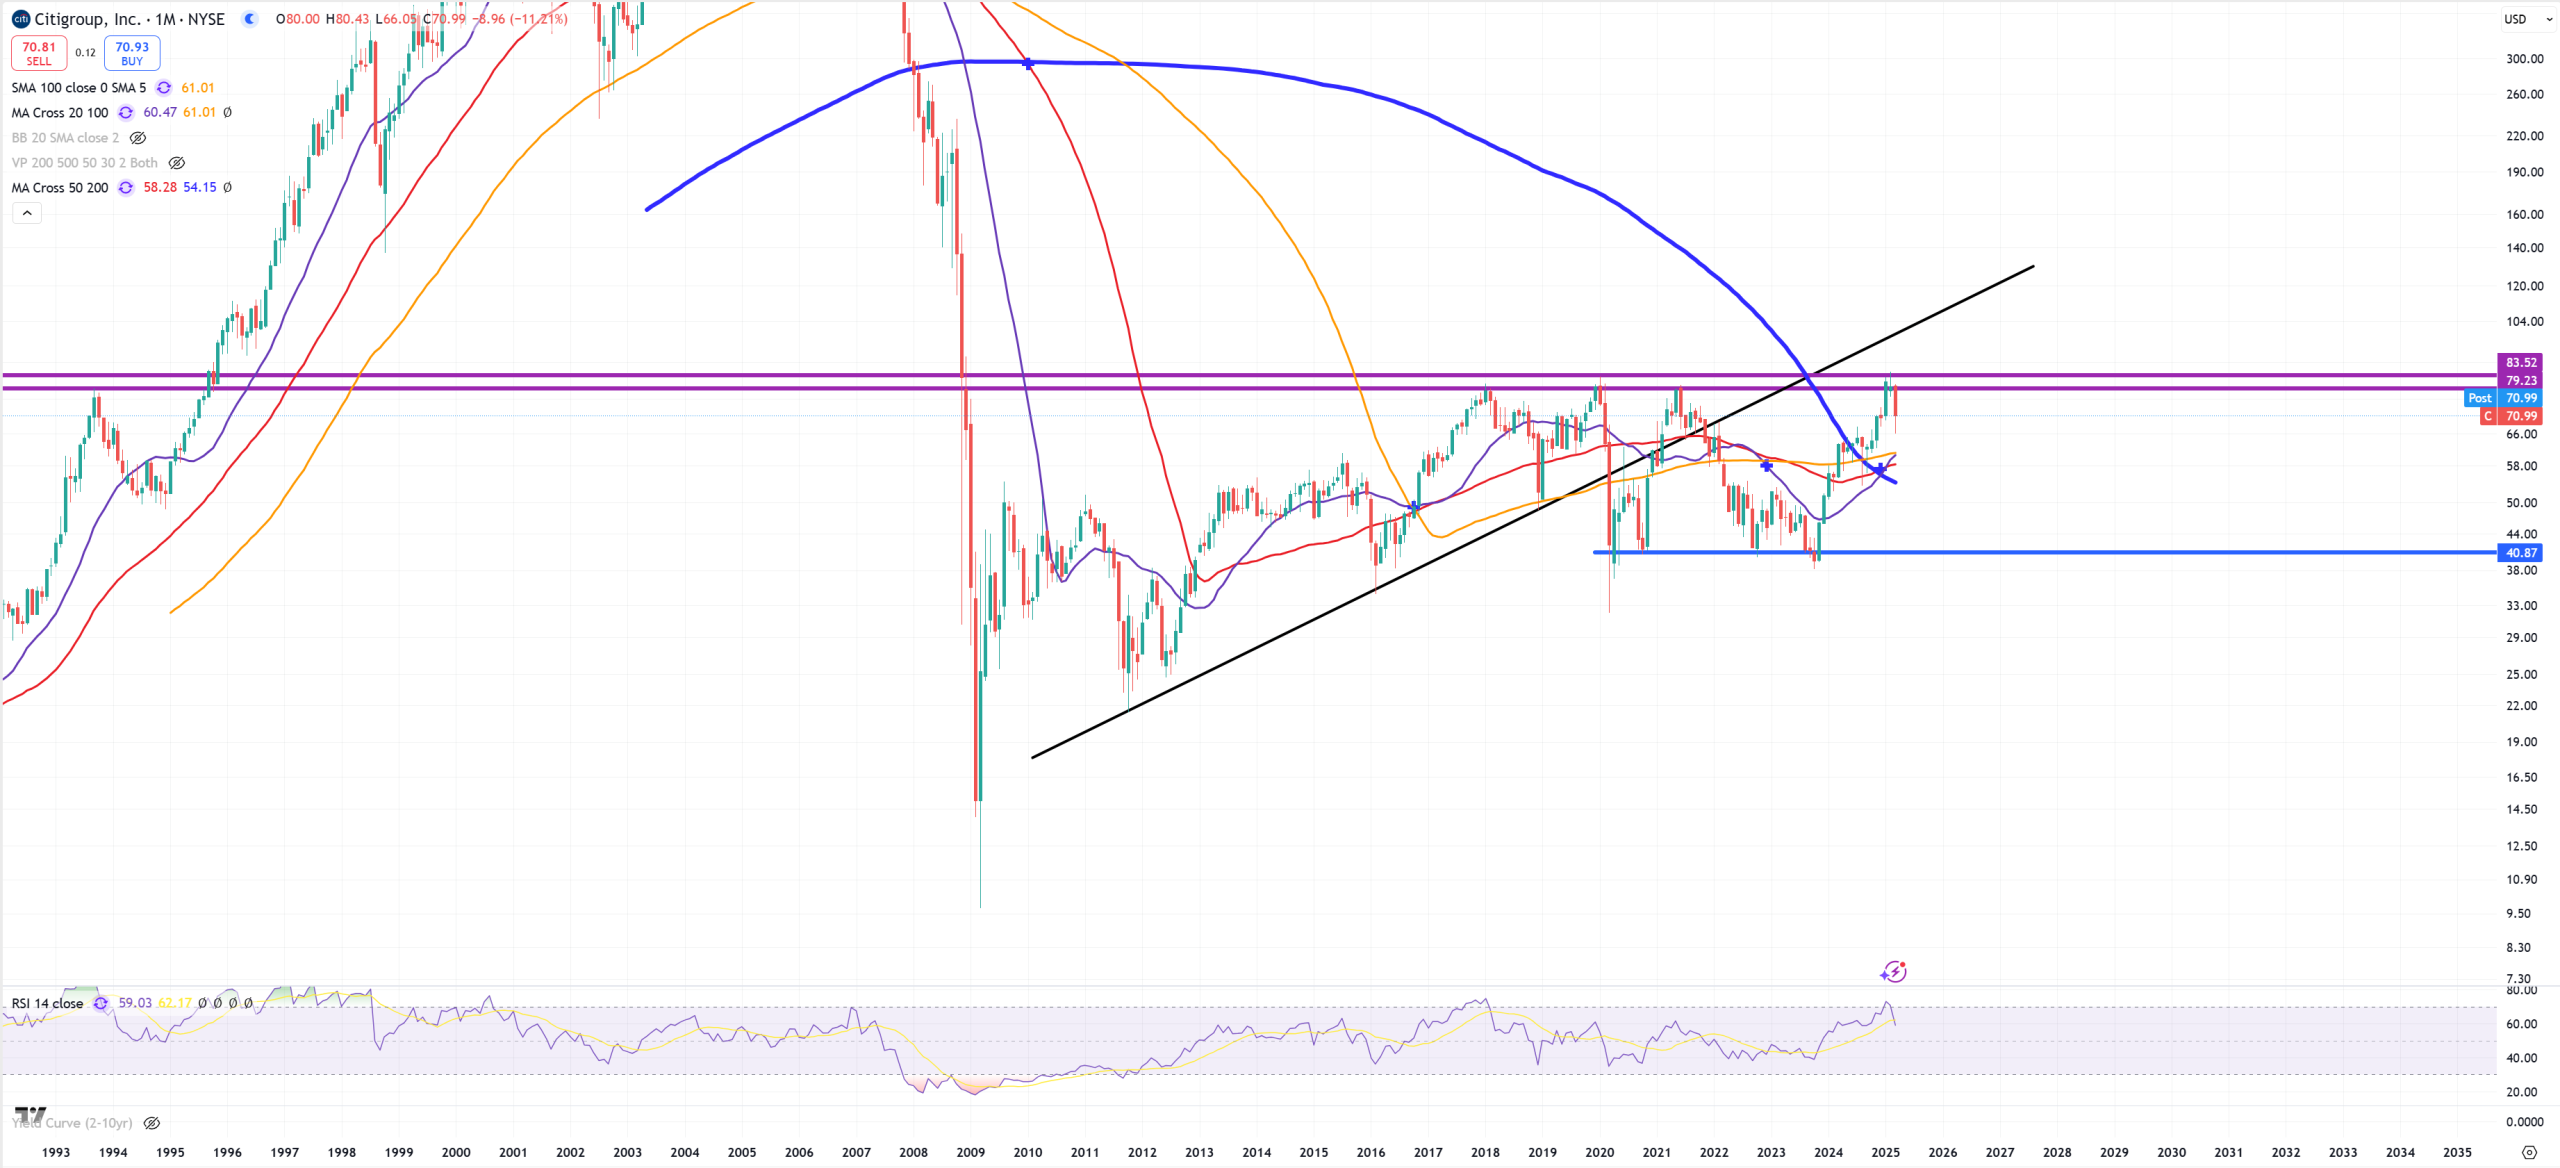
C – multiple rejection of resistance
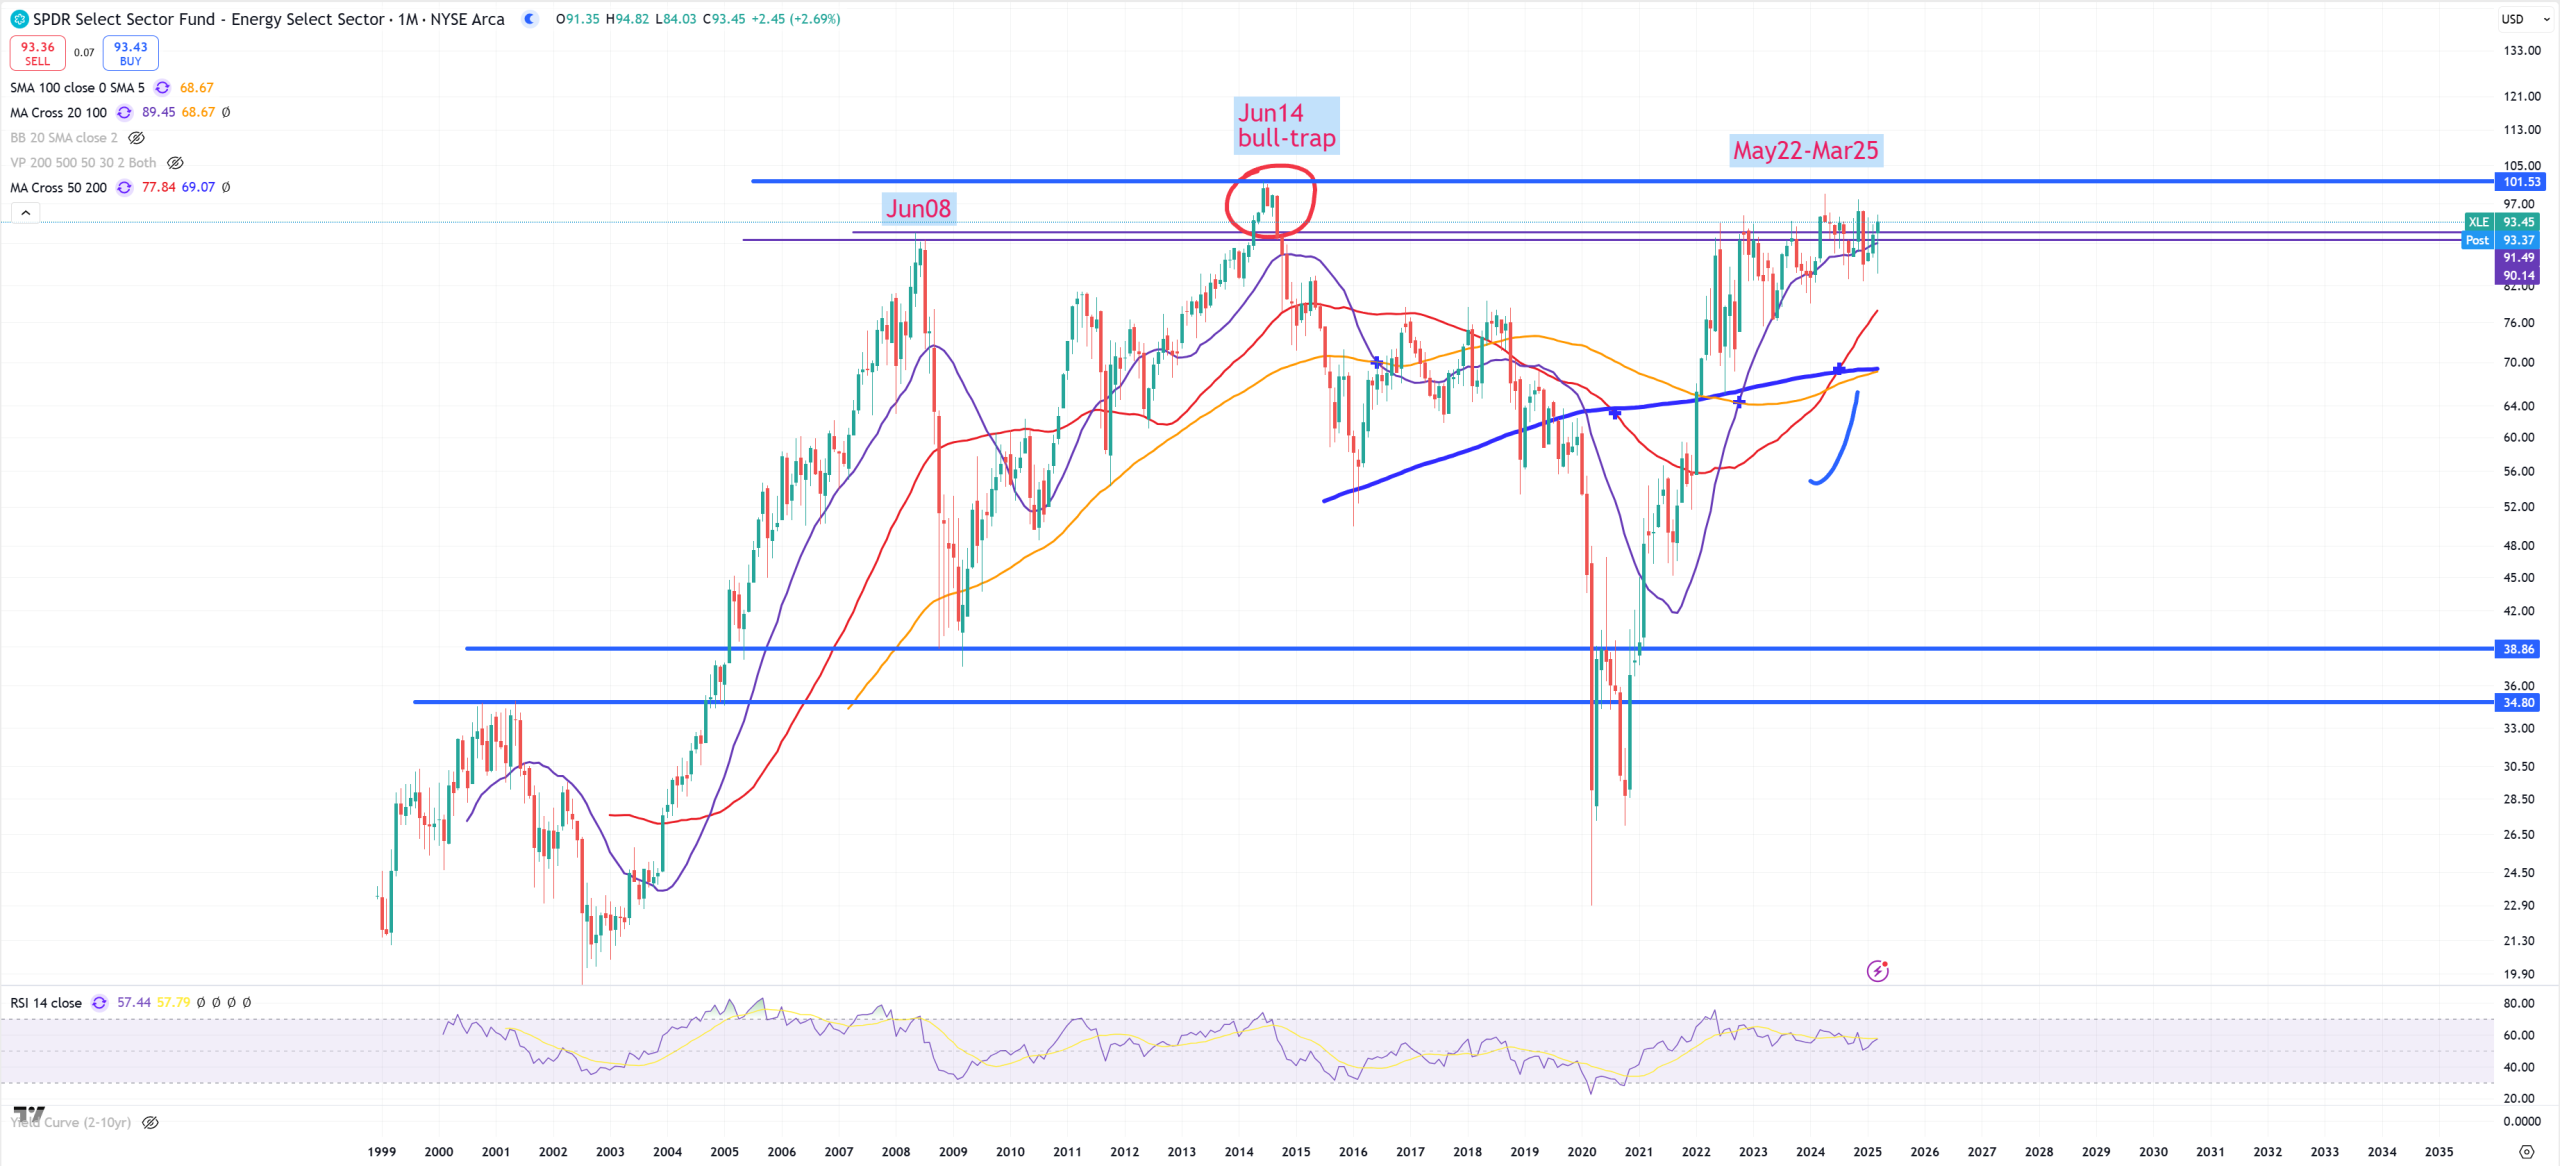
XLE – its trying soon for 3 years to stay around this level
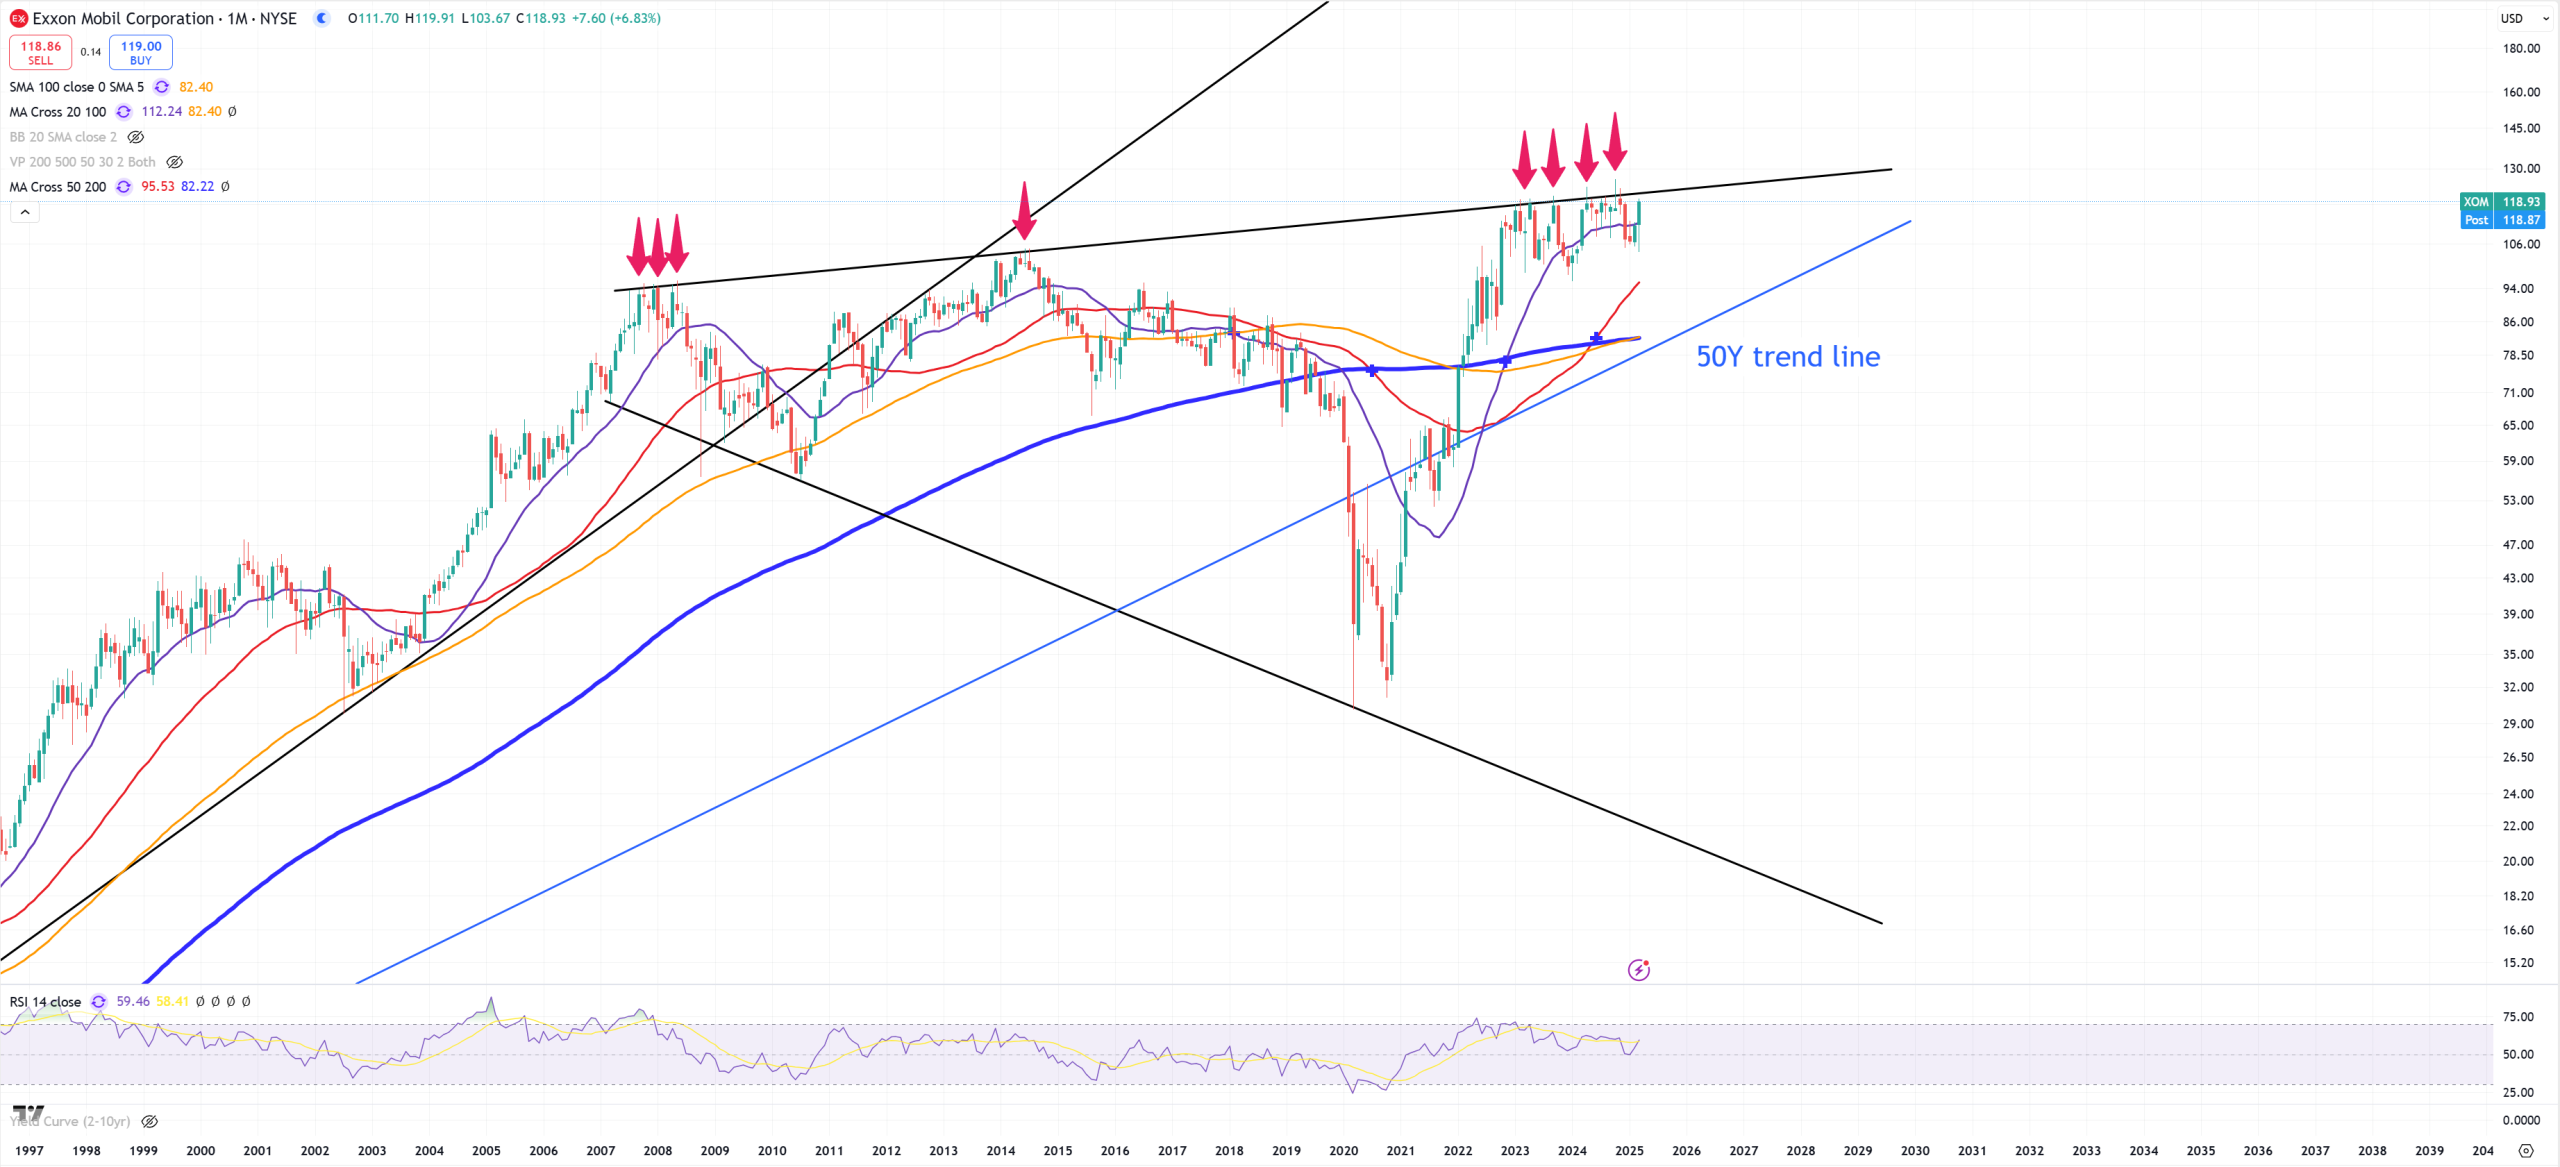
XOM – but this megaphone pattern is rock solid so far
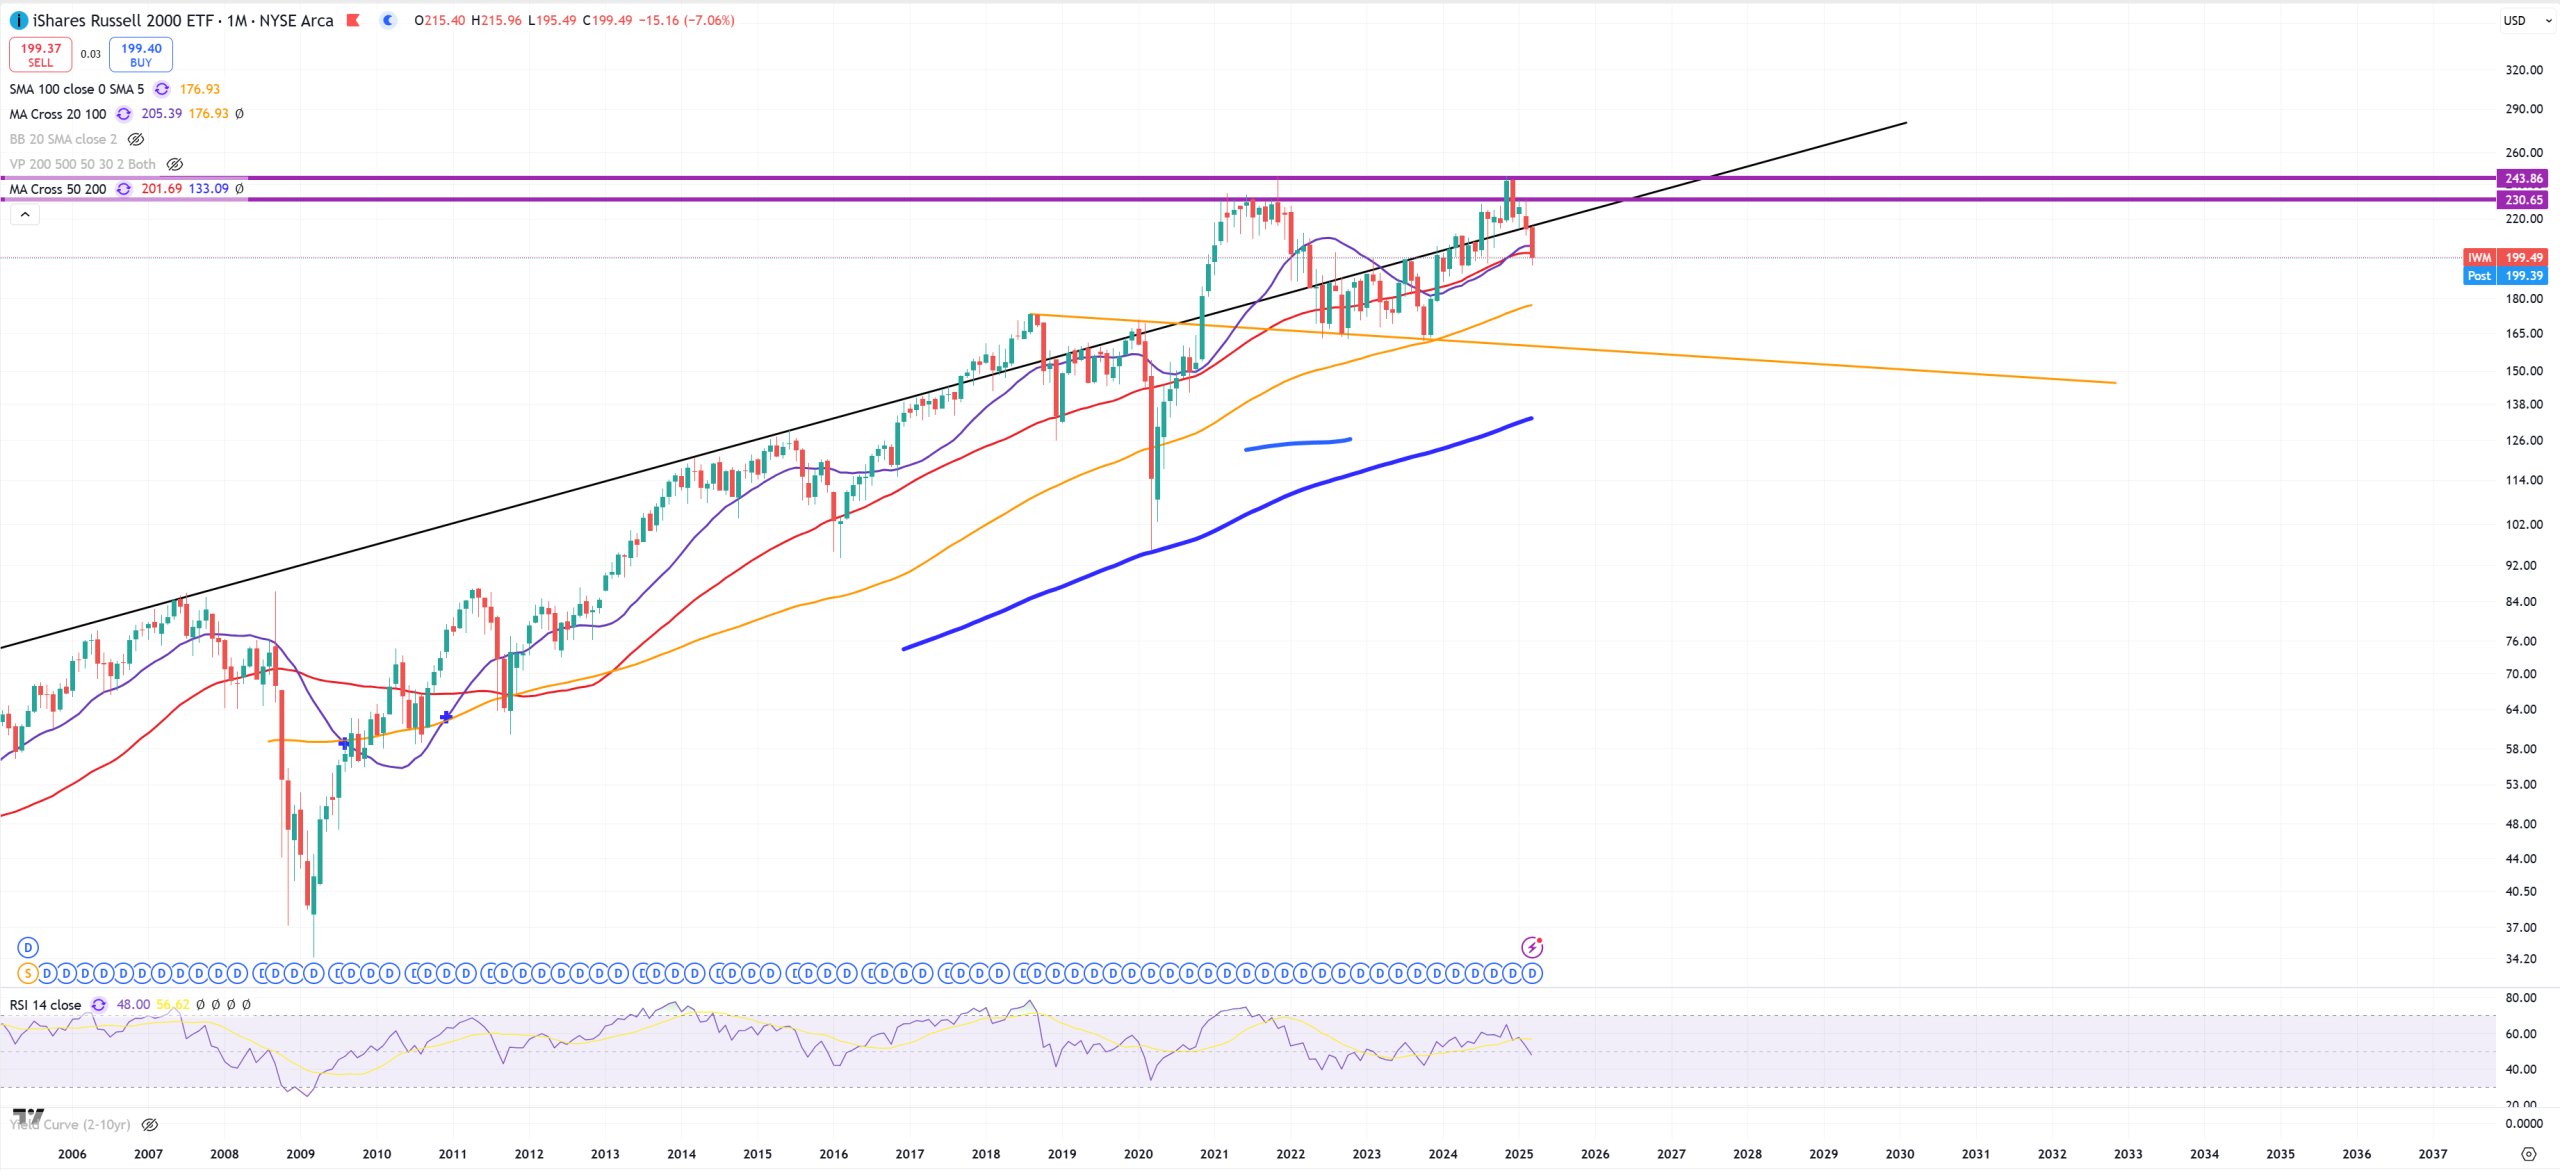
IWM – Small Caps closing below (M)MA50 with a massive DOUBLE-TOP
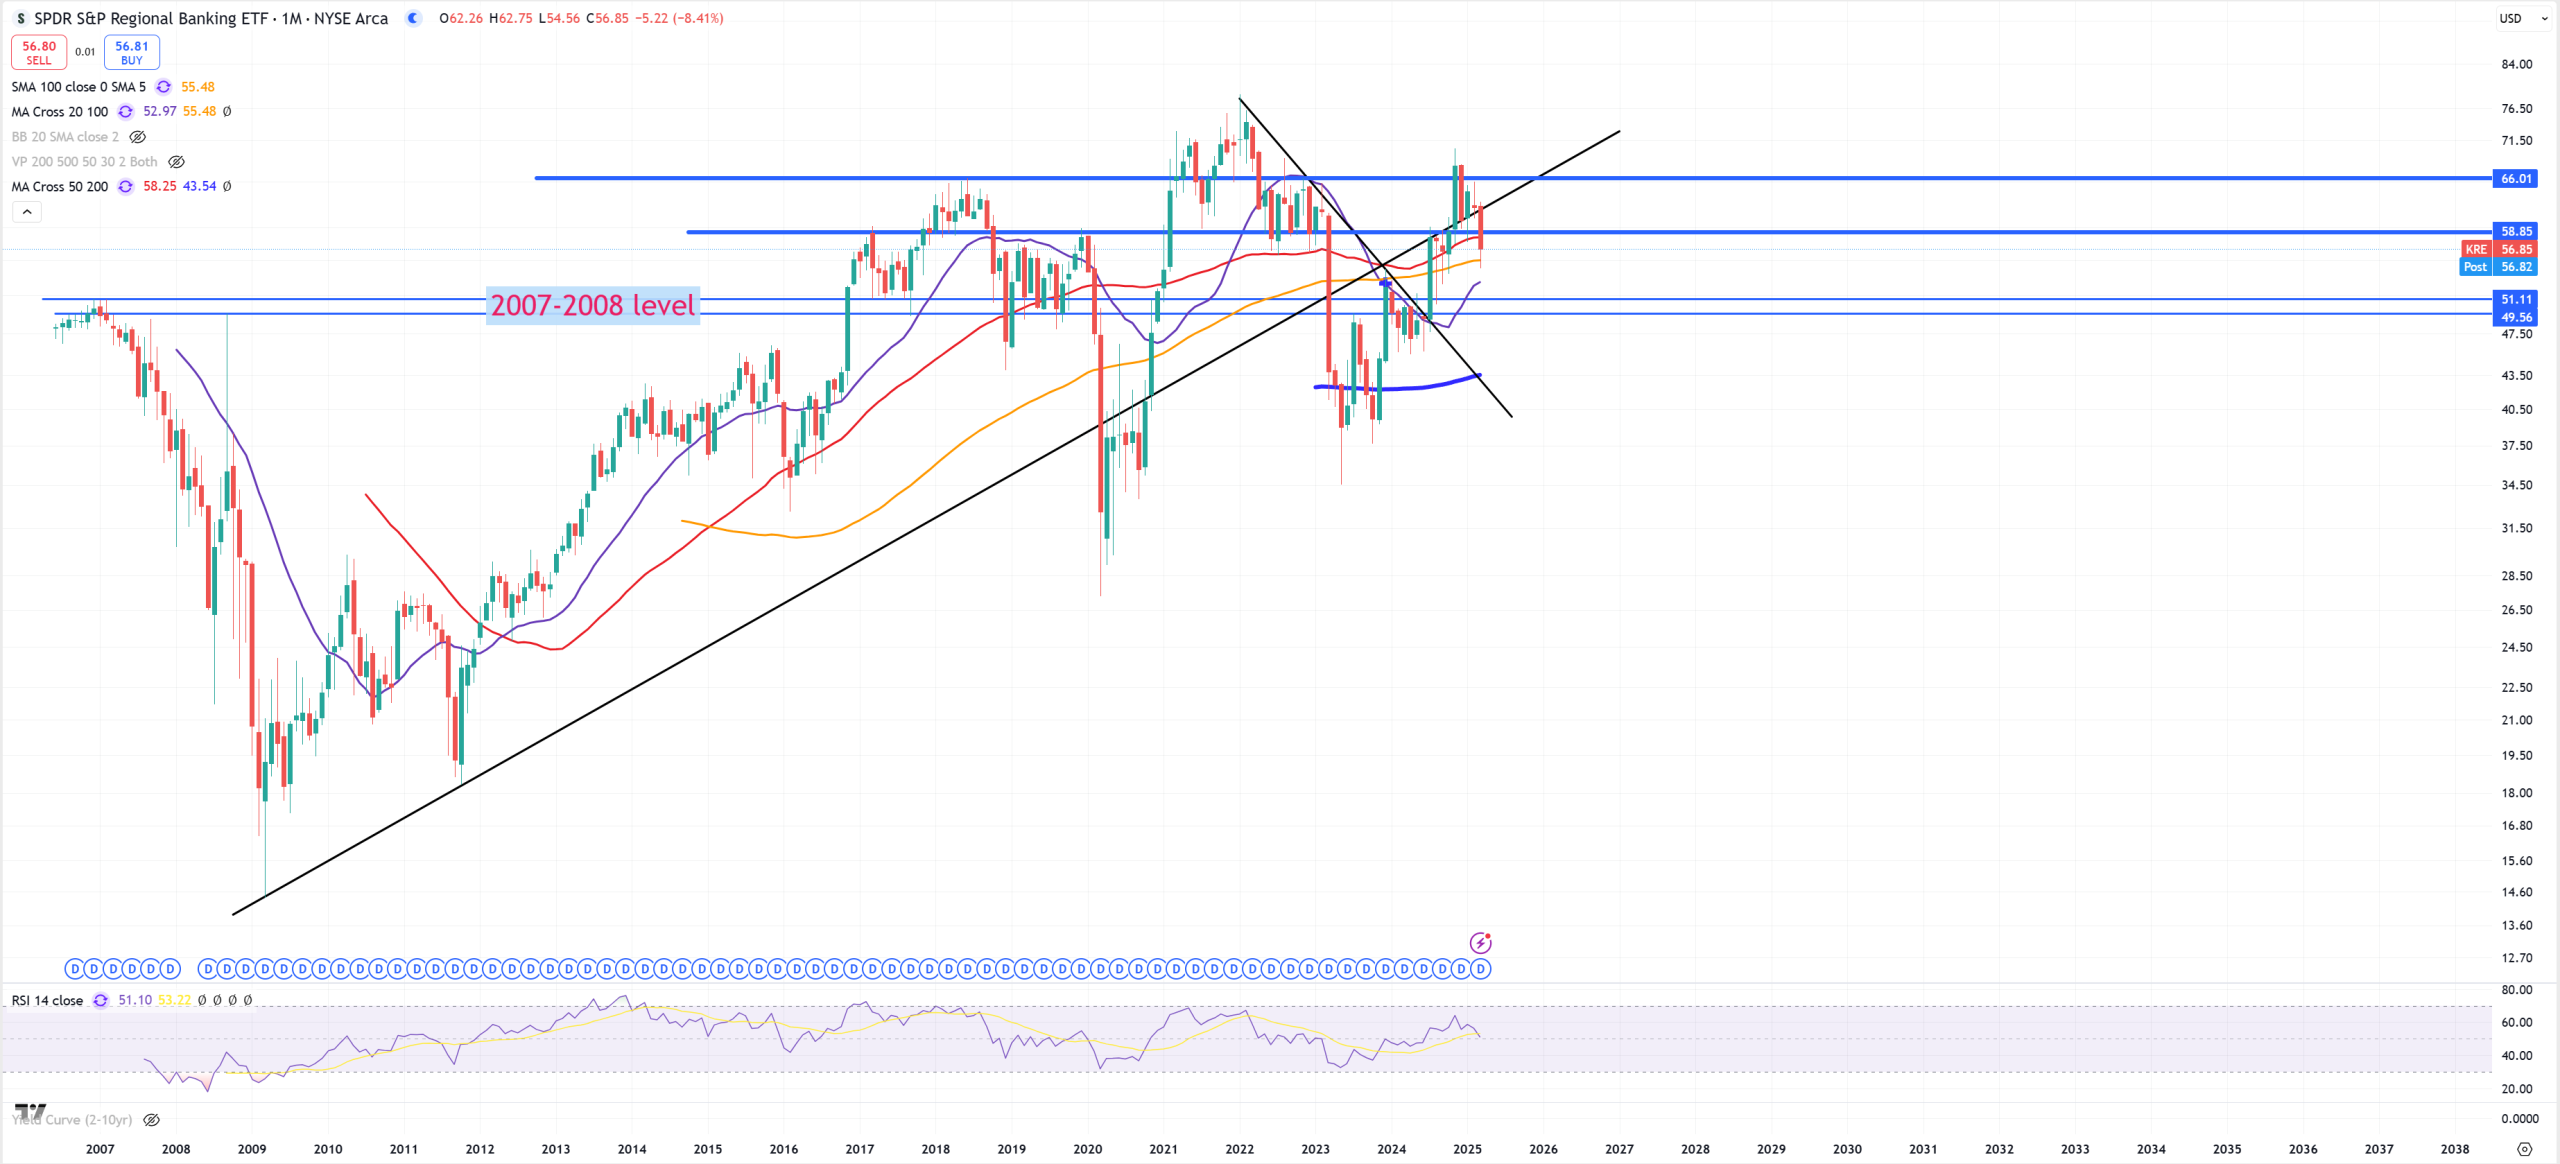
KRE – Regional Banking is more or less following IWM, below trend with a massive false spike like IWM above it and again below (M)MA50
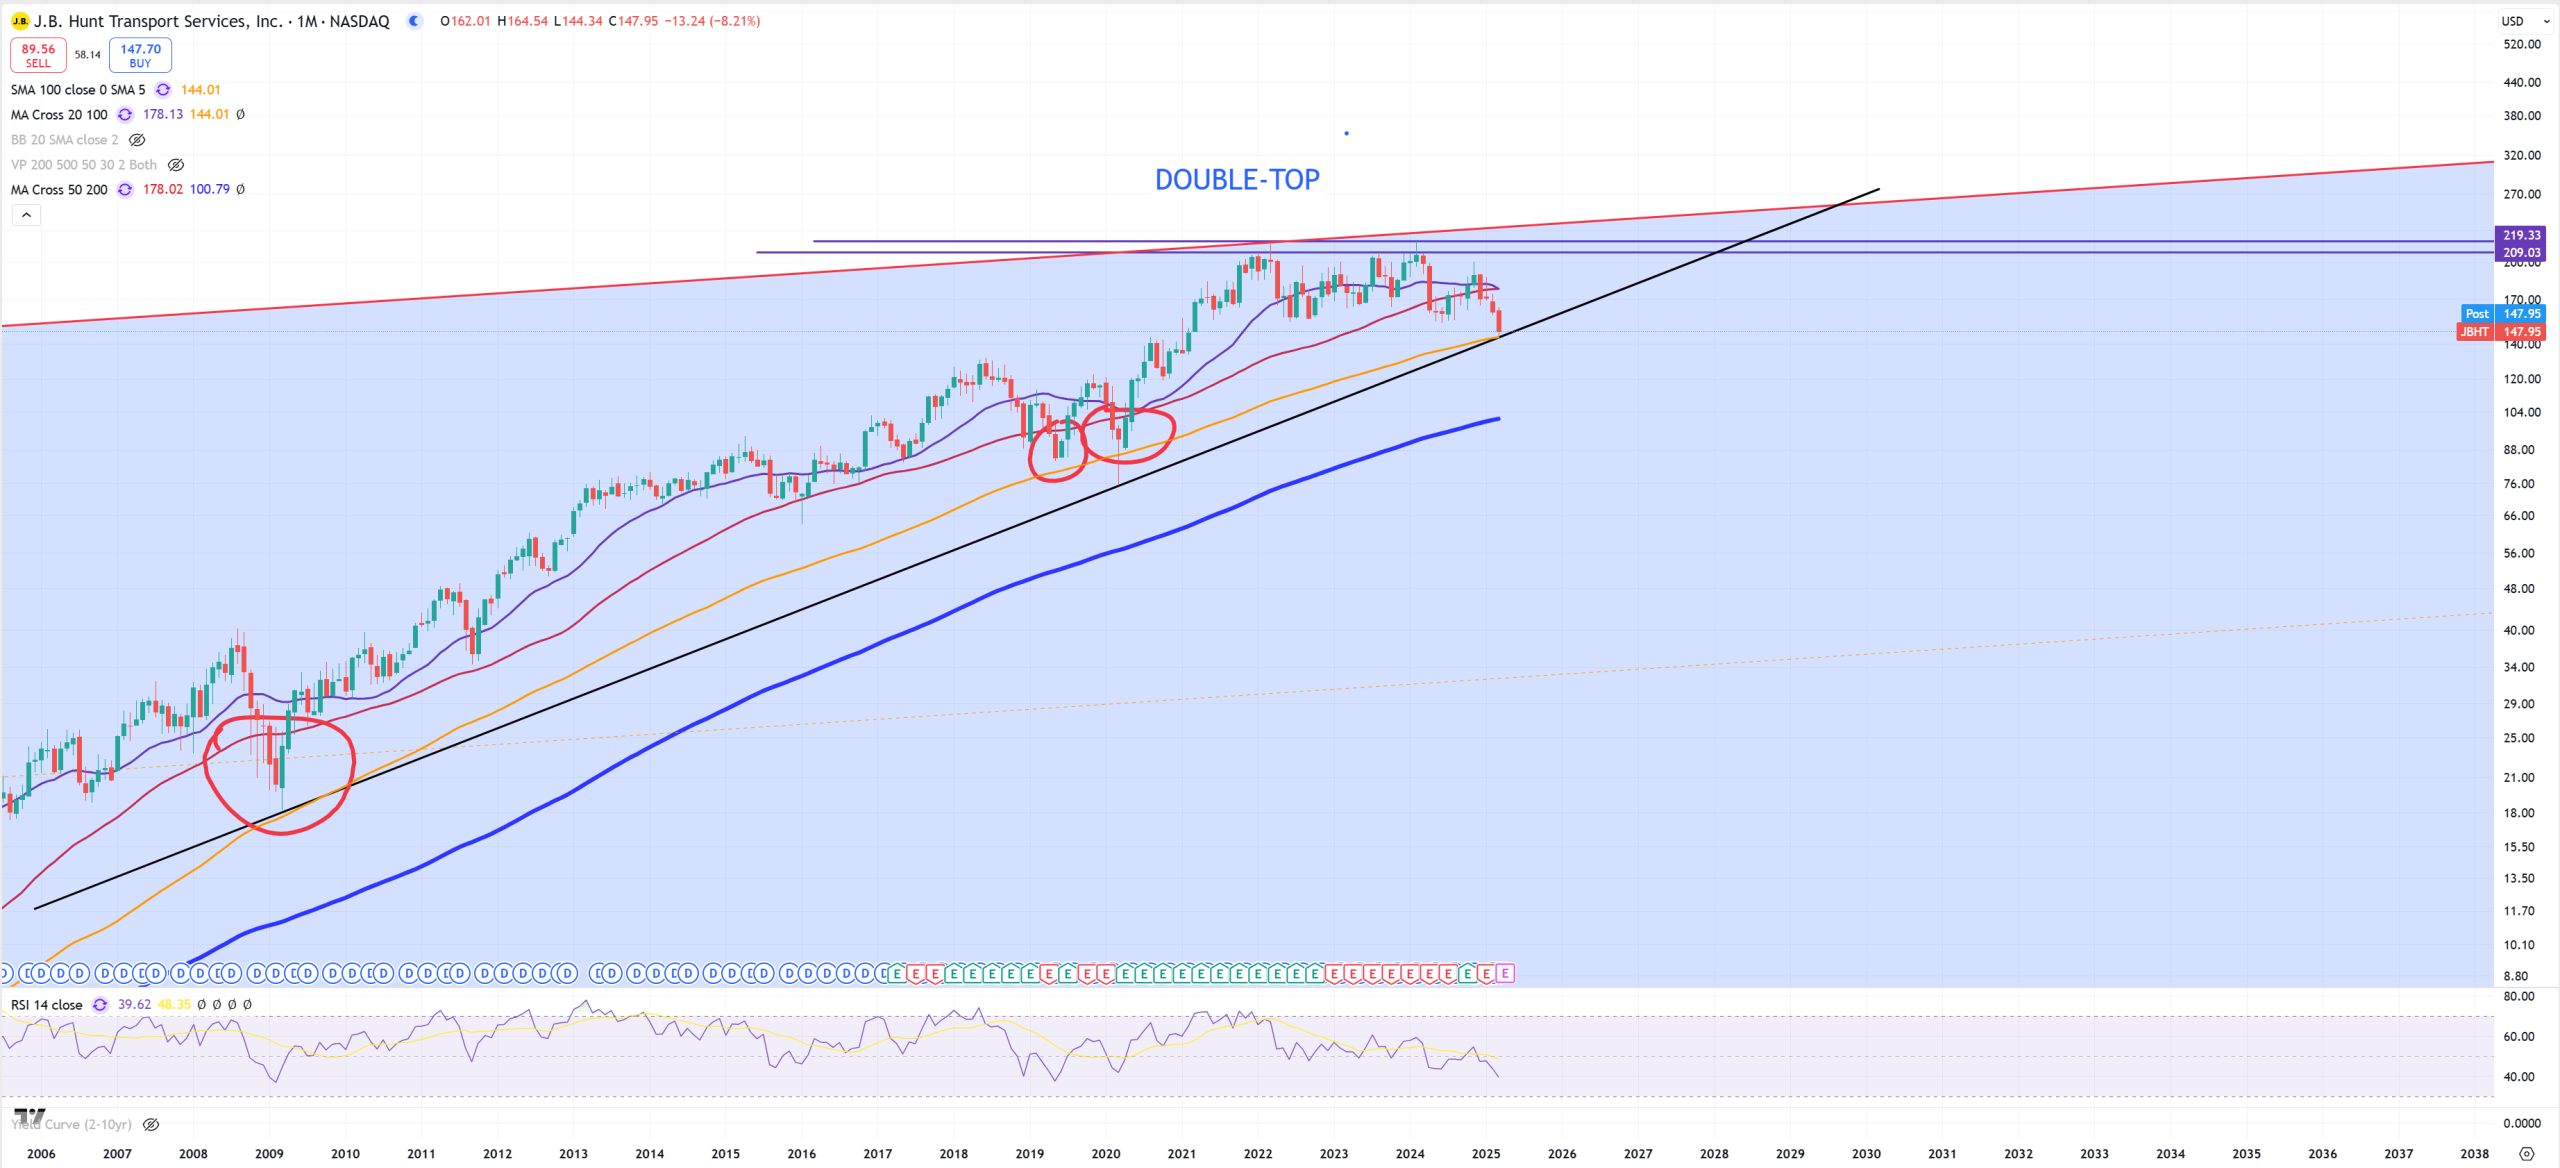
JBHT – trend (and (M)MA100) saved
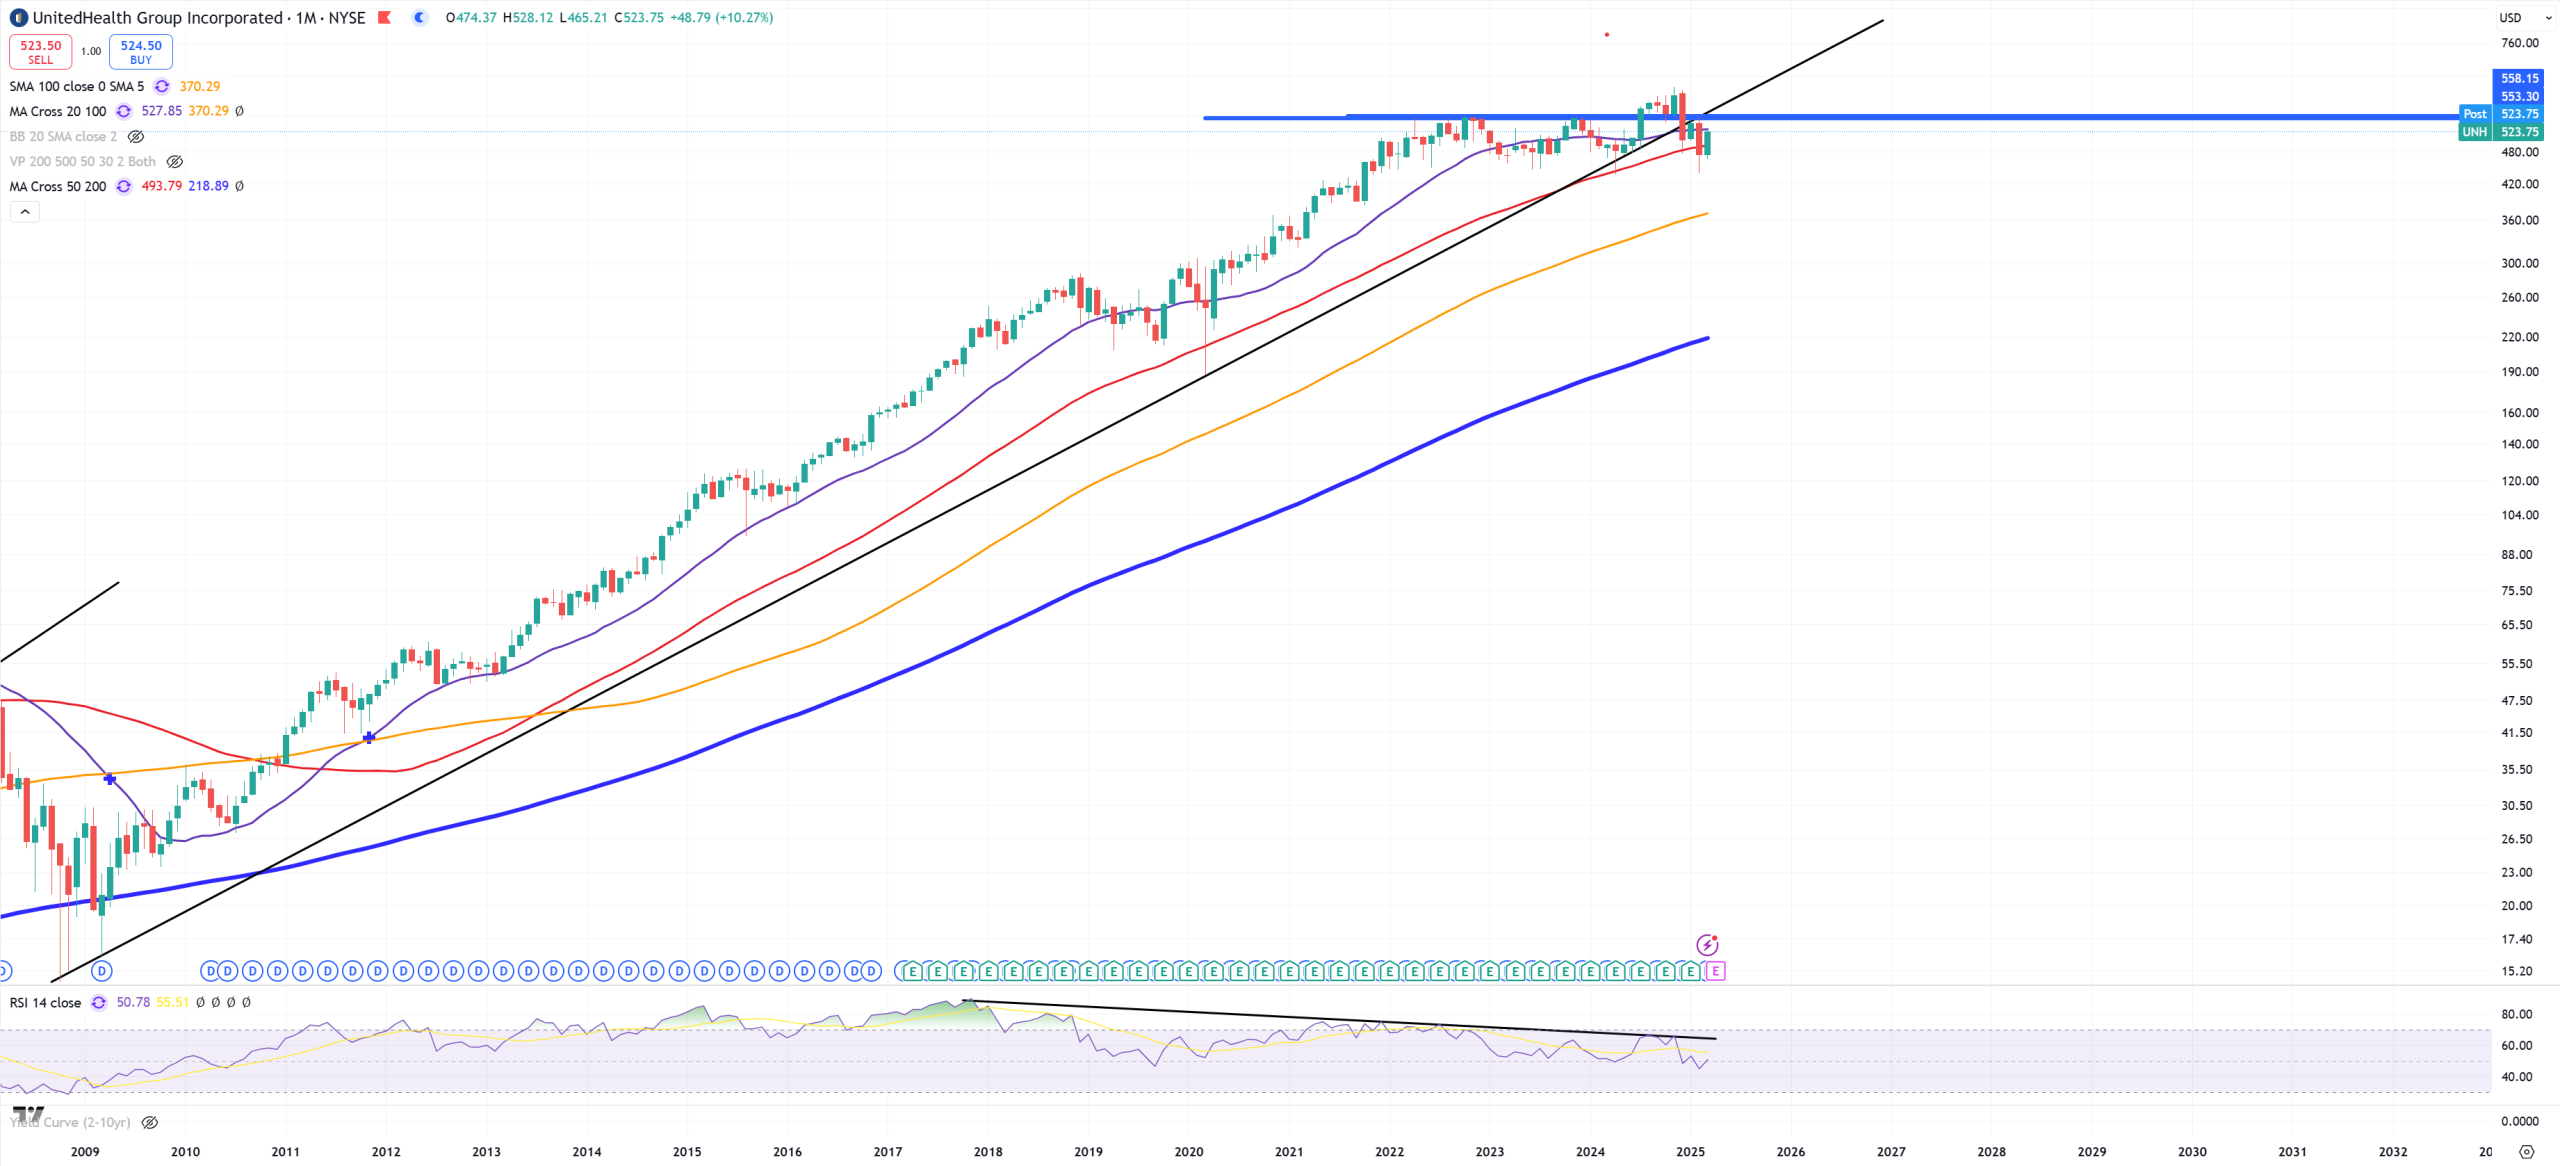
UNH – trend broken, (M)MA50 doesn’t want to give up for now
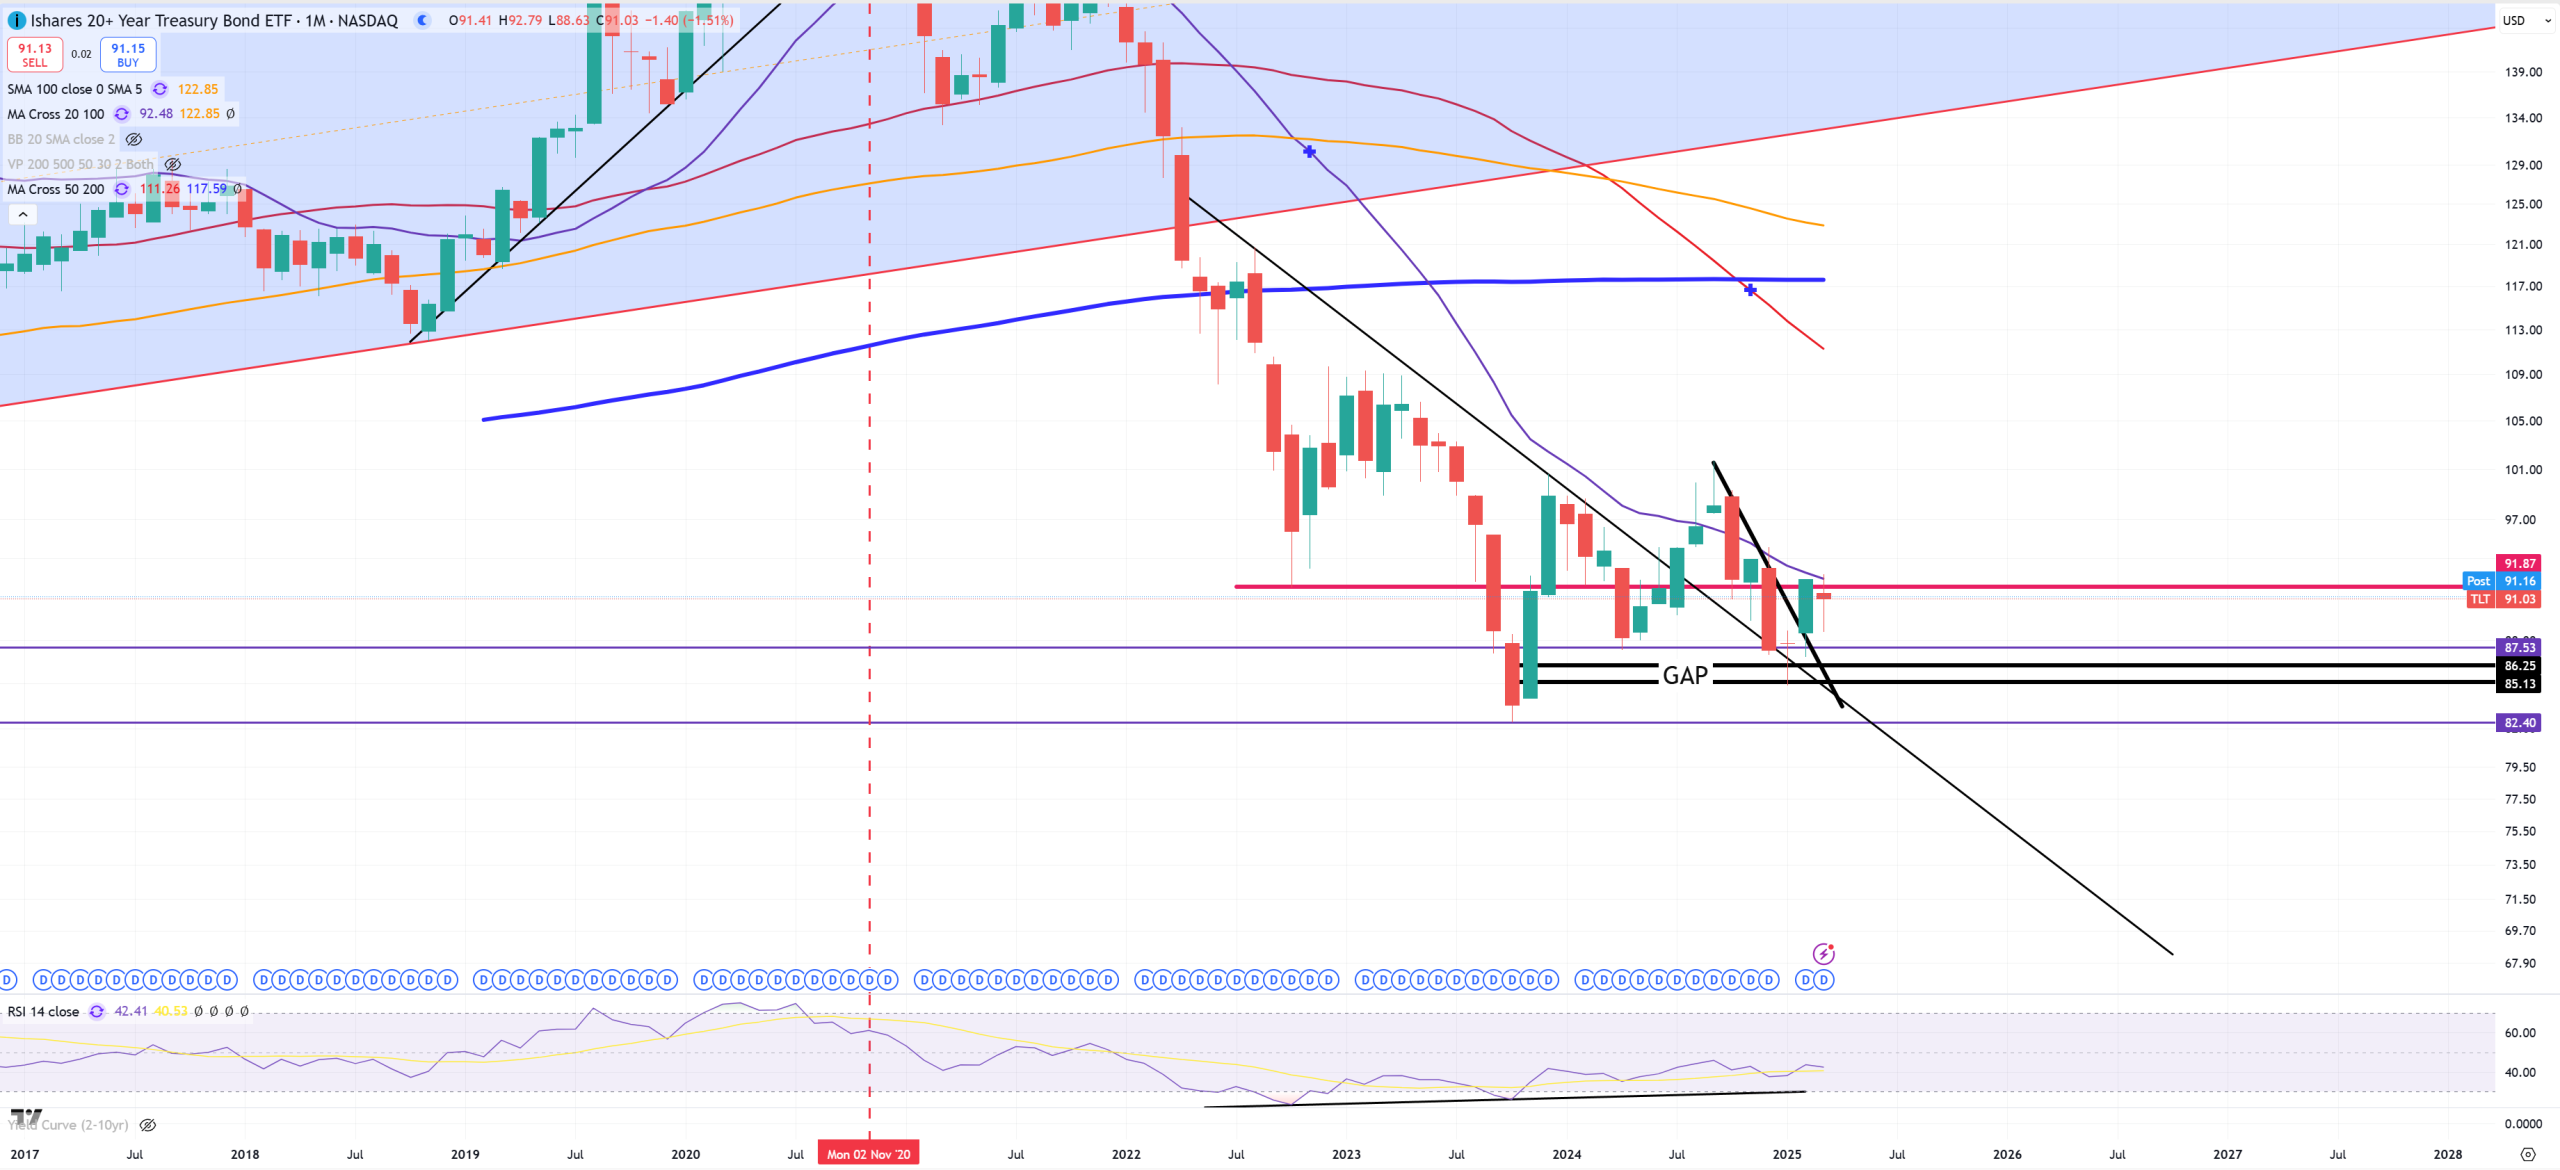
TLT and its situation. Just like stocks fighting for critical point, TLT fights also for a final break of 92$ resistance which is also (M)MA20. My bet 82$ is the ultimate bottom
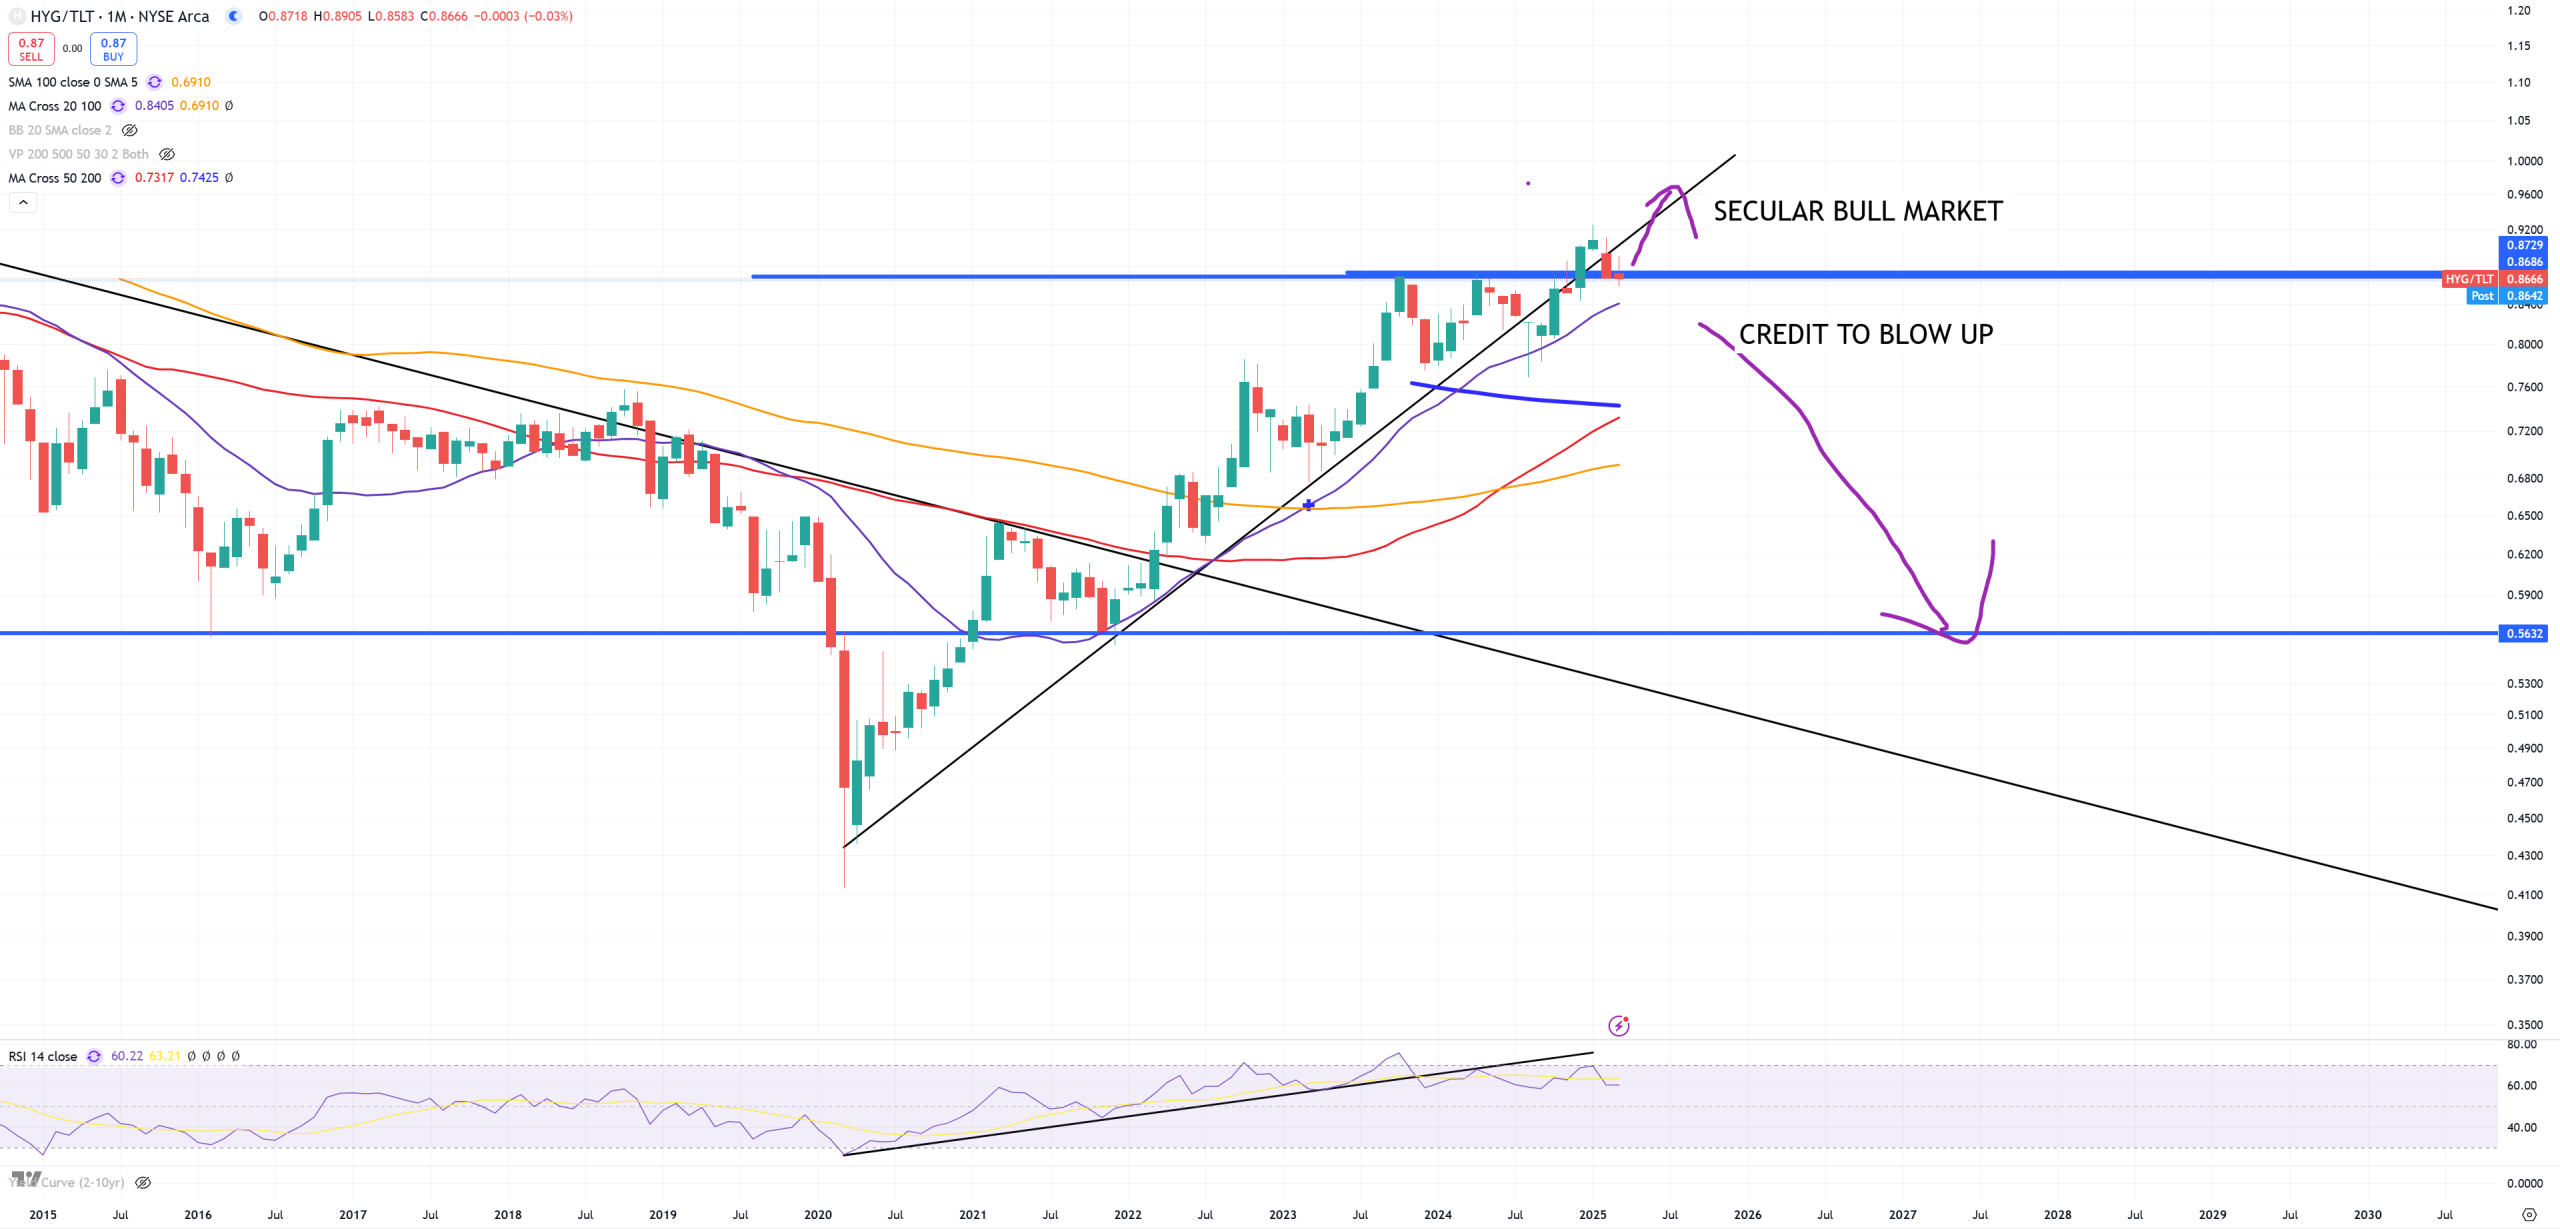
HYG/TLT – below resistance = credit blowing up and so far it works fine.
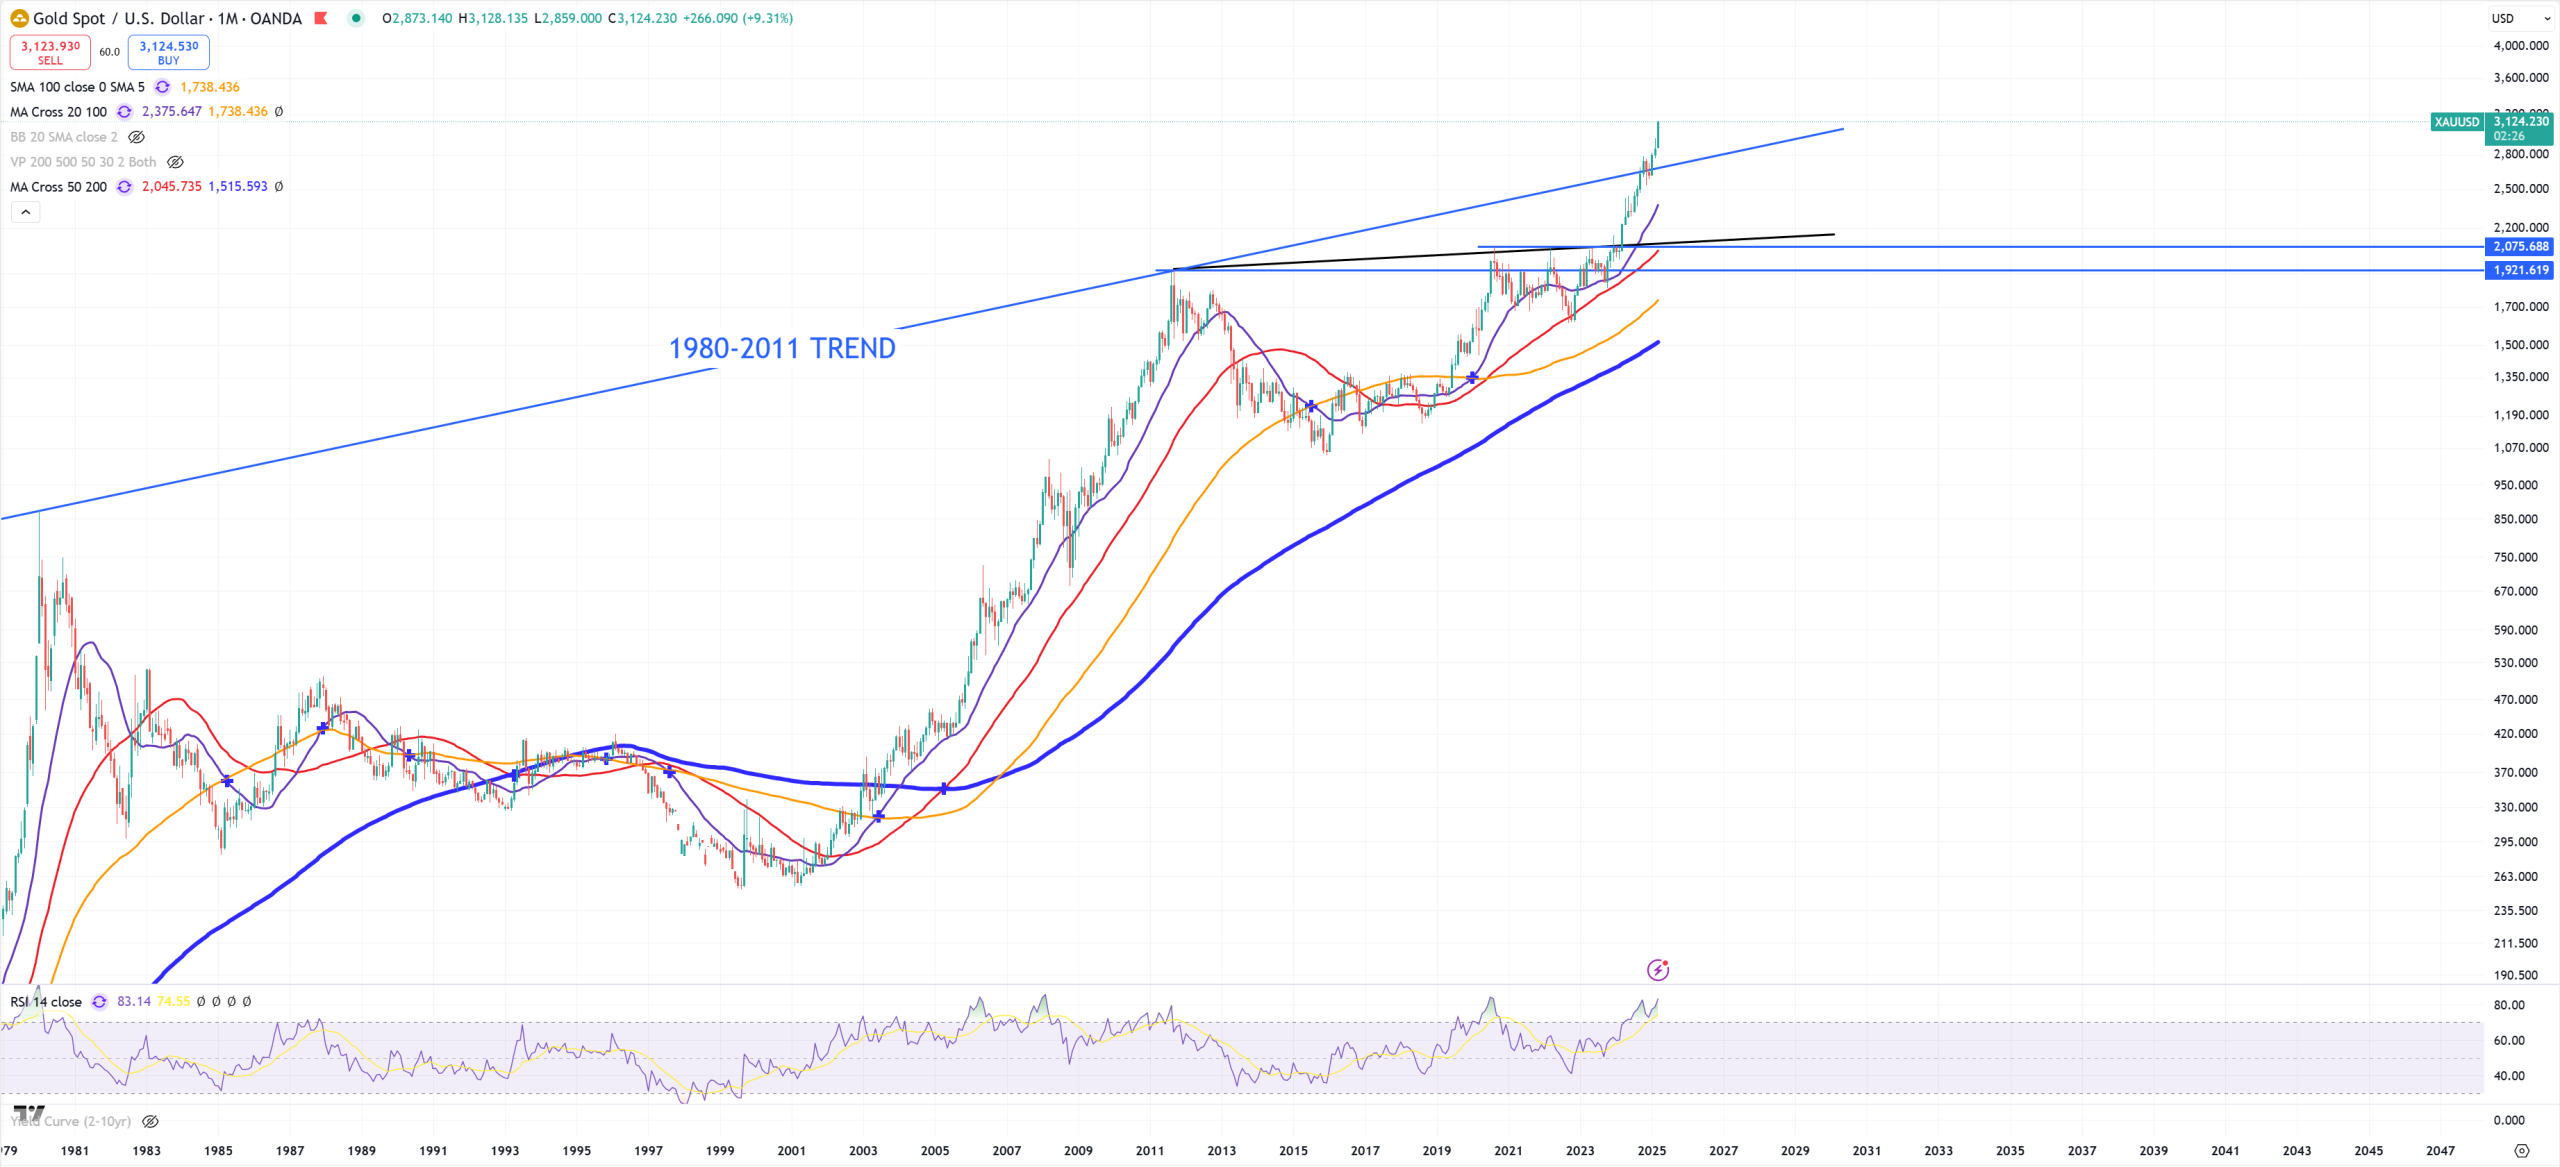
XAUUSD – massive break of secular trend, my bet it’ll continue going higher until SPX (M)MA50 will be broken down
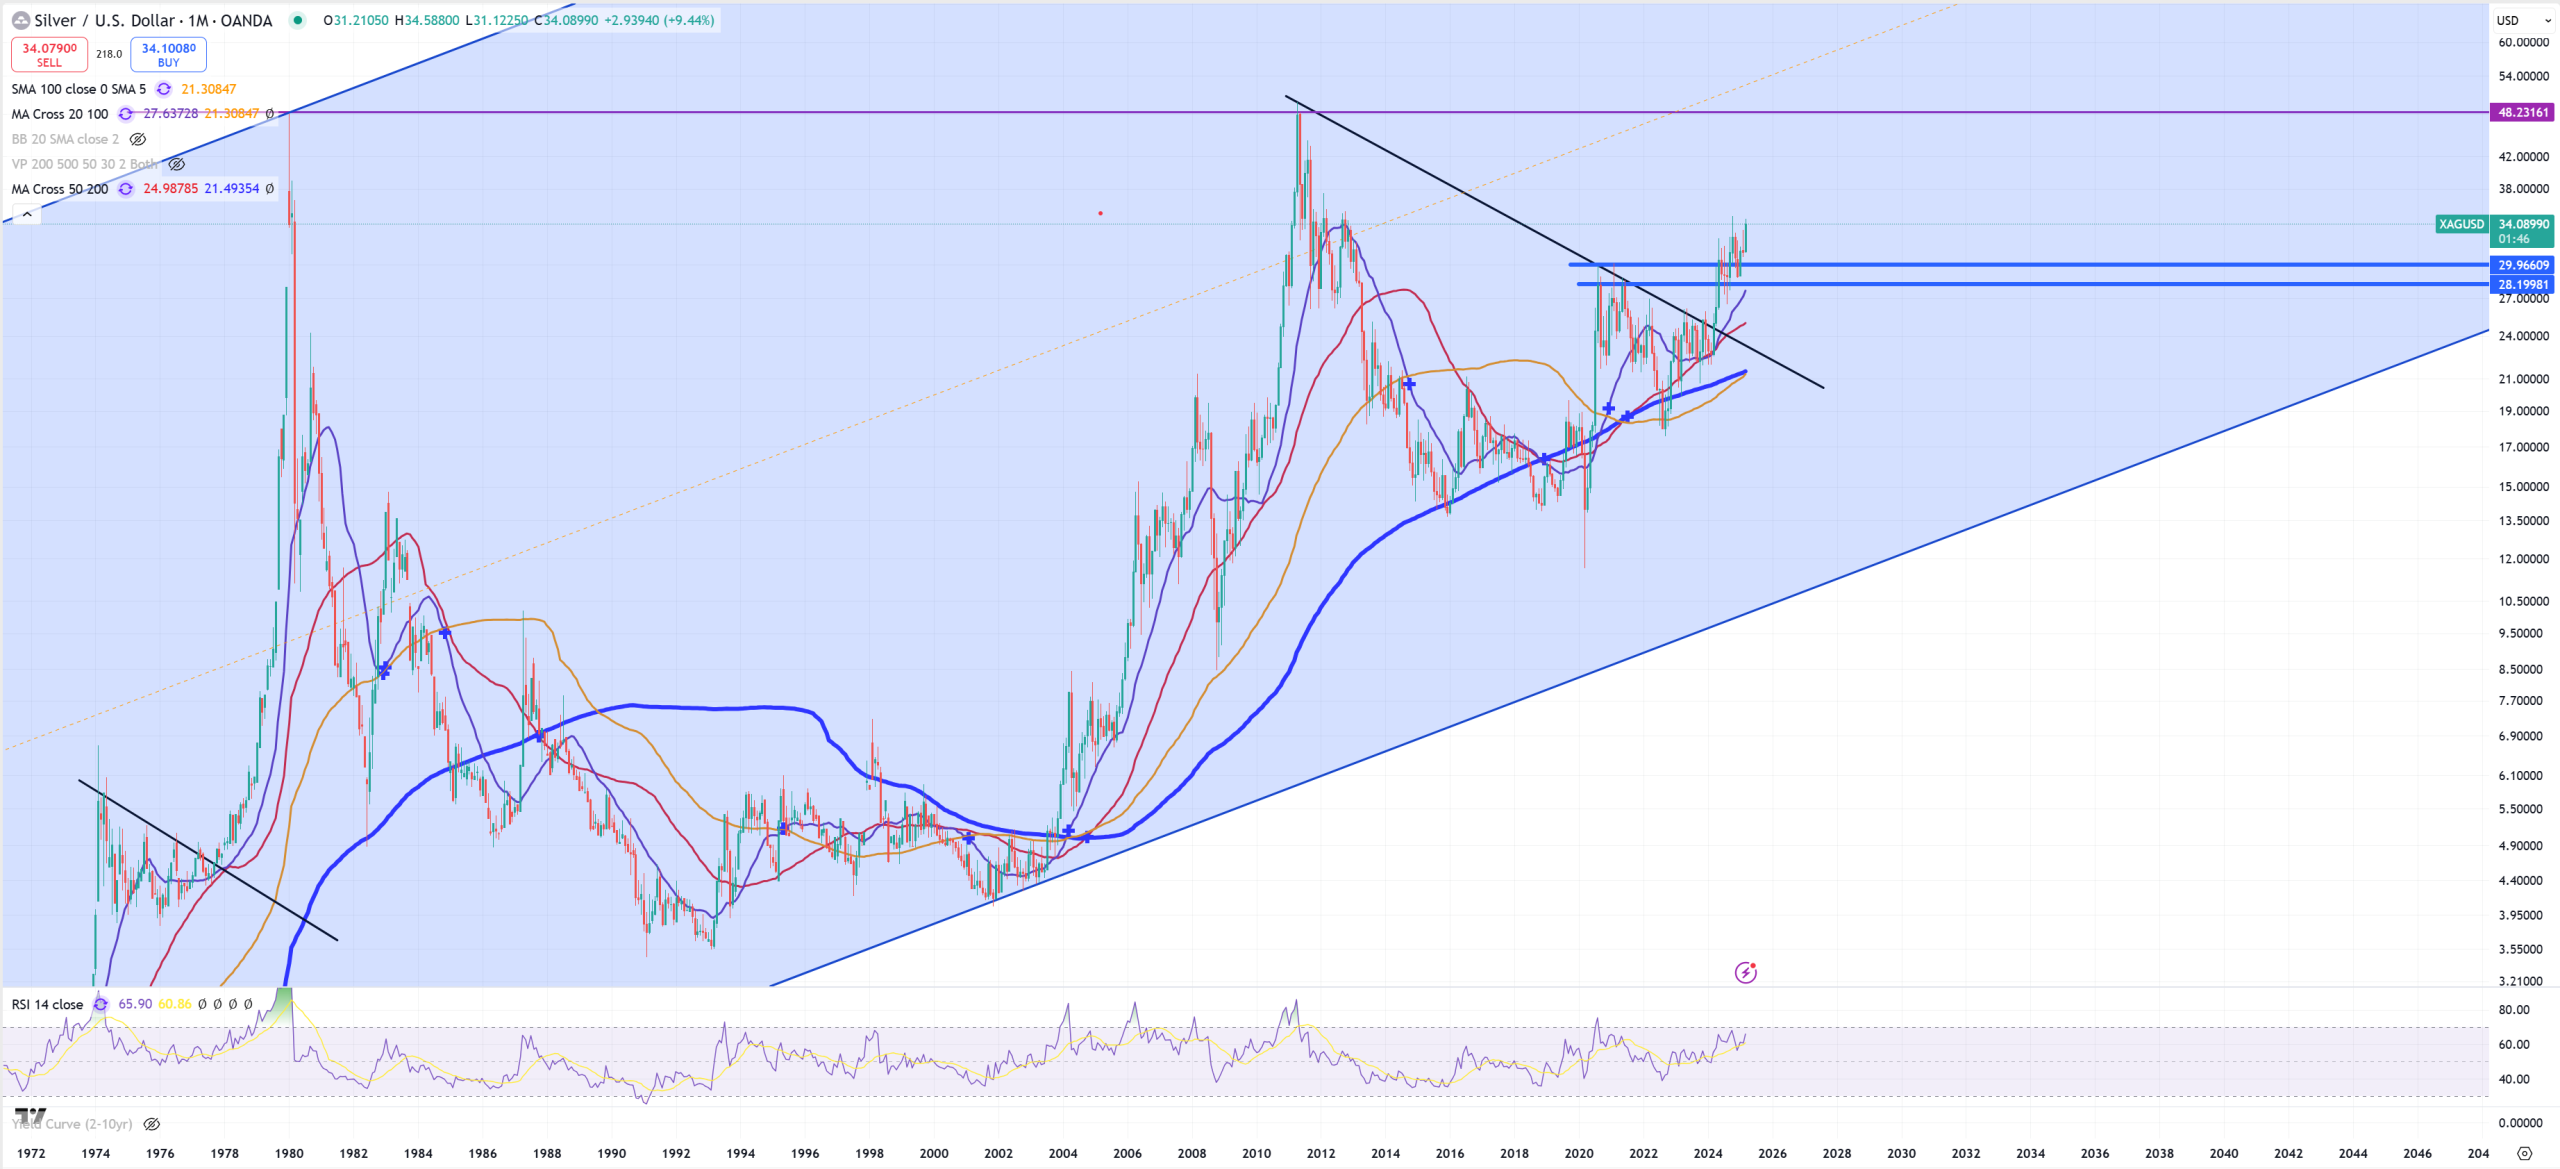
XAGUSD – looks like path to 48$ is open
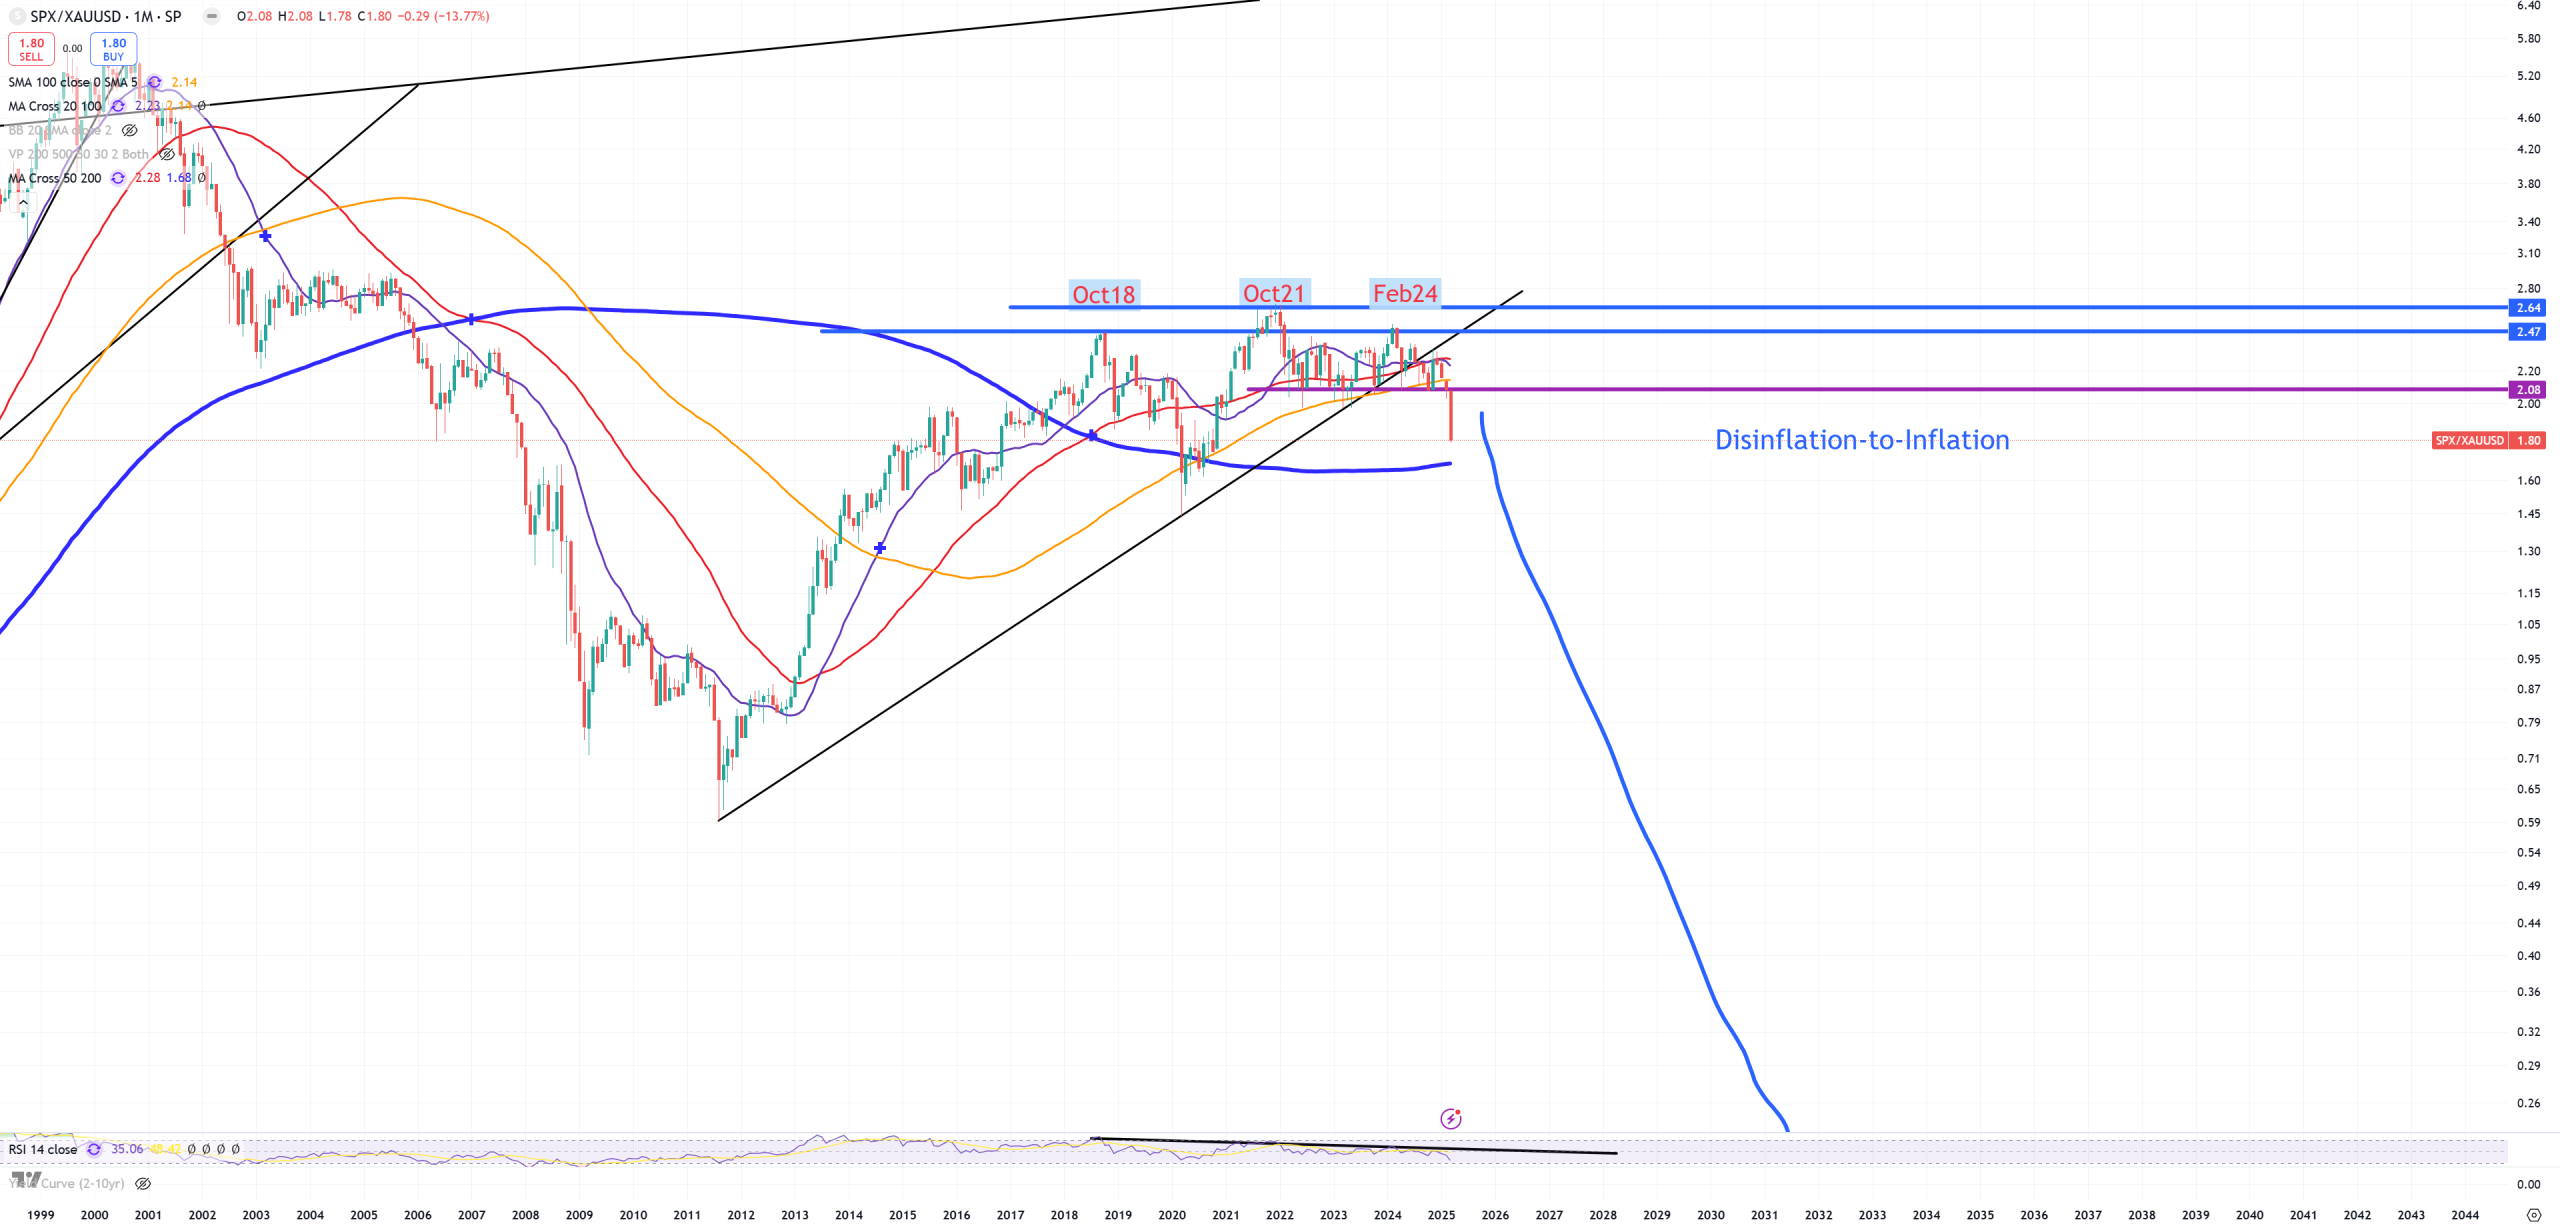
SPX/GOLD – cycle indicator, around mid 2024 trend was broken (the same moment AUDJPY peaked)
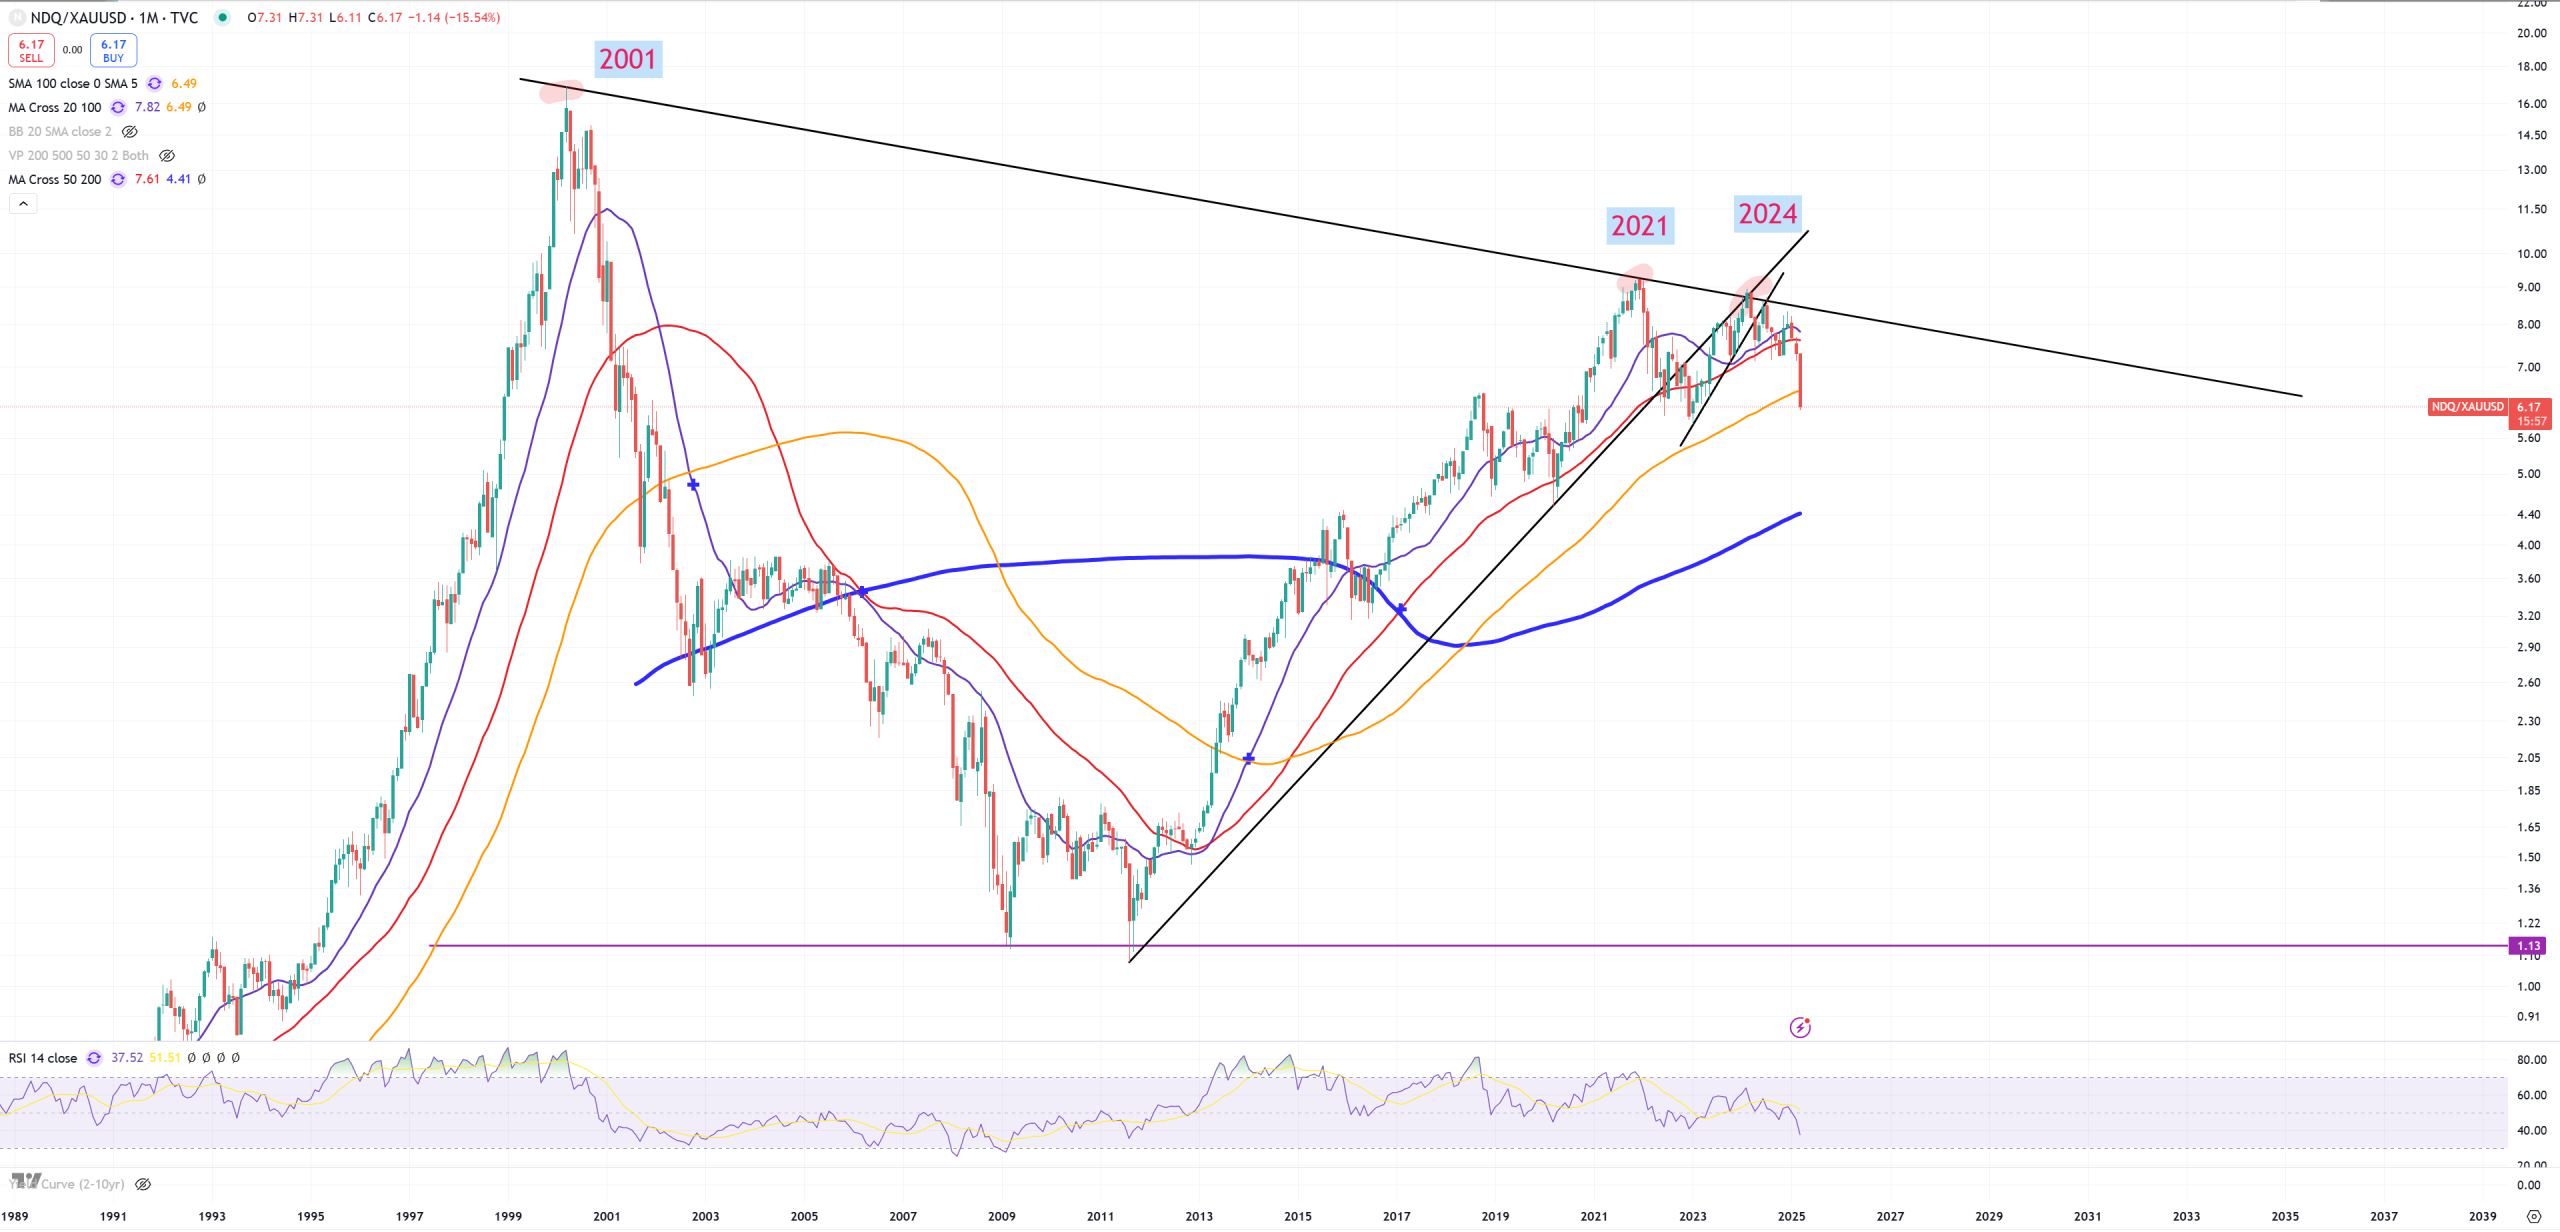
NDQ/GOLD – not so long term chart like SPX/GOLD or DJI/GOLD but this 1.13 level is tempting
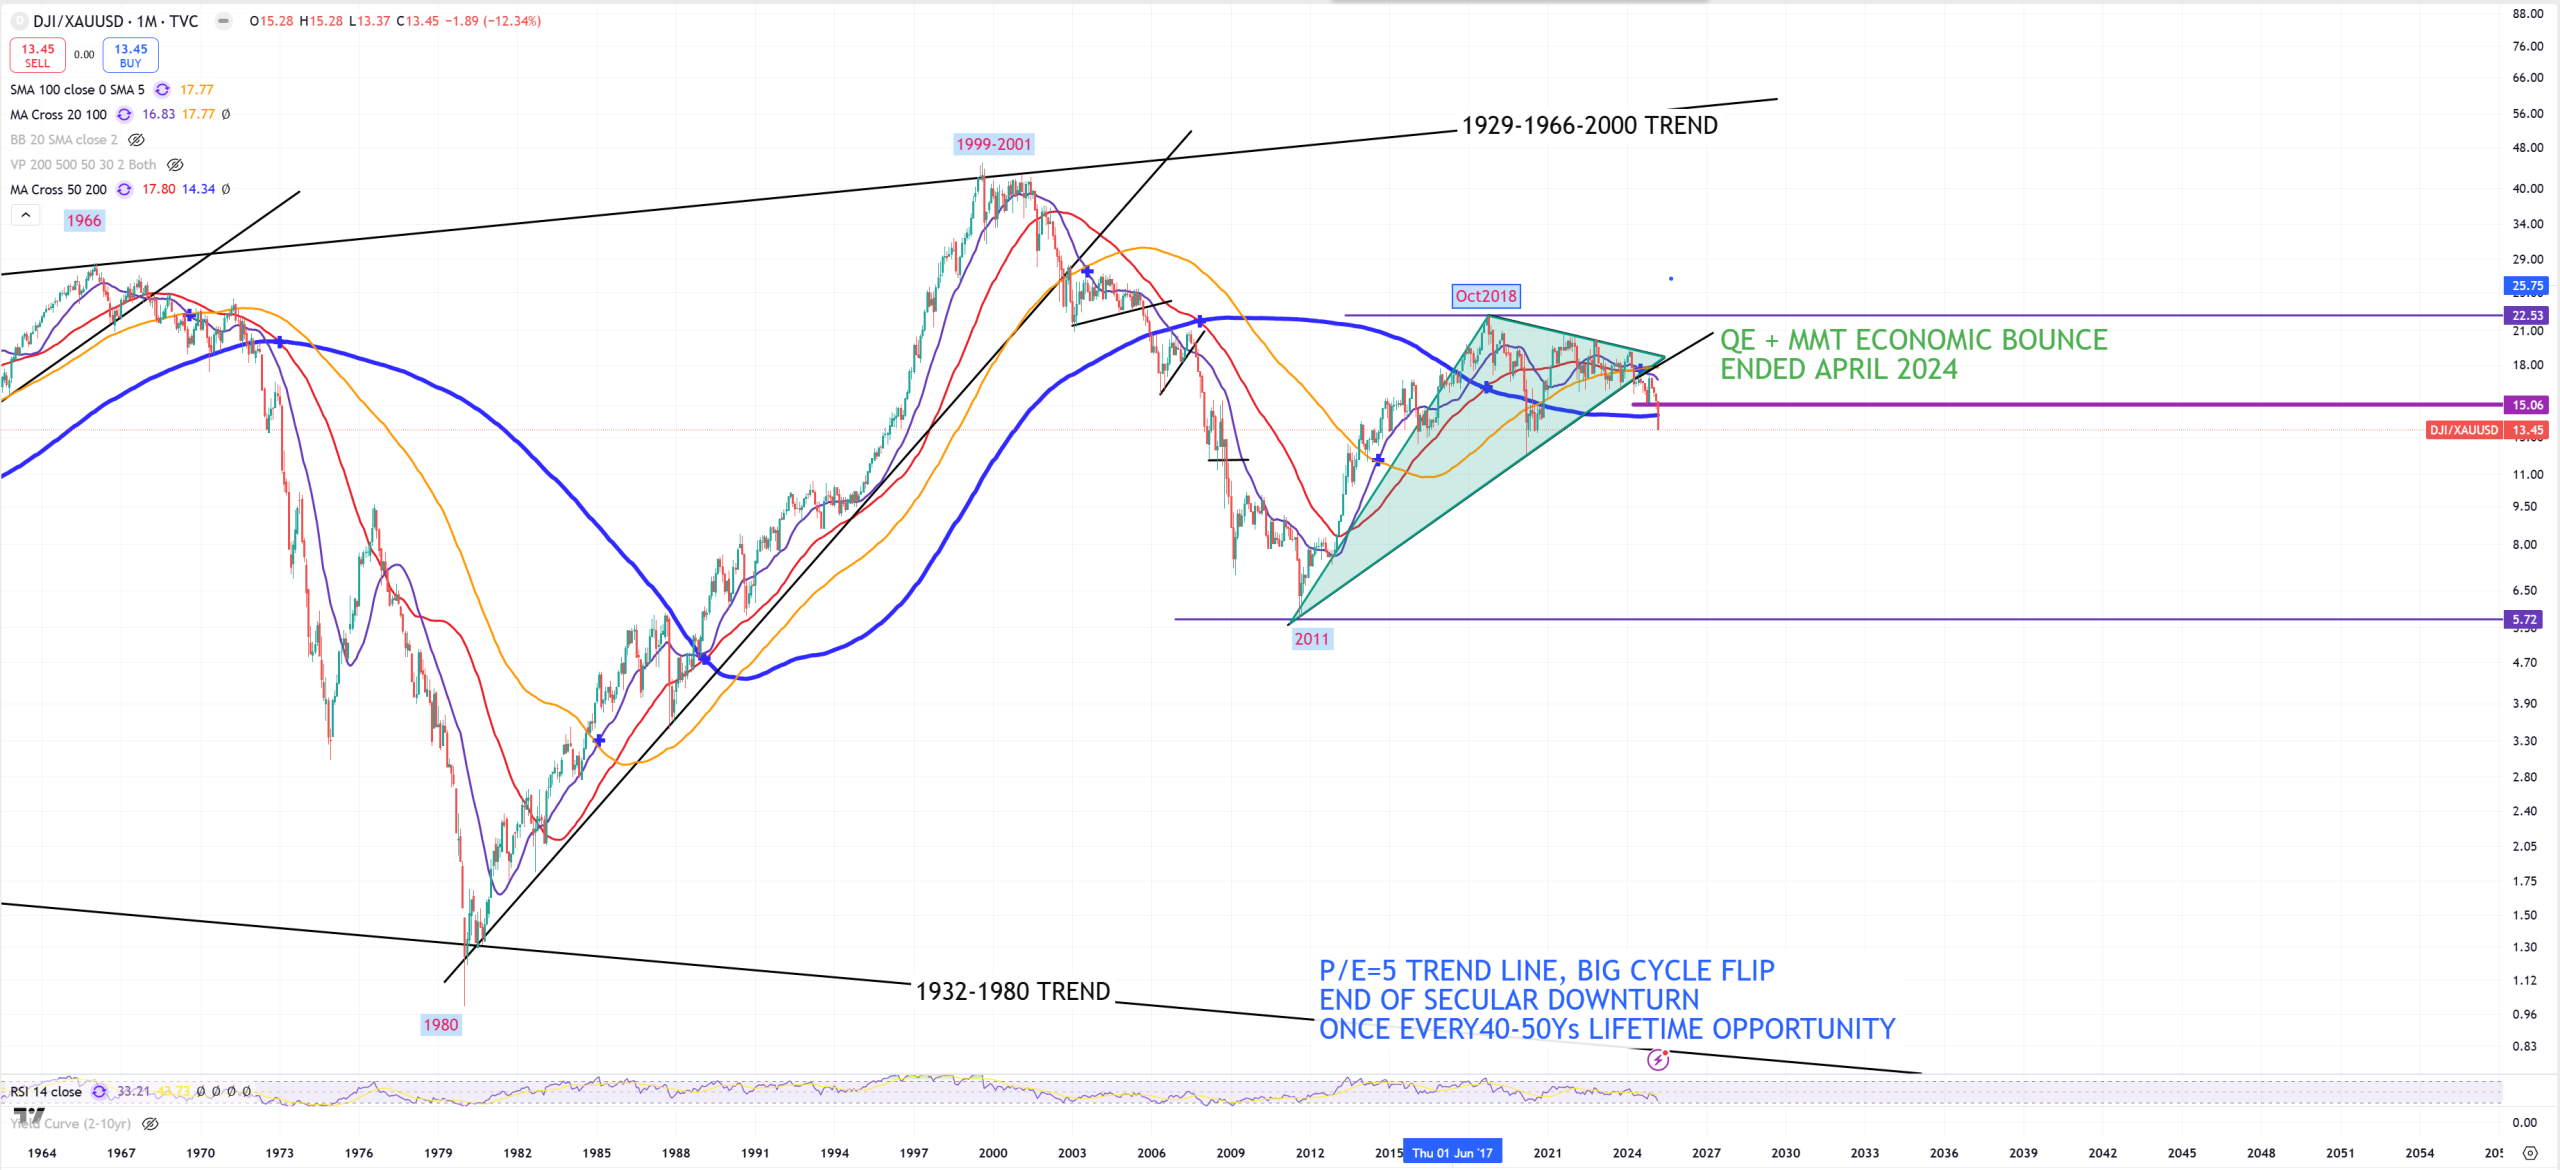
DJI/GOLD – (M)MA200 broken – it’s a disaster. You see from those 2 charts DJI/GOLD and SPX/GOLD that longer term flip to get out from stocks post 2011 bounce was in 2018. 2018 was a year to replace stocks with gold and forget for years. Waiting for lower trend line. Might take 2-3Ys or 20Ys, but I think personally it’ll be 2-3Ys.
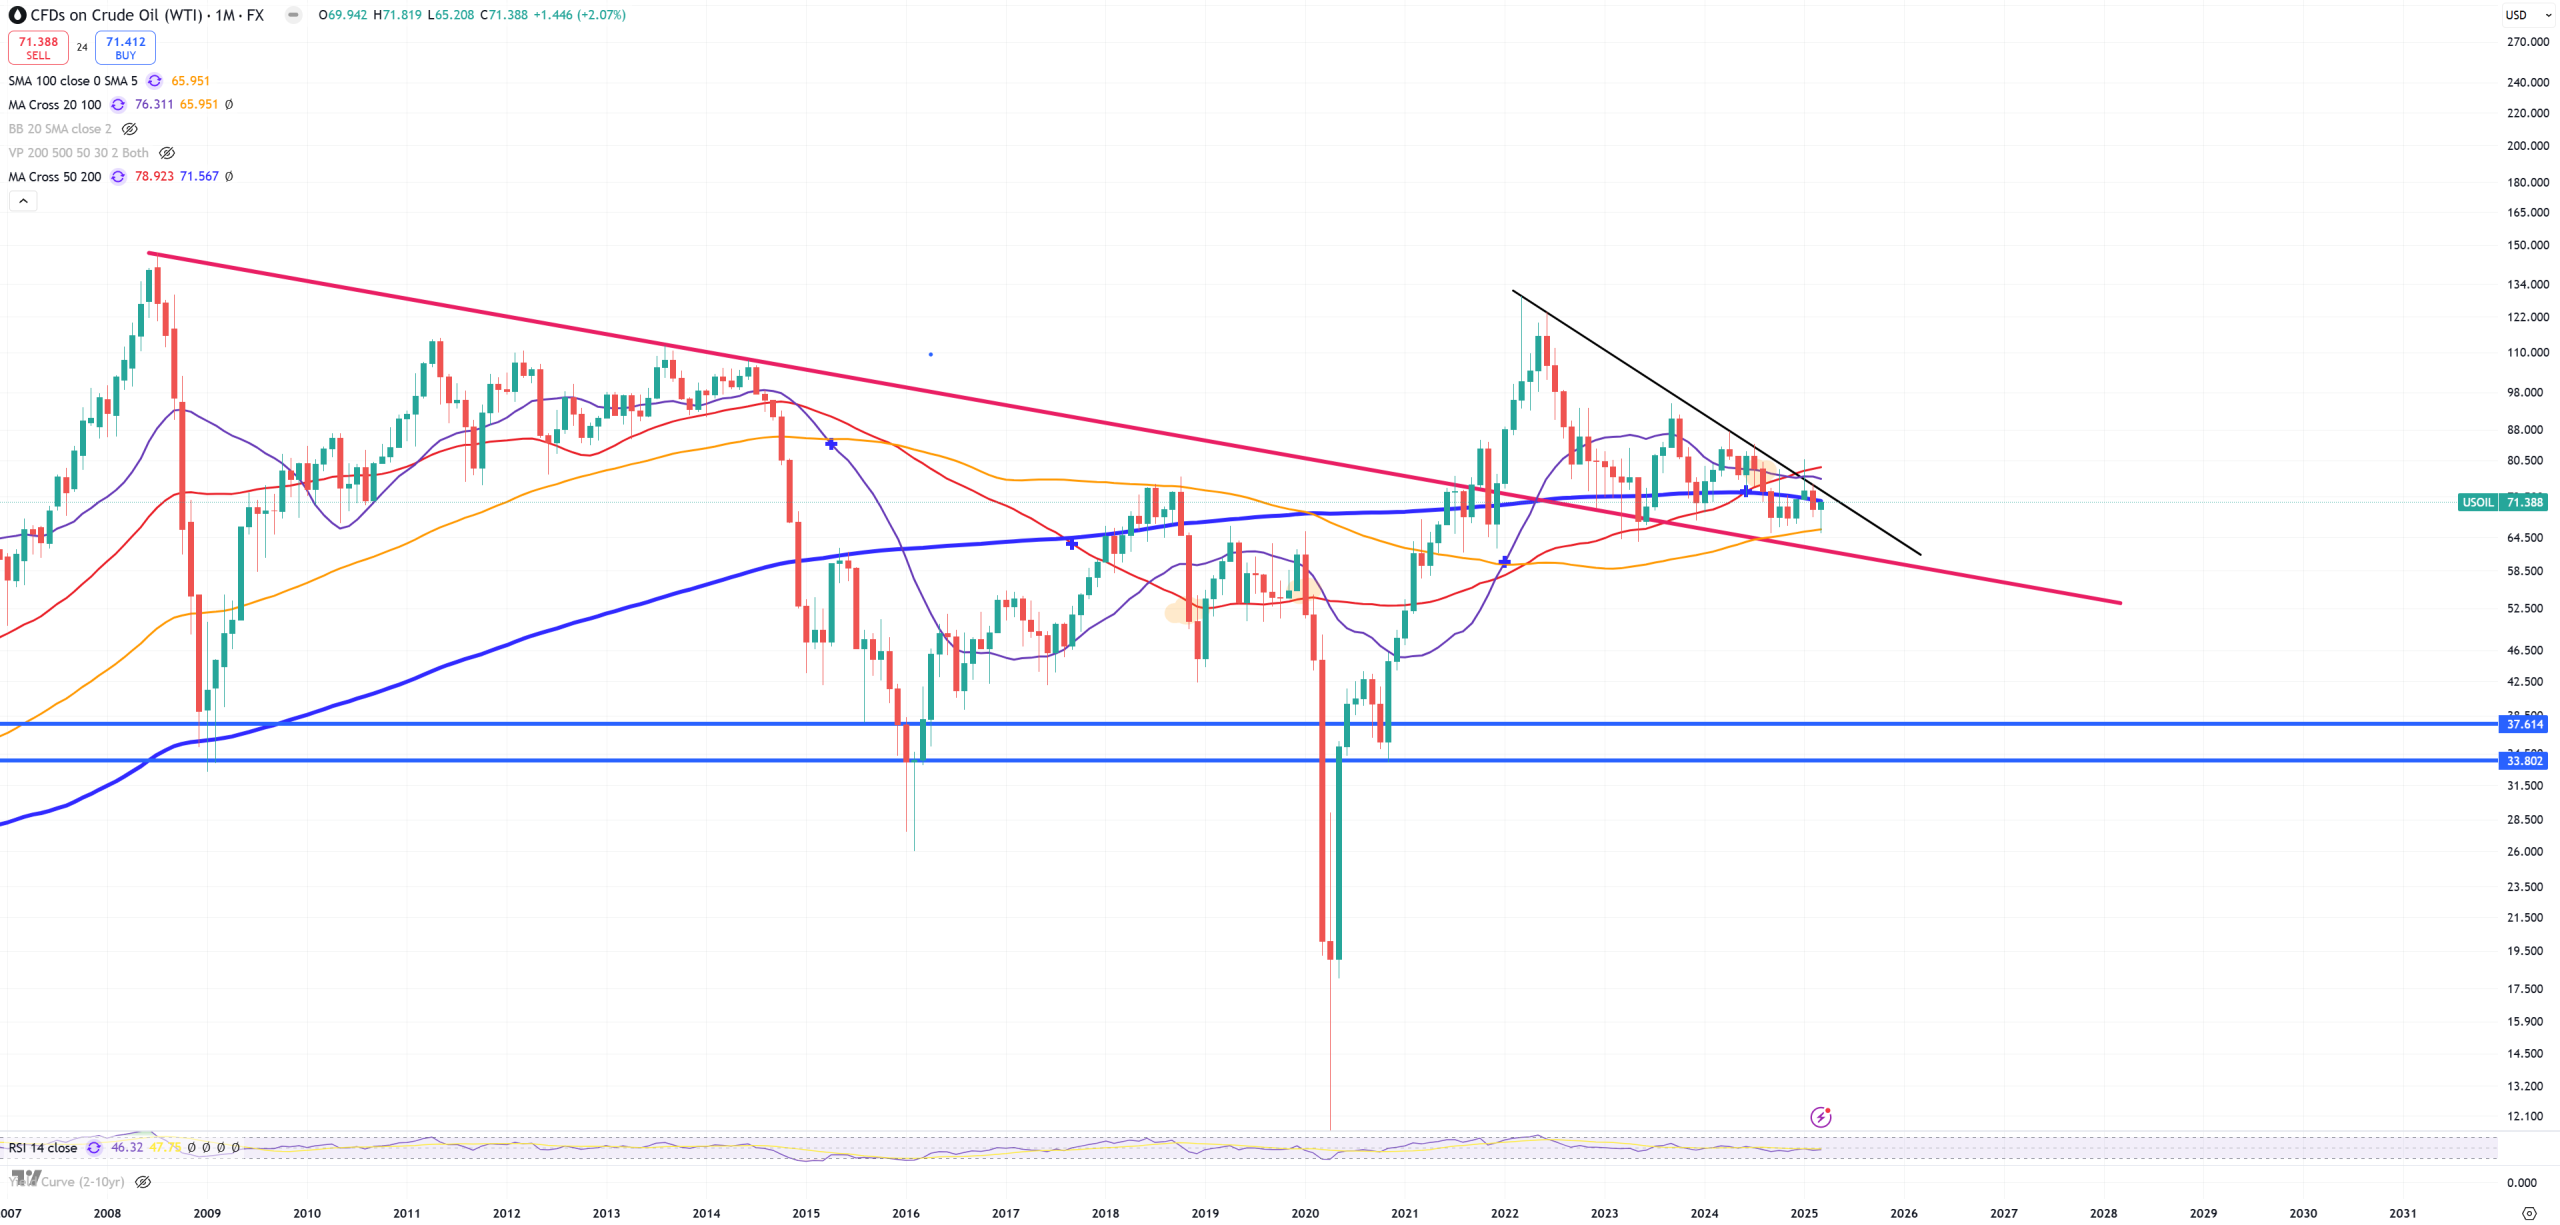
OIL – (M)MA200 retest, but closed below, breaking below red trend line = disaster.
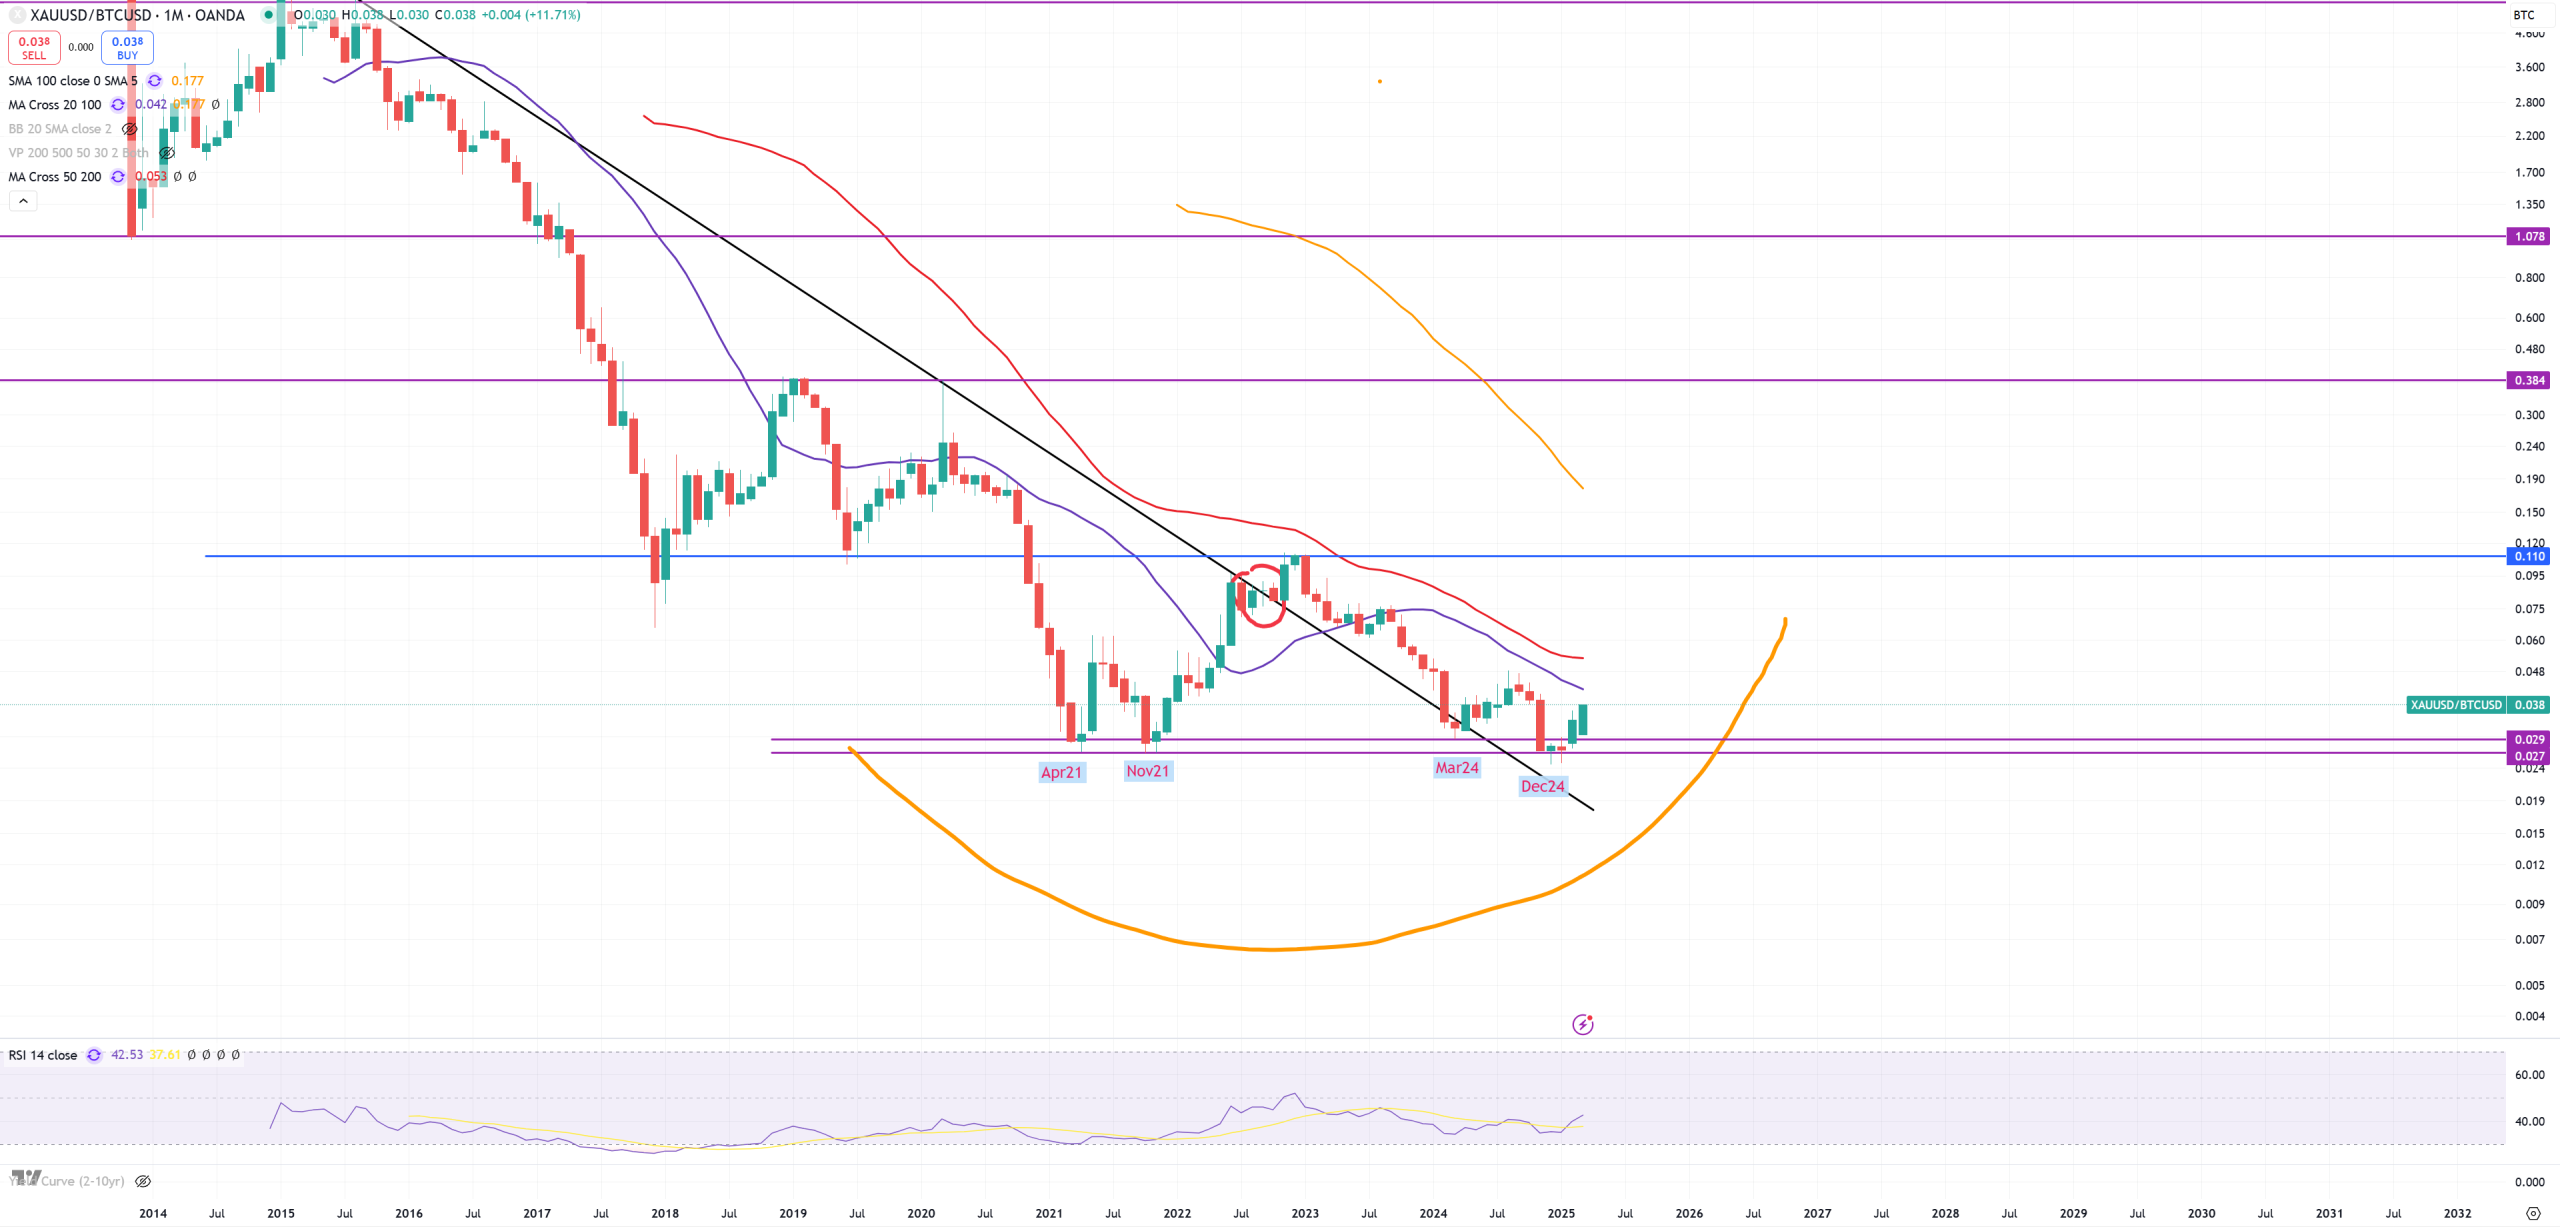
GOLD/BTC – BTC peak indicator so far works great
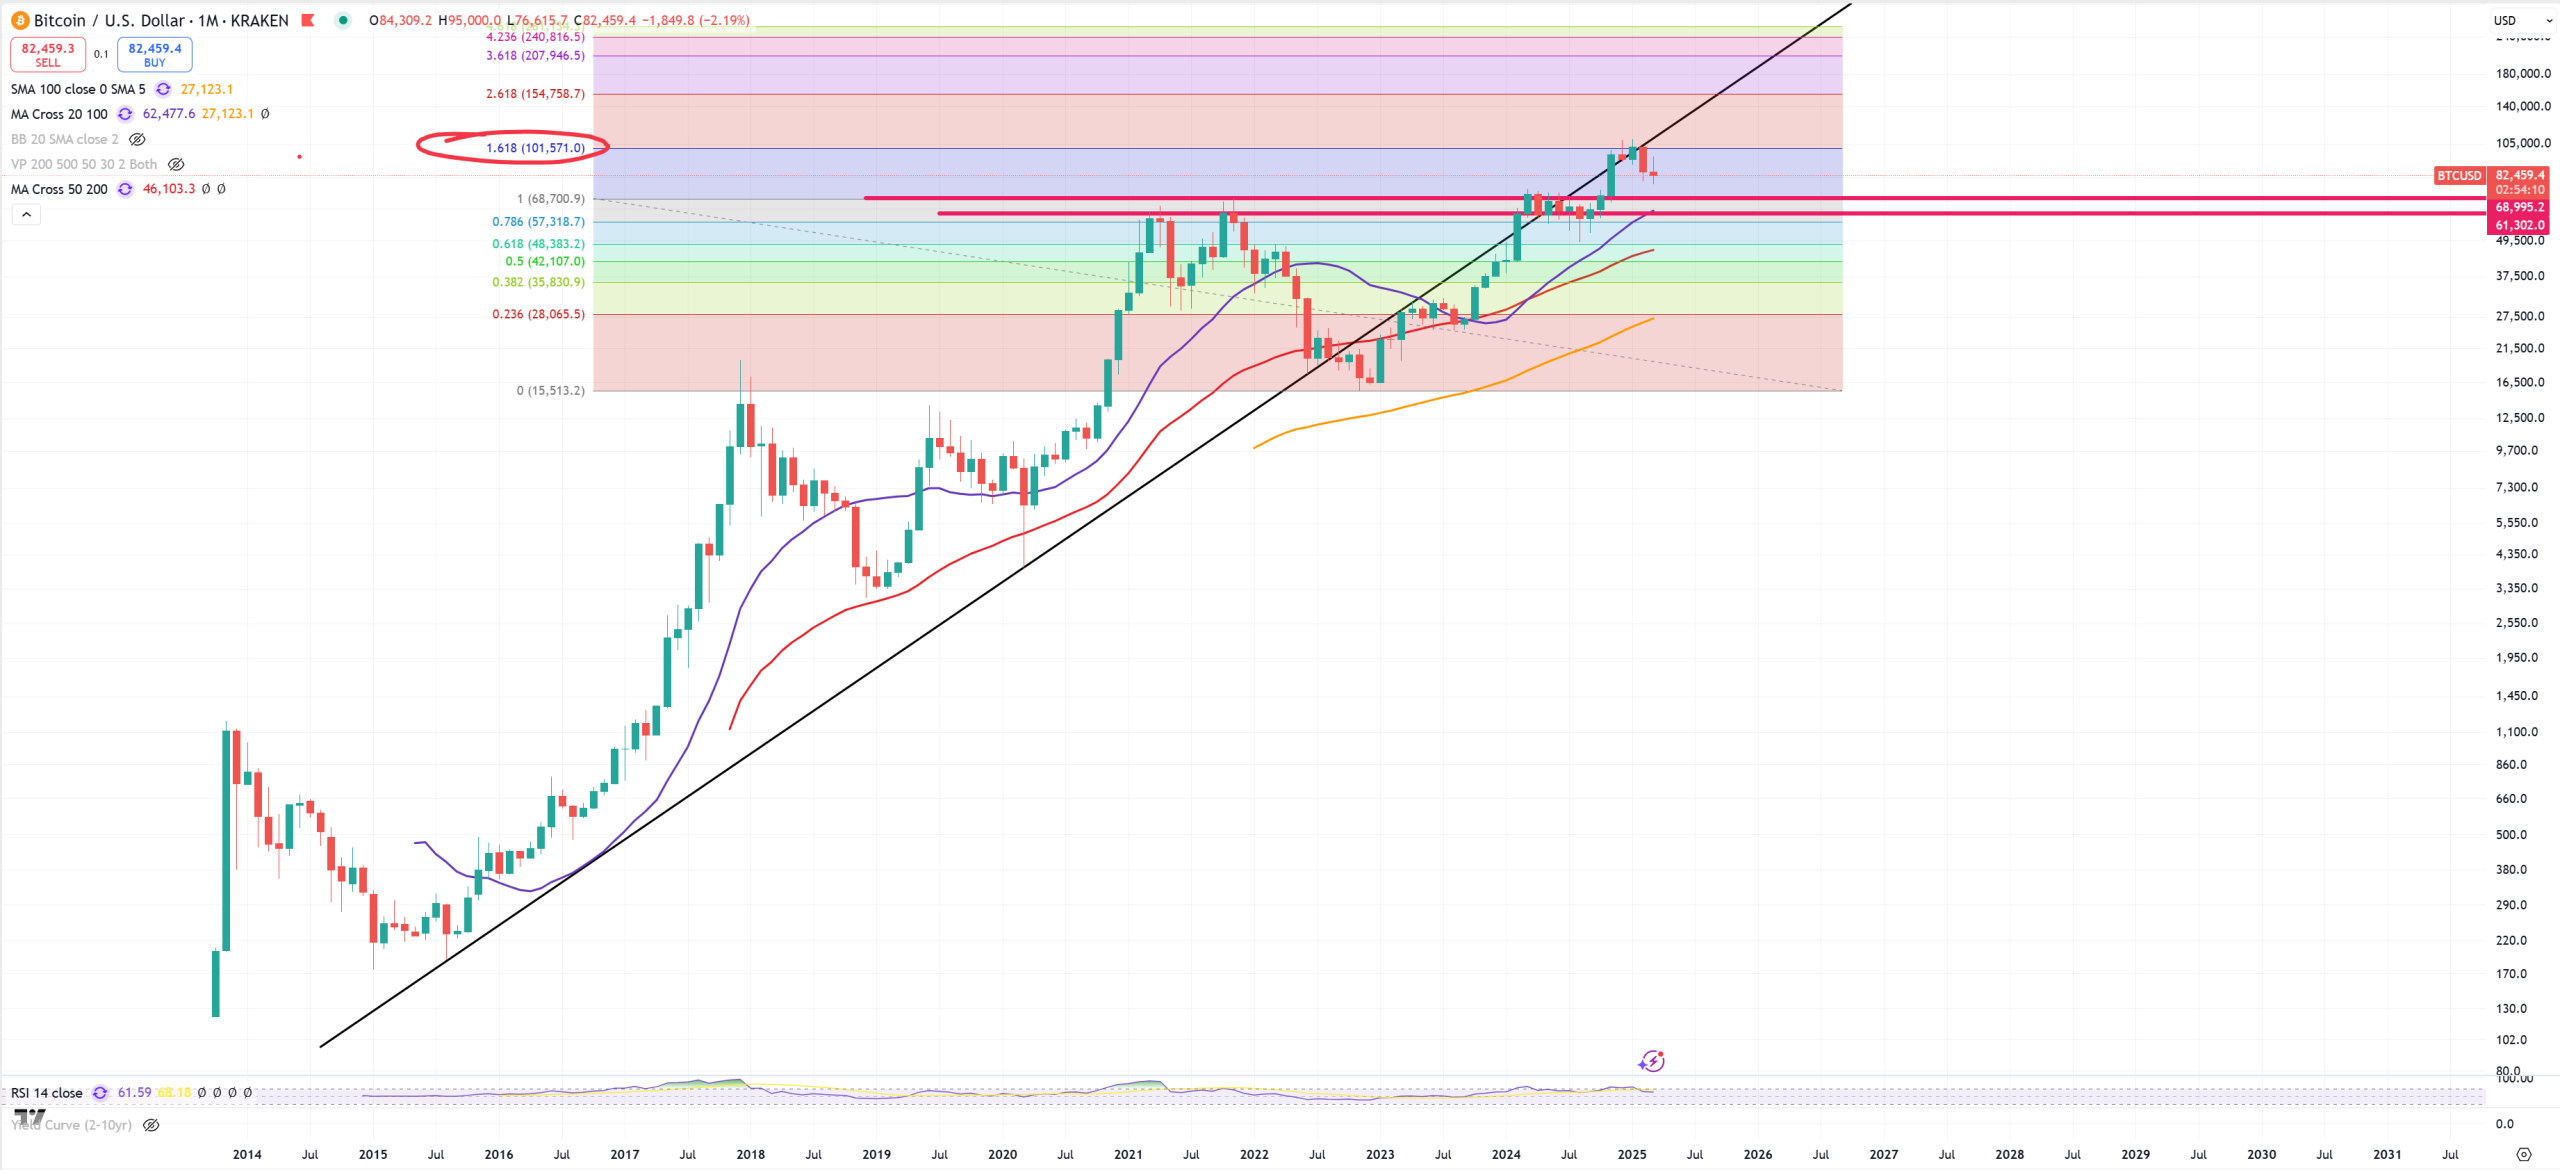
BTC – soon we’ll know if this break above 70k$ was a bull-trap or not
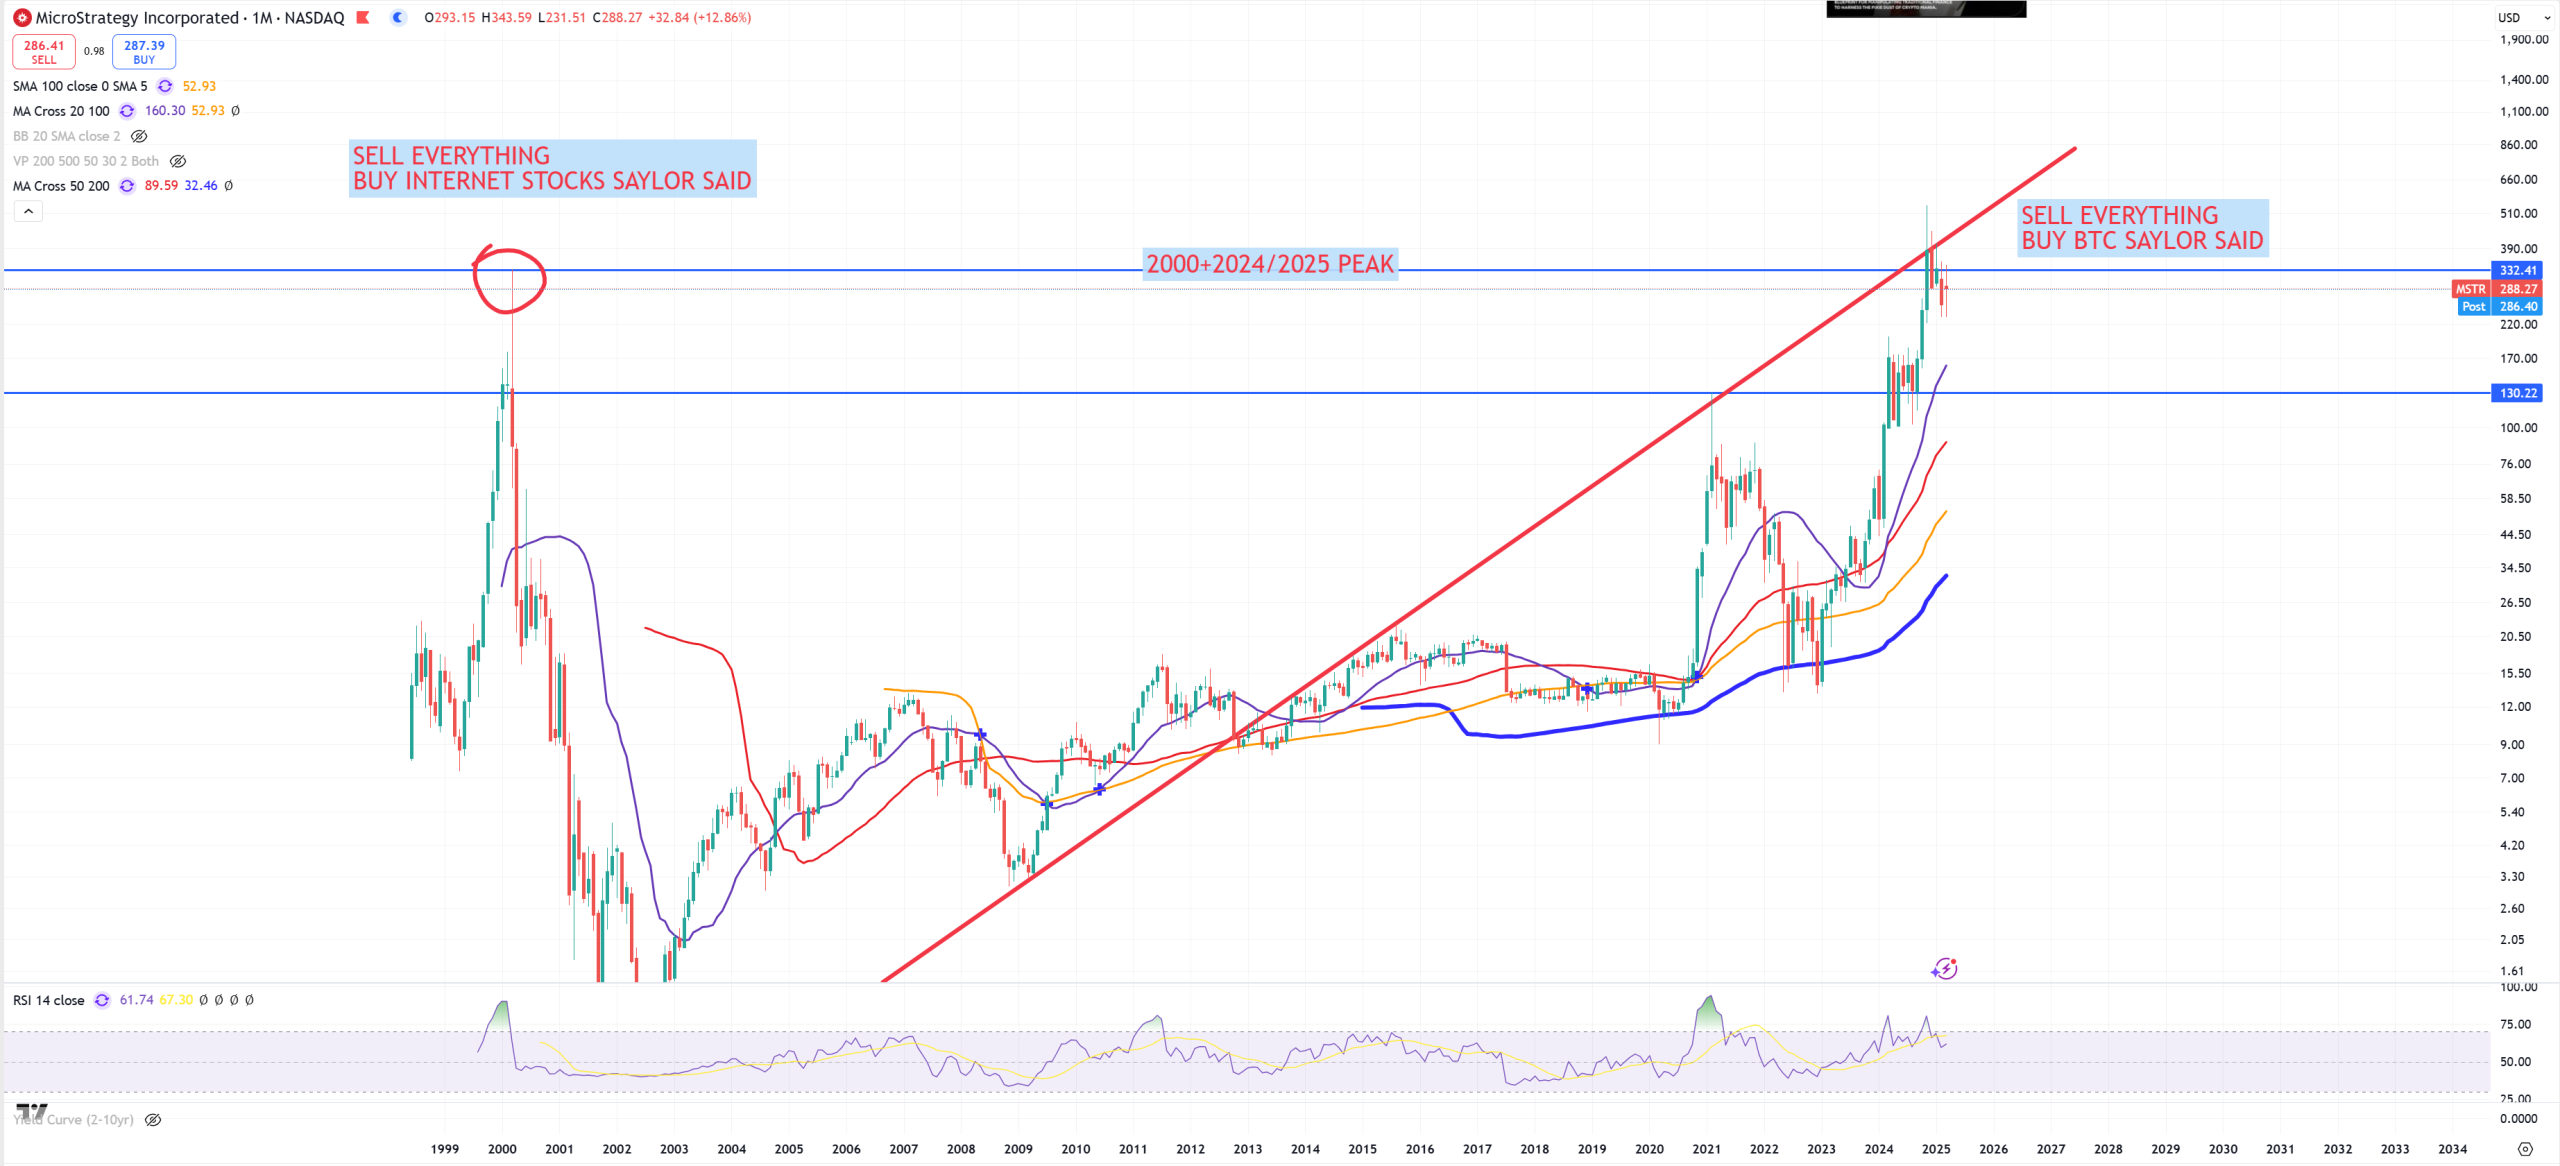
MSTR – we can’t really look on BTC without MSTR. Saylor should feel 2000 vibes
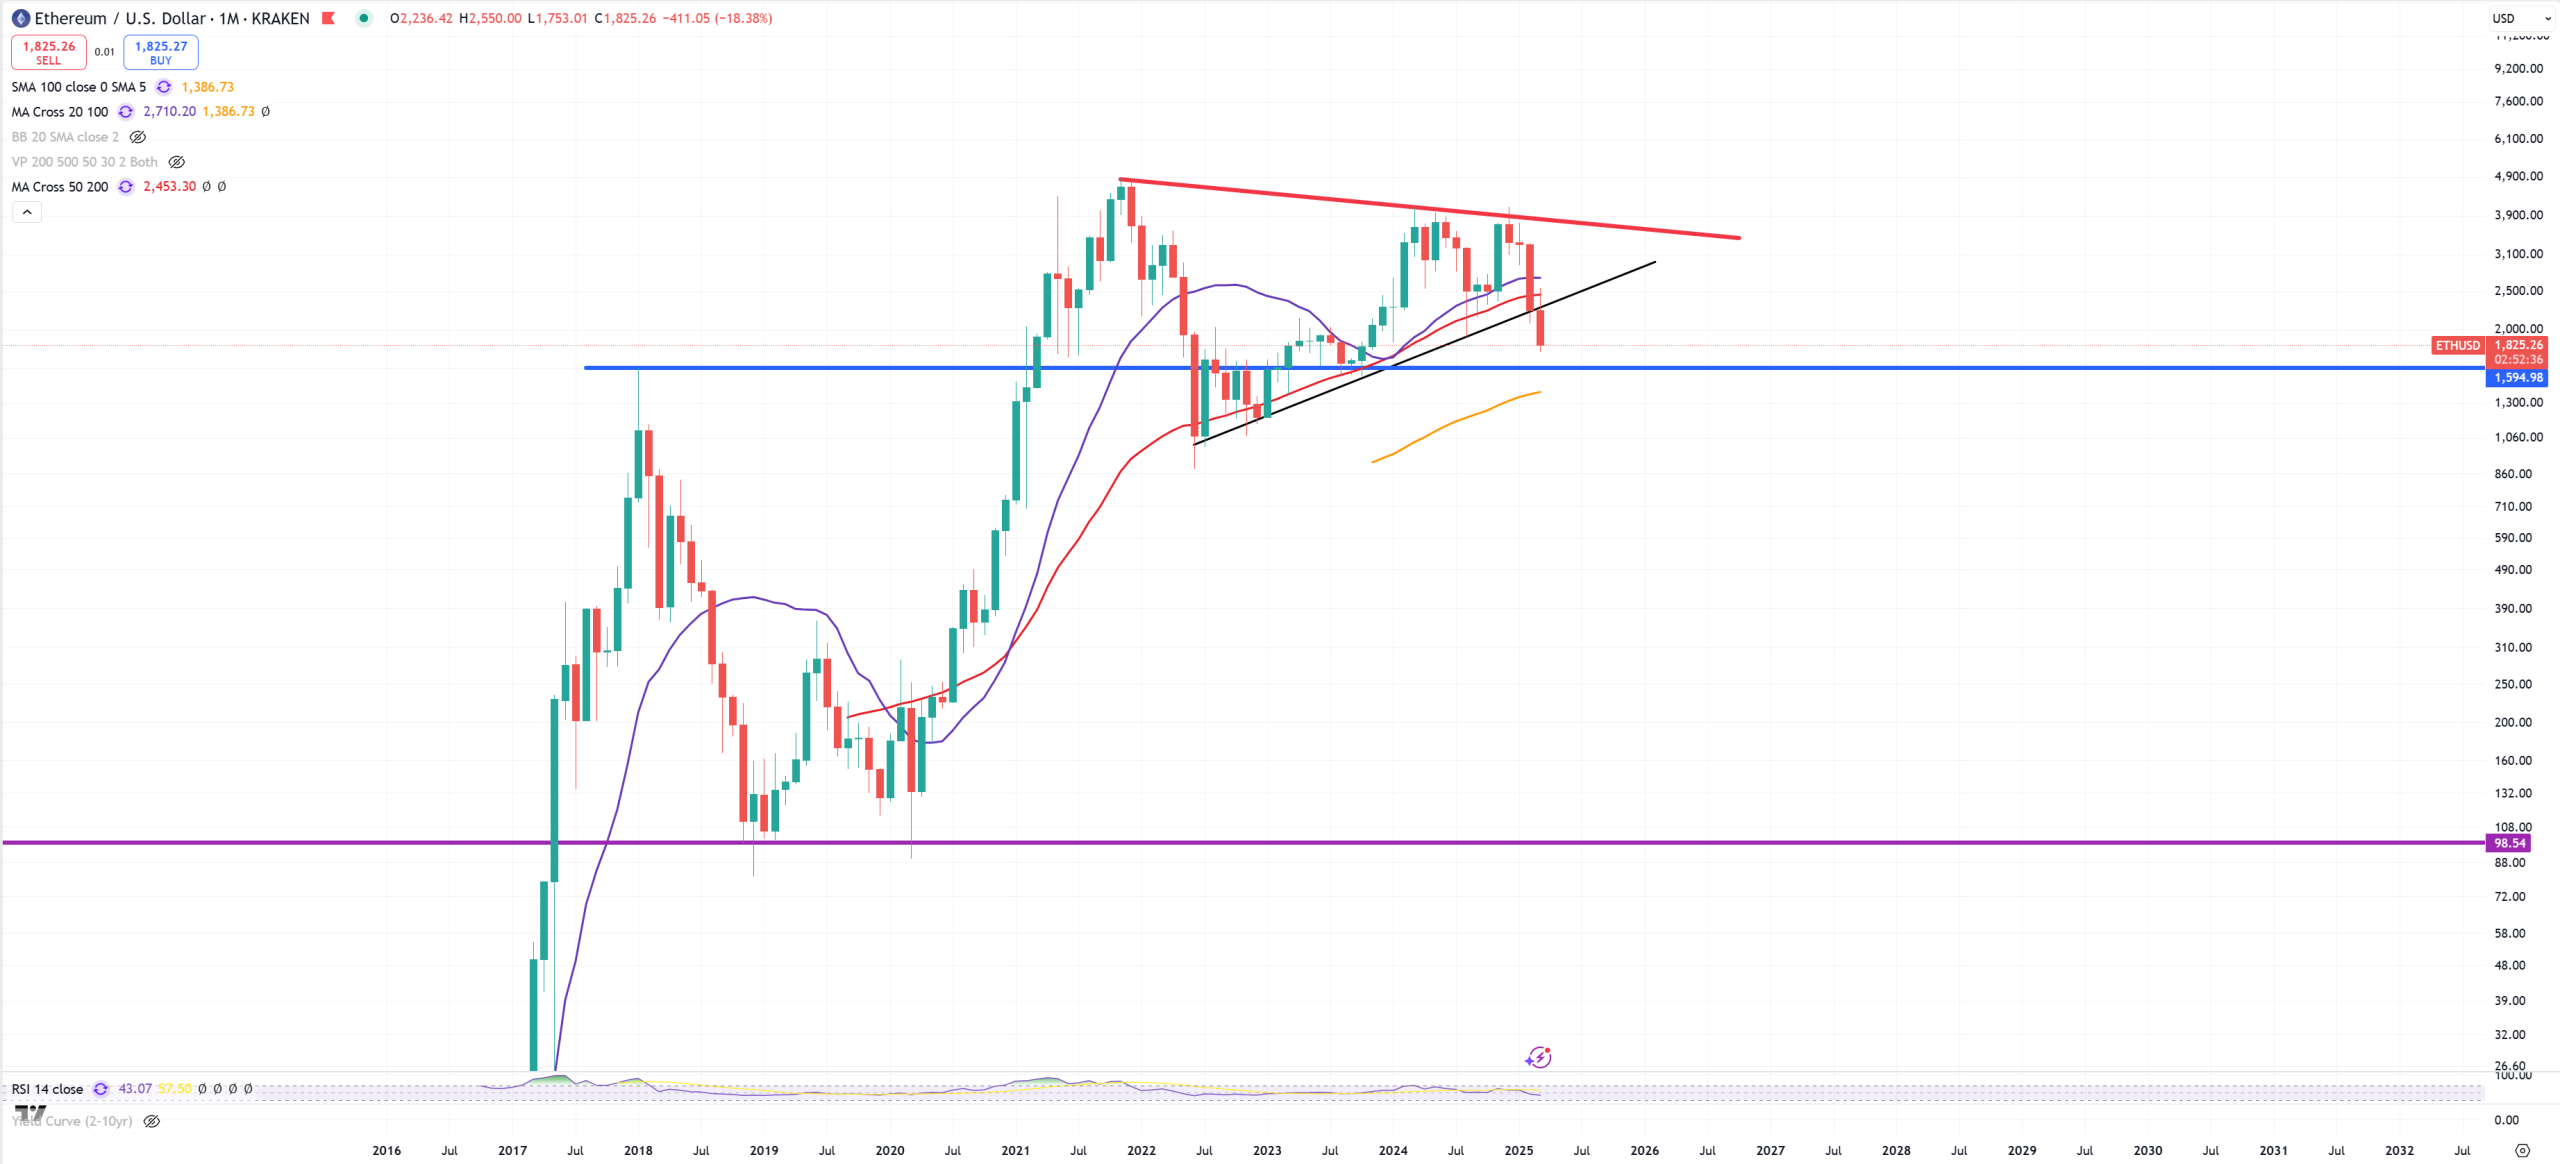
ETH – 1600$ level is really important, so far pattern is broken, (M)MA50 broken and soon 1600$ retest.
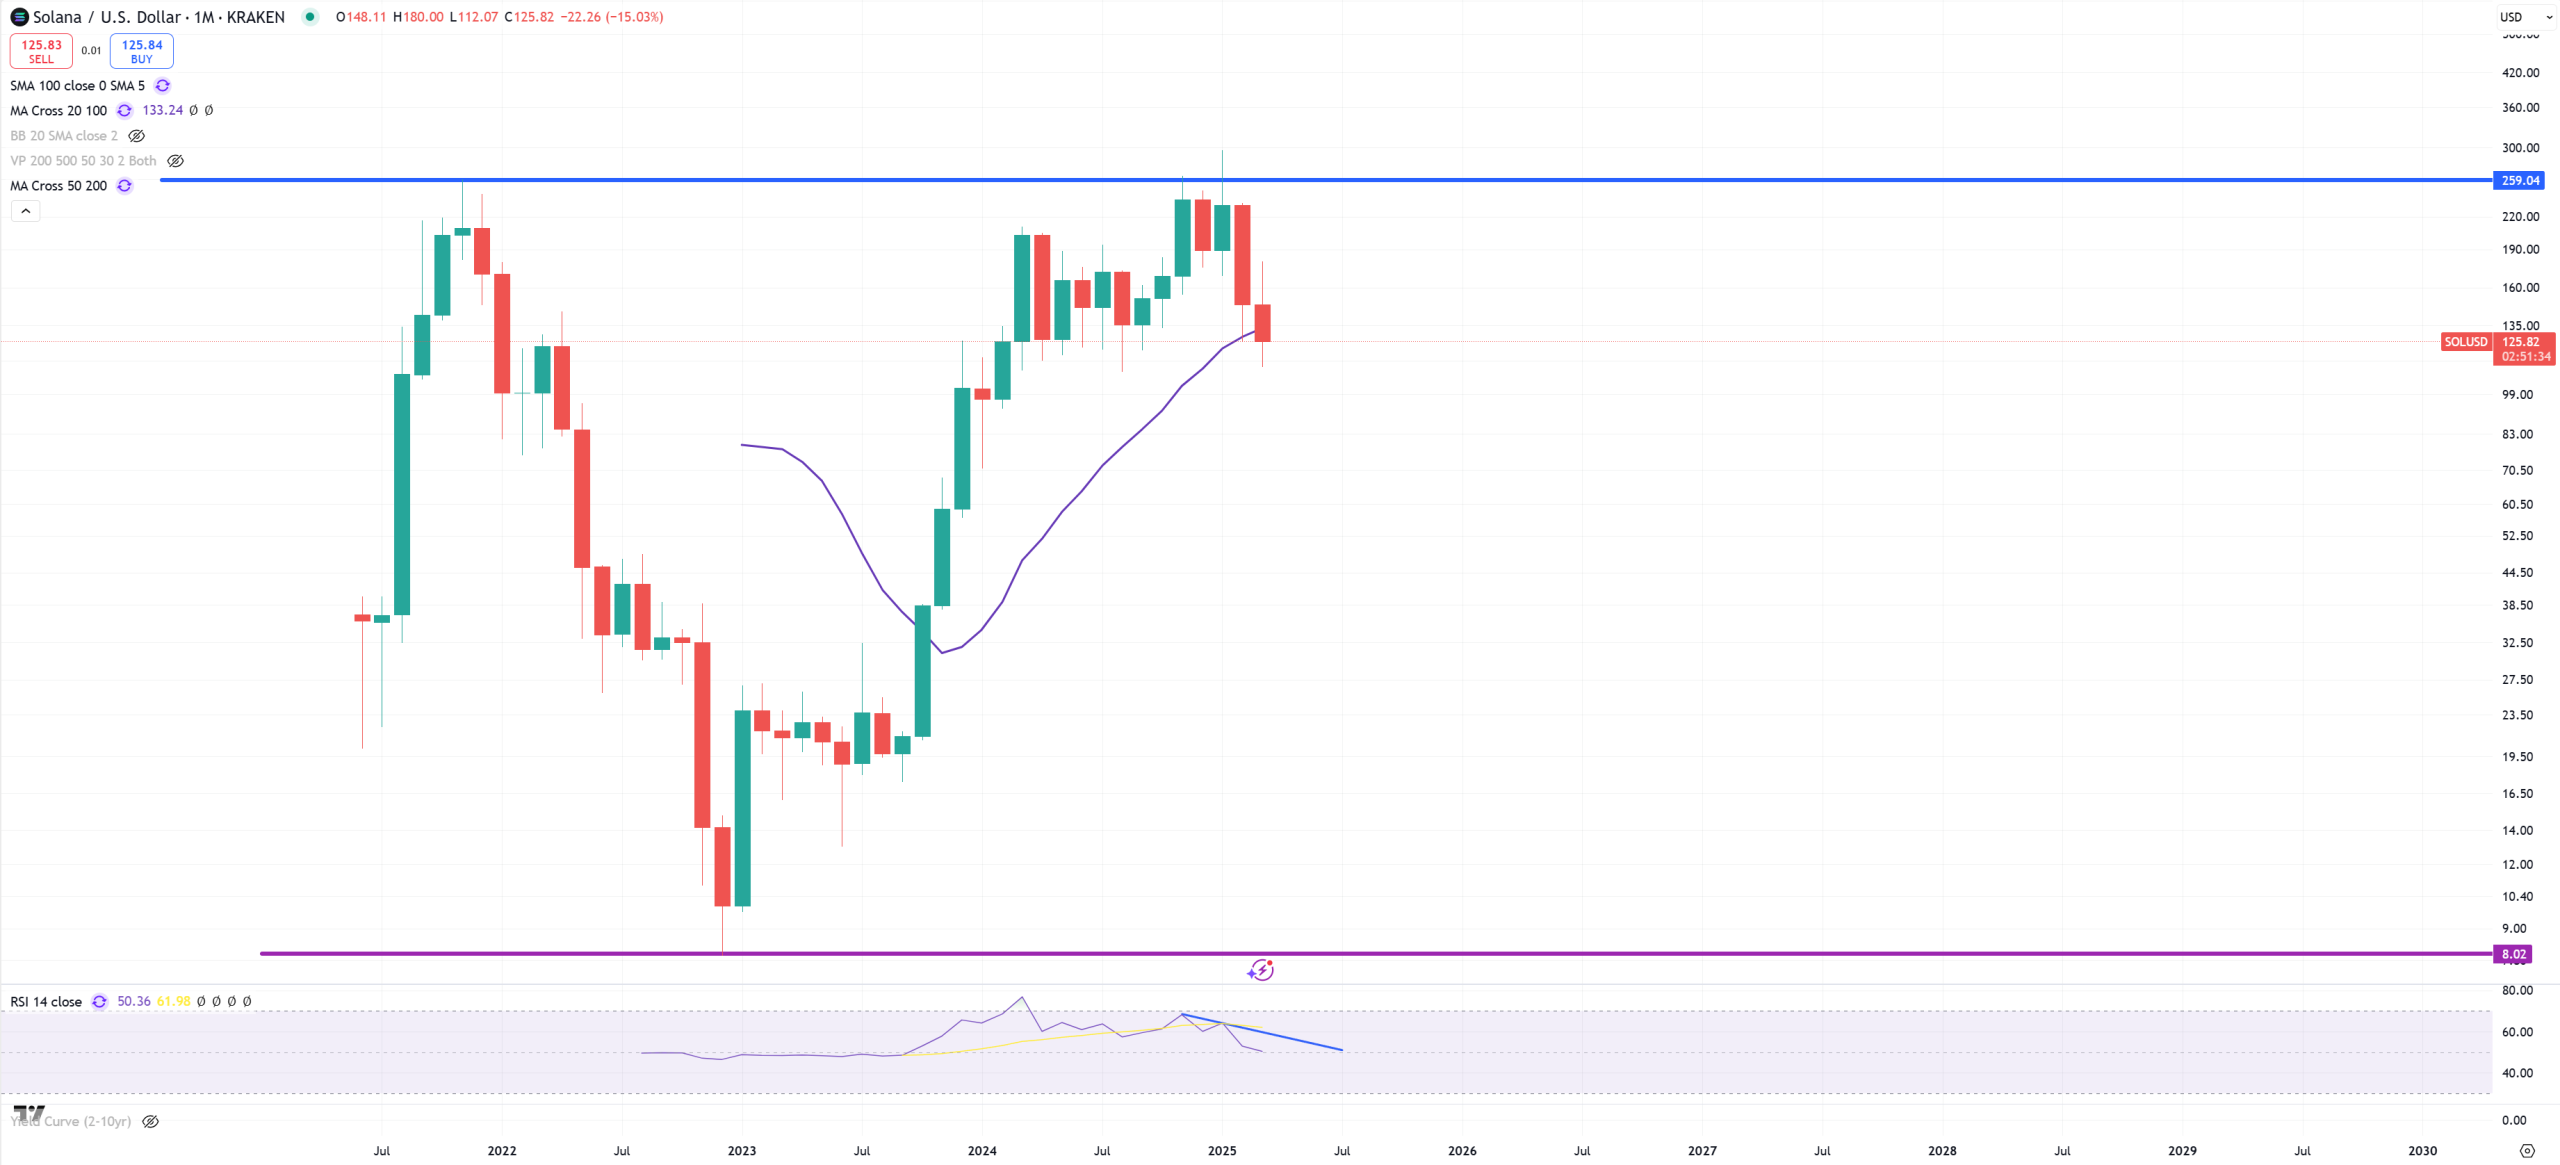
SOL – (M)MA20 broken and possible DOUBLE-TOP
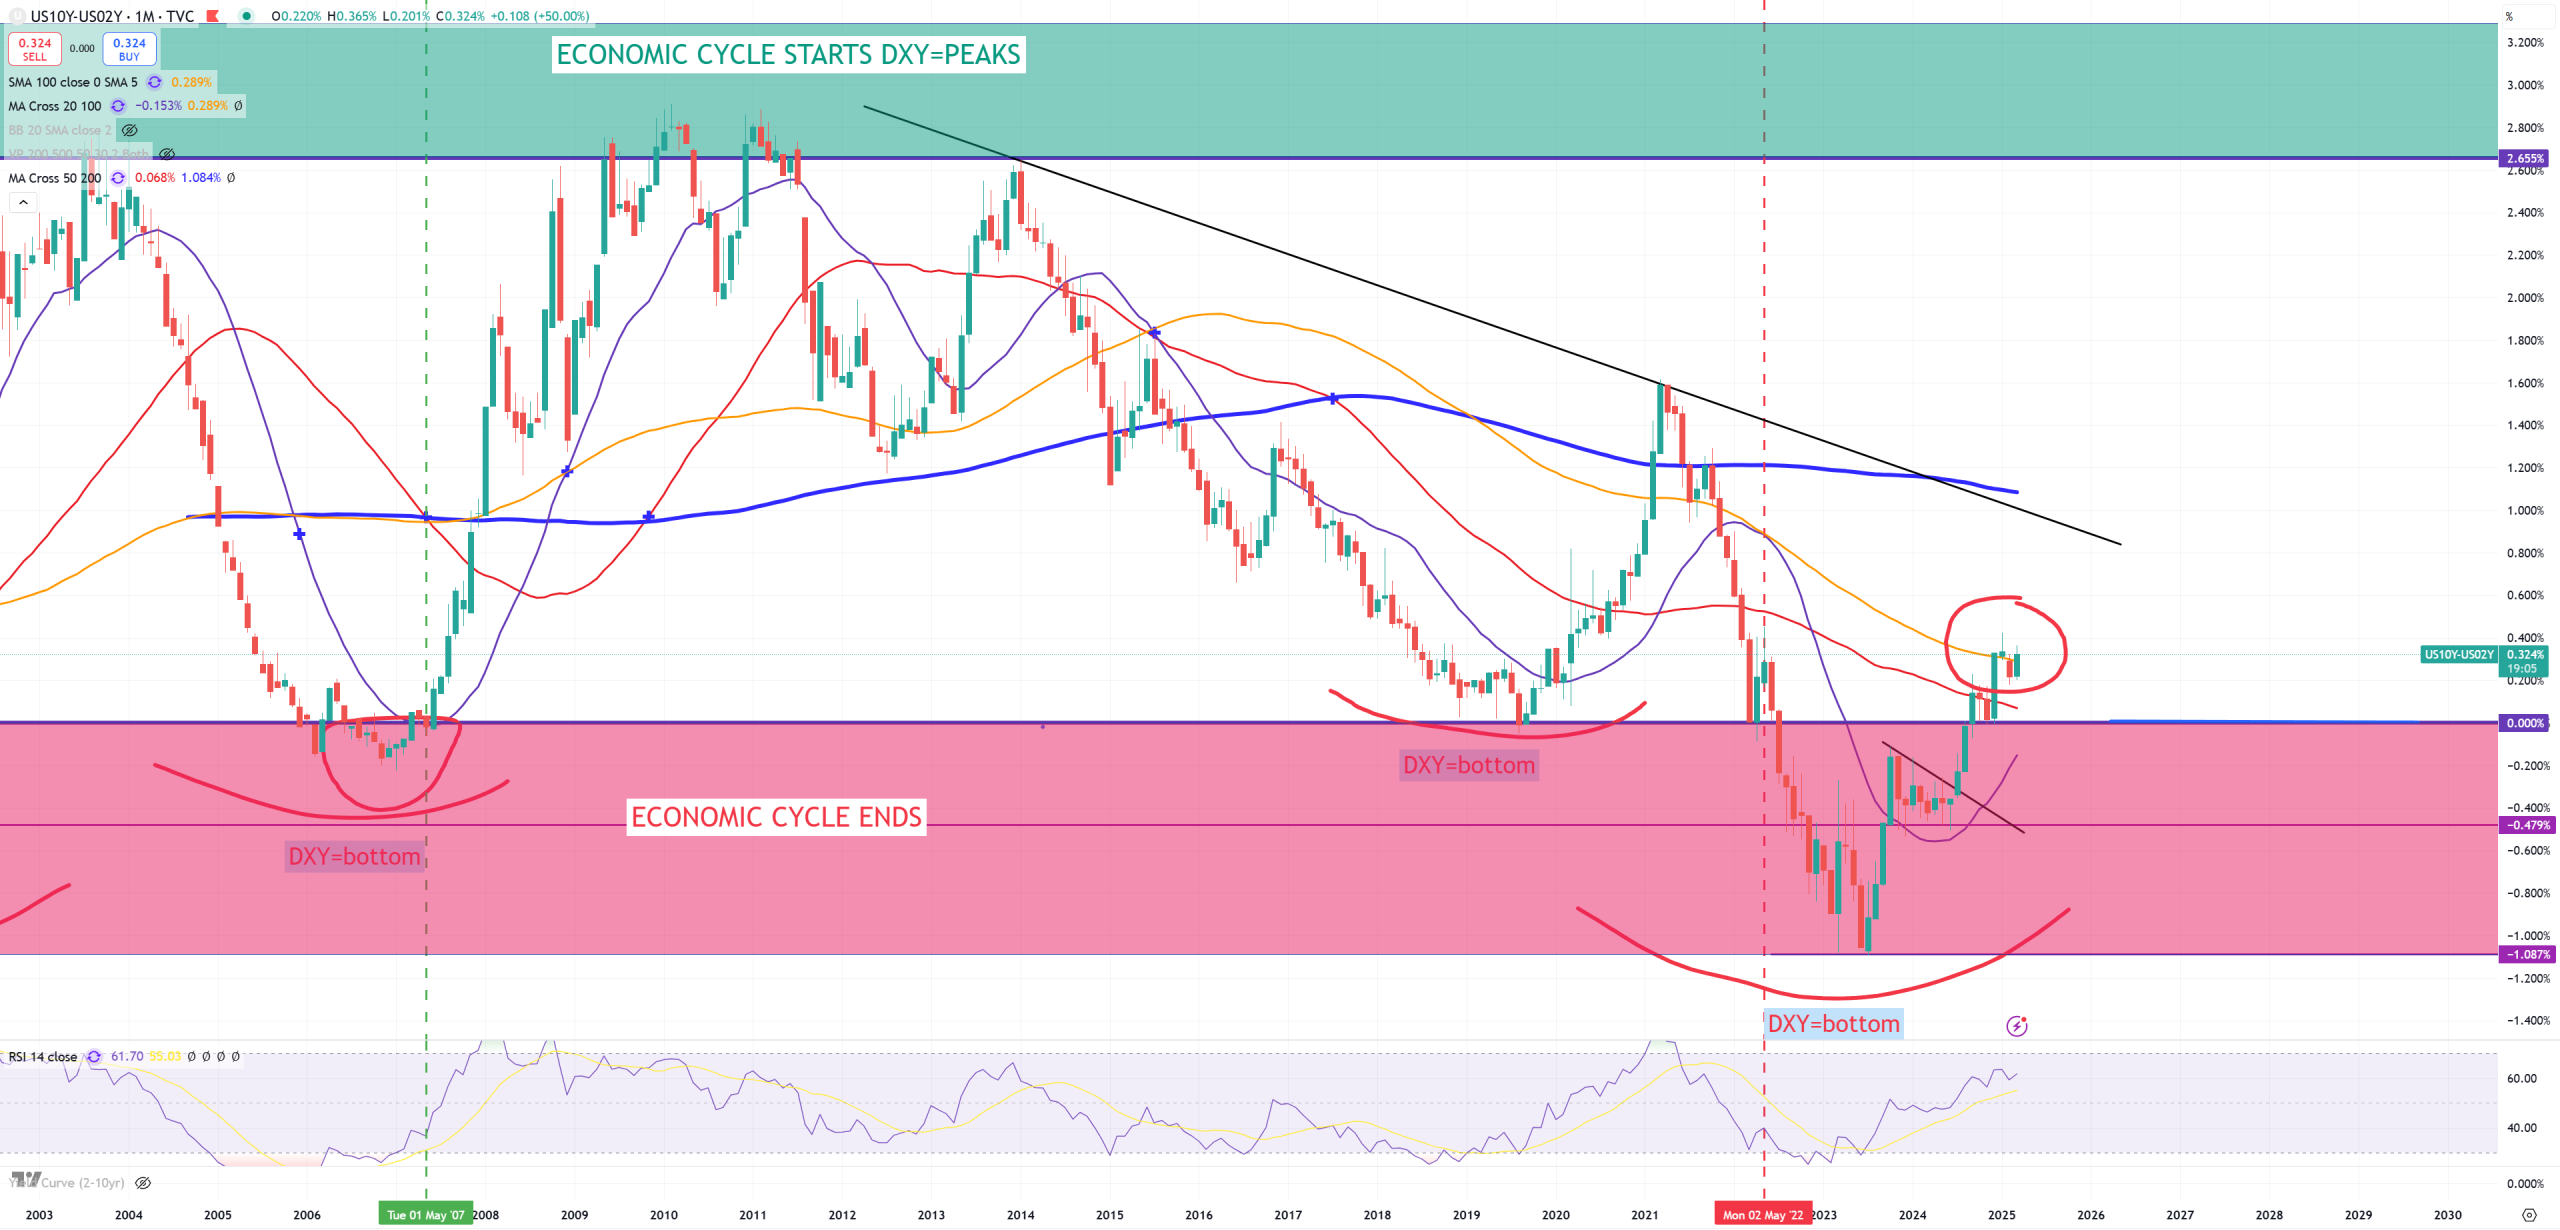
10Y/2Y – another month to fight for (M)MA100. Closed above
10Y/3M – closed below (M)MA50, so we have again a big difference between 10Y/2Y which does not move and 10Y/3M which tries to invert again. If 10Y/2Y will not plunge, soon 10Y/3M will spike higher to join 10Y/2Y.