07/2025
July 7, 2025

So with a short delay (vacations) here comes monthly chart. Unfortunatelly you also see last (M) candle from July, which shouldn’t be here, as I always try to post (M) charts without new (M) candle. Also June is the end of quarter, so in some key long term ratio charts I’ll give (3M) view too.
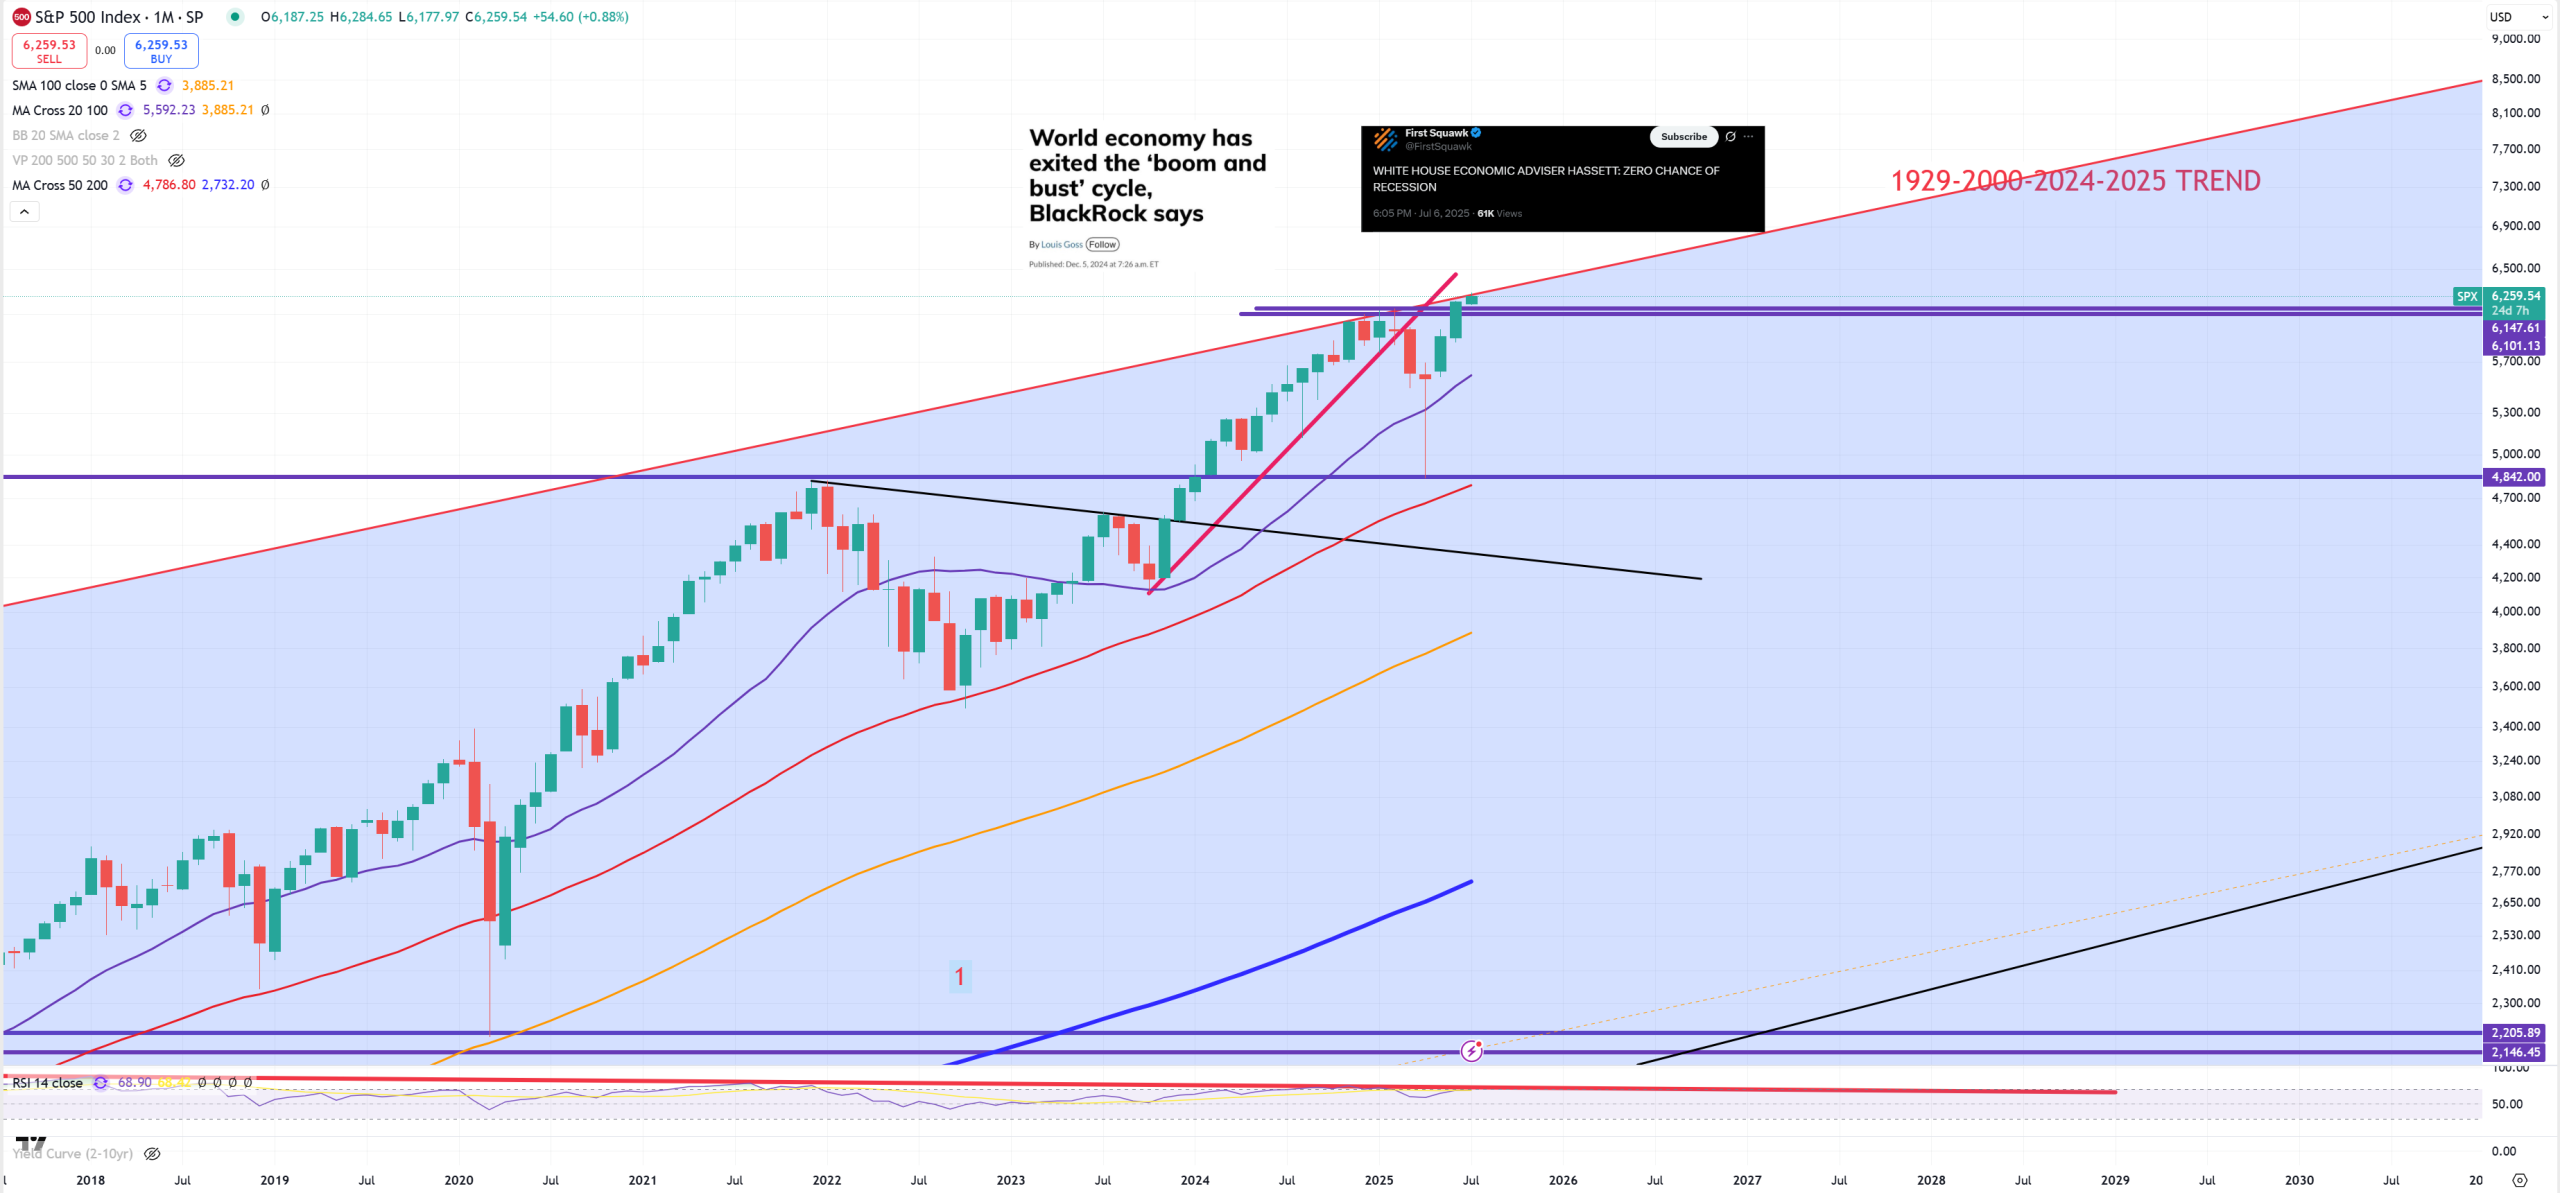
SPX – as usual we start from SPX chart and it’s 1929-2000 trend new points are 2024 and 2025. Trend line limiter stays around ~6260-6270
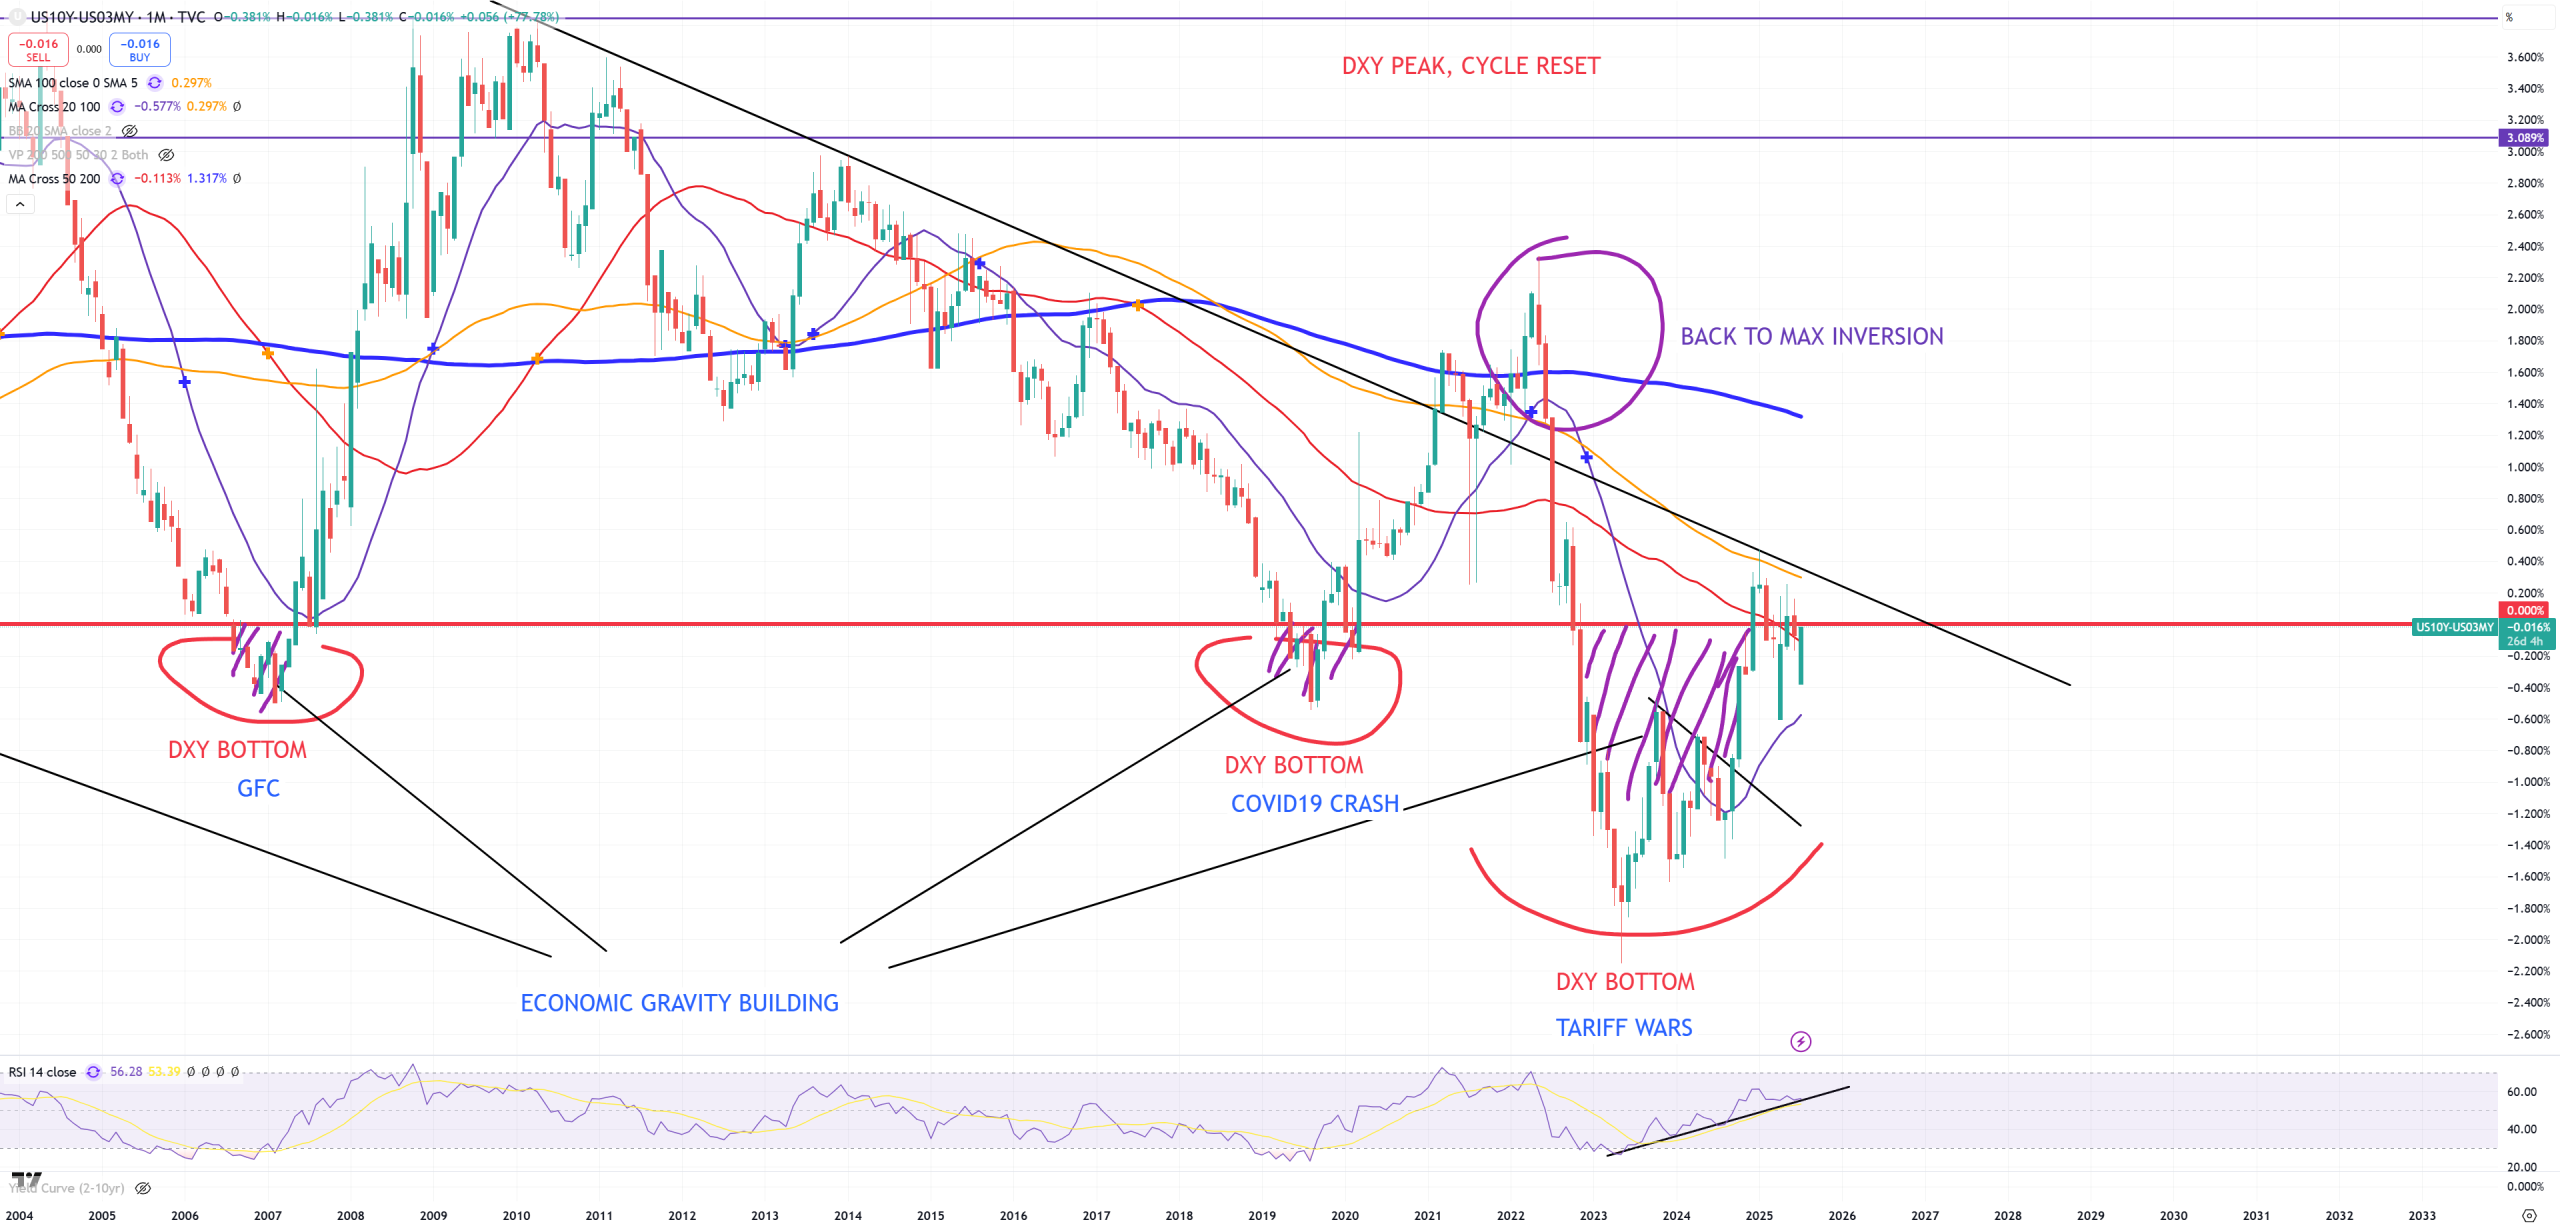
10Y/3M – assuming those small spikes between +20 towards -20bps are still around inversion we are still talking about uninversion process which so far takes around 1000 days. We ended above red (M)MA50, but we are still circling around 0bps with massive positive divergence. 10Y/3M down = DXY down, 10Y/3M up = DXY up. So far we live in a world where DXY is getting hammered so much but 10Y/3M can’t really drop lower. The longer and deeper inversion the more powerful crisis. Previous record belonged to 1929 (700 days), we are now around 1000 days here.
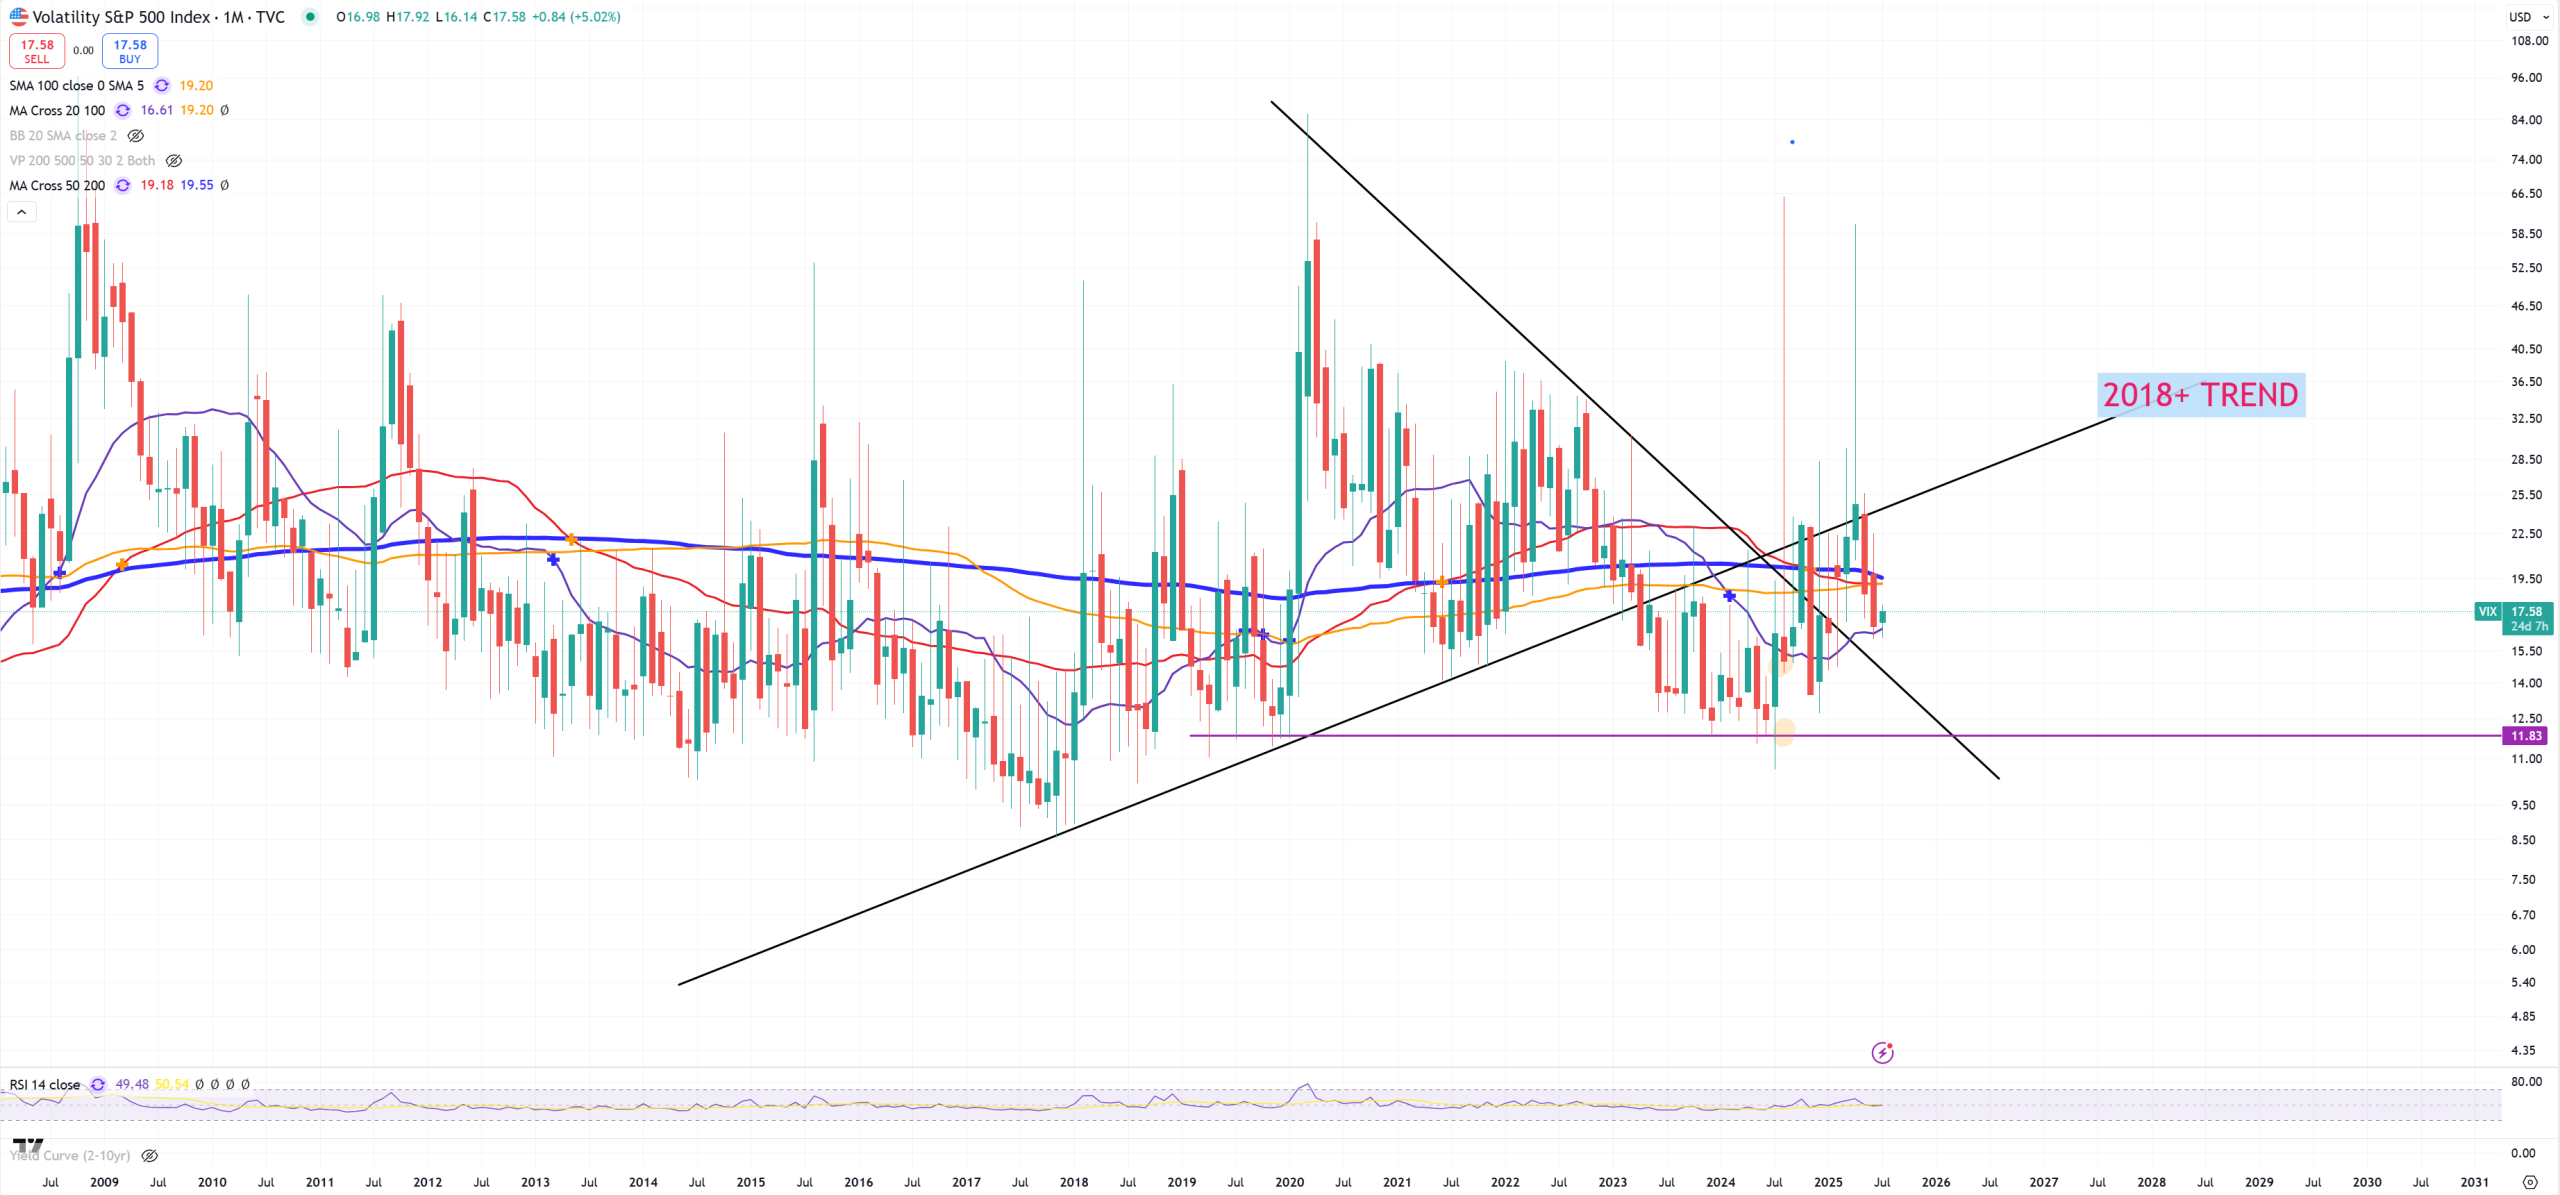
VIX – dead money, market tries to defend “the back to natural 2018+ trend), last (M)MA20 support later 14 later 11. But if we assume SPX will hold 1929-2000 trend this (M)MA20 should be the lowest level of support
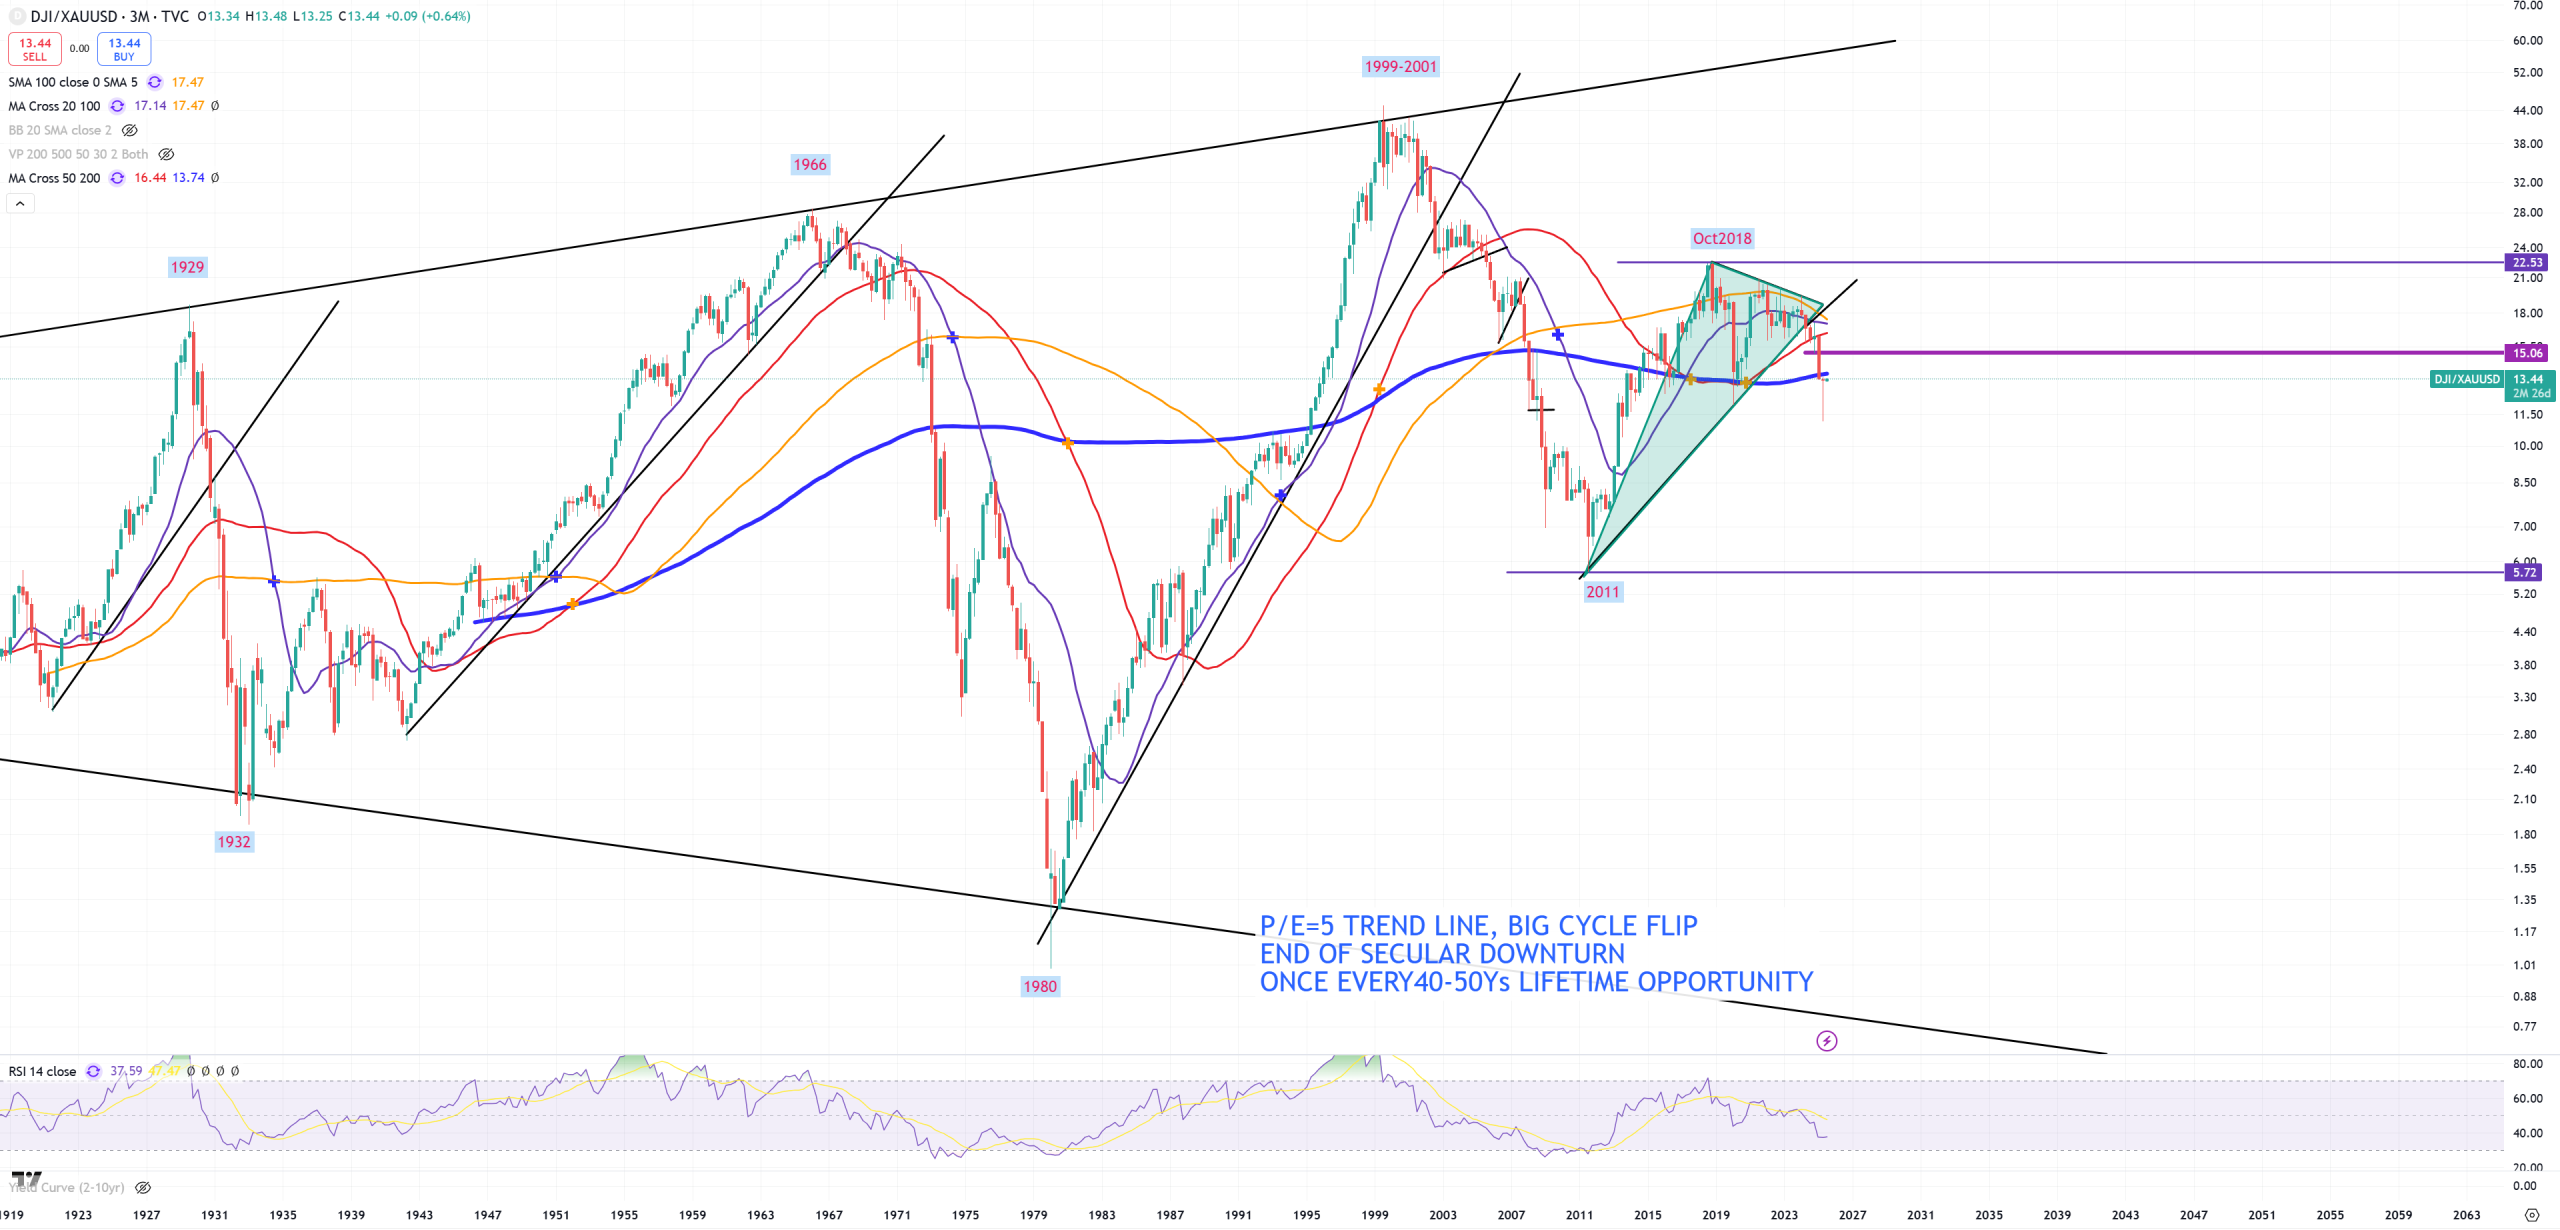
DJI/GOLD – as this ratio on (M)MA200 is broken, it’s still broken on (3M). (3M)MA200 was broken down 5 times : 1931, 1937, 1973, 2008, 4Q2024, as (M)MA200 is broken really big one, I’m not posting it here
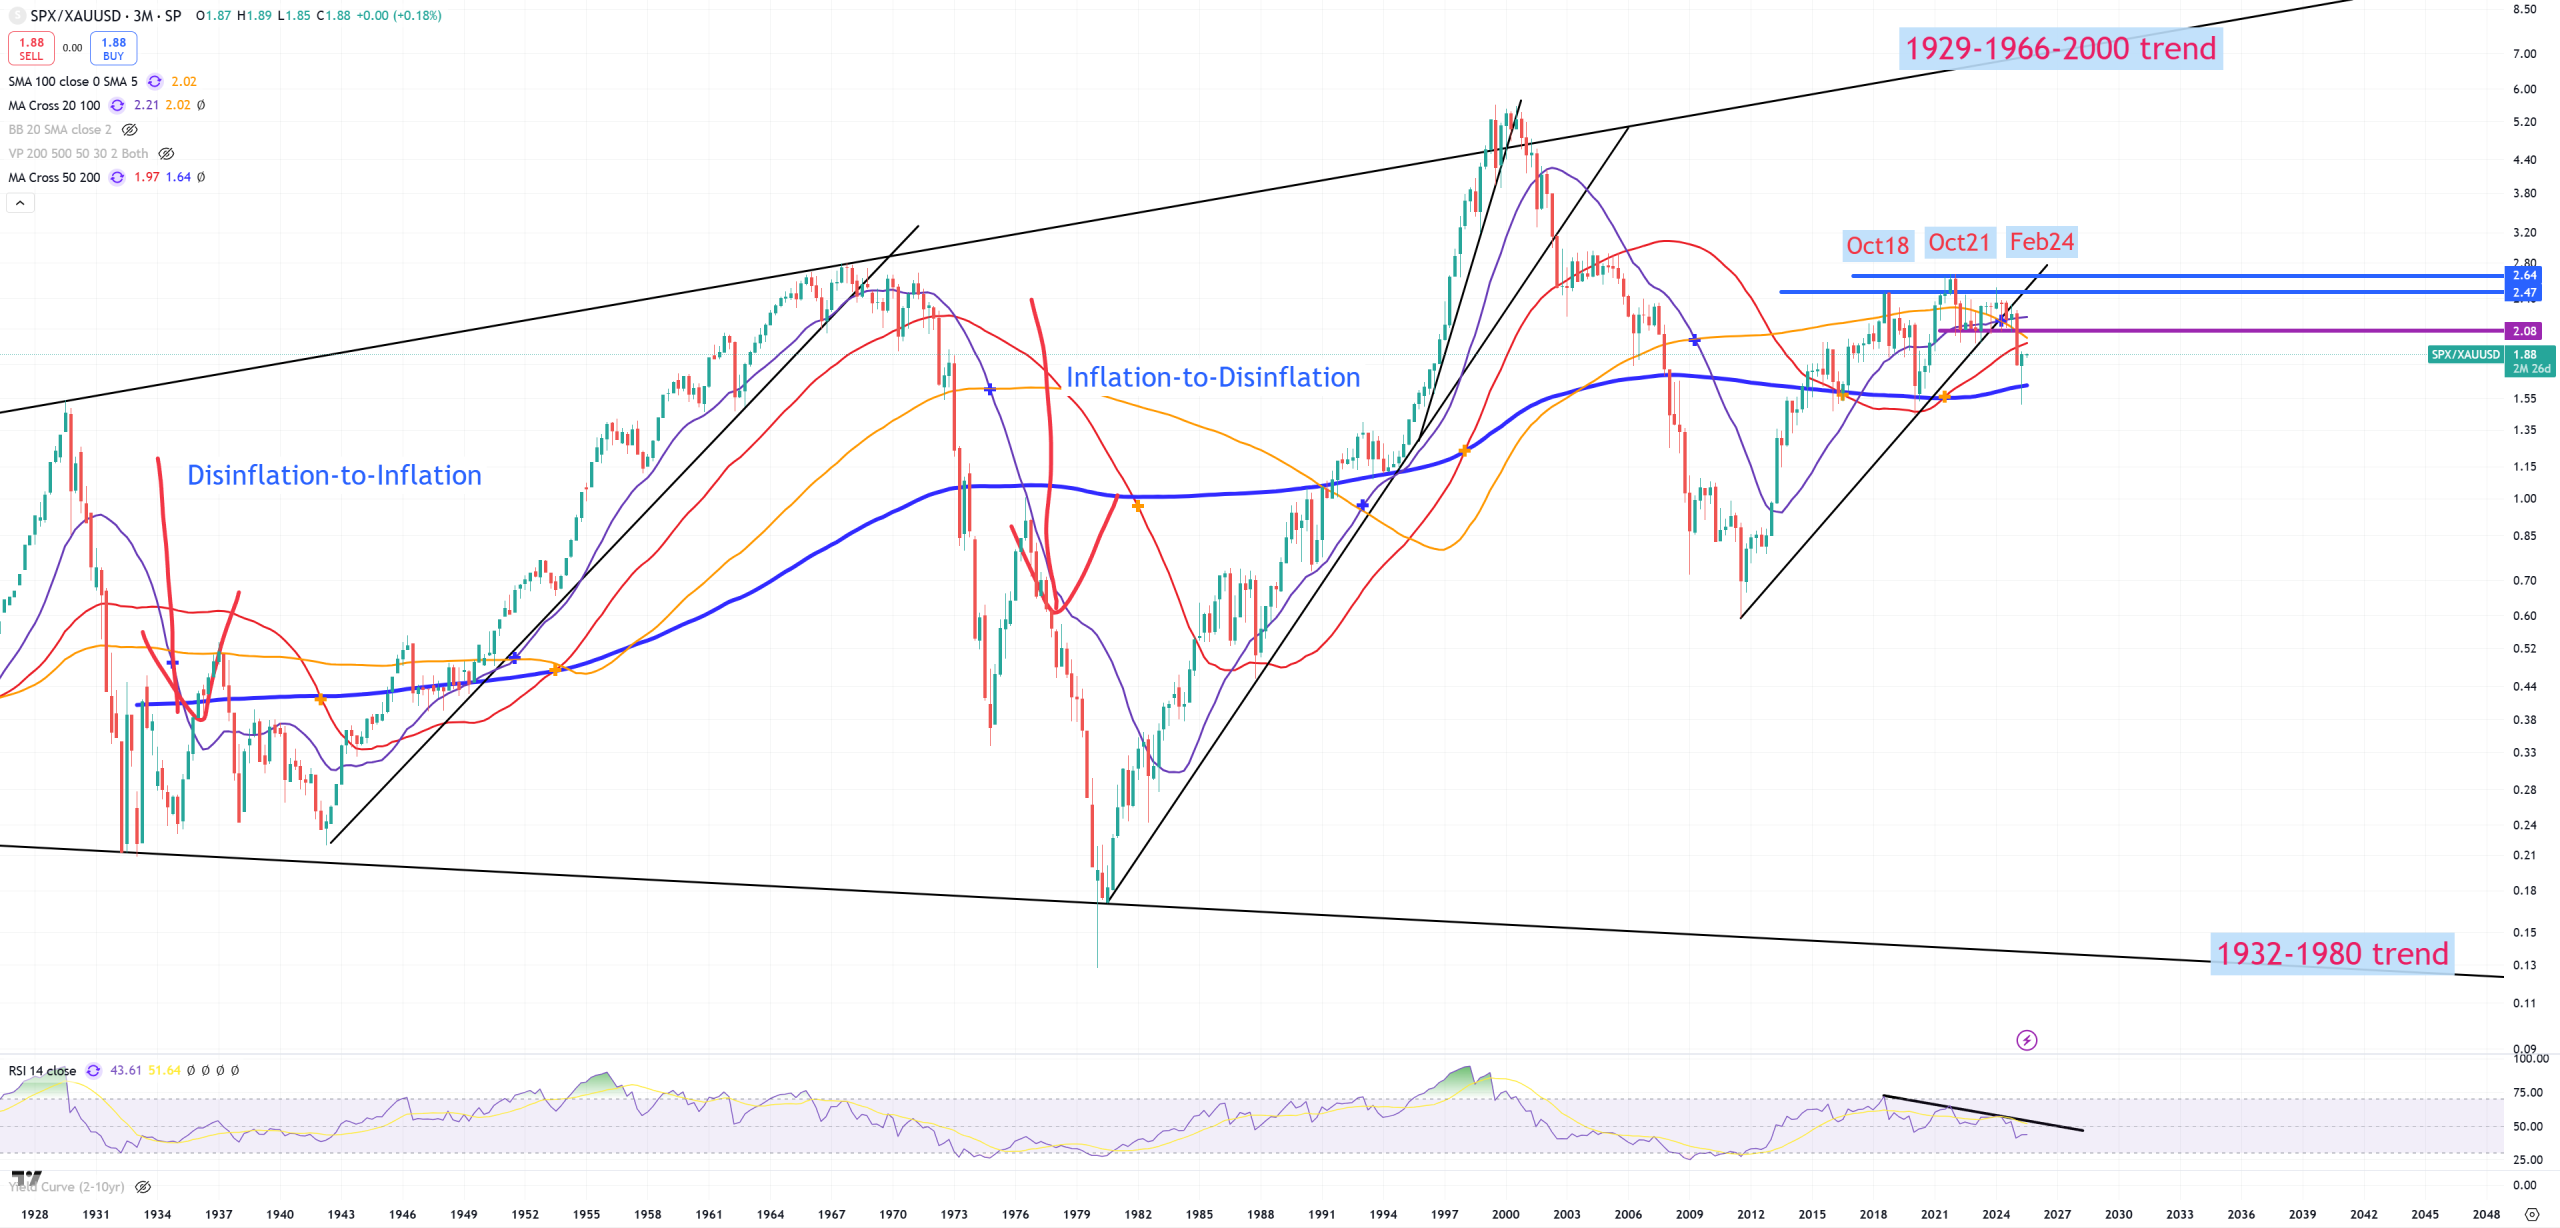
SPX/GOLD – I’m also posting (3M) view, because in this case (3M)MA200 and (M)MA200 are almost exactly in the same position. SPX is so far rescued
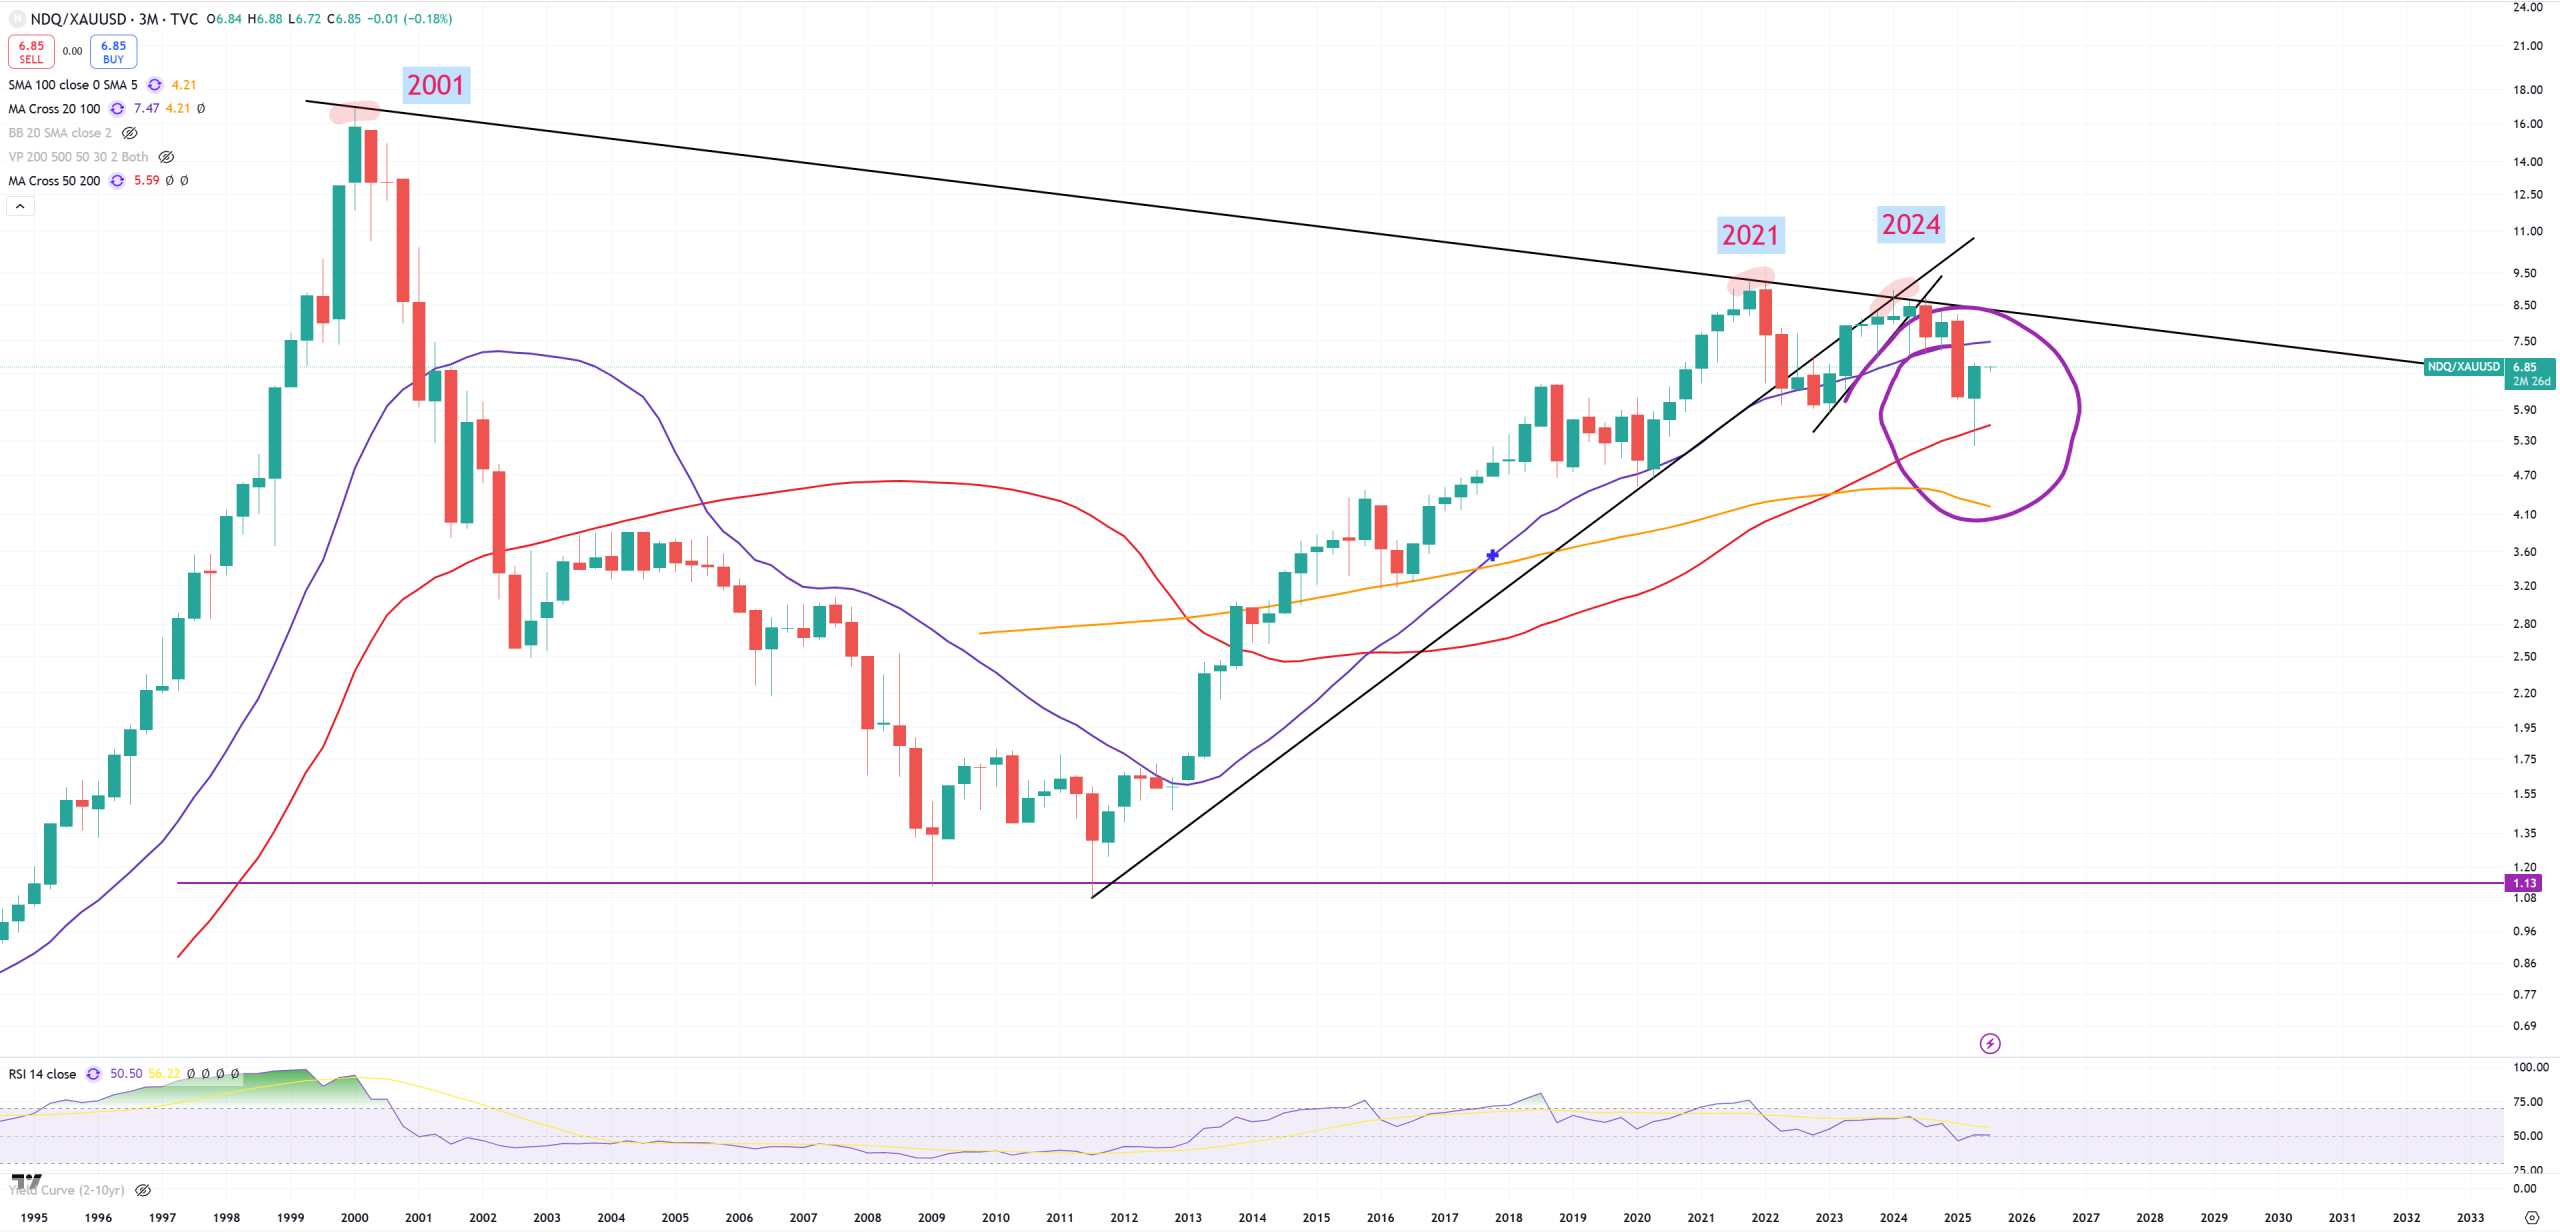
NDQ/GOLD – Because we saw previous ratios in (3M) view, here comes 3M view too. Both NDQ and SPX are “safe” but DJI is the weakest index.
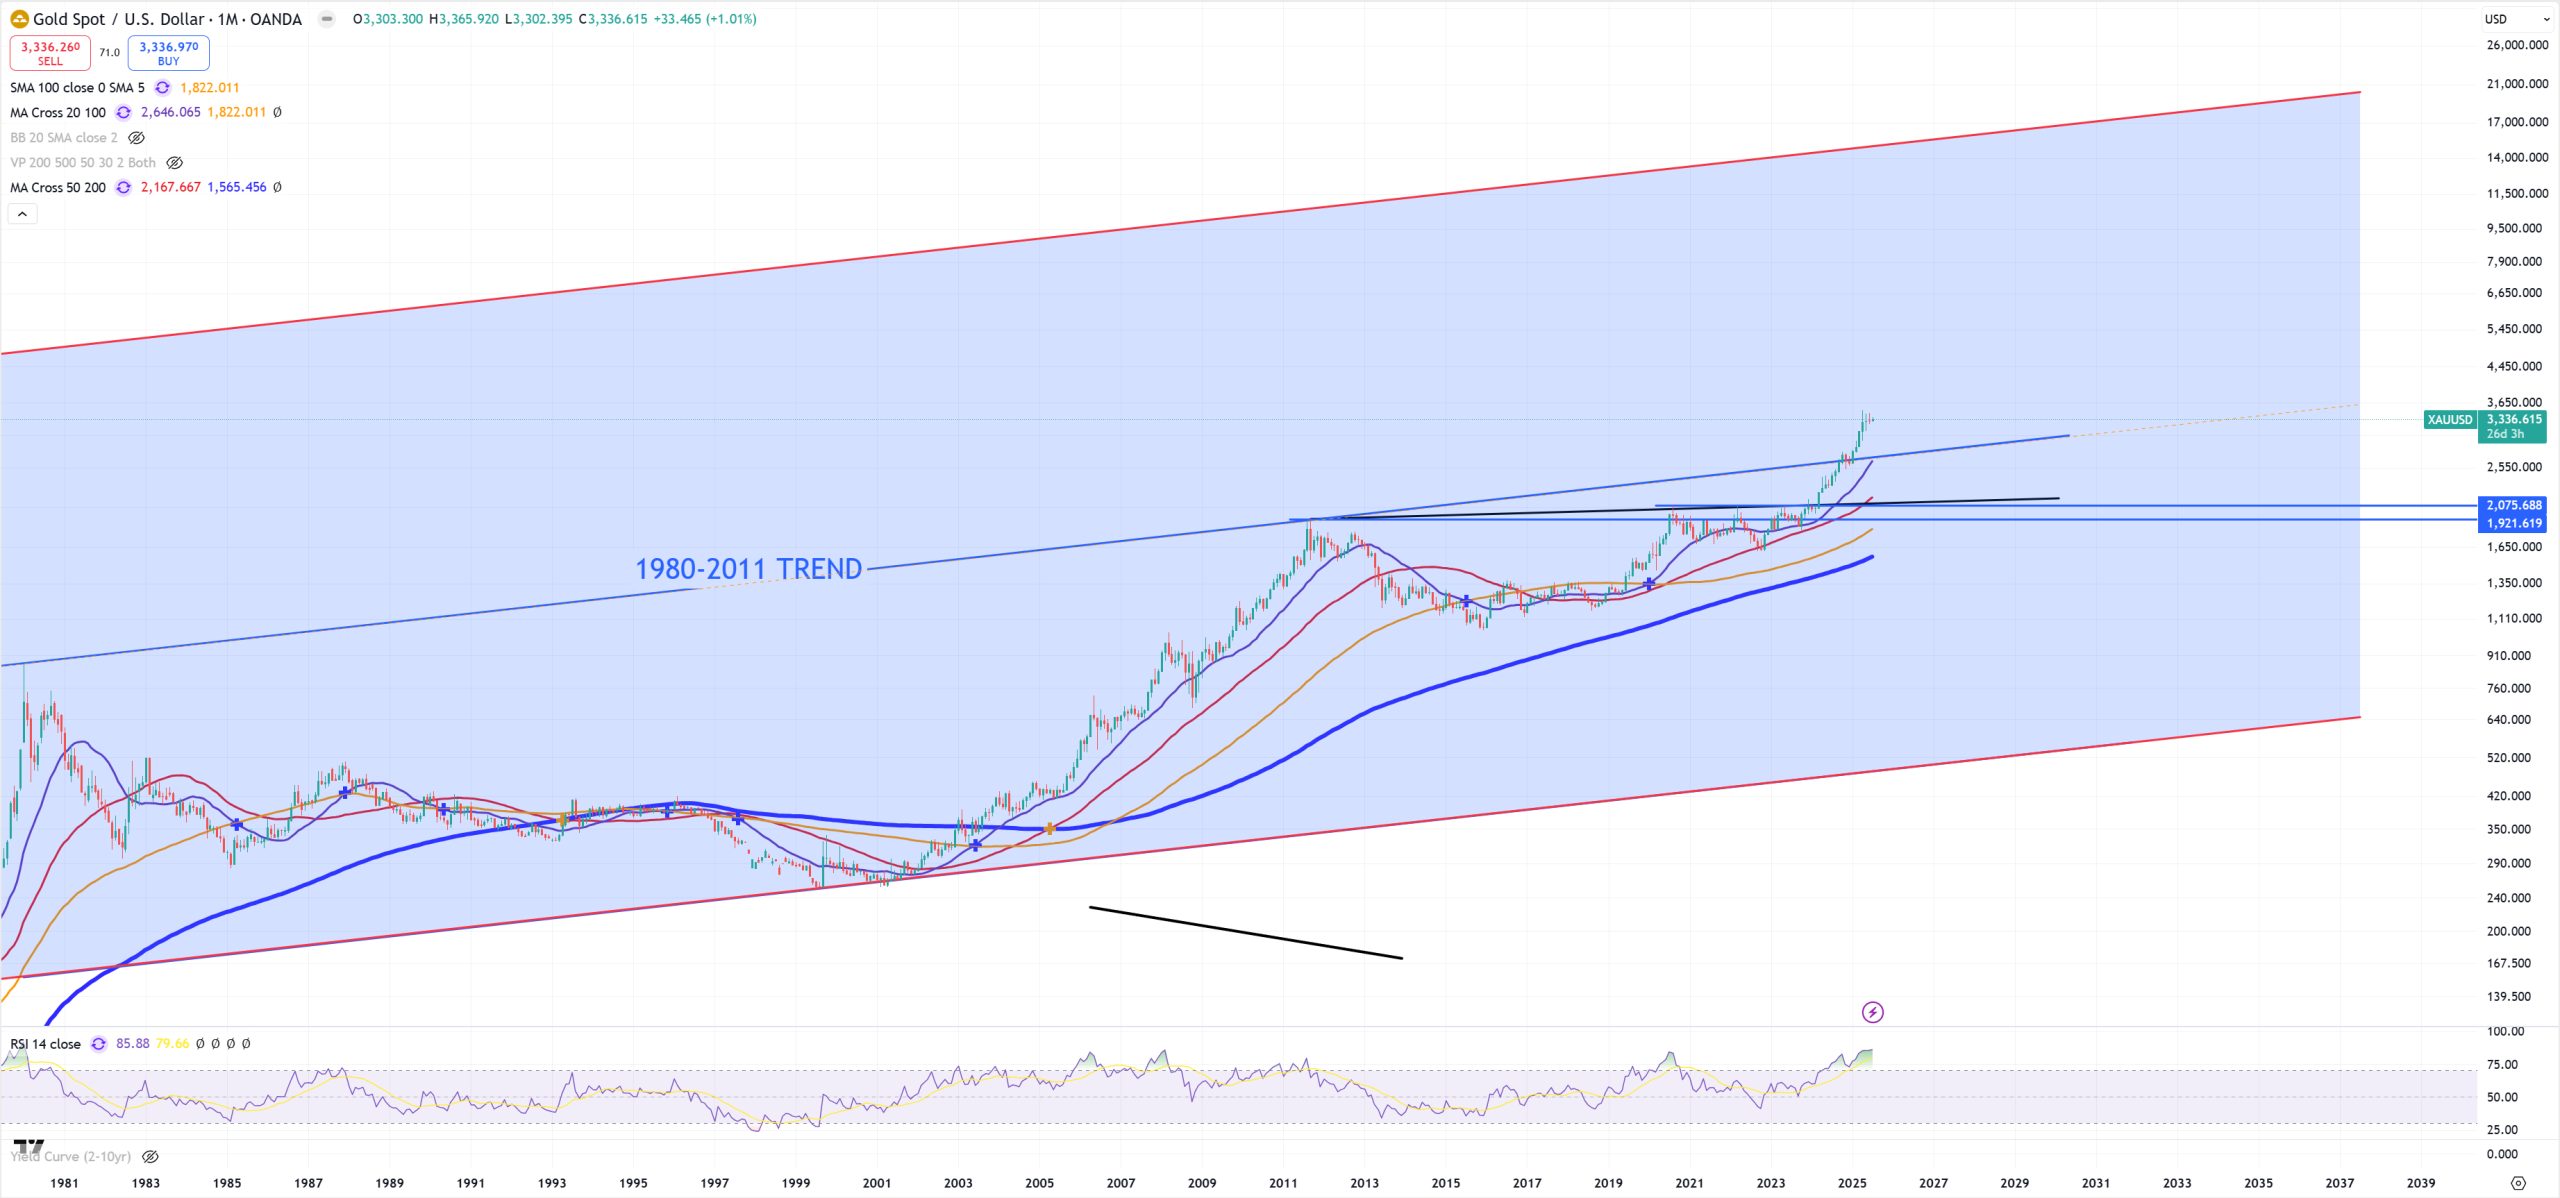
XAUUSD – GOLD – At some point of time this 1980-2011 trend should be retested. If we place a symmetrical channel, the upper level is 16000$, but don’t treat this 16000$ level so far seriously.
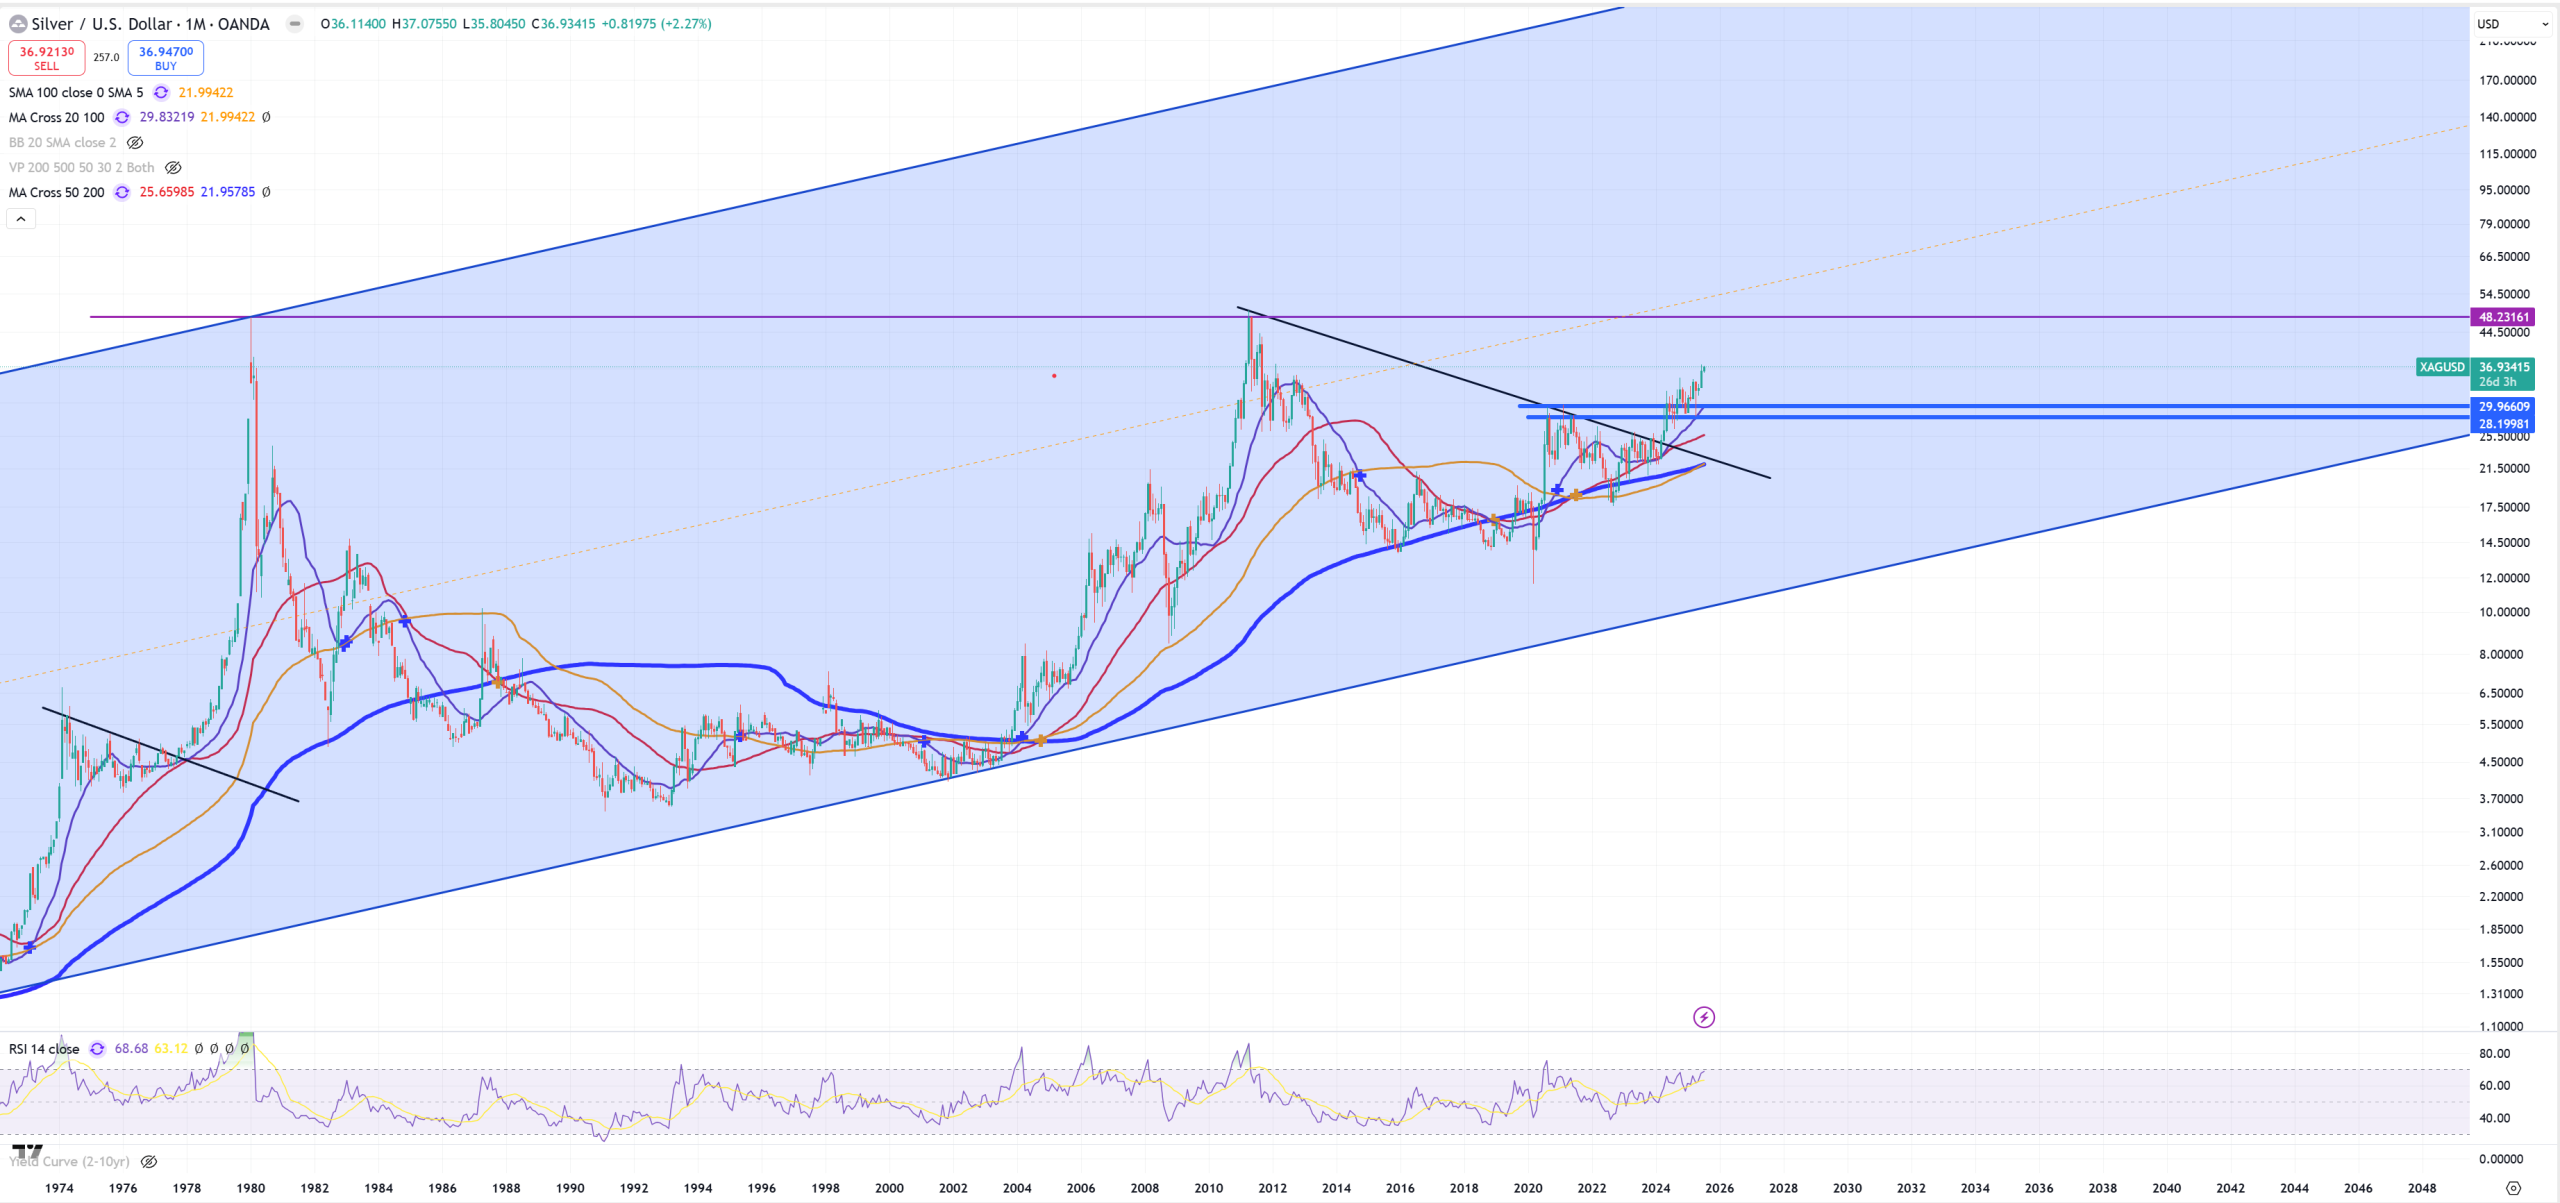
XAGUSD – SILVER – fun will start once this 1980 peak will be broken. Breaking 48$ level will be important.
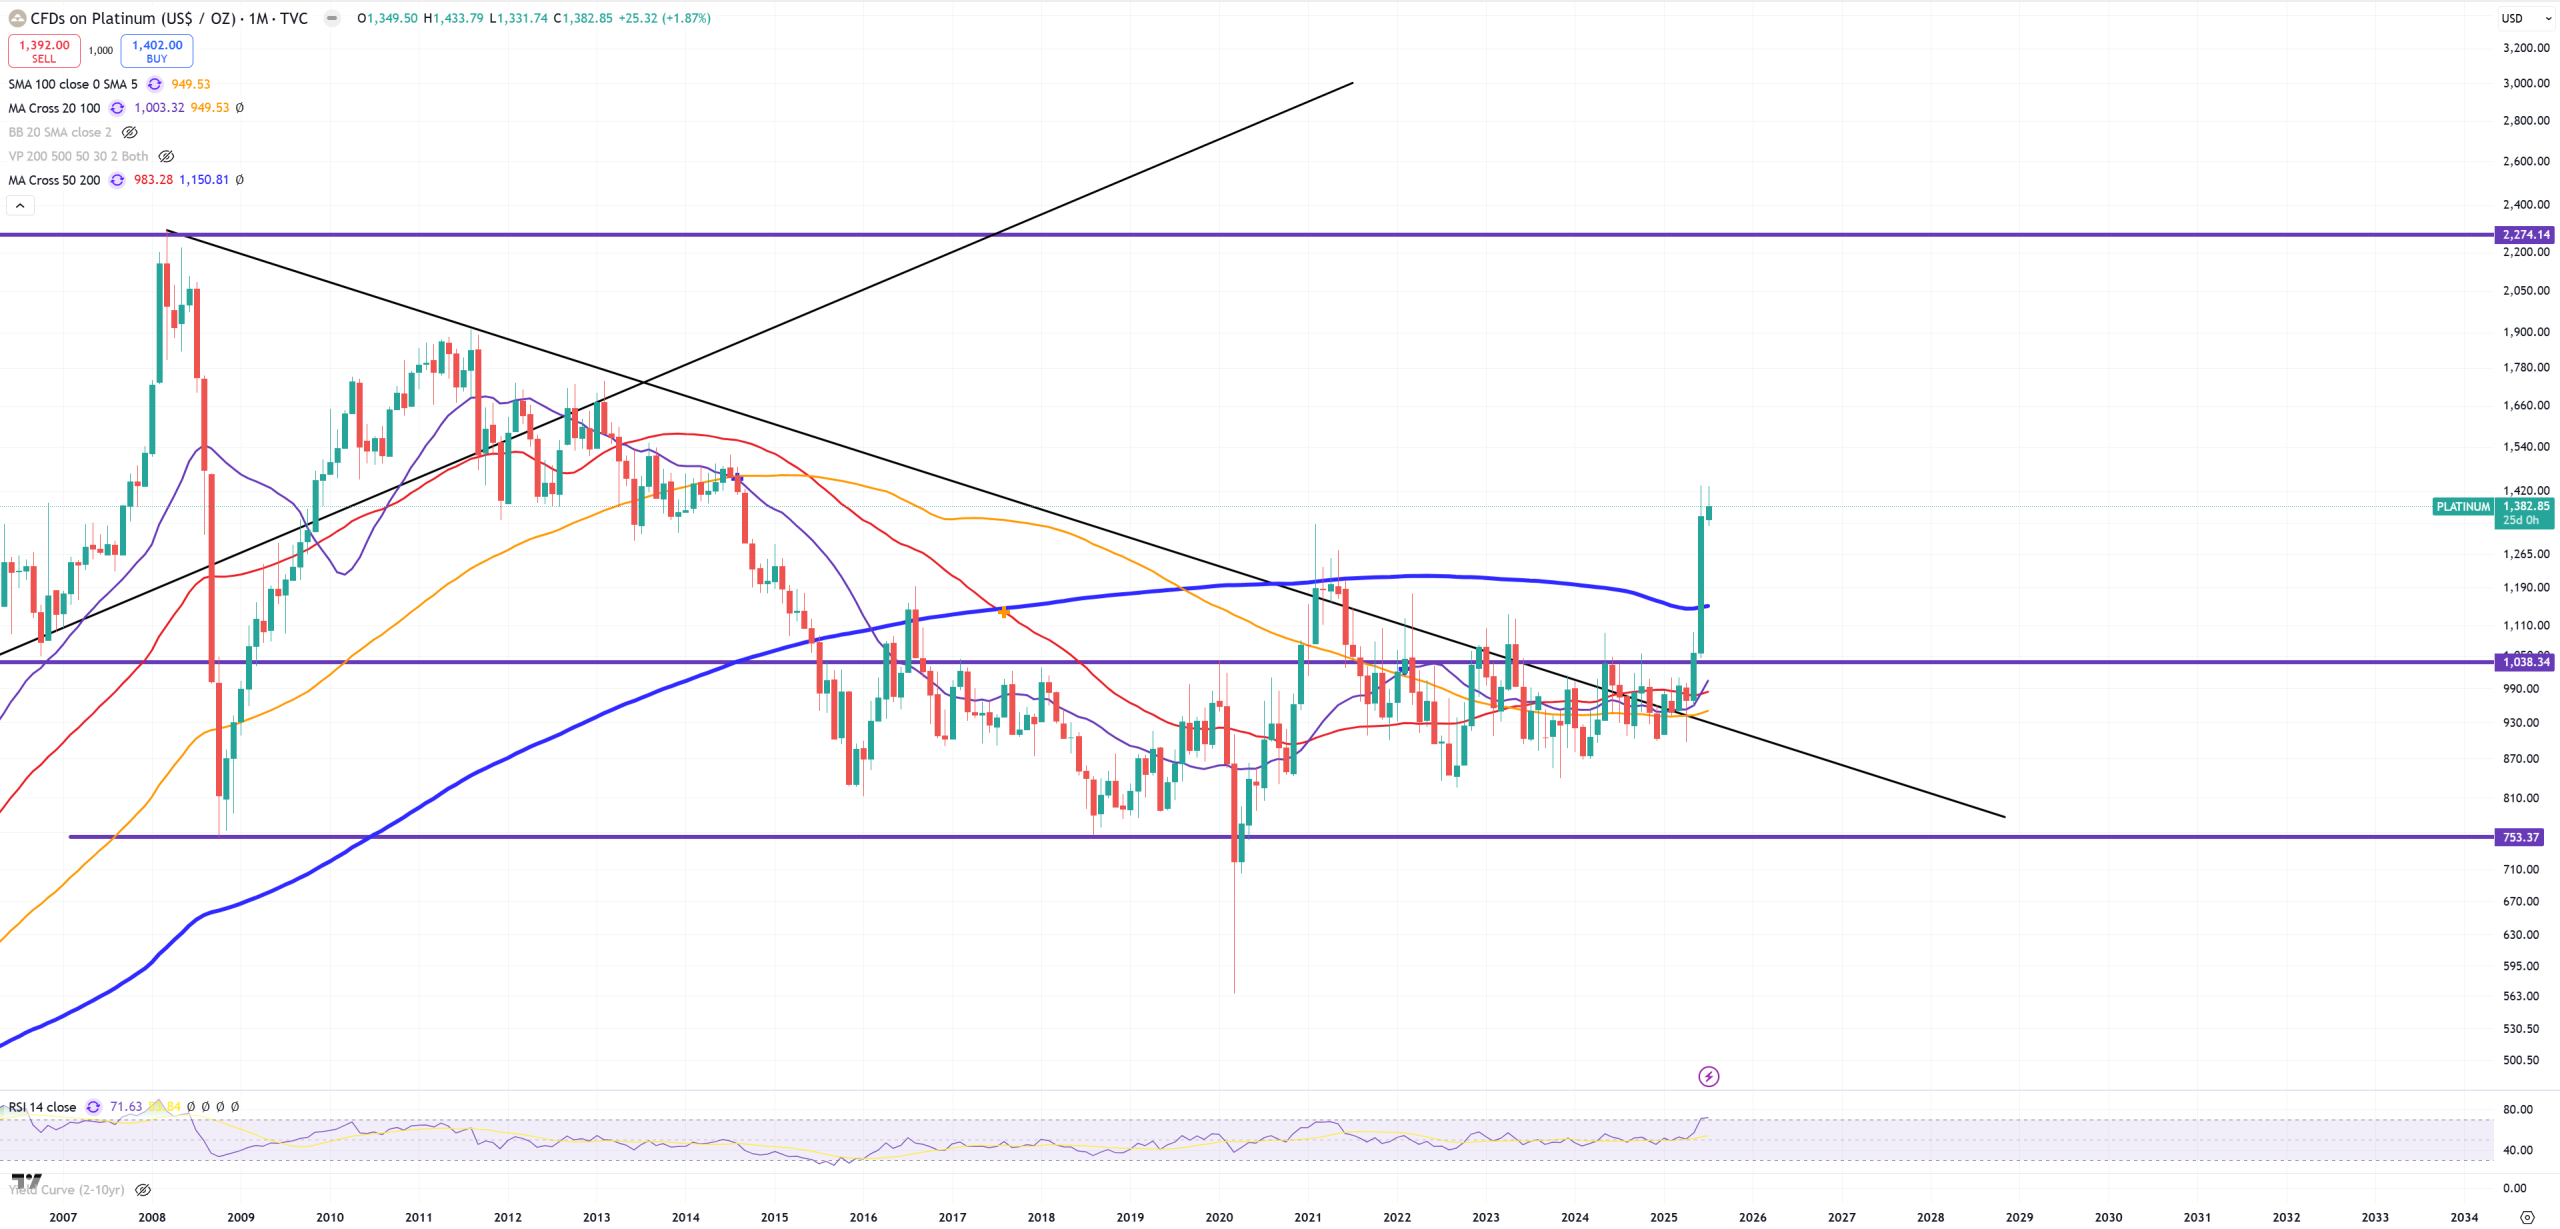
PLATINIUM – 2008 down-trend broken. That’s logical seeing GOLD & SILVER
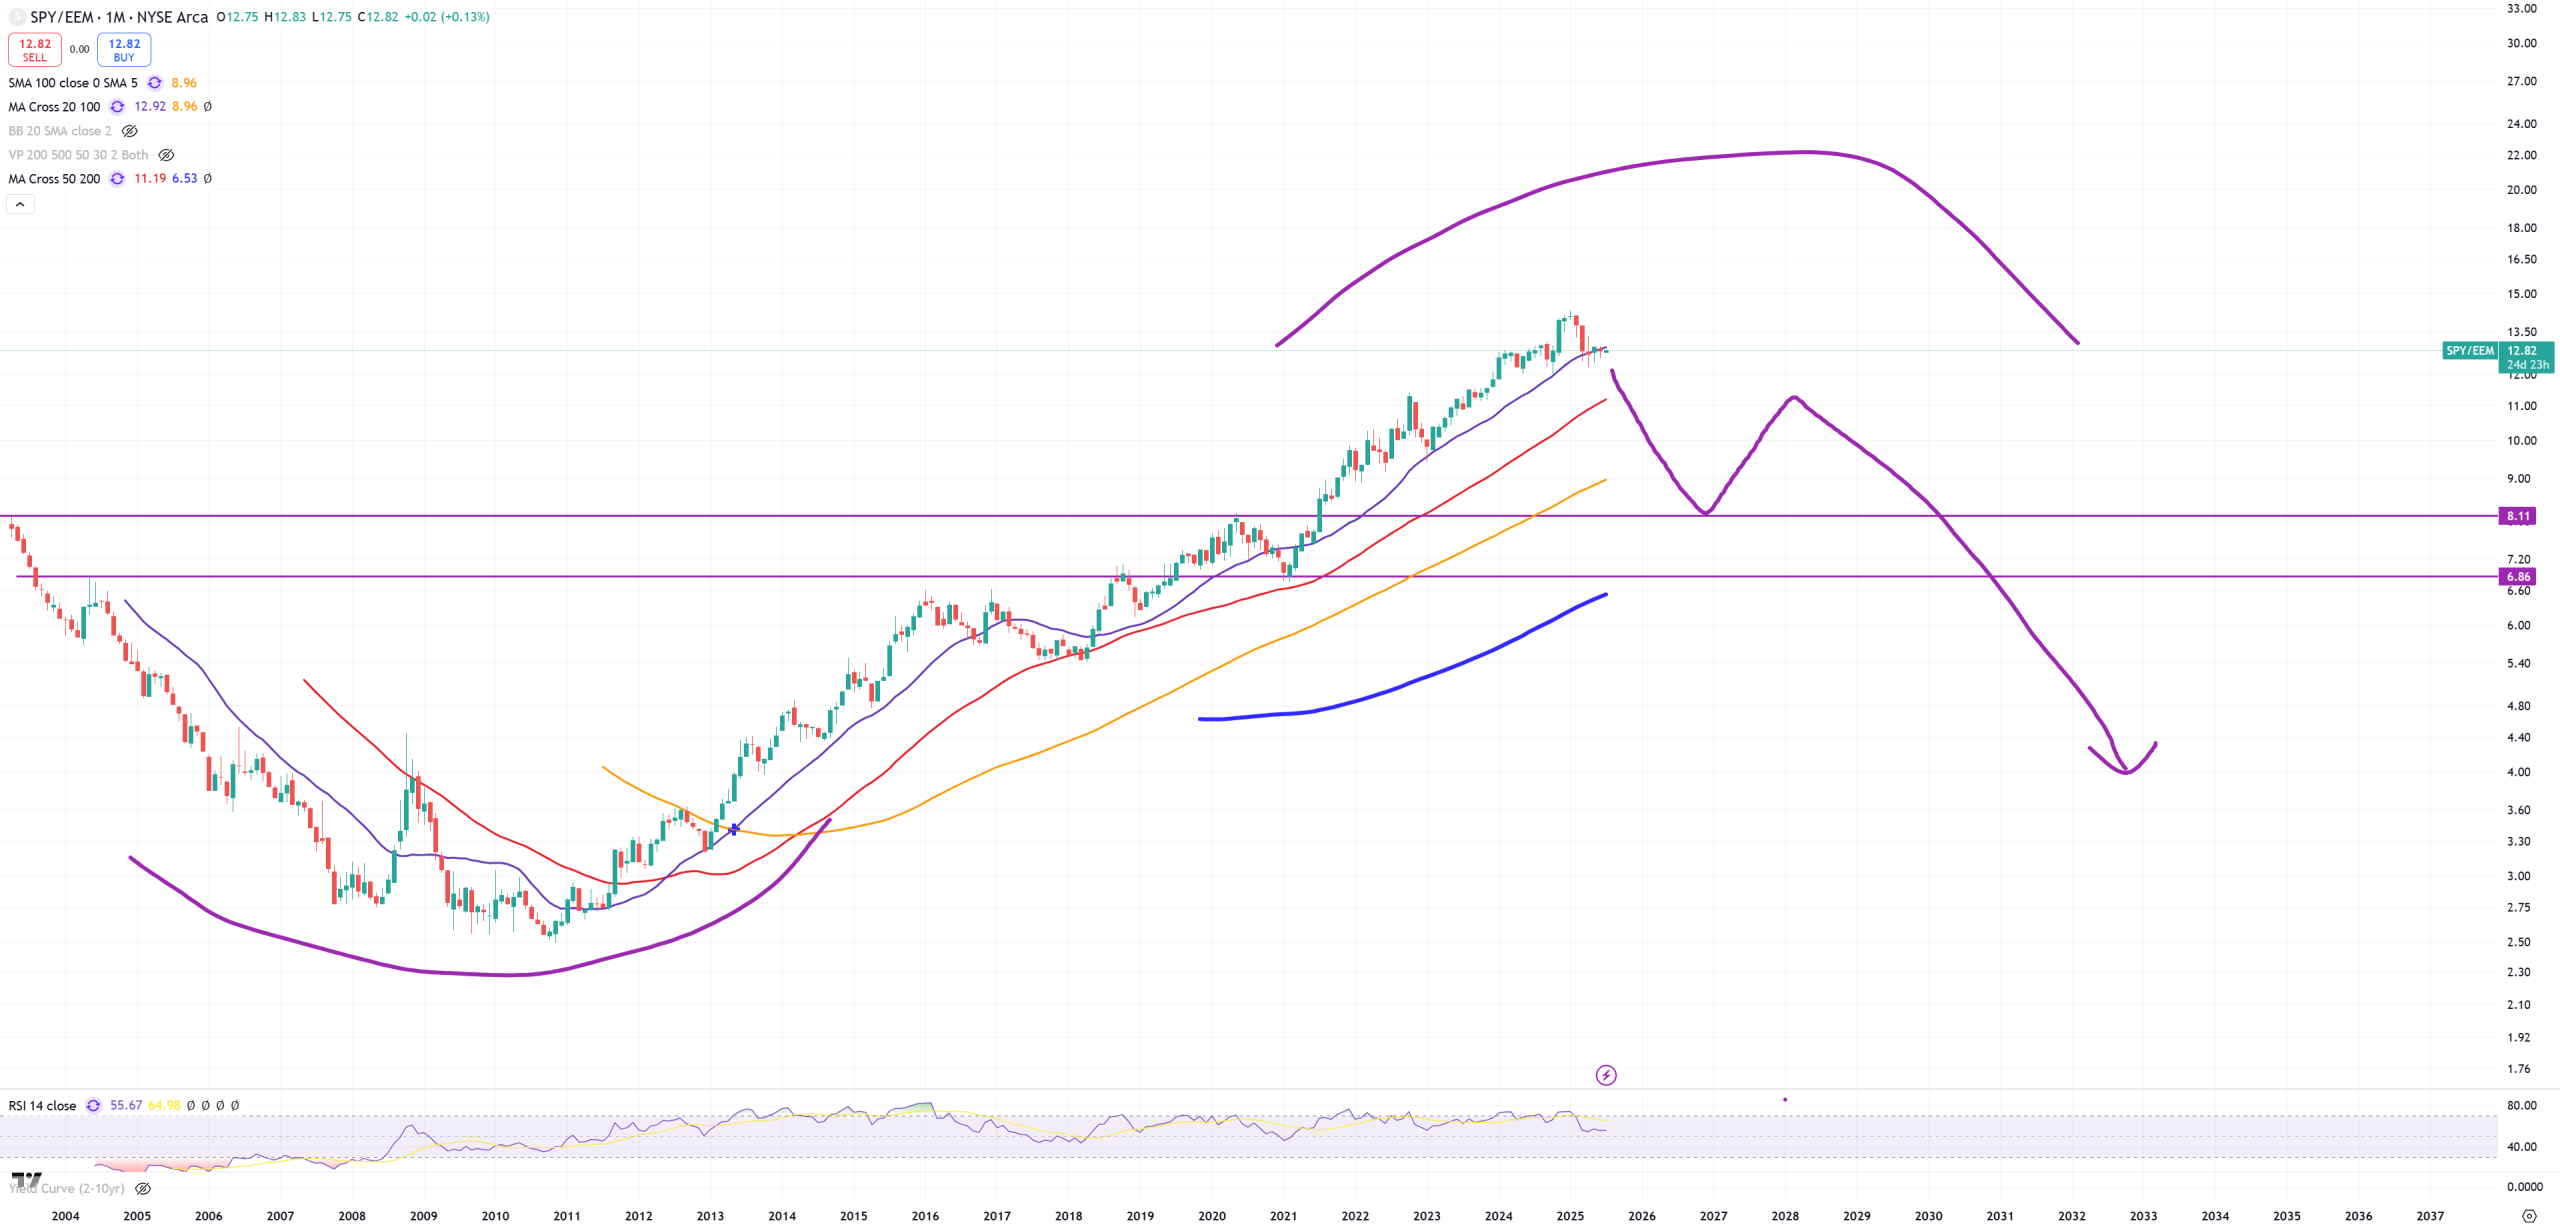
SPY/EEM – let’s see if it starts to turn down
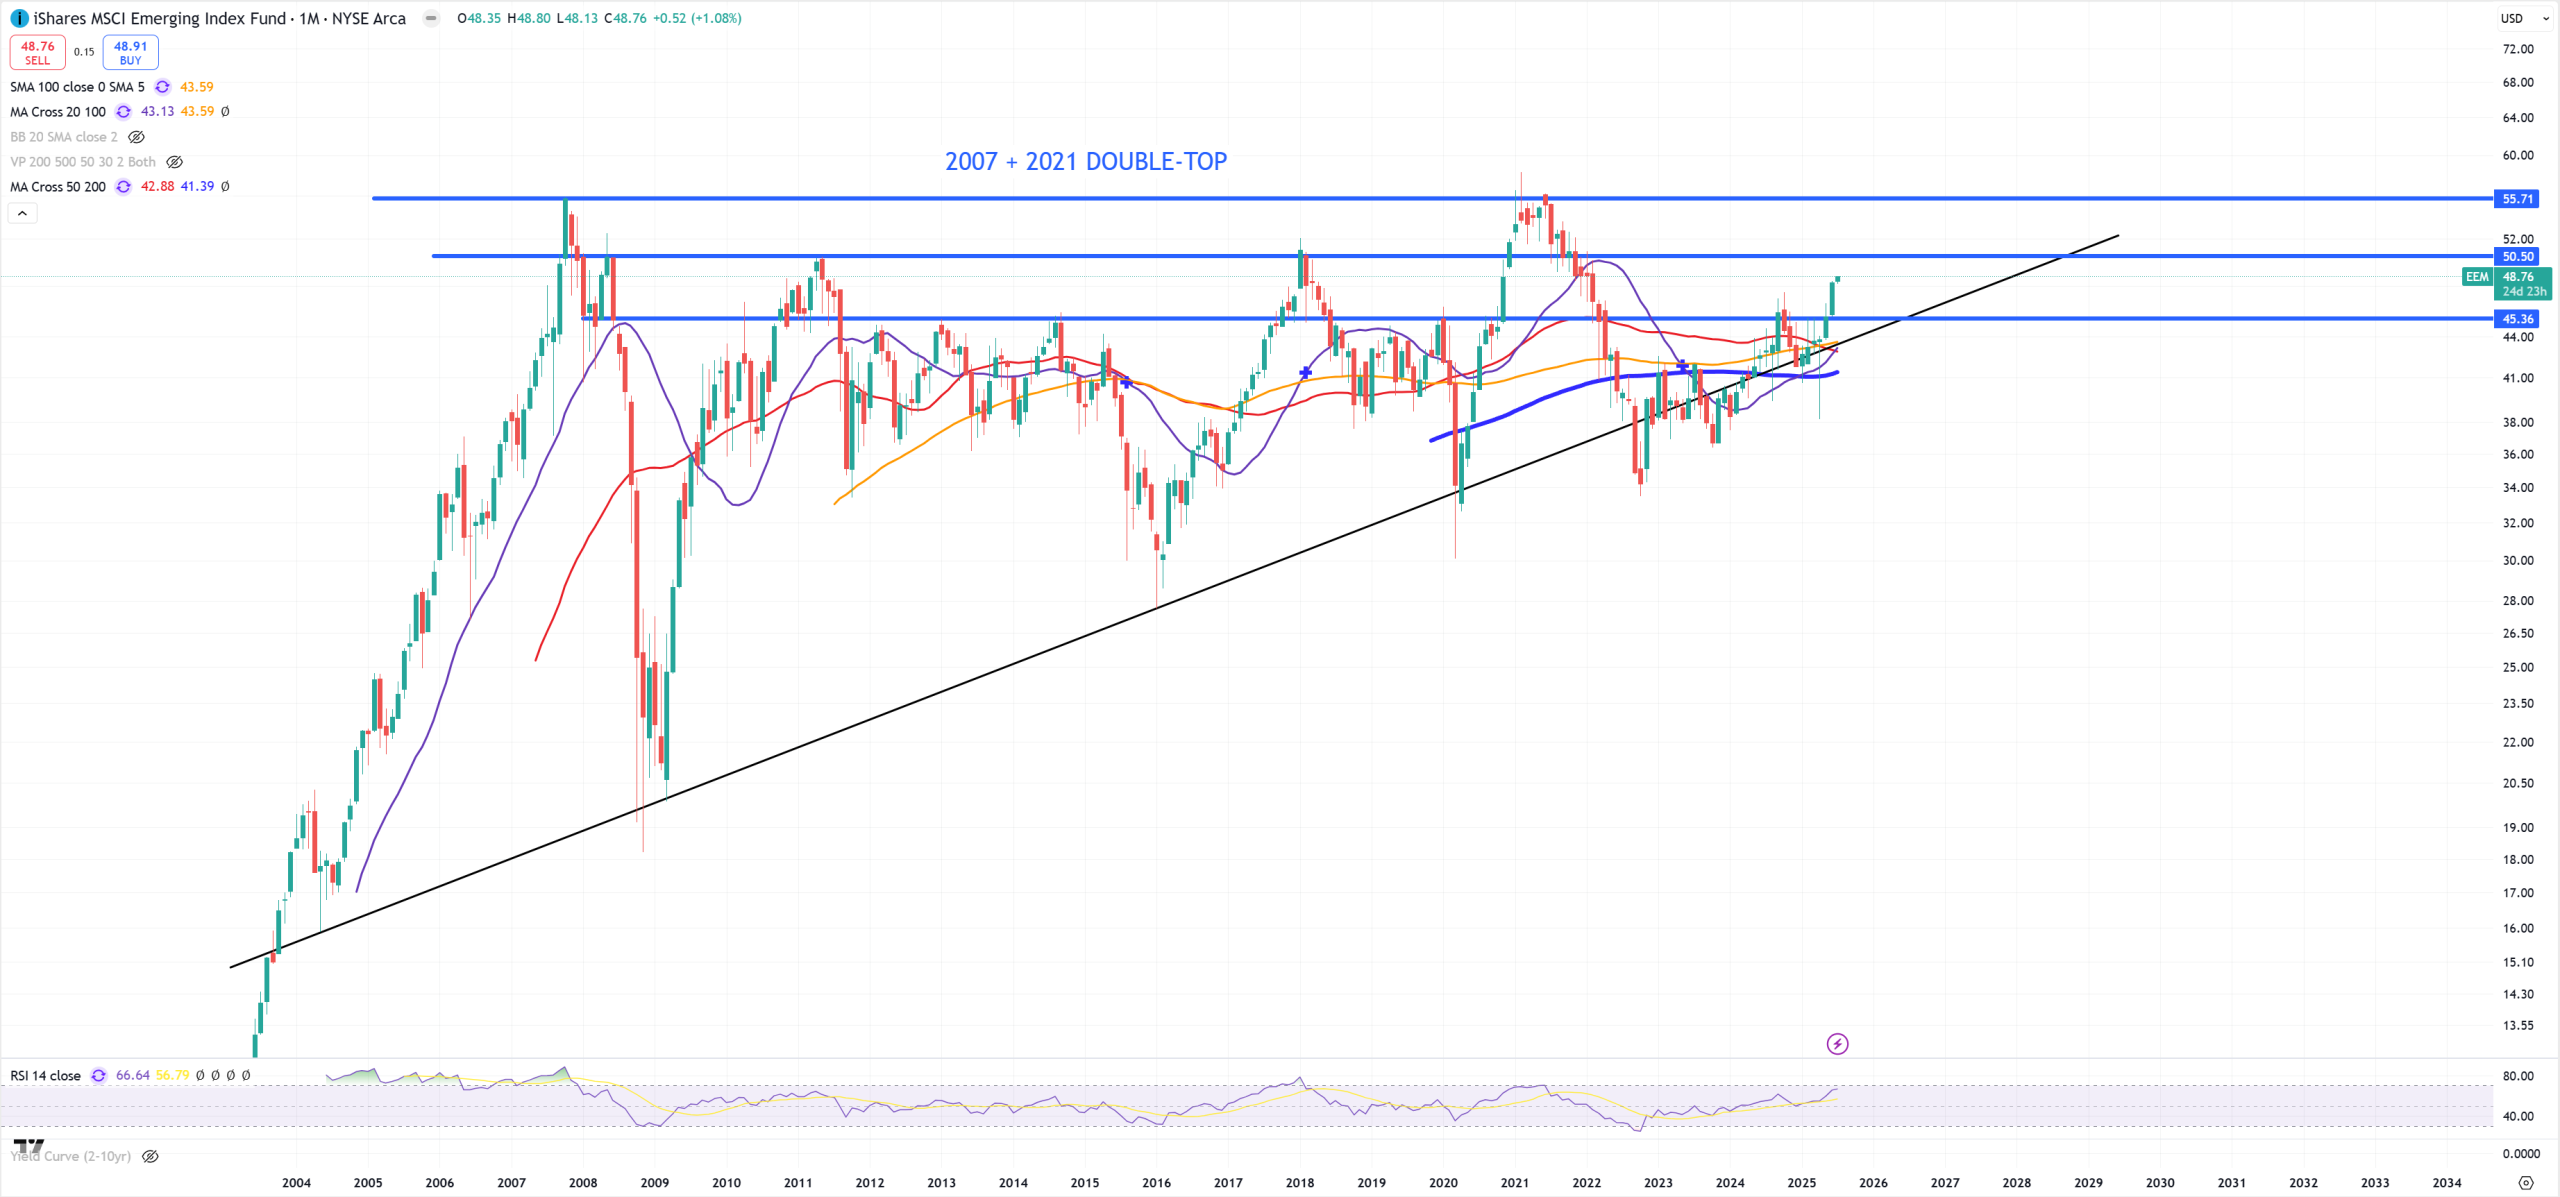
EEM – Emerging Markets – sliding on the key trend
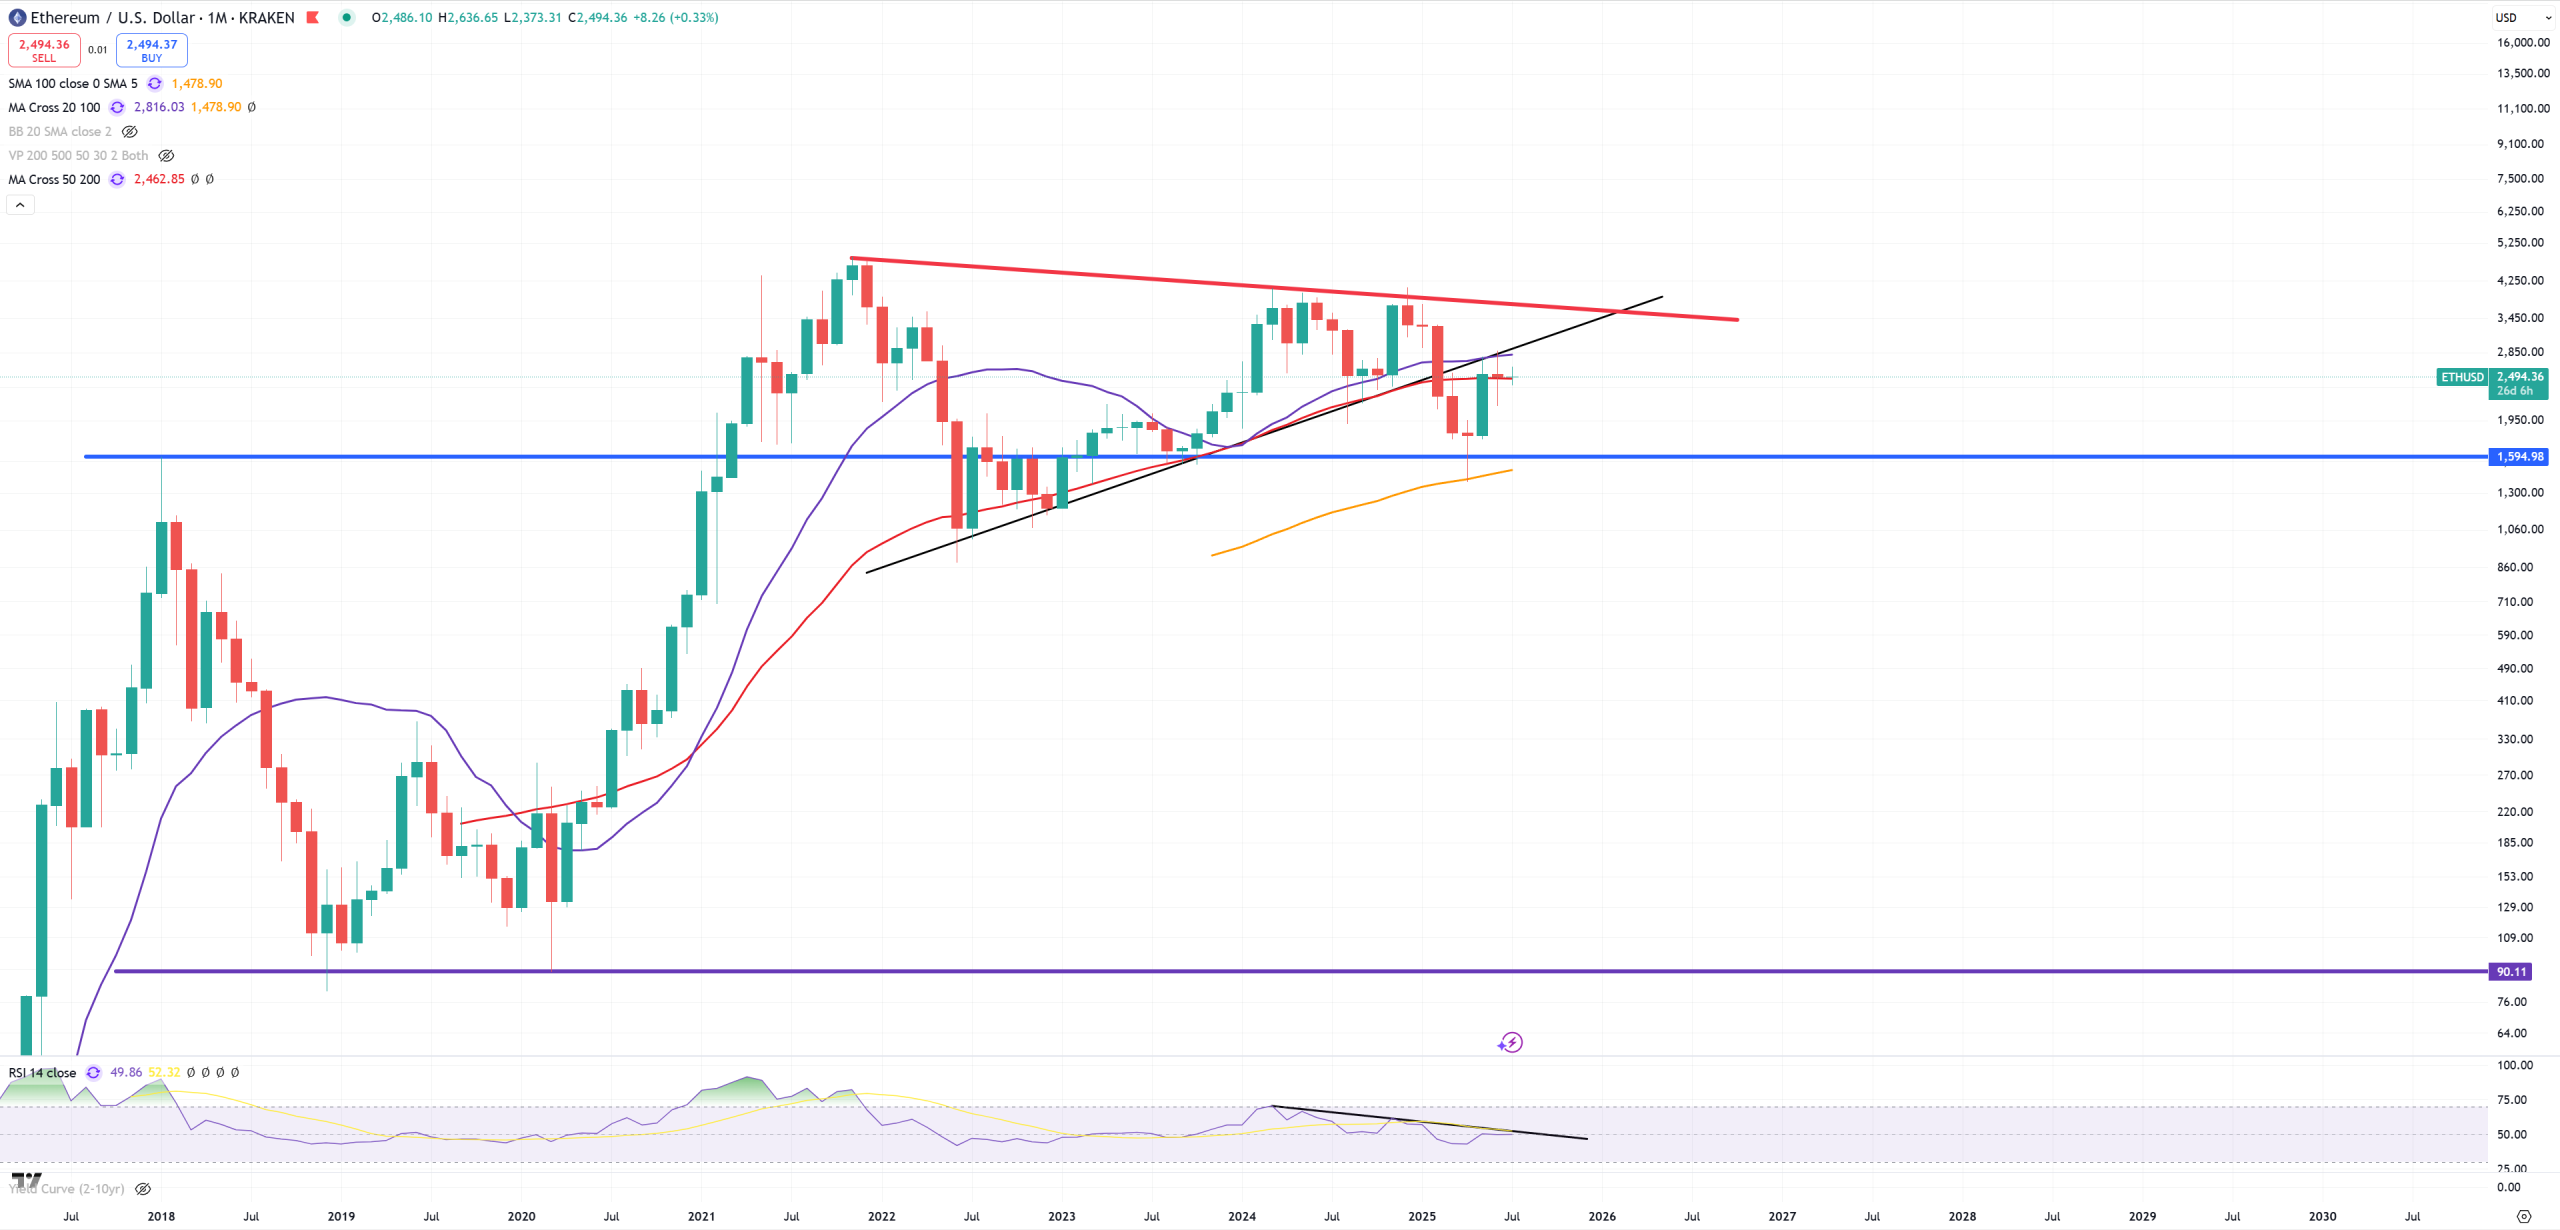
ETH – market fights for retest + (M)MA50. 1600$ if won’t be defended there’s no other support IMO until 90$. June was closed above (M)MA50.
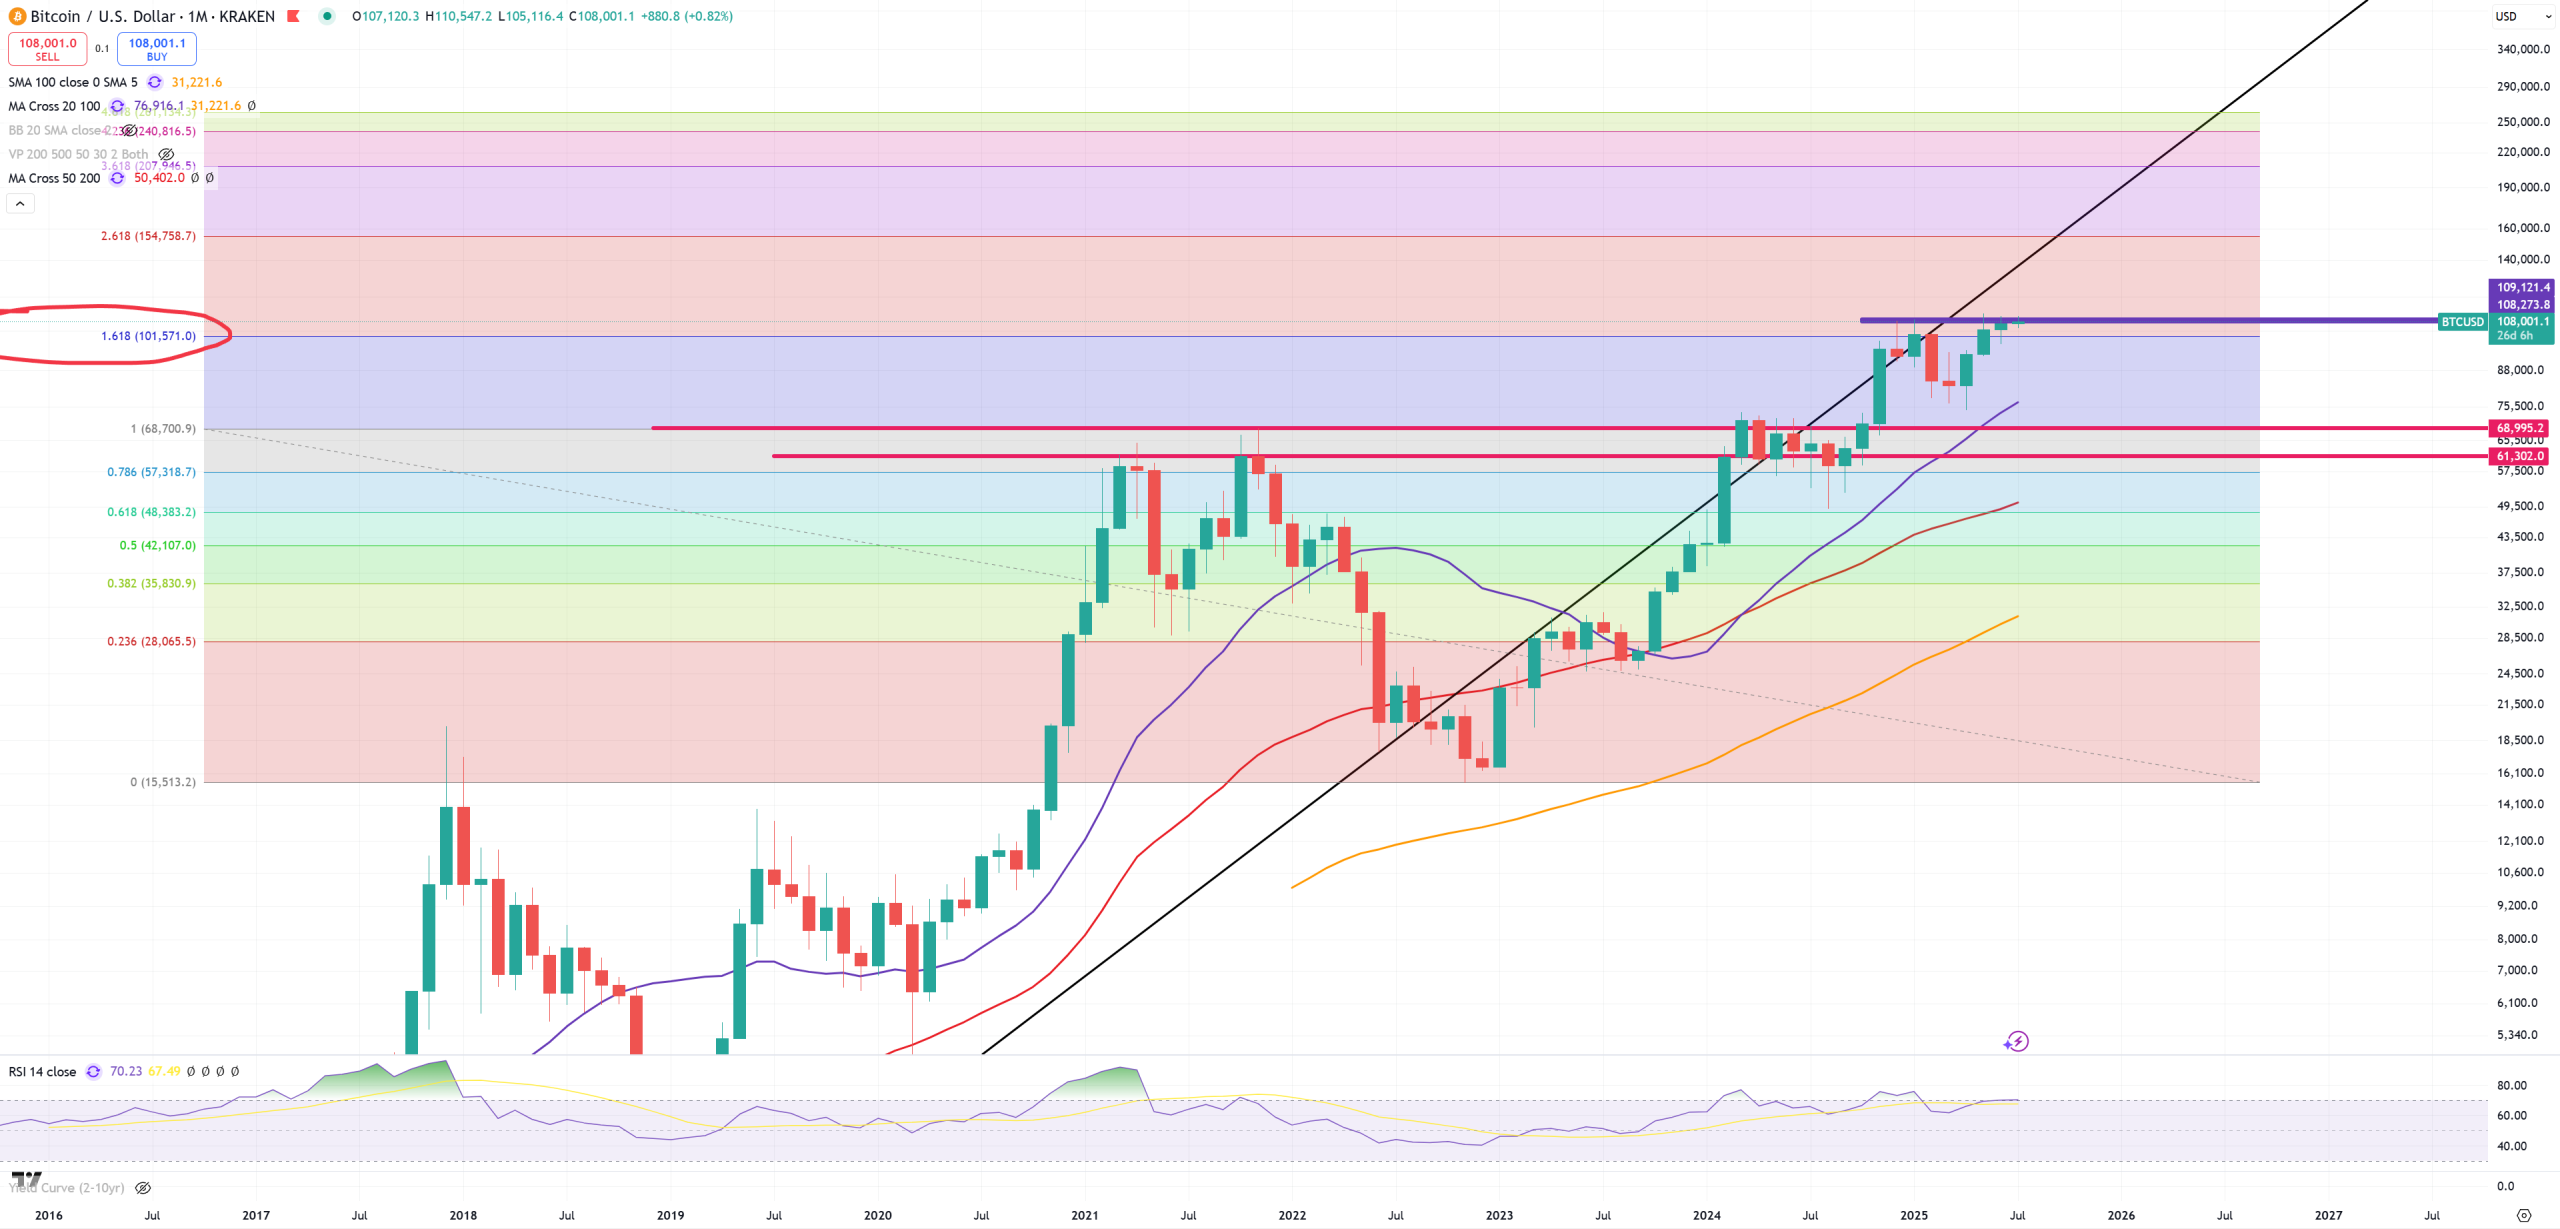
BTC – This level around 110k$ is really important
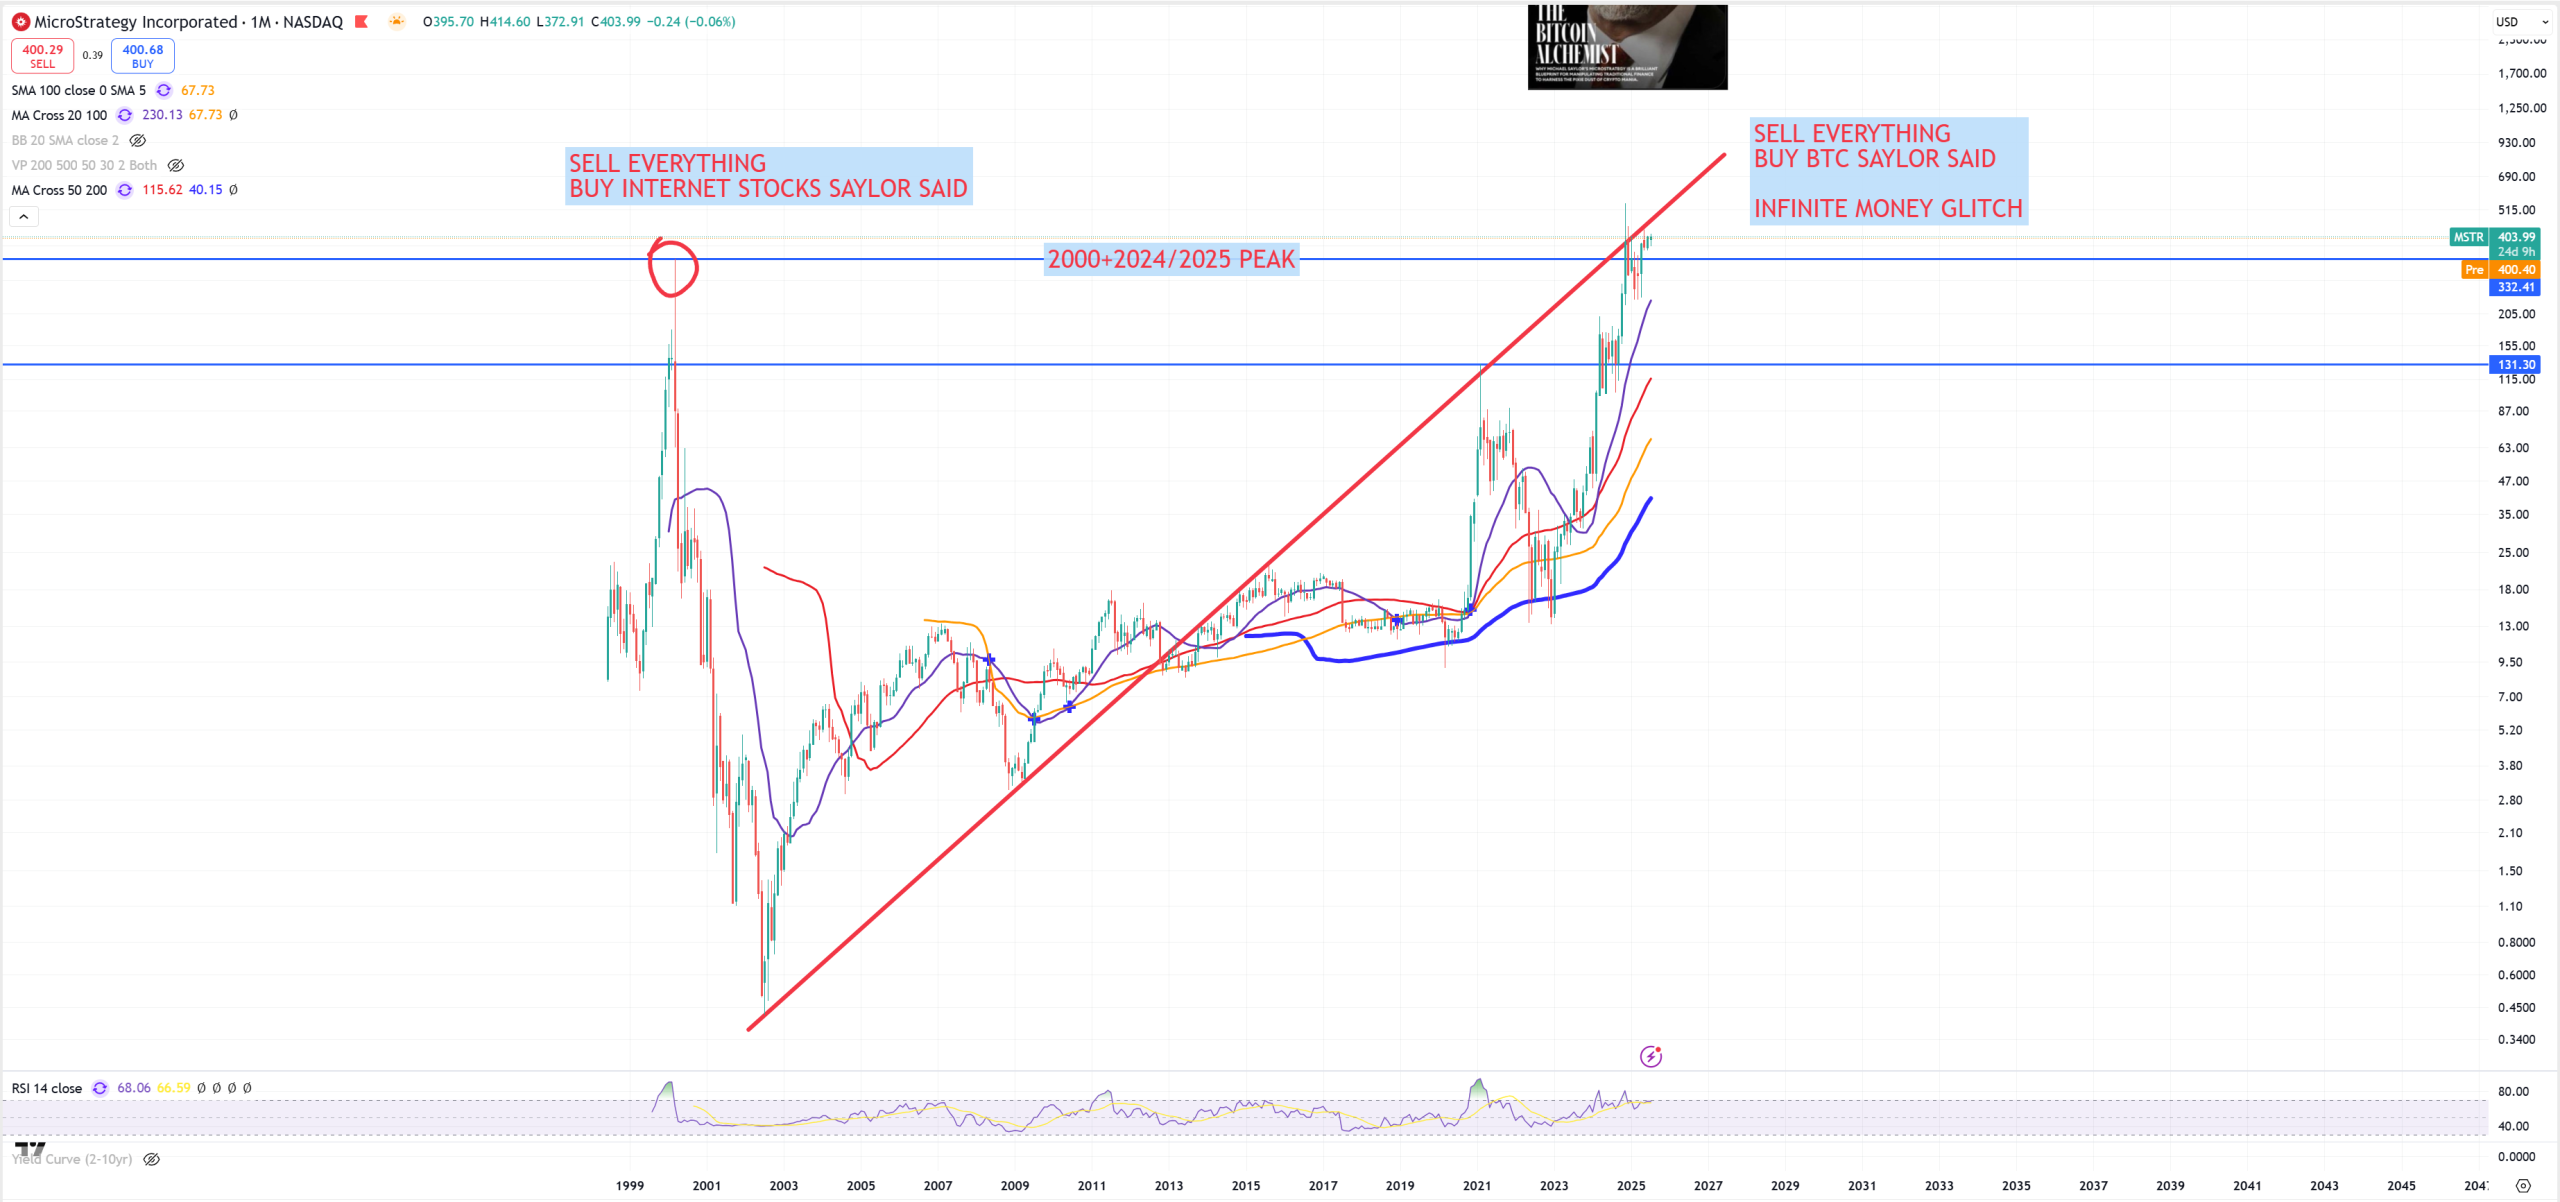
MSTR – key BTC machine – I hope we’ll find out soon if this 2000-2024/2025 peak is still valid.
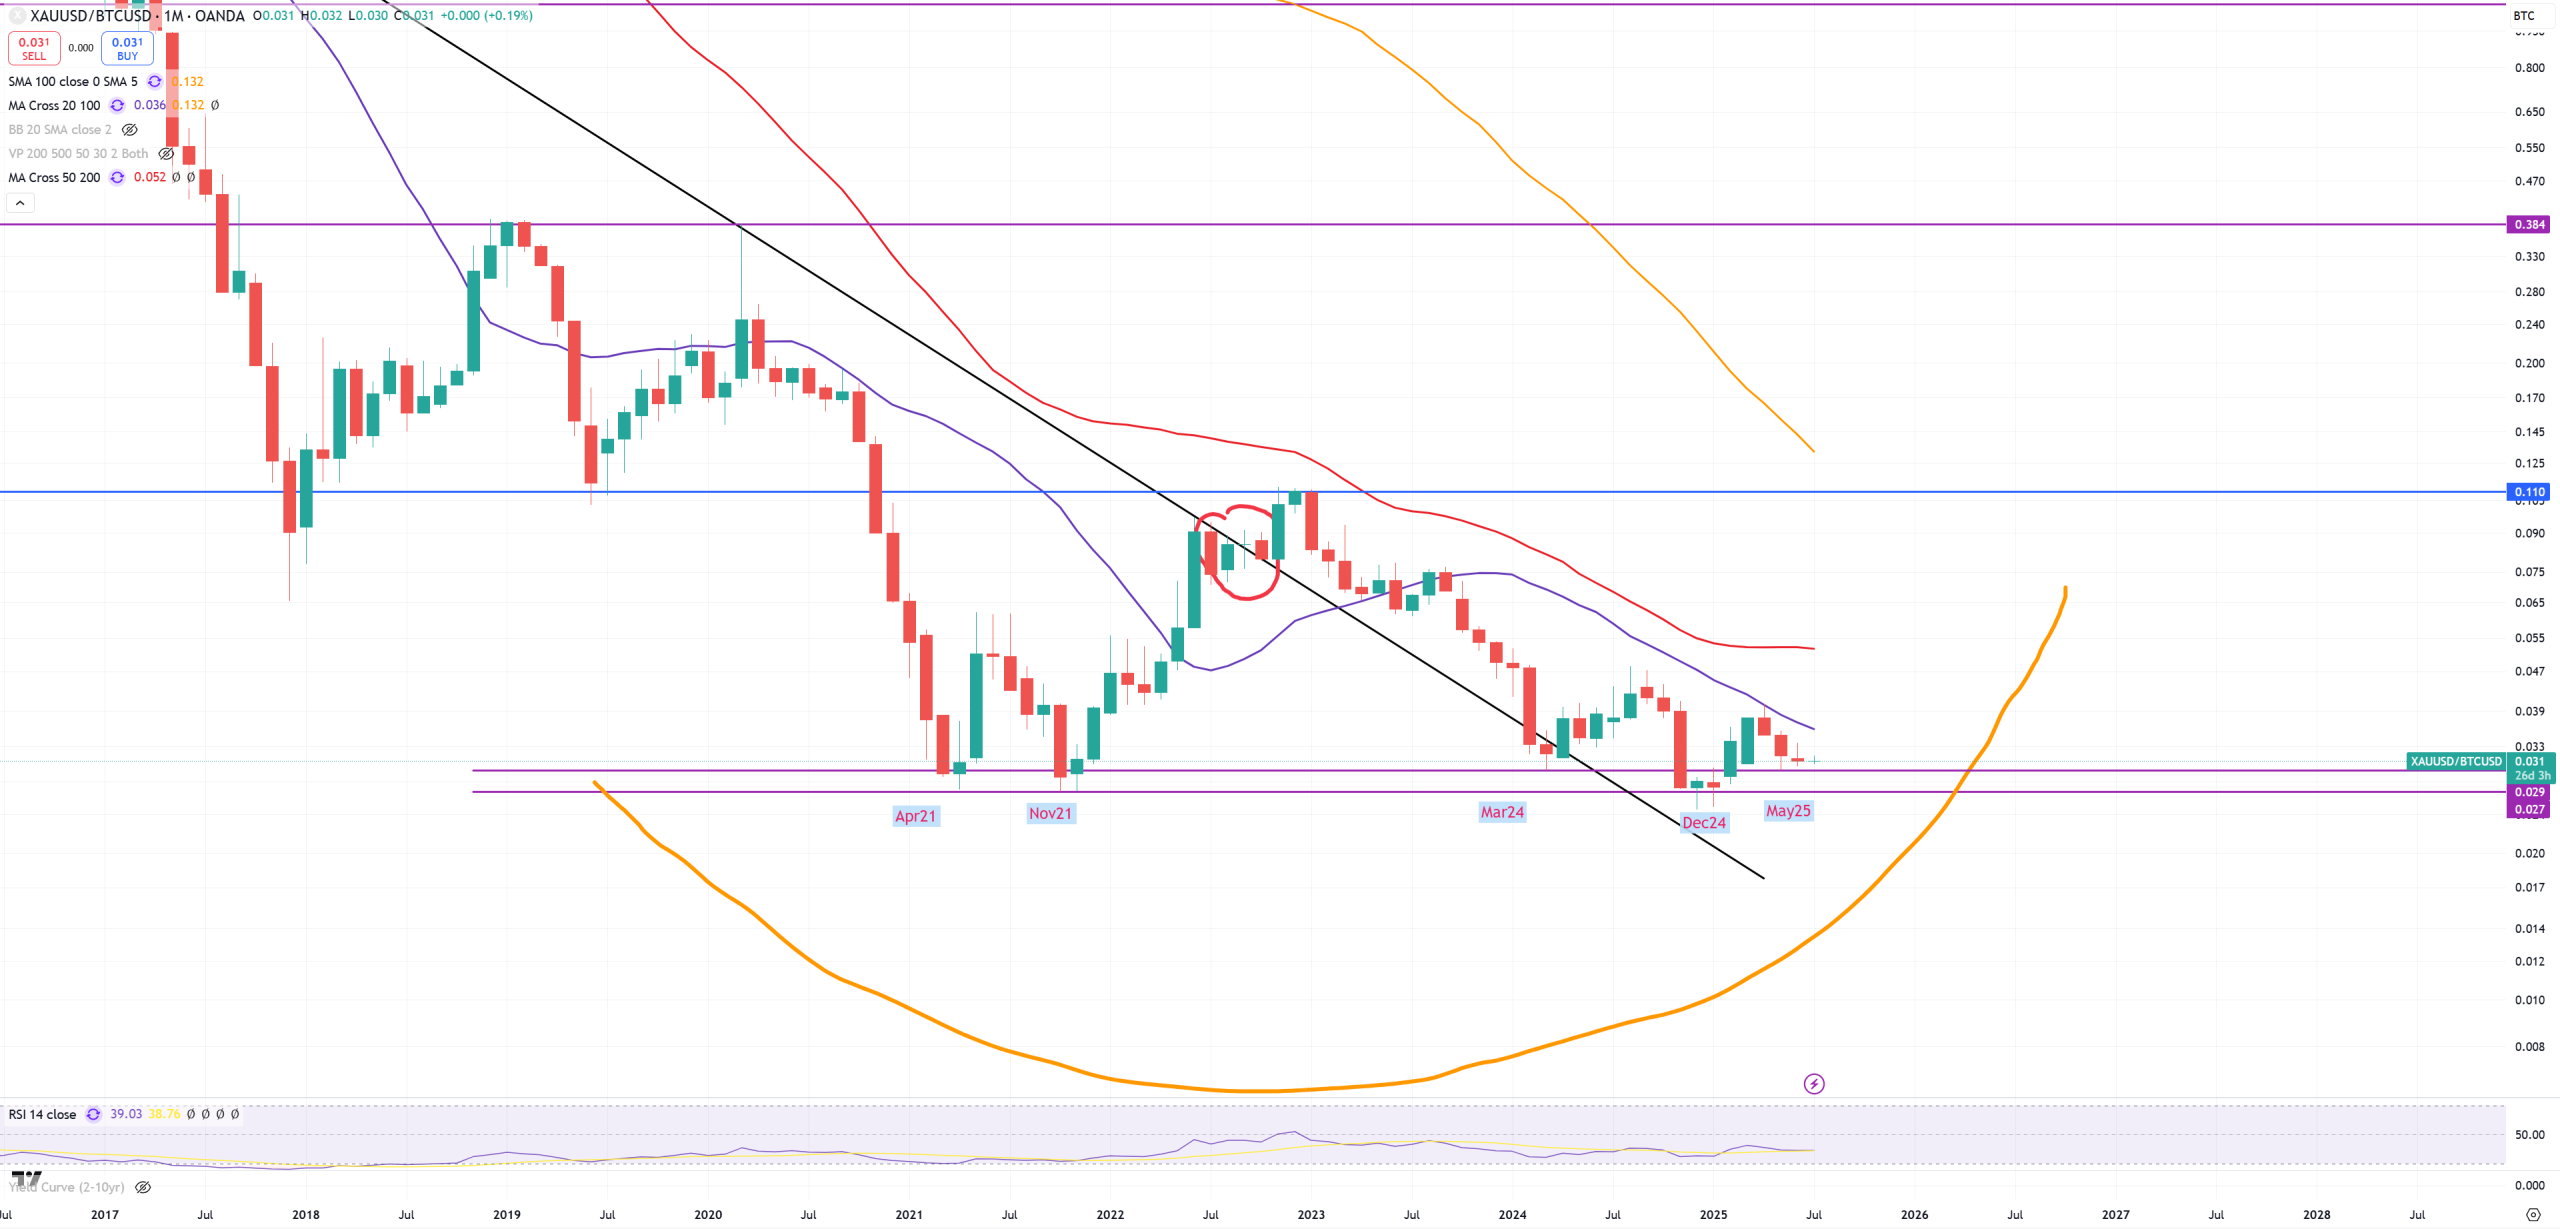
GOLD/BTC – since 2021 this ratio can’t go lower marking so far BTC peak each time it holds this support. As BTC goes higher, this ratio is unchanged,because GOLD is also going higher. If this support will hold we’re observing rotation from BTC towards GOLD.
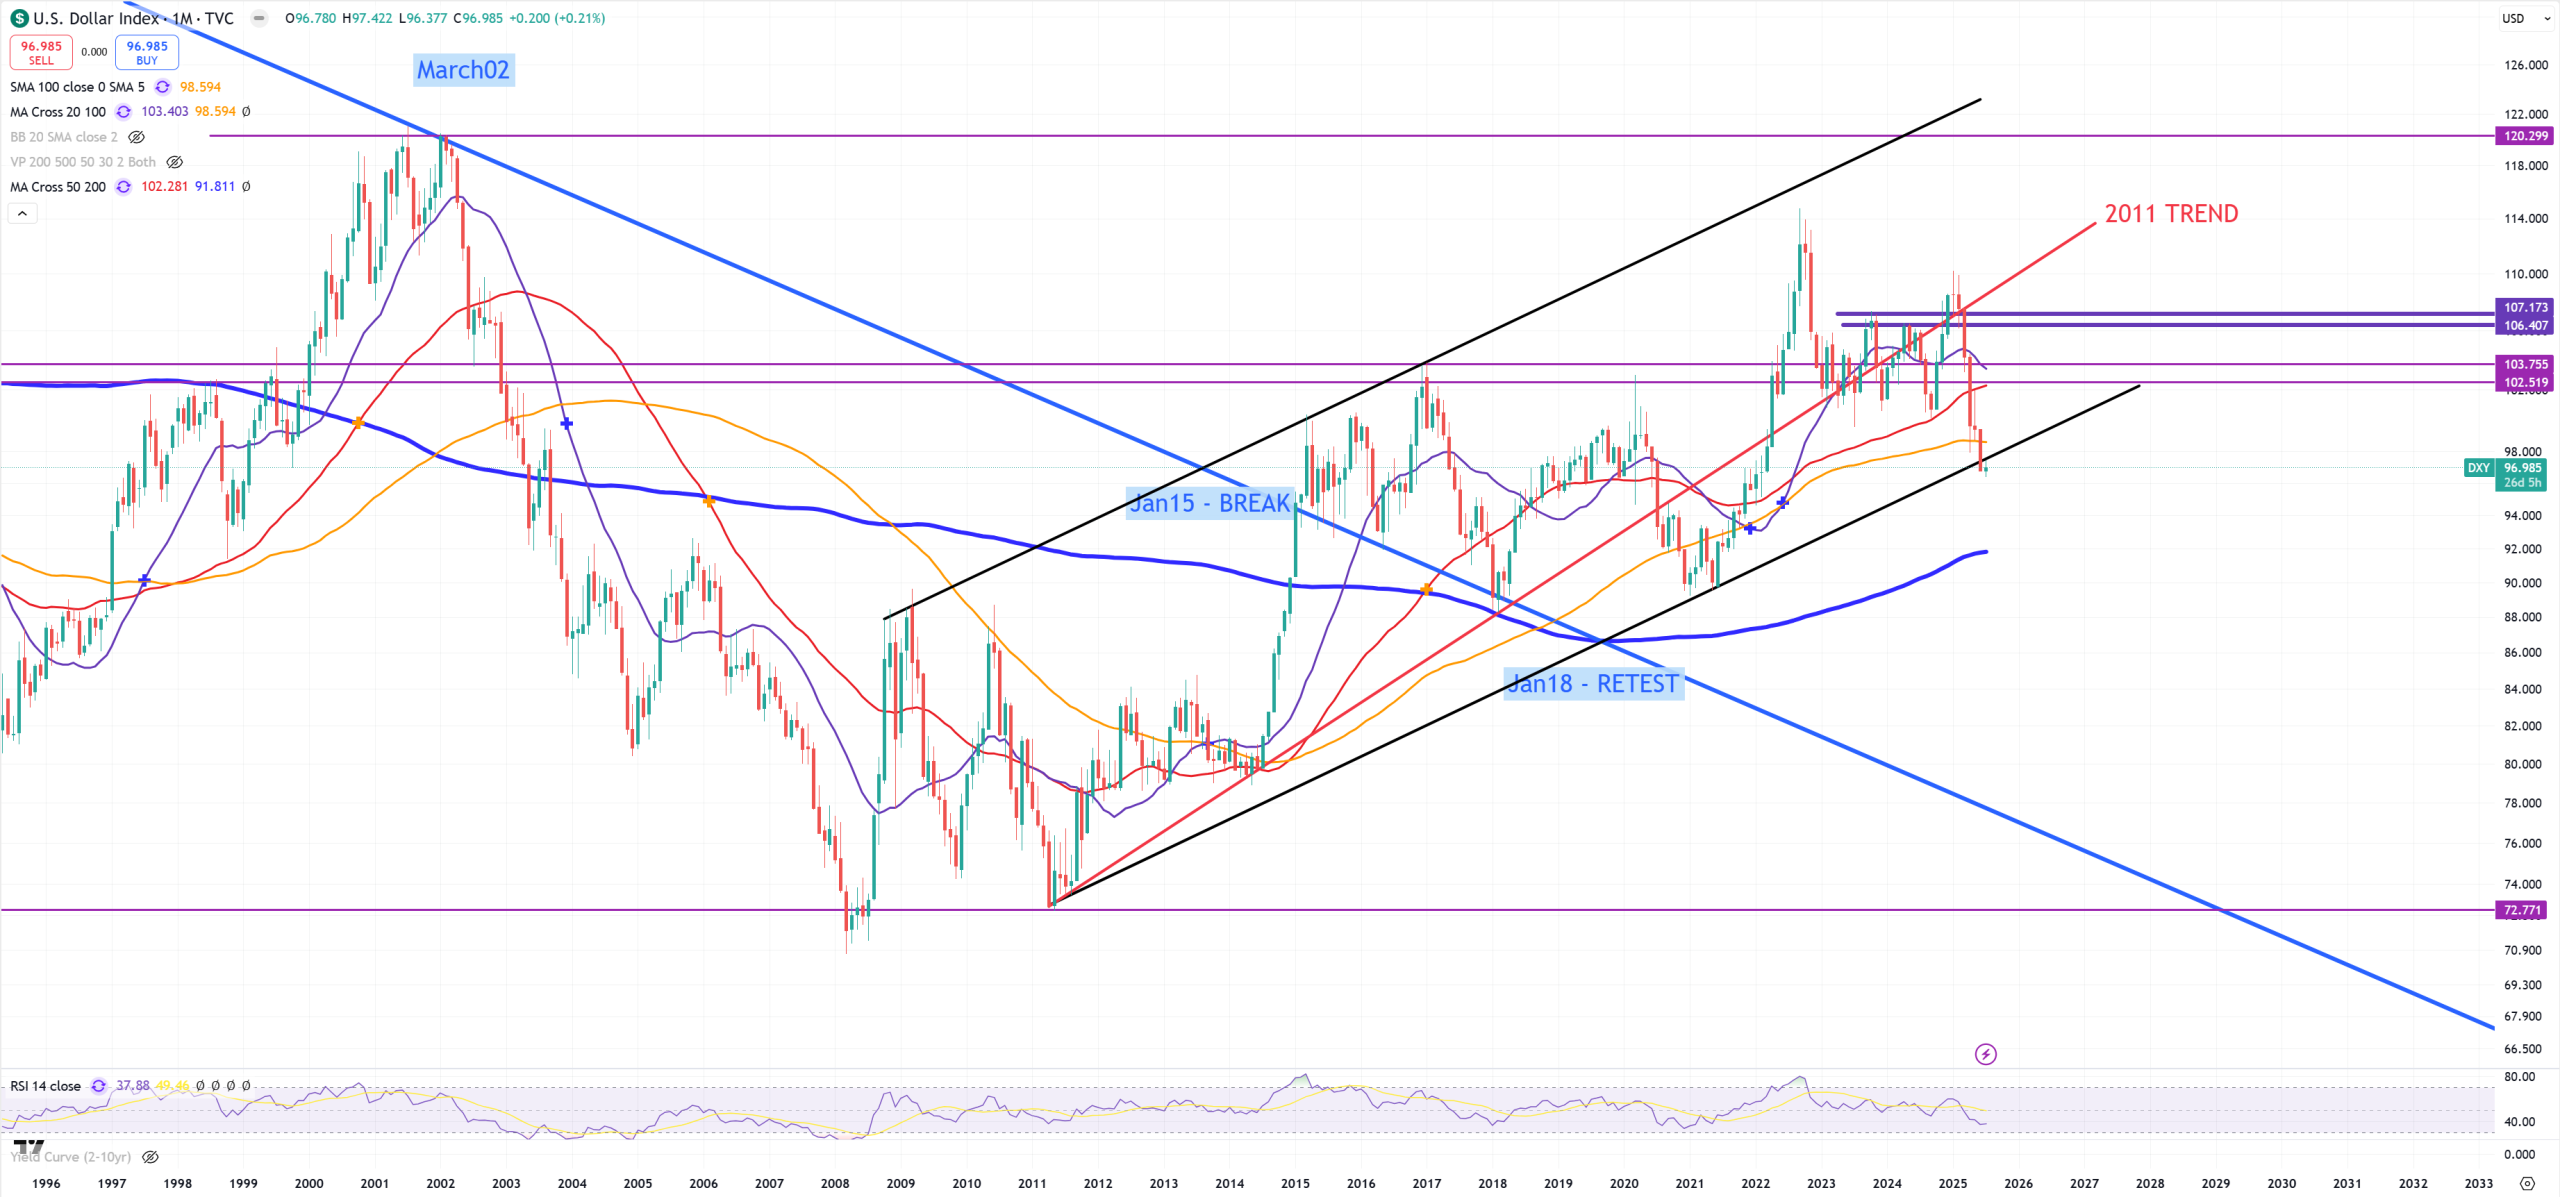
DXY – I’ve modified this chart as my previous 2011 TREND line was the only one line, but there’s also a lower trend line. We clearly see level 105 these days is a level where market can’t handle it doing everything not to blow 10Y/3M higher. Looks bad, and it’ll be looking bad as long as market’ll be trying to keep 10Y/3M inverted, pushing this ball down until it won’t be able.
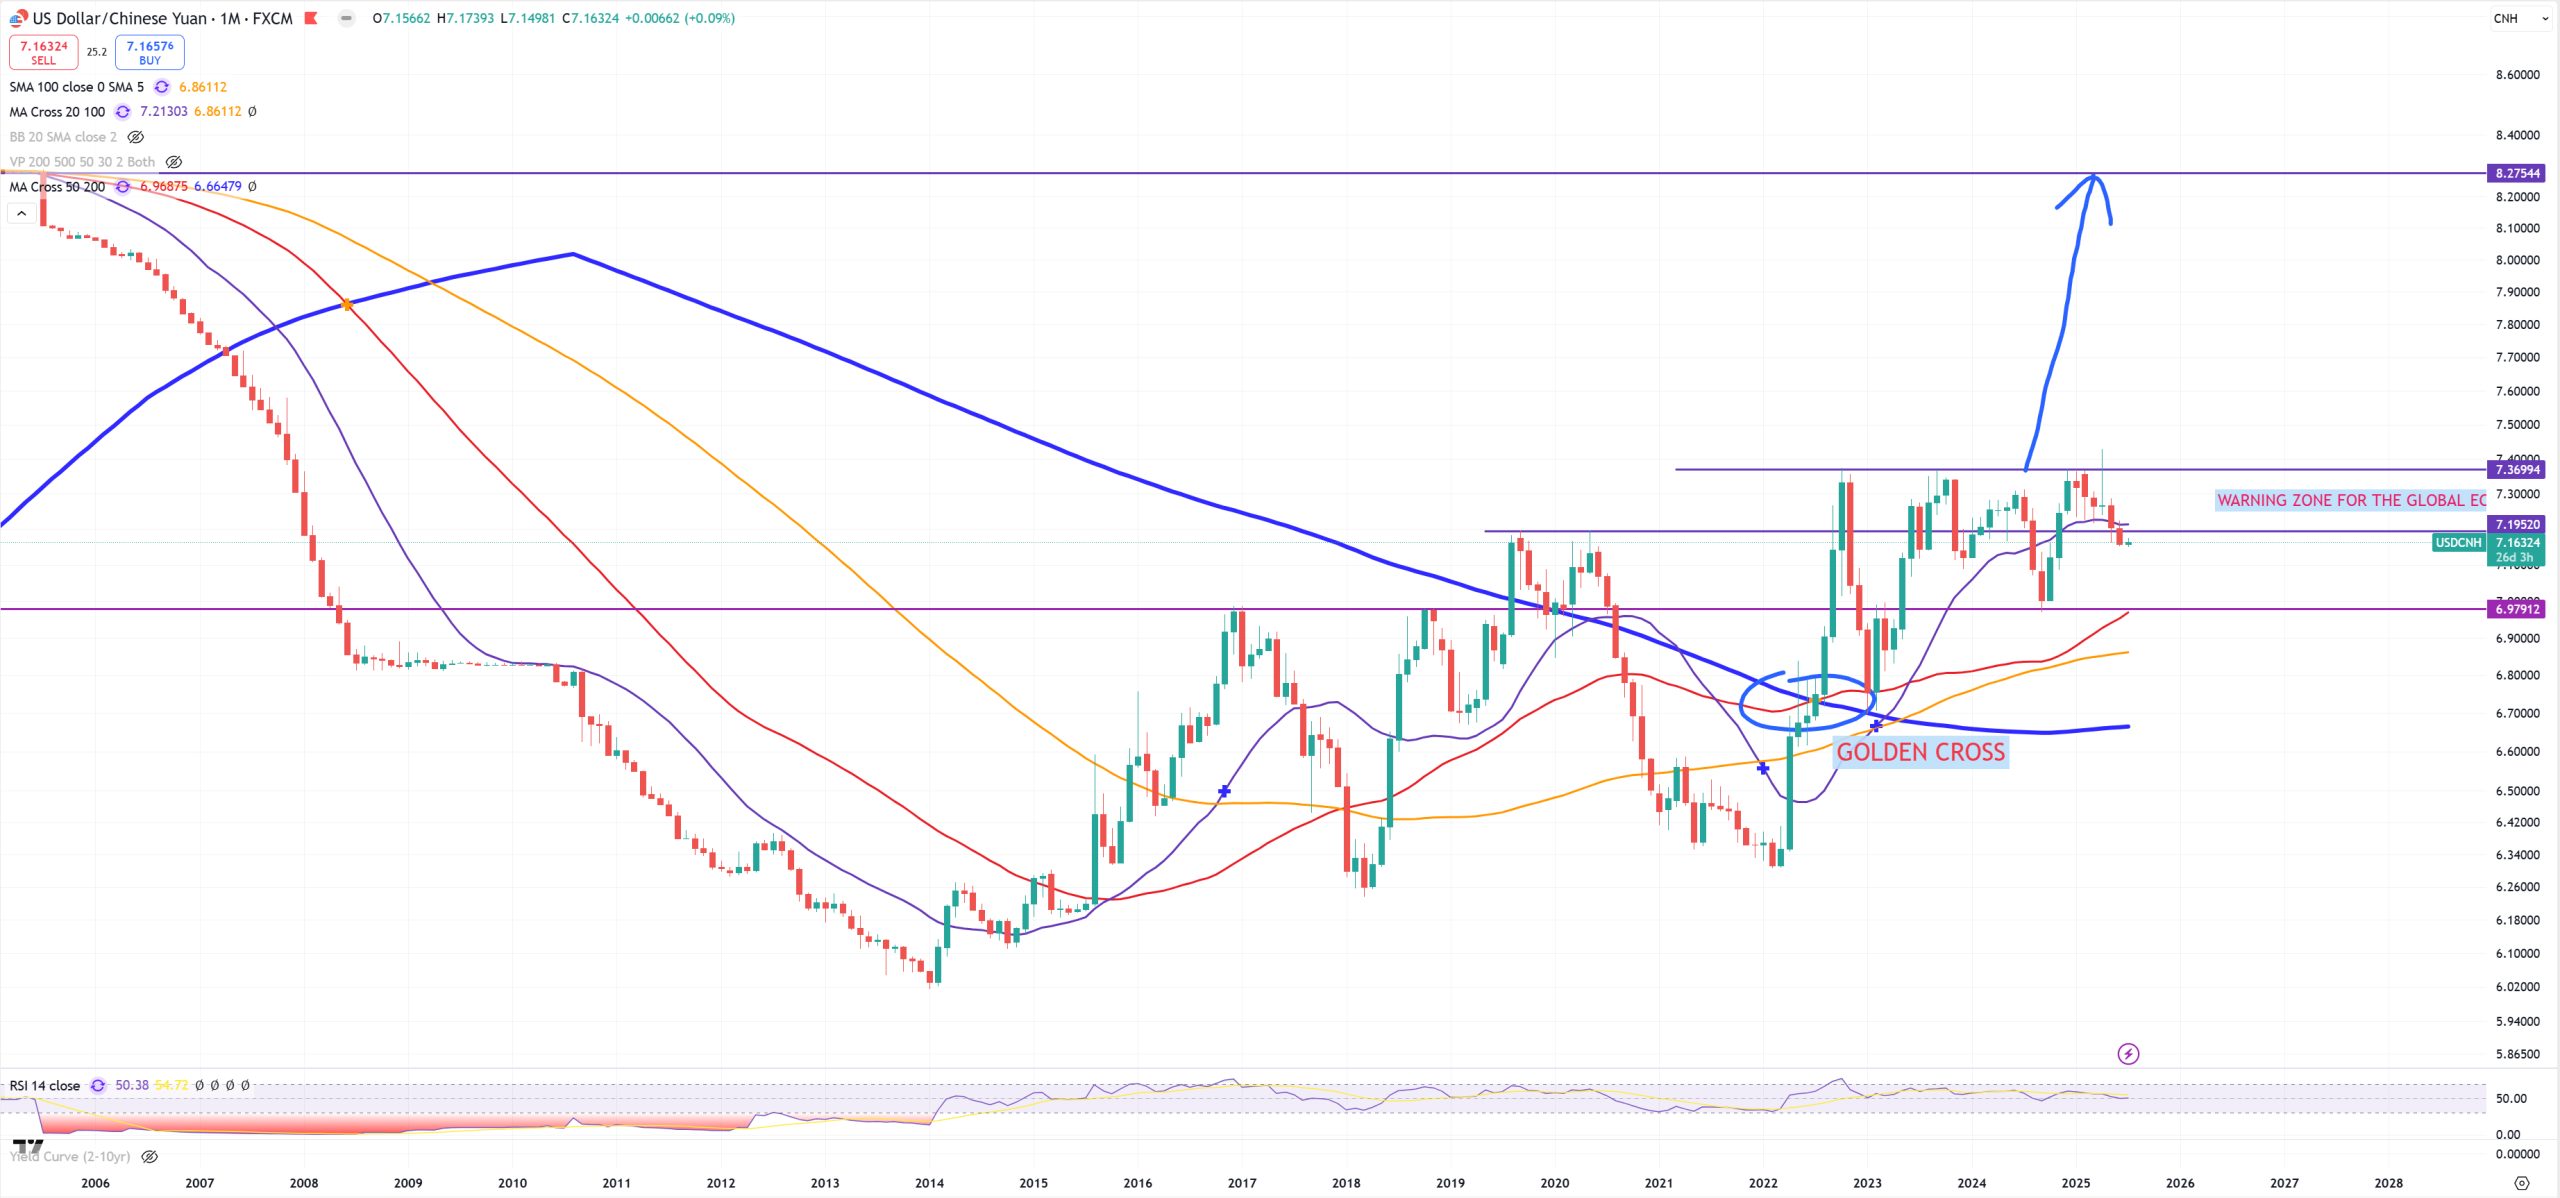
USDCNH – and my motto : “The power of the $$$ is the weakness of the Yuan” – but Yuan dropped from 7.45 to 7.16 – huge move – Yuan is strong = $$$ is weak. In reality we can make it really simple. Either you believe in $$$ or believe in Yuan. No other way. You believe in US debt, or Chinese const 5-6% GDP growth where including shadow banking they are going towards 400% debt/gdp probably higher than Japan. This or this. As 7.20 is a critical level we moved down to 7.16. Next level is 6.93. USDCNH going lower = China exports inflation, USDCNH going higher = China exports deflation. Breaking 7.37-7.40 is a deflationary spiral in the world.
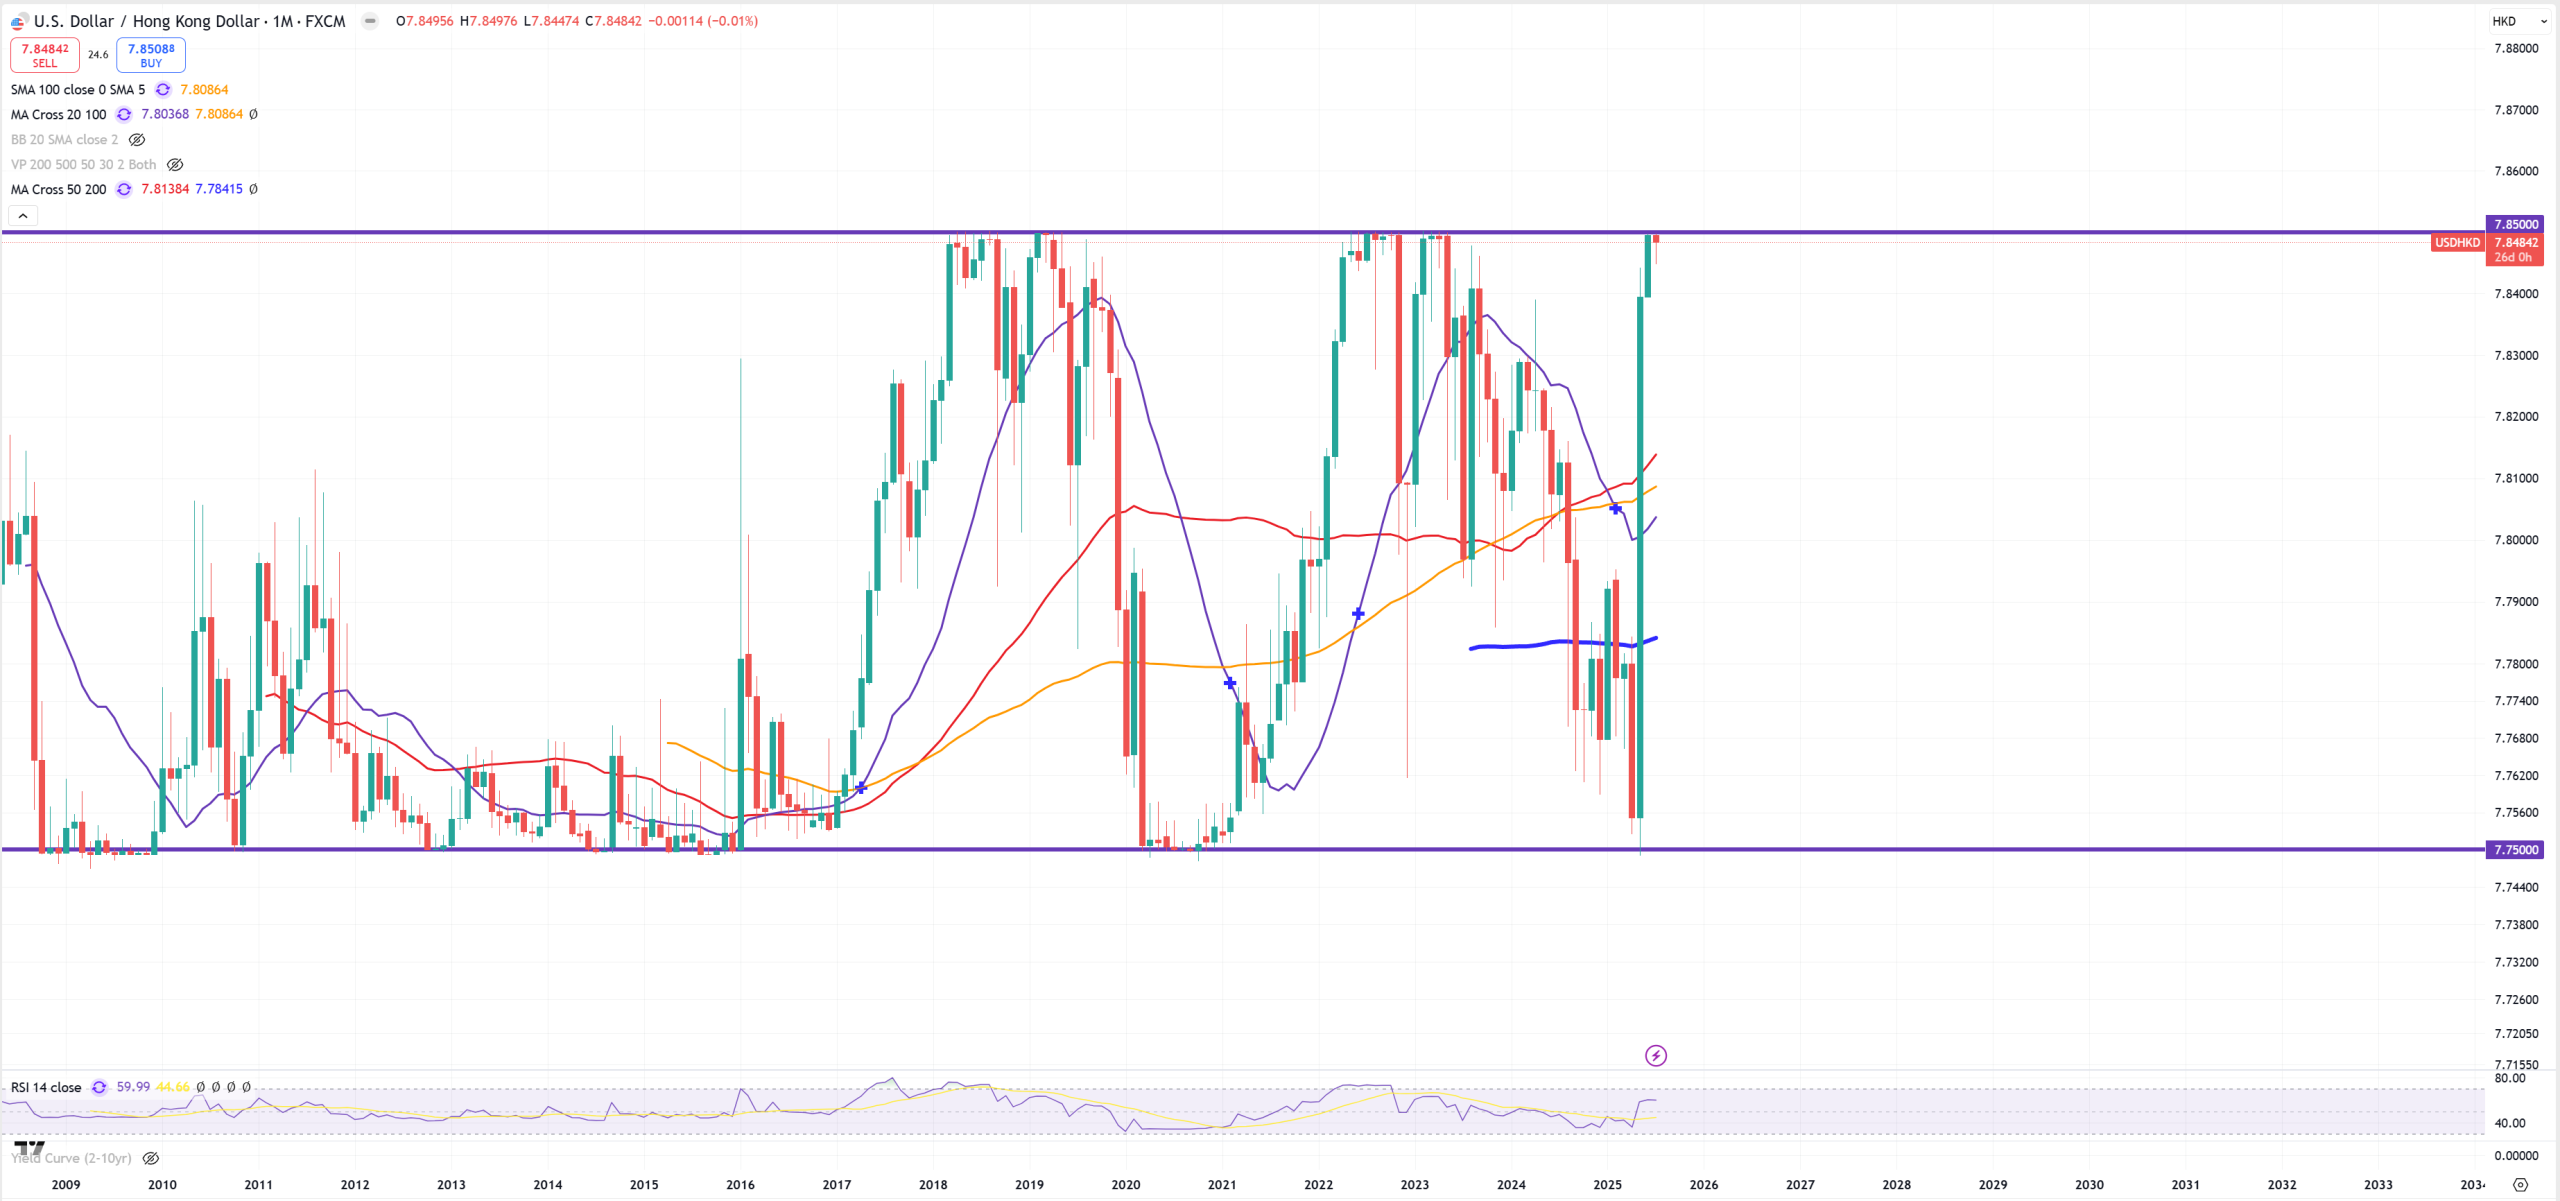
USDHKD – something that needs to unwind to check Yuan true value. If you follow me long enough you know my bet that this PEG will be broken (That’s my #1 bet for black swan event and Lehman Brothers event). Since last 2-3 months HKMA had to go away from tracing FED’s rates and 2 years of going down from 7.85 to 7.75 went poof in let’s say 1 month. This is the fastest move from lower band 7.75 to upper band 7.85 ever. Now HKMA sells B$ not to cross 7.85 while the HKD is not tracing FED rates anymore. What are their plan? No idea.
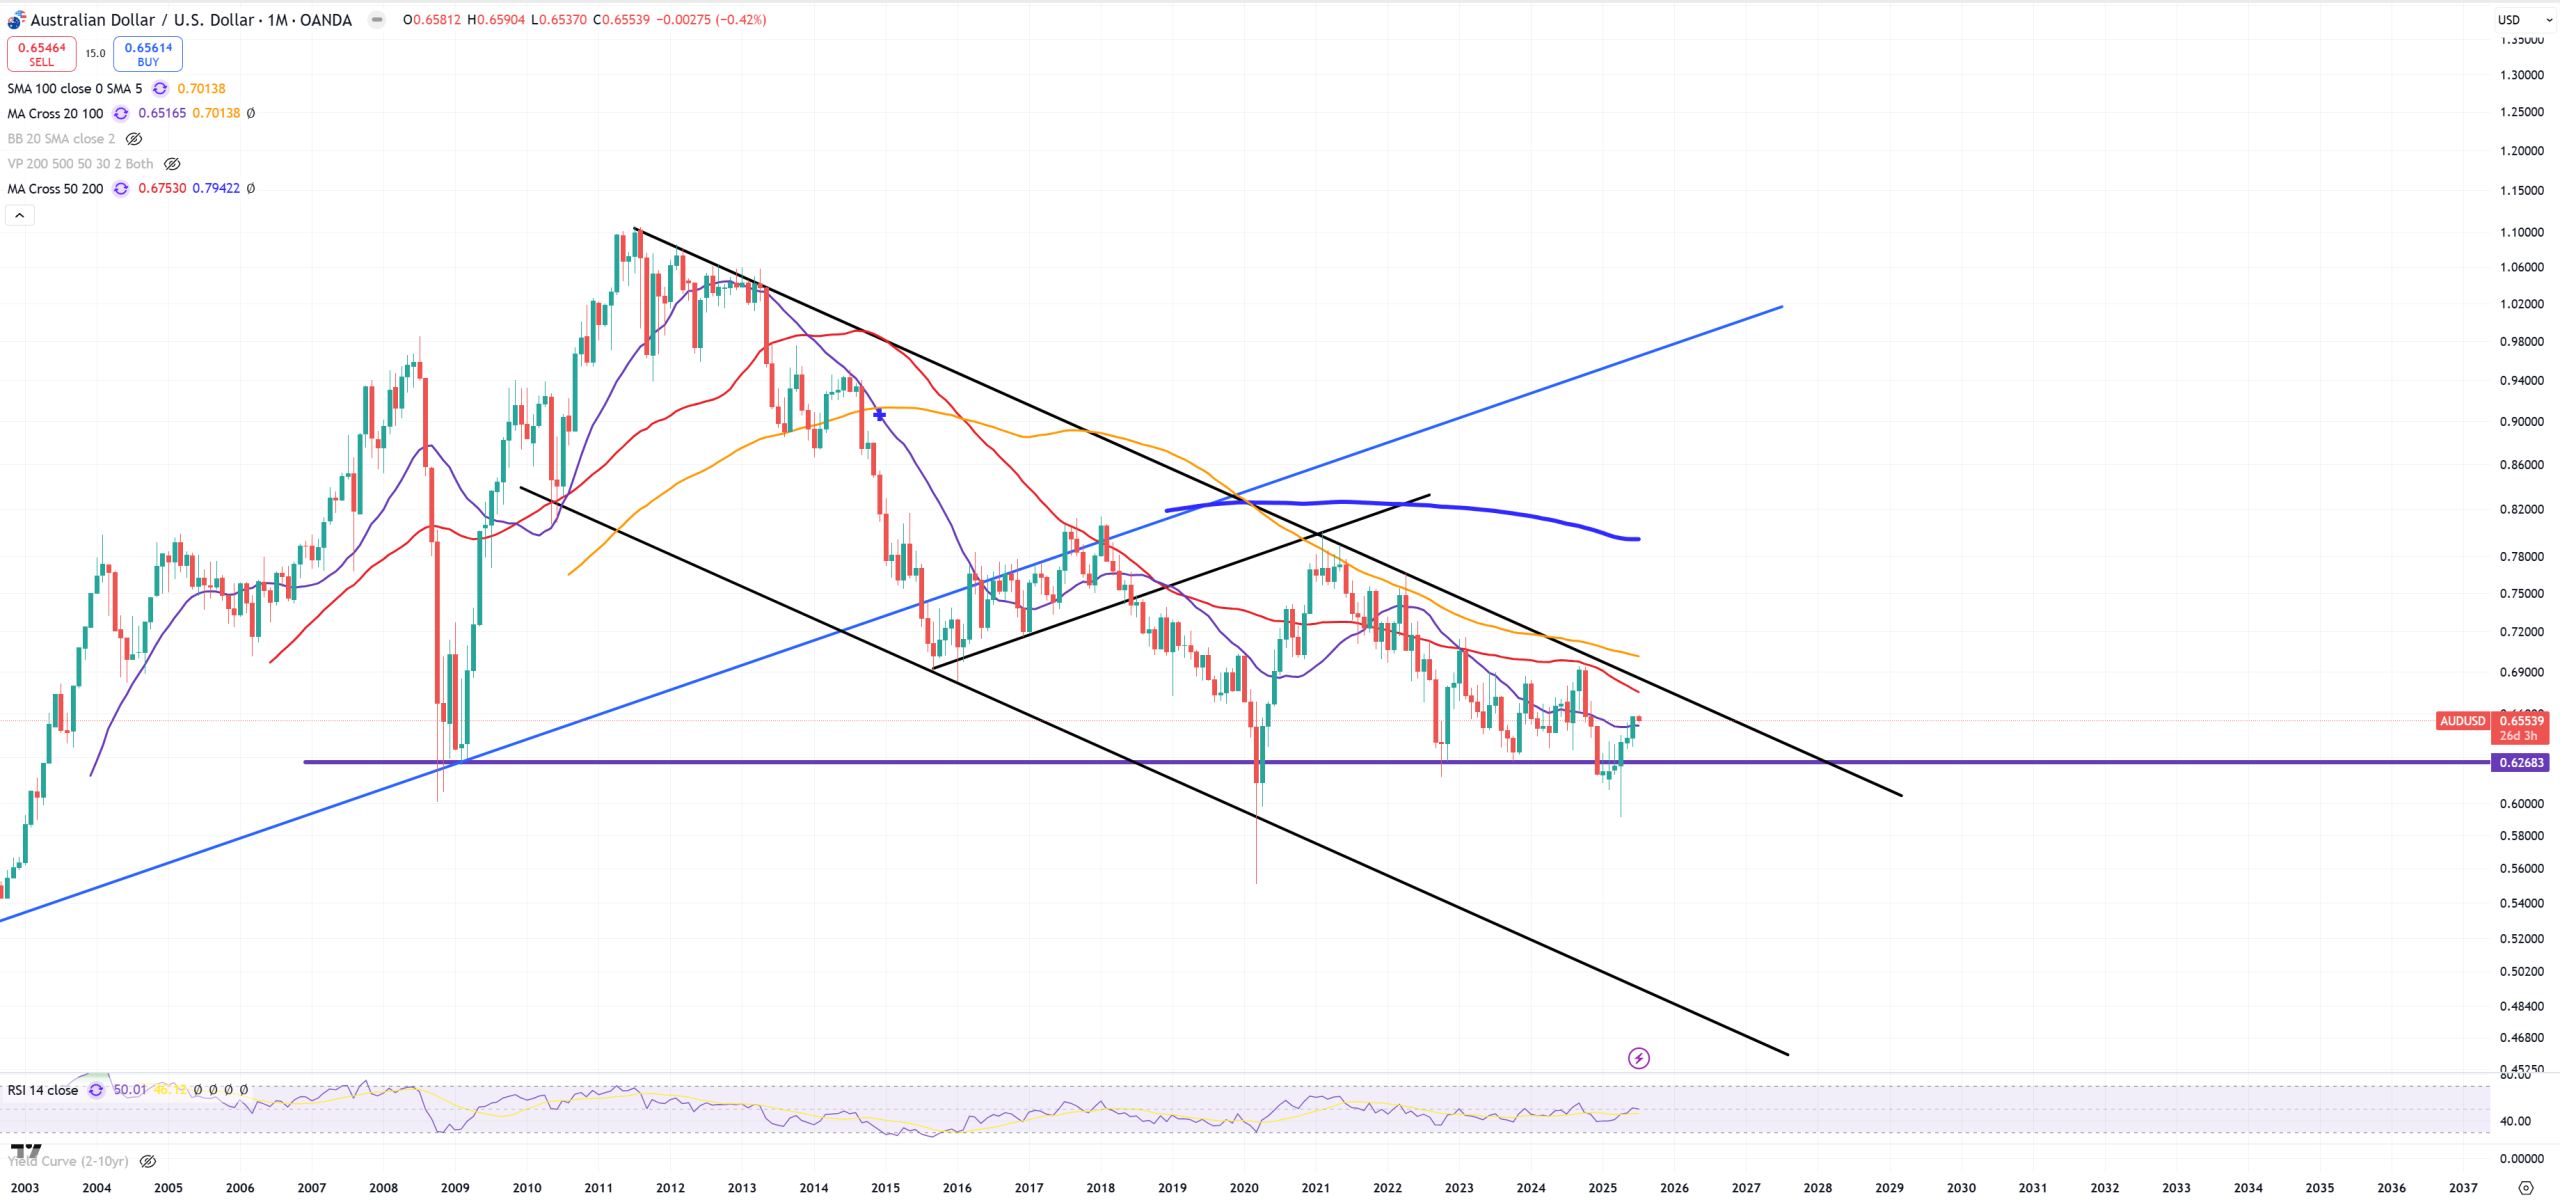
AUDUSD – is a derivative of USDCNH, where its move we can calculate by : -4xUSDCNH [in % points], so if USDCNH goes down -1%, AUDUSD will go up +4%. We clearly see this 2009 lows will need “the event” to break lower. This level is also the equivalent of USDCNH breaking 7.37 higher.
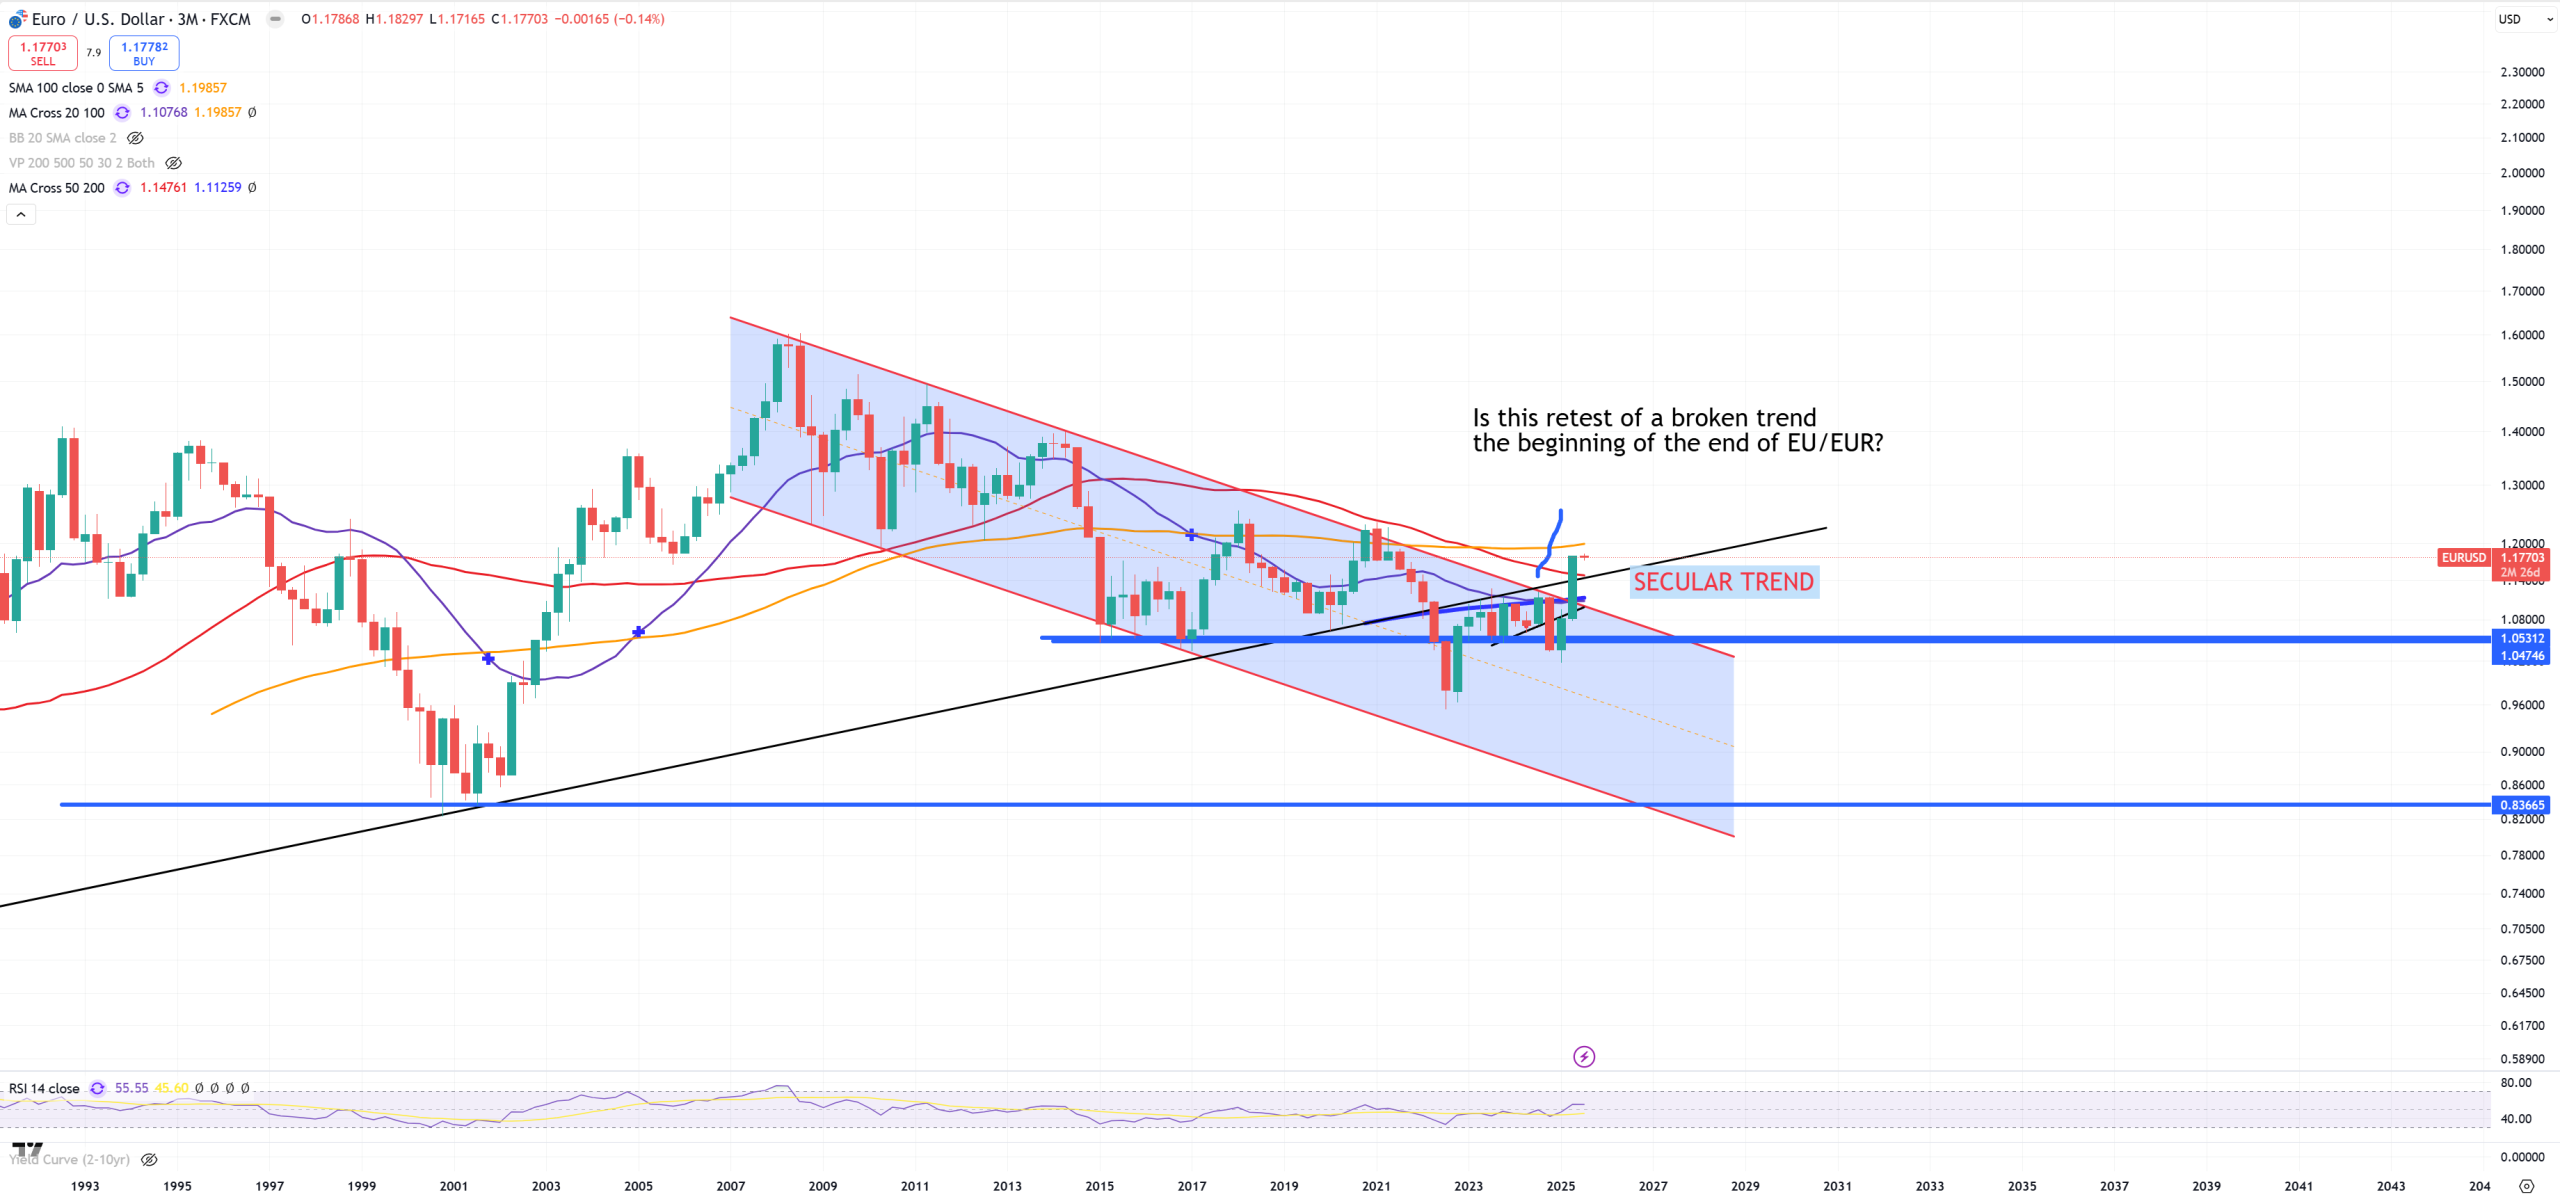
EURUSD – here I’m showing (3M) chart and blue (3M)MA200 was broken. 1.14 is support and later 1.10. $$$ starts seeing its life once 1.14 will be broken down, so far it looks really good for EURUSD
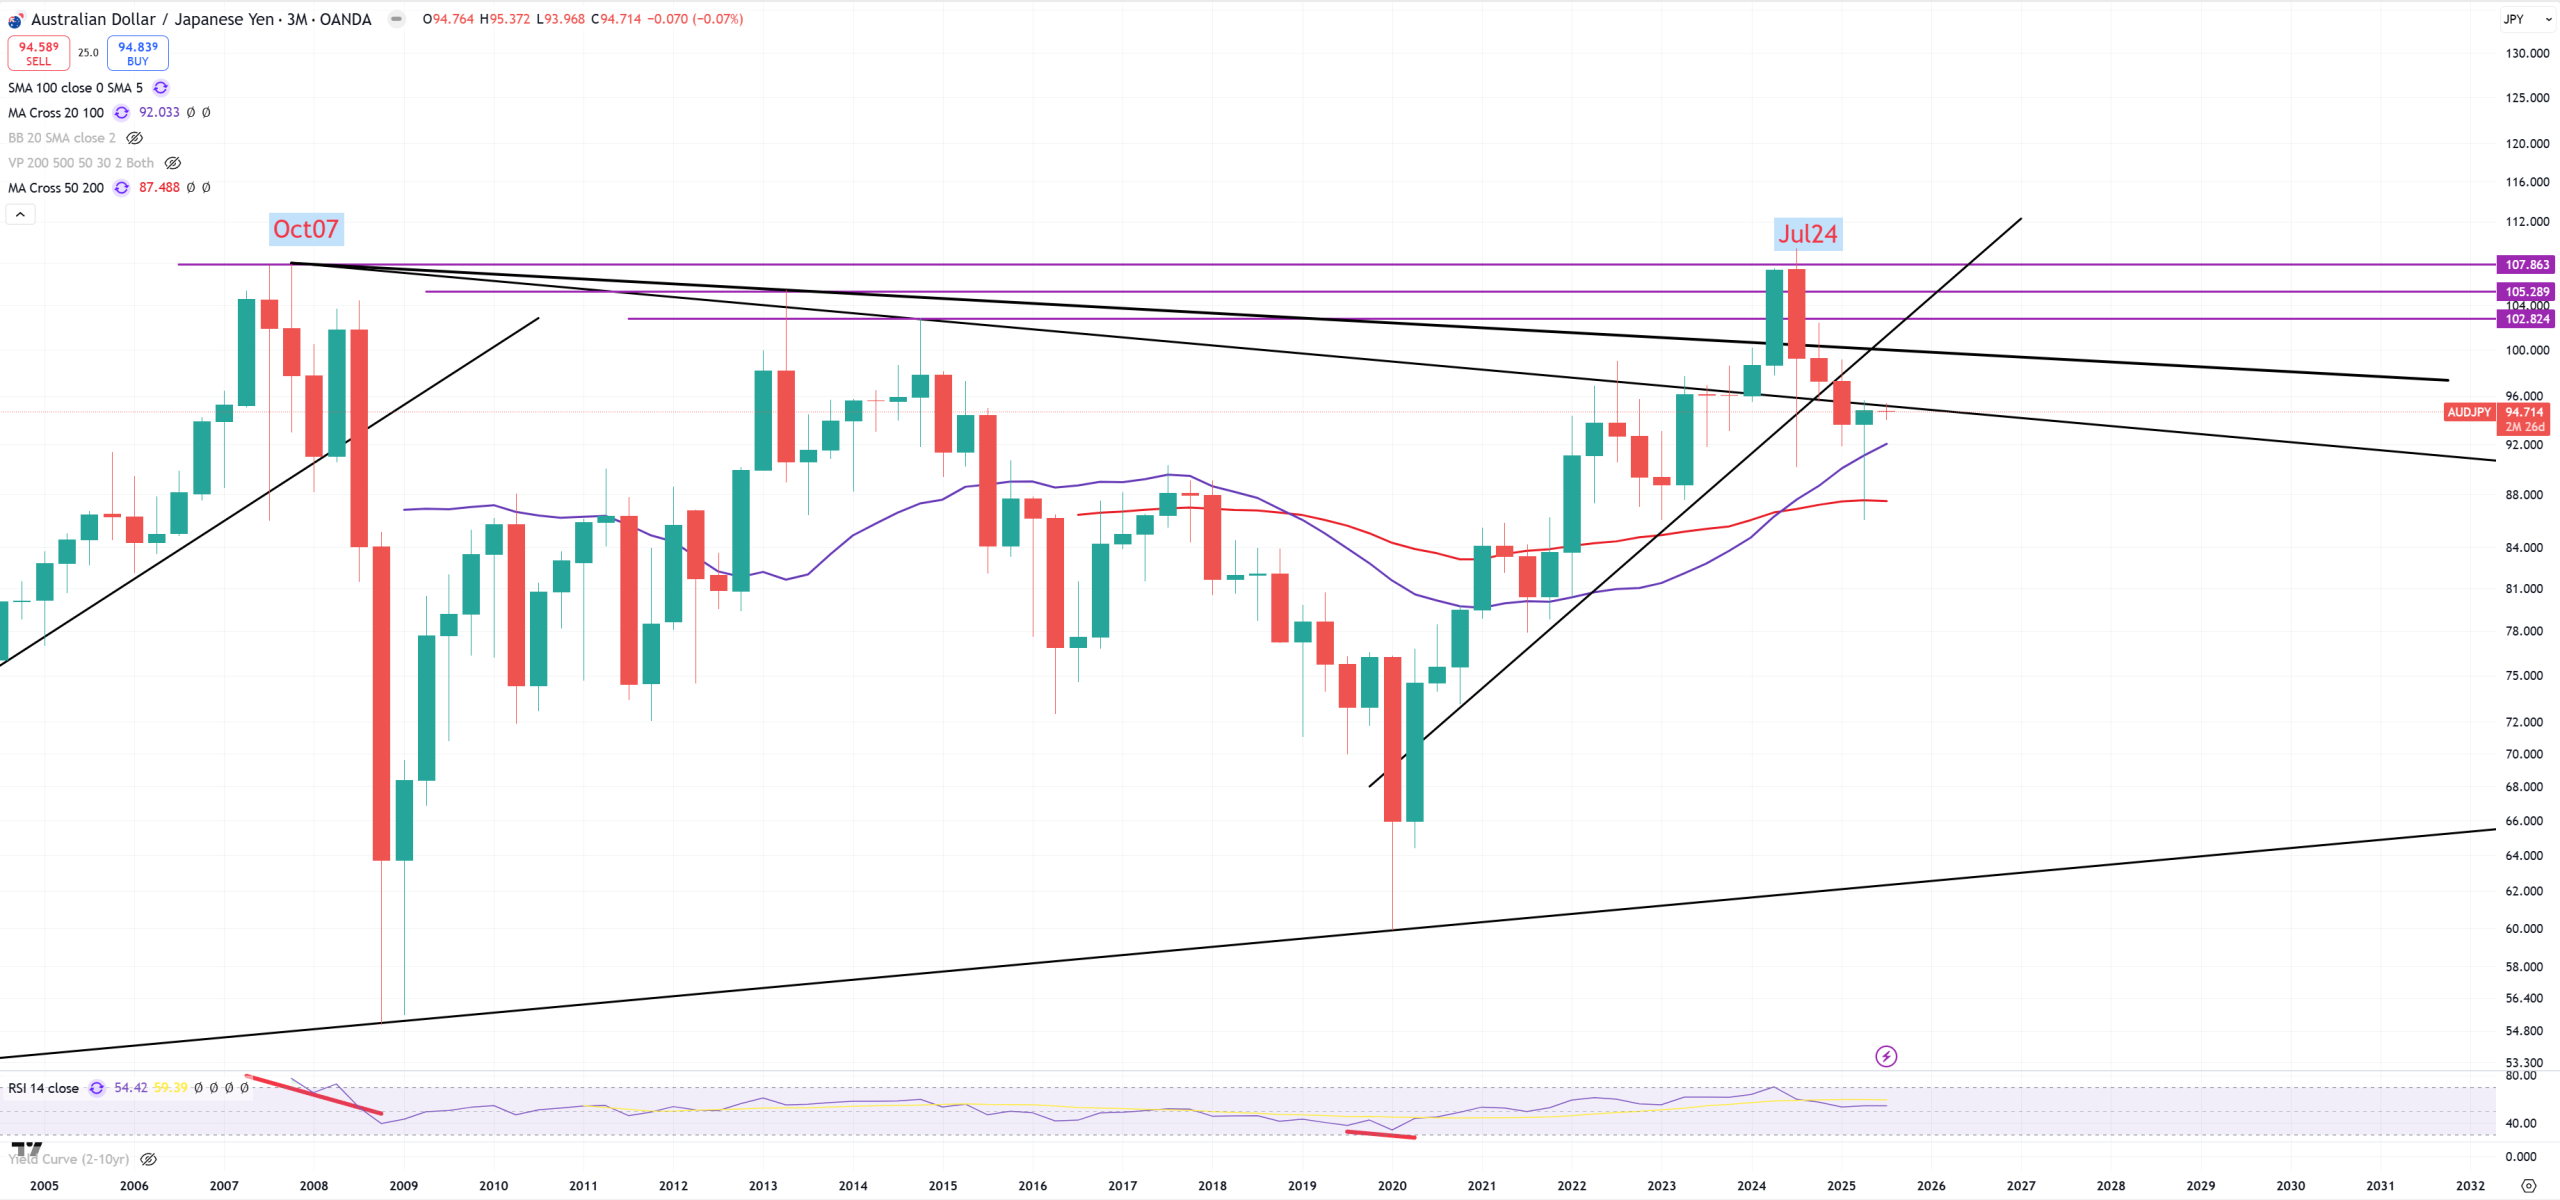
AUDJPY – my favorite indictor and pair related to stocks. Let’s put it also on (3M) view.
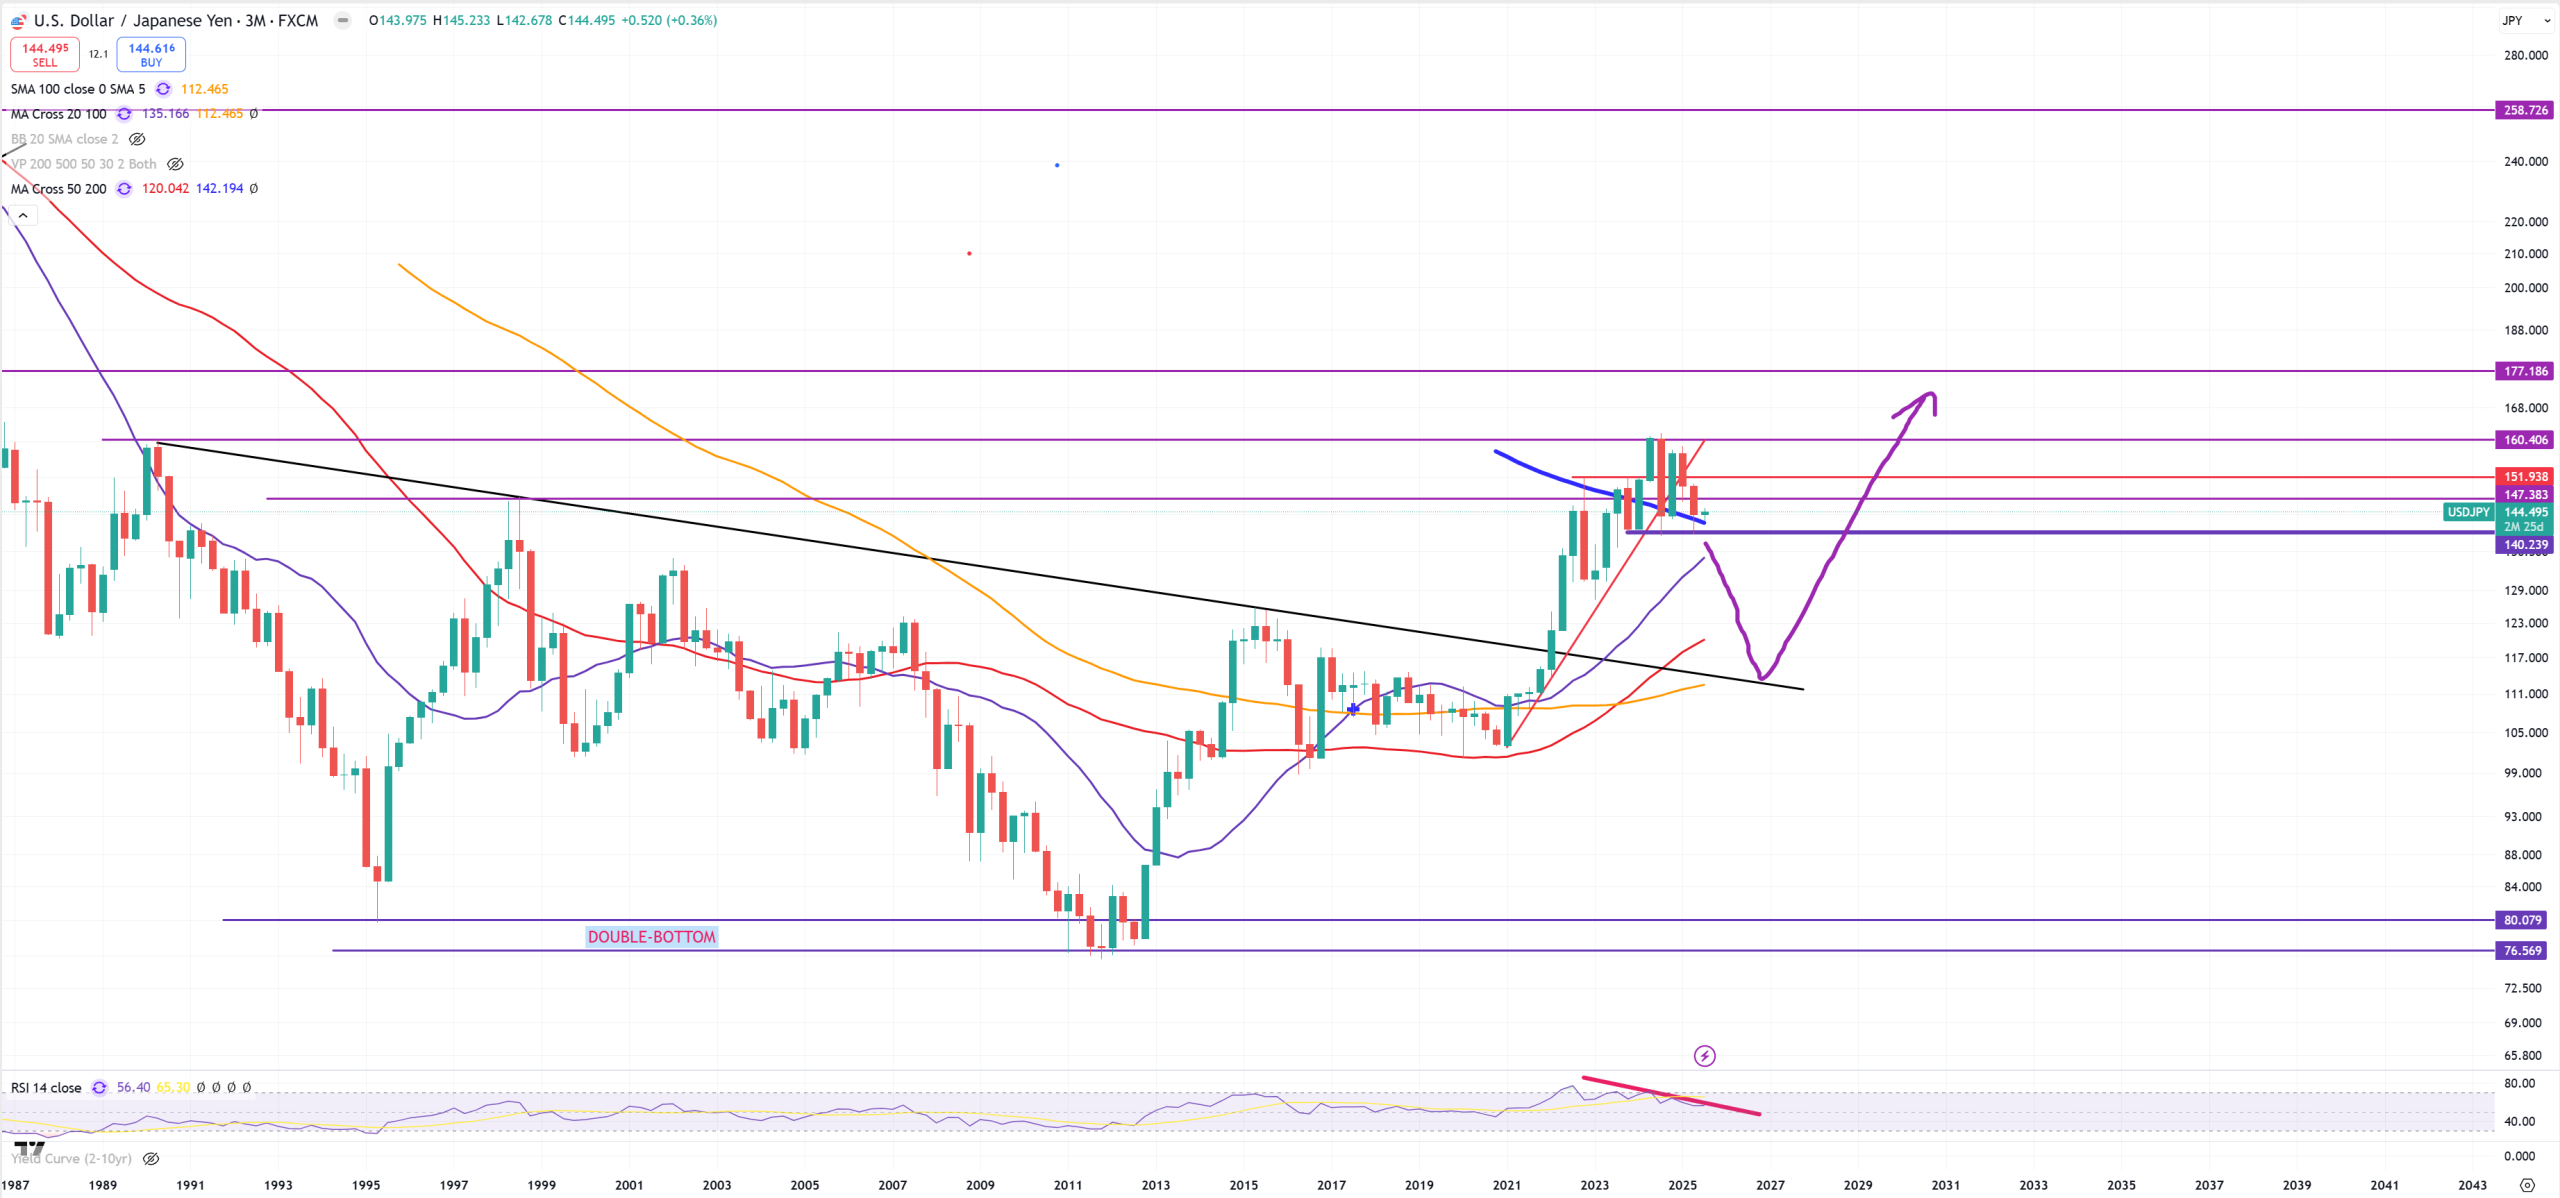
USDJPY – Yen – my bet USDJPY’s going lower, because Japan’s bond market is going to implode, but the view is on (3M), and you see blue (3M)MA200 which was heavy support so far. So this 140-142 level is a massive support. To break it, Japan needs to lose control over its bond market.
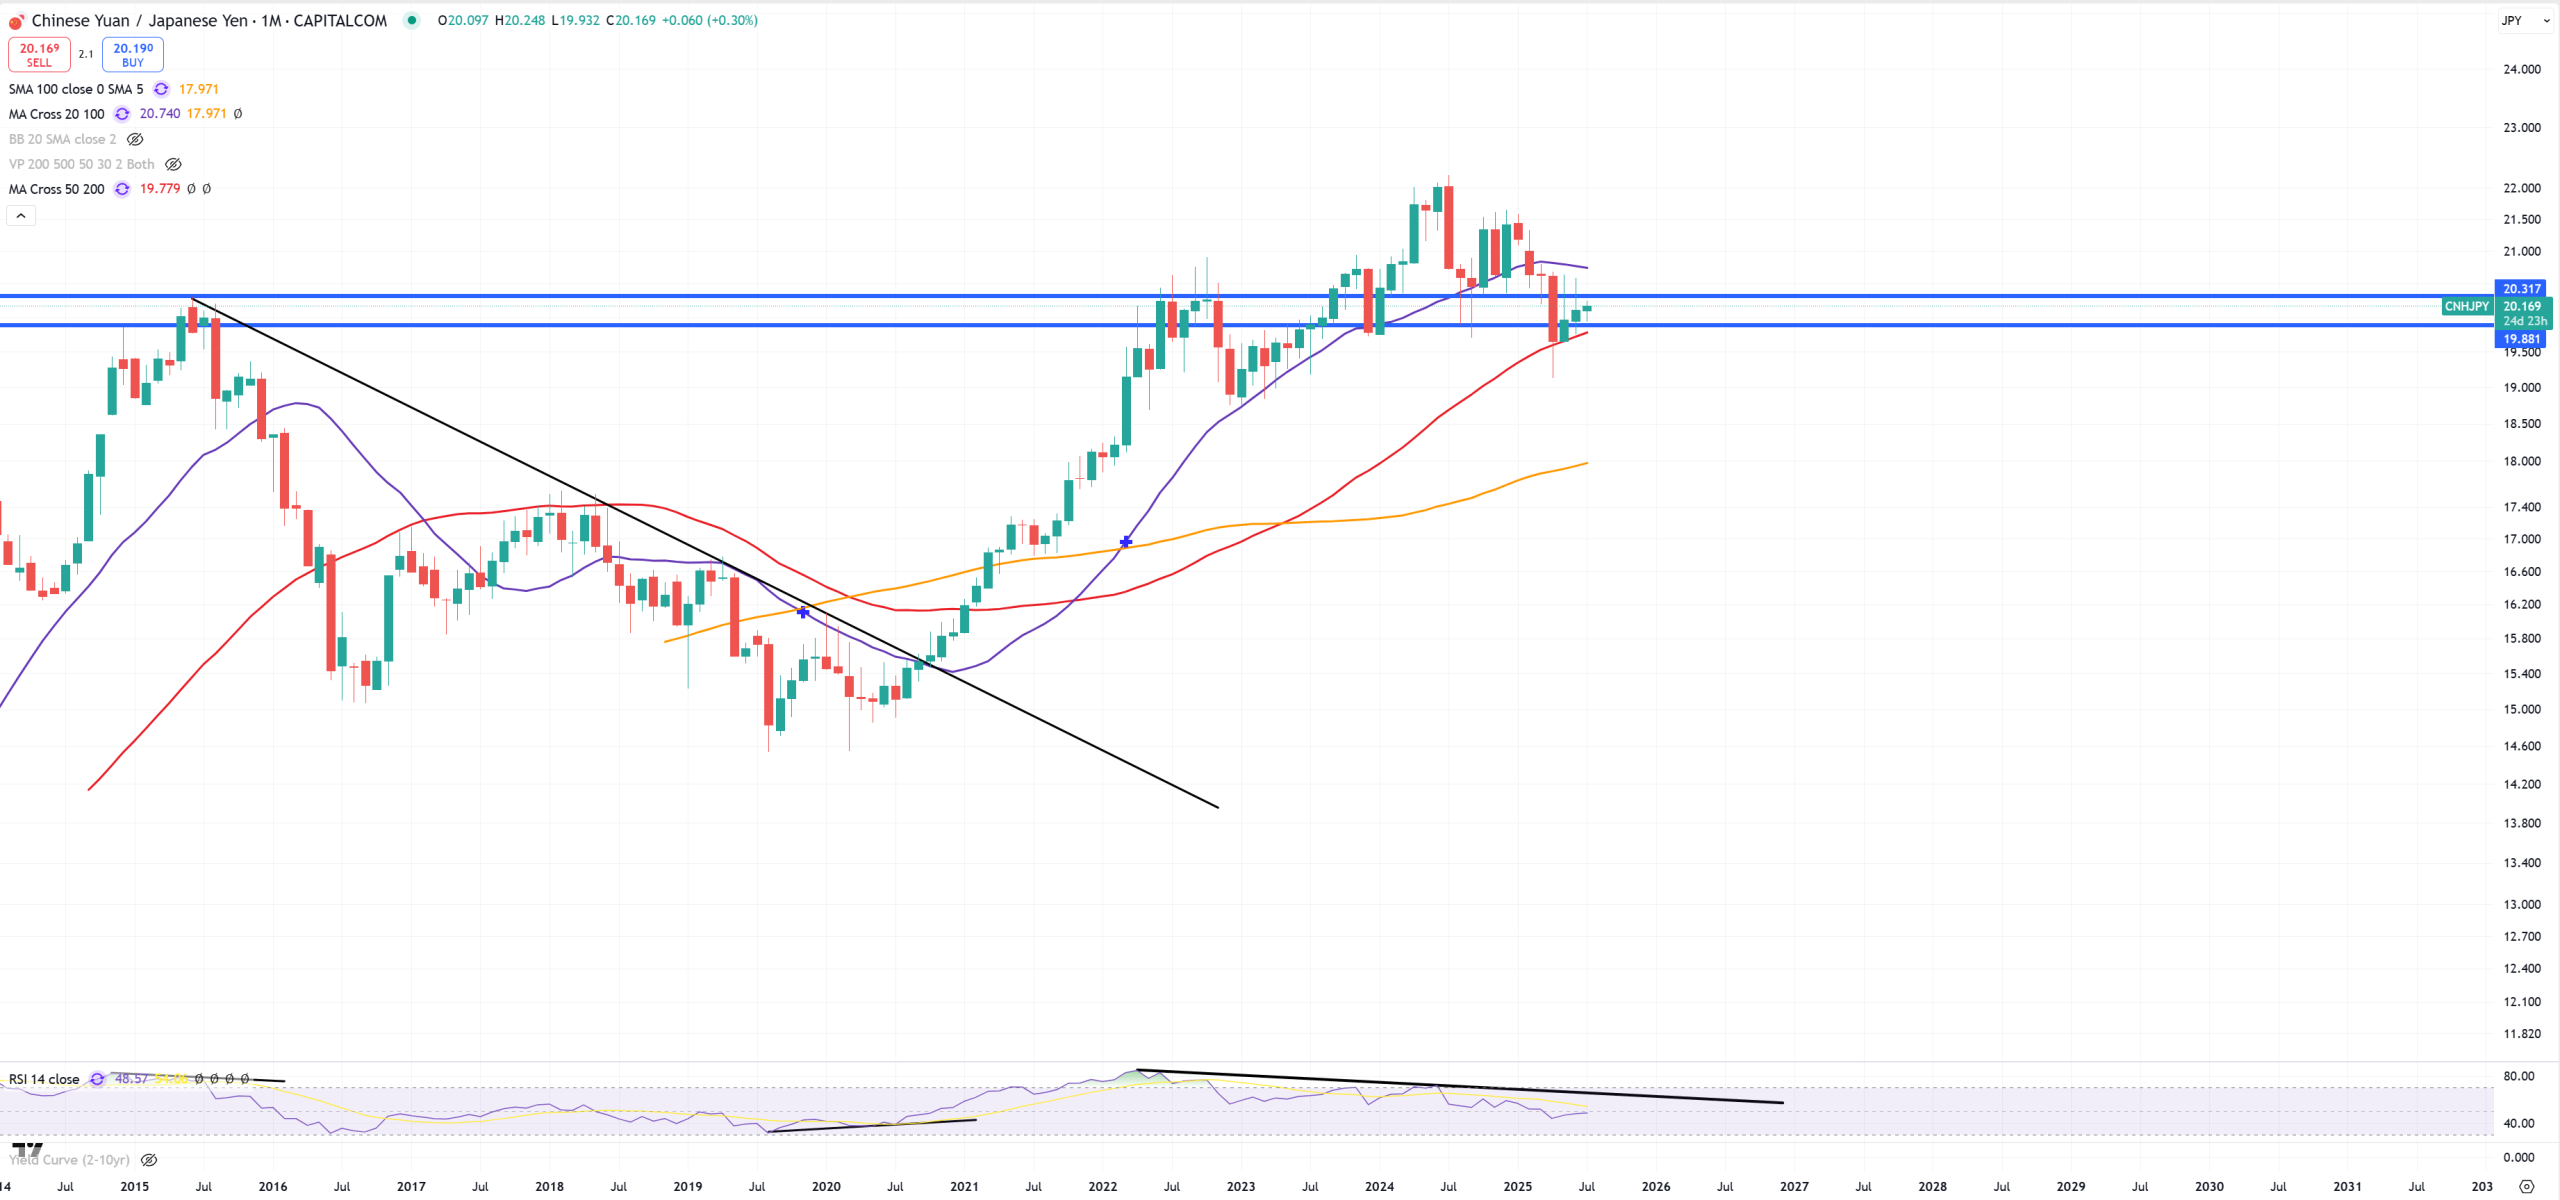
CNHJPY – it plays more or less same role as AUDJPY.You see it’s between red (M)MA50 and key resistance
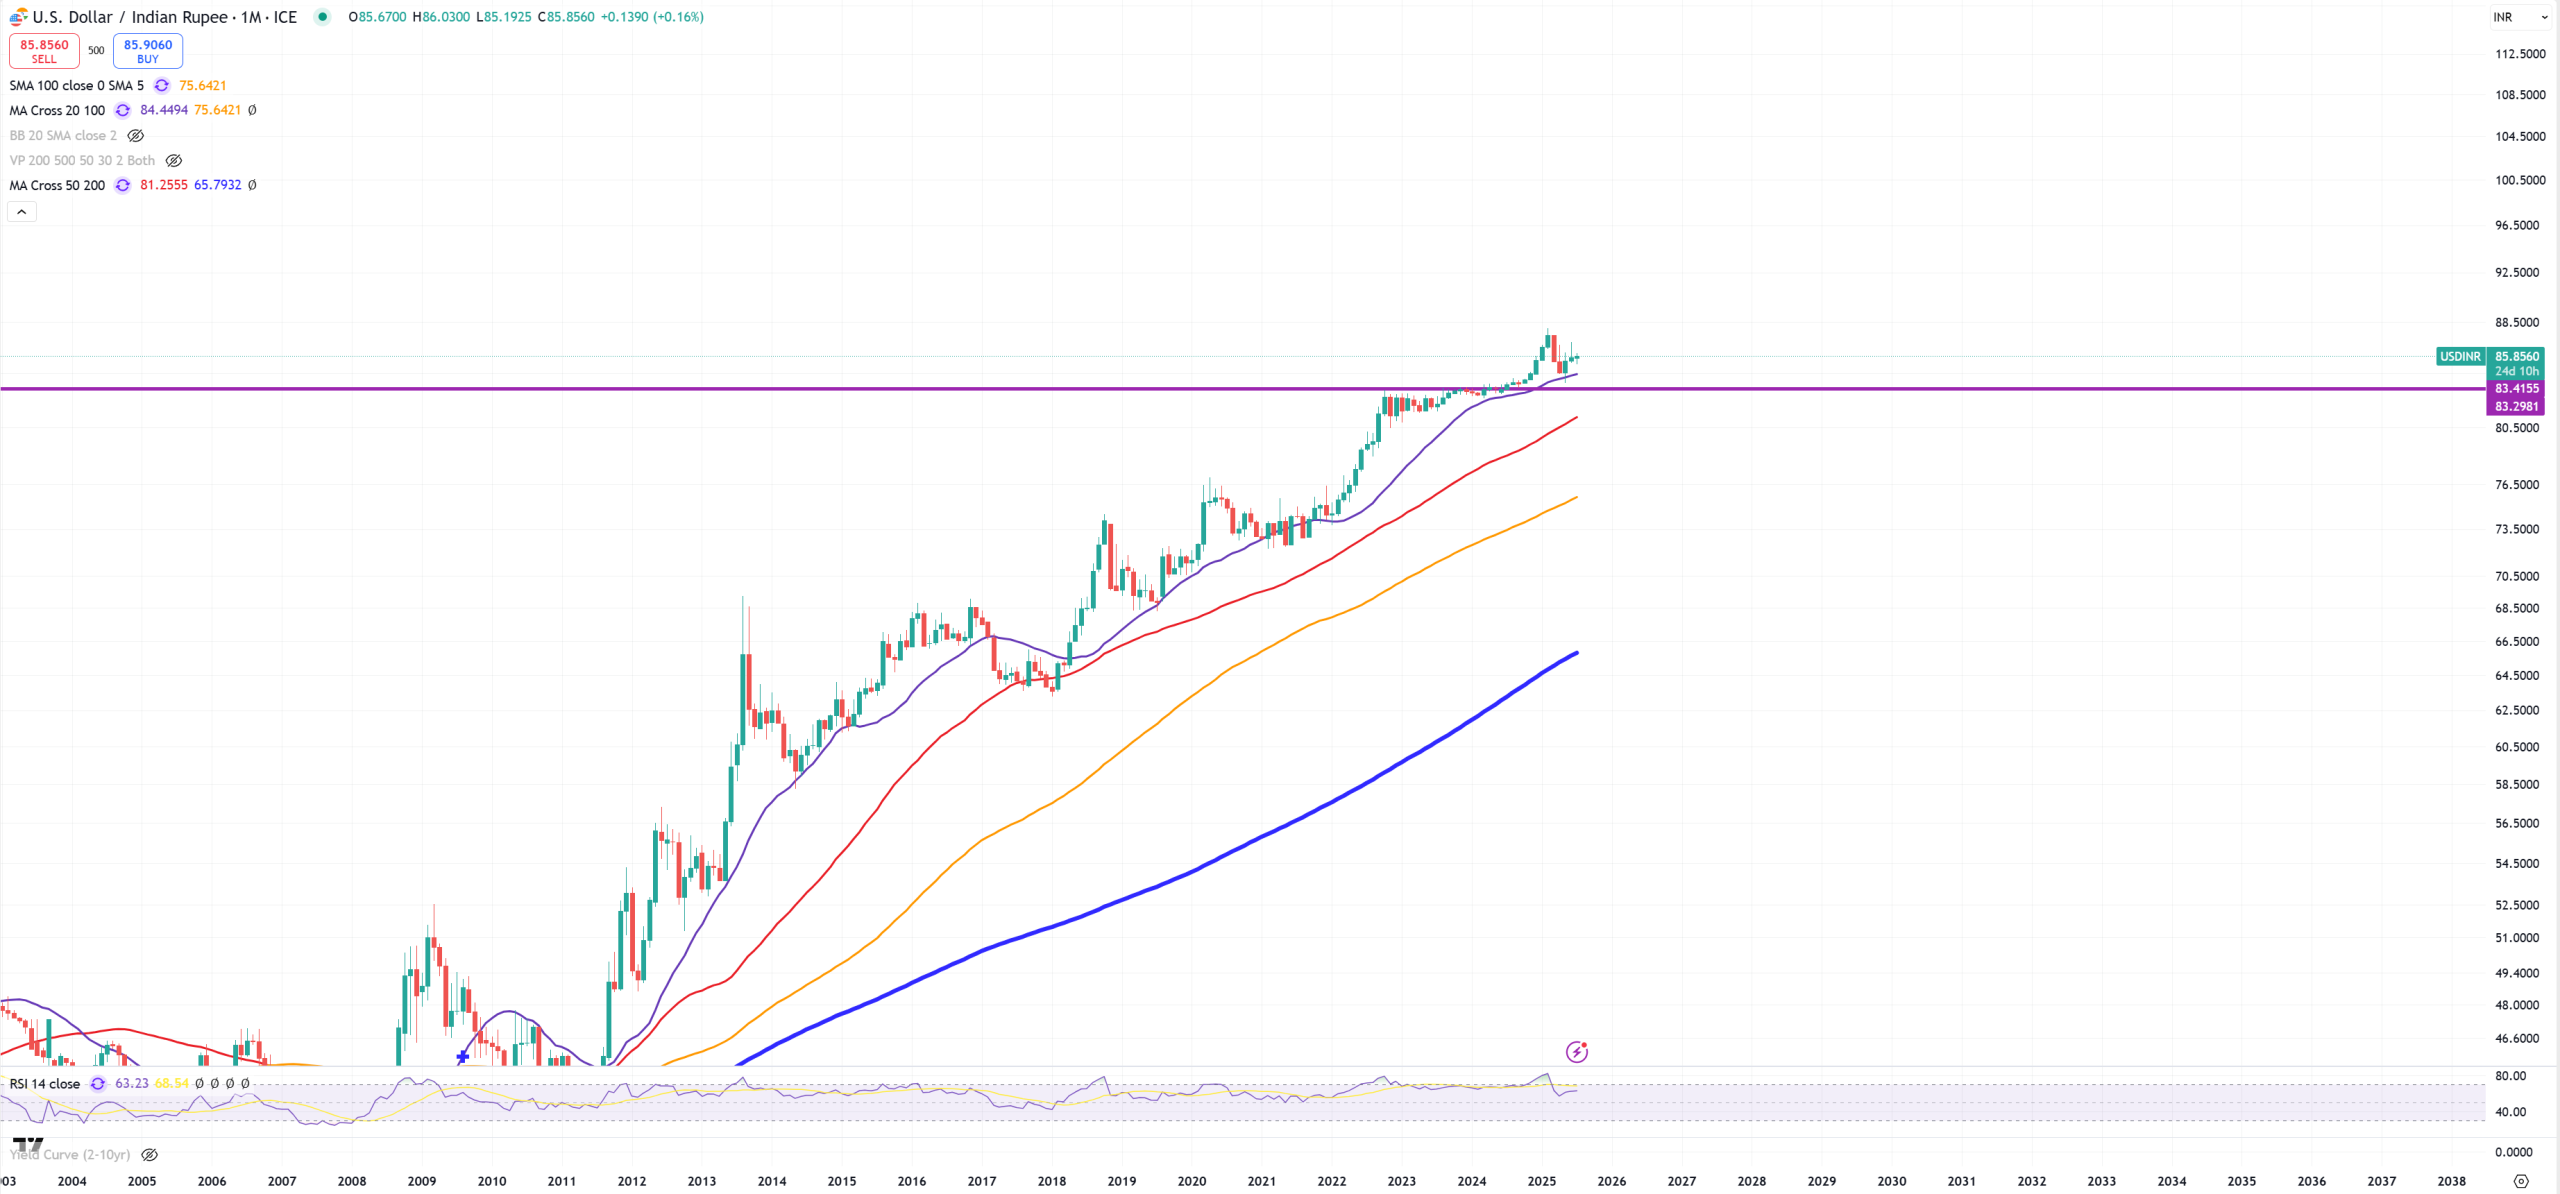
USDINR – Indian Rupee, so despite strong DXY down, just remember this move is mostly relative to key peers, mostly to EURUSD, not everywere we can say $$$ is weak, and USDINR is this example
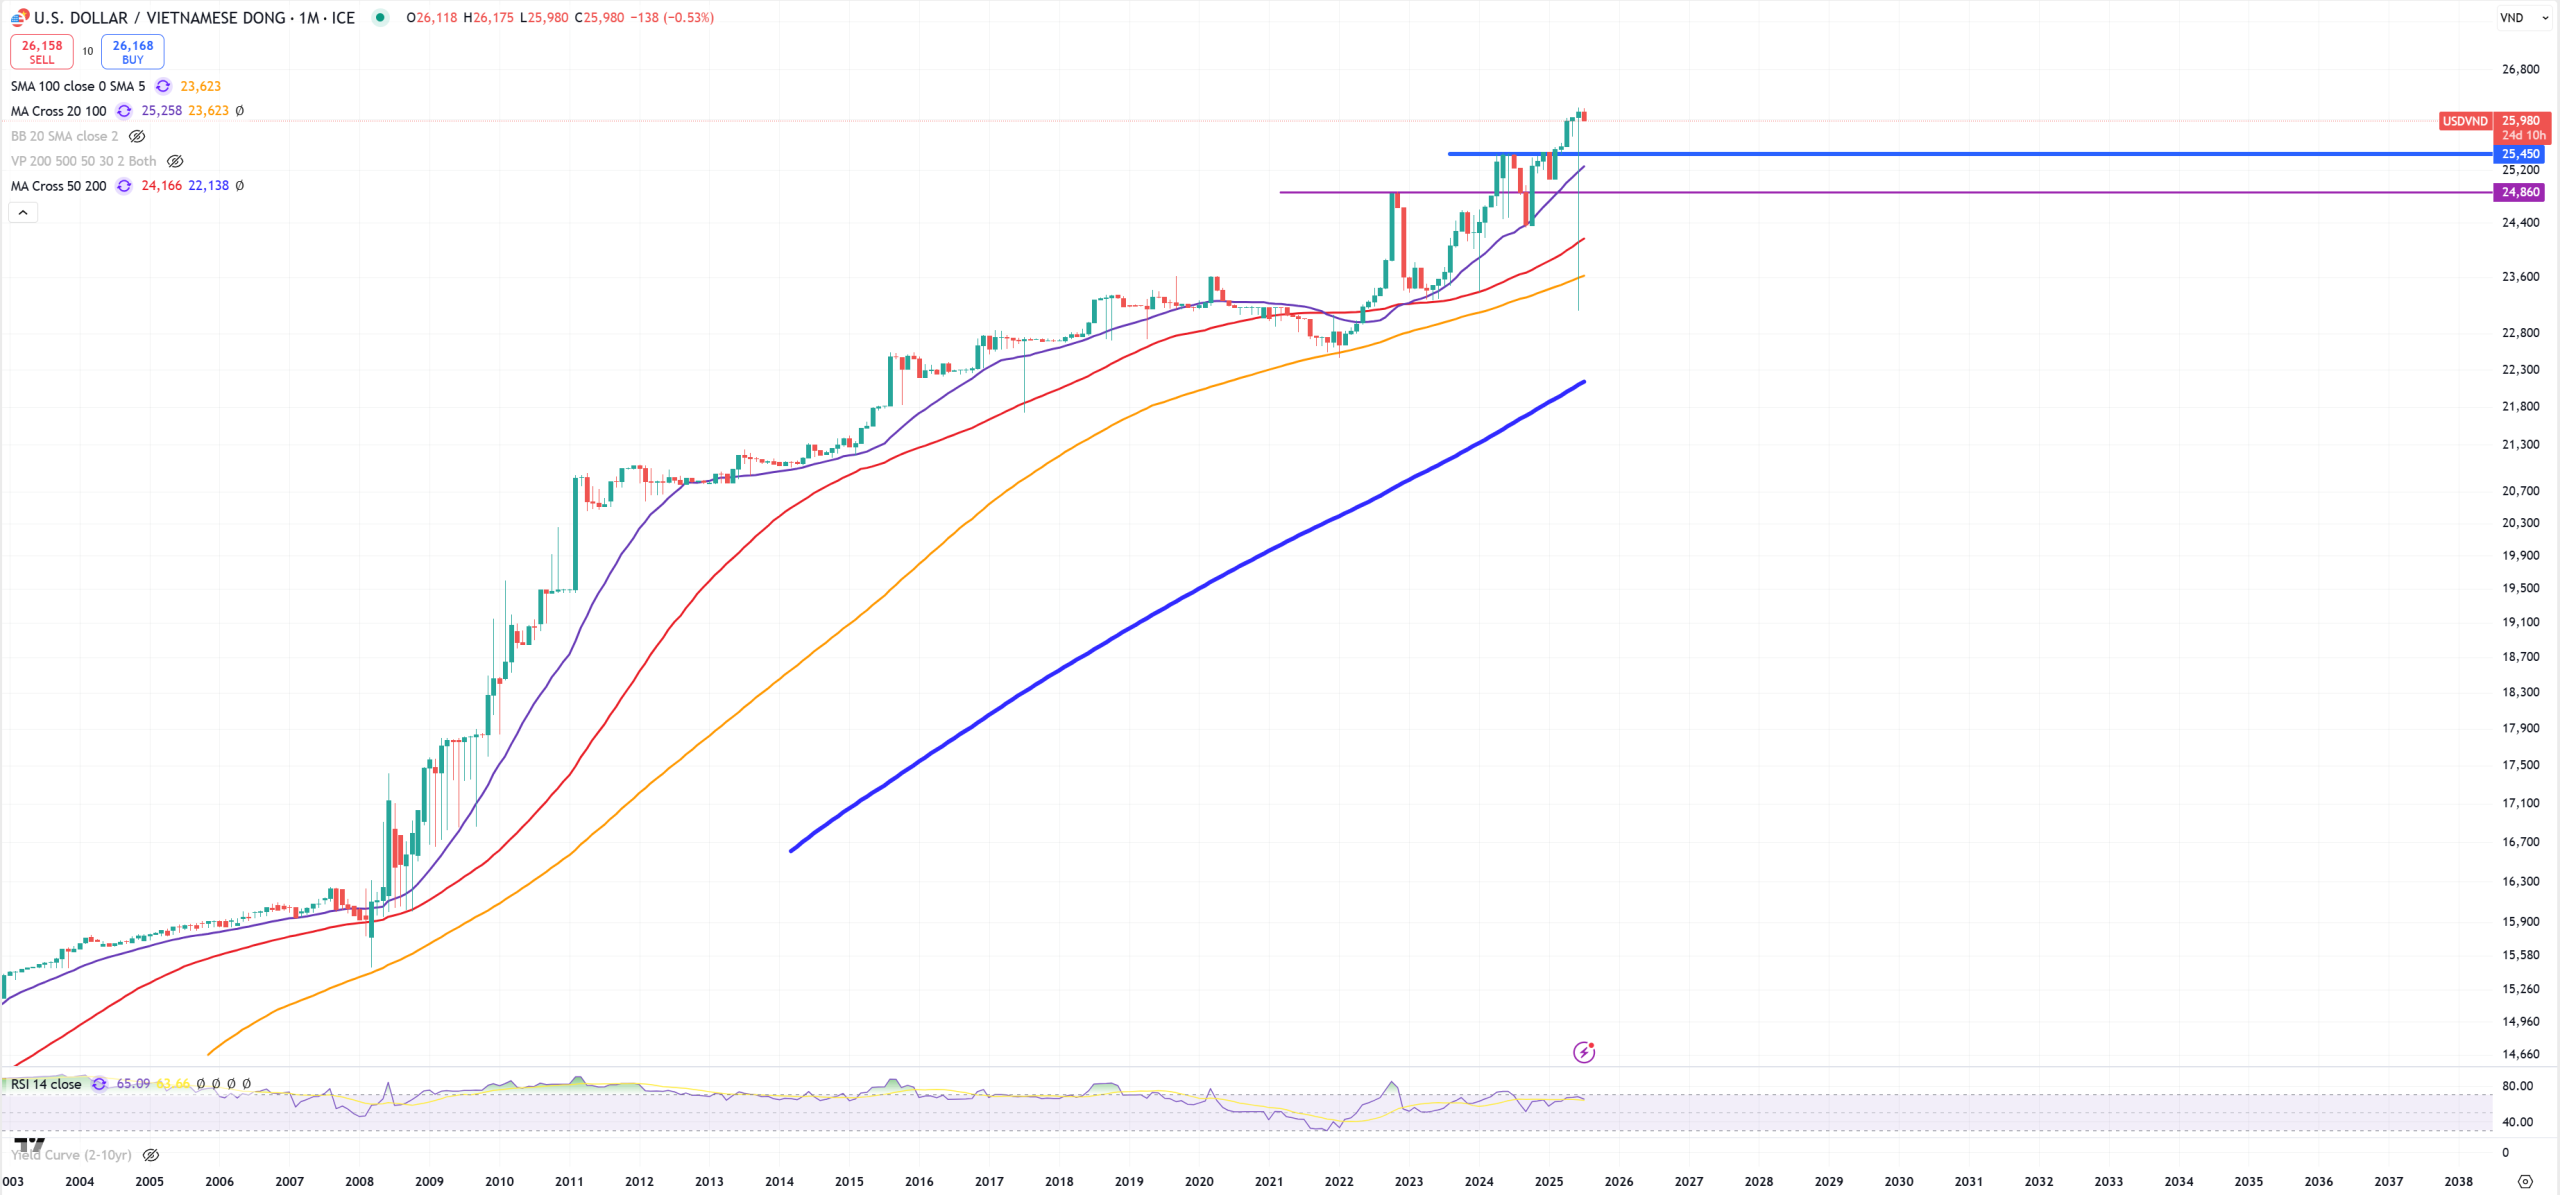
USDVND – Vietnamese Dong, slapped with 20% tariffs too, also very week, as you see this currency is in freefall.
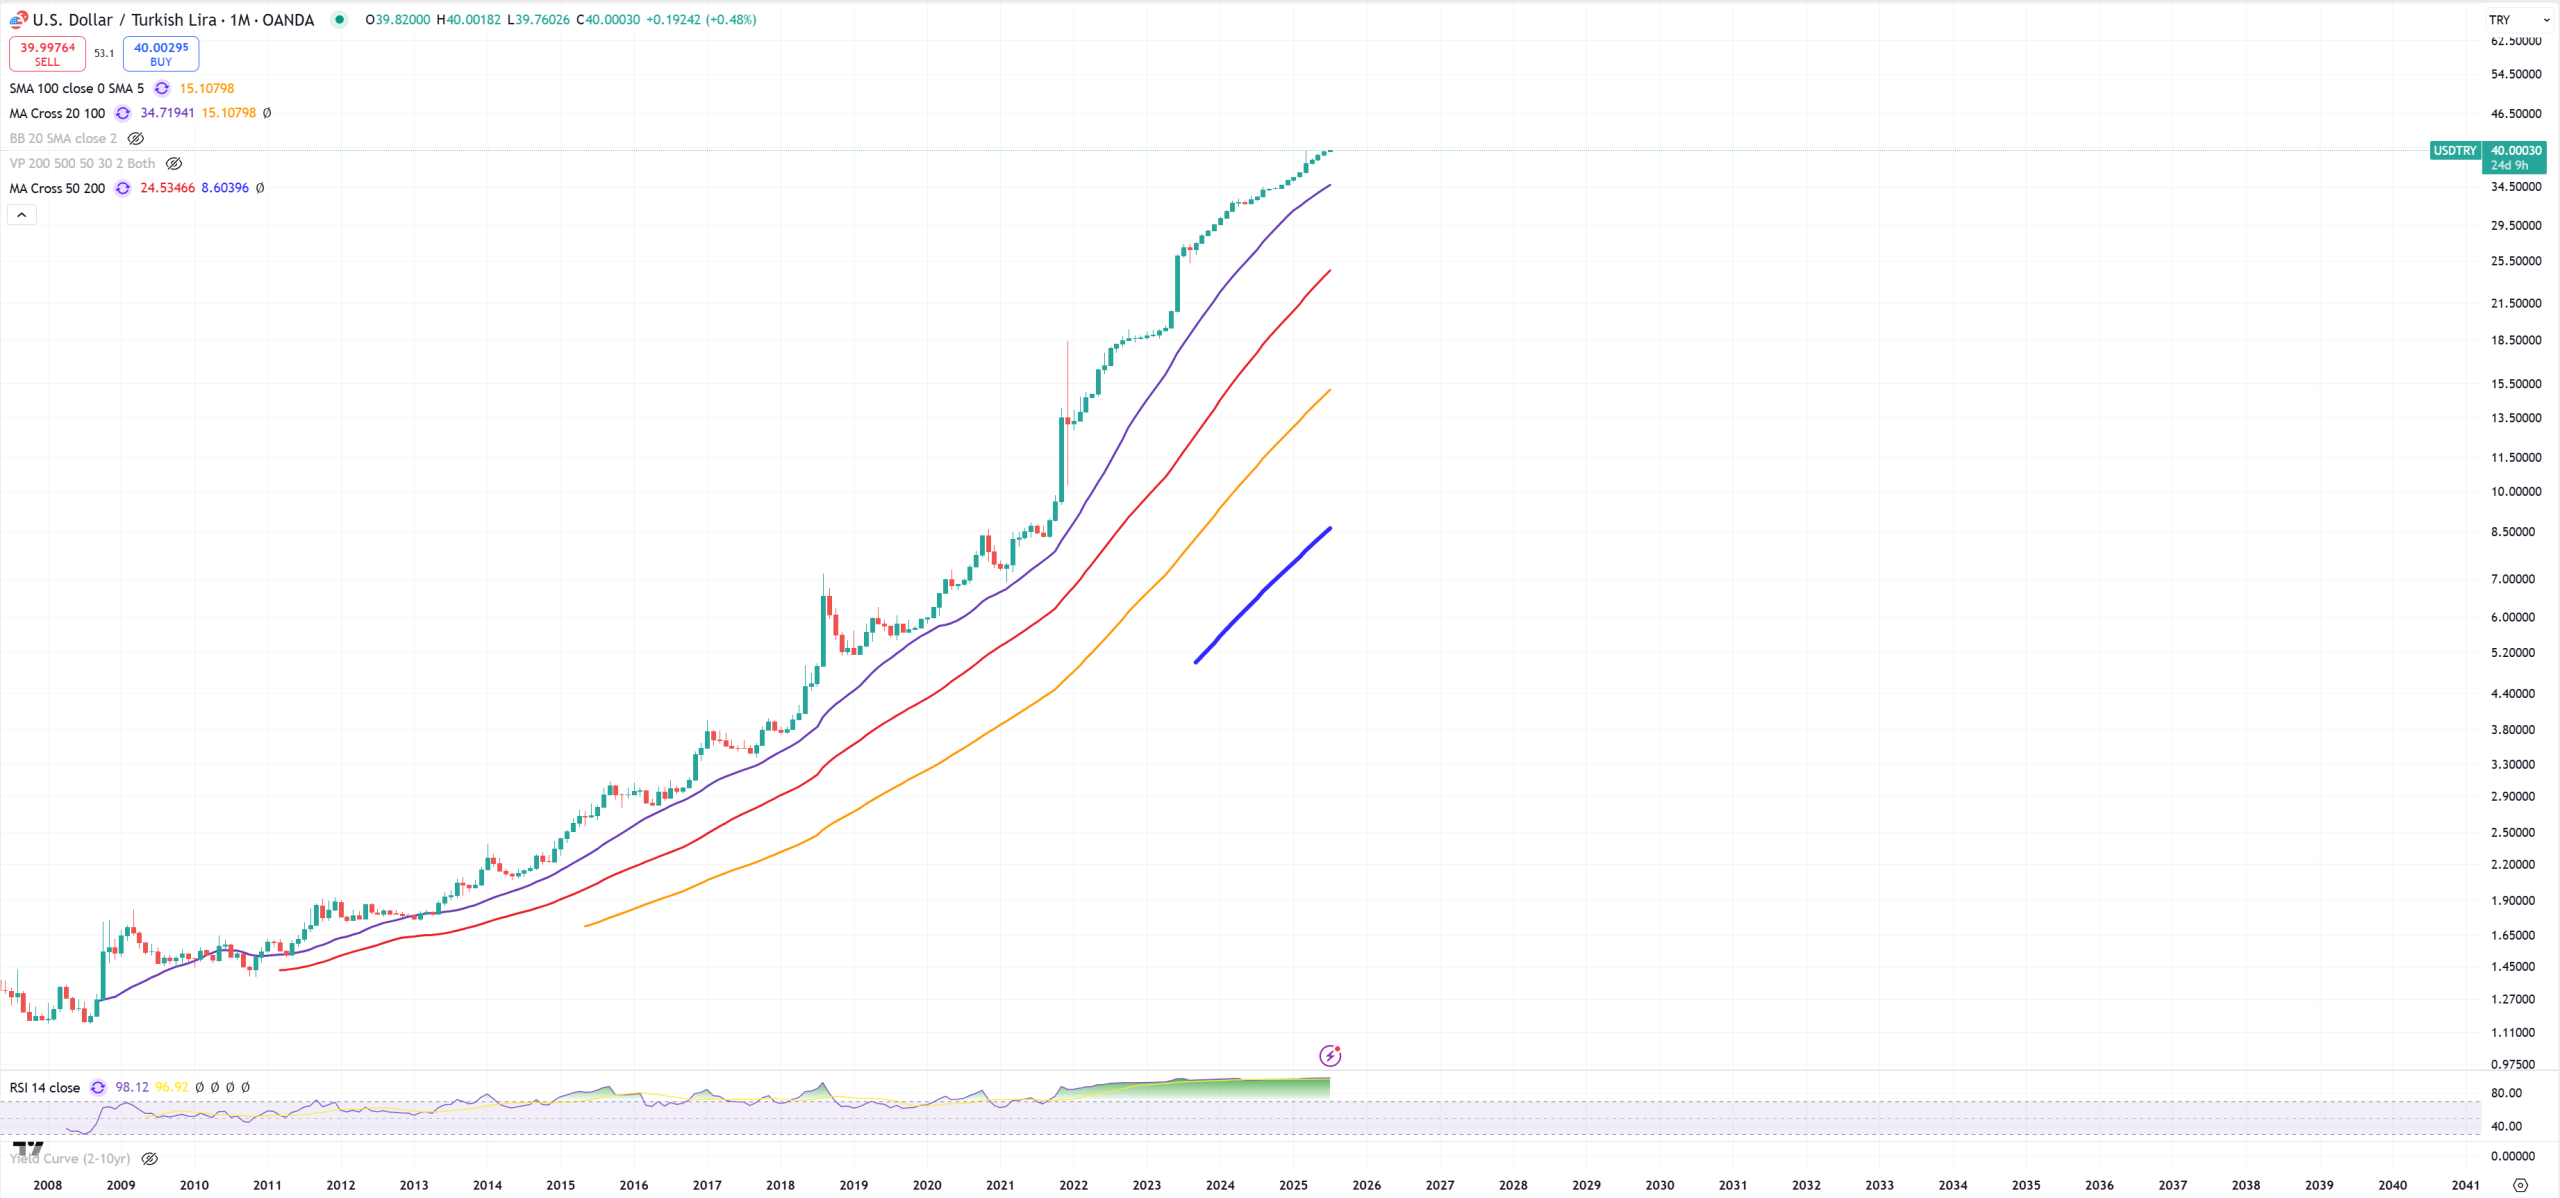
USDTRY – 40 on the table, I’m still shocked why It’s not 140 yet, but I assume it needs DXY to go a bit higher so the parabolic speed to the upside will arrive
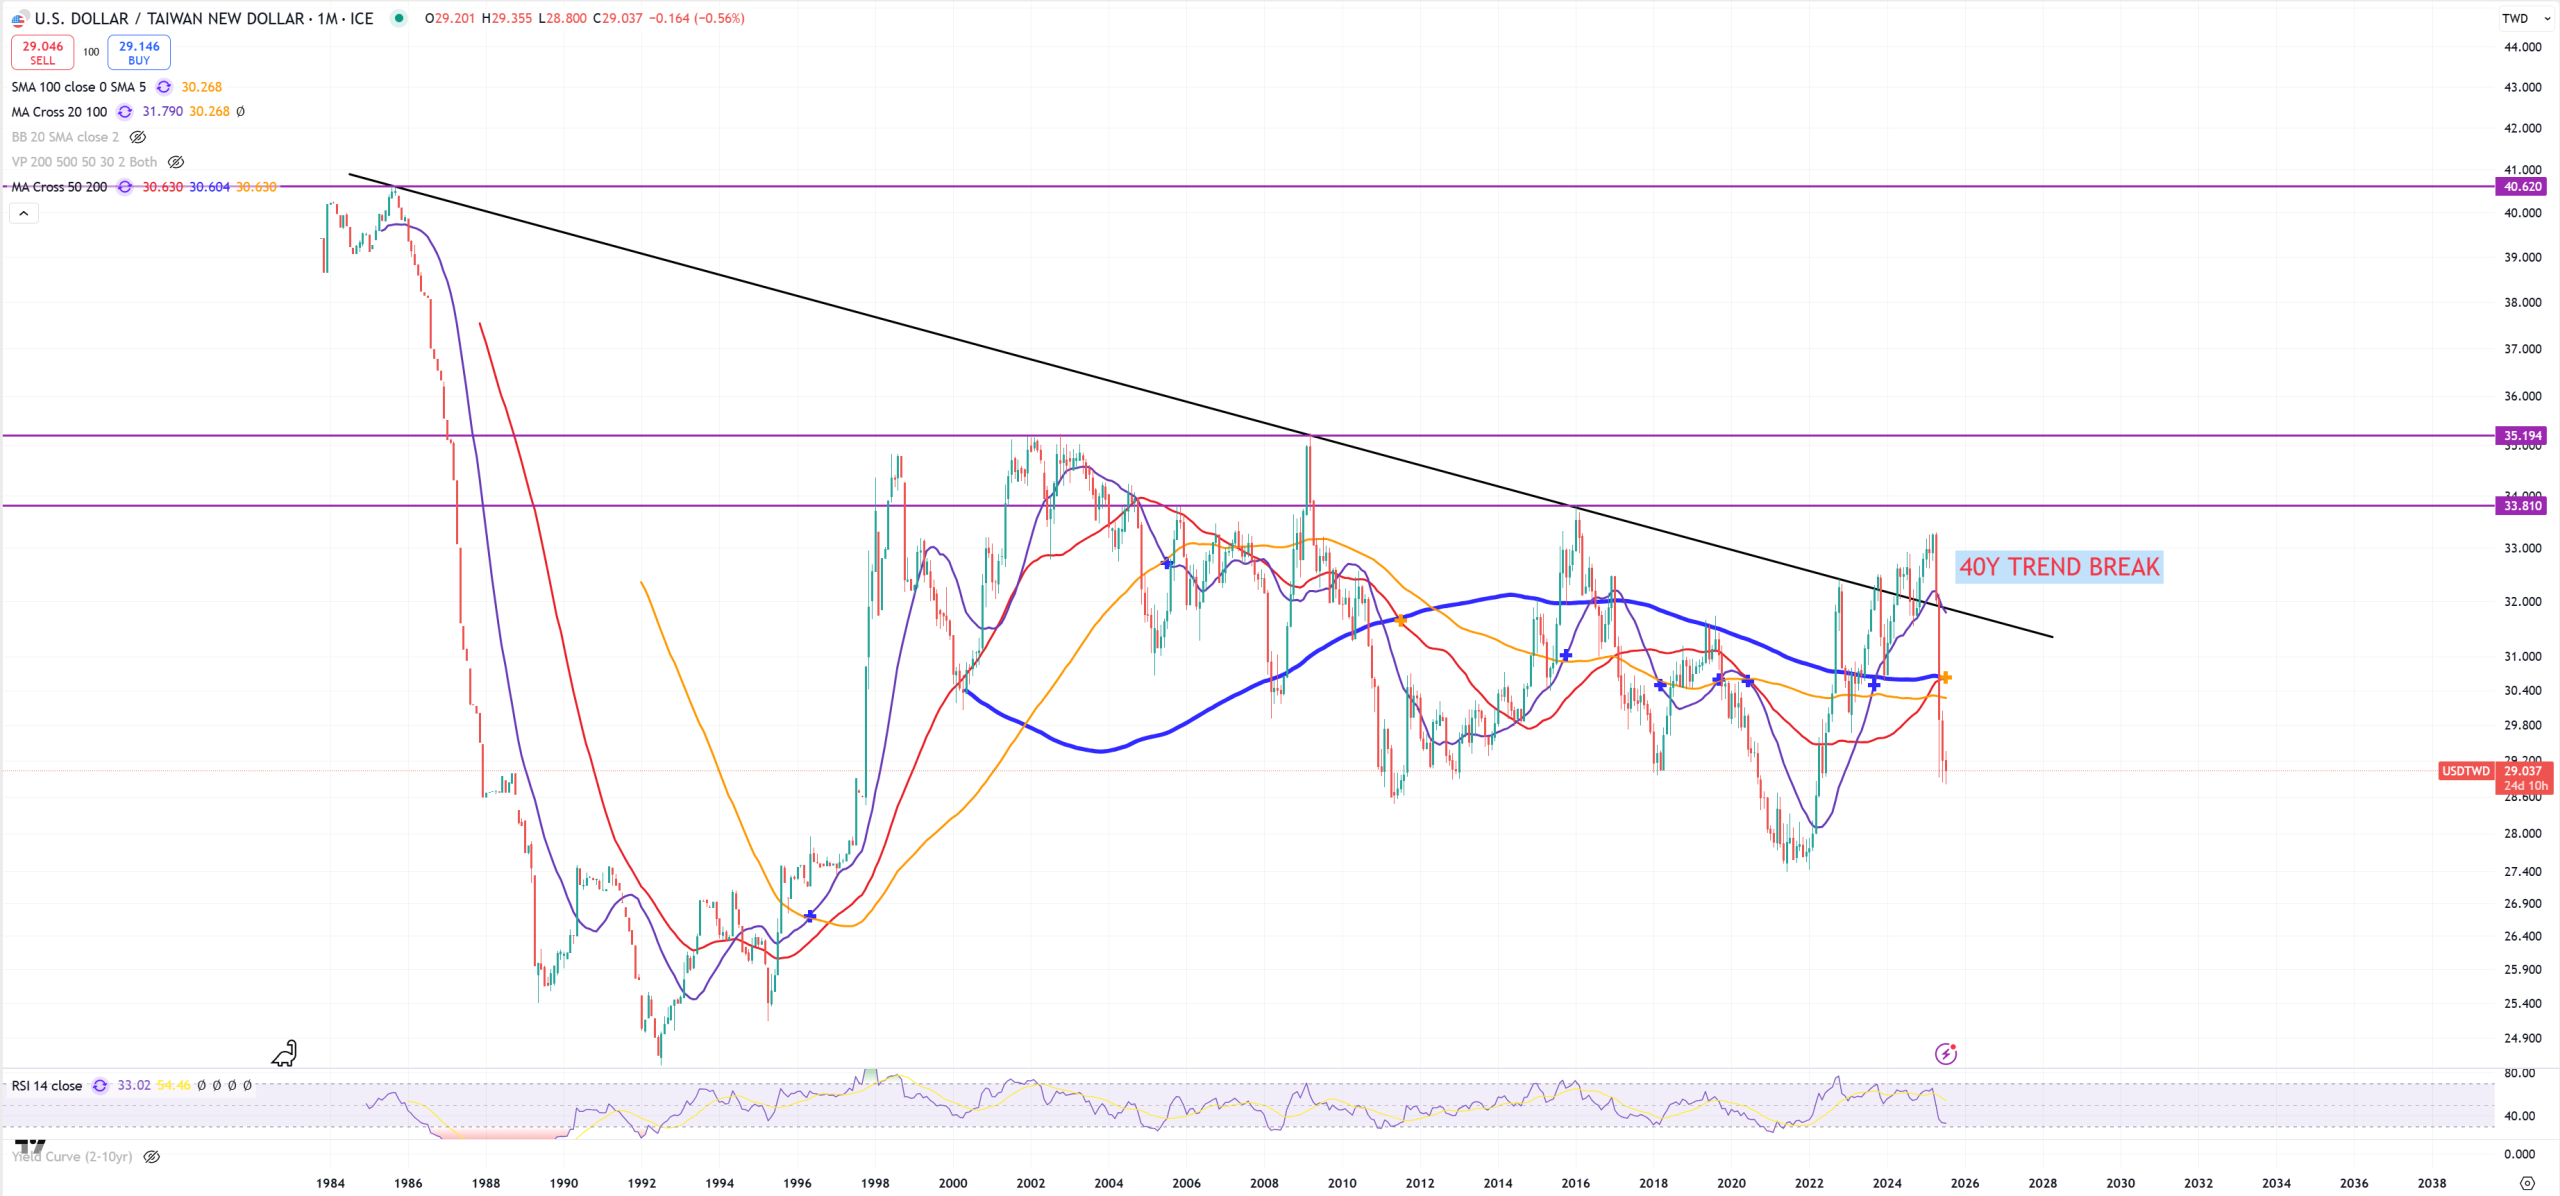
USDTWD – and my idea : 40Y trend break in USDTWD = peak in SOX, but it turned out to be a massive trap here, and SOX jumped higher.
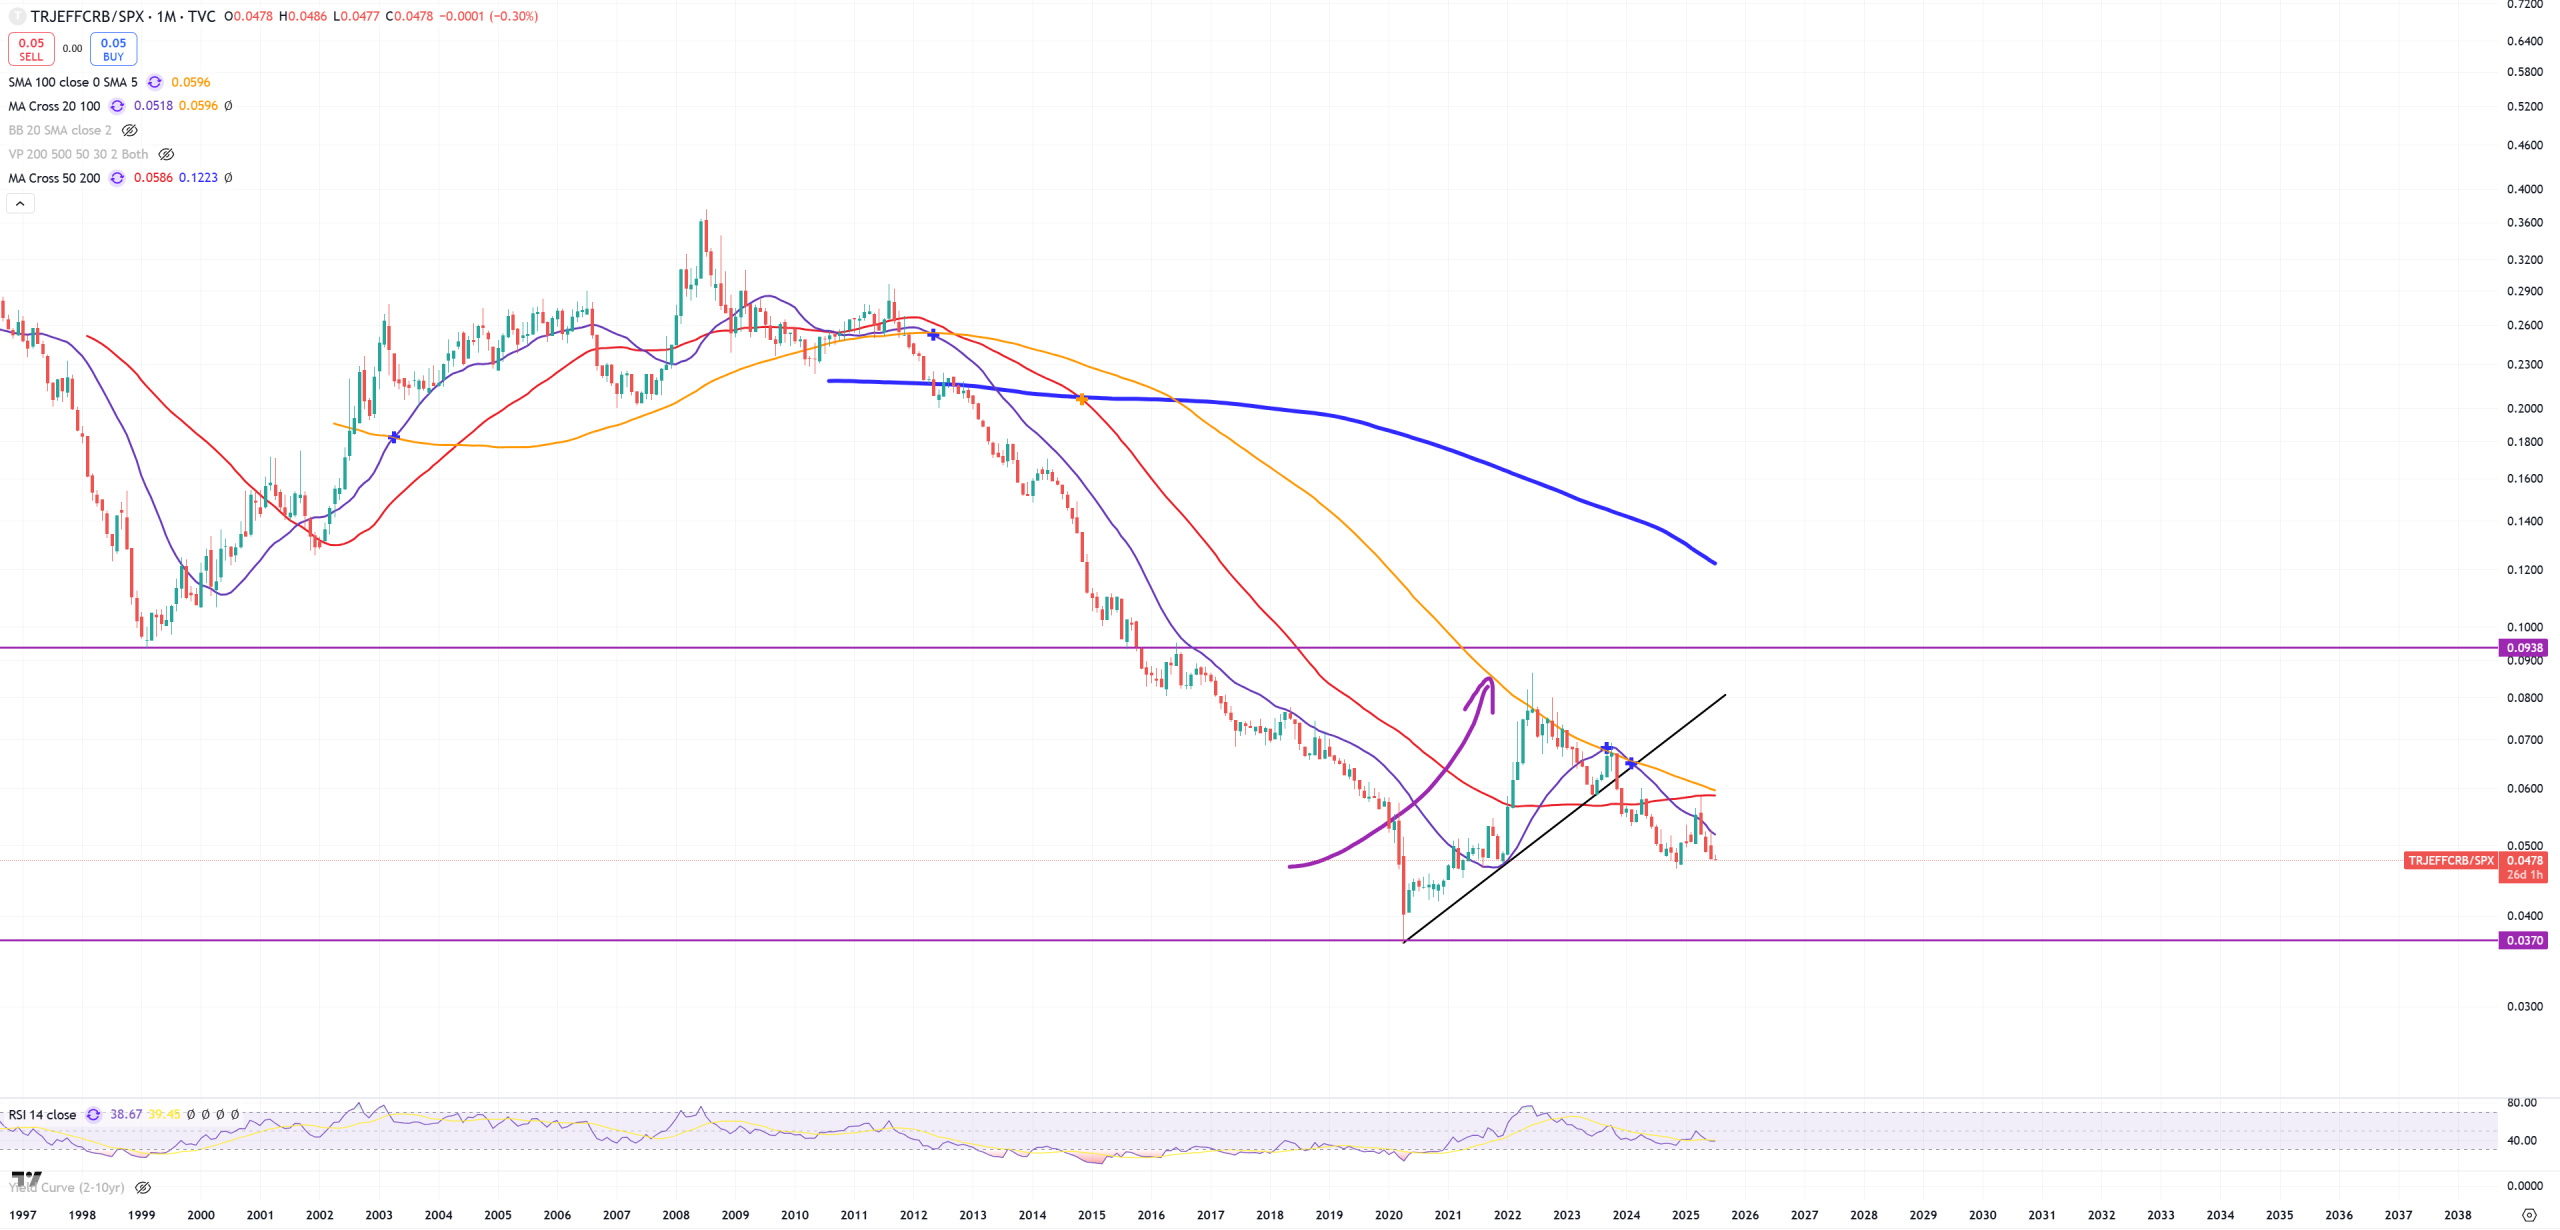
CRB/SPX – Commodity CRB Index / SPX – you see peak in Jul 2008, from that moment move down. Since 2020 inflationary spike lifting CRB/SPX towards Jul 2022 peak and again move down.
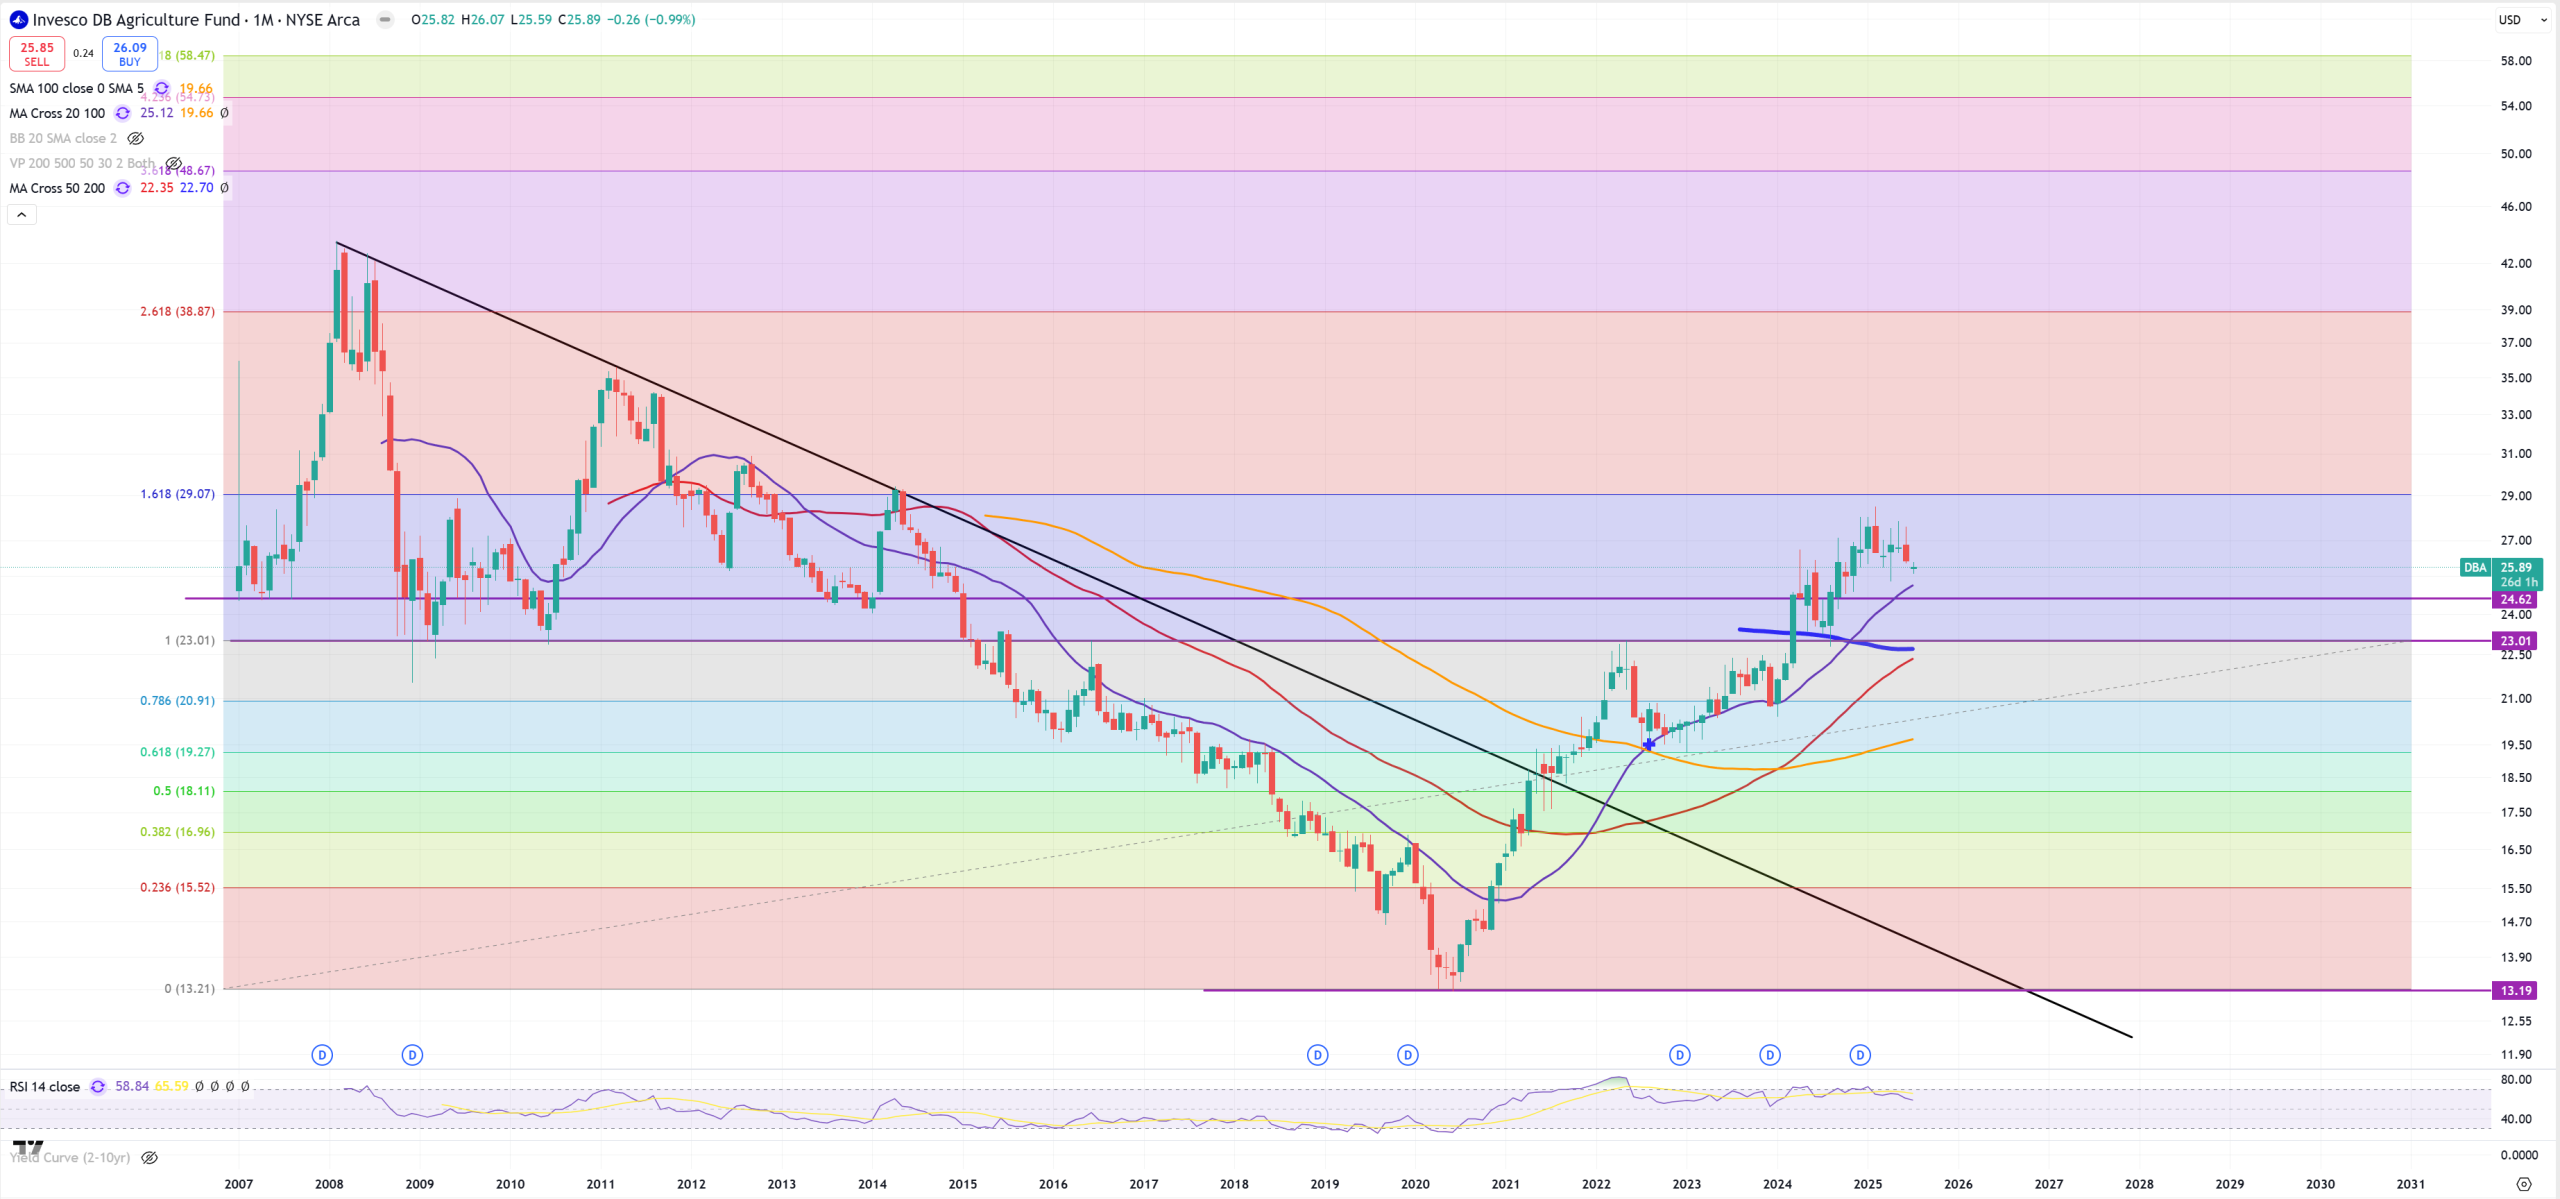
DBA – Agruculture commodities ETN – this is your food inflation index. It stays strong, and IMO it’ll stay strong until we eliminate excess consumption and seriously crash the market. Food inflation stays here to make sure you will not buy new iPhone, go to holiday, buy new computer etc.
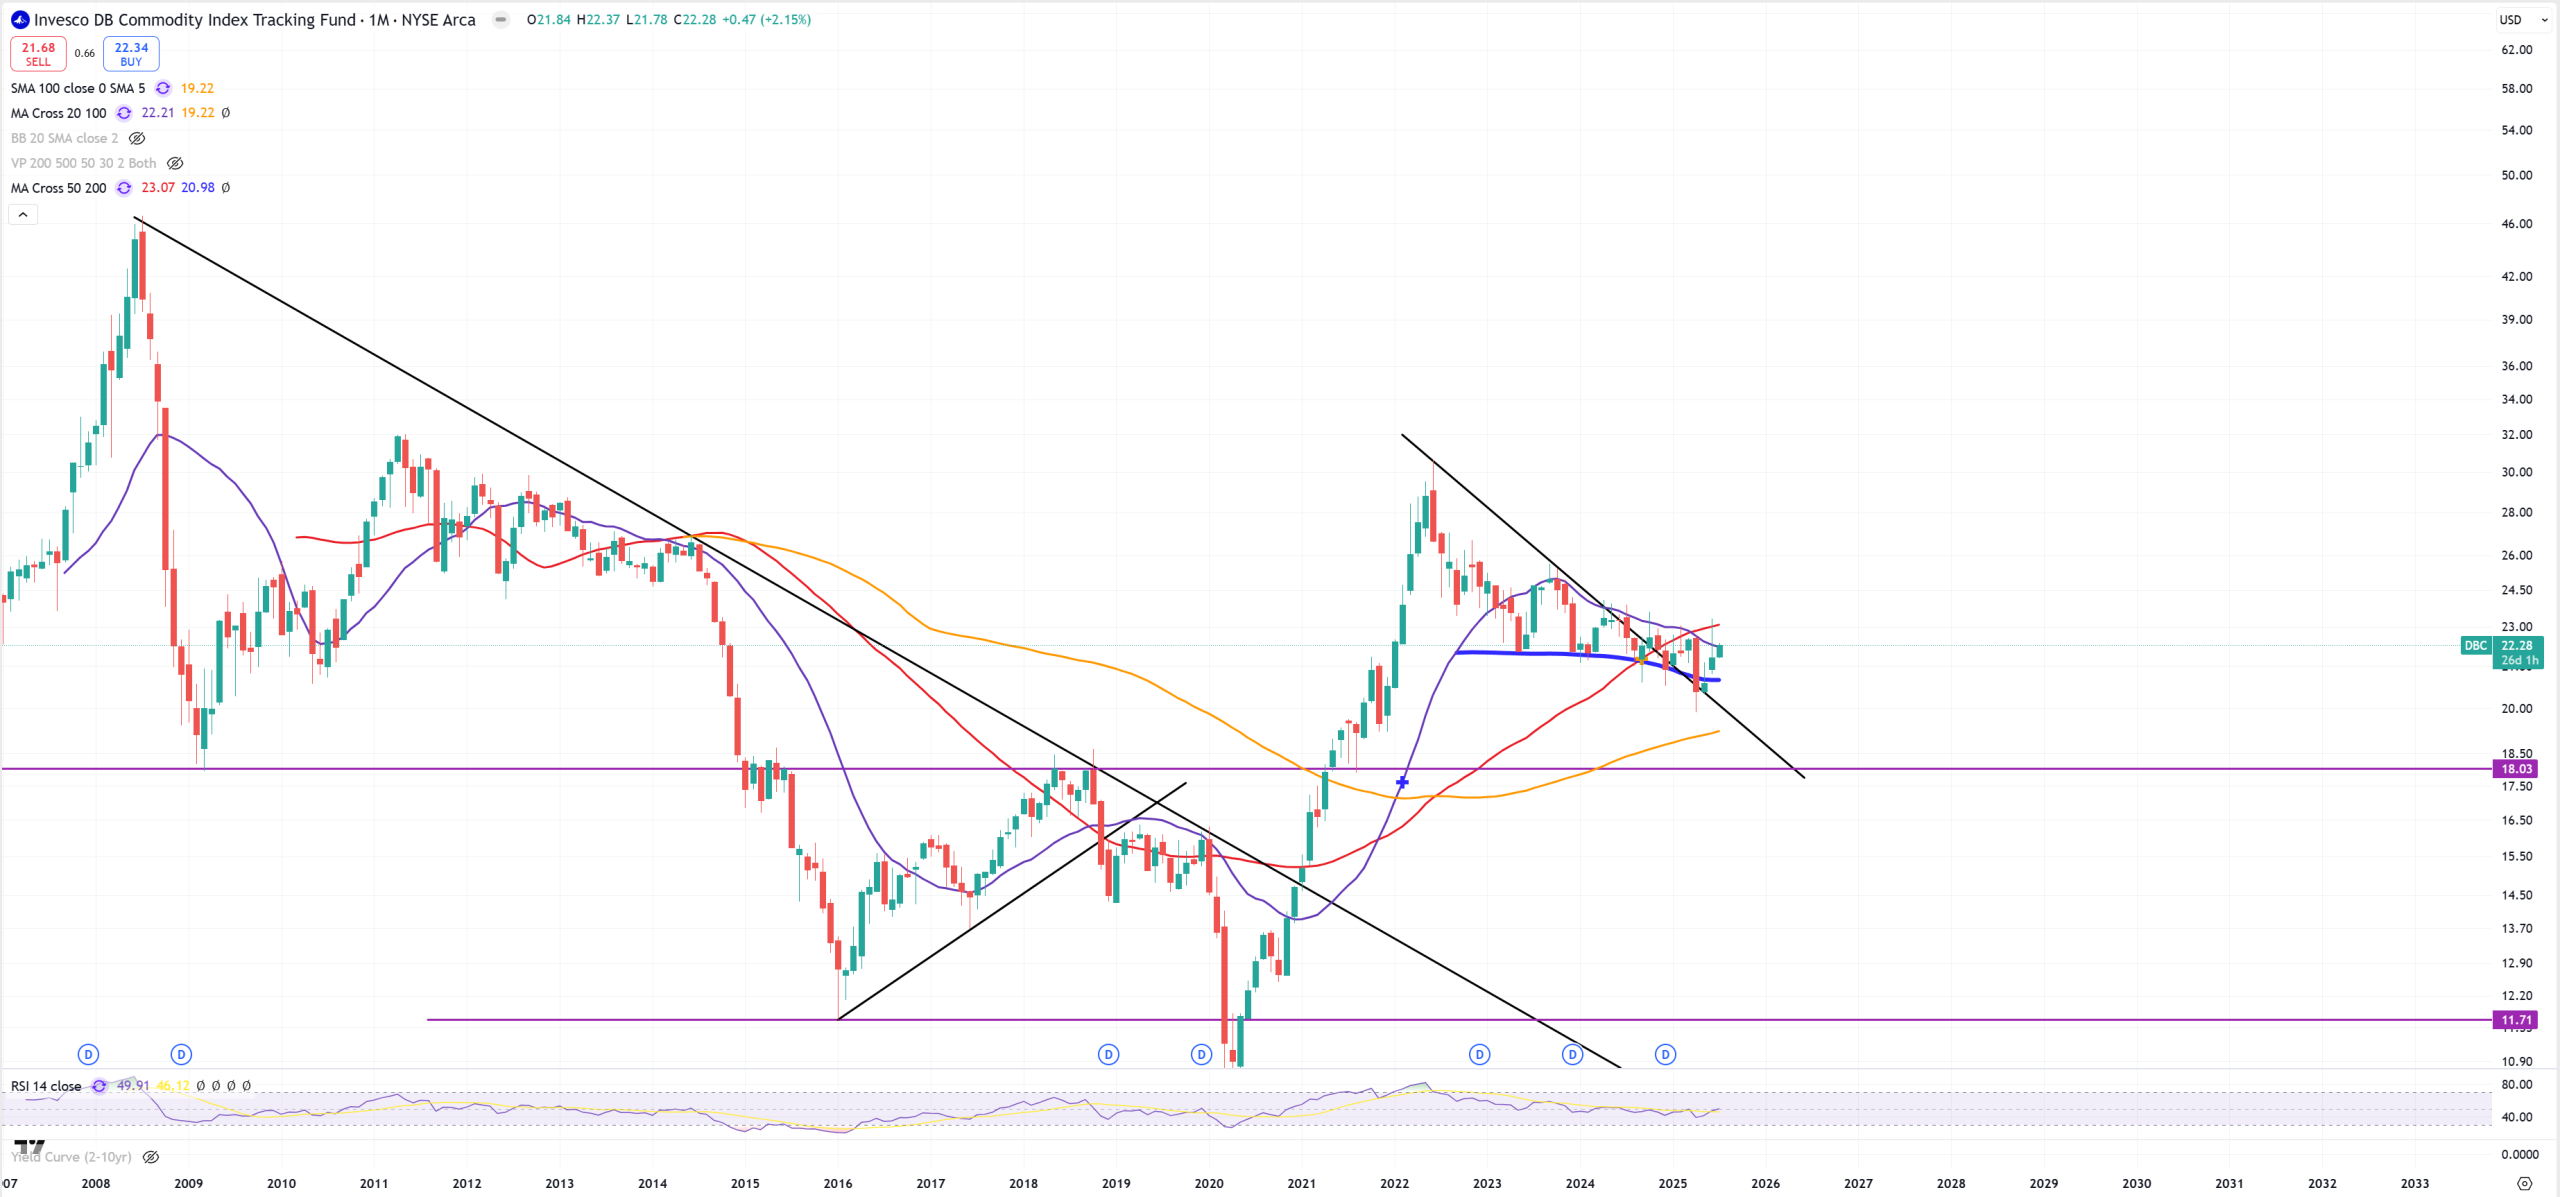
DBC – Commodities ETN – it fights hard, you see this blue (M)MA200 was support for long time, but now market wants to go down and break it again, but bulls fights.
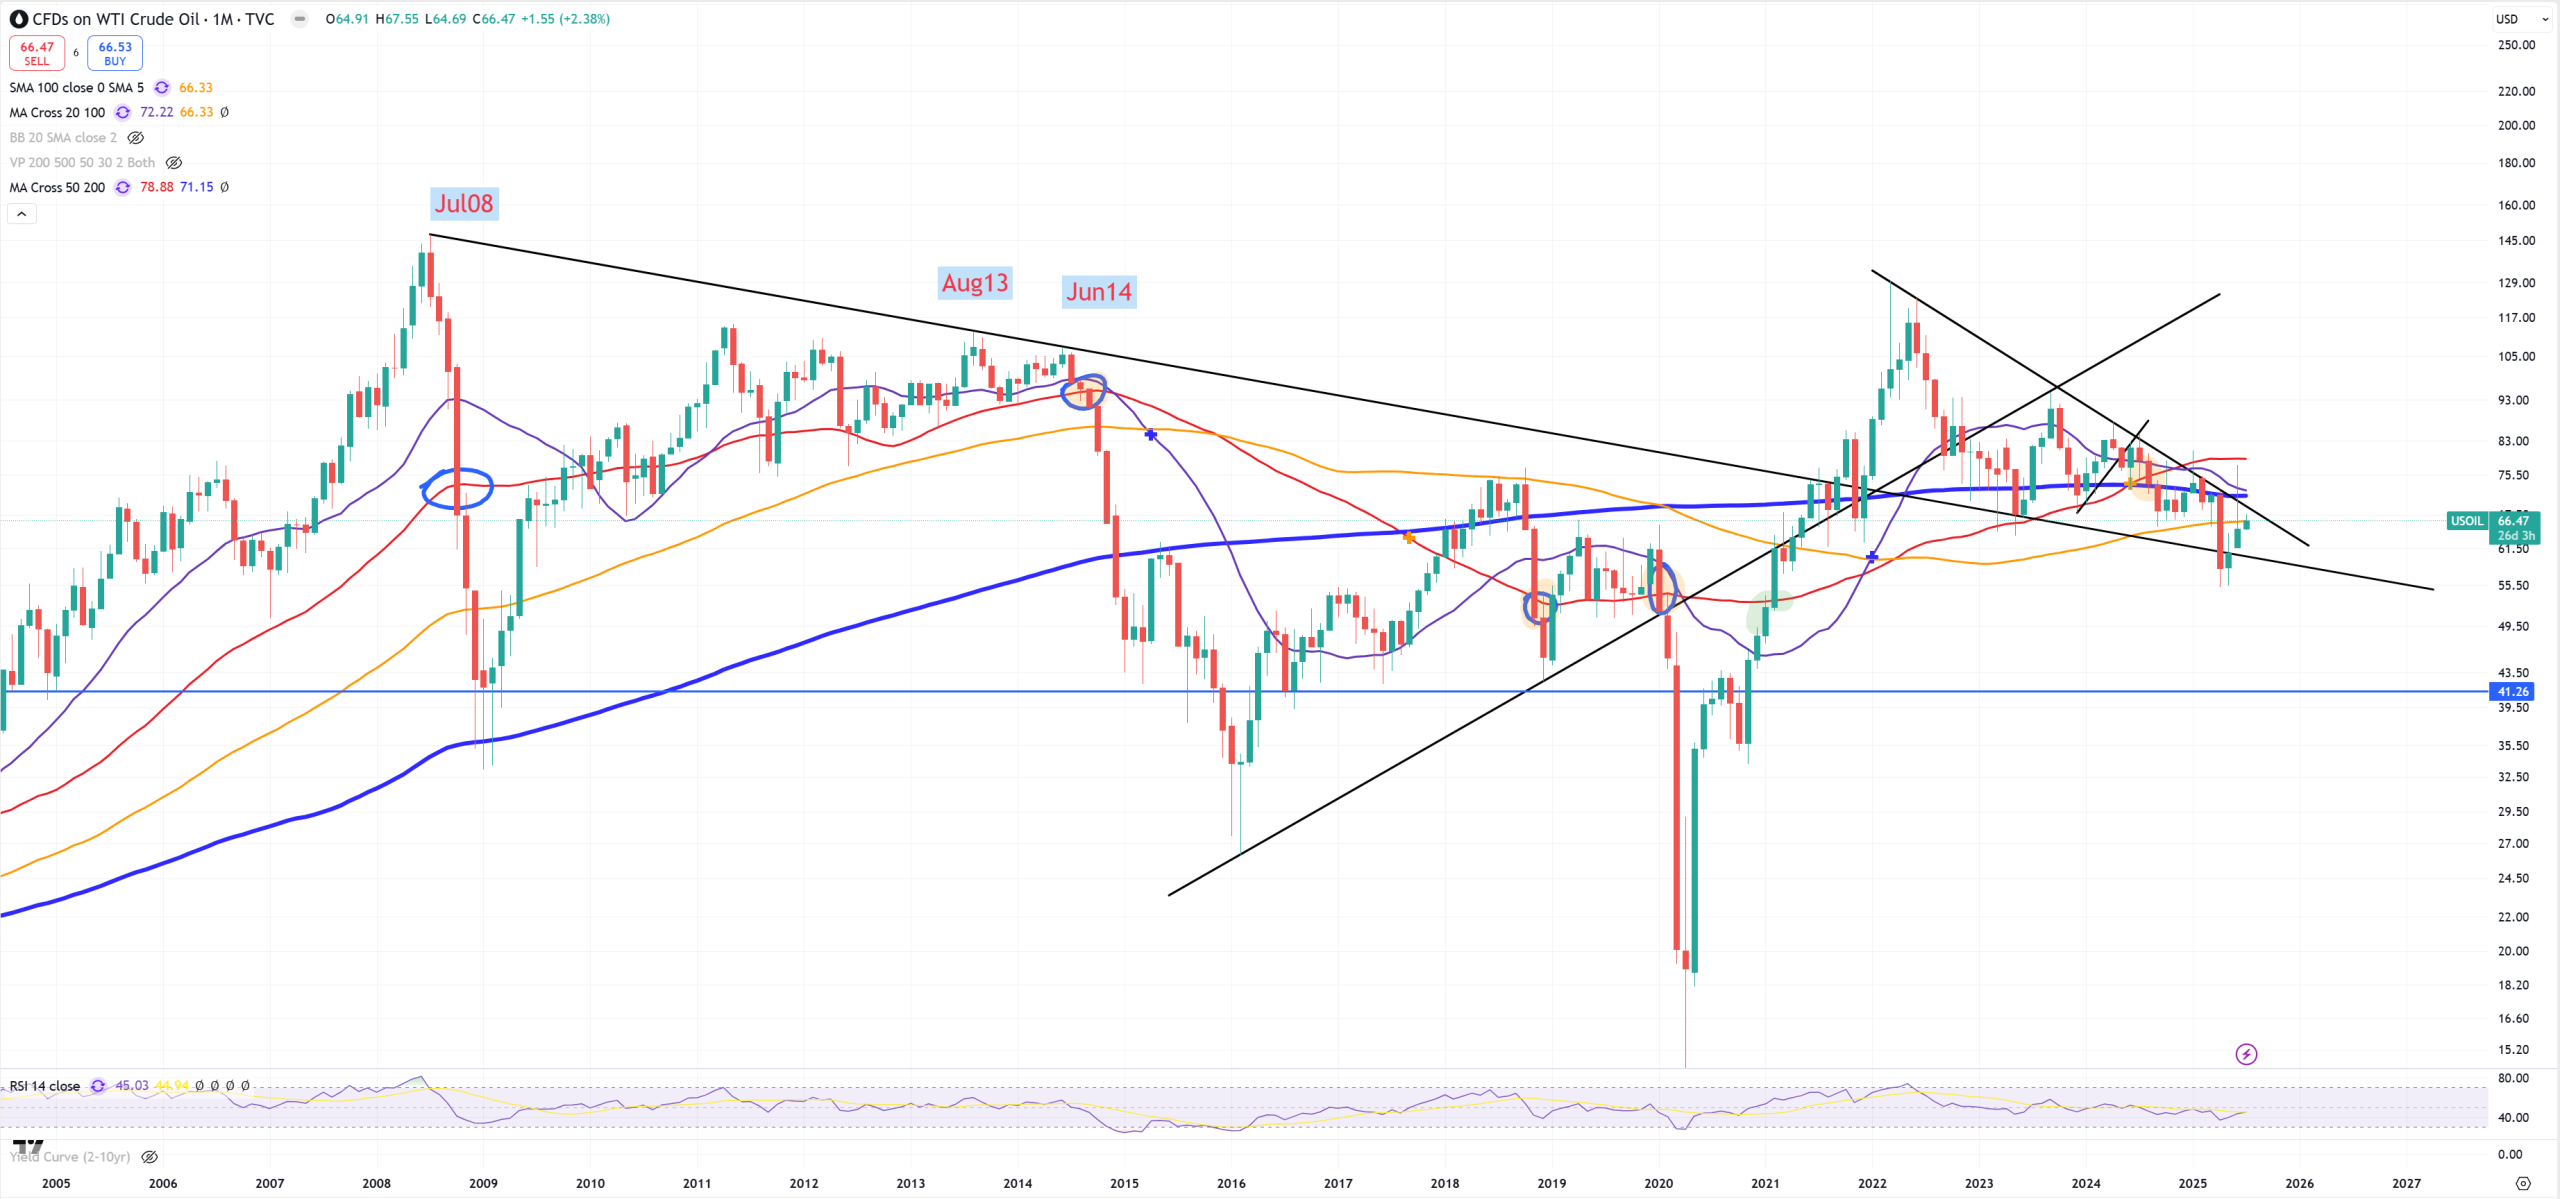
OIL – runs away from the hammer, breaking down trend 08-13-14. This is still related also to USDCNH trying to break 7.37 and made a come back to 7.16 just in inverted way.
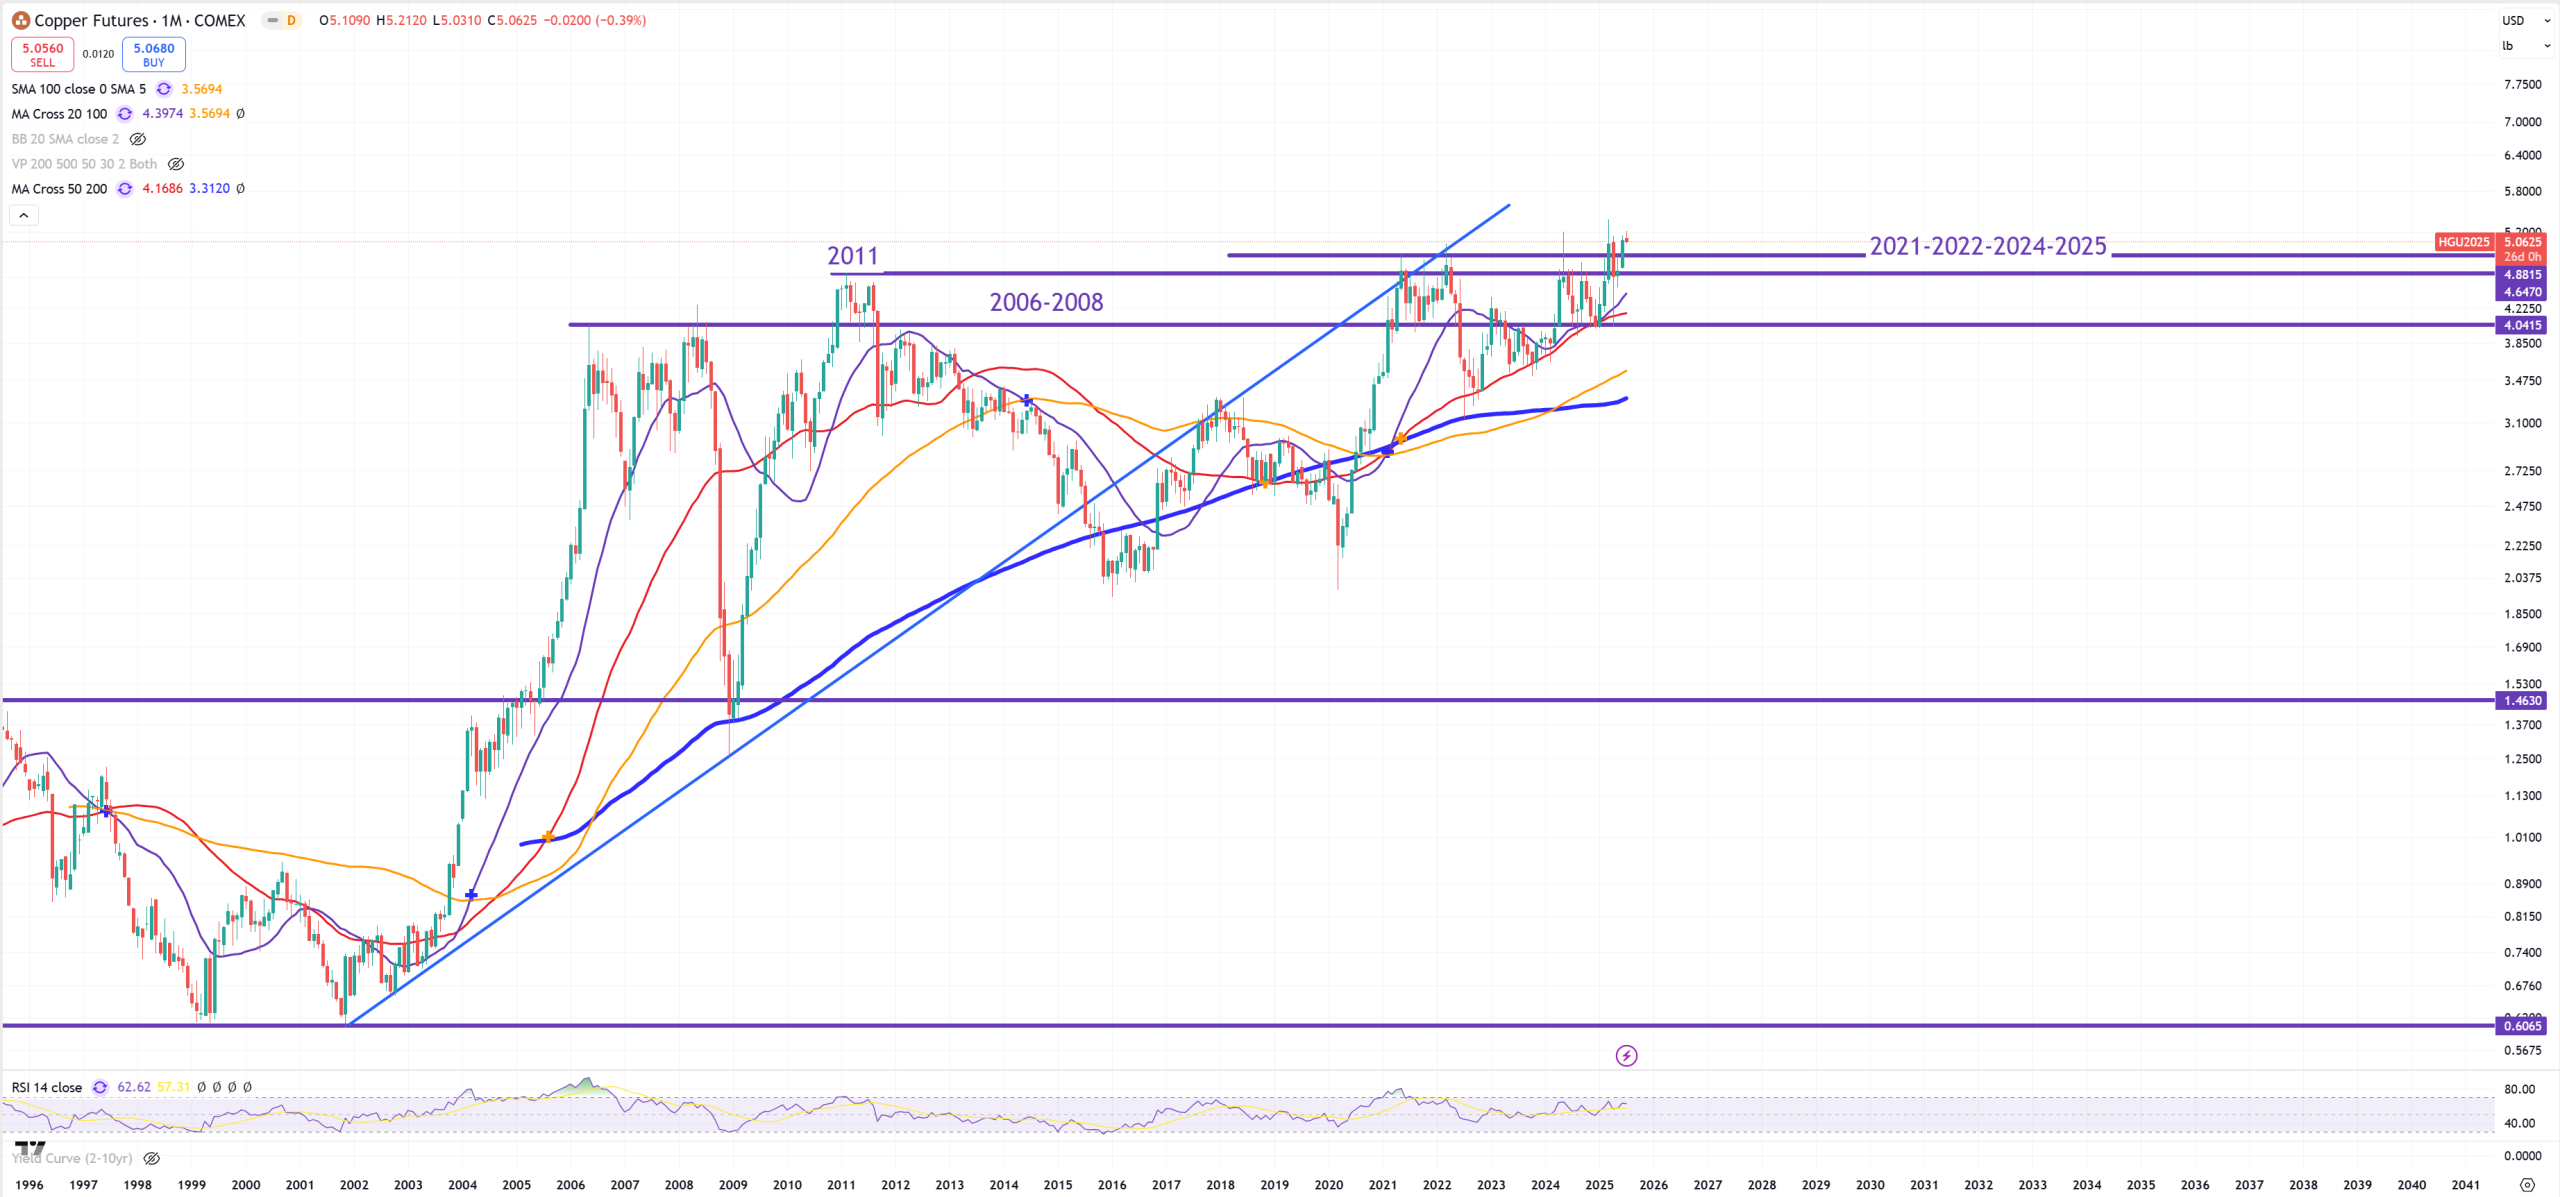
COPPER – Copper goes where Yuan goes, as USDCNH goes down = COPPER goes up.
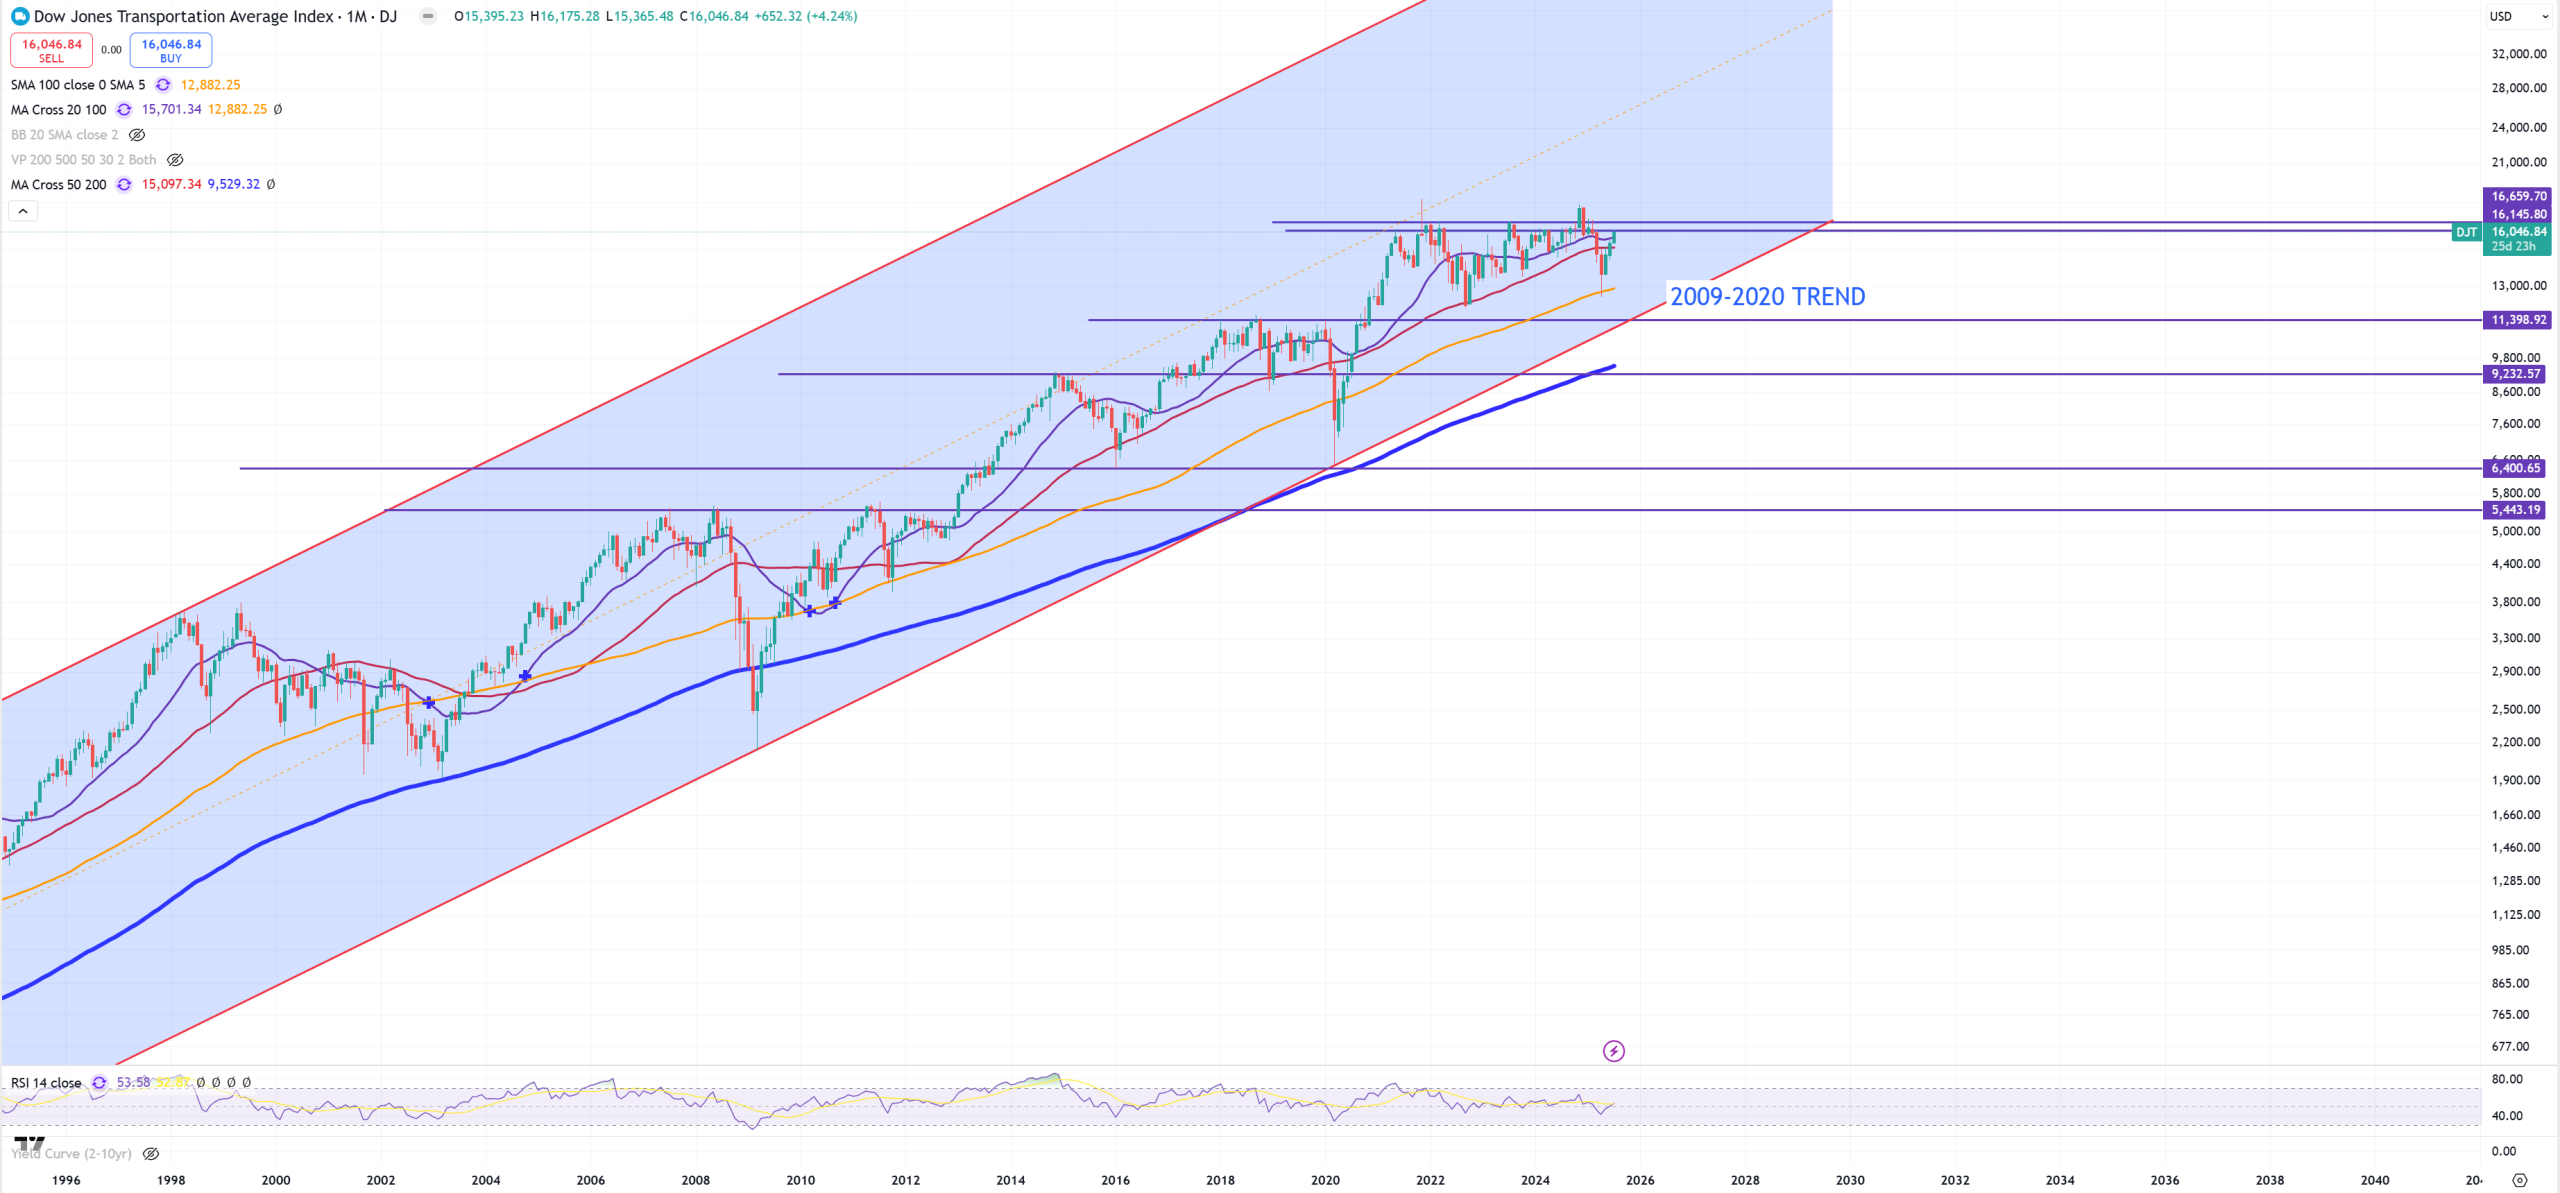
DJT – So Transportation – flat since 2021
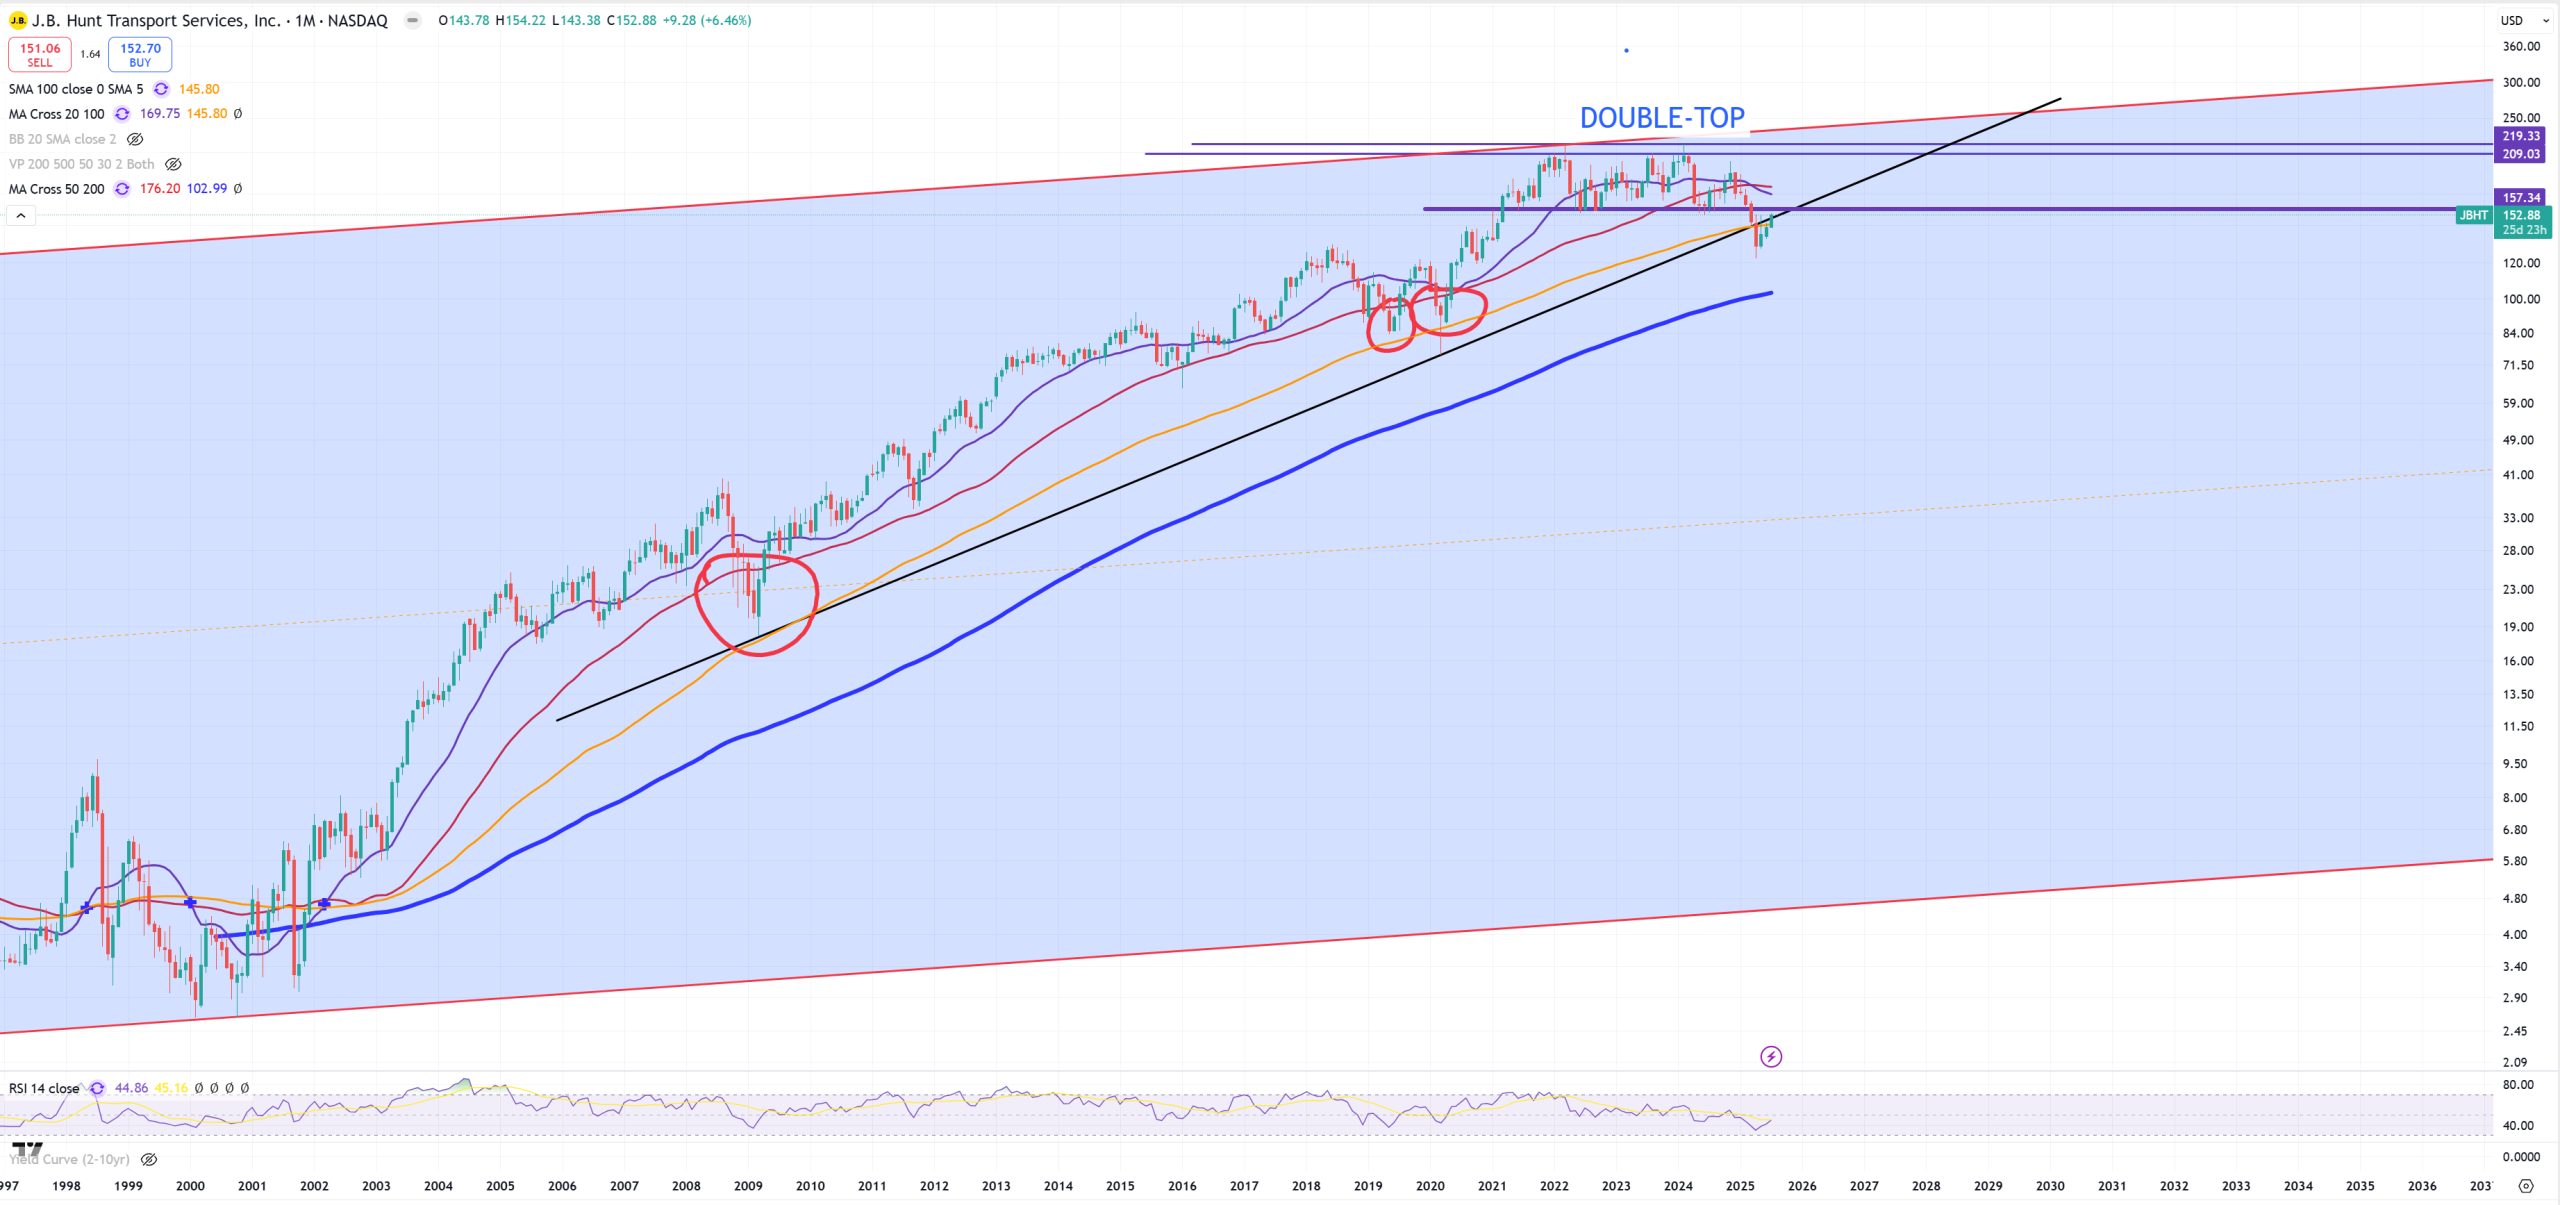
JBHT – So transportation – previous month ended on retest to trend and yellow (M)MA100, July market rallies let’s see where it’ll end at the end of a month.
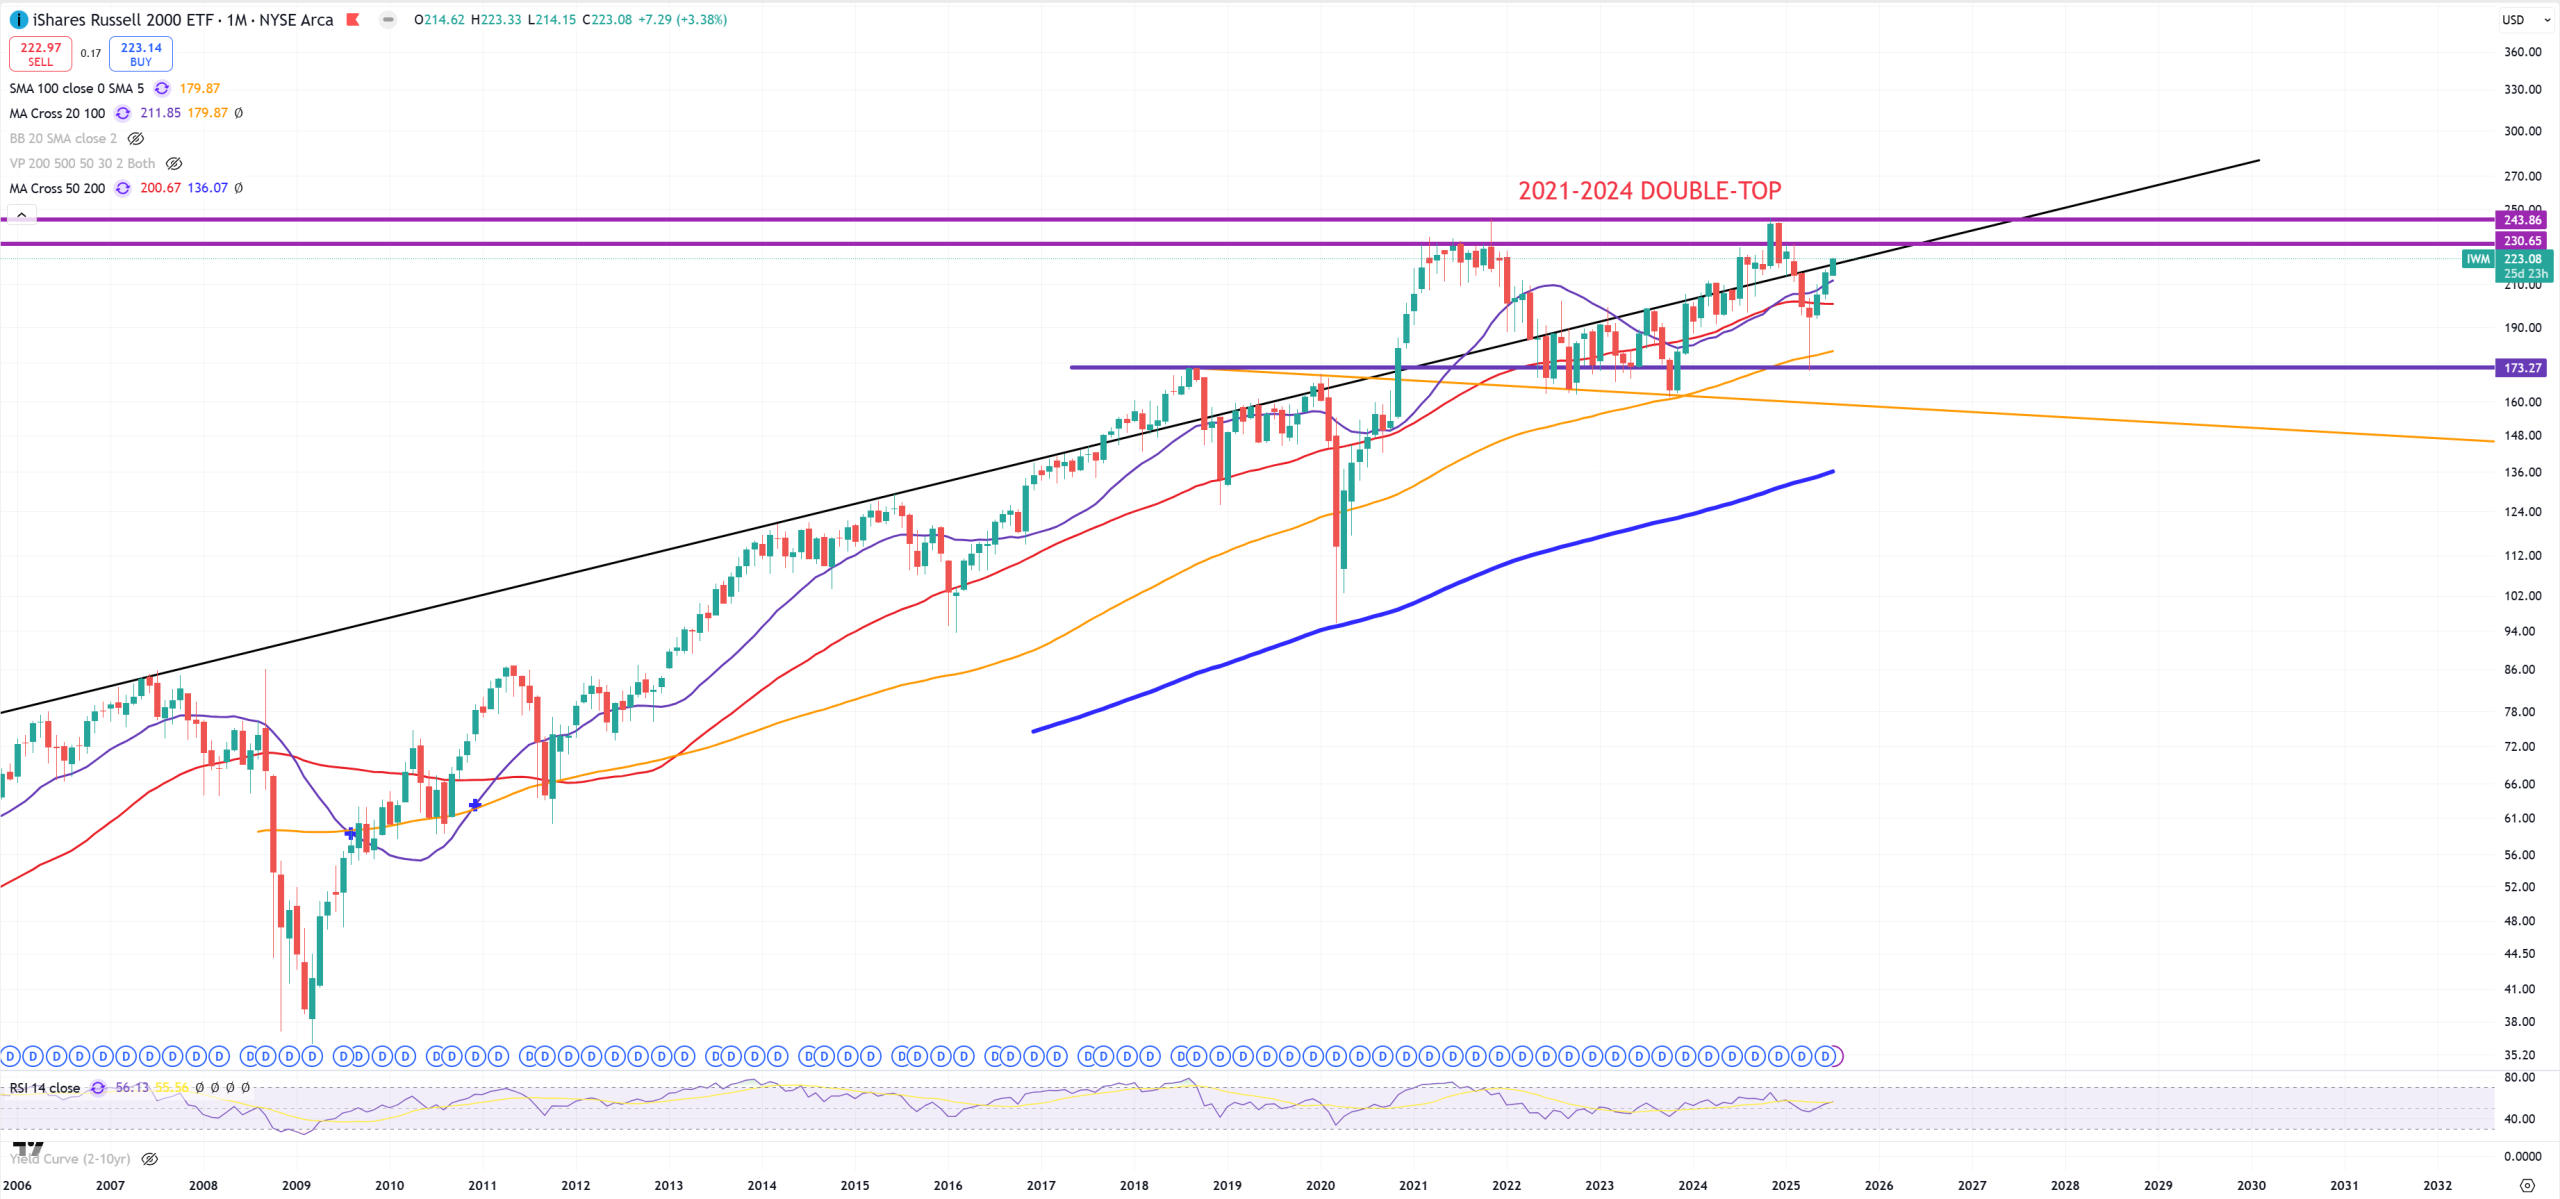
IWM – Small Caps – also 2021-2024 DOUBLE-TOP and the game is still all the time around black trend line
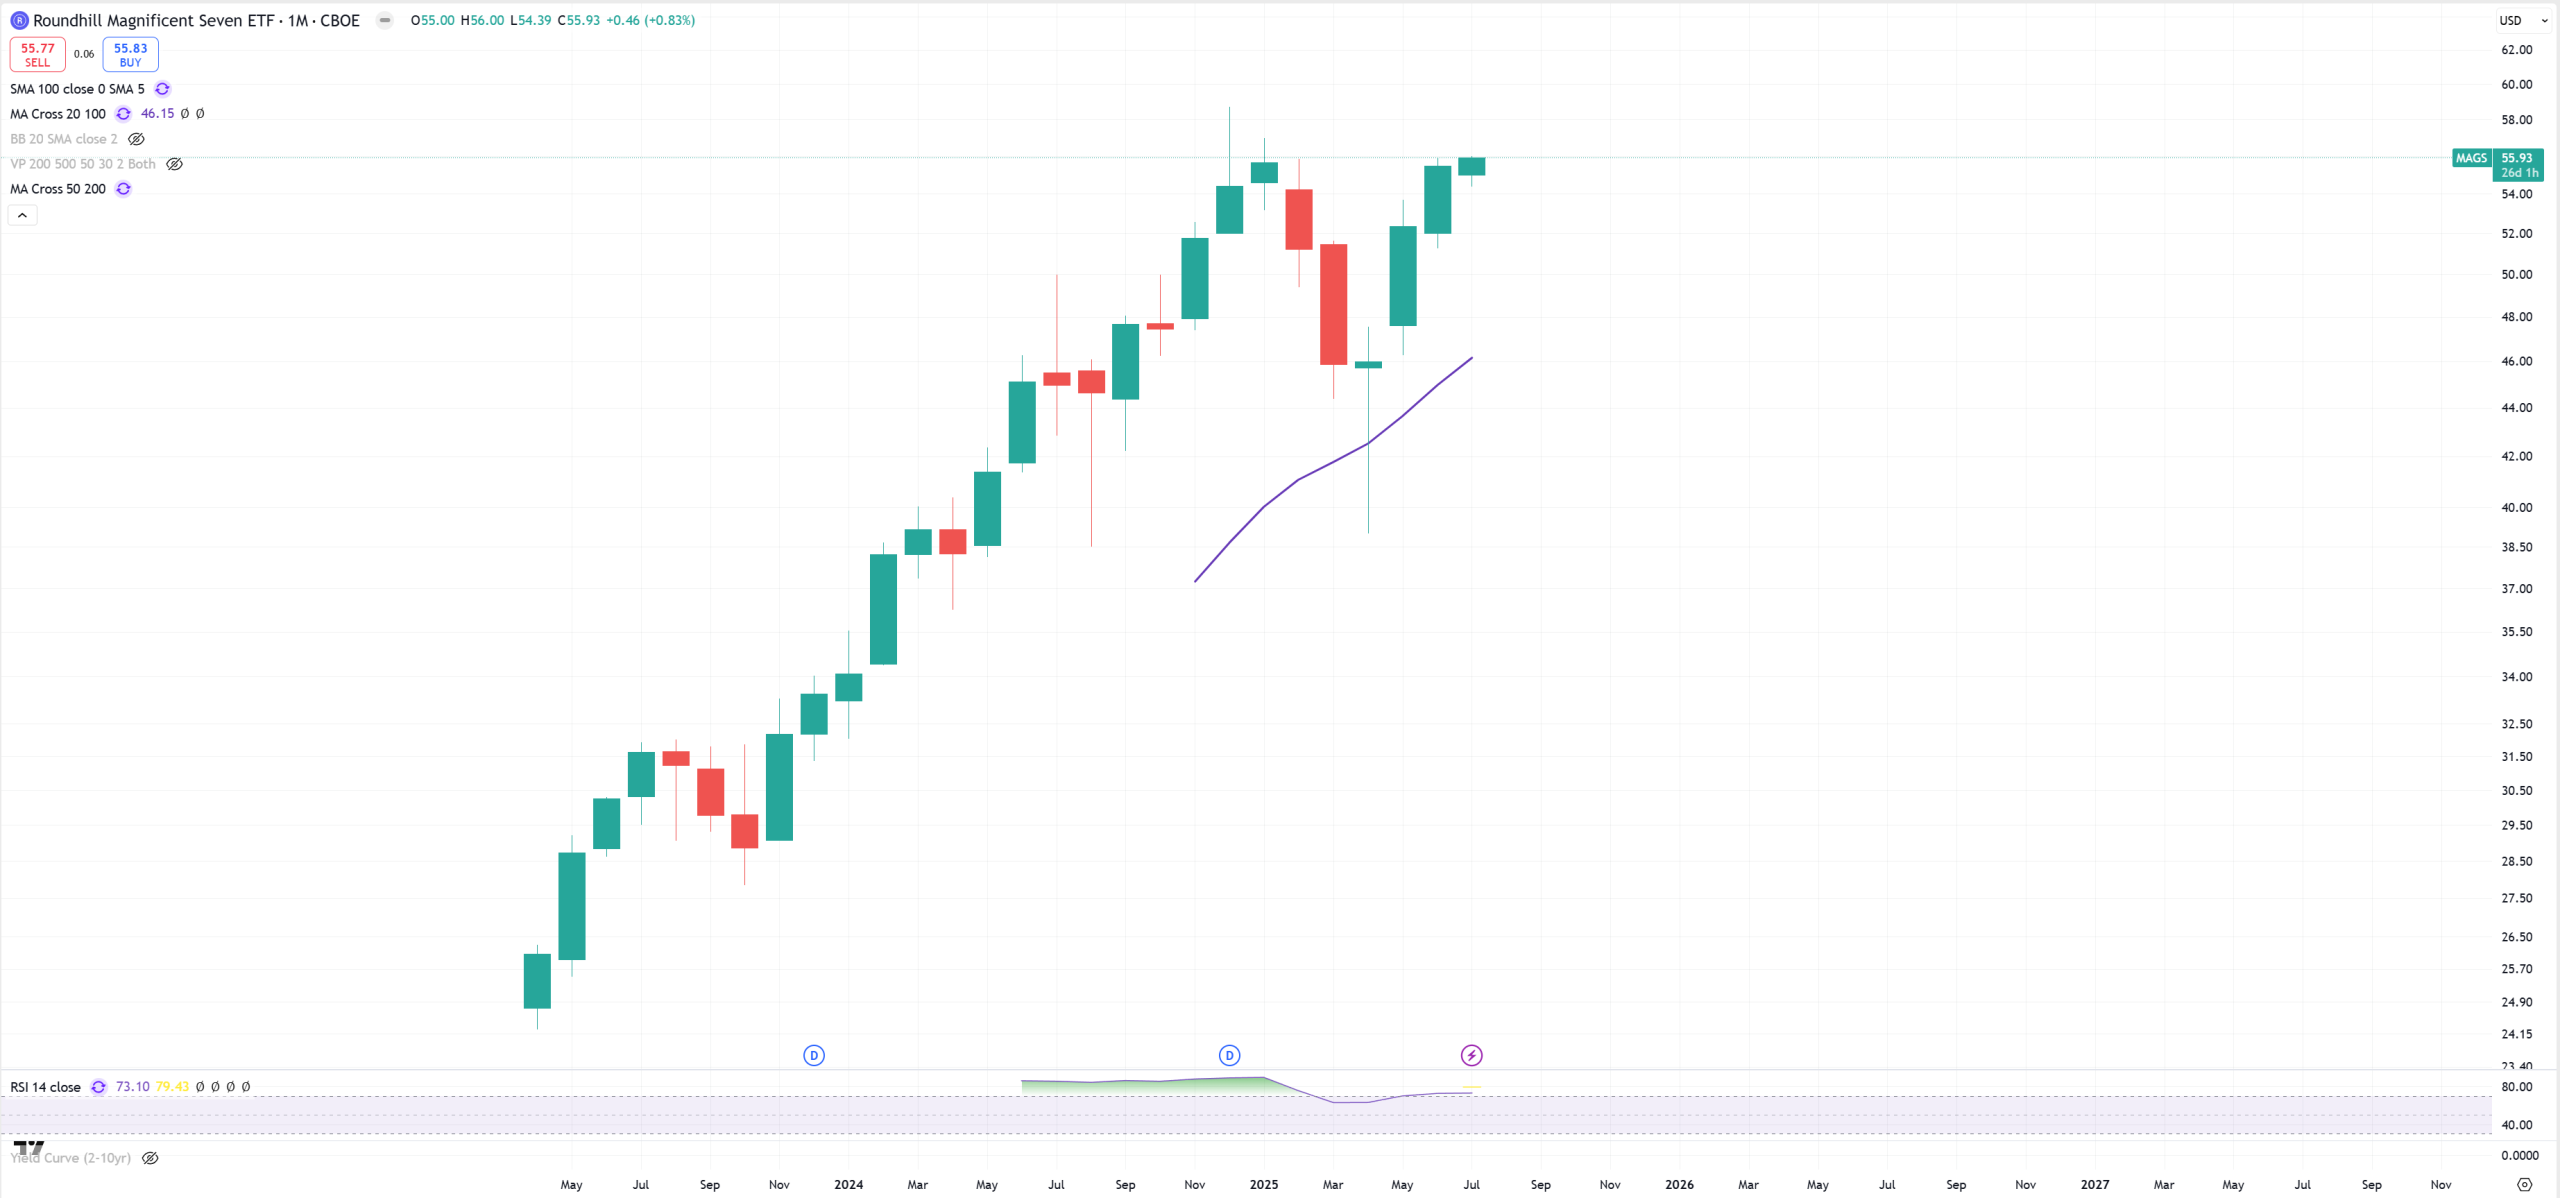
MAGS – so Mag7 ETF – not giving any clues here – but it needs to go higher or place double-top
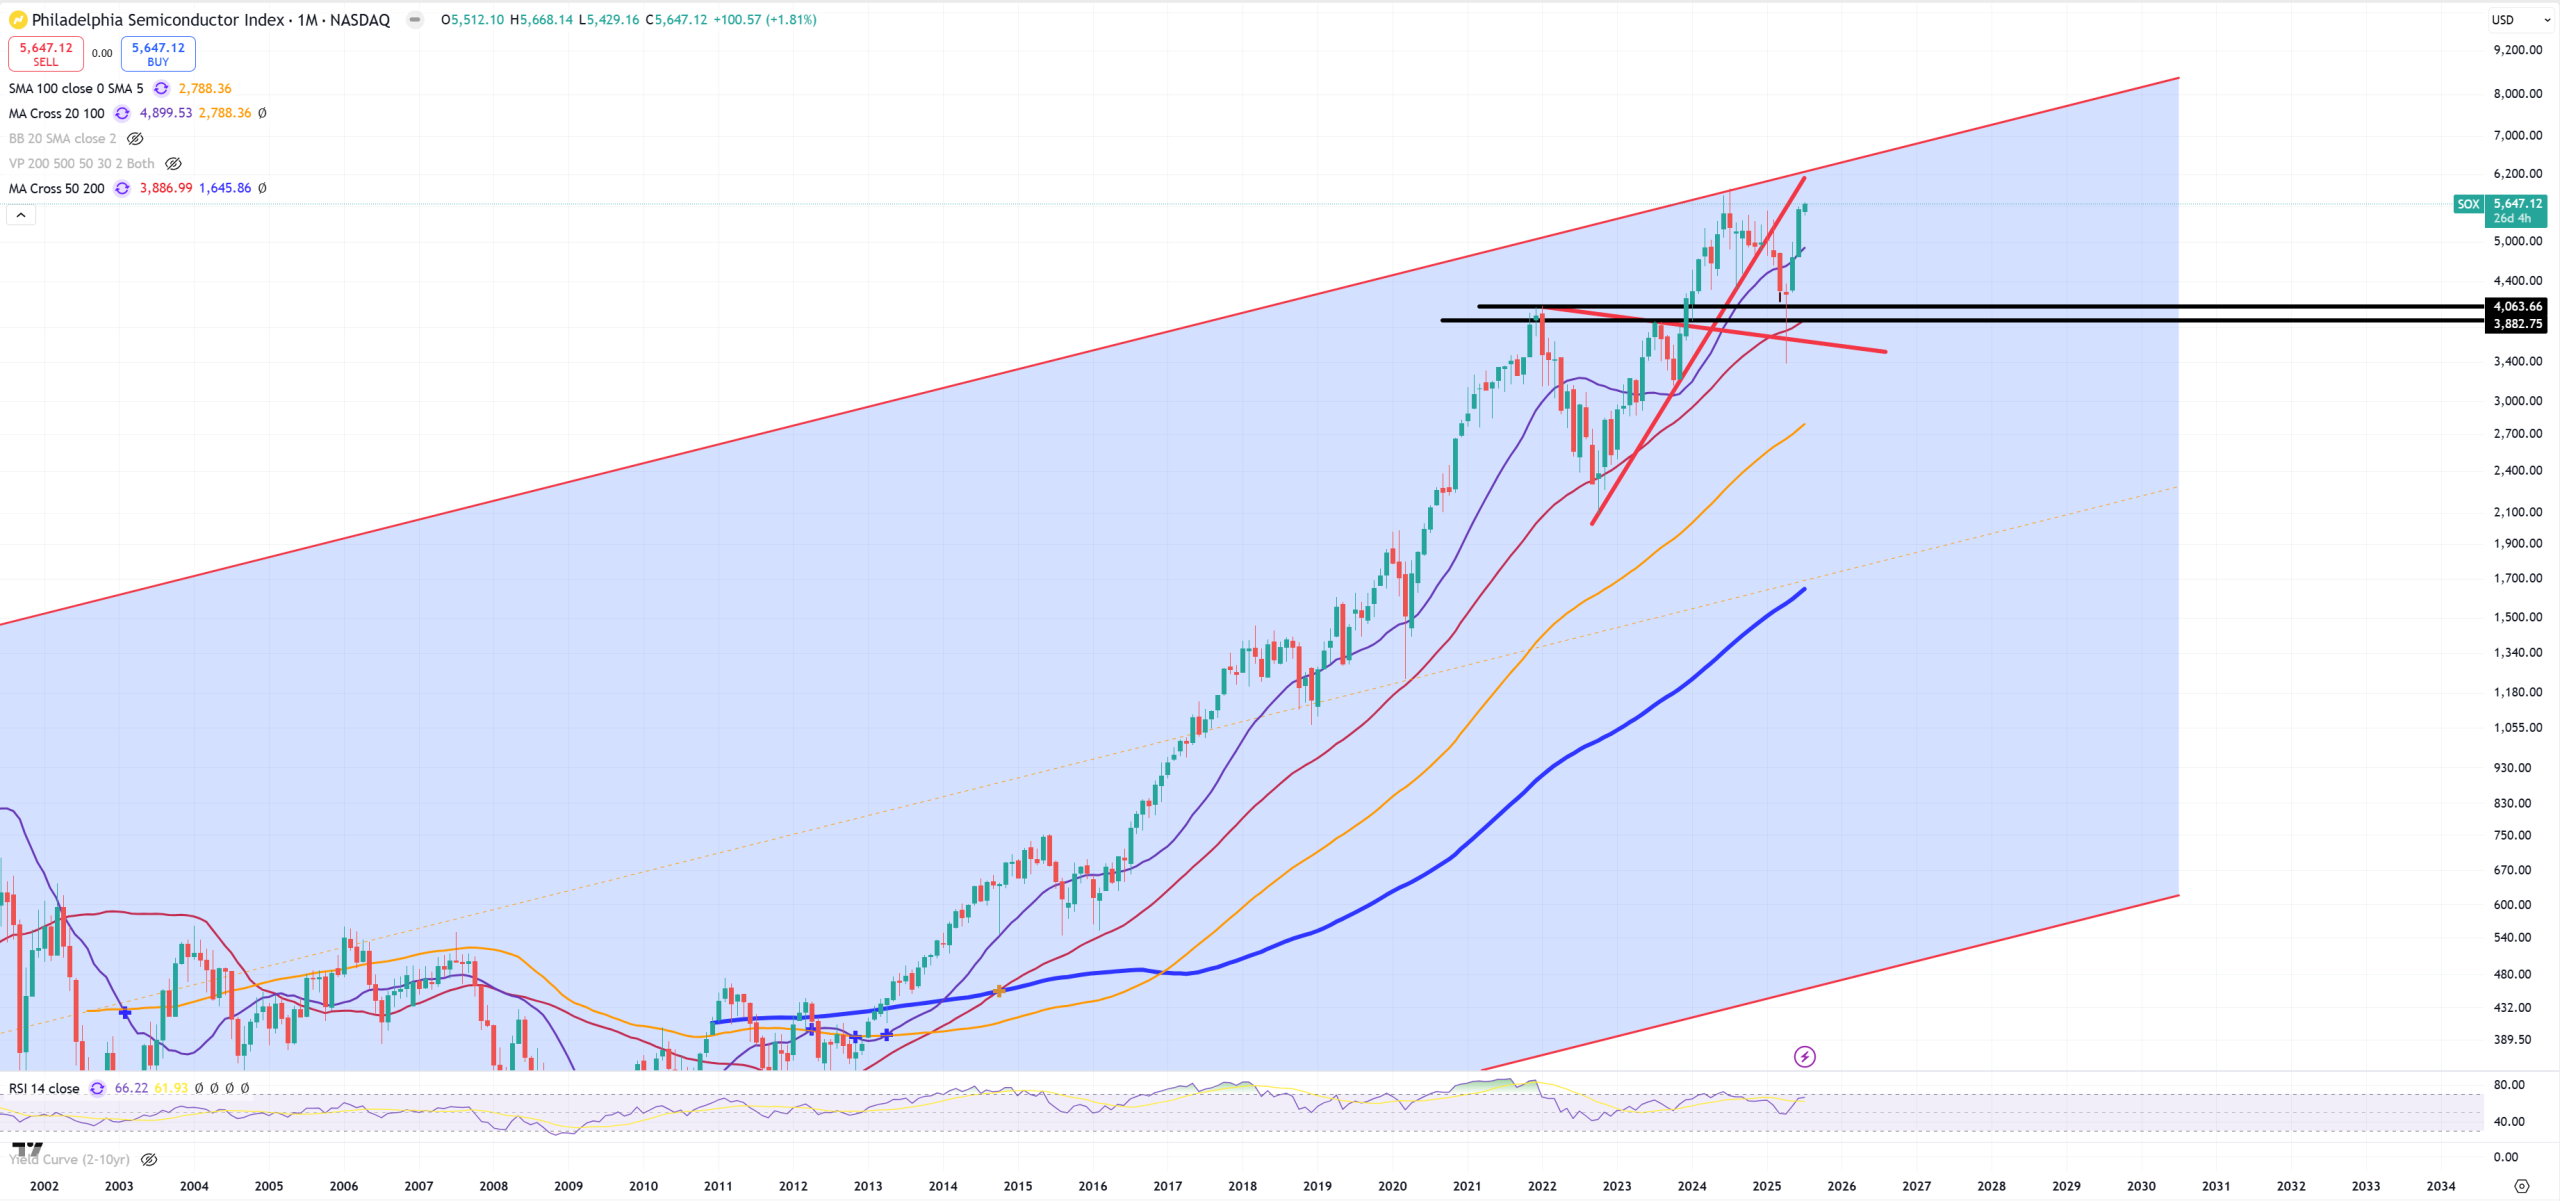
SOX – you rarely see break on such big index on the first try. In this case I’m talking about those 2 horizontal black lines. Double-top or move higher. SOX is still the #1 leading index, due to all this AI revolution.
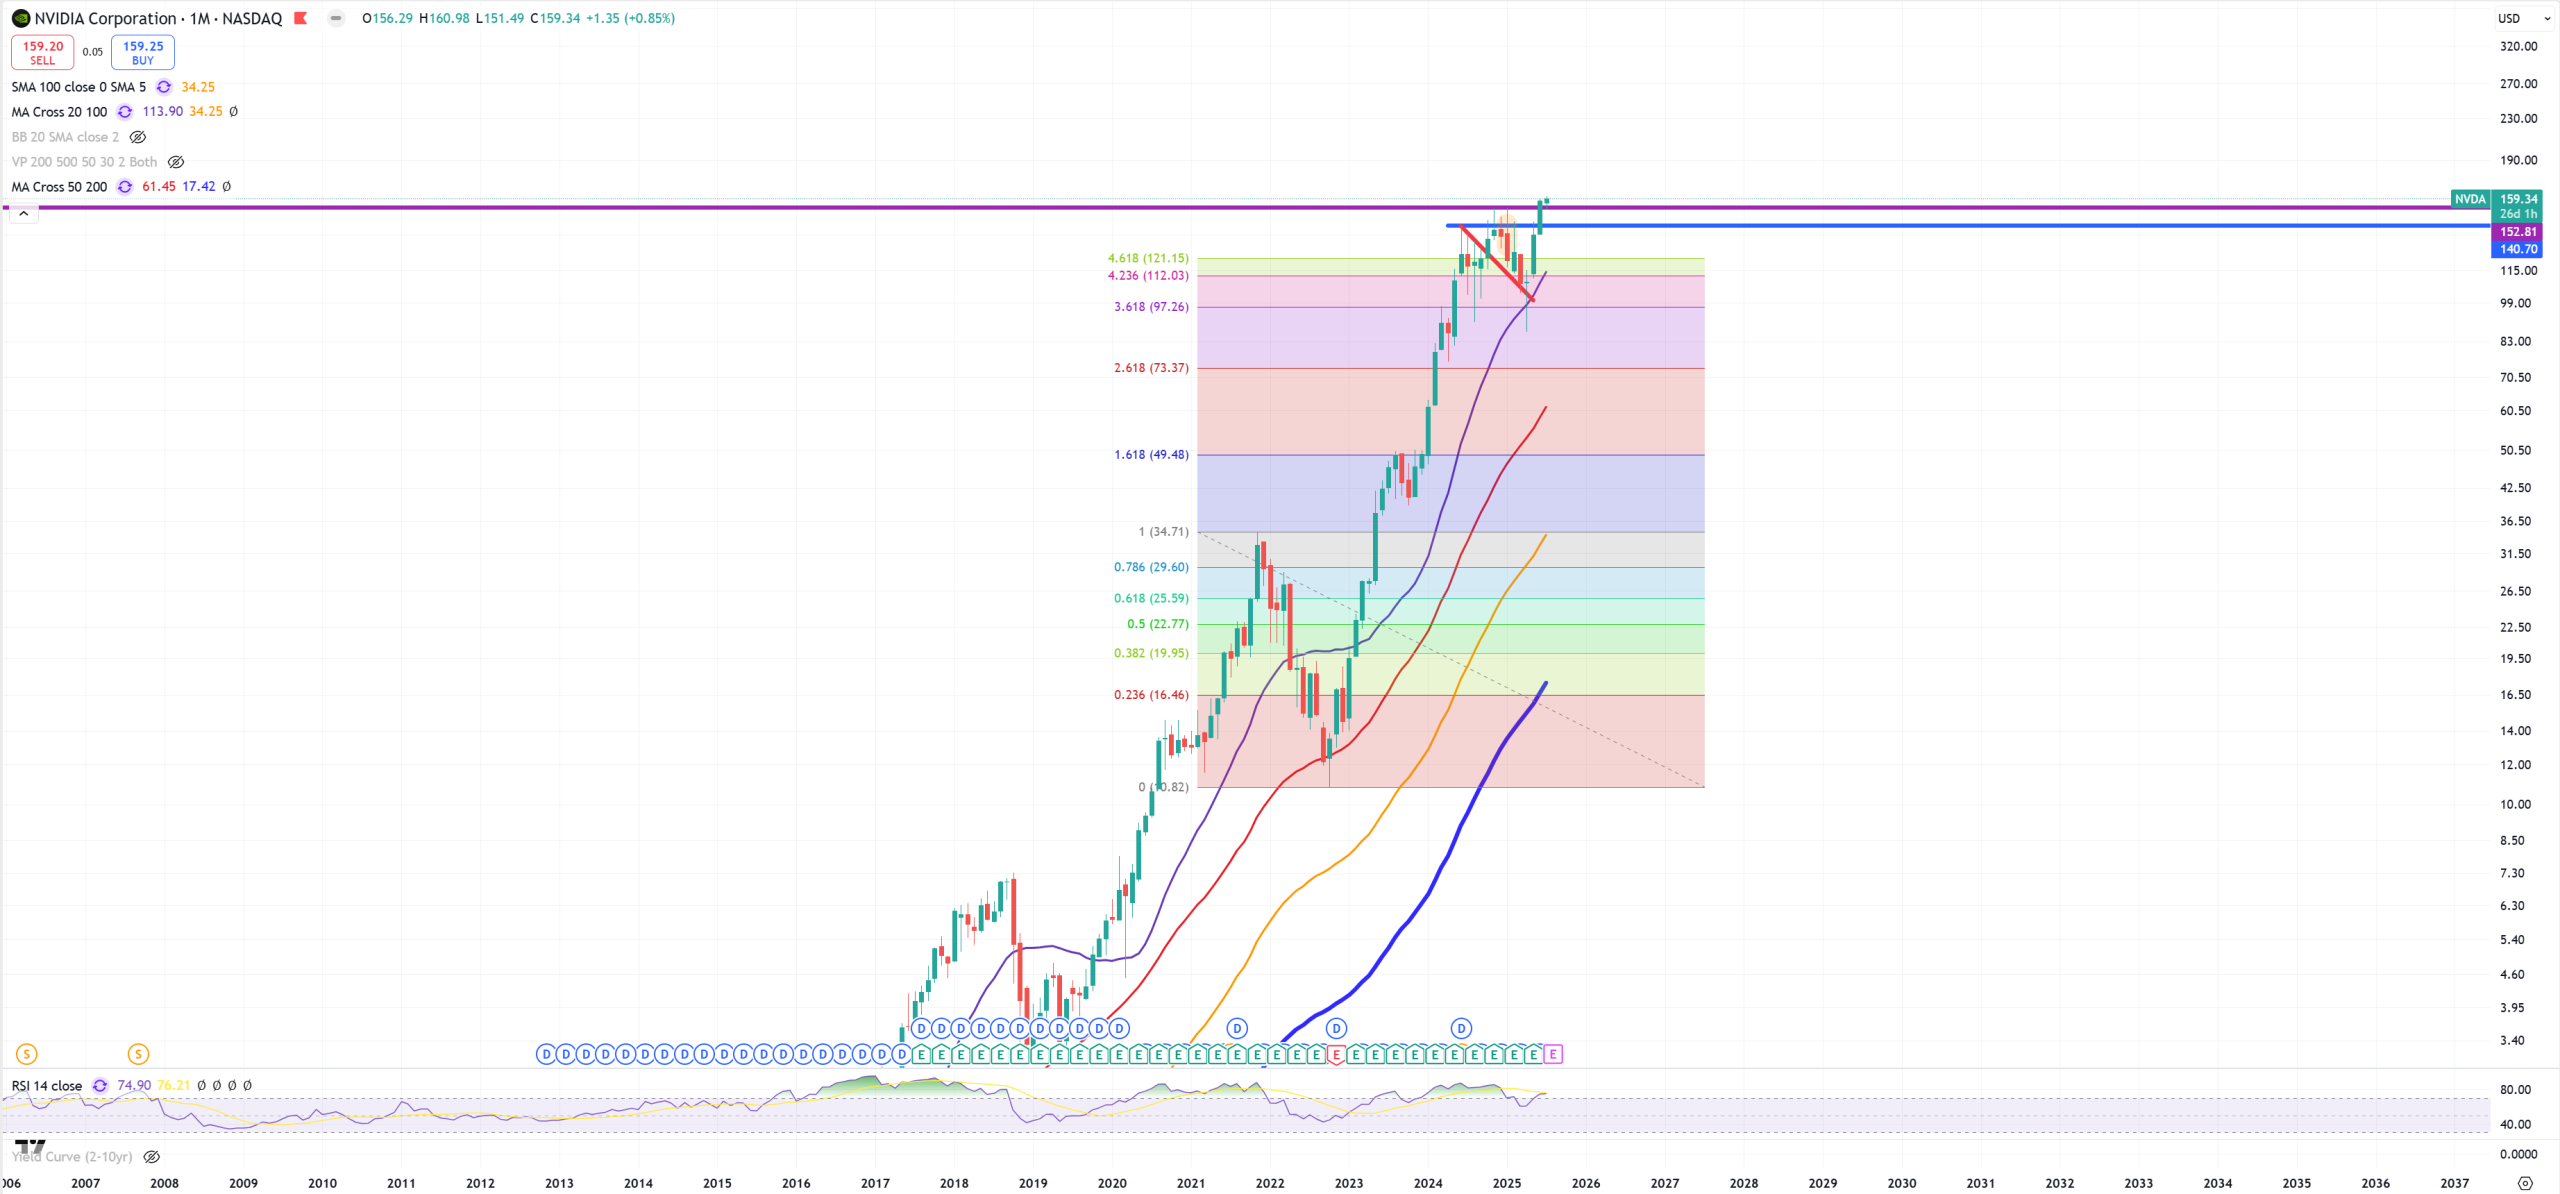
NVDA – so far it broke last 152$ level
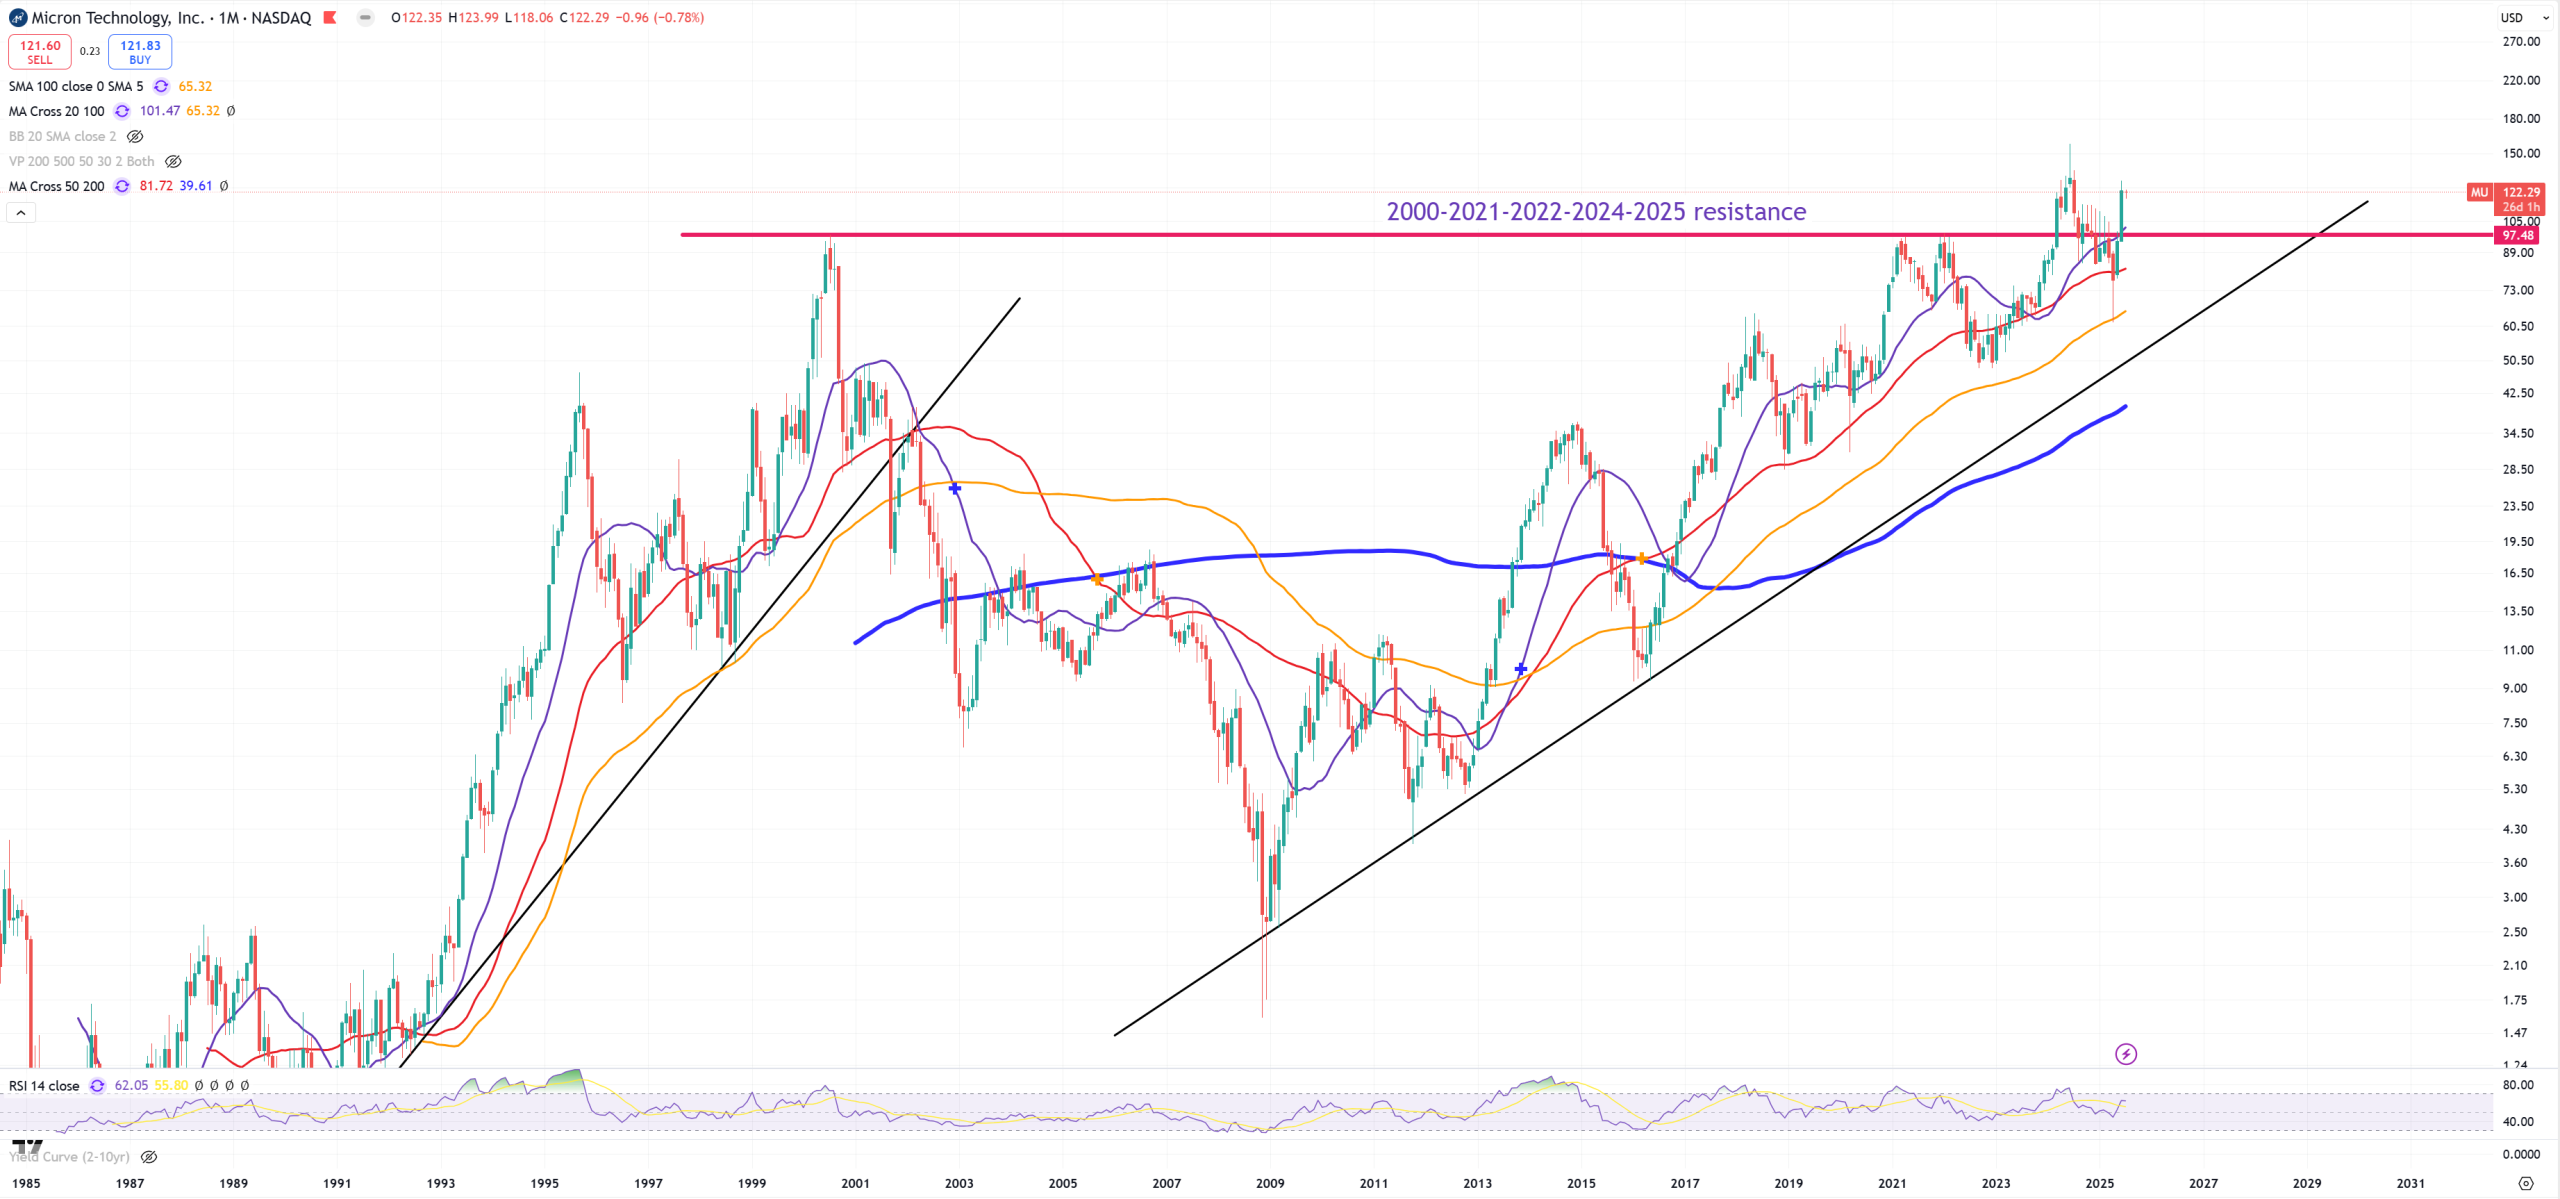
MU – I see it tries to wipe out this resistance. It’s just too strong, but market doing everything no to tank.
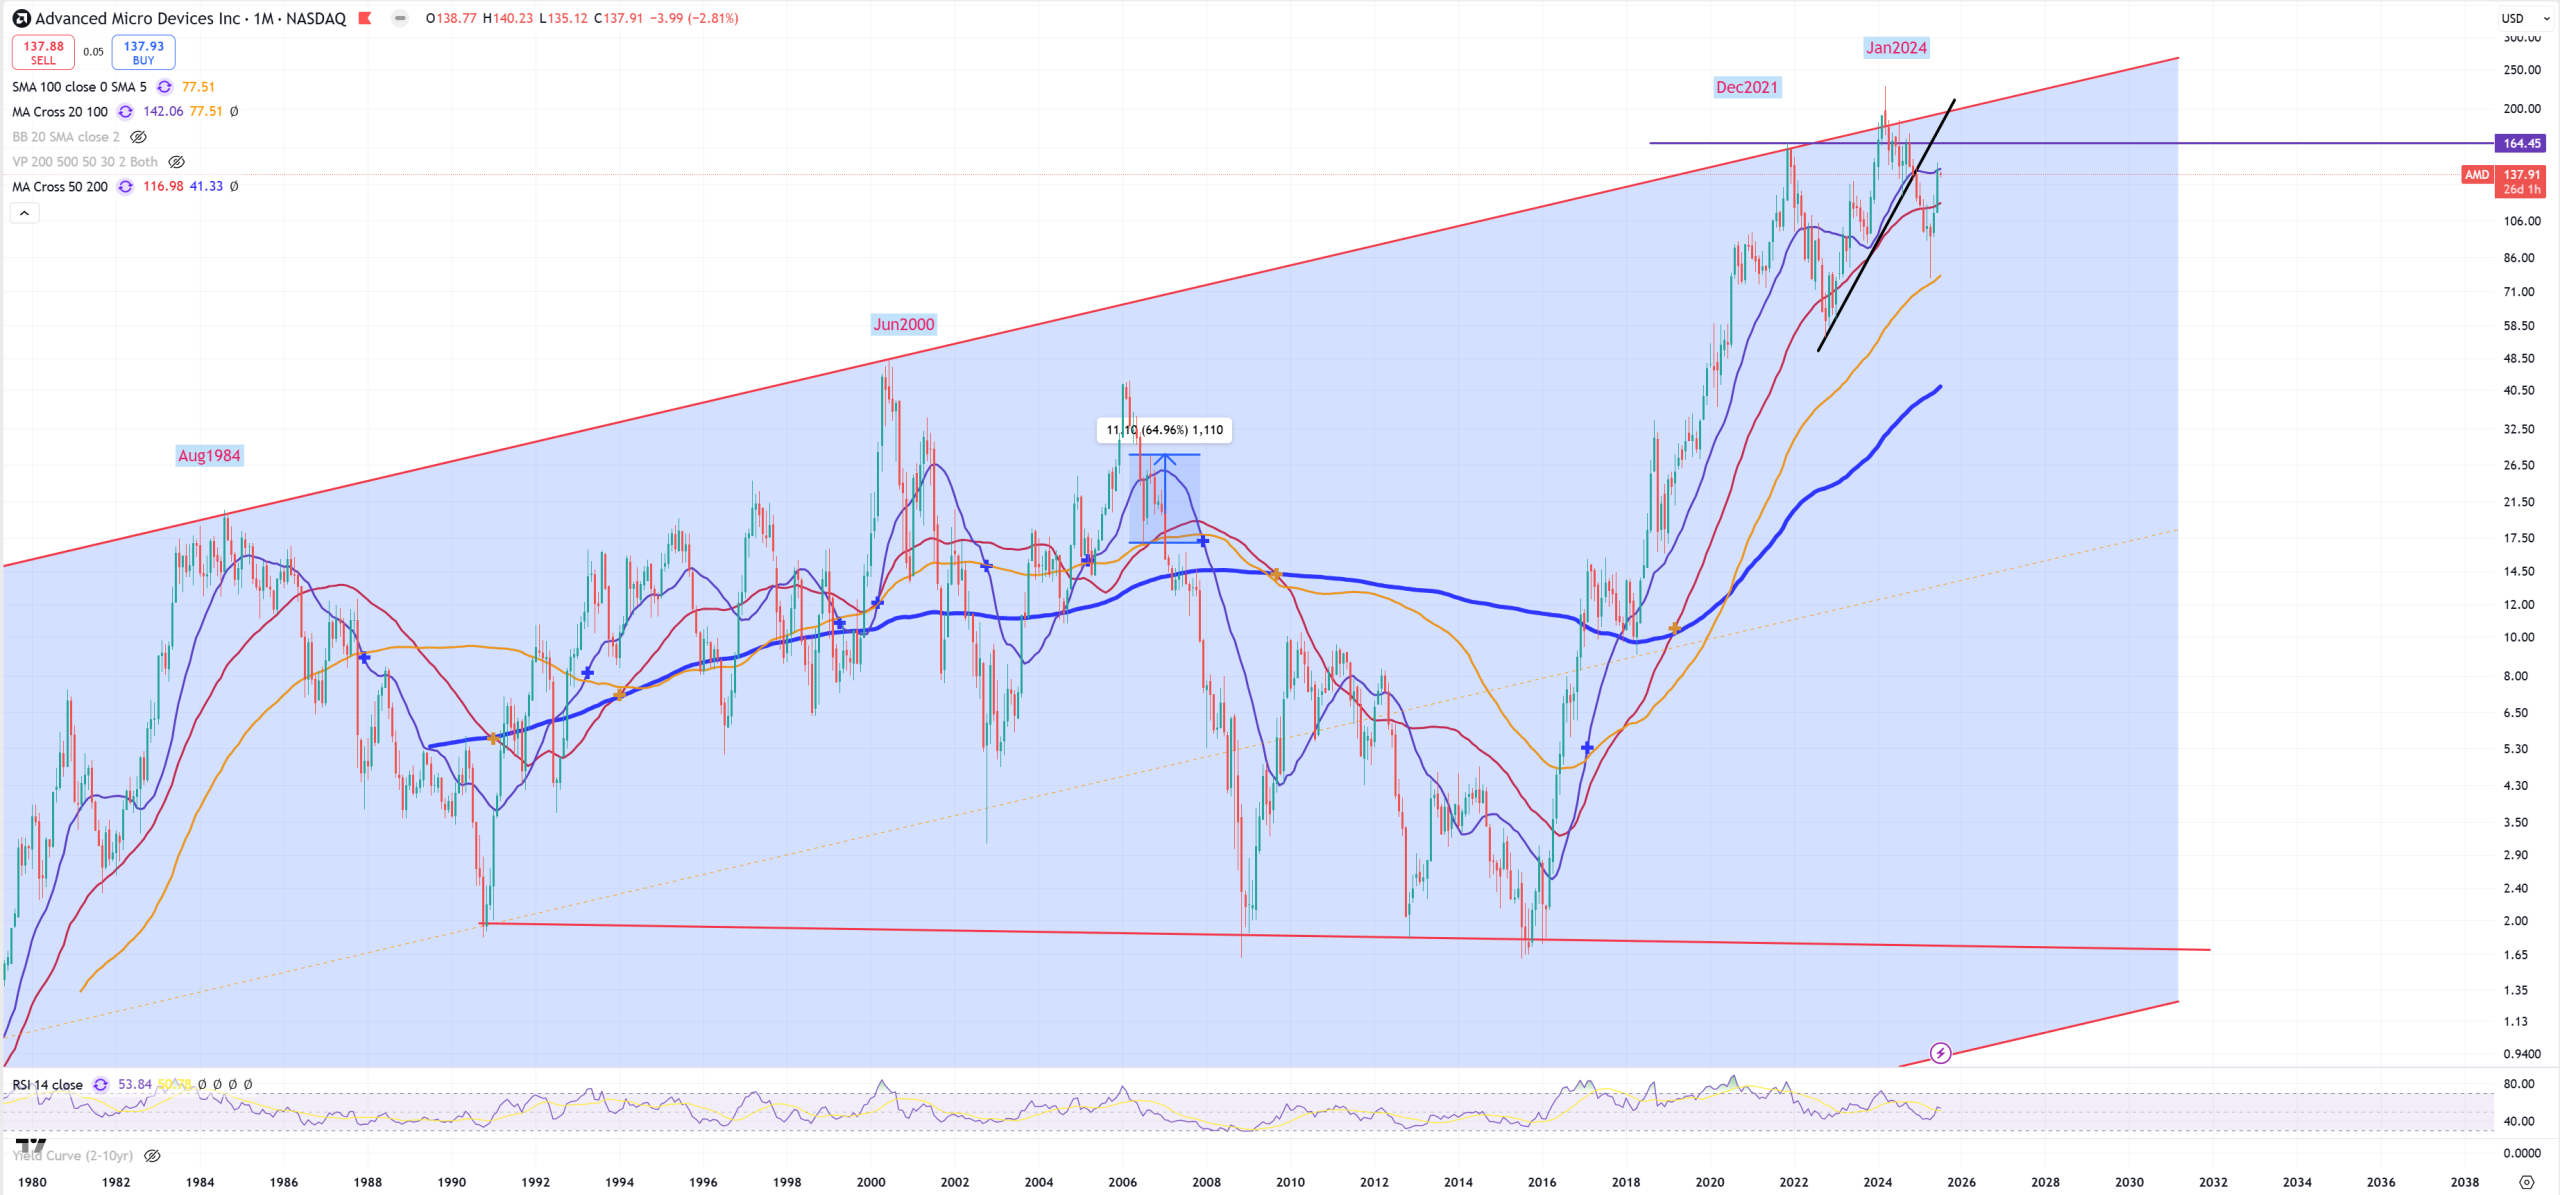
AMD – I think AMD is seriously hit
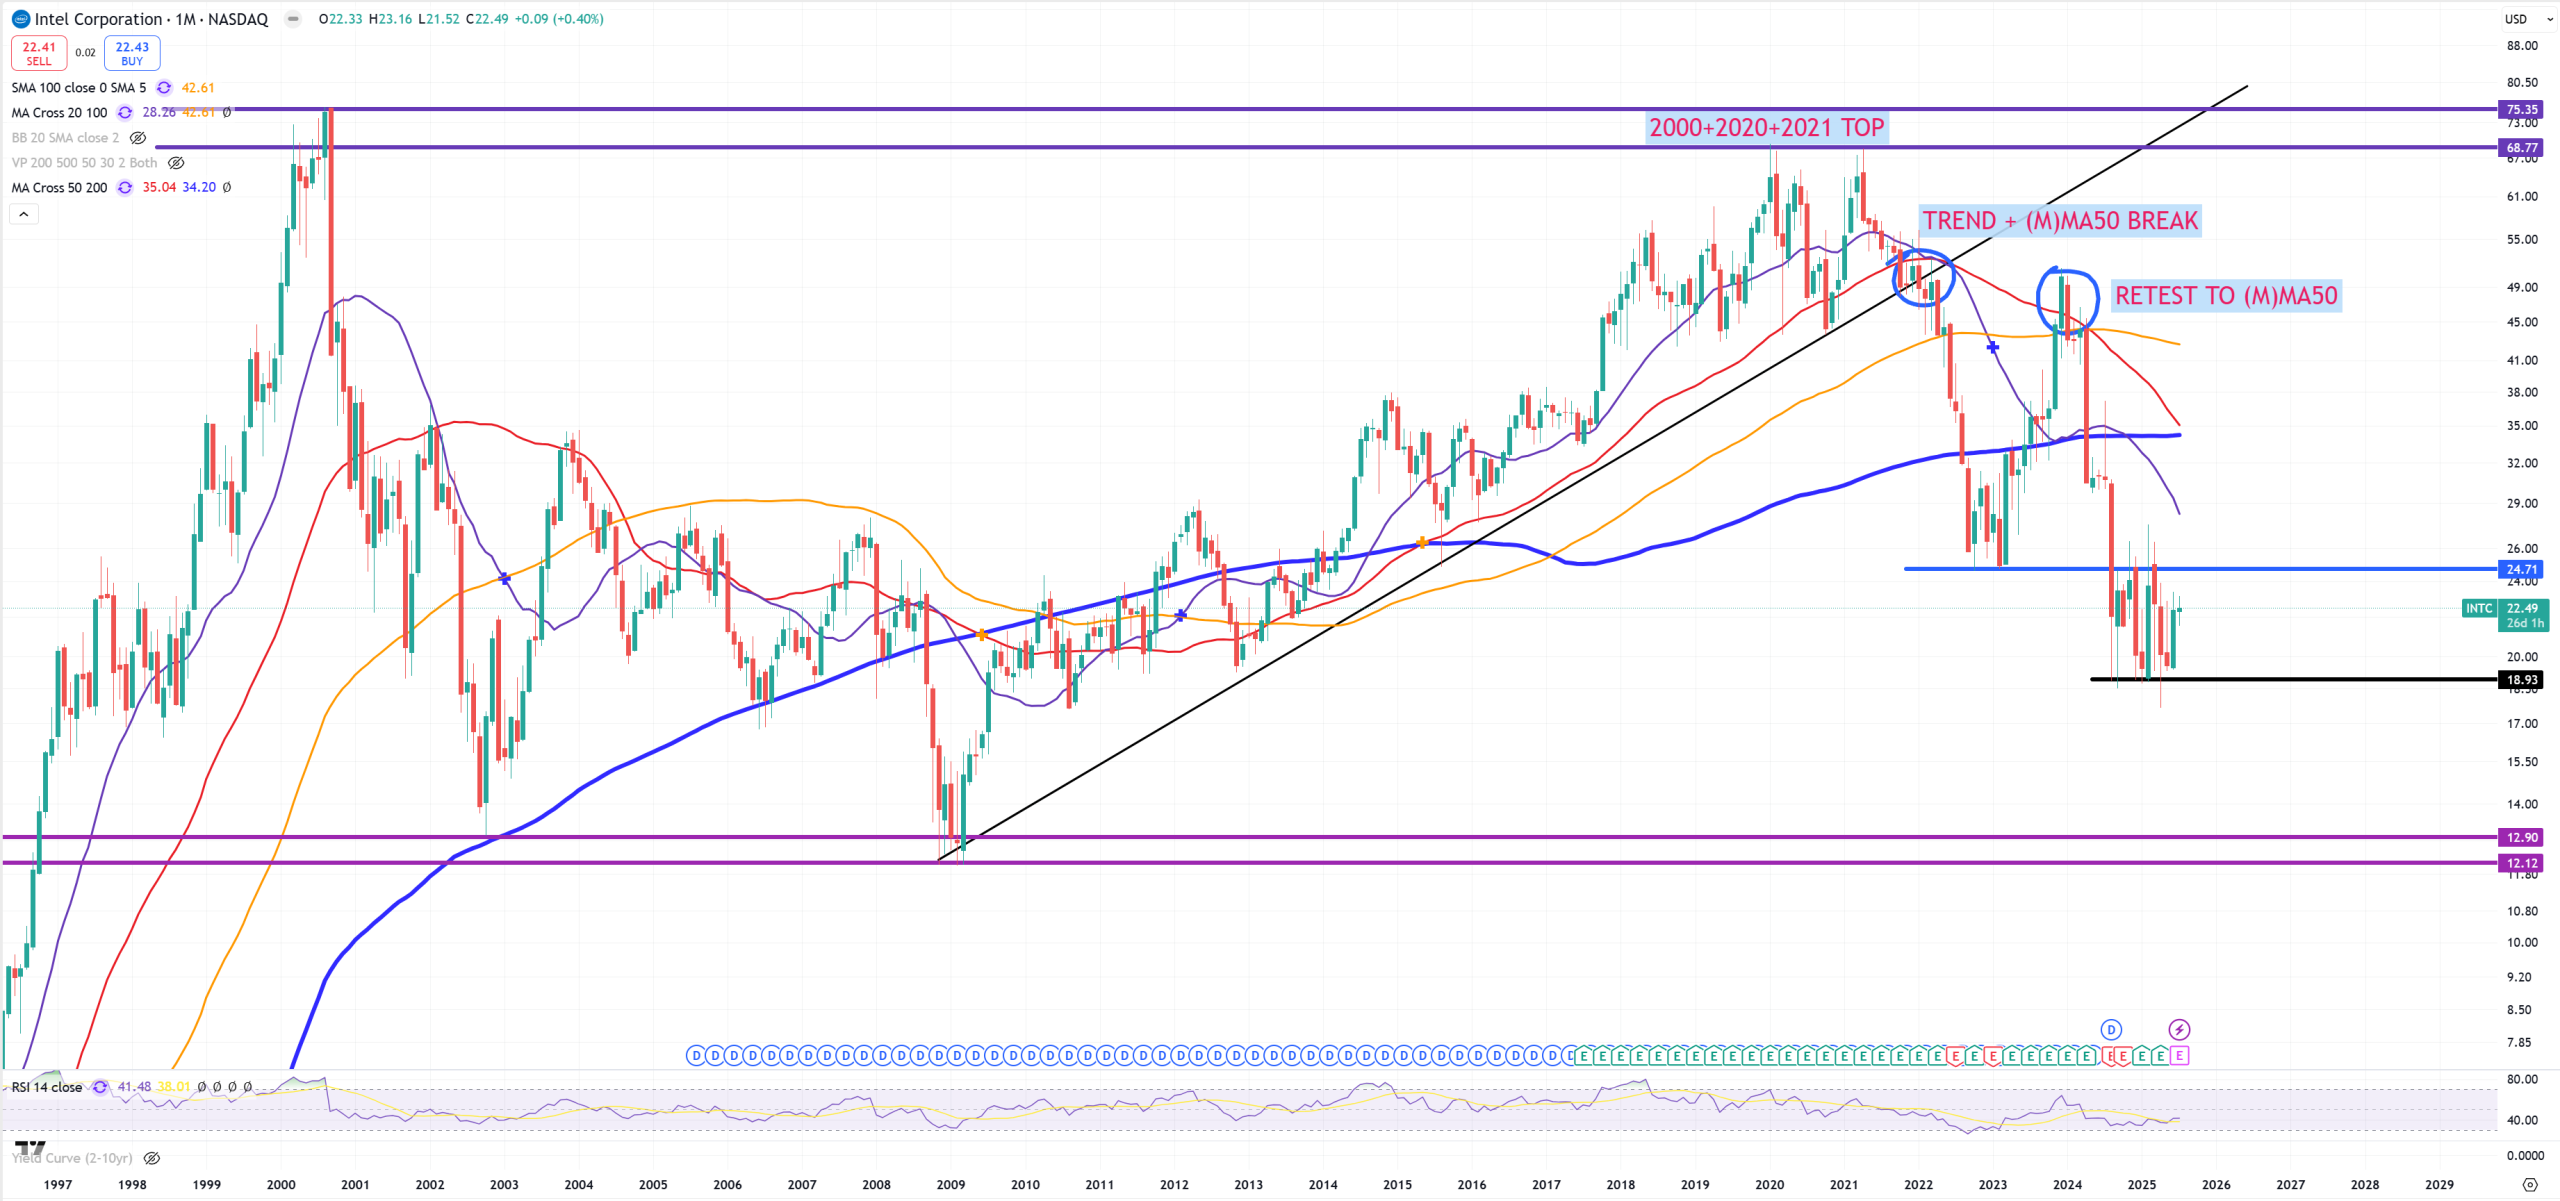
INTC – I don’t believe in this company anymore, that’s how you end when you do buybacks, and ignore engineering – your core business
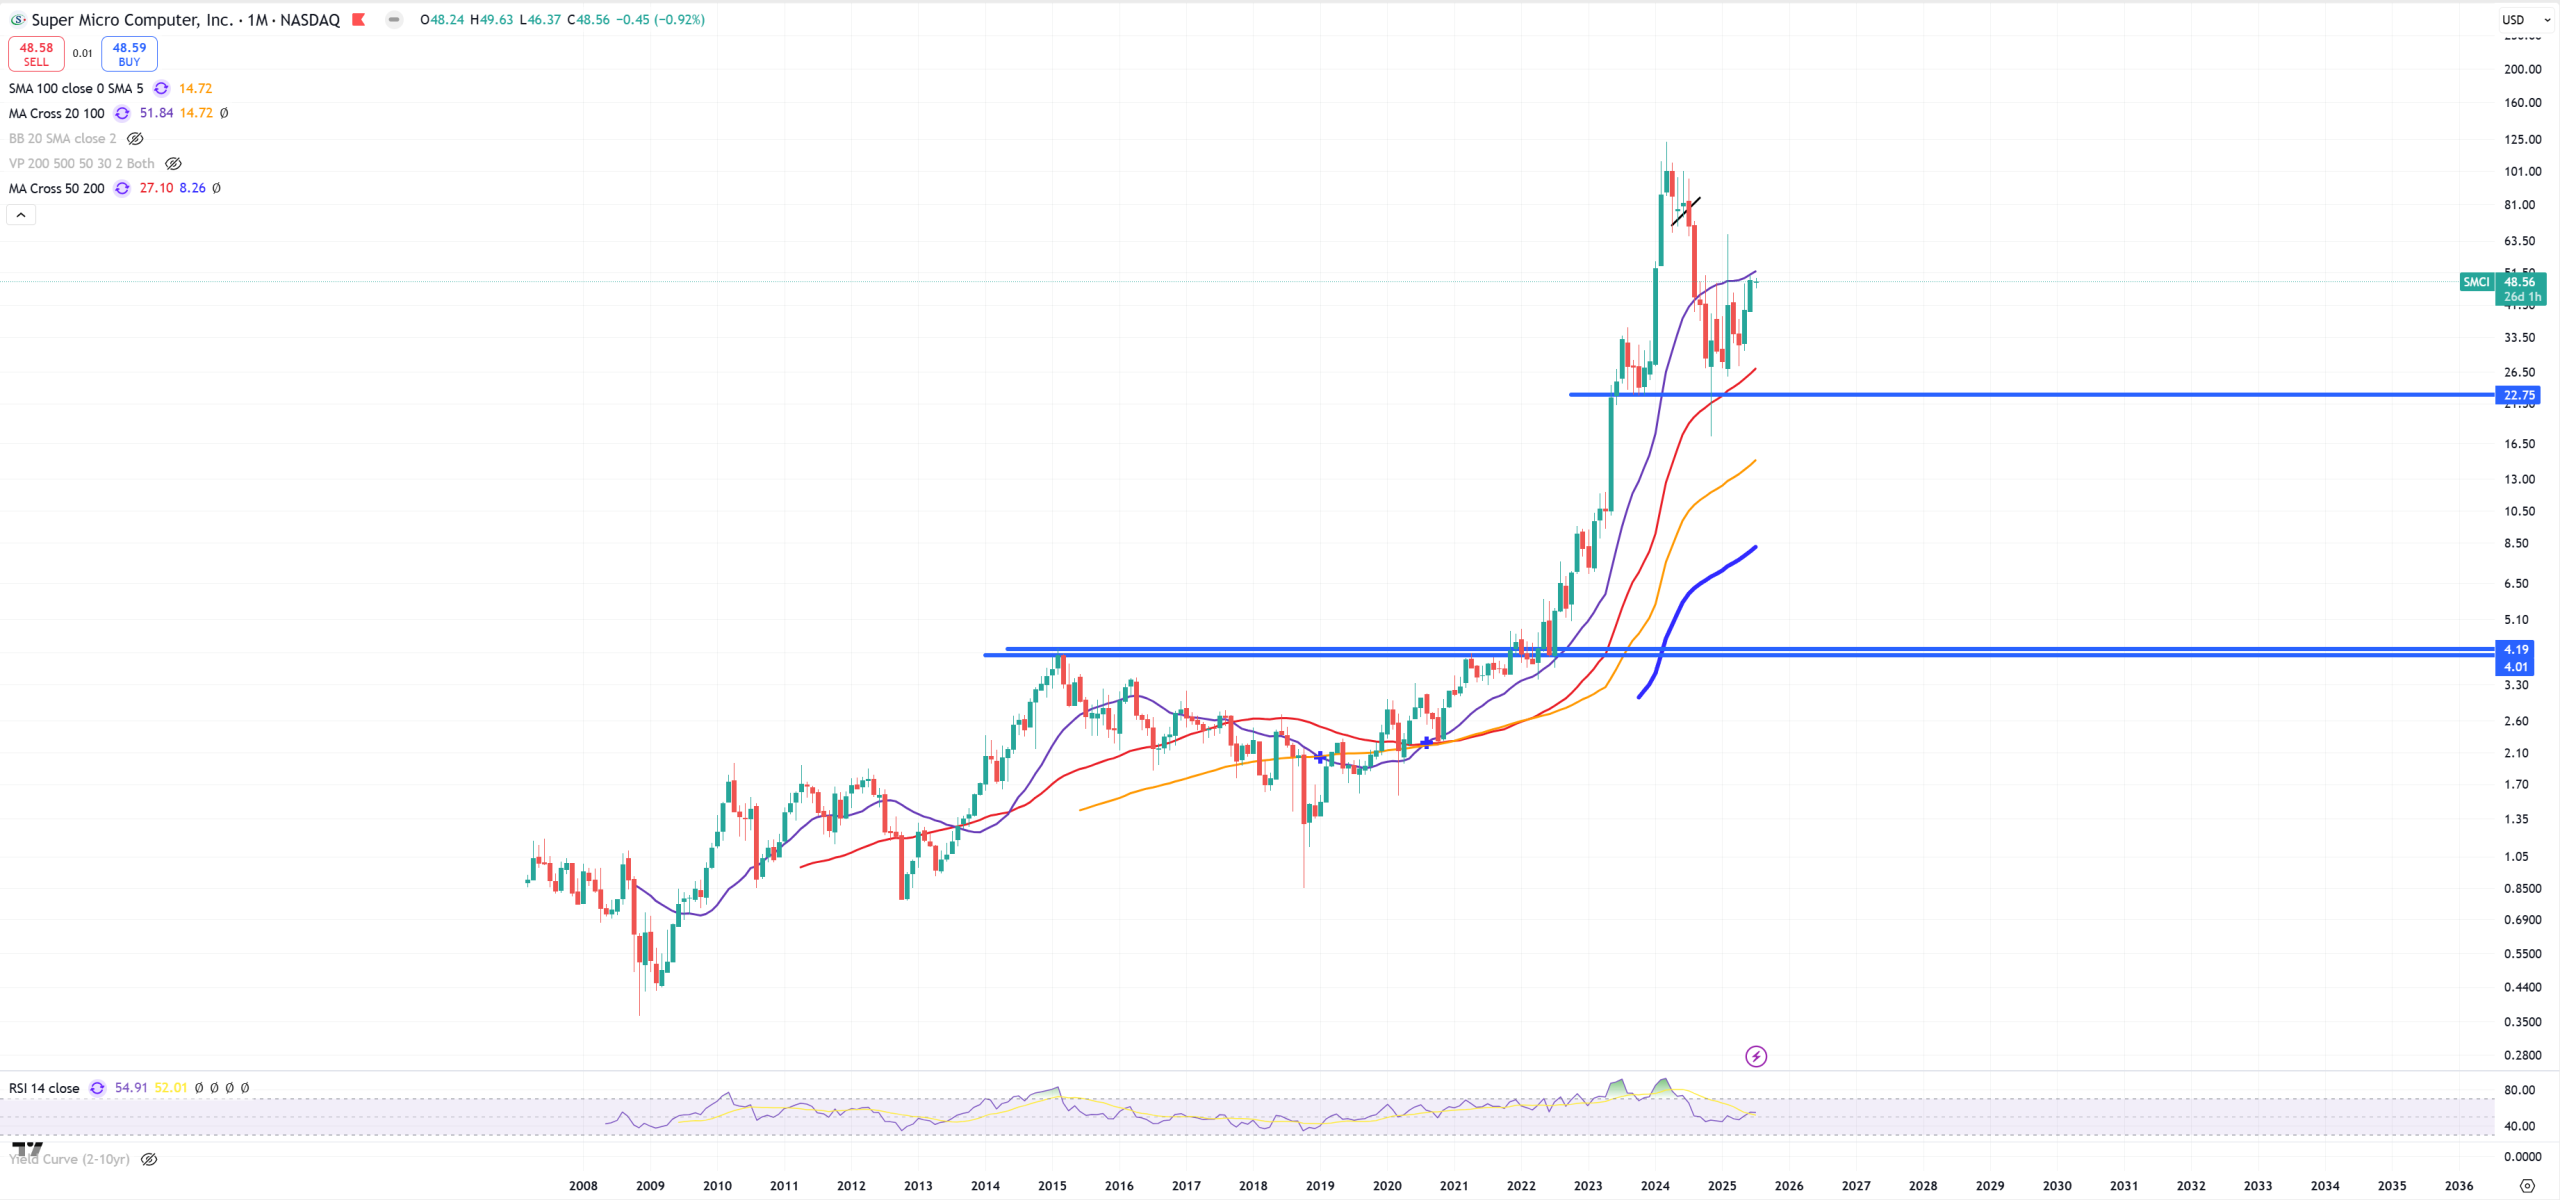
SMCI – boucing between (M)MA20 (violet) and support + (M)MA50 (red). Breaking (M)MA50 it’s 4$ target.
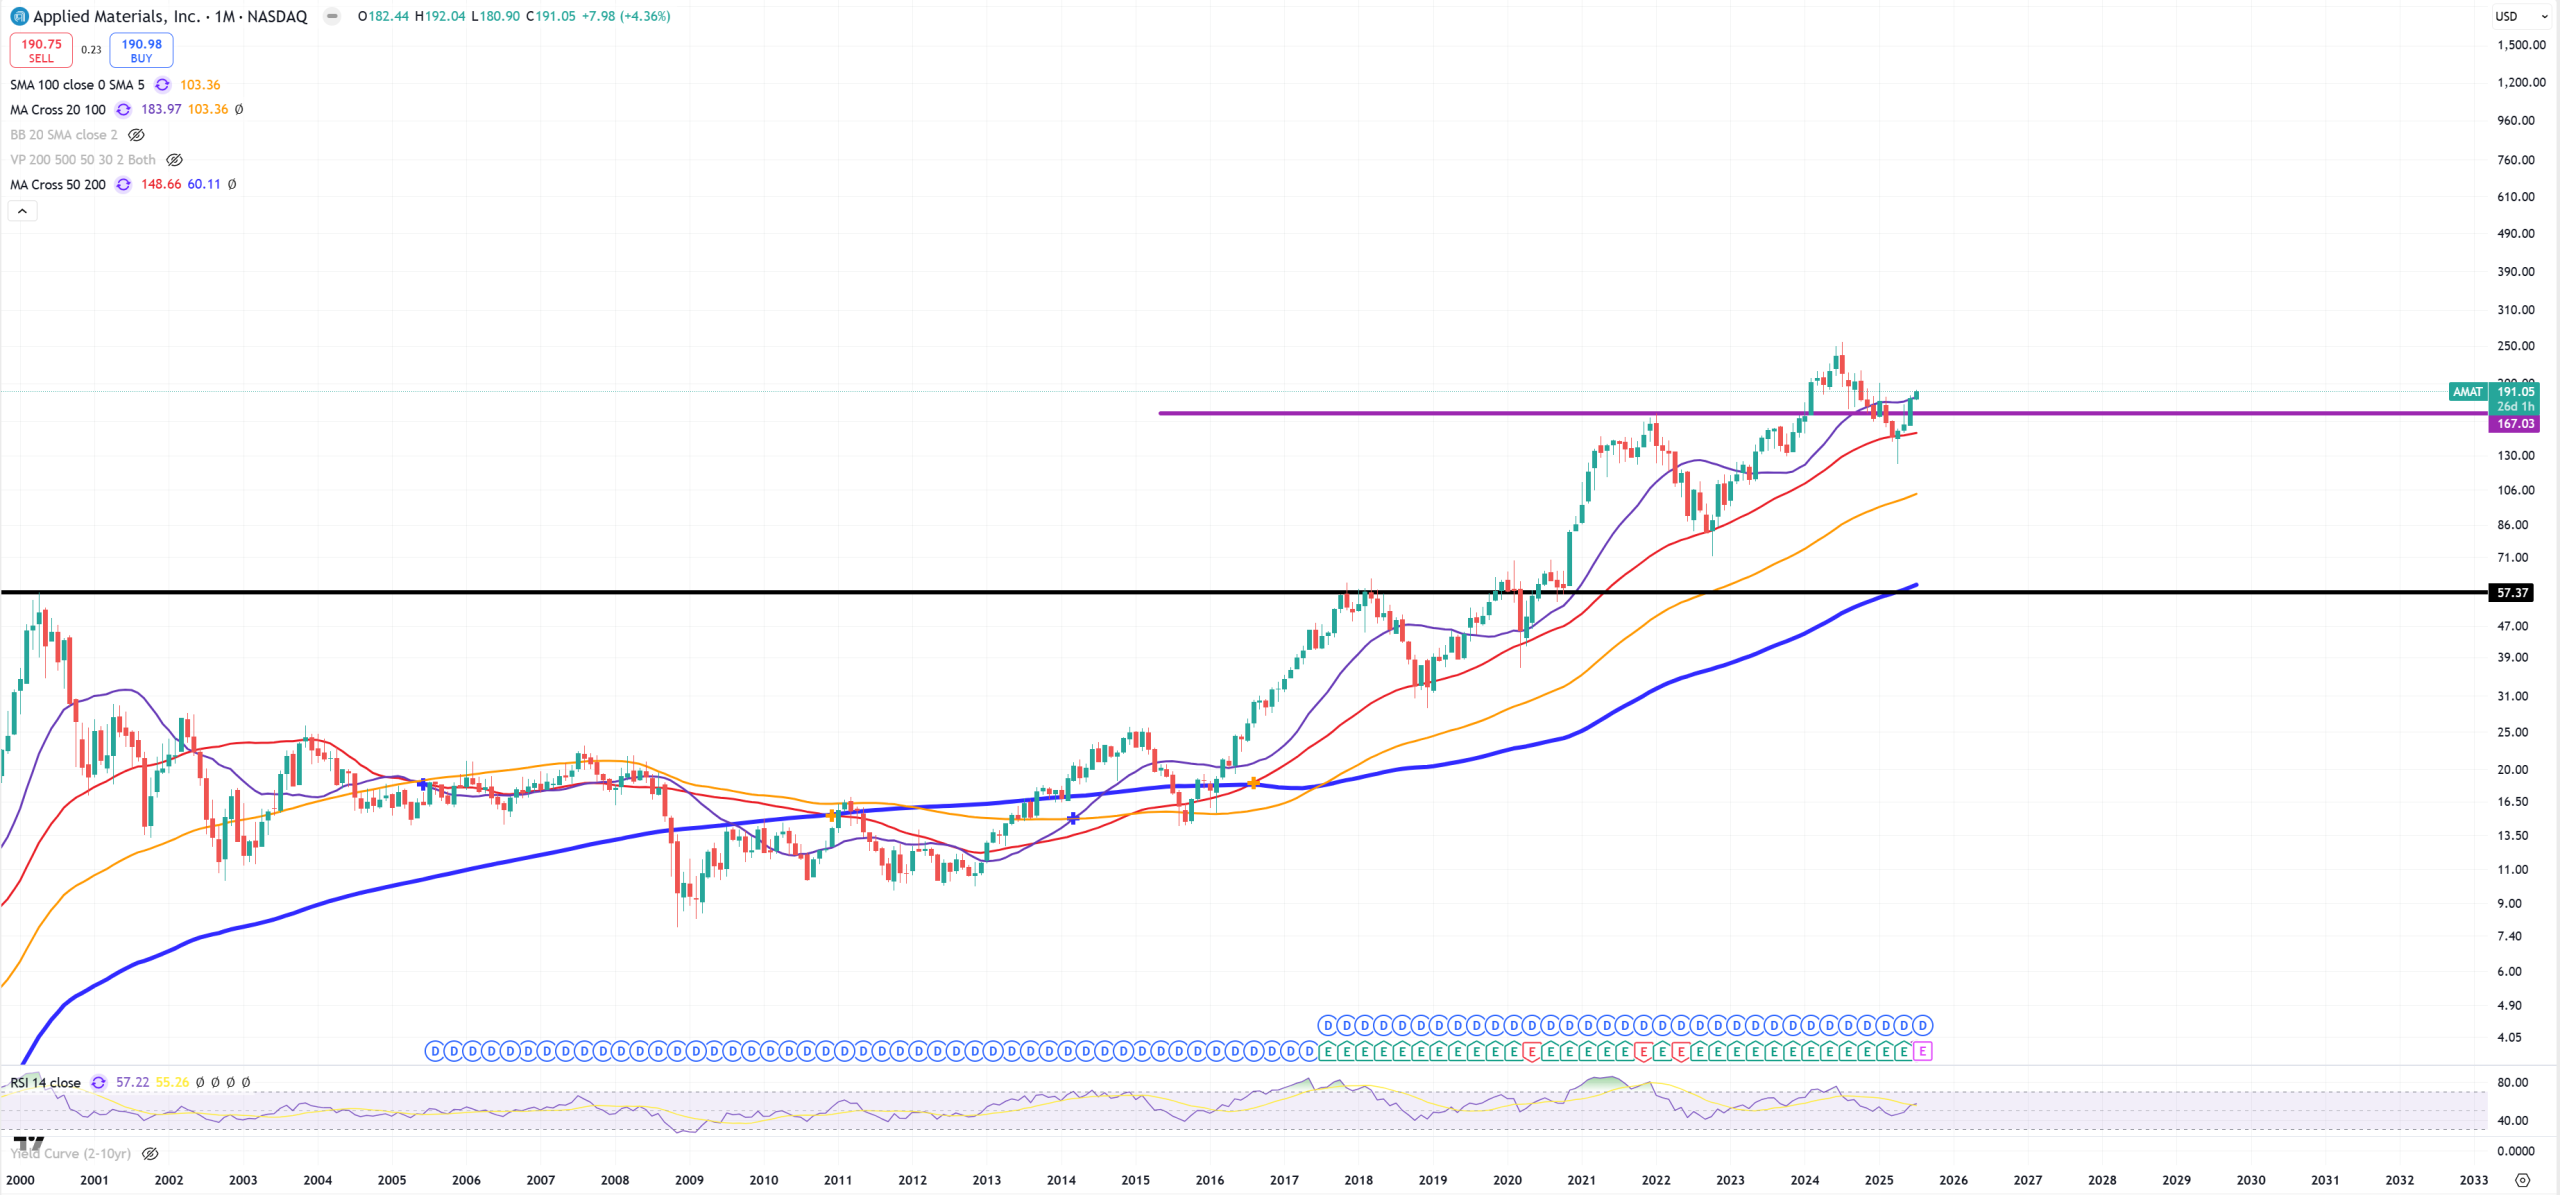
AMAT – same style. In general SOX tries to stay afloat
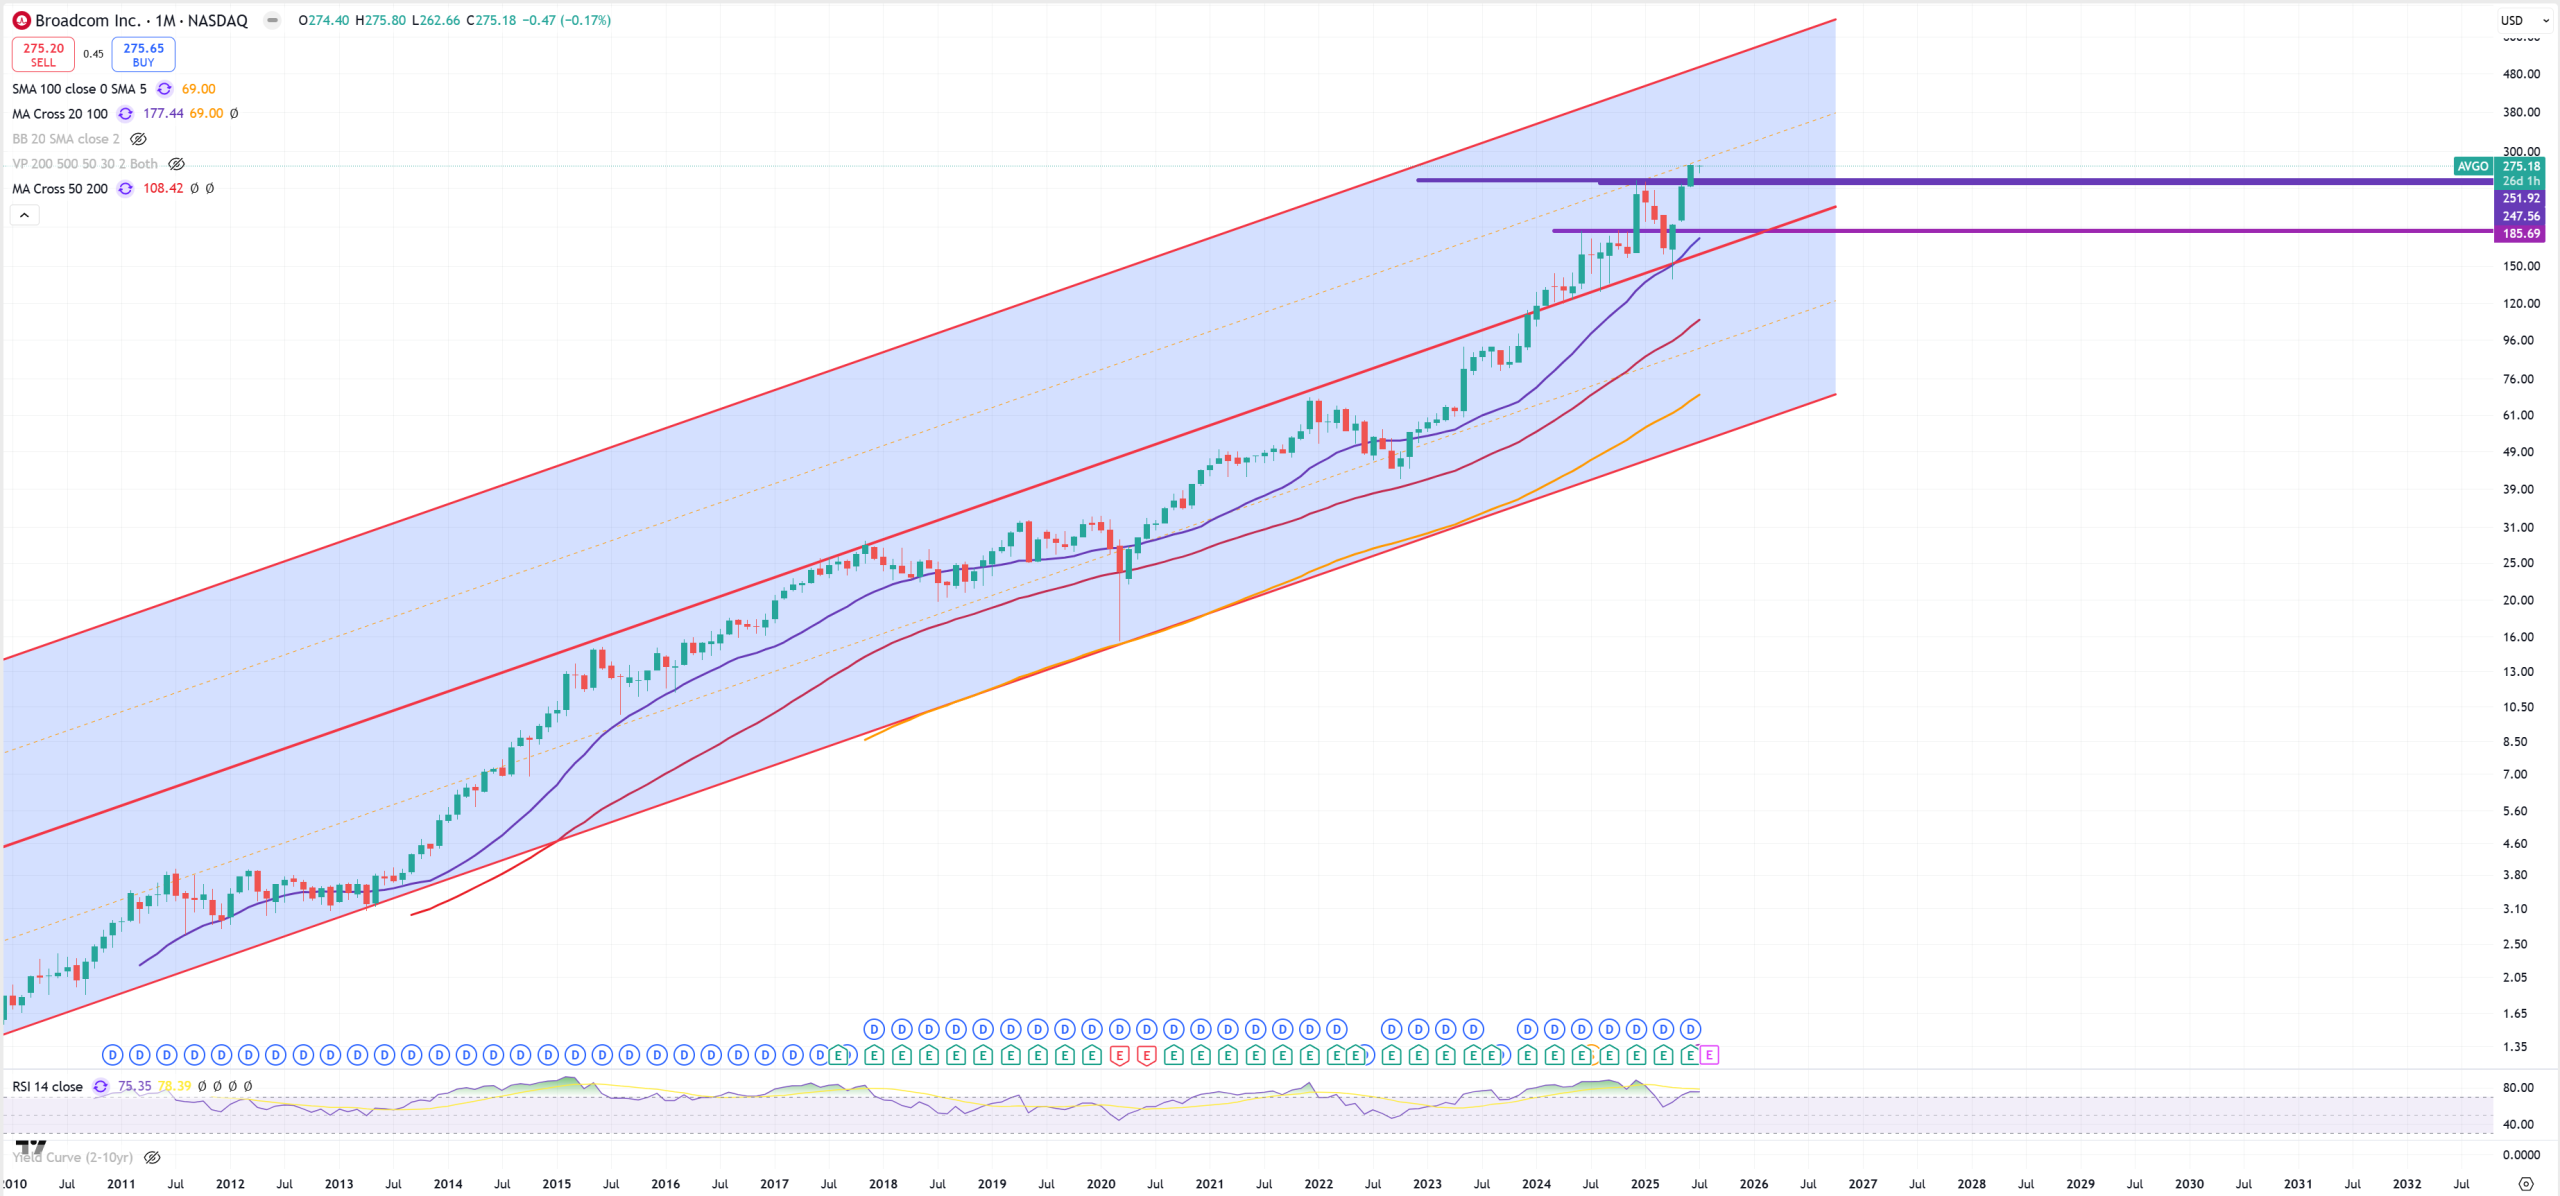
AVGO – like NVDA
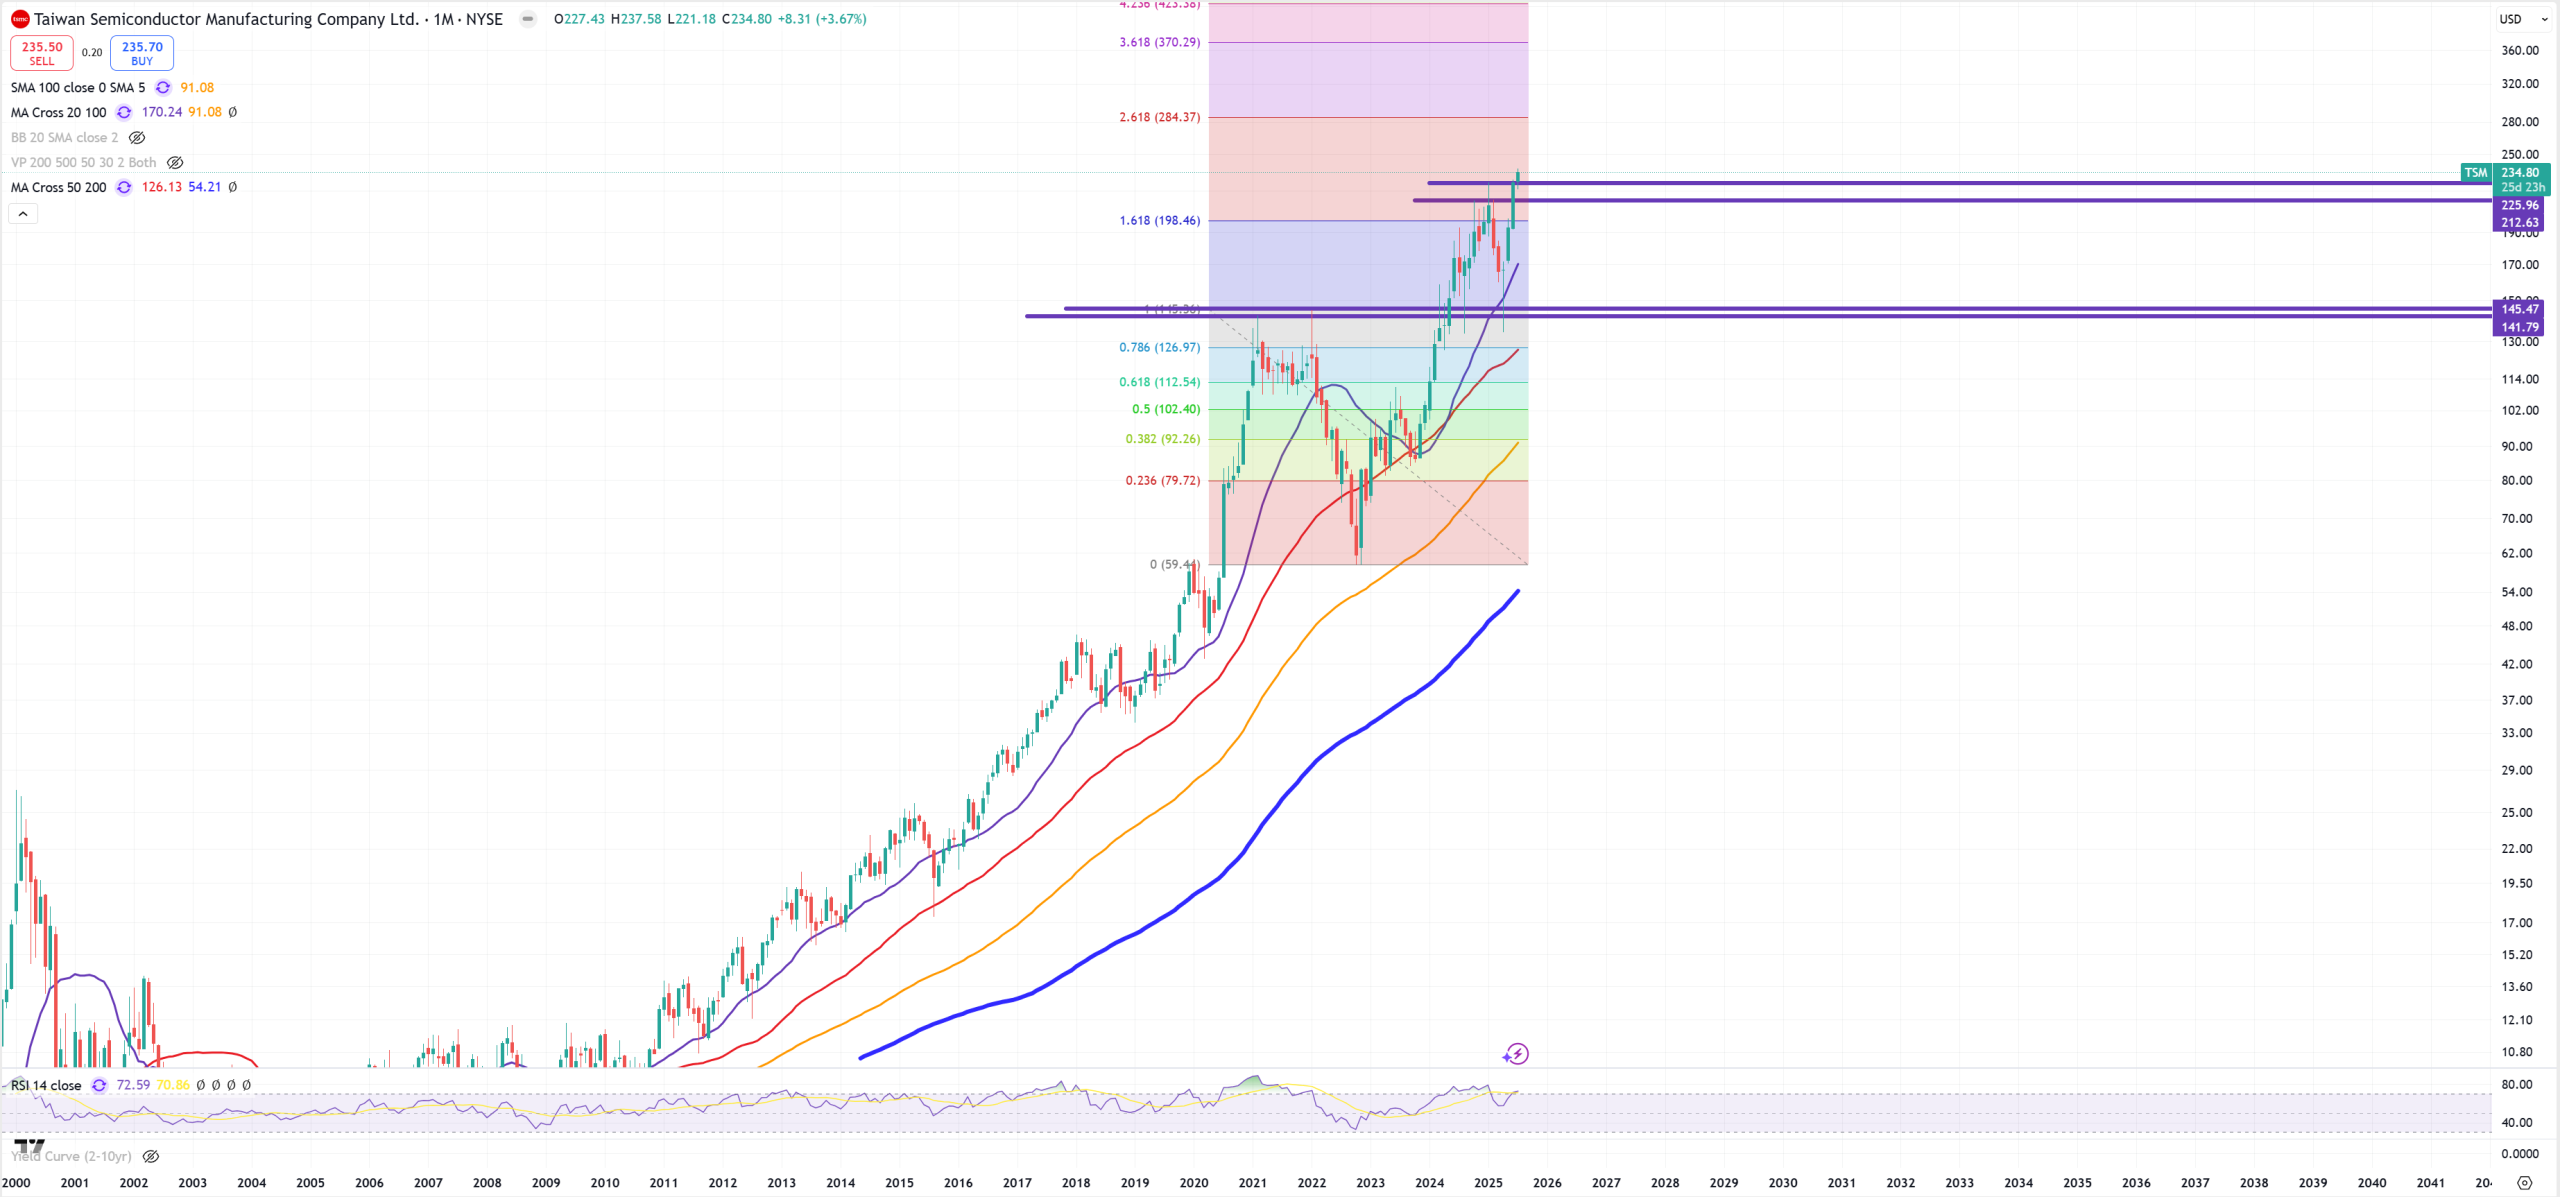
TSM – previous month June ended on upper resistance 226$, this month we started and we push higher, but the month will be really long
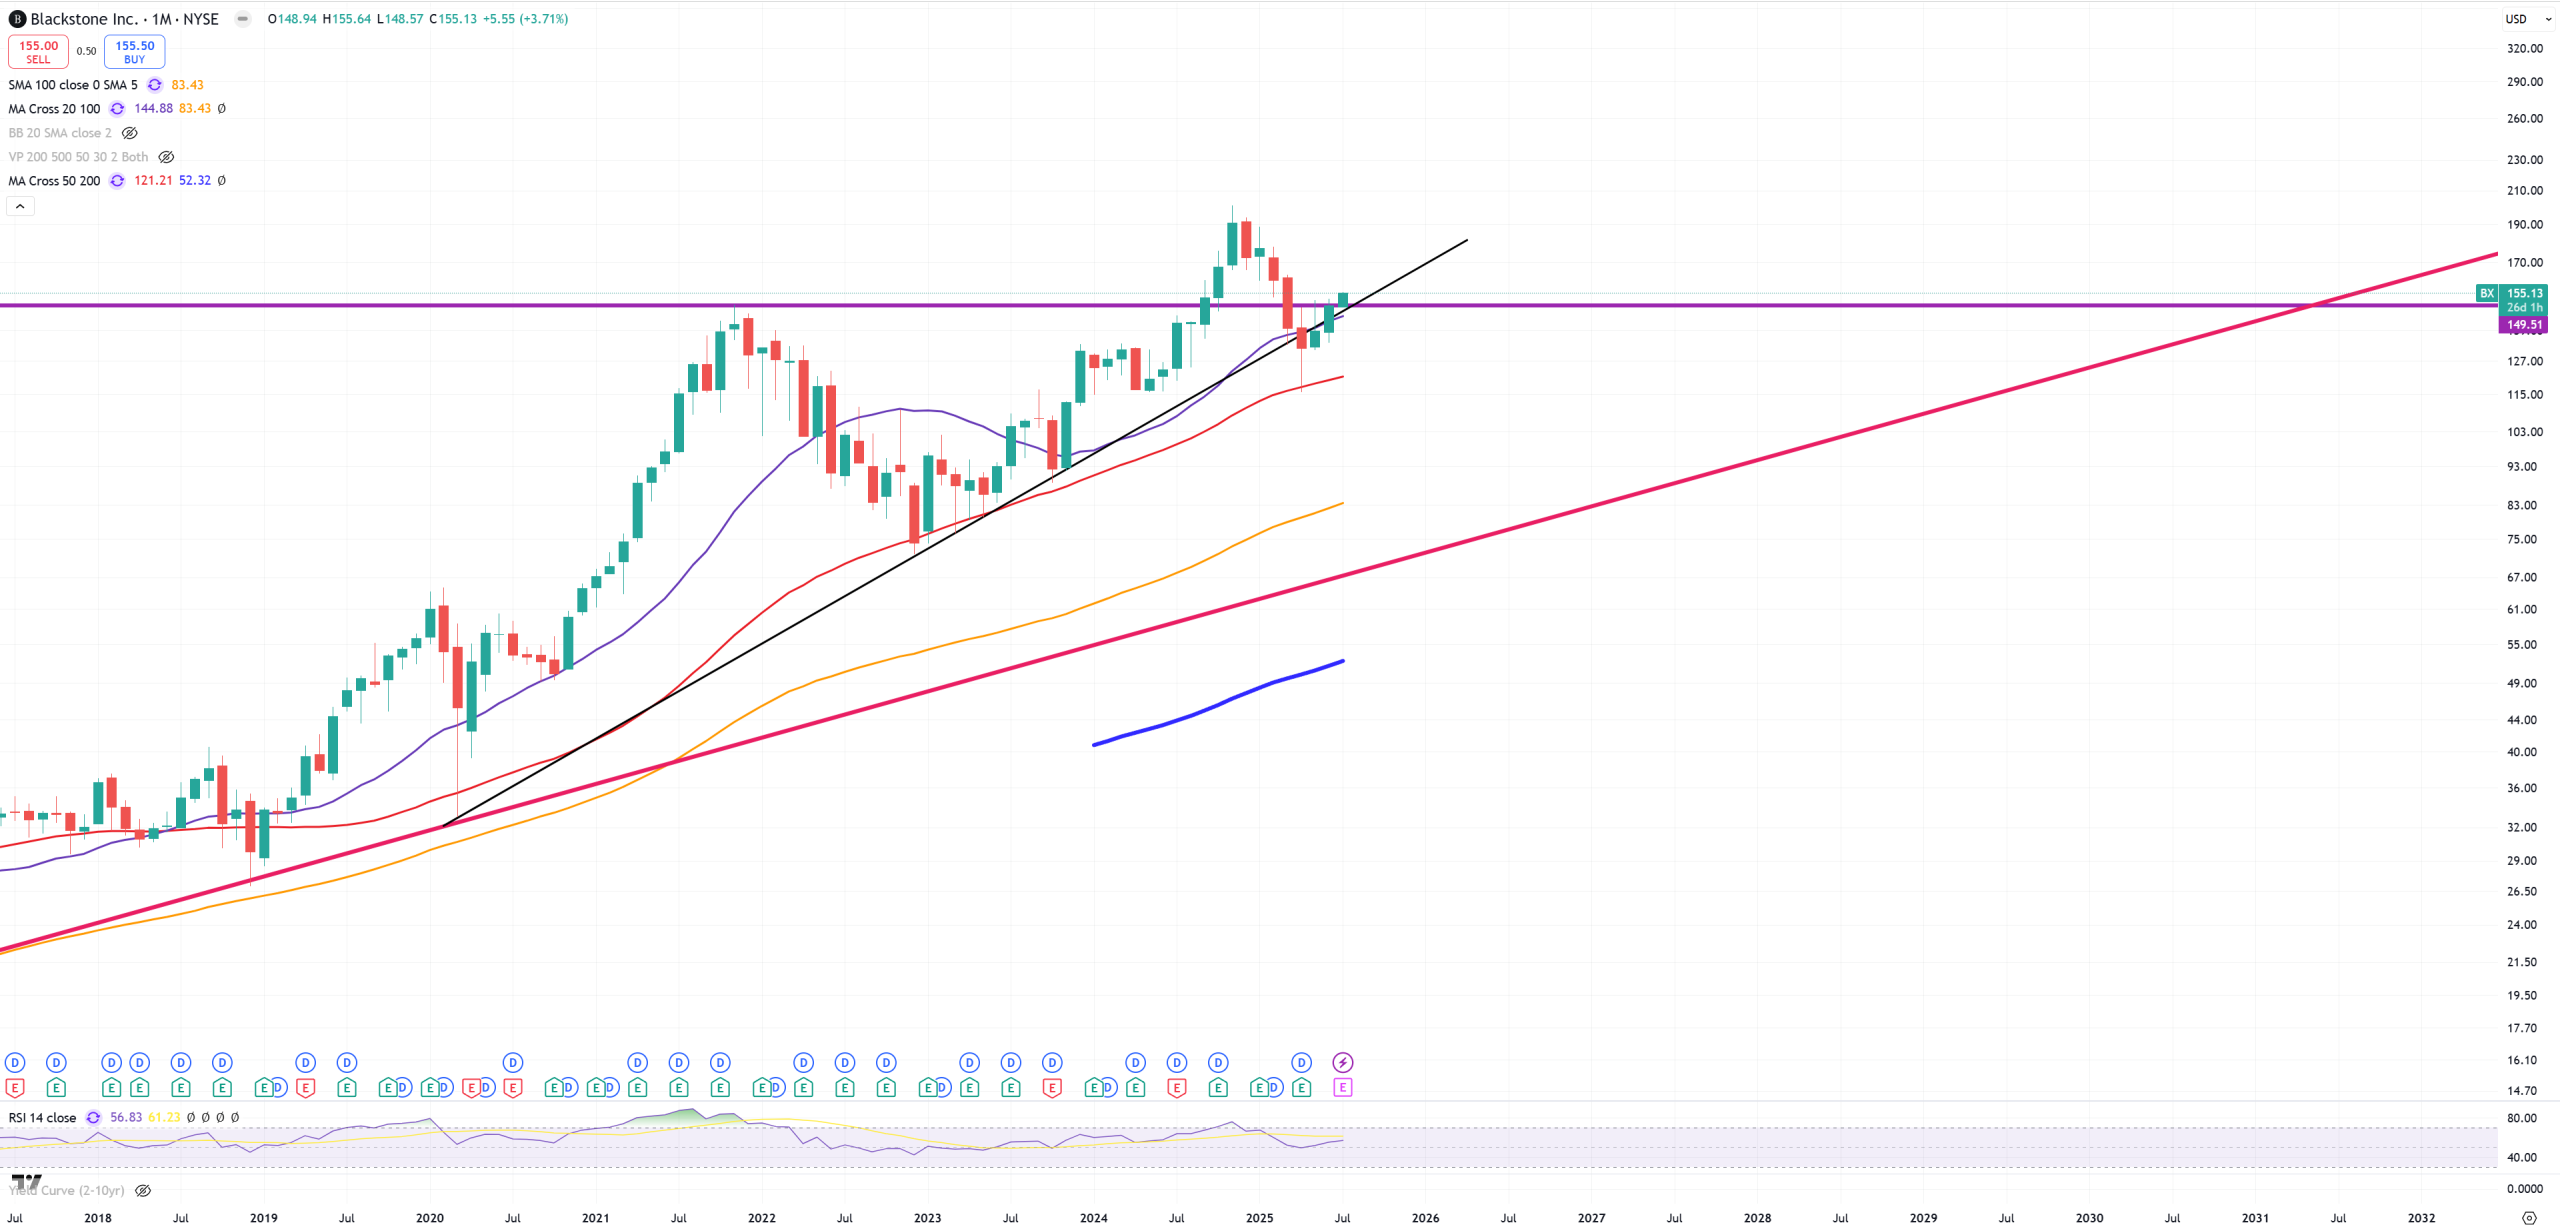
BX – Blackstone, so CRE – June candle closed on the resistance, July tries to go higher, but the month is still on the beginning
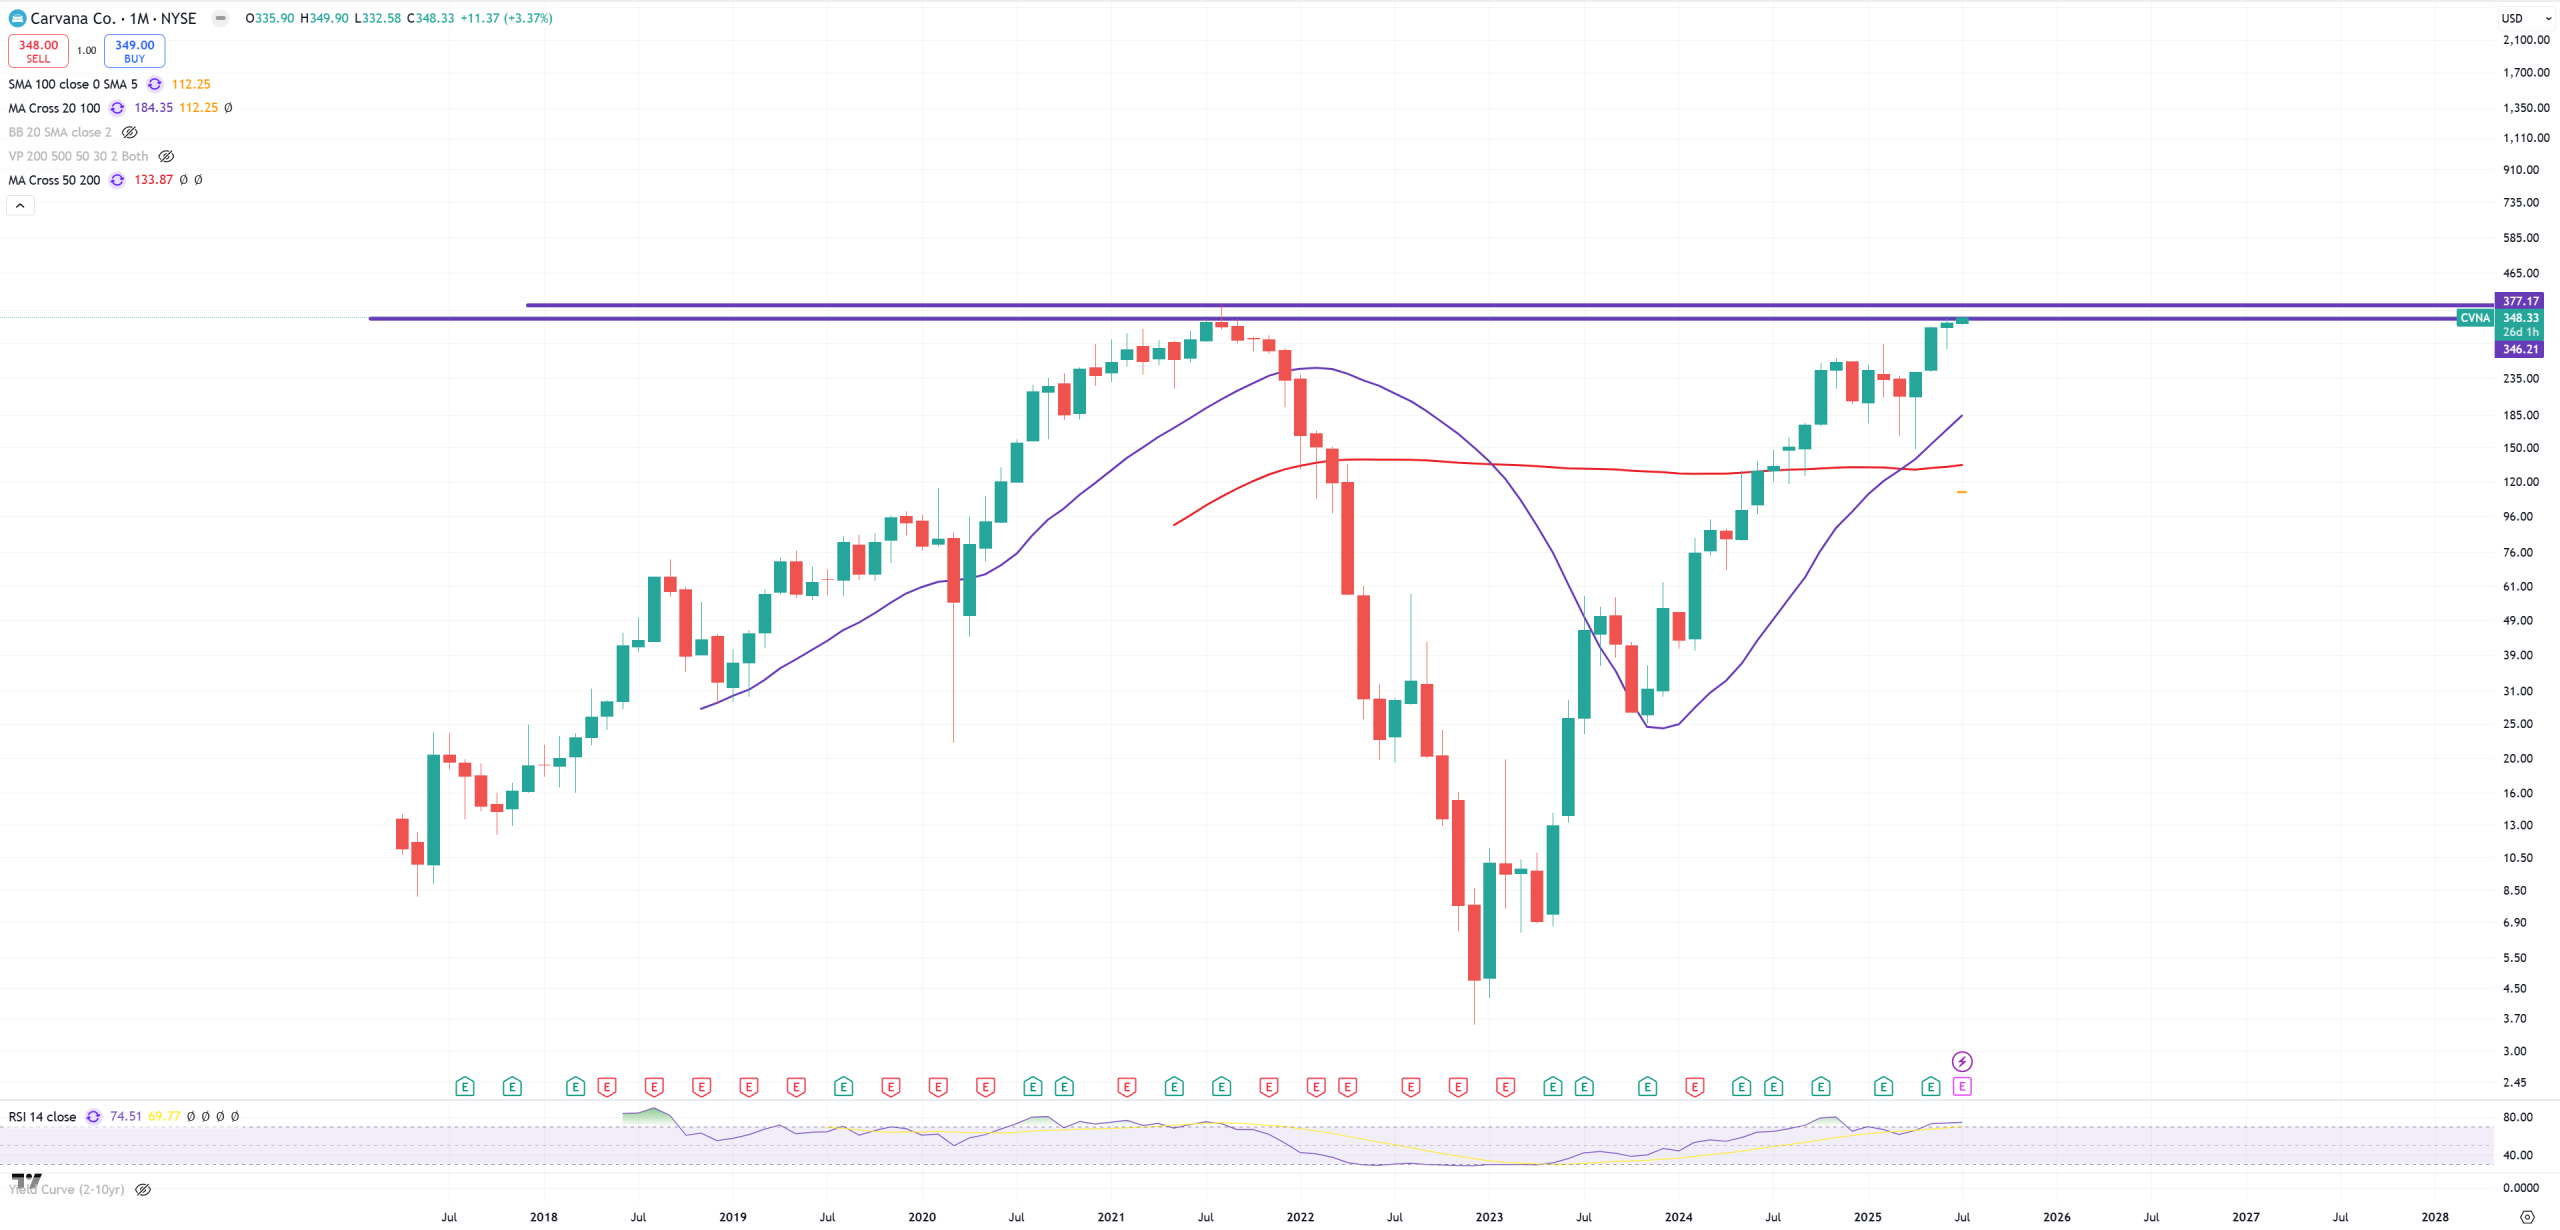
CVNA – also break here or double-top. This is probably one of the biggest recovery after (M)MA50 break down I’ve ever seen.
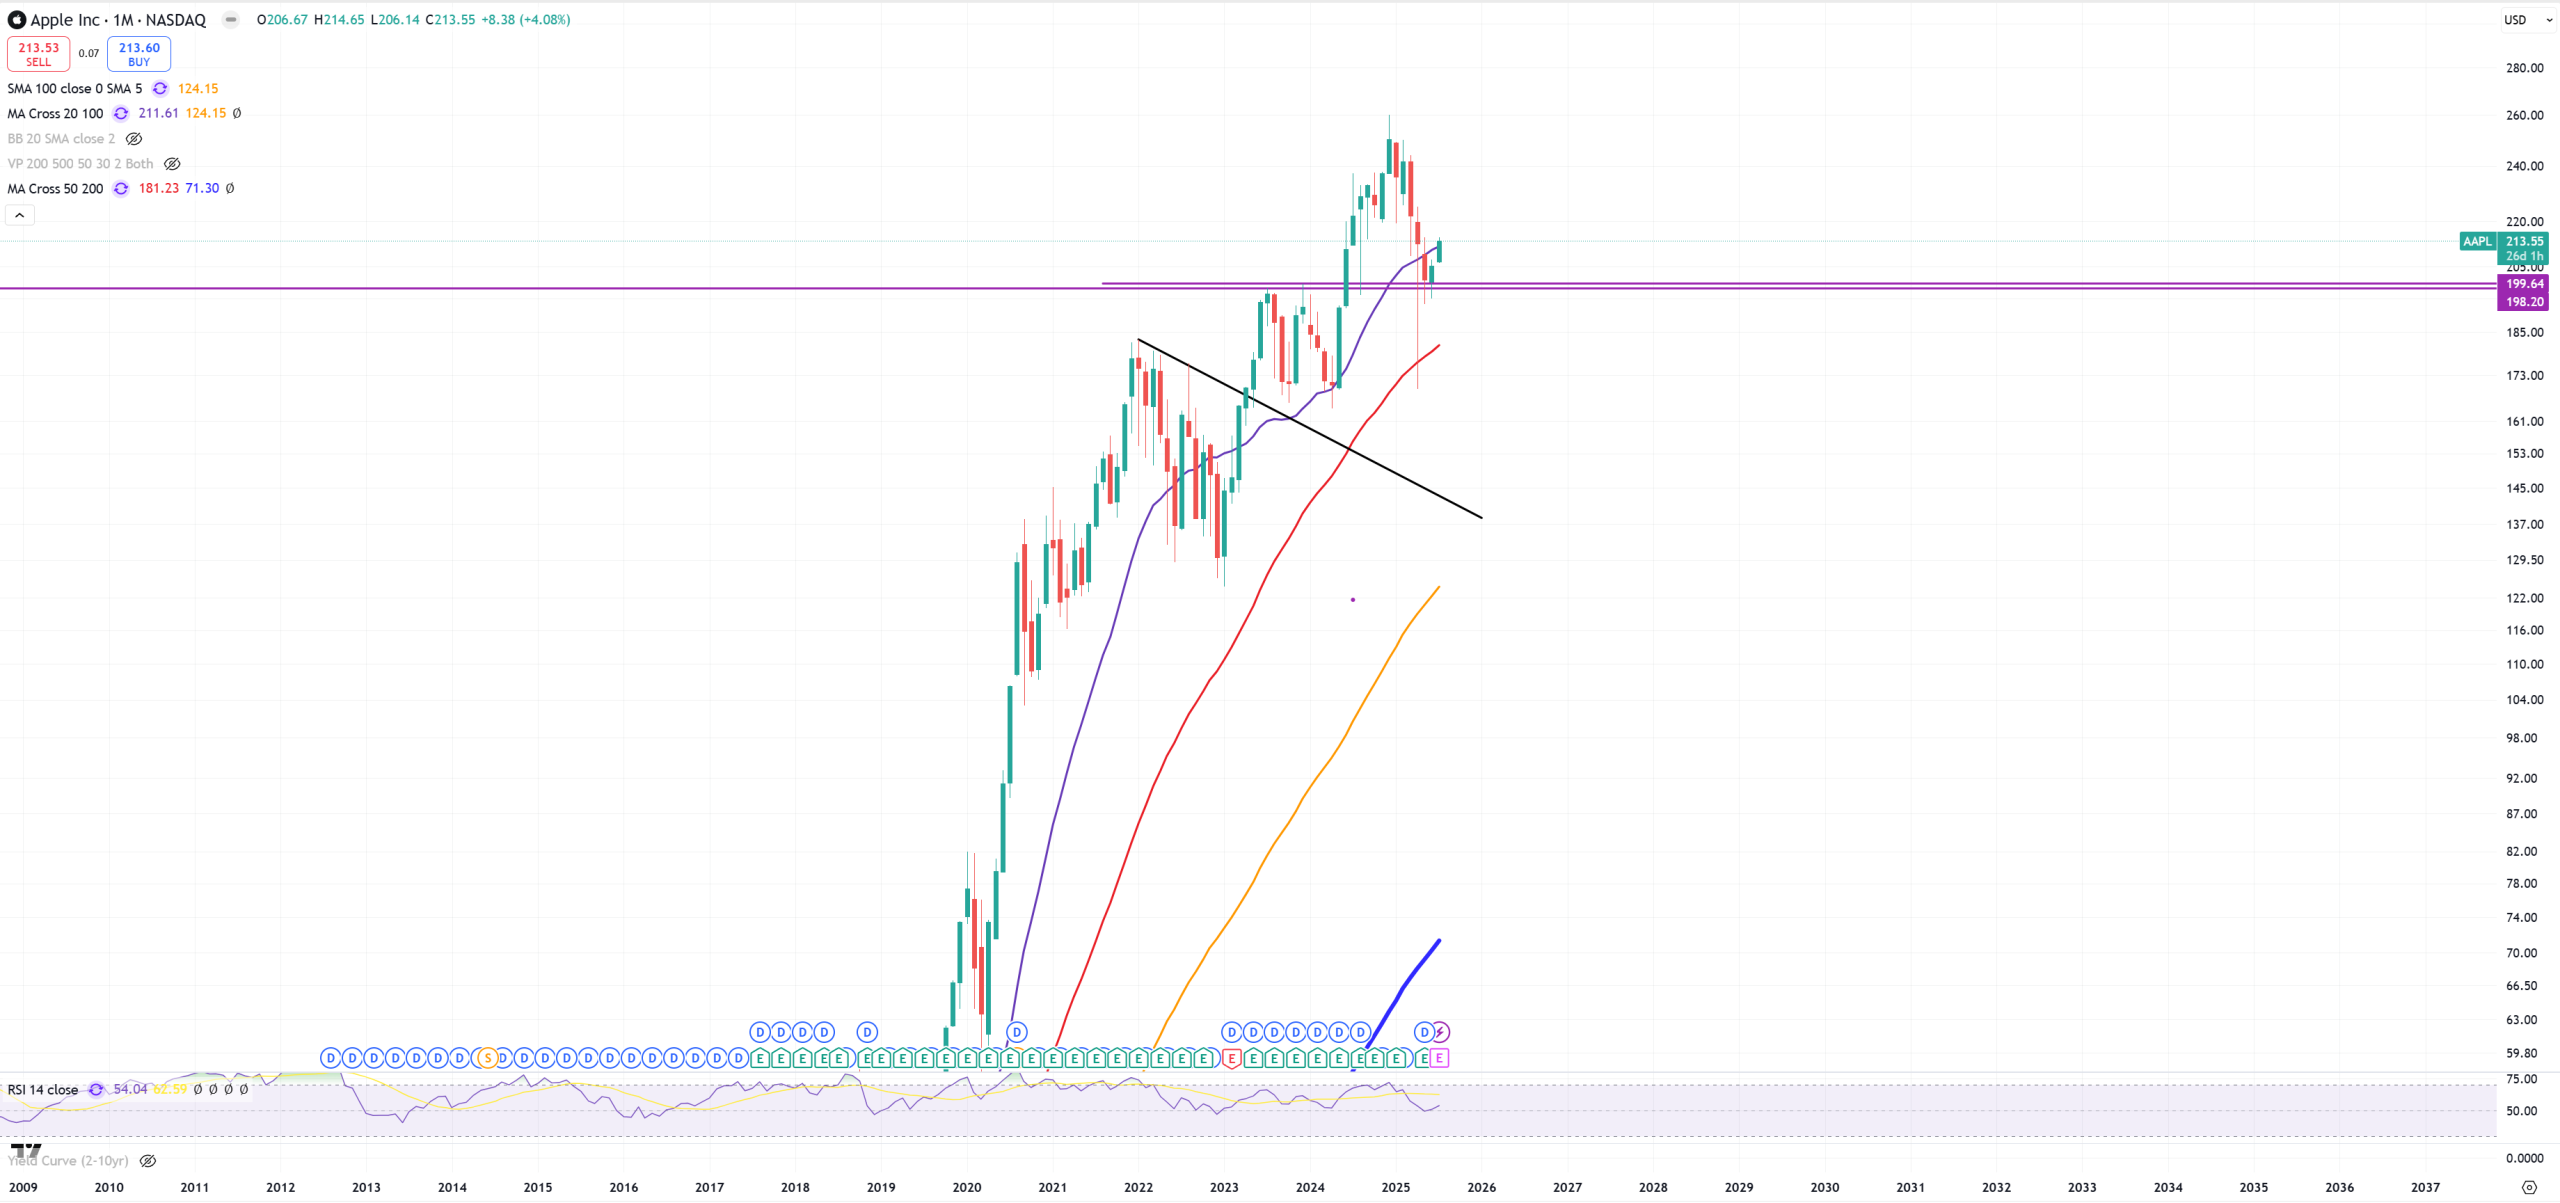
AAPL – support 200$ holds, my motto is : as Apple holds this support market will make new ATHs.
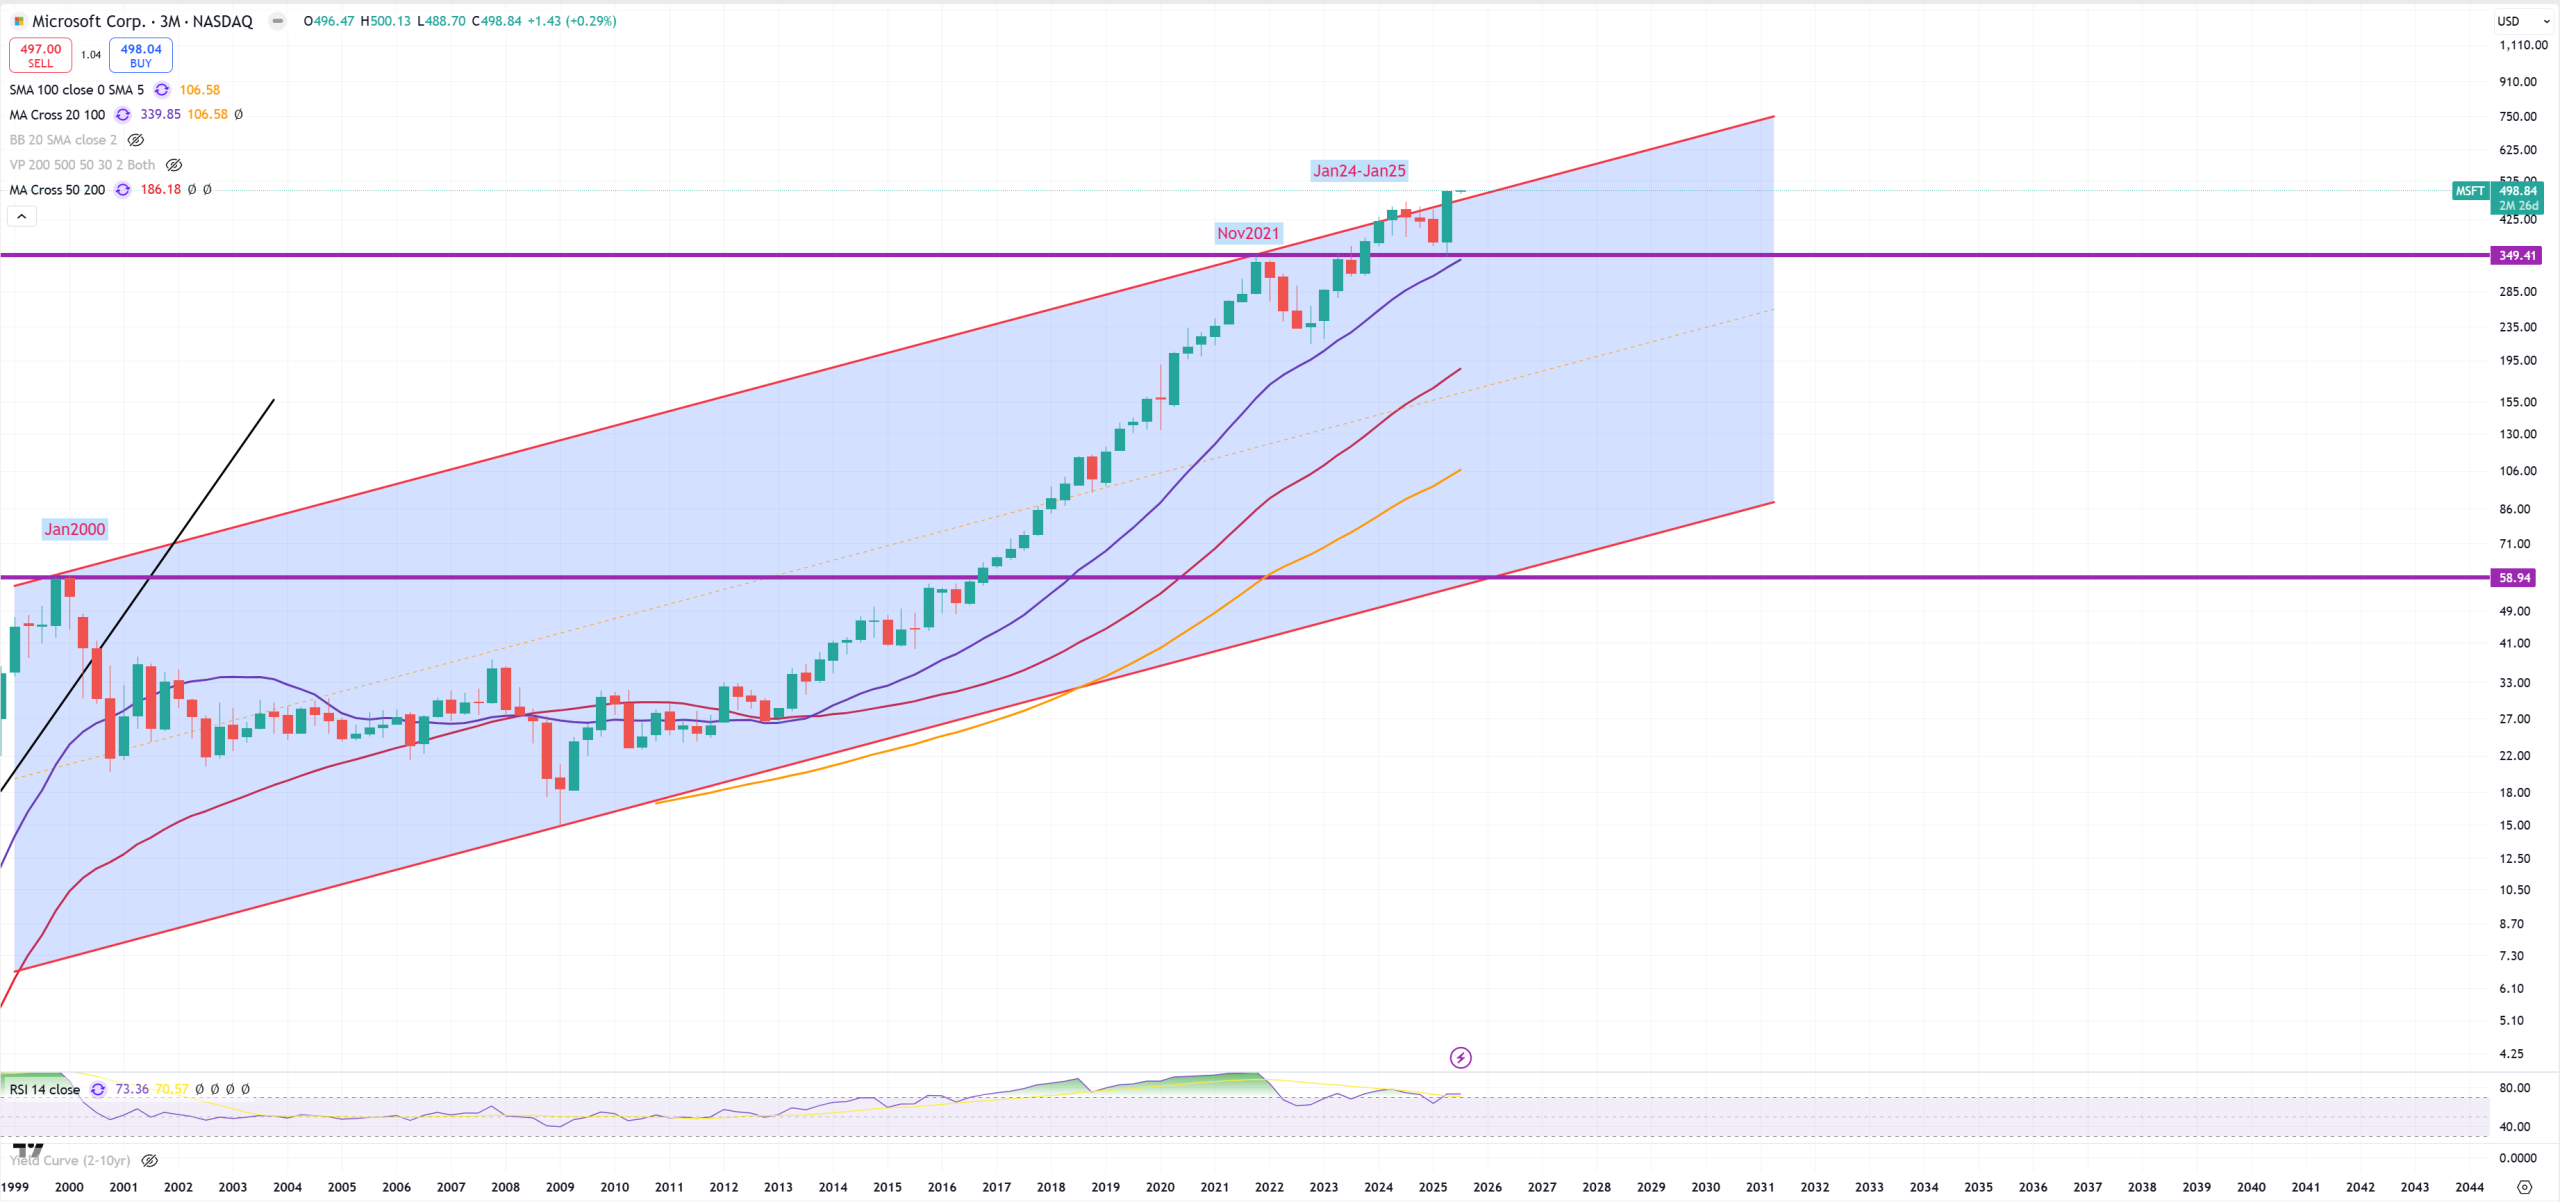
MSFT – also above 2000-2021 trend
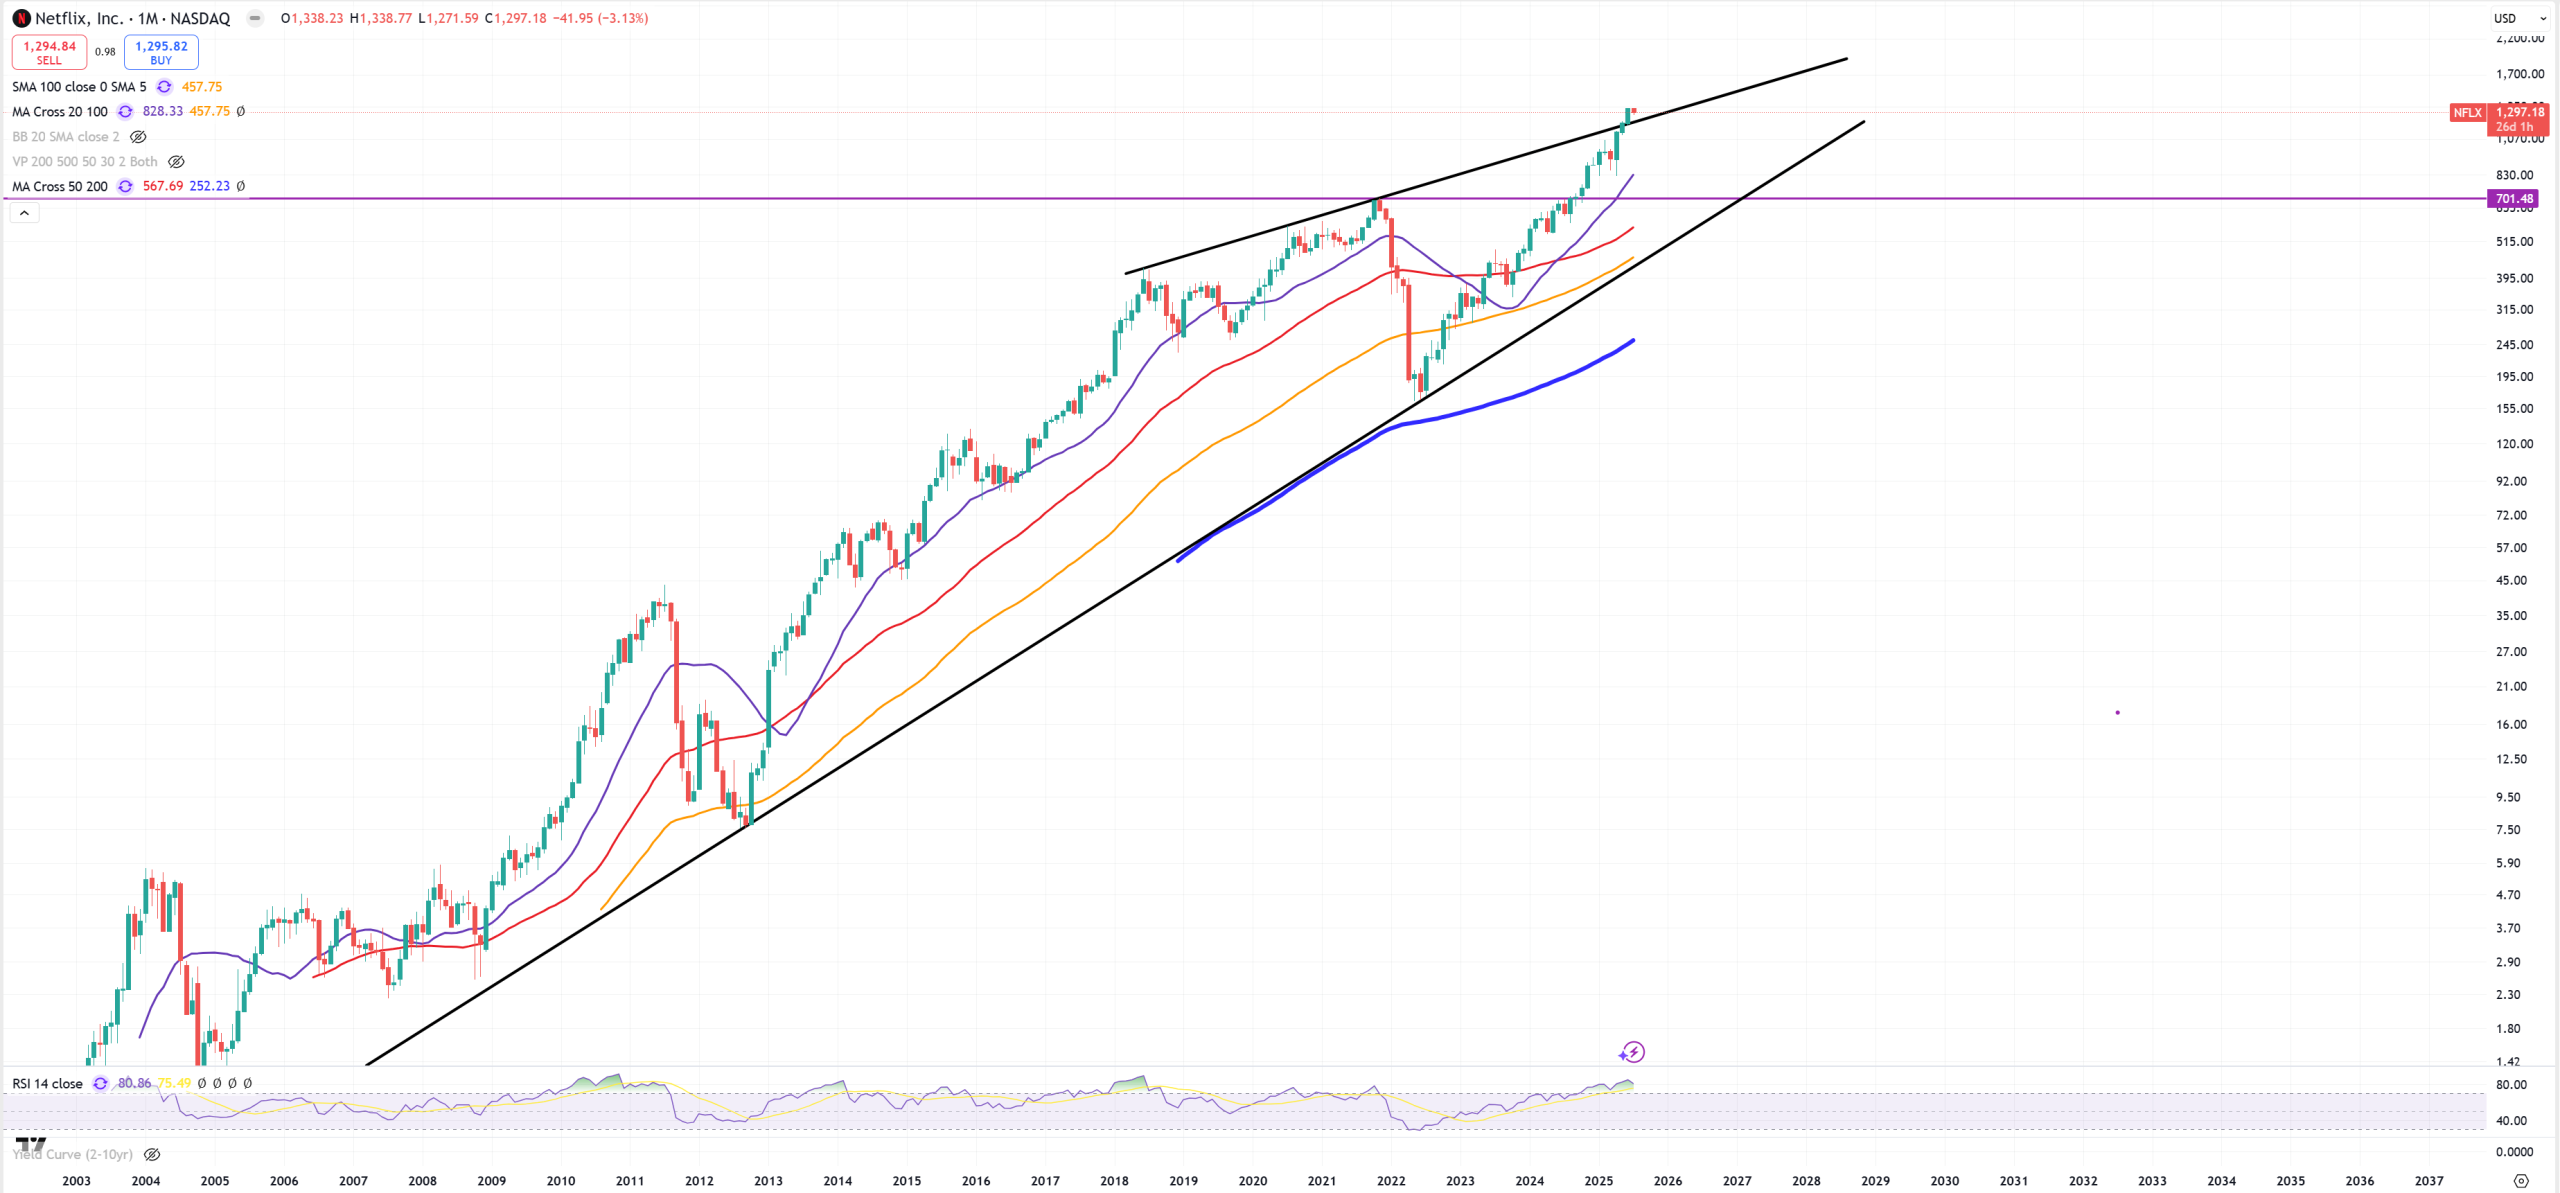
NFLX – breaking key level and now going like double-parabolic.
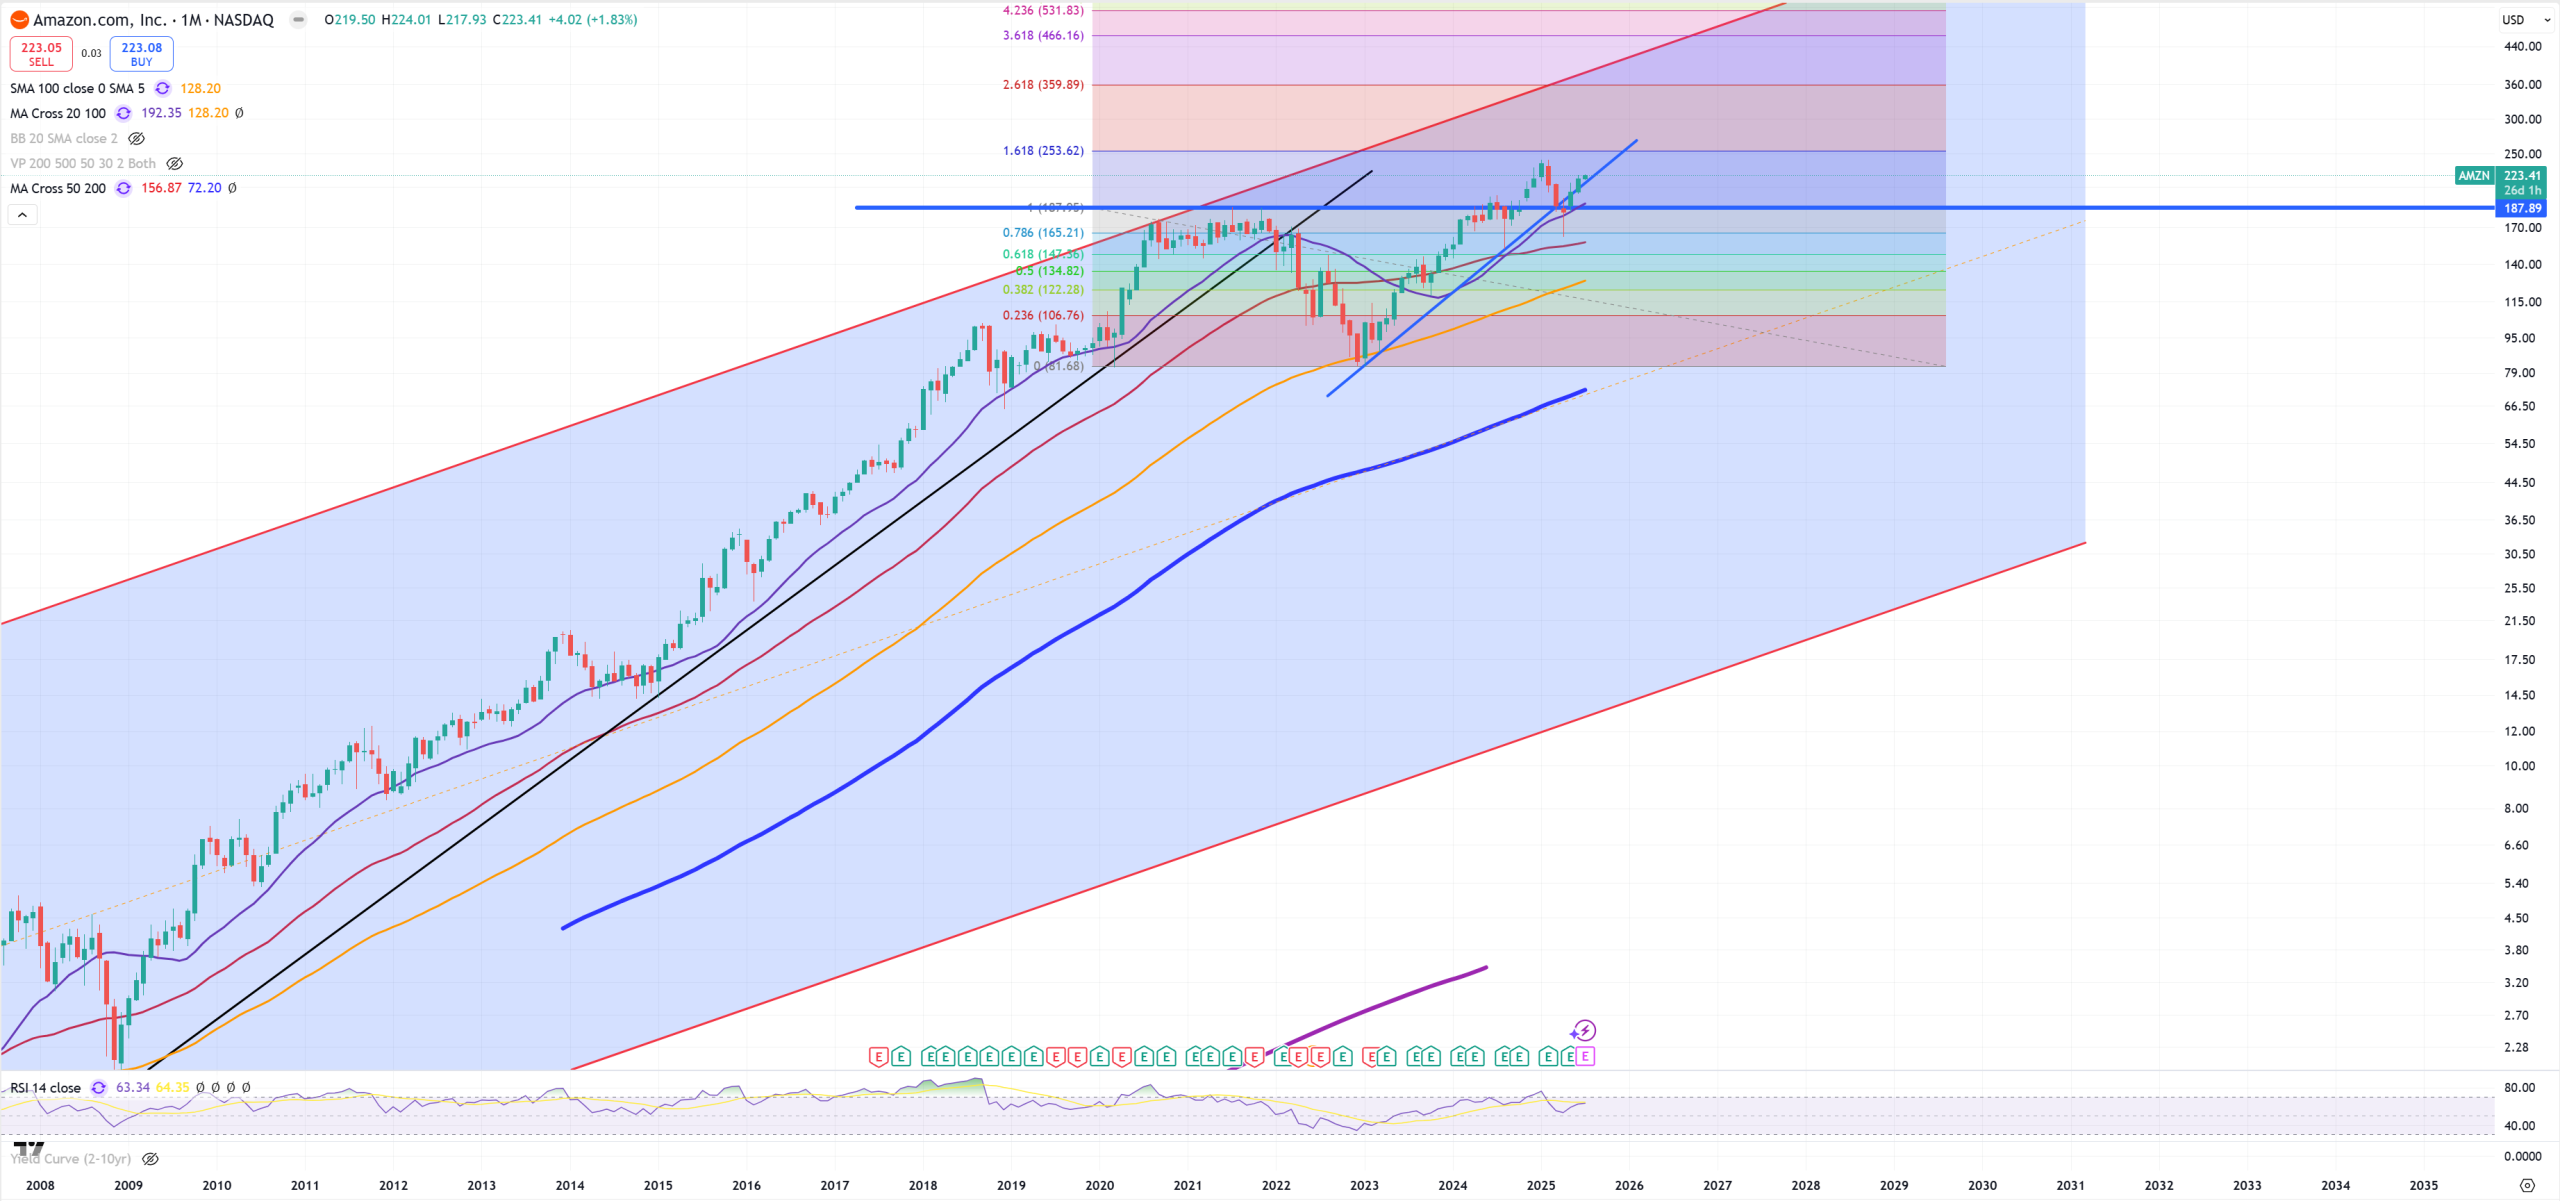
AMZN – key level around blue horizontal line, acts as a support
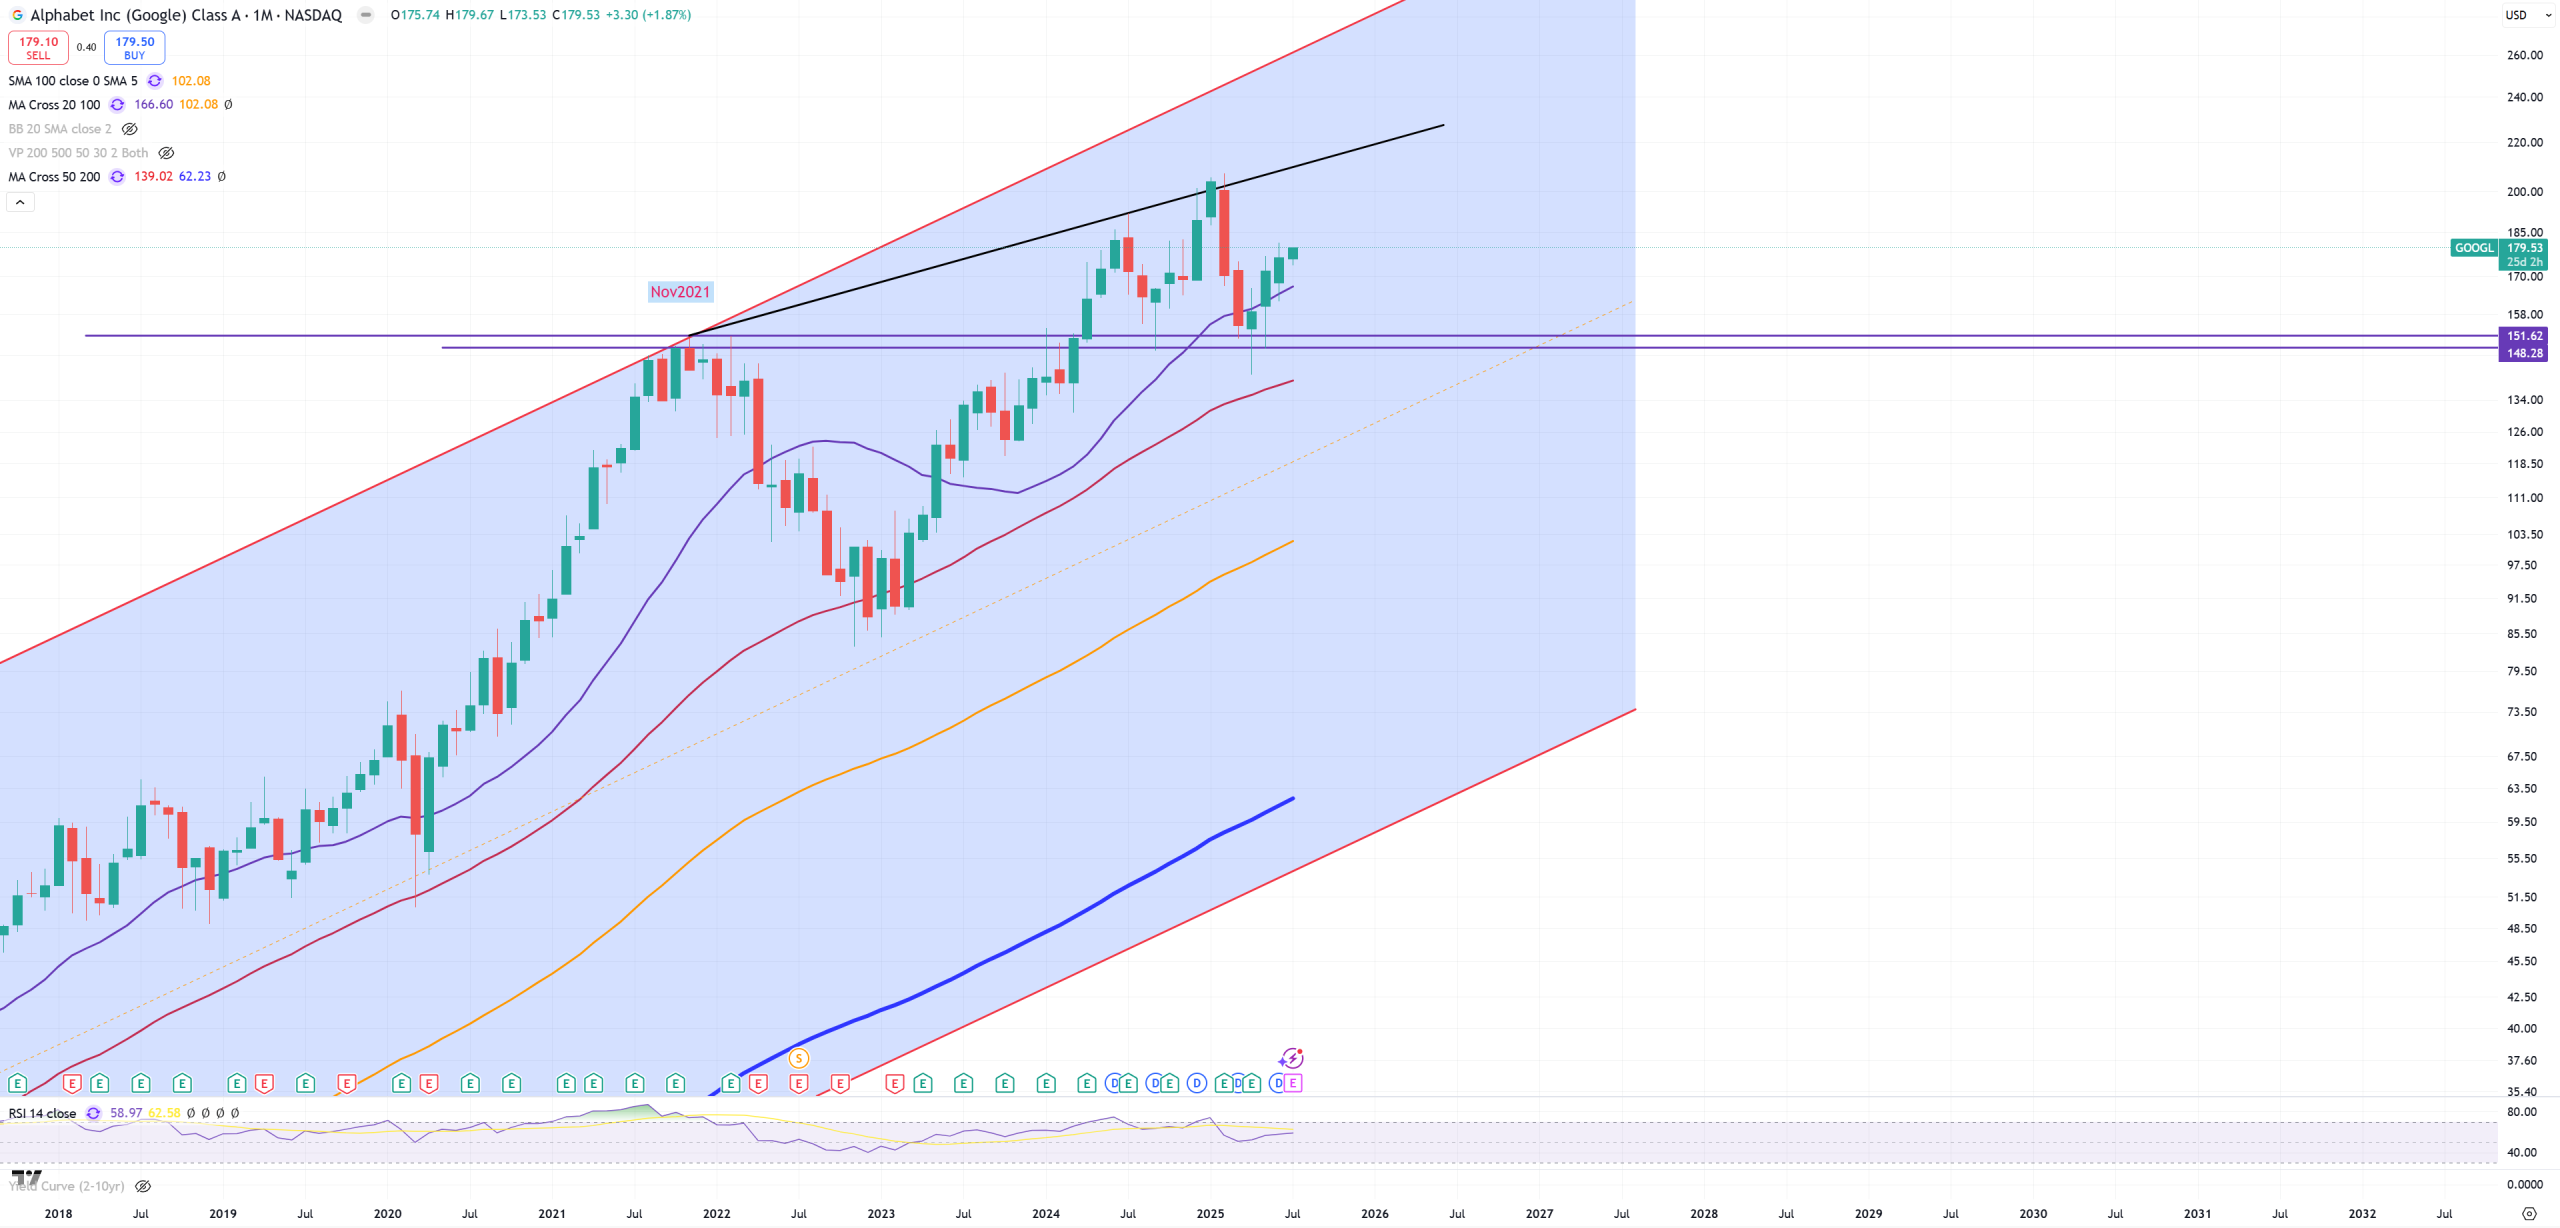
GOOGL – looks like Google traces Amazon
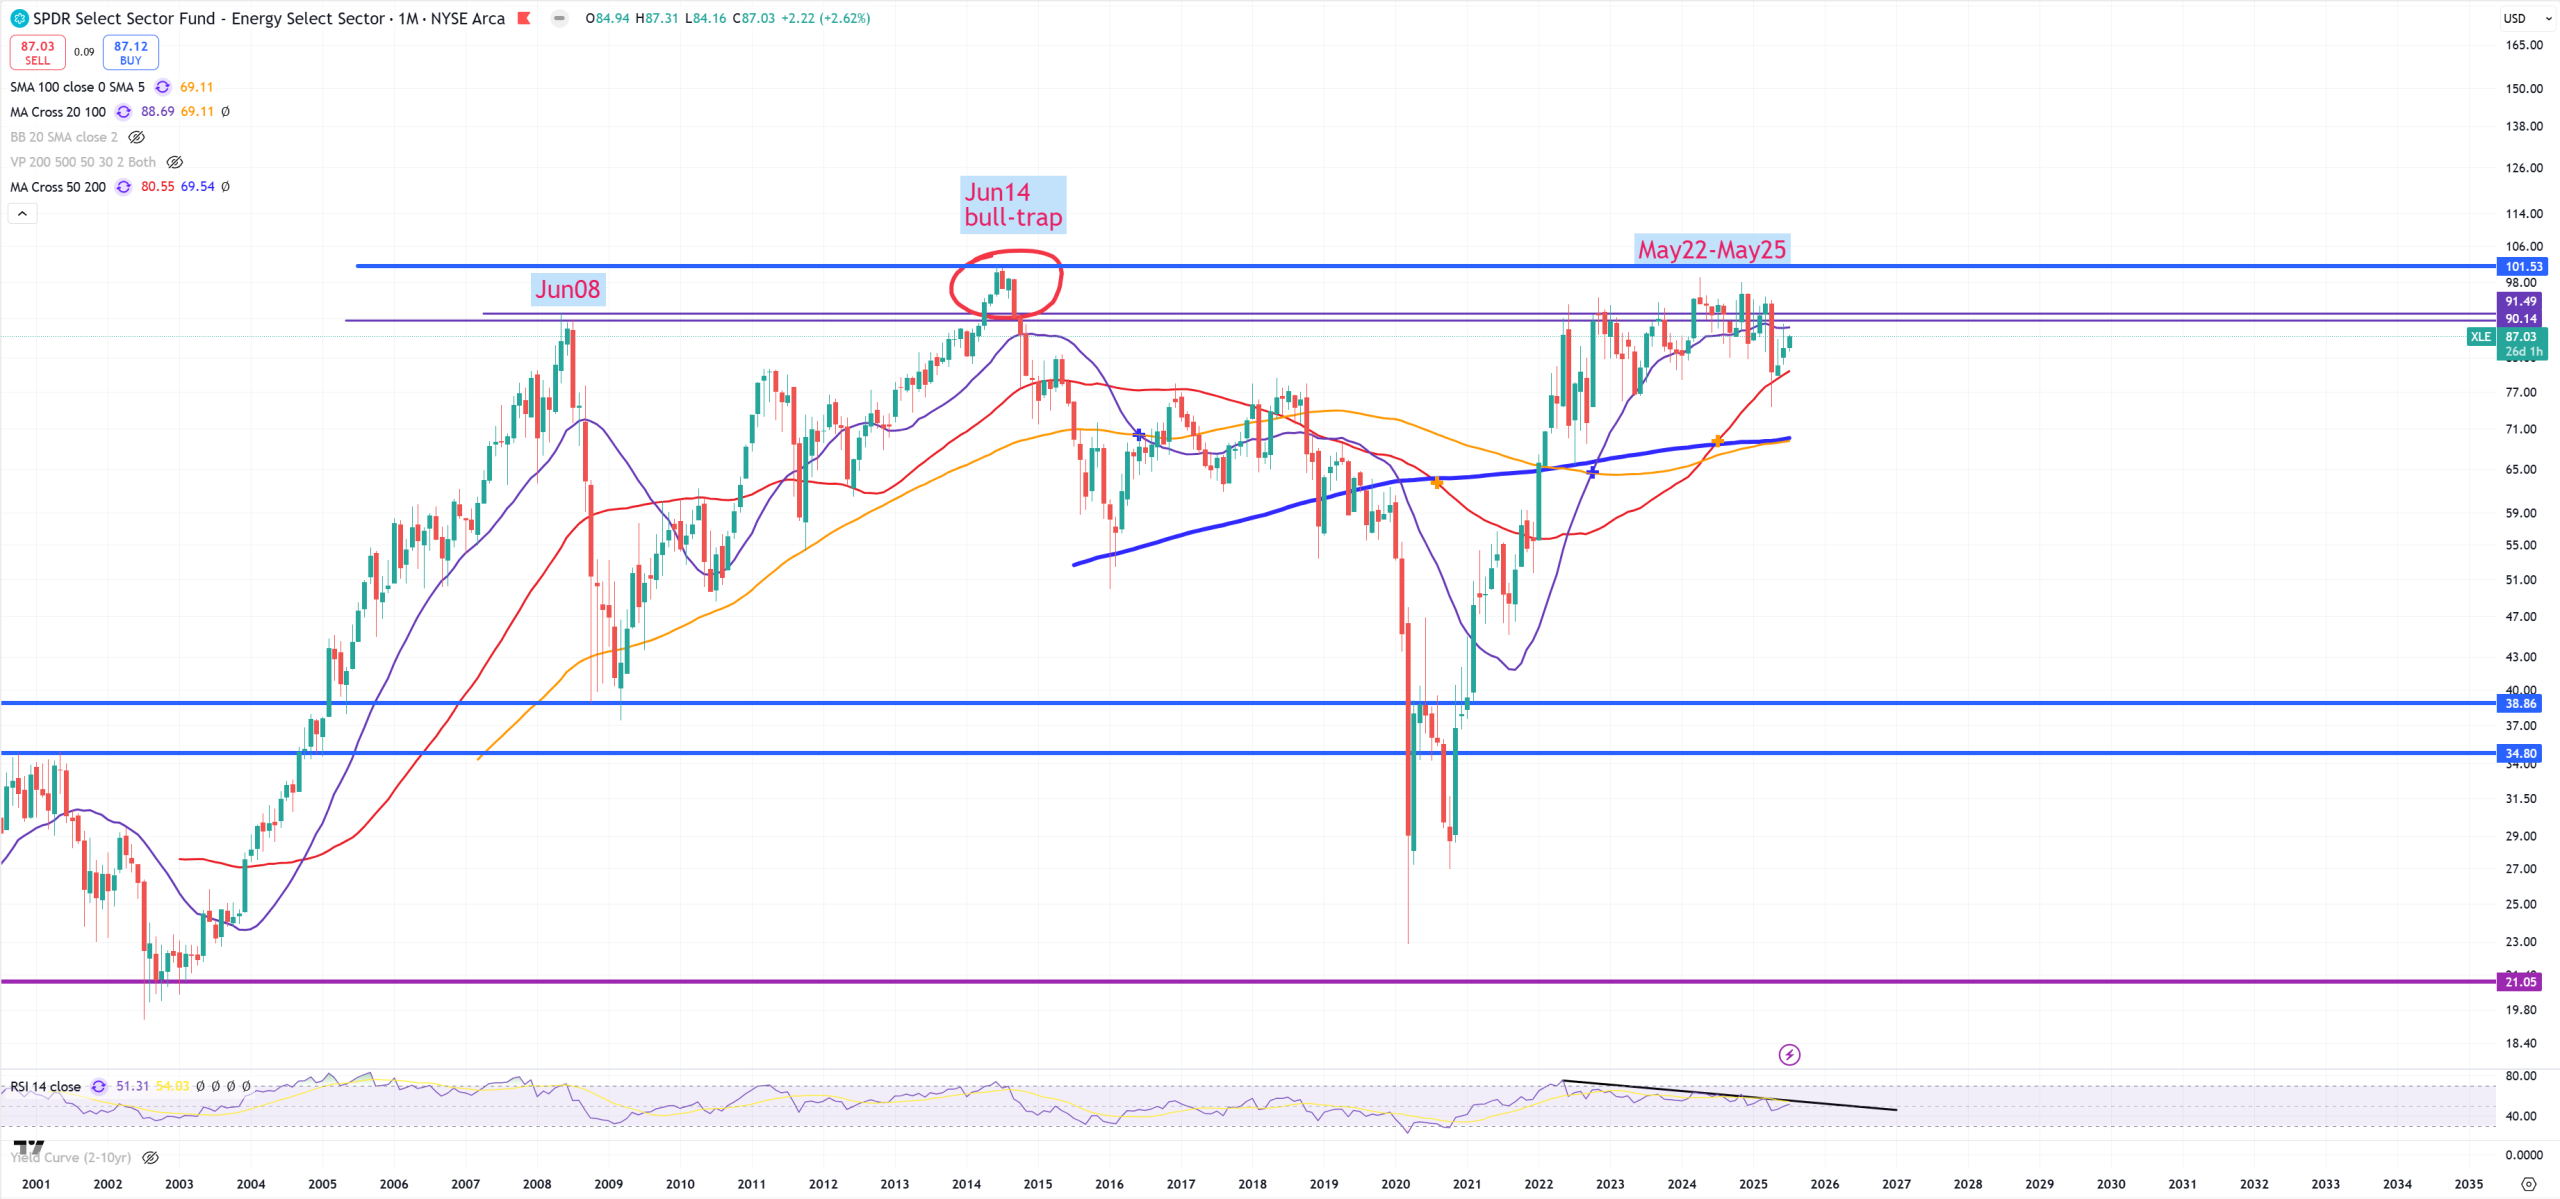
XLE – Energy – so 3 years on the same level
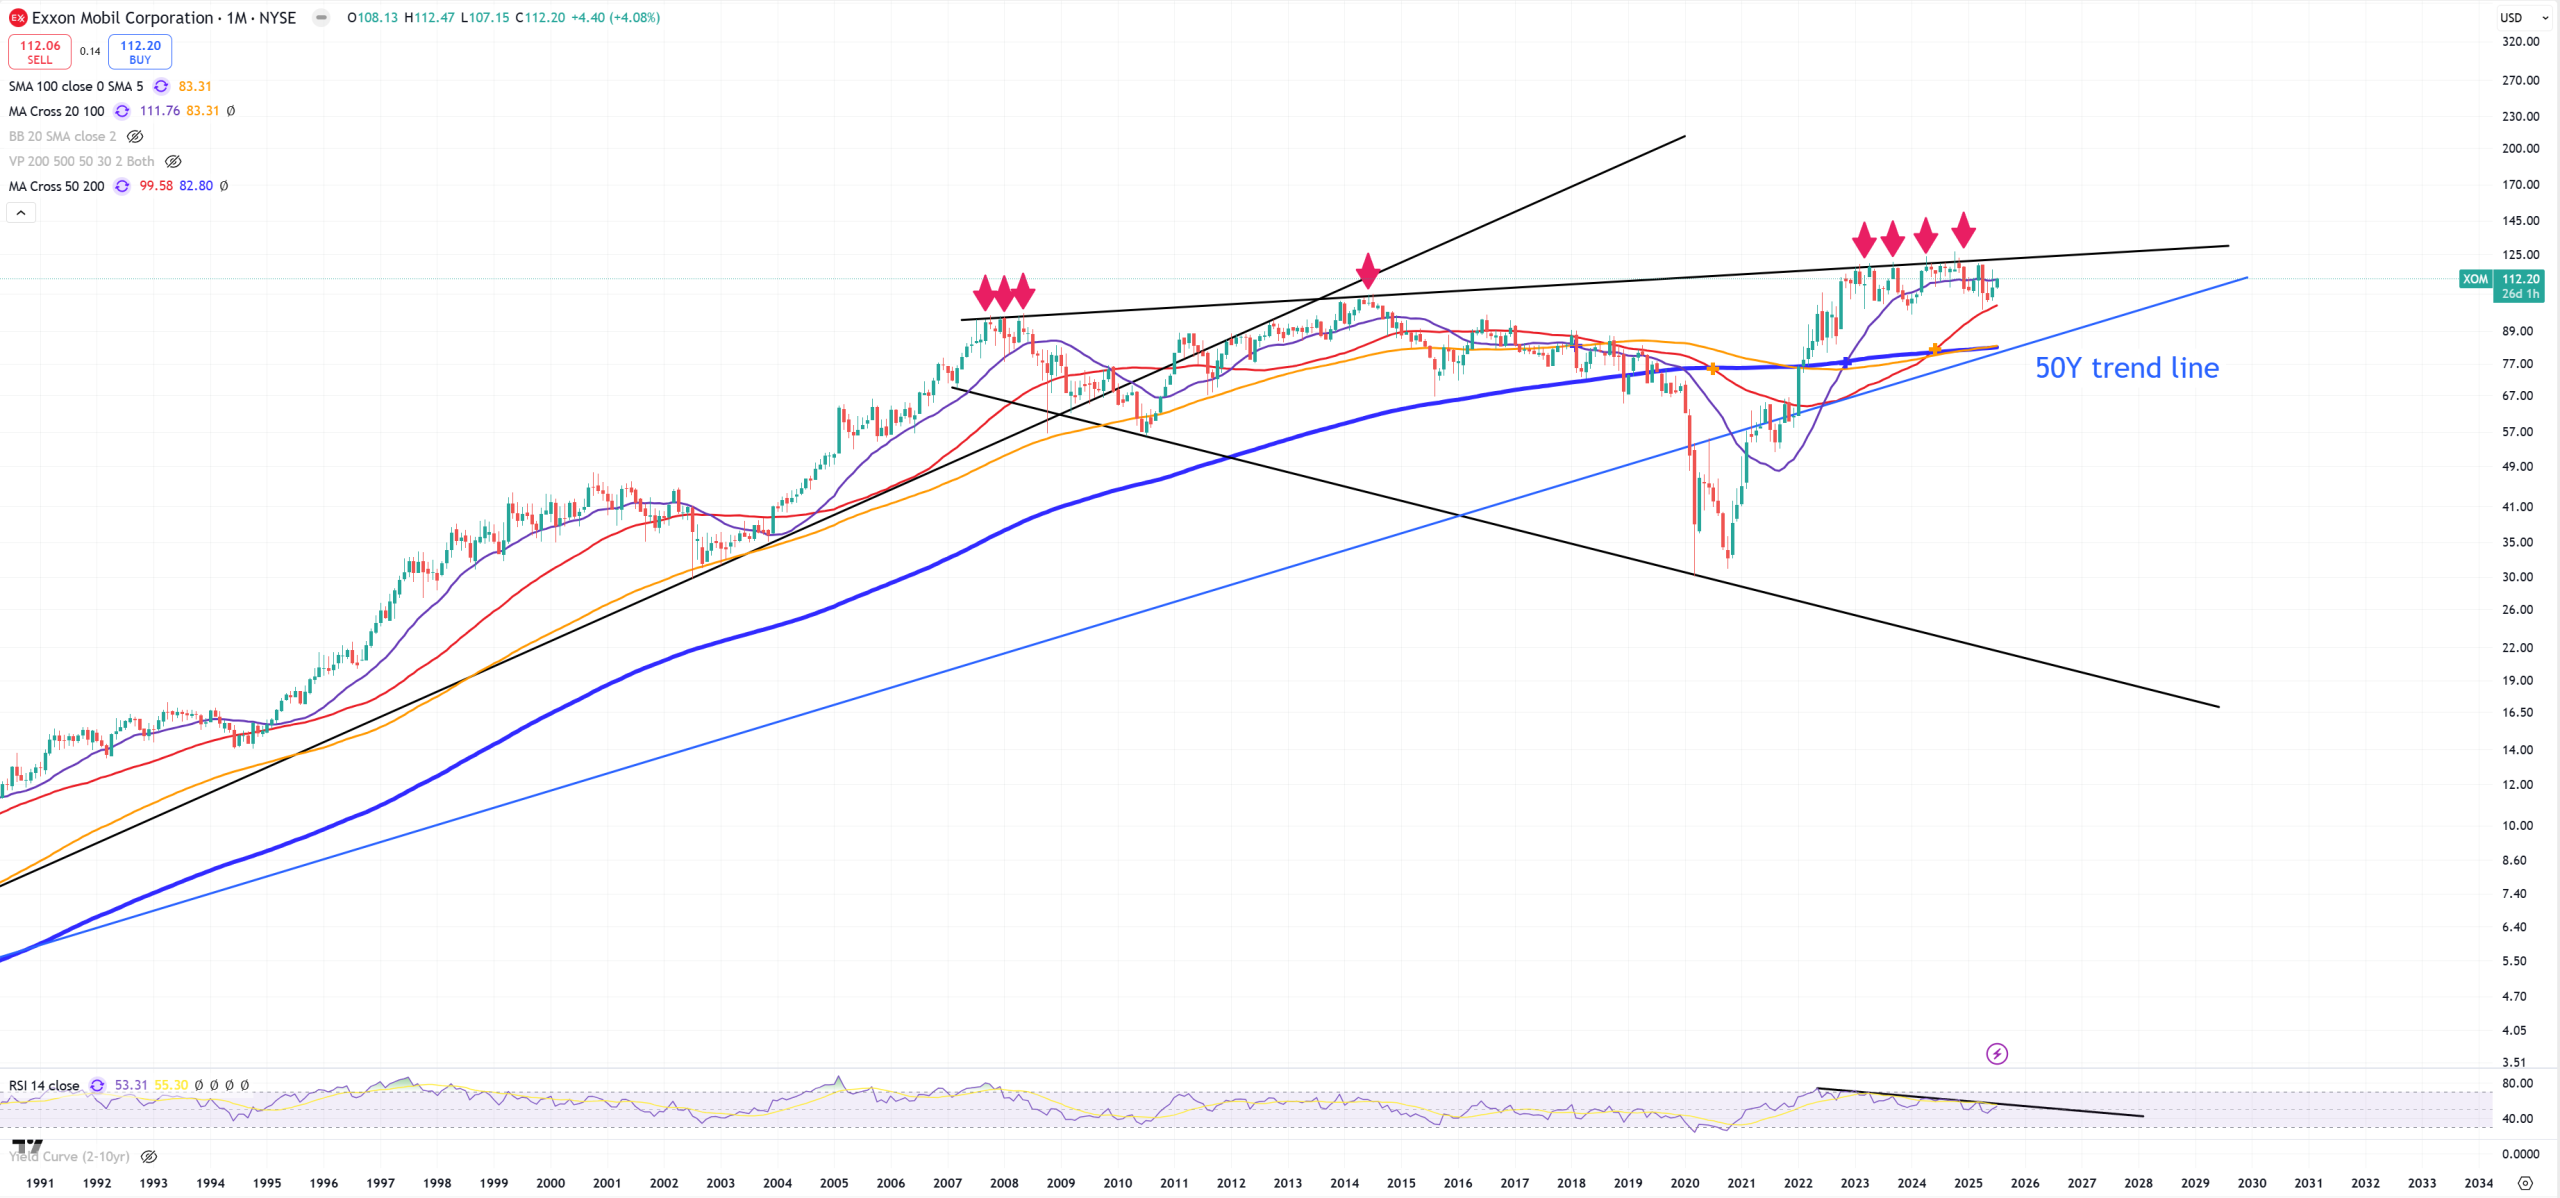
XOM – derivative of XLE – same style.
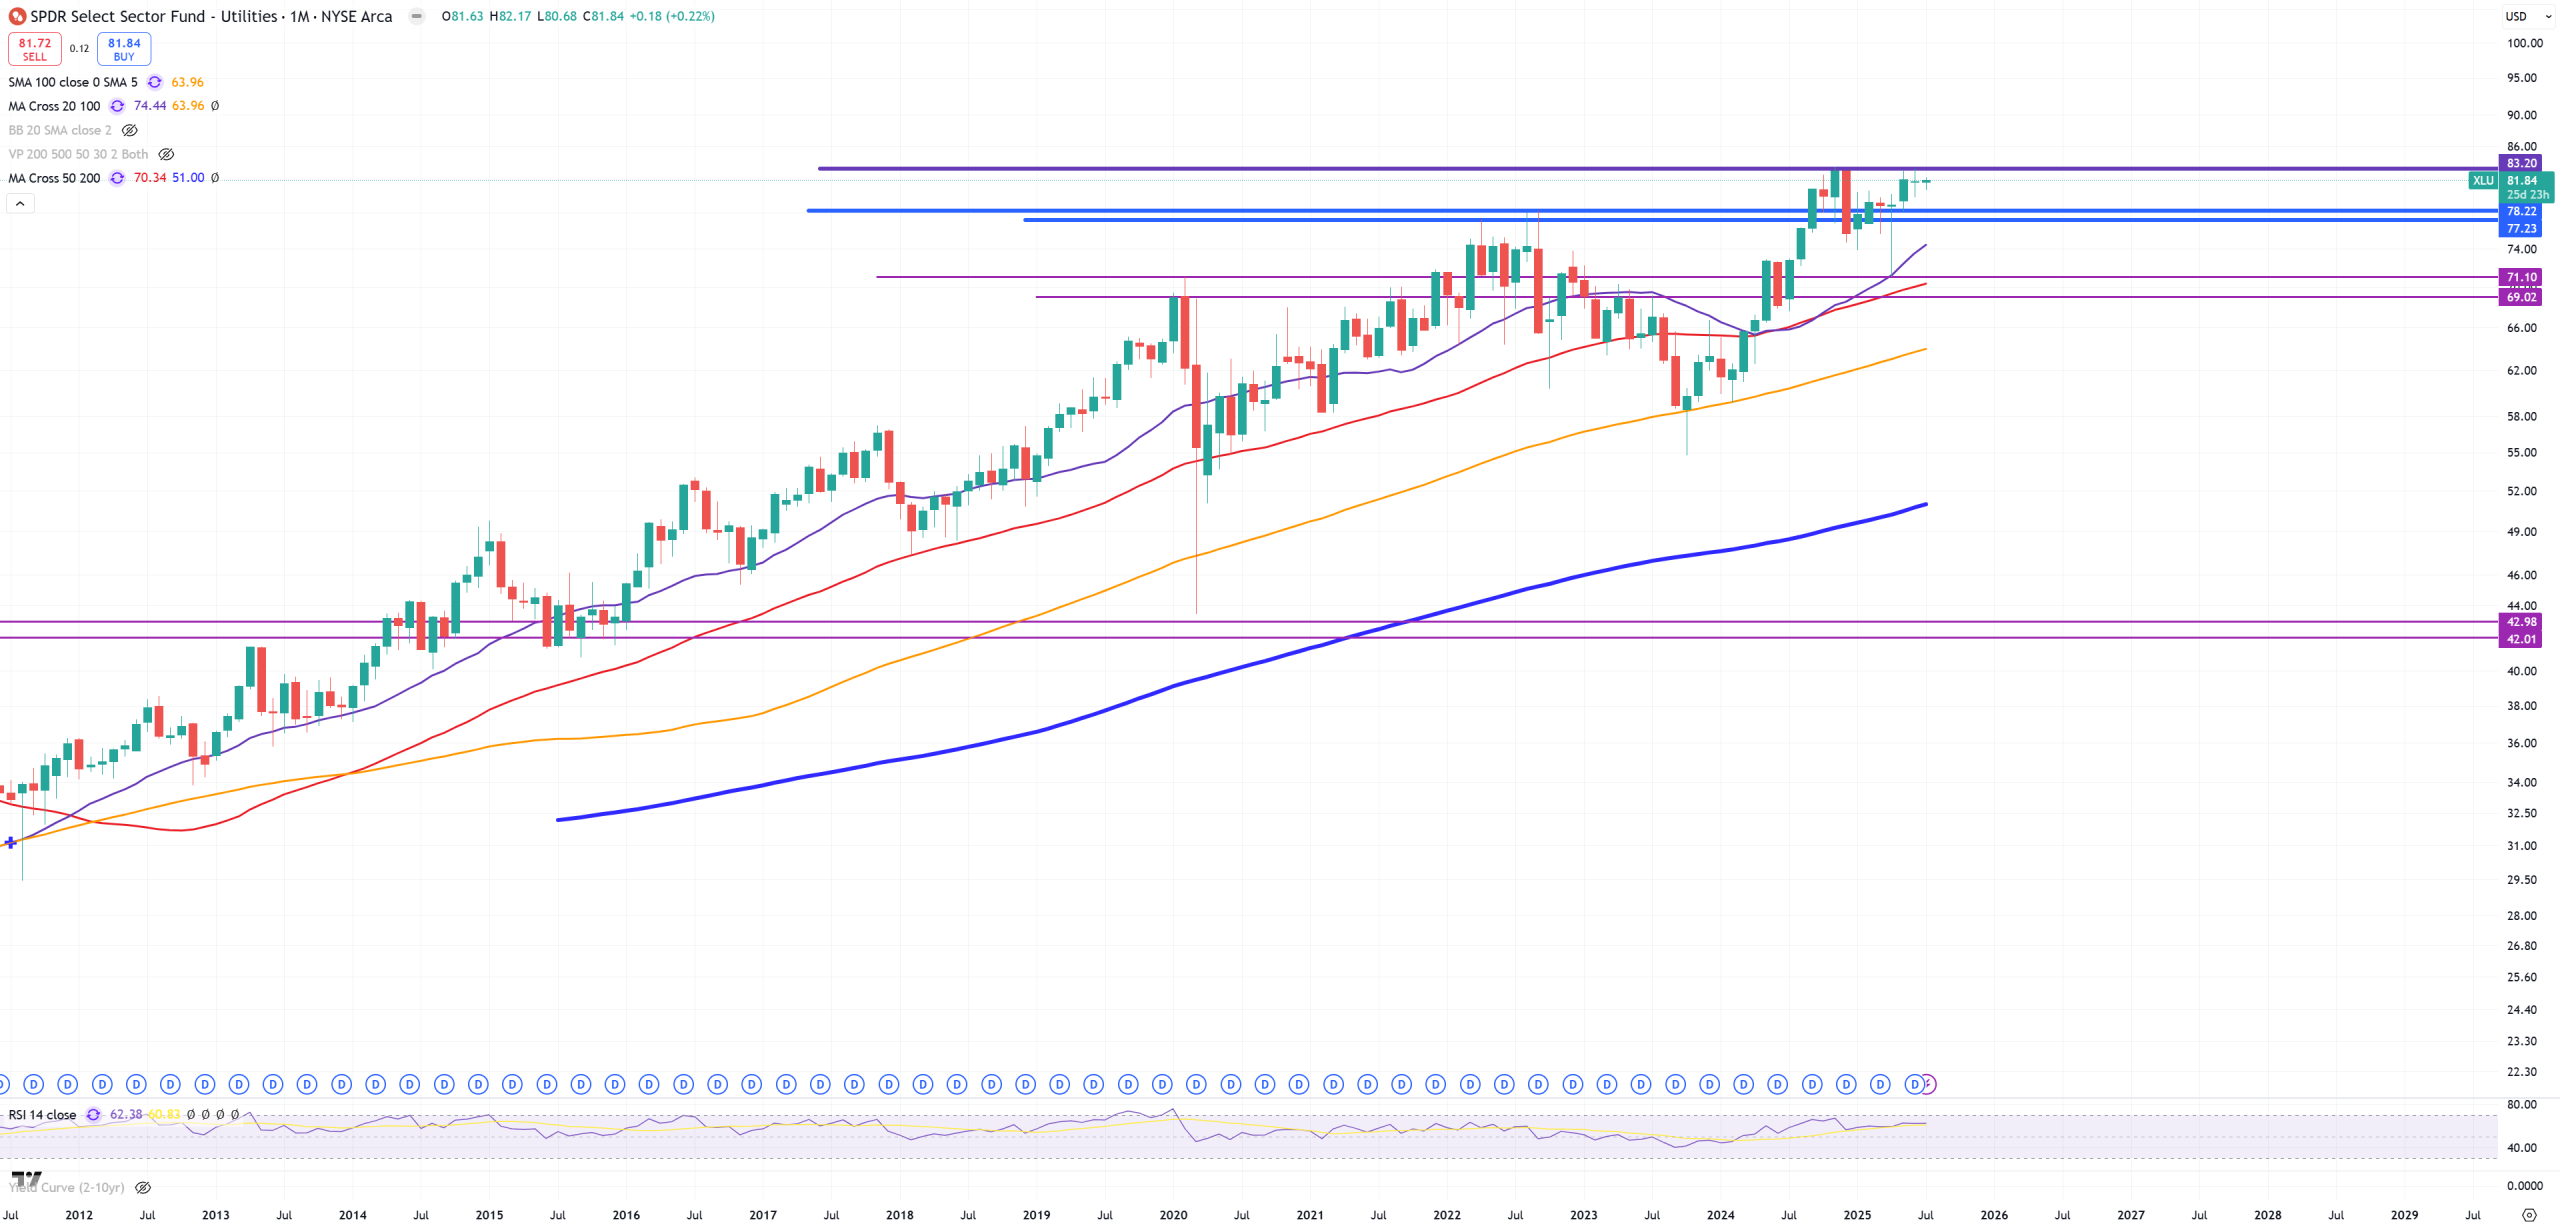
XLU – Utils and key levels
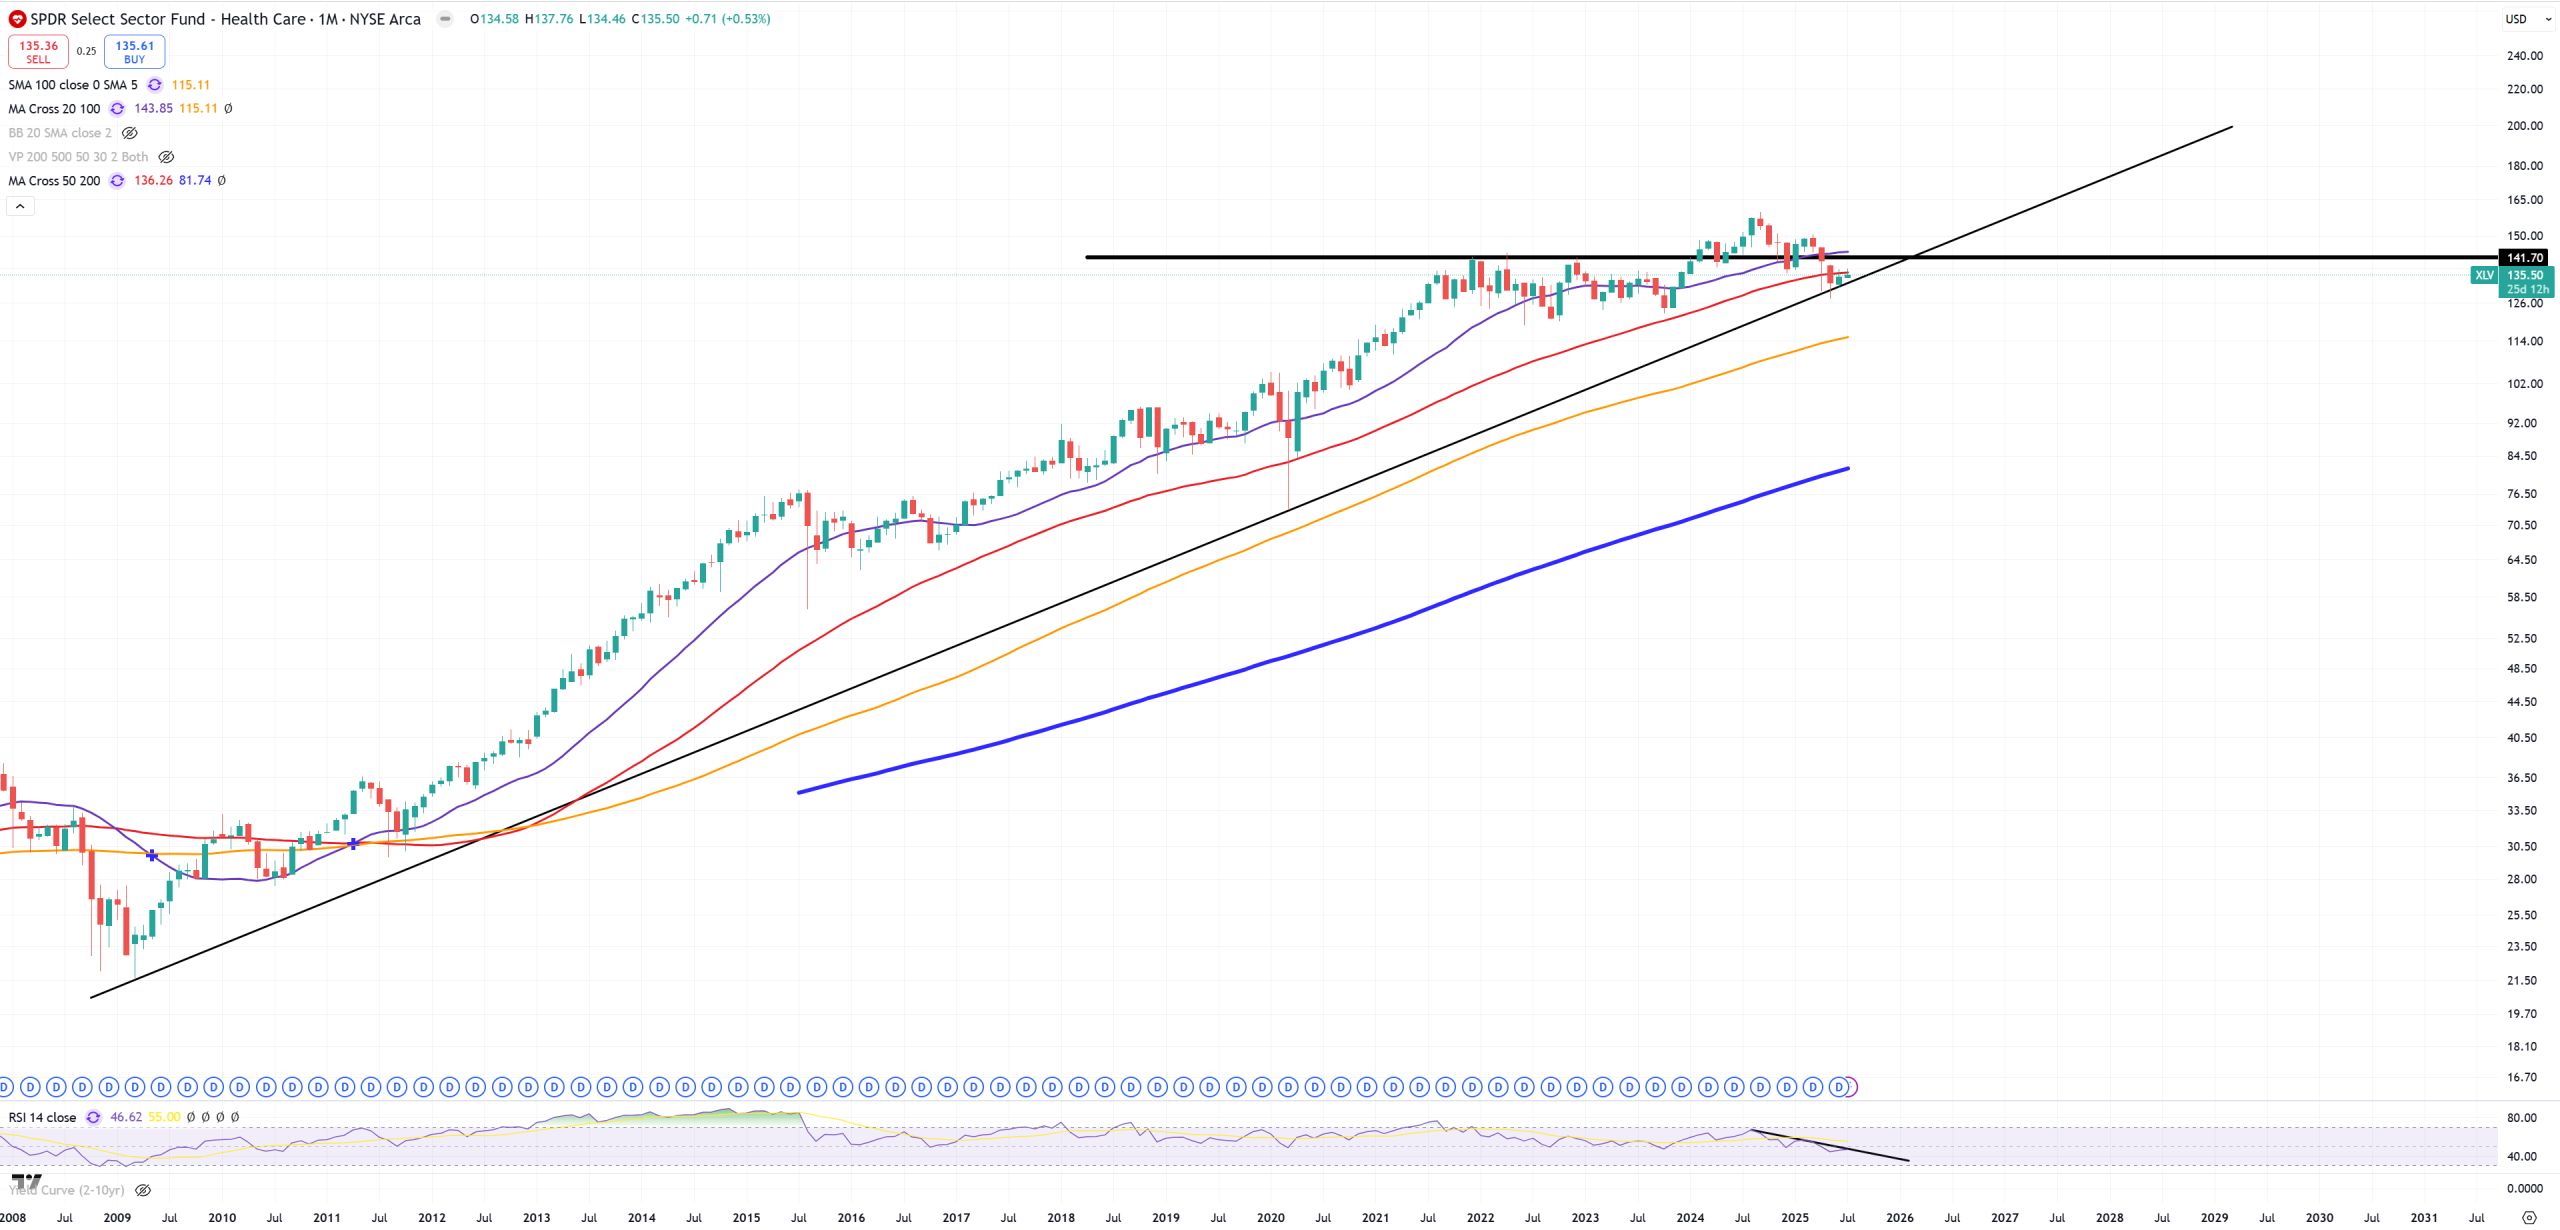
XLV – Health Care is probably the weakest technical chart from all sector ETFs.
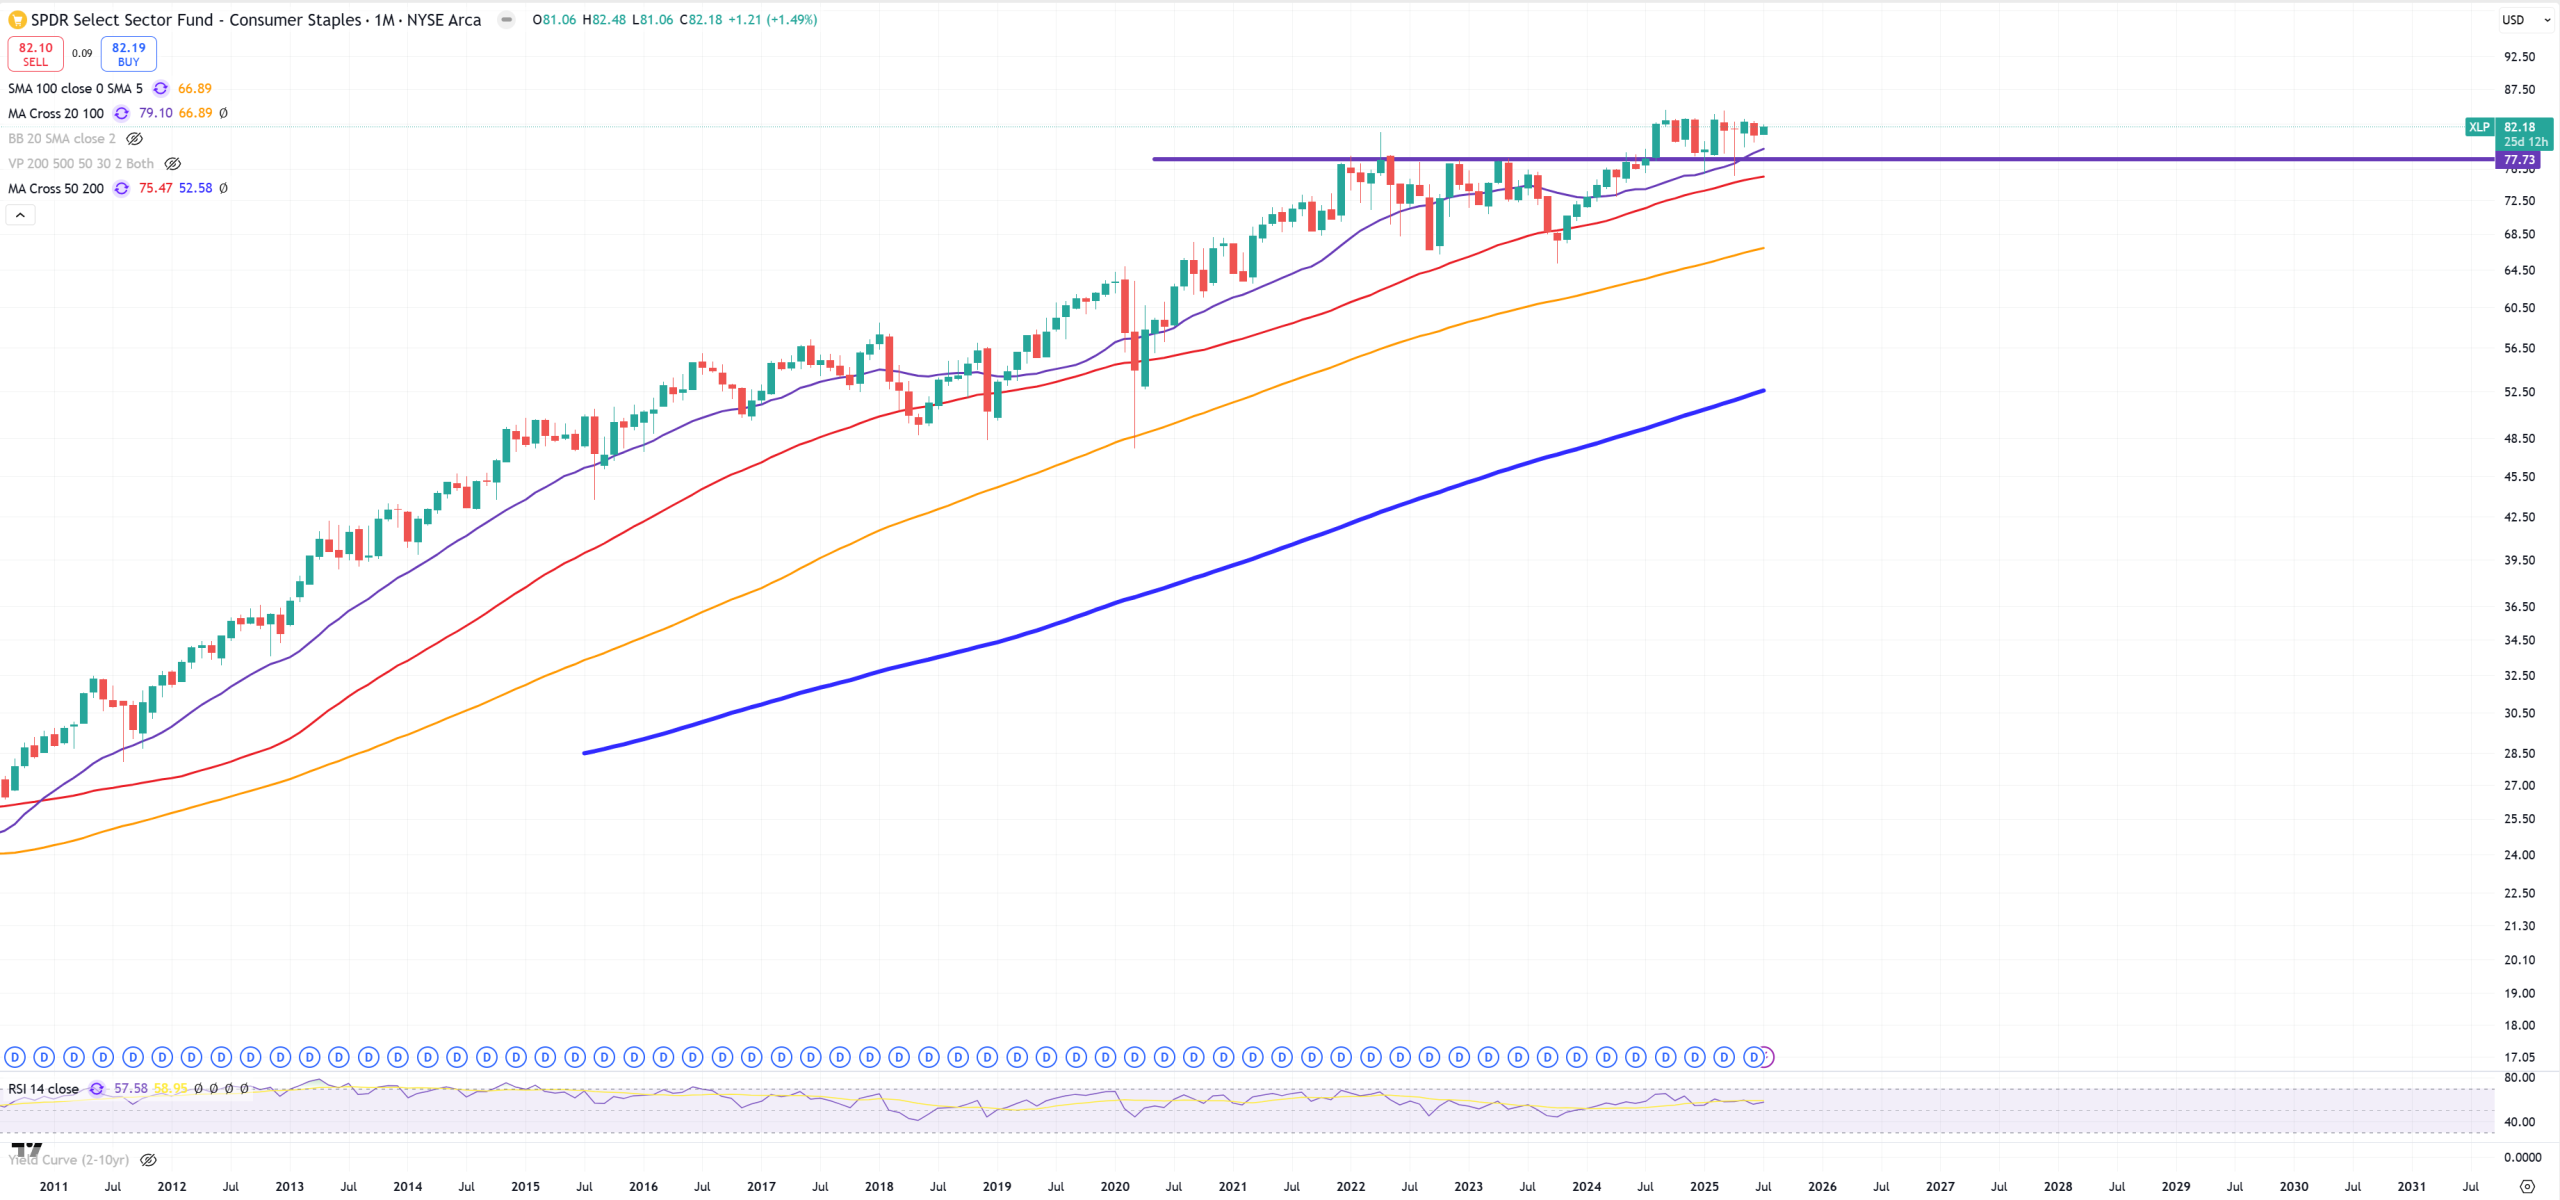
XLP – Consumer Staples – 12Ms above key level which is now support.
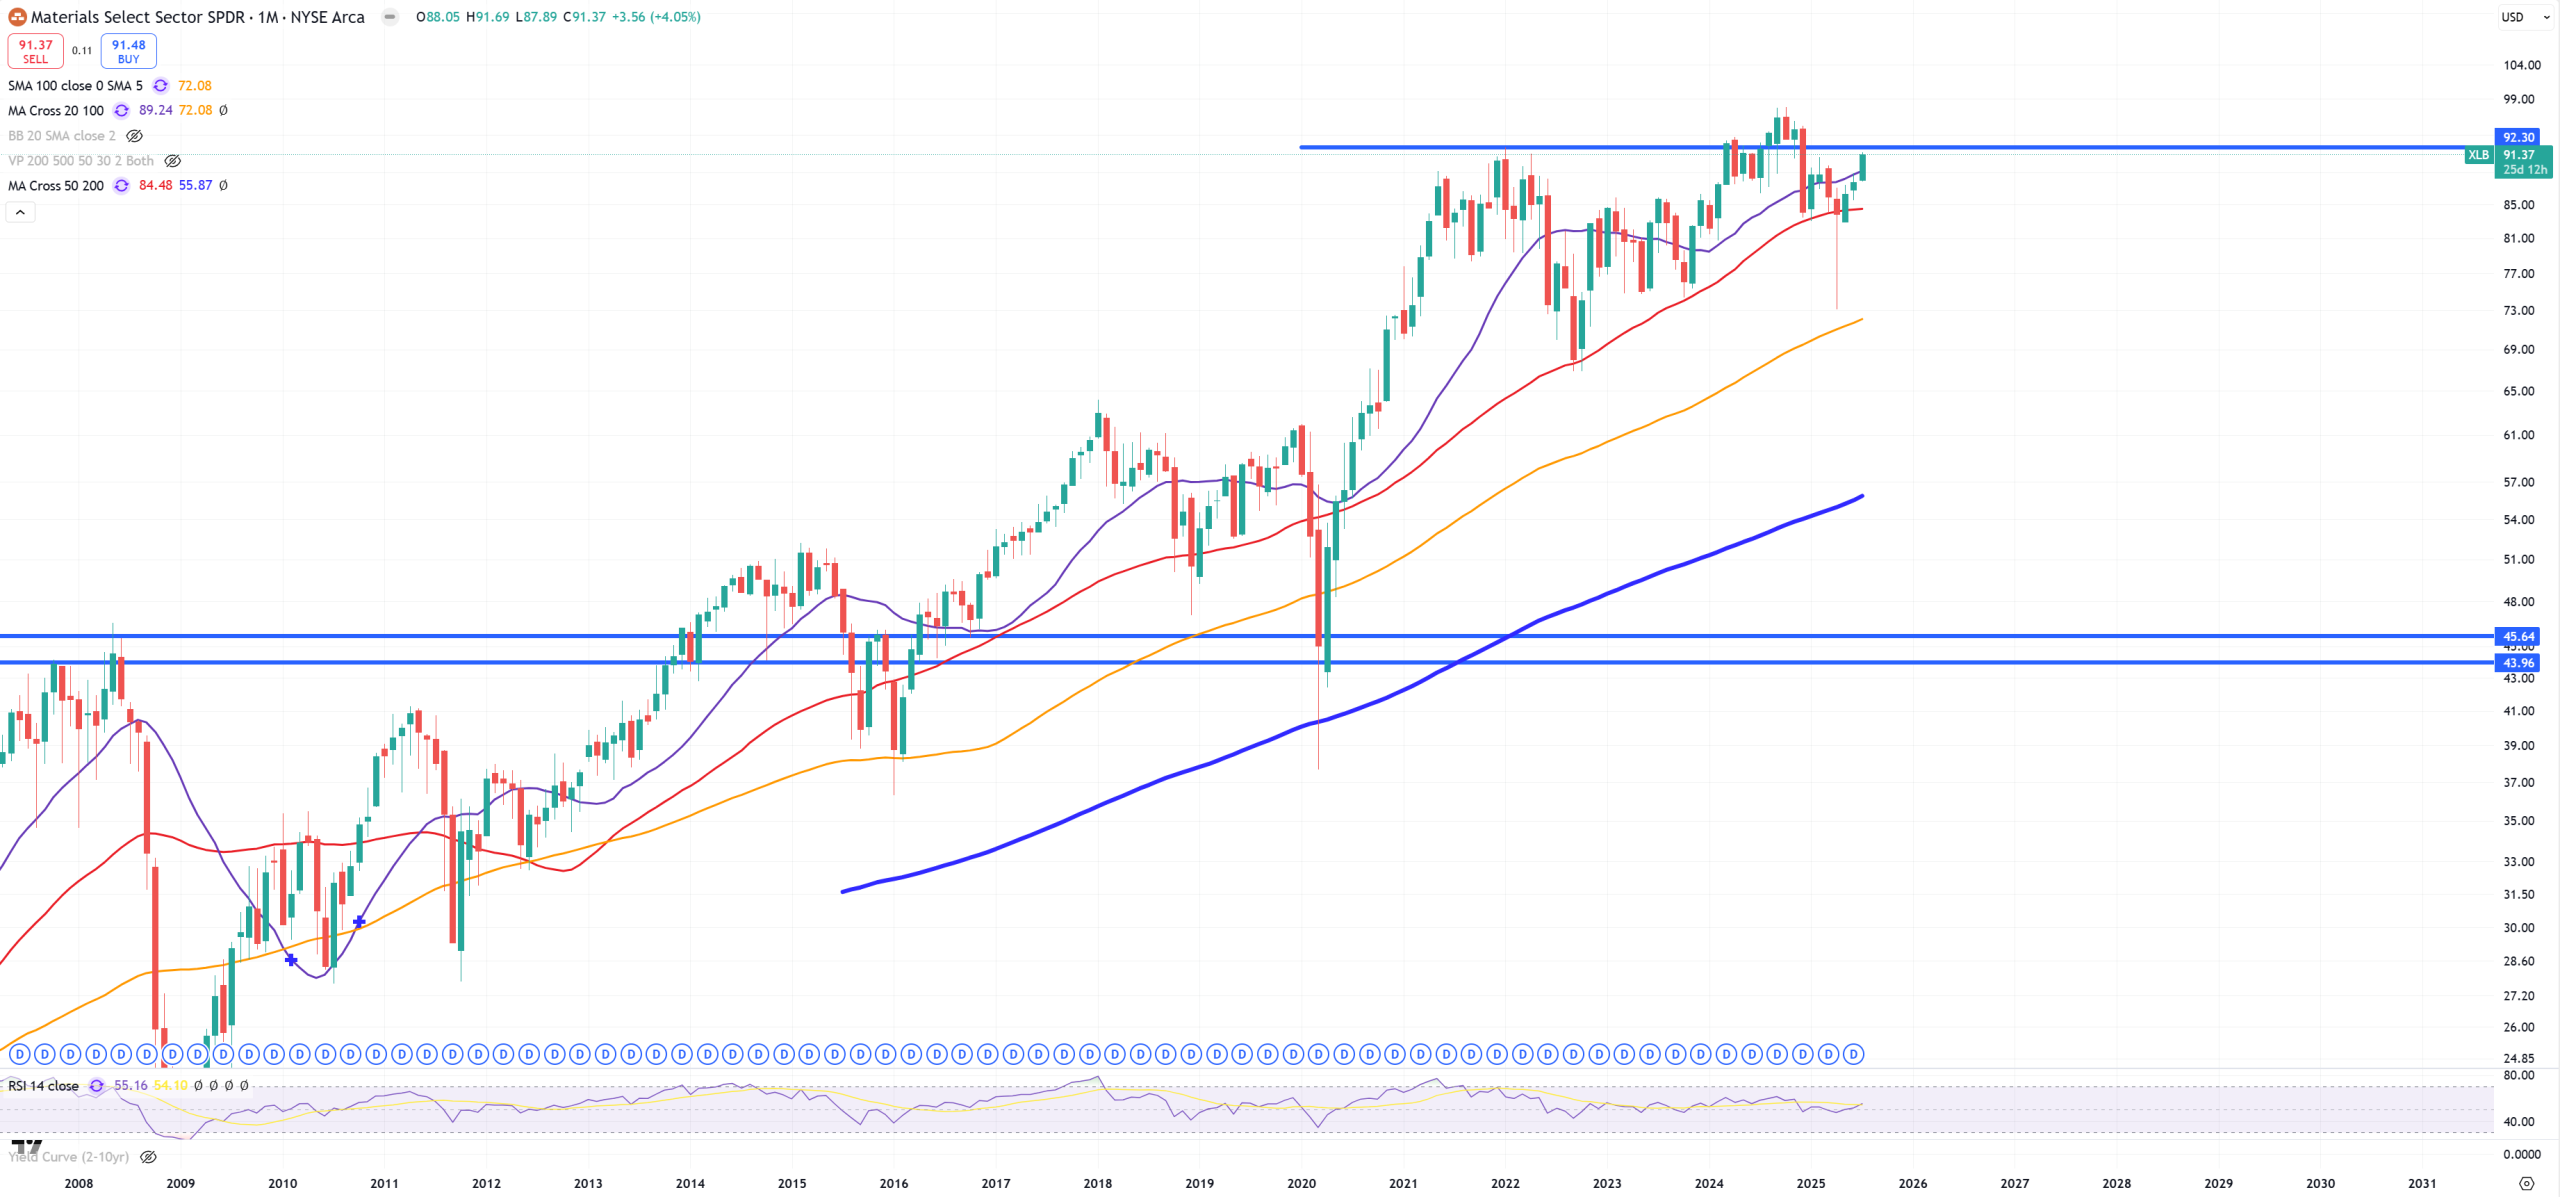
XLB – Materials – so far can’t really break 2021 level
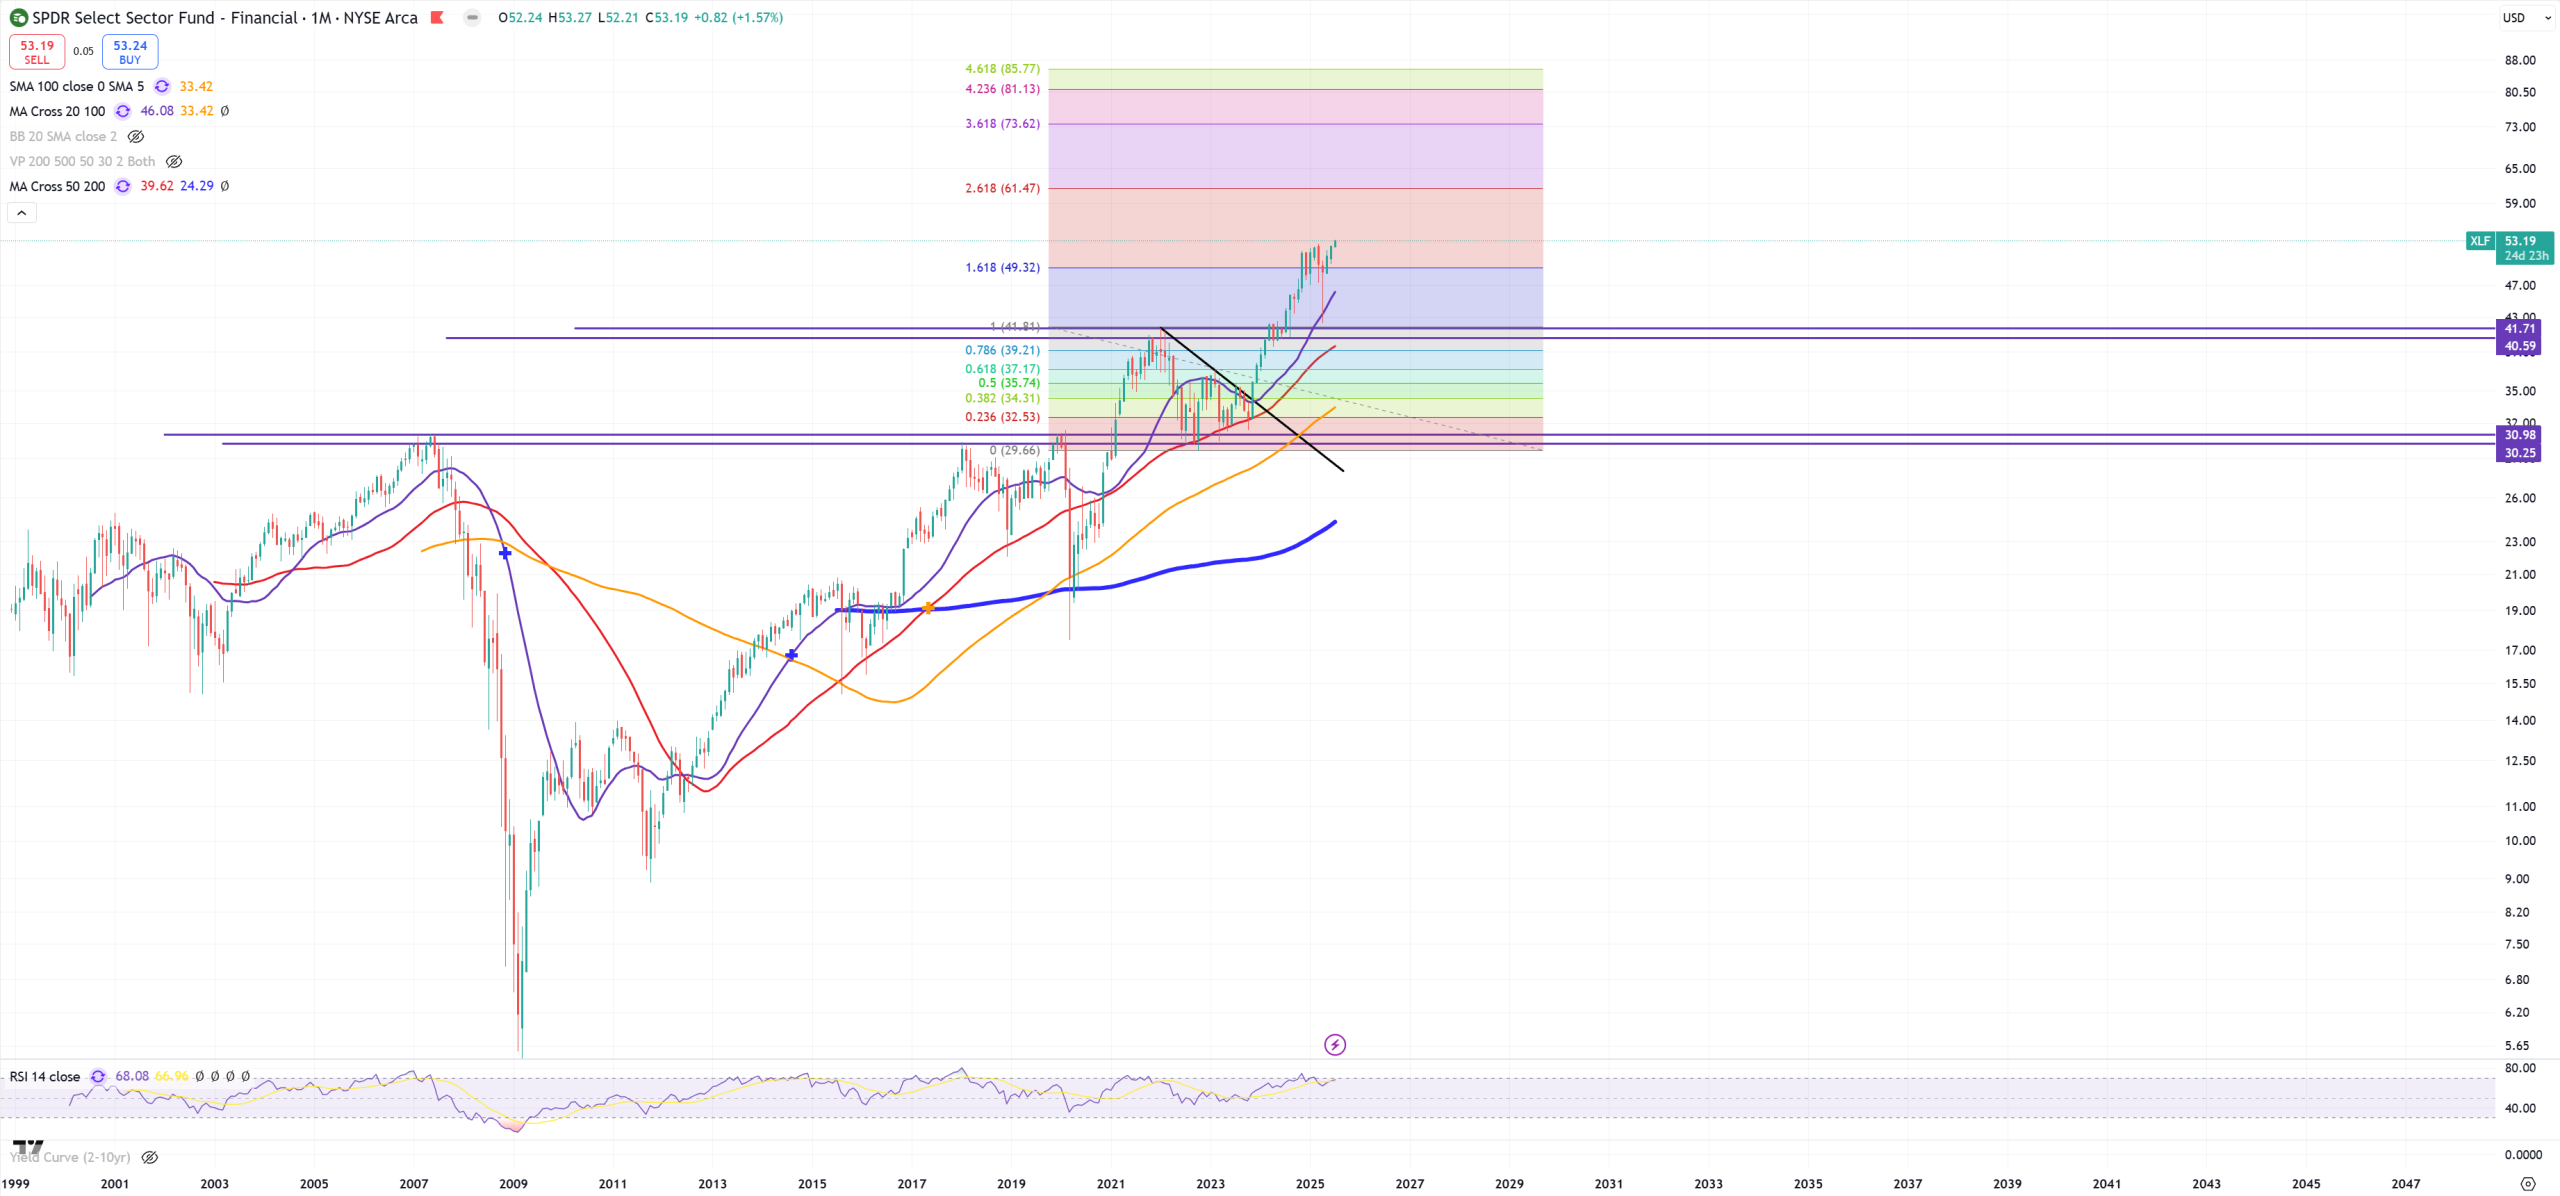
XLF – Financials
KRE – Regional Banking – June closed right into resistance, July starts as massive move above, again due to my holidays we see next (M) candle which in this case is massive, cheating a general view on June close.
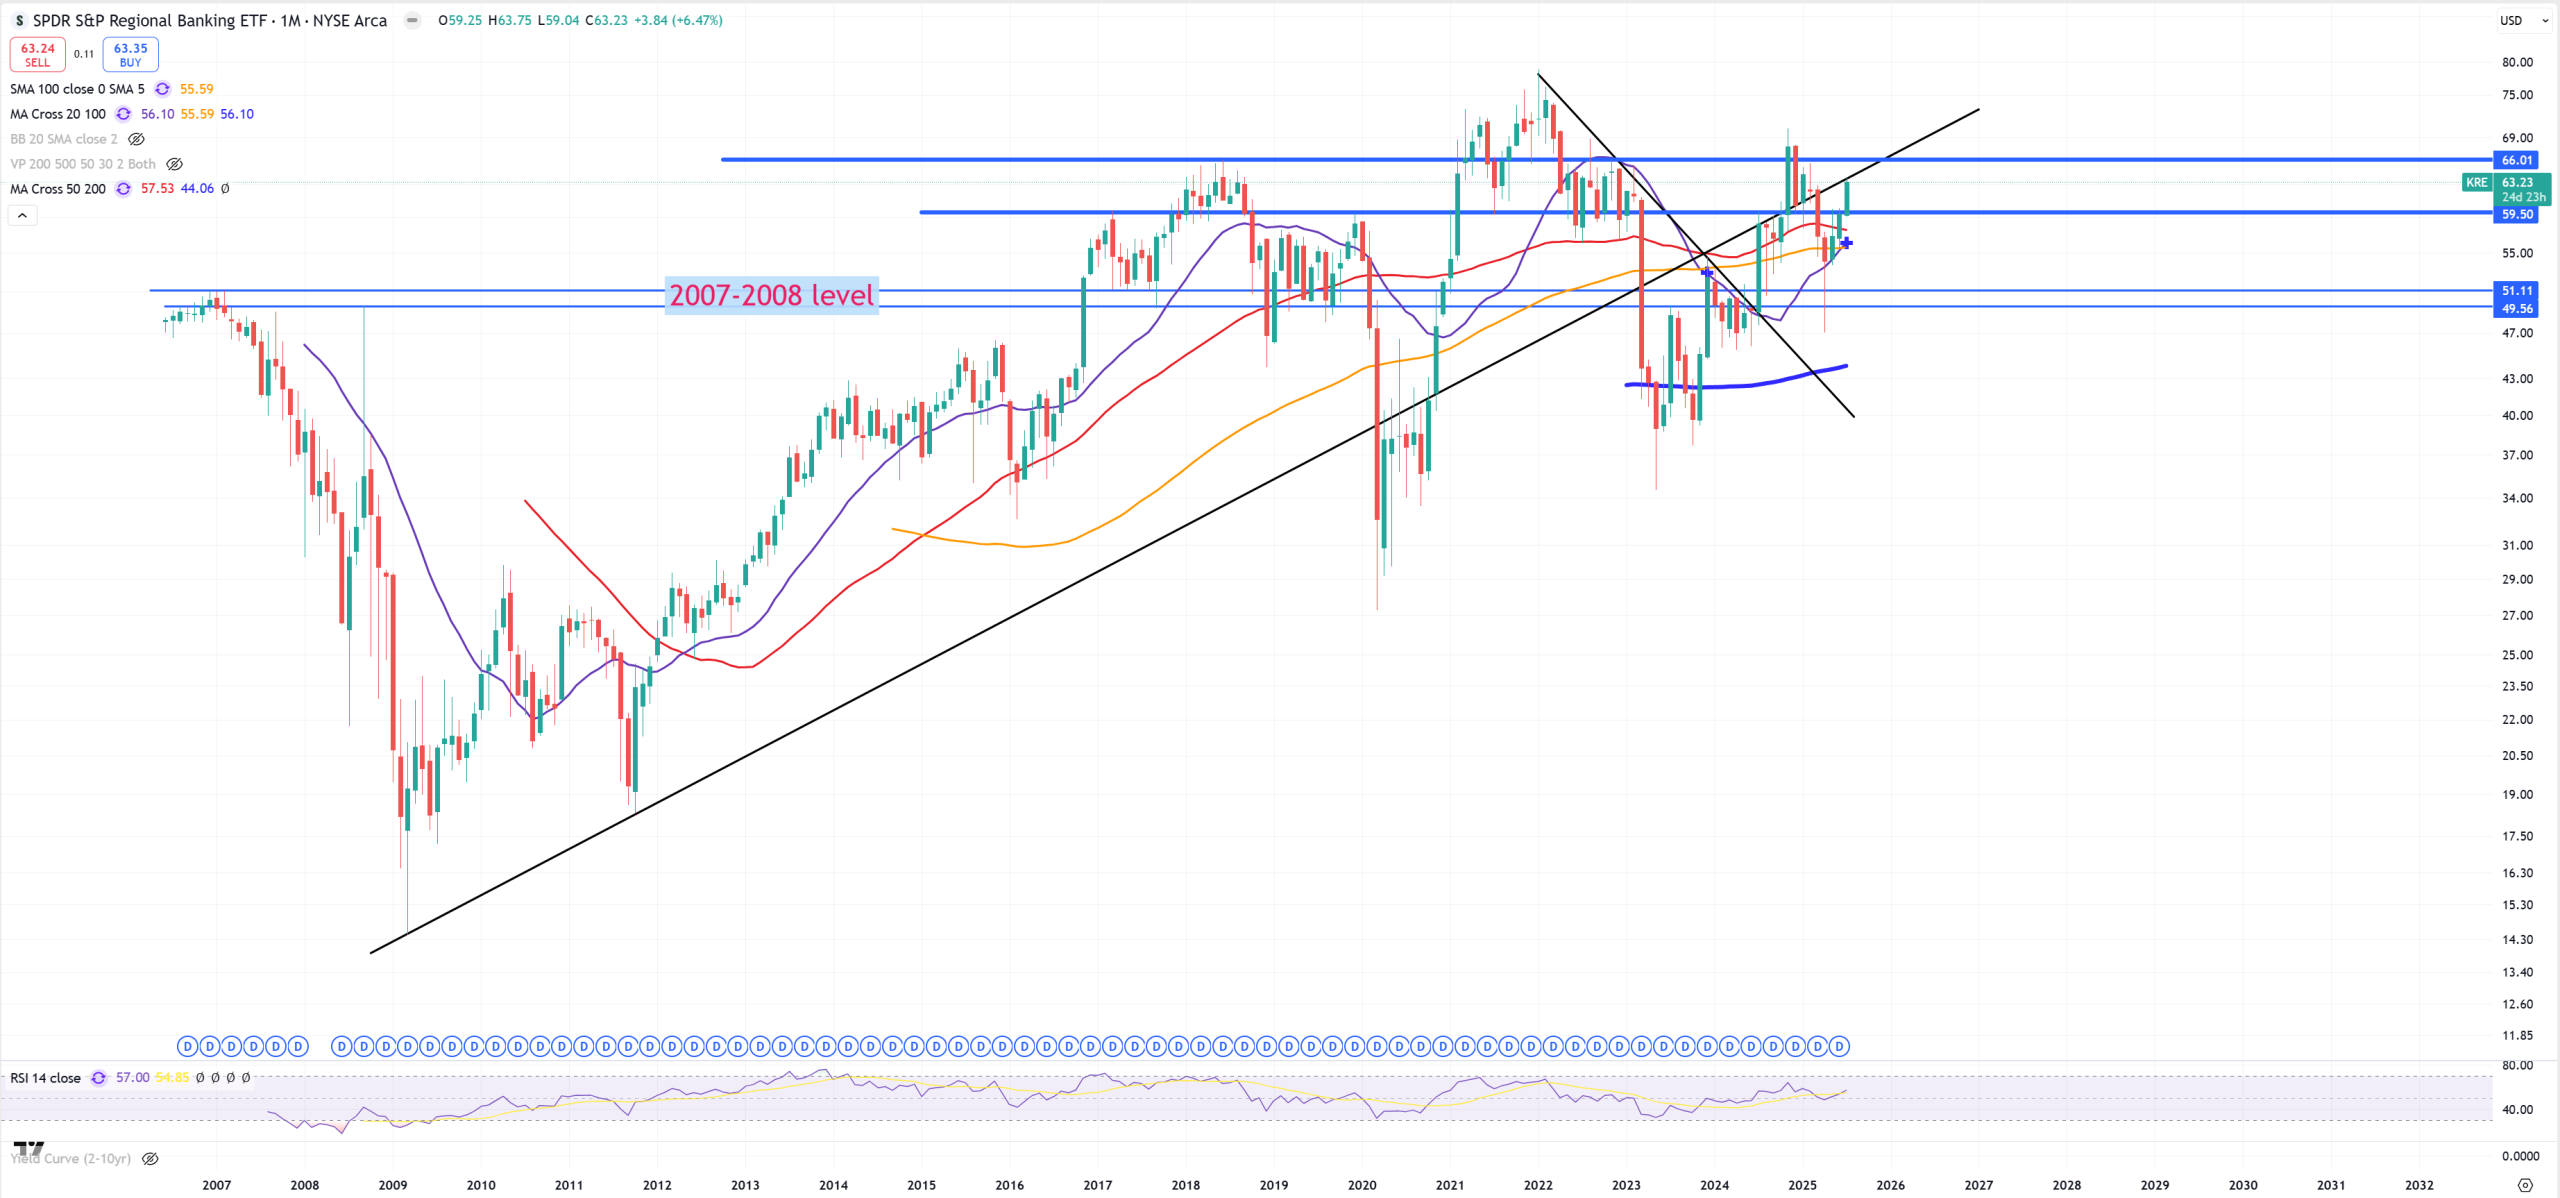
COF – It’s all good until 2021 peak will be taken down – flipping towards resistance from support
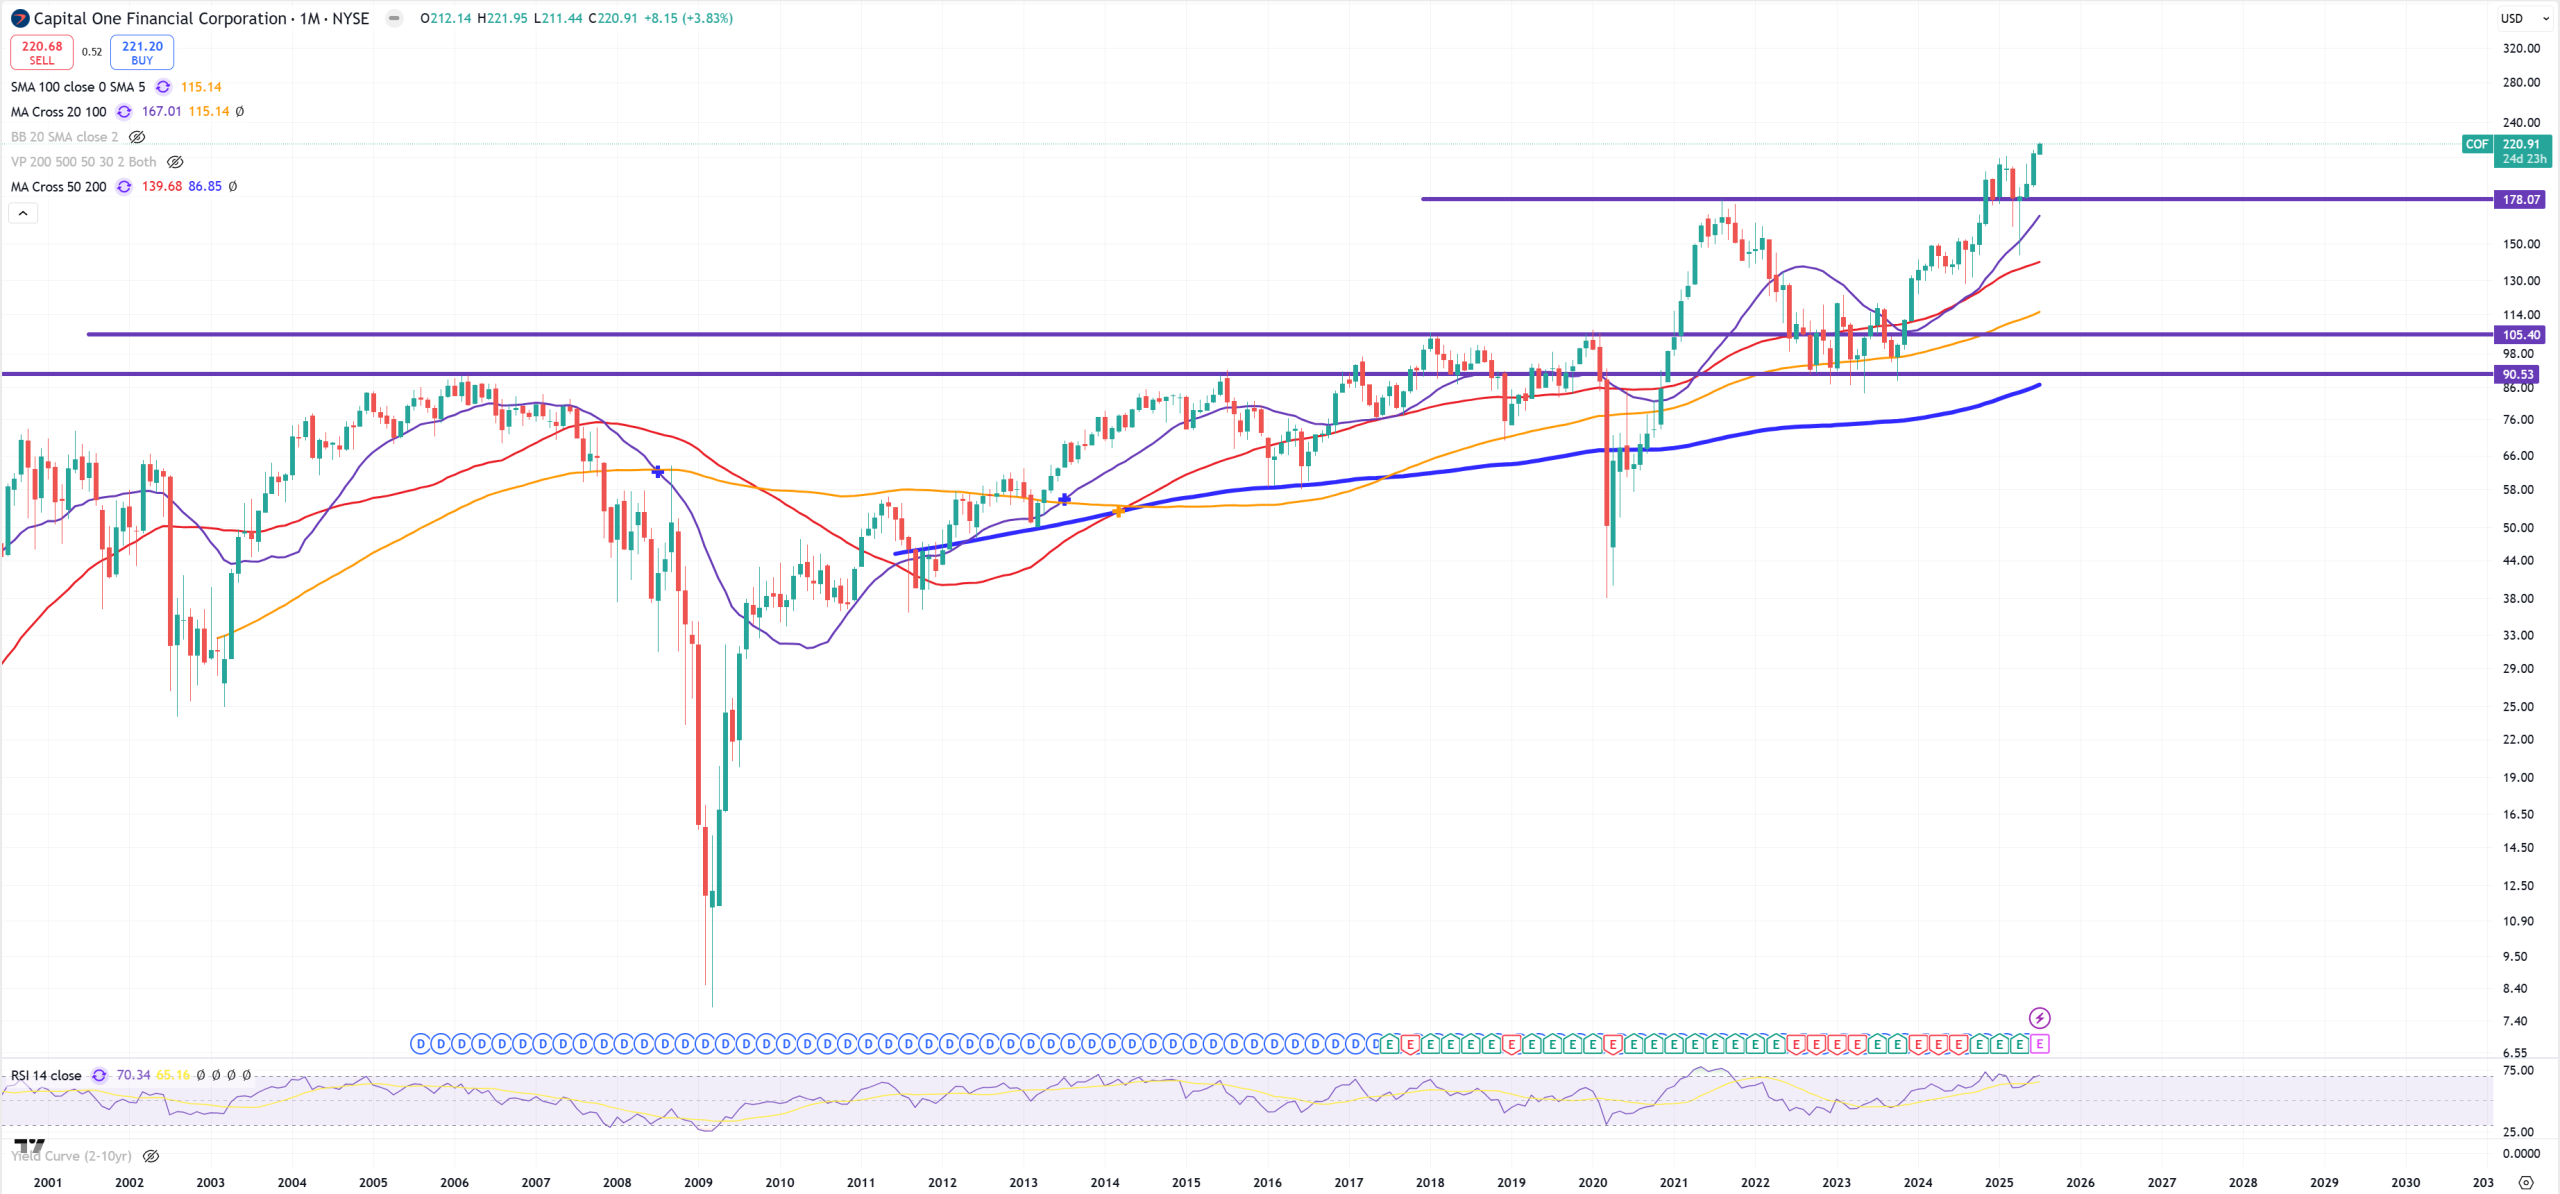
FXI – China – Chinese FXI is nothing IMO else than -USDCNH, as Yuan gets bid, so does FXI.
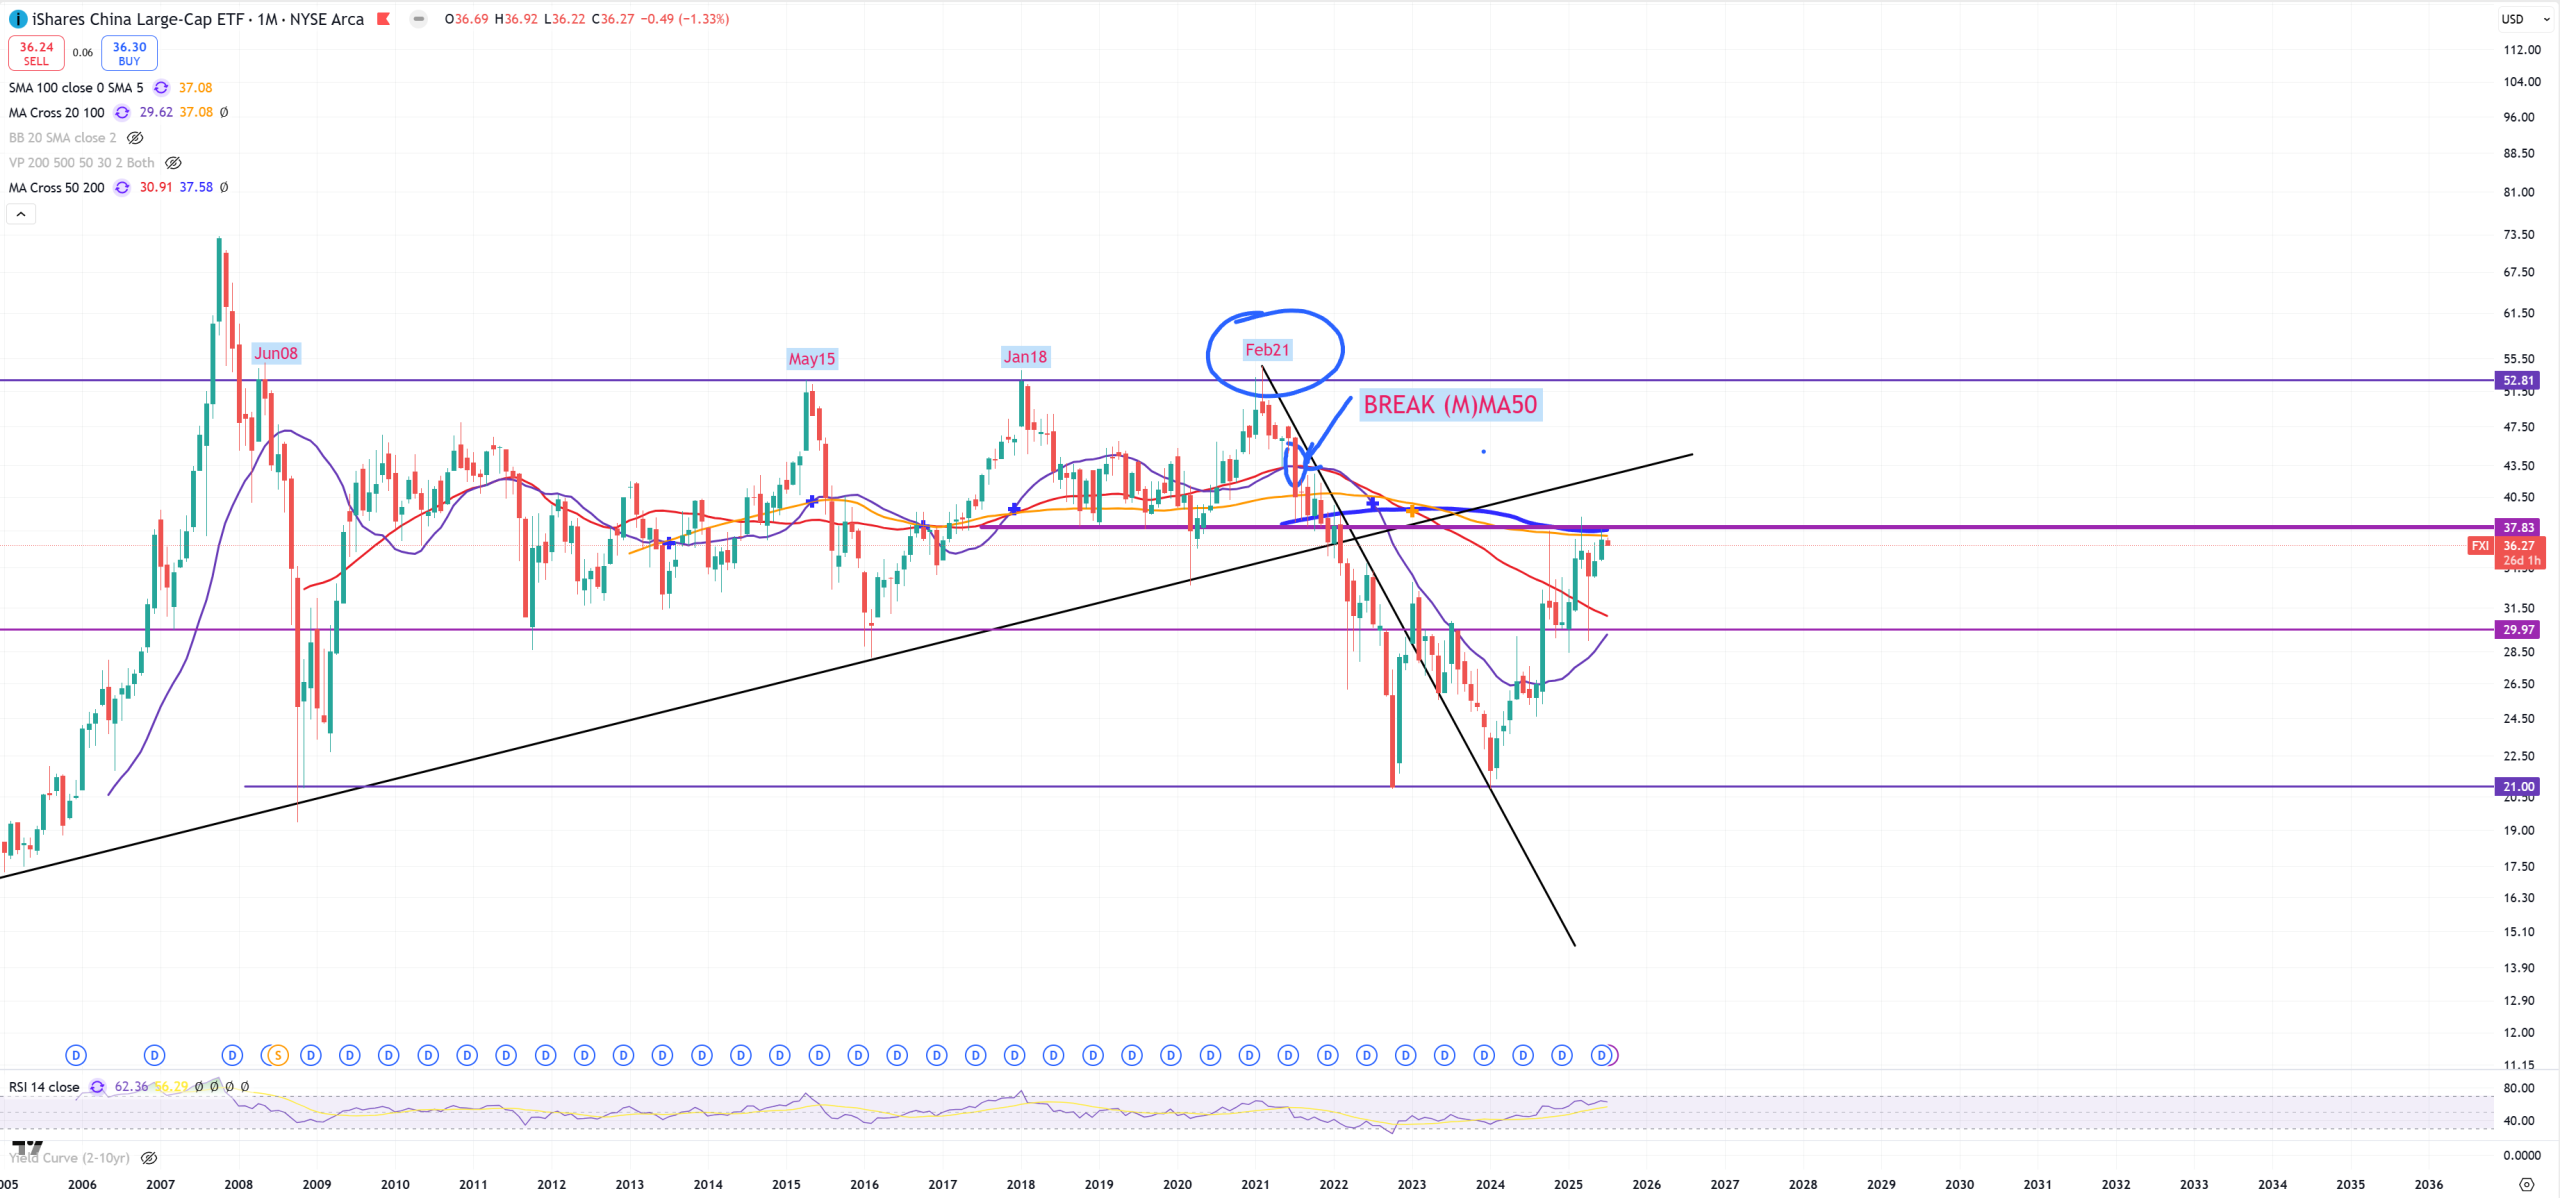
EWZ – Brazil – I’ve said many times this market isn’t easy, like break-retest-go, or double-top and go.
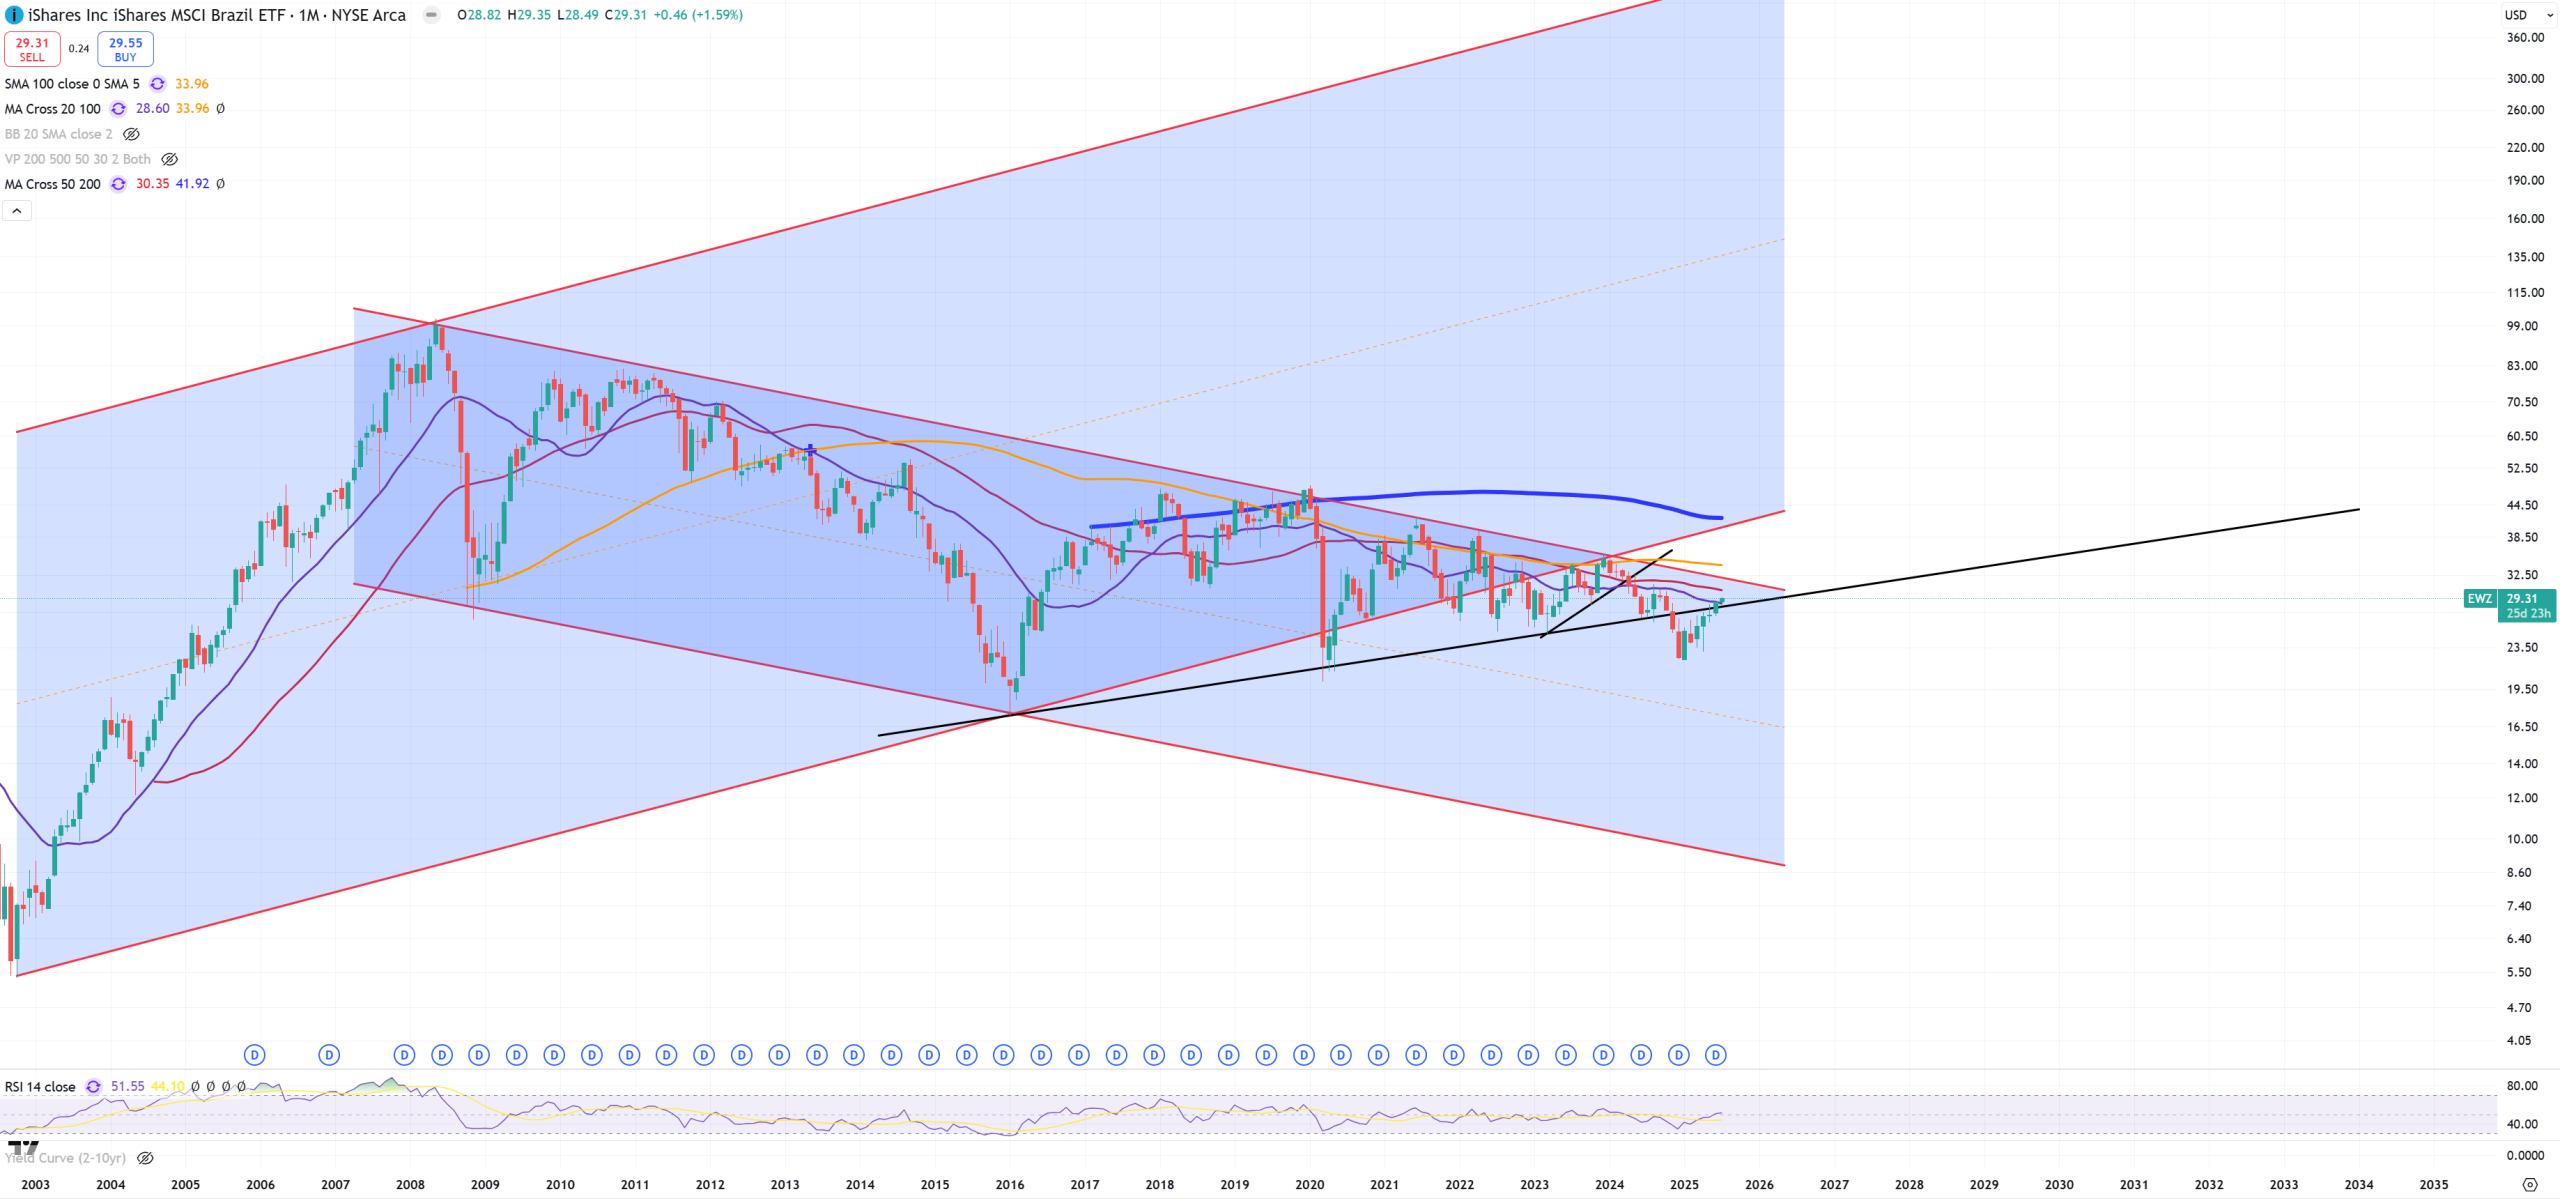
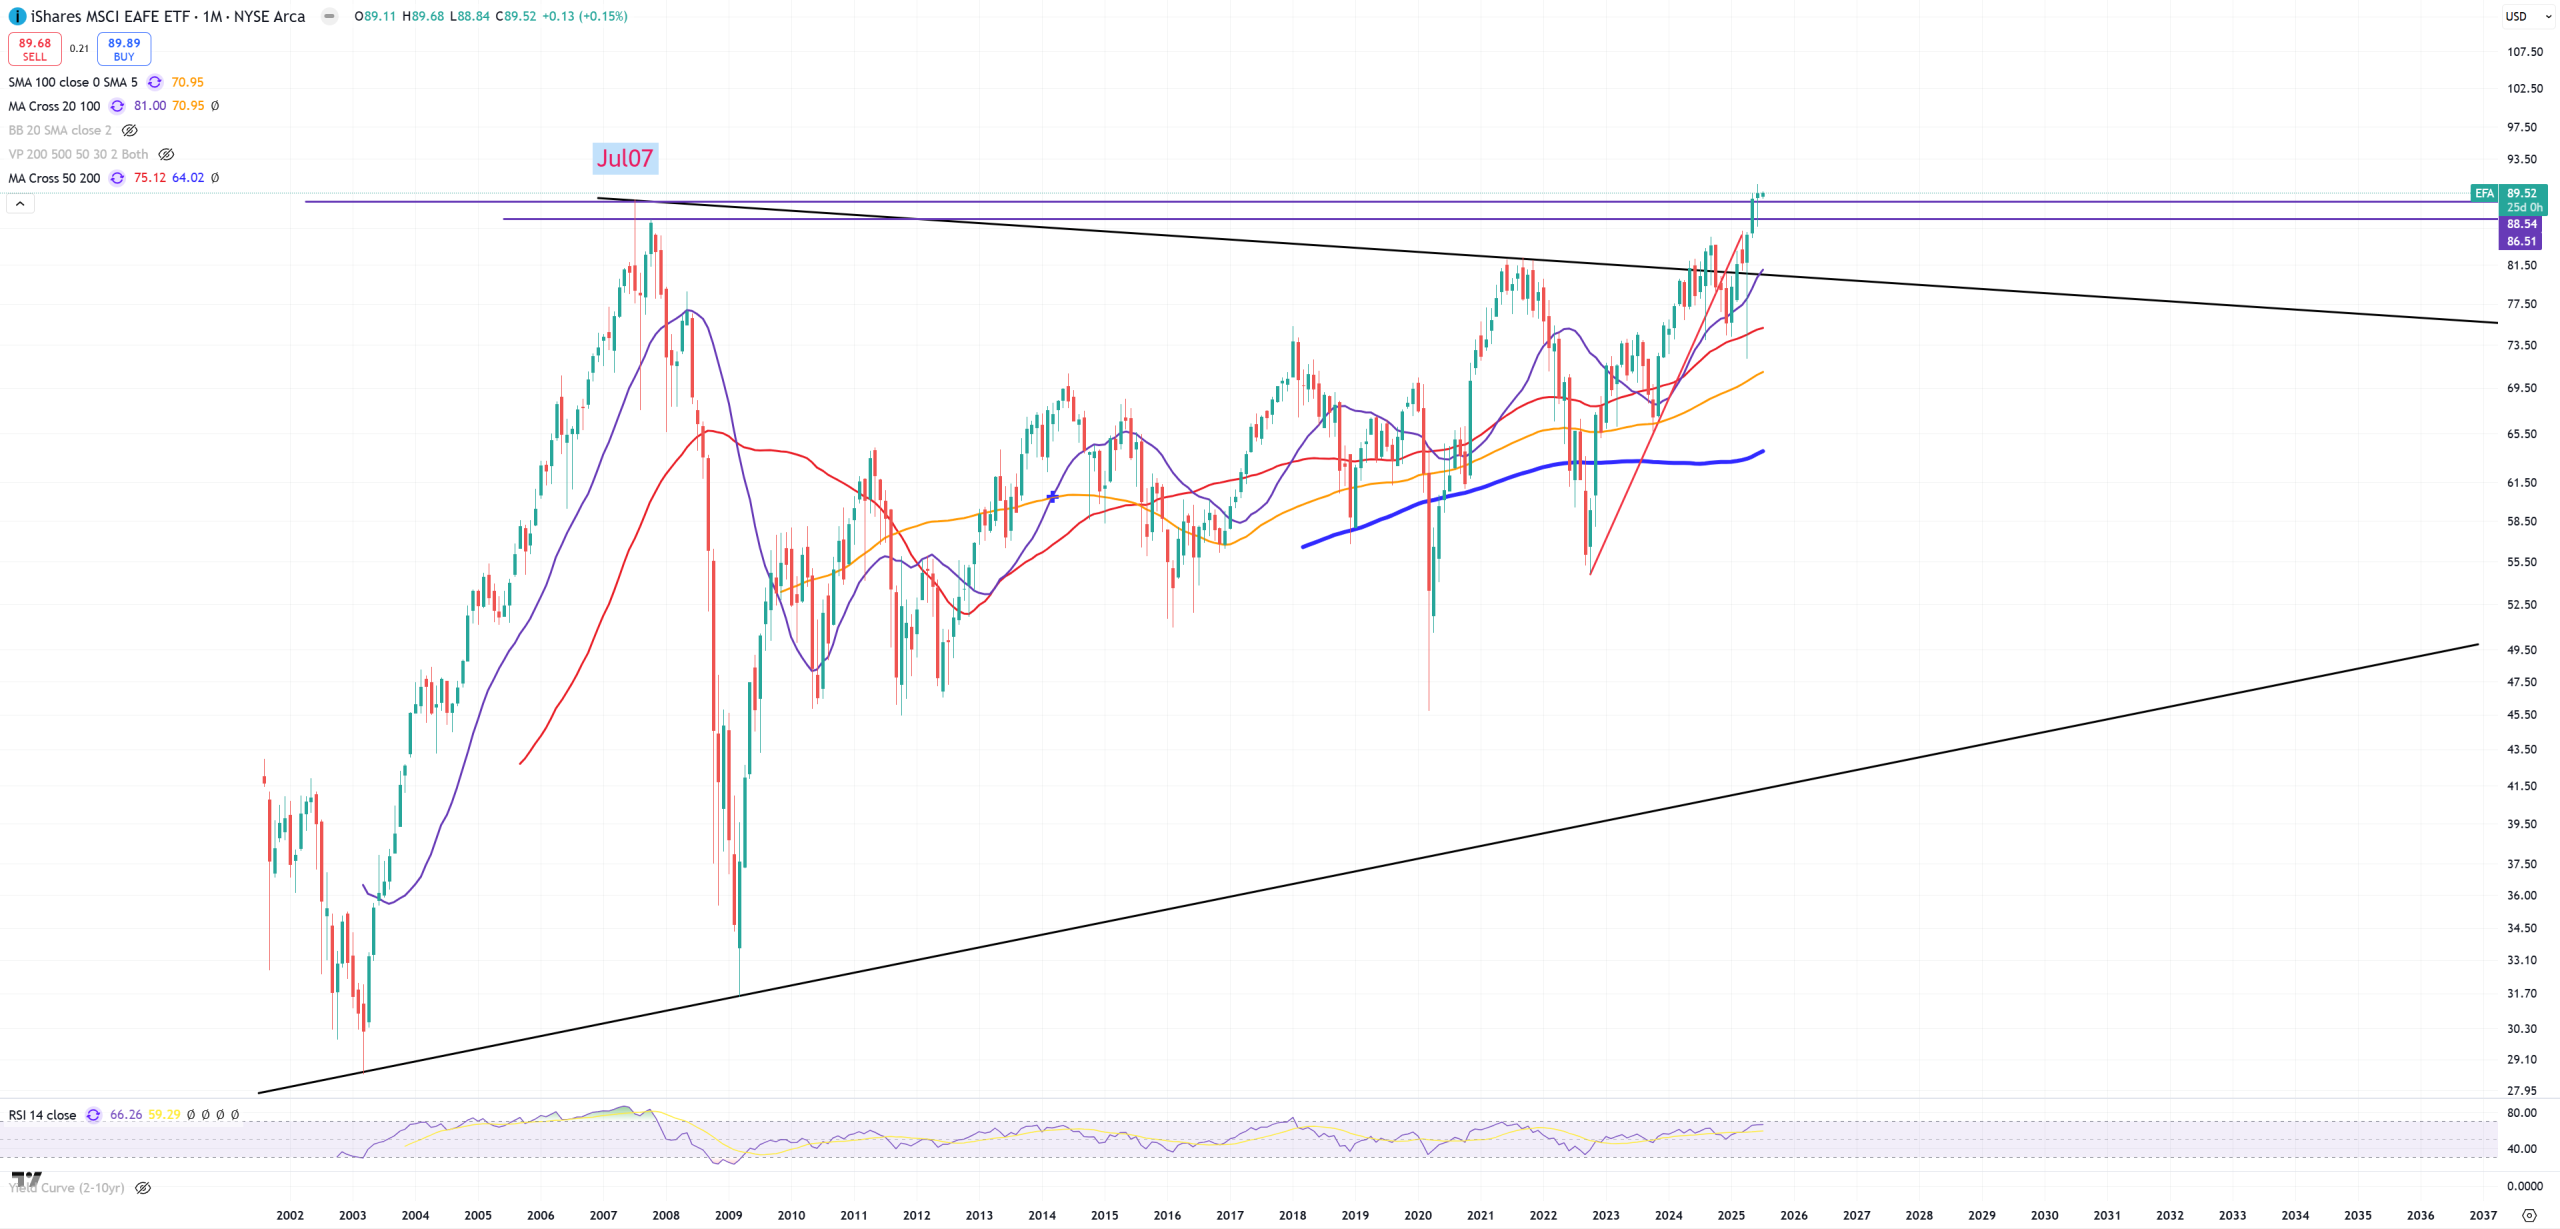
EFA – Developed markets ex-US, do we have a full break here?
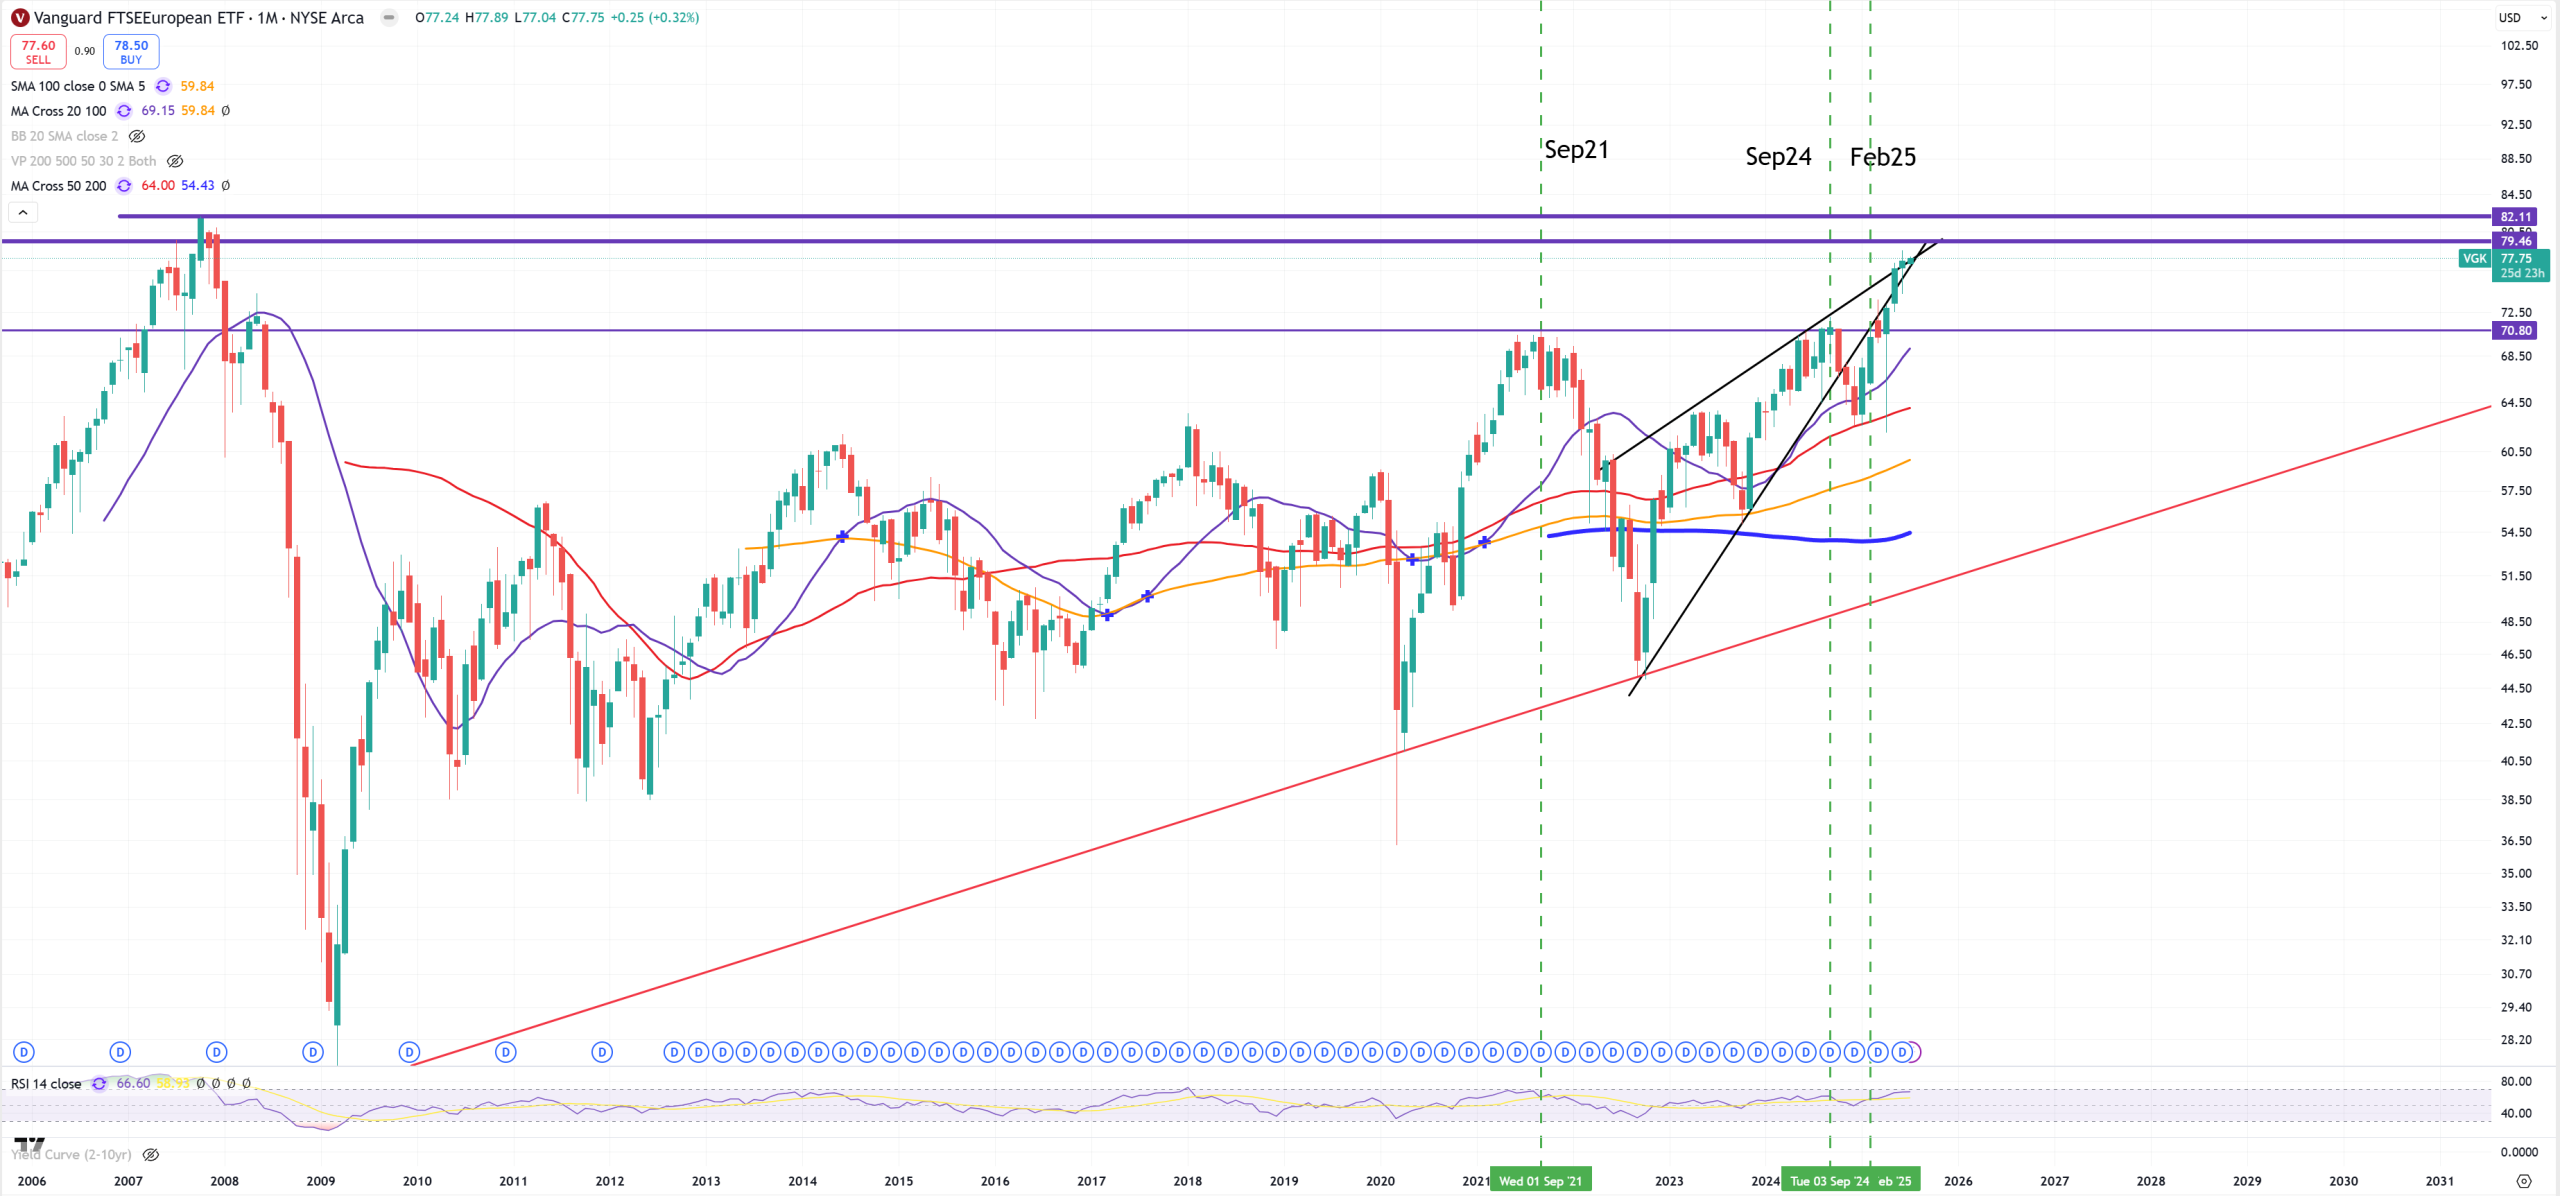
VGK – Europe
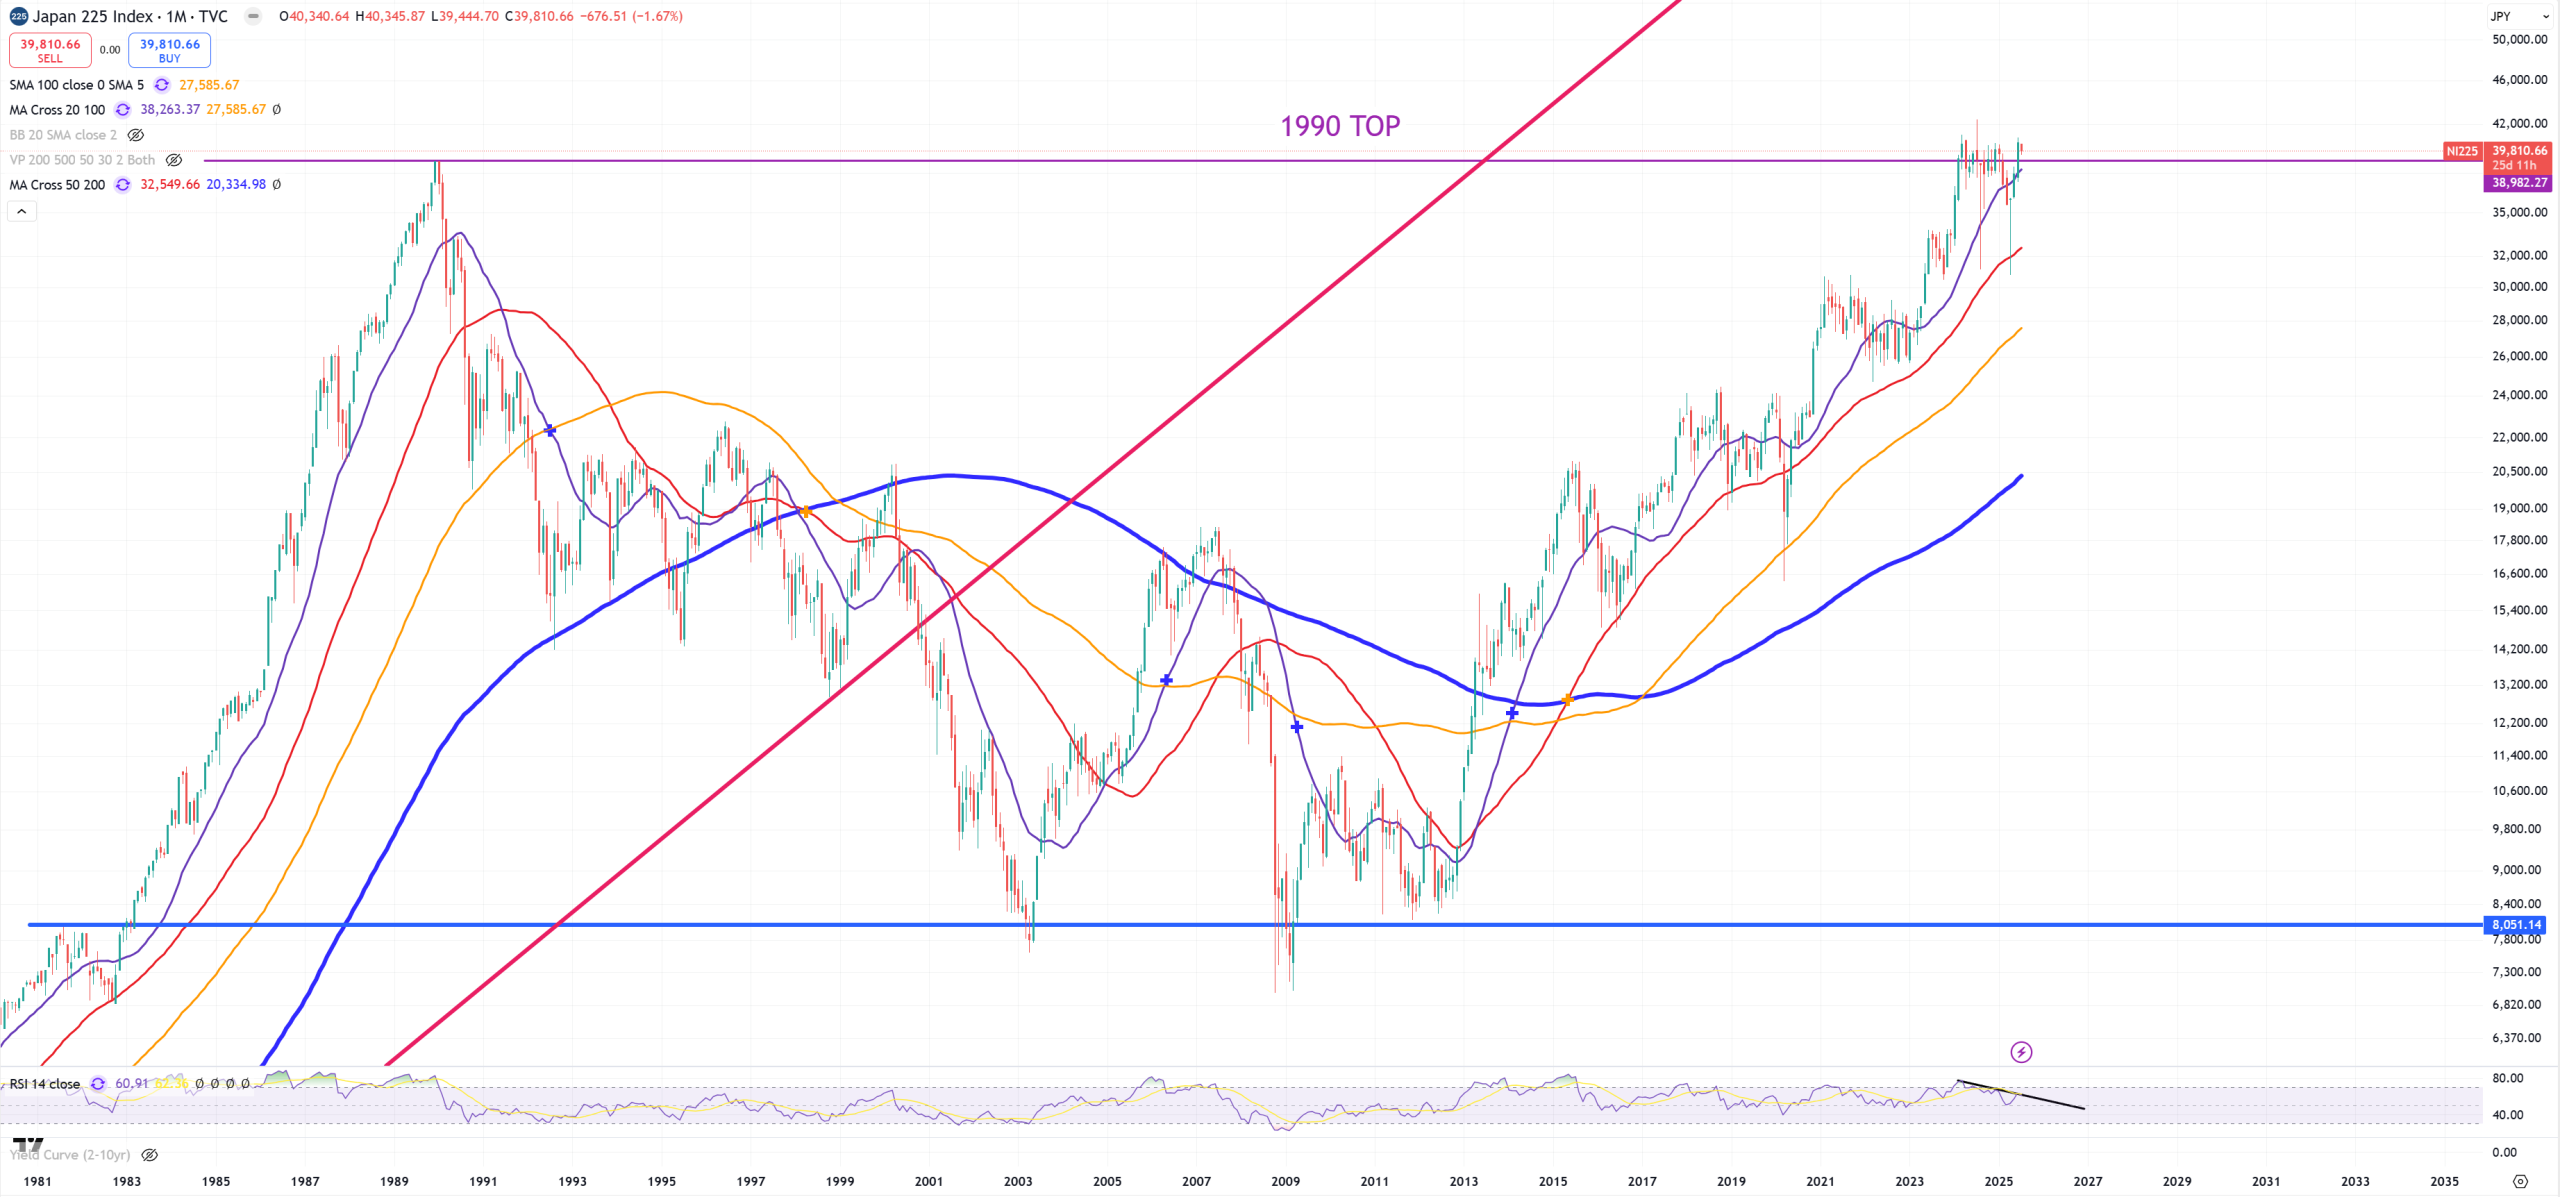
NIKKEI225 – still around 1990 TOP, it did not manage to close below violet (M)MA20 last month.
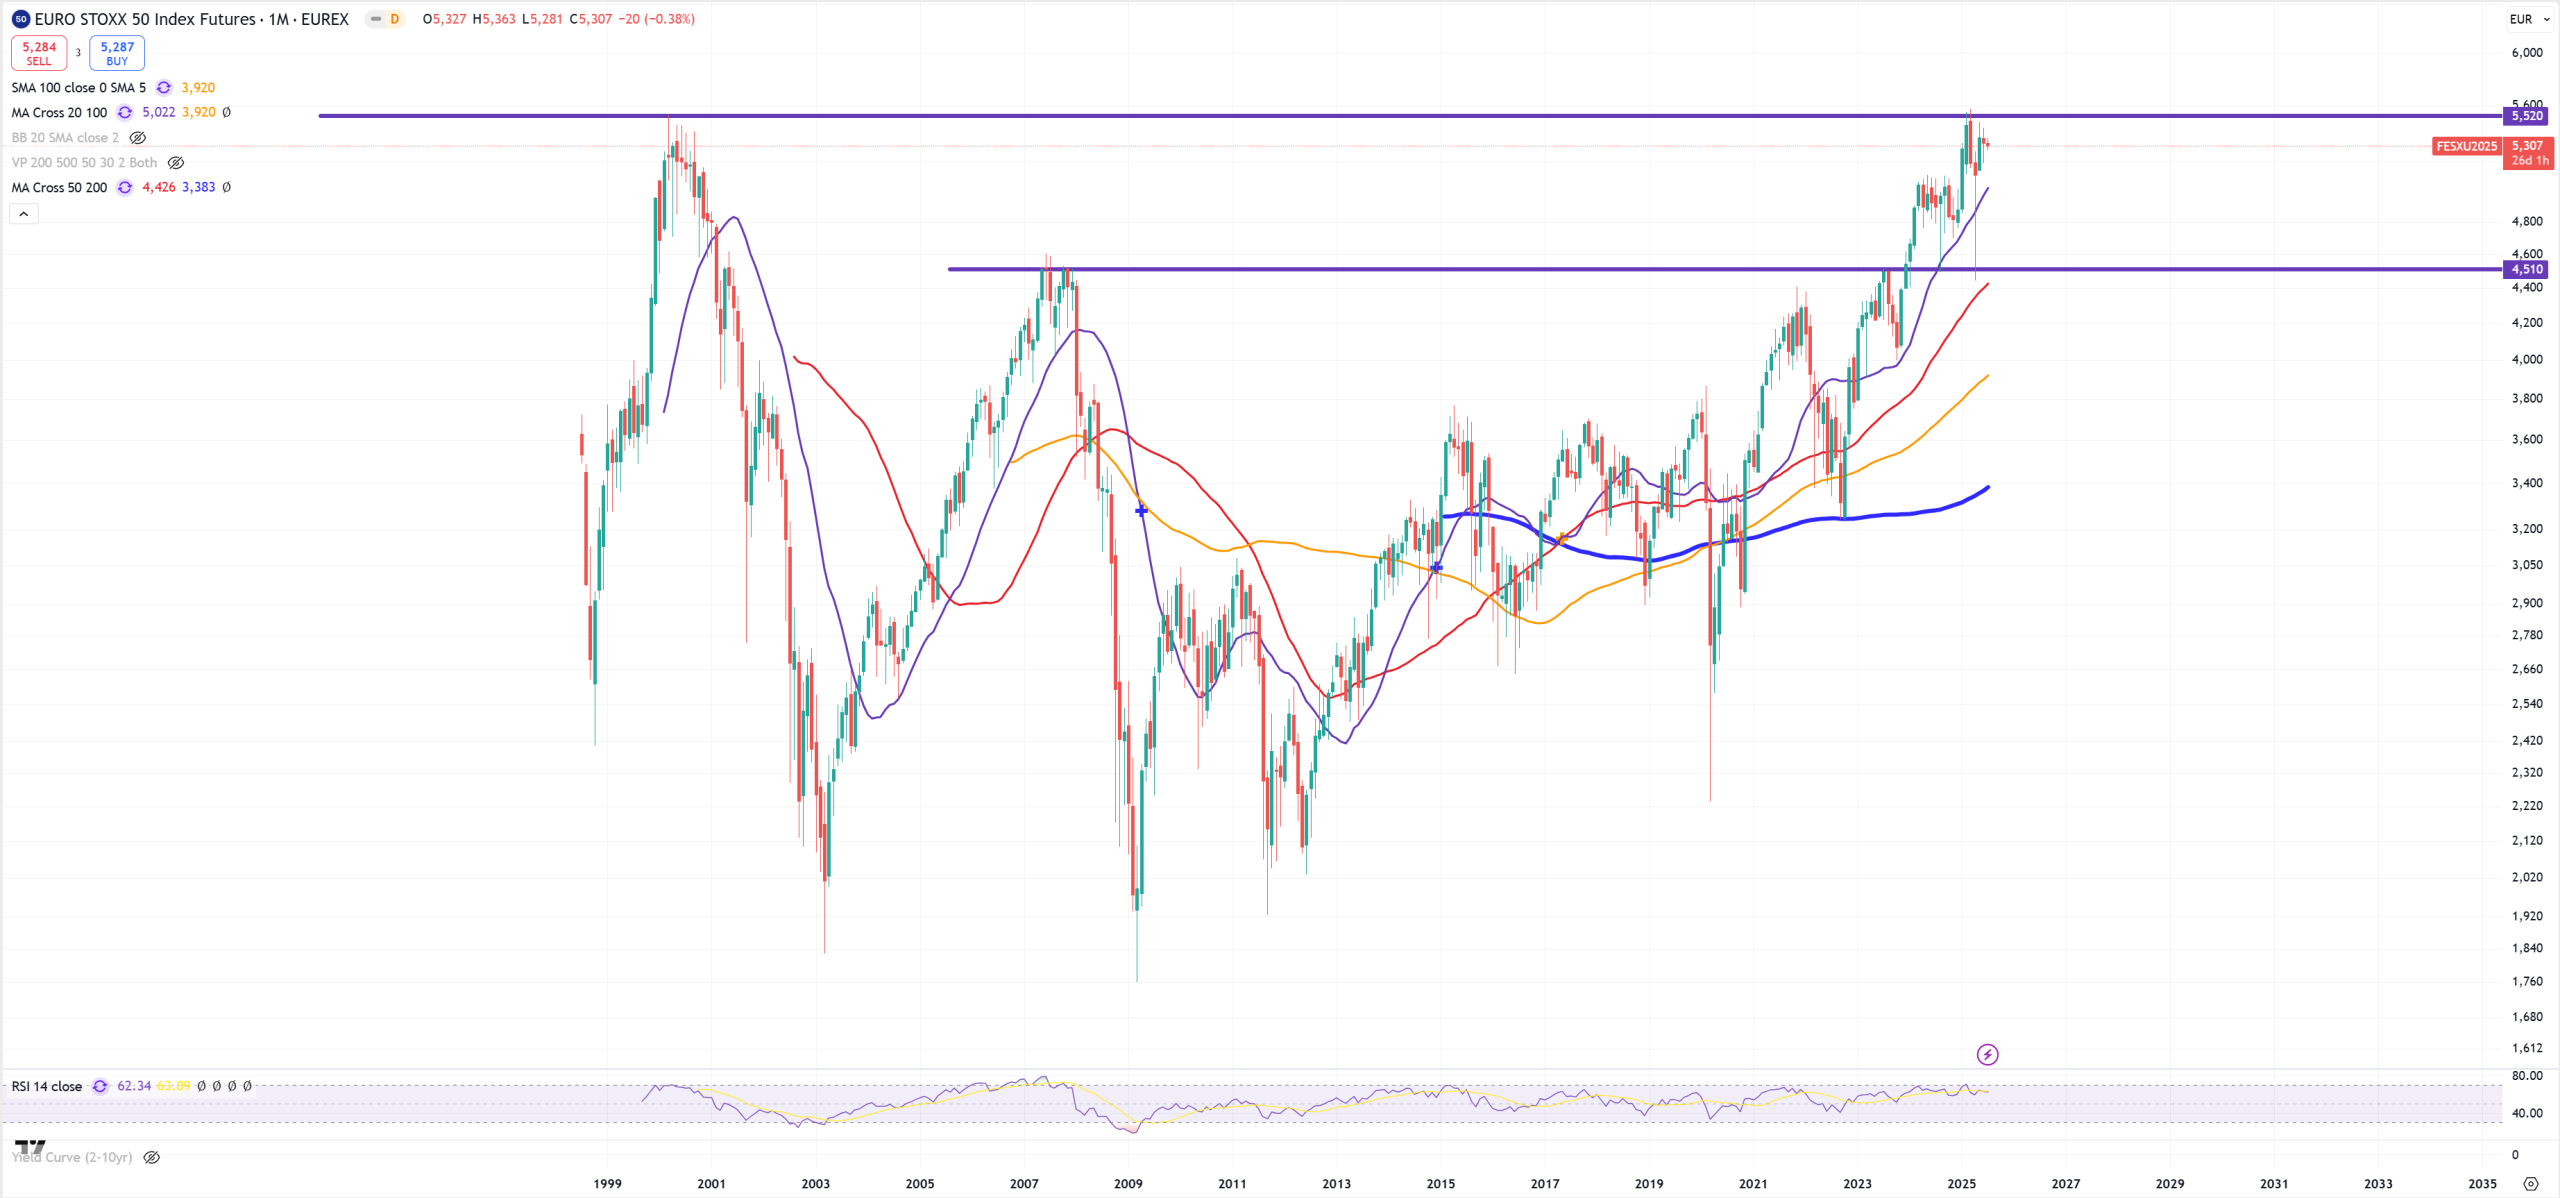
EUROSTOXX50 – and so far it got stuck between 2007 support and 2000 resistance.
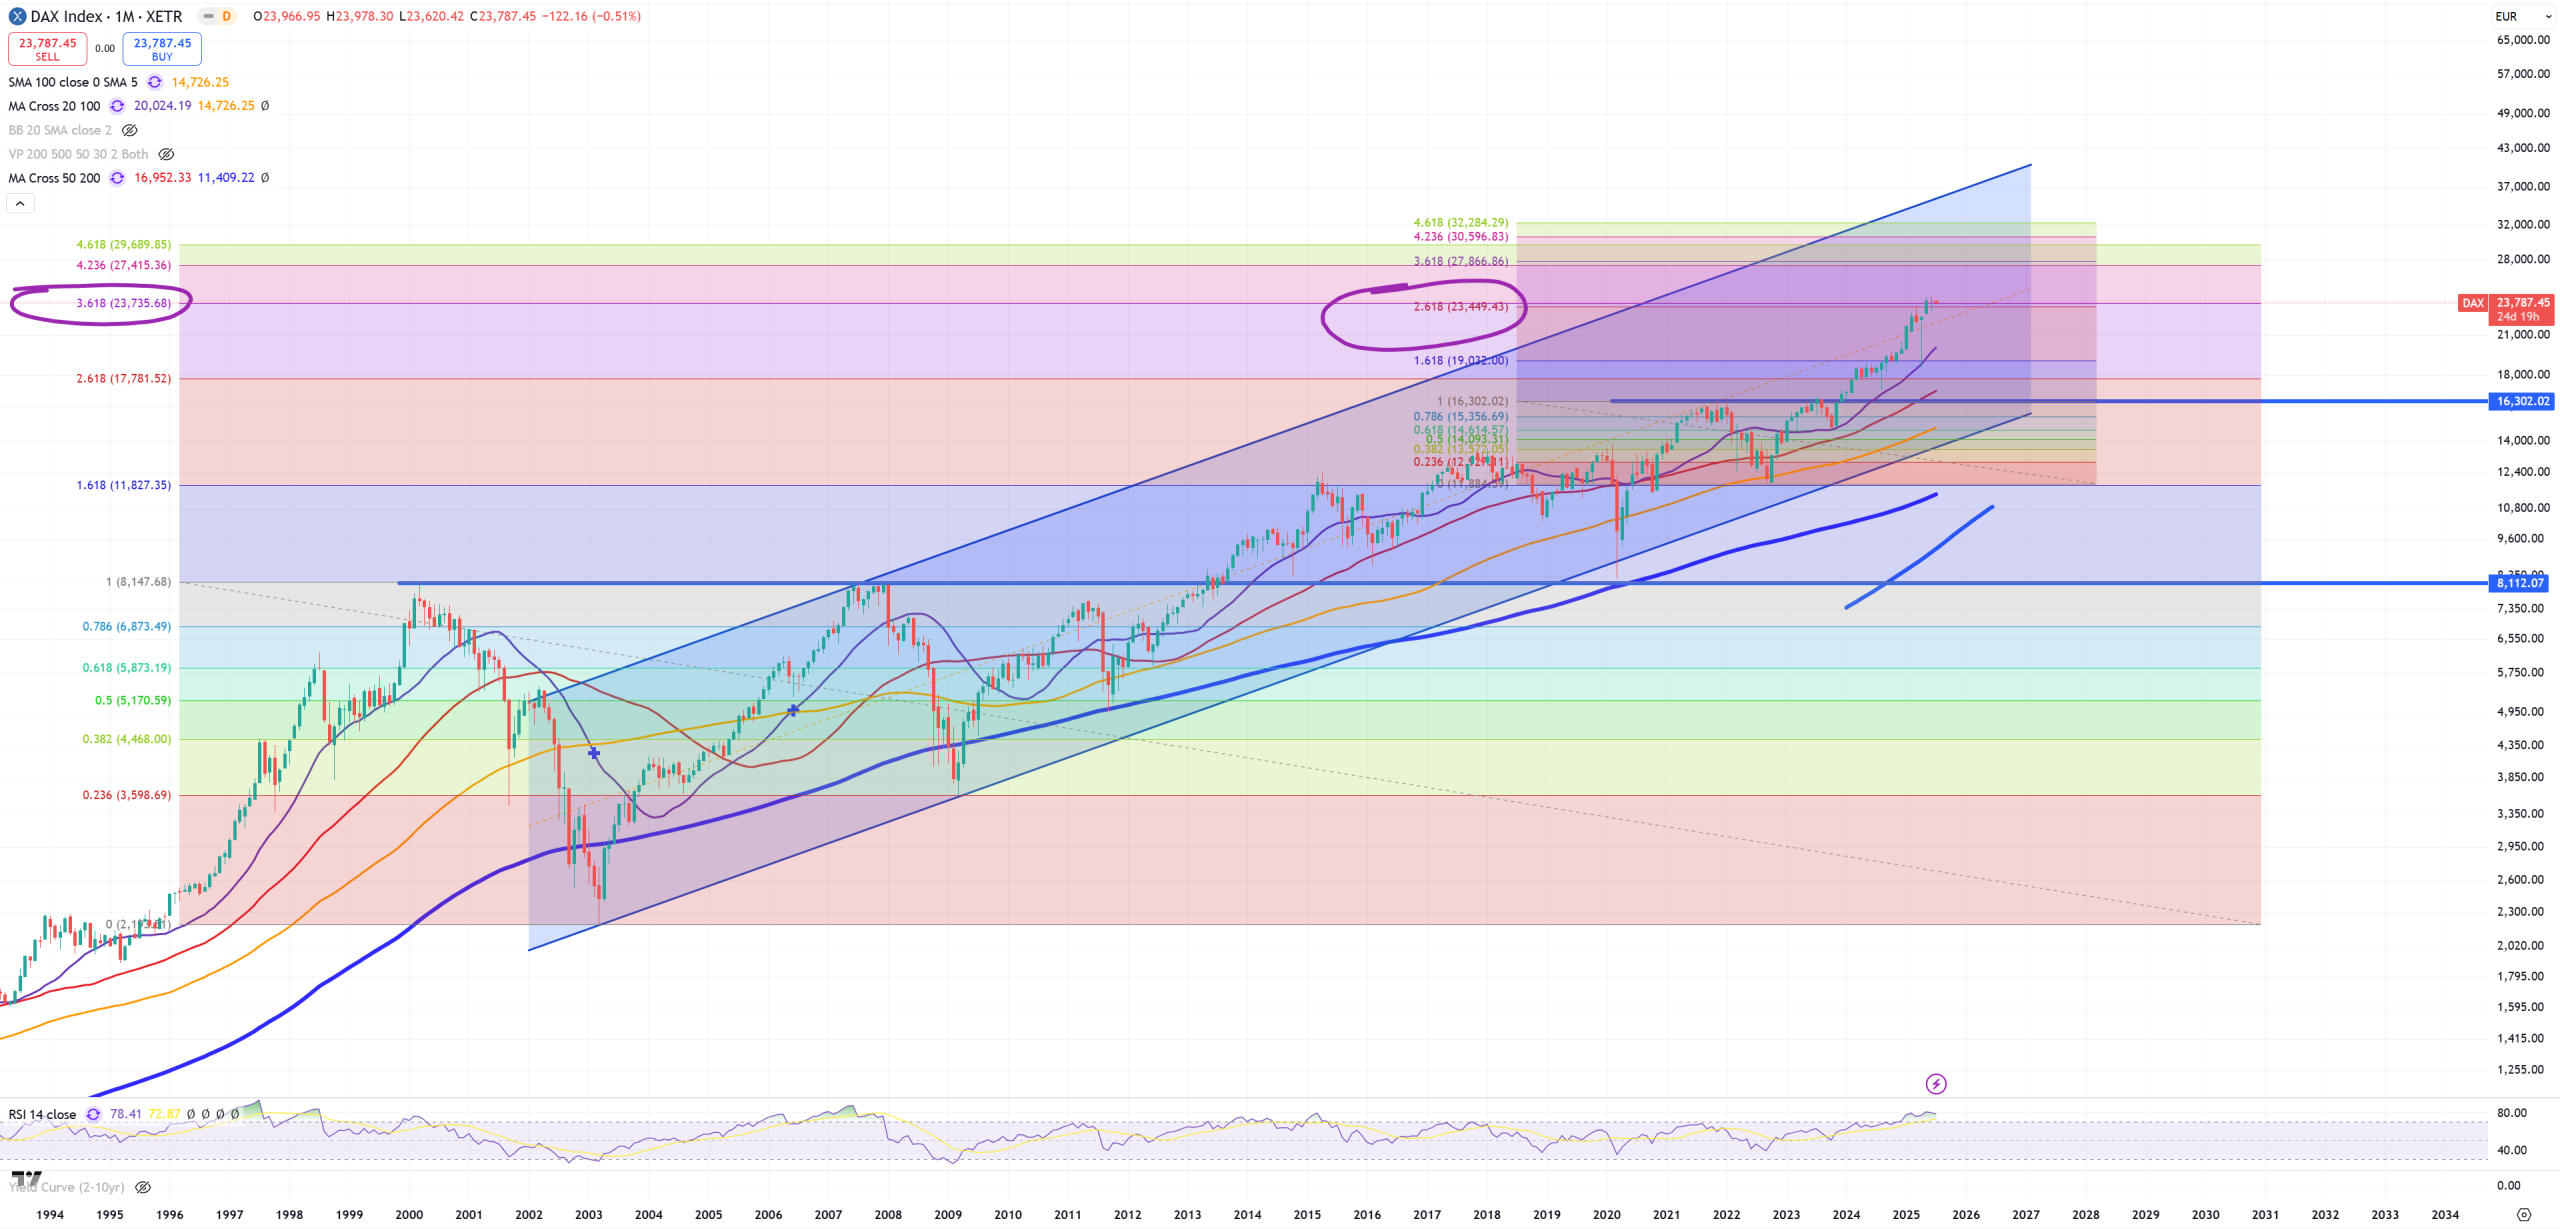
DAX – not much to comment, we’re tracing just FIBO levels
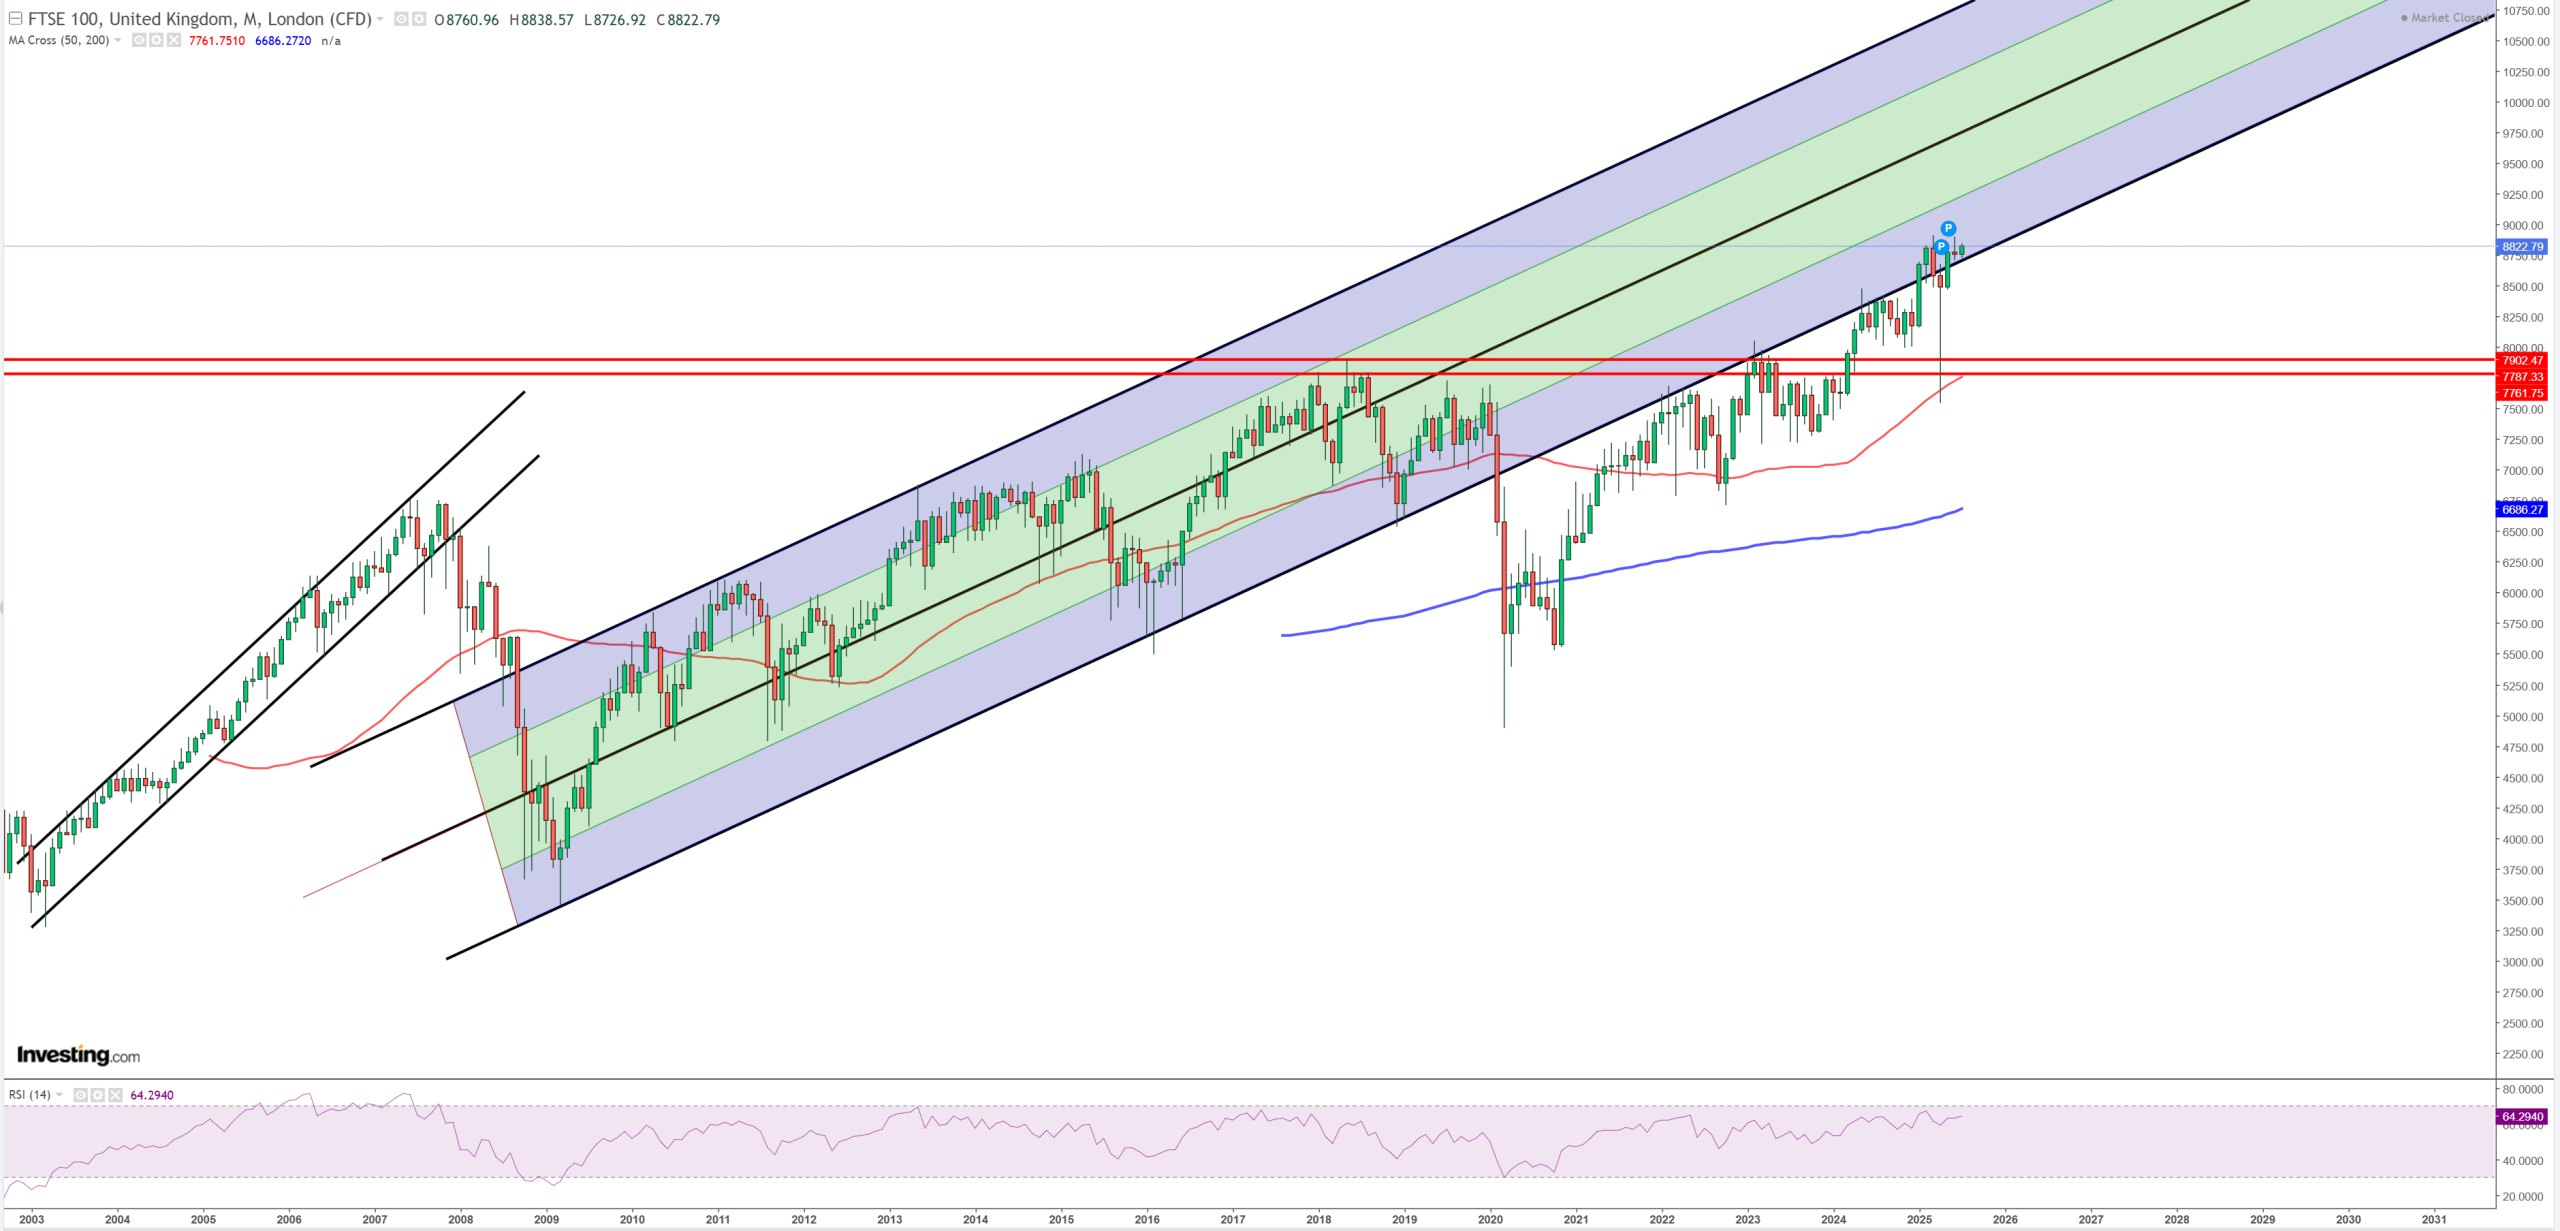
UK100 – so far it’s trying to get back above it’s key 2009 trend. Will it hold?
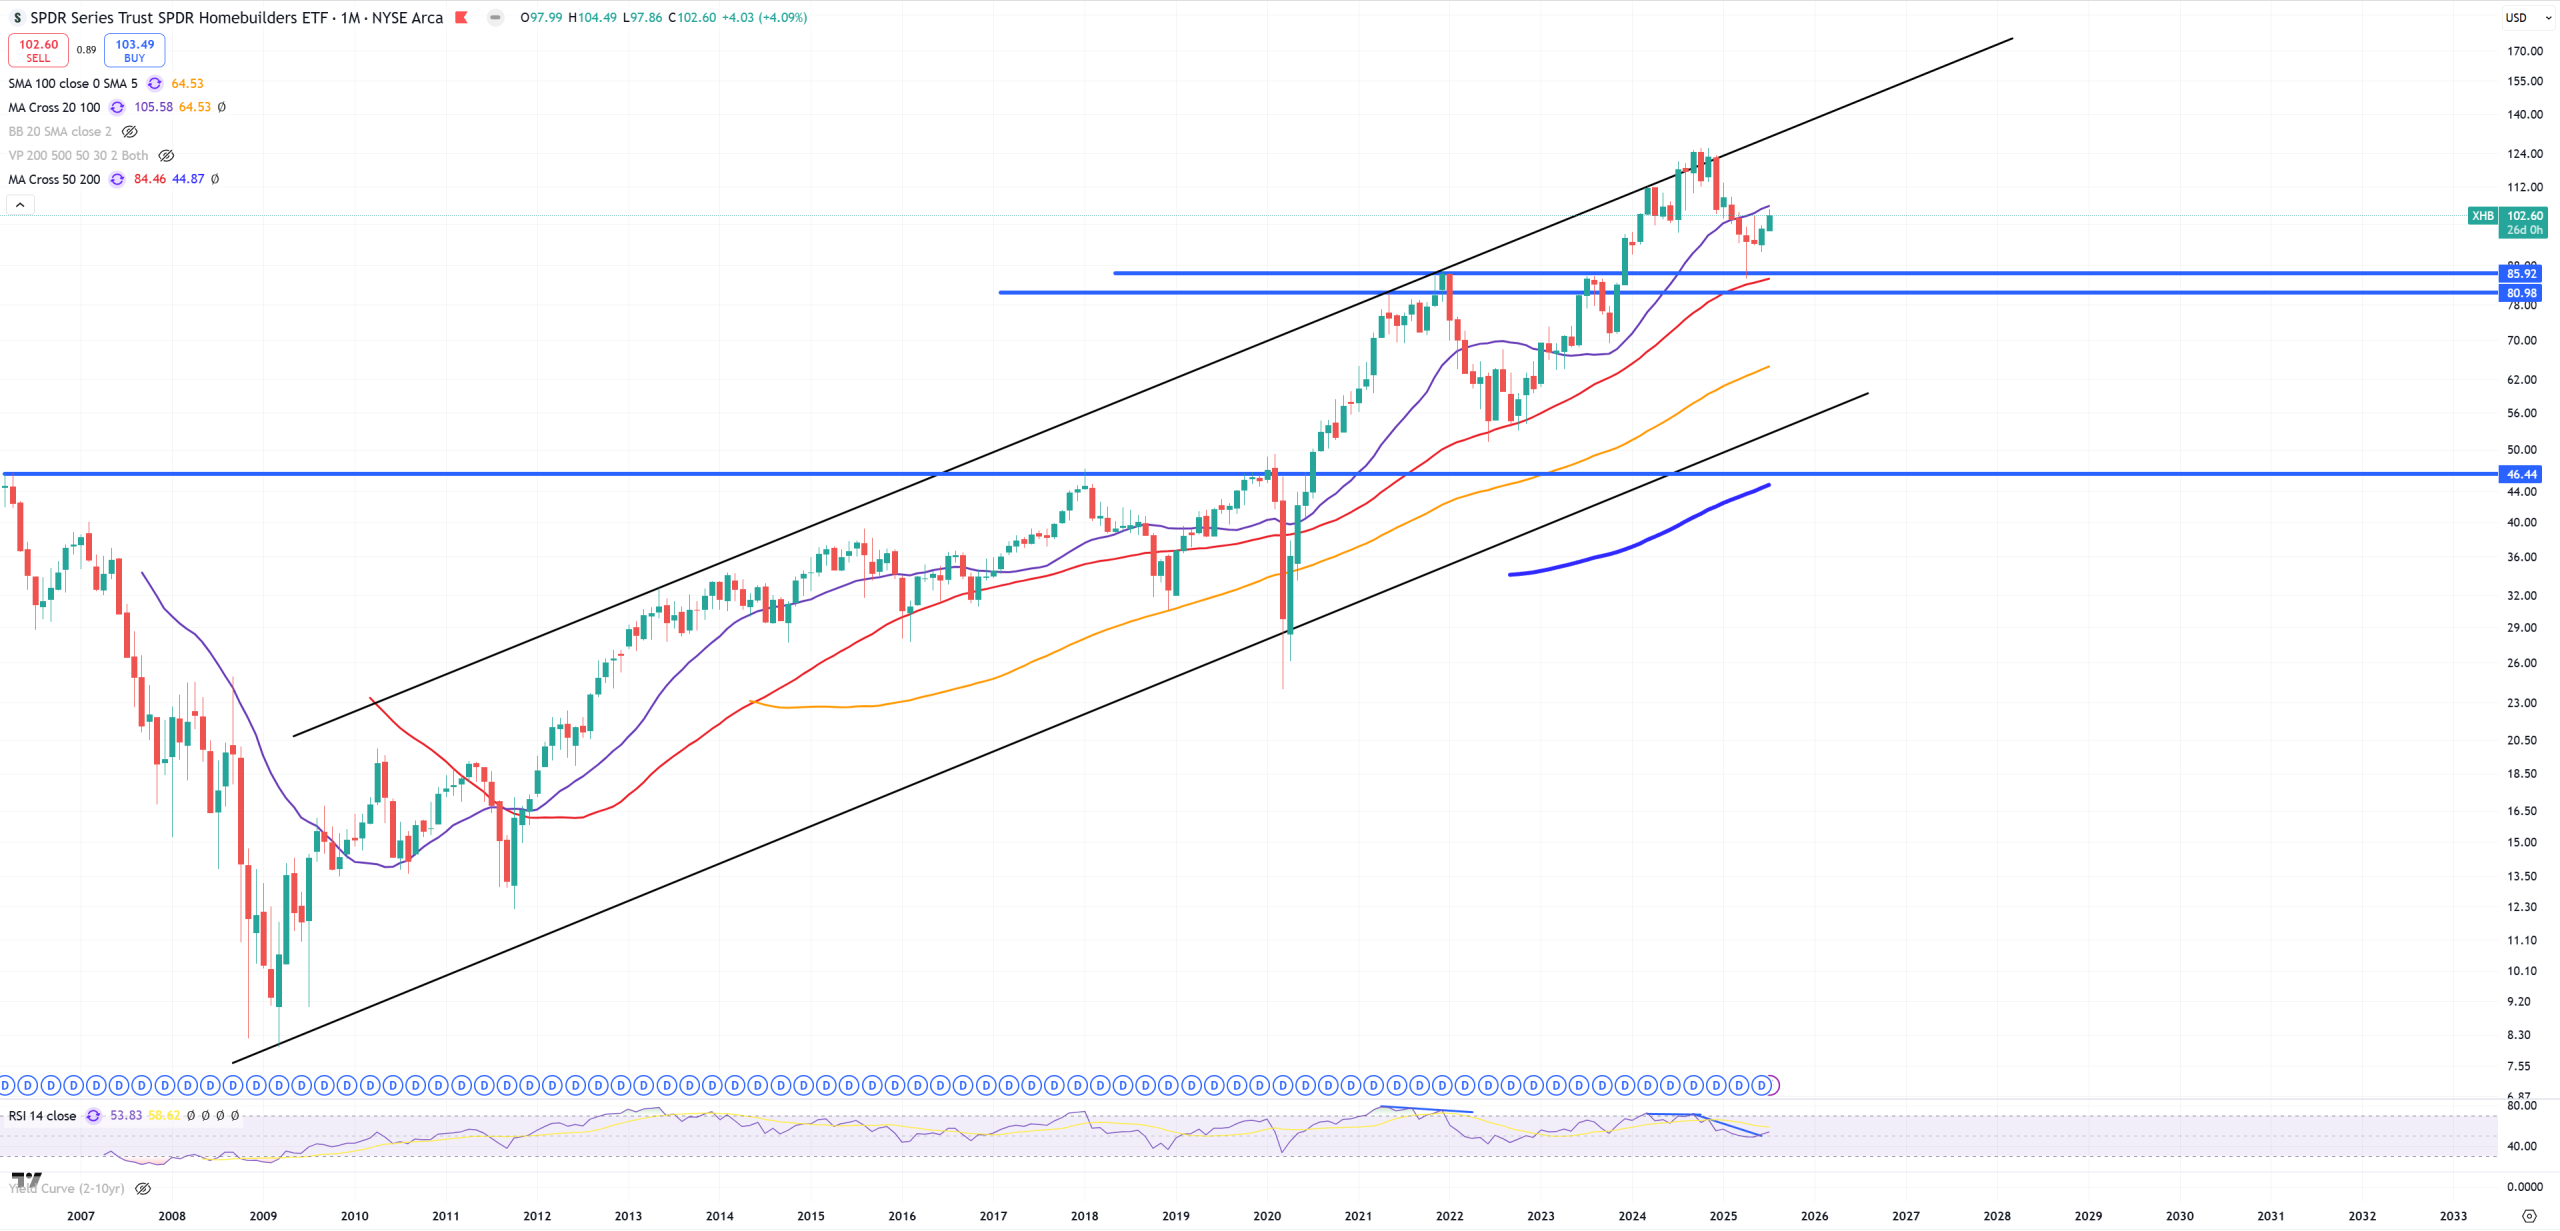
XHB – Homebuilders – key level also covers red (M)MA50. It’ll mostly never get broken after first hit.
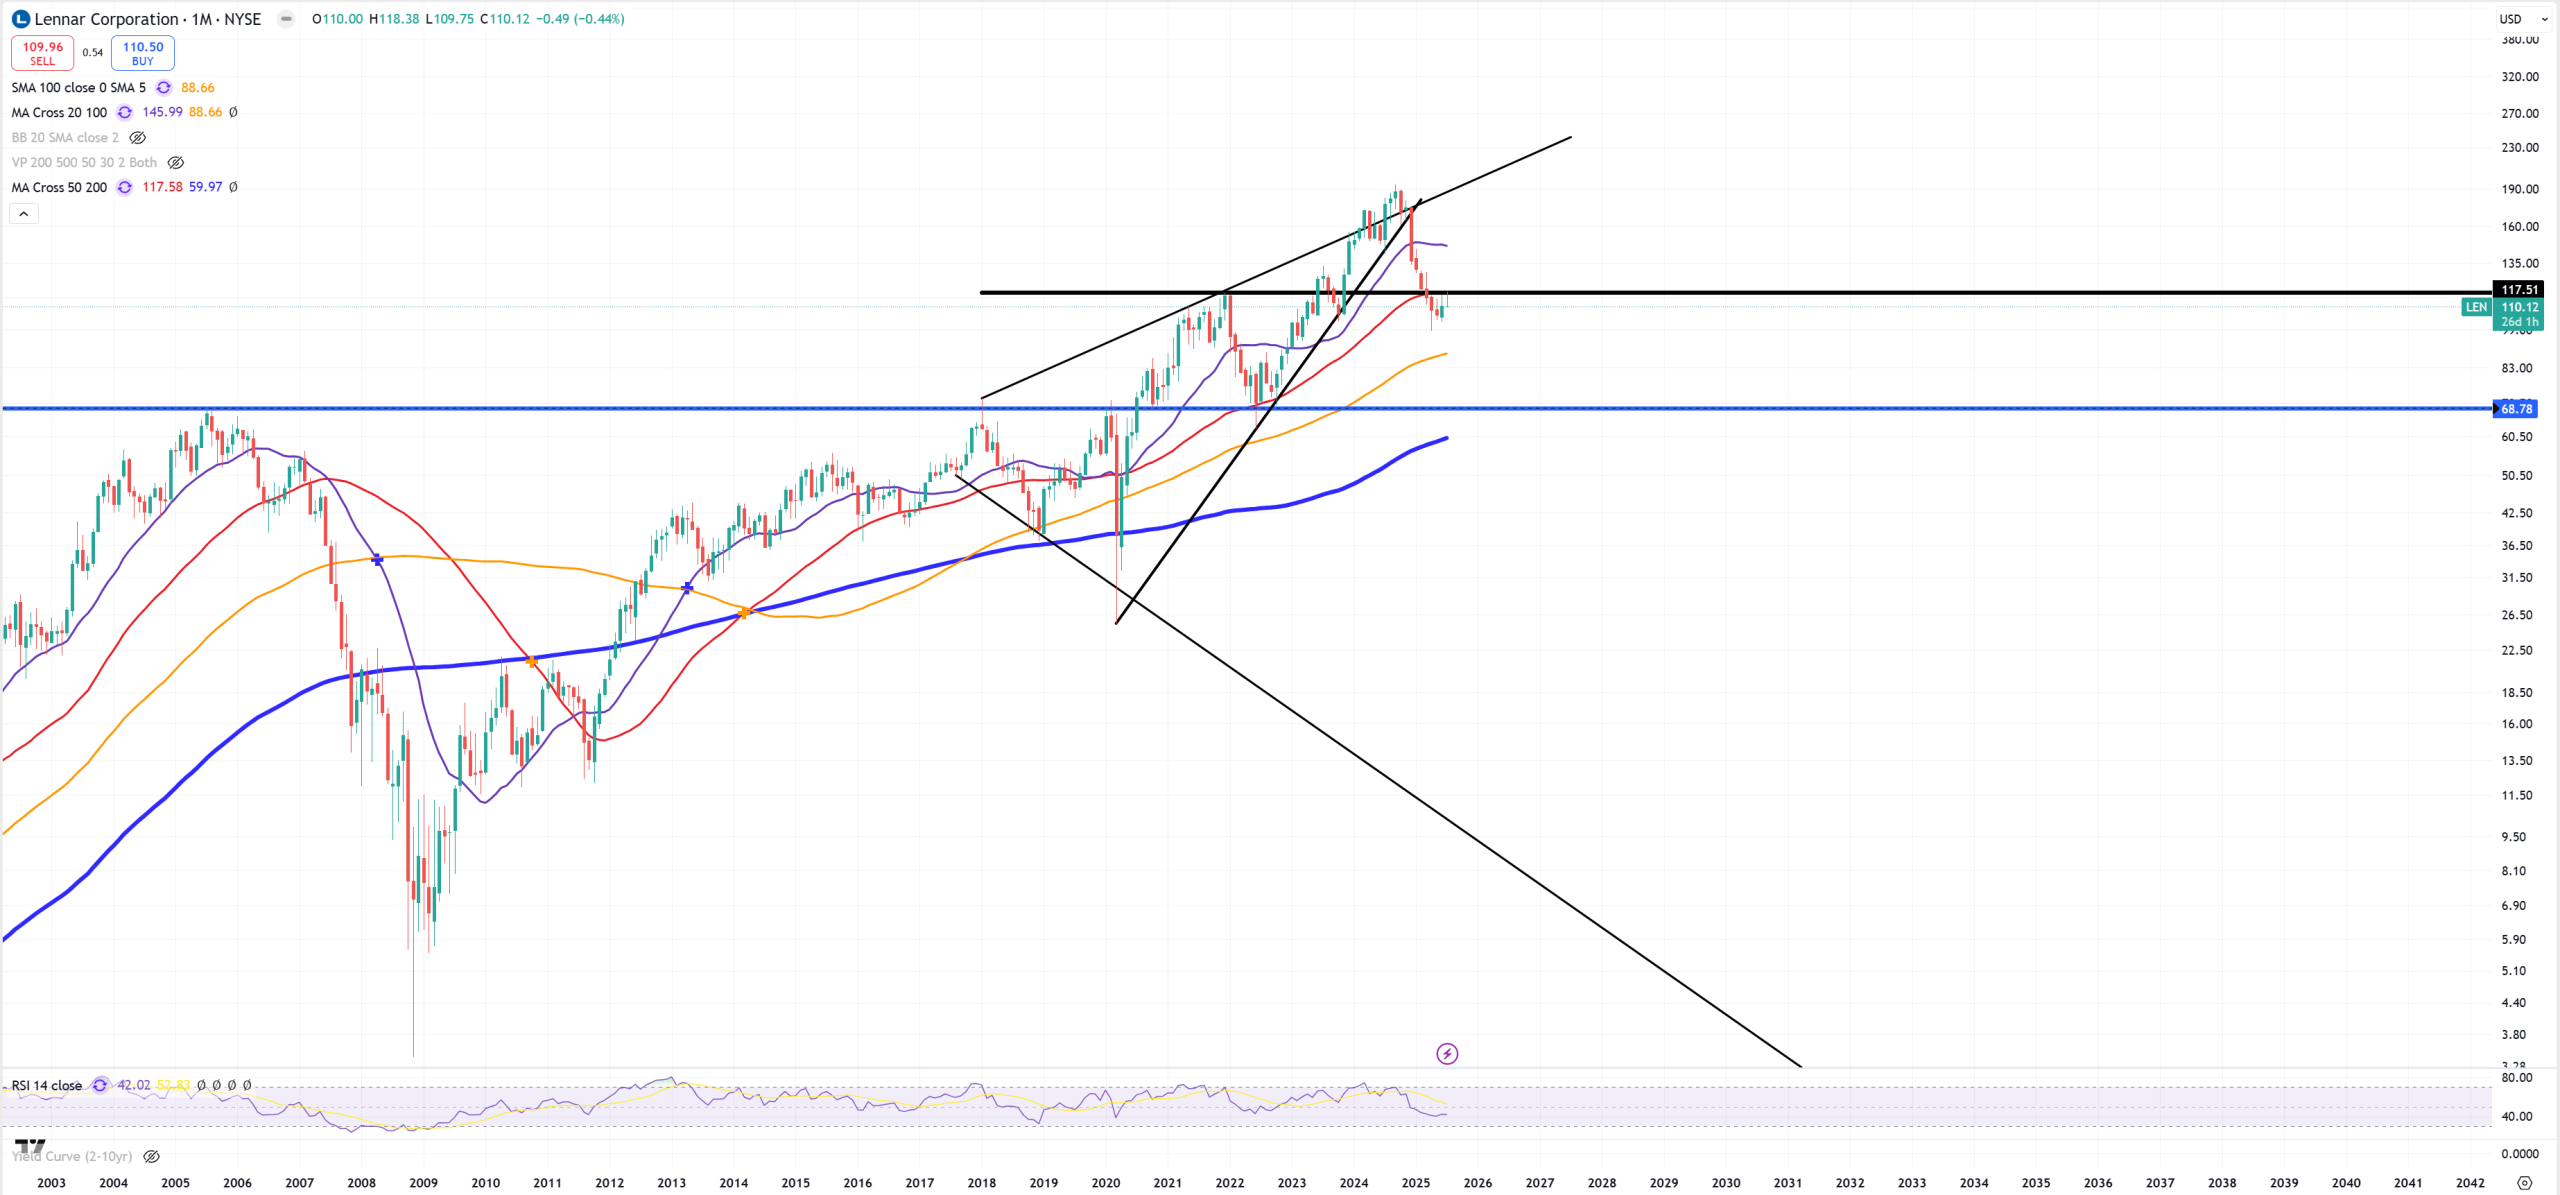
LEN – Lennar – so housing market – LEN finally jumped below key 2021 level (bold horizontal black line).
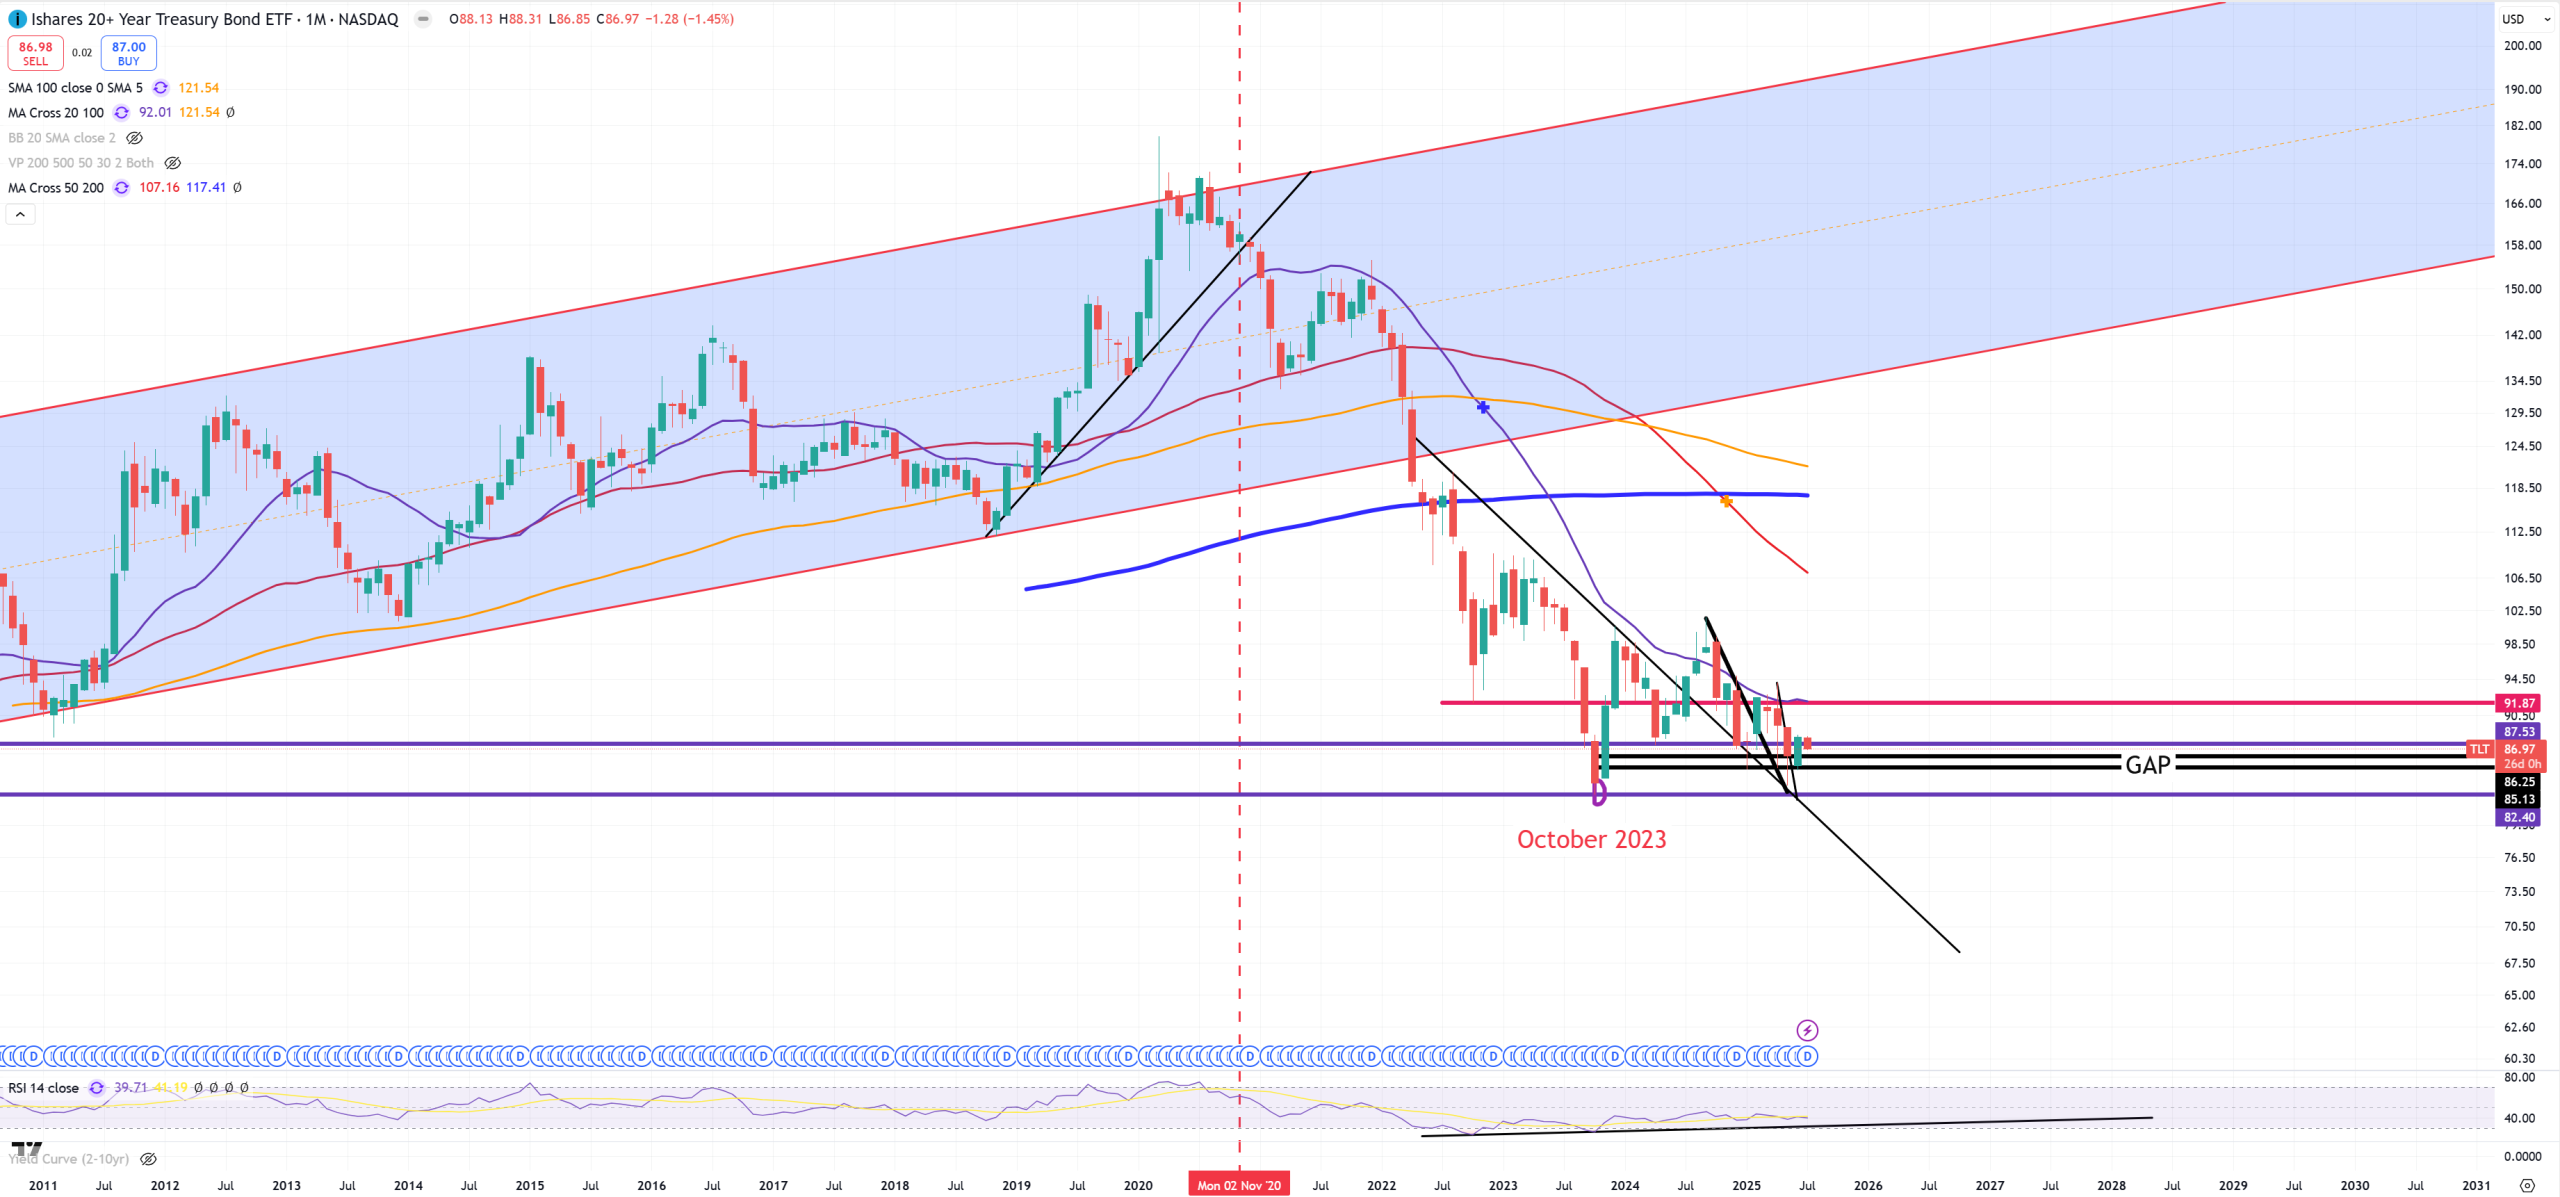
TLT – so the bond market, my bet unchanged 82$ is the ultimate low since Oct23, I don’t really care about deficits etc, we’re playing just with technicals
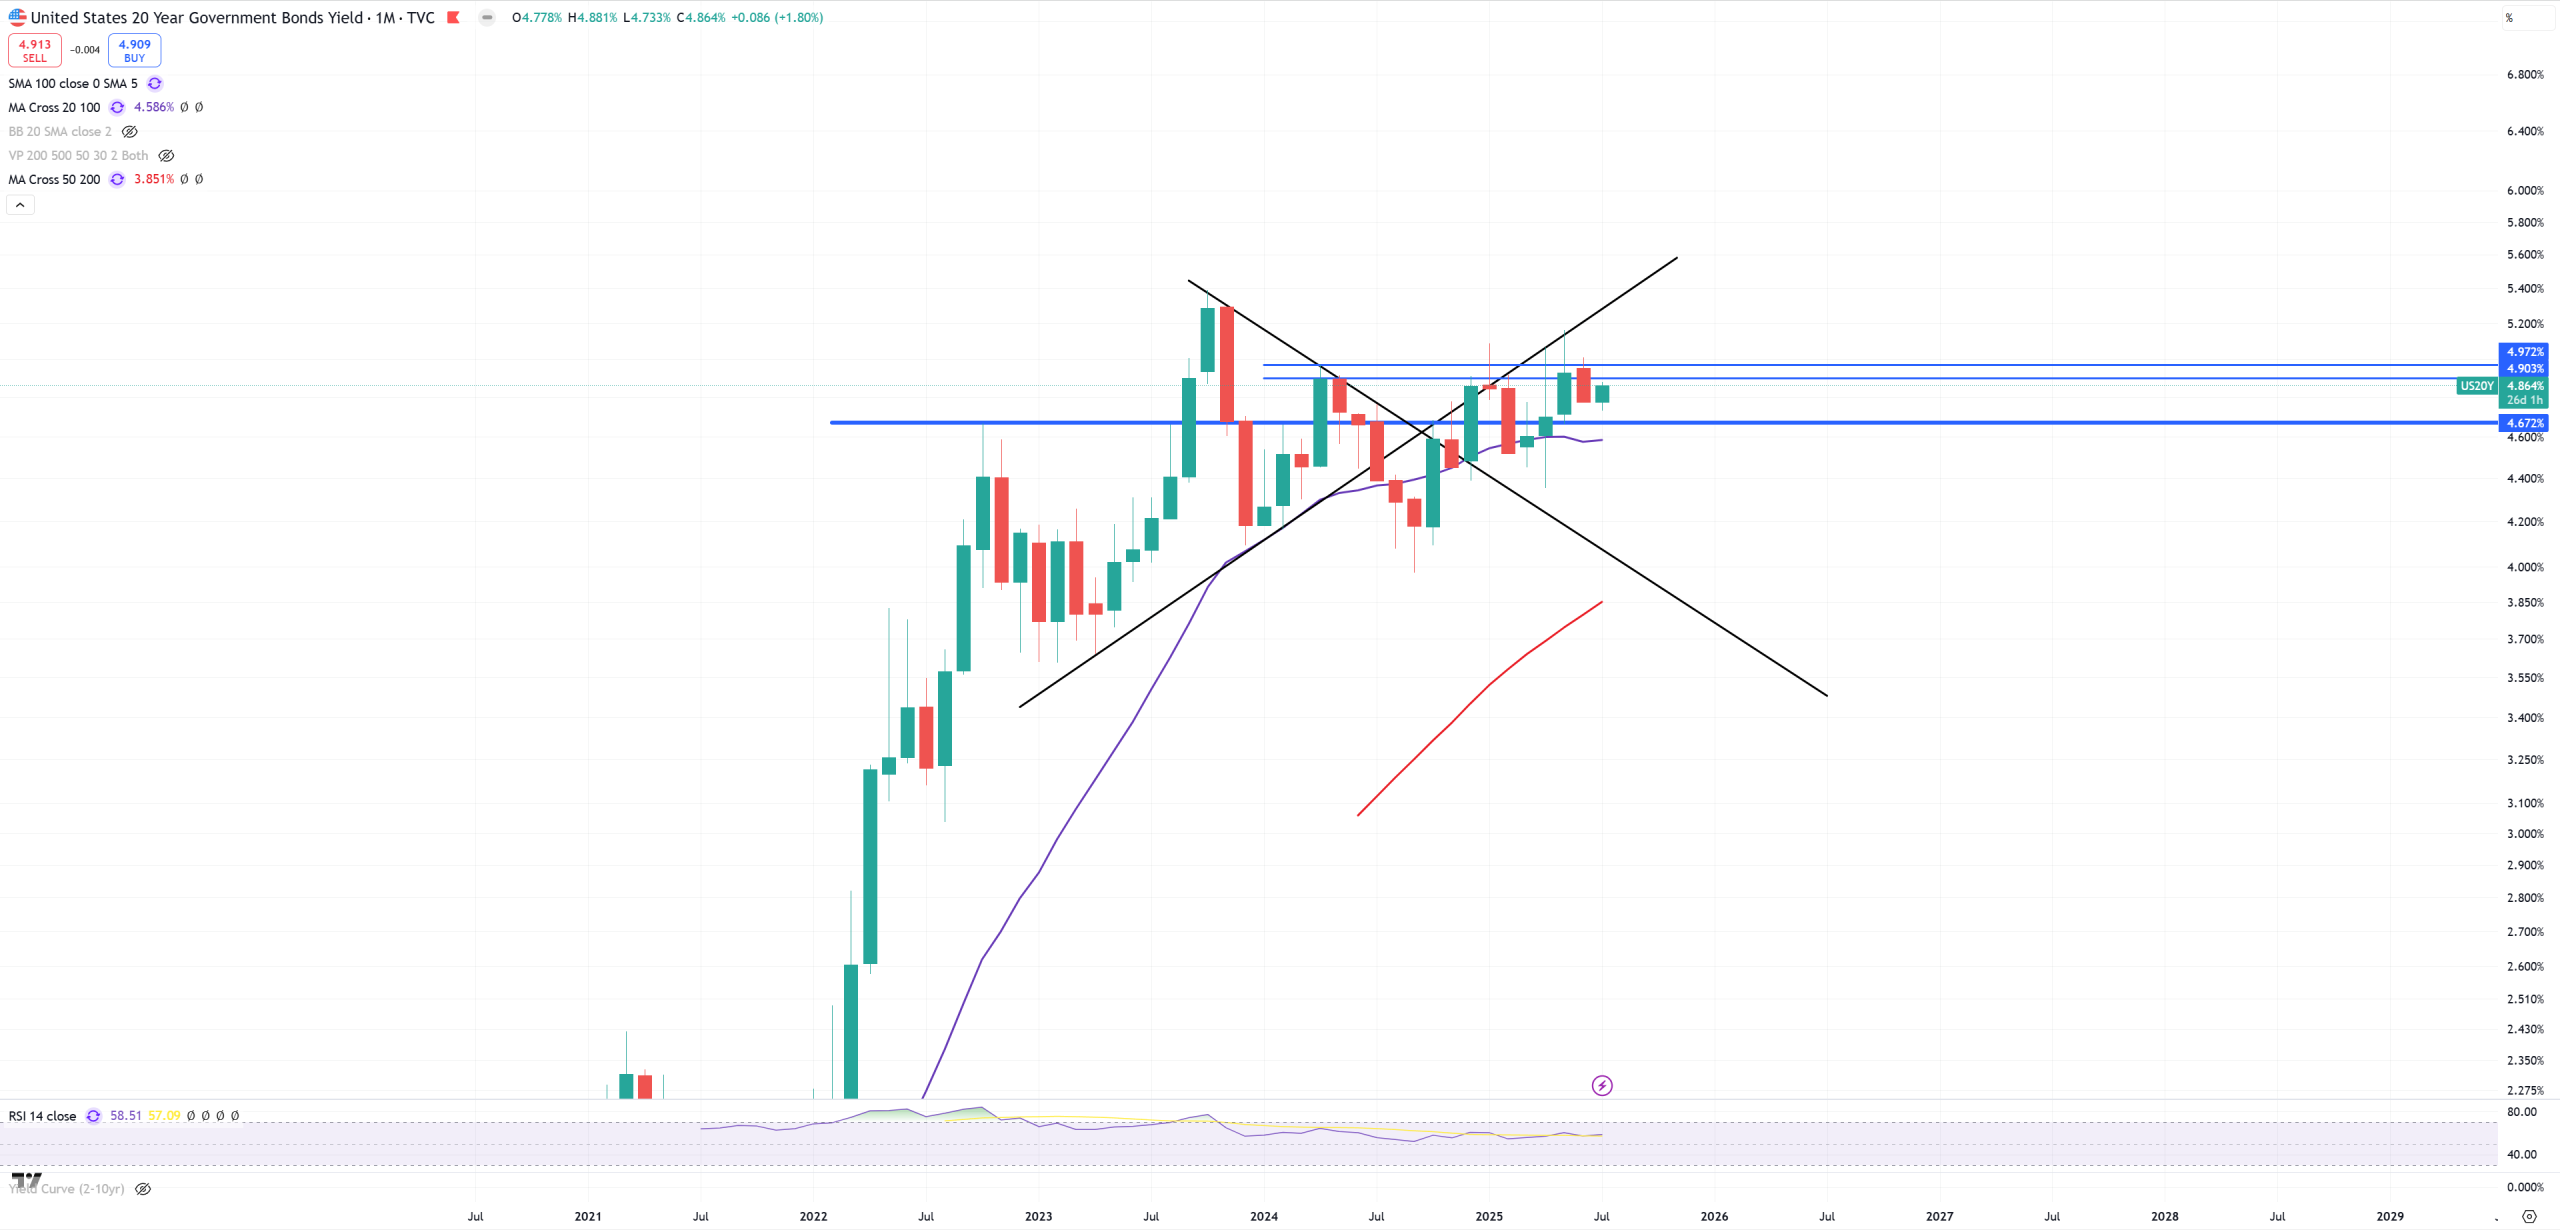
US20Y – so that’s just equivalent of TLT and 5.0% as a key resistance
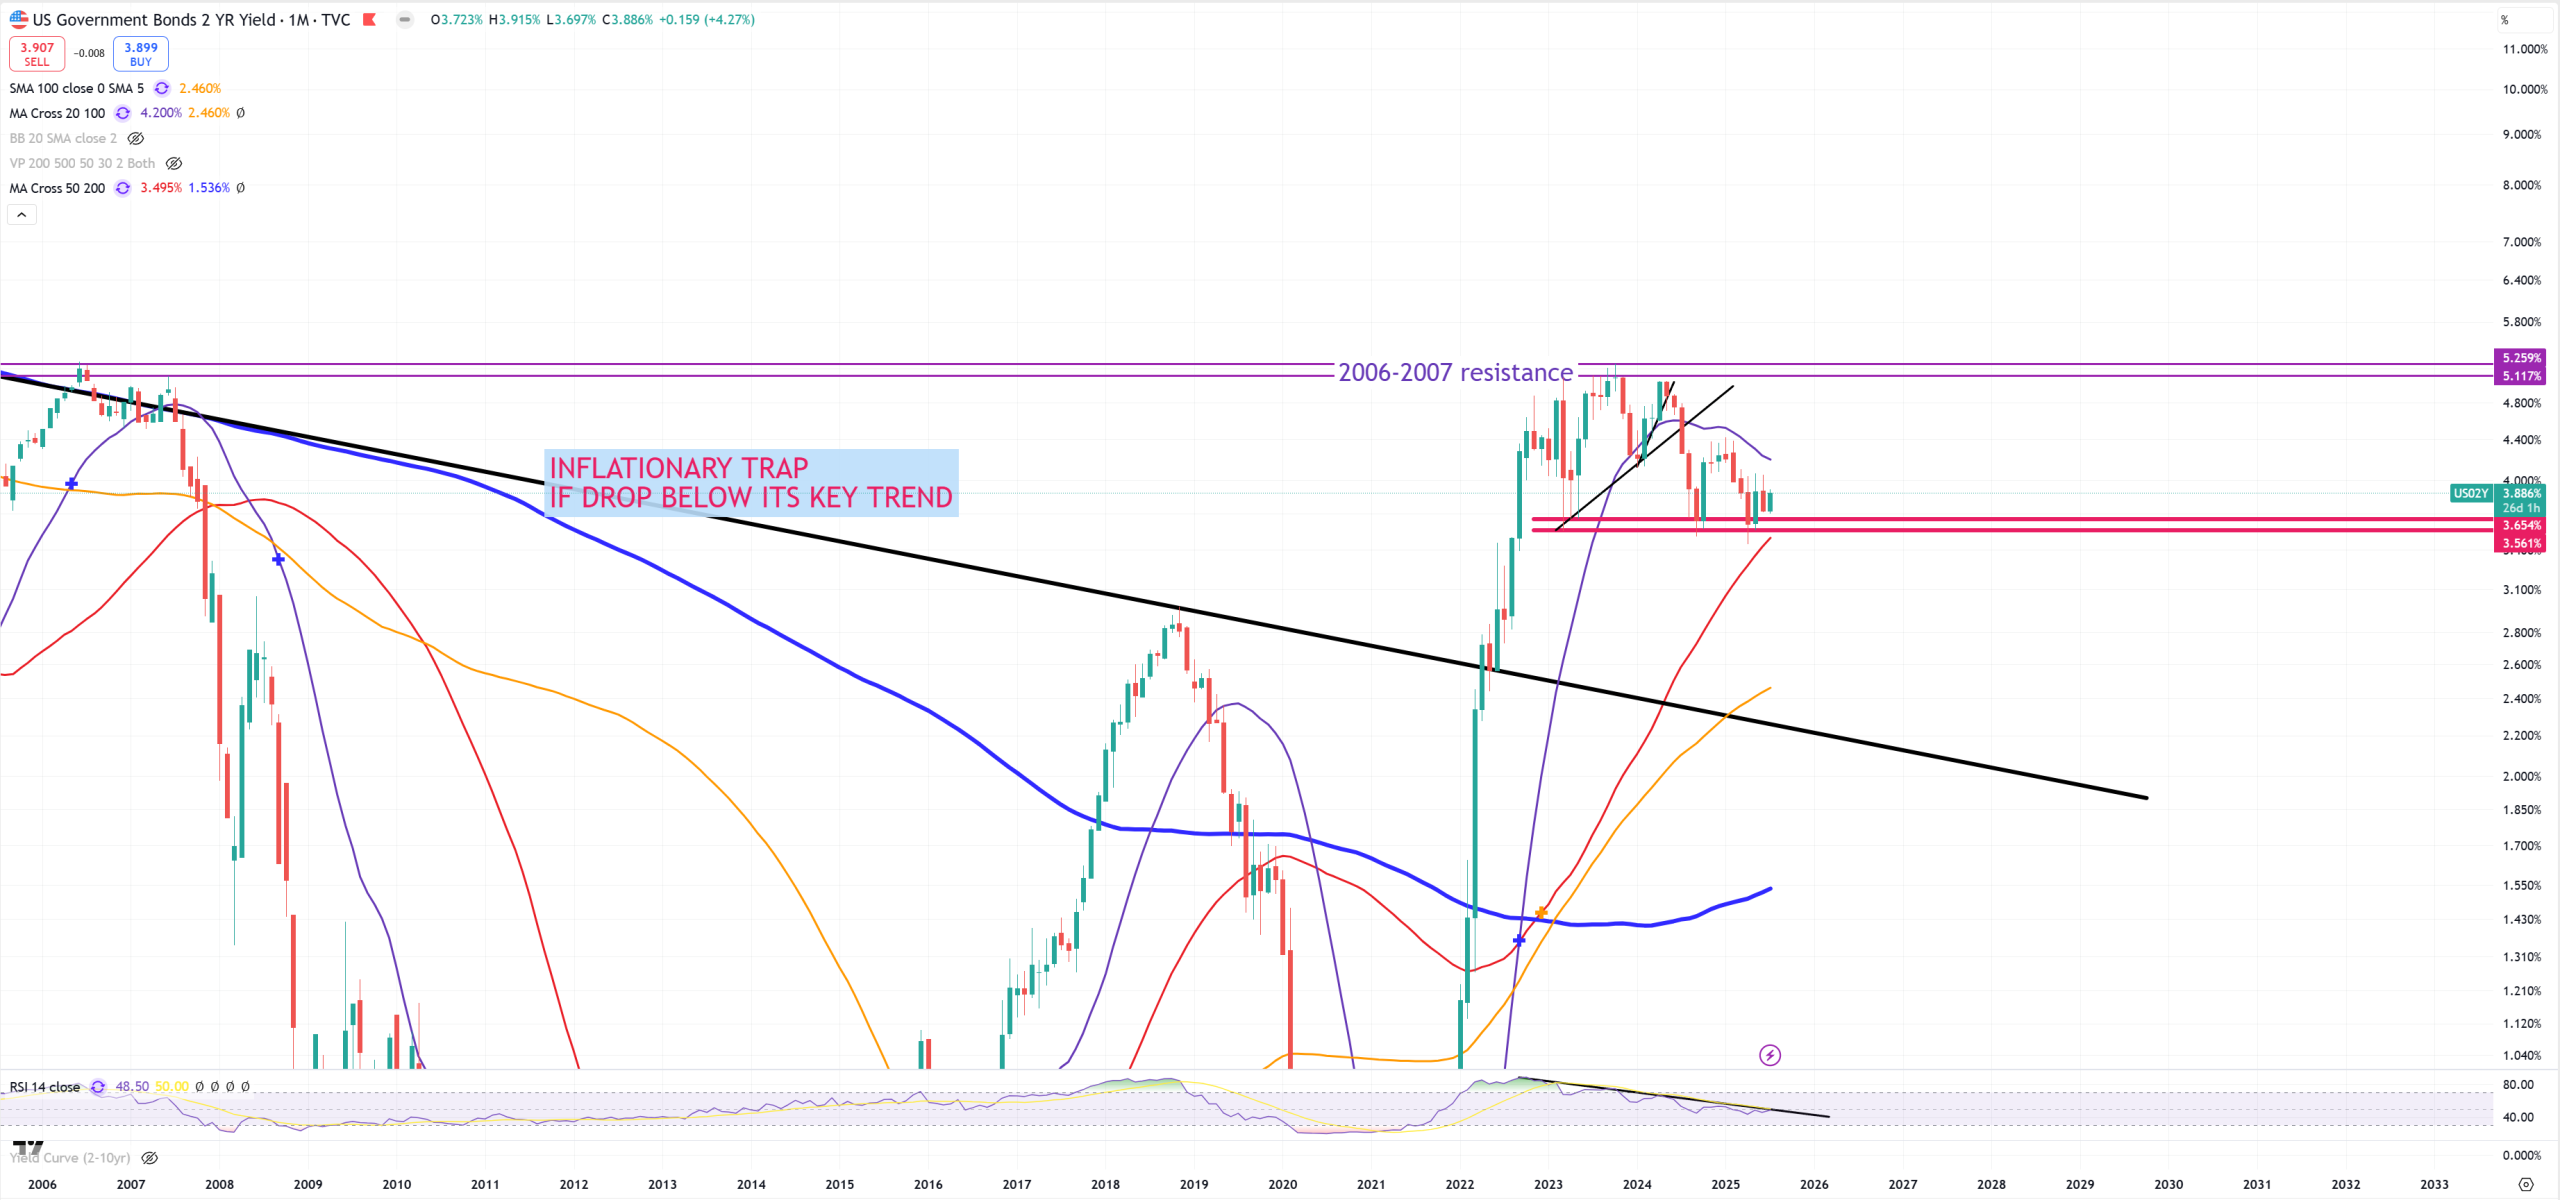
US02Y – Level 3.50% is make it or crash it IMO
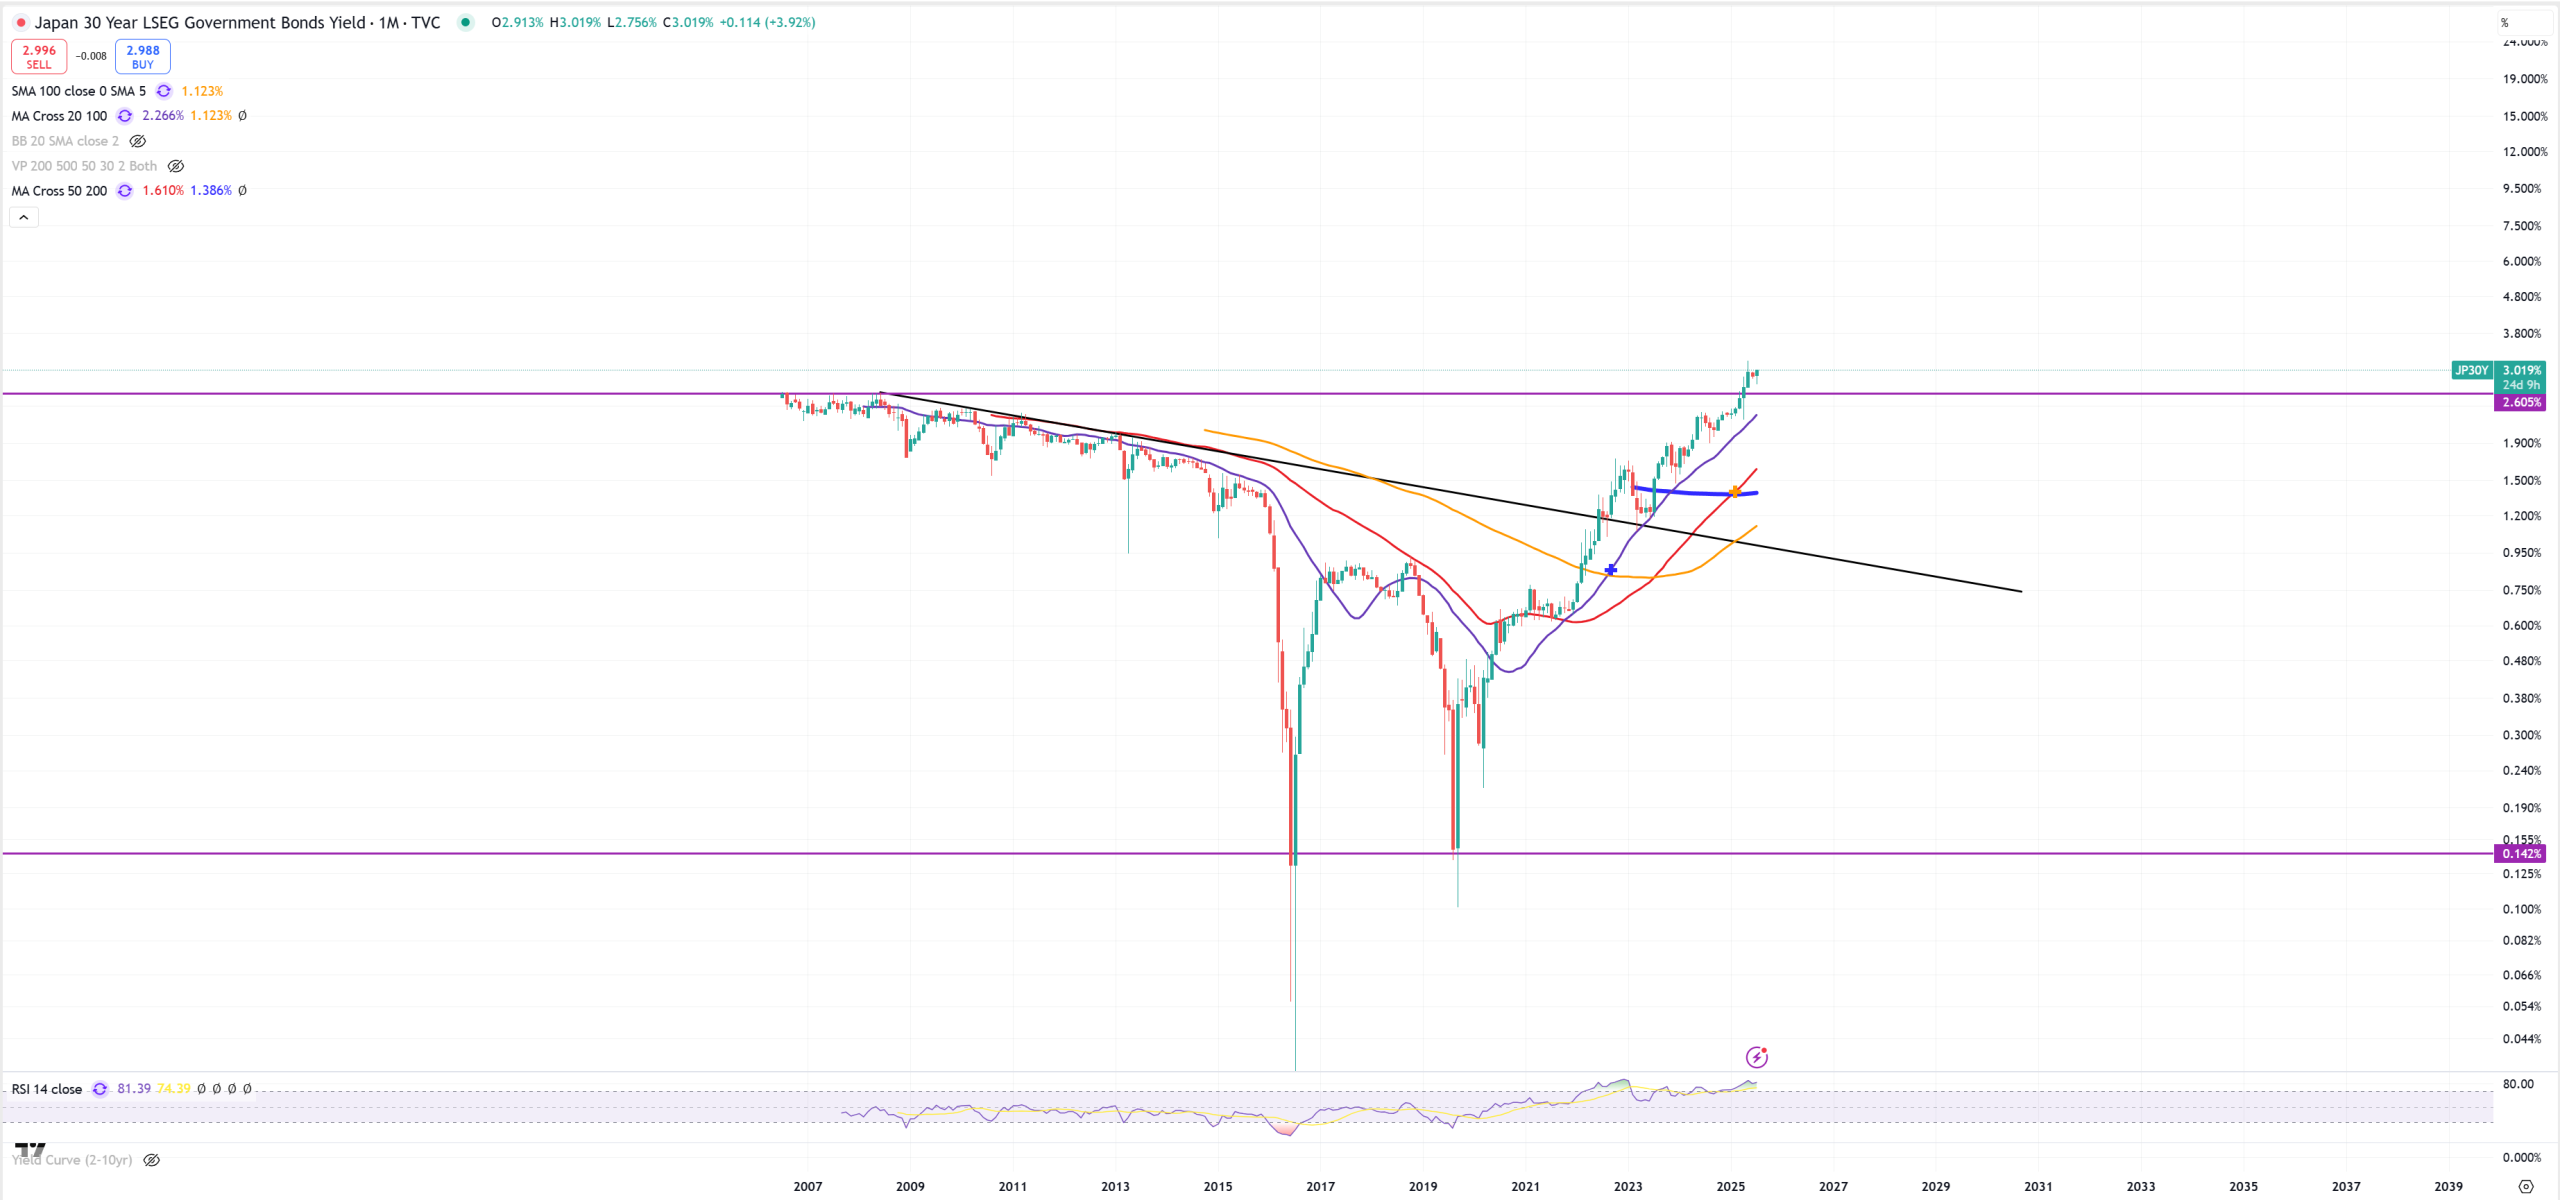
JP30Y – I personally believe the trust in Japanese bond market has gone. So their real rates will skyrocket soon forcing USDJPY to tank heavily. We can say : For 20Ys JP30Y going down, placed some kind of double bottom and in 5Ys it’s all gone.
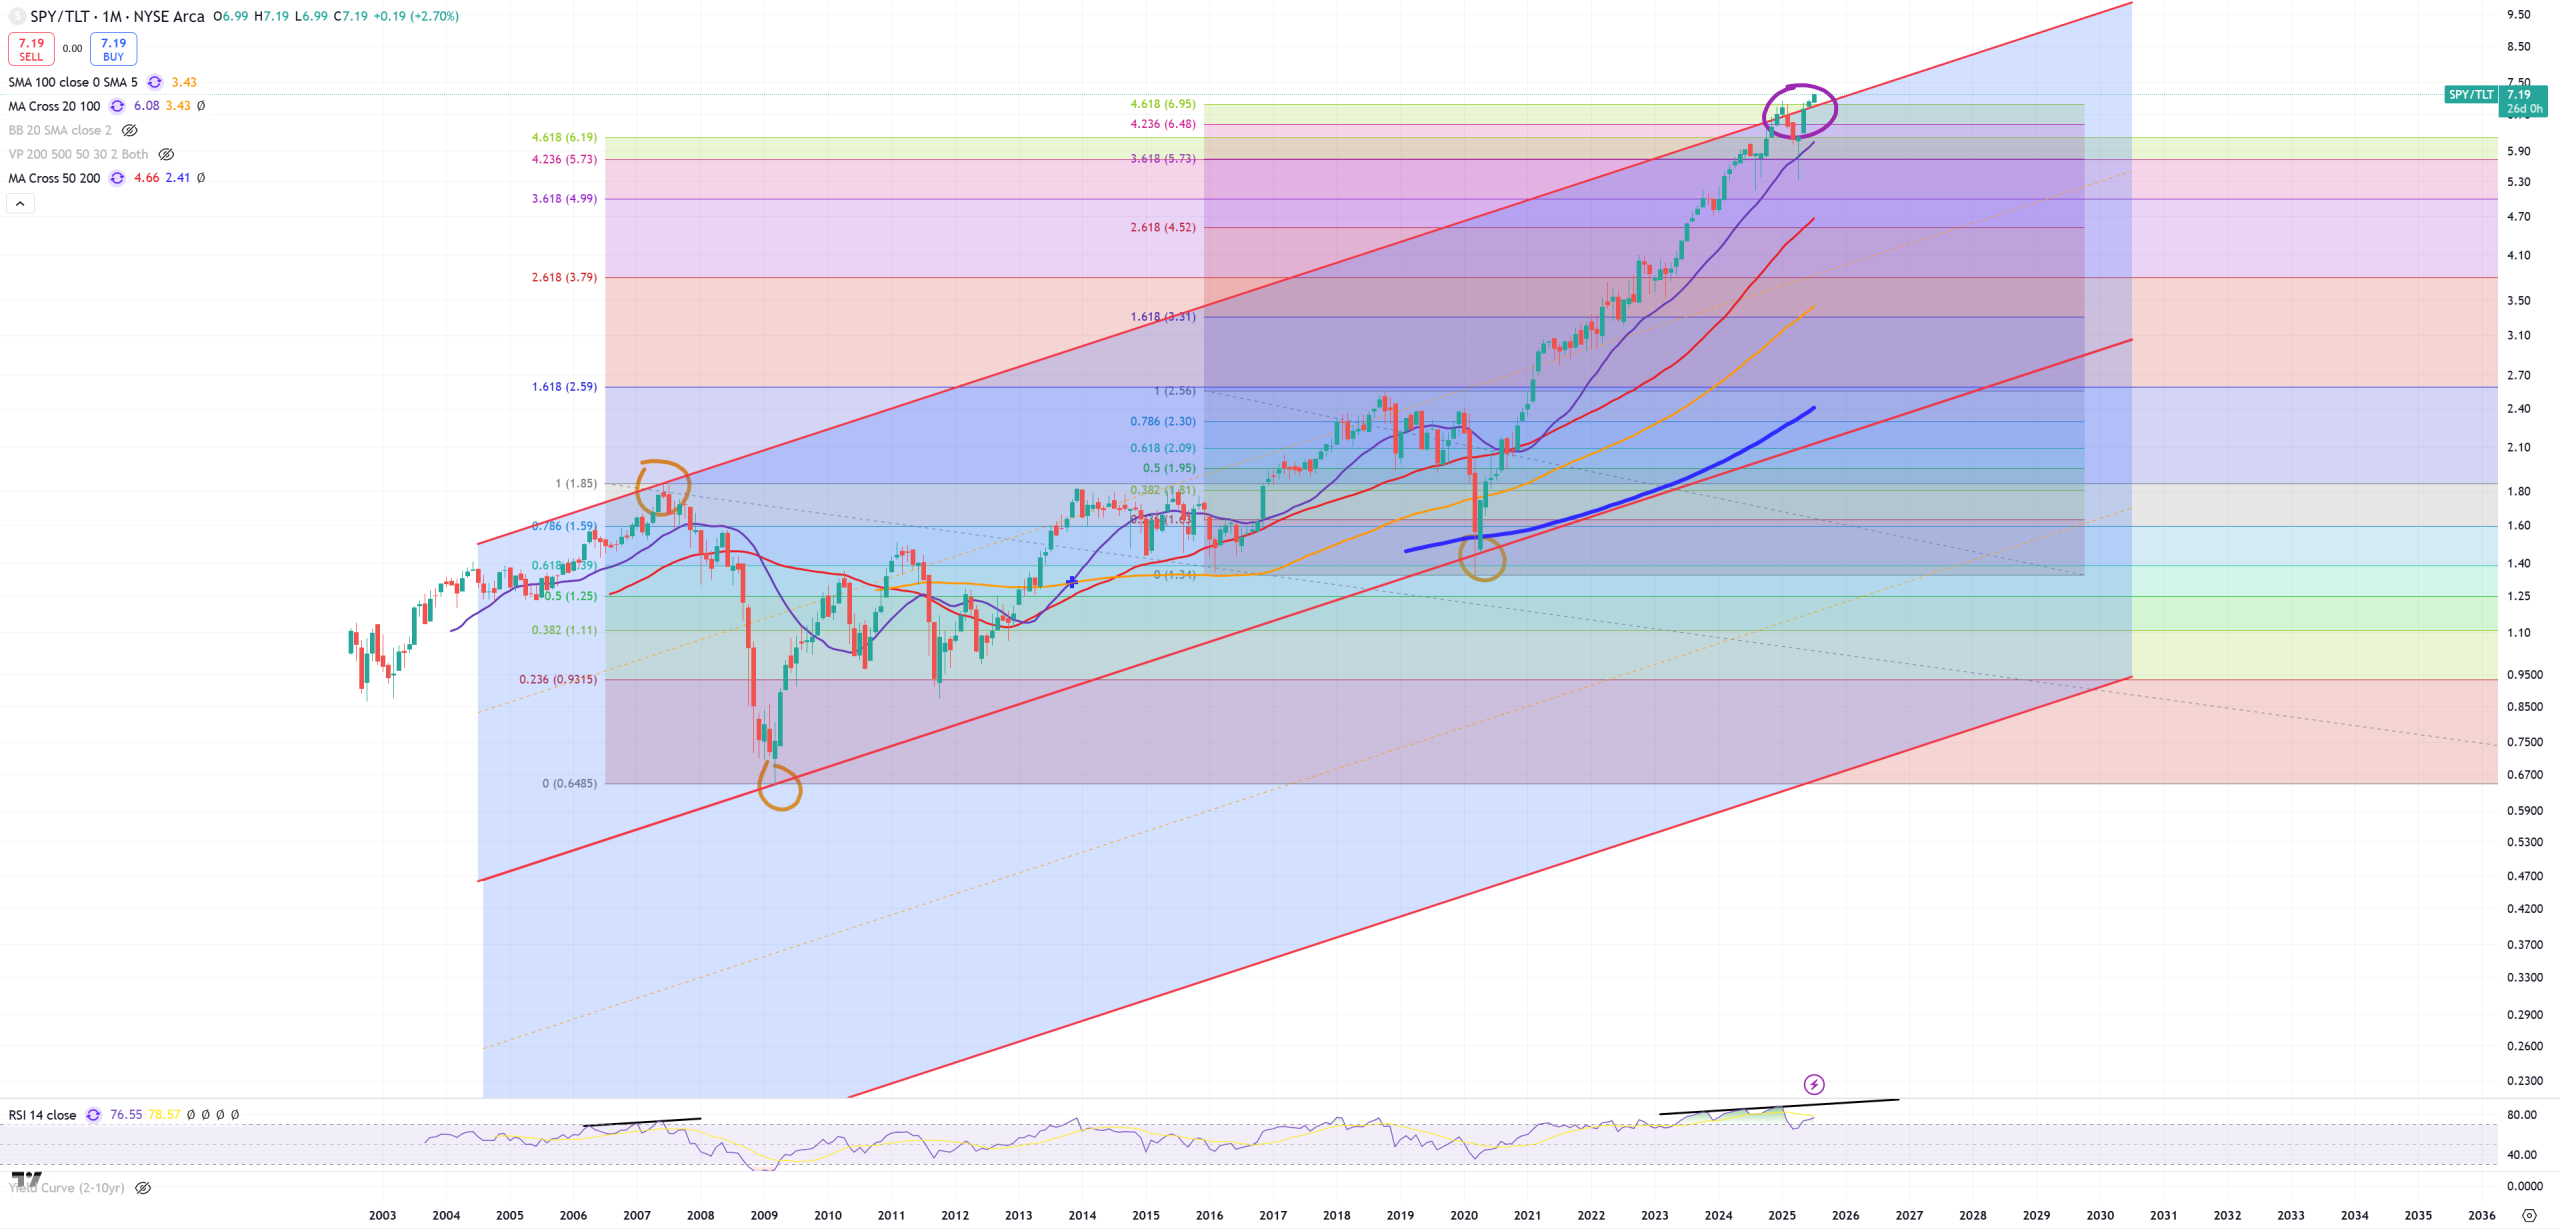
SPY/TLT – new ATH 7.19
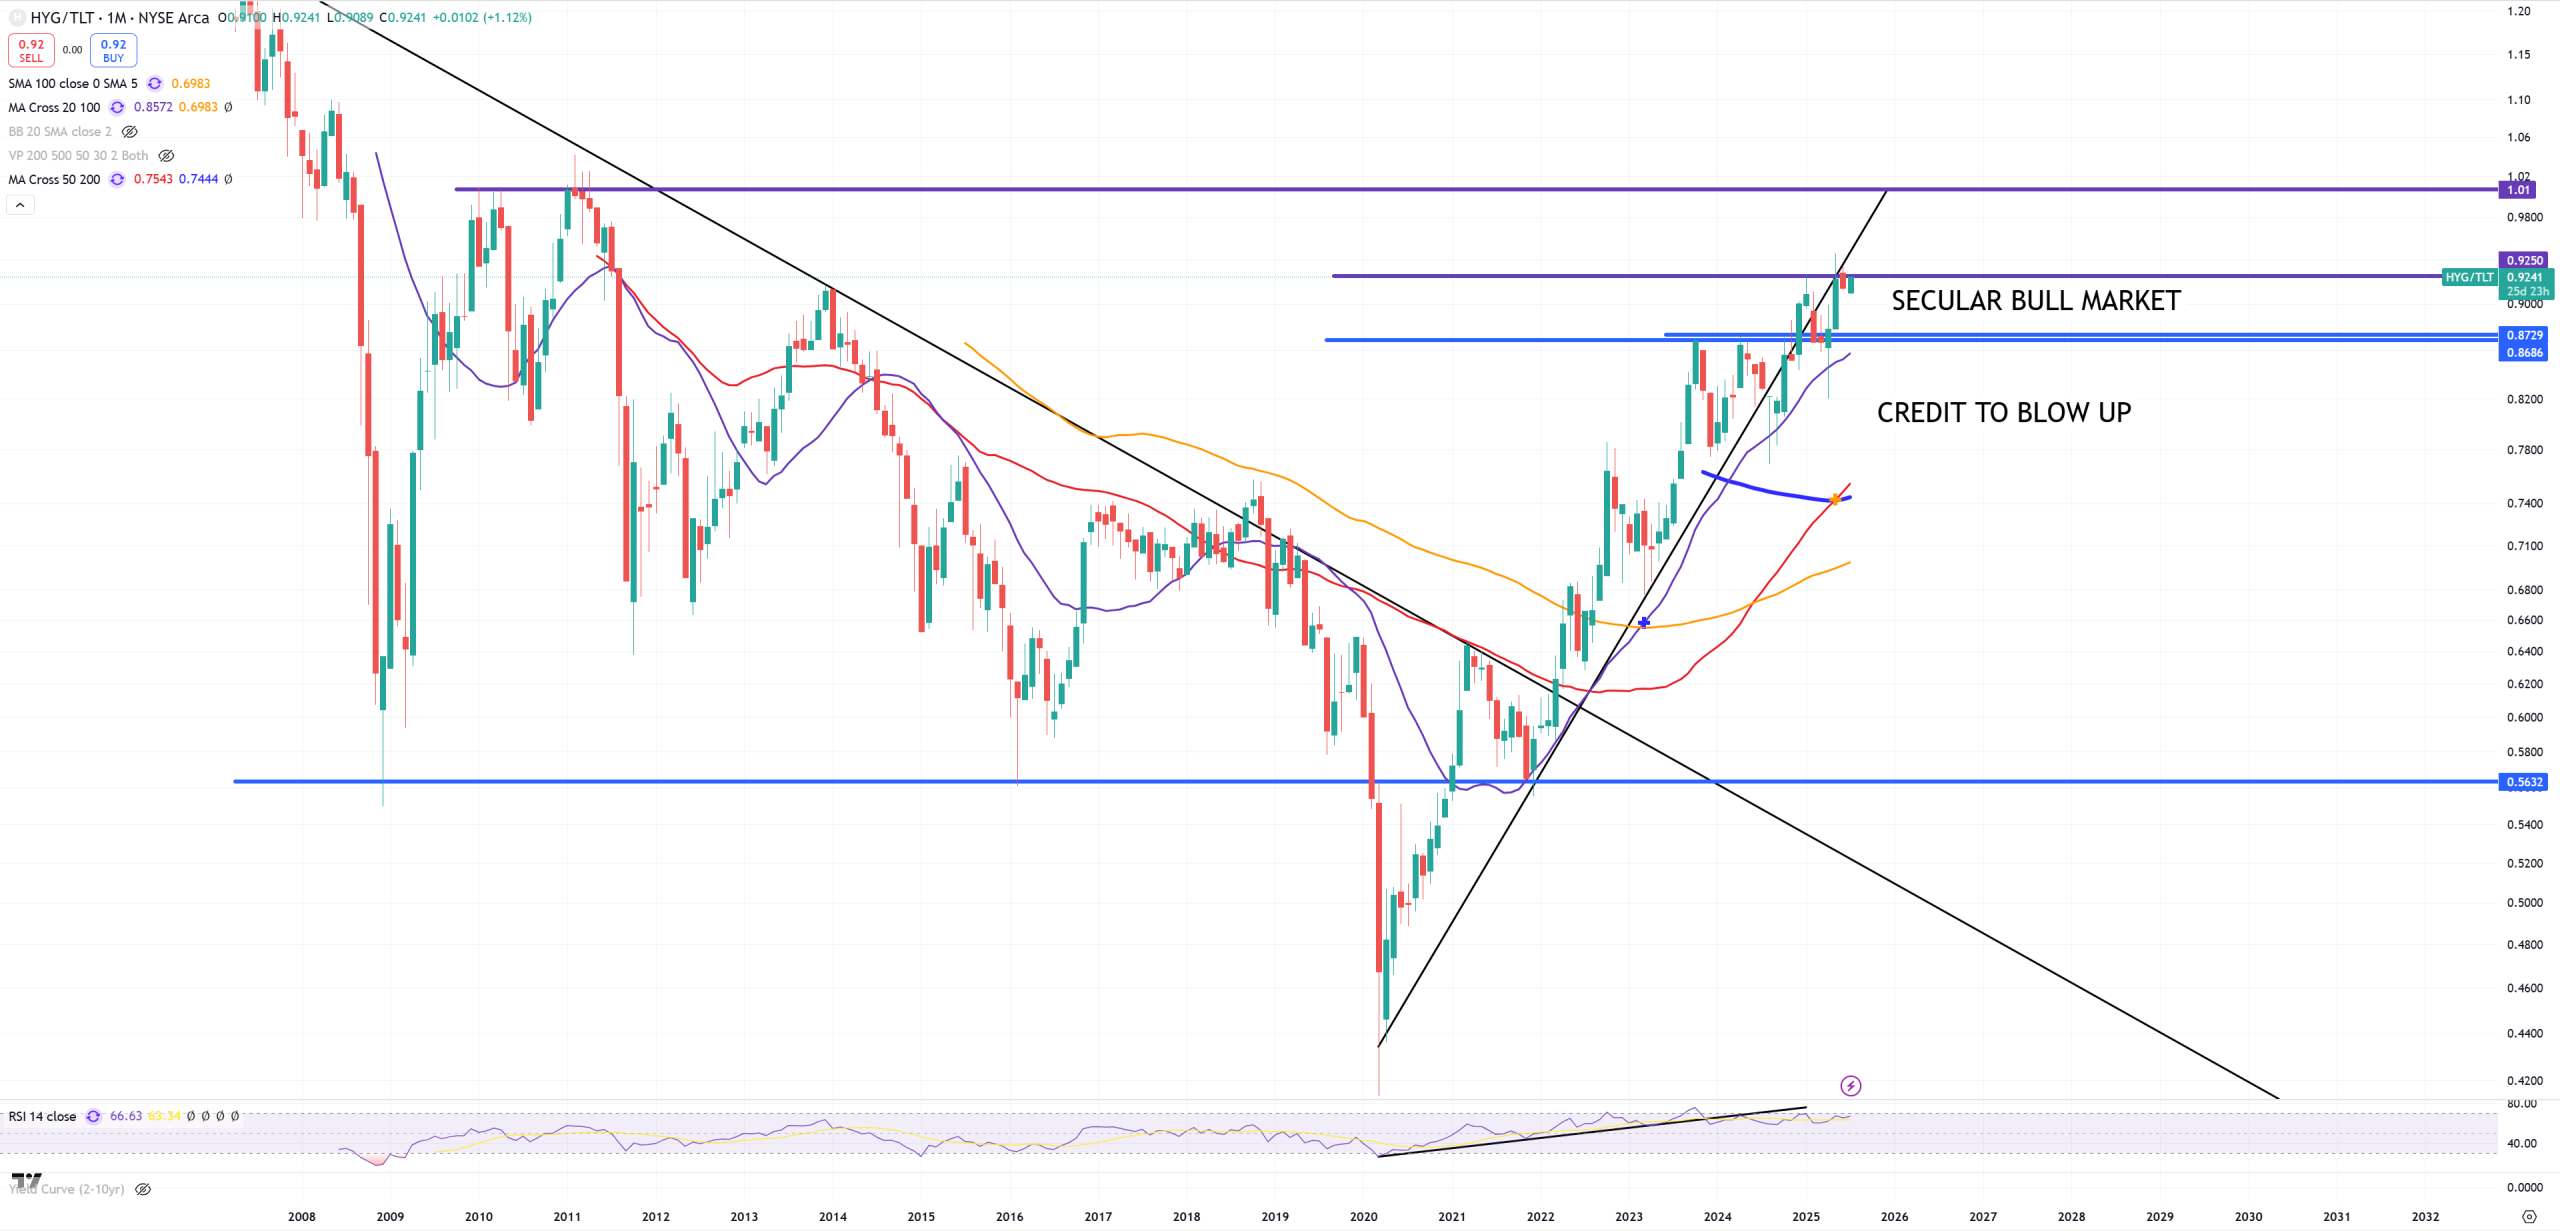
HYG/TLT – bull continue once this ratio goes up.
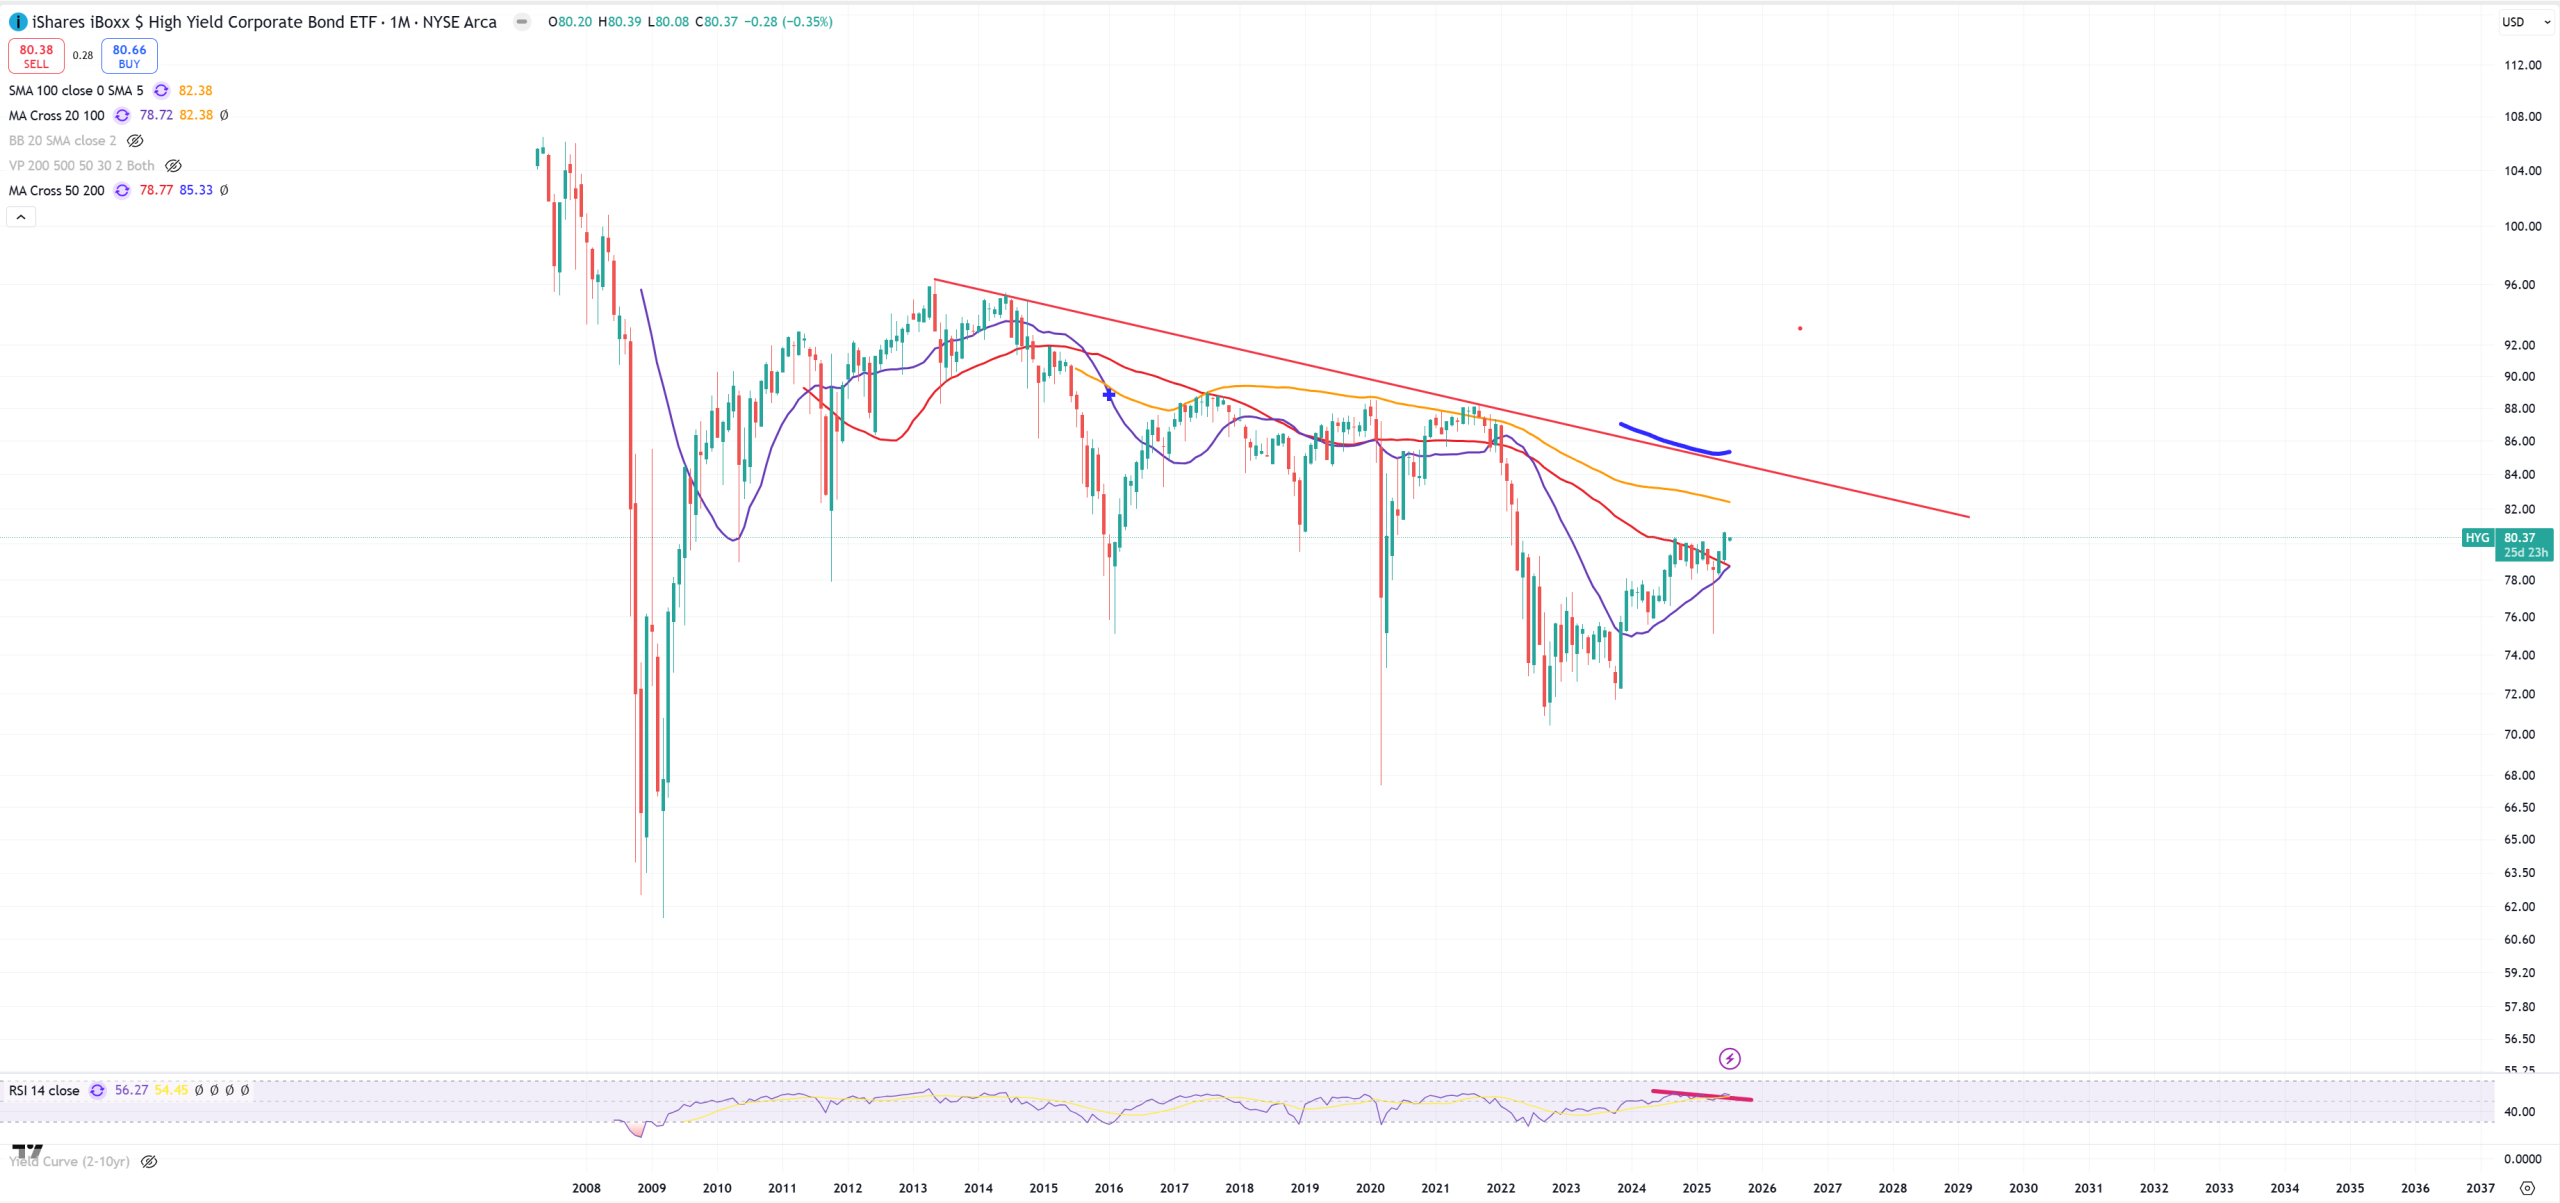
HYG – it broke (M)MA50 telling us credit still gets massive BID.
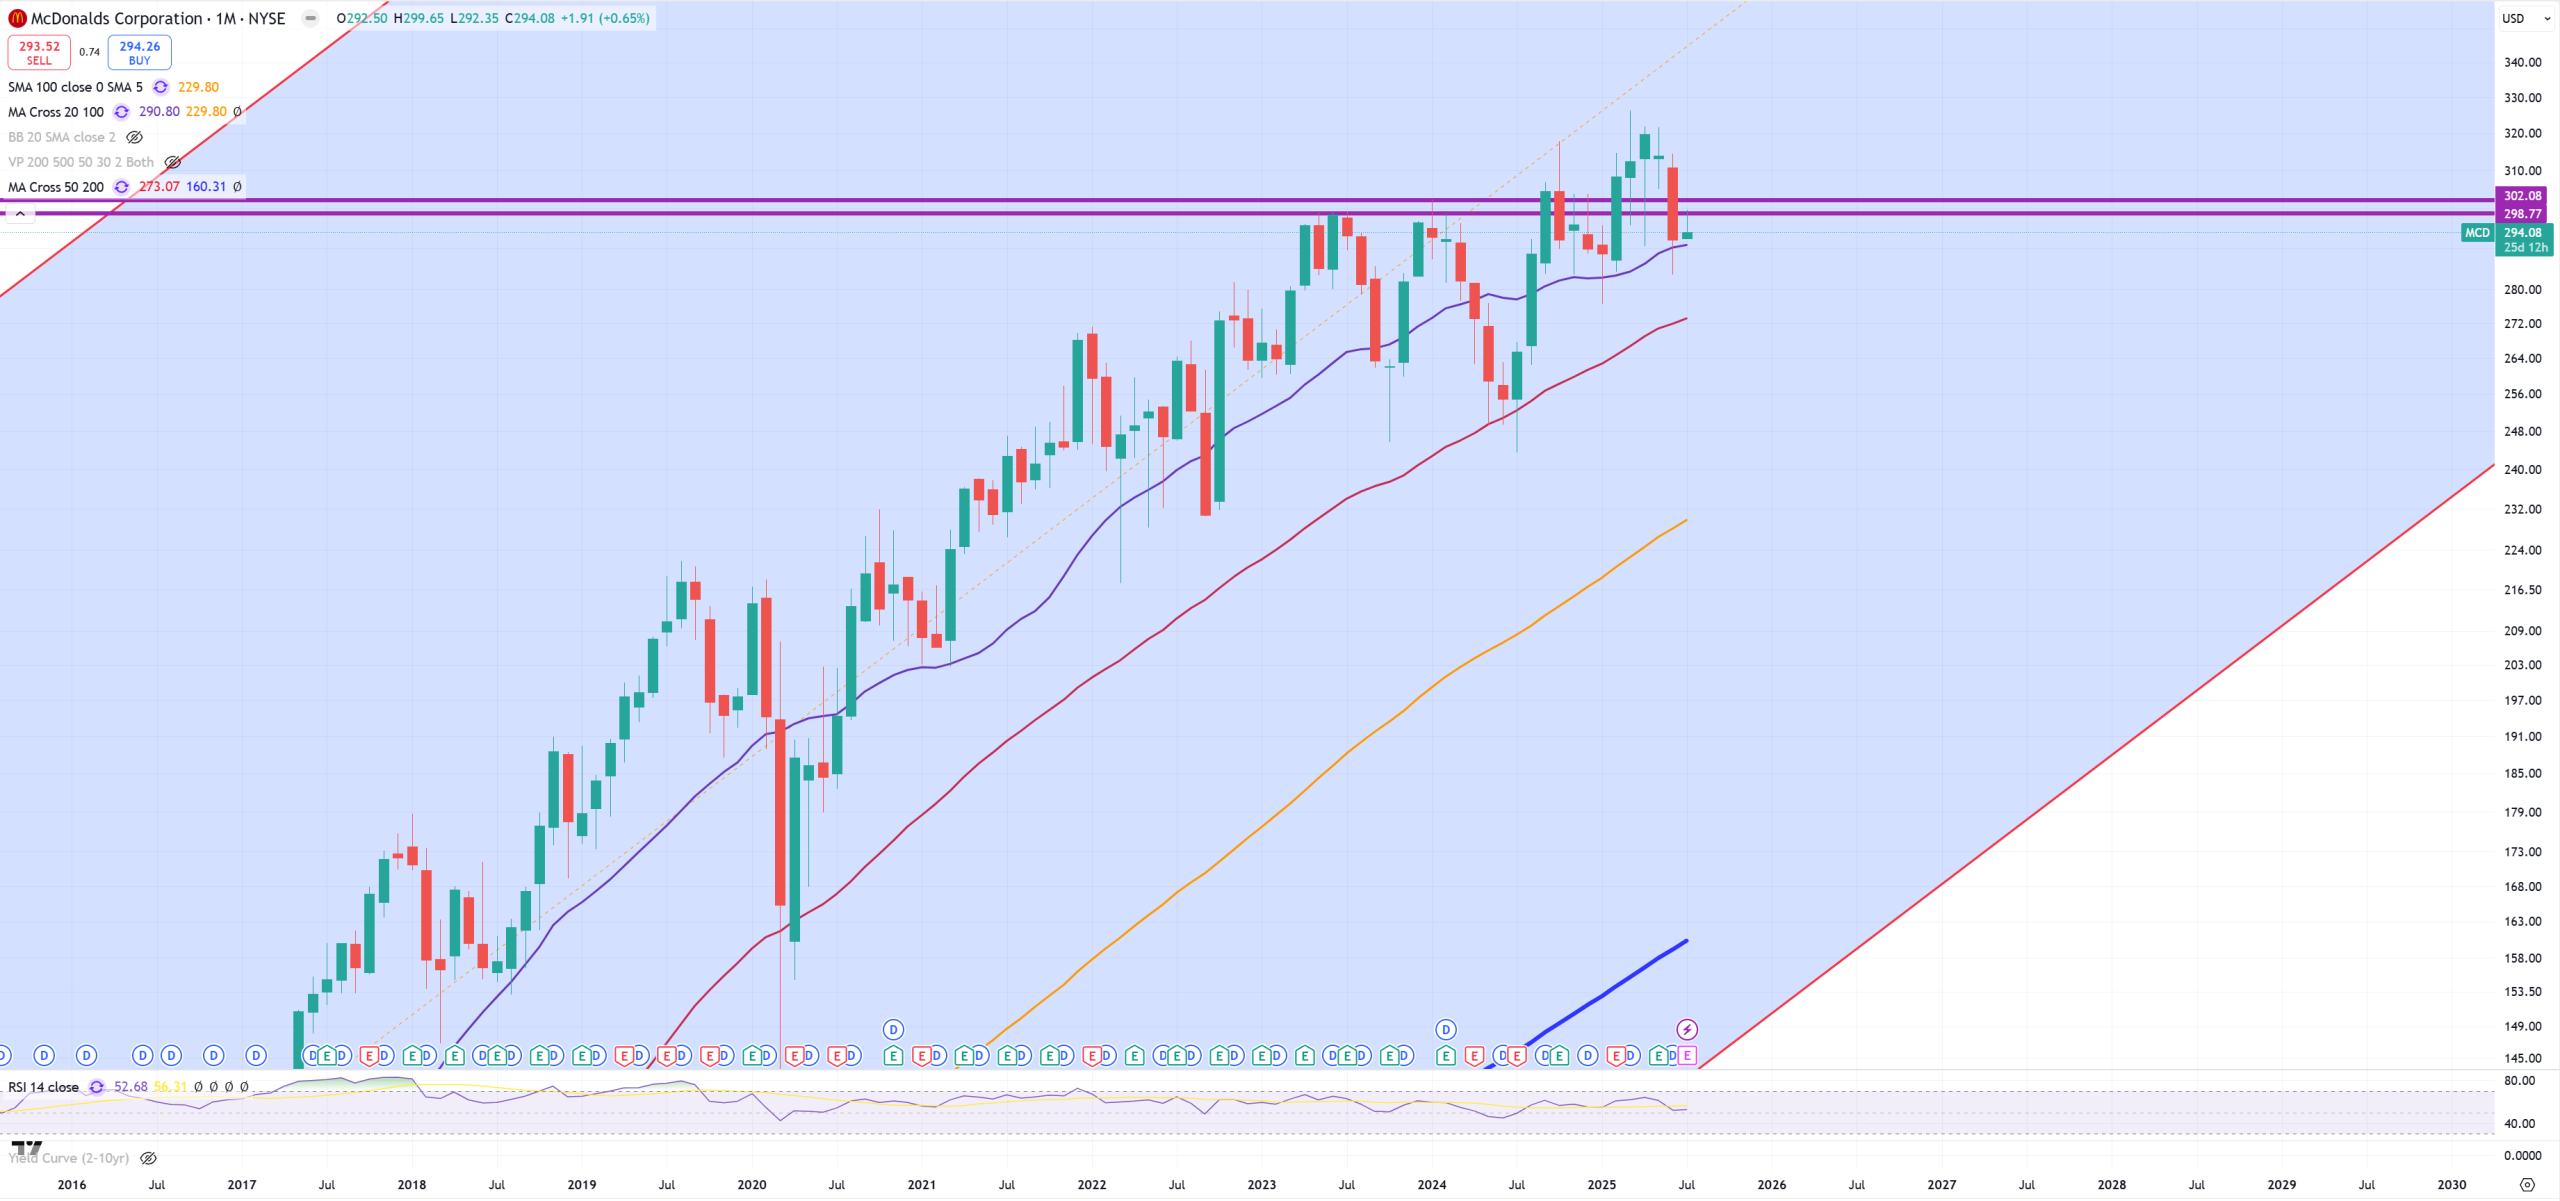
MCD – small fake and back
NKE – it fights hard not to get 2020 lows a massive resistance, despite super weak results market decided to defend this level so far. It’s like middle class is coming back to work soon with massive salaries.
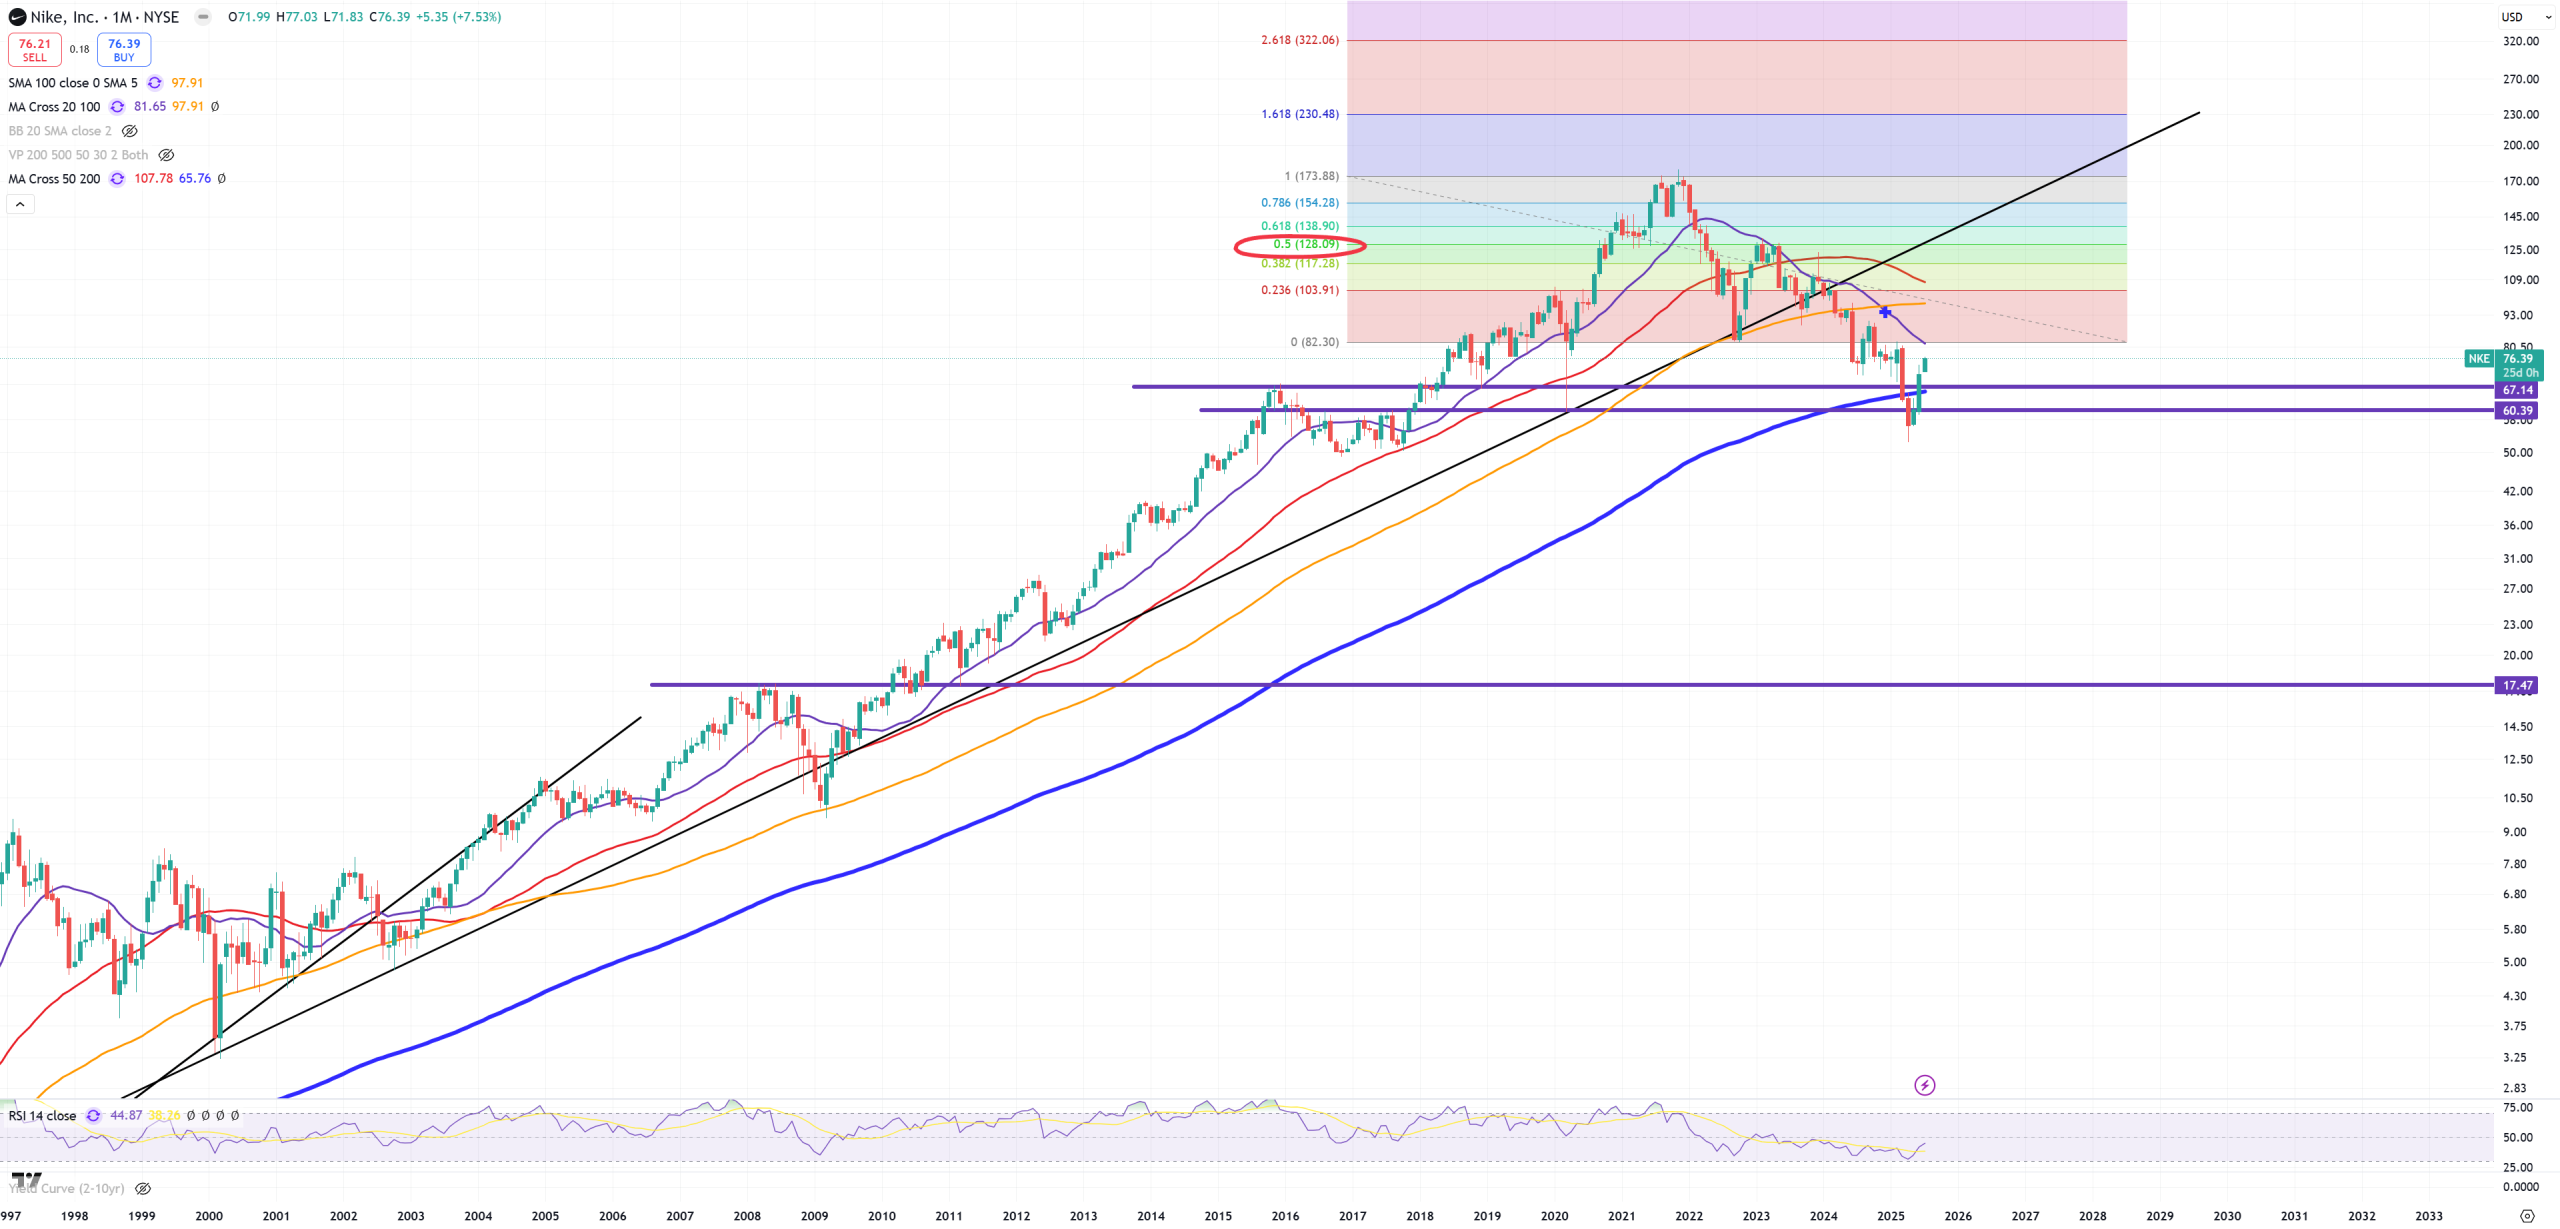
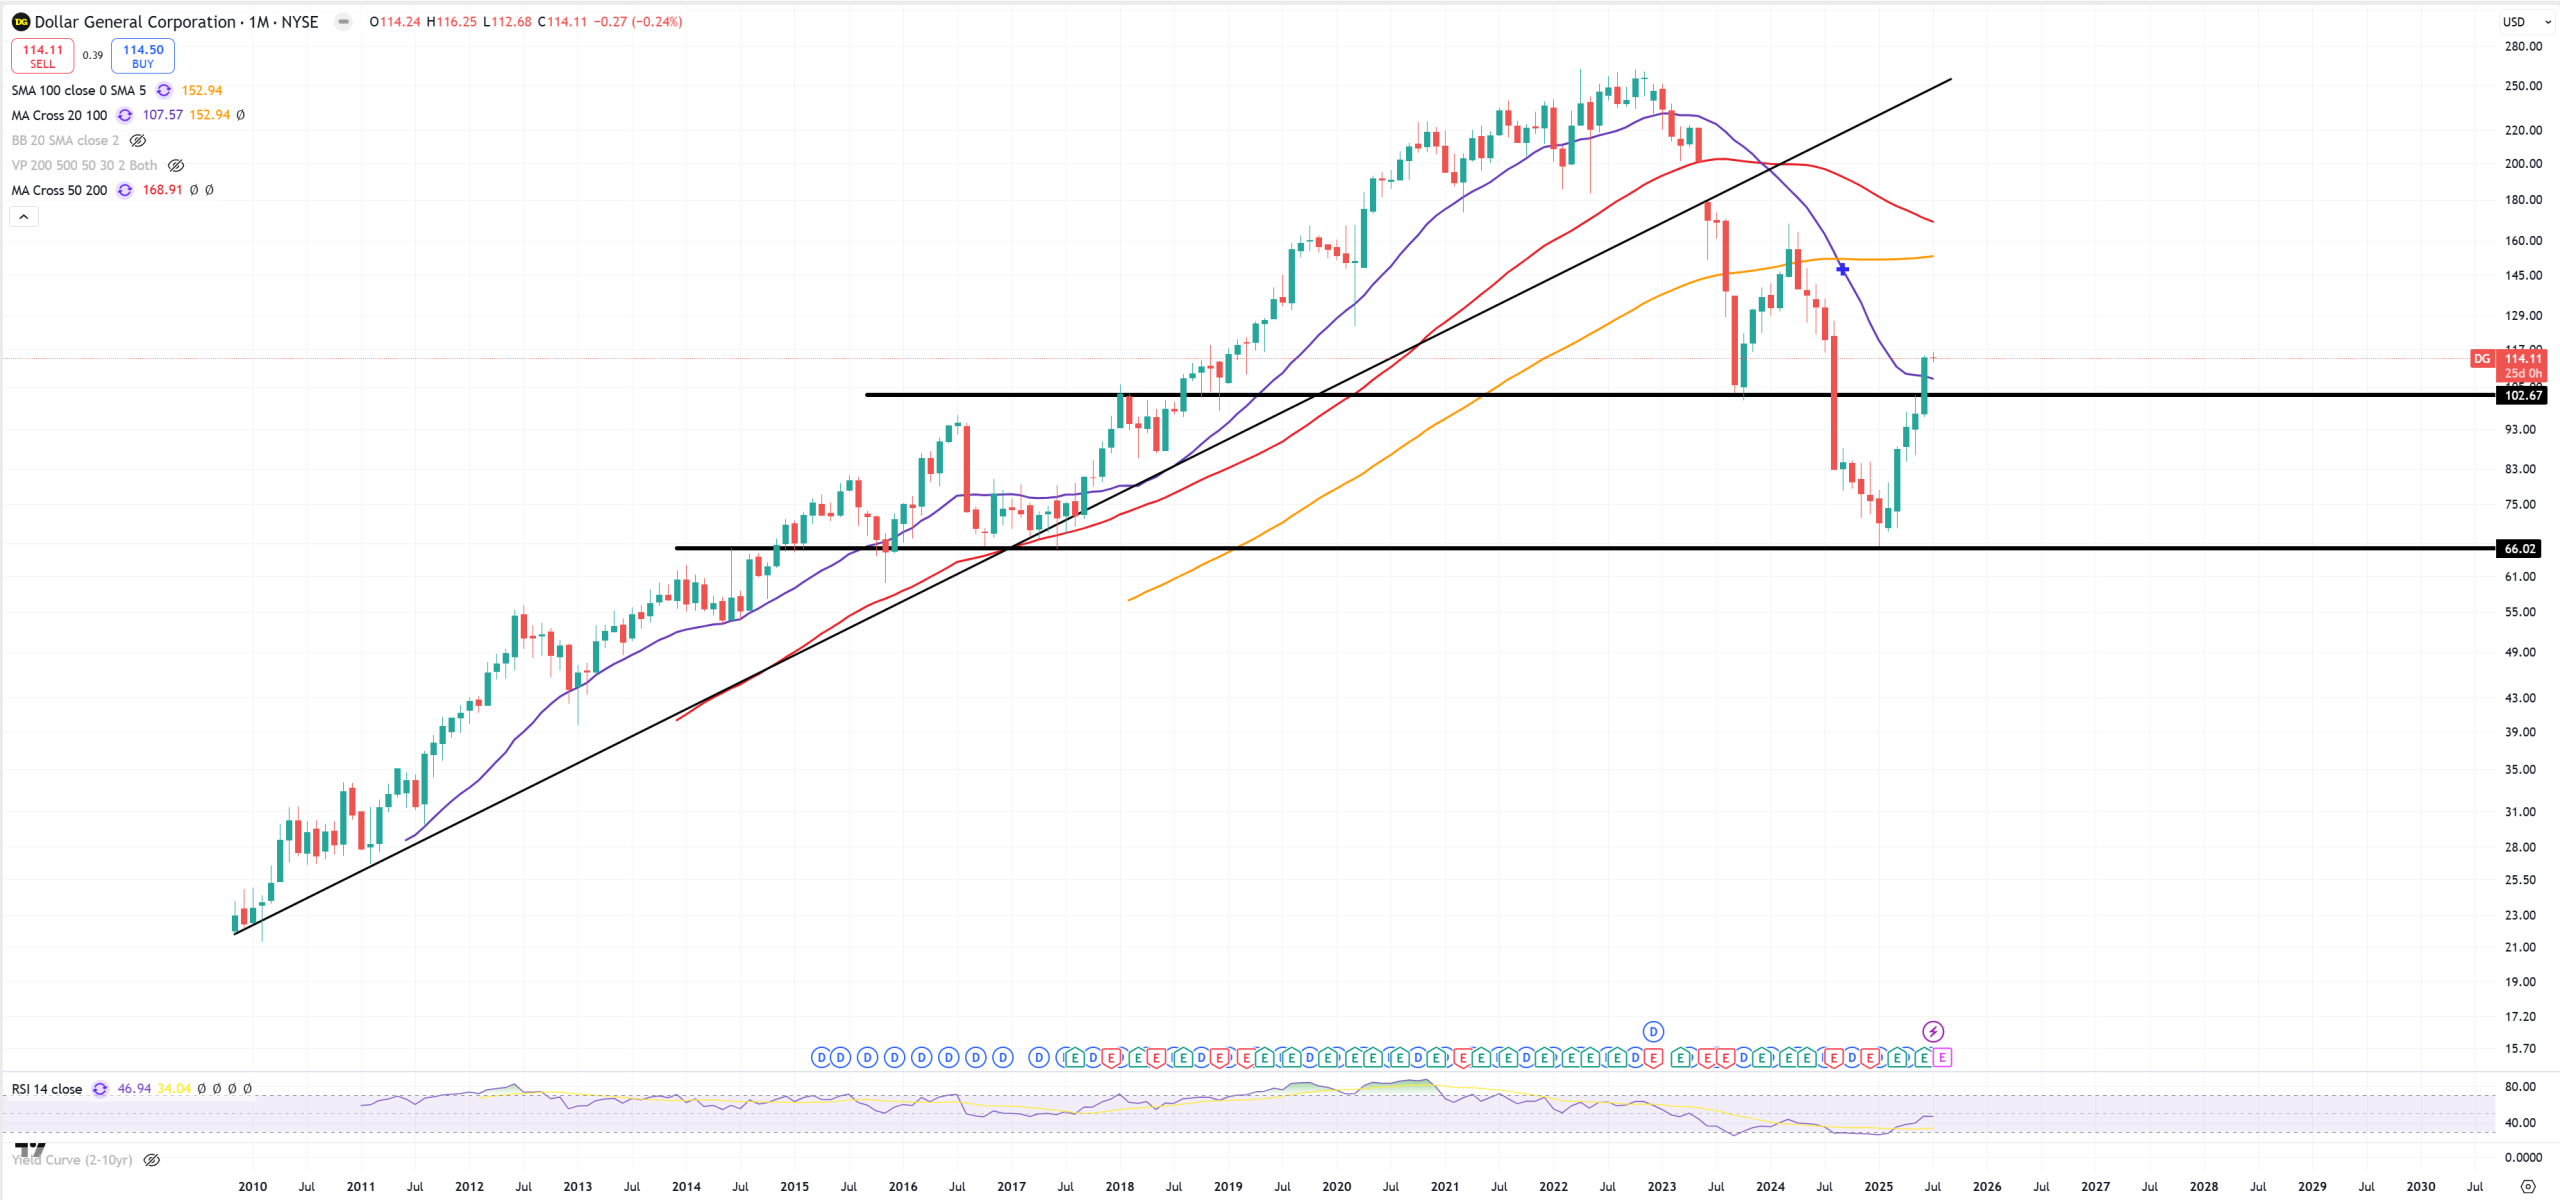
DG – Dolar General – looks a bit the same as NKE – squeezing higher. So far it jumped from 2017 level. Let’s see what the future is going to bring here
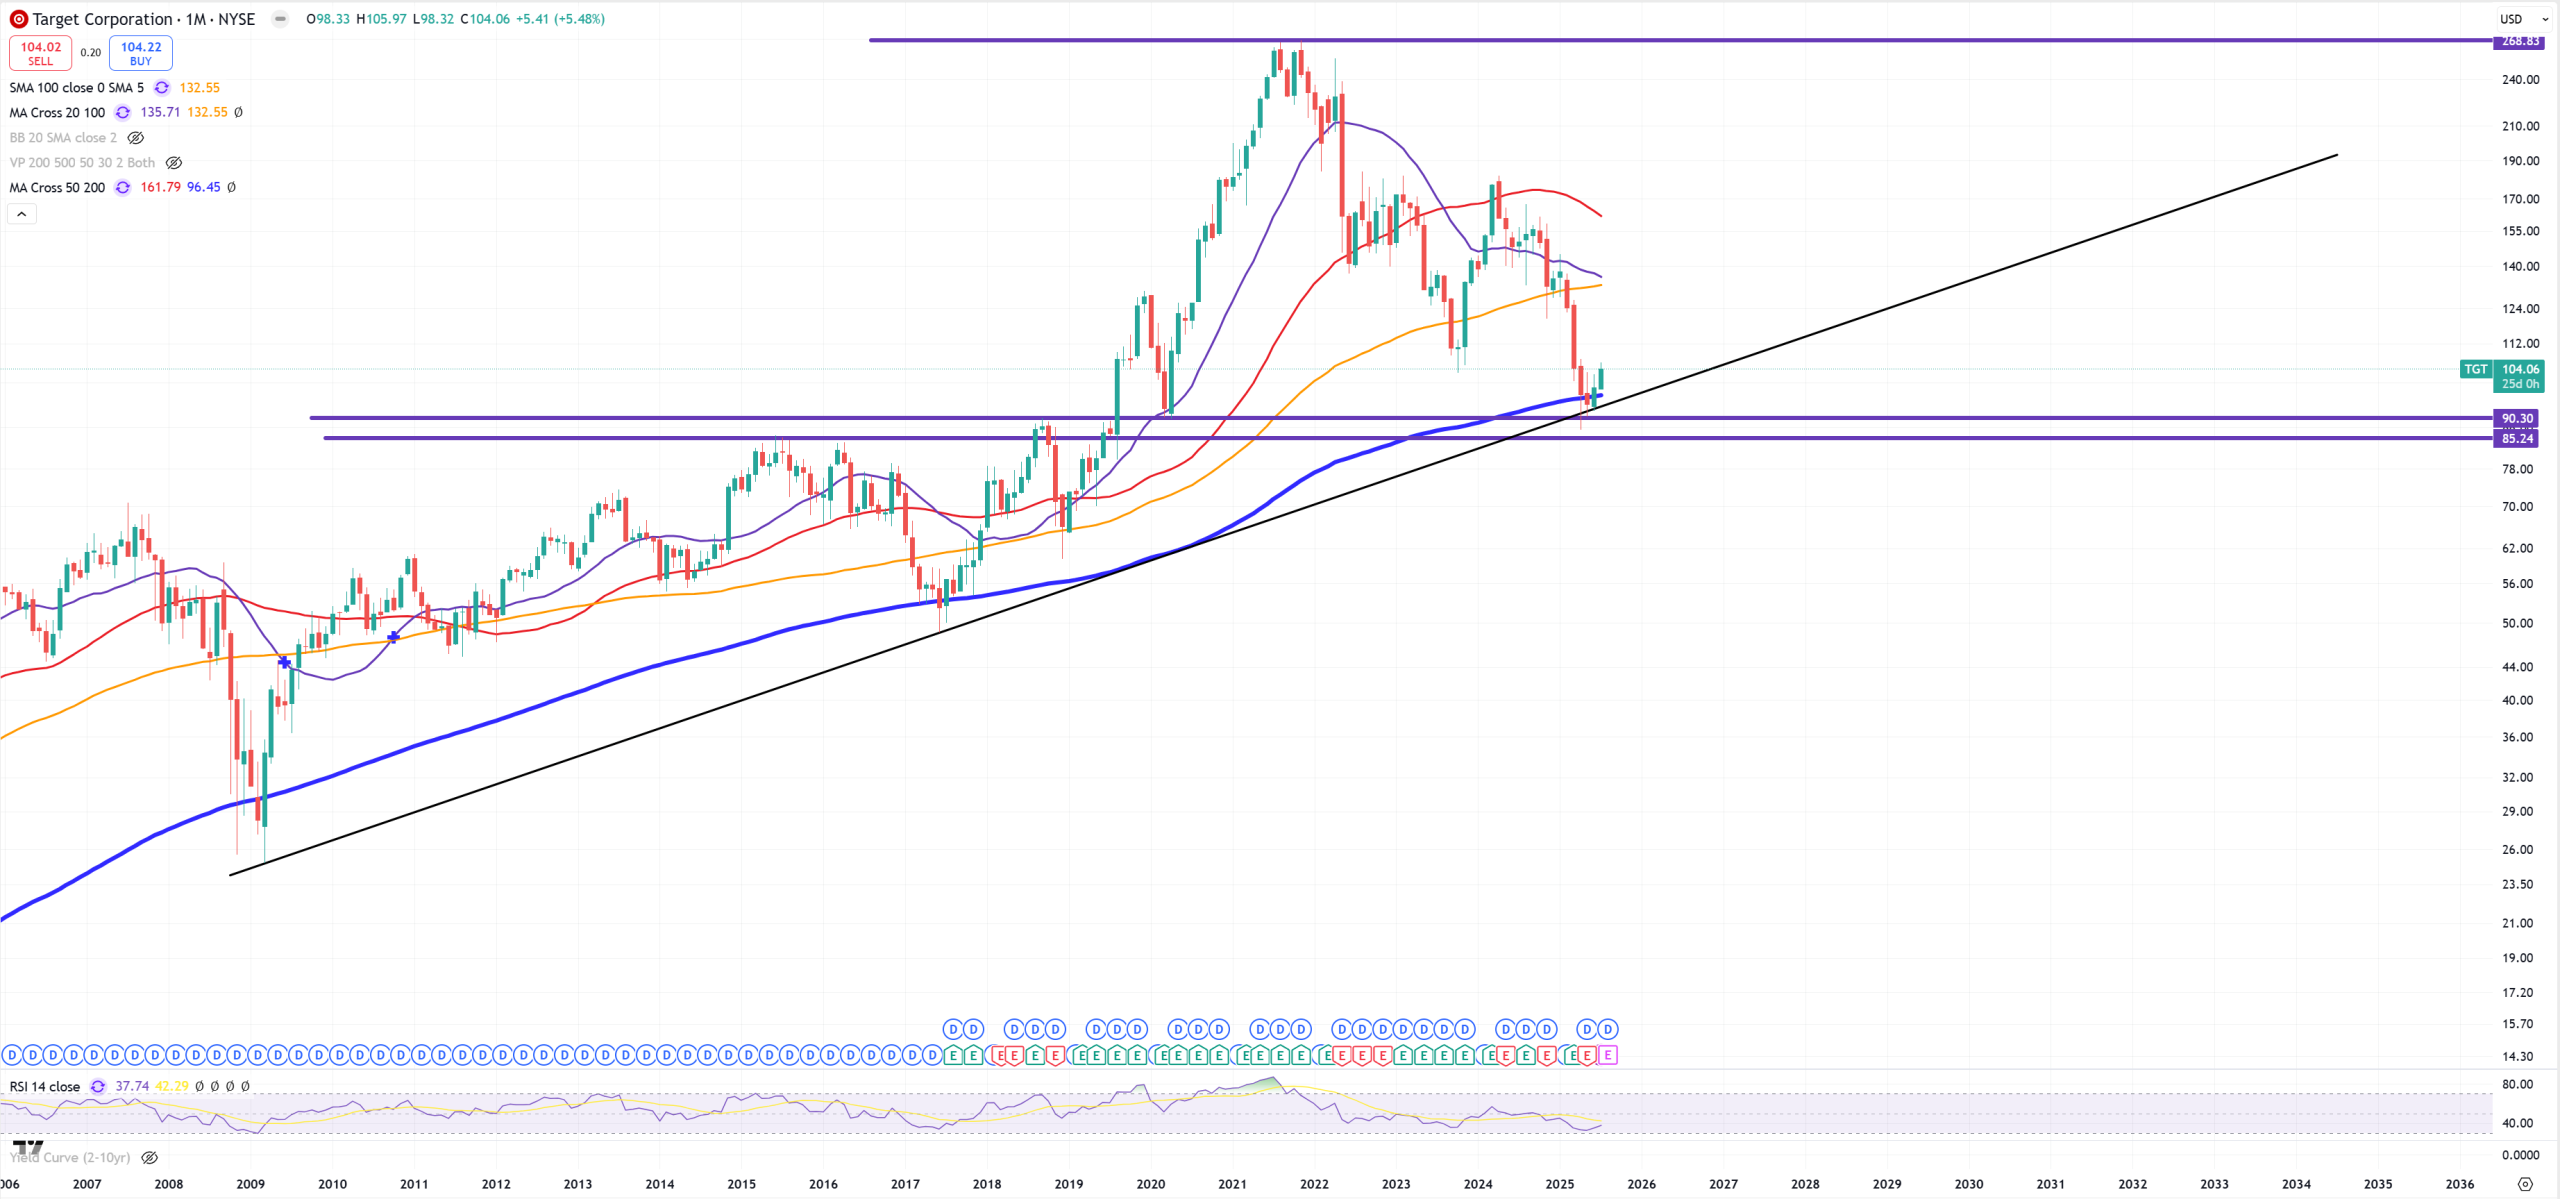
TGT – Target – looks as bad as DG & NKE – that’s the same league, but technical bounce is needed here
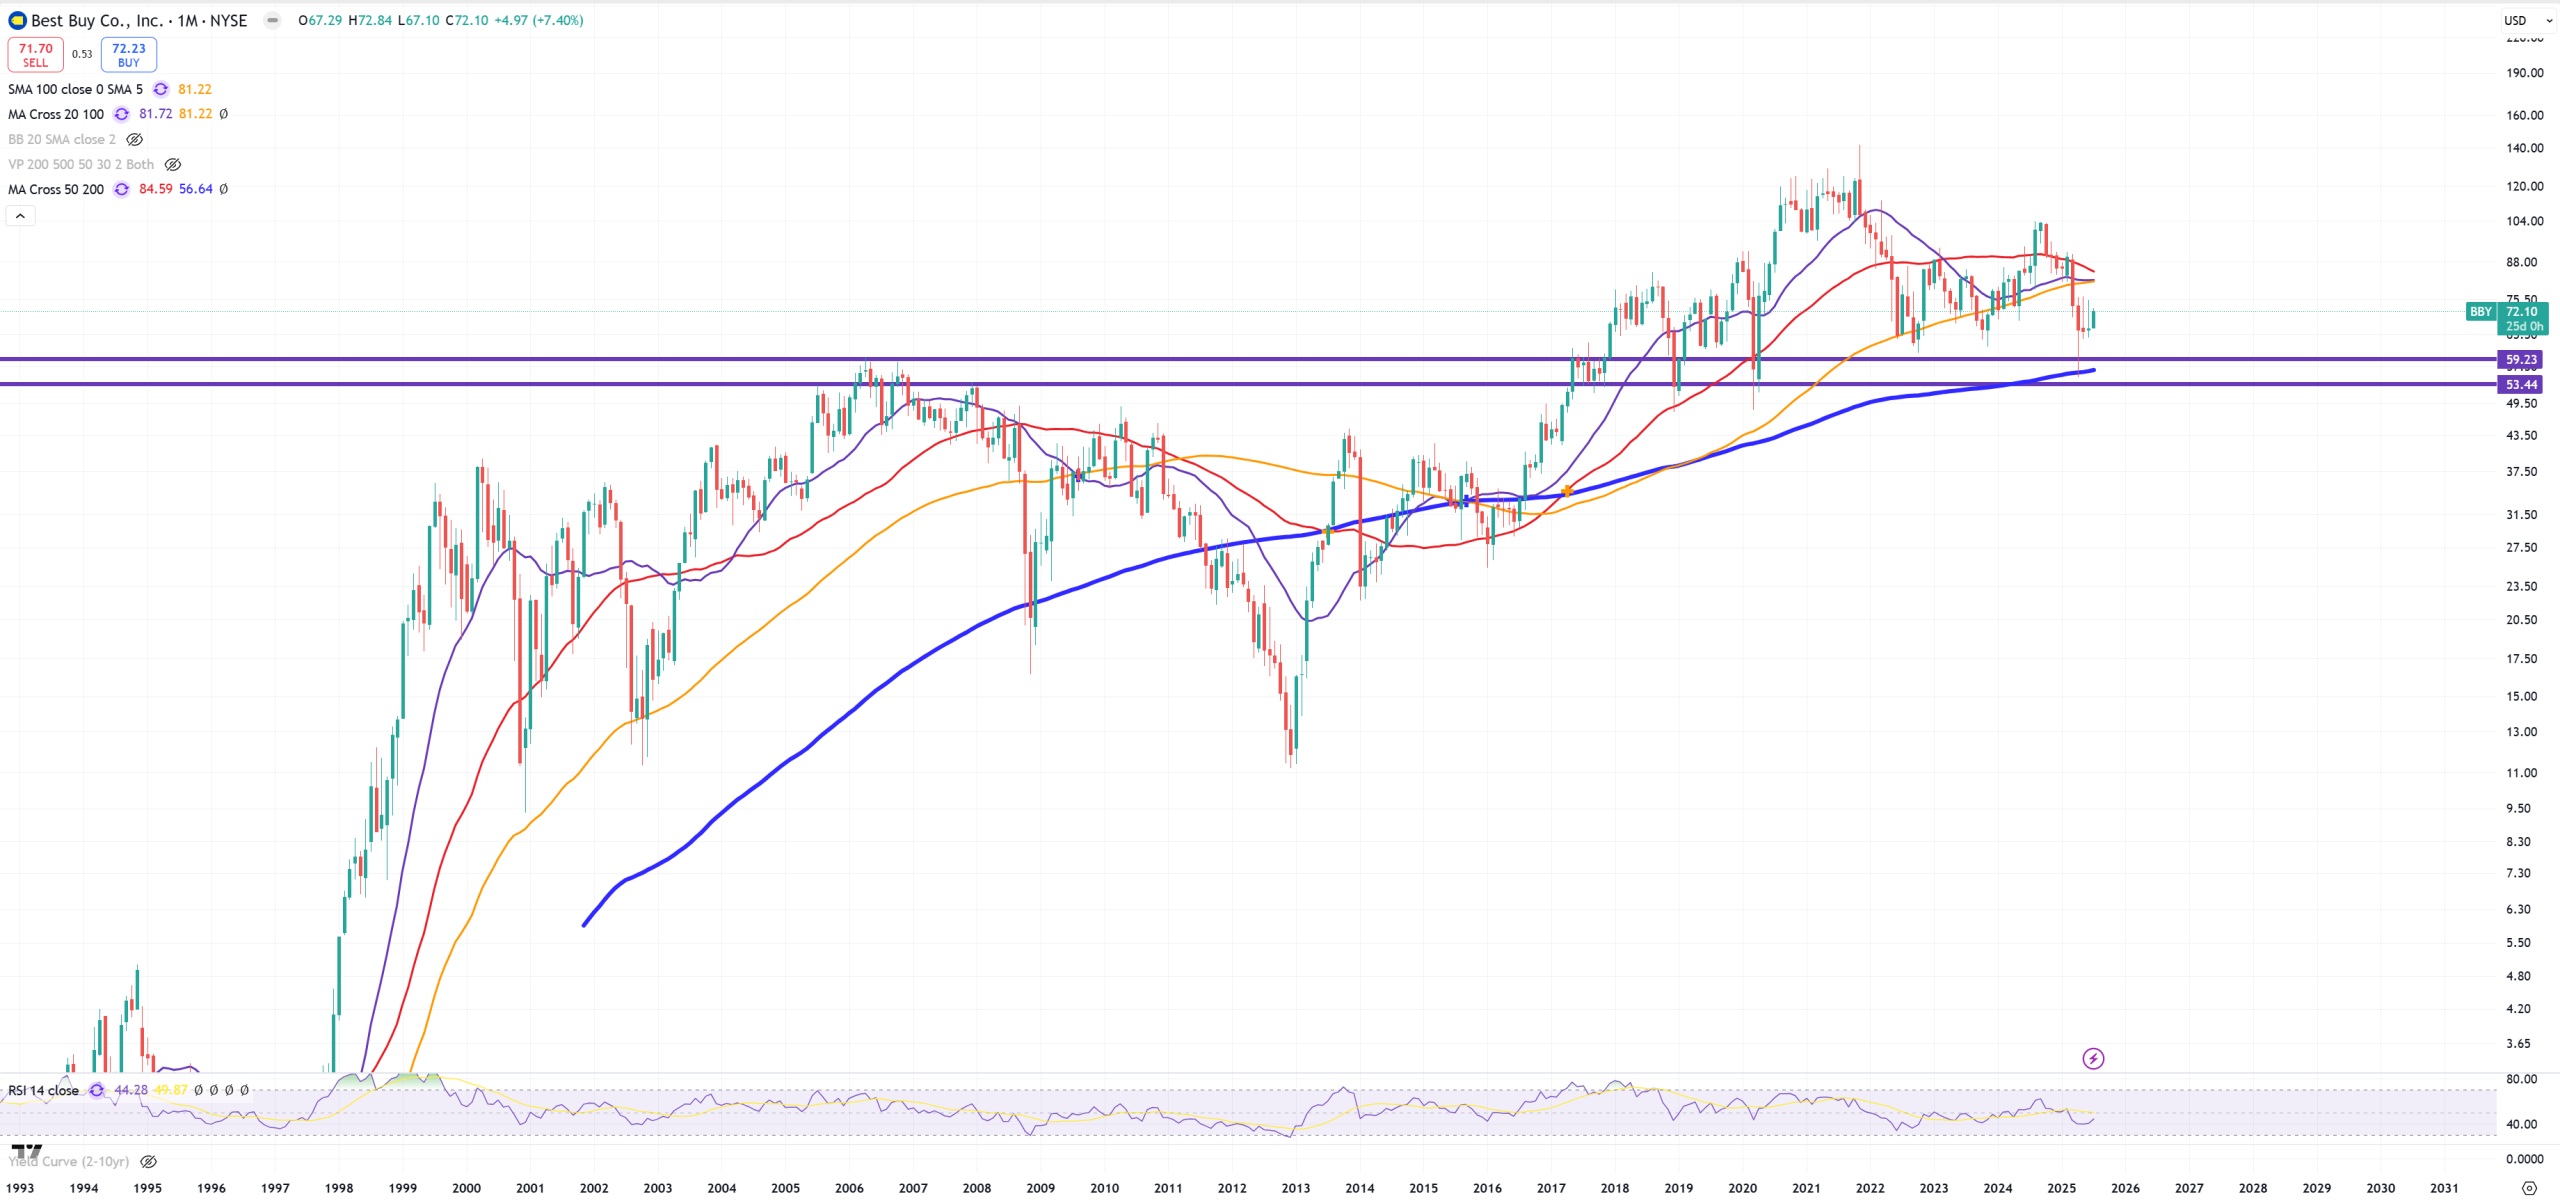
BBY – BestBuy – 2006-2007 key support for today. In 2018 we broke finally this resistance and now it’s support. Dead money since 2018
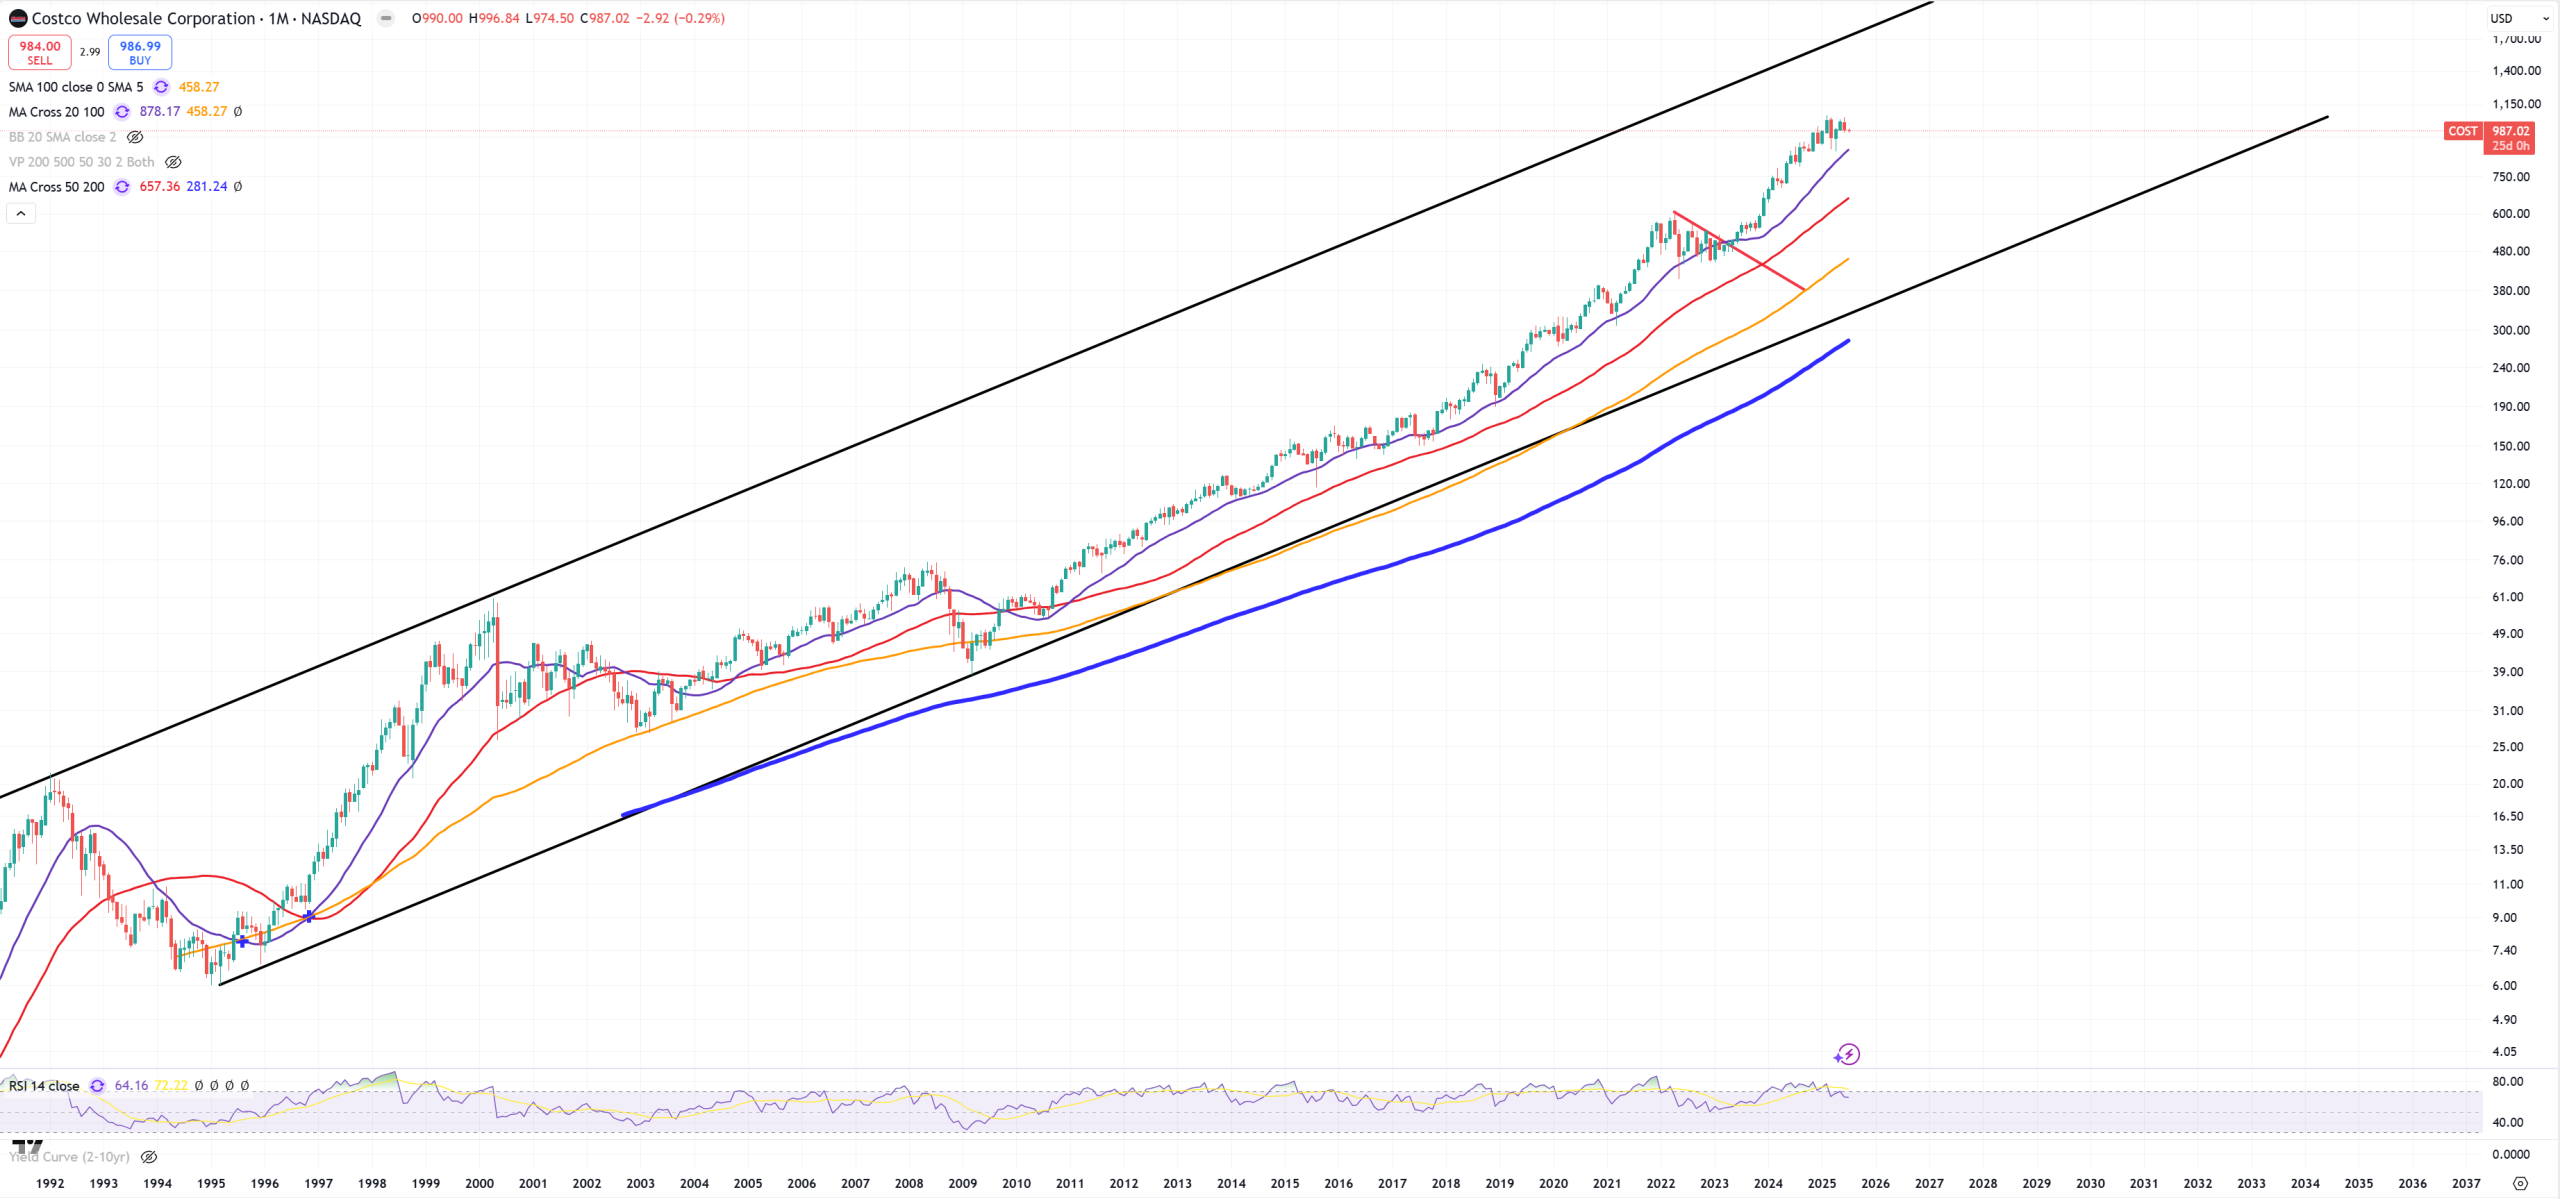
COST – I’ll use Costco chart (Wallmart is more or less similar), as inflation rages it has key task to make sure bottom 90% will be wiped out. They can cut spending on new iPhones, but they can’t stop spending on groceries and toiler paper so far. If COST chart will start to reverse we’ll have a big problem.
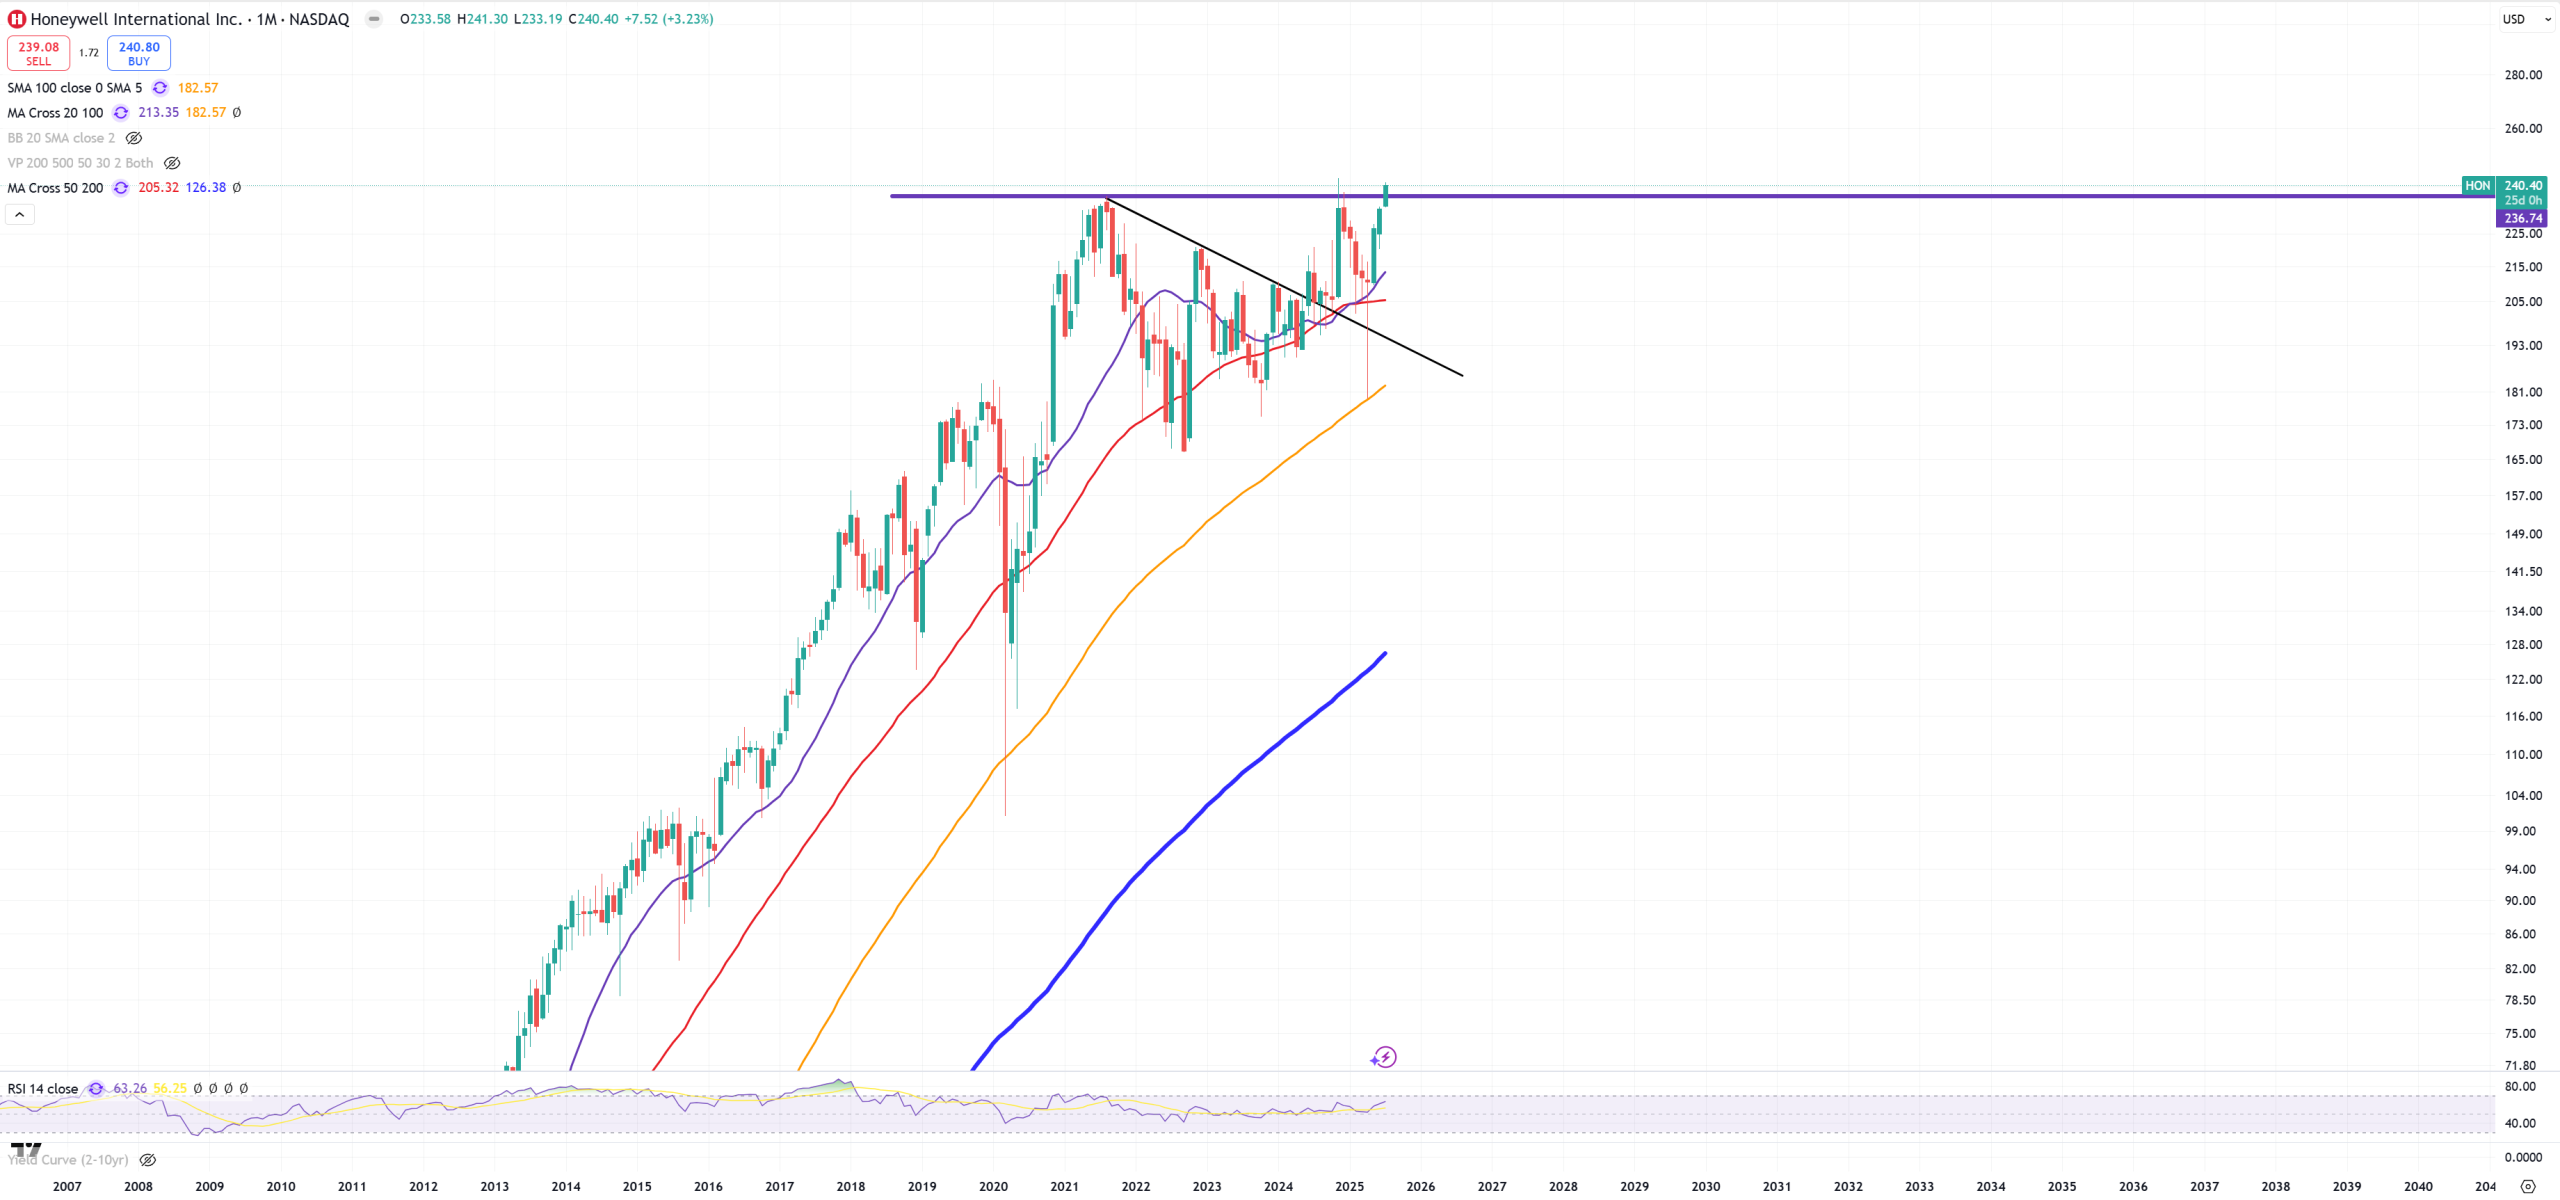
HON – let’s see what’s going to happen around this level.
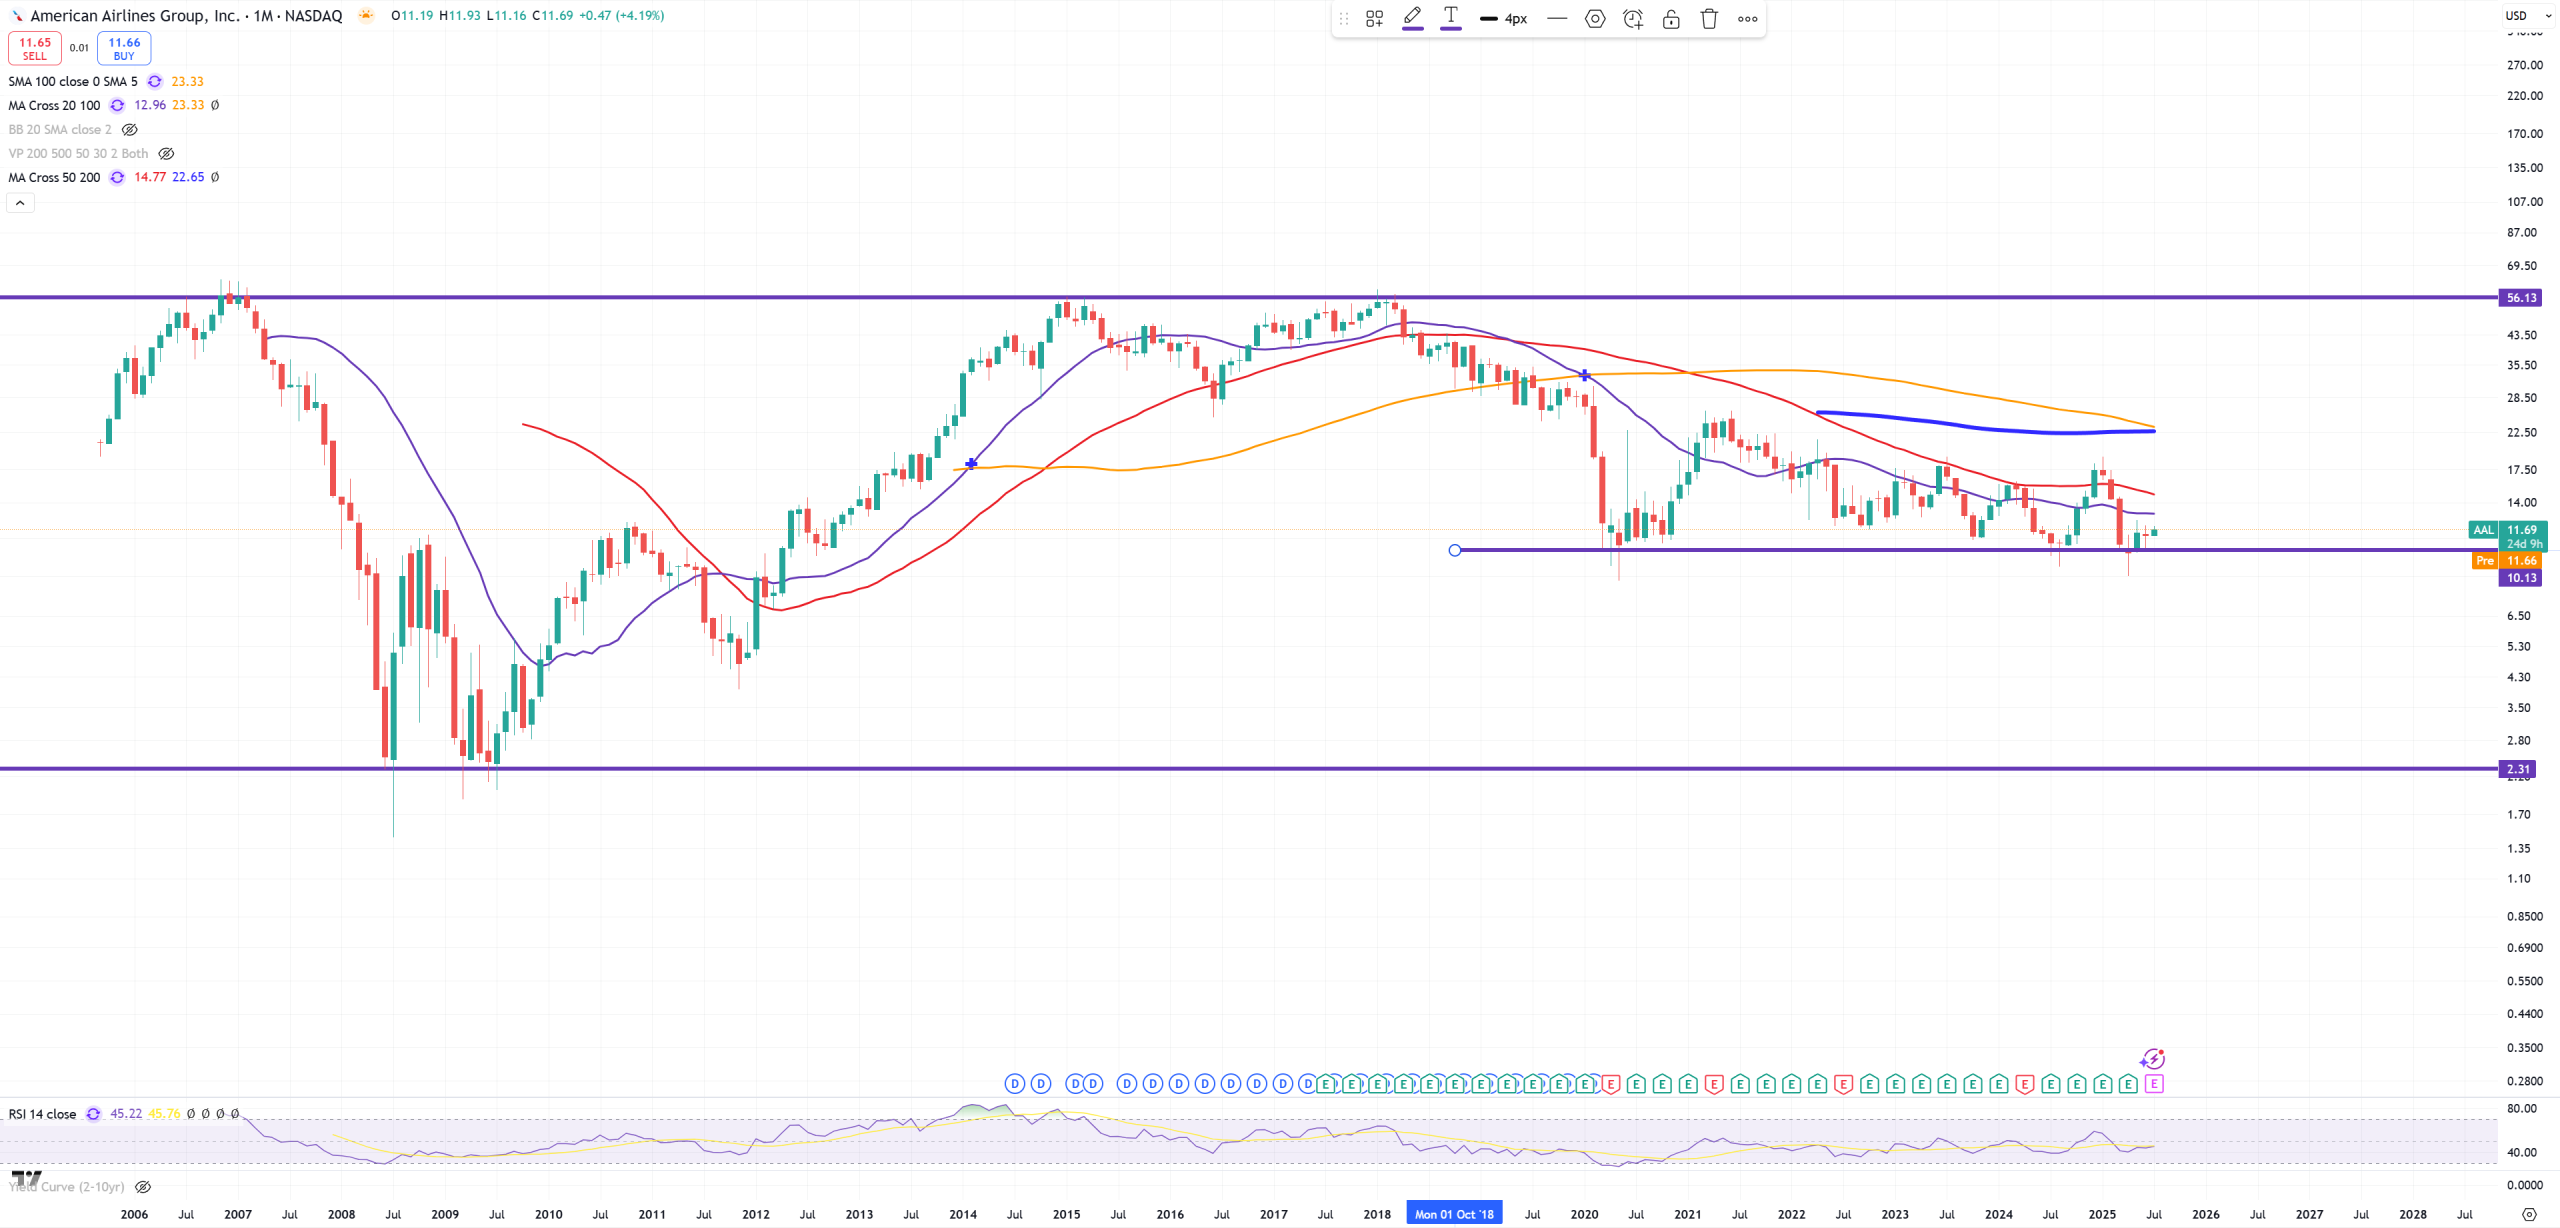
AAL – American Airlines – peaked in 2015 and 2018, fighting to break 2020 support?
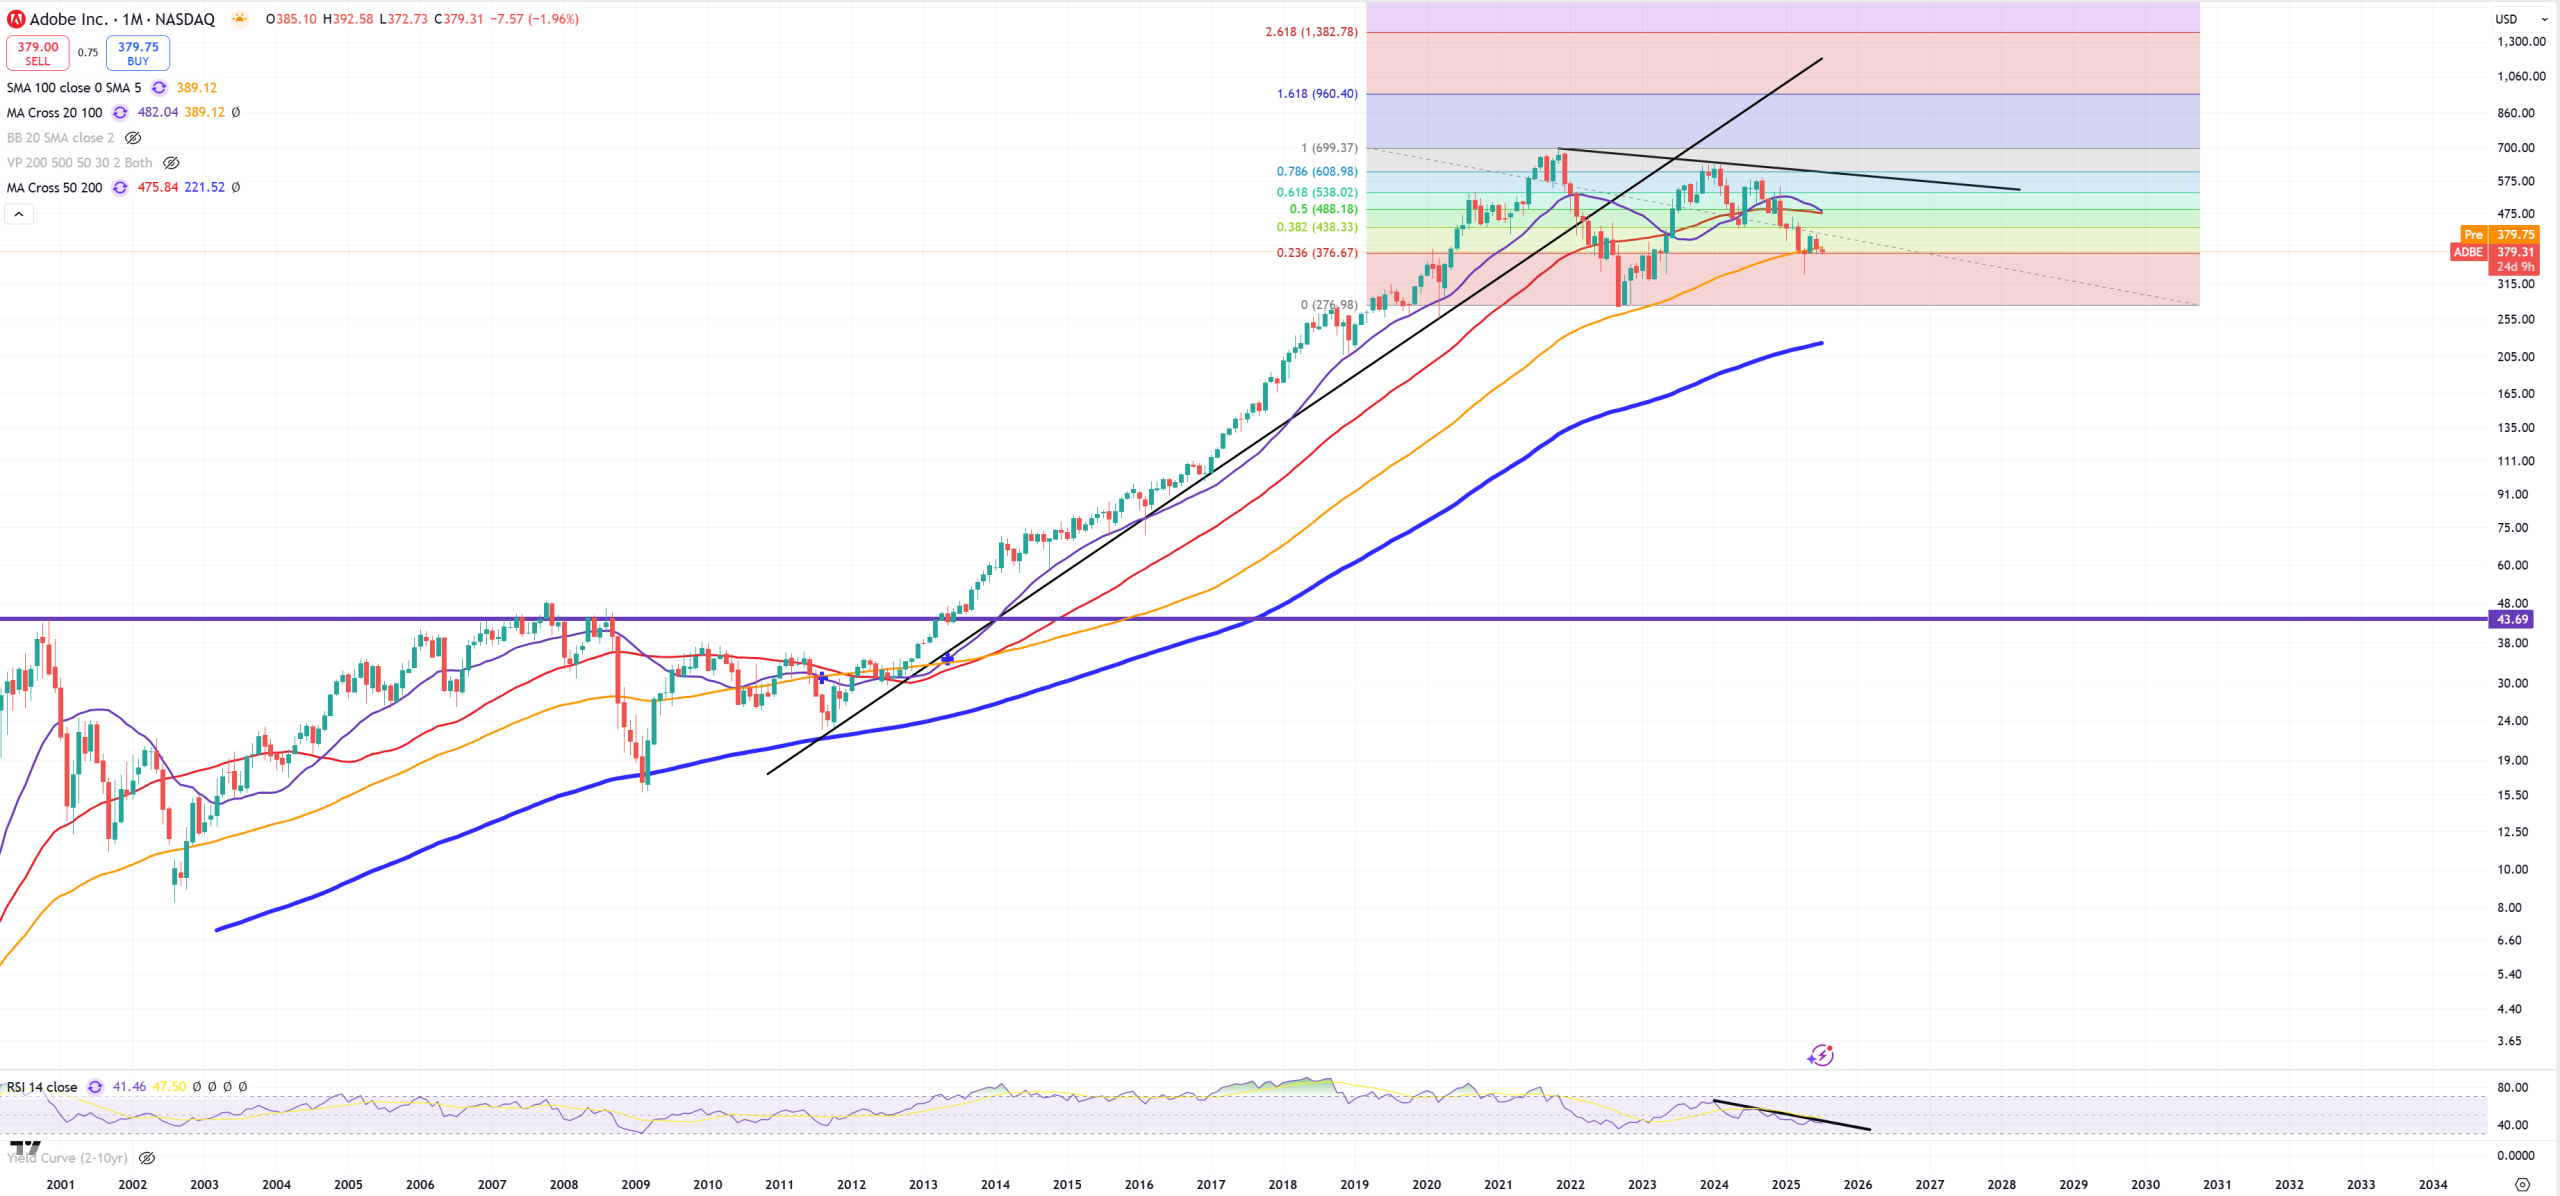
ADBE – Adobe – peak 2021
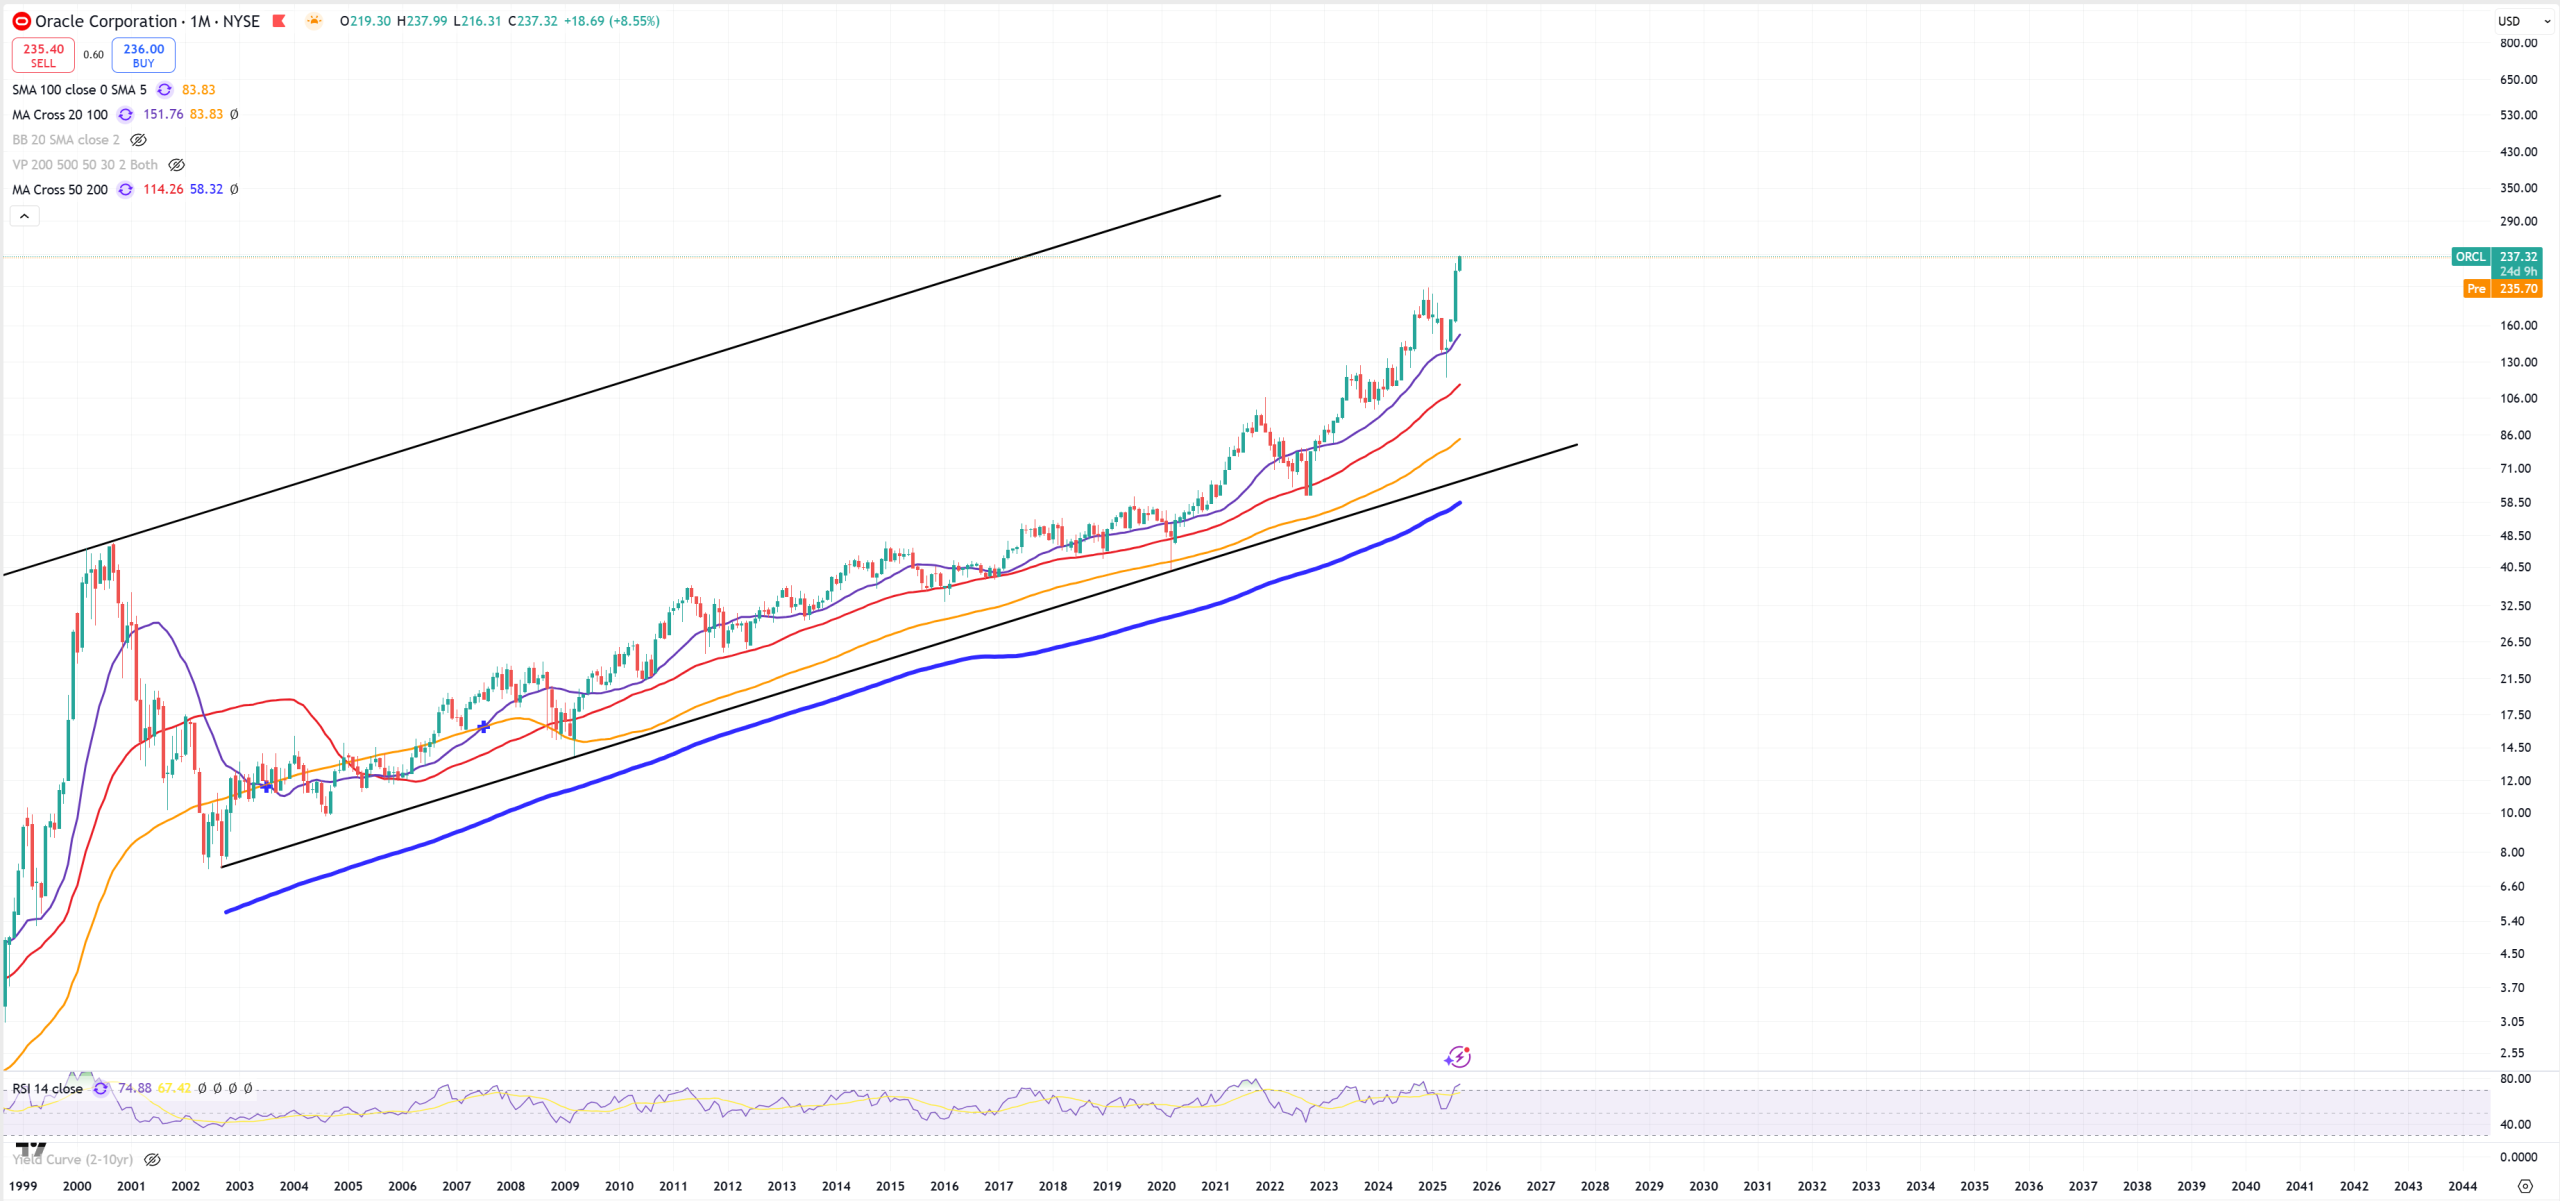
ORCL – Oracle – this stock is correleted with AI mania, in 3 months it’s up more than 100%
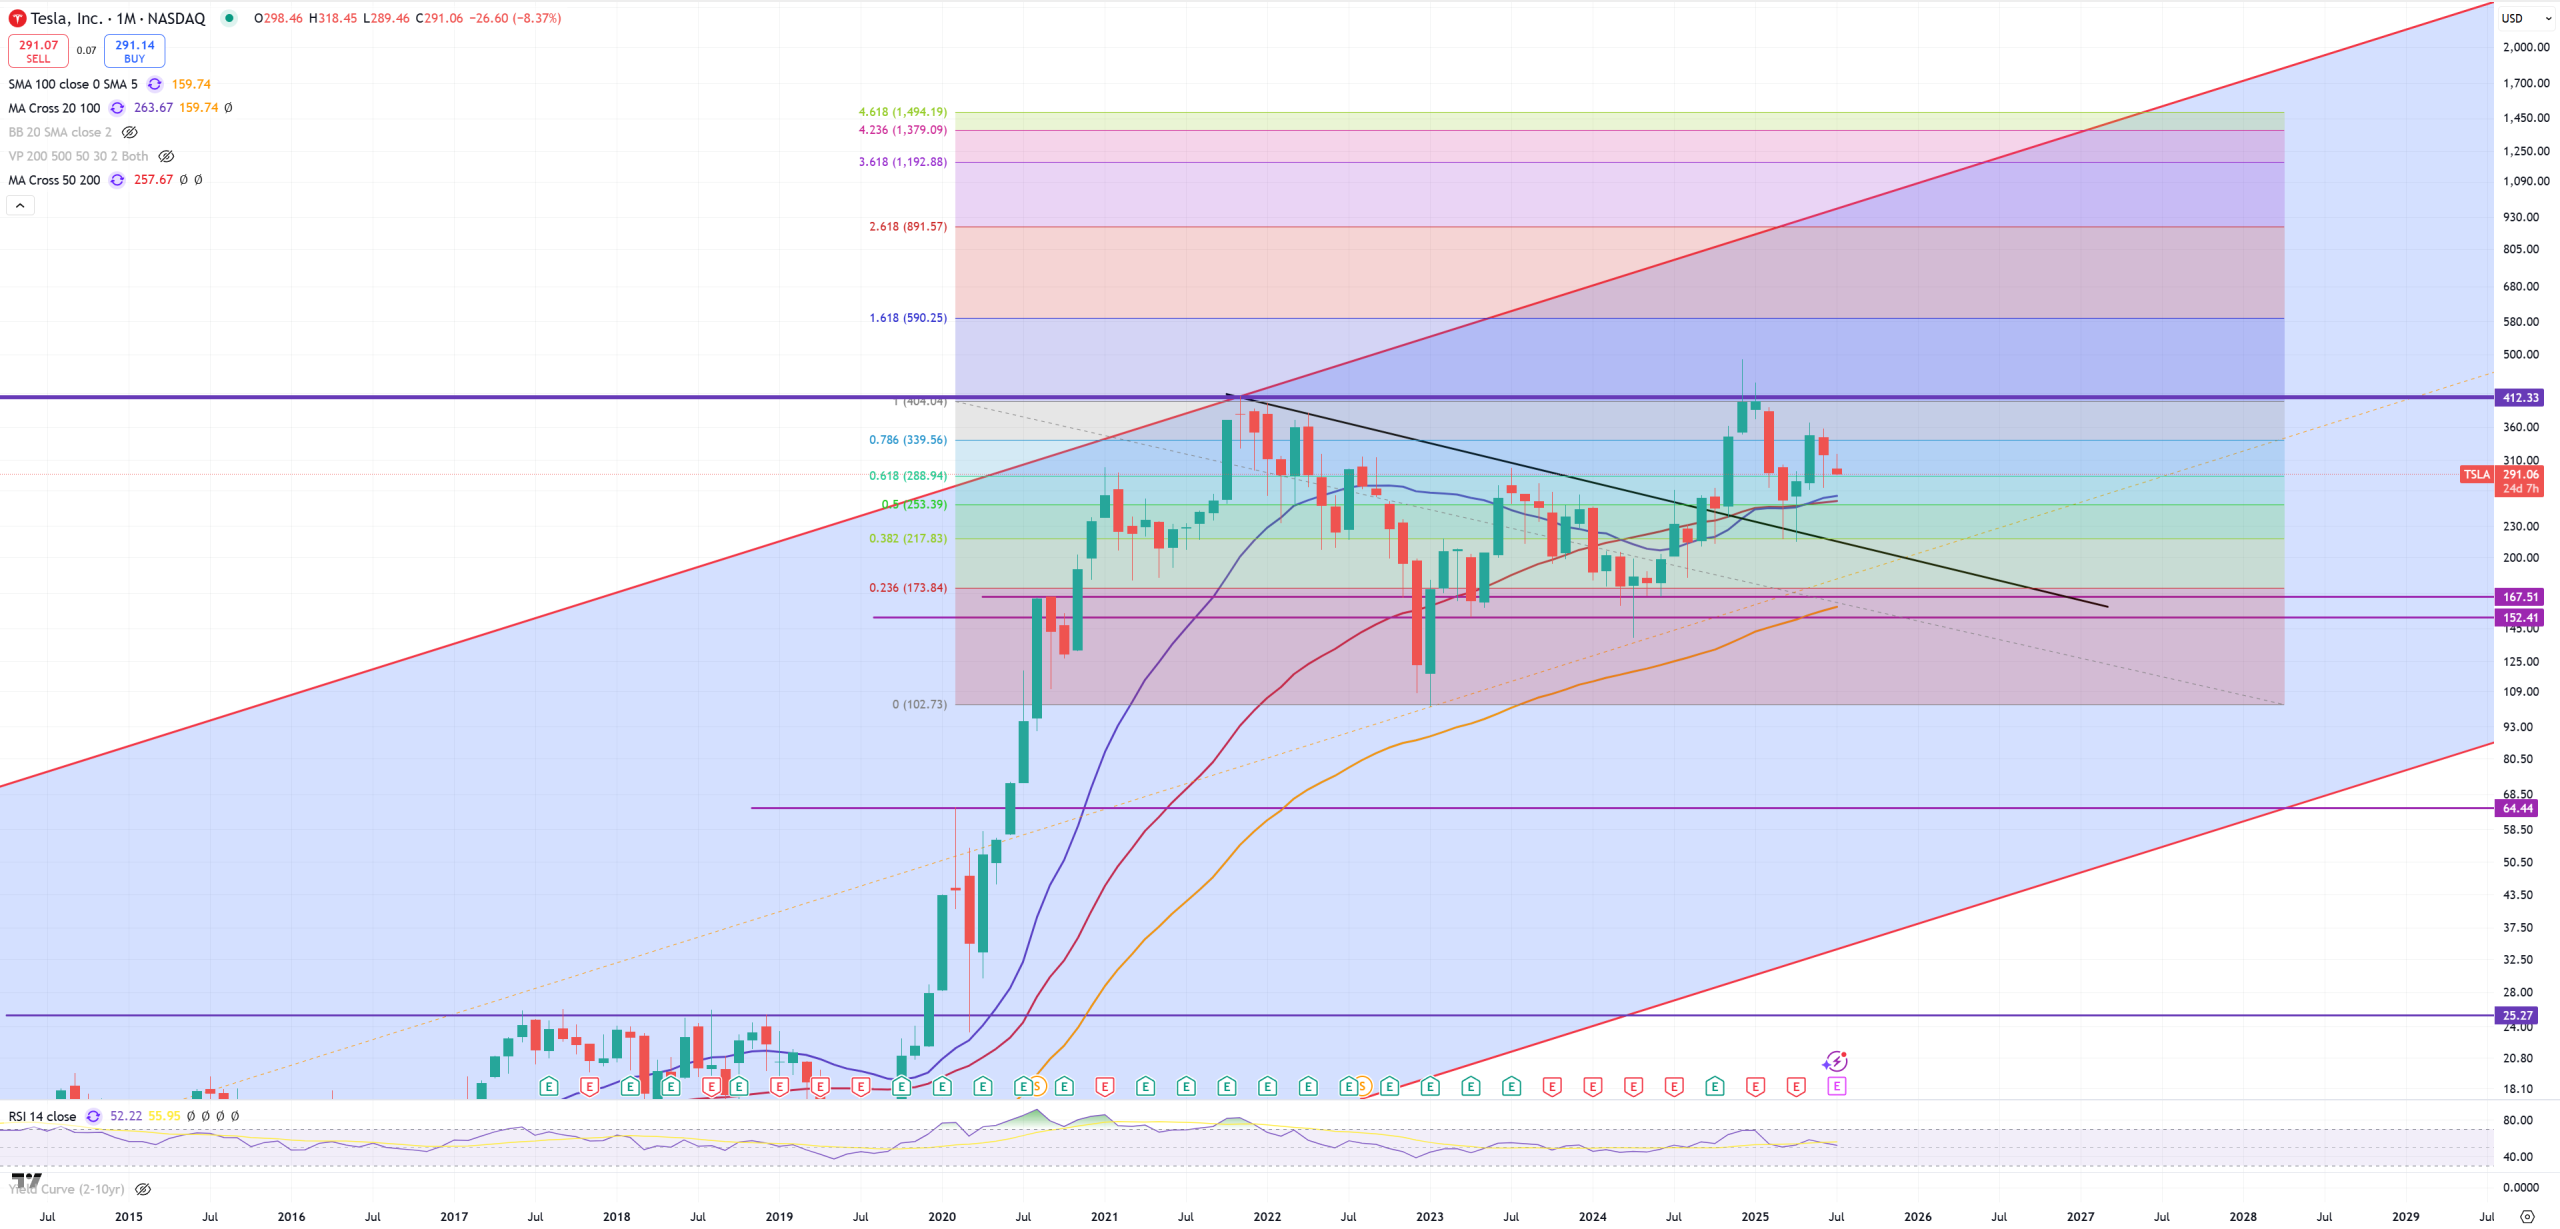
TSLA – Elon lost his mind so far, but let’s be honest, Tesla is slowly getting out of the market in EV sales, replaced slowly by Chinese manufacturers. Robotaxi was a joke, optimus even bigger. Still can’t believe people do believe in Elon for so long, now his own political party and mess with Trump. Tesla has record amount of free lives. So far it’s double-top (2021-2024/2025).
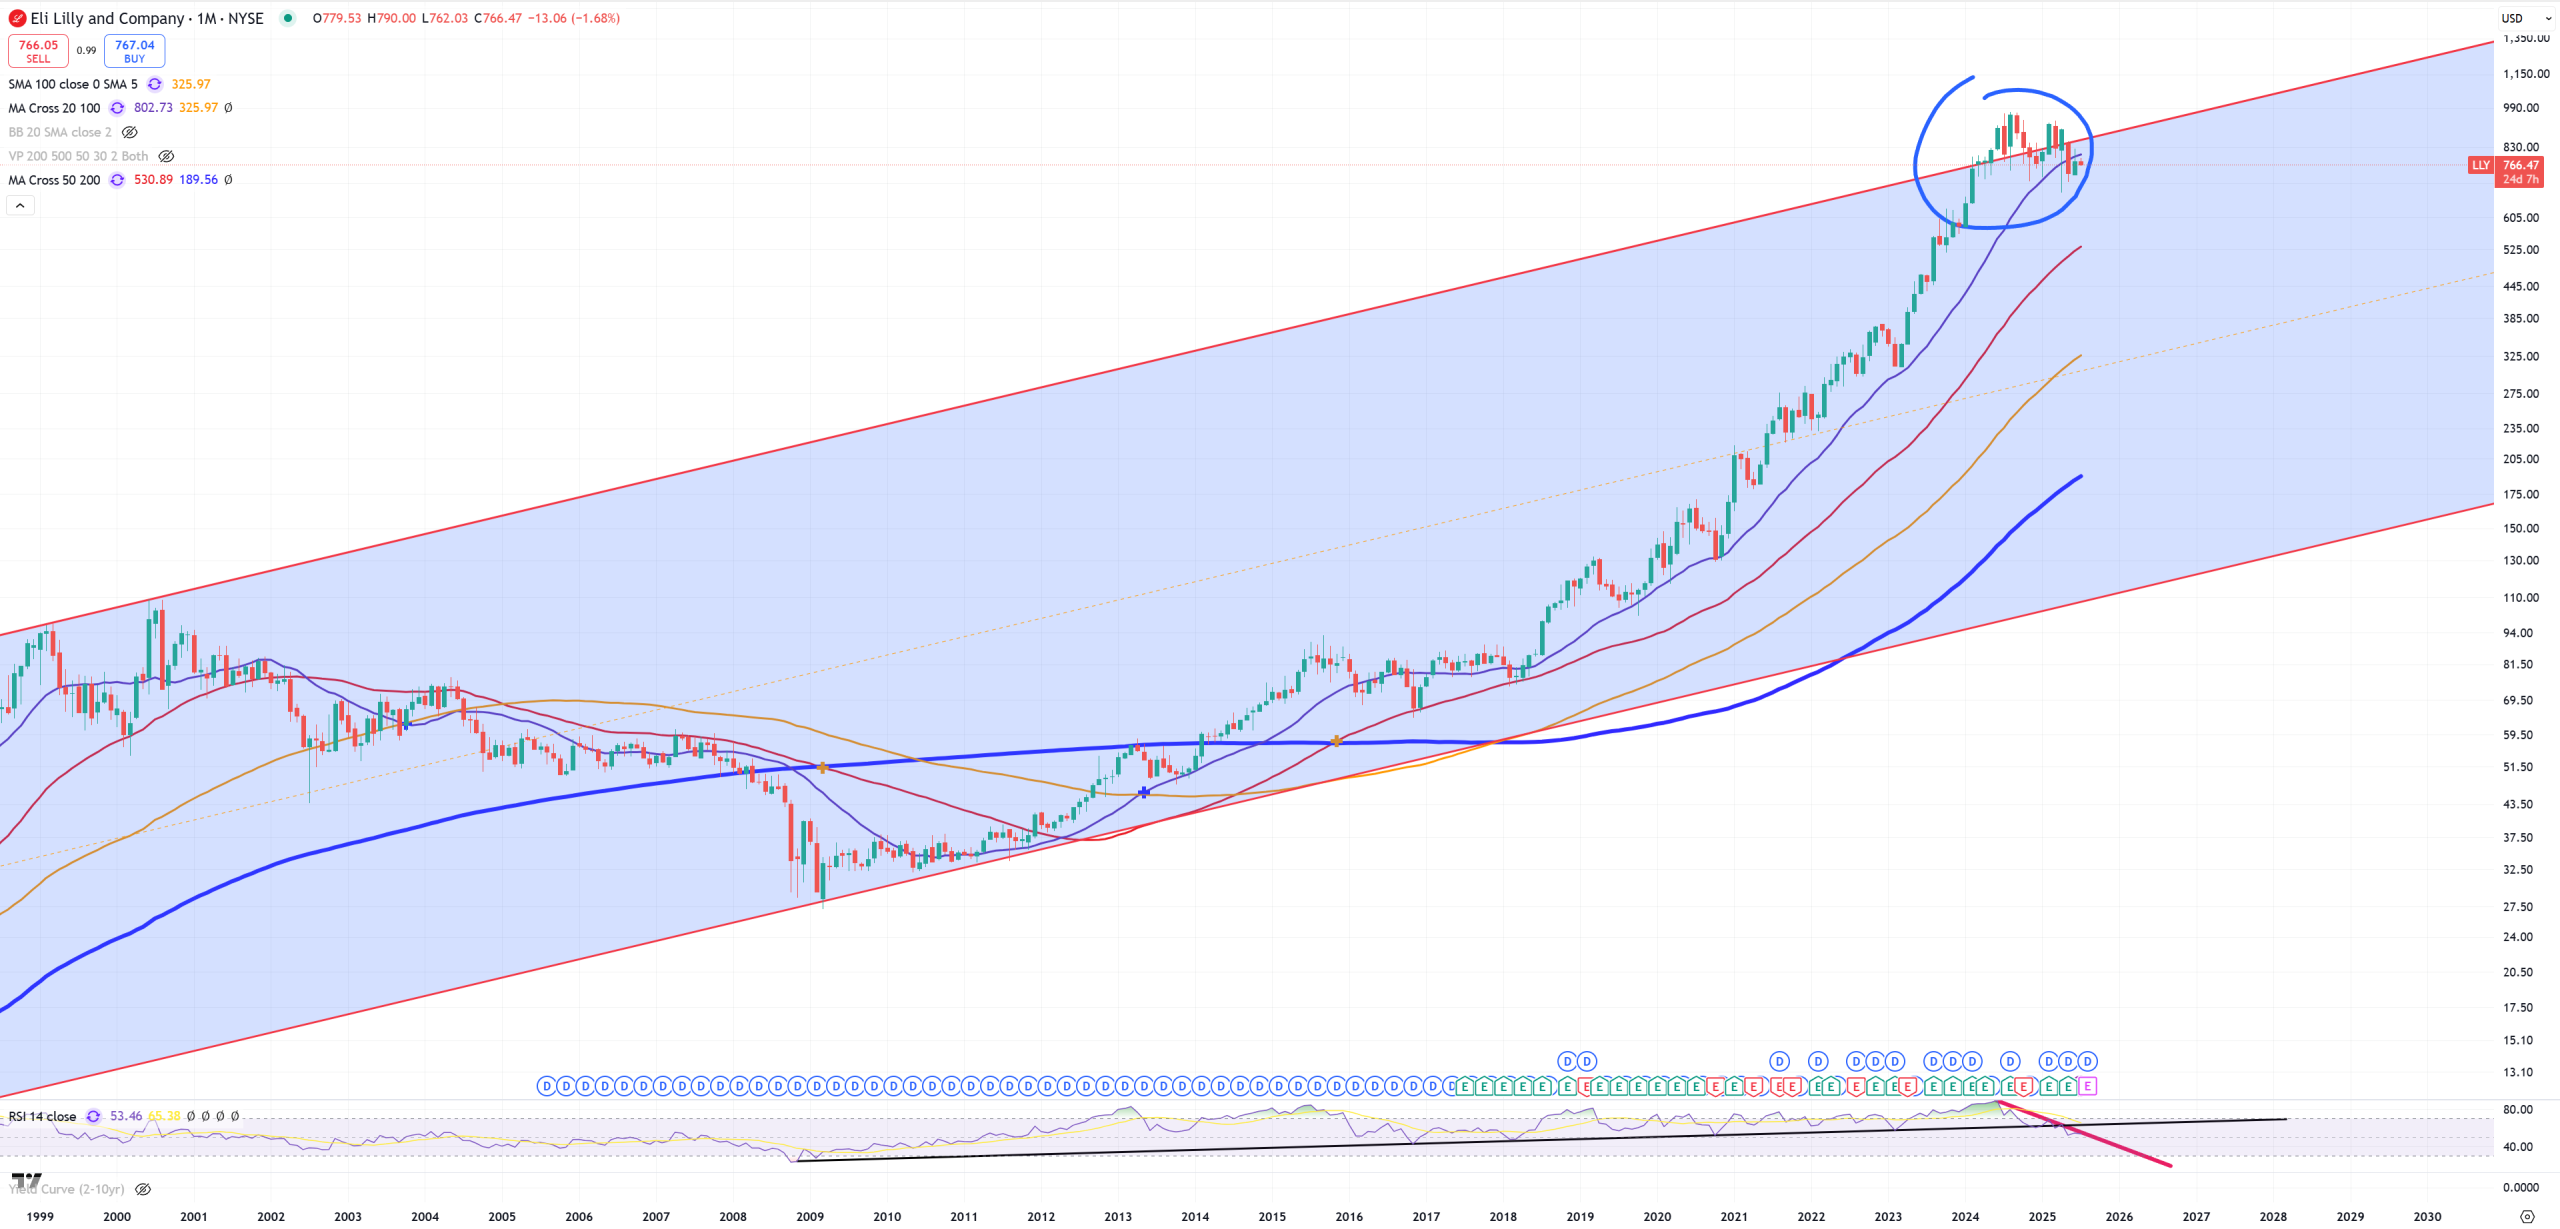
LLY – massive bubble so far still in bursting mode
