06/2026
July 4, 2026

Month and quarter passed and on the charts there’s no “clear” solution. Still a mix of a bear and mix of a bull indicators, but nothing has been changed. Since 2021 more and more charts look worse and worse. It looks like we’ll need to wait another quarter to get any kind of confirmation about broad US indexes. Of course each quarter there’re more charts that break key levels (entering massive bear market) but assuming that :
BREAKING: Semiconductor stocks now account for a record 19.7% of the S&P 500.
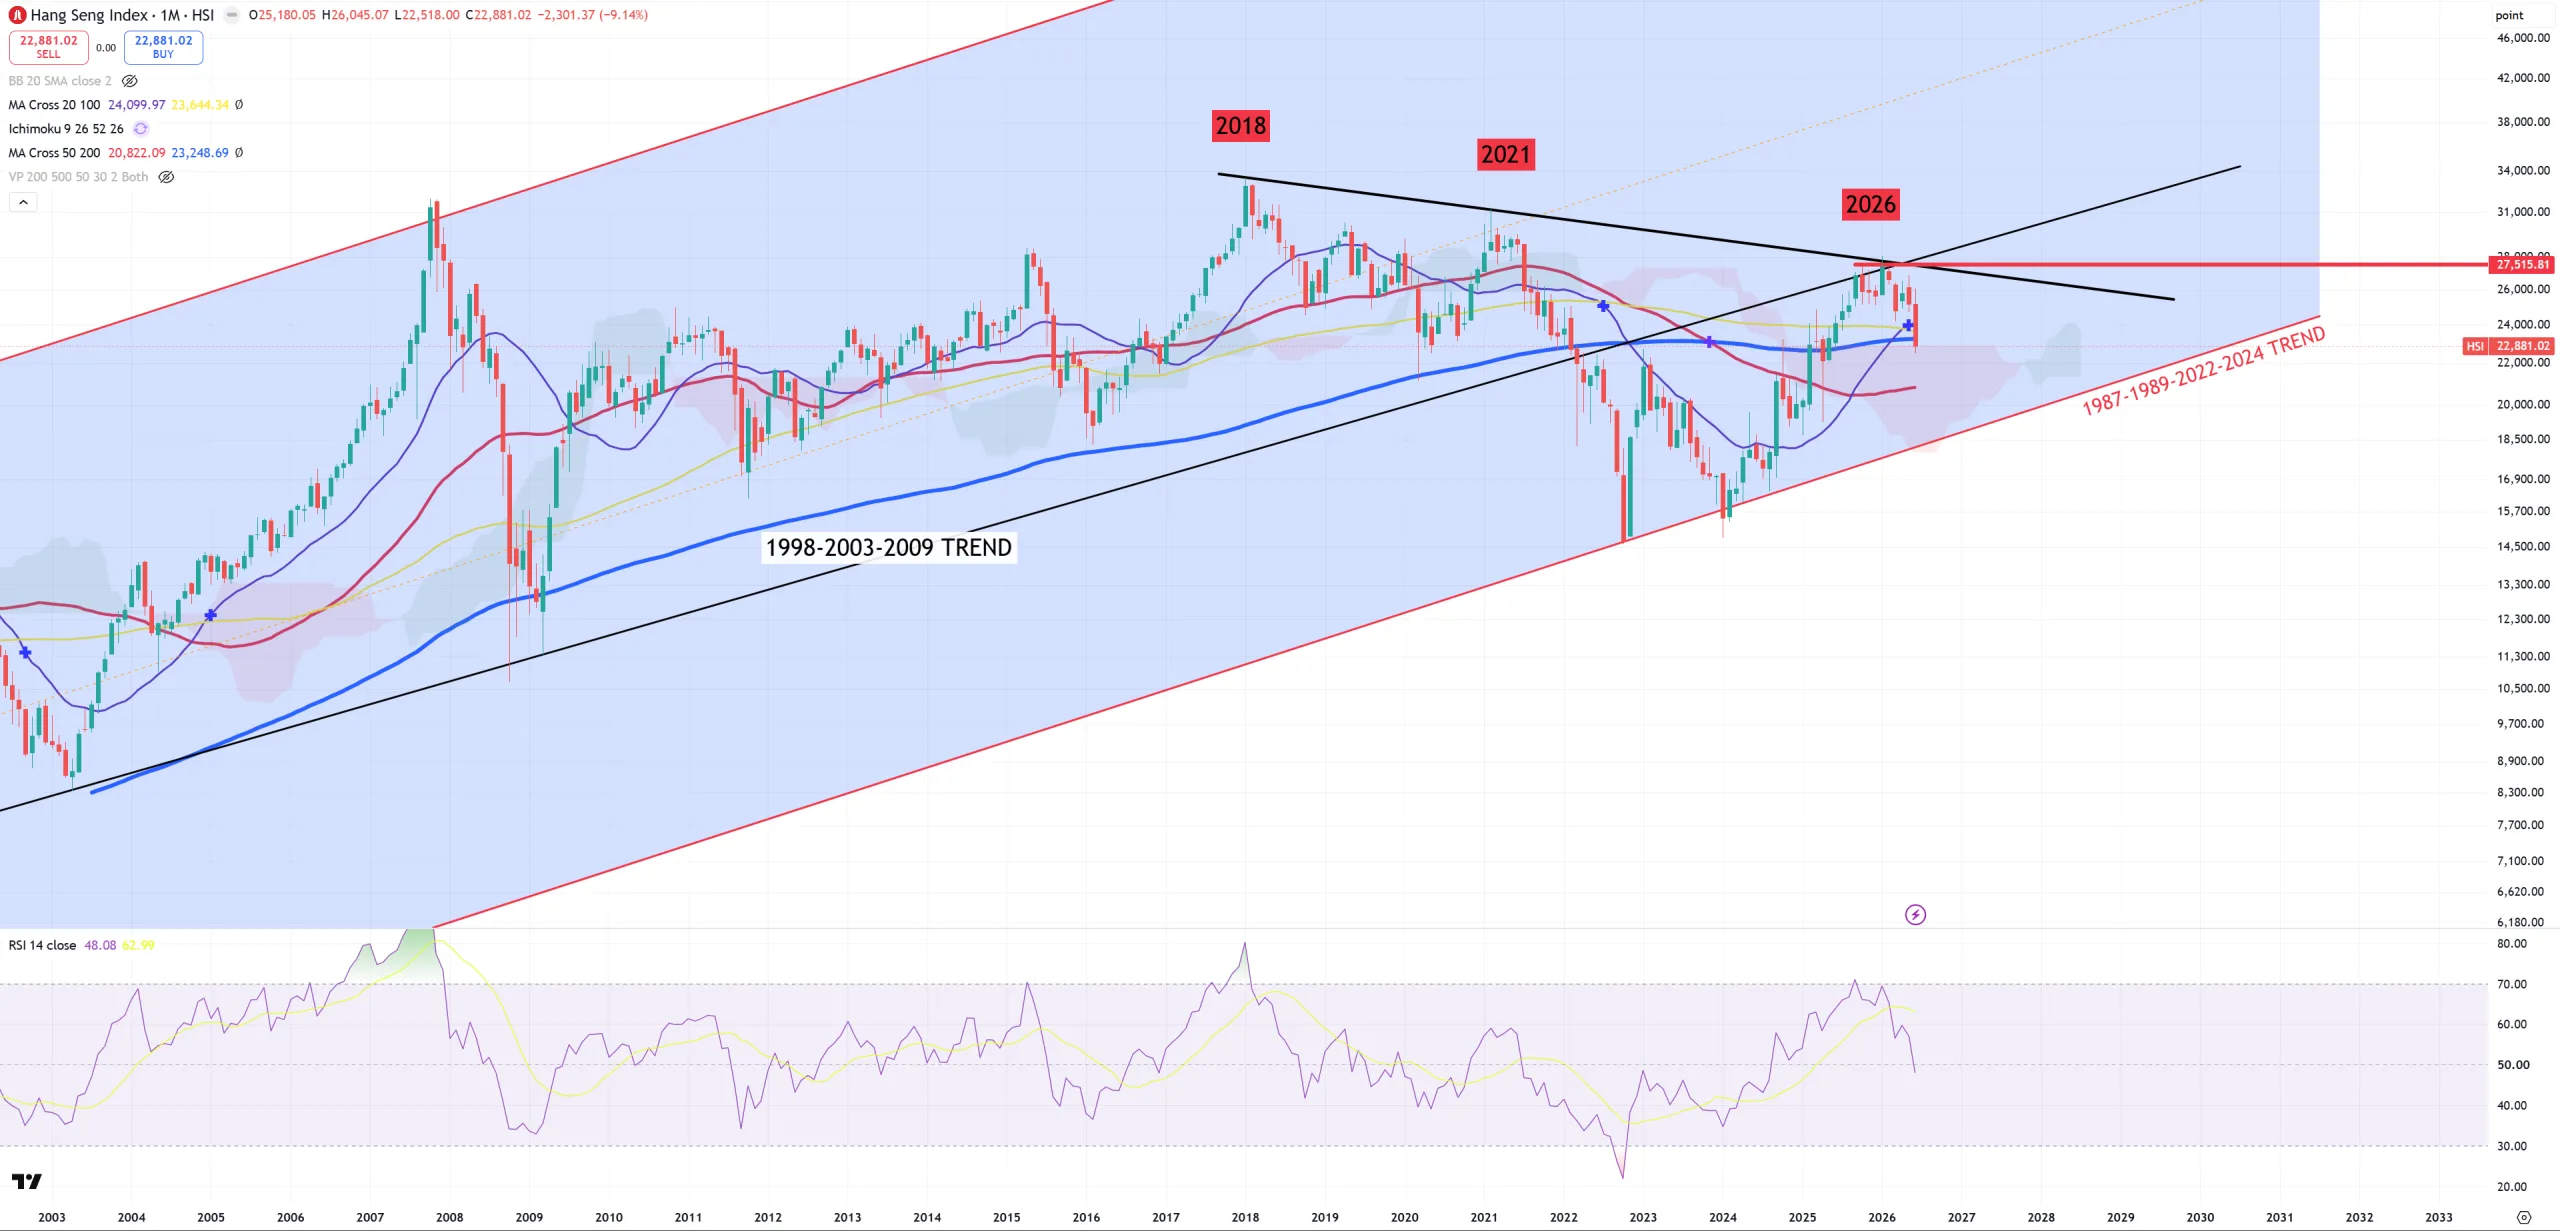
AI/SOX bubble wants to grow into enormous levels, we might get a bigger disguise behind the market which from month to month, quarter and quarter, very methodically cutting the oxygen. Today I’ll start from the market that really really FAILED after a bounce and that’s Hang-Seng. It managed to – just like China – retest its key trend, made lower high and get back below (M)MA200. Why it’s so important? Mostly because I assume and I keep saying it for years – if financial crisis hits it’ll start from Asia and it’ll be mostly connected with HKD peg break & China (no Japan, no Yen here as you see). So China + Hong-Kong play the piano, and rest of the world with a bit of a lag (mostly ~3Qs) getting the problems from Hong-Kong & China. In reality #1 asset to watch for the world reversal is Chinese FXI + USDCNH when it starts going up. Rest is a derivative of those two. There are some other indicators that telling us it might/will happen like uninvering yield-curve in the US, or ratios like SPX/GOLD, currency pairs like EURUSD, AUDJPY, AUDUSD, or just DXY, but these are still just derivatives of China and Chinese currency. Maybe I have a different point of view, but I assume (maybe wrong maybe not) that US stock market is also a derivative of China. So let’s start.
If I won’t show you anything like GOLD or SILVER it means it doesn’t need to get any comment. My idea is to show you flipping momentums. To remind you my key understanding of key (M)MA definitions. violet (M)MA20 = high momentum bull (above)/bear (below) indicator, red (M)MA50 = technical border between bull/bear market -> the most important MA for me. Yellow (M)MA100 – typical level of bull/bear trap. Blue (M)MA200 – secular bull/bear market technical border.
Charts in this report (63)
Hang-Seng – after long bounce keeping the main lower trend from 1987 it managed to retest its key 1998 trend and failed. That was a kind of the highest possible moment to define it as a “bear market” rally. Now closed below (M)MA200 what is not surprising looking on Chinese FXI.
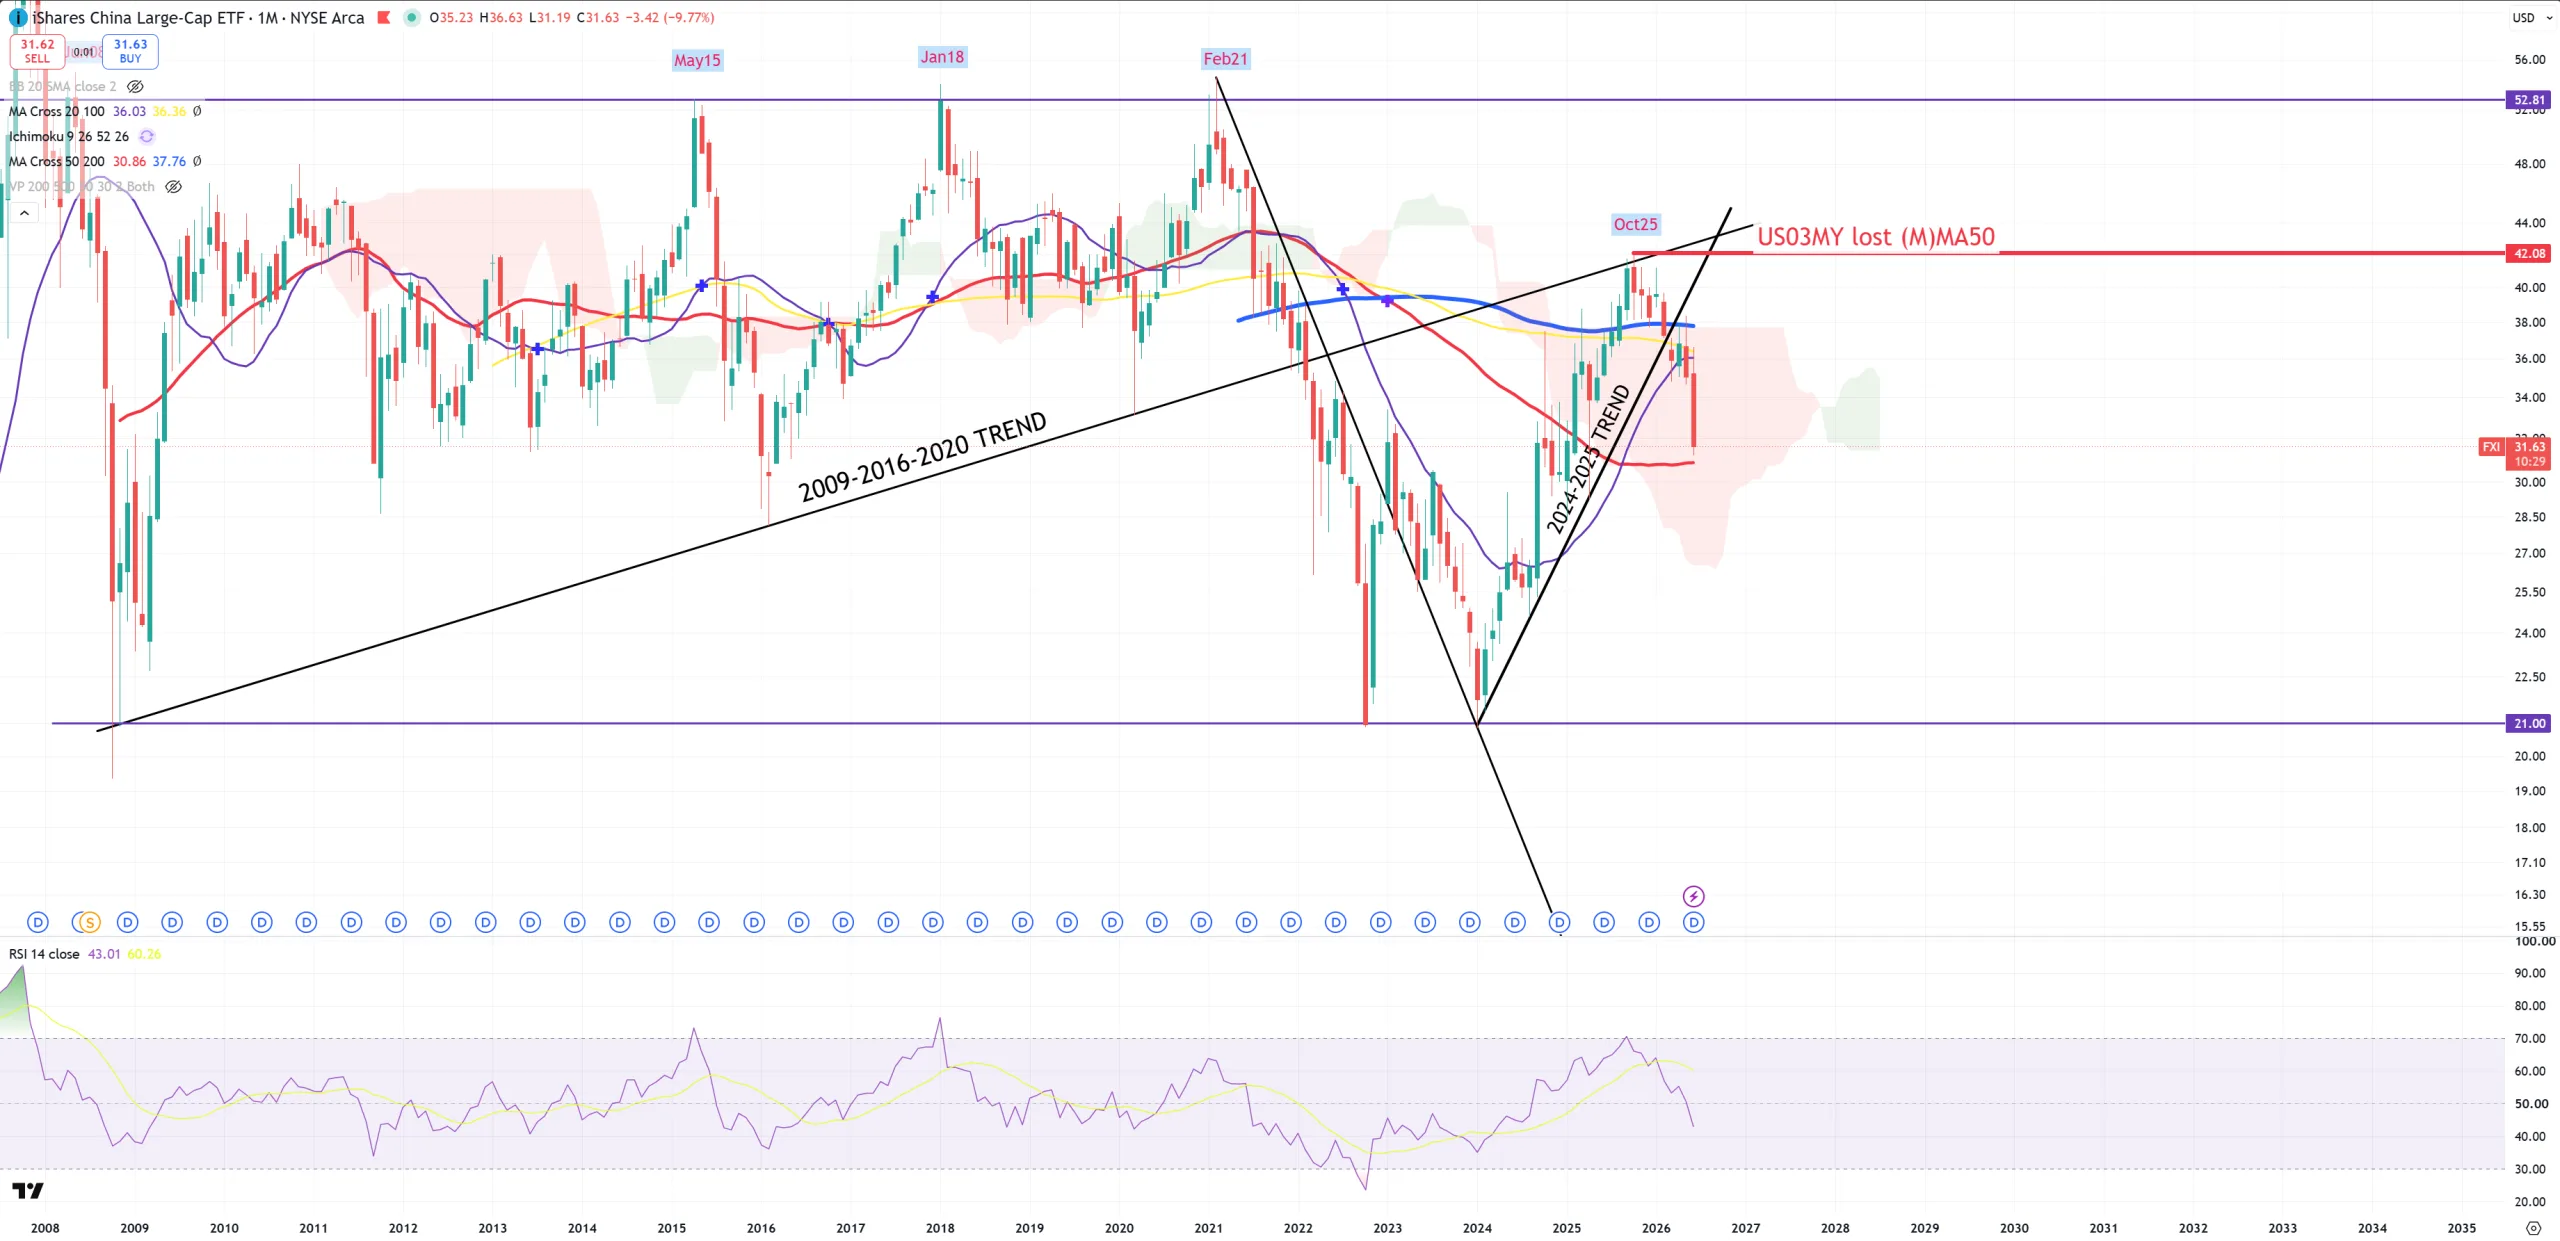
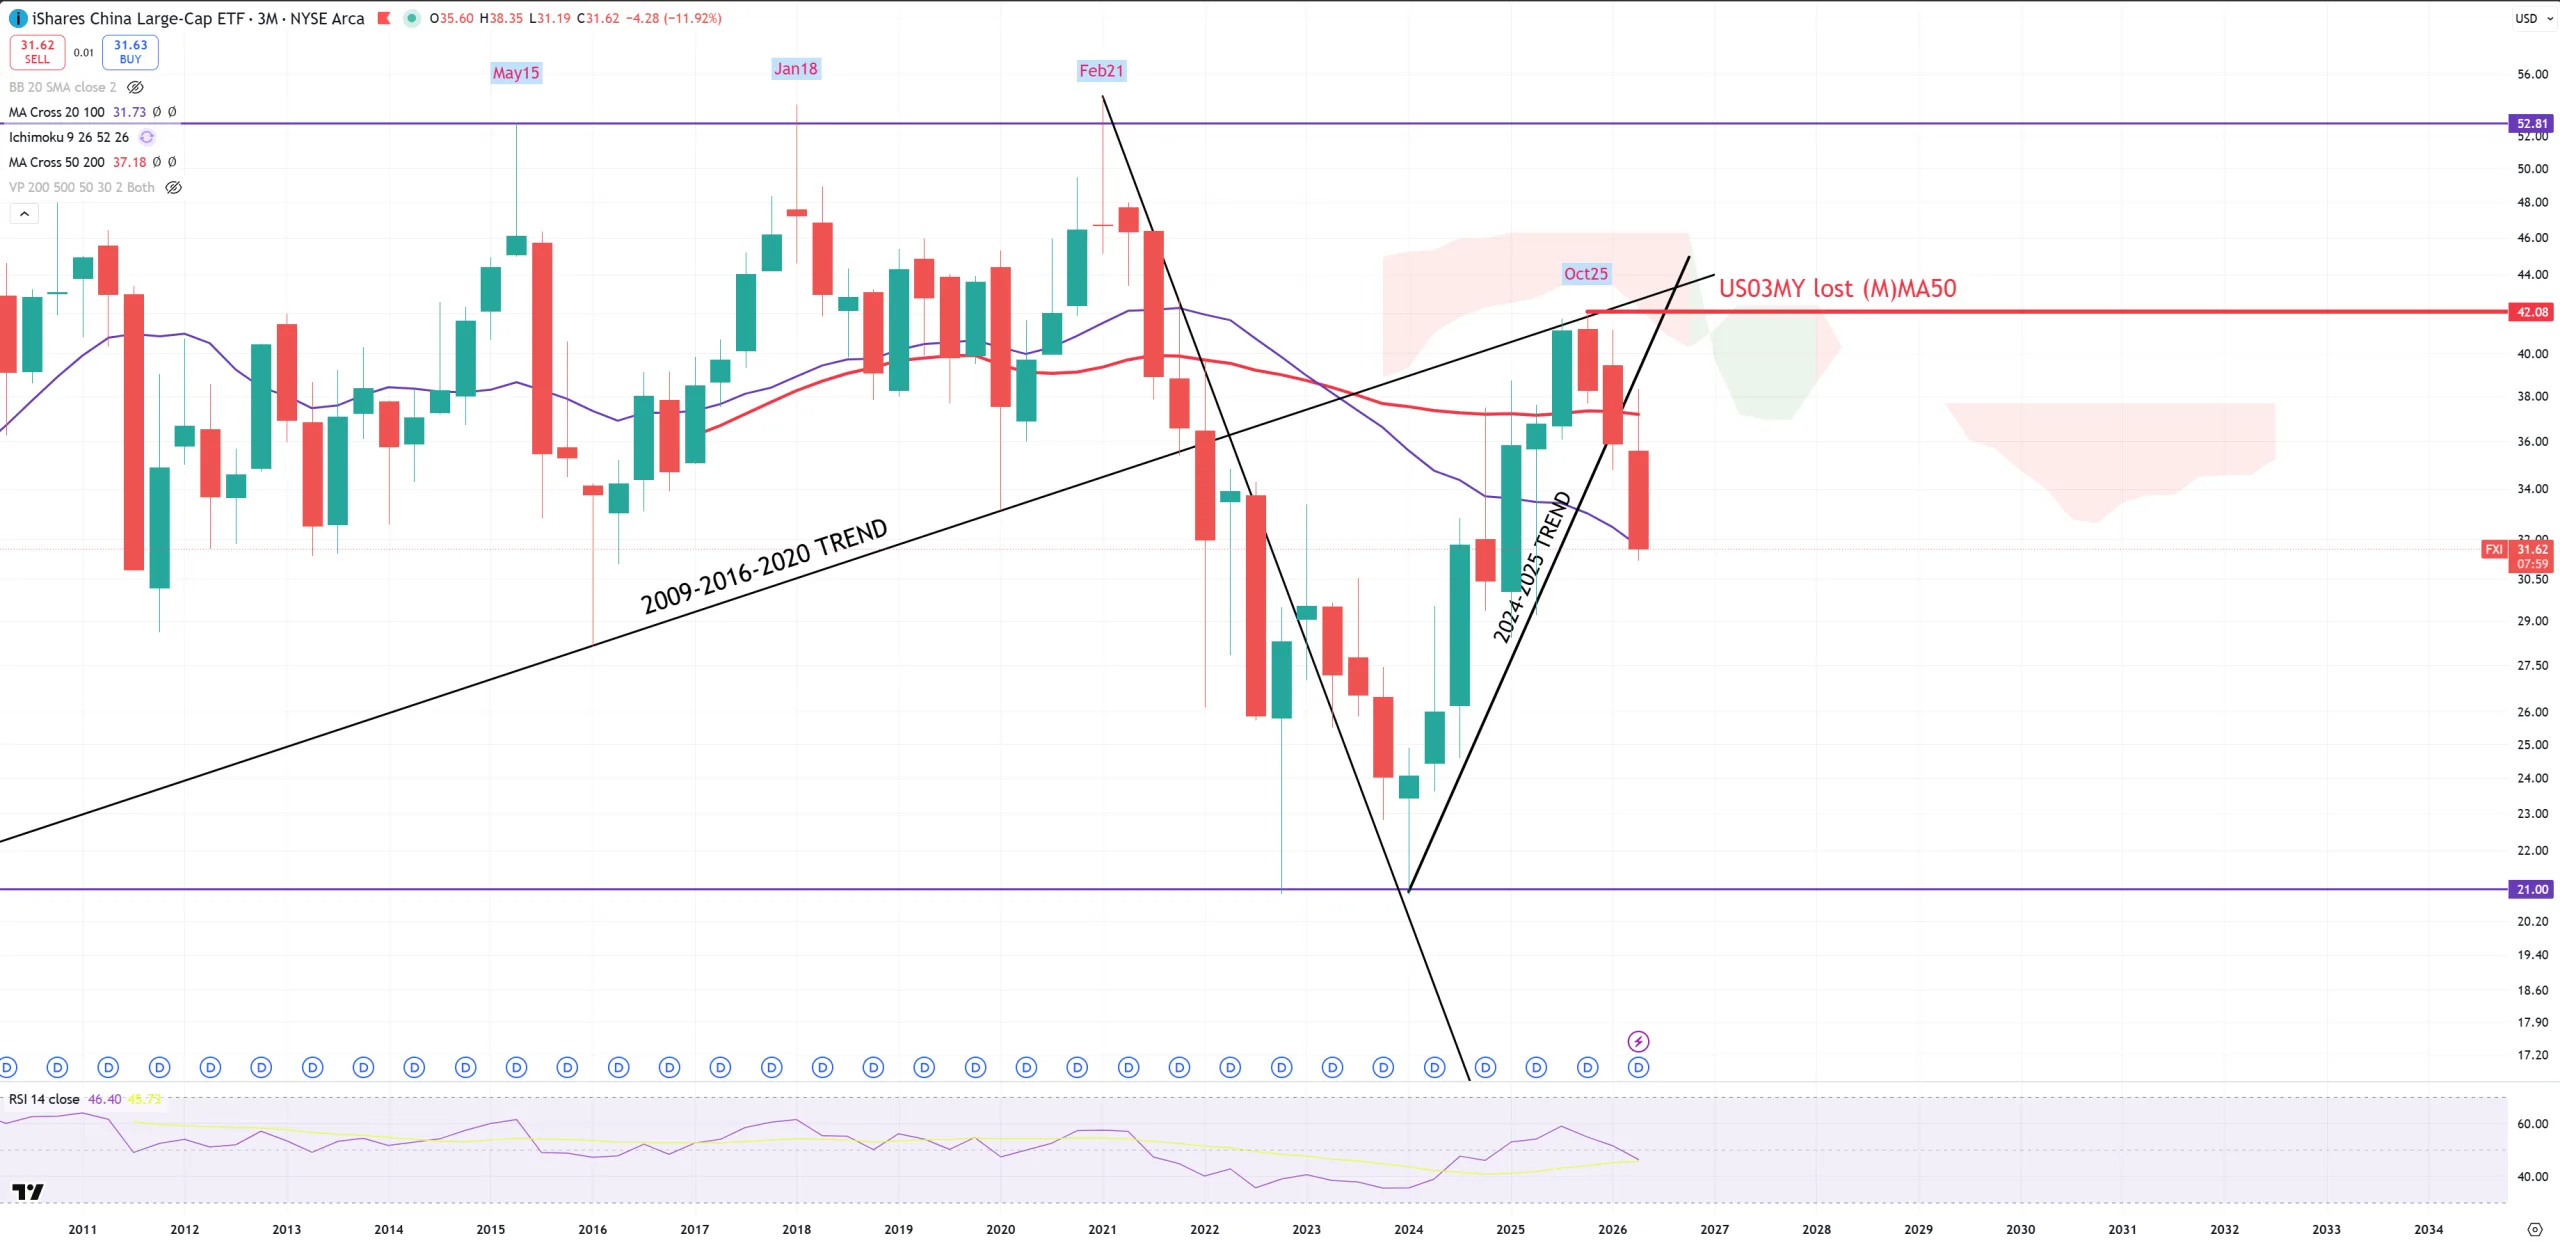
FXI – where China goes, the world goes or crypto goes or oil goes. Also highest possible bear market rally level was the magic touch of 2009-2020 trend line = 42$. And it did. This month it failed to break (M)MA50 – the key technical border between bull/bear. If we take a look on FXI in quarterly (3M) chart (second) – you see a break of (3M)MA20. So without a doubt big moment for China coming.
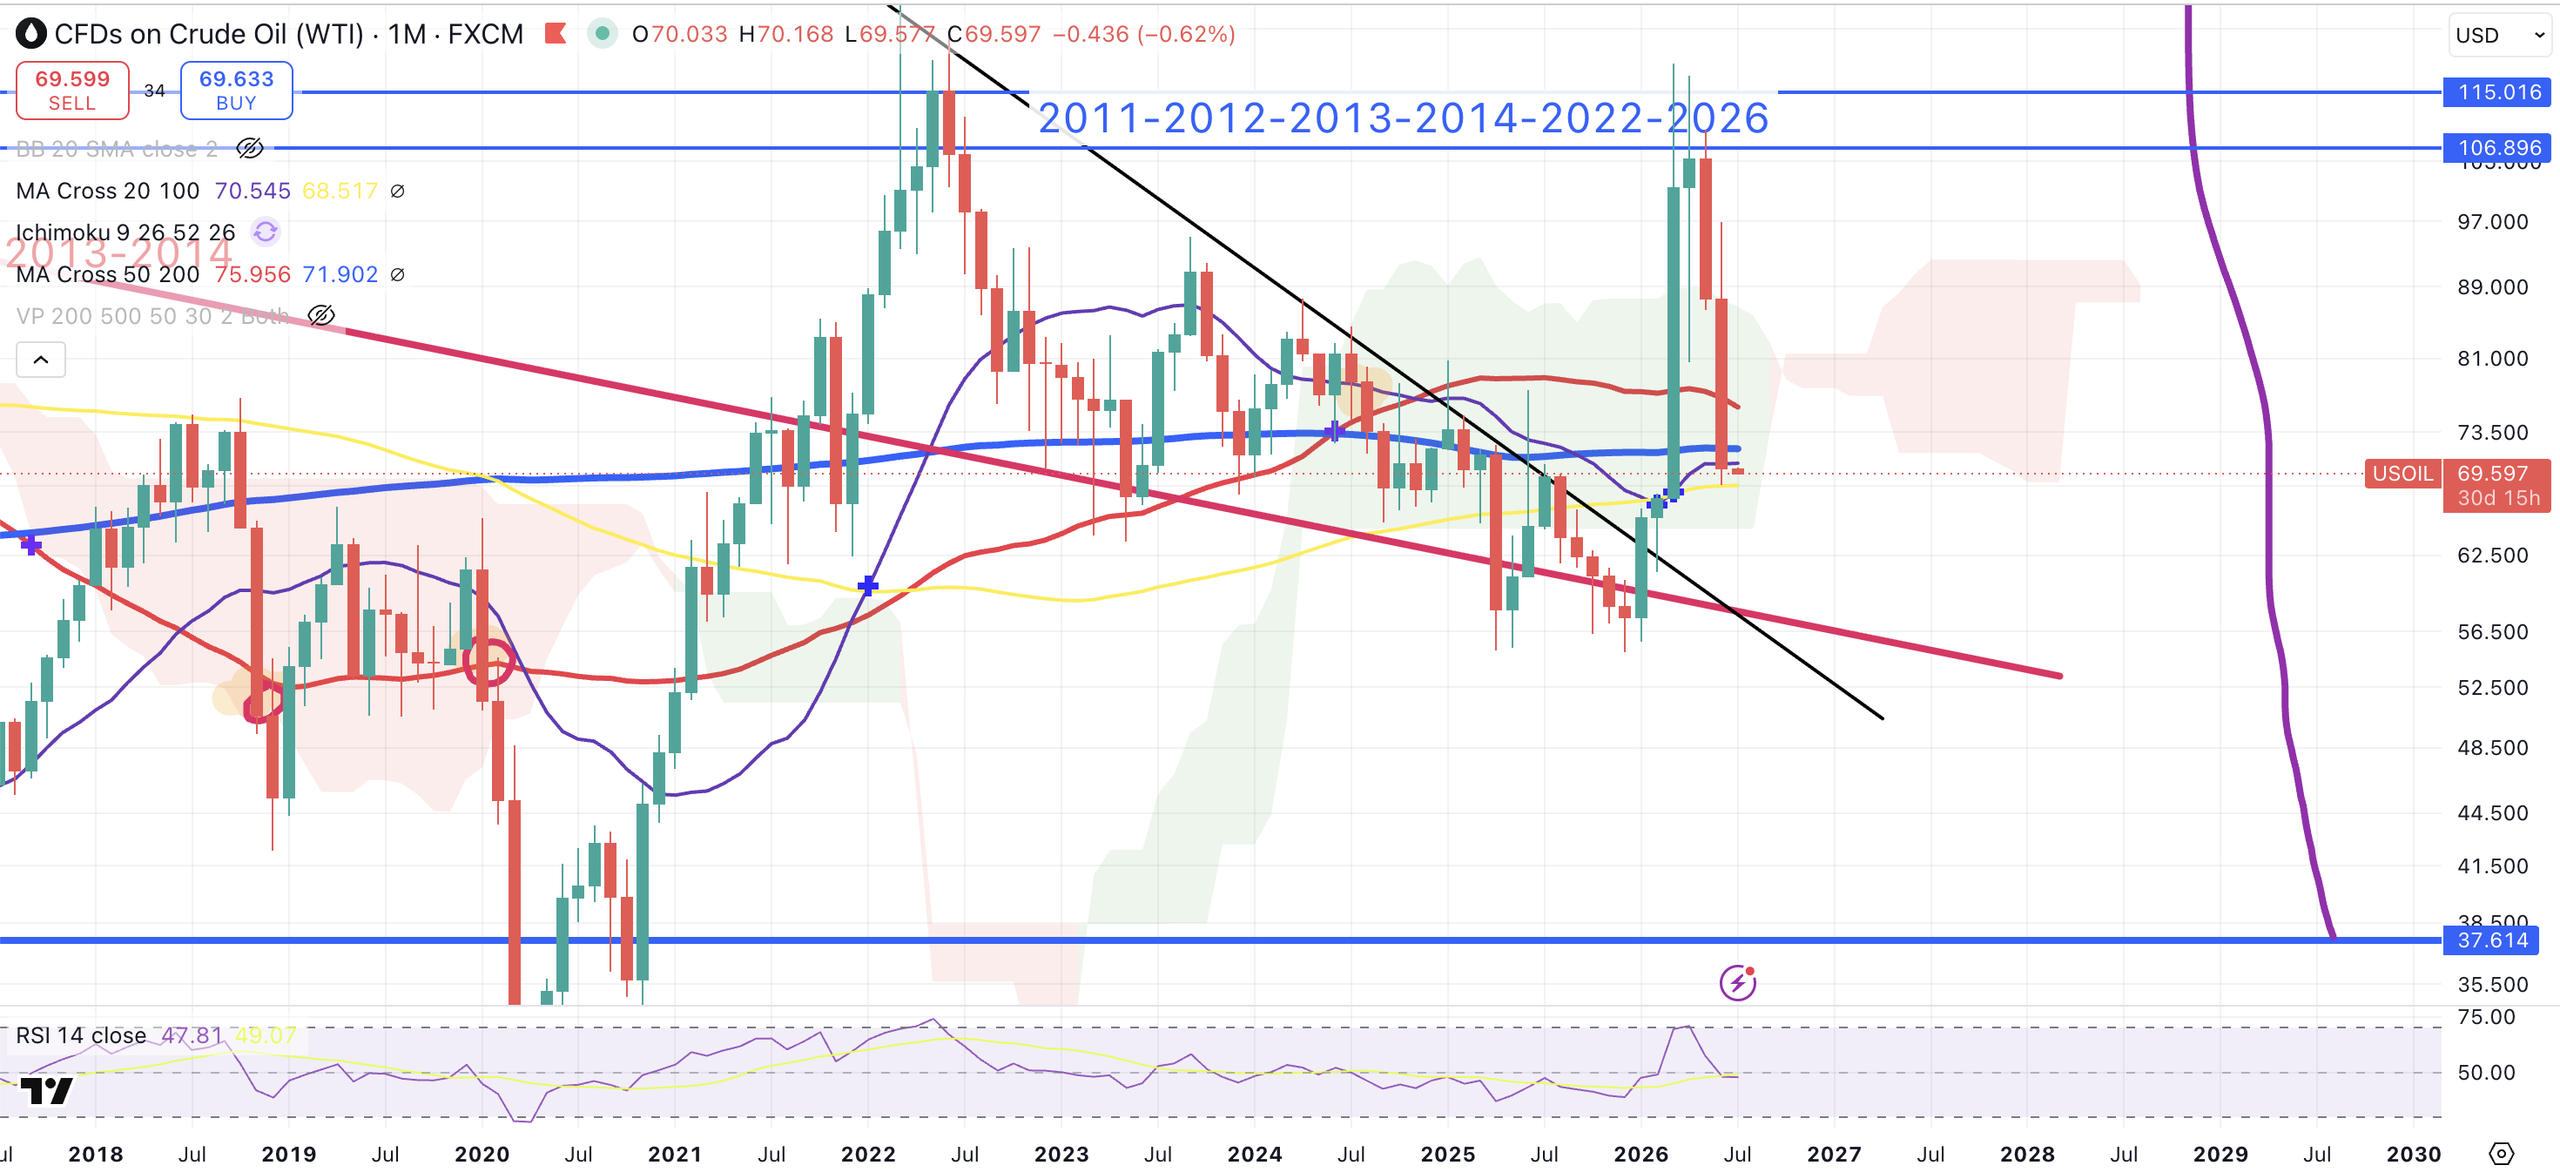
OIL – so far 120$ level holds, we ended below (M)MA200 & (M)MA50 & (M)MA20 – what a false spike! Collapsing FXI takes OIL with it. In reality this spike was just a short term “event”. It helped a lot the market (beliving in inflationary narration = market friendly future), but help for the market = huge damage for the economy.
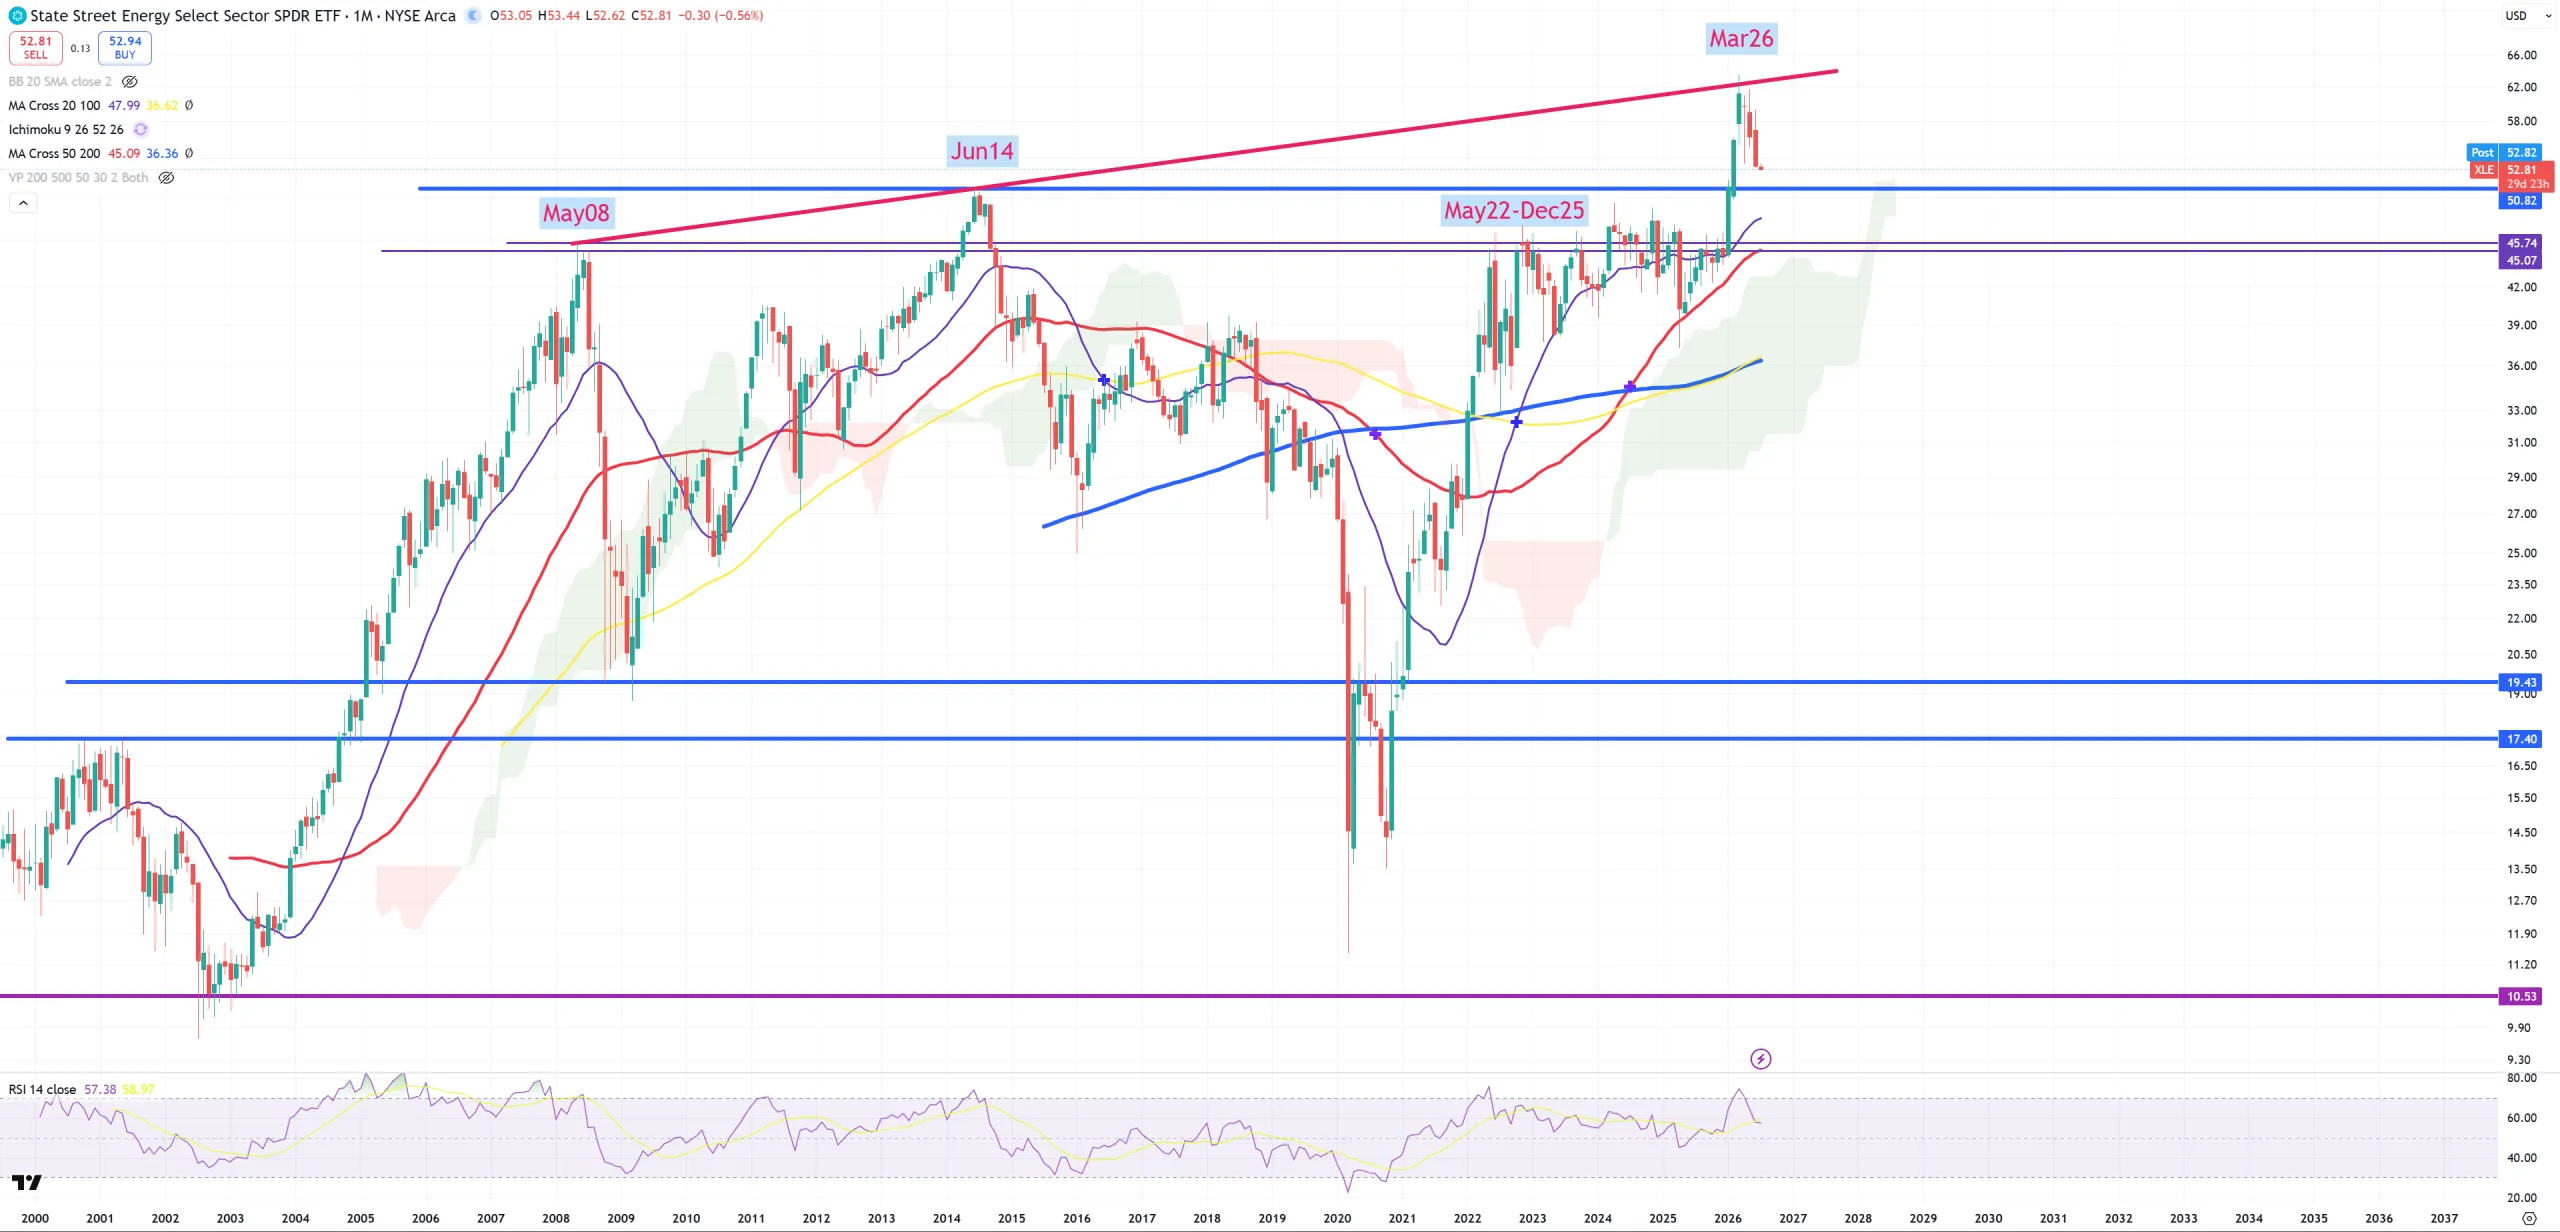
XLE hit last possible level of resistance – big break or bull-trap?
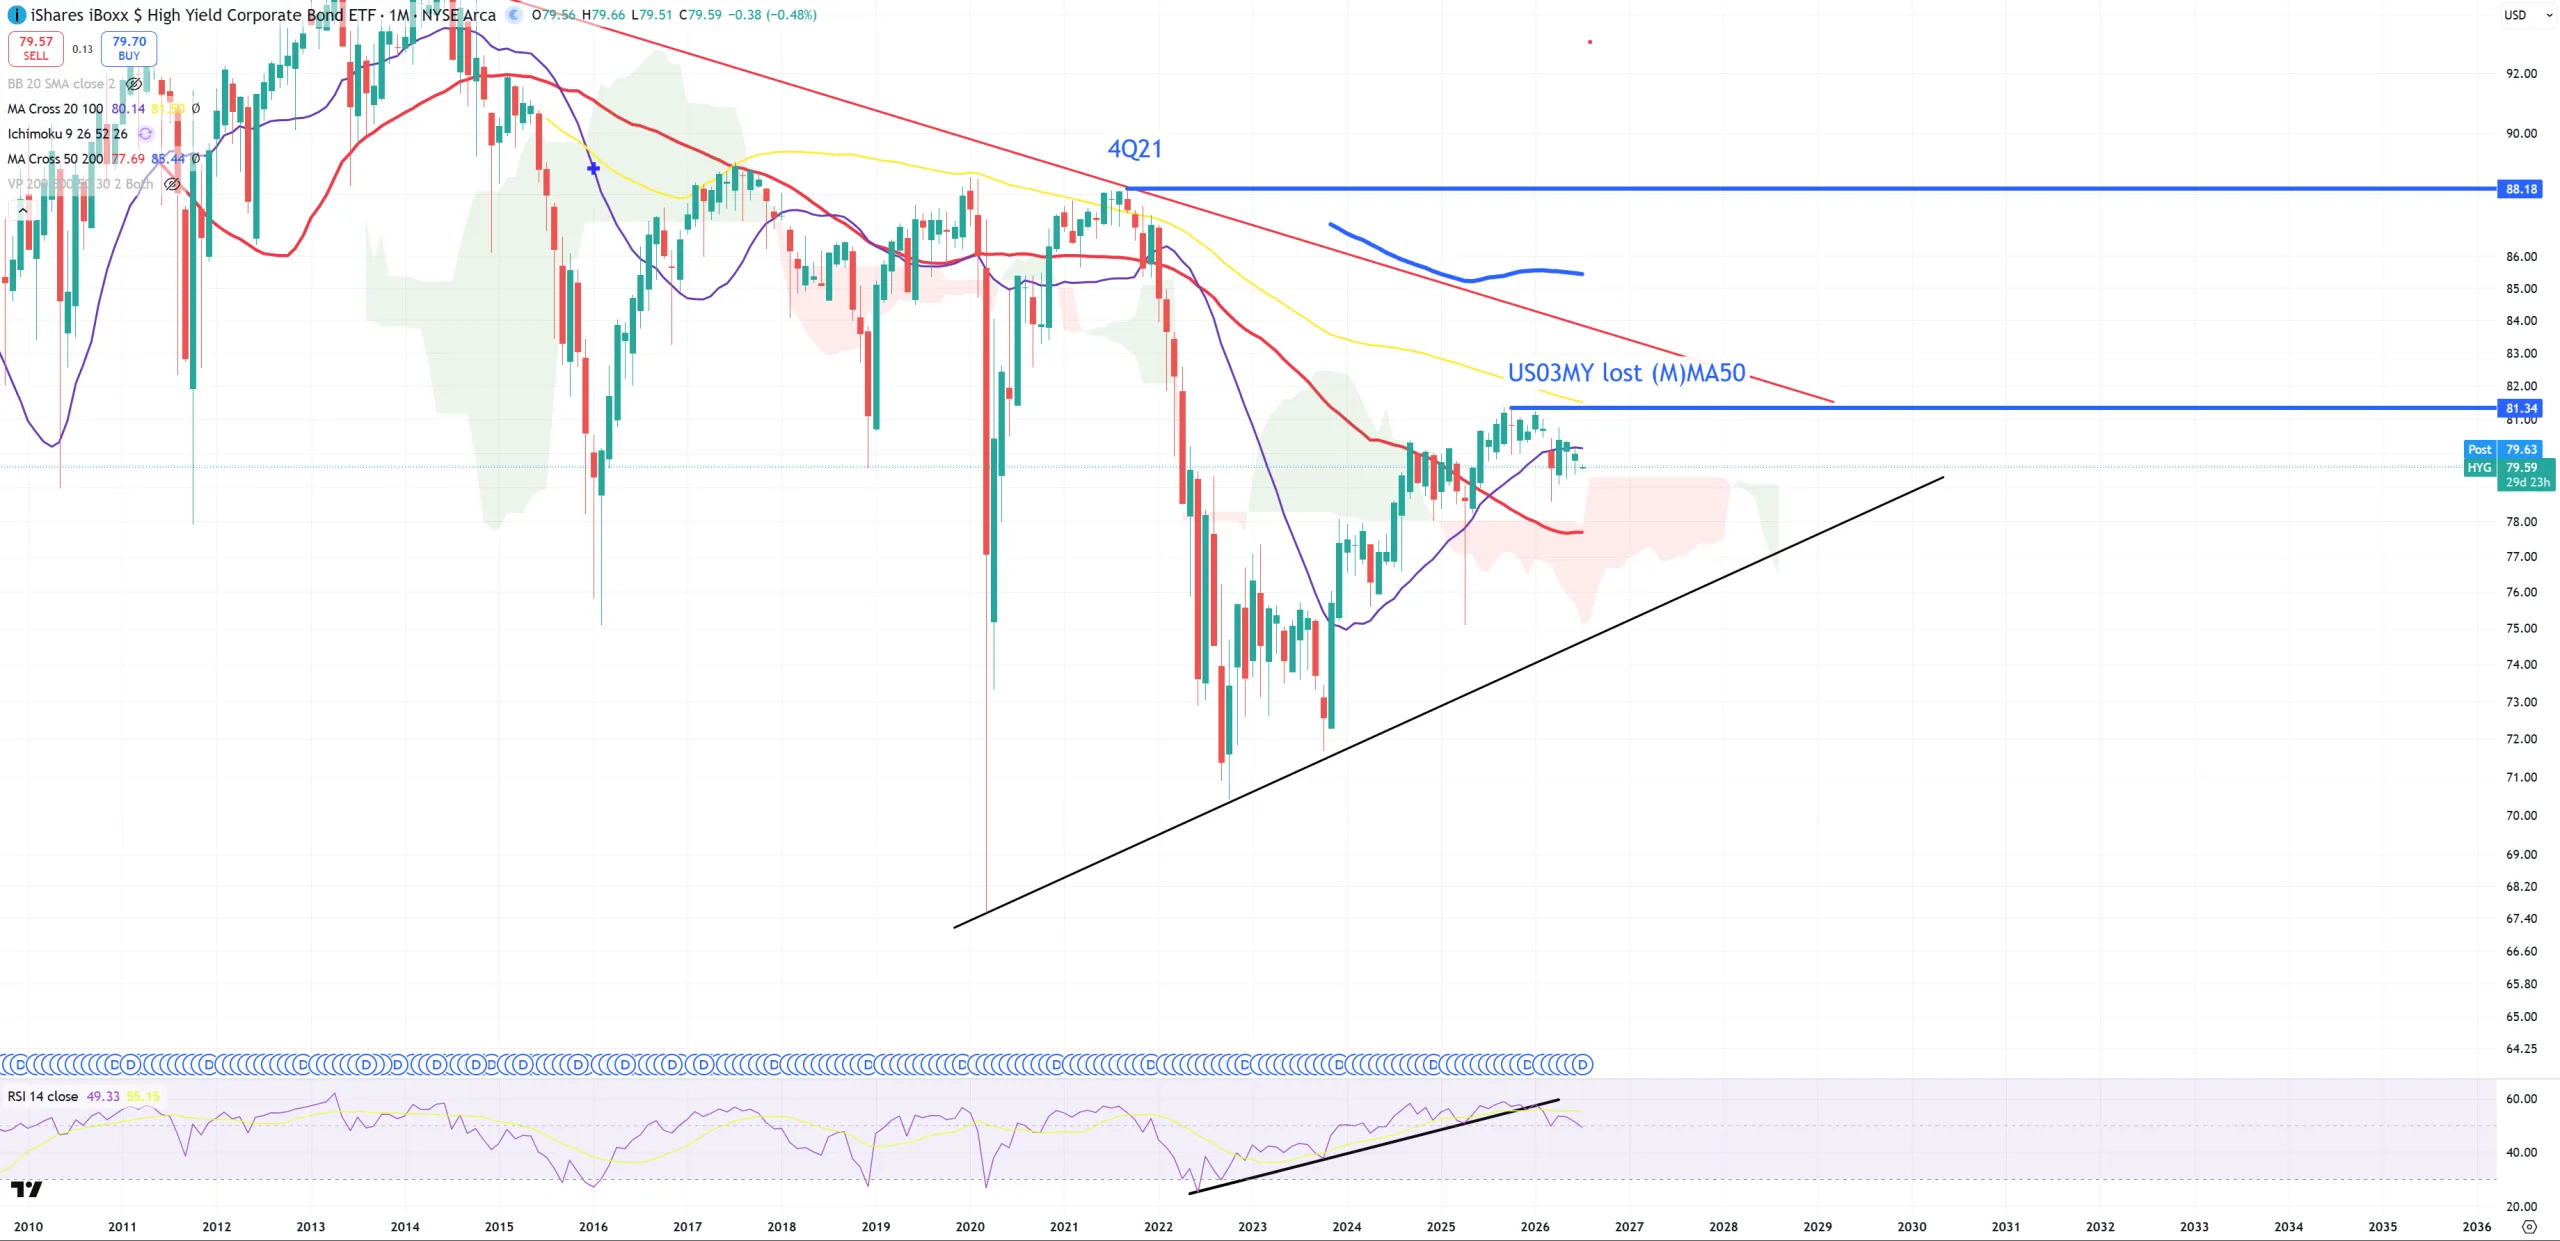
HYG – back below (M)MA20
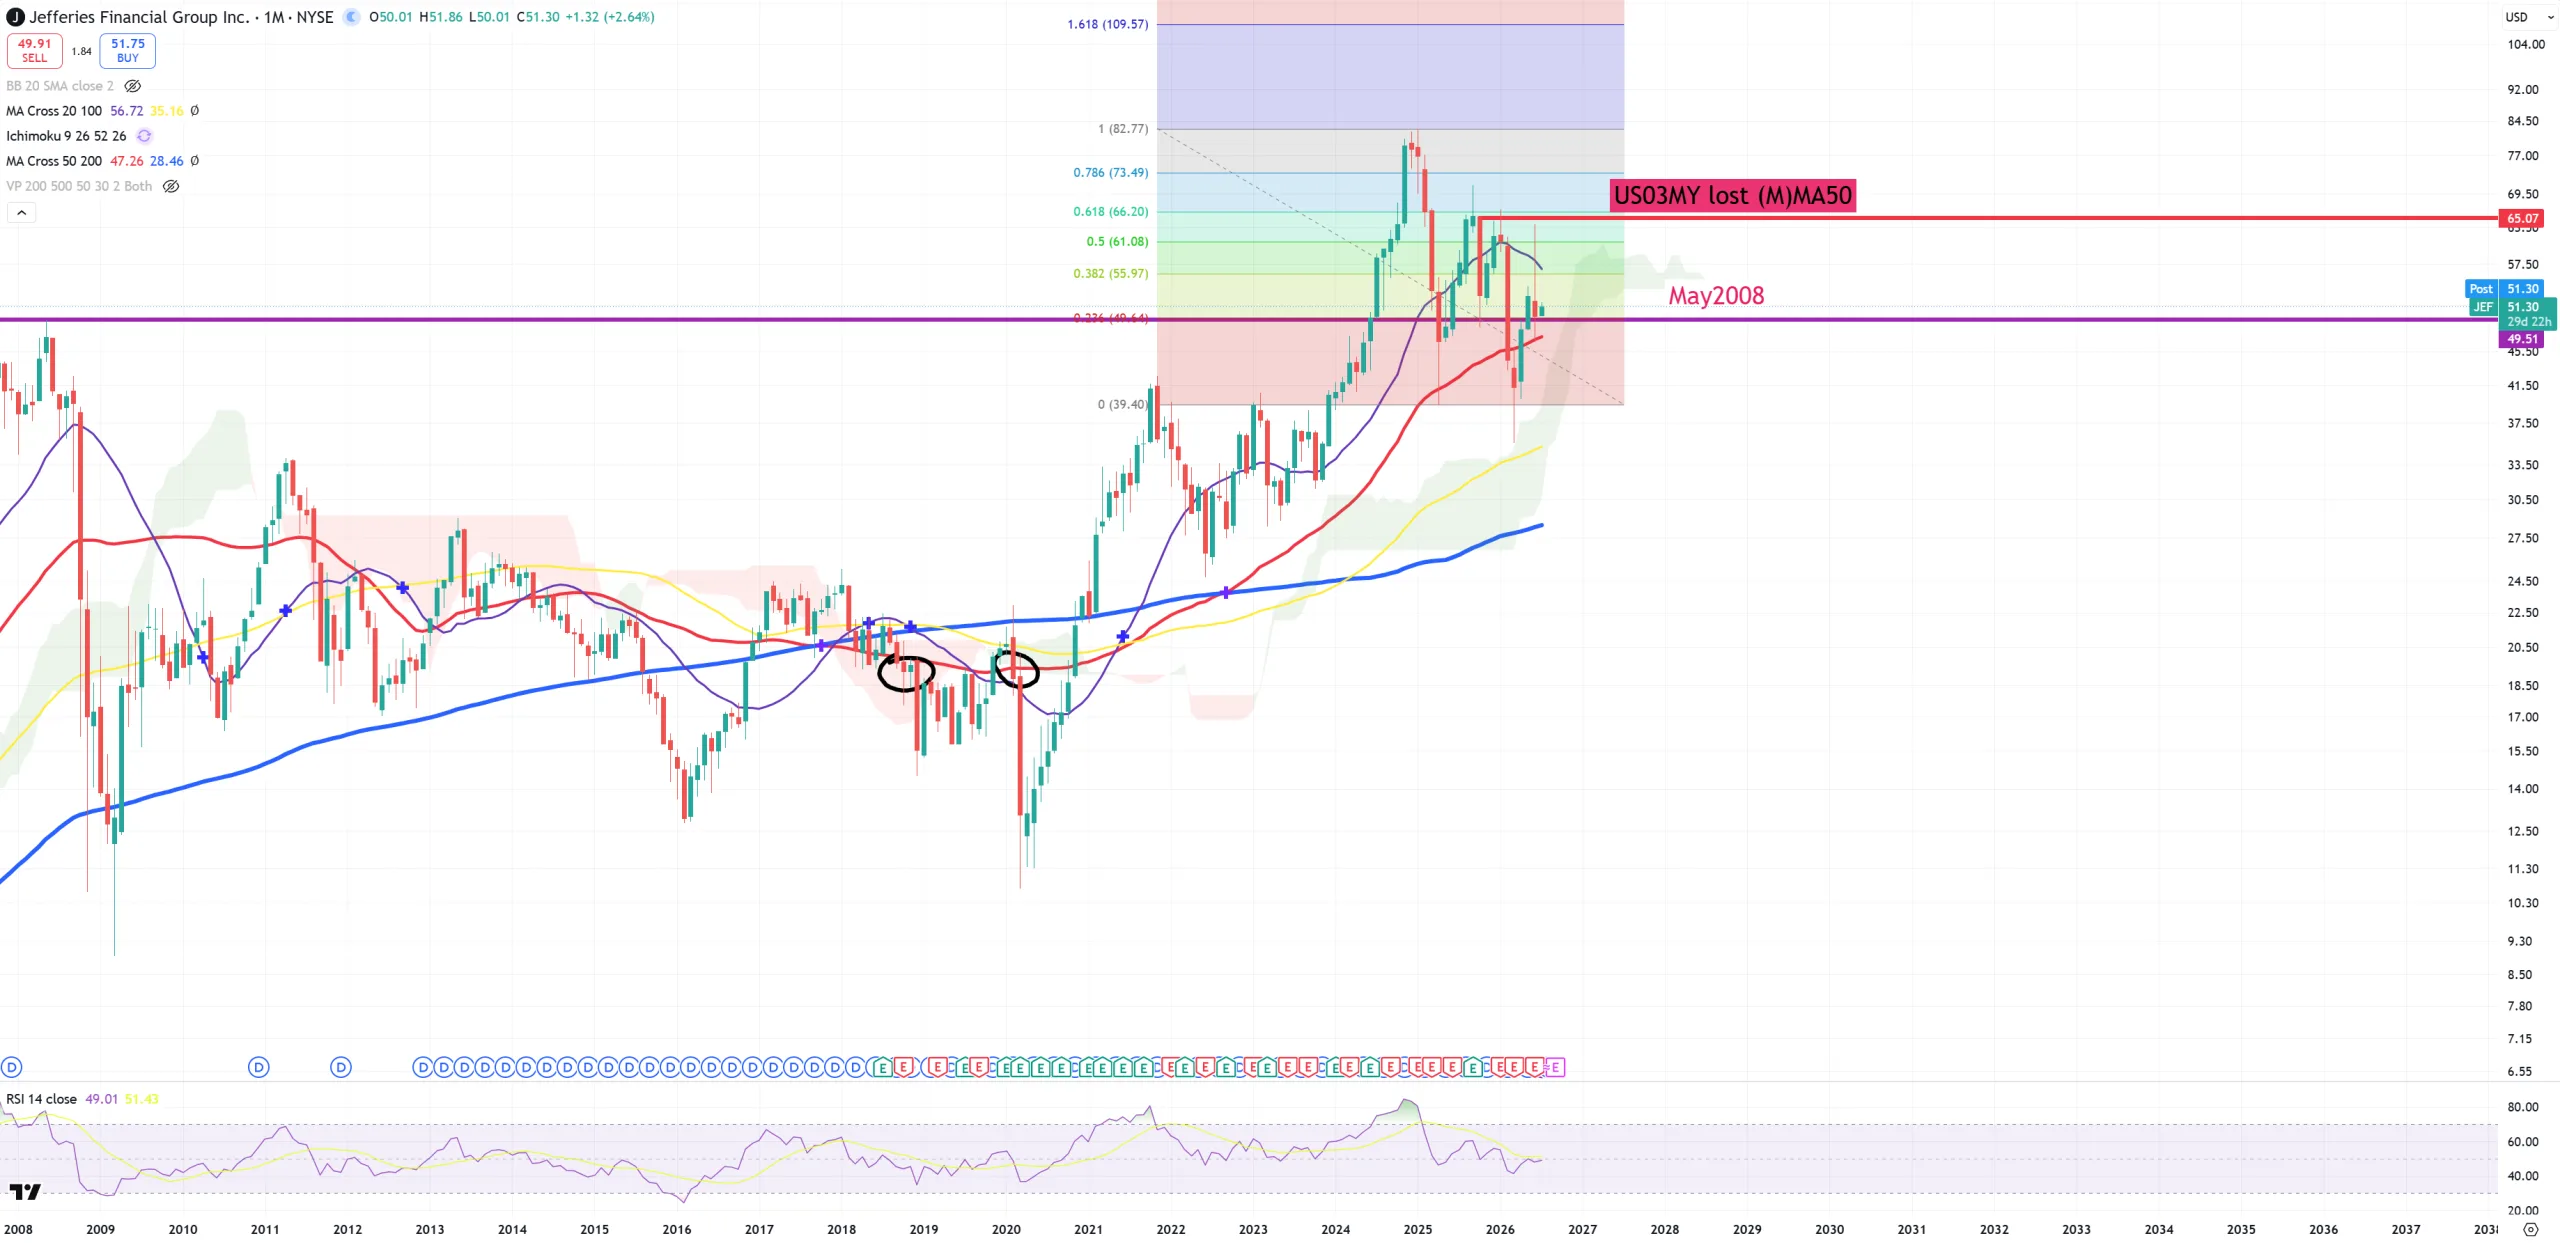
JEF – Jefferies – there’s no need to watch banks in reality, but this company takes my attention. So far this May 2008 was saved just … a little bit.
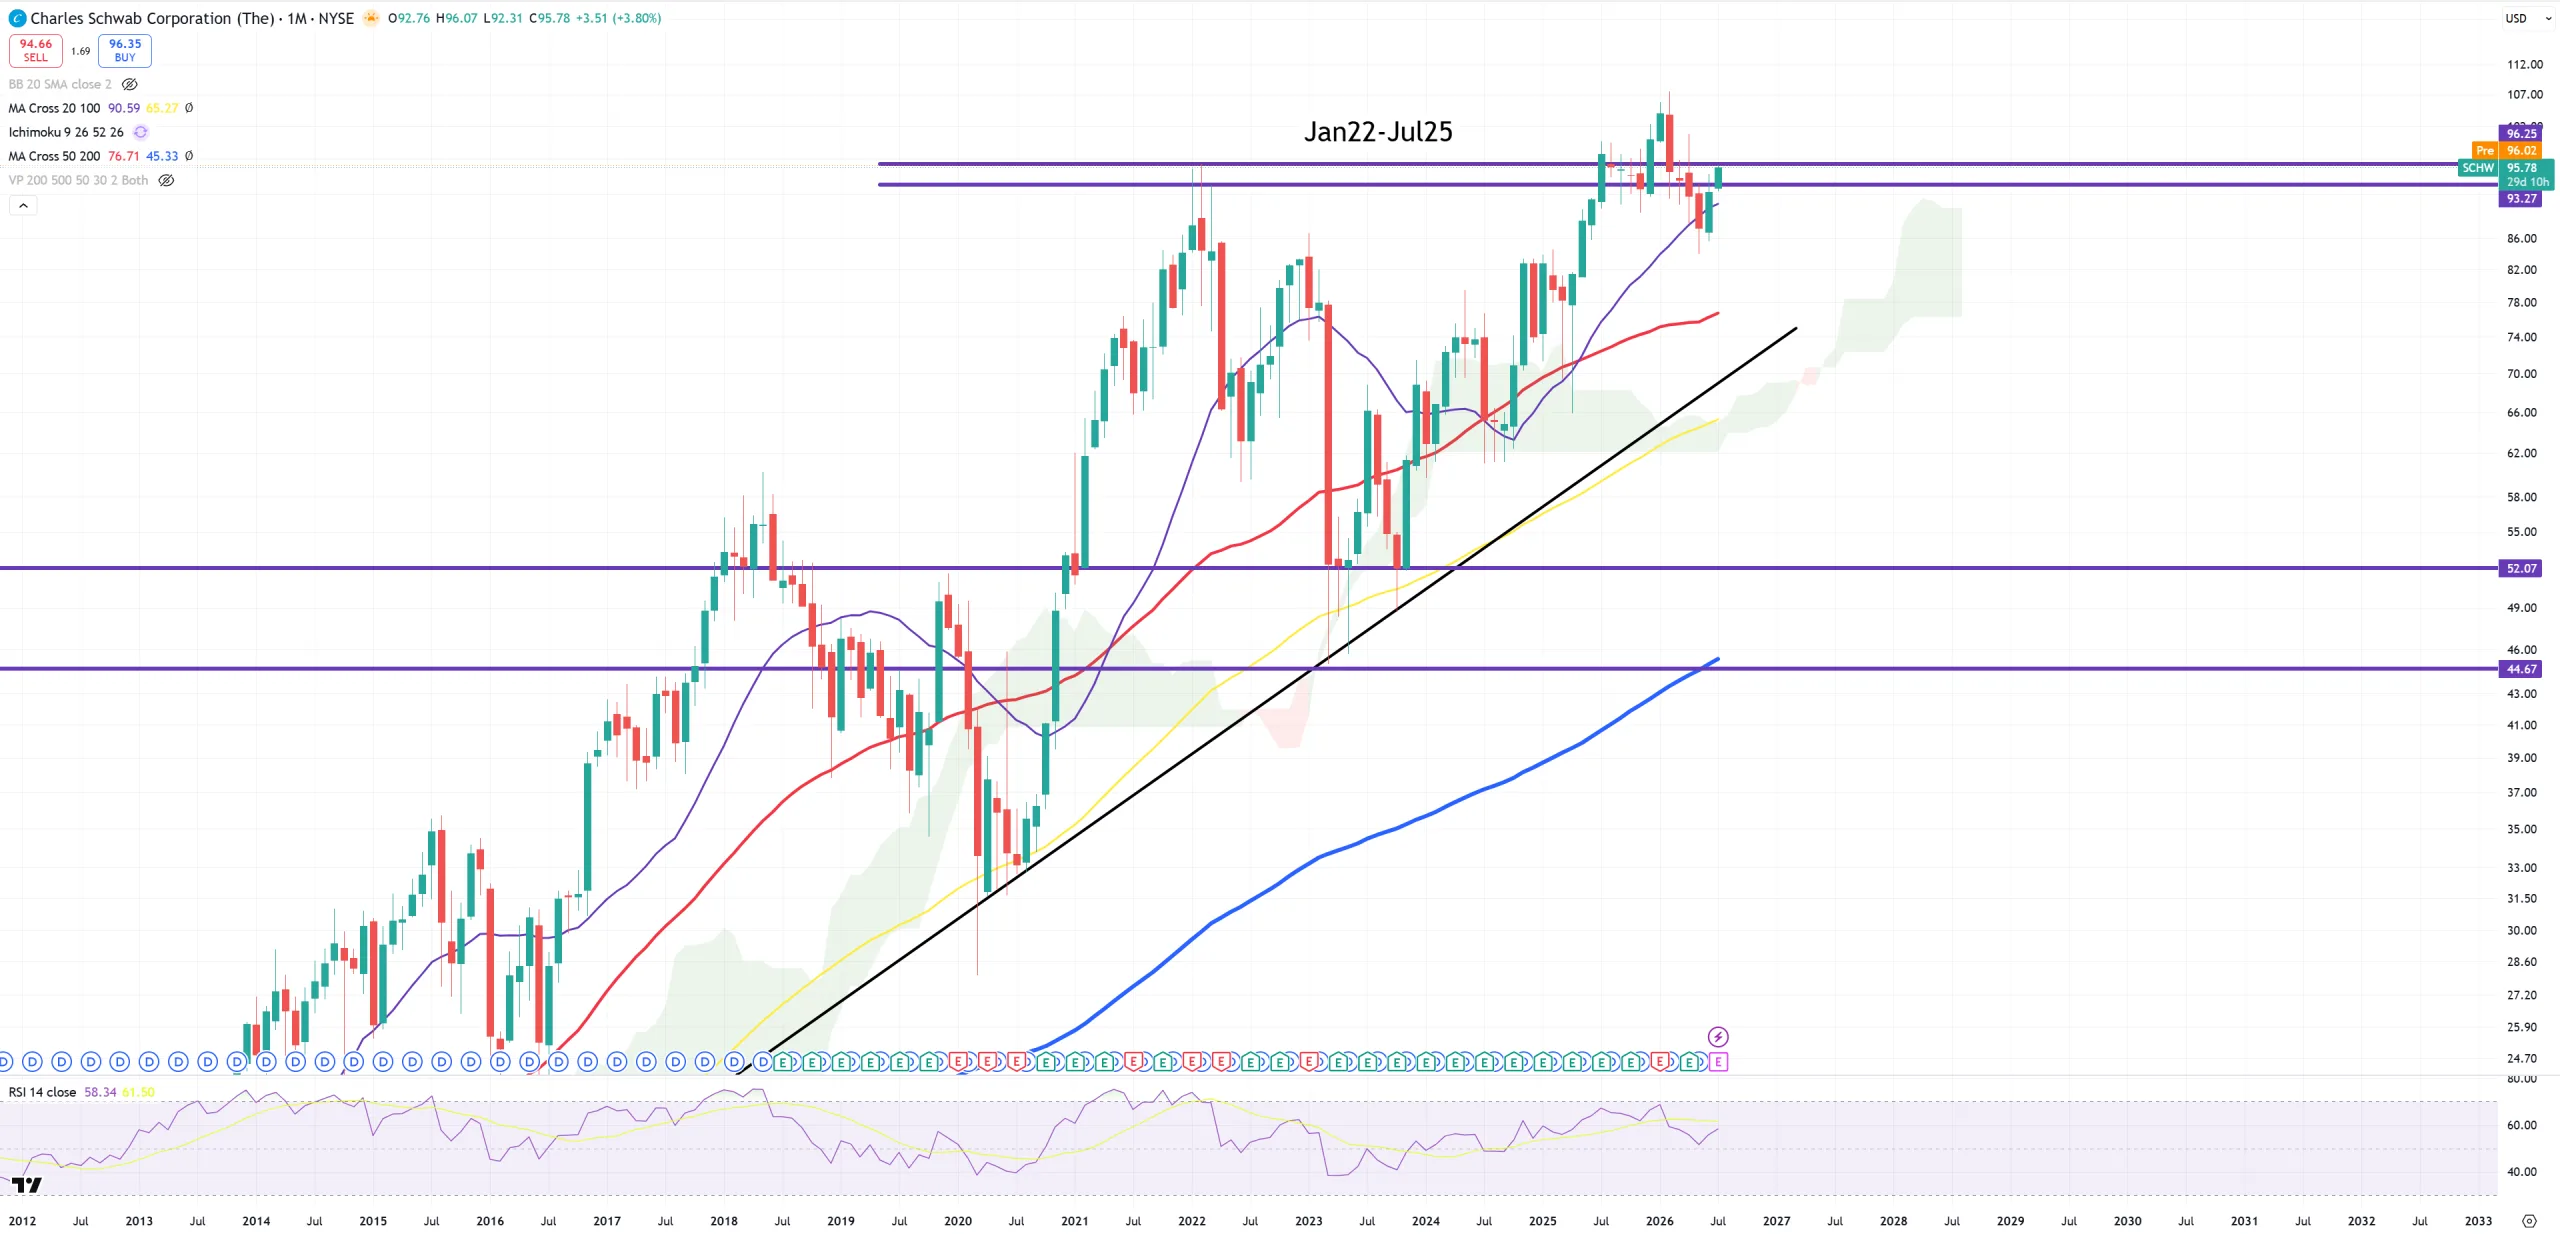
SCHW – but of course there are some banks that are in worse situation than others
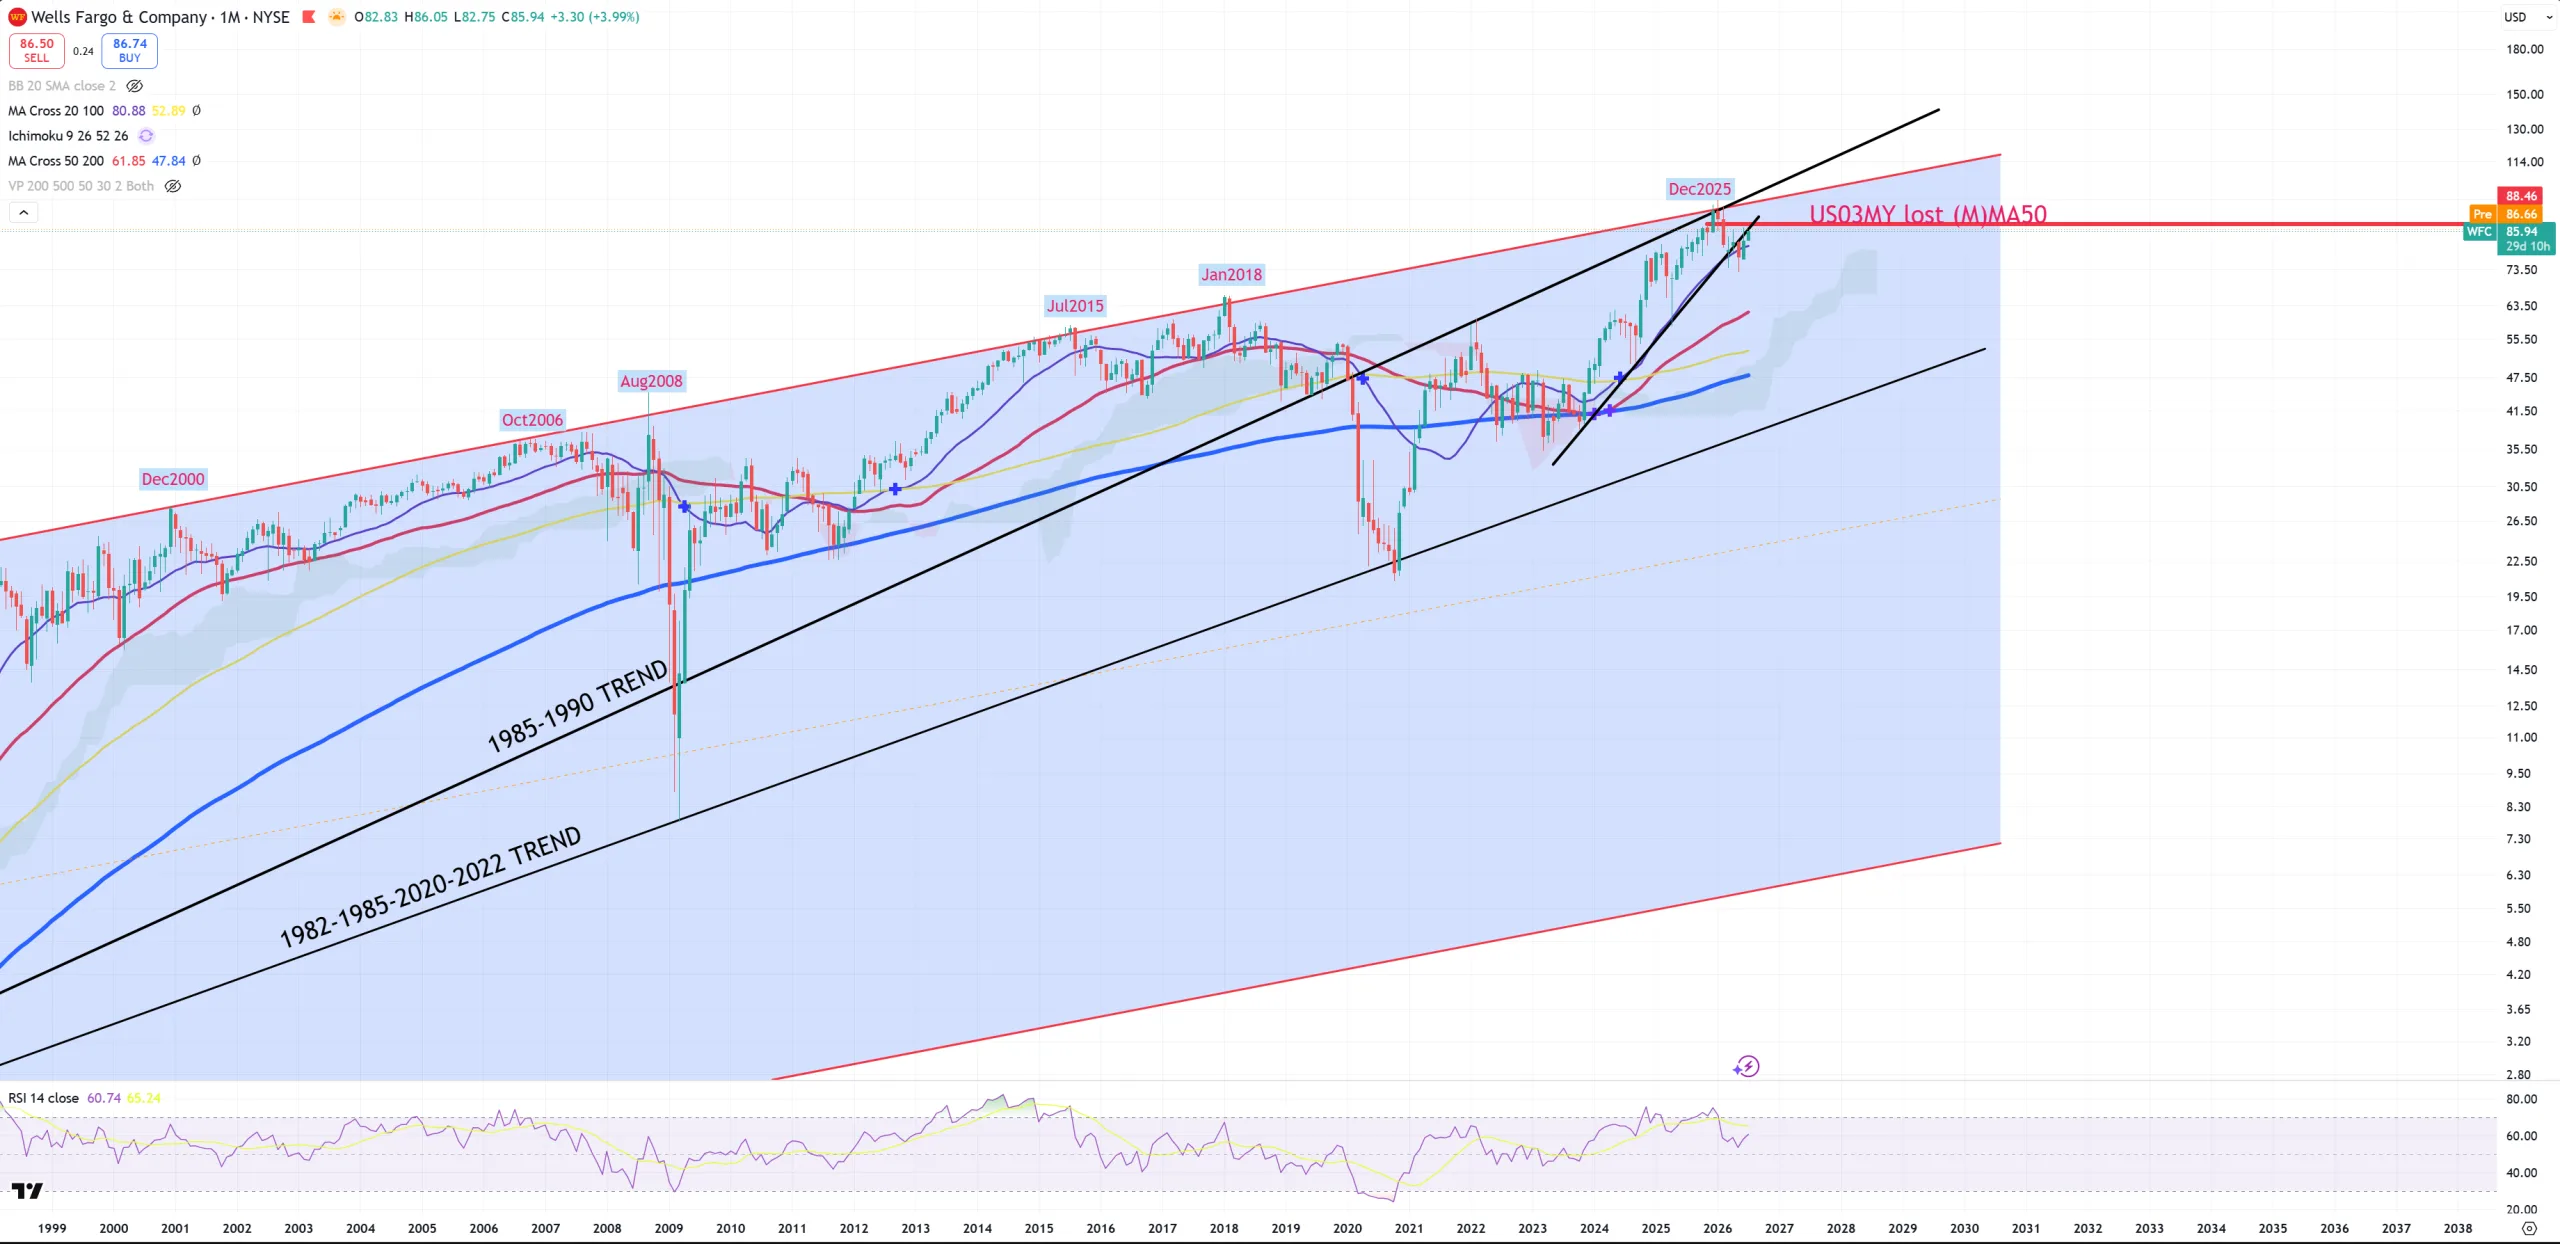
WFC – retesting the trend after a break. WFC has a perfect upper channel trend as you can see.
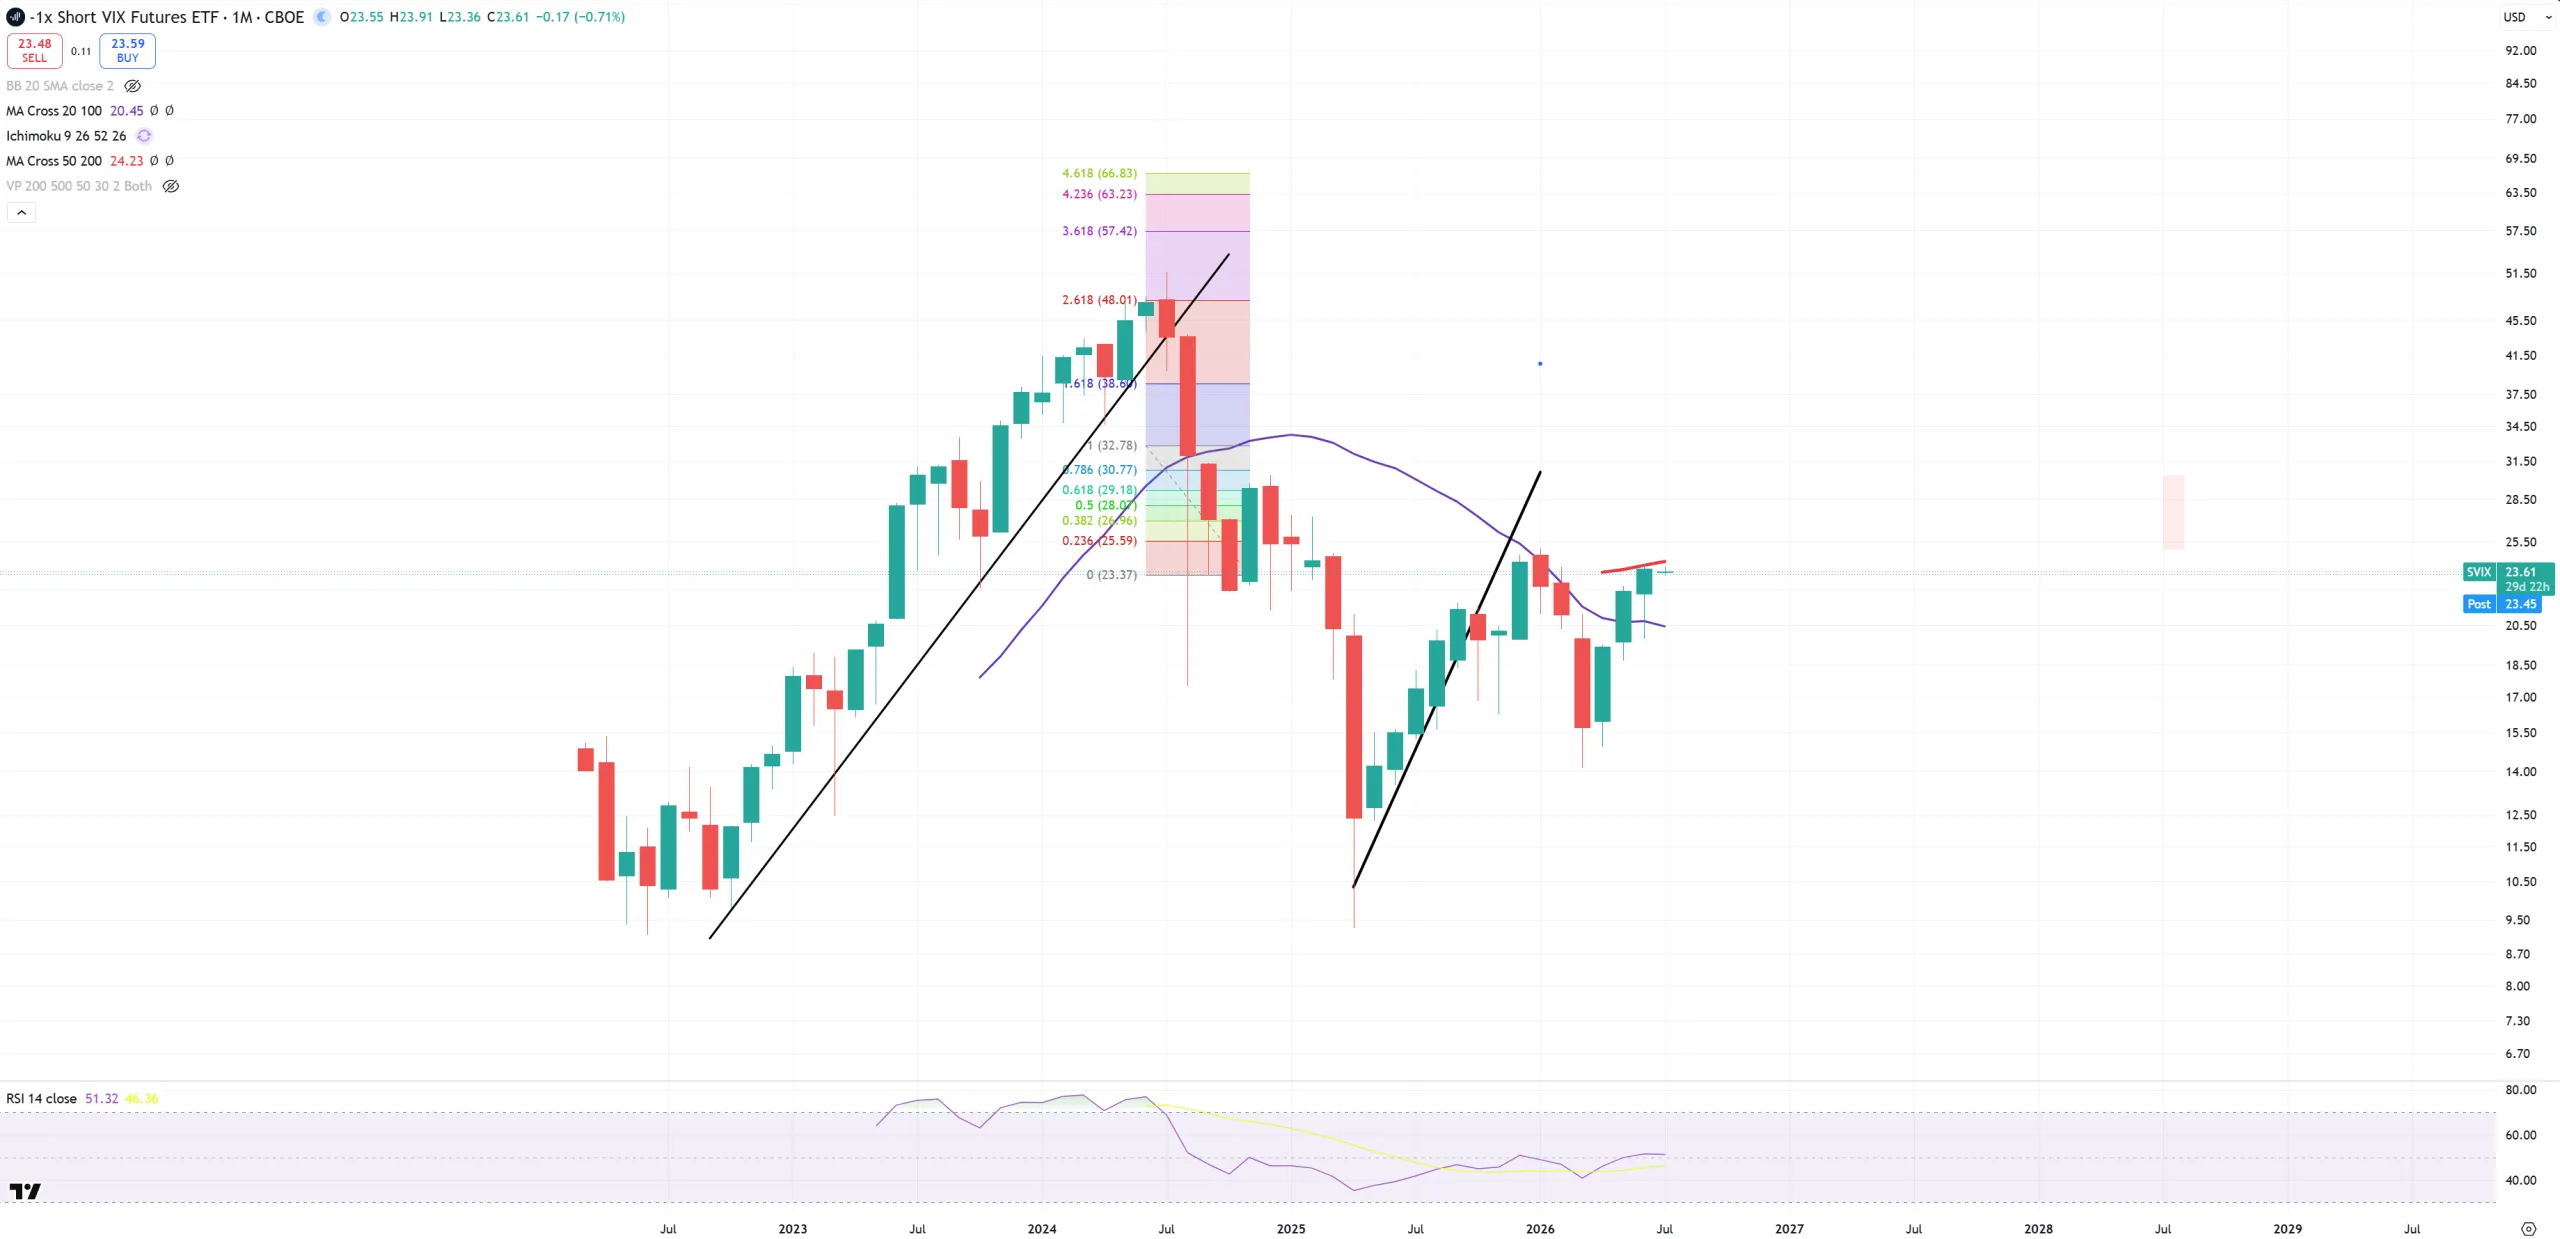
SVIX – when we take a look on VIX we won’t see anything, but on SVIX we see (M)MA50 retesting from the bottom
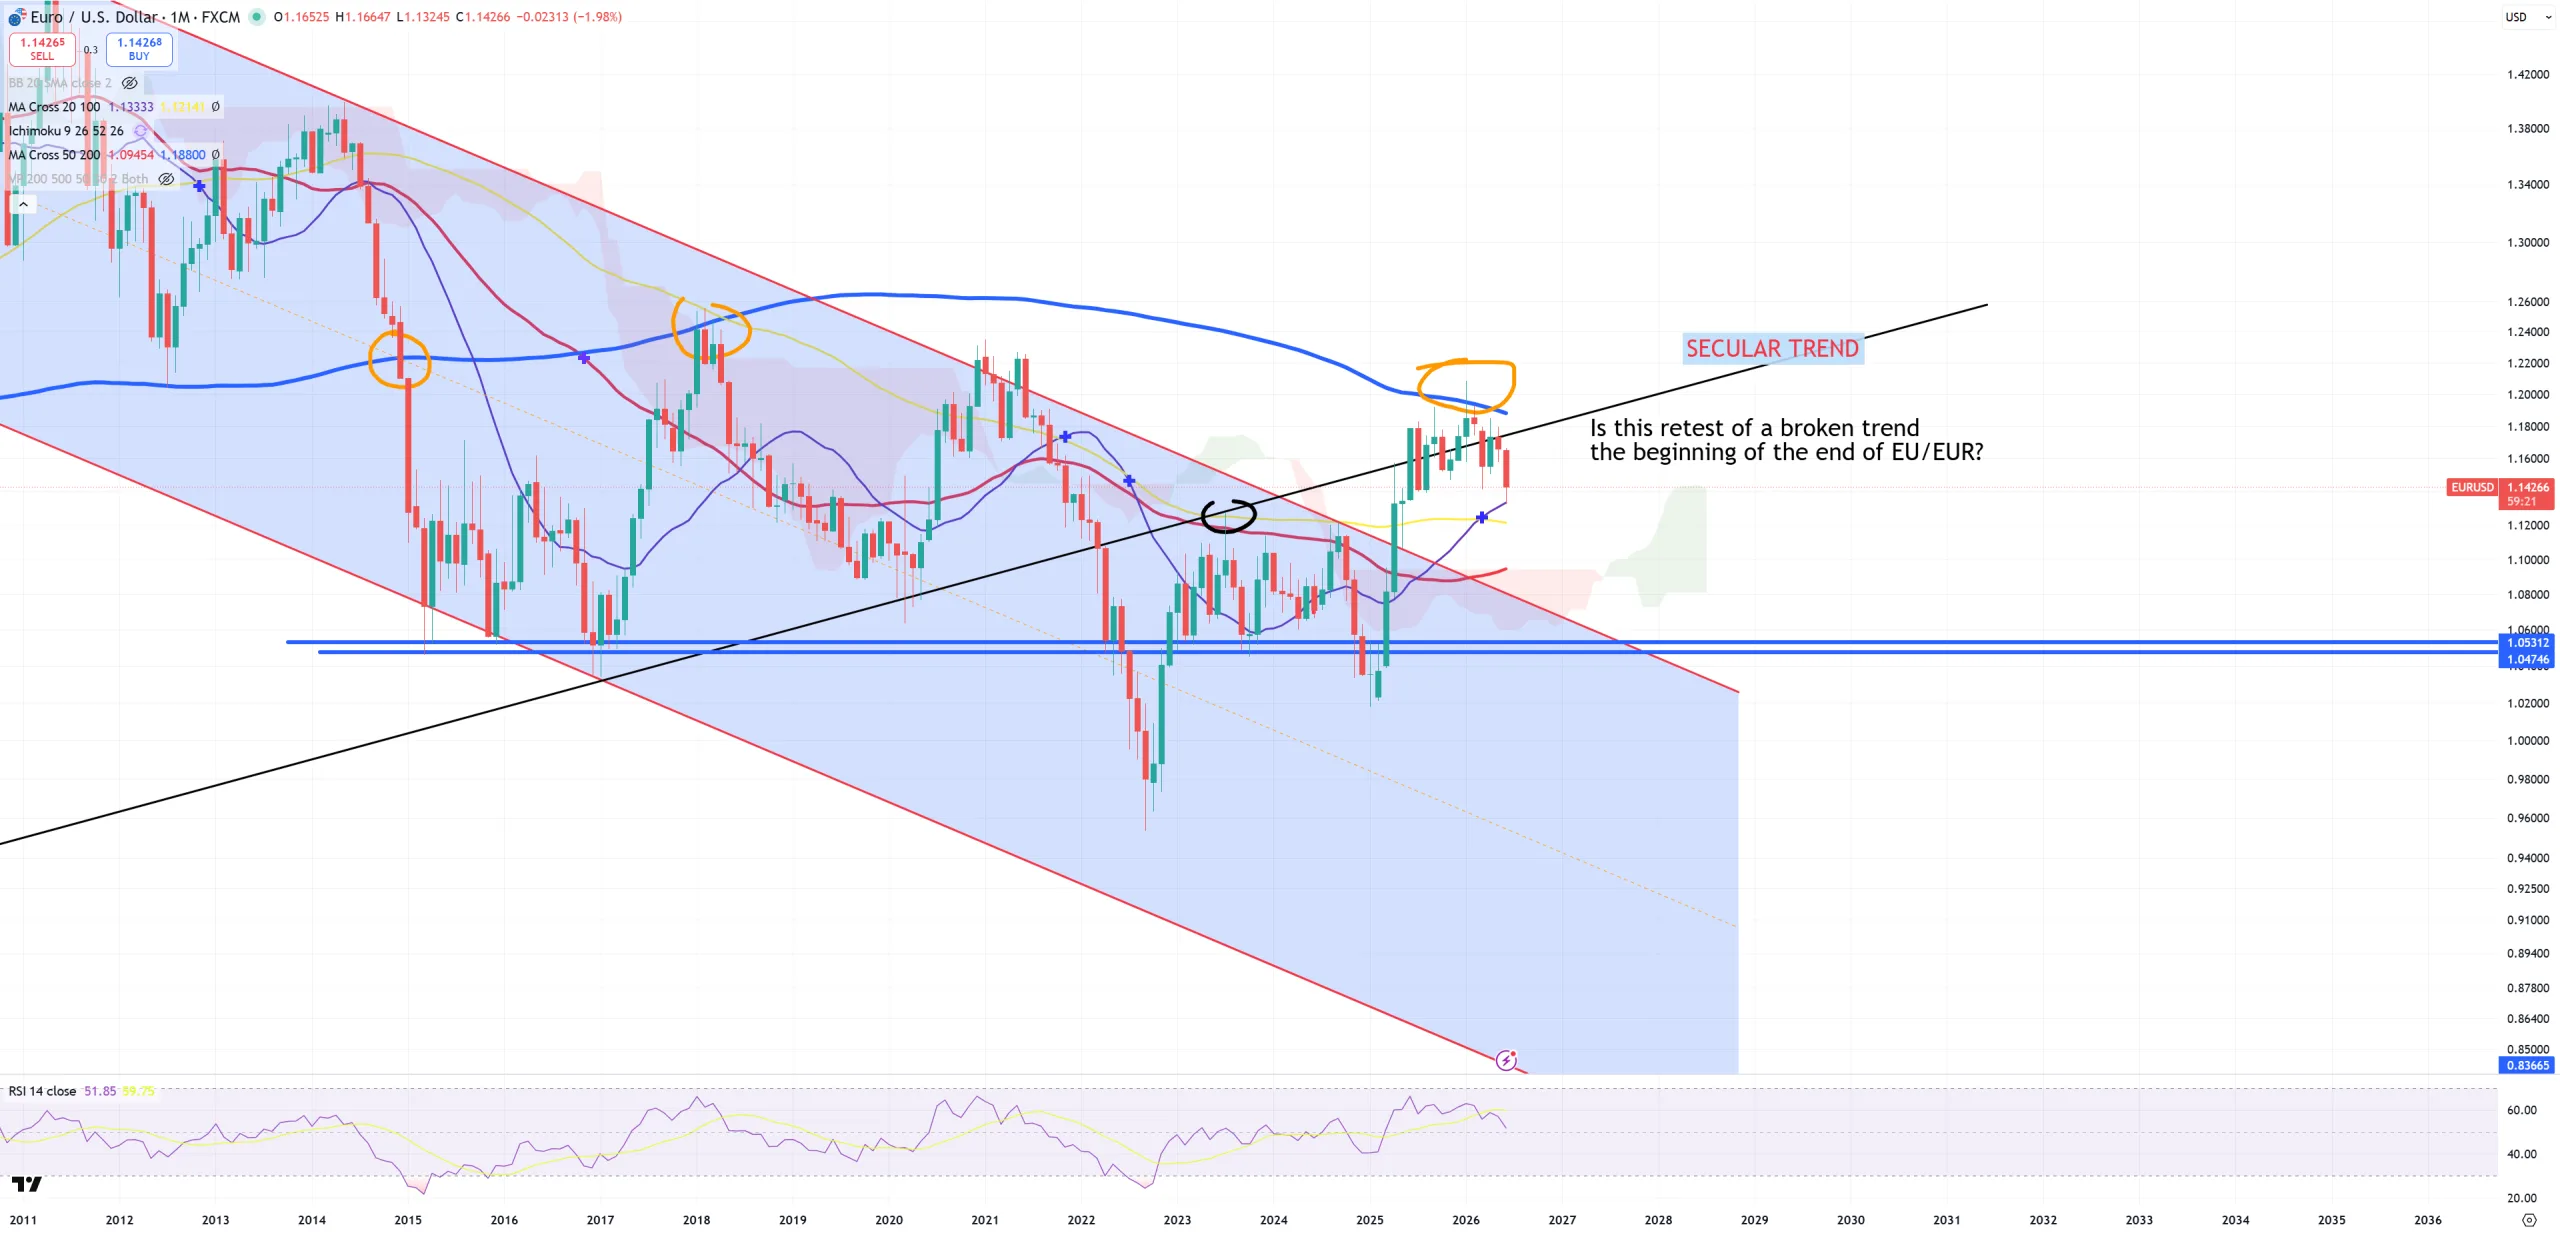
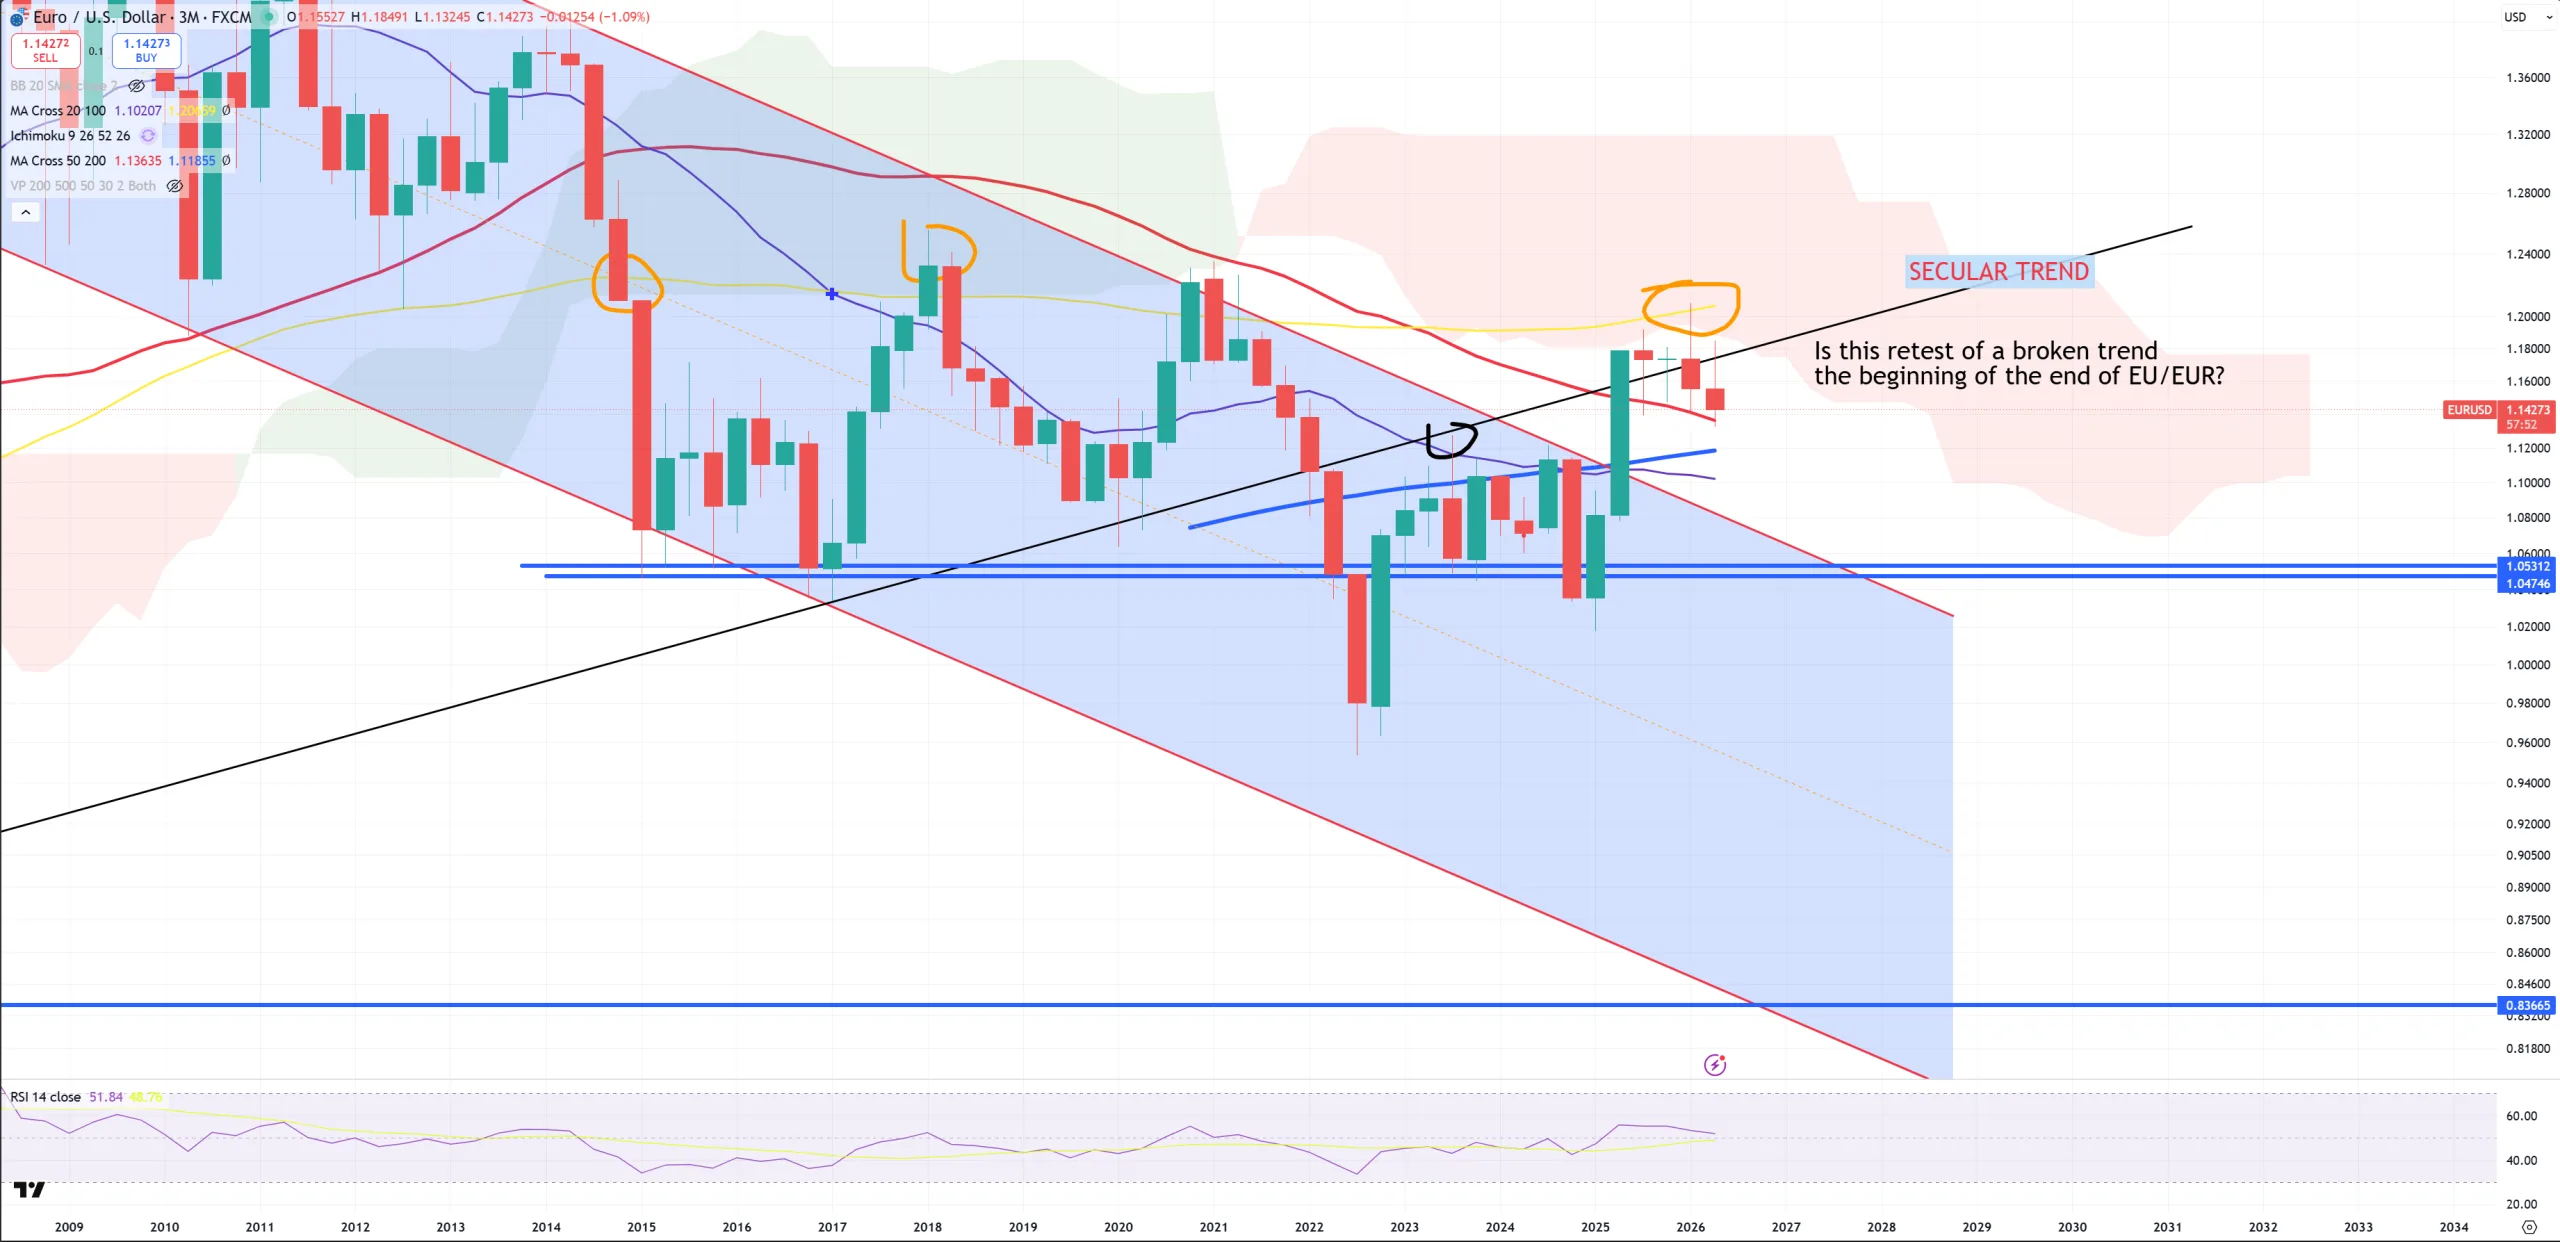
EURUSD – when we take a look on EURUSD on (M) you can see (M)MA20 support. So we’re limited between (M)MA200 + SECULAR TREND and now (M)MA20 is support. Situation looks more or less the same on (3M) view, where support hits on (3M)MA50. If bears really wanted to hurt this market I was expecting EURUSD to drop in 2Q26 below (3M)MA50 = 1.136 & (3M)MA200=1.118 – but that failed.
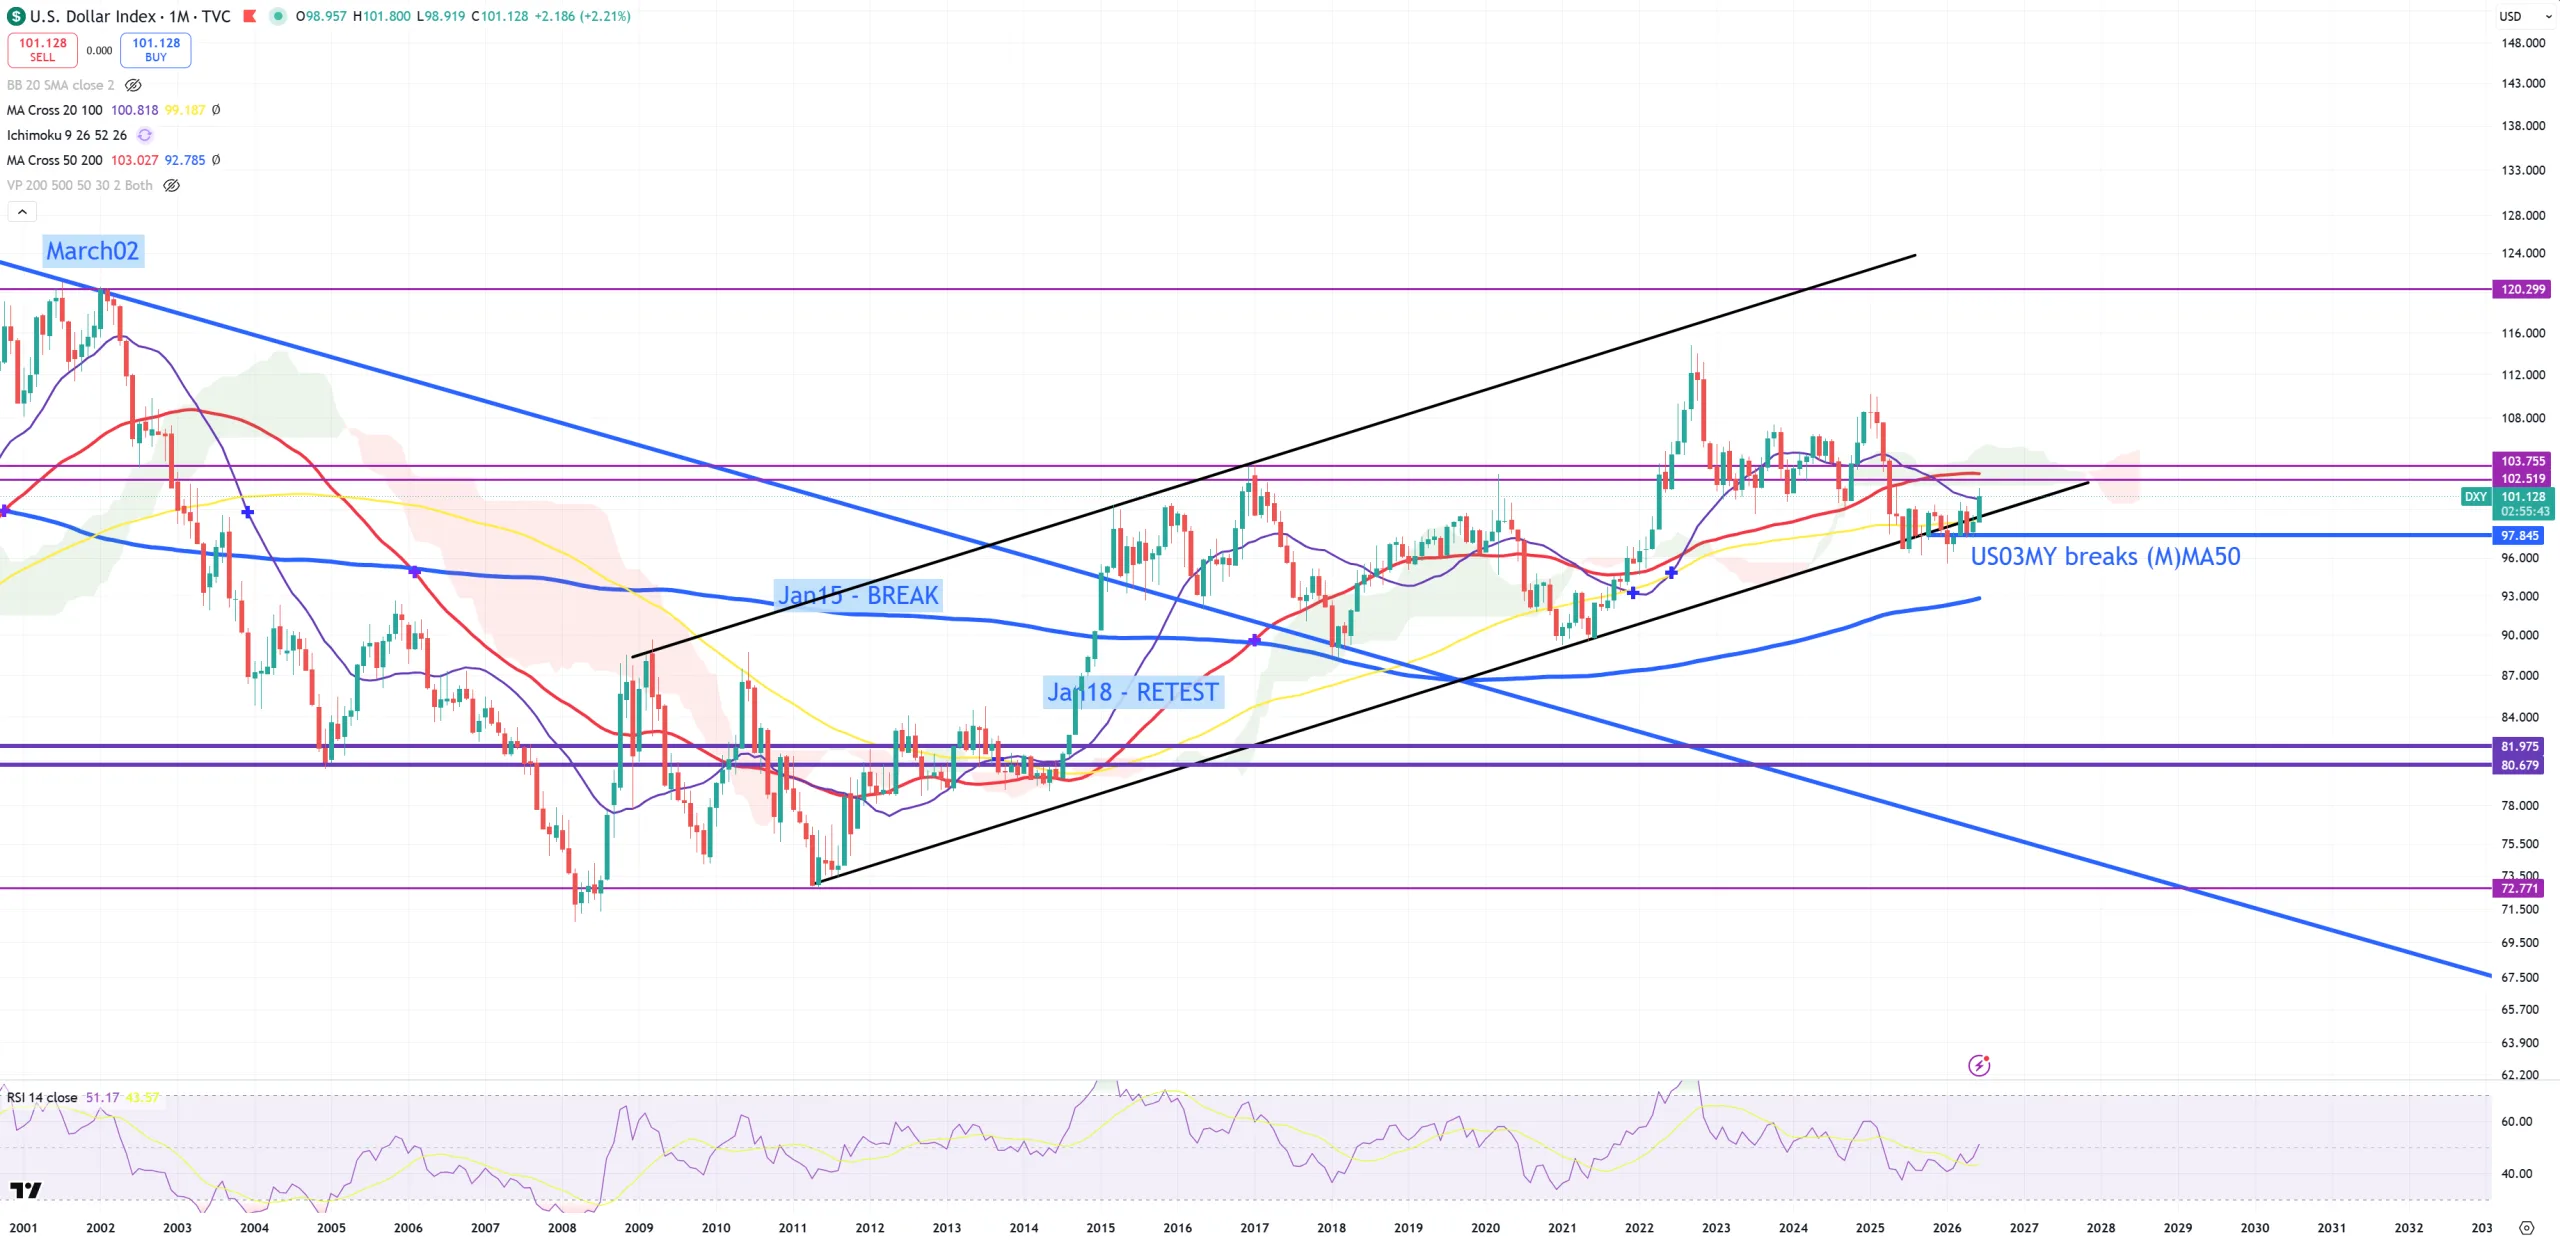
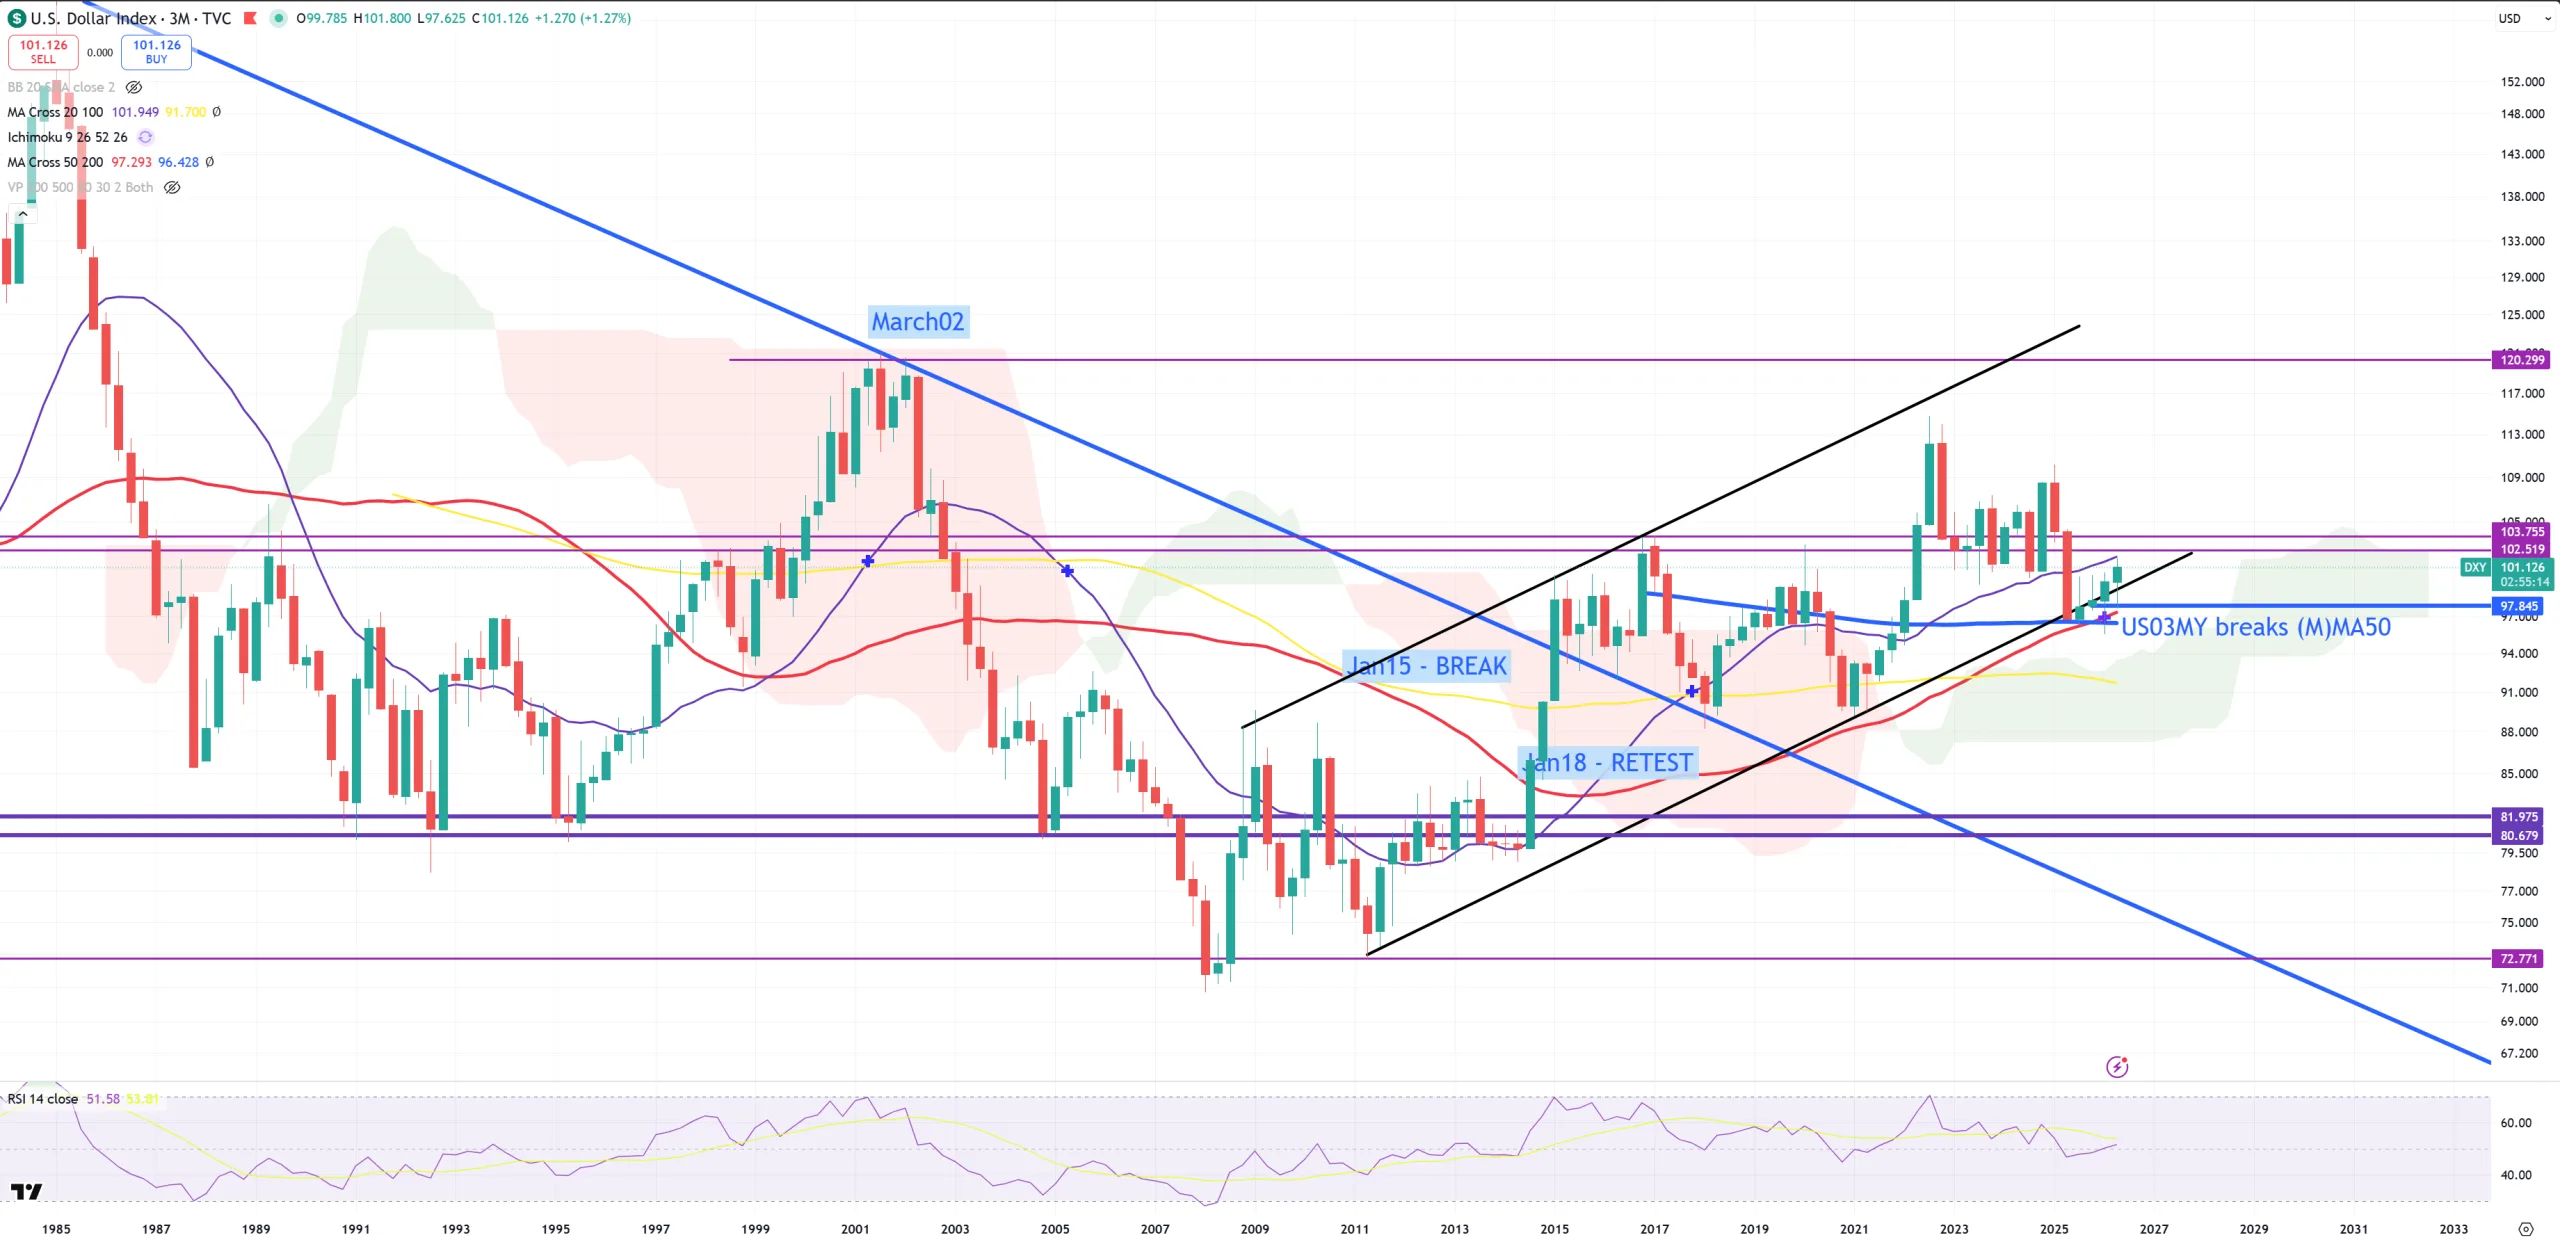
DXY – that’s a kind of the same chart as EURUSD – but here on (M) we managed to take (M)MA20. On (3M) we failed to break (3M)MA20. What is important : still looks like a super bull market for $$$ keeps building. We need let’s say > 104 on DXY on (M) to get this confirmation and get red (M)MA50 broken. As USDCNH from next example finds support, as FXI collapses = DXY starts going up. DXY will never crash lower once FXI goes down & USDCNH goes up. It’s not the FED, it’s not the Trump, it’s not about anything else than China.
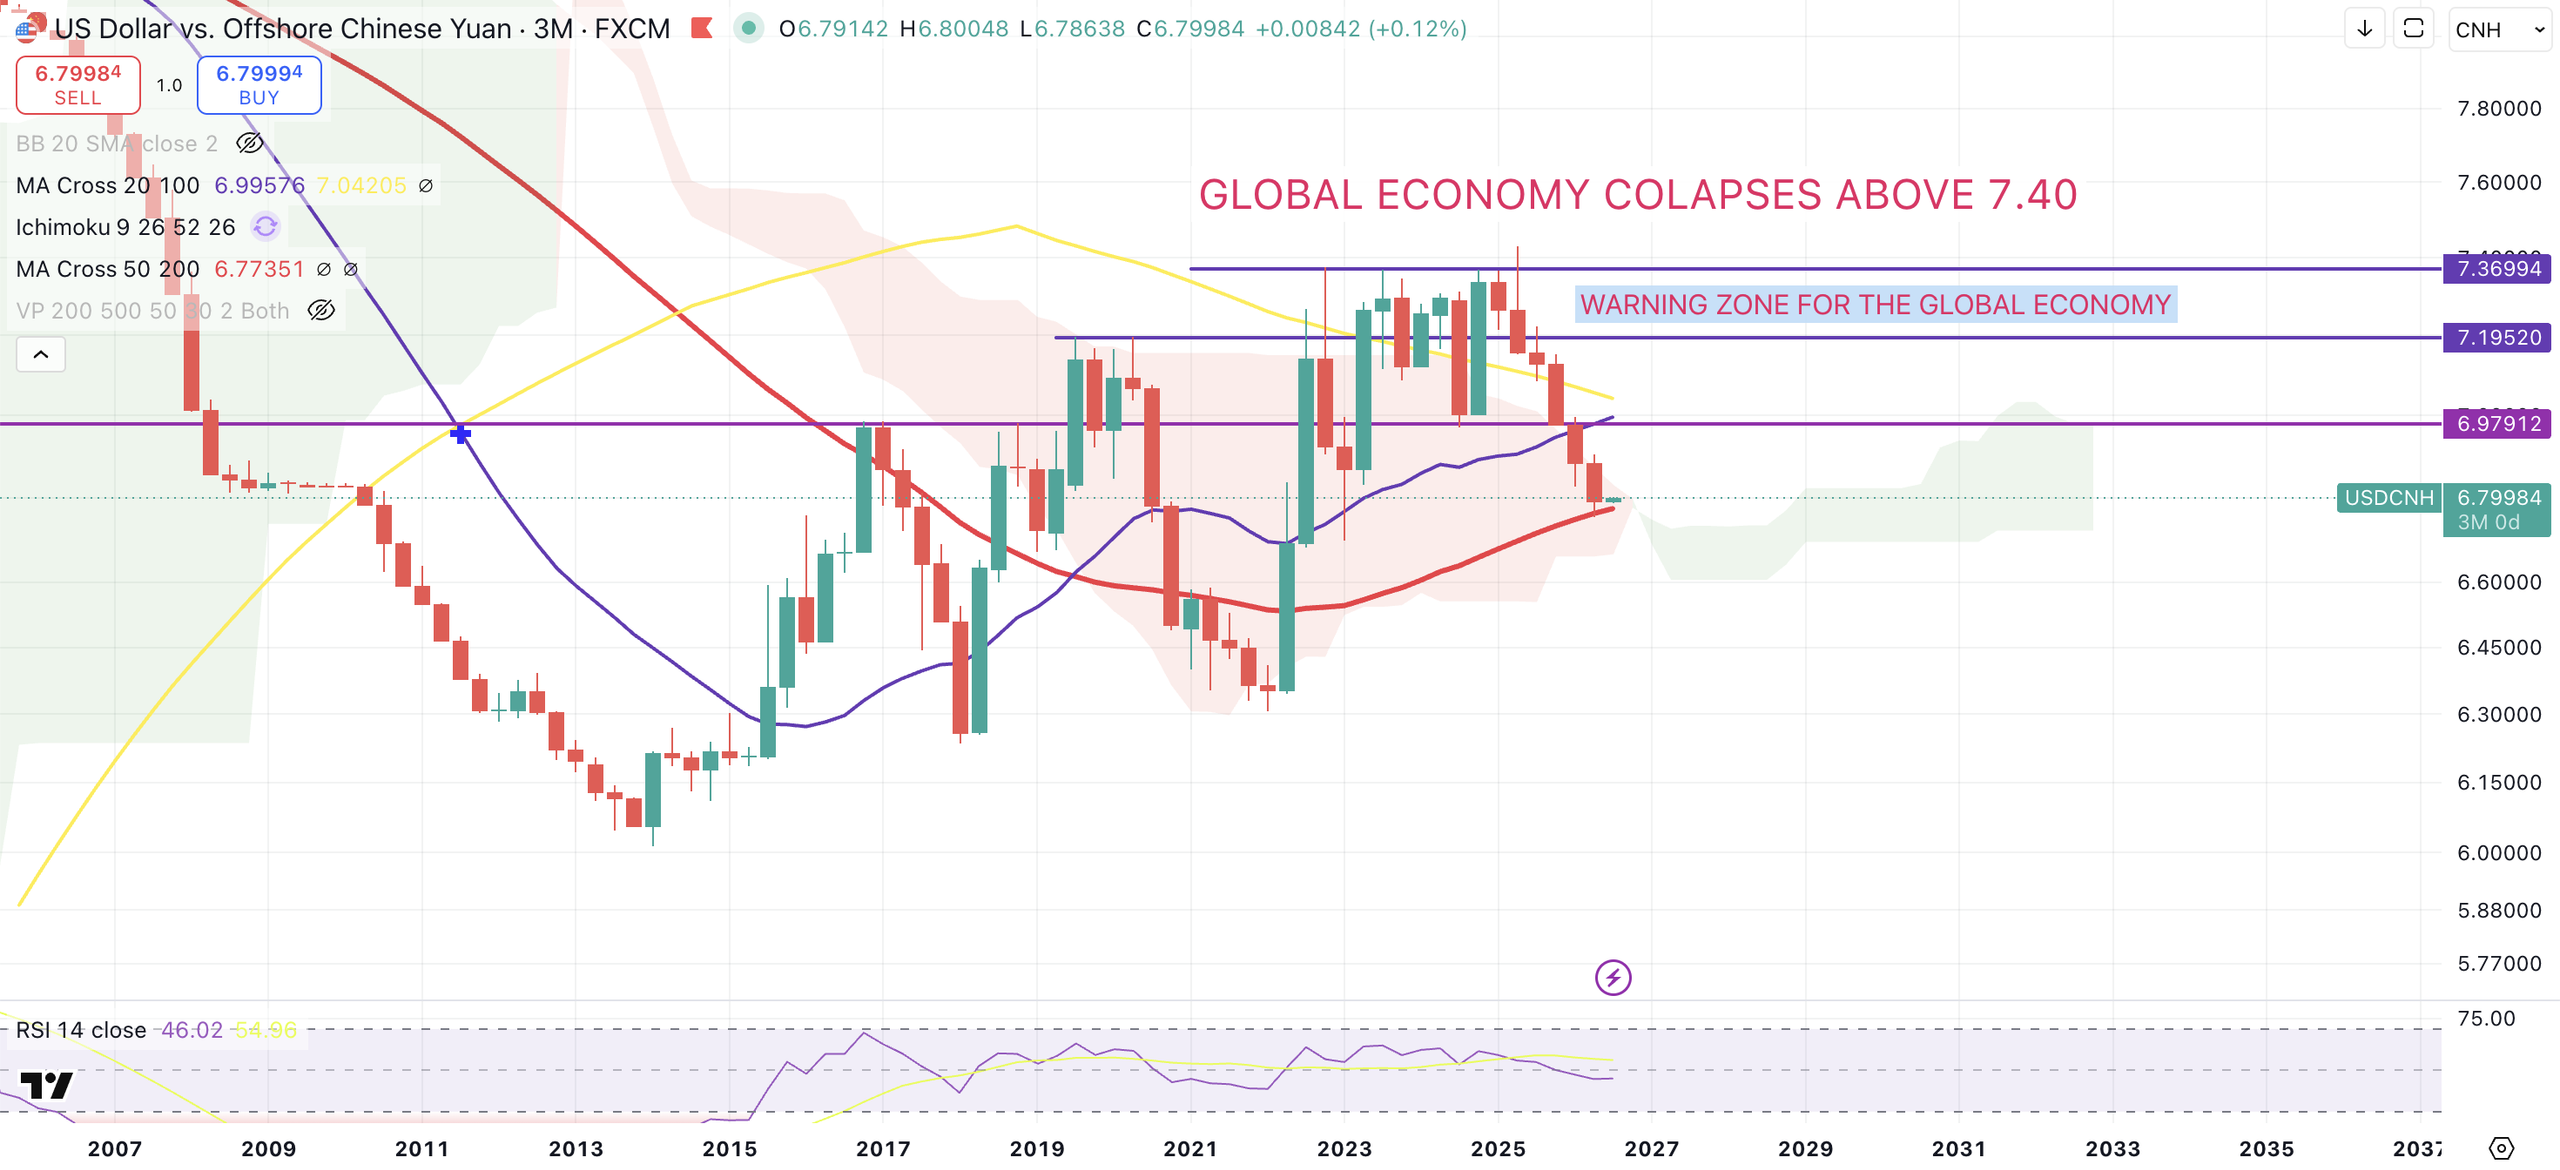
USDCNH – “The power of the $$$ is the weakness of the Yuan” or “You have 2 trades on the market – either you are long Yuan short $$$, or you are long $$$ short Yuan”. These 2 are my statements. Yuan seems to have (3M)MA50 support on 6.77. USDCNH up will force multiple other trades like AUDUSD down or EURUSD down. USDCNH up = US stock market down. Let me give you a hint. AI/SOX trade (recovery) allowed USDCNH to go lower not blowing up 7.40 level earlier. Later you will see 10y/3m yield-curve and you’ll see how this curve crashed back to inversion under the same trade – extending the recovery process.
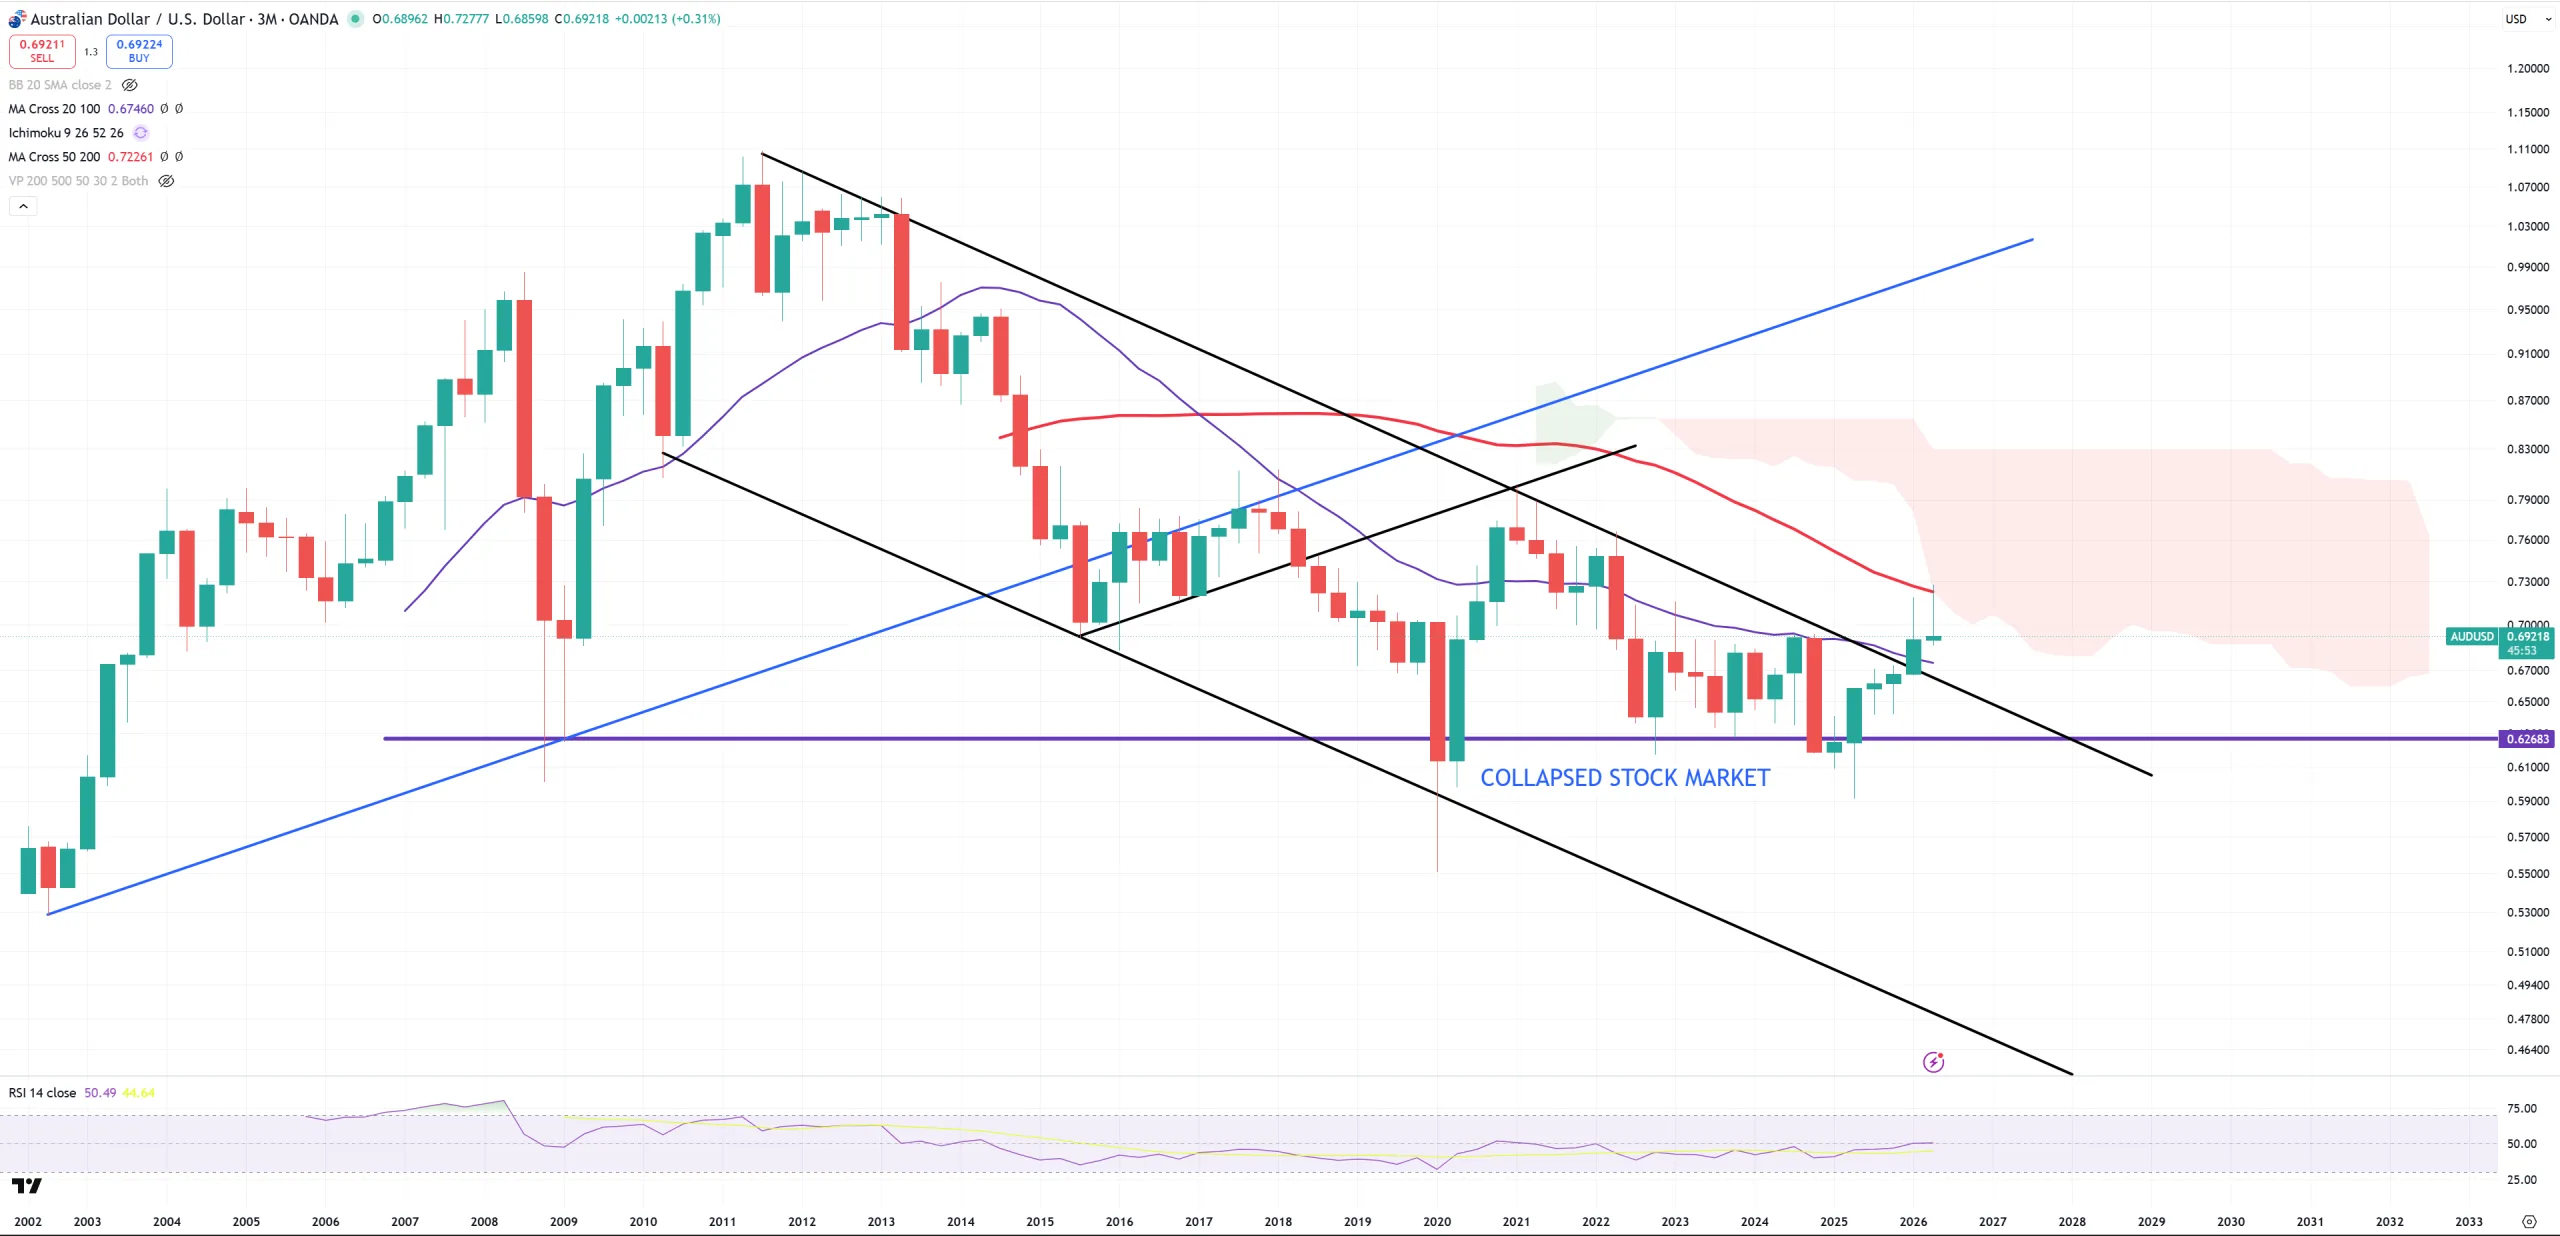
AUDUSD – risk on/off – same situation as EURUSD. Ideal for the bears is to move back below black channel. It failed, just (3M)MA50 rejection.
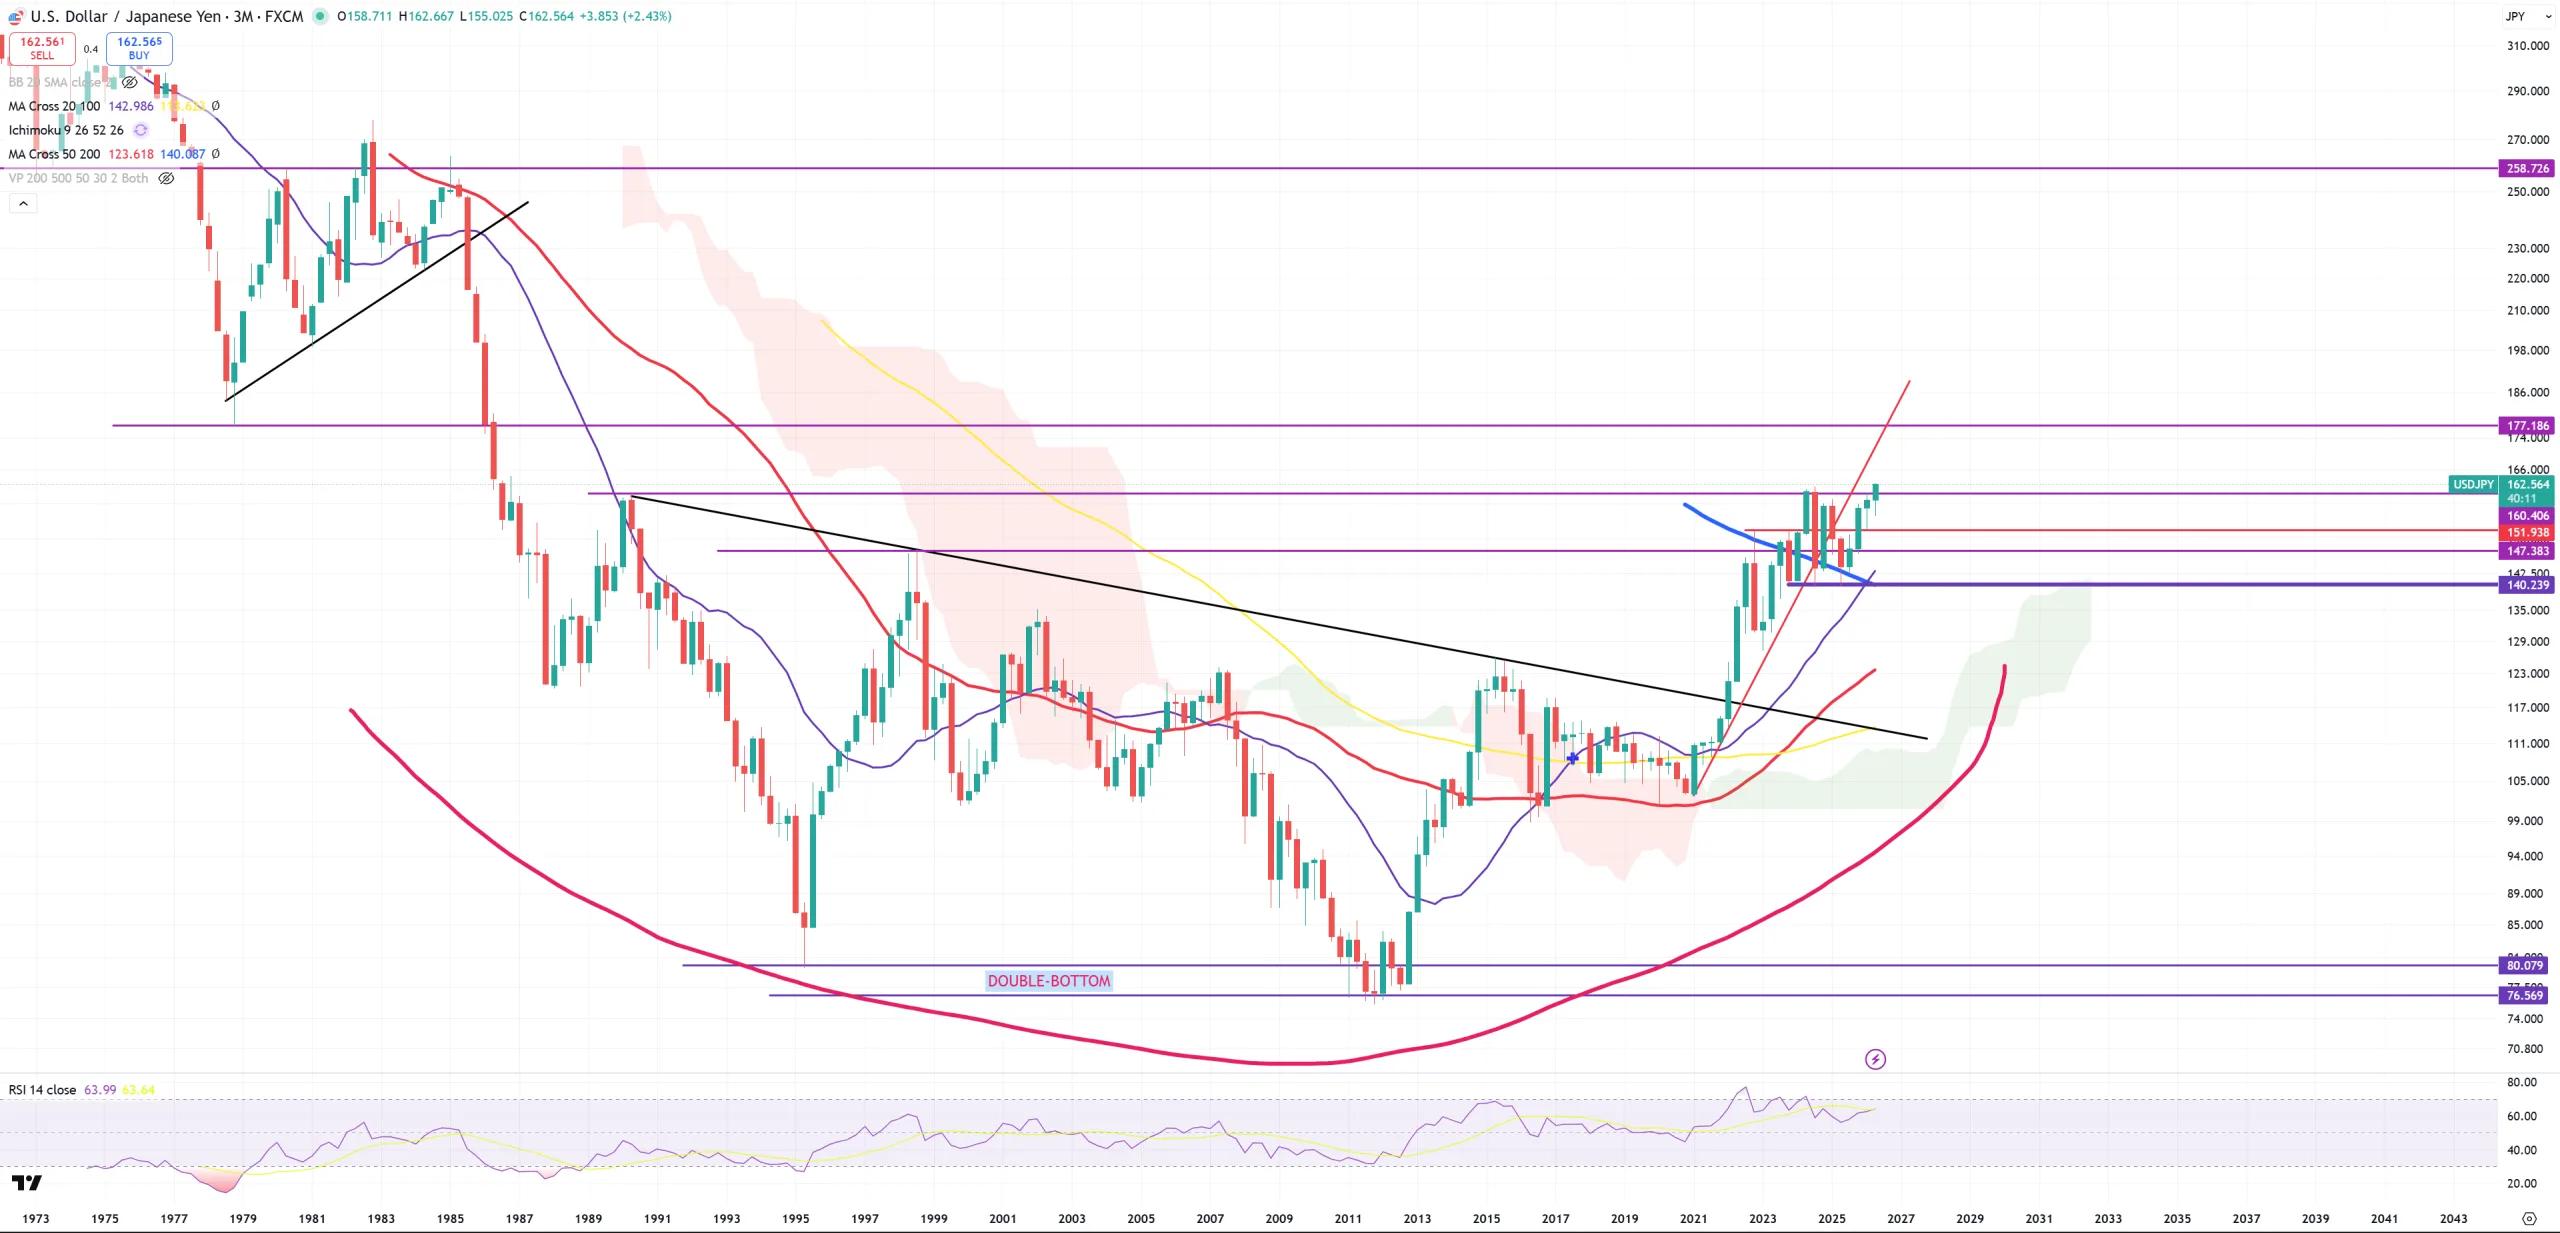
USDJPY – this is 3M view. Looks like ~180 is next. Later we’ll discuss bond market, but a hint : it looks terrible for Japan. It looks so terrible that BoJ will be forced to hike by 75-100bps at some point of time when panic begins. I think you should totally ignore JPY as this currency is worthless staring tracking demographics programs. Its correlations with oil, gold etc, do not matter anymore any longer. Well deserved RIP. Japan with its monetary policies blocked the economy from reborn and implications will be massive for decades. BoJ can shut down its operations = they lost vs the gravity and their own stupidity.
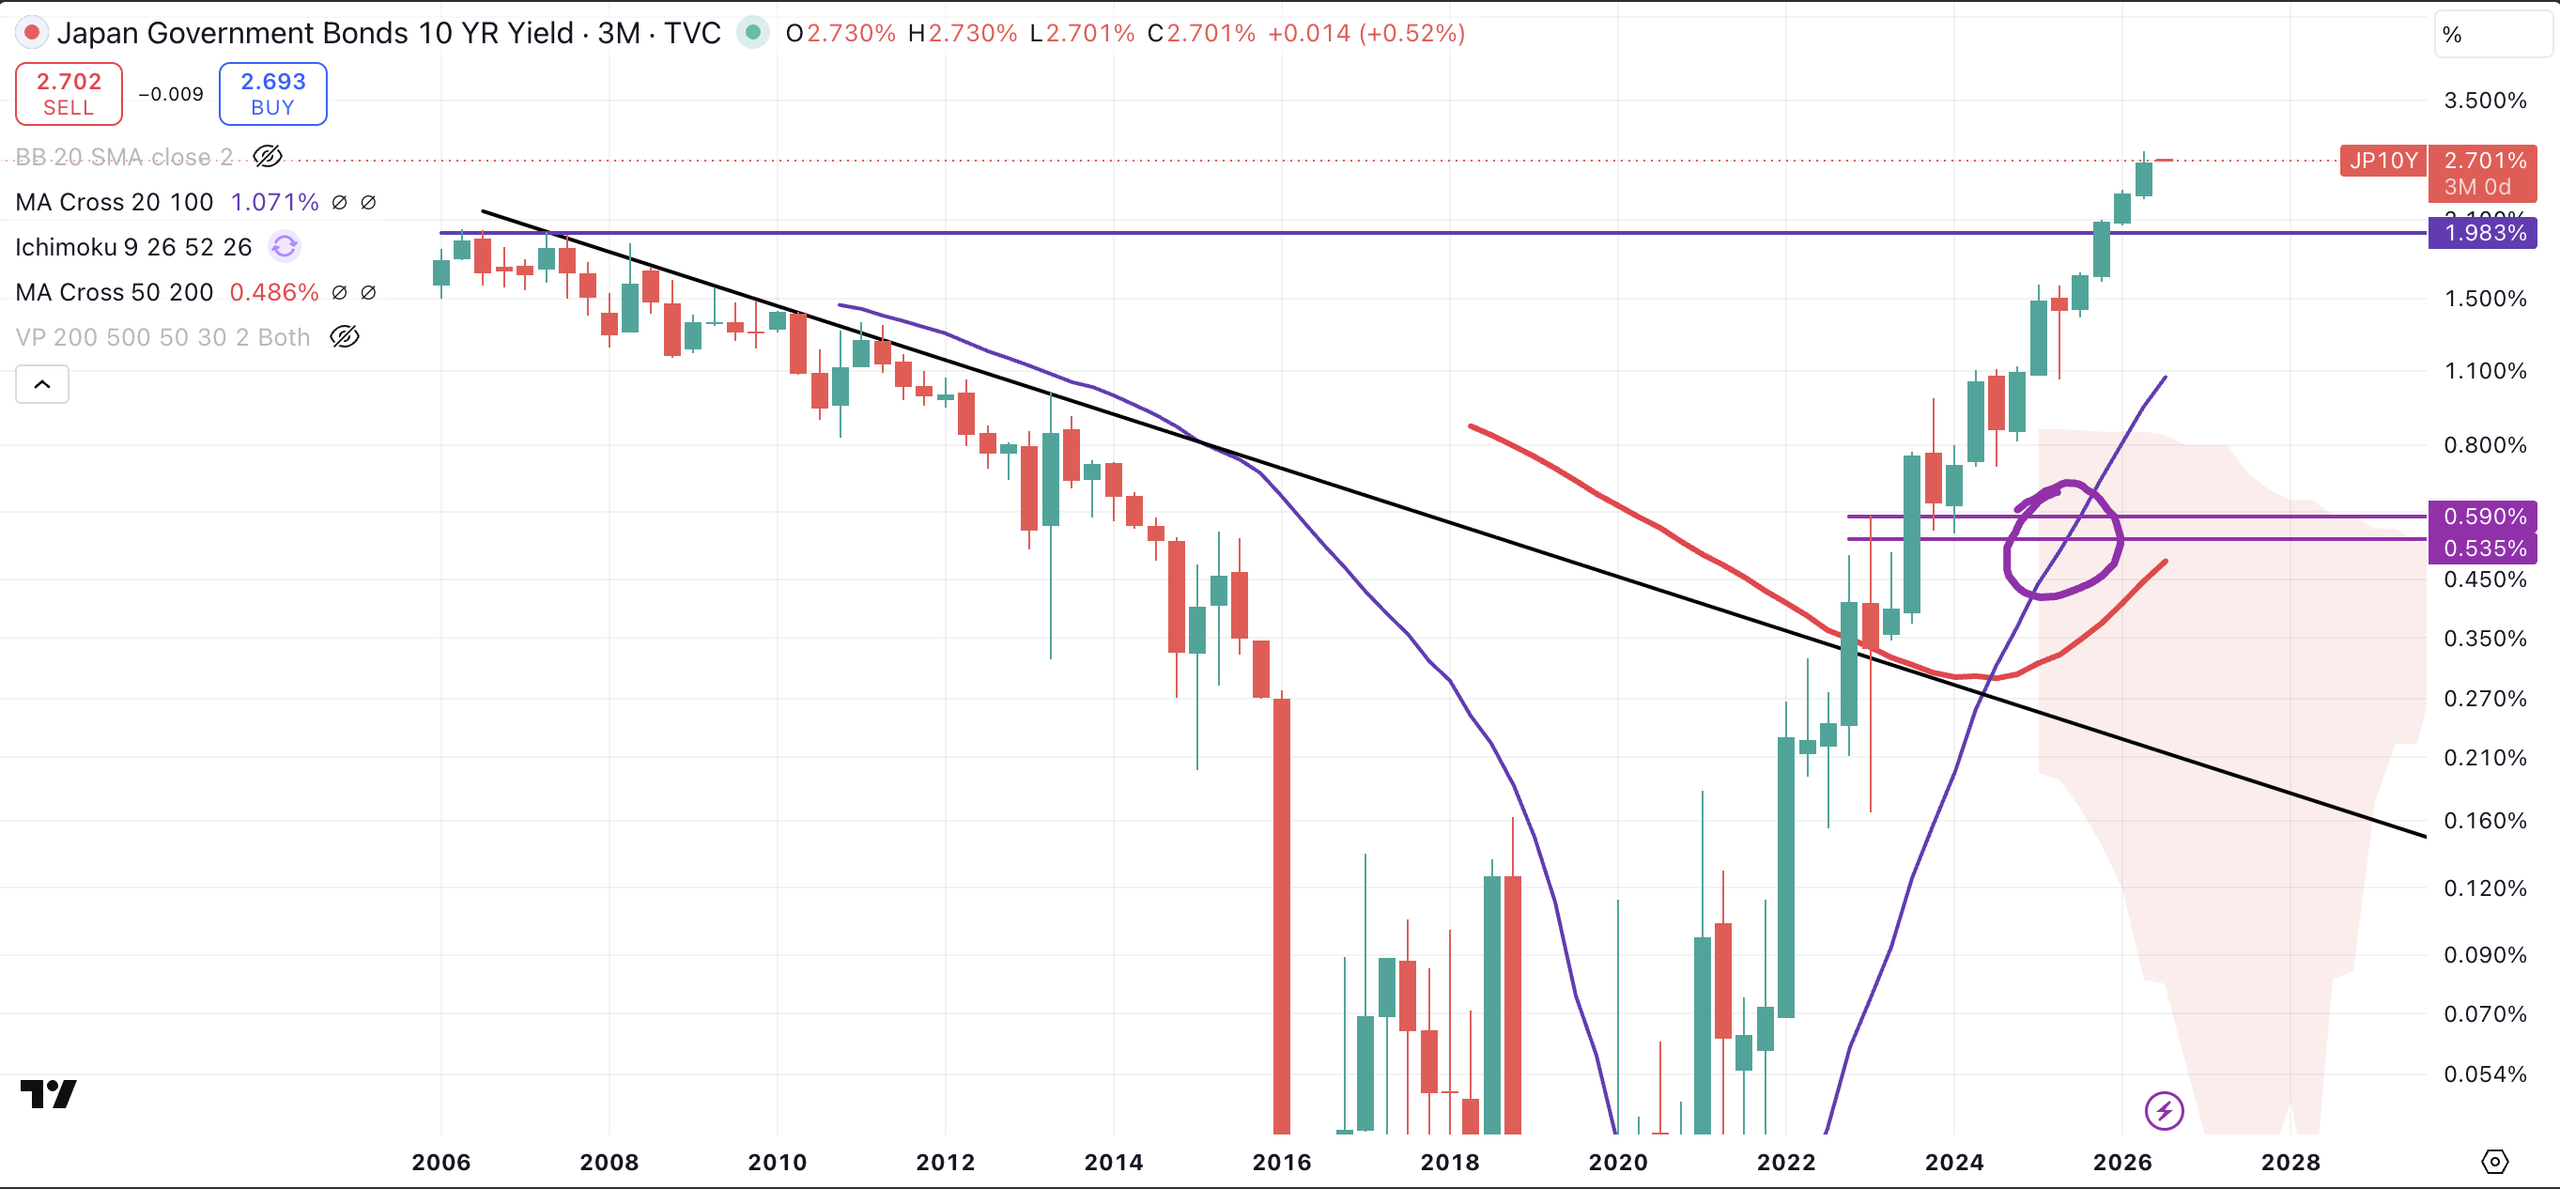
JP10Y – this is game over – well deserved. While I was a big fan of Japanese bond market blow up with targets staring from 0.5% later 1.0% later 2.0%, I’ve stopped counting post 2.0% break as sky is the limit. Maybe we might have here SOX style pattern going to 5.0%-8.0% – also well deserved value. Country which is collapsing on its own demographics won’t get any flows of funds even if they print 20% on 10Ys.
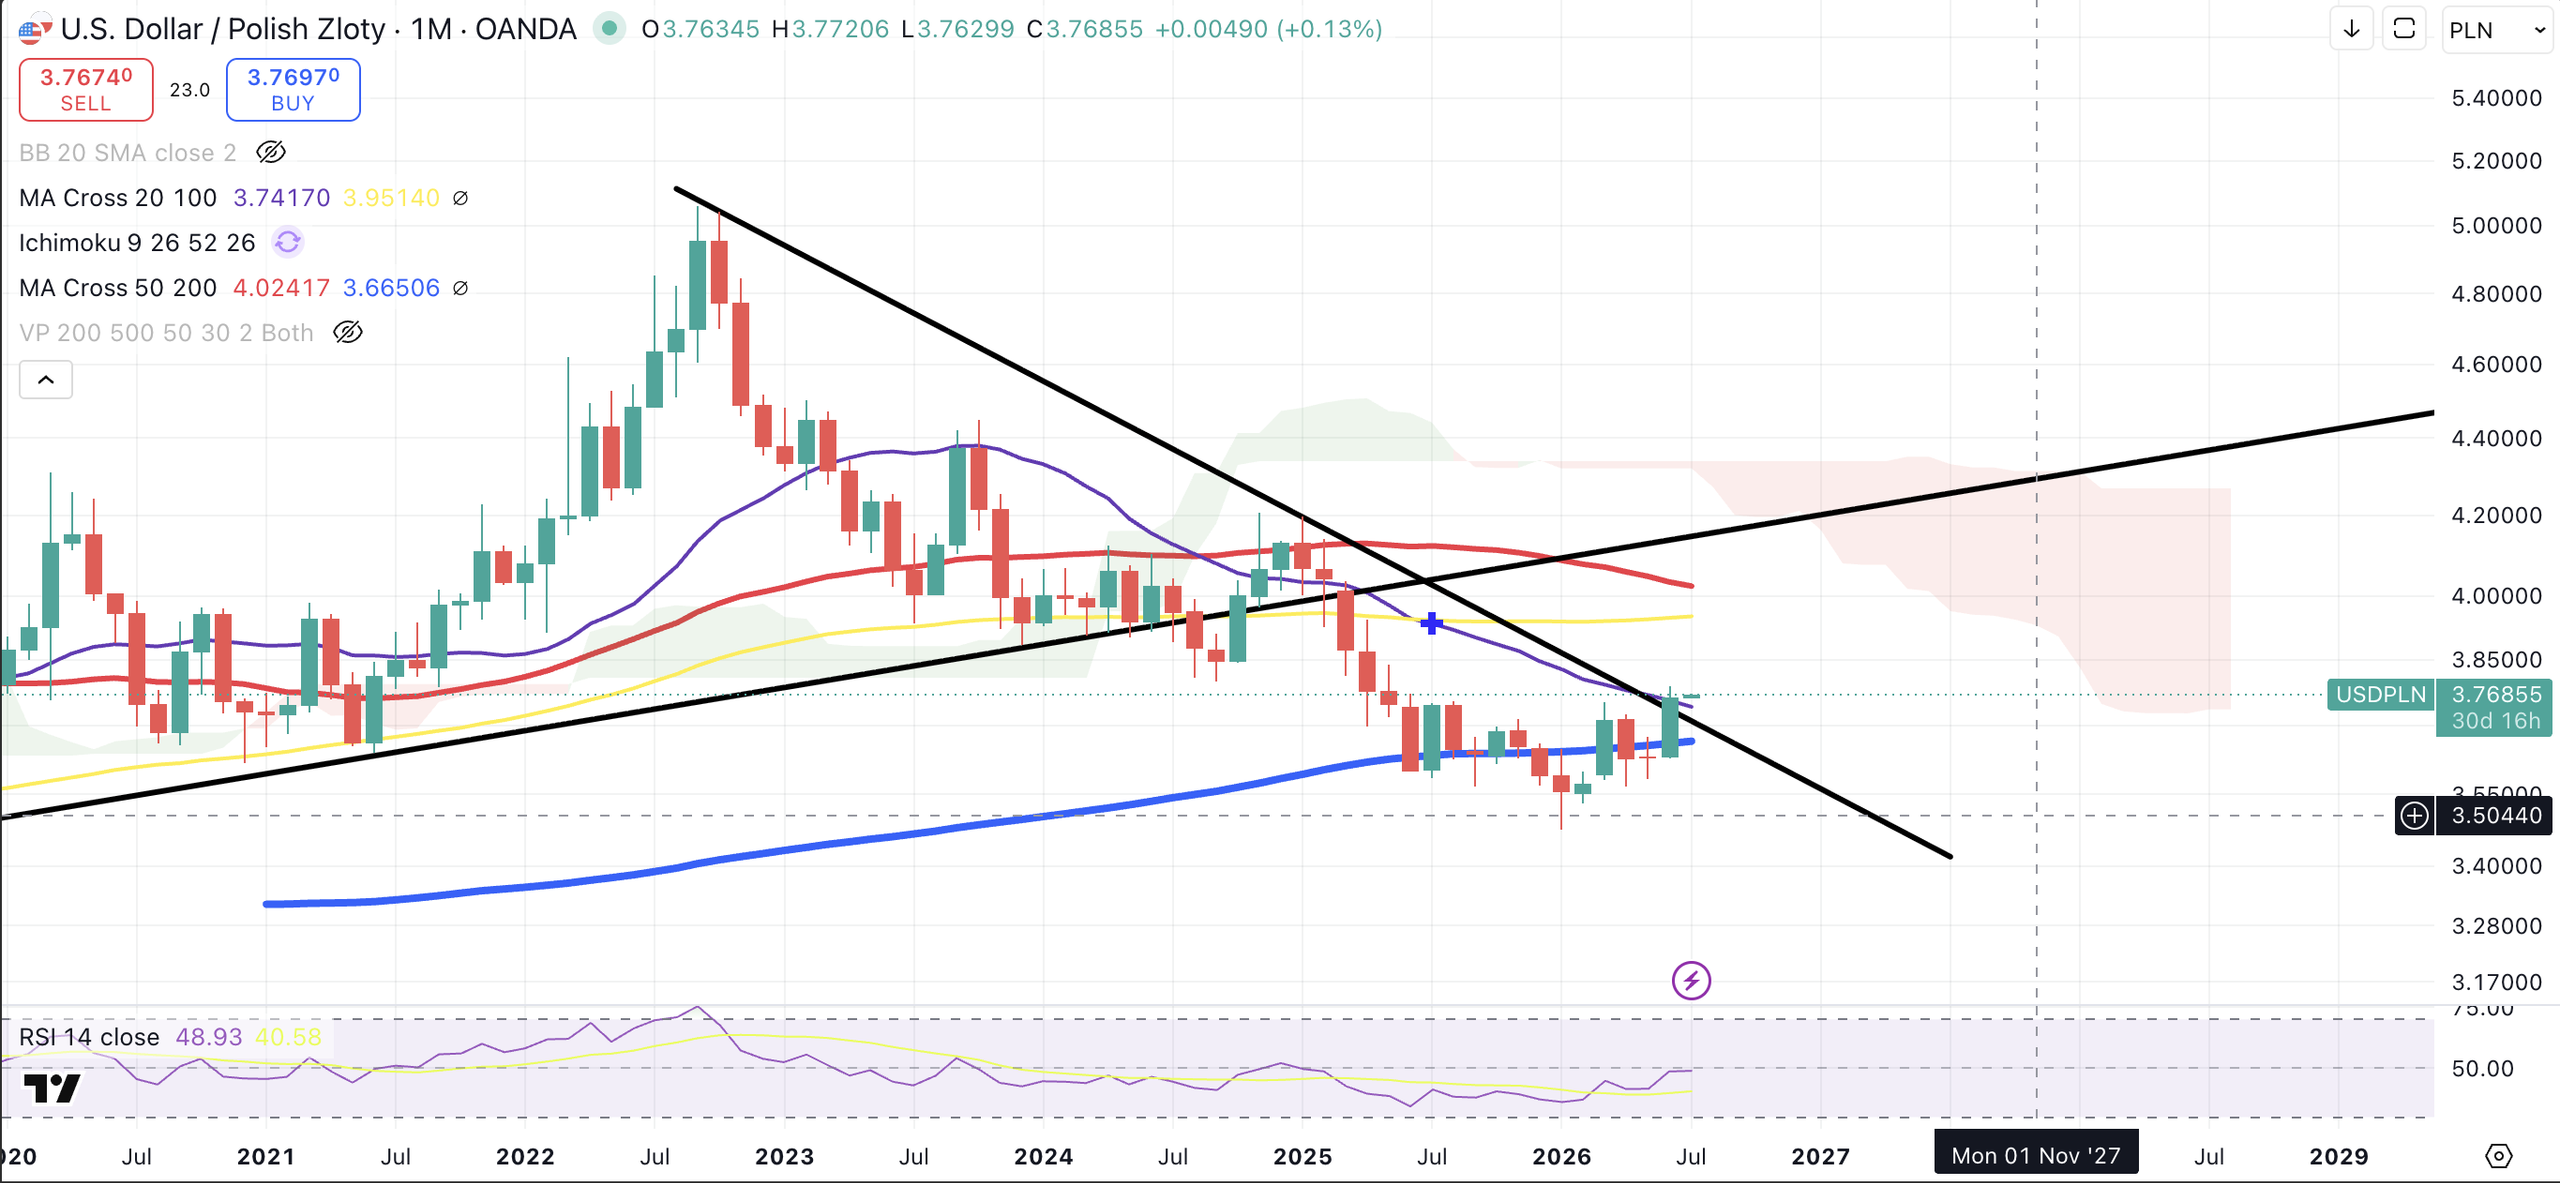
USDPLN – another technical example connected with everything. It tracks EURUSD which tracks DXY which tracks USDCNH. All 3 assets are on the same key technical junction, so does USDPLN and its (M)MA200, and a trend break, starting from above (M)MA20 = losing high momentum bear market in this case. 3.60 for USDPLN is the same level as EURUSD=1.20 = both (M)MA200. Regaining 4.0+ opening path to rest 5.0 again.
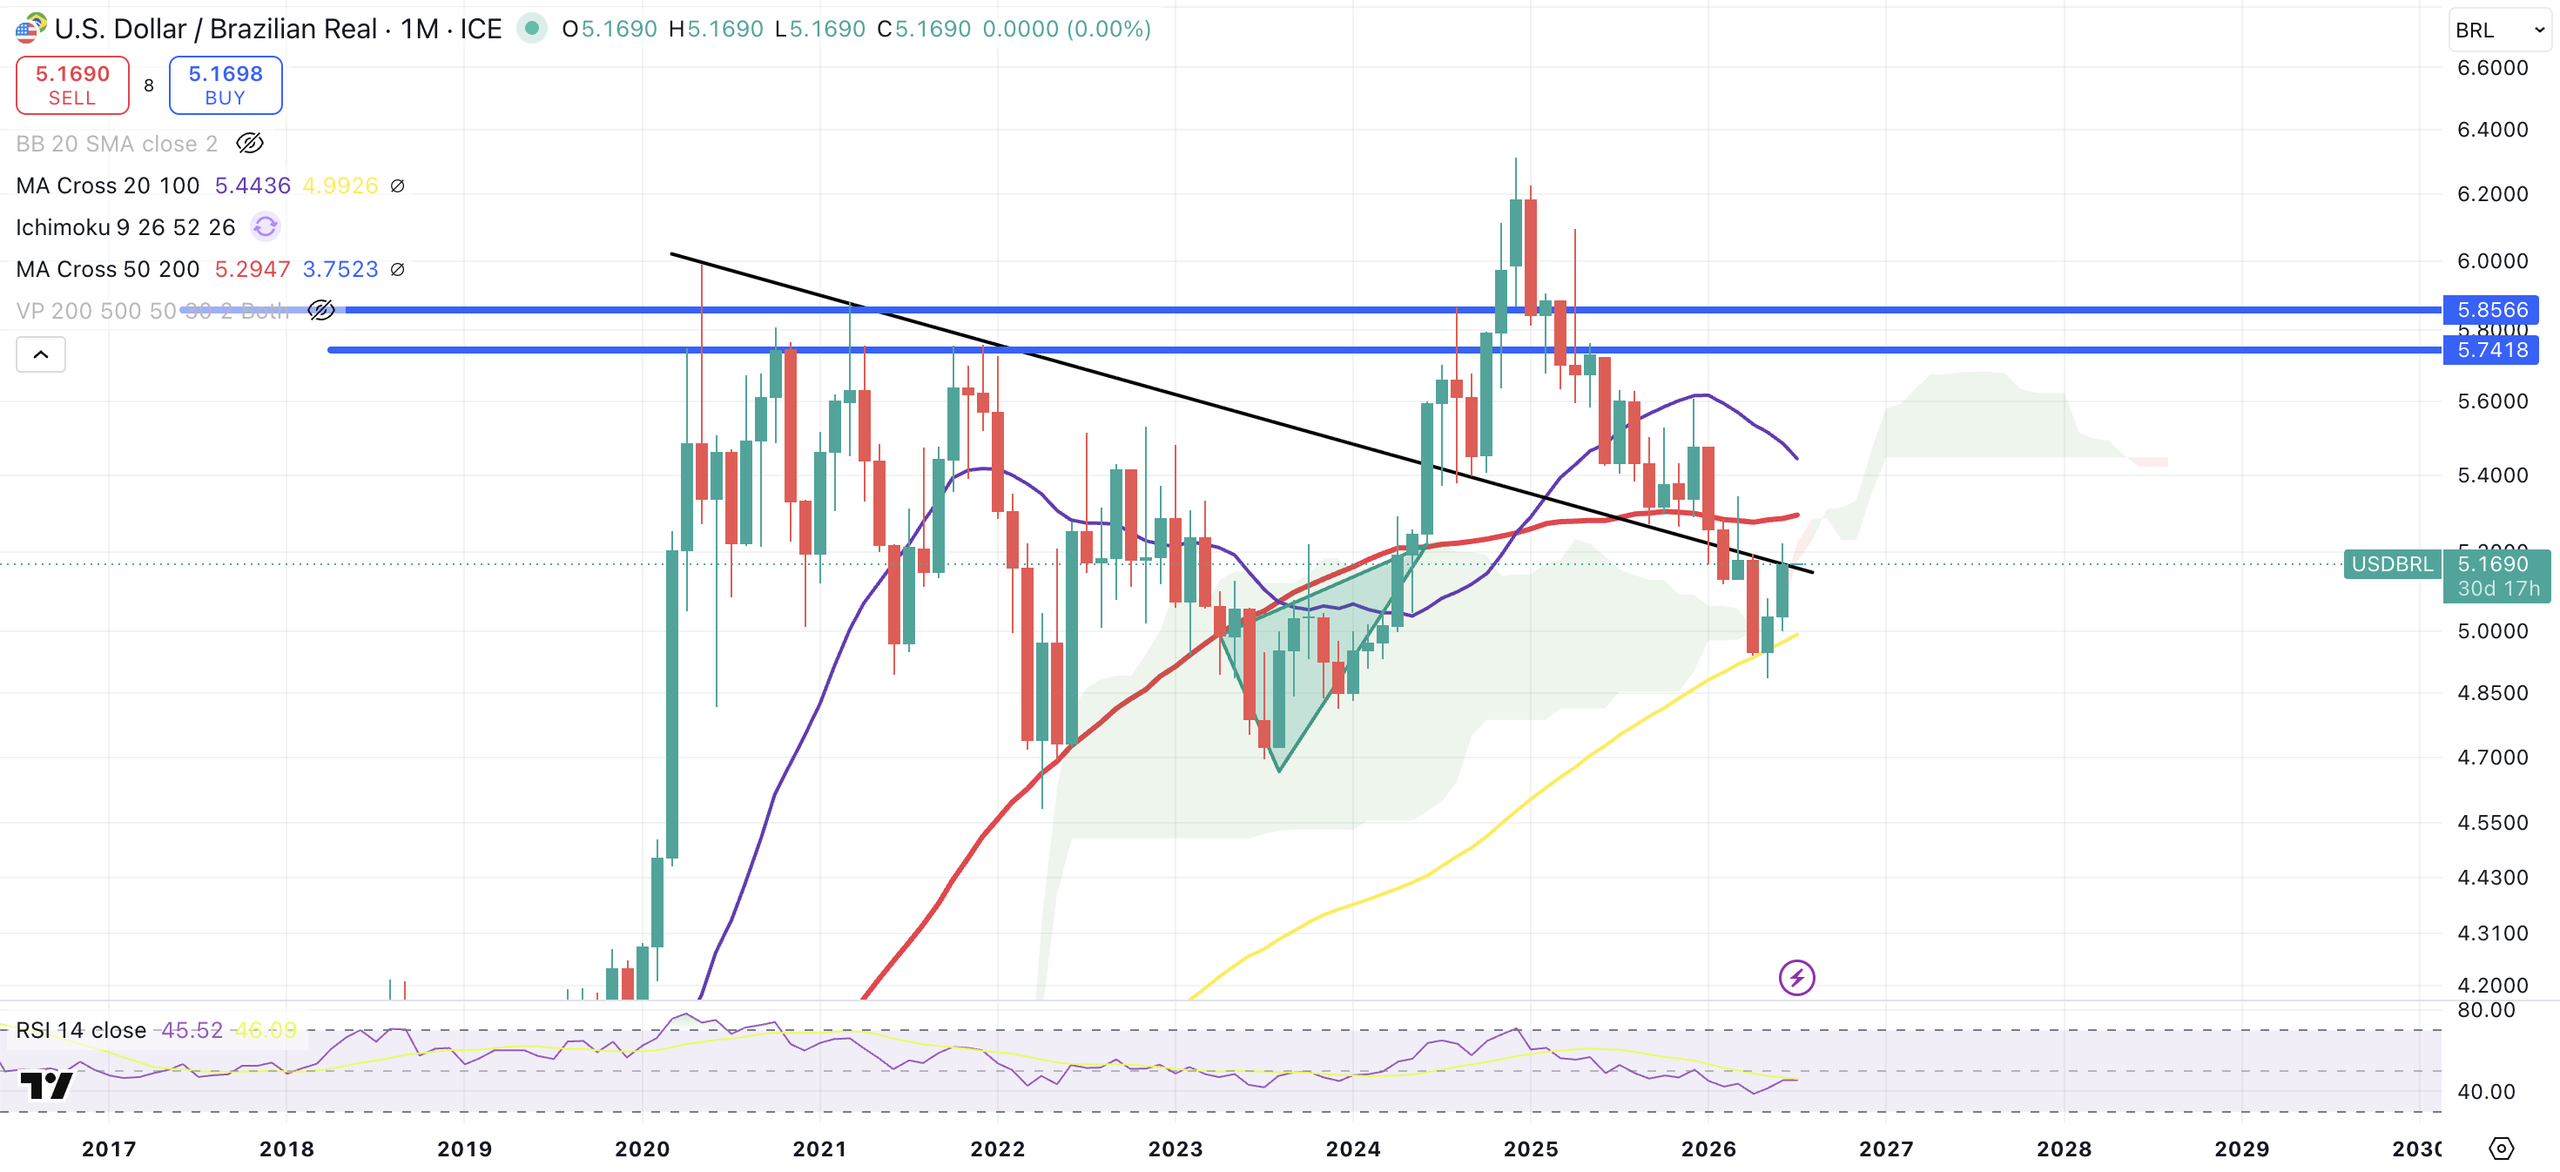
USDBRL – This currency is imo way way too strong. (M)MA100 support = typical bear/bull trap level. Starting above the trend, but both (M)MA50 & (M)MA20 ahead.While we see currencies collapse around the world, I don’t believe this currency will stay strong.
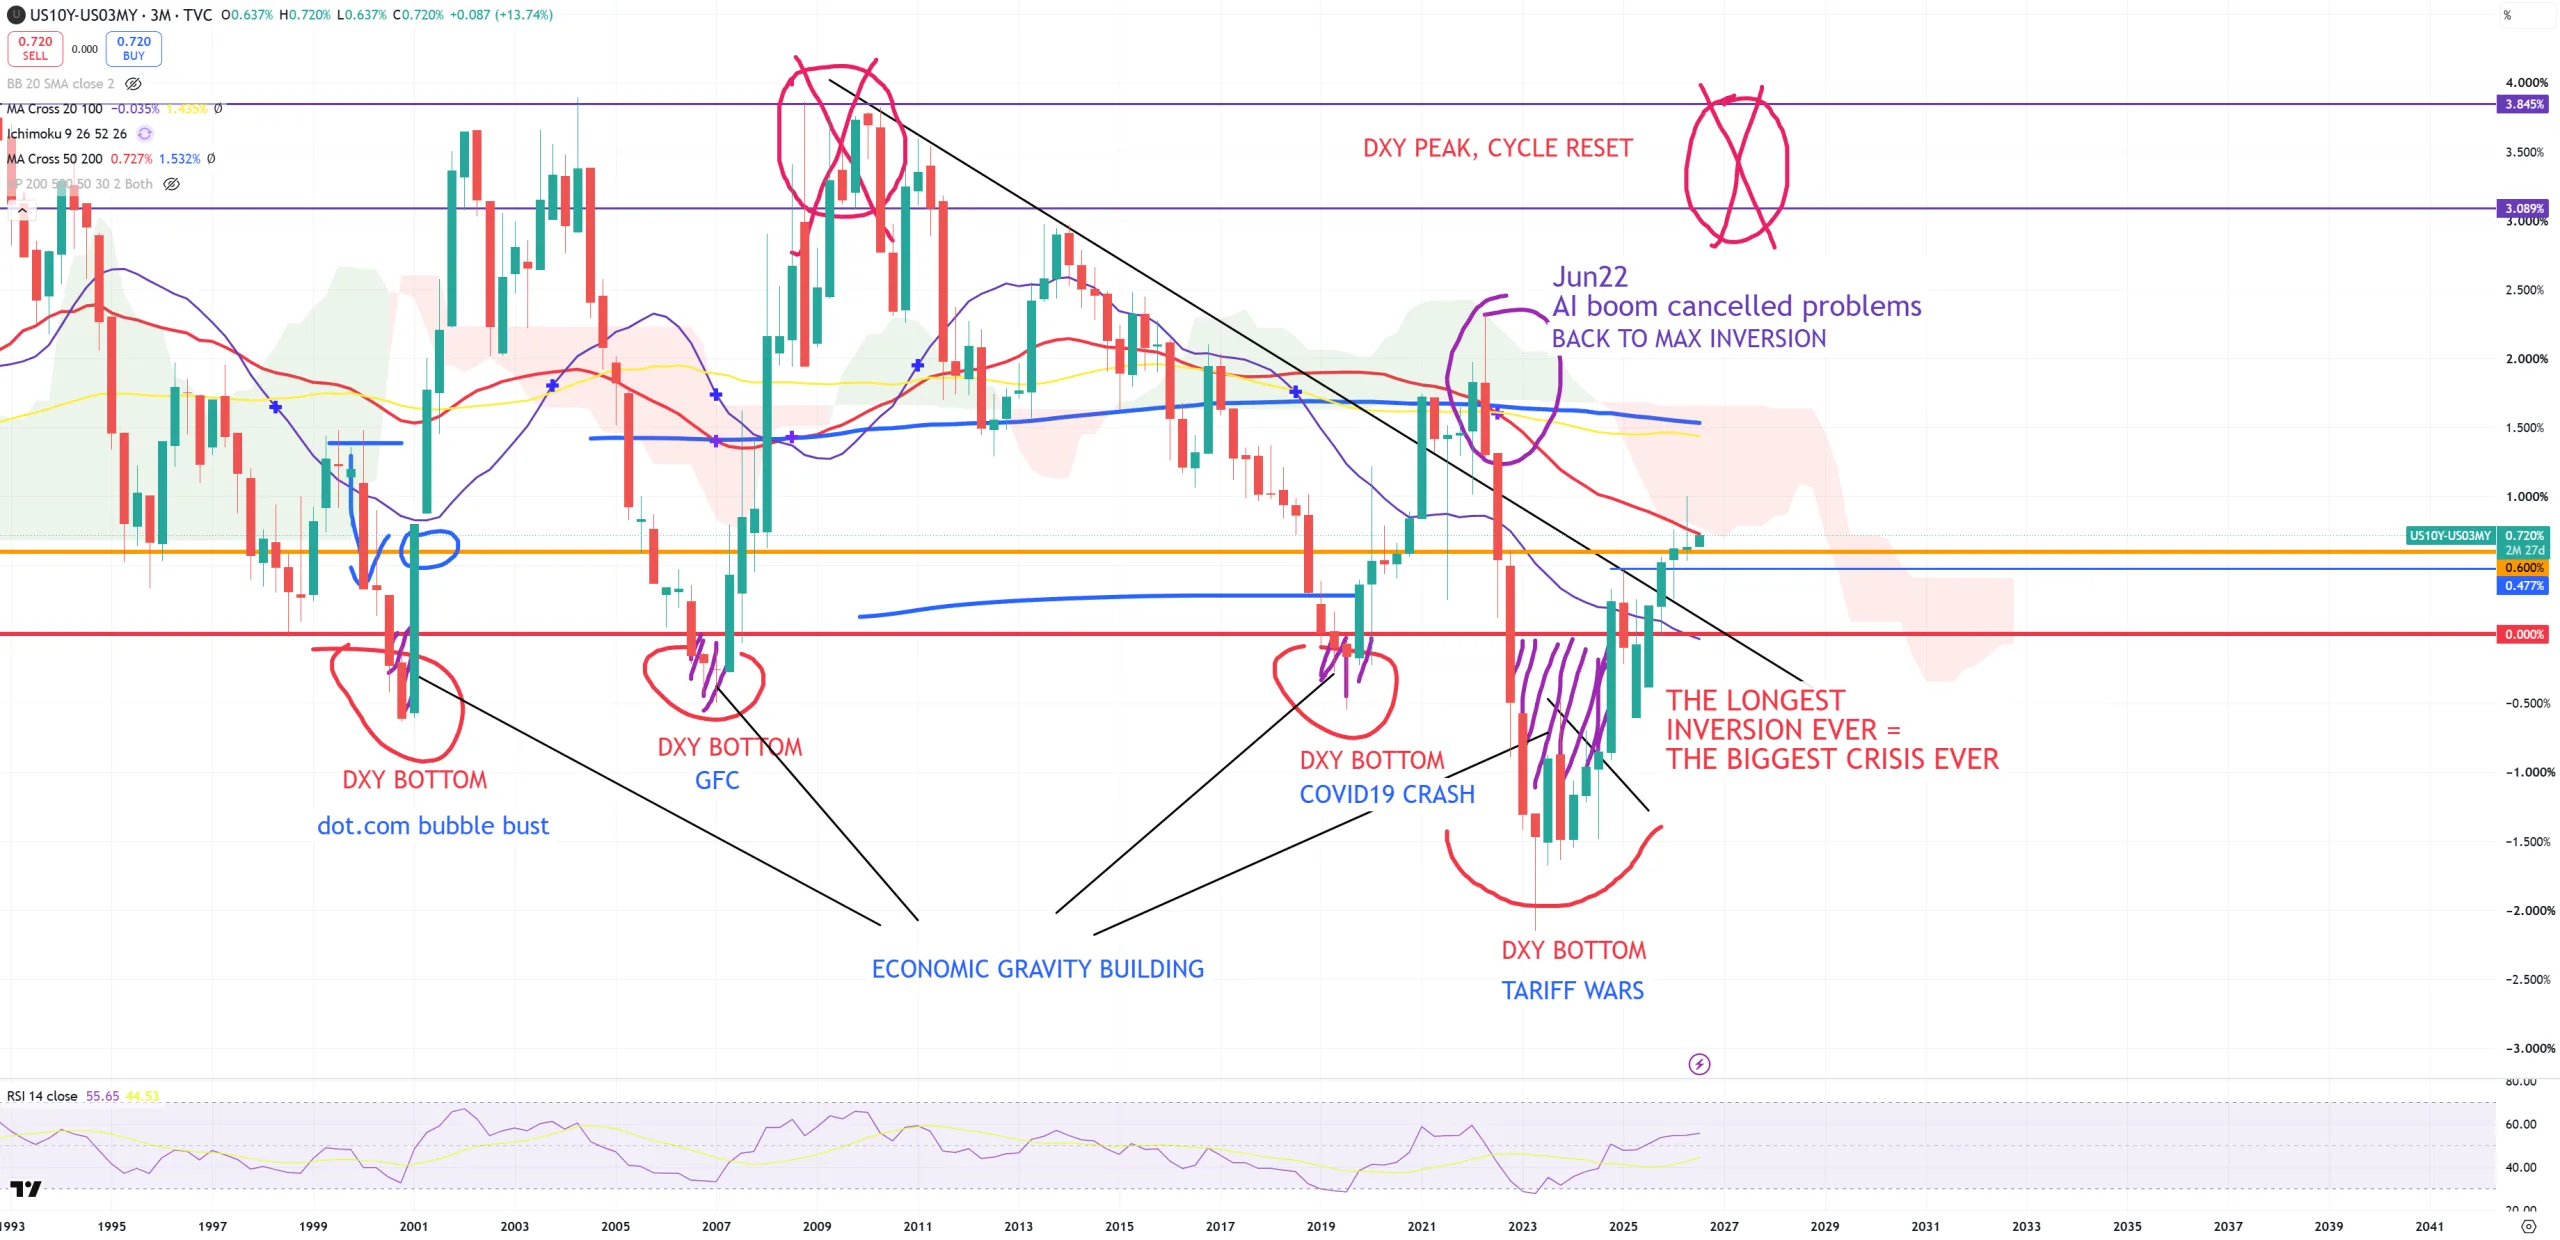
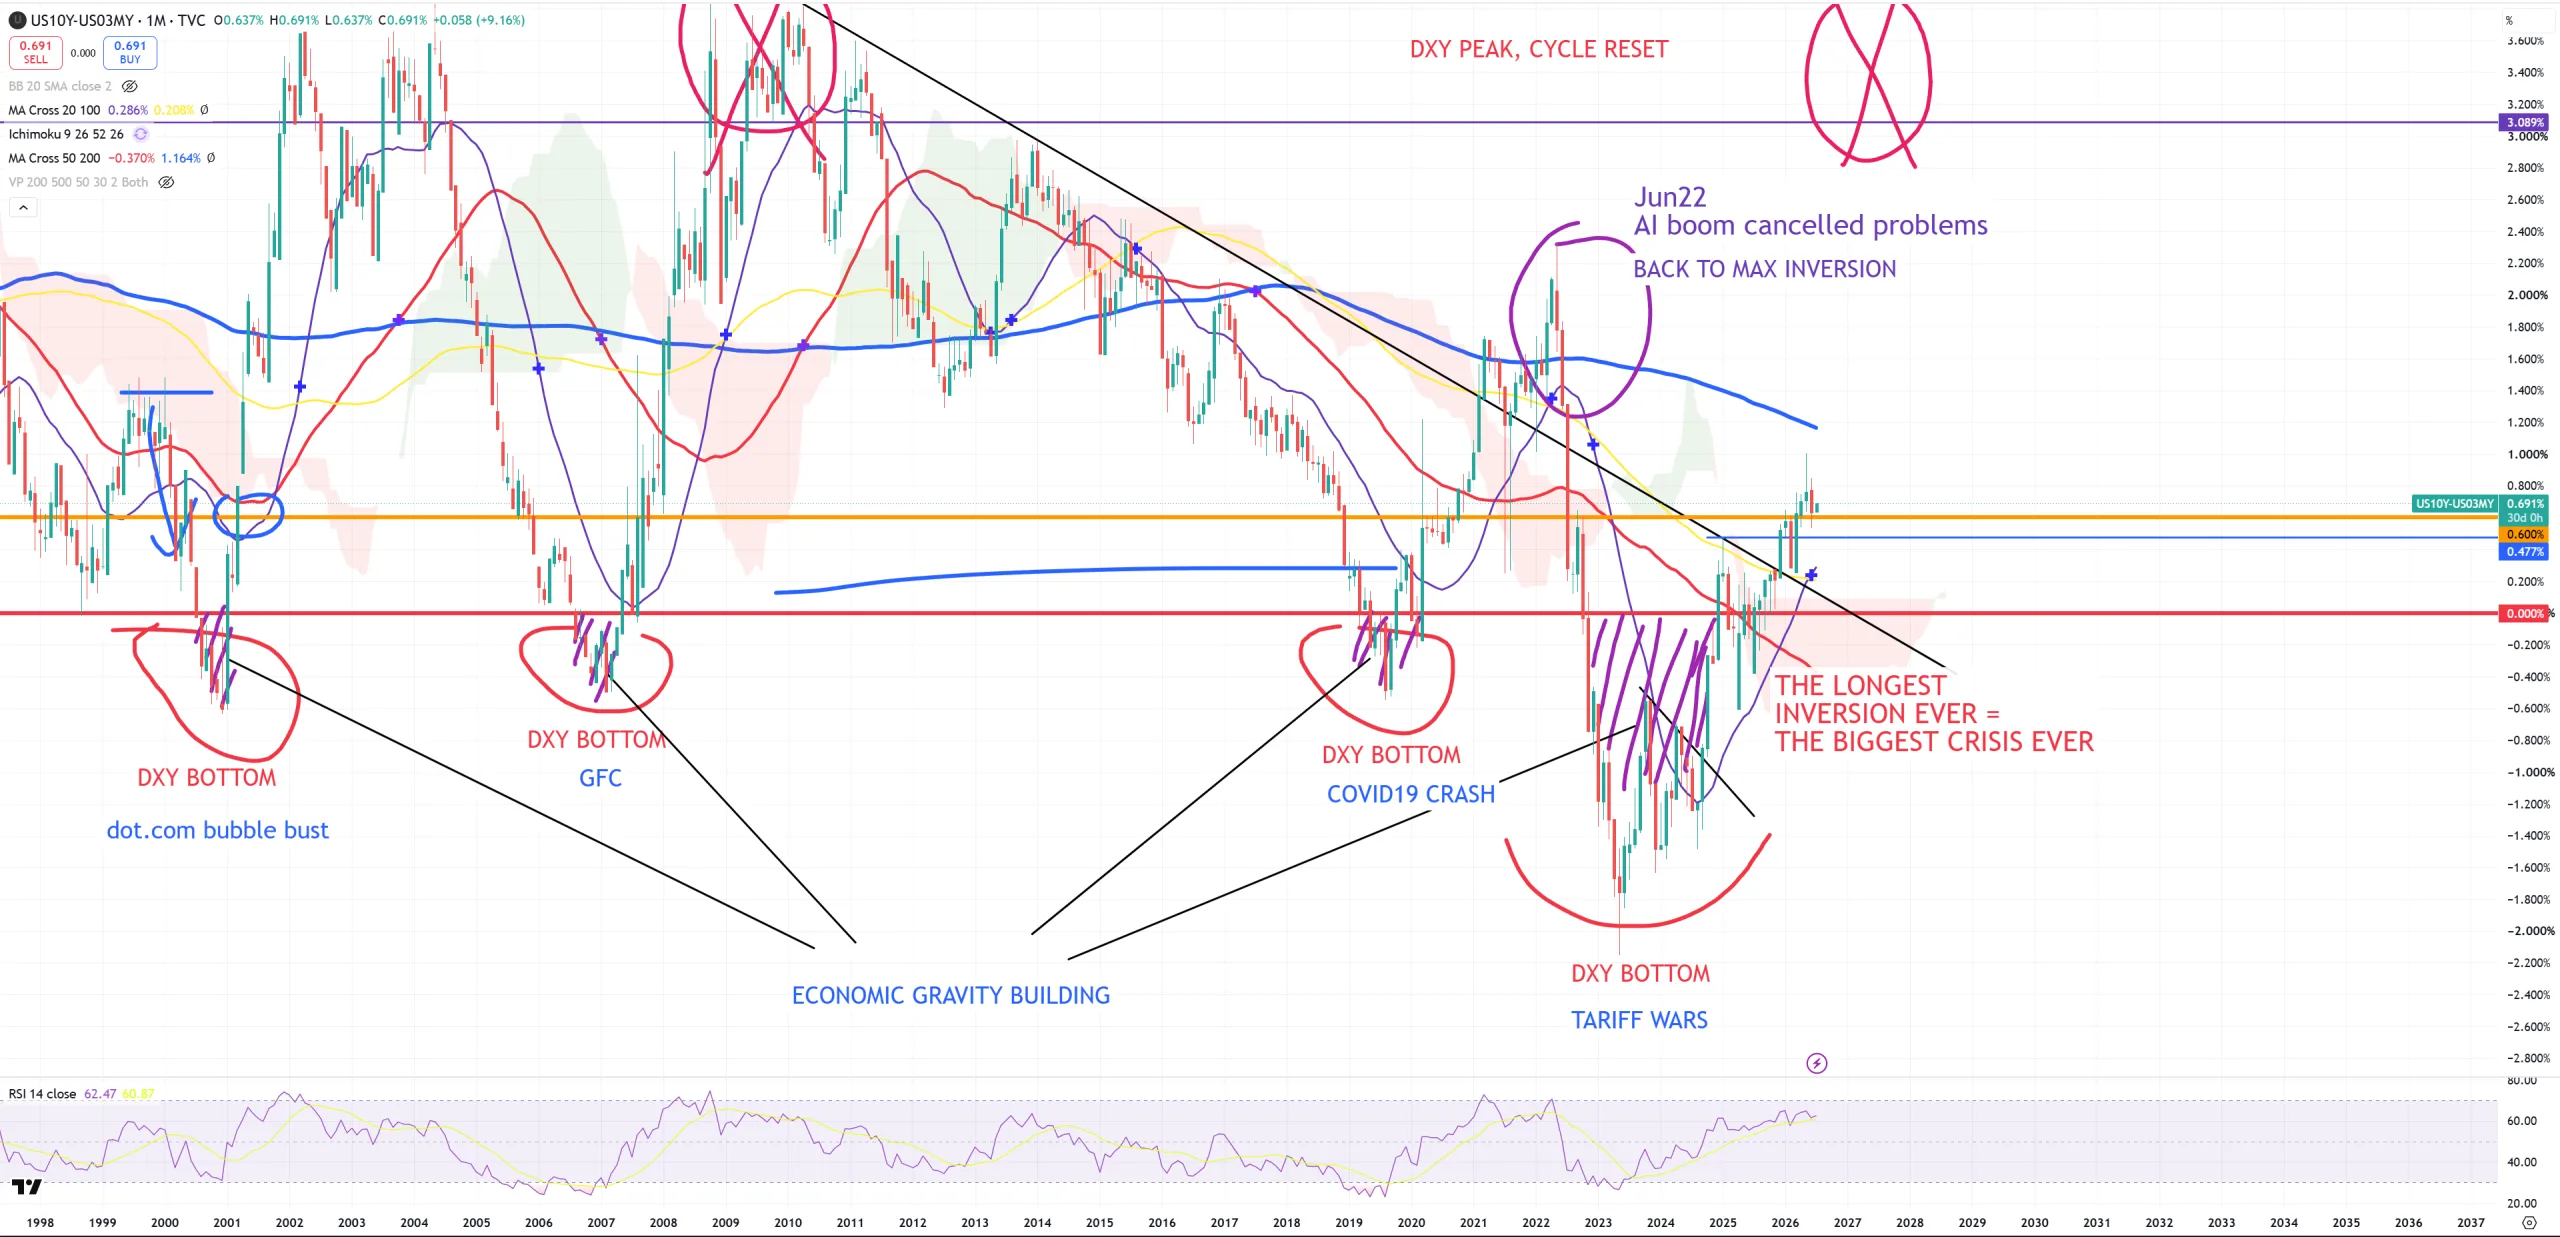
10Y/3M – key gravity indicator still floating over +60bps post uninversion. My idea is that at some point you’ll see bull steepening, but to get into this point you need USDCNH to blow up to the upside…
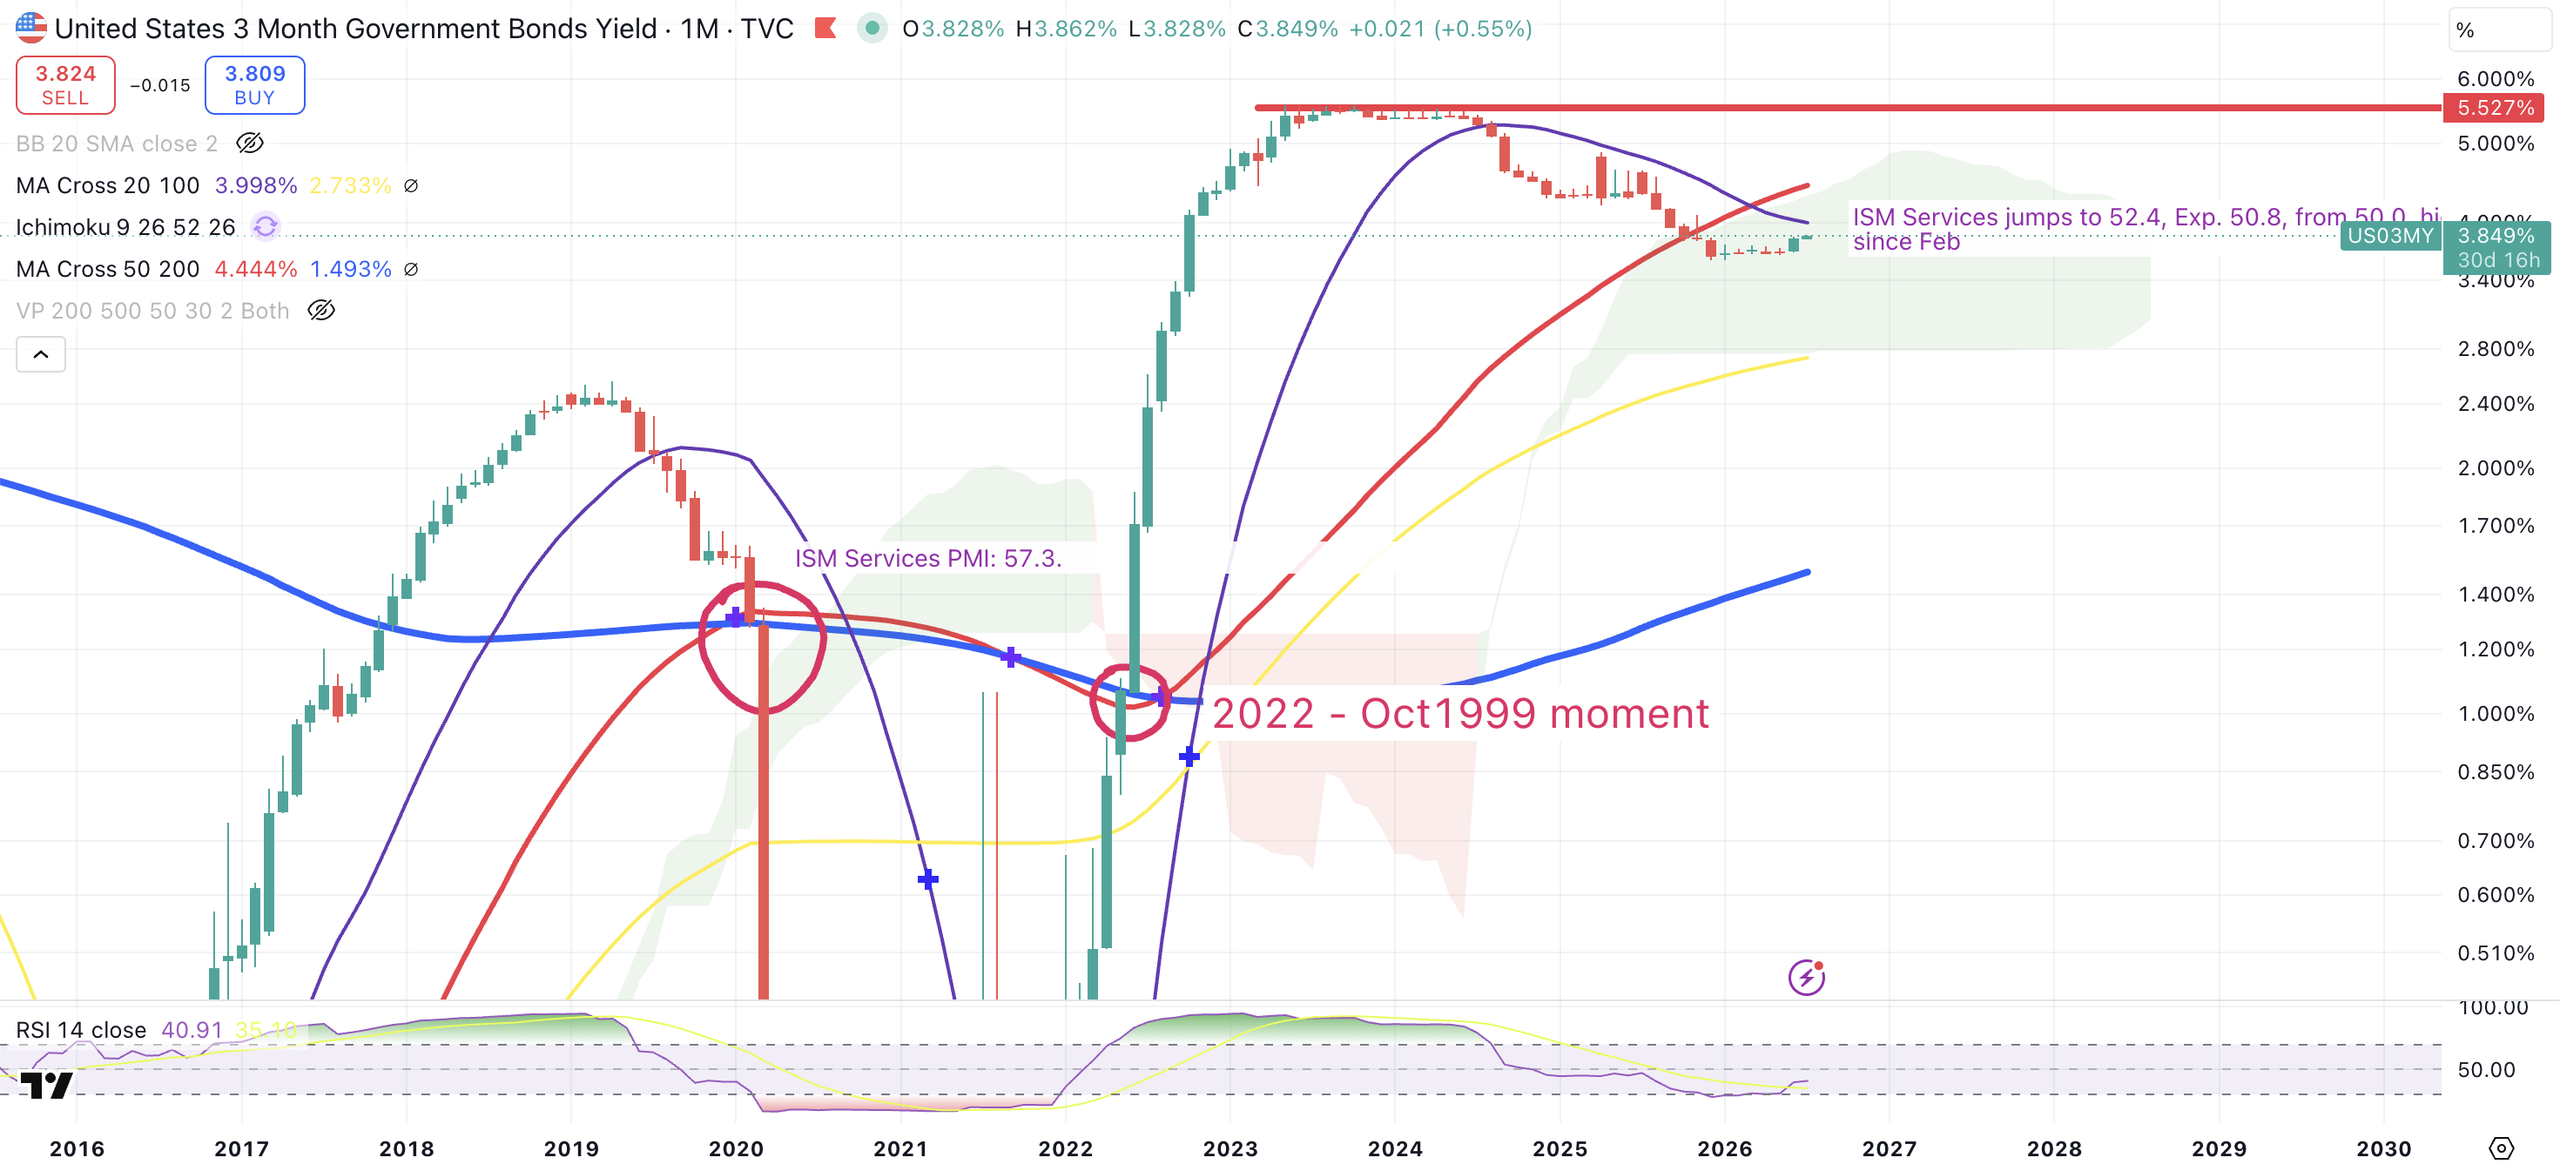
US03MY – my key topping indicator – nothing has been changed here. Considering we’re still in the same cycle from 2009 (what 10y/3m tells us about). And as my rule says : market tops once 10y/3m permanently univerts > 60bps and US03MY breaks (M)MA50.
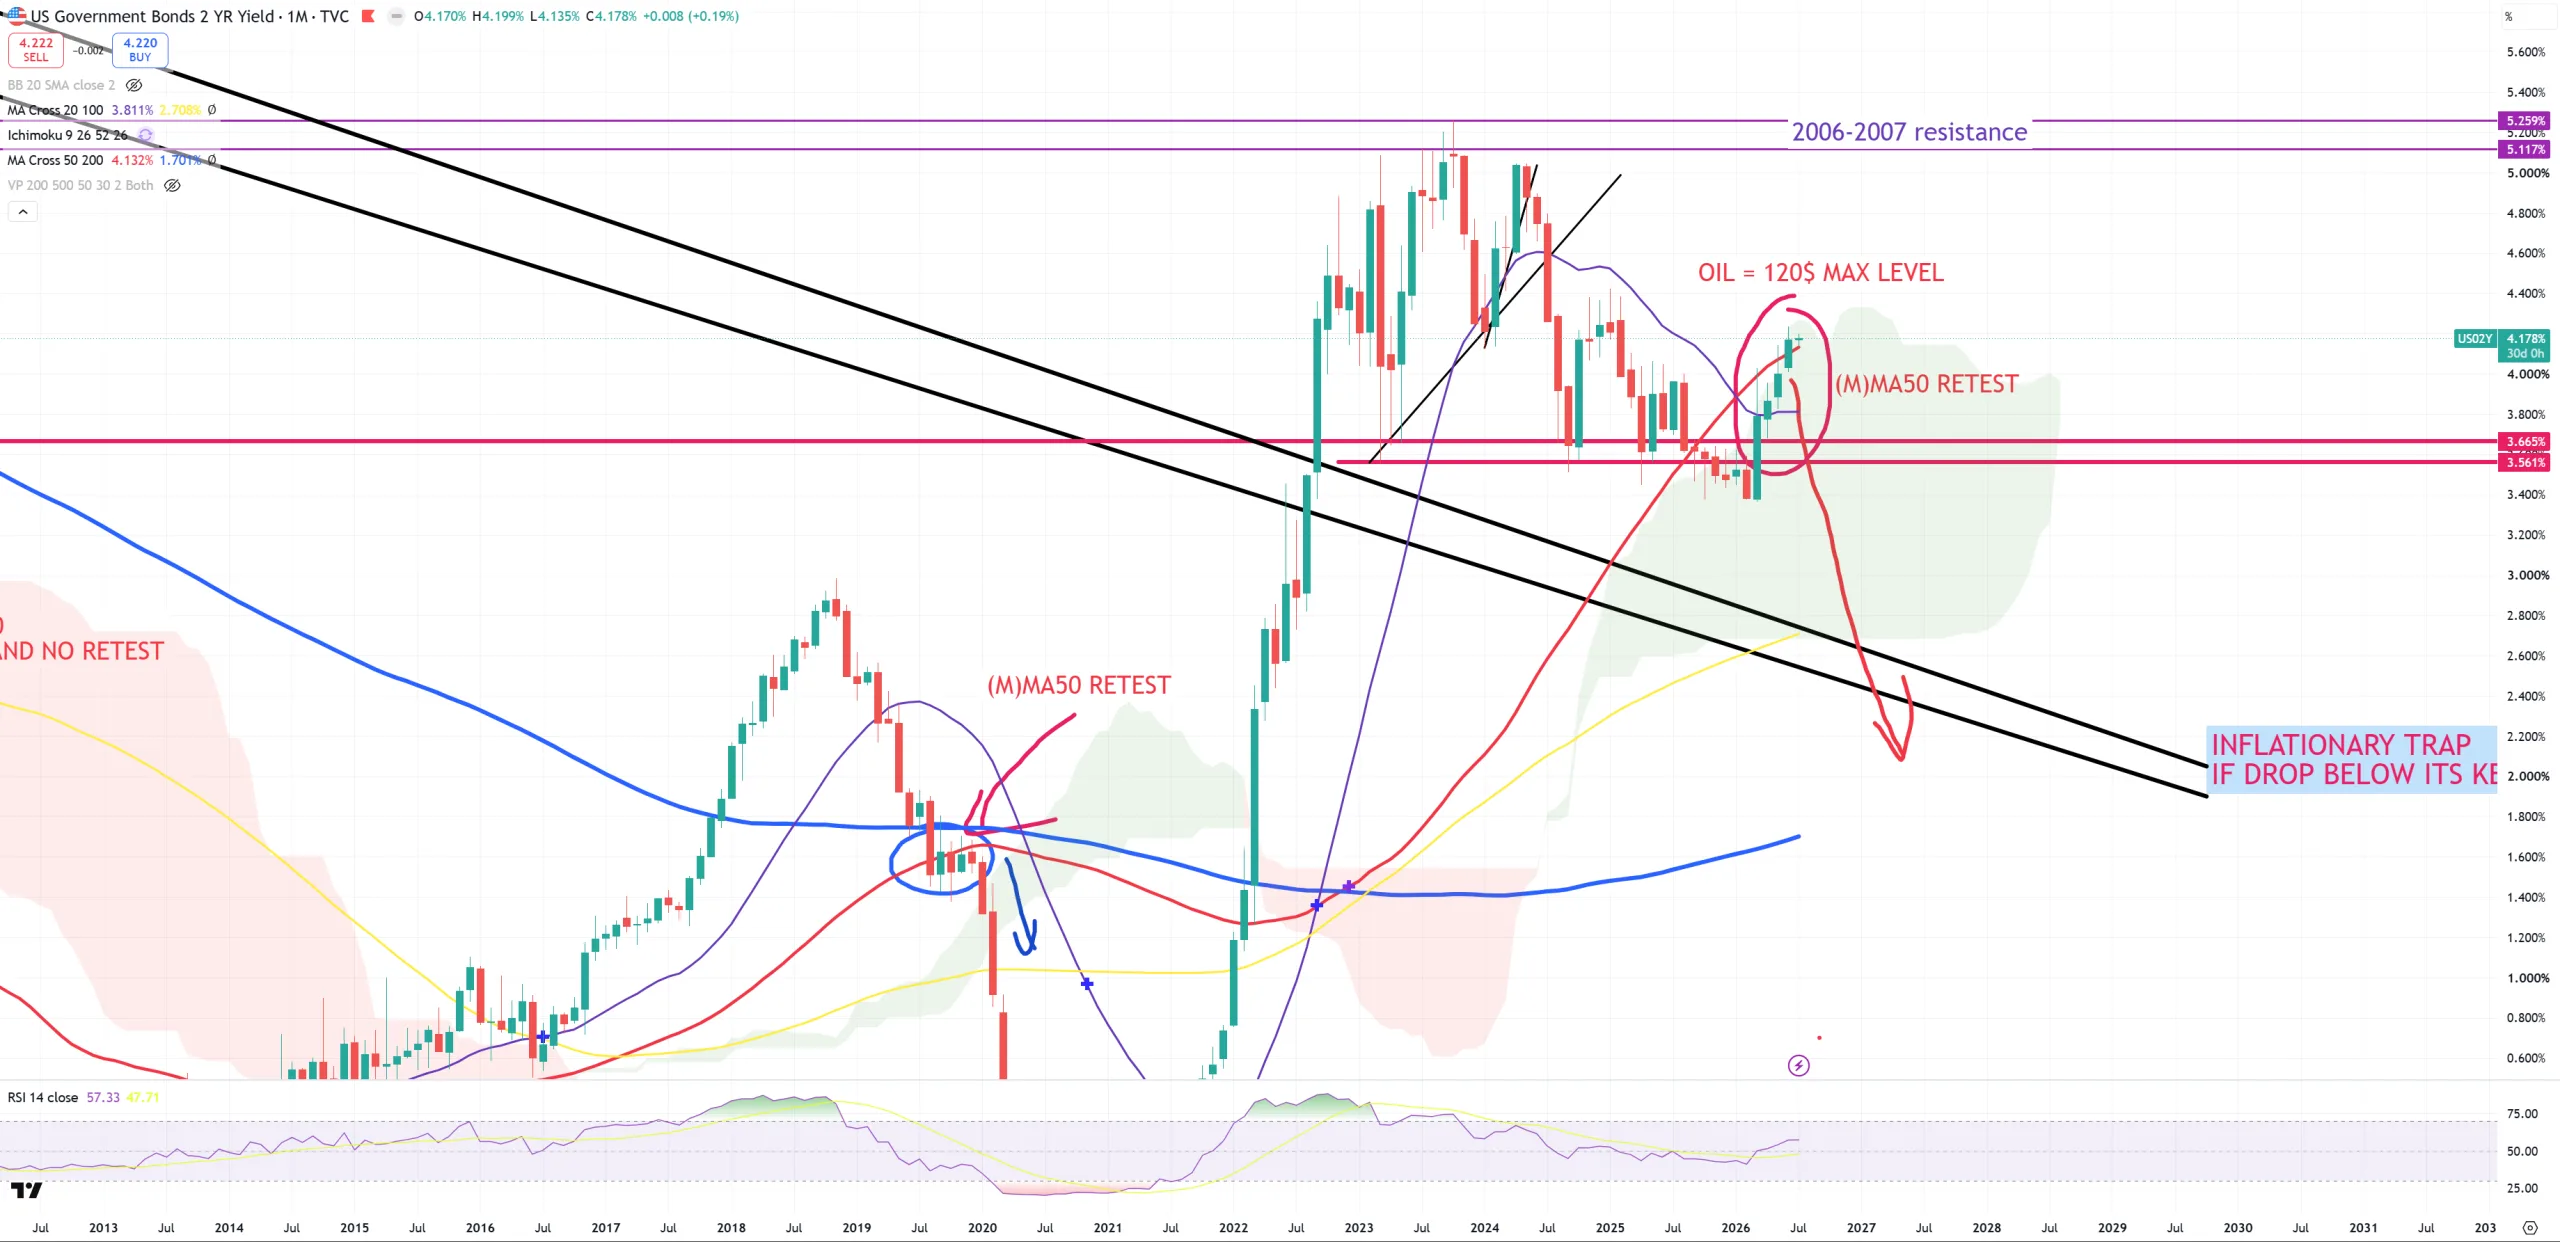
US02Y – here we have a jump > (M)MA50. The problem is that’s it’s just the first day of the month, so we’ll need to wait for a confirmation if US02Y decided to jump towards > 5.0%
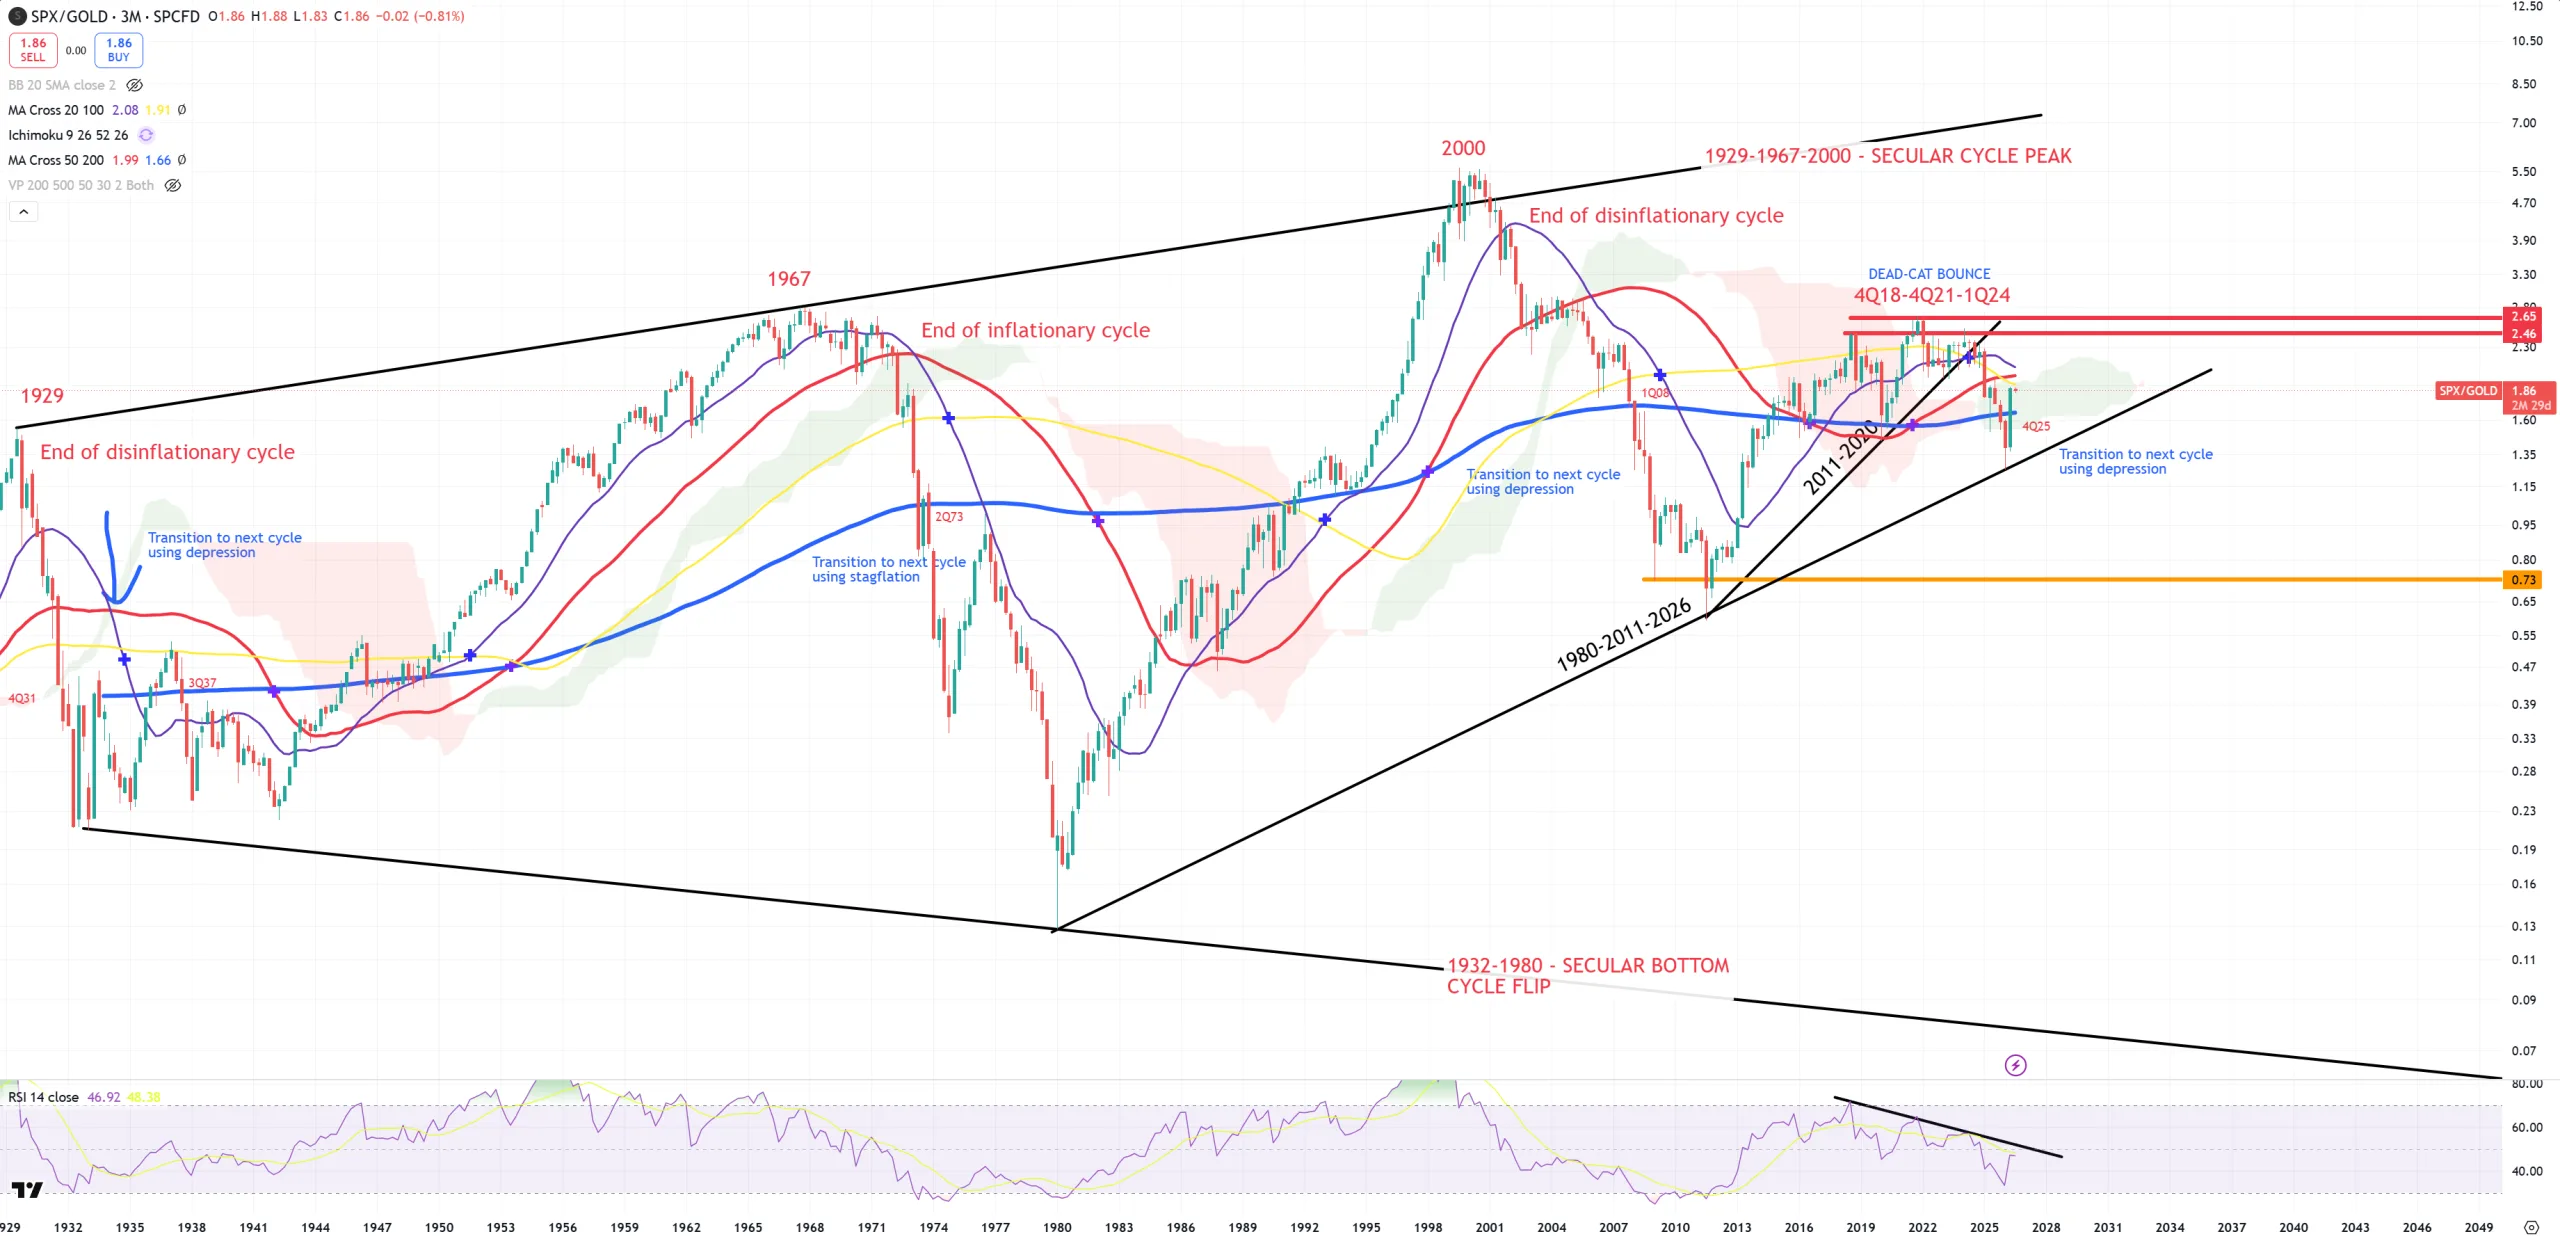
SPX/GOLD – and key cycle indicator and its (3M)MA200 level. The same issue like US02Y with its (M)MA50 break. This is still a kind of retest IMO because it requires FXI to go UP & USDCNH to go lower. Once we dance on the edge of 5th event since 100Ys and each one was really really bad we need to wait another 3Ms. This ratio used 1980-2011 trend line to bounce. Still tons of strong resistance (we hit now one) above (3M)MA200. Around 70s we had the same problem. Another quarter to wait.
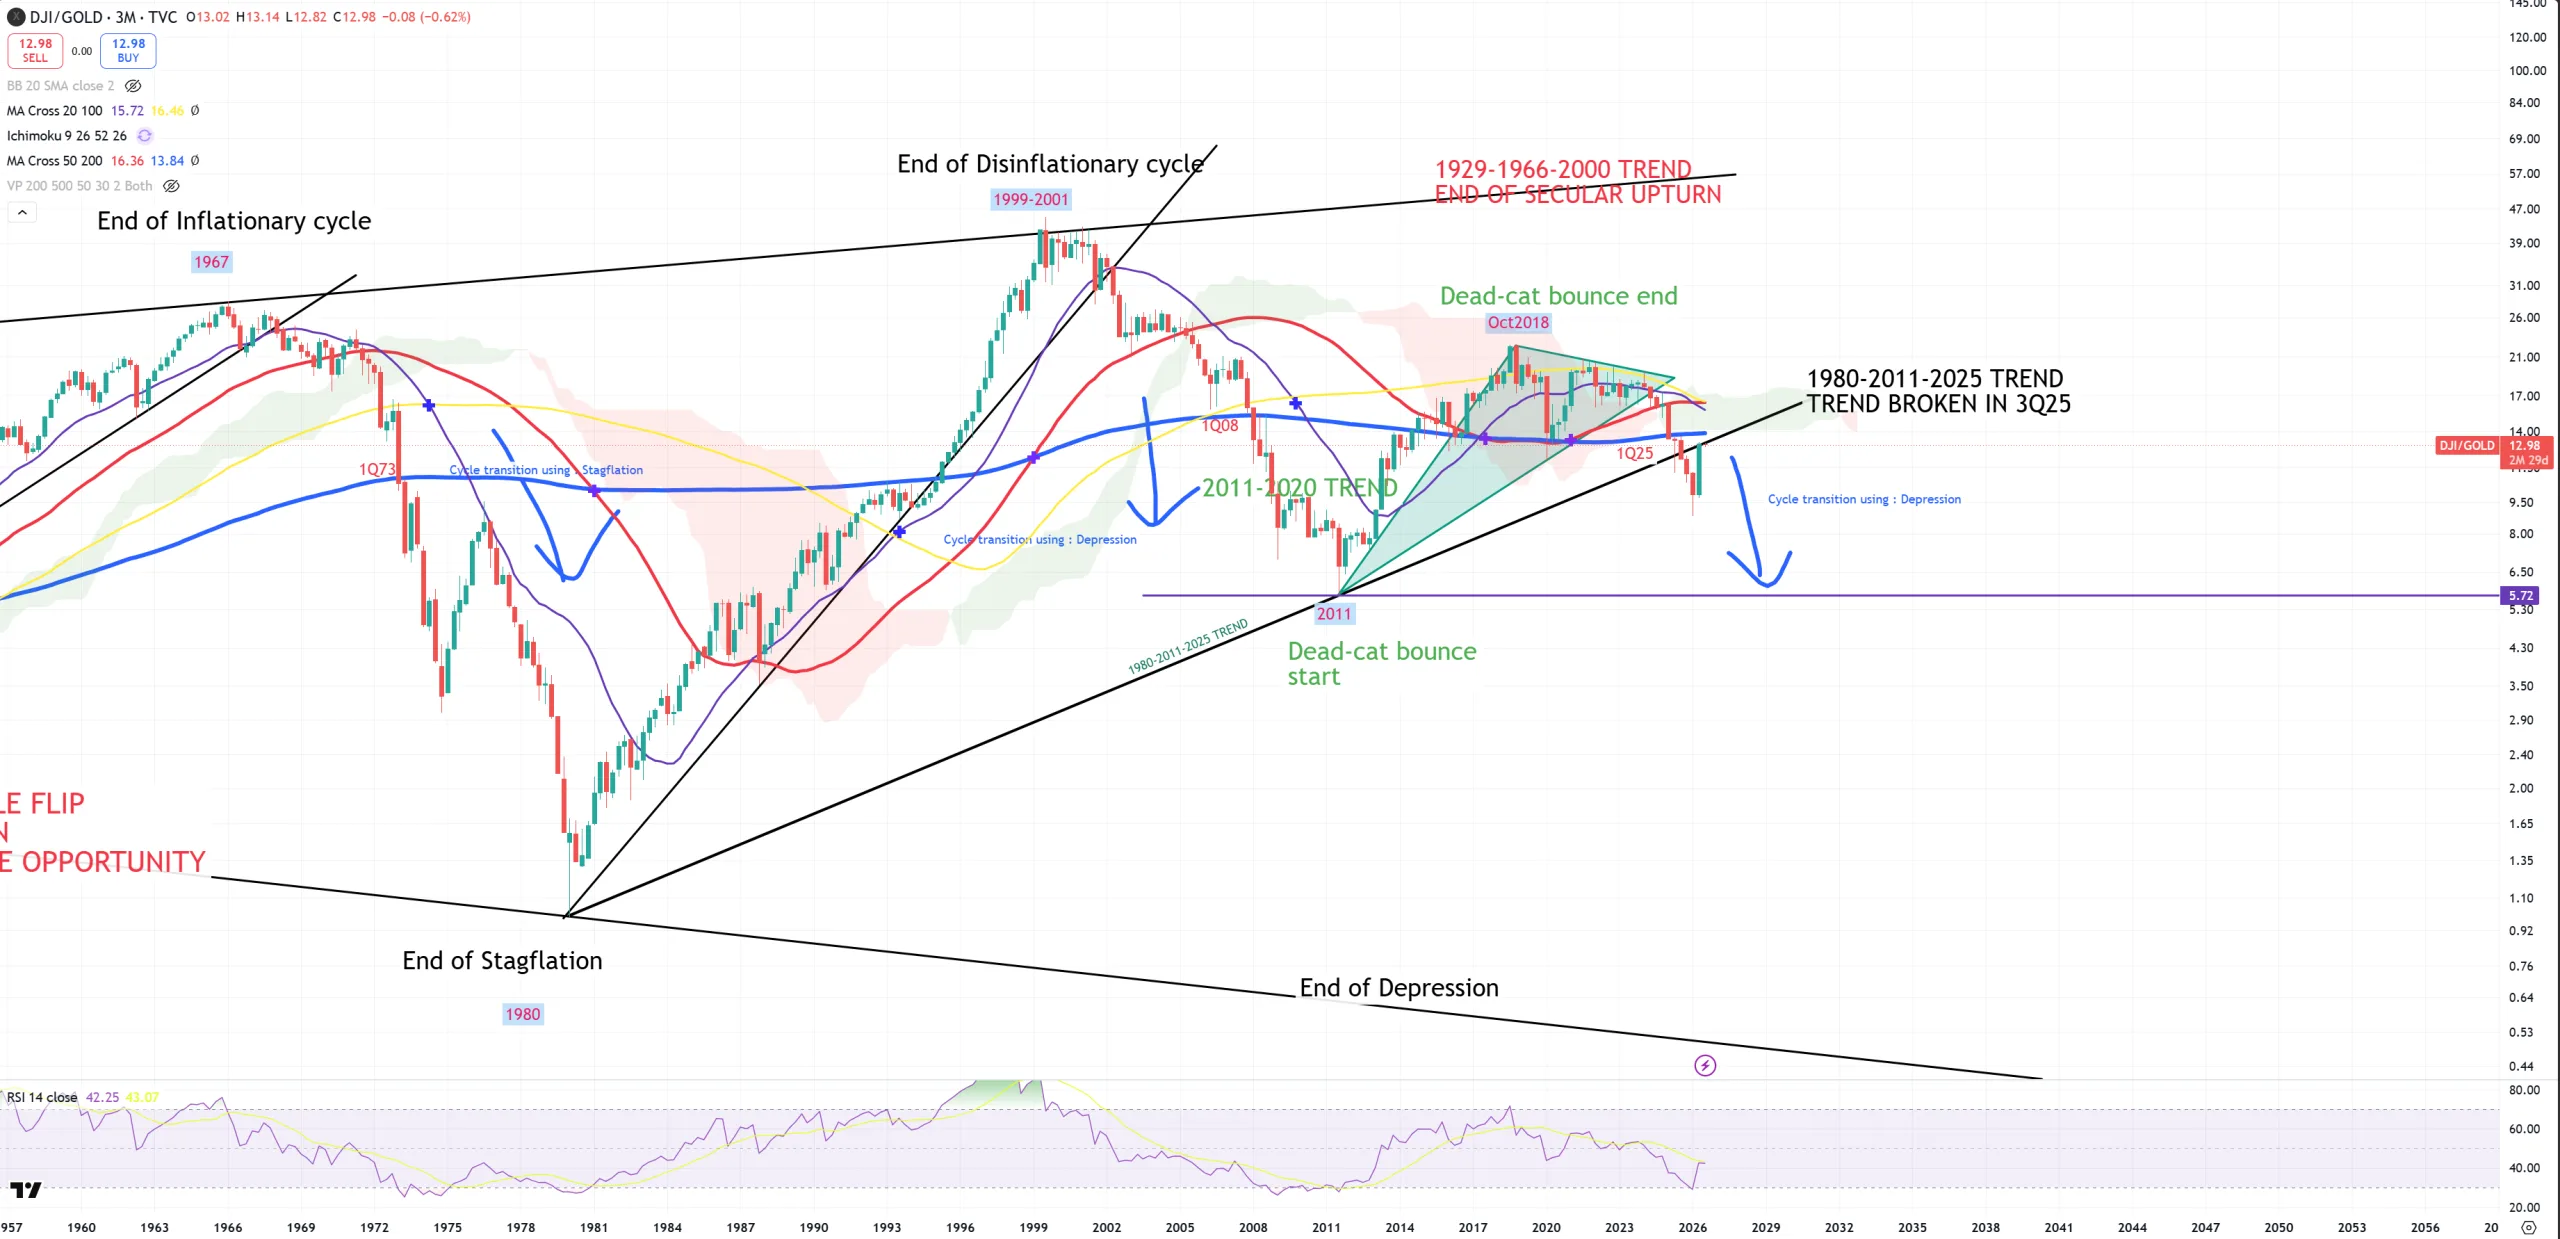
DJI/GOLD – which leads IMO SPX/GOLD is perfectly retesting 1980-2011 from the bottom. 3M view.
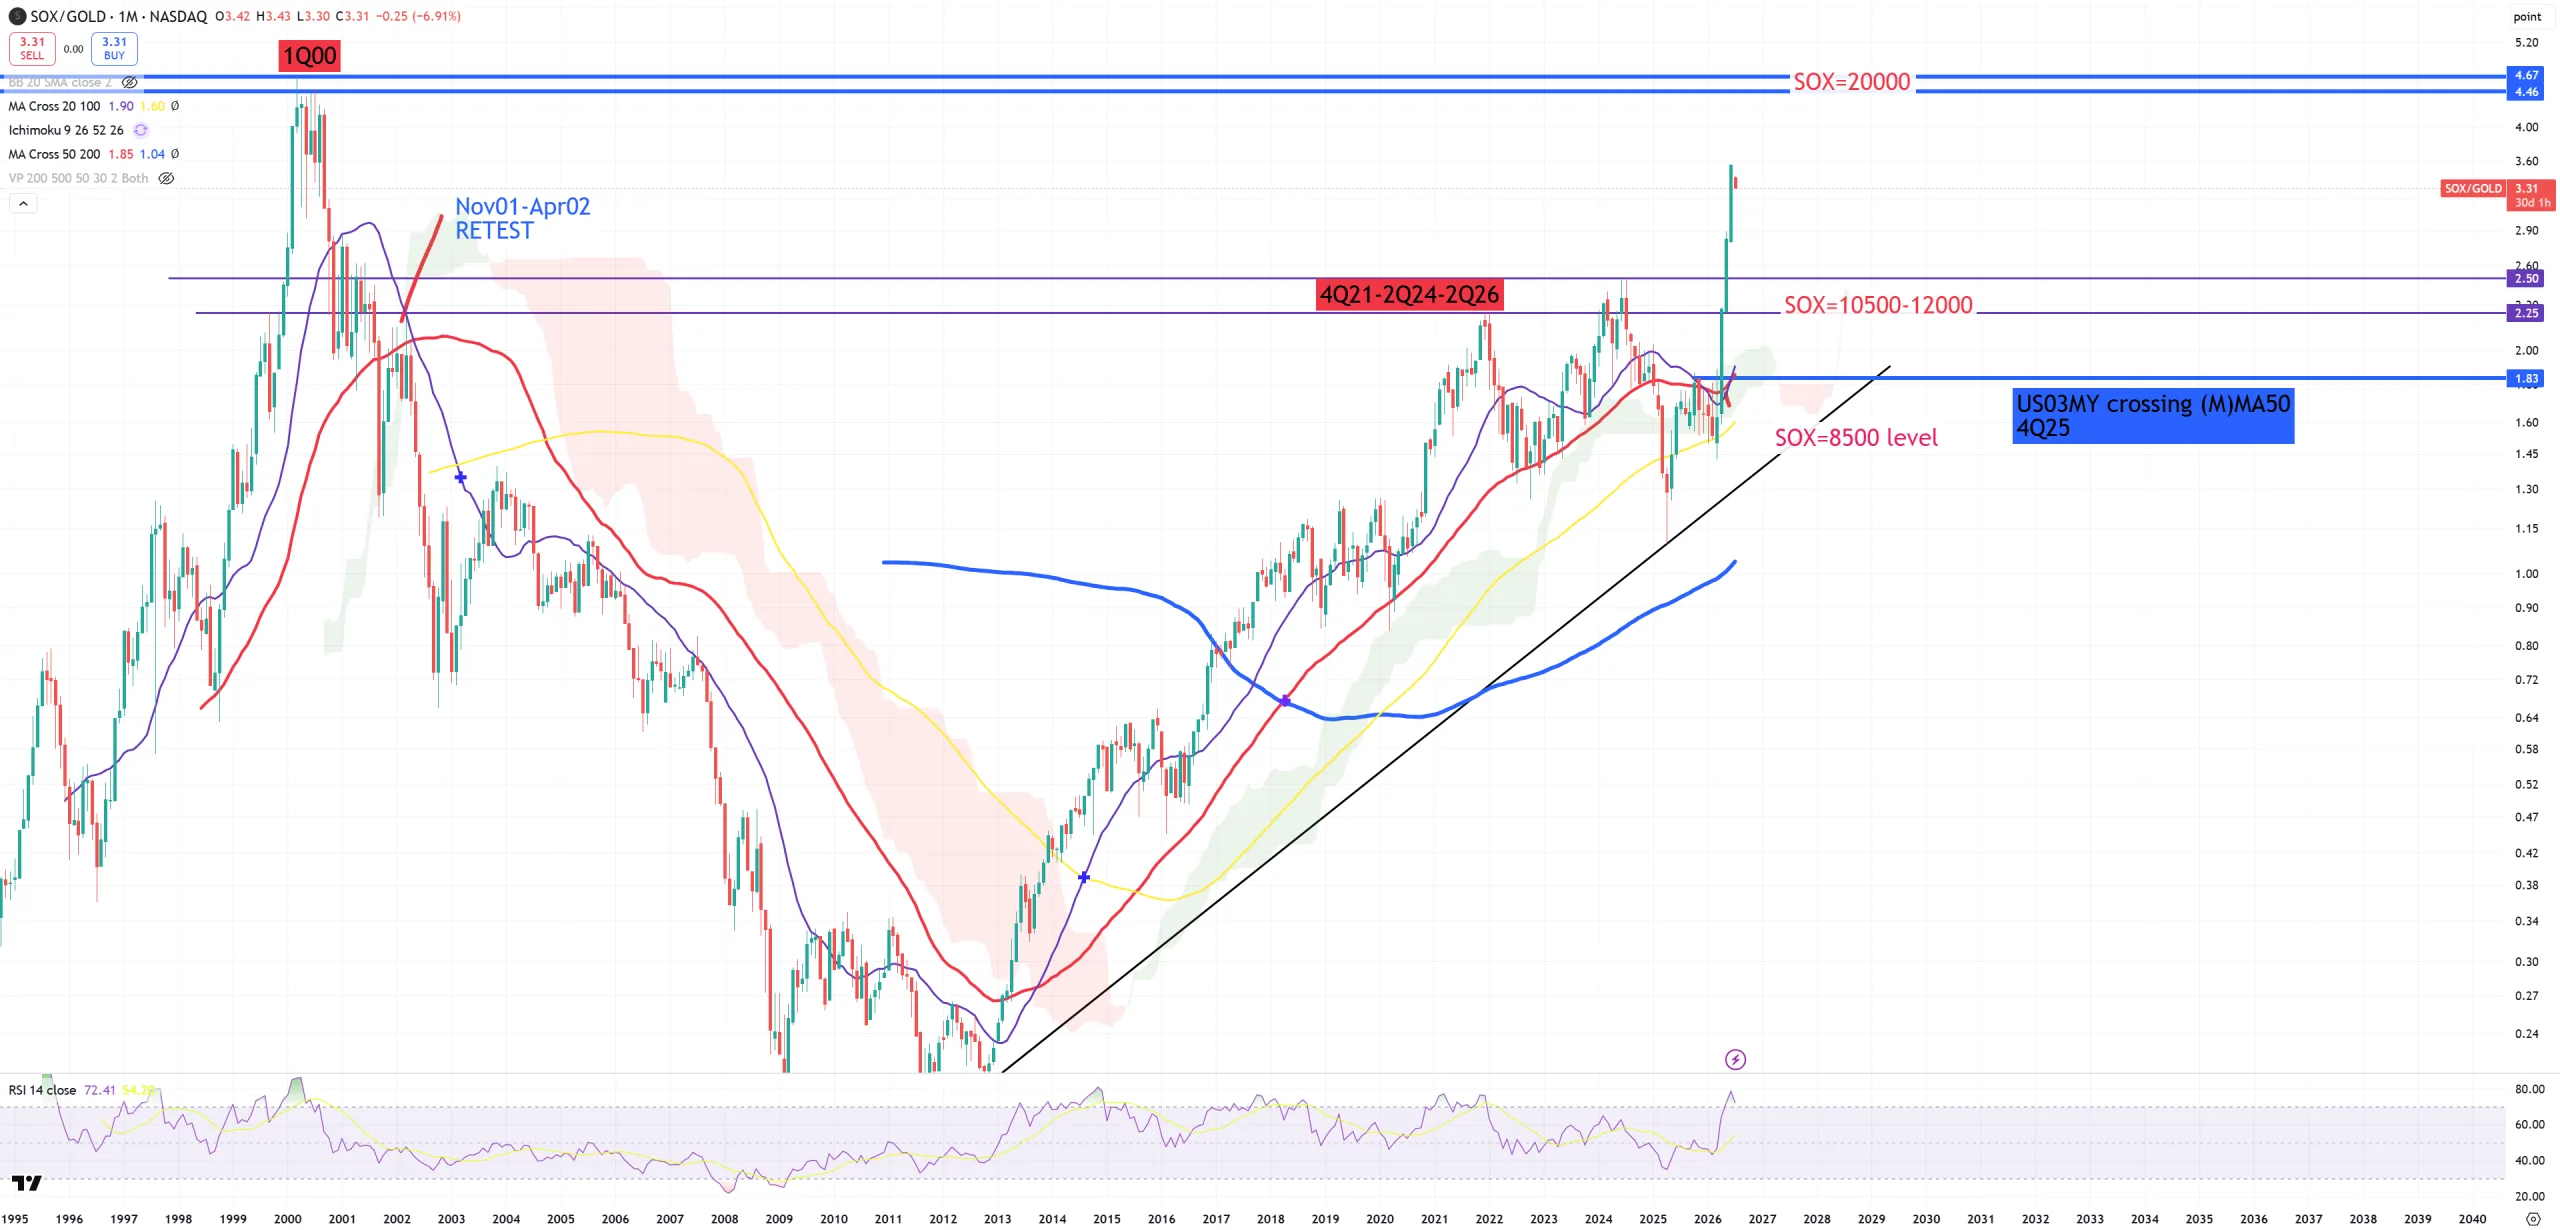
SOX/GOLD – in the middle of nowhere
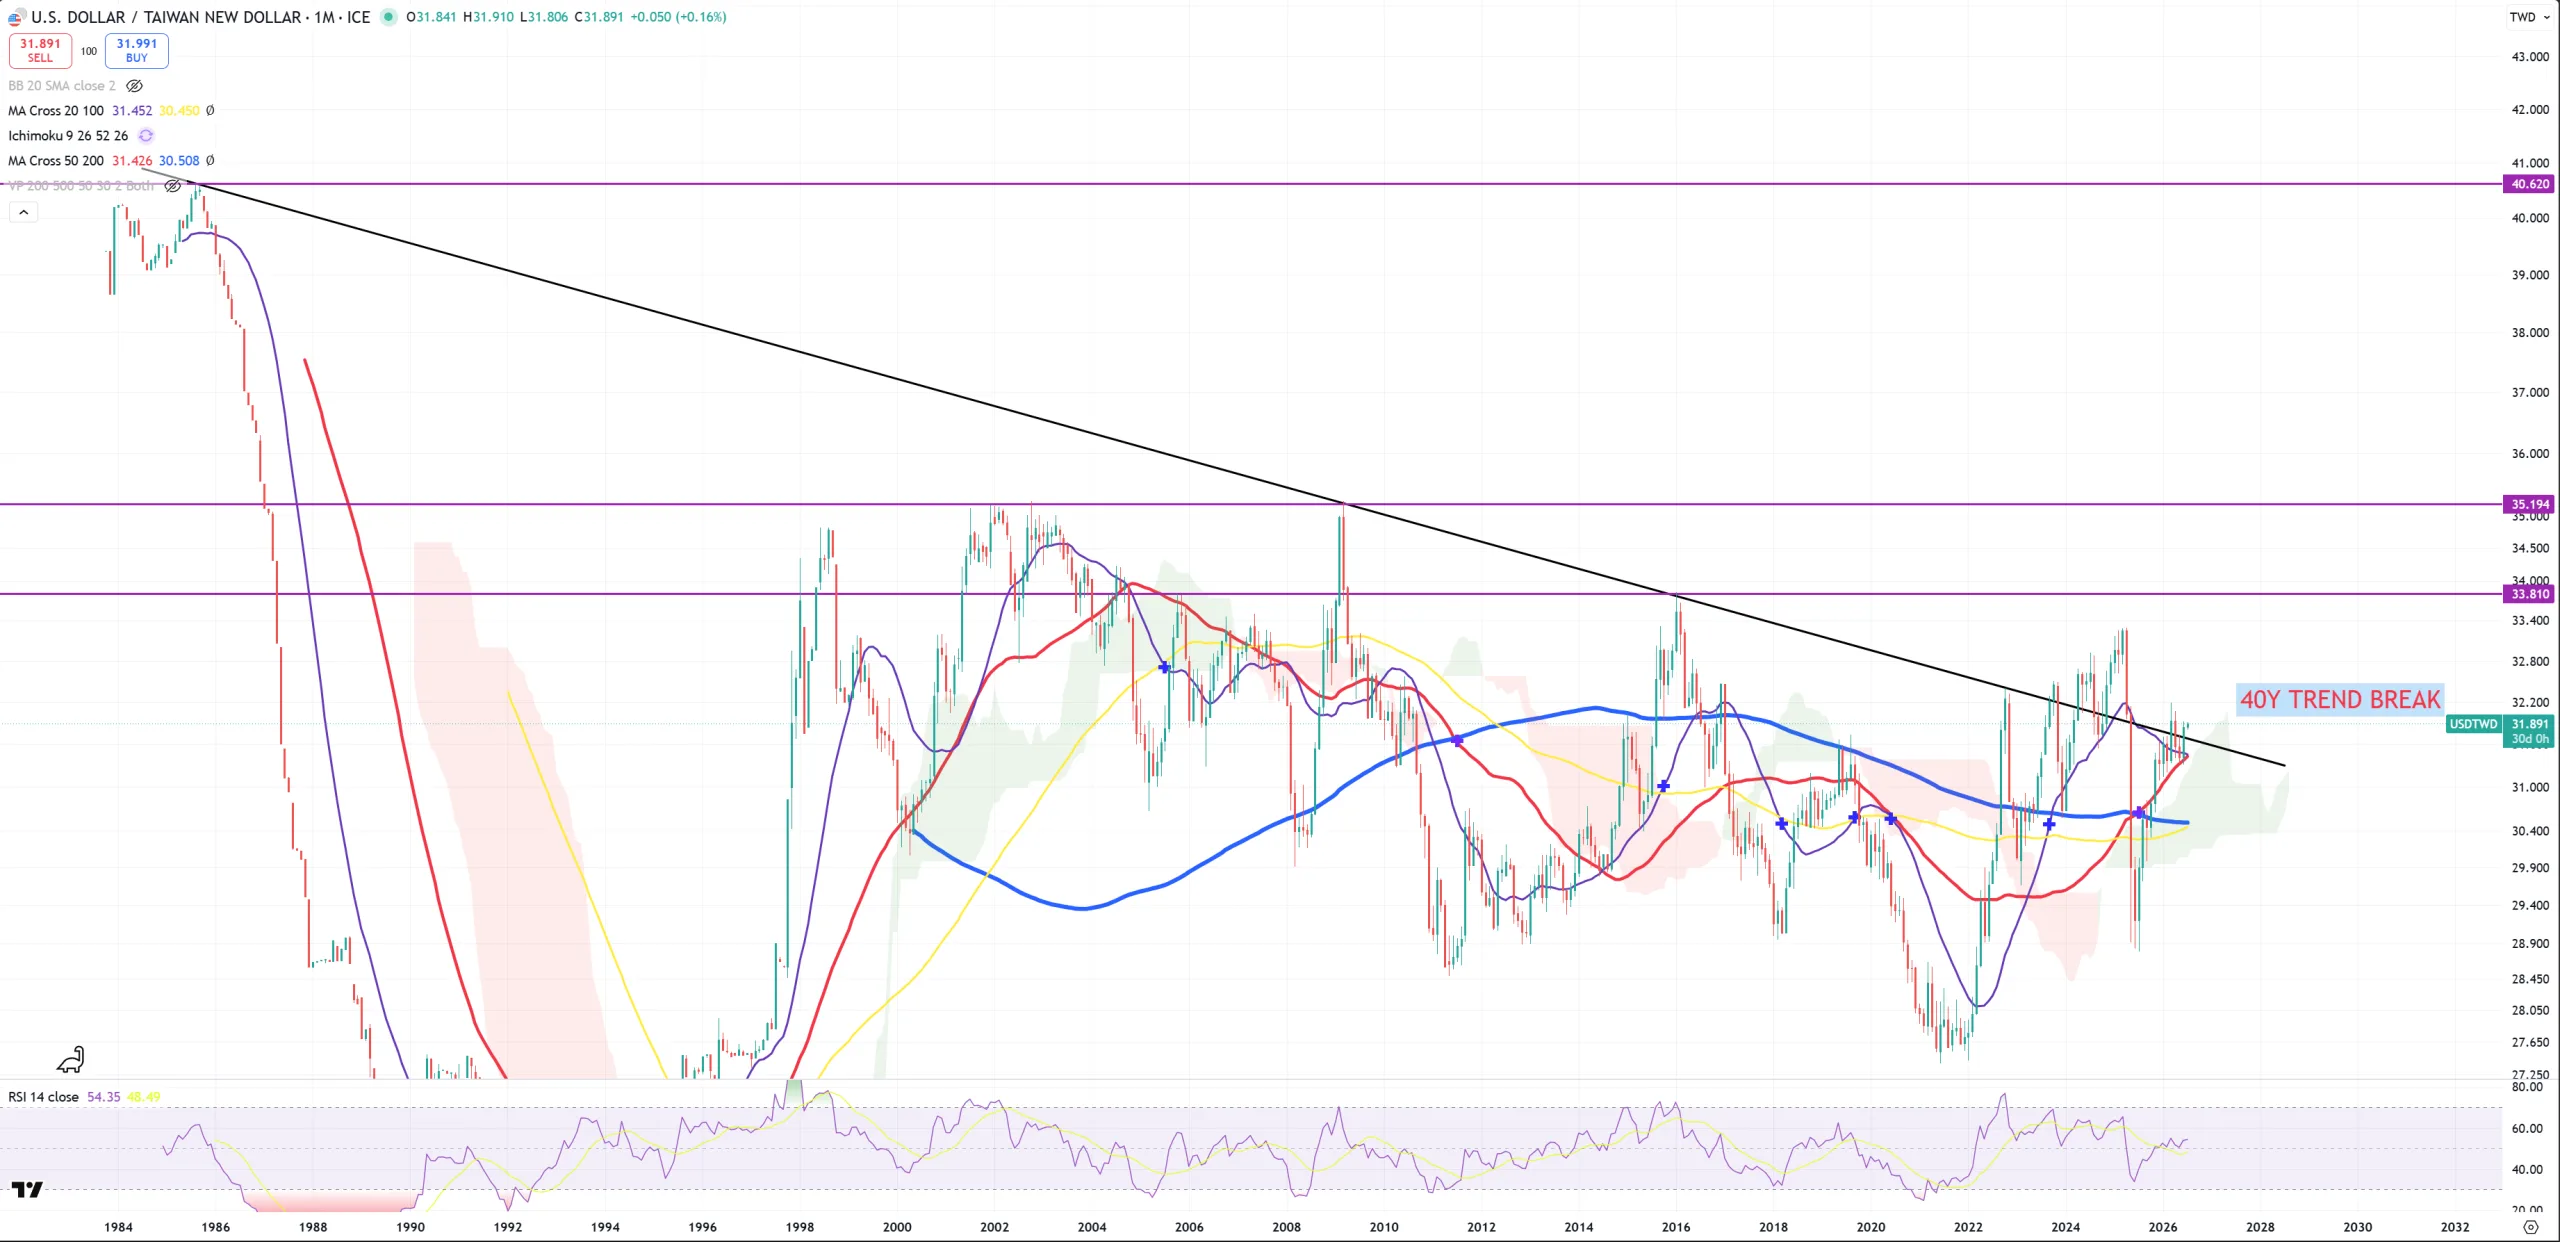
USDTWD – and 40Ys trend break. As I’ve been saying there’s no SOX peak until TWD break will become permanent, another attempt.
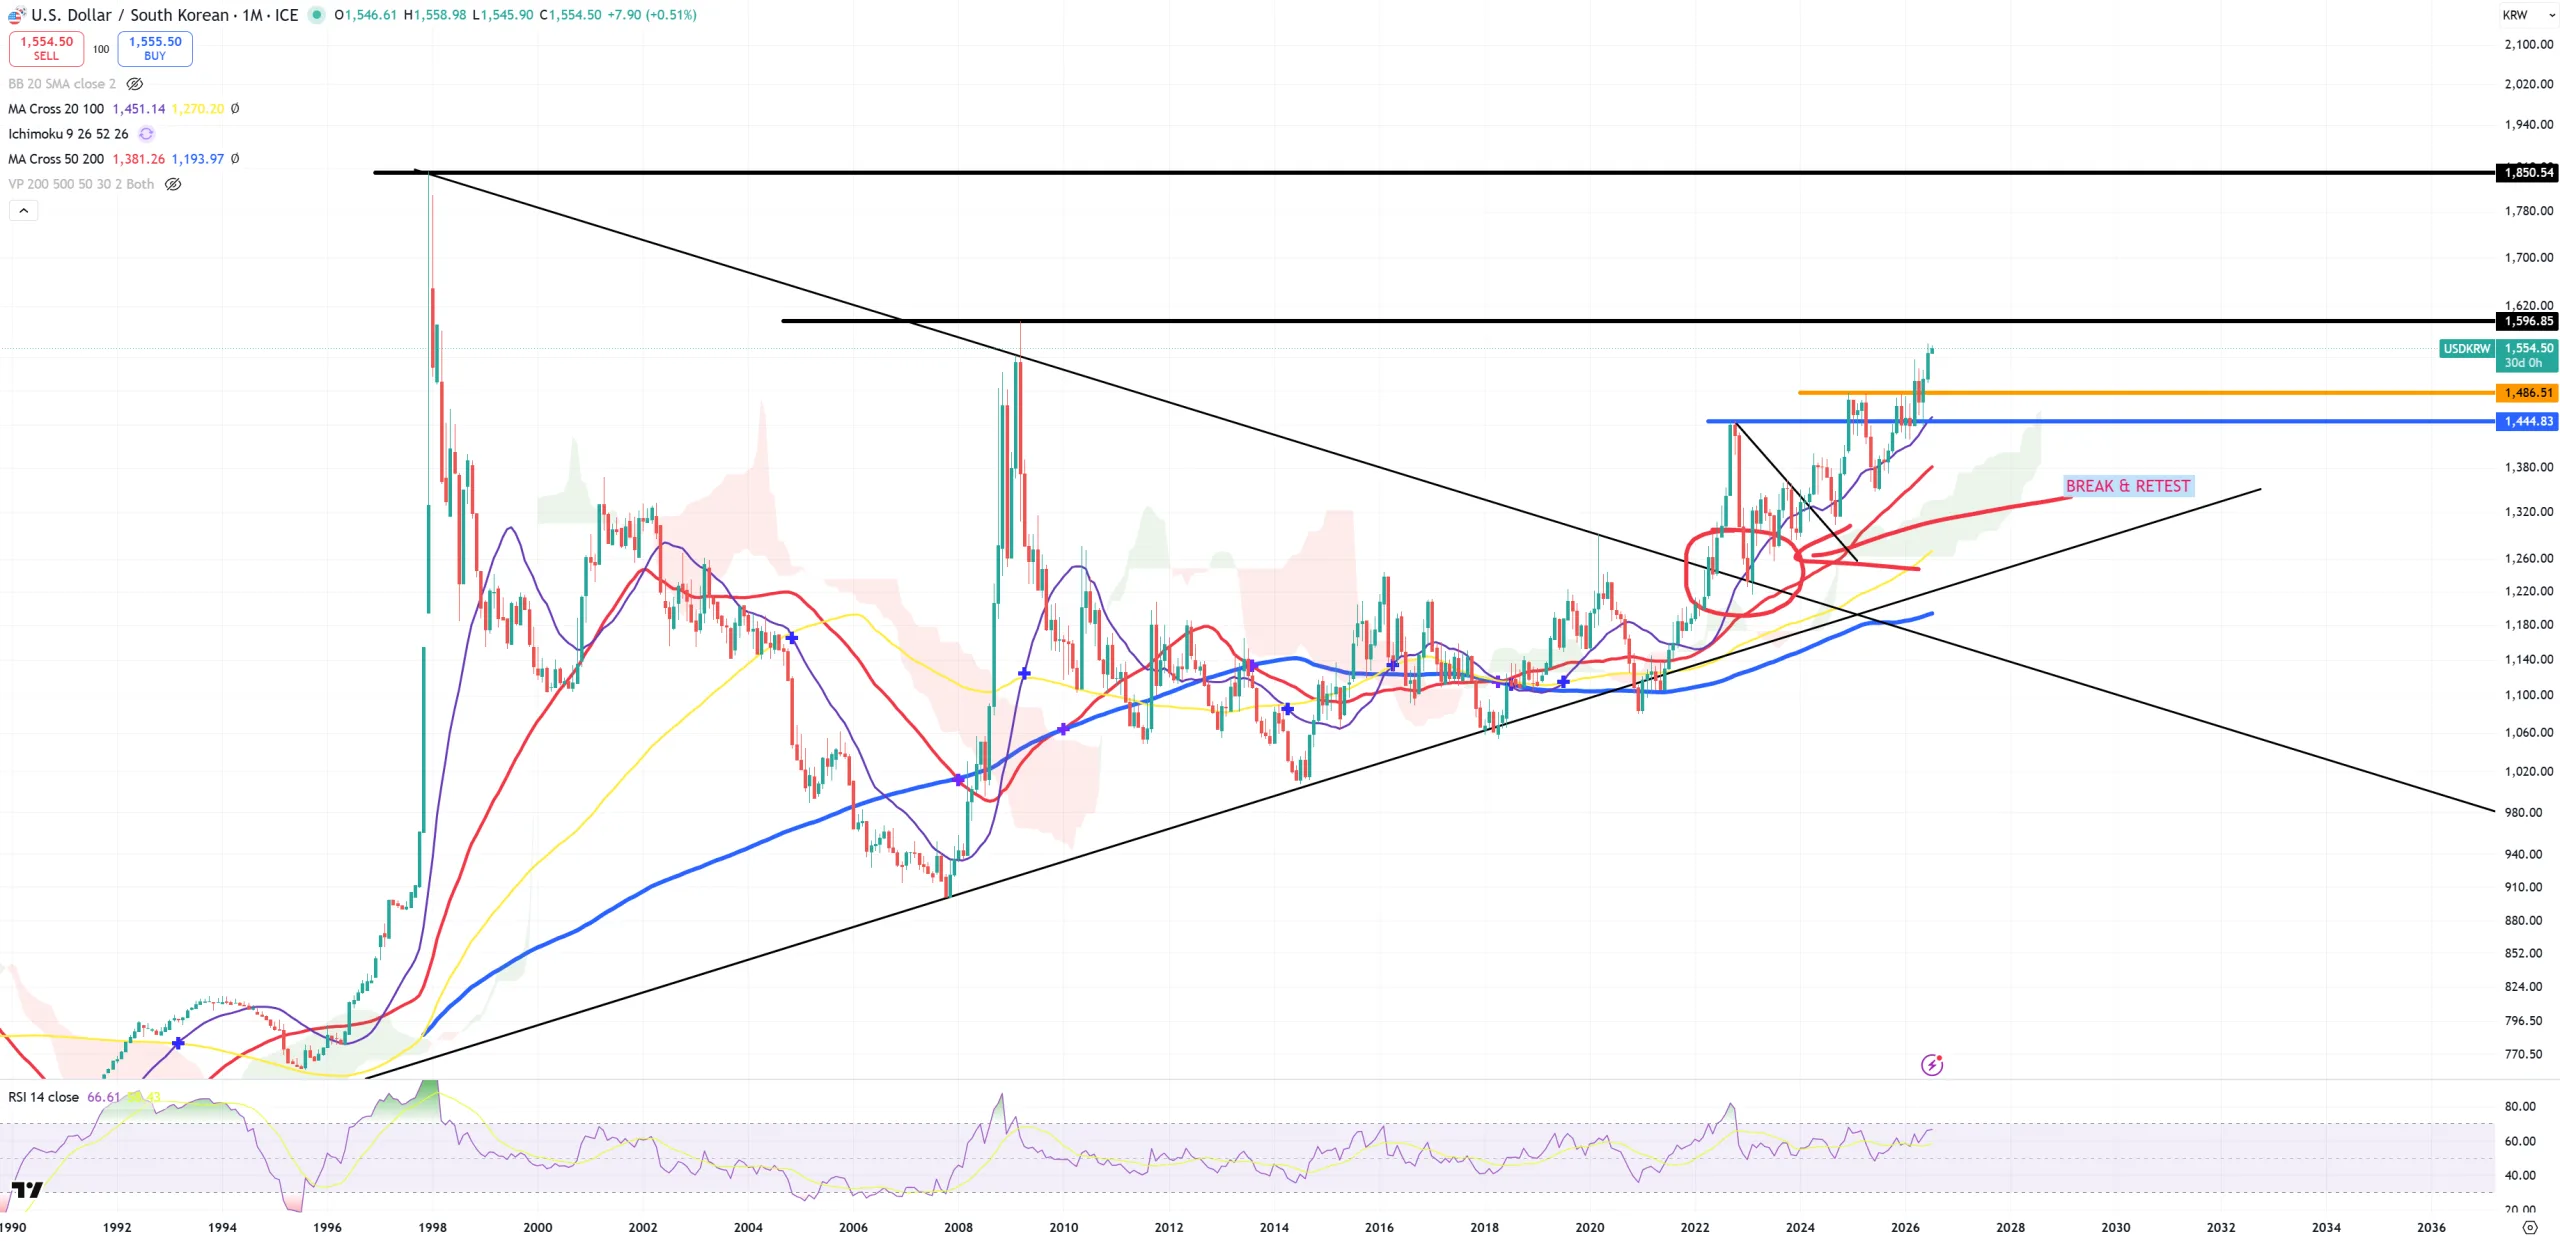
USDKRW – Hynix + Samsung play the game, but KRW blows up. Hard to imagine how high KRW will go once Hynix+Samsung parabolic bubble collapses.
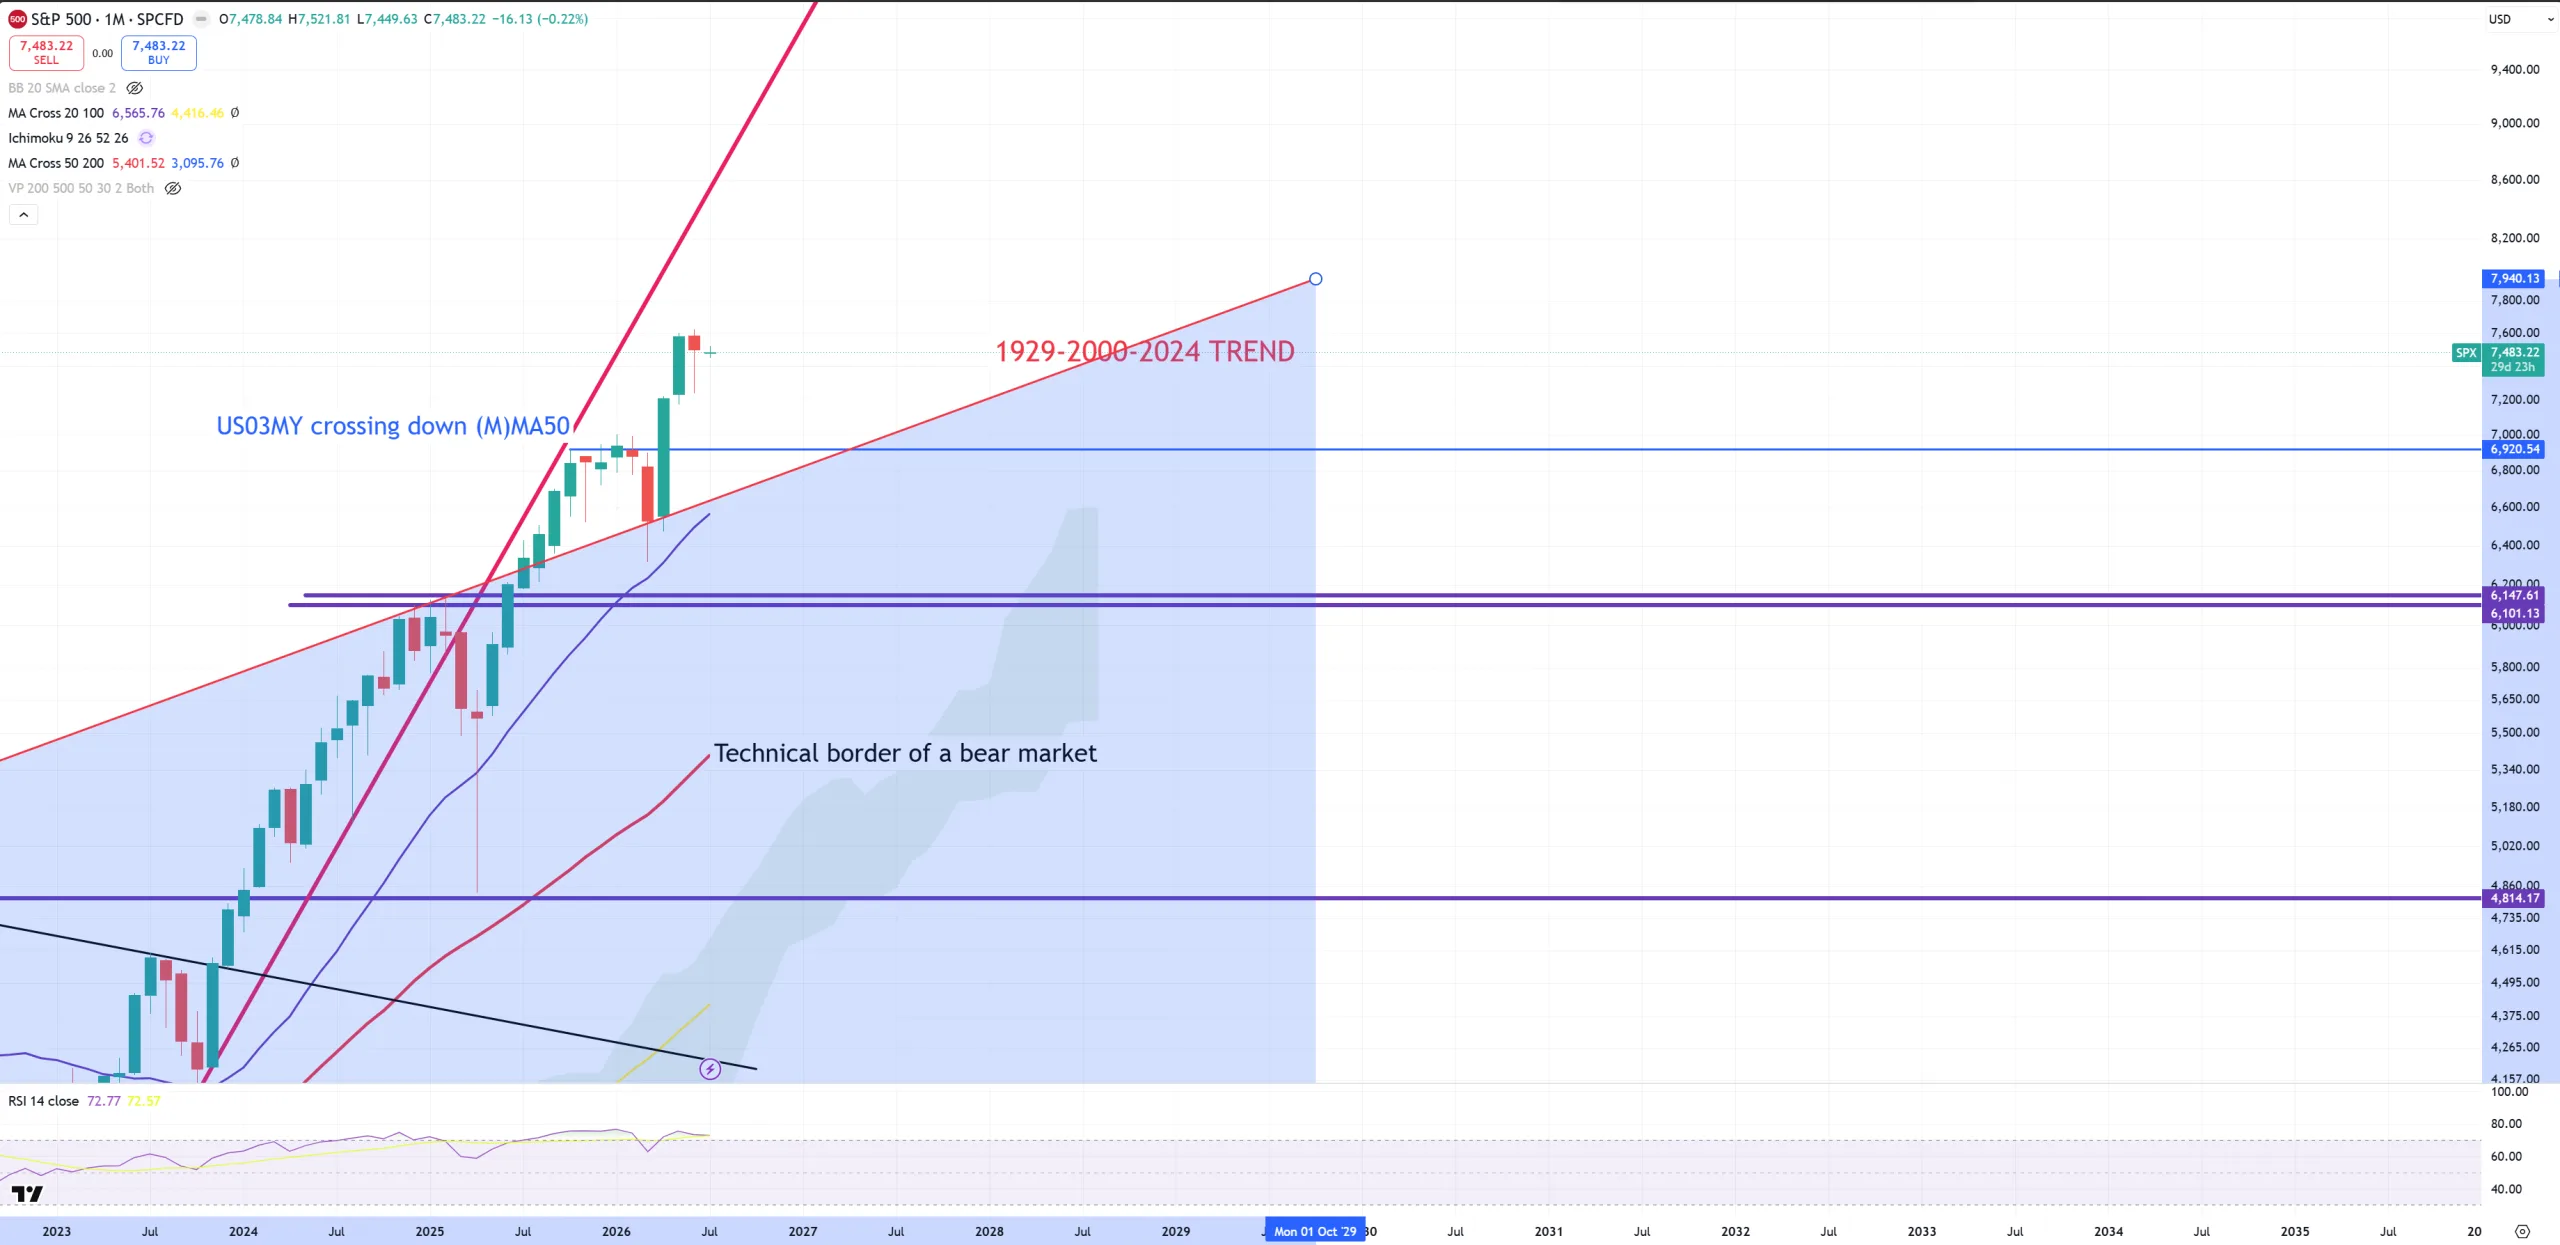
SPX – and its 1929-2000 trend. 6650 is 1929-2000 trend connected to violet (M)MA20. 1929-2000 trend is so far support as you see. Nothing to panic unless we close below (M)MA20 and 1929-2000 trend.
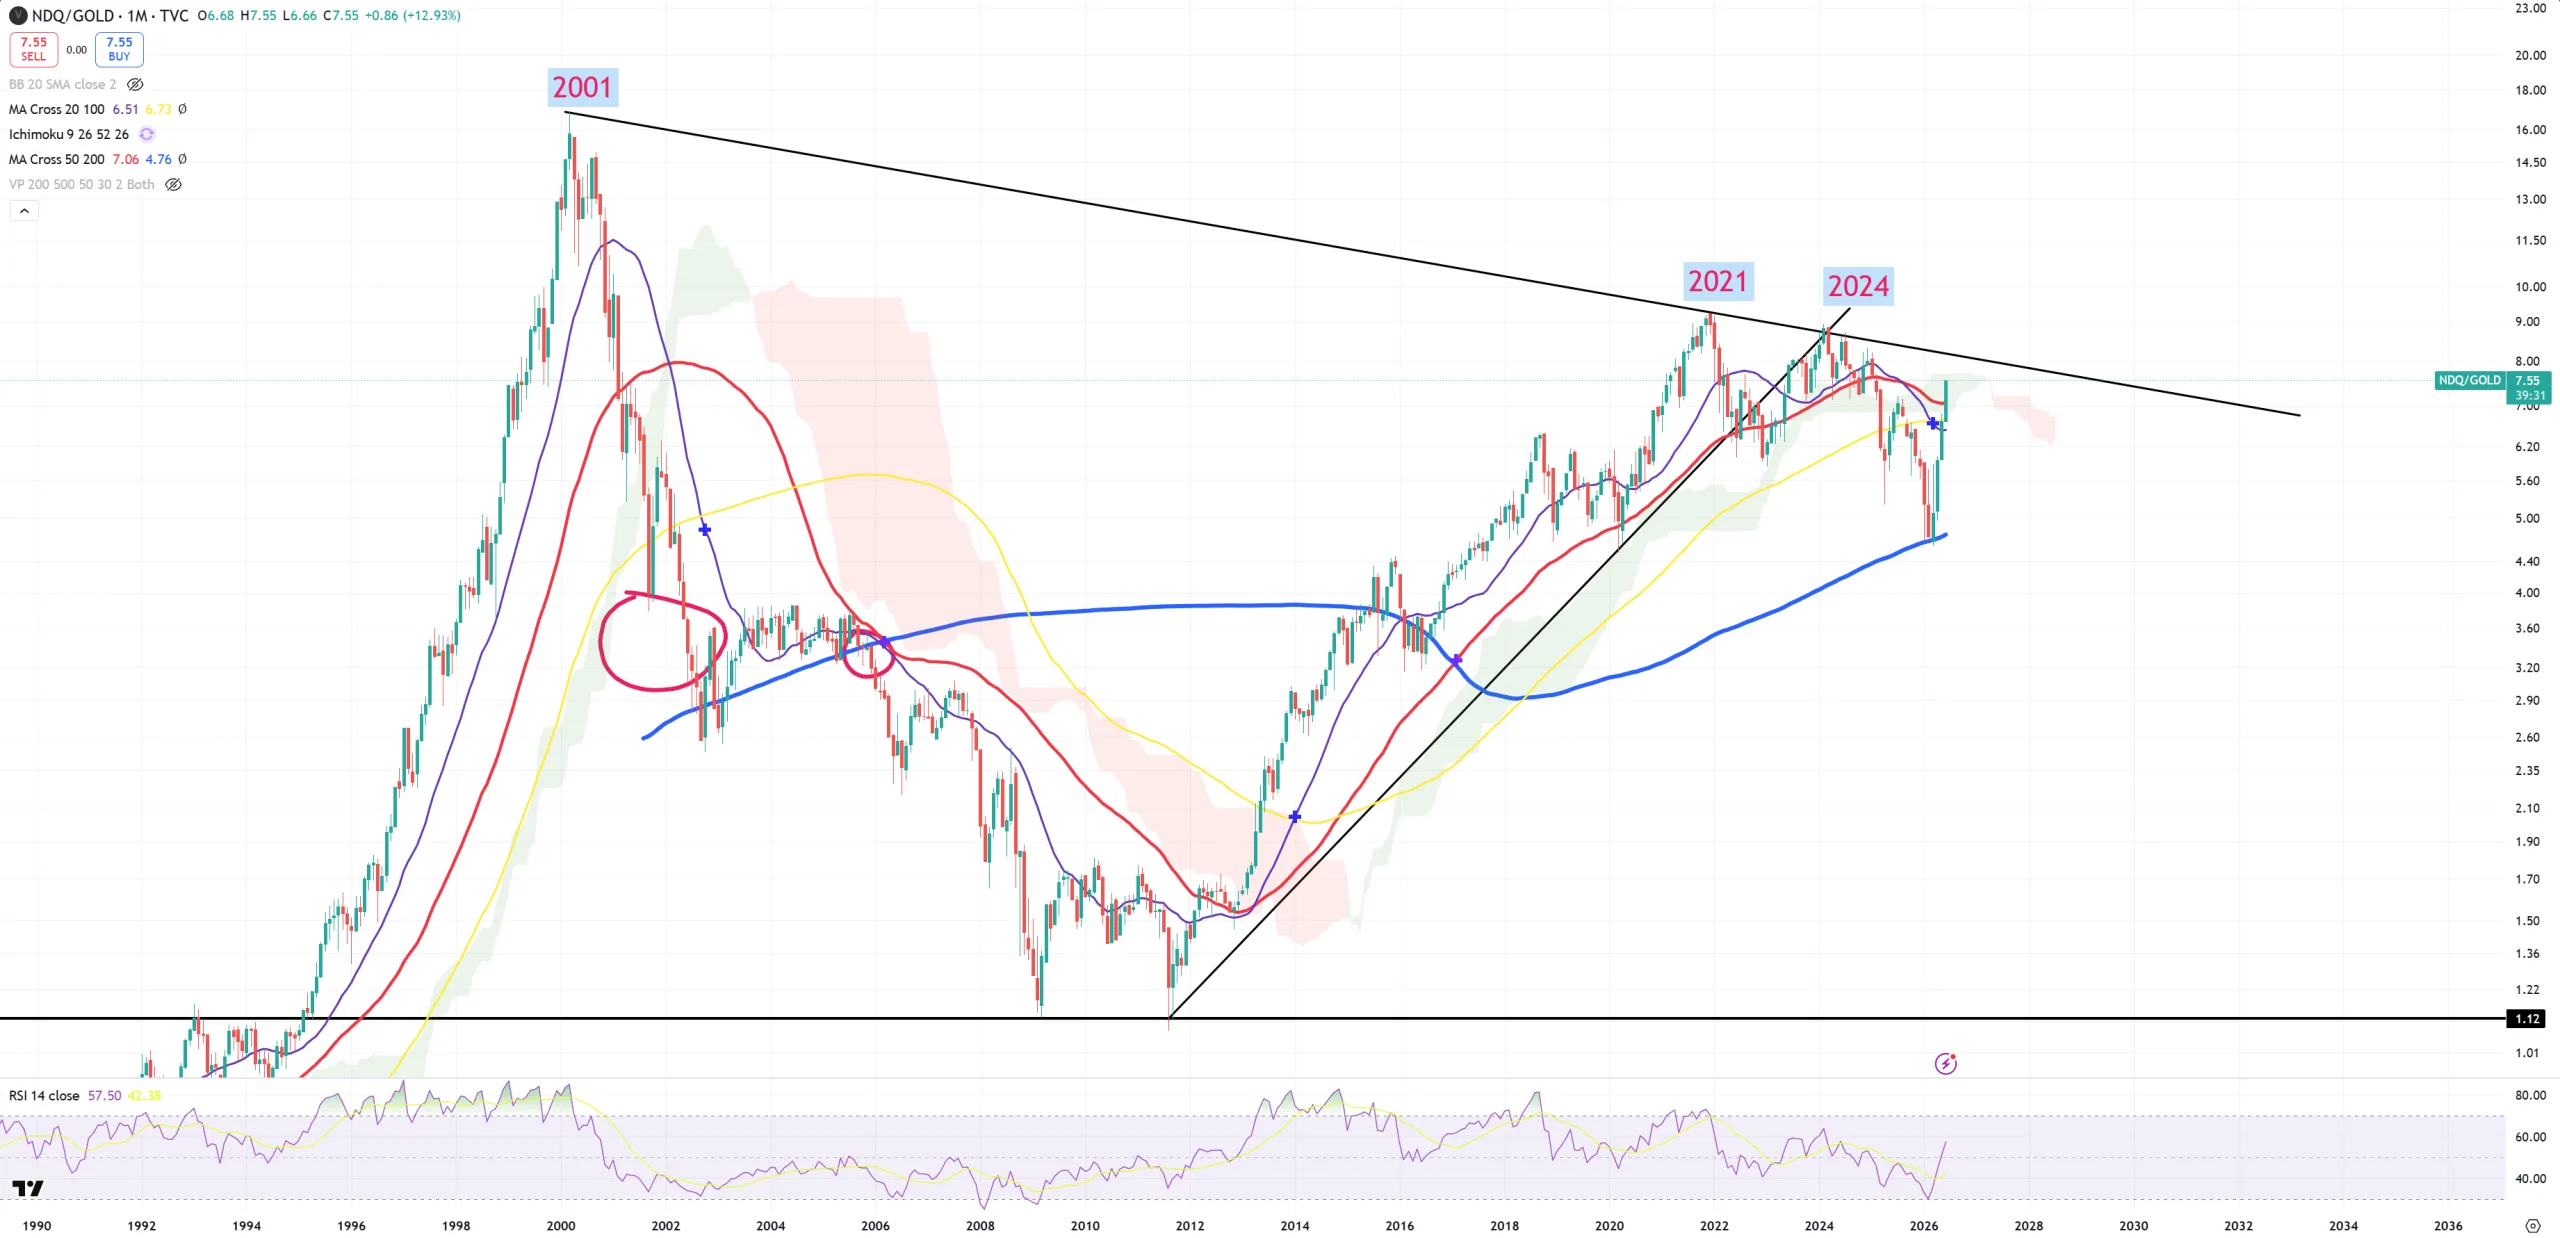
NDQ/GOLD – (M)MA200 support and highest possible rally to ~8.20 to match the trend from 2001/2021/2024
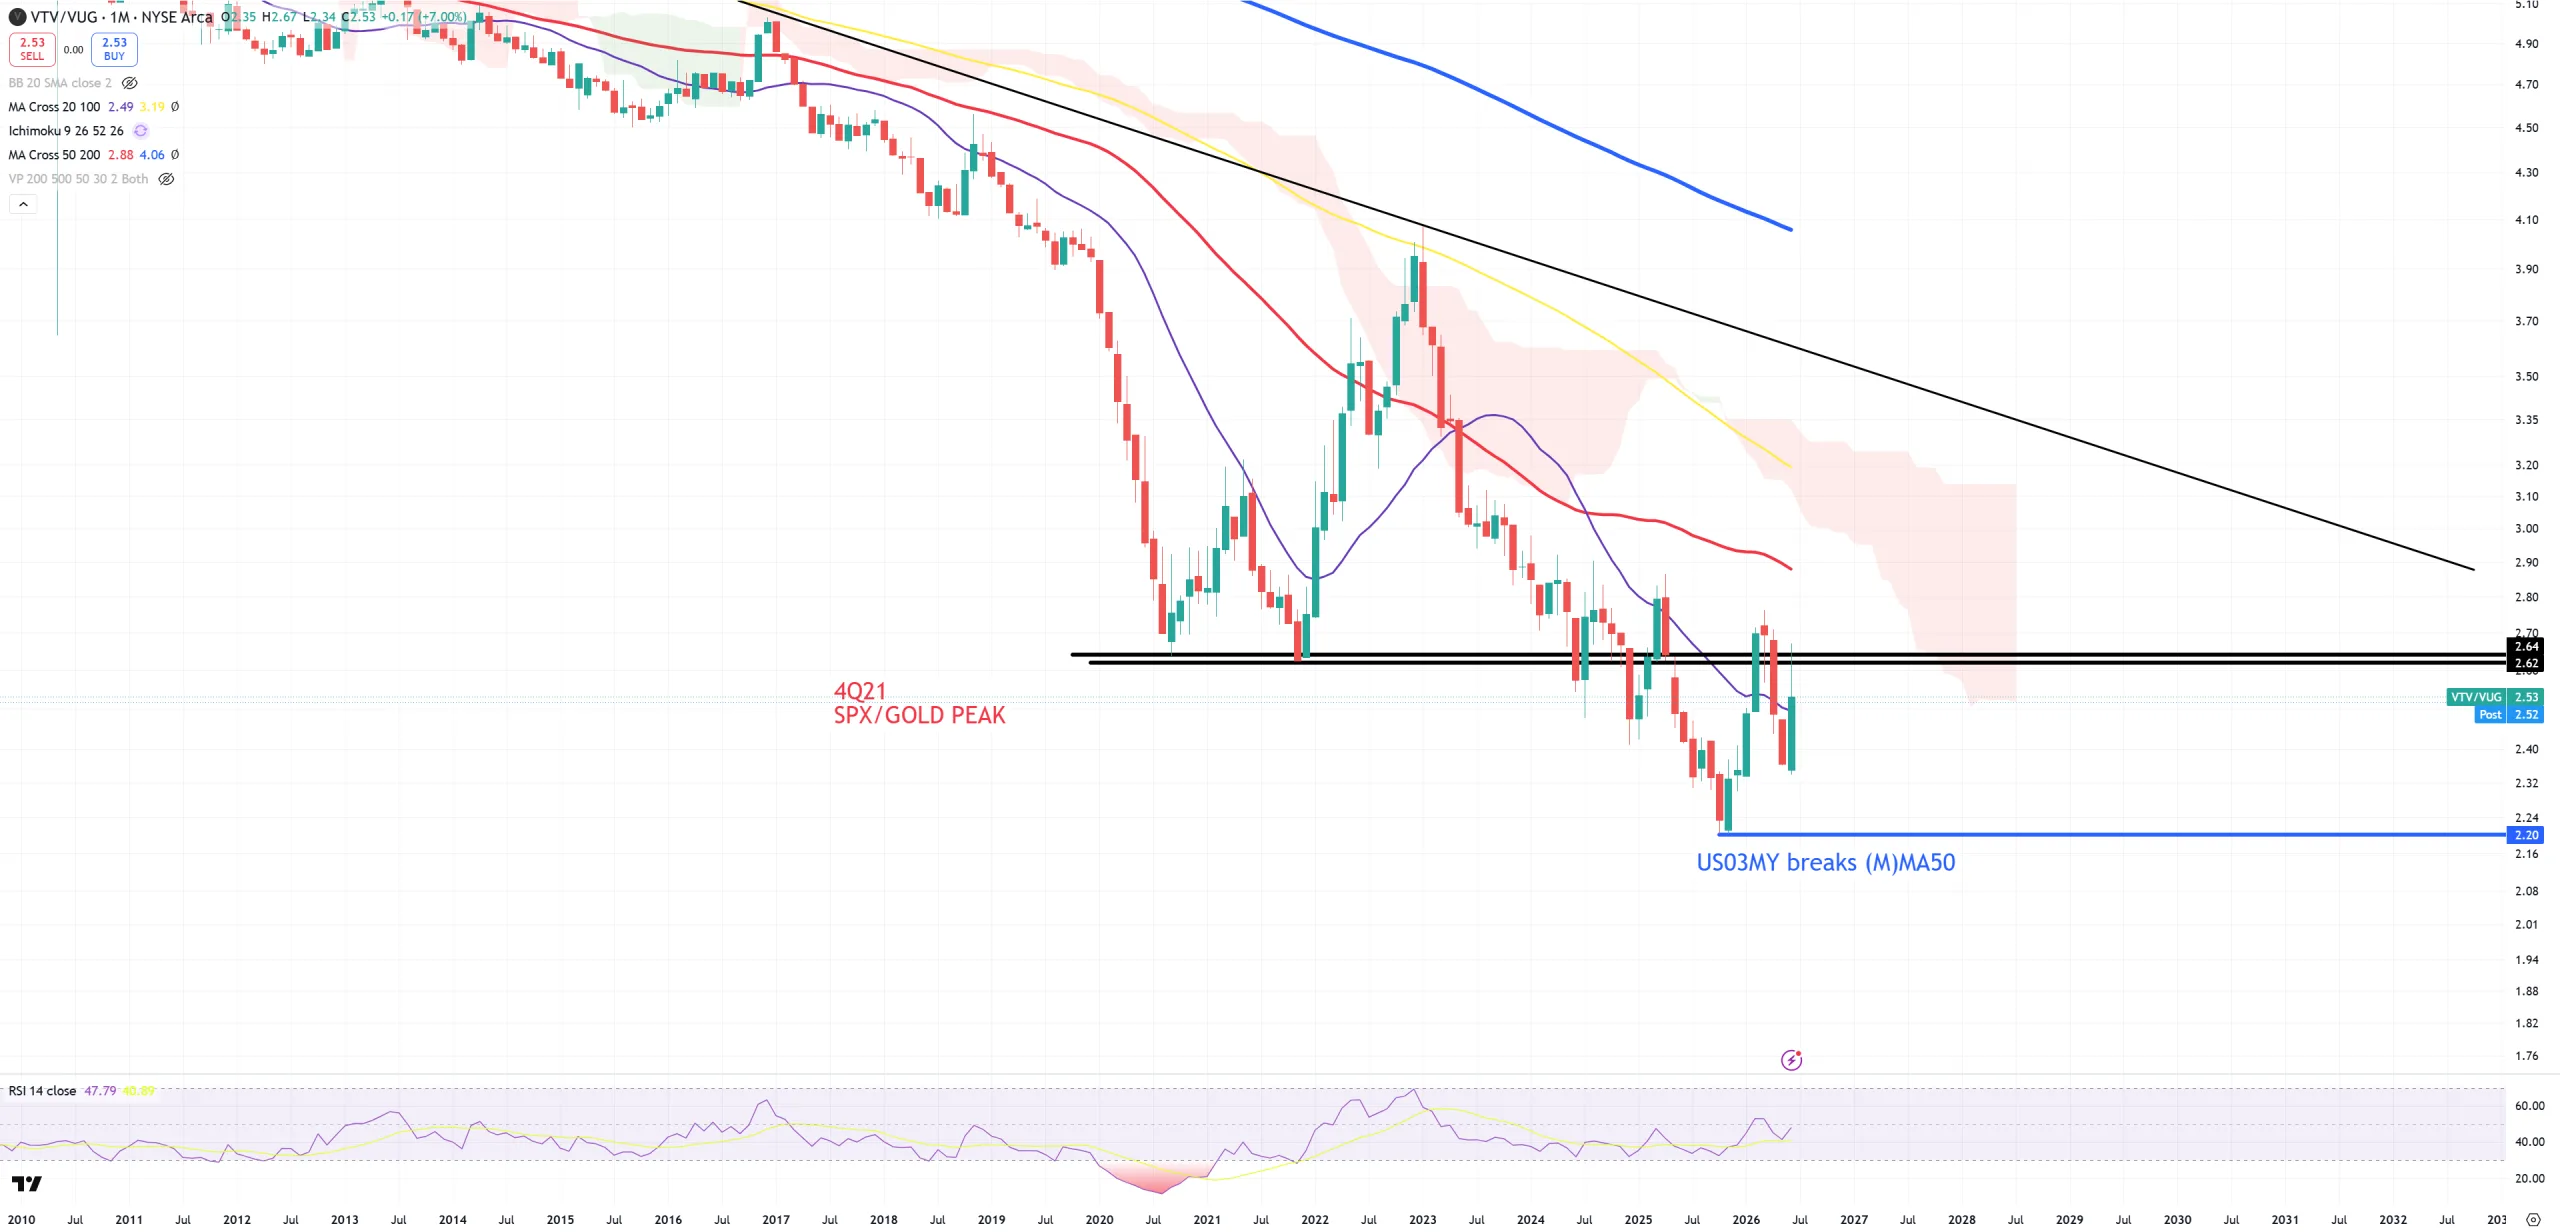
VALUE/GROWTH – I bet the moment it’ll move > 4Q21 level it’ll made a game over for AI/SOX. Now this level is resistance. Another chart showing mixed bullish/bearish thesis. Bulls can’t allow this chart to break above 4Q21 level.
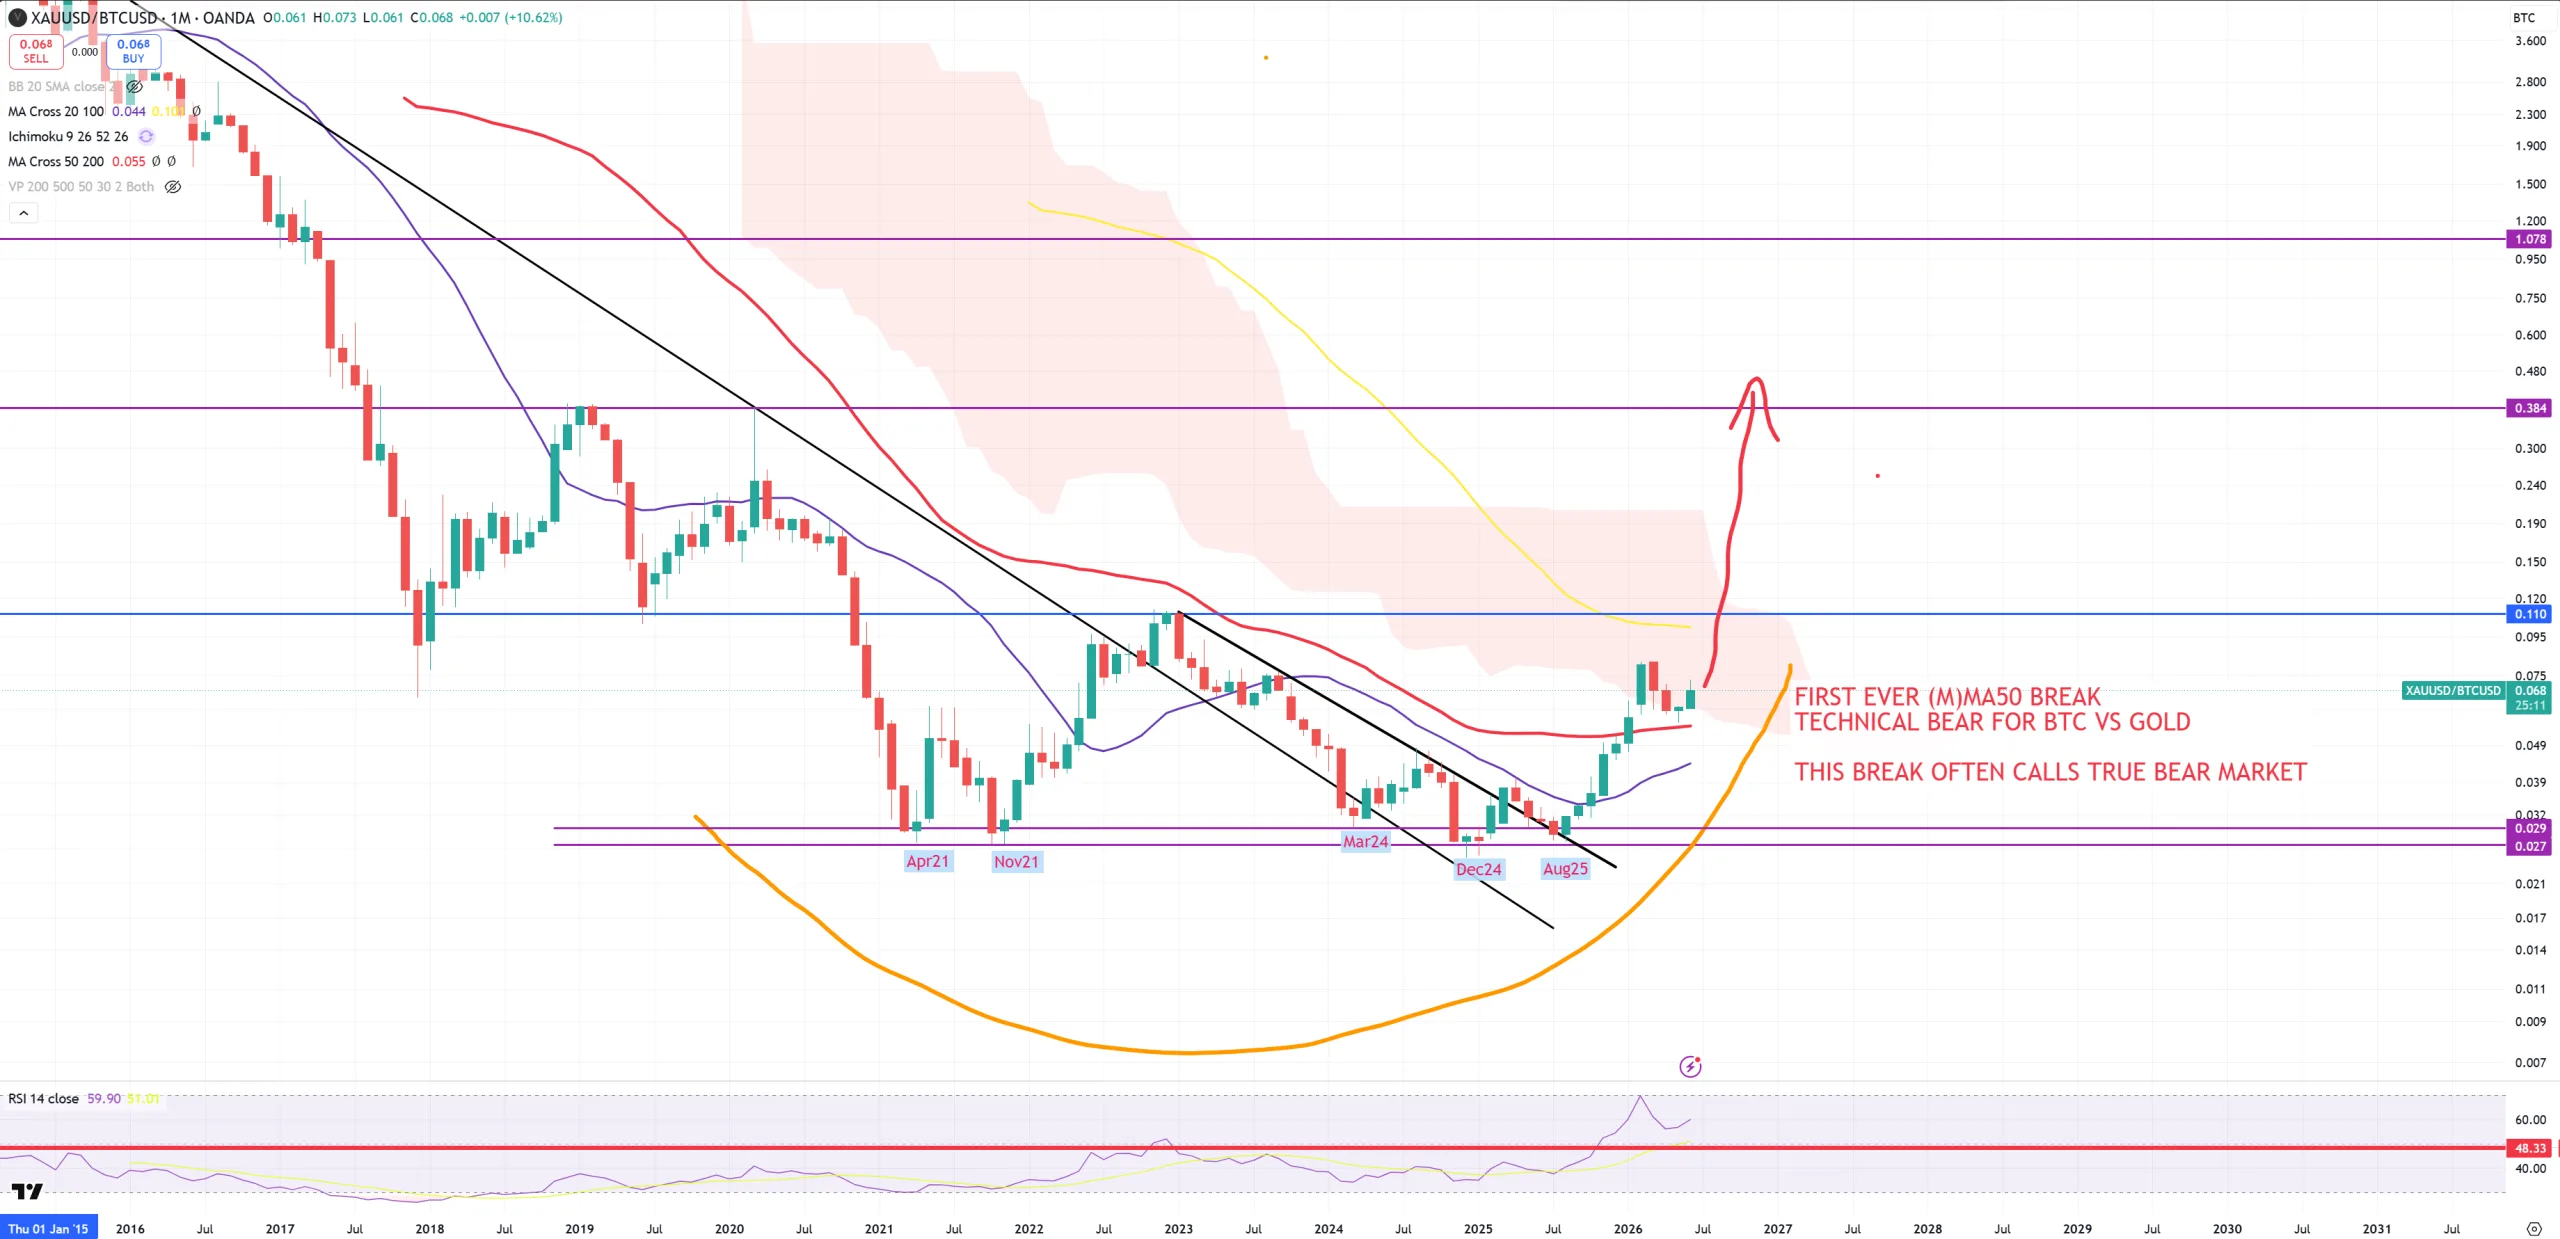
GOLD/BTC – no surprise here after (M)MA50 break and last bottom in 3-4Q25.
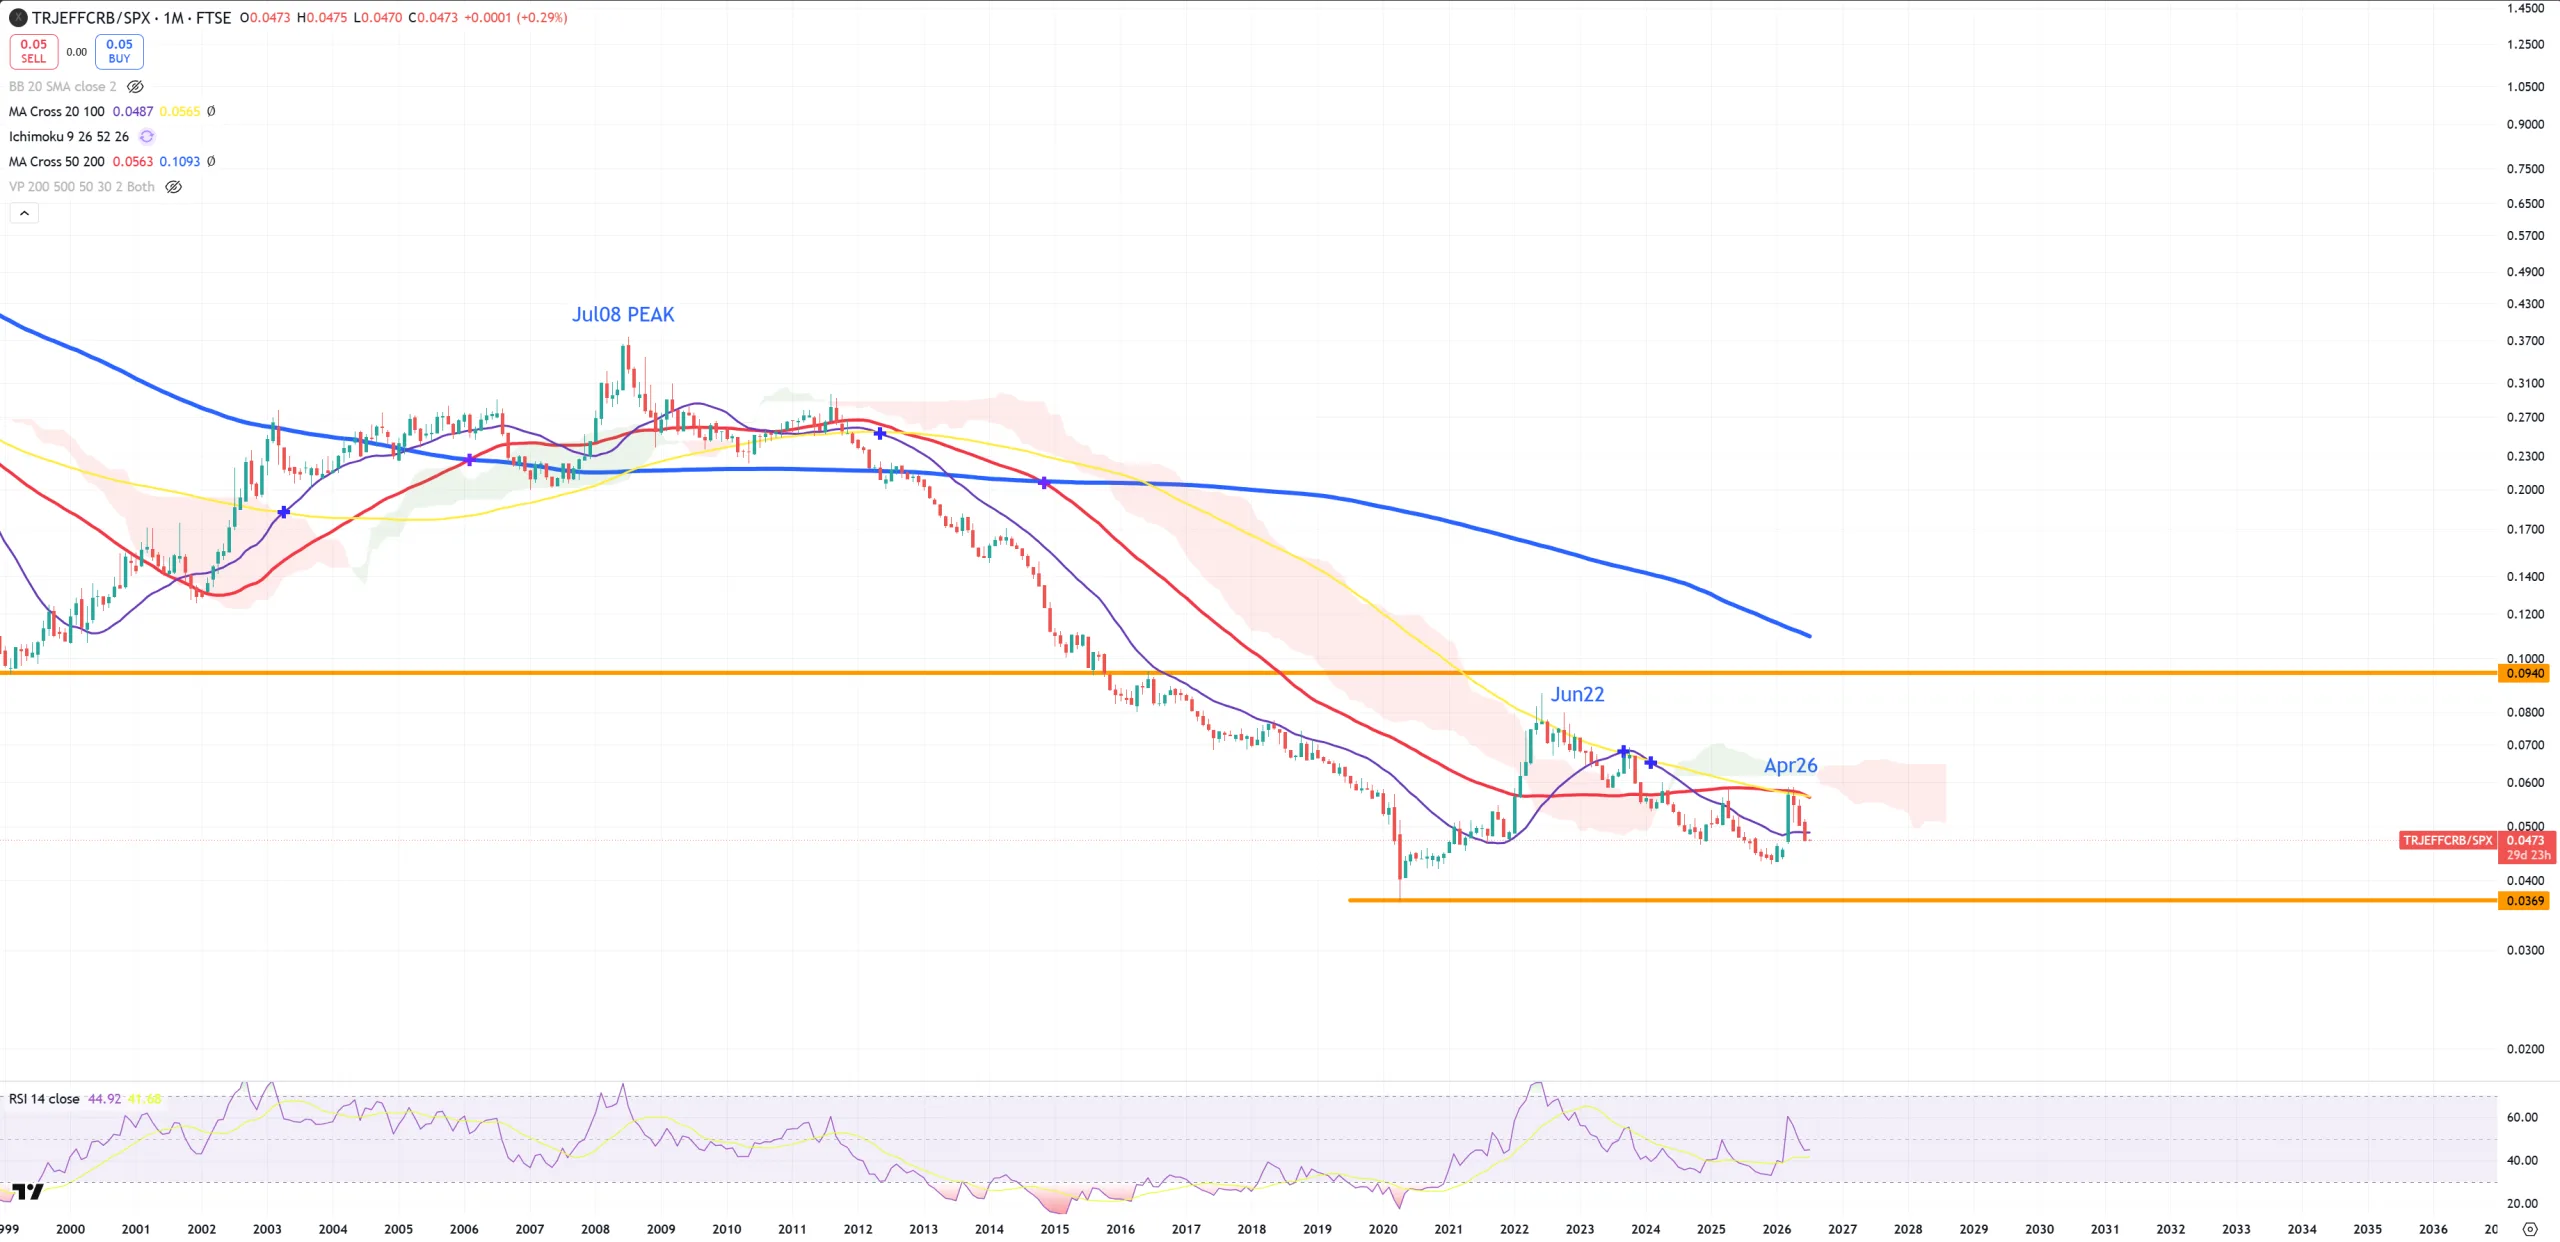
CRB/SPX – last bounce was just a typical bear market bounce to retest (M)MA50 from the bottom and FAILED.
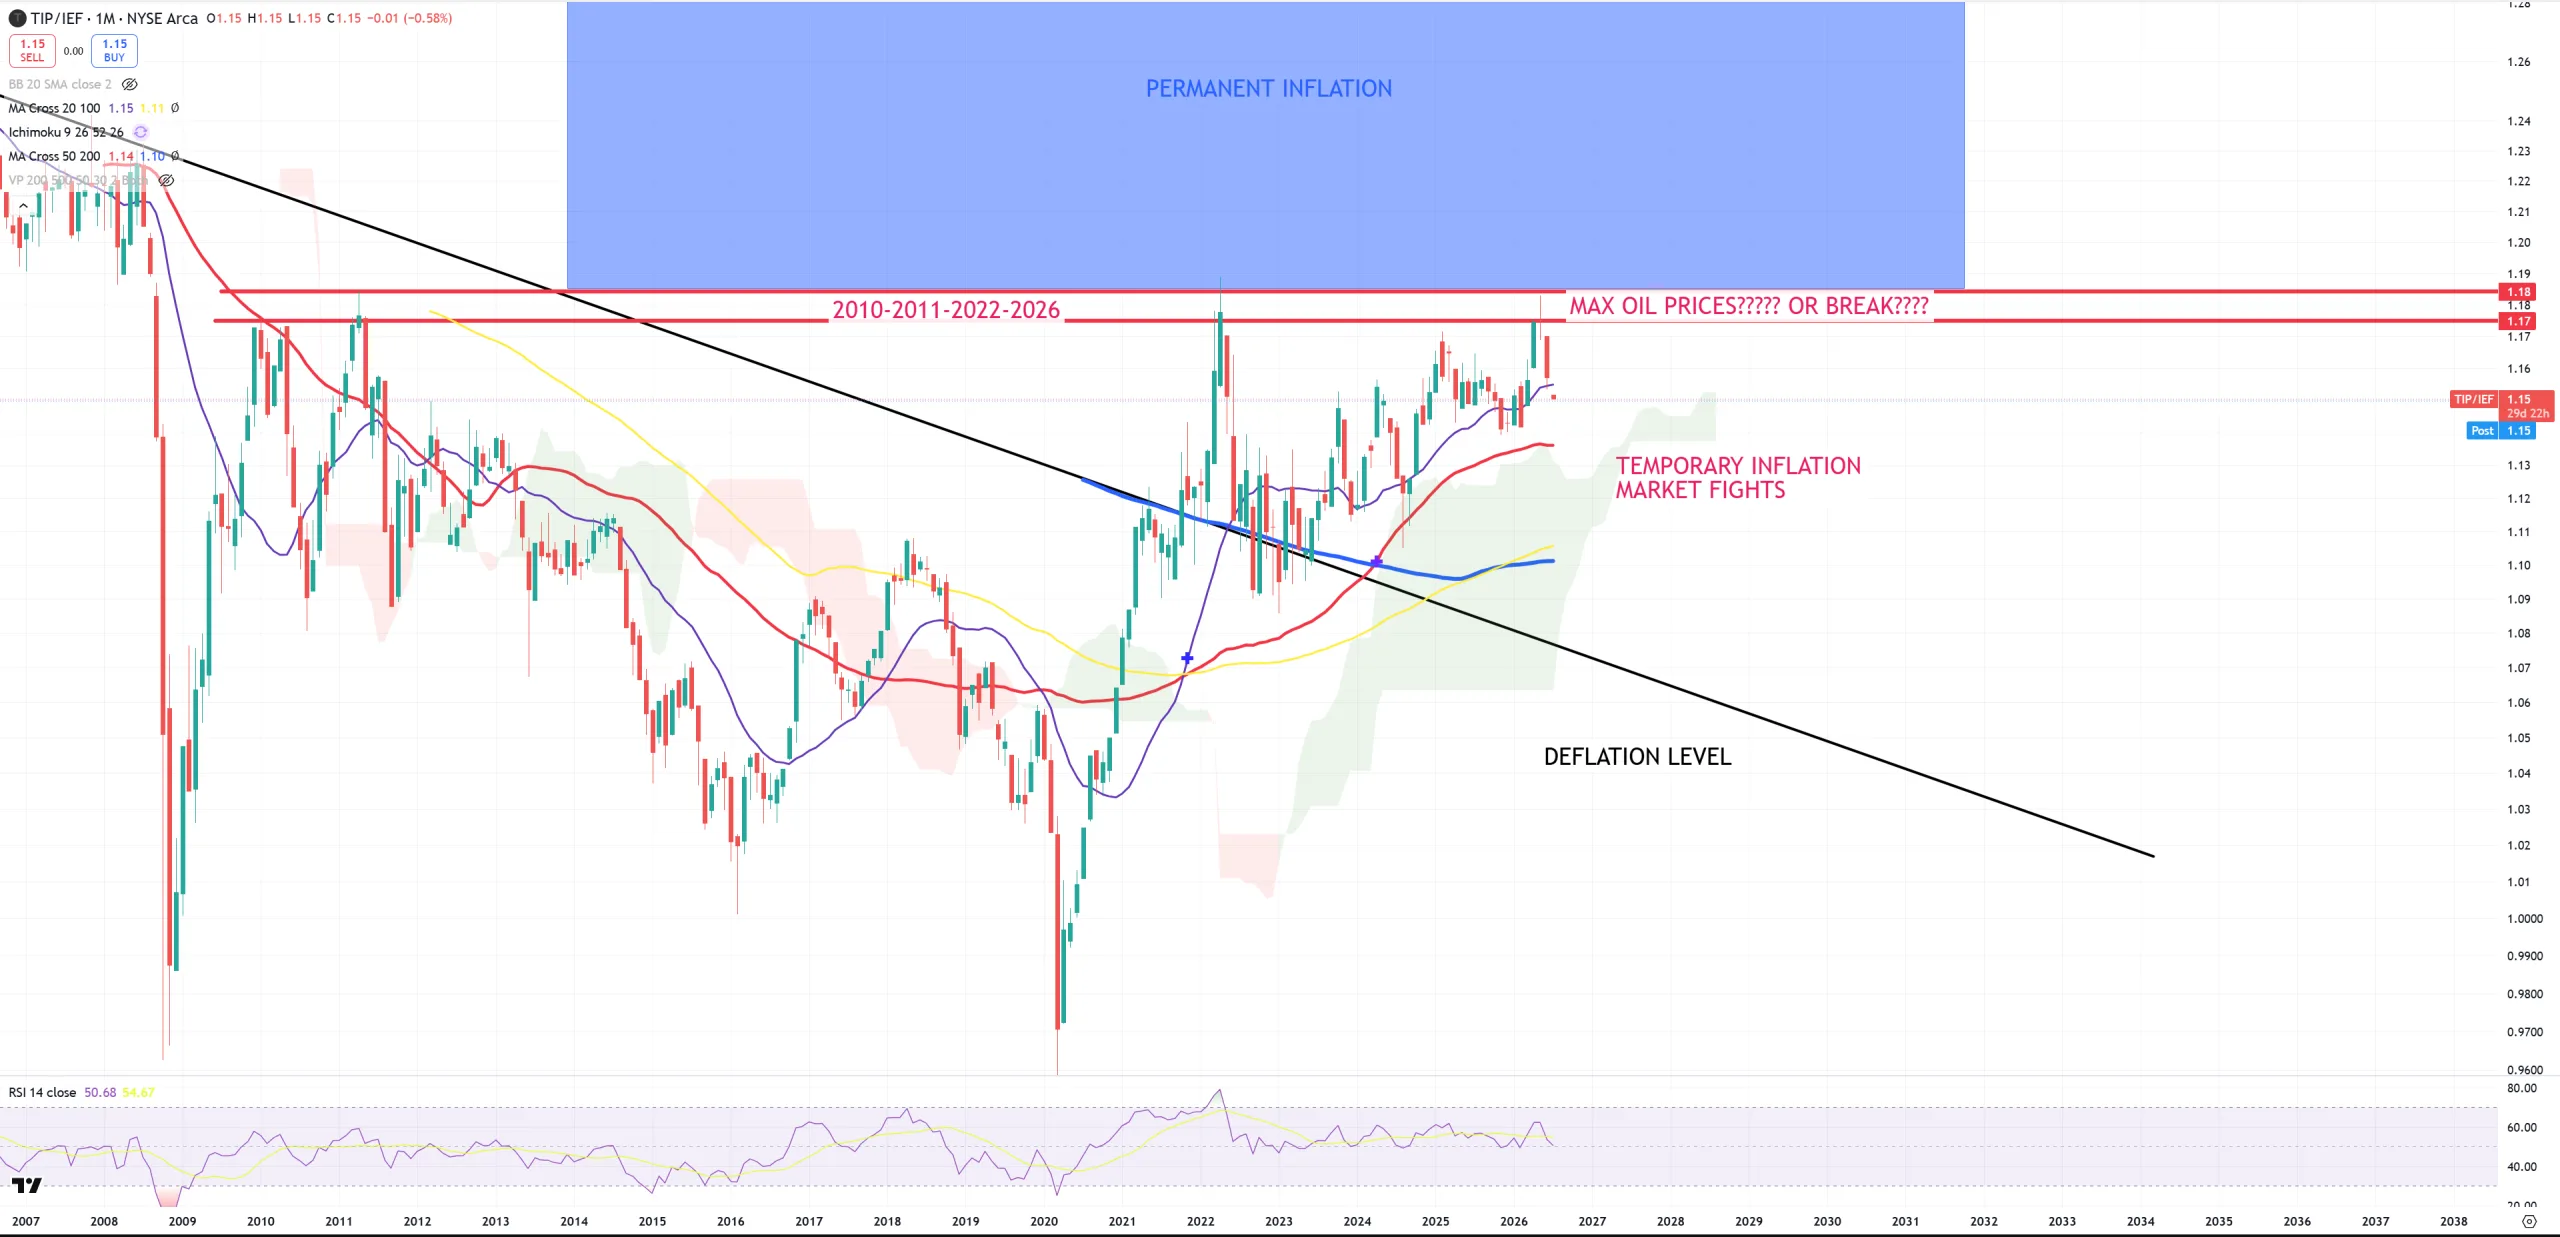
TIP/IEF – inflation/deflation metrics. Same resistance as OIL more or less. We will be boxing between key resistance called MAX OIL PRICES and support around DEFLATION LEVEL black trend line.
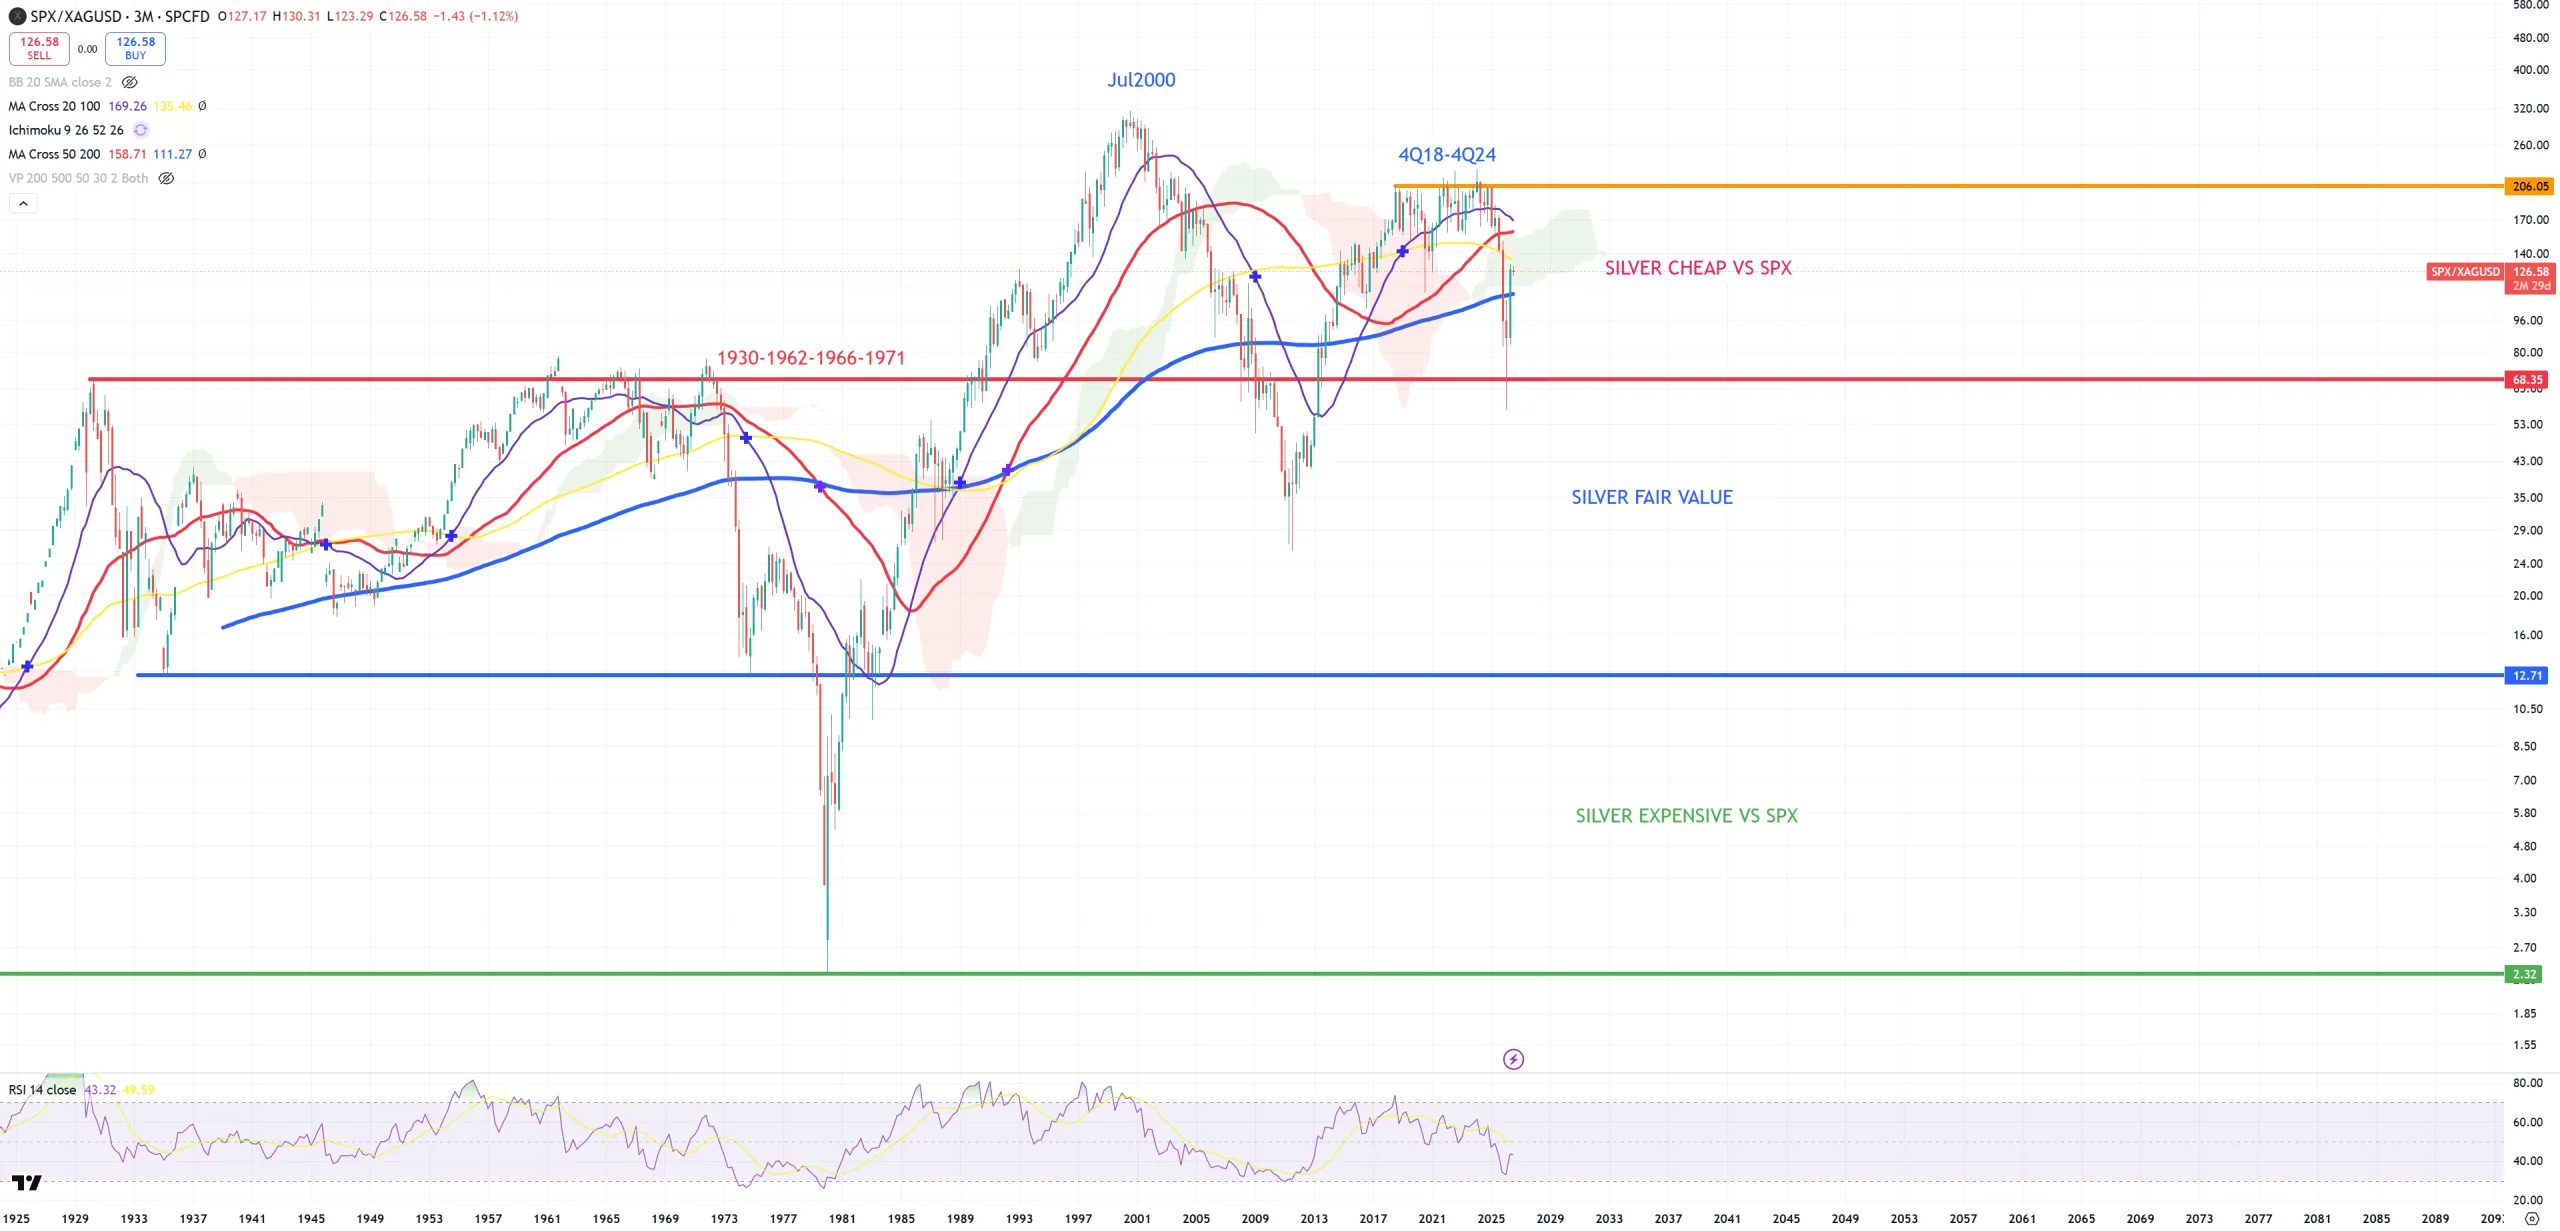
SPX/SILVER keeps defending key support. 3M view.
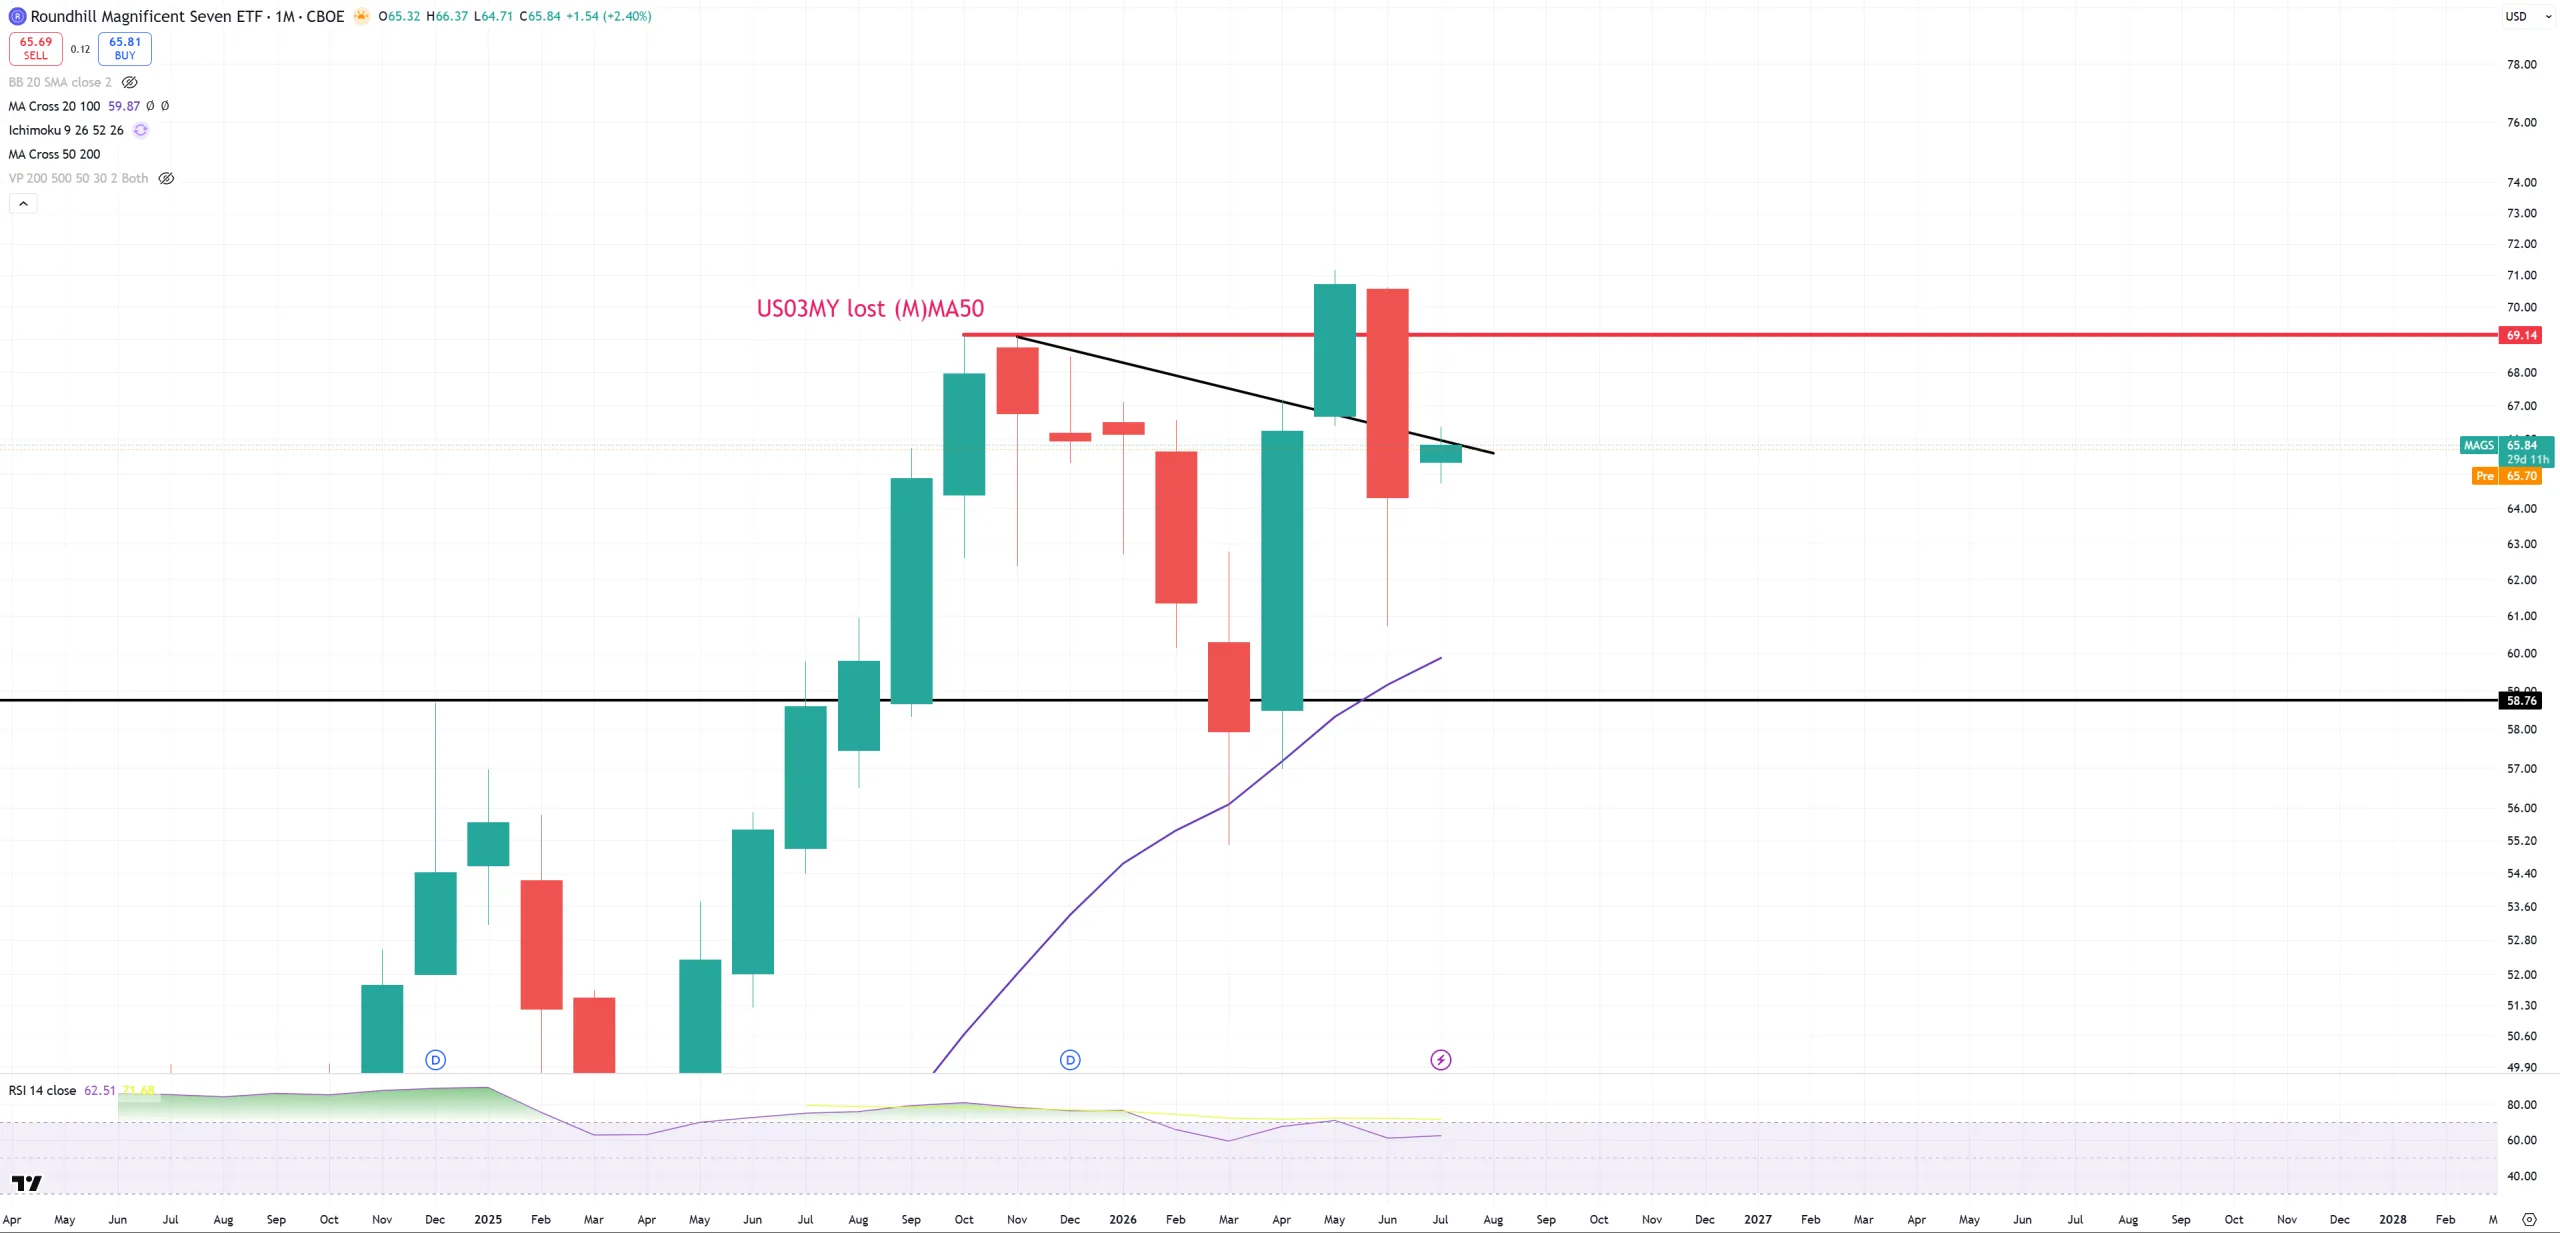
MAGS – Mag7 stocks have its key moment. Not much happened, but key resistance stays around 69$
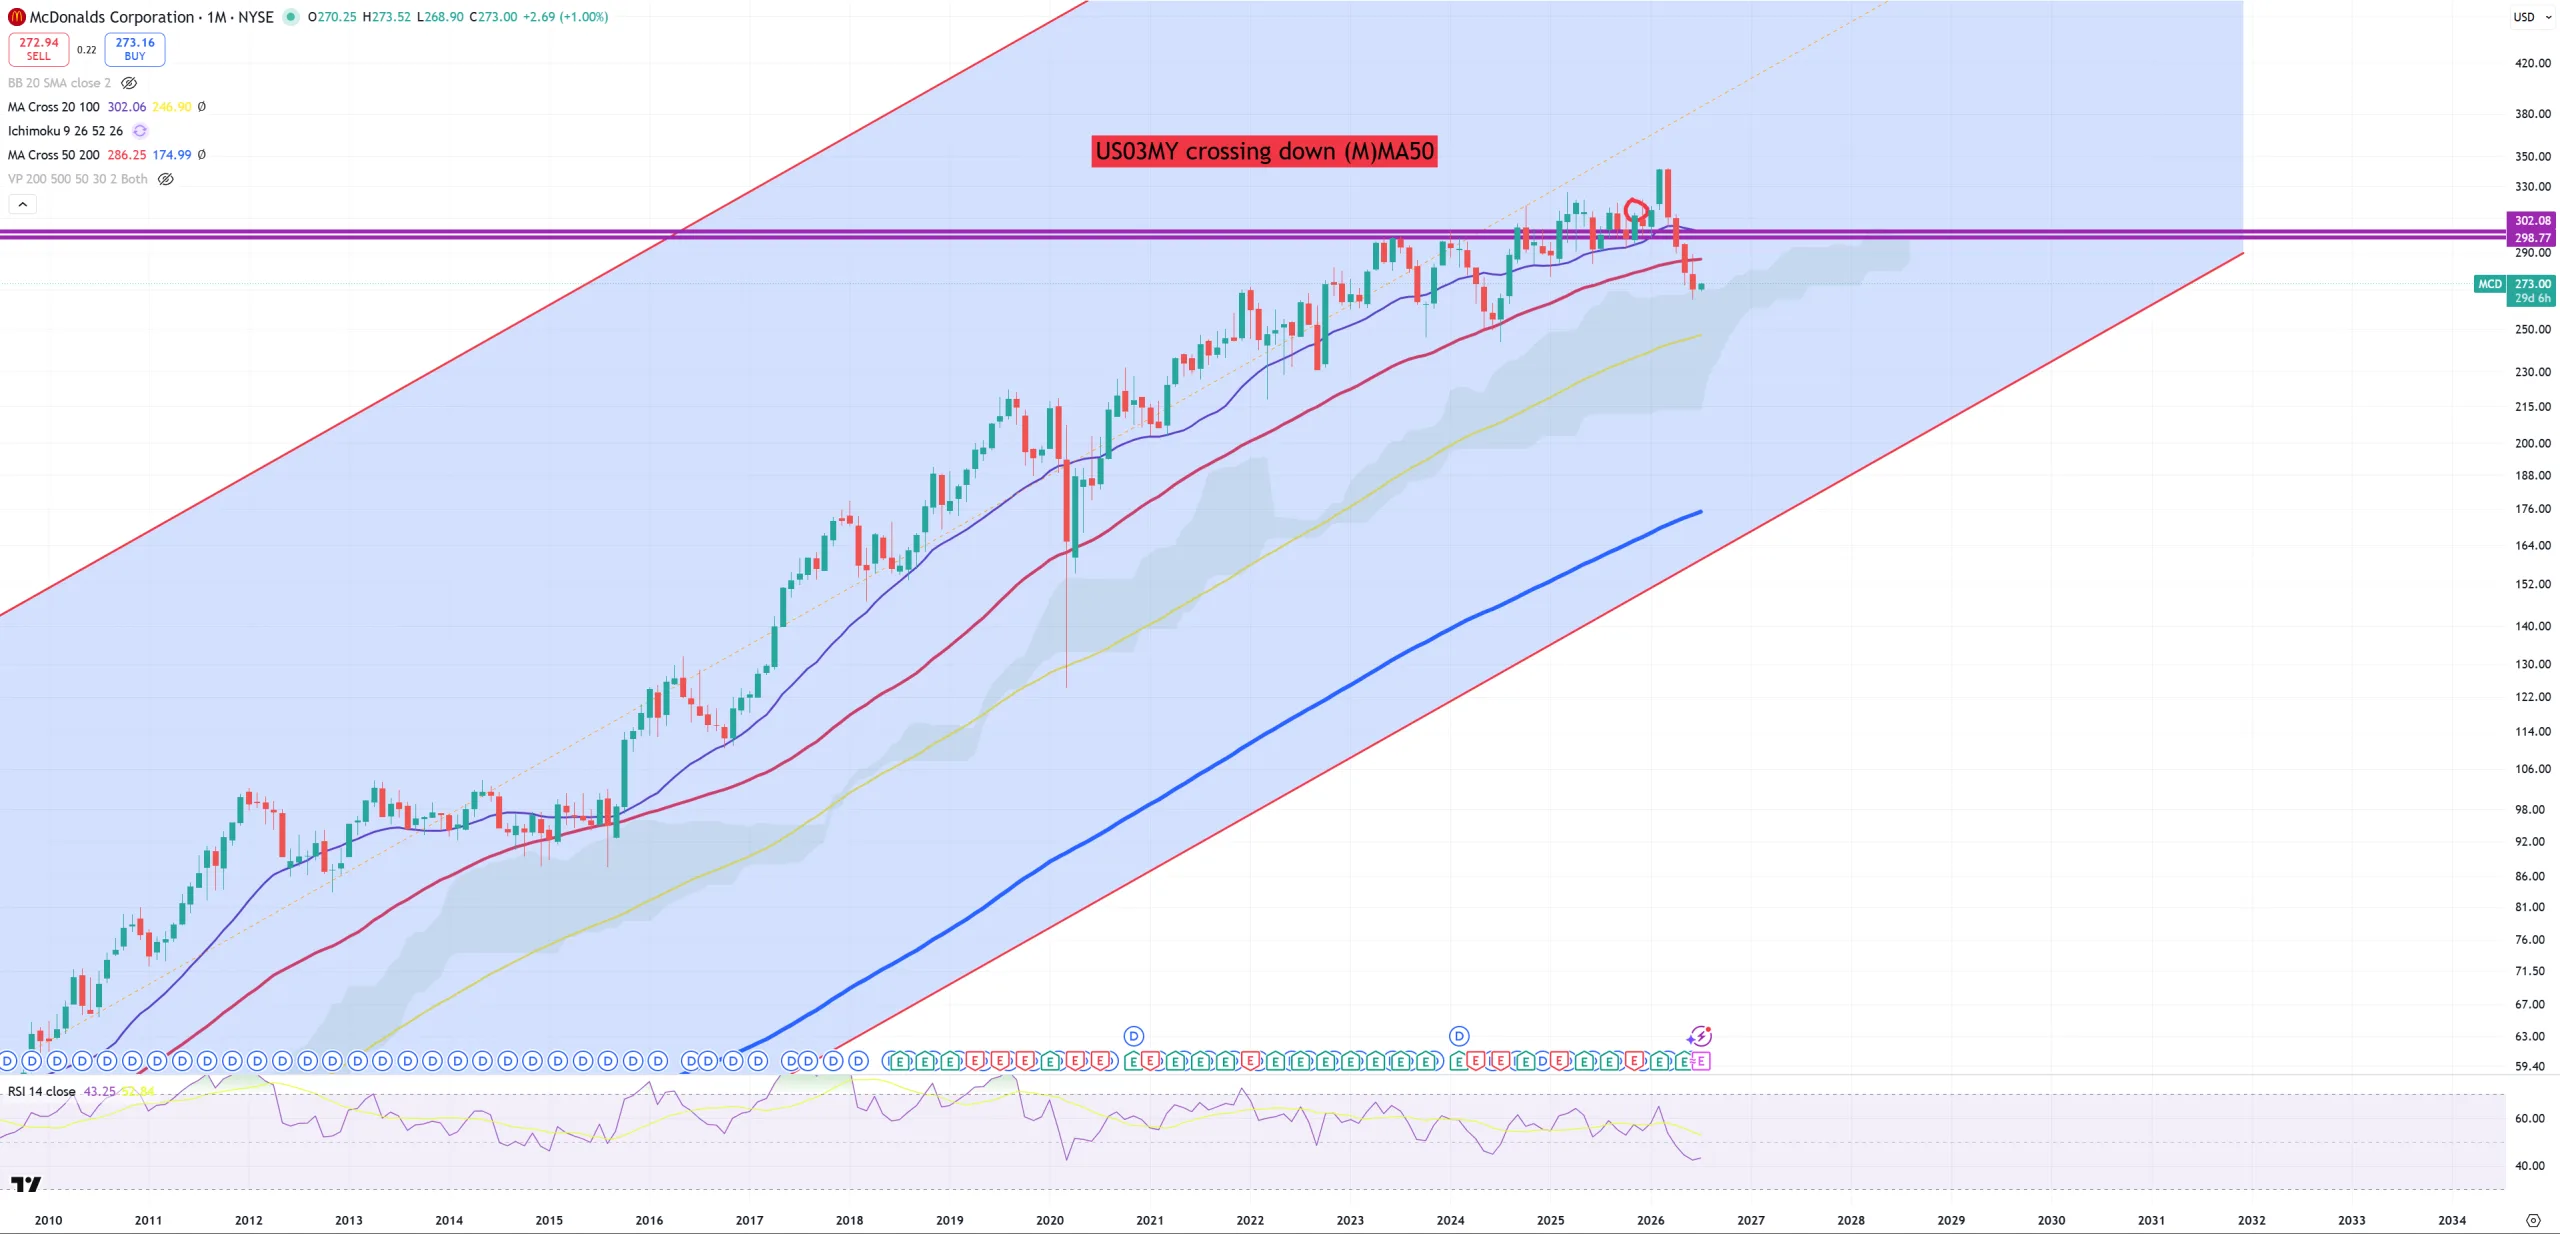
MCD – when last time (M)MA50 was broken? When dotcom bubble collapsed
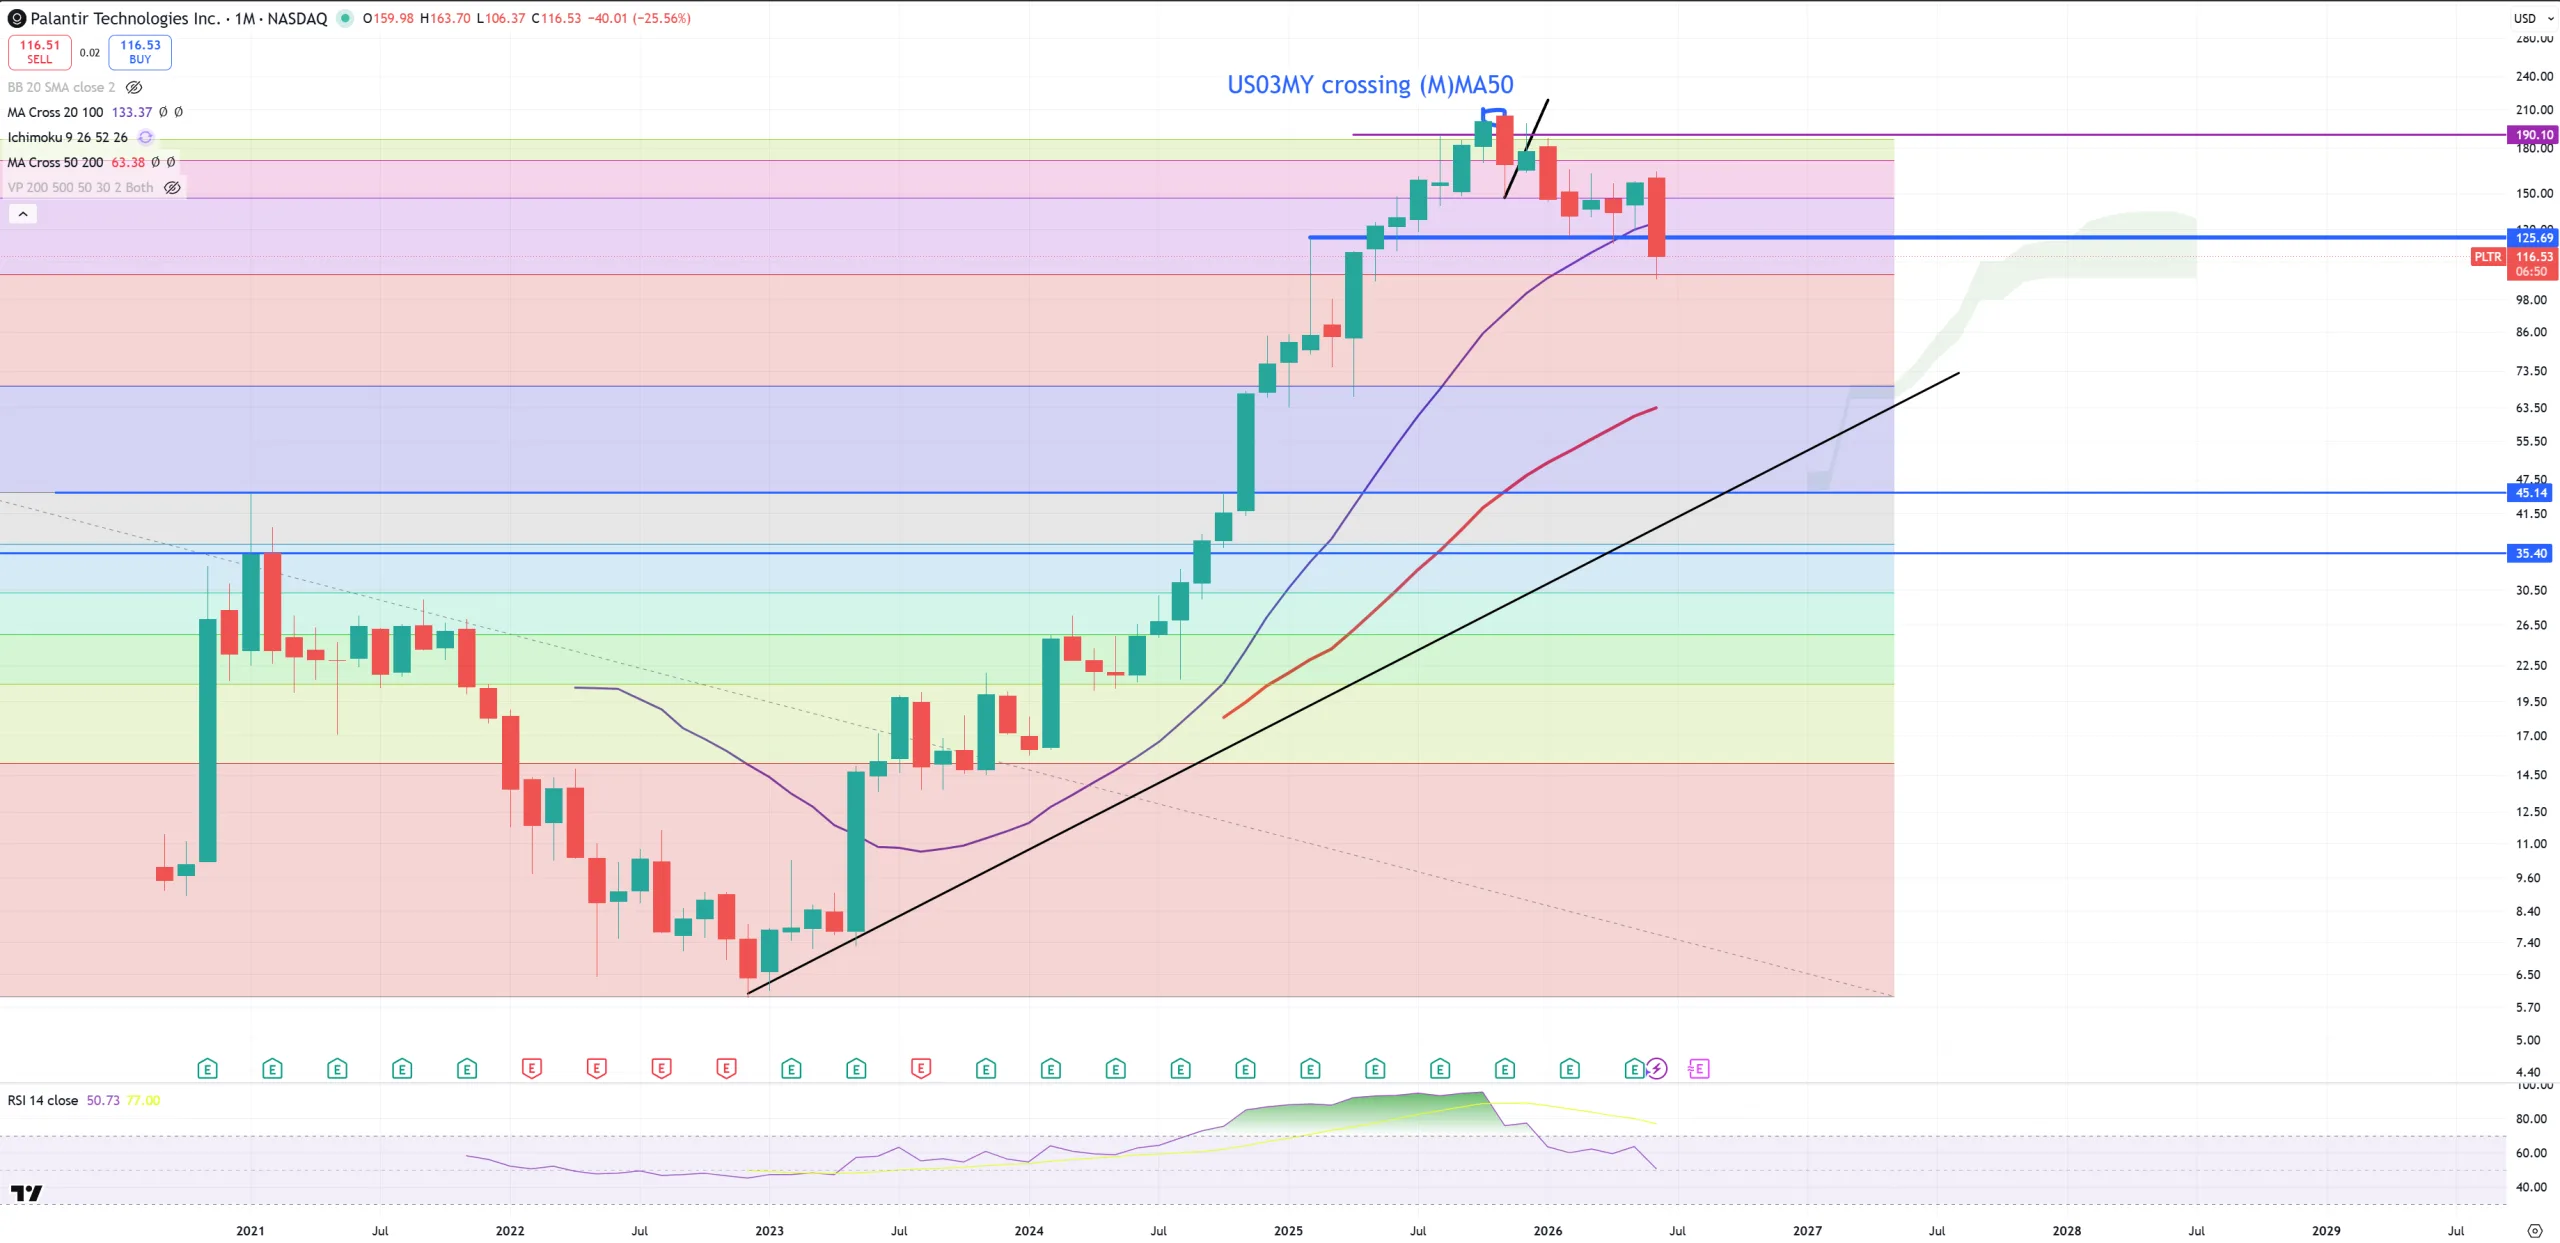
PLTR – this month belongs to Palantir and its (M)MA20 break + key support level
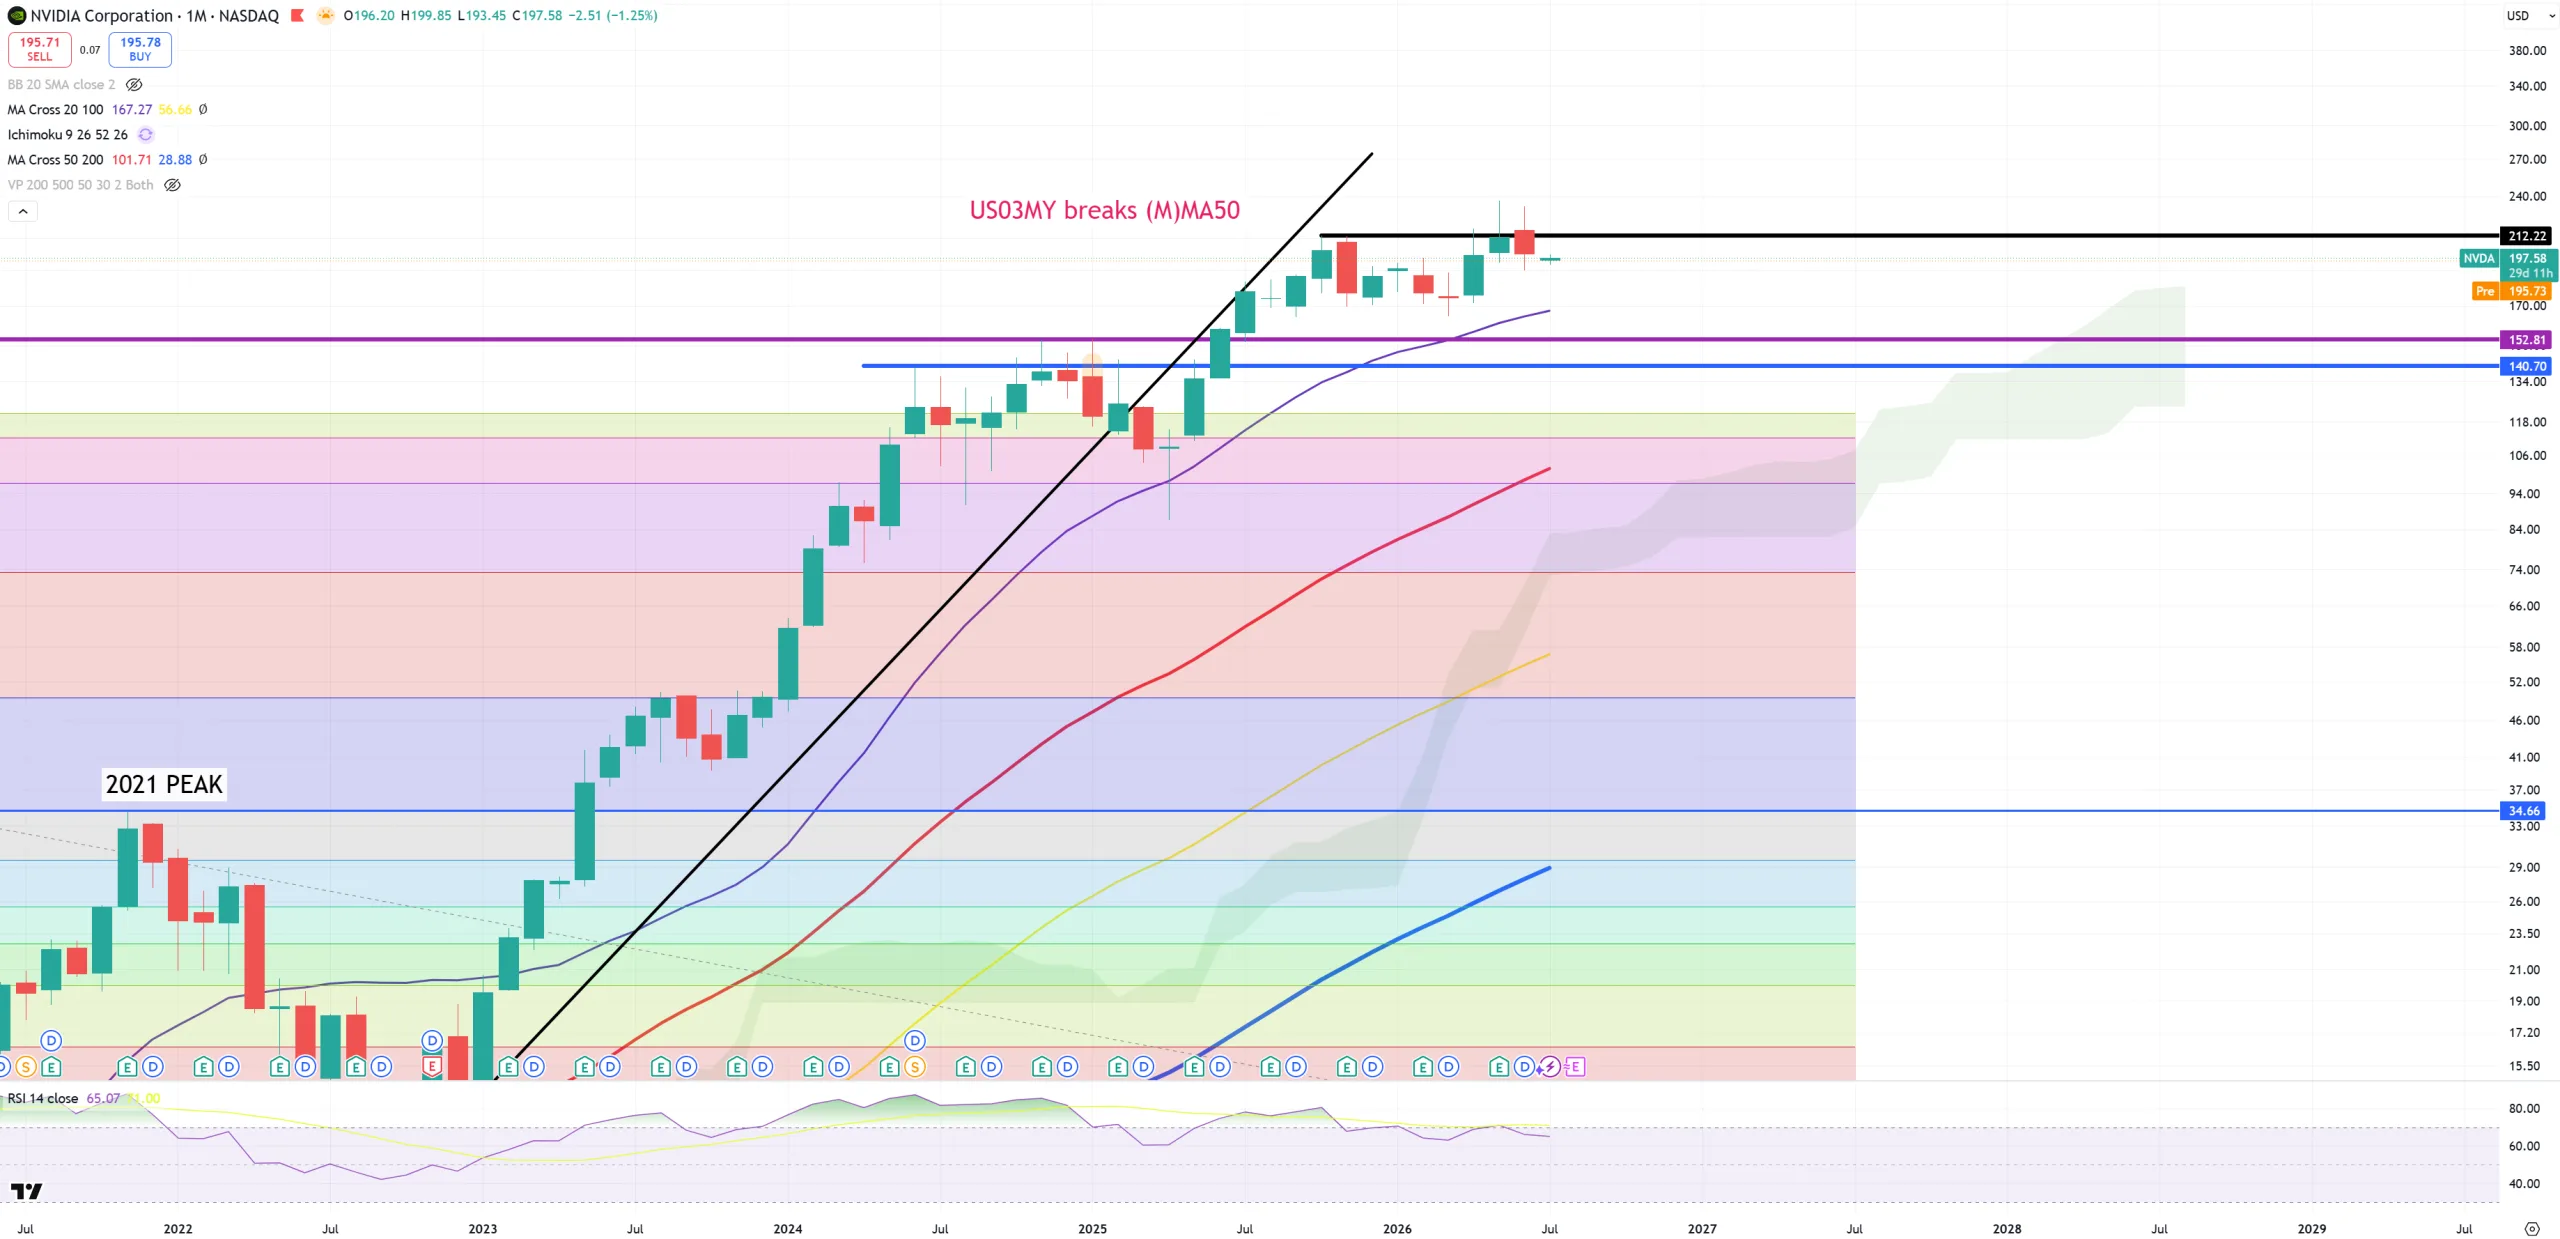
NVDA – also key consolidation. I don’t want to share more useless charts, but around this key level from 4Q25 (FXI peak + SPX/GOLD (3M)MA200 break + US03MY lost (M)MA50) we have only Apple & Google above it.
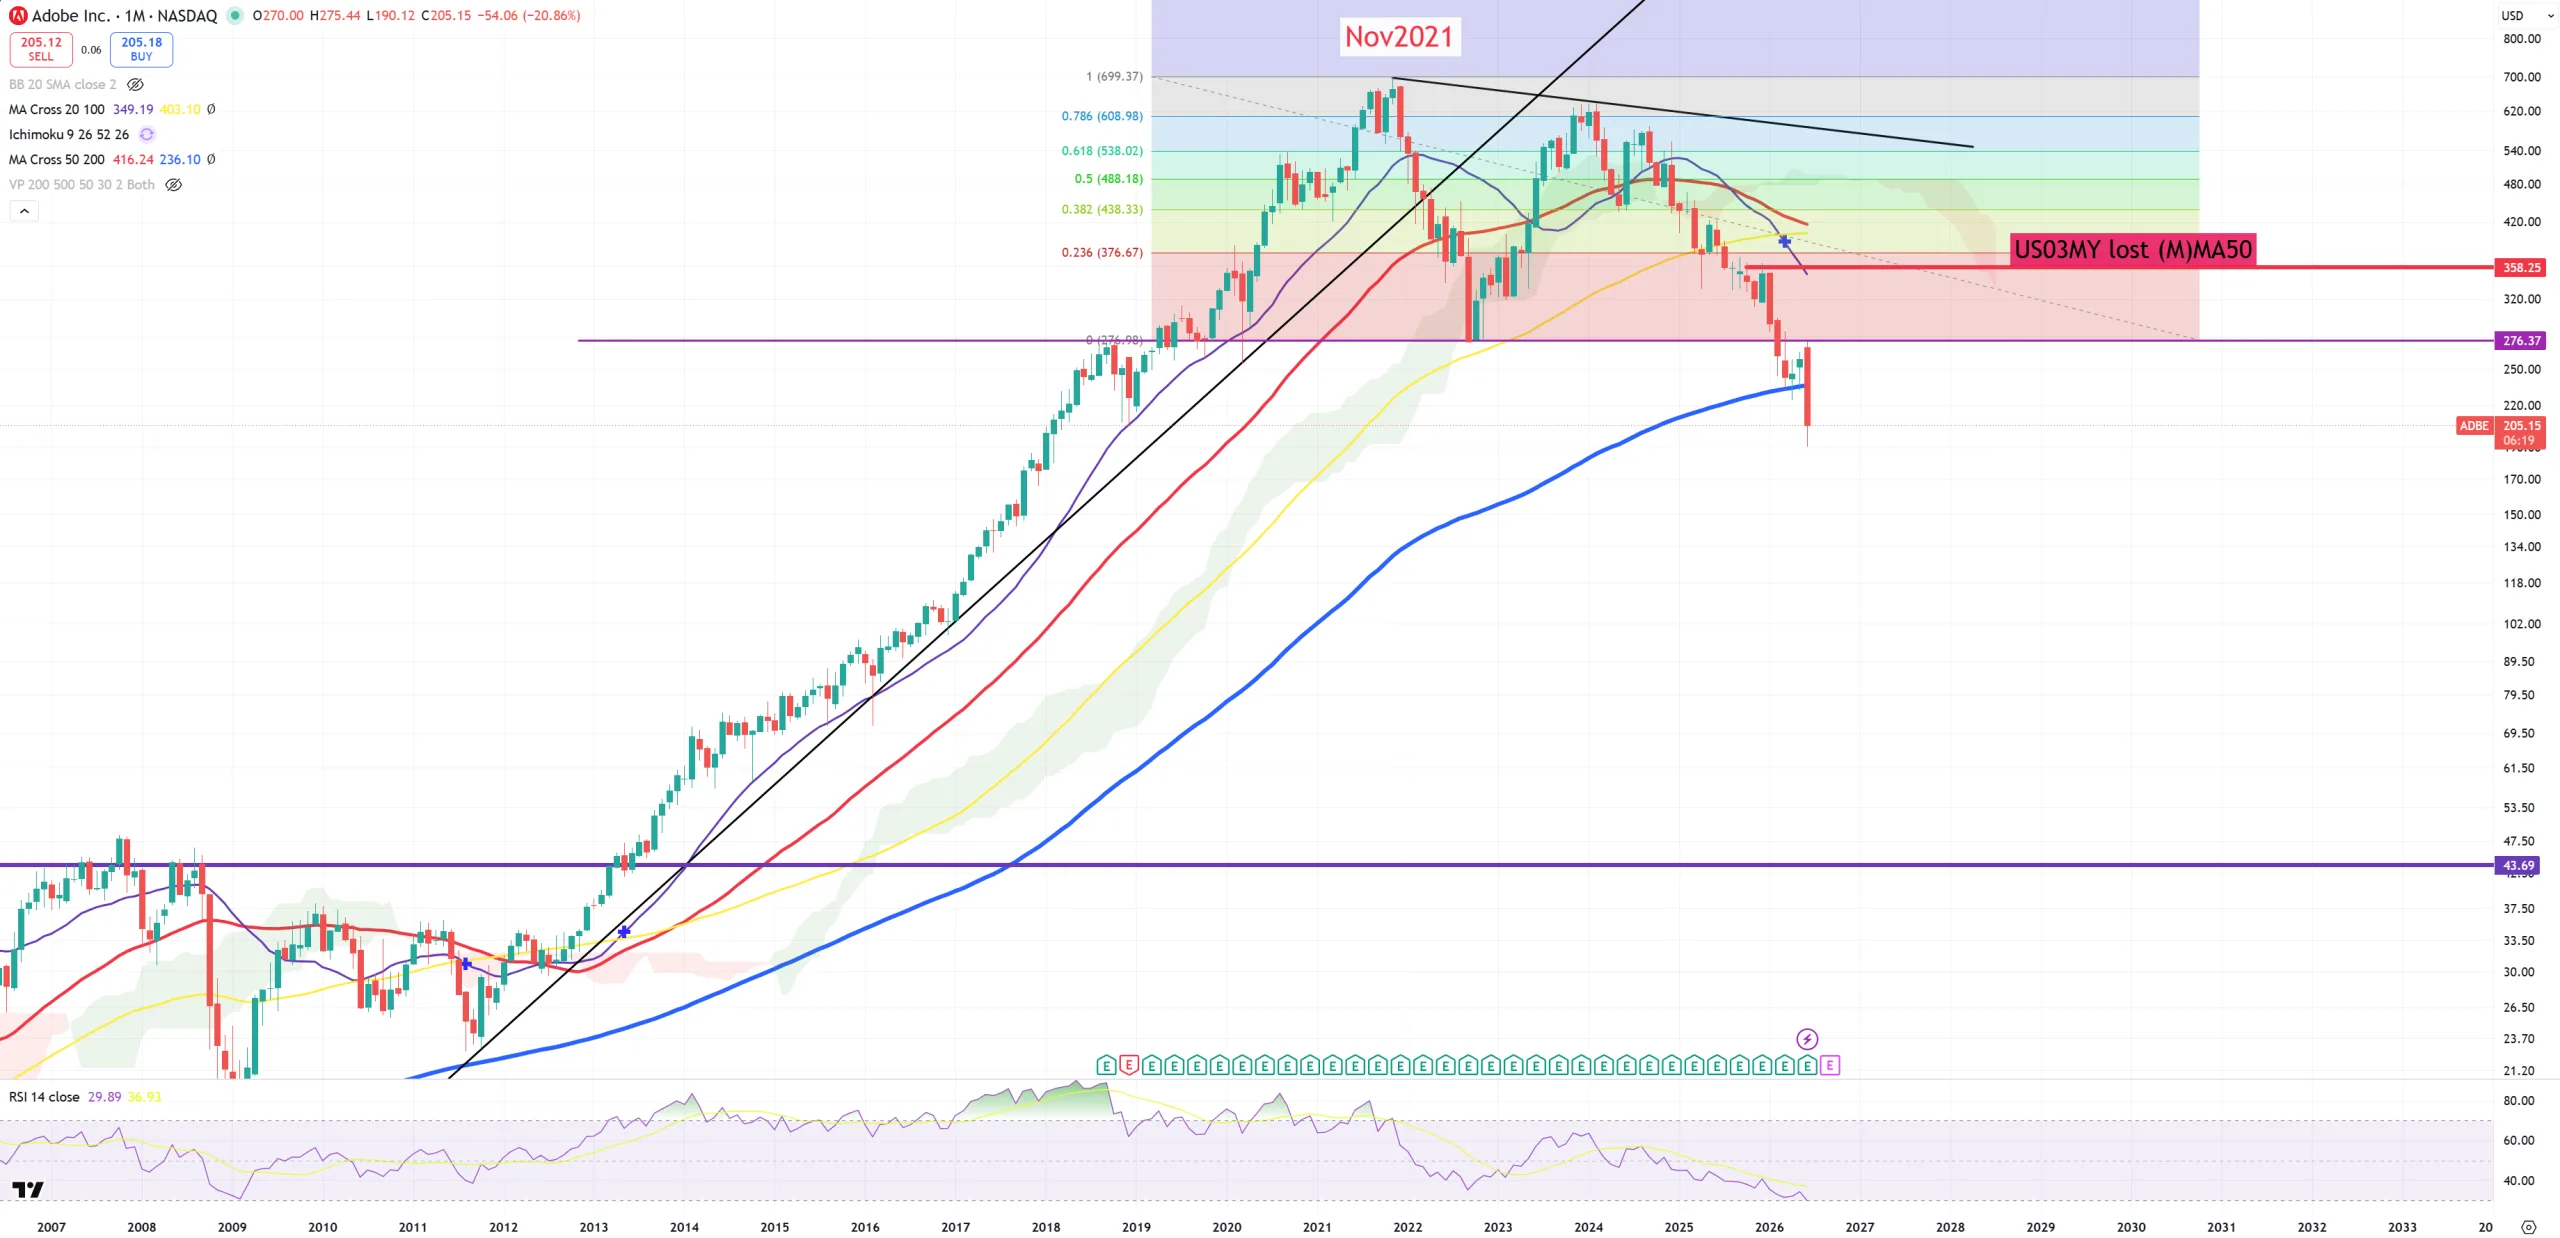
ADBE – not only Palantir has its break. Adobe has its secular break of (M)MA200 opening path towards 40$
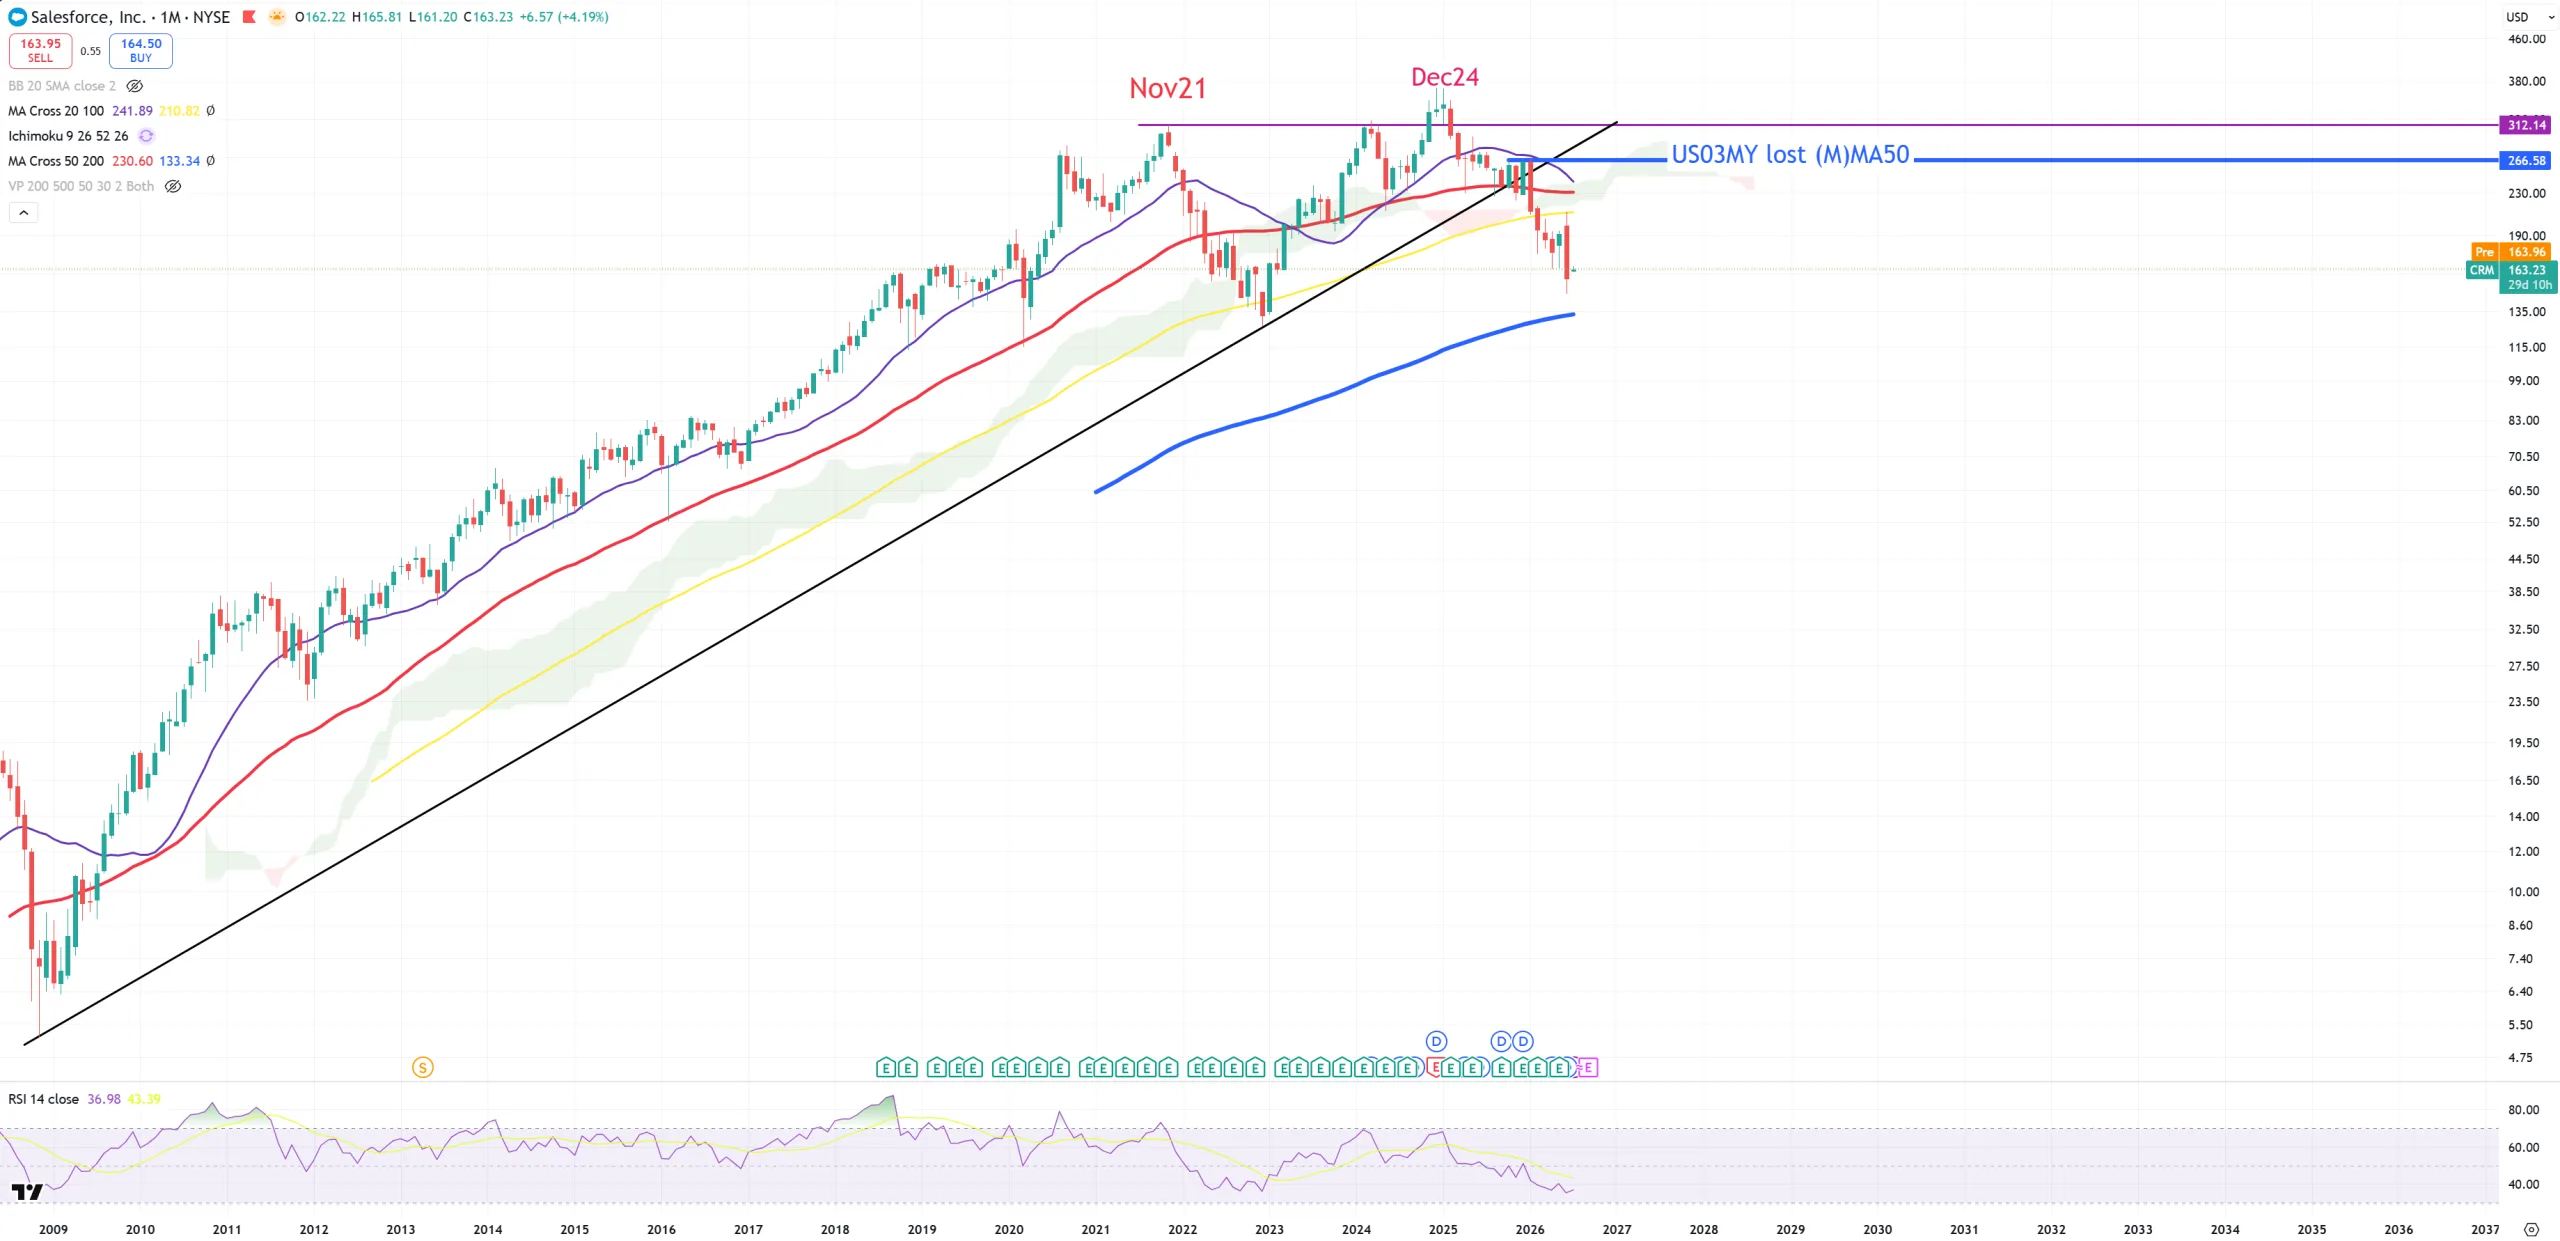
CRM – SalesForce – still some path to (M)MA200 left, there’ll be a big support there
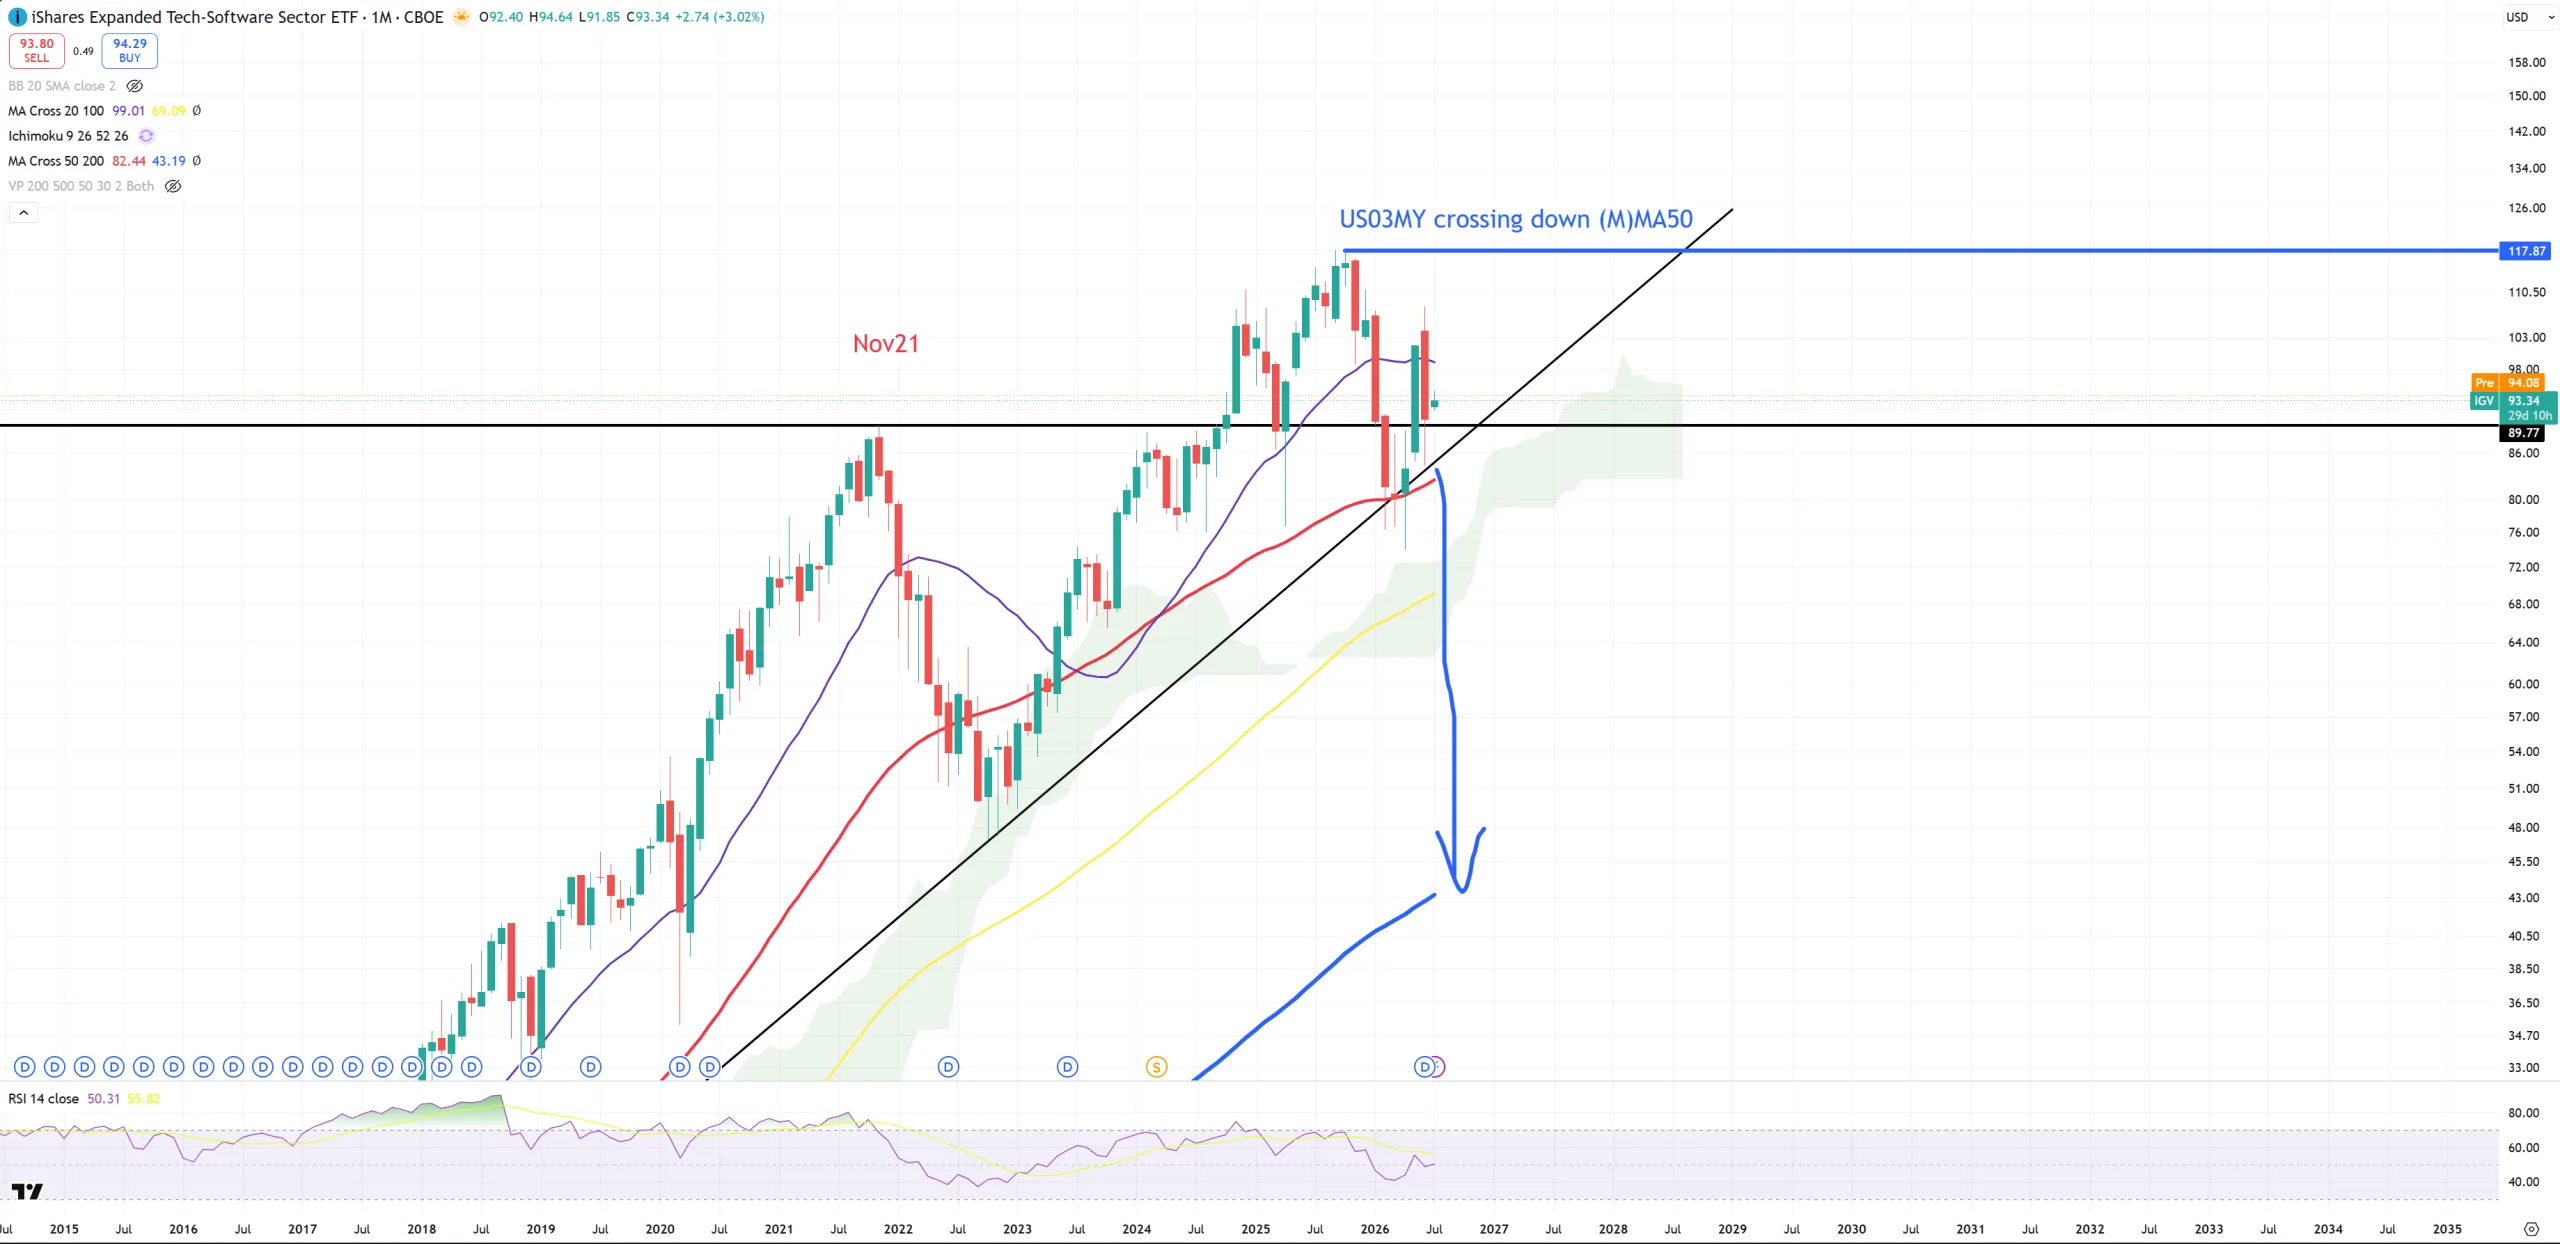
IGV – Software stocks in general. Doesn’t still want to close below 2021 so far it keeps fighting. Weird because really tons of Software stocks are in secular bear market
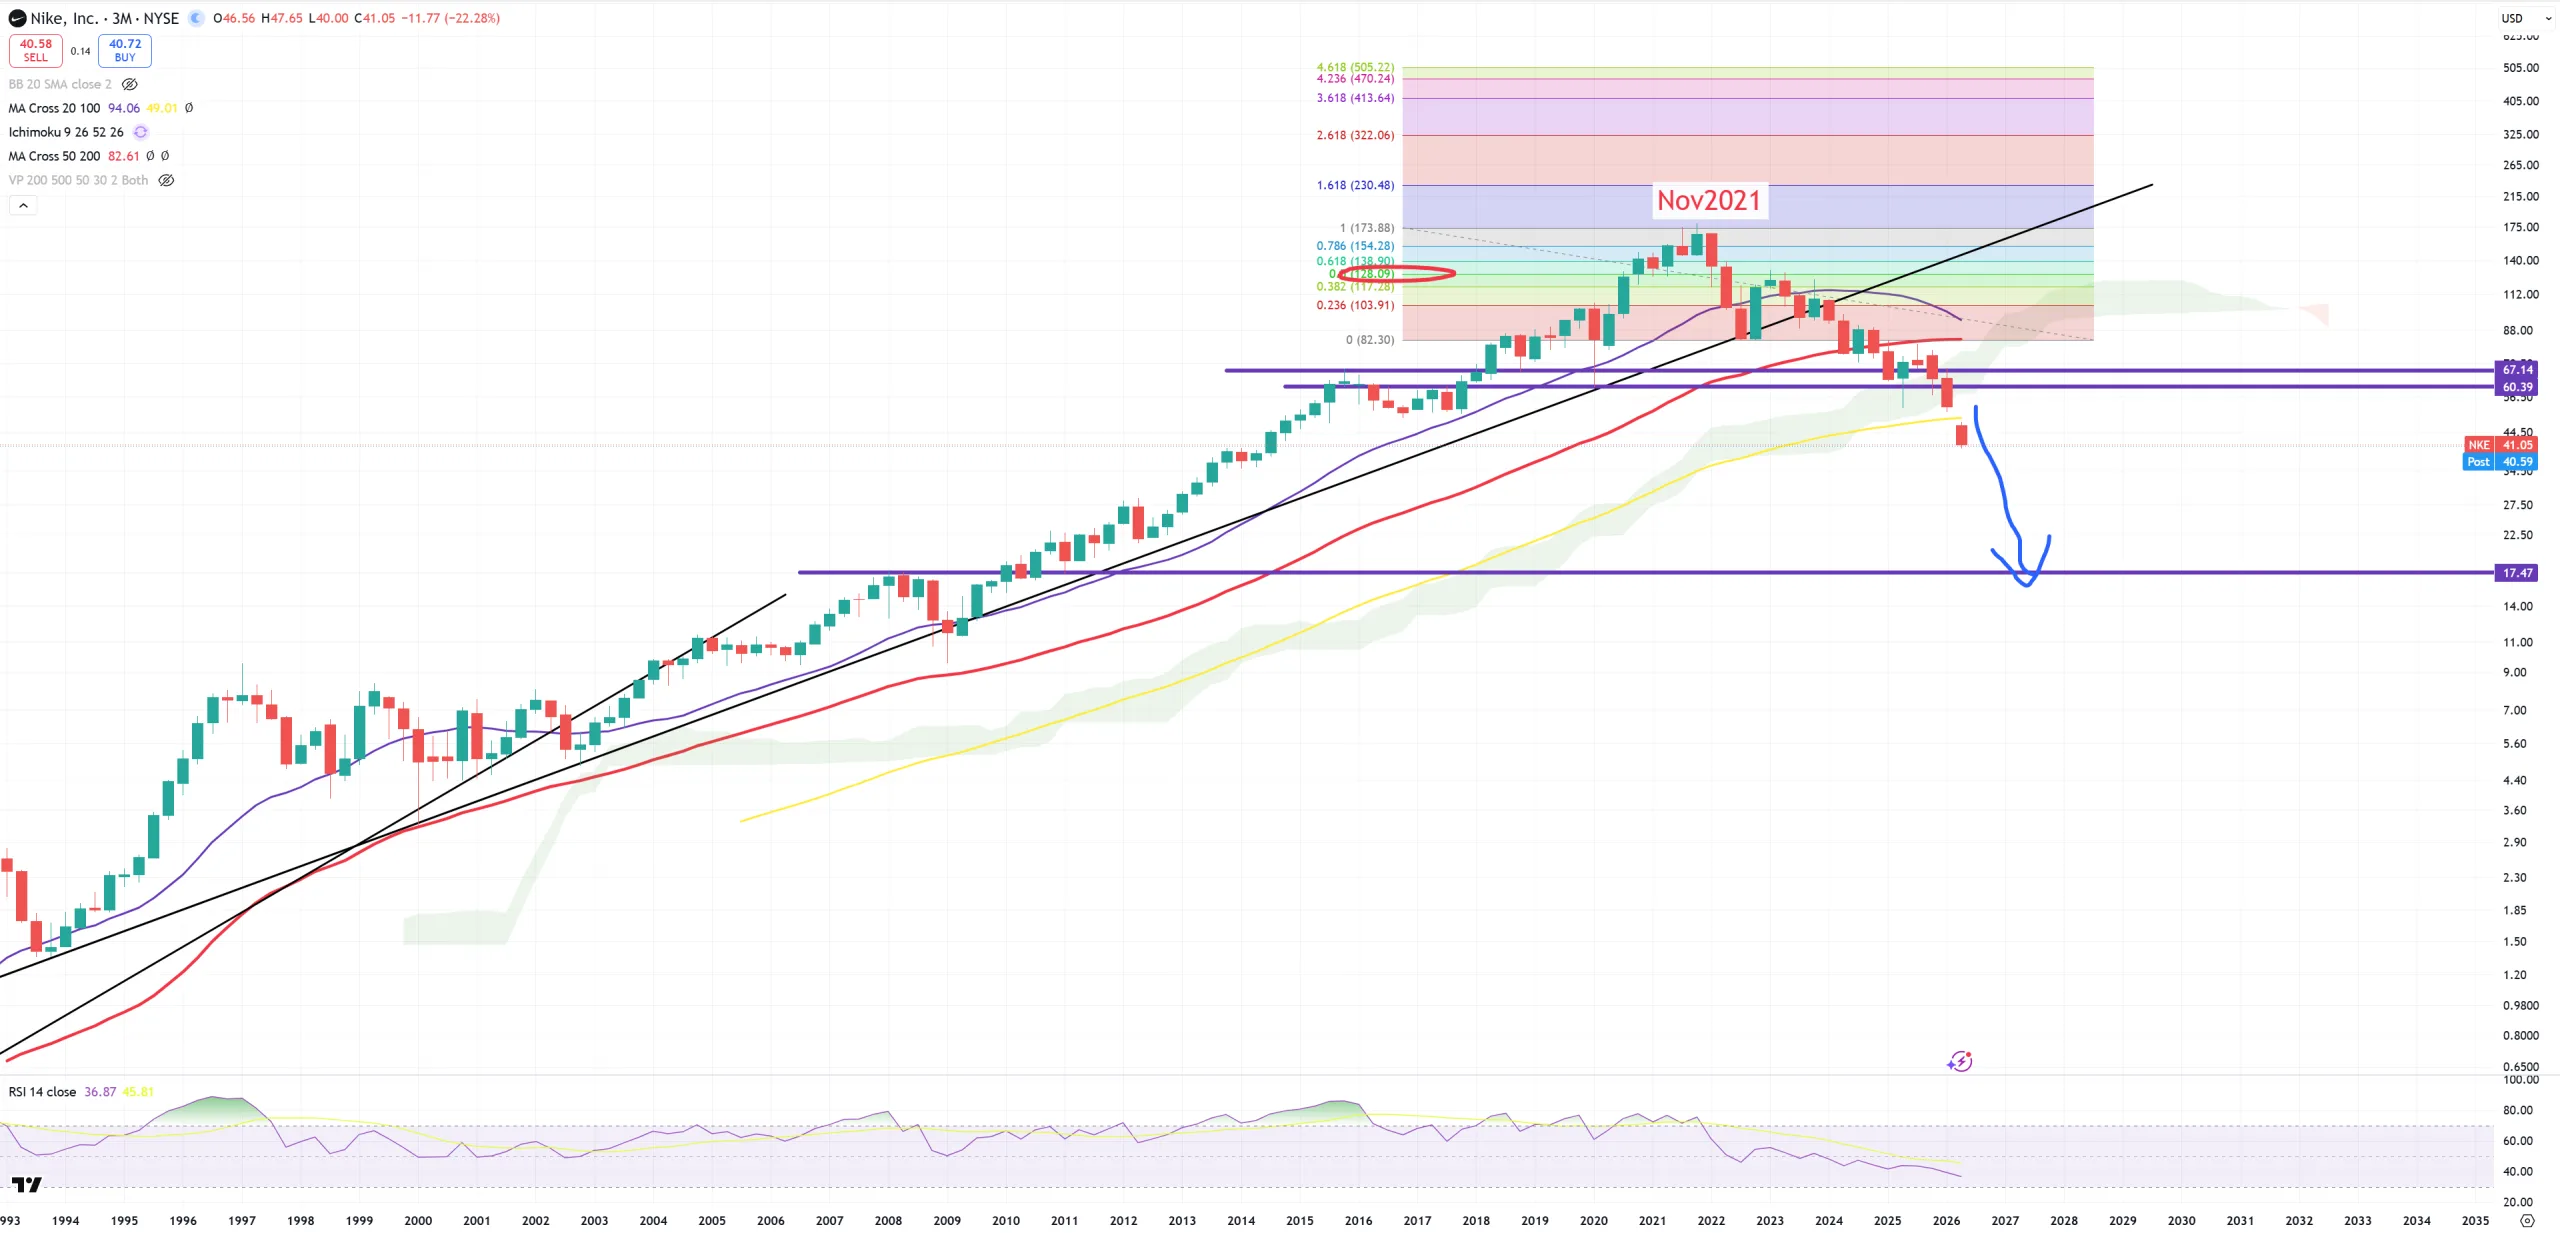
NKE – Nike and 3M view, because on M there’s nothing left… On 3M also nothing’s left and still everything points to 17$ level.
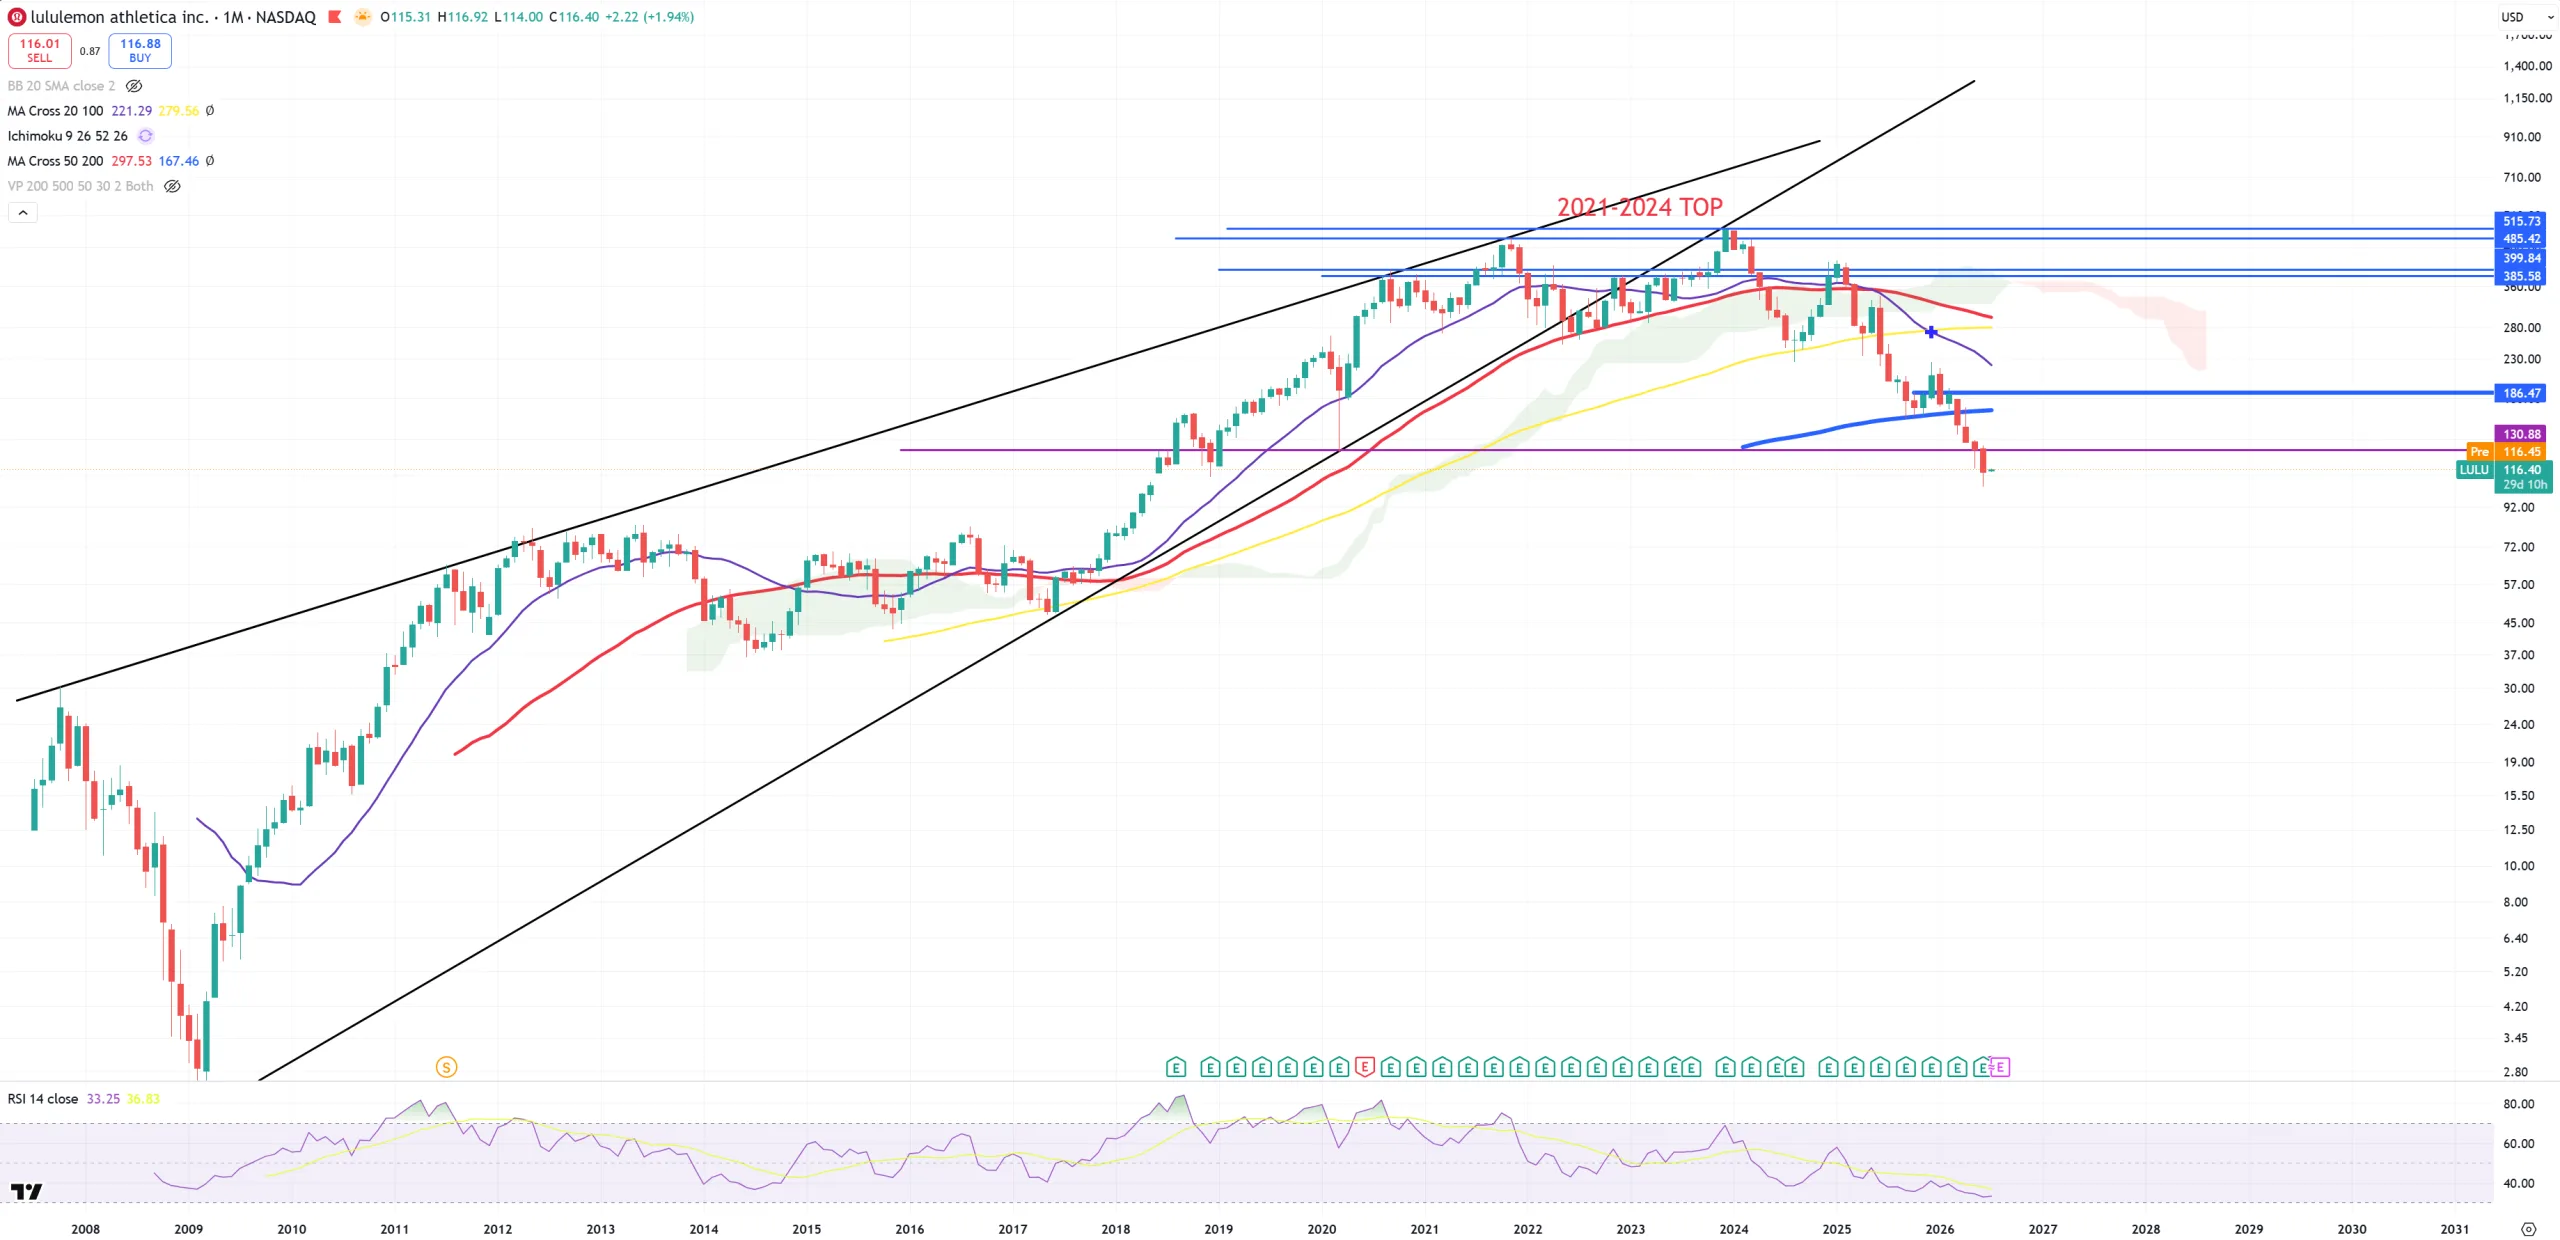
LULU – it’s the same path as Nike. (M)MA200 broken – secular bear market. Now even below 2020 lows.
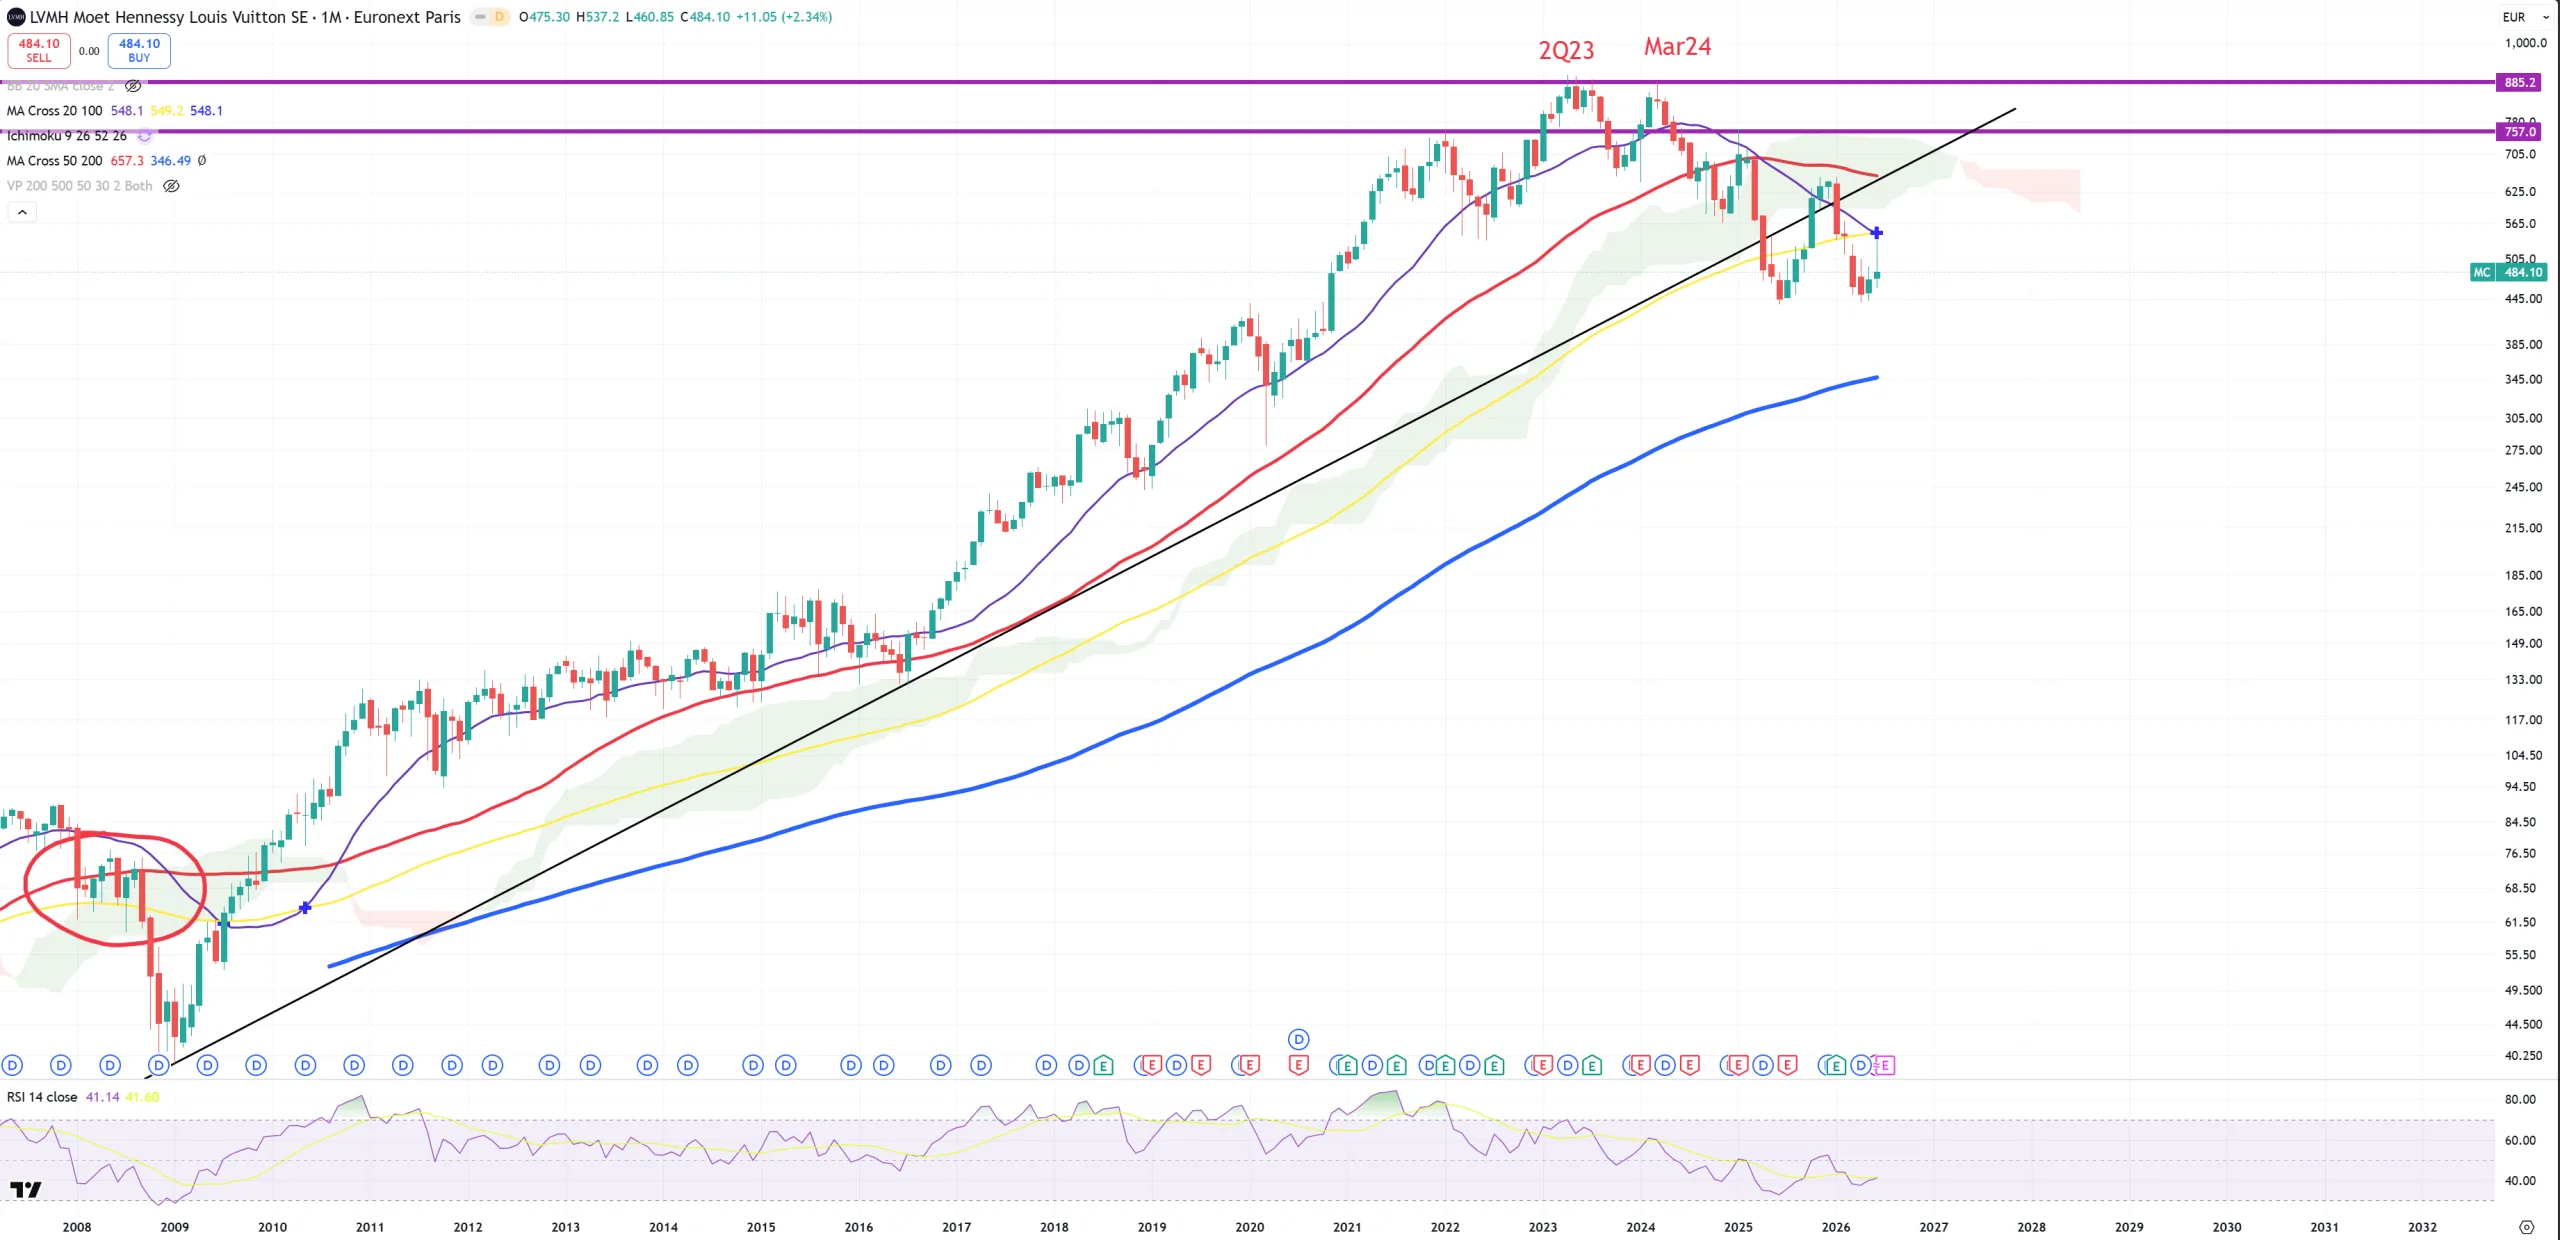
LVMH and its broken 2009-2016 trend + retest (M)MA100 (in most cases that’s bull/bear trap level) combined with violet (M)MA20 – high momentum (in this case bear market because it’s above the candles).
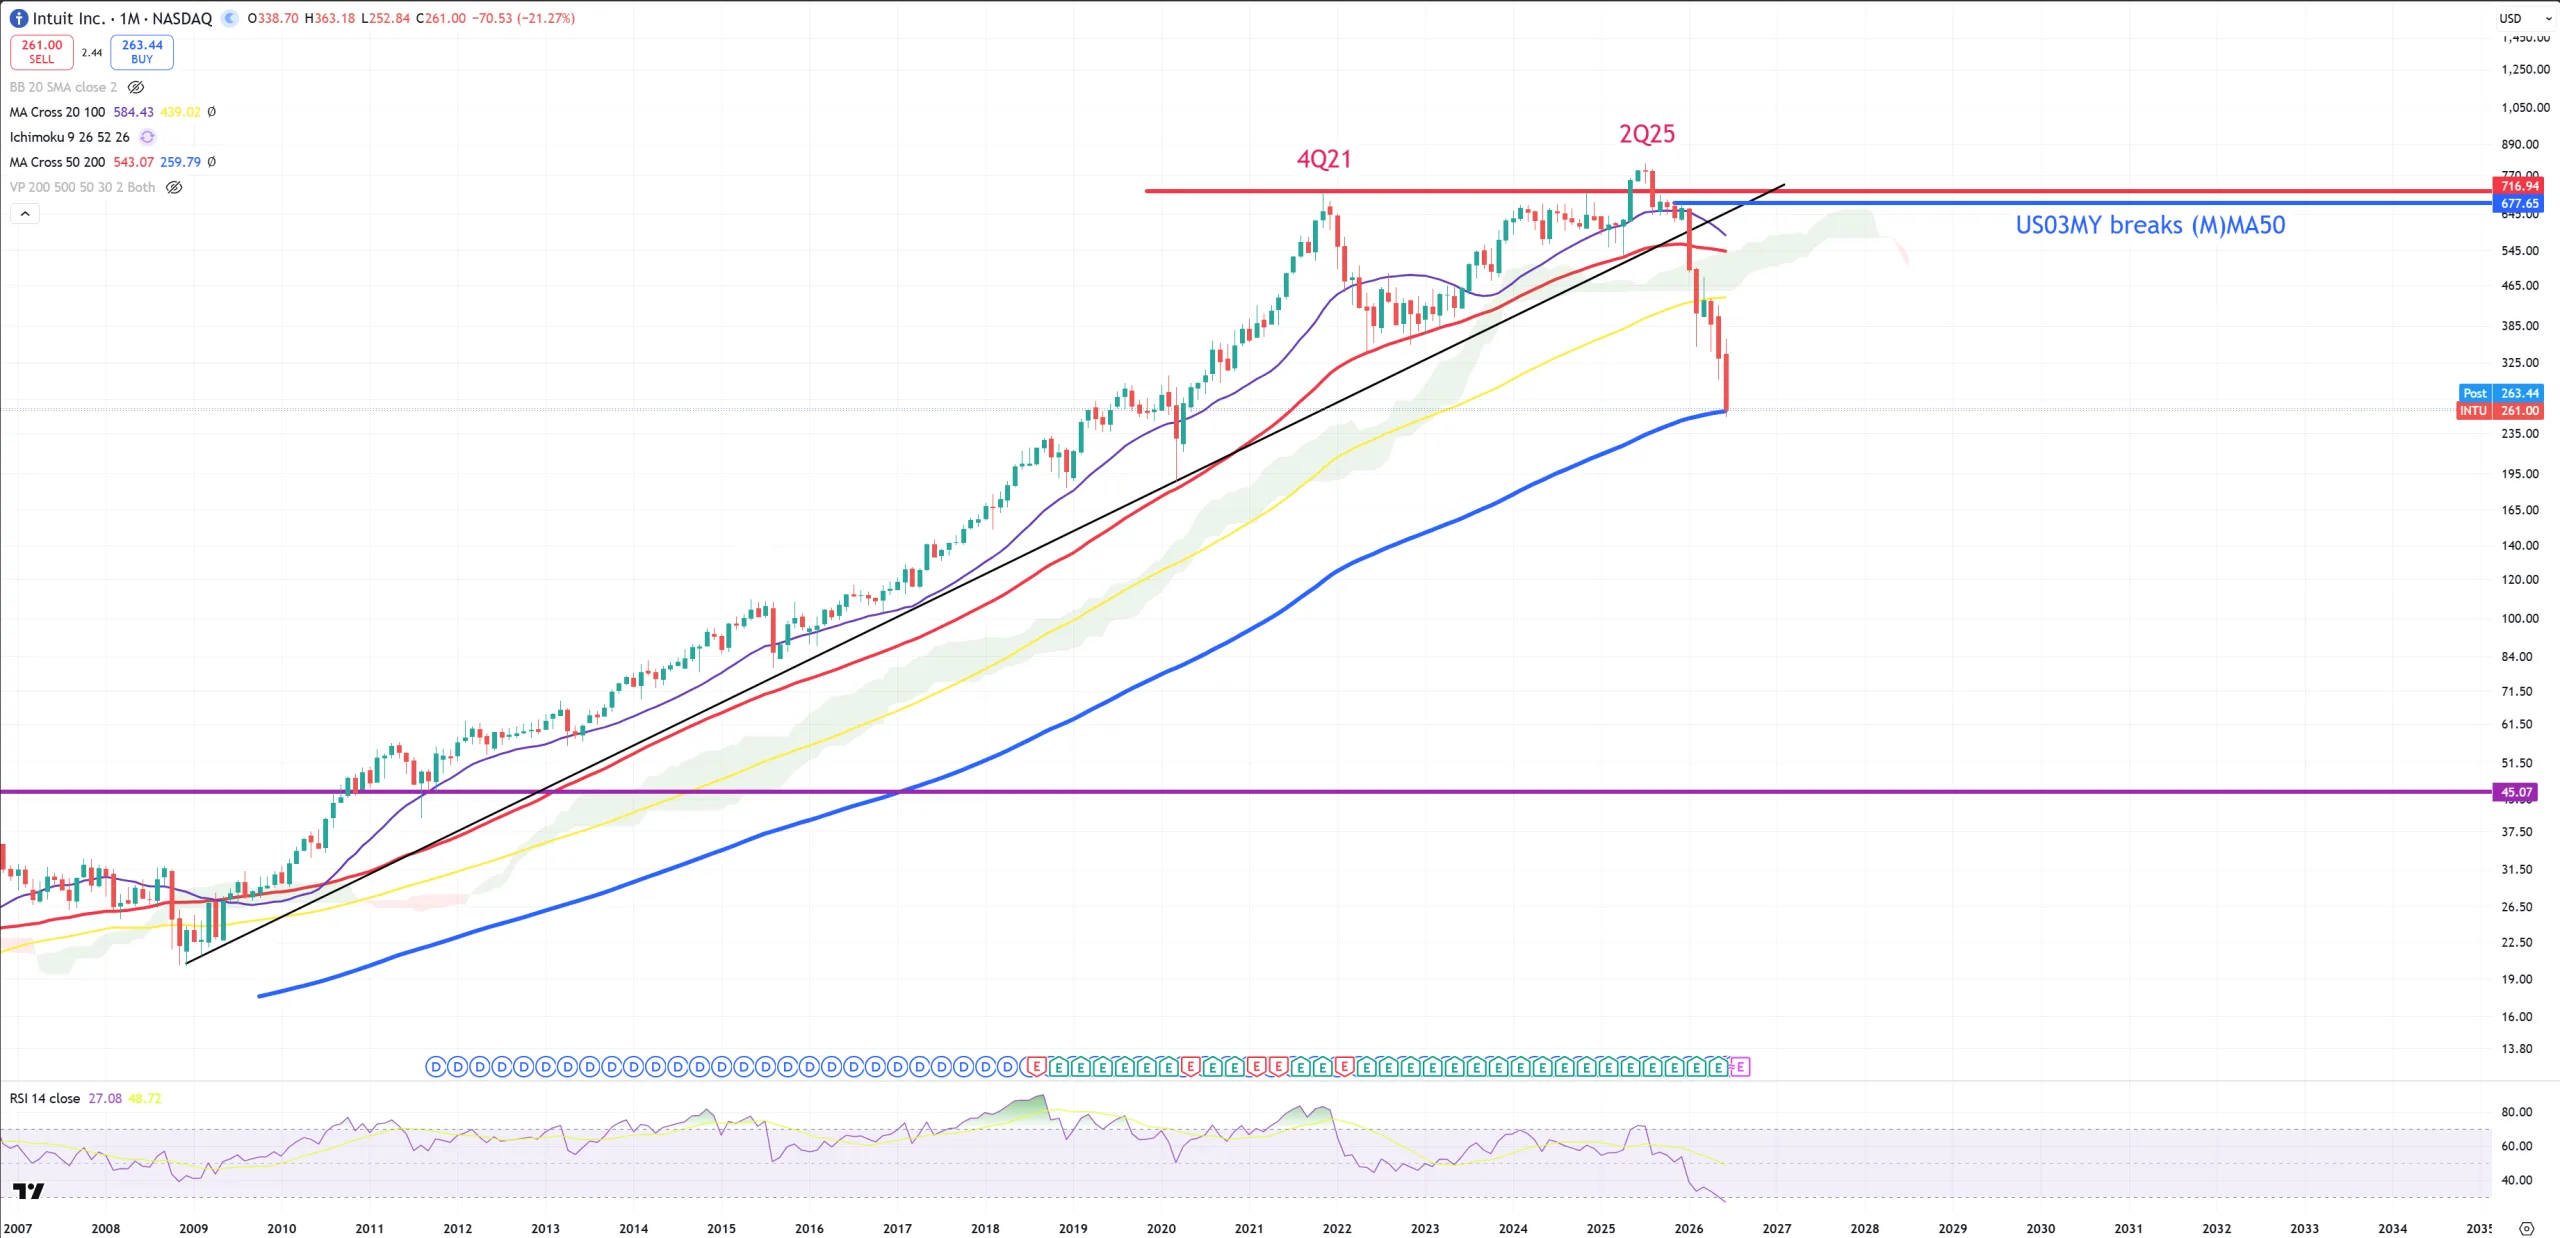
INTU – bounce on (M)MA200 or we open below it. Anyway we might dance here. Never in a history this secular bull market border was broken here
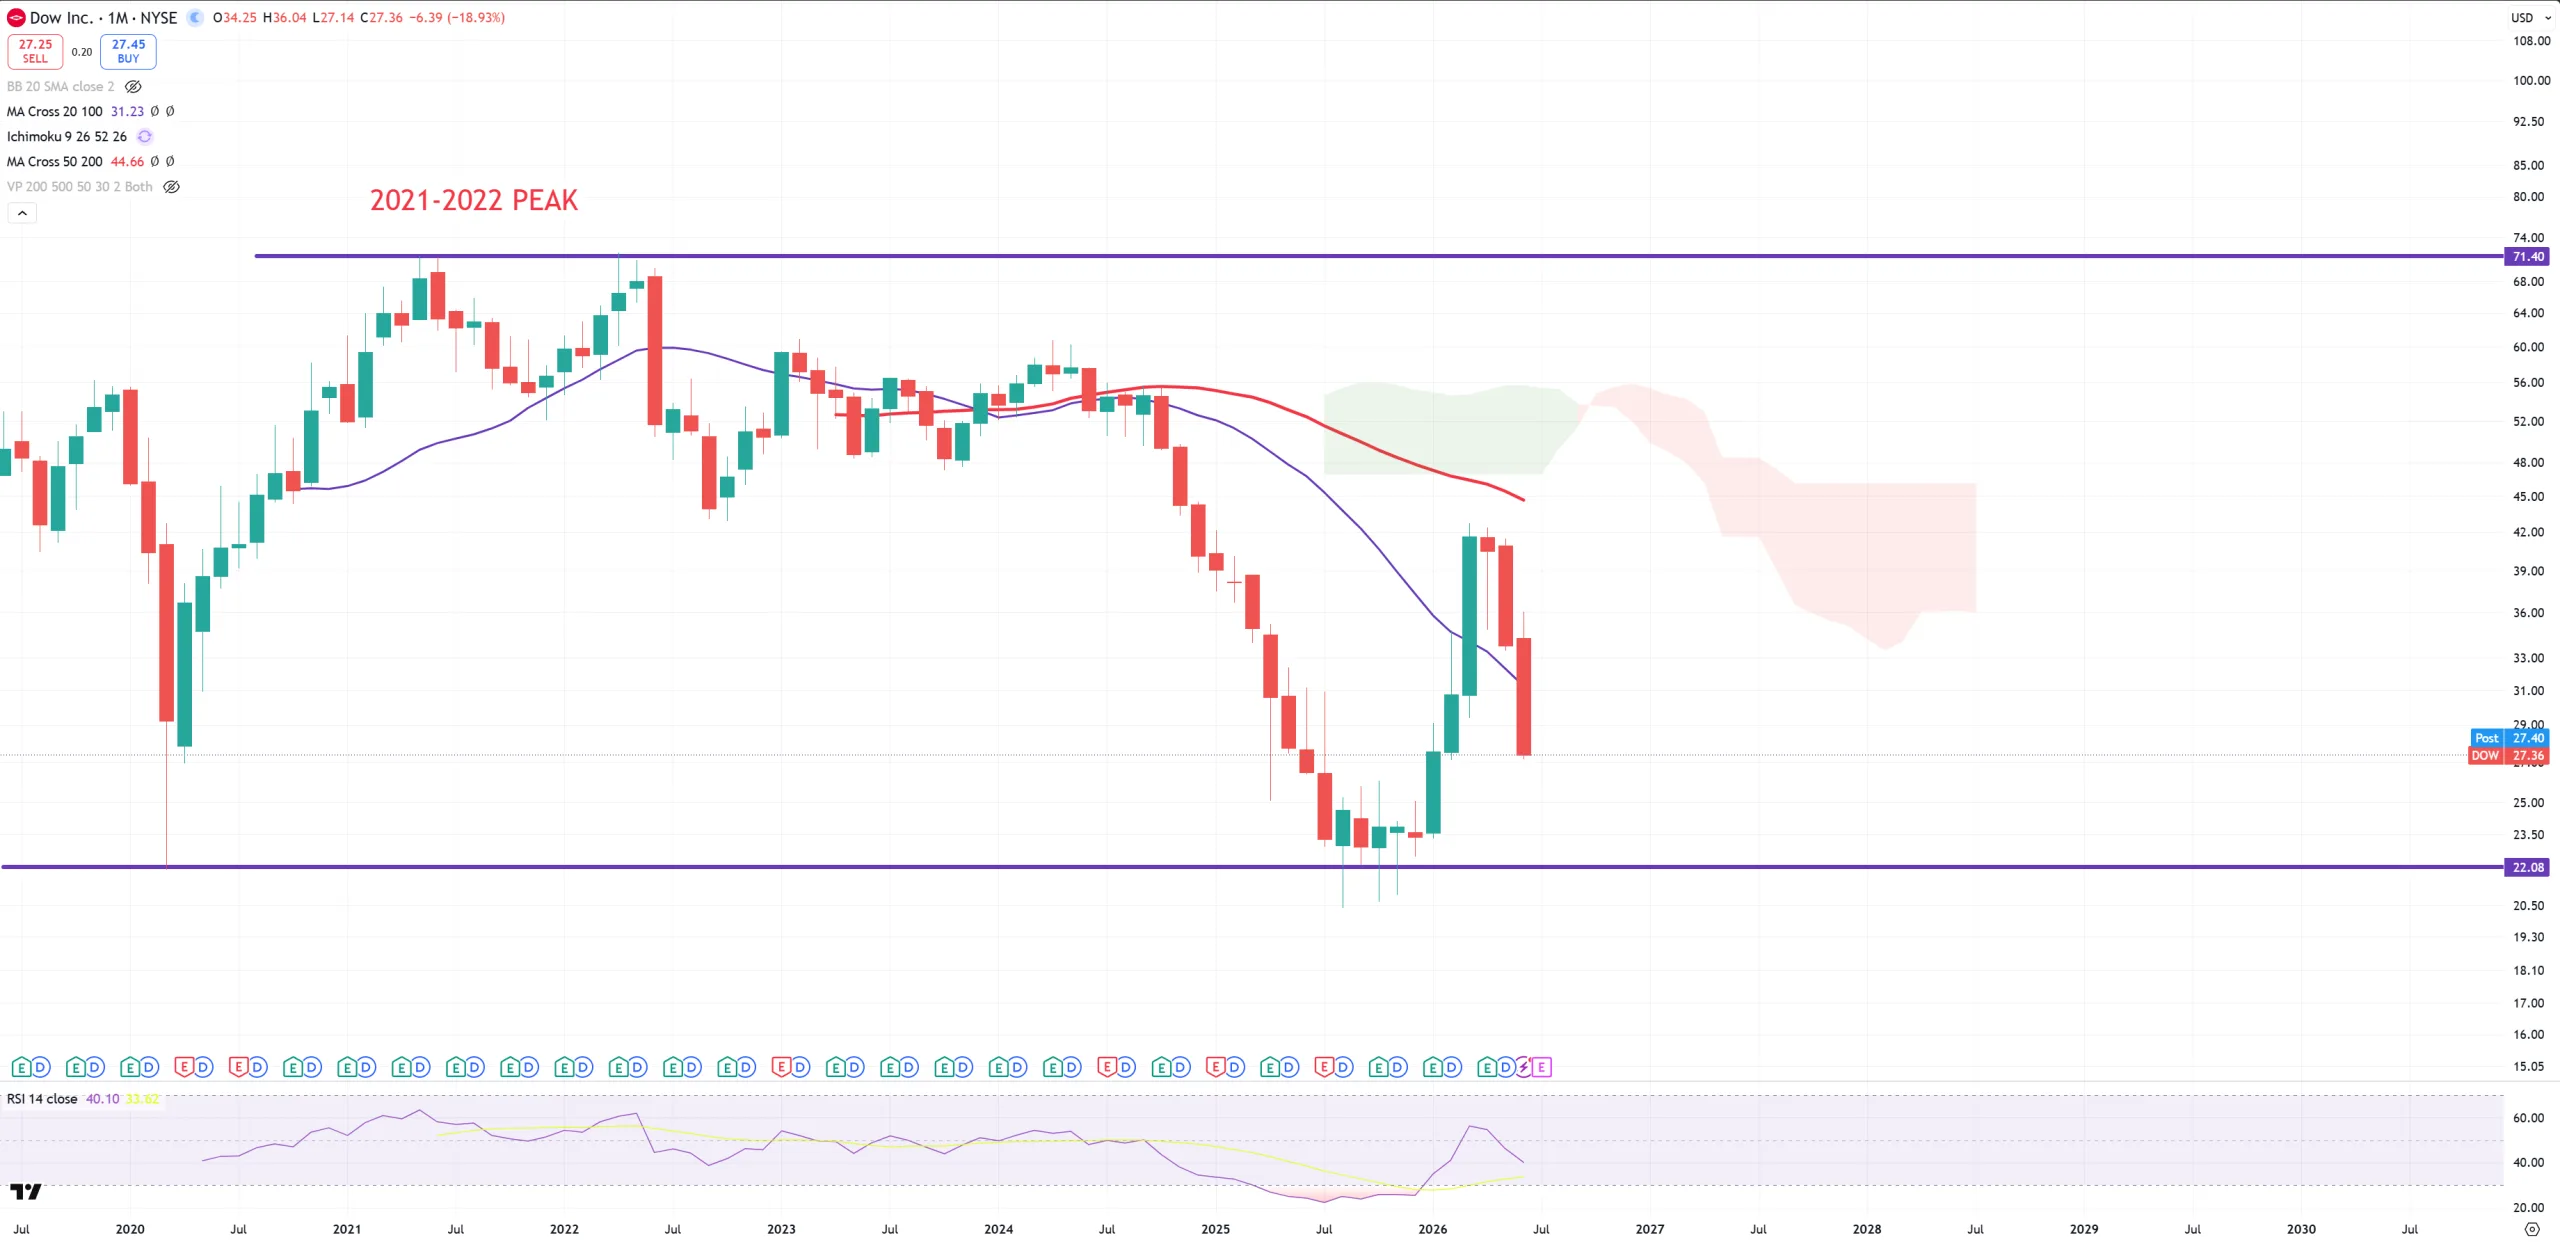
DOW – weird chart. Bounce on key support – expected to travel to (M)MA50 but it failed
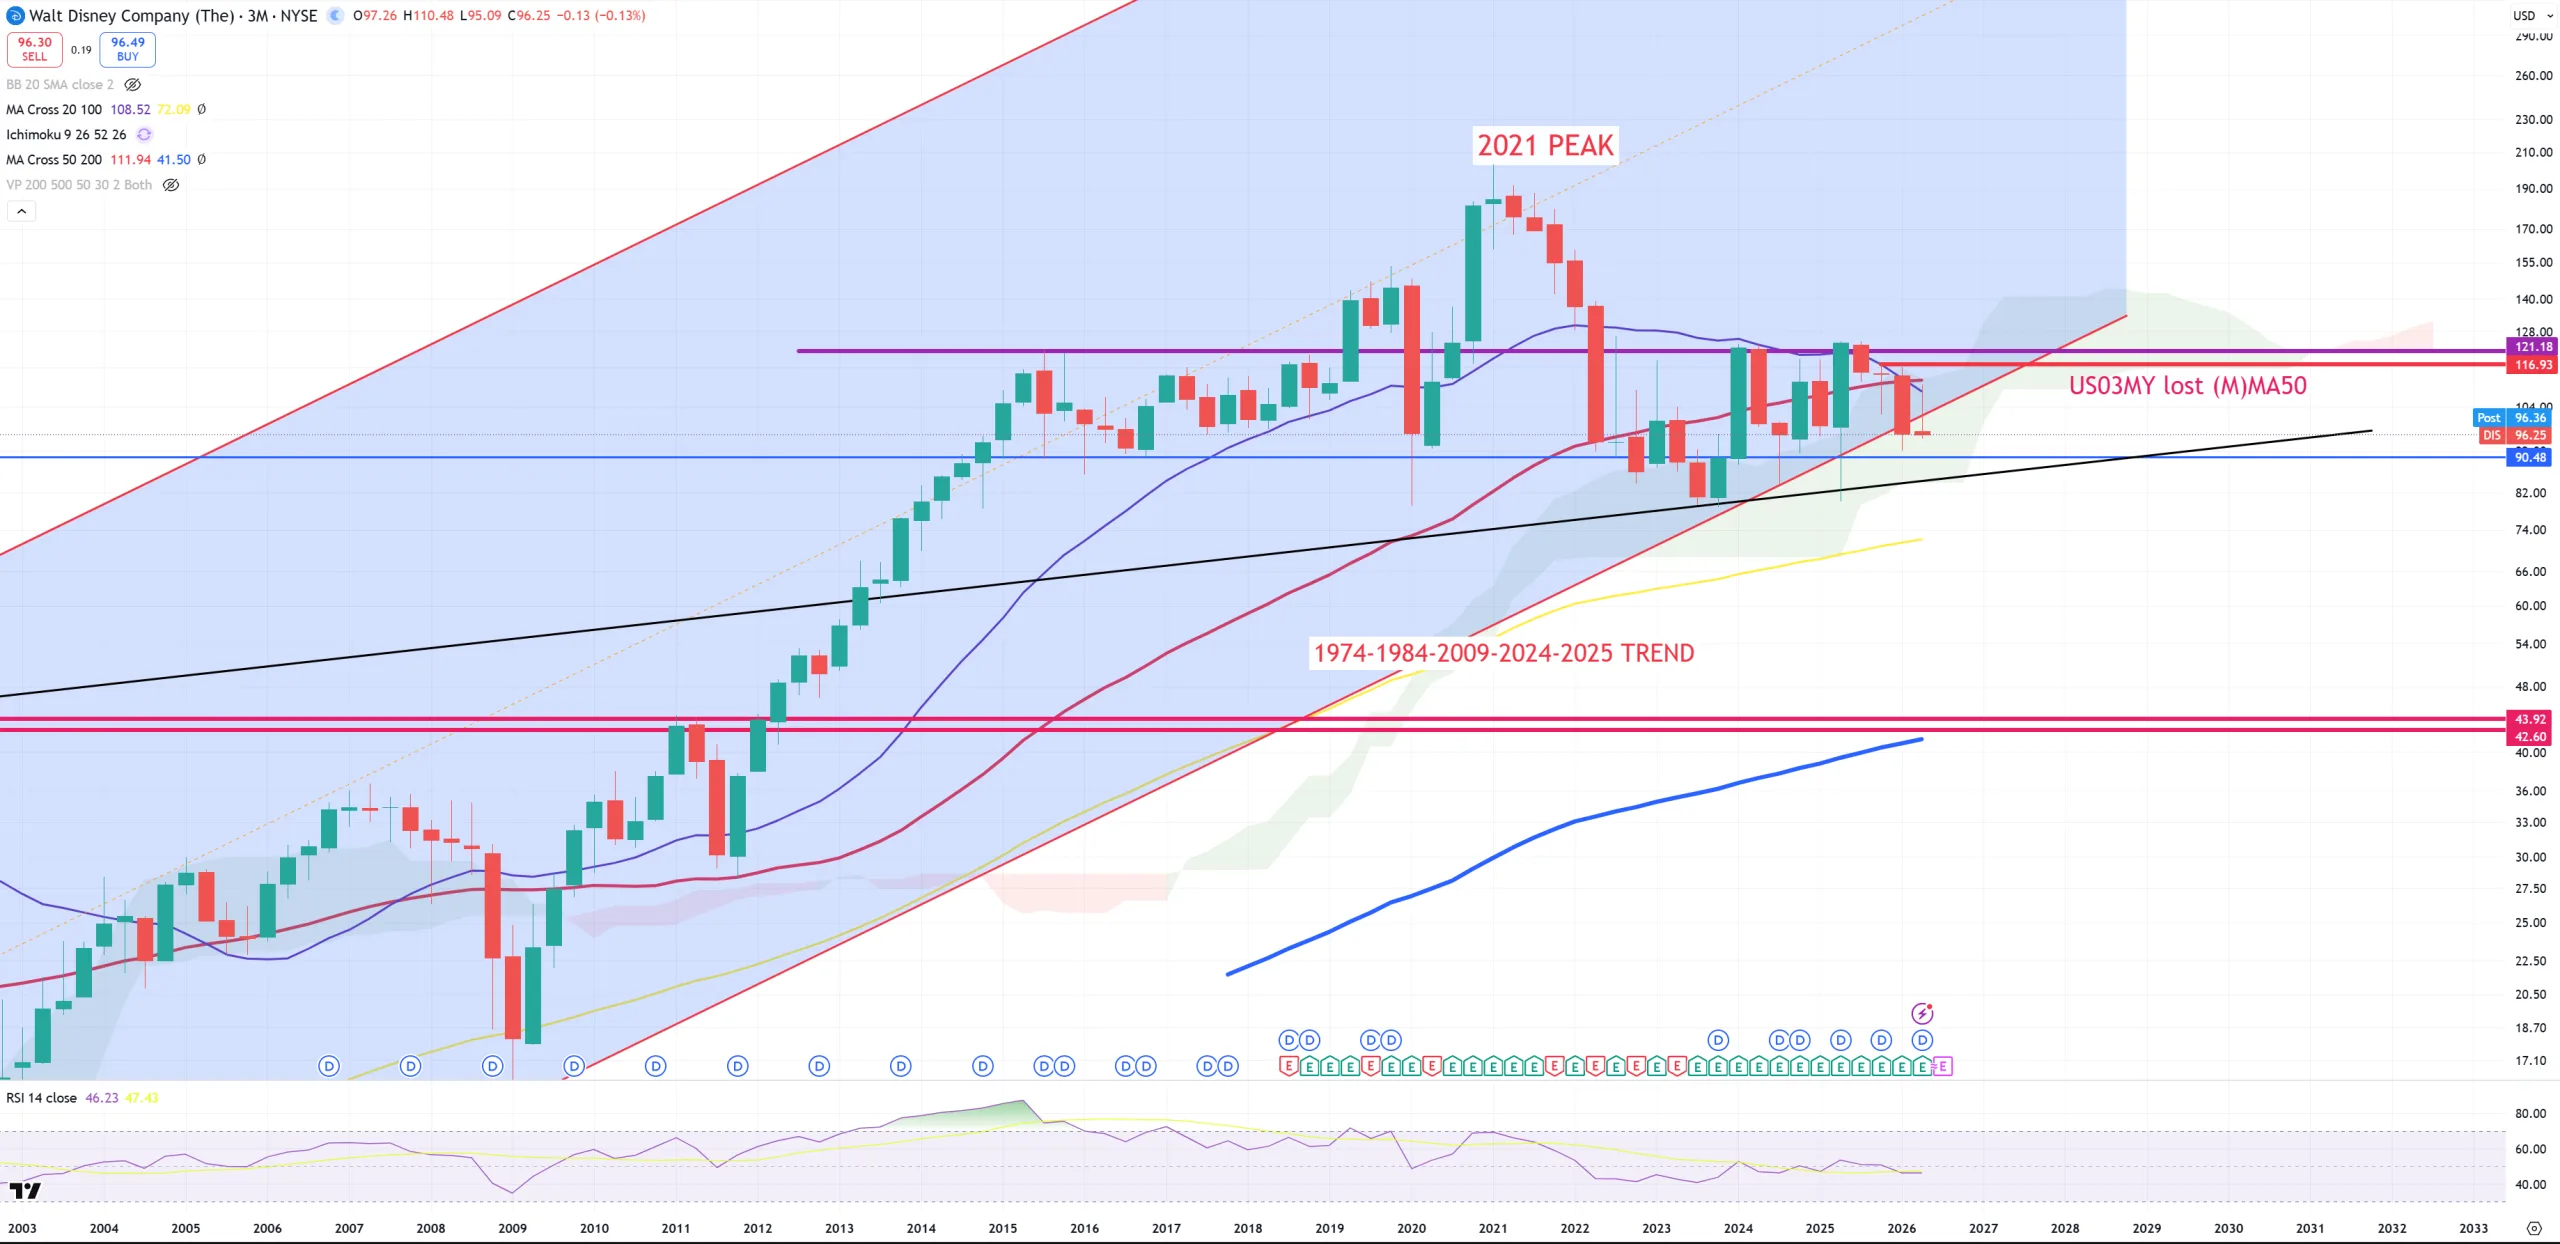
DIS – I’m waiting the most probably for this chart. (M)MA50 has gone, now trend from 1974 finally has gone.
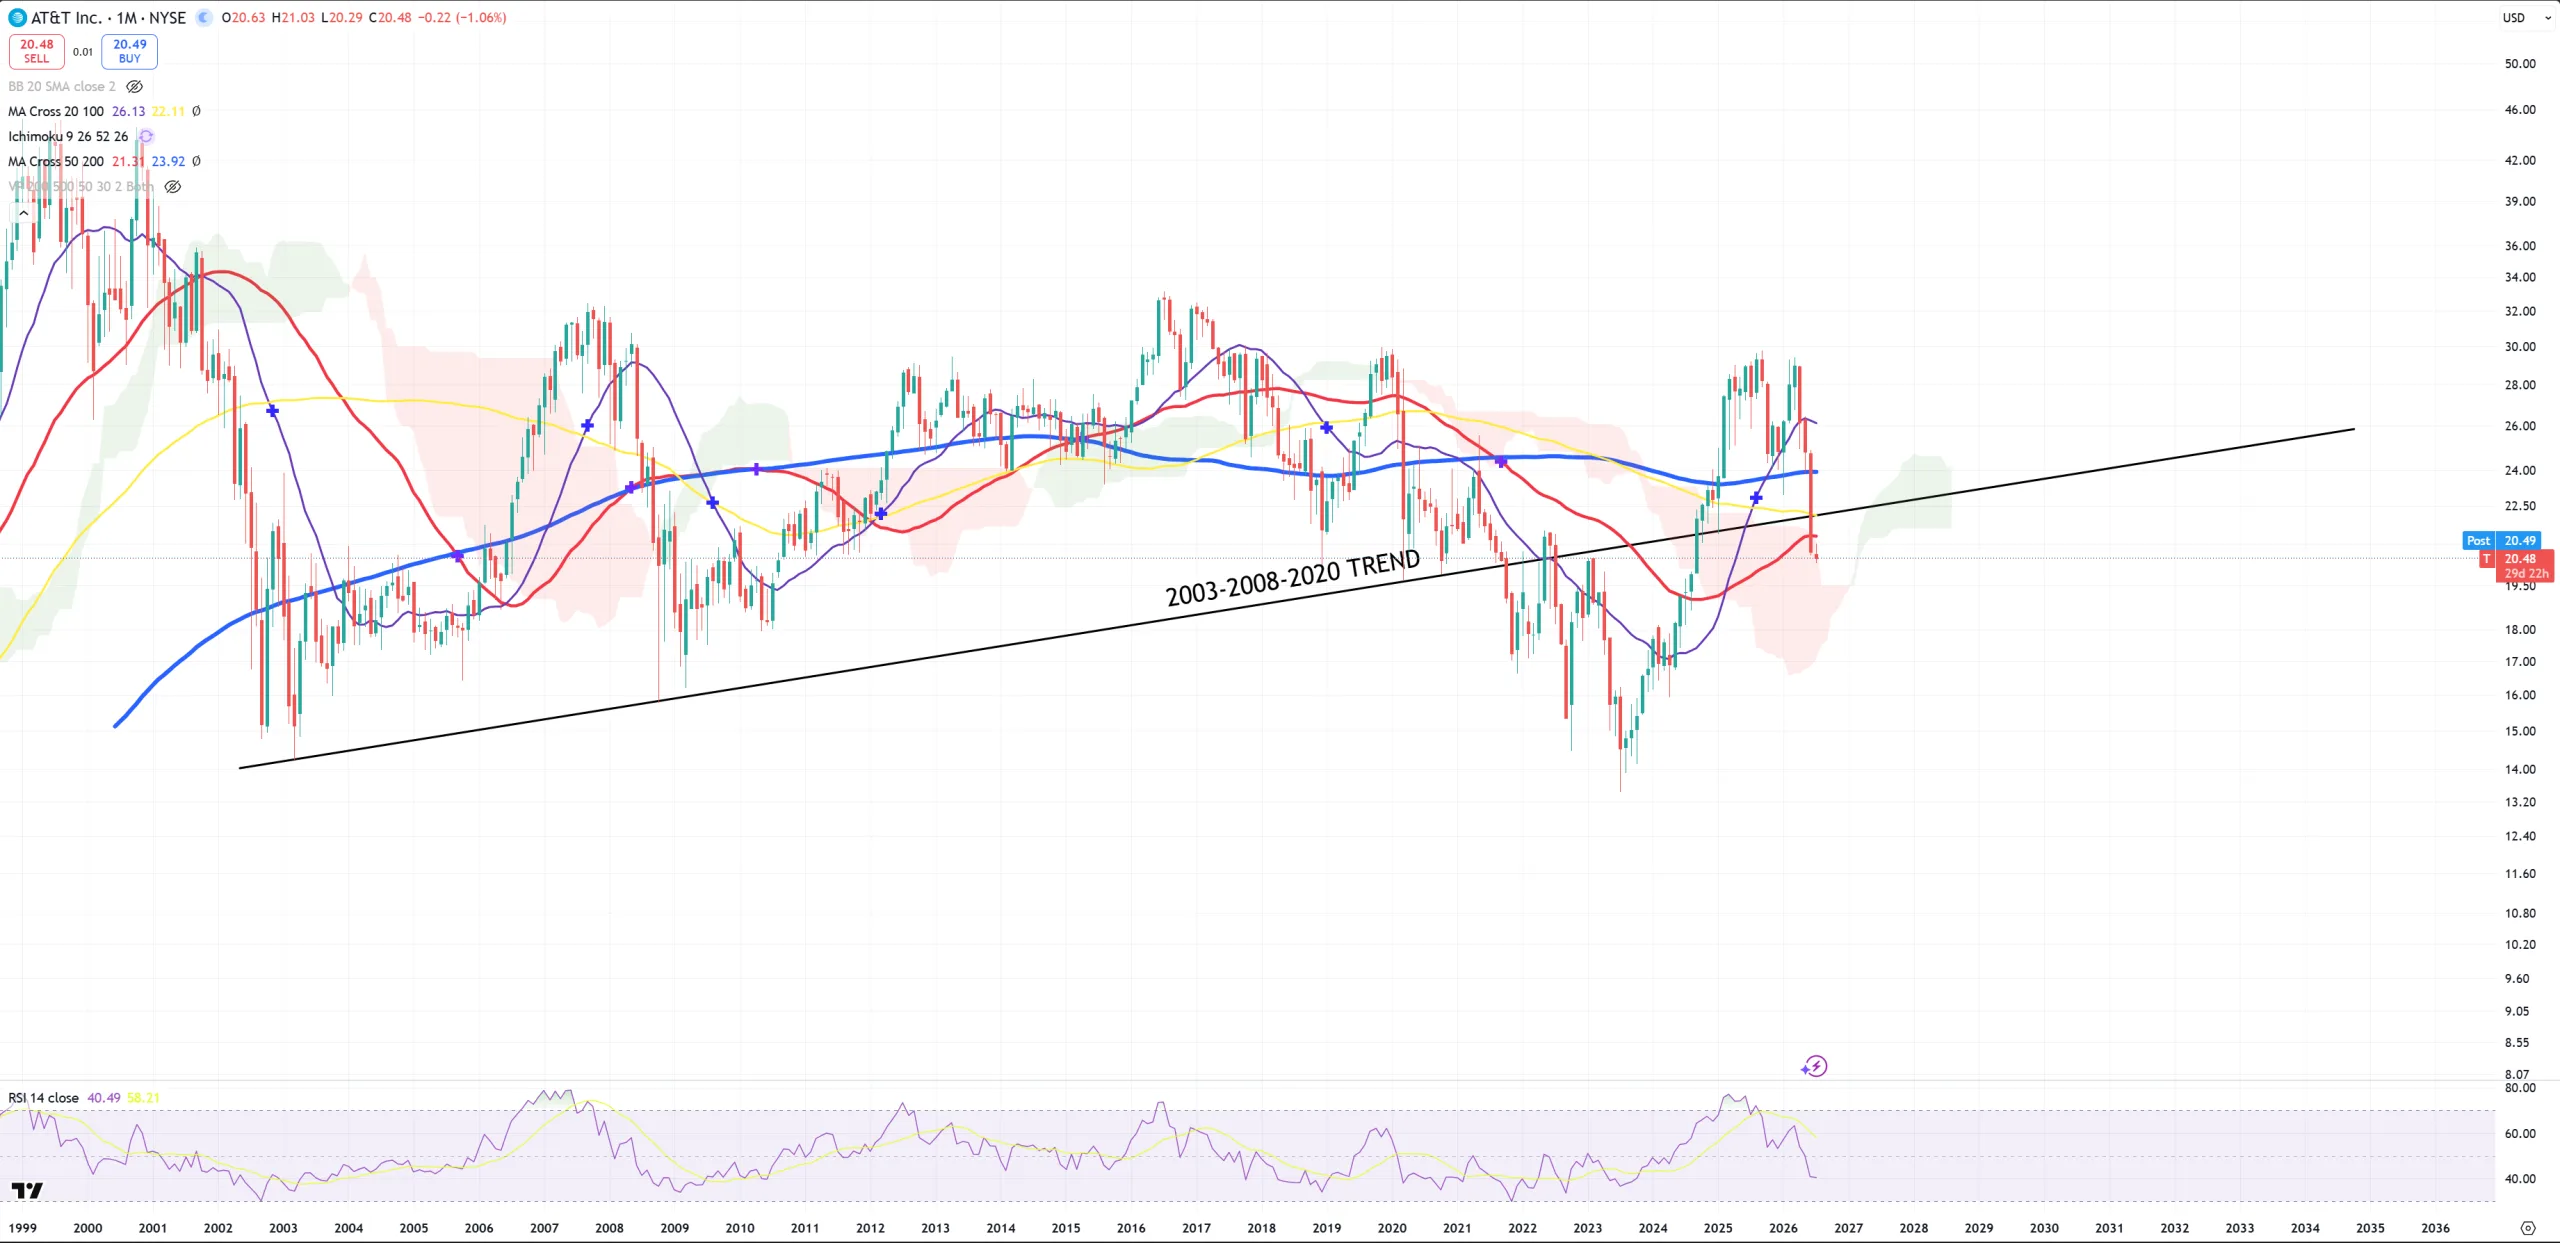
T – AT&T had enormous … bull-trap. Big come back above its 2002 trend and … big failure. We have June’s candle closed below (M)MA50 too. One of the biggest bull-traps I’ve probably ever seen.
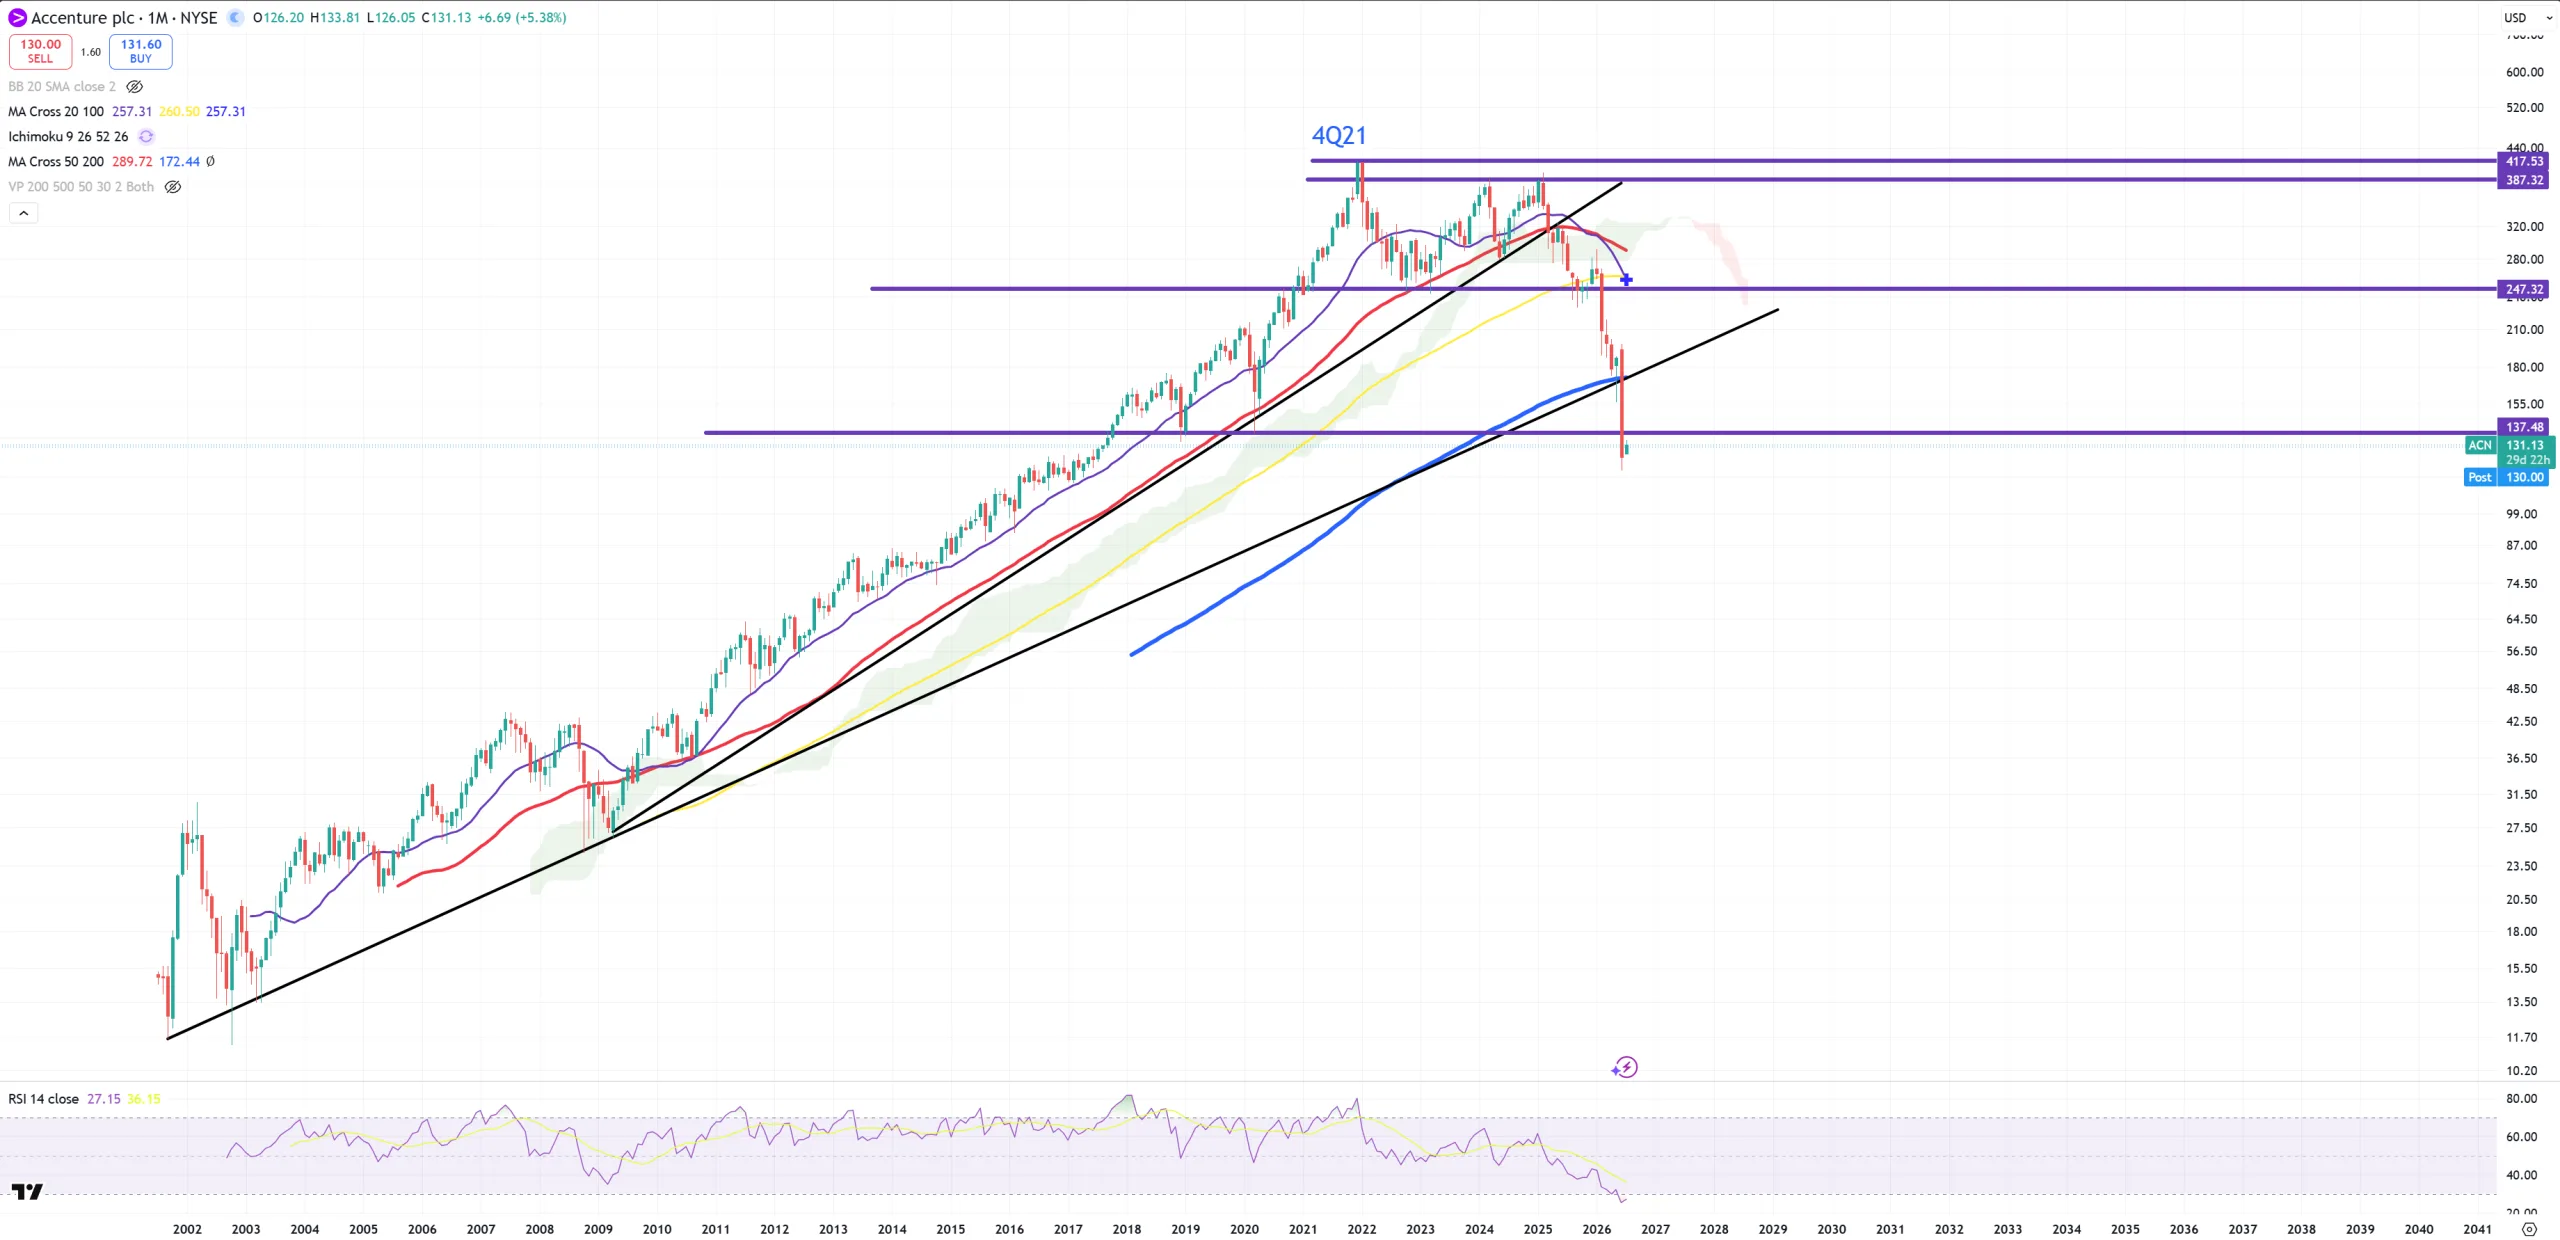
ACN – Accenture – wow what a chart.
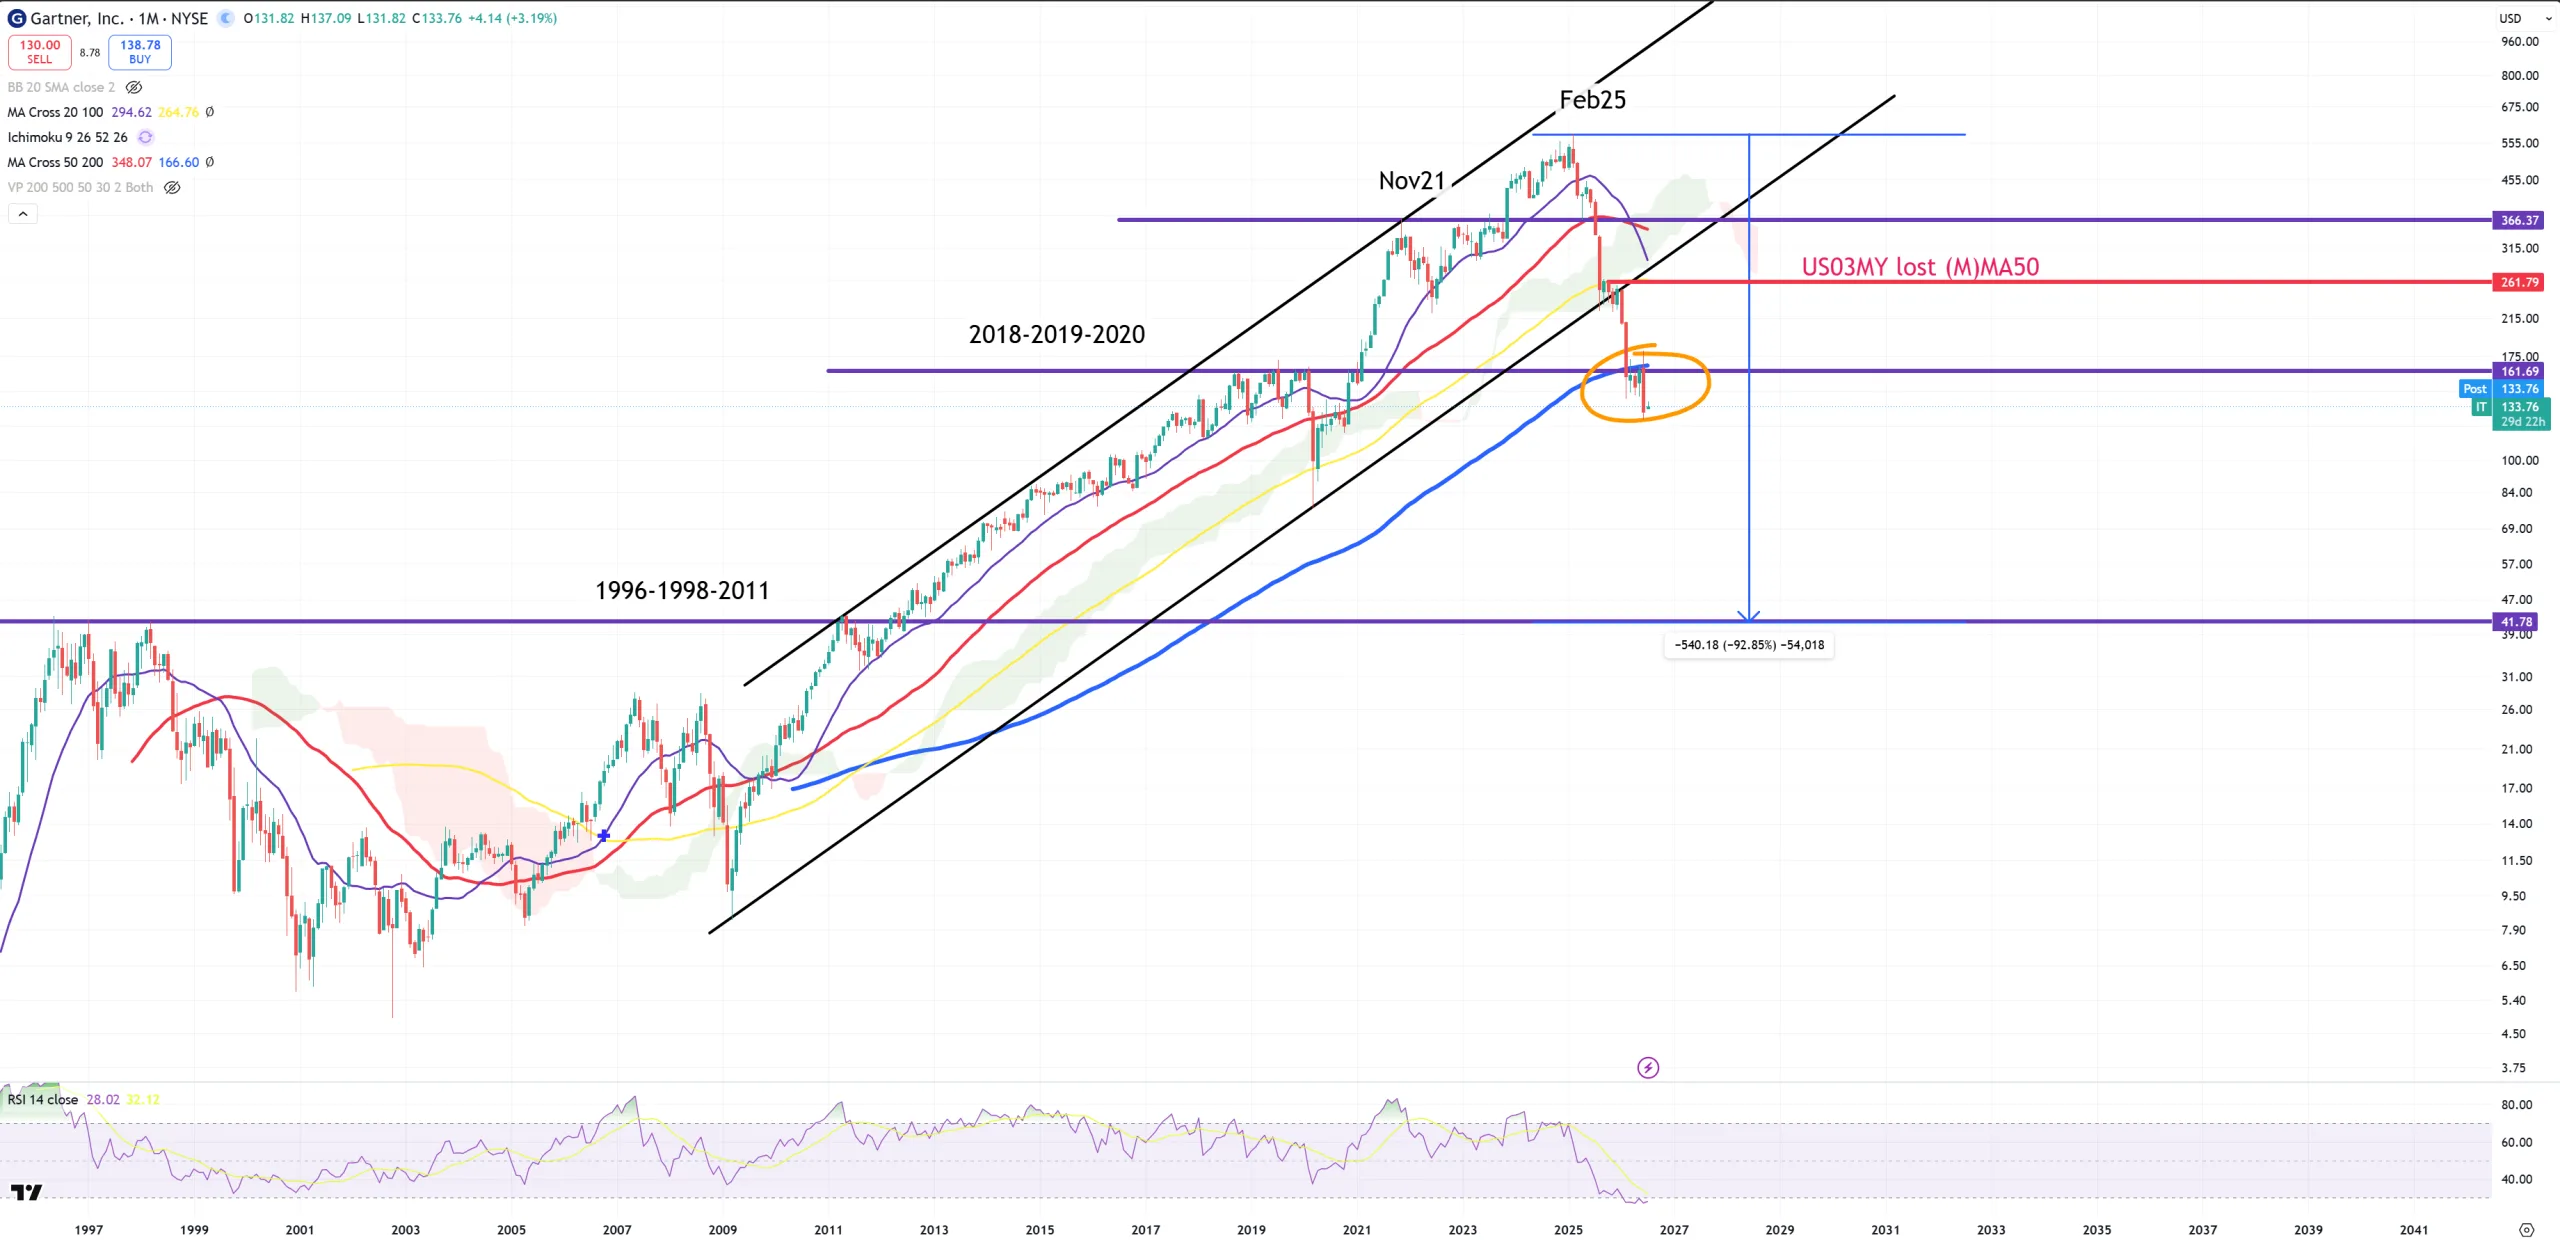
IT – Gartner – just as good as ACN. It’s 40$ magnet level
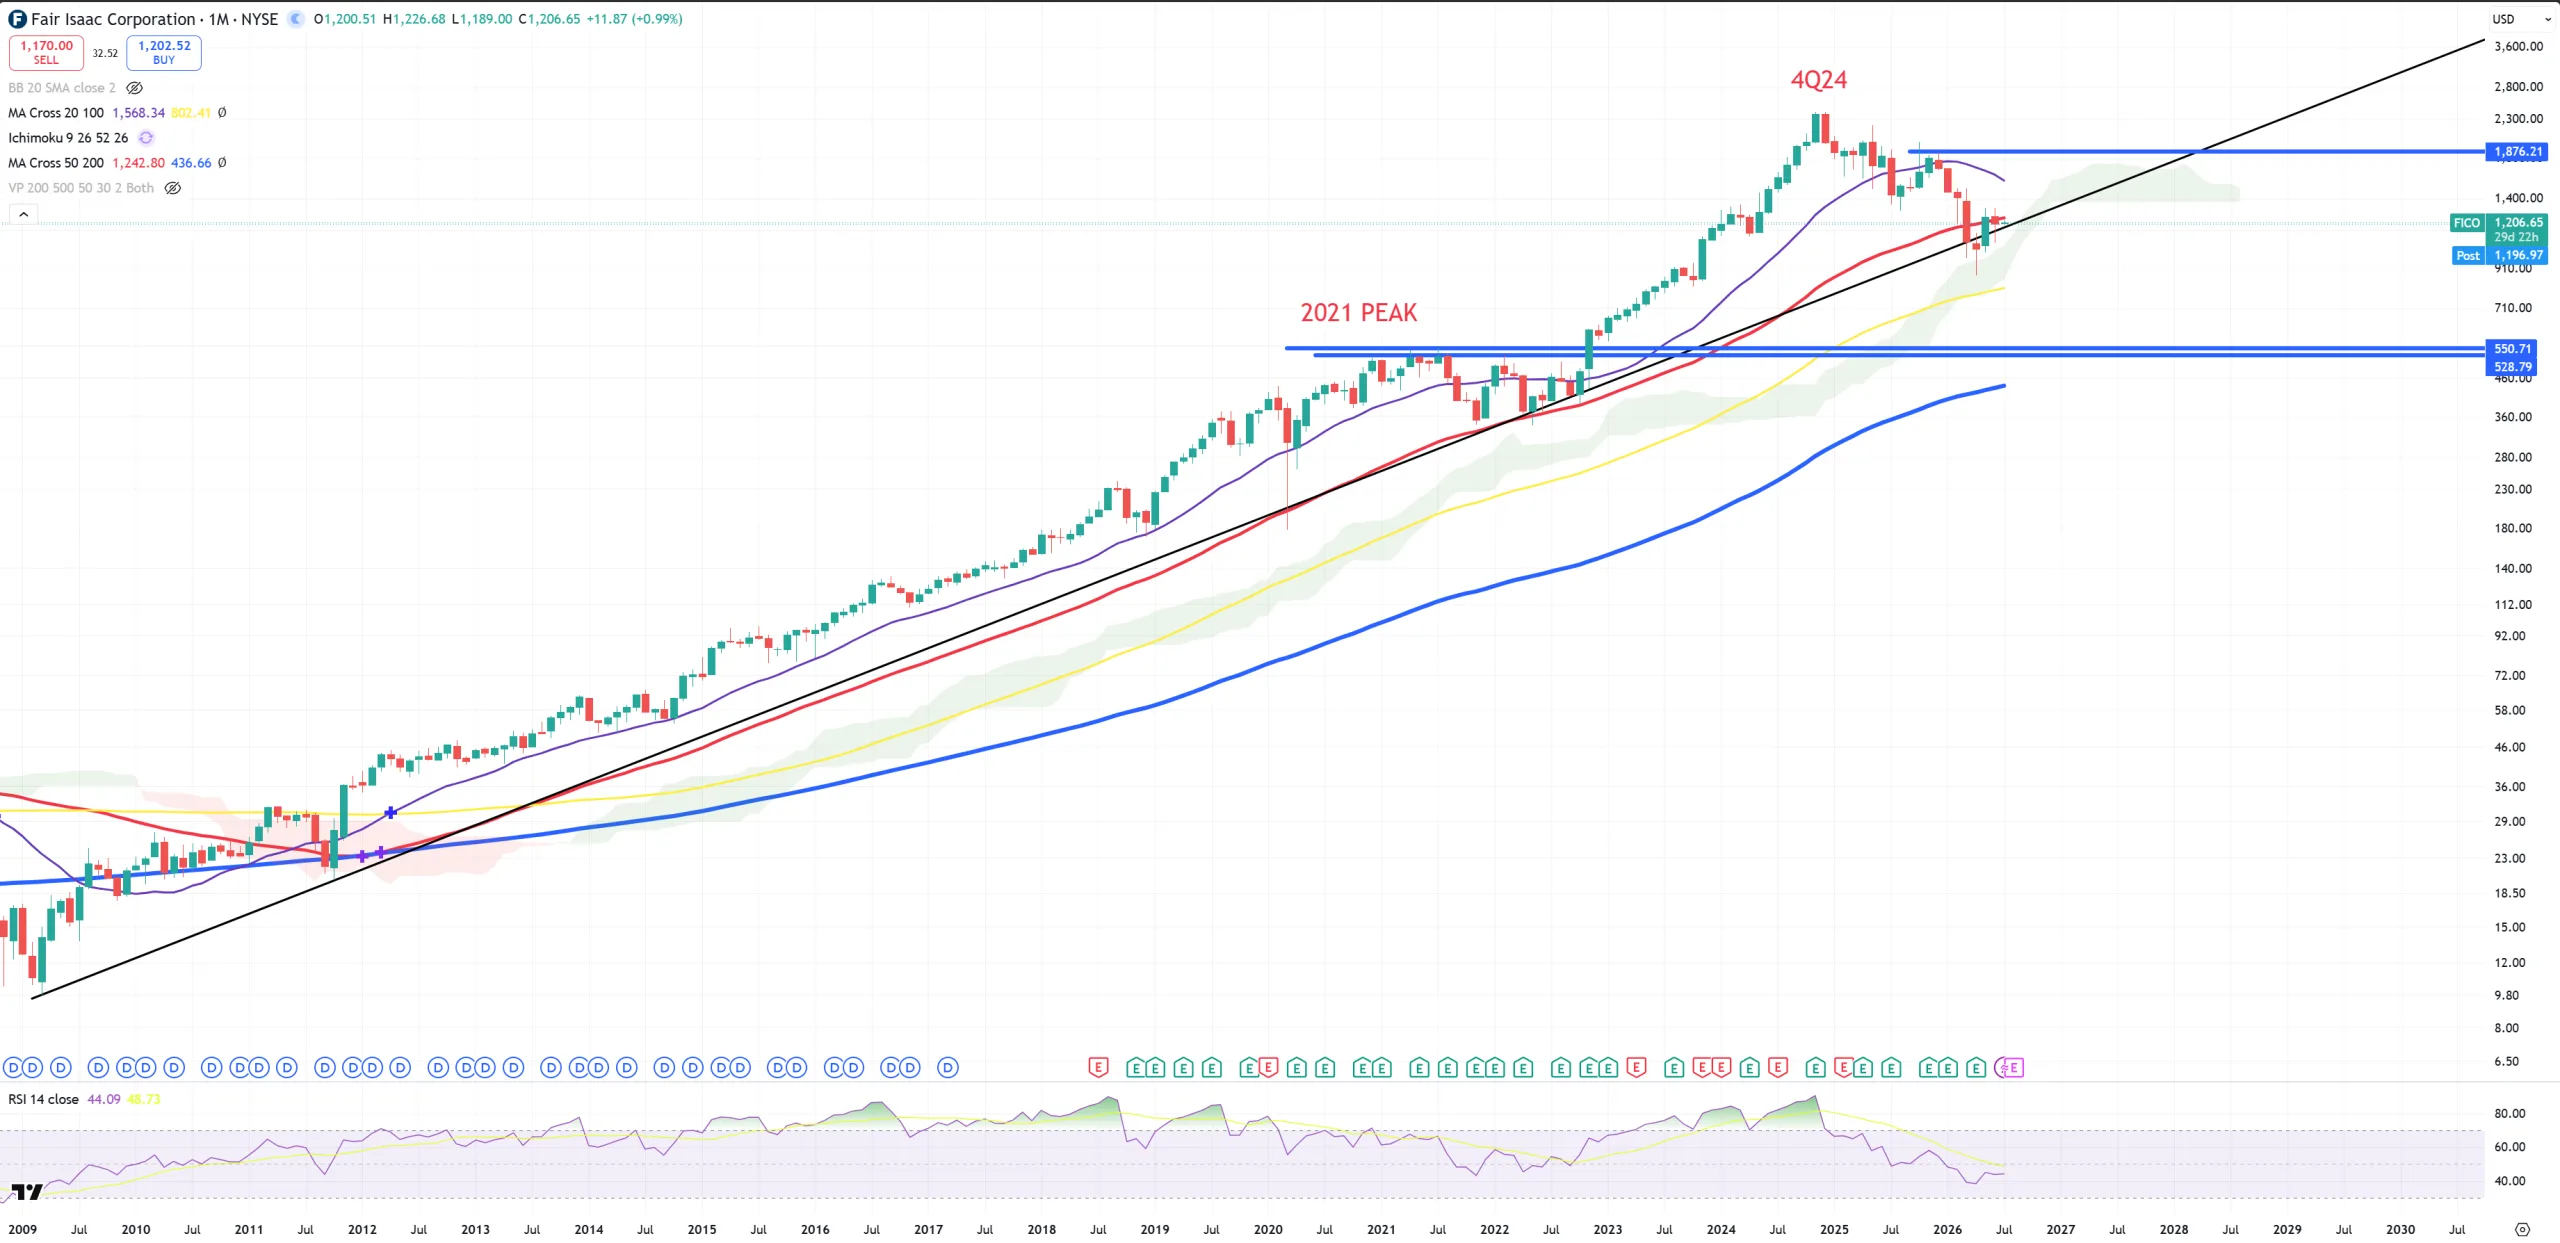
FICO – manages the trend, but it failed to break above (M)MA50
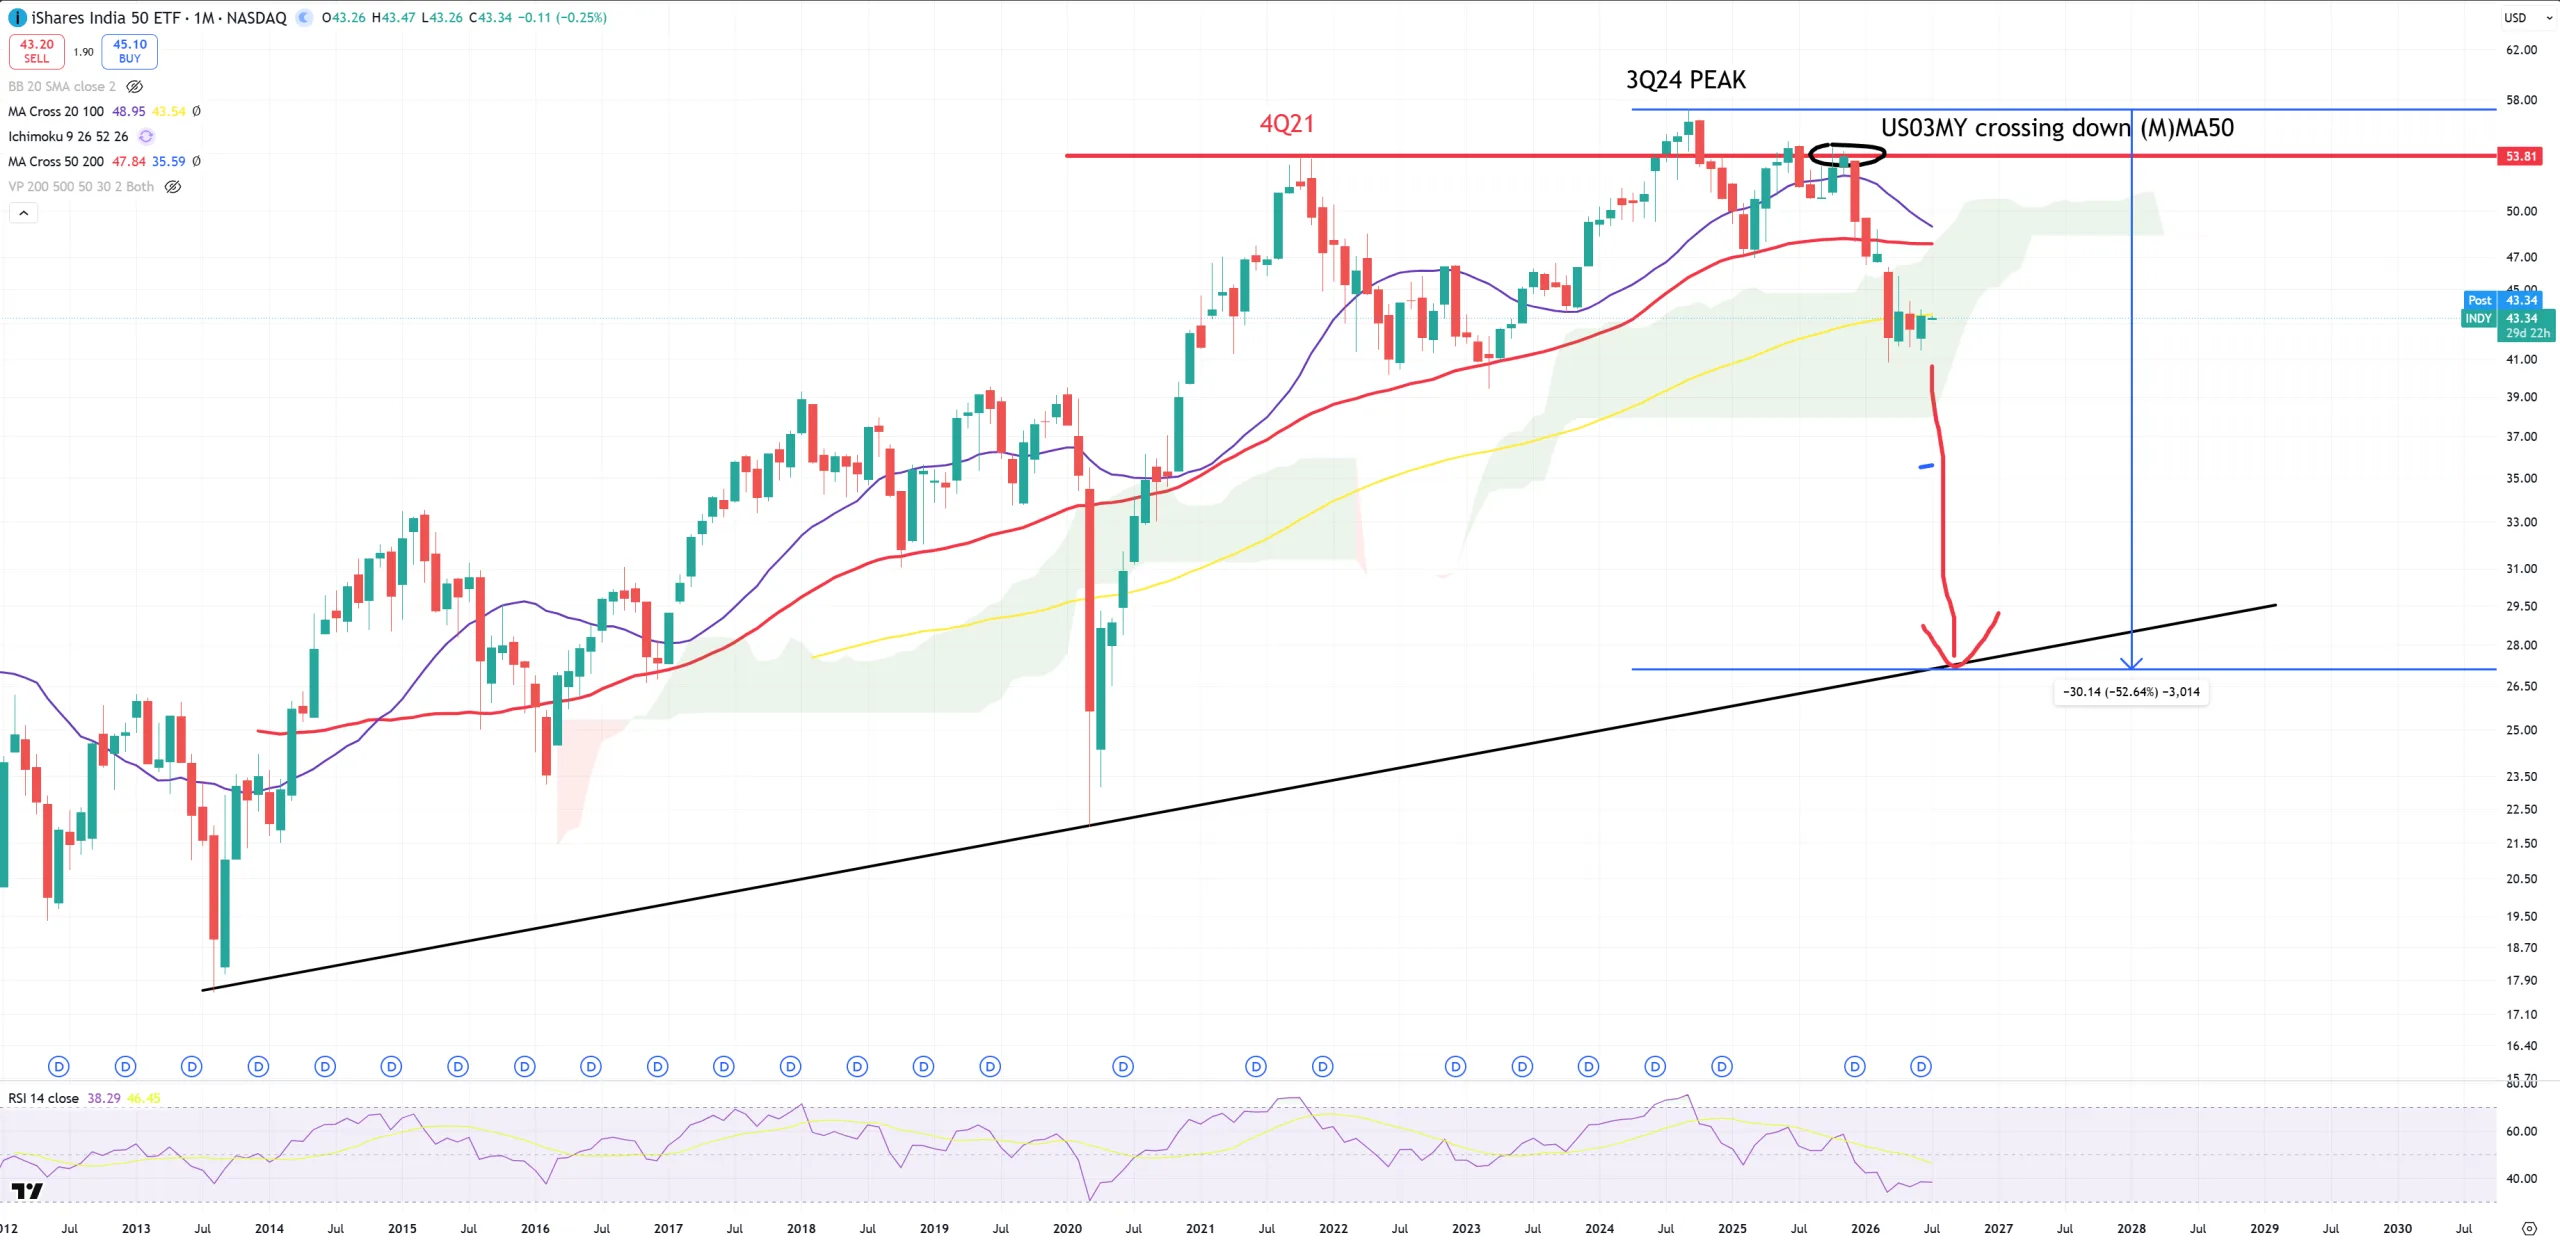
INDY – still in crash mode retesting (M)MA100, 35$ is (M)MA200
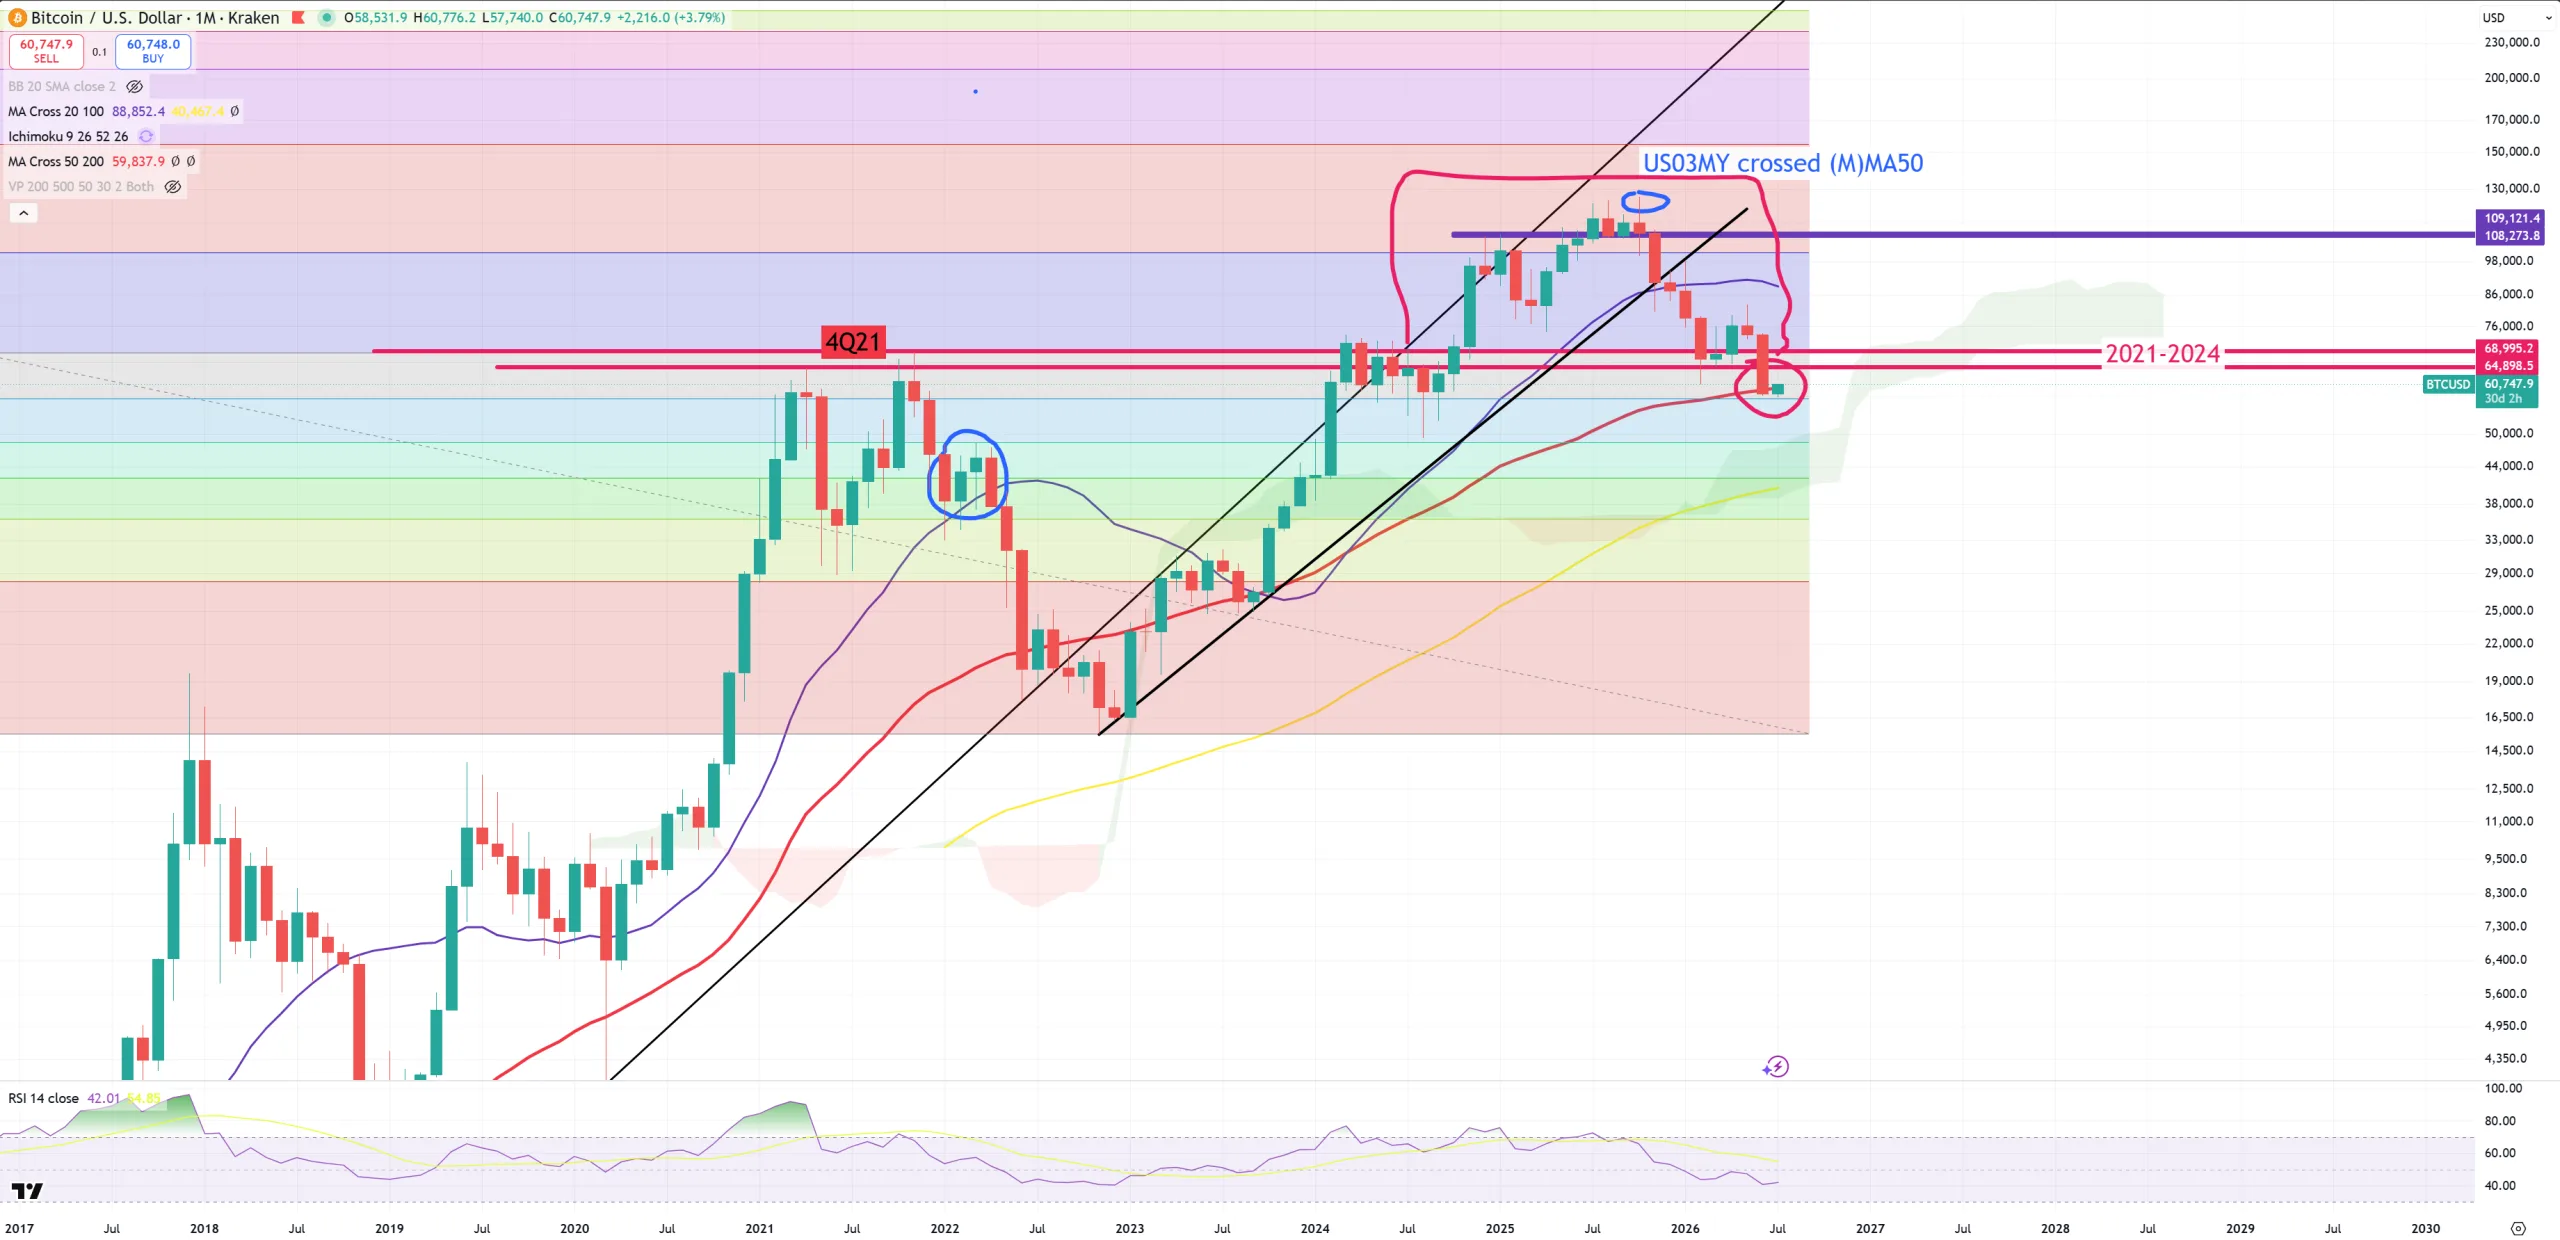
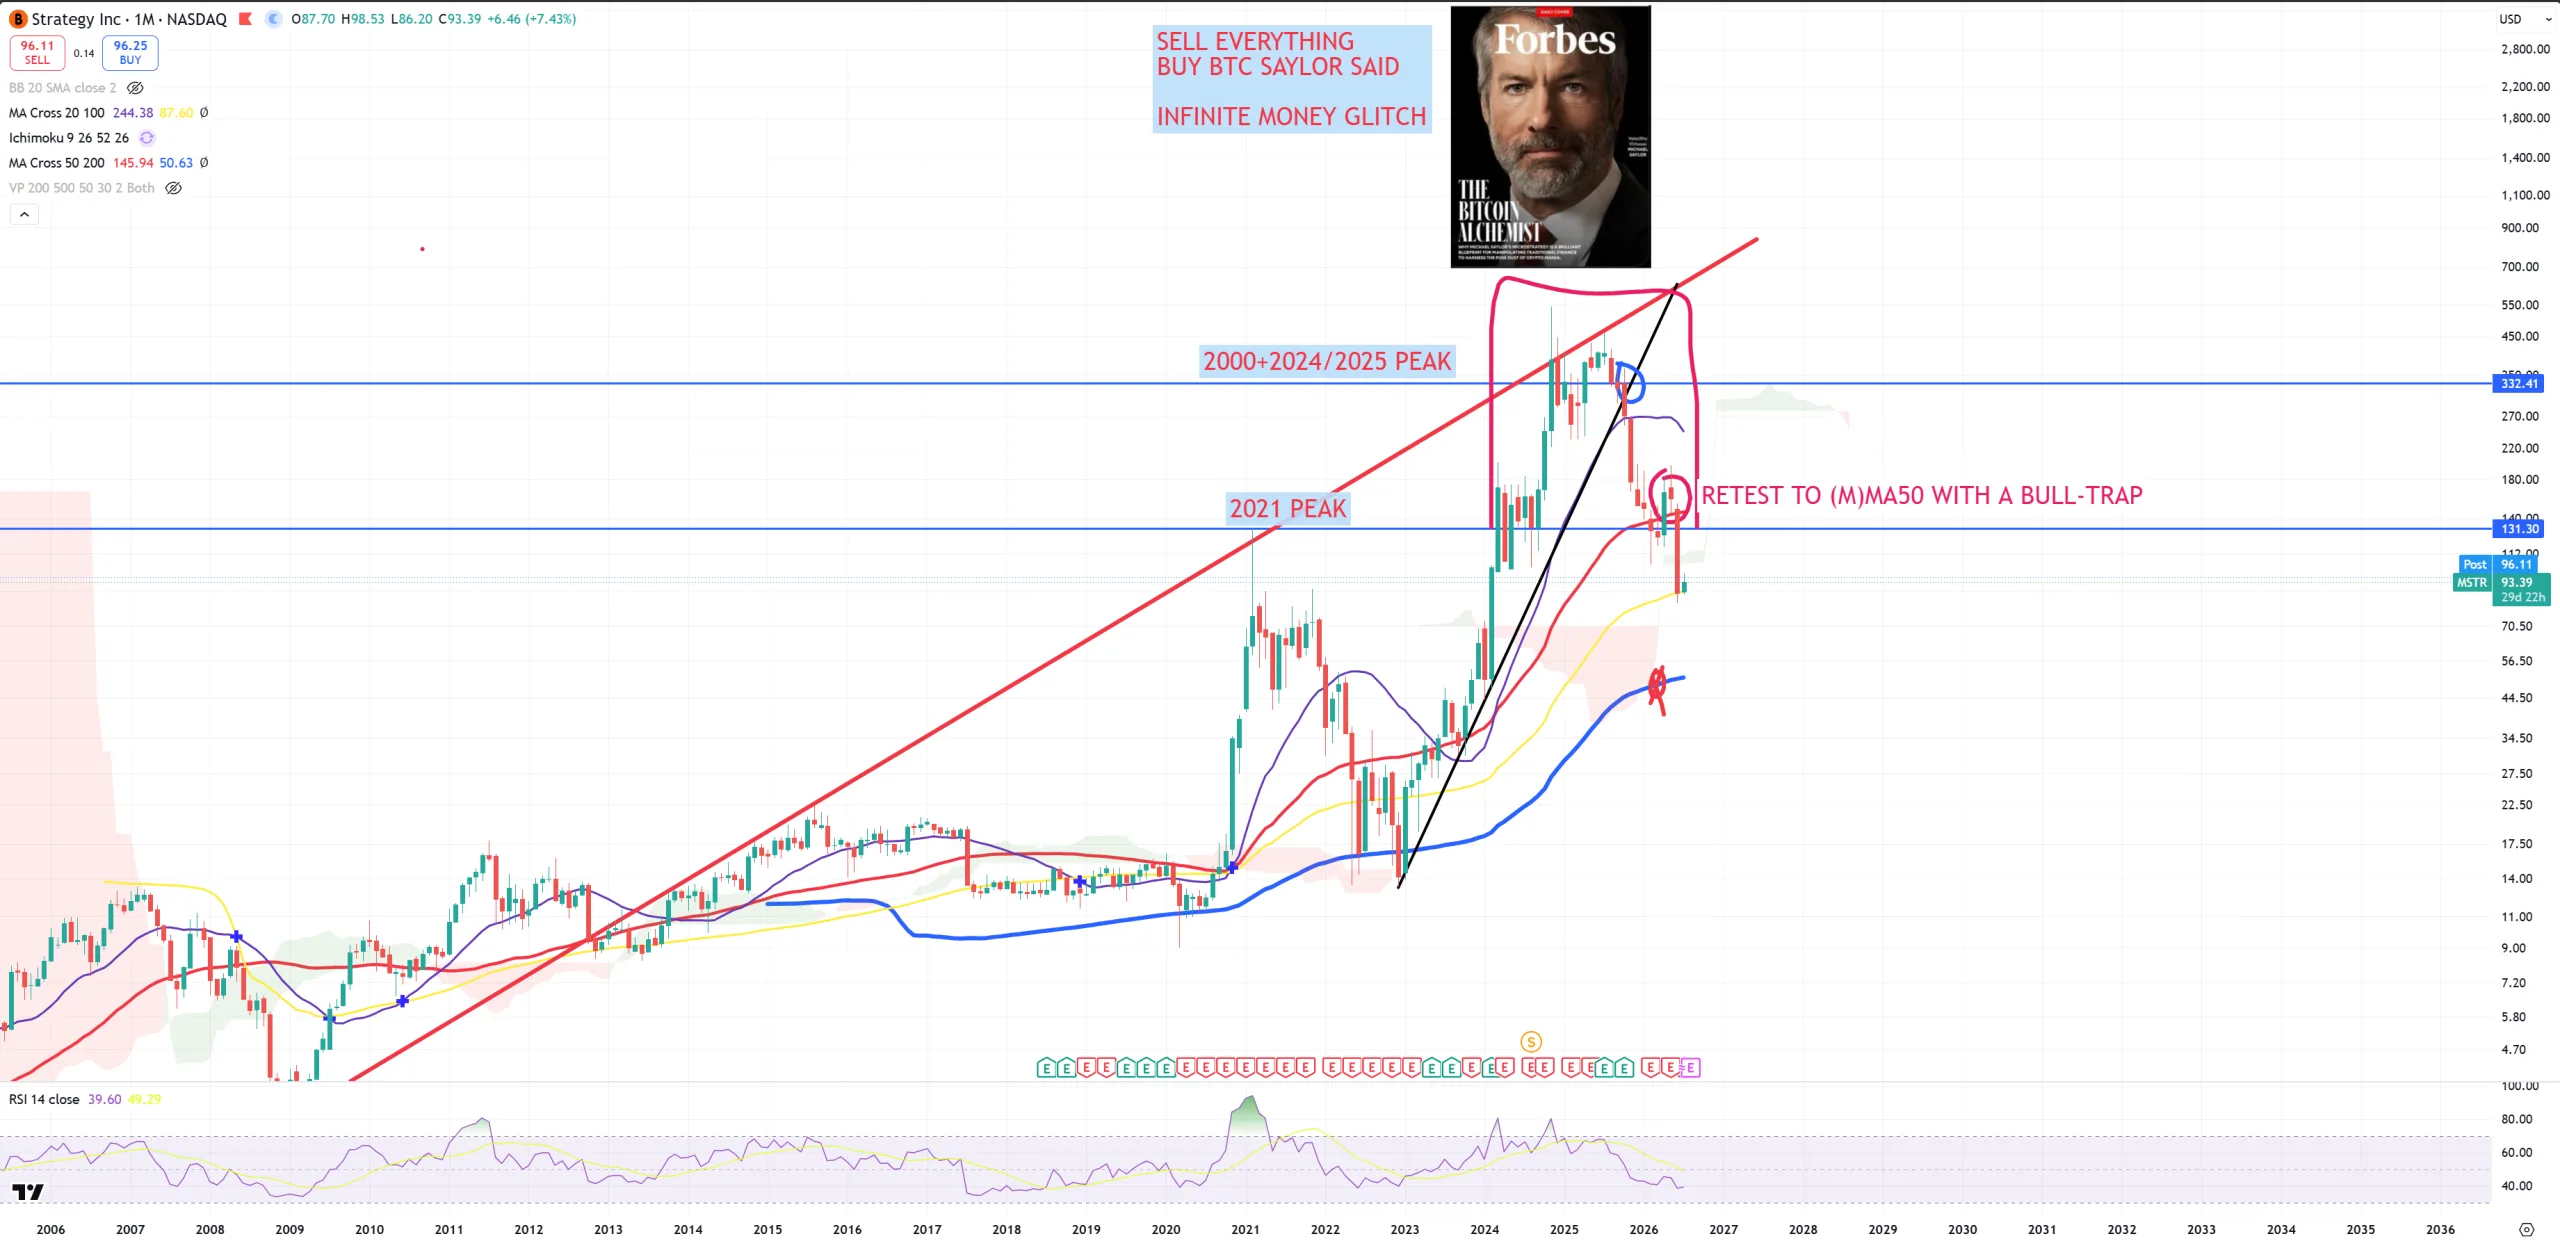
BTC – oh my BTC – opens below (M)MA50 – fight continue, but this time 70k$ level is ultra heavy resistance which Saylor was defending at any cost. In reality move > 2021 70k$ level was a massive distribution and bull-trap – mostly exit liquidity provided by MSTR.
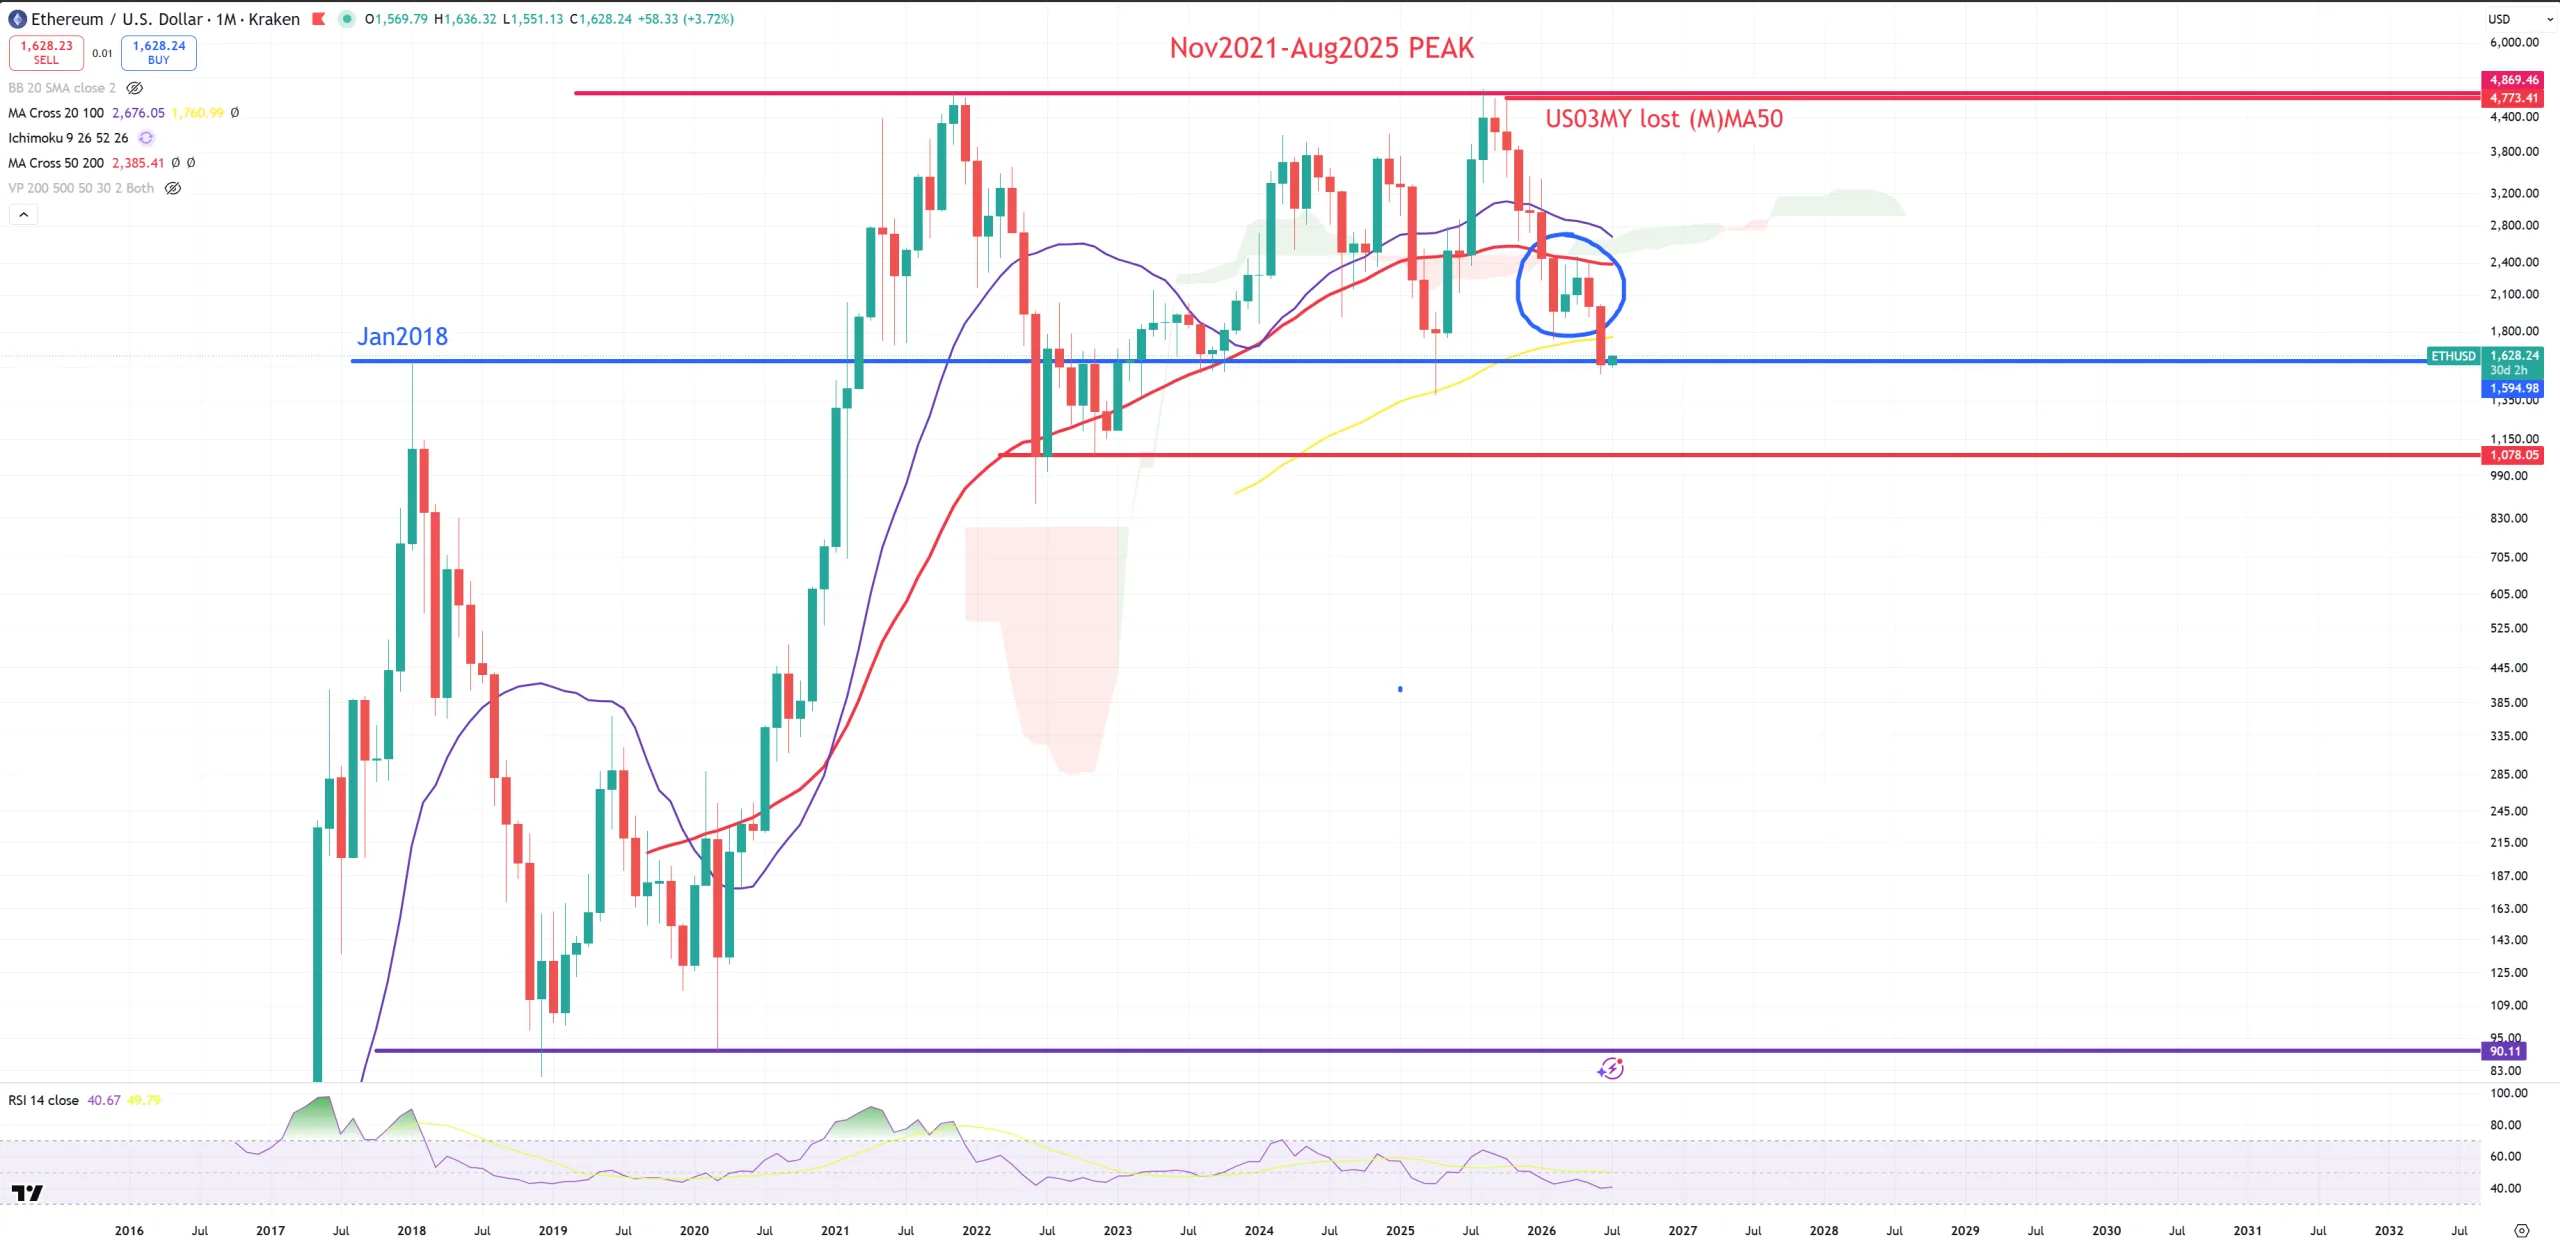
ETH – worse than BTC – as it now has January 2018 as resistance. If it holds we have 1000$ as a next true support. Ig 1600$ will be gone, 1000$ is in play.
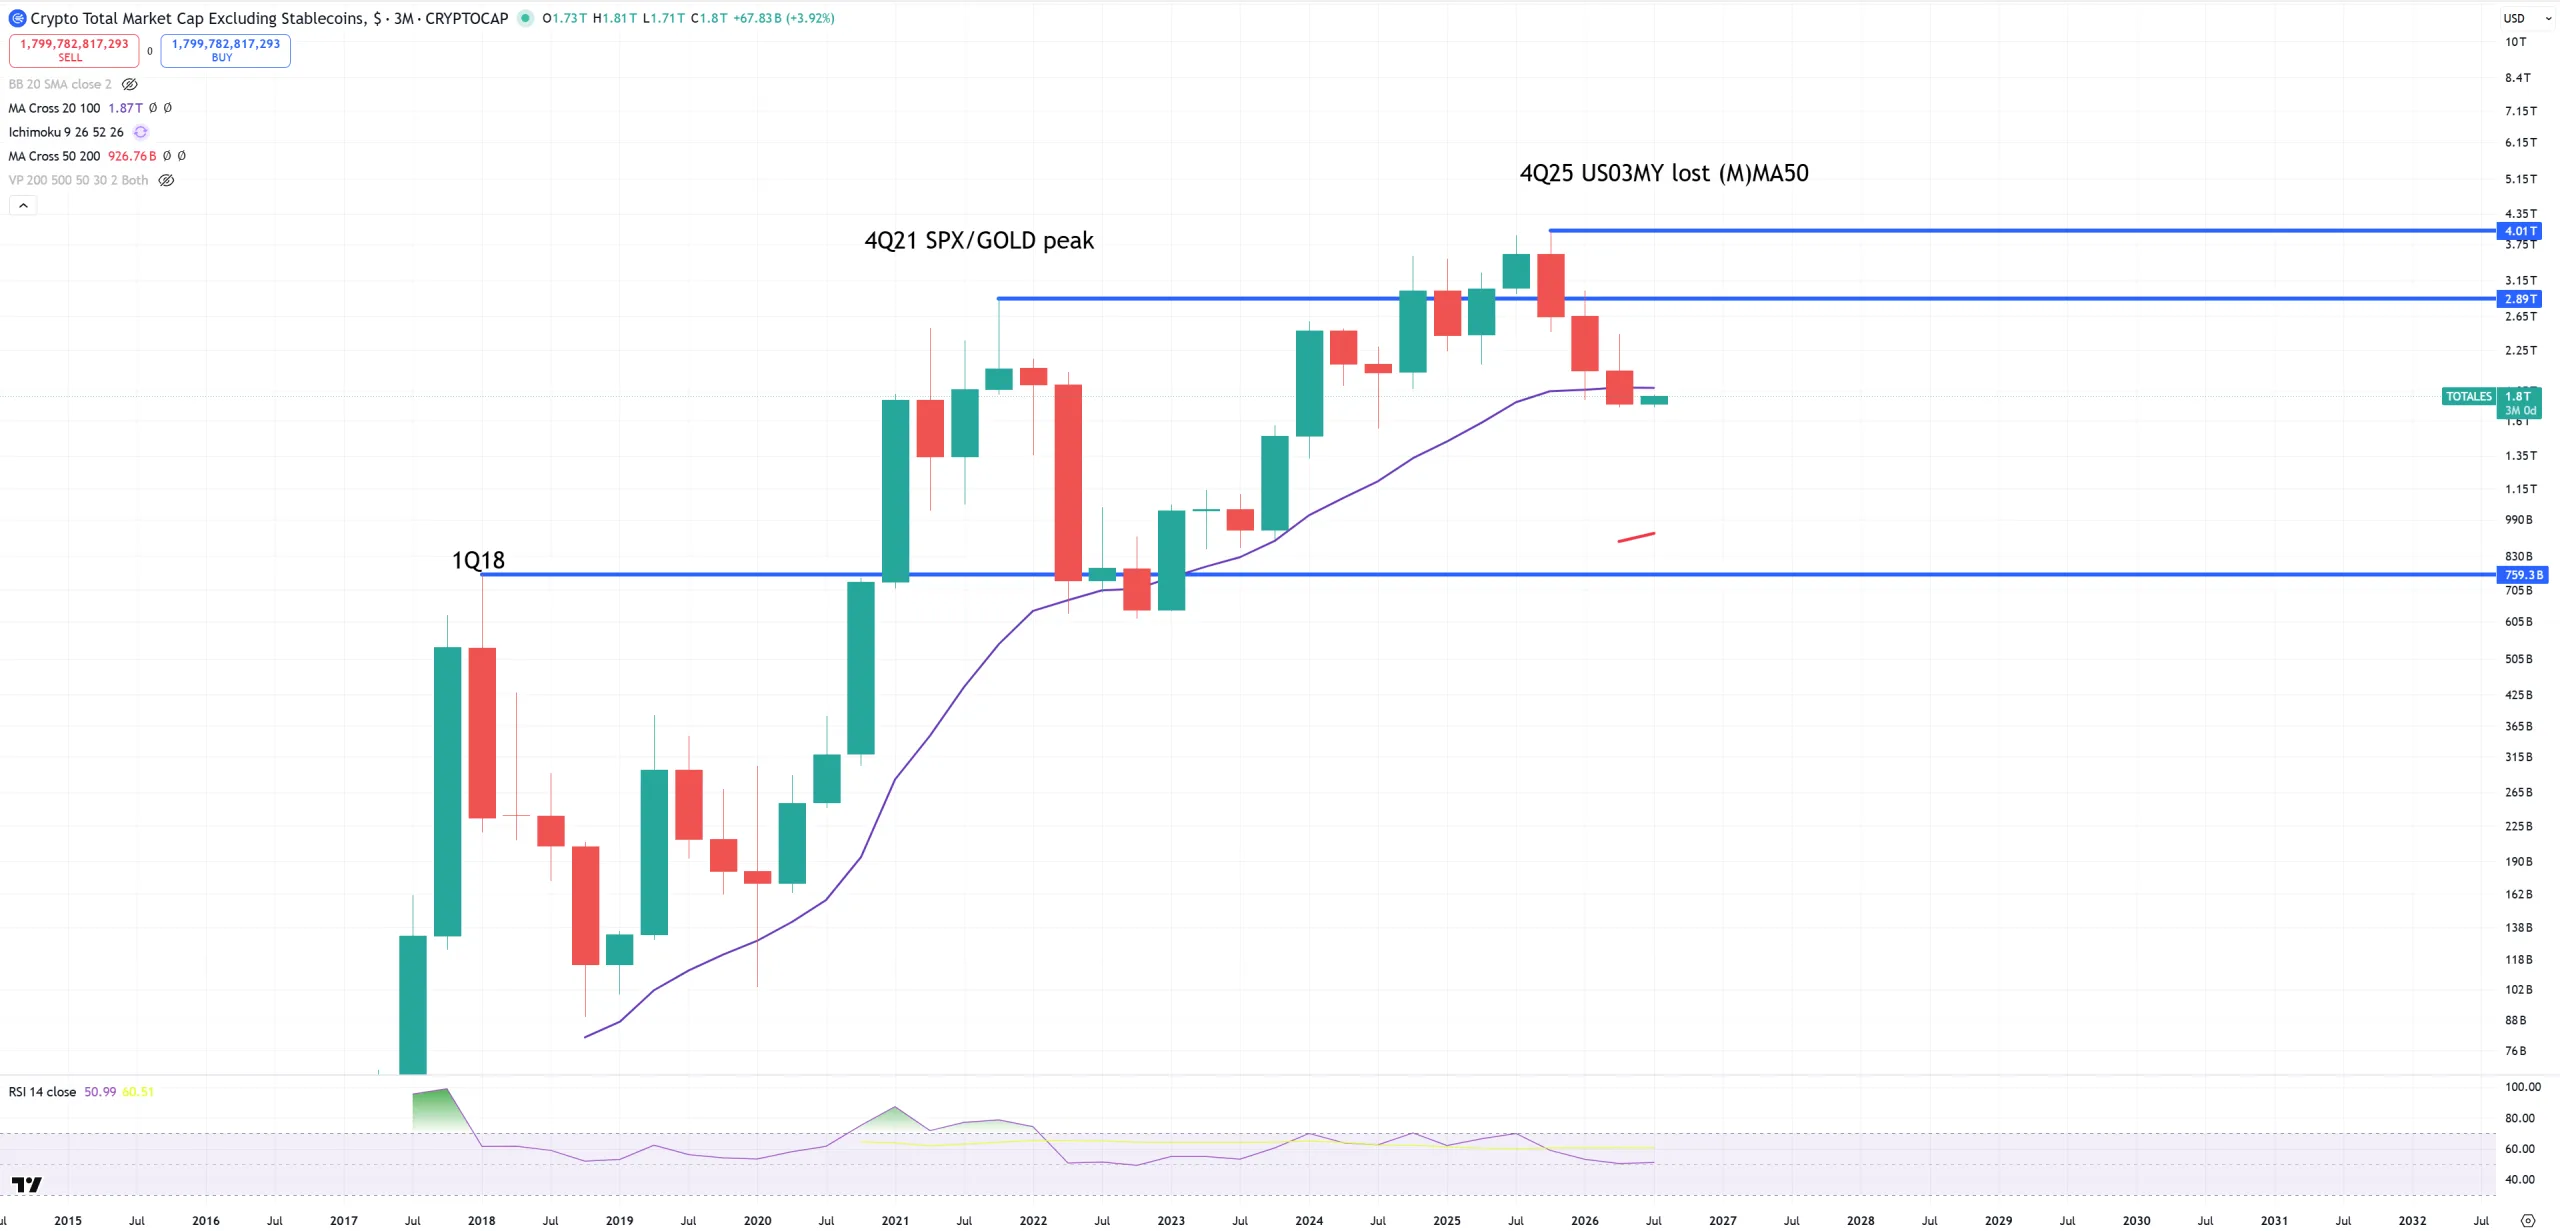
TOTAL CRYPTO MARKET excluding STABLE COINS – this is 3M view, because on M it’s below (M)MA50.
MSTR – can’t have BTC without MSTR. BTC sits around (M)MA50, MSTR sits around (M)MA100. It might have a bounce it might have not. Blue (M)MA200 will be a magnet so 40-50$. If we break this level I bet 0.42c double-bottom to arrive.
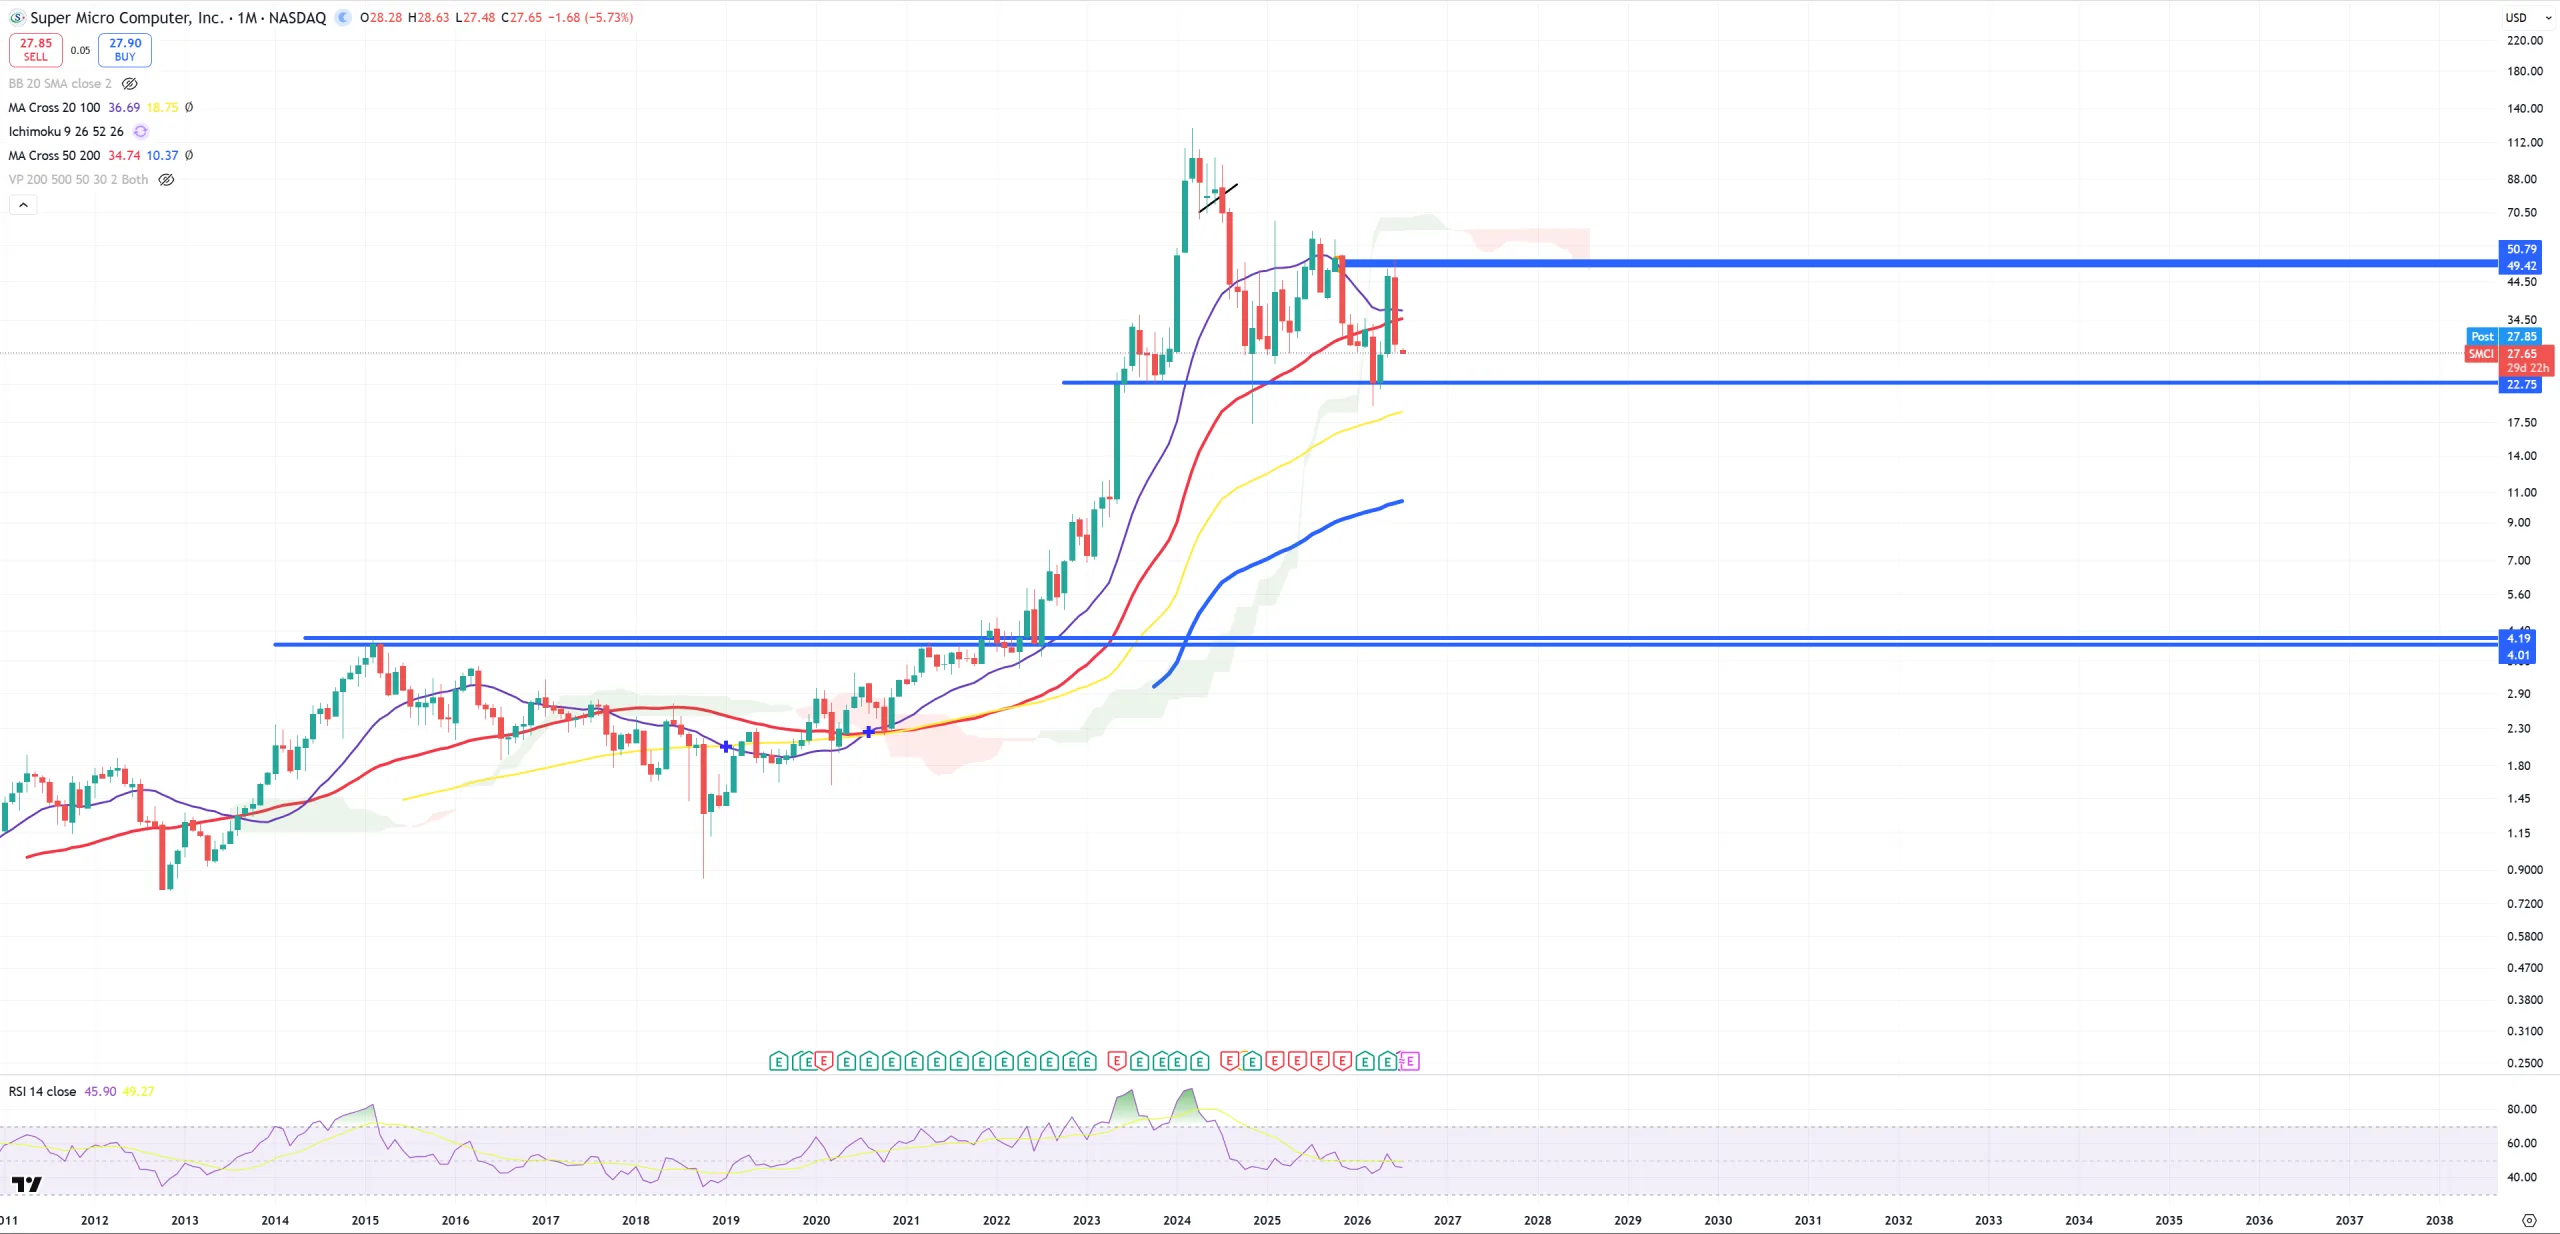
SMCI – (M)MA50 bull trap and now we’ll be boxing to blow up this 22.75$ support
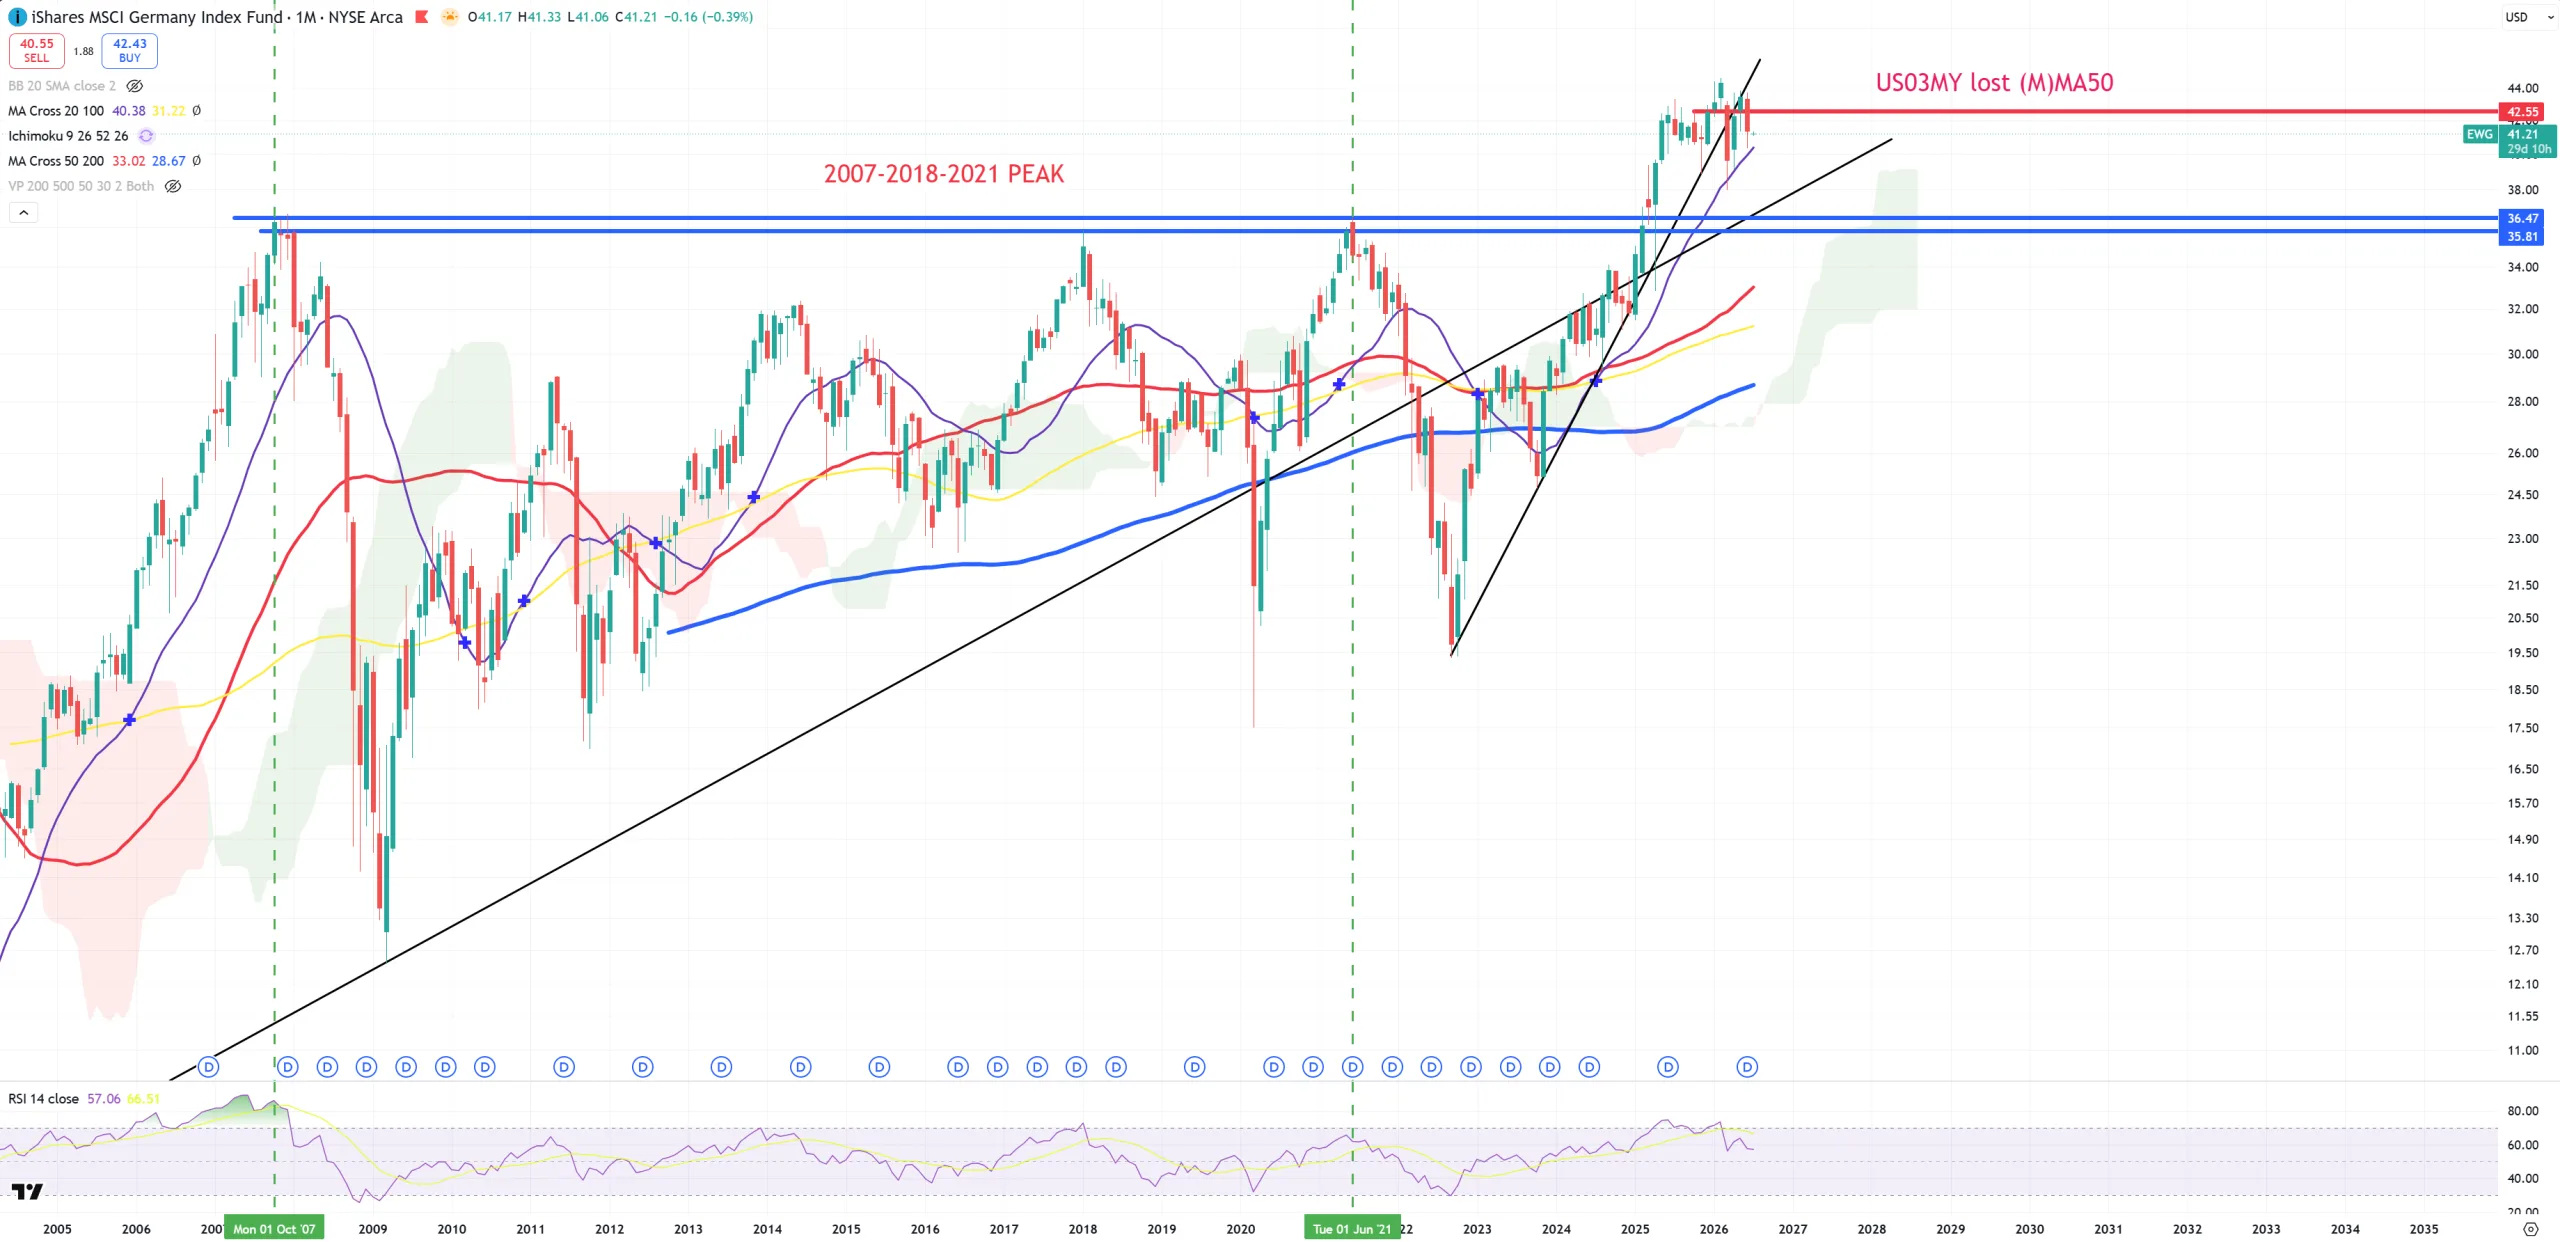
EWG – Germany – I must say this is shocker it managed to break this 2021 level
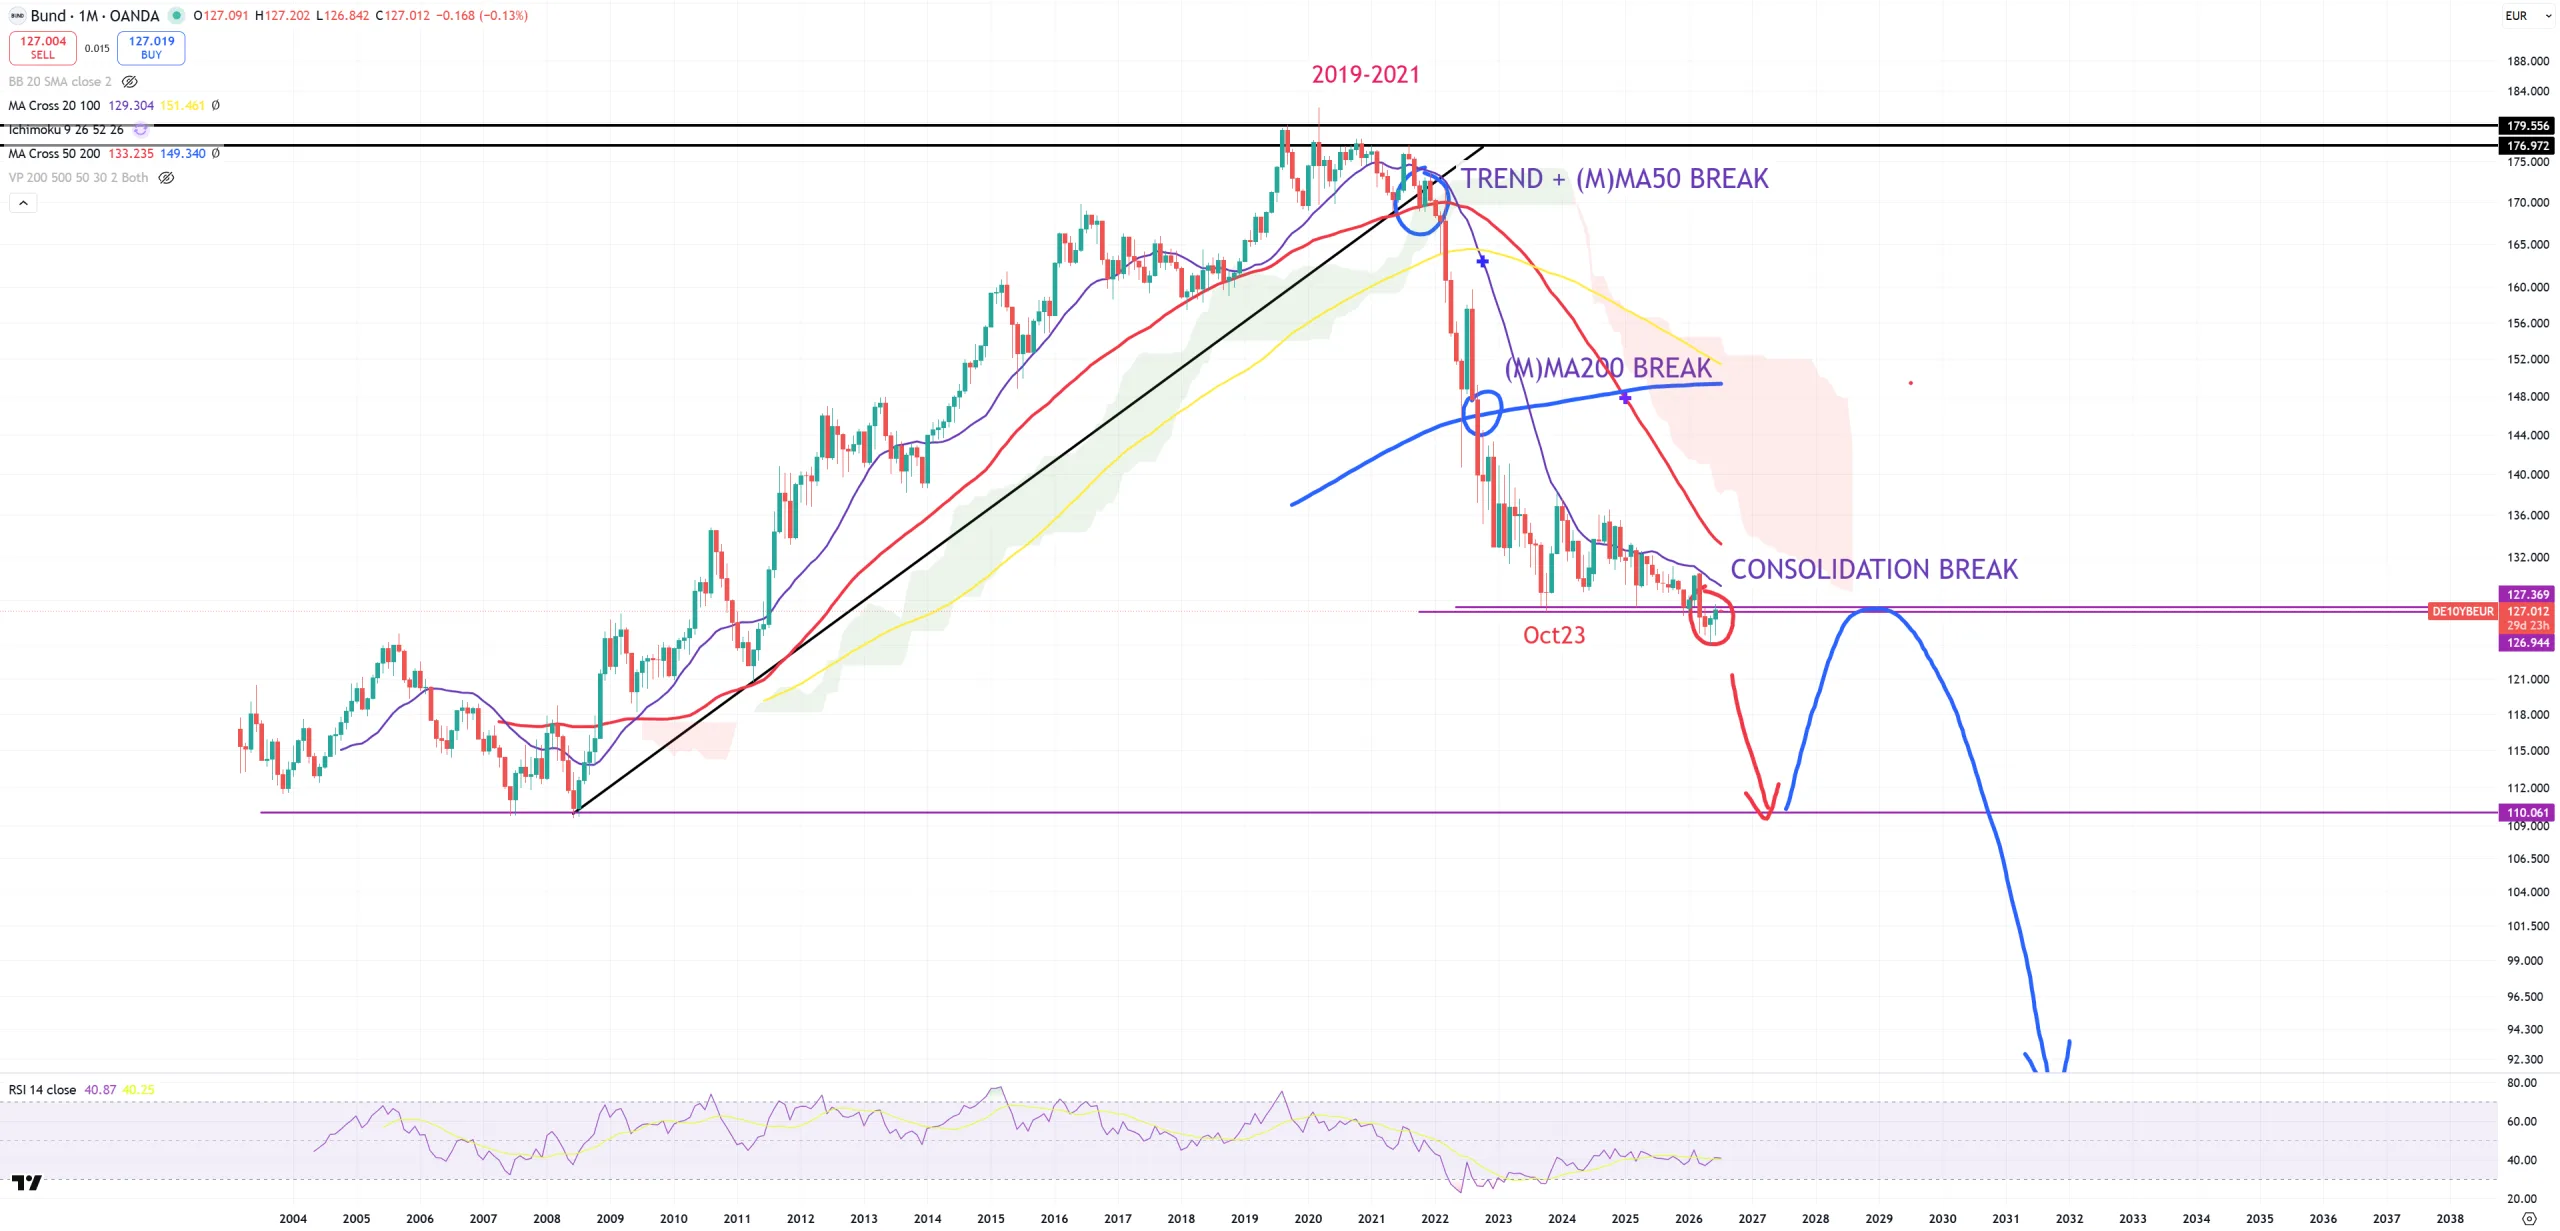
DE10Y – big moment
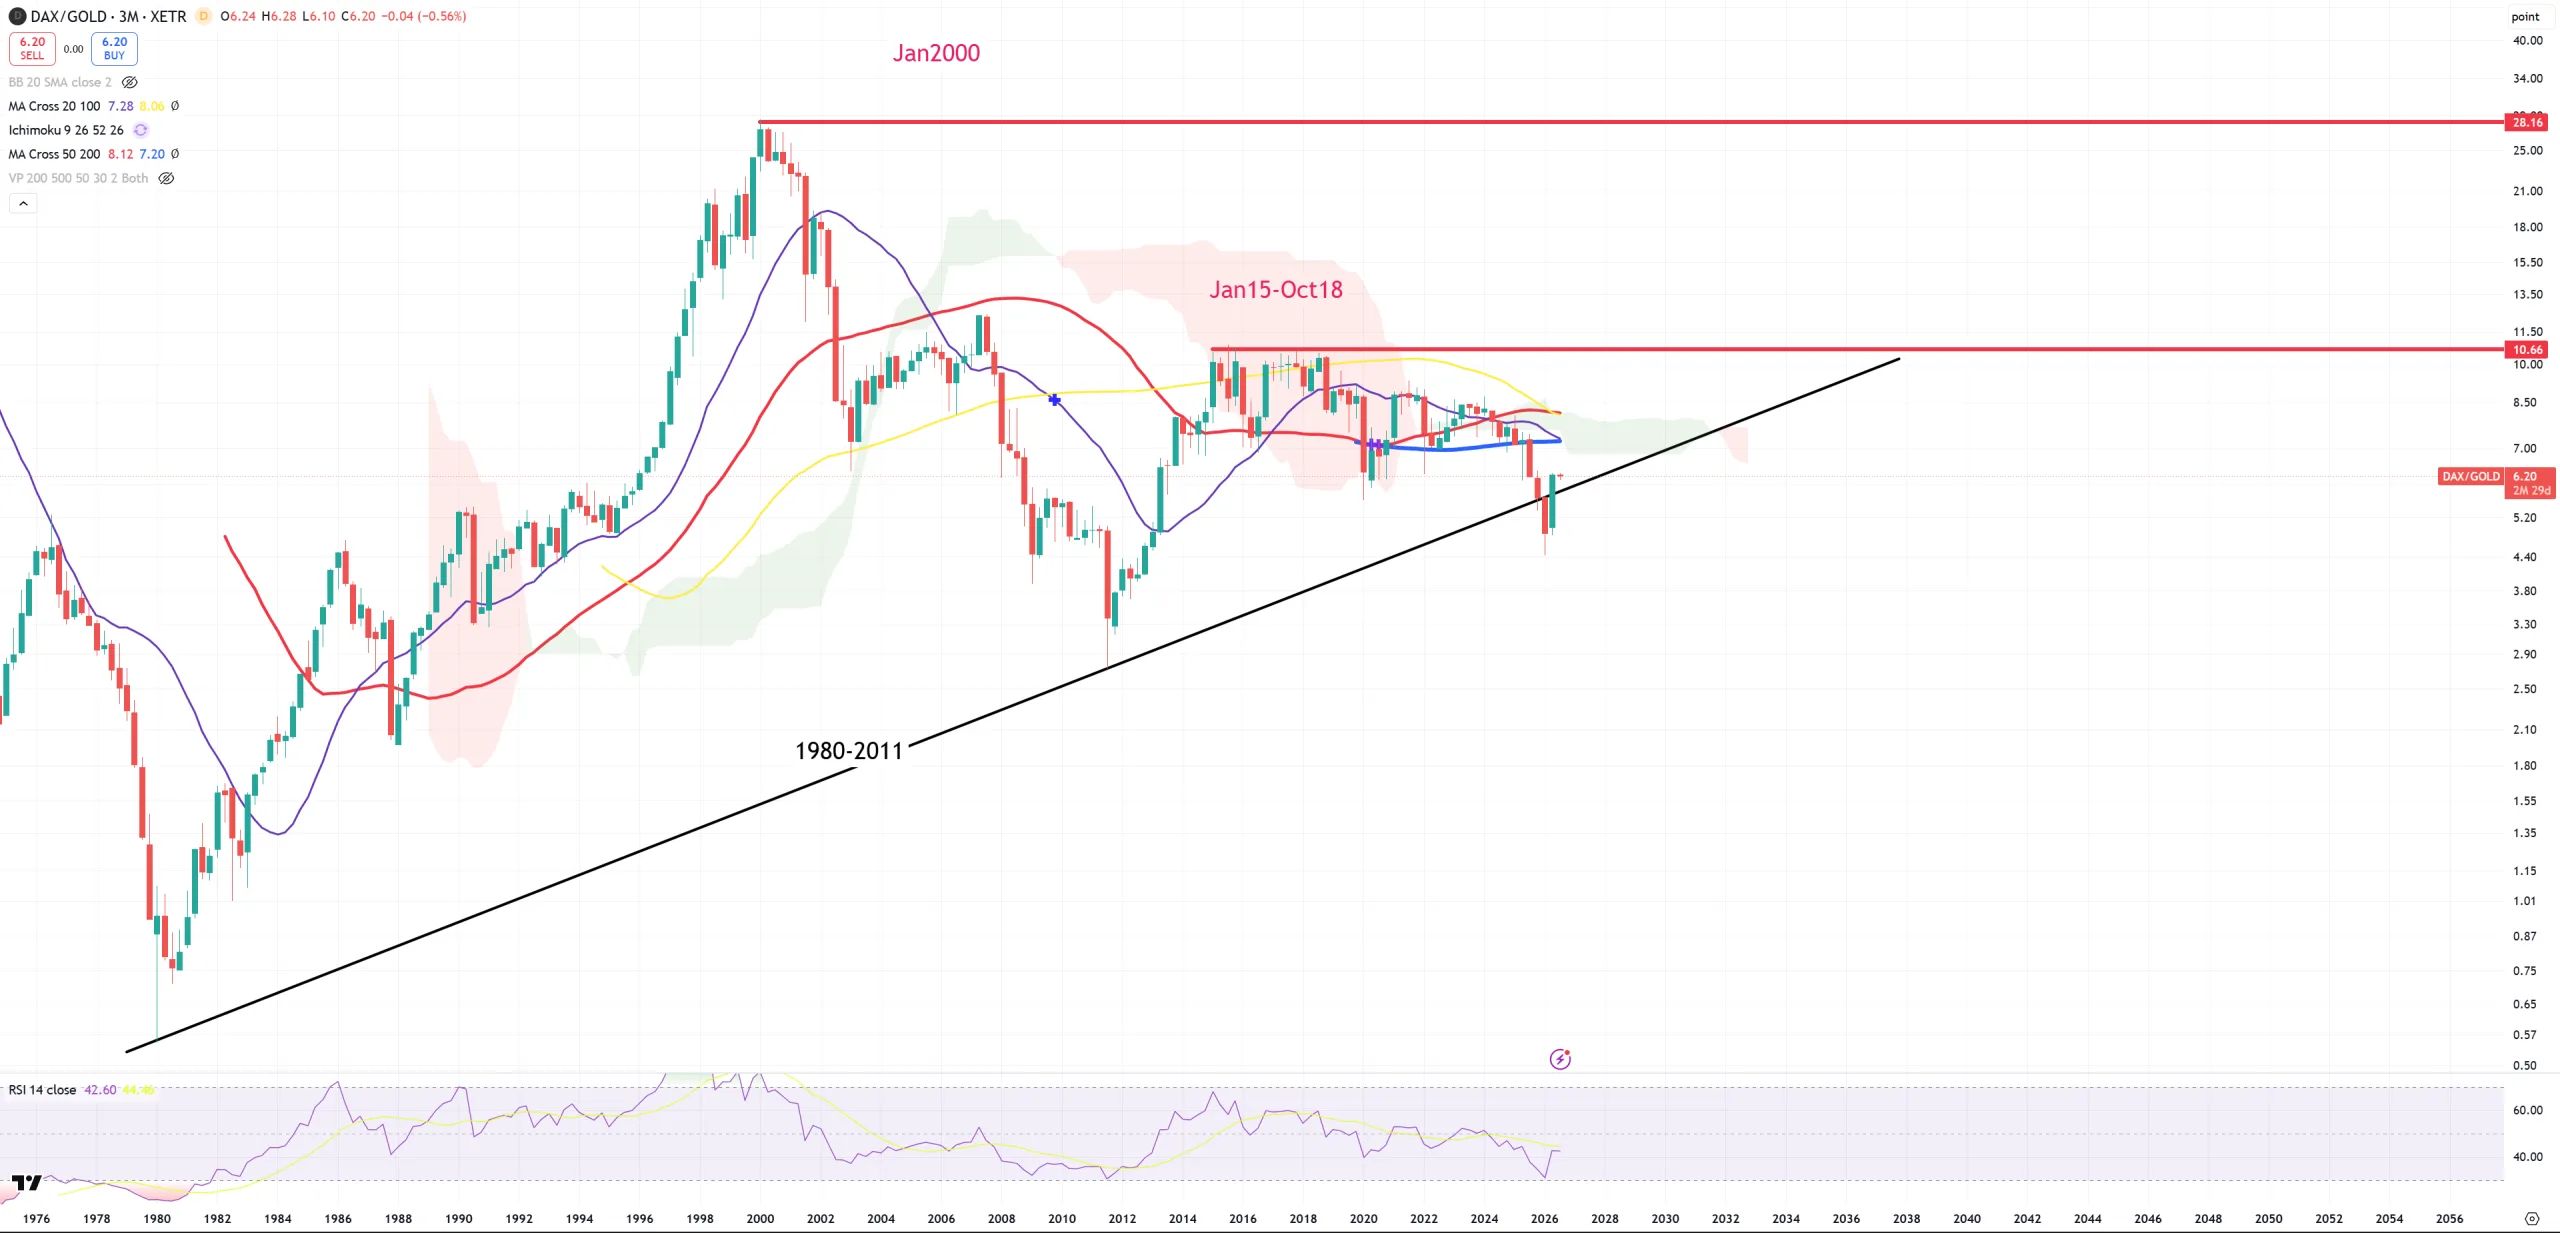
DAX/GOLD doesn’t want to make a perfect retest. Keep trying. Another month(s) to wait.
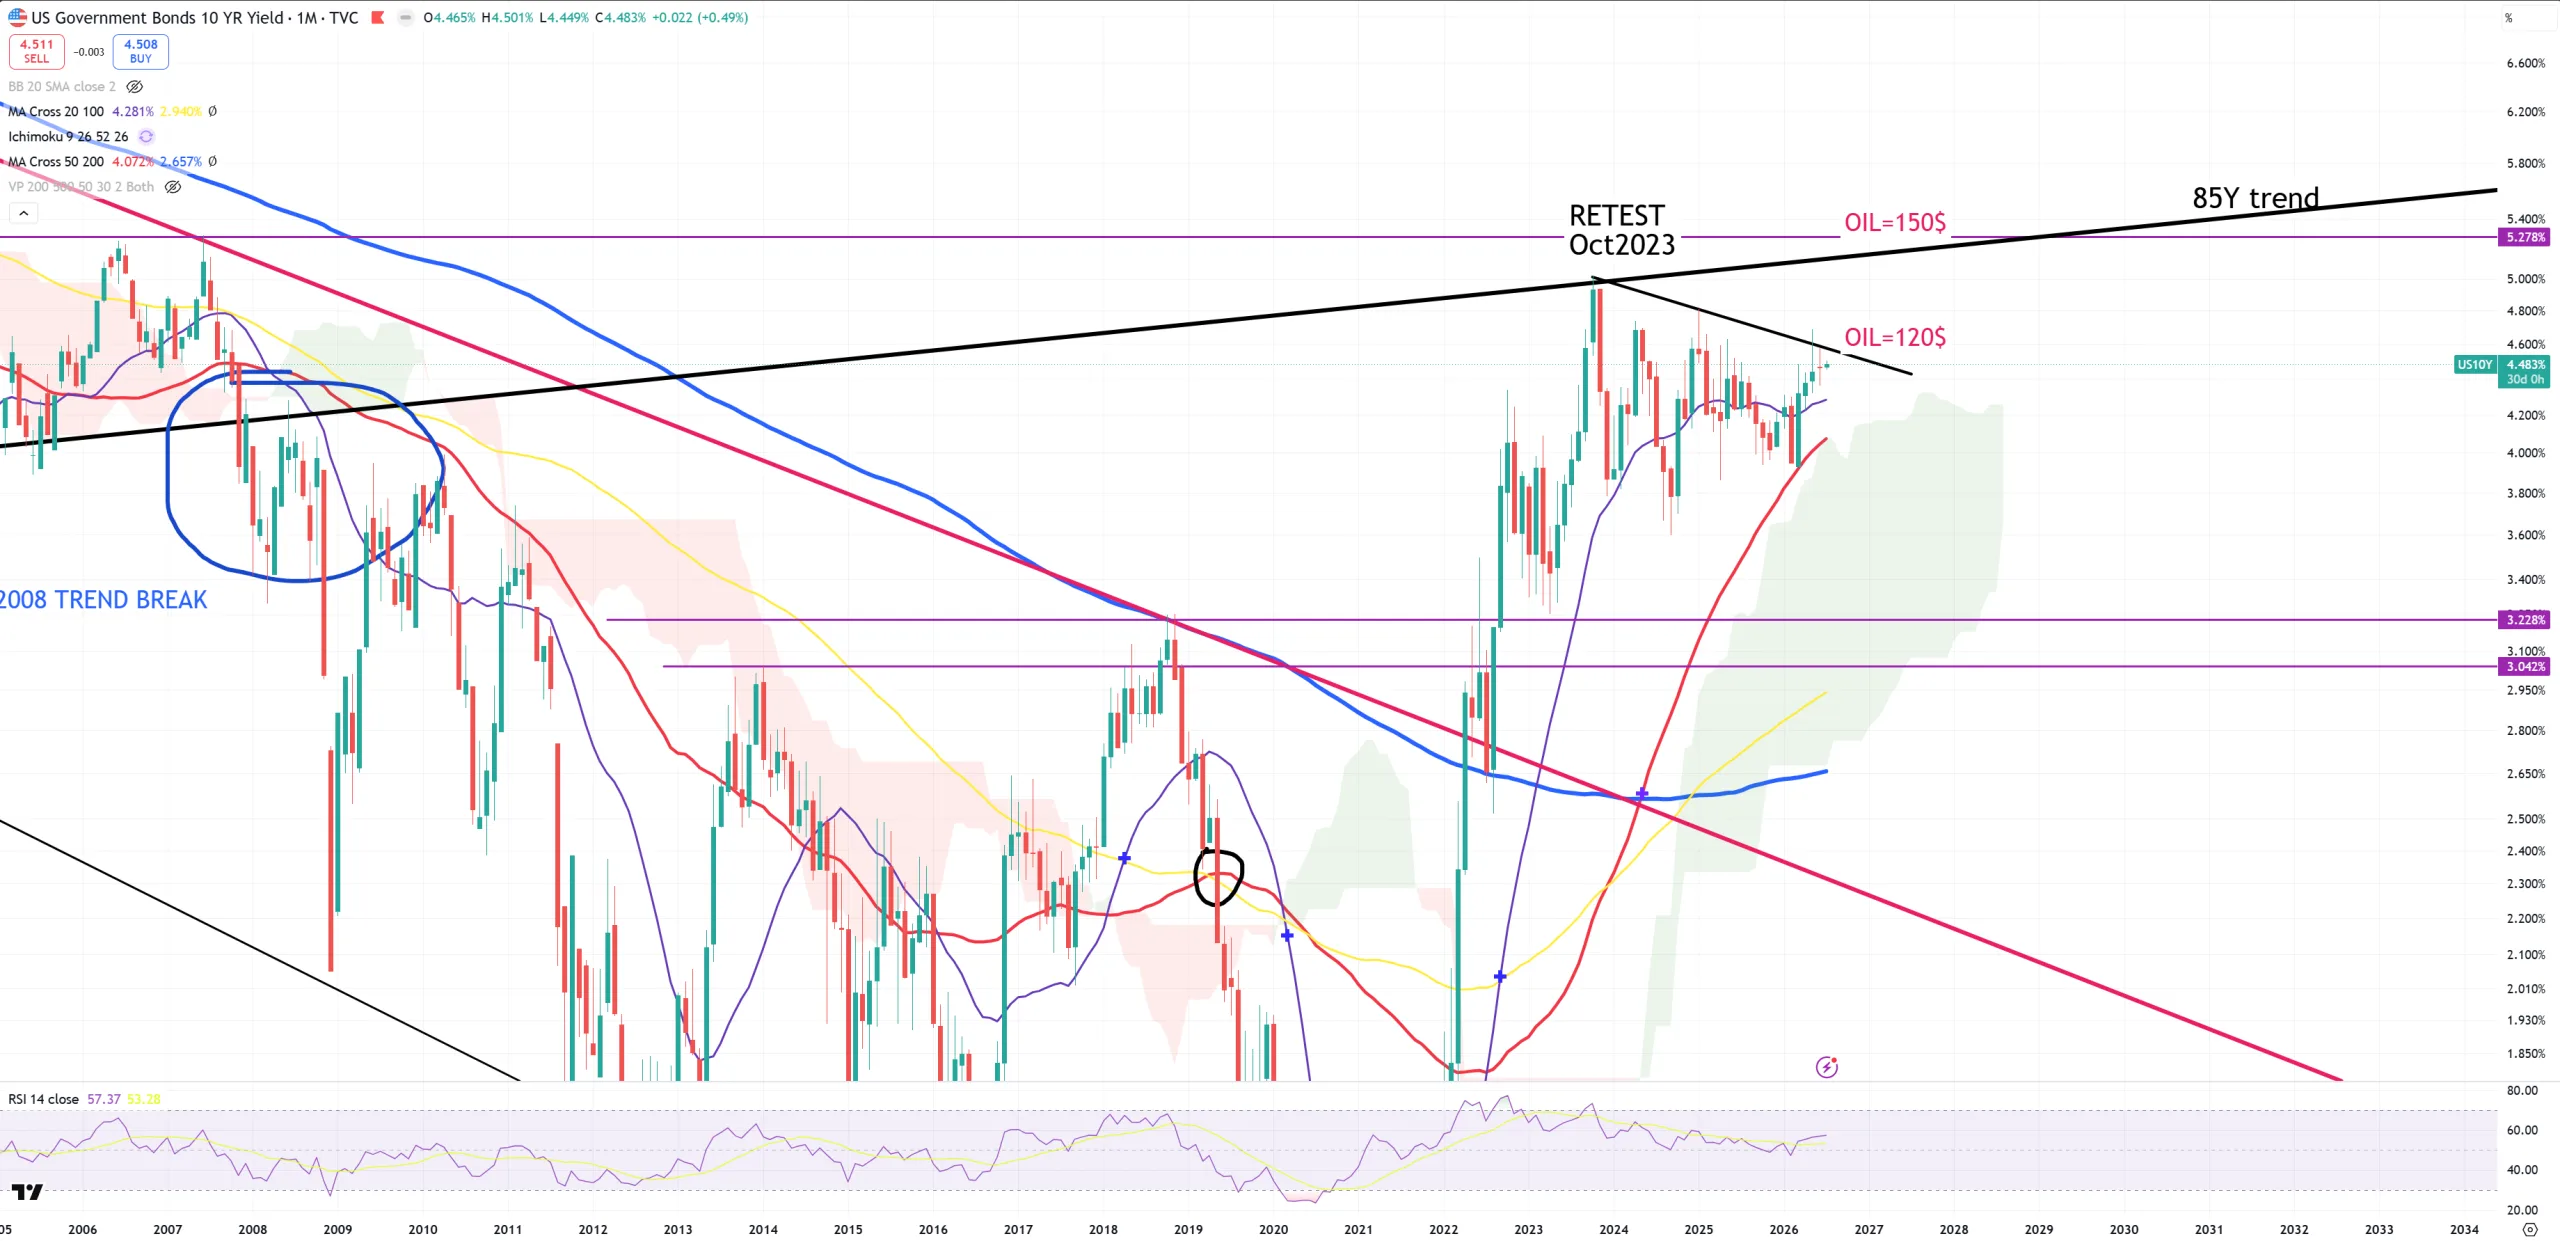
US10Y – not much changed
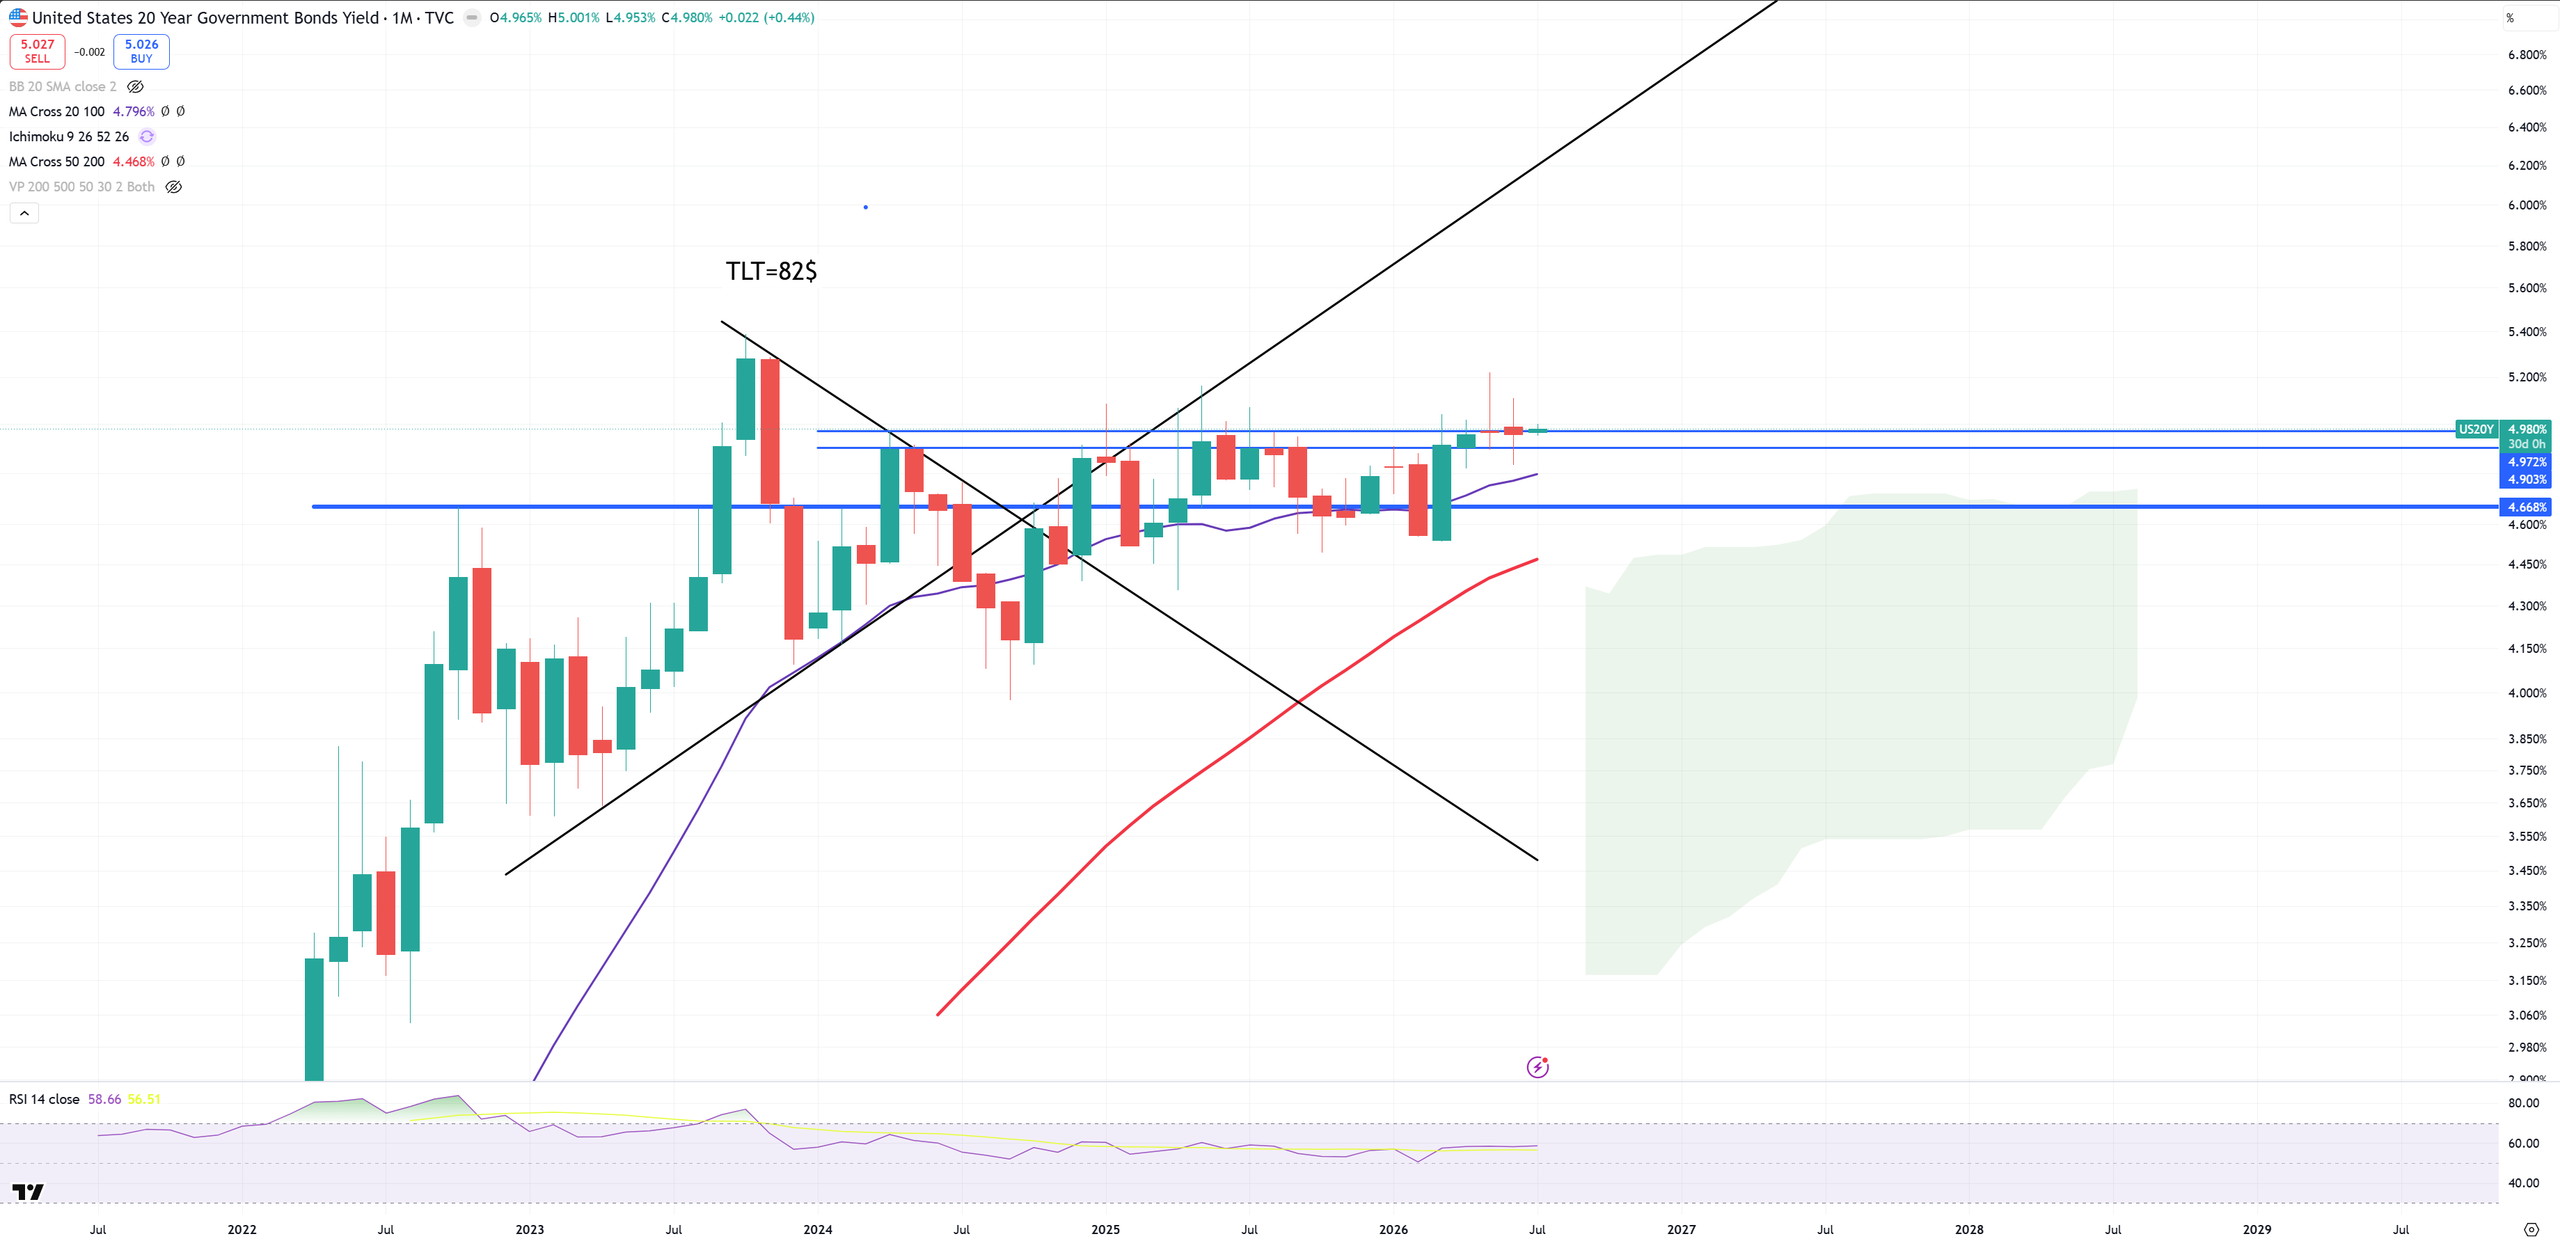
US20Y – and its 5.0% resistance
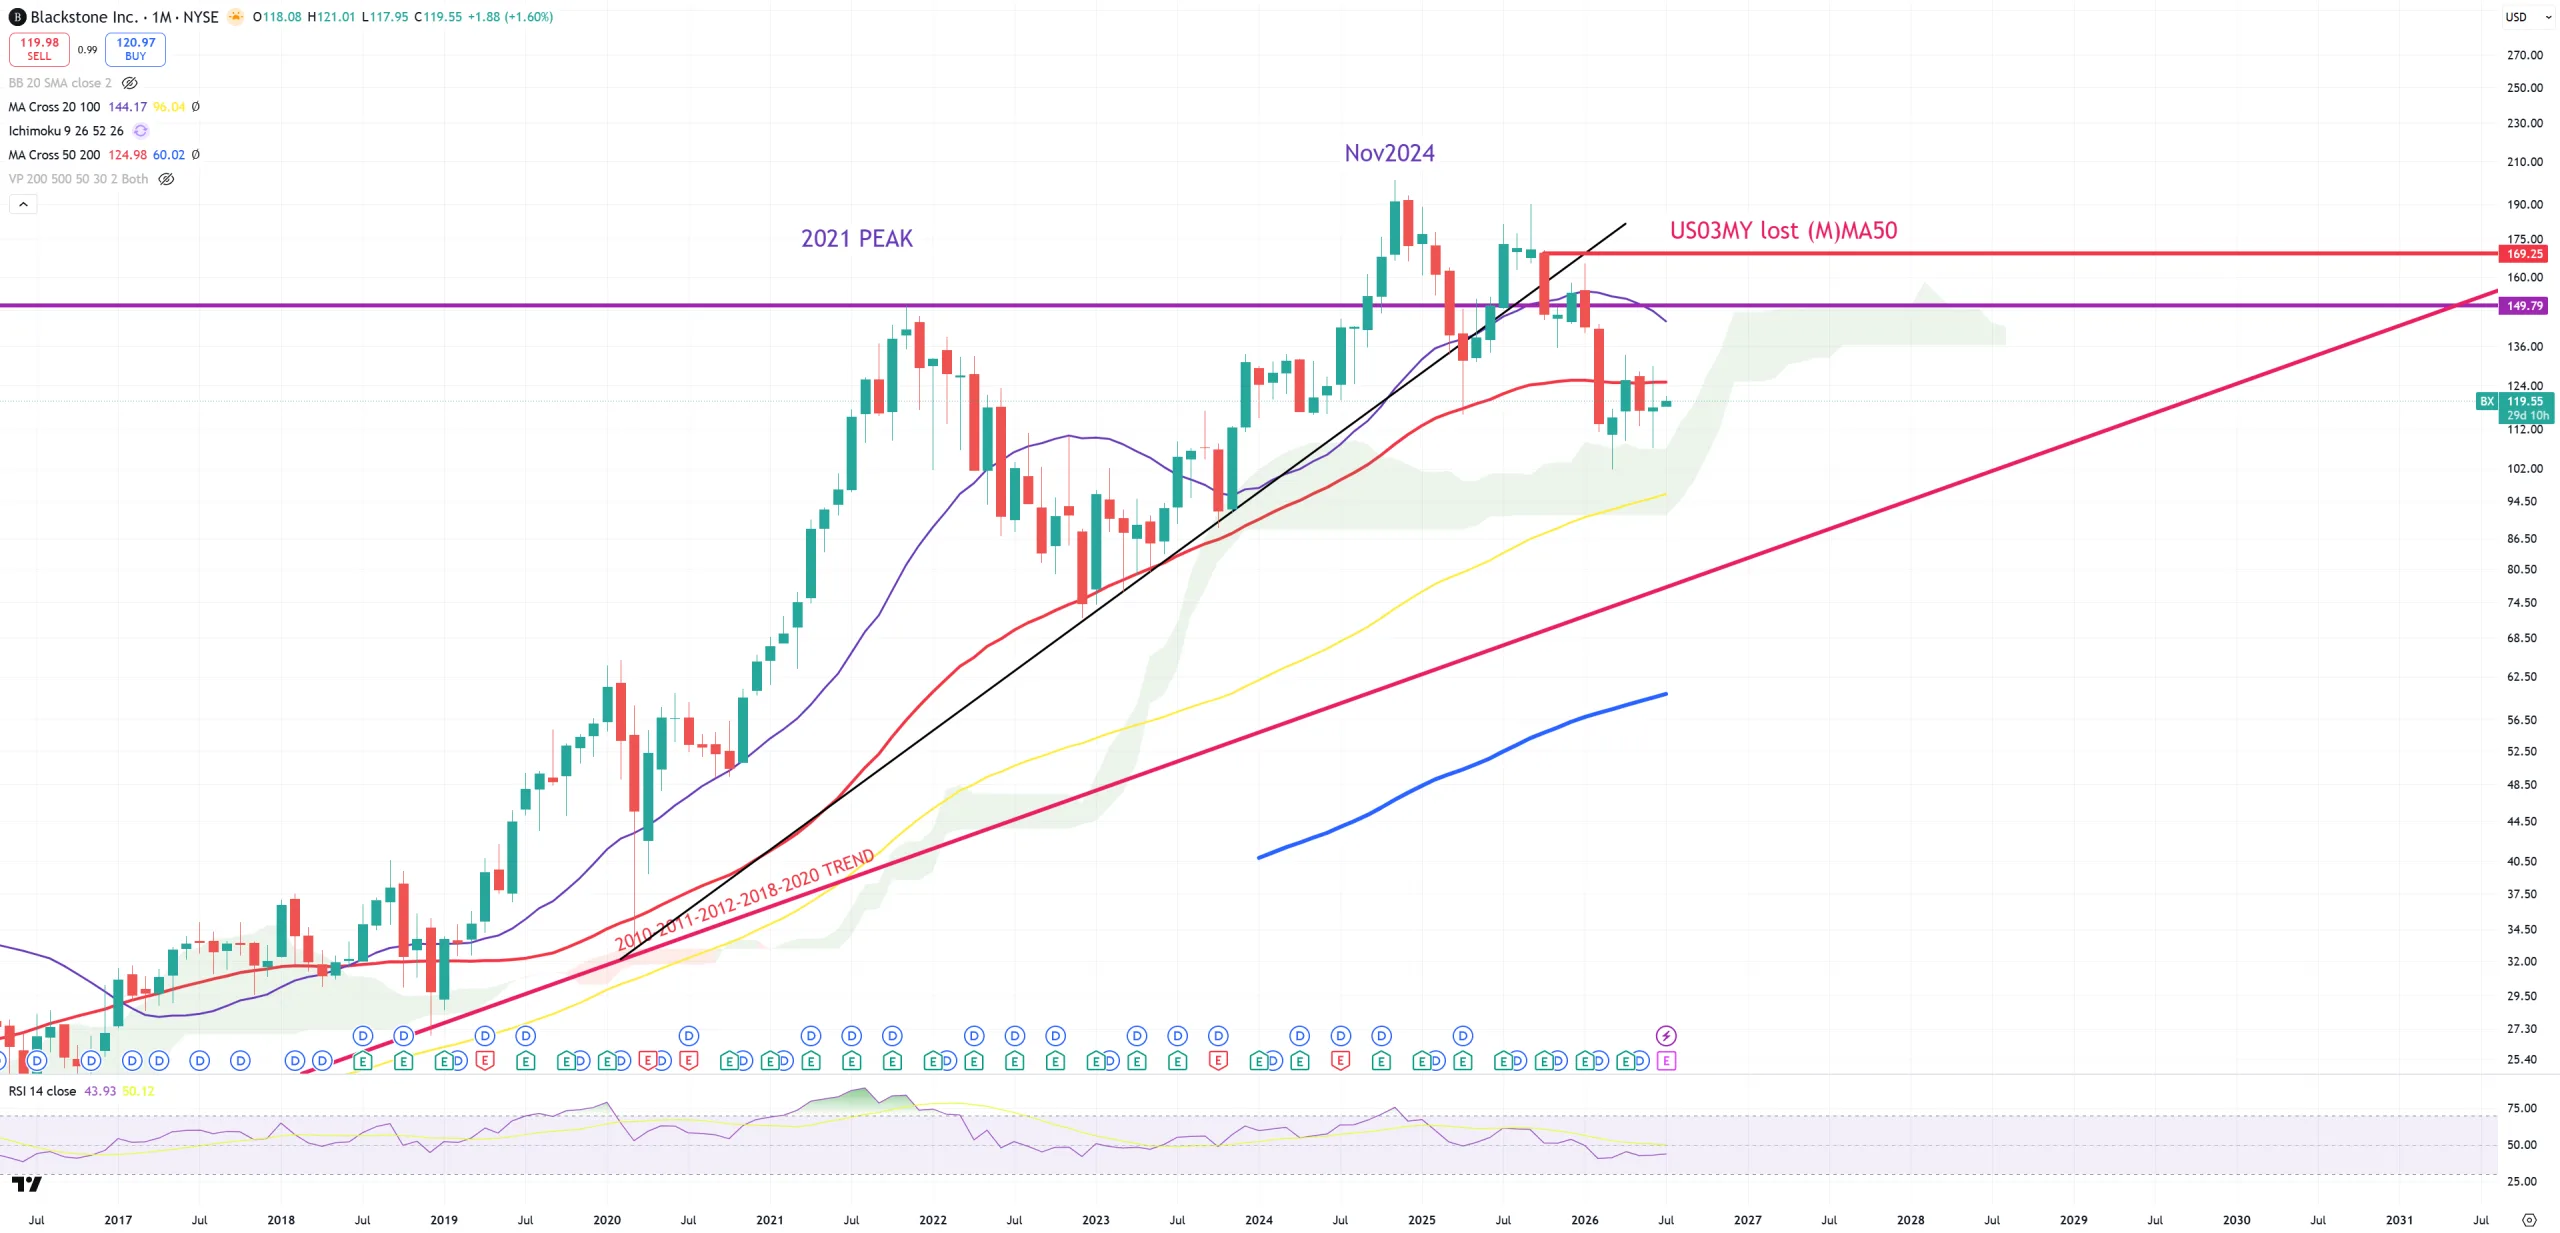
BX – so private credit keeps its consolidation below (M)MA50
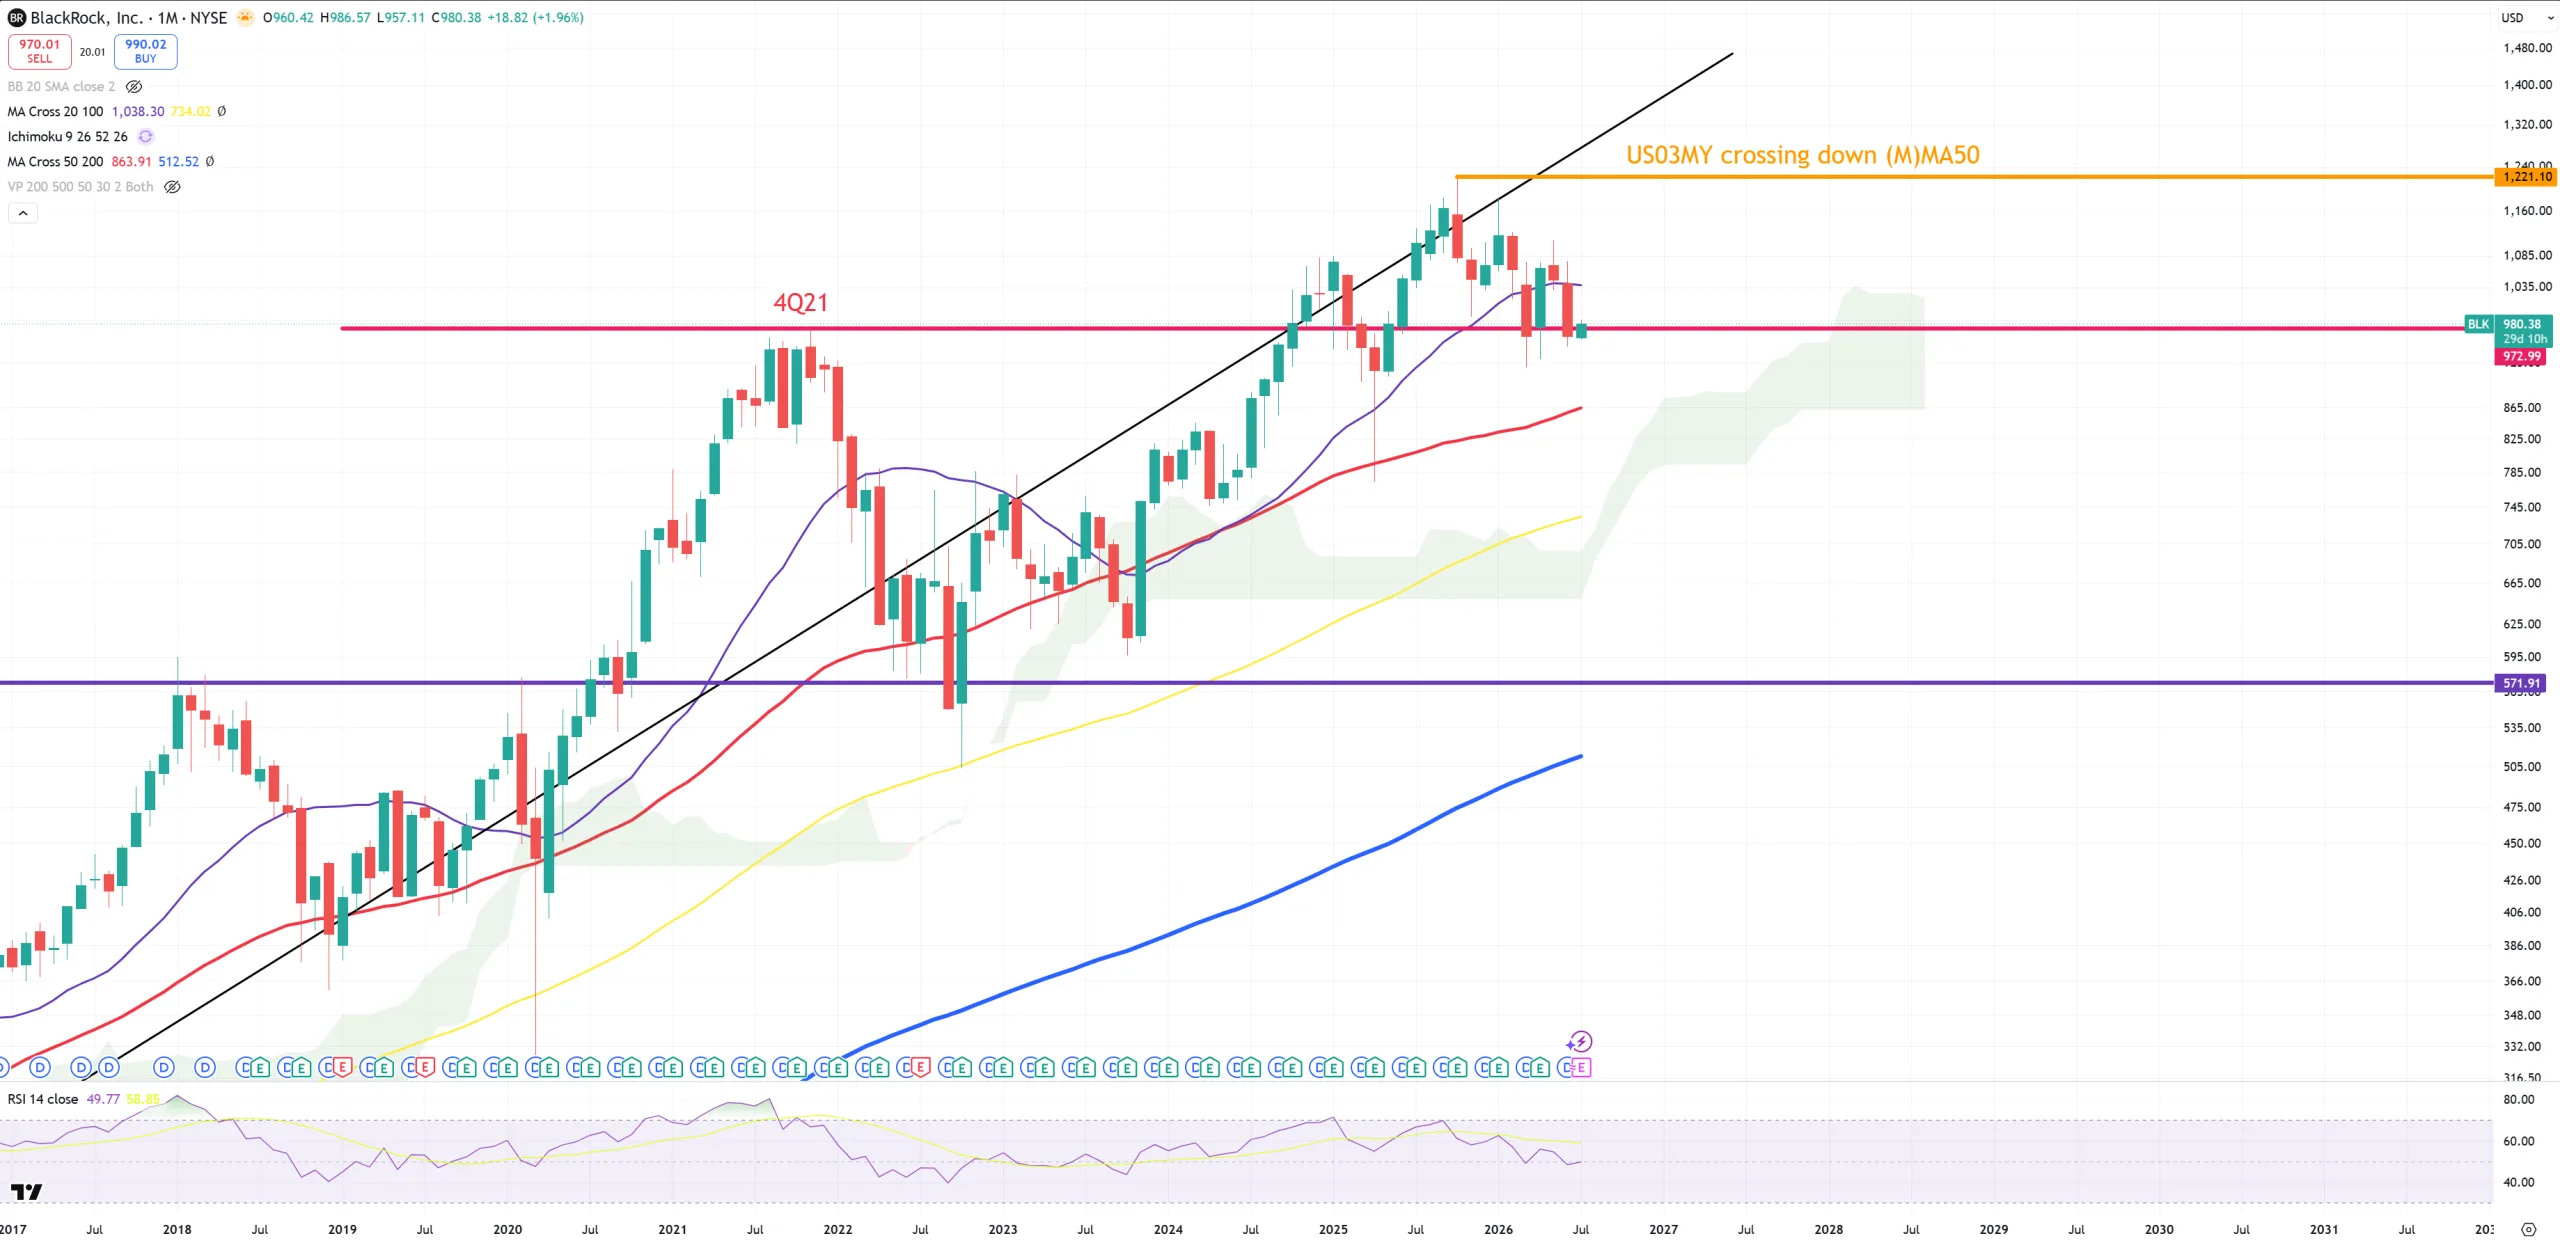
BLK – BlackRock : big warning here as we had another close below 2021 peak
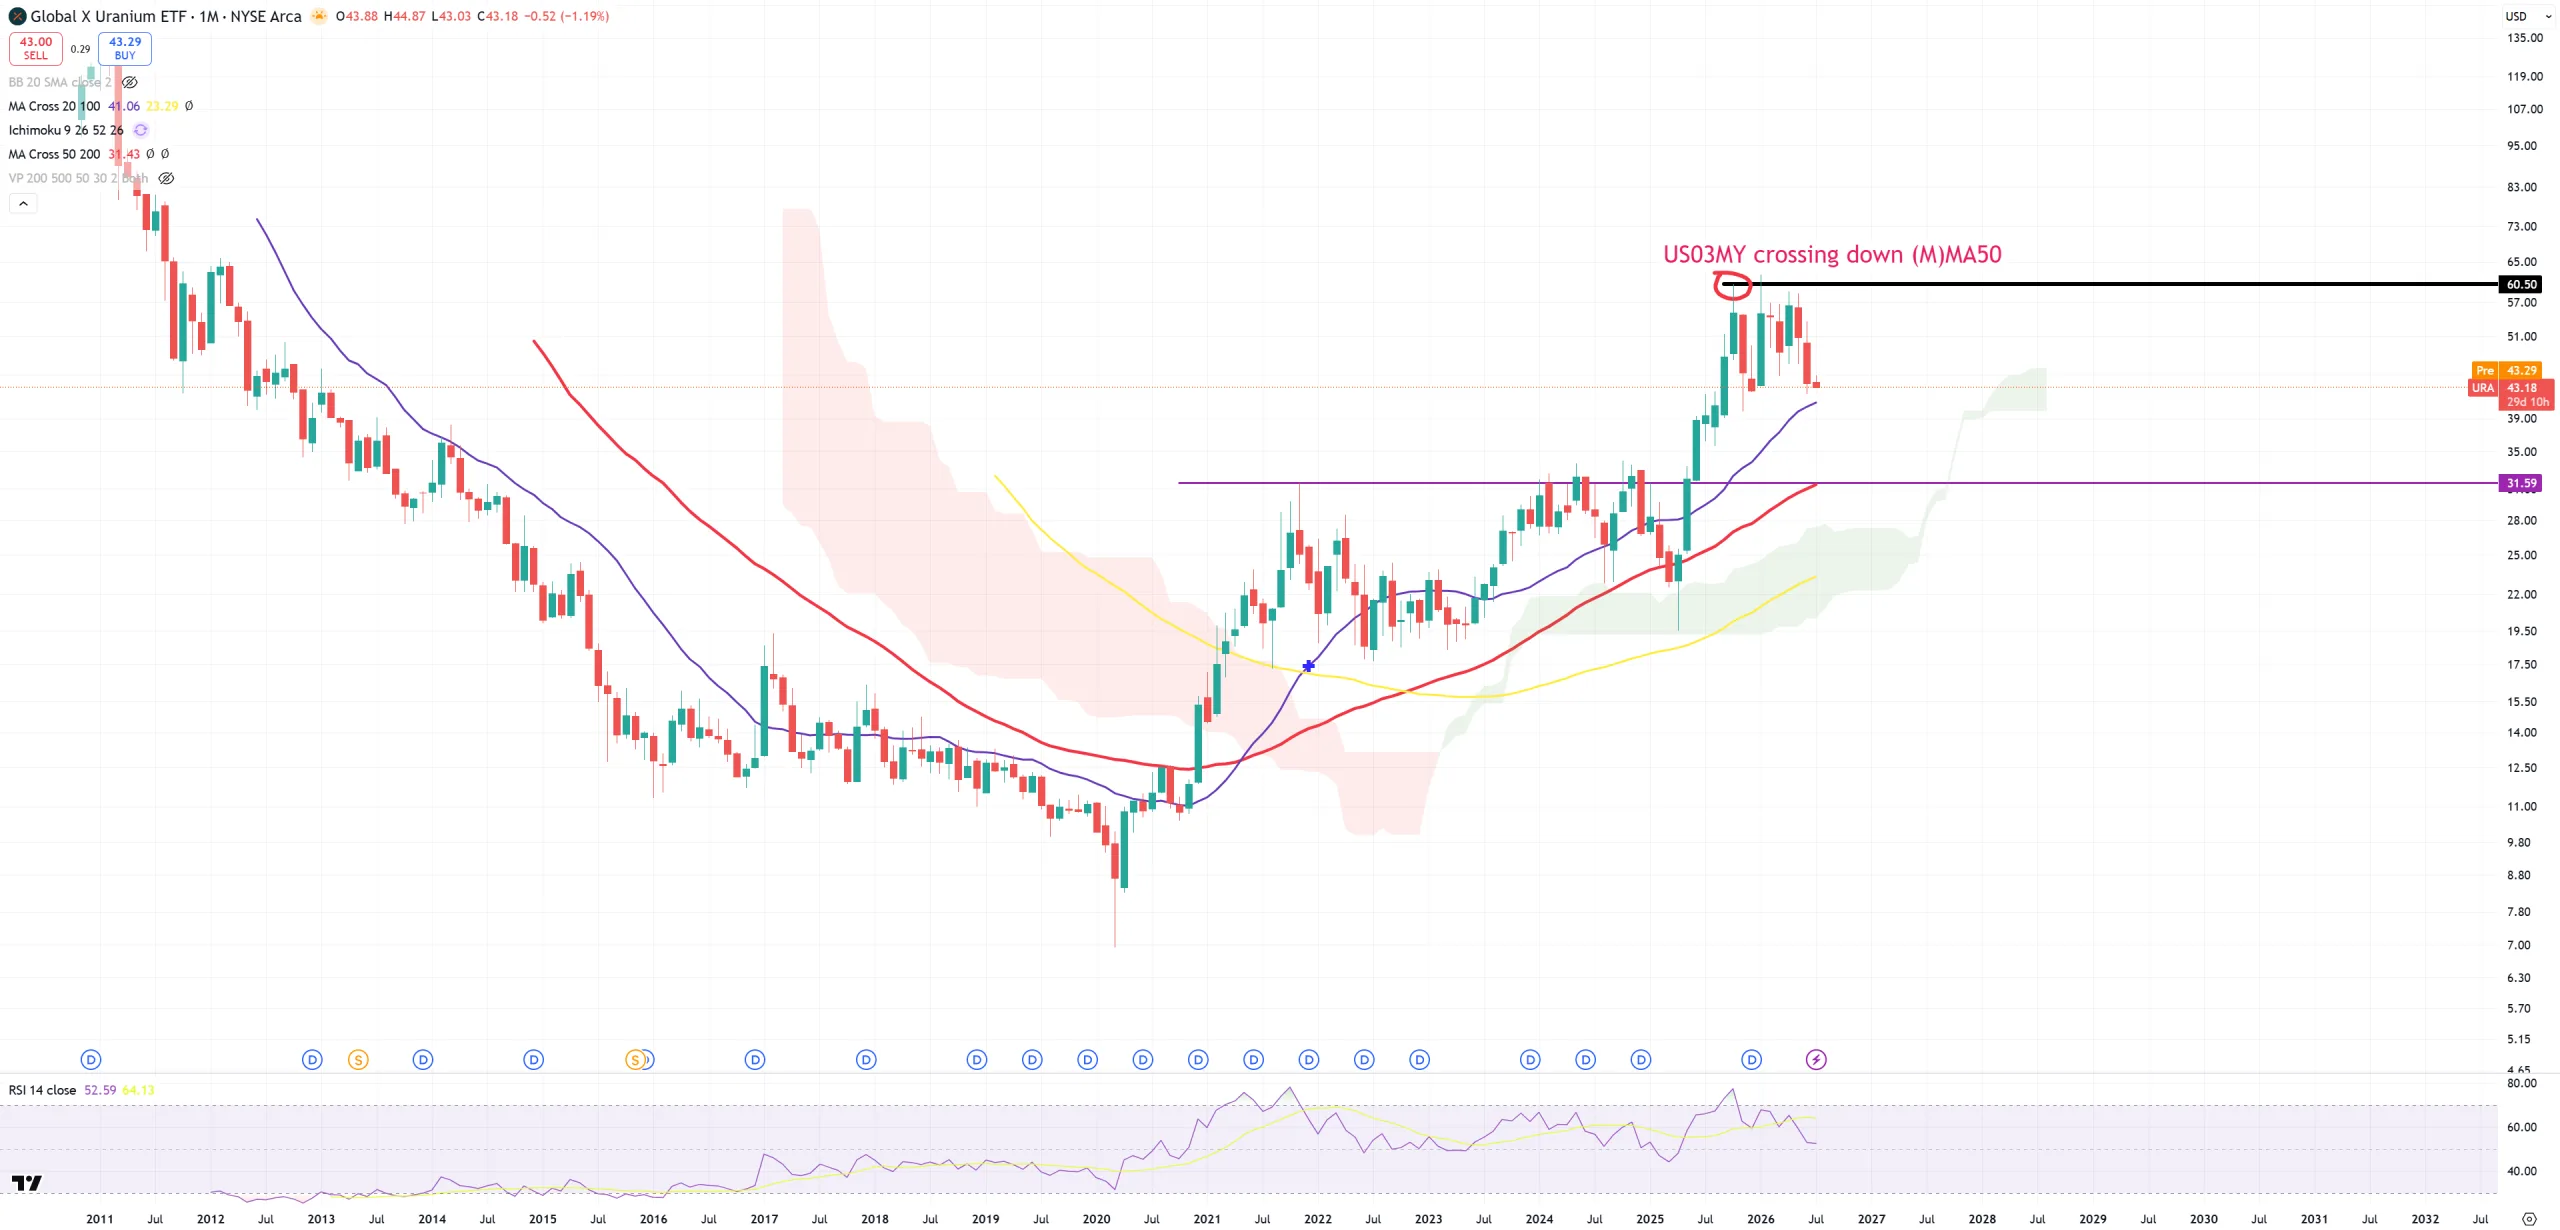
URA – I know so many people are obsessed with this ETF
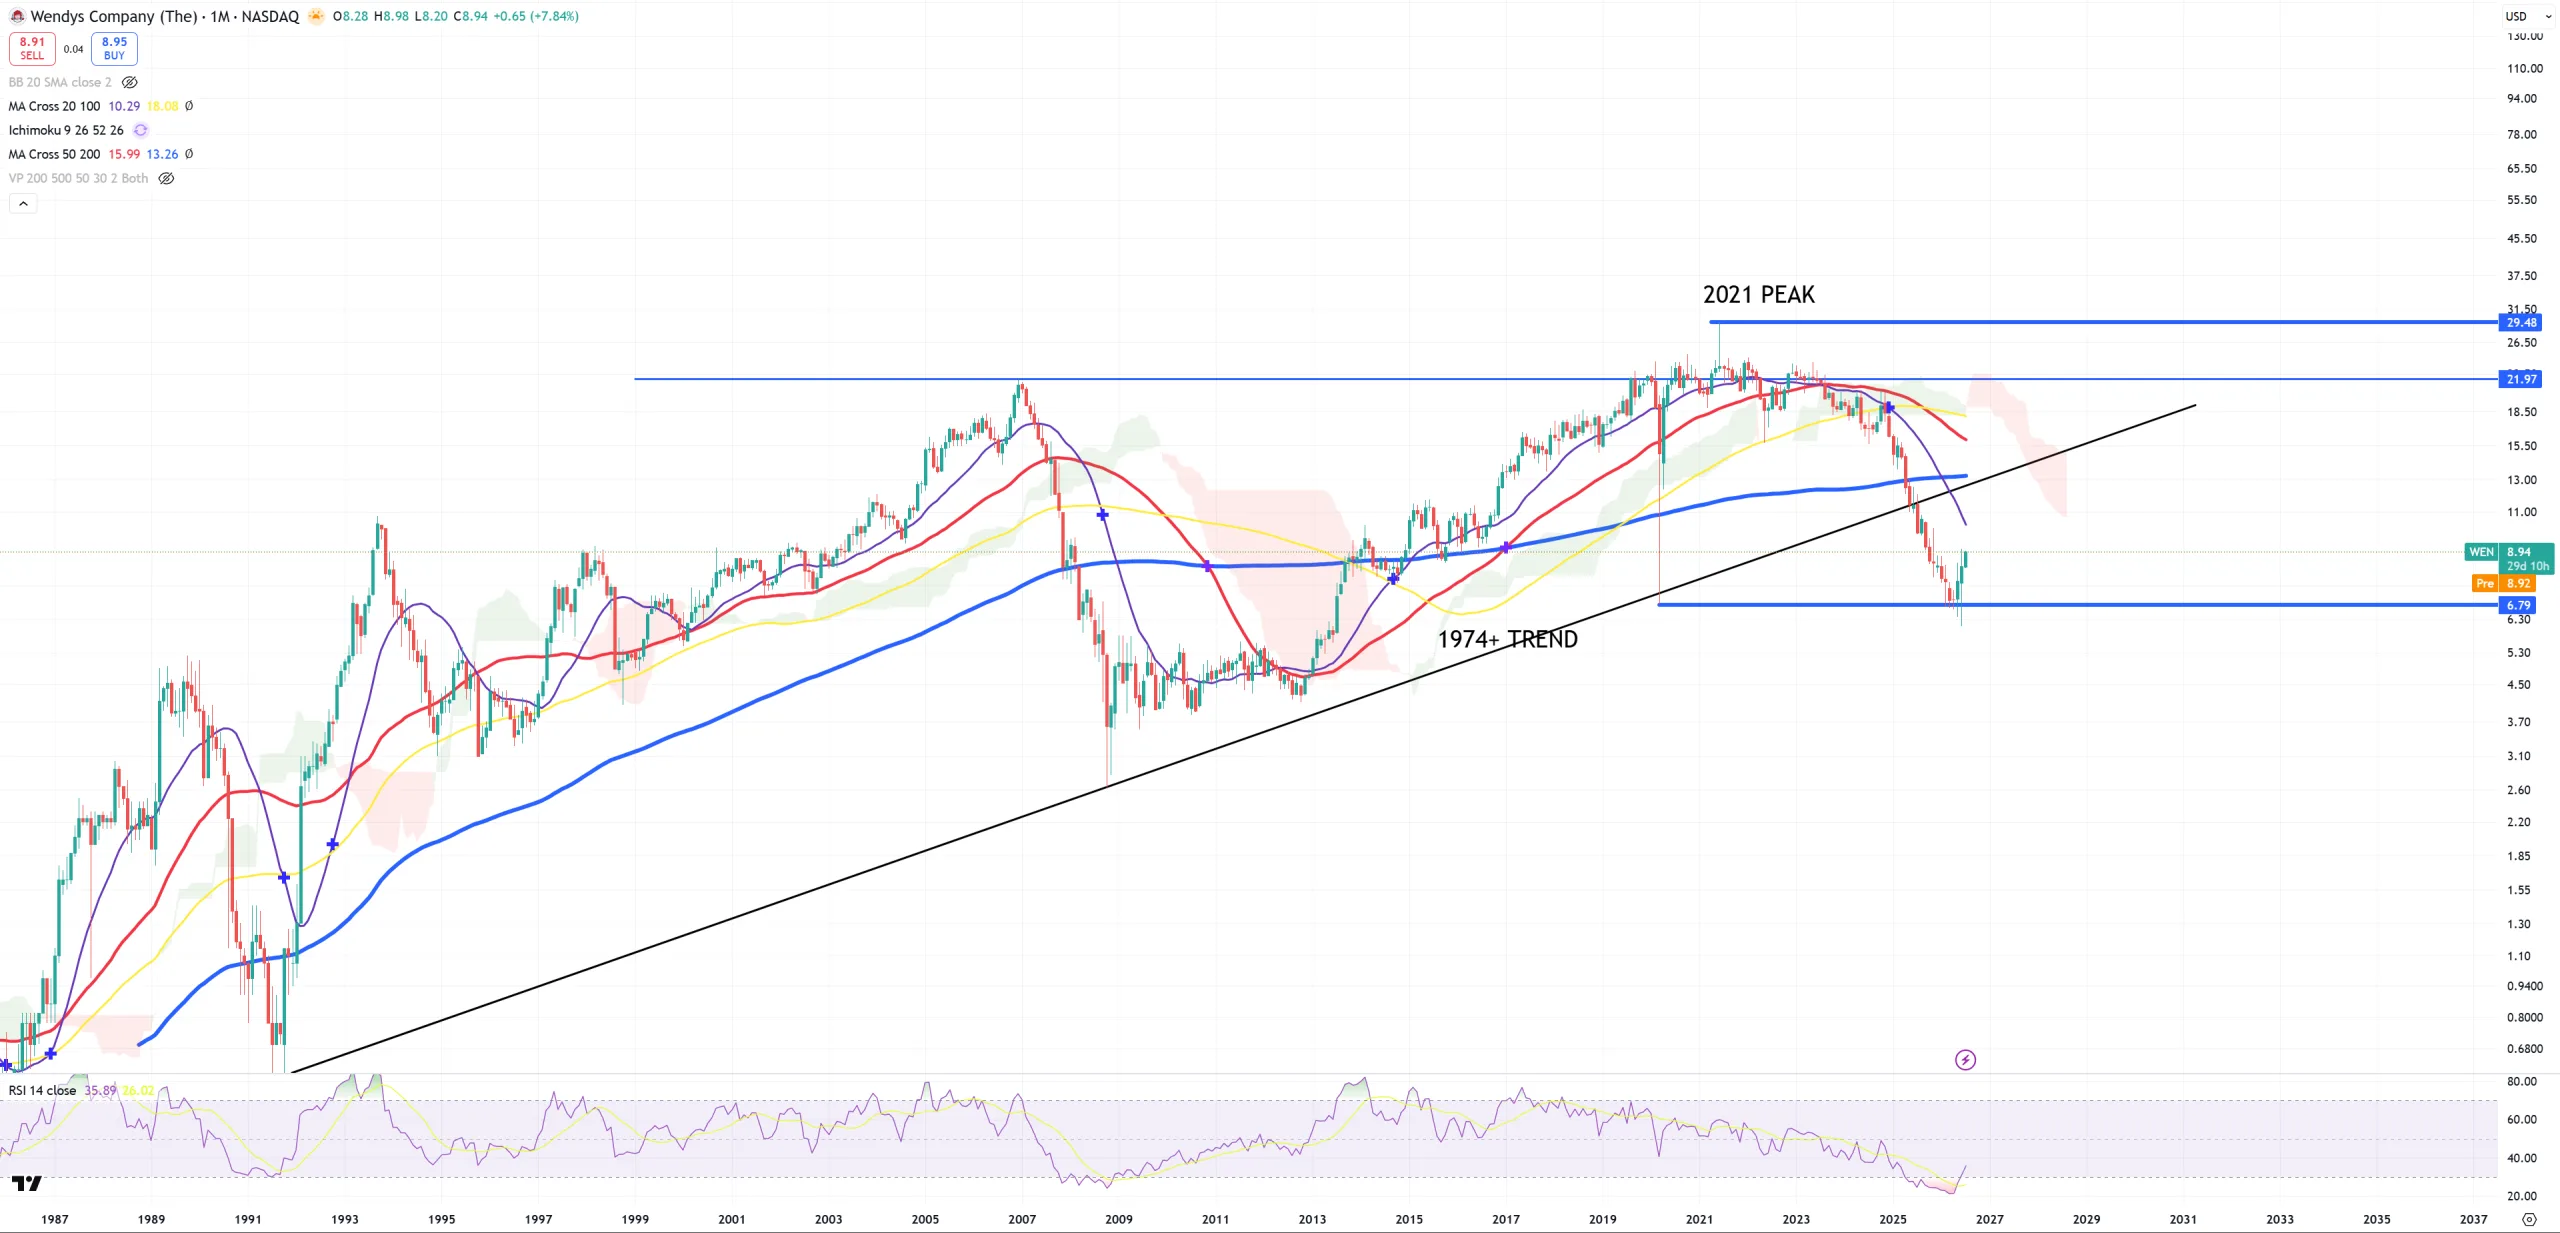
WEN – Wendy’s – like so may restaurant chains is in deep troubles. I love to say once super long term trends break – it’s very easy path to go bankrupt. Support holds as it should. Once it’ll break .. Kiss of goodbye.
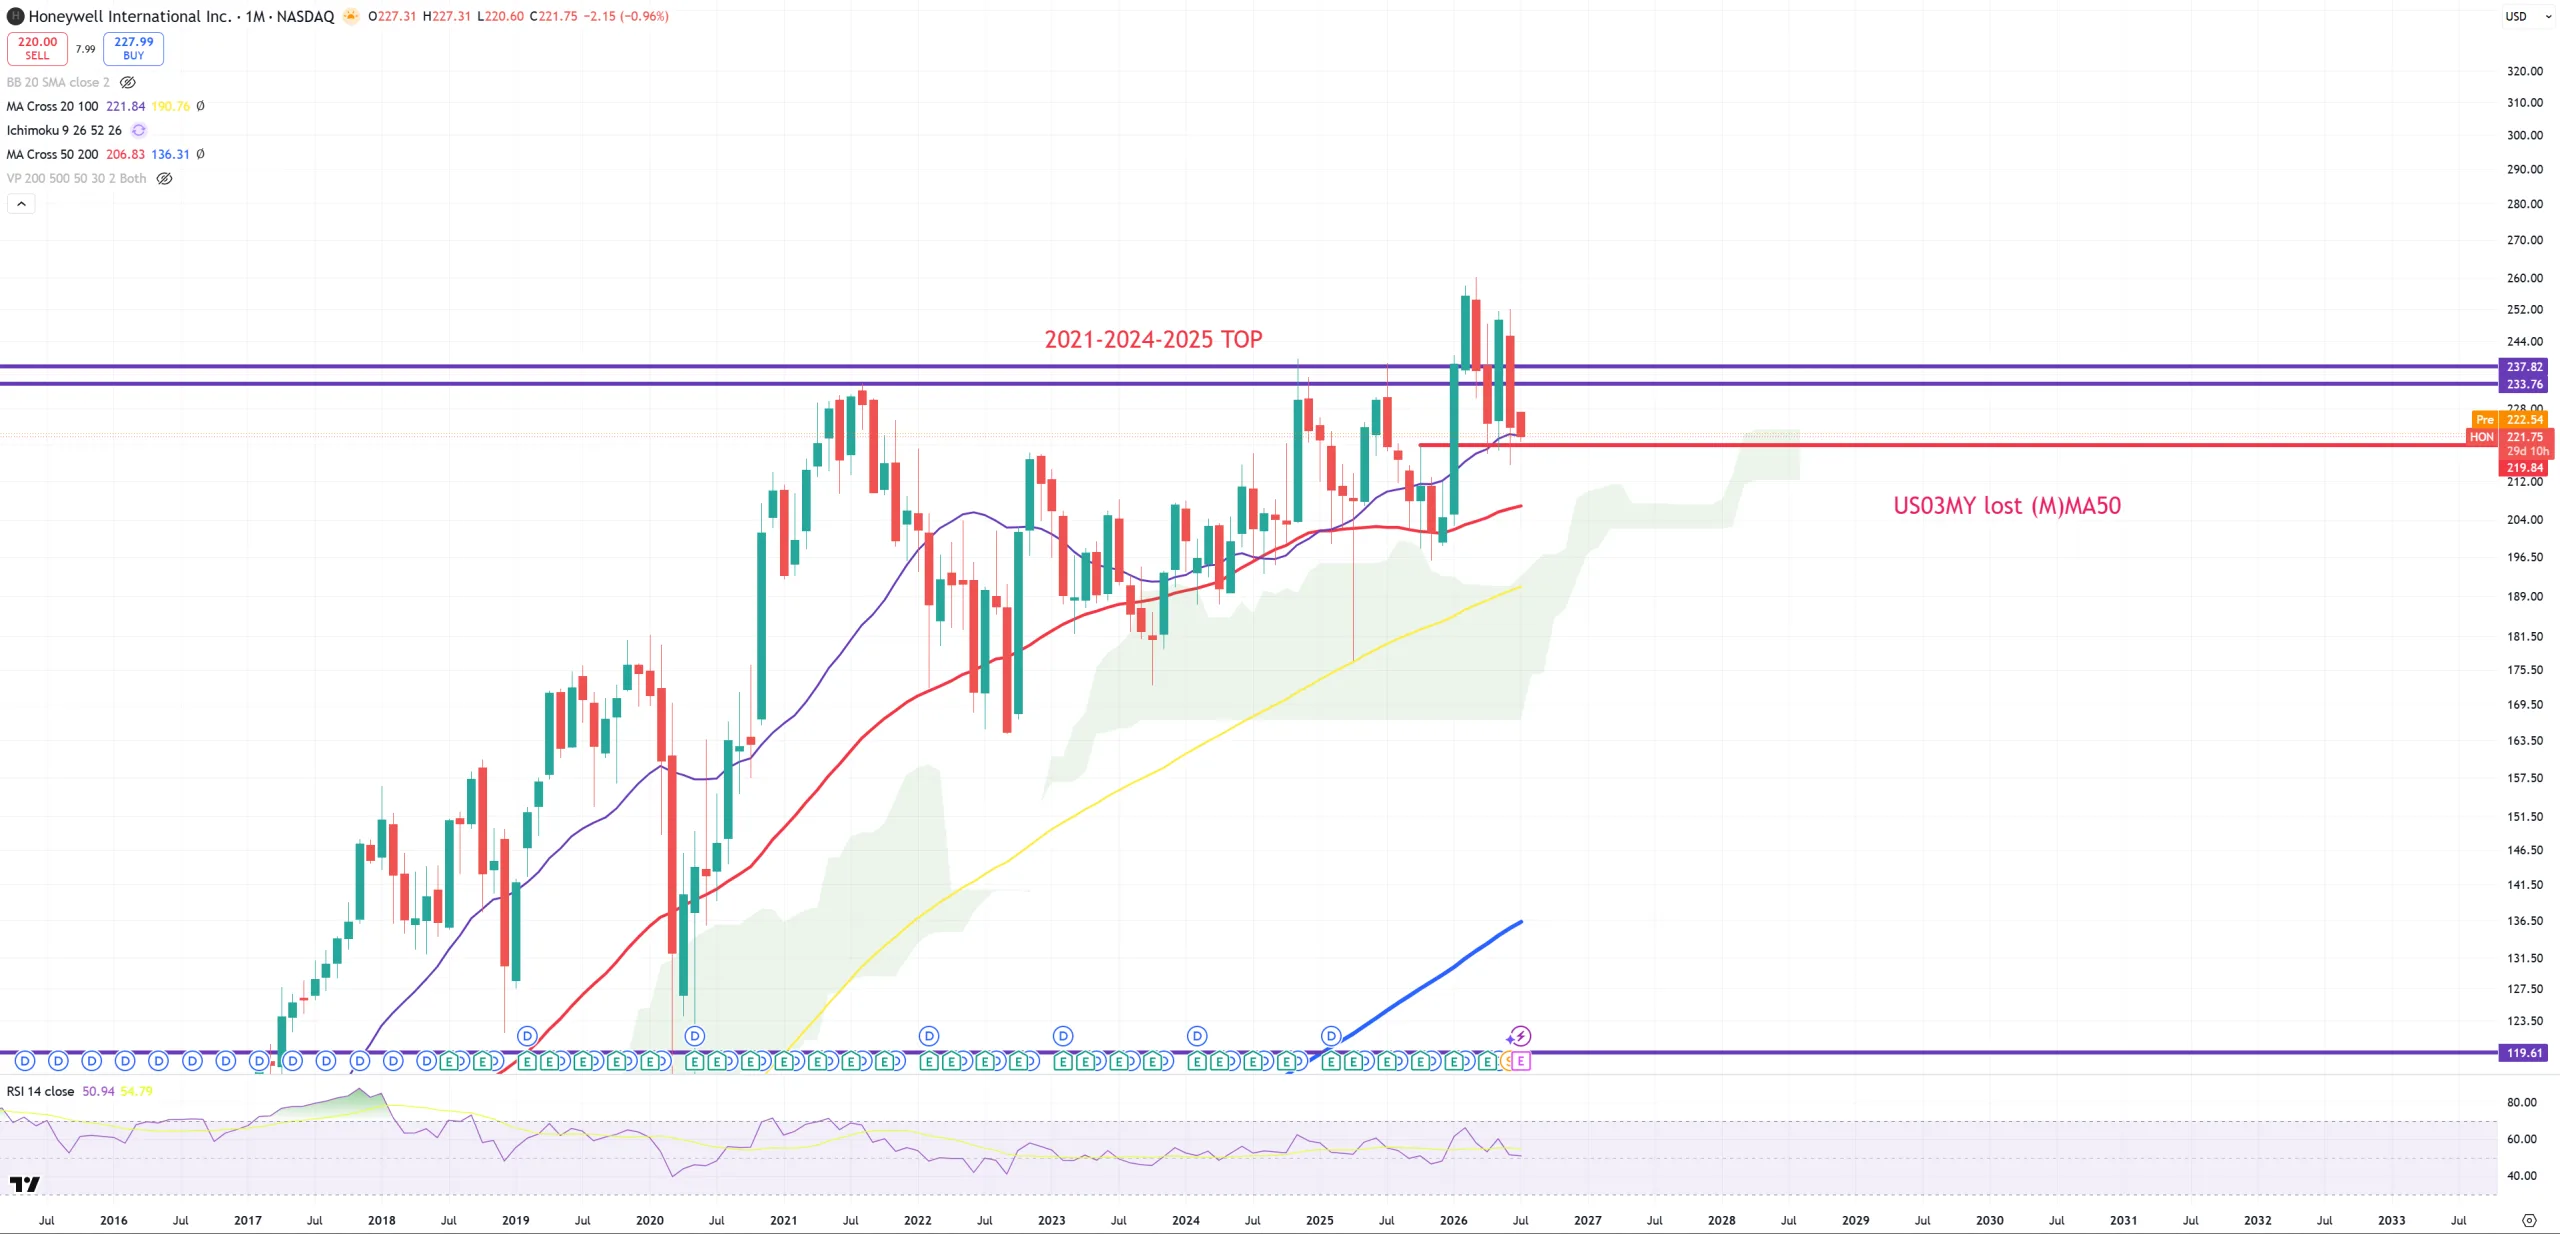
HON – returning from the overextended trip
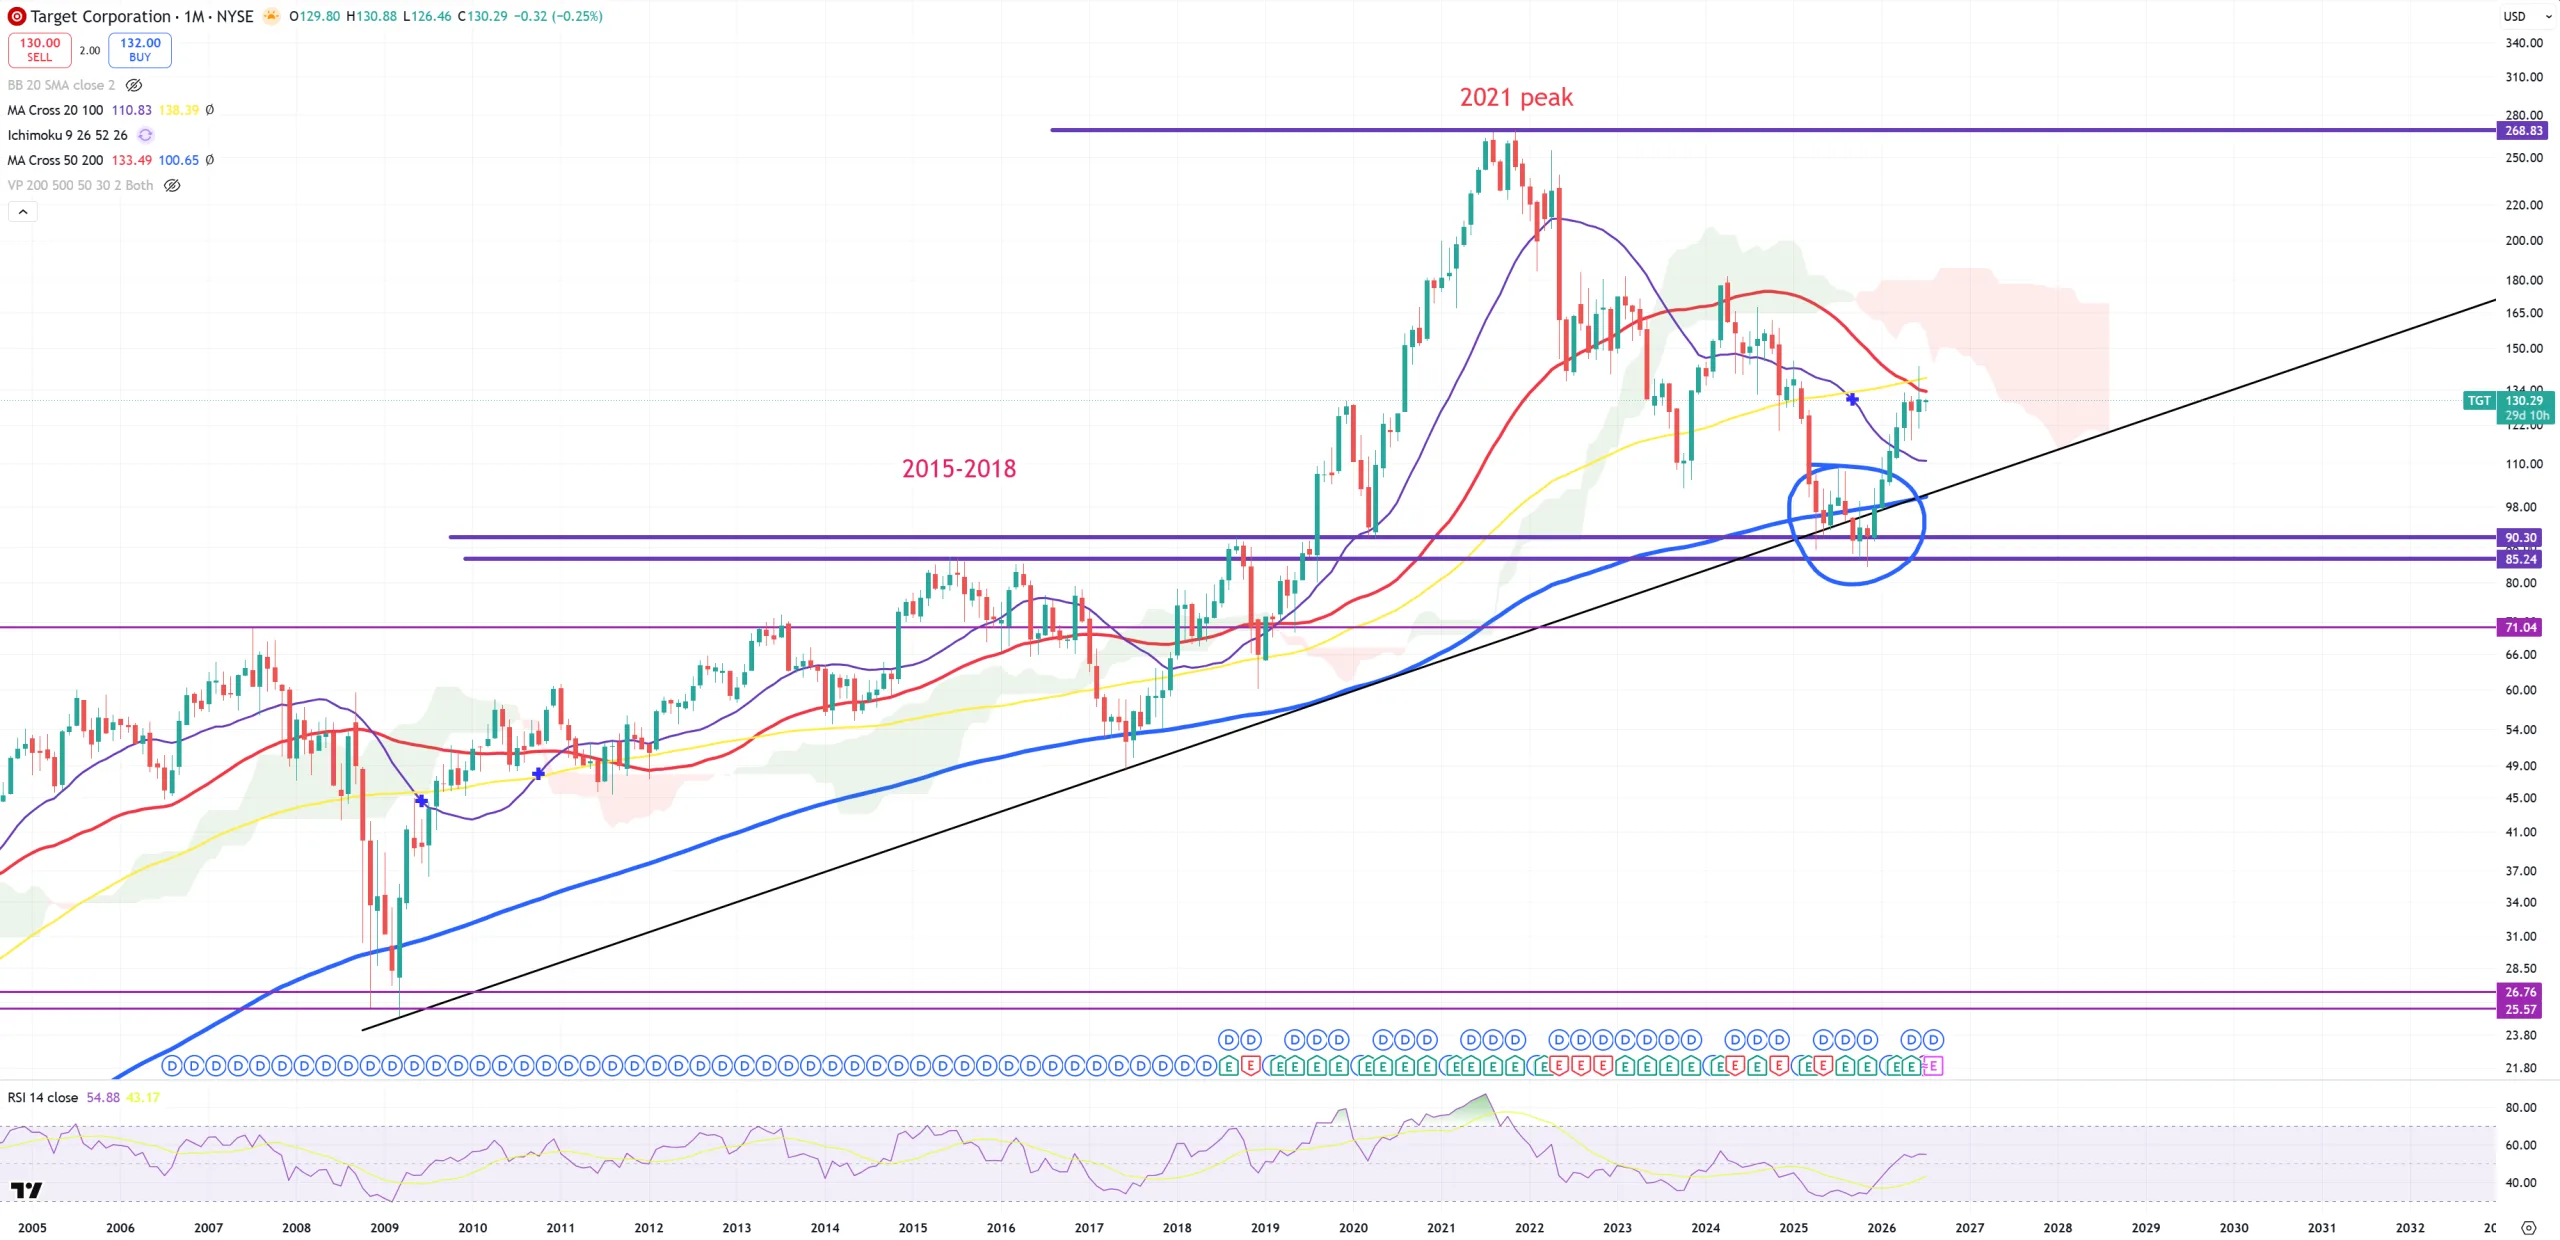
TGT – Target get a jump after its first attempt to break (M)MA200 + TREND – retesting (M)MA50 from the bottom.
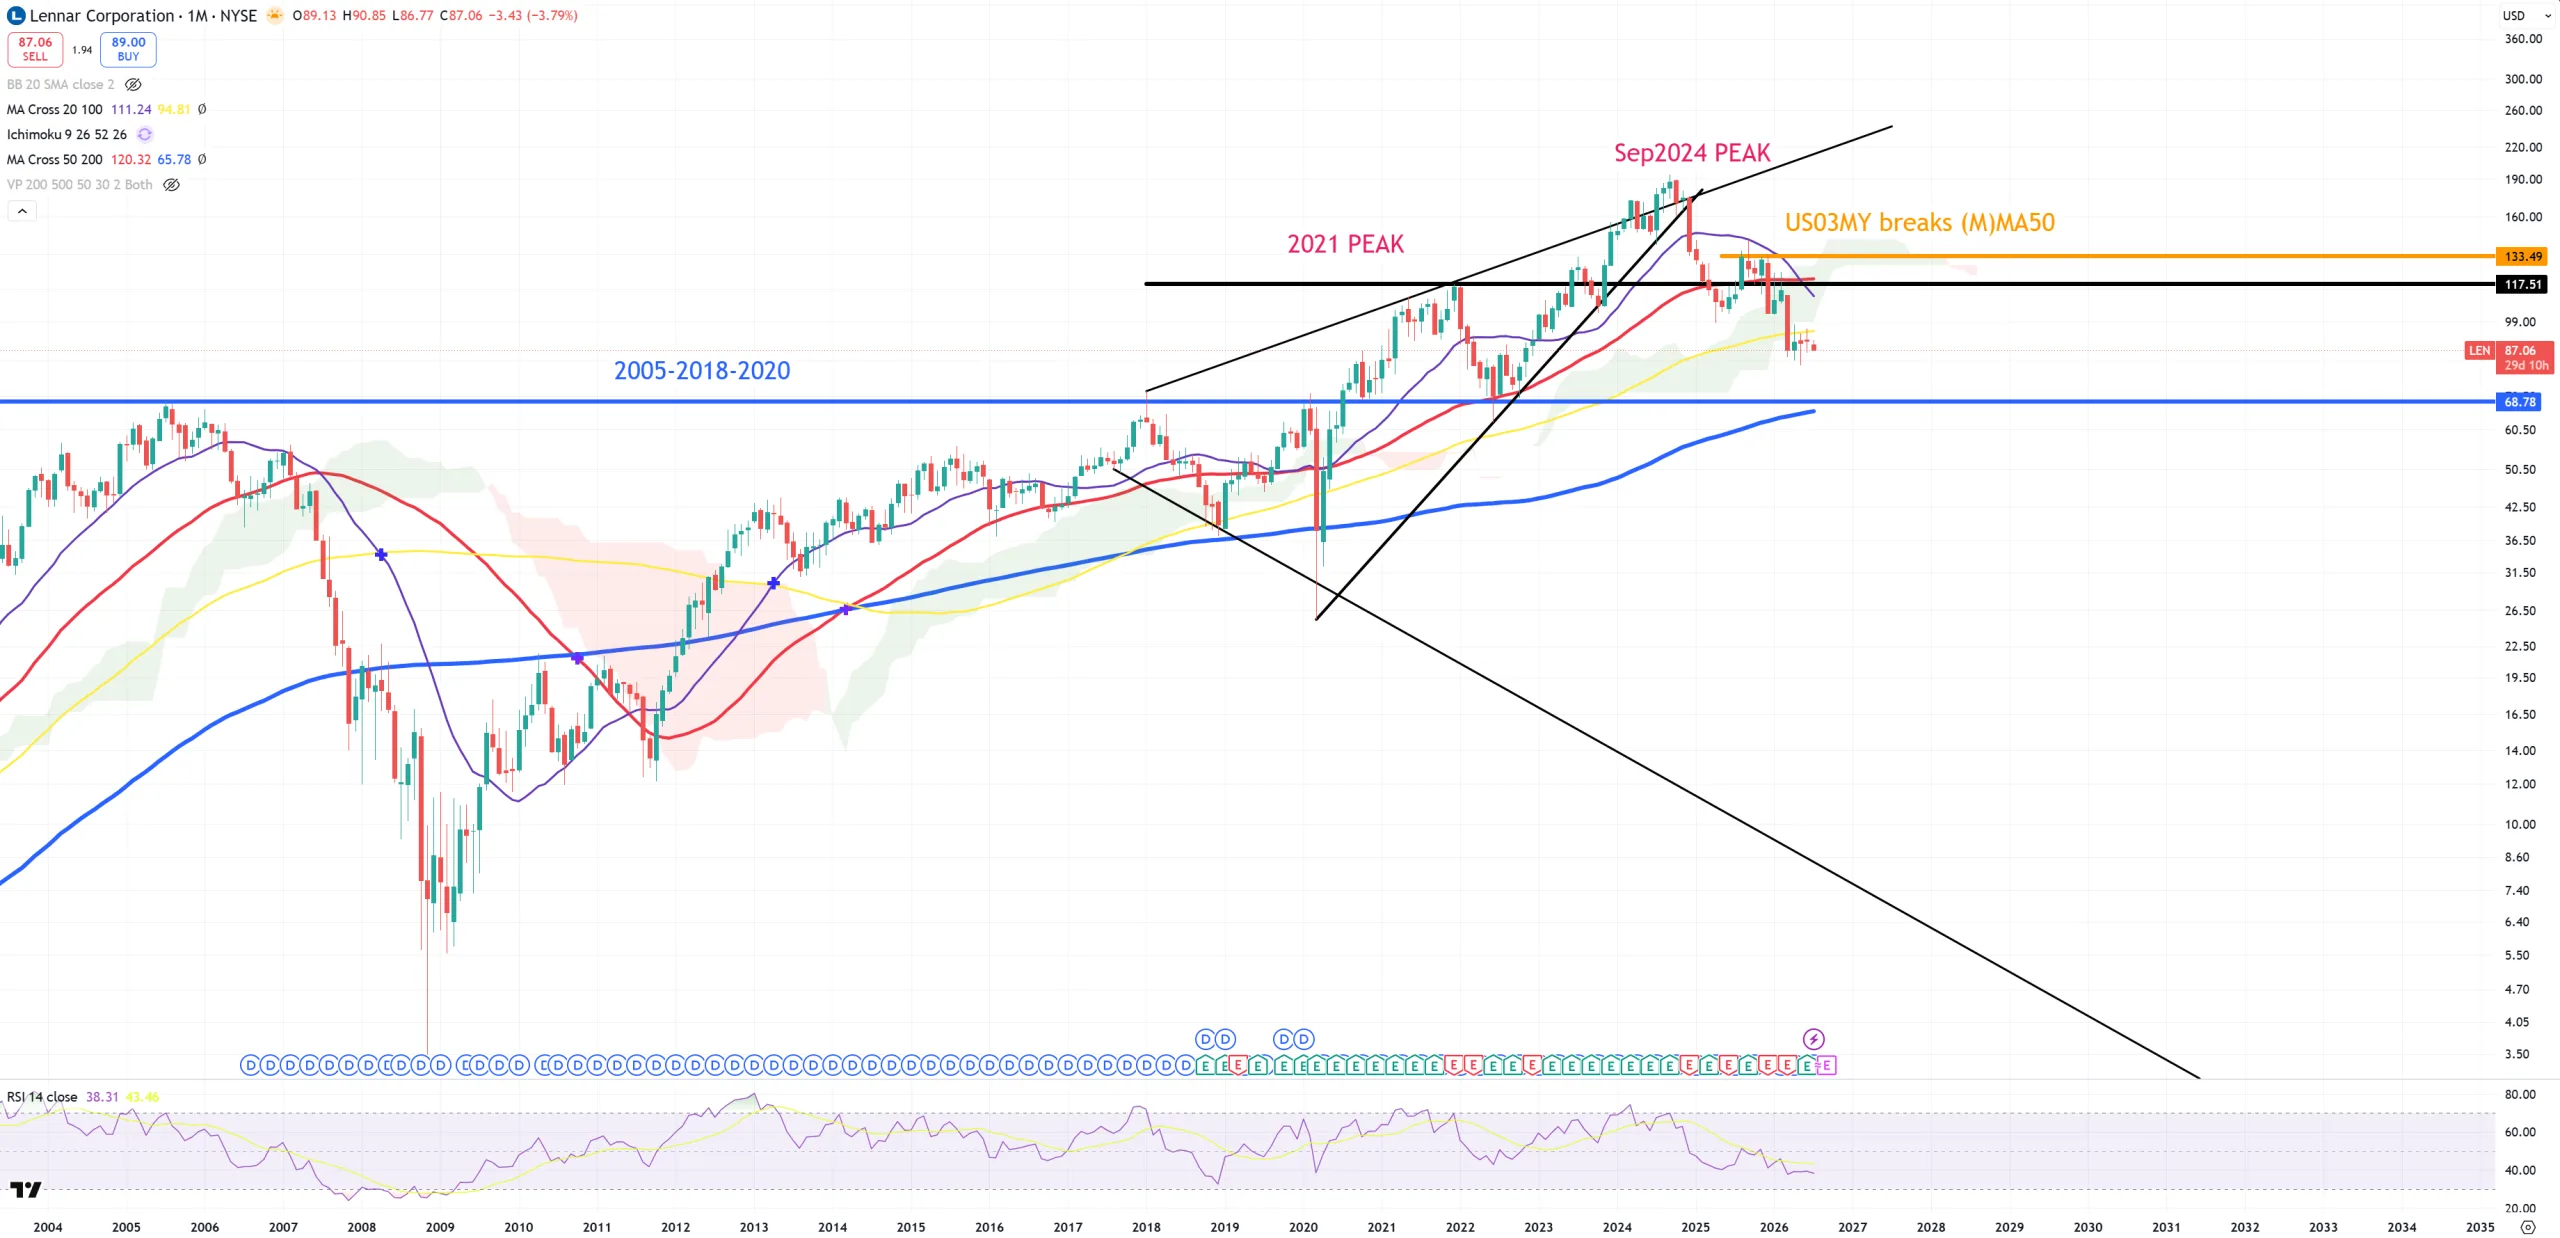
LEN – the biggest homebuiler – it looks dramatic. Look how blue (M)MA200 blends perfectly around this 2005-2018-2020 support :
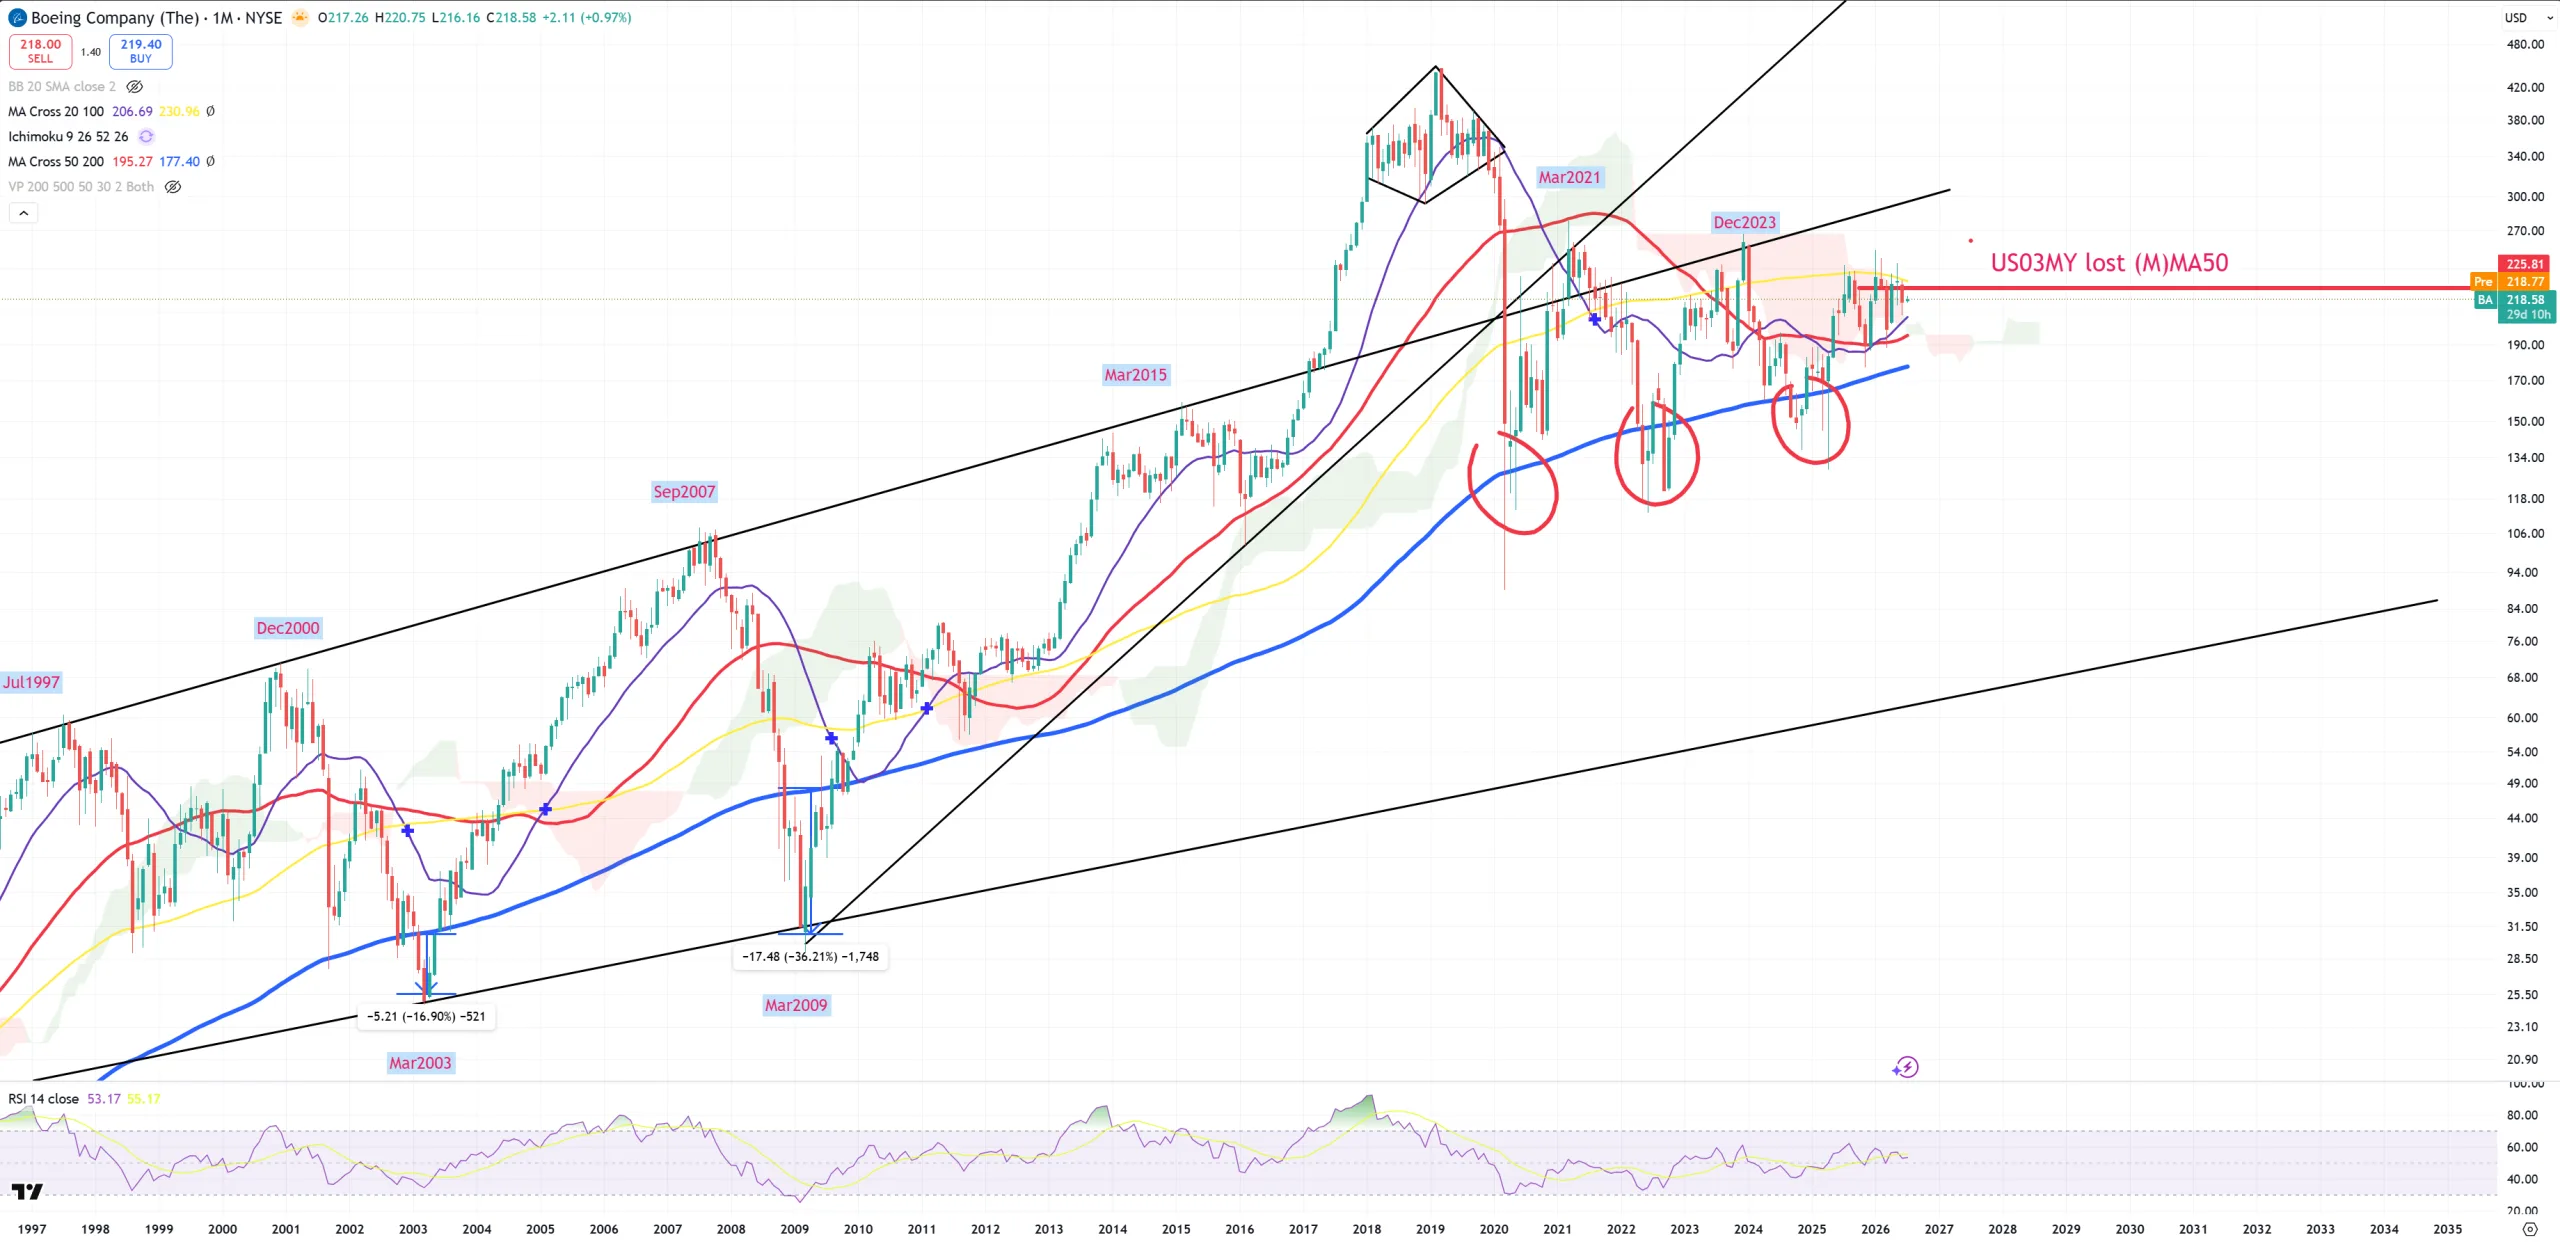
BA – Boeing – this chart I love, because everytime Boeing permanently breaks (M)MA200 it’s coming towards lower trend in this case 50-60$. Now yellow (M)MA100 -> typical bull trap level. Three times BA managed to save itself from (M)MA200 break. Can it hold it 4th time?
The market continue to cut more and more stocks and you either hit levels from 2021/2022 or second levels 4Q25 trying to disguise the problems behind AI/SOX trade. In reality AI/SOX trade has juiced the cycle, what you can easily see on 10y/3m chart in this case it’s 3M view. We see that from 2009 it hasn’t jumped towards 3.0%+ (we’re in the same 2009+ economic cycle). We see that around 2022 AI boom managed to cancel the problems pushing 10y/3m back down this time to super heavy inversion around (3M)MA200. We see again that we’re a massive technical moment around red (3M)MA50. Can 2009+ cycle has finally come to an end? Nobody knows, but gravity that was created defined by how long and deep 10y/3m was inverted is … the record one = record ever economical problems to arrive. Look how non meaningful previous gravities were : 2008, 2020 – almost nothing vs what’s happening right now.