9/2025
August 31, 2025
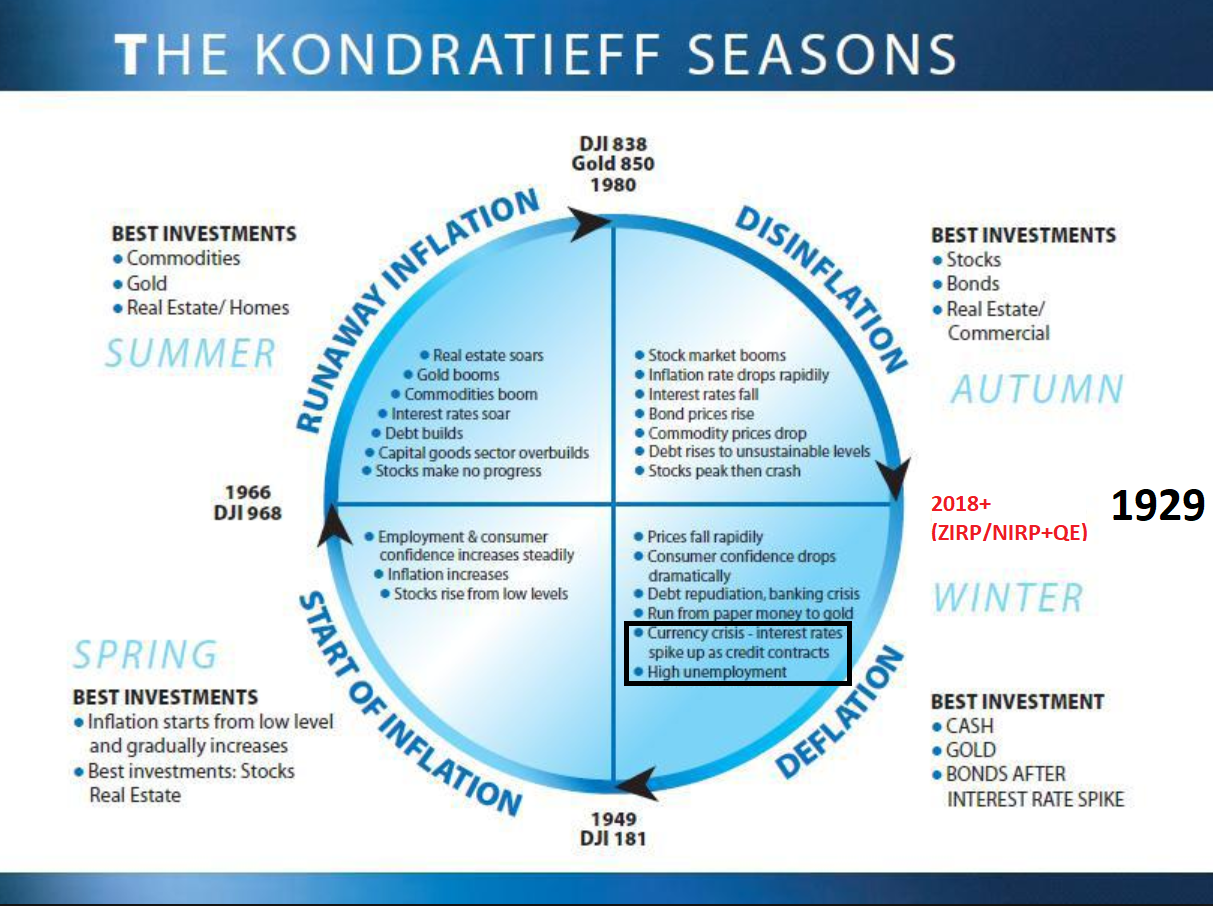
Month ends and signals are totally mixed, it looks we’ll need to see (3M) charts to get more info, so September will be really important month, I’ll try to put charts in order, so you can see some kind of a logic here. In reality we’ll see lots of stocks which peaked mostly around 2021/2022 (4Q21/1Q22), that’s the level where SPX/GOLD peaked. I’d like you to see how the market is 1/2 broken 1/2 fine. This 1/2 fine is usually on a small break above key technical levels. You’ll understand seeing the charts what I’m talking about. I think we’re still based on DJI/GOLD and SPX/GOLD rotating using economic depression towards next secular inflationary cycle. To summary I use this circle cycle, where 2018 level I posted as a transition start moment is DJI/GOLD peak. My current allocation are unchanged.
The most I own physical GOLD (since 2018) – in general I replaced stocks holding to Gold holding that year, TUA (since 2024), TYA (since 2024/2025), holding some physical $$$ cash (since 2018 – that was really bad idea), and those 4 assets (GOLD, TUA, TYA, Cash) are like 90%+ of all allocation.
US02Y – this time we won’t start from SPX chart, but US02Y. Key mixed signal is the fact that it’s below (W)MA200 but still above (M)MA50. Because we’re discussing here (M) candles, we can say it’s all OK because (M)MA50 holds which is 3.56%. EFFR is 4.33% so we can say FED is 75bps too tight, if they cut 25bps they are going to cook this economy as IMO yields will plunge even more, because keeping too tight the economy will require way more powerful rate cuts later.
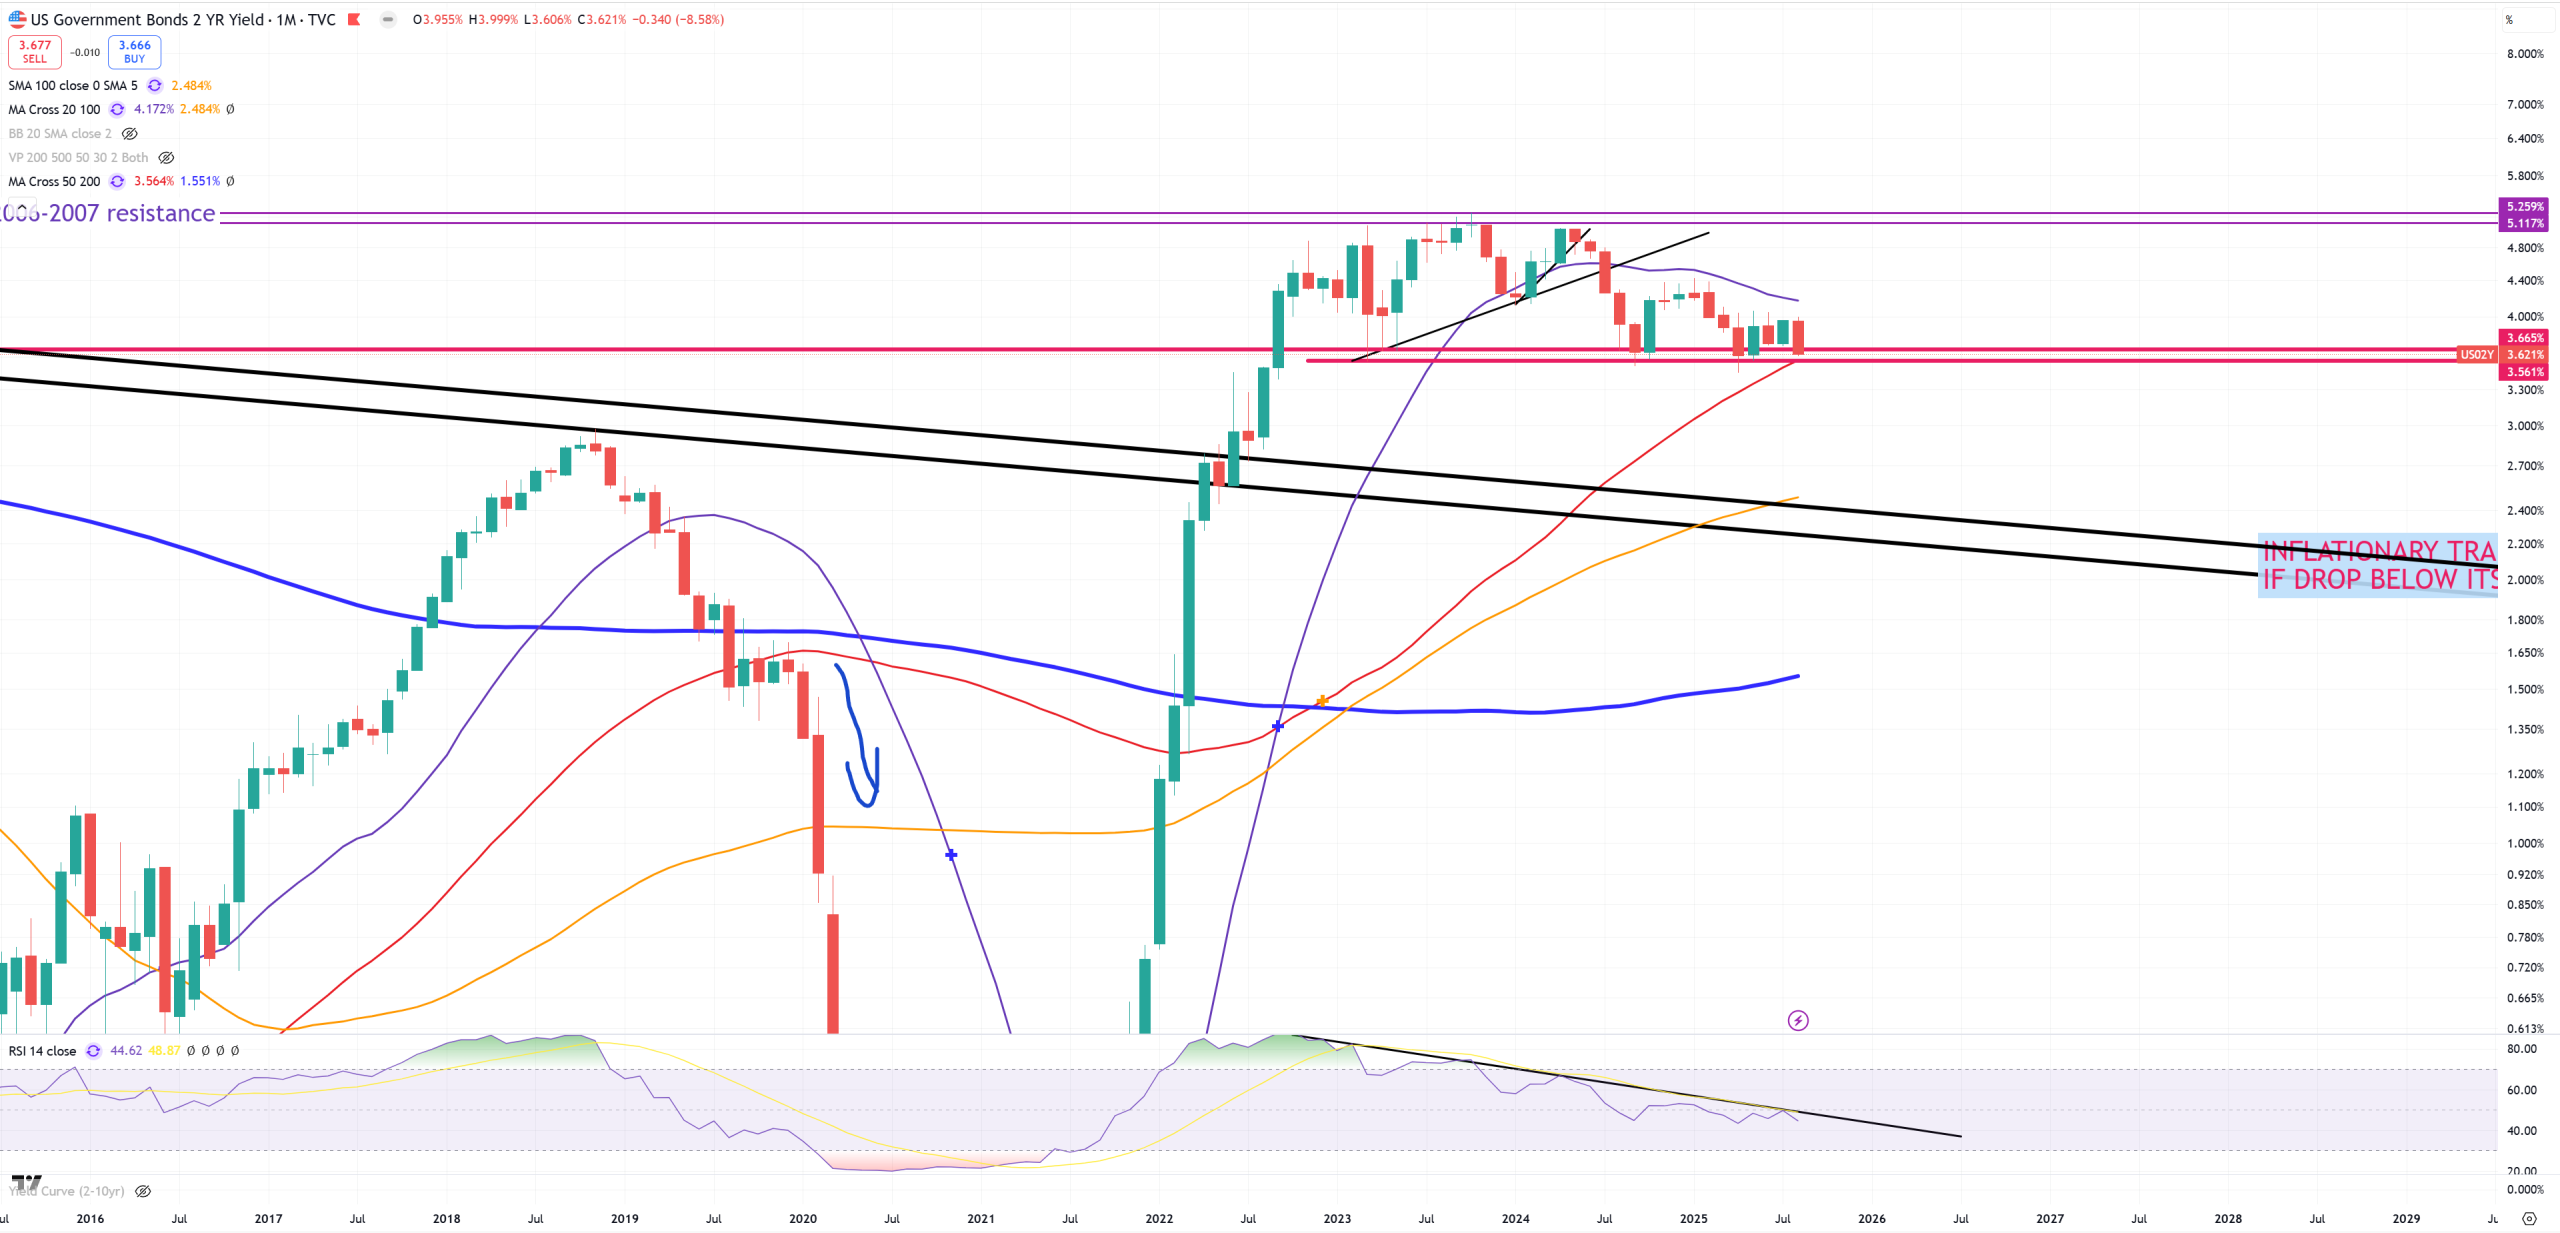
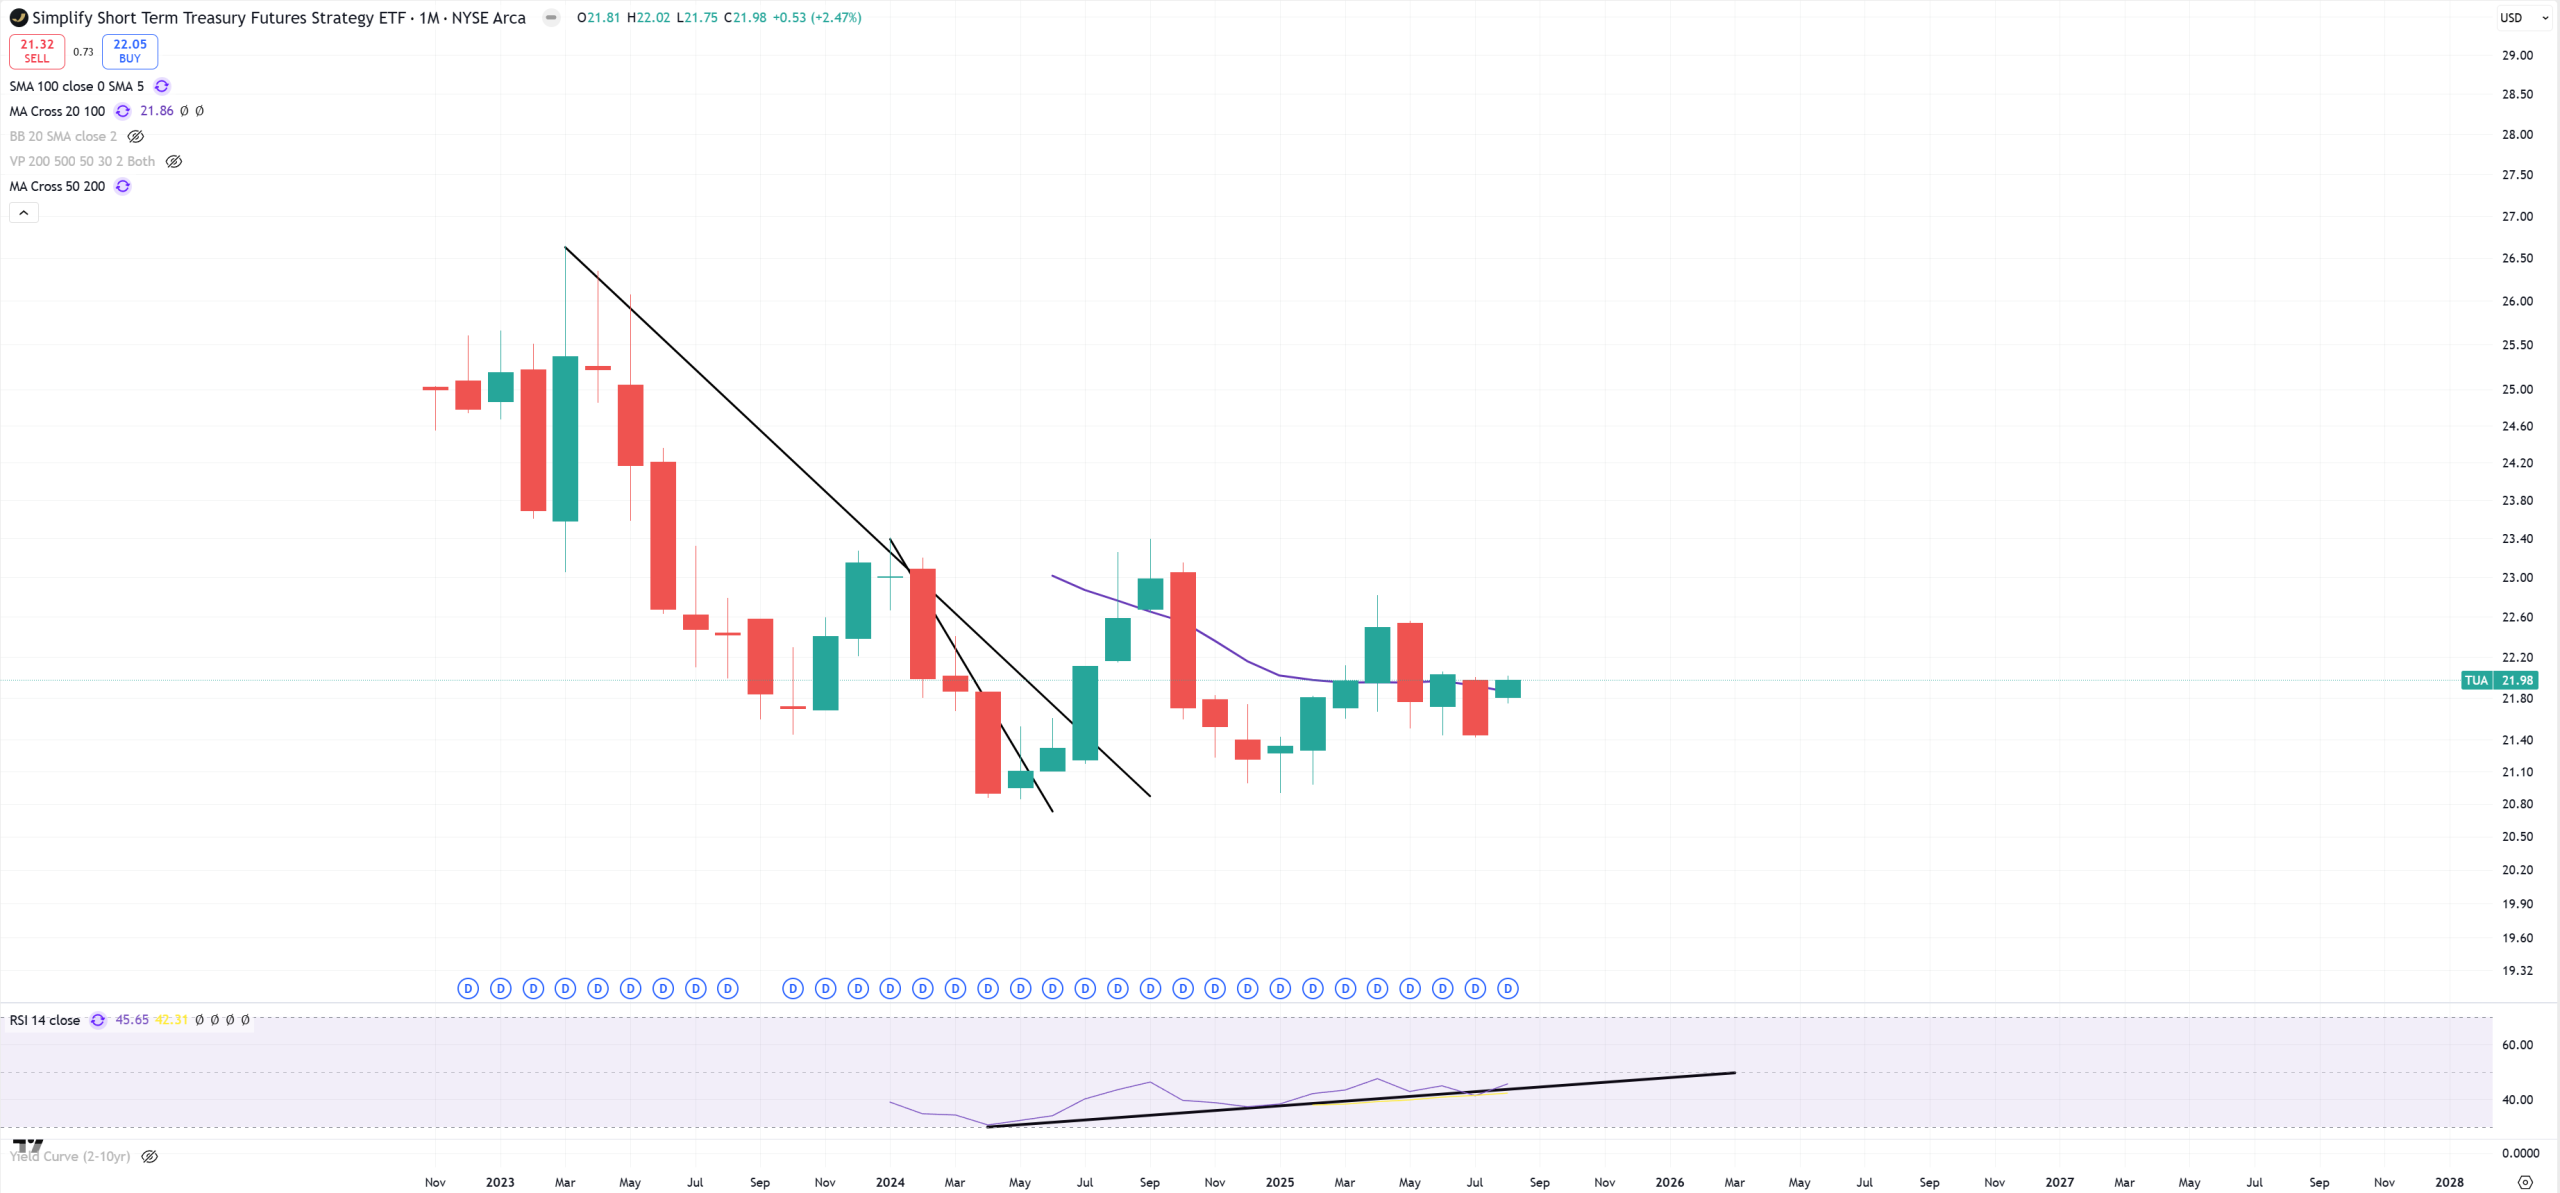
TUA – it’s leveraged US02Y (giving dividends like T-Bills)
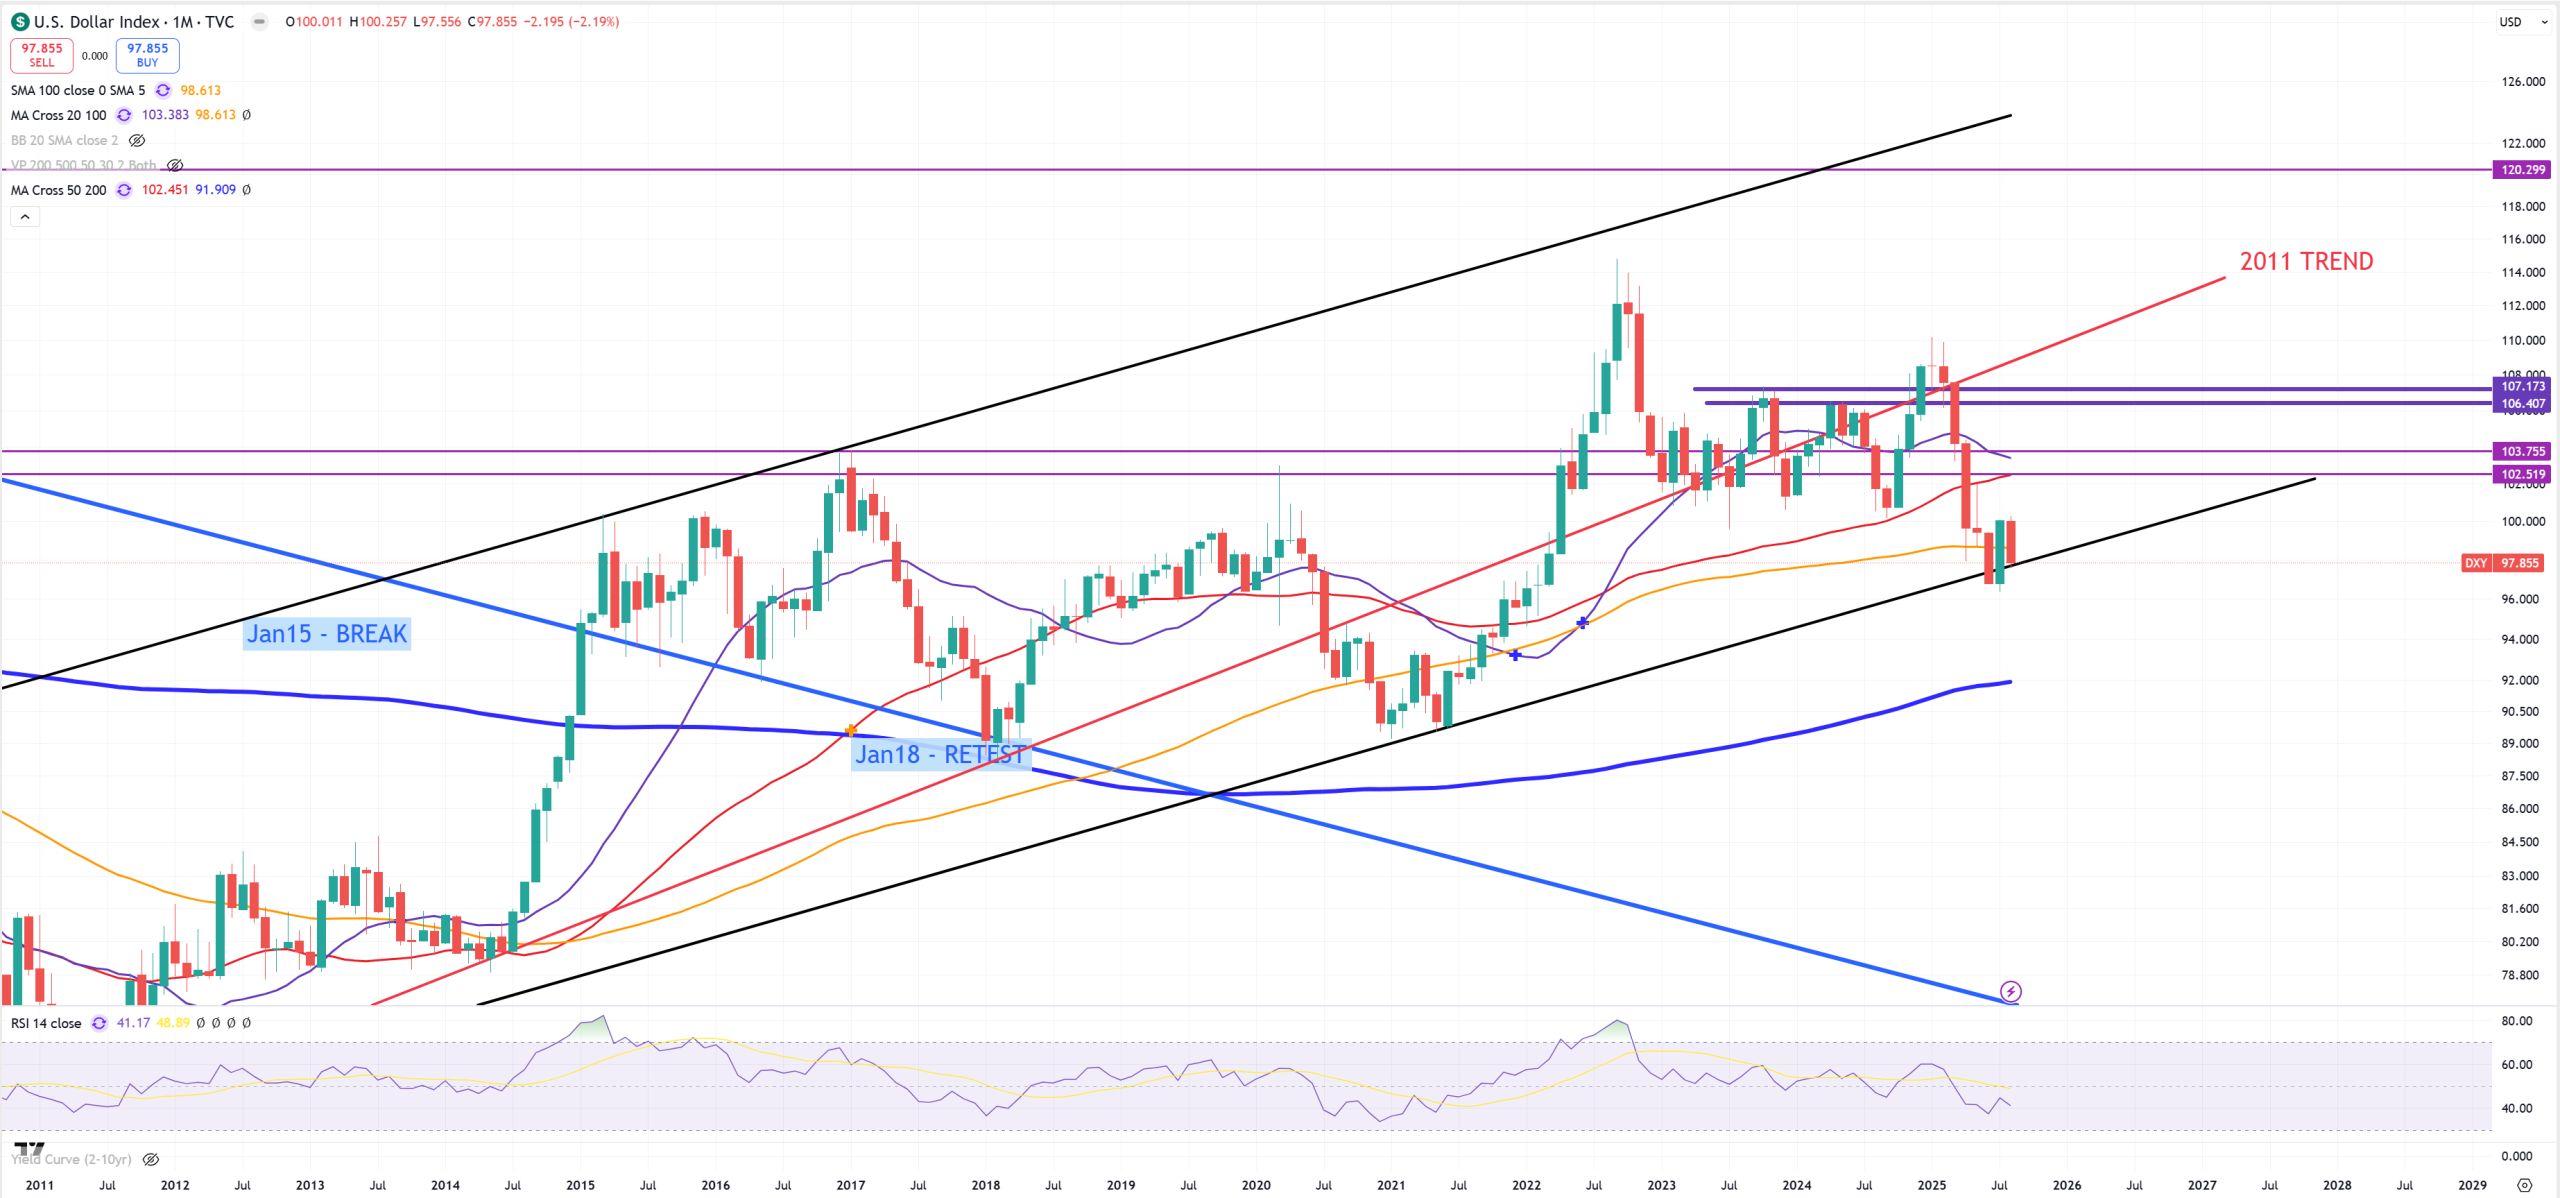
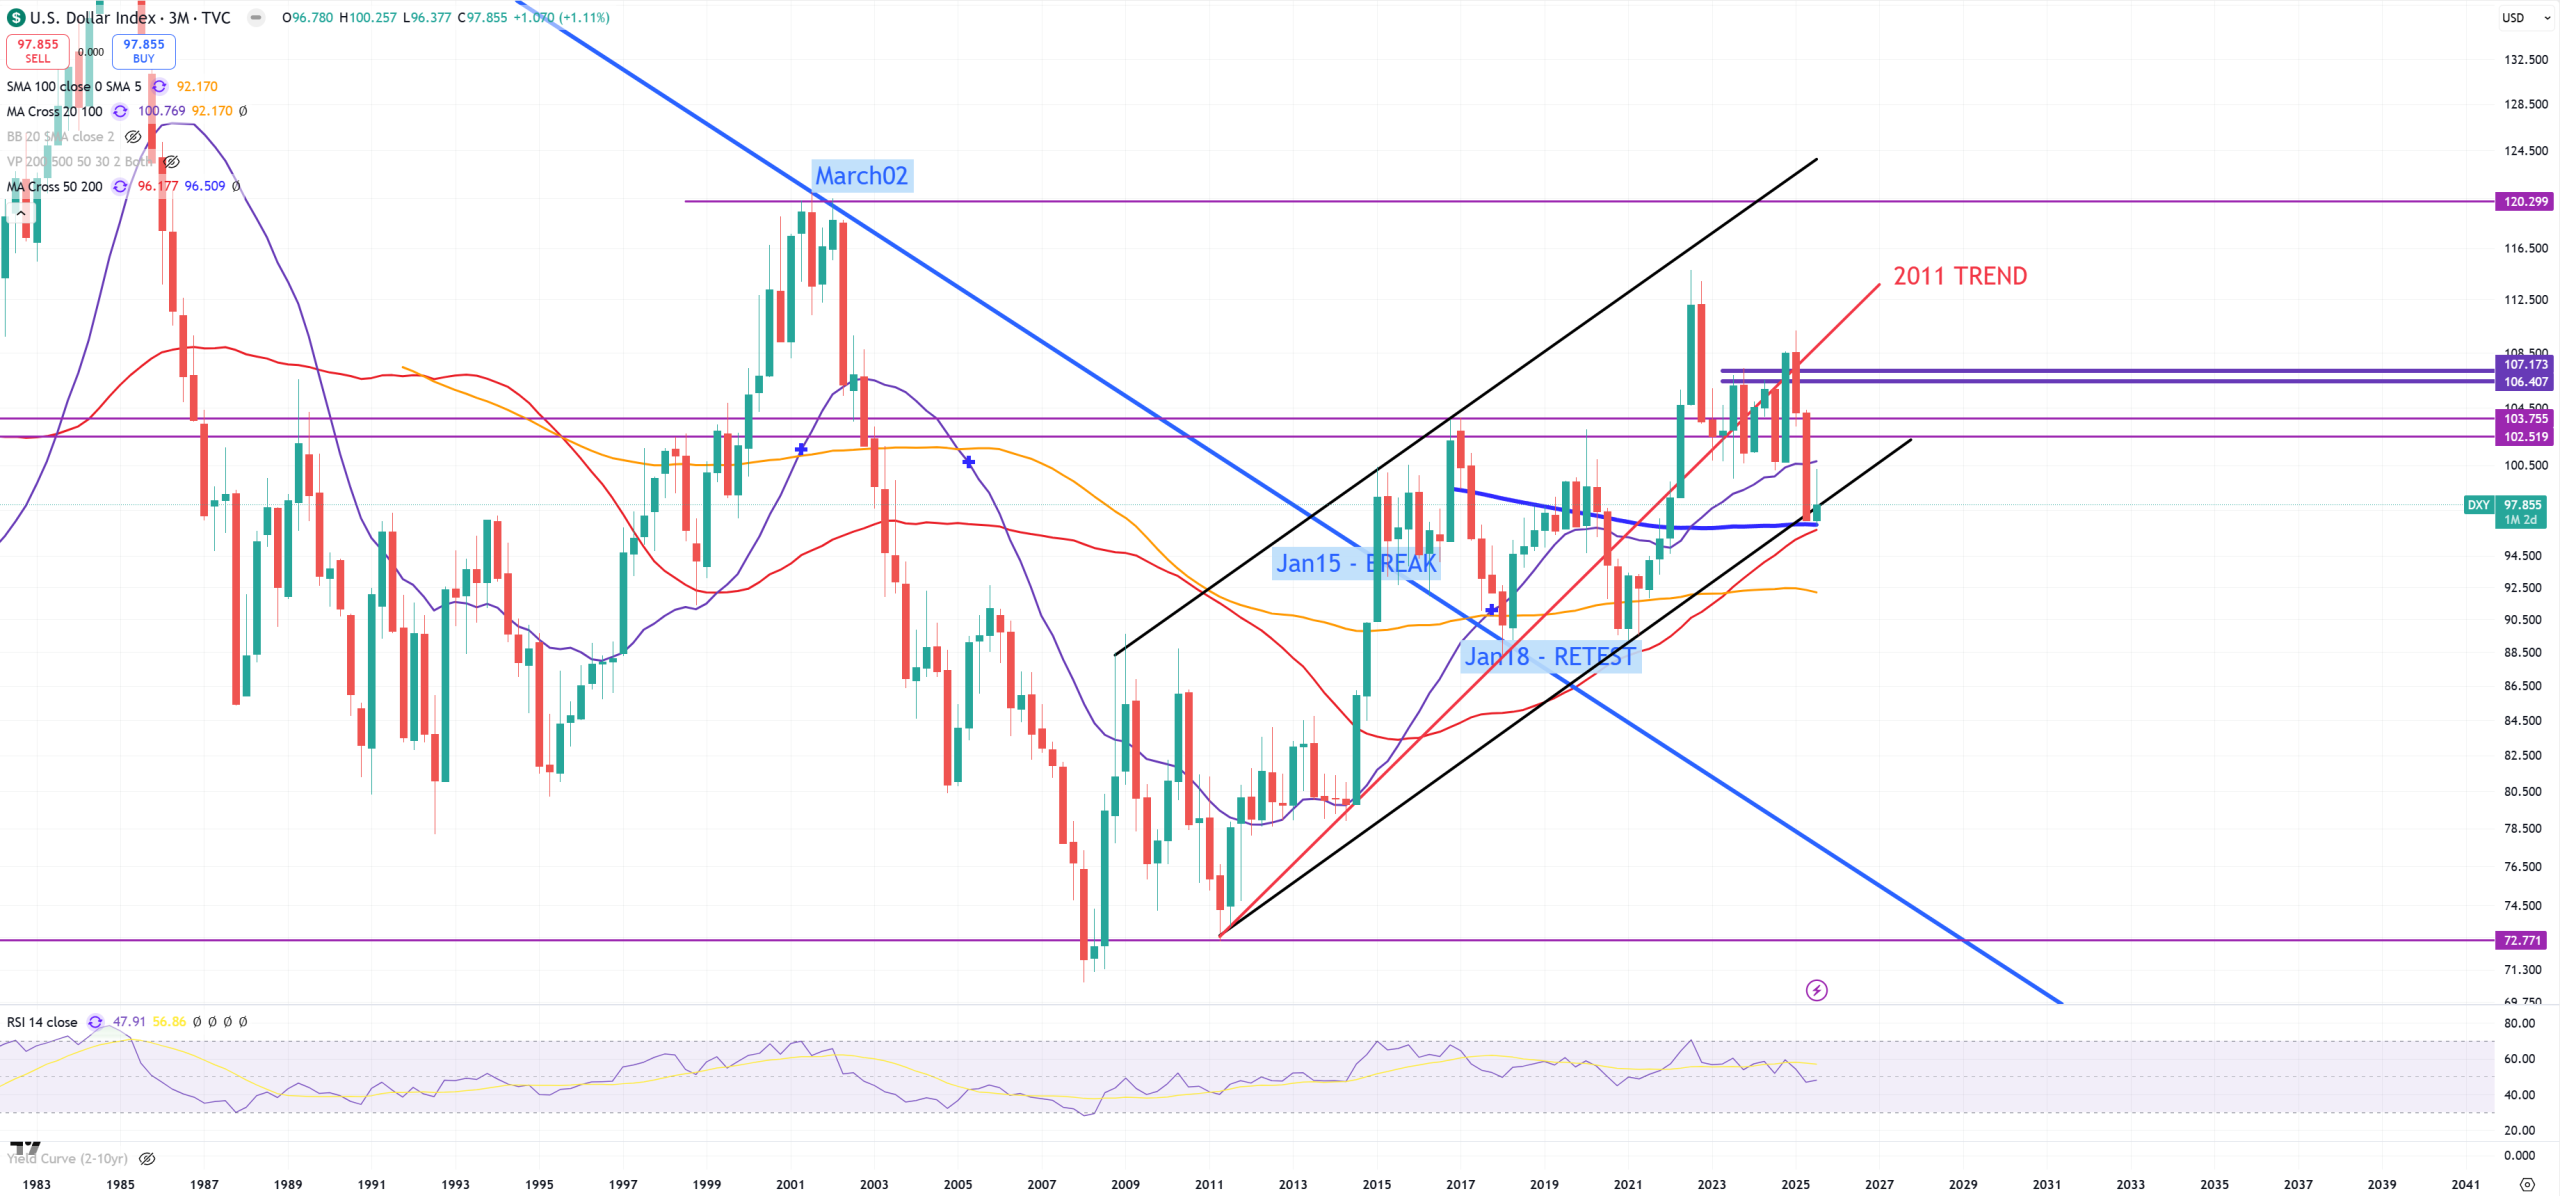
DXY-holds its last level of support. More important is the fact it’s also a cross of (3M)MA200 and (3M)MA50, so first is (M) view, second is (3M) view
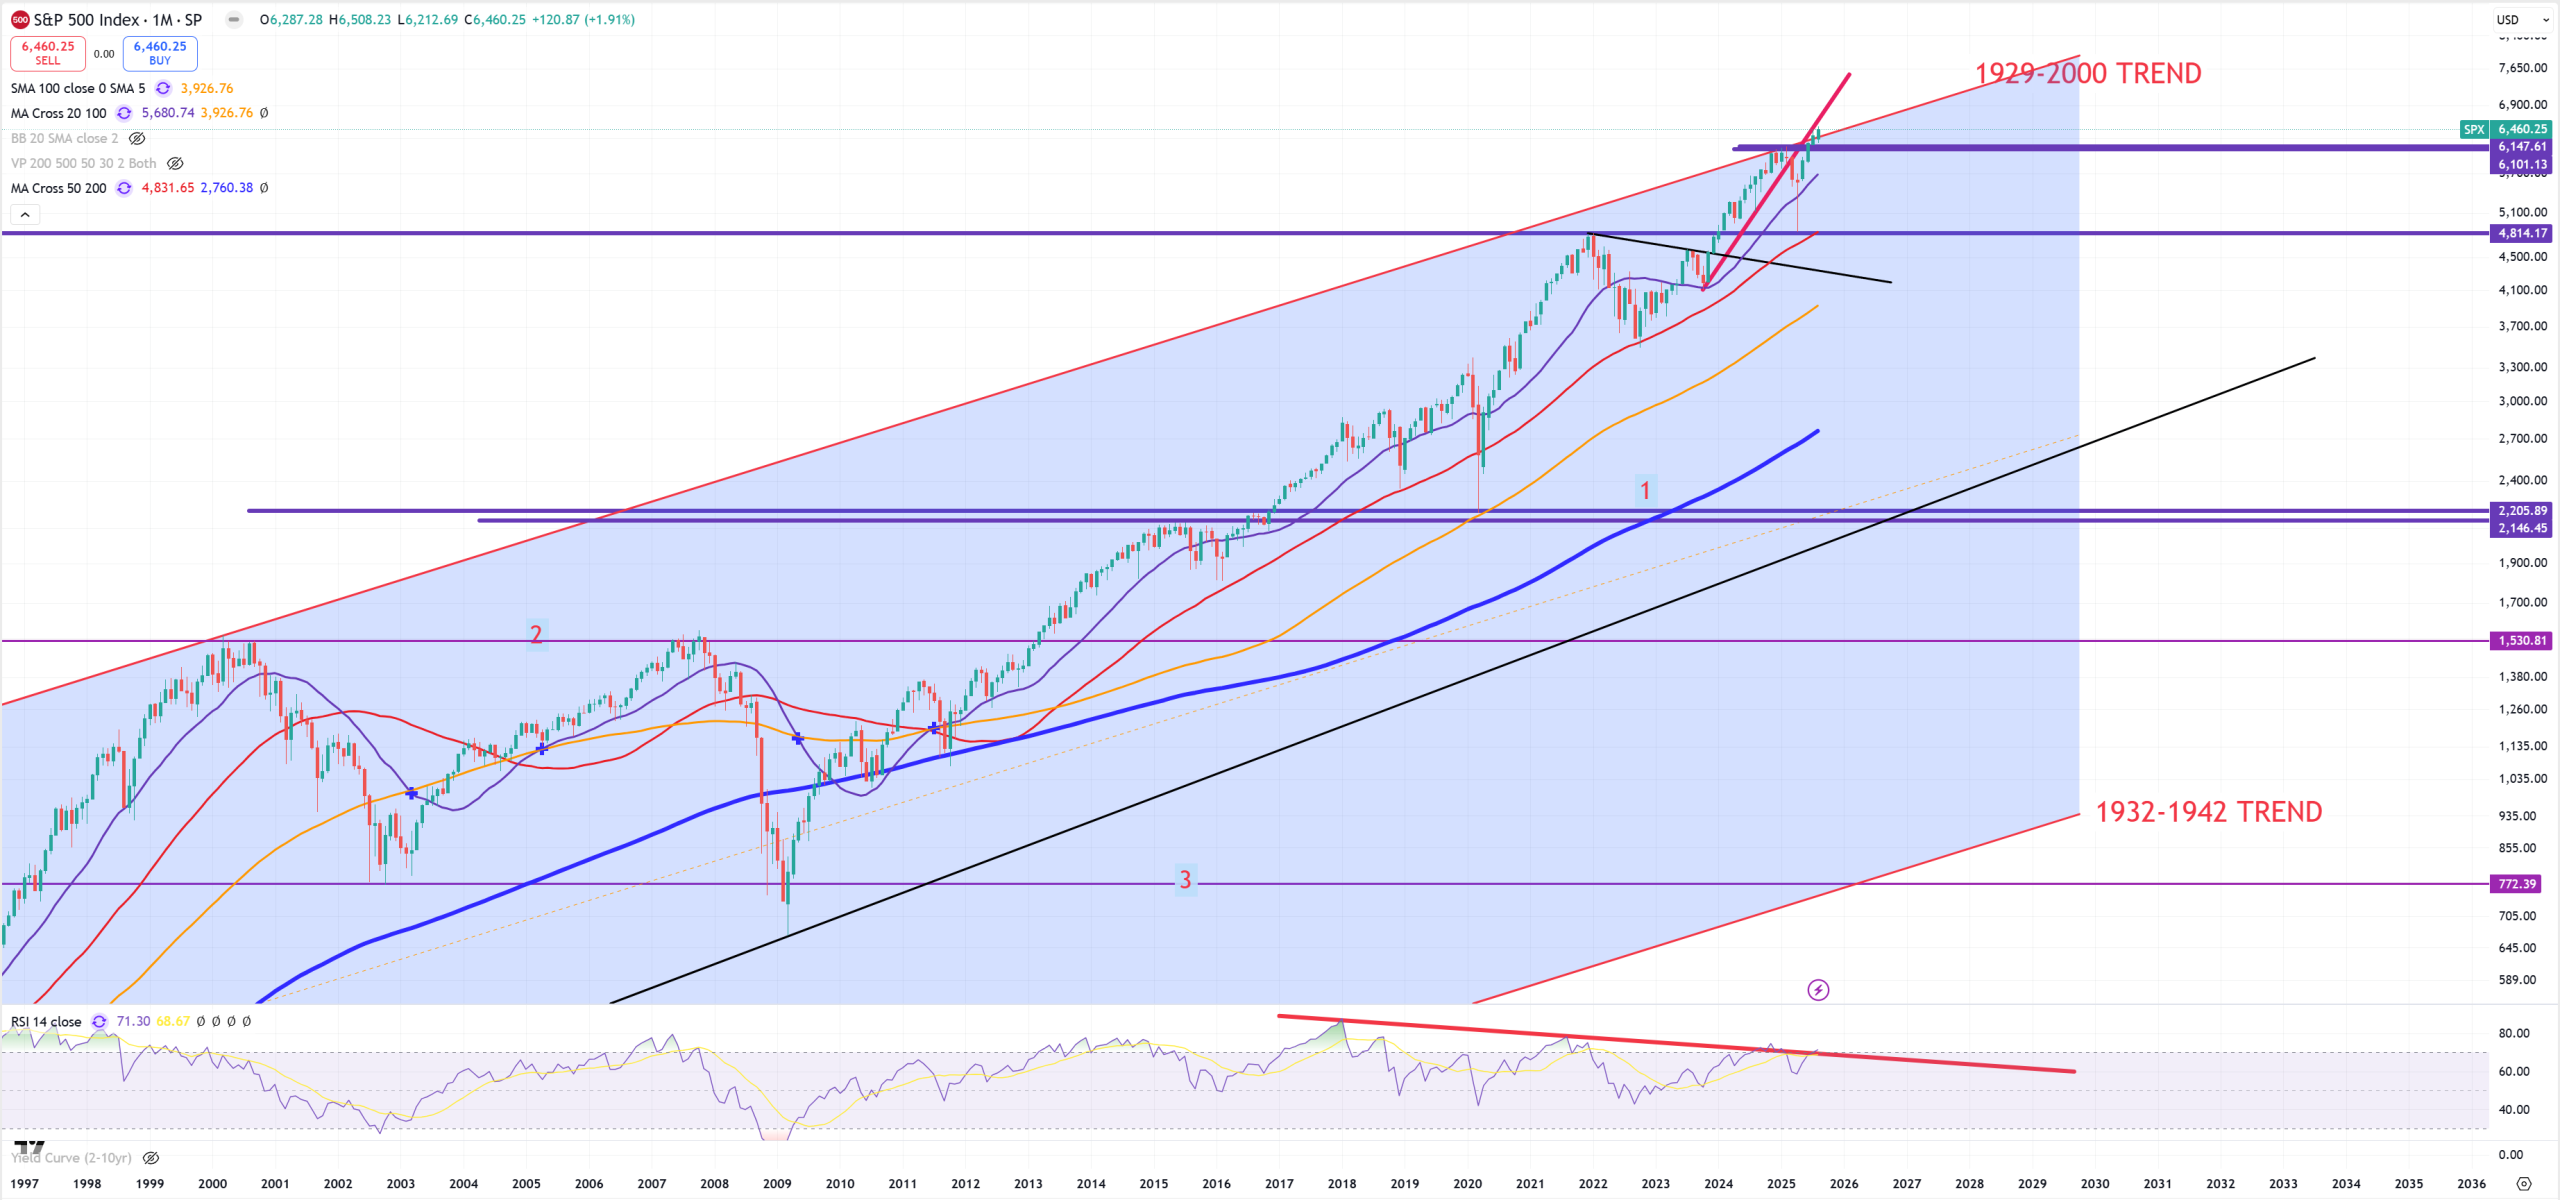
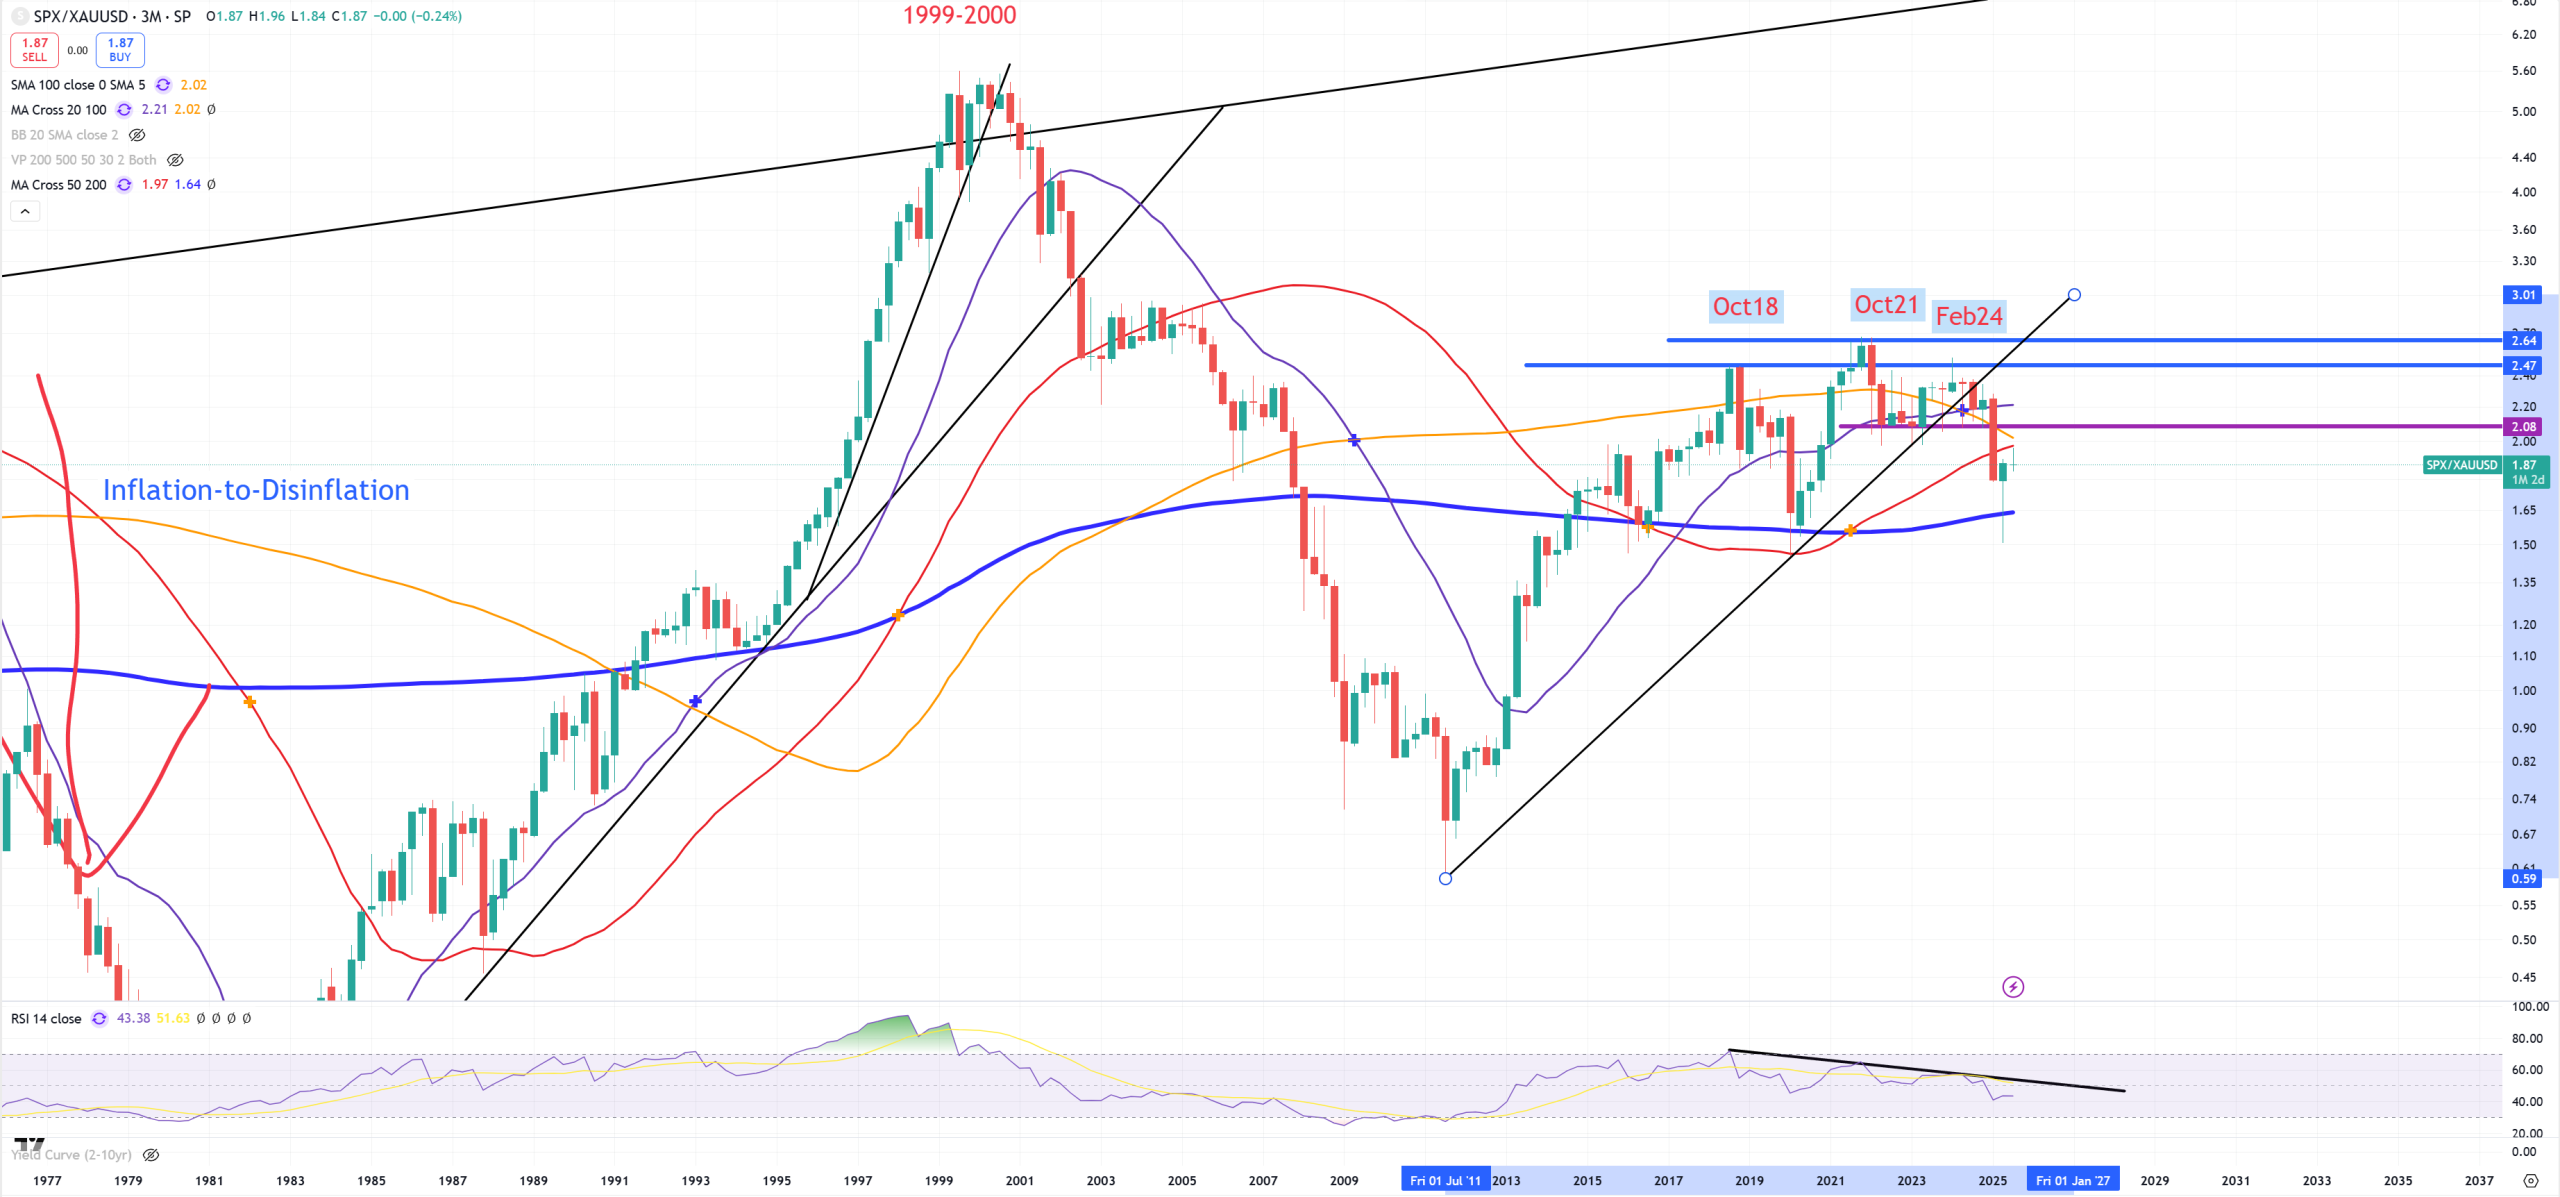
SPX – trend 1929-2000 is broken, September level is 6340, what is more important is look how 2021 peak is alligned with red (M)MA50 = 4850.
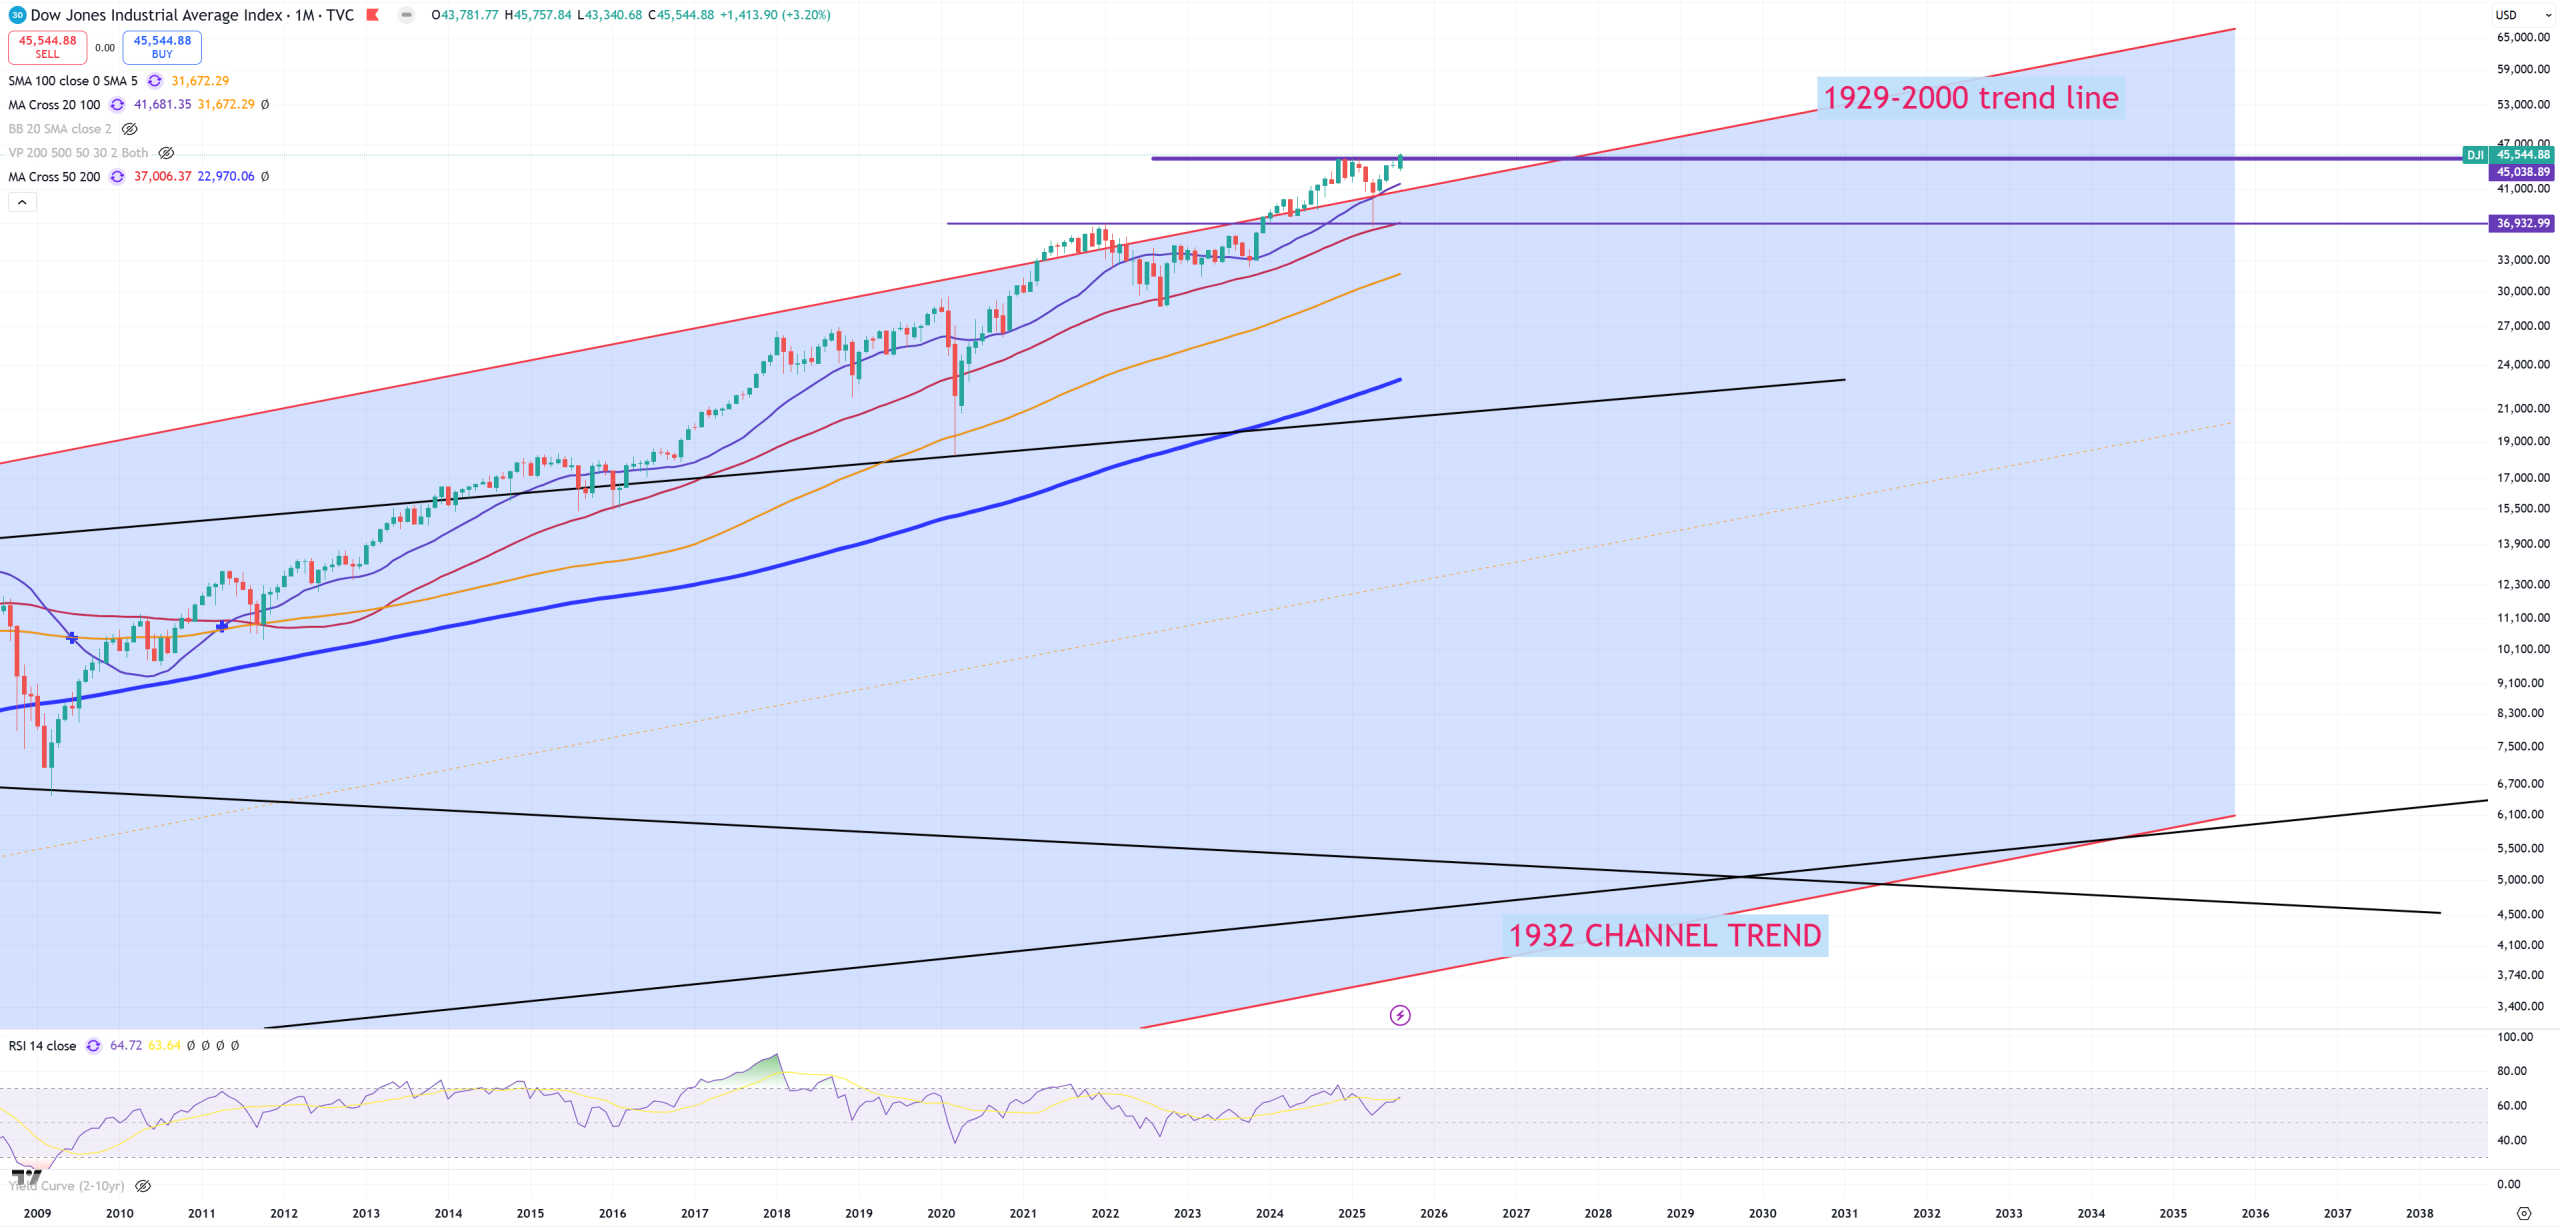
DJI – trend 1929-2000 isn’t really important here as 2000 wasn’t a bubble for DJI, but we’ll keep it too, so far you see how market defends this 1929-2000 trend.
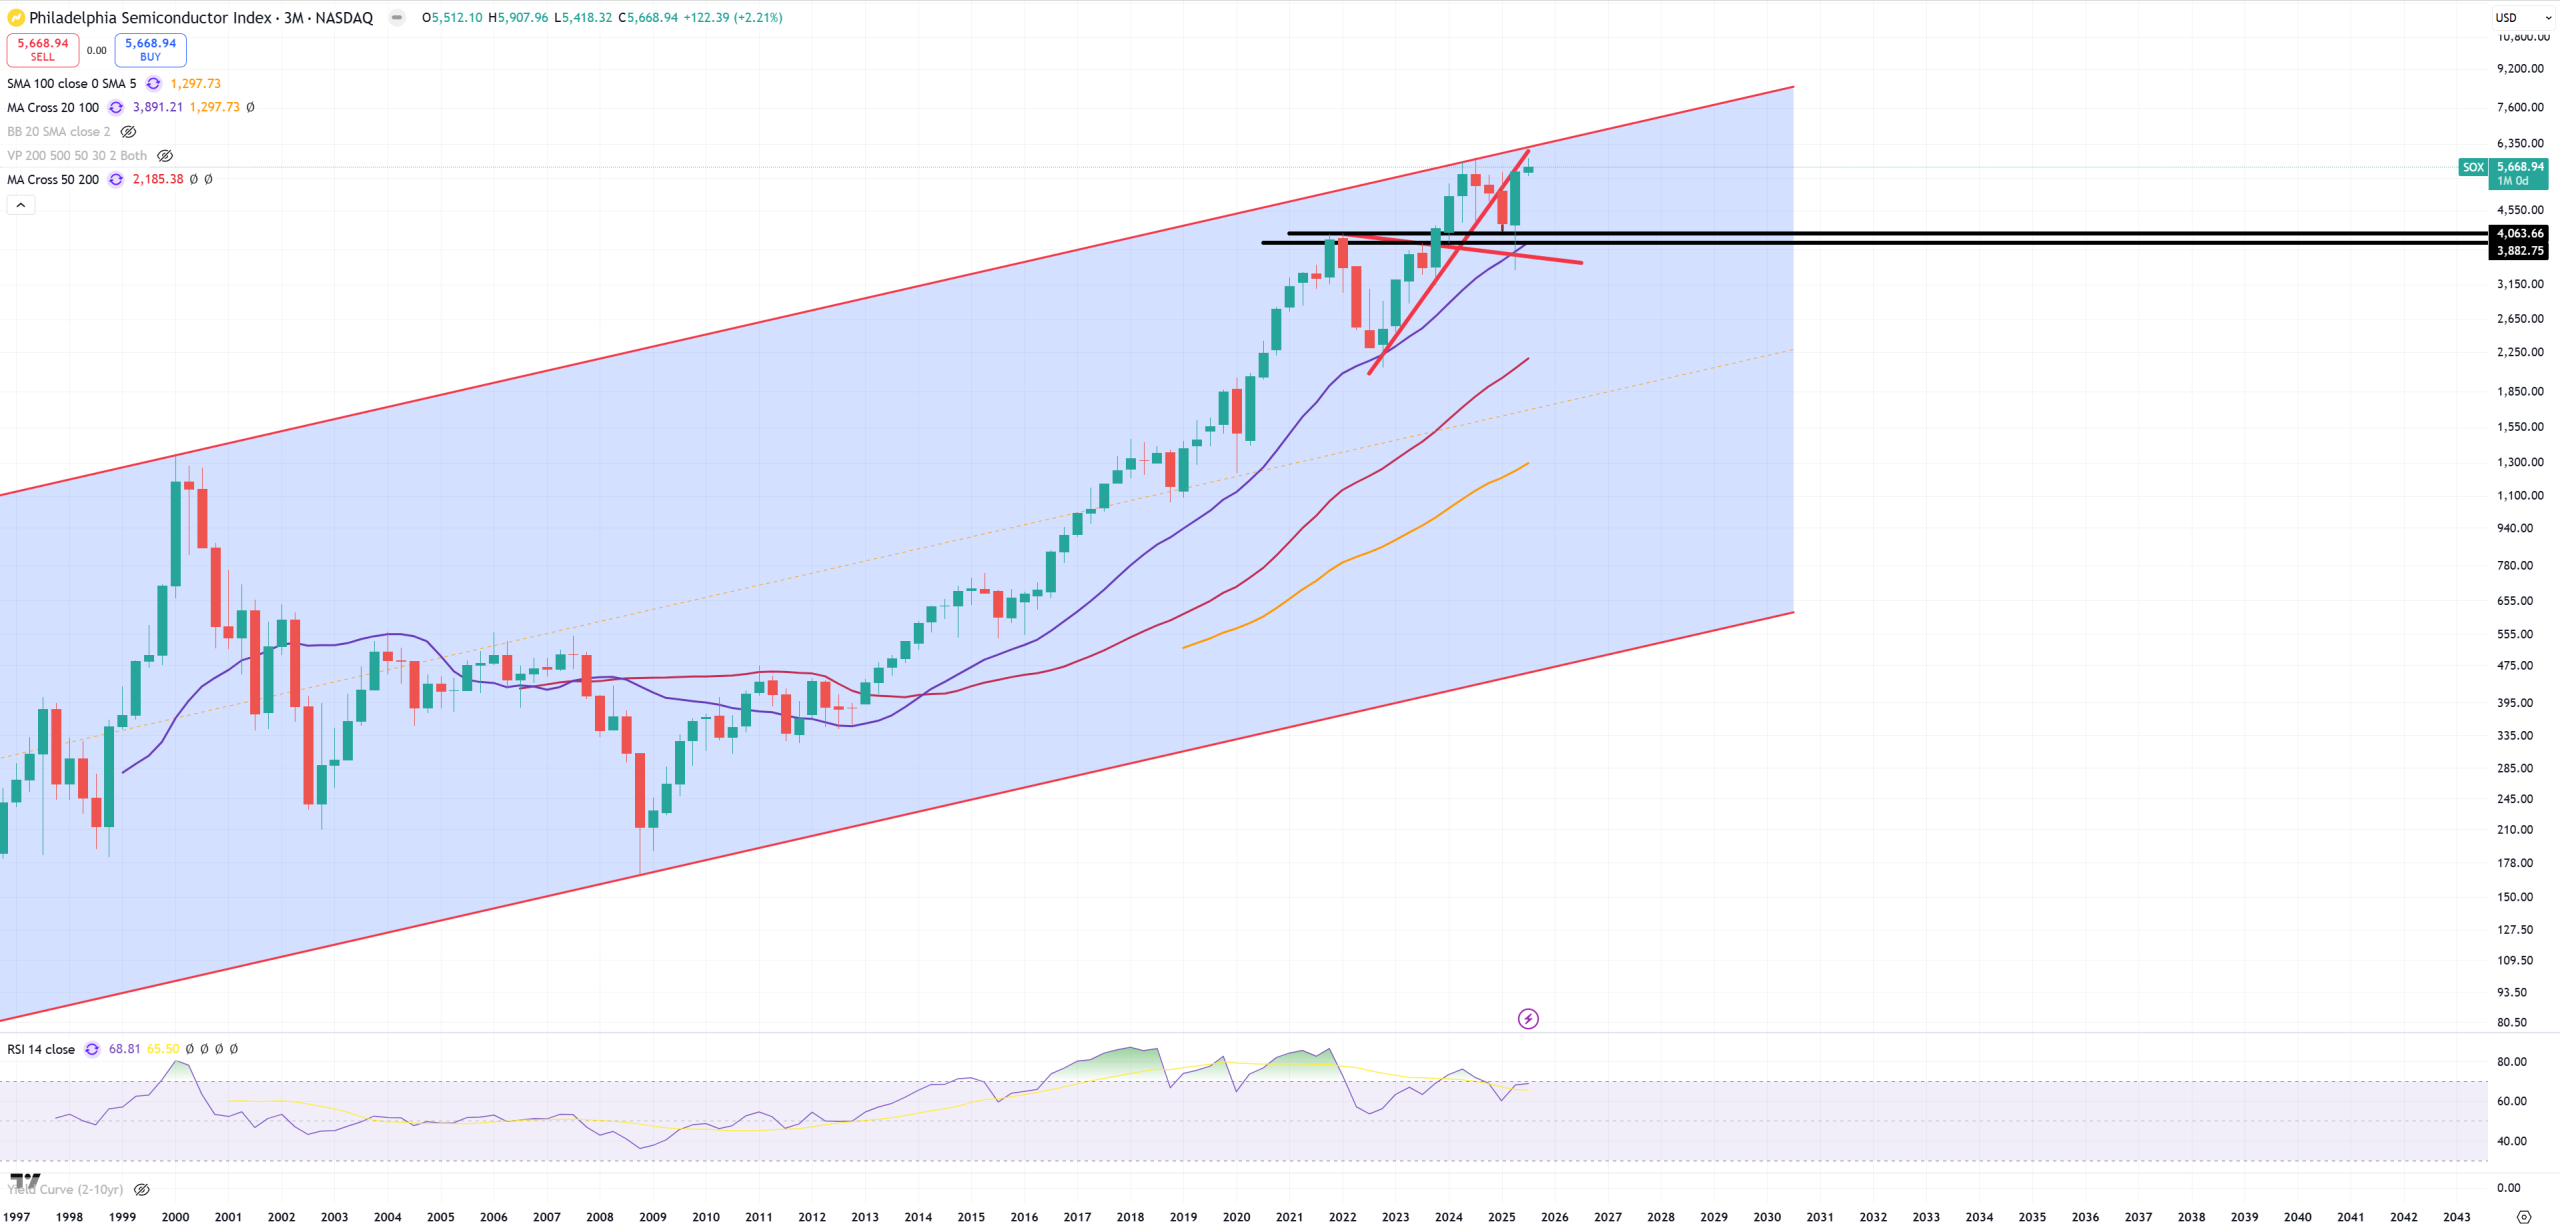
SOX – Semiconductors
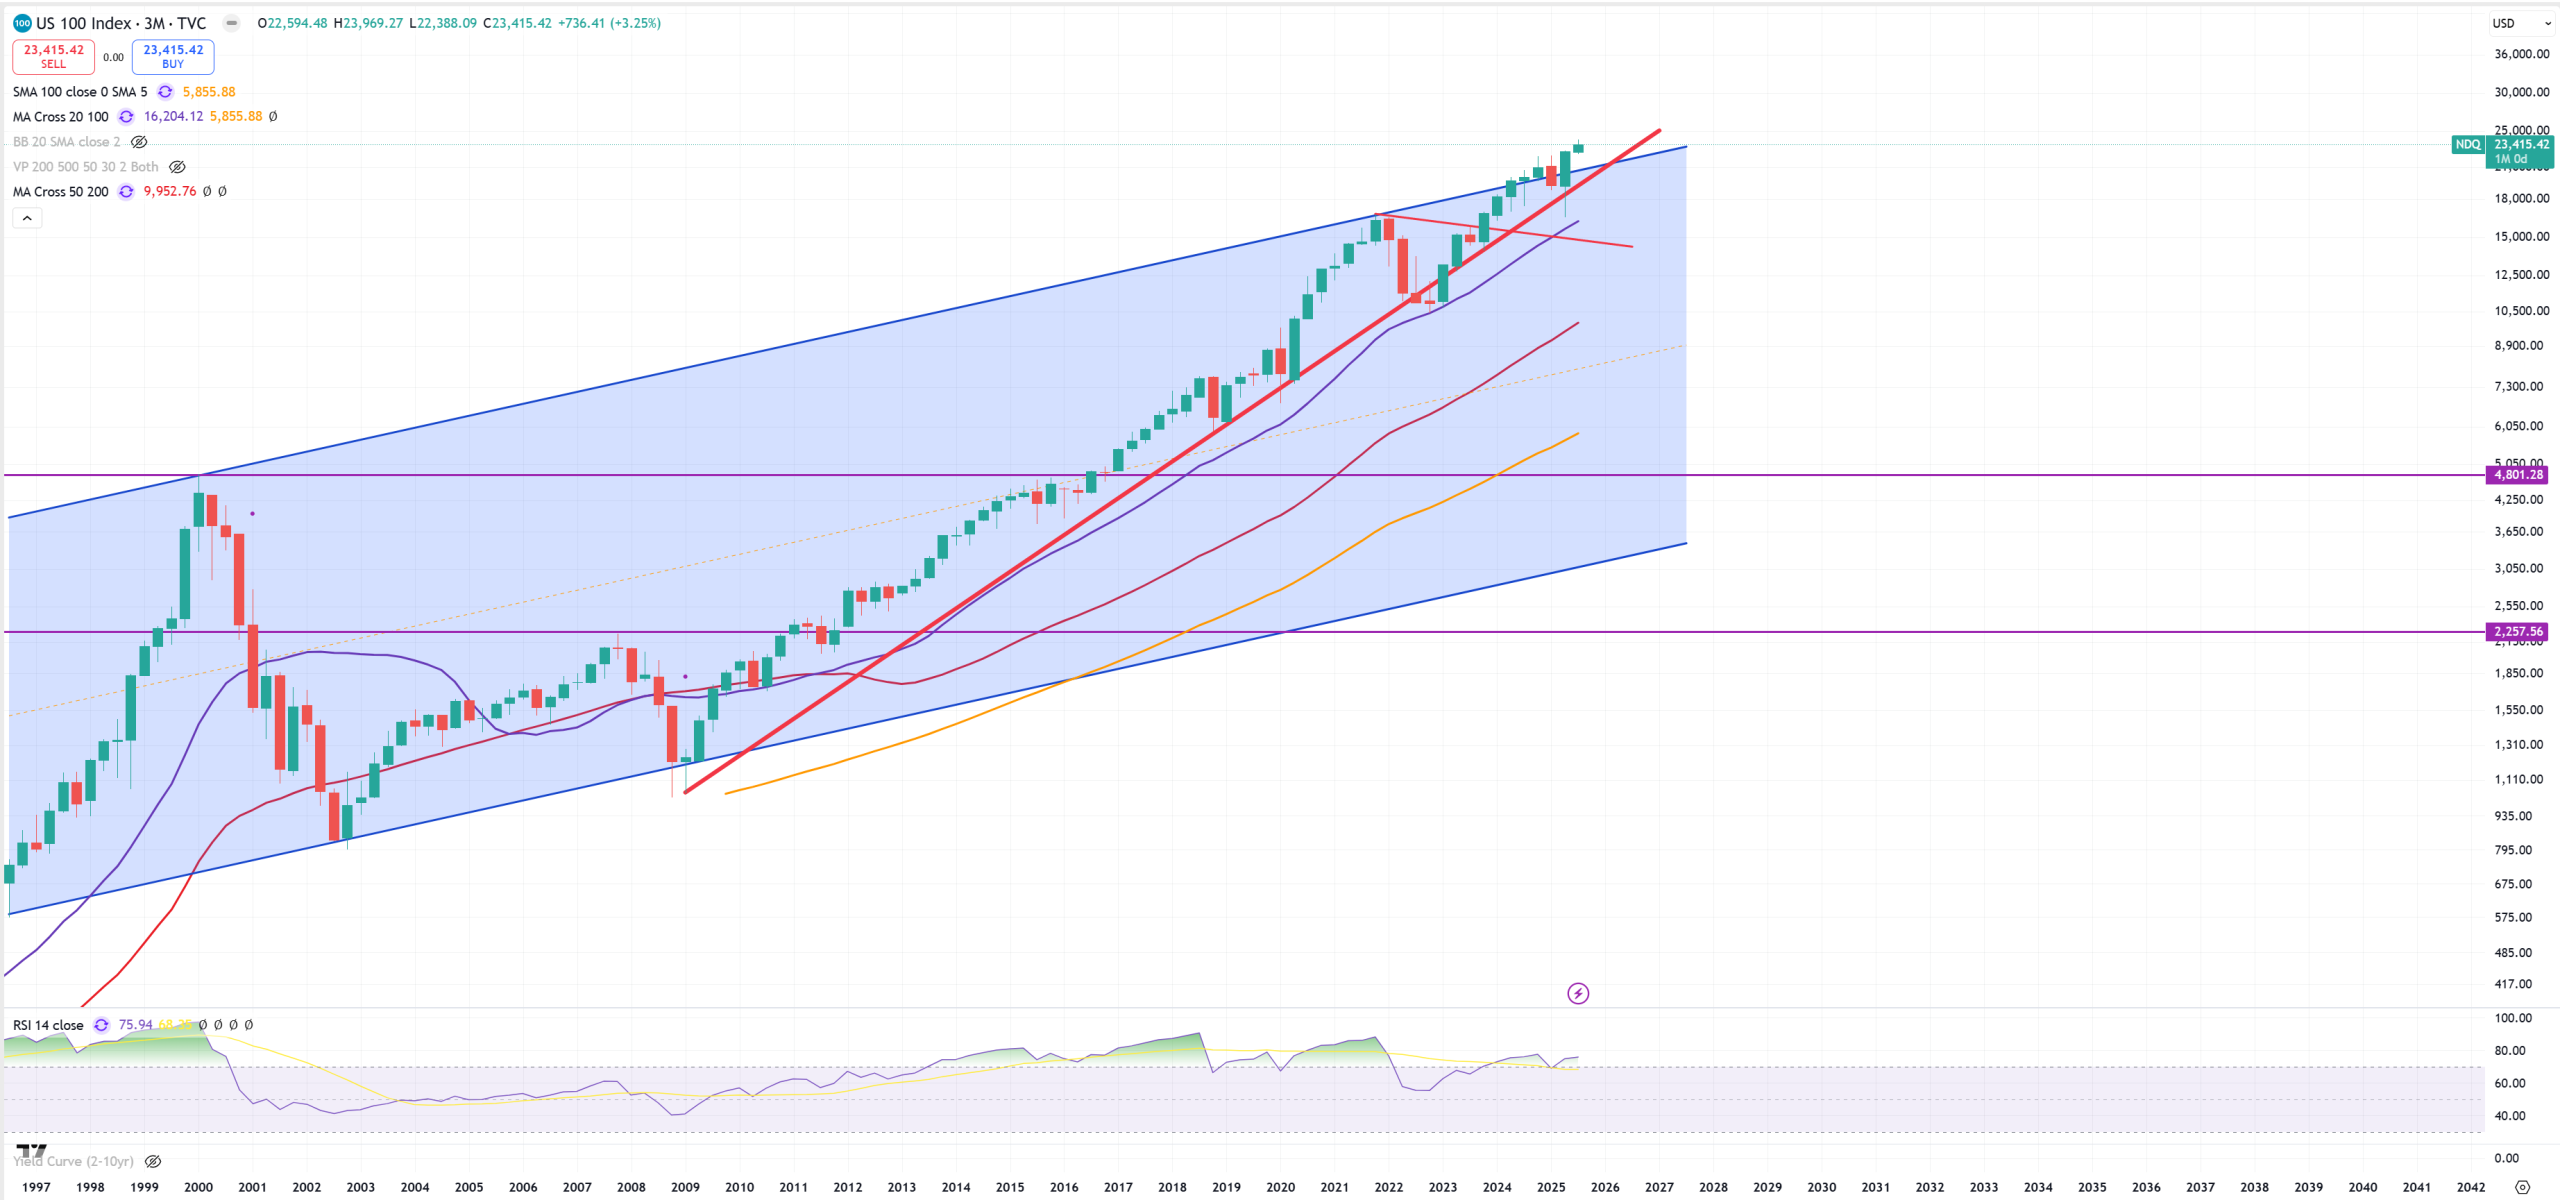
NDQ – Nasdaq 100. To be fair I don’t believe in this channel, but so far let’s keep it.
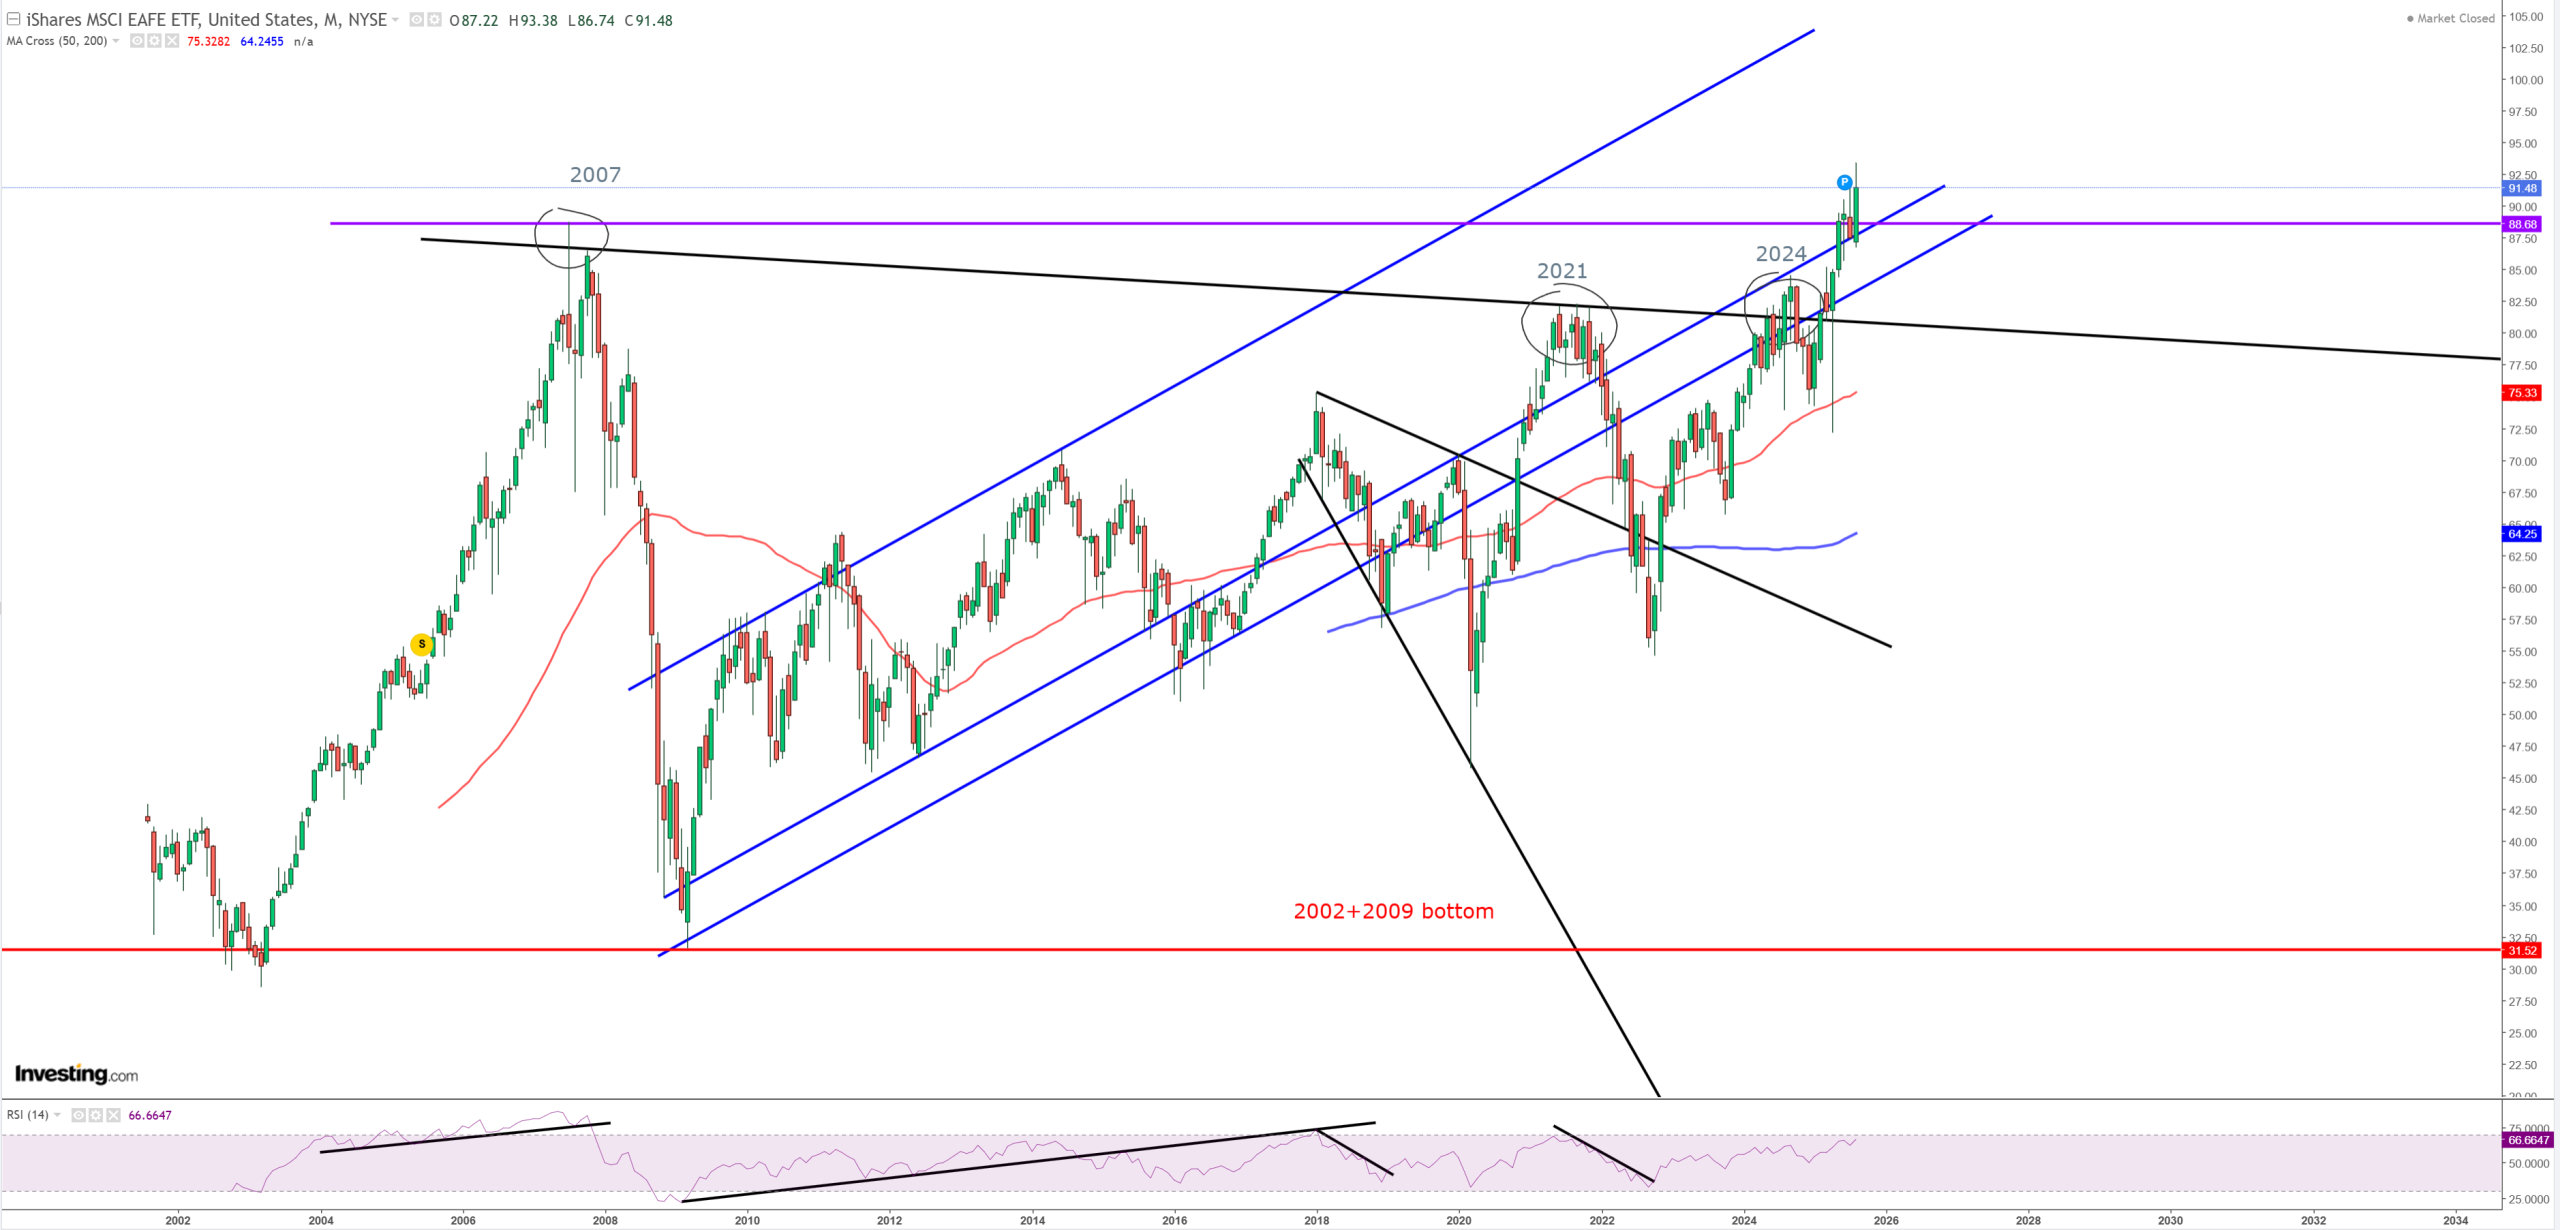
EFA – Developed Markets excluding USA, breaking biggest 2007 peak.
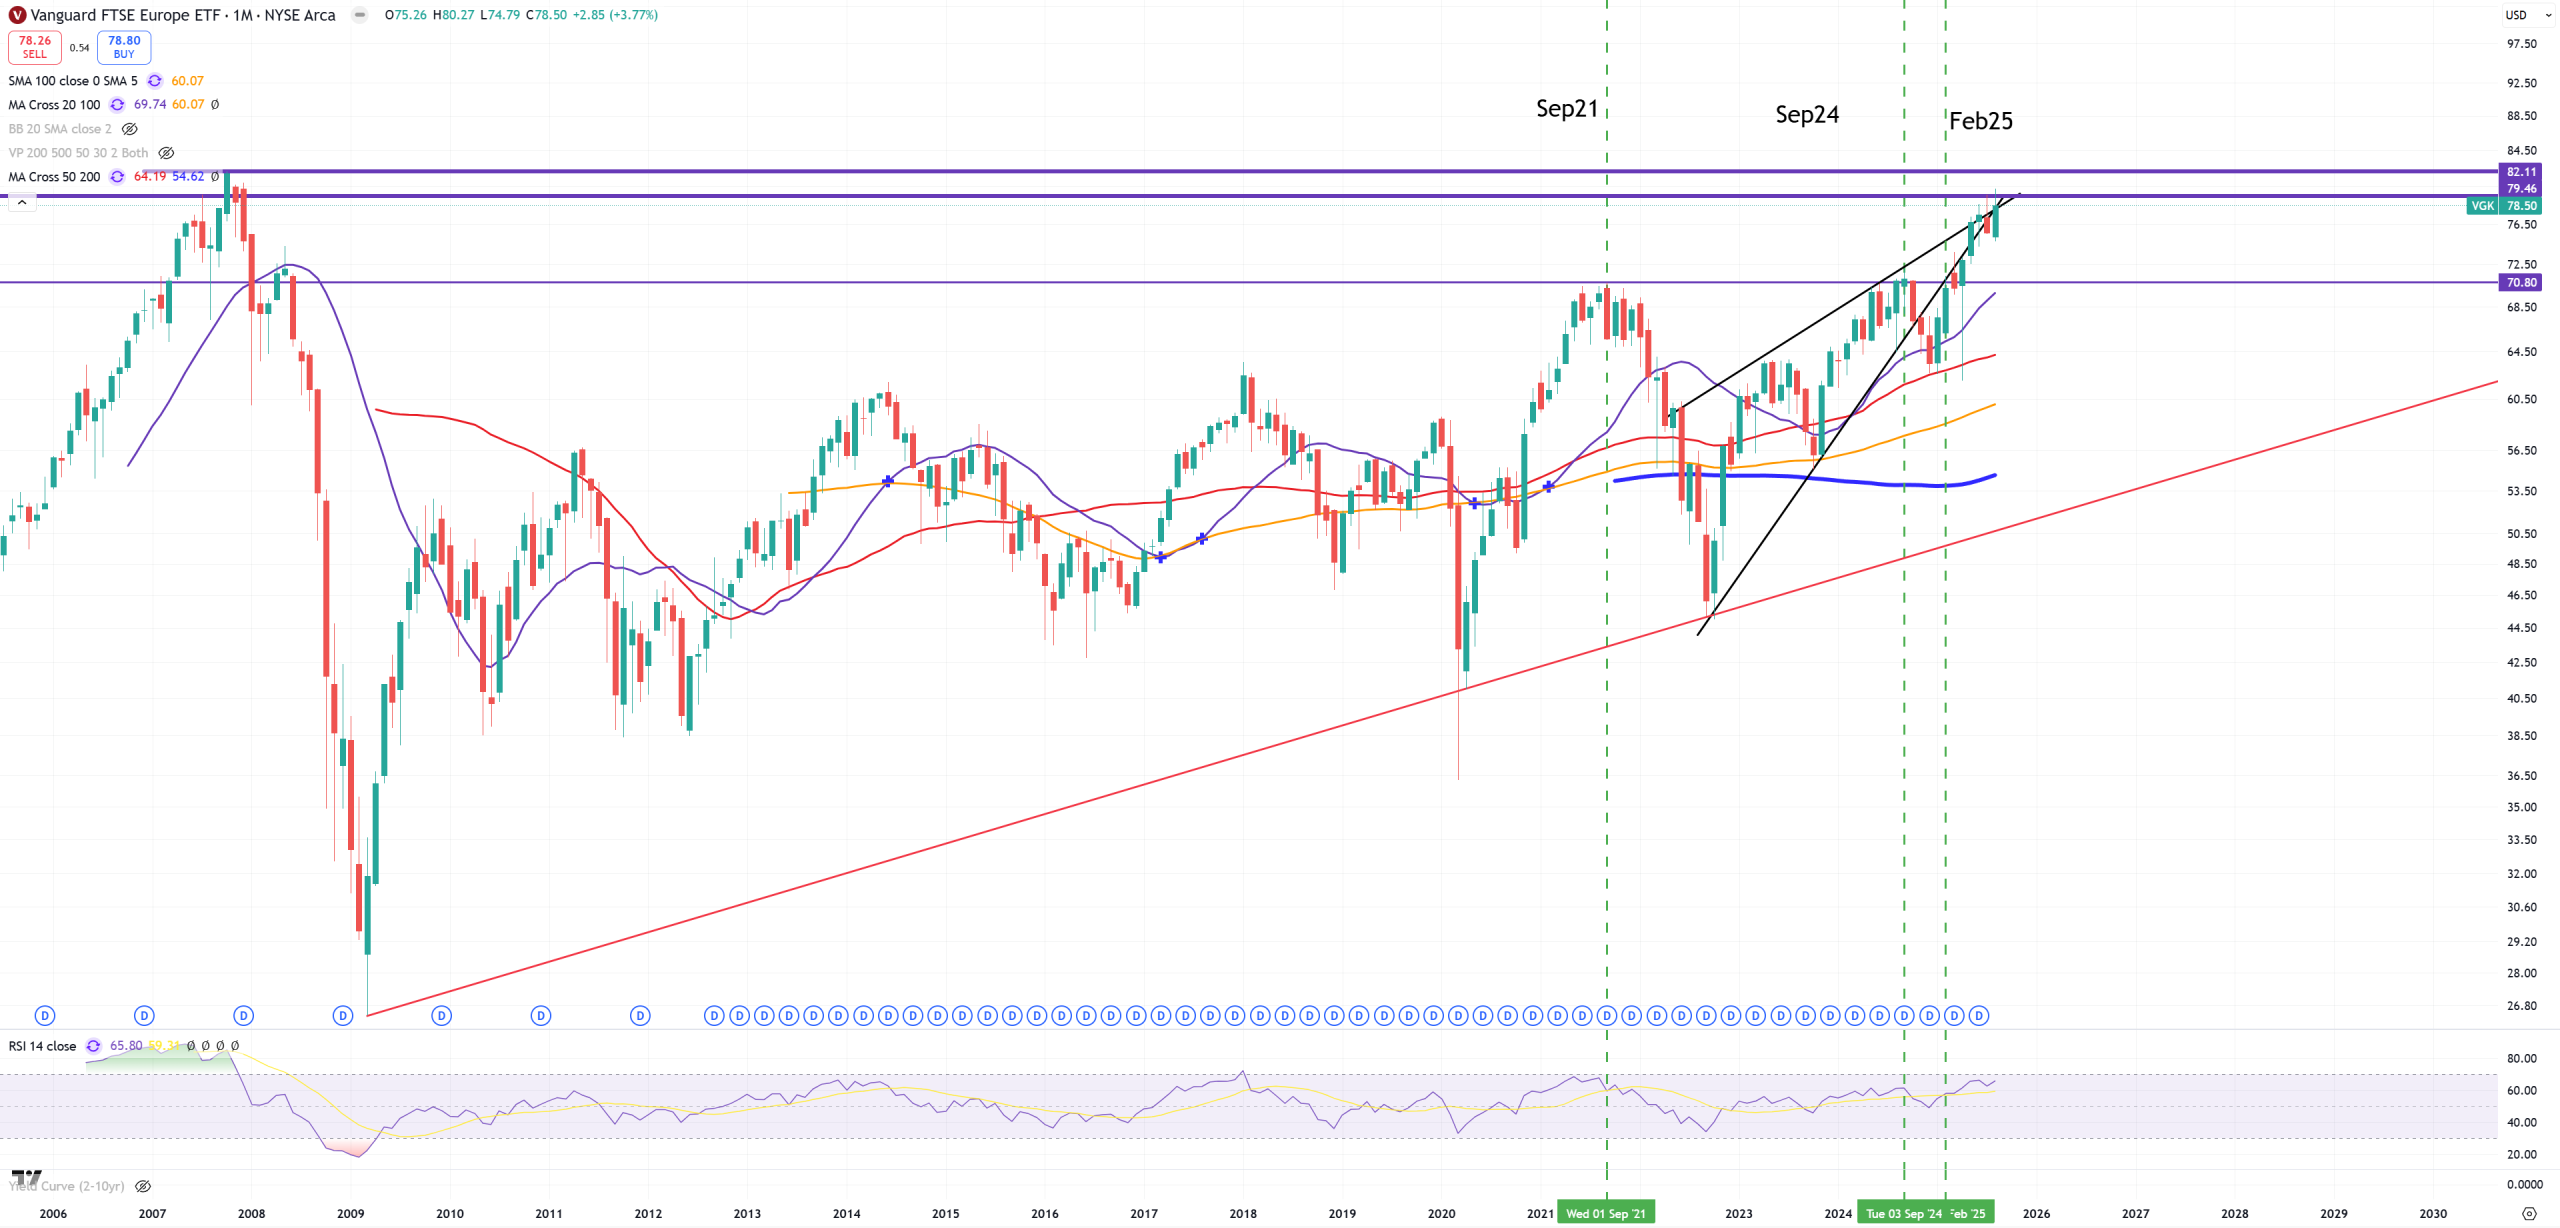
VGK – Europe
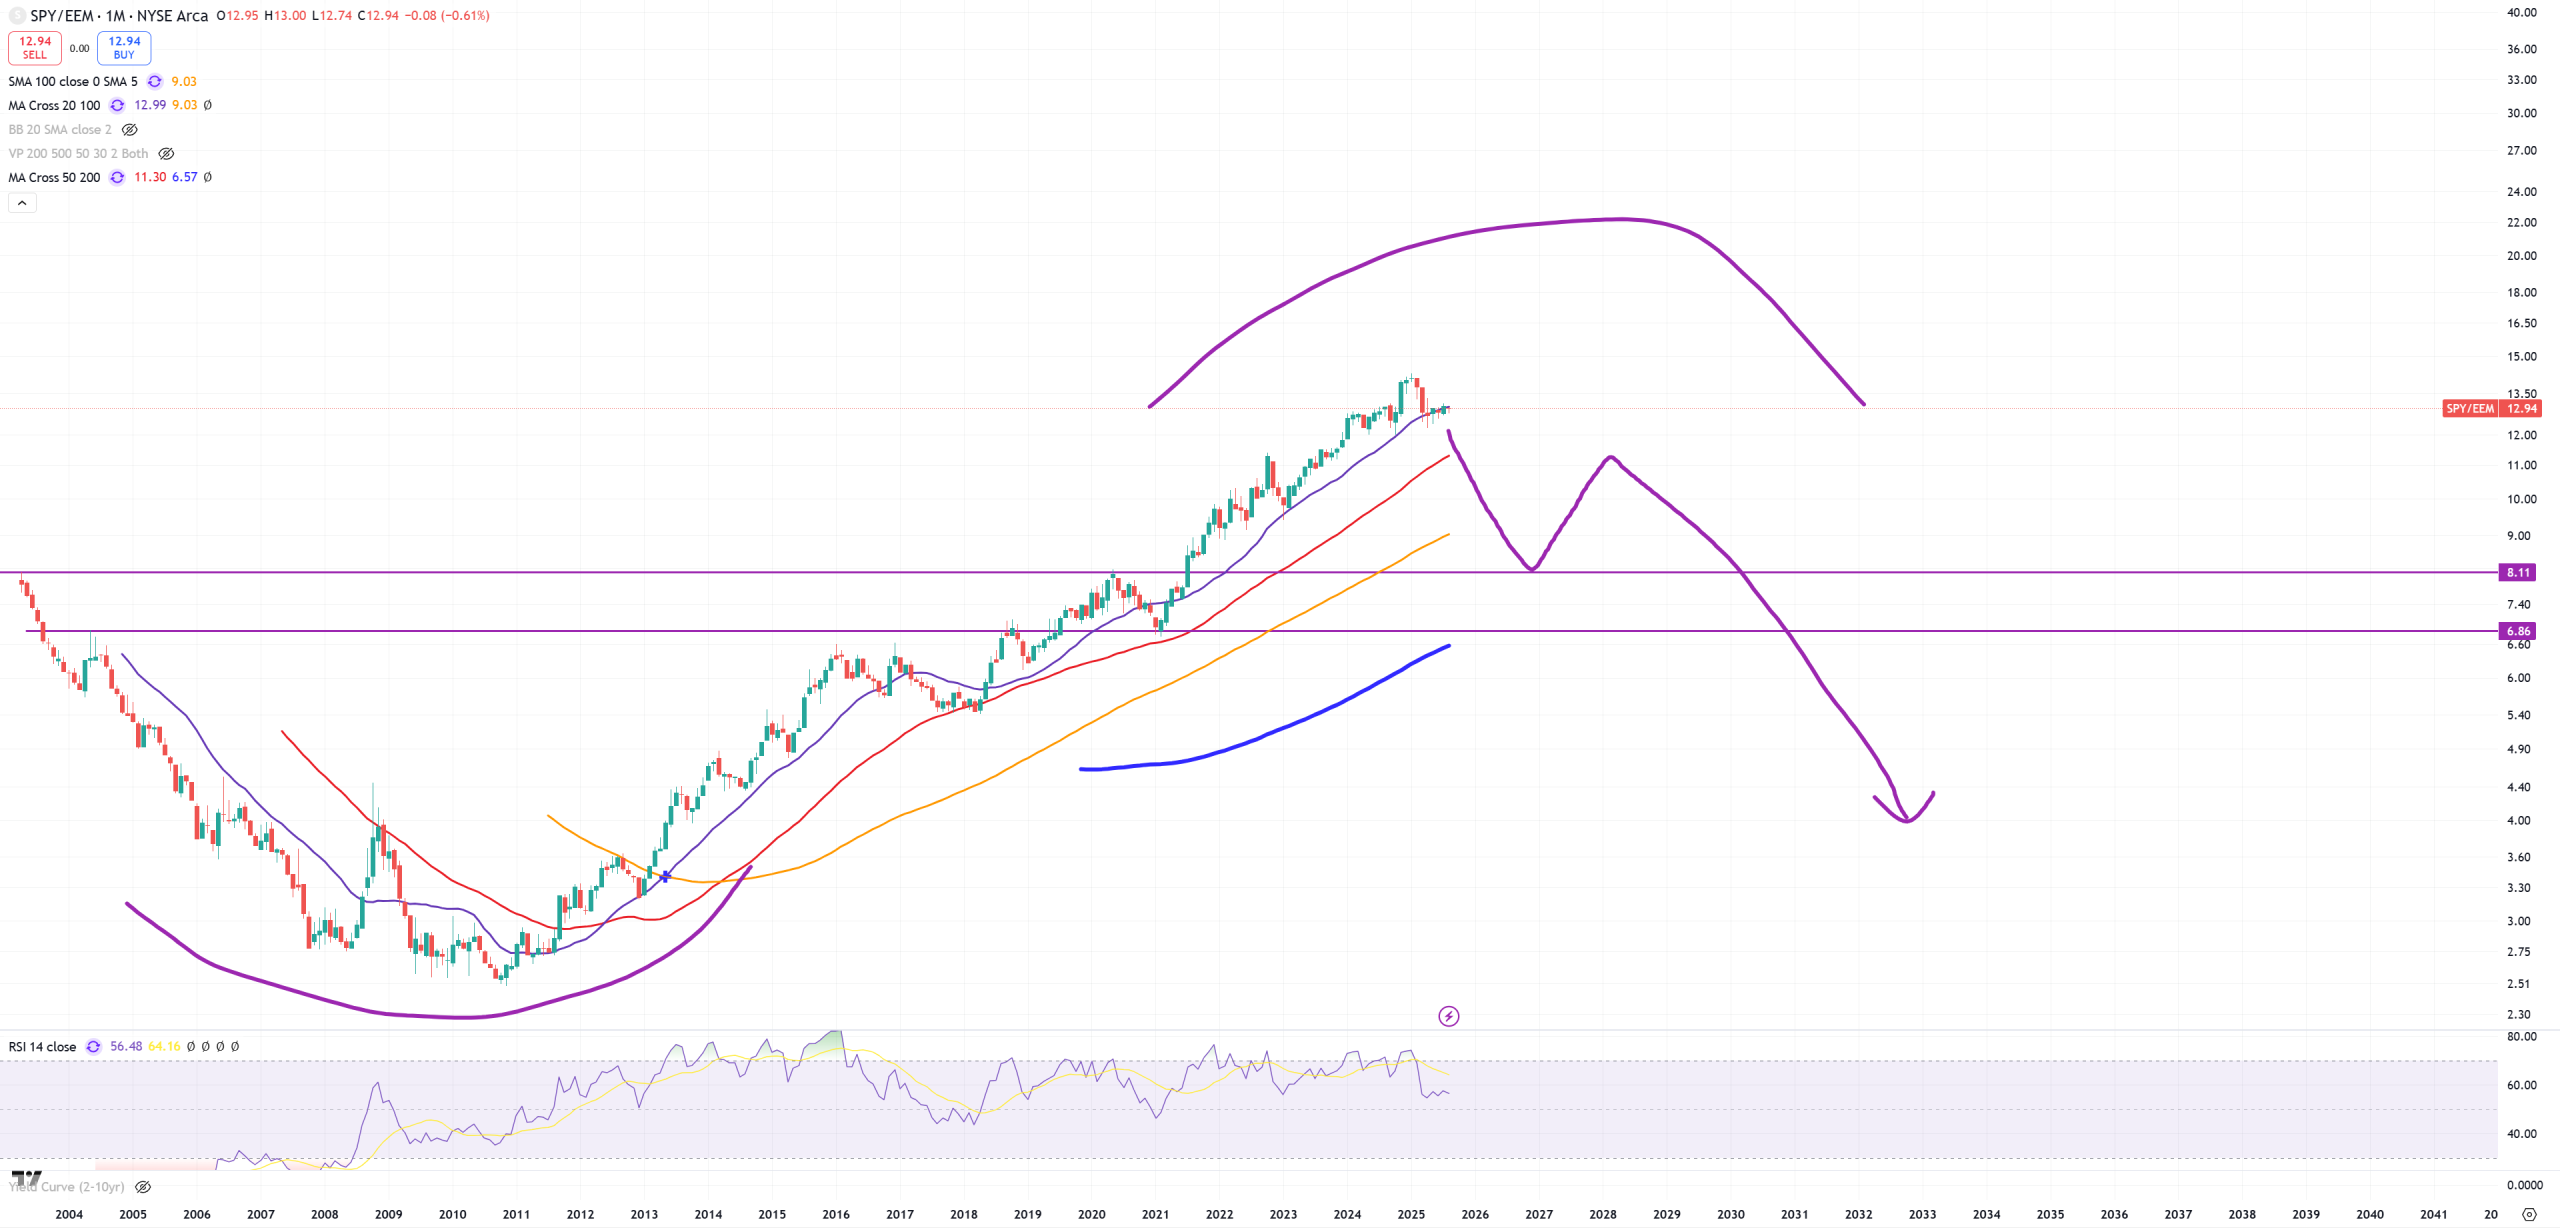
SPY/EEM – are we rotating?
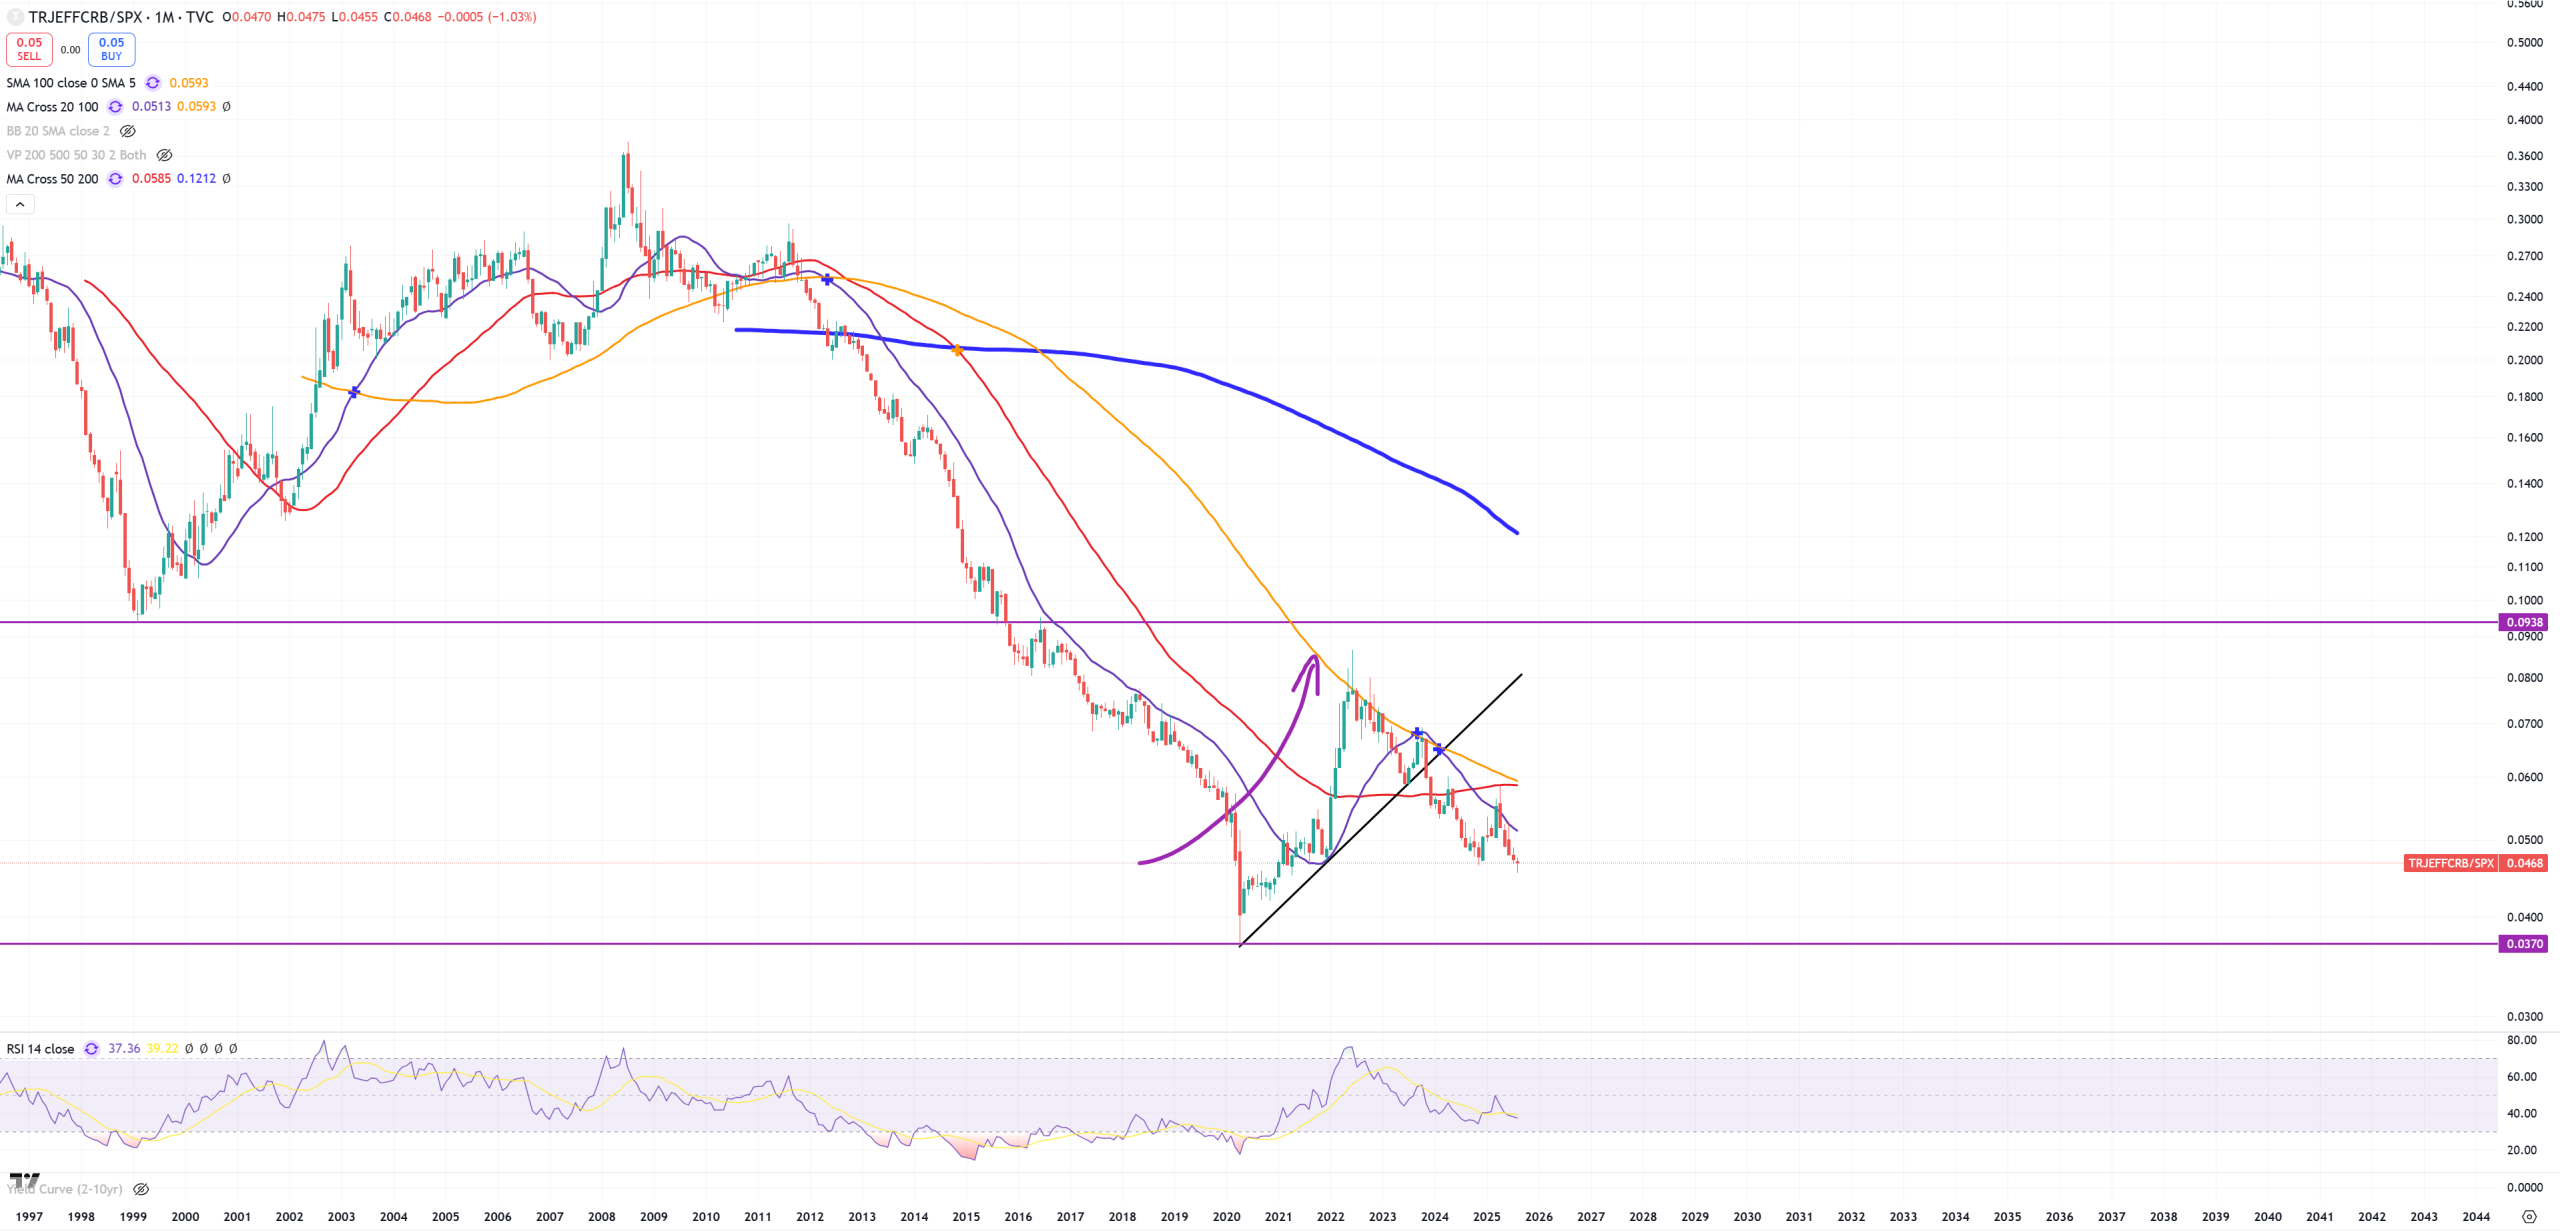
CRB/SPX – Commodities / SP500 – I like this chart because it interprets inflation. We see from 2020 lows big spike here till Jun2022, last biggest peak July 2008.
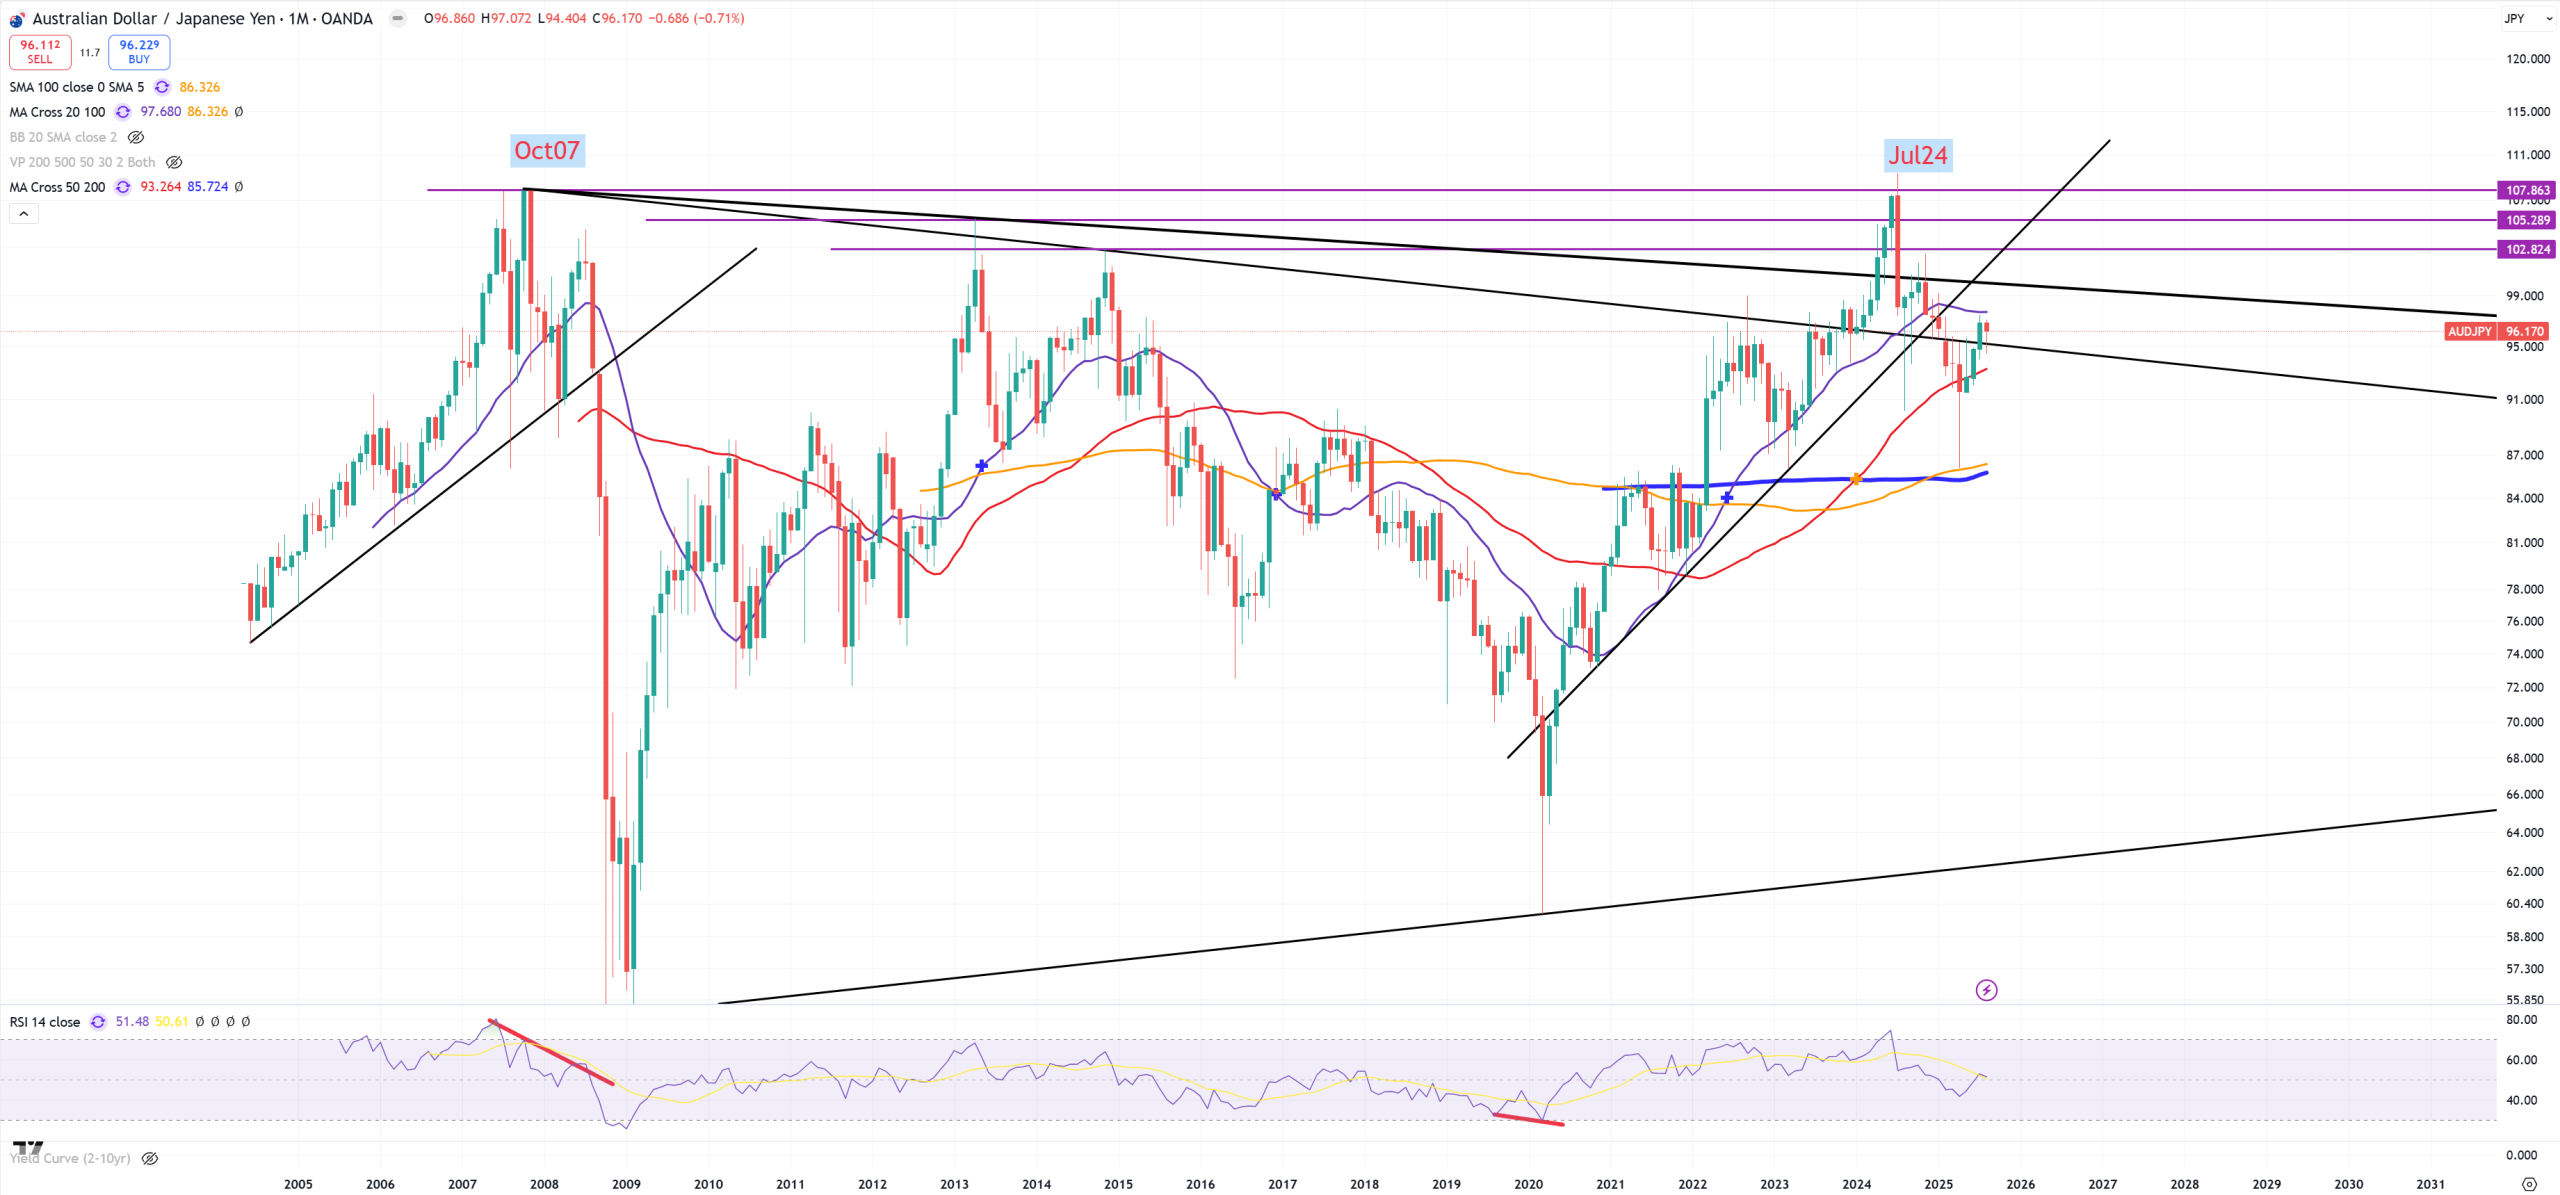
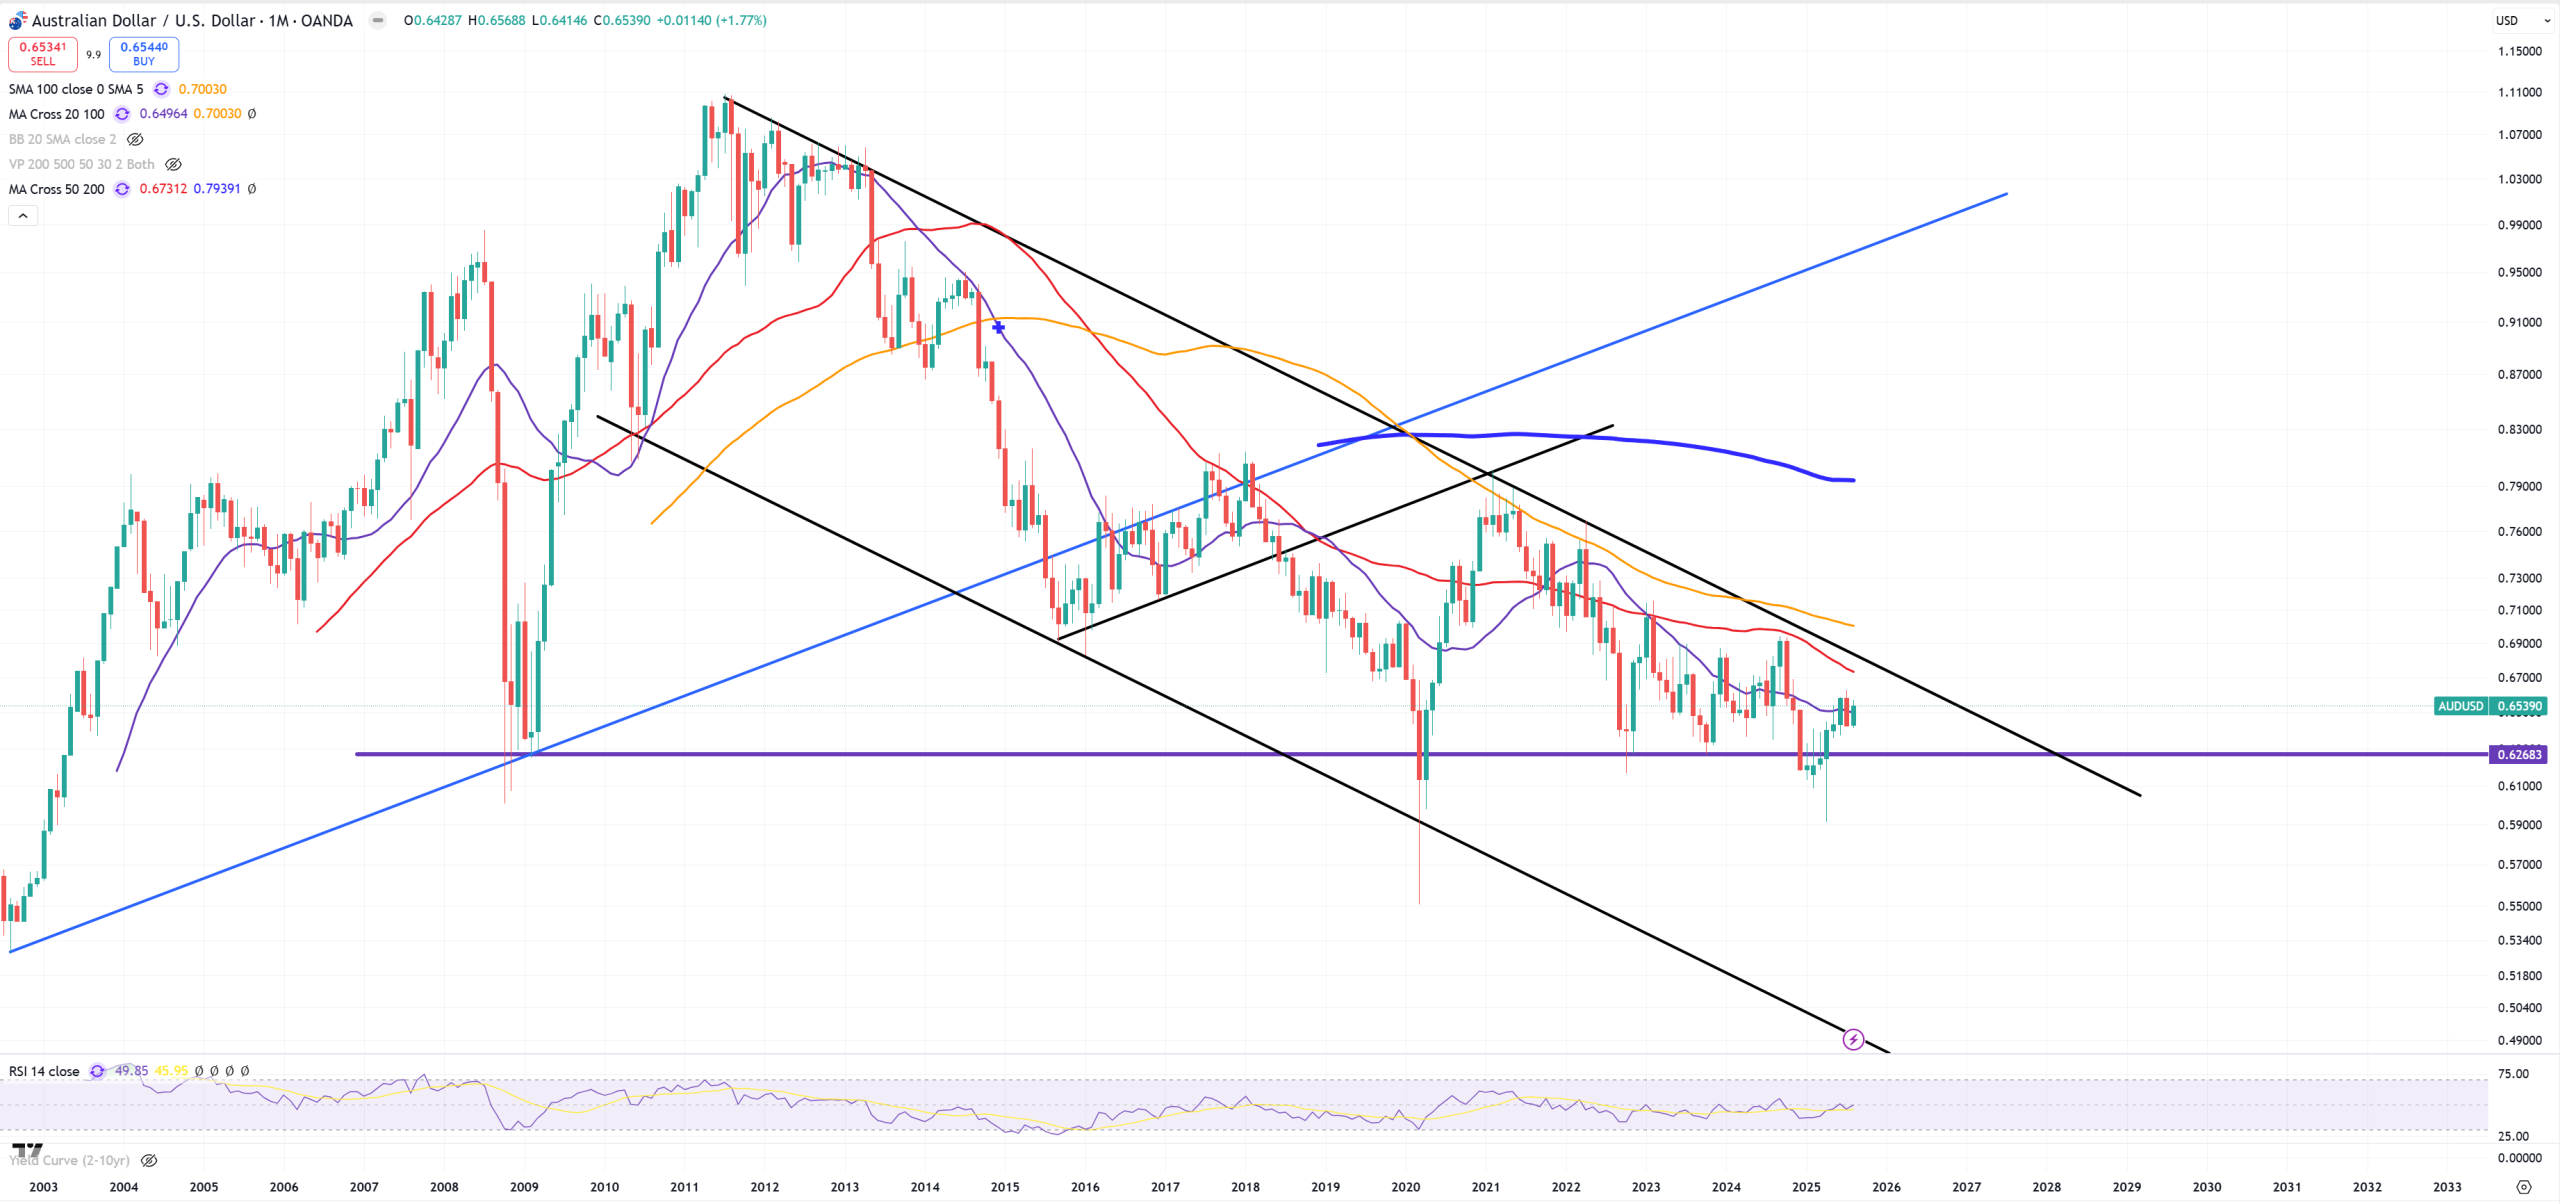
AUDJPY – because SPX trend is broken here we have a kind of similar break, trying to hold above key trend line
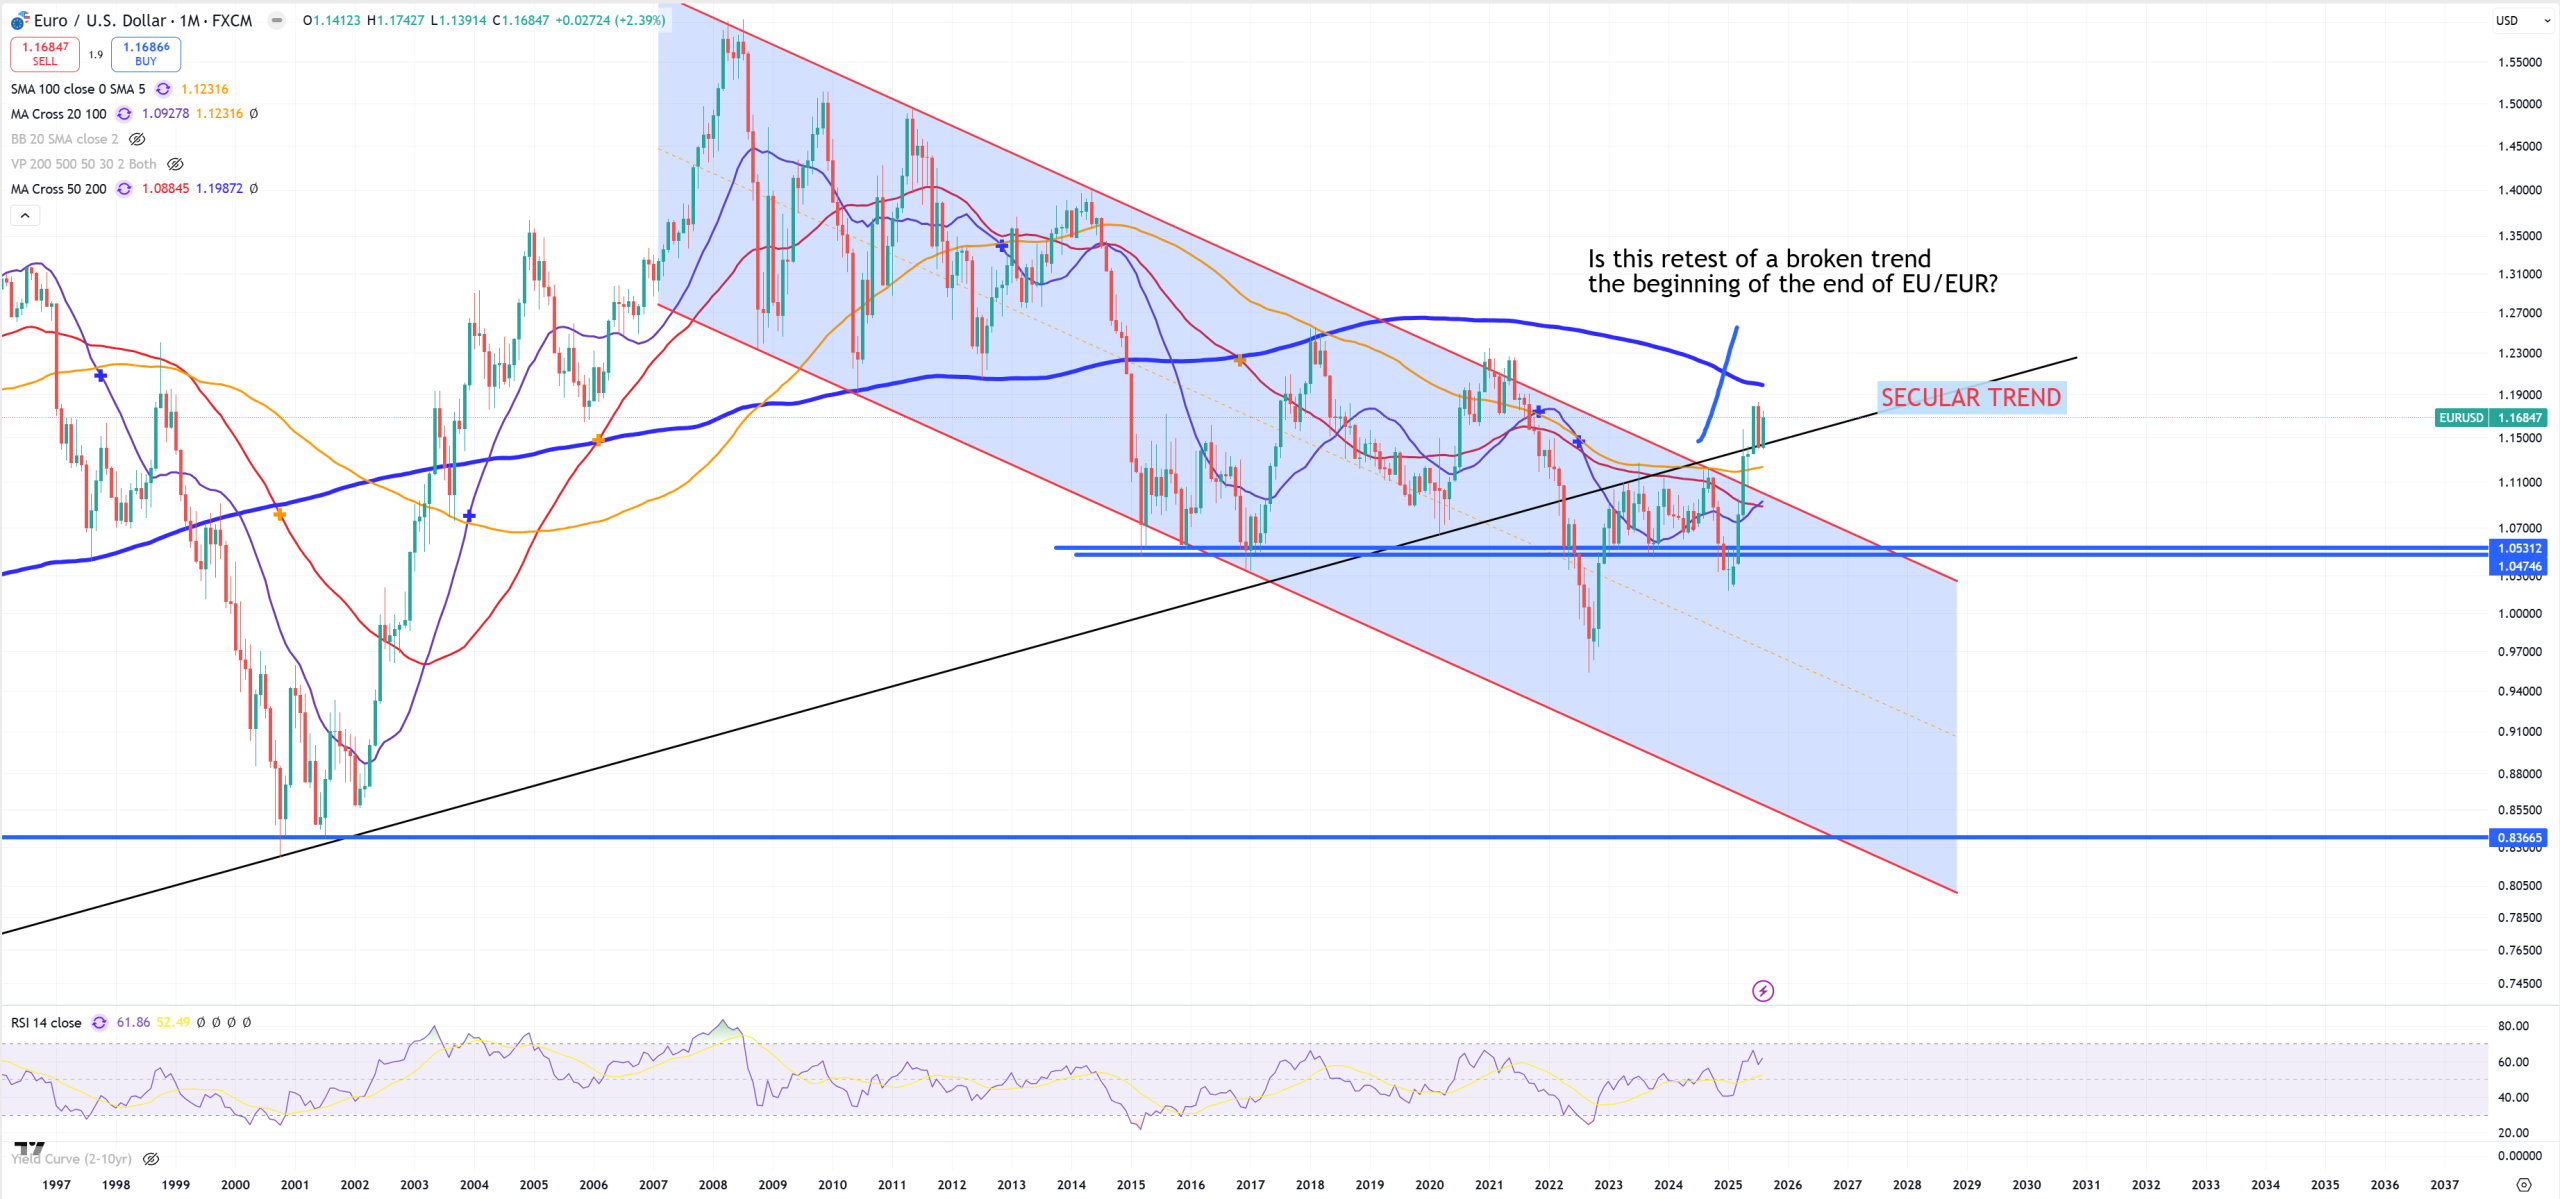
EURUSD – that’s the same setup as SPX and AUDJPY
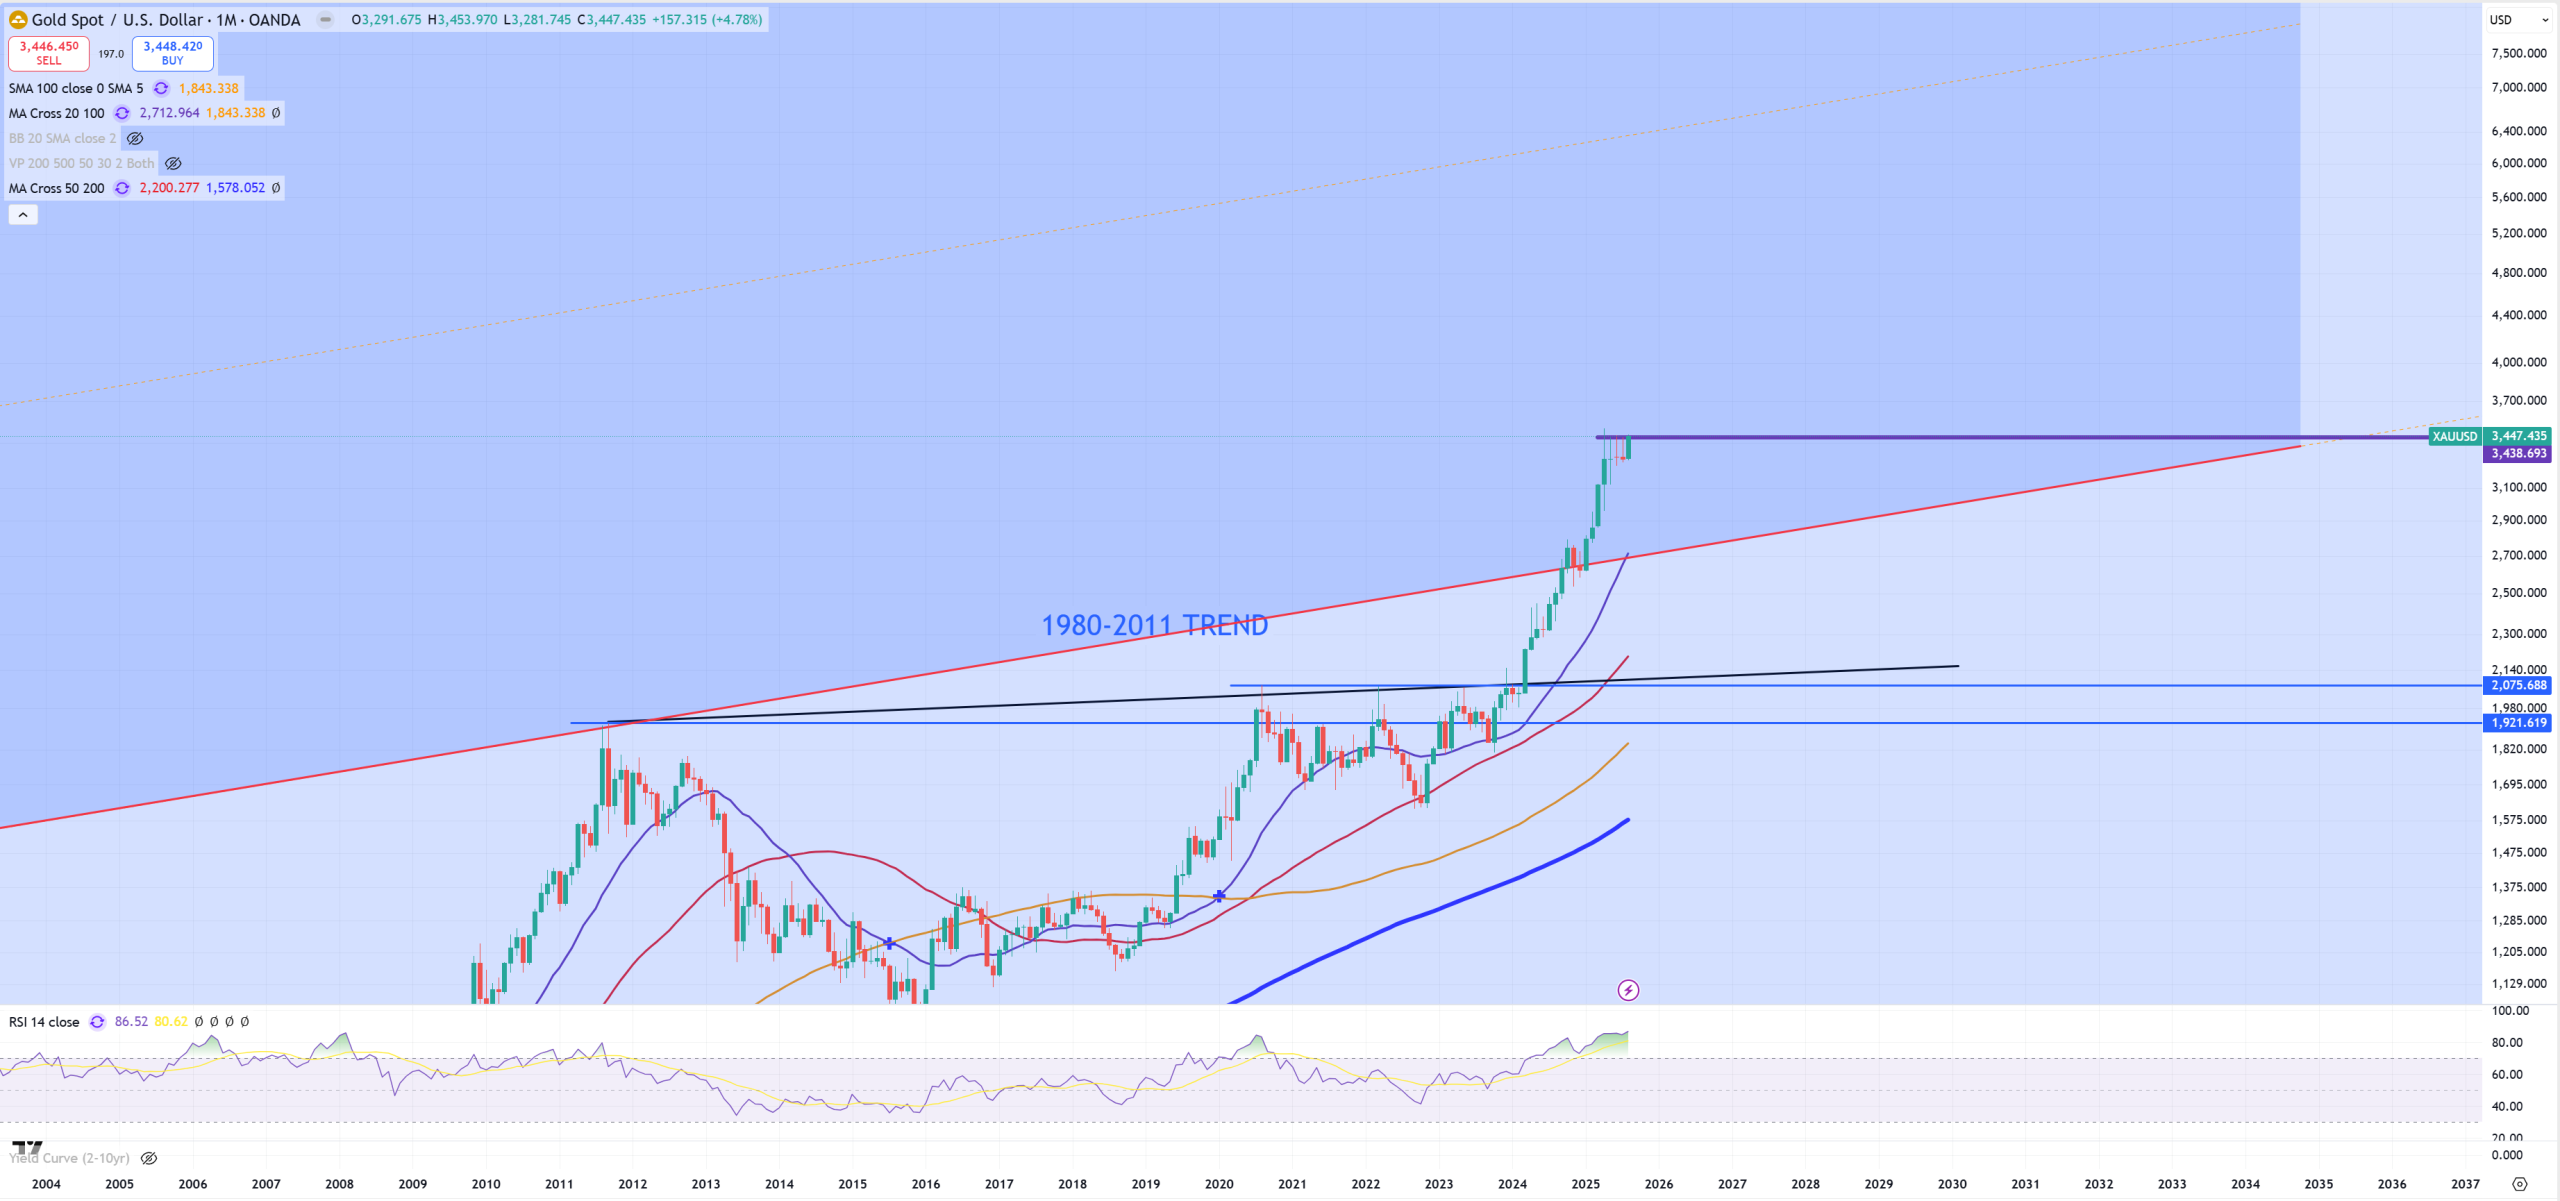
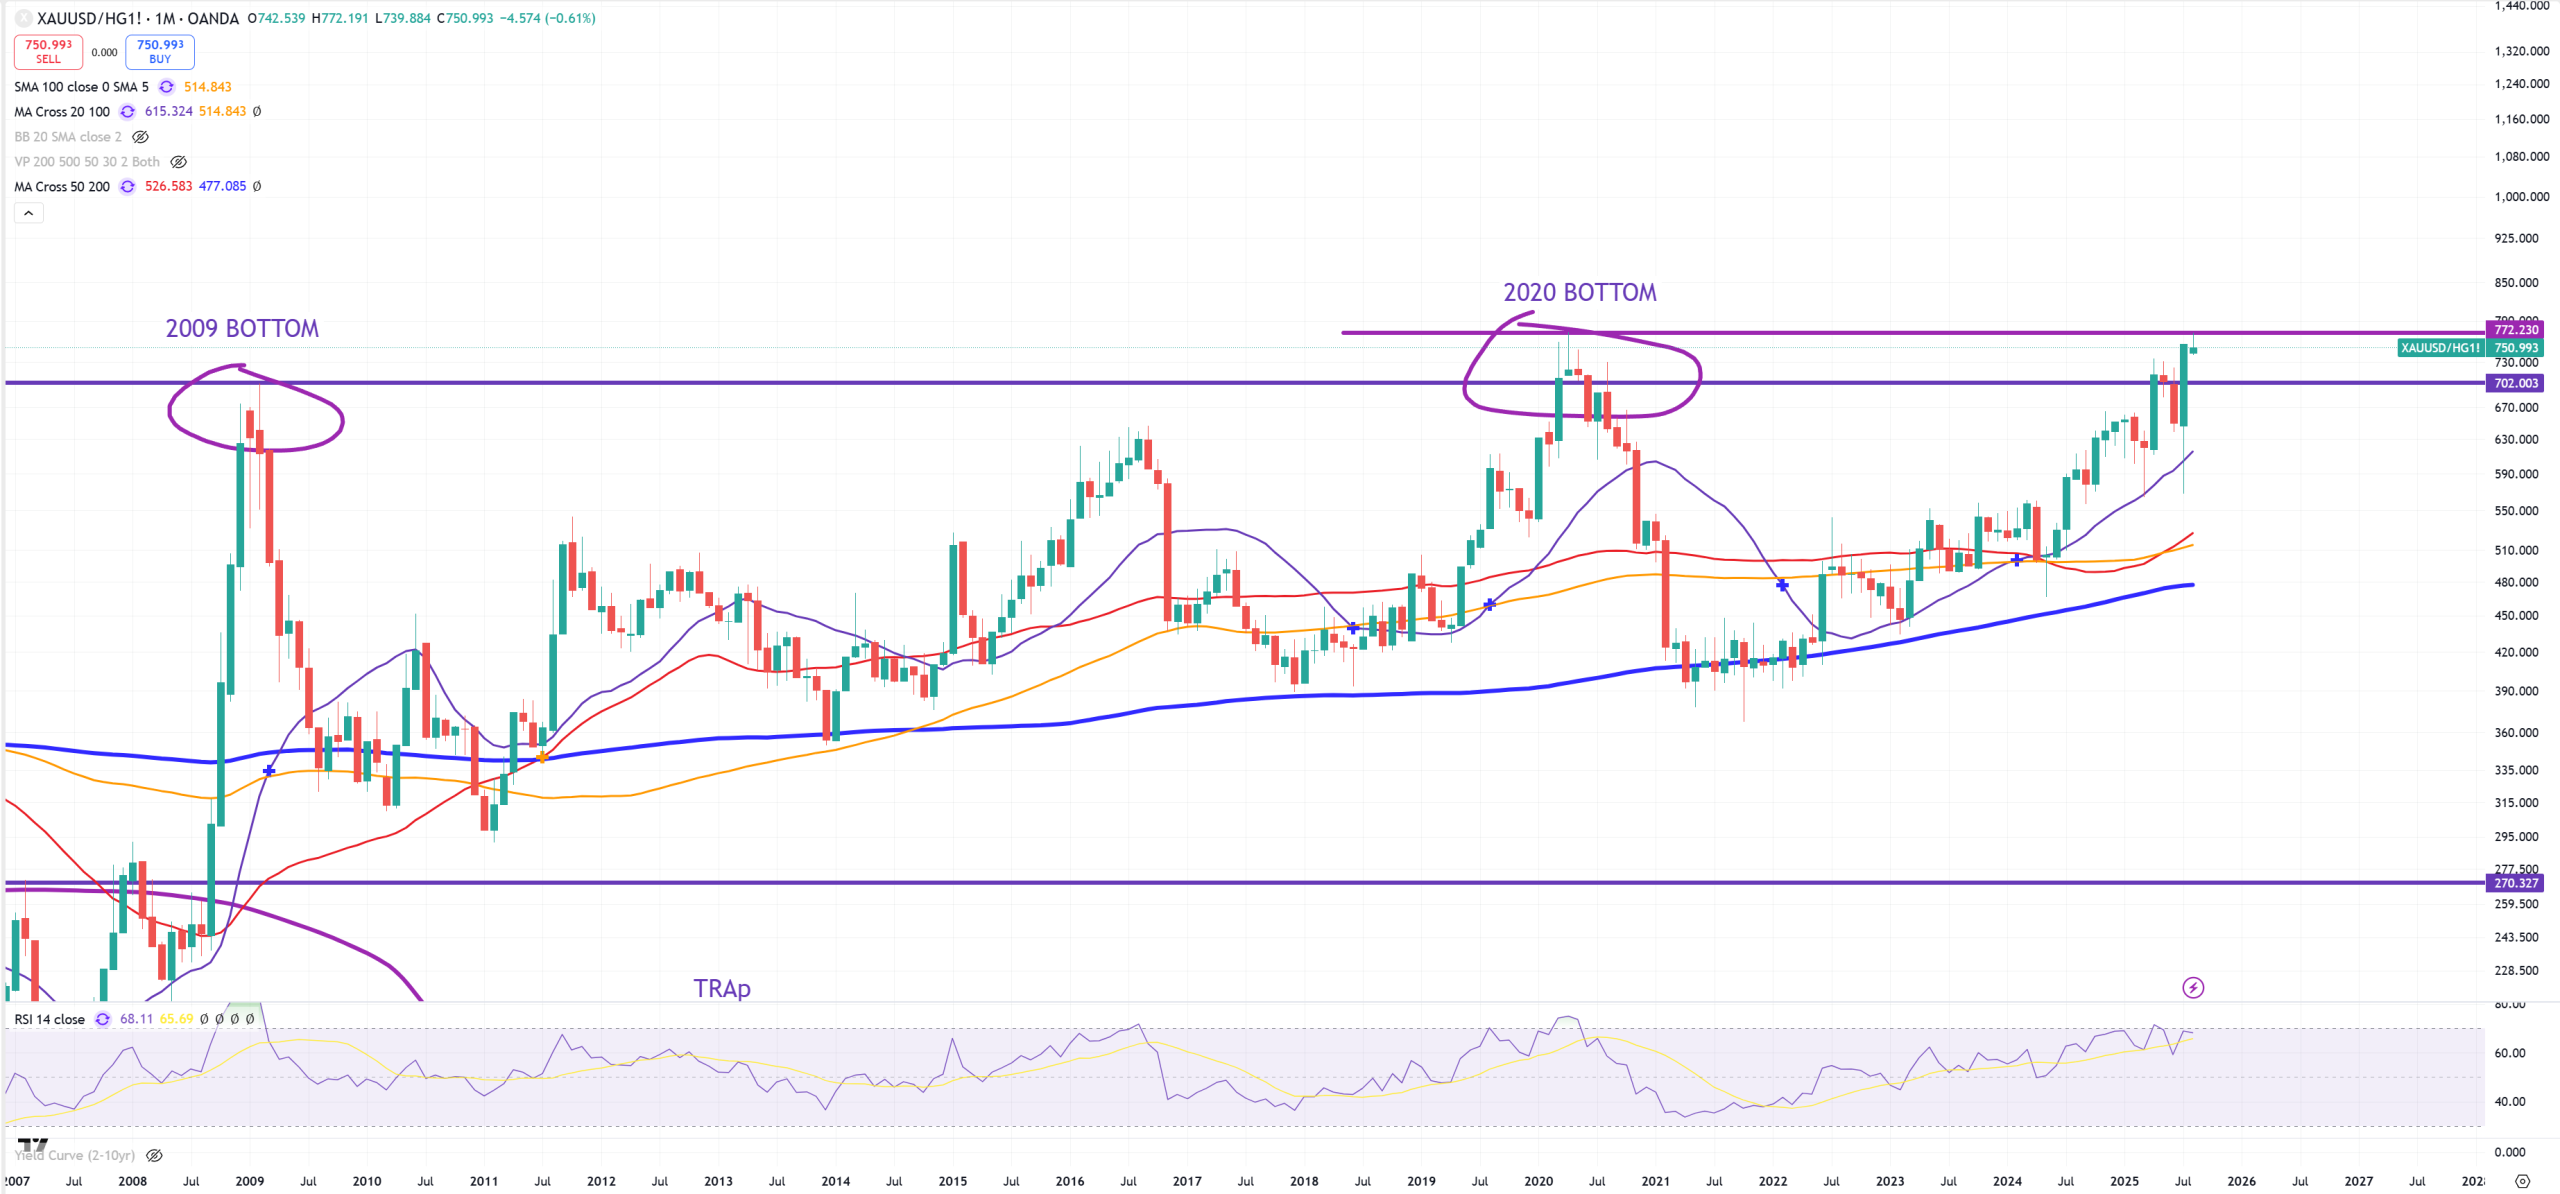
XAUUSD – Gold, it might correct to 2700$ or it might not. (M)RSI is the highest since 1980 when the peak arrived, I have big doubts this time it’s the peak and more confirmed we’ll see soon a break here. Even some time ago I posted my own thesis that gold will be raising until SPX will close below (M)MA50 = 4850.
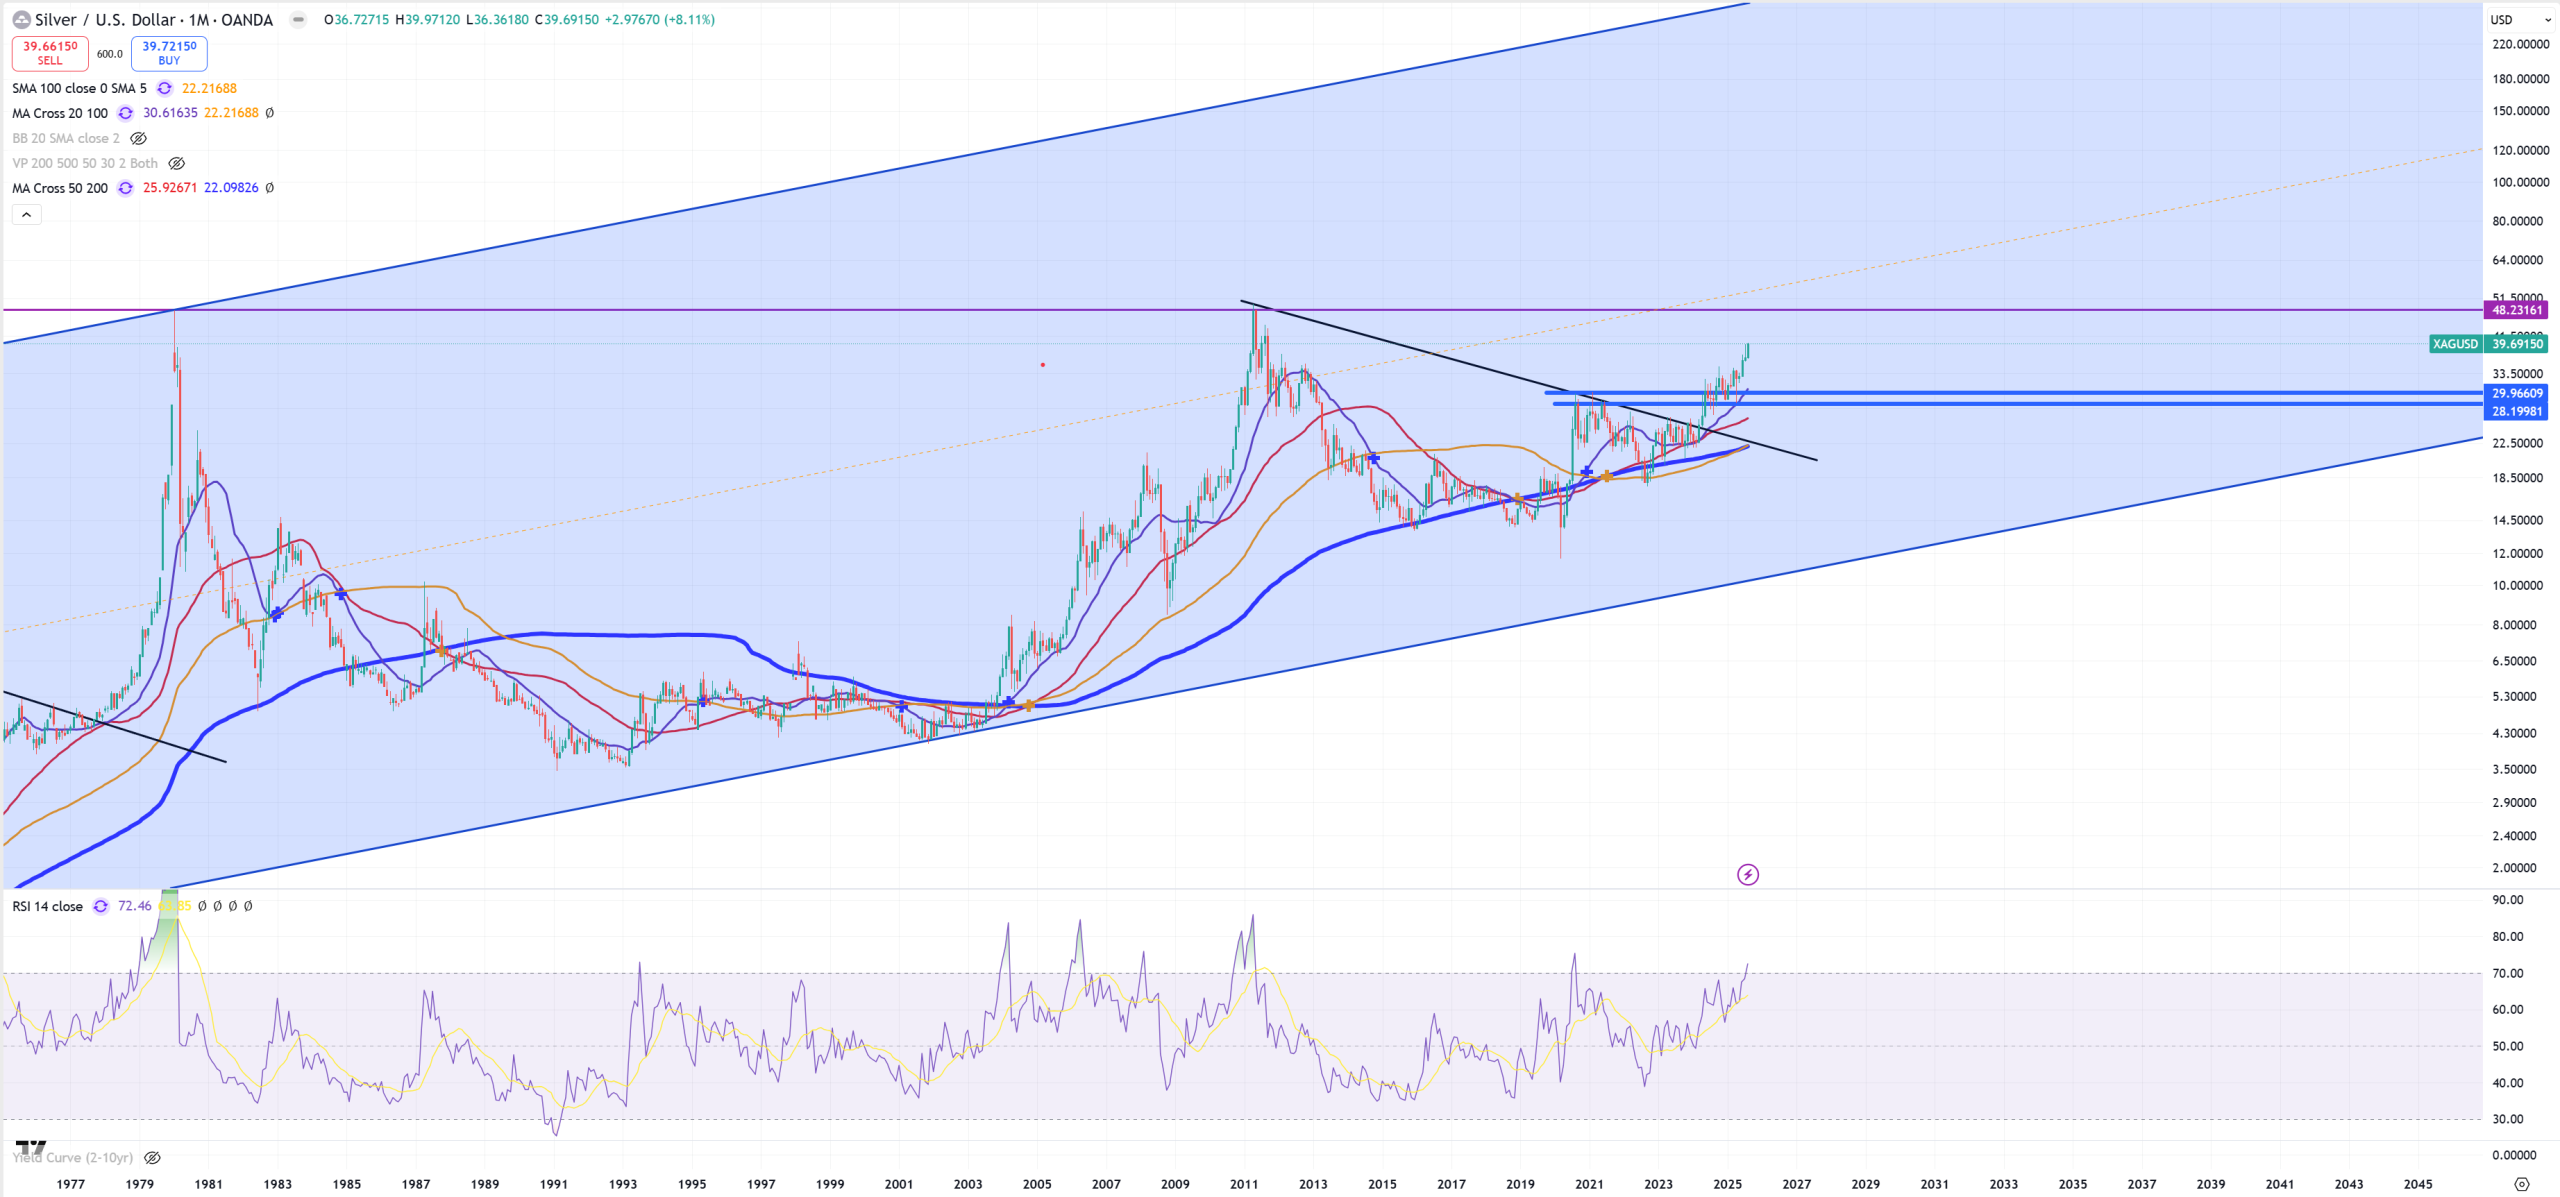
XAGUSD – Silver is in very powerful pattern, long term head and shoulders
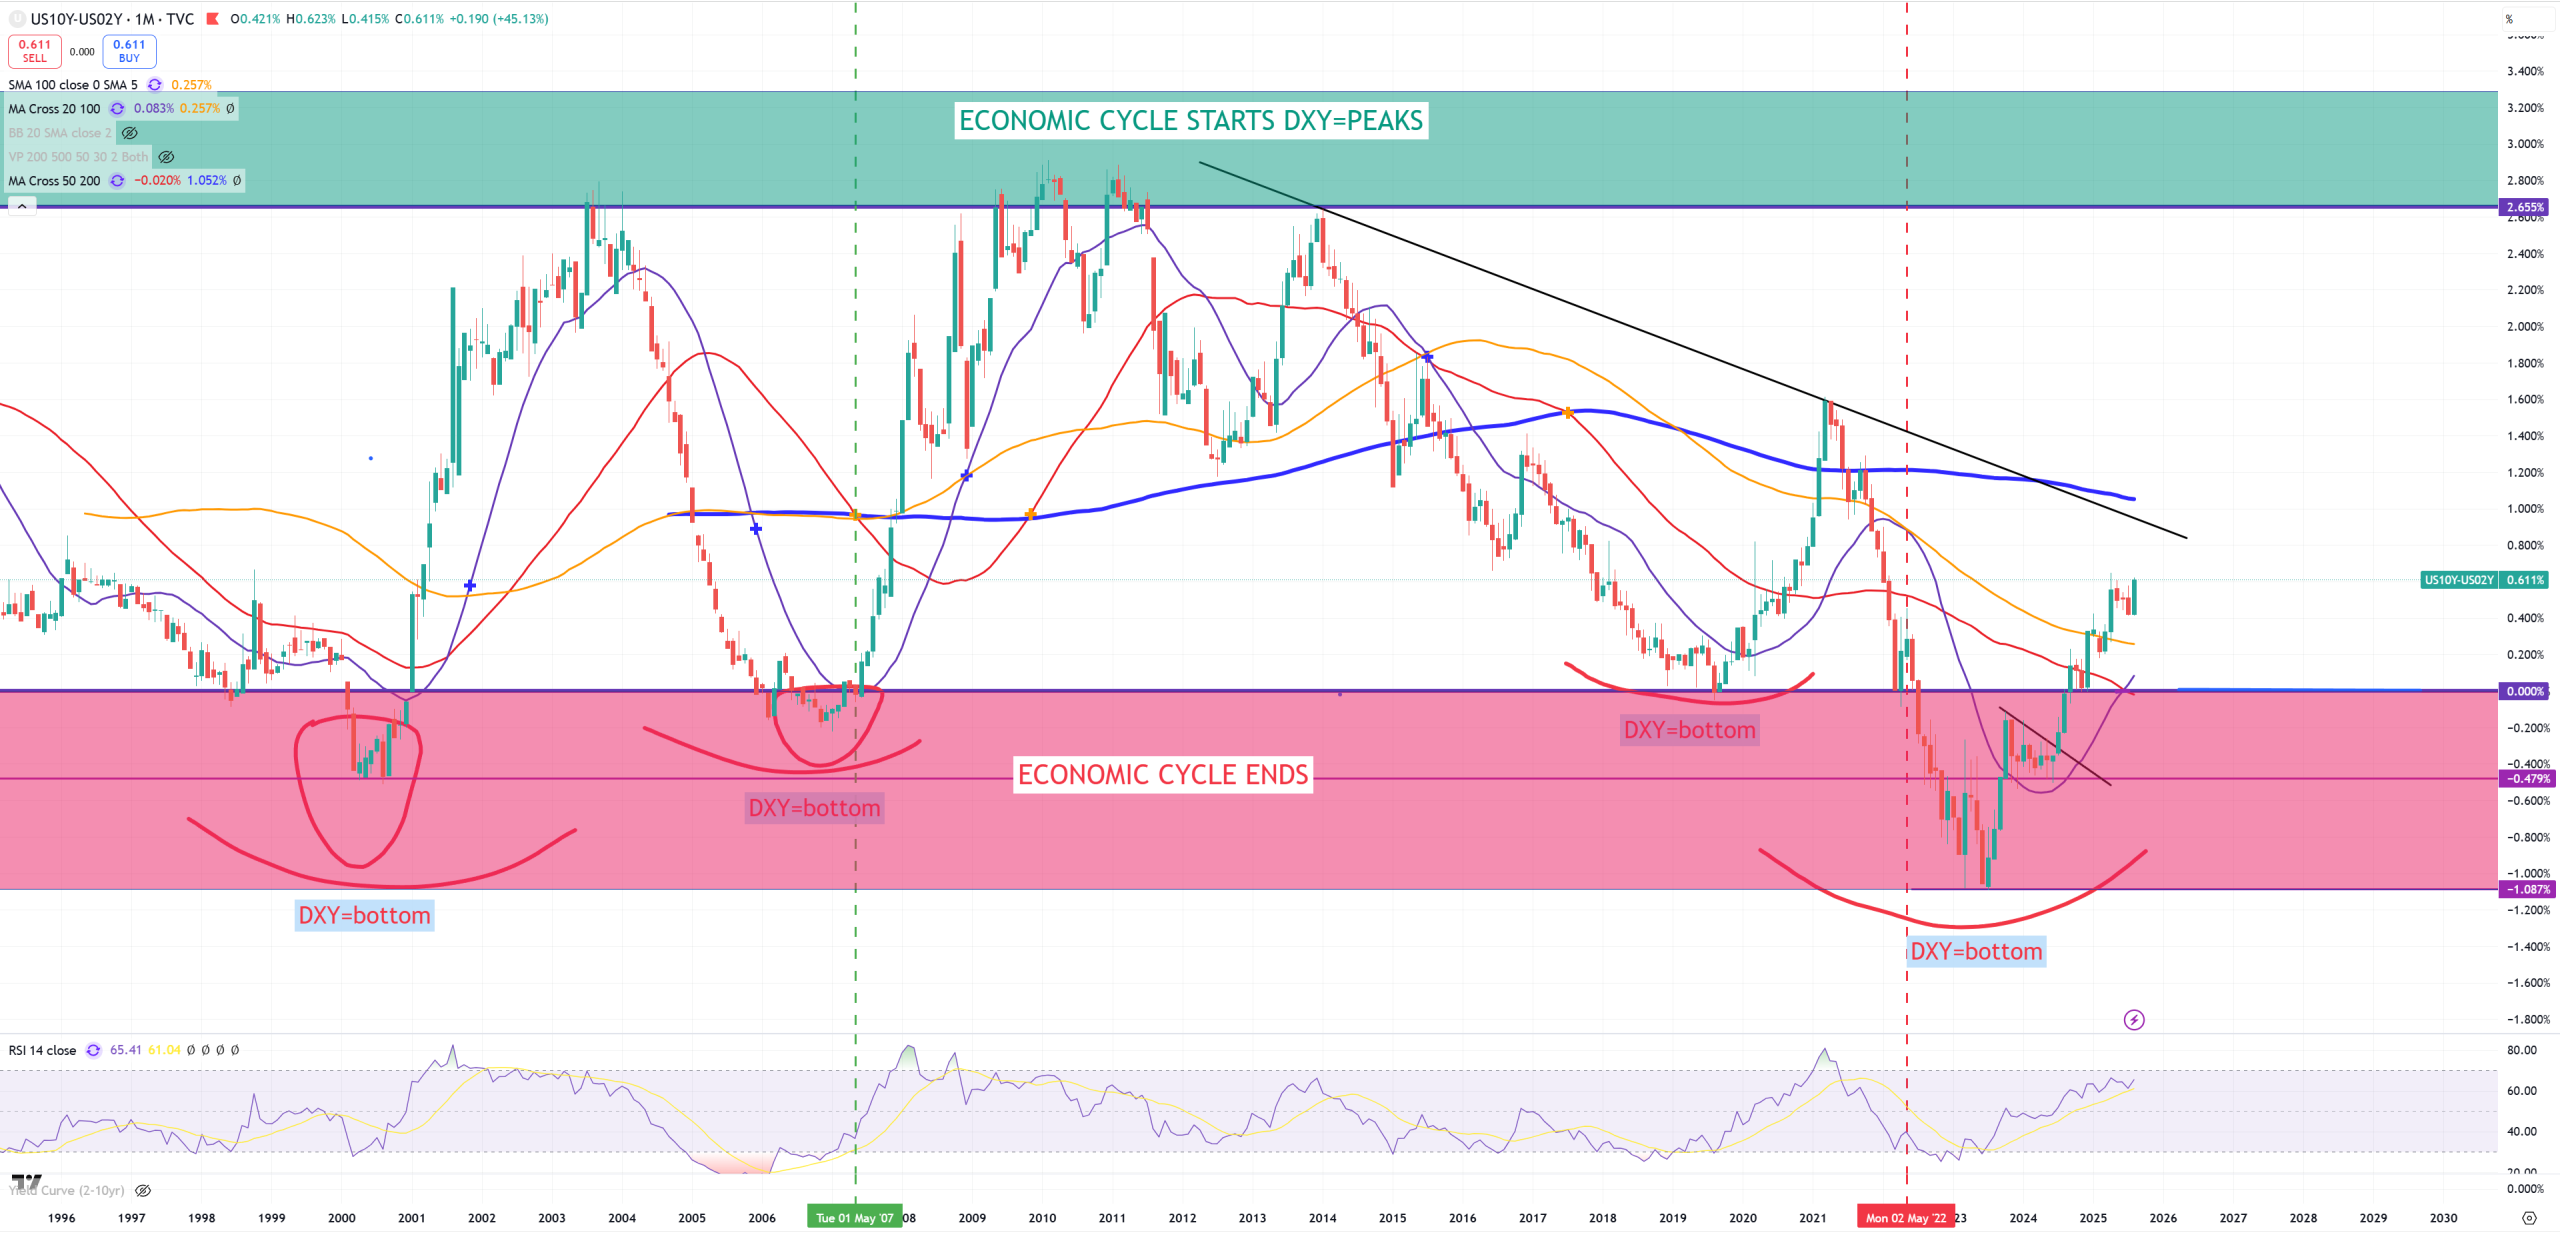
DJI/GOLD – key ratio telling us about turn in the economy, peaked in October 2018, 2011 trend broken in April 2024. This chart is below all key (M)MAs, so we’ll be considering only (3M)MA200 here which was broken 5 times in last 100Ys. 1931, 1937, 1973, 2008 and 2025. We see this (3M)MA200 retest what points us to a statement : September will be really important, also huge negative (3M)RSI
SPX/GOLD – here is a bit different story on another key ratio chart. That’s why markets are mixed. While DJI/GOLD is broken on (3M)MA200 for the 5th time in 100 years, SPX/GOLD with October 2021 peak just retests (3M)MA50 after a break with (3M)MA200 support. Also 2011 trend break happens in July 2024 not April 2024 like DJI/GOLD. This red (3M)MA50 retest is super important, because even 2020 lows made this (3M)MA50 as a support. Negative (3M)RSI
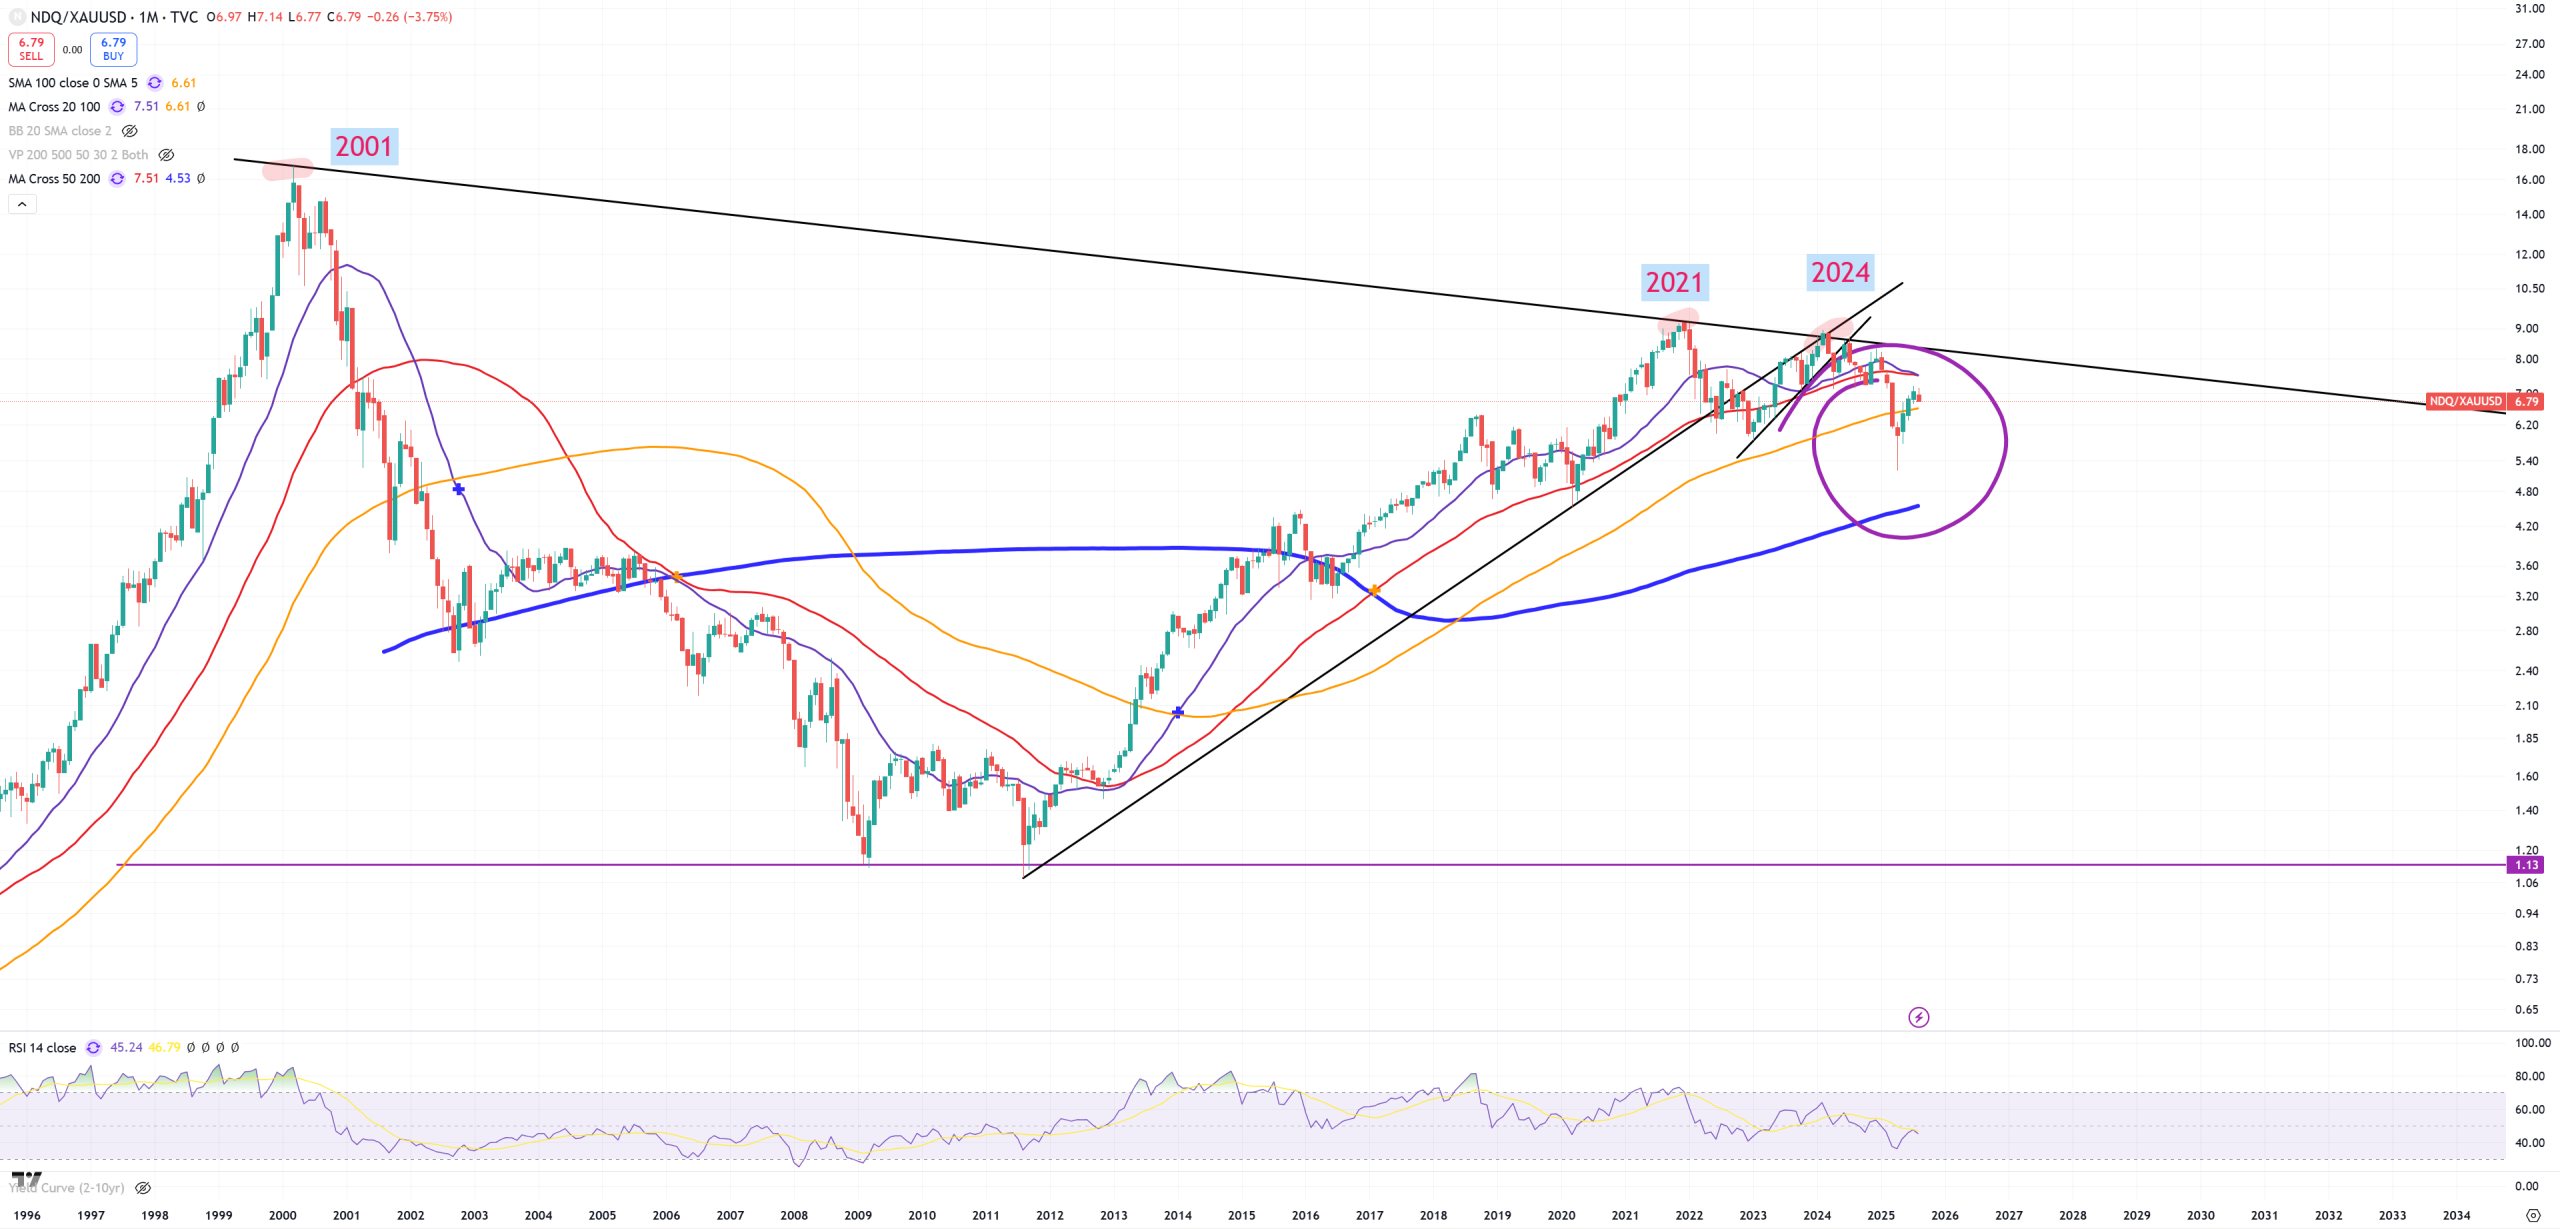
NDQ/GOLD – this chart means nothing because it’s too short.
GOLD/BTC – main crypto peak indicator hits another support
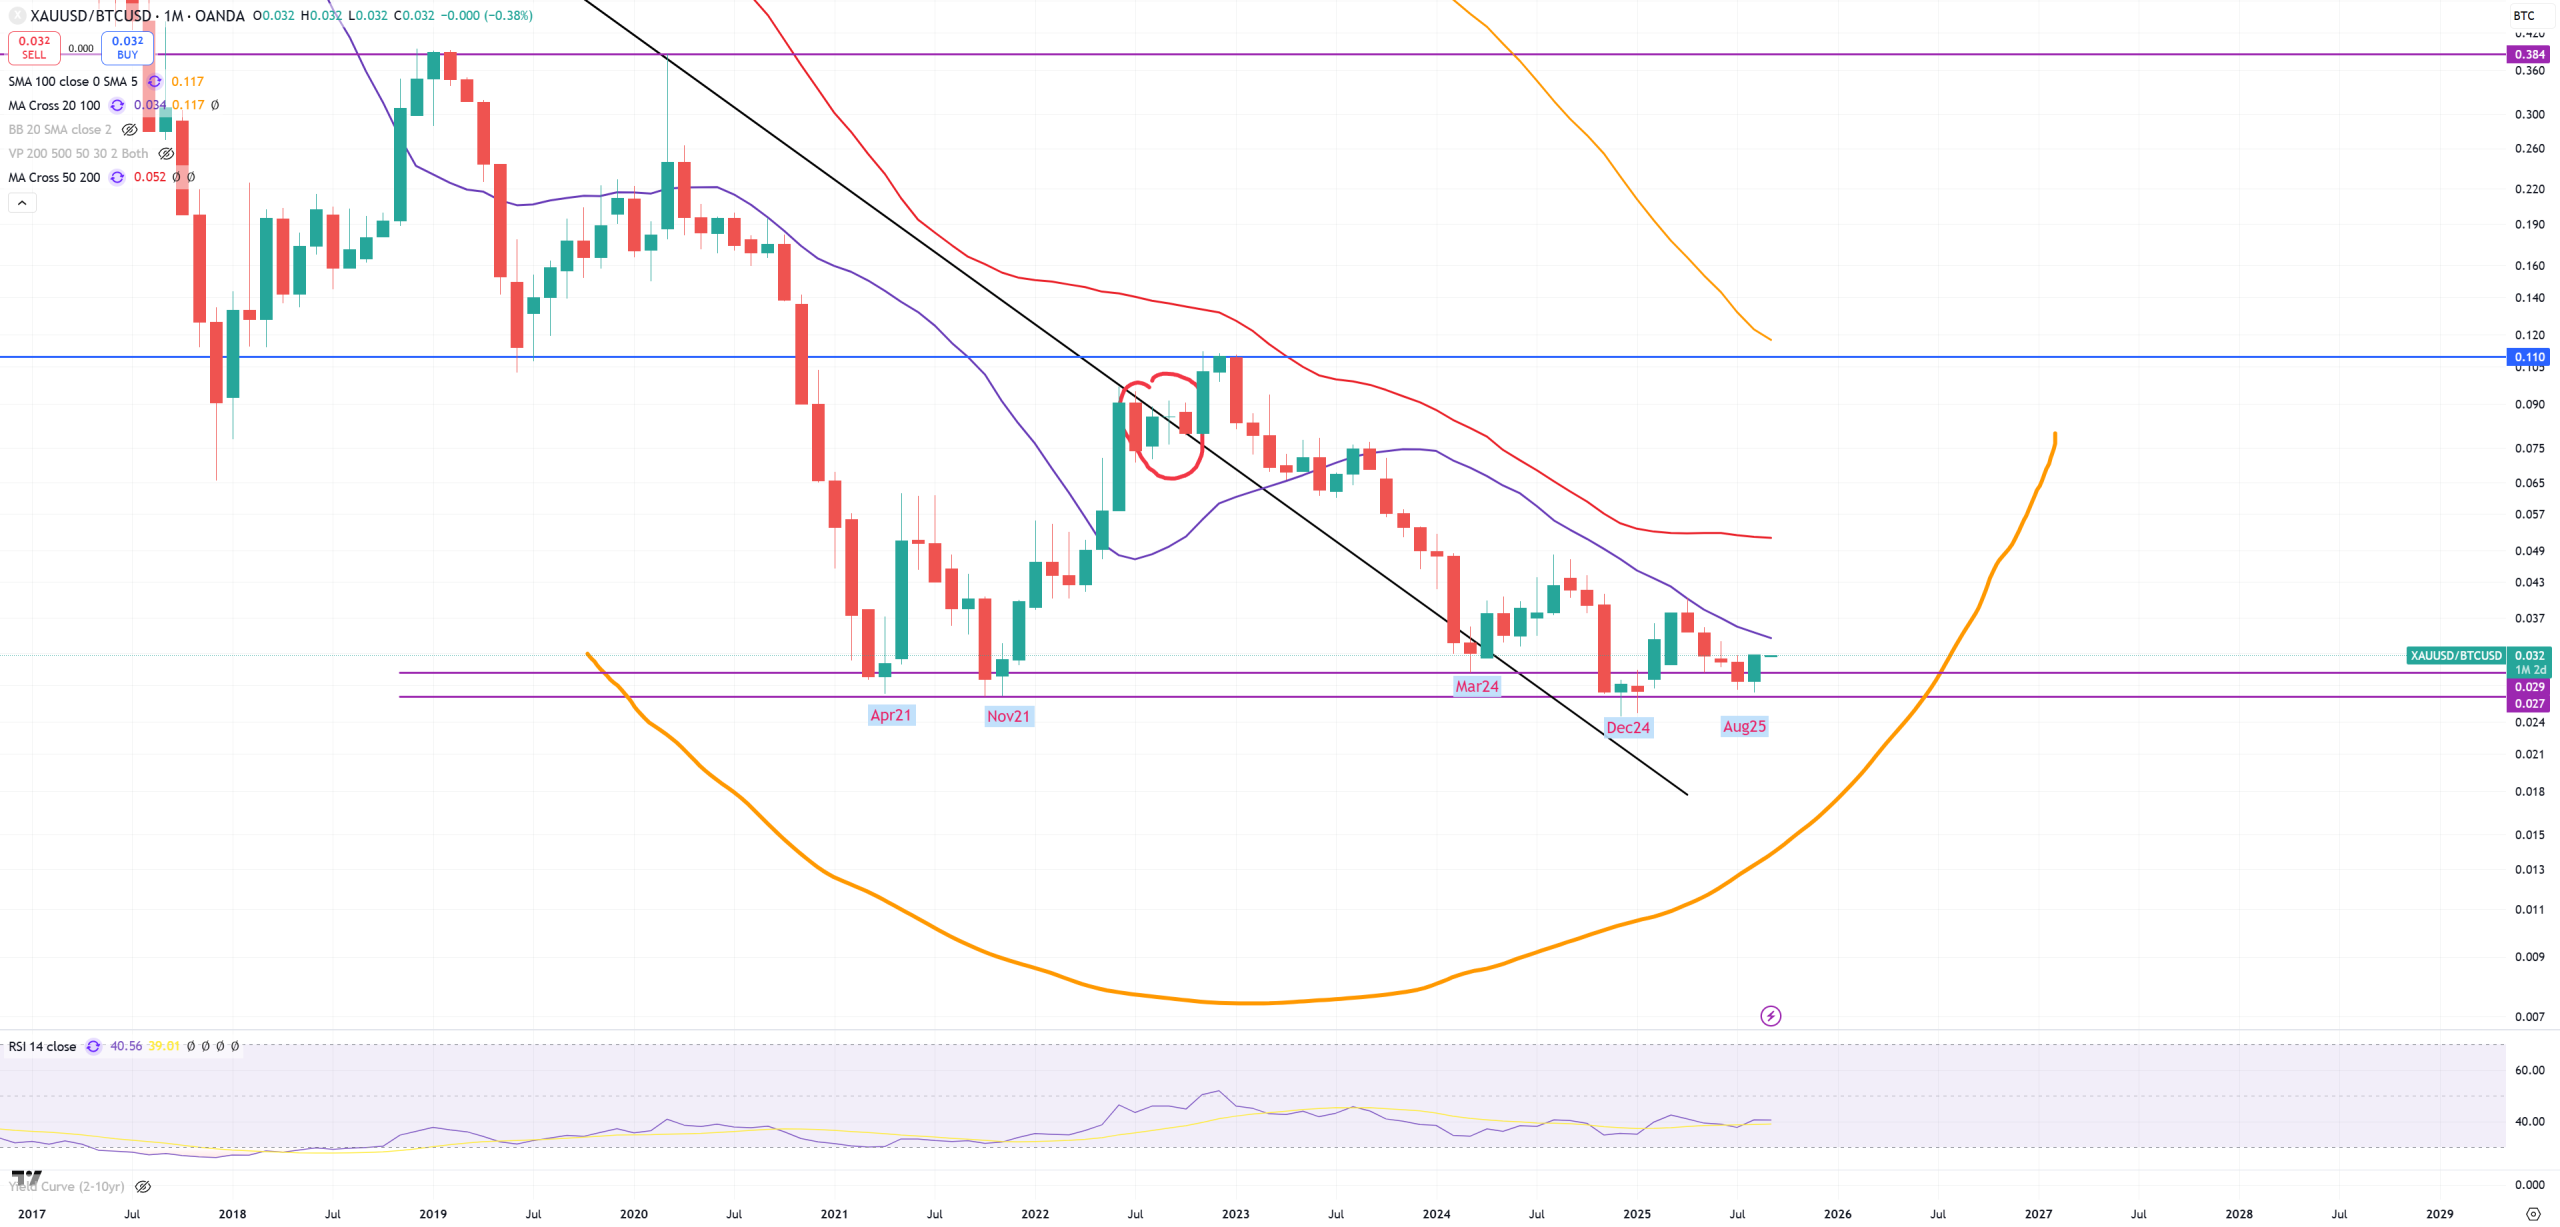
BTC – question if this spike above key resistance was a bull trap, if GOLD/BTC ratio seriously hits this support which is unbreakable, BTC should start going down, bit GOLD/BTC hits support level since 2021, so 4 years and nobody knows how long it’ll say on this support level
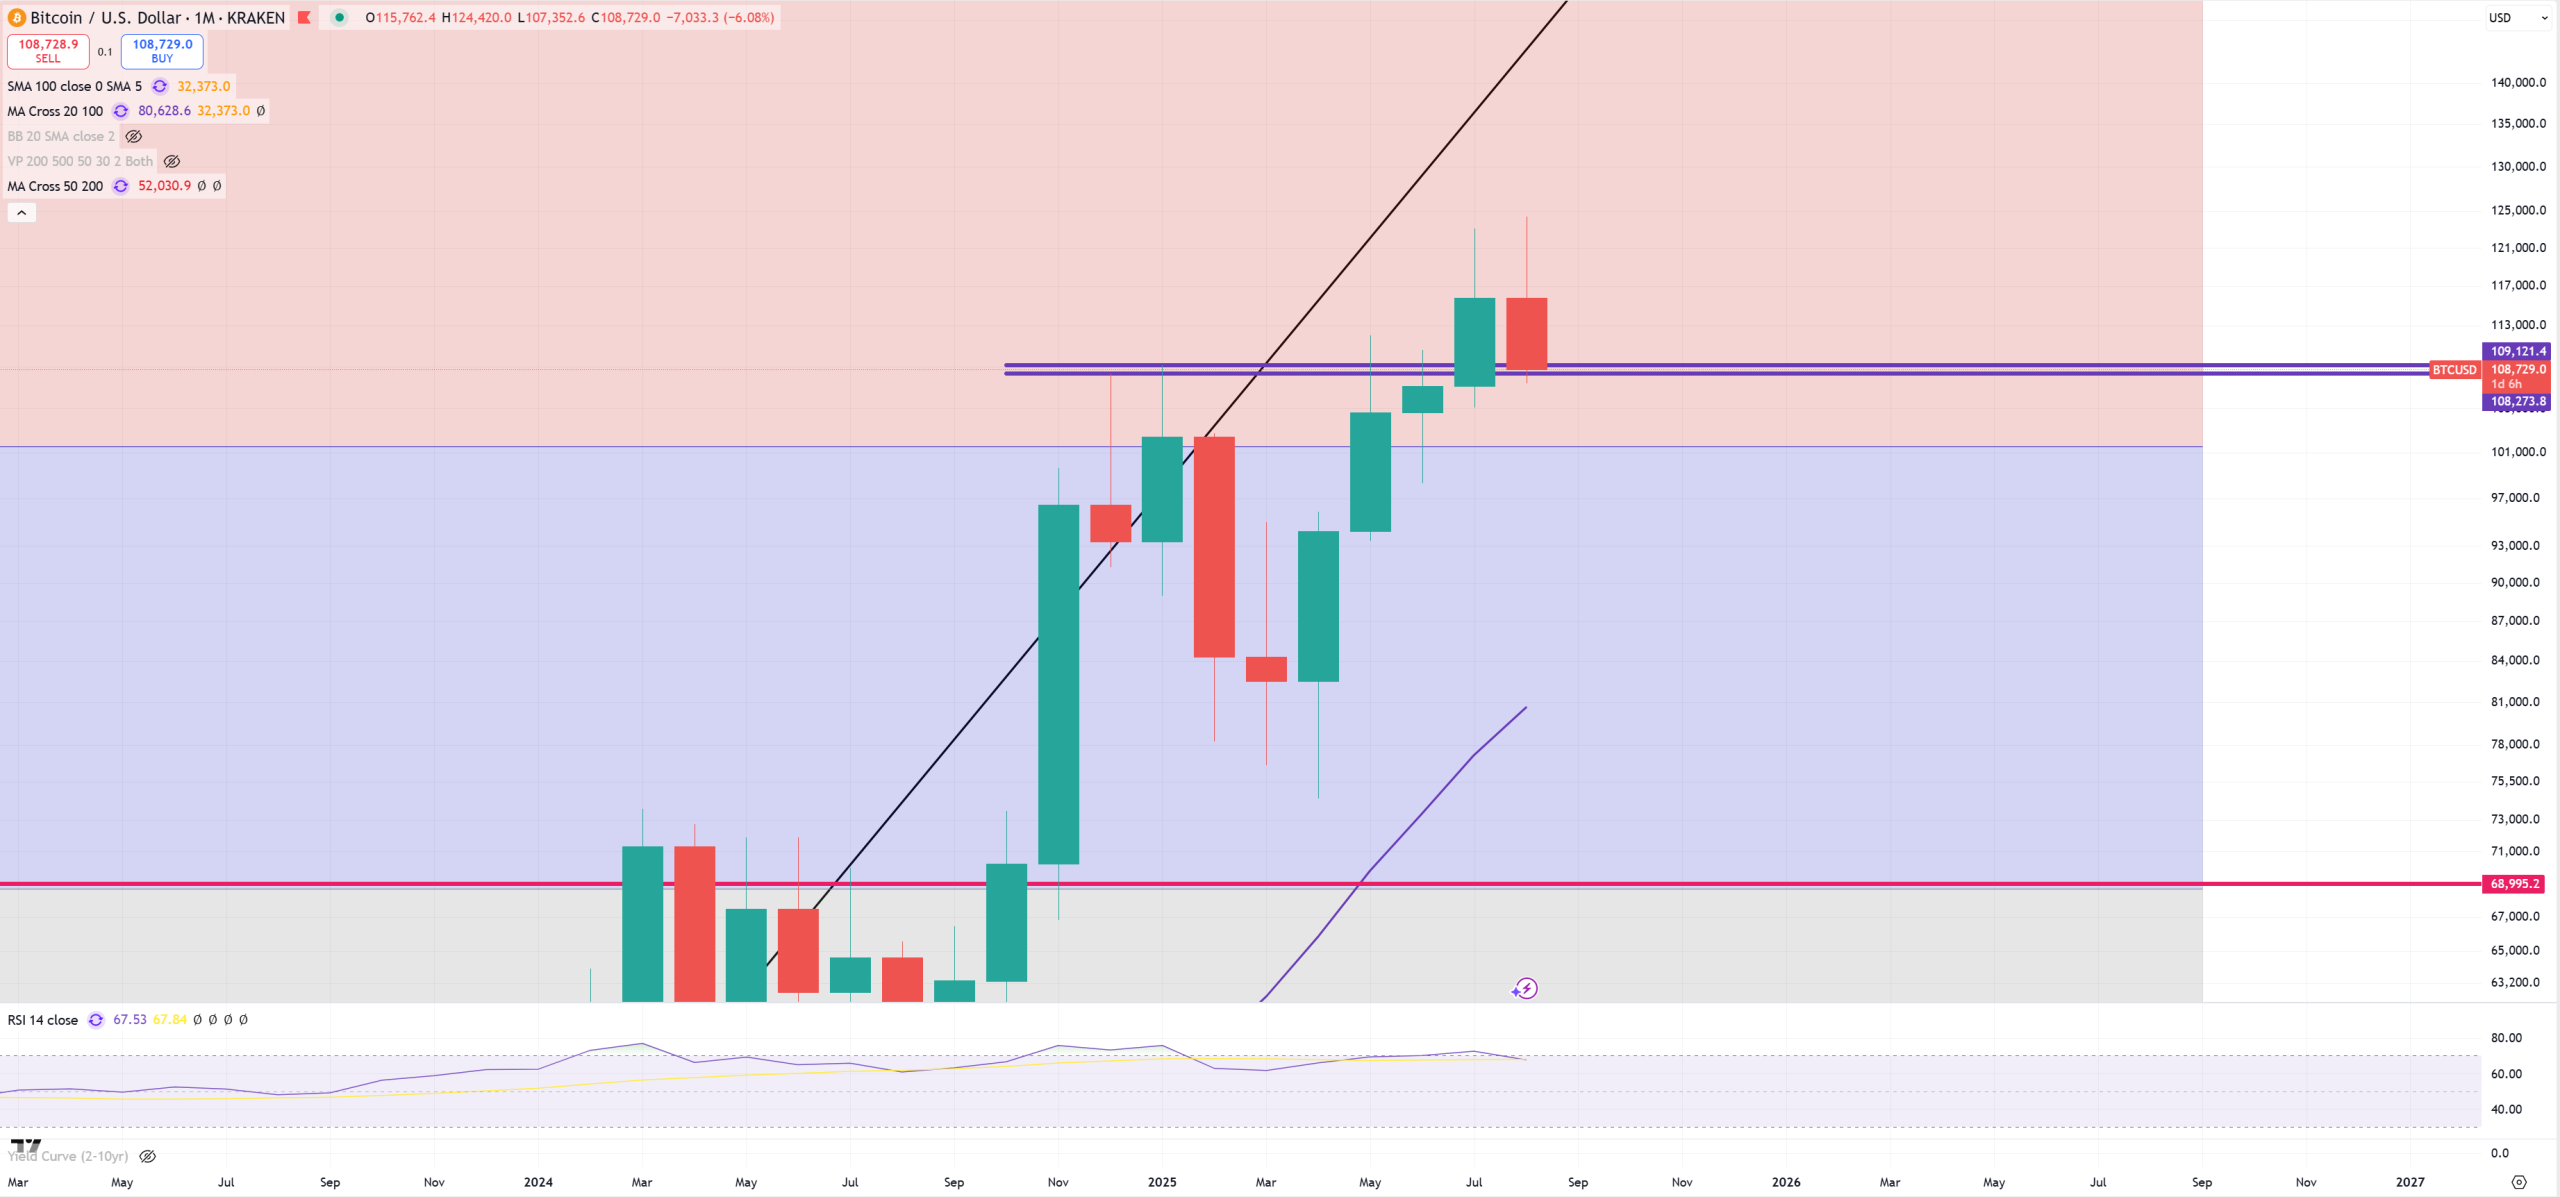
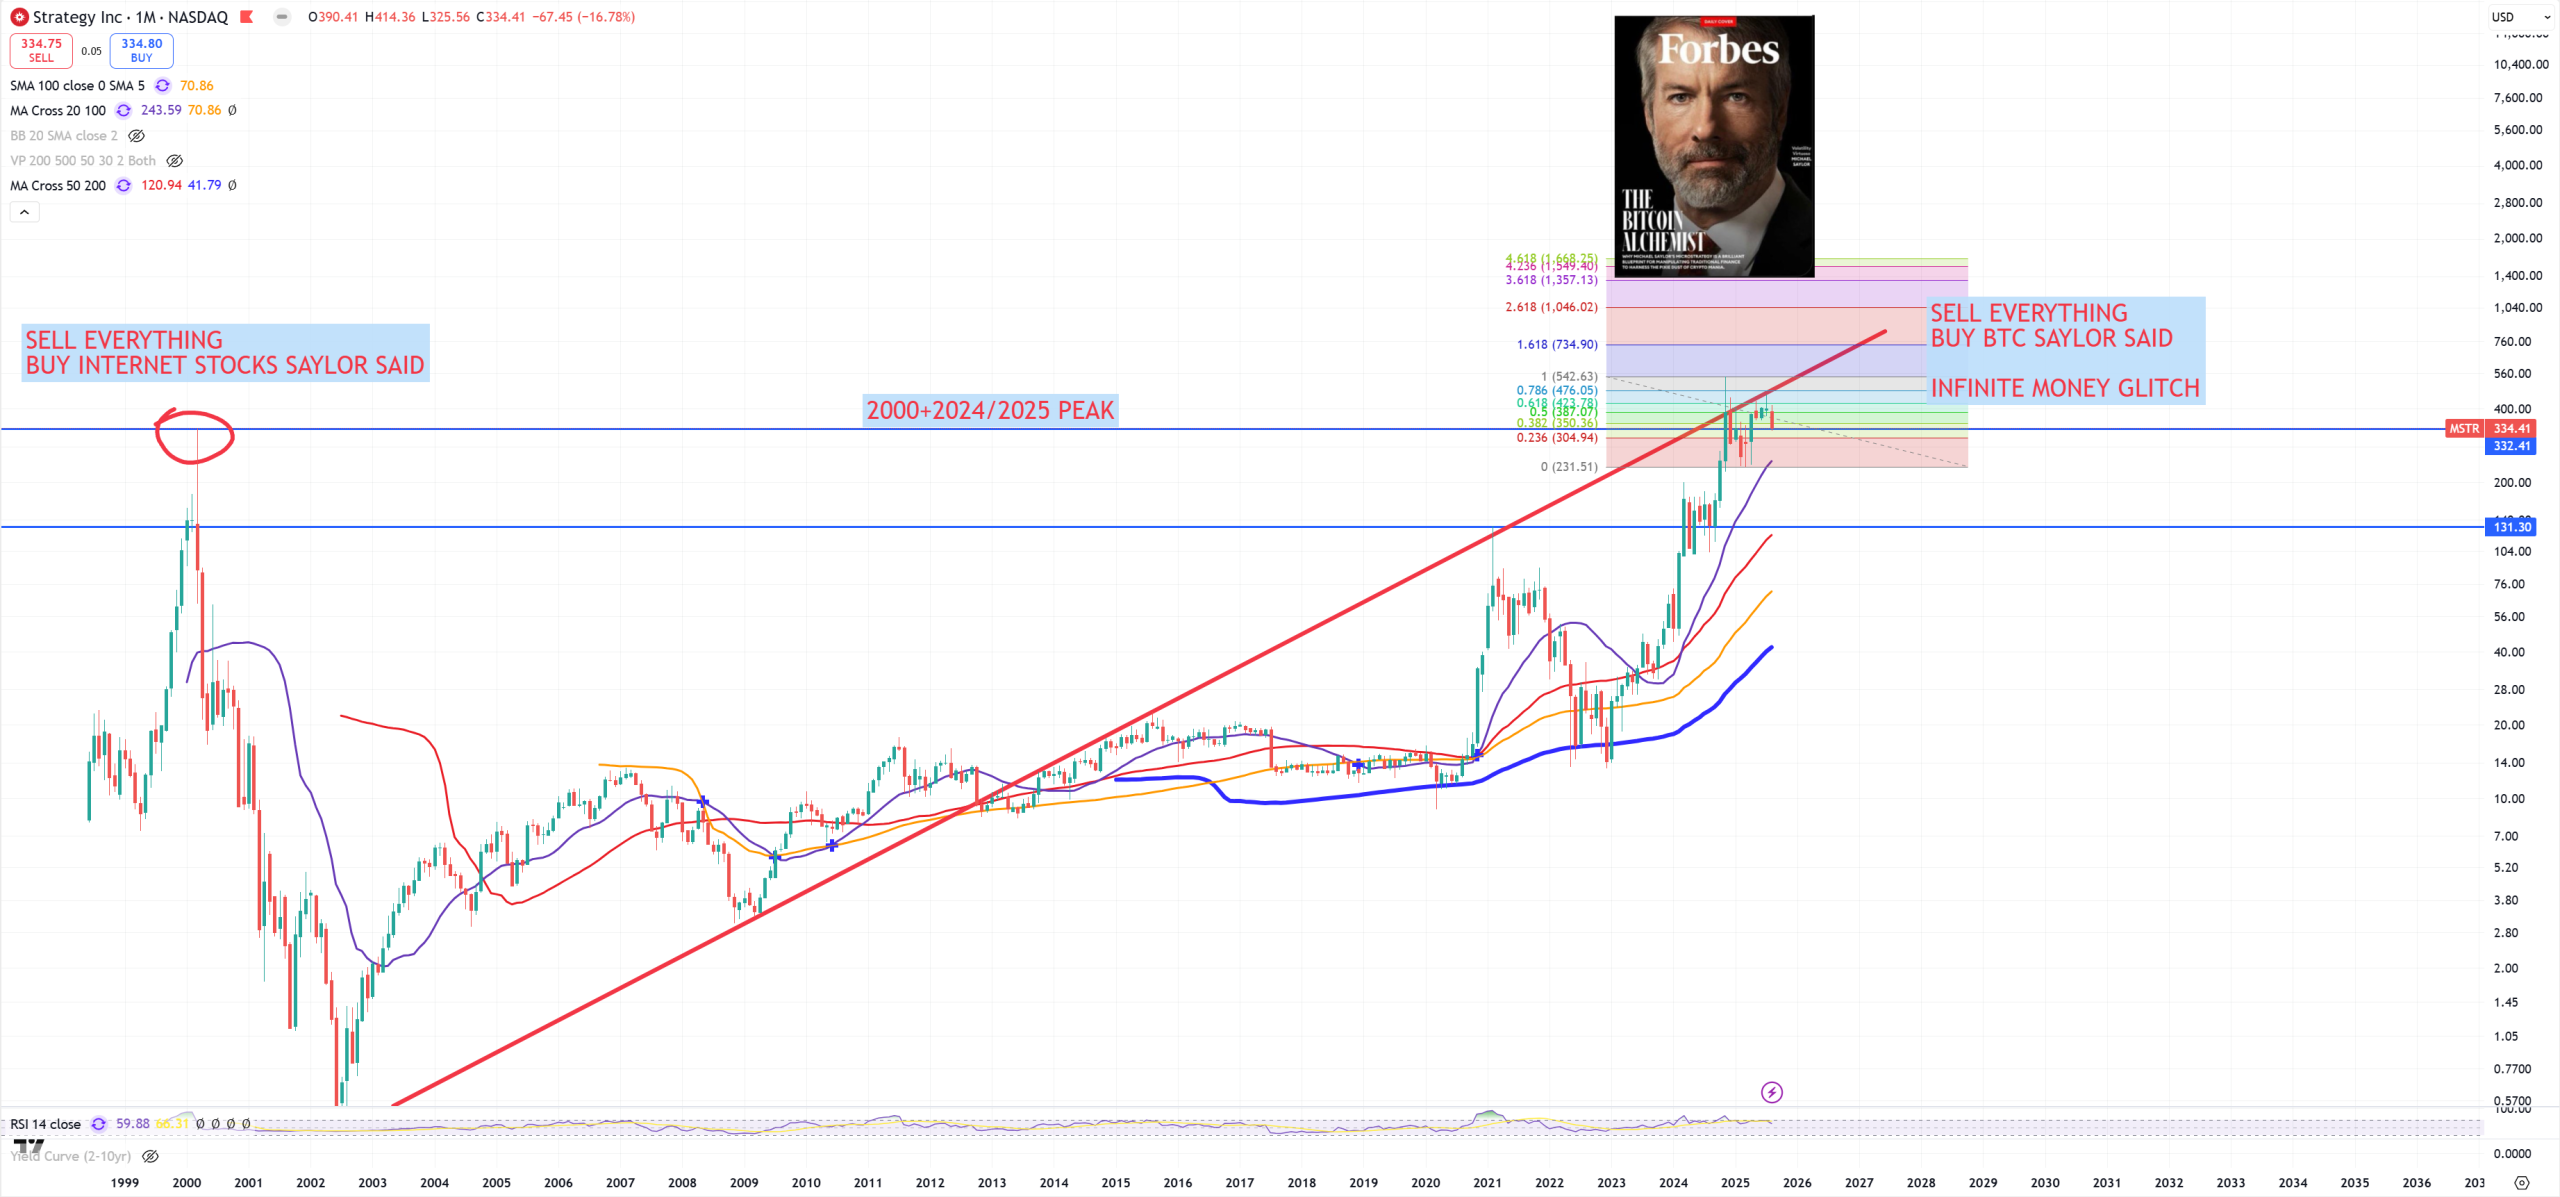
MSTR – we must link BTC & MSTR & GOLD/BTC ratio. If MSTR will not hold this 332$ ghosts of its 2000 peaks are going to arrive.
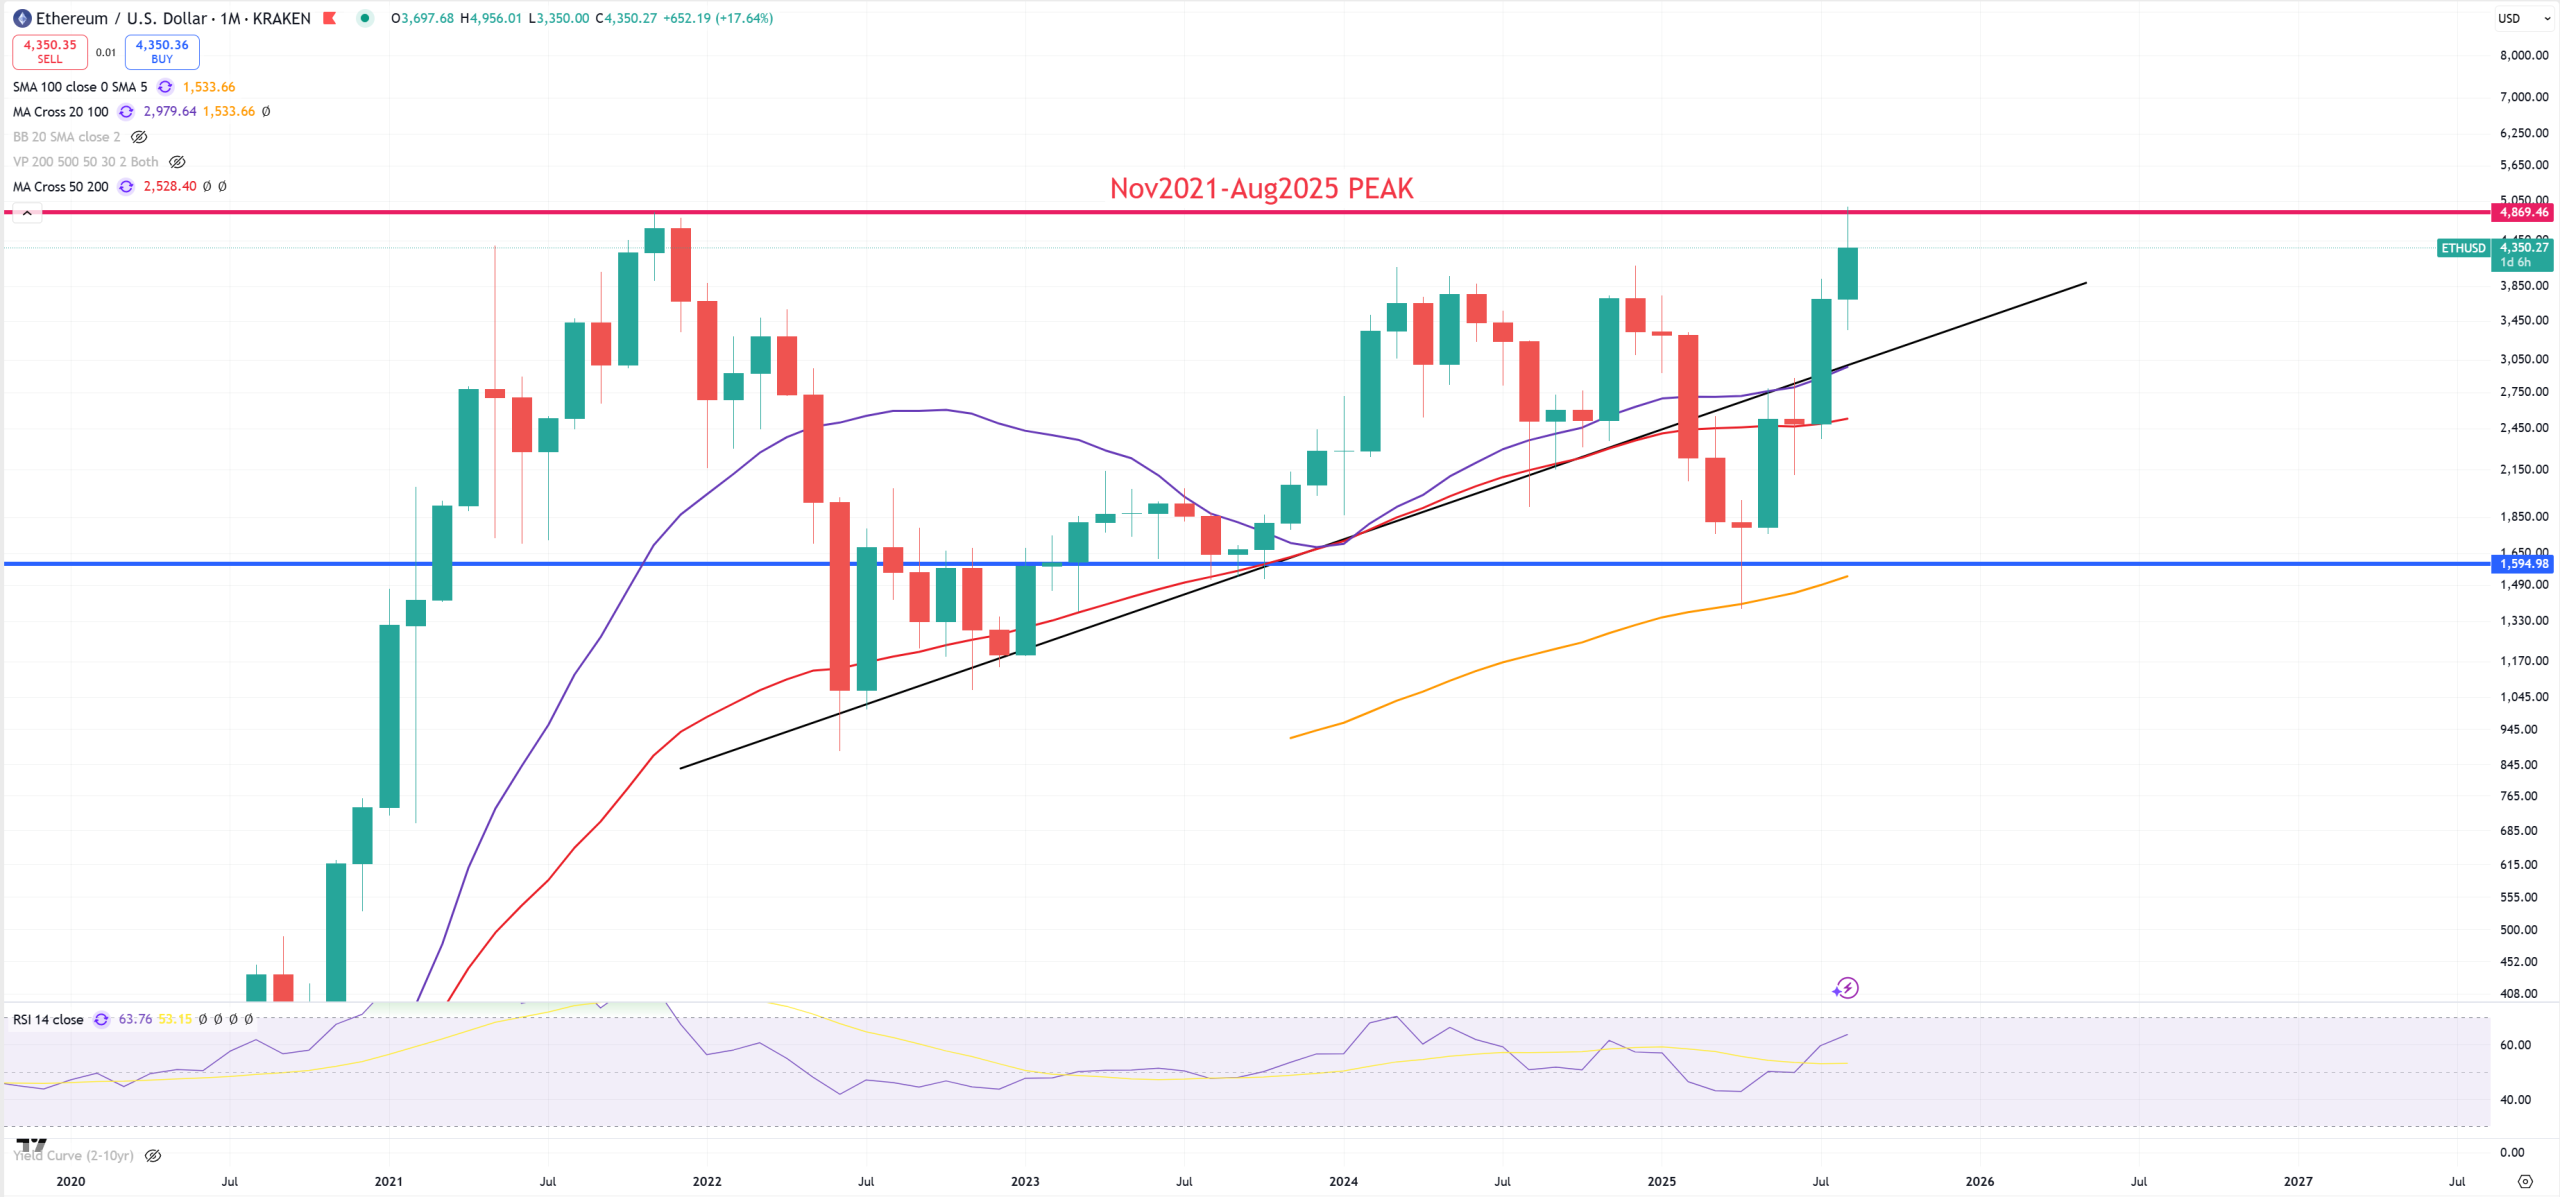
ETH – it’s much easier here and again both key cryptocurrencies sending mixed signal. While BTC 2021/2022 peak is around 70k$, ETH hits perfect DOUBLE-TOP with 2021/2022 peak.
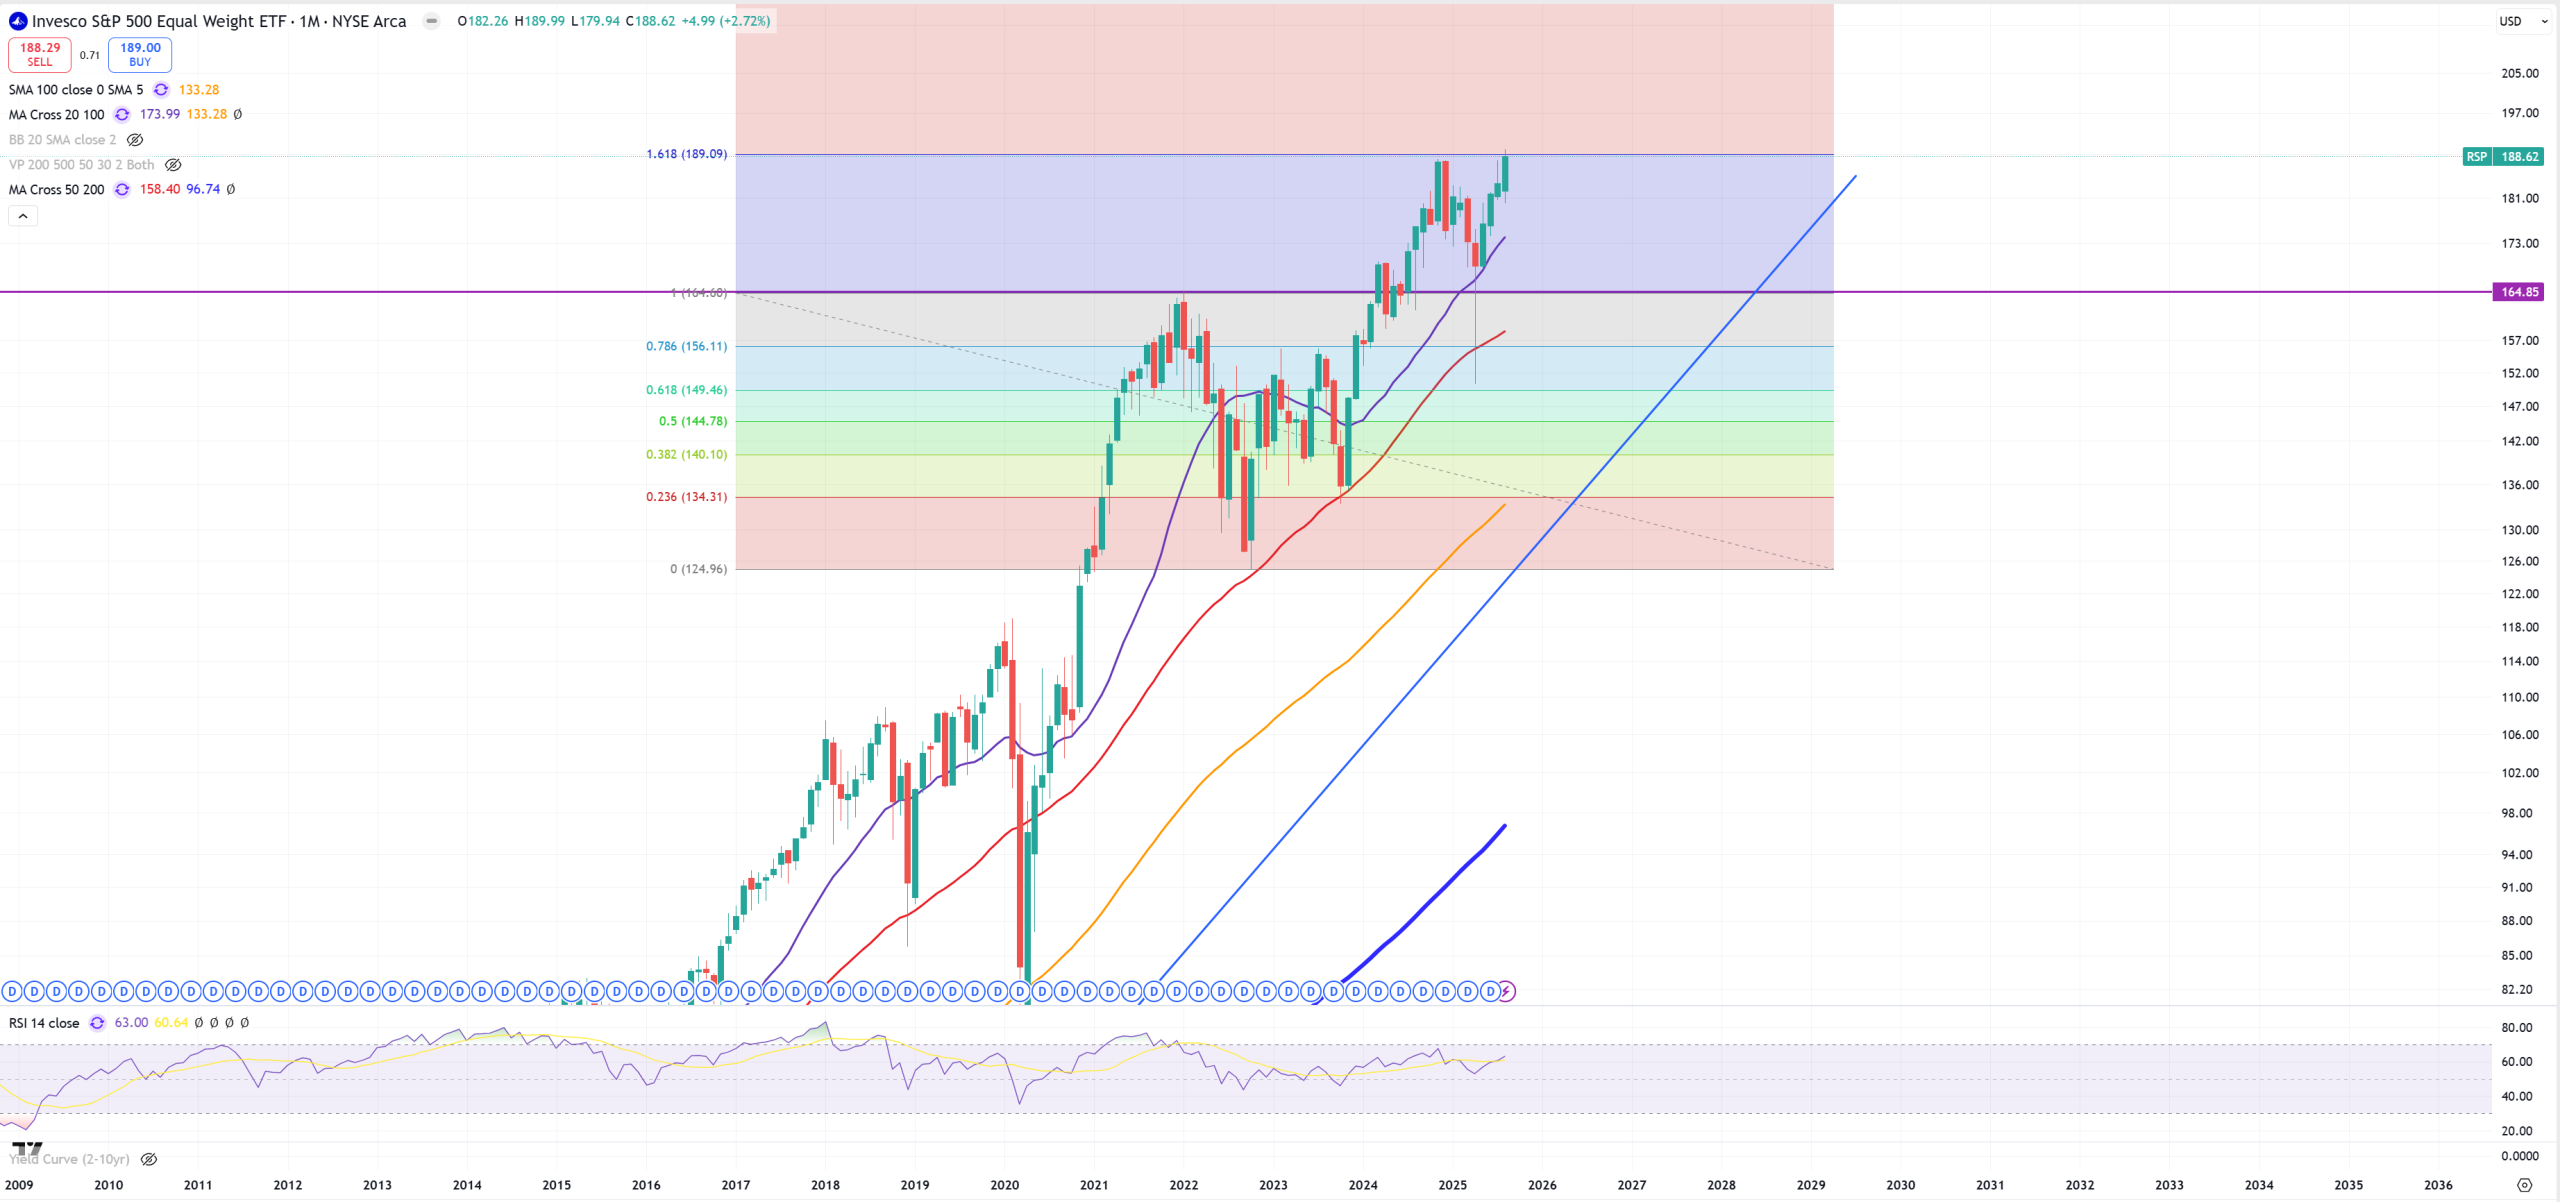
RSP – Equal Weight – flirting around possible DOUBLE TOP
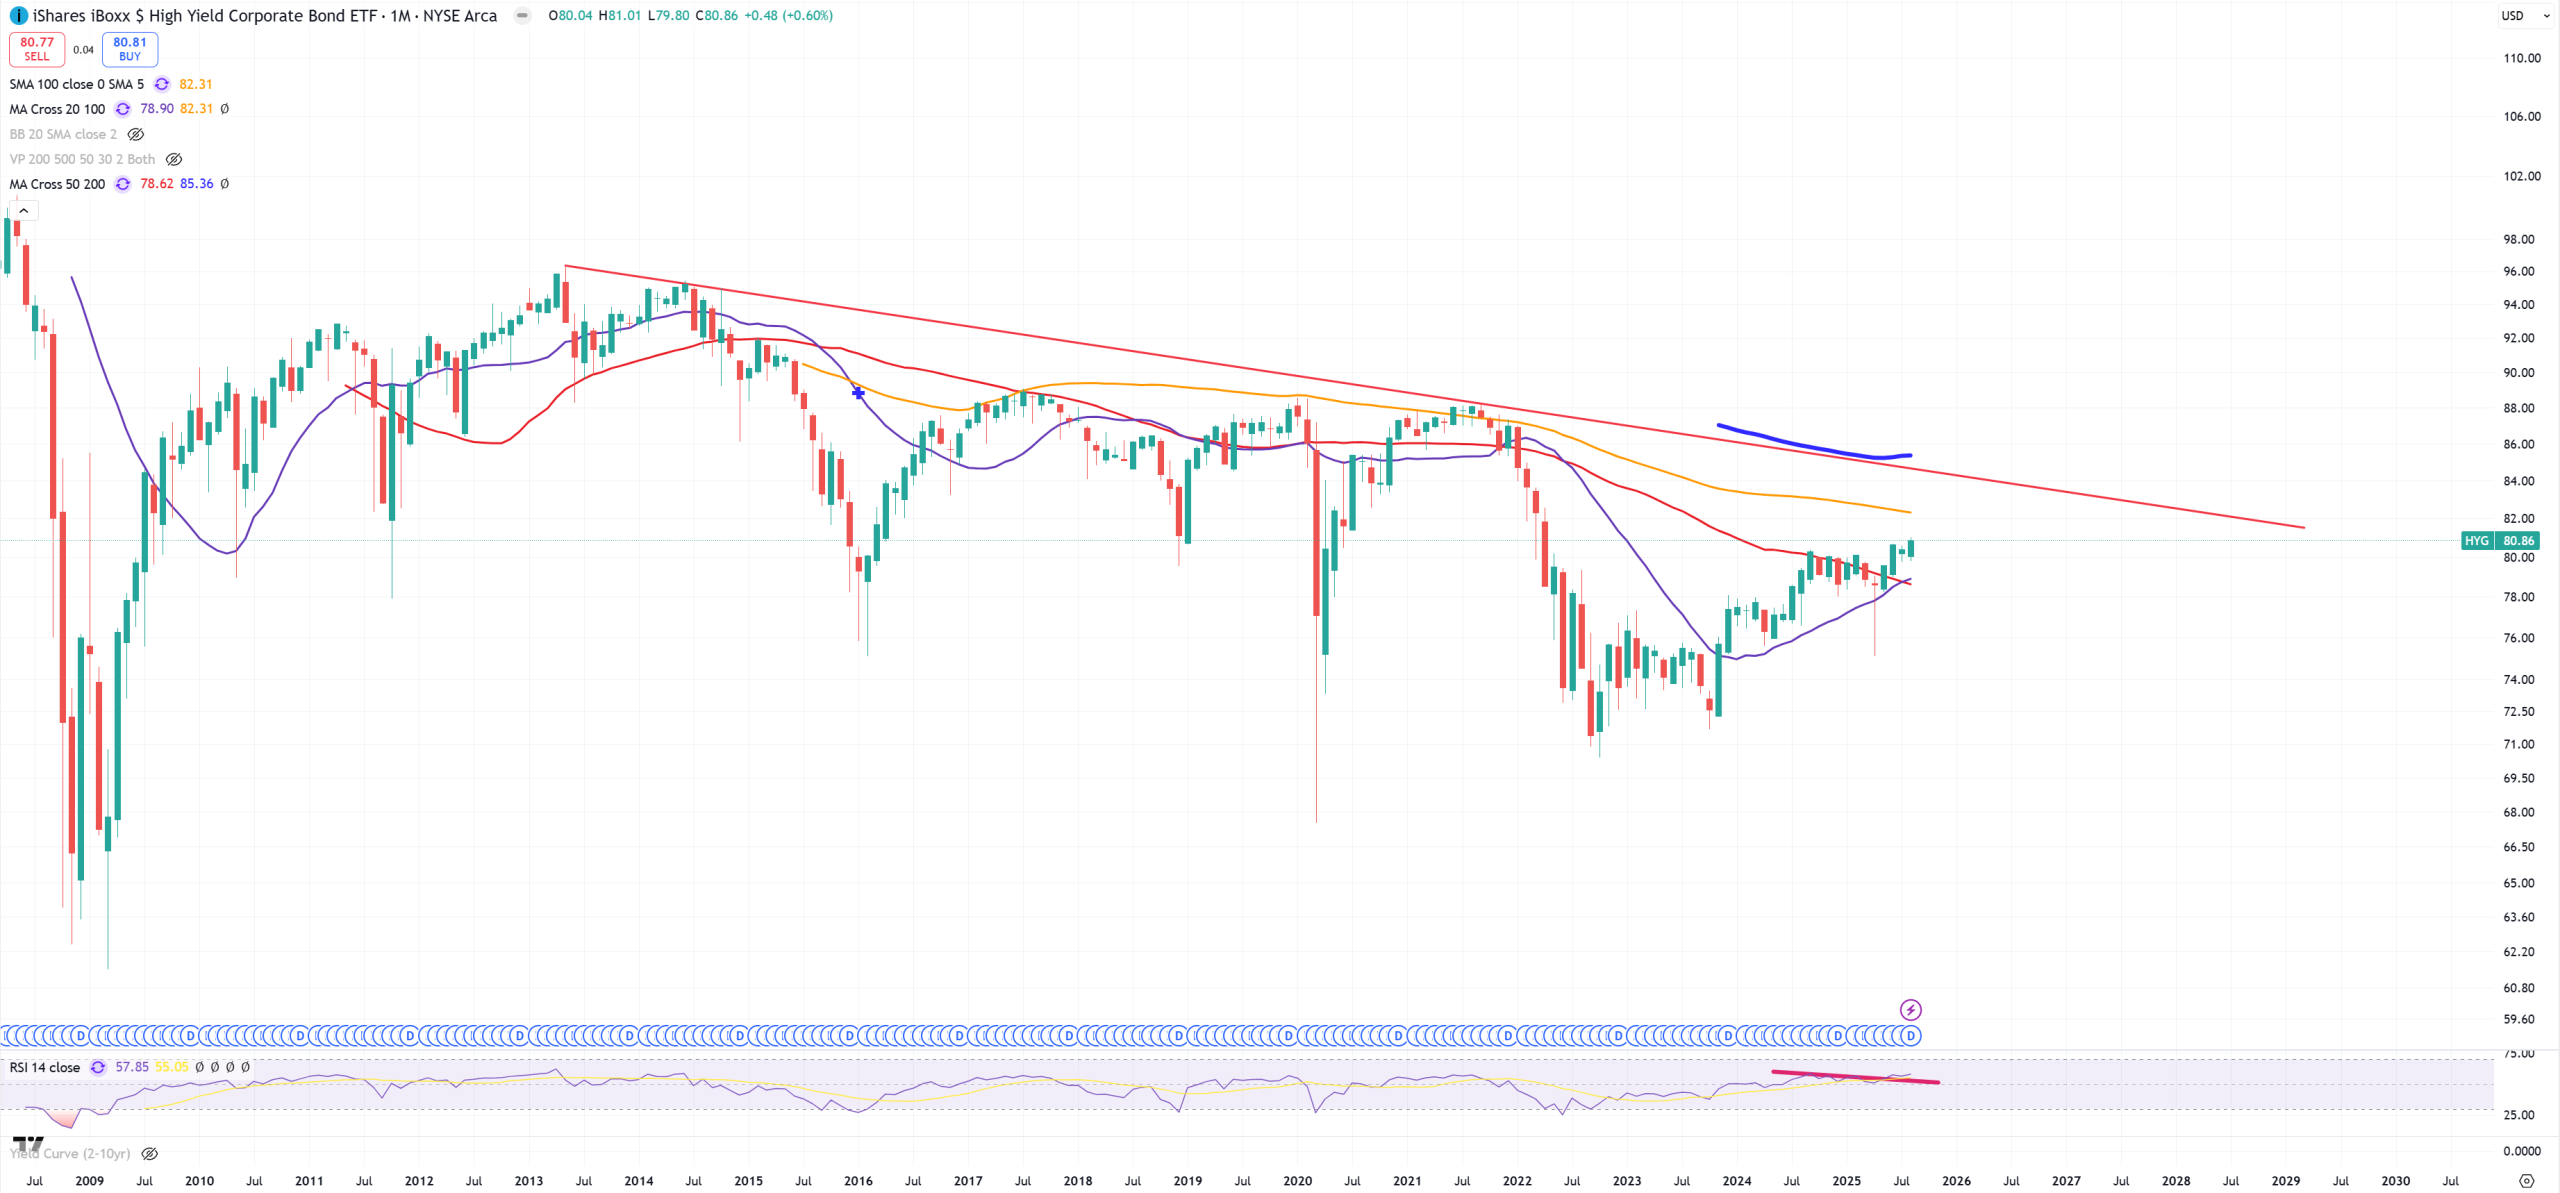
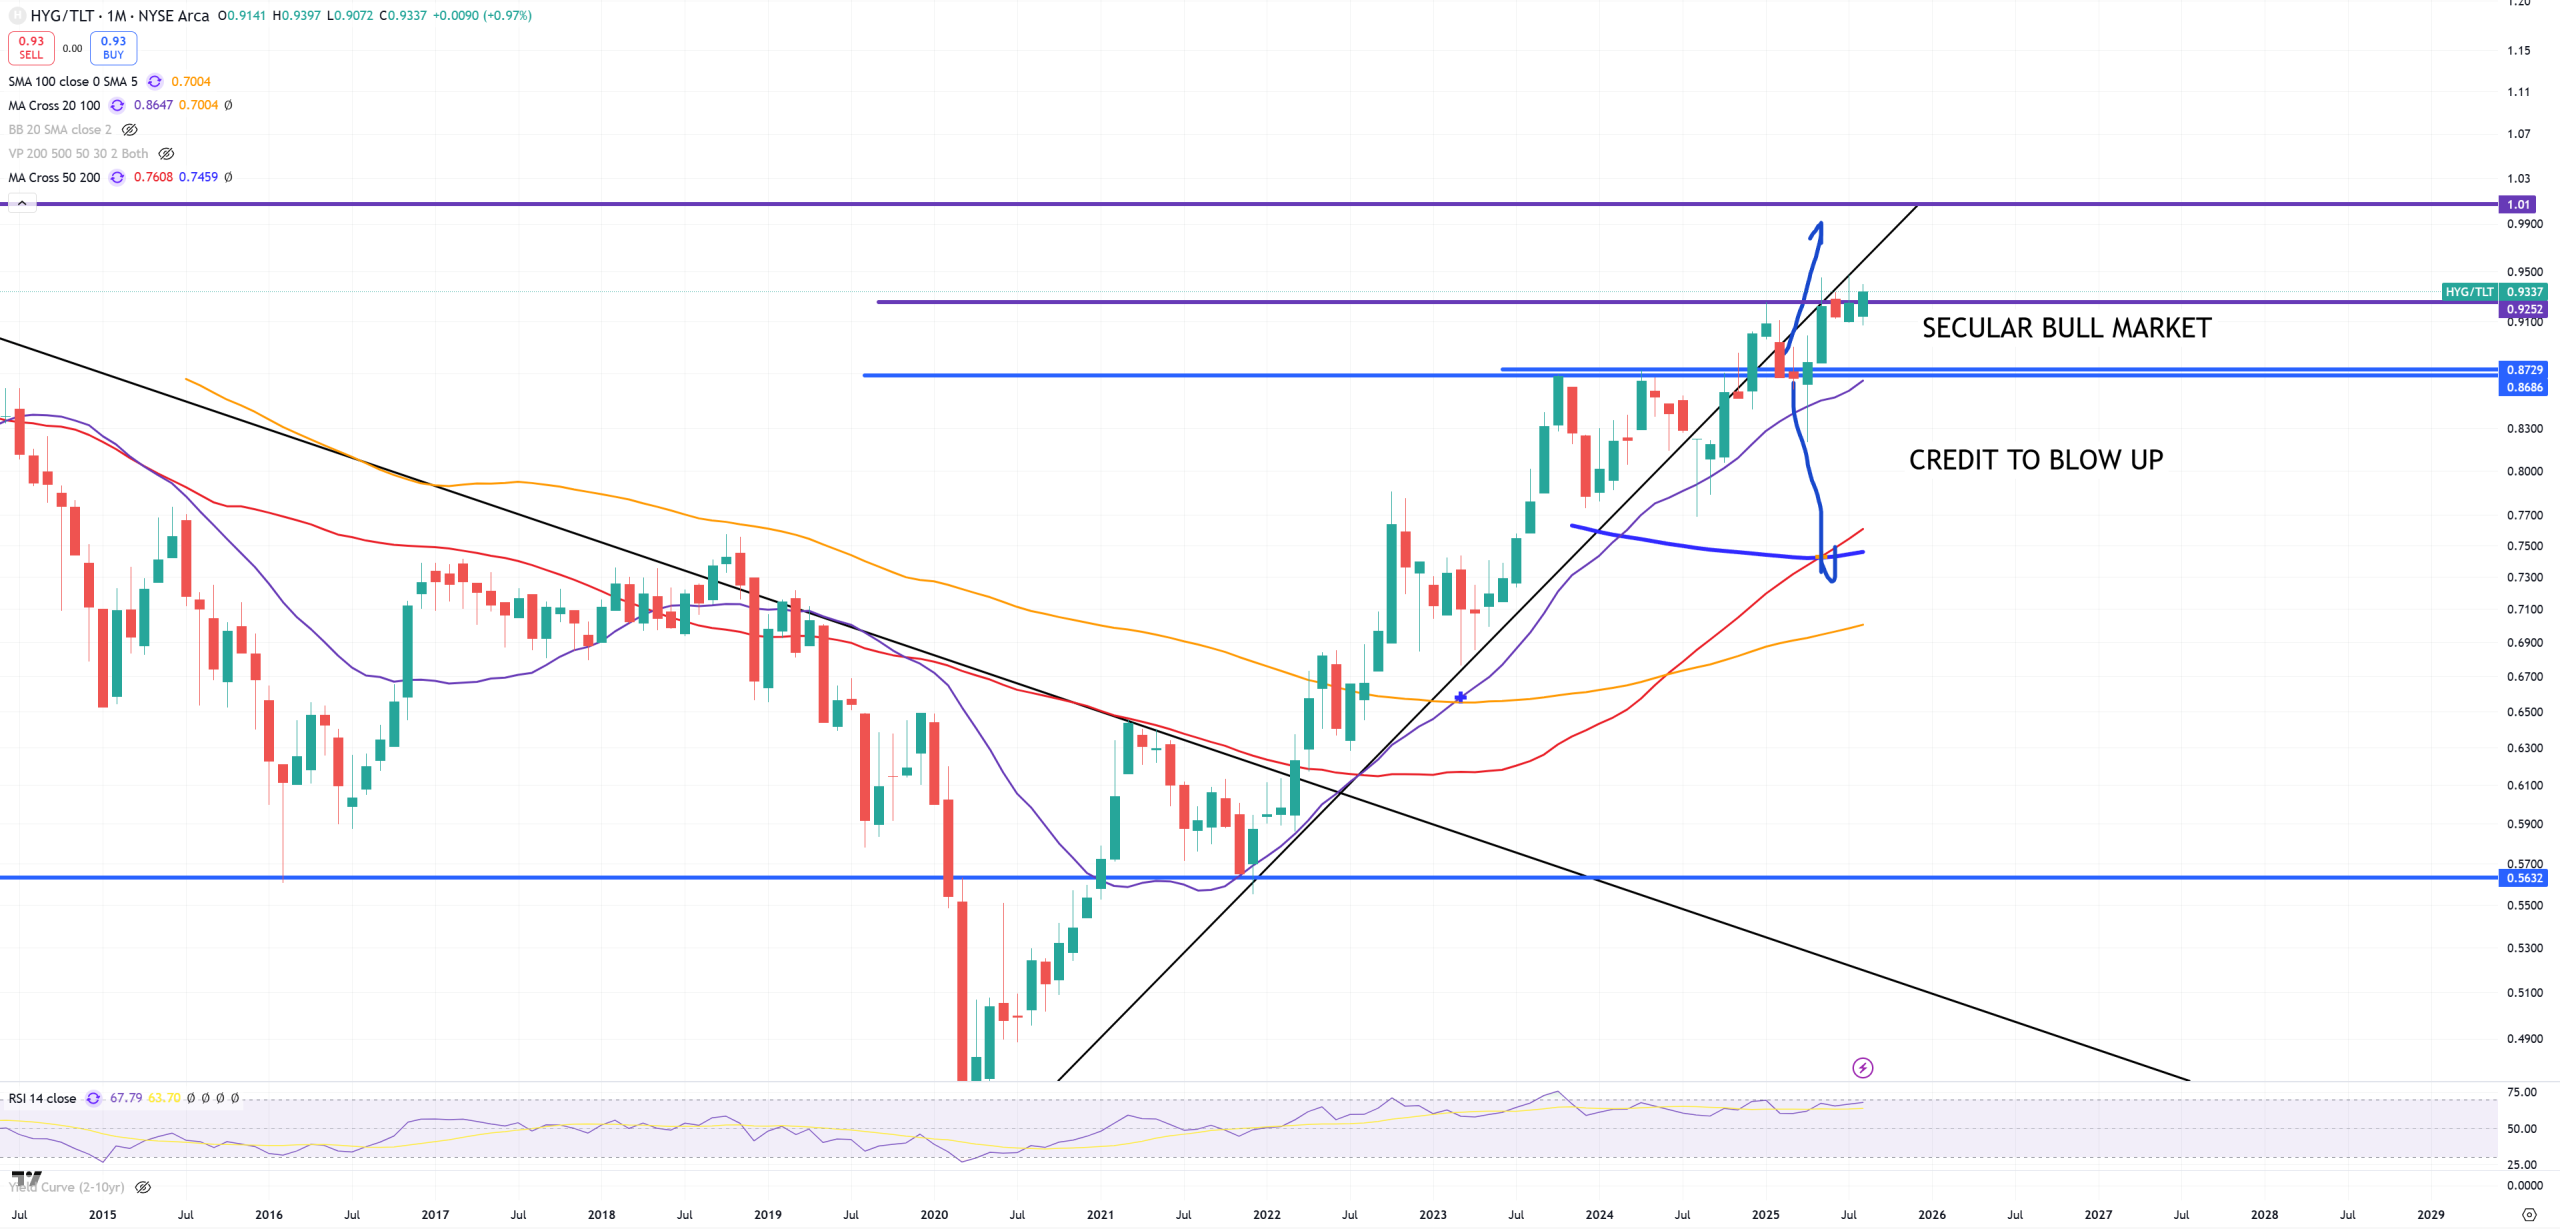
HYG – Junk credit still holds very well
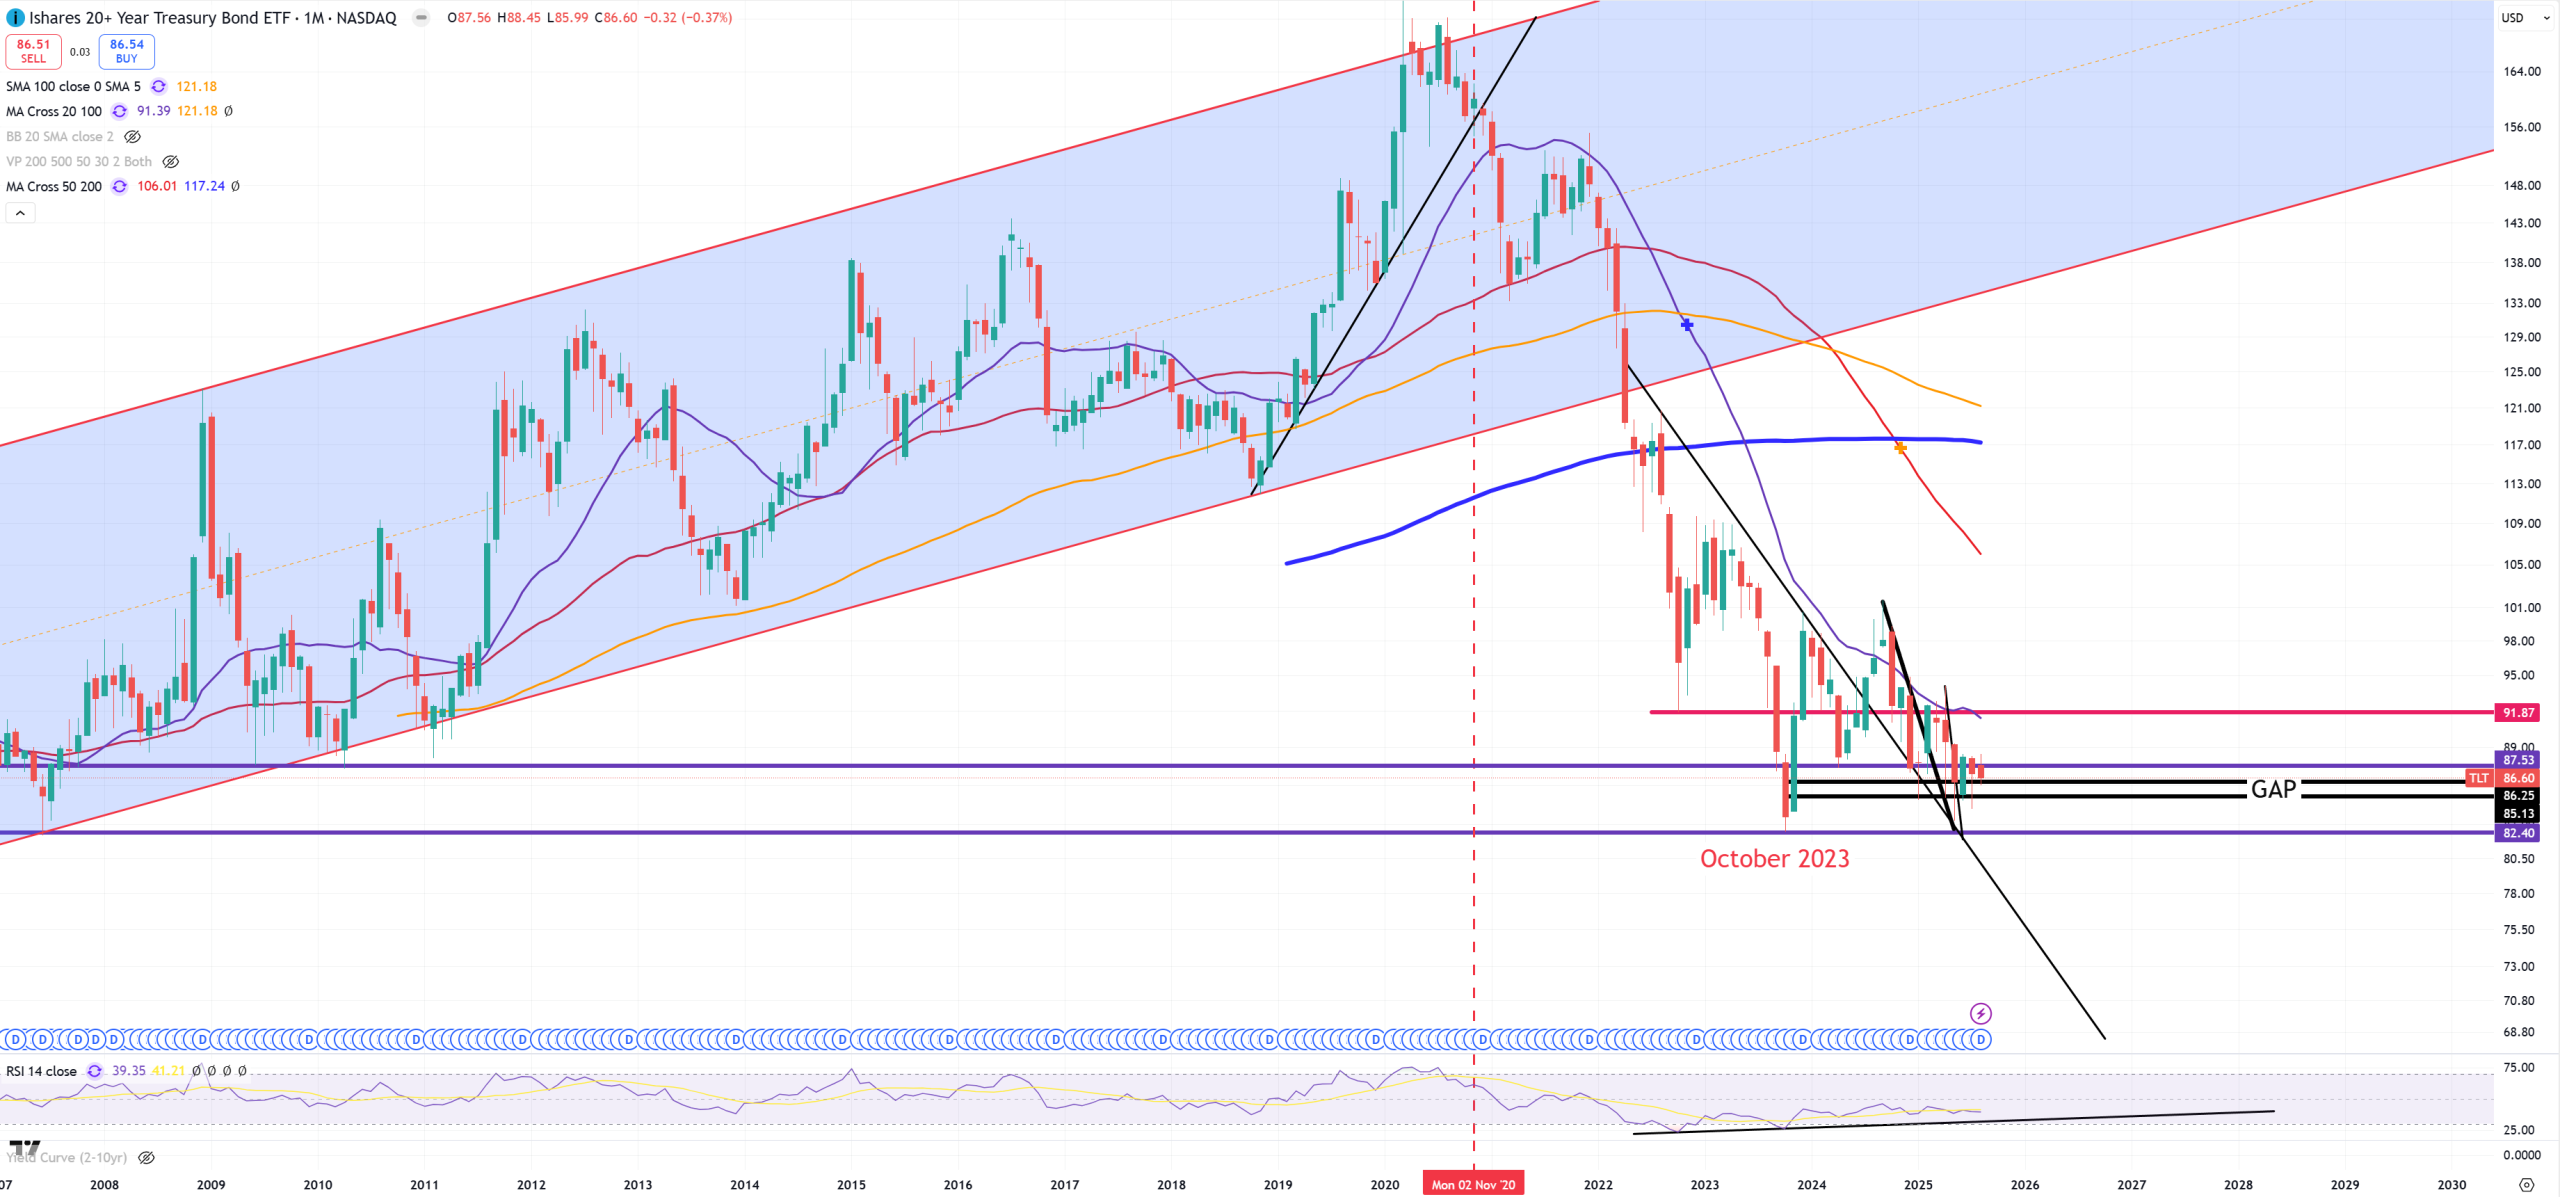
TLT – support holds, true bull market above 92$ and that’s also (M)MA20.
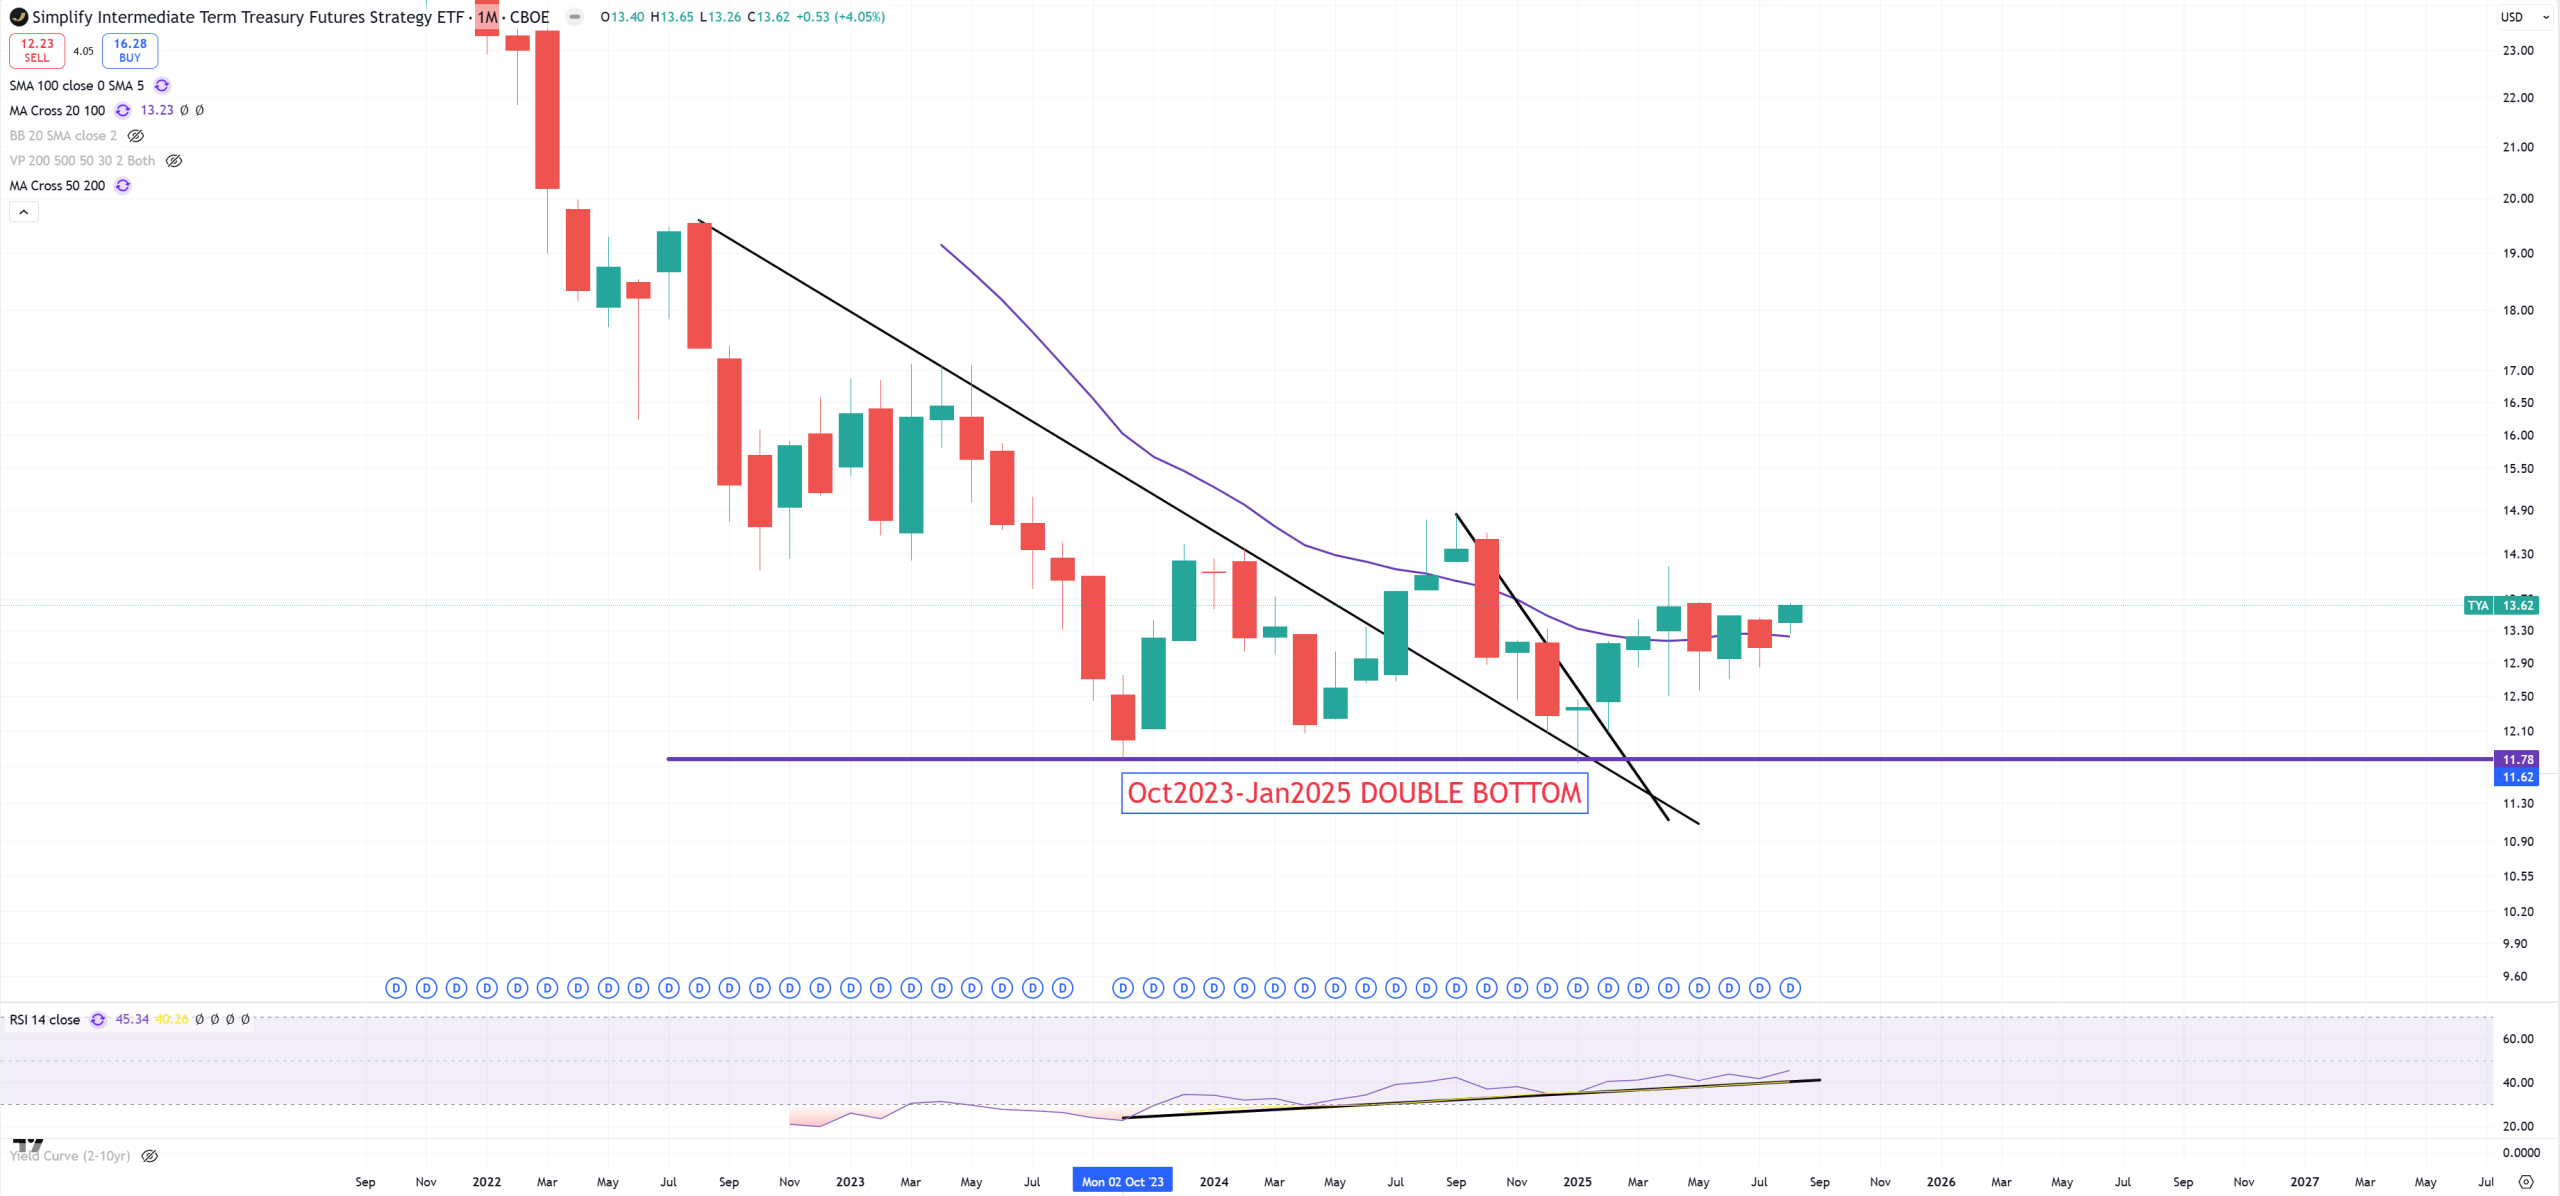
TYA – it’s a leveraged US10Y
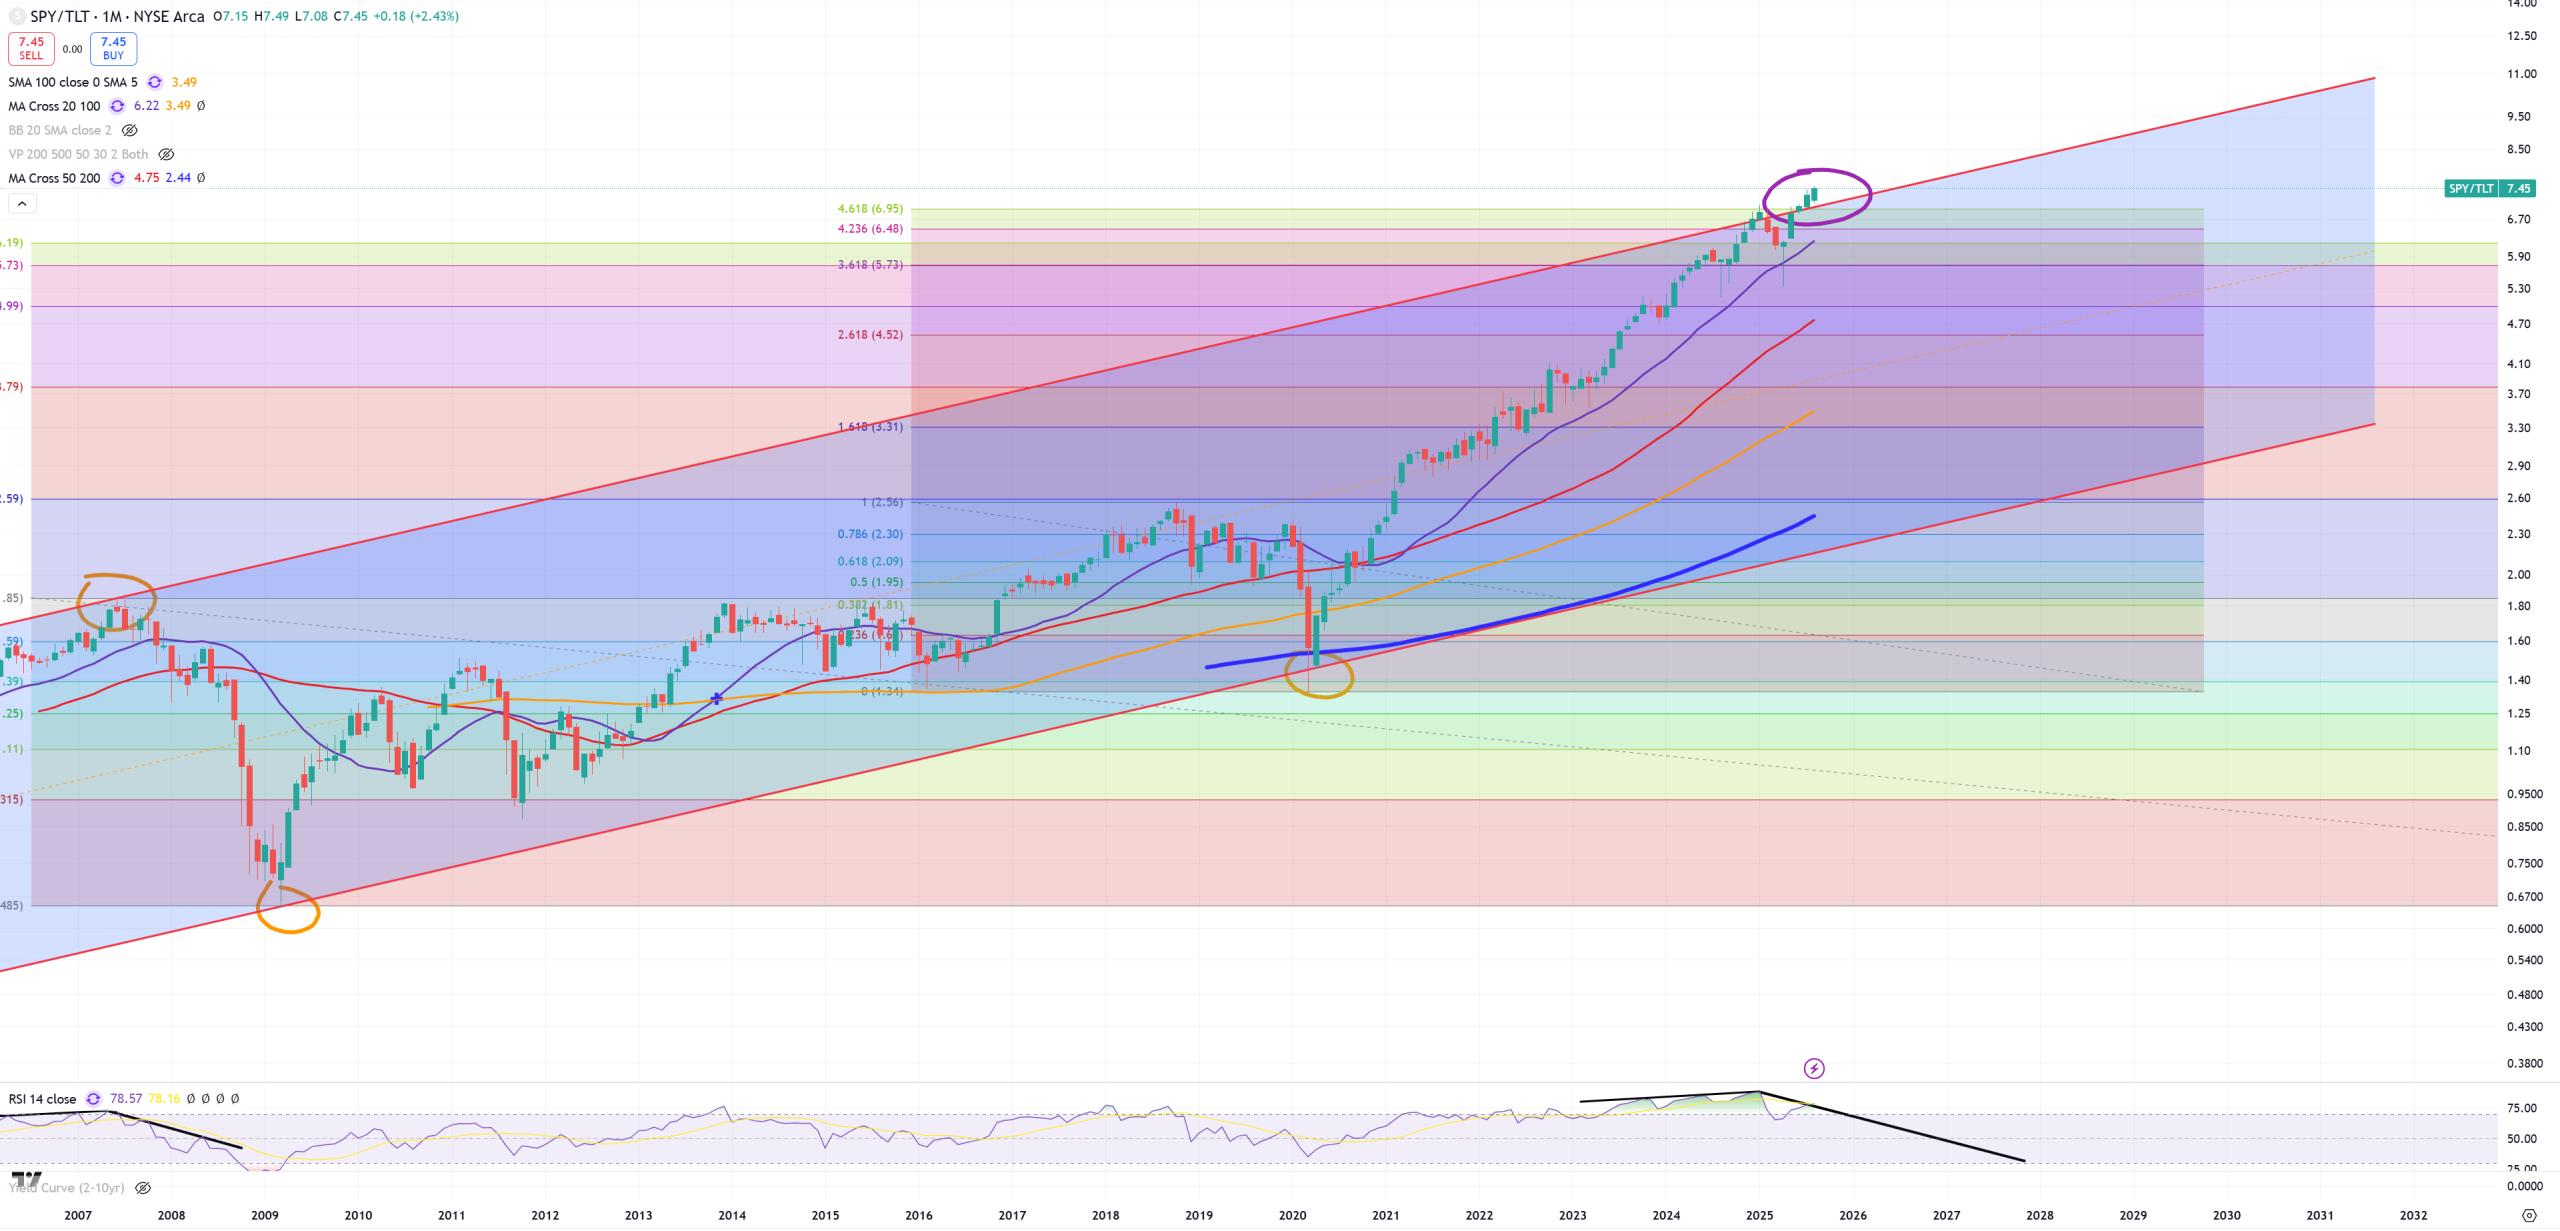
SPY/TLT
HYG/TLT – up bullish, down bearish.
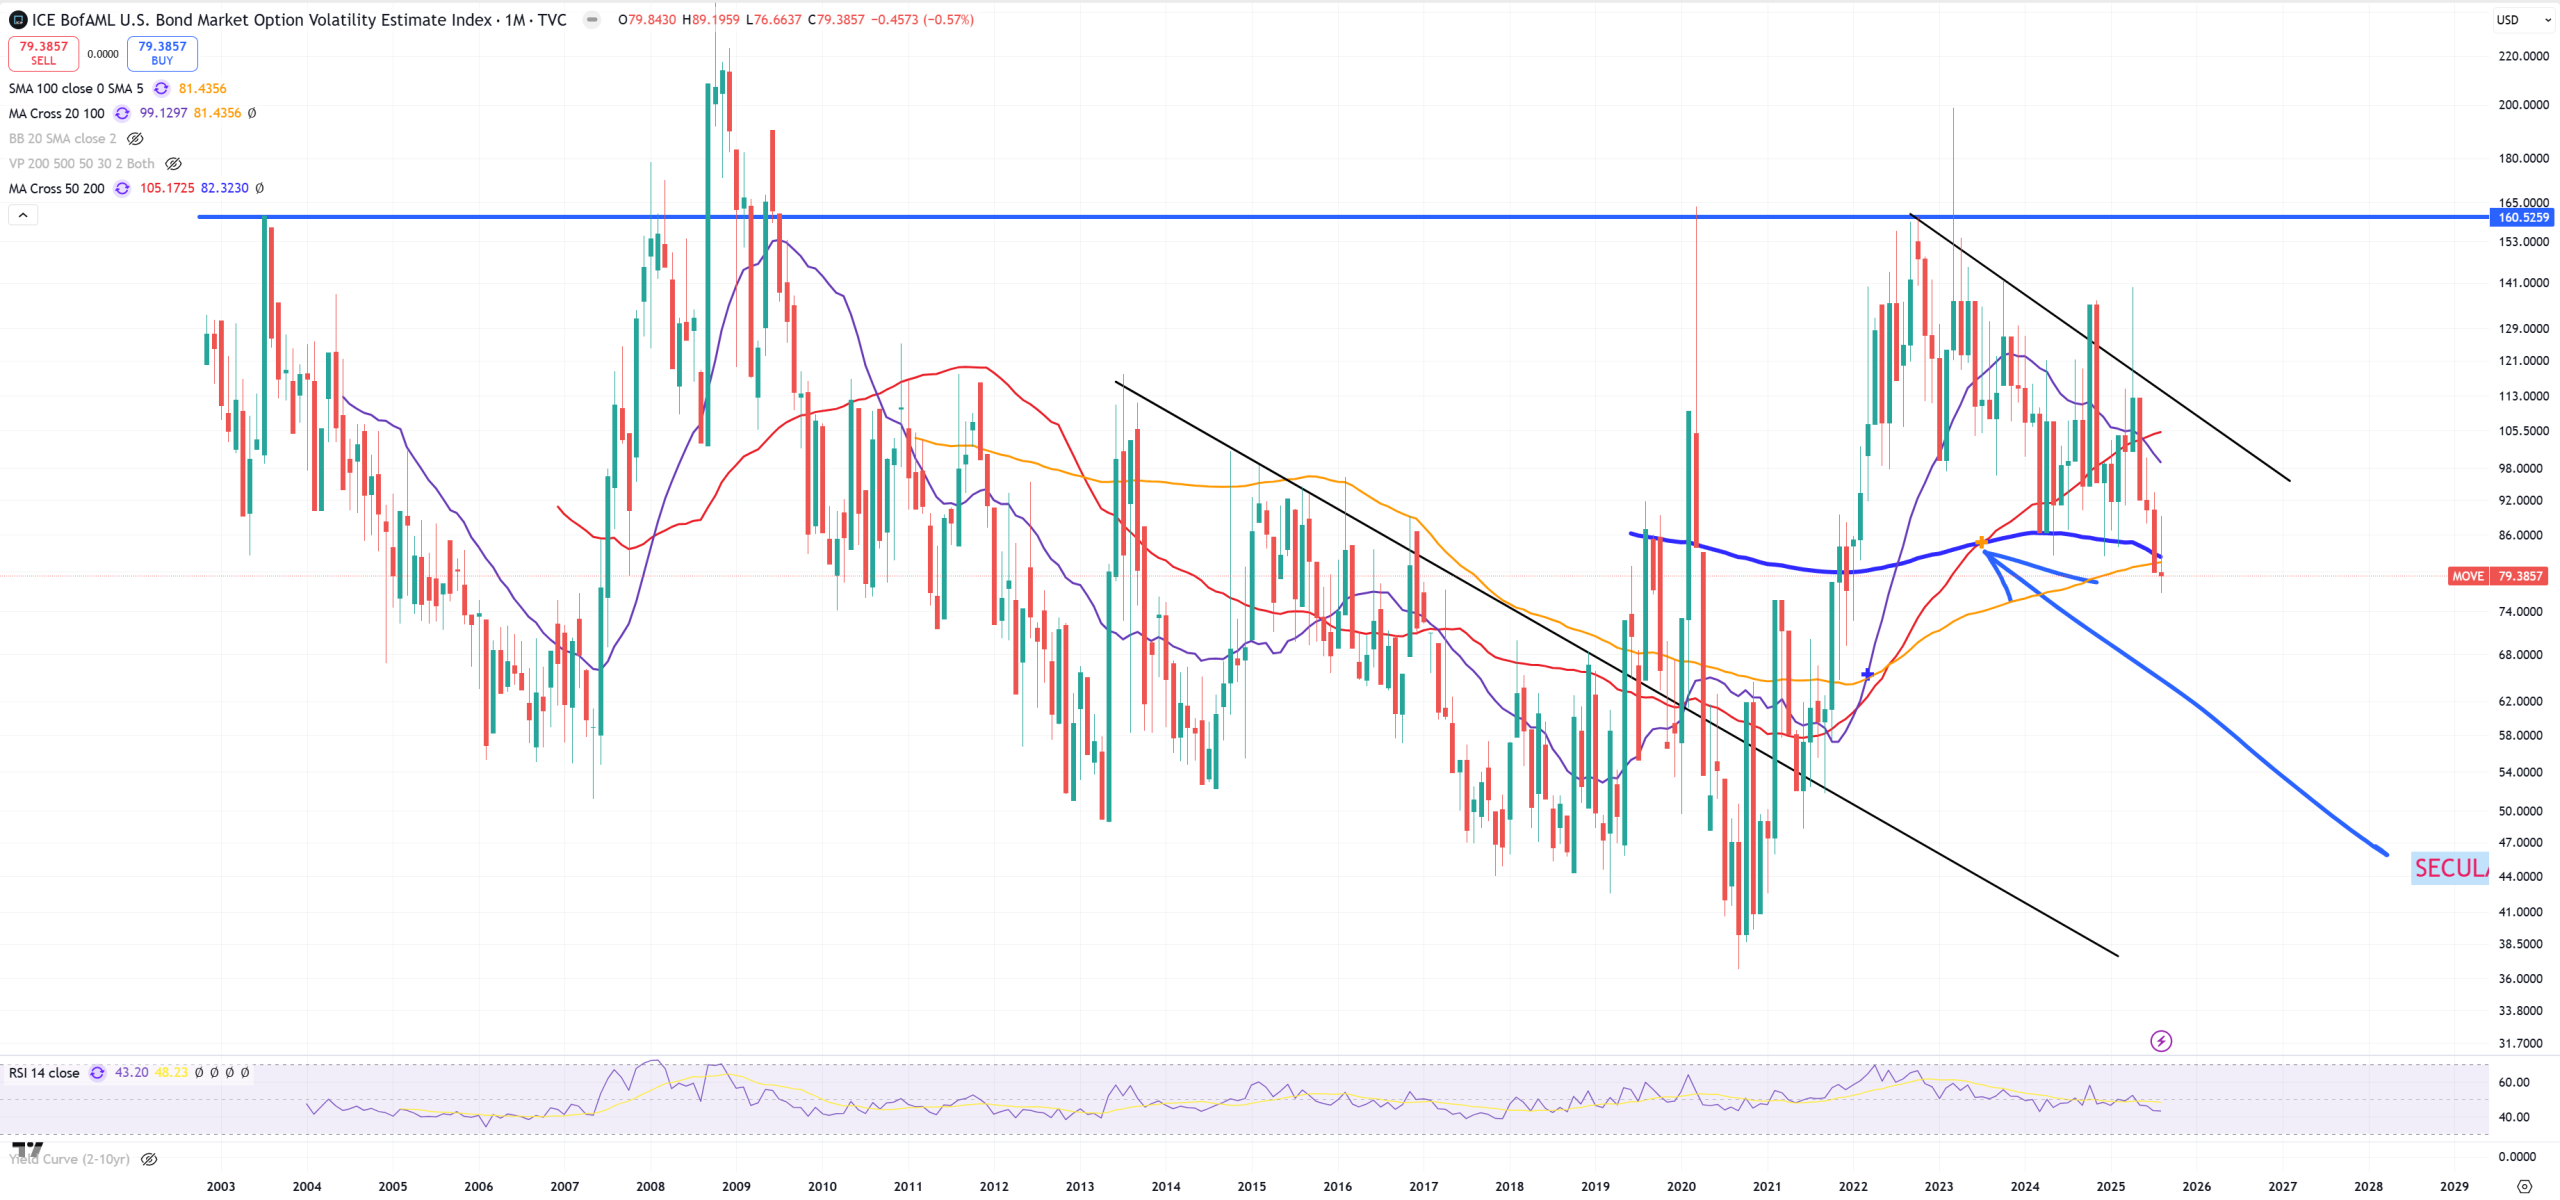
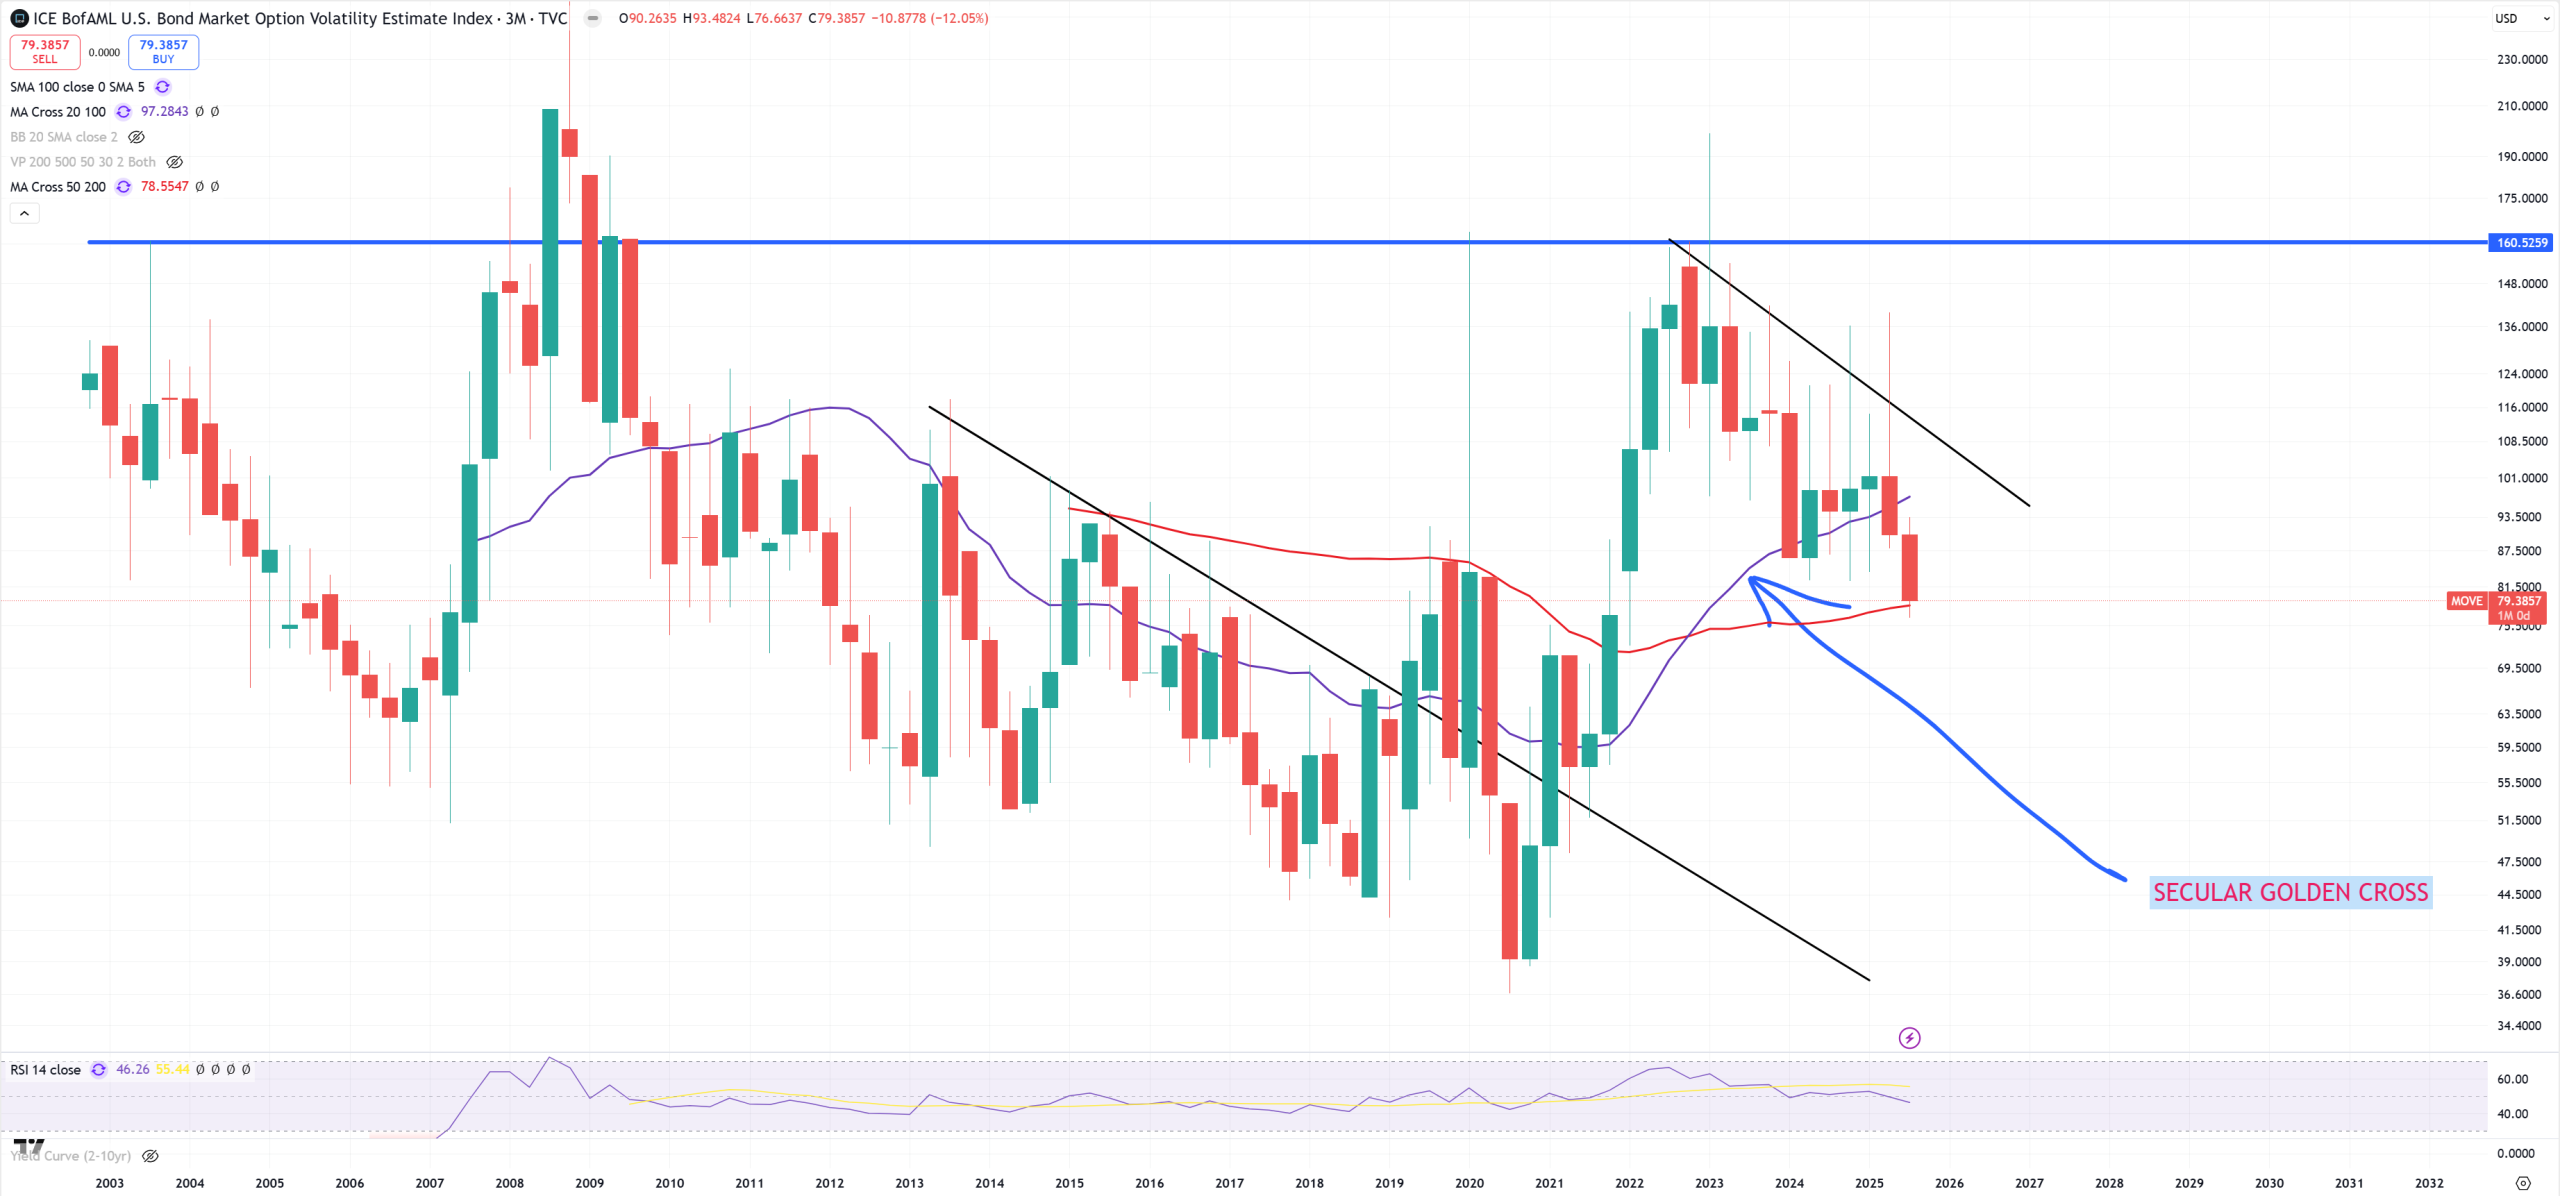
MOVE – Bond market volatility – we need to see (M) and (3M) to understand it. On (M) we have massive (M)MA200 break (I wasn’t expecting that, but this market has proven it can make a lot of big fakes). From the other hand on (3M) we see (3M)MA50 level, so (M) chart showing break, longer term chart (3M) showing last support.
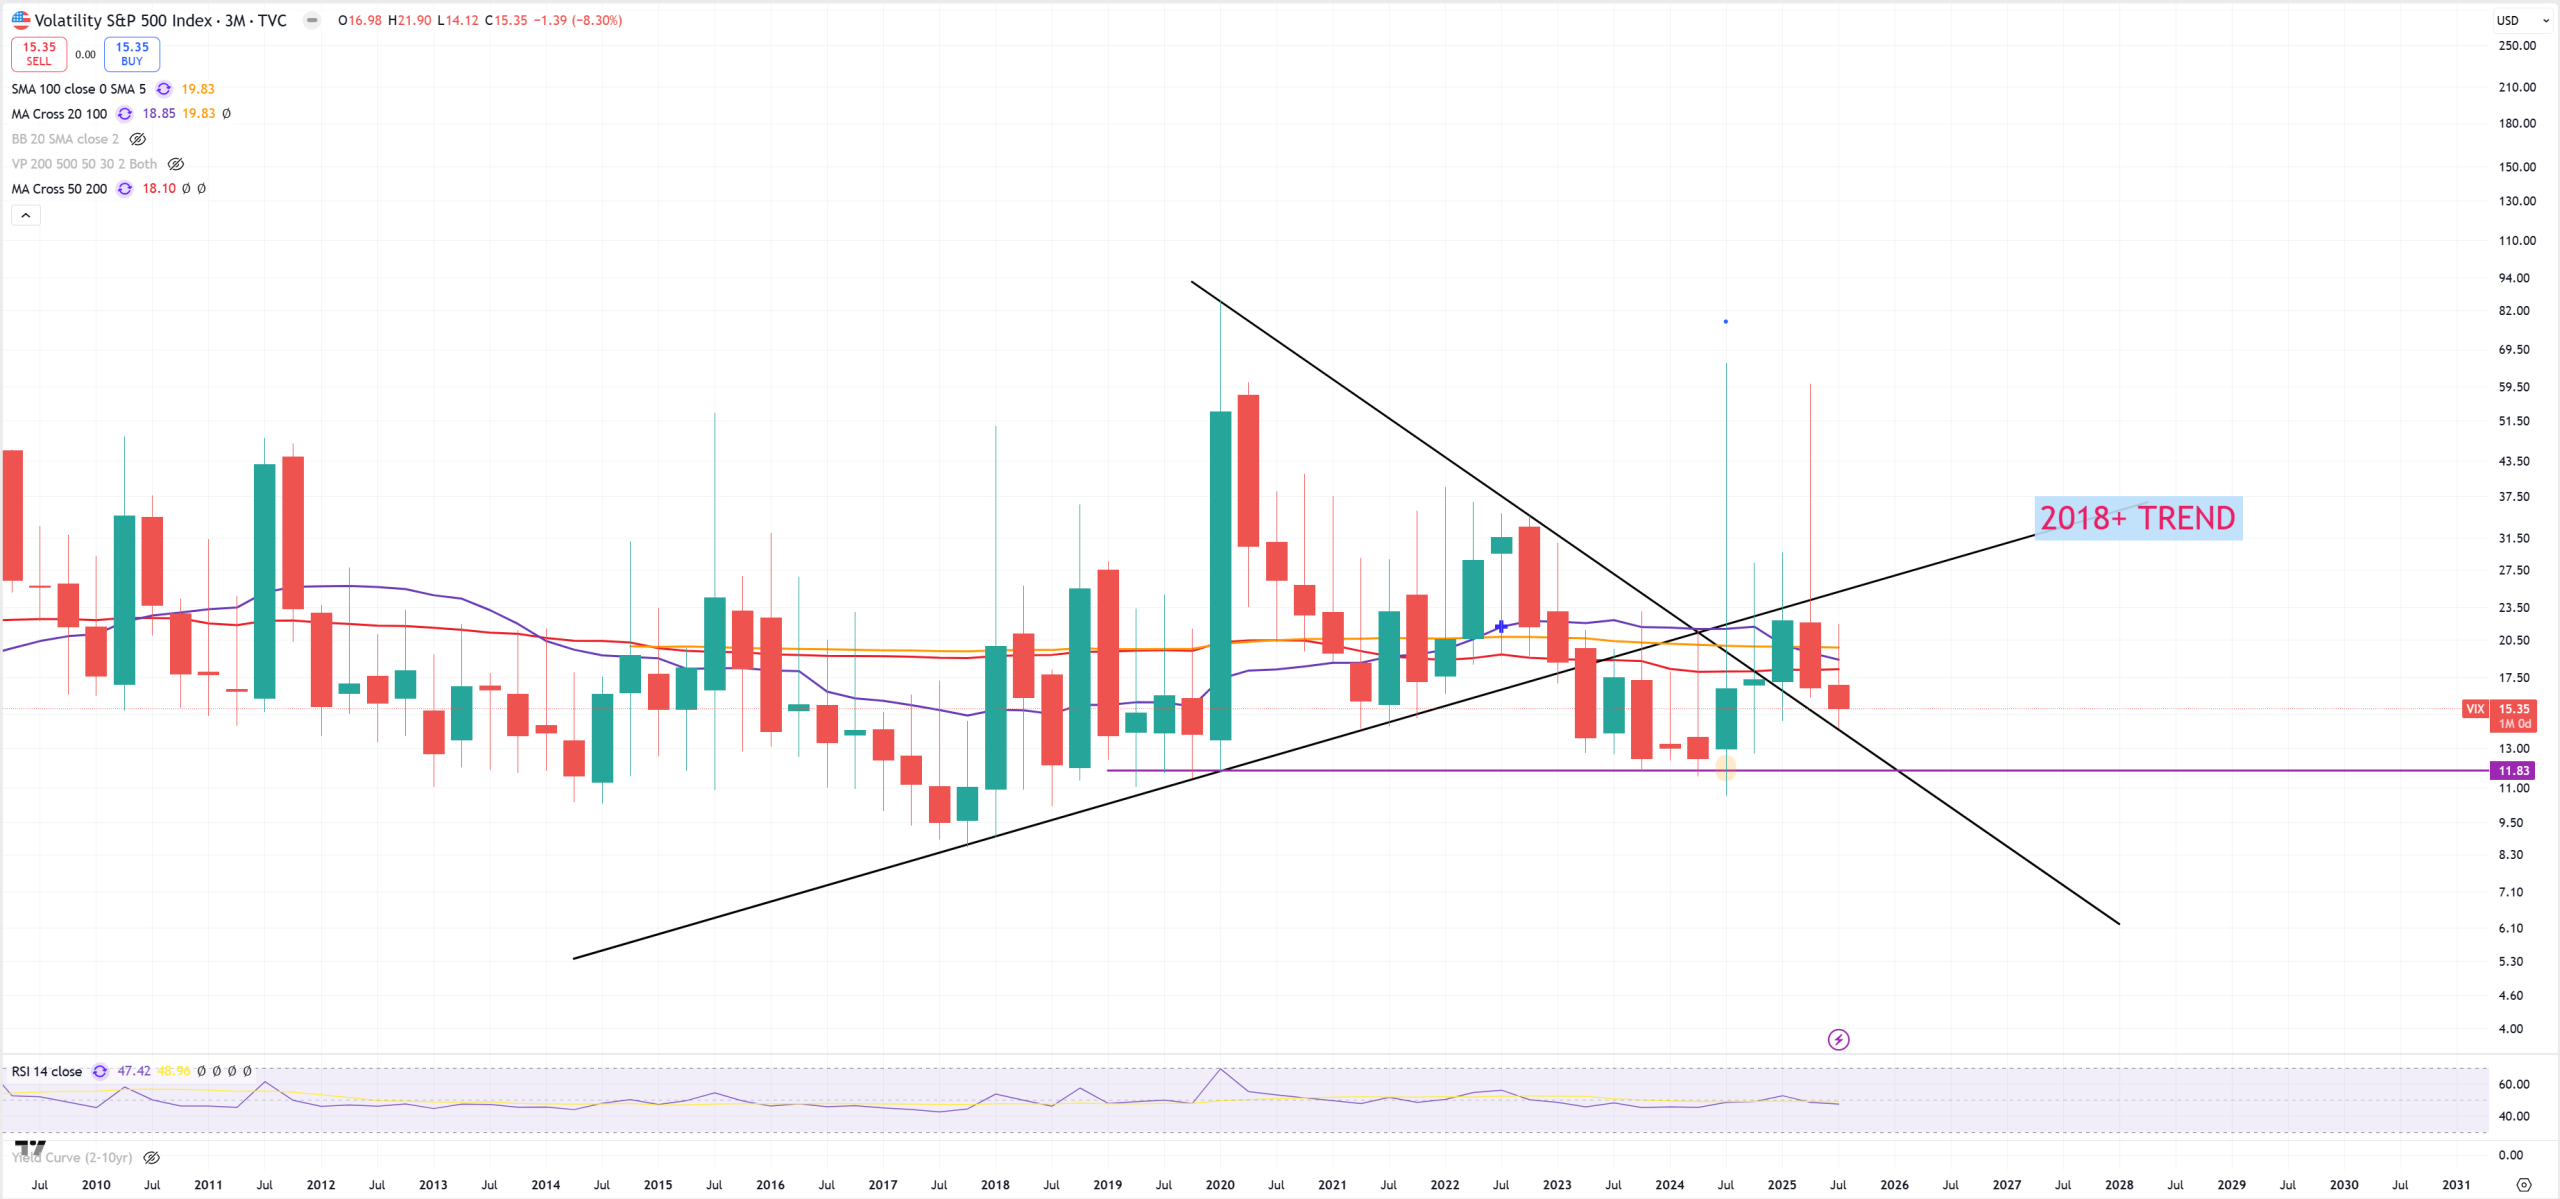
VIX – better to see it on 3M to eliminate lots of wicks. 2018 trend was not broken and it acts as a big resistance. From the other hand we have approached to key retest level, which is 14.
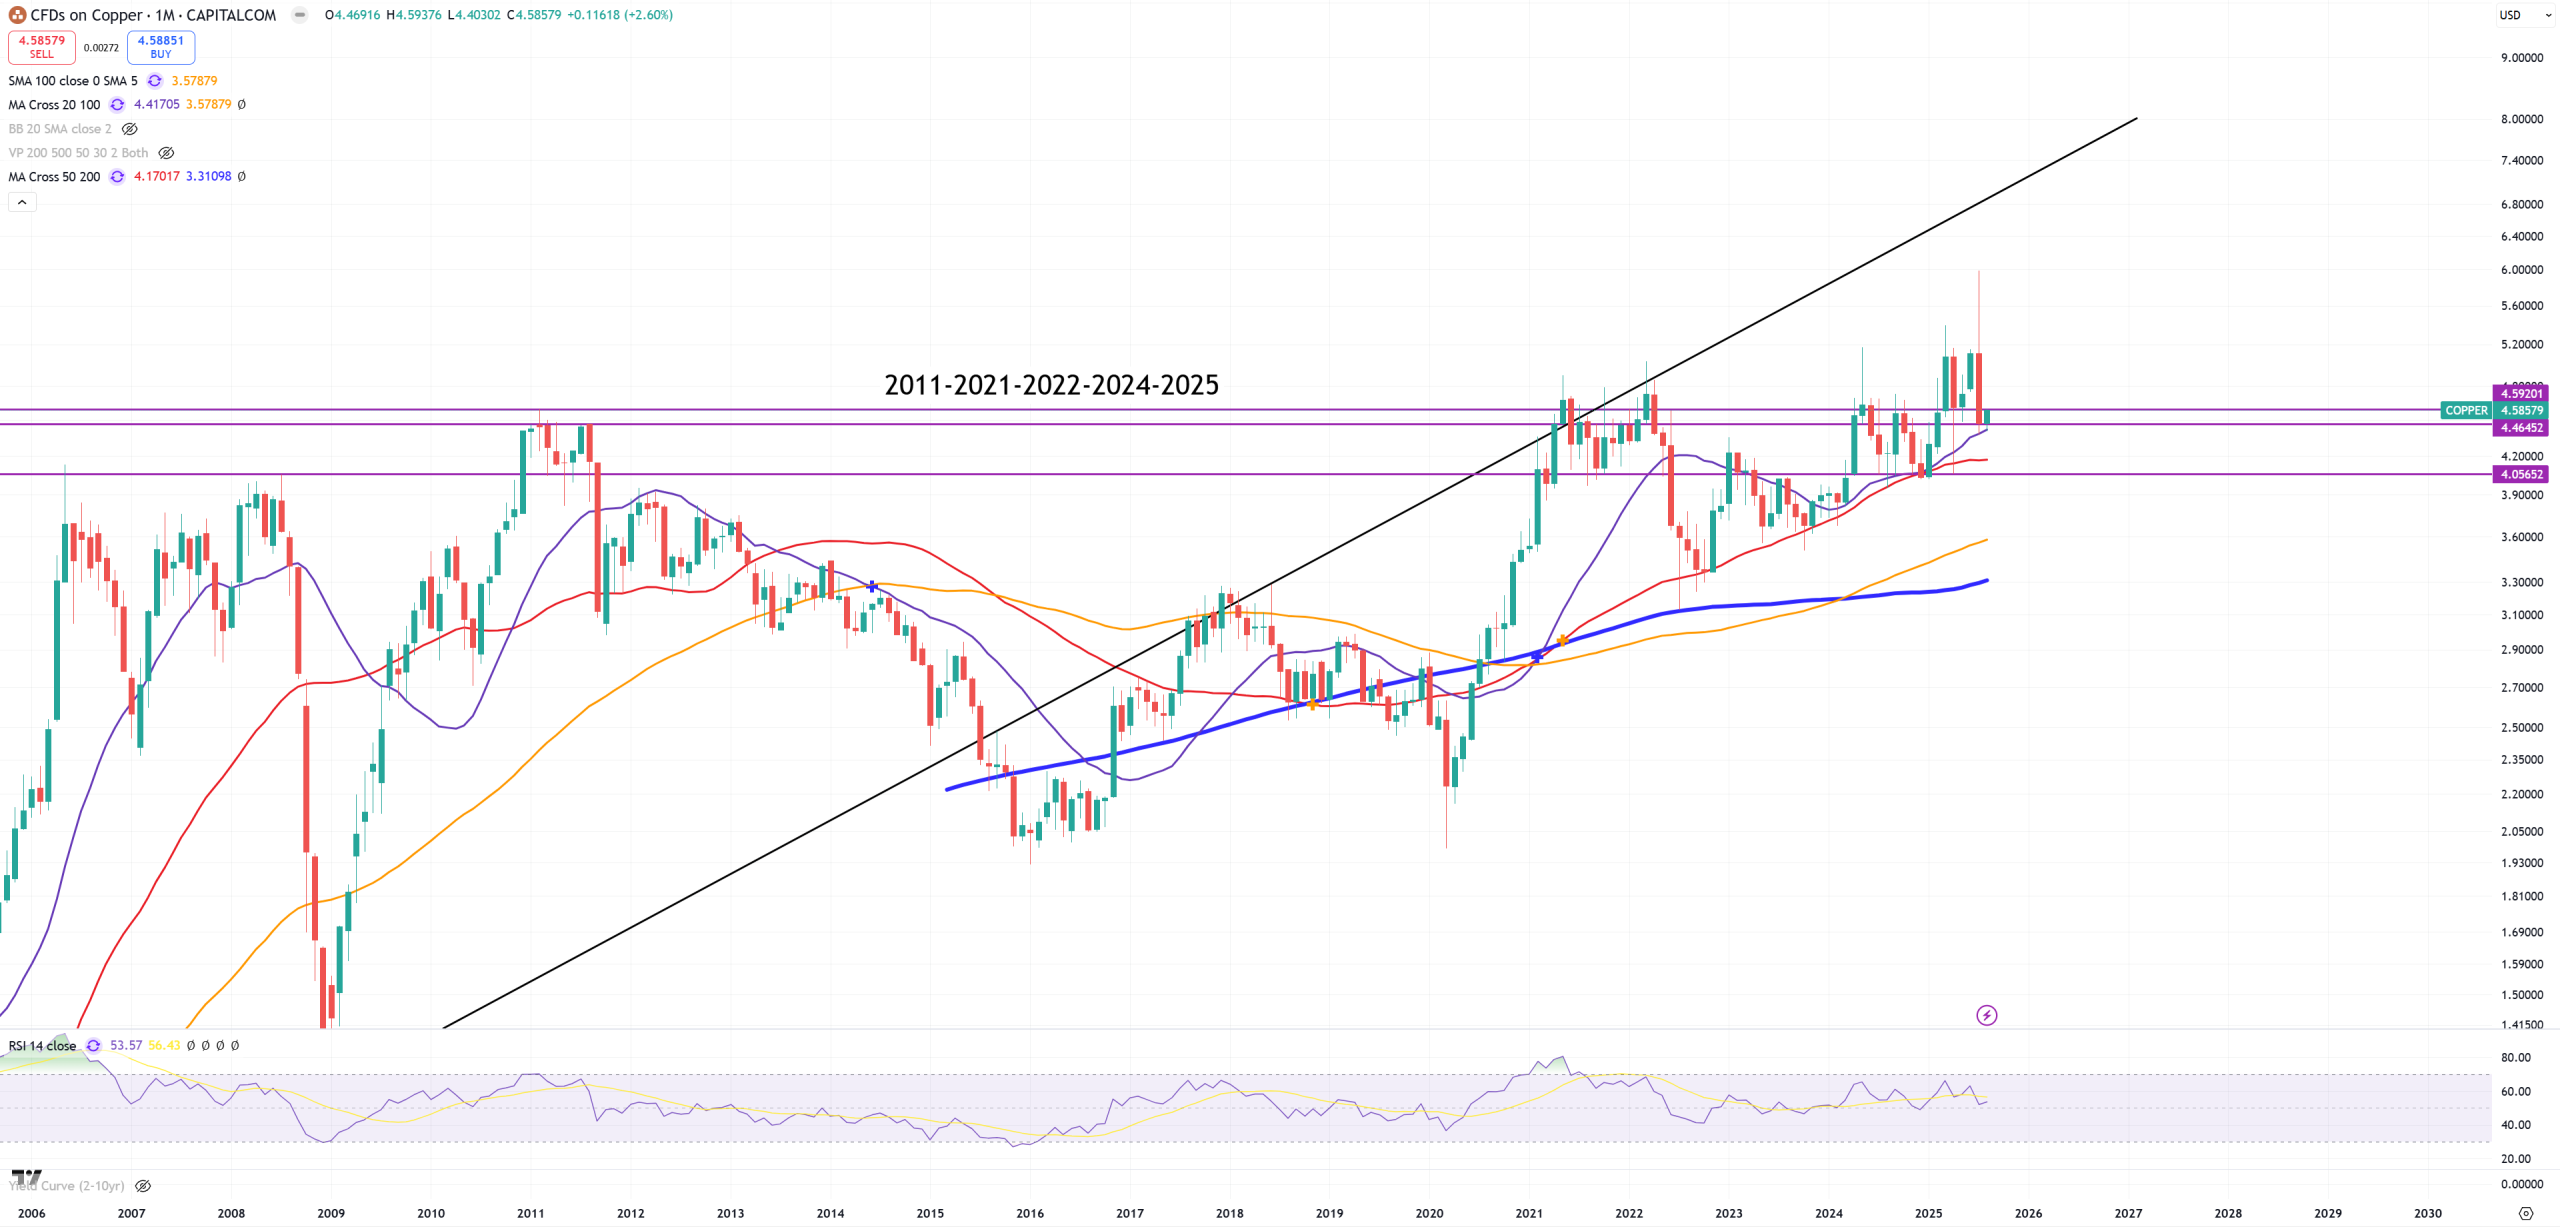
GOLD/COPPER – if market is going to drop I expect this ratio to go higher.
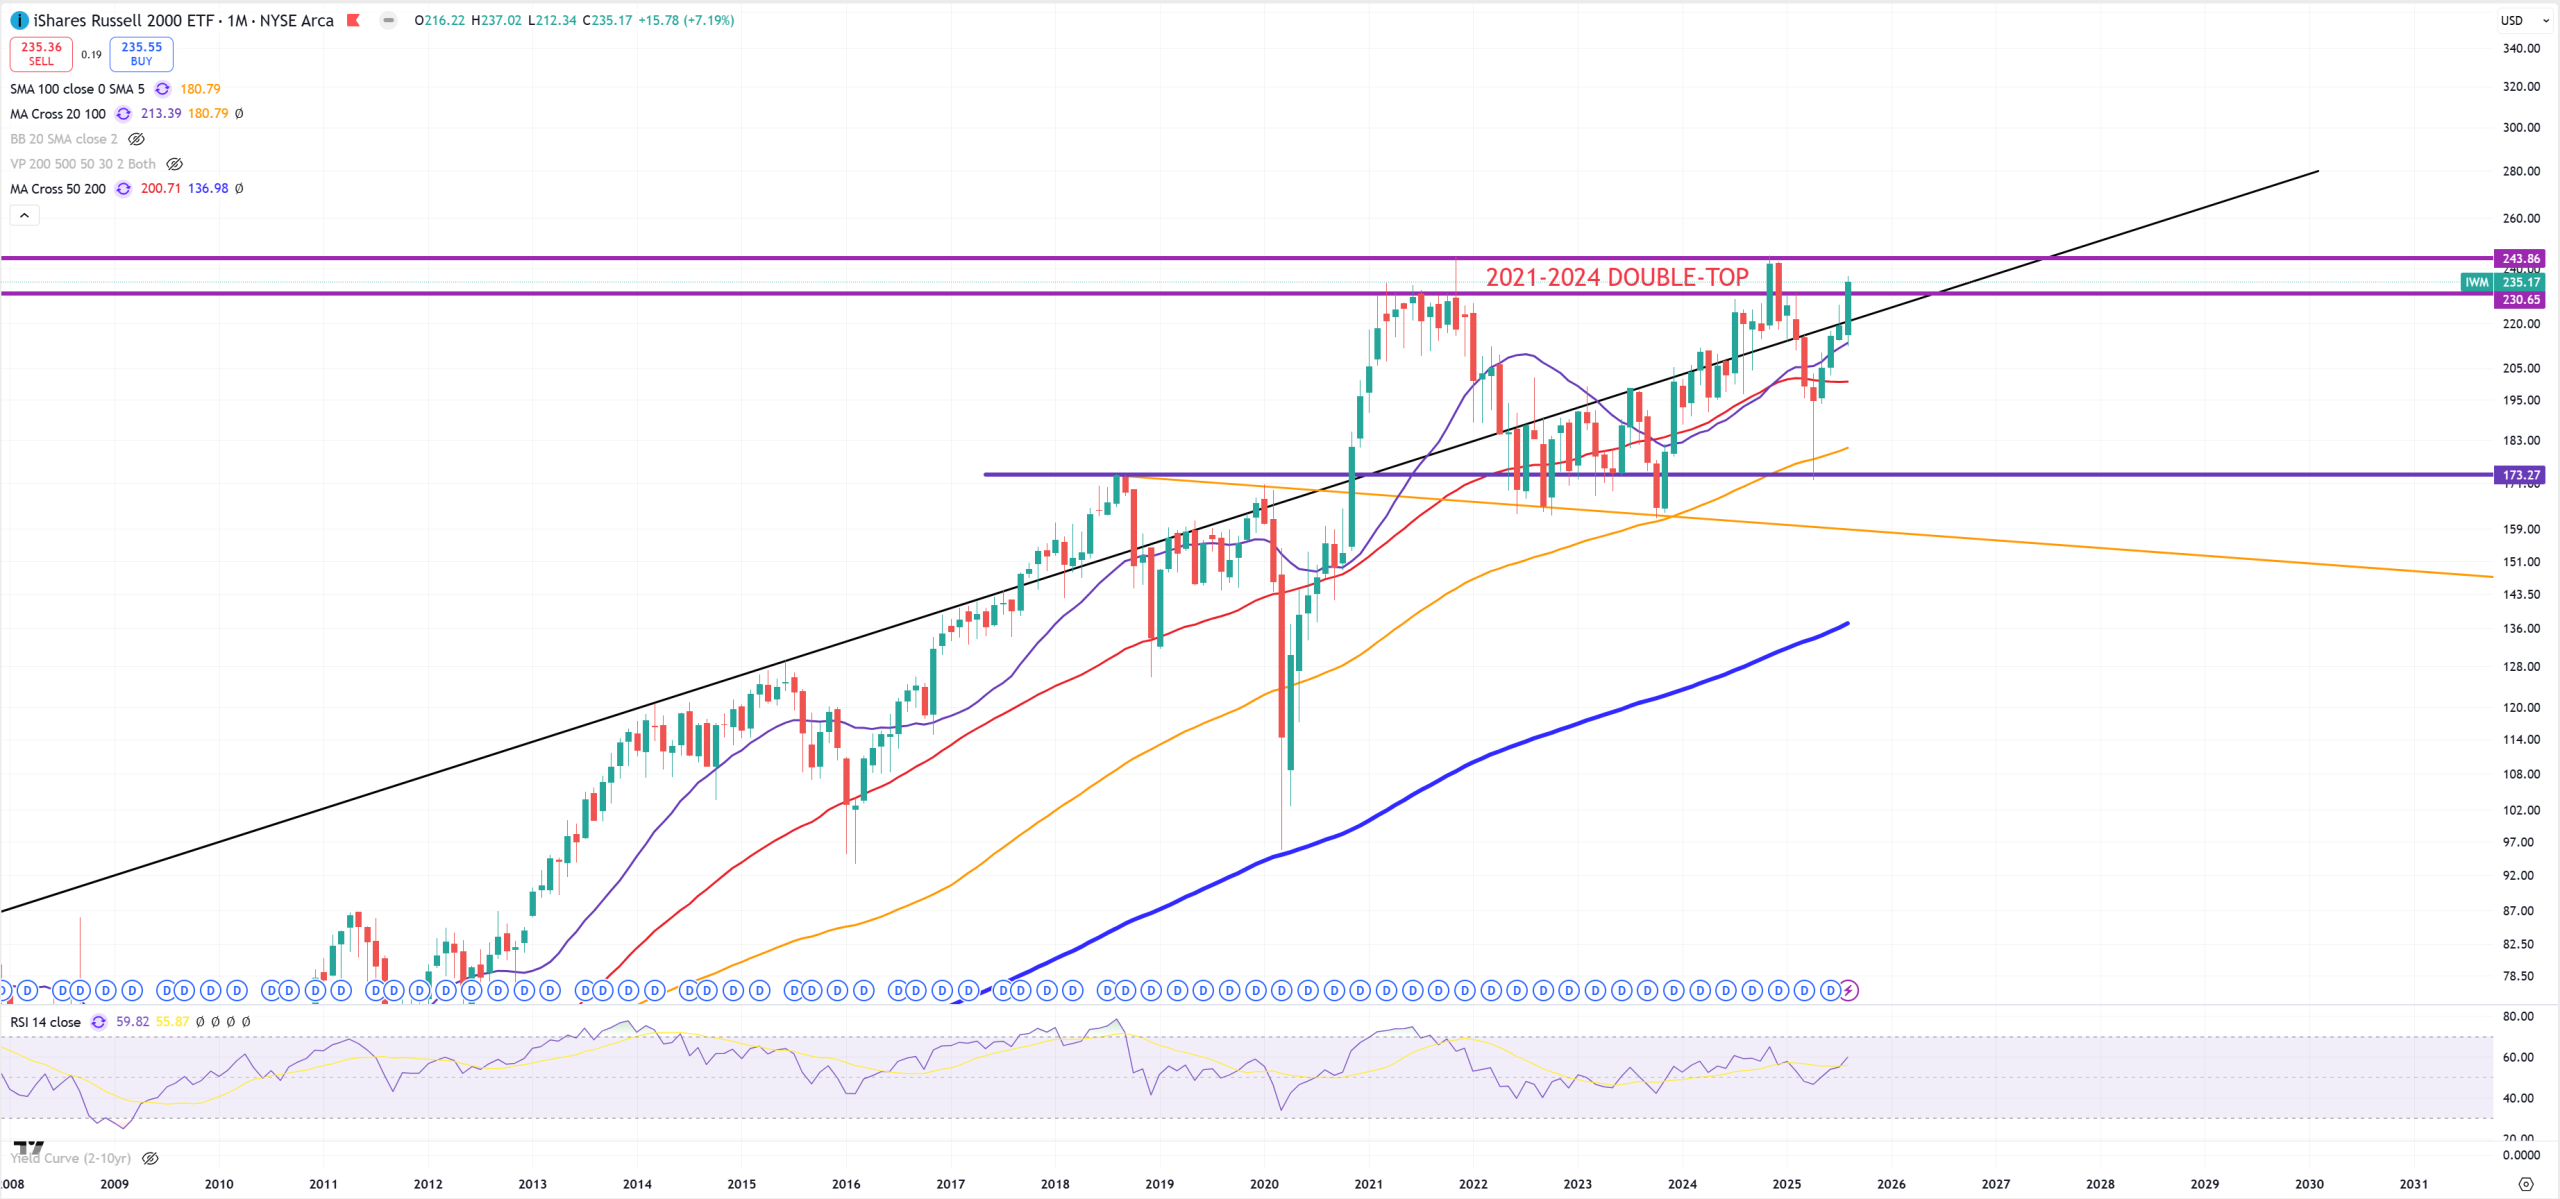
IWM – SmallCaps, more or less the same as DJT
So just have in mind how market is still “mixed” in lots of charts, it’s like DJI/GOLD pattern which indicates “GAME OVER” or SPX/GOLD pattern which indicates a consolidation between (3M)MA50 and (3M)MA200 – not giving us a clear answer.
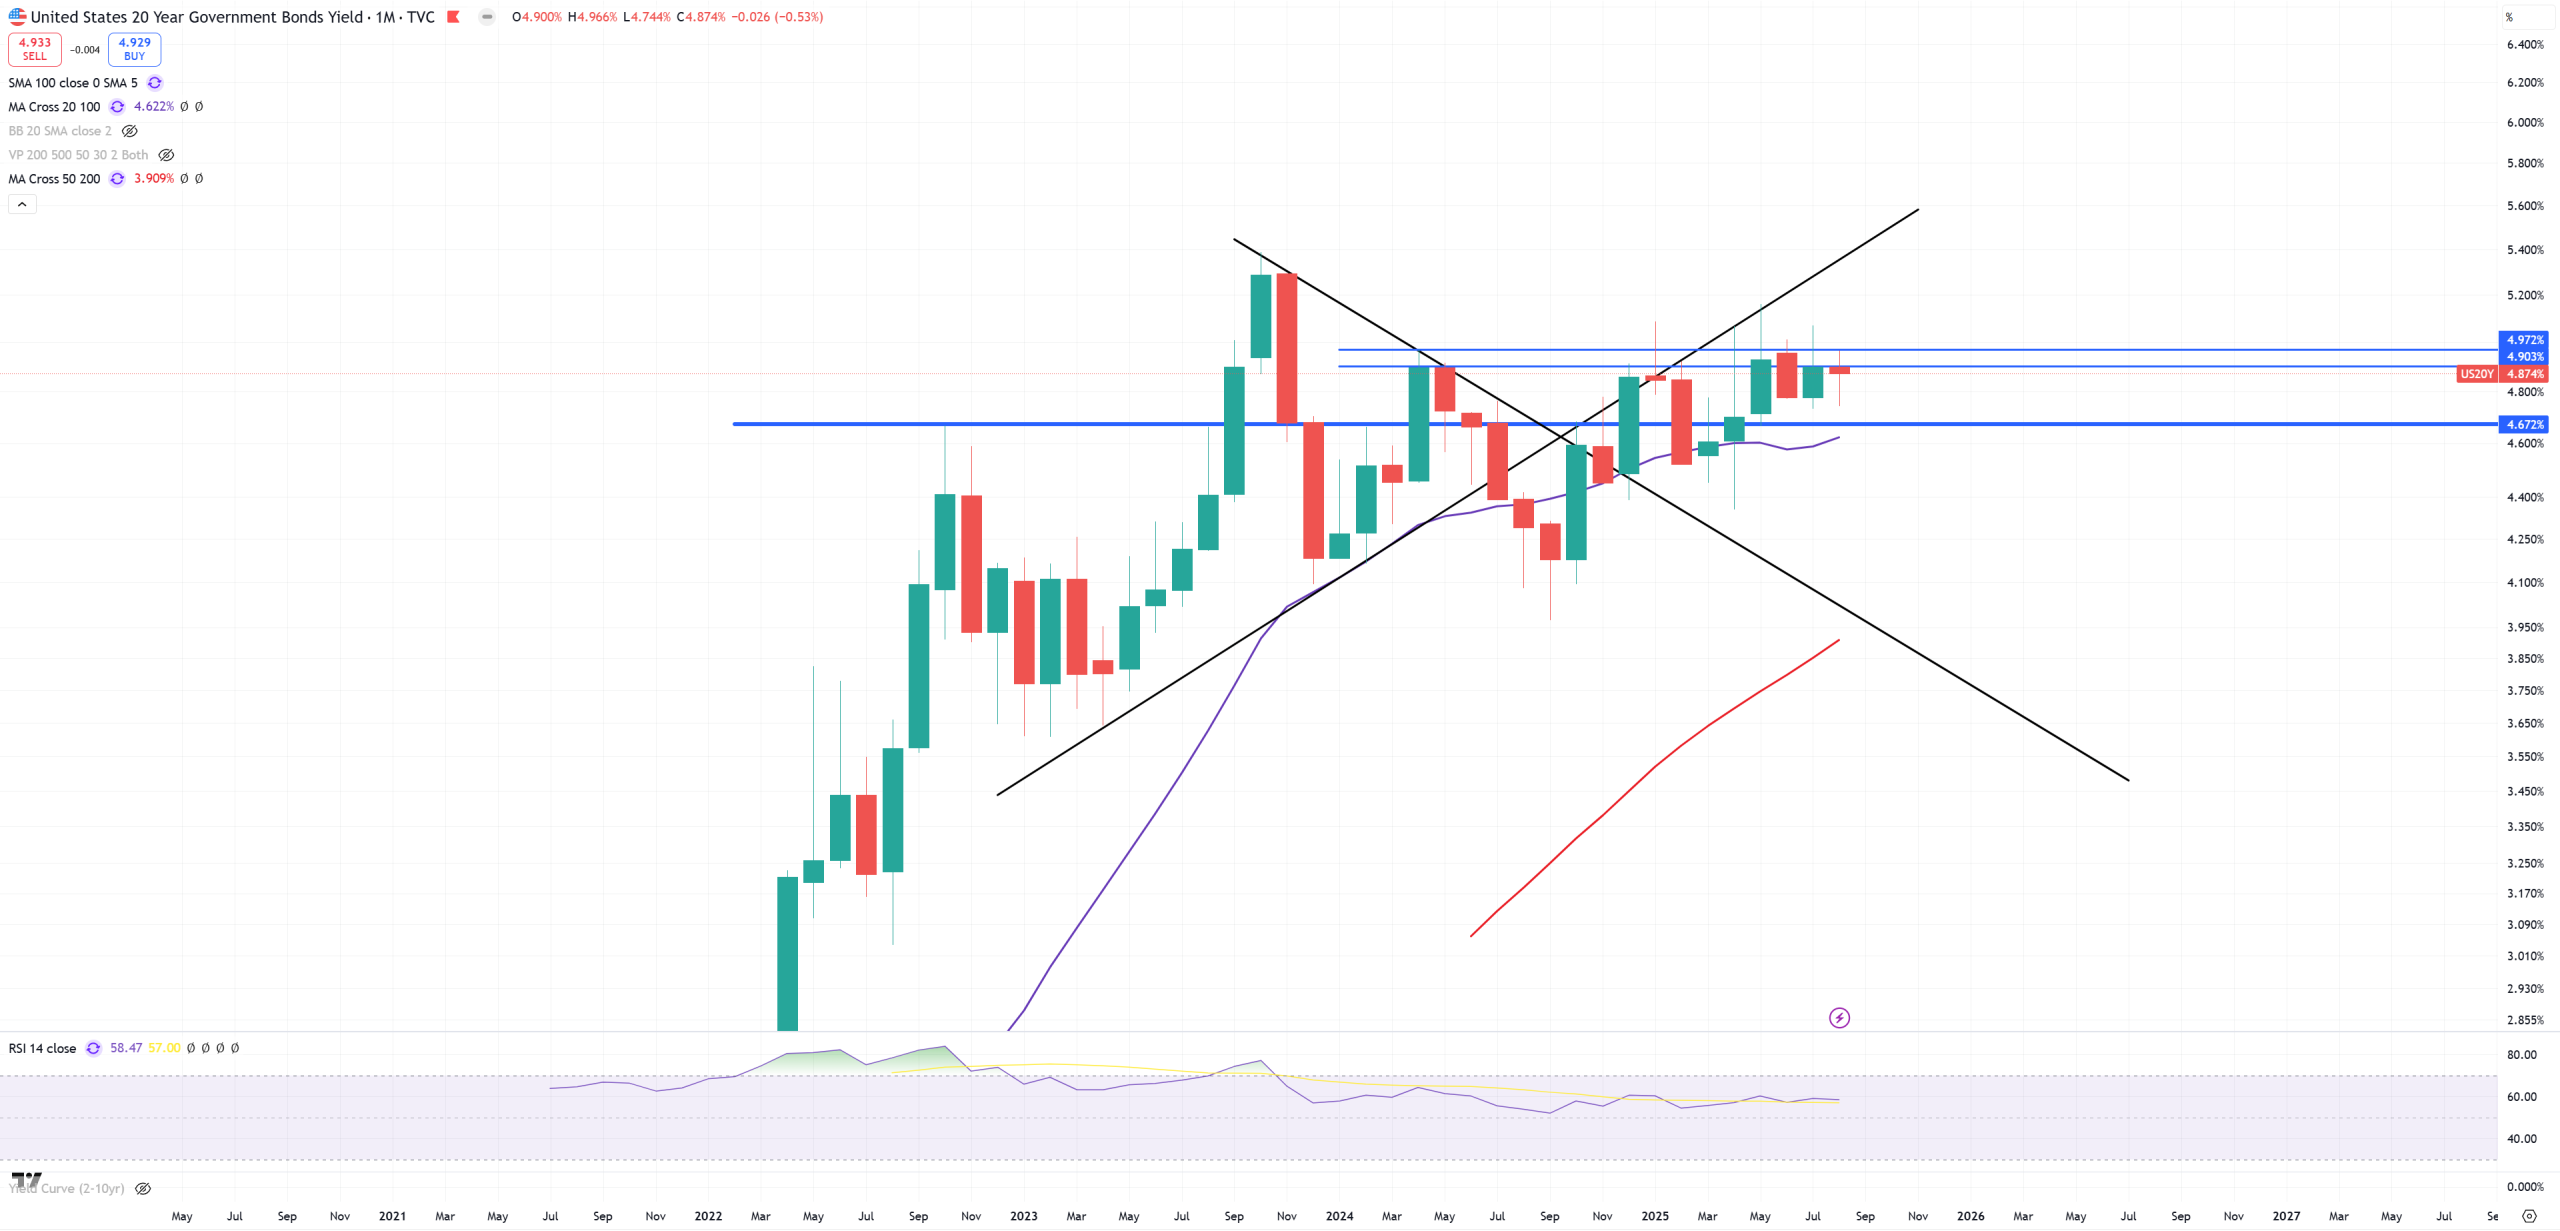
US20Y – so equivalent of TLT and its 5.00% resistance.
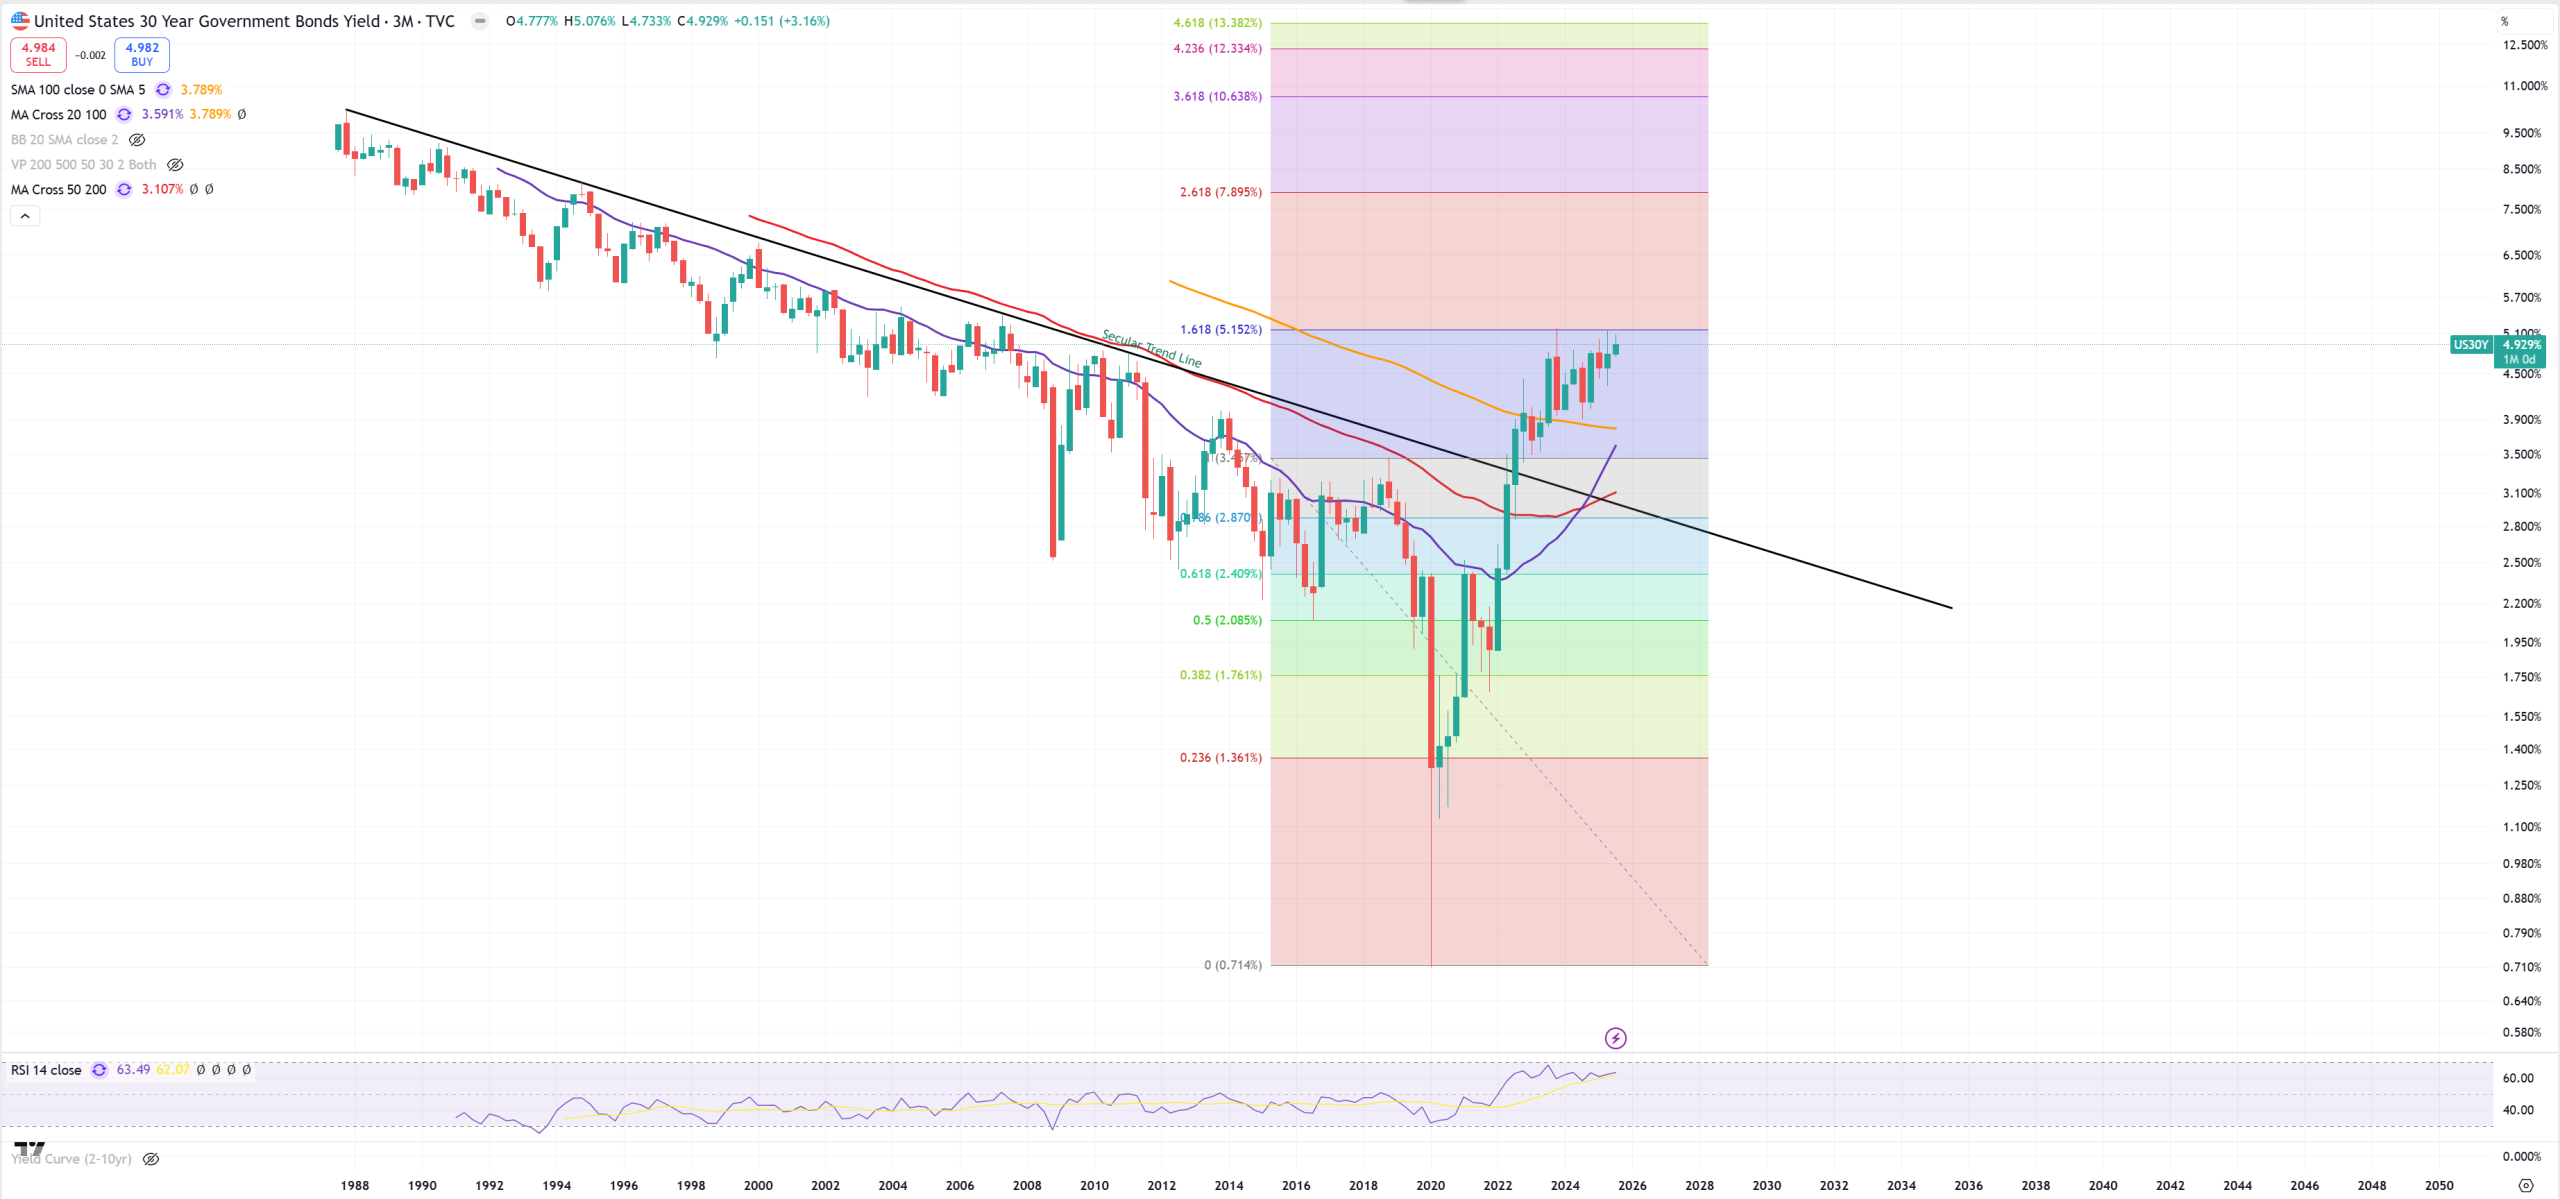
US30Y – have in mind that US Bonds are the only one from DM markets which have not broken to higher level (that’s why others got their currencies stronger – but it’ll have massive consequences)
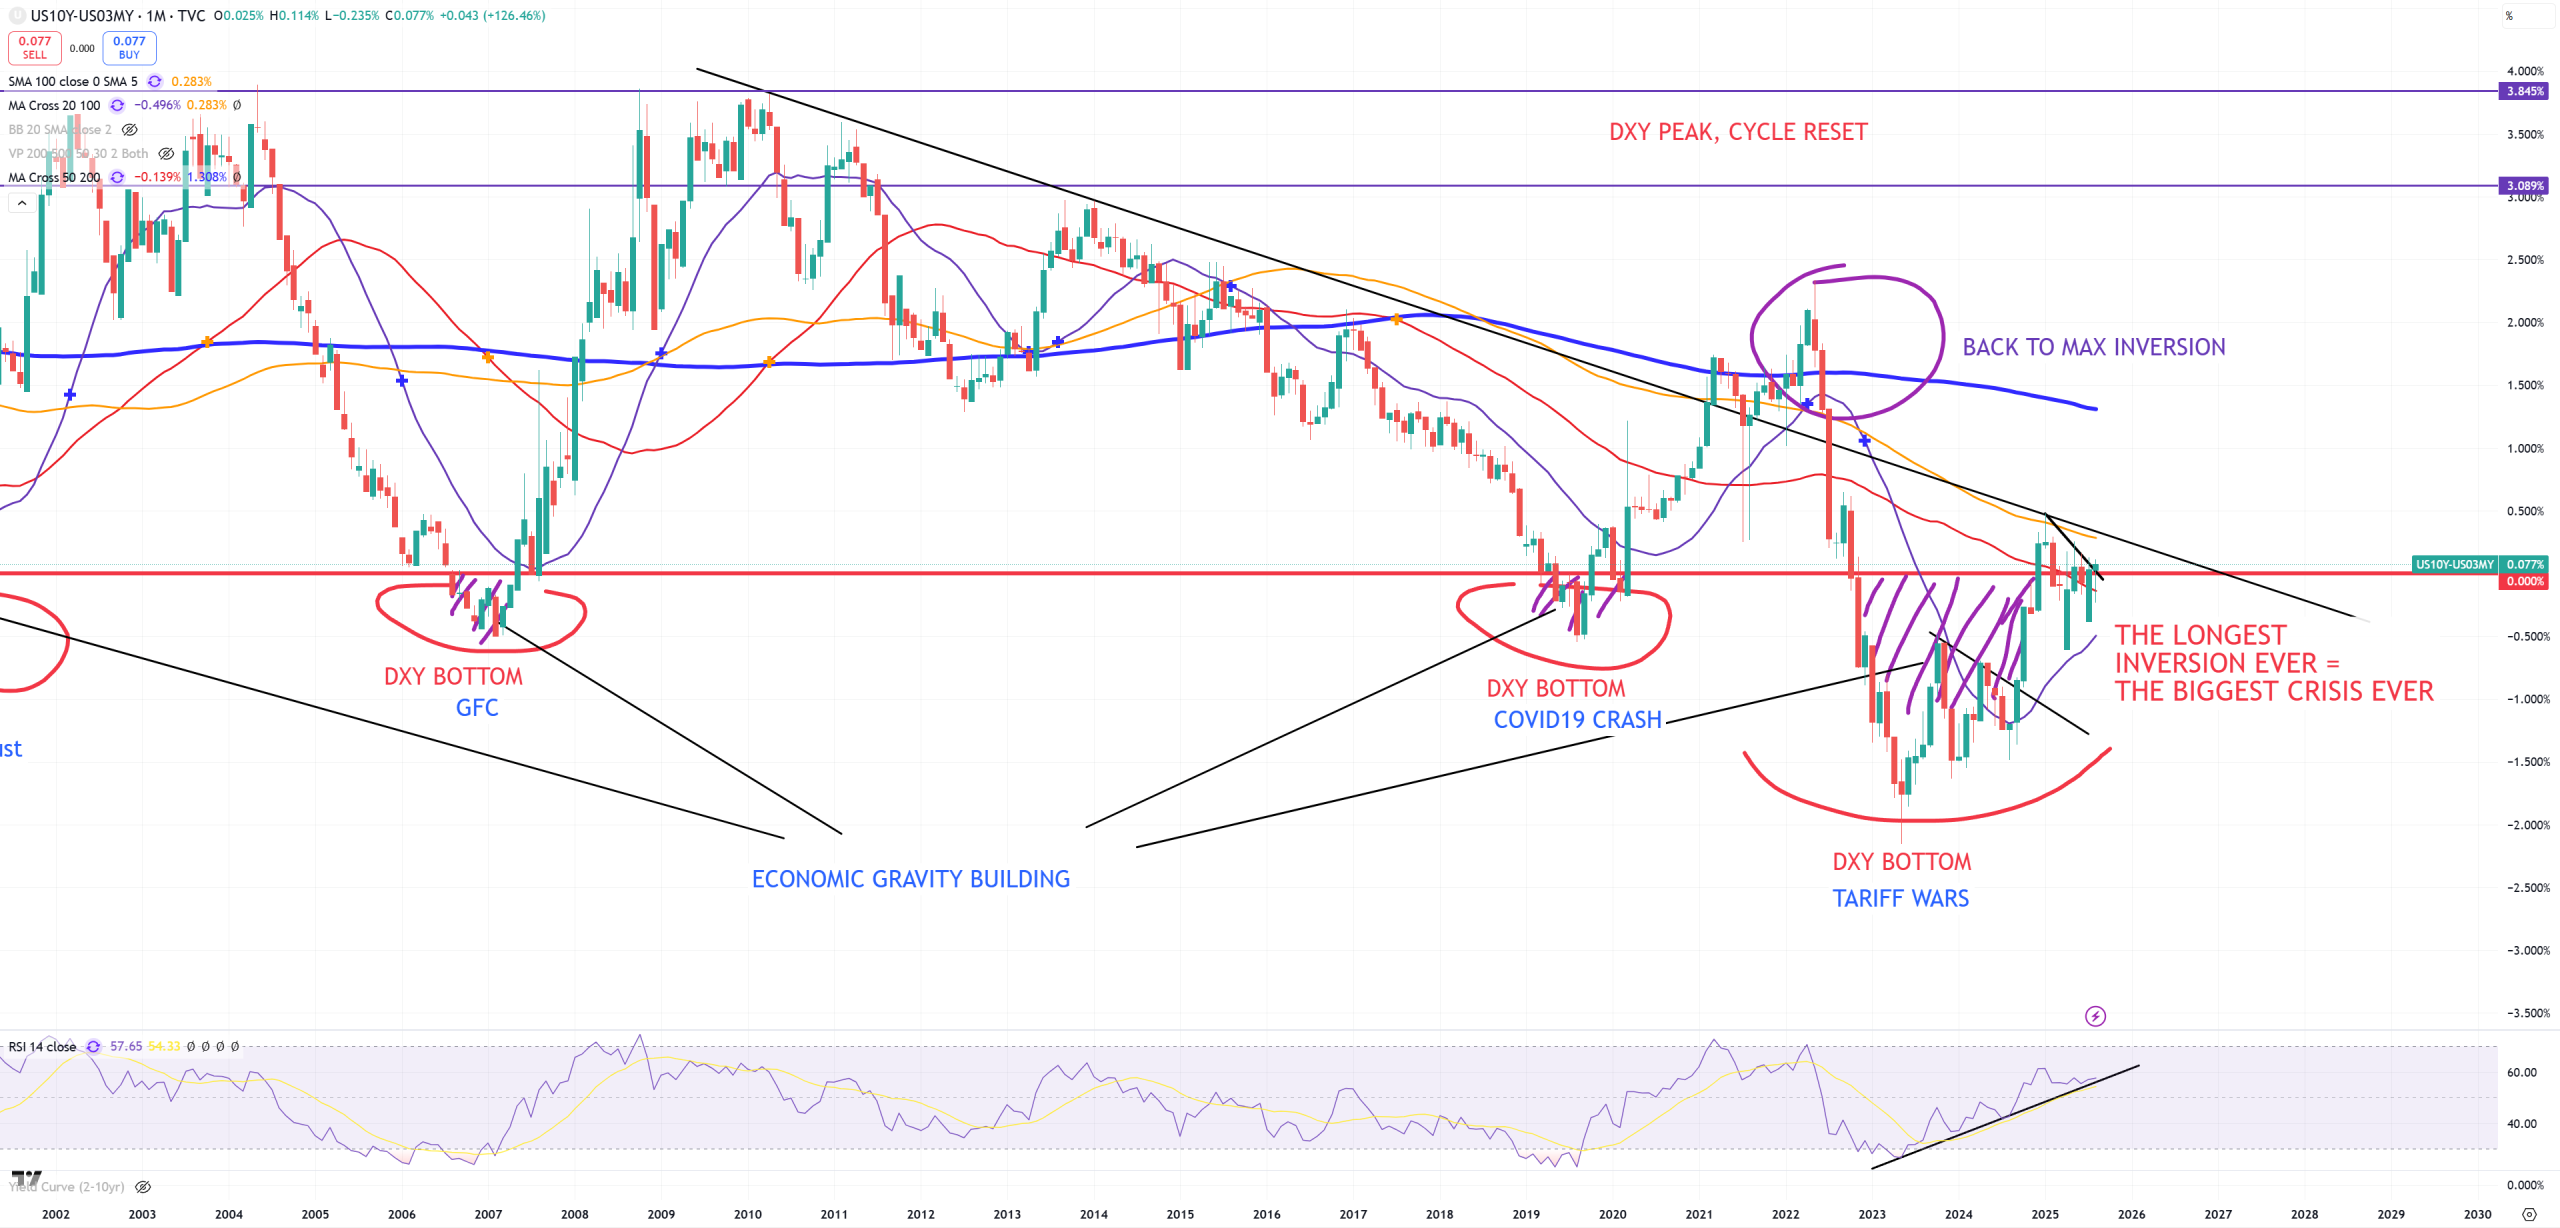
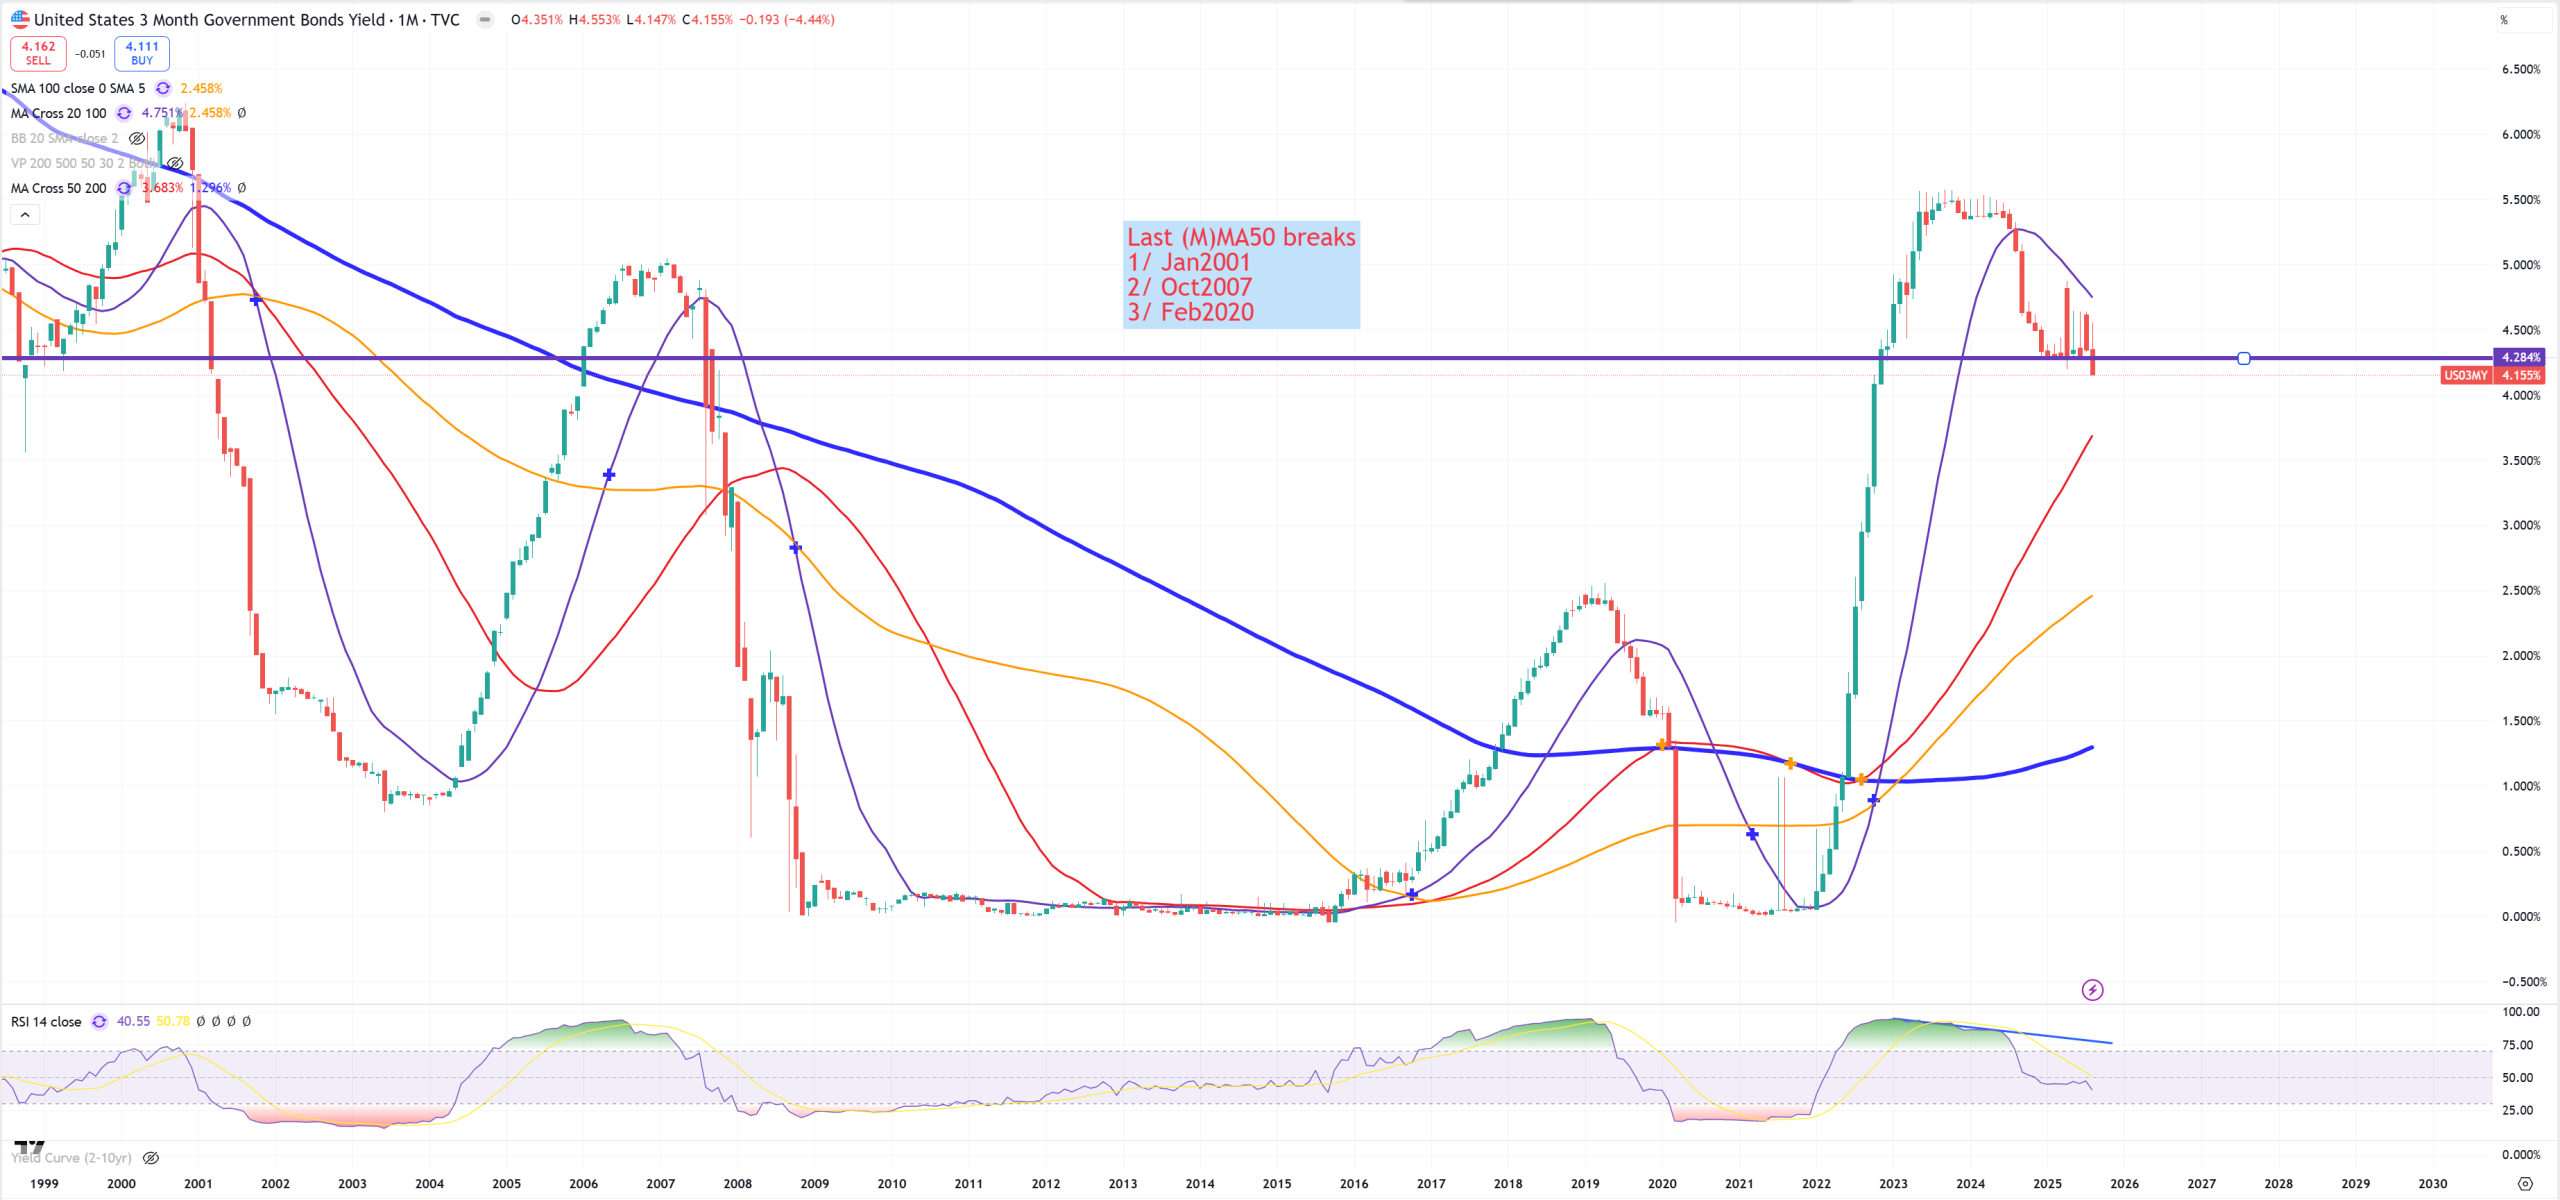
US10Y/US03MY – so yield-curve uninversion is > (M)MA50 with massive positive (M)RSI divergence. We can say we’re uninverting > 1000 days – the longest and deepest ever and rule of thumb is : the longer and deeper inversion of this spread is -> the more powerful economic crisis to follow. As we’ve passed 700 days of 1929 inversion this rule of thumb tells us it’ll be worse. 10Y/3M needs to pass > +50-60bps to finish the economy so far it’s +8bps.
US10Y/US02Y – this yield-curve should give 10Y/3MY a signal
US03MY – important (M)MA50 (3.68%) is far away. Looks like we have a sure bet about September cuts, but only 25bps.
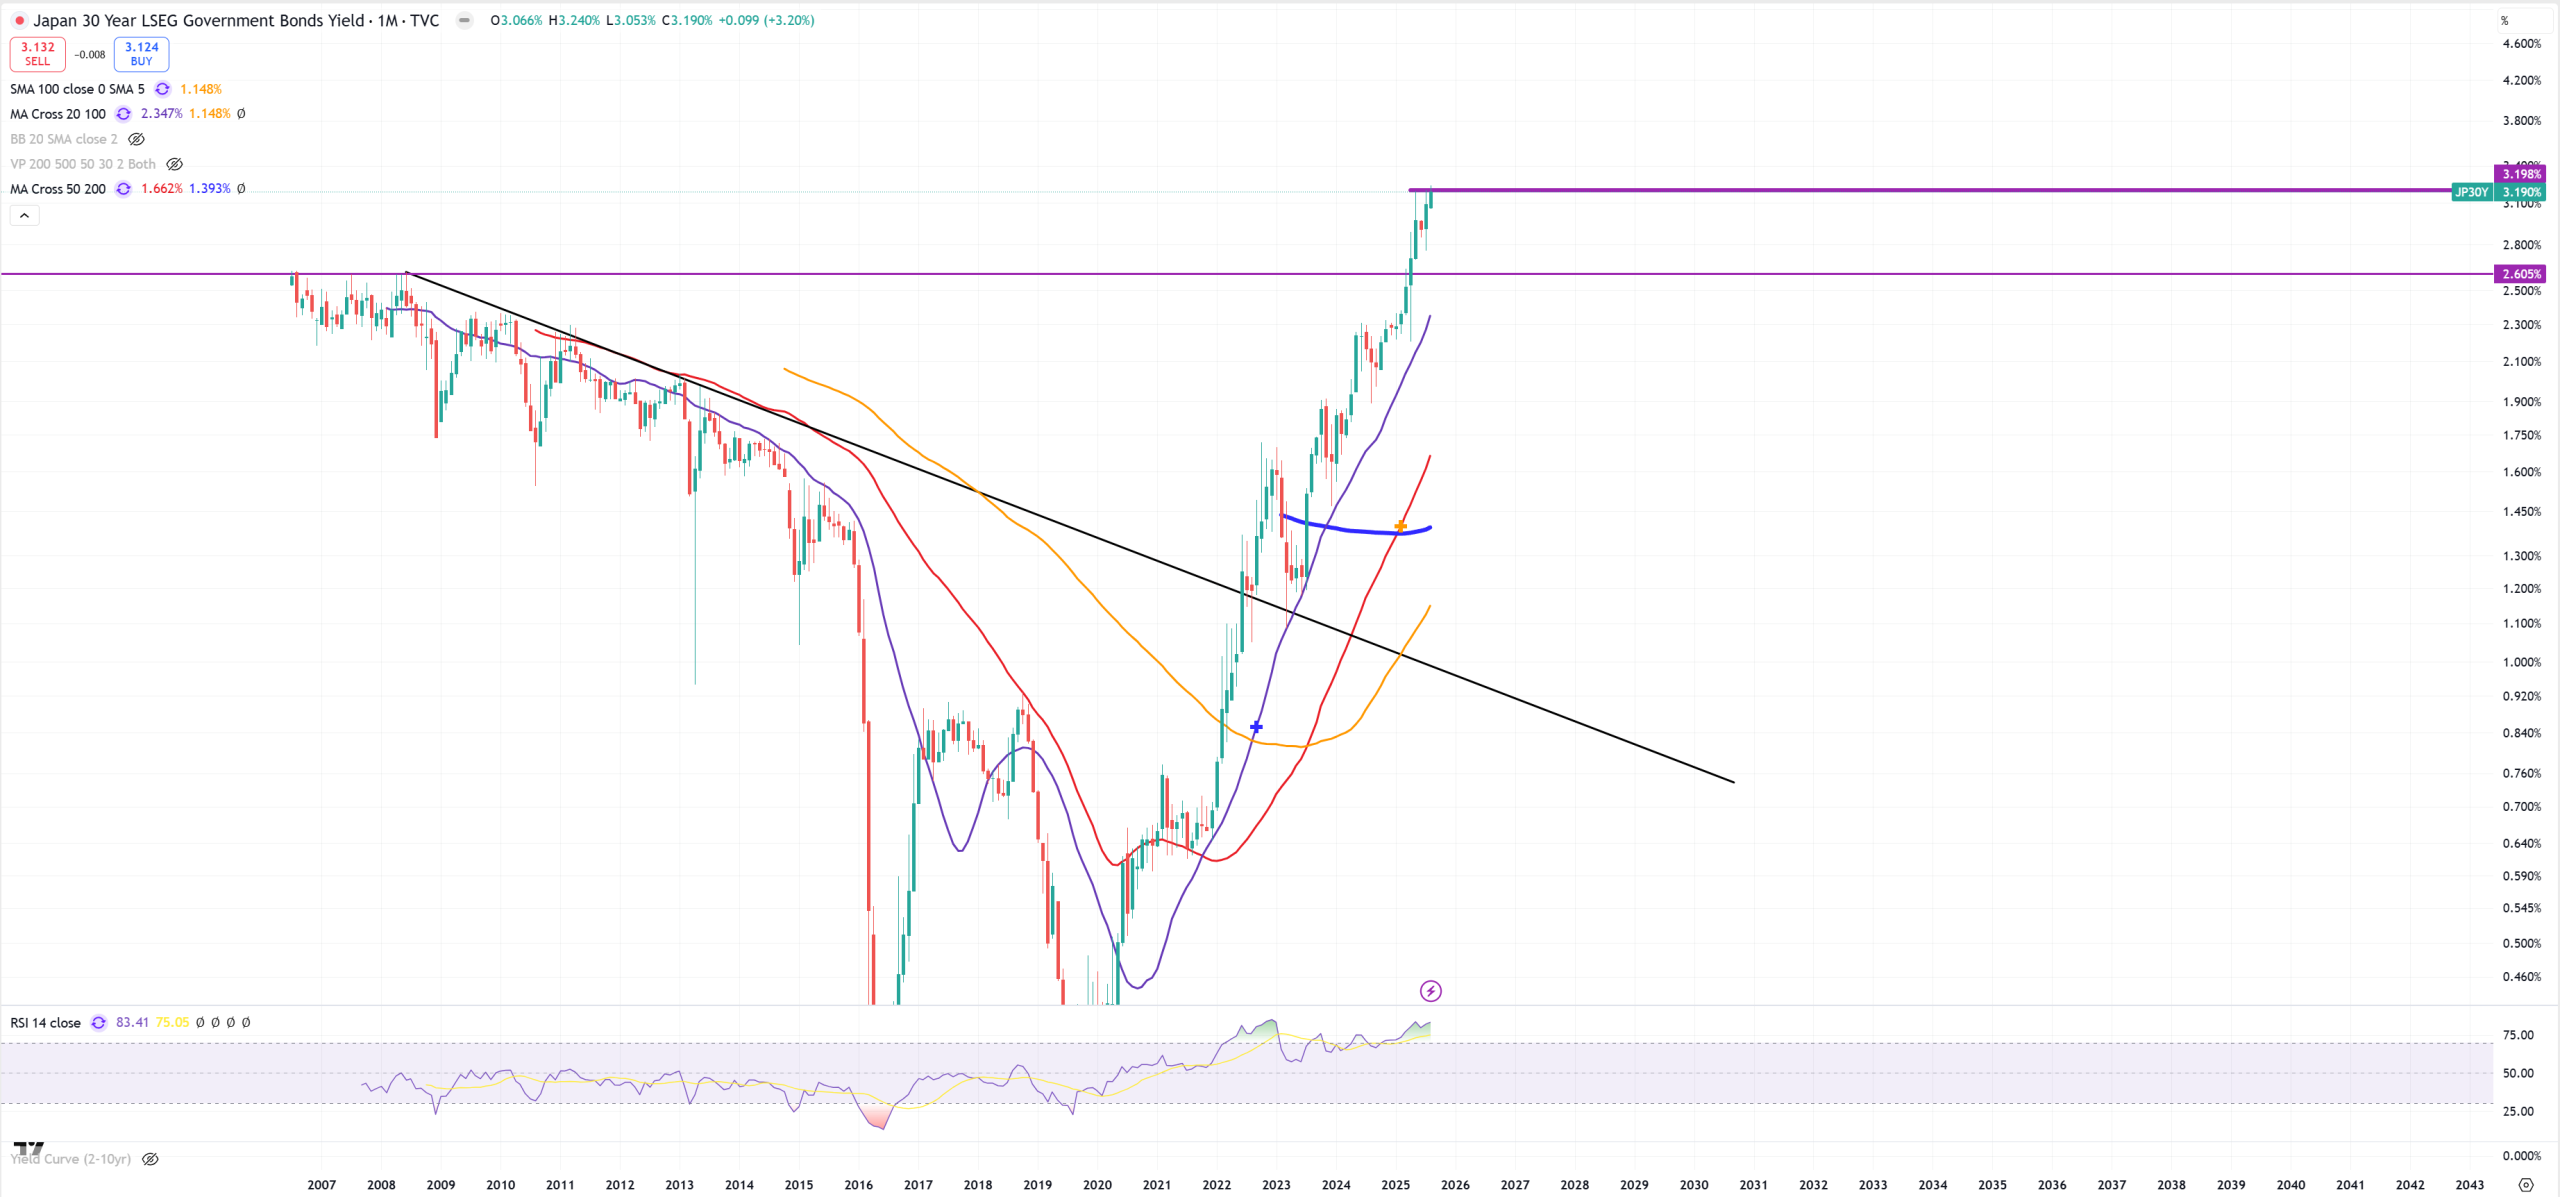
JP30Y and key 3.20% resistance
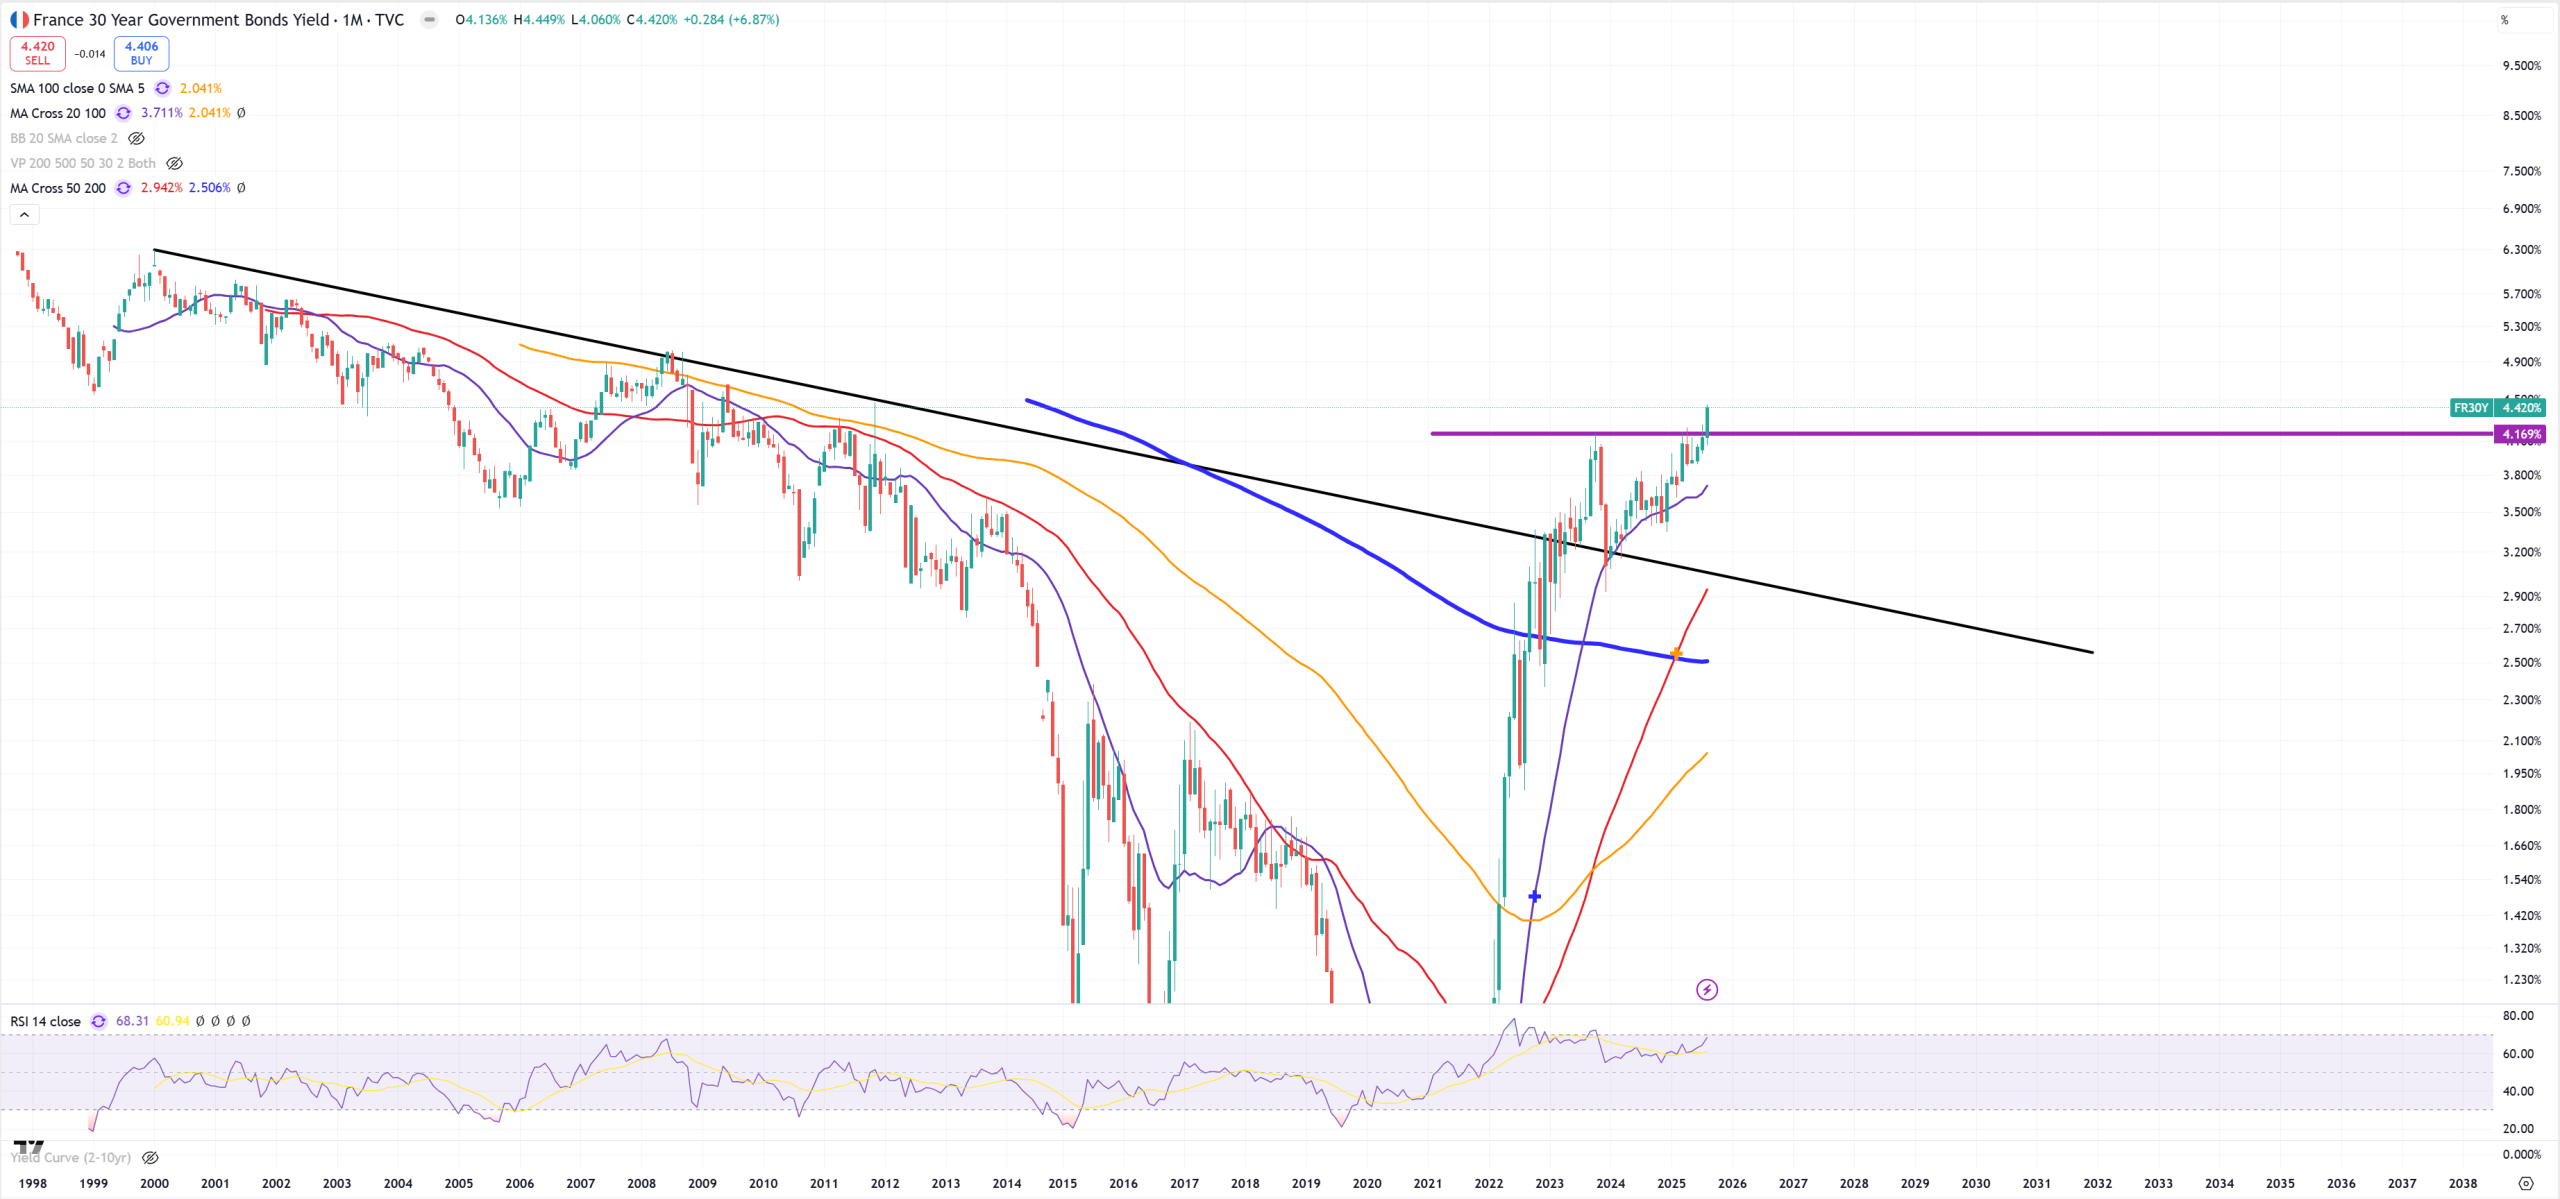
FR30Y – no comment
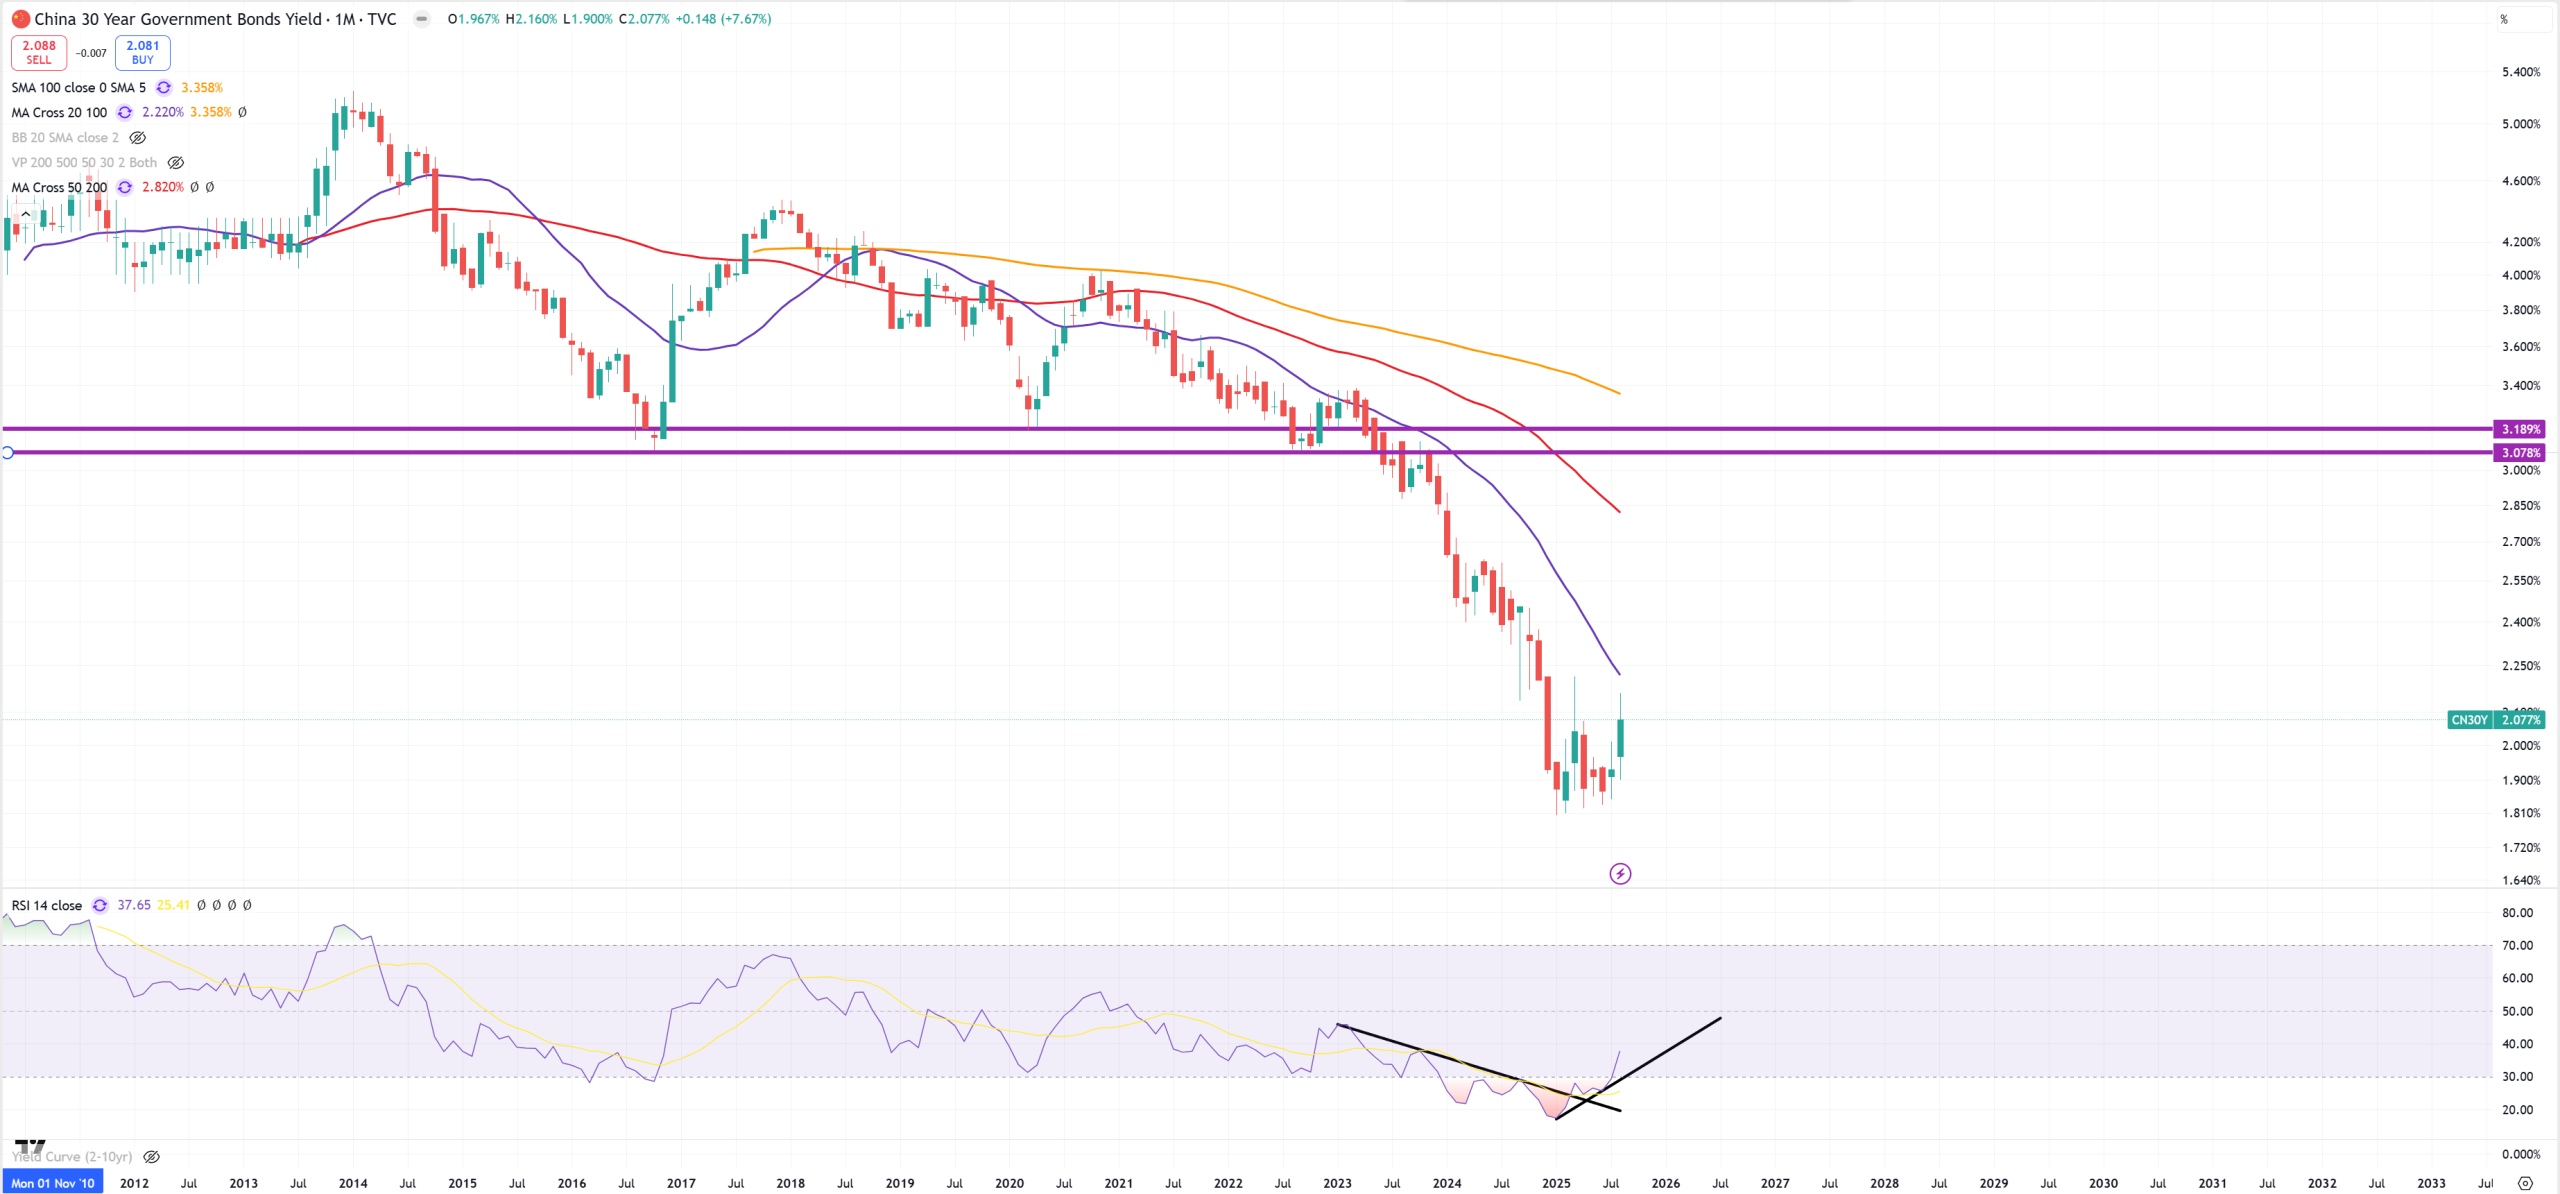
CN30Y – and finally we have Chinese bonds
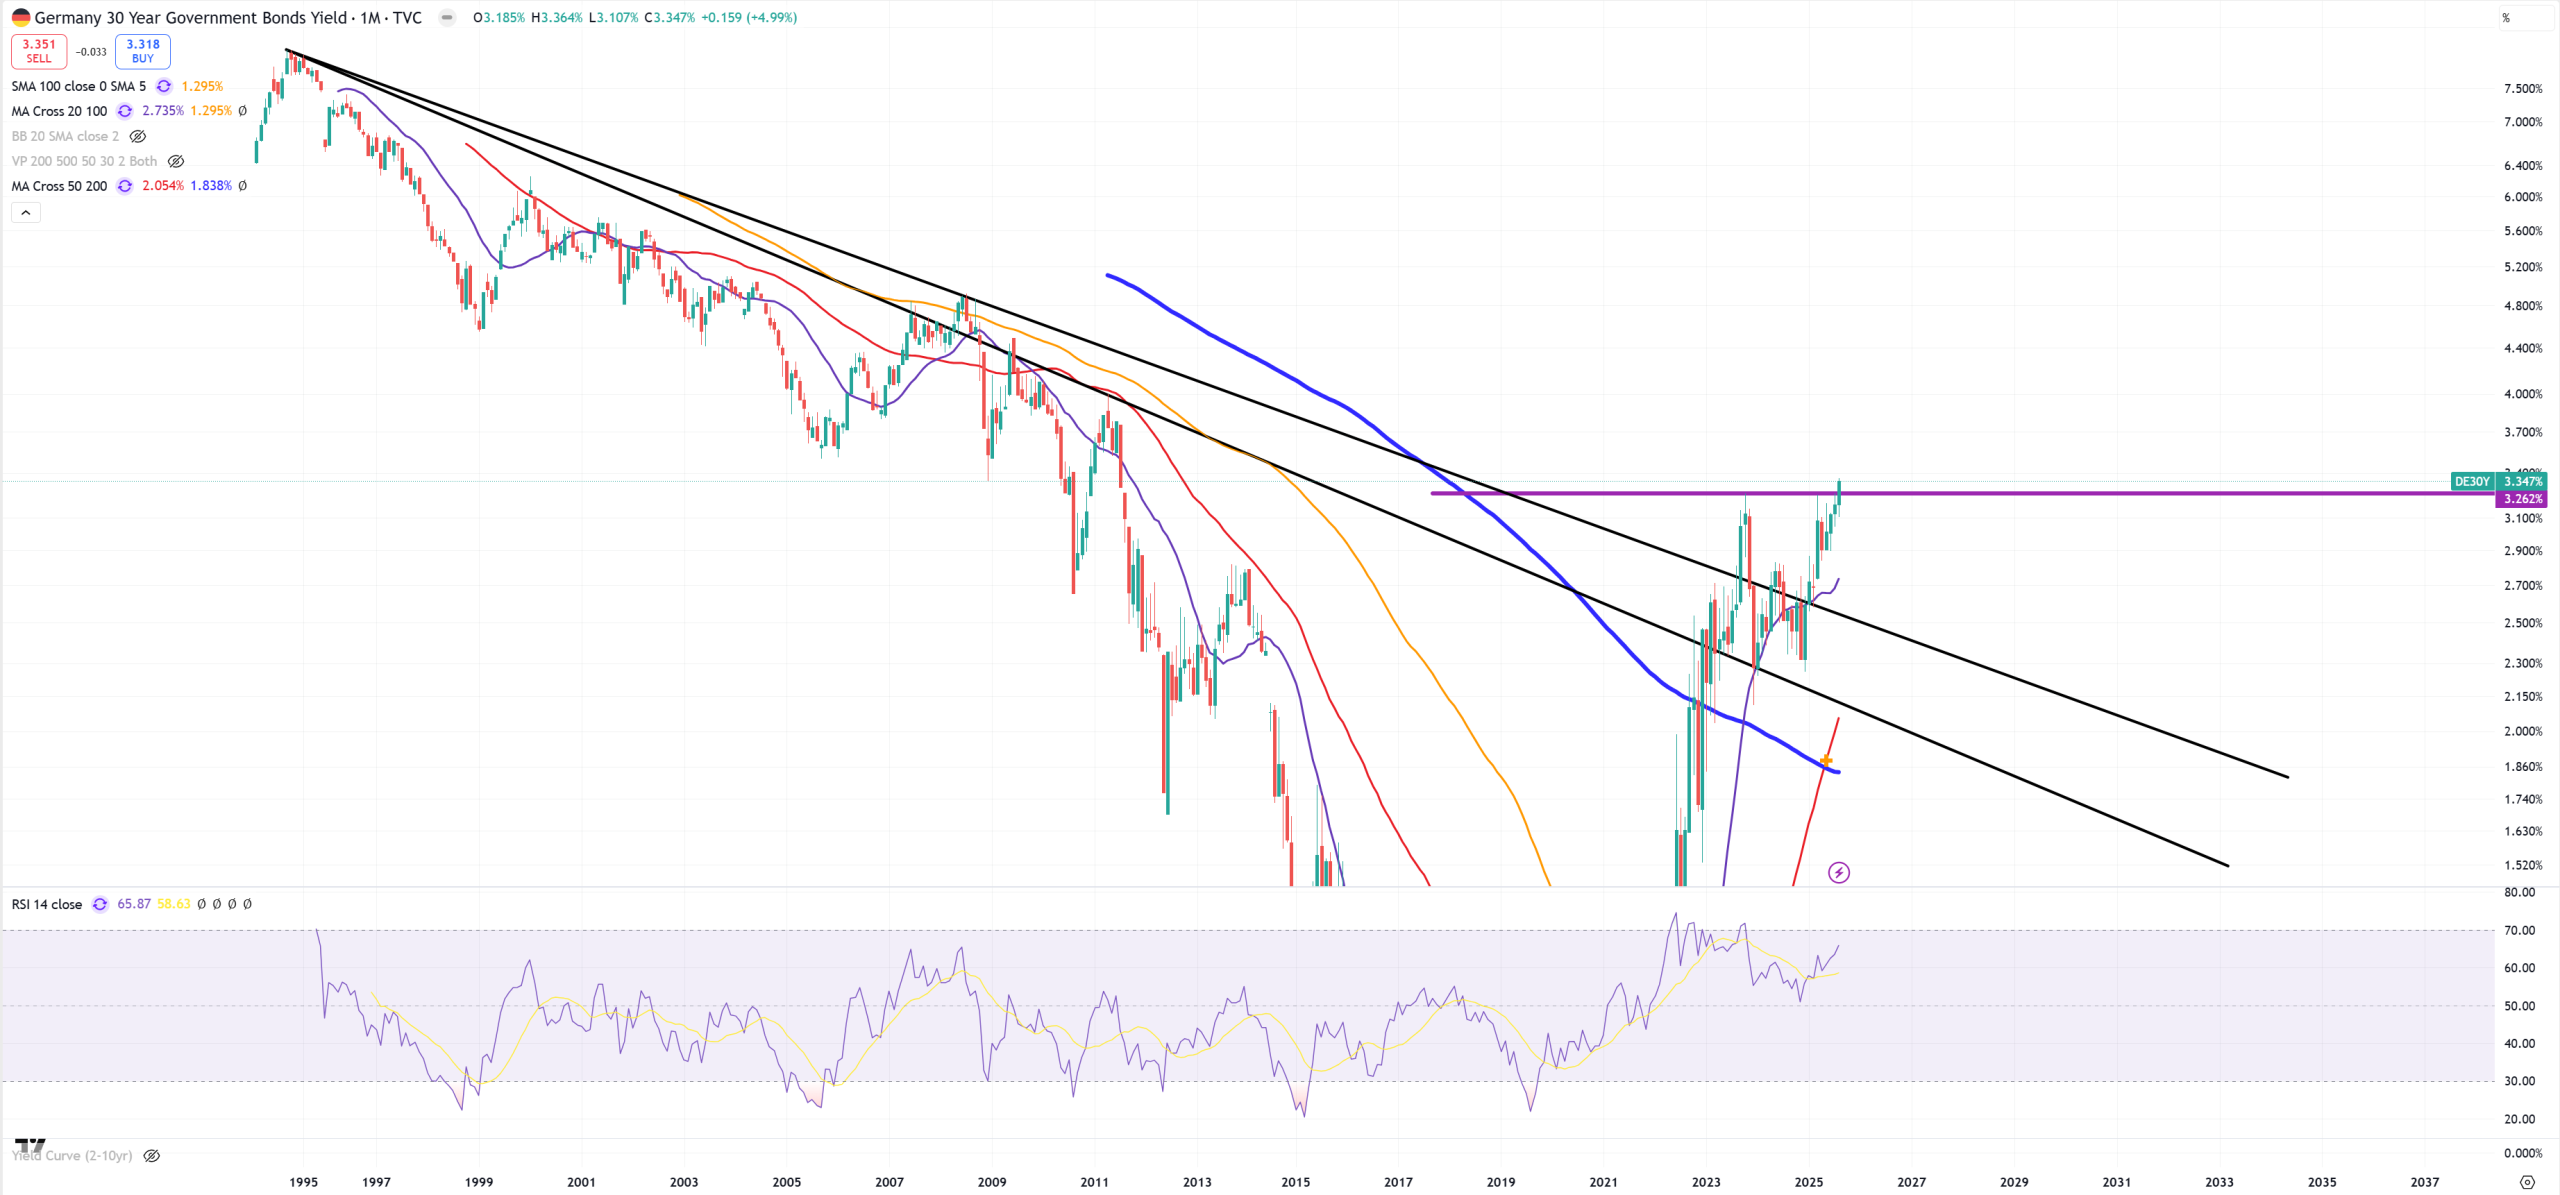
DE30Y – Germany is in troubles too
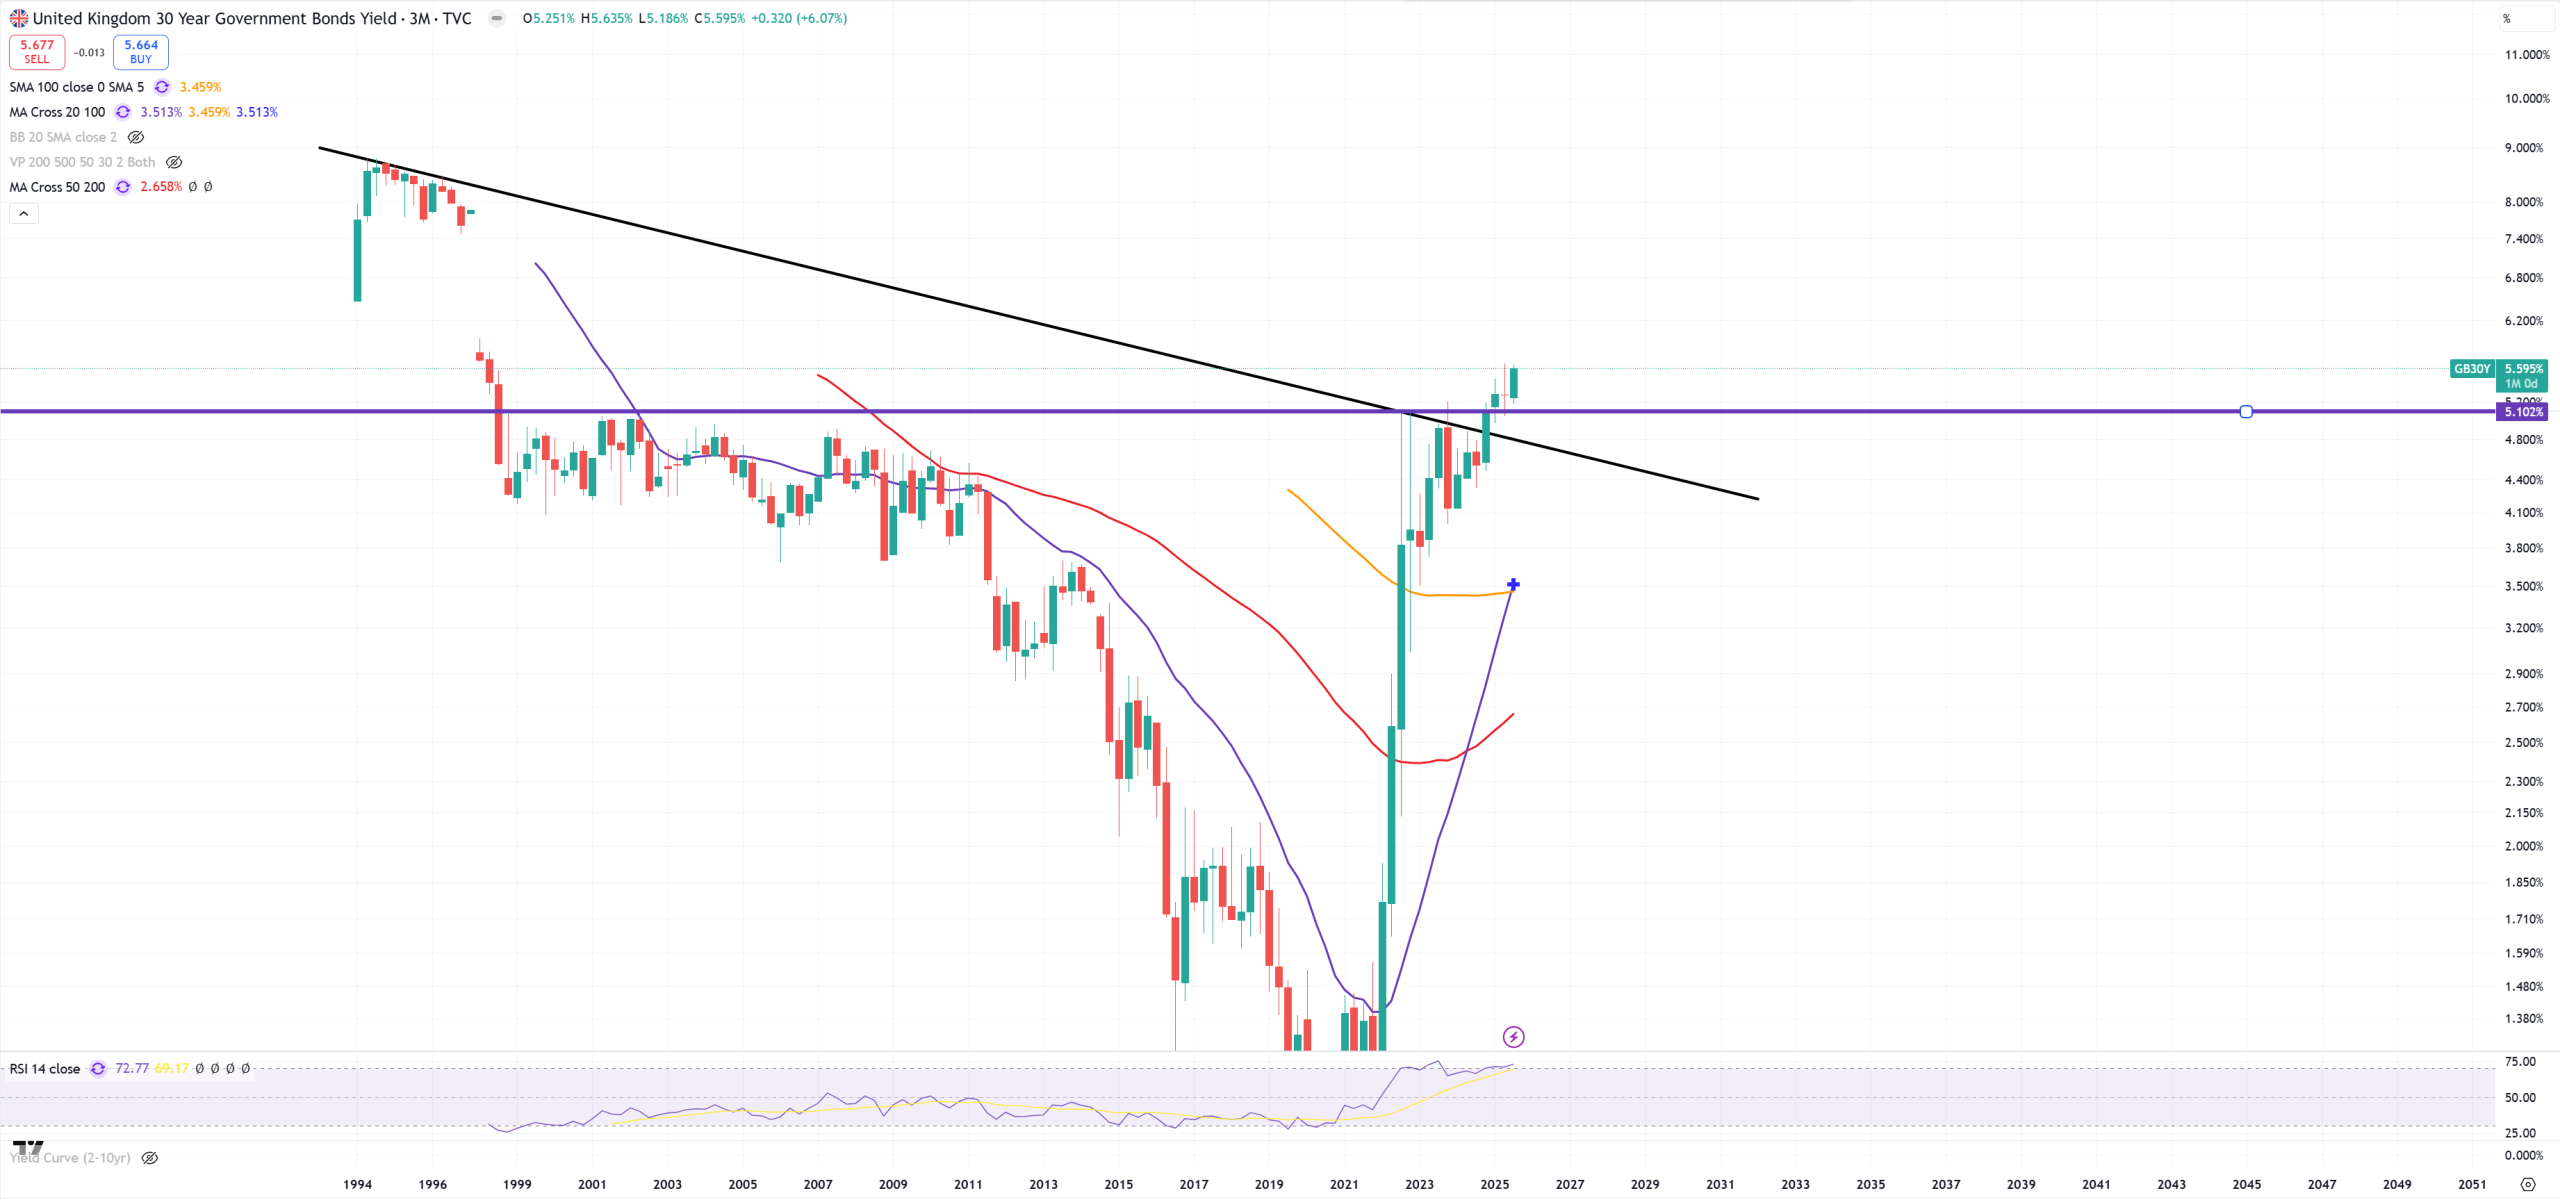
GB30Y – UK is in troubles too.
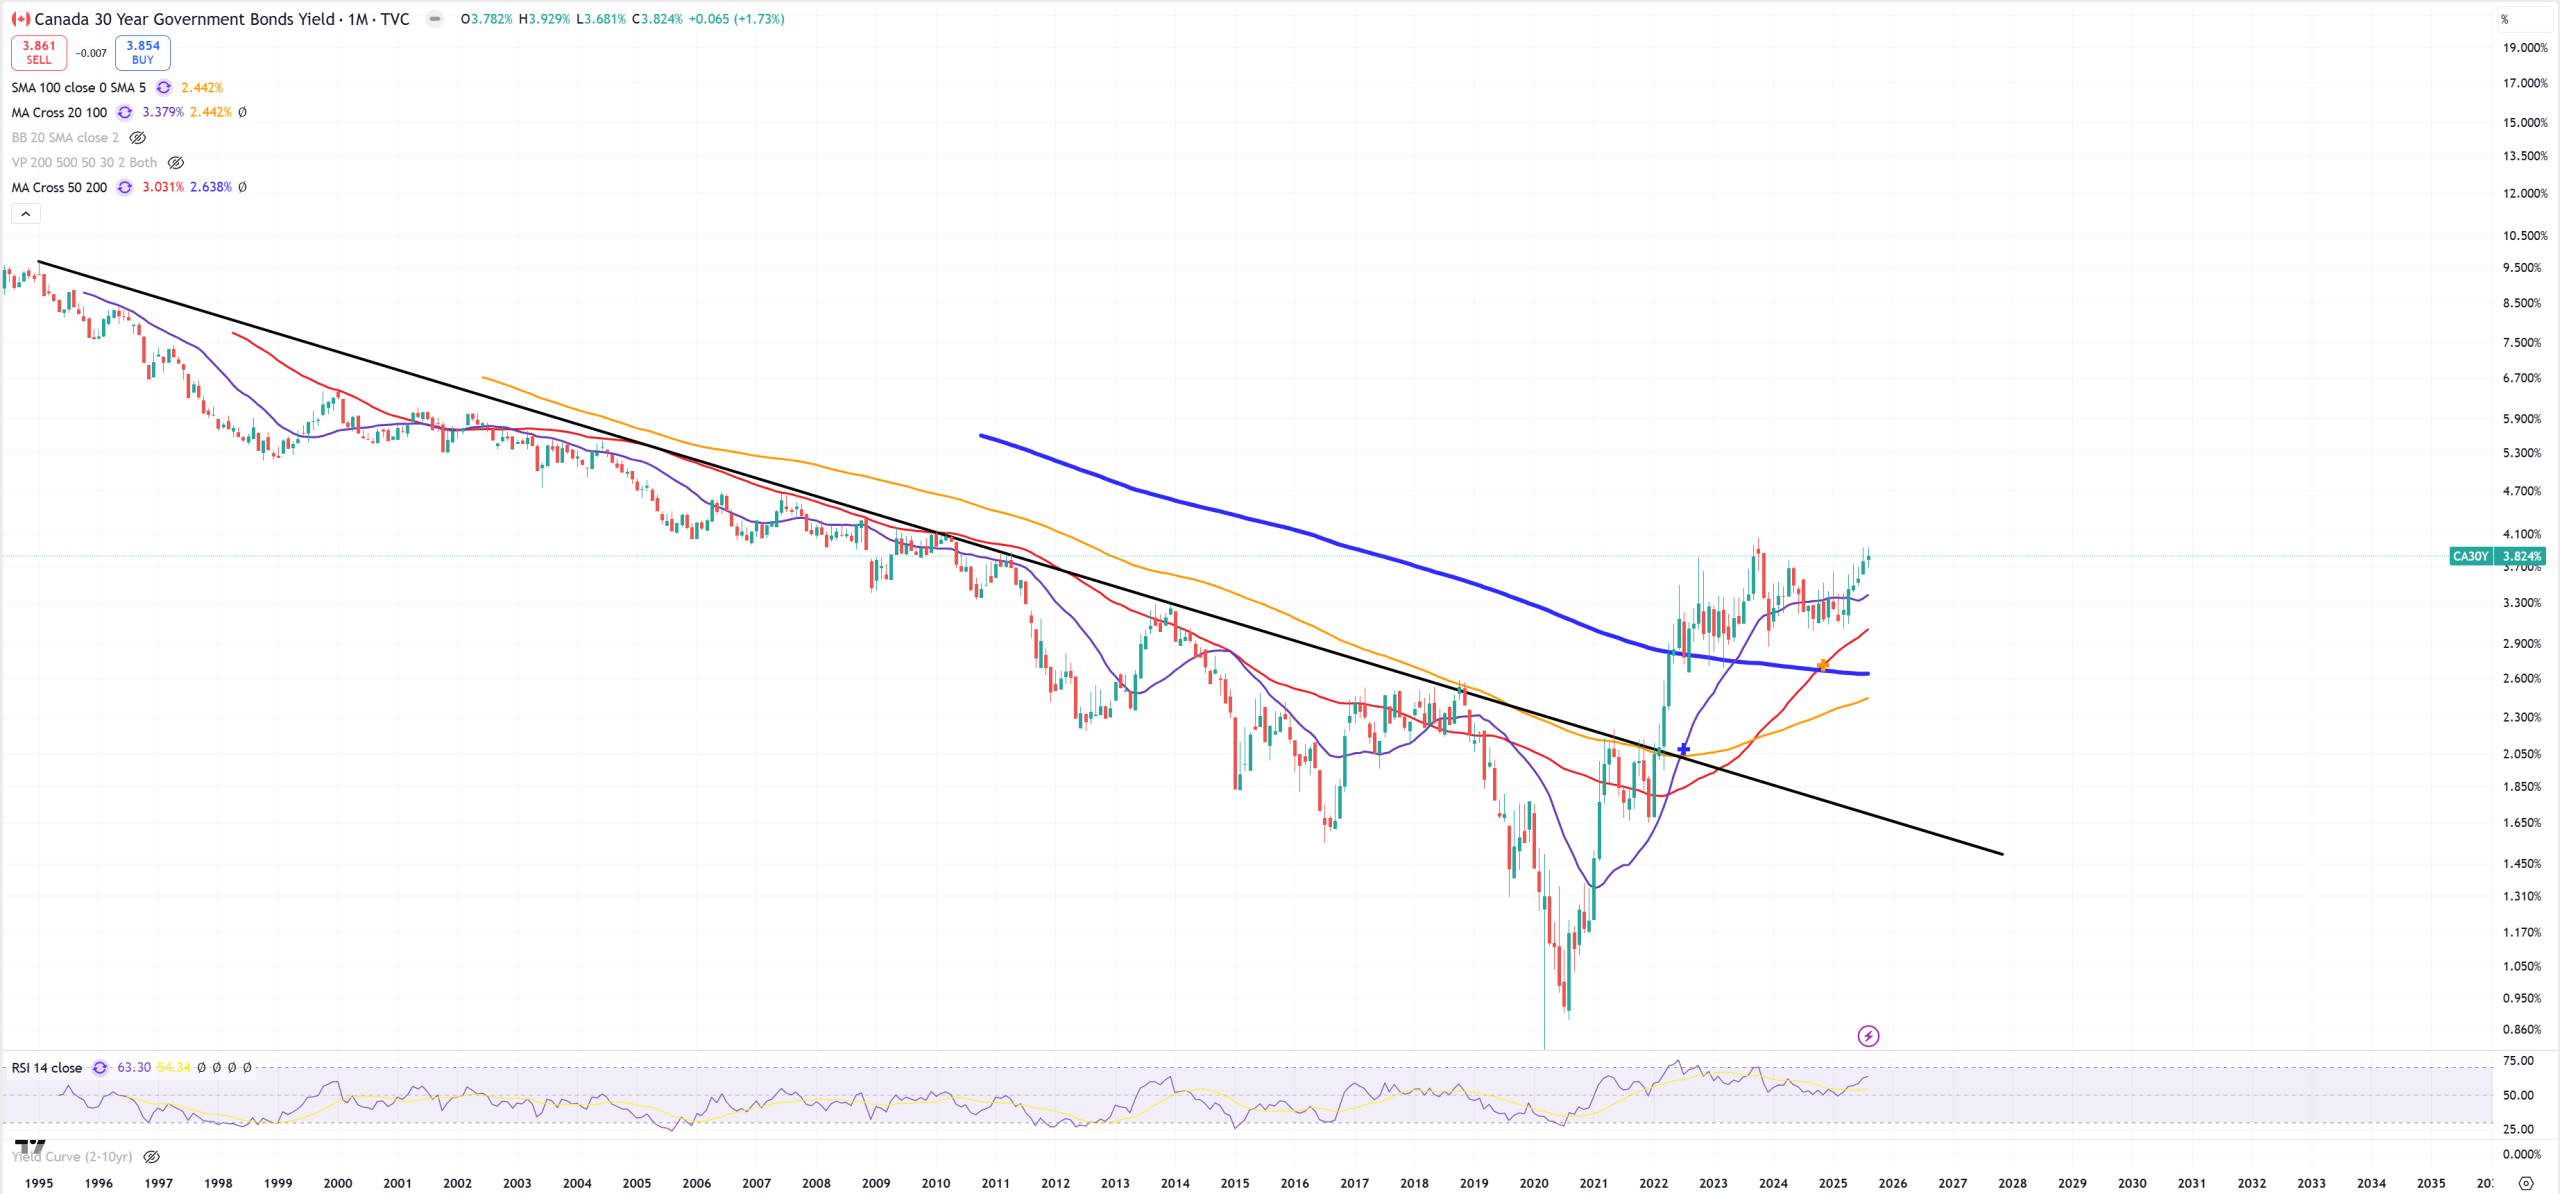
CA30Y – Canada is in the same position as US
Commodities – gold & silver were in first sections, let’s see some others
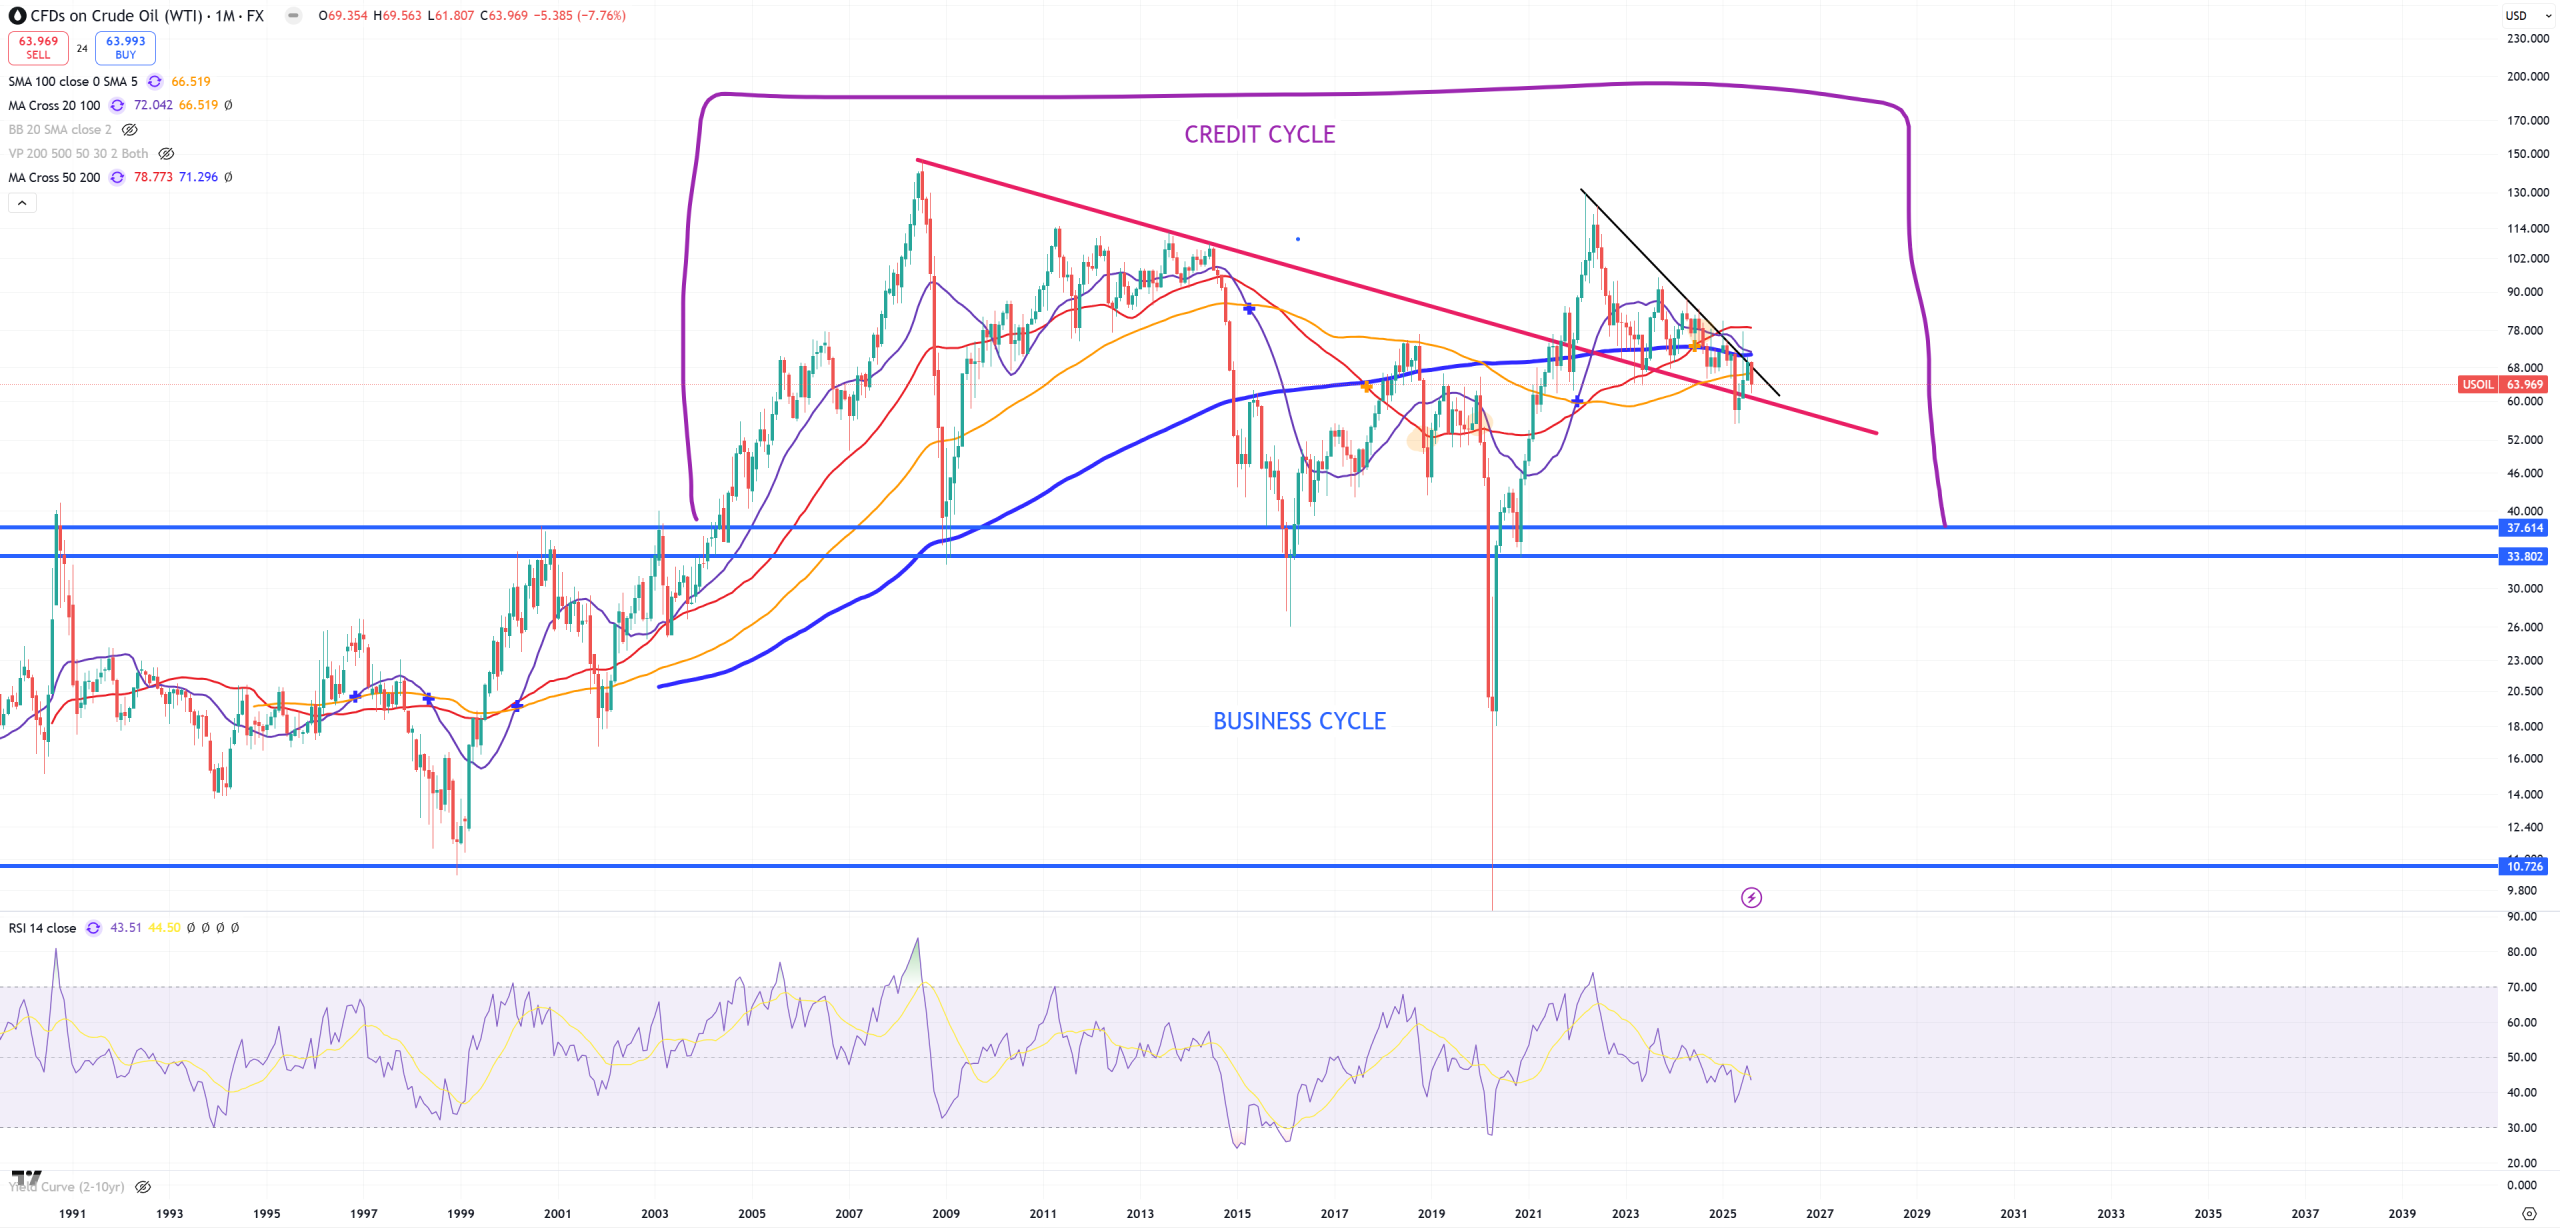
OIL – nothing to see here. Long term (M)MA200 holds, despite some false spikes, and now red trend line is key support
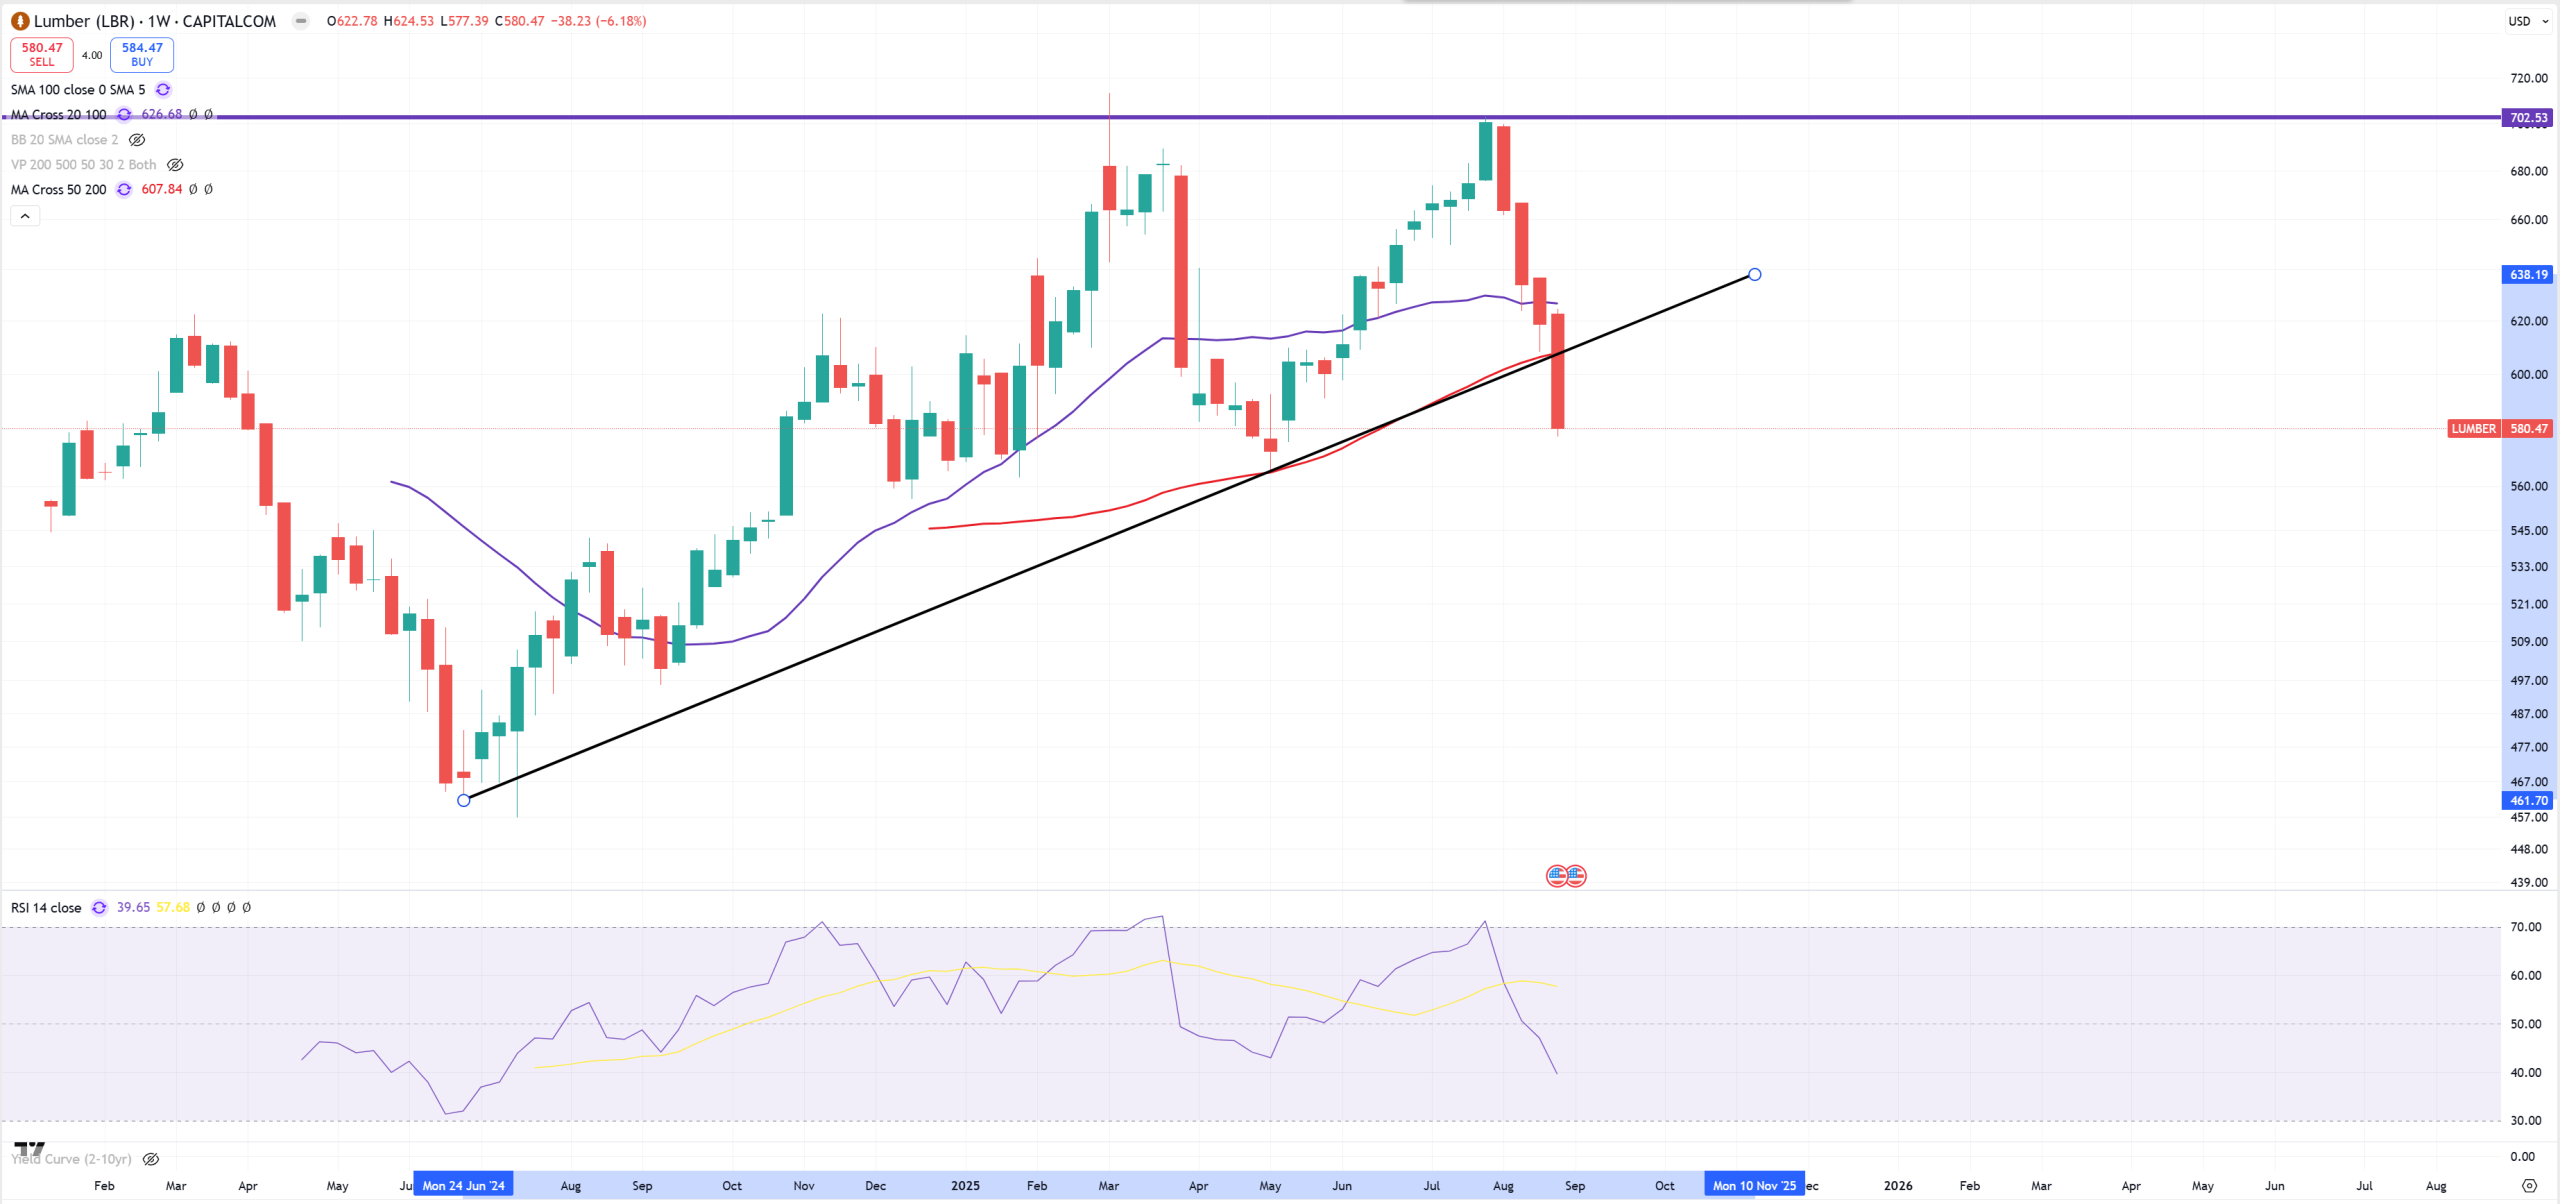
LUMBER – and its double top, now below (M)MA50. It’s chasing broken homebuilders index
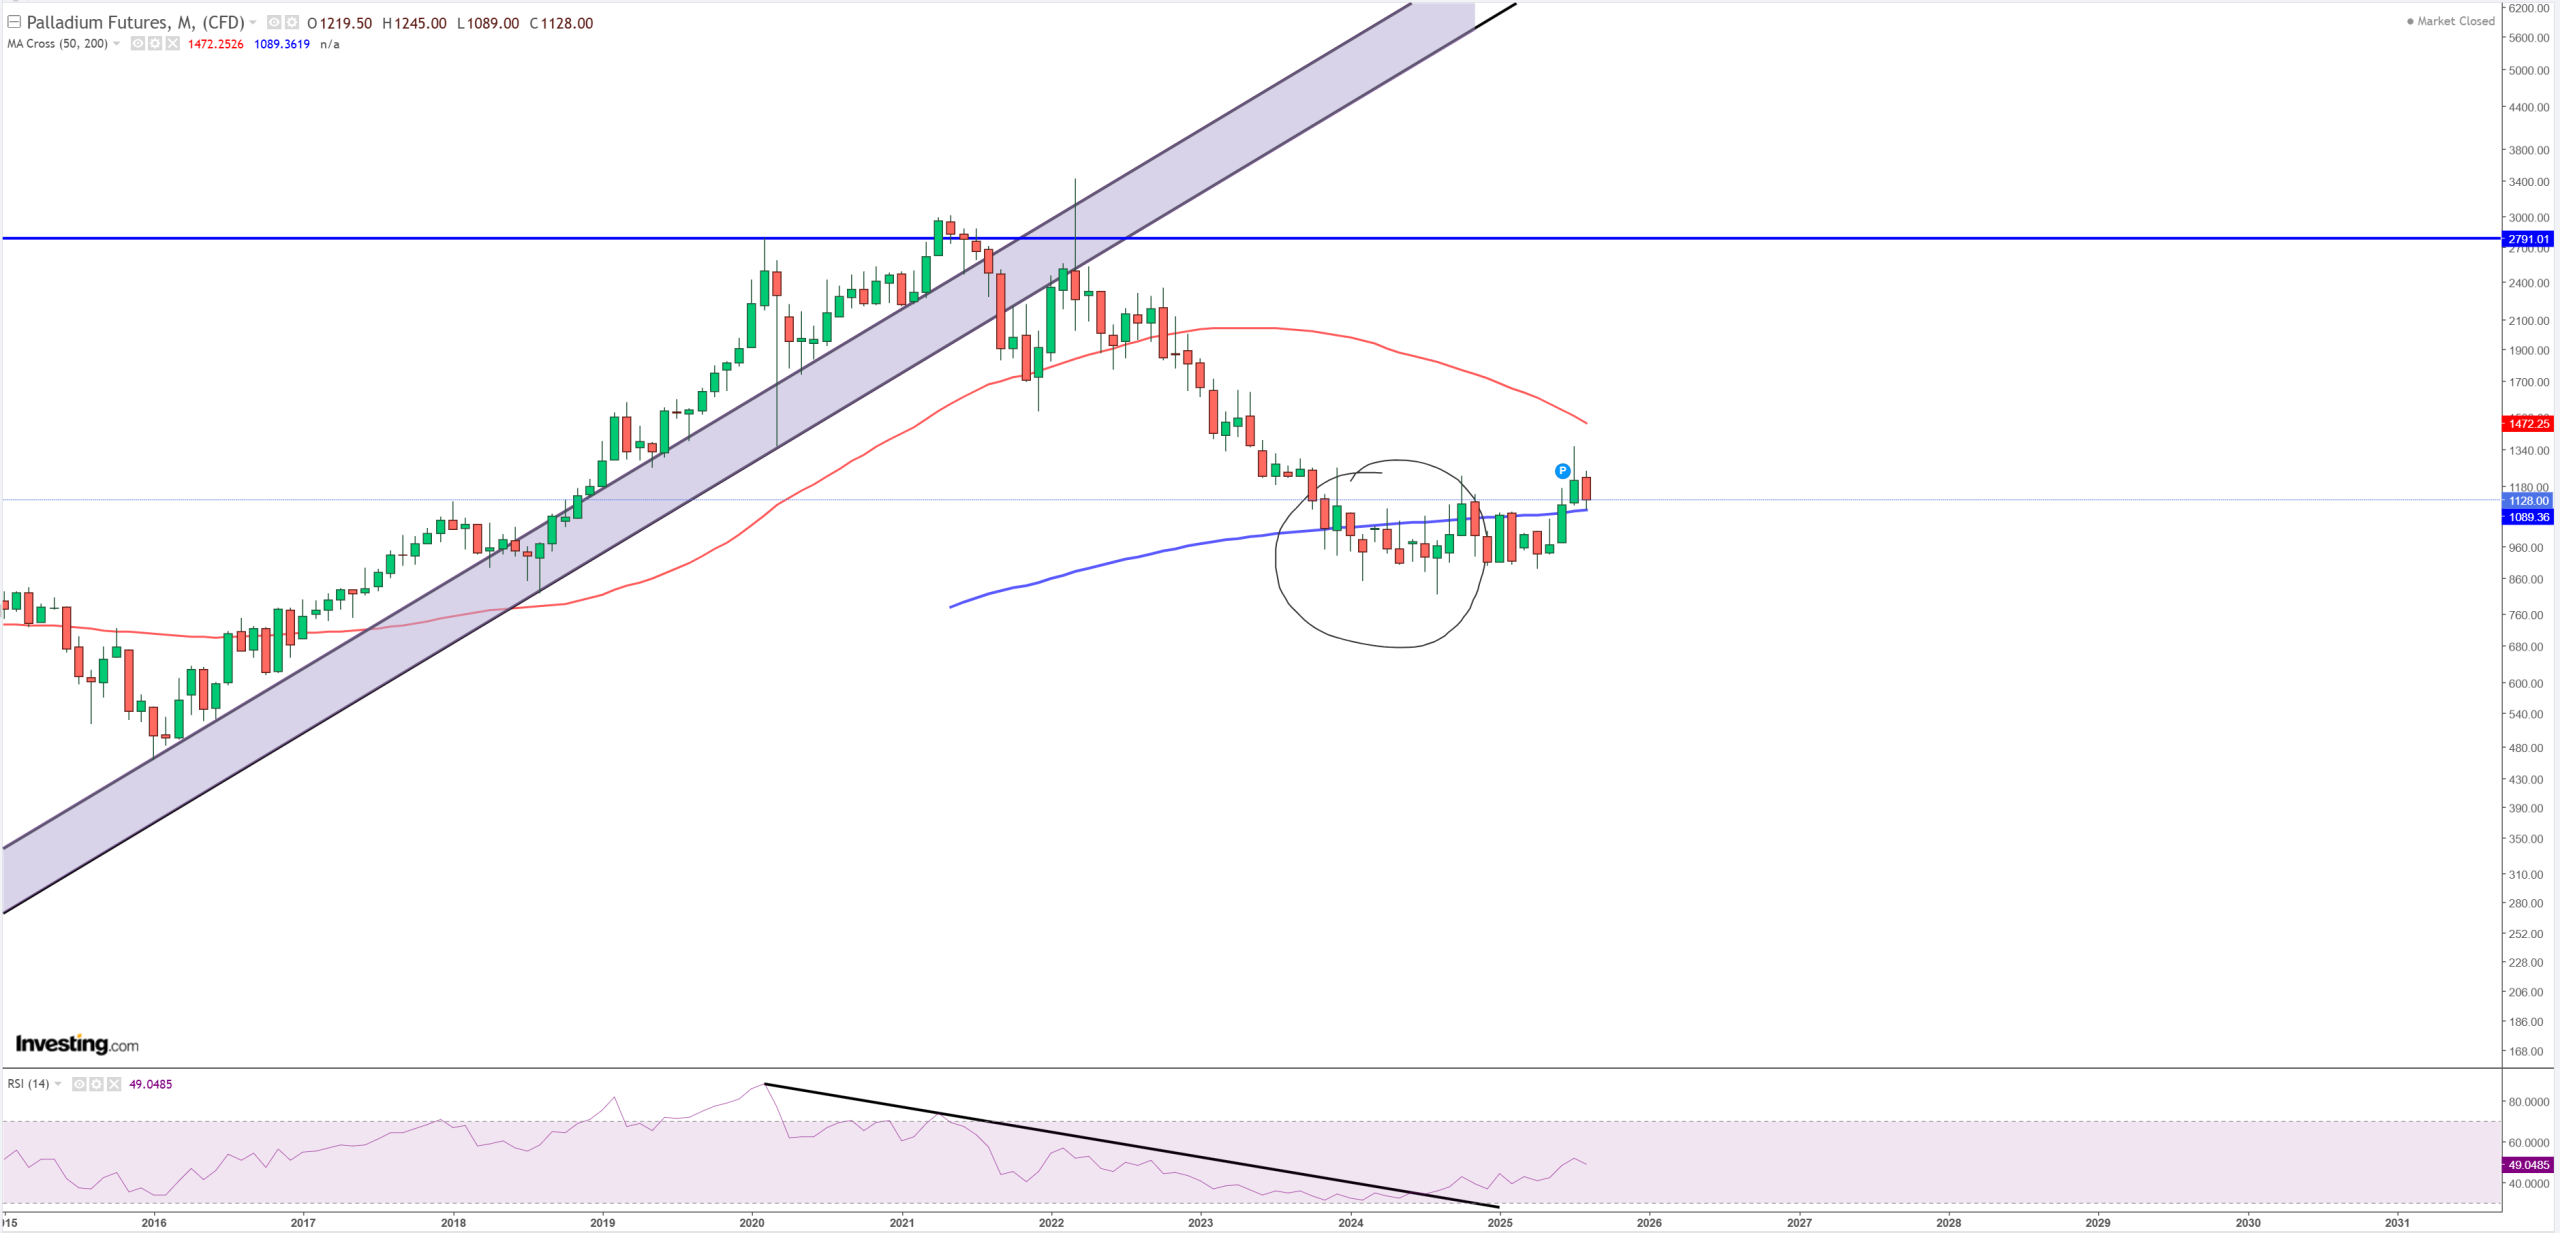
PALLADIUM – after long term consolidation it tries to jump above (M)MA200. Bull-trap or jump? Palladium is being used mostly in car manufacturing, but maybe just like Silver it might get some attention as a “precious metal”?
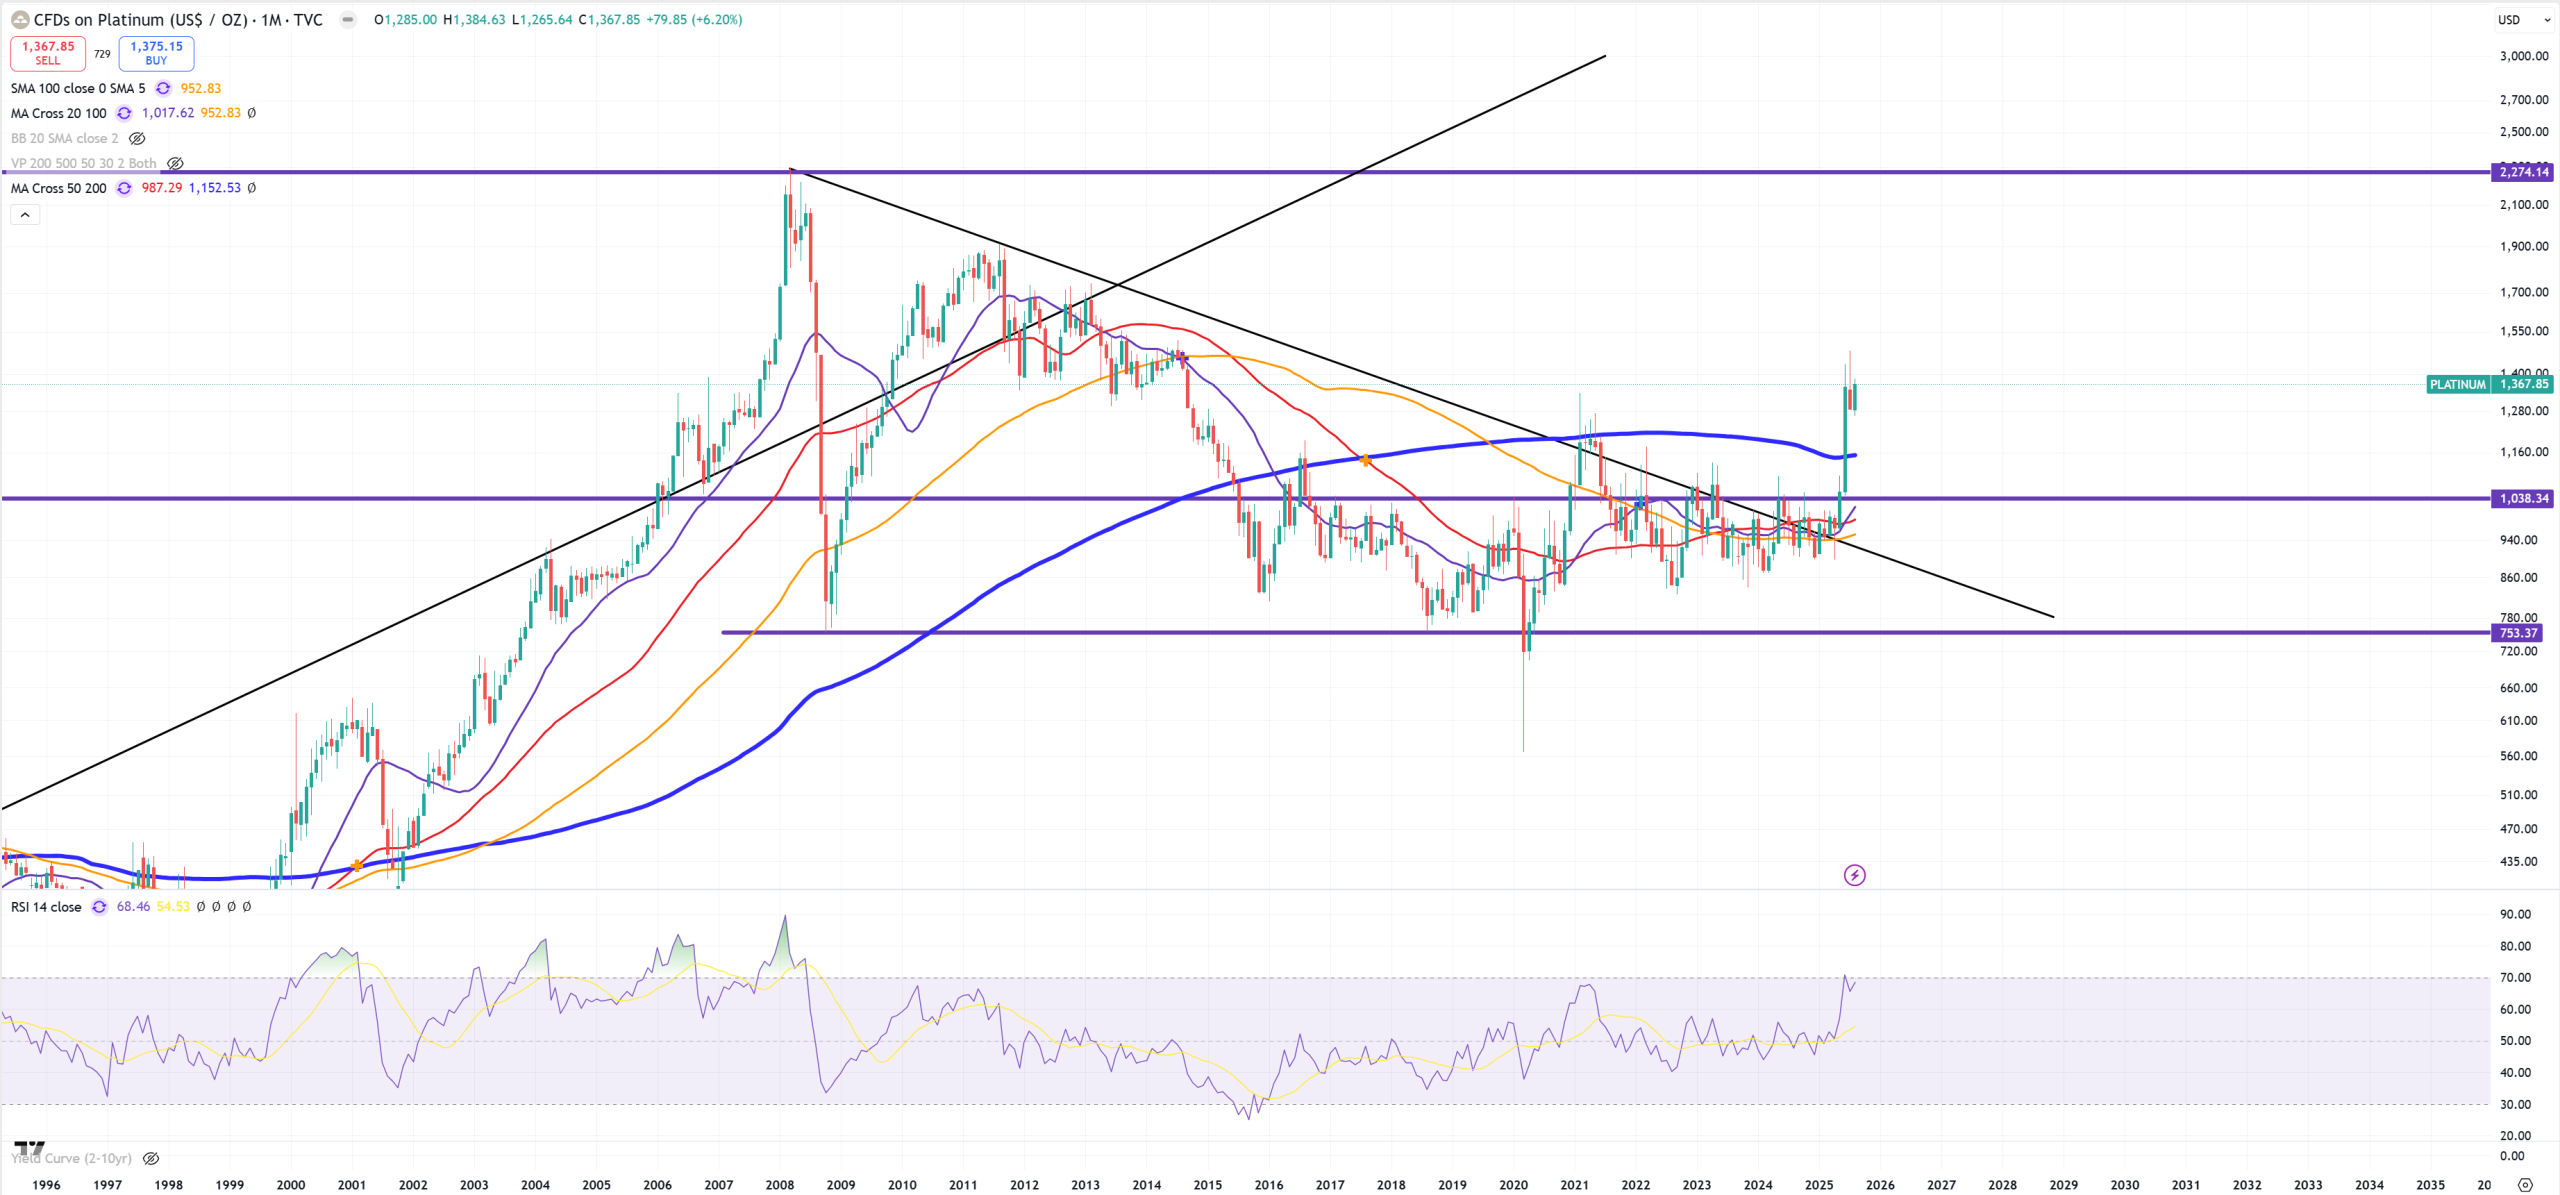
PLATINIUM – same example as Palladium.
COPPER – another example how market can make big false spikes. So far key massive 2011 resistance holds.
Currencies – we managed to discuss EURUSD & AUDJPY in the first section, so let’s see others
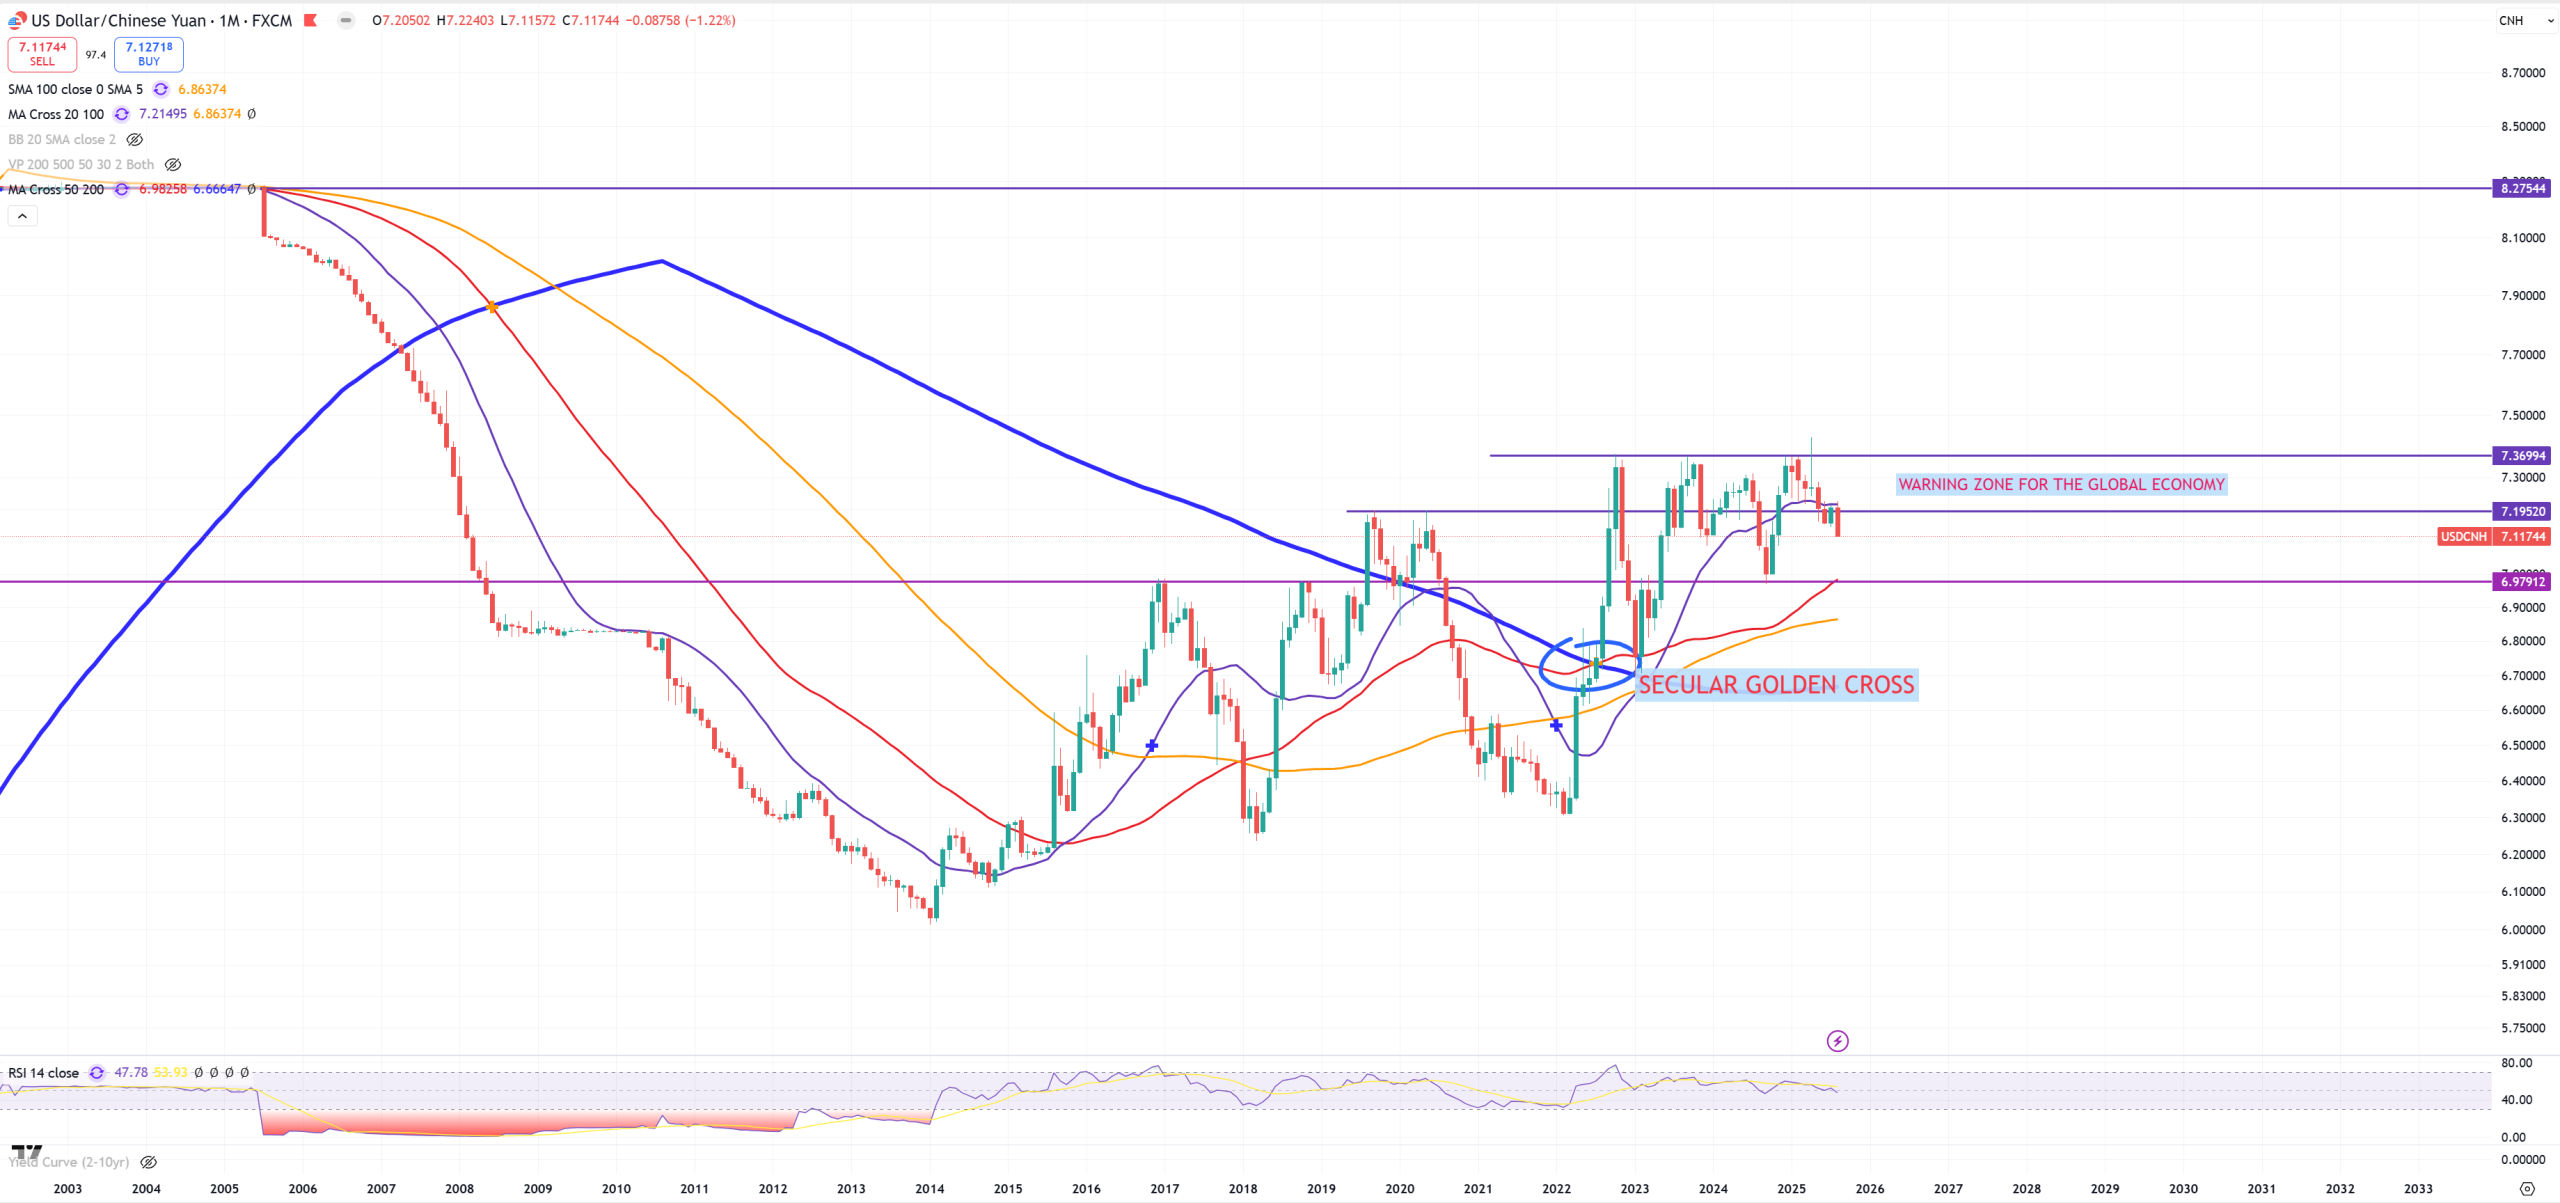
USDCNH – Because CN30Y starts going higher it makes pressure on USDCNH to drop lower, CN30Y isn’t going higher because of economic recovery, it goes due to the same reasons as JP30Y, because China in japanification index is higher than Japan, and market should get it.
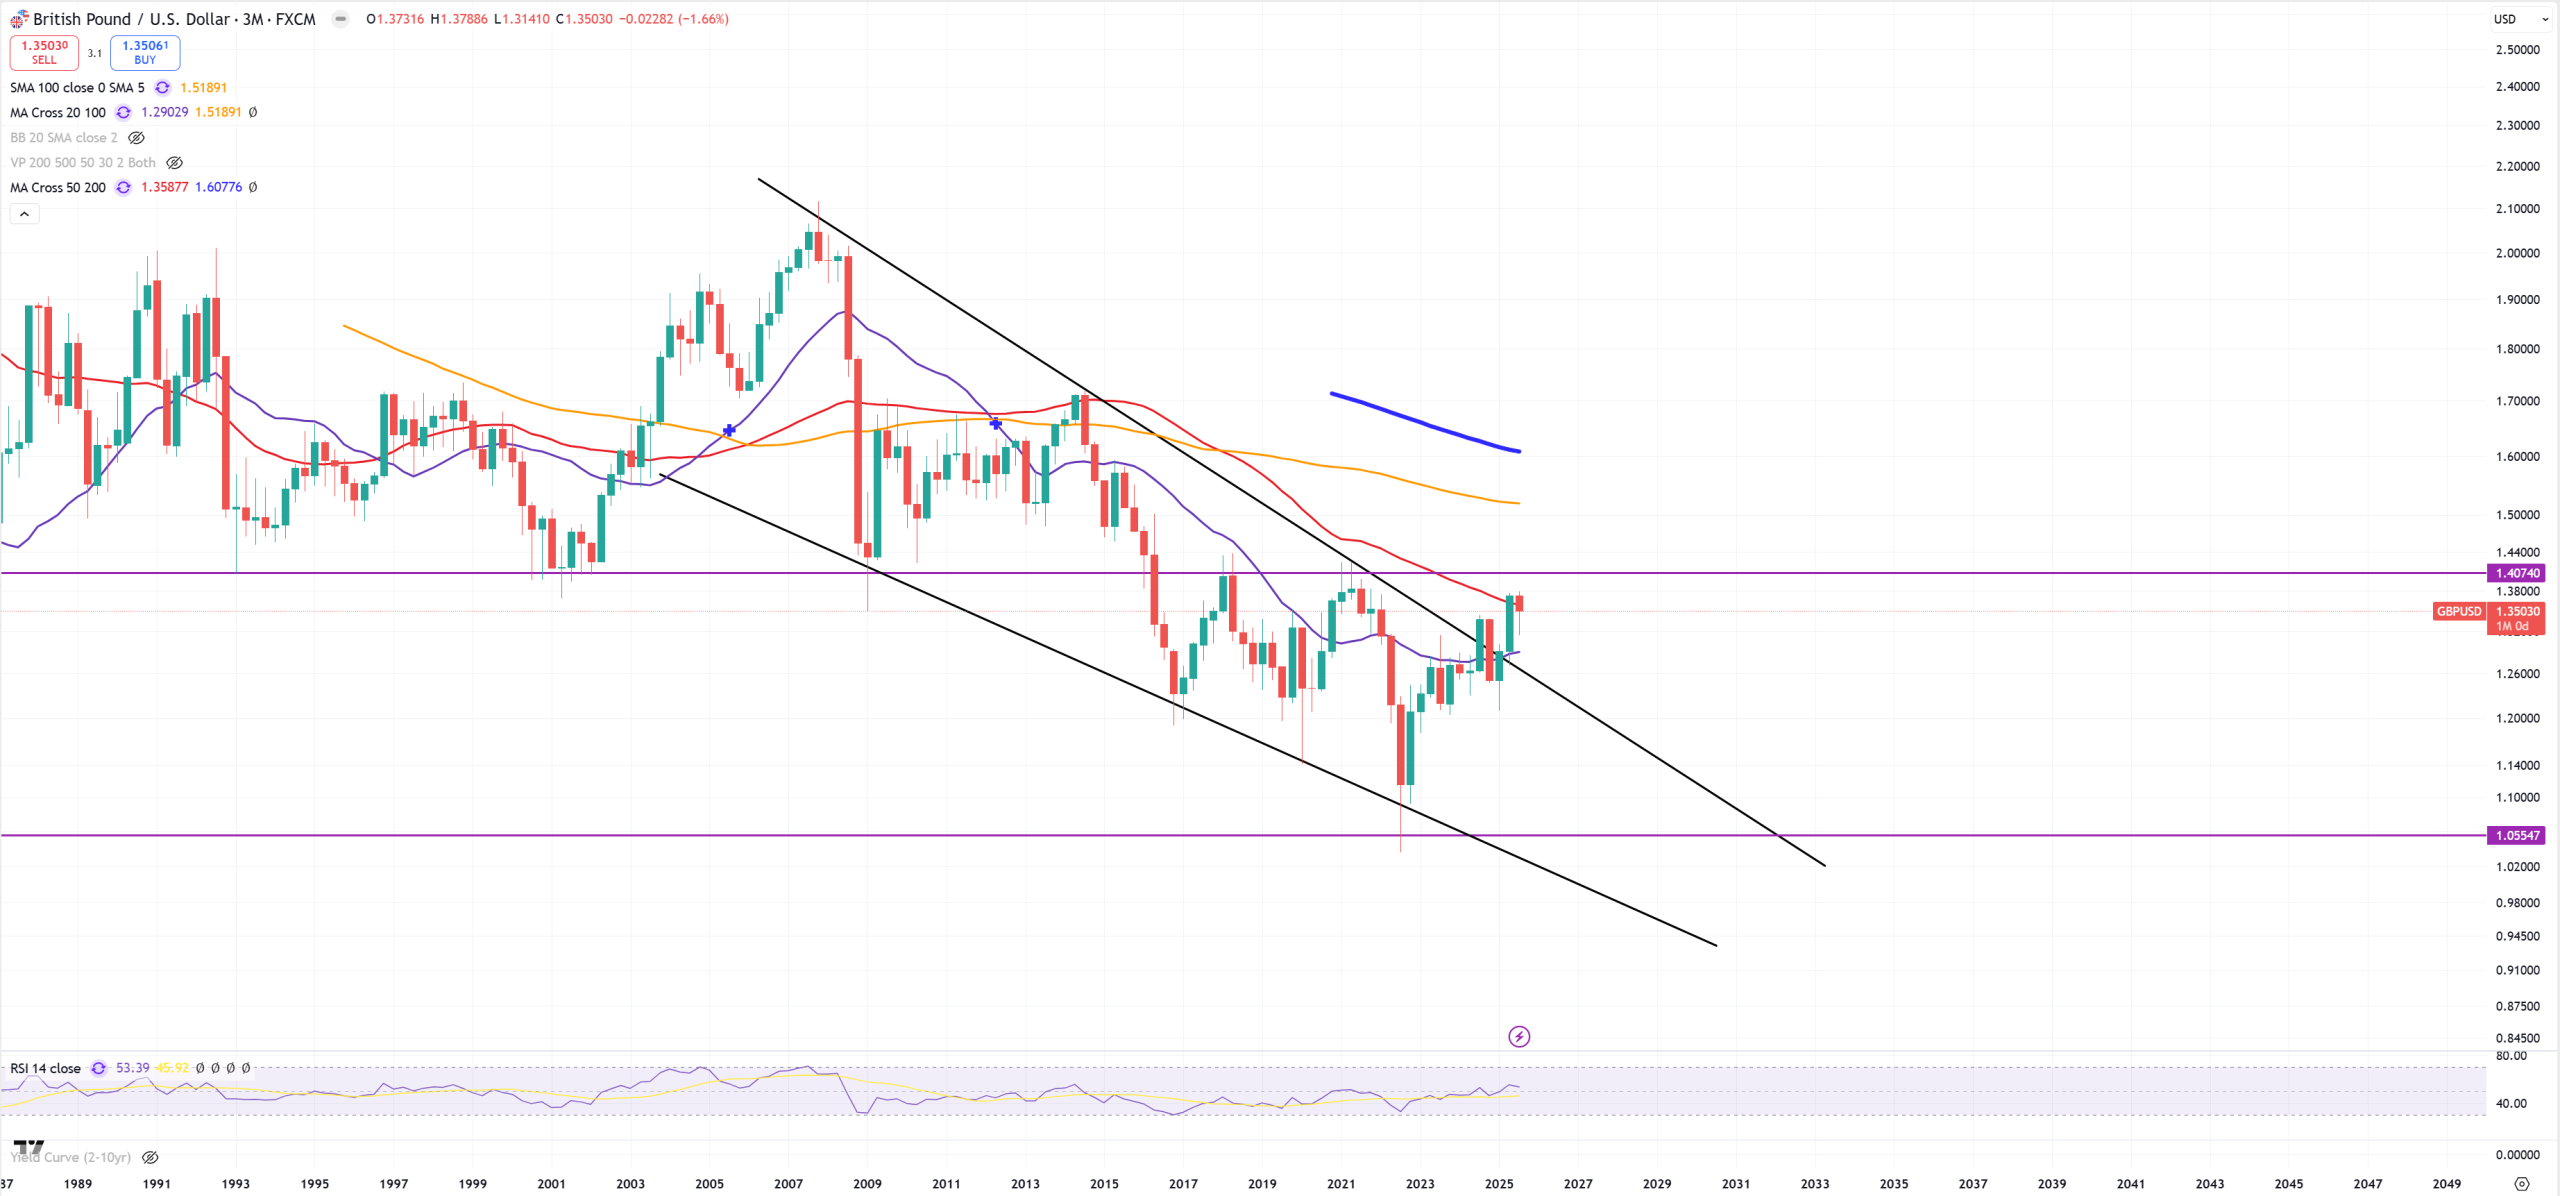
GBPUSD – I post (3M) view because on 3M there’s one level : (3M)MA50, higher is only resistance on 1.40
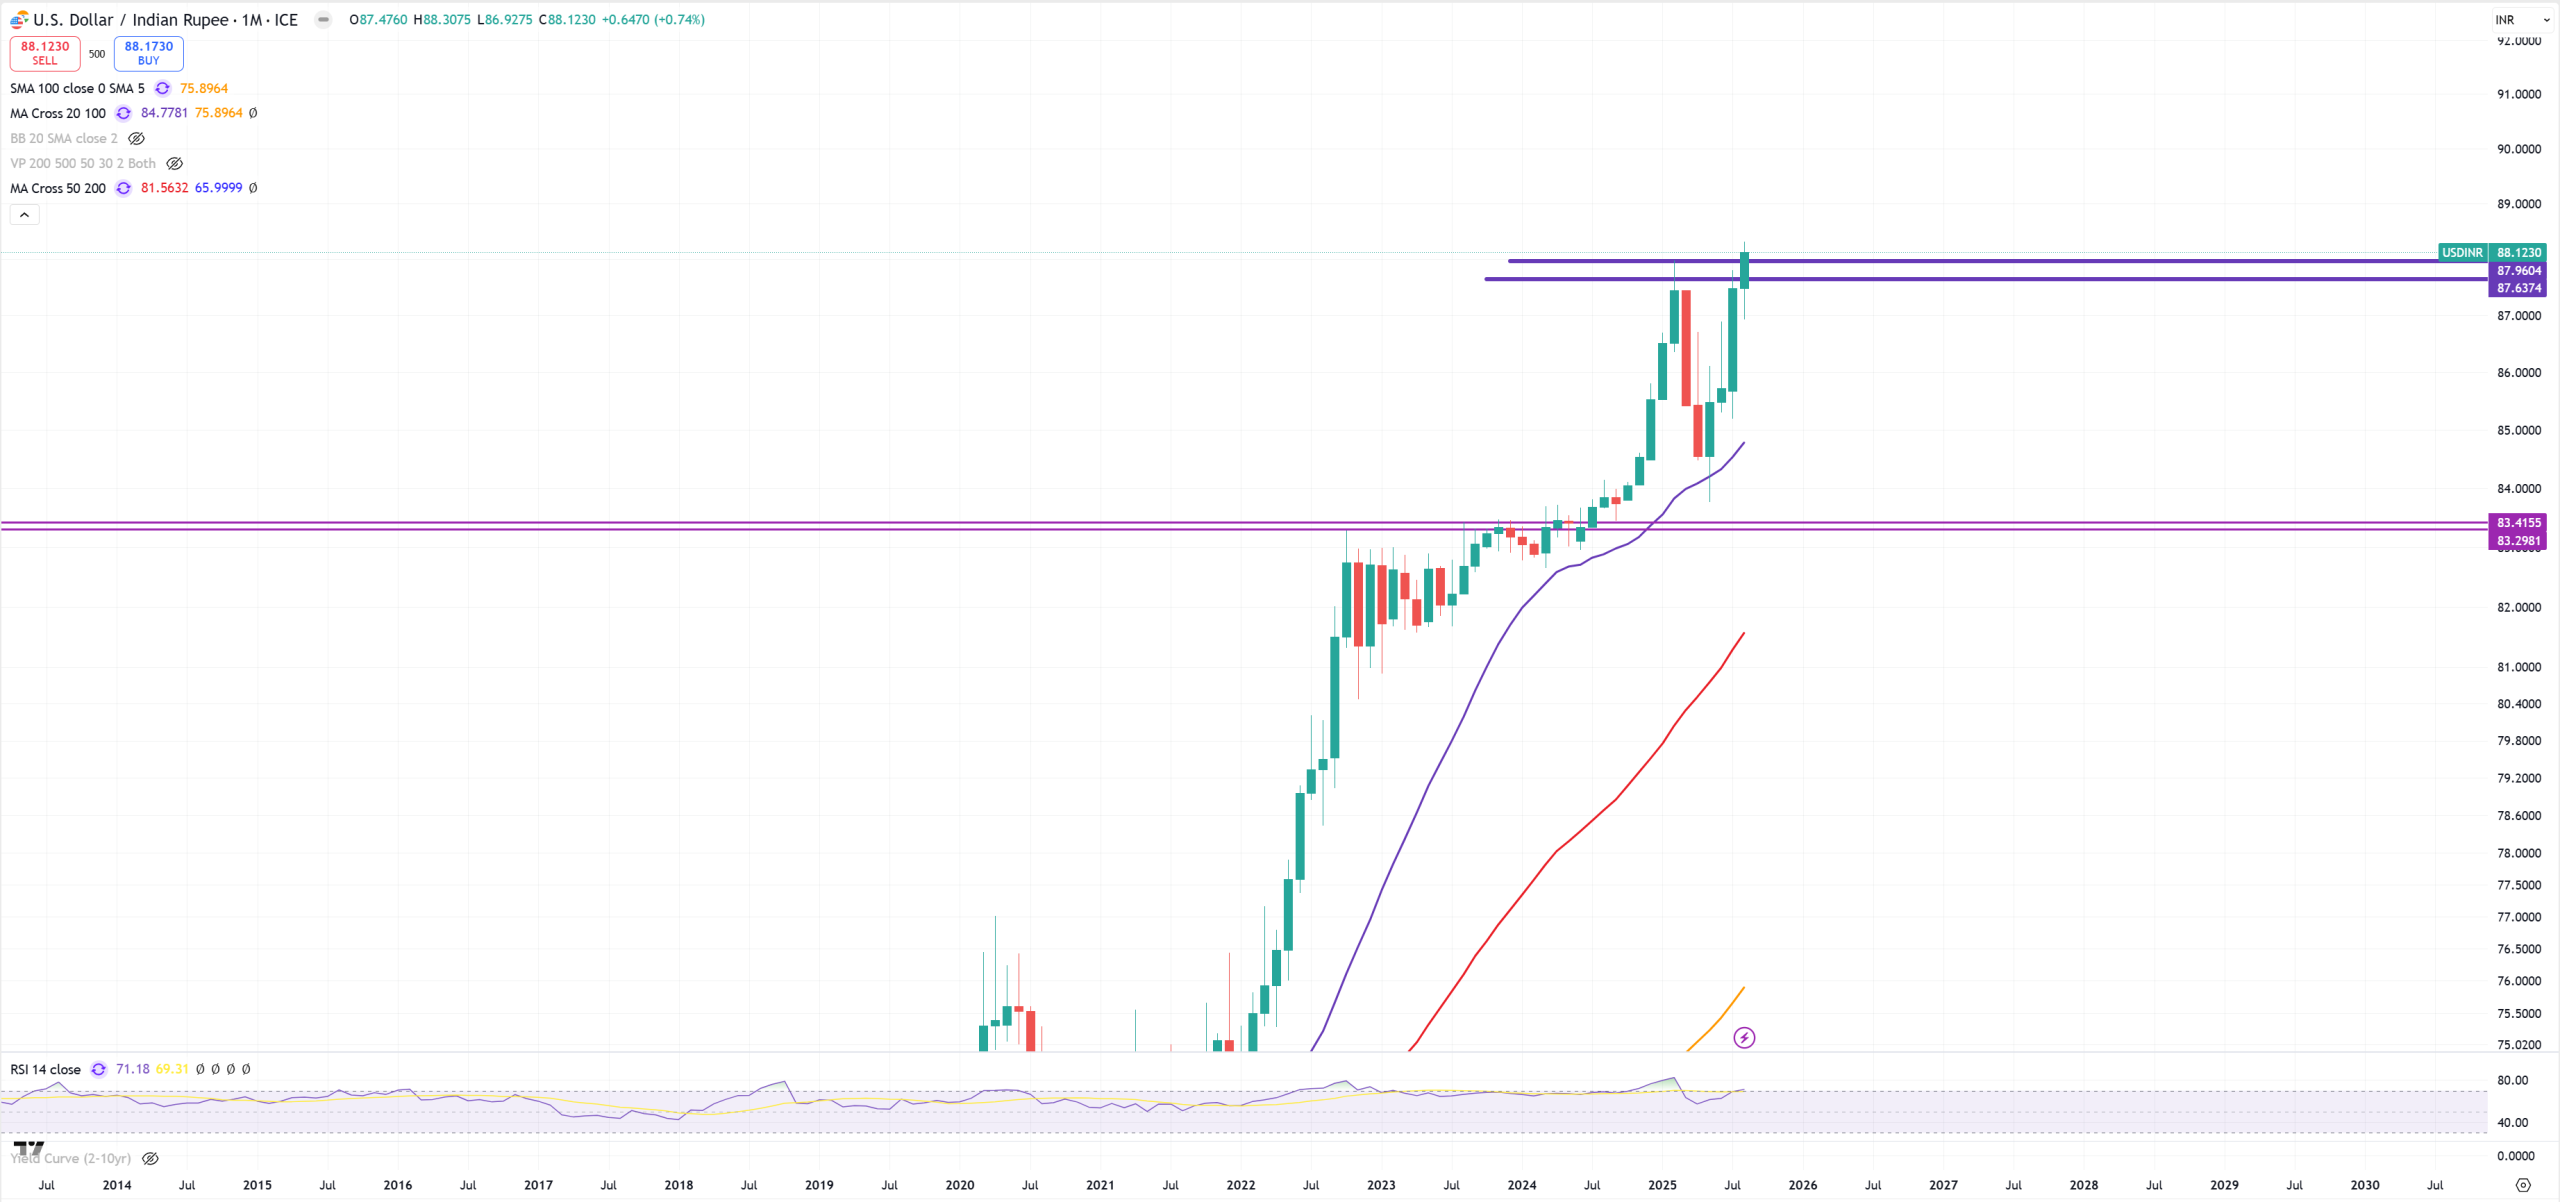
USDINR – breaking higher
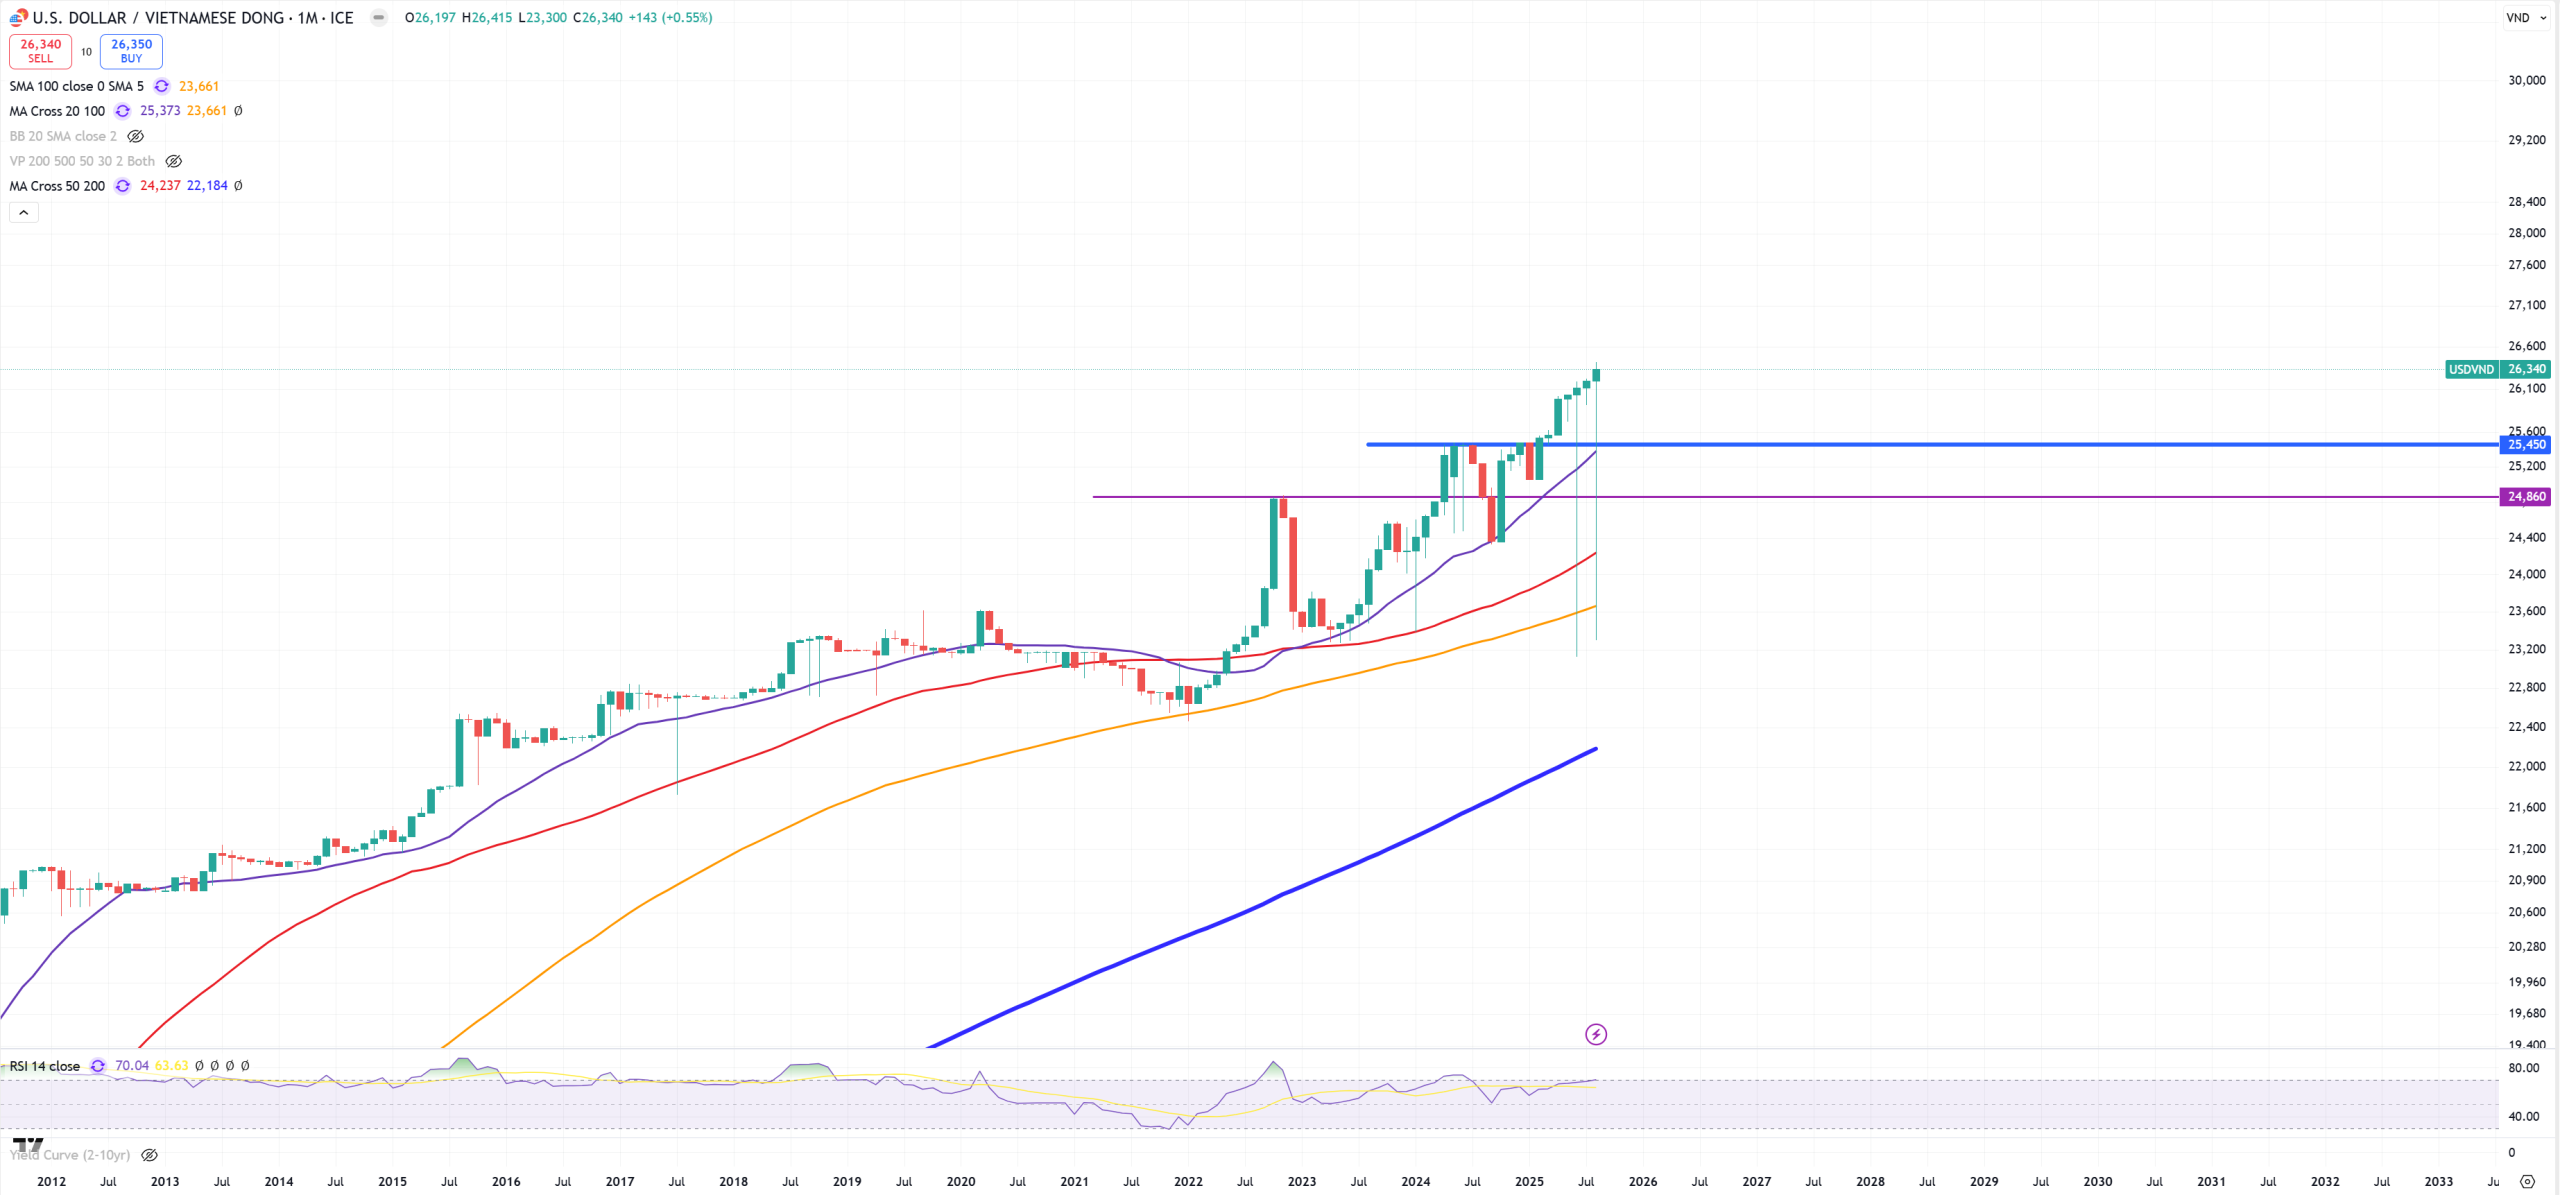
USDVND – breaking higher
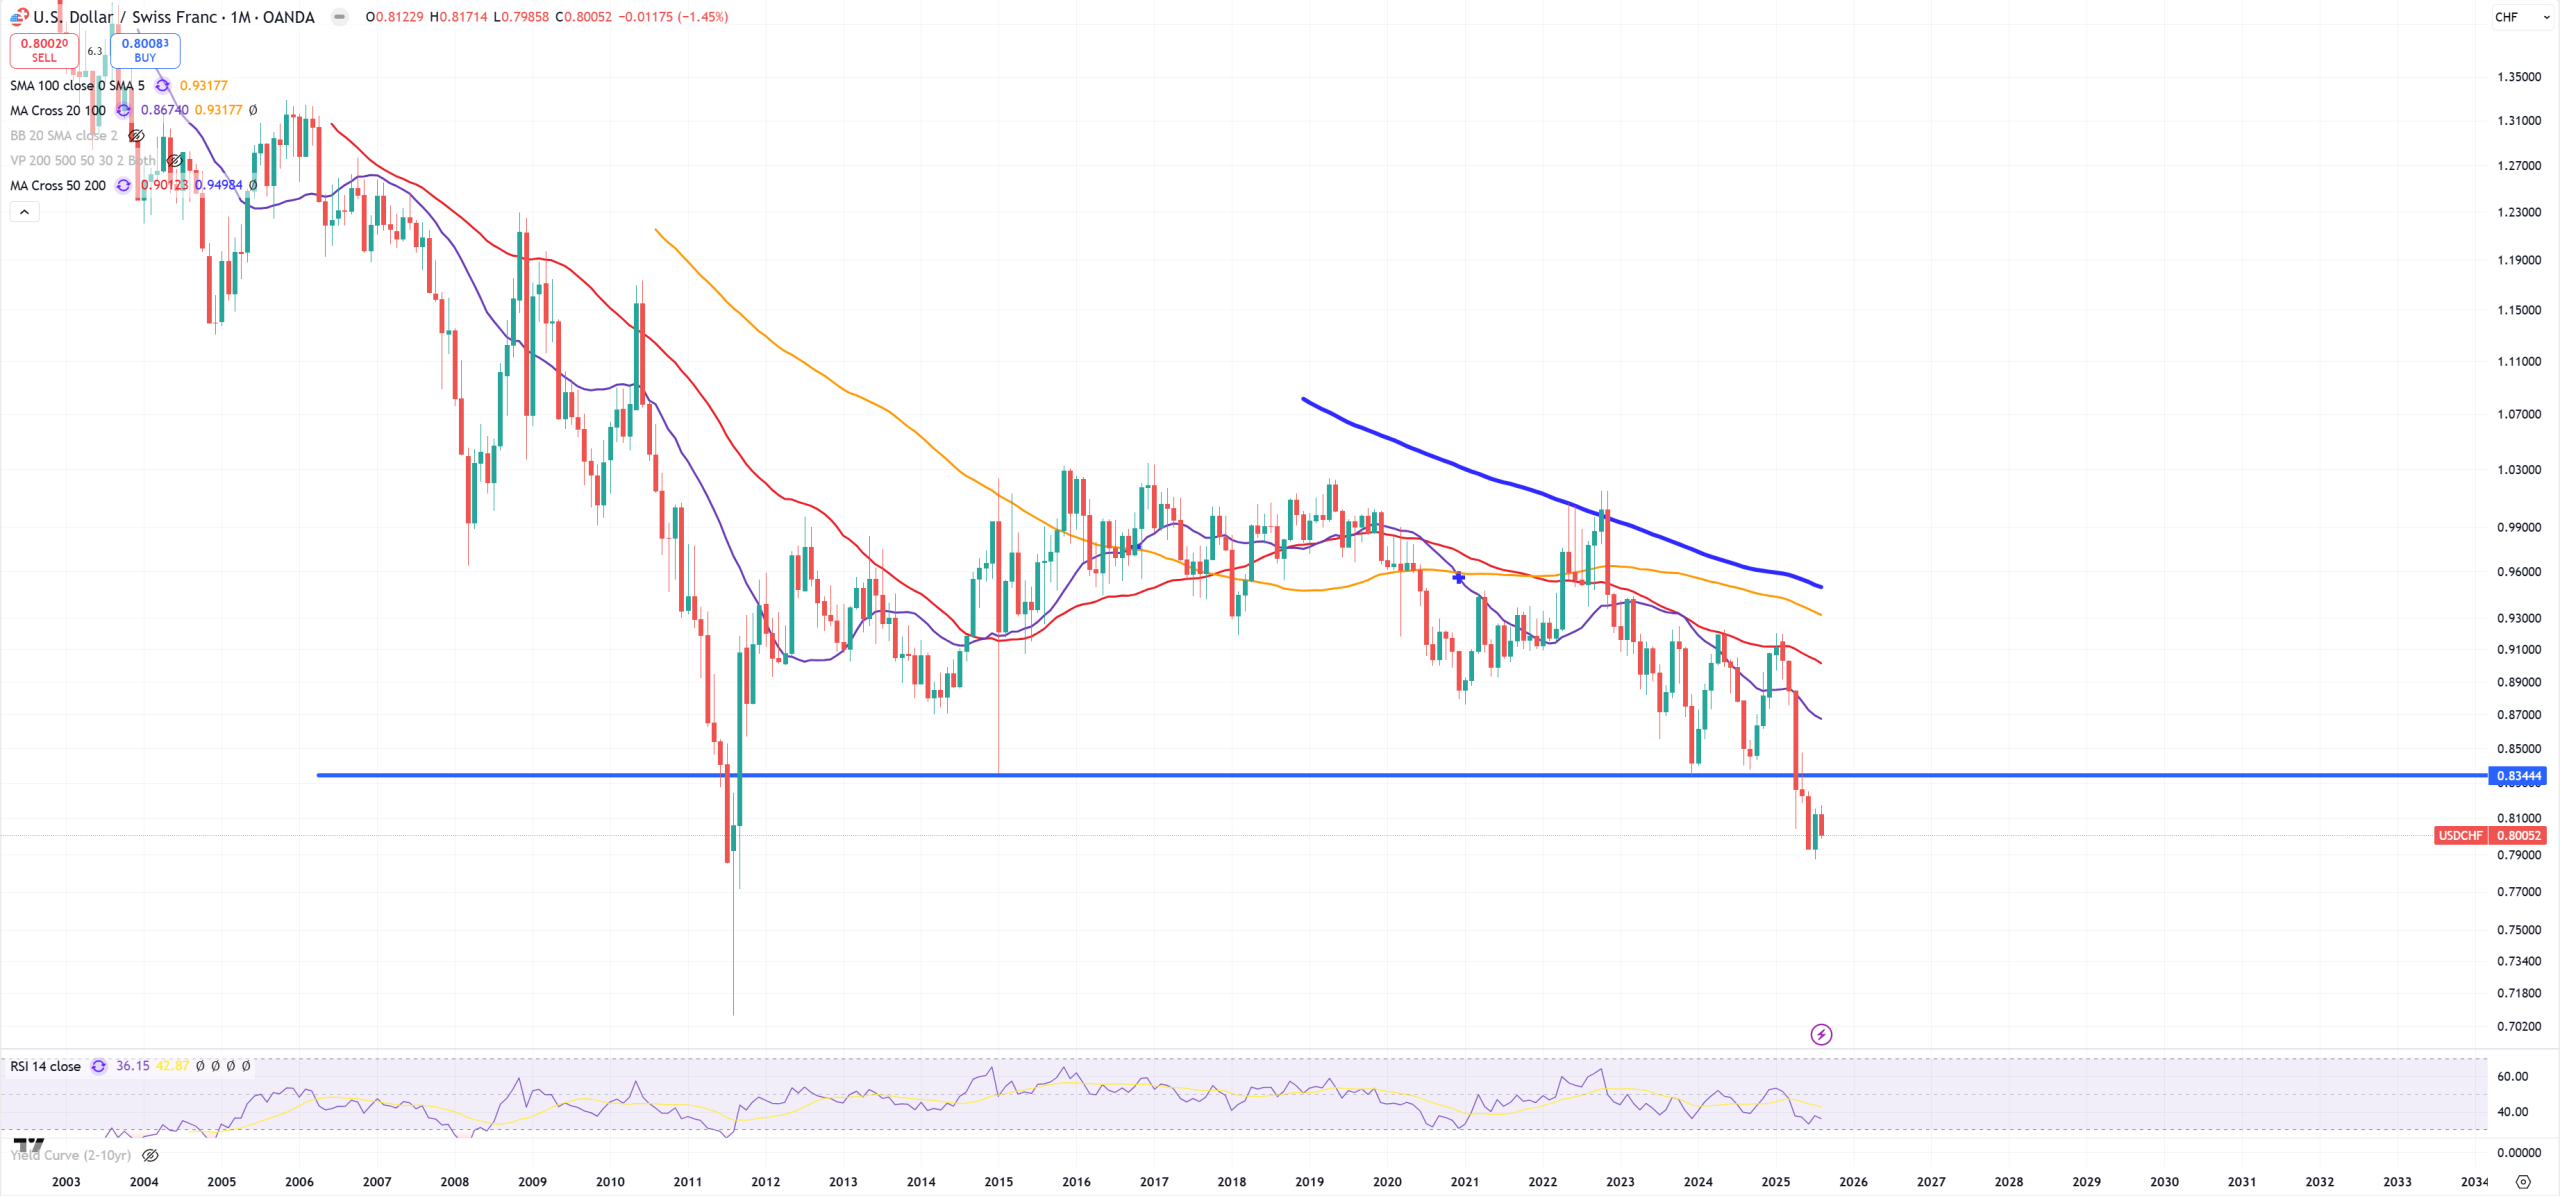
USDCHF – this is this kind of break as EURUSD from the first section. CH bonds are now in NIRP mode and 39% Tariffs biting hard this economy. It just looks to return above this key level 0.83.
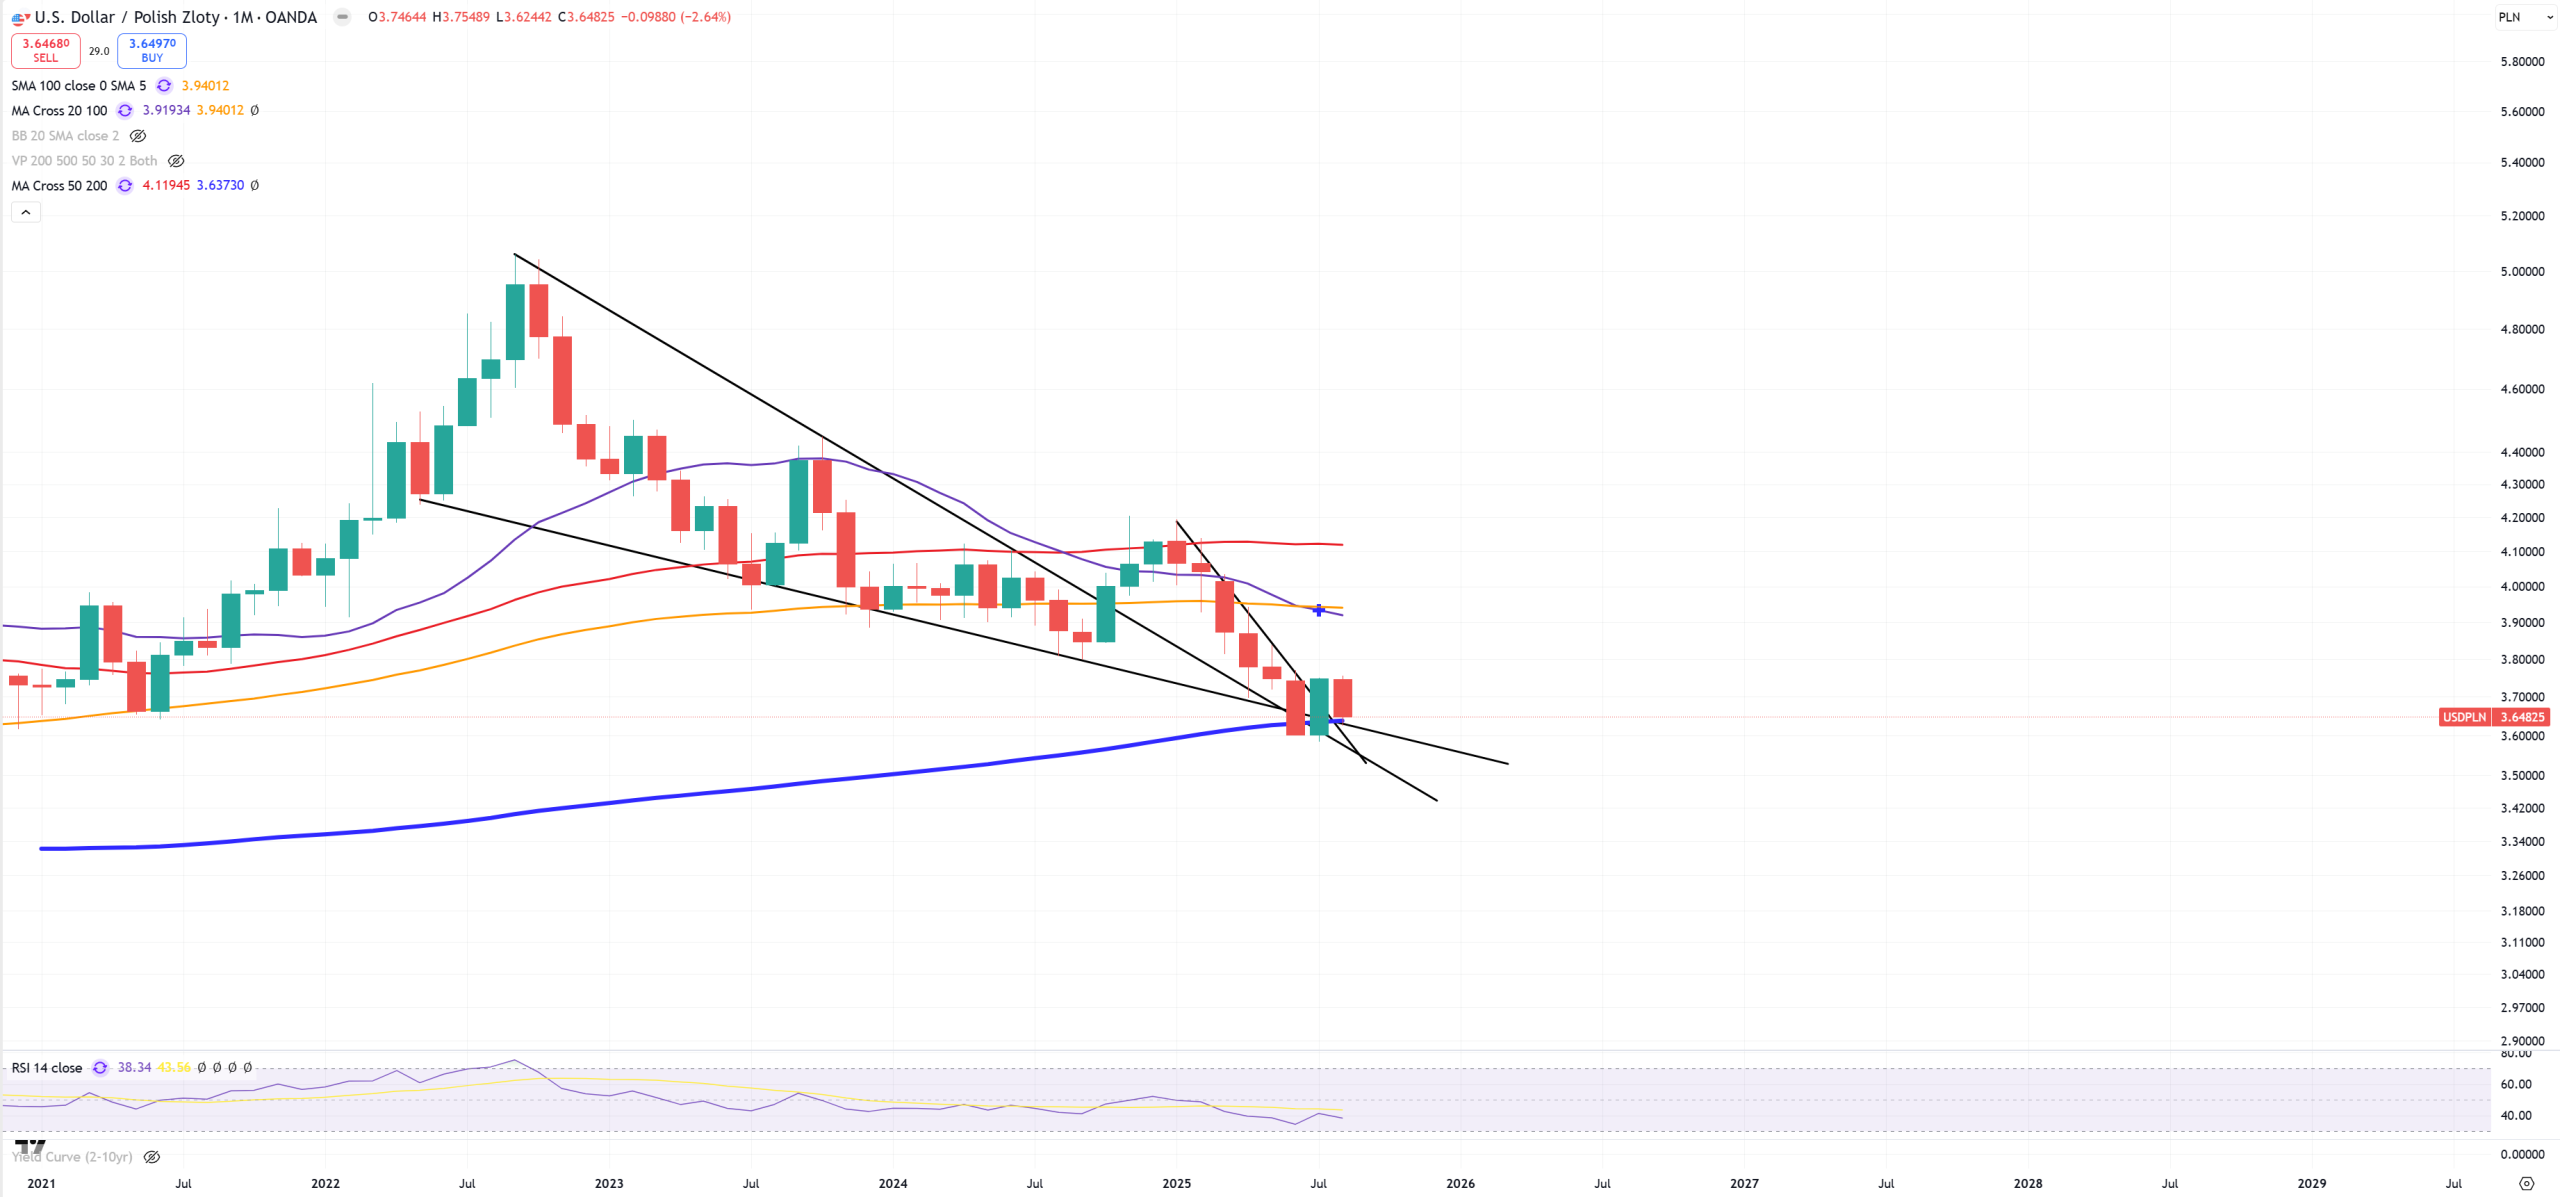
USDPLN – heavily dependent on EURUSD and #1 in country ETFs returns in 2025 reaching couple retests to wedges + (M)MA200.
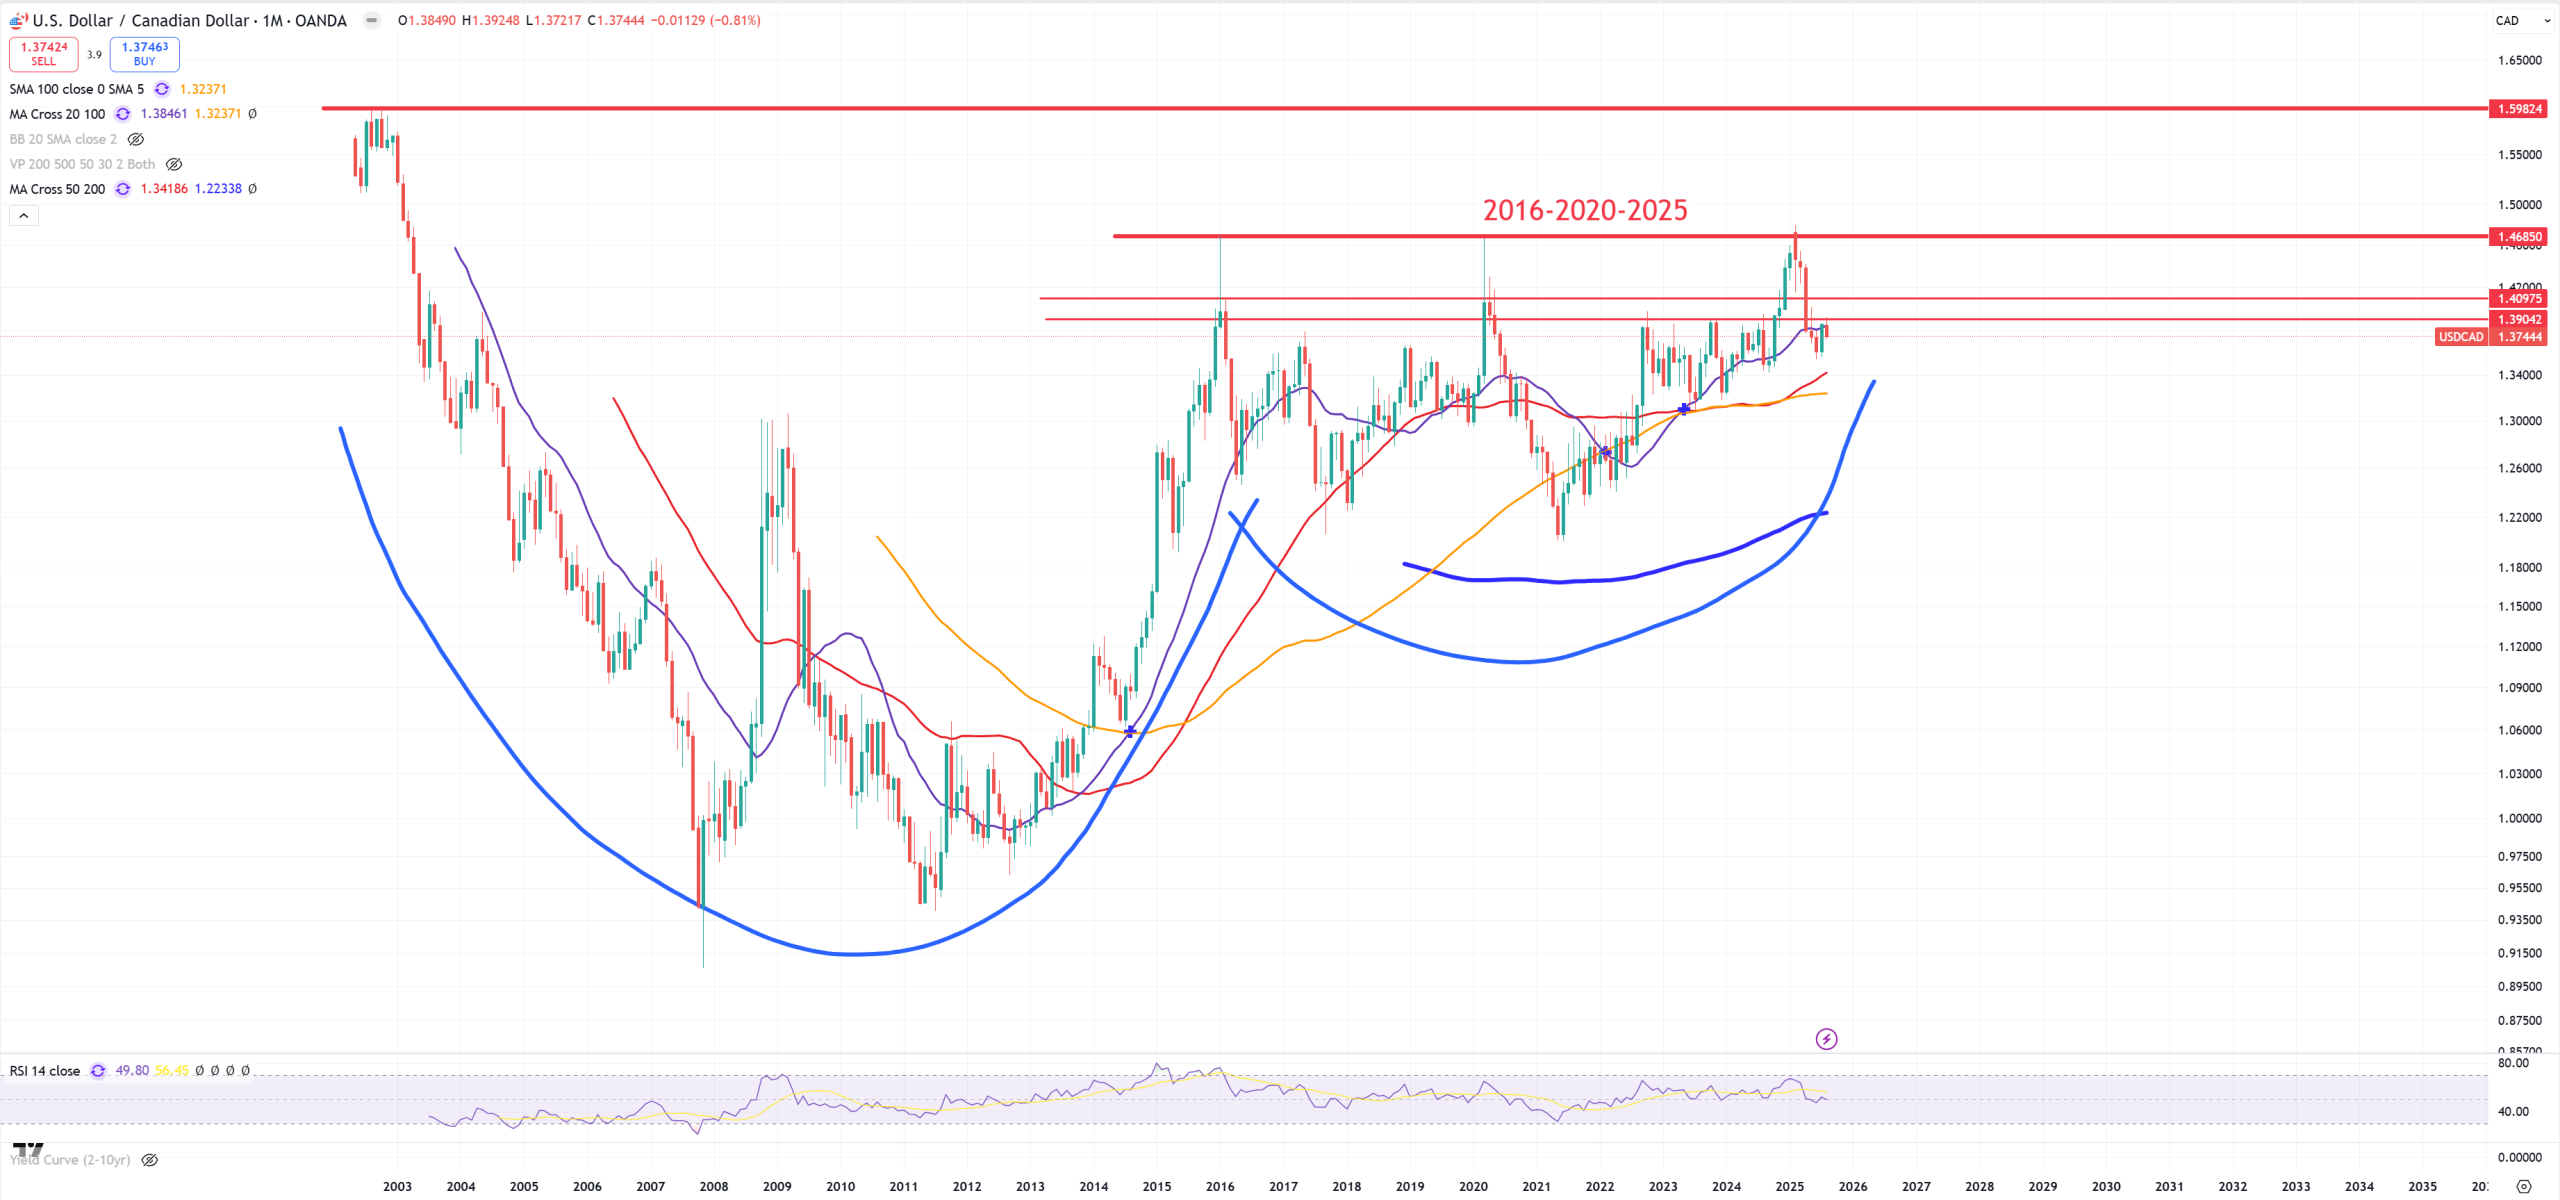
USDCAD – after -1.6% QoQ annualized GDP has been hit by tariffs CAD is fighting with its key level – it’s all about liqudity crisis.
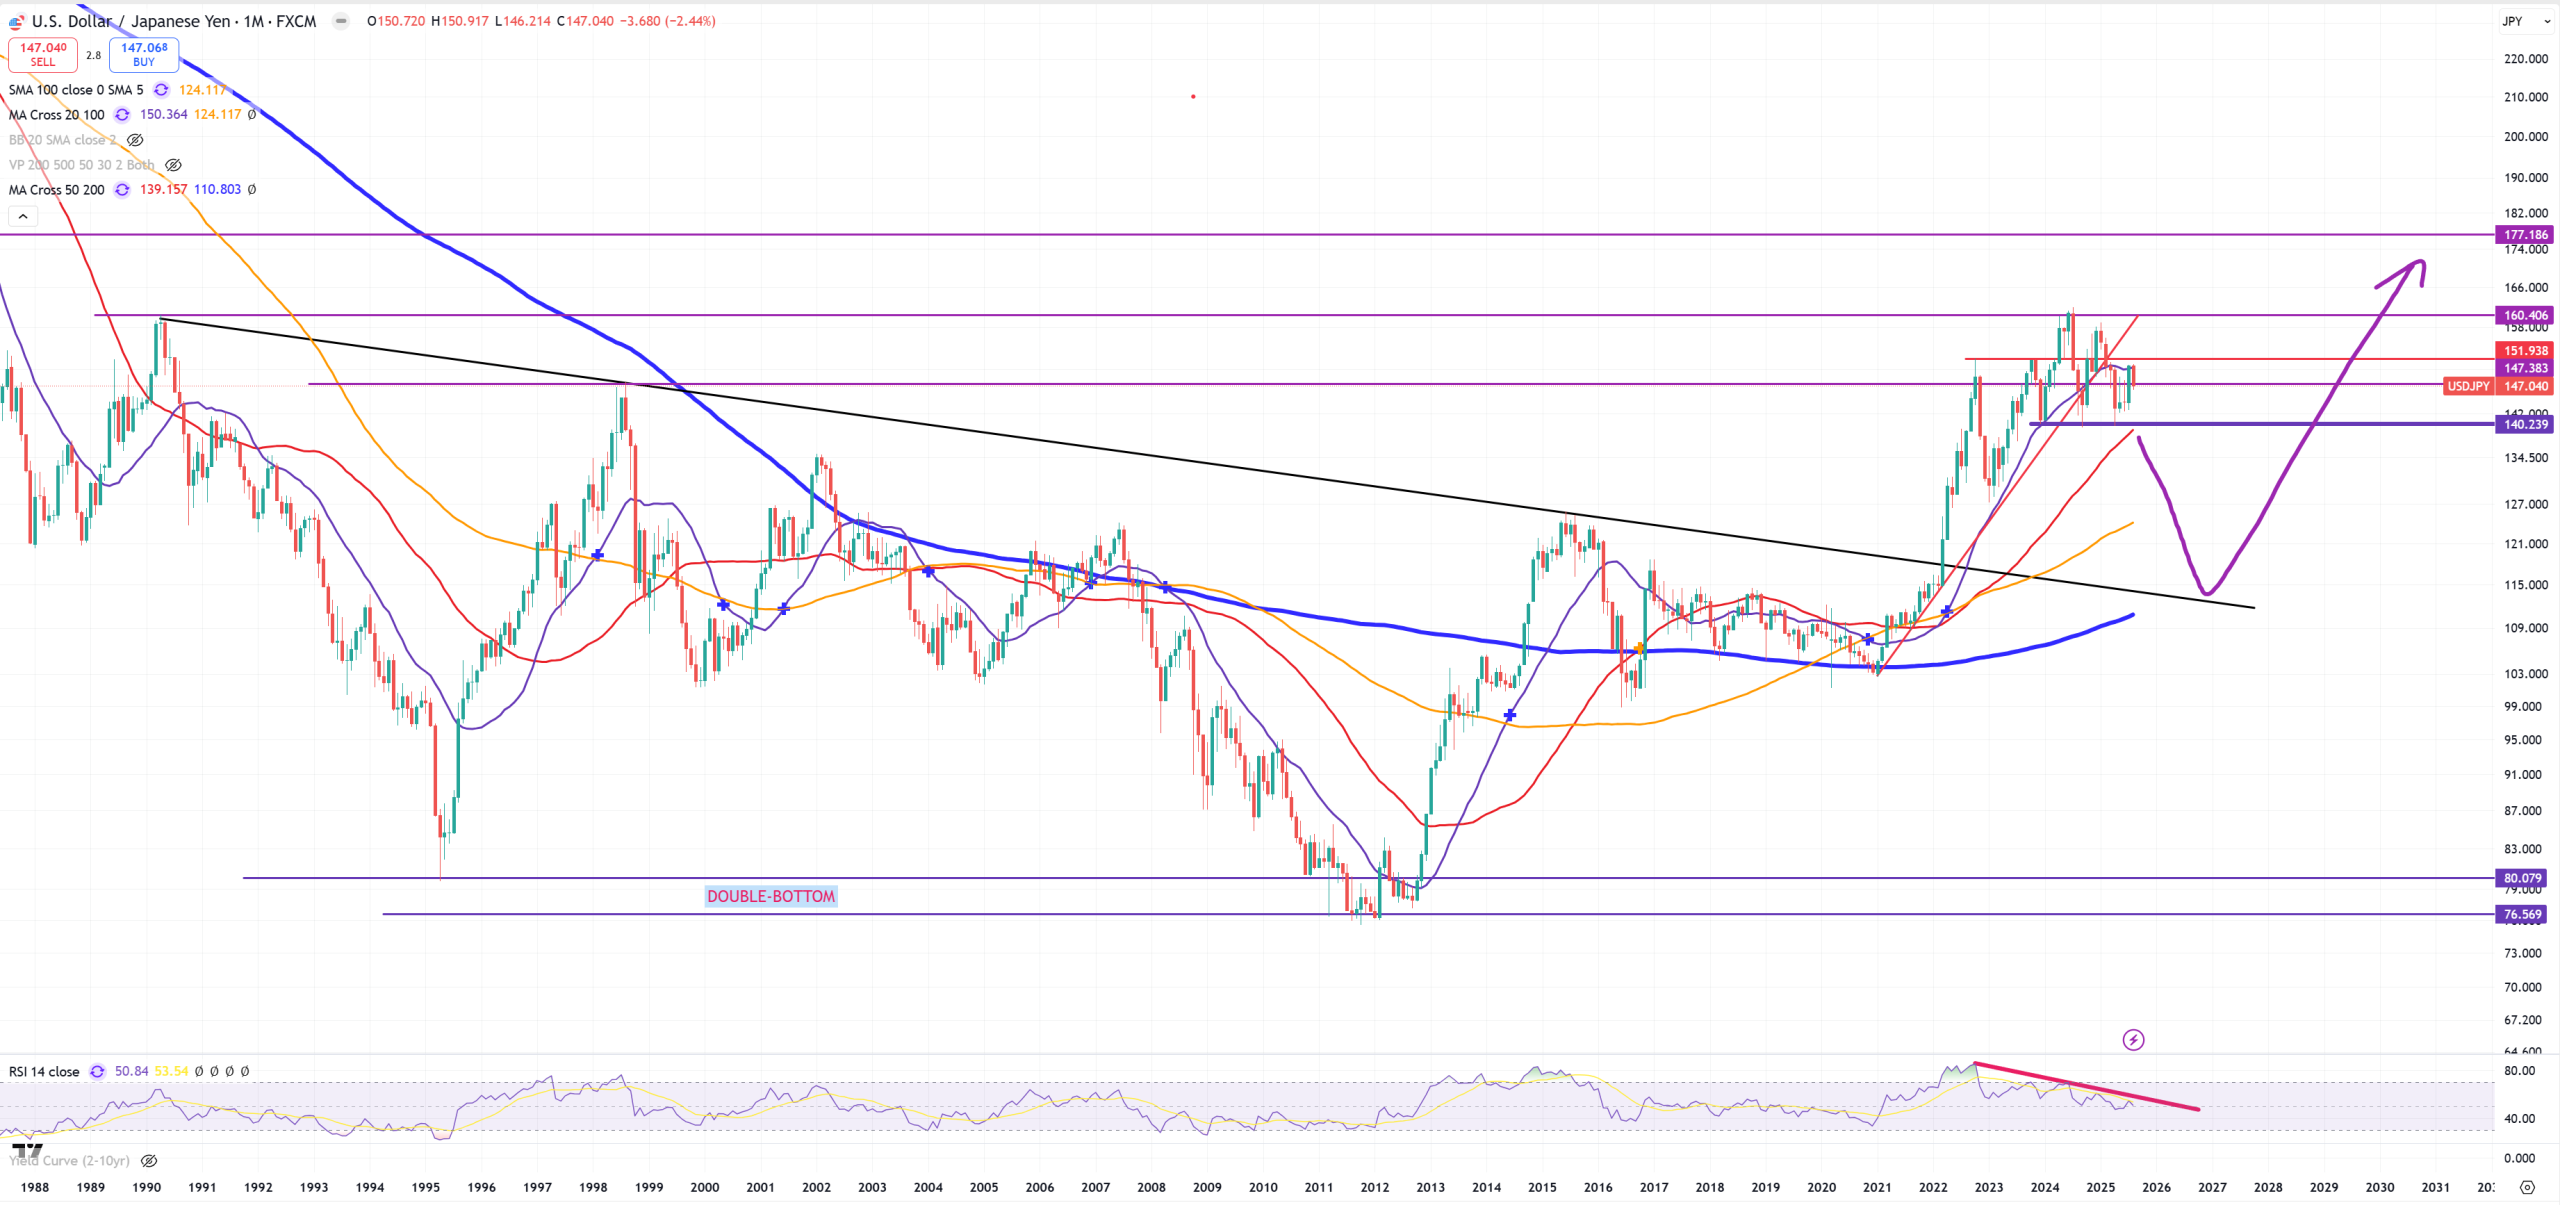
USDJPY – I expect Japan to totally lose control over its bond market sending long end yields parabolic towards 5-6% sending real yields in Japan sky high taking USDJPY pair down
AUDUSD – this pair + USDJPY creates the most important pair AUDJPY which was in the first section. This support level around 0.63 is really important
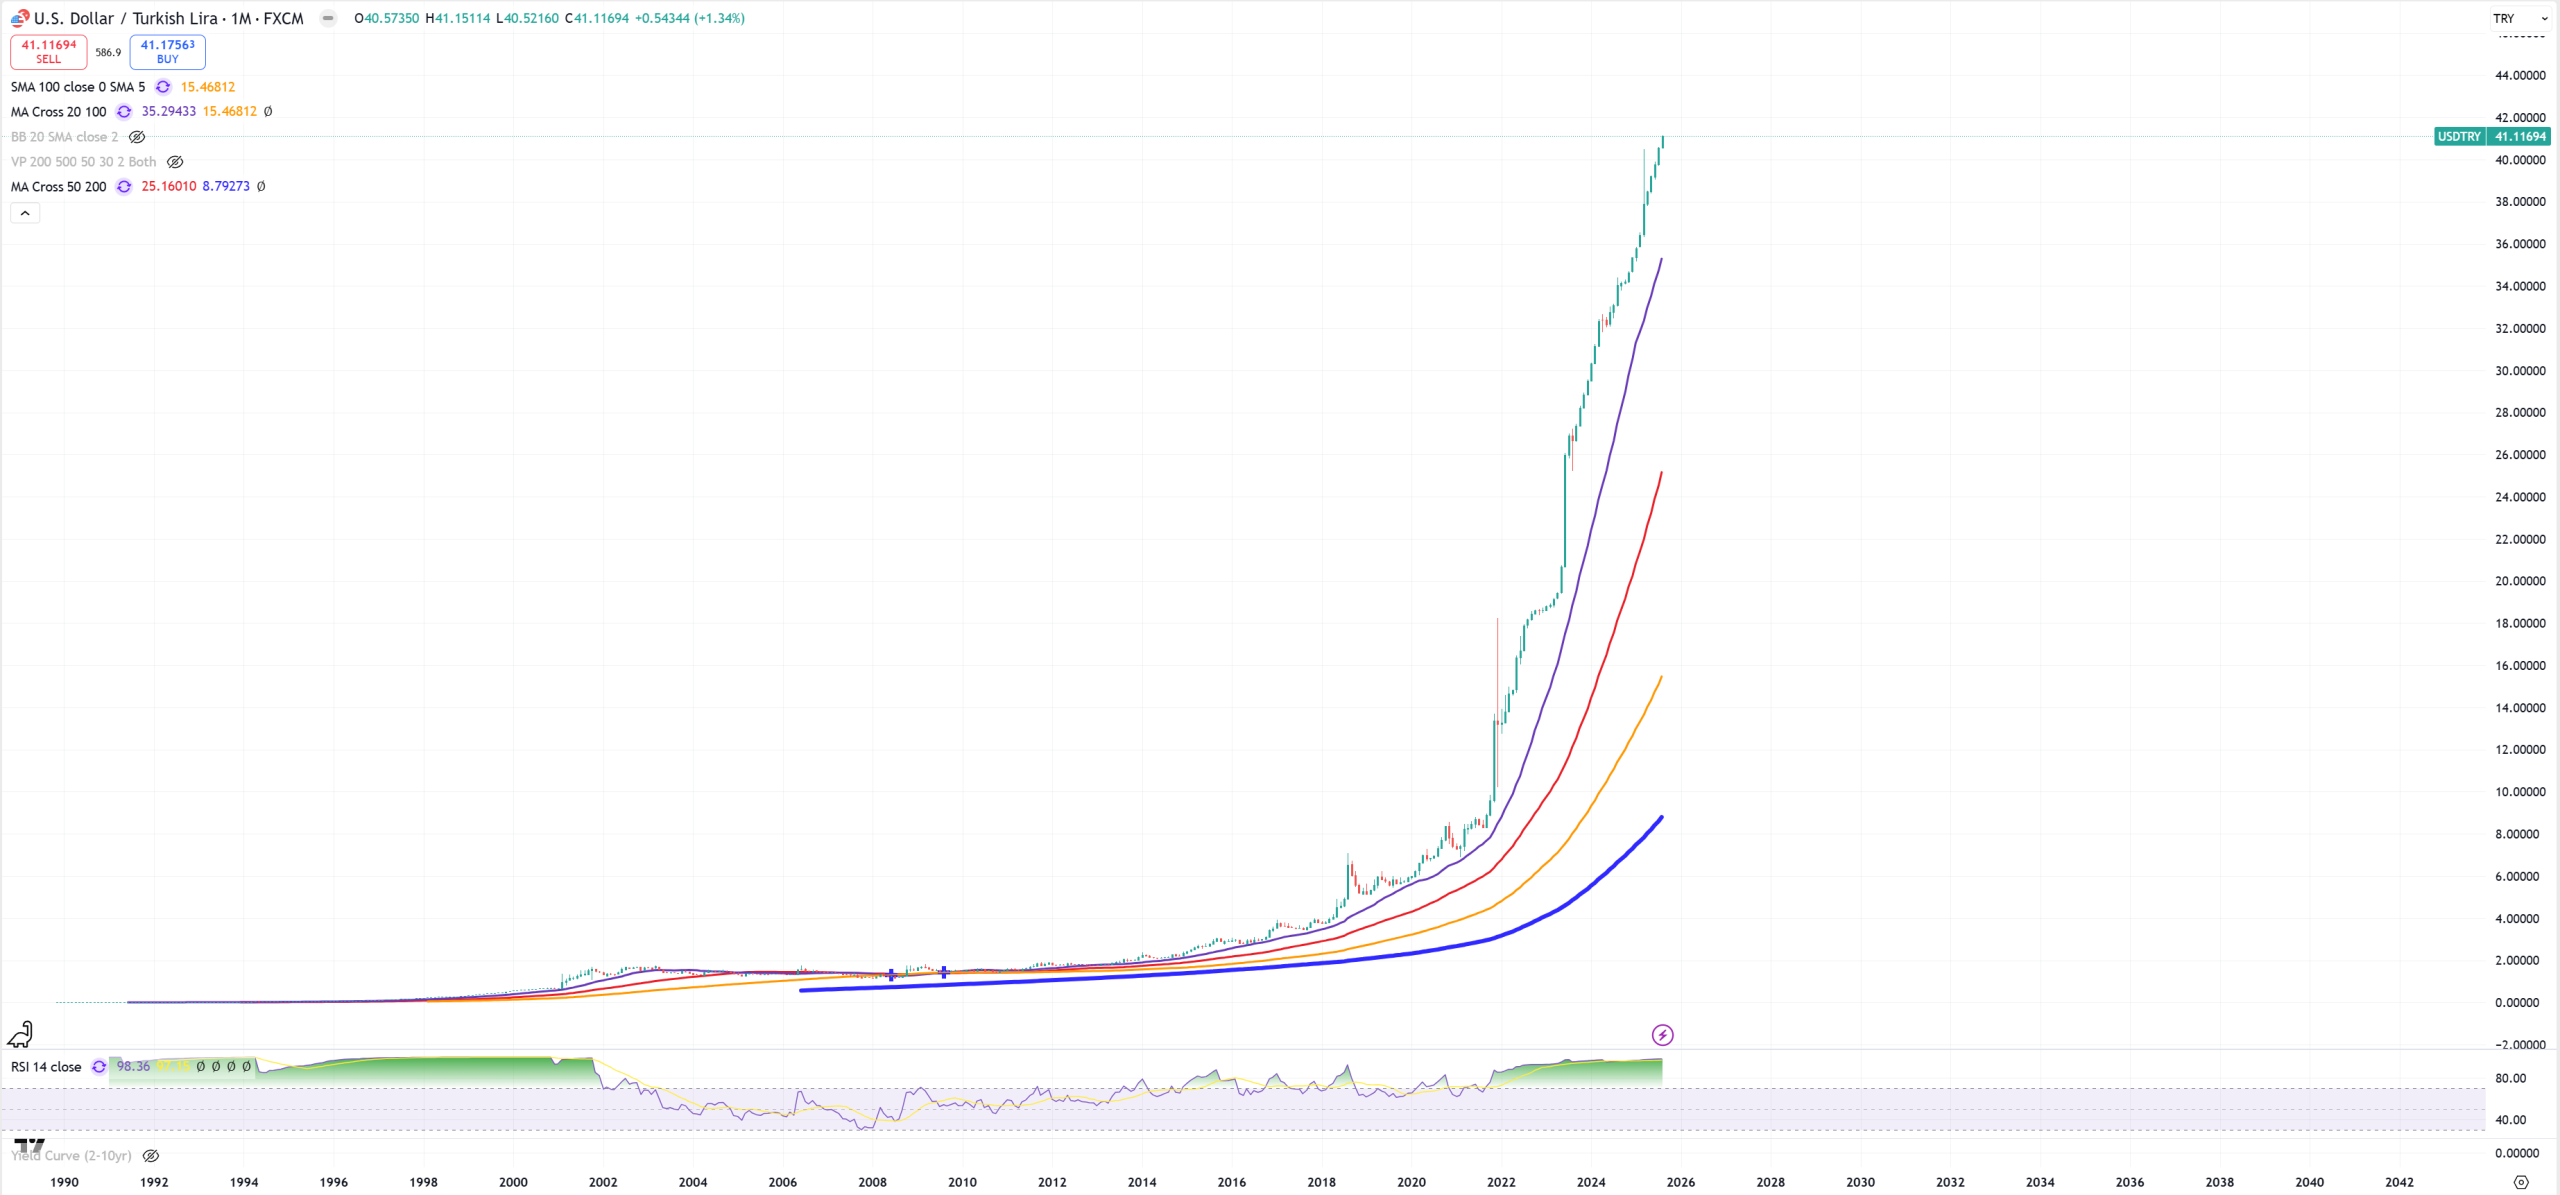
USDTRY – going into hyperinflation
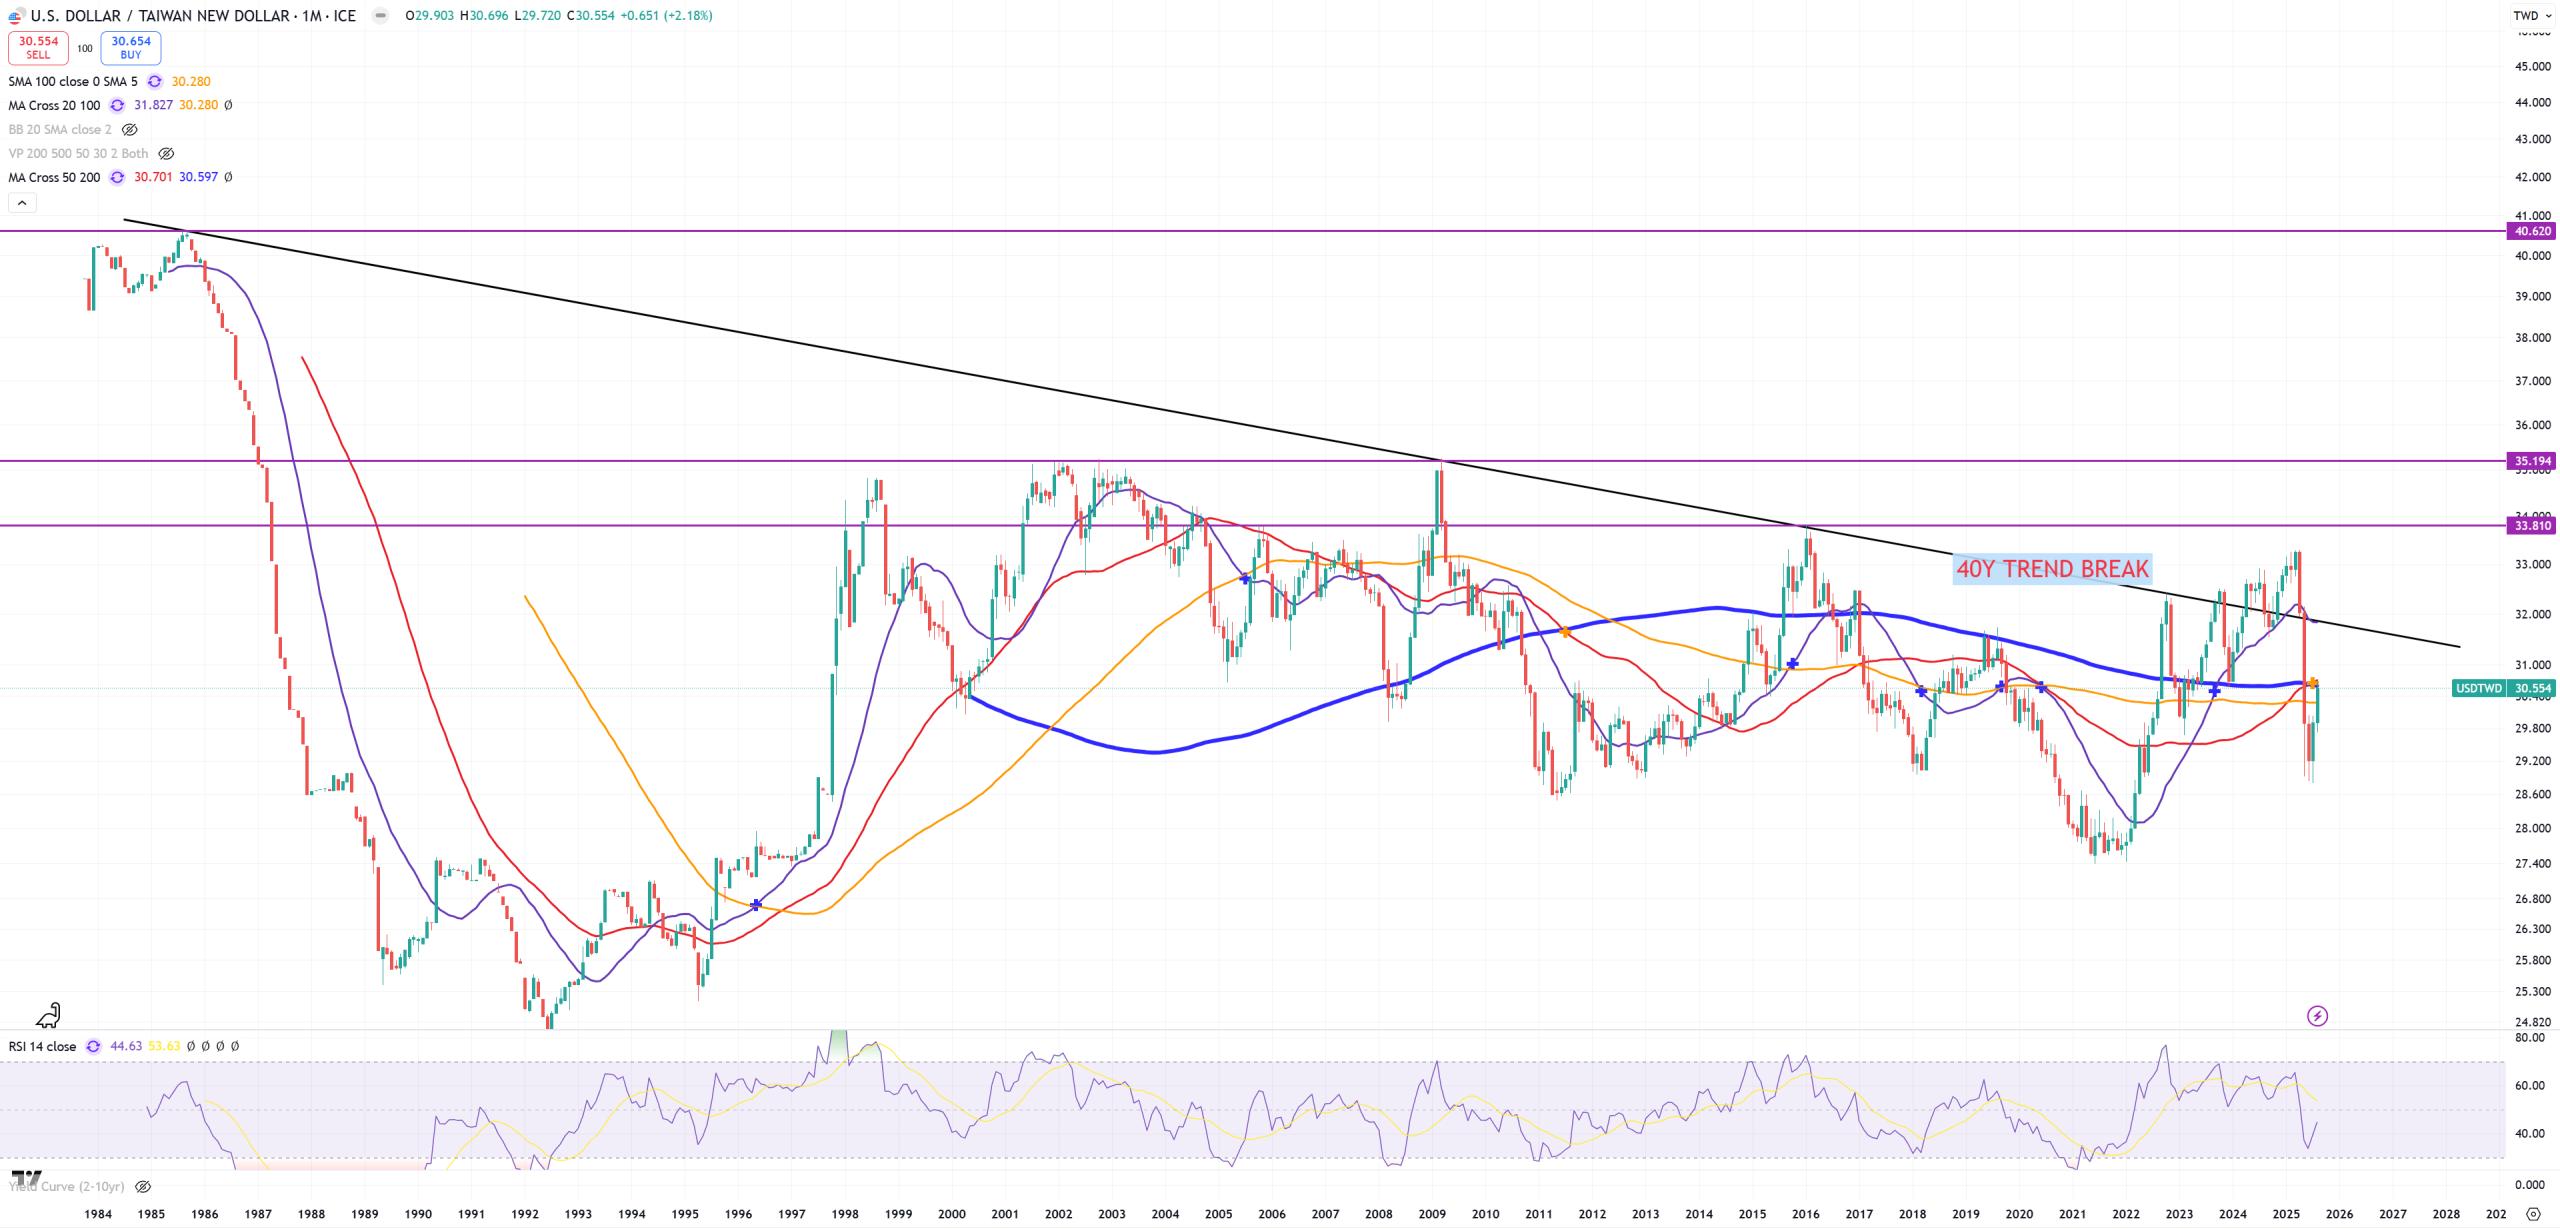
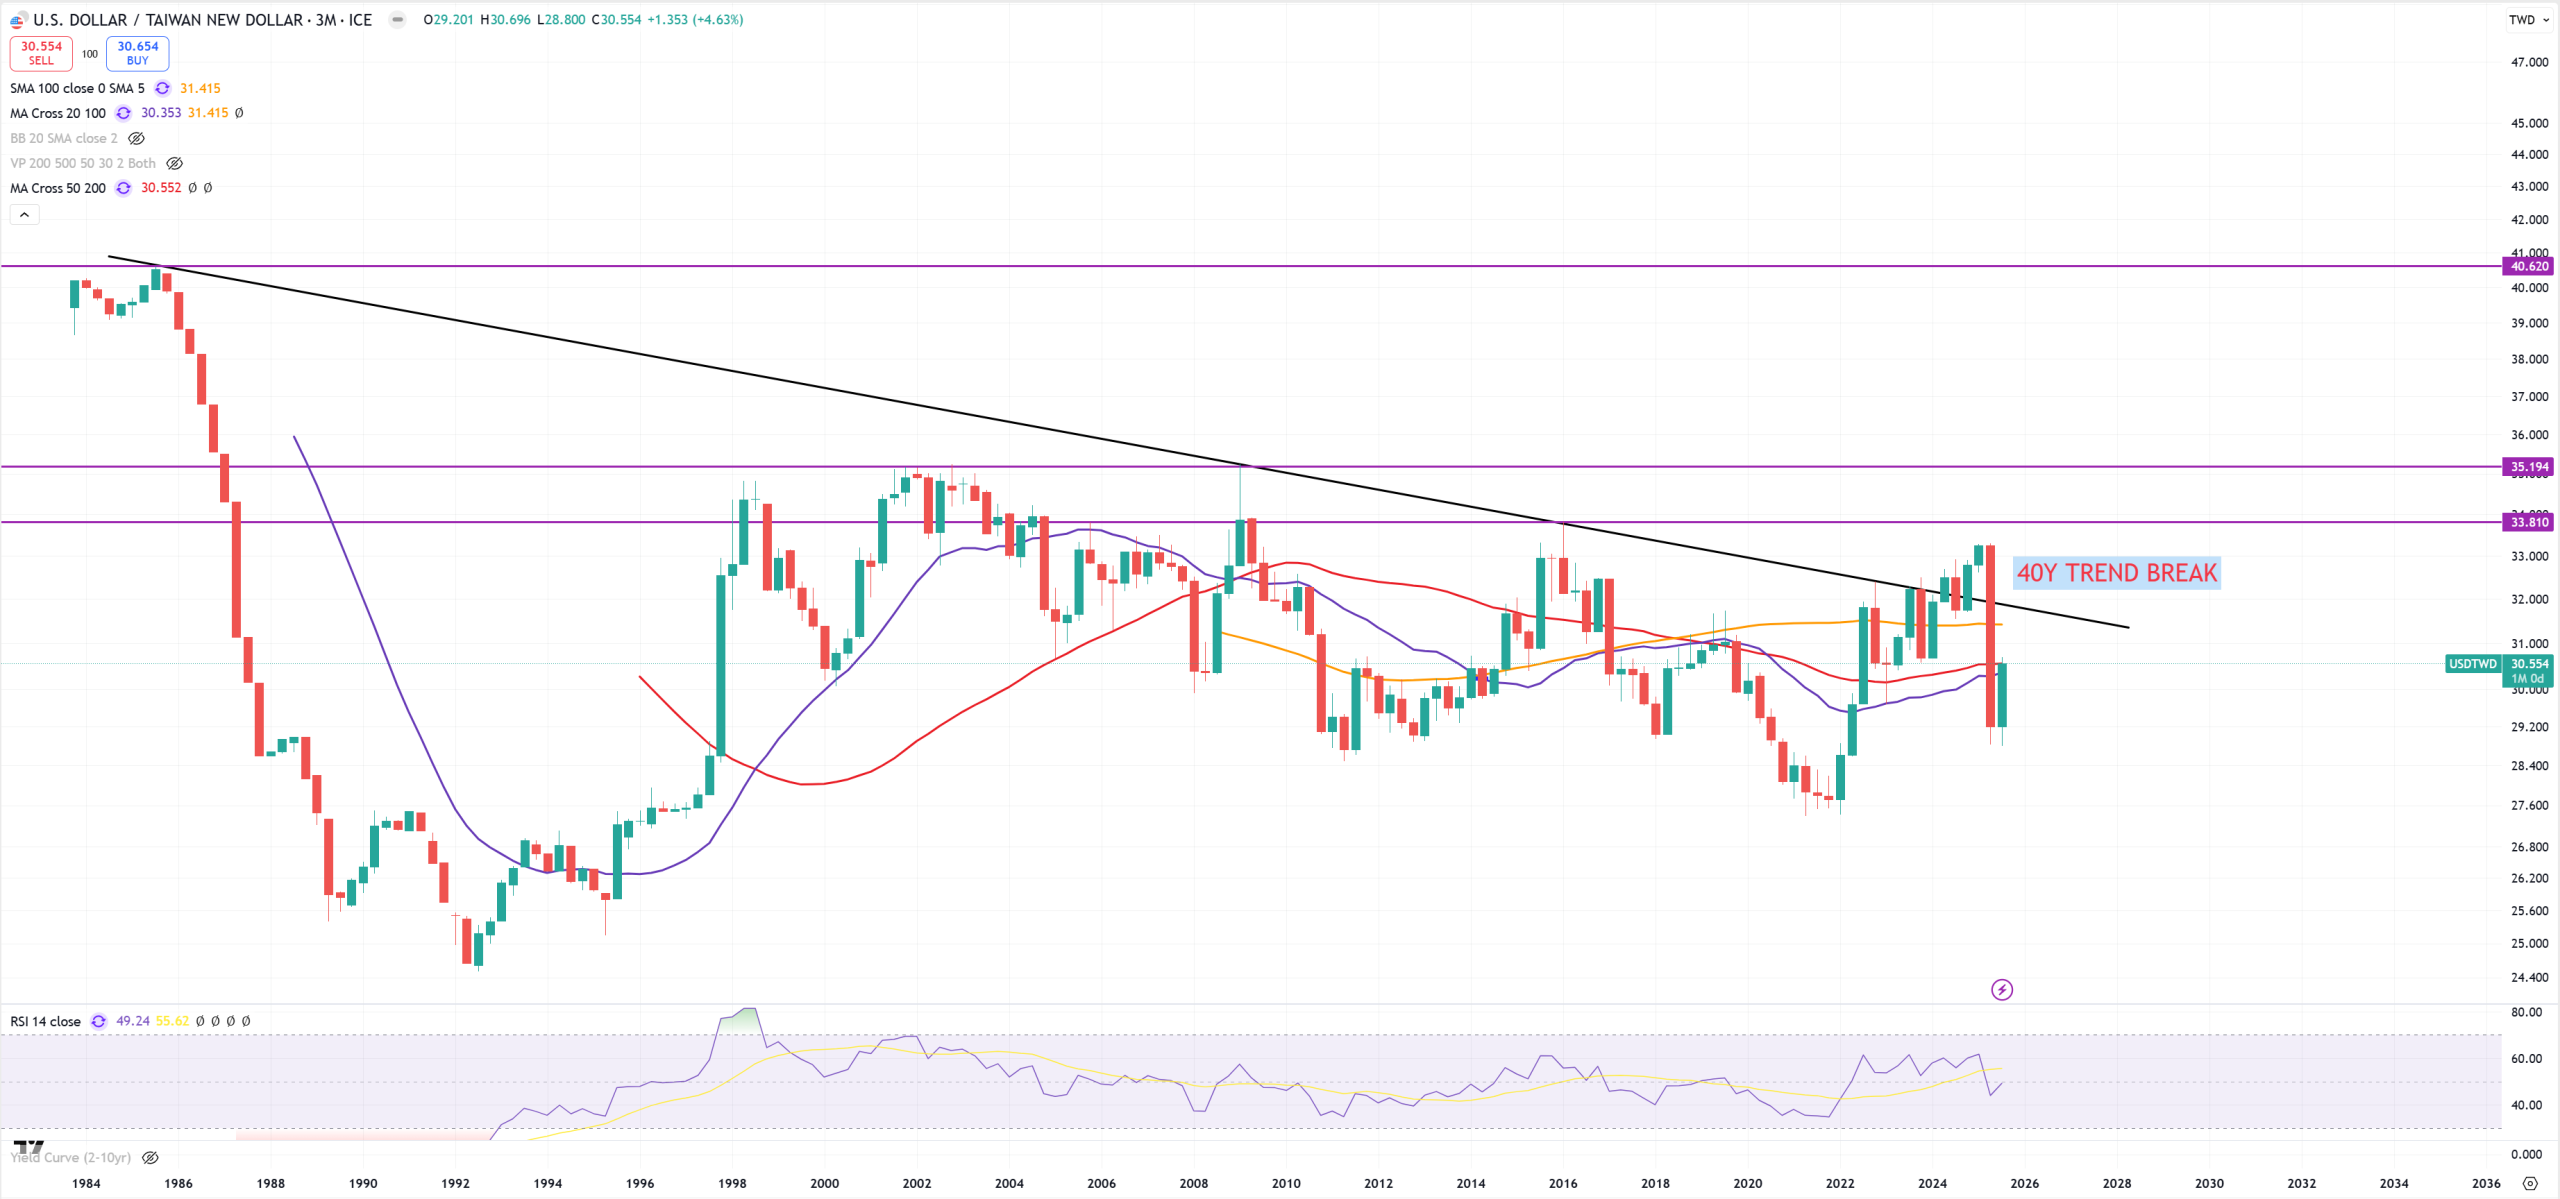
USDTWD – Taiwan $$$, big crash now reversing. (M)MA200 / (M)MA50 retest or massive trap here? If you take a look on (3M) view (September needs to close) we see also retesting to (3M)MA50.
TECH stocks
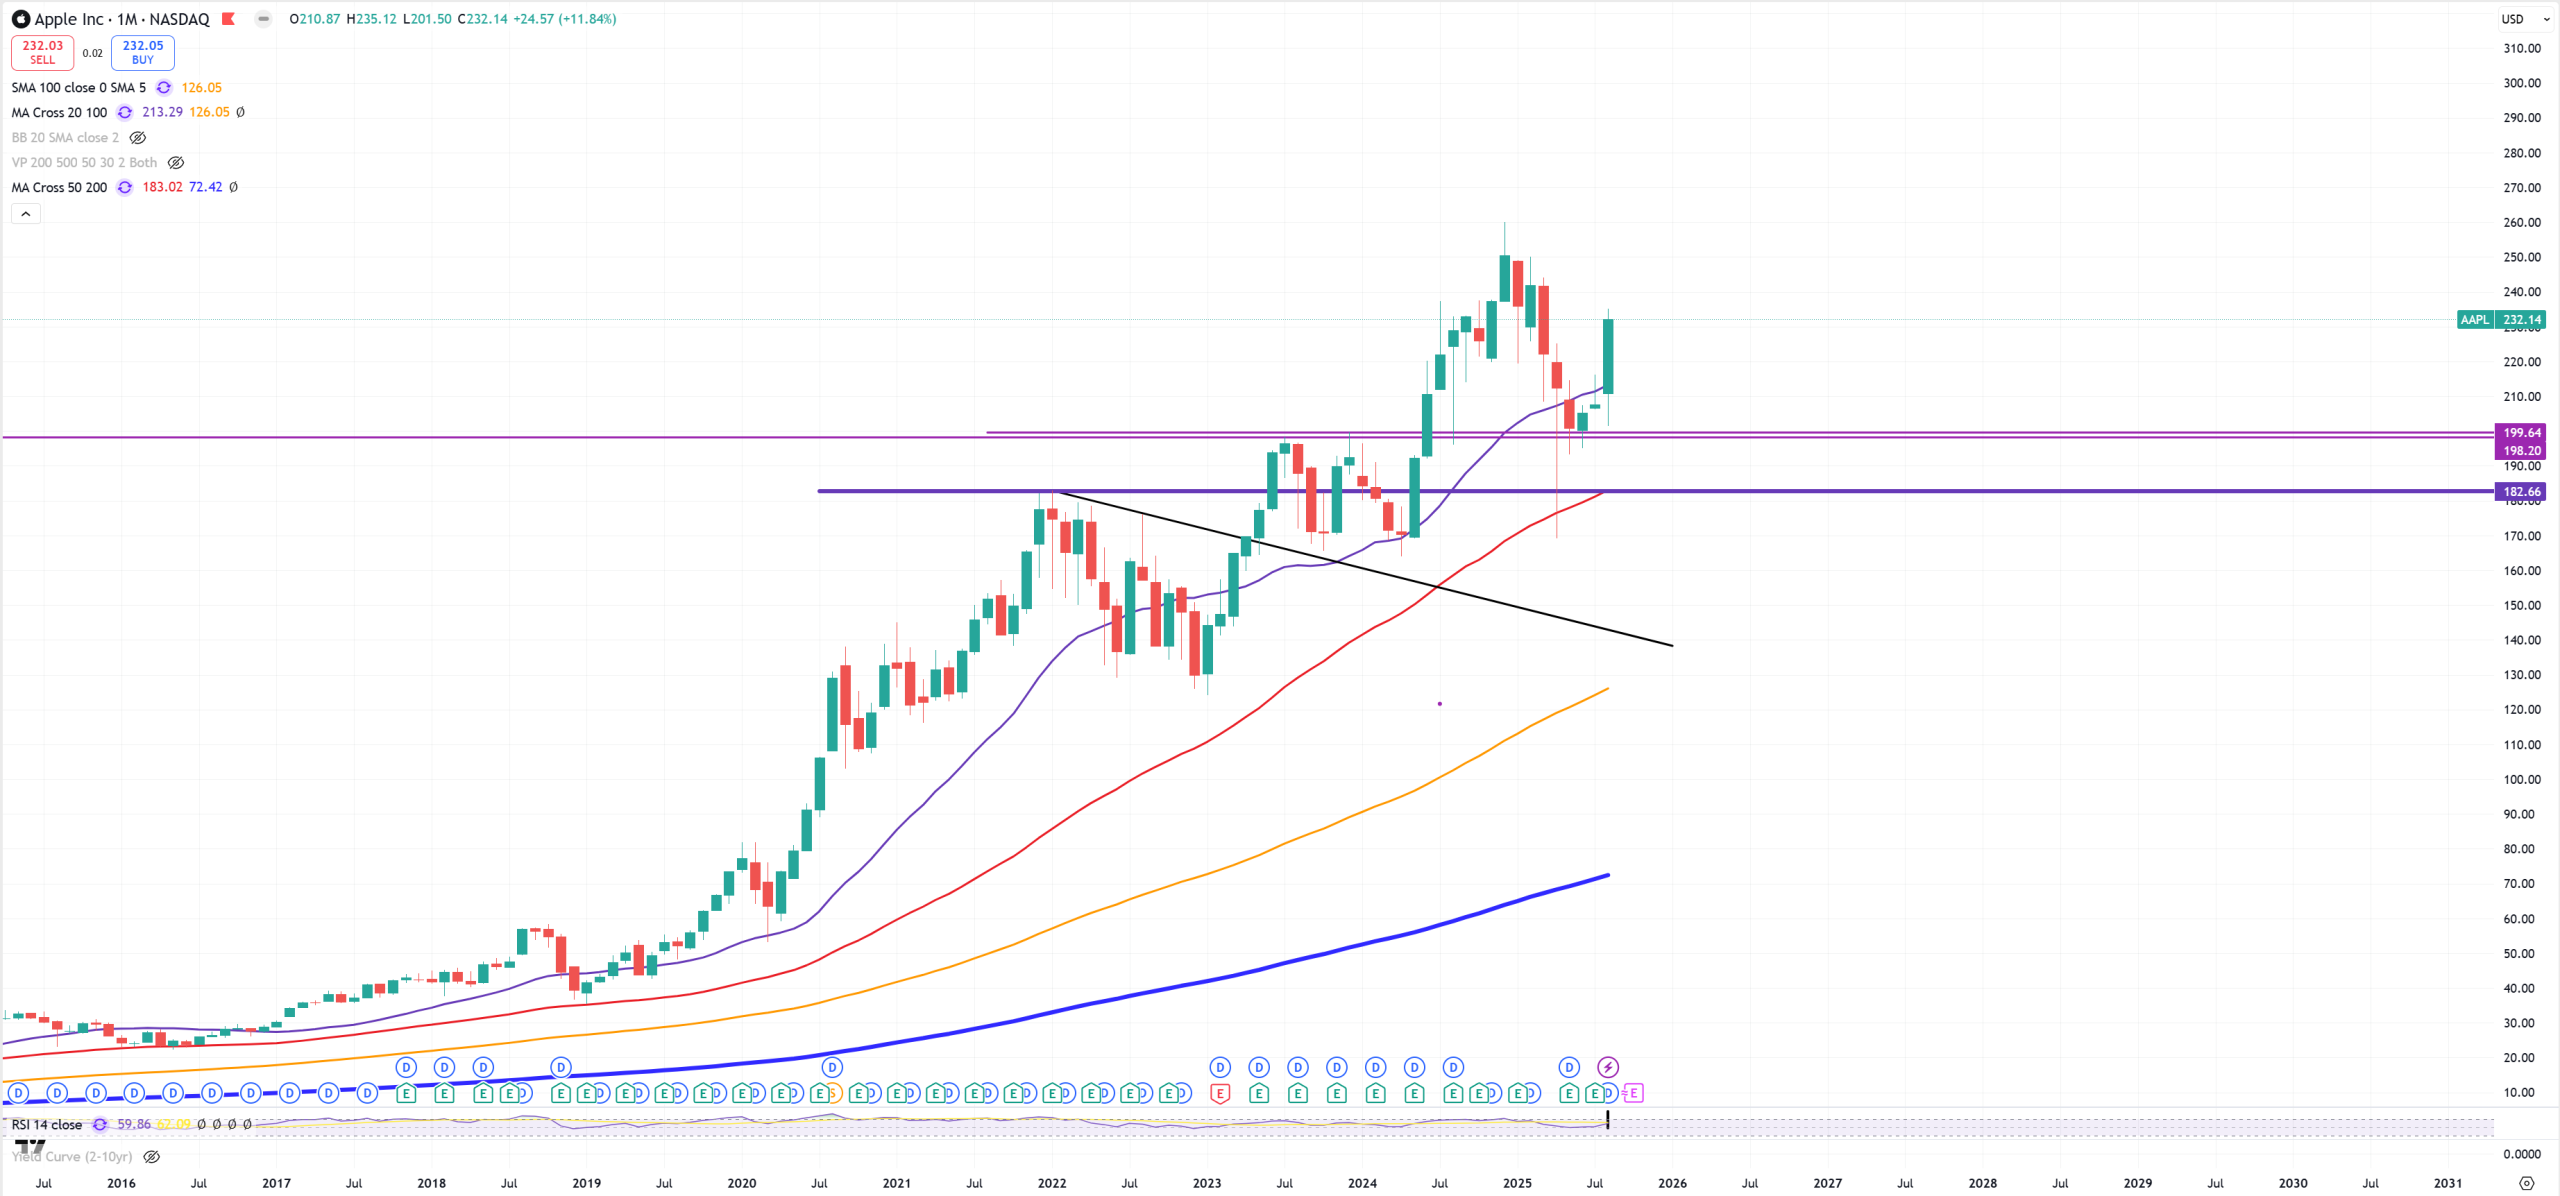
AAPL – Apple as support 200$ holds, we see bounce on the market
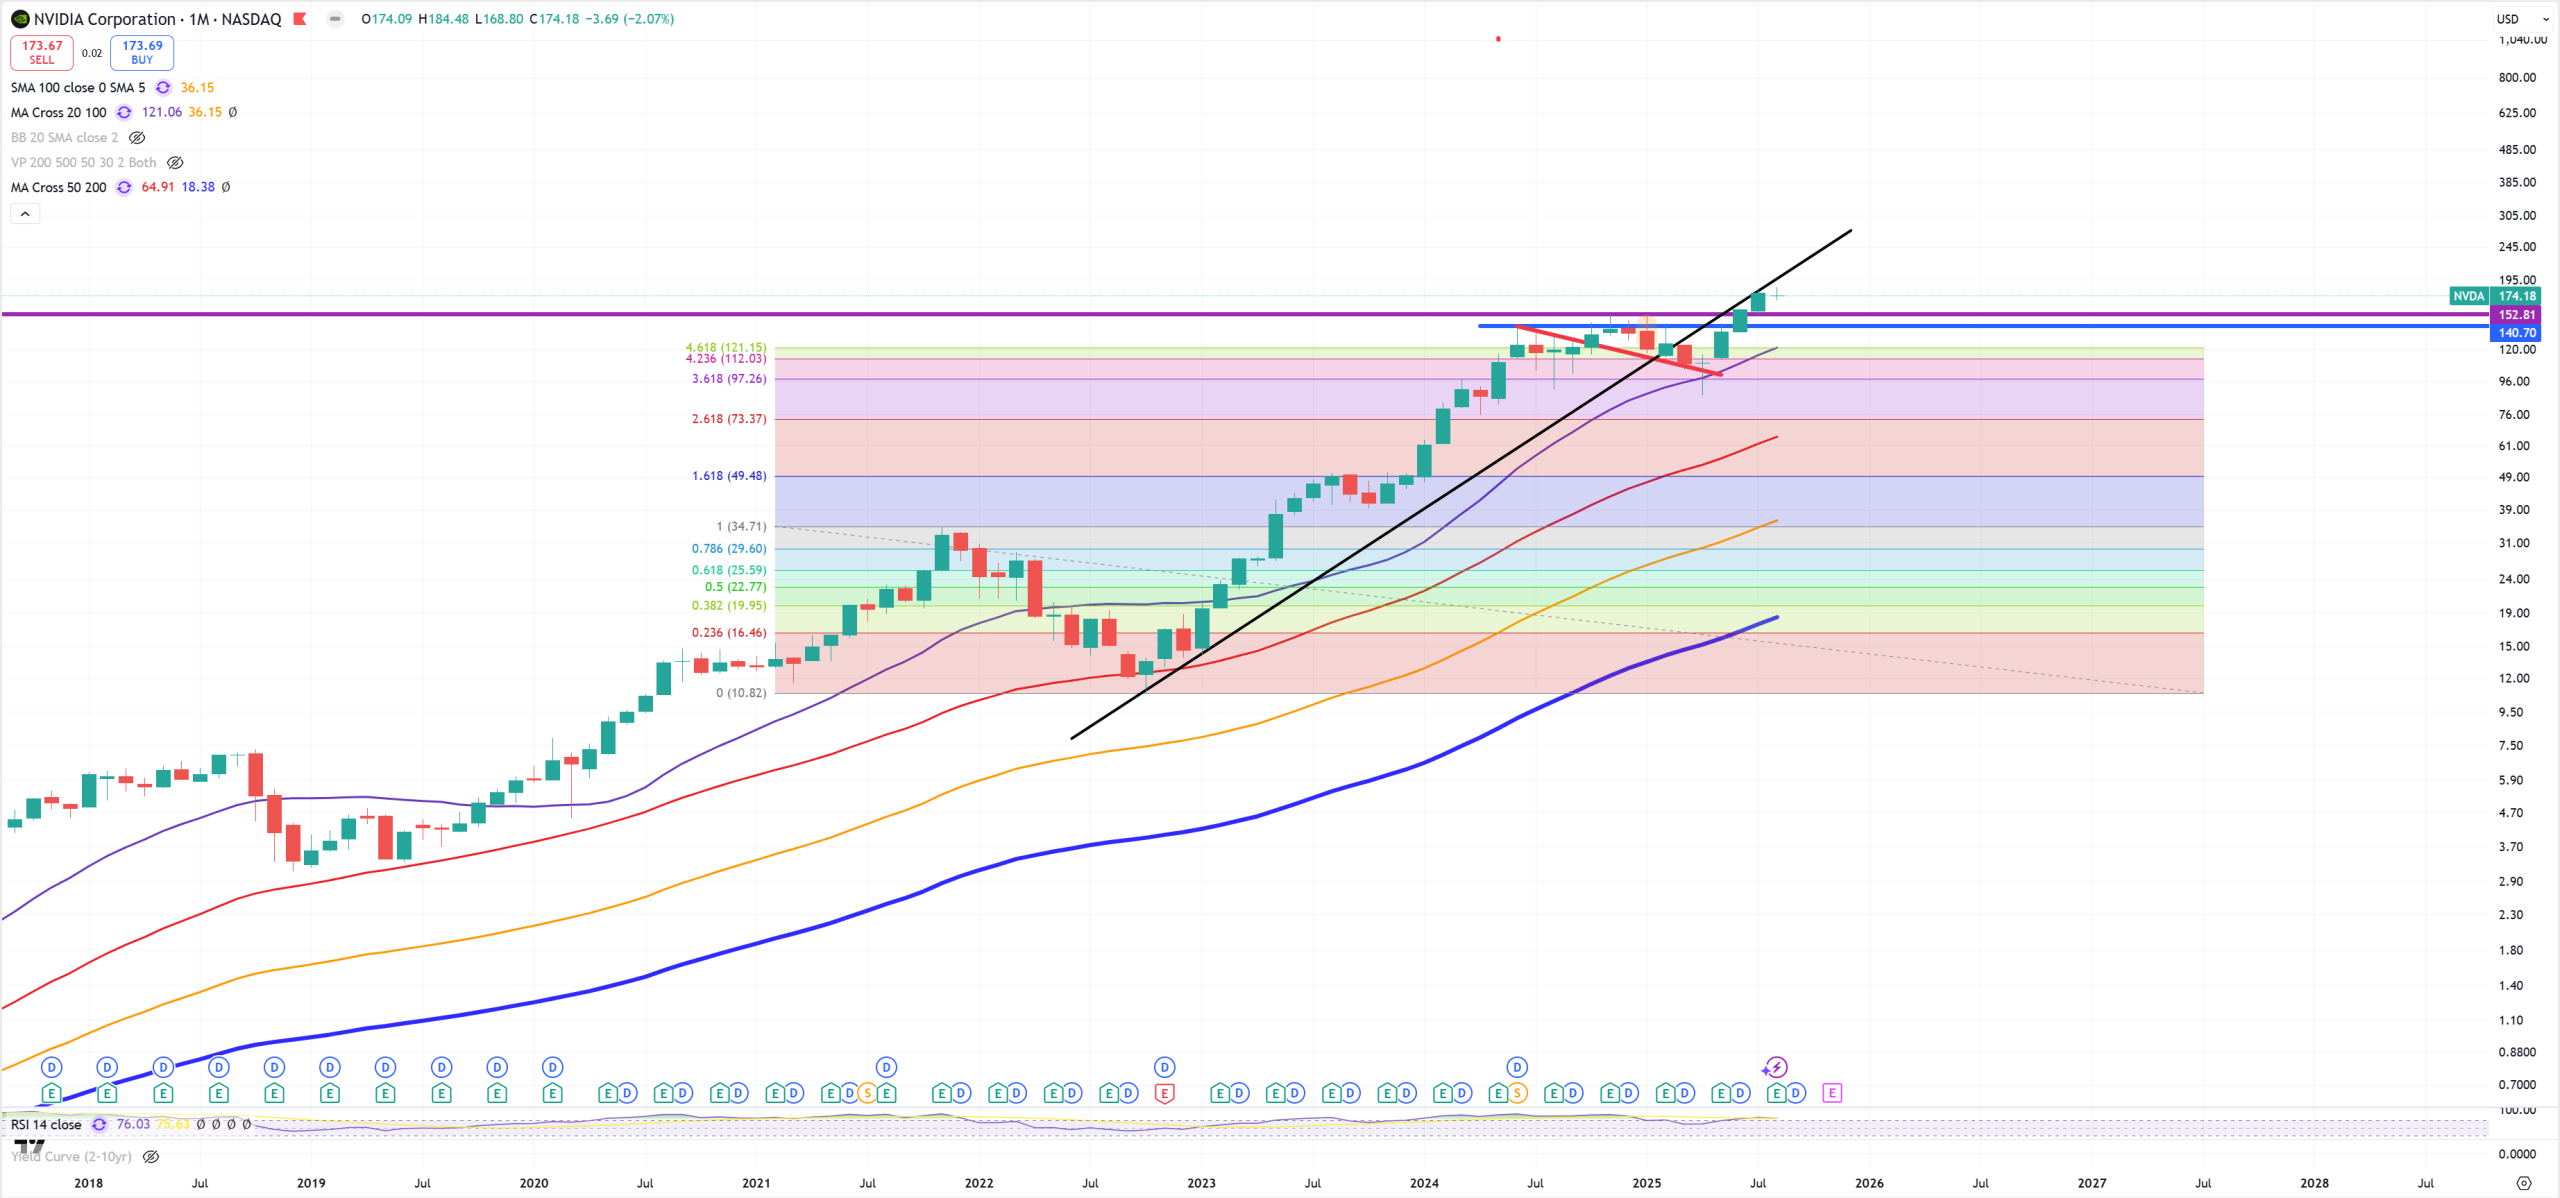
NVDA – Nvidia push to new ATH breaking previous resistance 152$, but look on this trend because AMD is doing the same
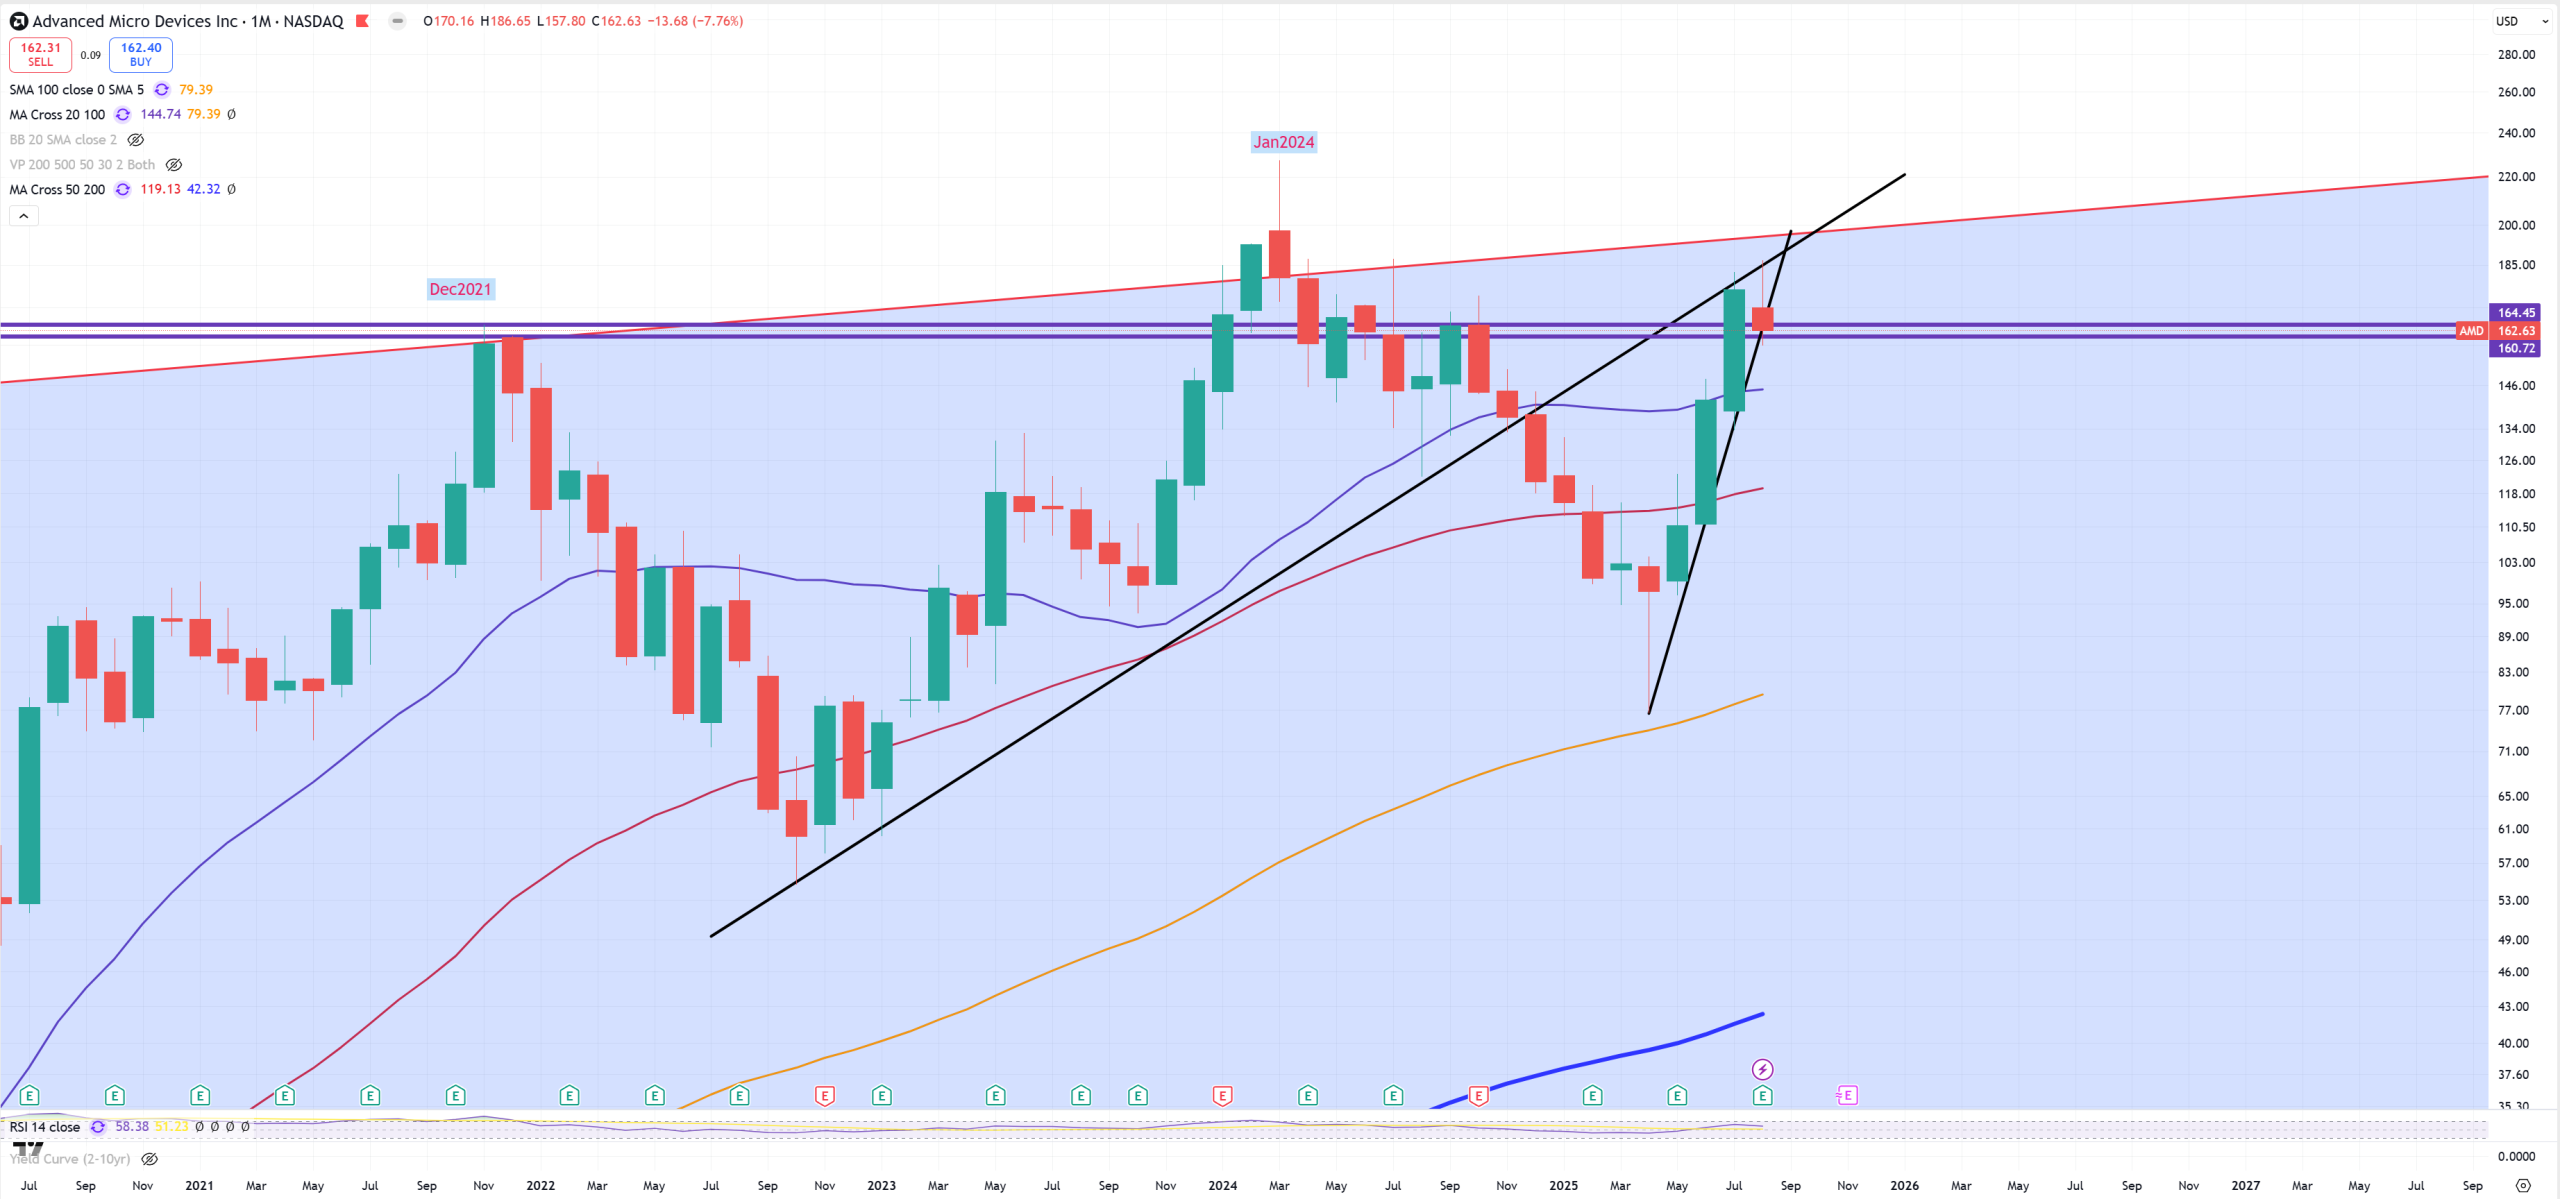
AMD – considering false spike in 1Q24, AMD falls below 2021 peak.
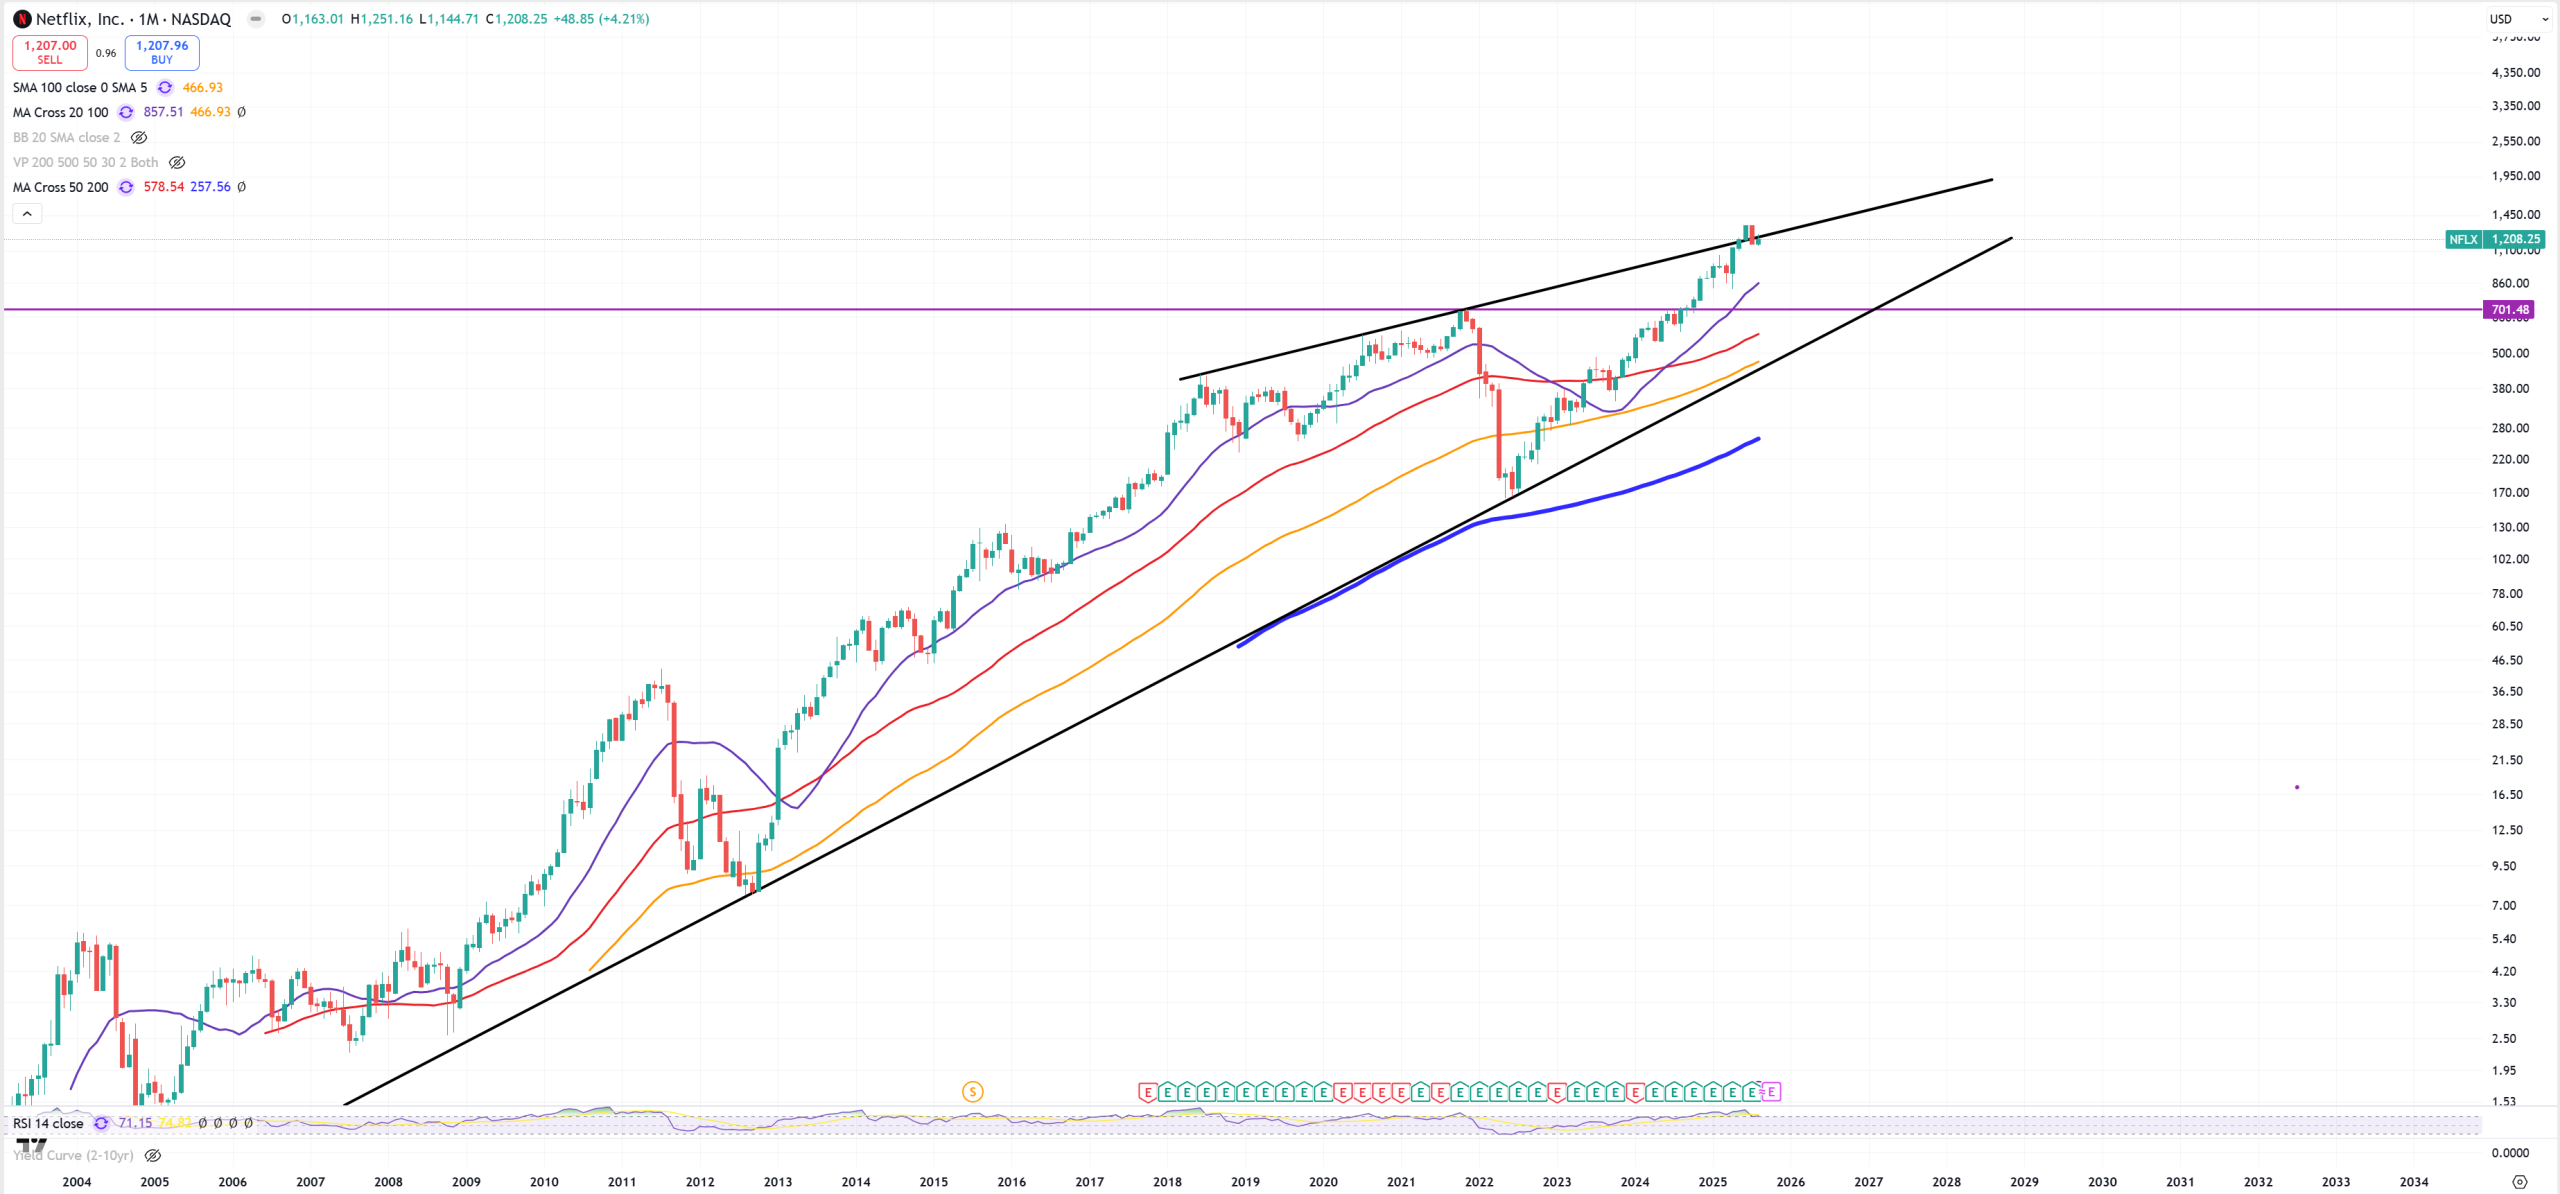
NFLX – Netflix
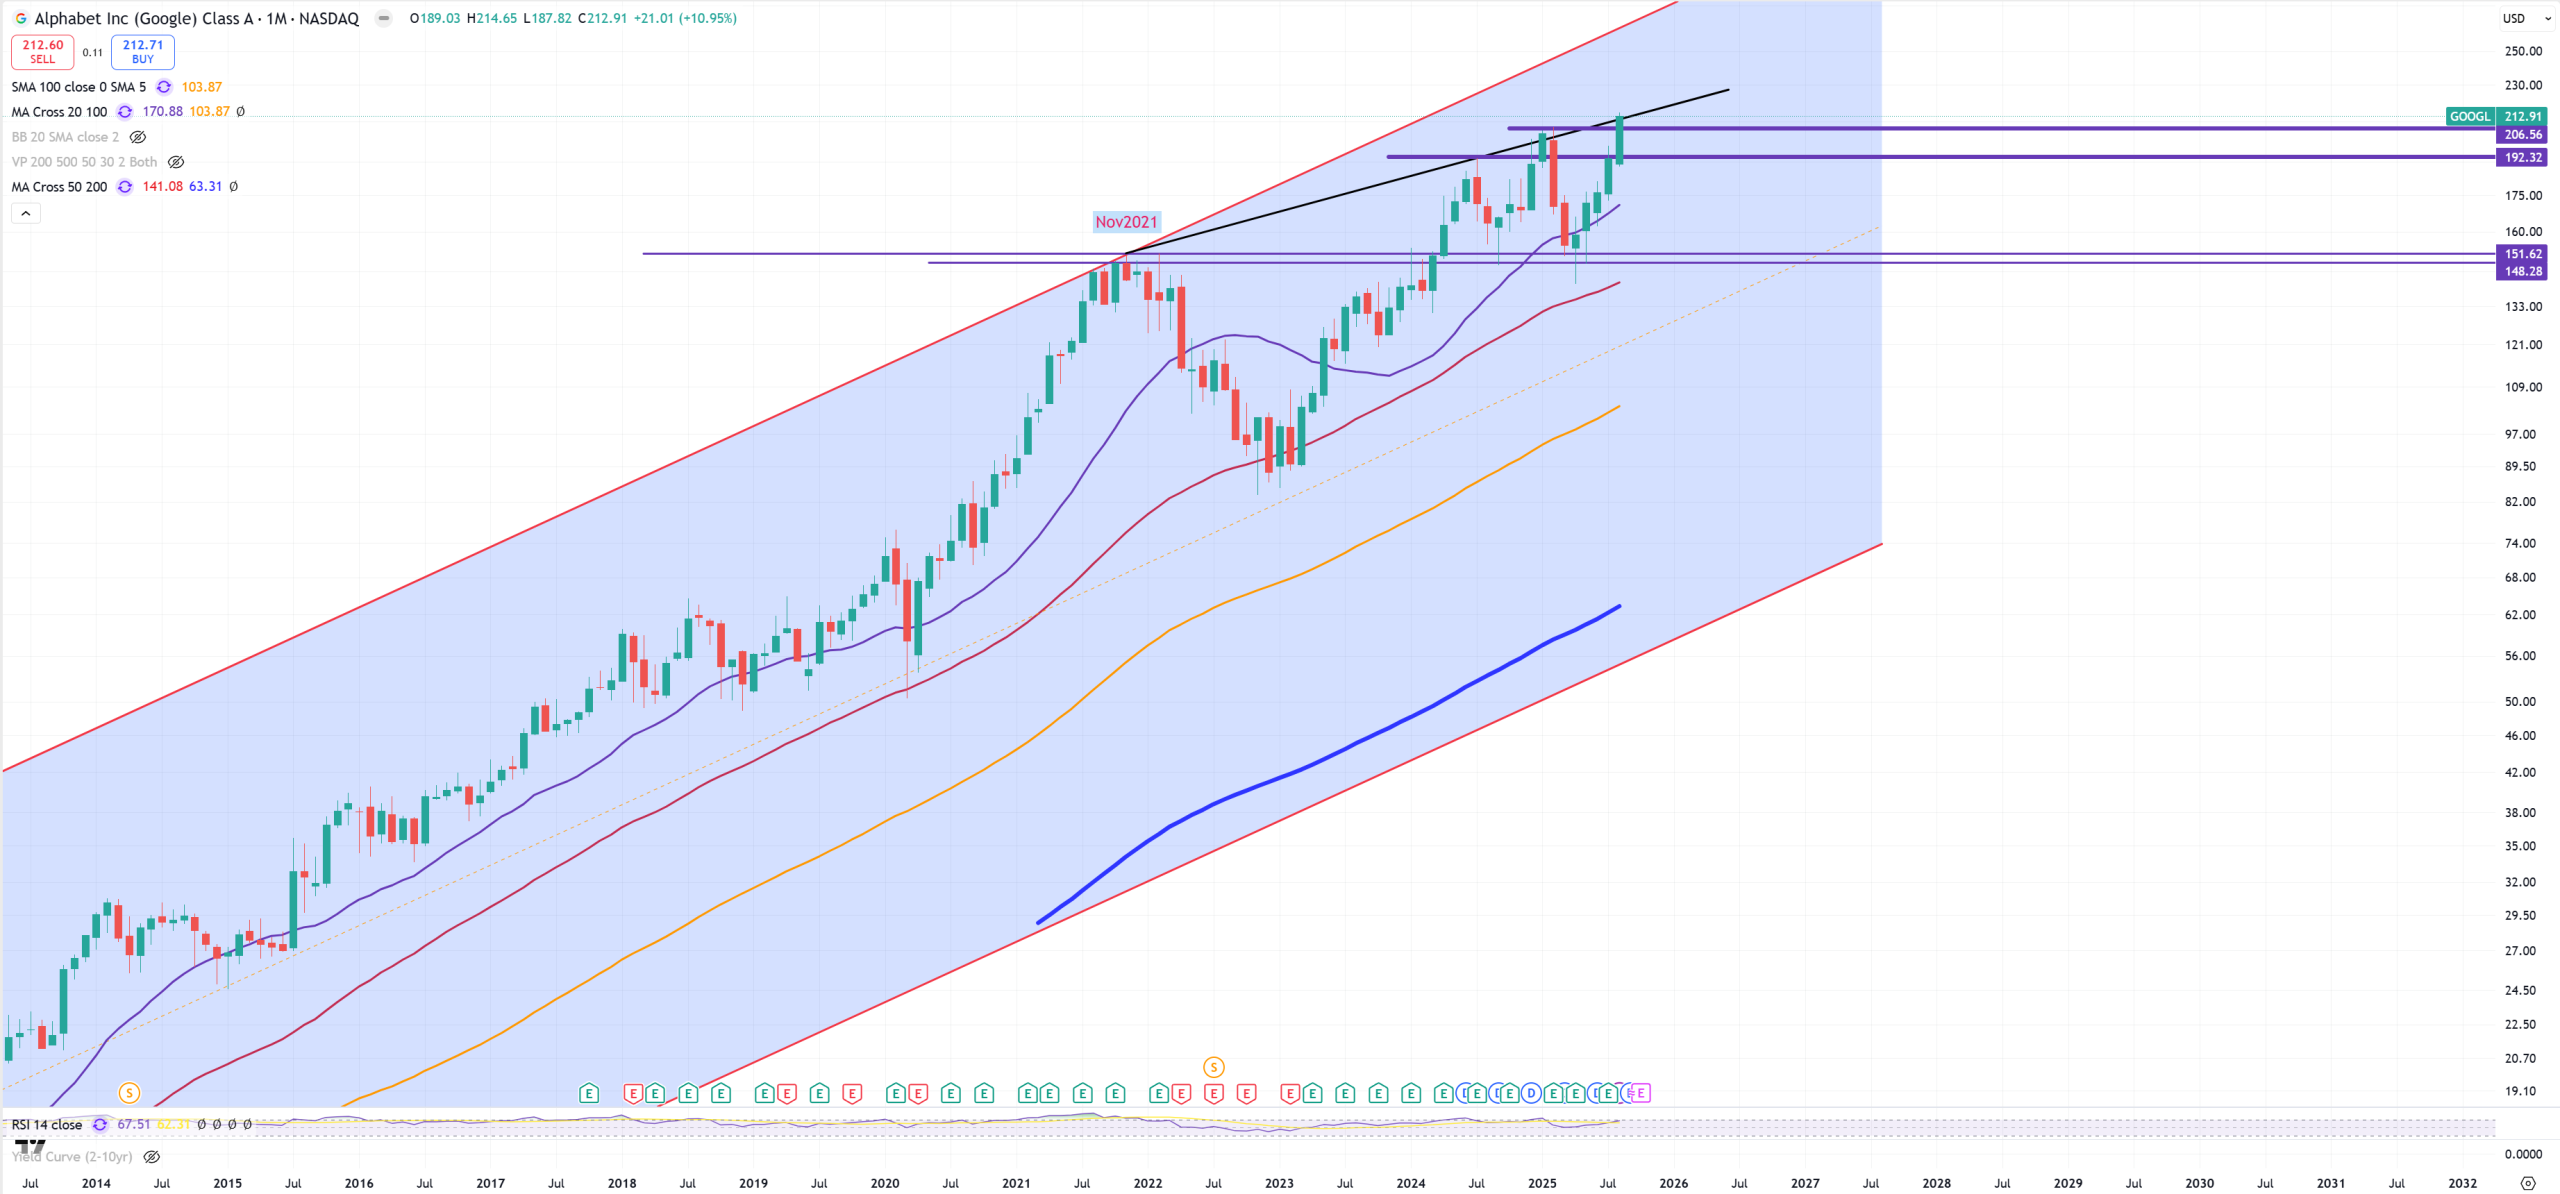
GOOGL – Google
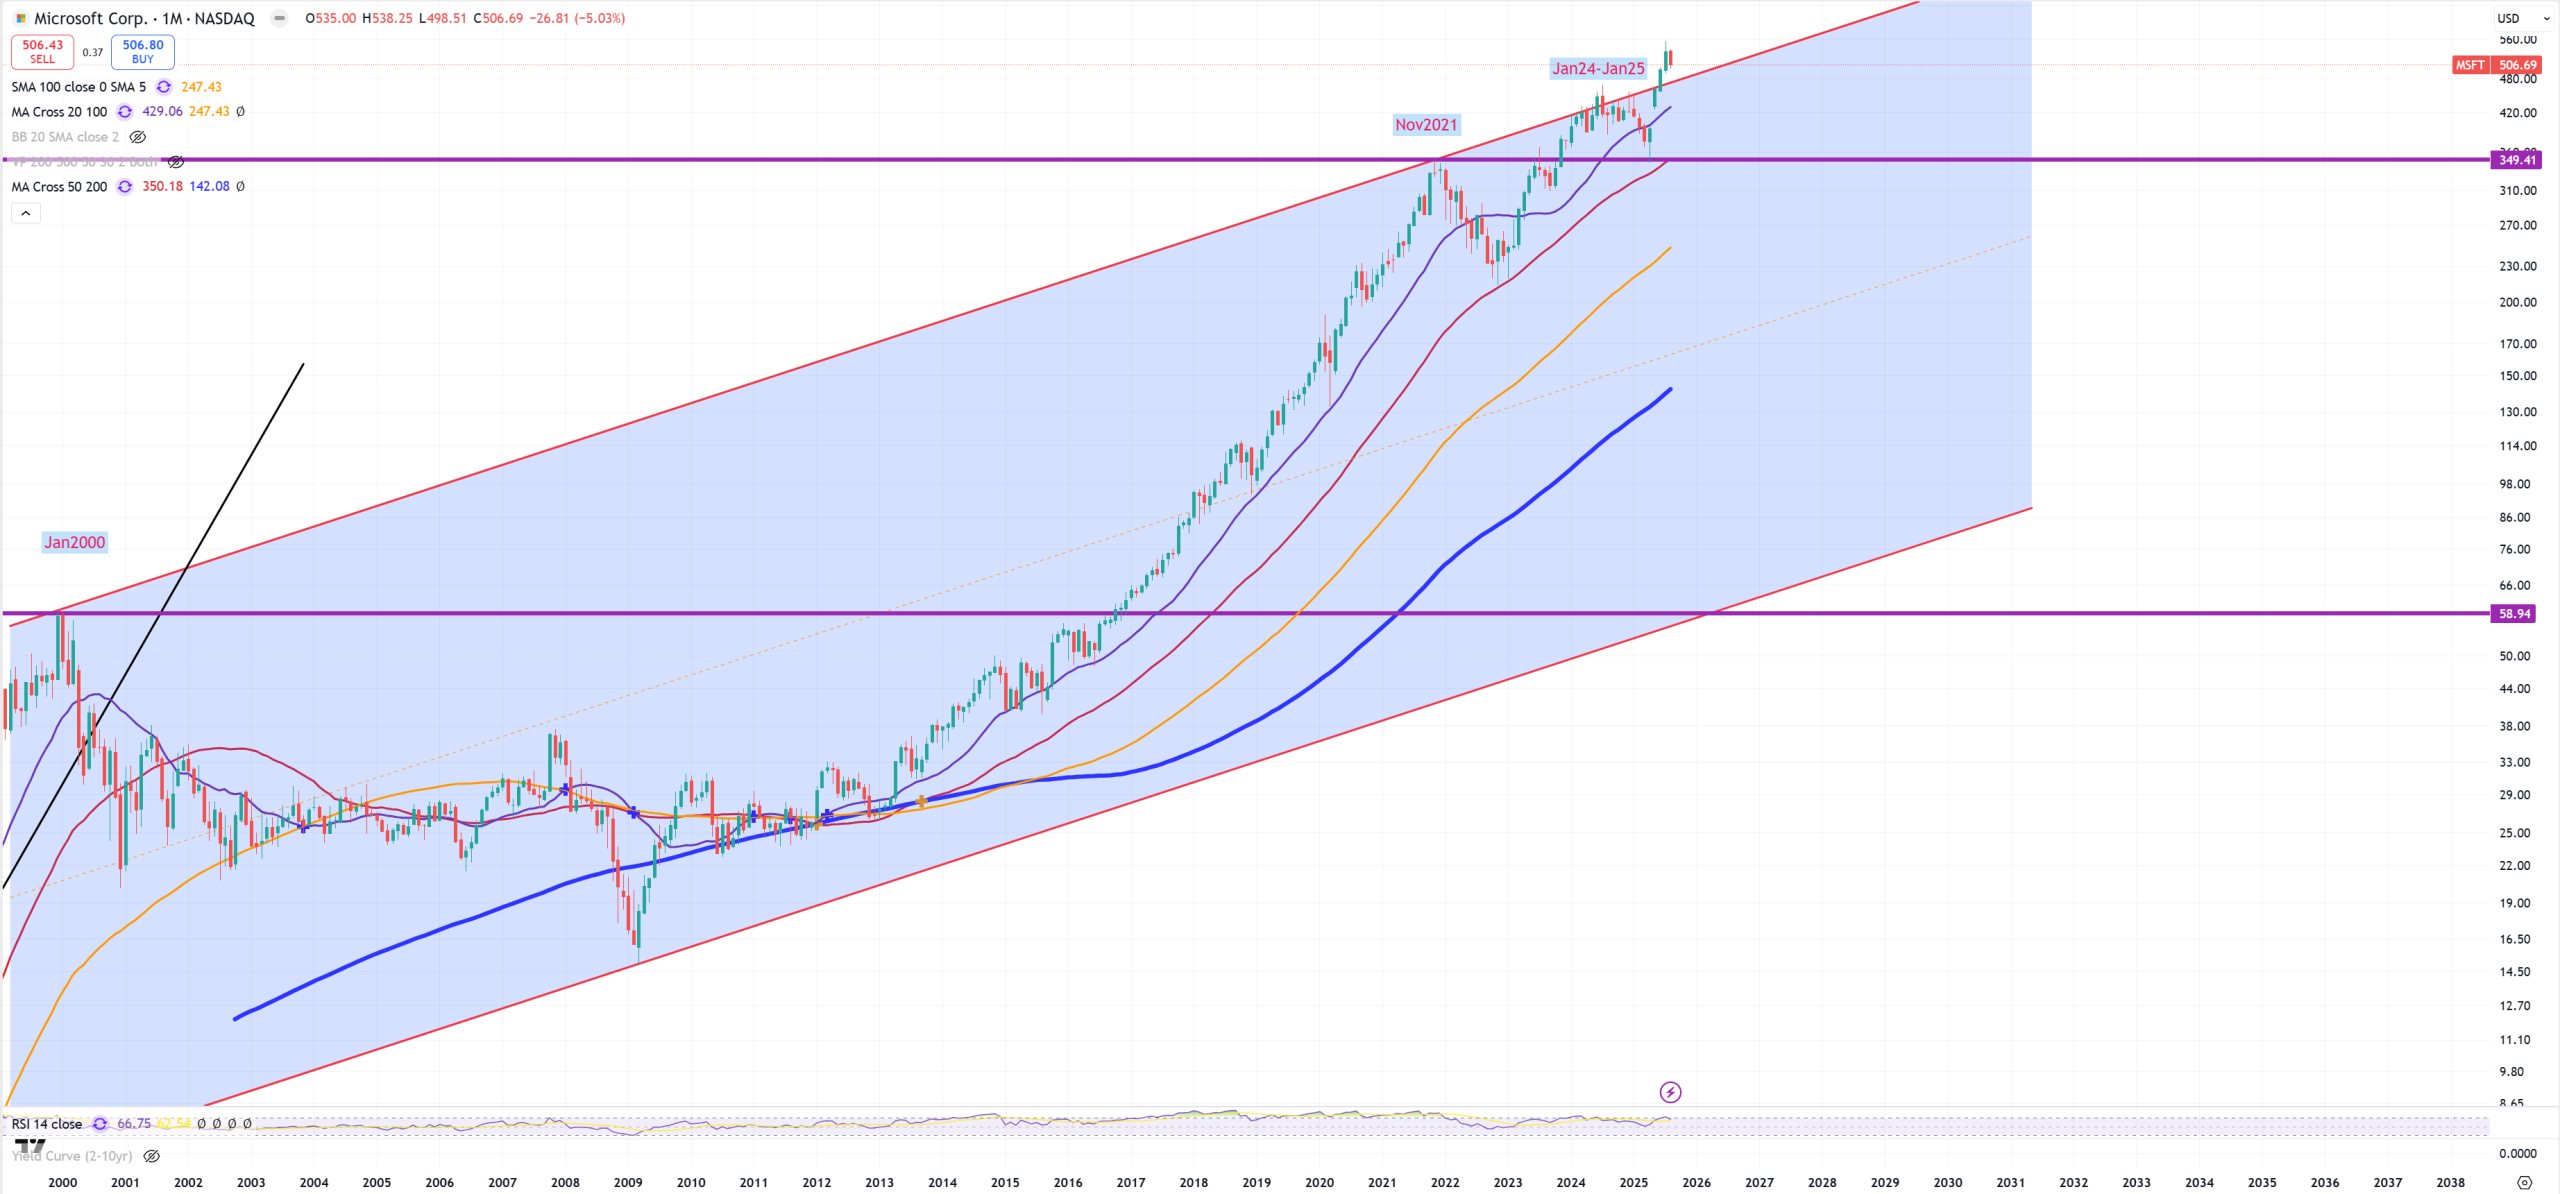
MSFT – Microsoft flying above its key trend – big break or big trap? Reminds be LLY (later)
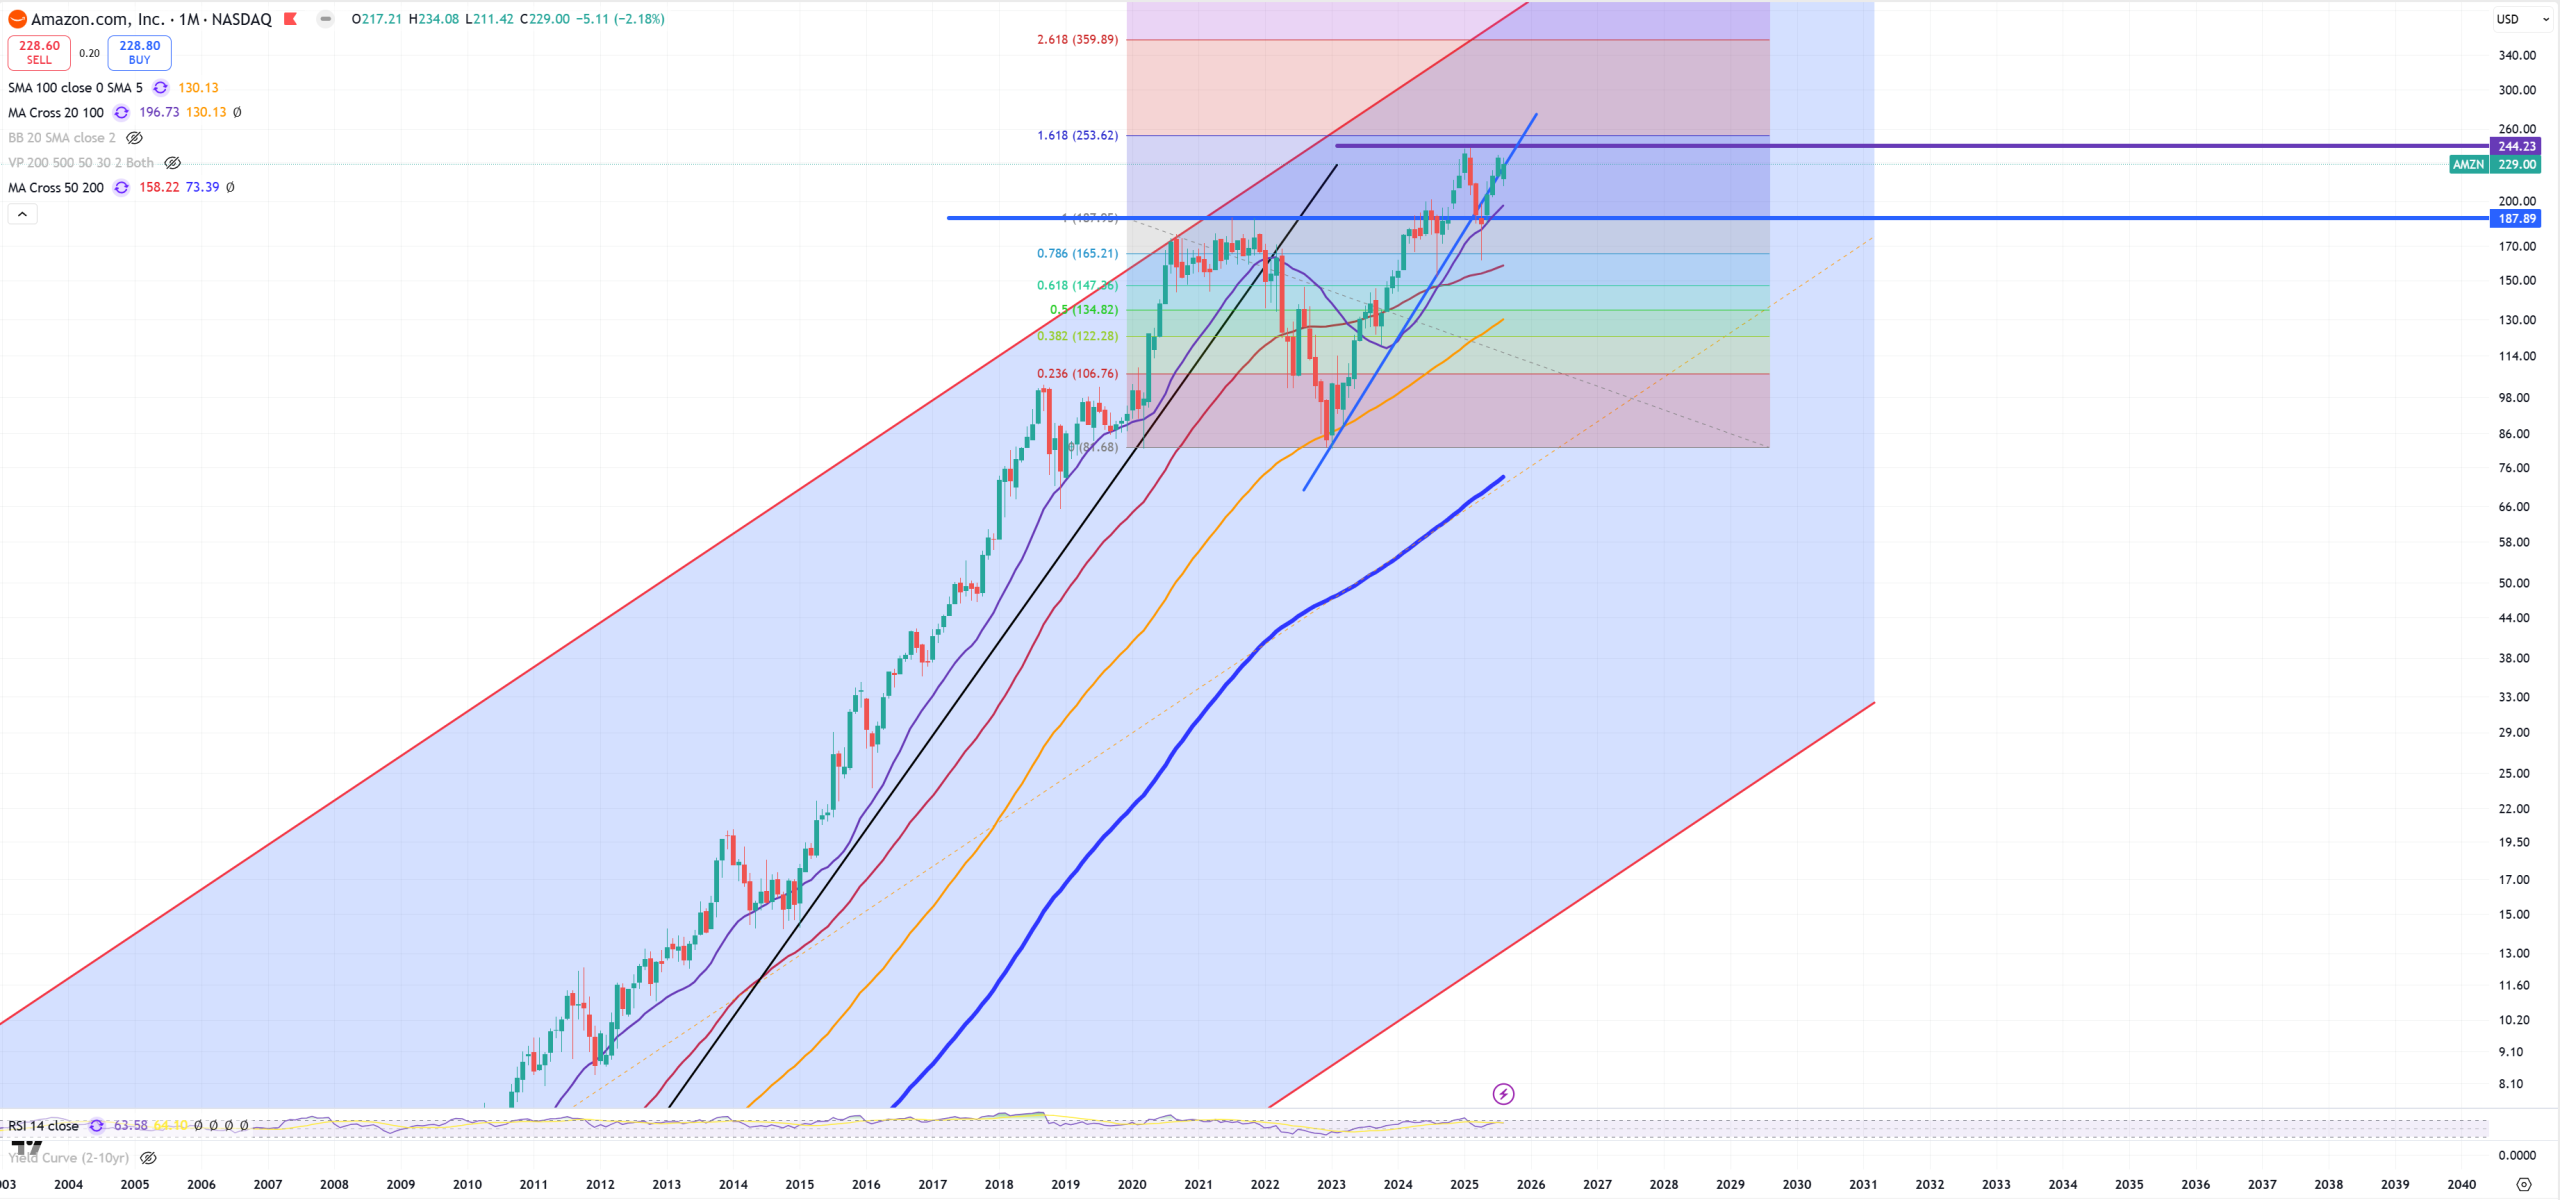
AMZN – Amazon
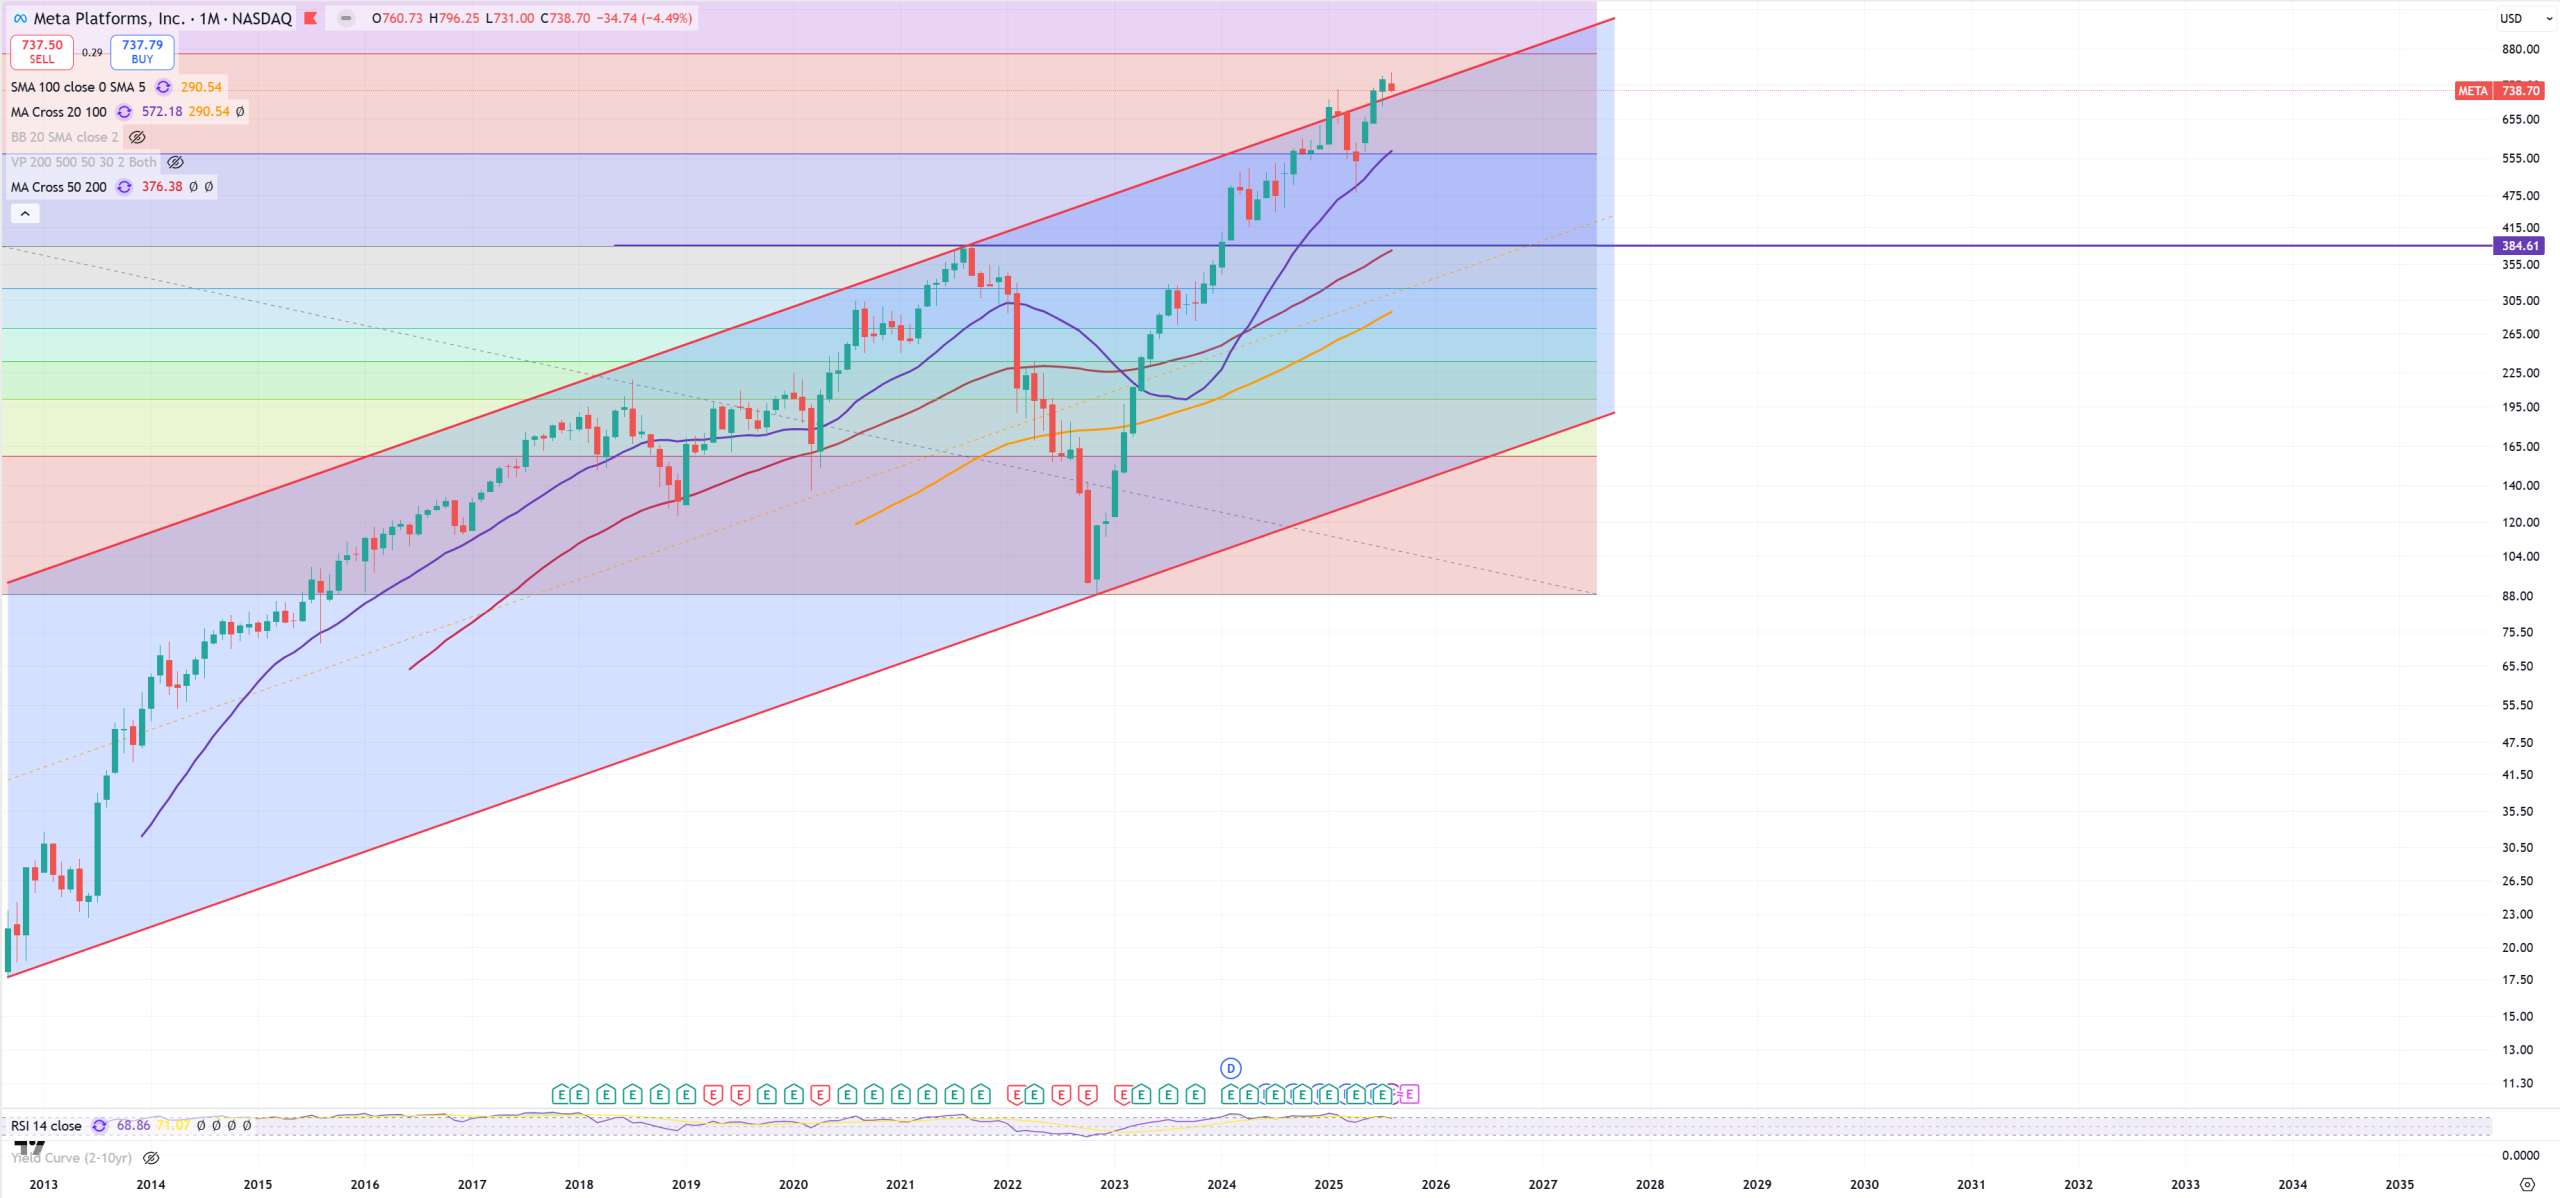
META
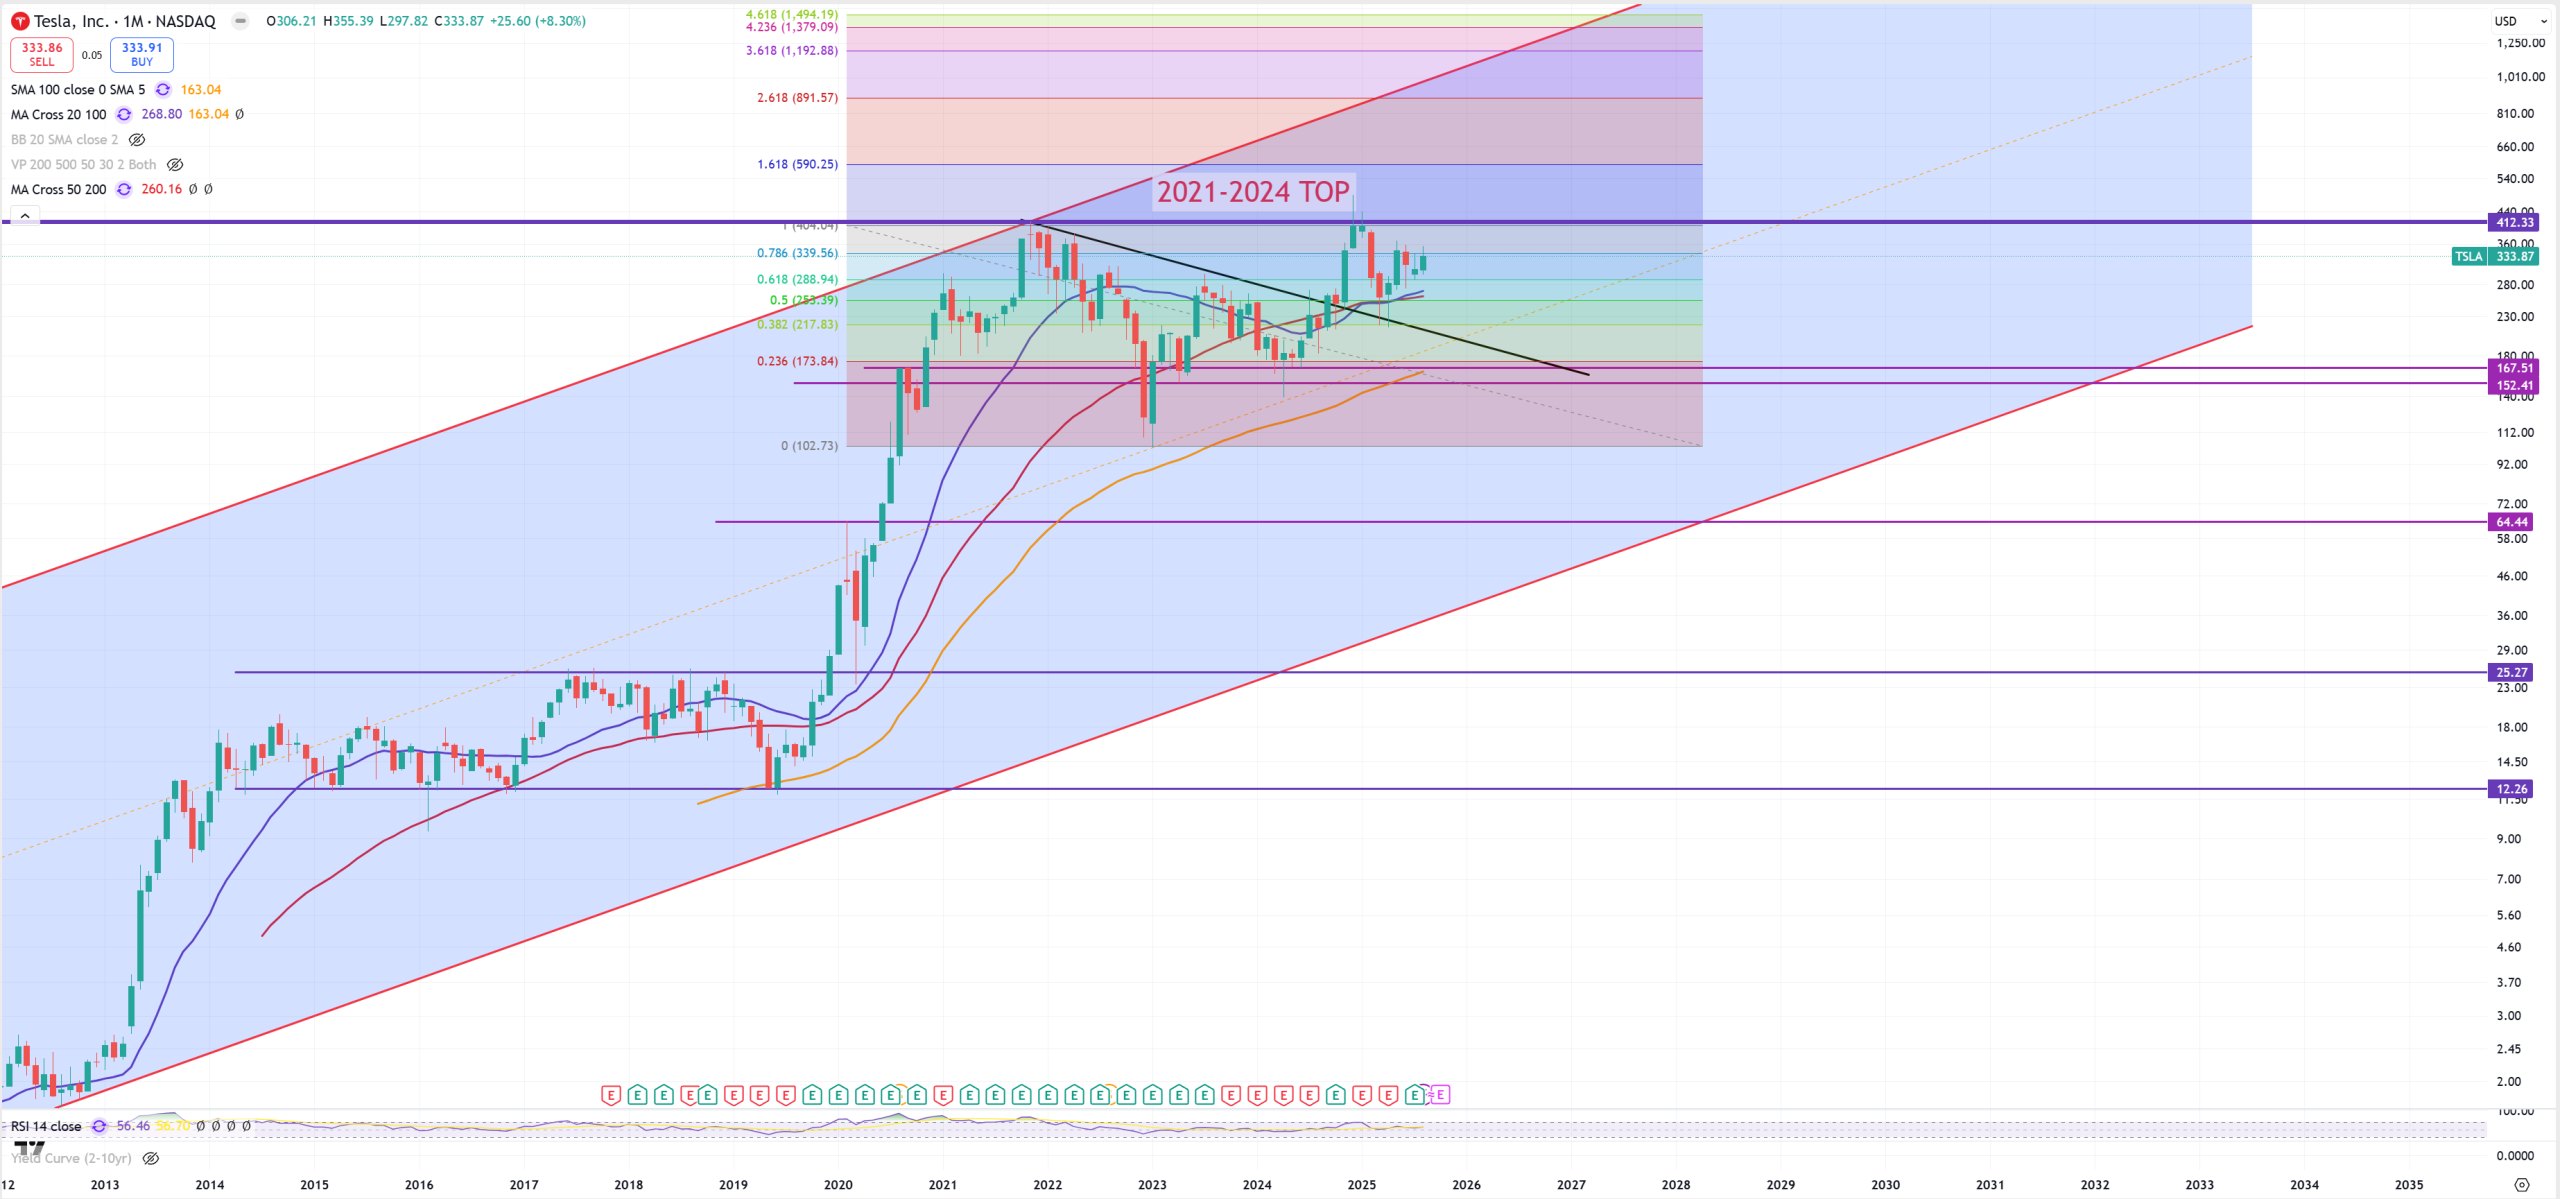
TSLA – Tesla losing market share probably in a record ever style, but market keeps holding it.
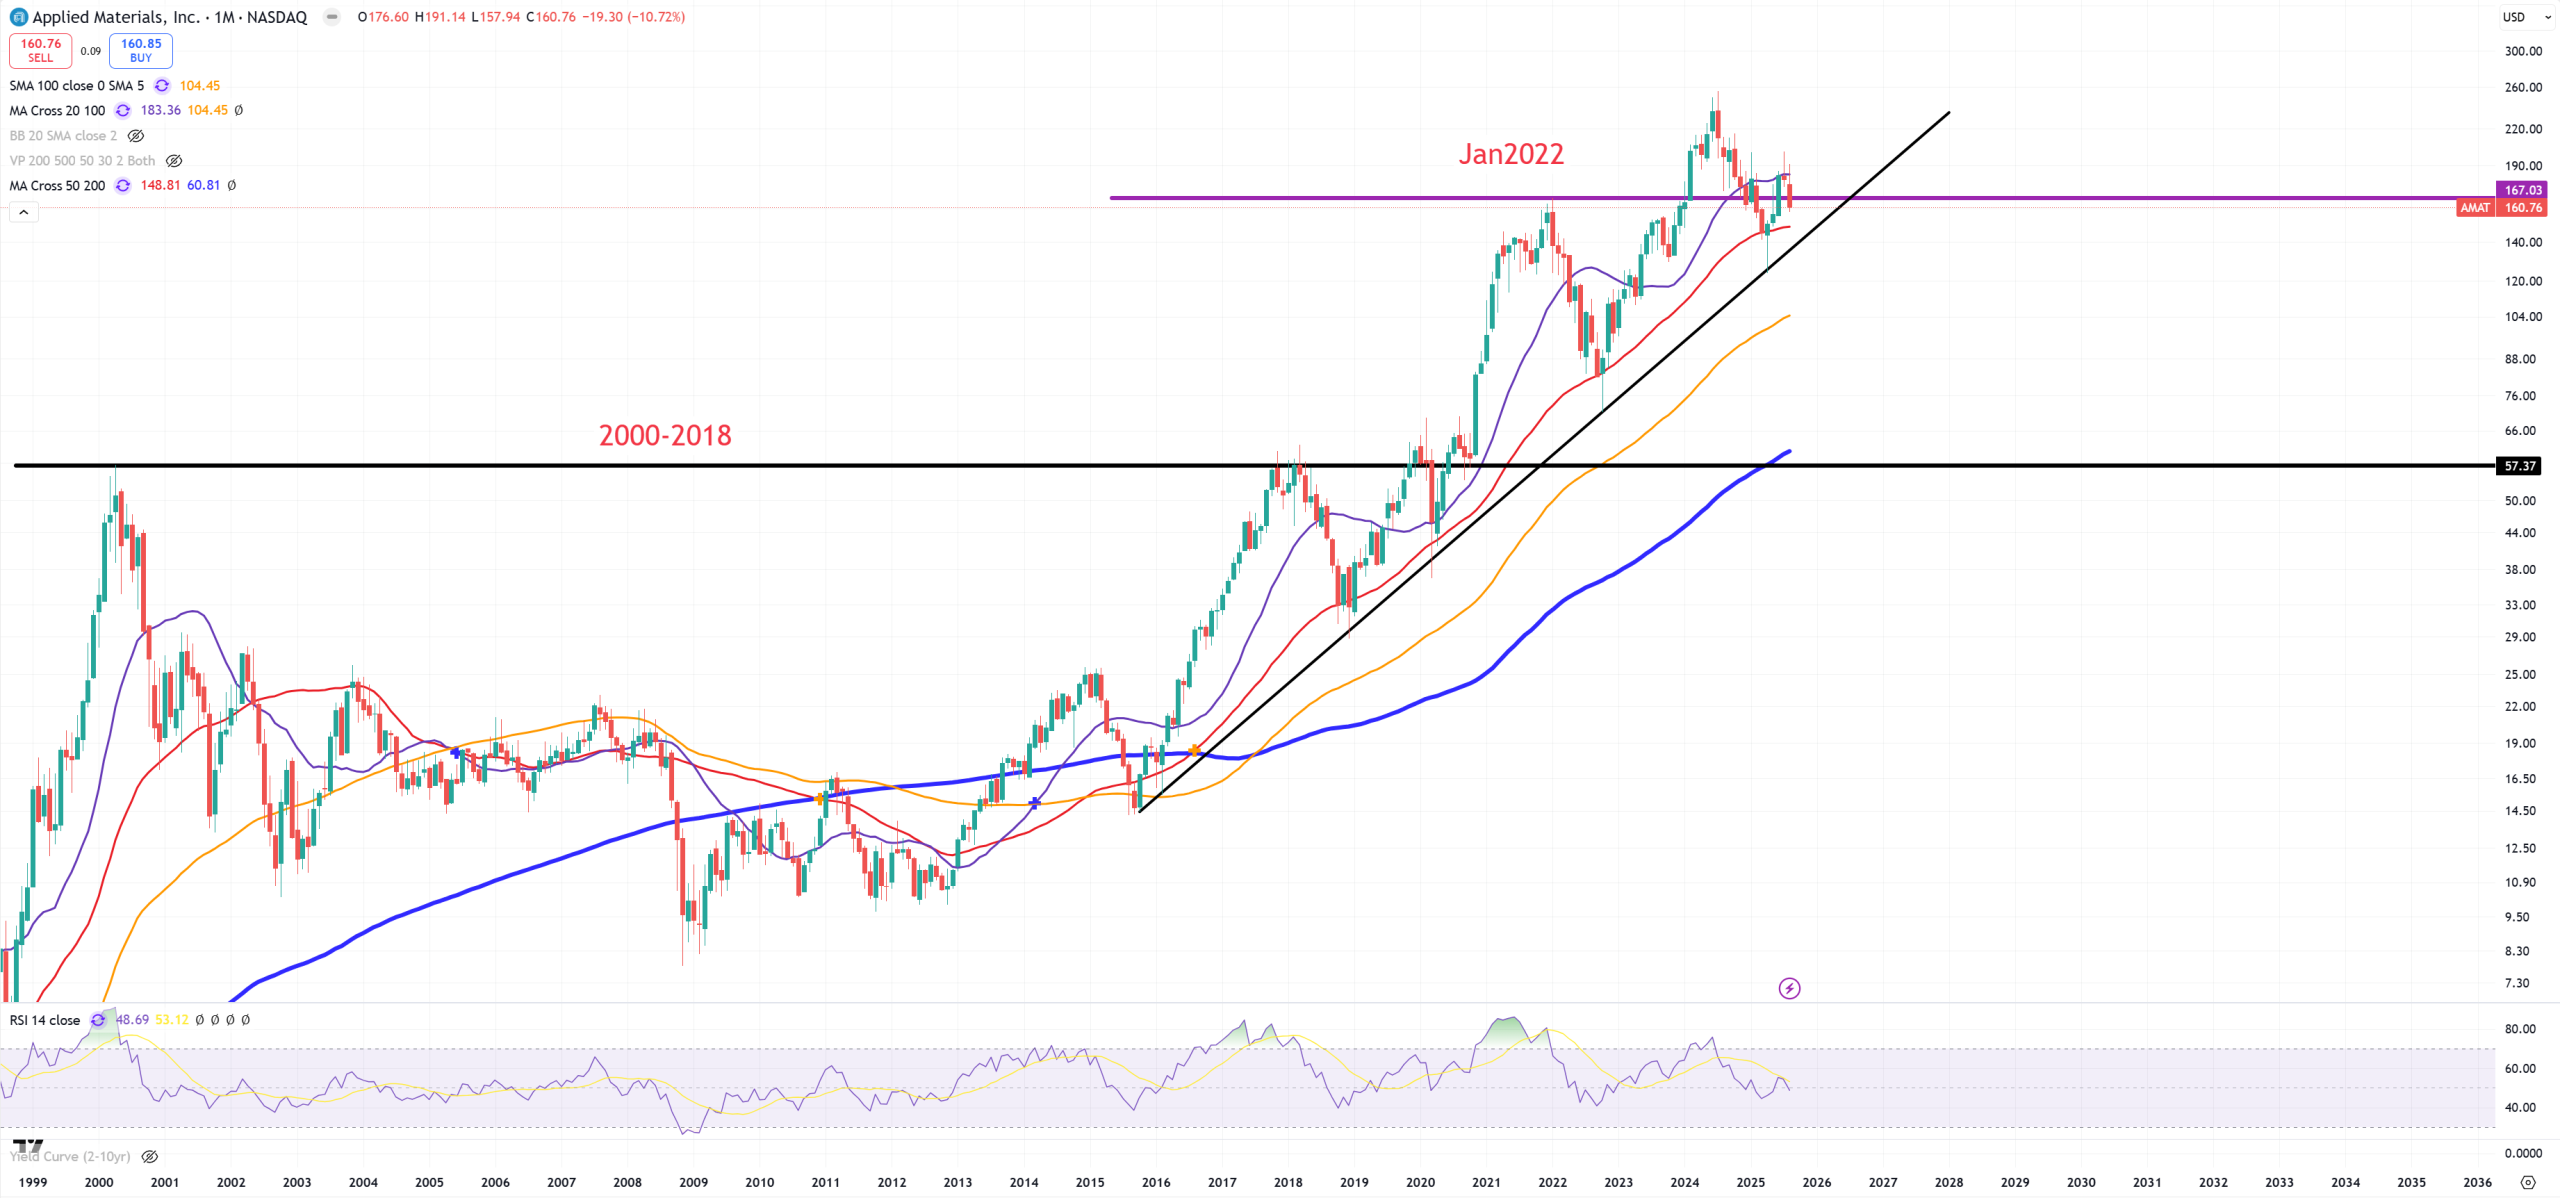
AMAT – back below 2022 level.
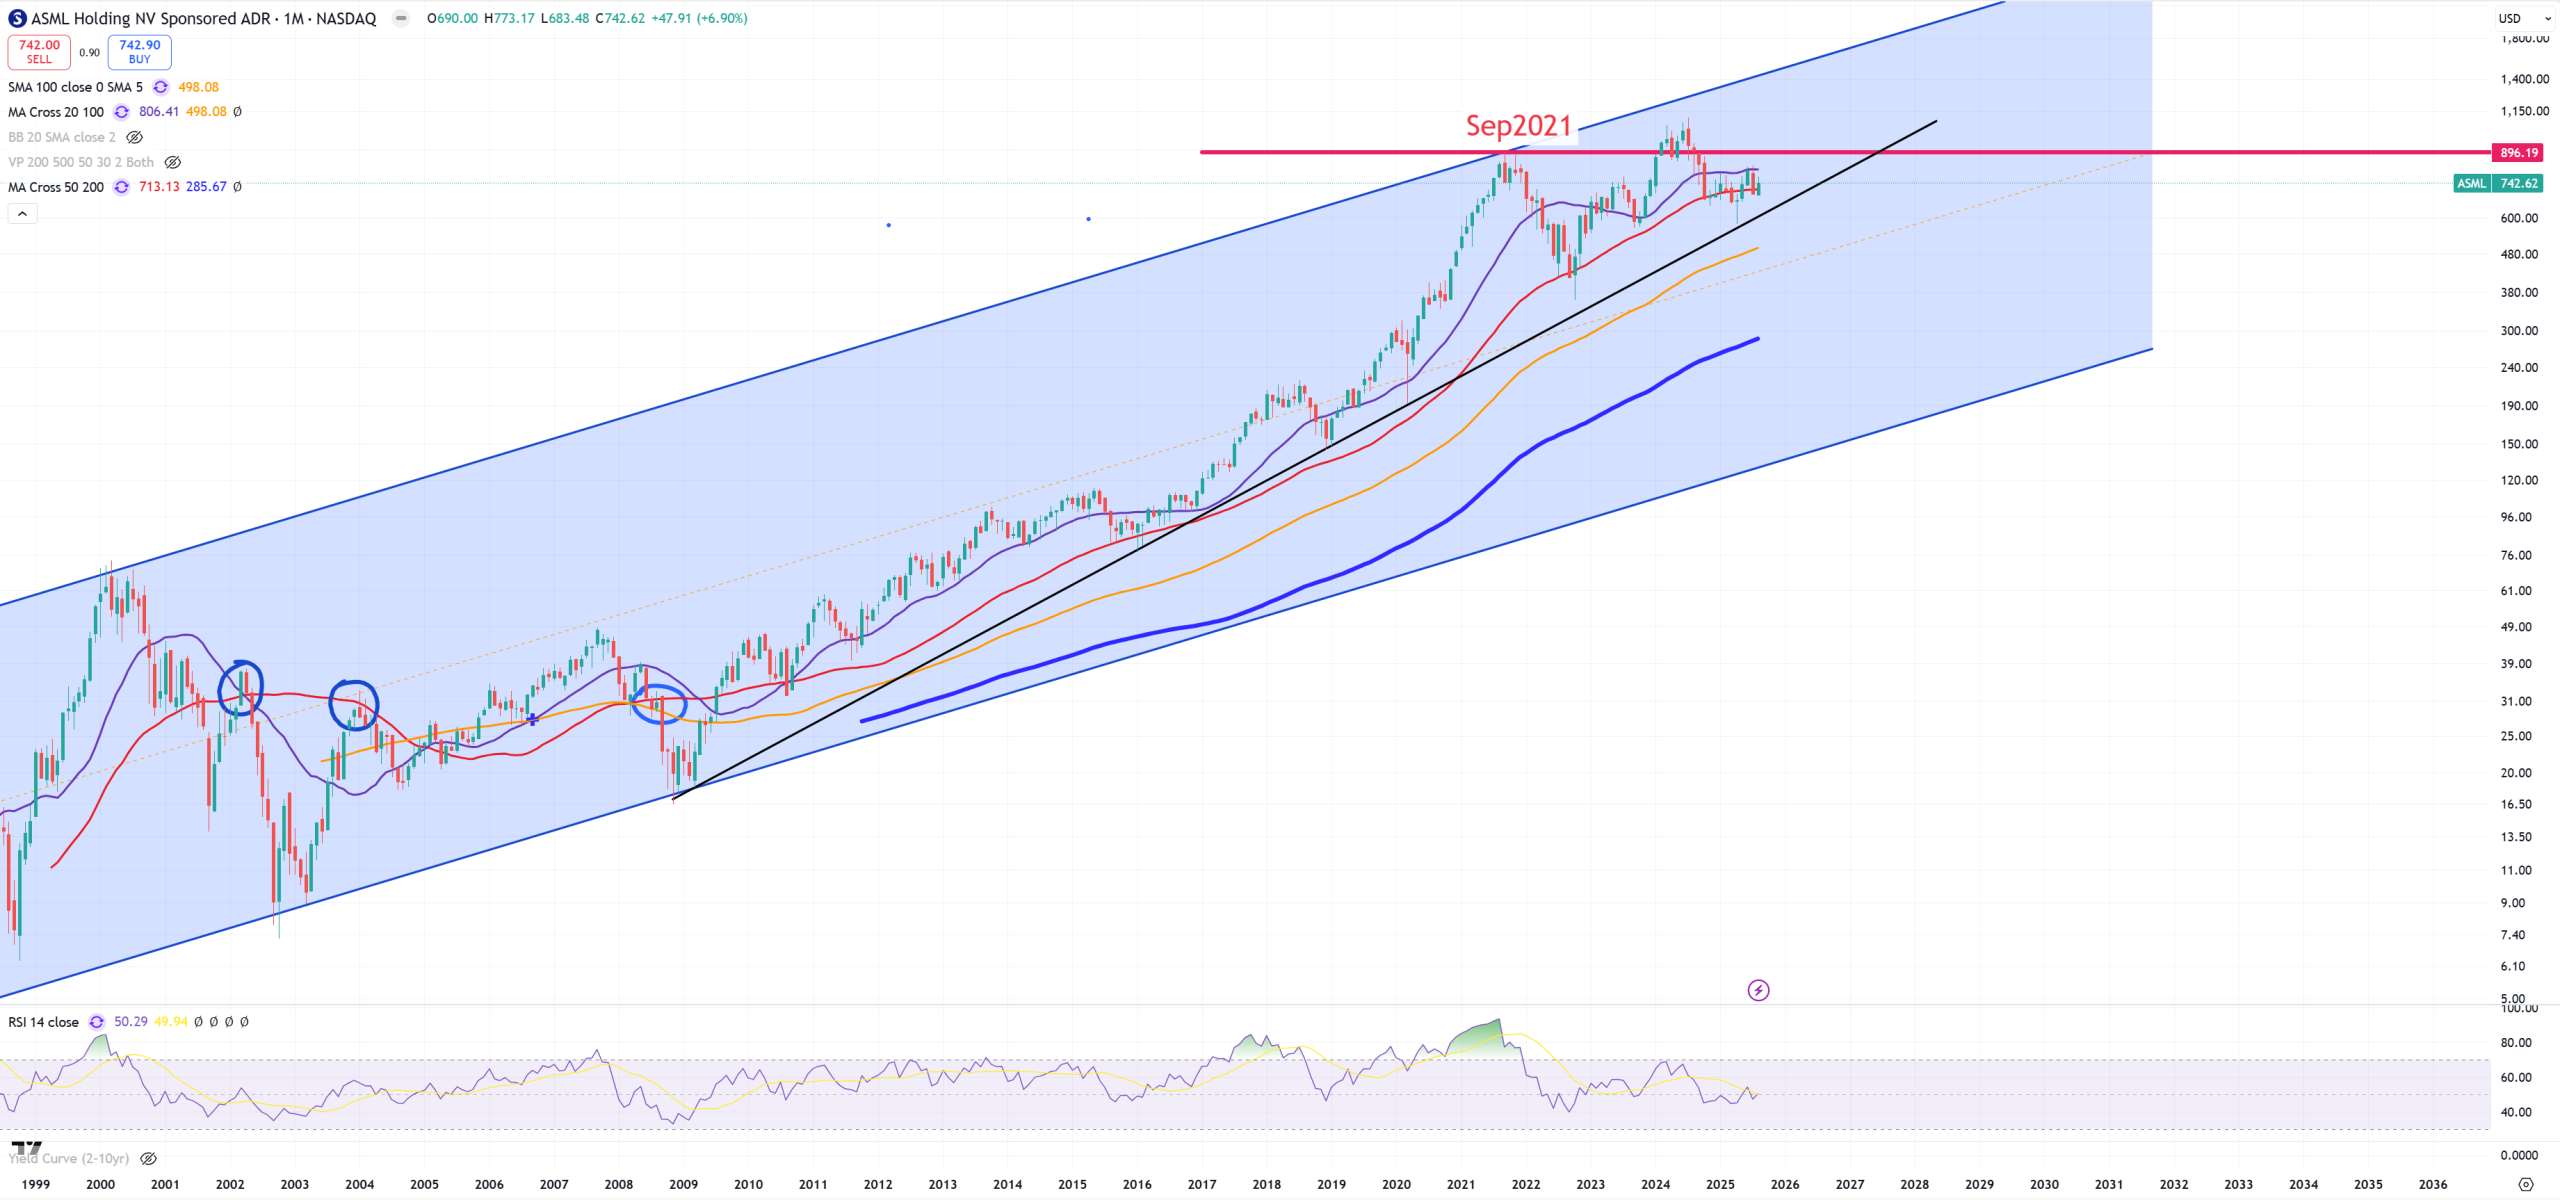
ASML – bulls defending (M)MA50
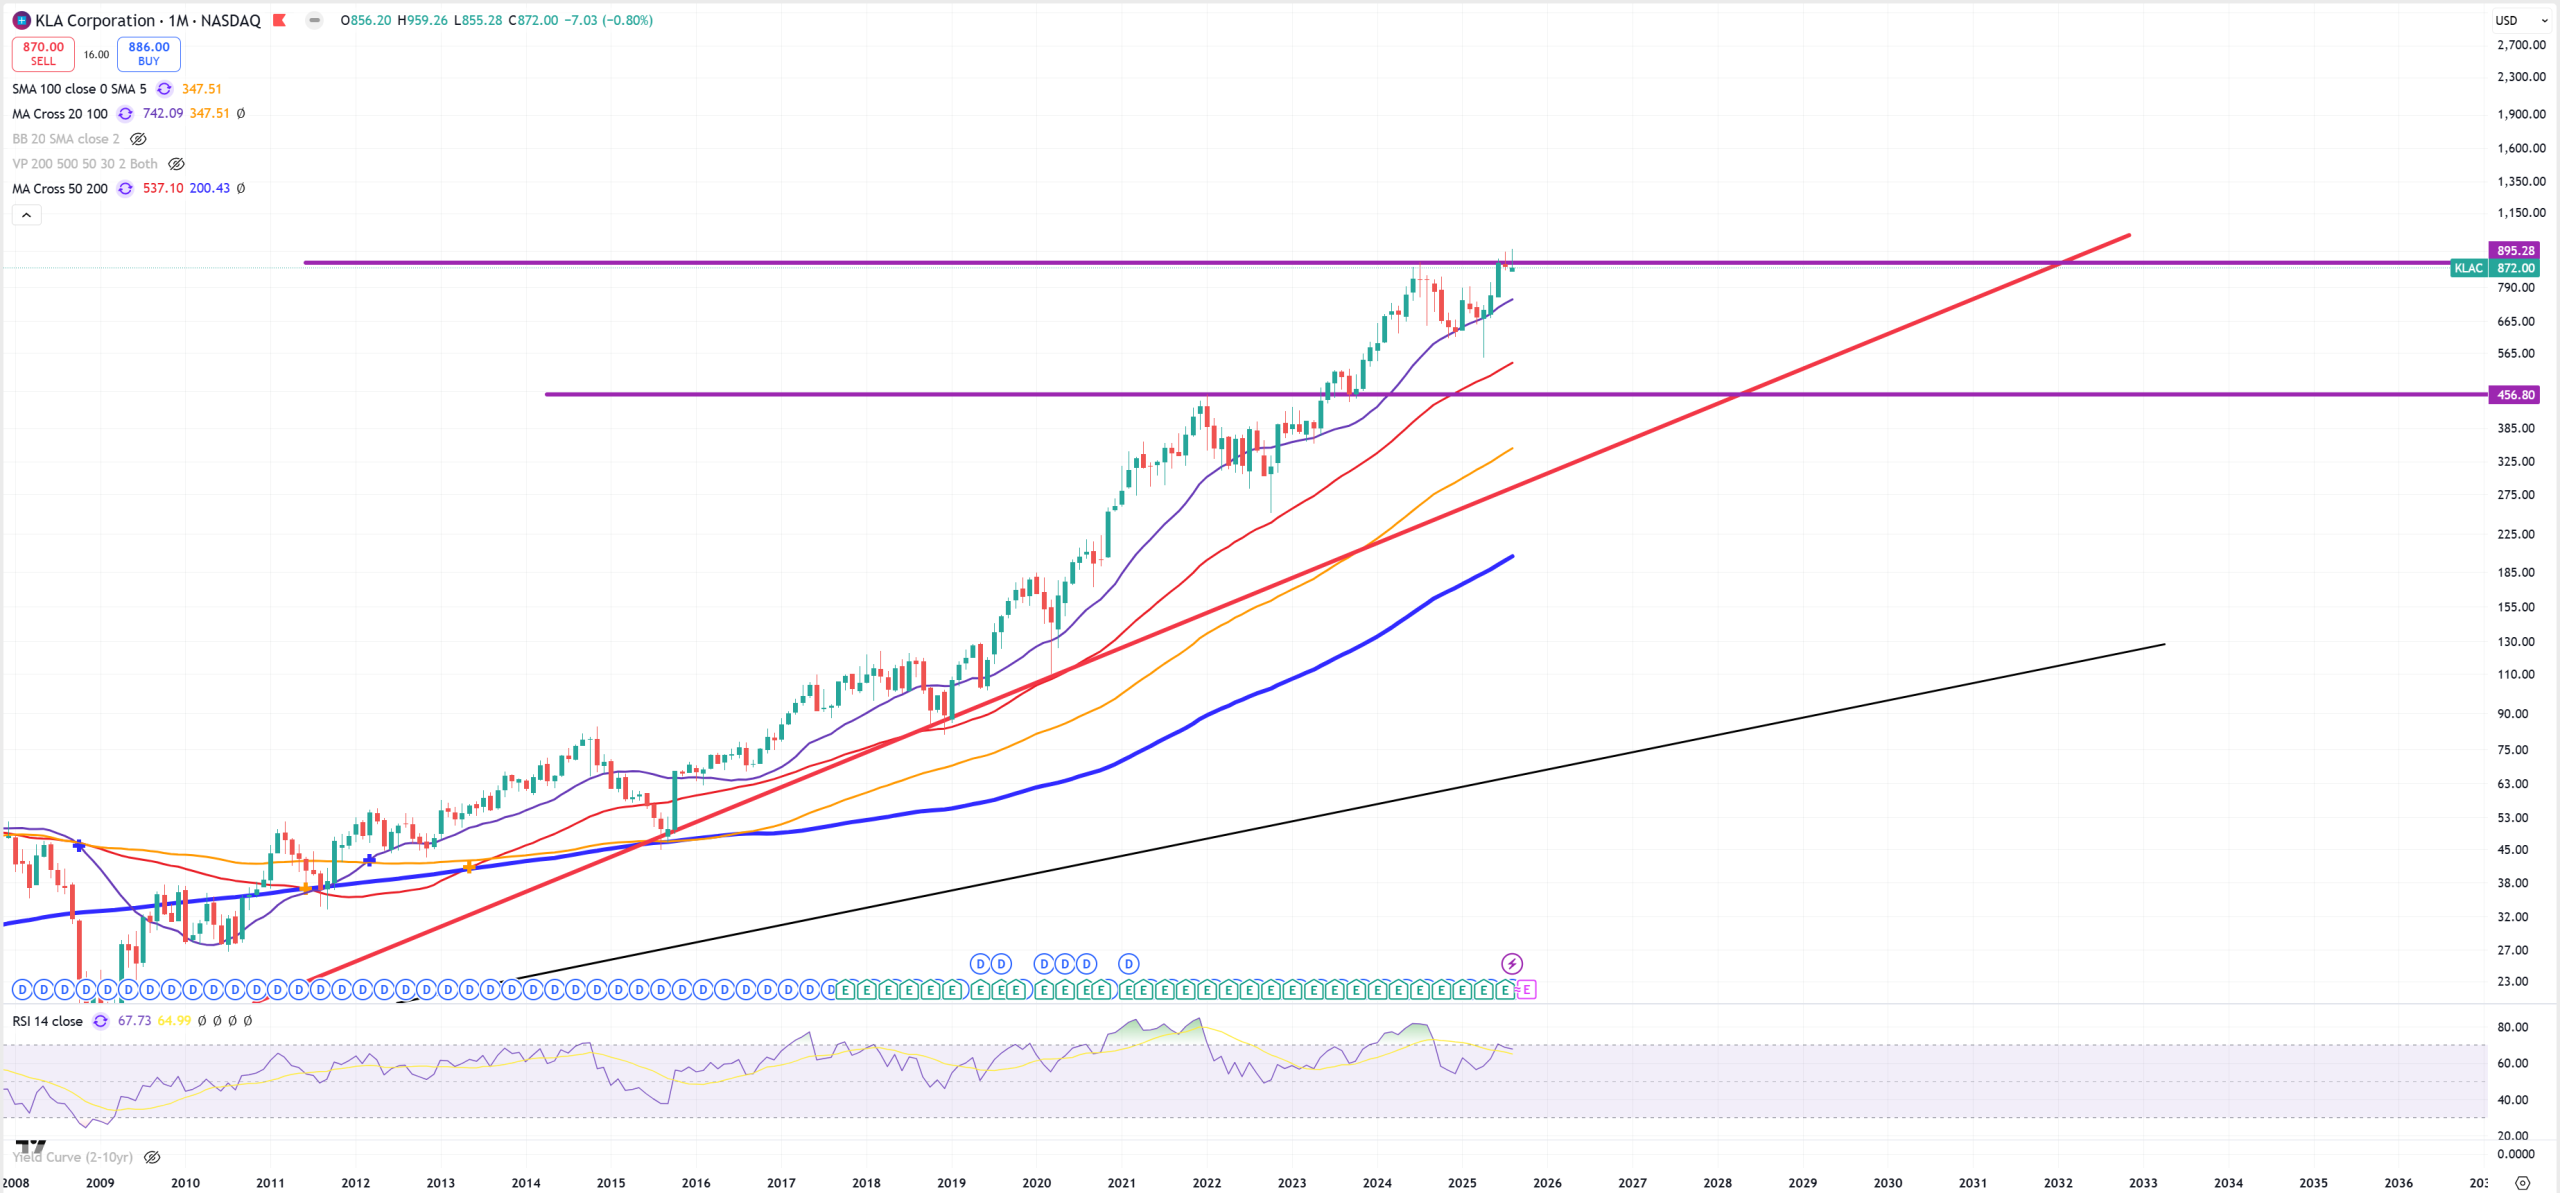
KLAC – key resistance holds
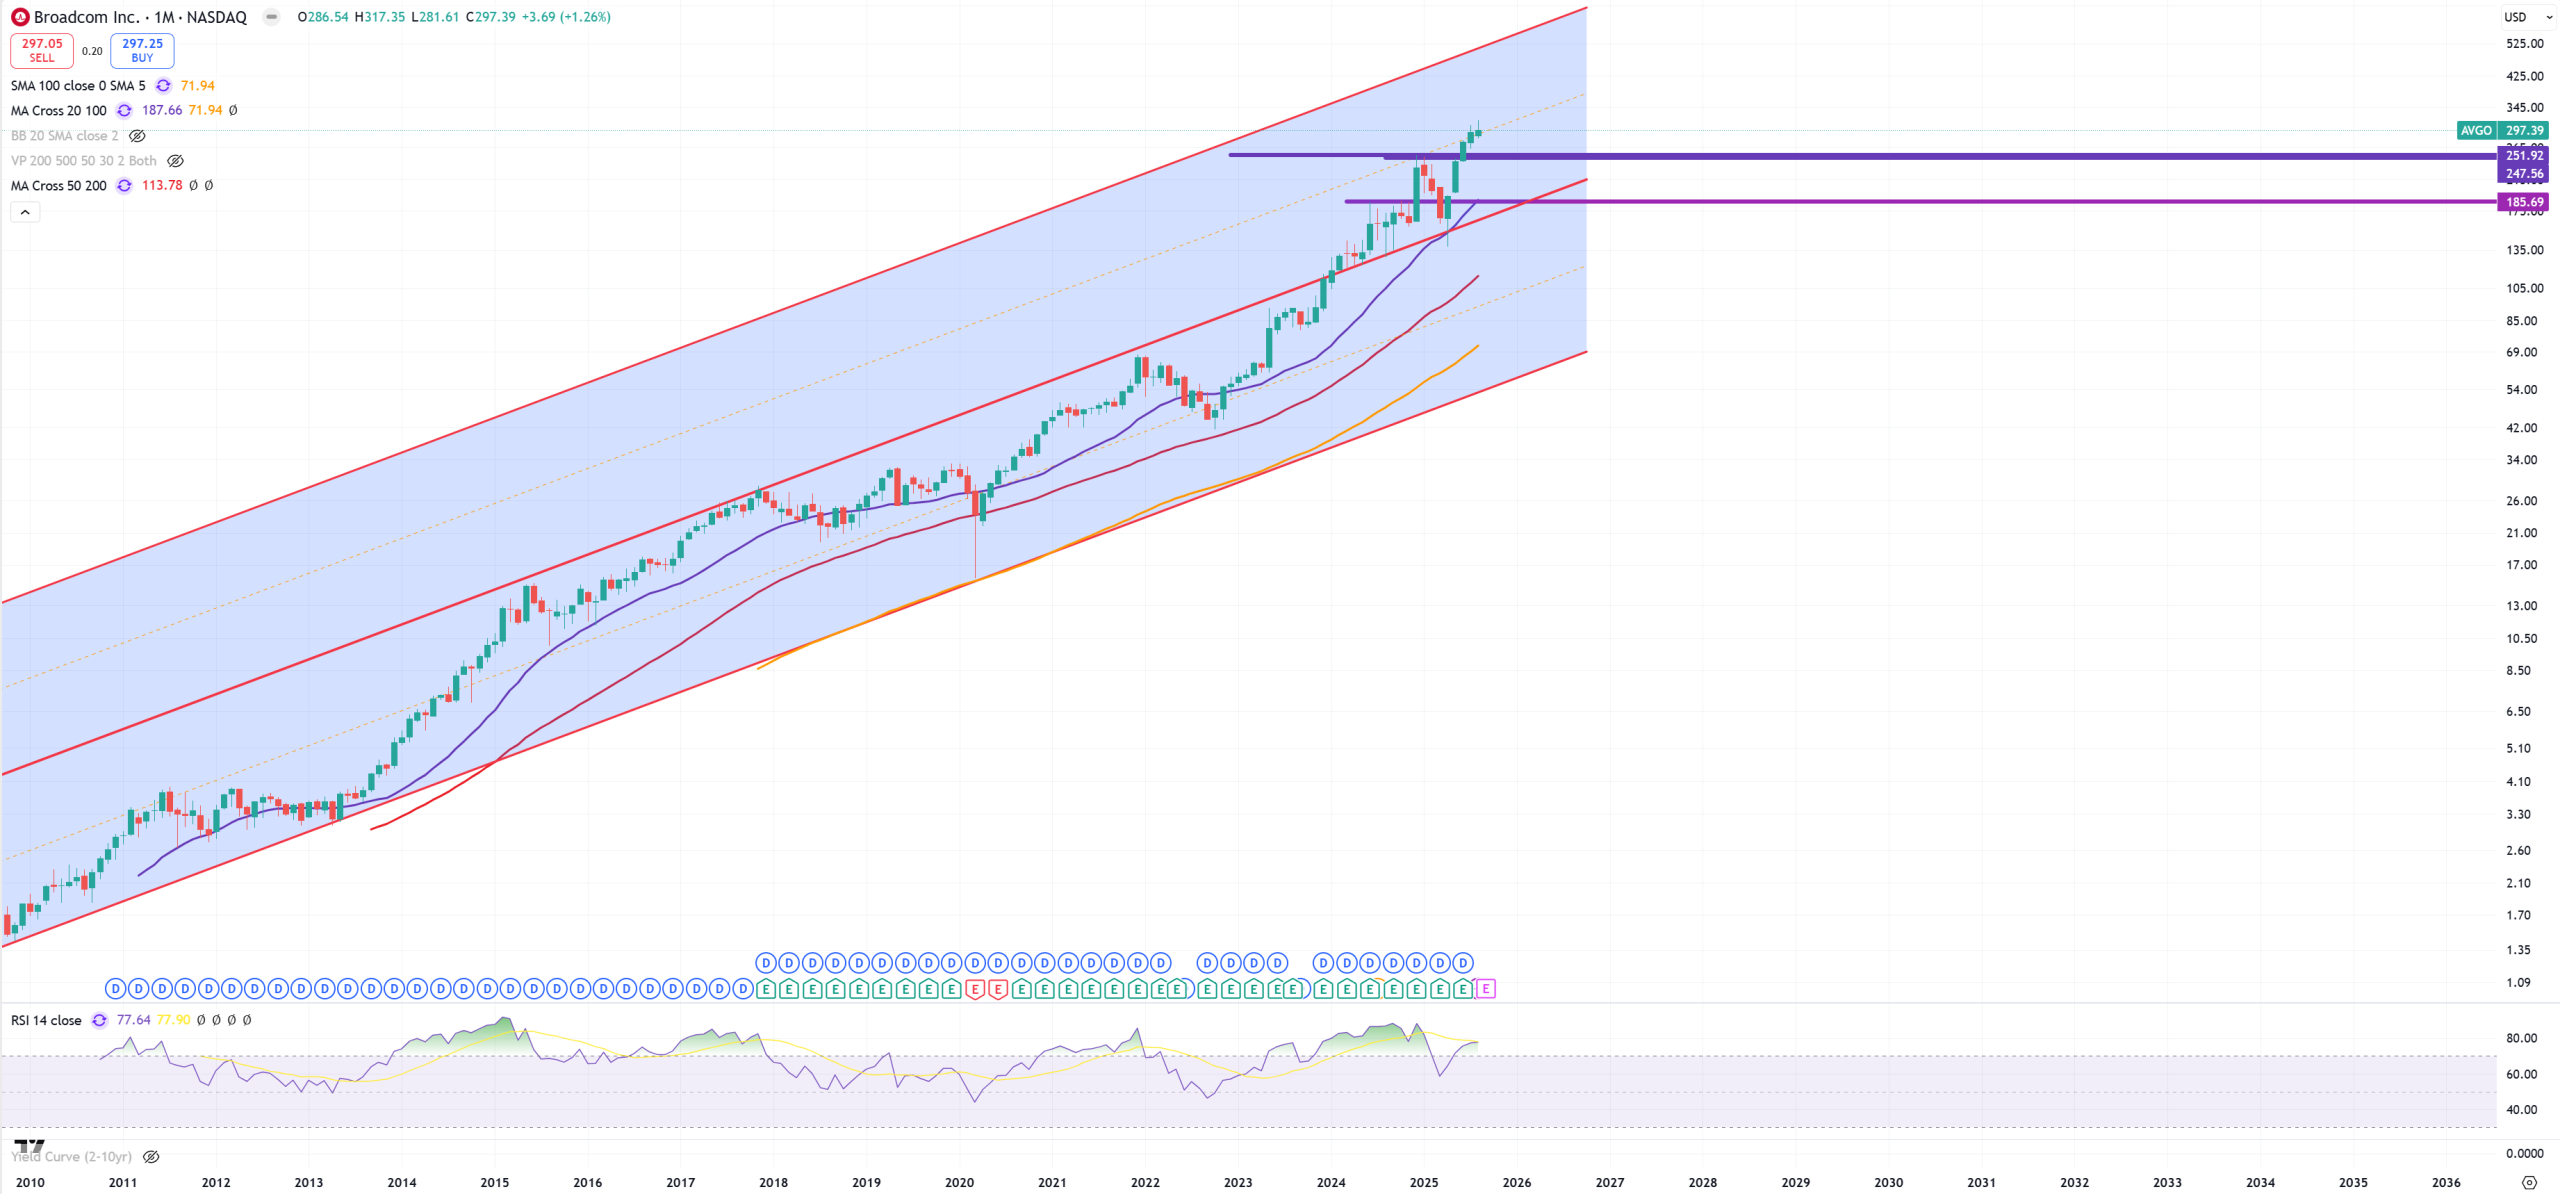
AVGO – Broadcom is very hyped vs rest of SOX and big break
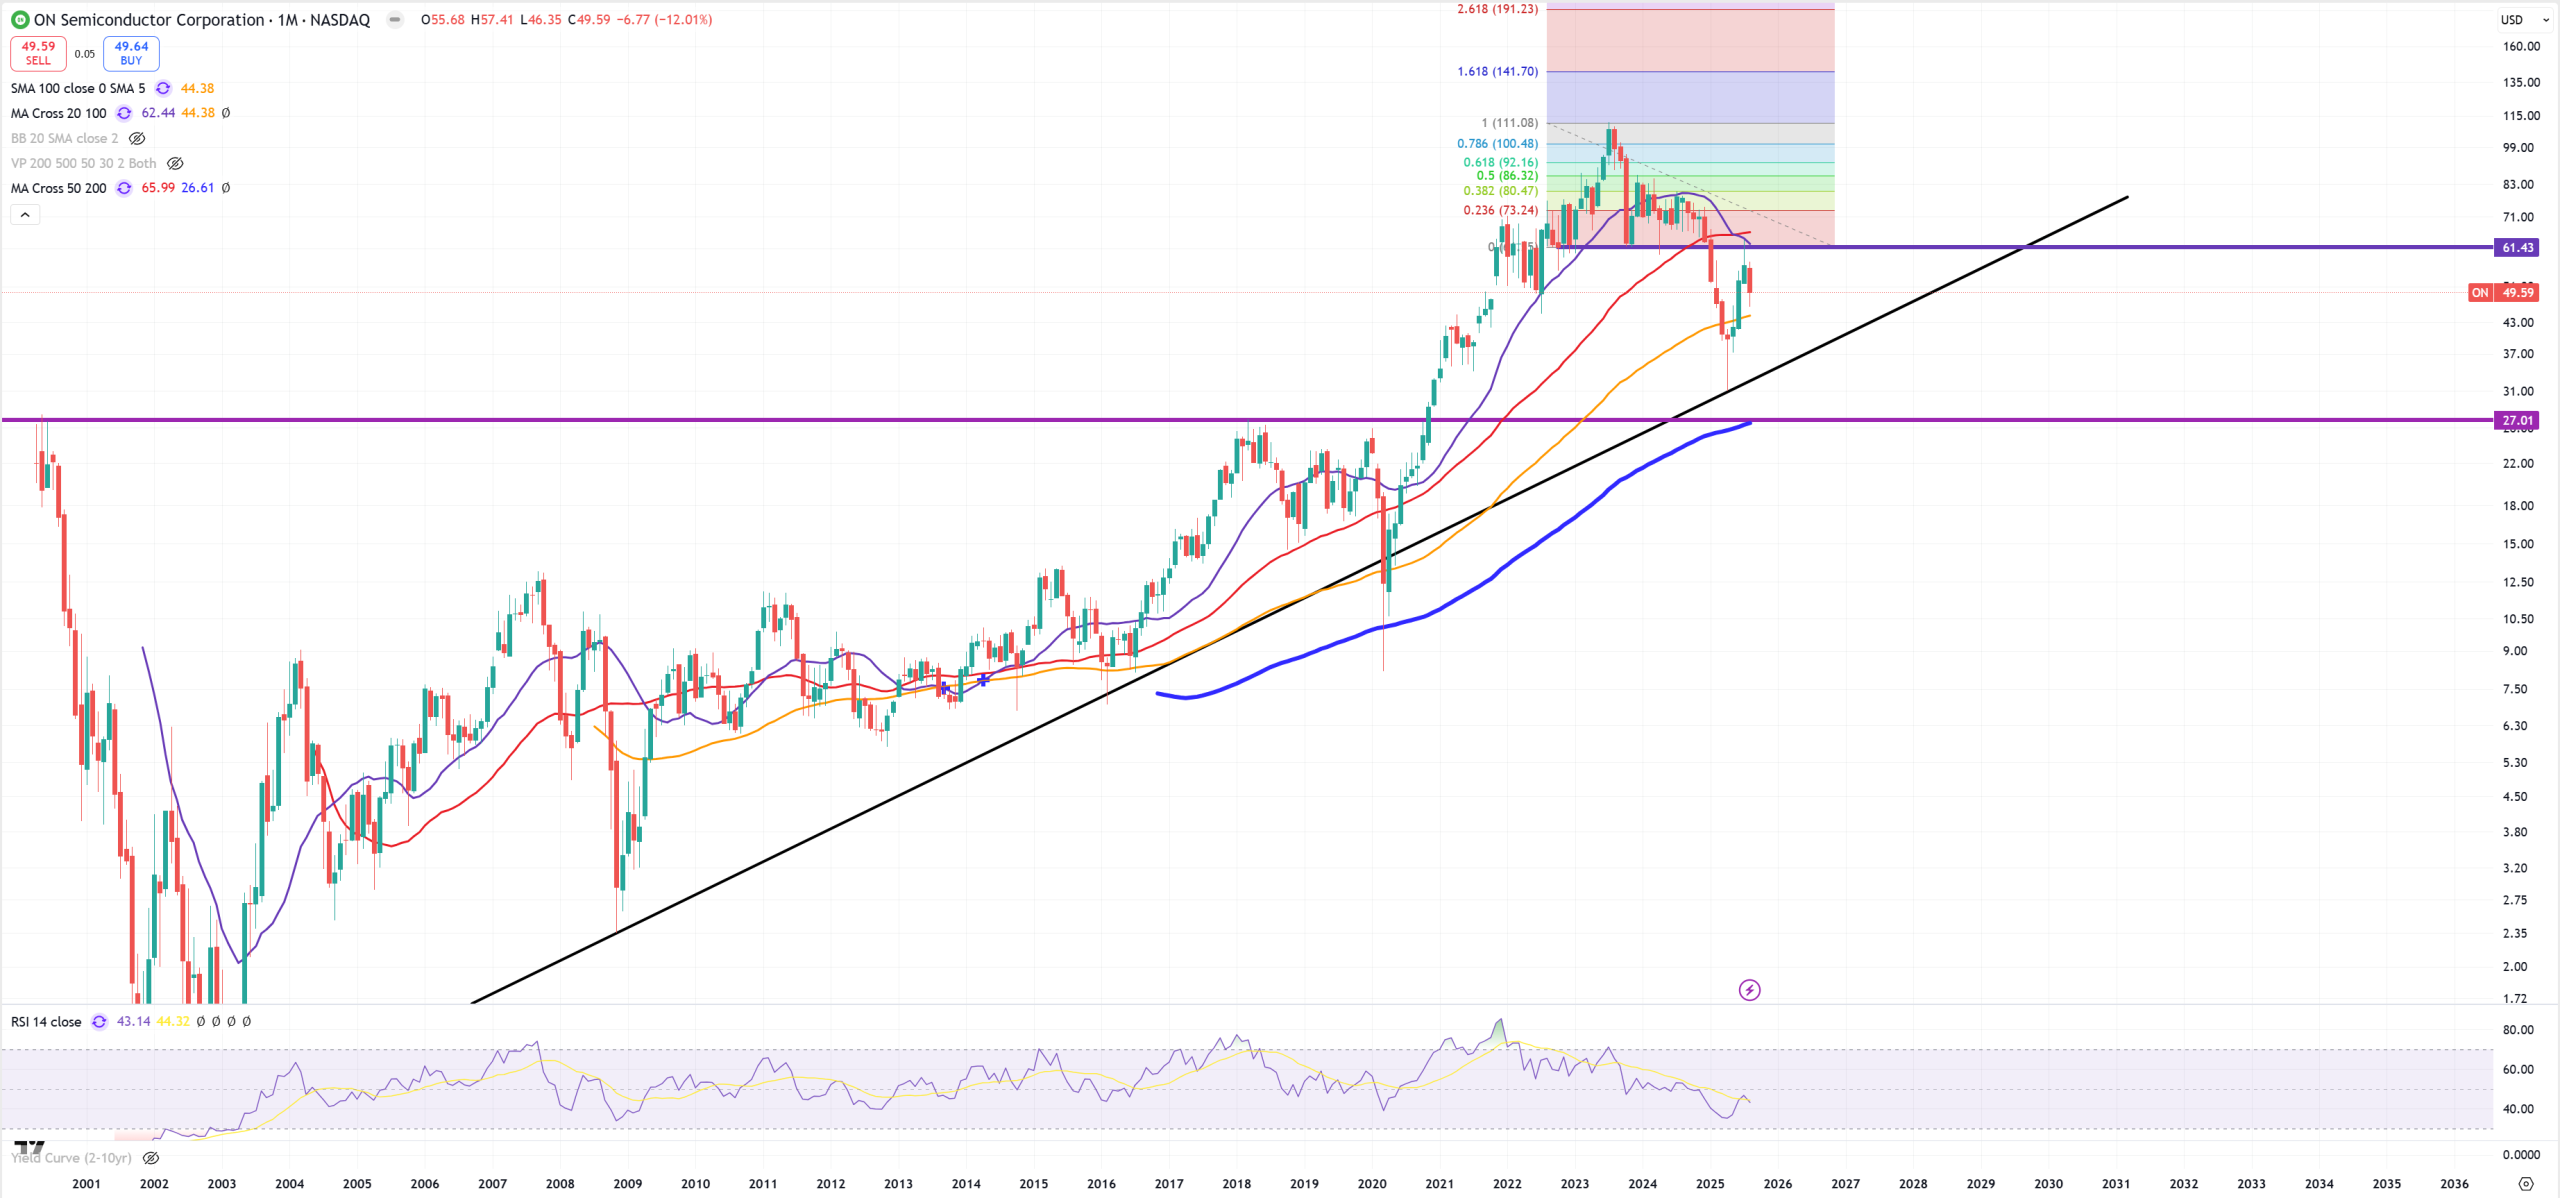
ON
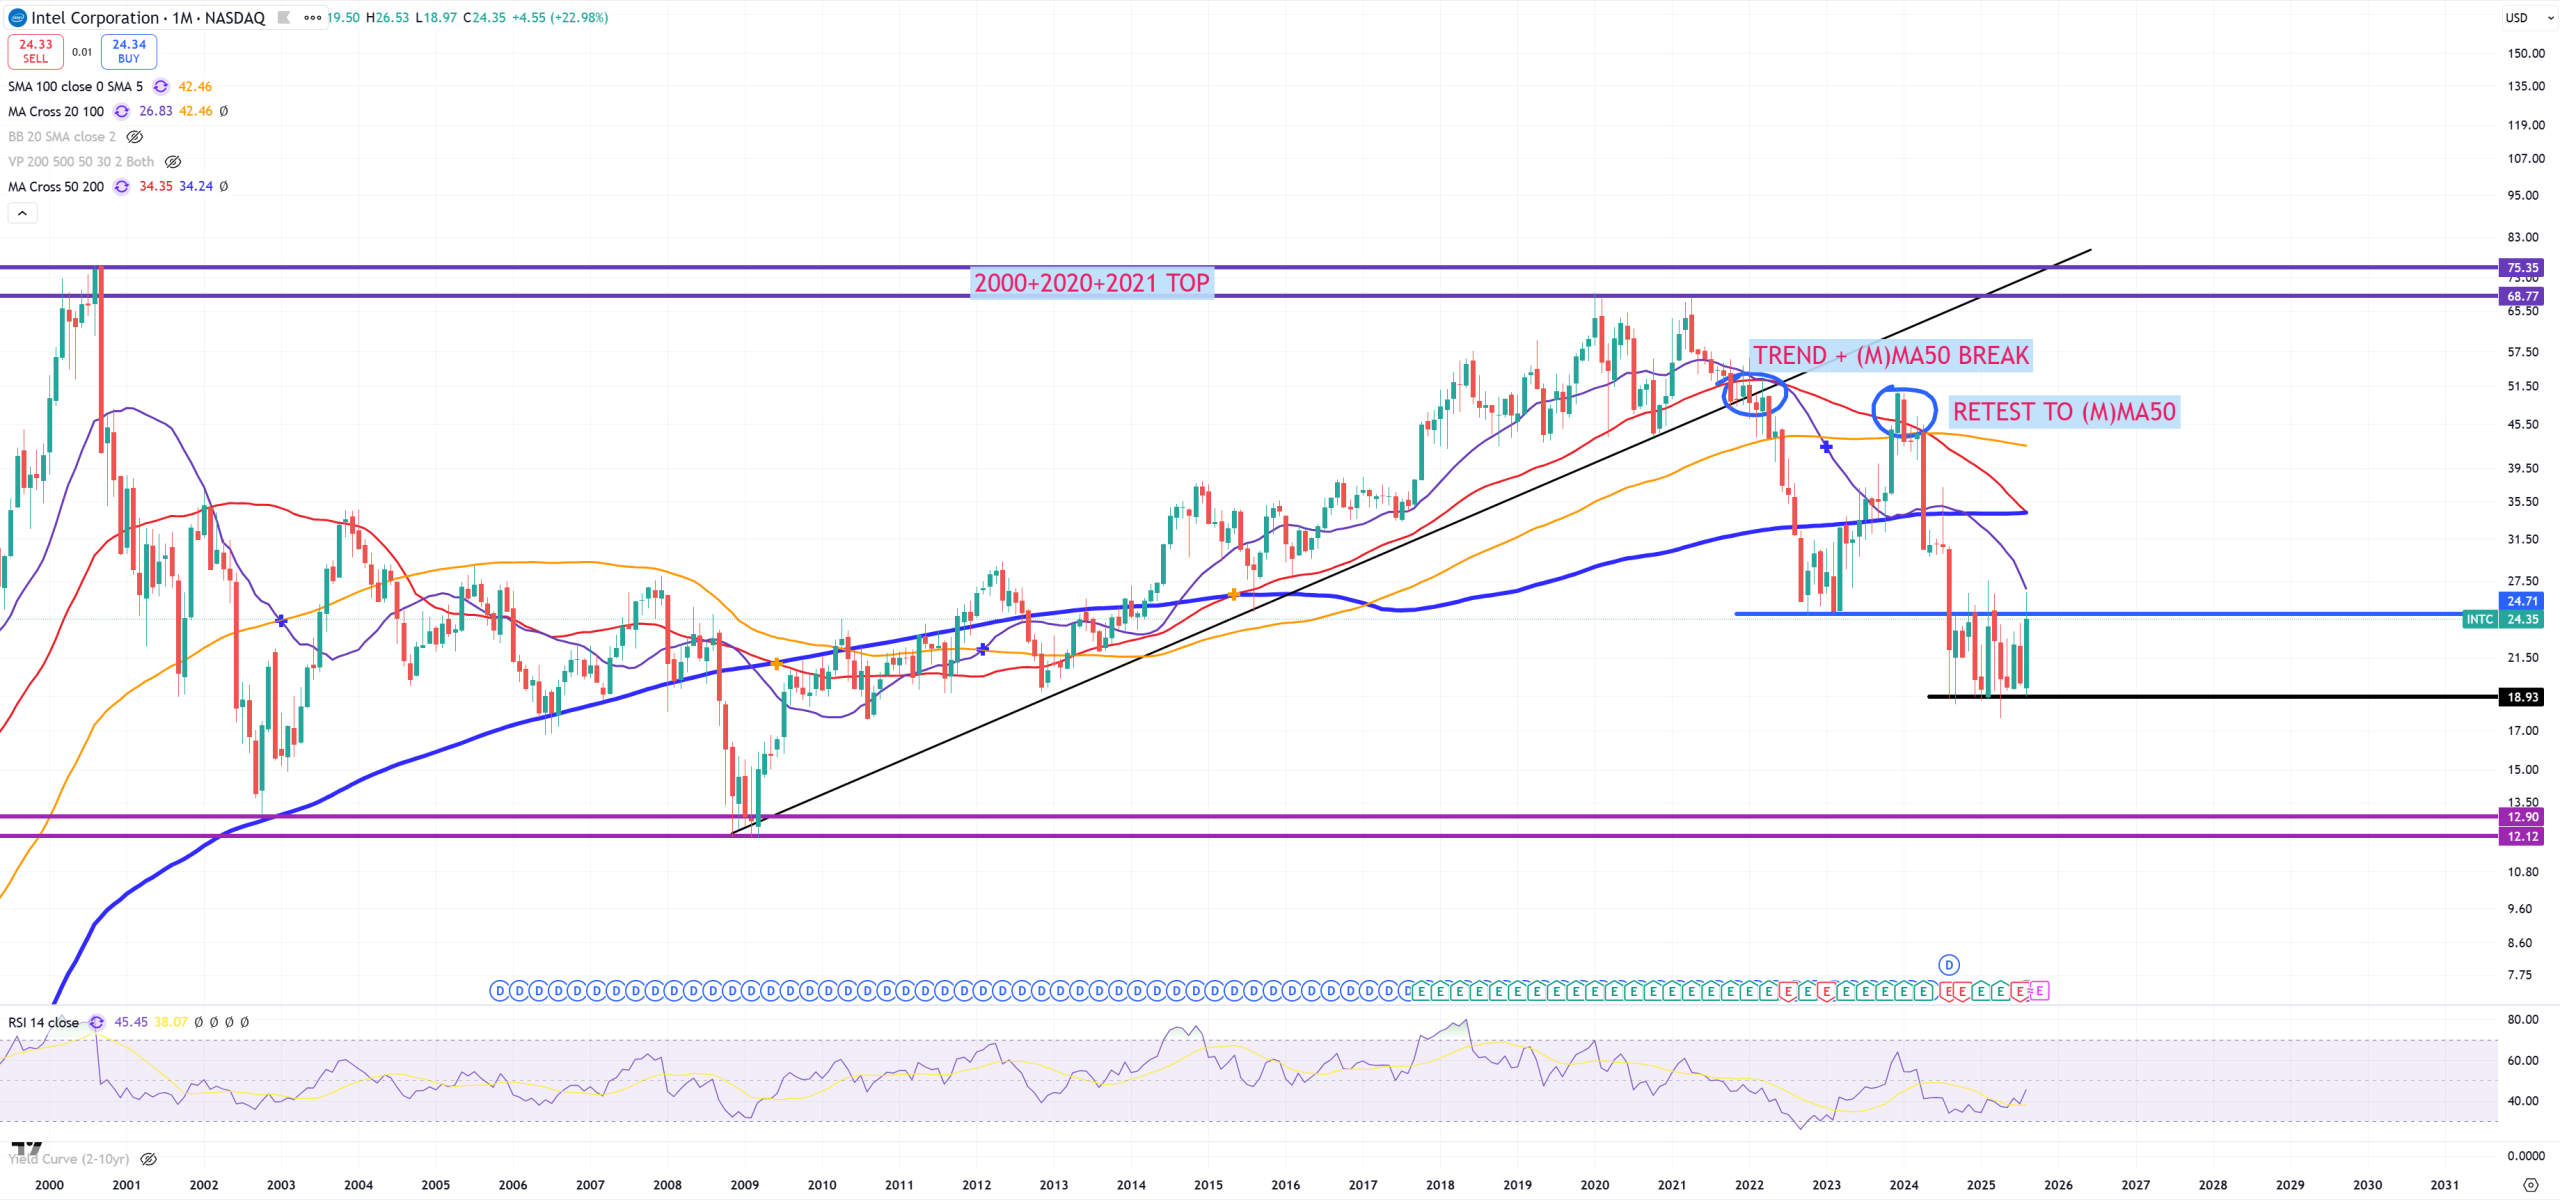
INTC – I’m not sure this government help will help Intel
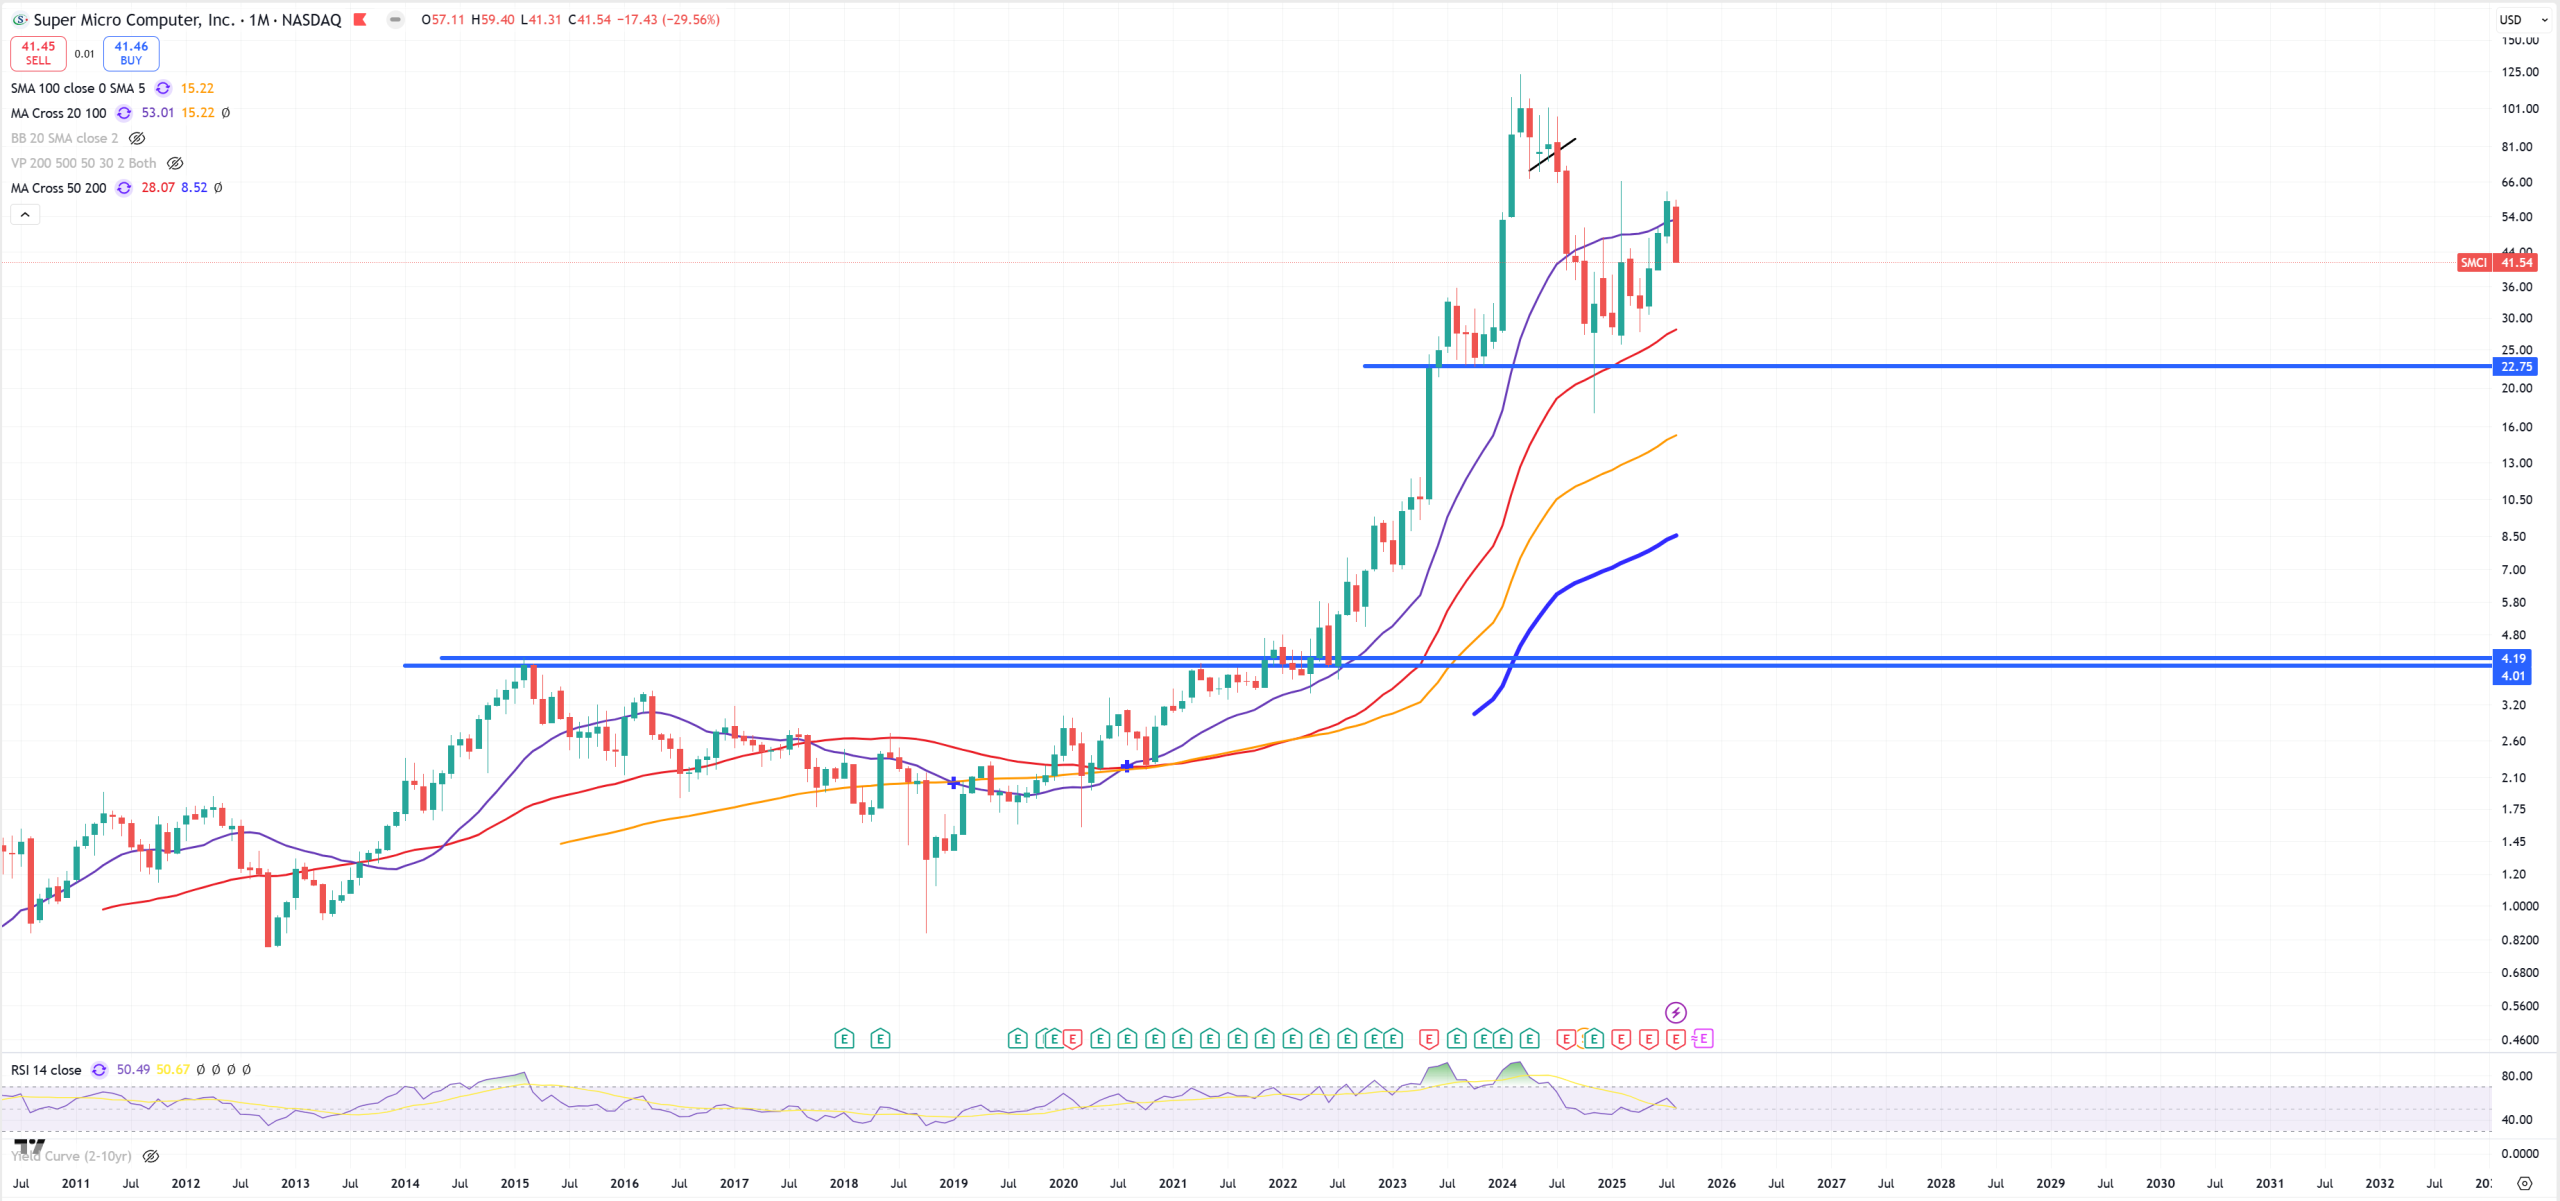
SMCI – Unchanged – small trap > (M)MA20. Breaking red (M)MA50 will land us into 4$
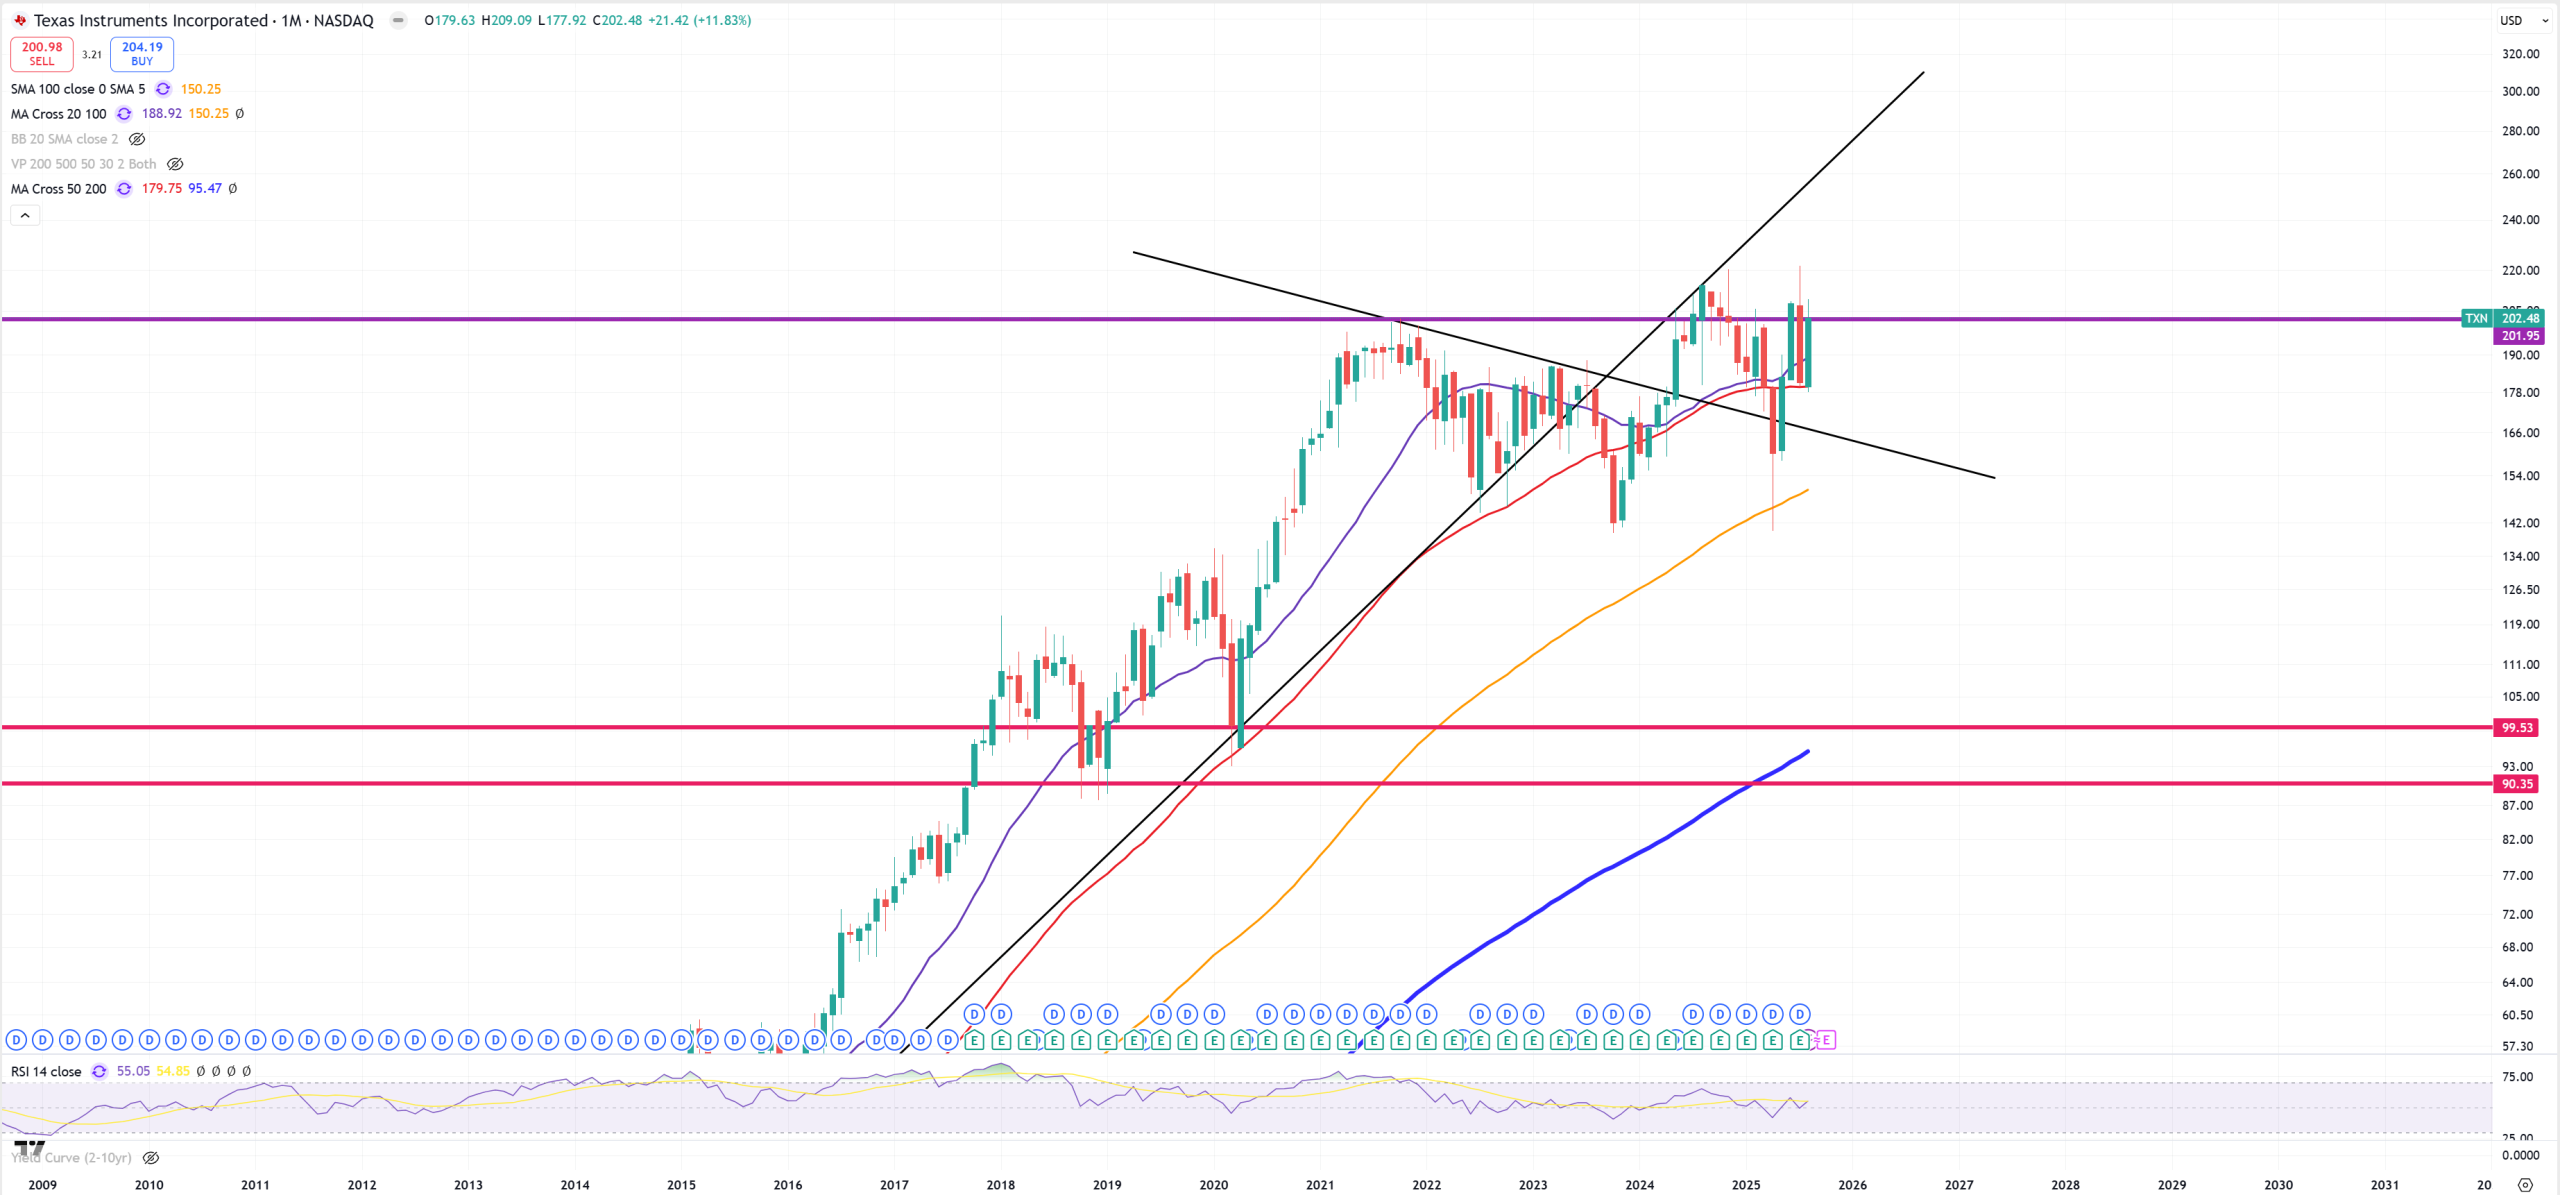
TXN – Texas Instuments and 2021 resistance
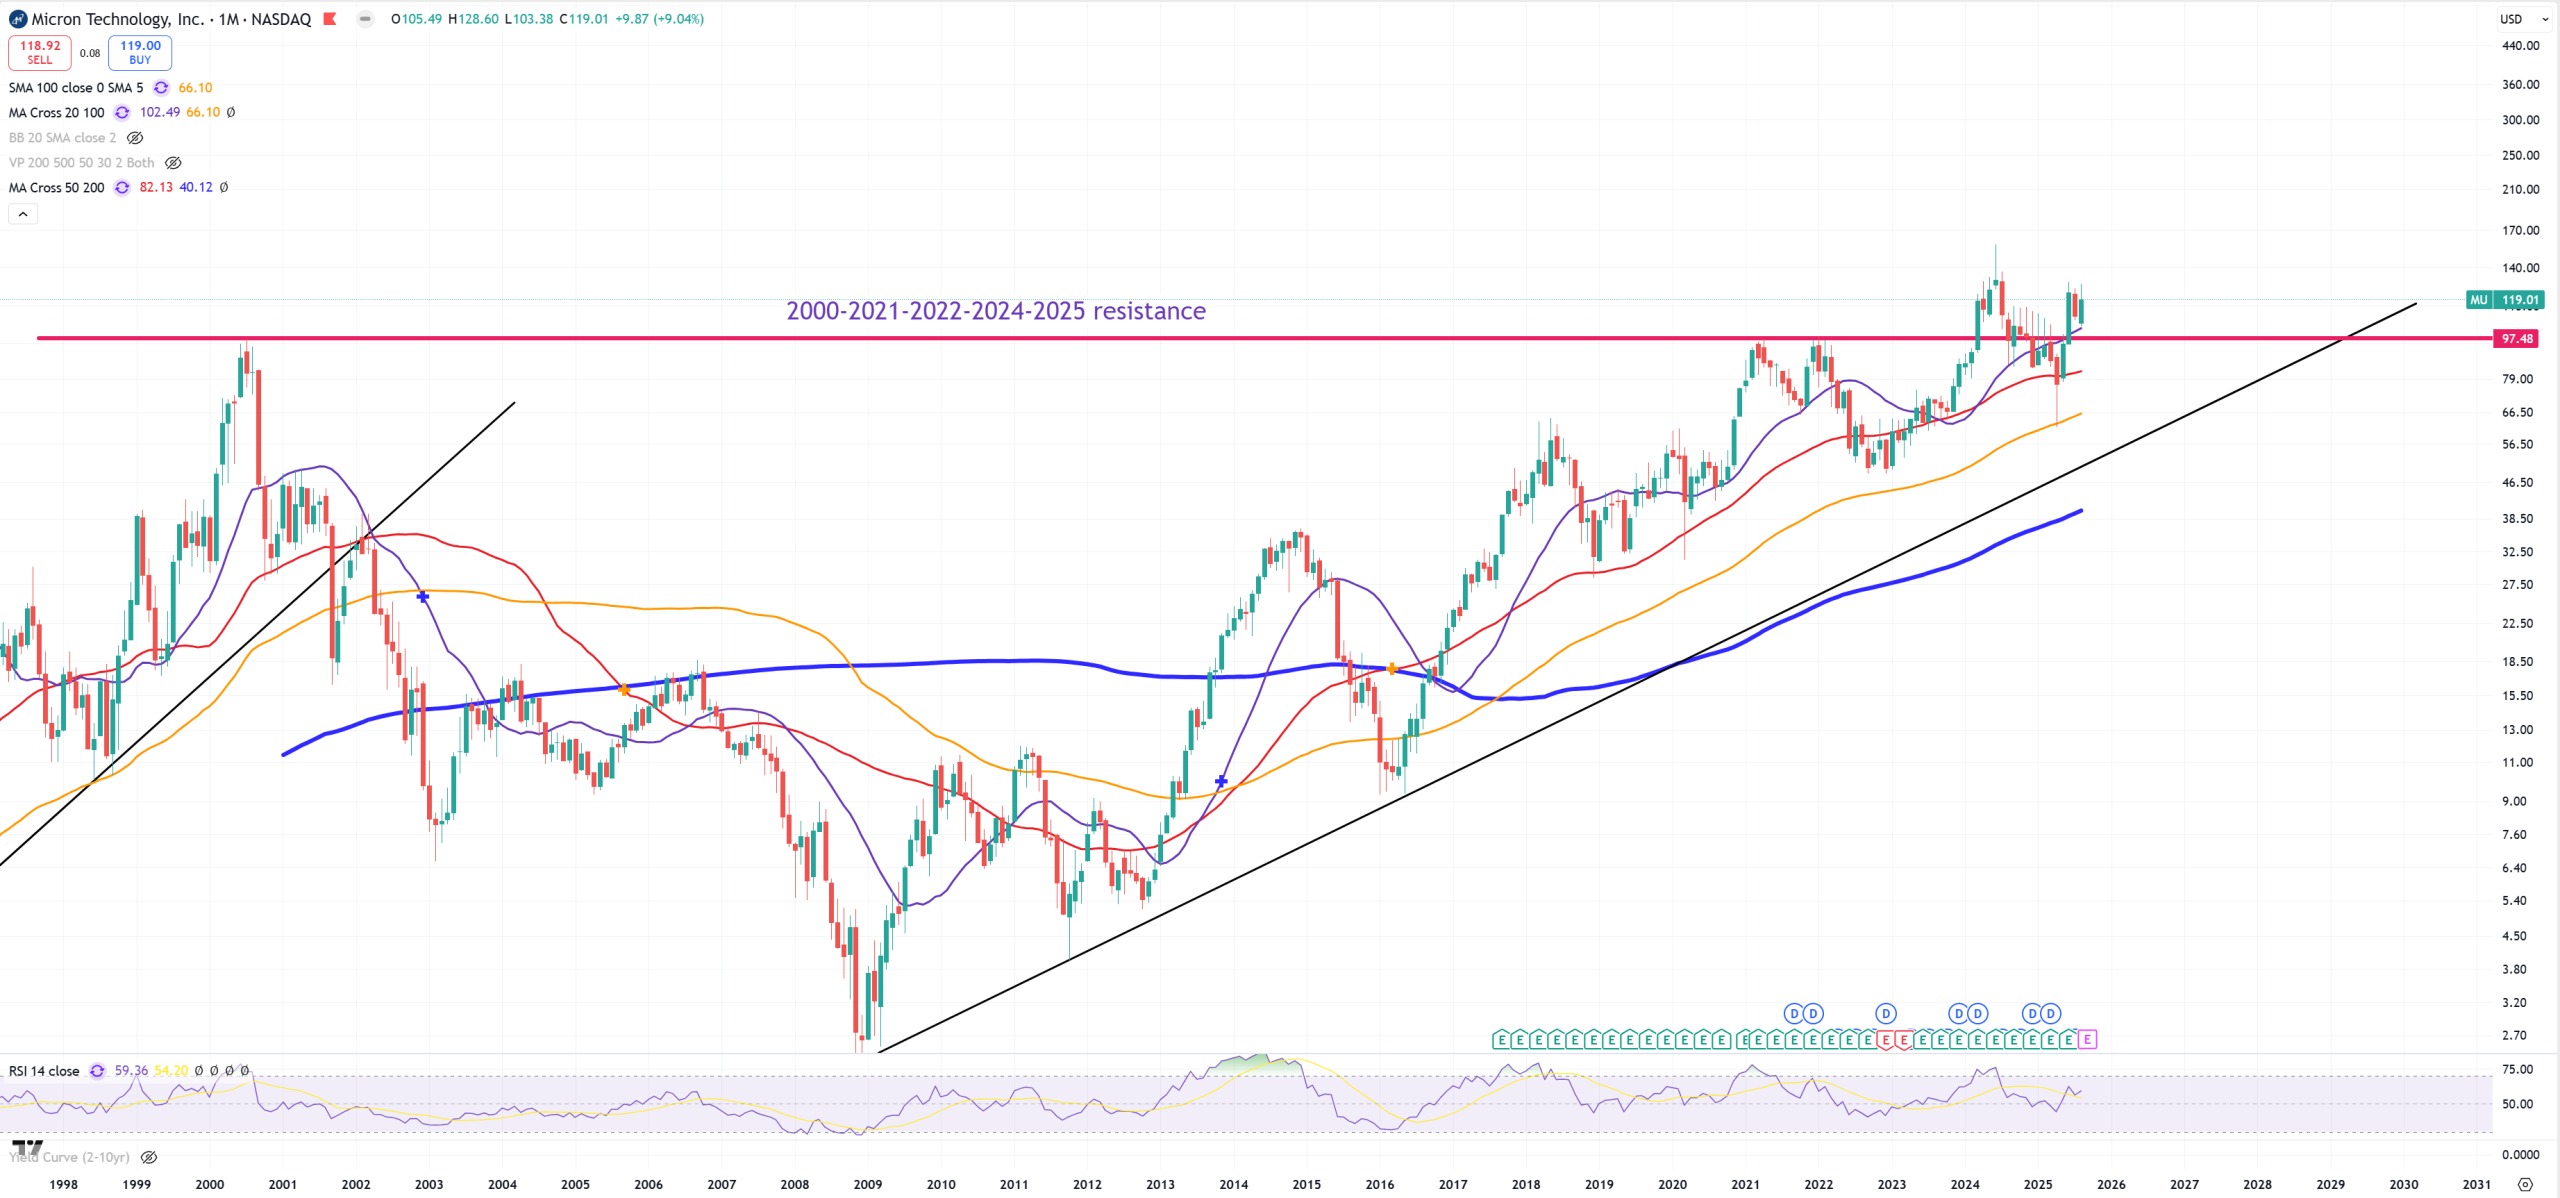
MU – Still above 2000 peak
Sector ETFs and stocks
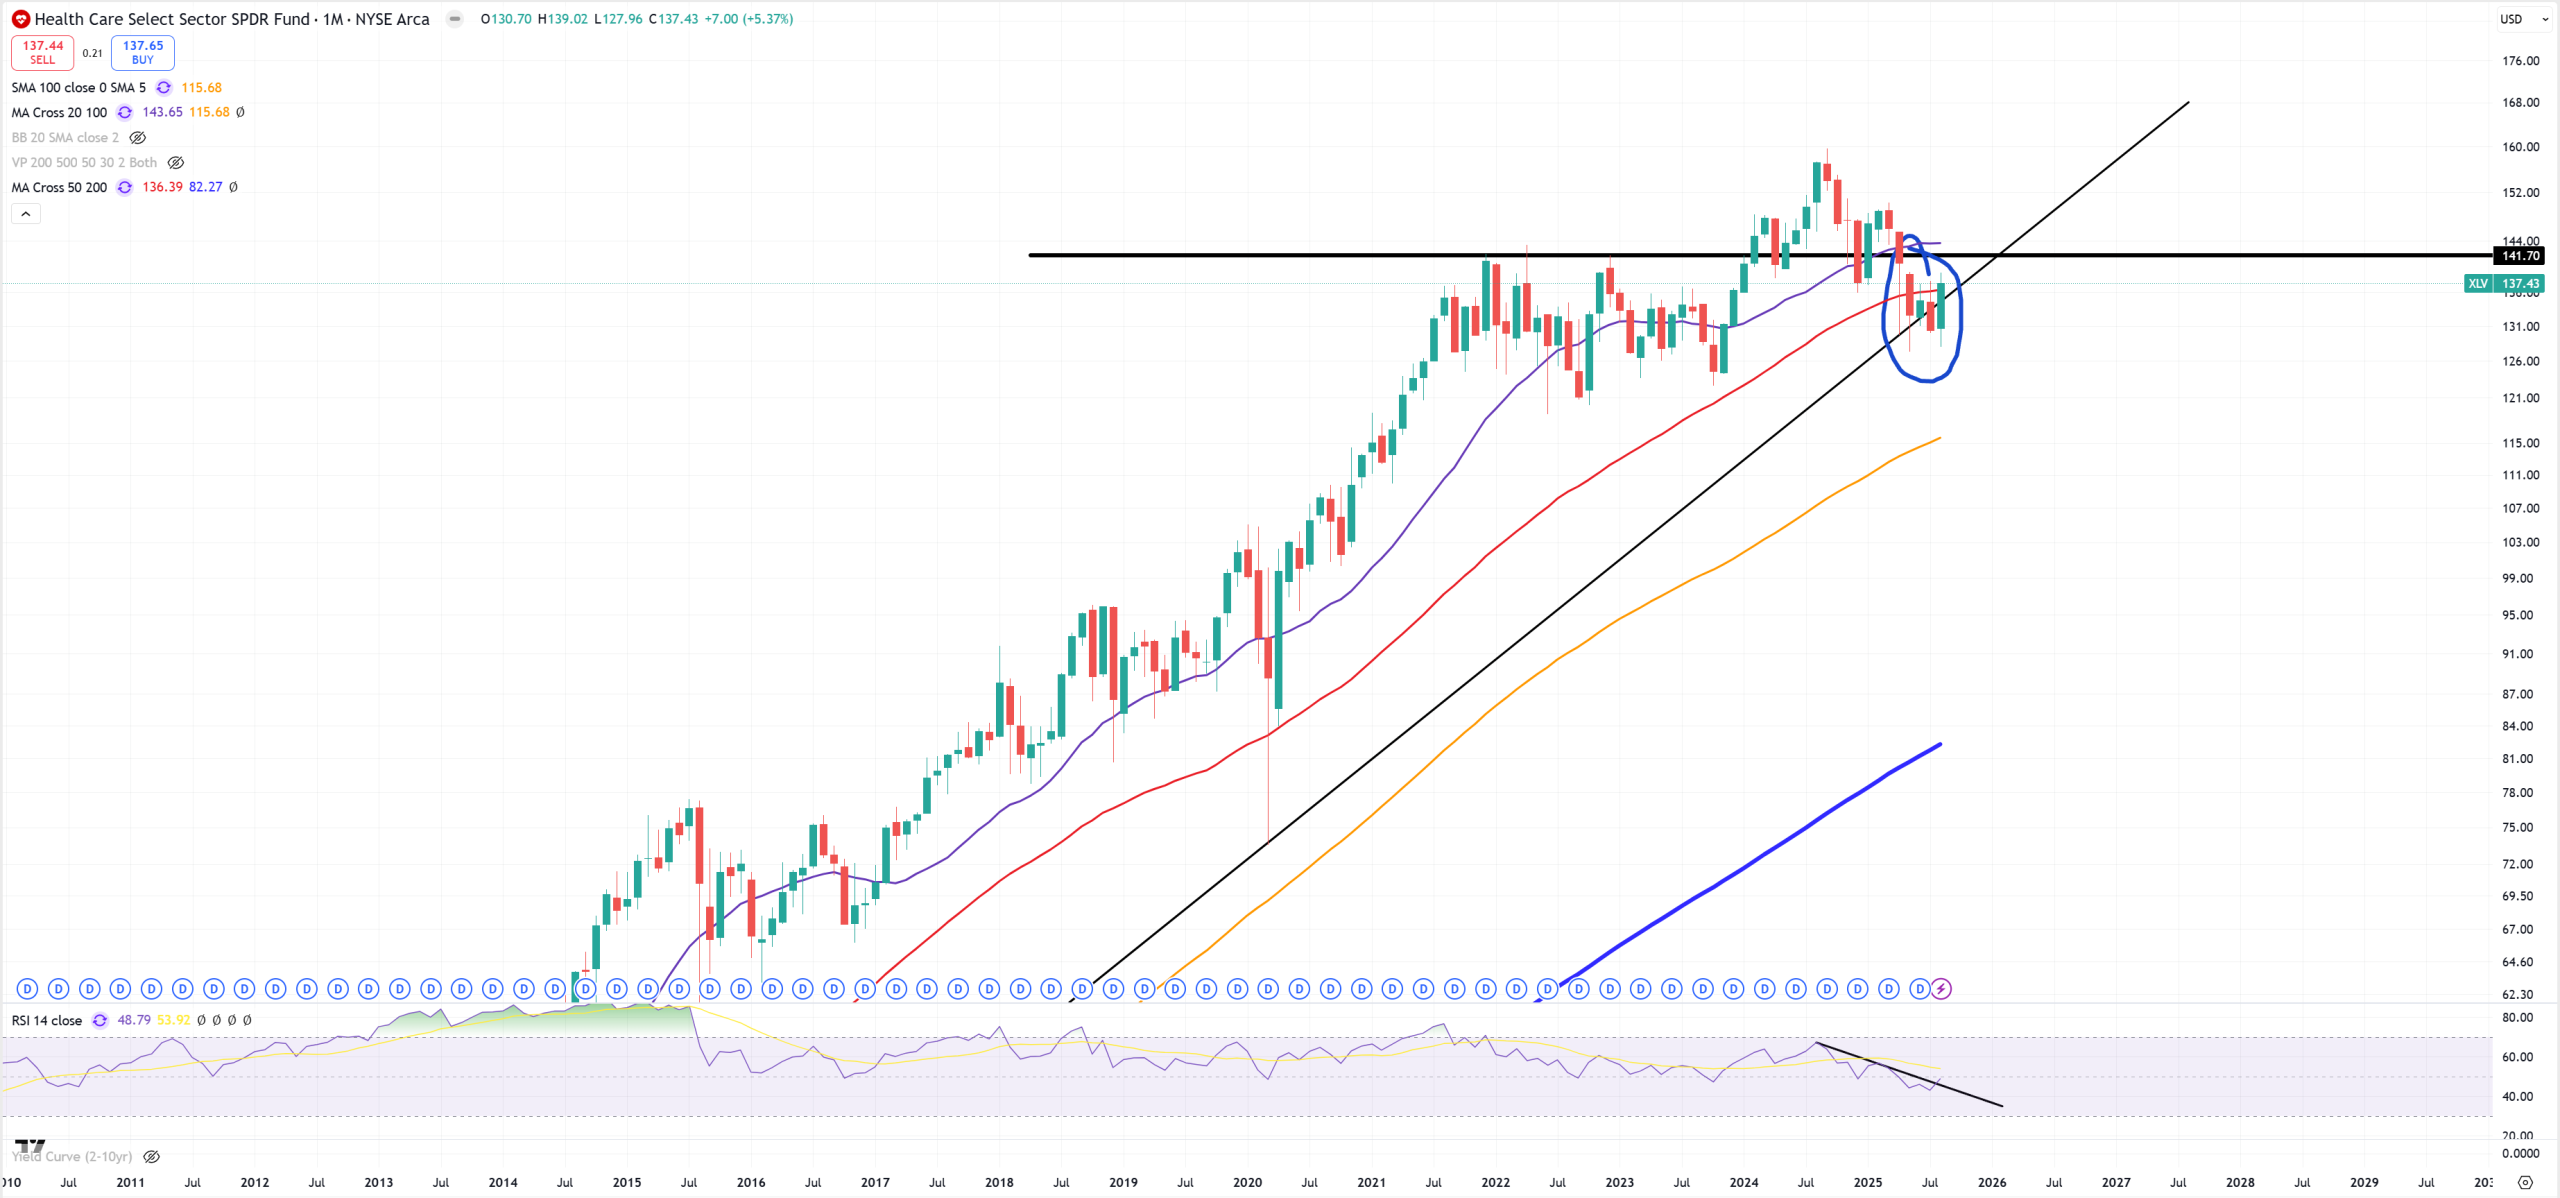
XLV – Healthcare, we’re going to start from XLV which is on the edge of its first bear market since 2009
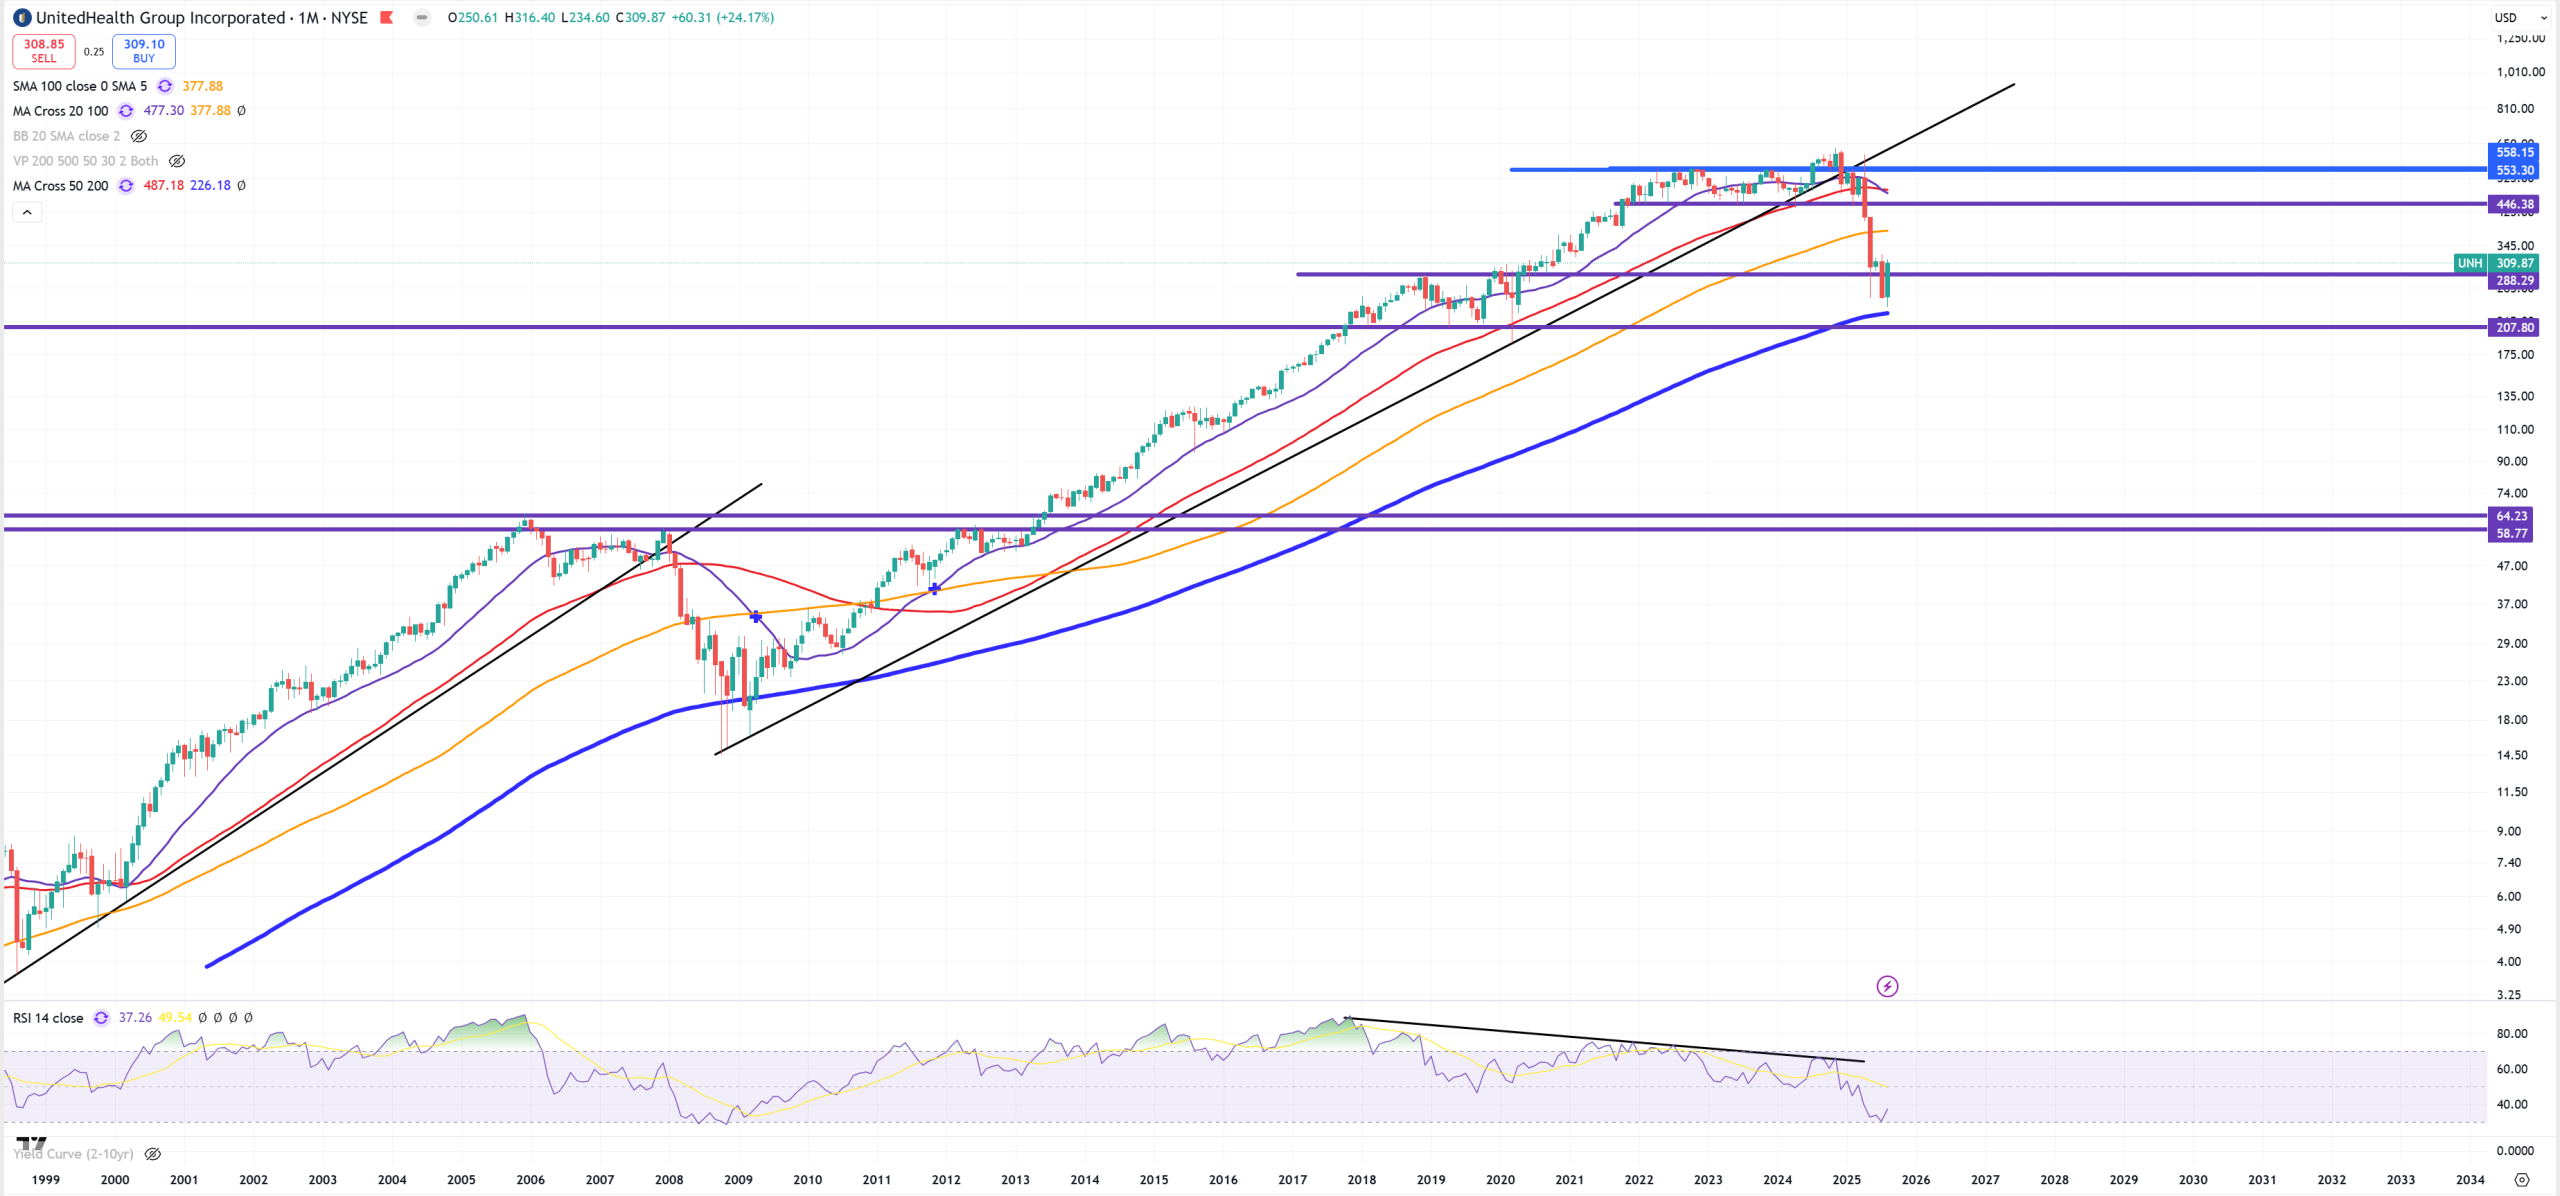
UNH – as XLV tries to jump, UNH tries to get above key level
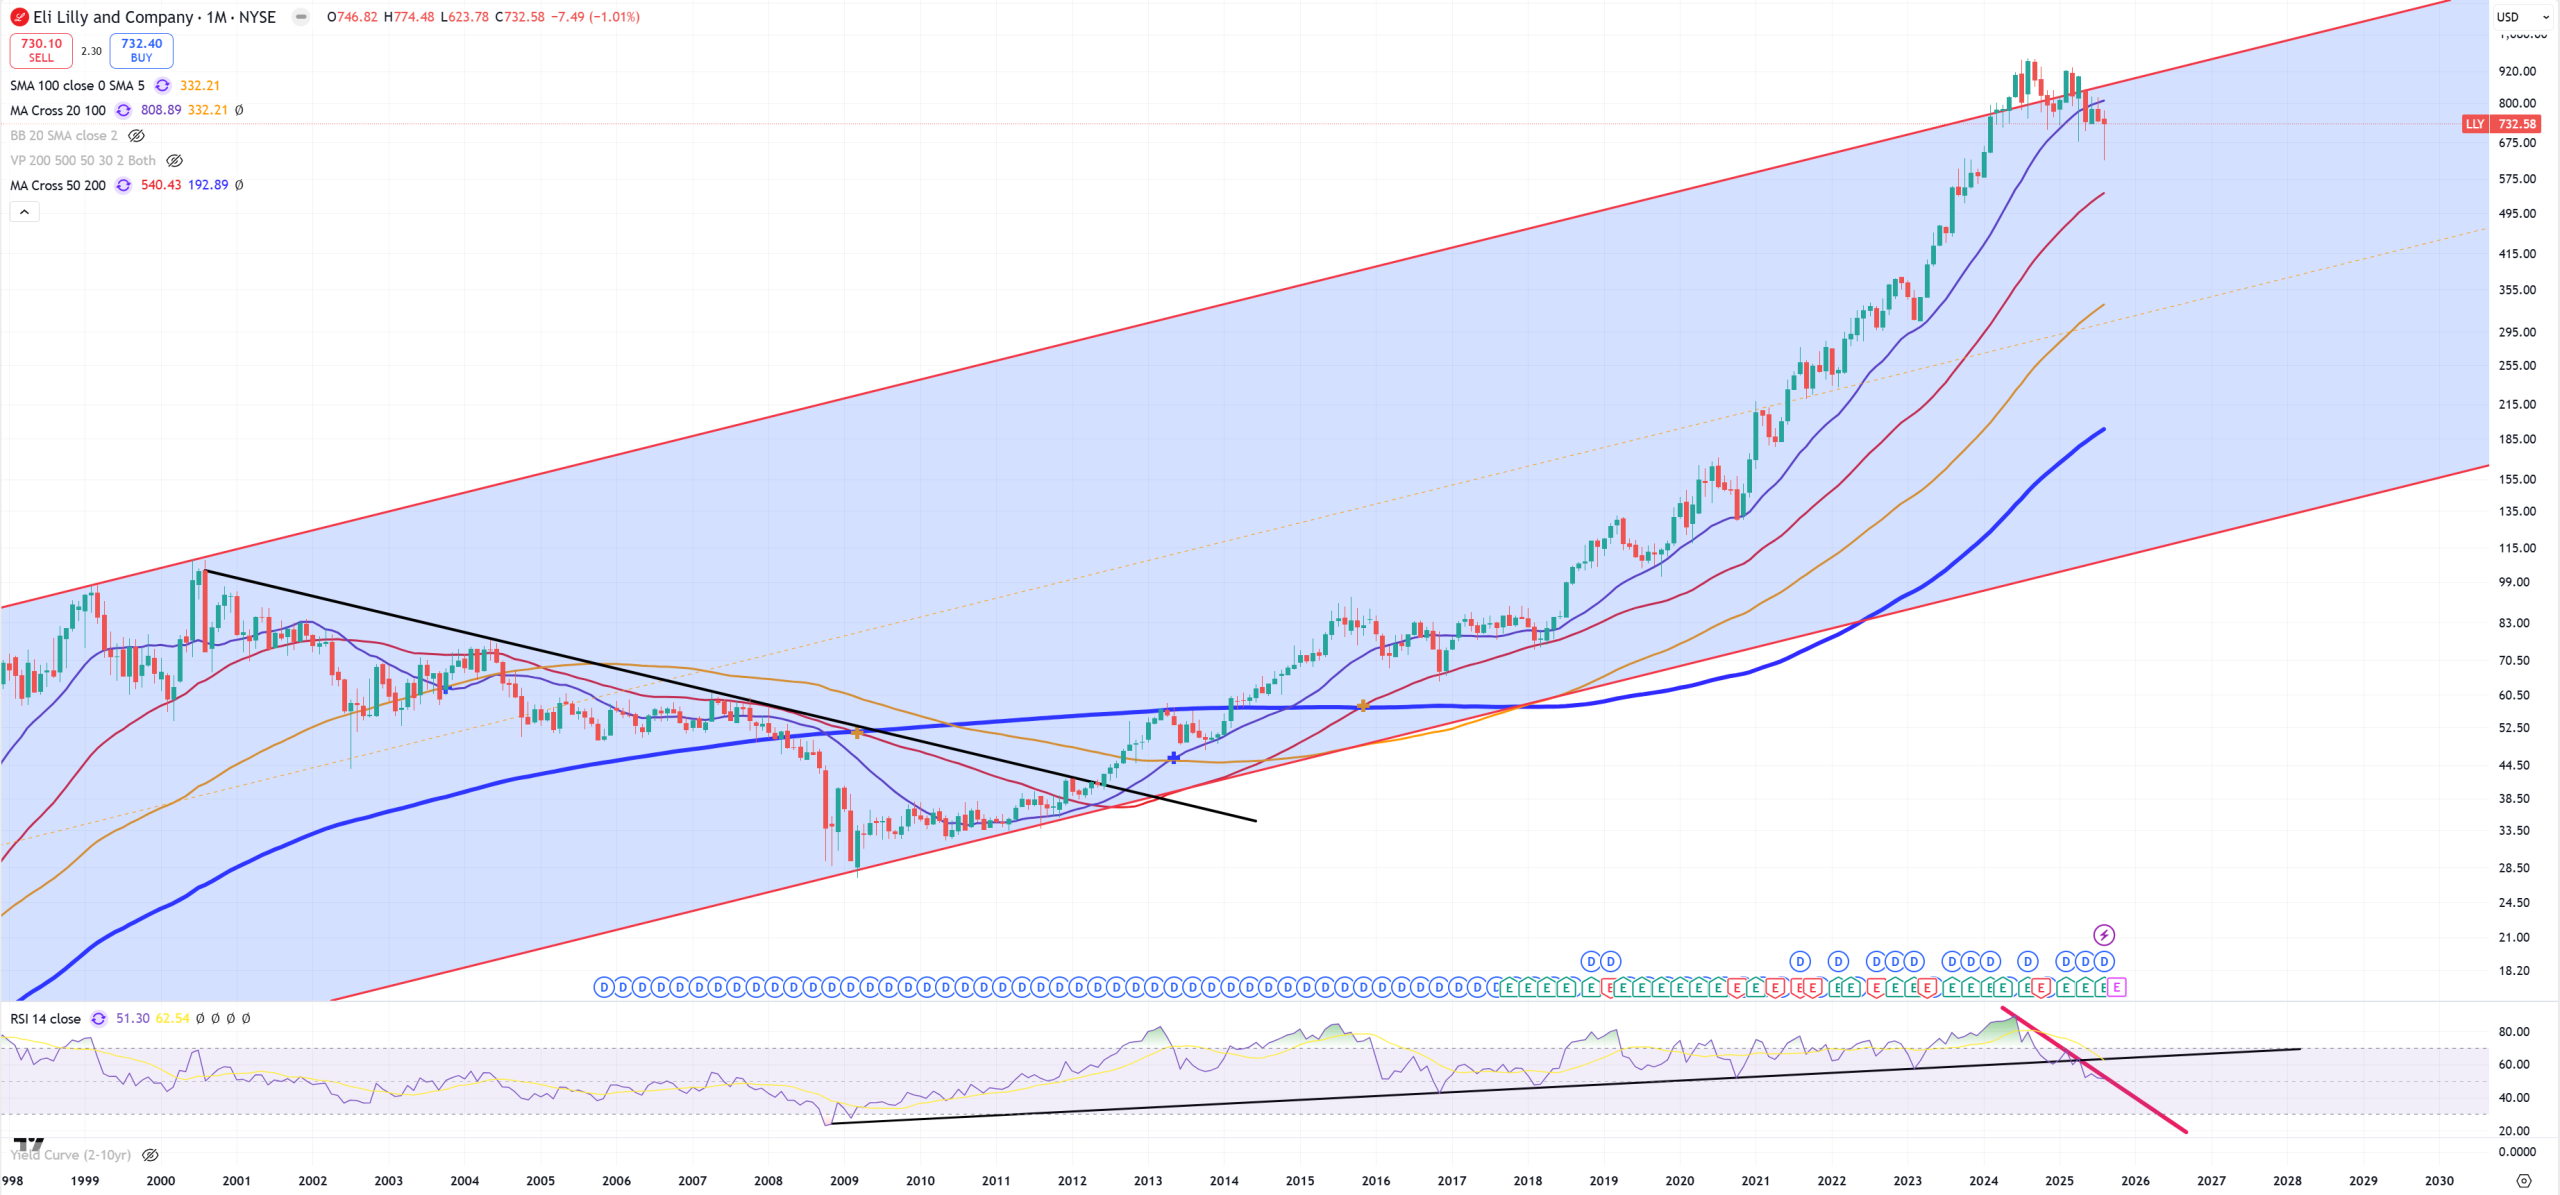
LLY – Eli Lilly
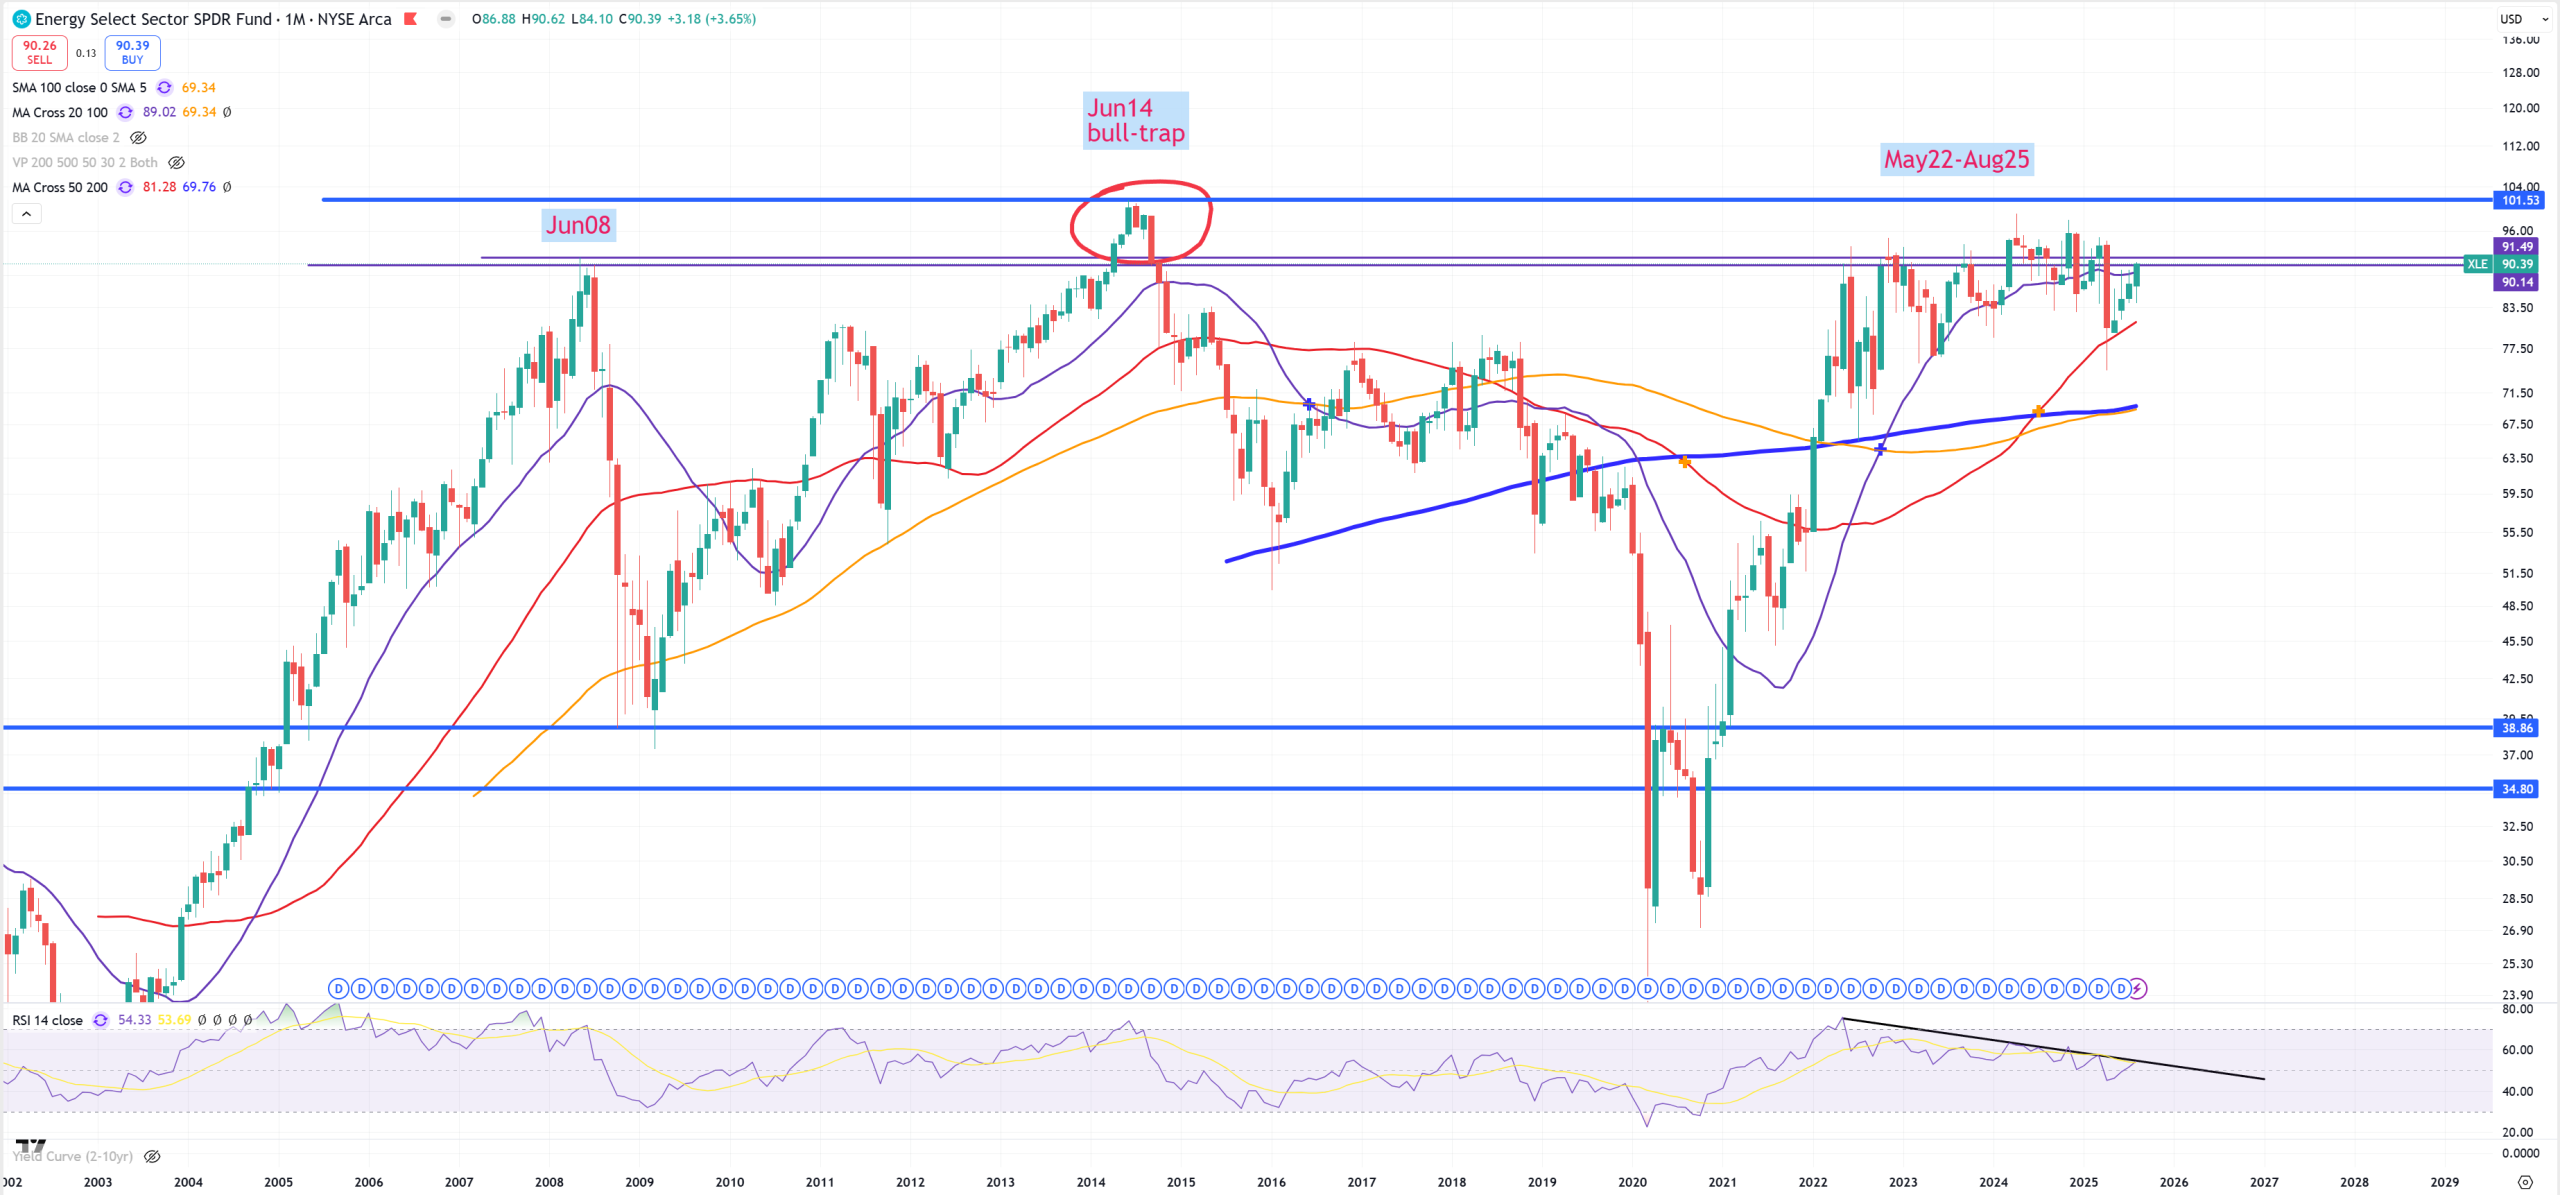
XLE – Energy and this chart is ridiculous how long it takes, but from the other hand it’s really odd not to jump on (M)MA50 support after first hit. In 2008 it was super unnatural to crash through this (M)MA50 like a butter.
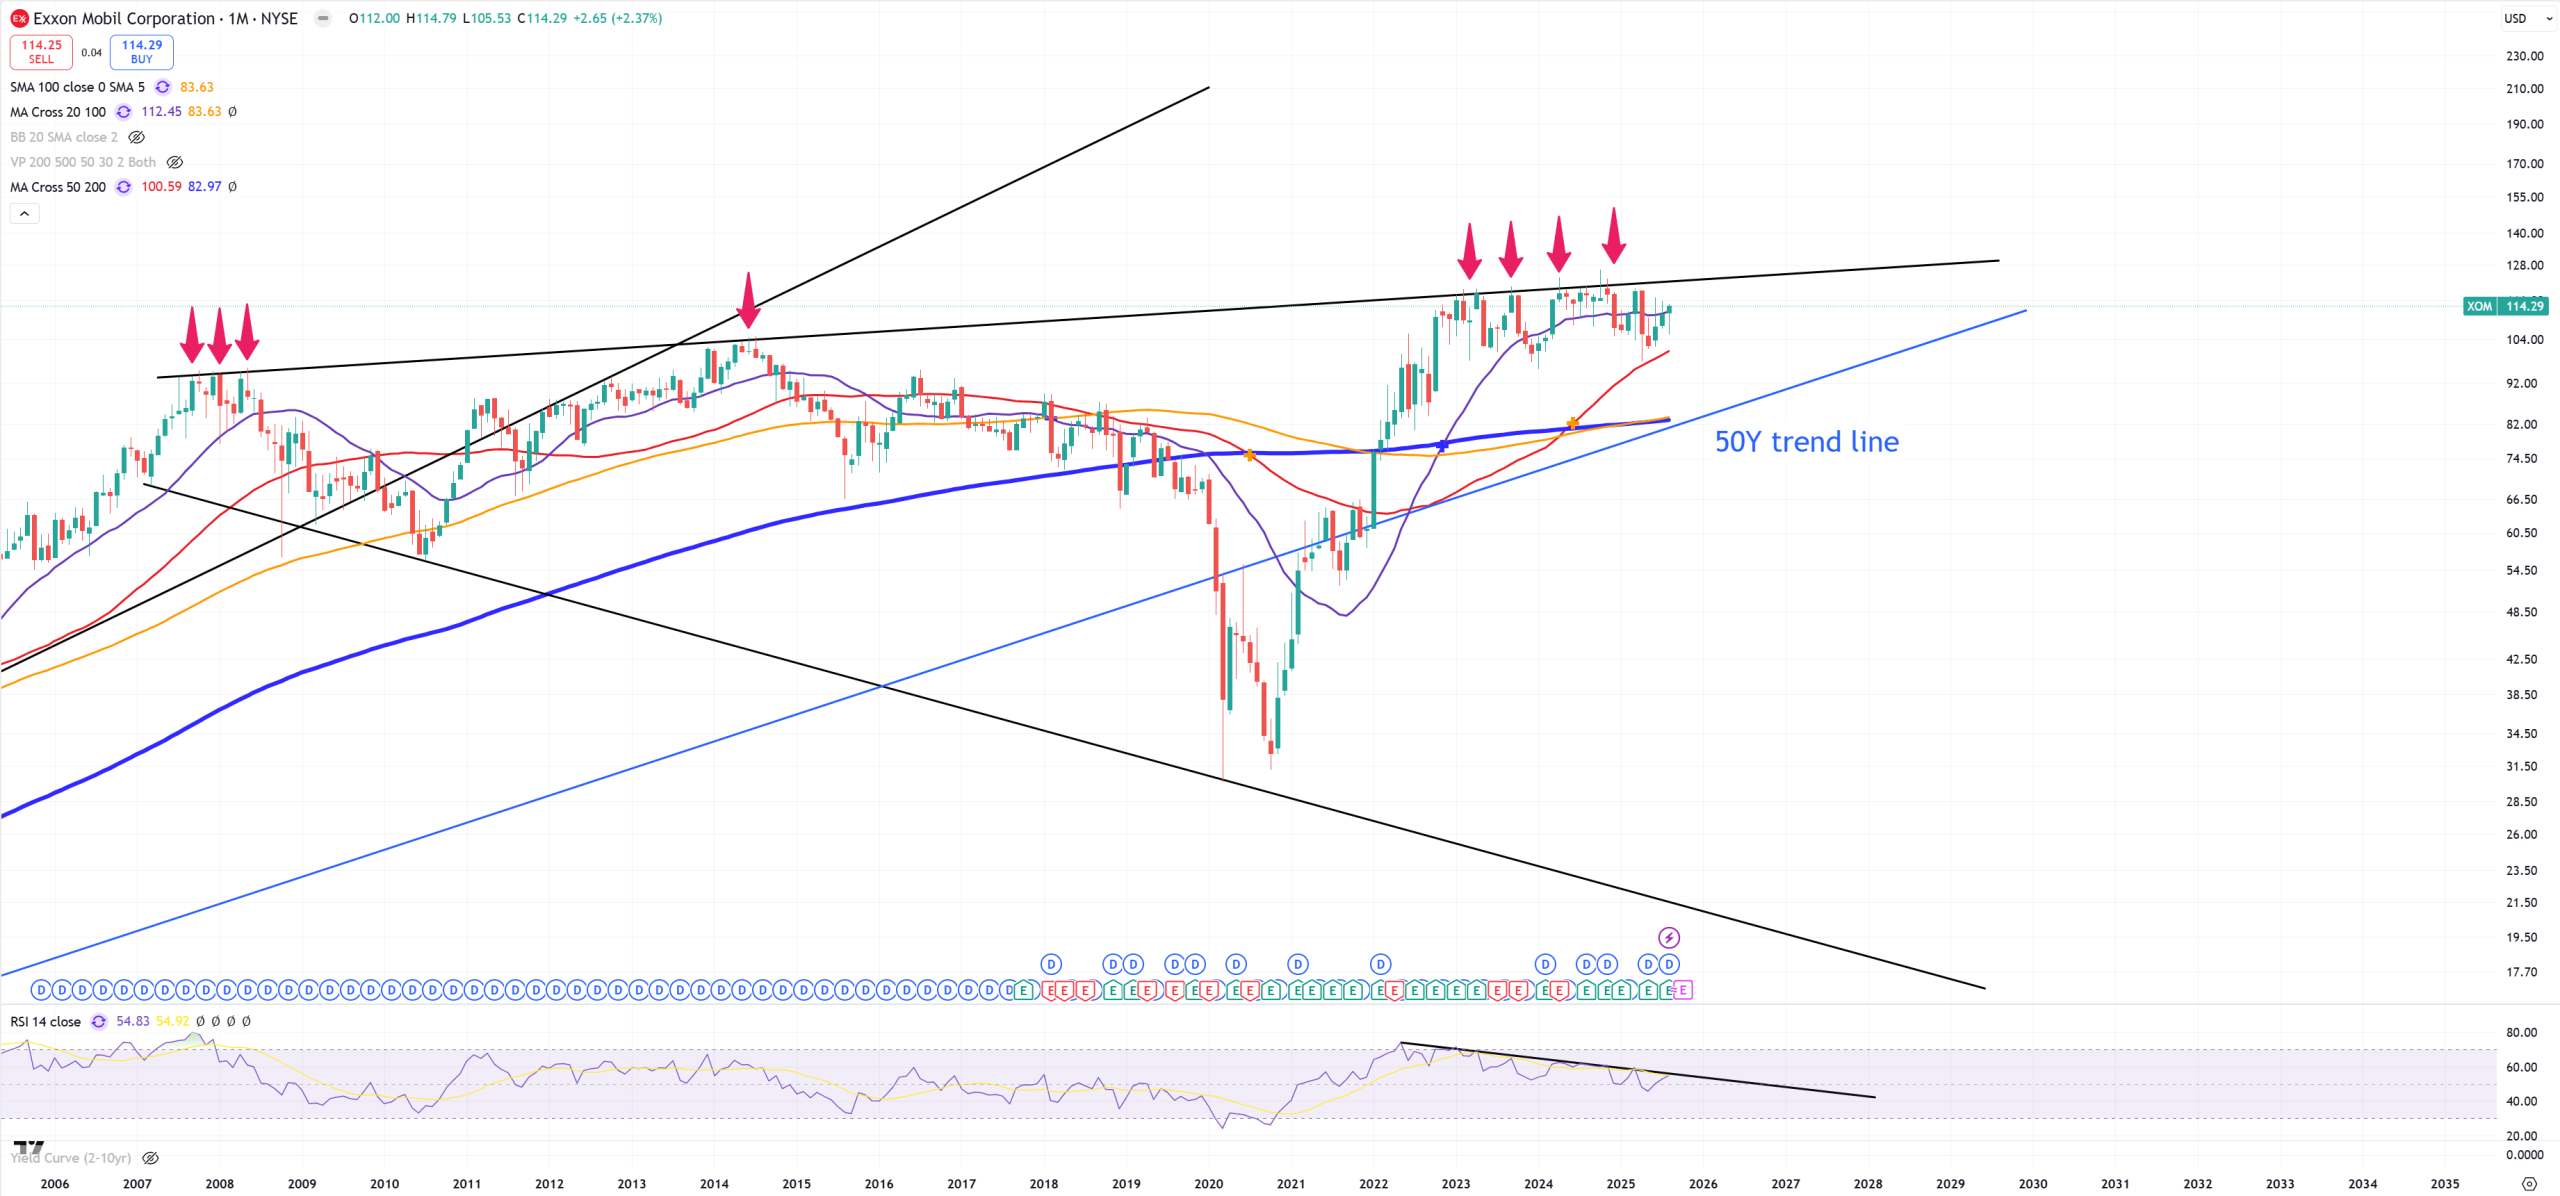
XOM – Exxon got stuck in a massive megaphone pattern
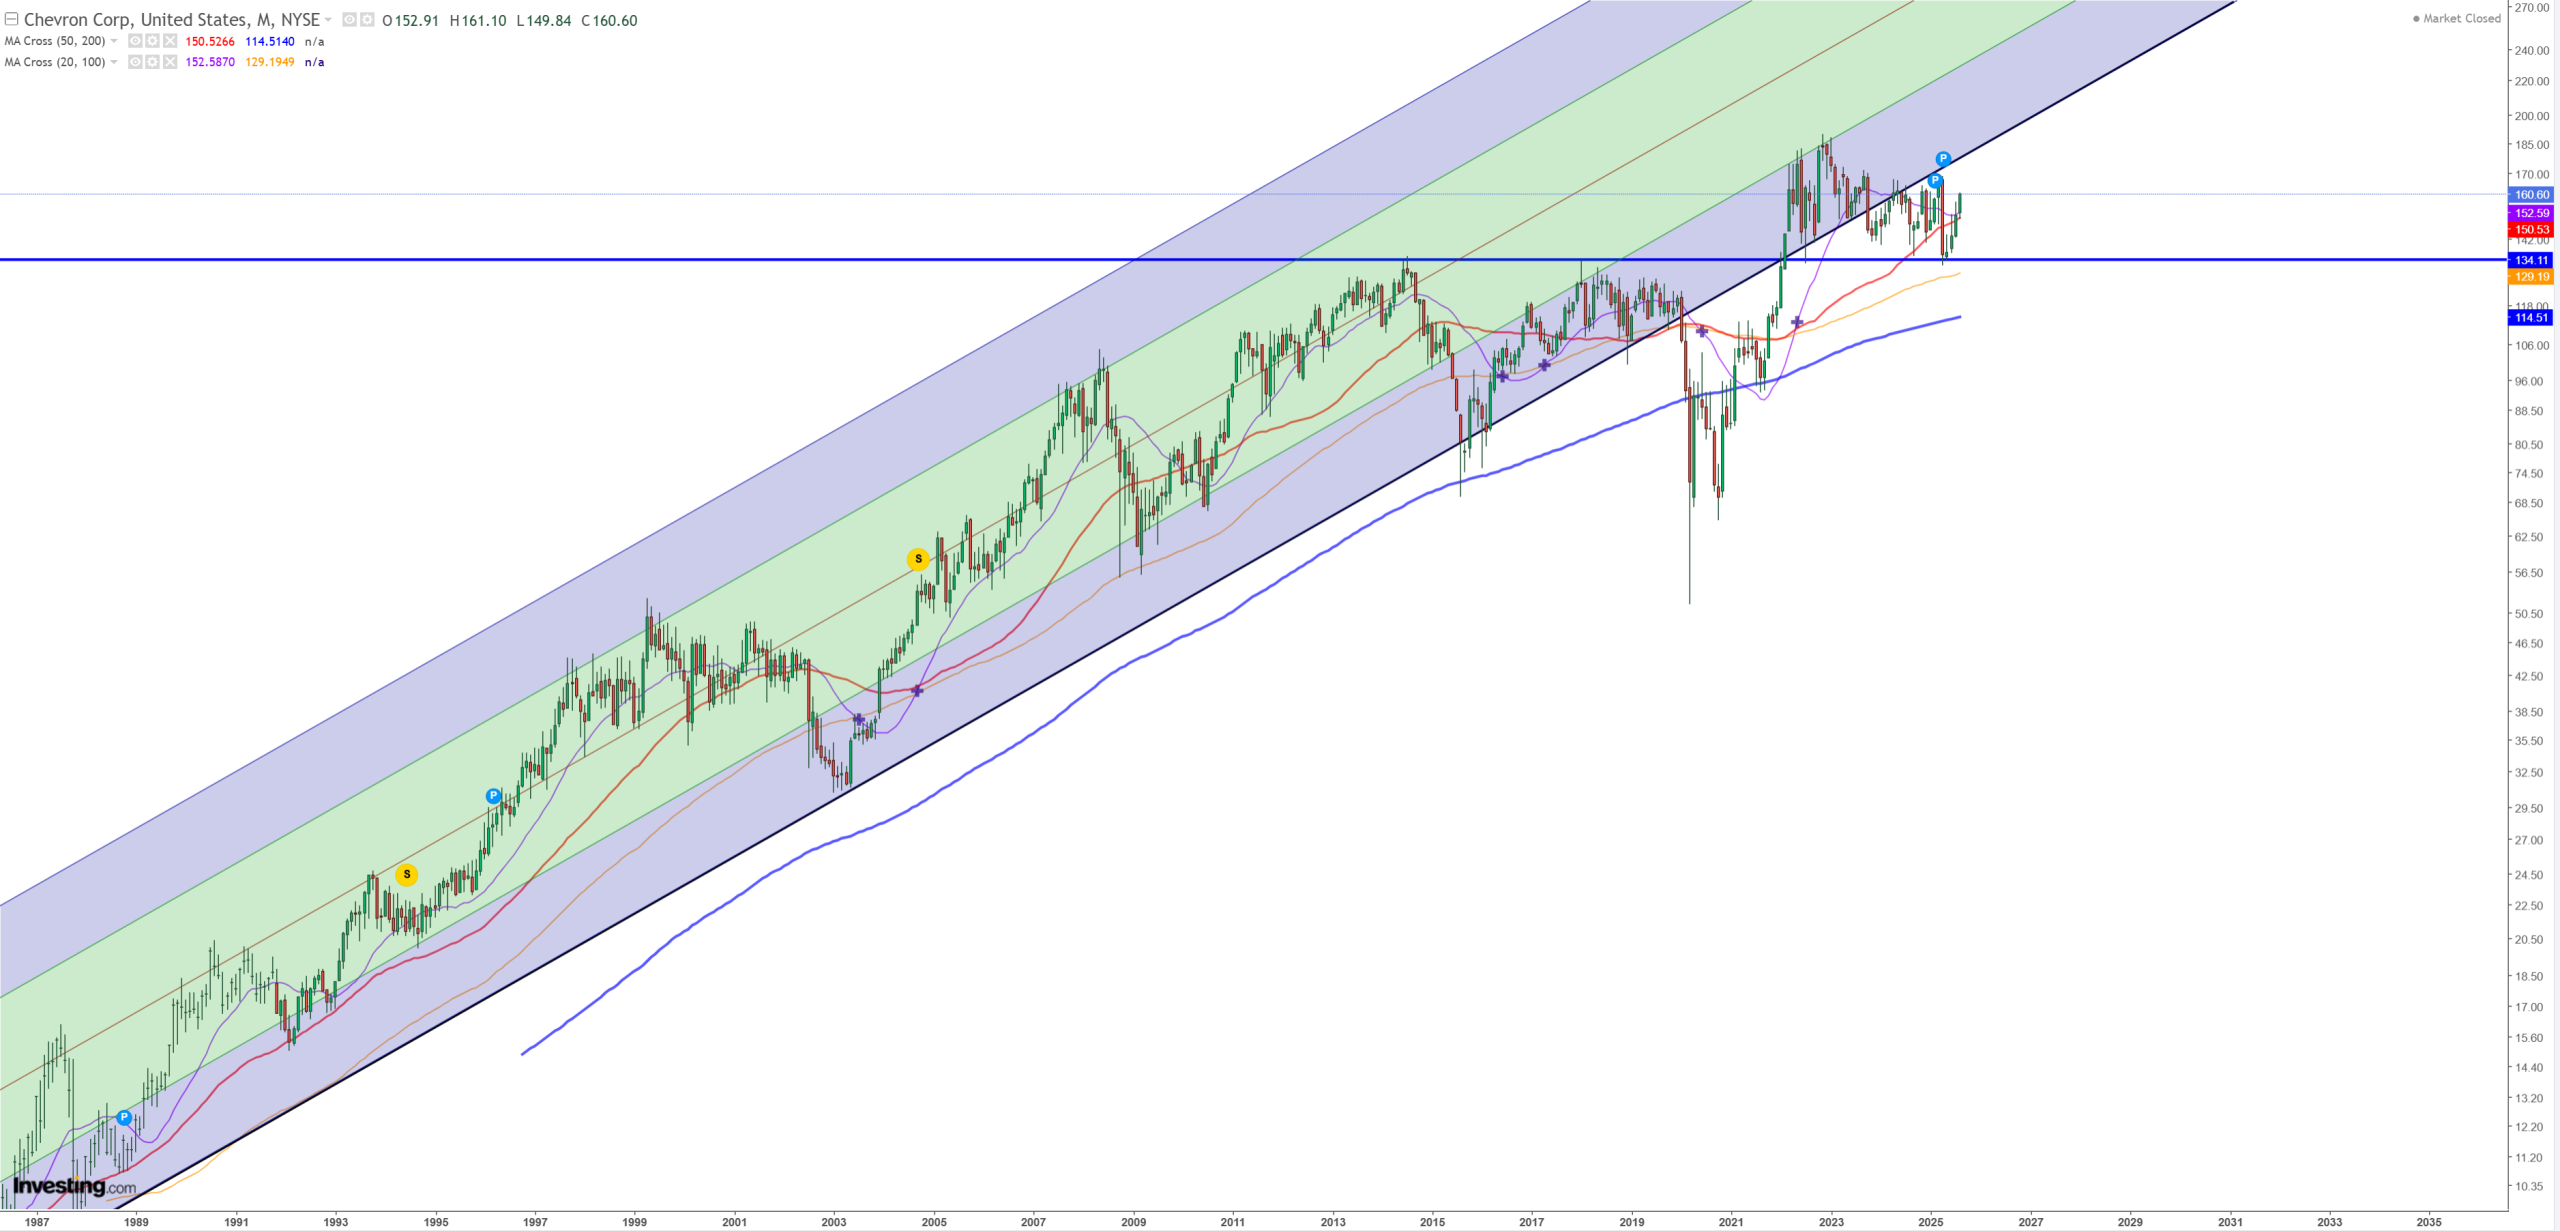
CVX – Chevron – massive break above 2014-2018 level, back to secular trend, again drop below it and bouncing off its 2014-2018 support. Mind-blowing
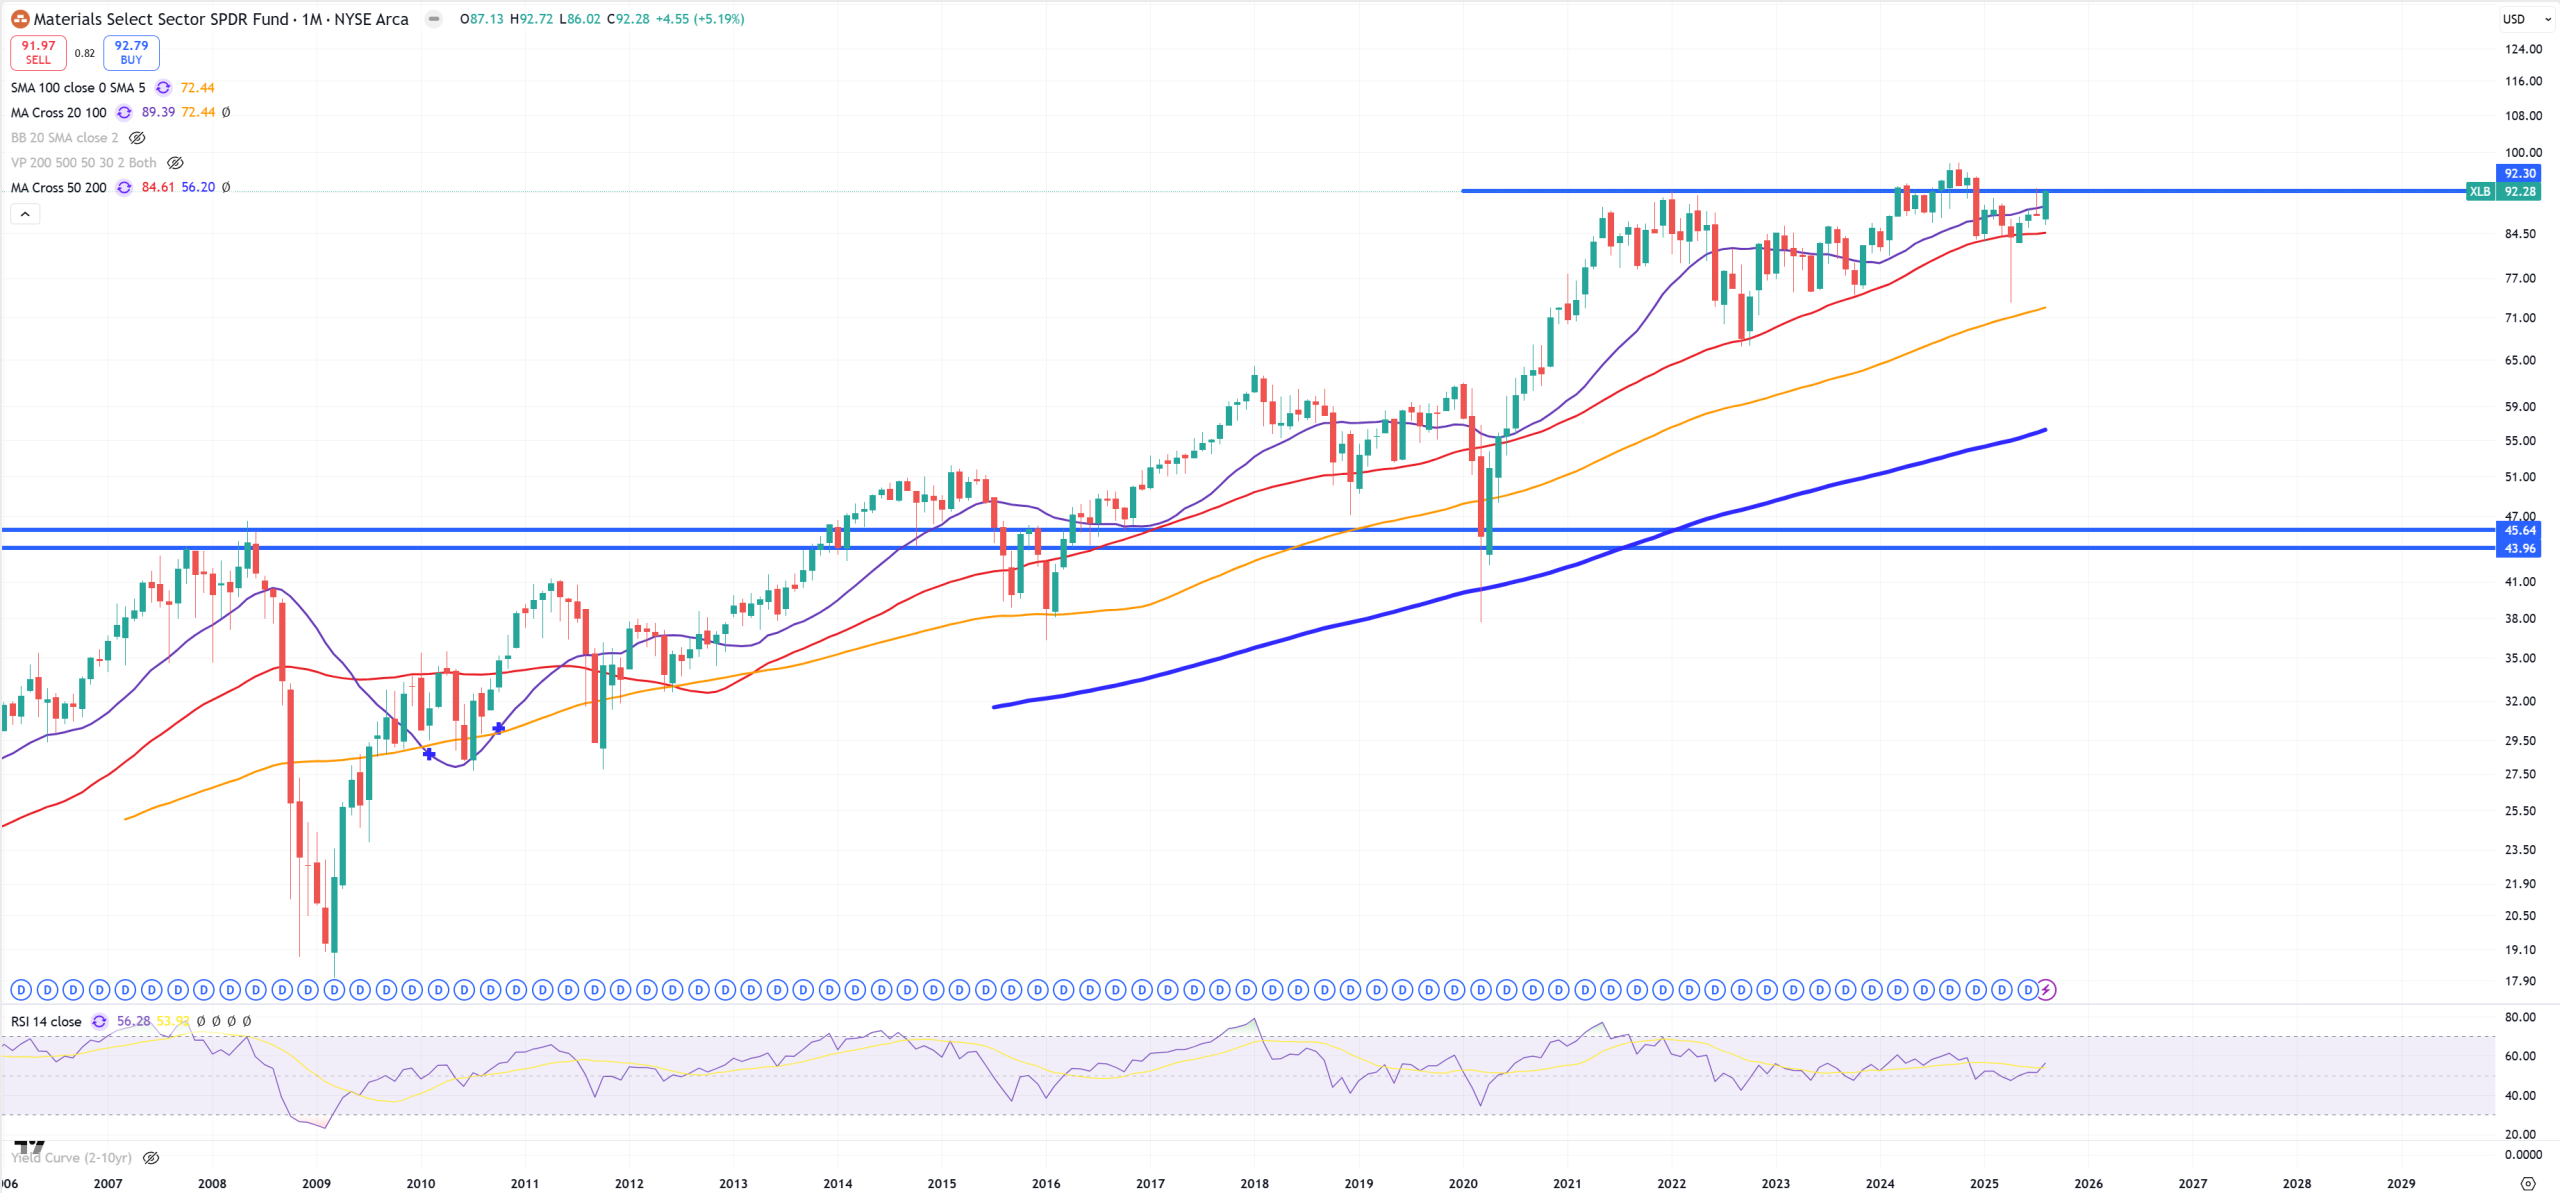
XLB – Materials
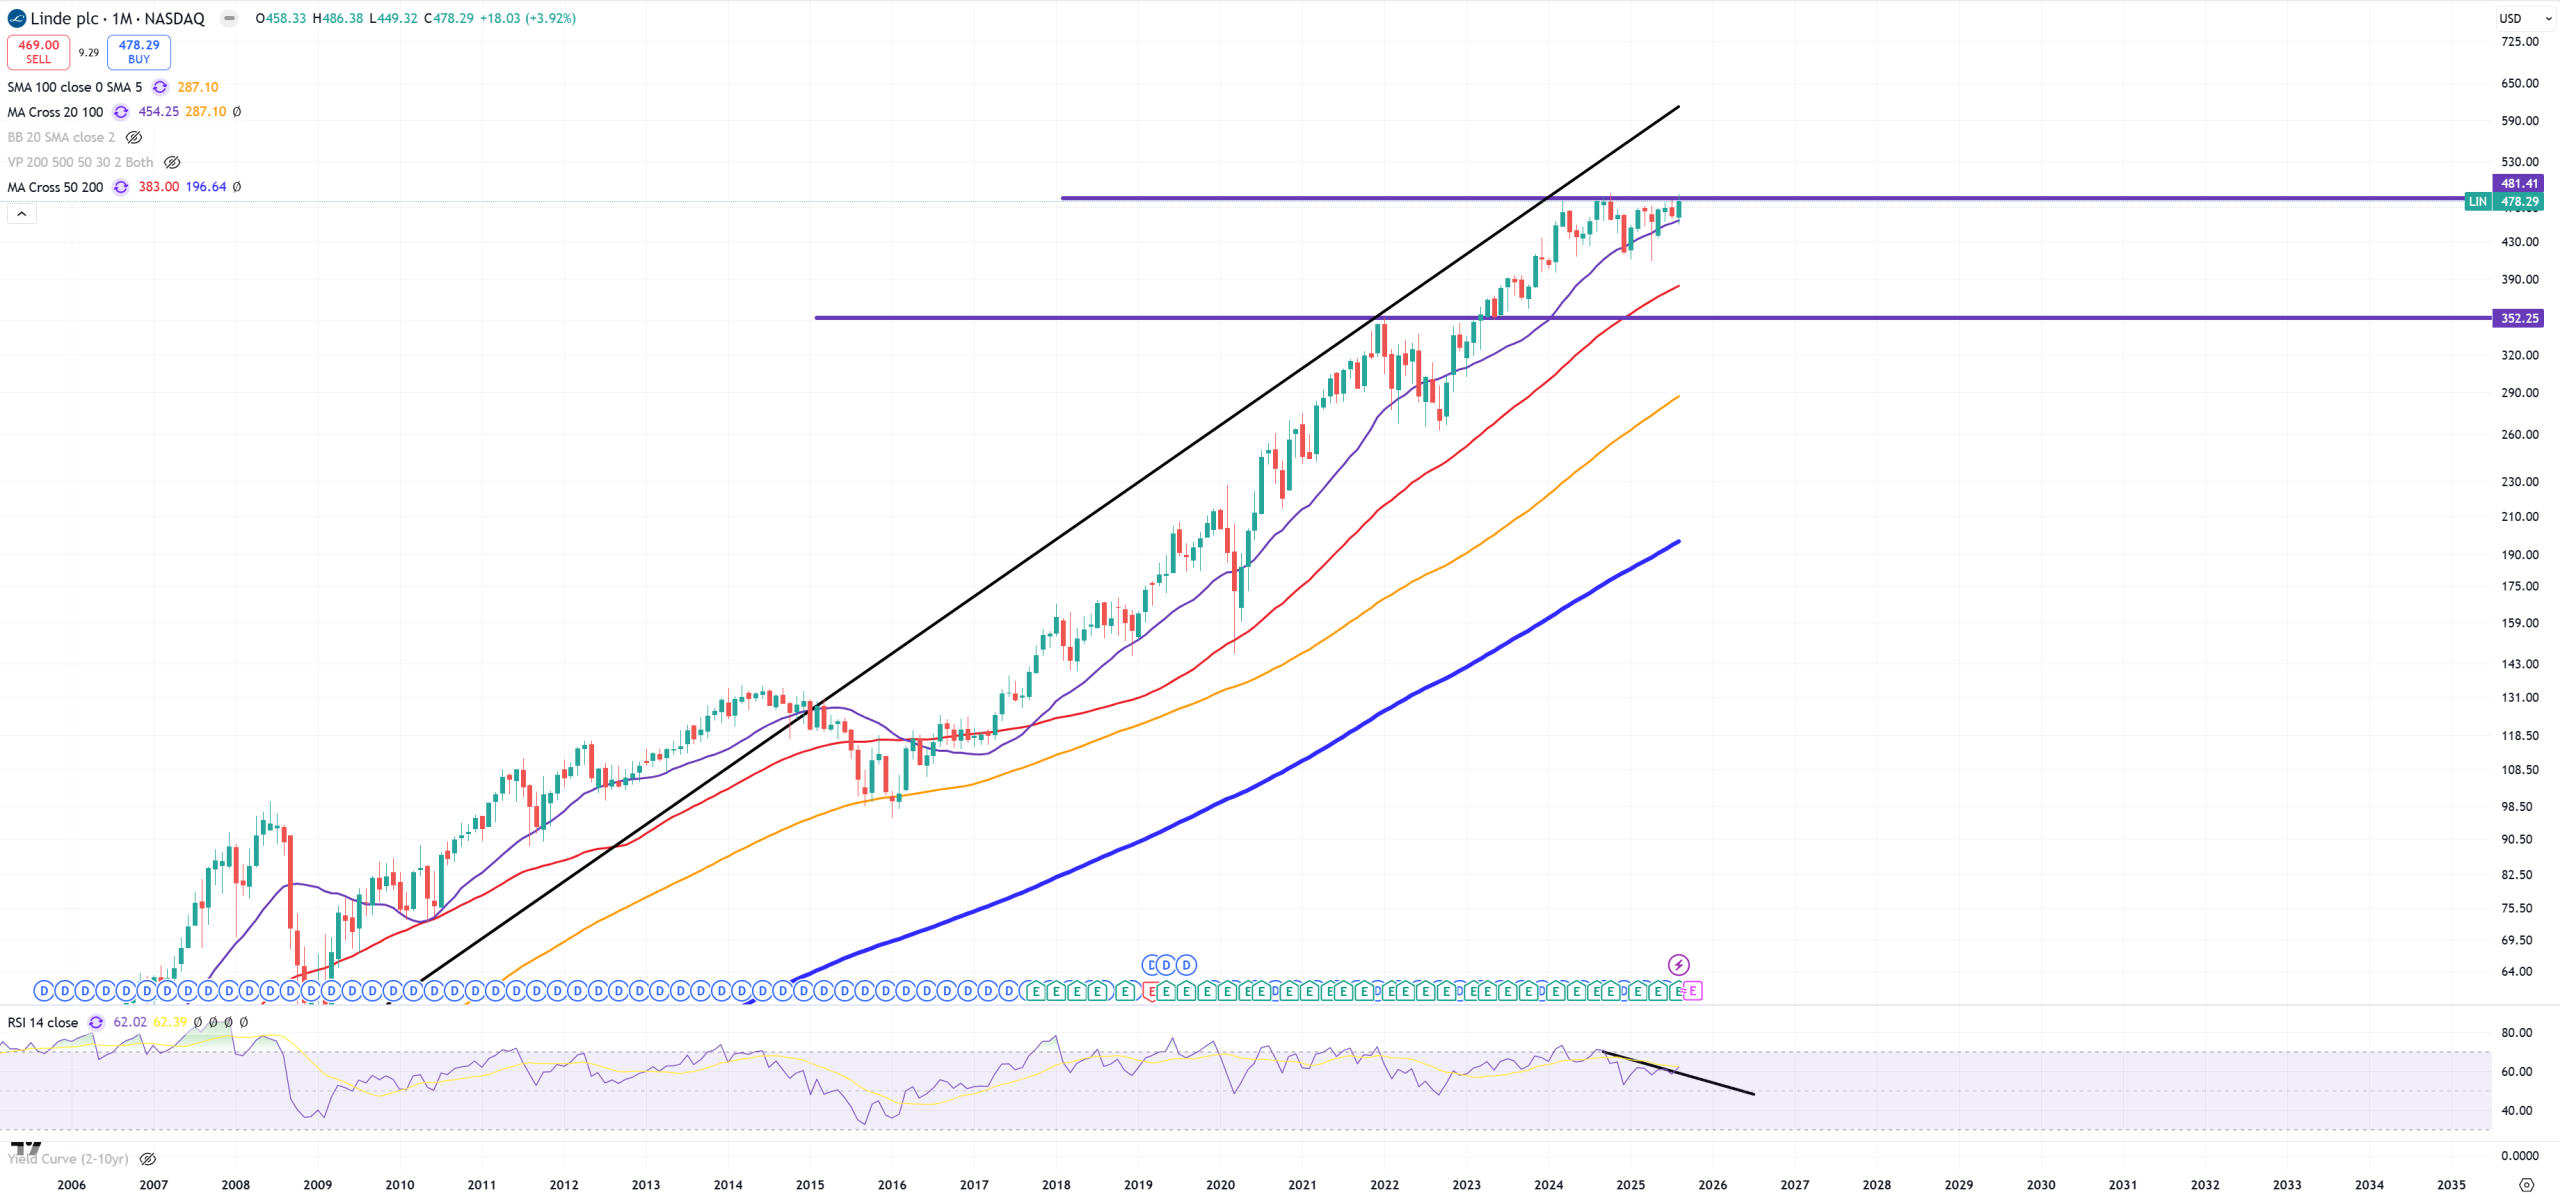
LIN – Linde – the biggest XLB holding
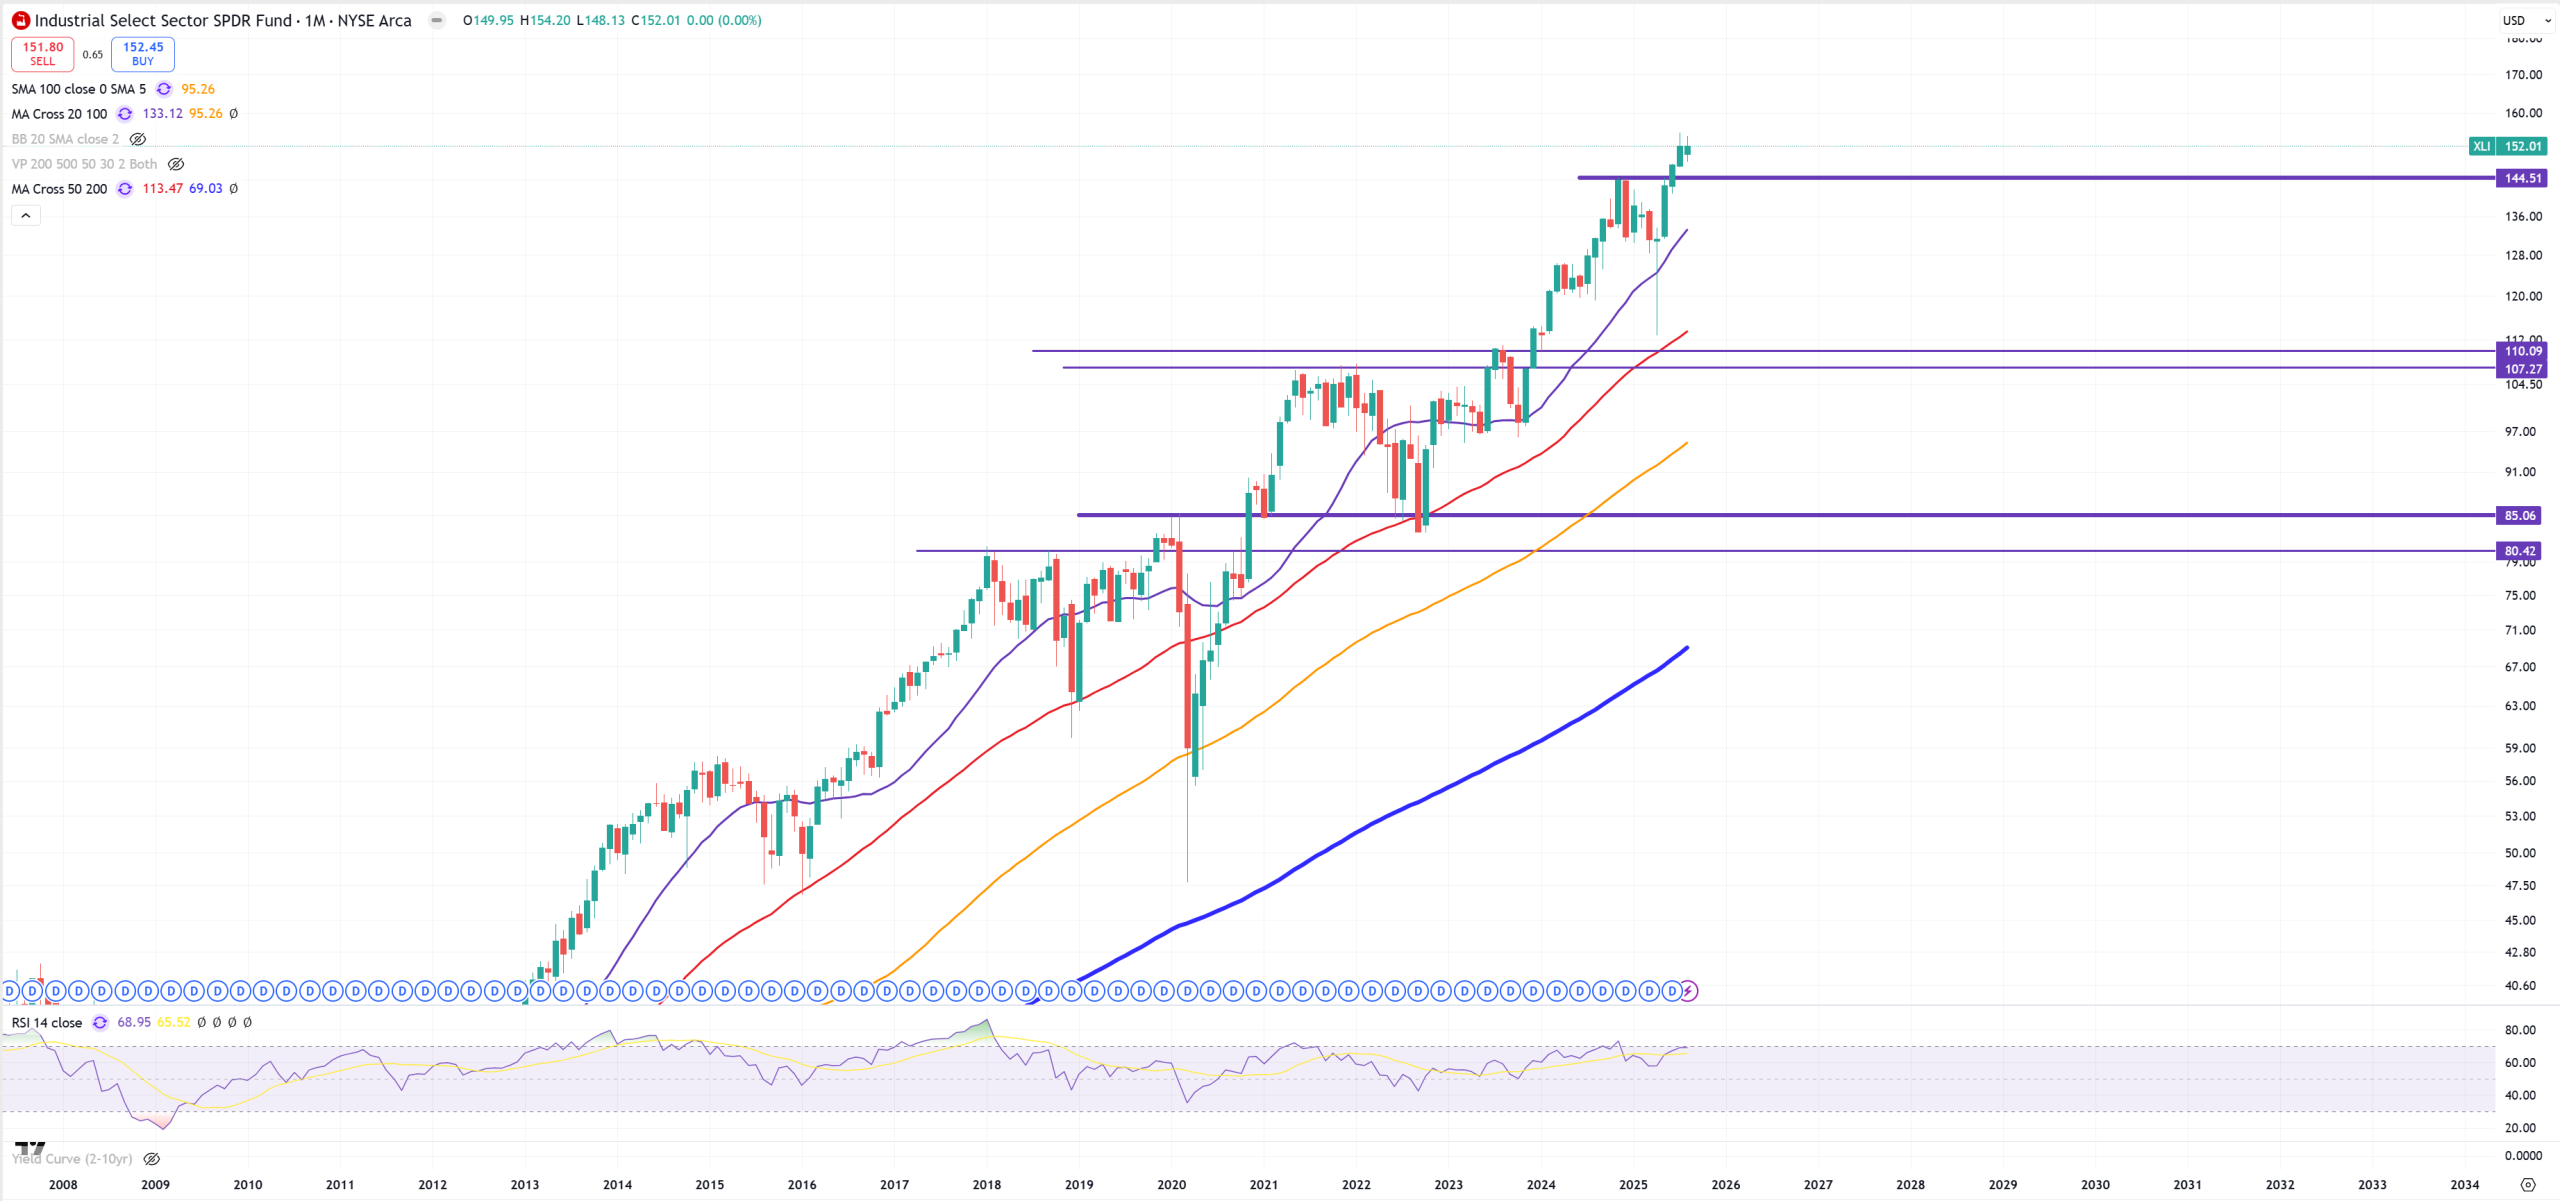
XLI – Industrial is breaking
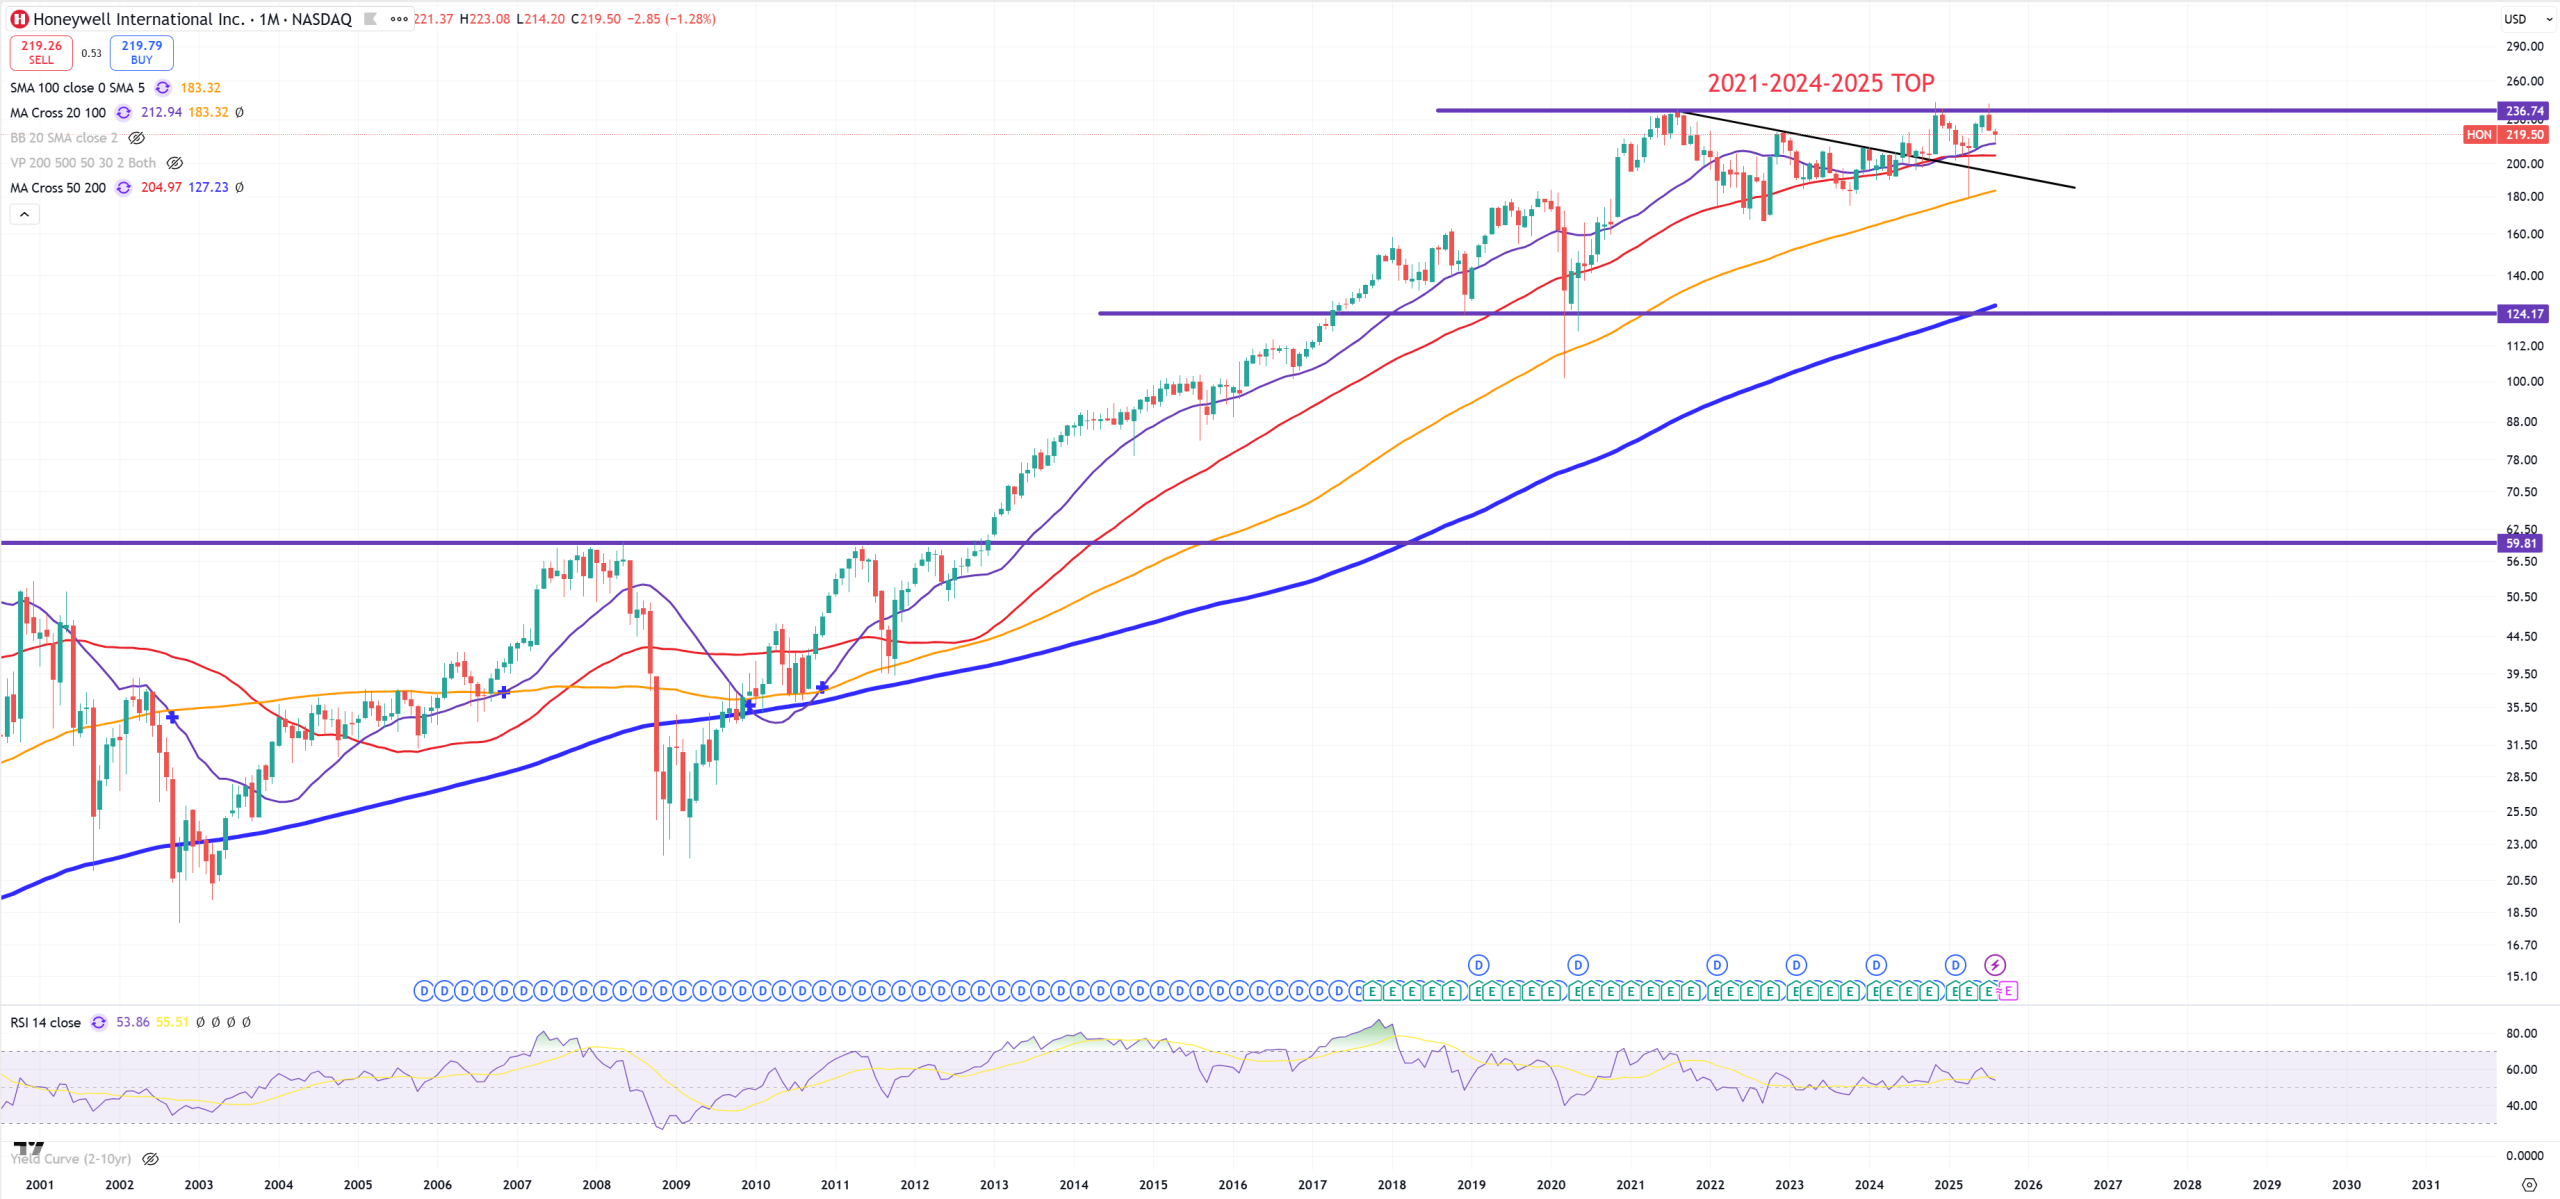
HON – HoneyWell
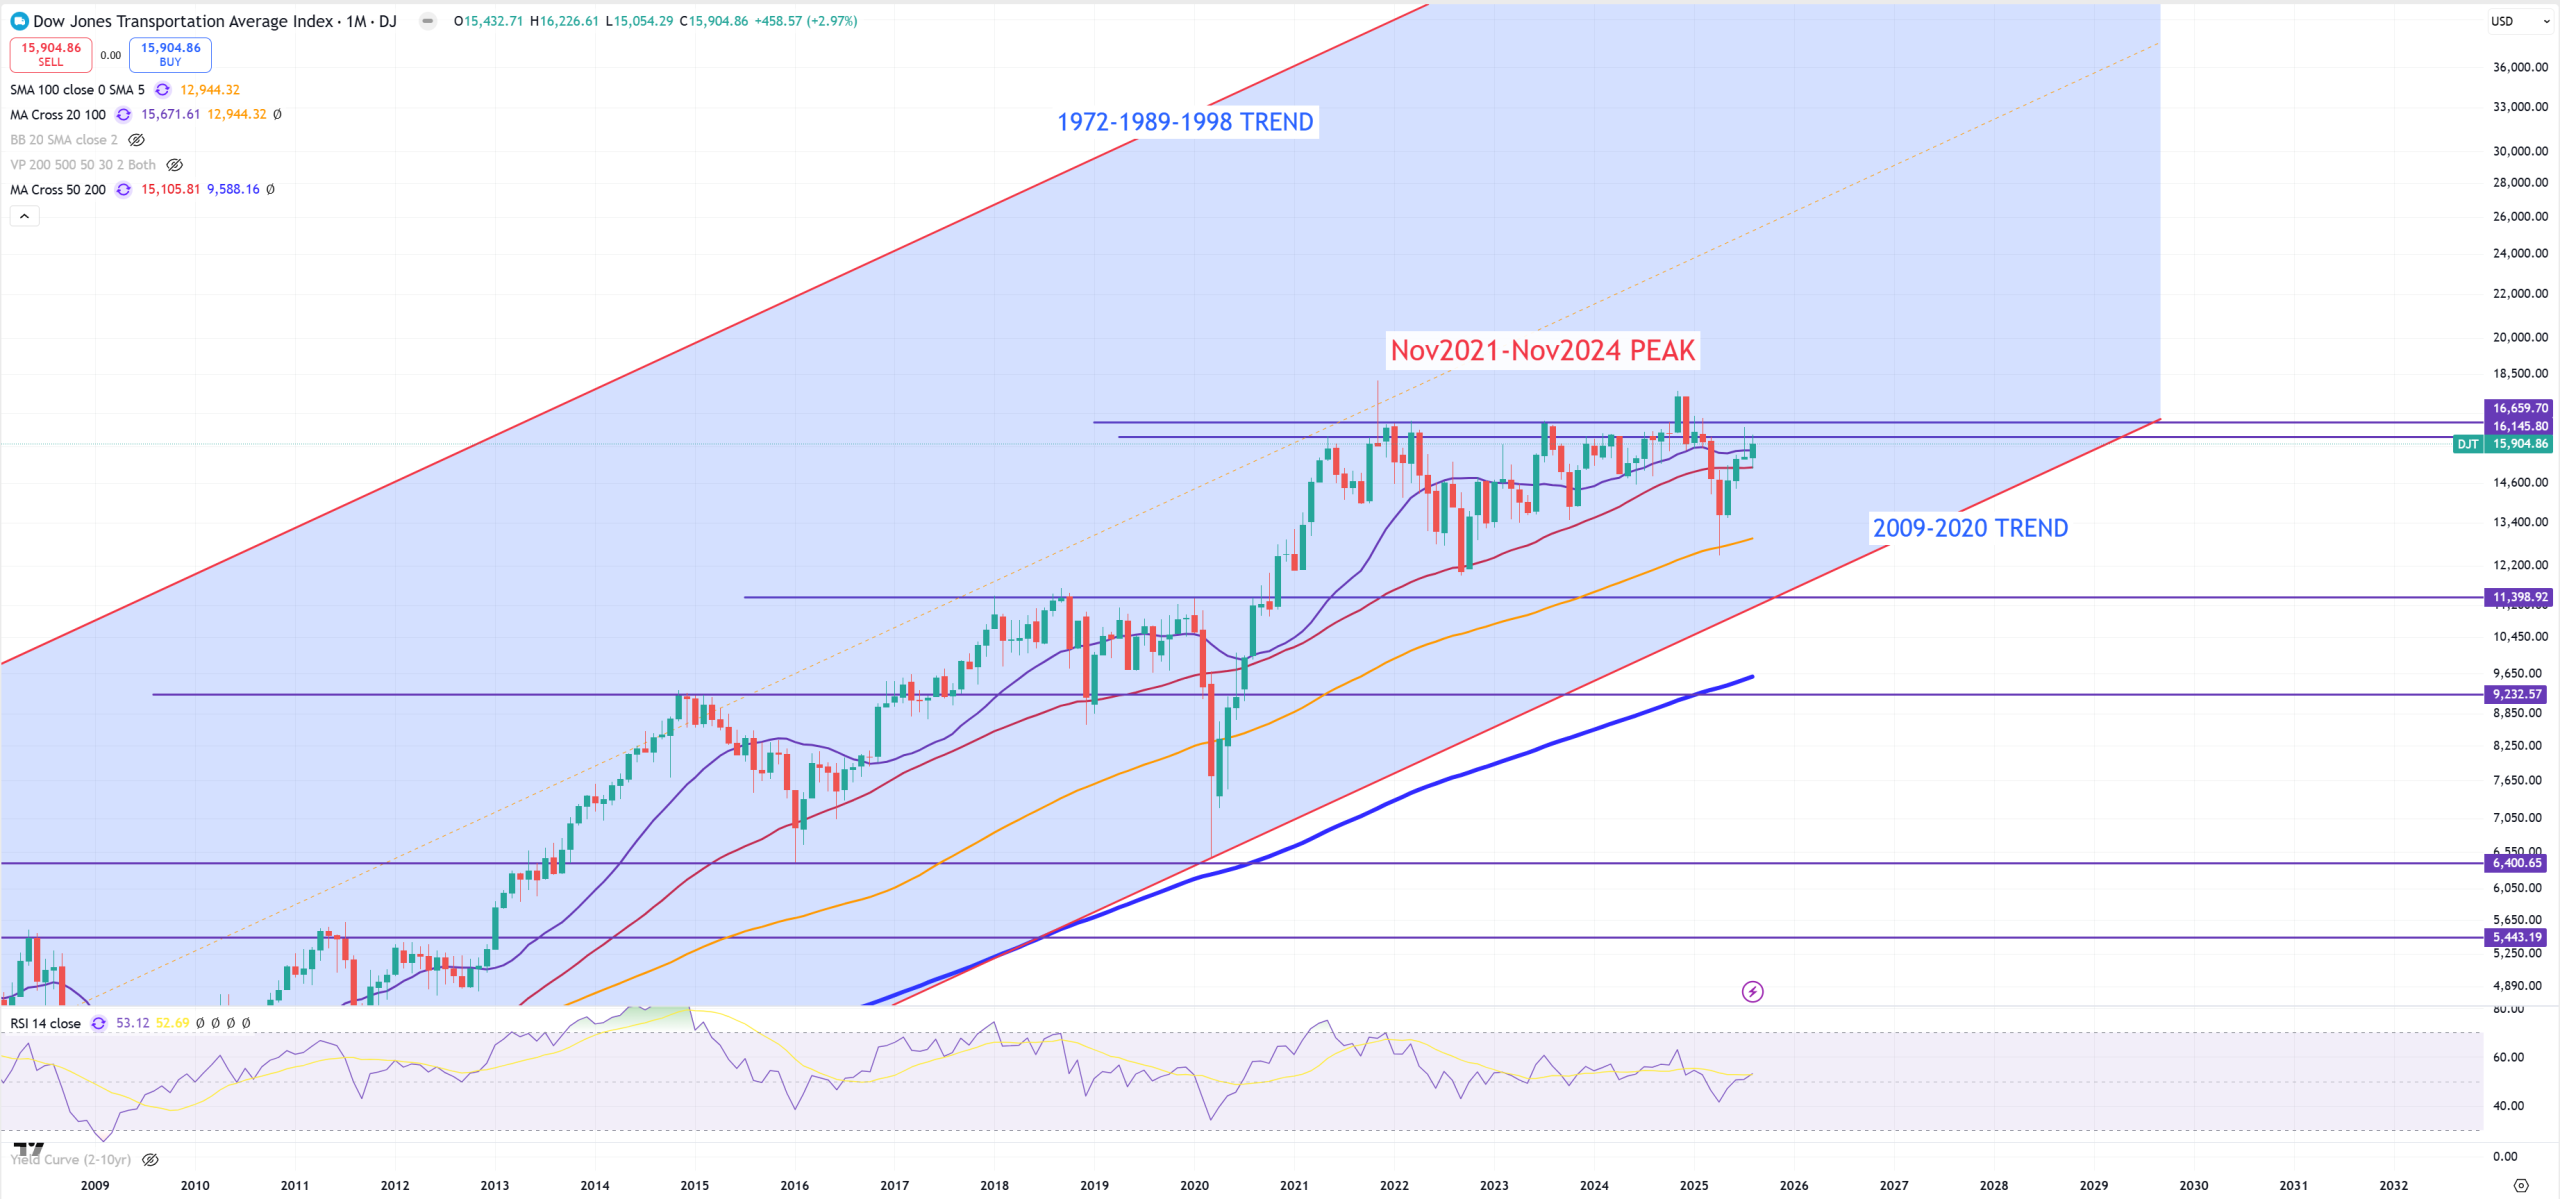
DJT – Dow Jones Transportation, also 4 years of resistance with some spikes in 2021 and 2024
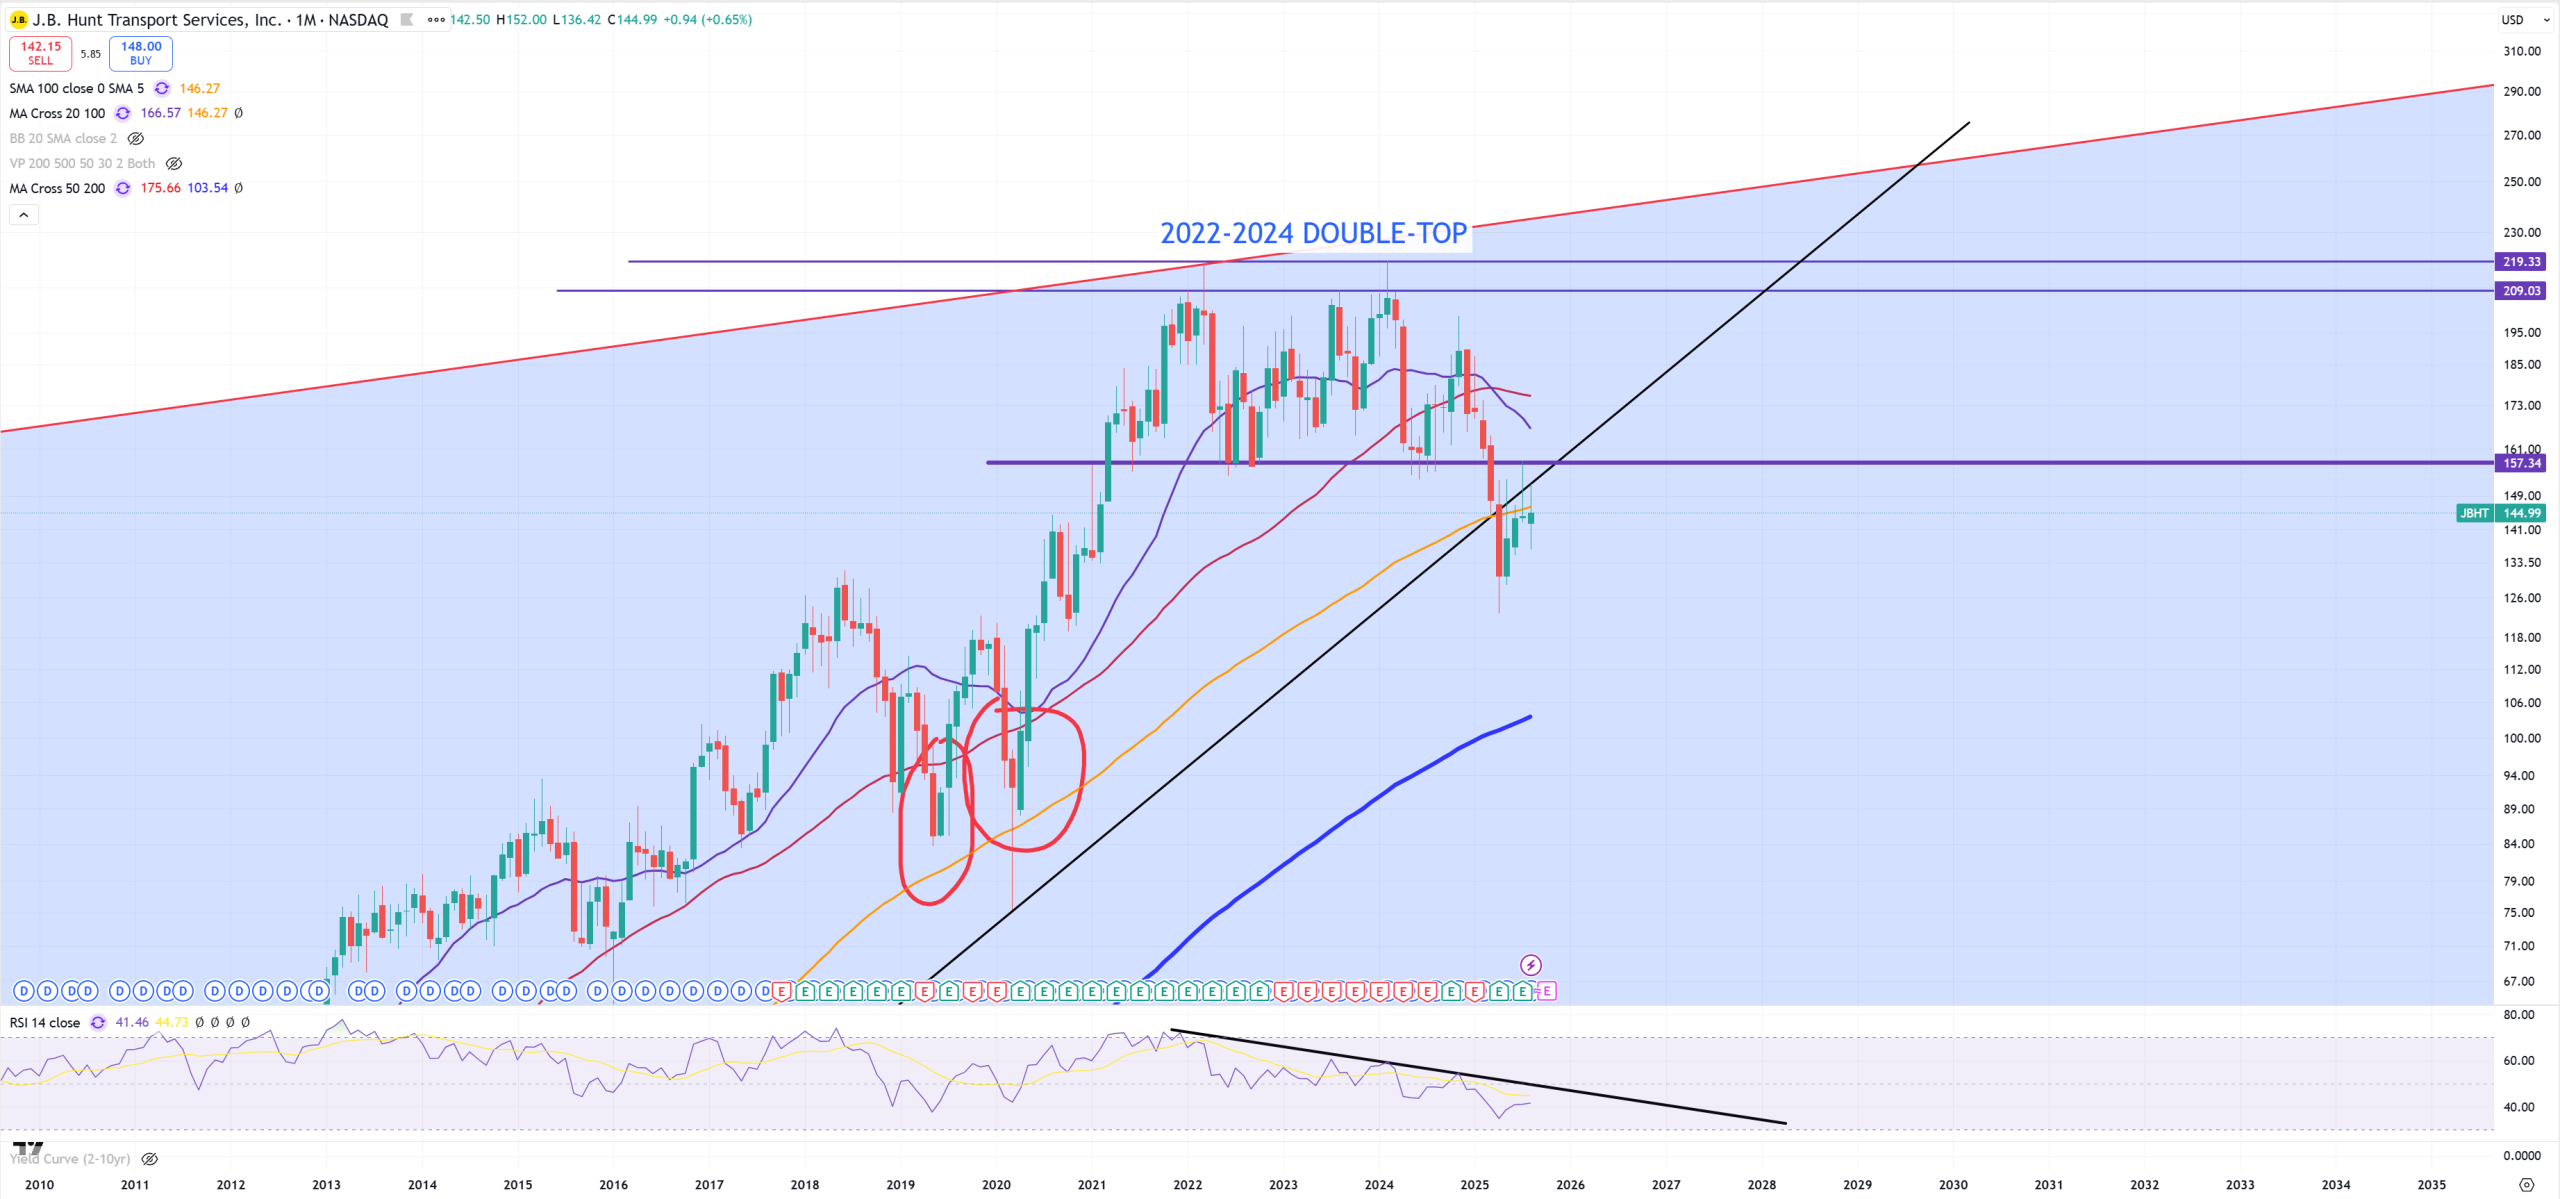
JBHT – Retesting broken 2009 trend and (M)MA100
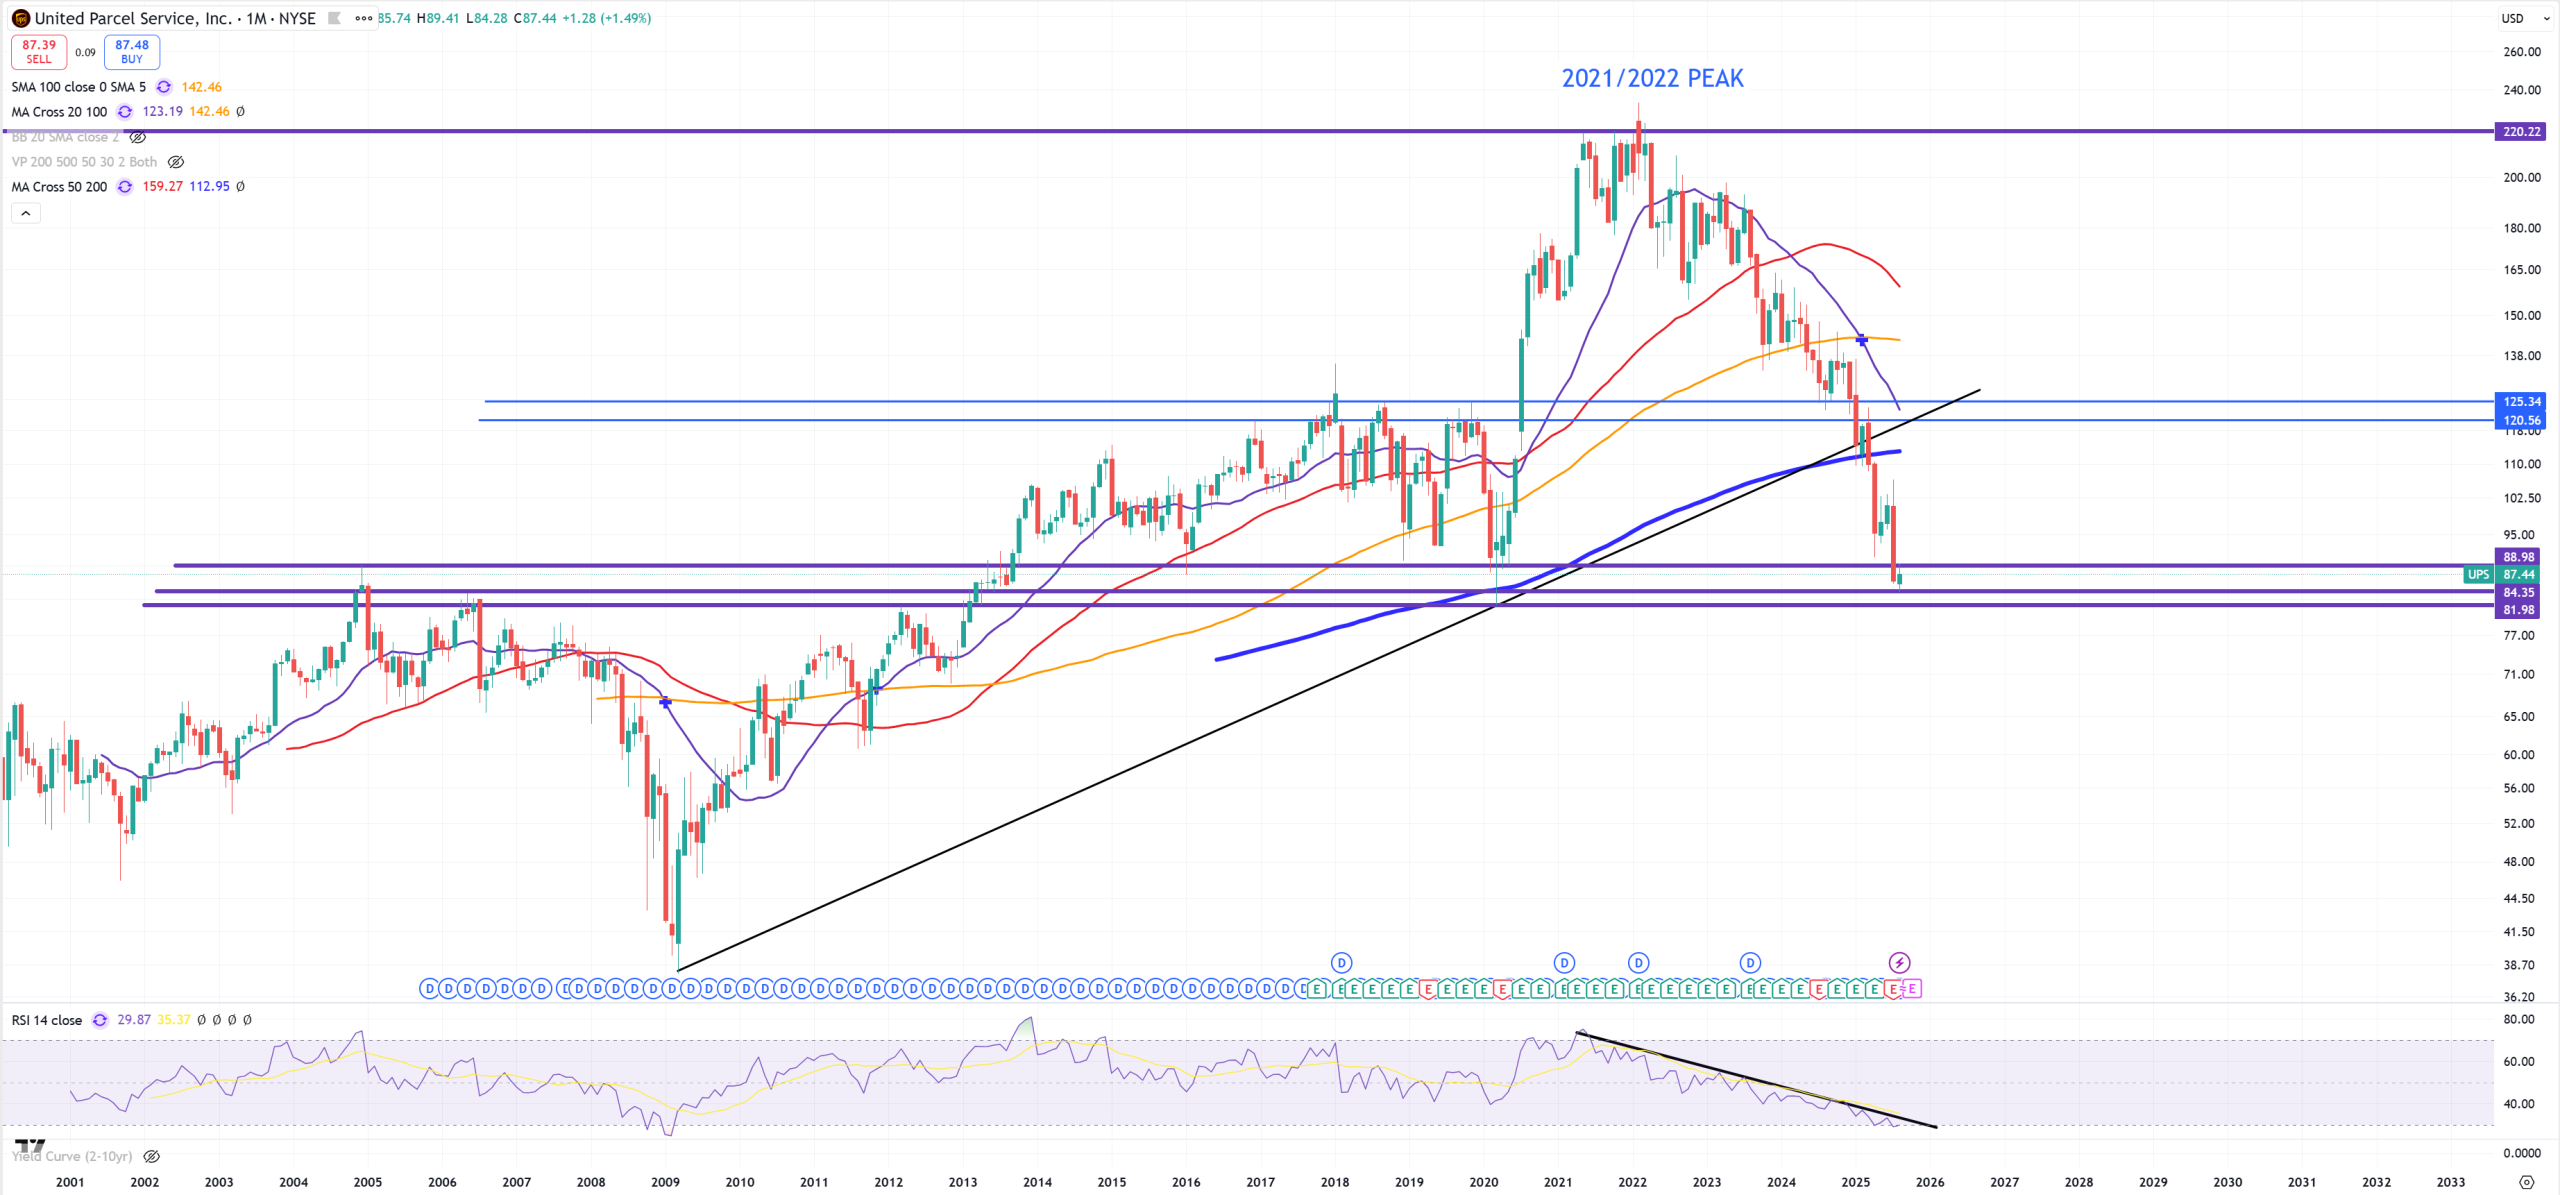
UPS – below 2004 level = resistance
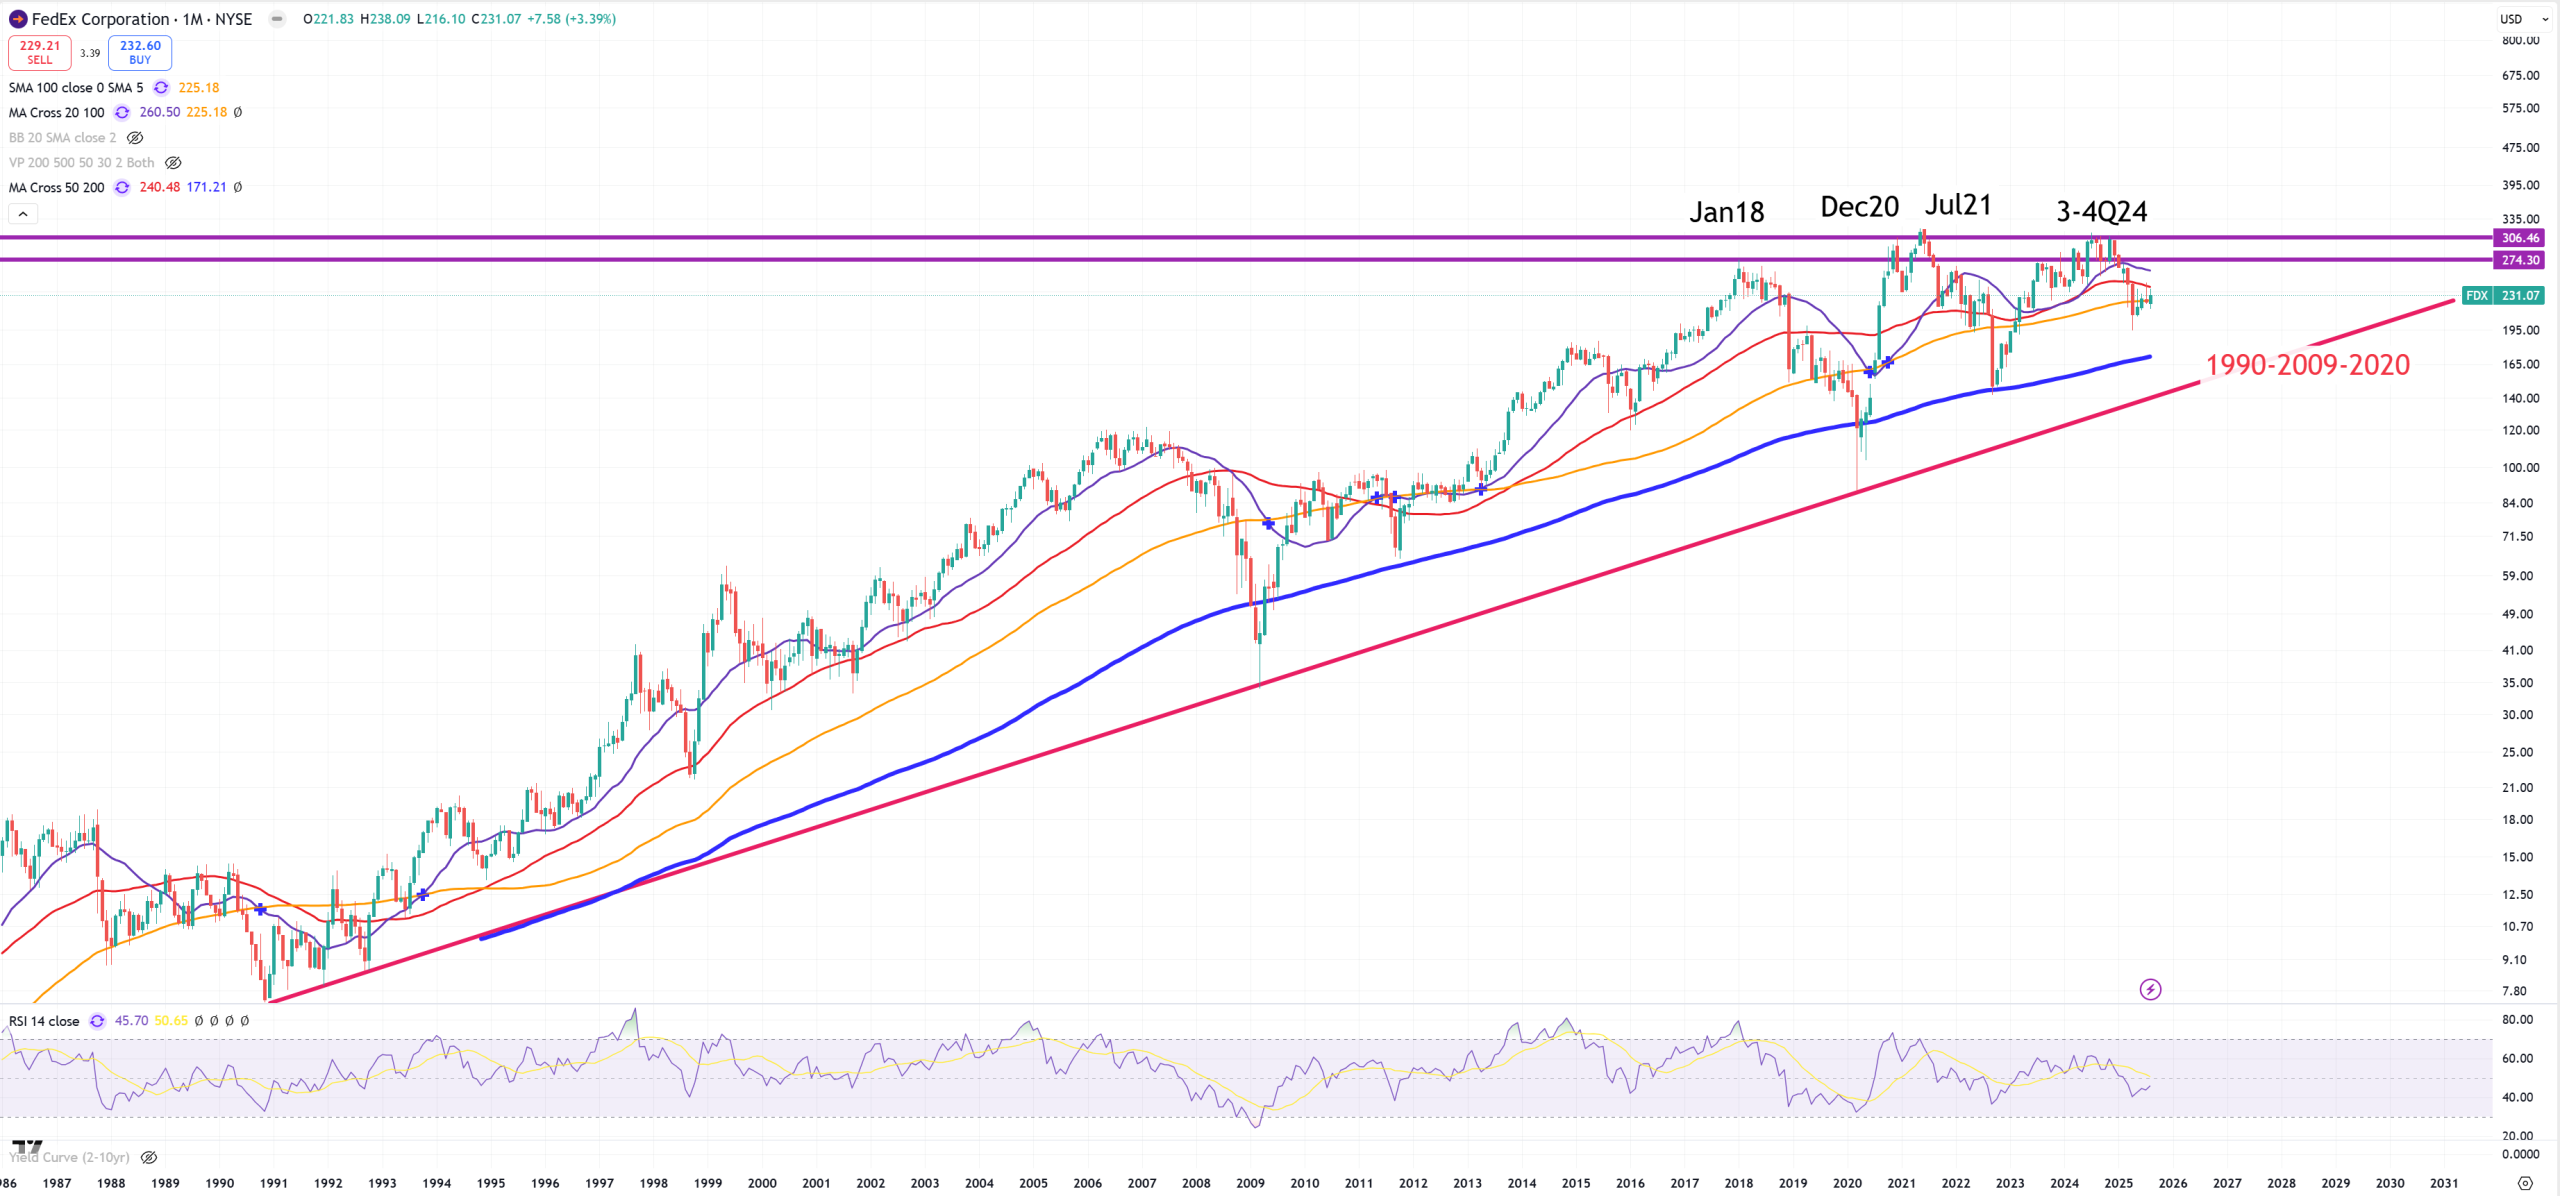
FDX – a bit different than UPS, peaks : 2021 & 3-4Q2024
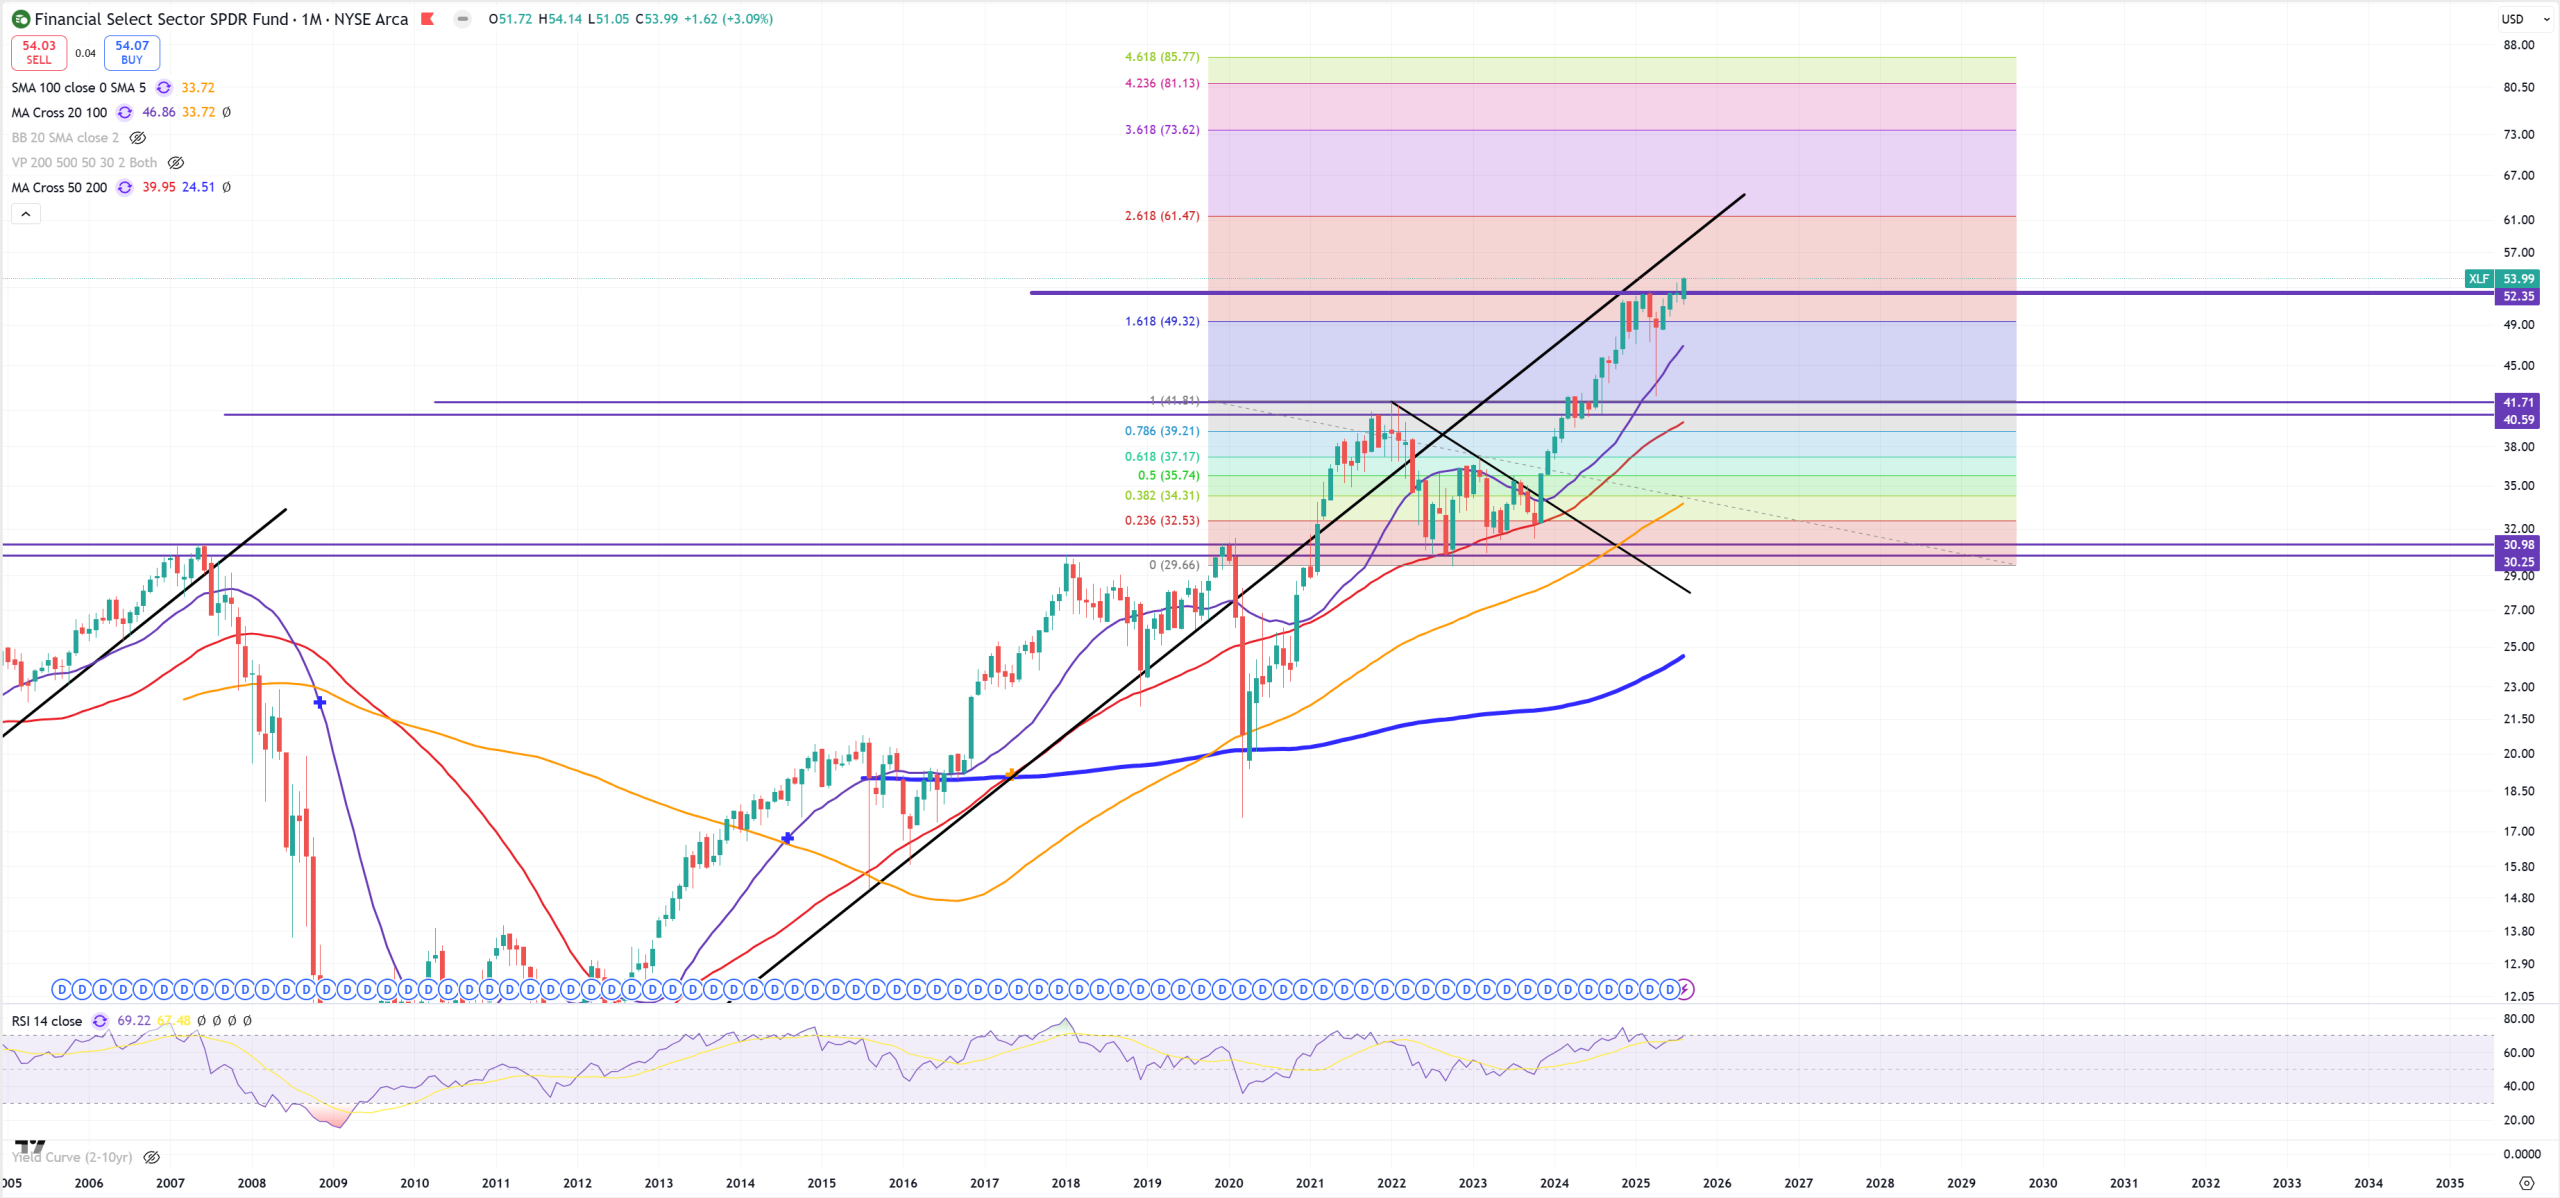
XLF – Banks rock, they love high interest rates, unless credit blows up, all key banks like GS, MS, JPM are running parabolic
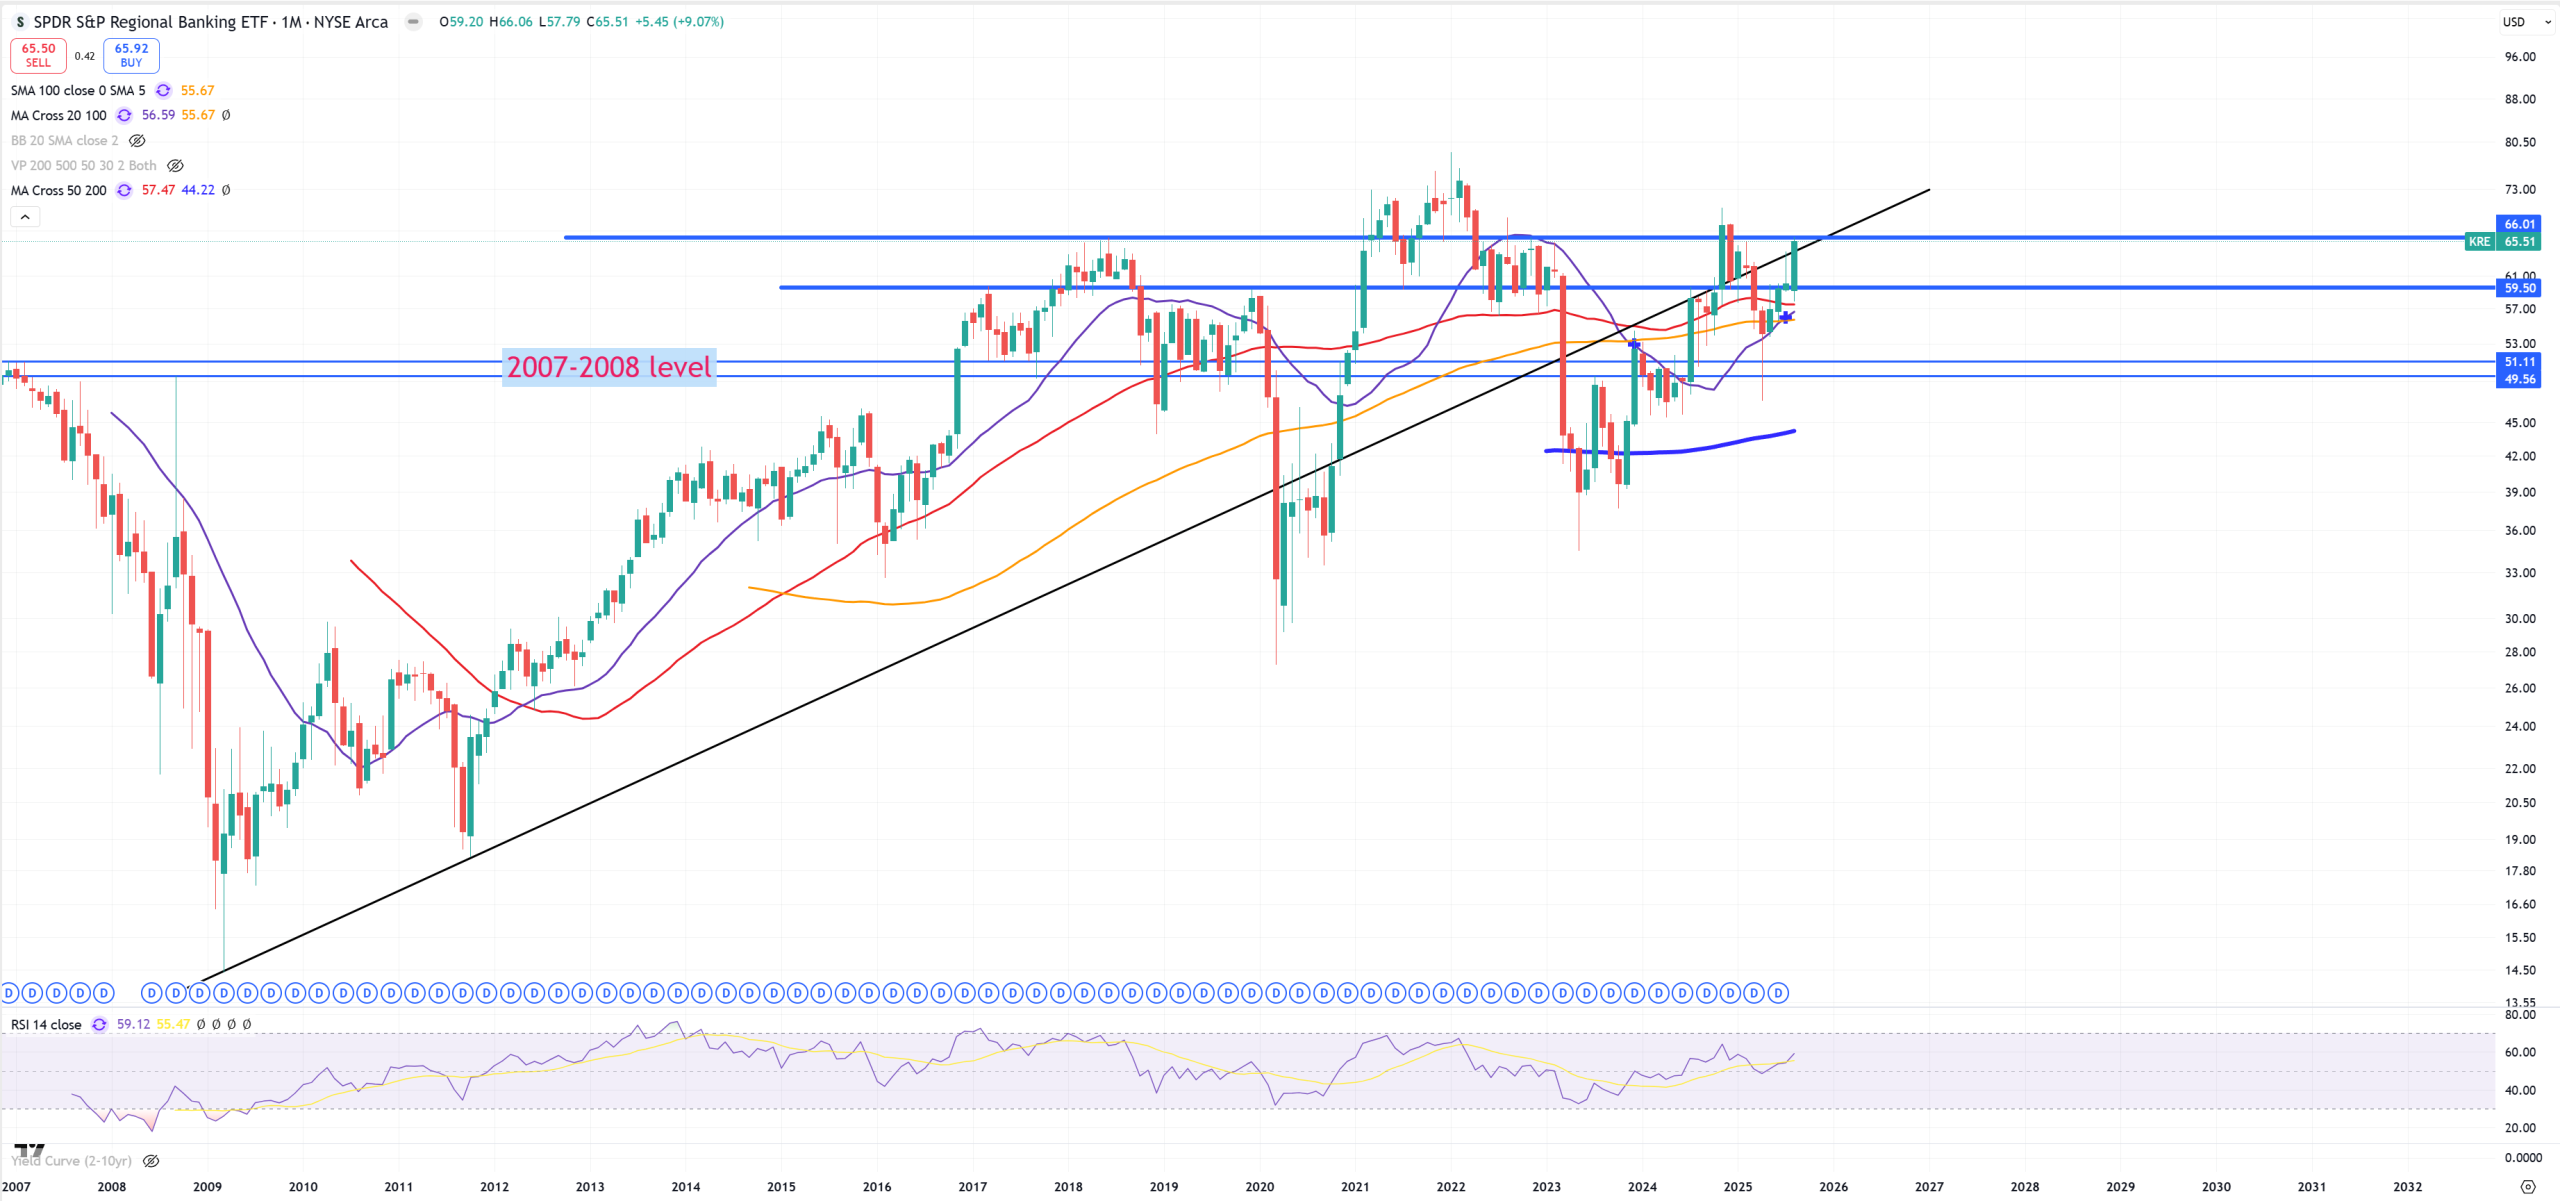
KRE – Regional Banks are more or less looking like IWM
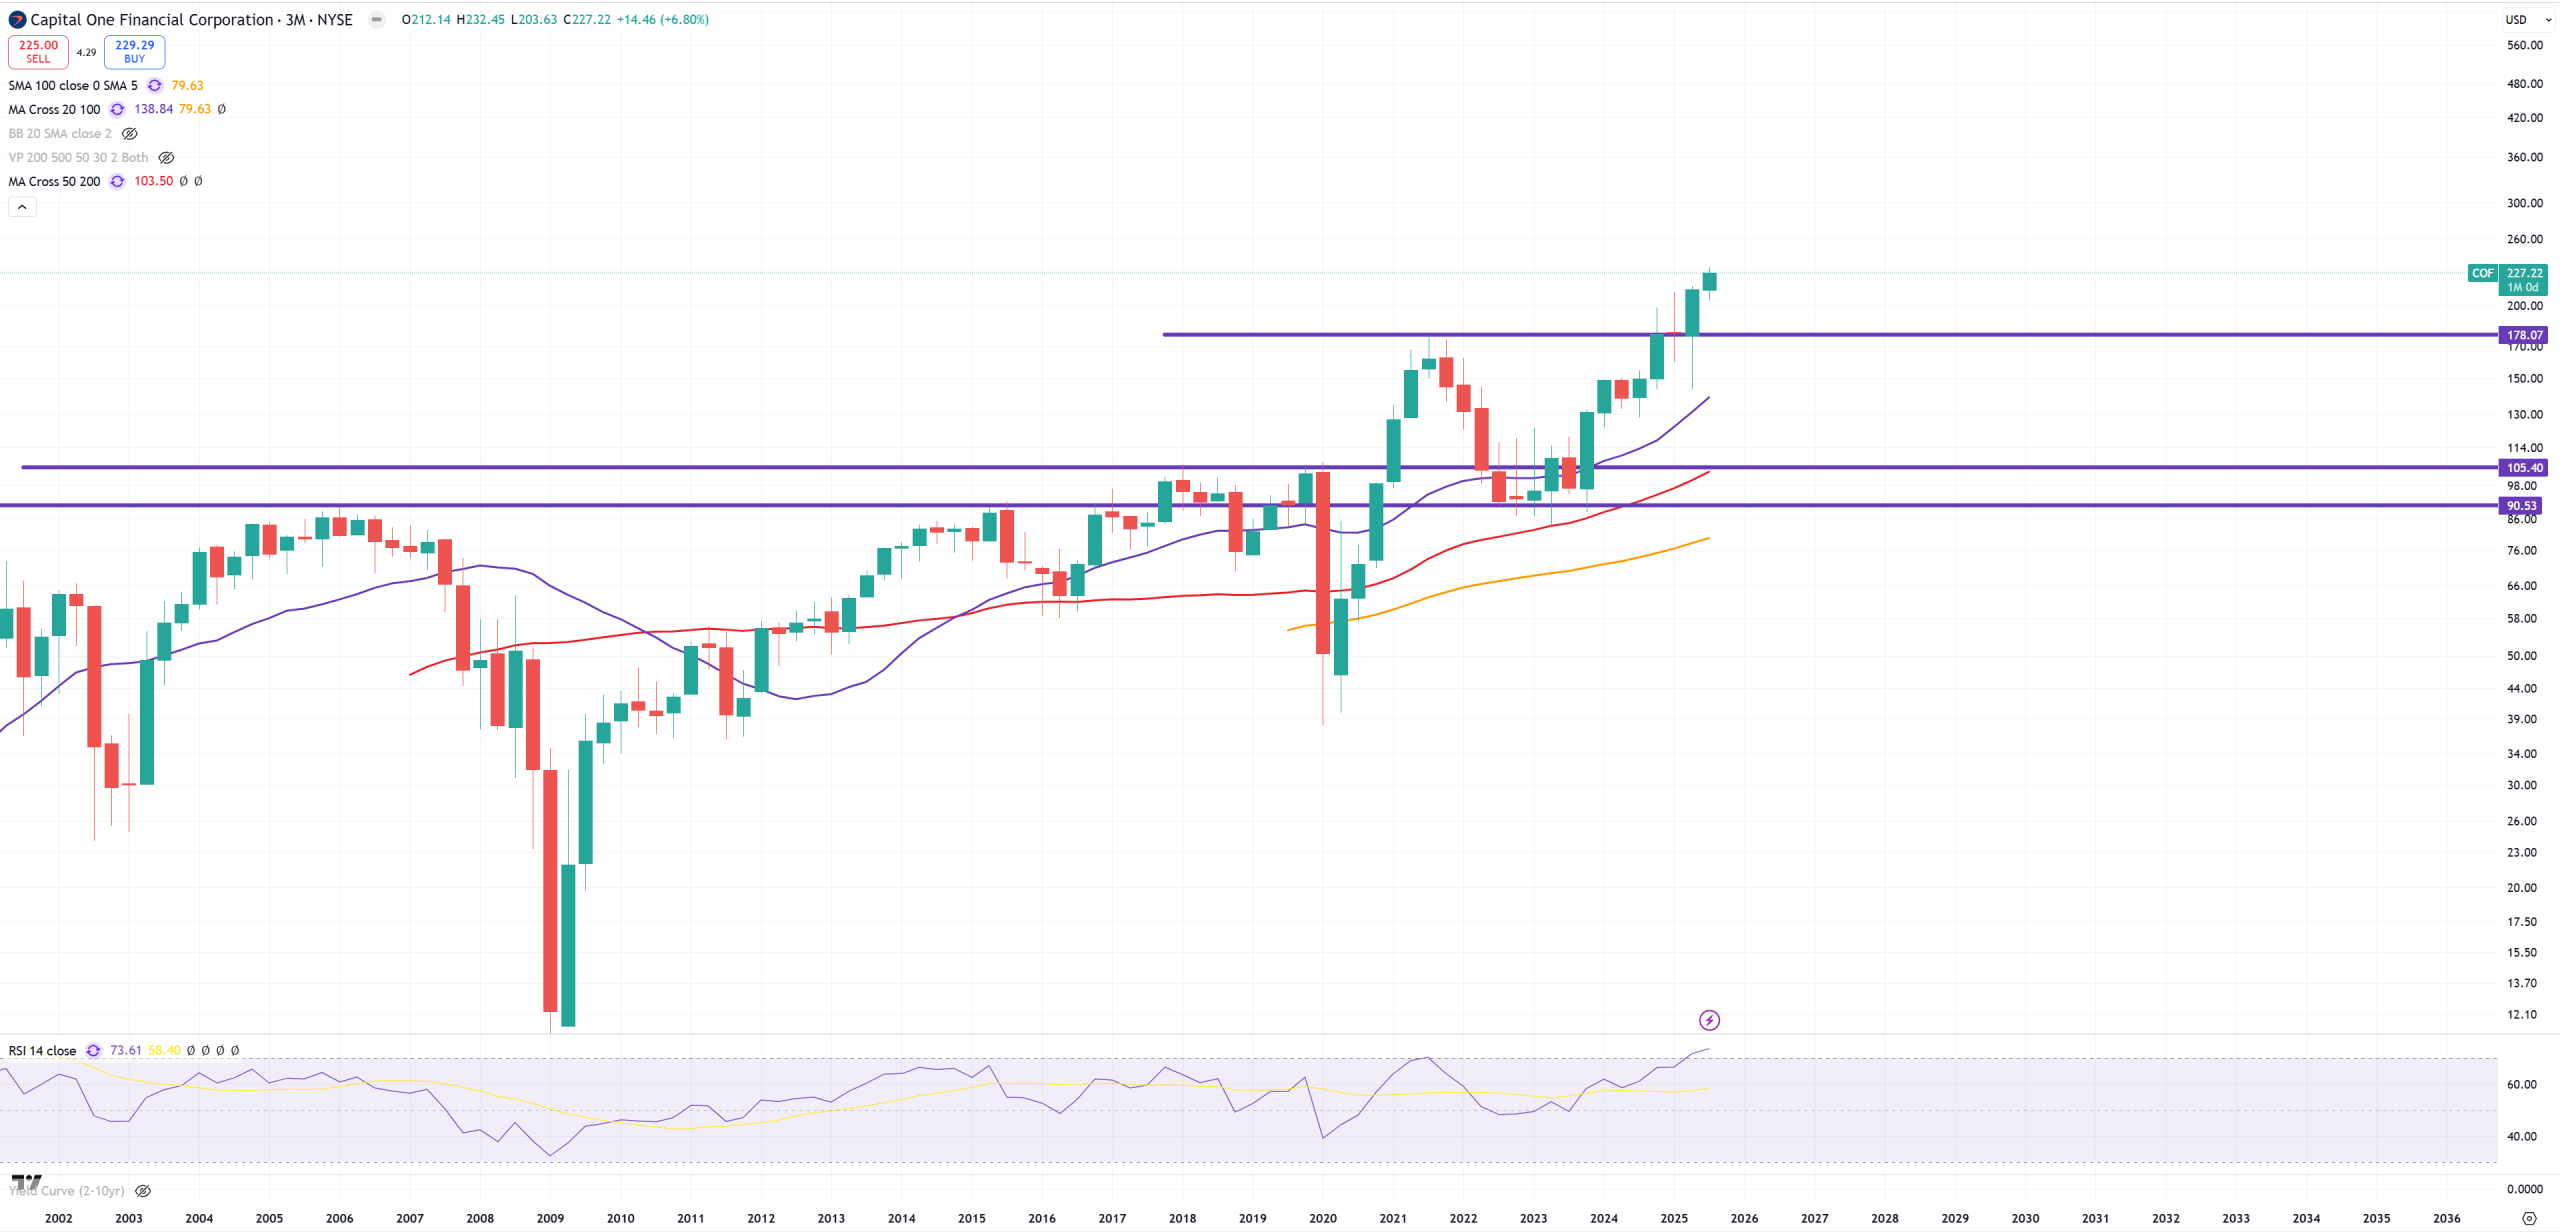
COF – Capital One Financial Corp – key company connected with junk credit. Because HYG does not go down, COF stays high
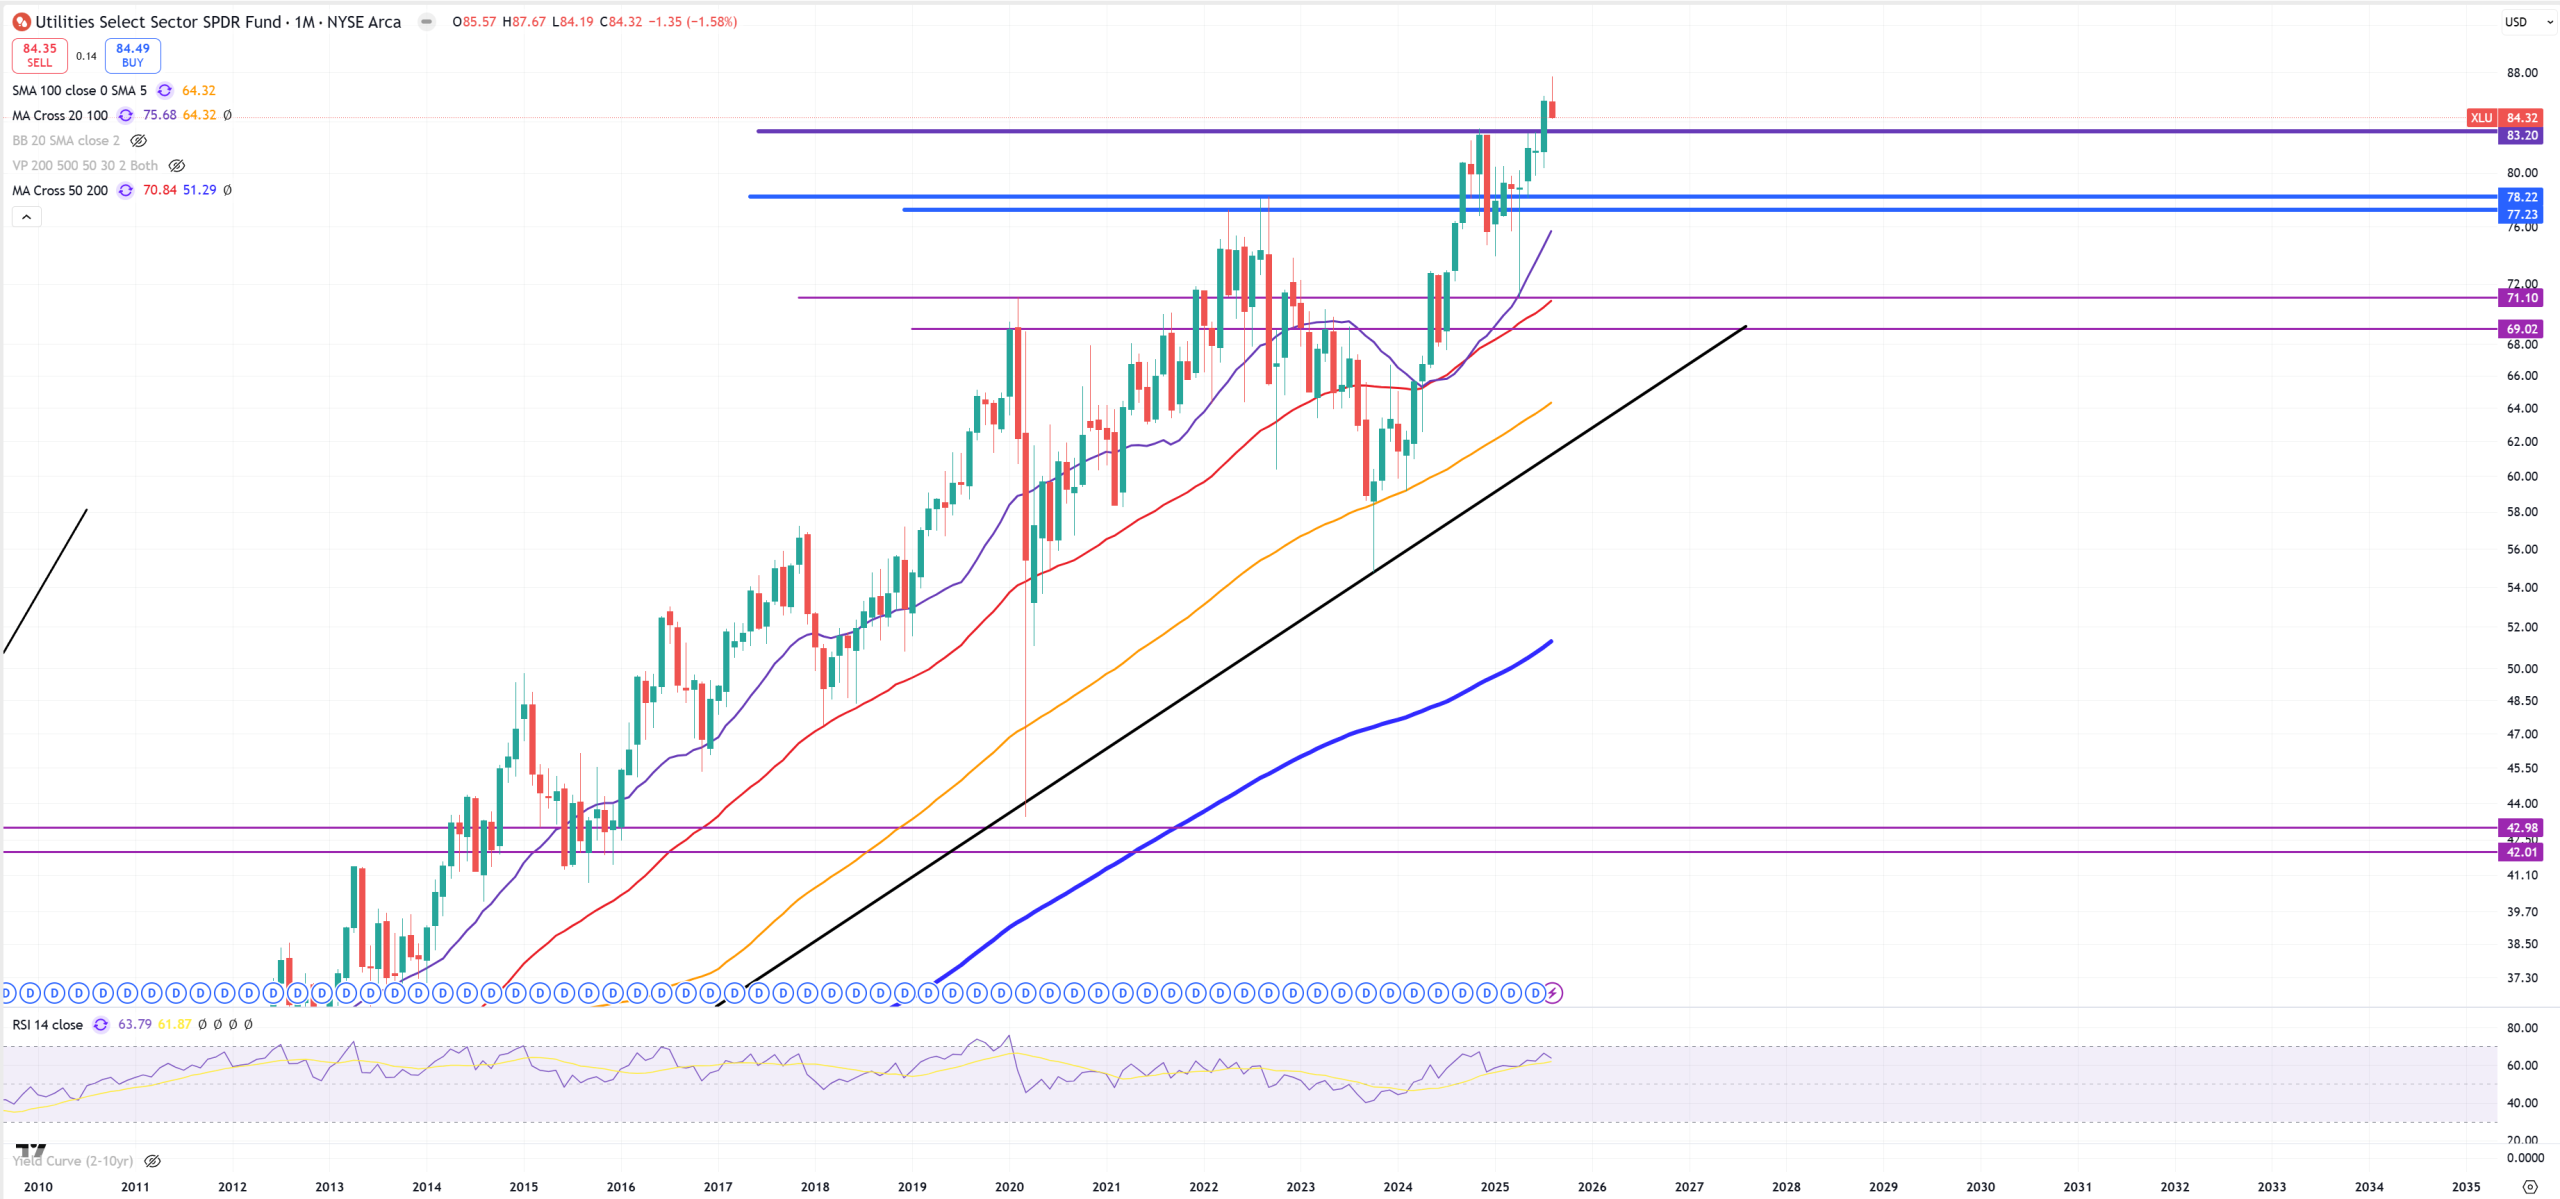
XLU – Utilities, this is always the last standing sector
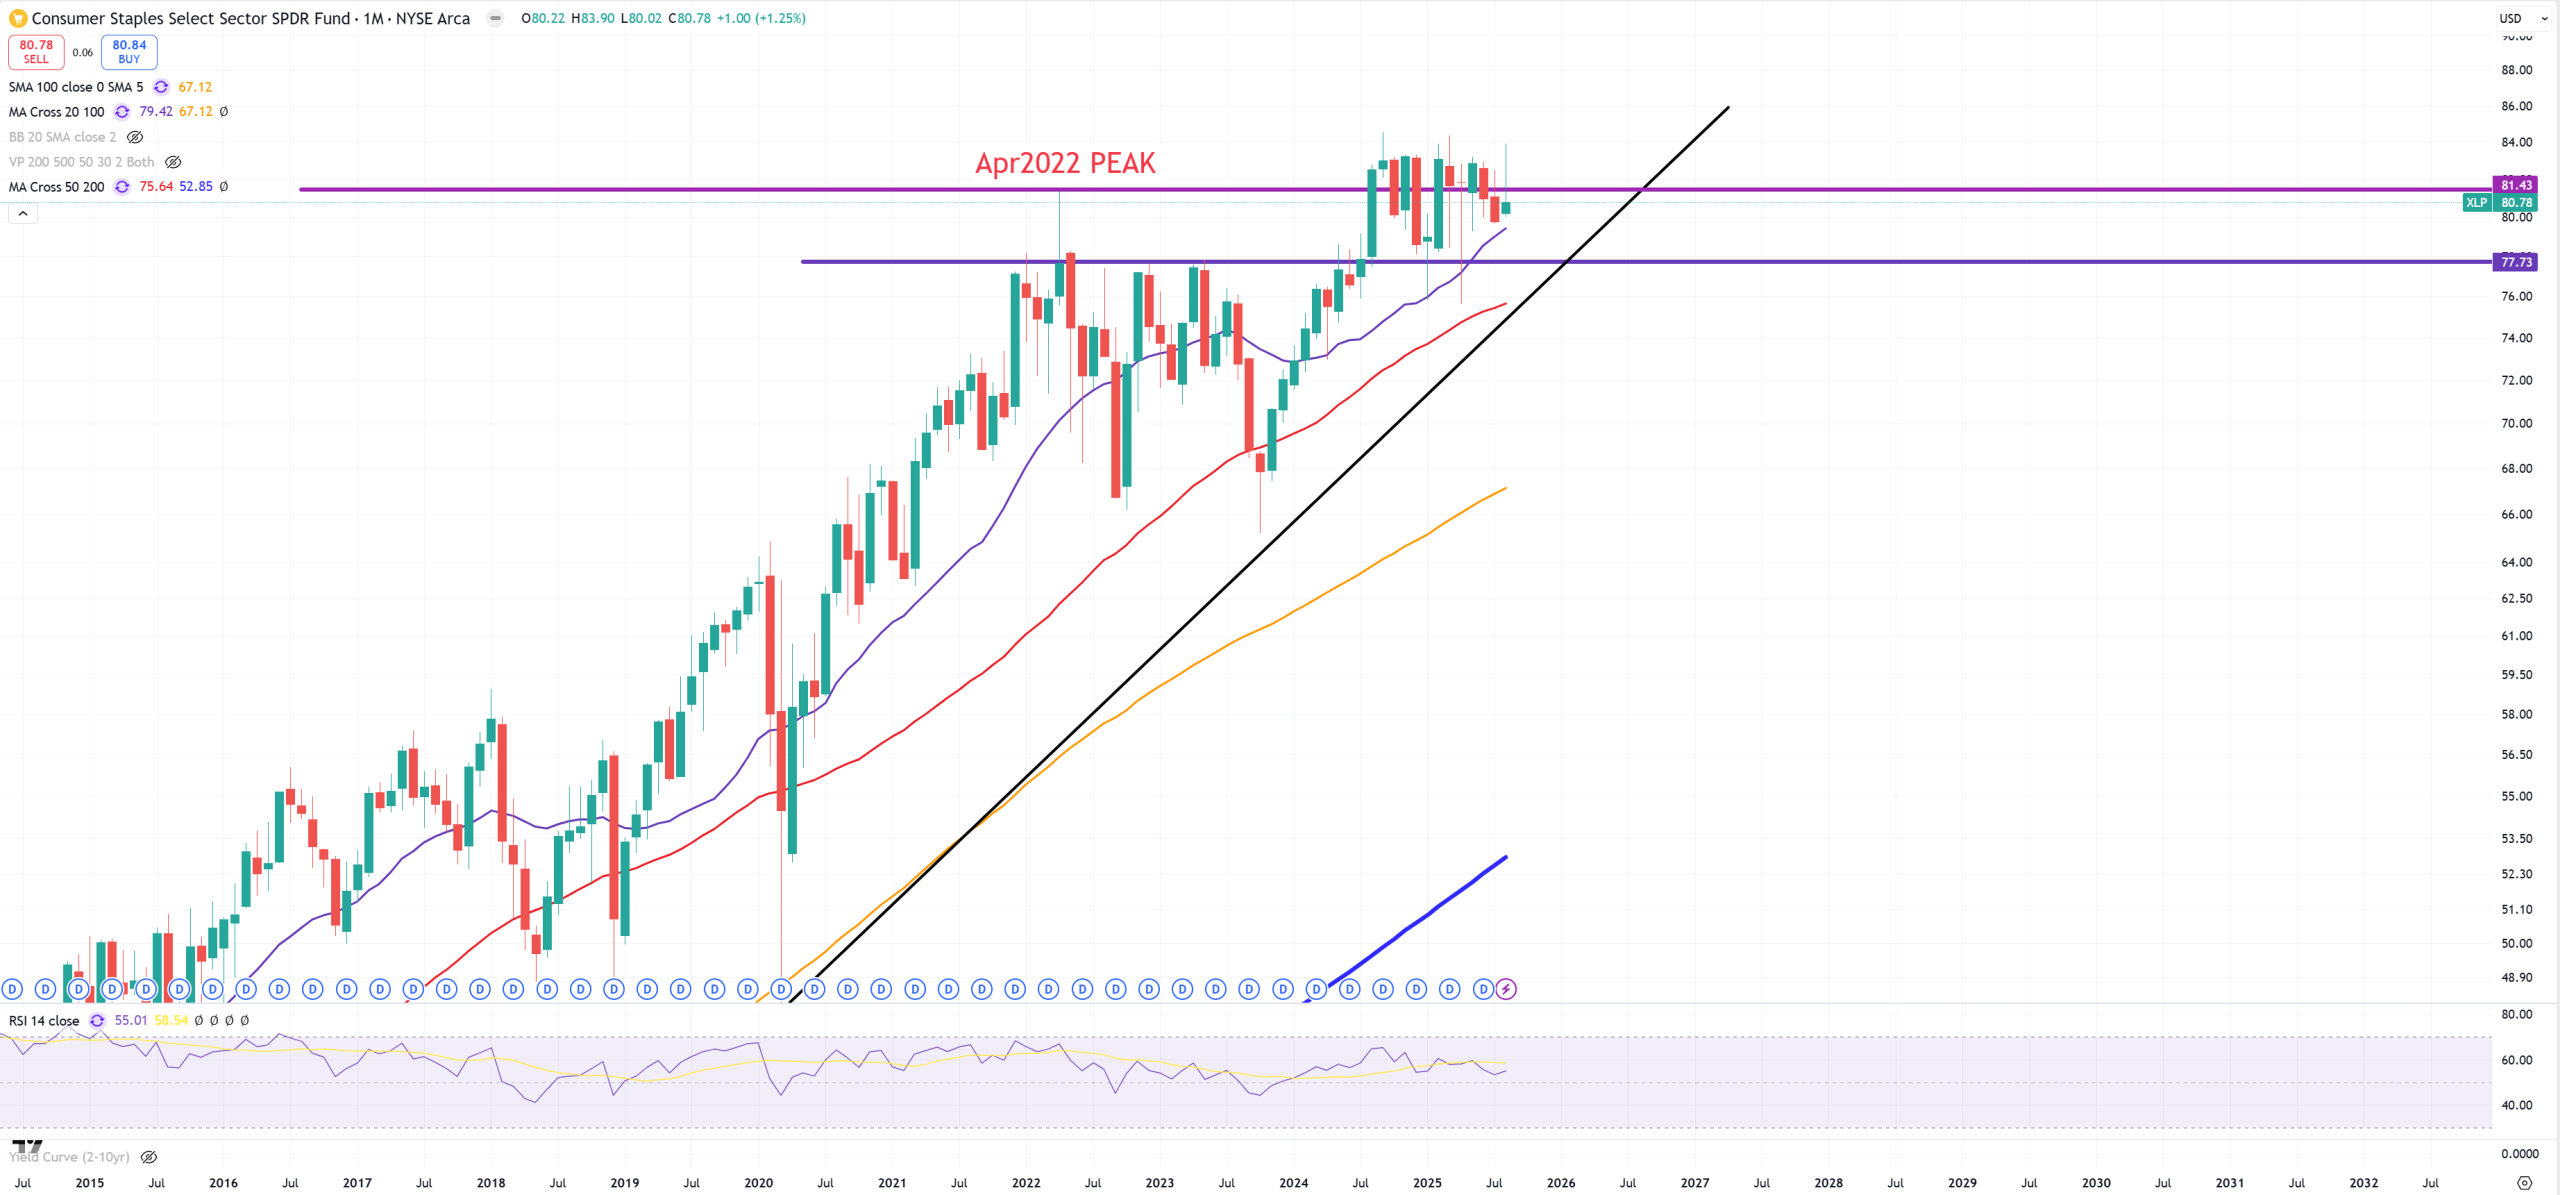
XLP – Consumer Staples. Big peak in April 2022, so far it fails to get above this level
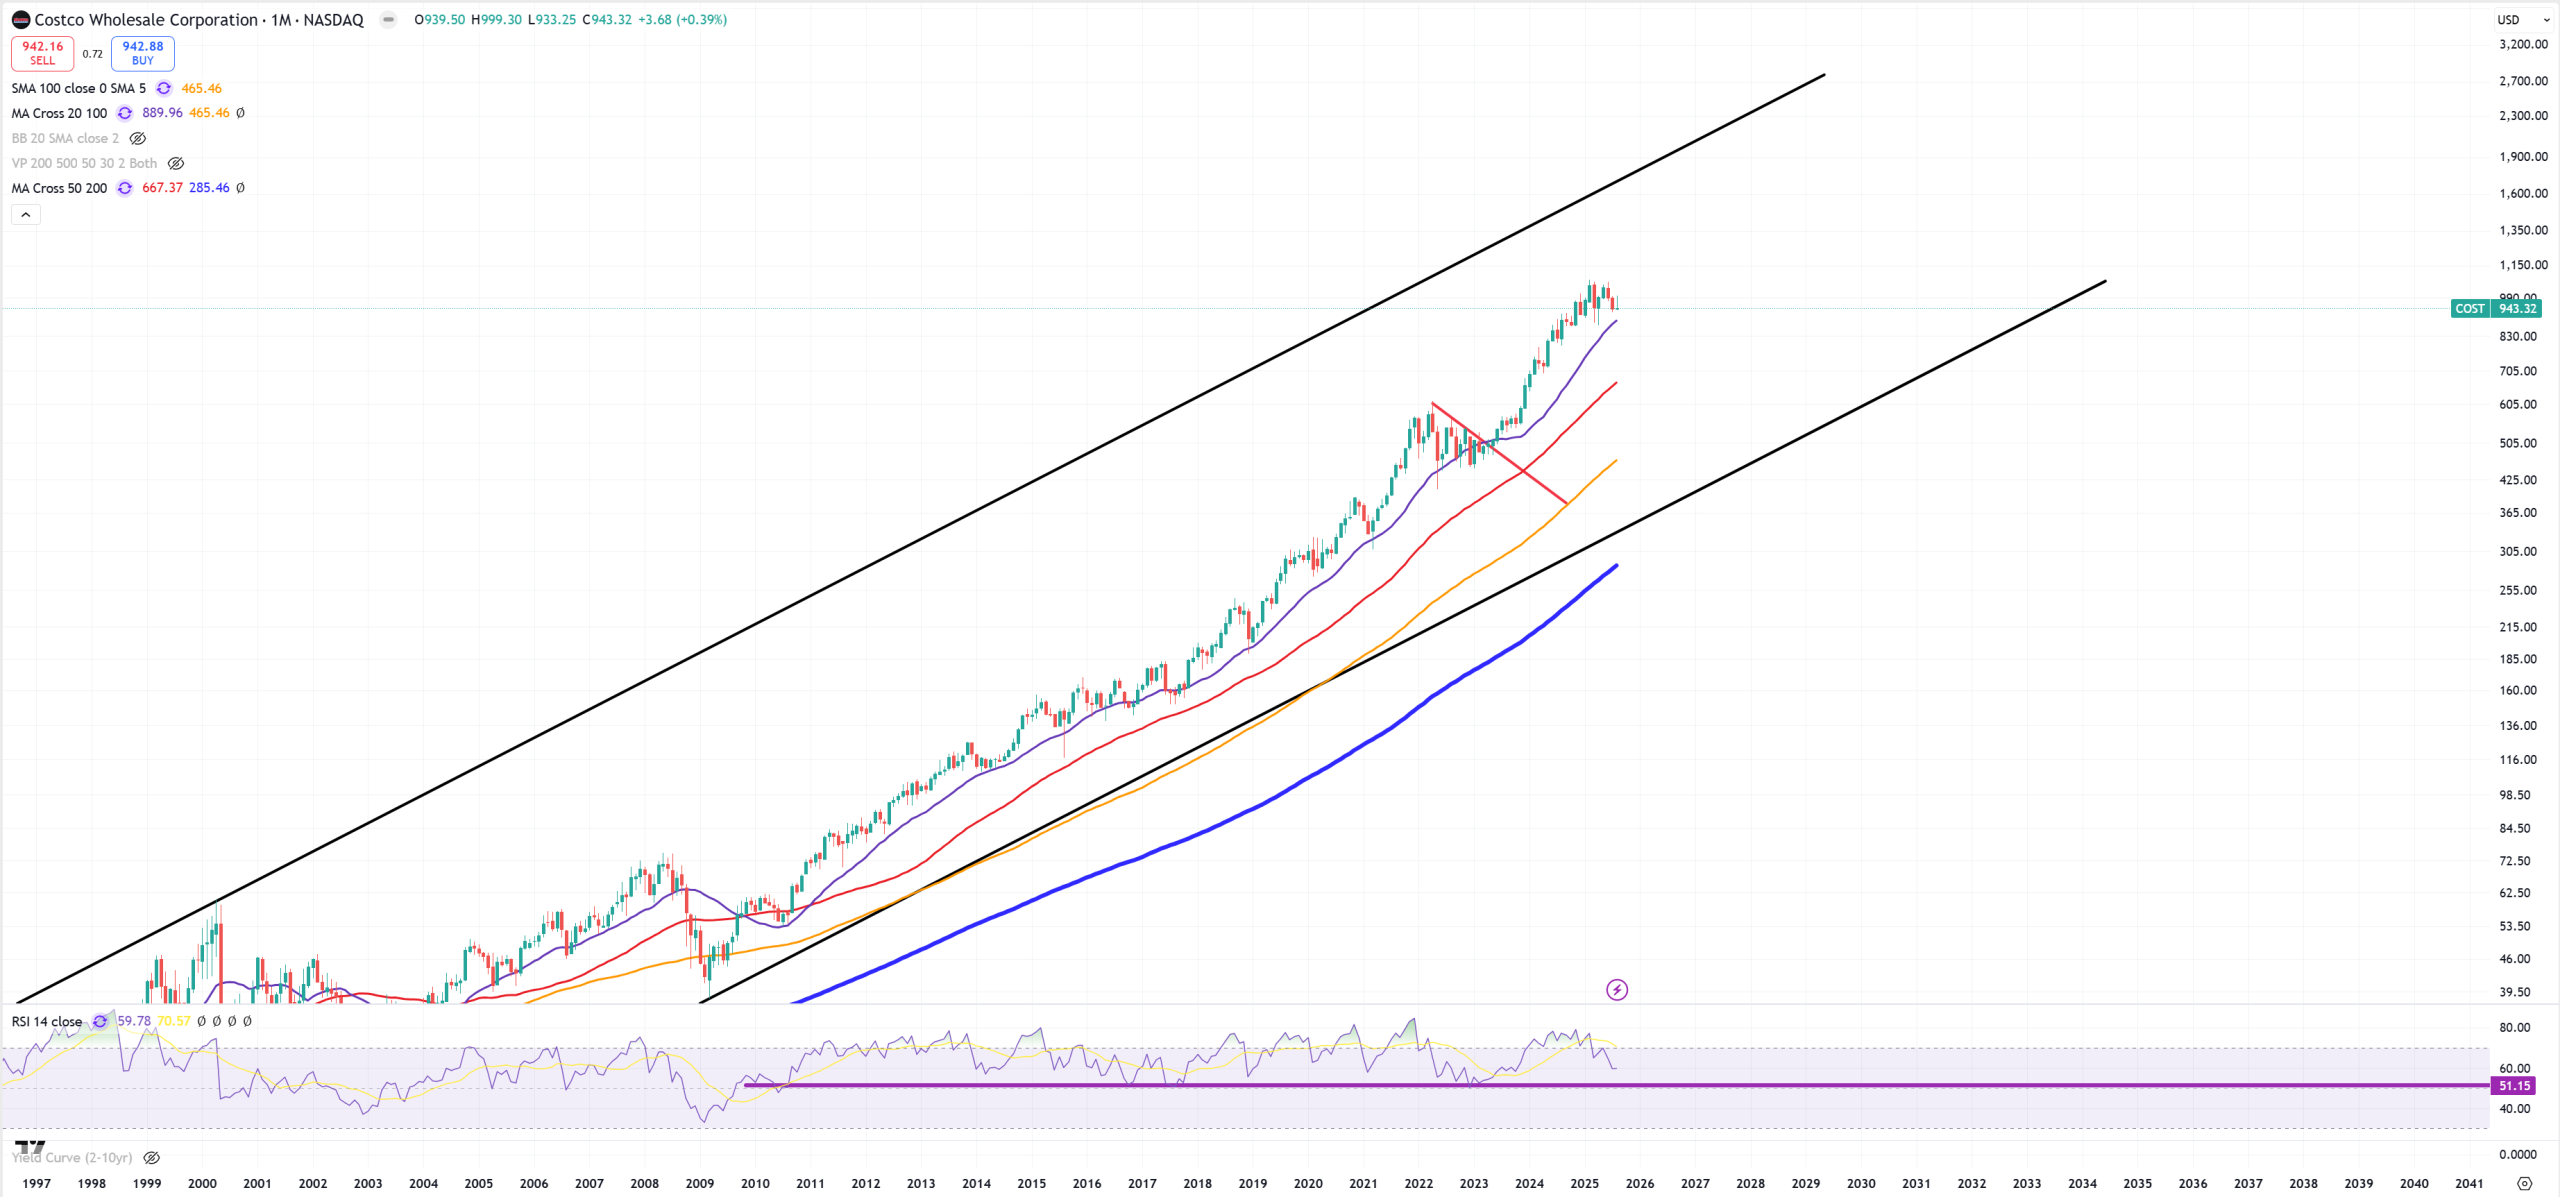
COST – Costco & WallMart are 2 biggest holdings of XLP, they look OK
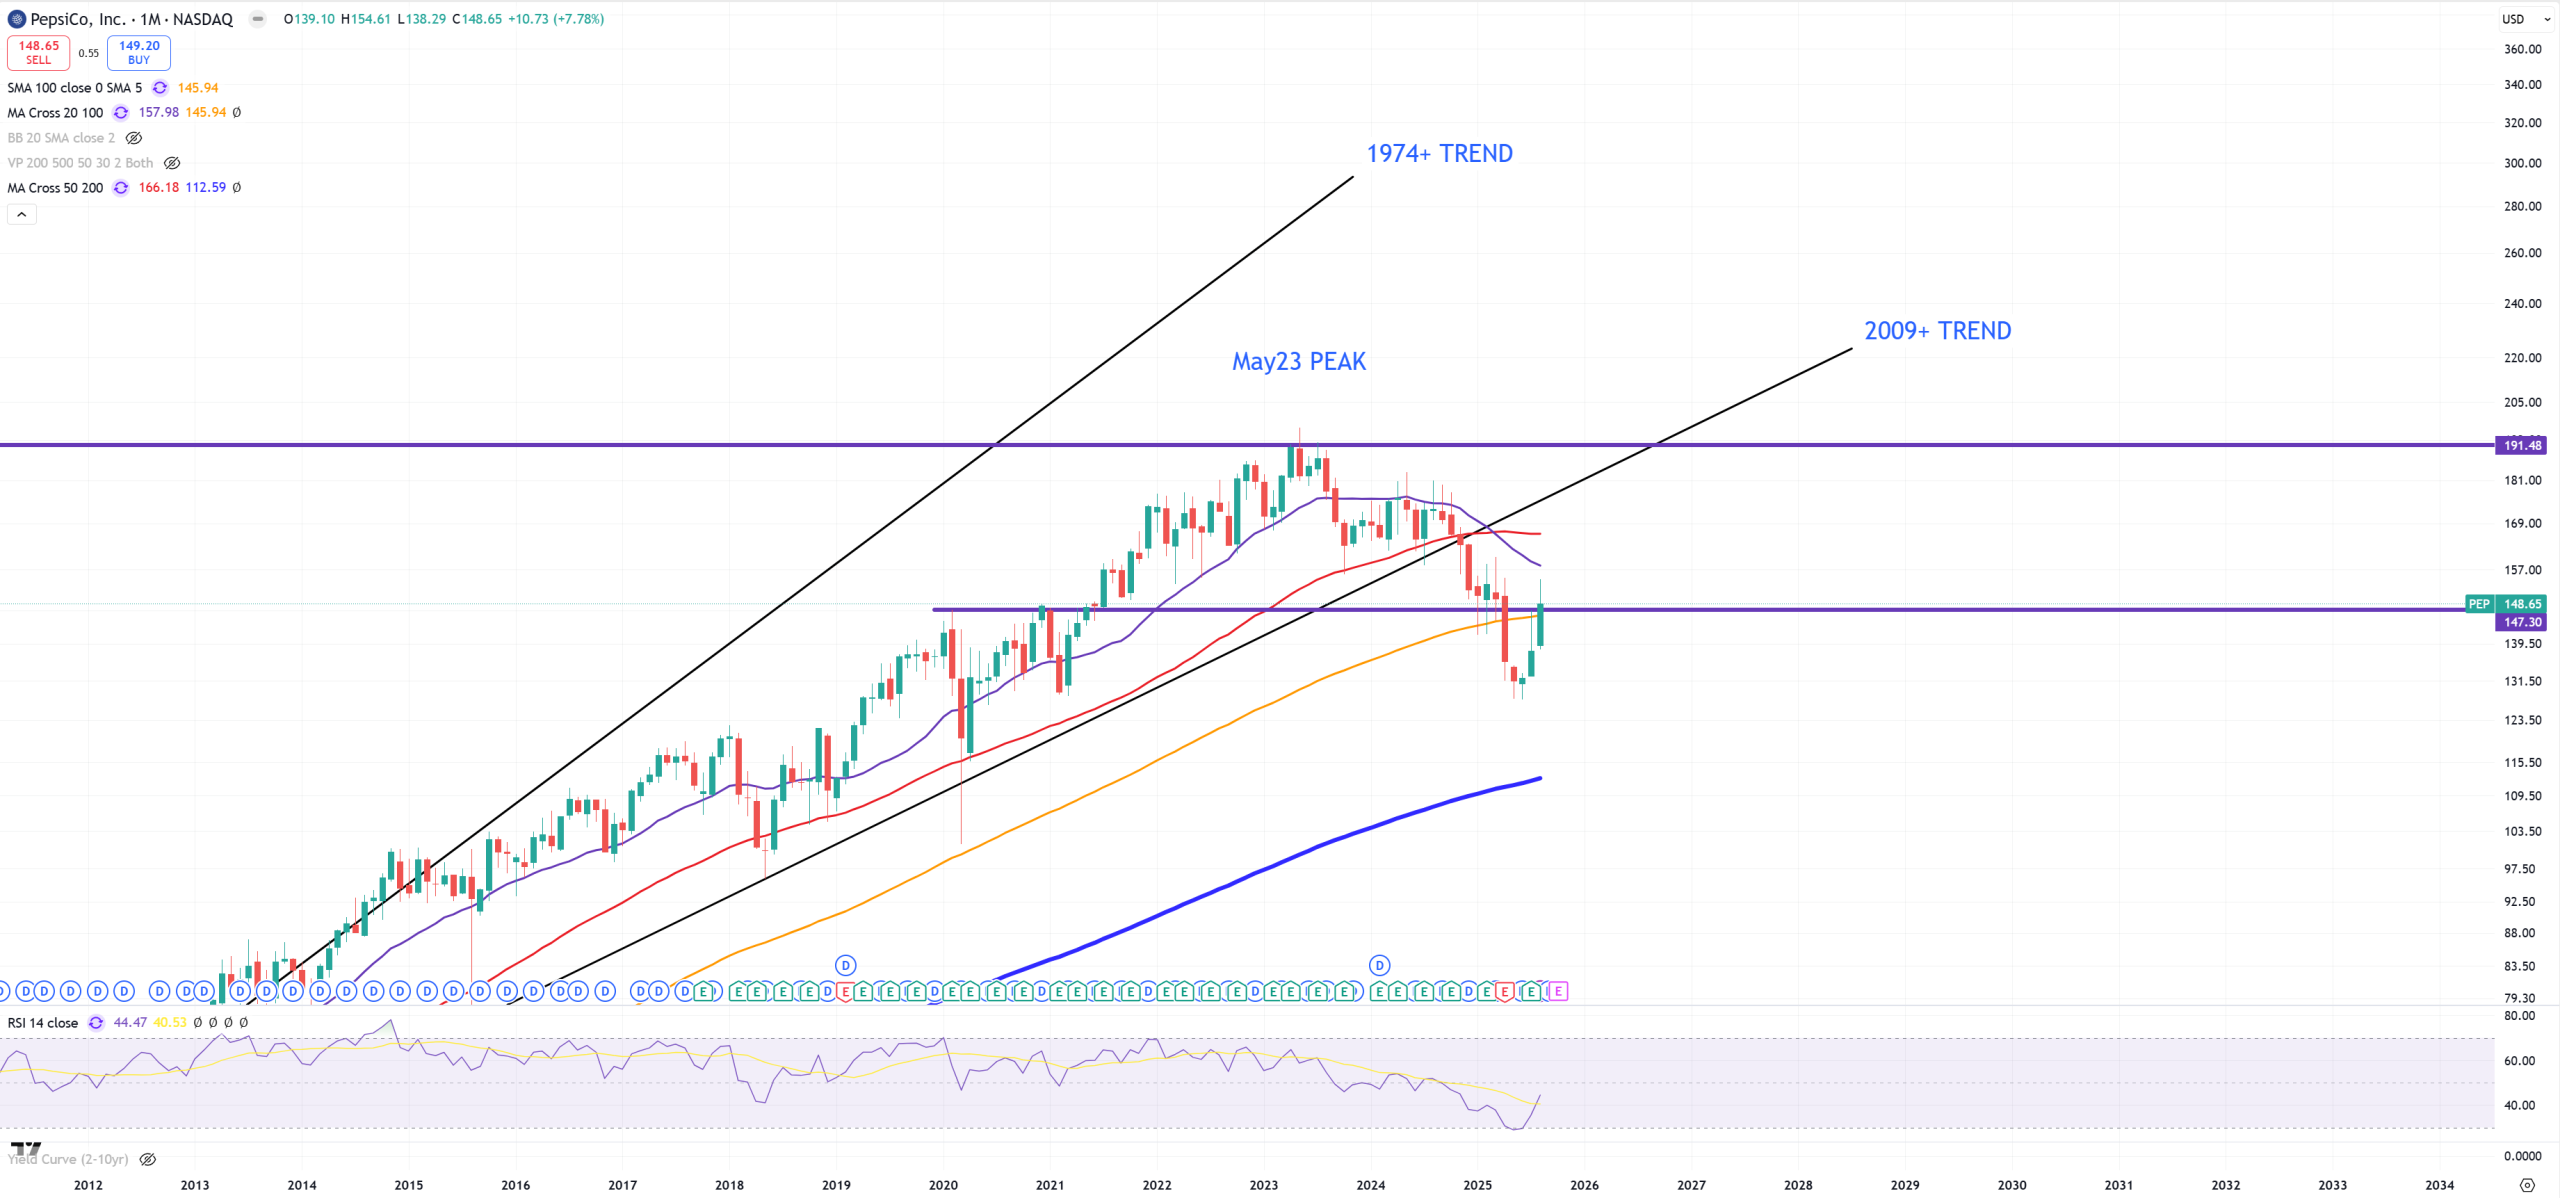
PEP – Pepsi does not look good as a part of XLP
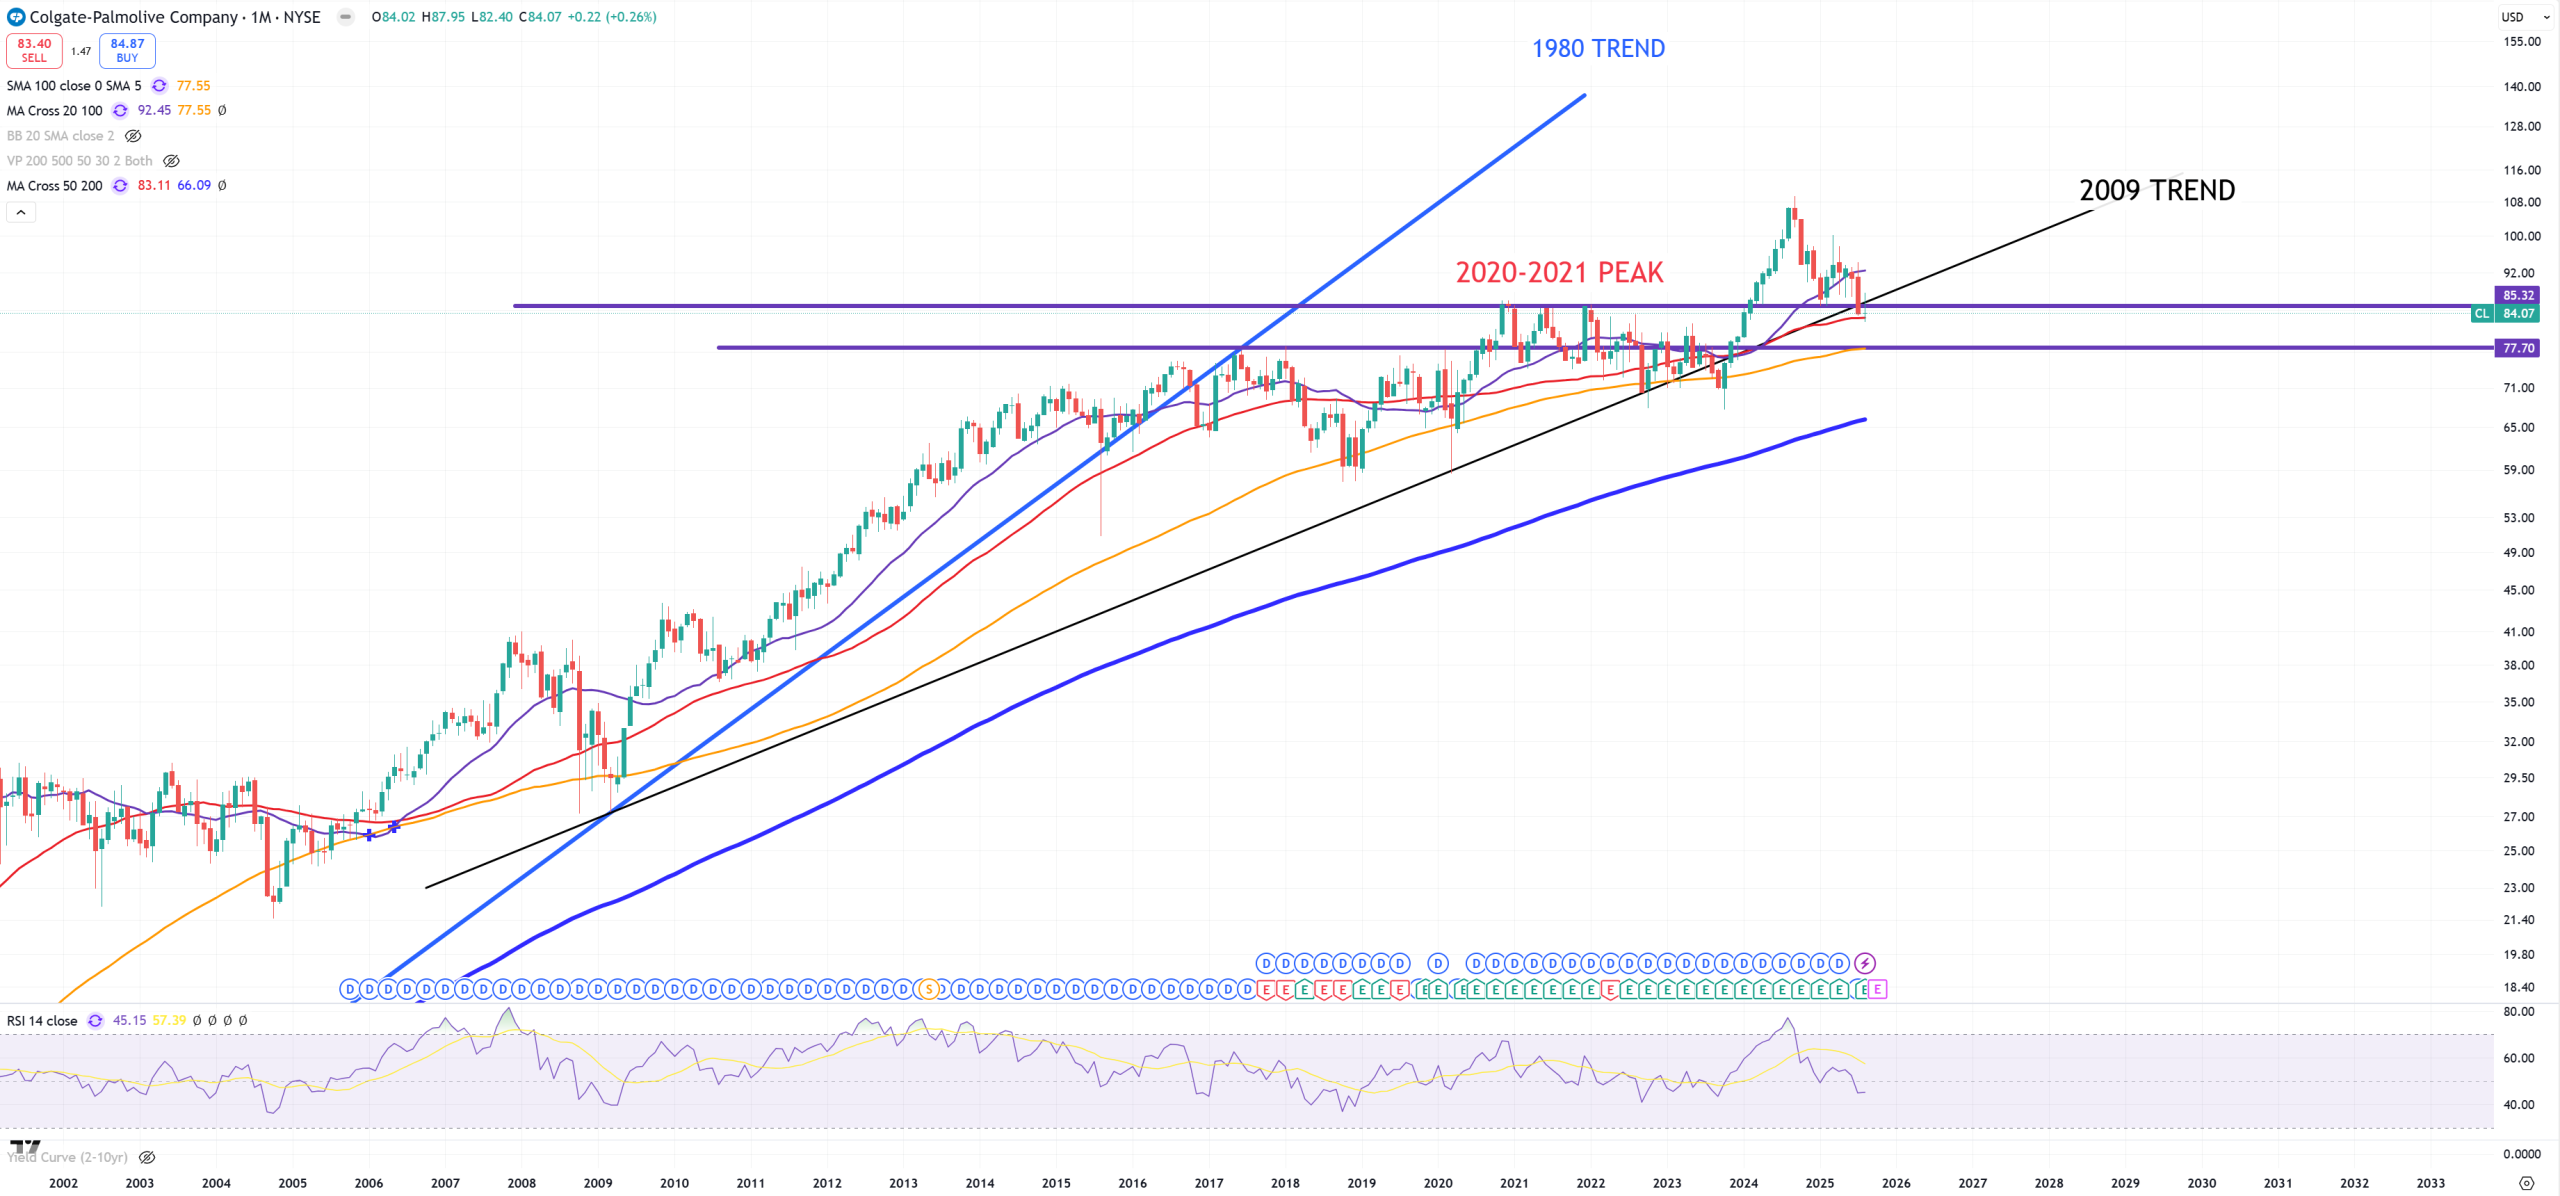
CL – Colgate – false spike till September 2024 and tanked below 2020-2021 peak. Now below 2009 trend but holds (M)MA50.
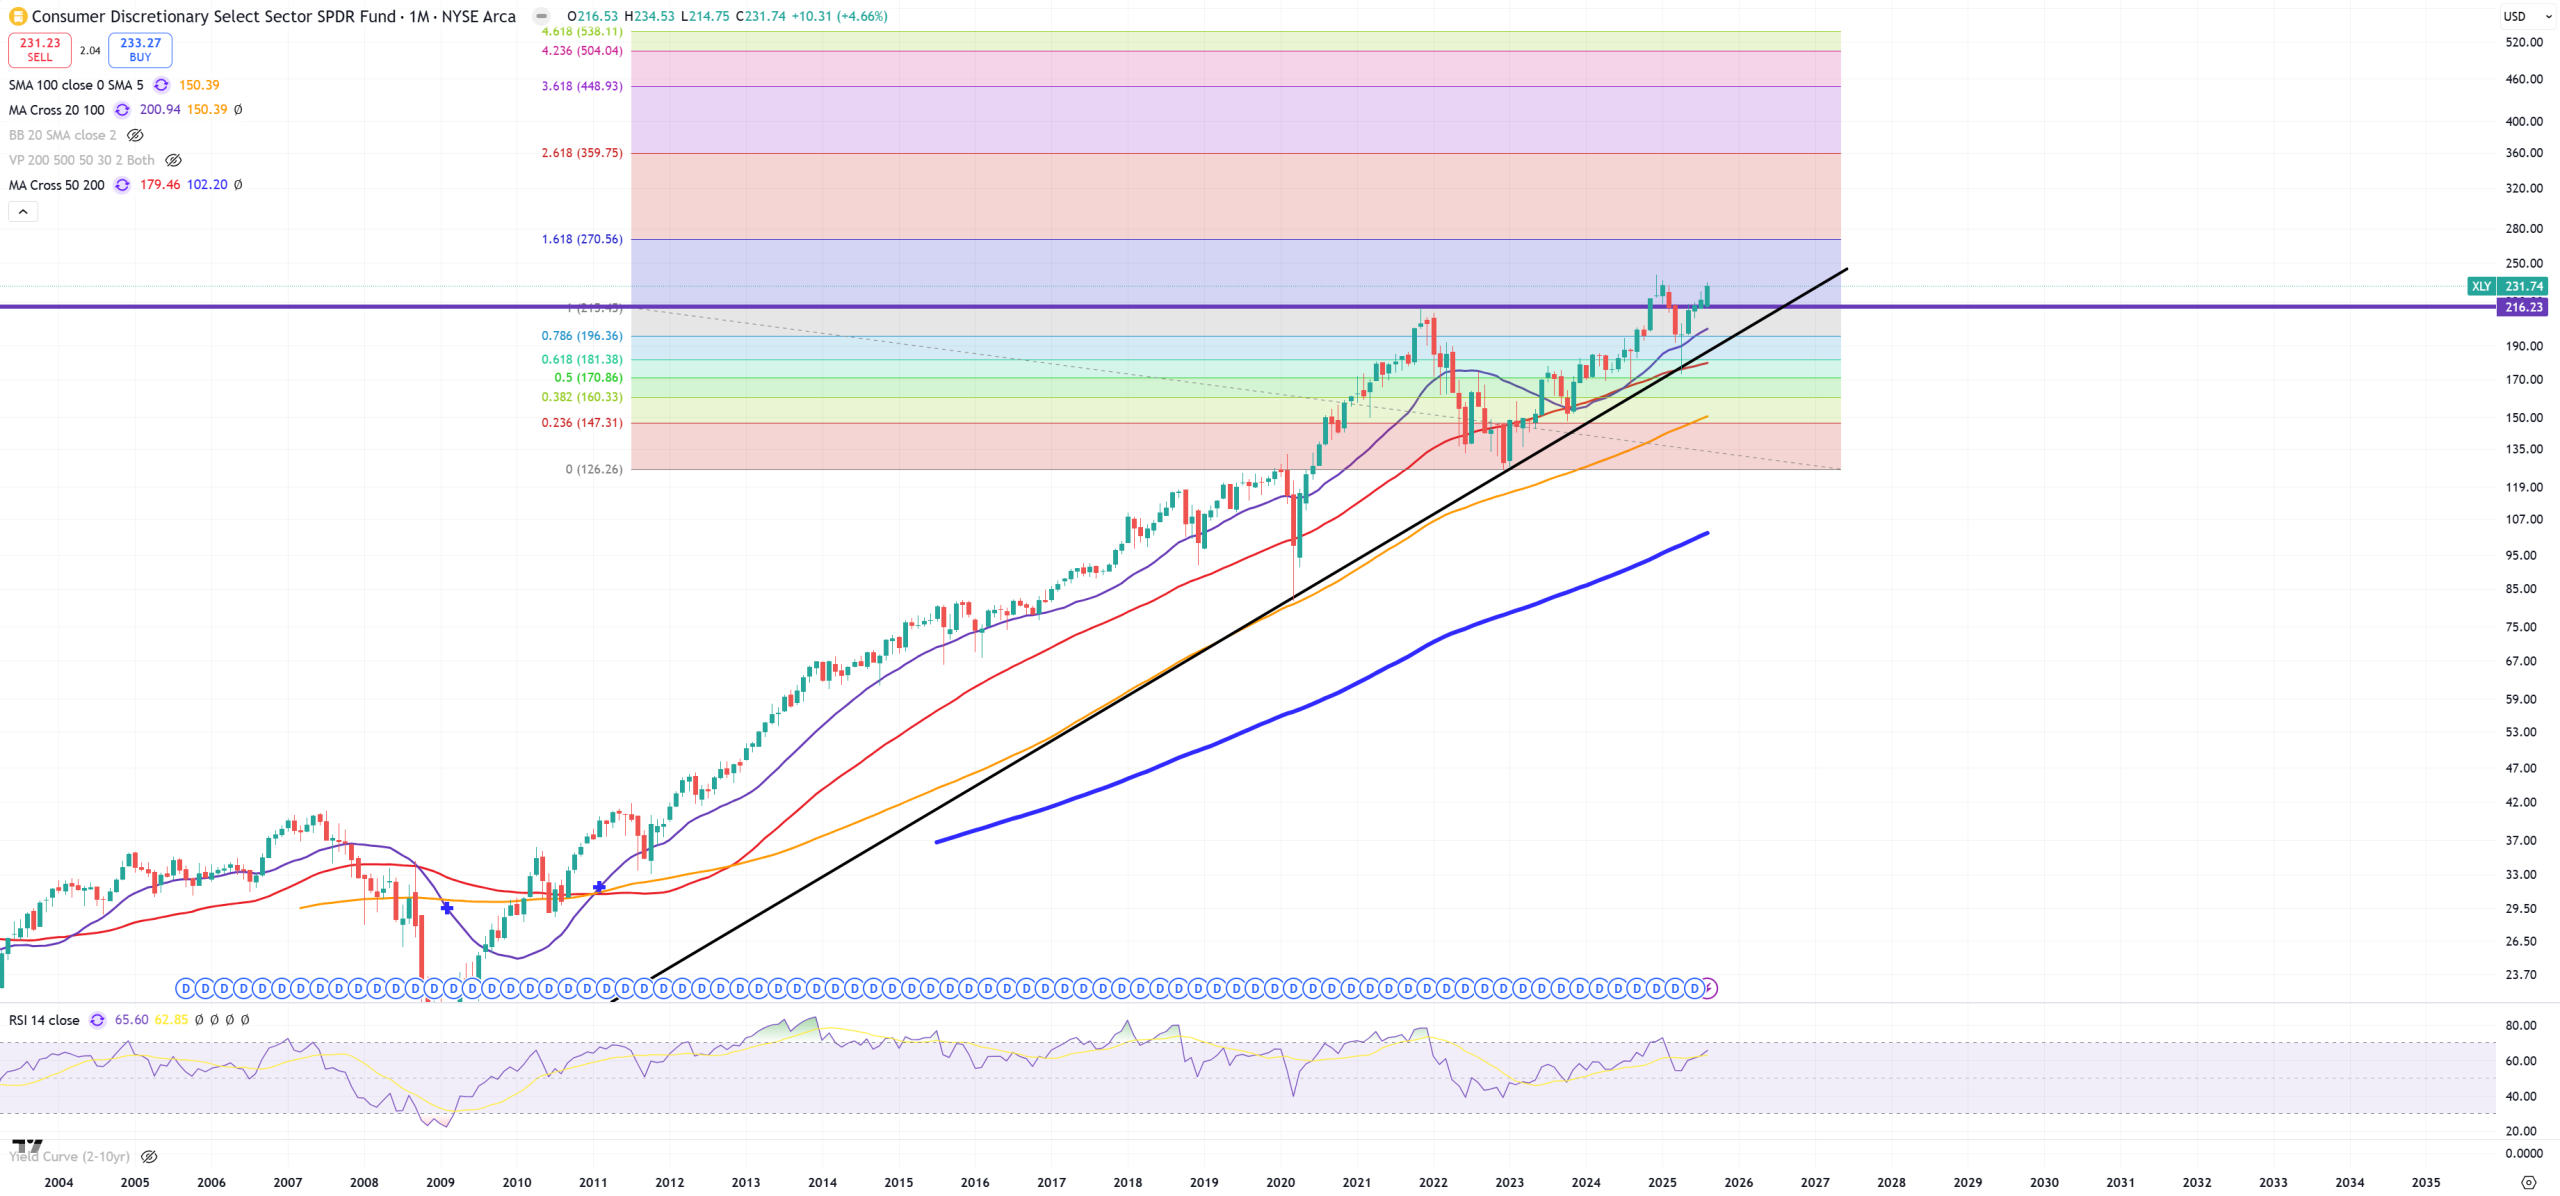
XLY – Consumer Discretionary – this ETF is dominated by Amazon & Tesla, which are mostly TECH, so we’ll see couple exTECH examples included in XLY, 40% of XLY is Amazon & Tesla.
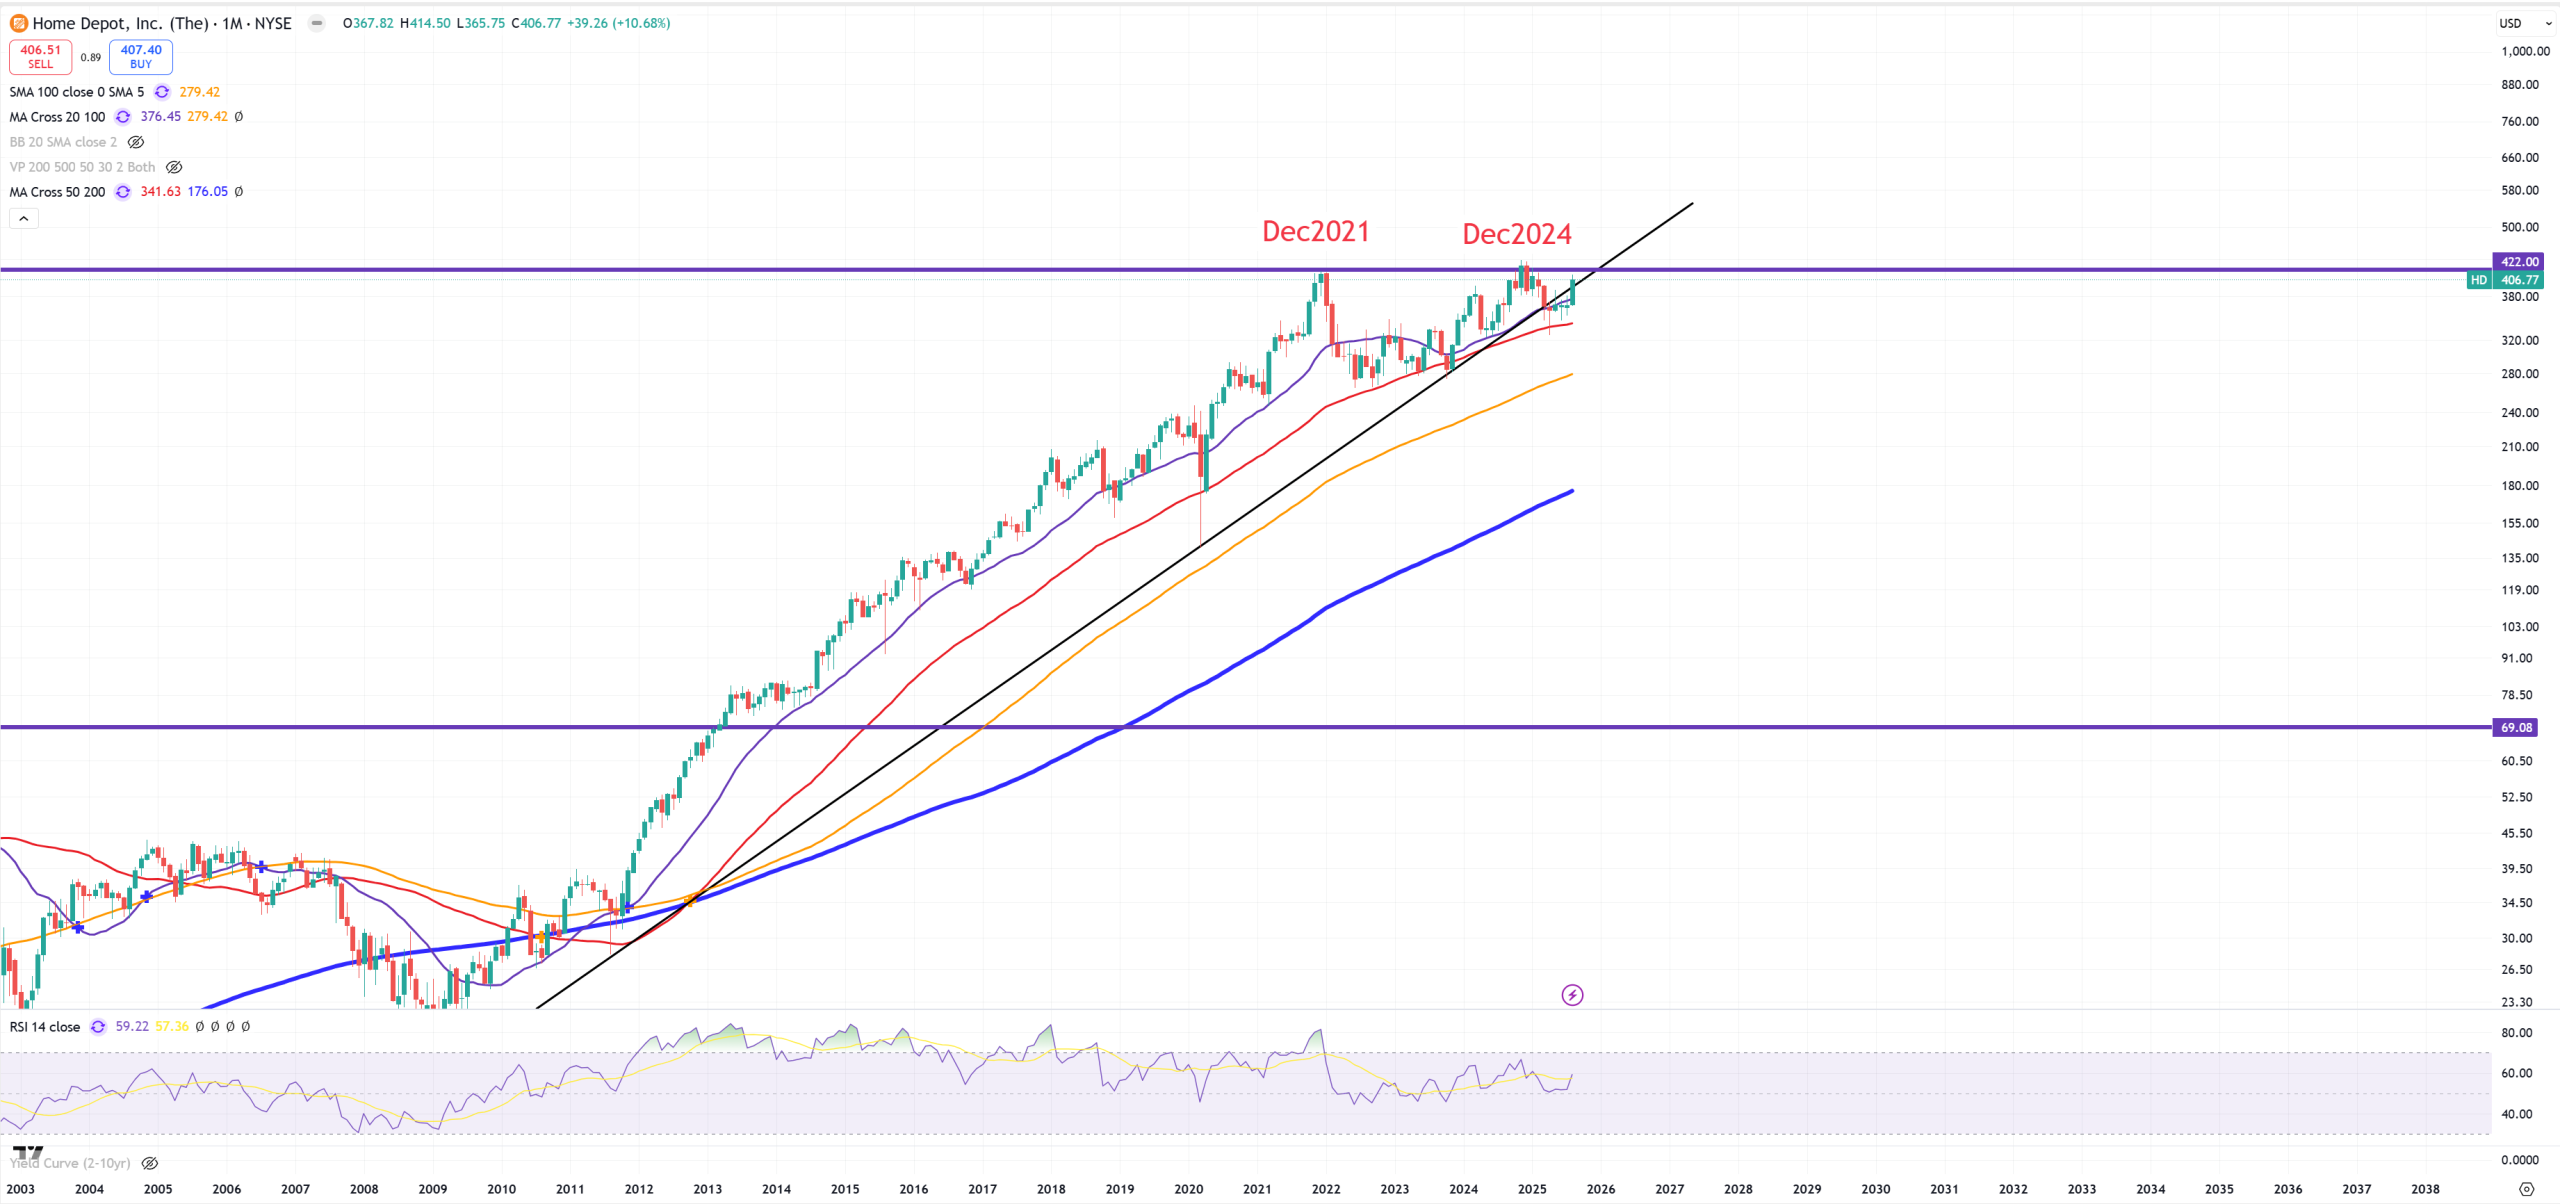
HD – Home Depot – #3 holding in XLY with 7%. Fights for breaking 2009 trend
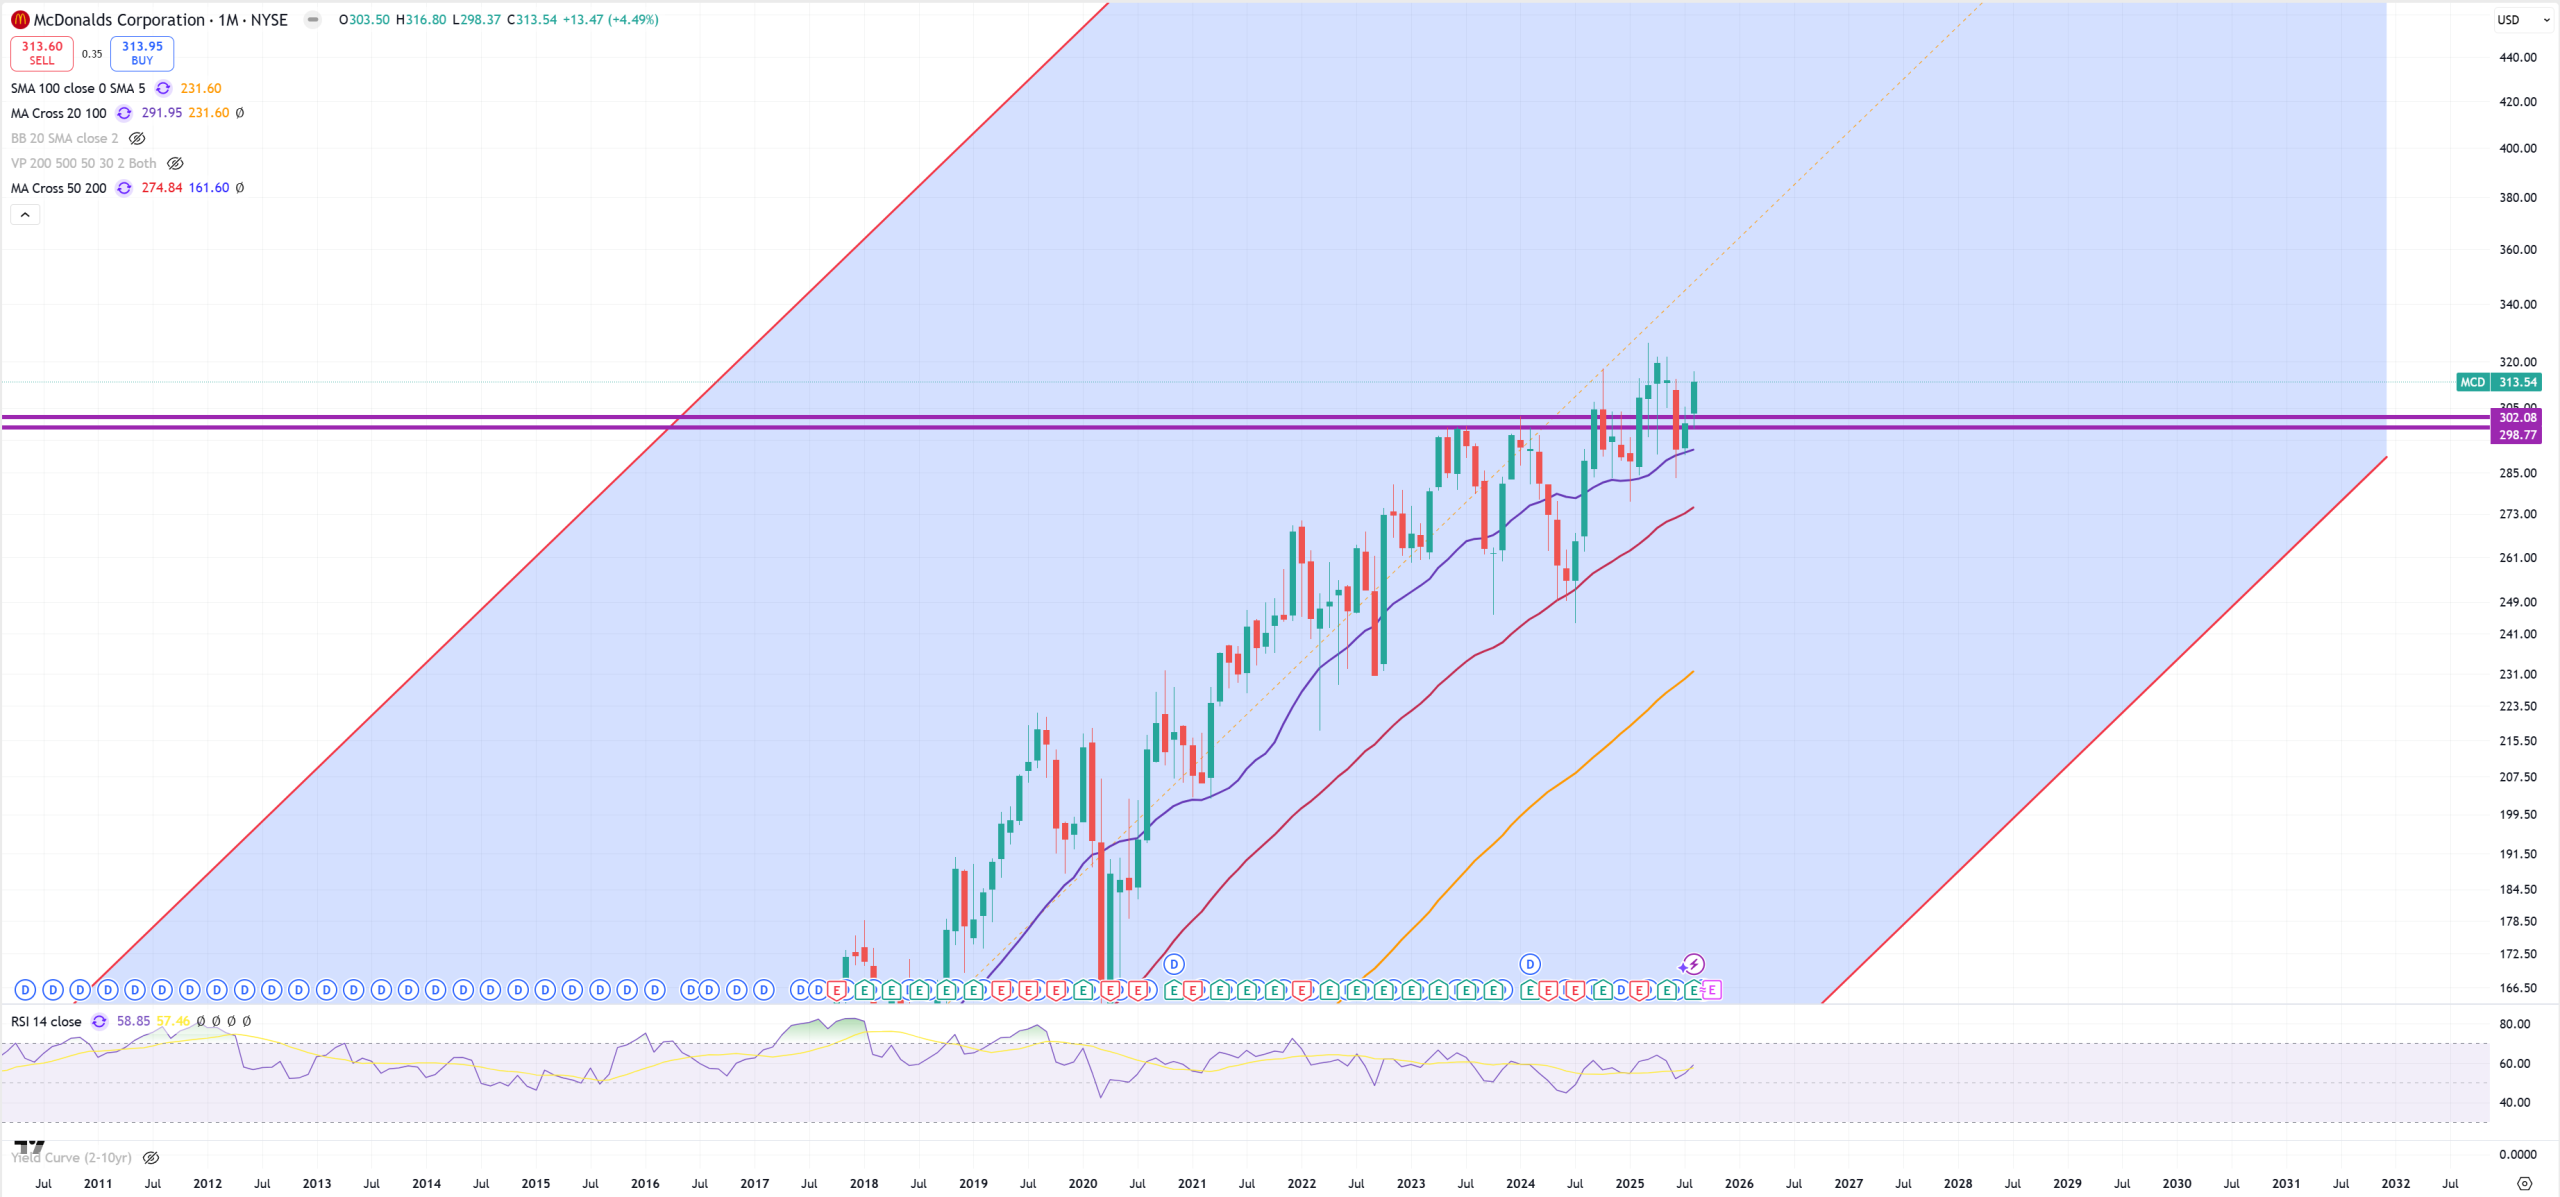
MCD – McDonalds – since 2023 the game is for 300-302$
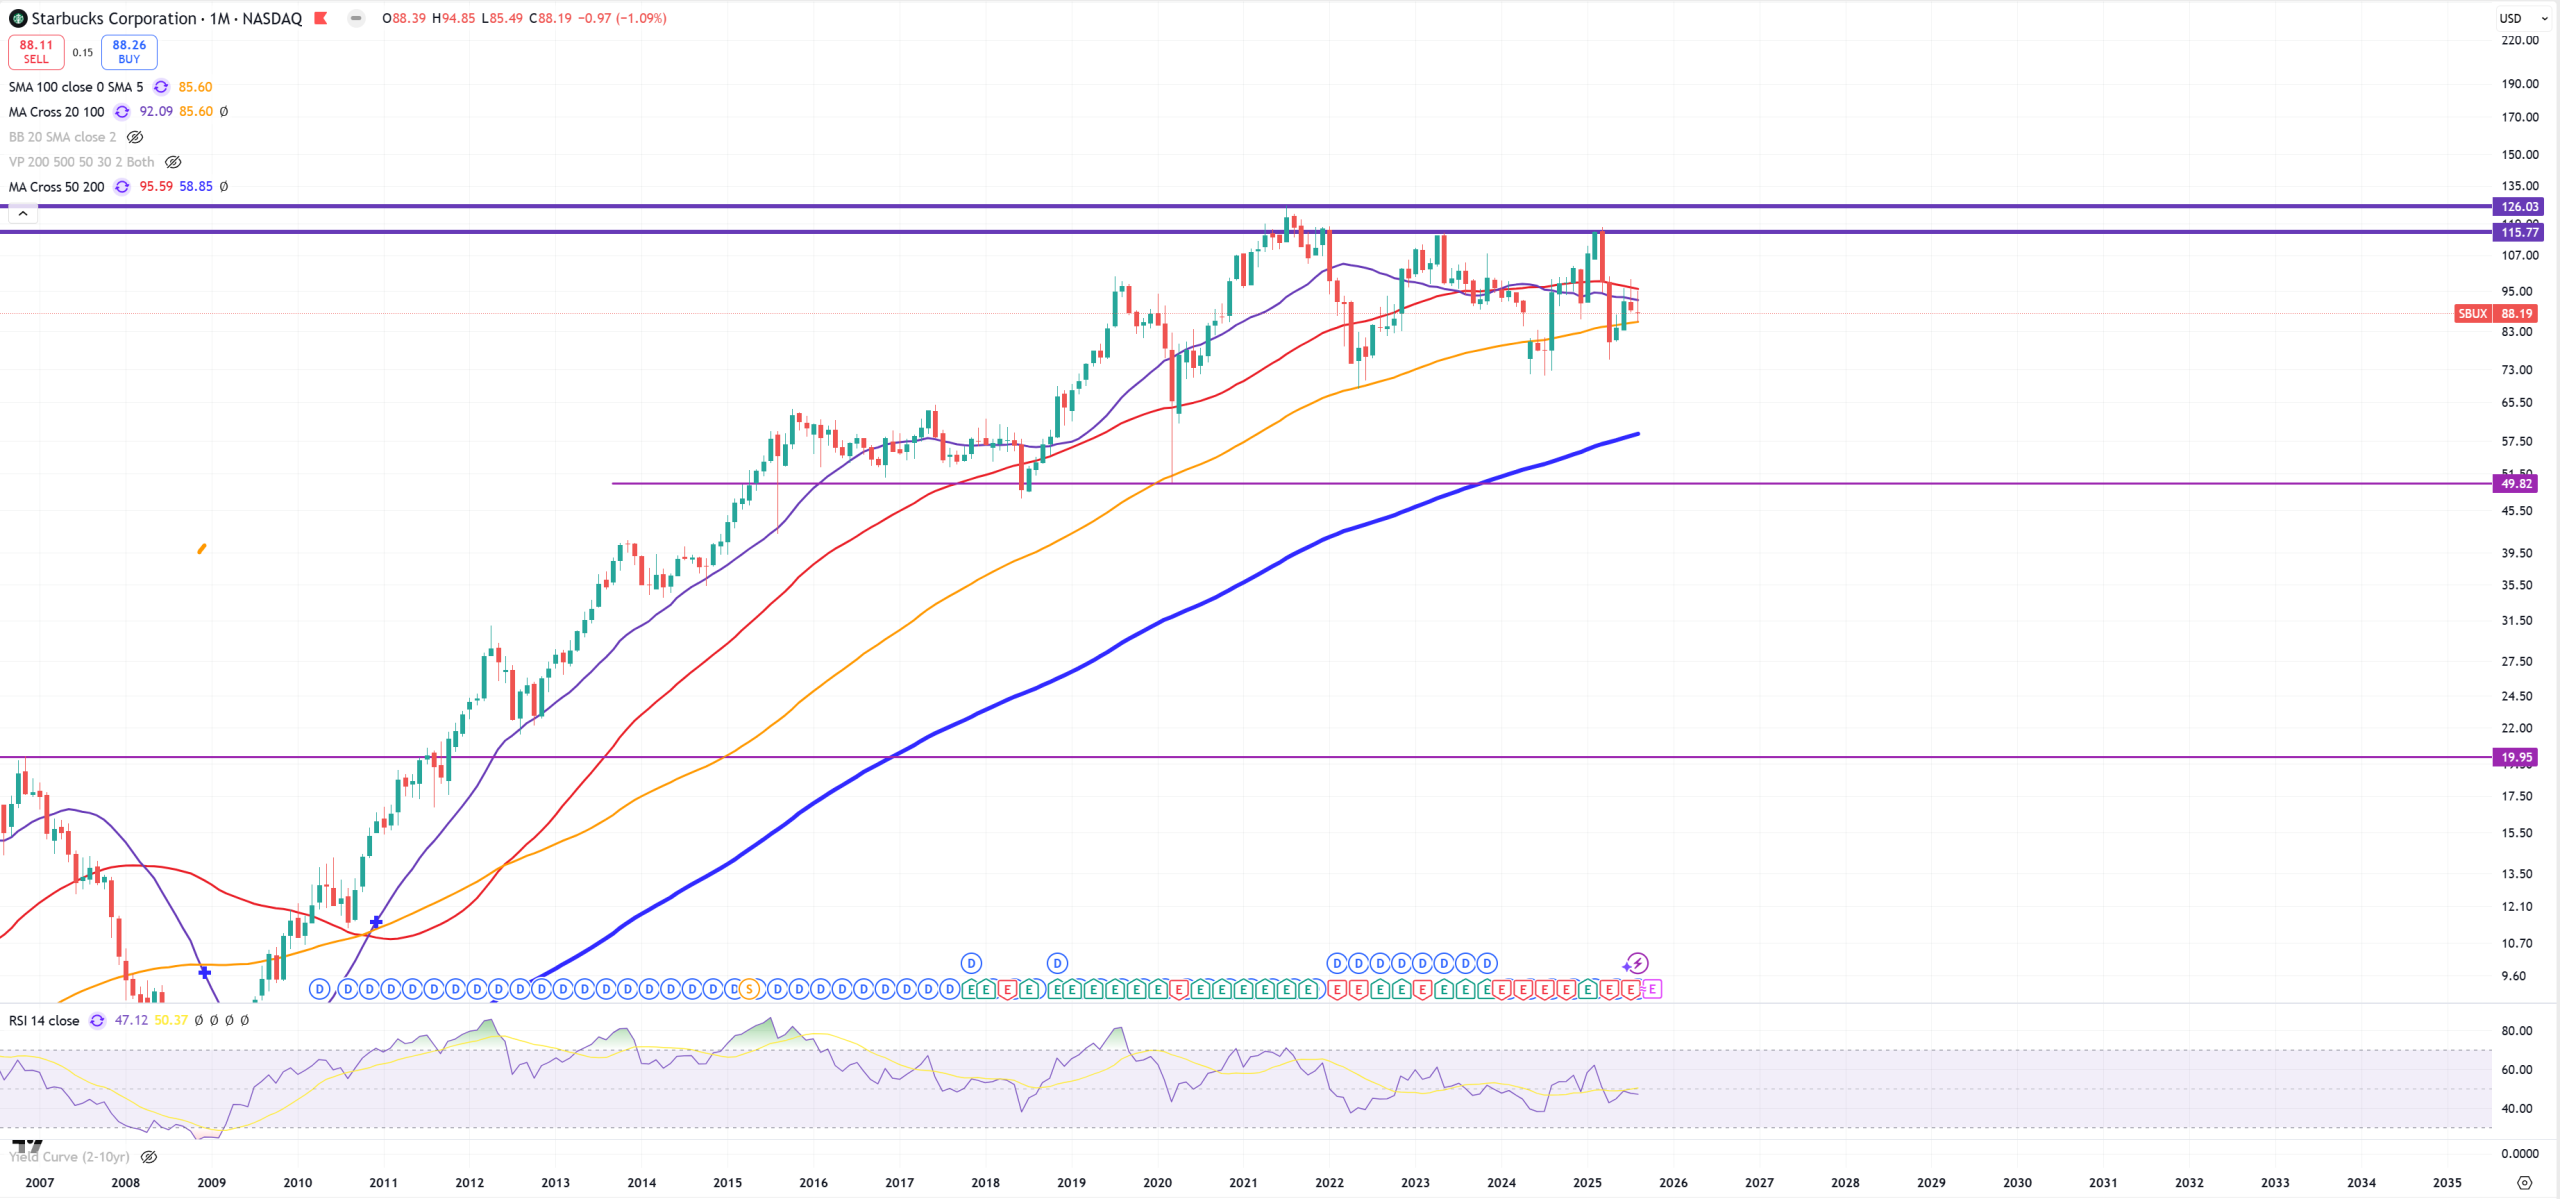
SBUX – peak in July 2021
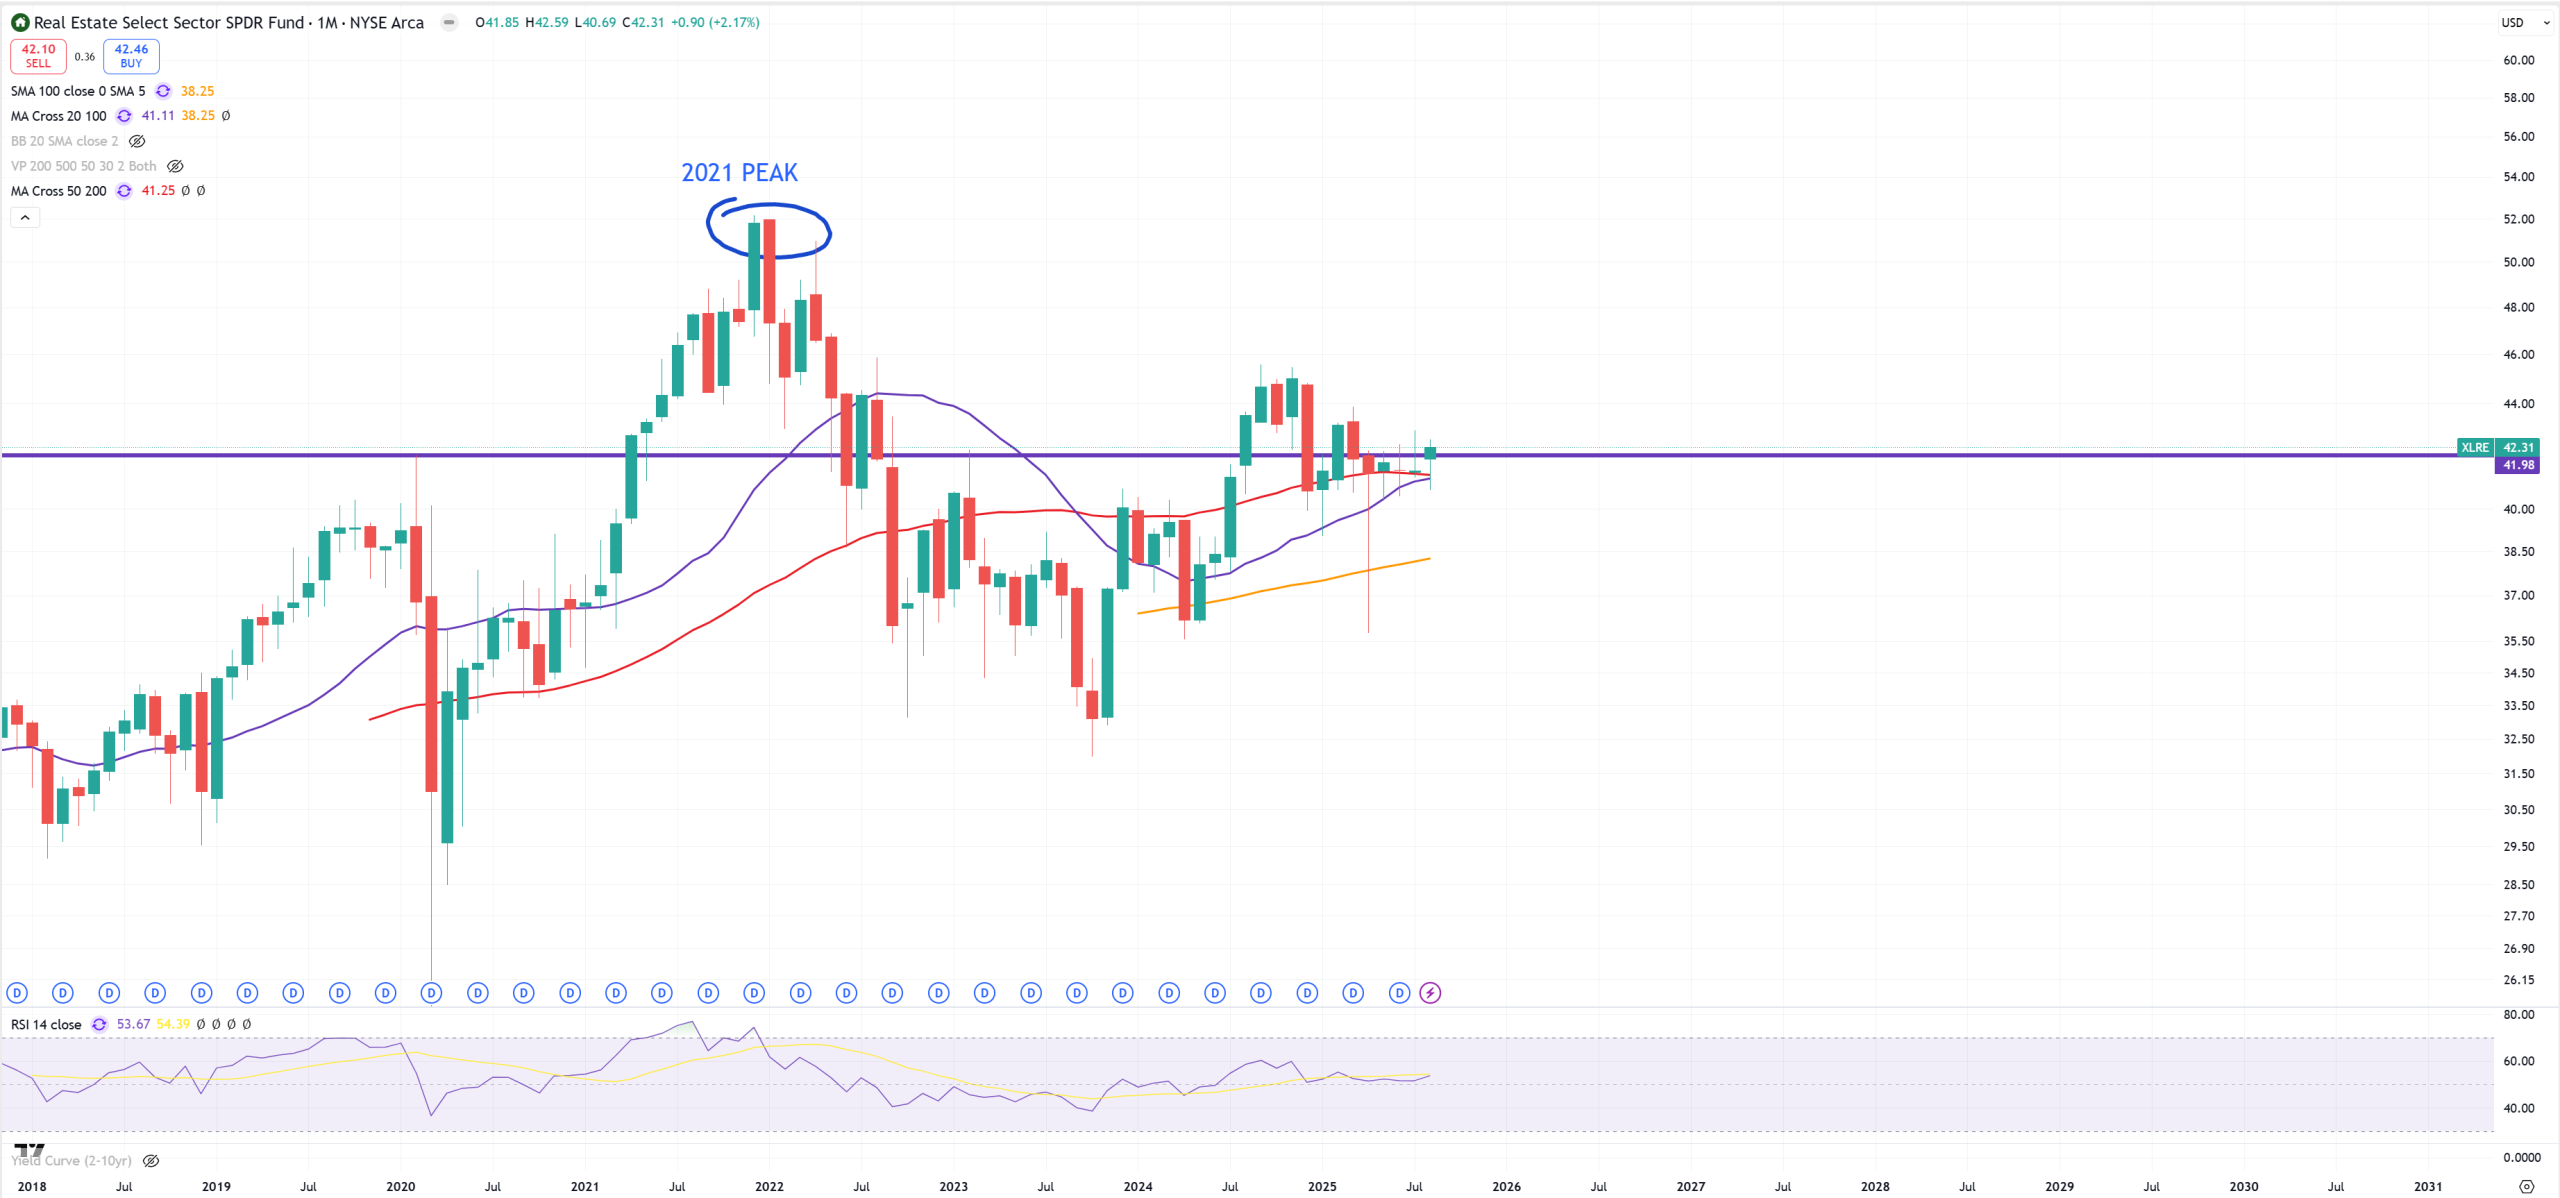
XLRE – Real Estate – 2021 big peak, now fights to drop below 2020 peak and (M)MA50/(M)MA20
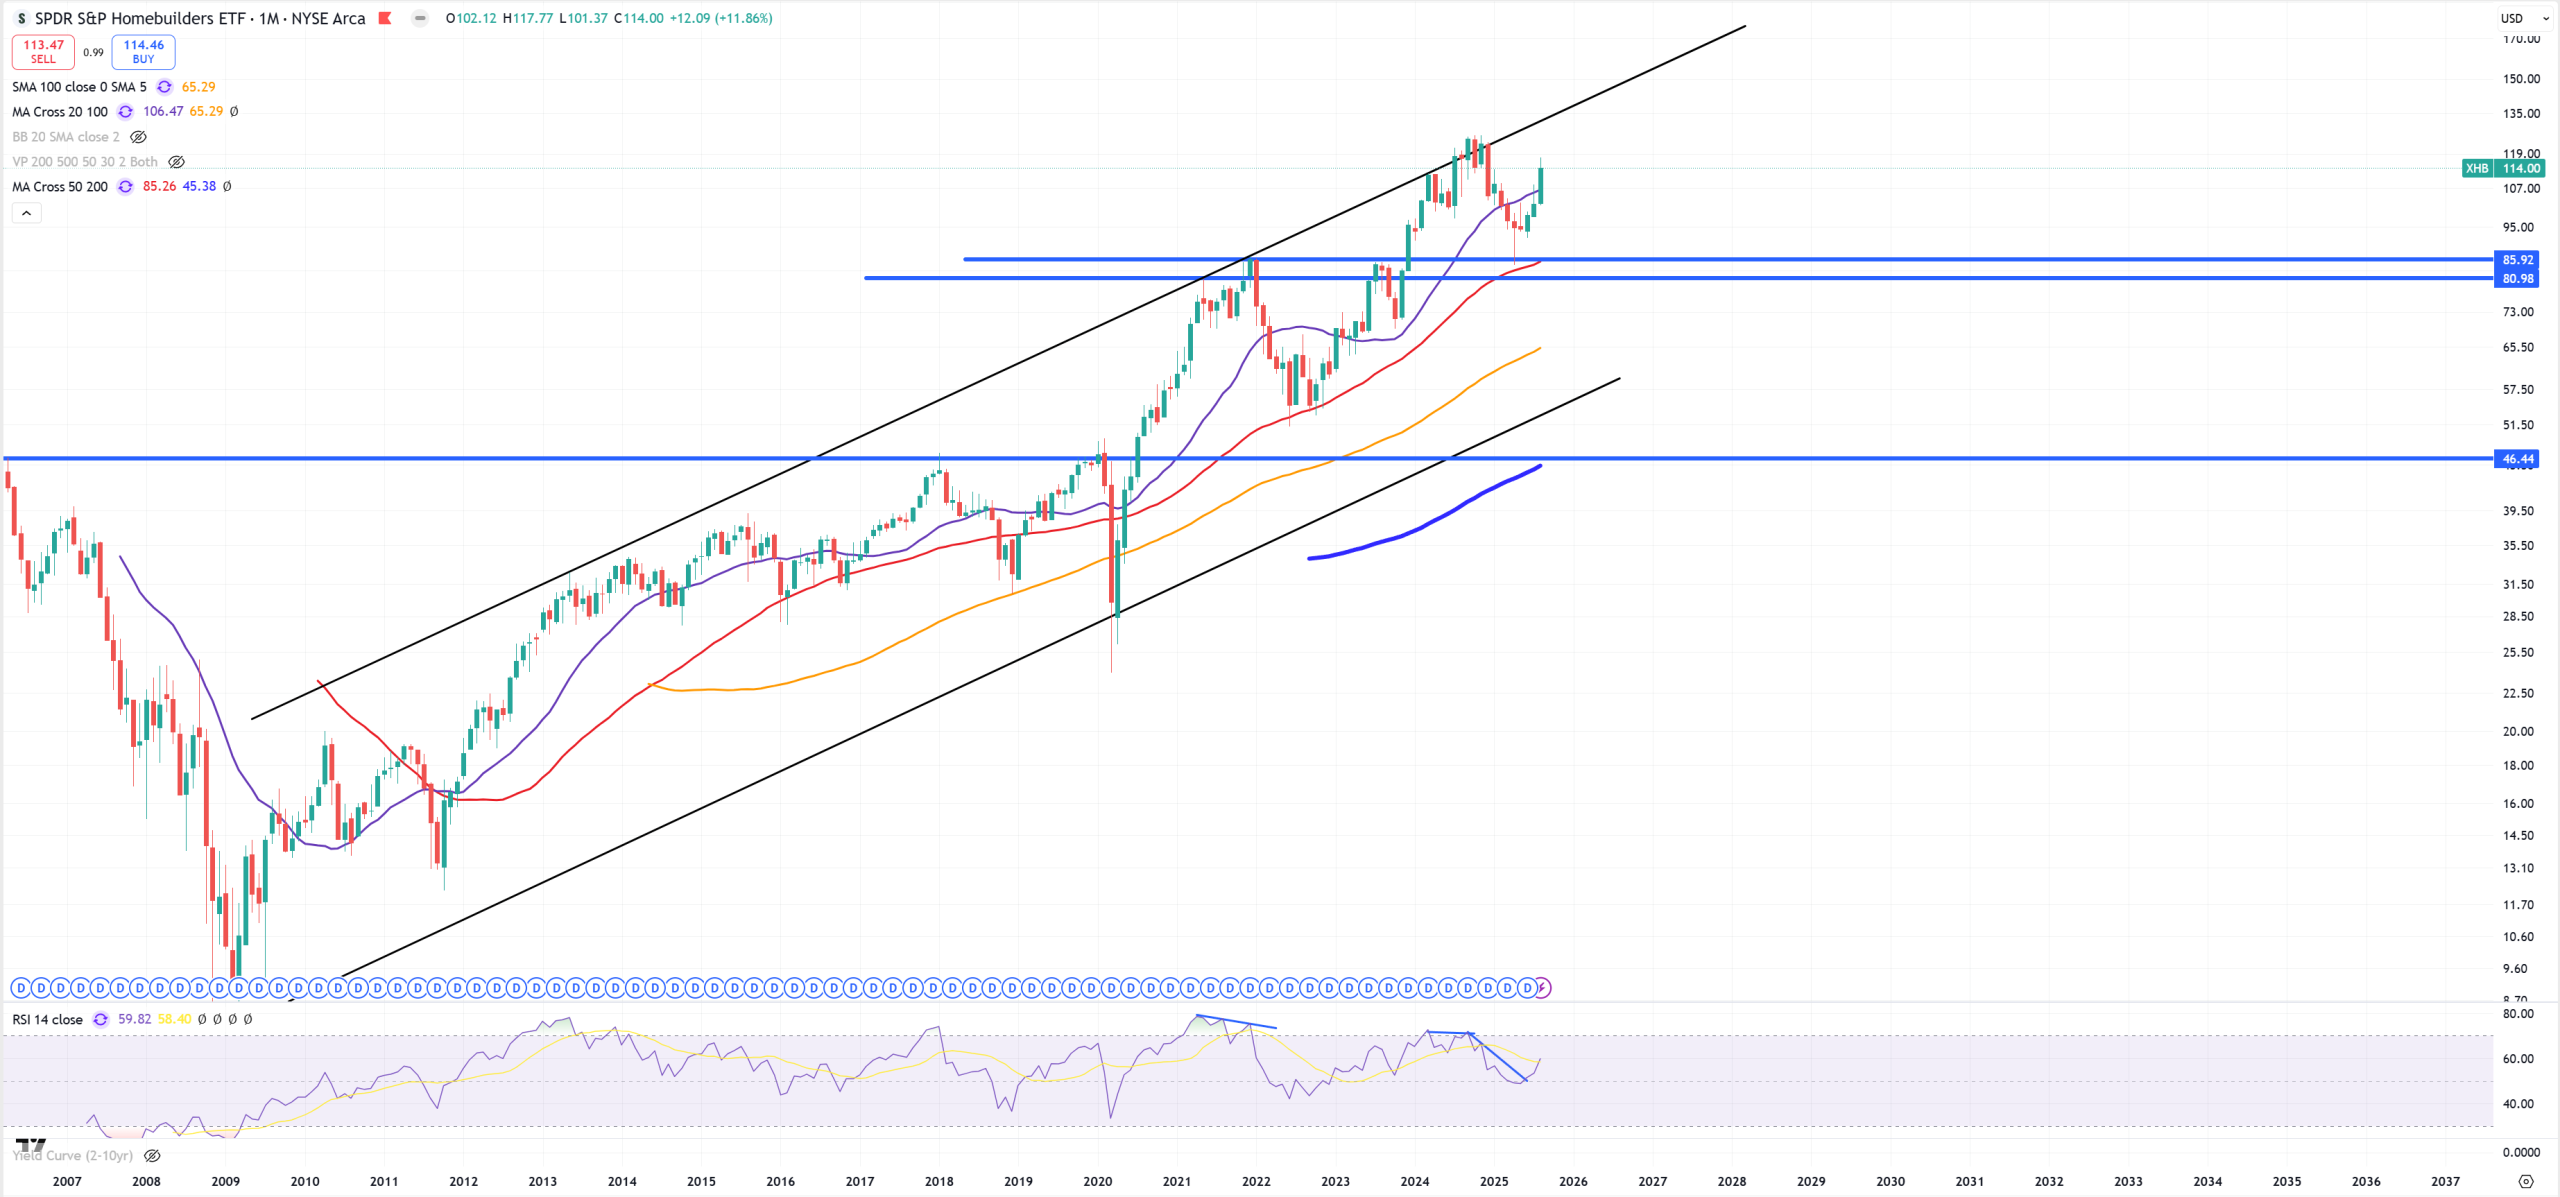
XHB – Homebuilders, 2021 support holds
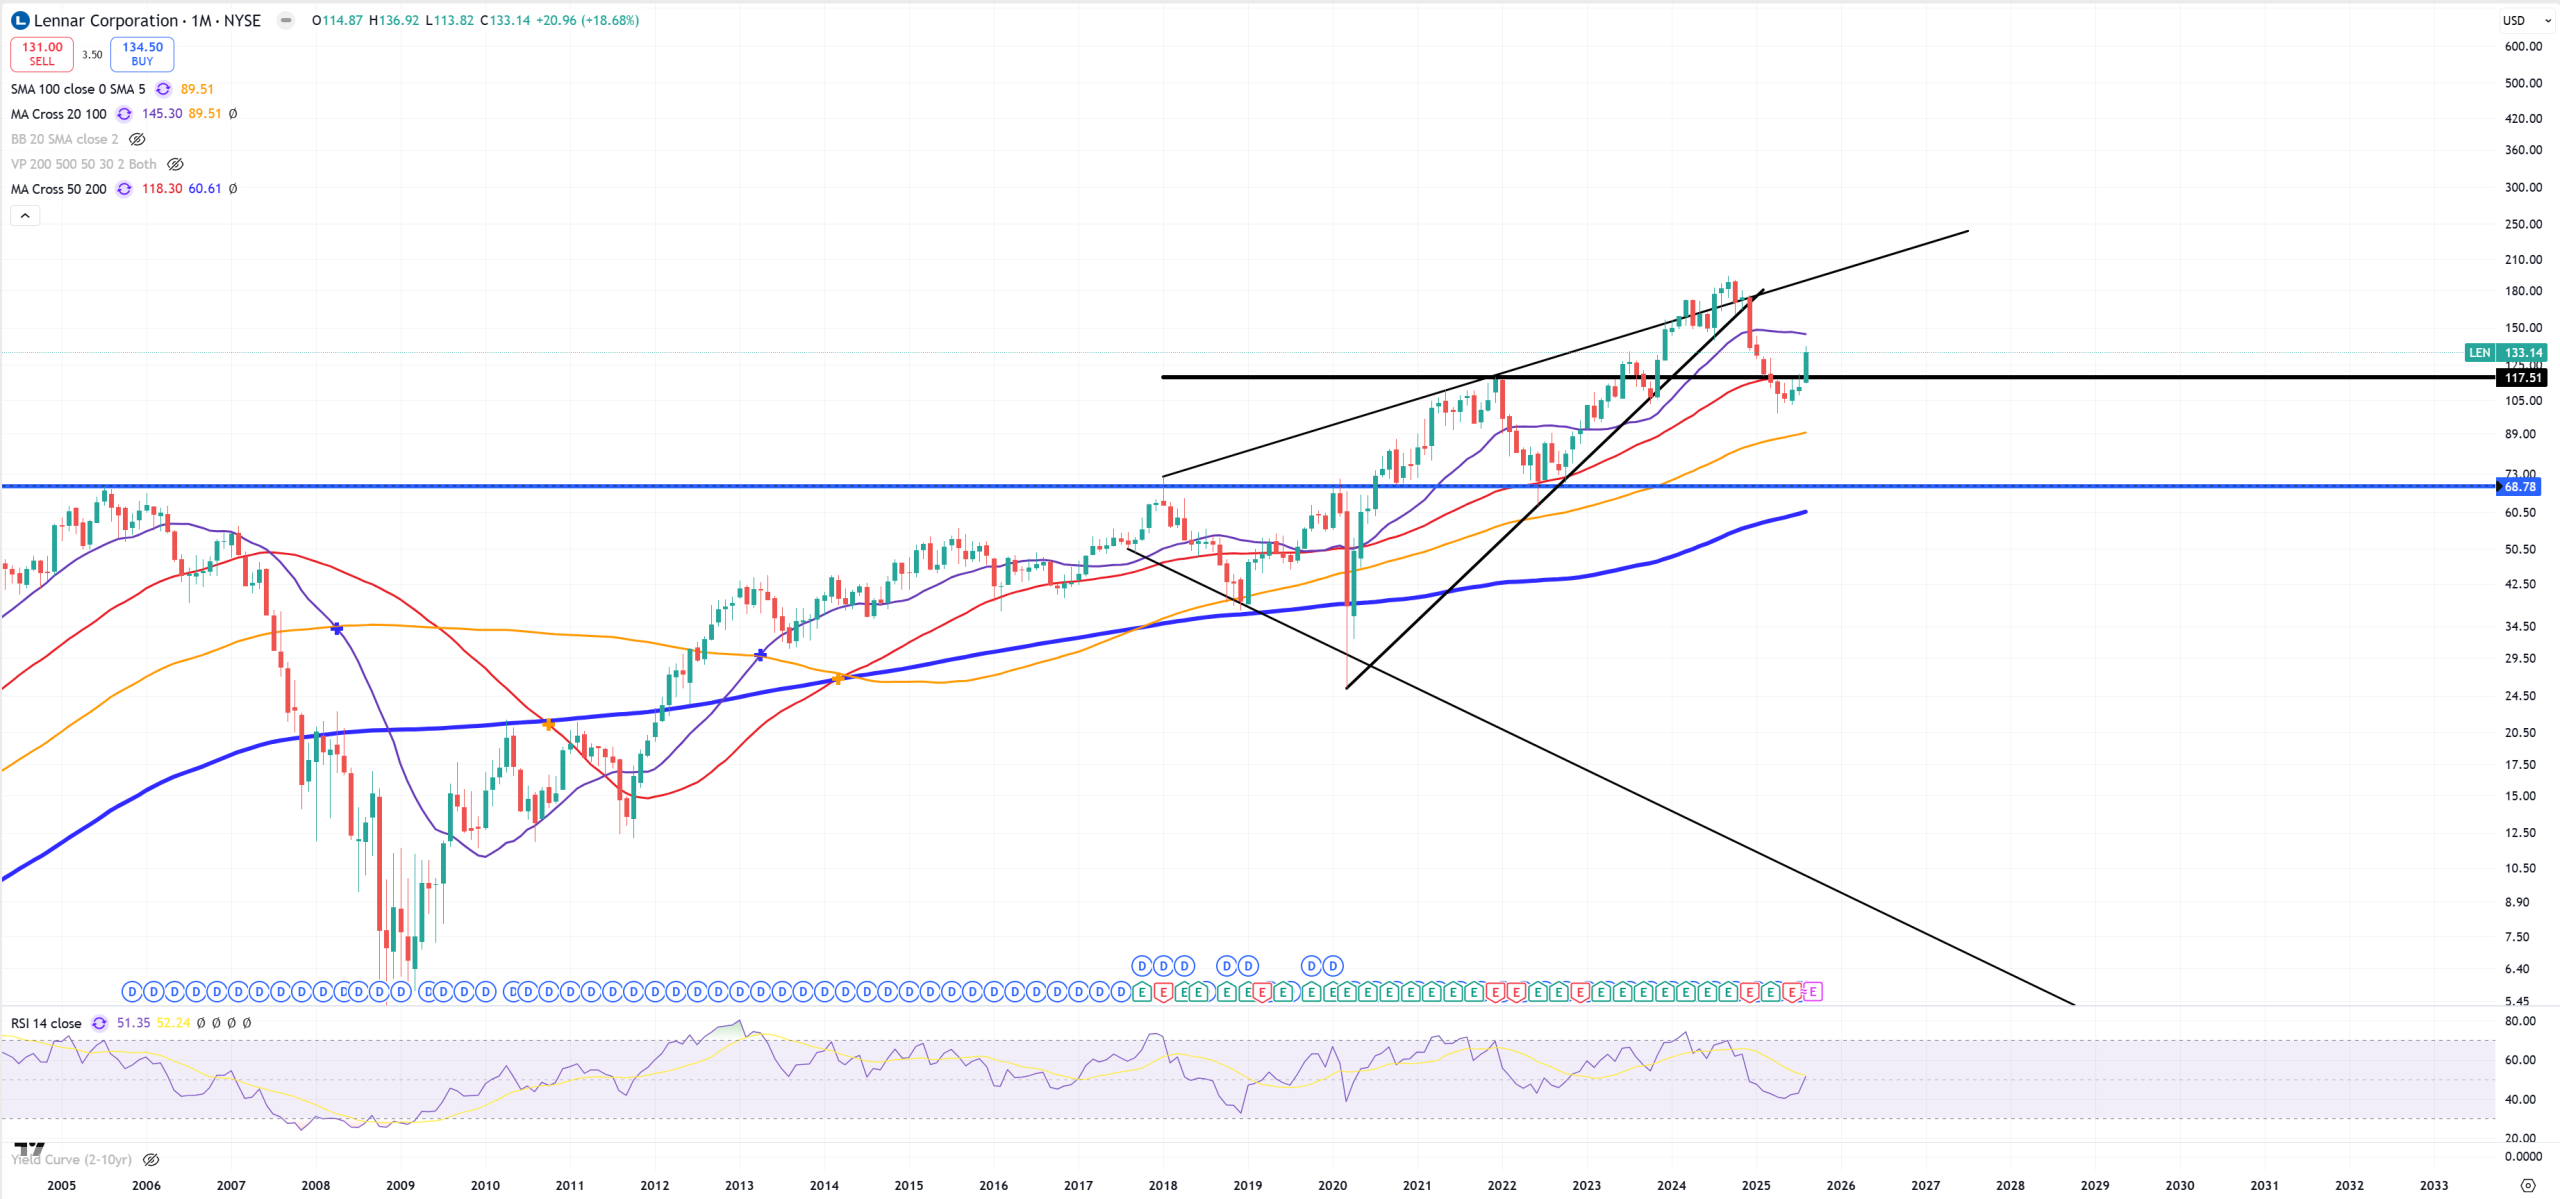
LEN – Lennar – massive megaphone channel (reminds me XOM).
Countries – in $$$, in nominals.
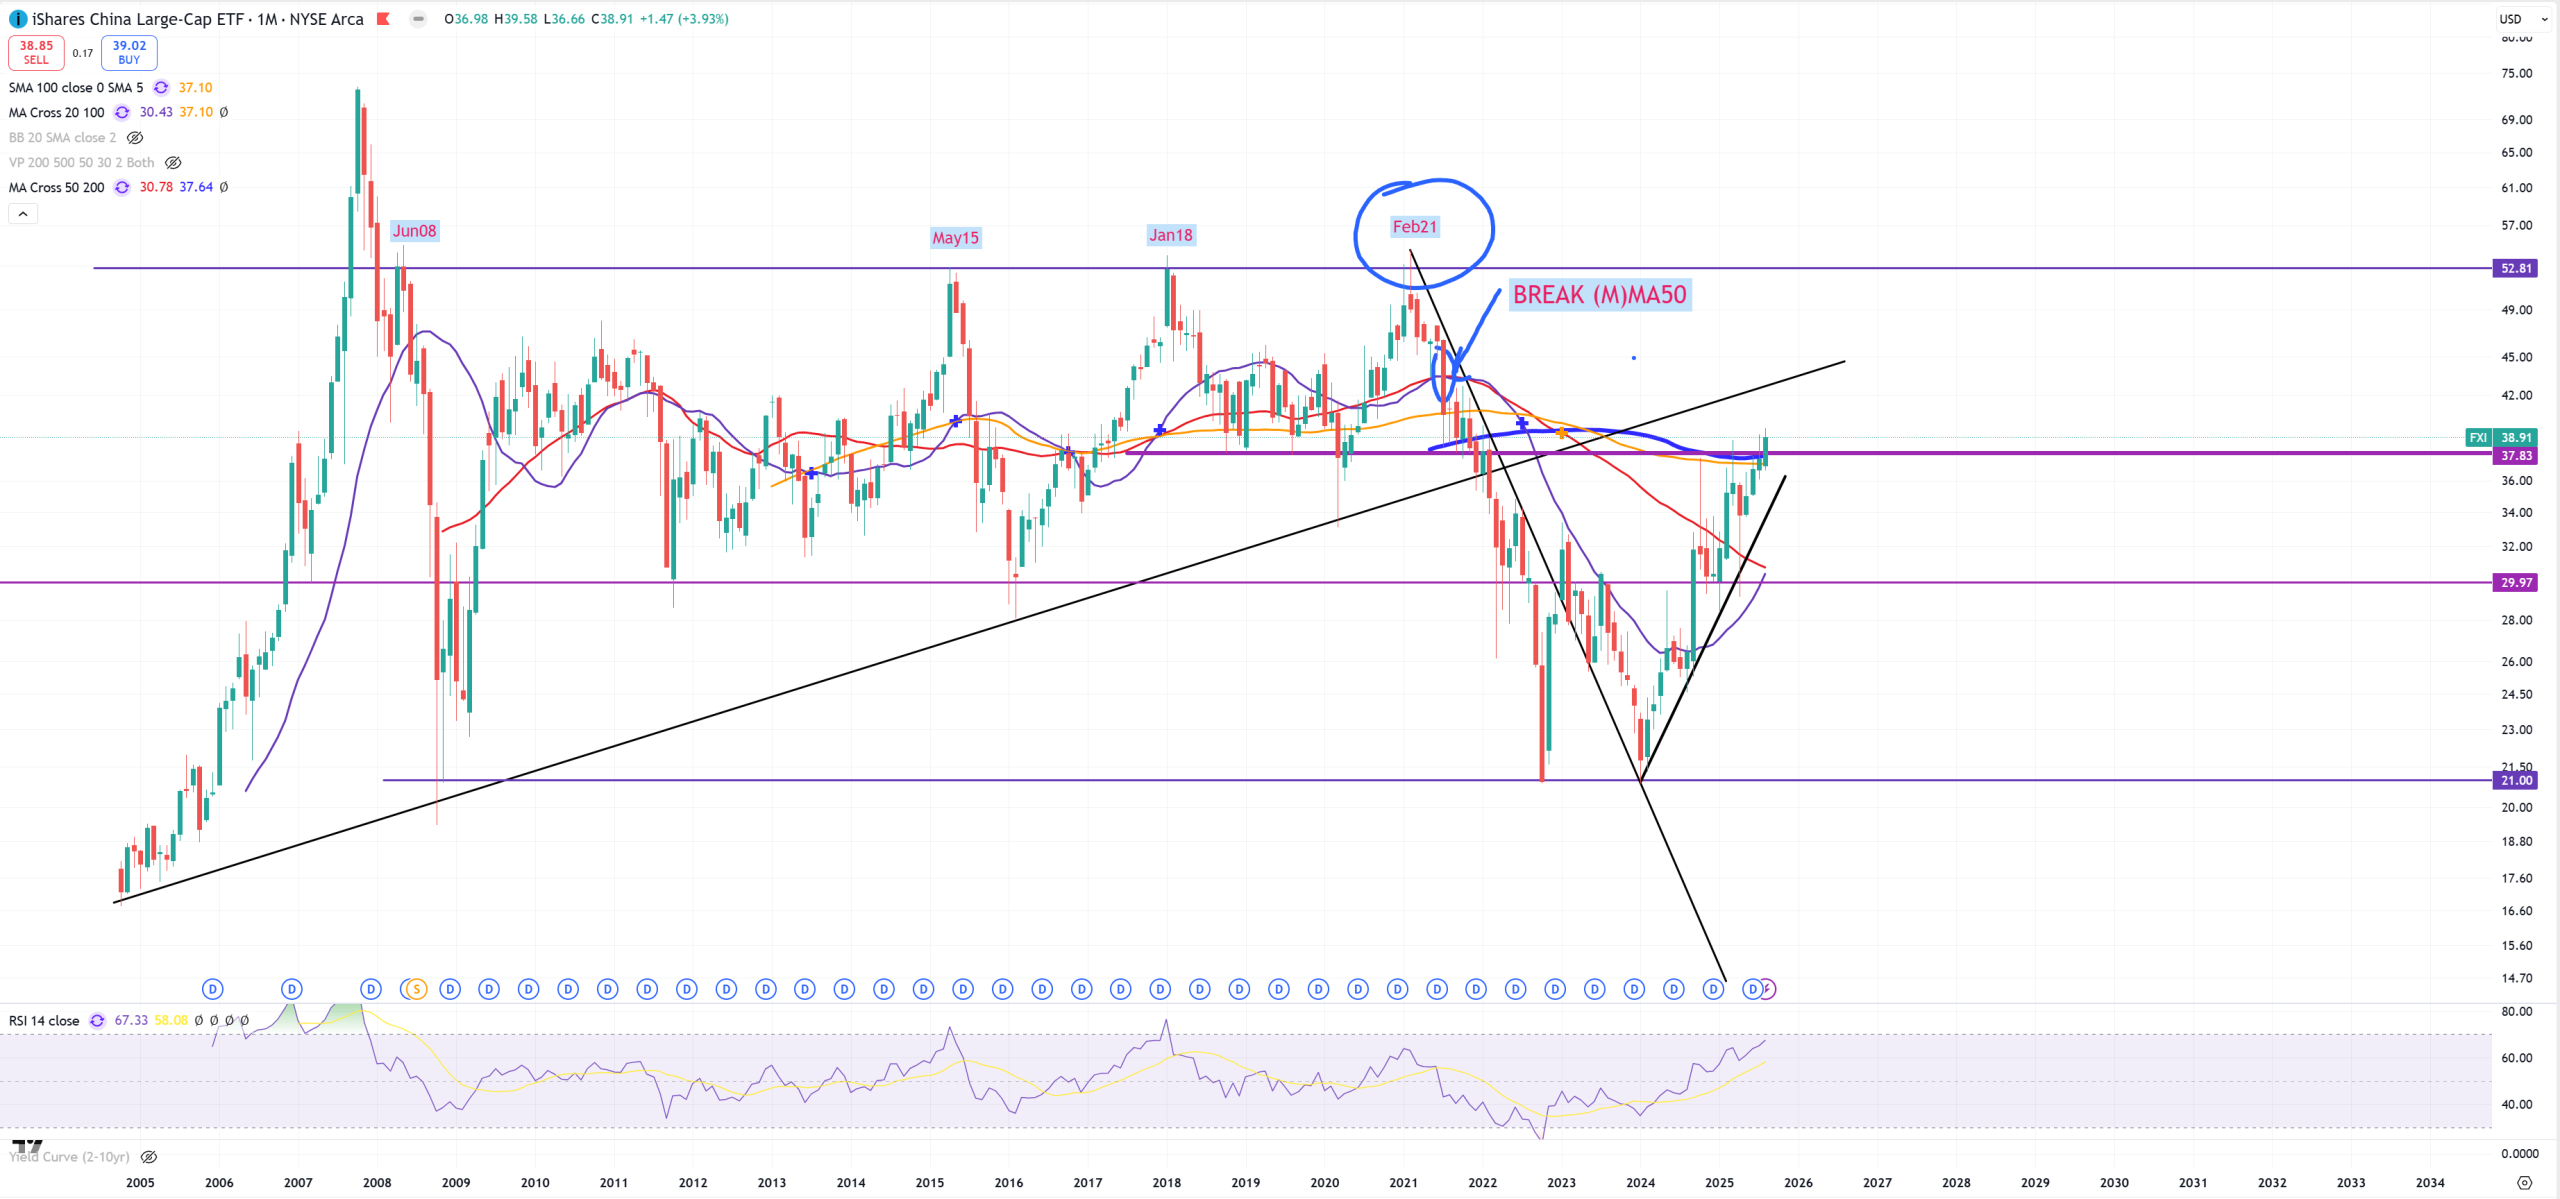
FXI – China – tries to break > (M)MA200 will it hold here?
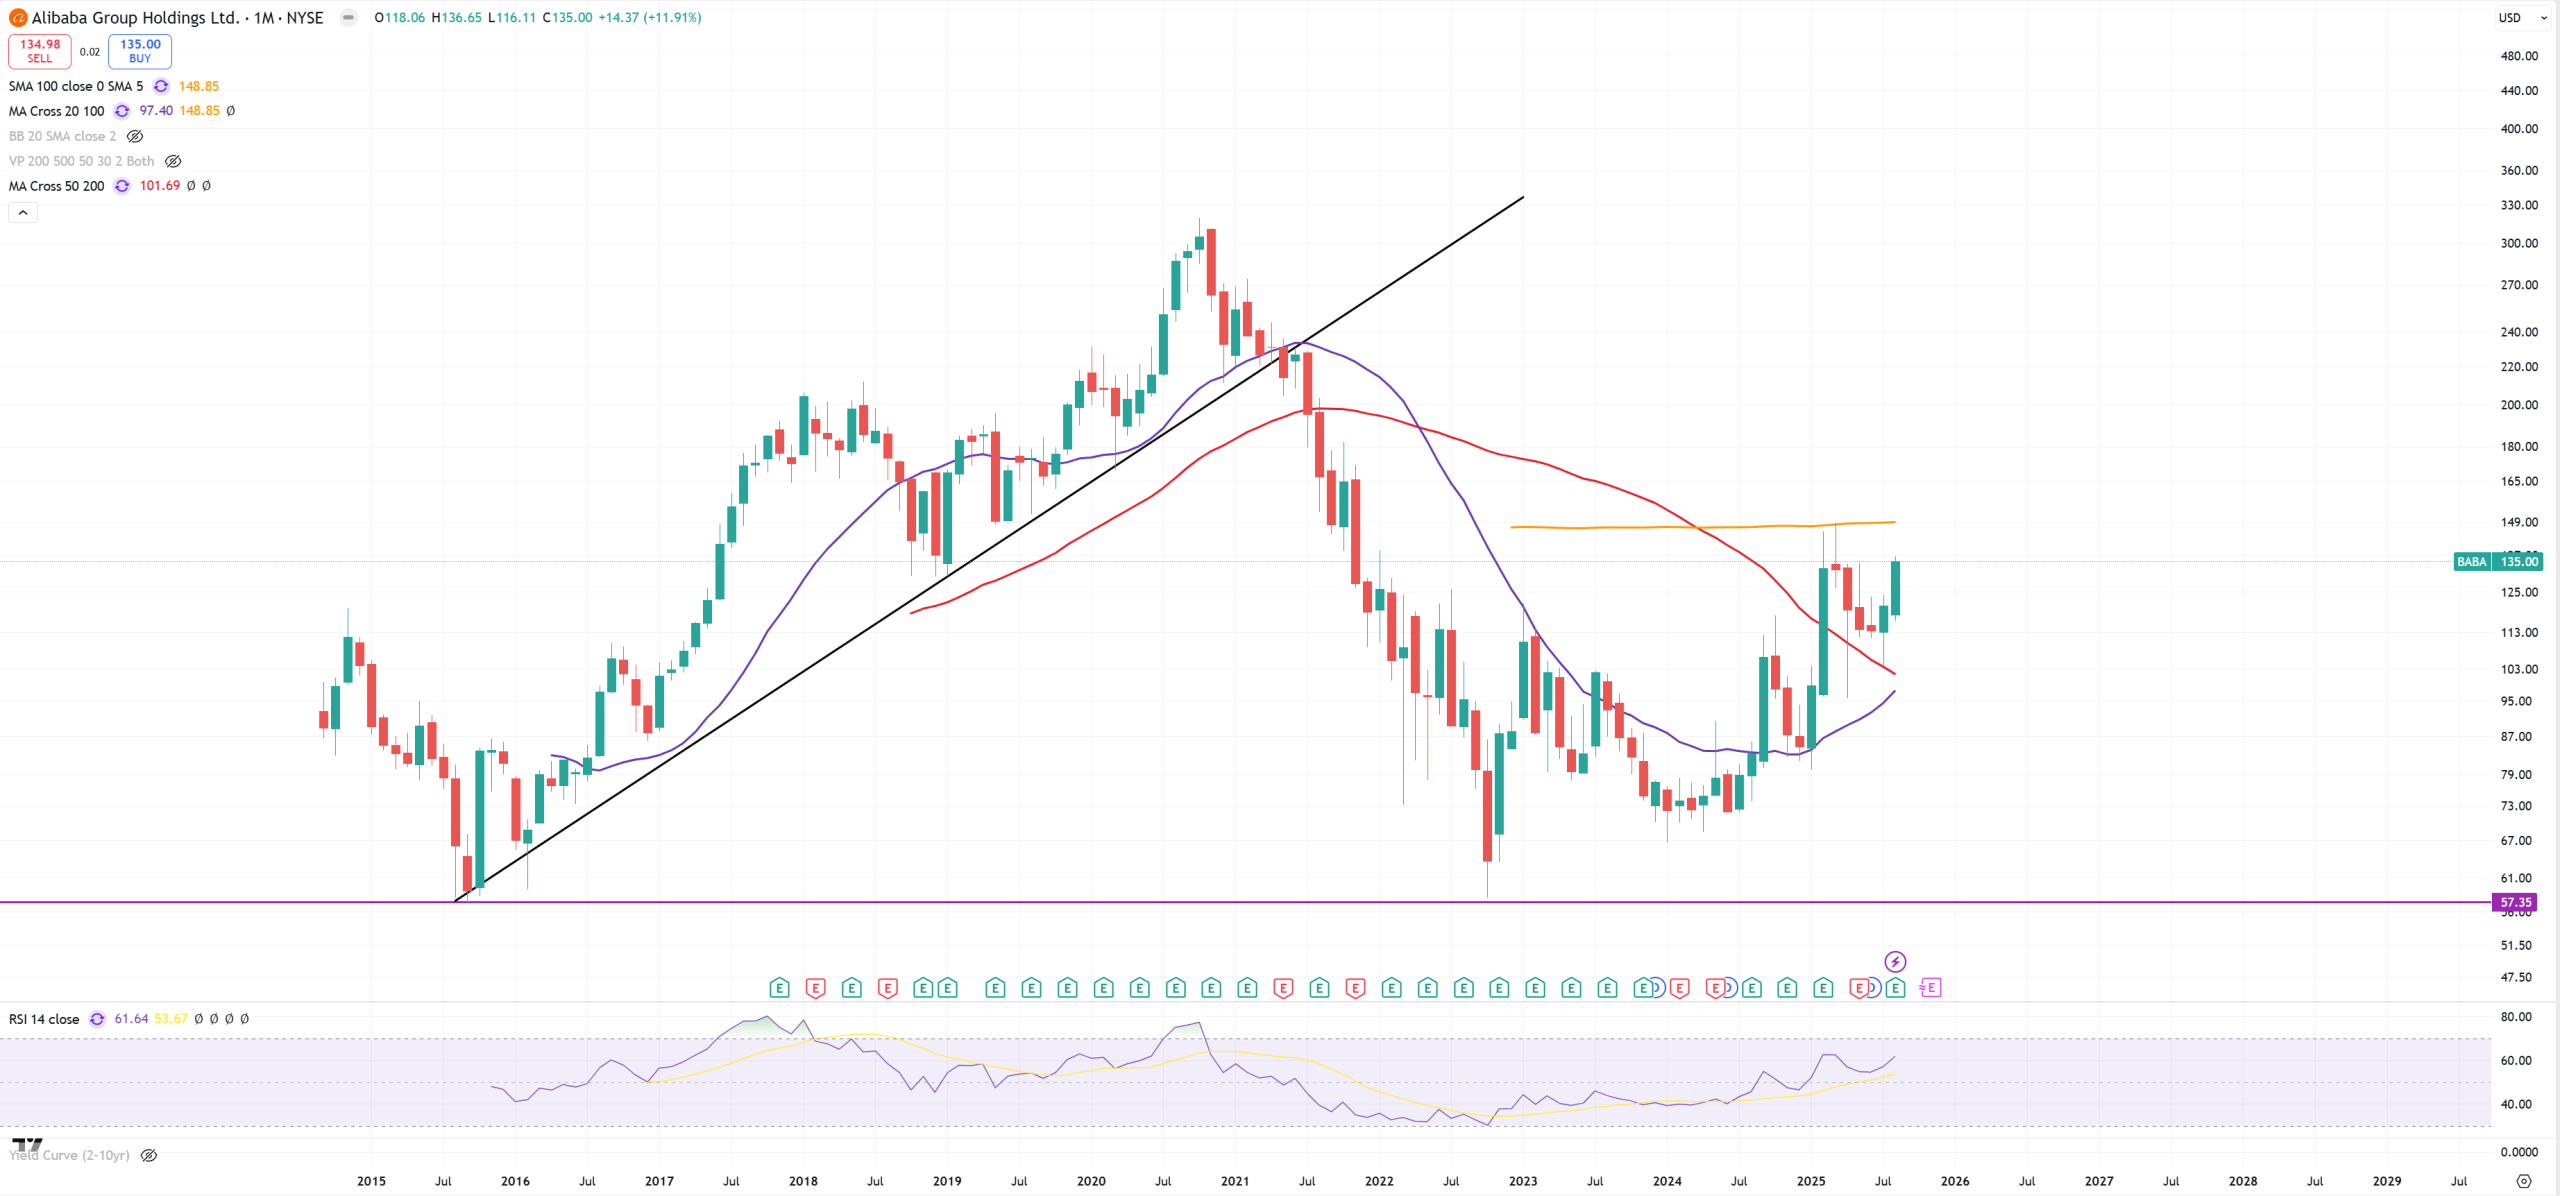
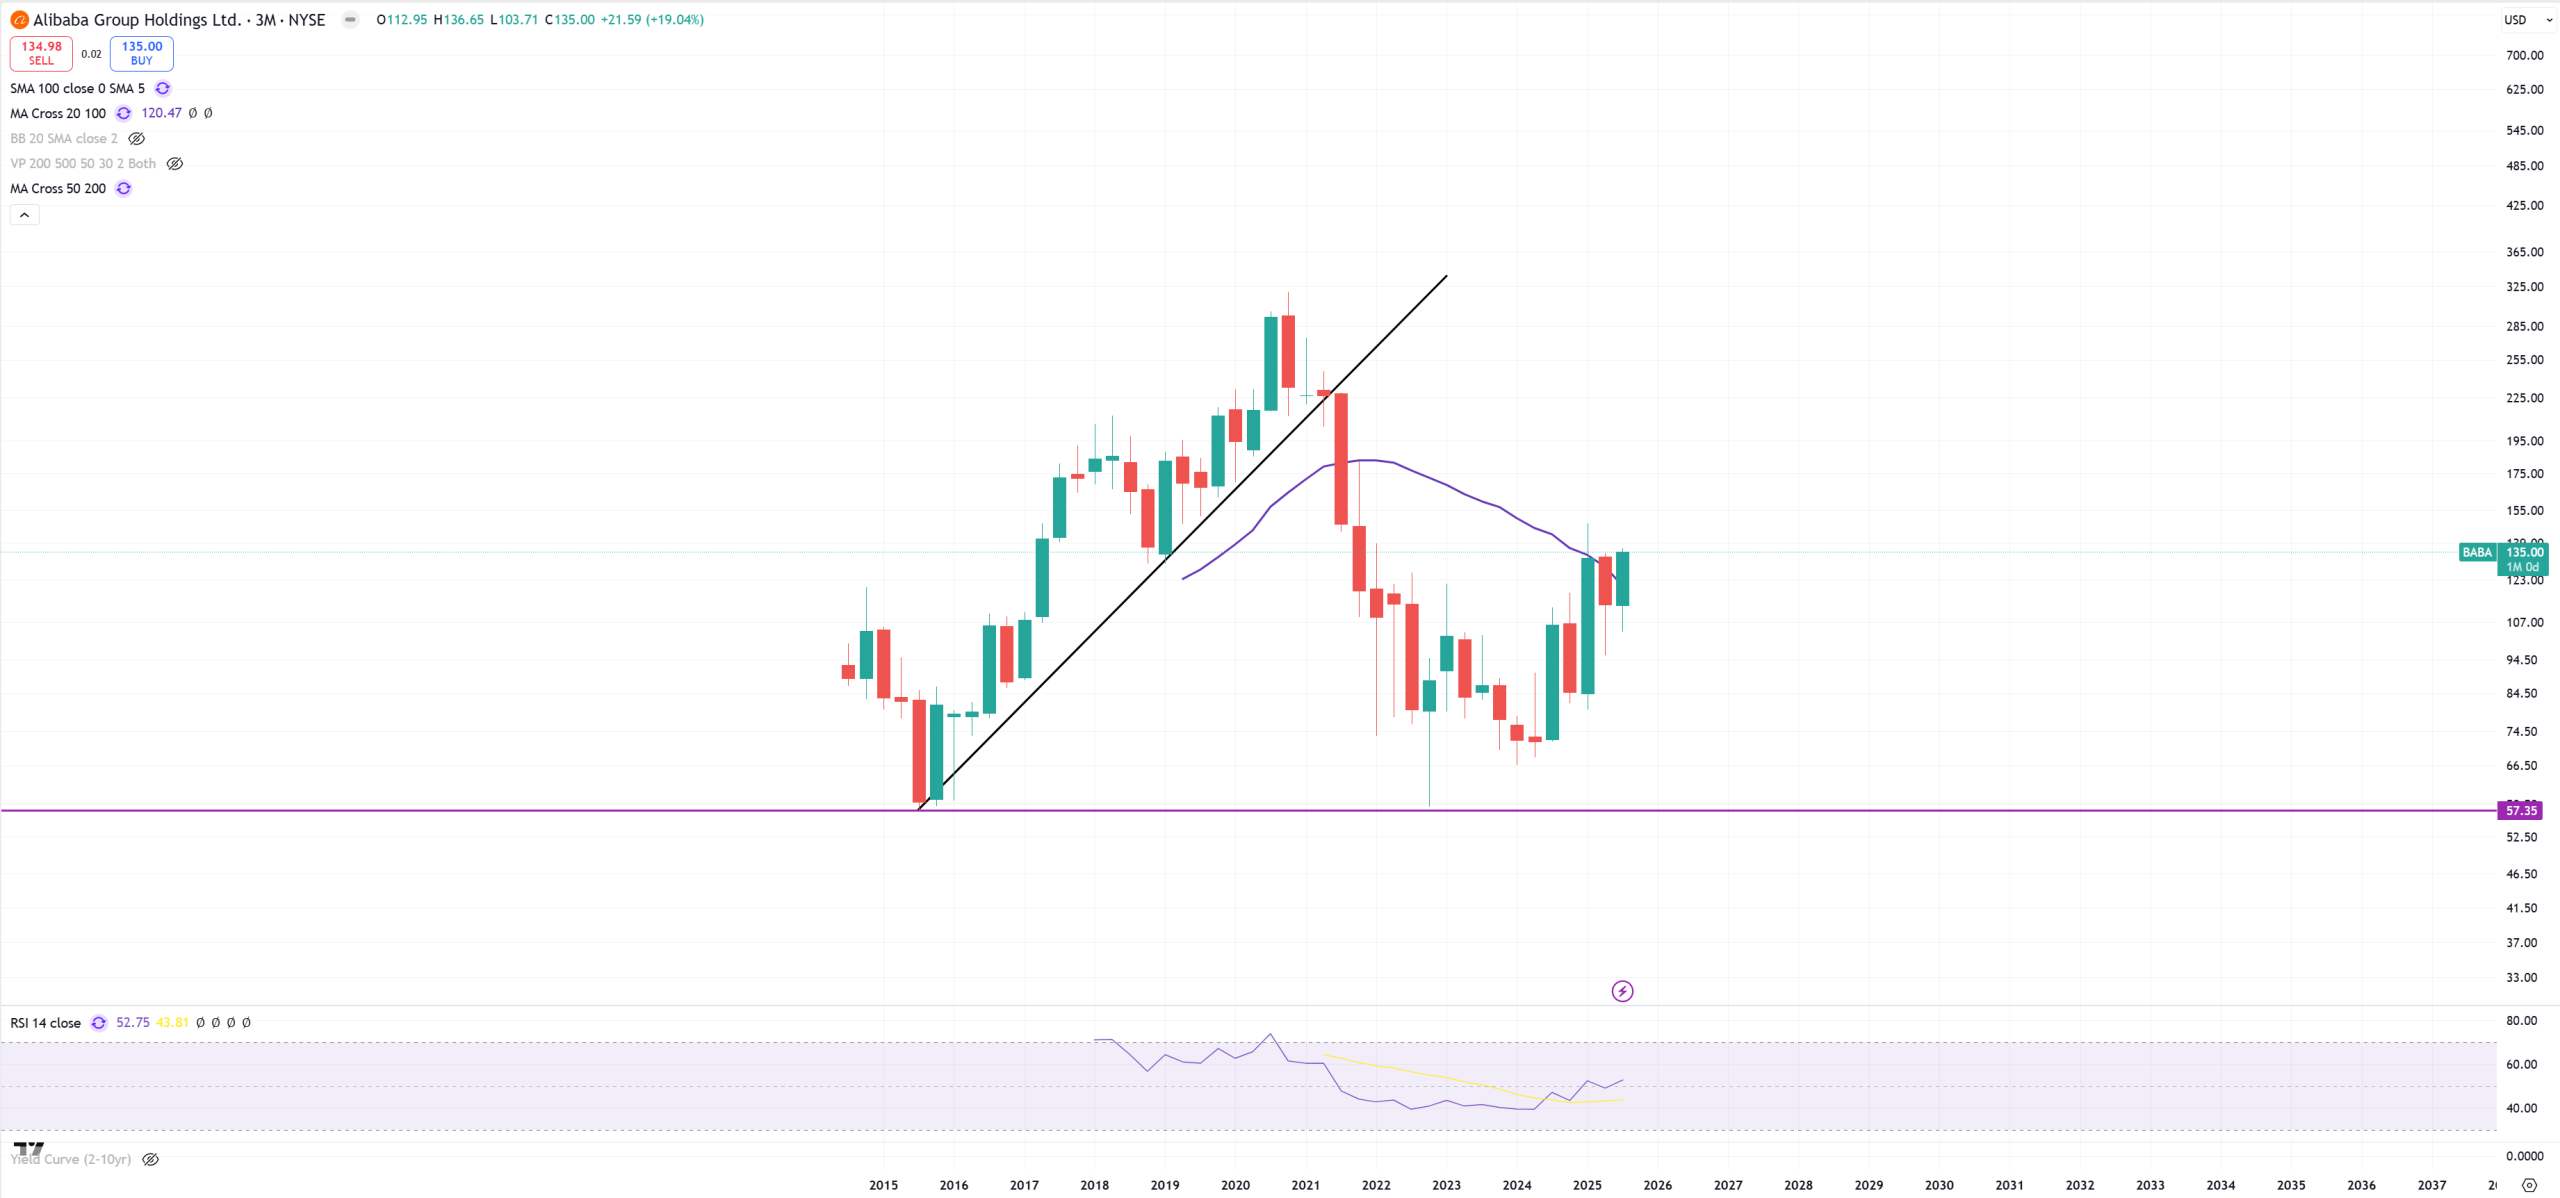
BABA – if we talk about China we needs to see BABA on (M) and (3M). September without a doubt will be important due to (3M)MA20 break moment.
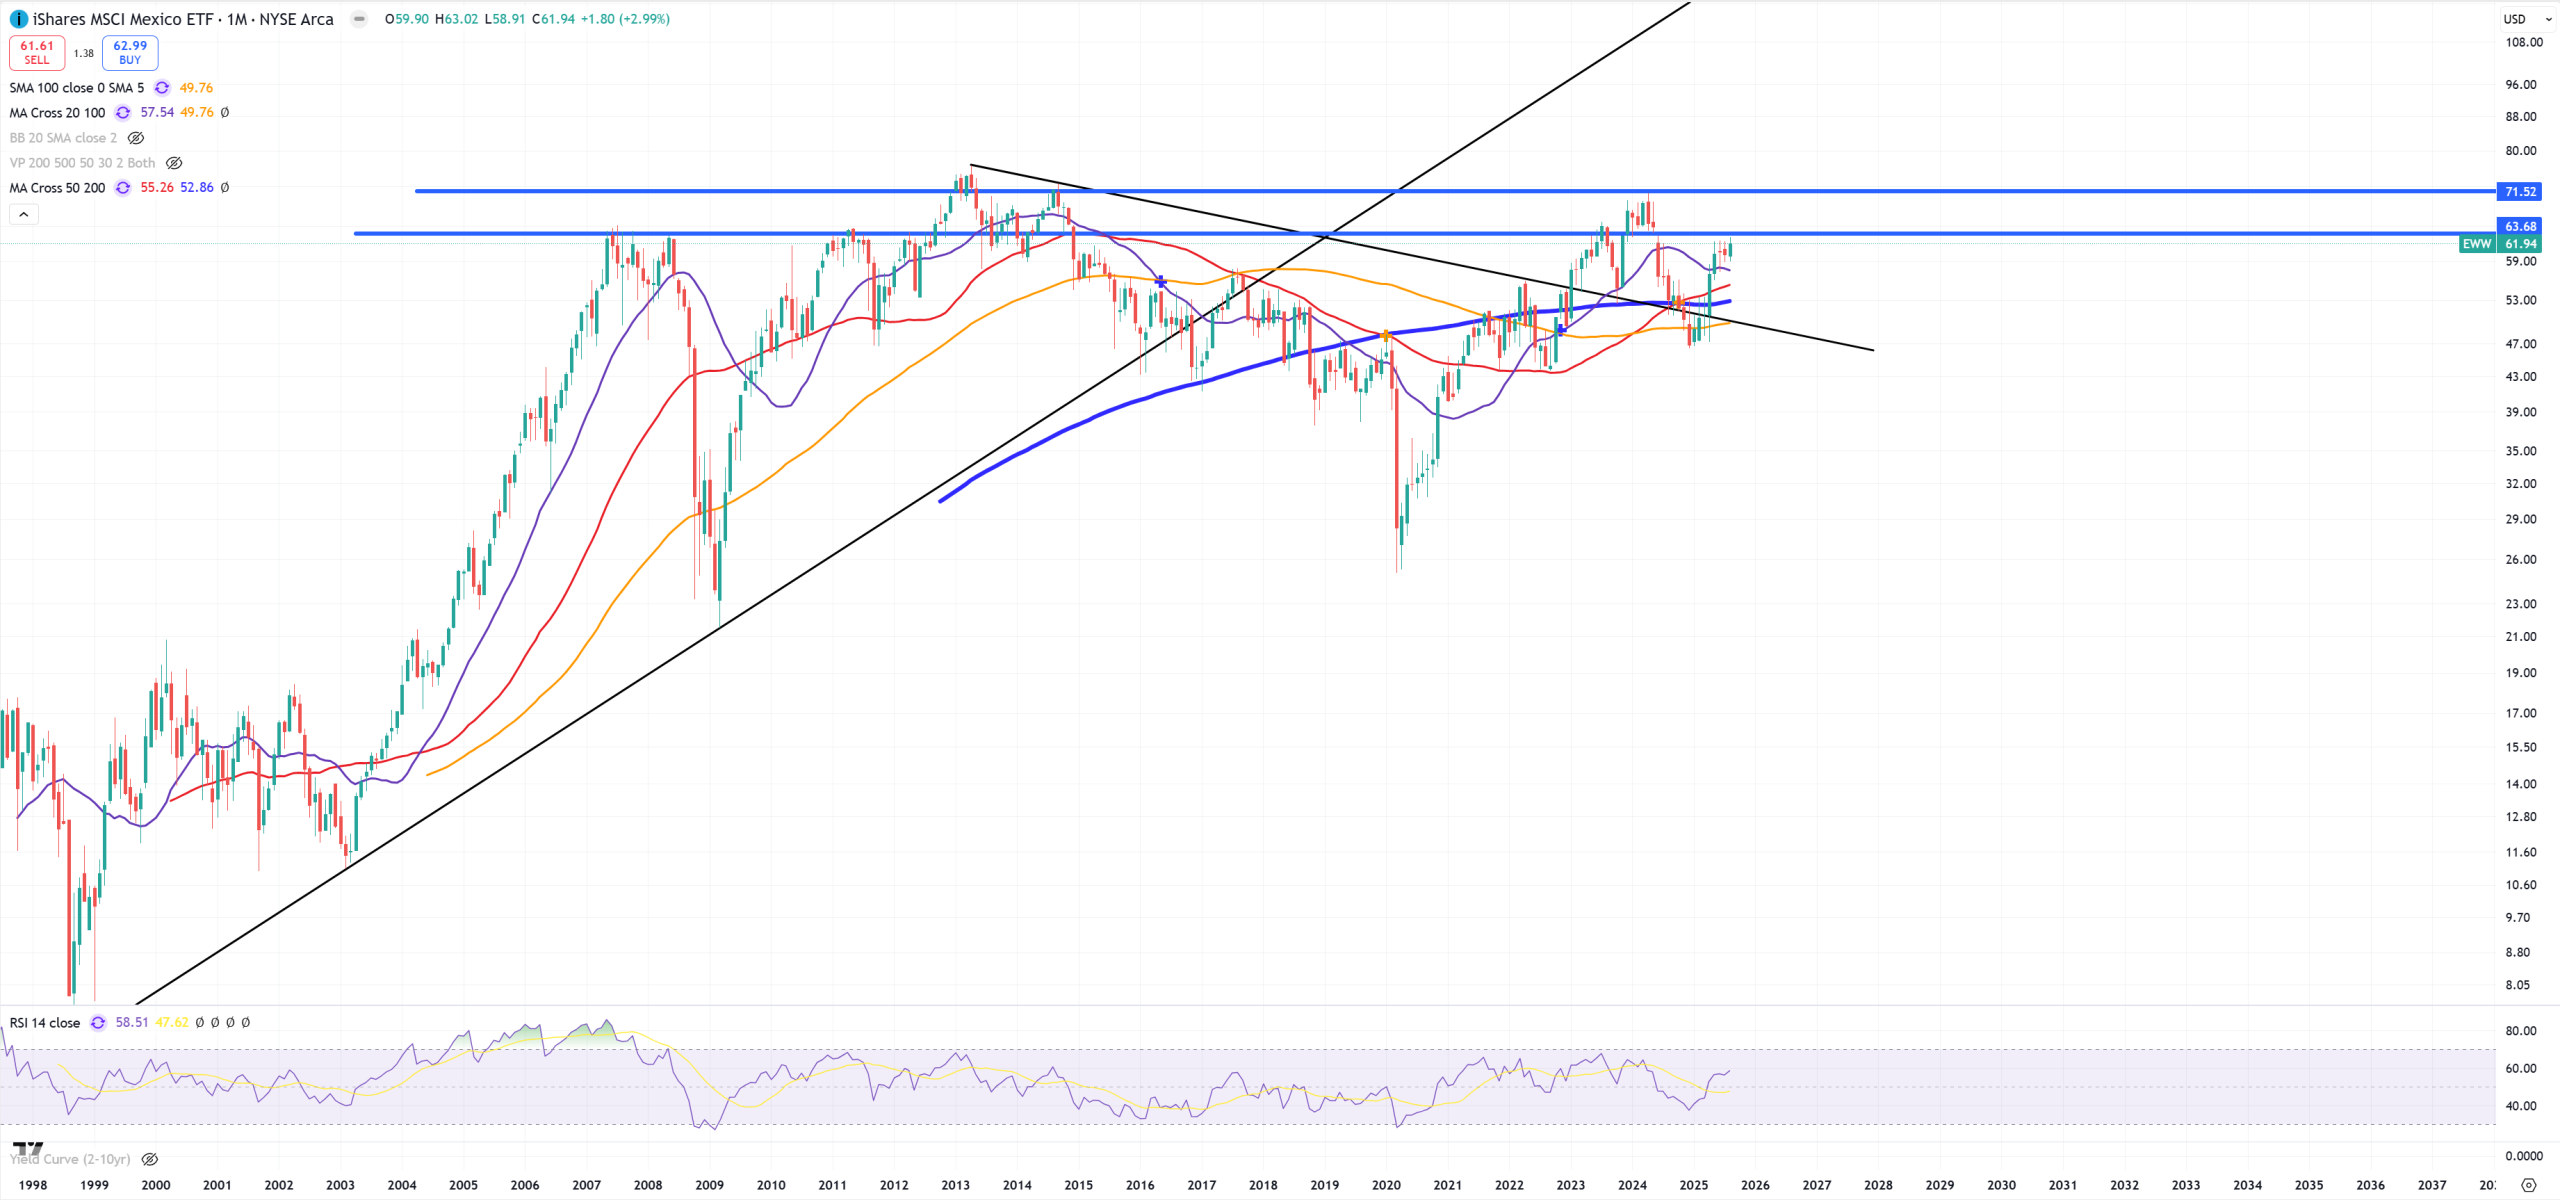
EWW – Mexico holds 2007 peak level
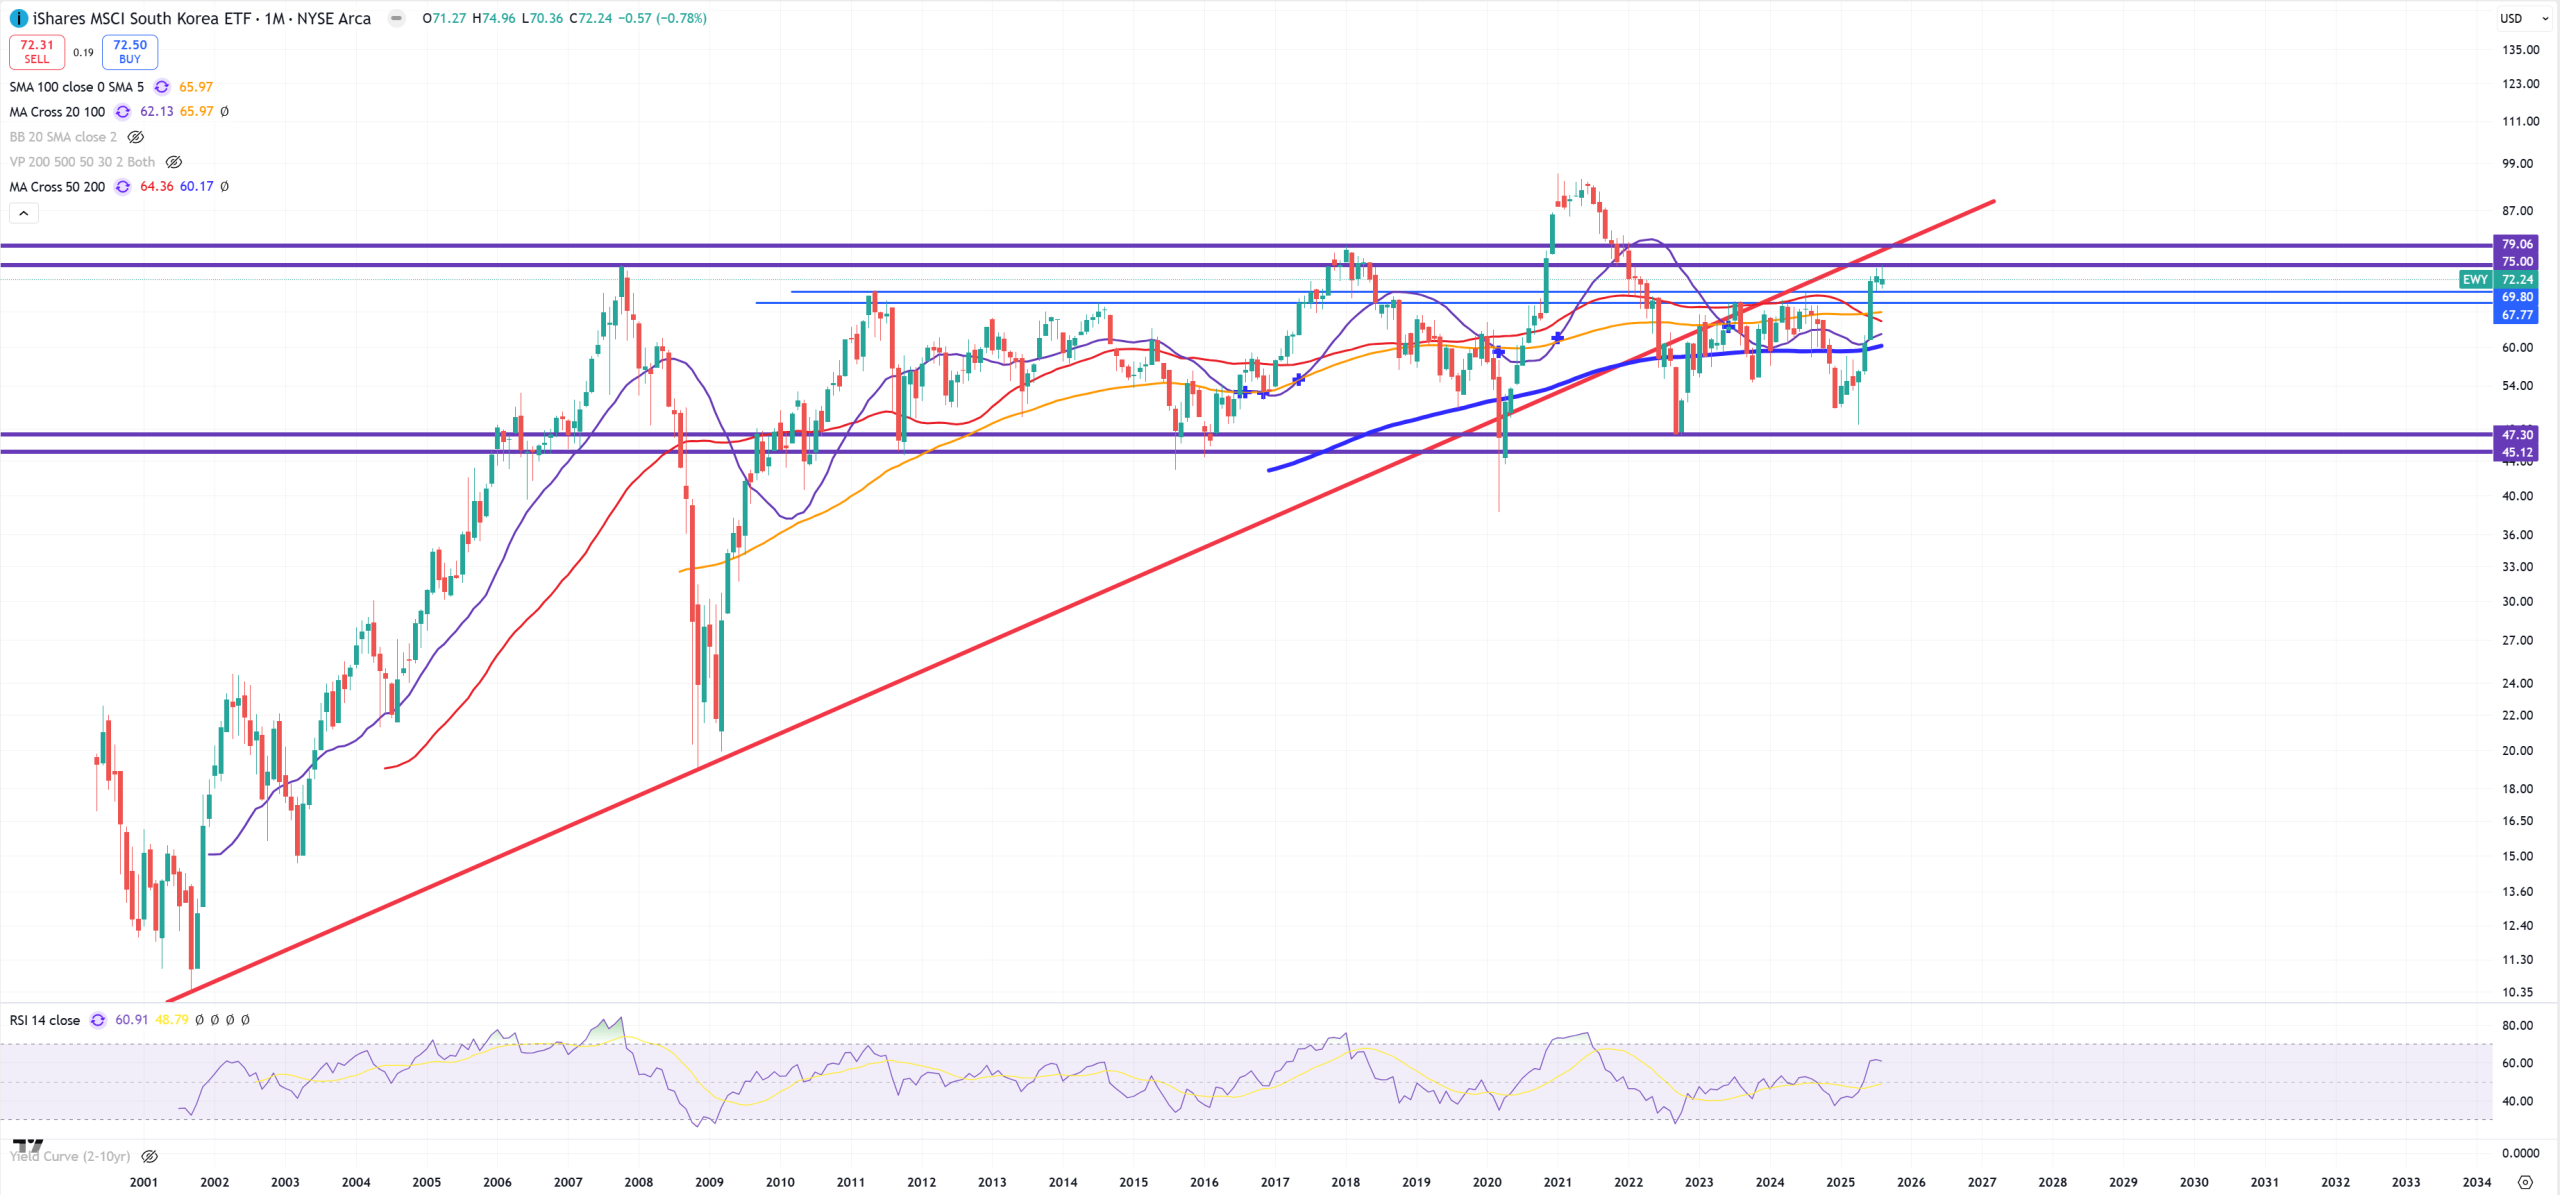
EWY – South Koreak and also 2007 level. Massive 2021 peak.
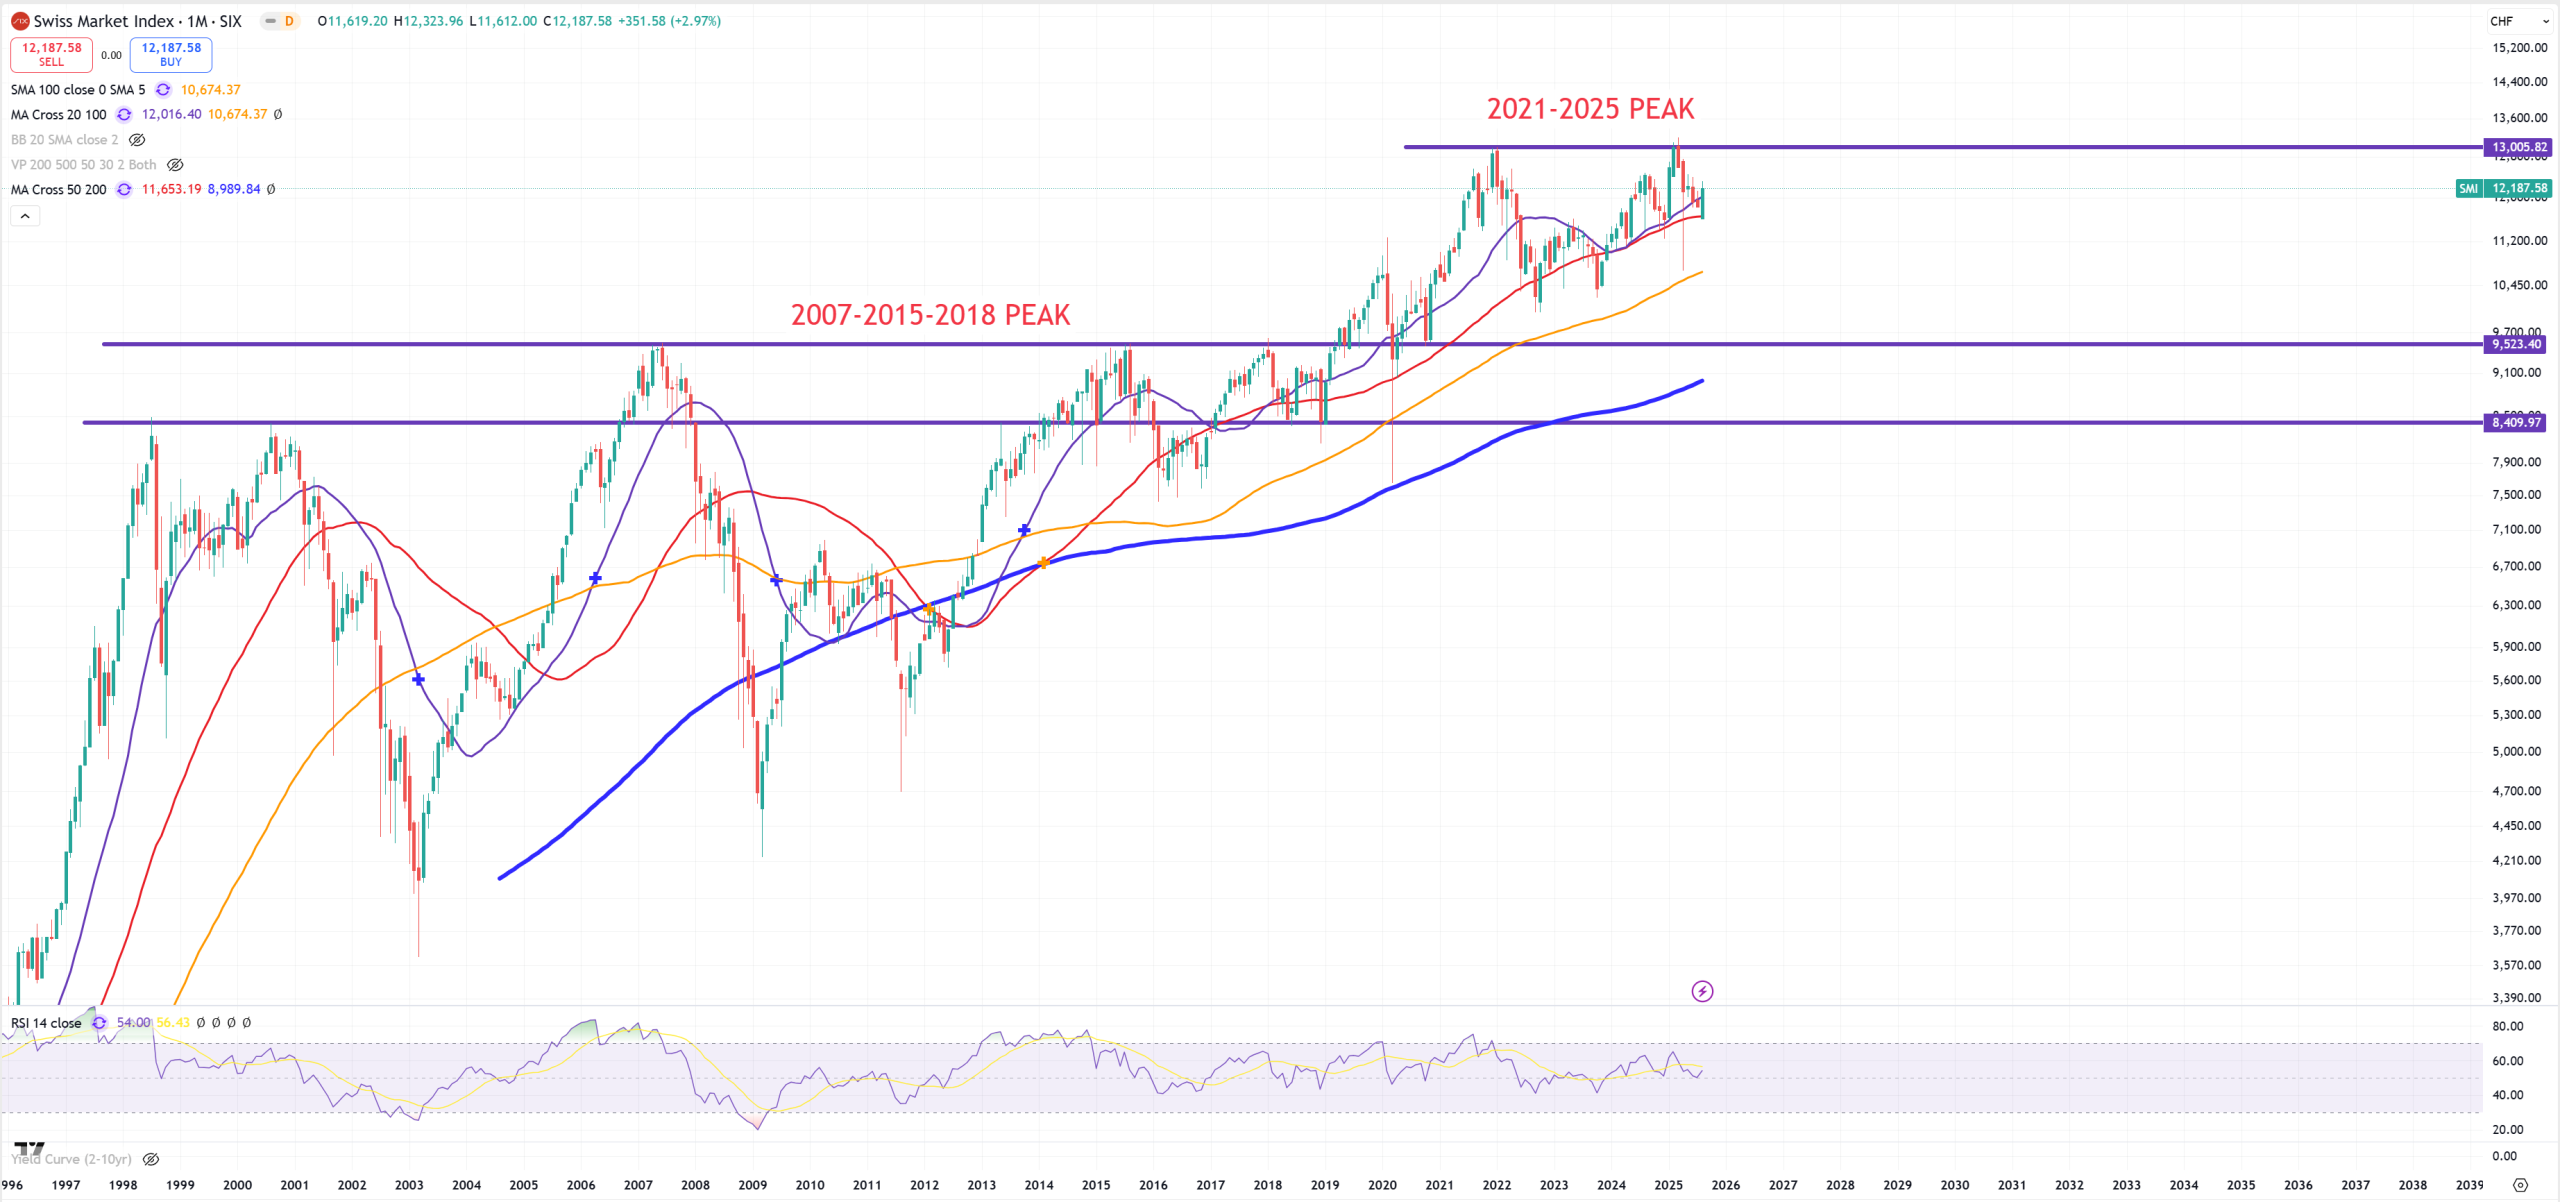
SMI – Swiss Market
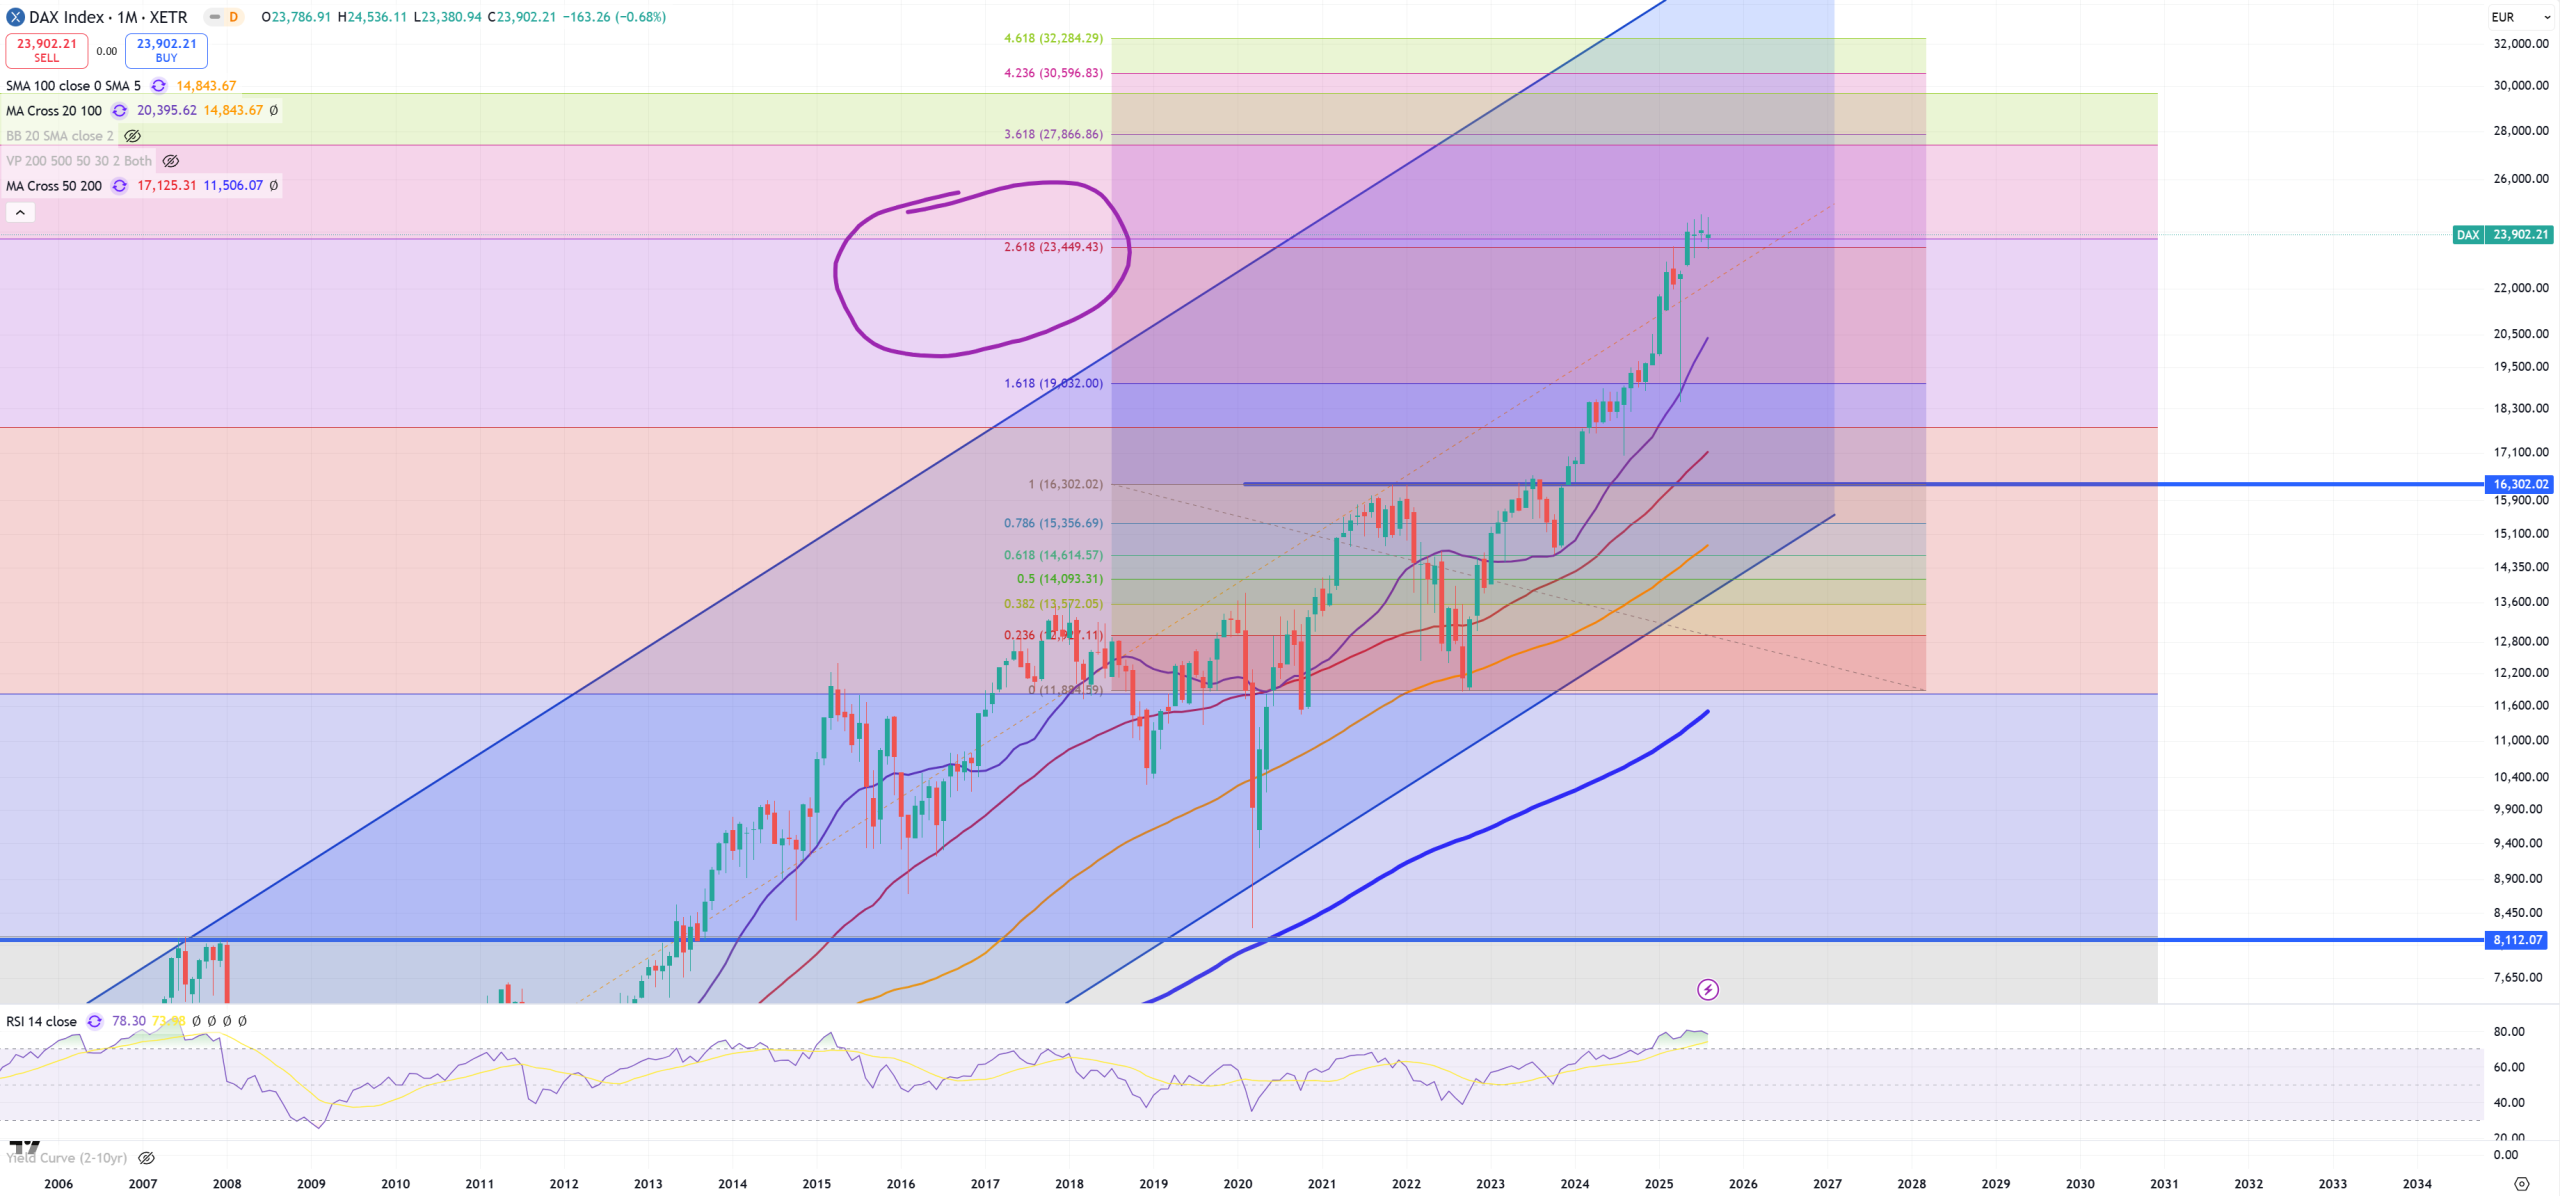
DAX – ~24000 is important level. 2 key FIBO levels crossing at this level. 2021 peak is at 16300 level.
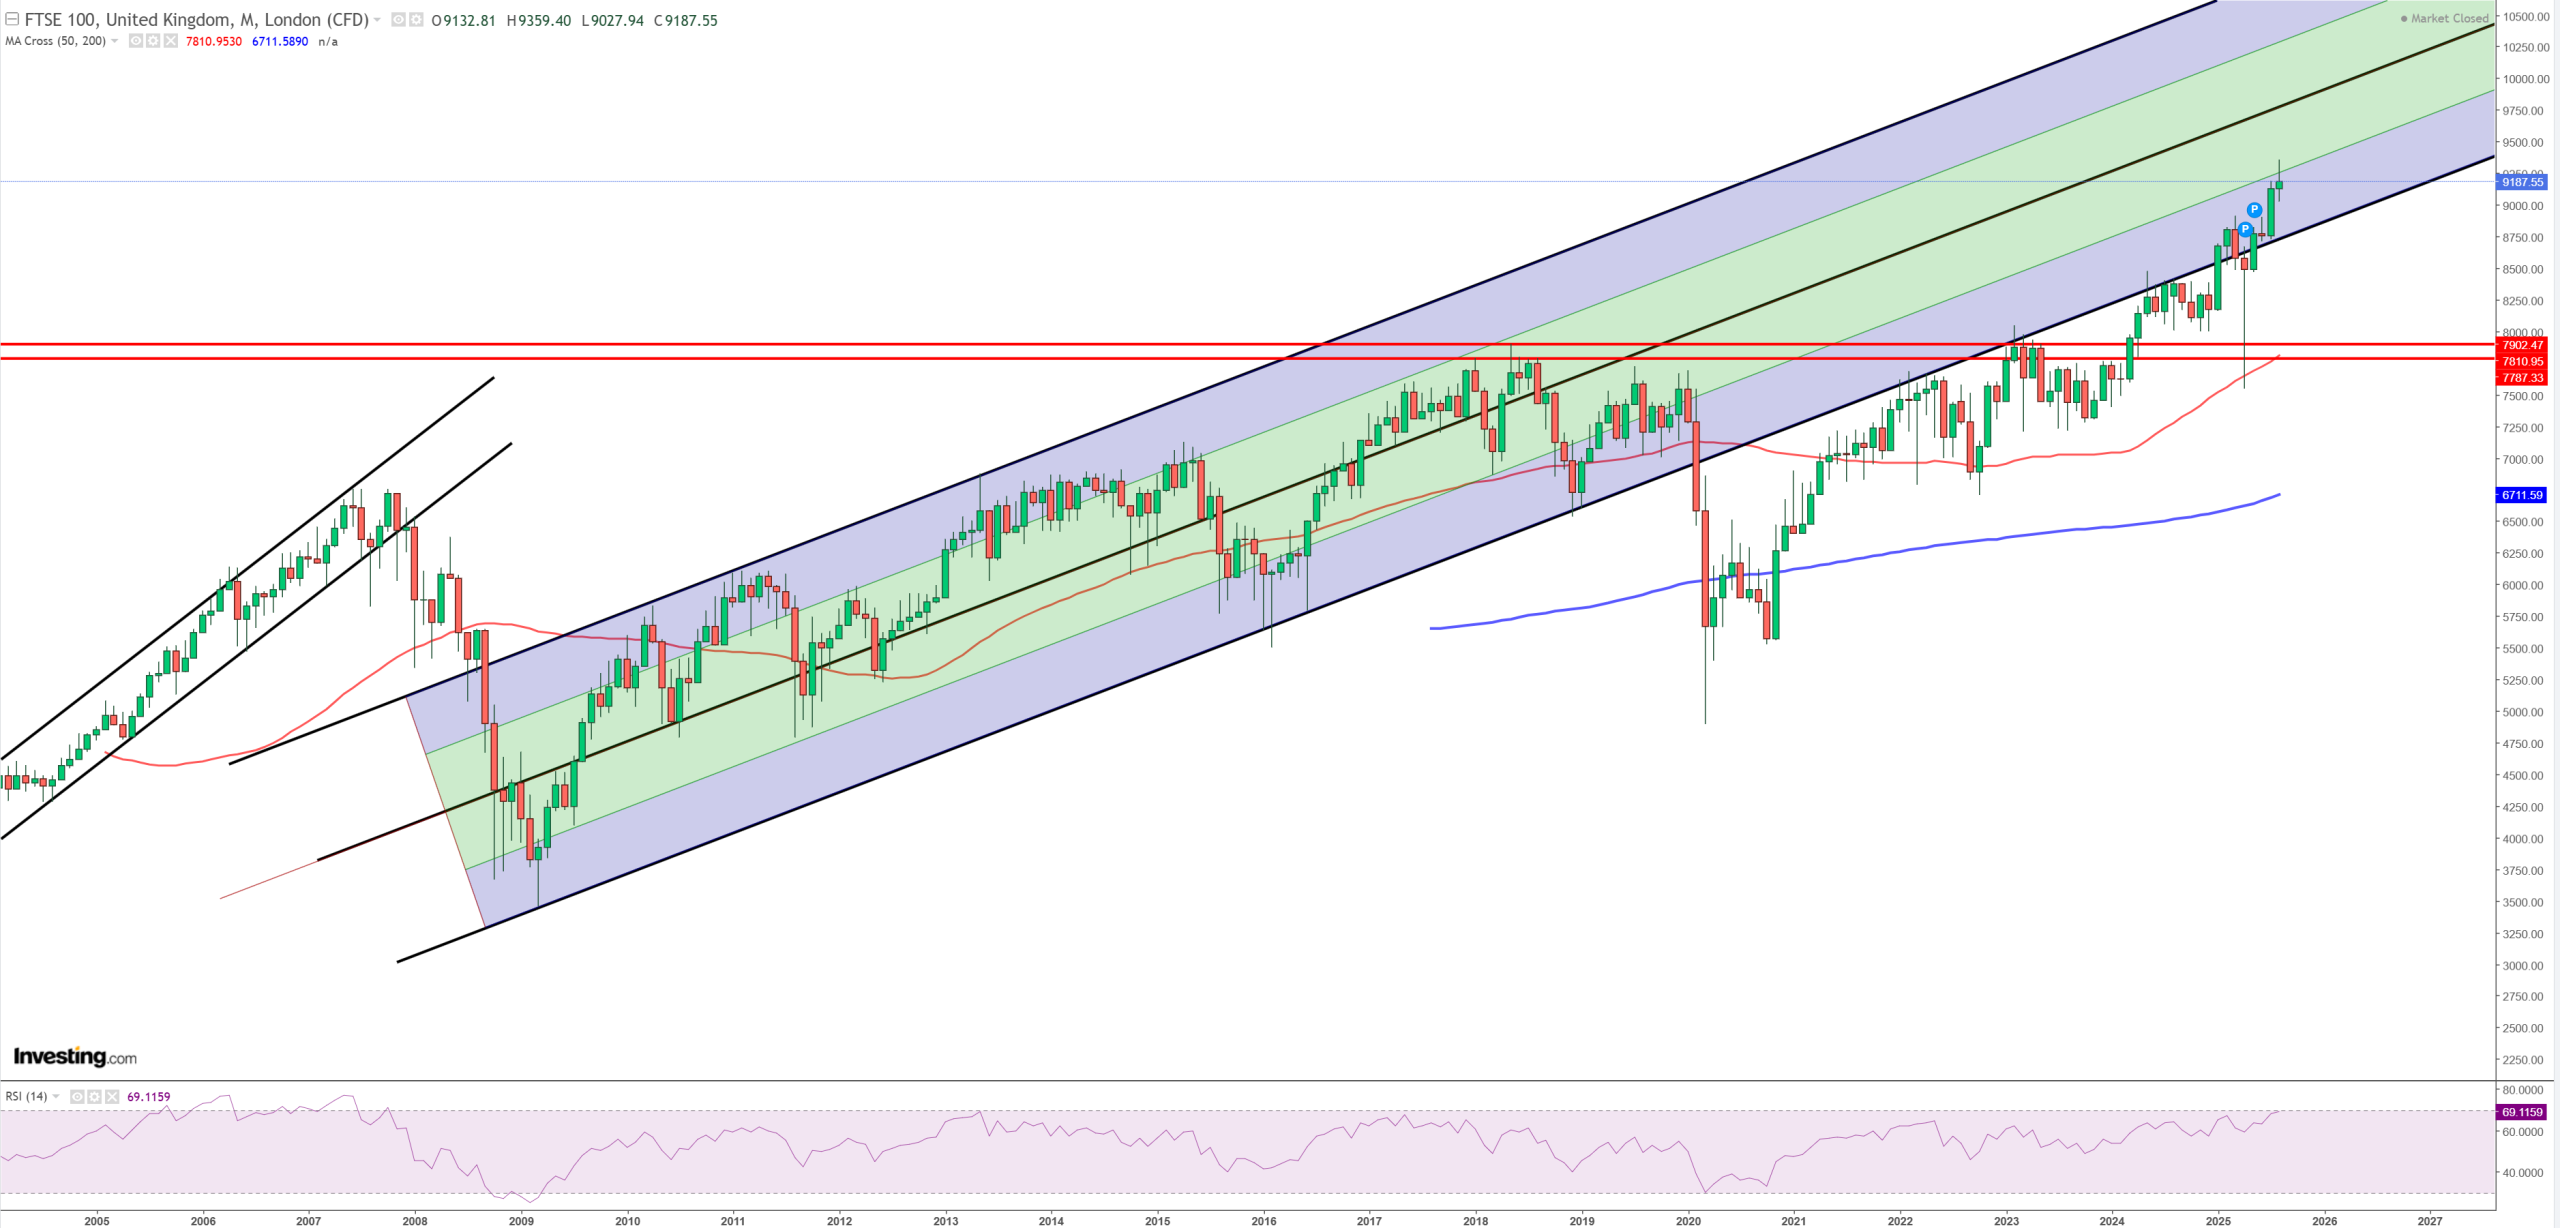
UK100 – this is a shocker for me, but also GBPUSD is a shocker. I’ve seen that also on CVX.
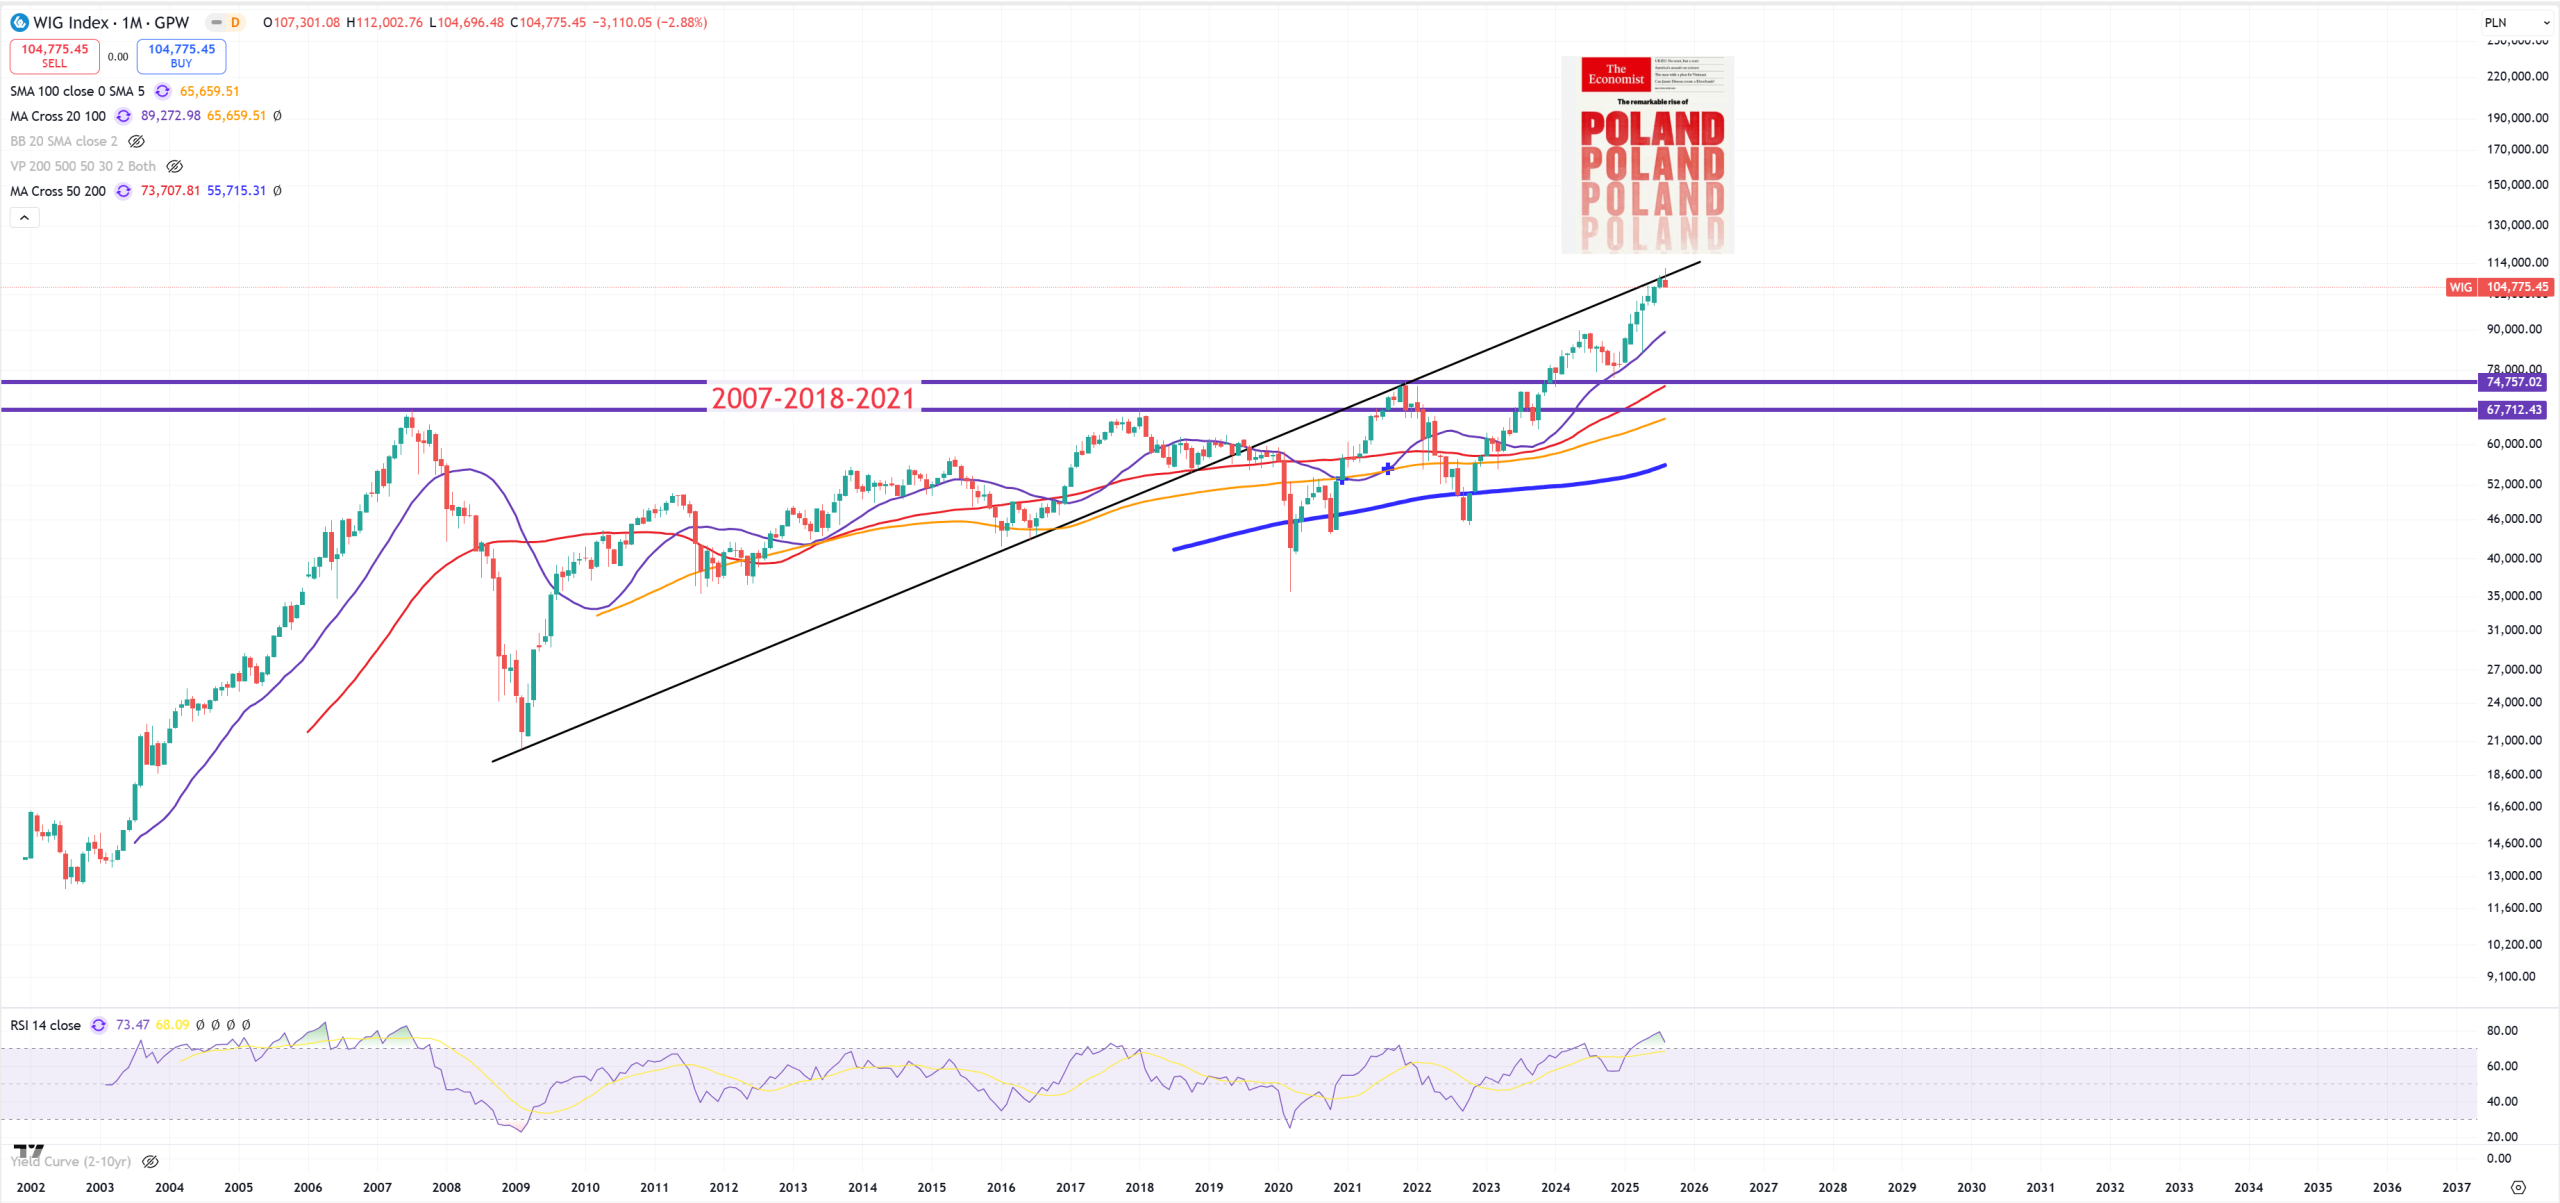
WIG – Poland in nominal, big moment connected with USDPLN retesting couple technical levels, described earlier. I don’t believe in any break above 2021/2022, but this one is massive
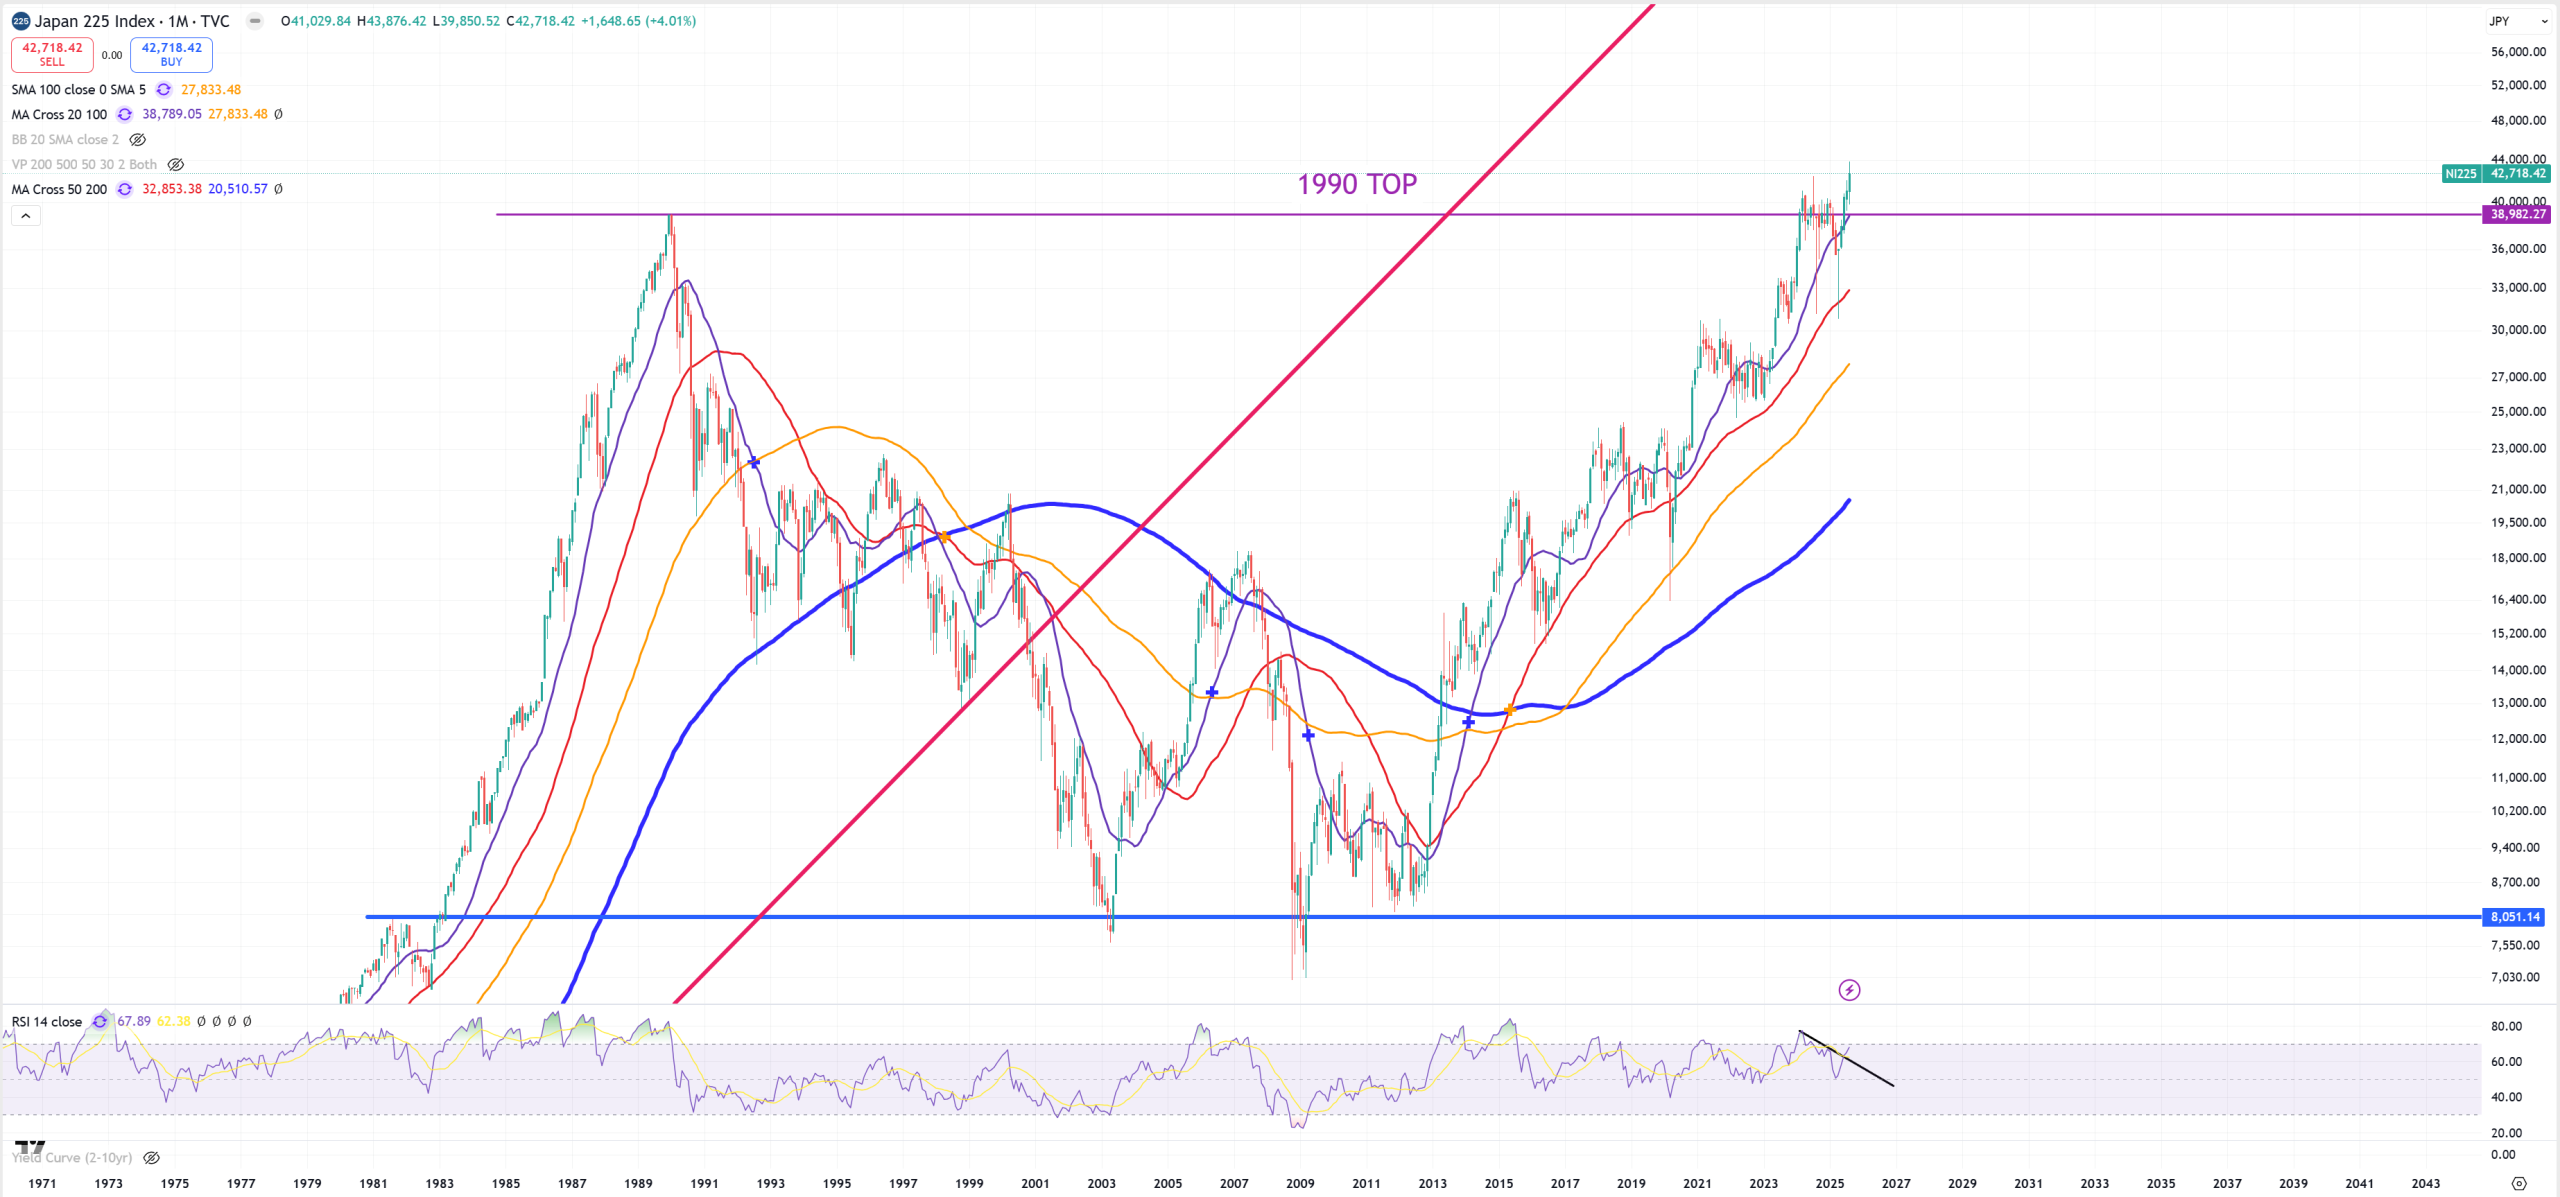
NI225 – Nikkei 225, and defending this 1990 peak
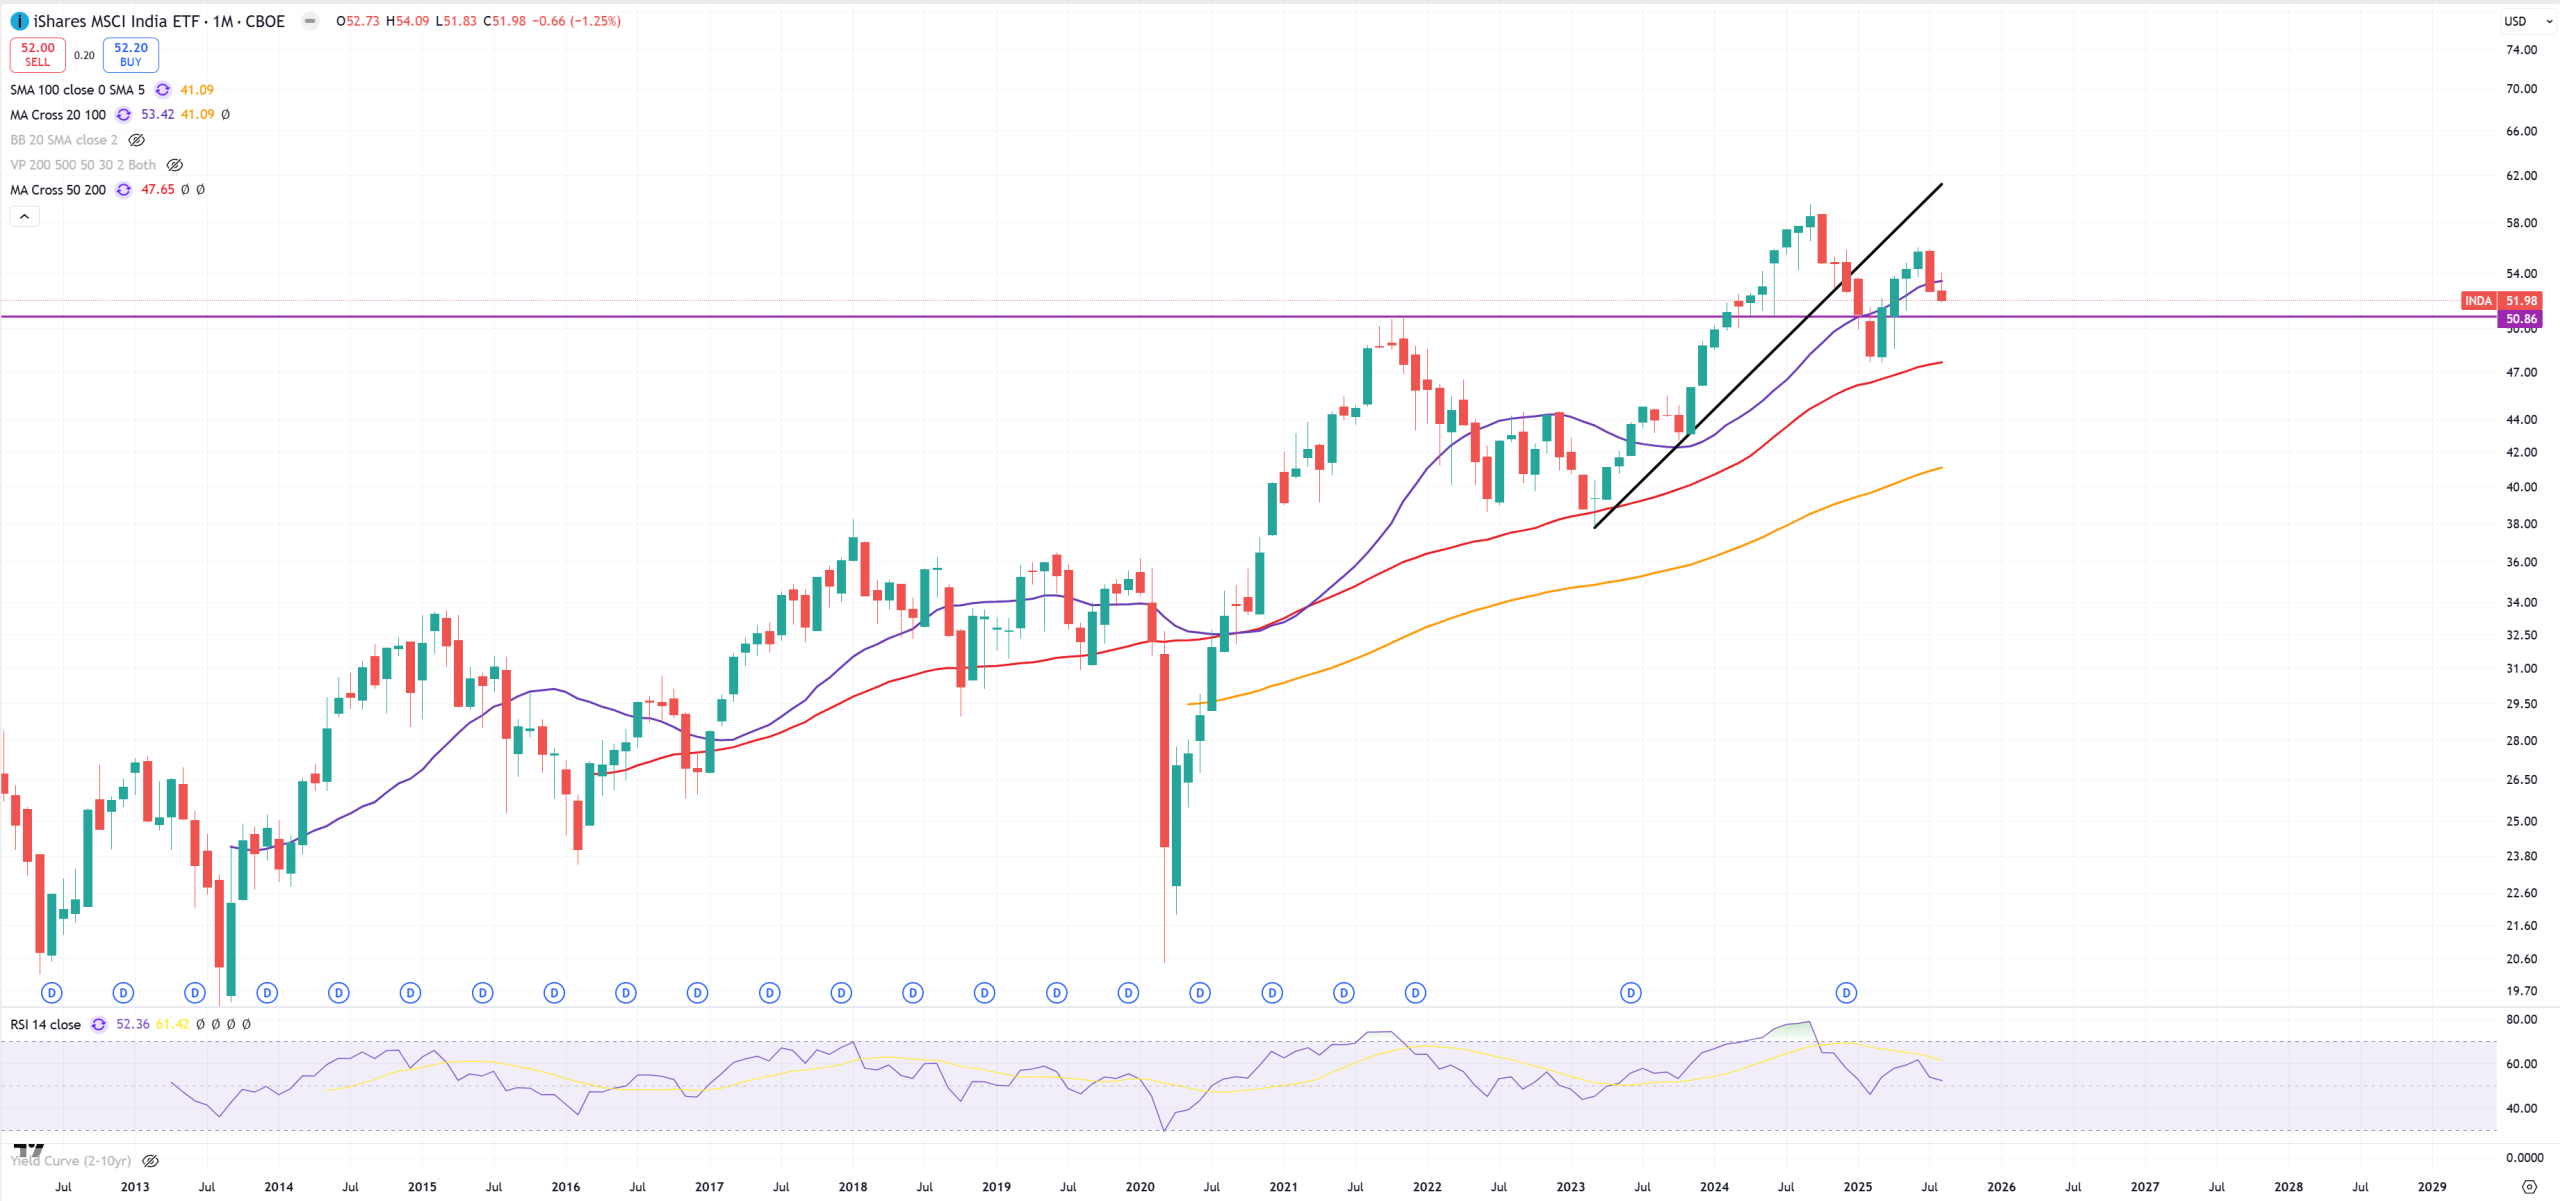
INDA – India ETF, as USDINR breaking higher, high chances it’ll drop below 2021 peak
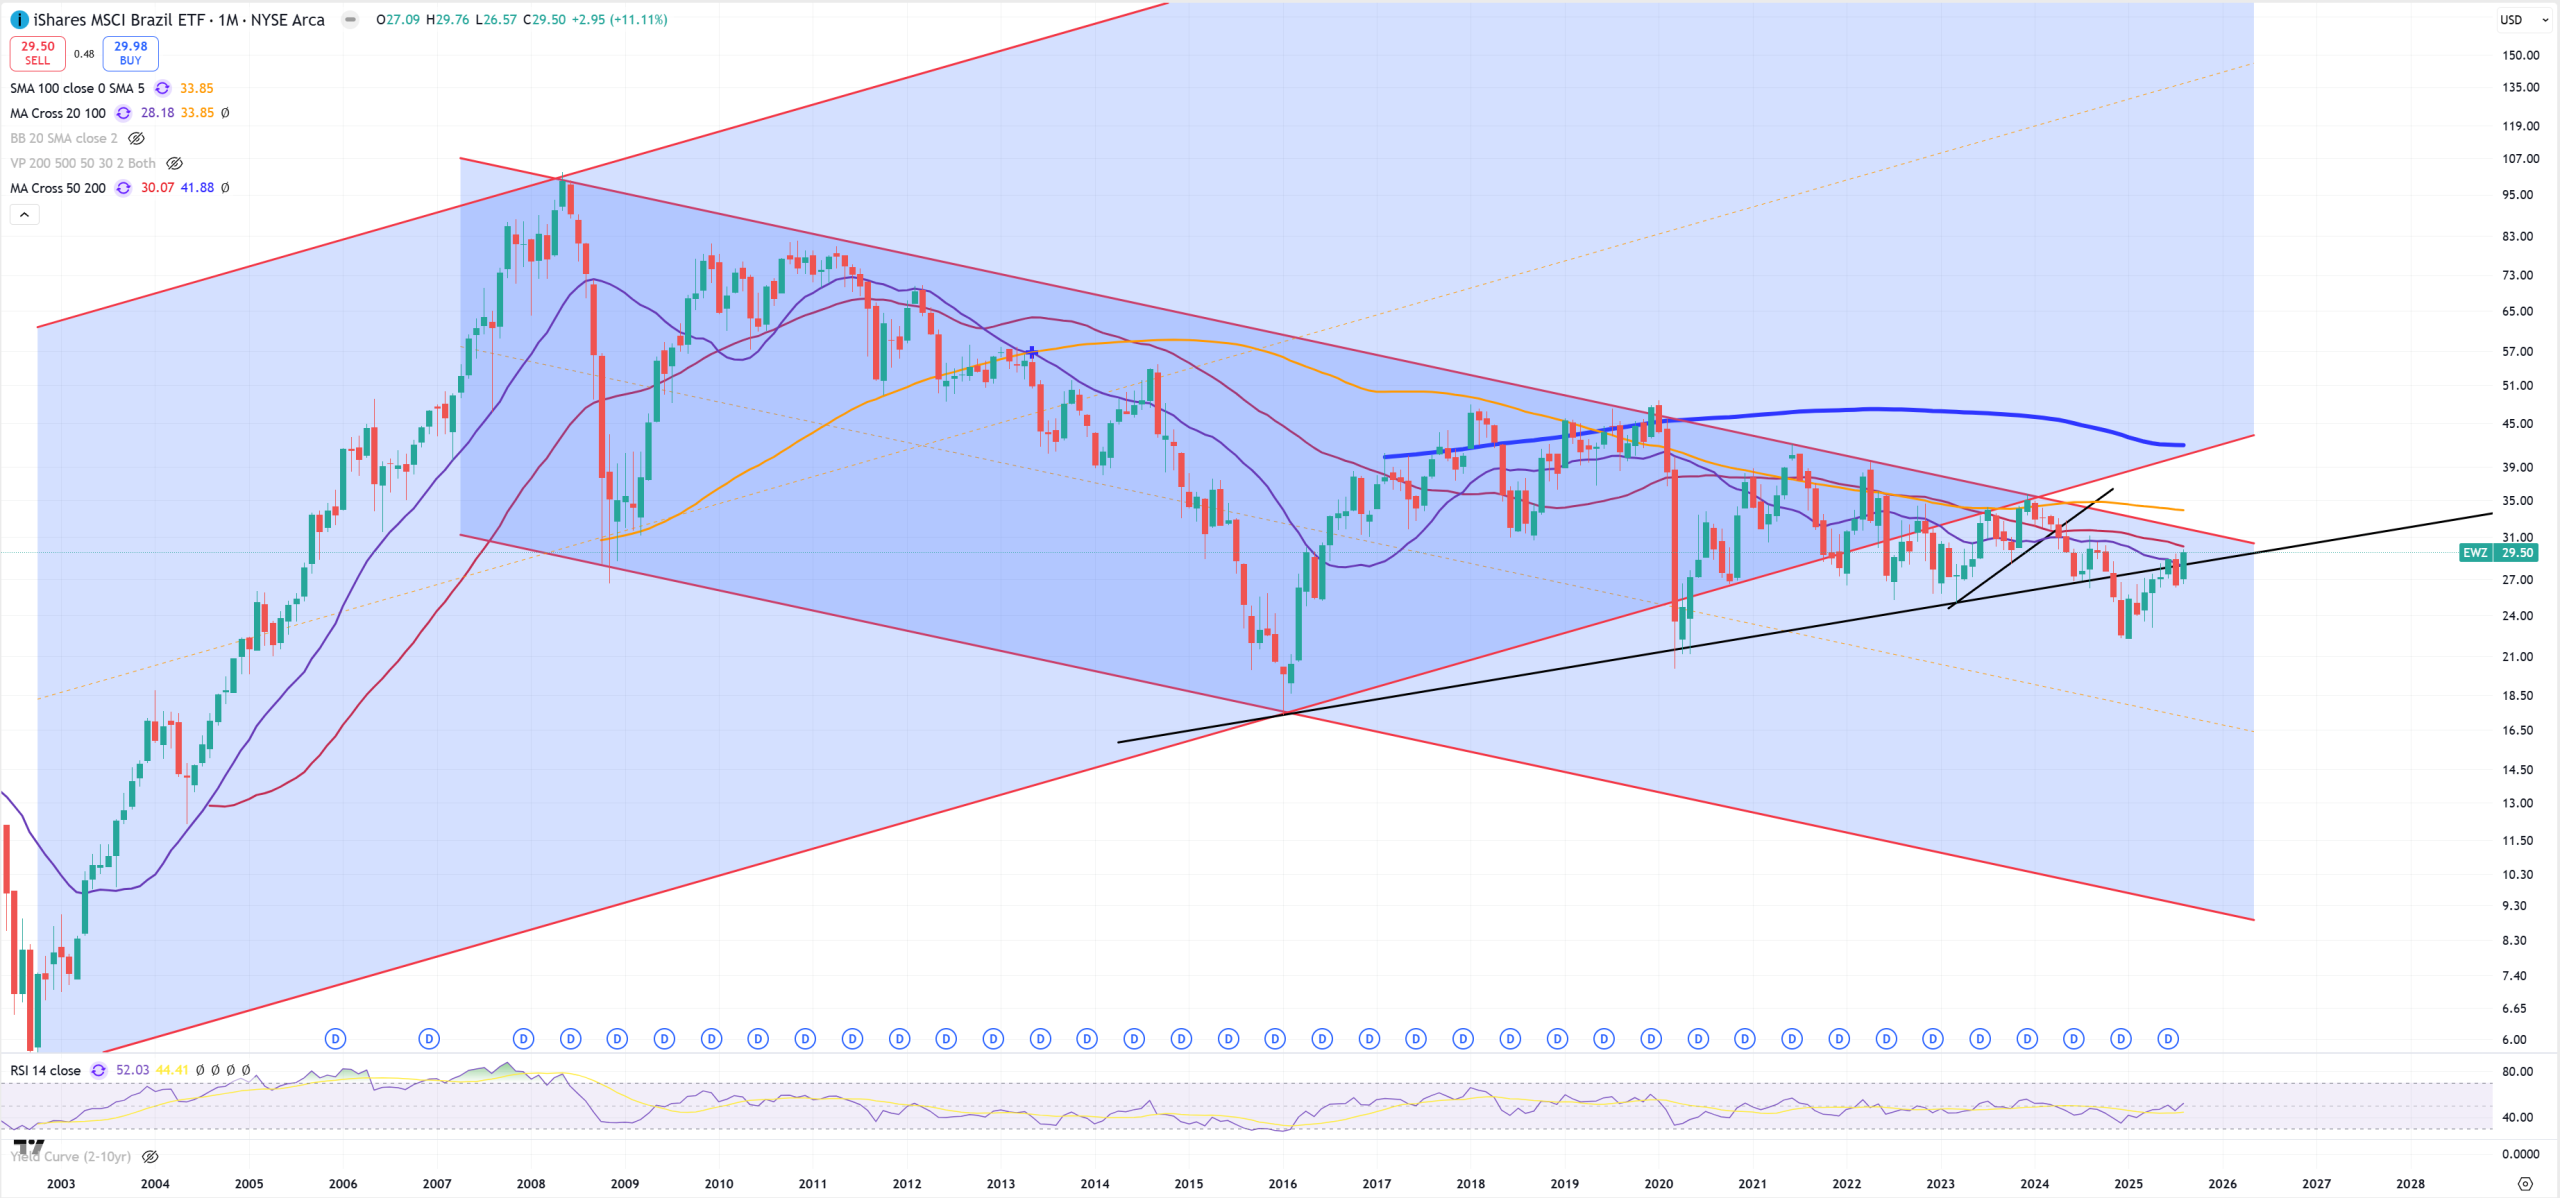
EWZ – Brazil
Different stocks & ETFs
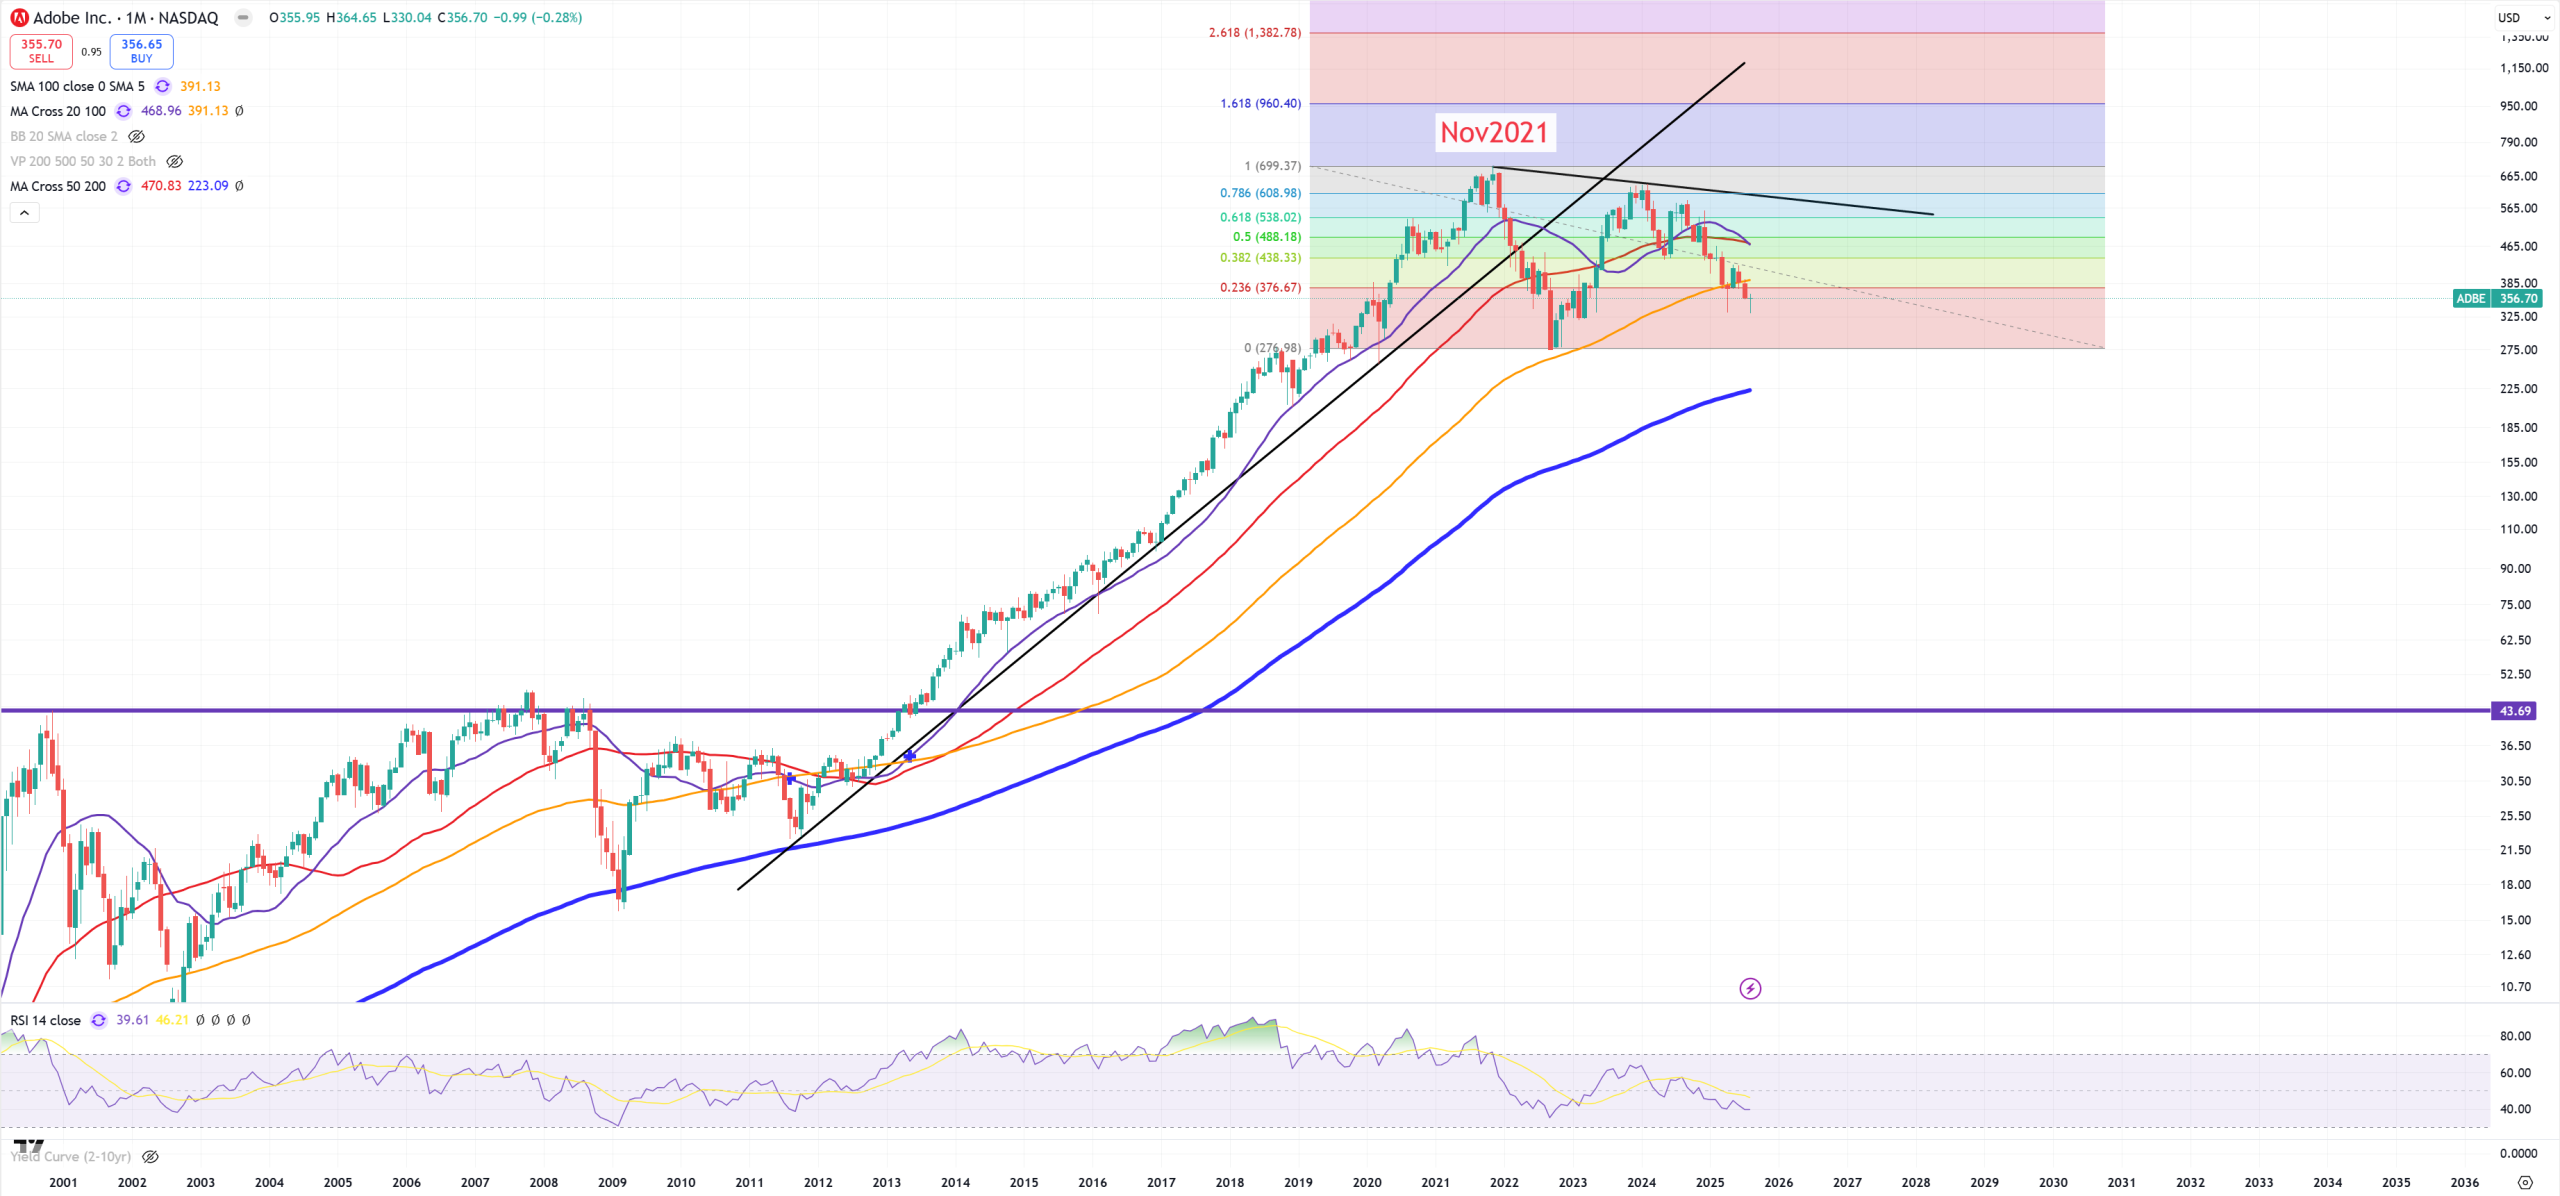
ADBE – Adobe
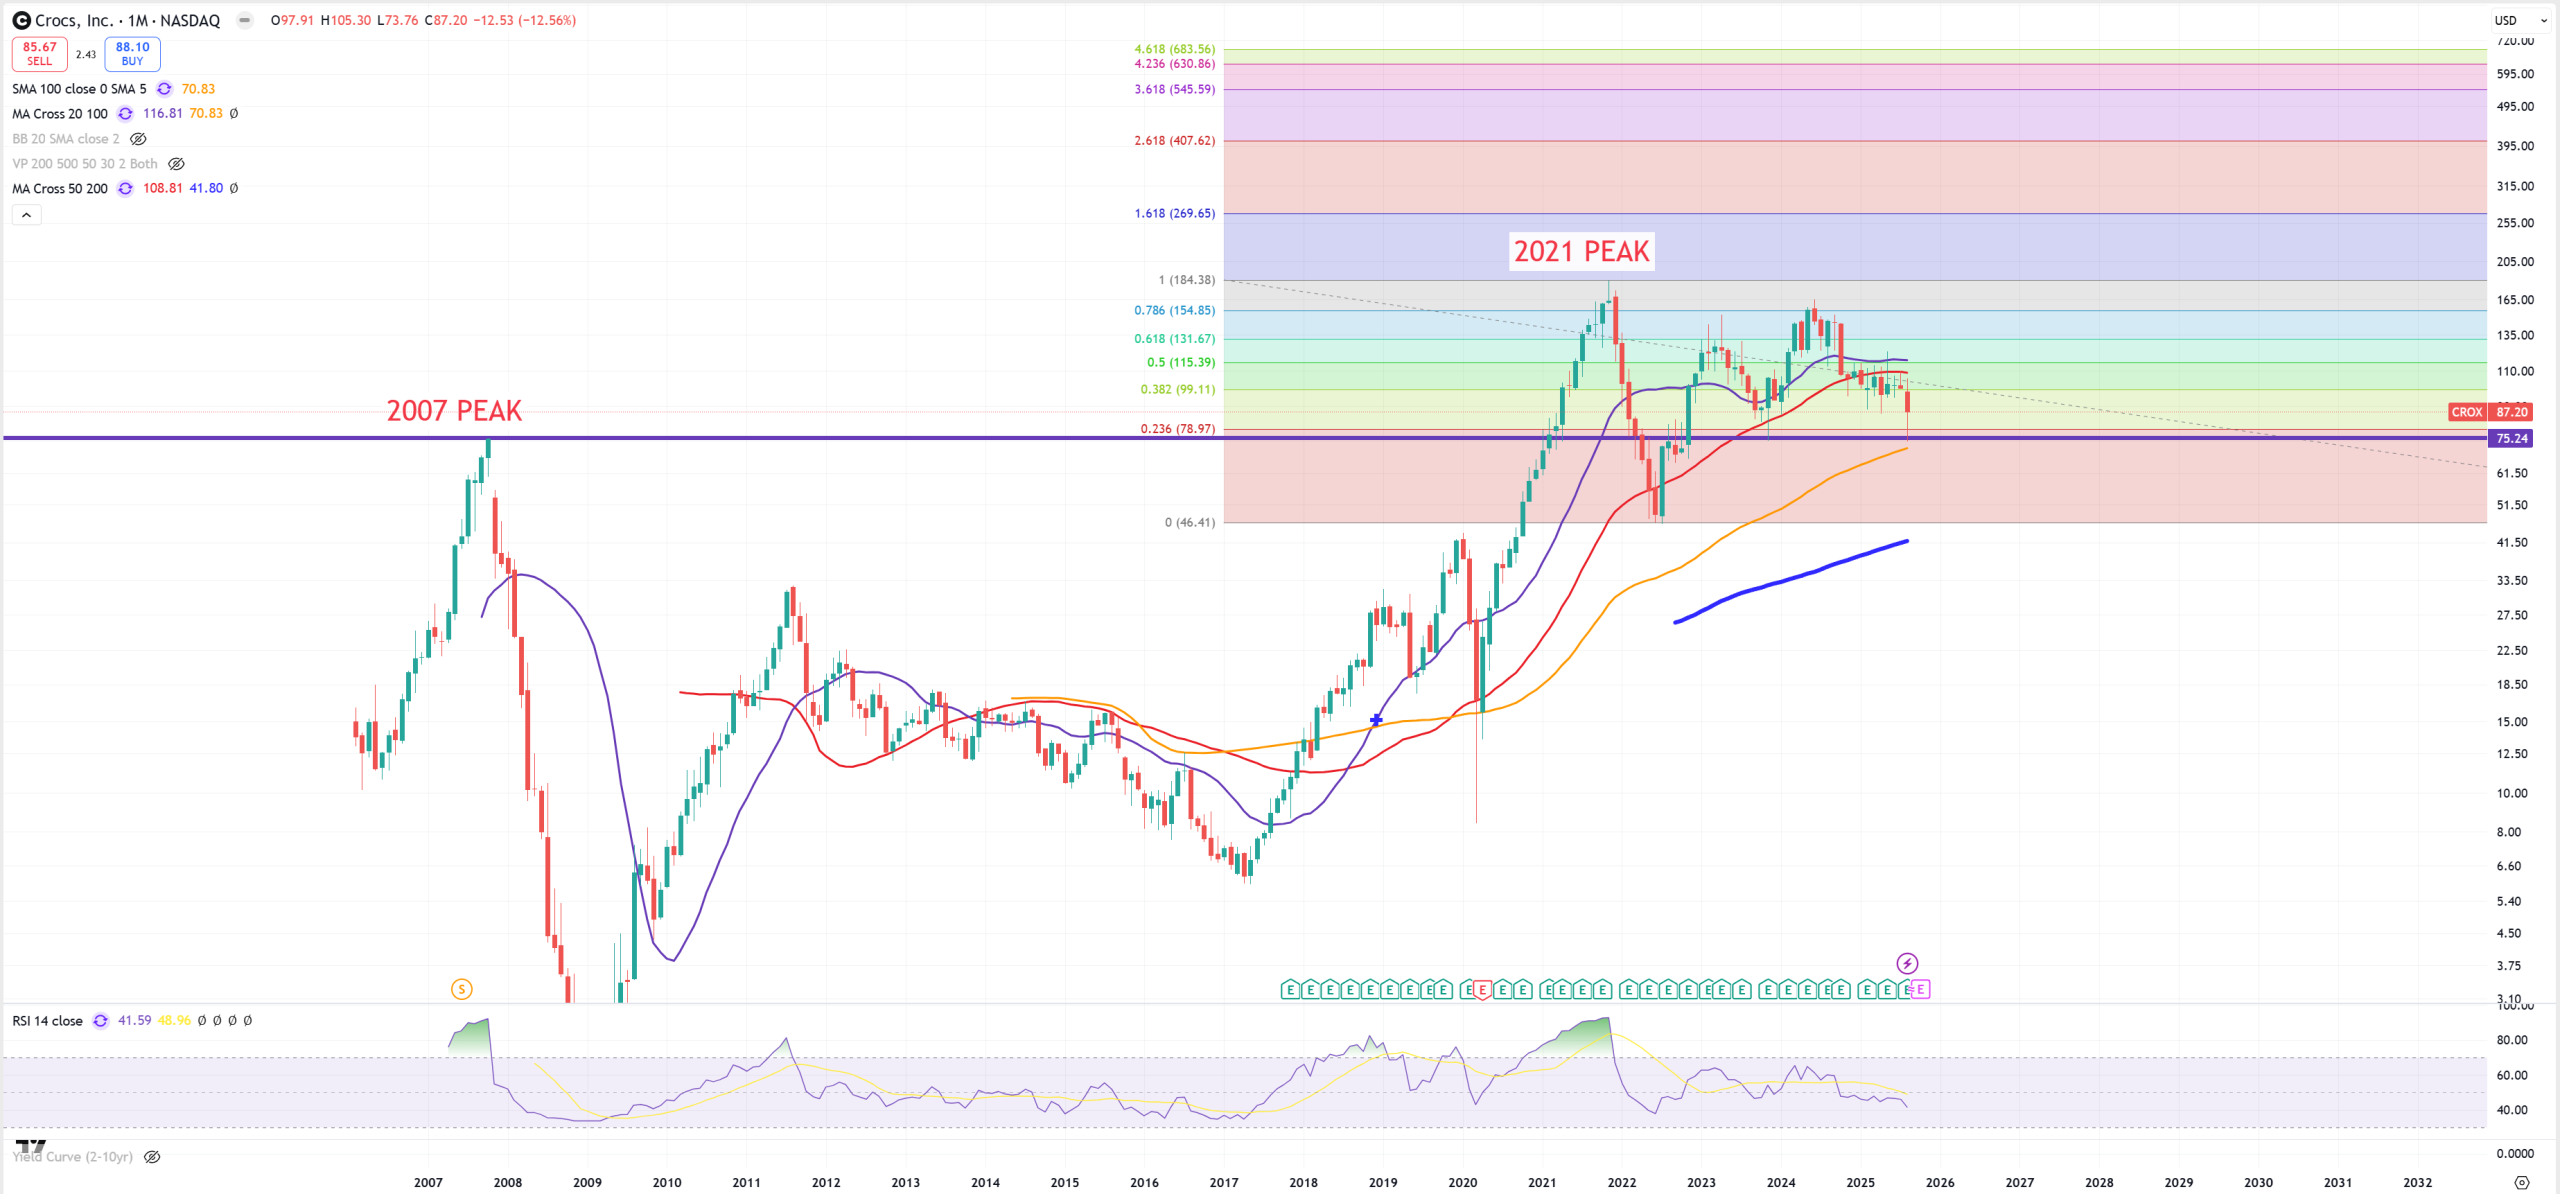
CROX
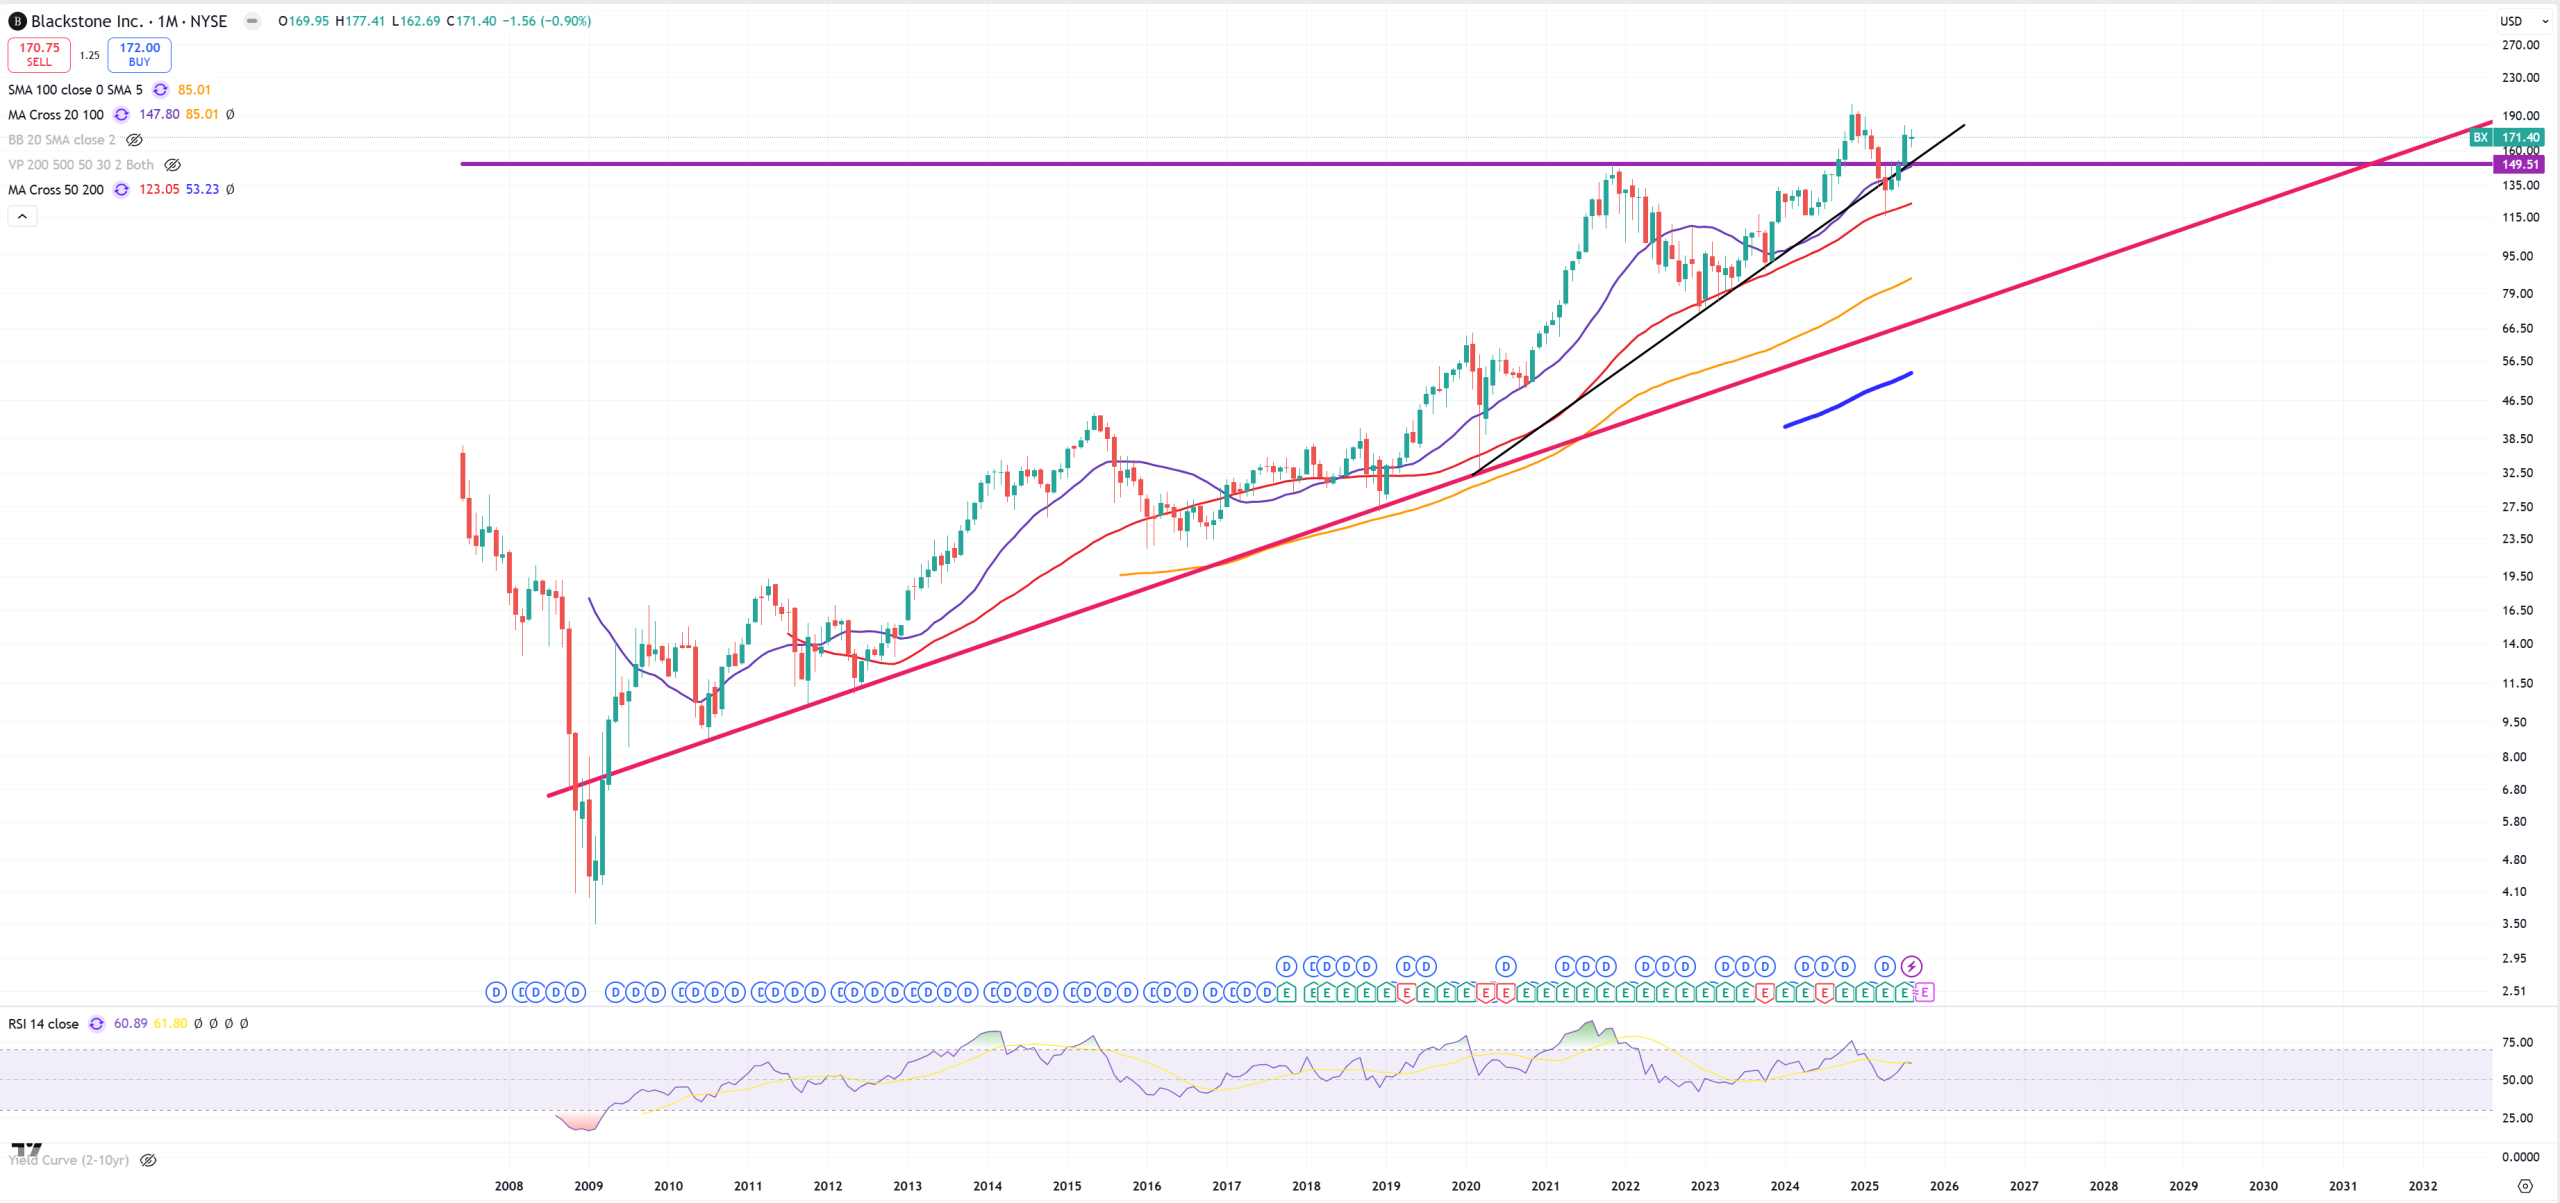
BX – BlackStone – can’t really believe it holds so high with massive CRE crisis ongoing
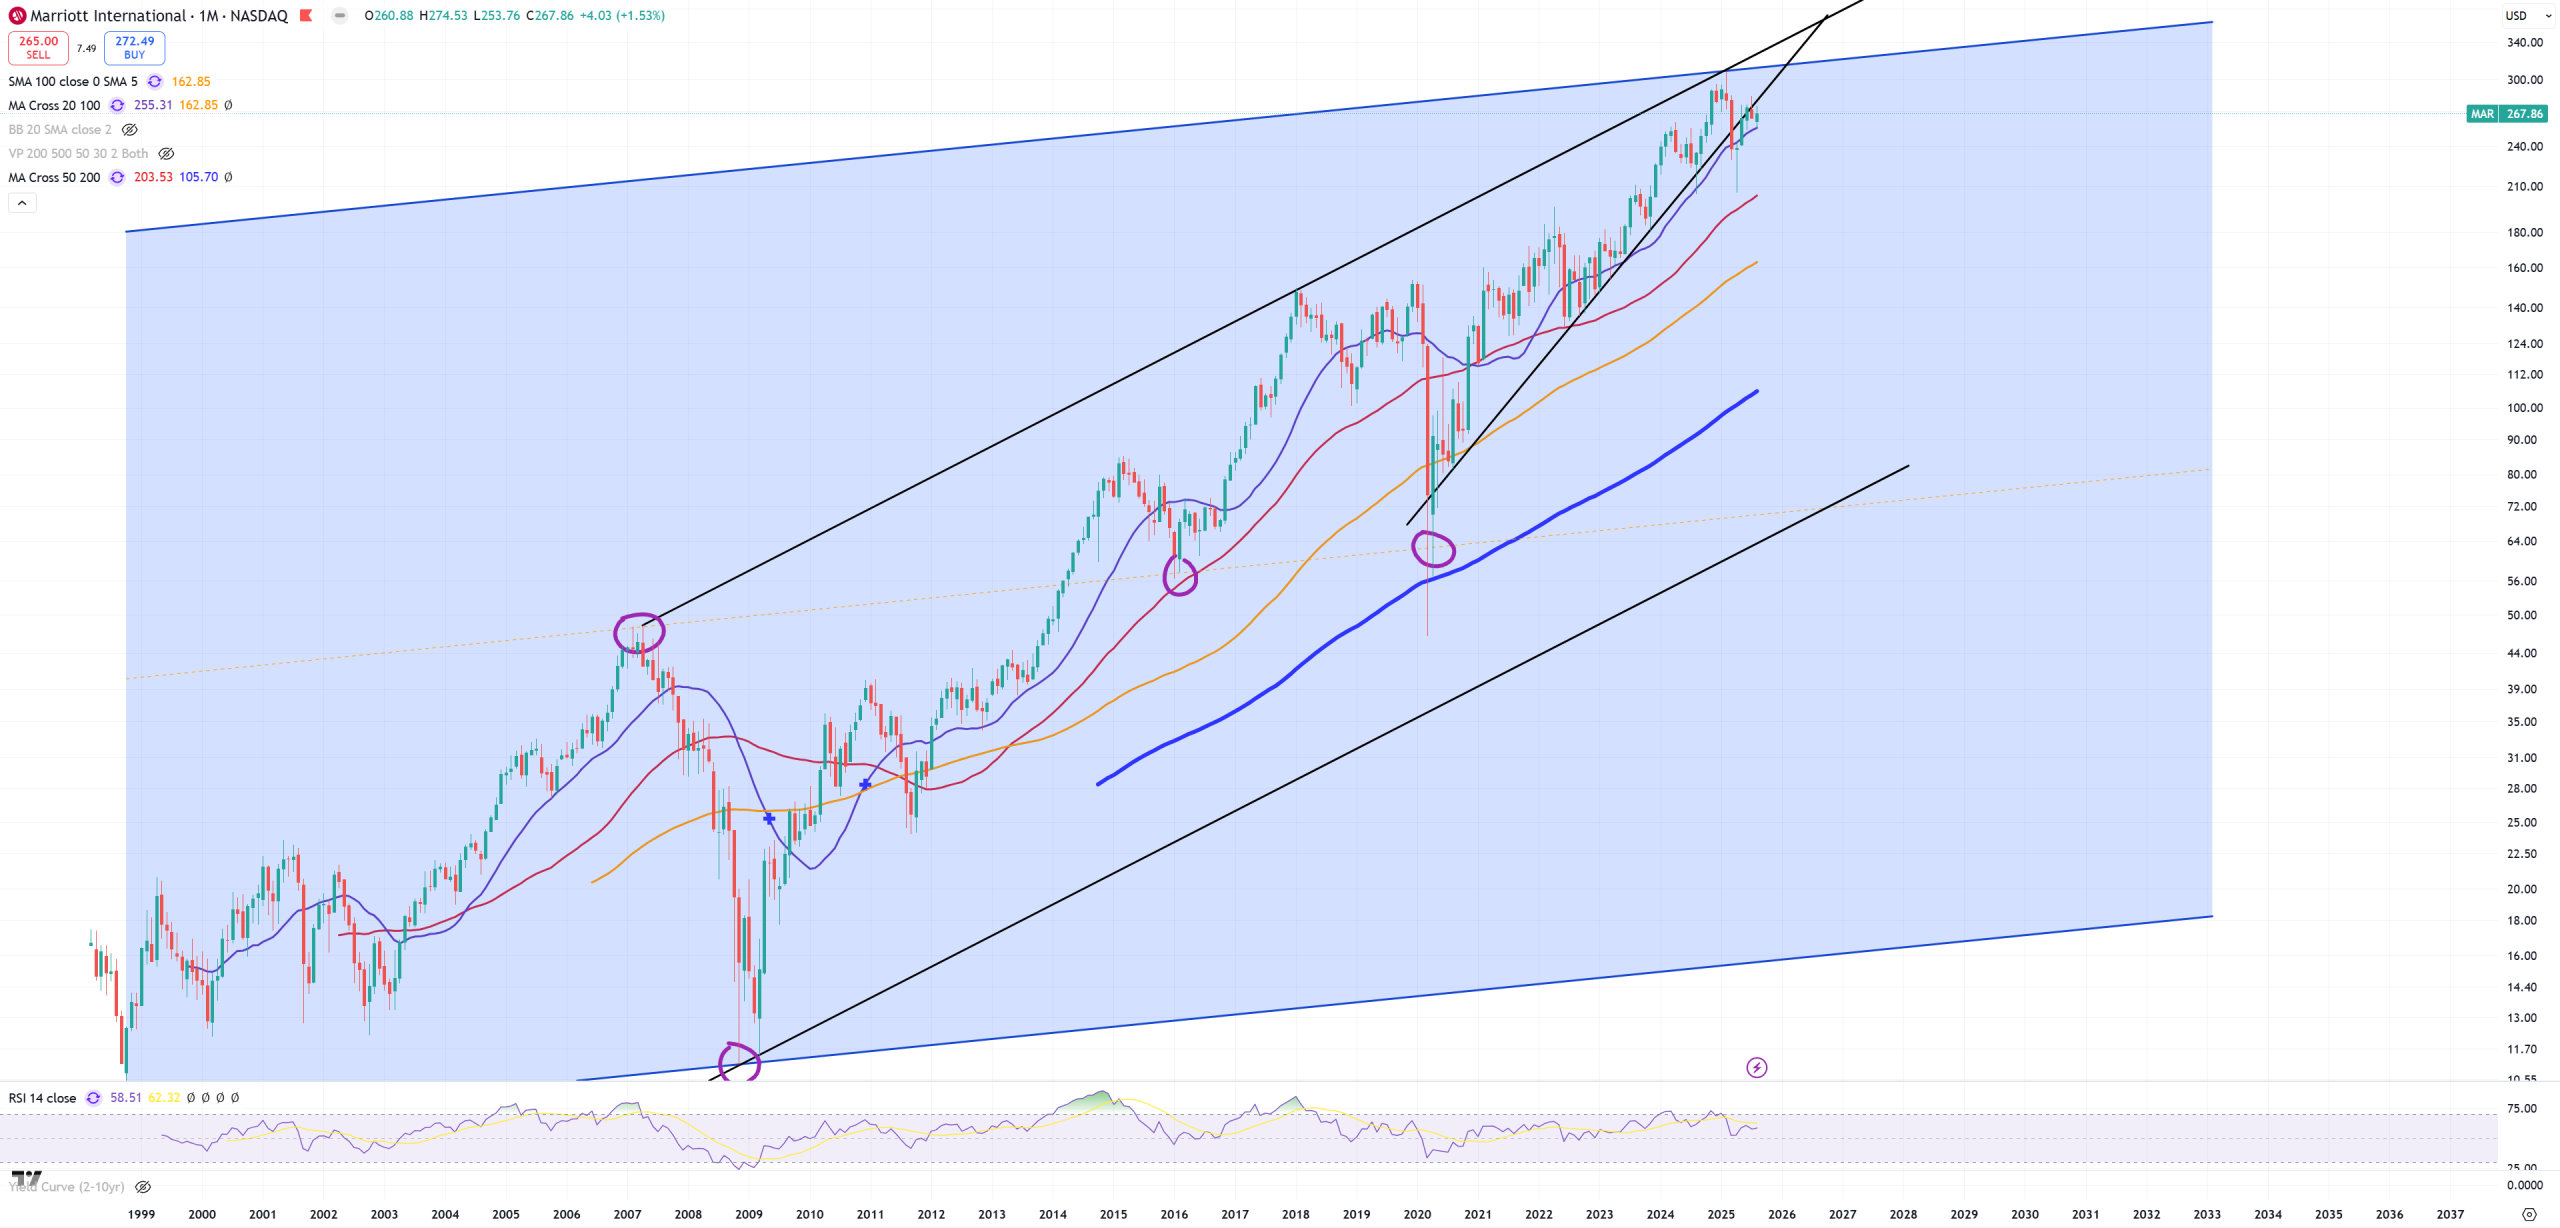
MAR – Mariott, exclusive hotels so far showing minimal sign of a weakness
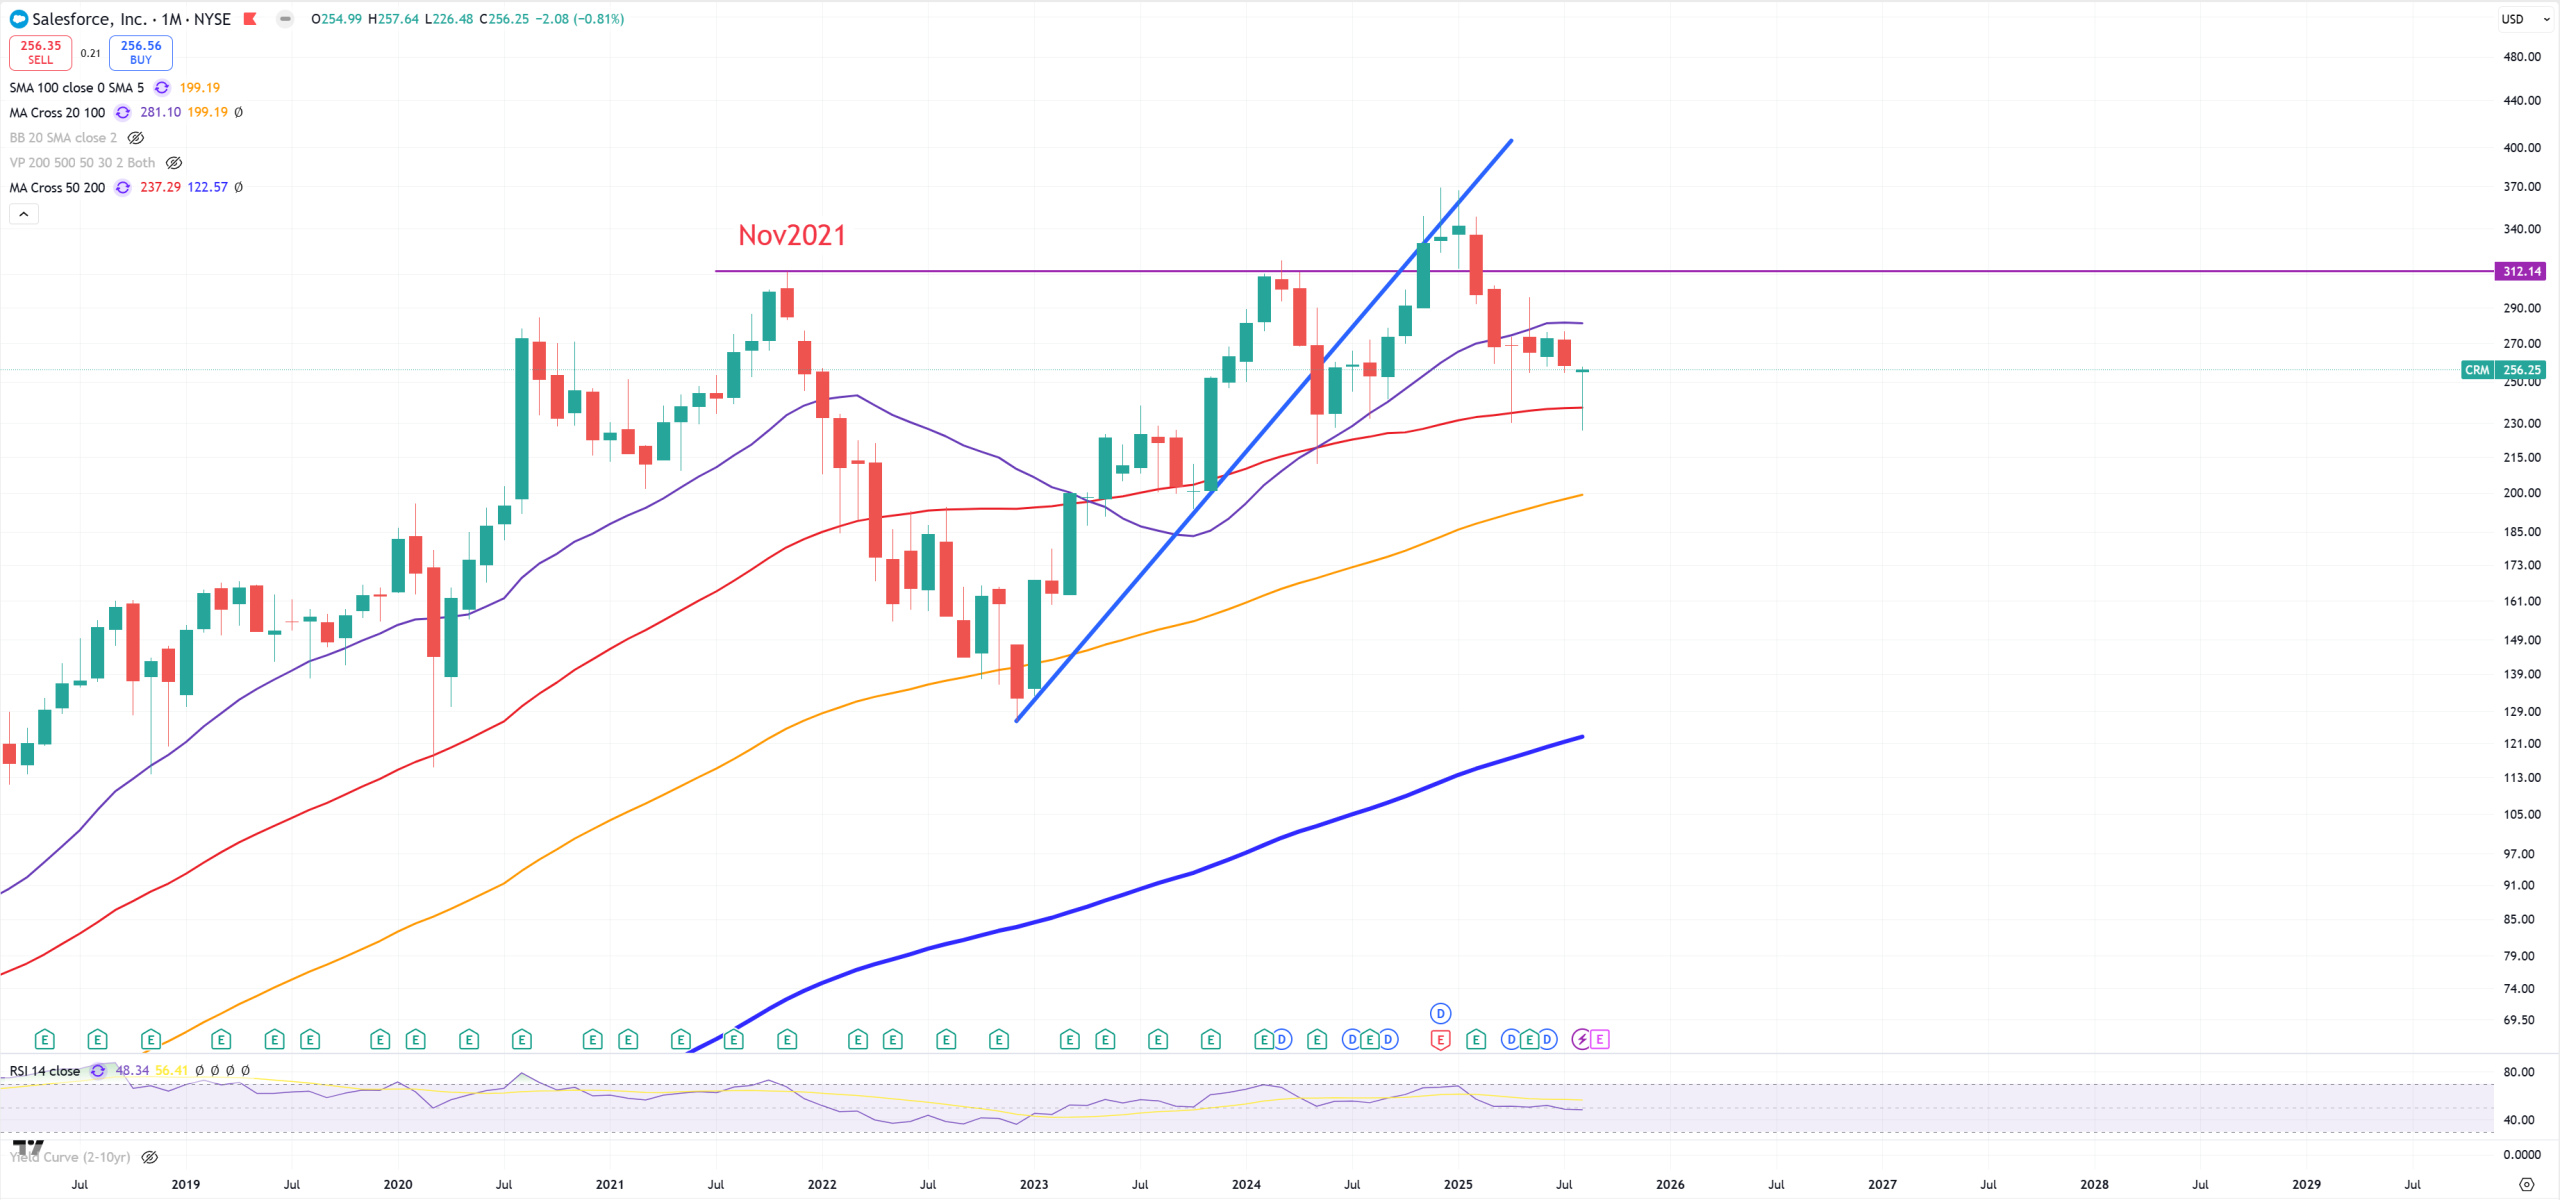
CRM – Salesforce
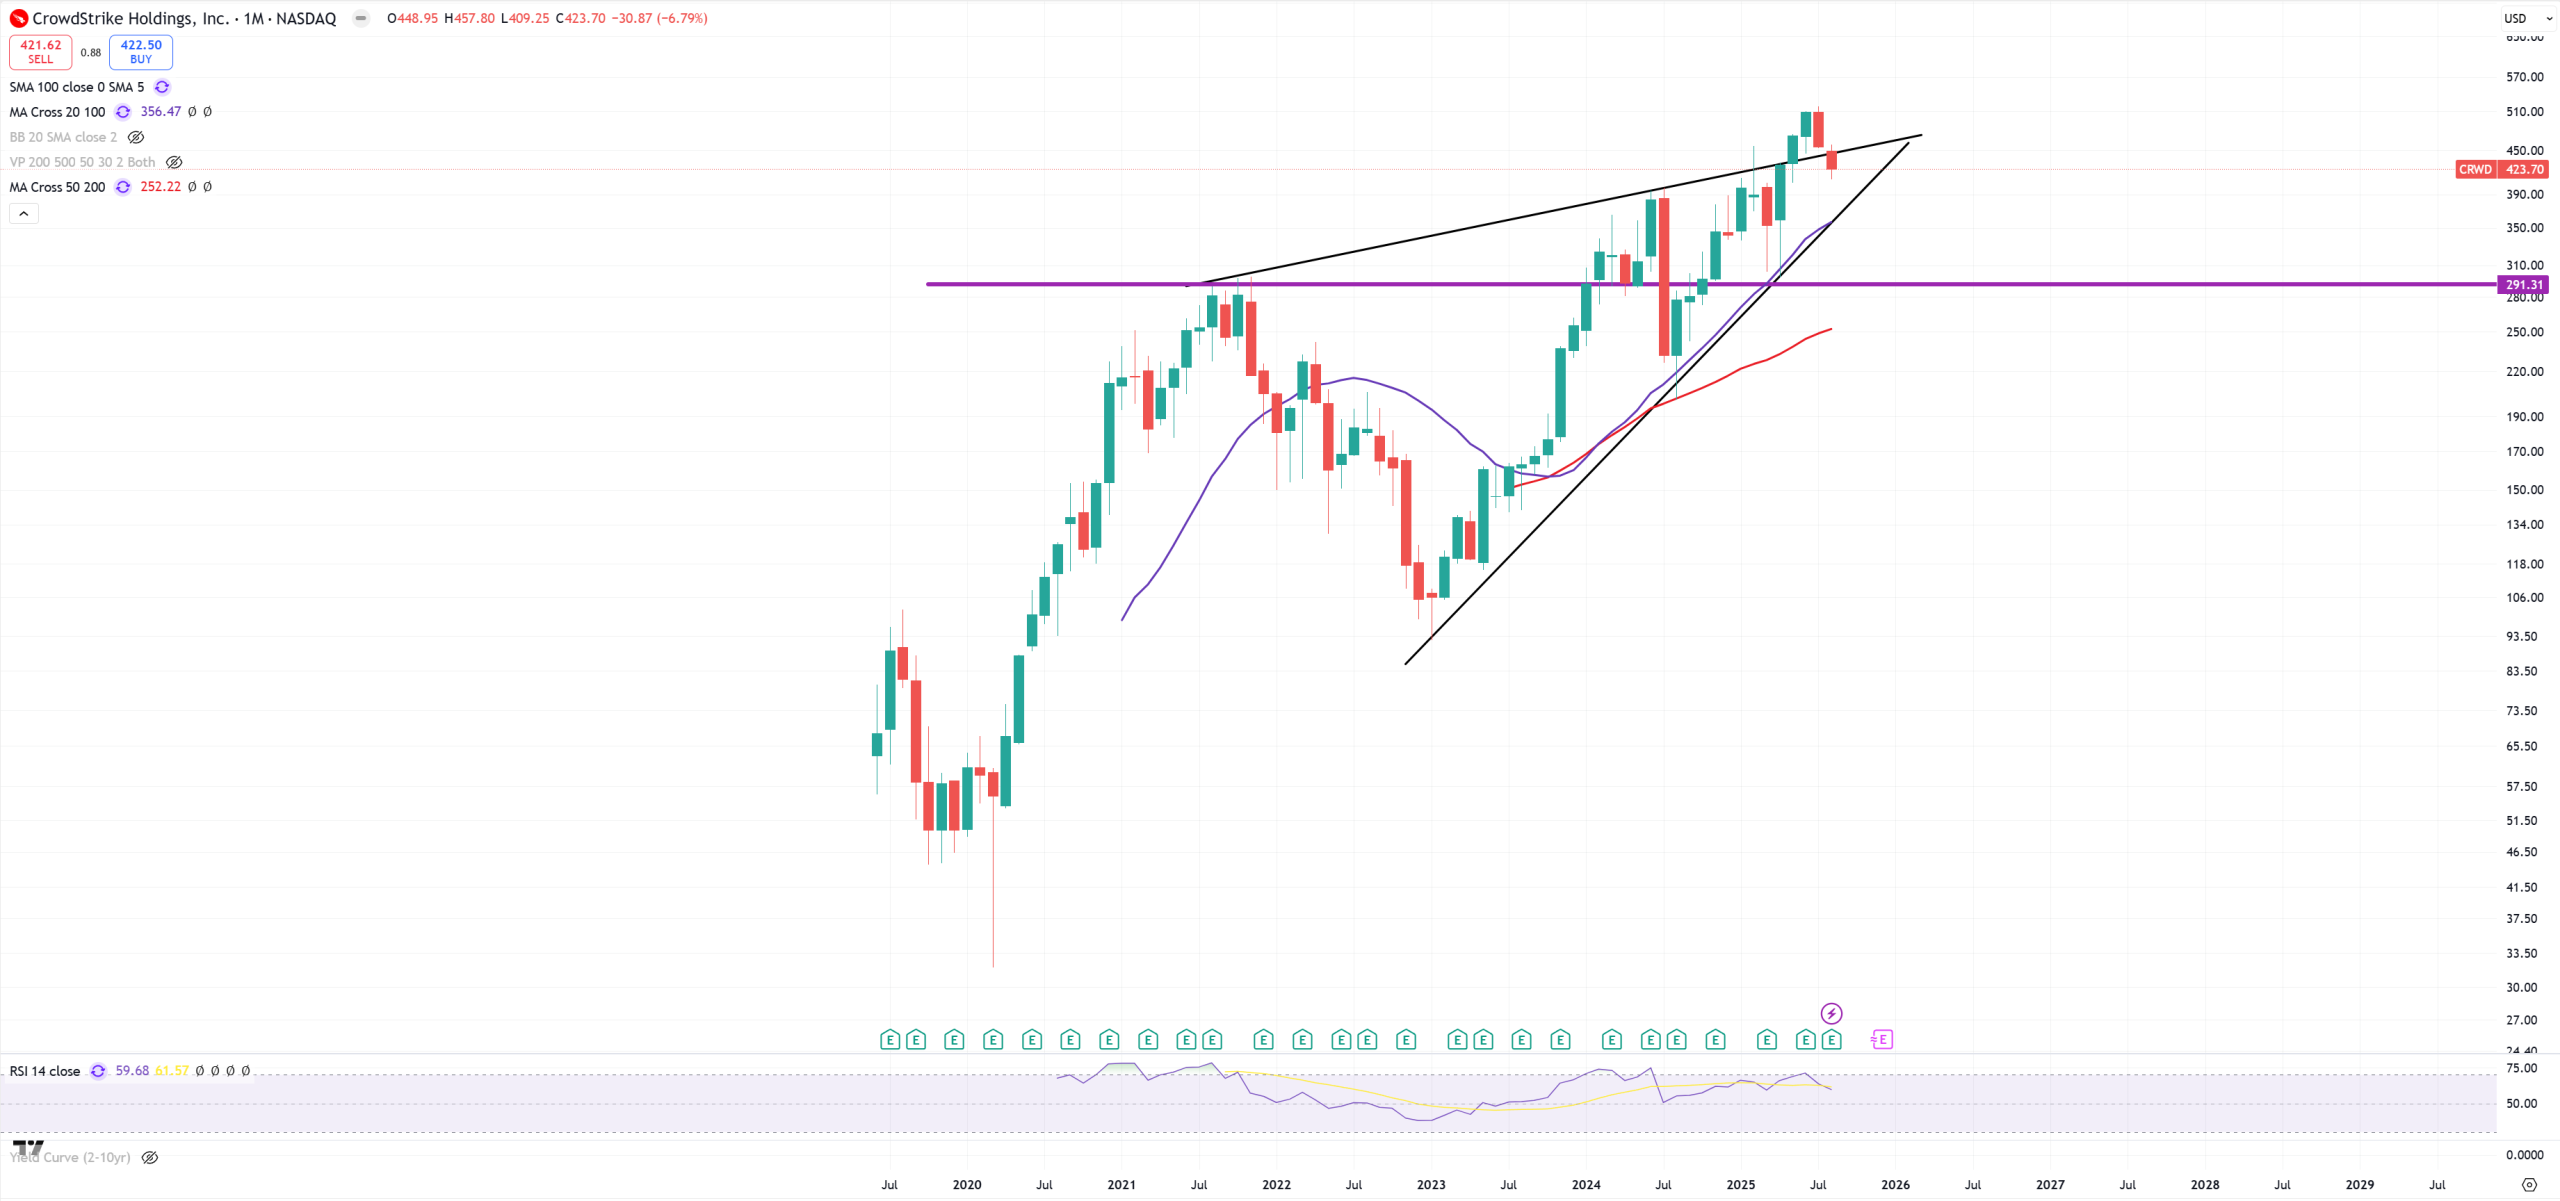
CRWD – Crowdstrike
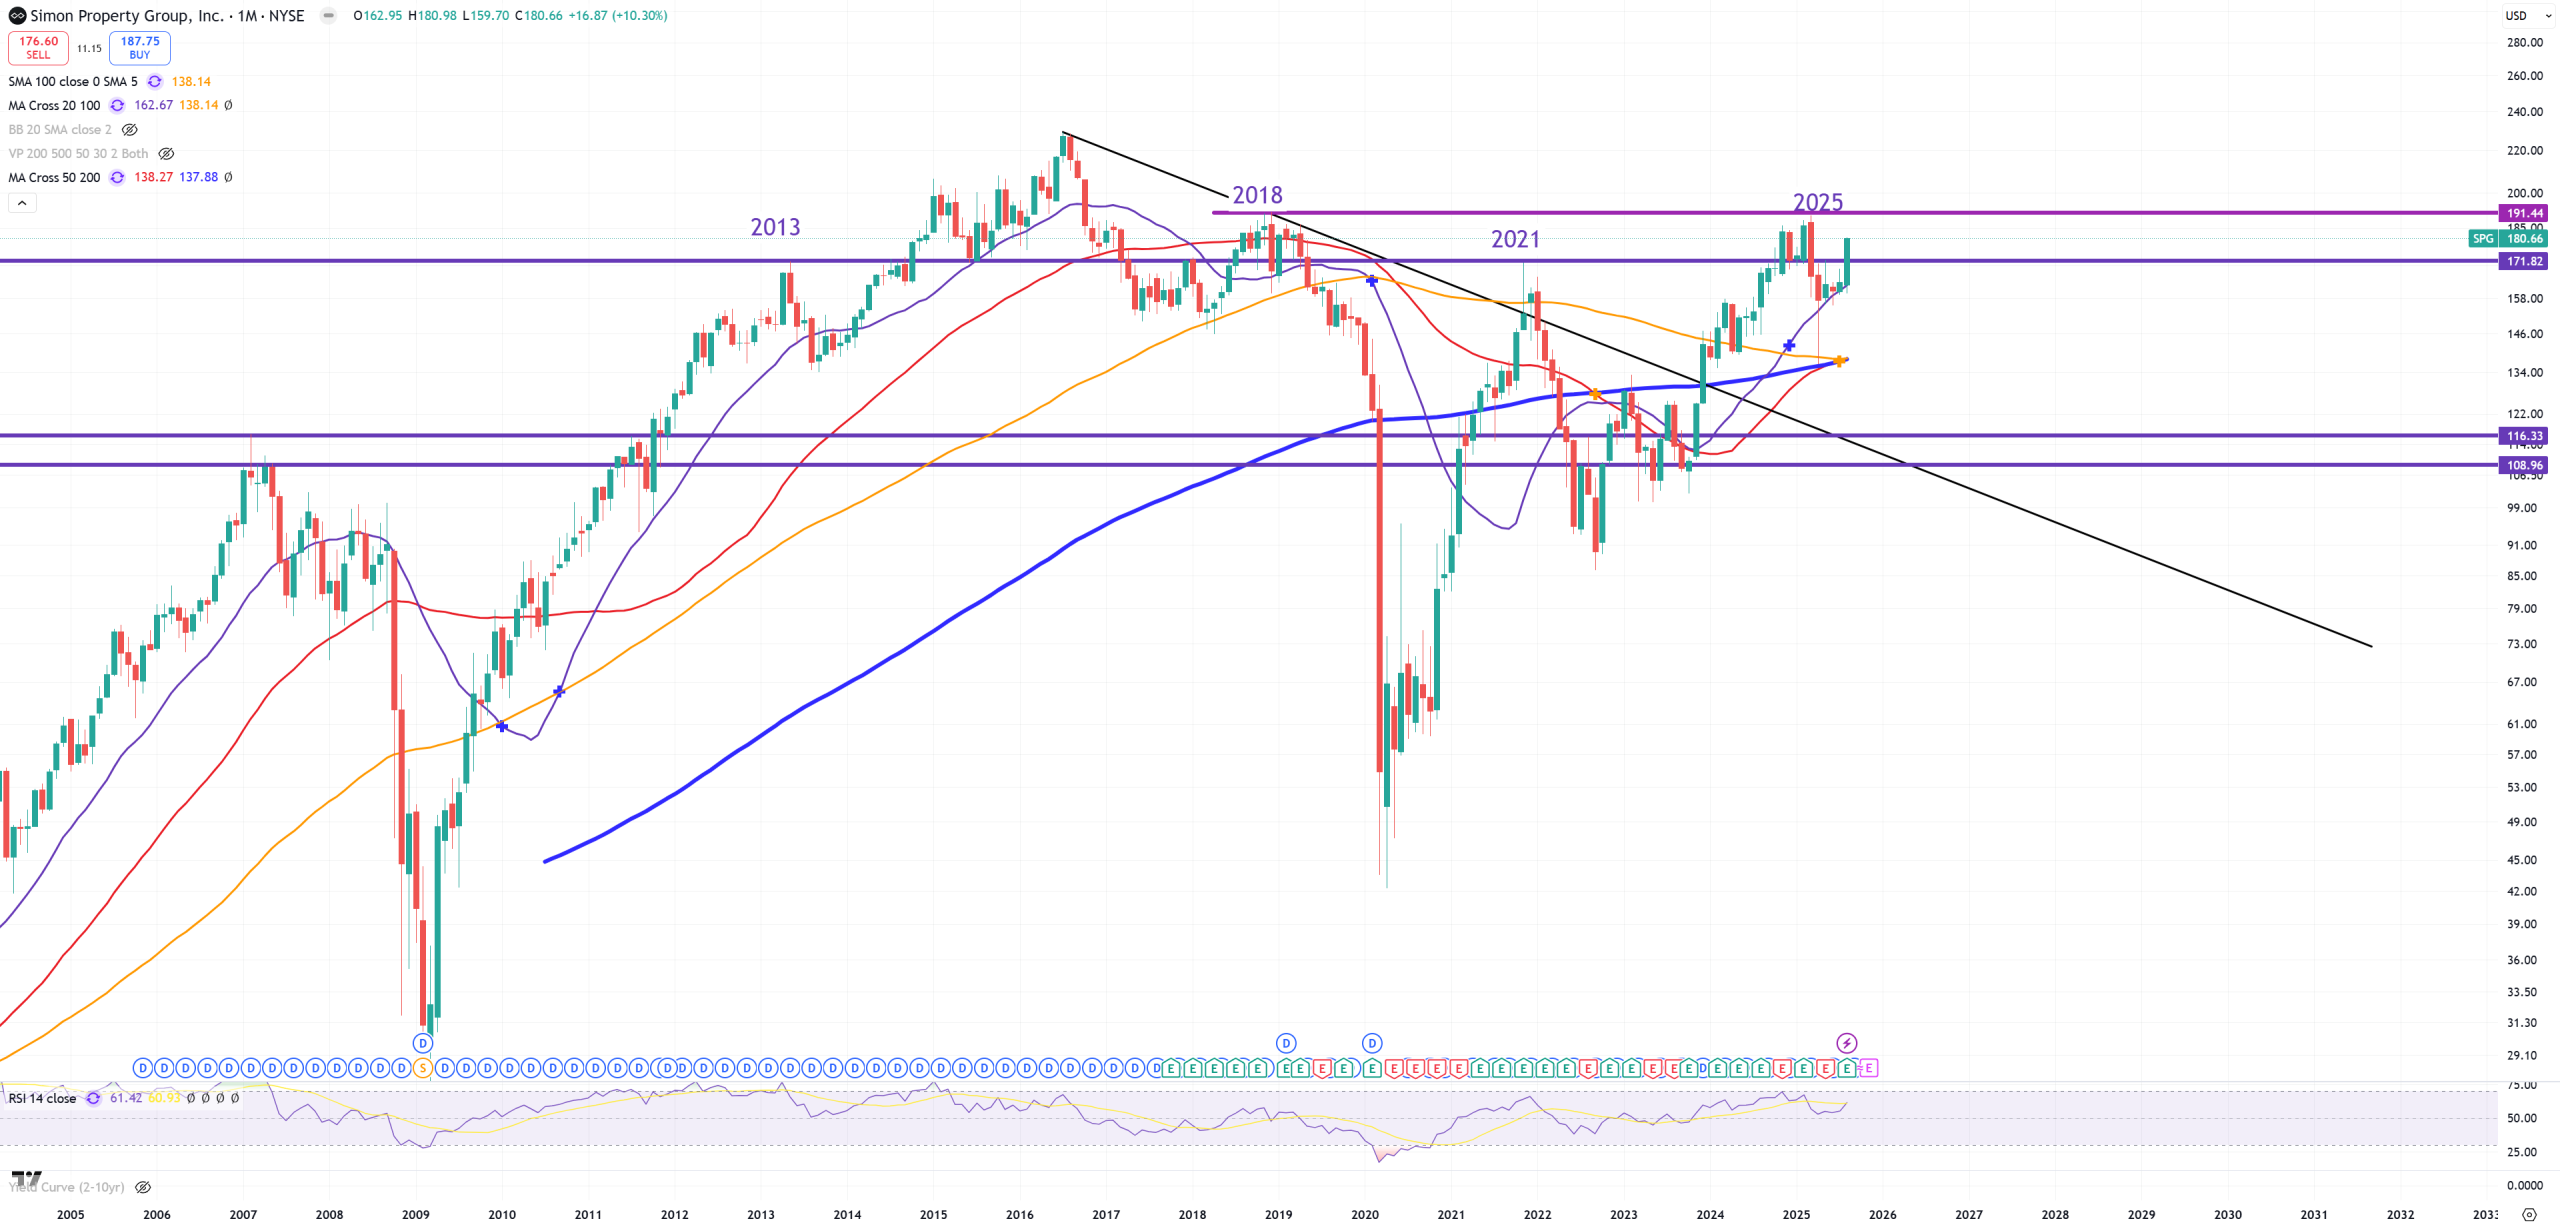
SPG – Simon Property Group
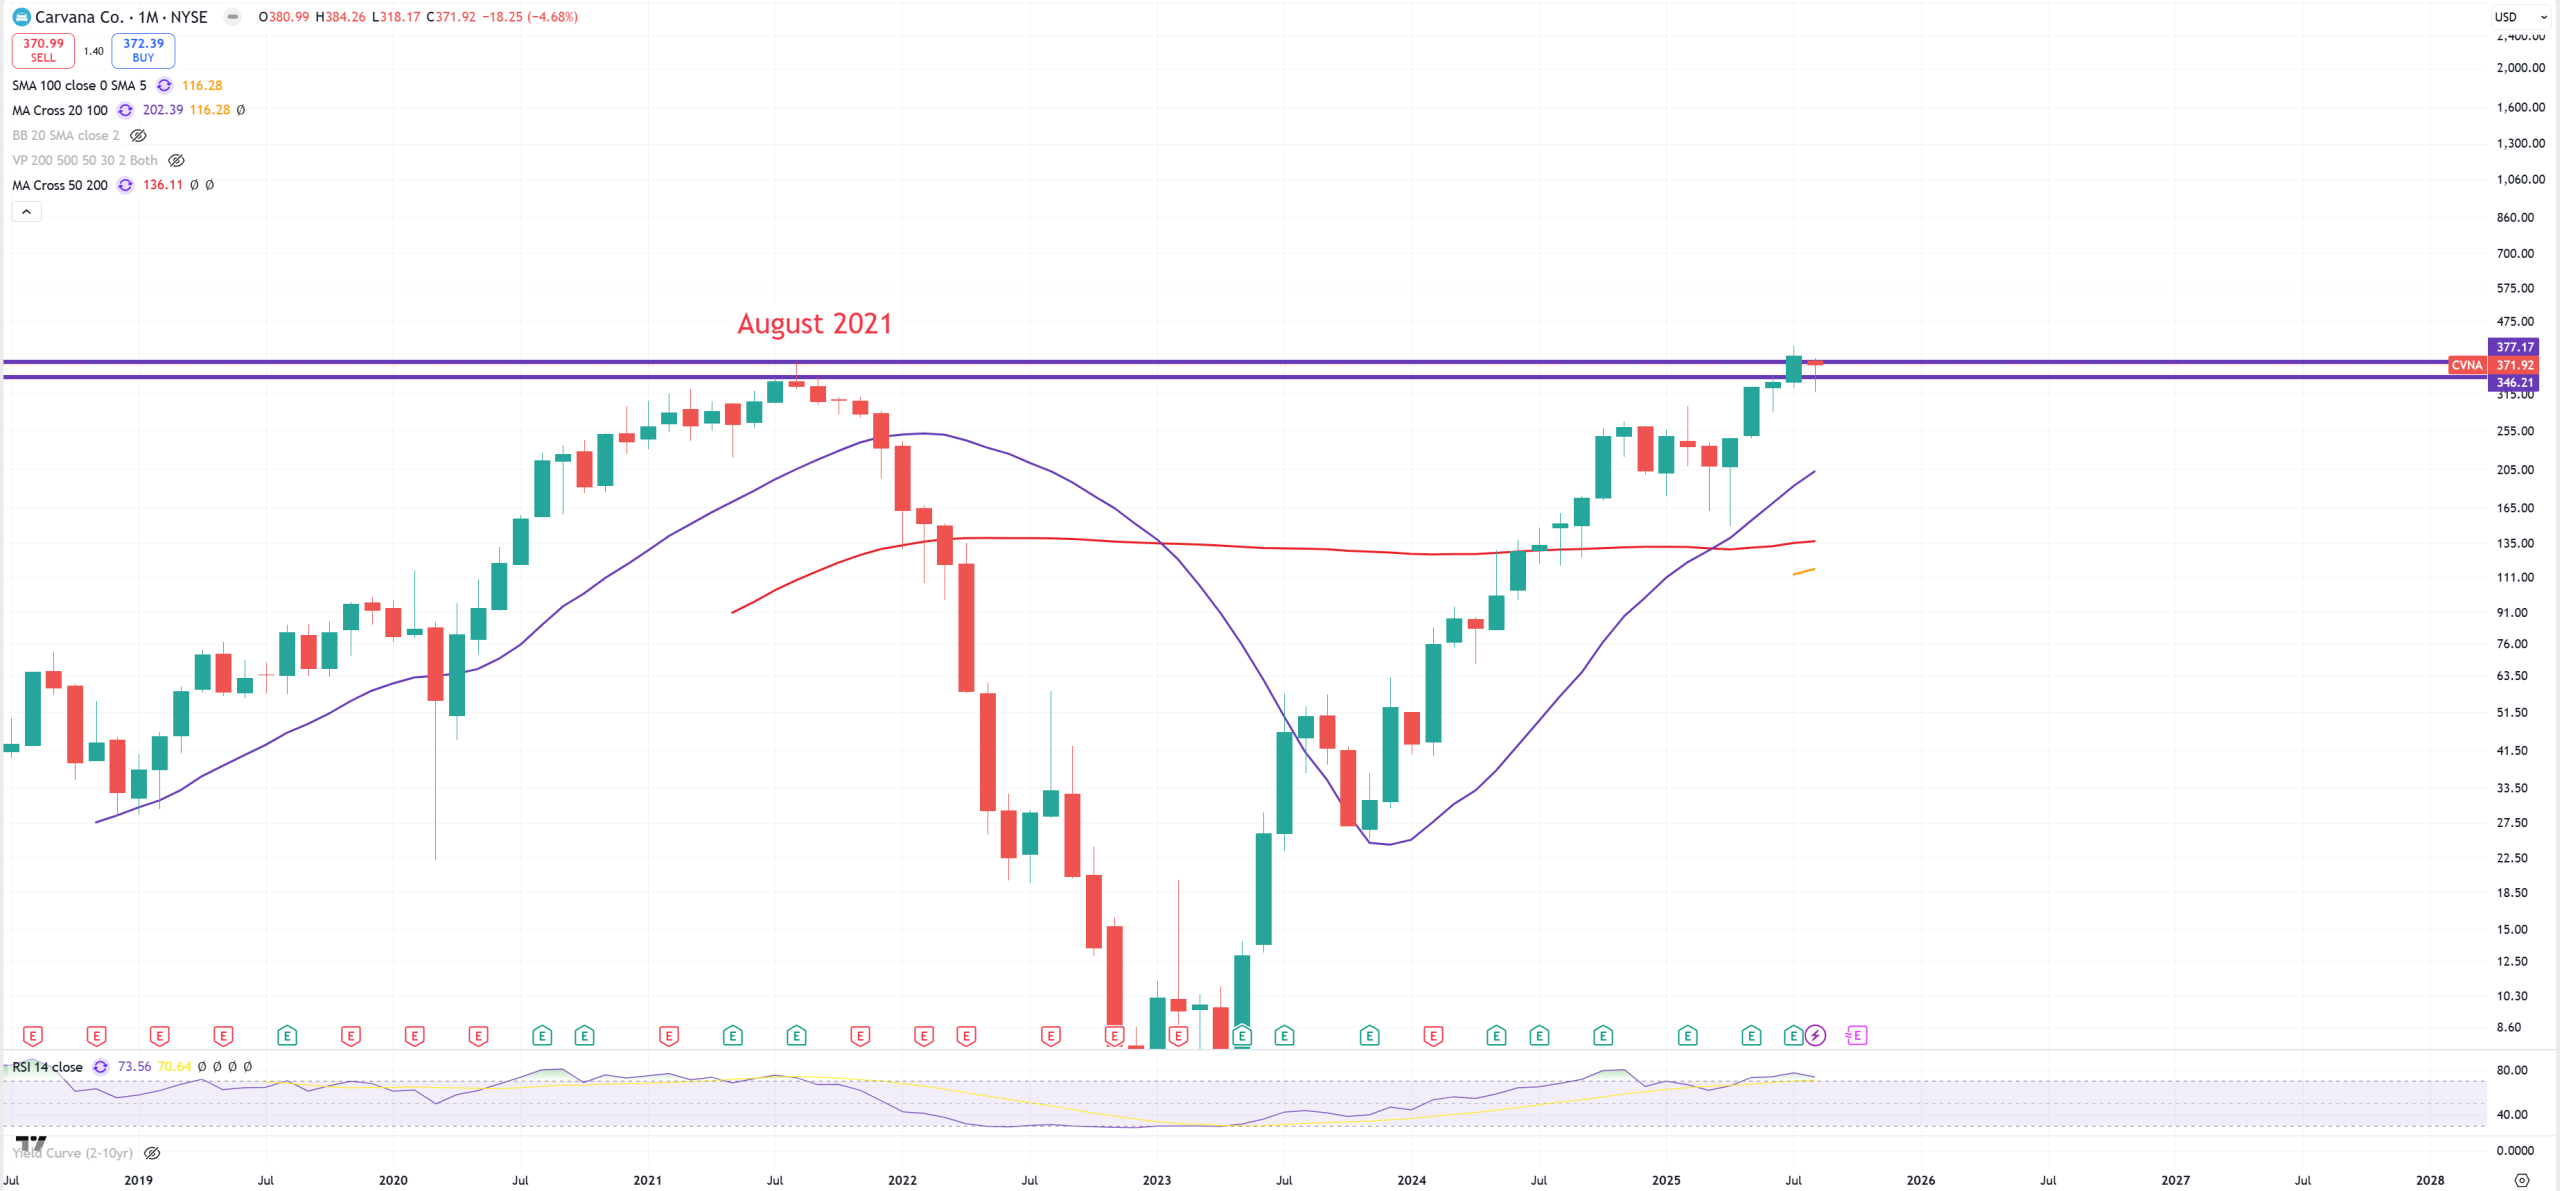
CVNA – Carvana
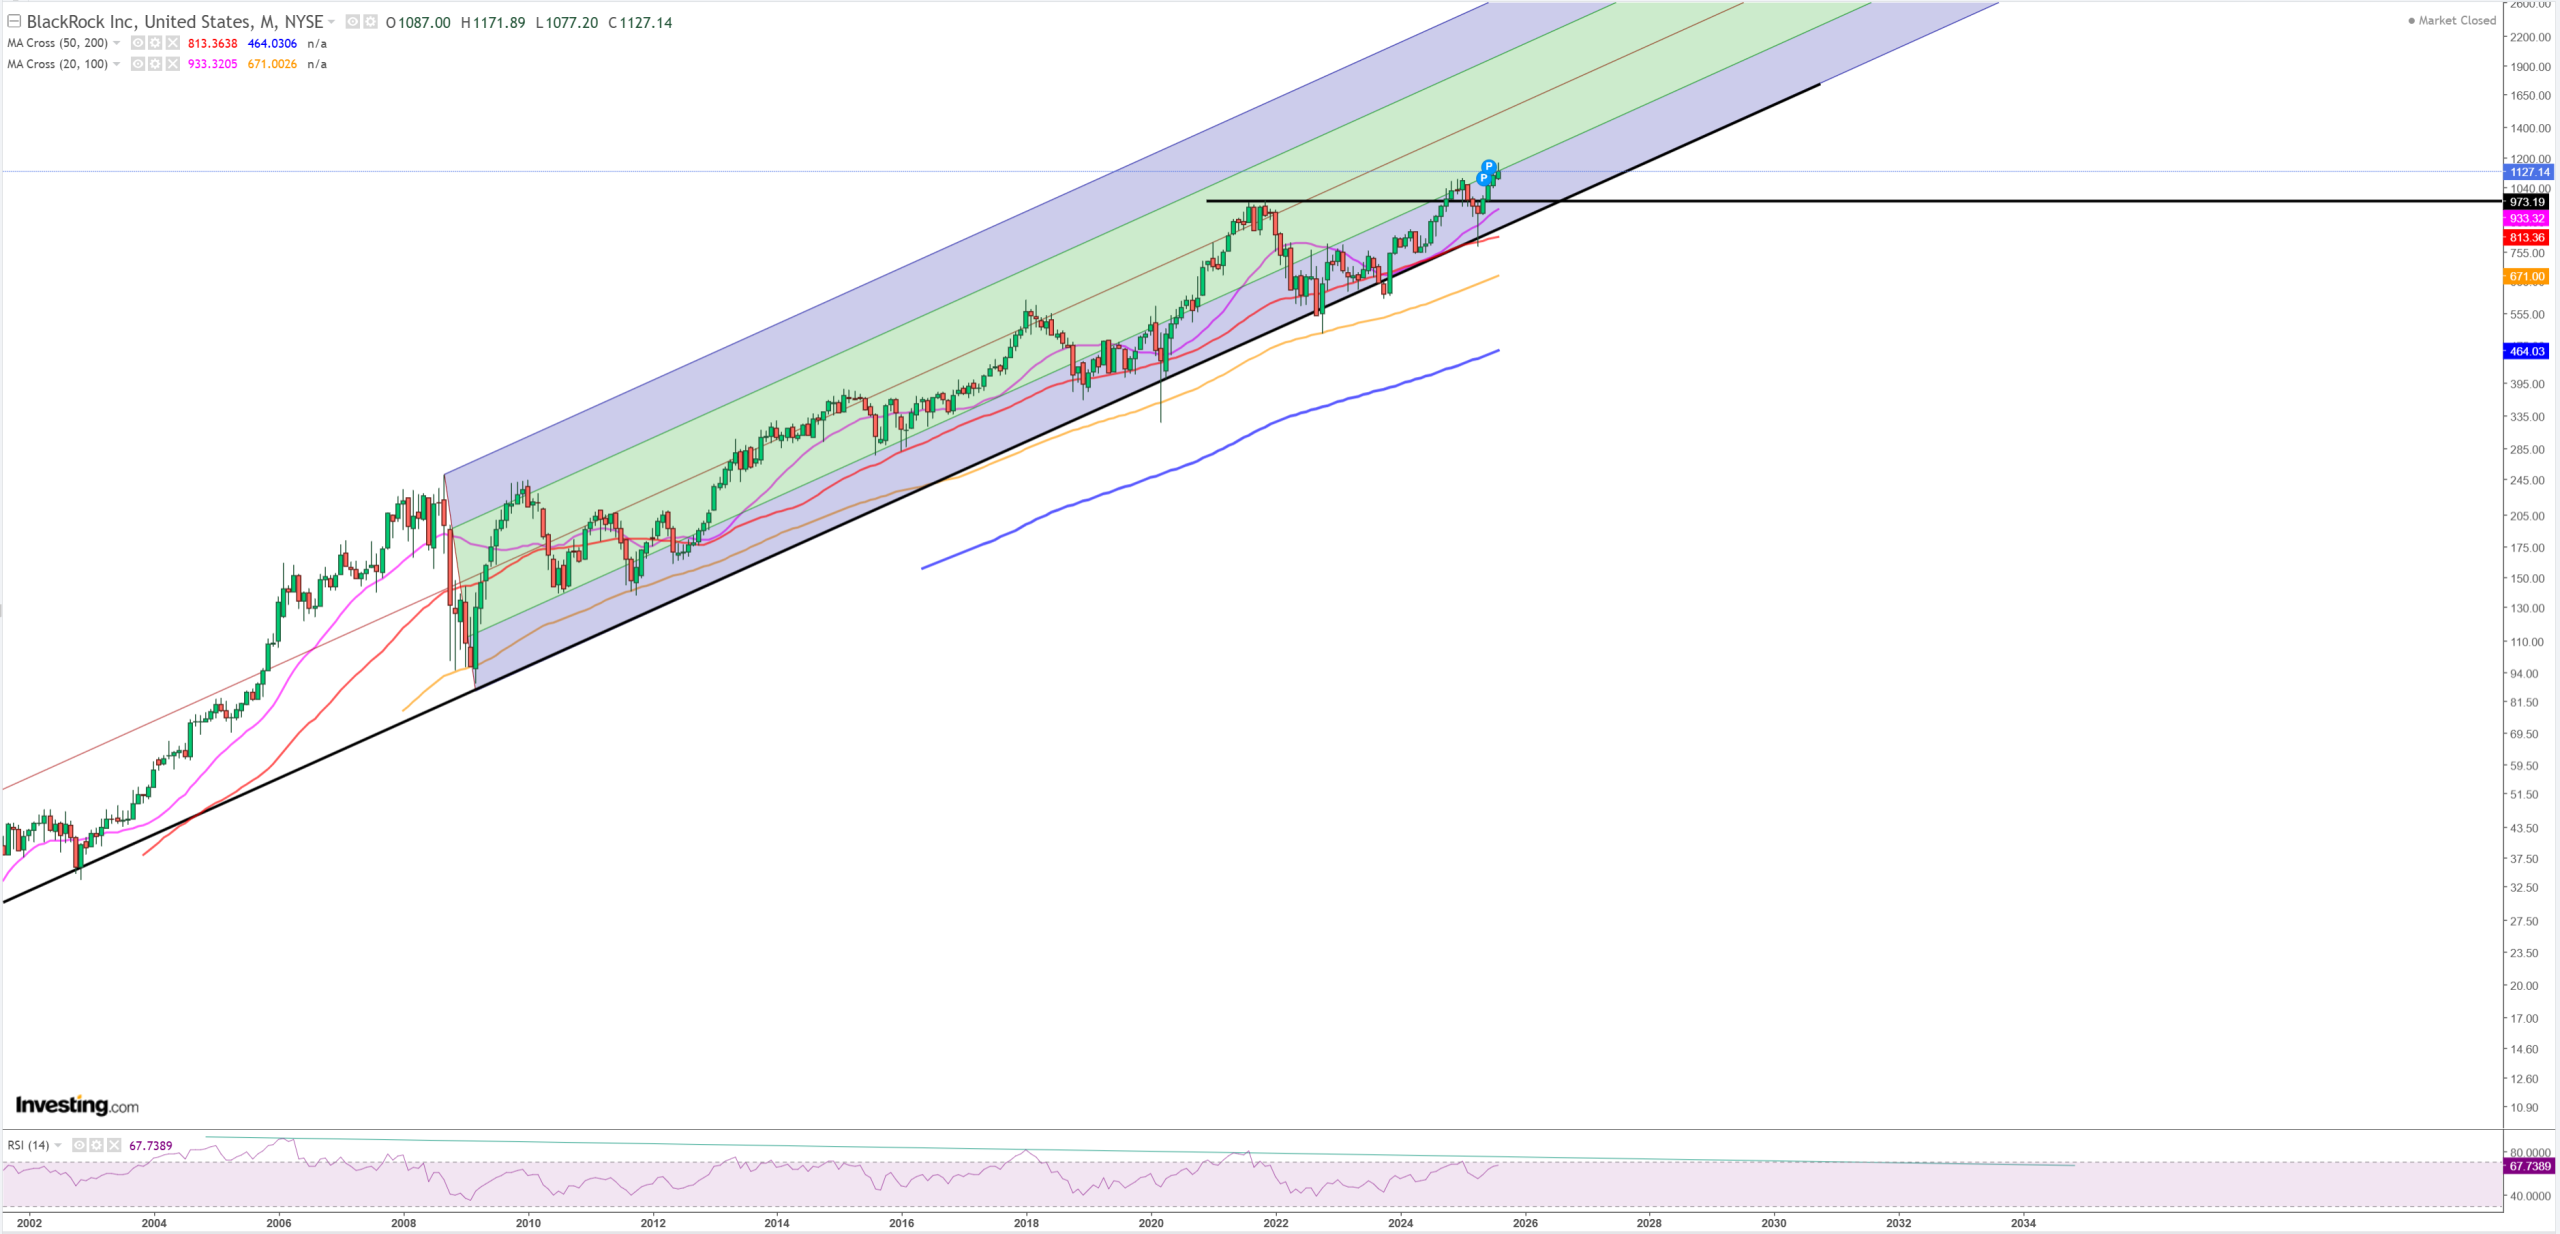
BLK – BlackRock – 2021 level broken, long term trend holds
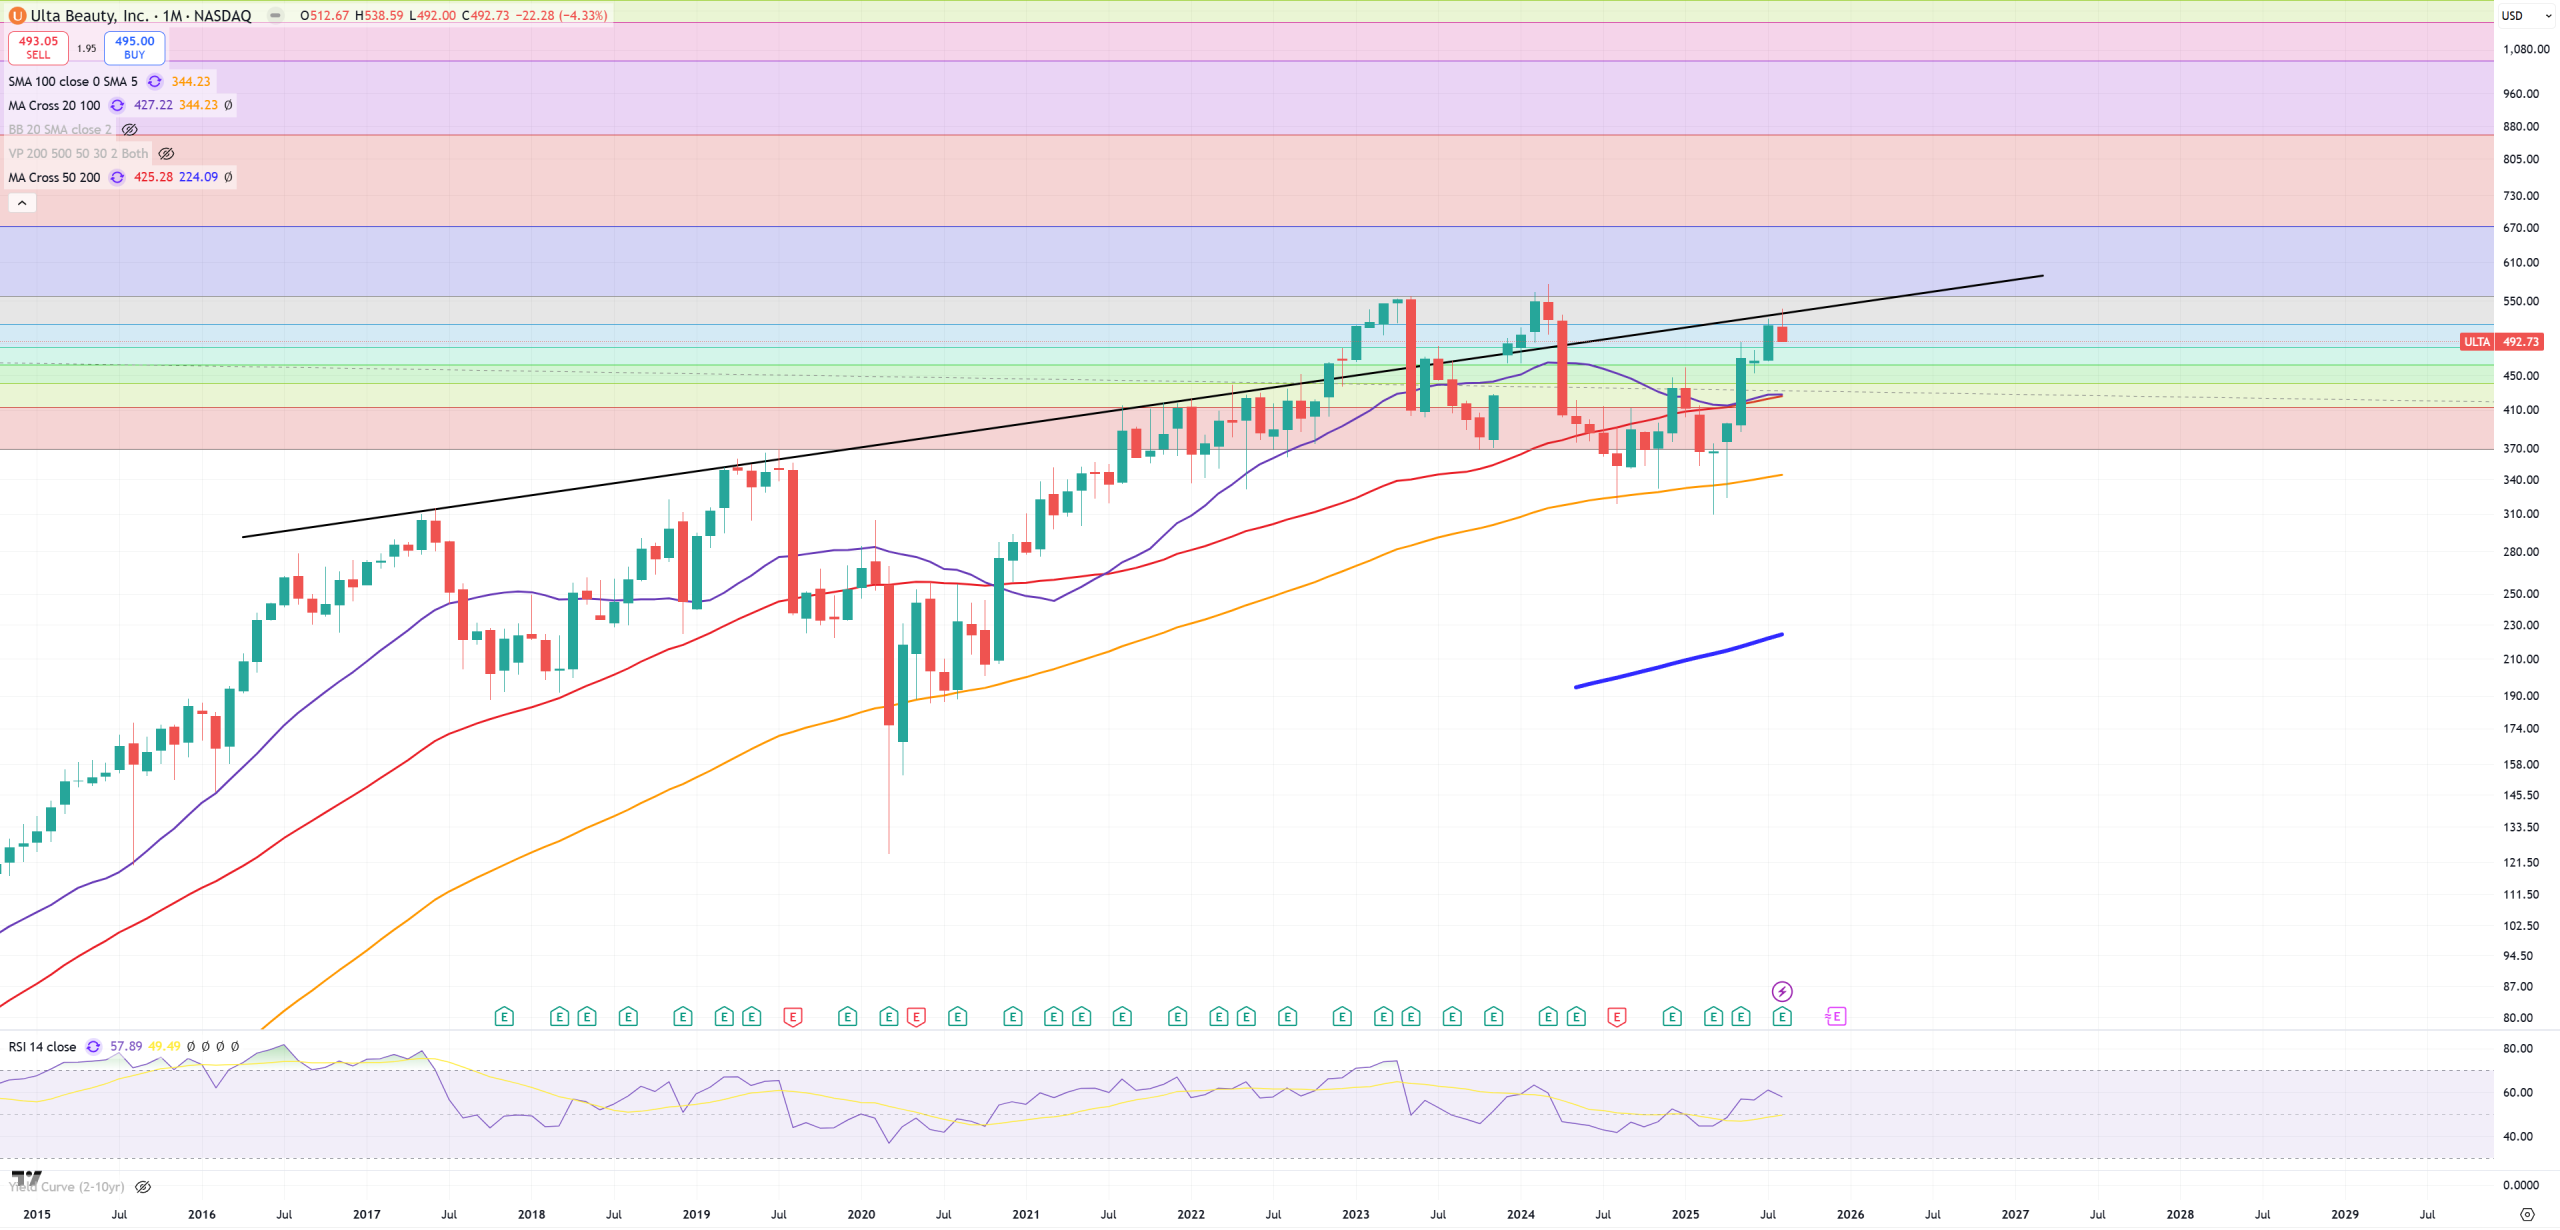
ULTA and some kind of megaphone channel
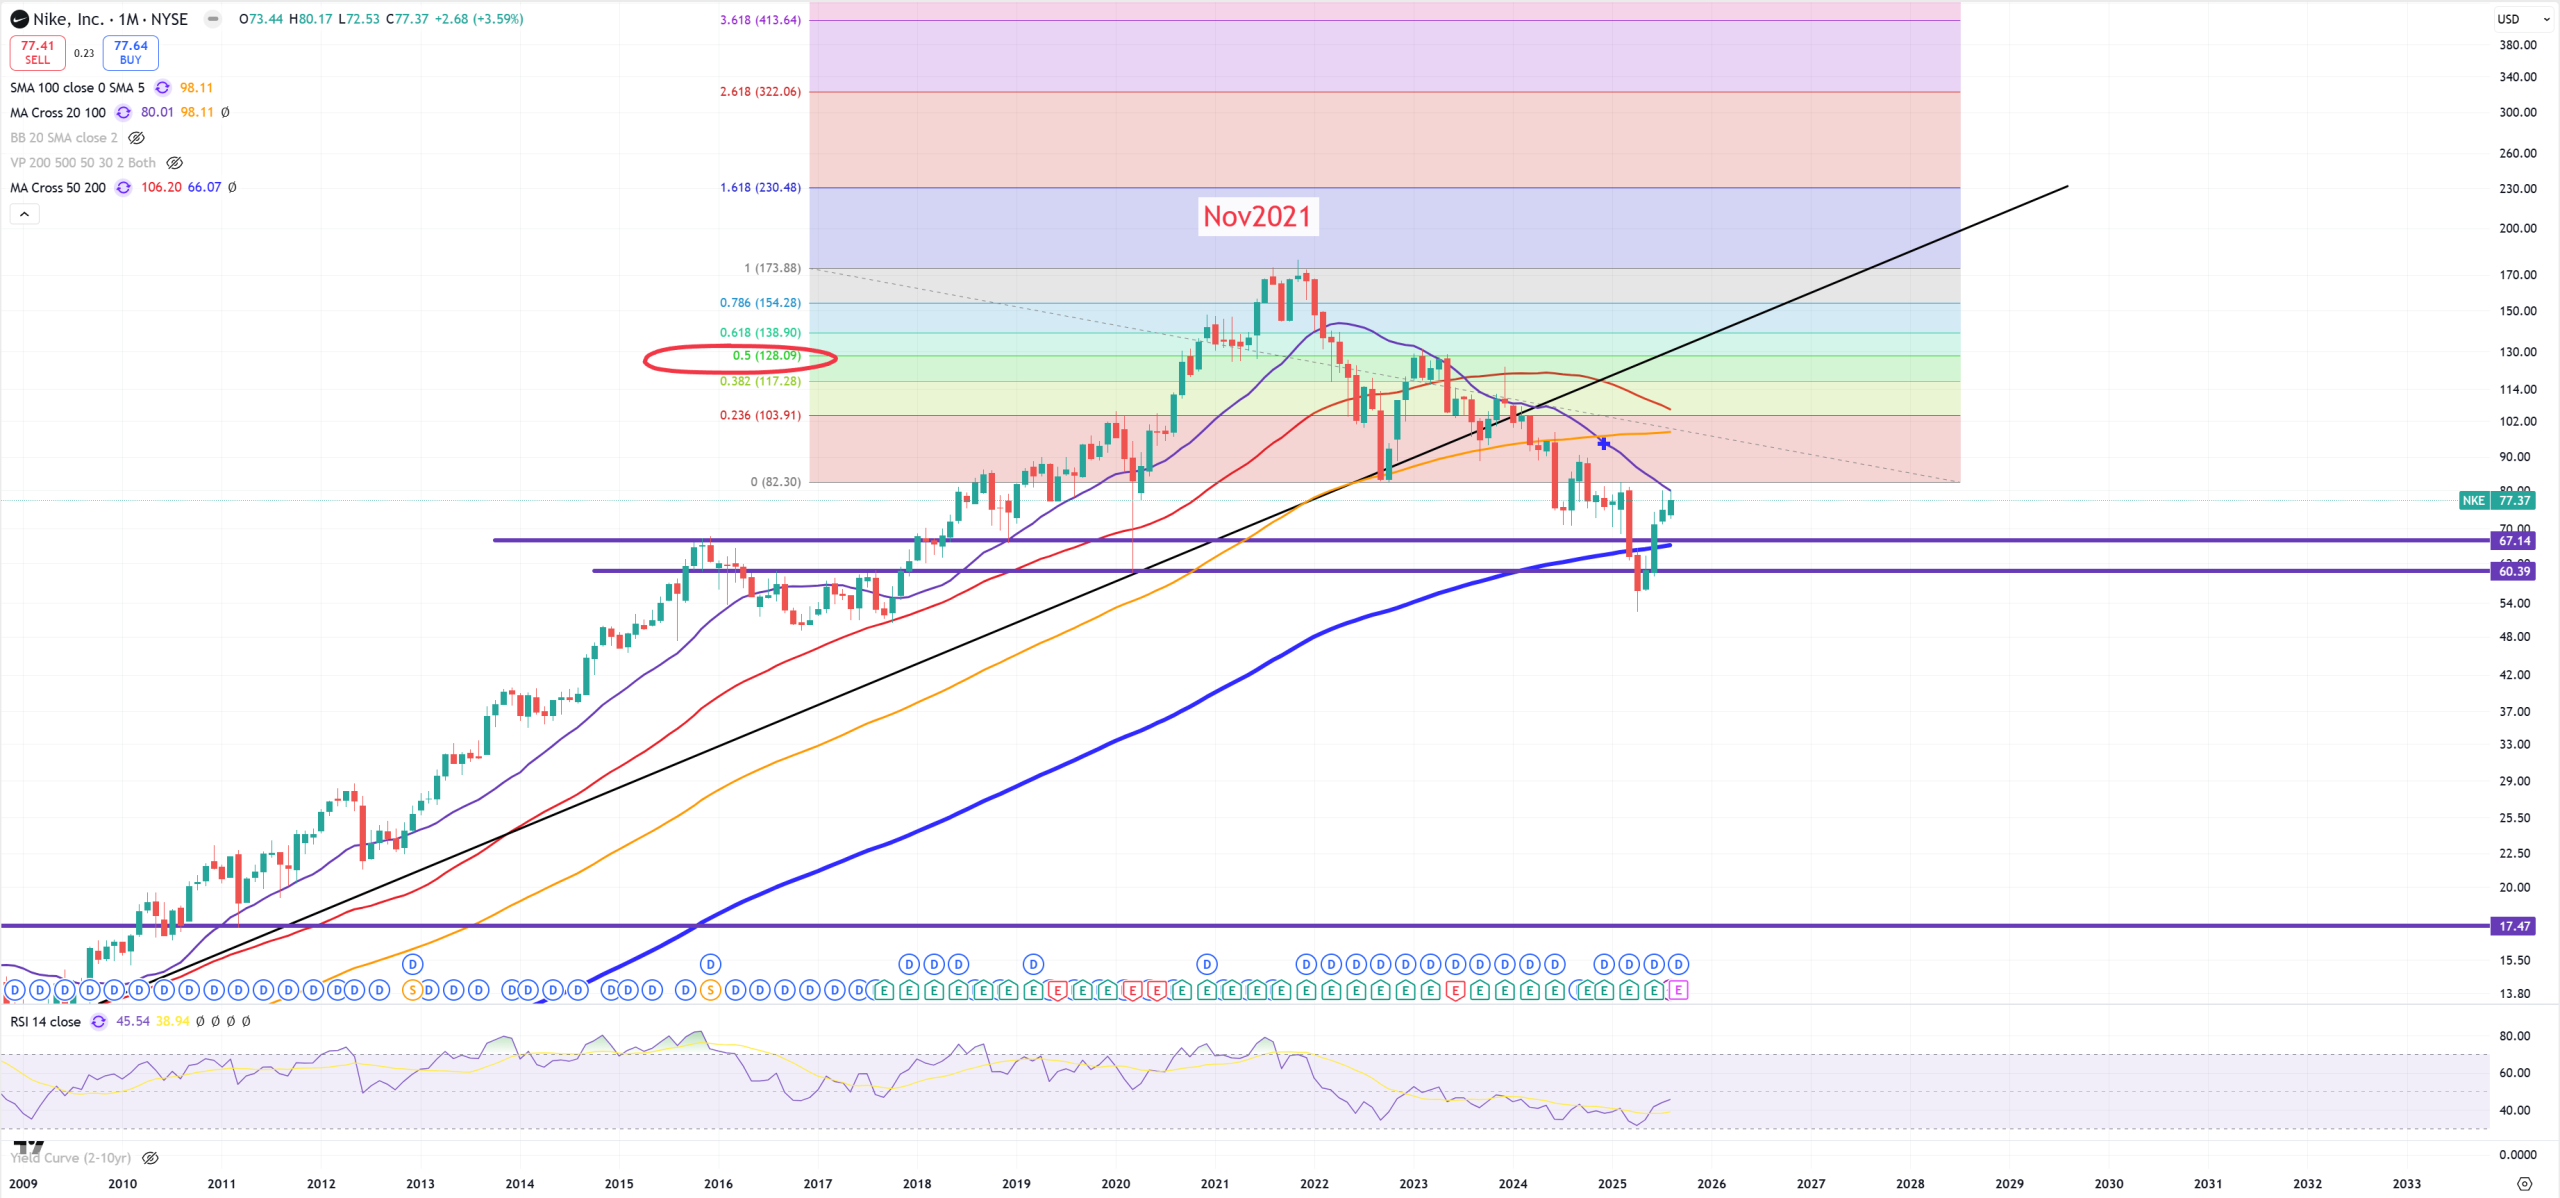
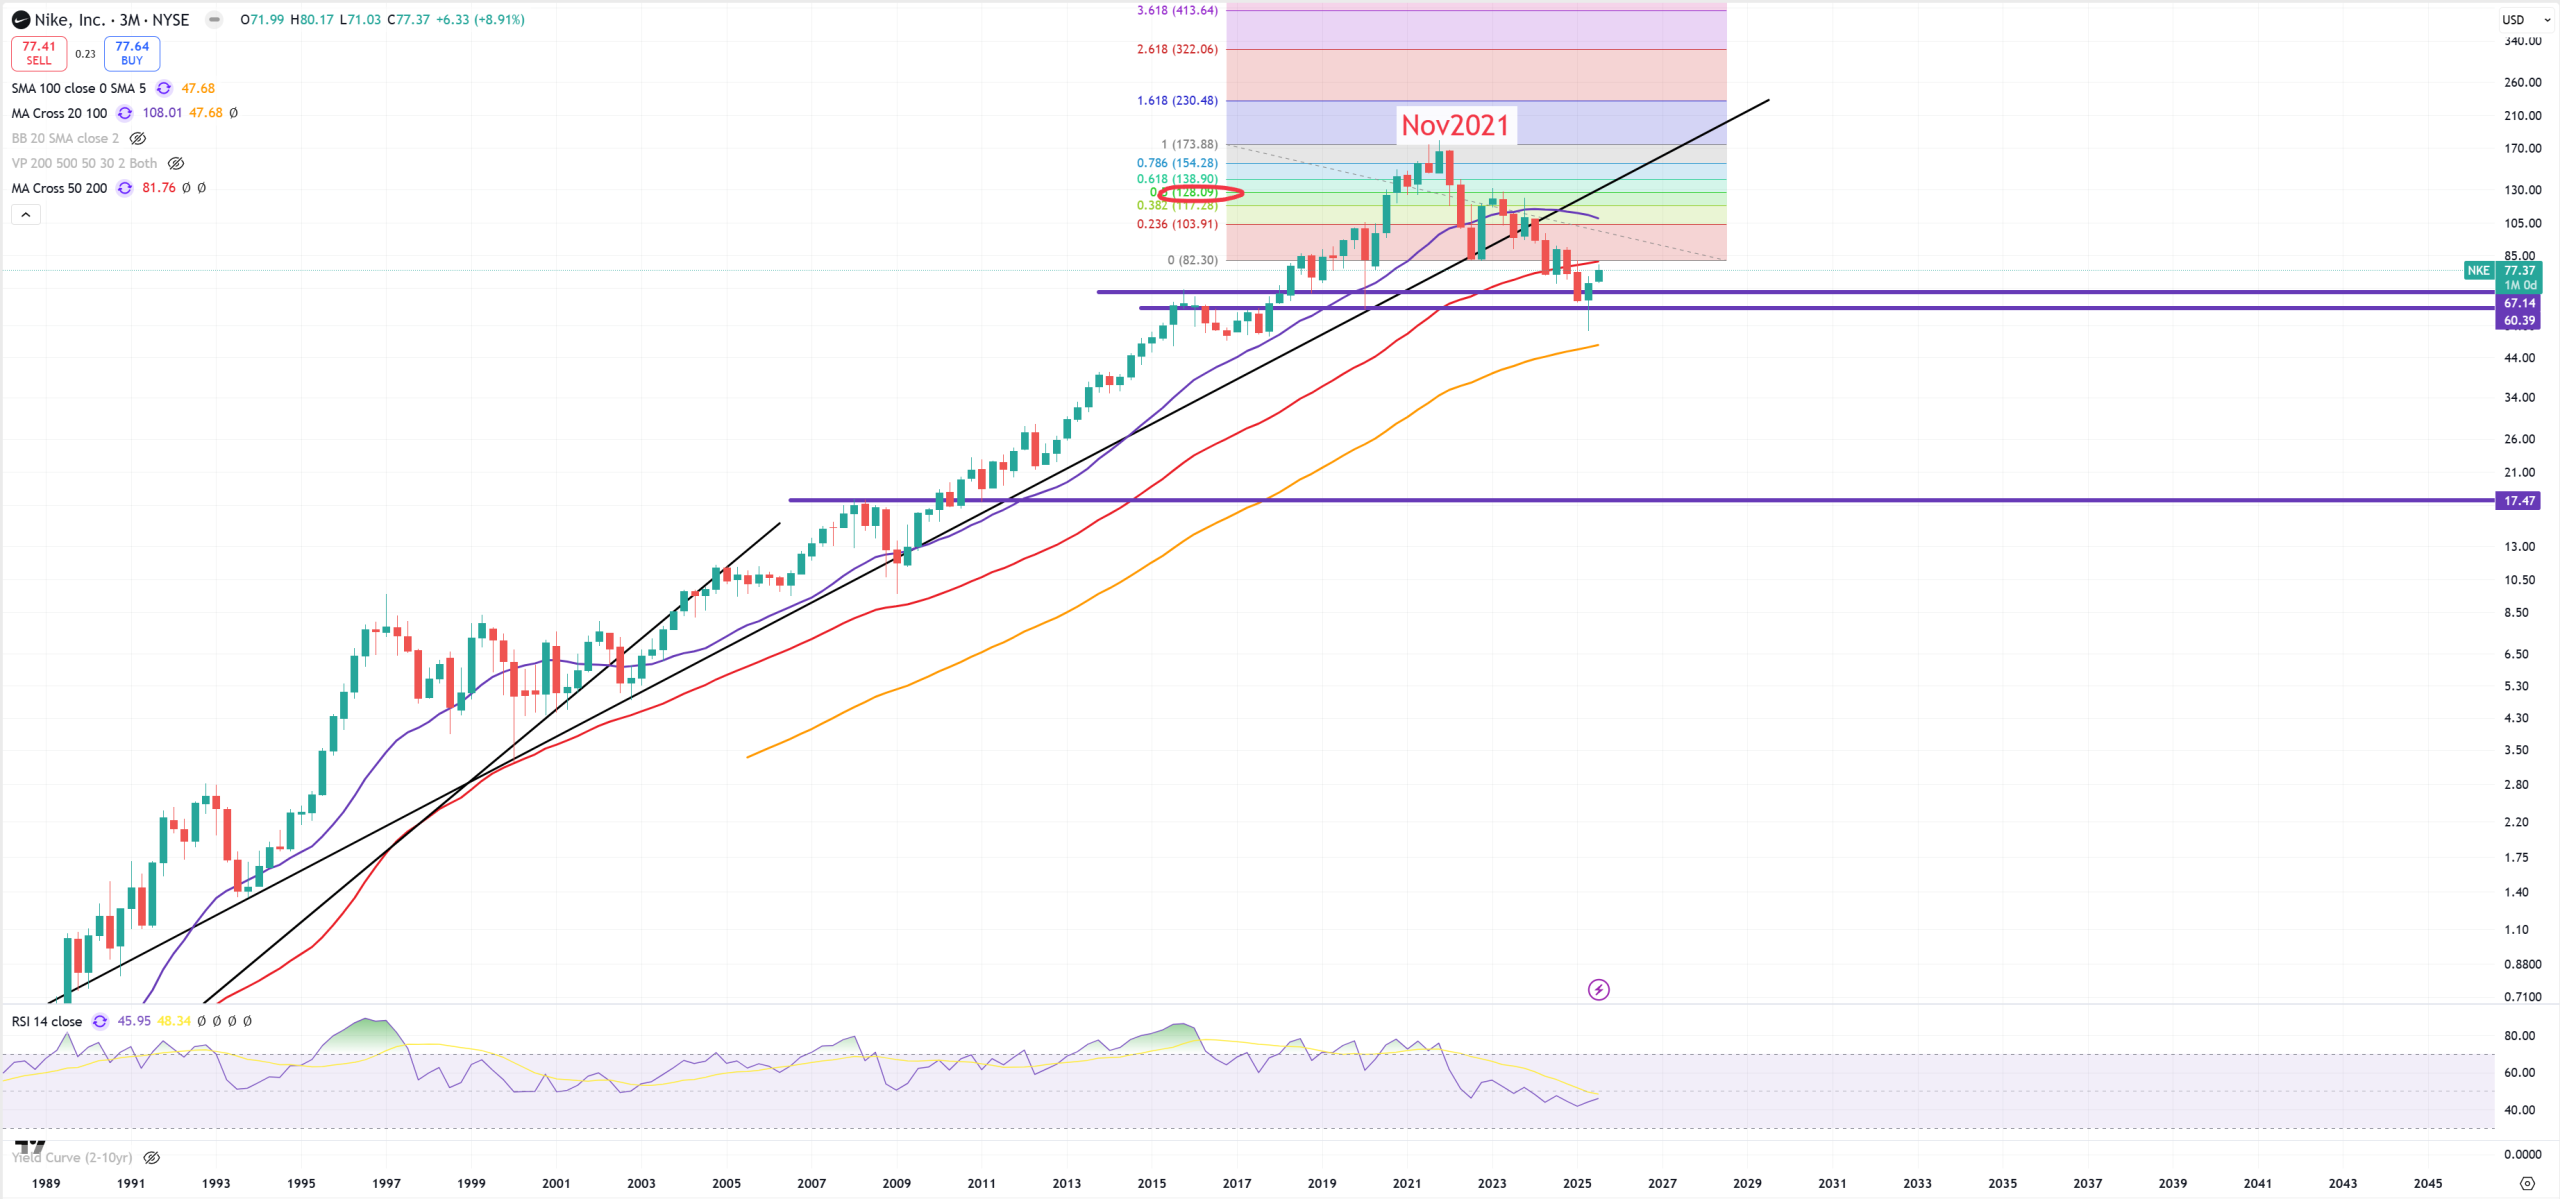
NKE – Nike – (M)MA200 won’t be easy to take, but here comes next resistance (3M)MA50. (3M)MA50 is almost at the same level as (M)MA20
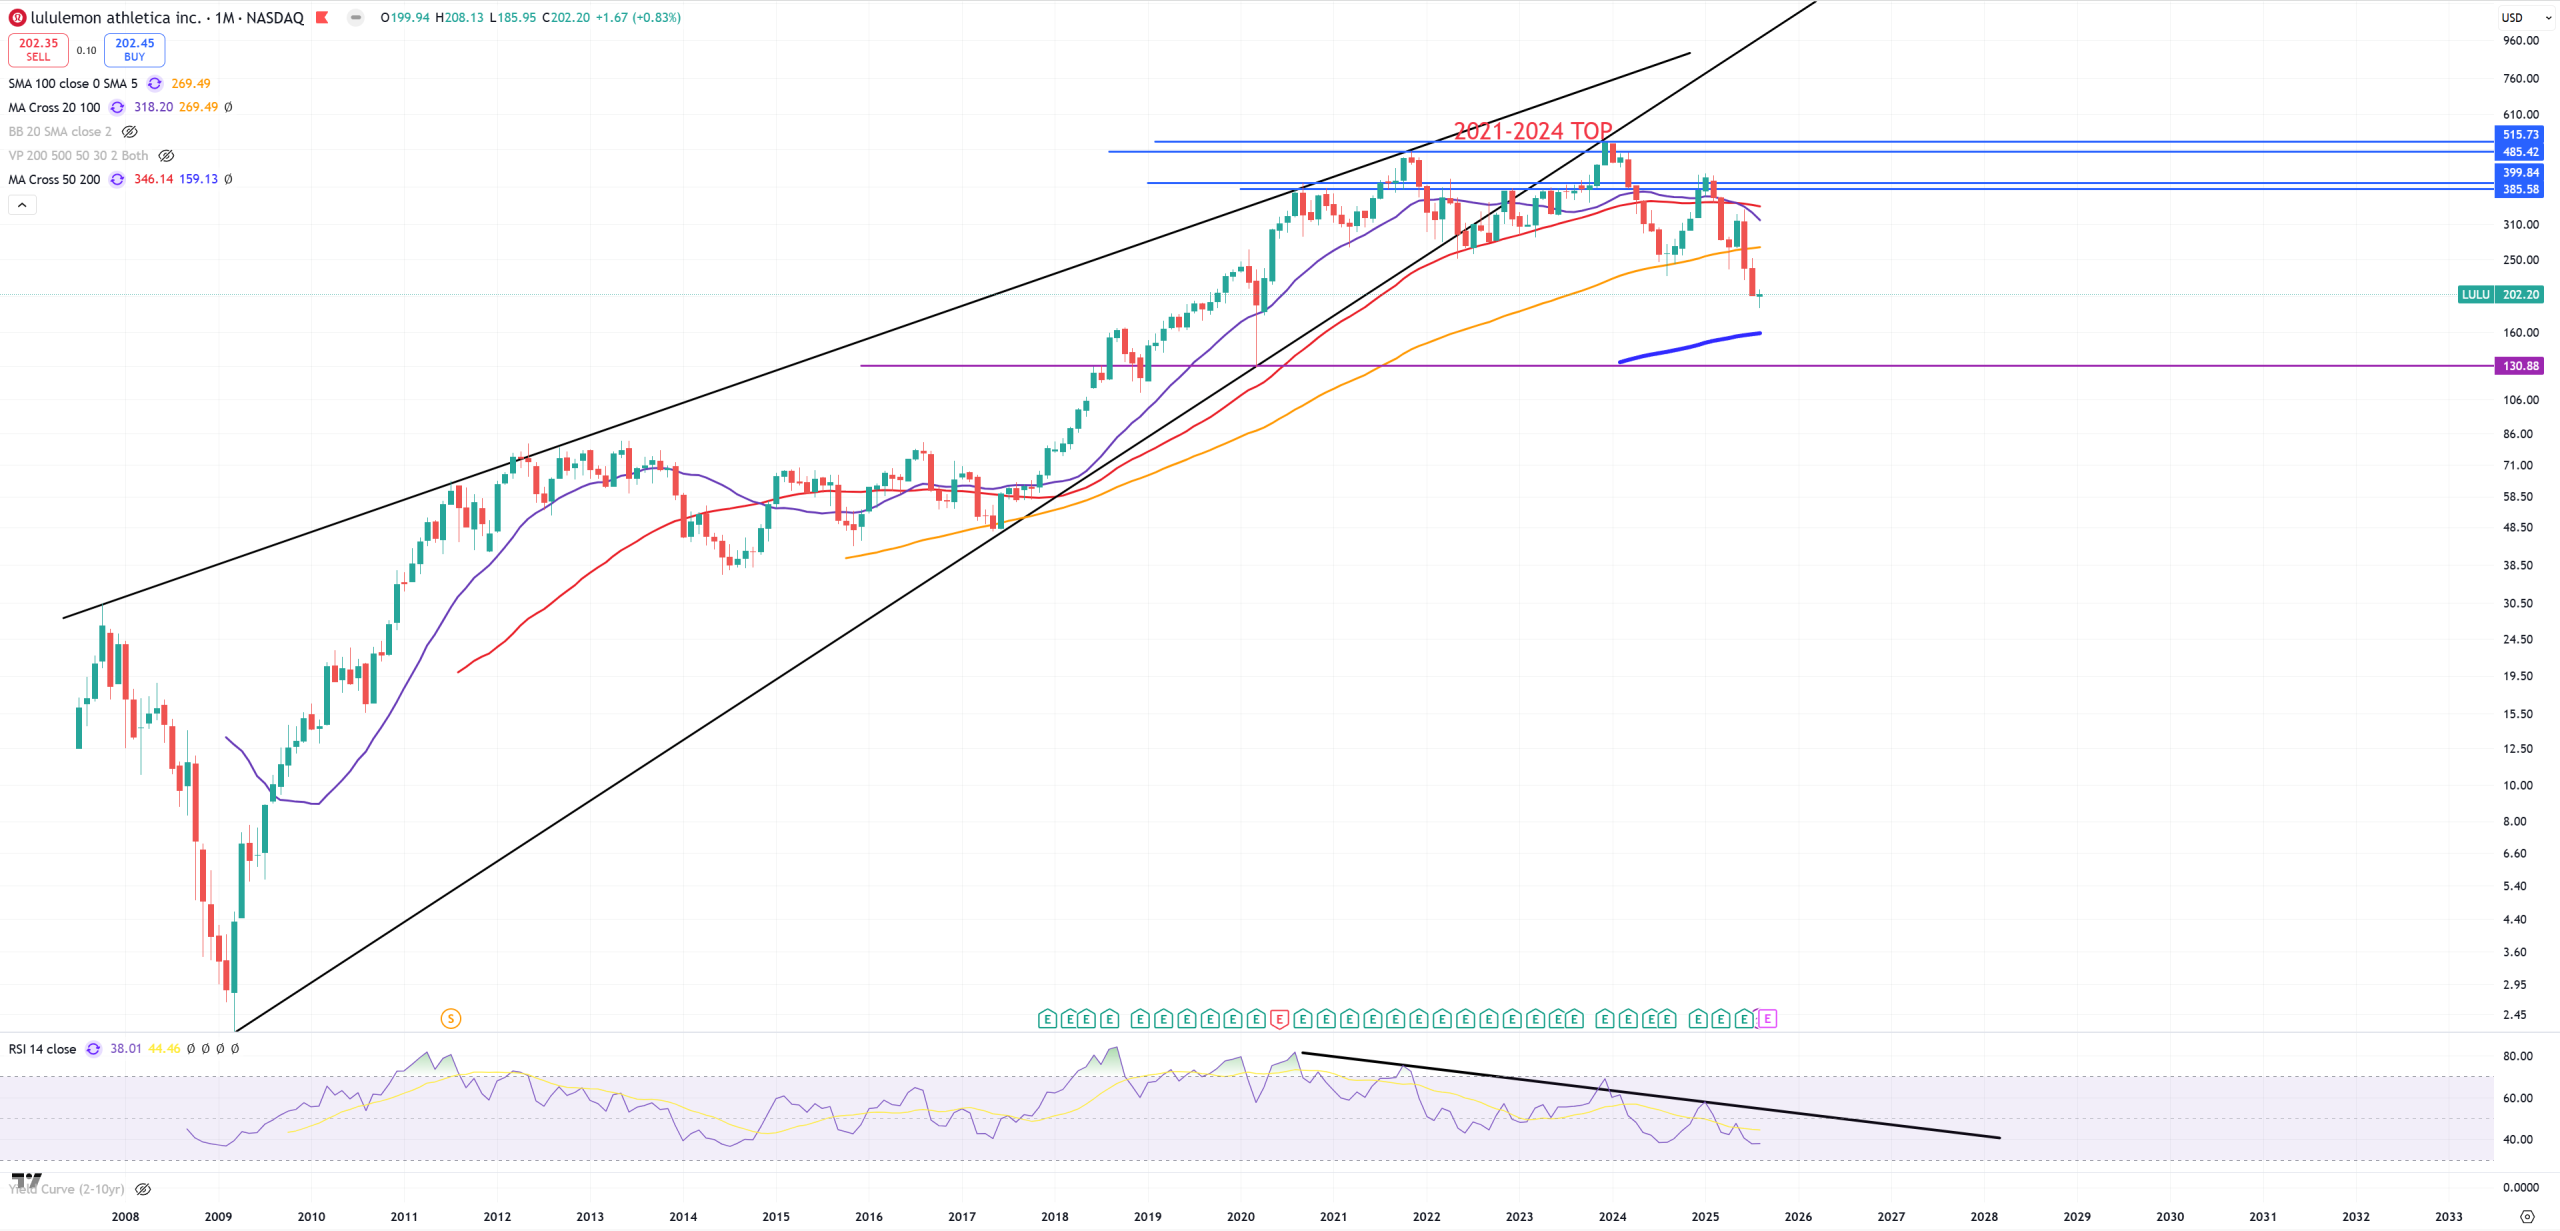
LULU – Also peak in 2021 like Nike
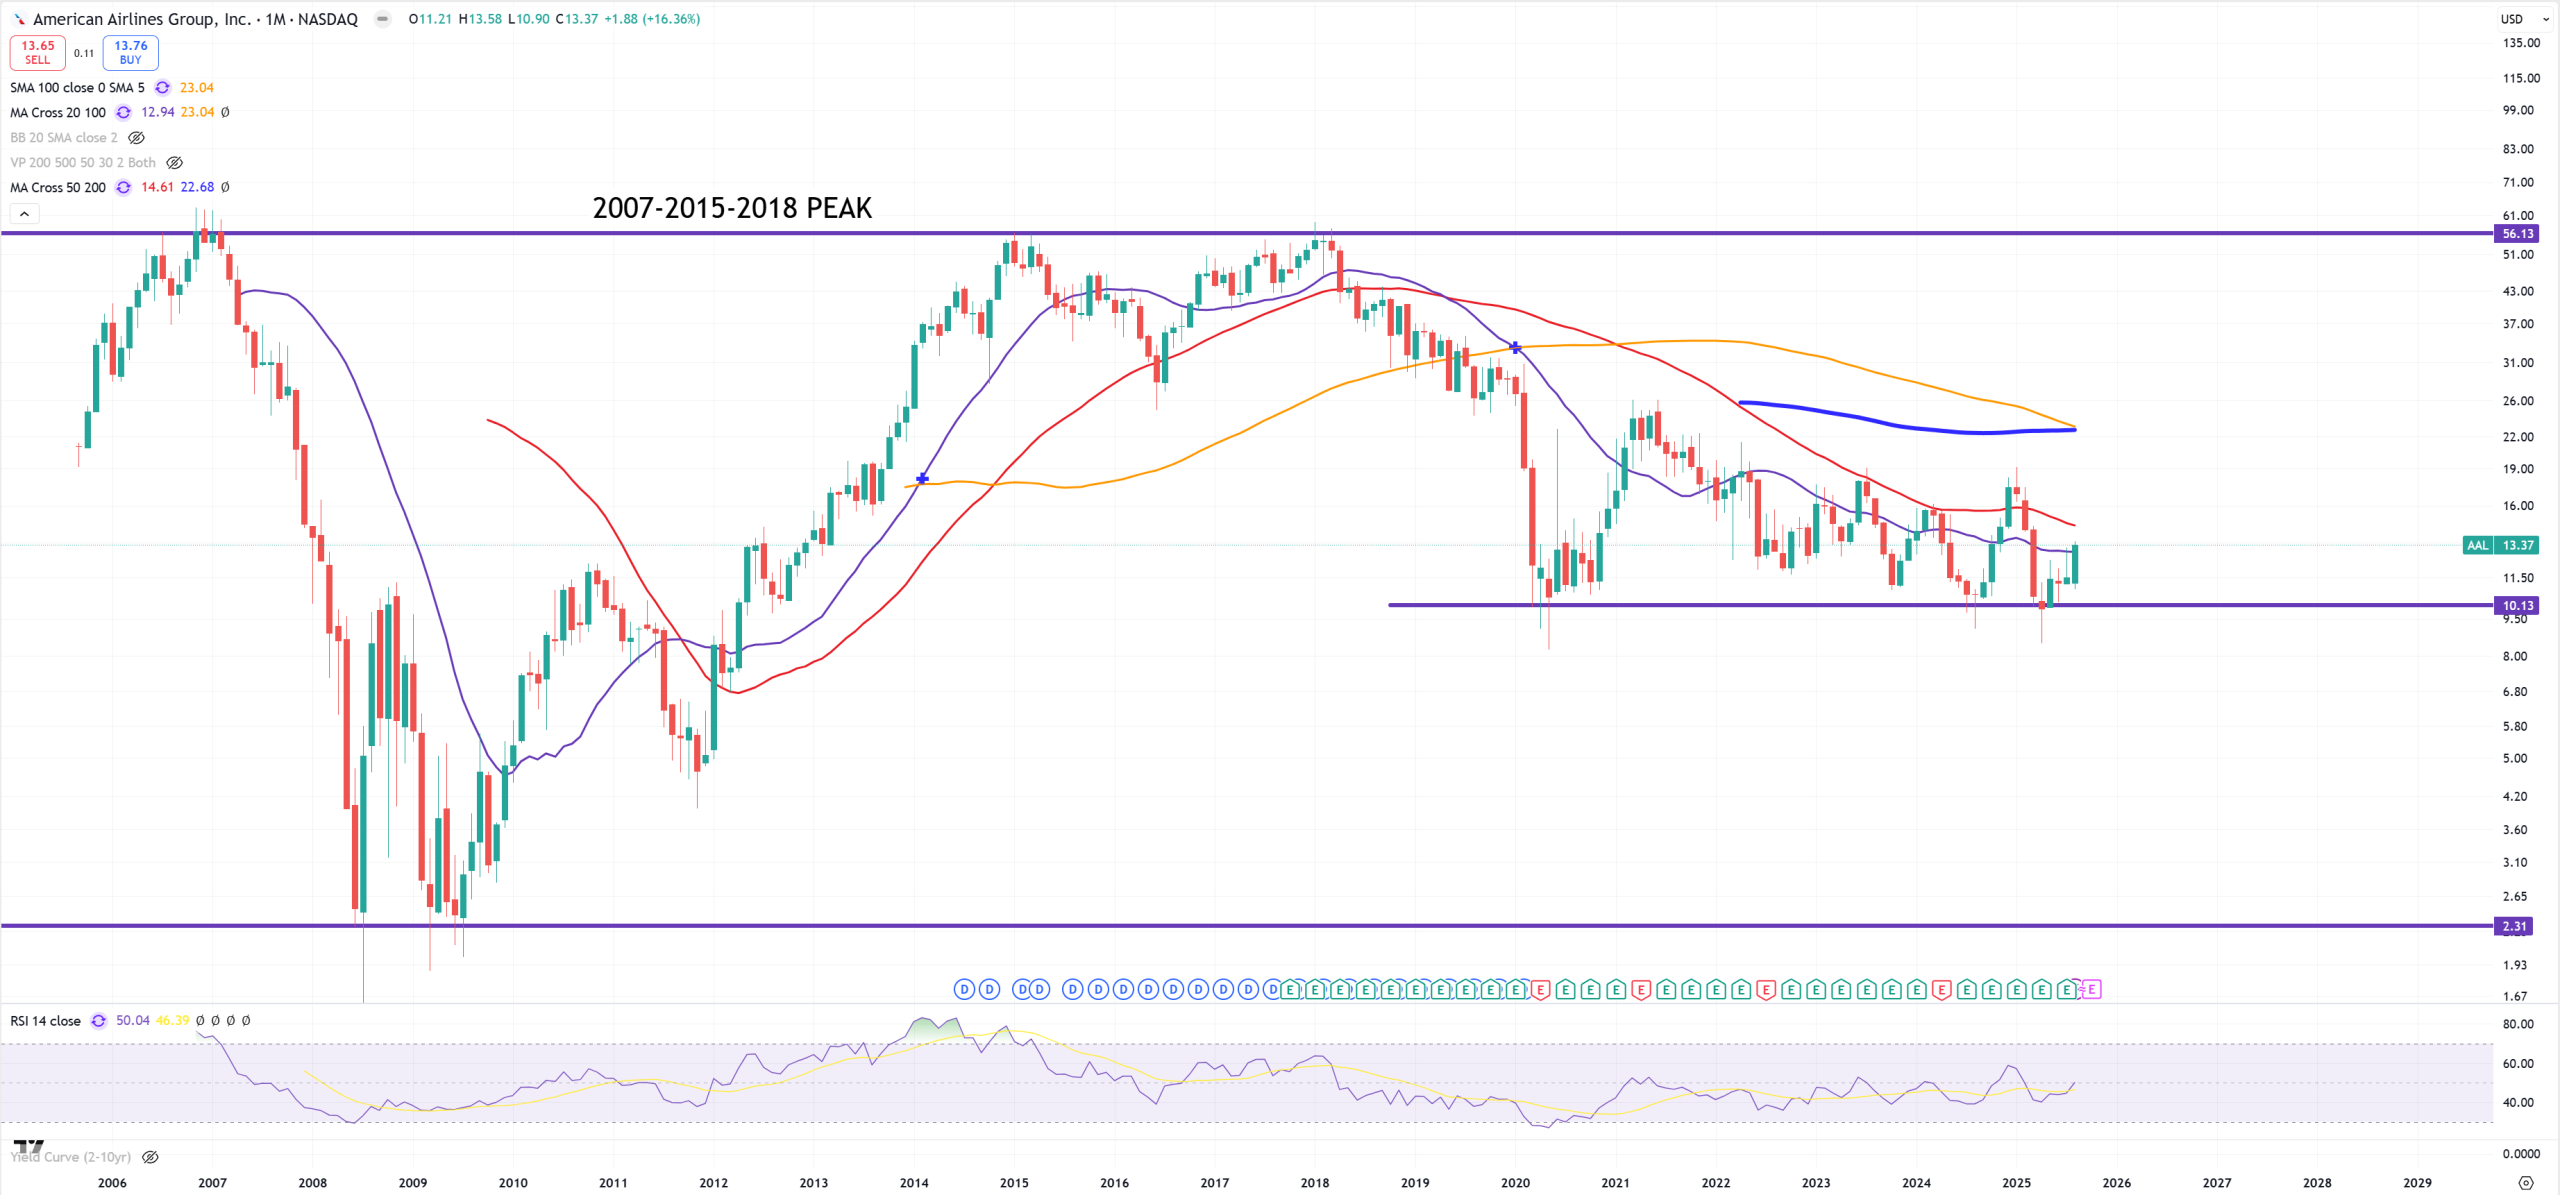
AAL – American Airlines – last peak in 2018, the moment DJI/GOLD peaked. Breaking this 10$ support will bring 2$ and 2009 lows bottom level.
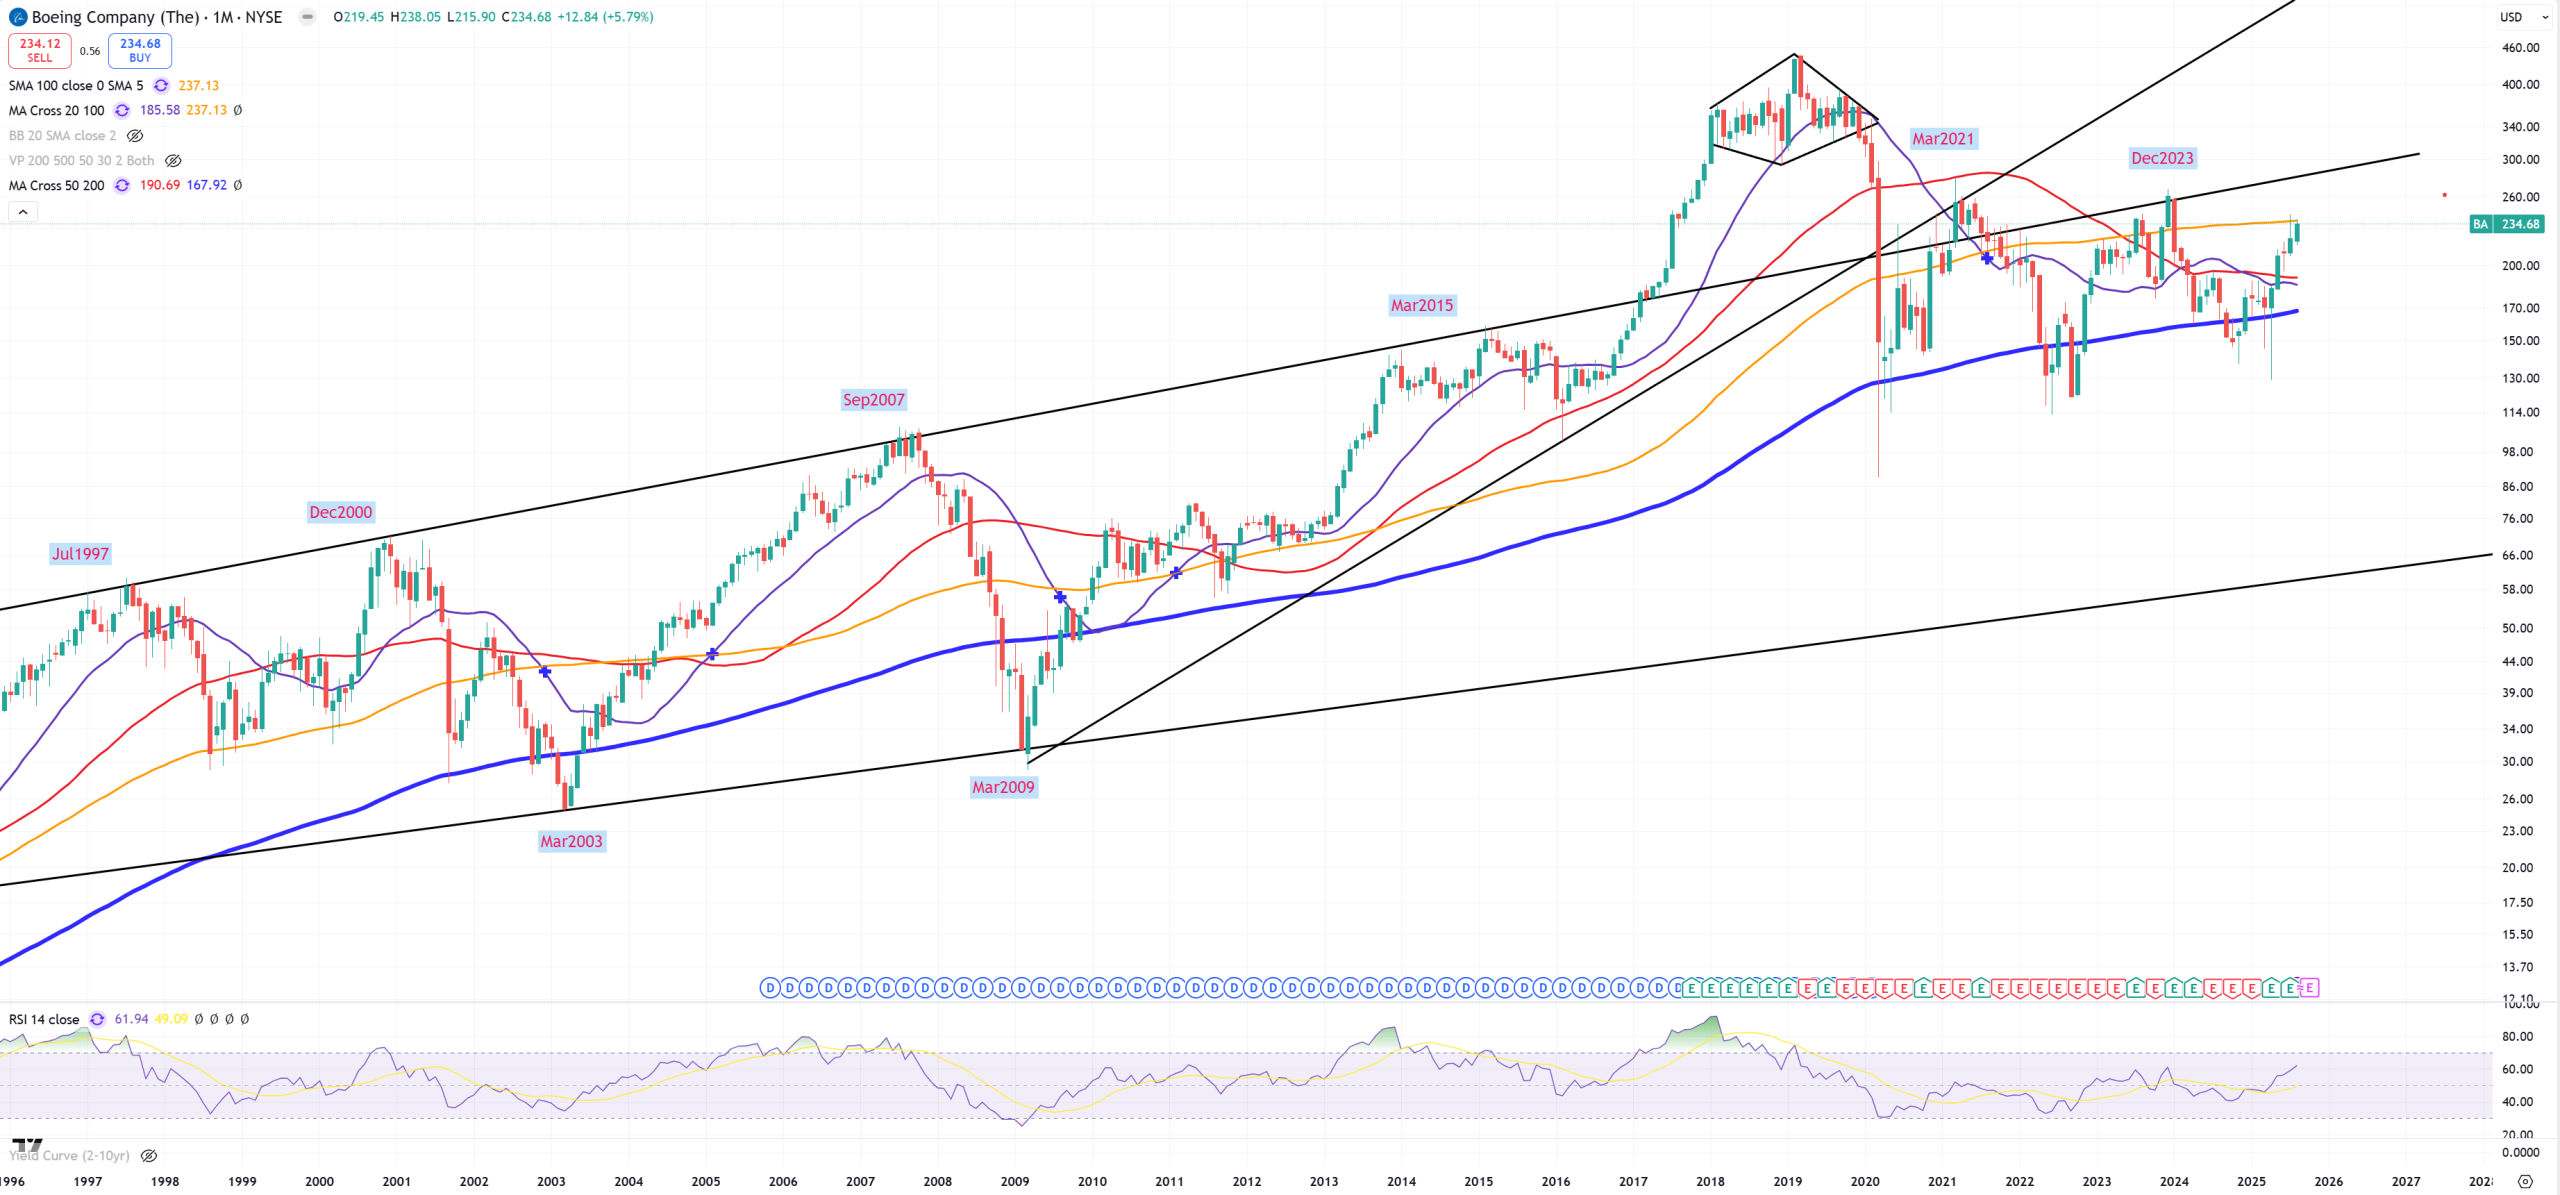
BA – Boeing, oh this company has plenty of lifes. Look how many times it defended (M)MA200, breaking towards (M)MA100 (yellow).
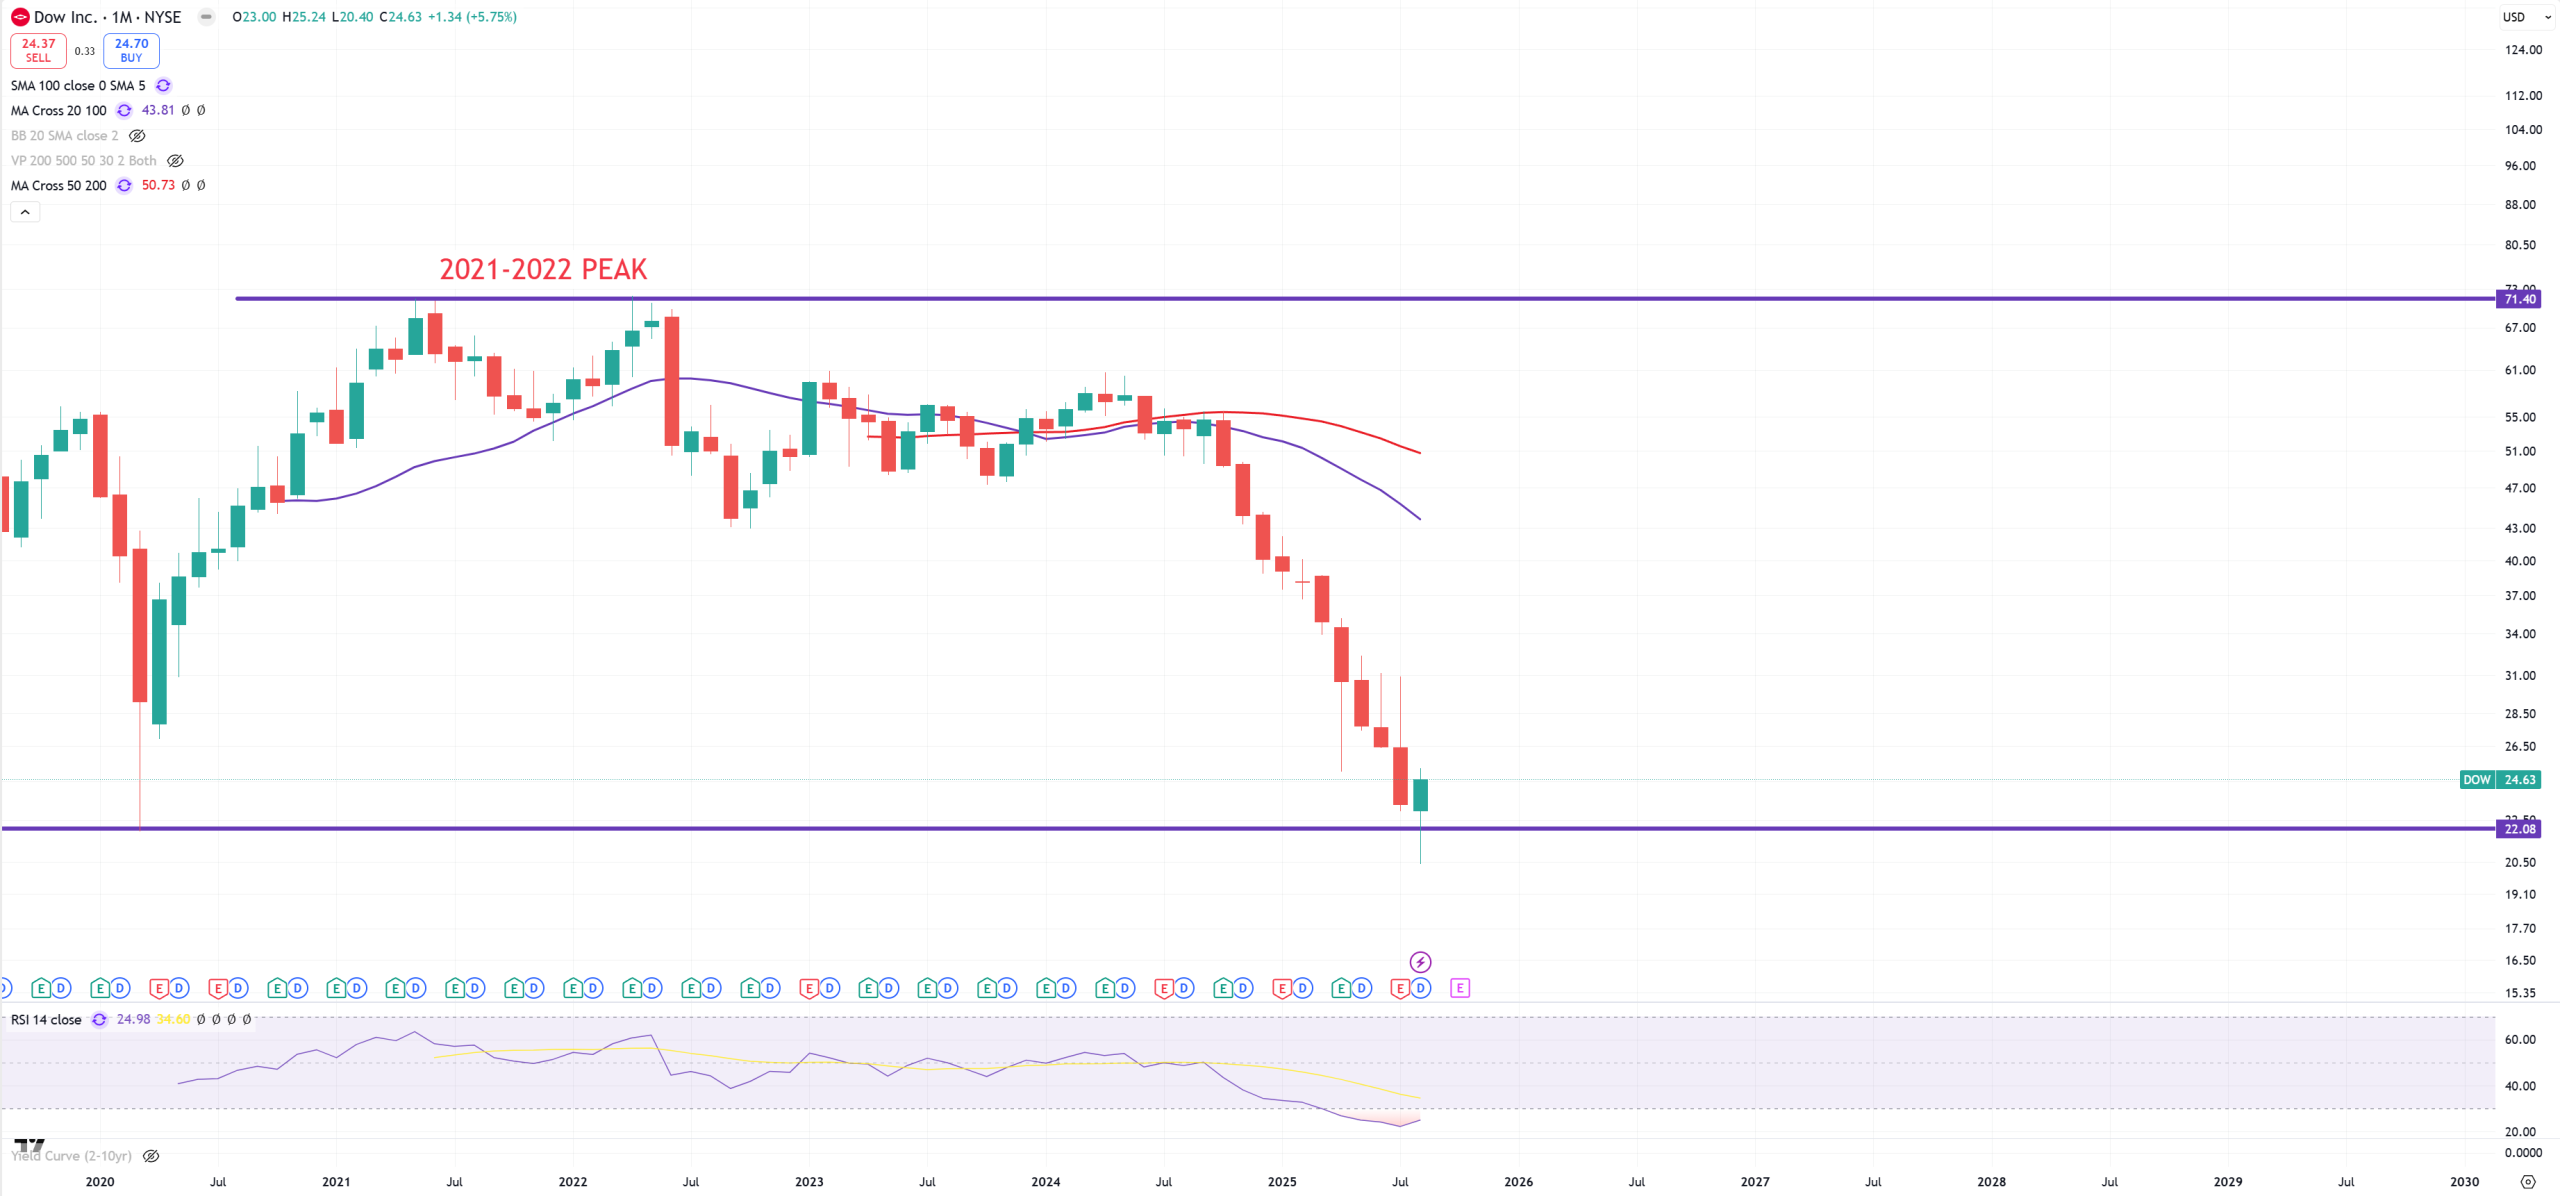
DOW – big support here, without a doubt market will be buying
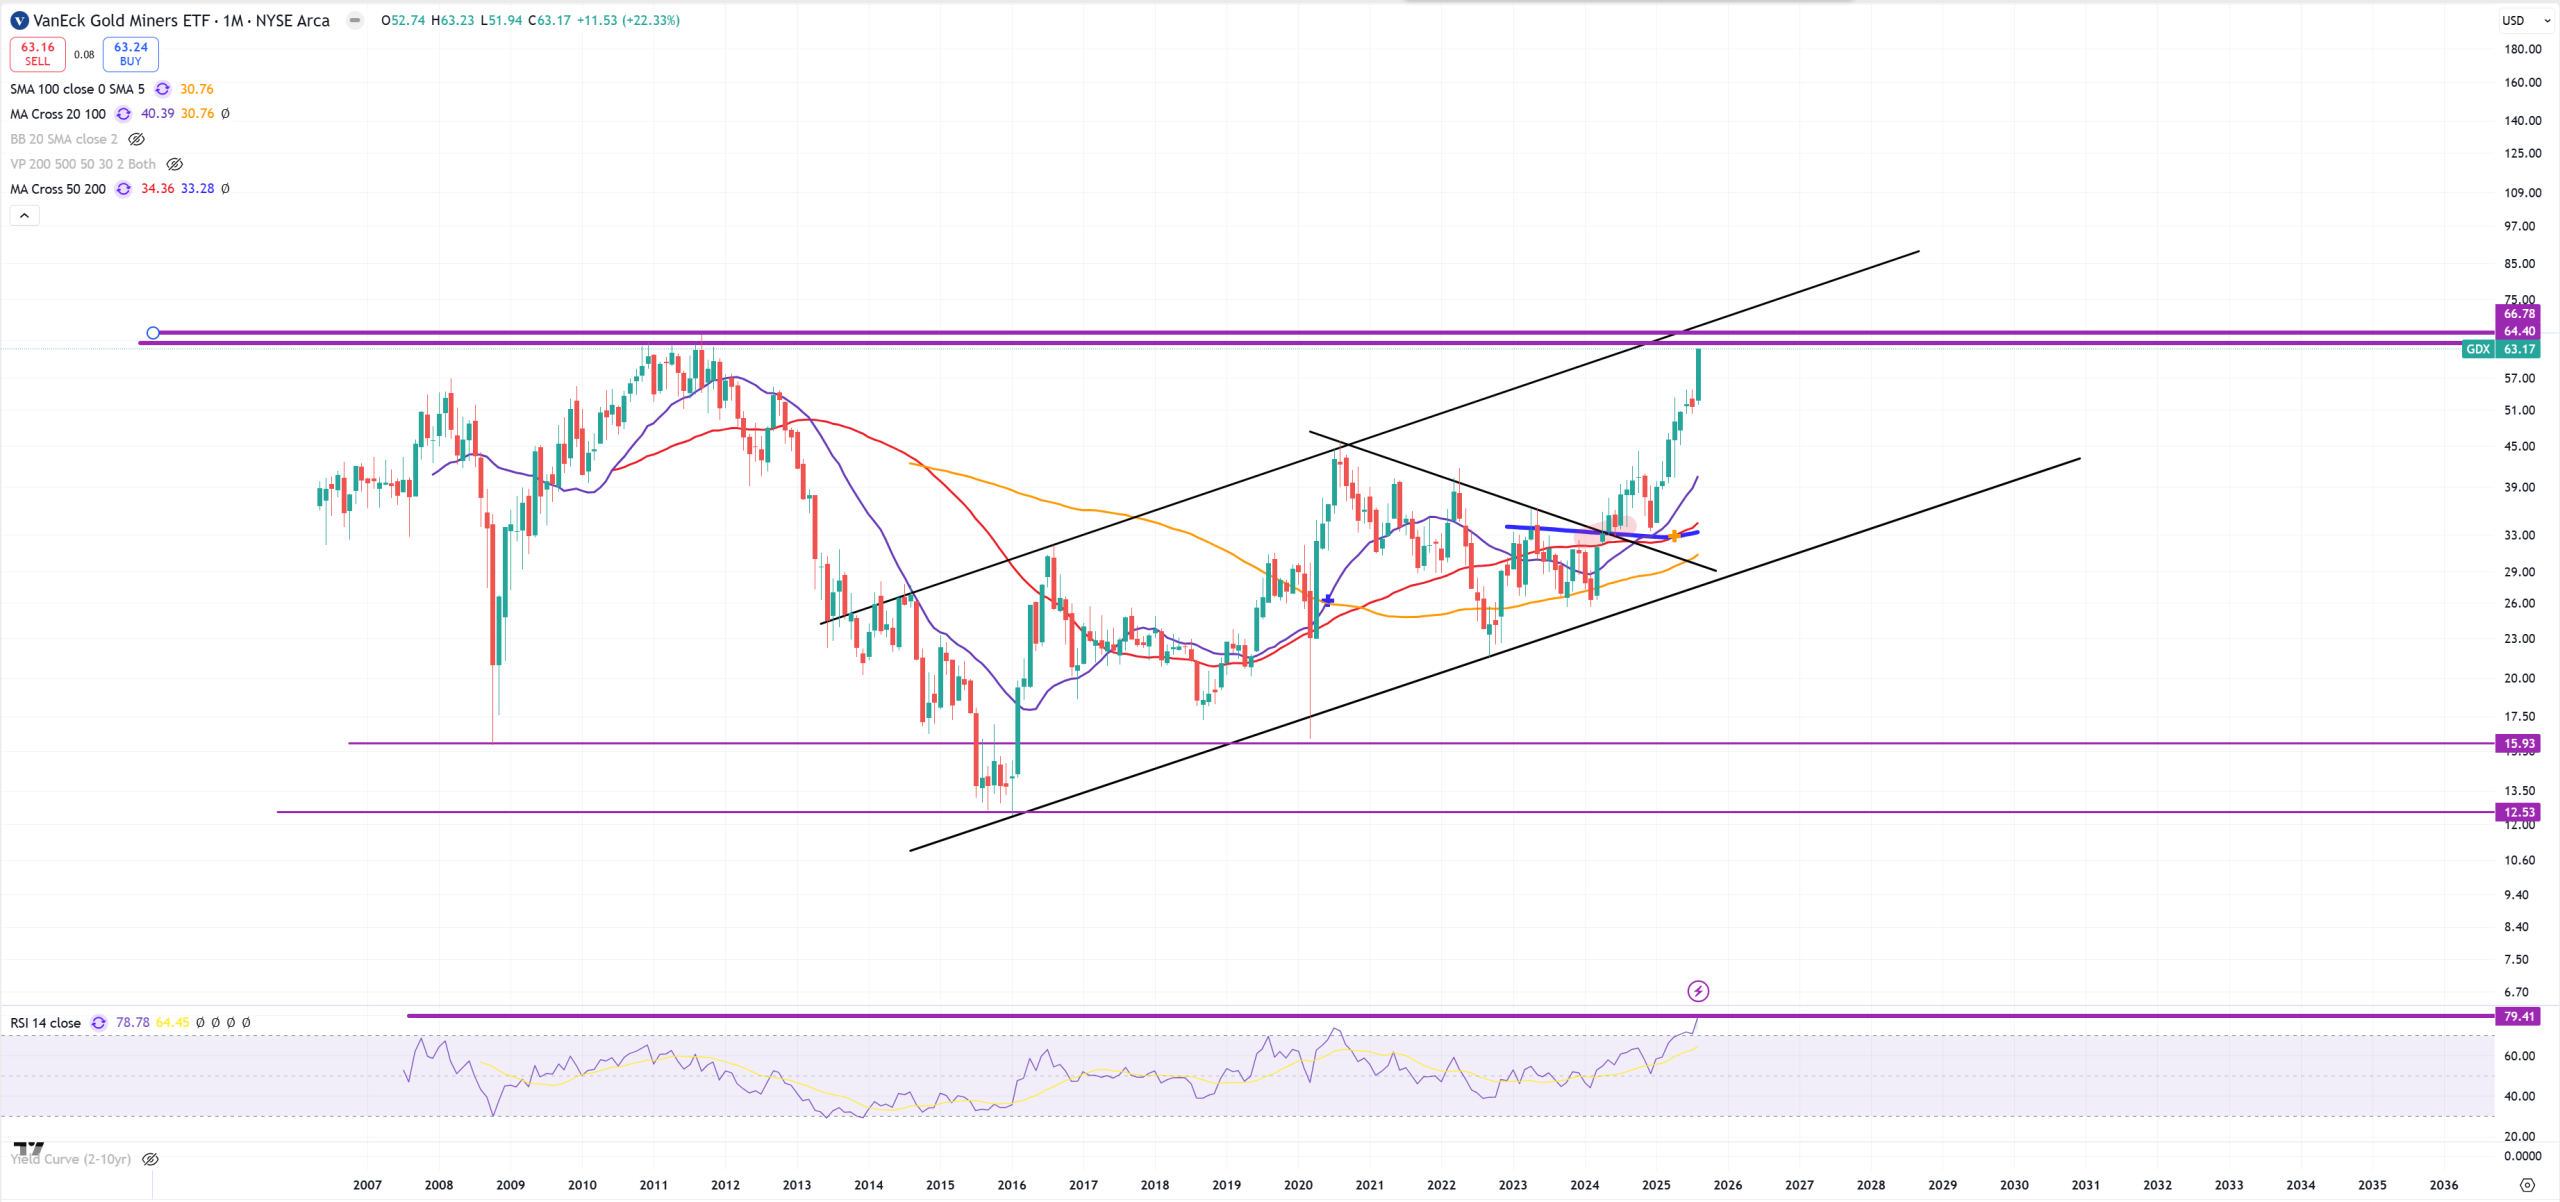
GDX – Gold bull market is ongoing but GDX approaching to key level. We see (M)MA200 break, gold going higher and GDX entered into bull market. How approaching towards channel end + 2007 resistance.
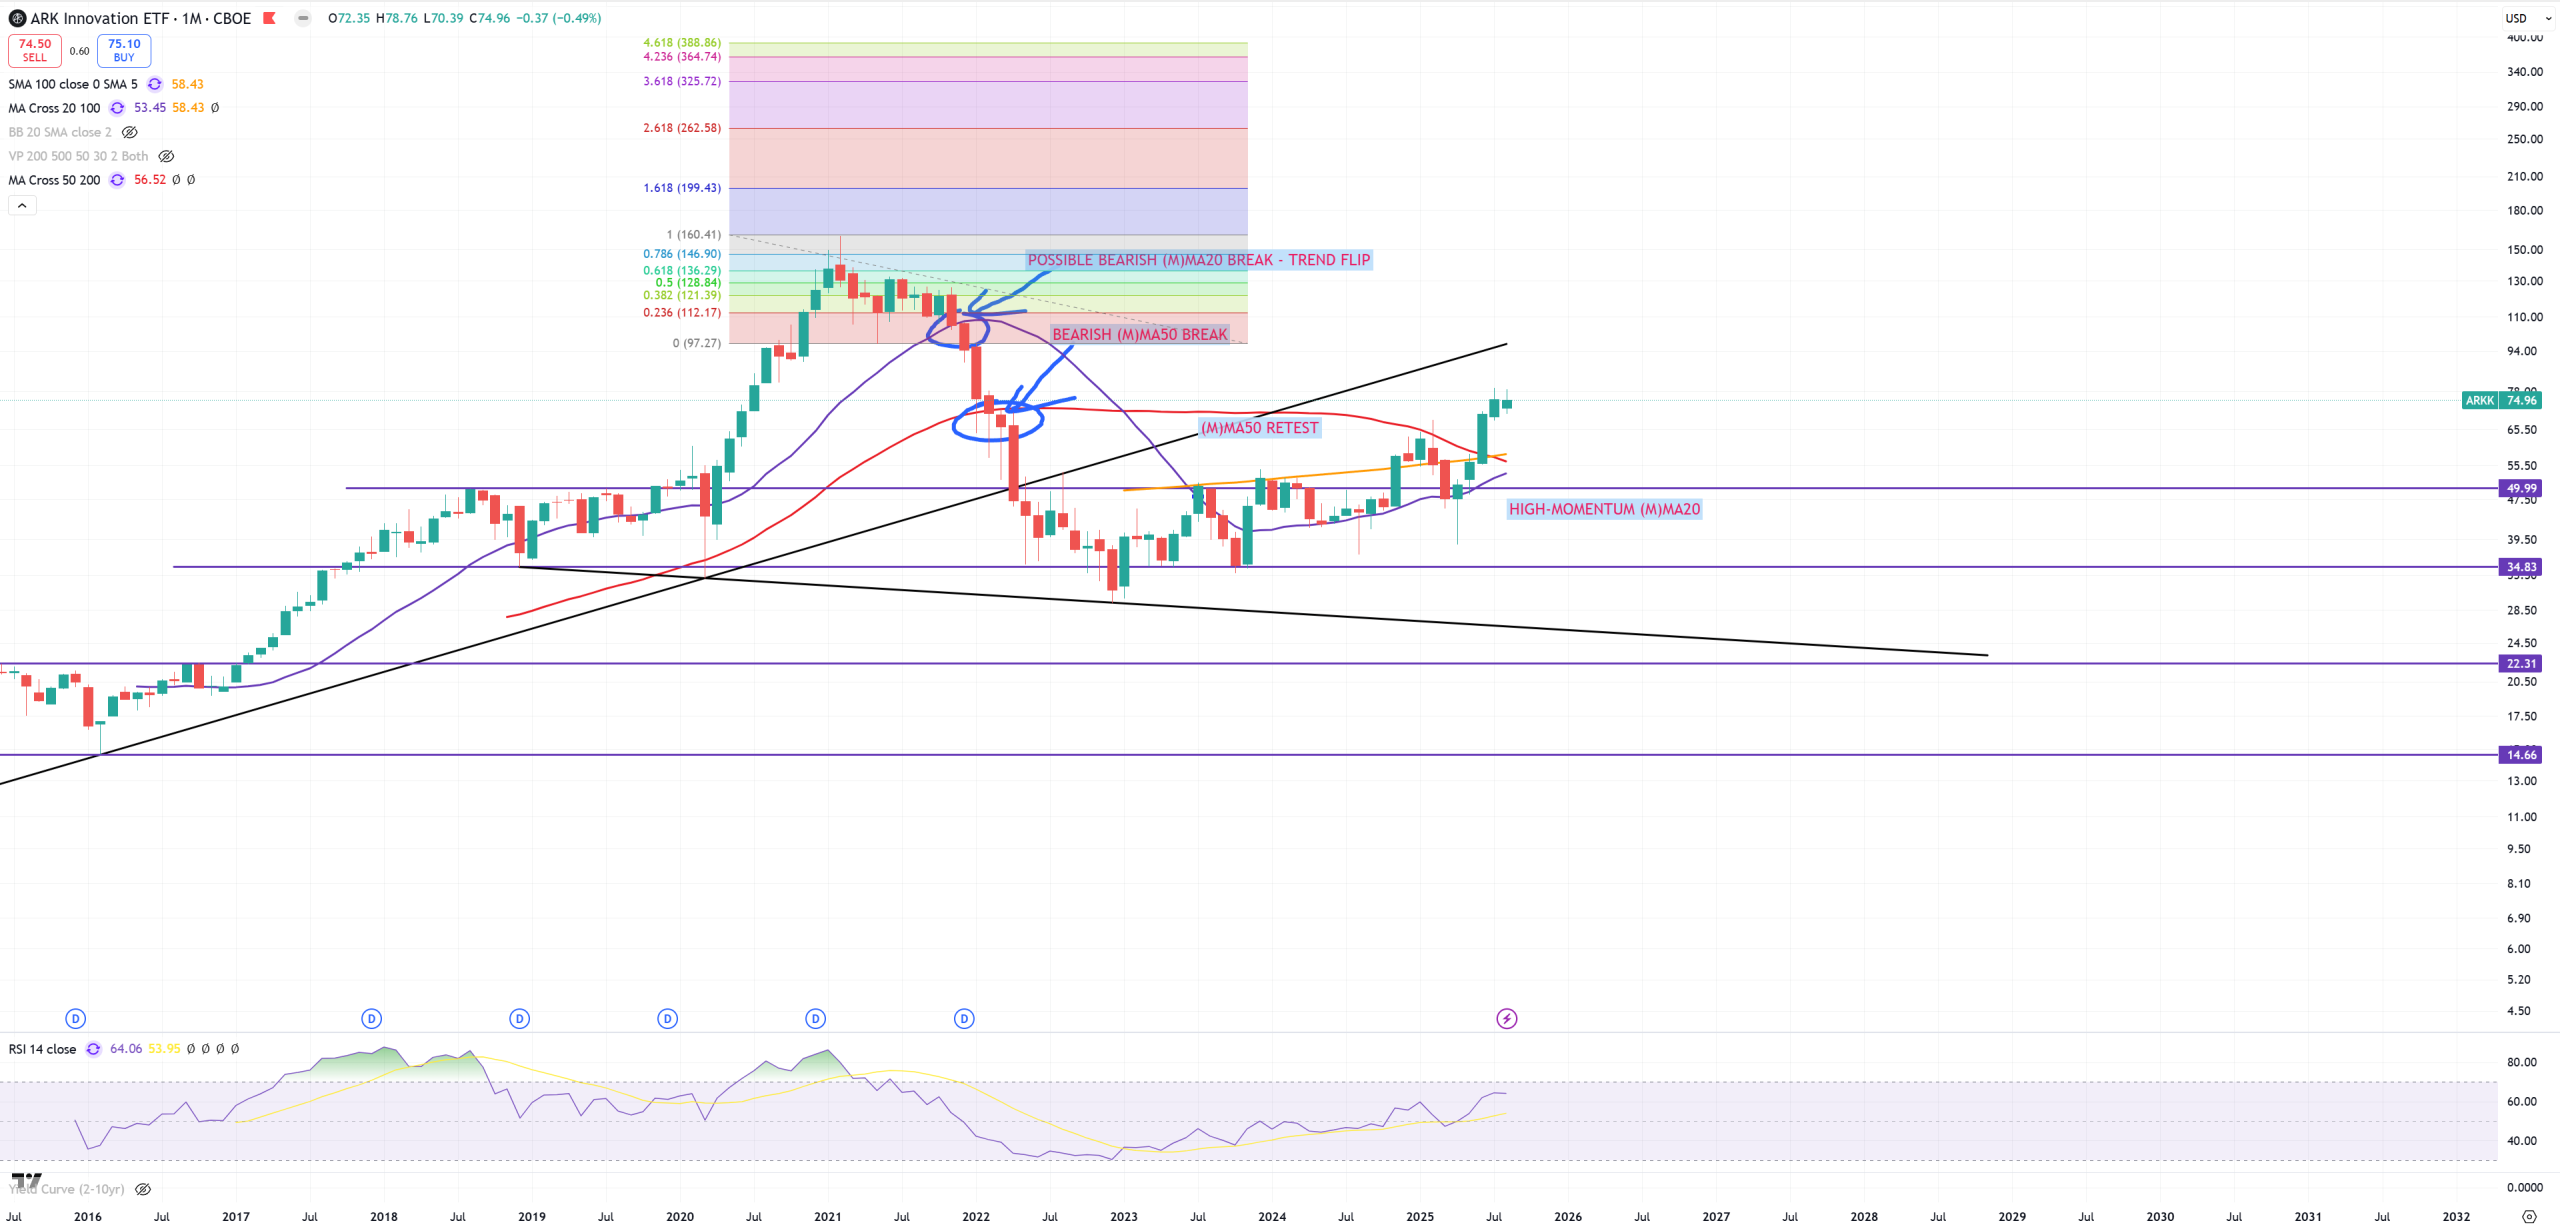
ARKK – I have no words about it, bulls blew up all levels. Retest to trend is around 100$ and this spike above (M)MA100 (yellow) and (M)MA50 (red) is super high to tell it’s bull trap. I would be really surprised if bears will trash it hard back below (M)MA50 fast.