10/2025
October 1, 2025

Month and quarter is passing, so let’s see what has been changed. Three most important charts I was waiting for : SPX and 1929-2000 trend and SPX/GOLD to break (M)MA200 & (3M)MA200 and US03MY and its (M)MA50. Nothing happened in this (M) and (3M). Market is 1/2 cracked based on DJI/GOLD, what we will see in many different areas. There’s couple reminders here. (M)MA20 is a high momentum MA, (M)MA50 is a natural border between bull/bear, (M)MA100 is a middle point which often acts as bull/bear trap, (M)MA200 is a secular border – not easy to give up. Also I measure a bubble by its peak to (M)MA50. Everything above -60% should be considered by huge bubble and above -70%+ as a “tulip bubble category”.
My observation : A lot of stocks peaked around late 2021 beginning 2022. That moment is in many macro peak of the economy and SPX/GOLD peak. Once stocks went down below this level they’re not coming back above it. Some stocks trying heavily to defend this level, some gave up and are -70% lower. Of course TECH+AI+Banks are mostly those stocks that lead everything.
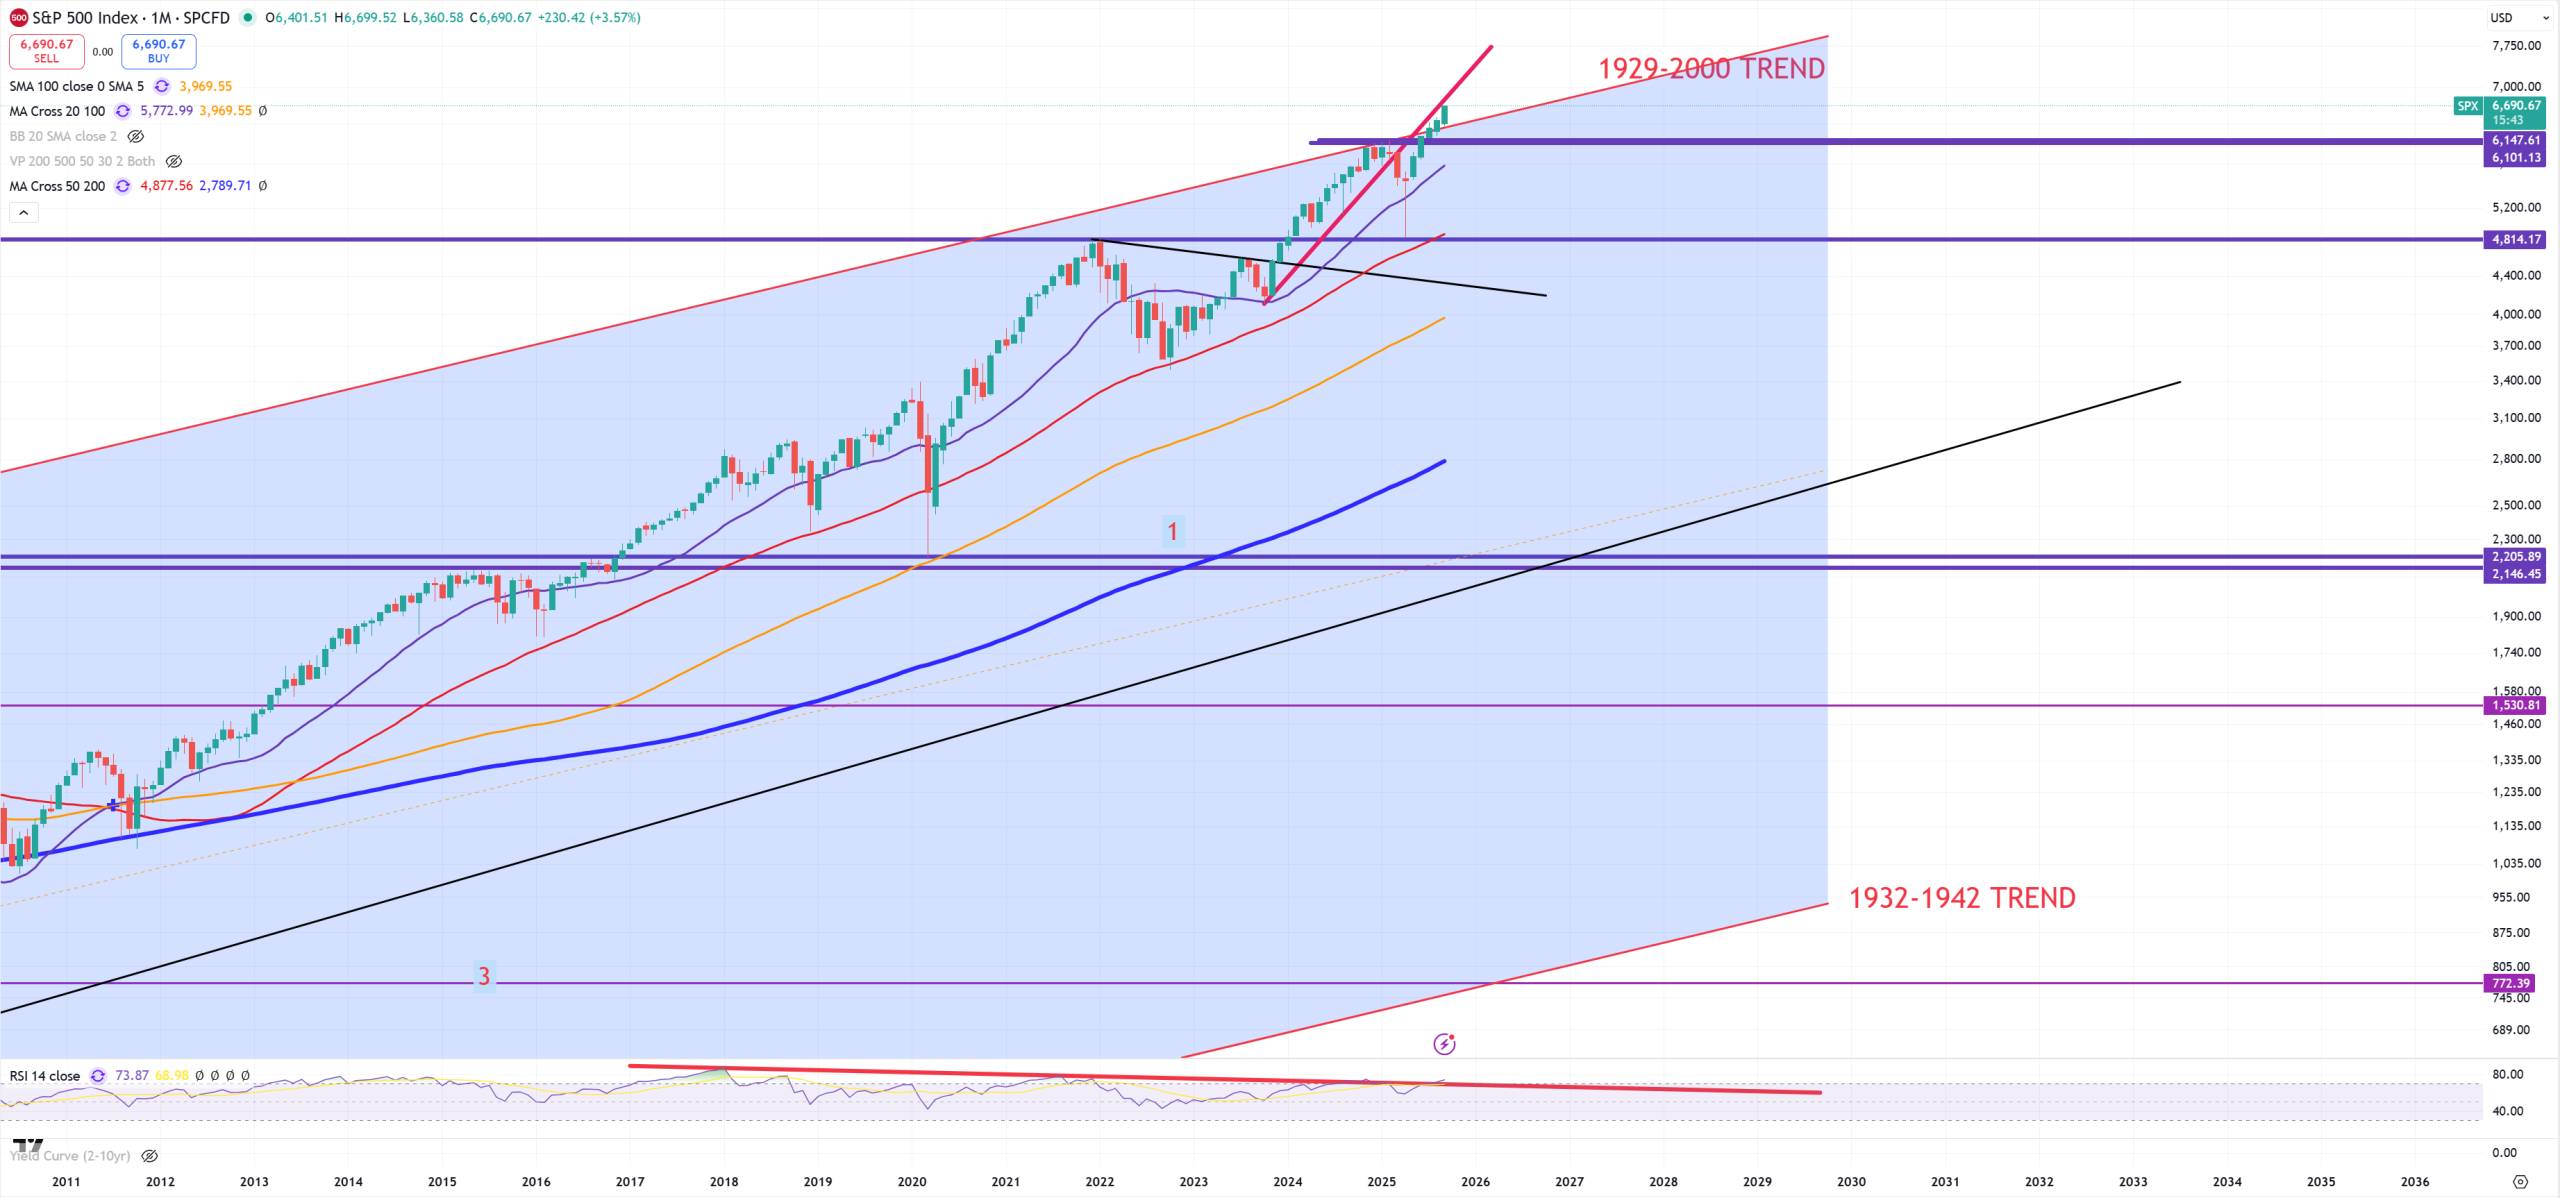
SPX – no doubts here market jumps above 1929-2000 trend, October 2025 level is 6380
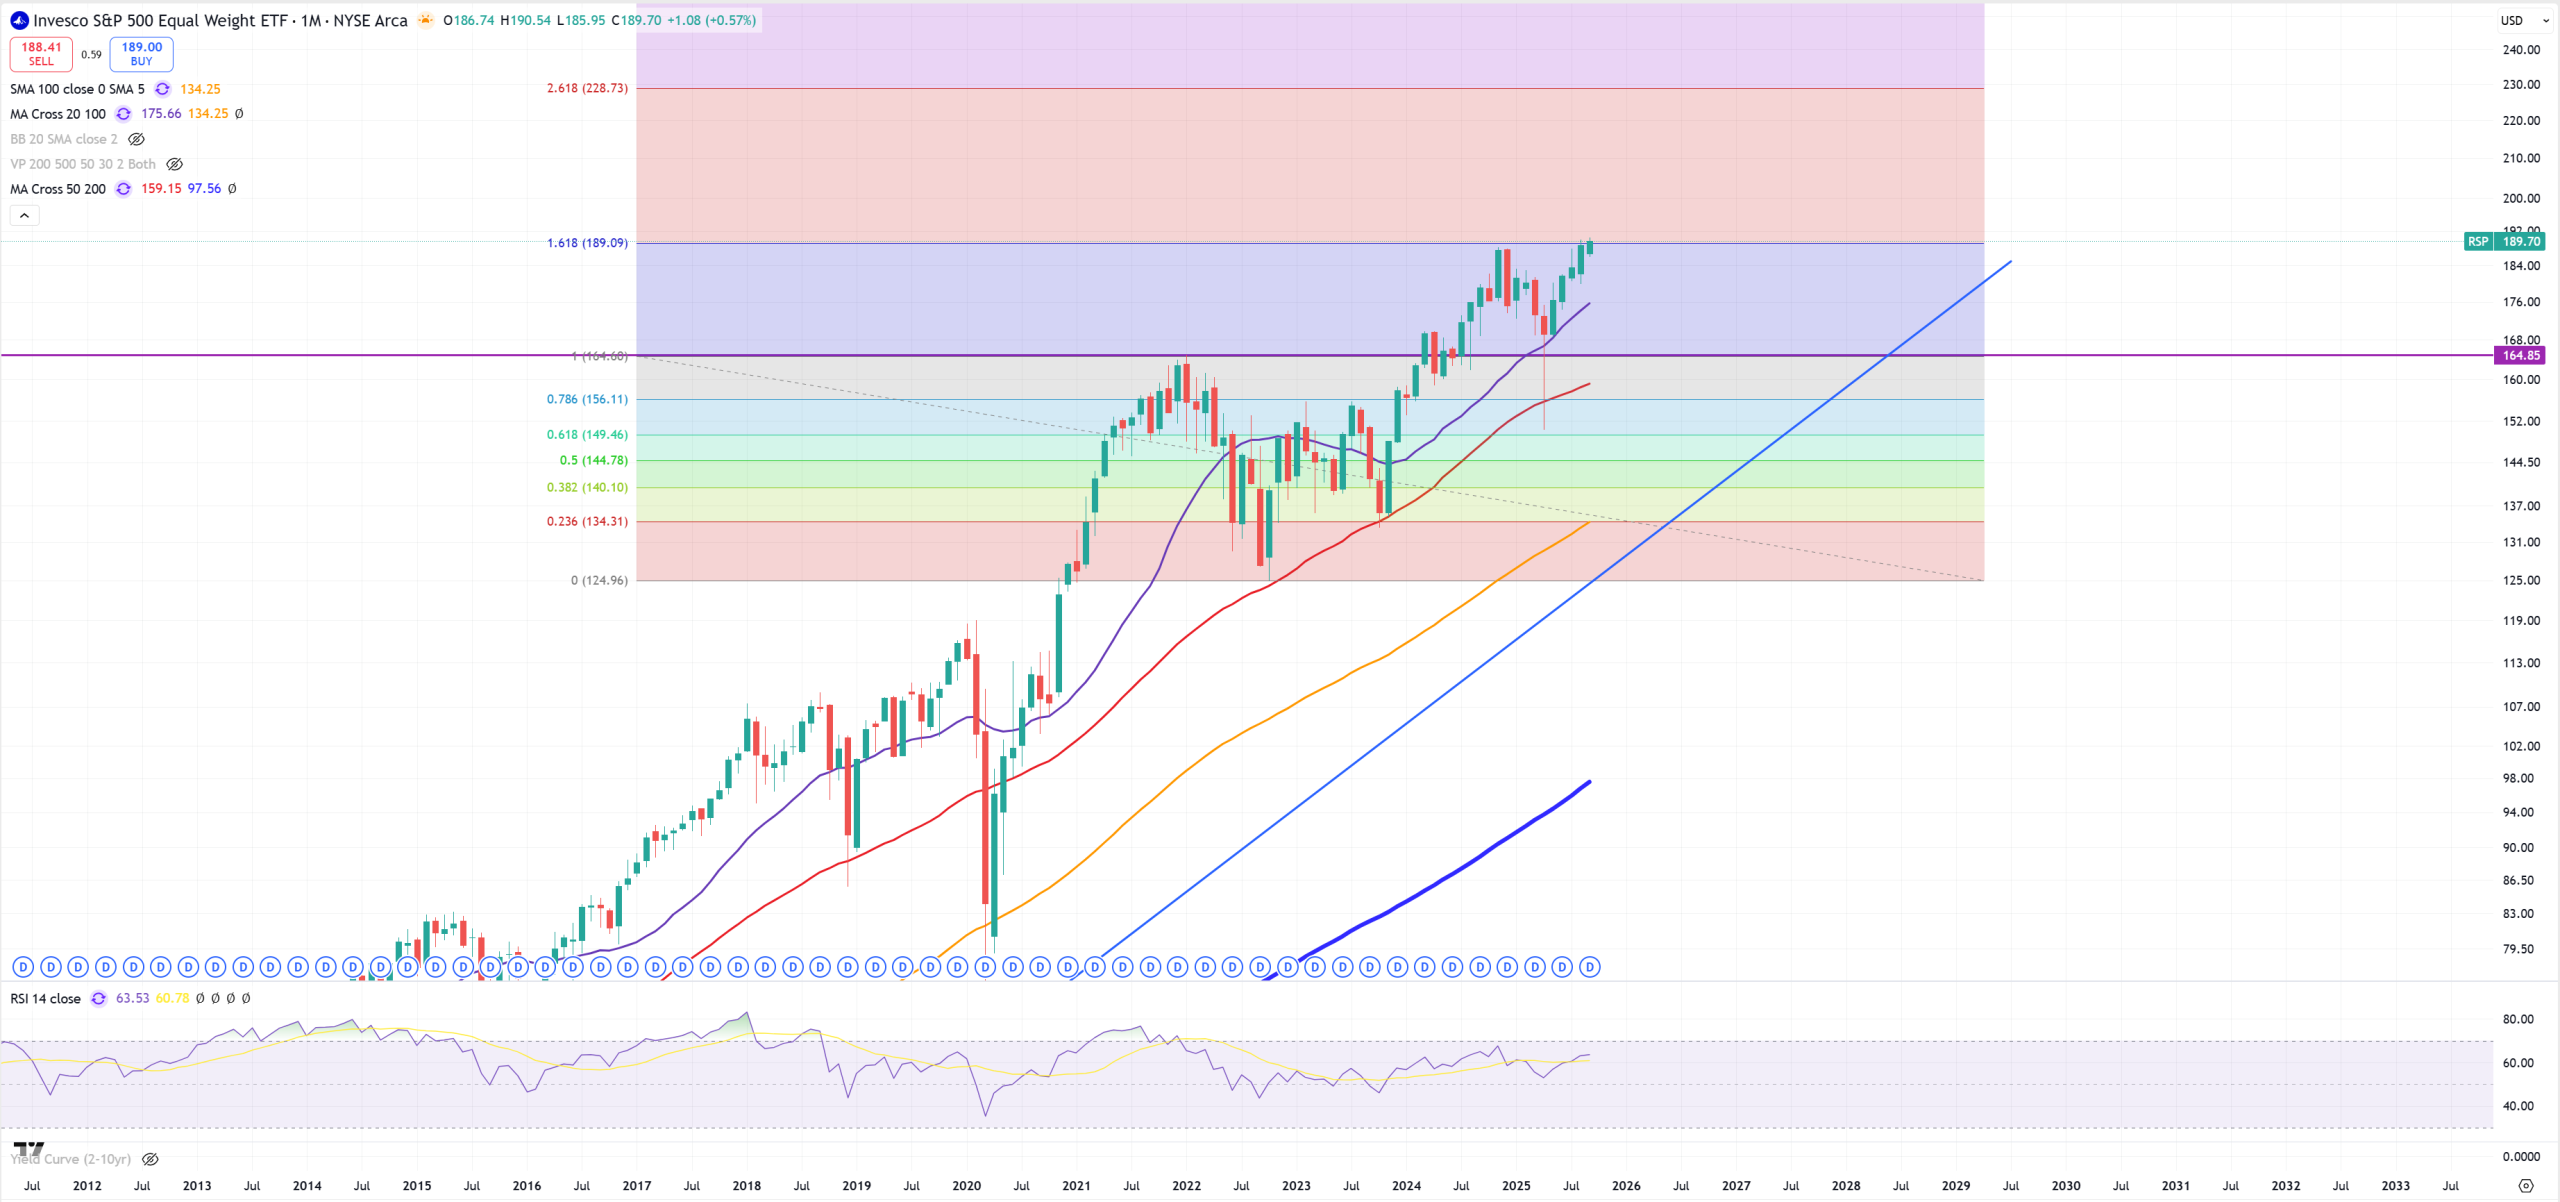
RSP – Equal Weight – needs to answer about this level if it wants to break or reject.
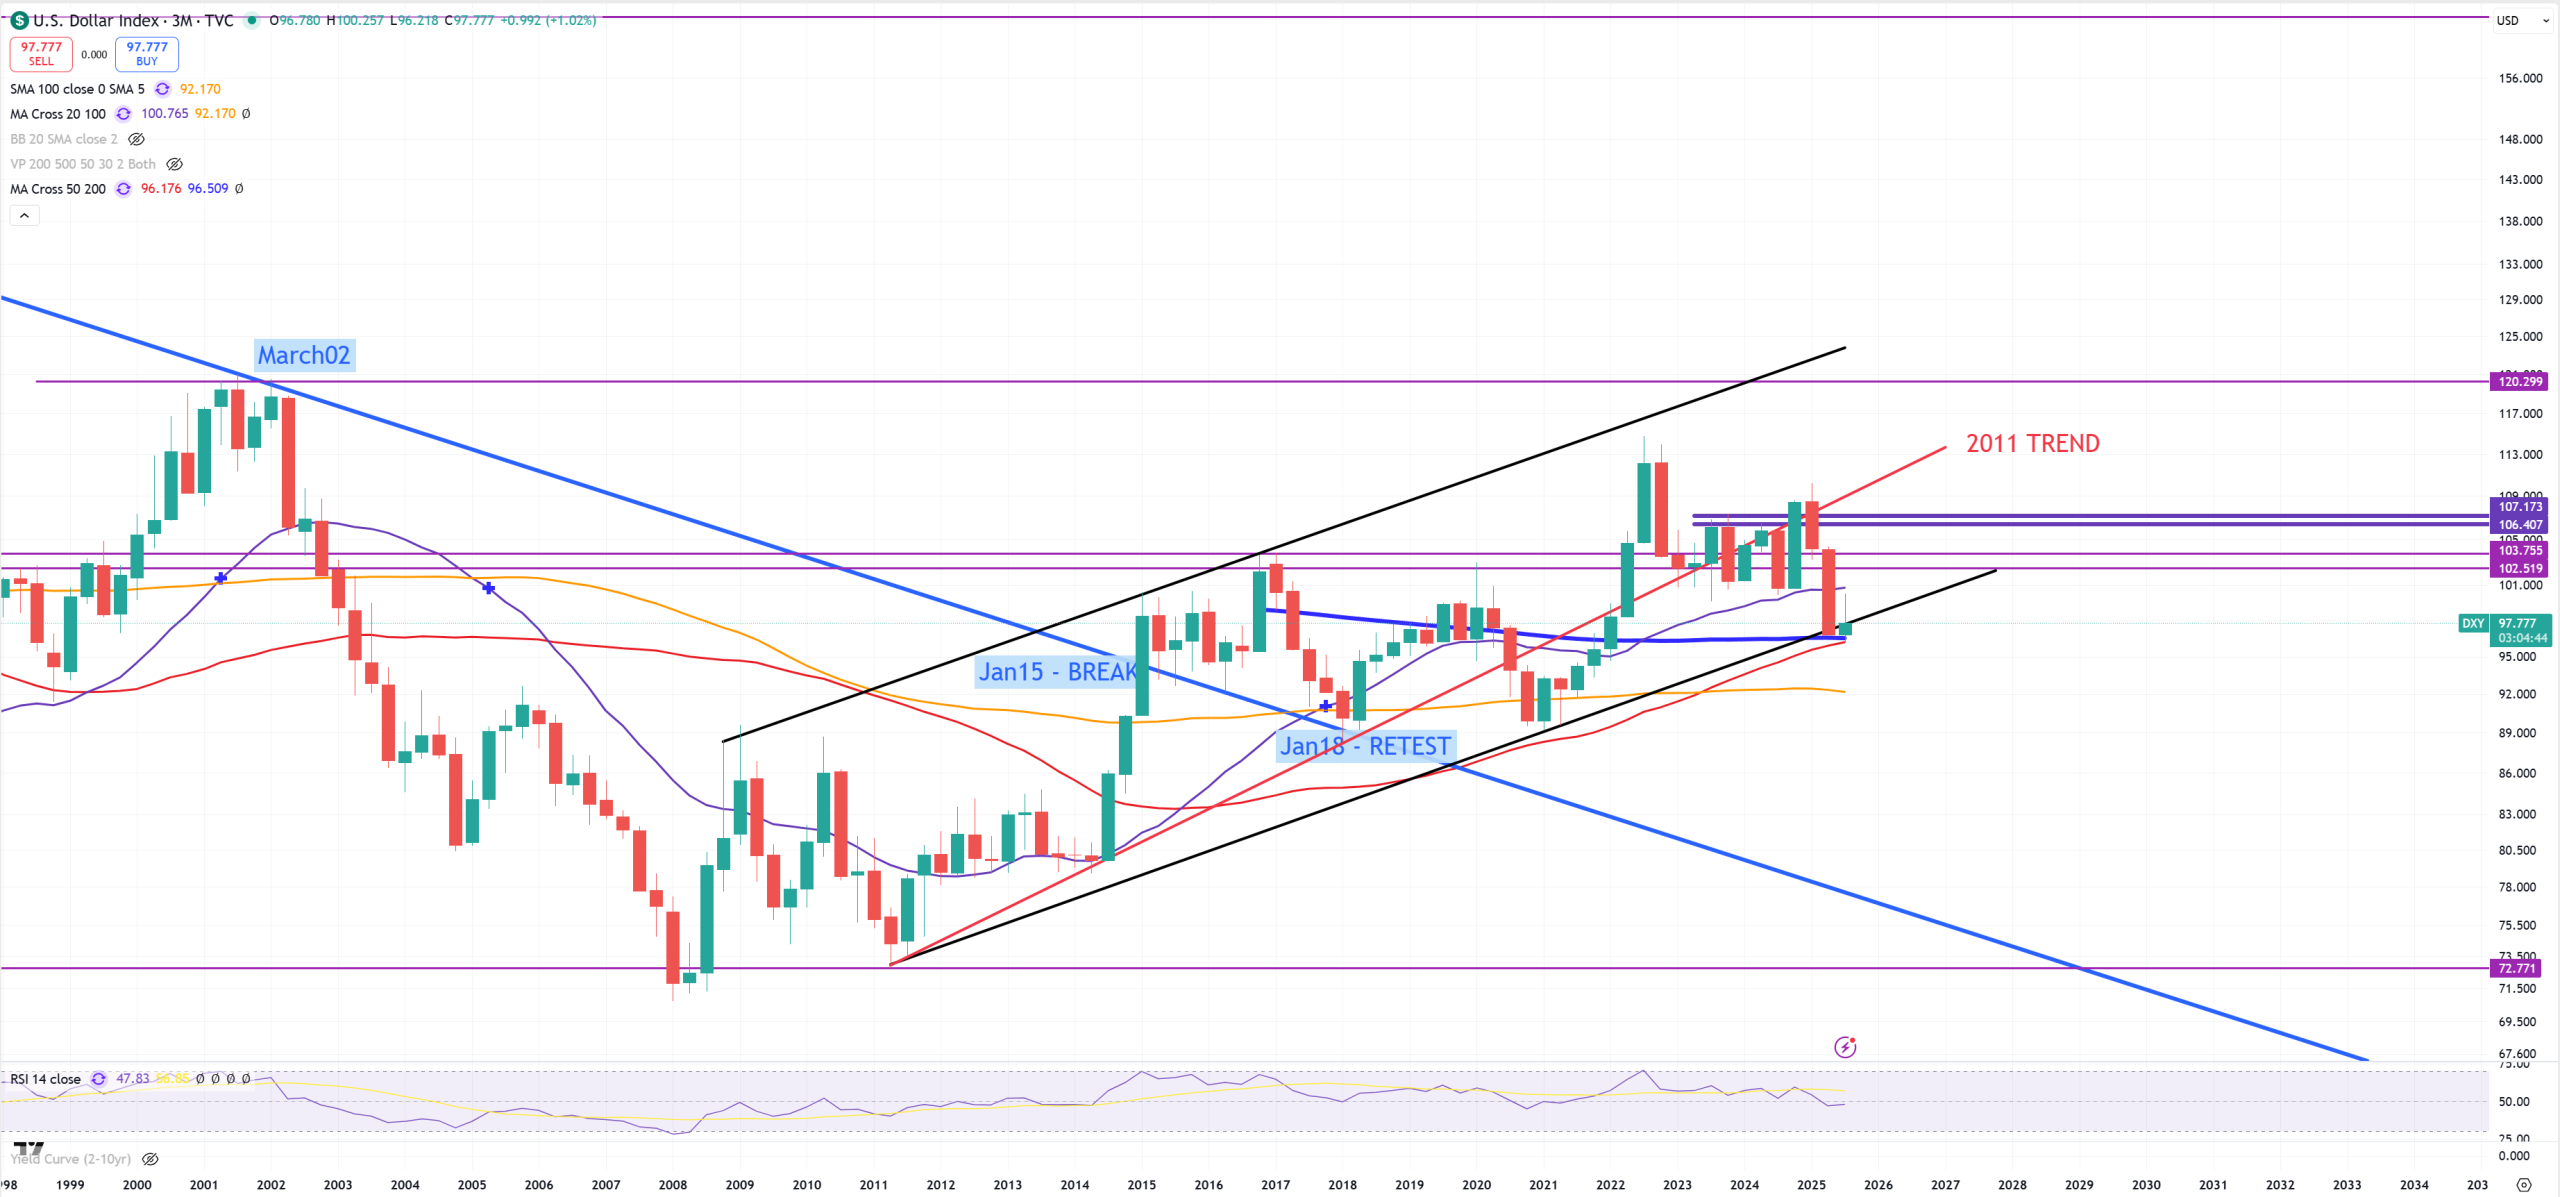
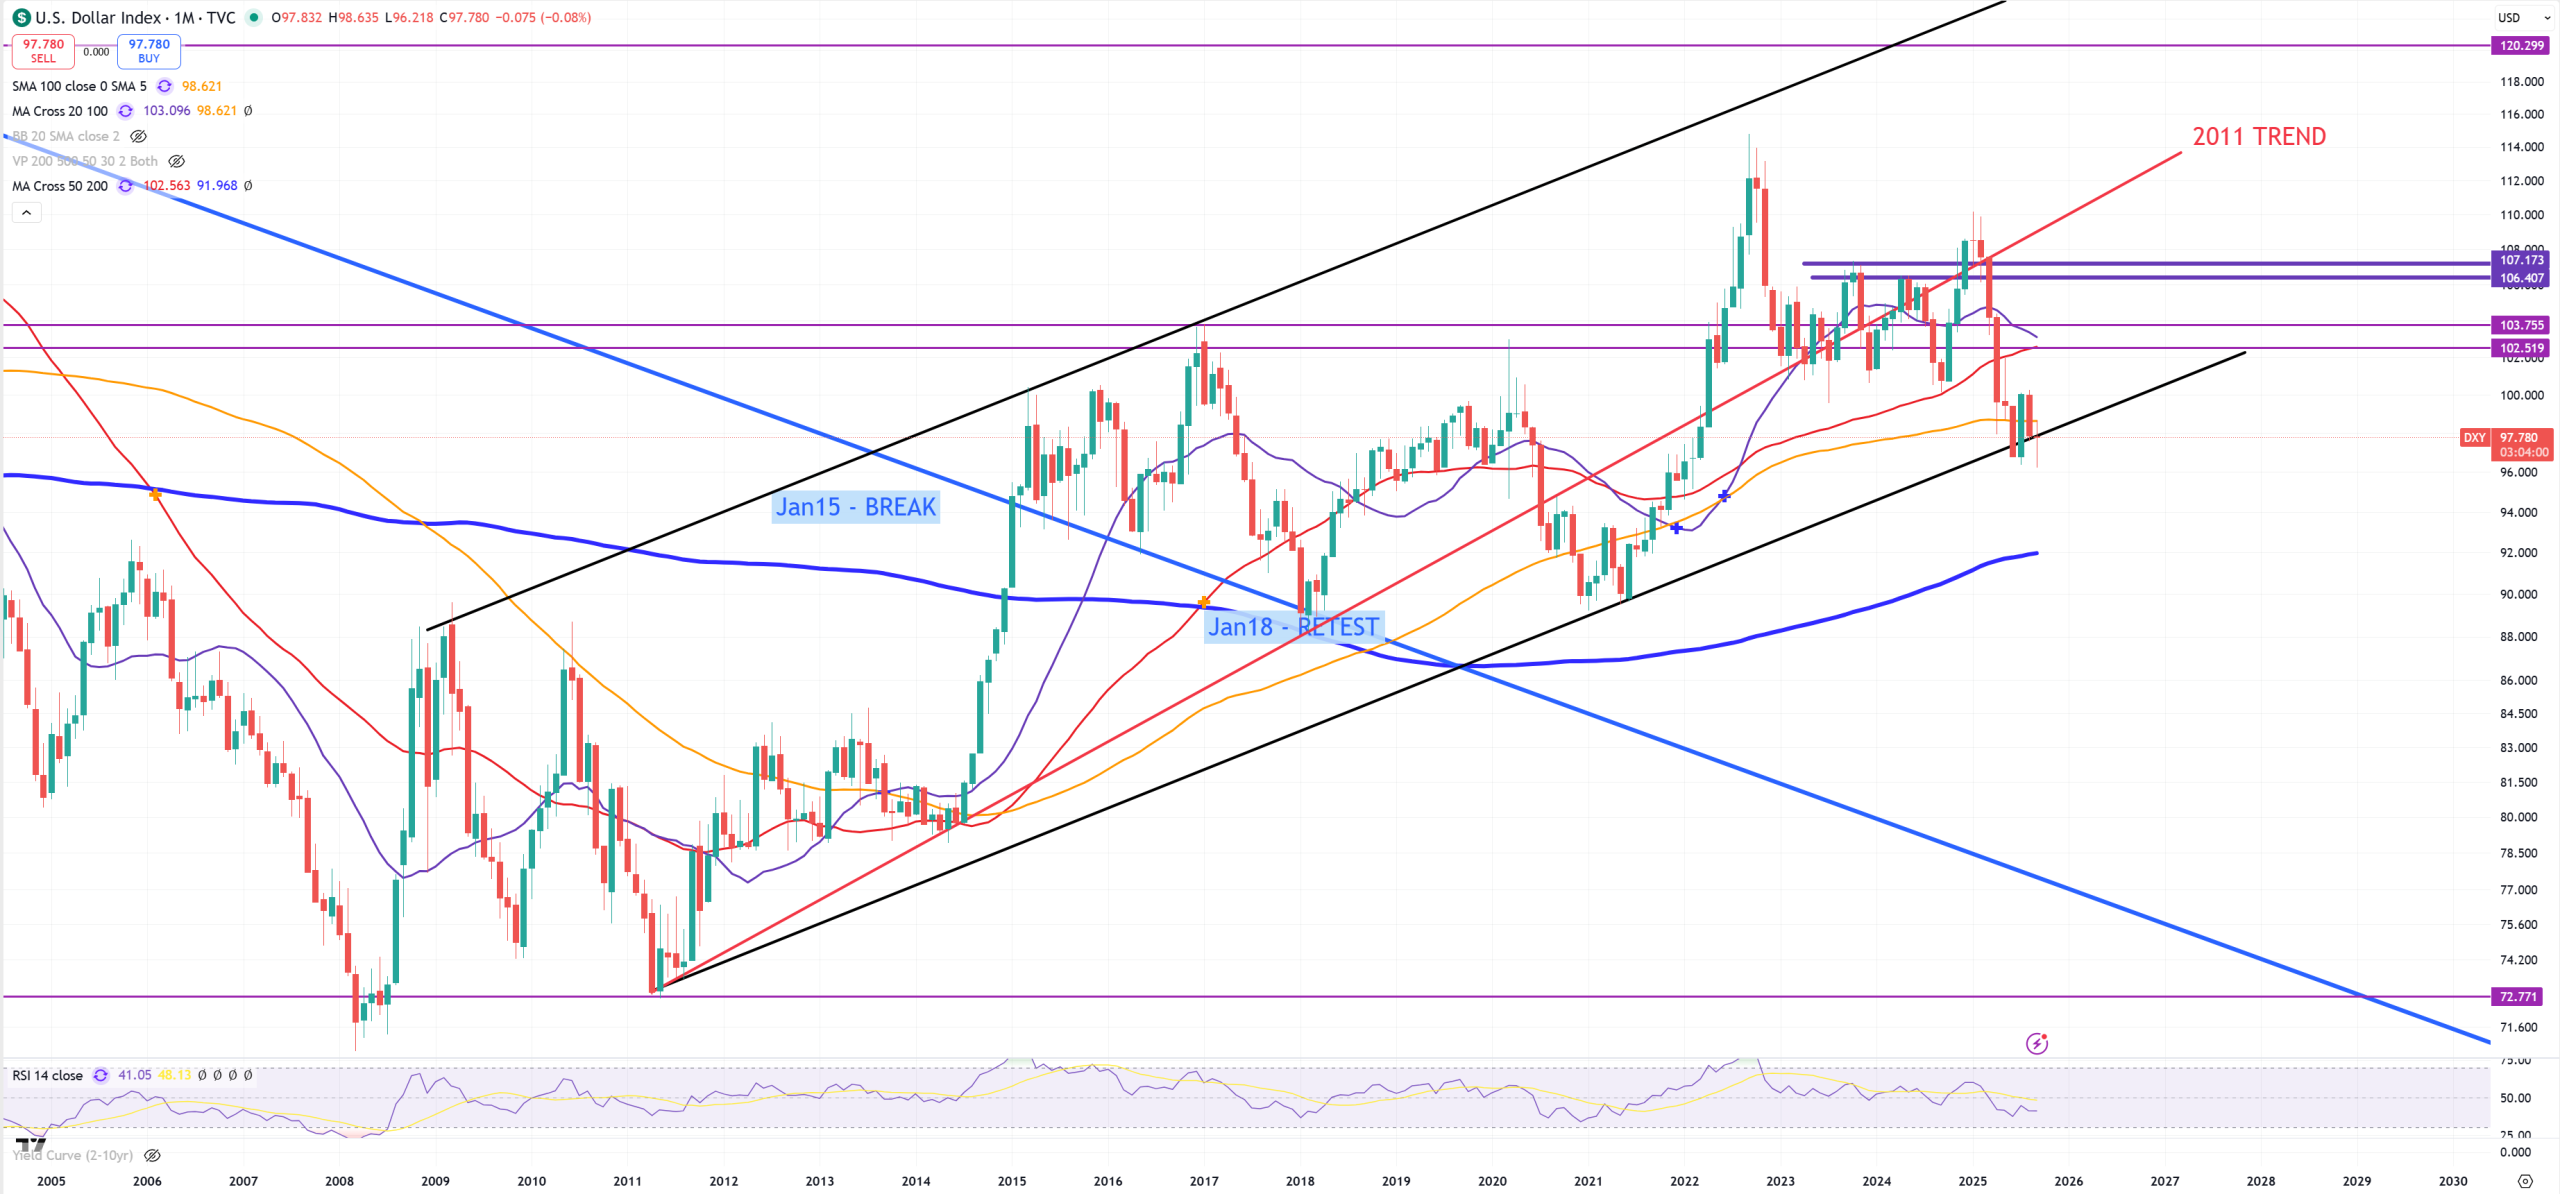
DXY – looking on (3M) we see big level on 96 – this one holds, also around the trend. On (M) you see that (M)MA100 now acts as a resistance.
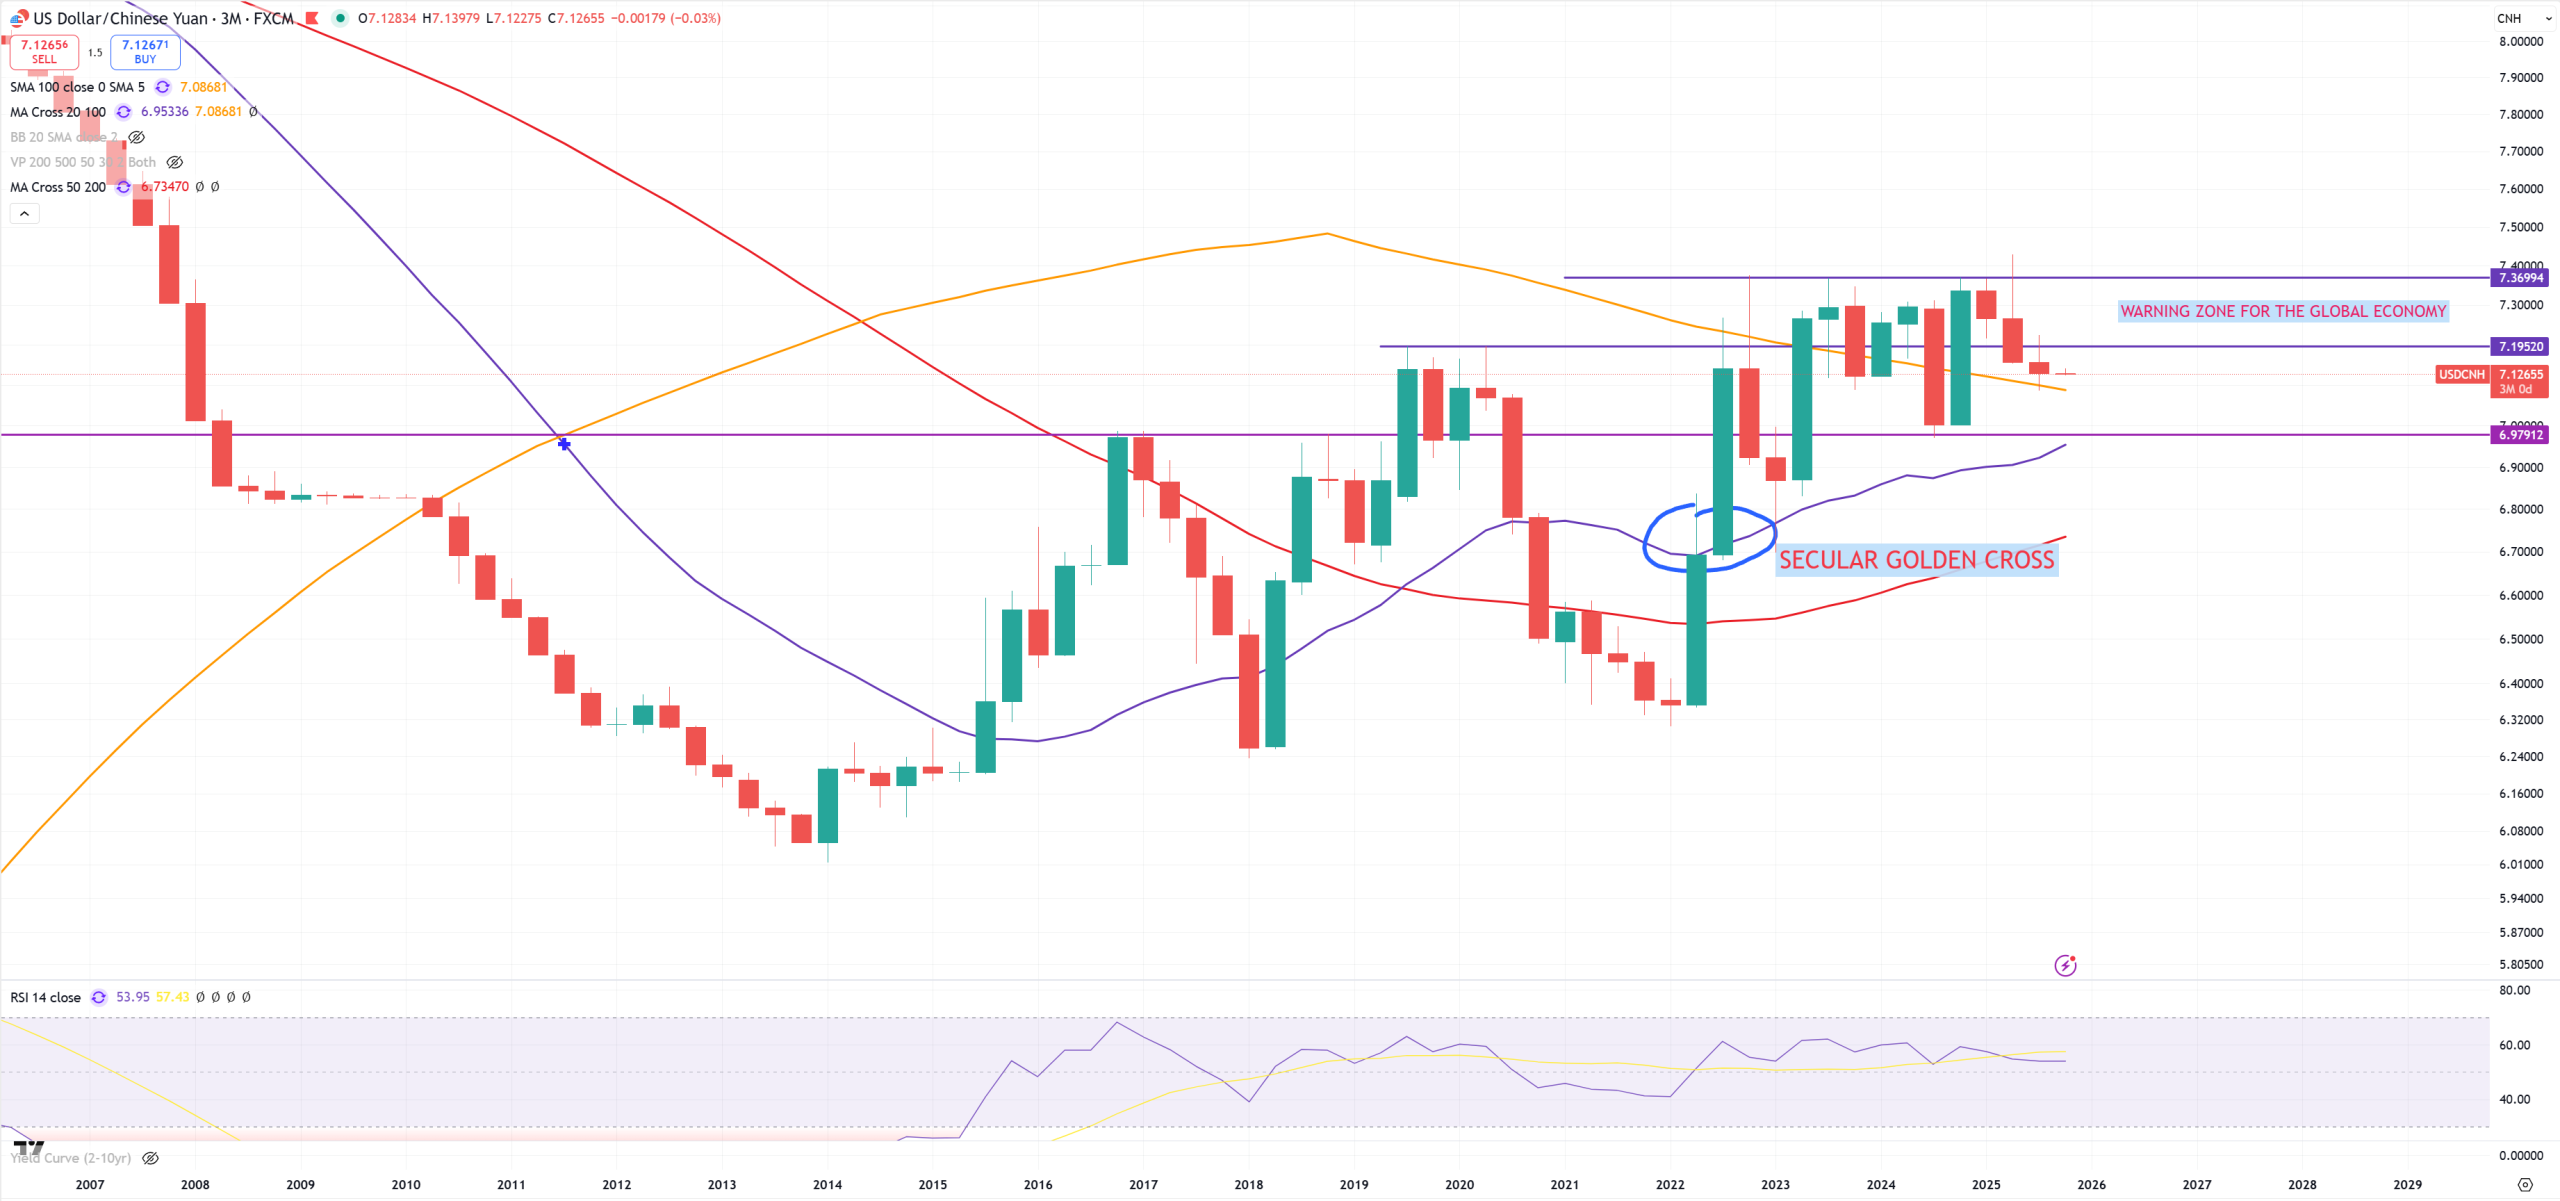
USDCNH – as I’ve been saying the power of the $$$ is a weakness of the Yuan – hard to see any level of support here when DXY sits on multiple support levels, unless you turn the chart into 3M view and you see yellow (3M)MA100 around 7.12. This USDCNH move from 7.40+ to 7.12 cost DXY a drop from 110 to 96.
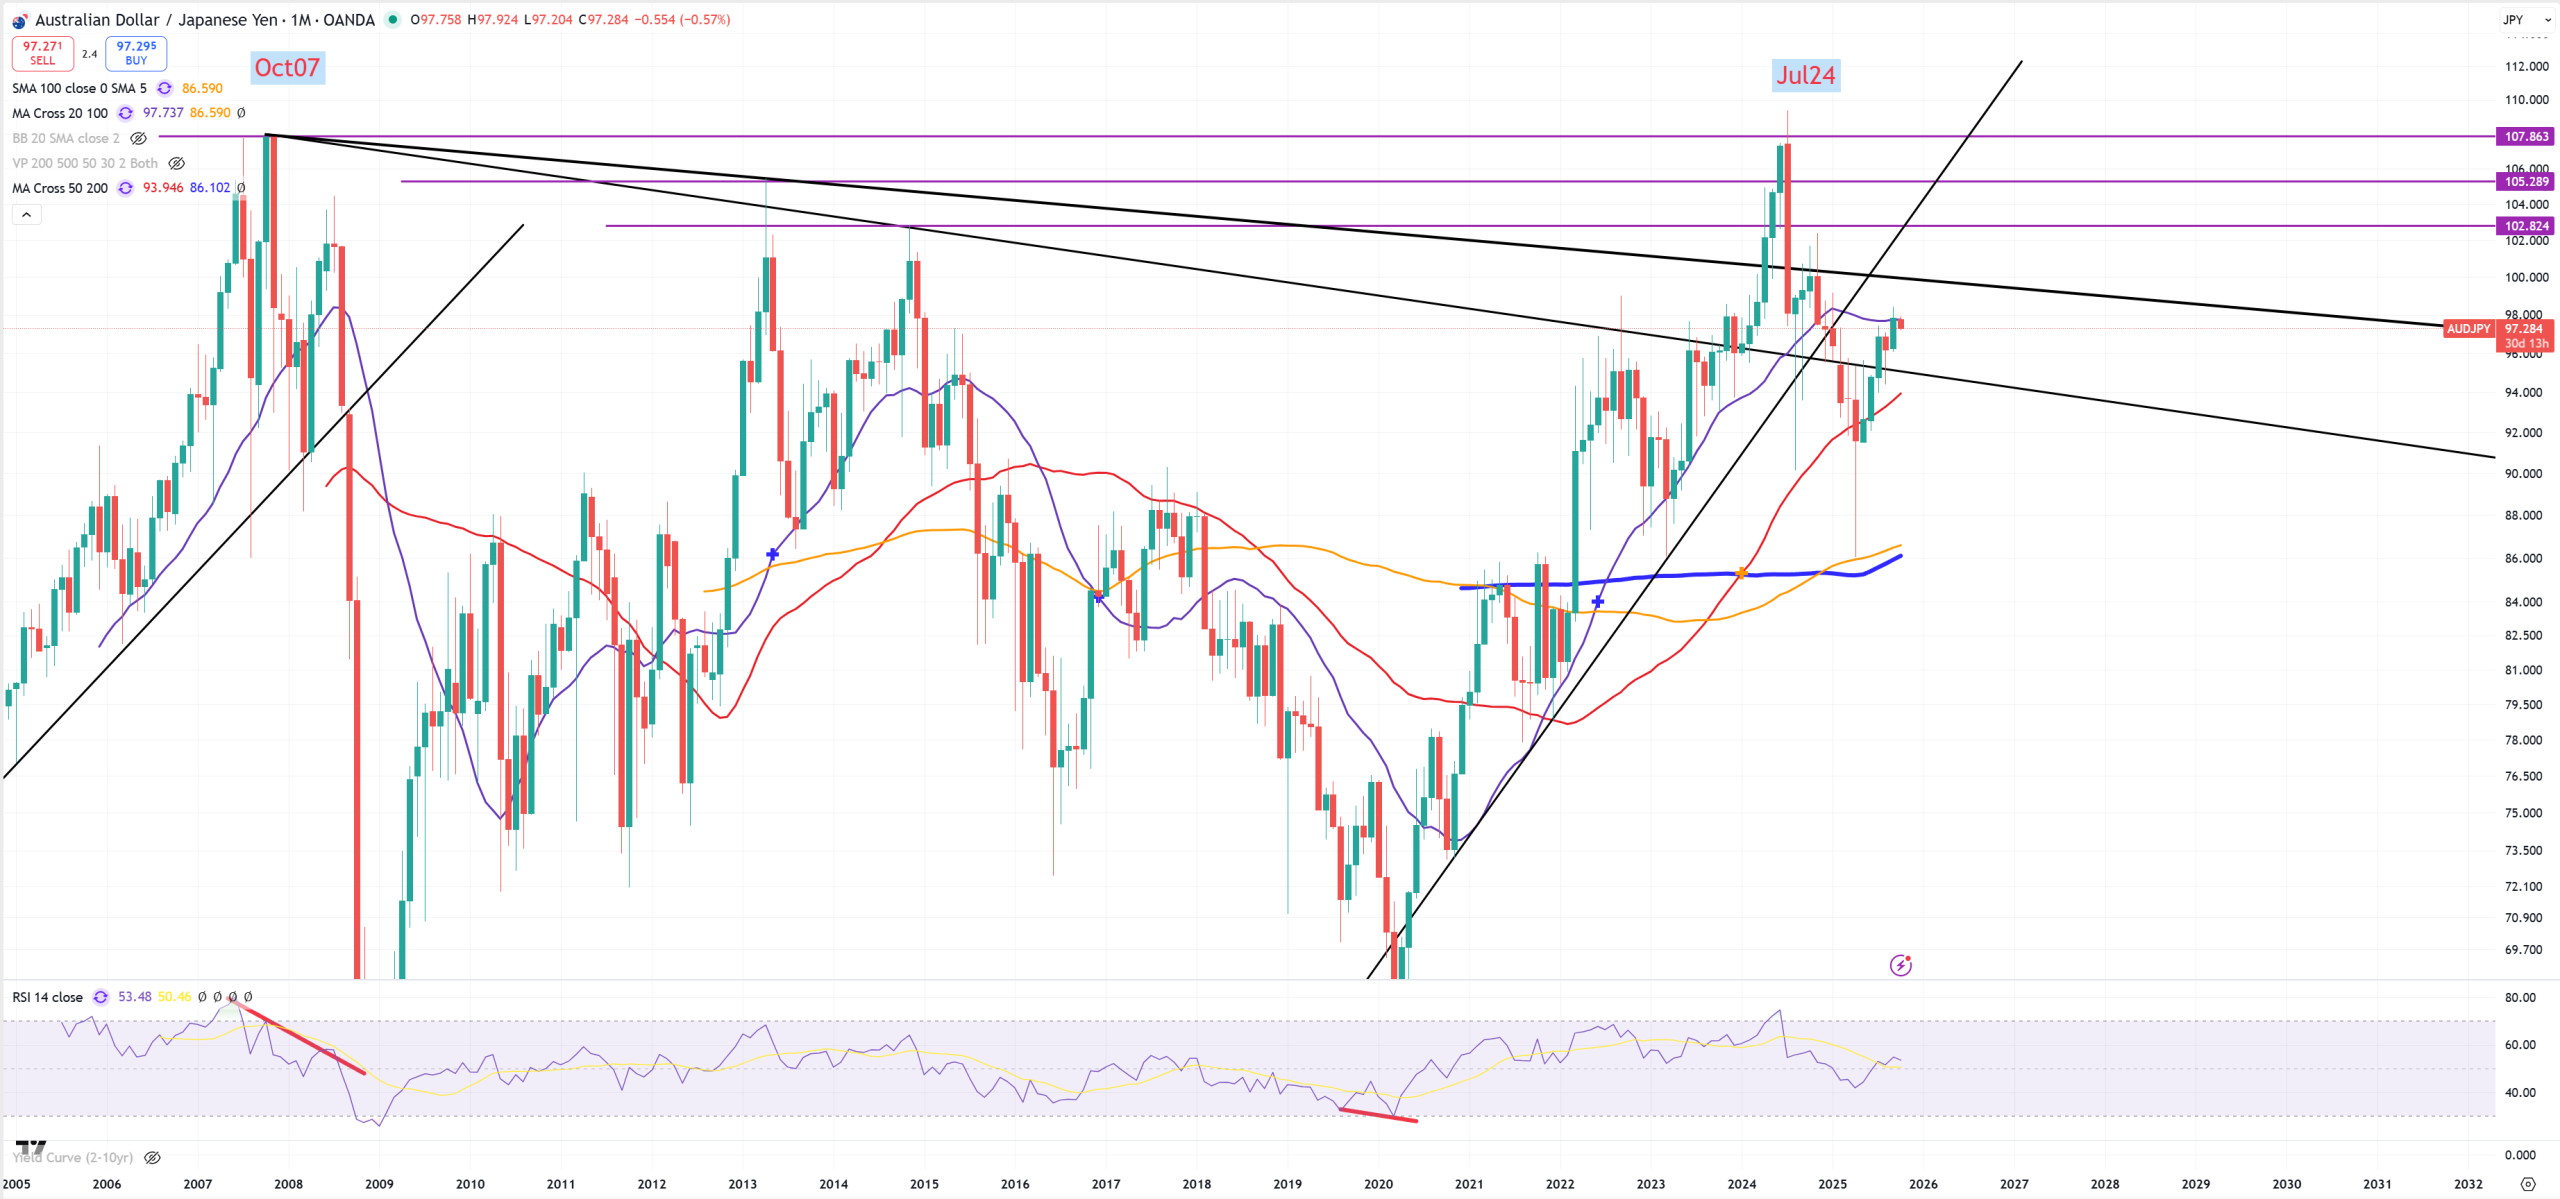
AUDJPY – just like SPX breaks 1929-2000 trend AUDJPY goes higher. AUDJPY up = risk ON, AUDJPY down = risk OFF. I think it’s all in JP bond market hands, where I expect yields to raise making pressure on USDJPY to drop.
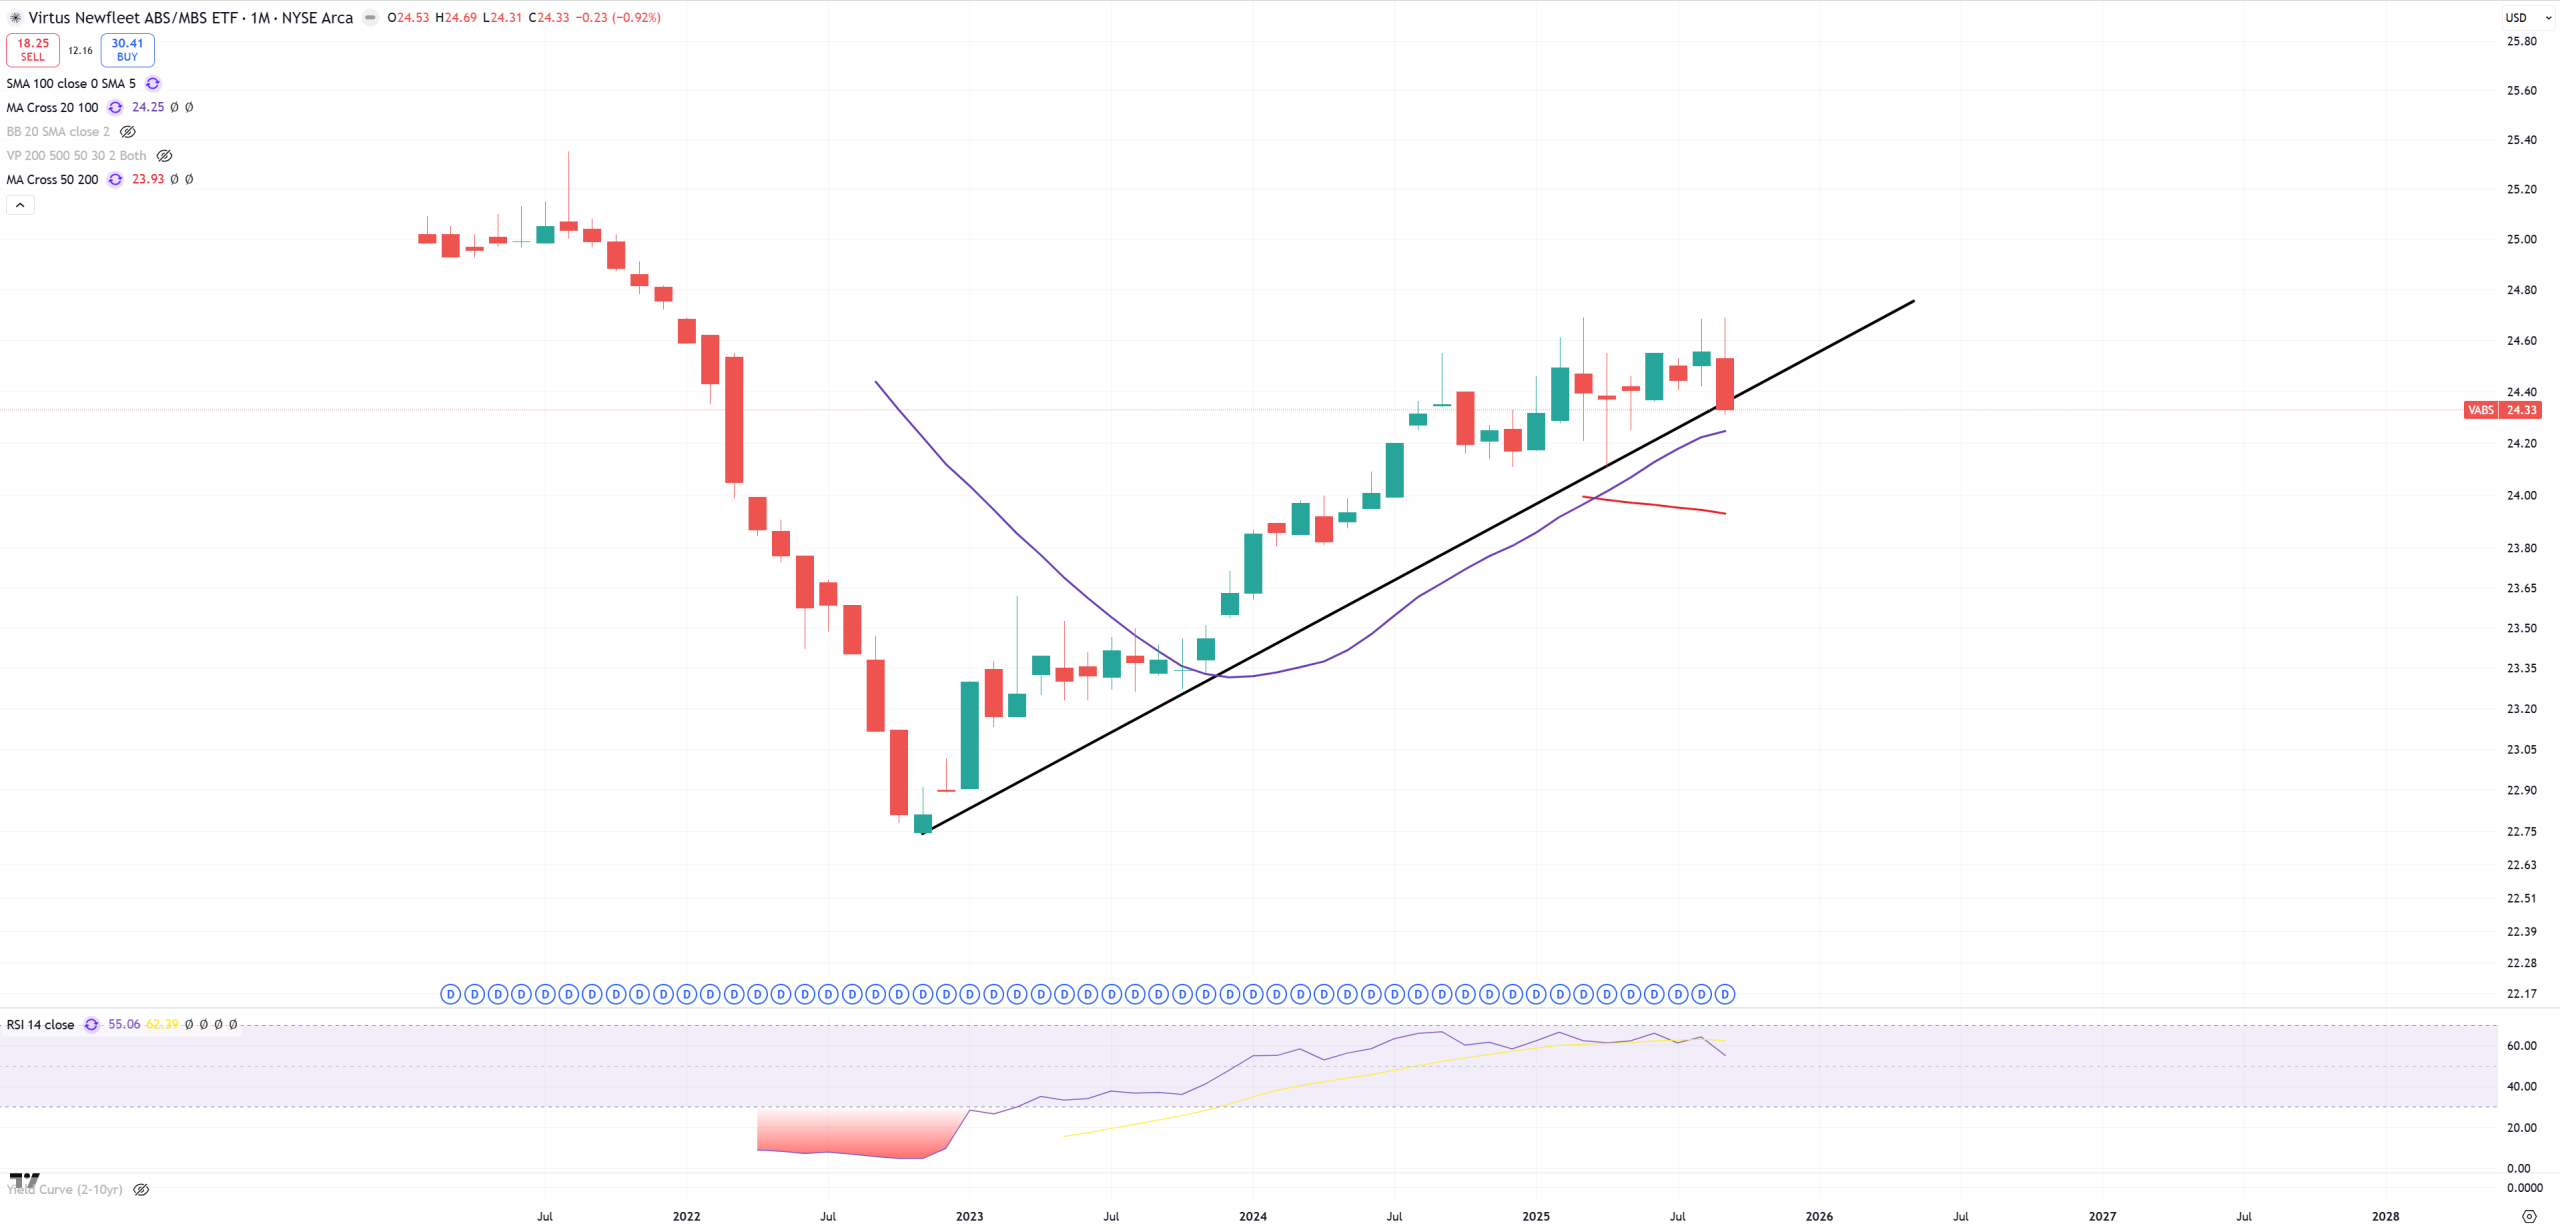
VABS – Shit credit breaks the trend
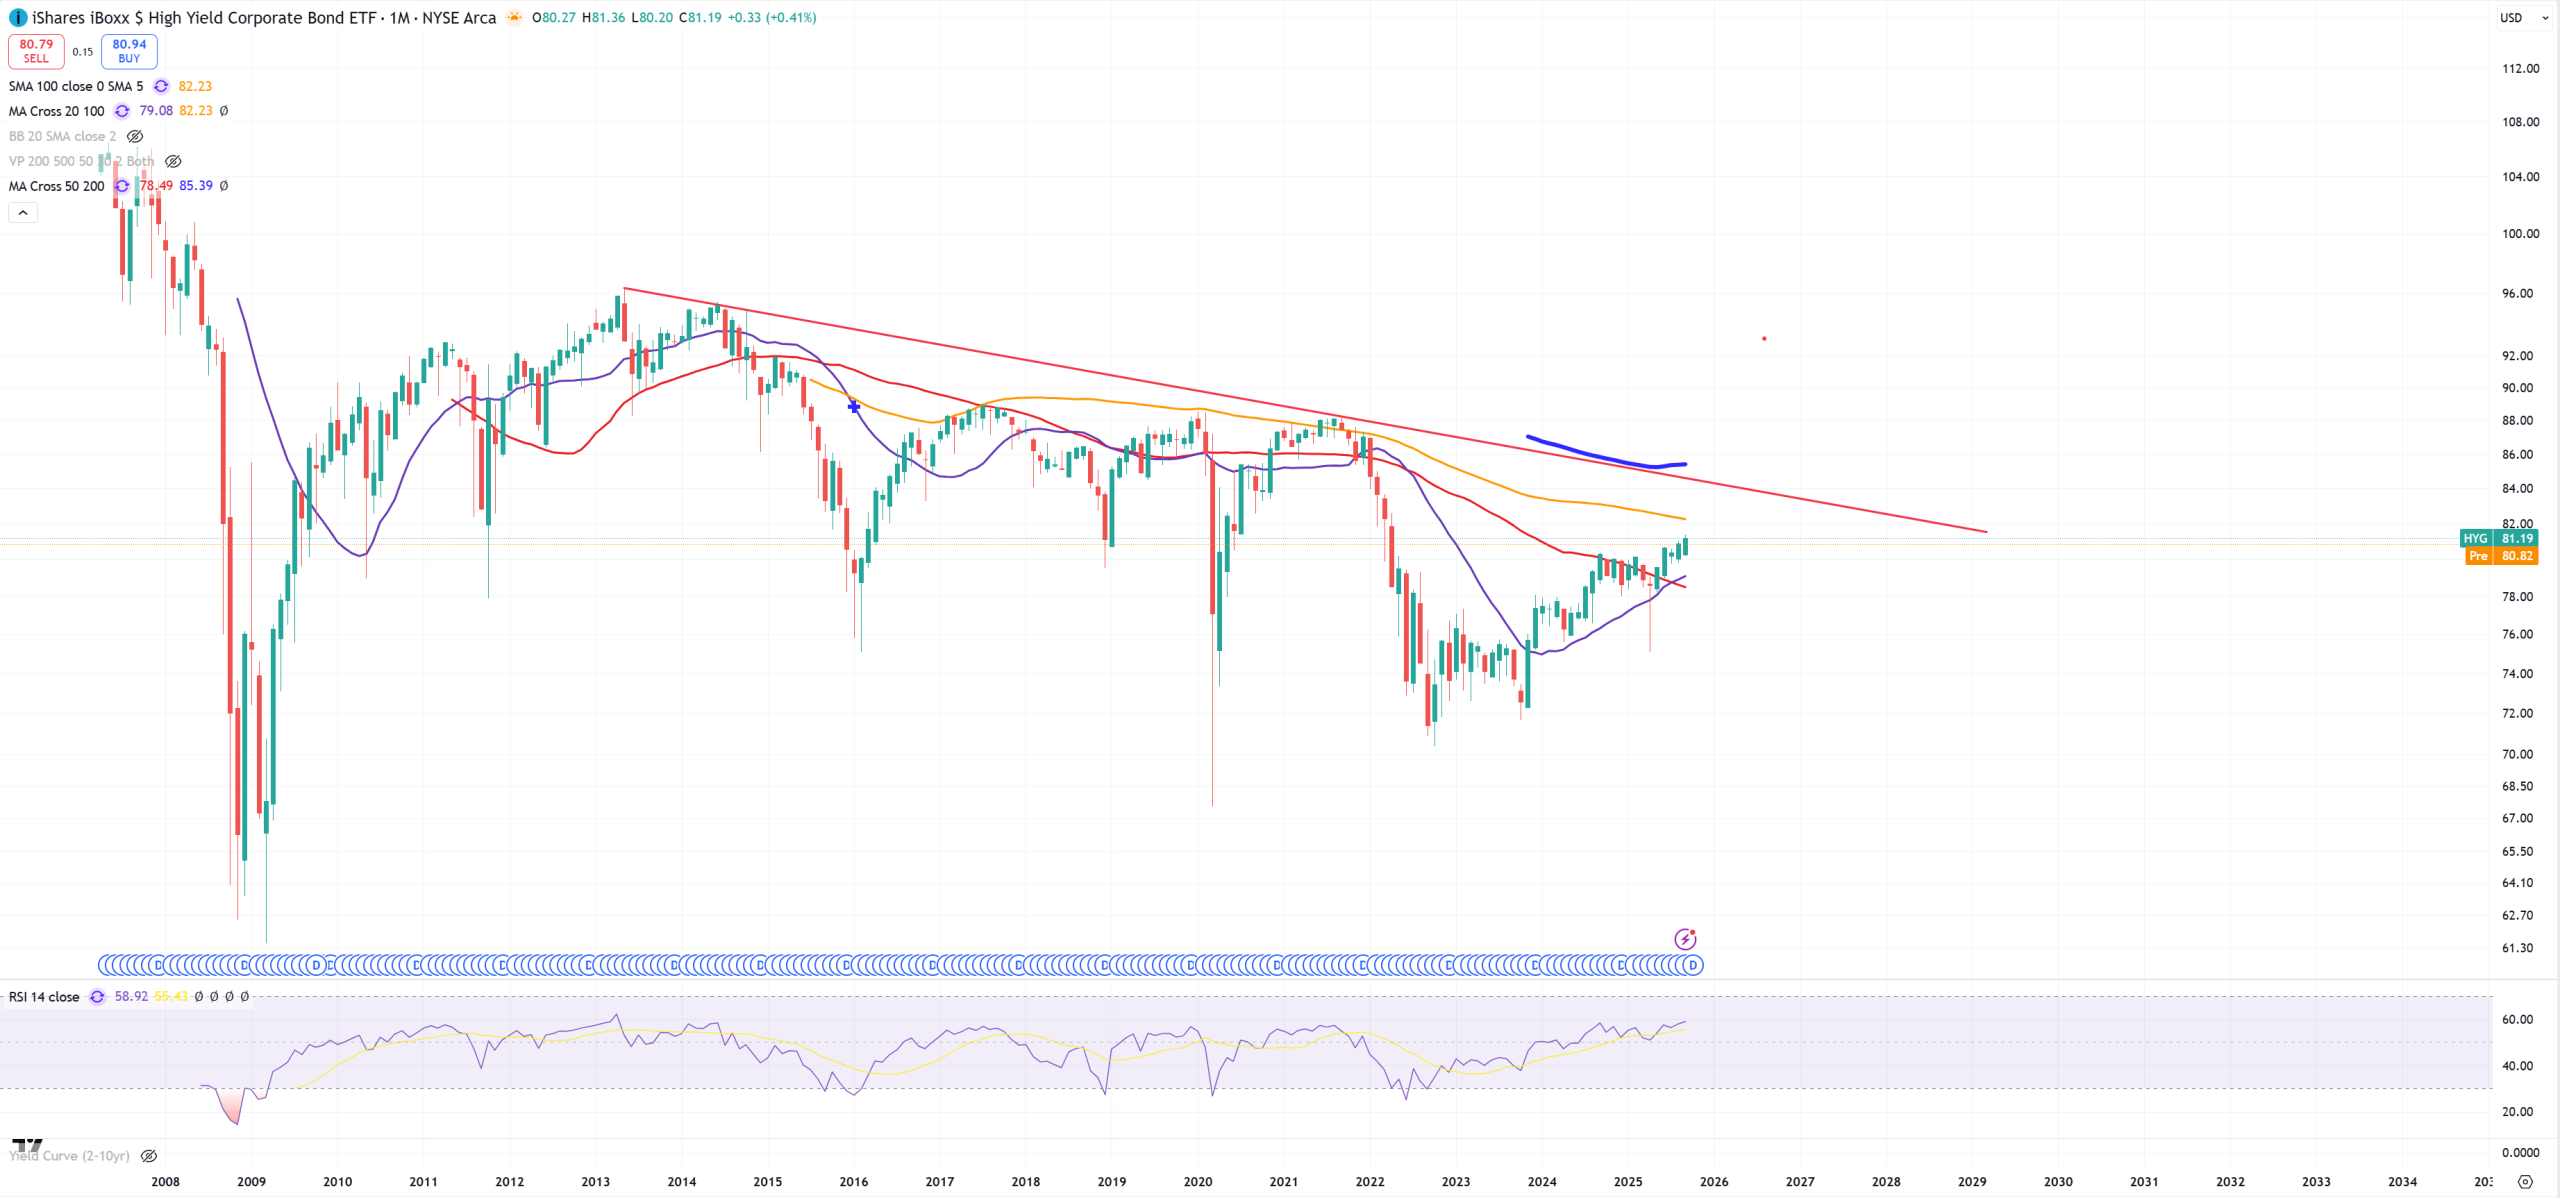
HYG – Junk credit is going higher – this is a break connected with SPX 1929-2000 break trend and MOVE break which will be a bit lower. Is it a permanent break like SPX 1929-2000 trend? Nobody knows.
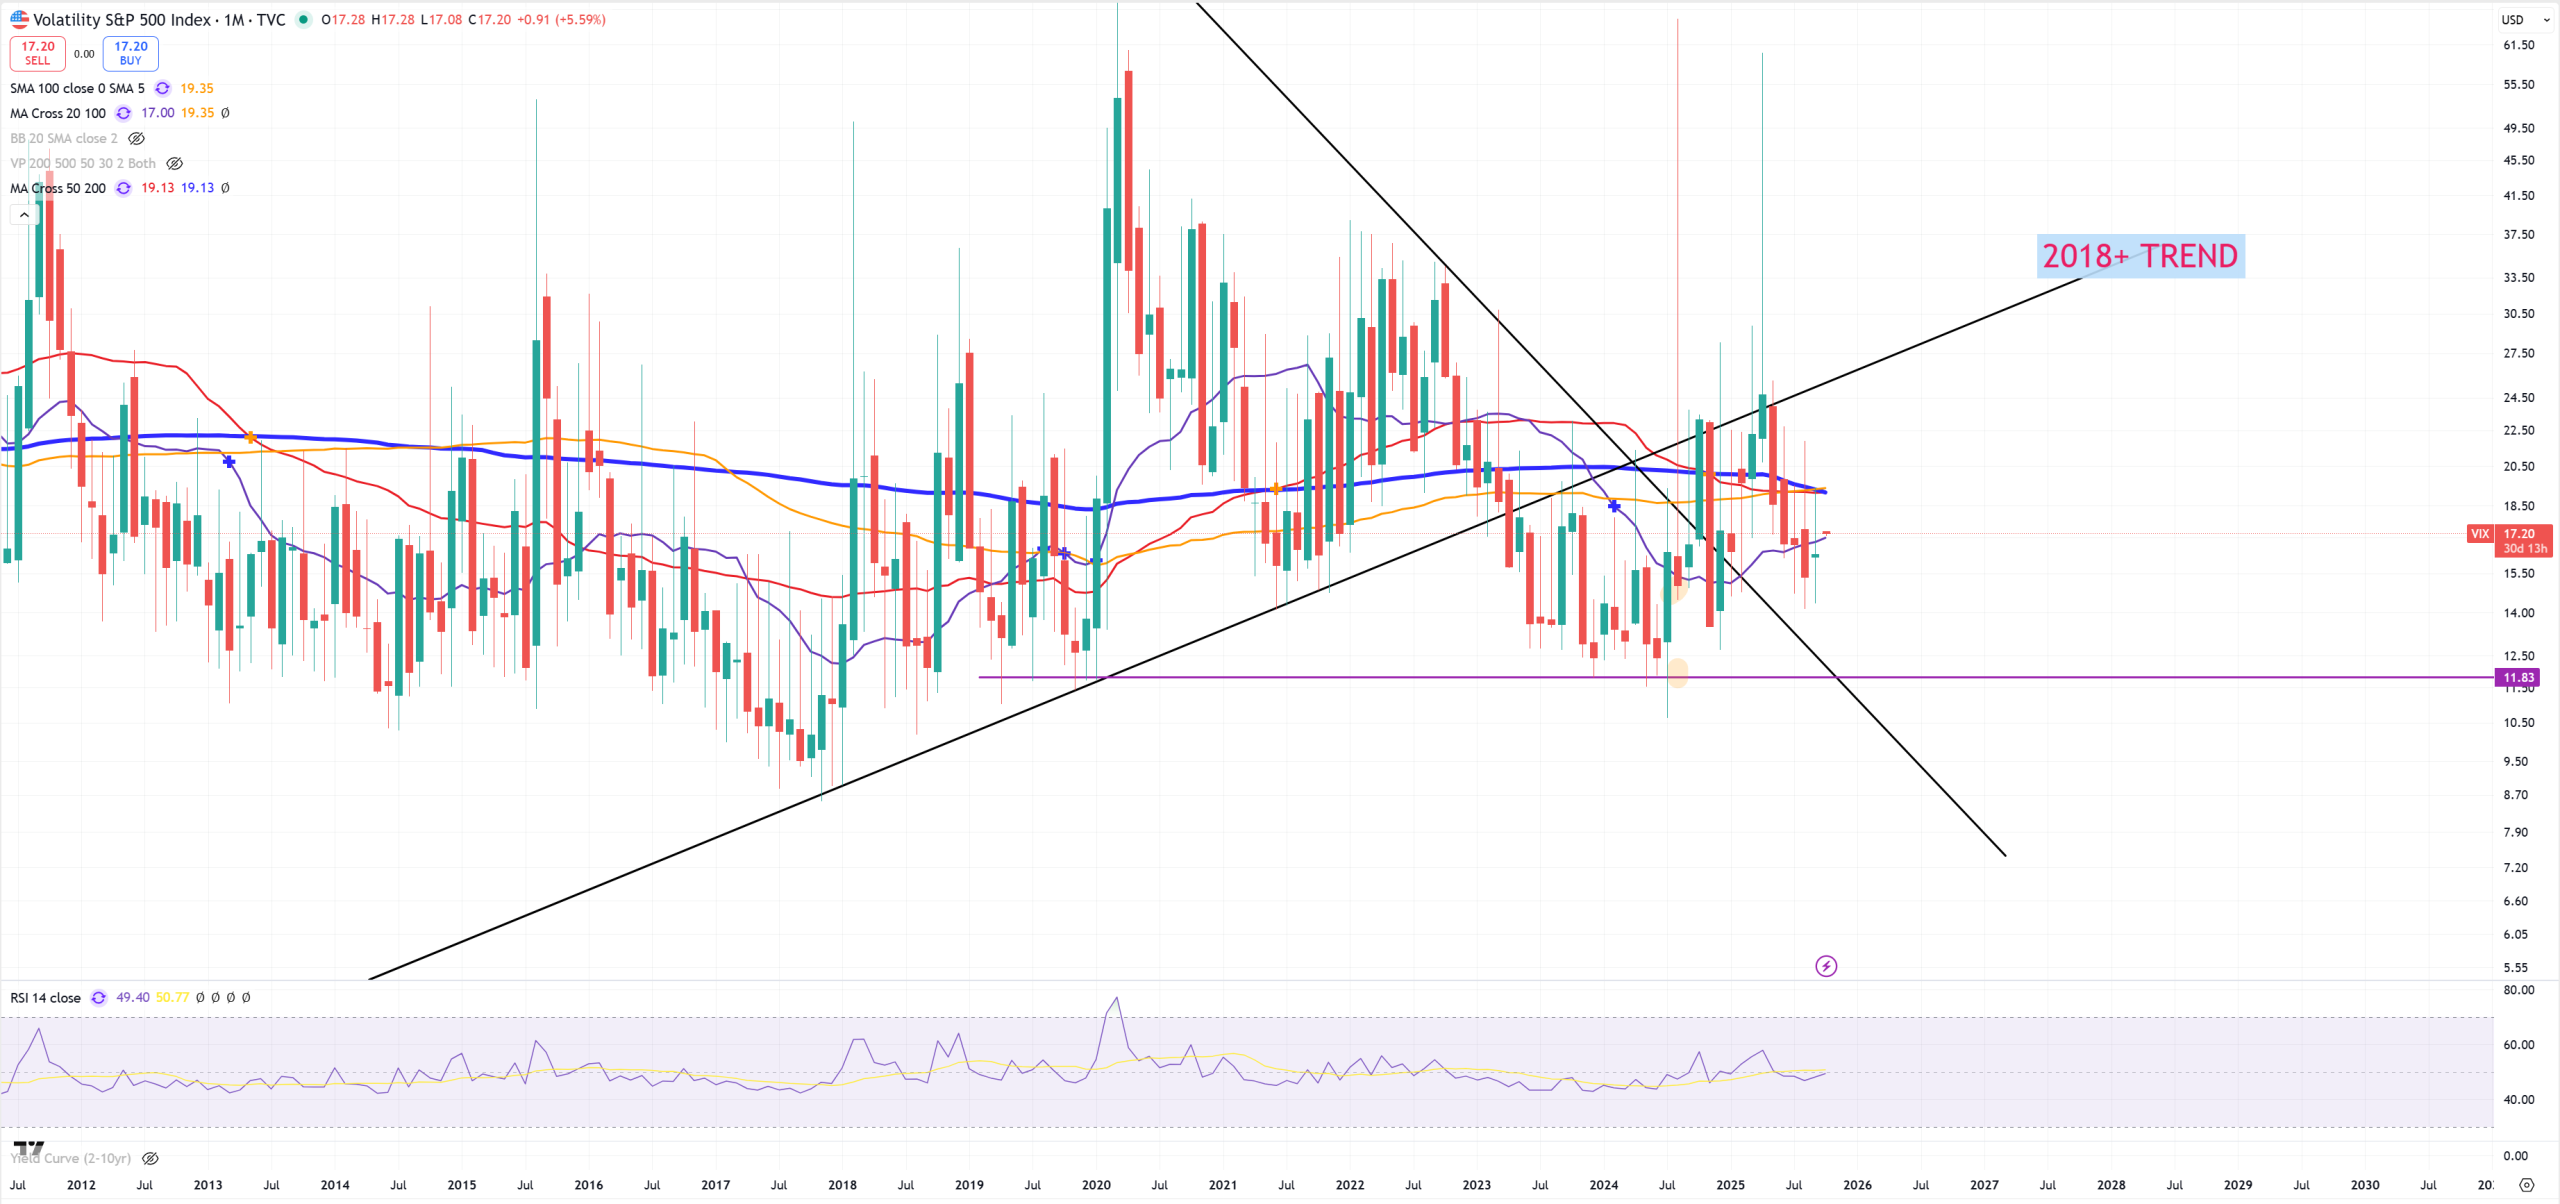
VIX – market still defends its 2018+ TREND not to jump above.
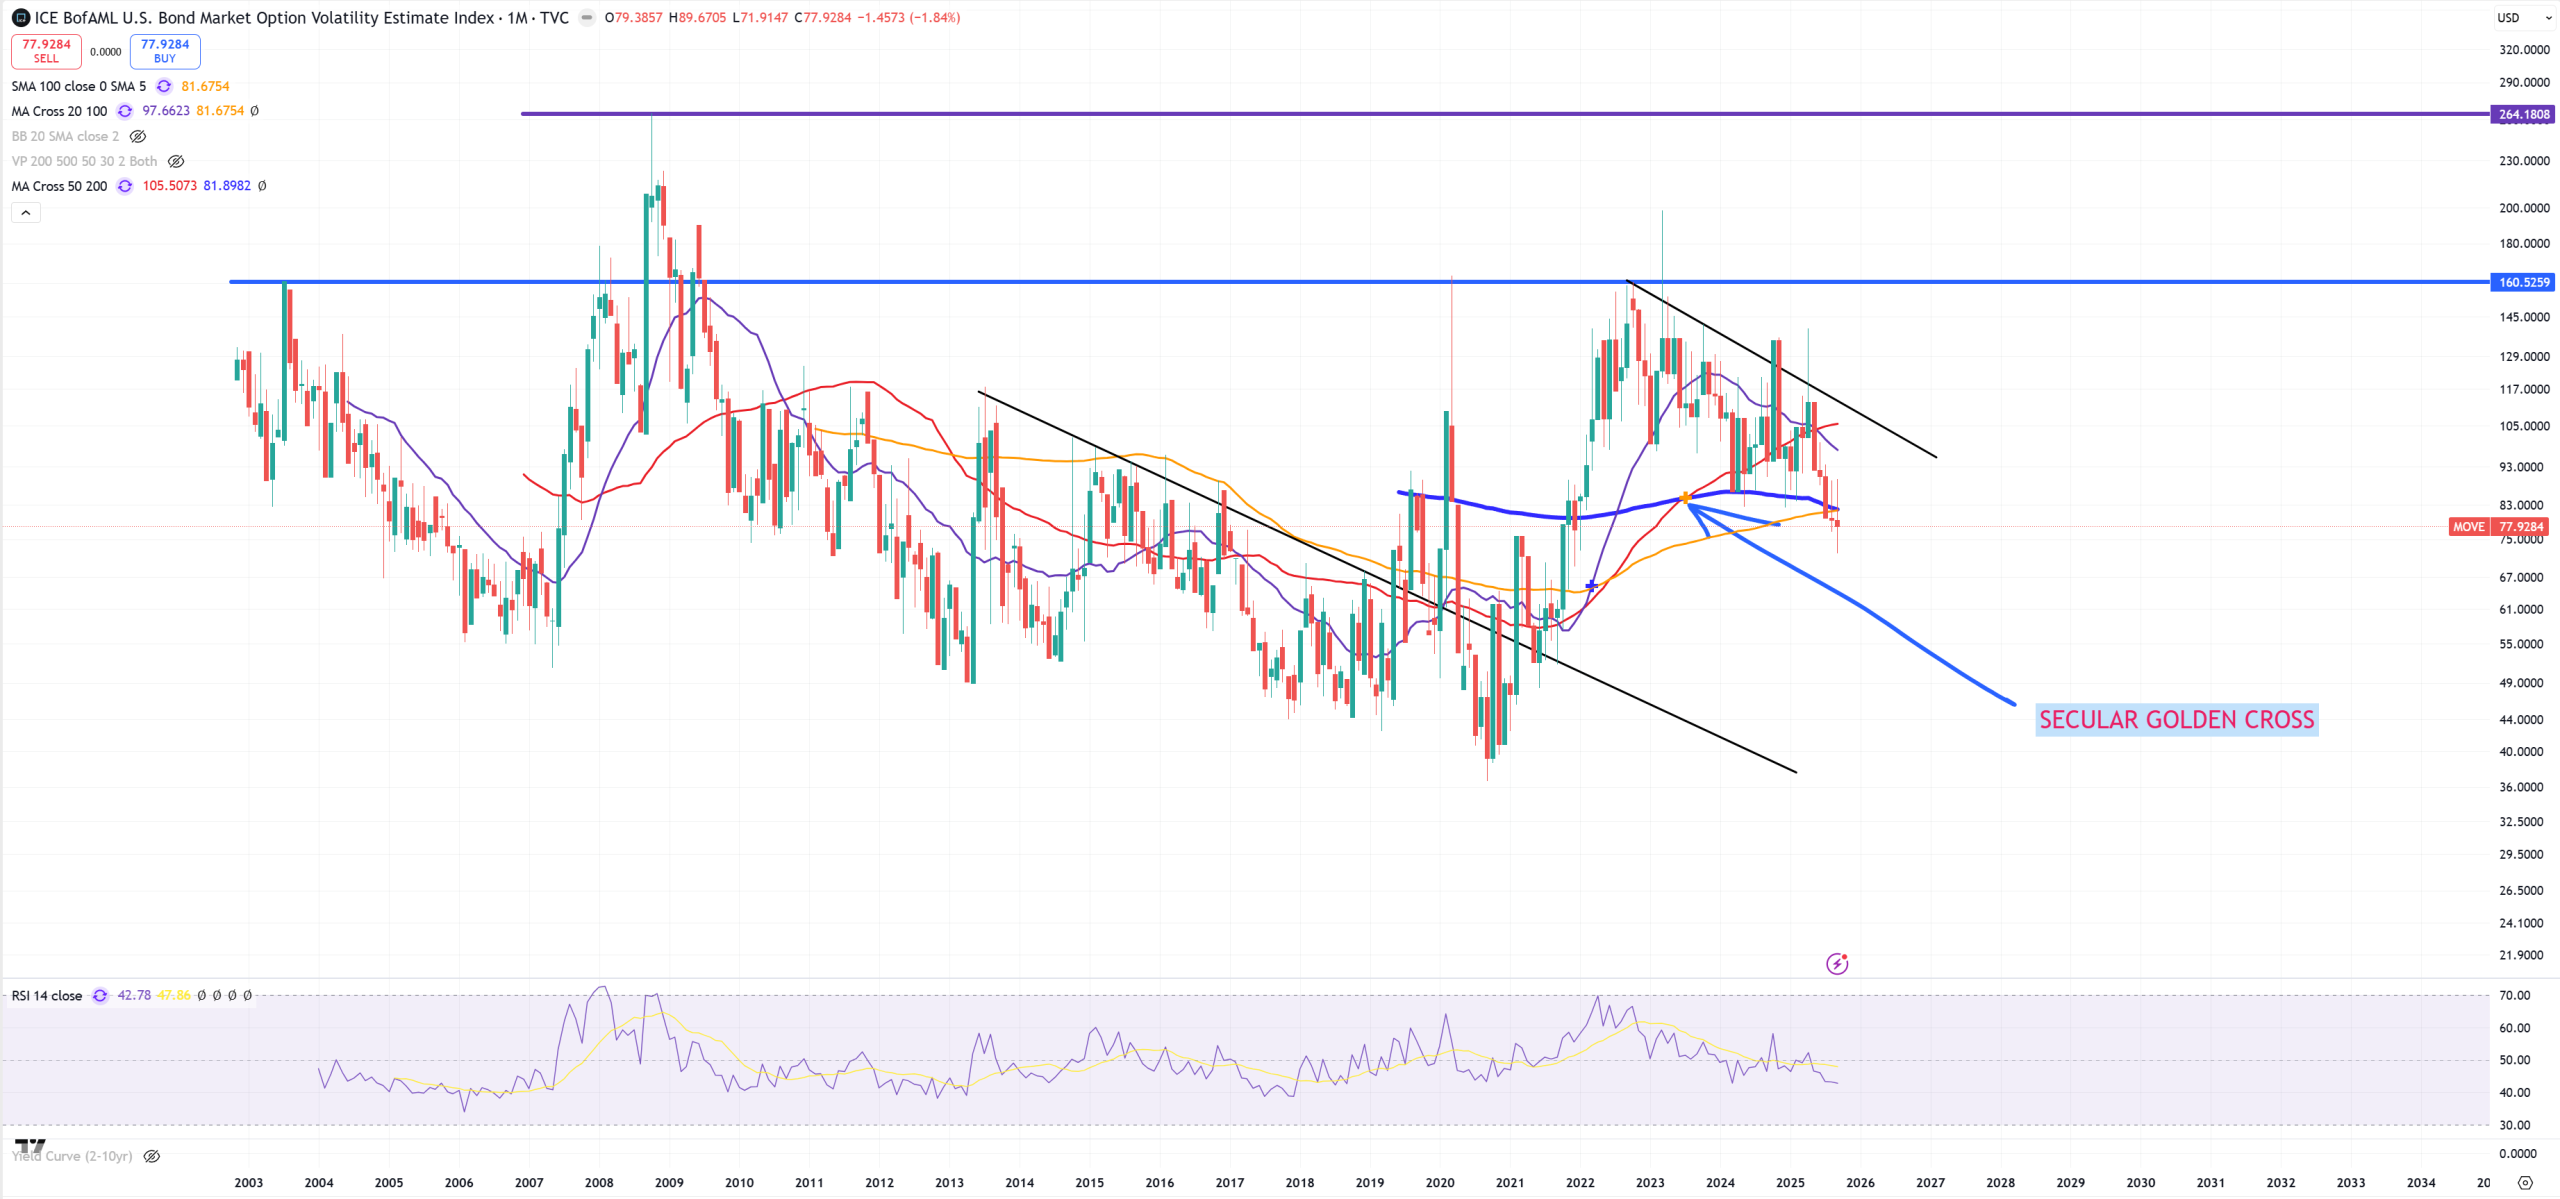
MOVE – this is also something I did not think it might happen, but that move below blue (M)MA200 is the same move as SPX breaking 1929-2000 trend.
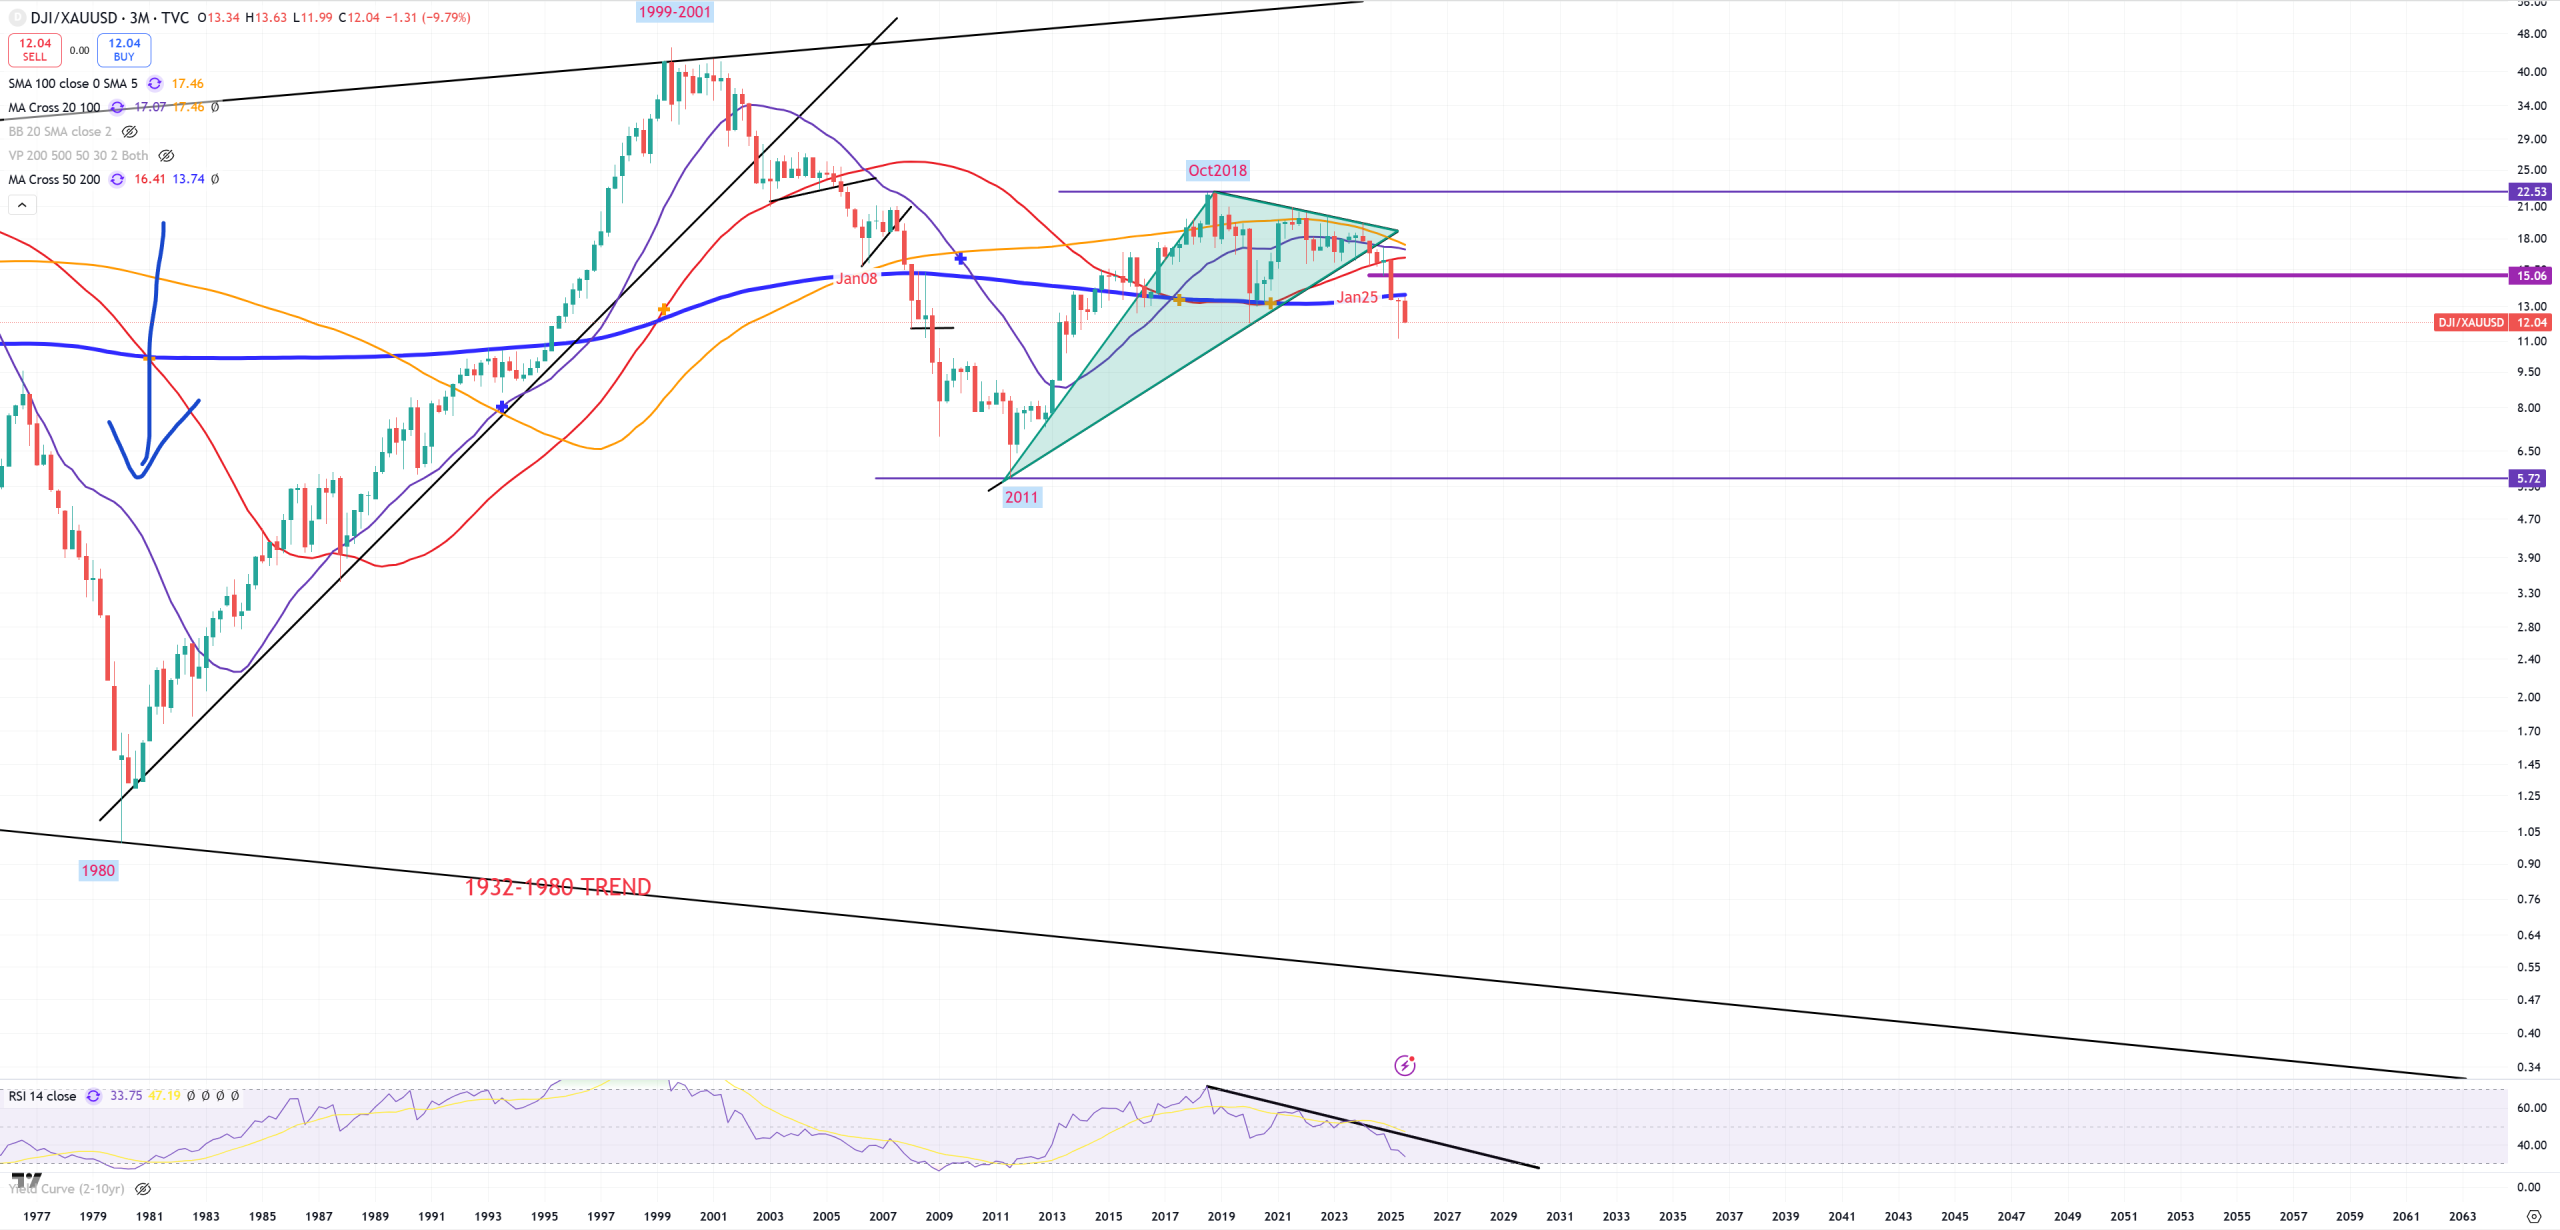
DJI/GOLD – this ratio looks very scarry. Not worth to show on (M) view as everything is broken, but on (3M) view everything is broken too. Last 5 breaks of blue (3M)MA200 : Jan25, Jan08, Jan73, Oct37, Oct31. Peak in Oct2018, lots of macro also peaked pre 2020. My inderpretation DJI/GOLD and SPX/GOLD are showing how economy goes. Down it goes down and up it goes up. It has nothing to do with stocks.
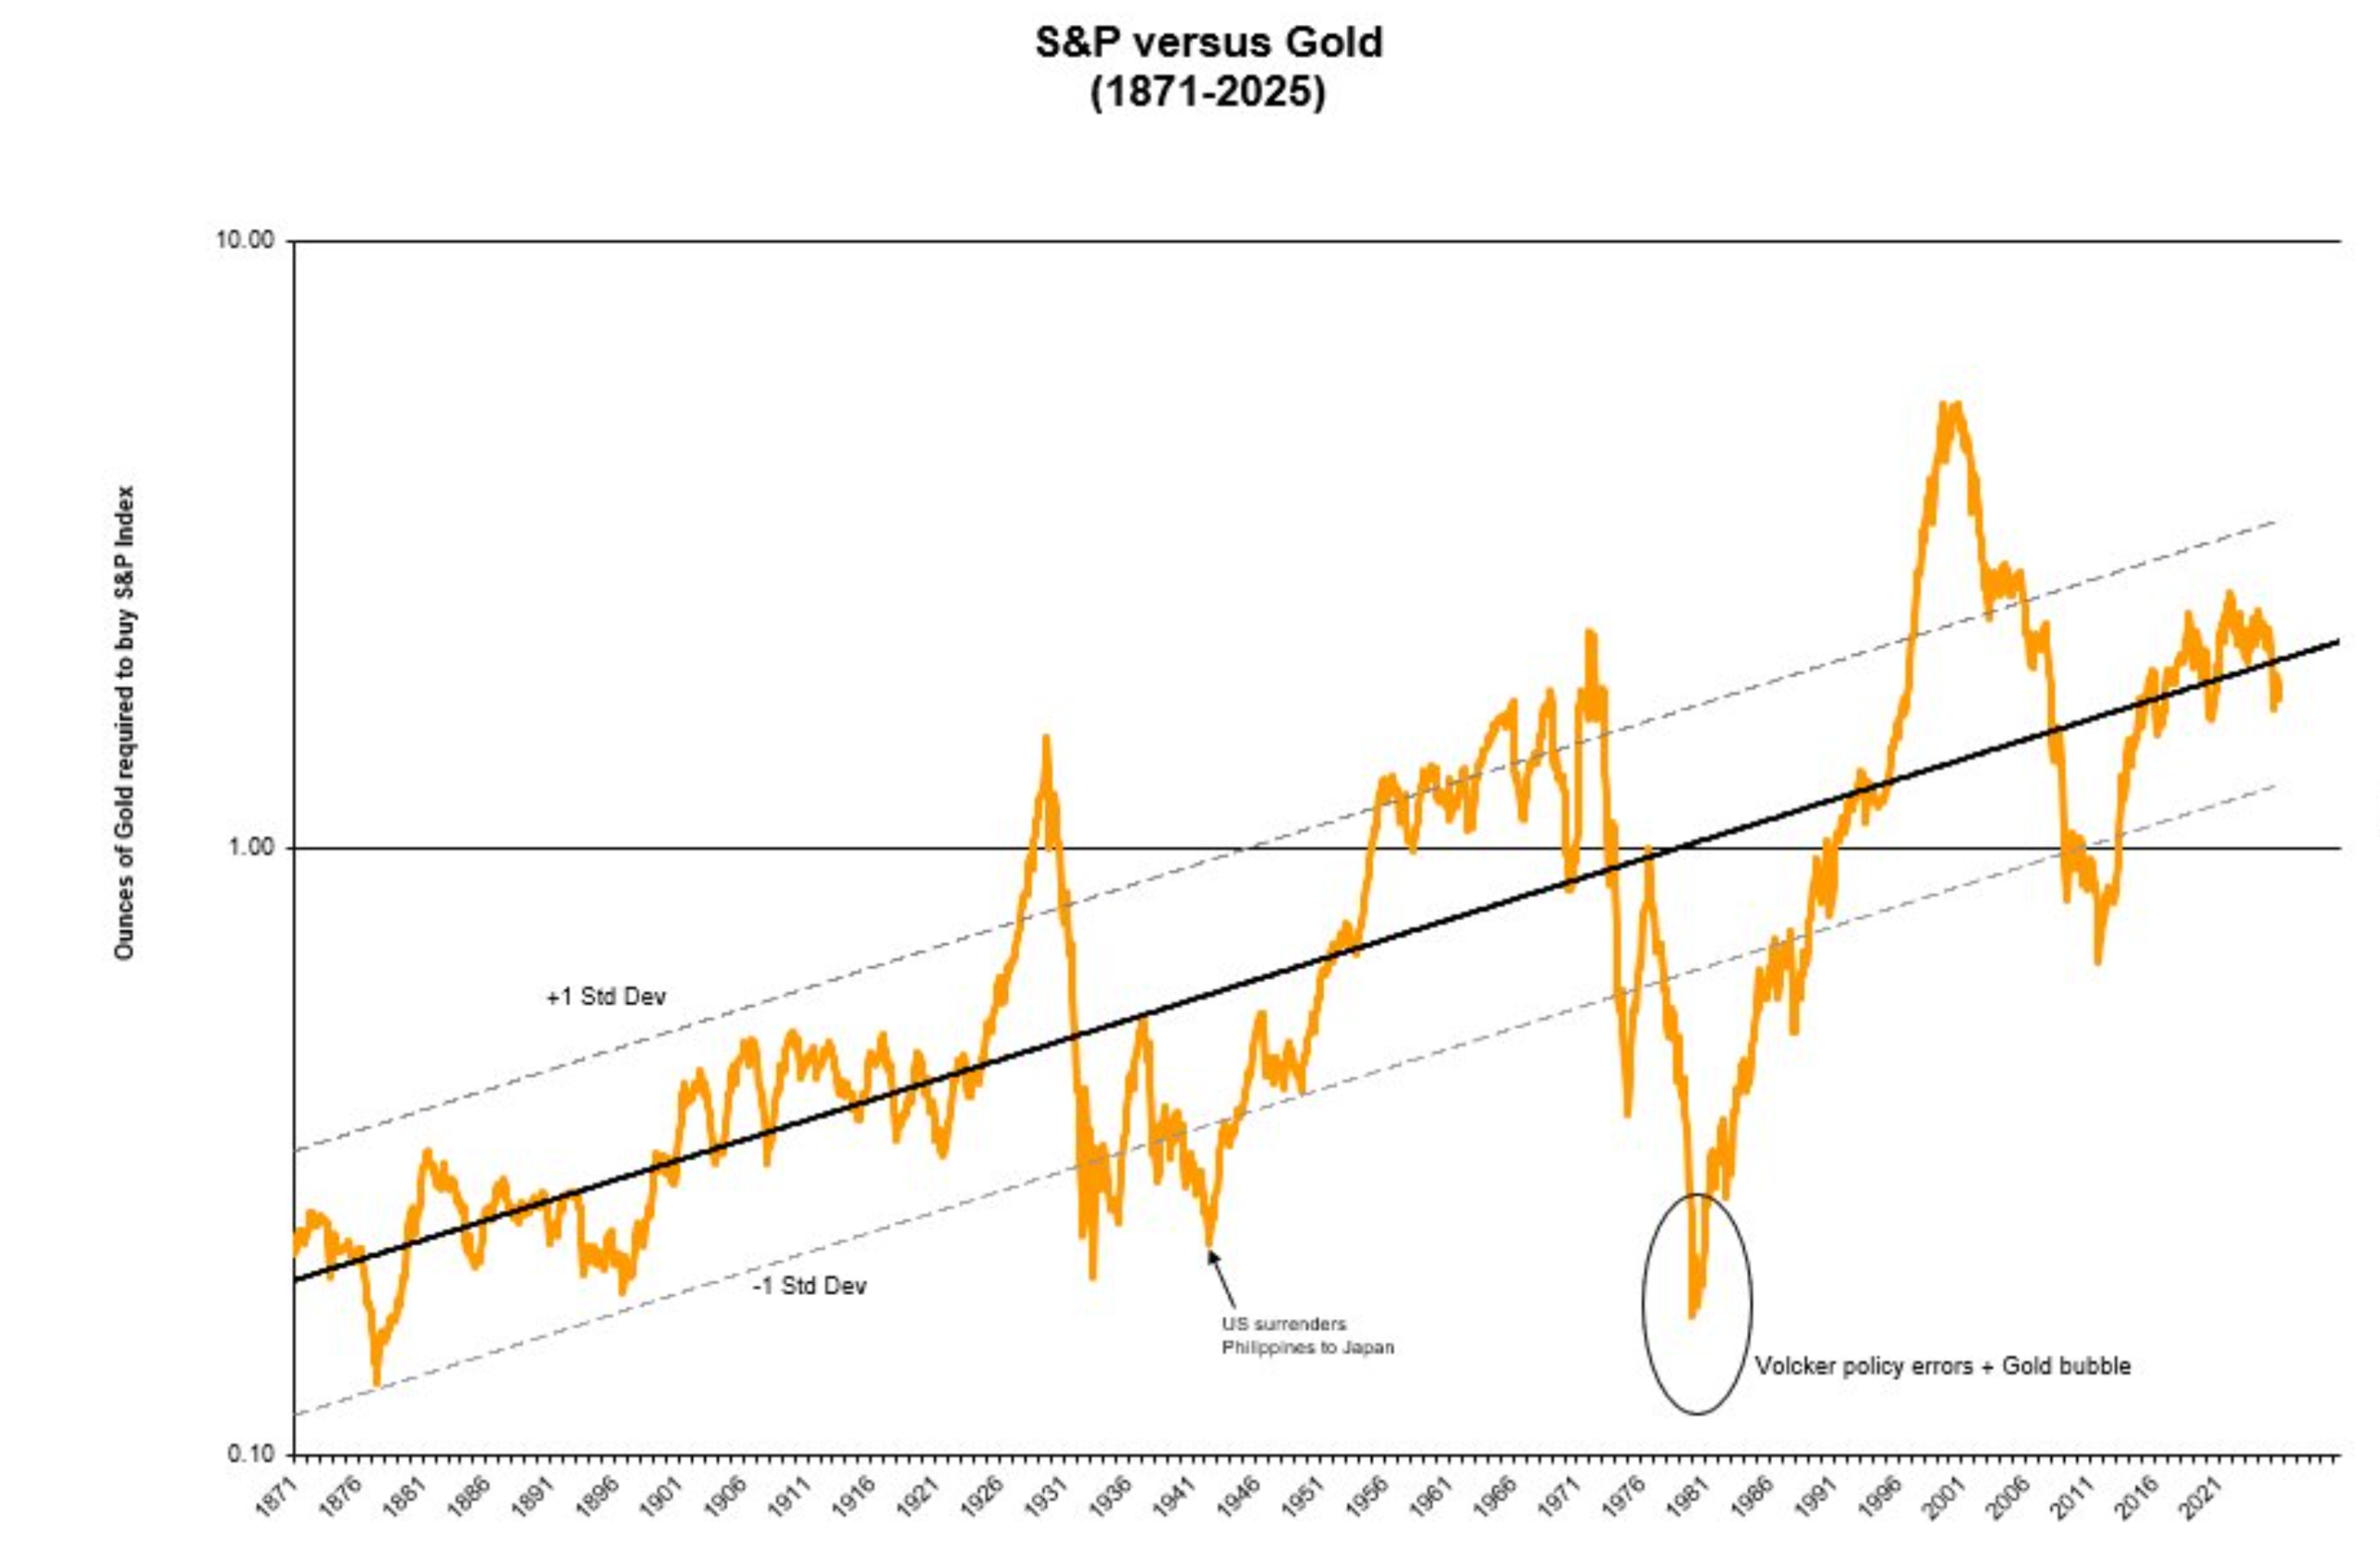
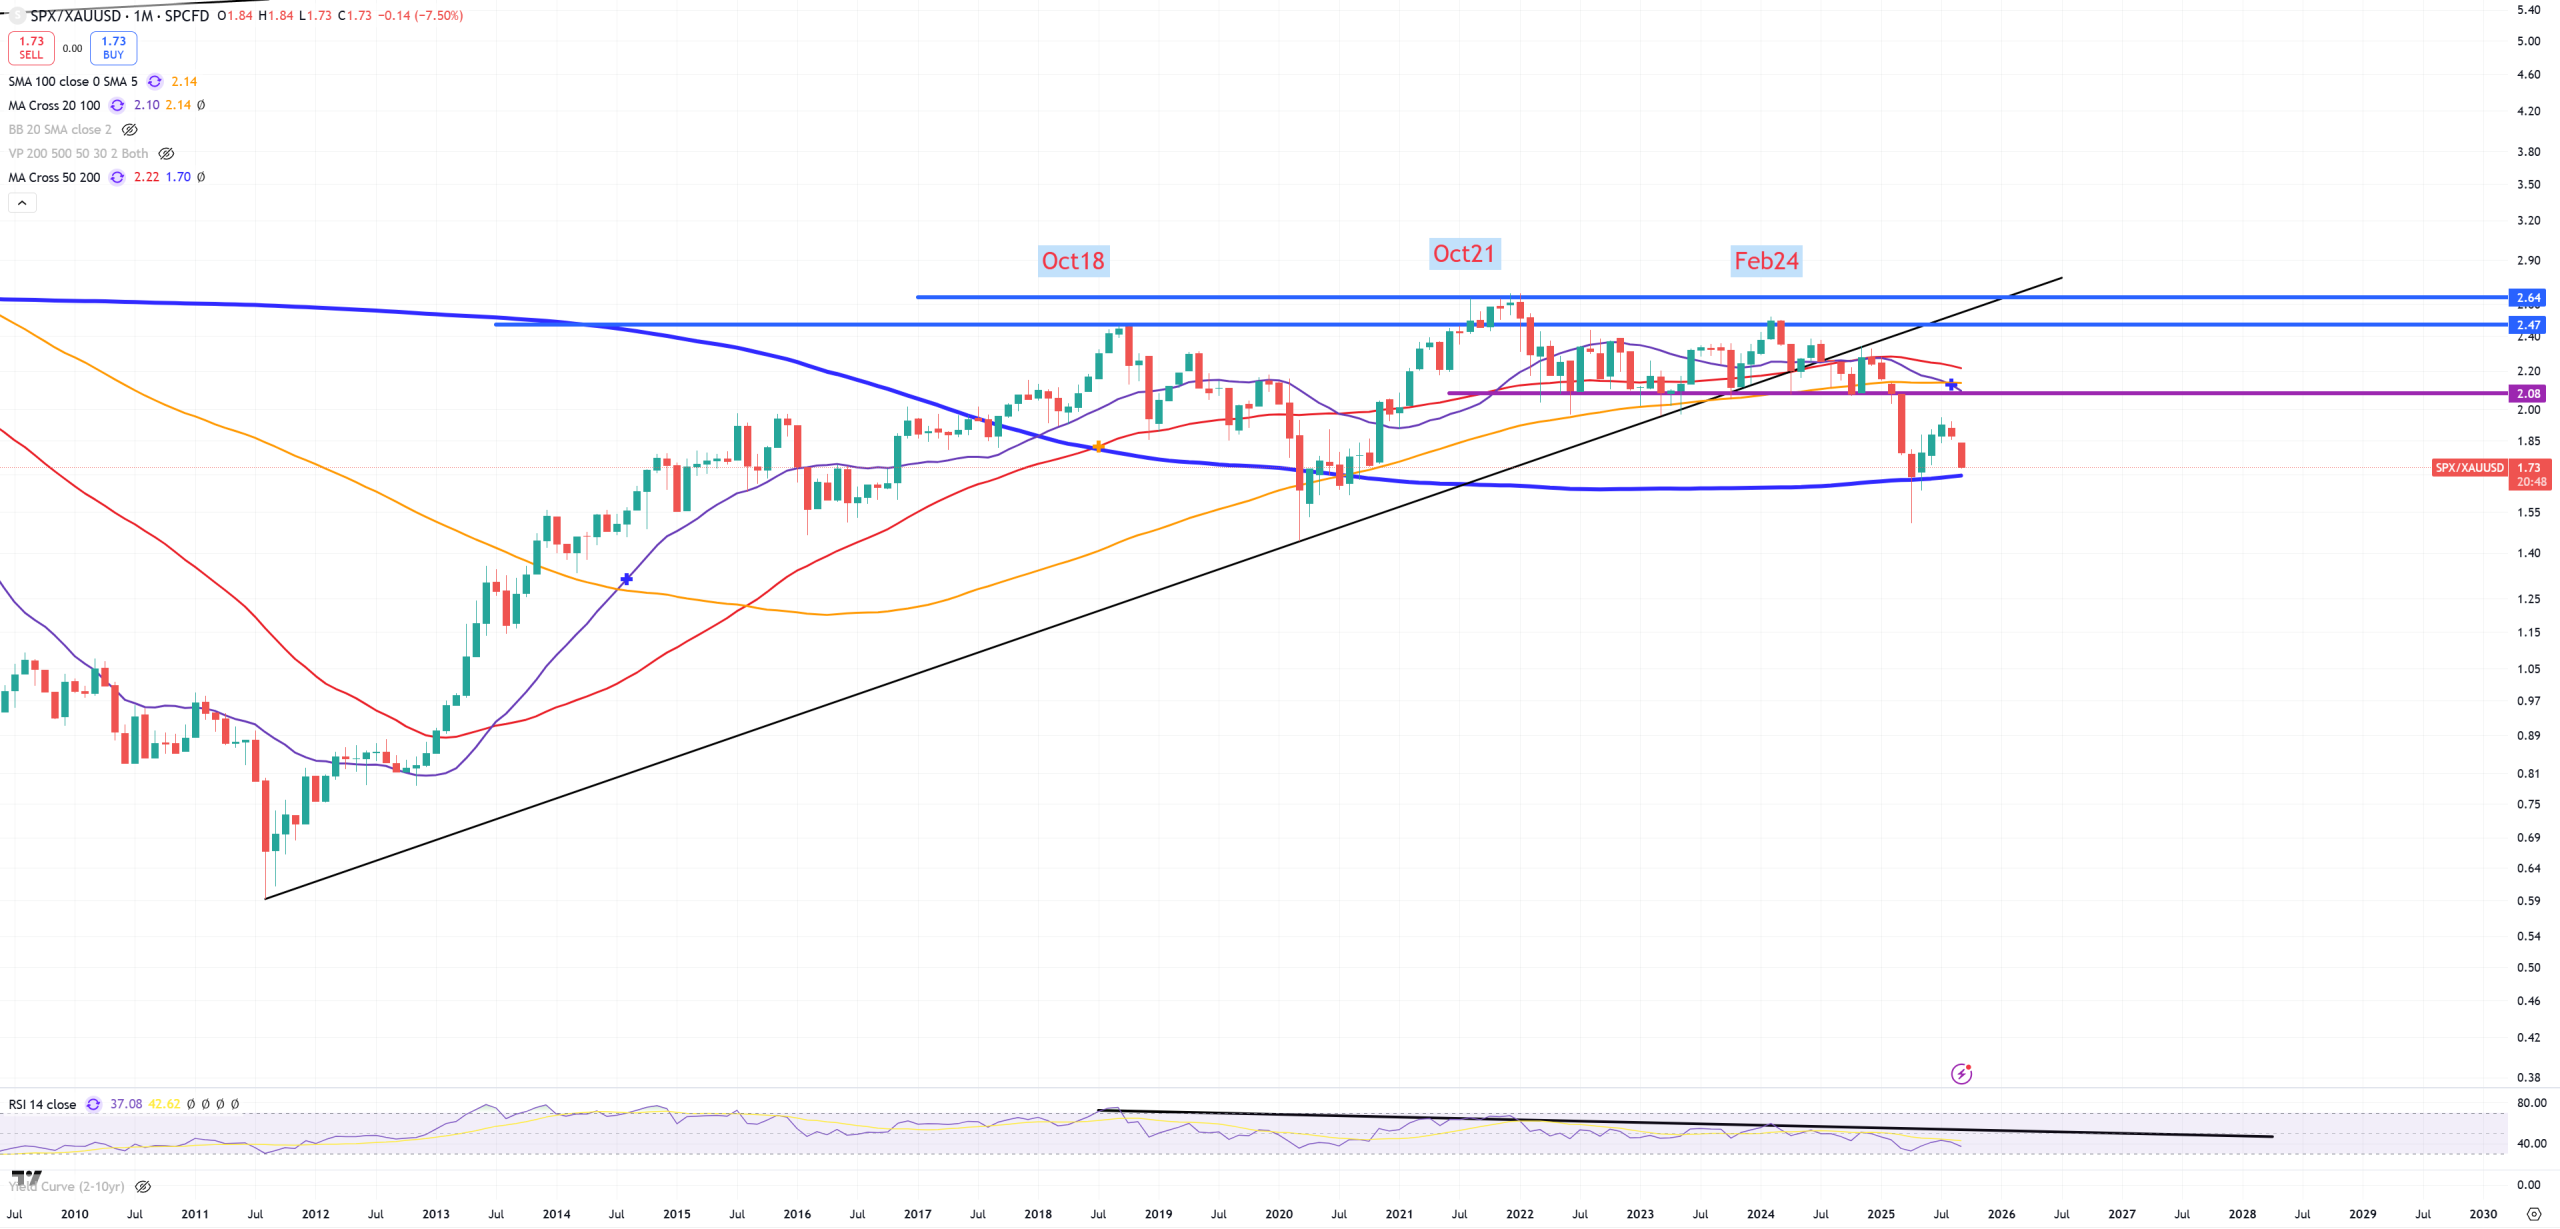
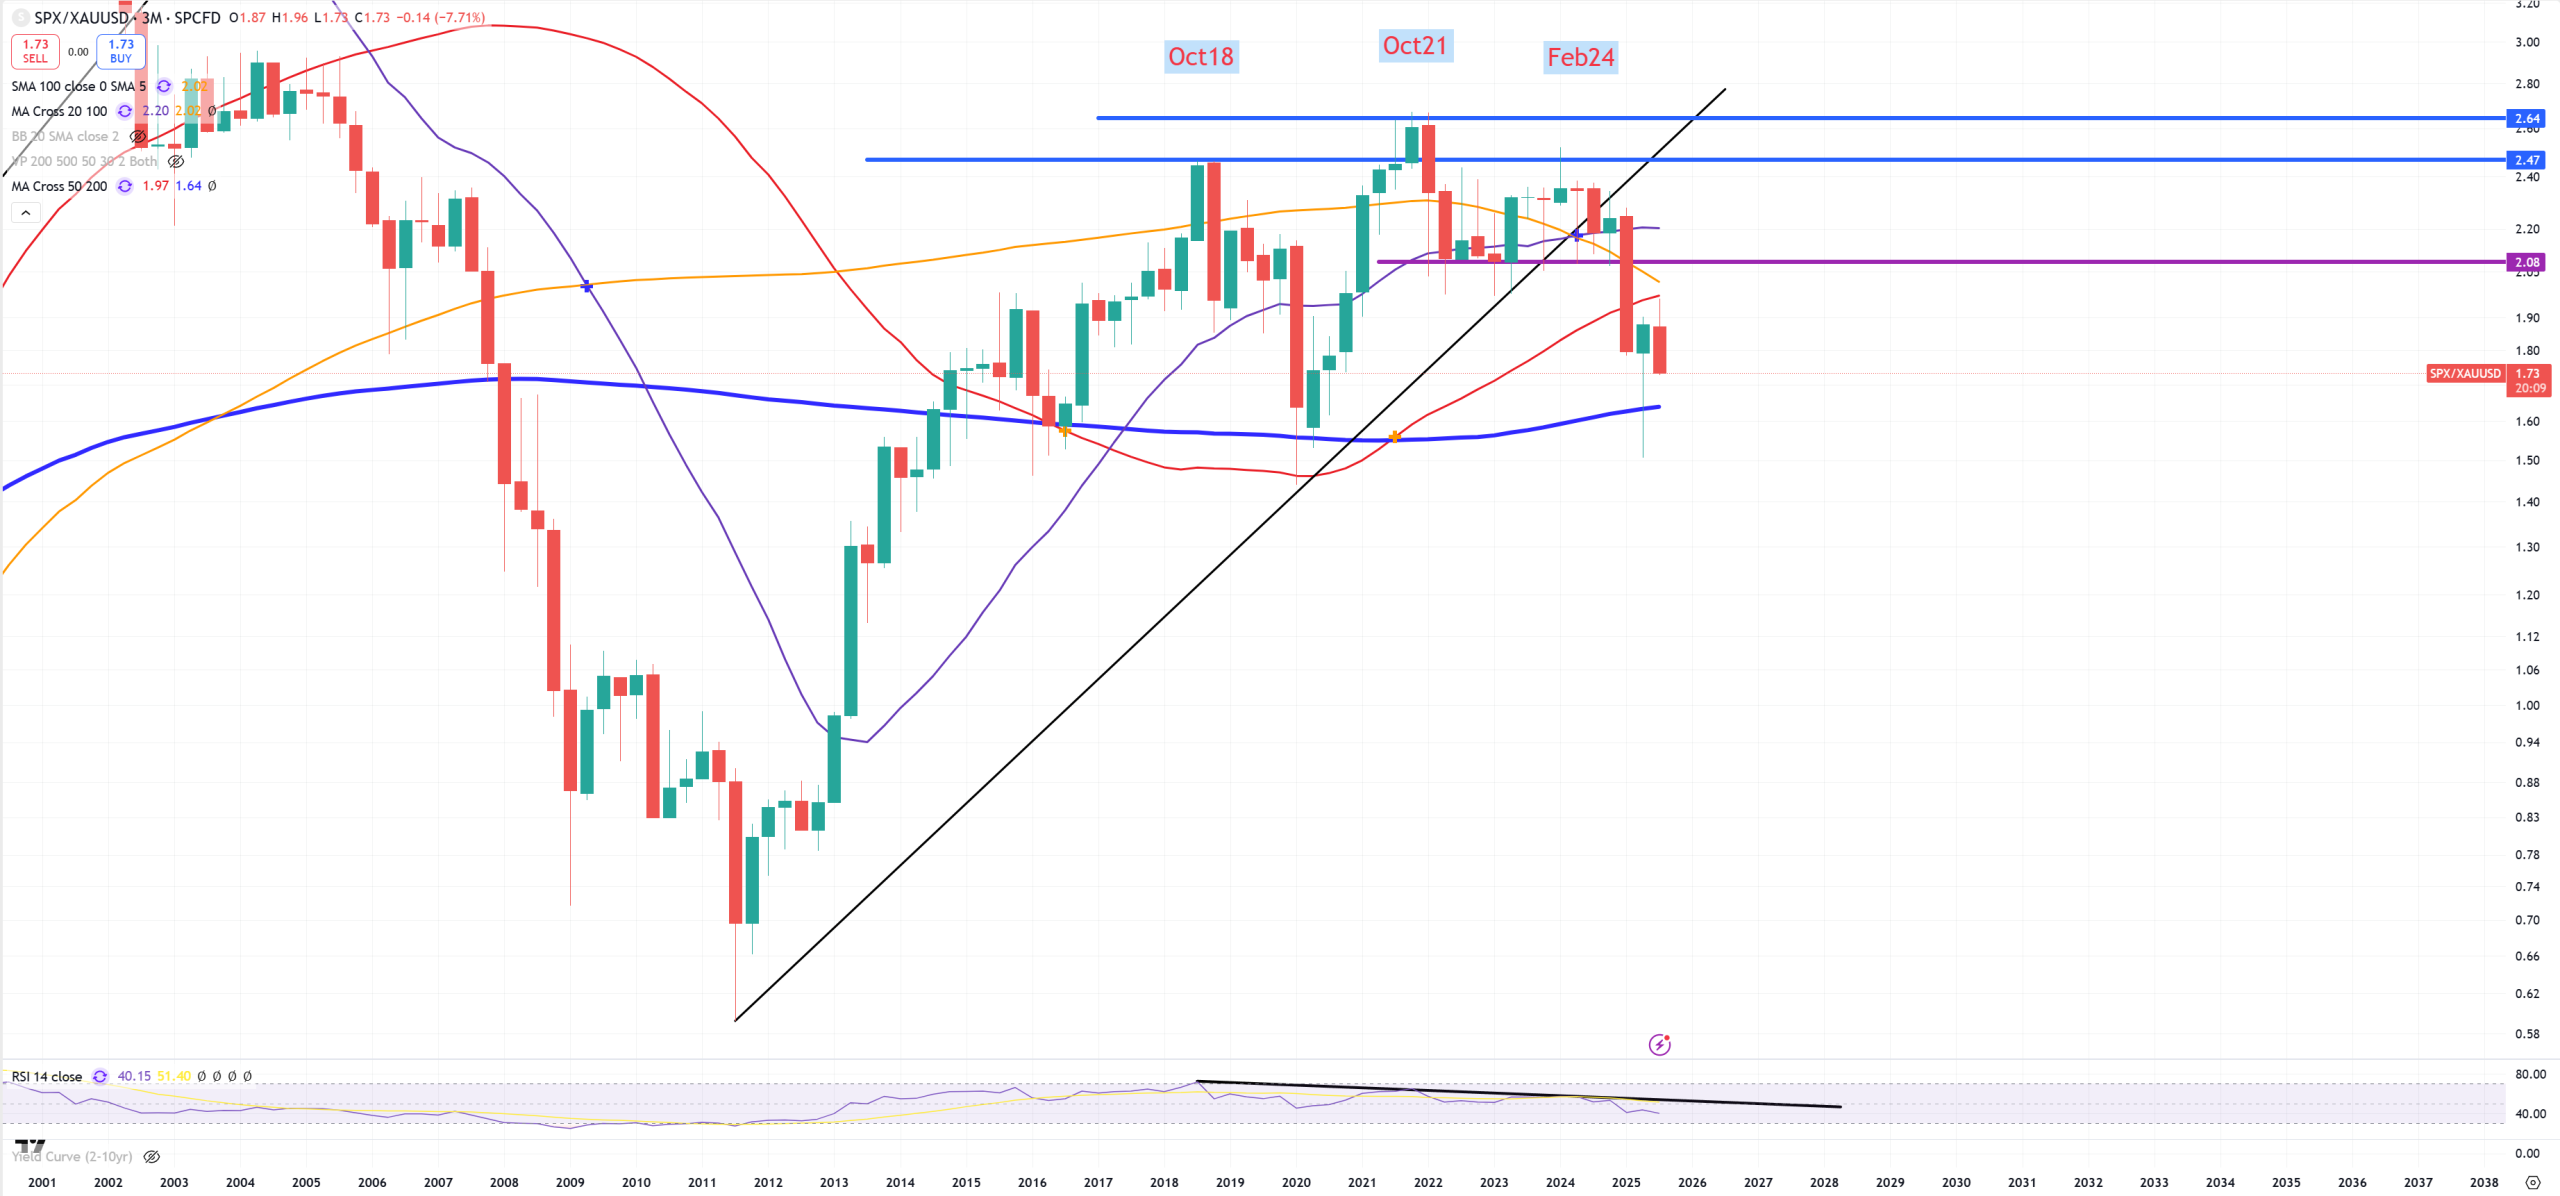
SPX/GOLD – here comes long term trend in gold chart we’ll answer if gold looks like a bubble, because here on DJI/GOLD without a doubt it’s not. (M)MA200 was not taken and (3M)MA200 was not taken here too, what might be considered as bullish. DJI/GOLD and SPX/GOLD are not going together. Peak Oct 2021 seems to be valid in so many macro data peaks.
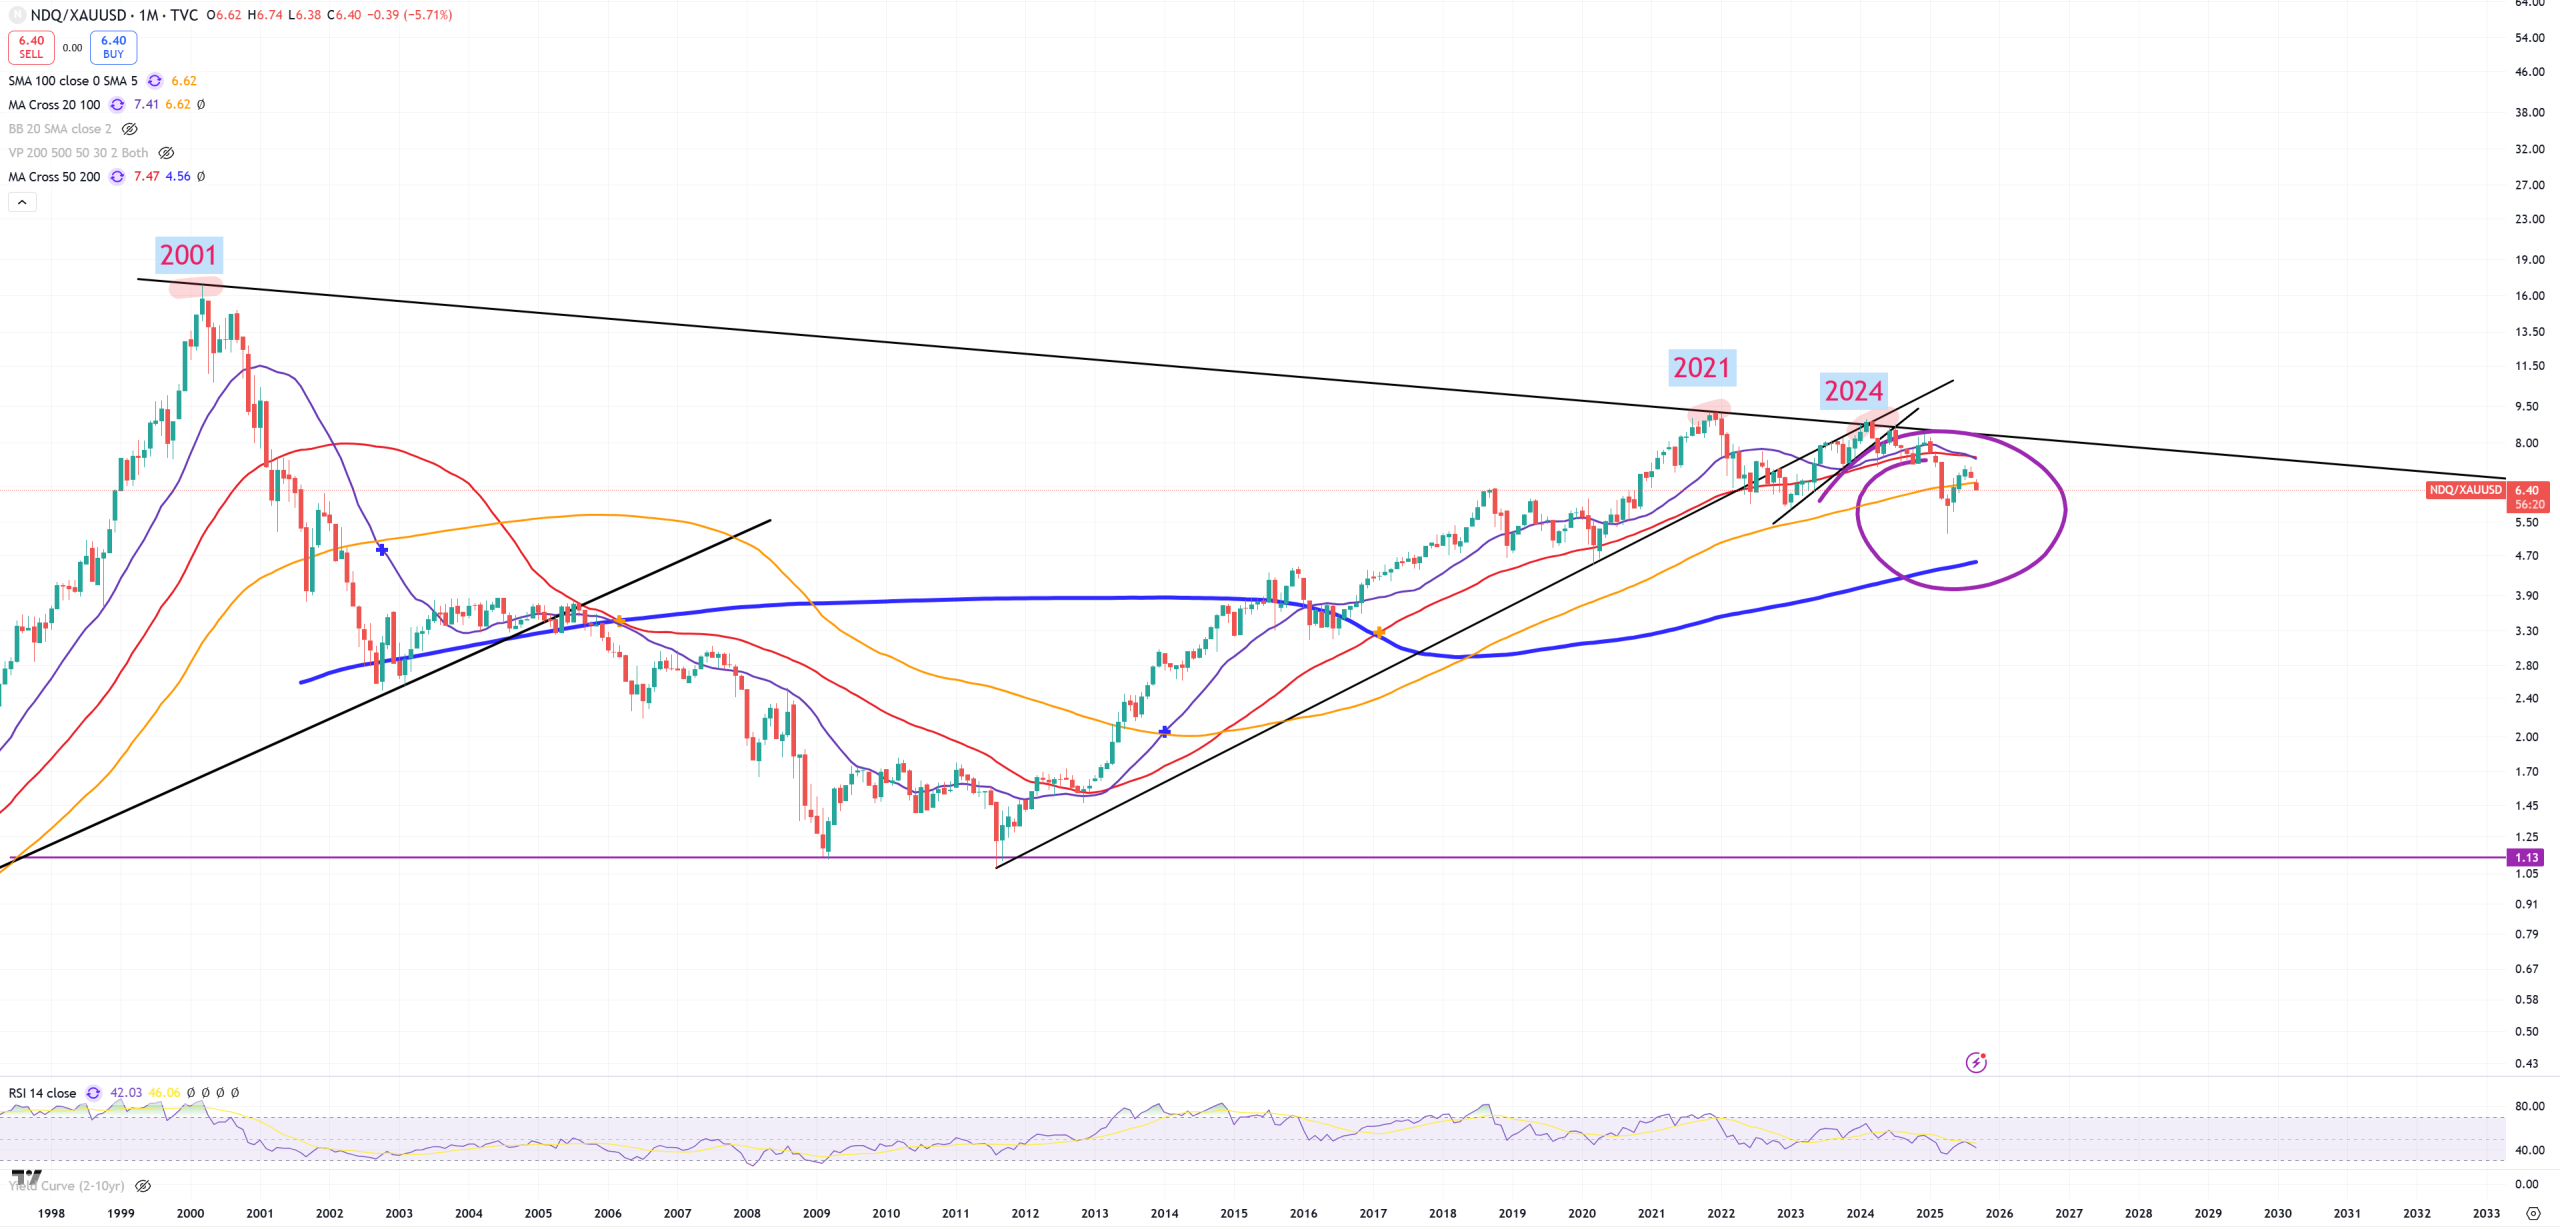
NDQ/GOLD – not surprising chart also should how gold outperforms Nasdaq 100, and yellow (M)MA100 did not give up this month.
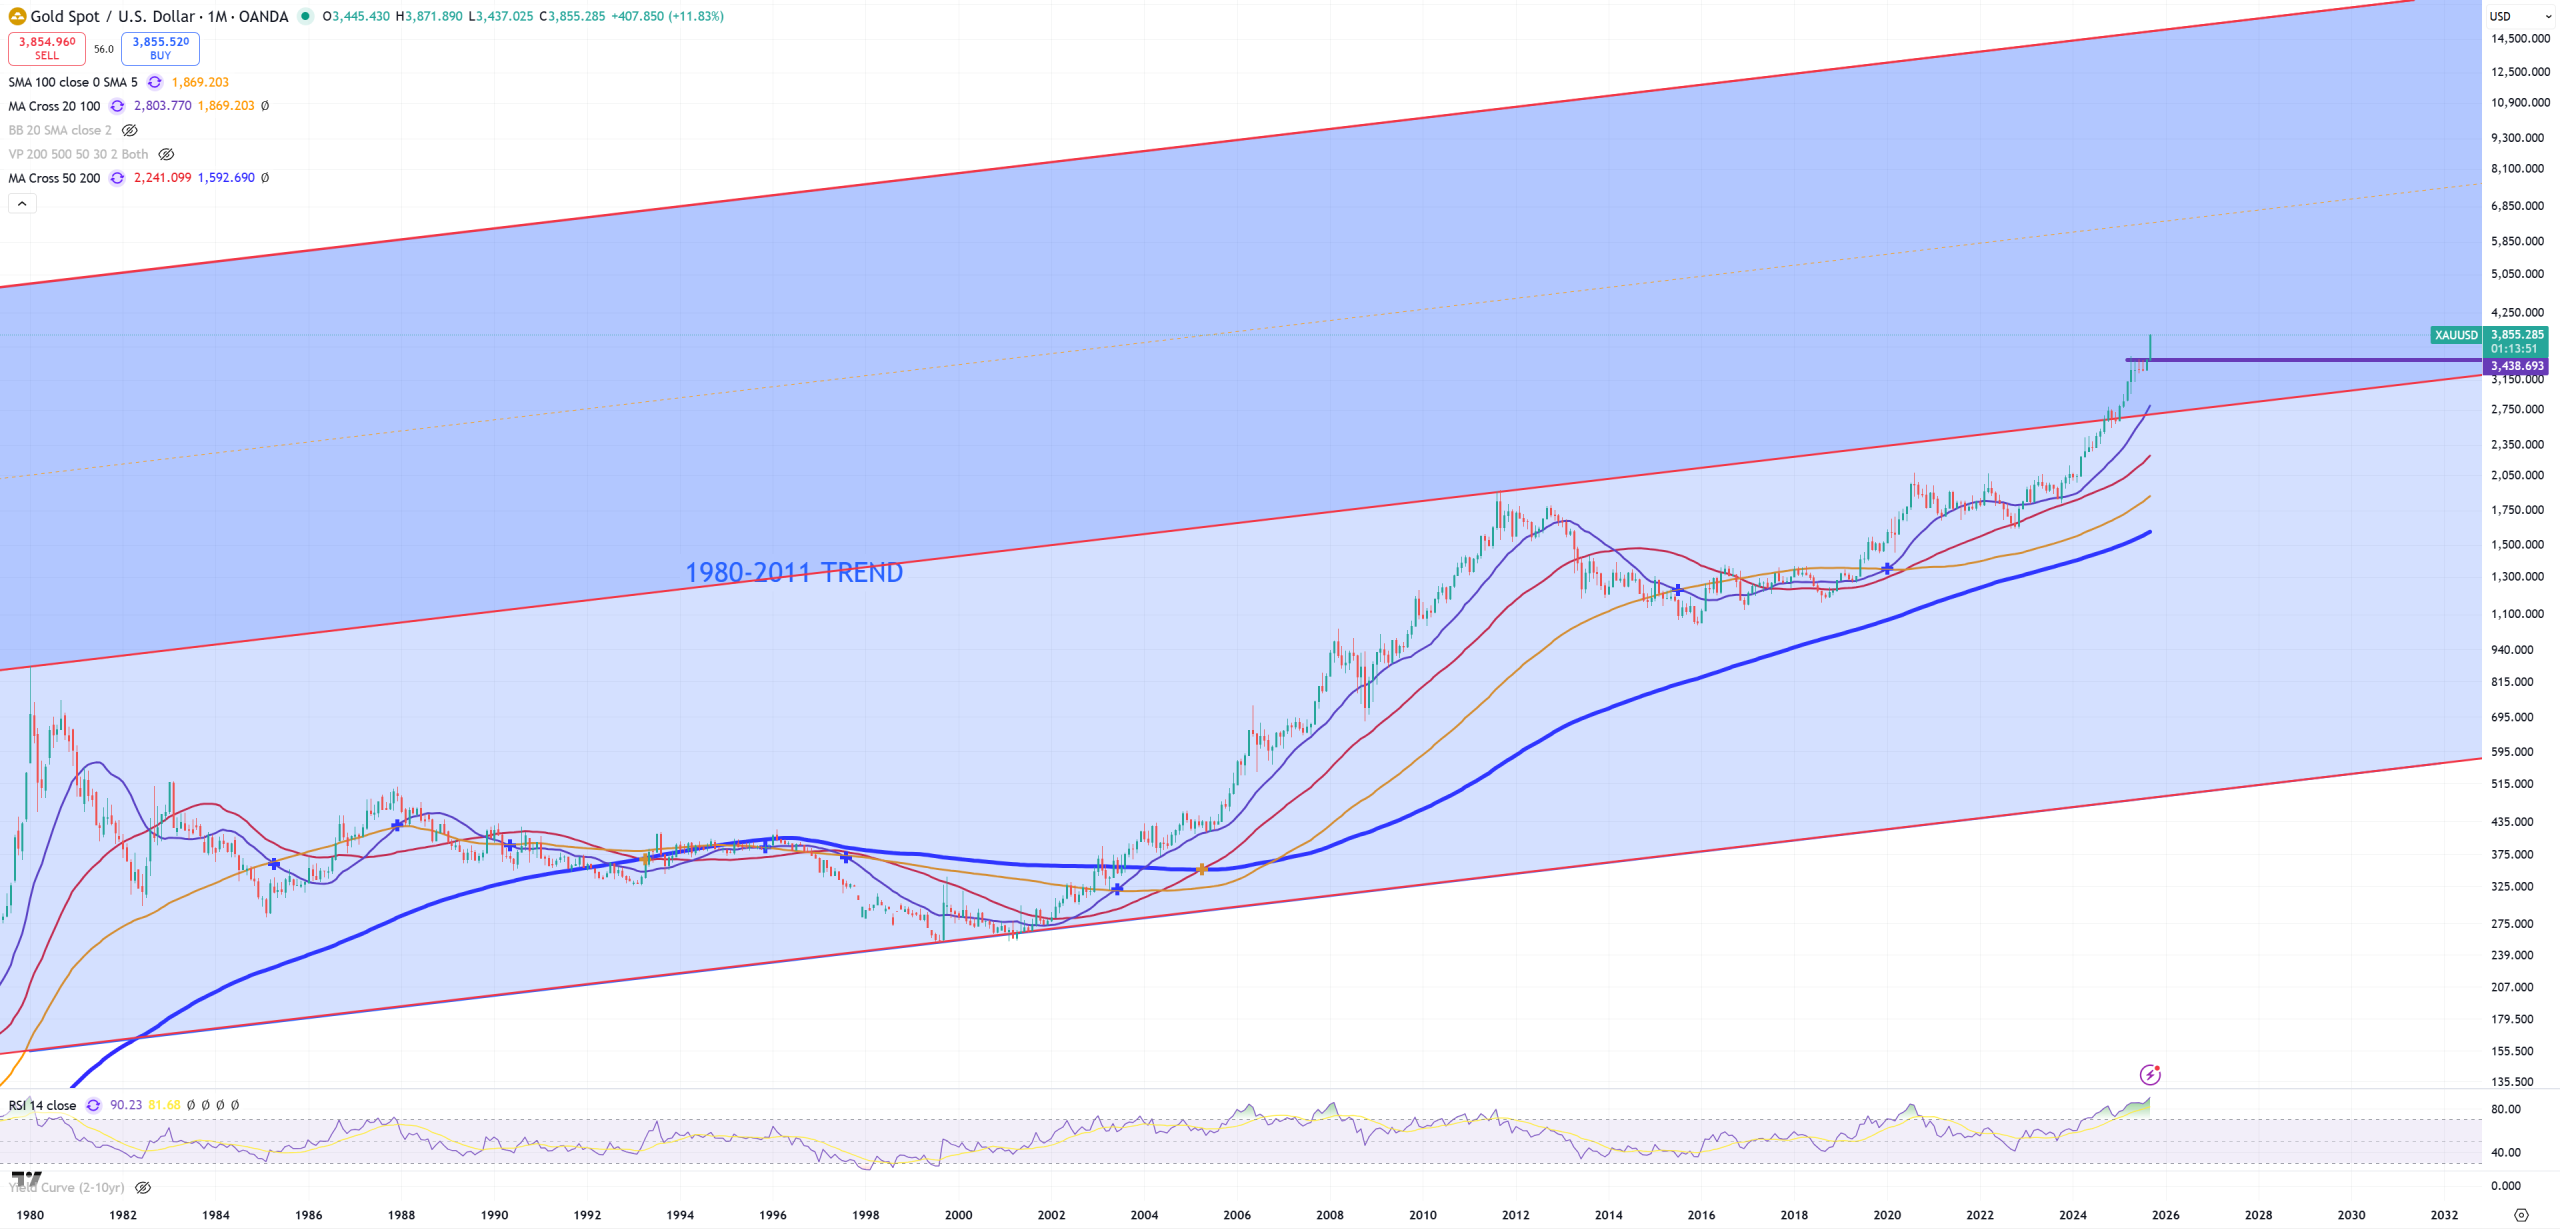
XAUUSD – is gold a bubble? Without a doubt (M)RSI is the most overbought since 1980, but in 1980 distance from peak to (M)MA50 was -75% (big “tulip bubble”) today it’s just -41%. To get to the same distance to (M)MA50 which used to be in 1980 we need to be fast in 6500$ level, which is exactly middle point of the upper channel (above 1980-2011 TREND) with upper level around 15000$
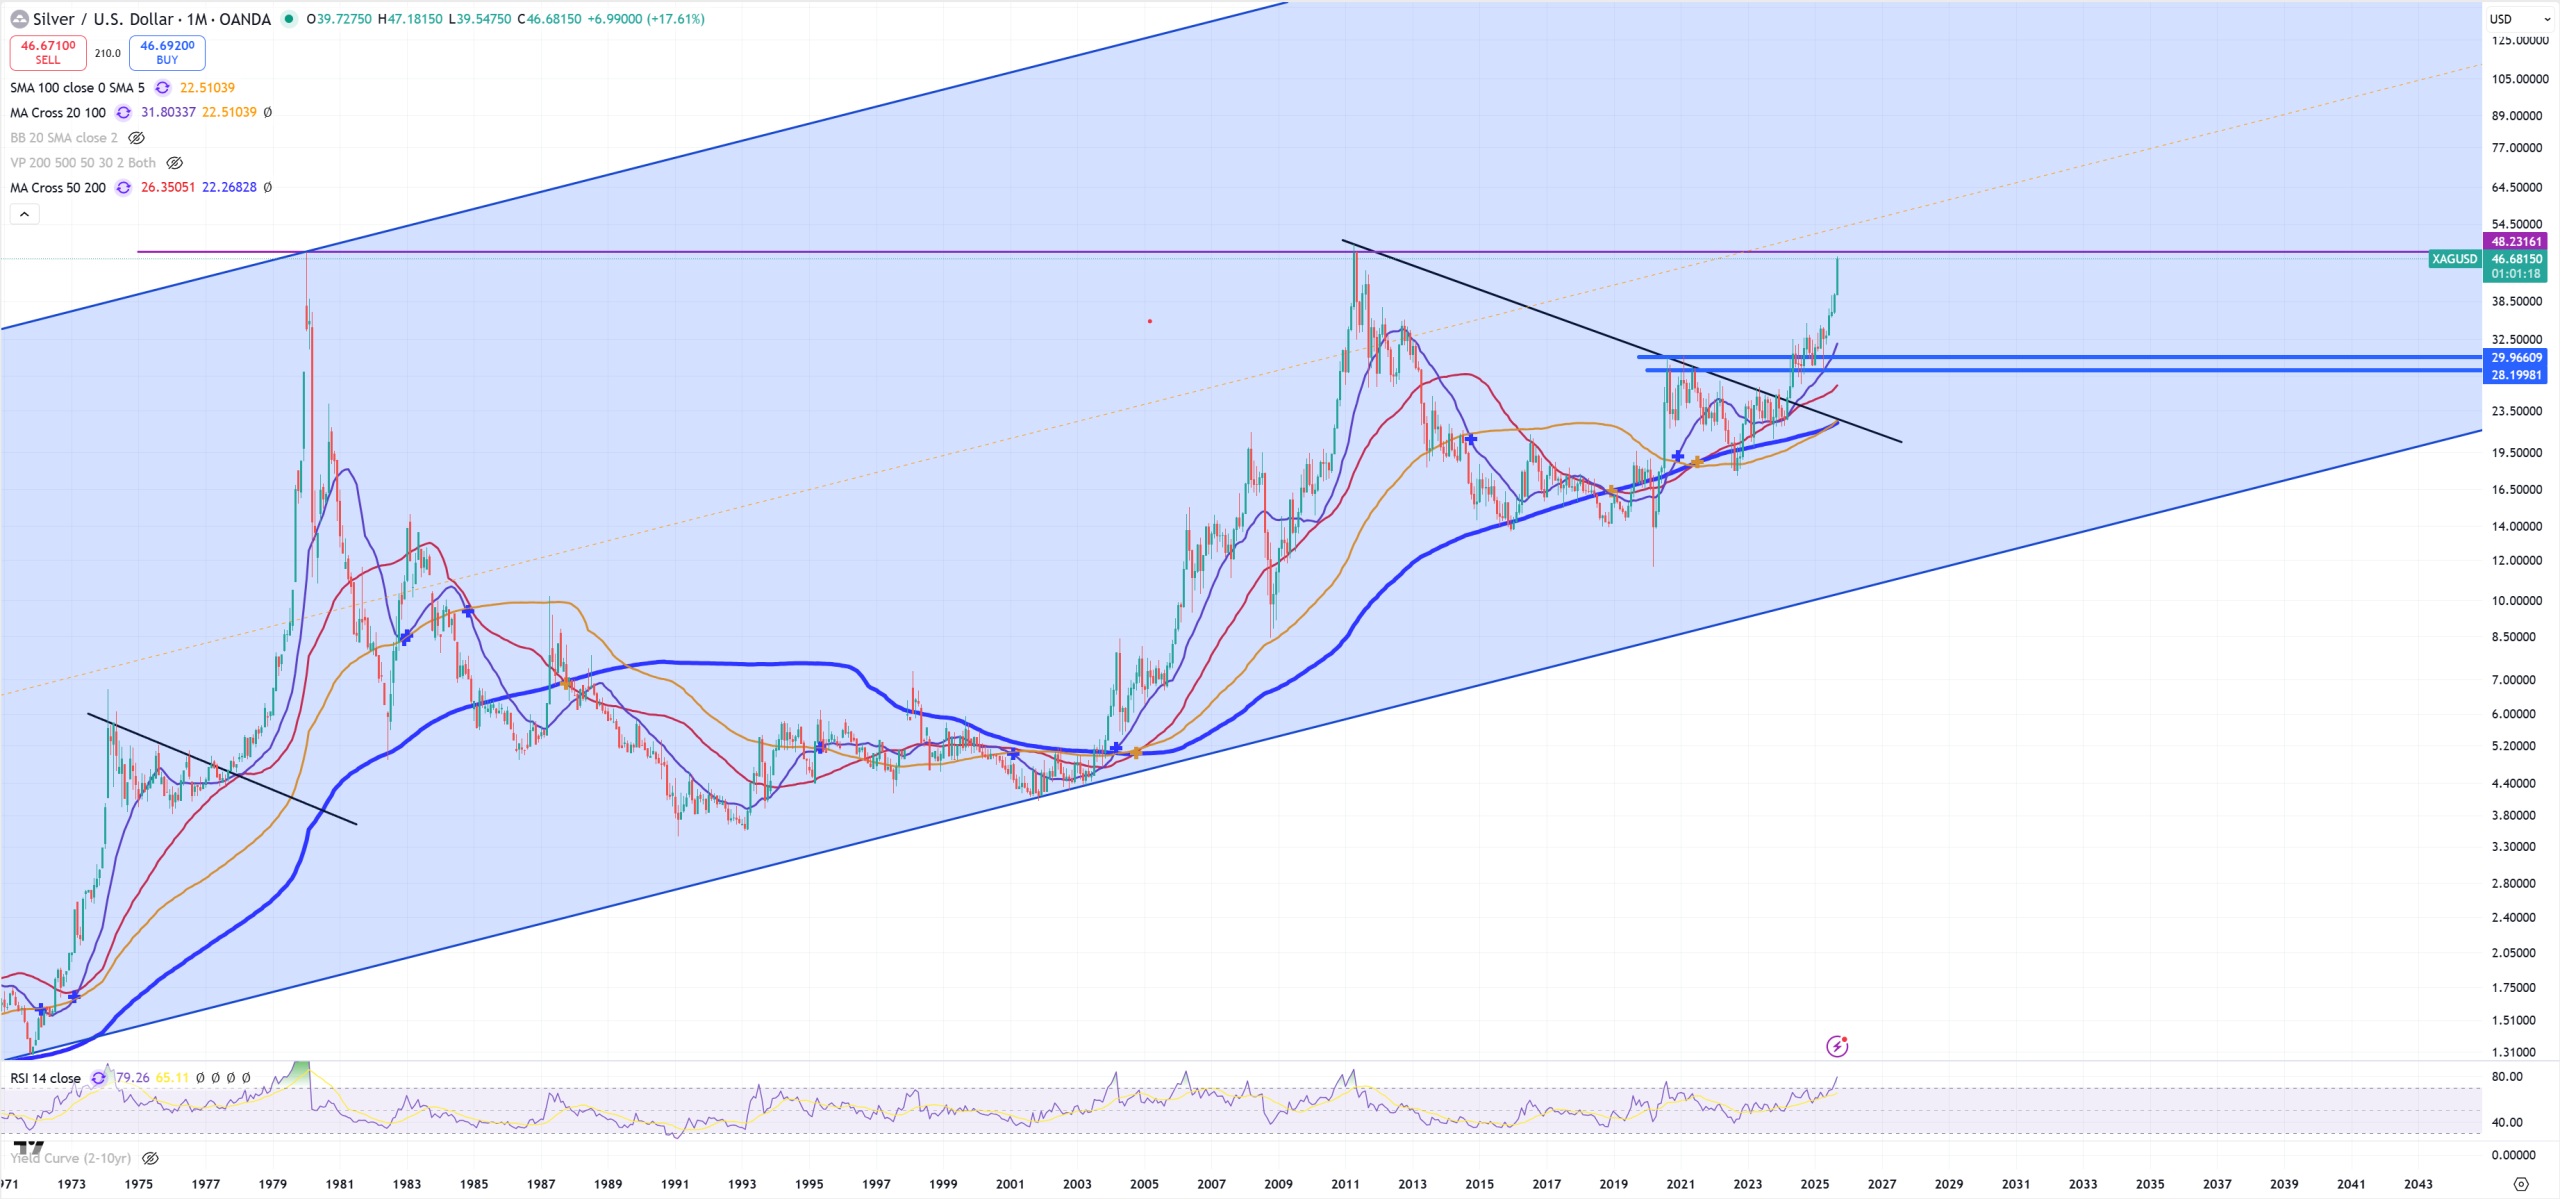
XAGUSD – Silver approaching to critical level.
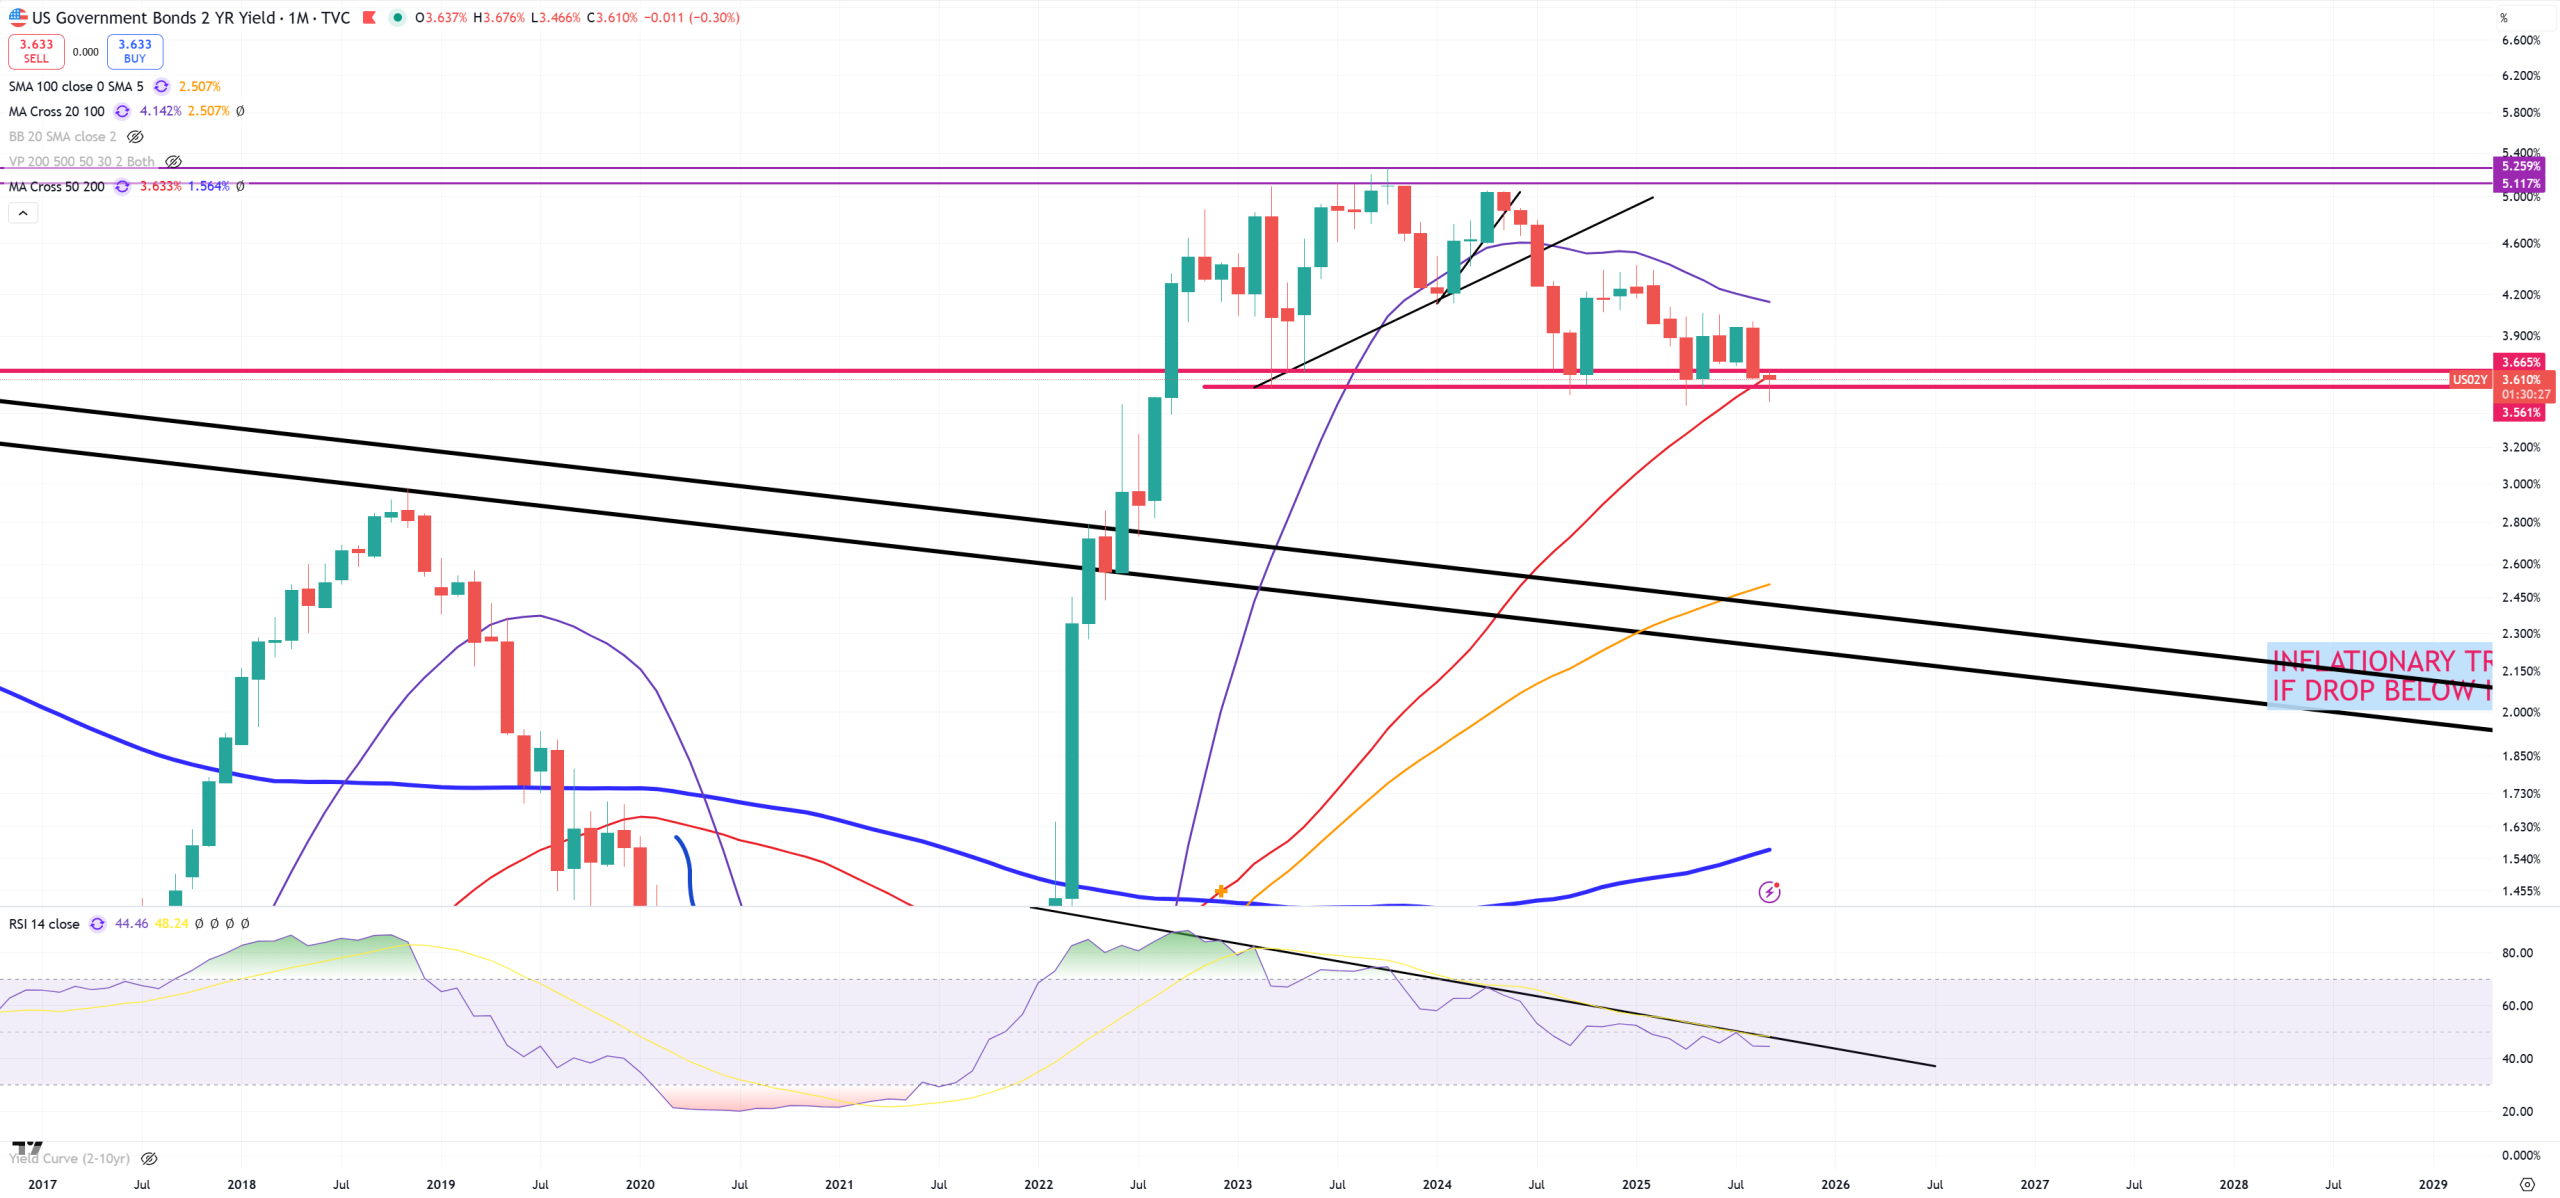
US02Y- the most unchanged chart. Failing to get above (M)MA50 so more rate cuts coming.
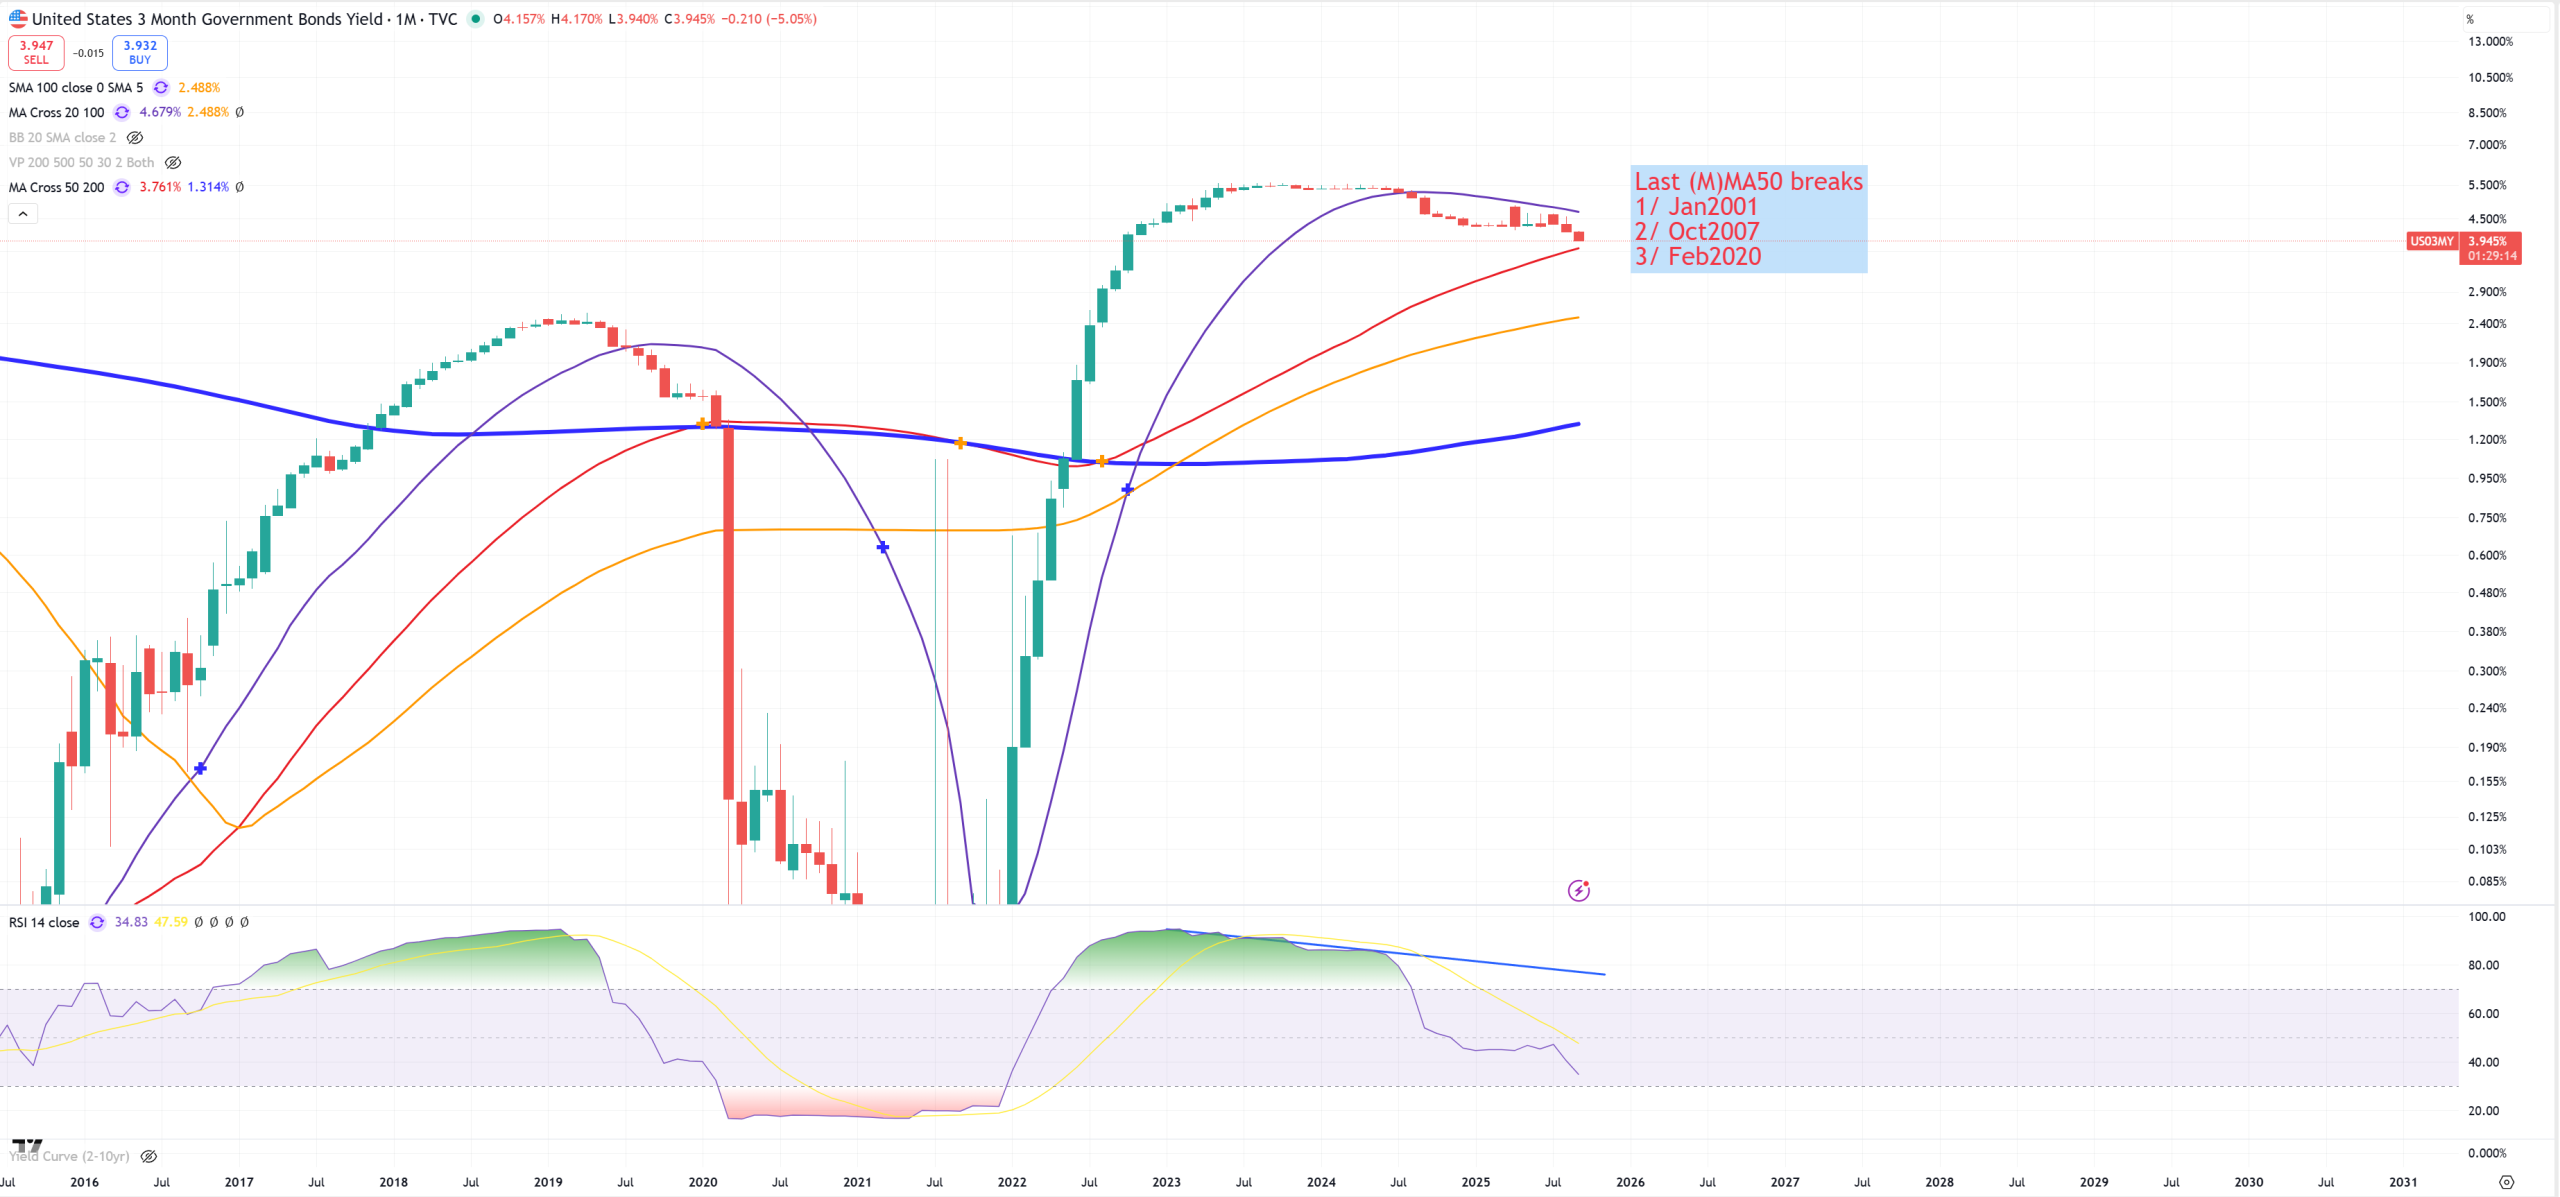
US03MY – this one is still > (M)MA50. I thought both US03MY & SPX/GOLD & SPX 1929-2000 trend will hold their key levels, but it has not happened in this month and quarter. US03MY needs 3.76% in September 2025 for (M)MA50 break.
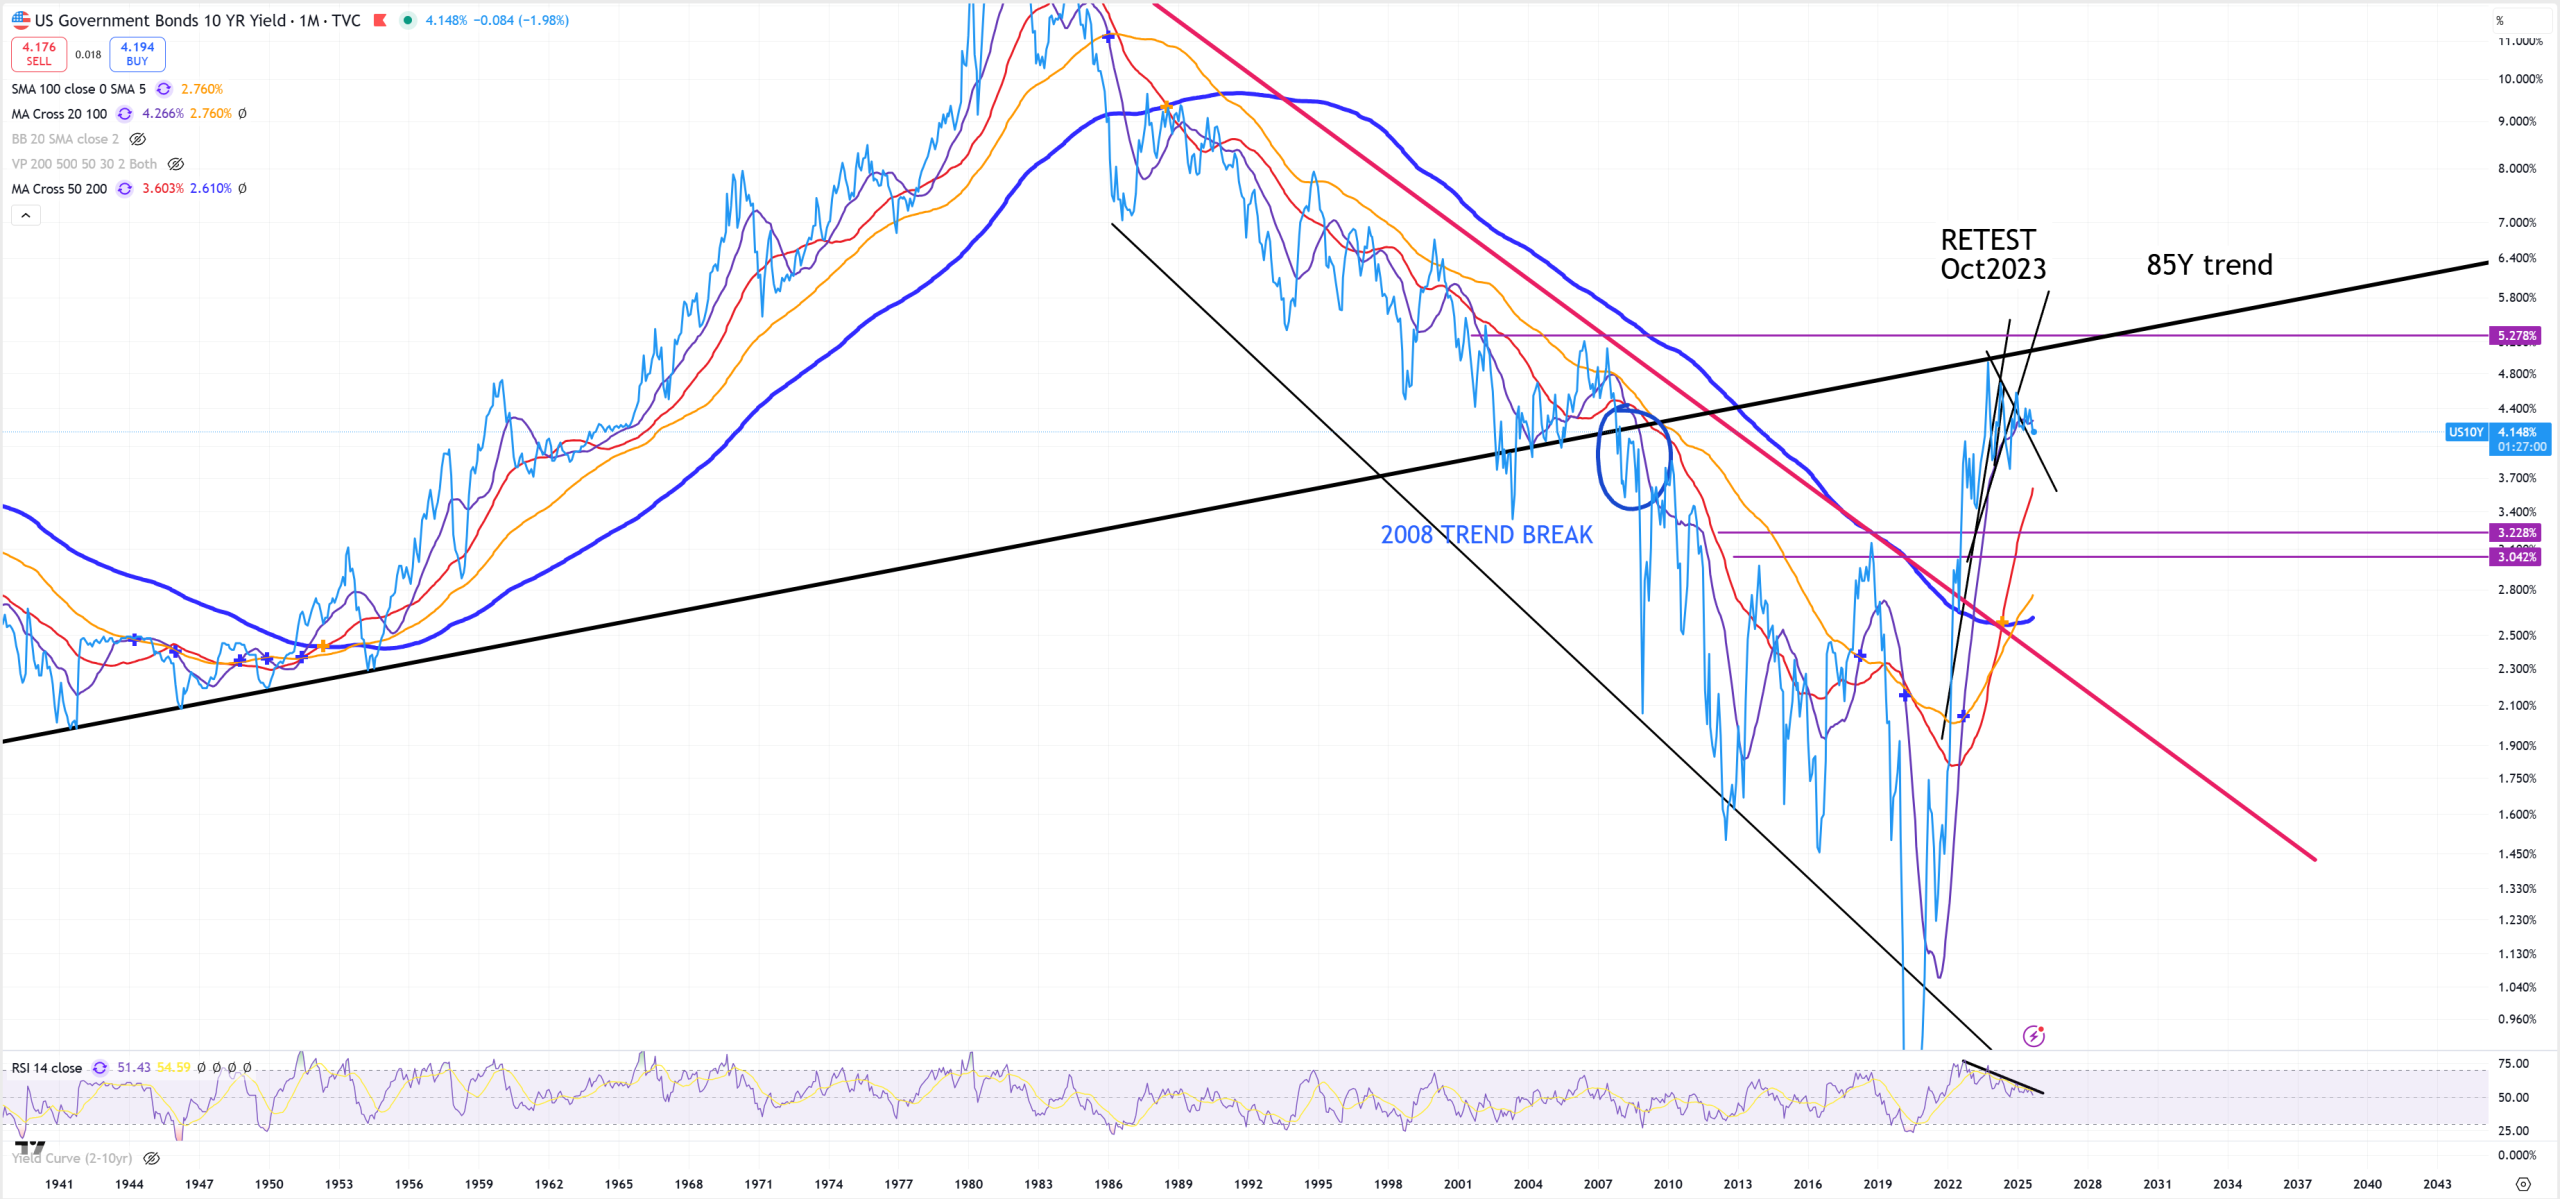
US10Y – line chart and October 2023 still acts as the last point of retest. Many saying we’ll break it higher, I think US will suck liqudity from the world to sponsor their debt.
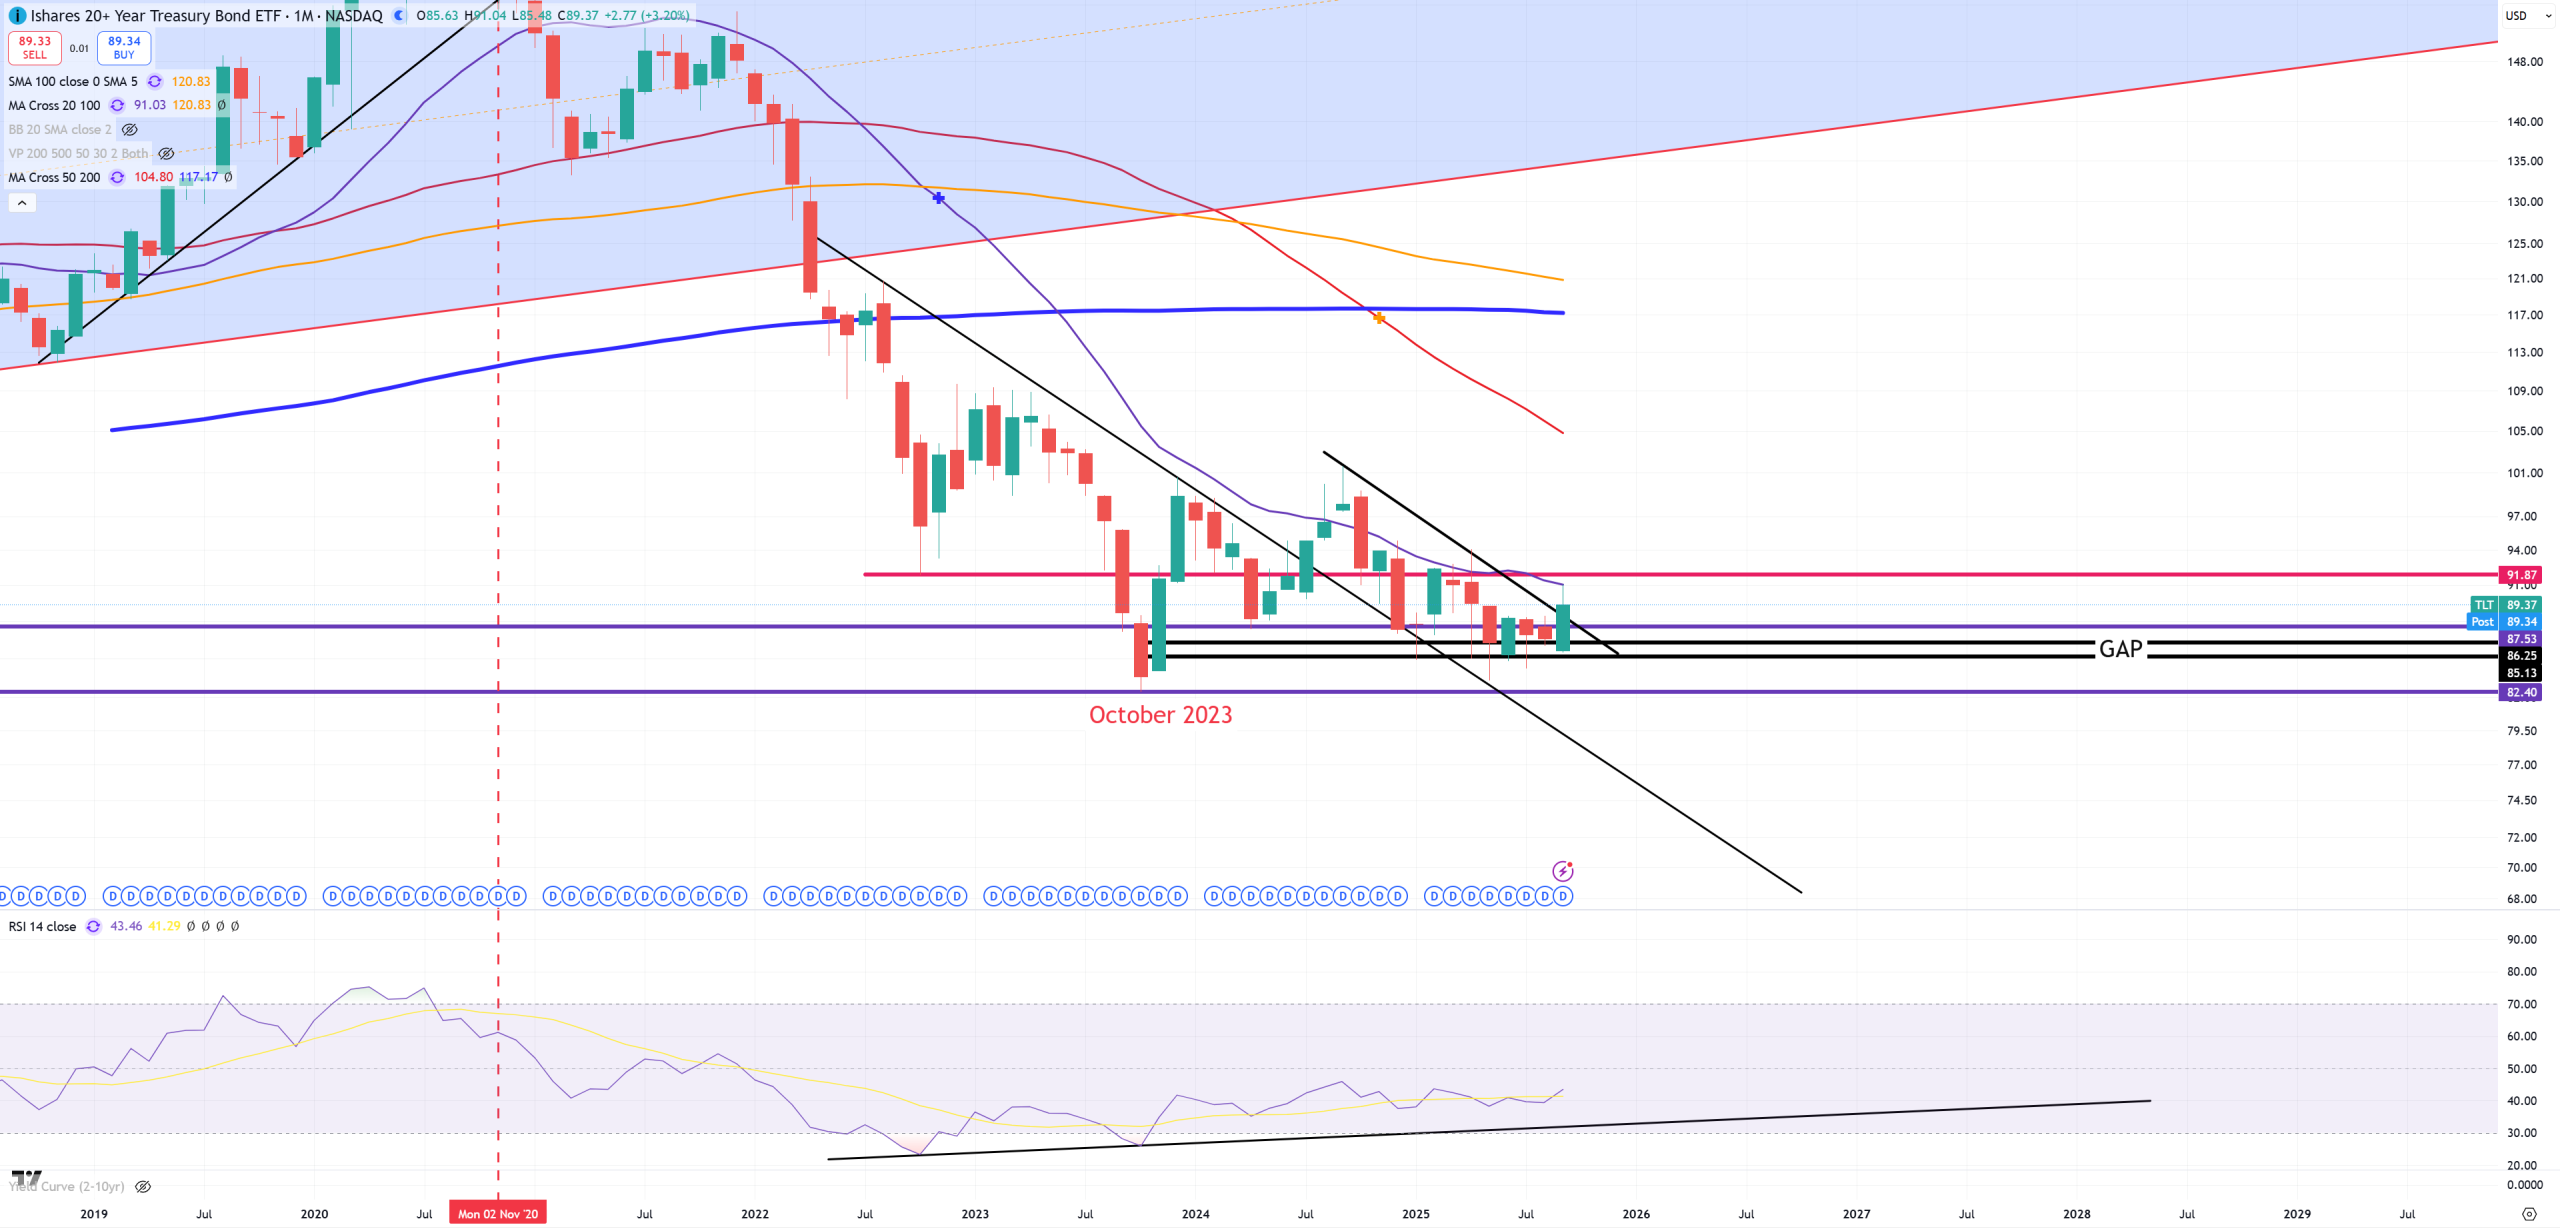
TLT – from (M) point of view the bull case is NOT confirmed as even violet (M)MA20 was not broken. 92$ is the key
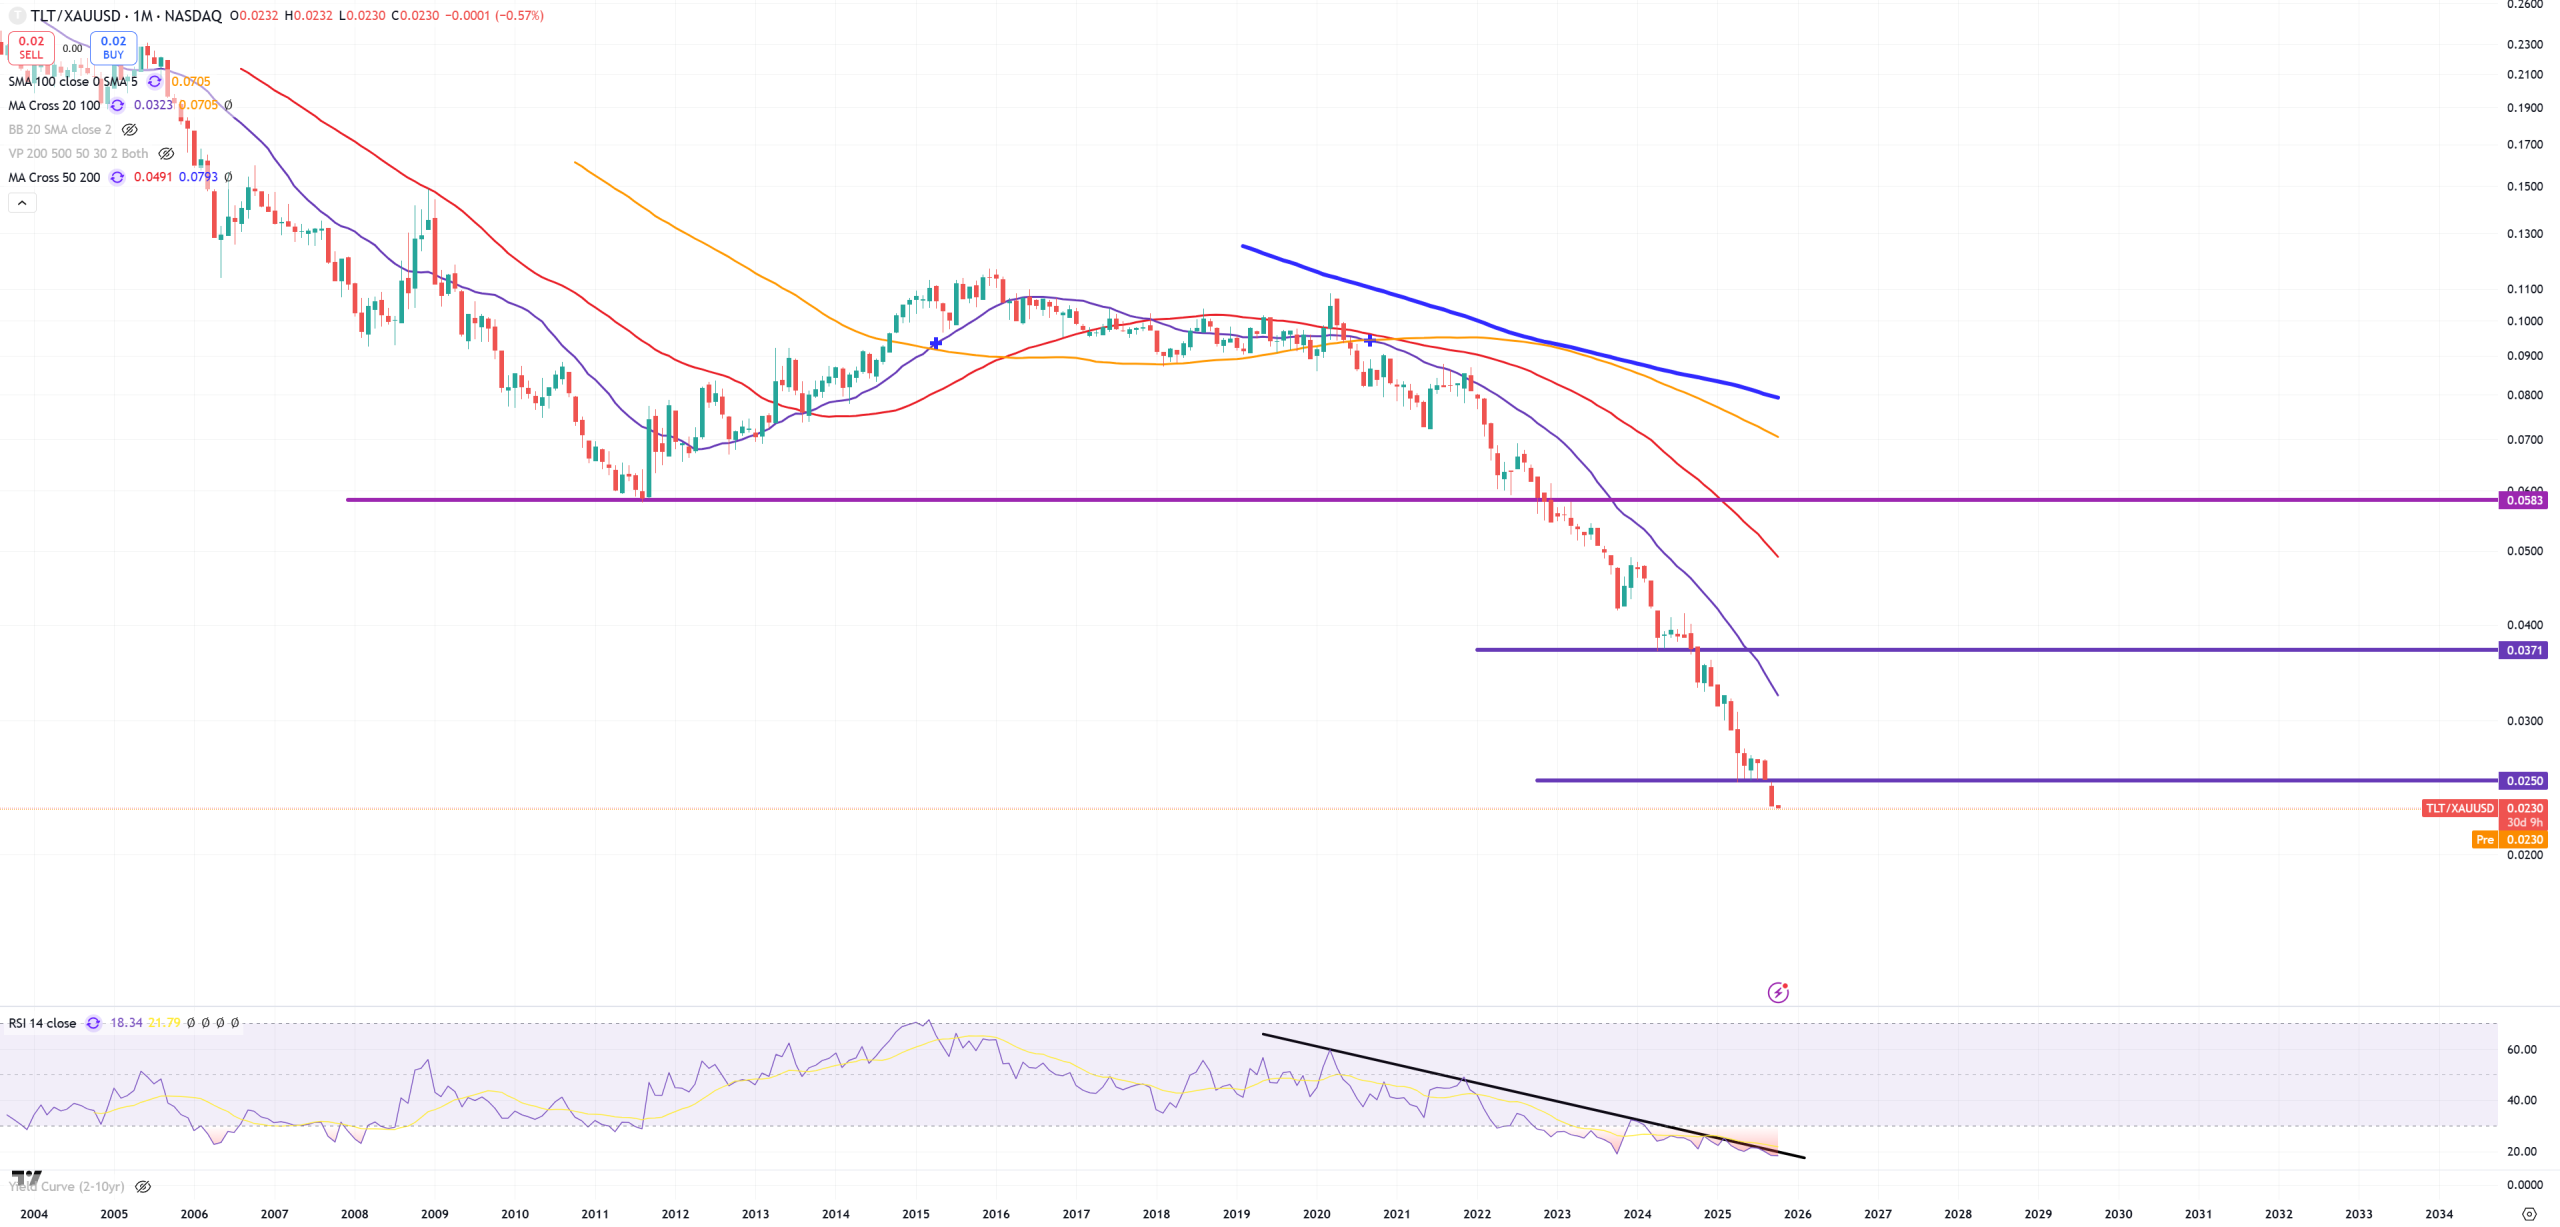
TLT/GOLD and next support GONE, GOLD still > TLT but levels of (M)RSI + trend in (M)RSI will be brutal.
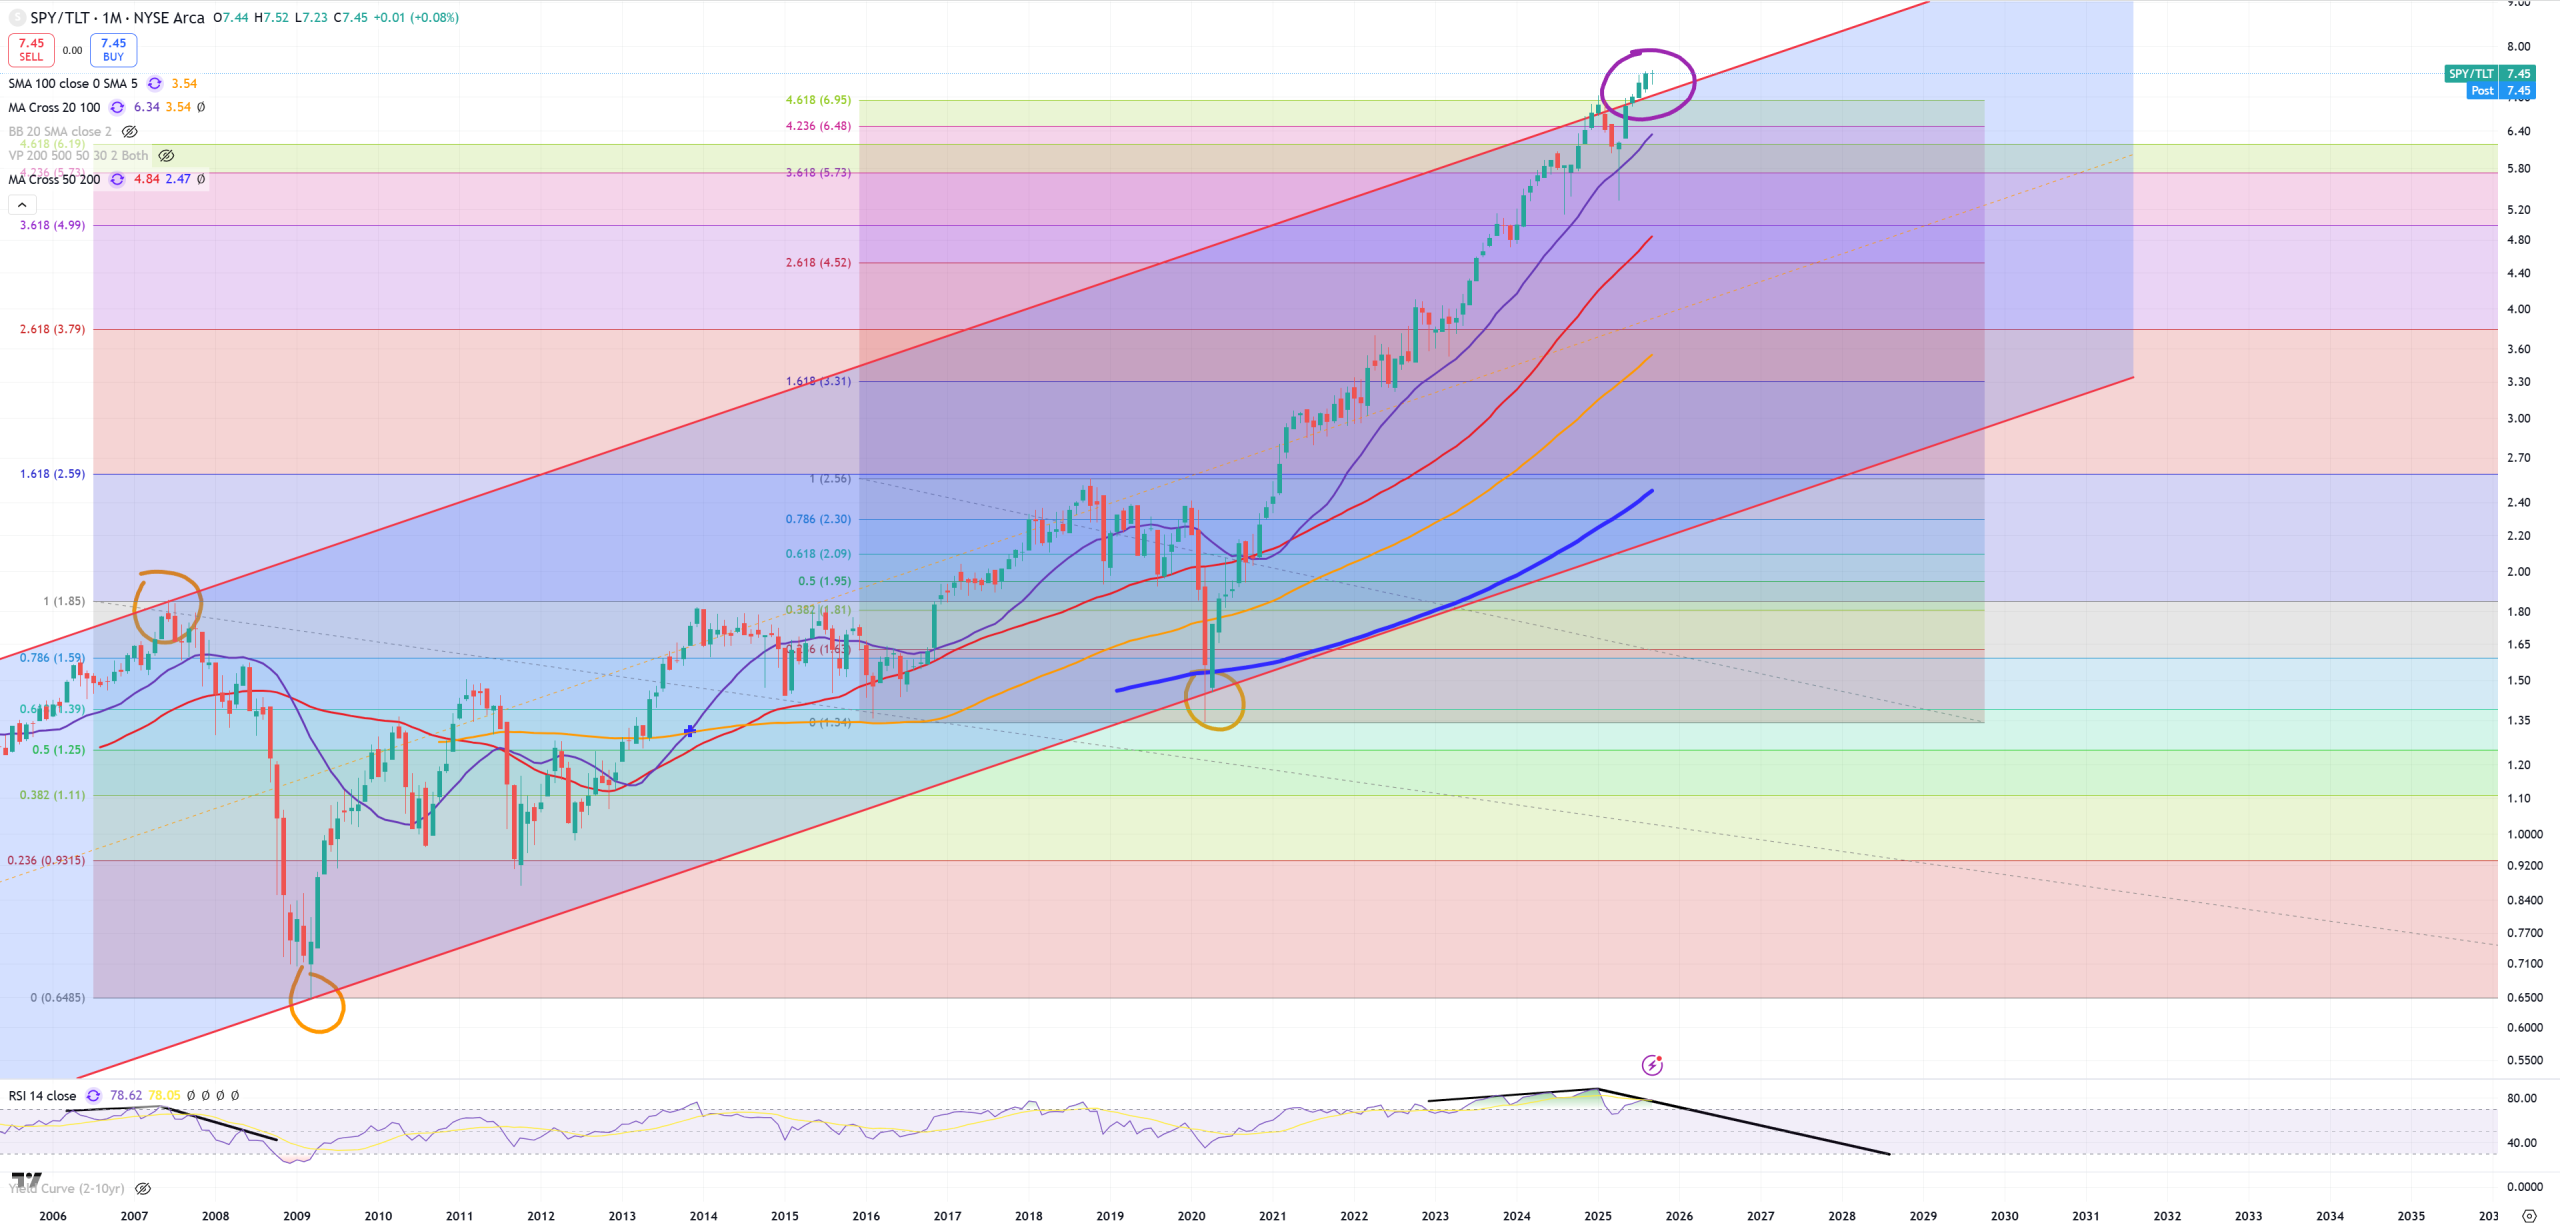
SPY/TLT – I like this chart, but it’s IMO too short to get any kind of trend, stocks outperform bonds by miles here, and I think it won’t change until under next point you see a big break
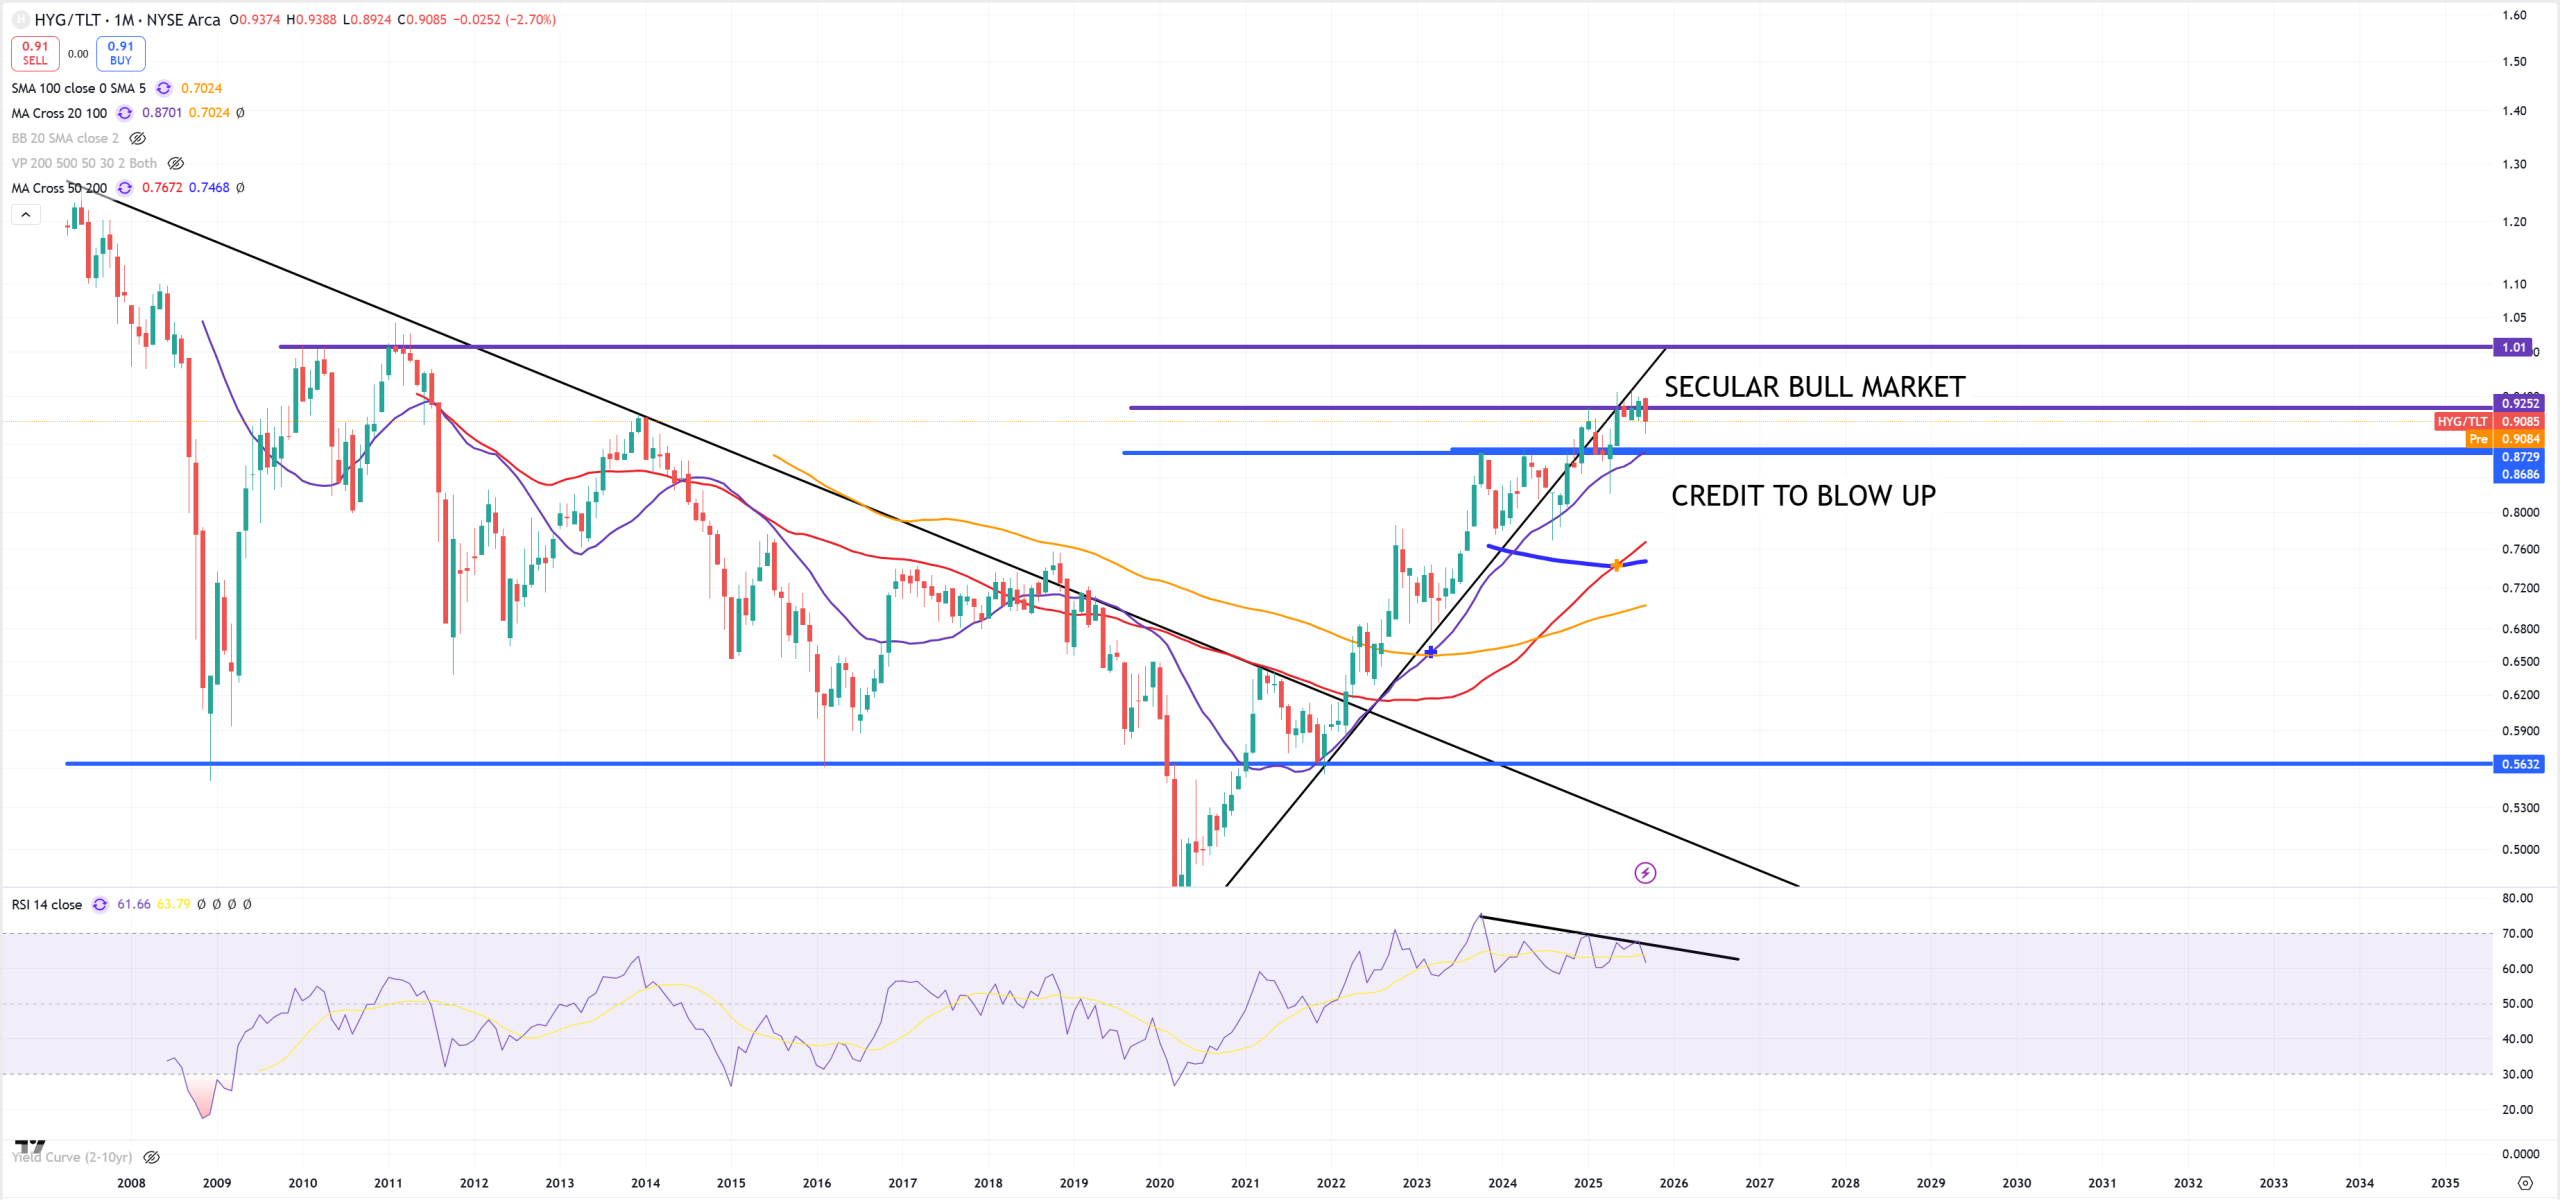
HYG/TLT – I like this indicator pointing for a credit problem once it starts going lower.
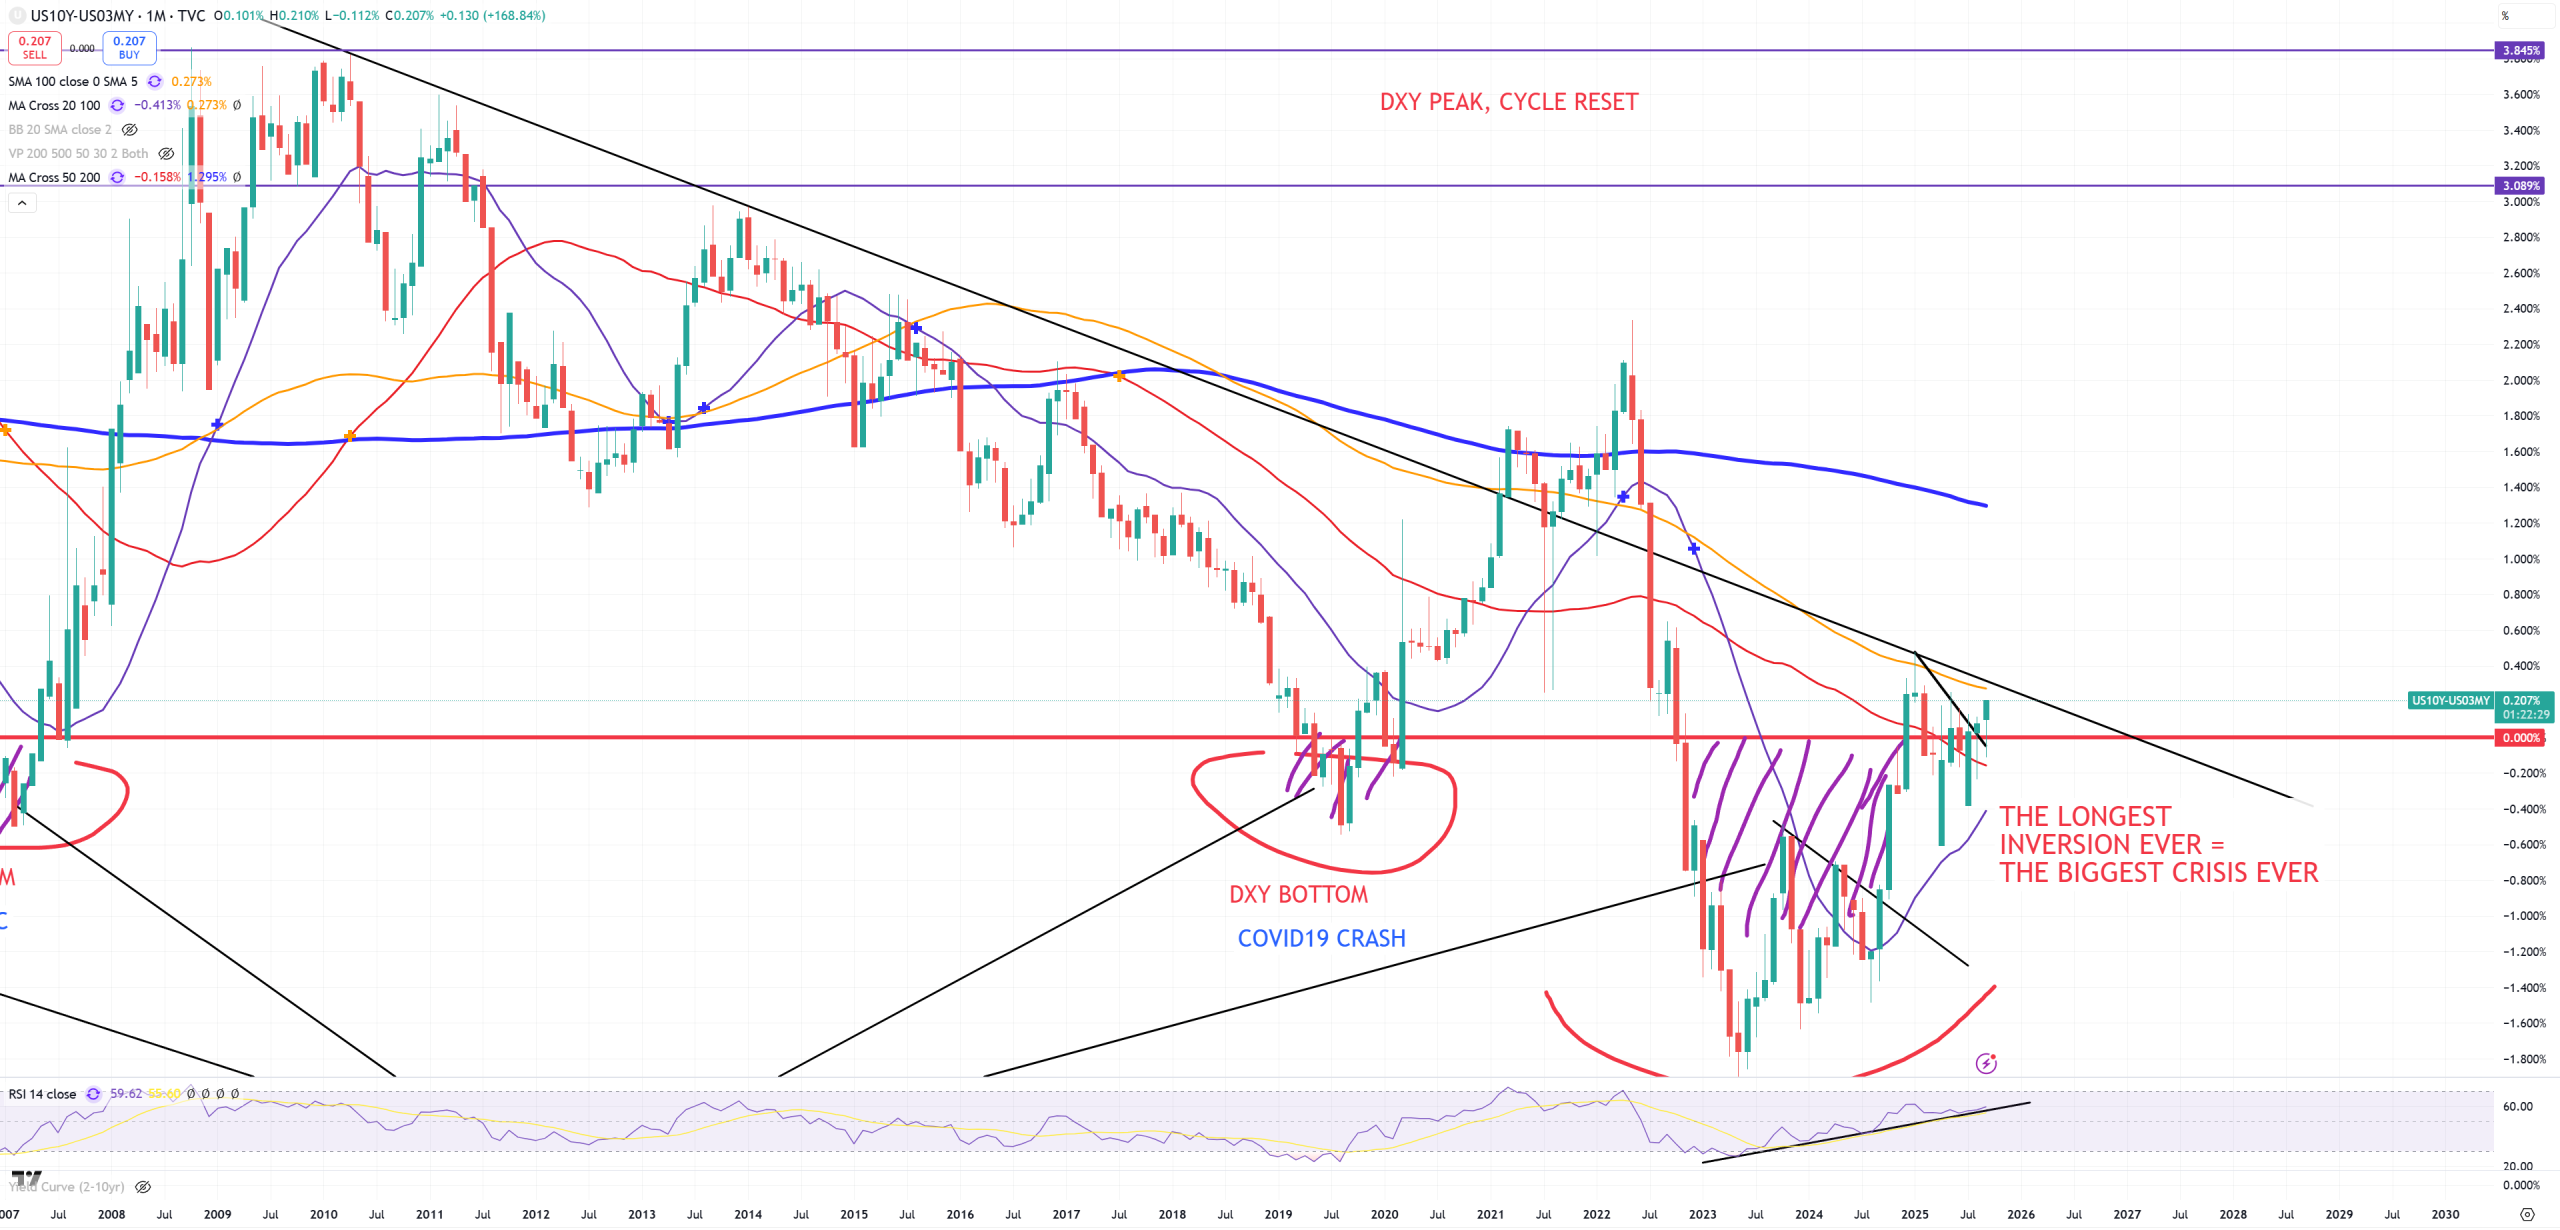
US10Y/US03MY – 1100 days of inversion or around inversion, previous record belonged to 1929 maybe soon will be doubled (700 days). Just +20bps – nothing happens to be interested in this spread. Until +50-60bps nothing is going to happen. This spread still proves that we’re on the same 2009+ cycle with the biggest rescue around 2022 when from +2.2% we managed to crash to -2.0%. Gravity still building.
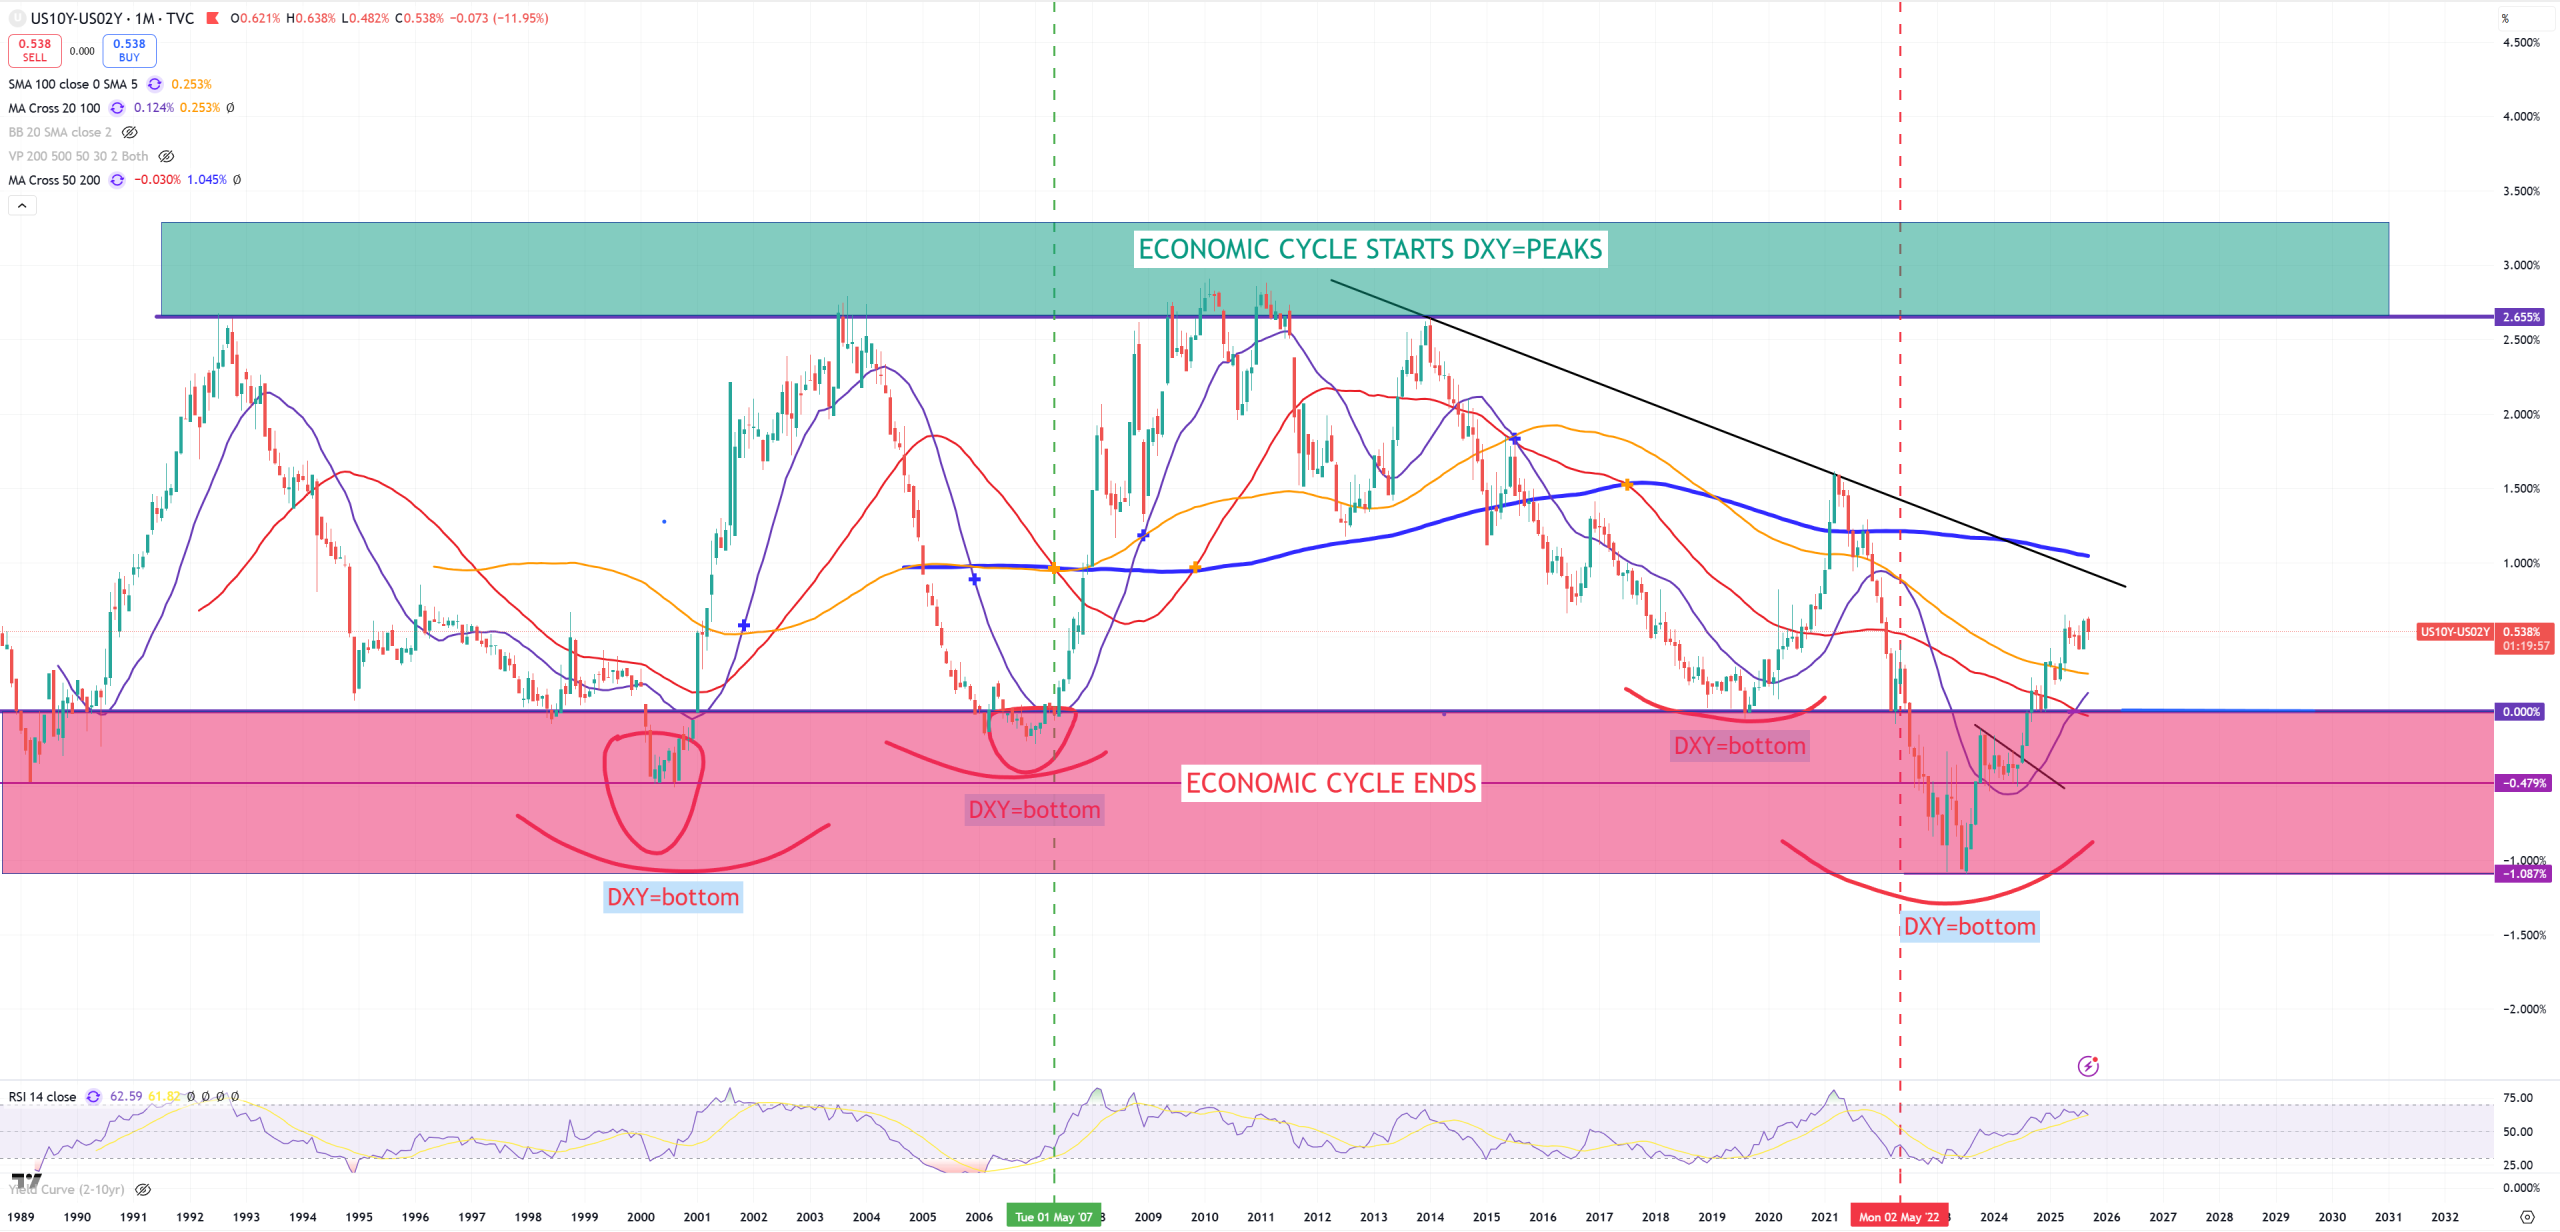
US10Y/US02Y – this spread should predict the future of 10Y/3M, with almost +60bps we’re on a level of March 2020, November 2007, March 2001. 10Y/3M is way more important spread than this one.
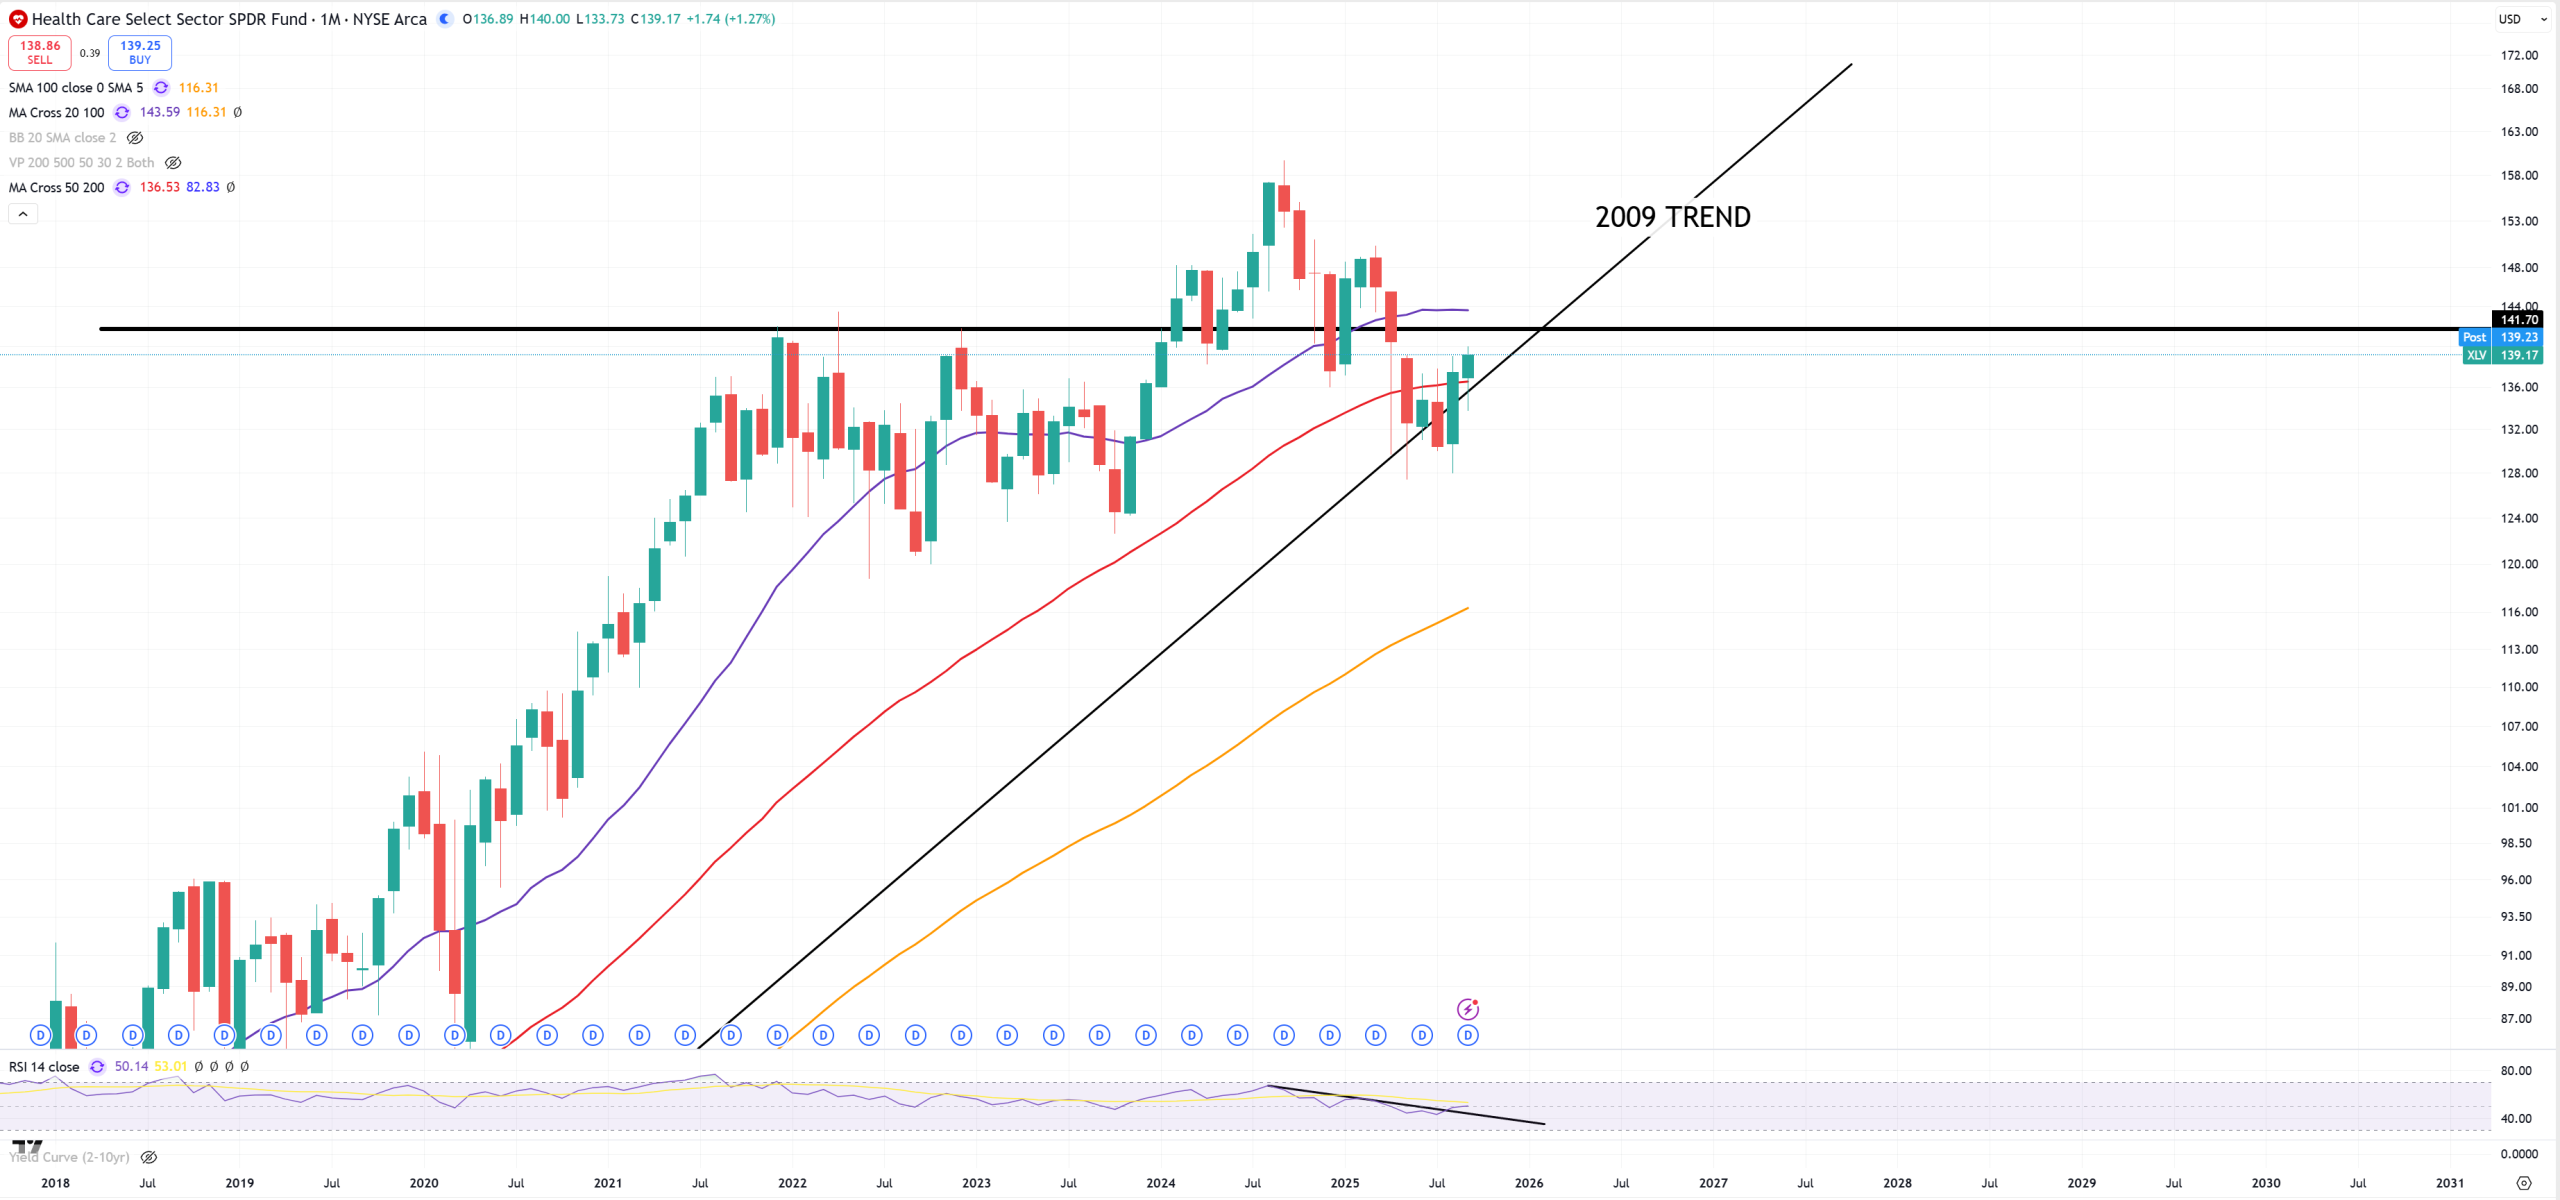
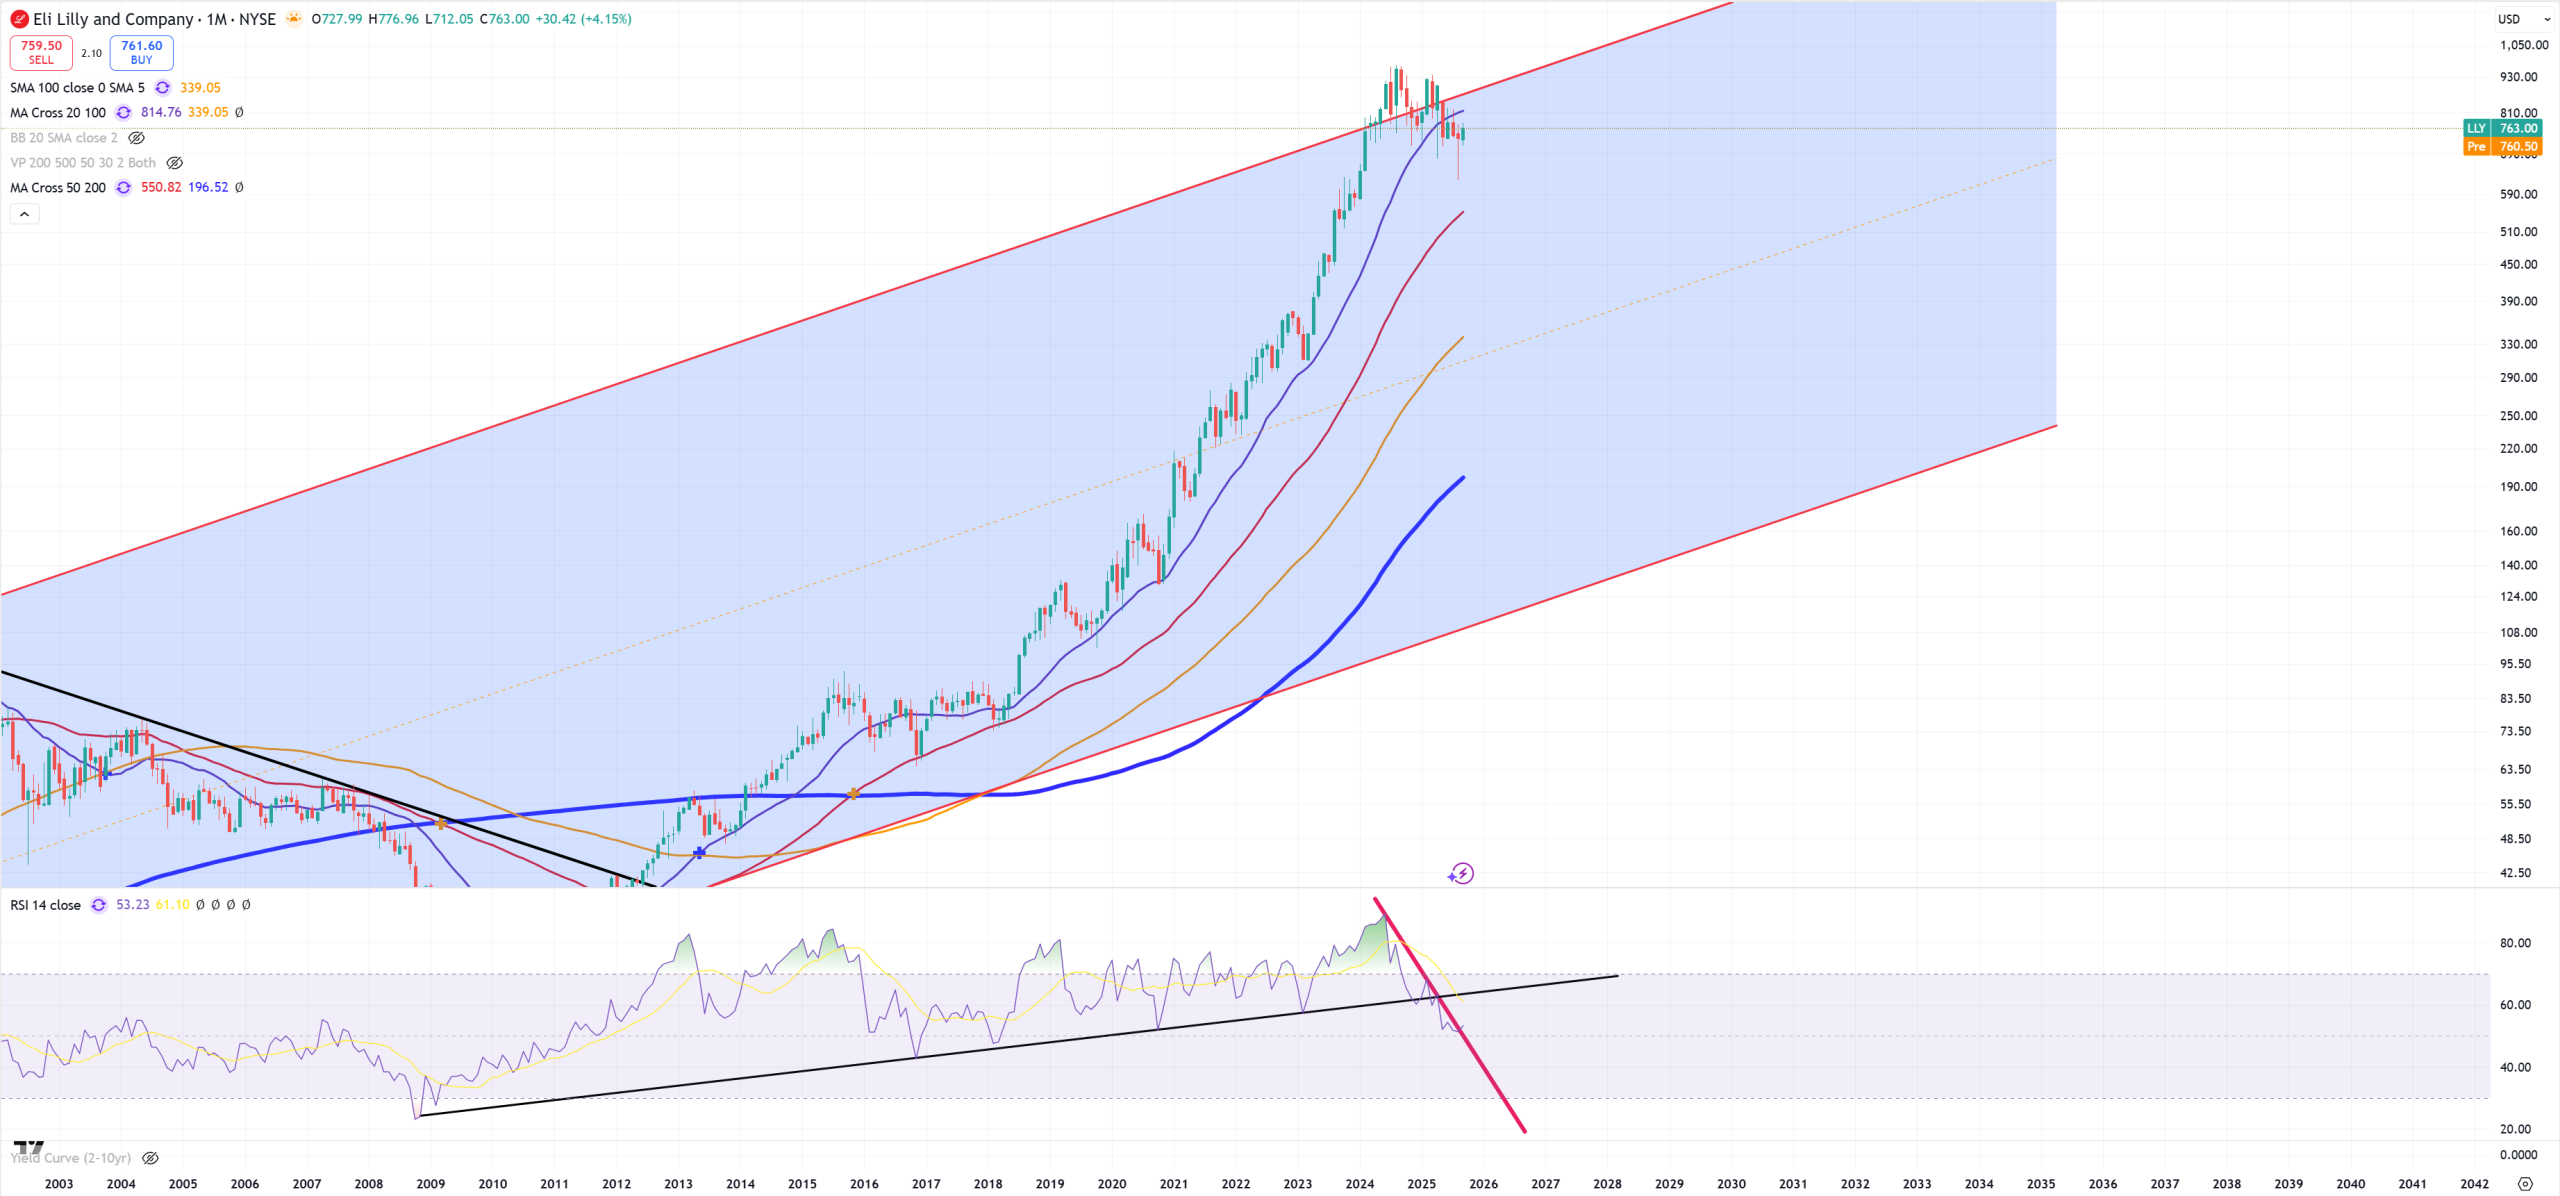
XLV – bulls were fighting and they won here (M)MA50 saved + 2009 trend let’s see for how long, XLV still looks the weakest from all sector ETFs.
LLY – main component of XLV
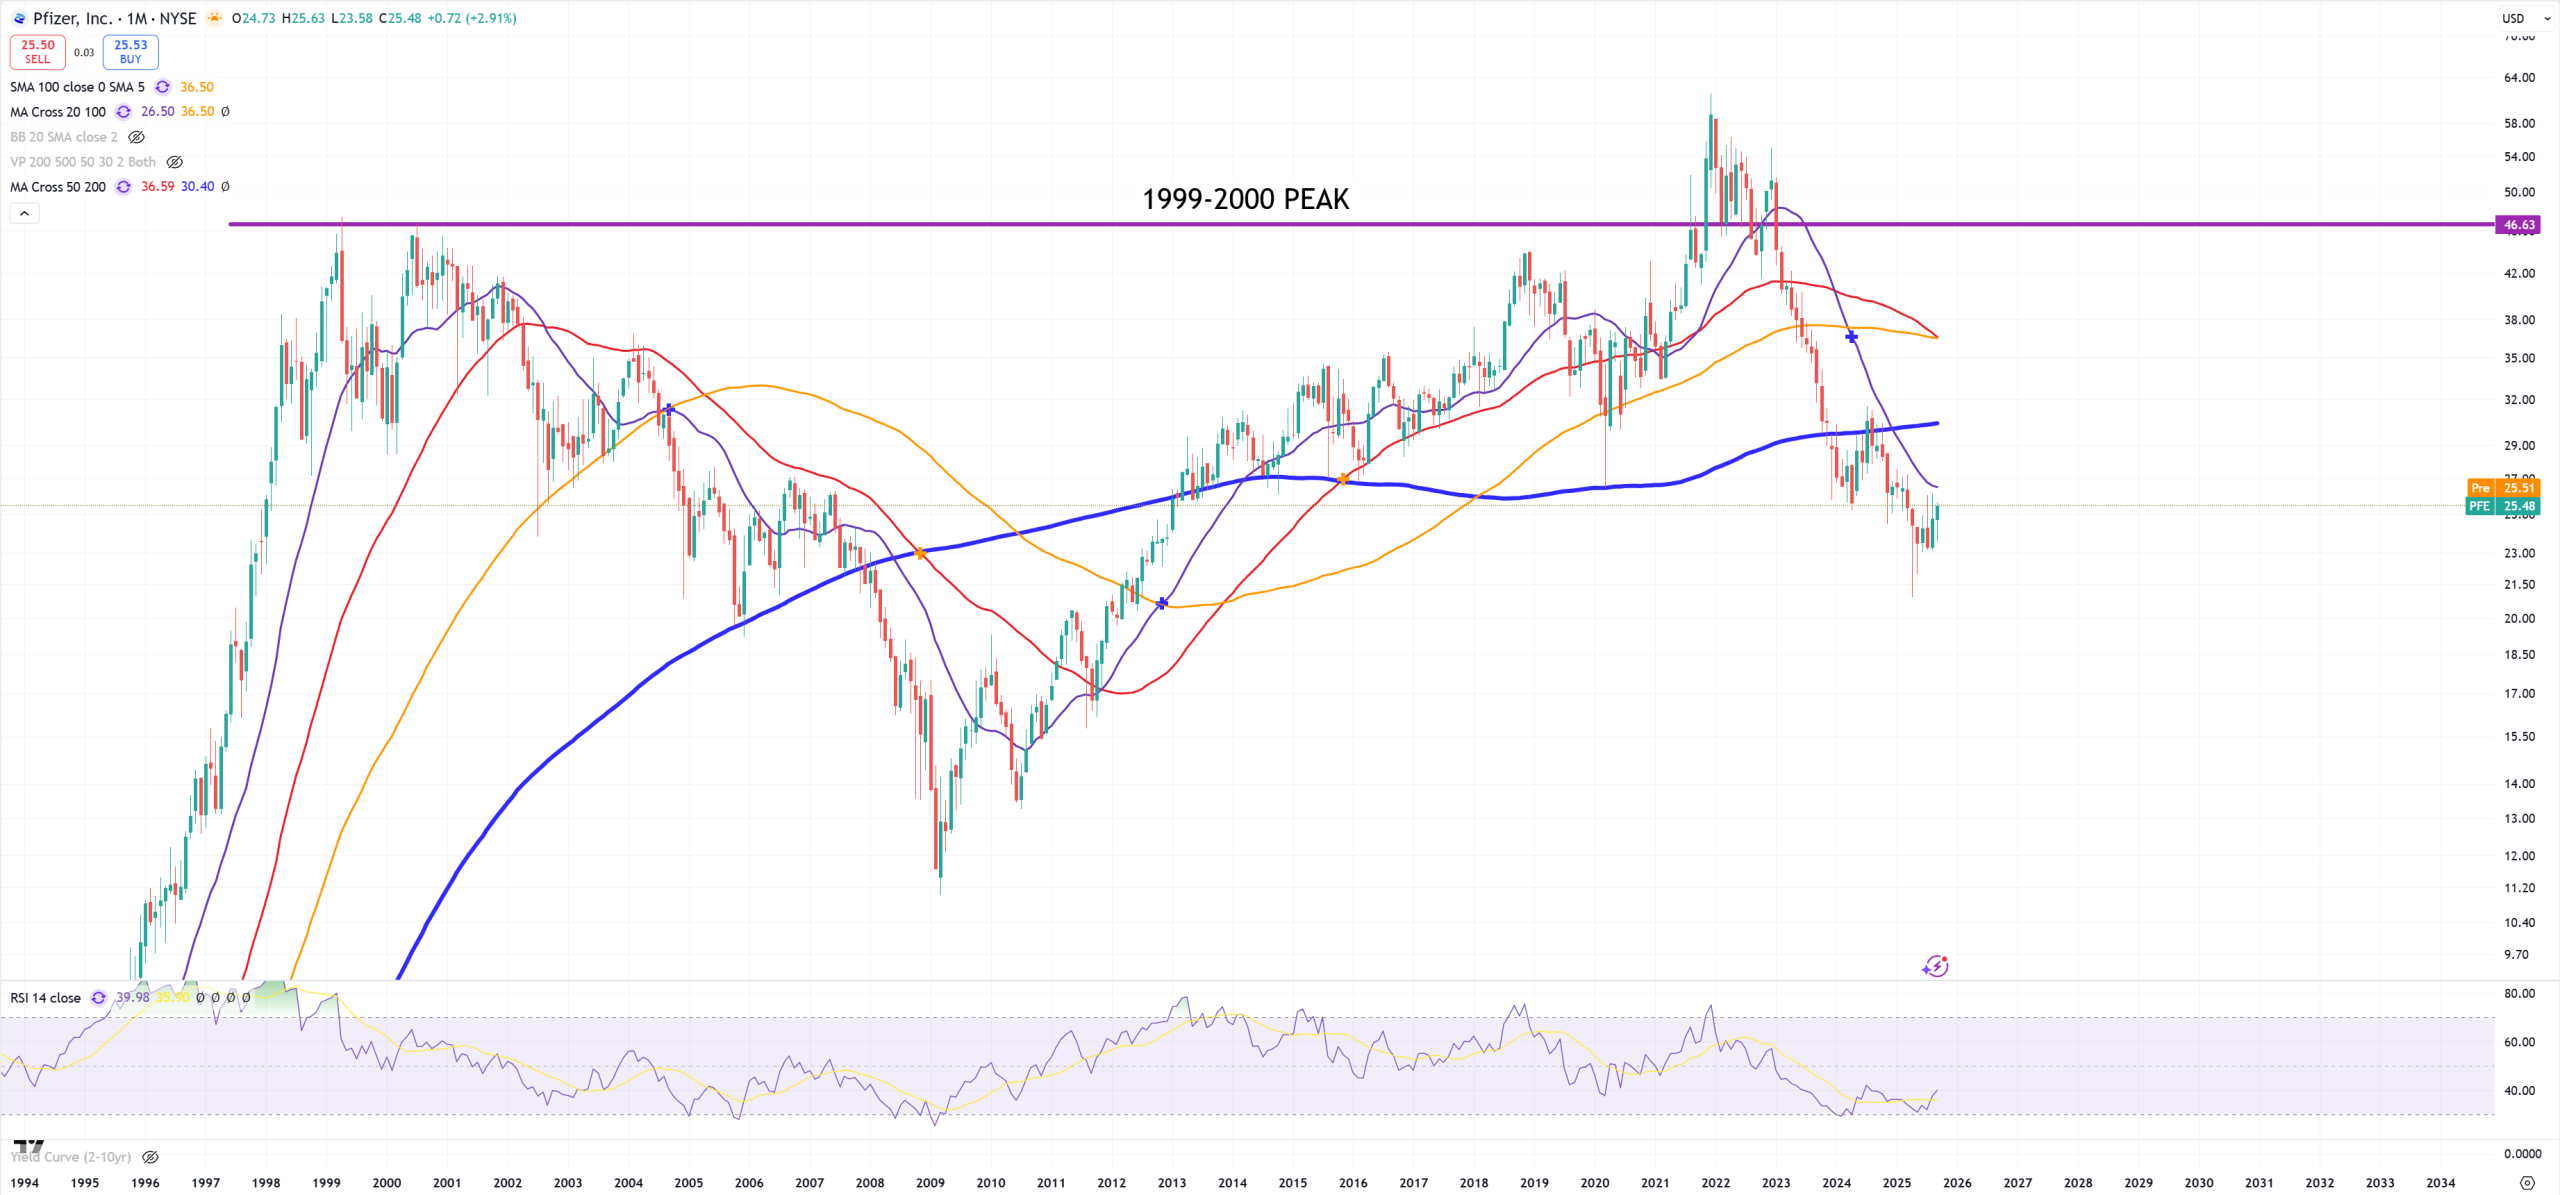
PFE – Pfizer
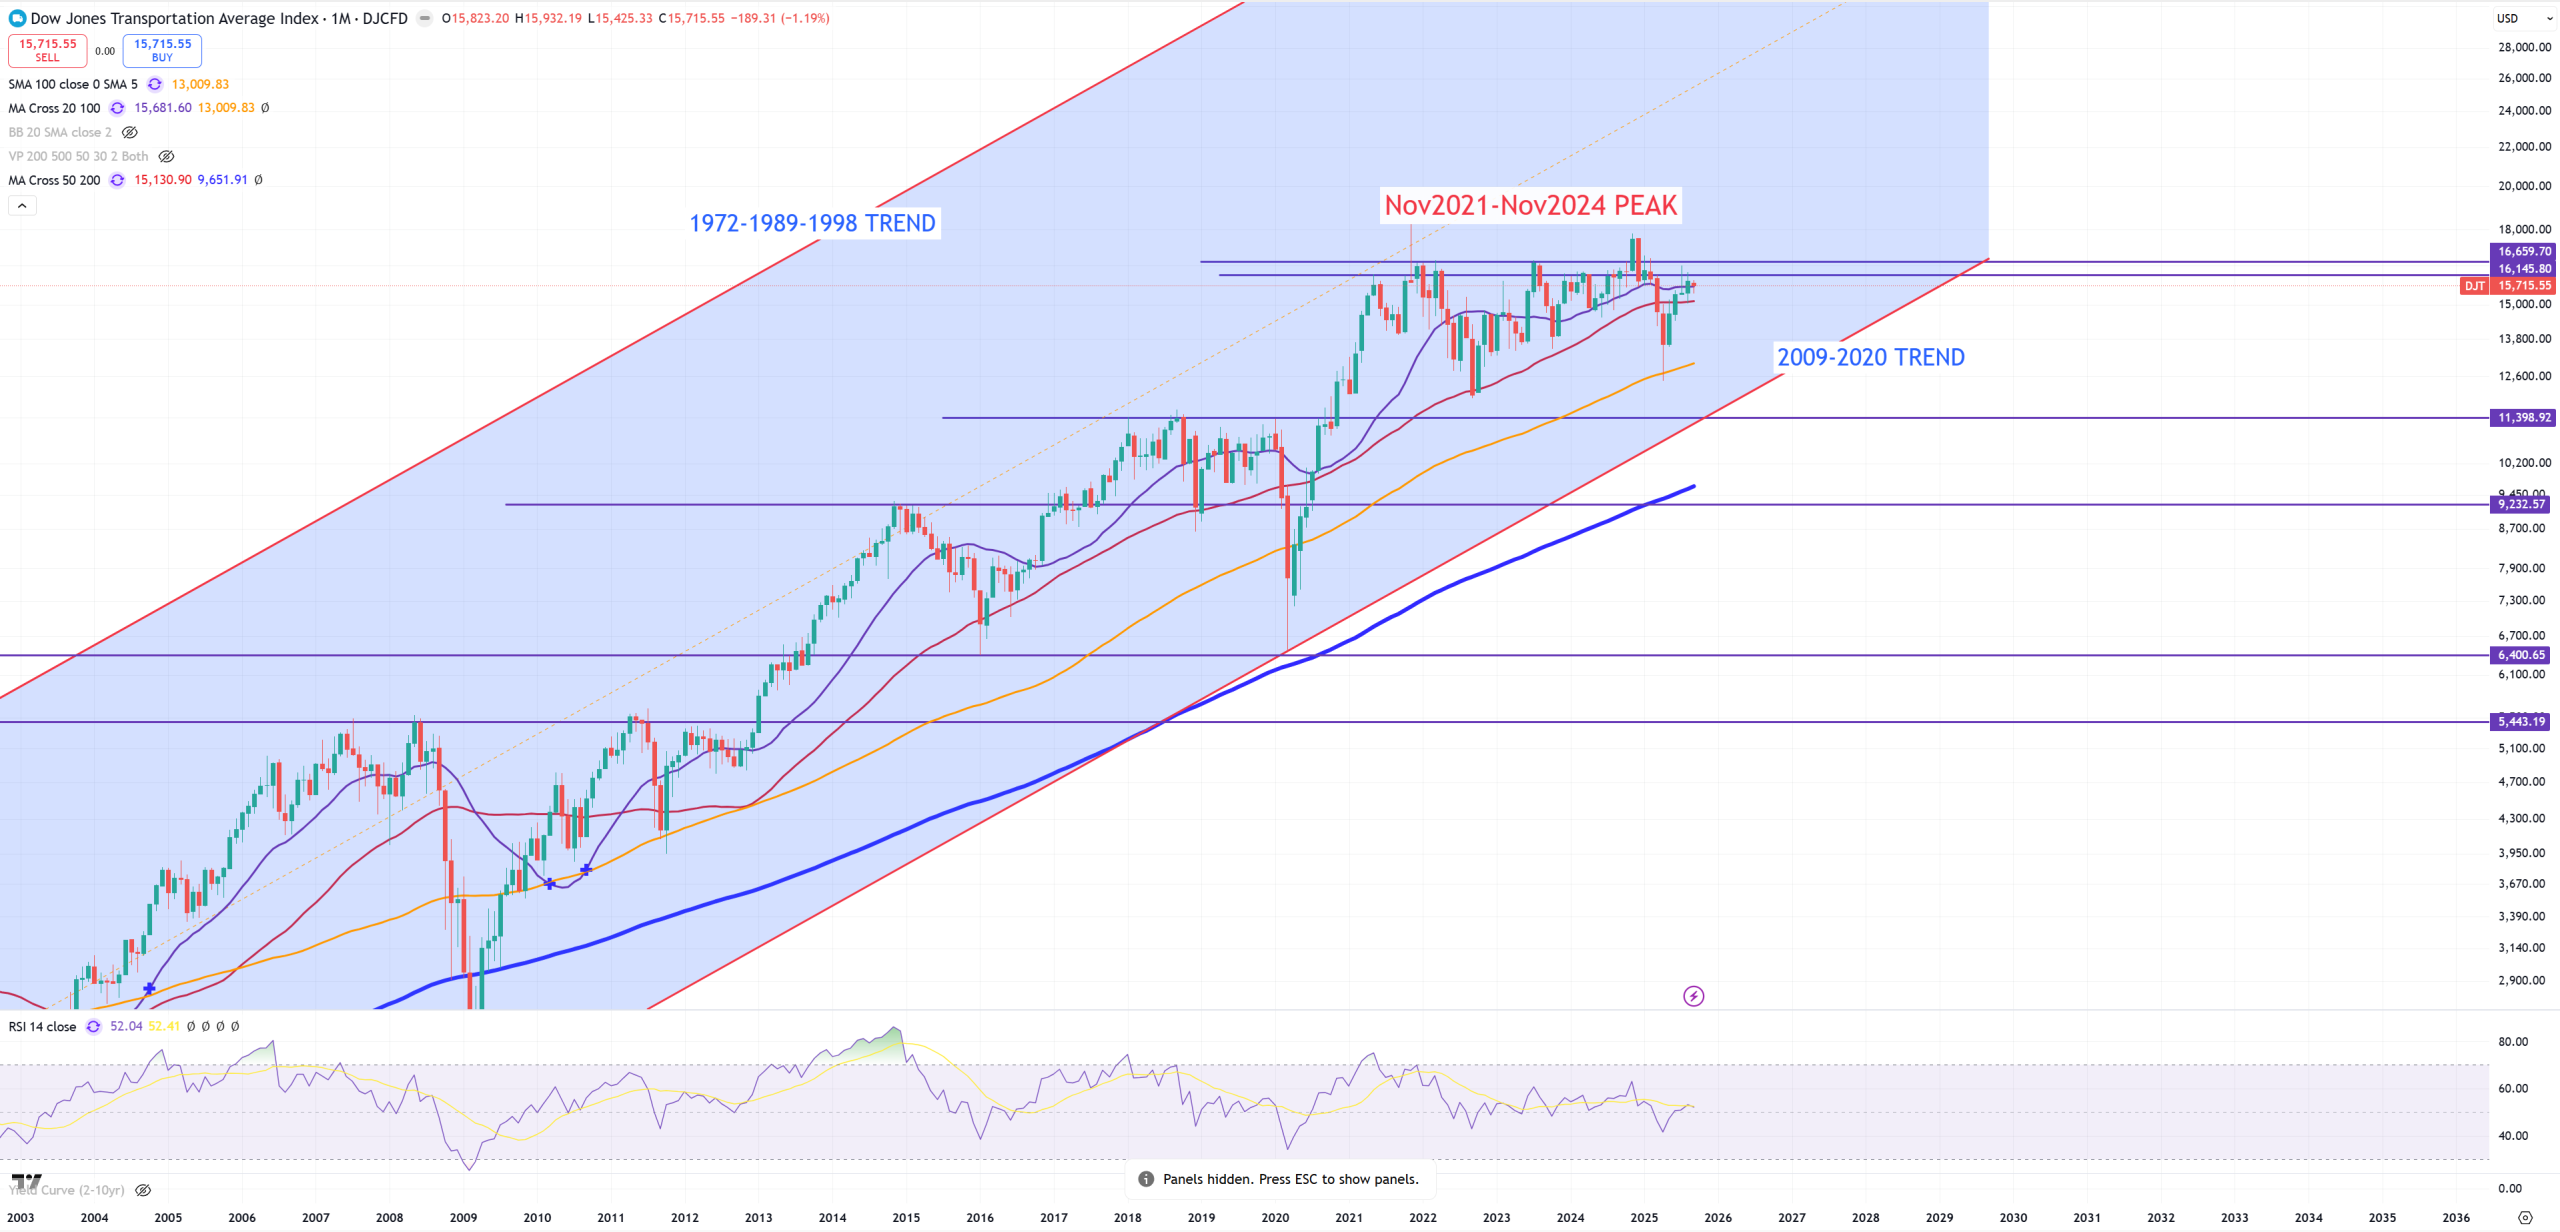
DJT – Dow Jones Transportation
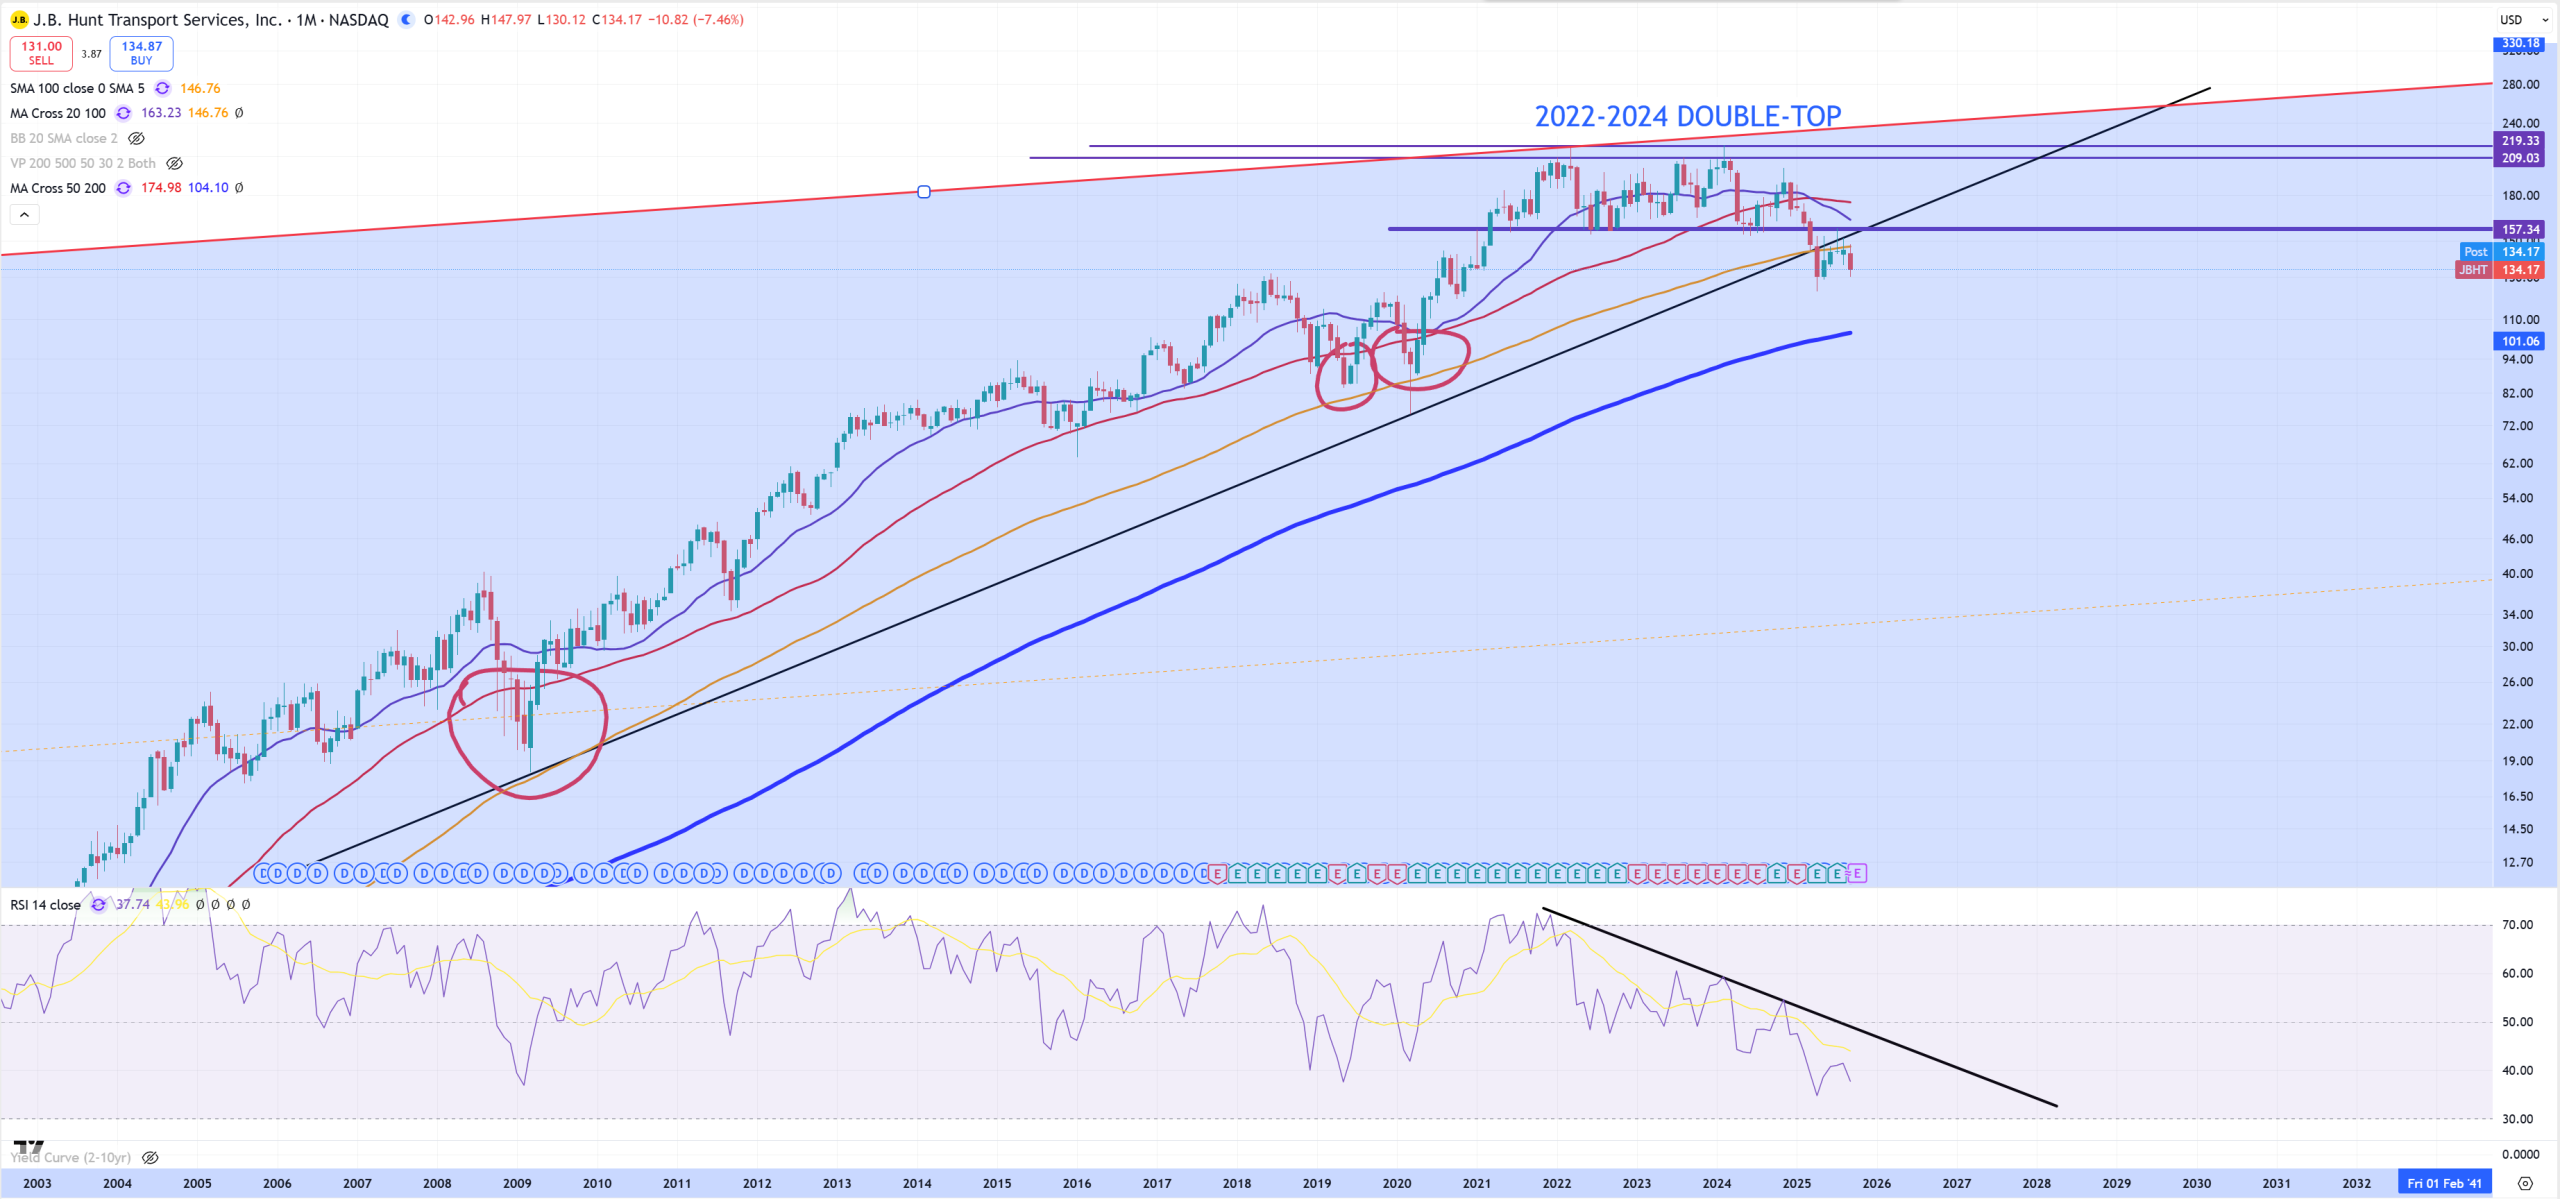
JBHT – road transport sucks and it looks like a big drop coming
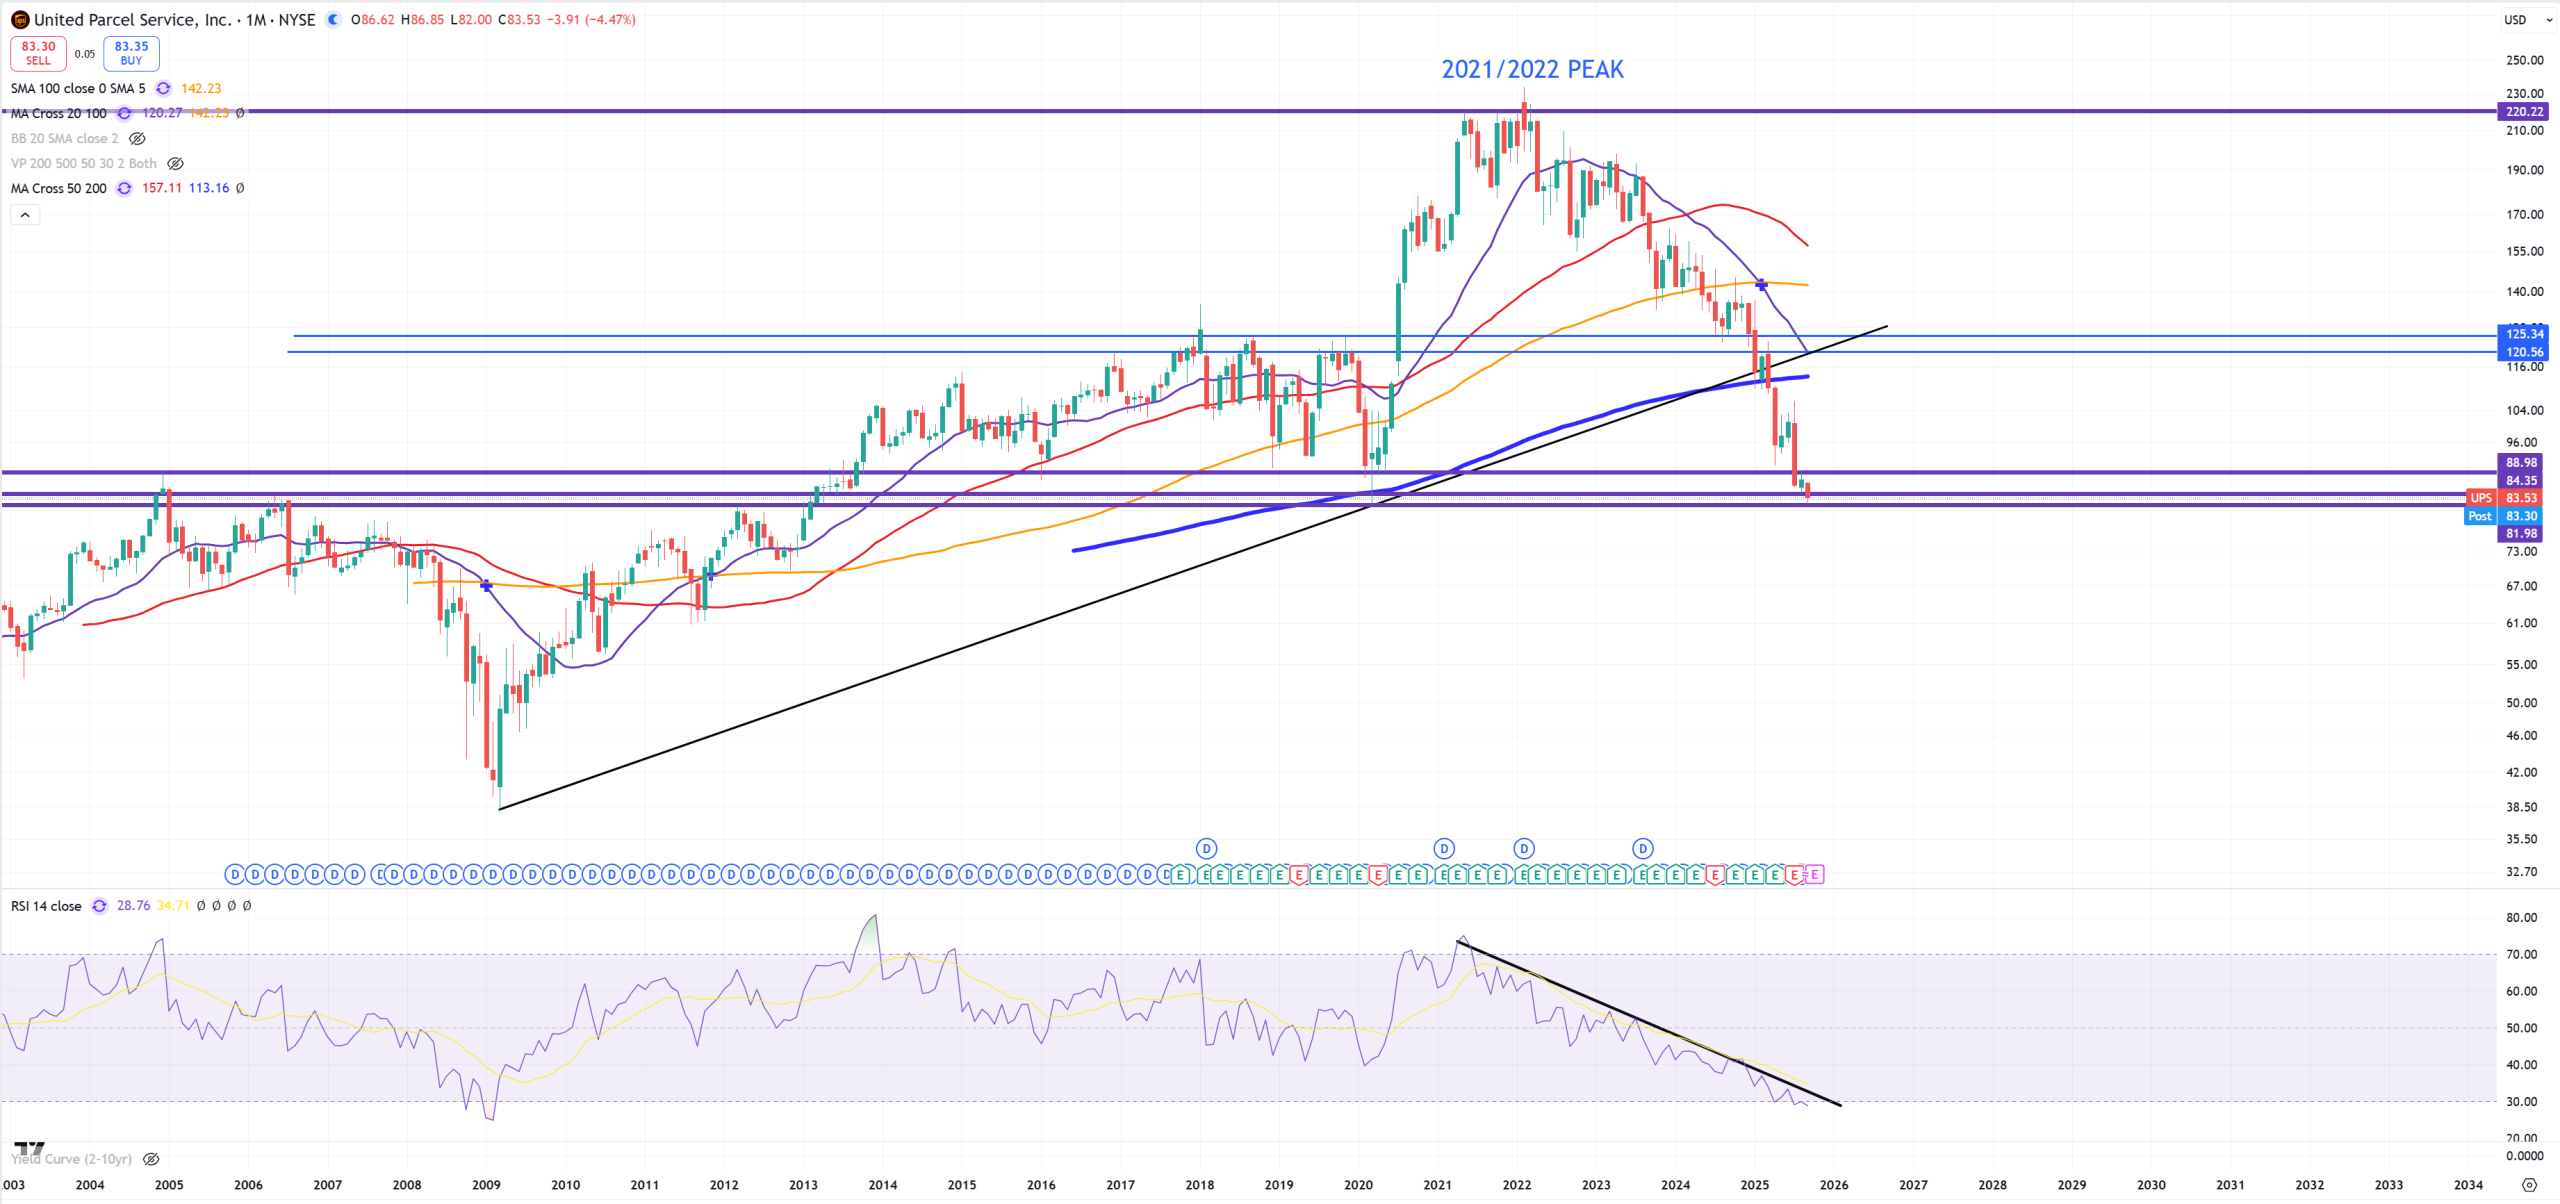
UPS – is now below 2005 peak – again 2005 peak!!!!!!!!!!!!!!!!!!!!!!!!!! And lockdown 2020 levels.
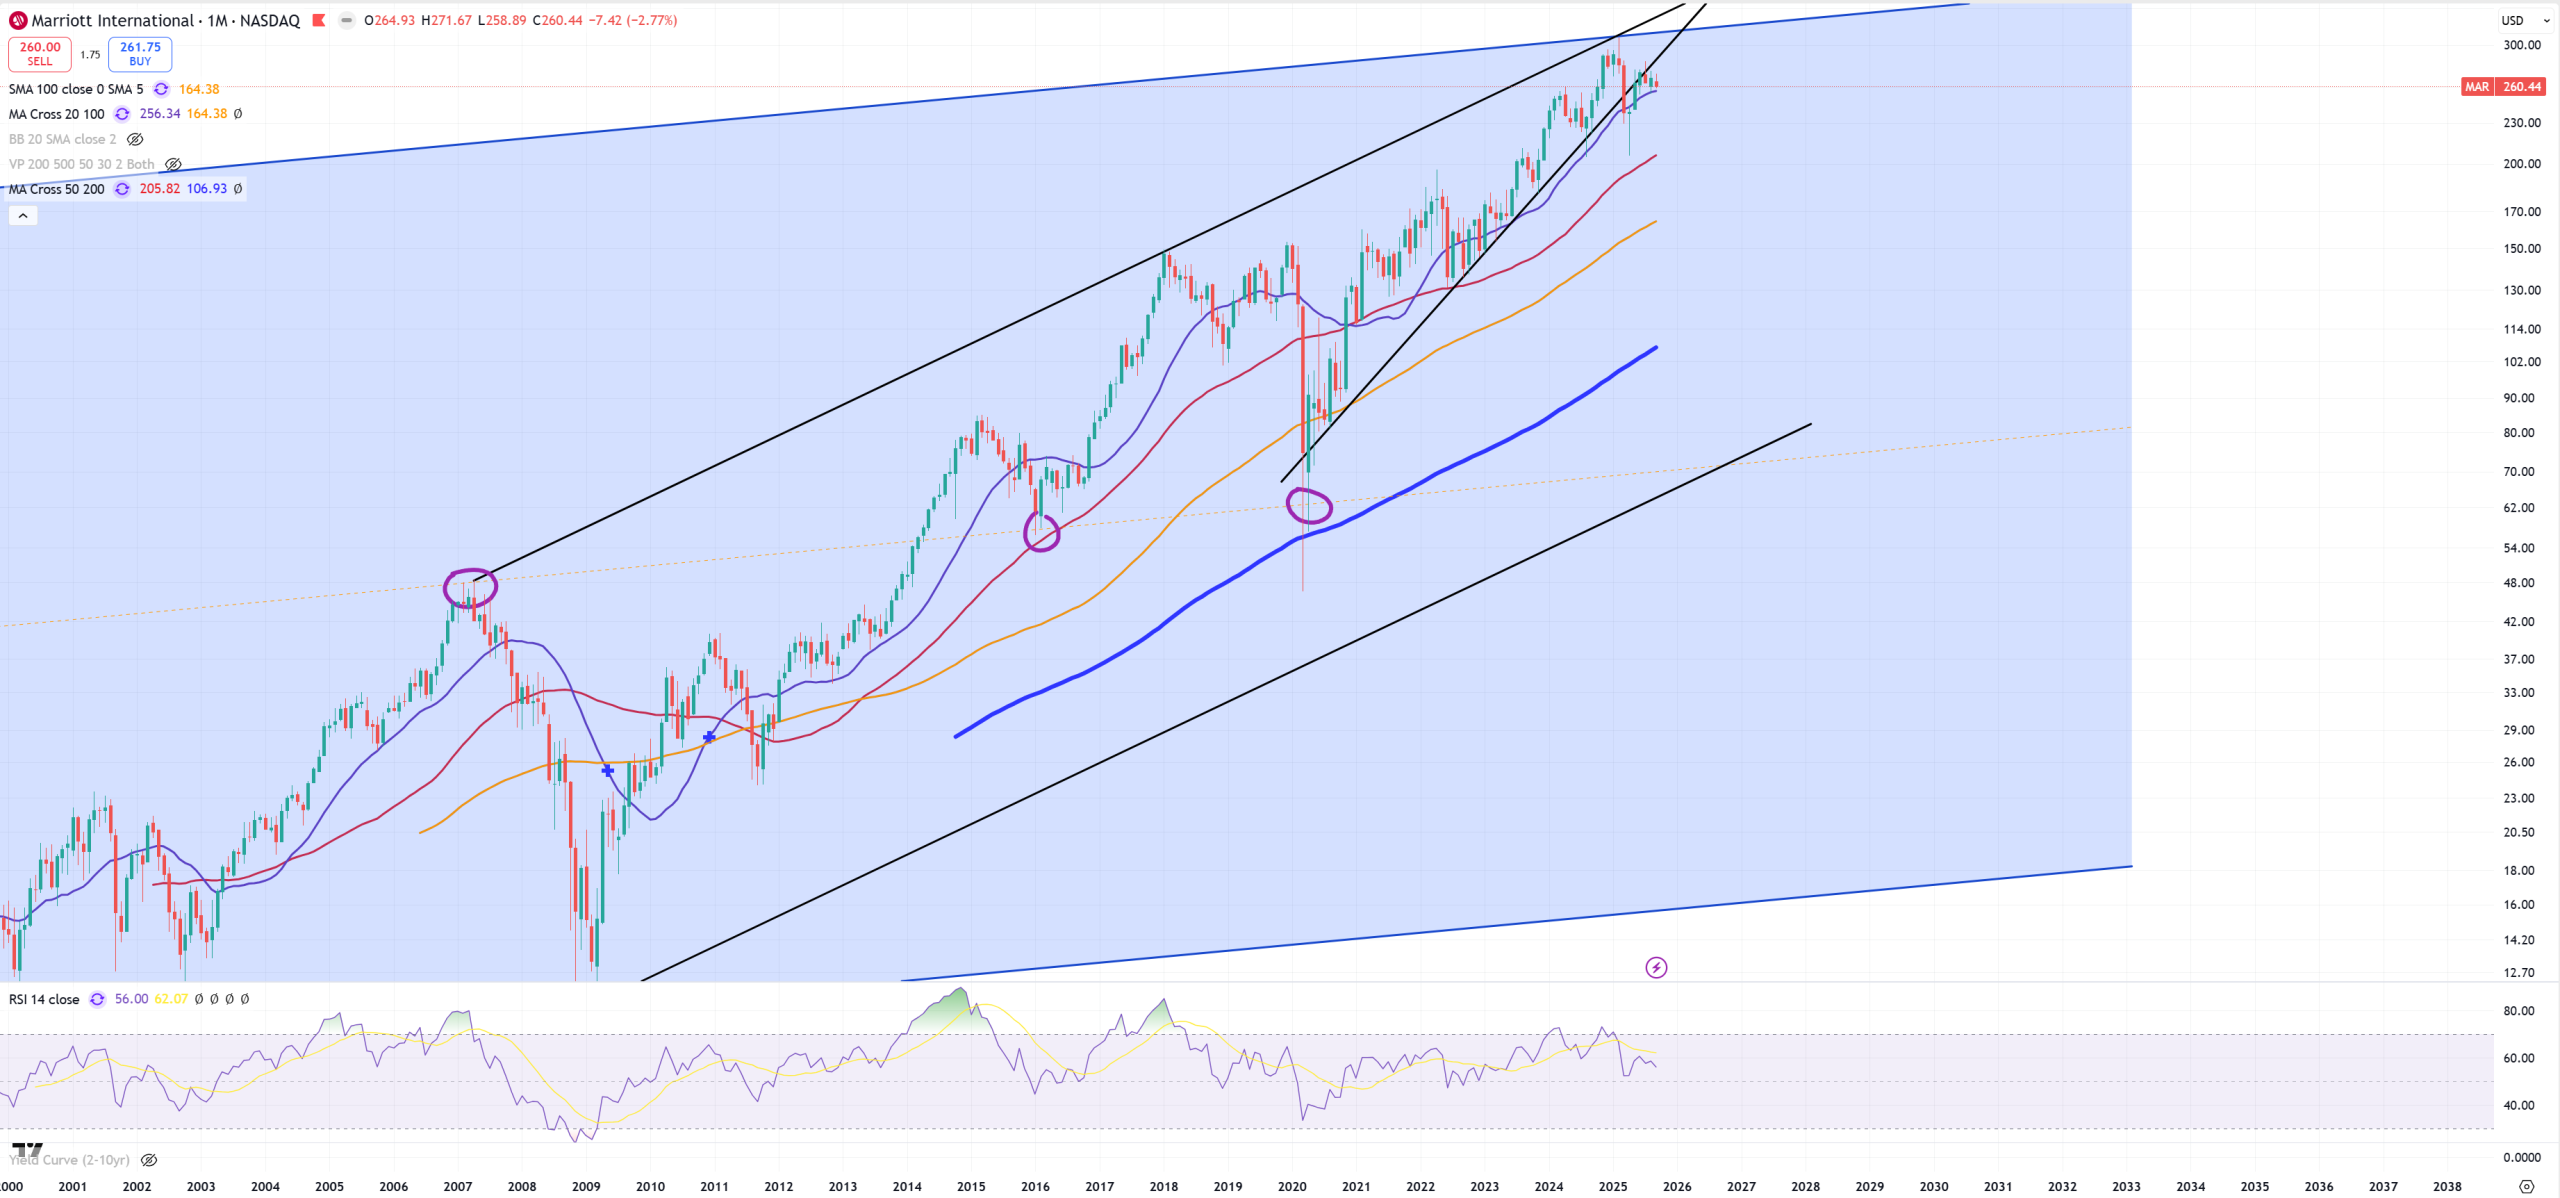
MAR – Hotels in general start to feel the pain. More exclusive not big one
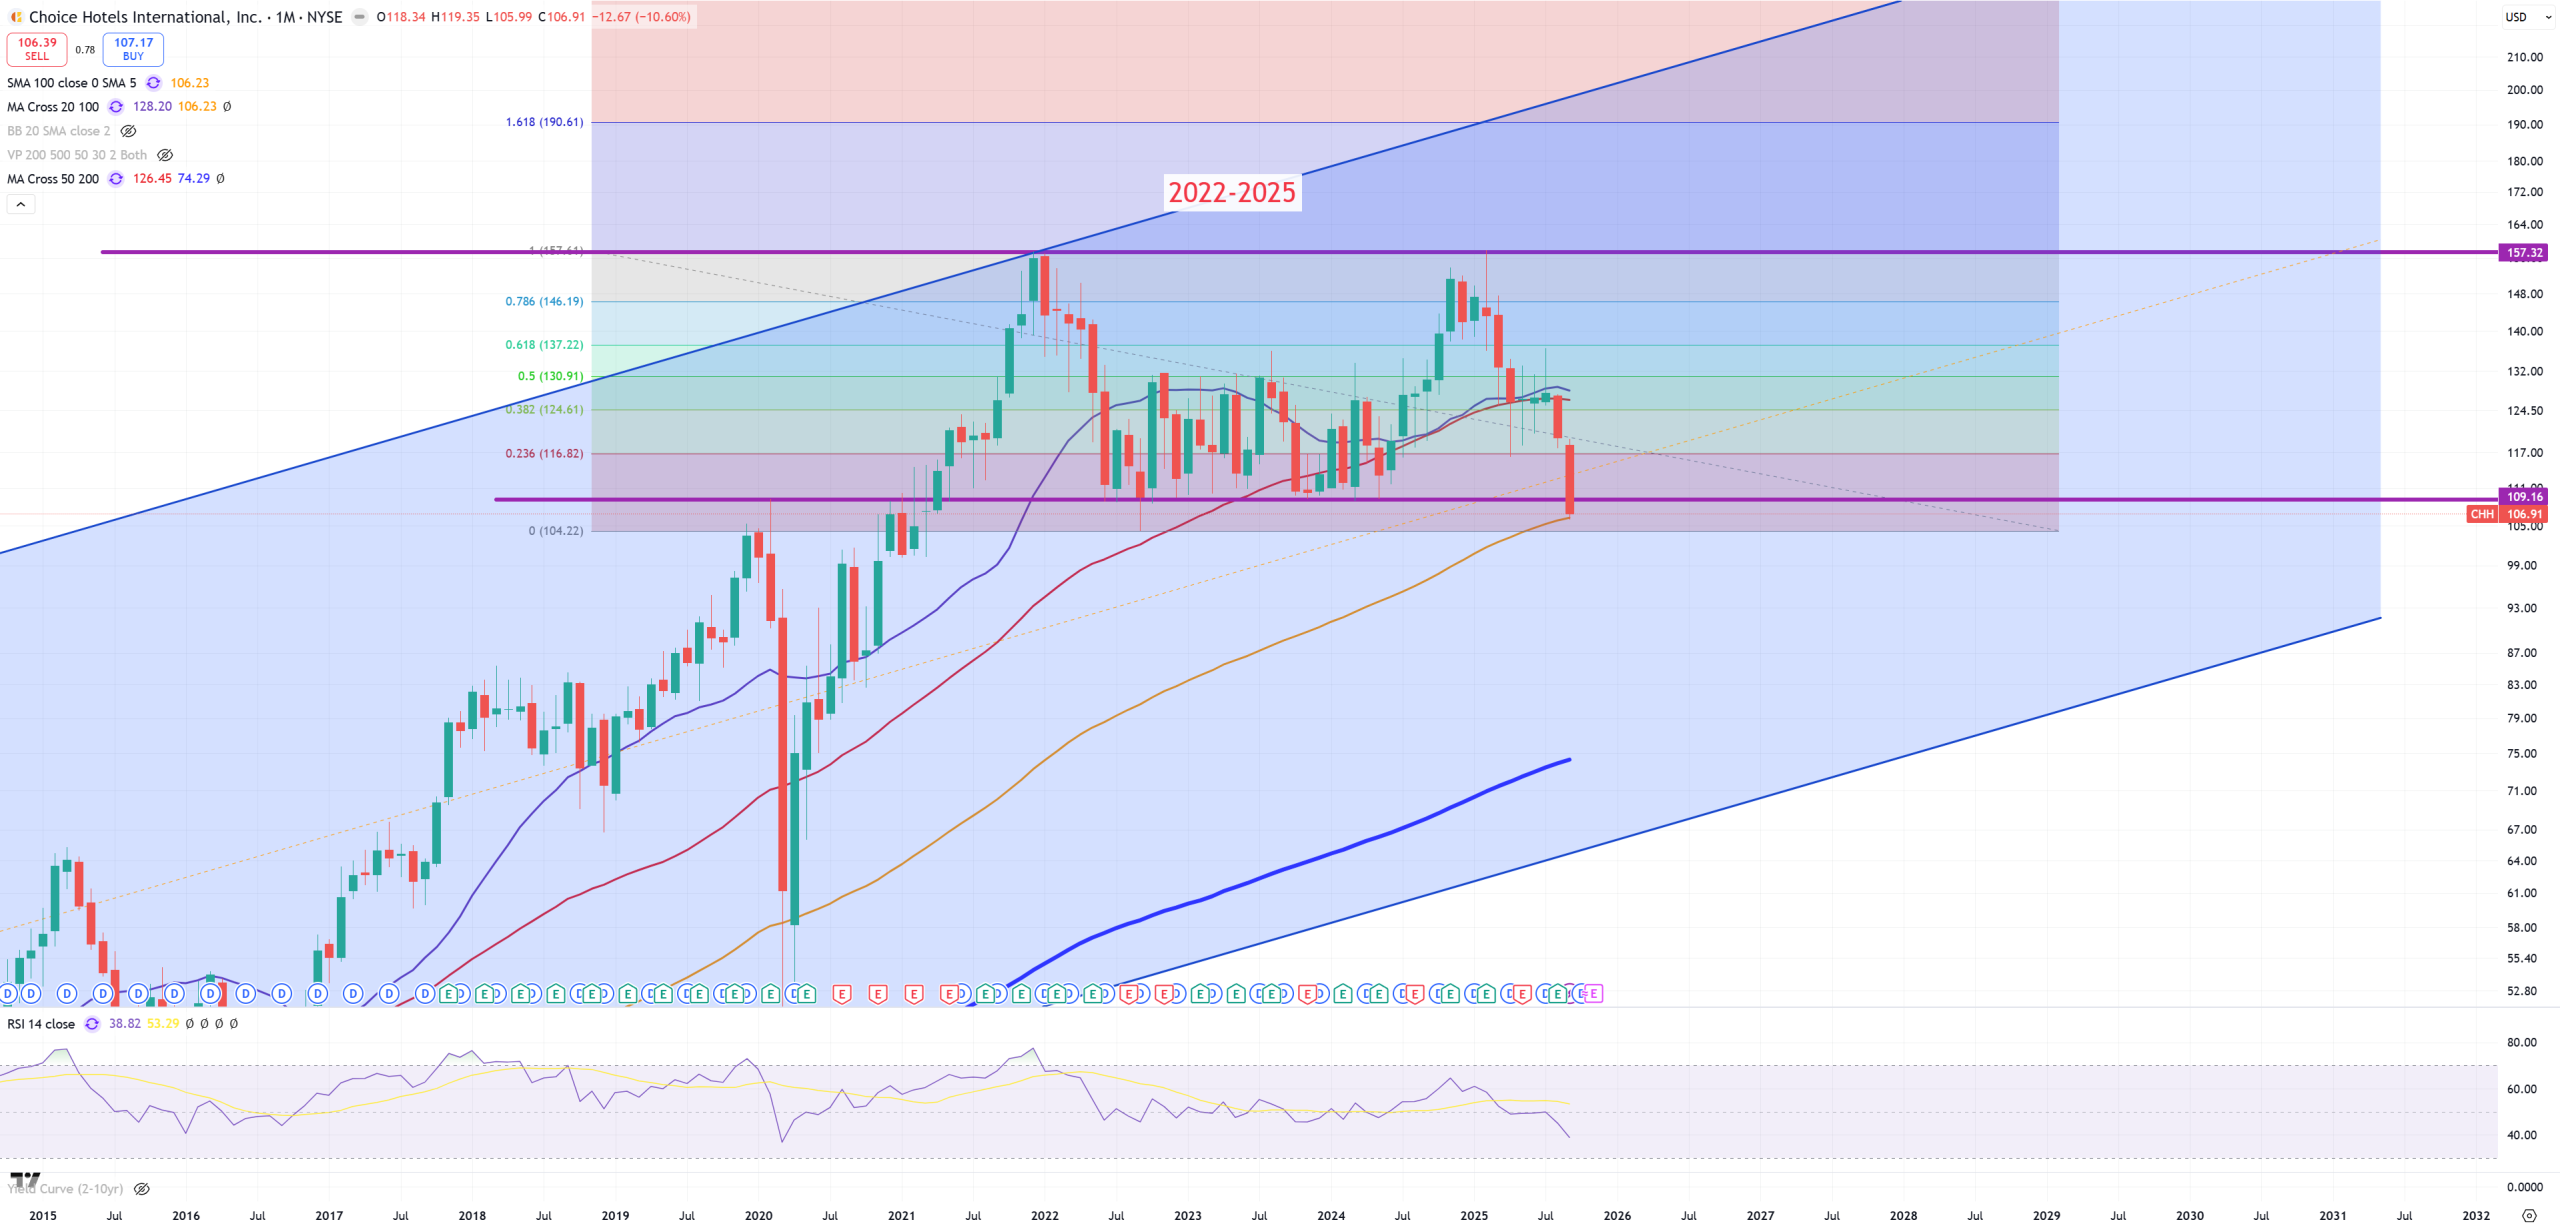
CCH – but hotels less exclusive feel the pain
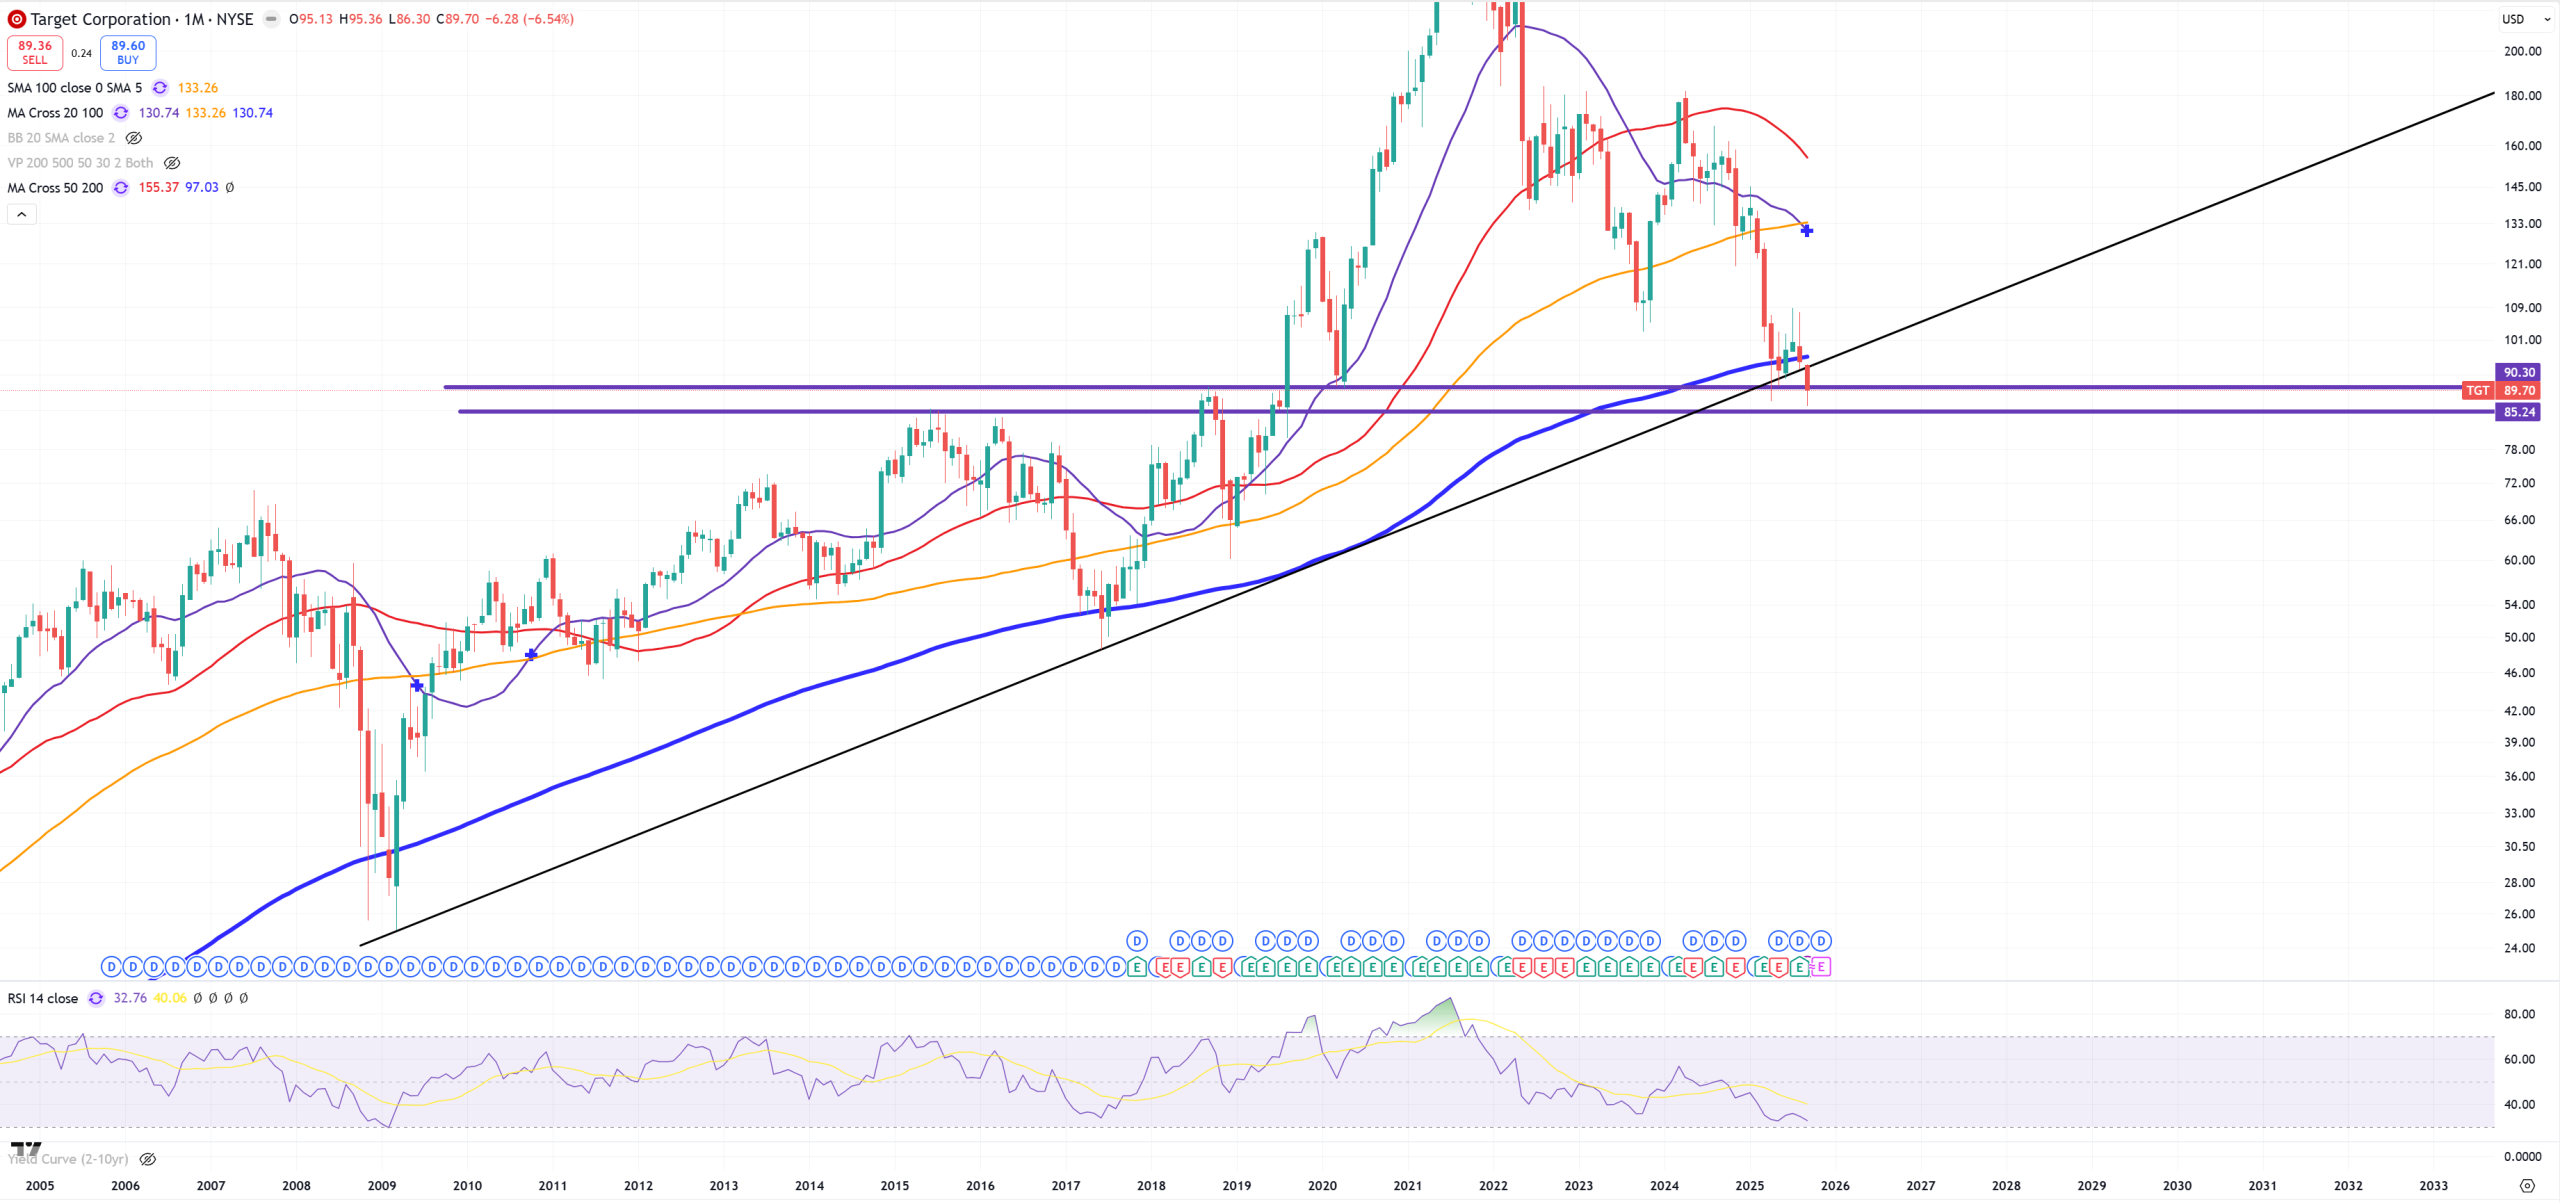
TGT – Target
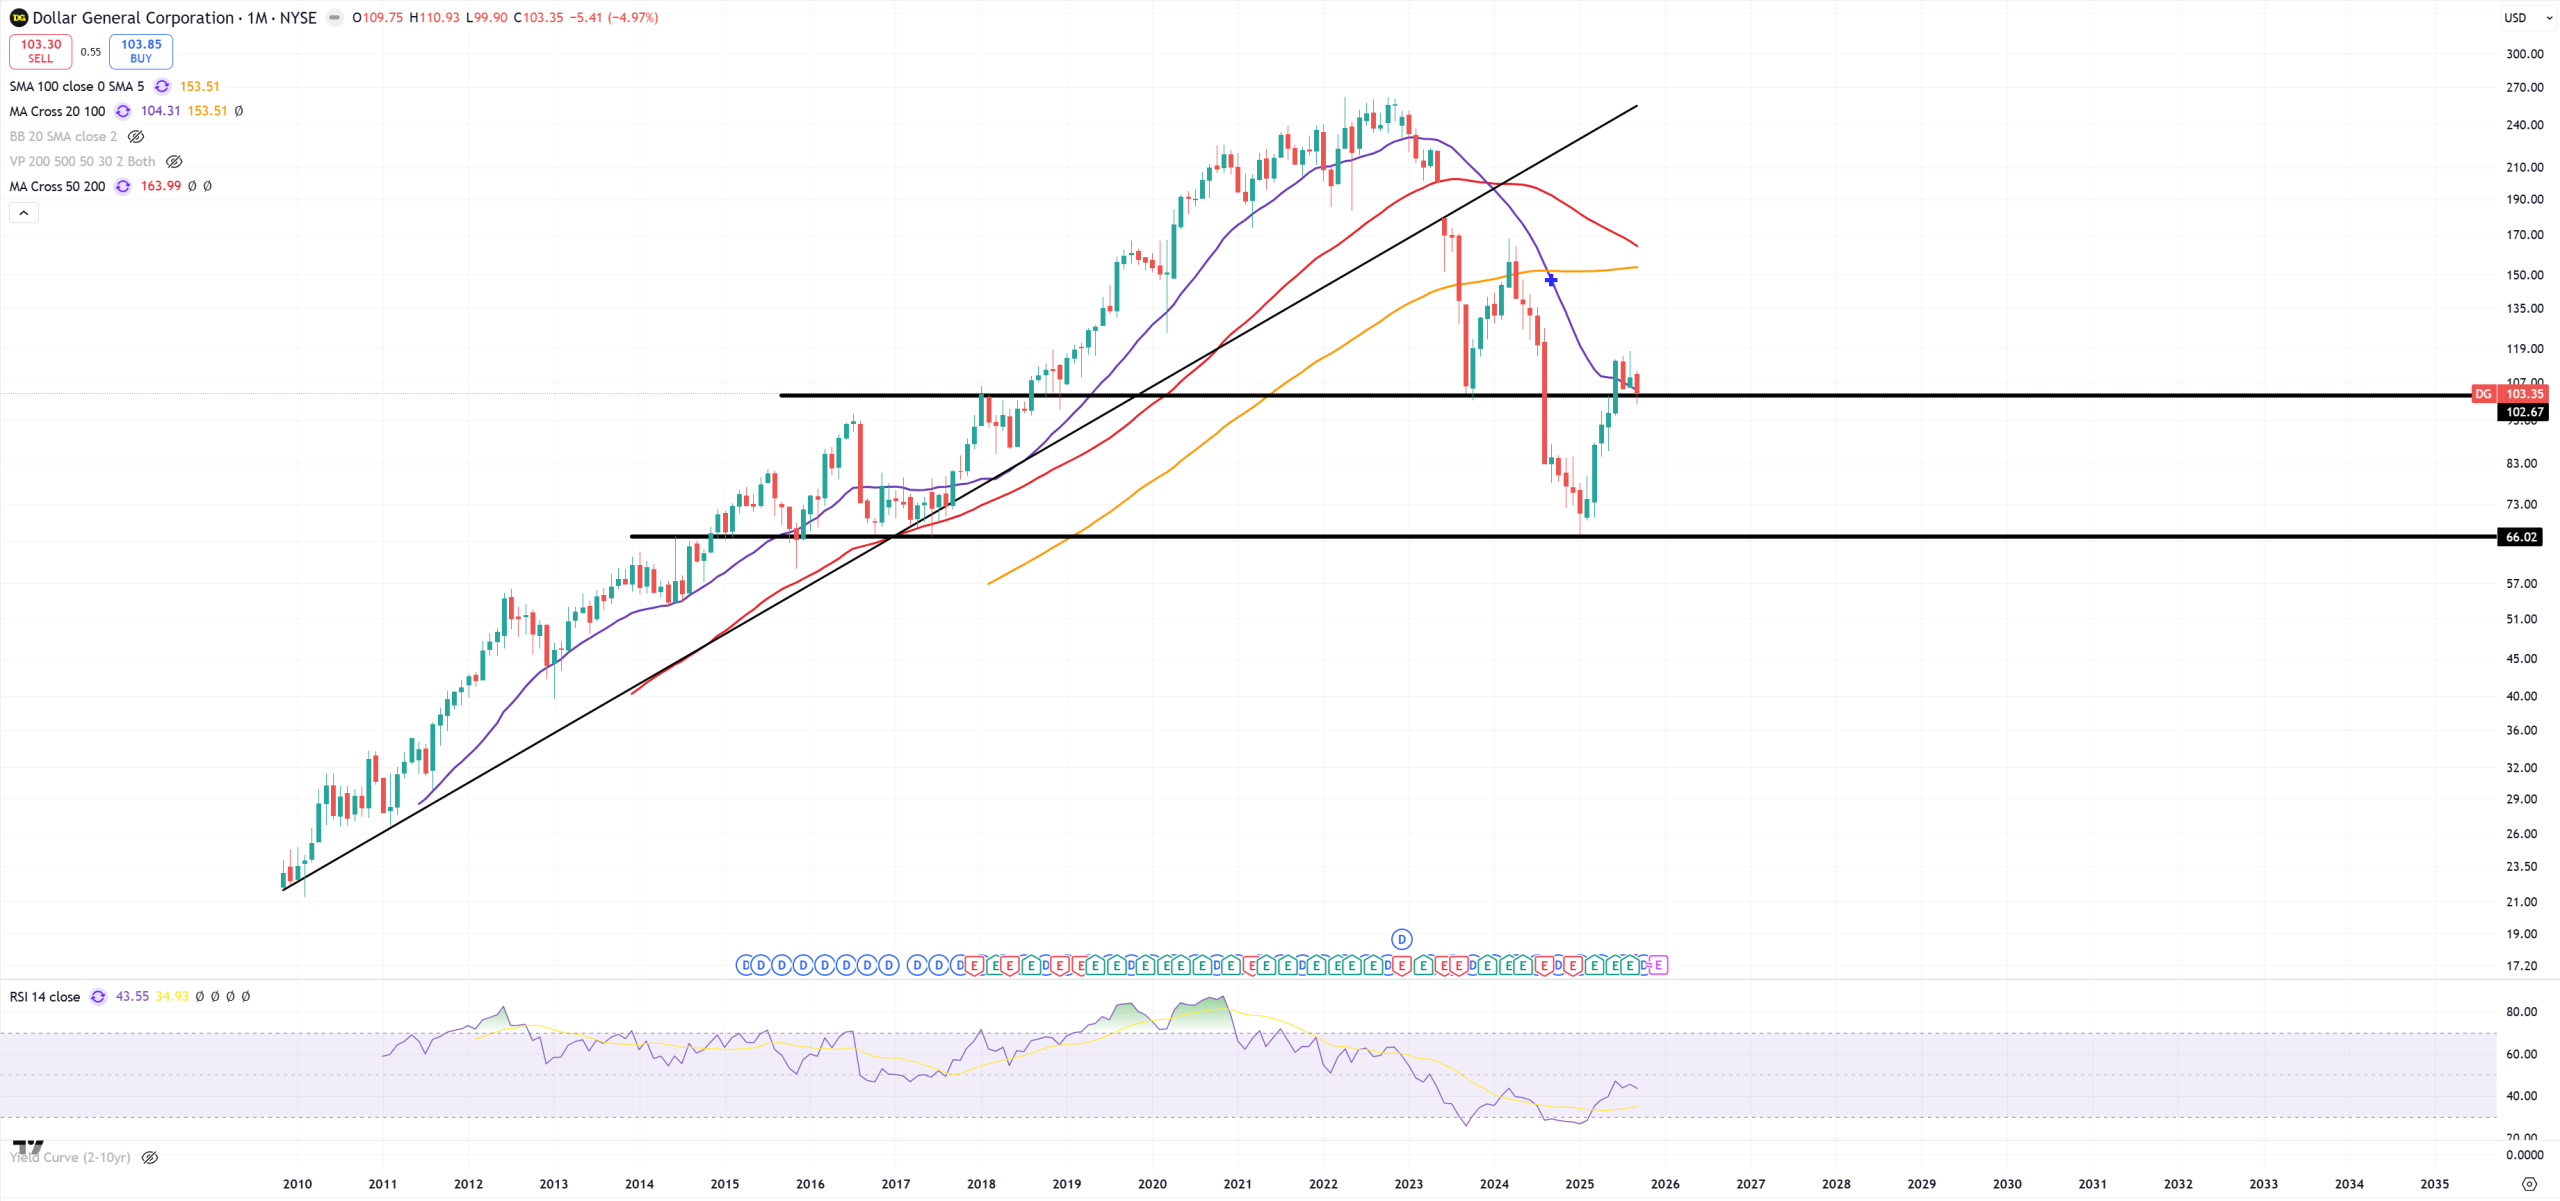
DG – Dollar General now tries to hold
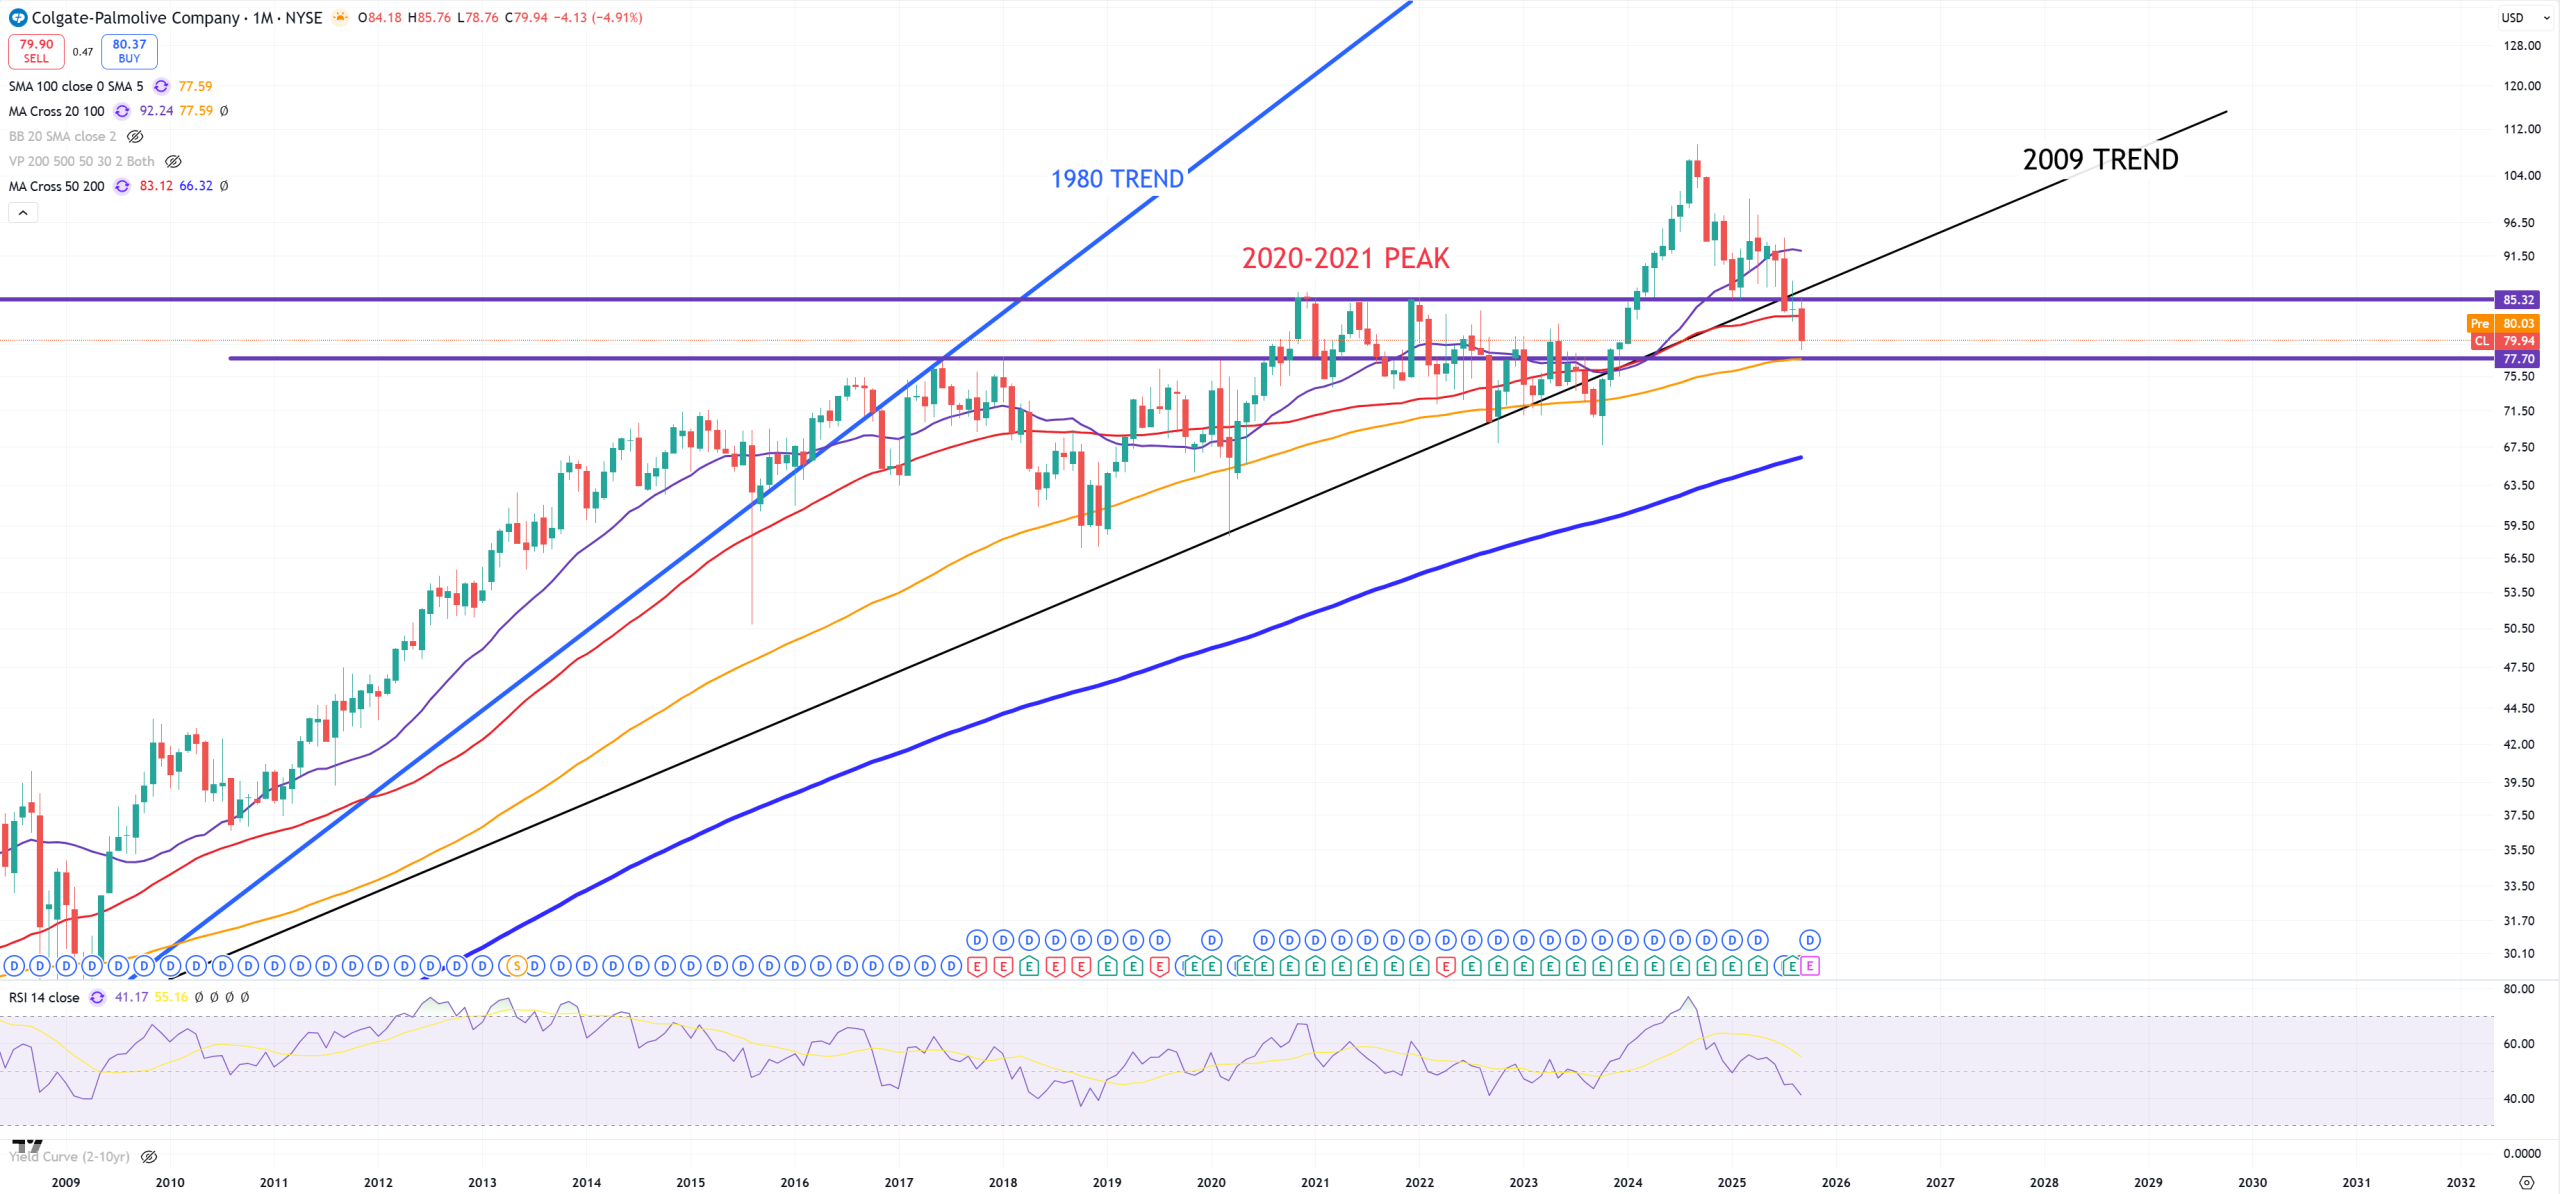
CL – Colgate – after false spike it returns below 2021 peak.
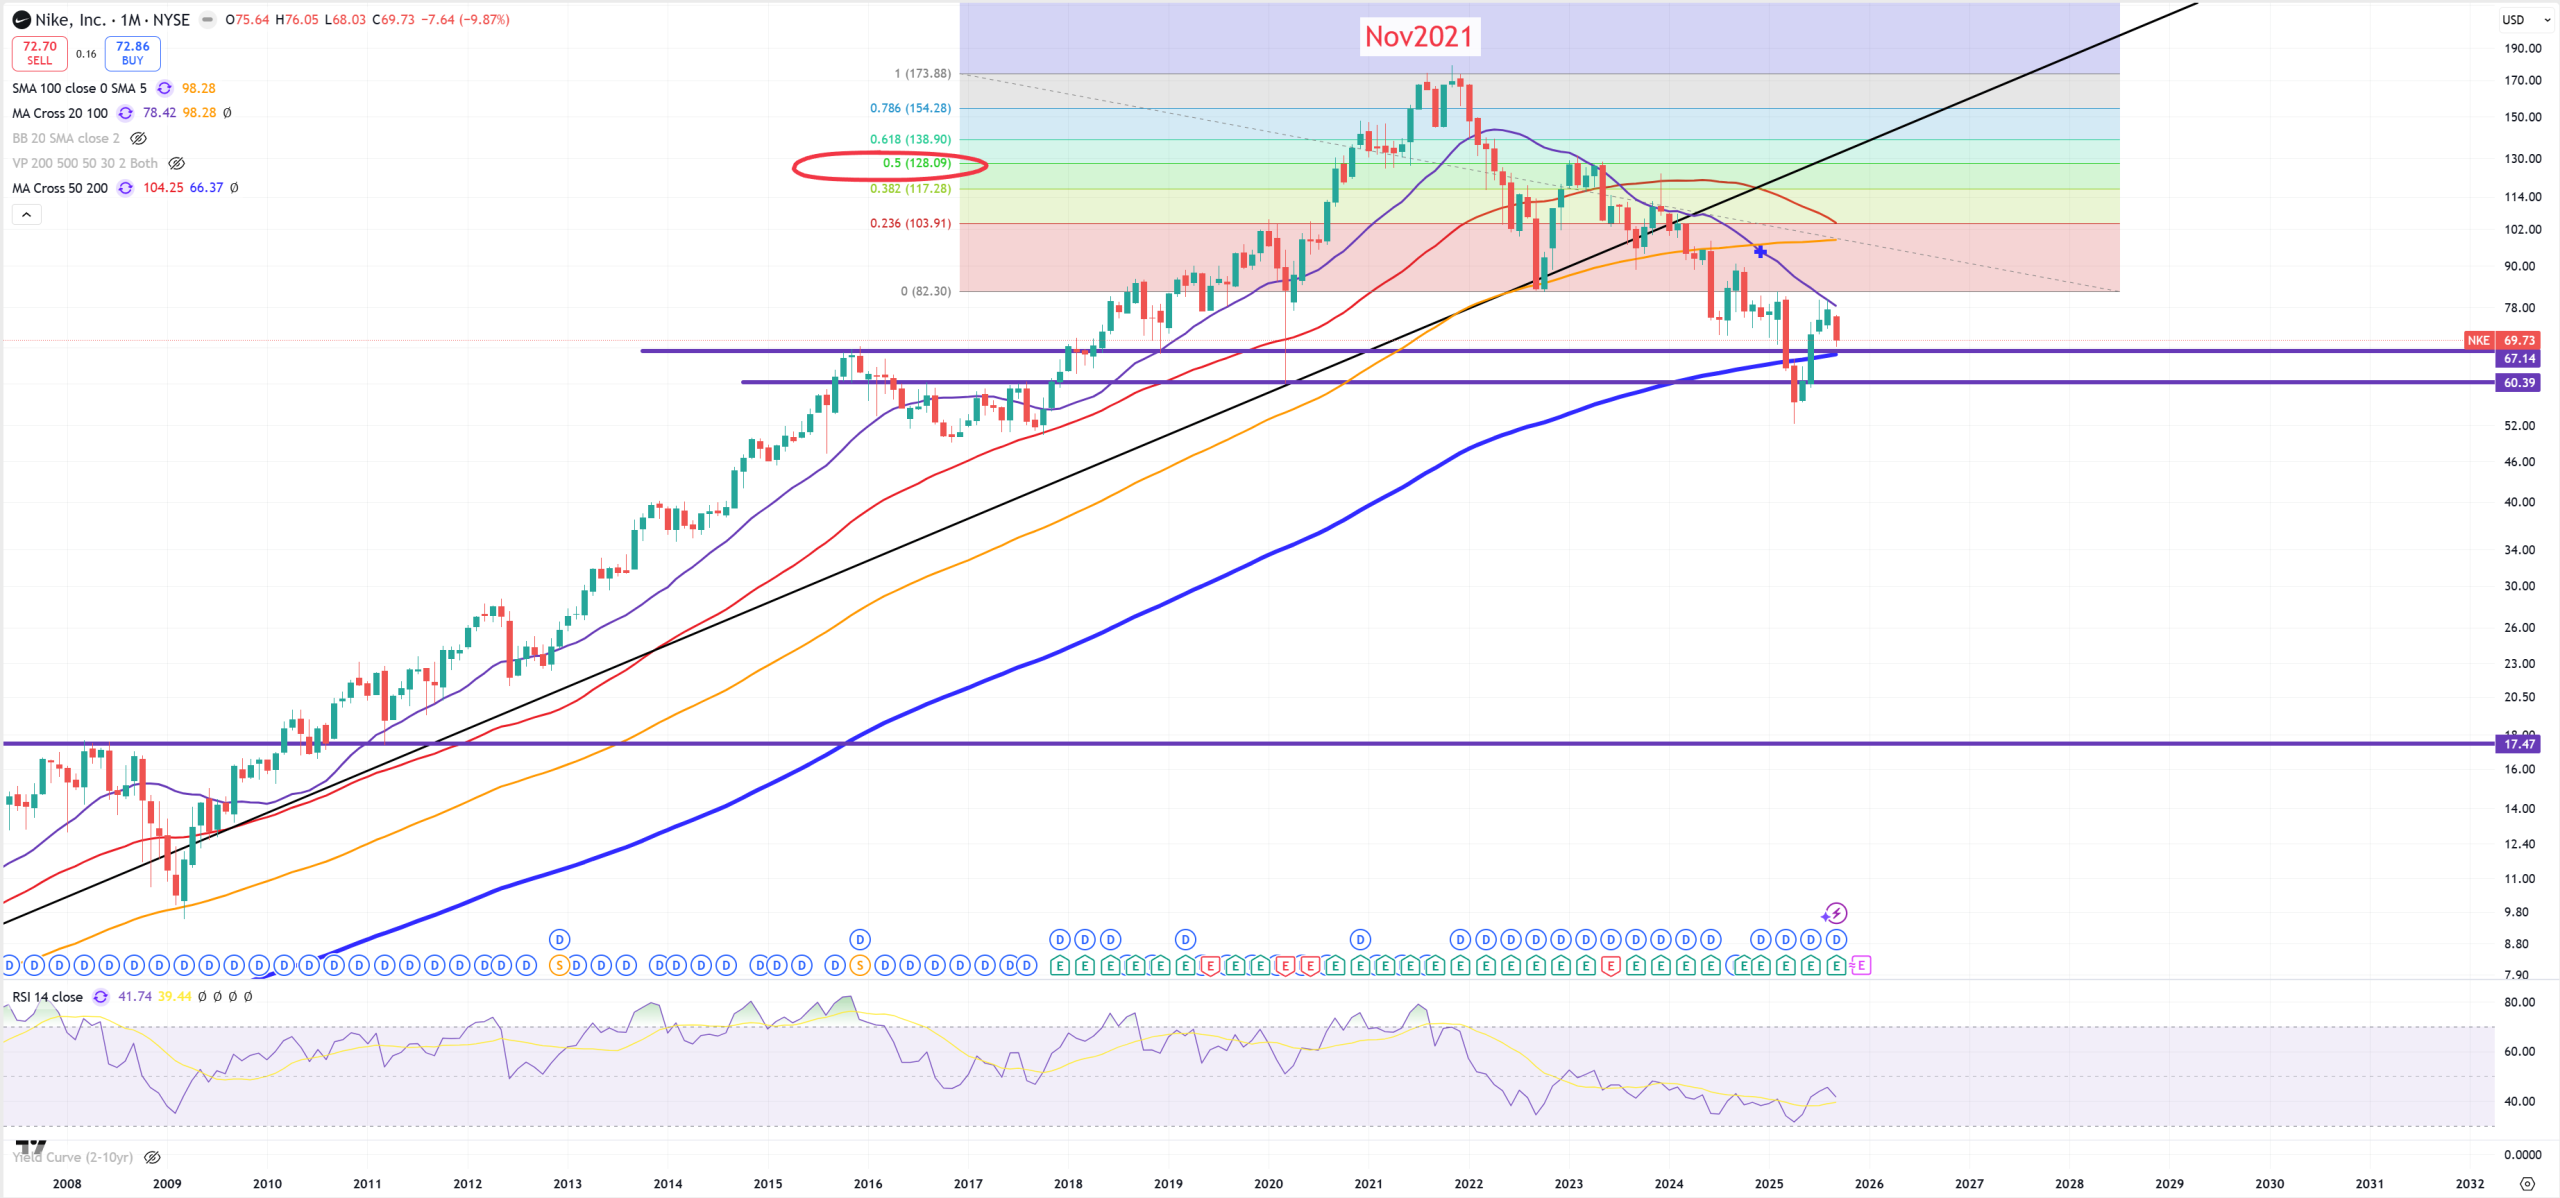
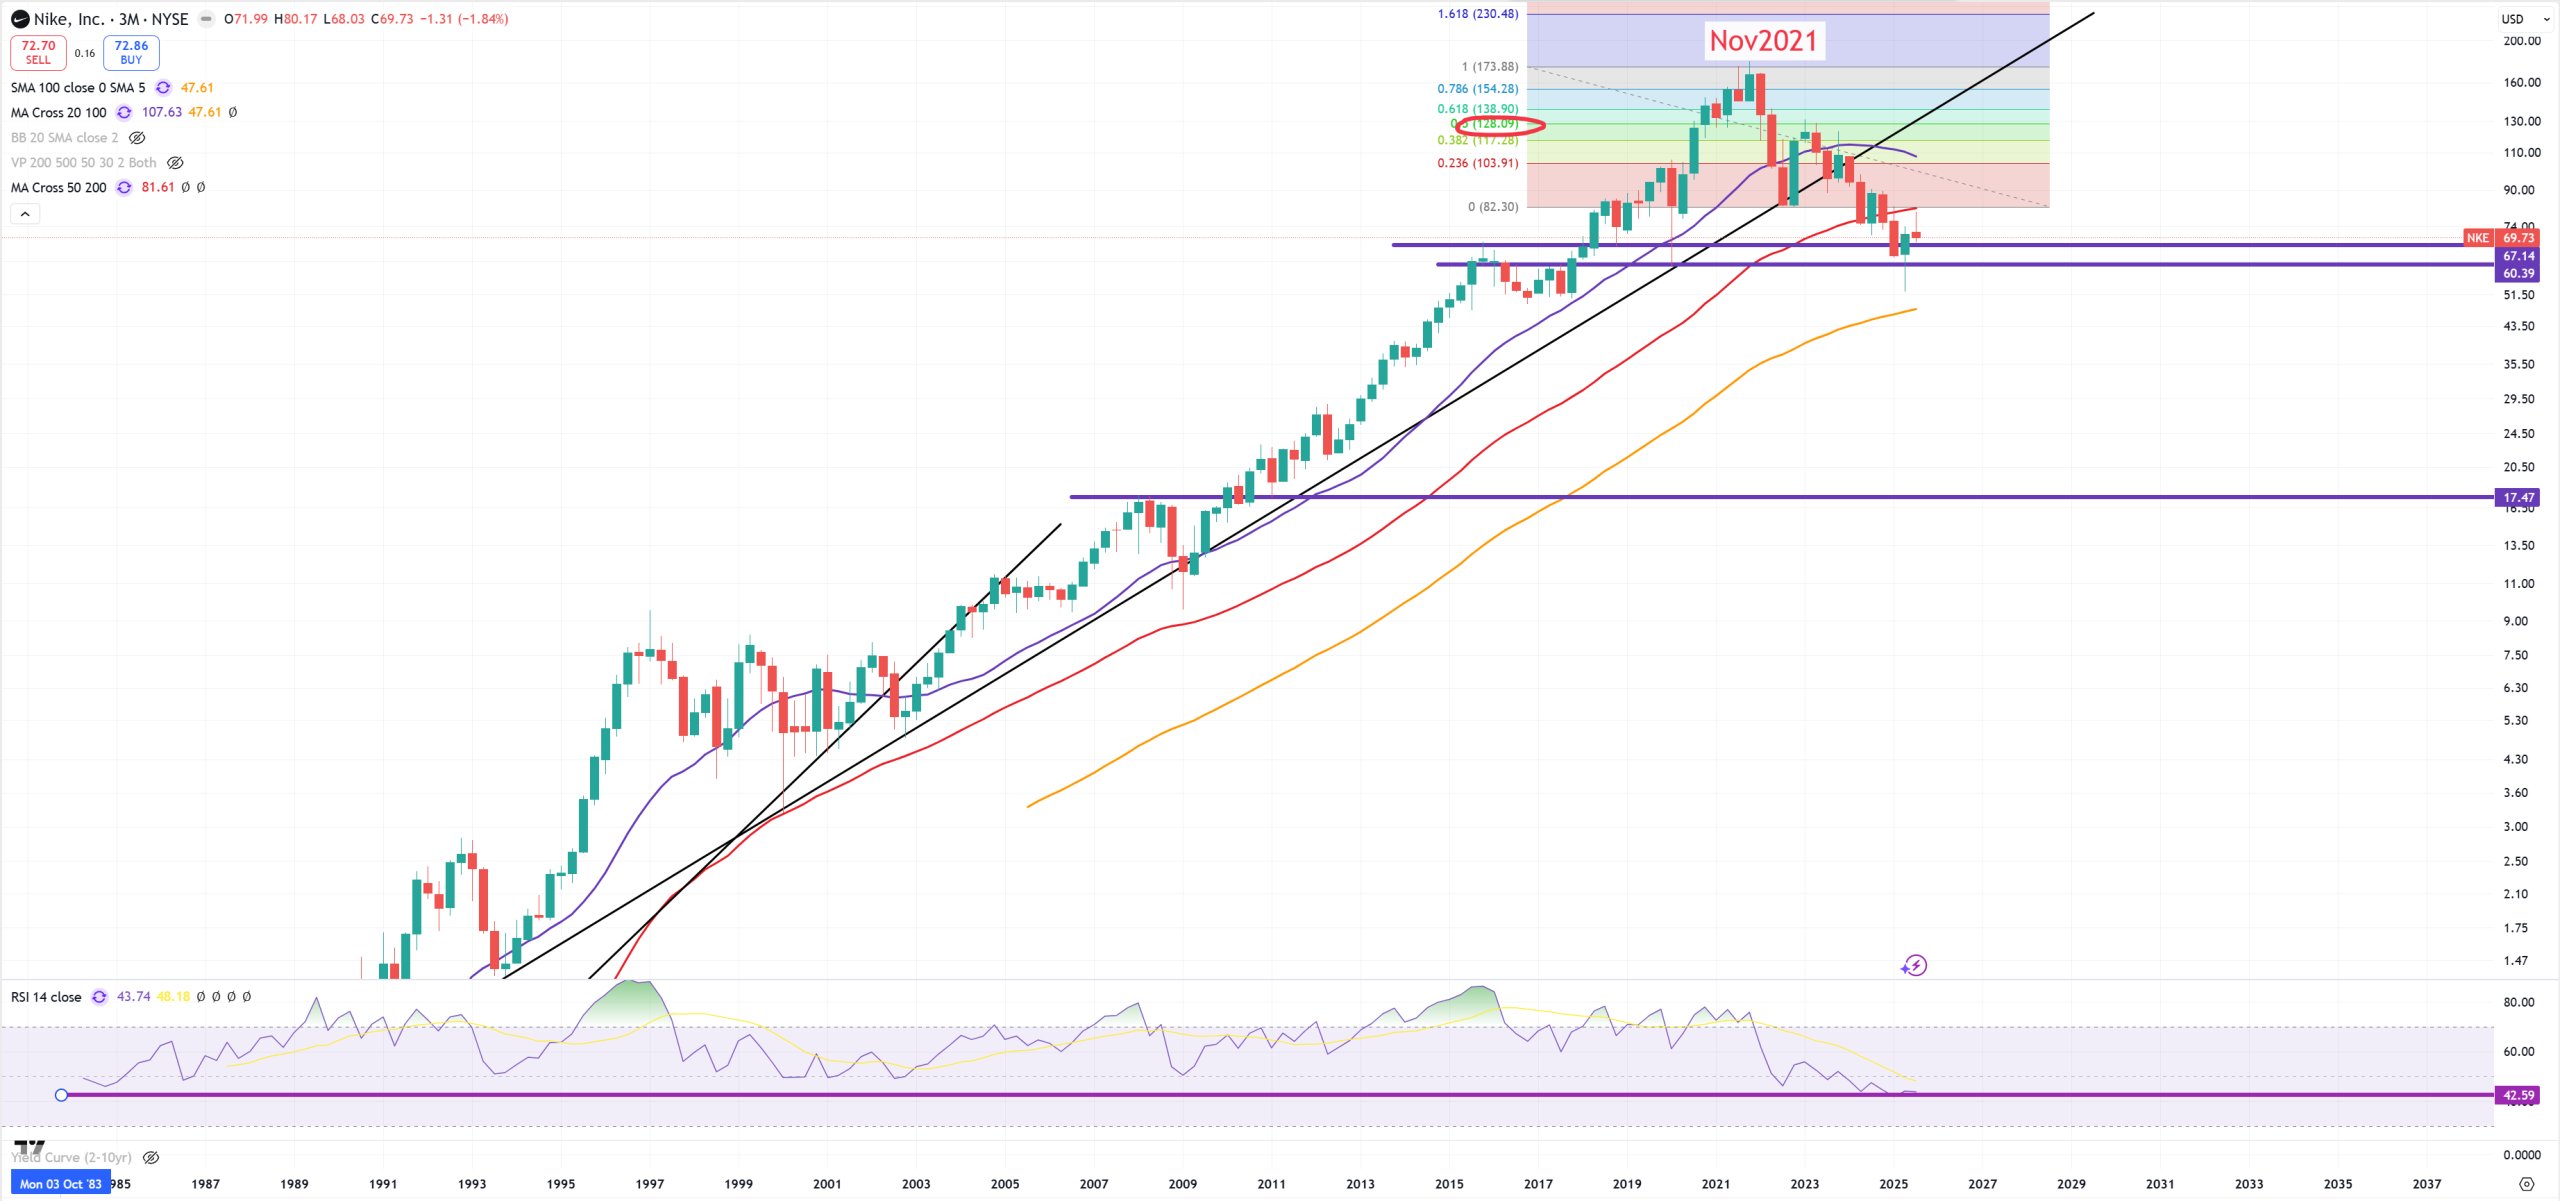
NKE – first chart on (M) second on (3M) – take a look that on (3M) NKE has never broken (3M)MA50 and has never been so low on (3M)RSI. You can tell it’s a bottom, or you can tell seeing 10Y/3M inverted for 1100 days it’s a big long term turn.
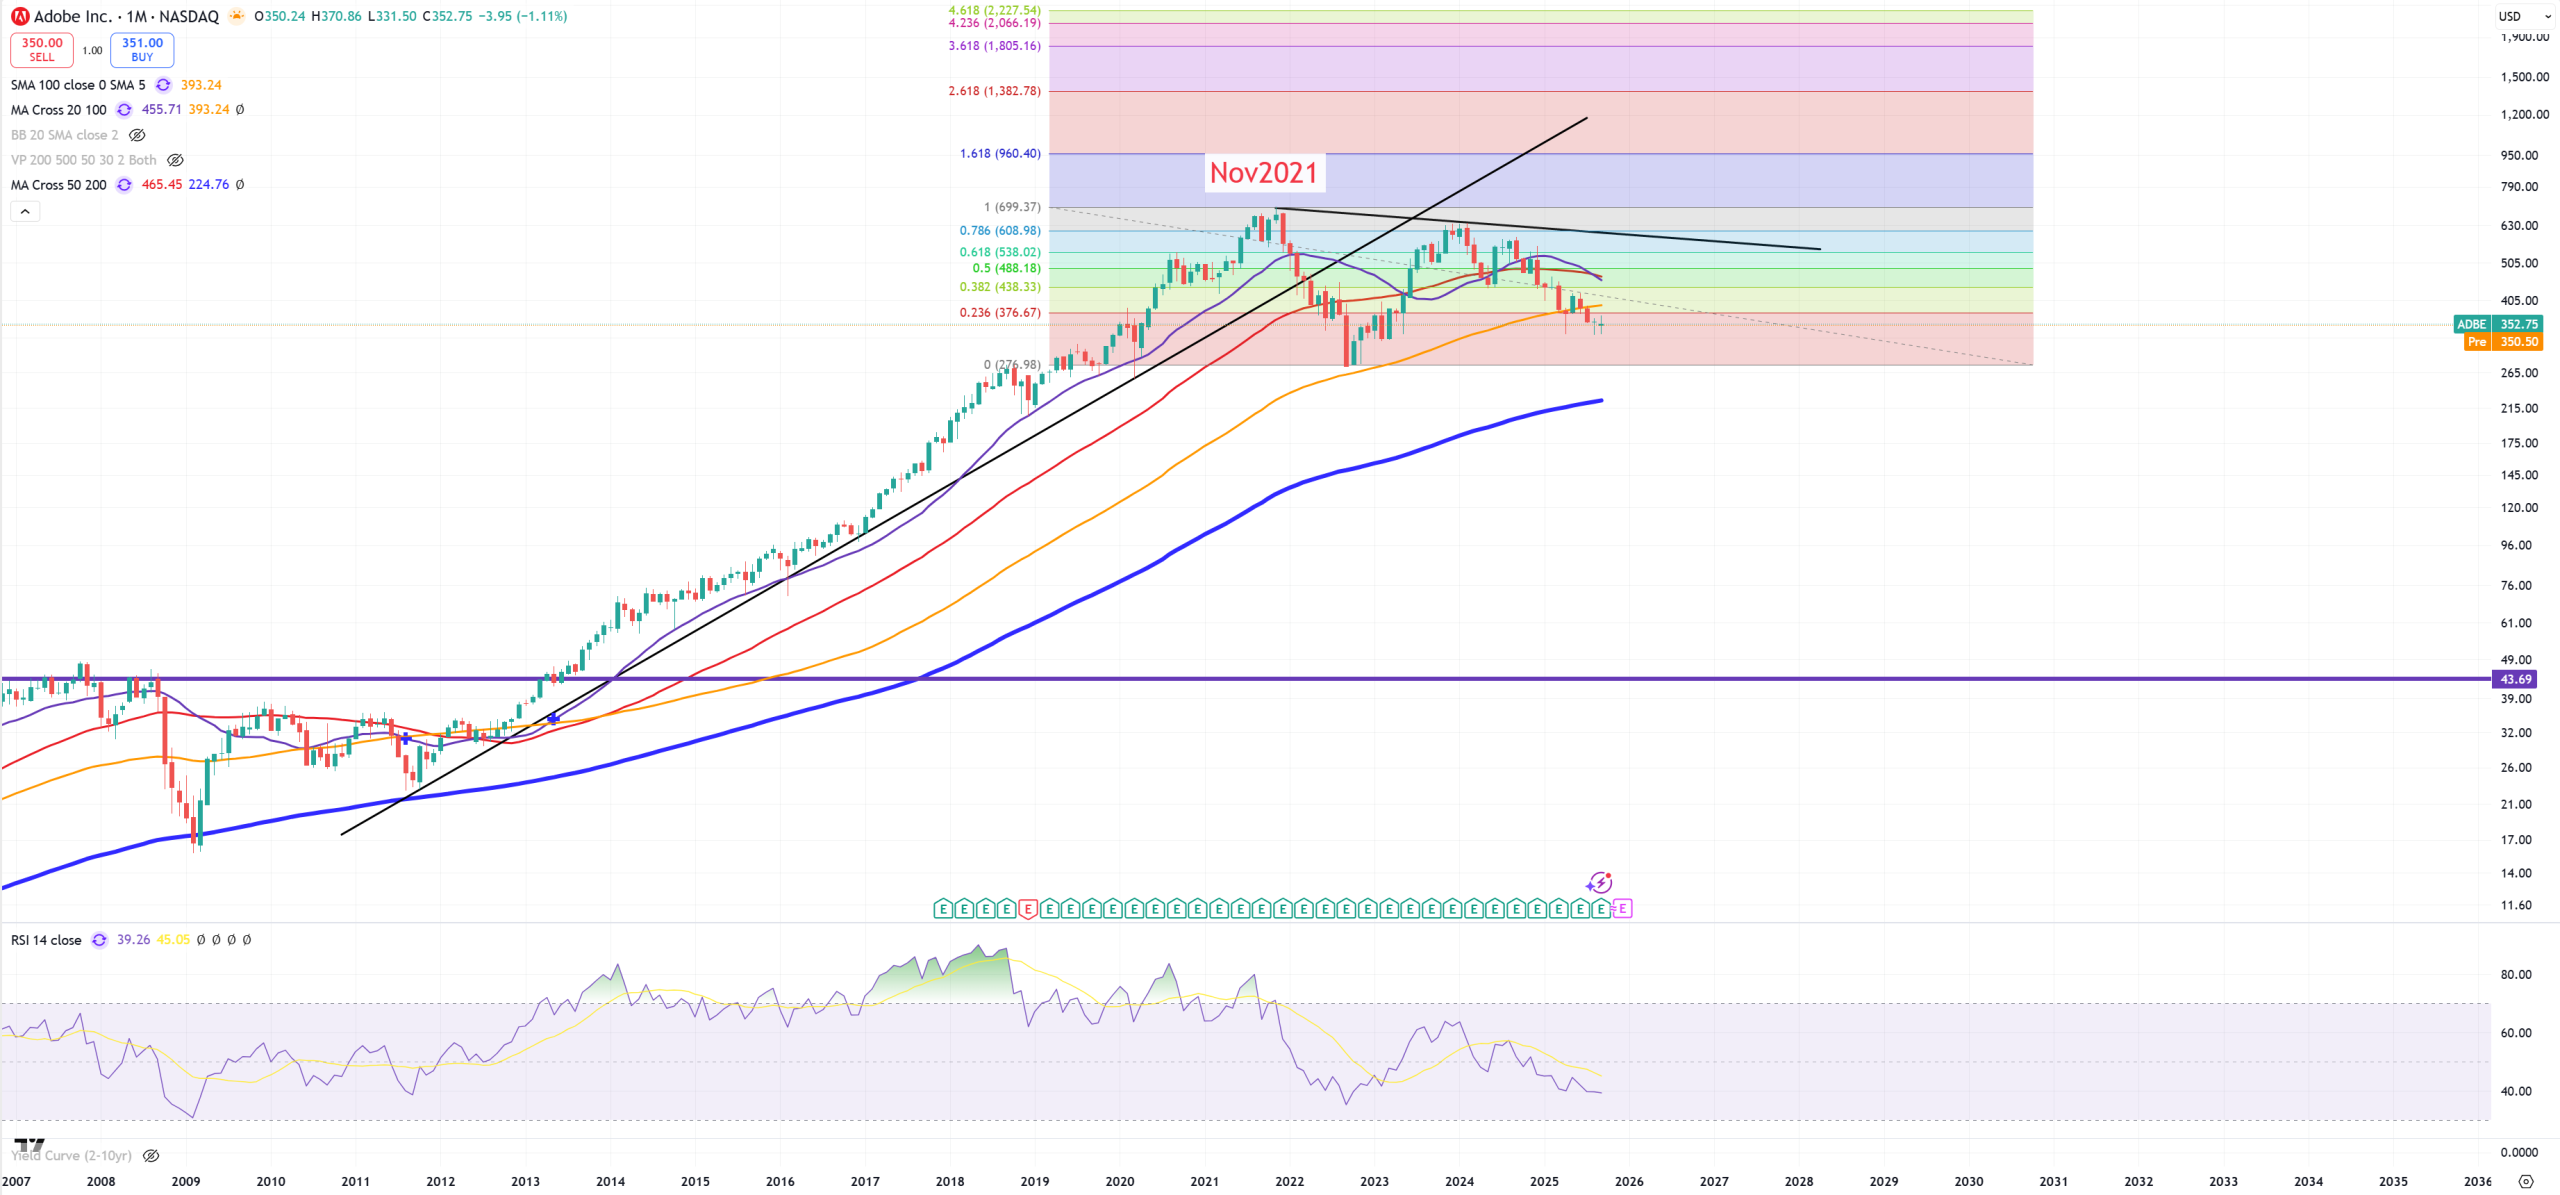
ADBE – Adobe is losing the ground
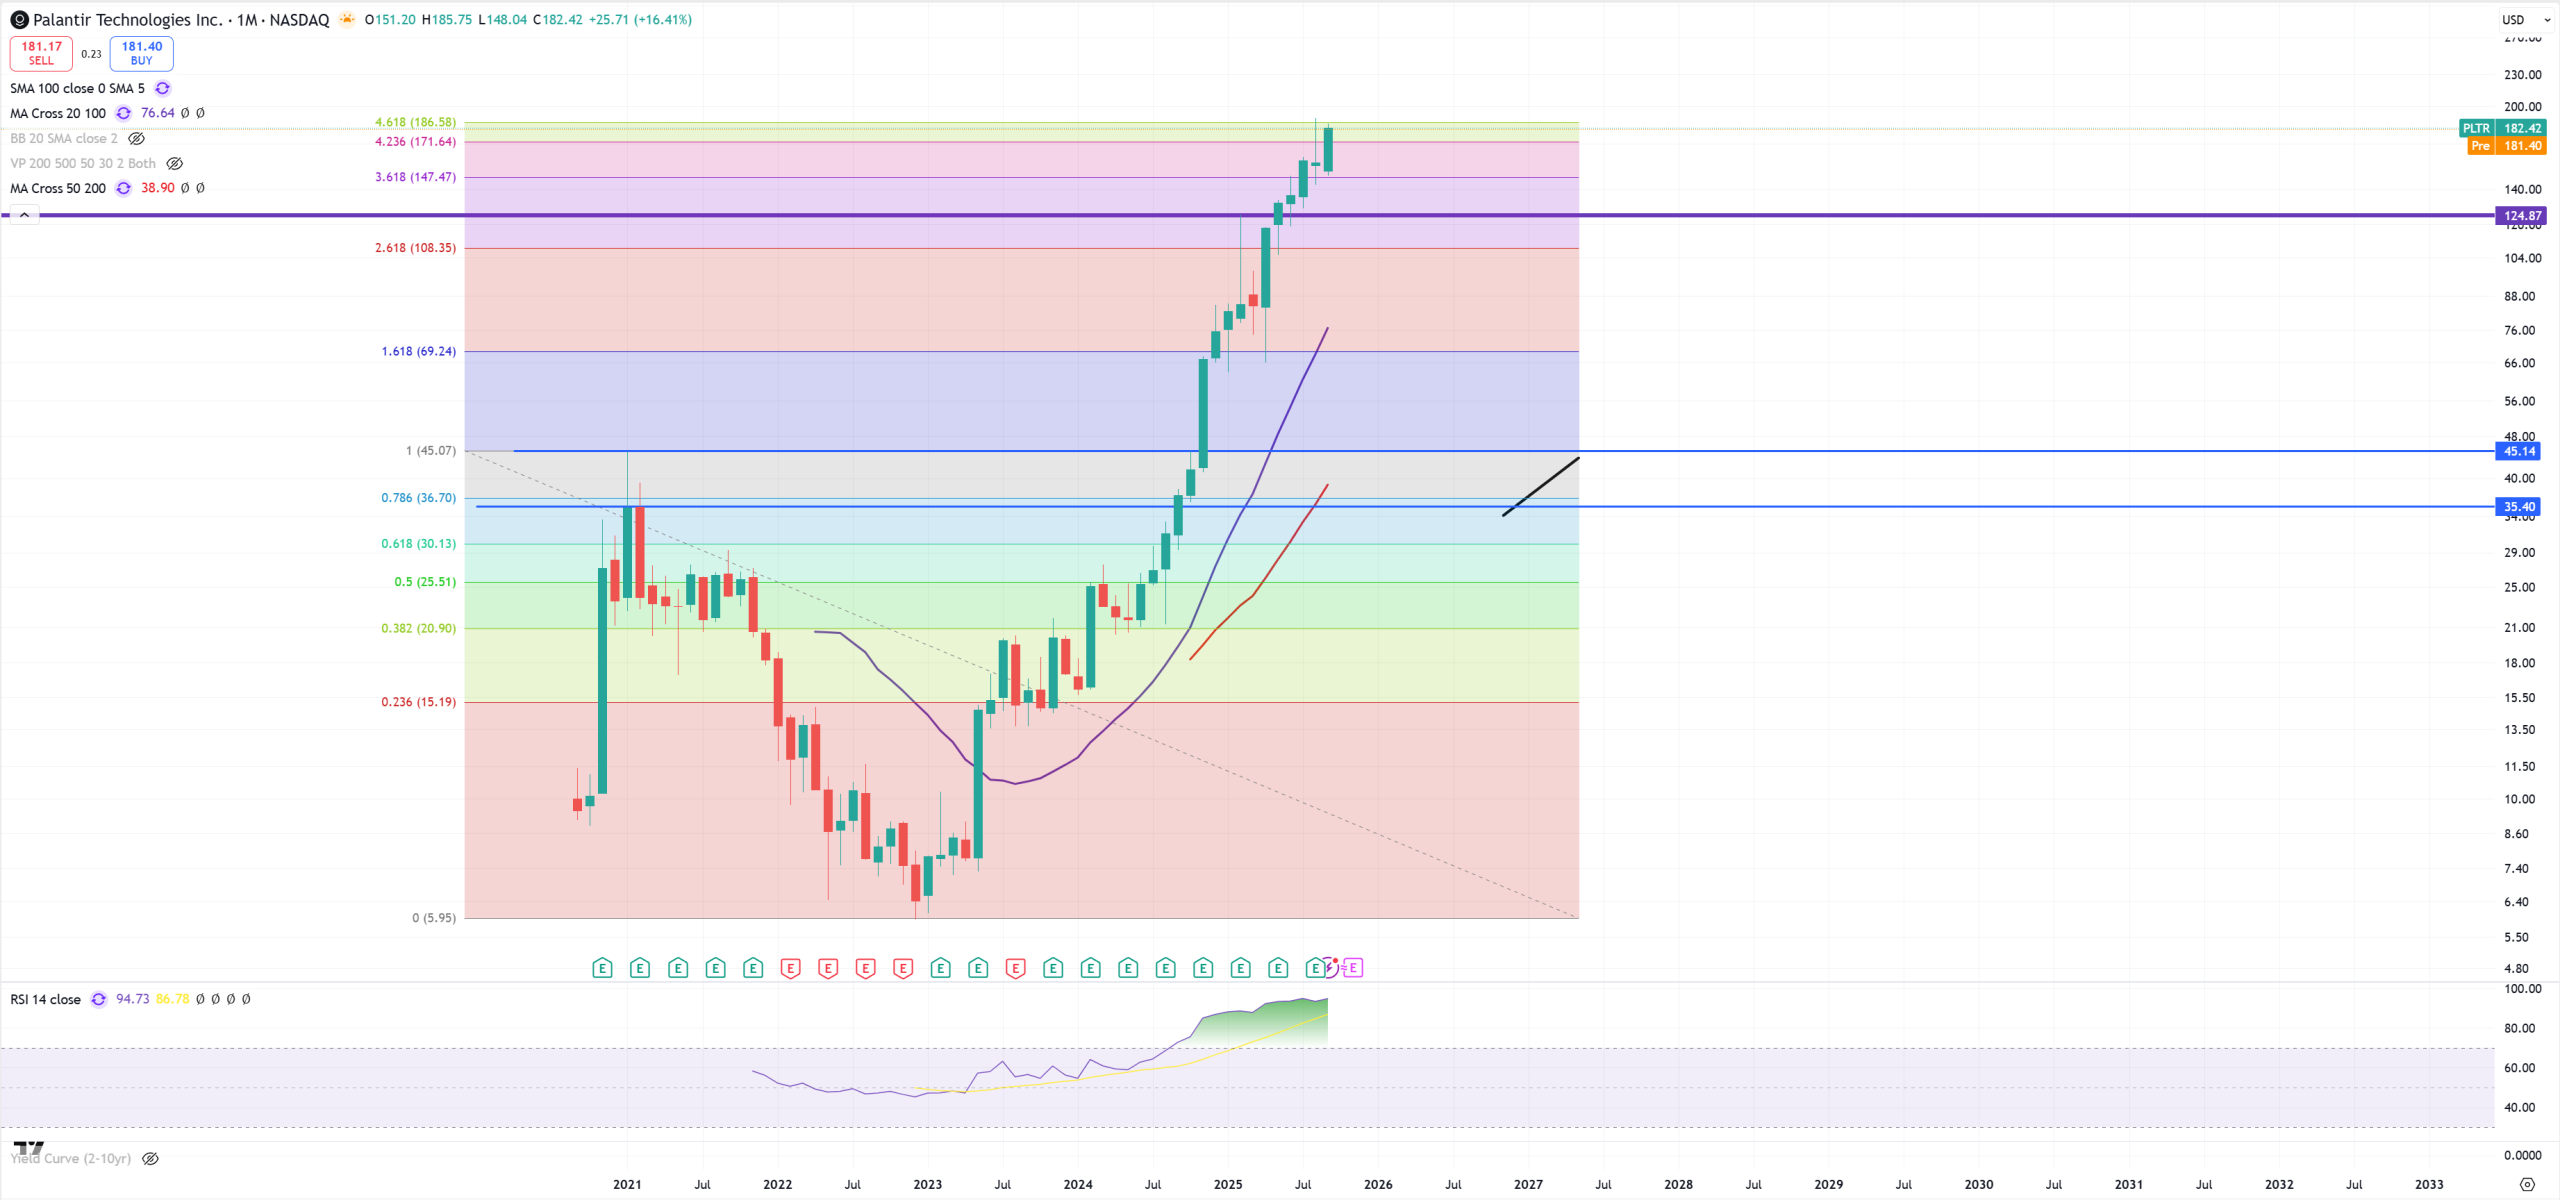
PLTR – The only one company I remind that was SMCI around its peak. Now PLTR has (M)RSI around 95-96 and distance to (M)MA50 over -80% and that’s like double-tulip-bubble.
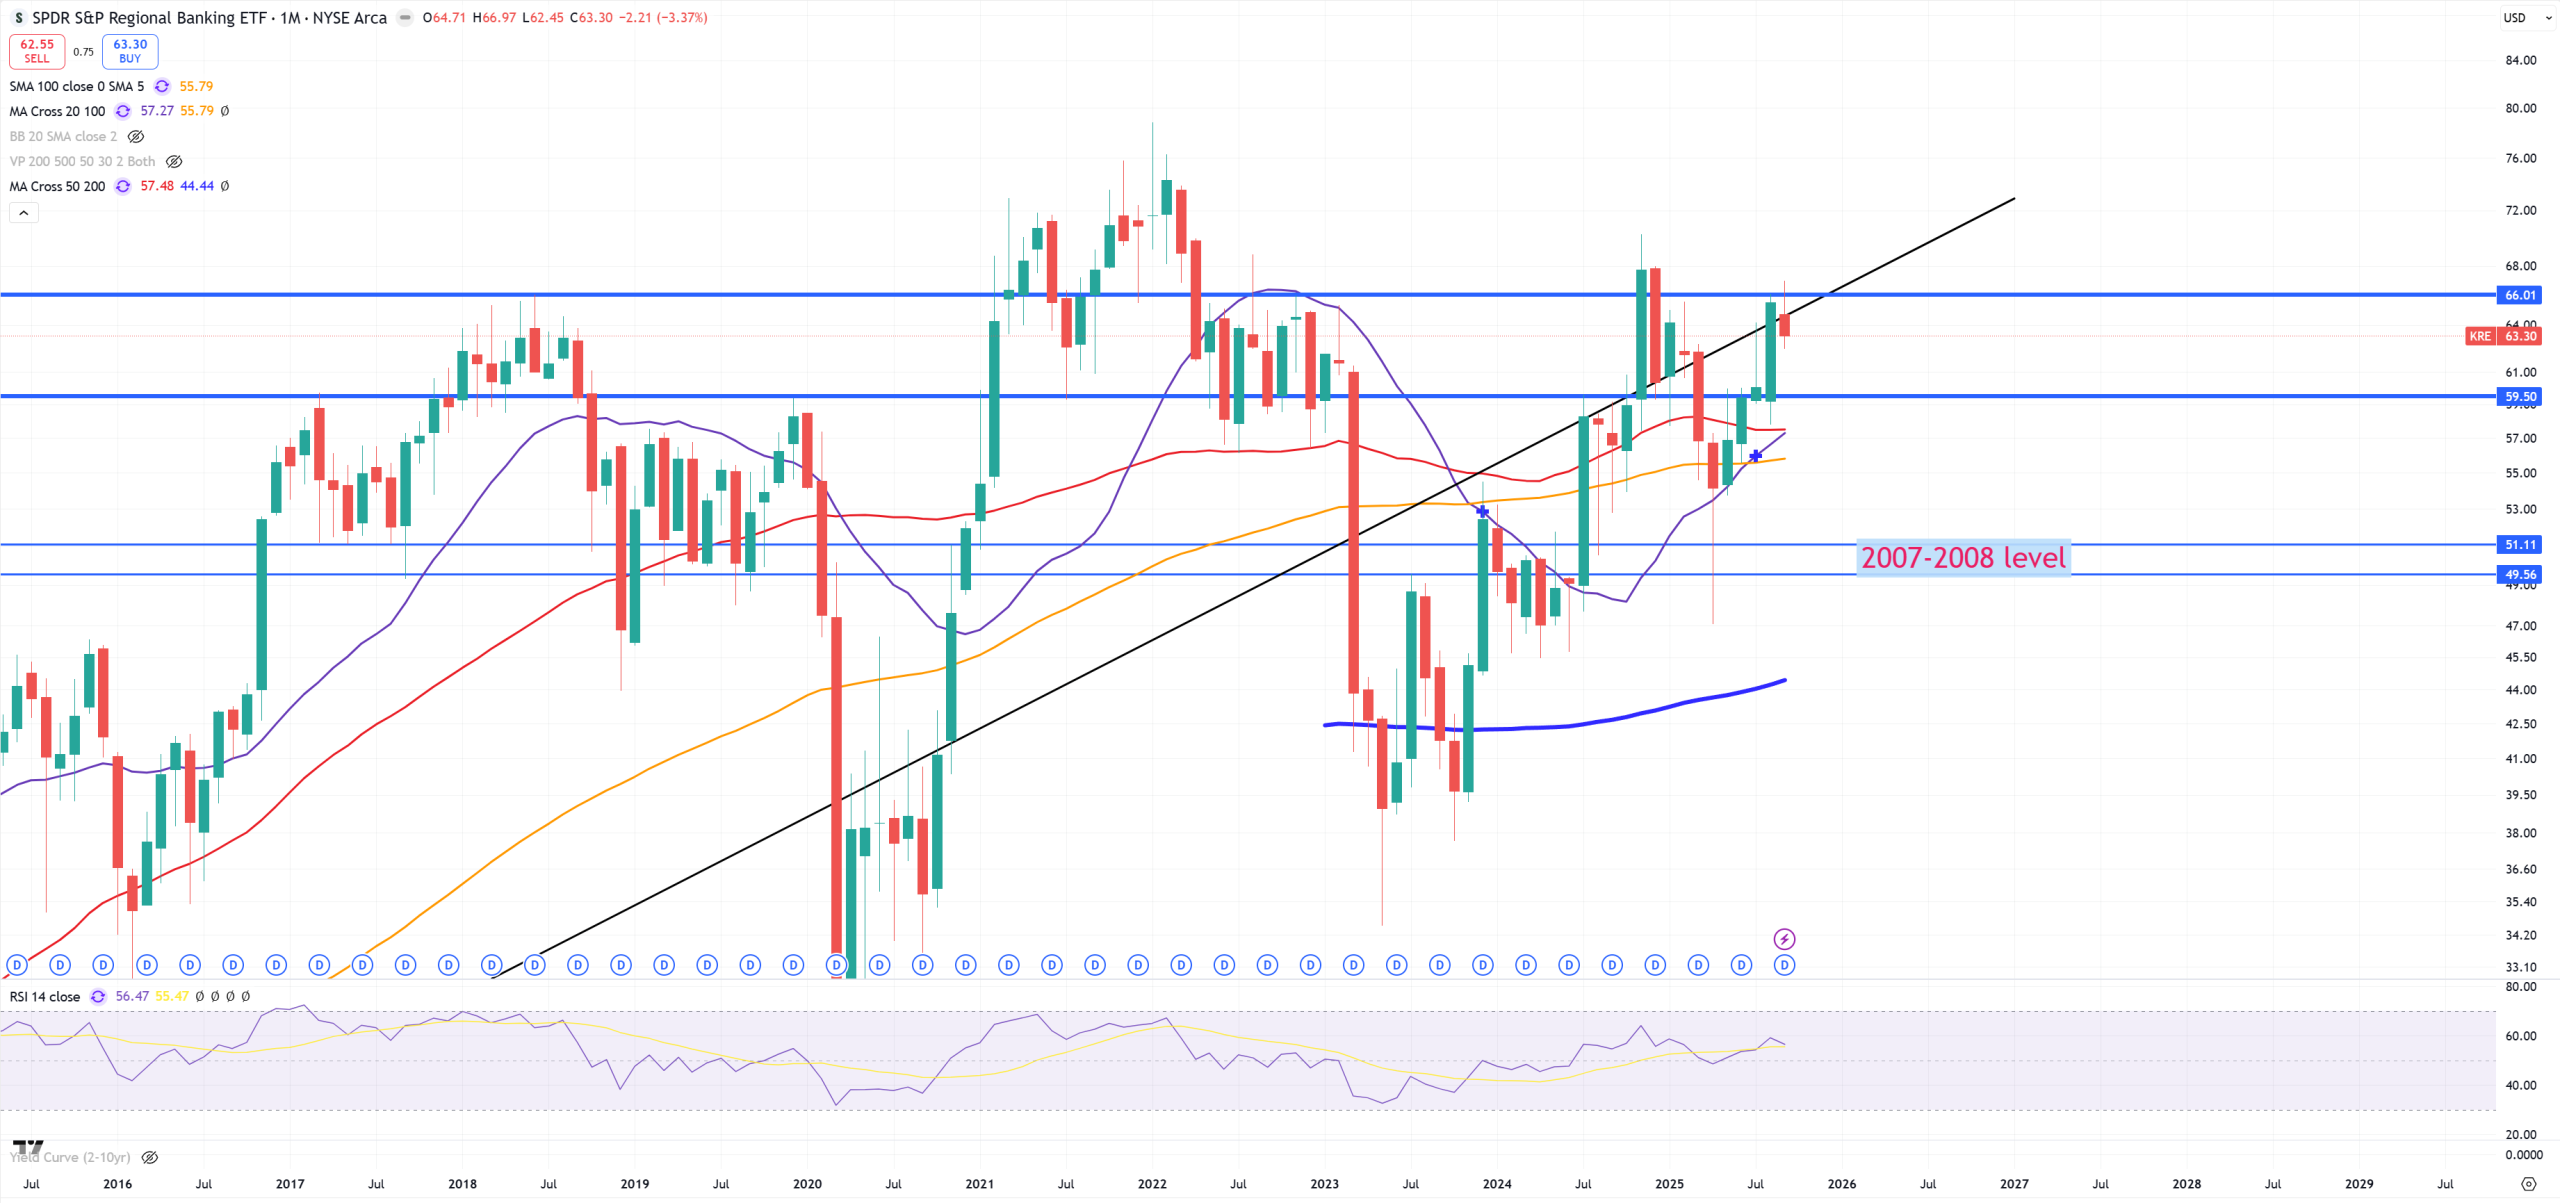
KRE – Regional Banks are great example how market doesn’t want to stick to key pattern/trend, but sofar it always lands below it with small spikes above.
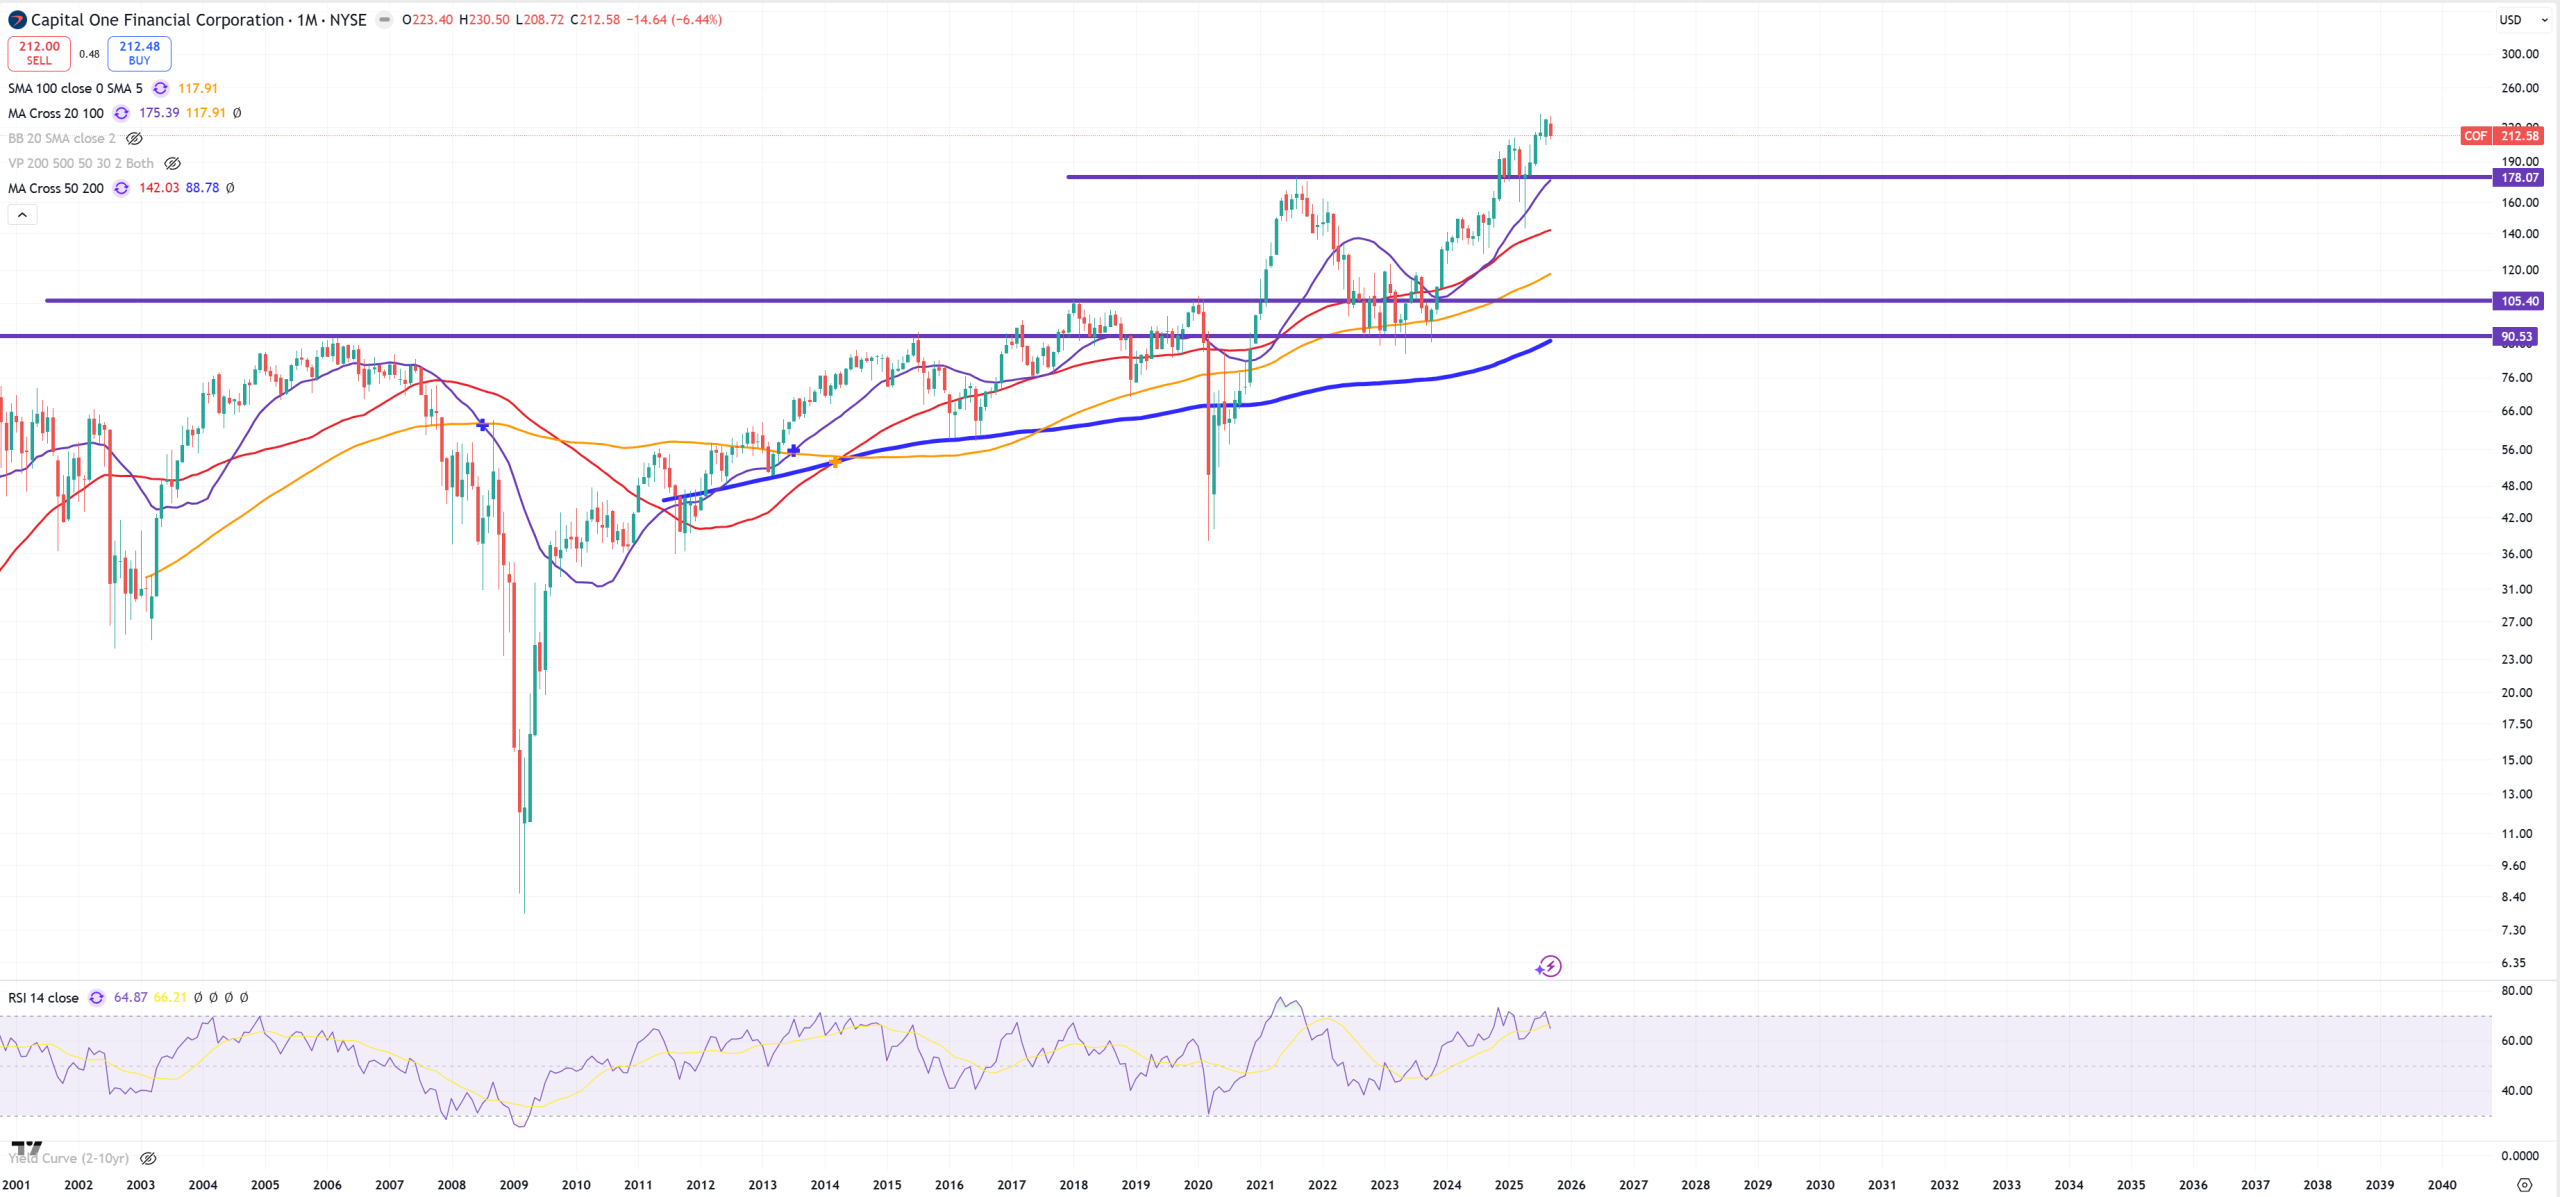
COF – Capital One – the key to watch if junk credit blows up.
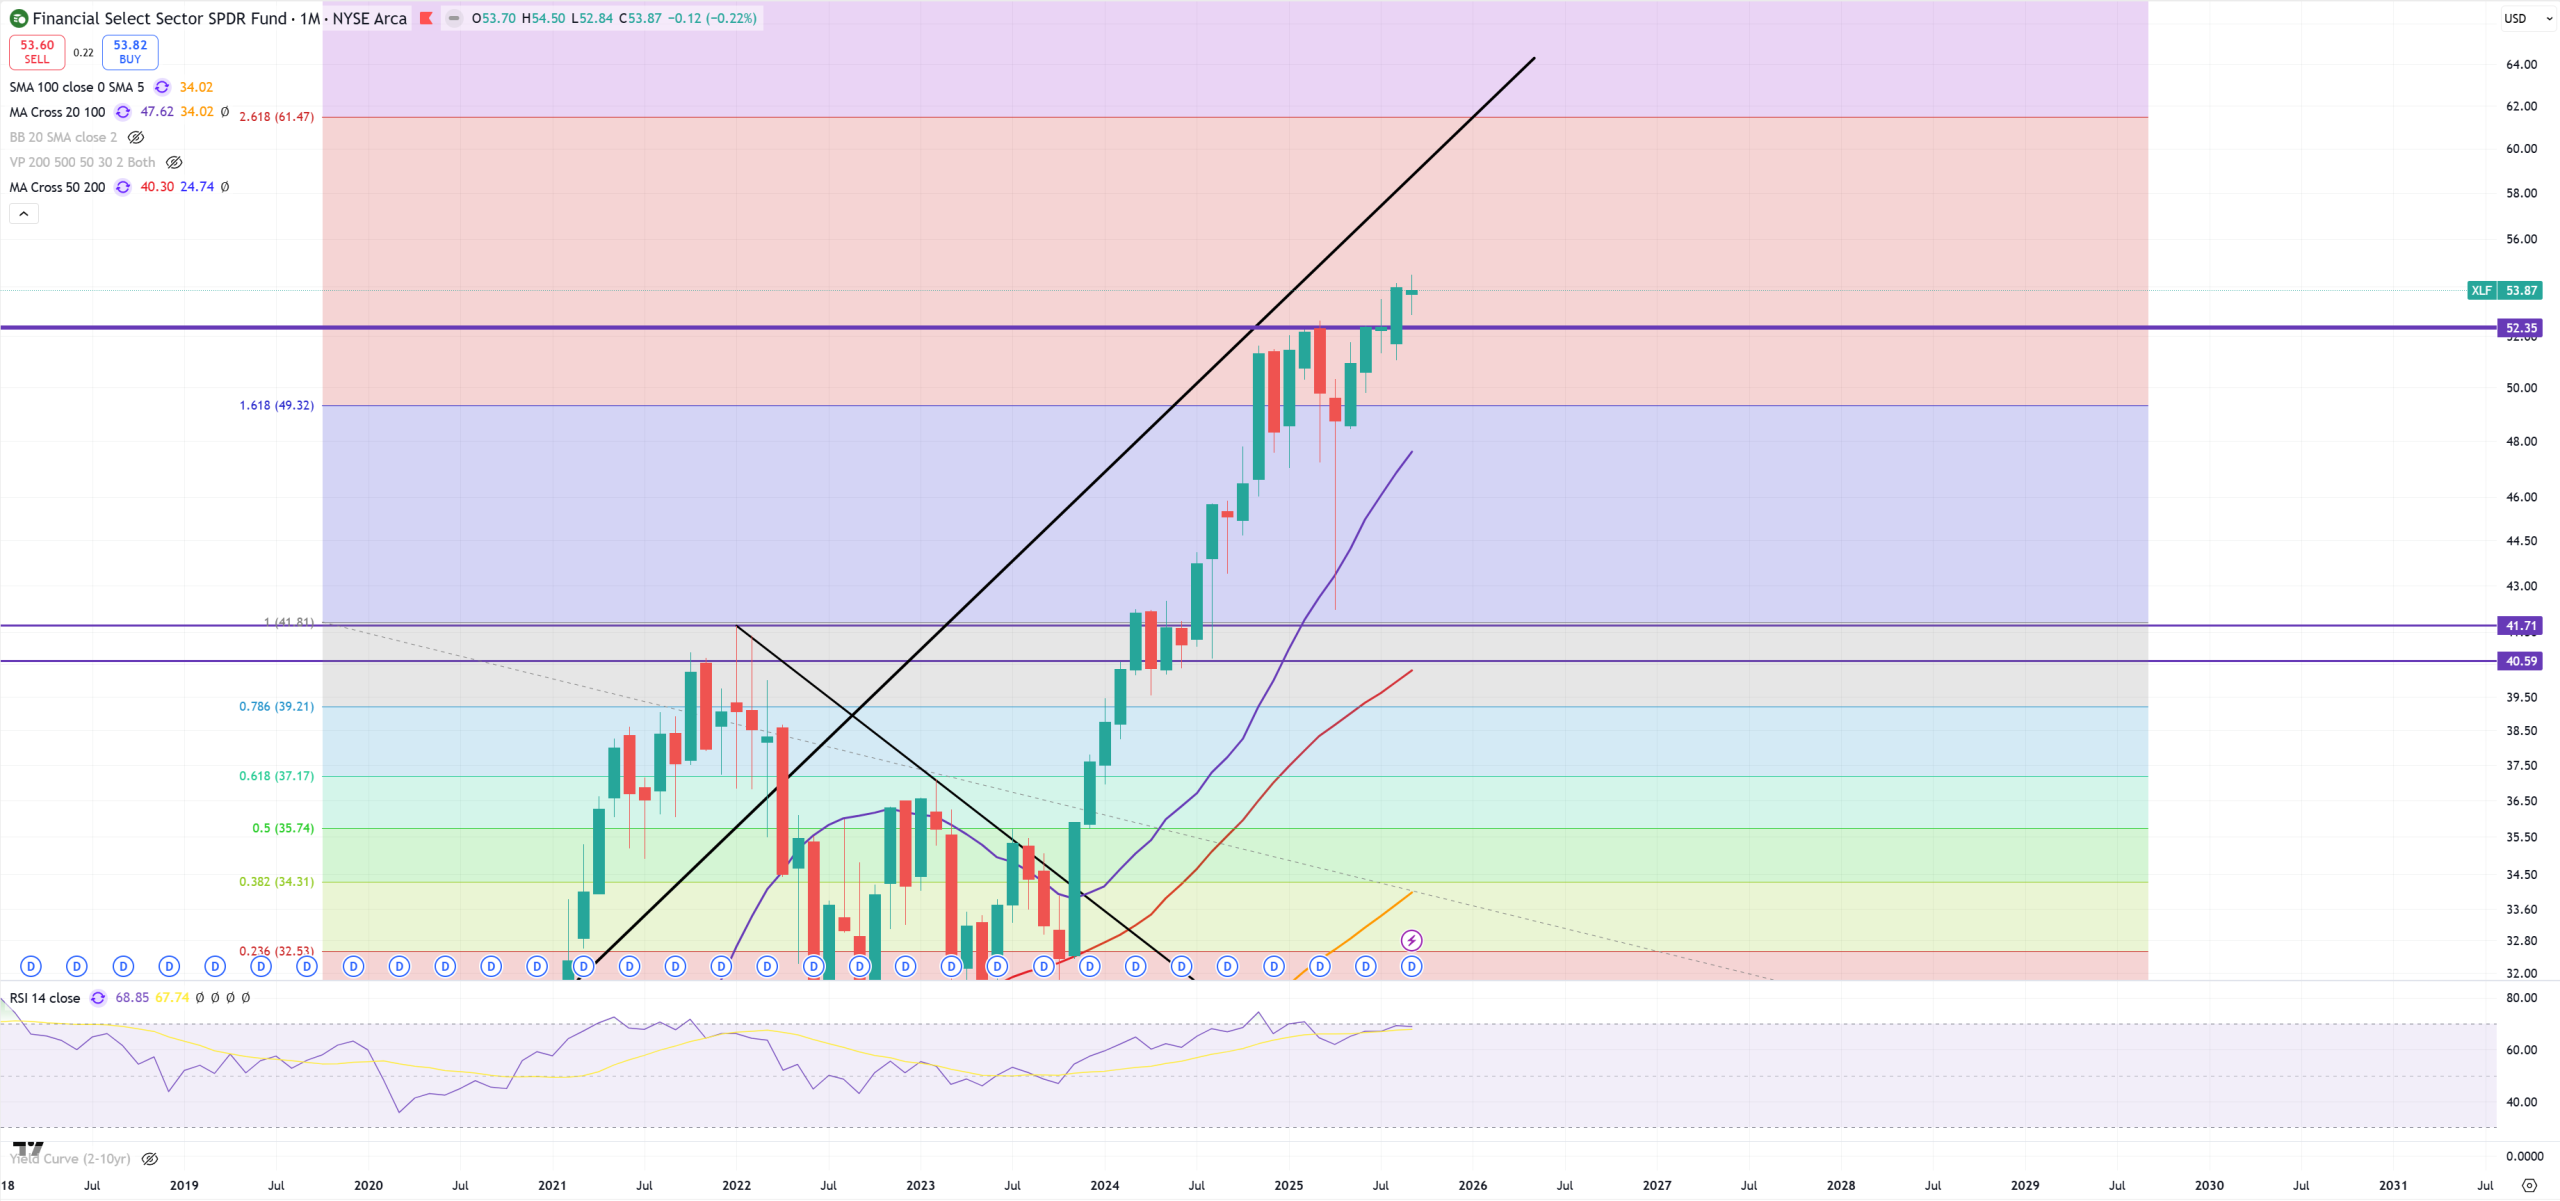
XLF – Financials
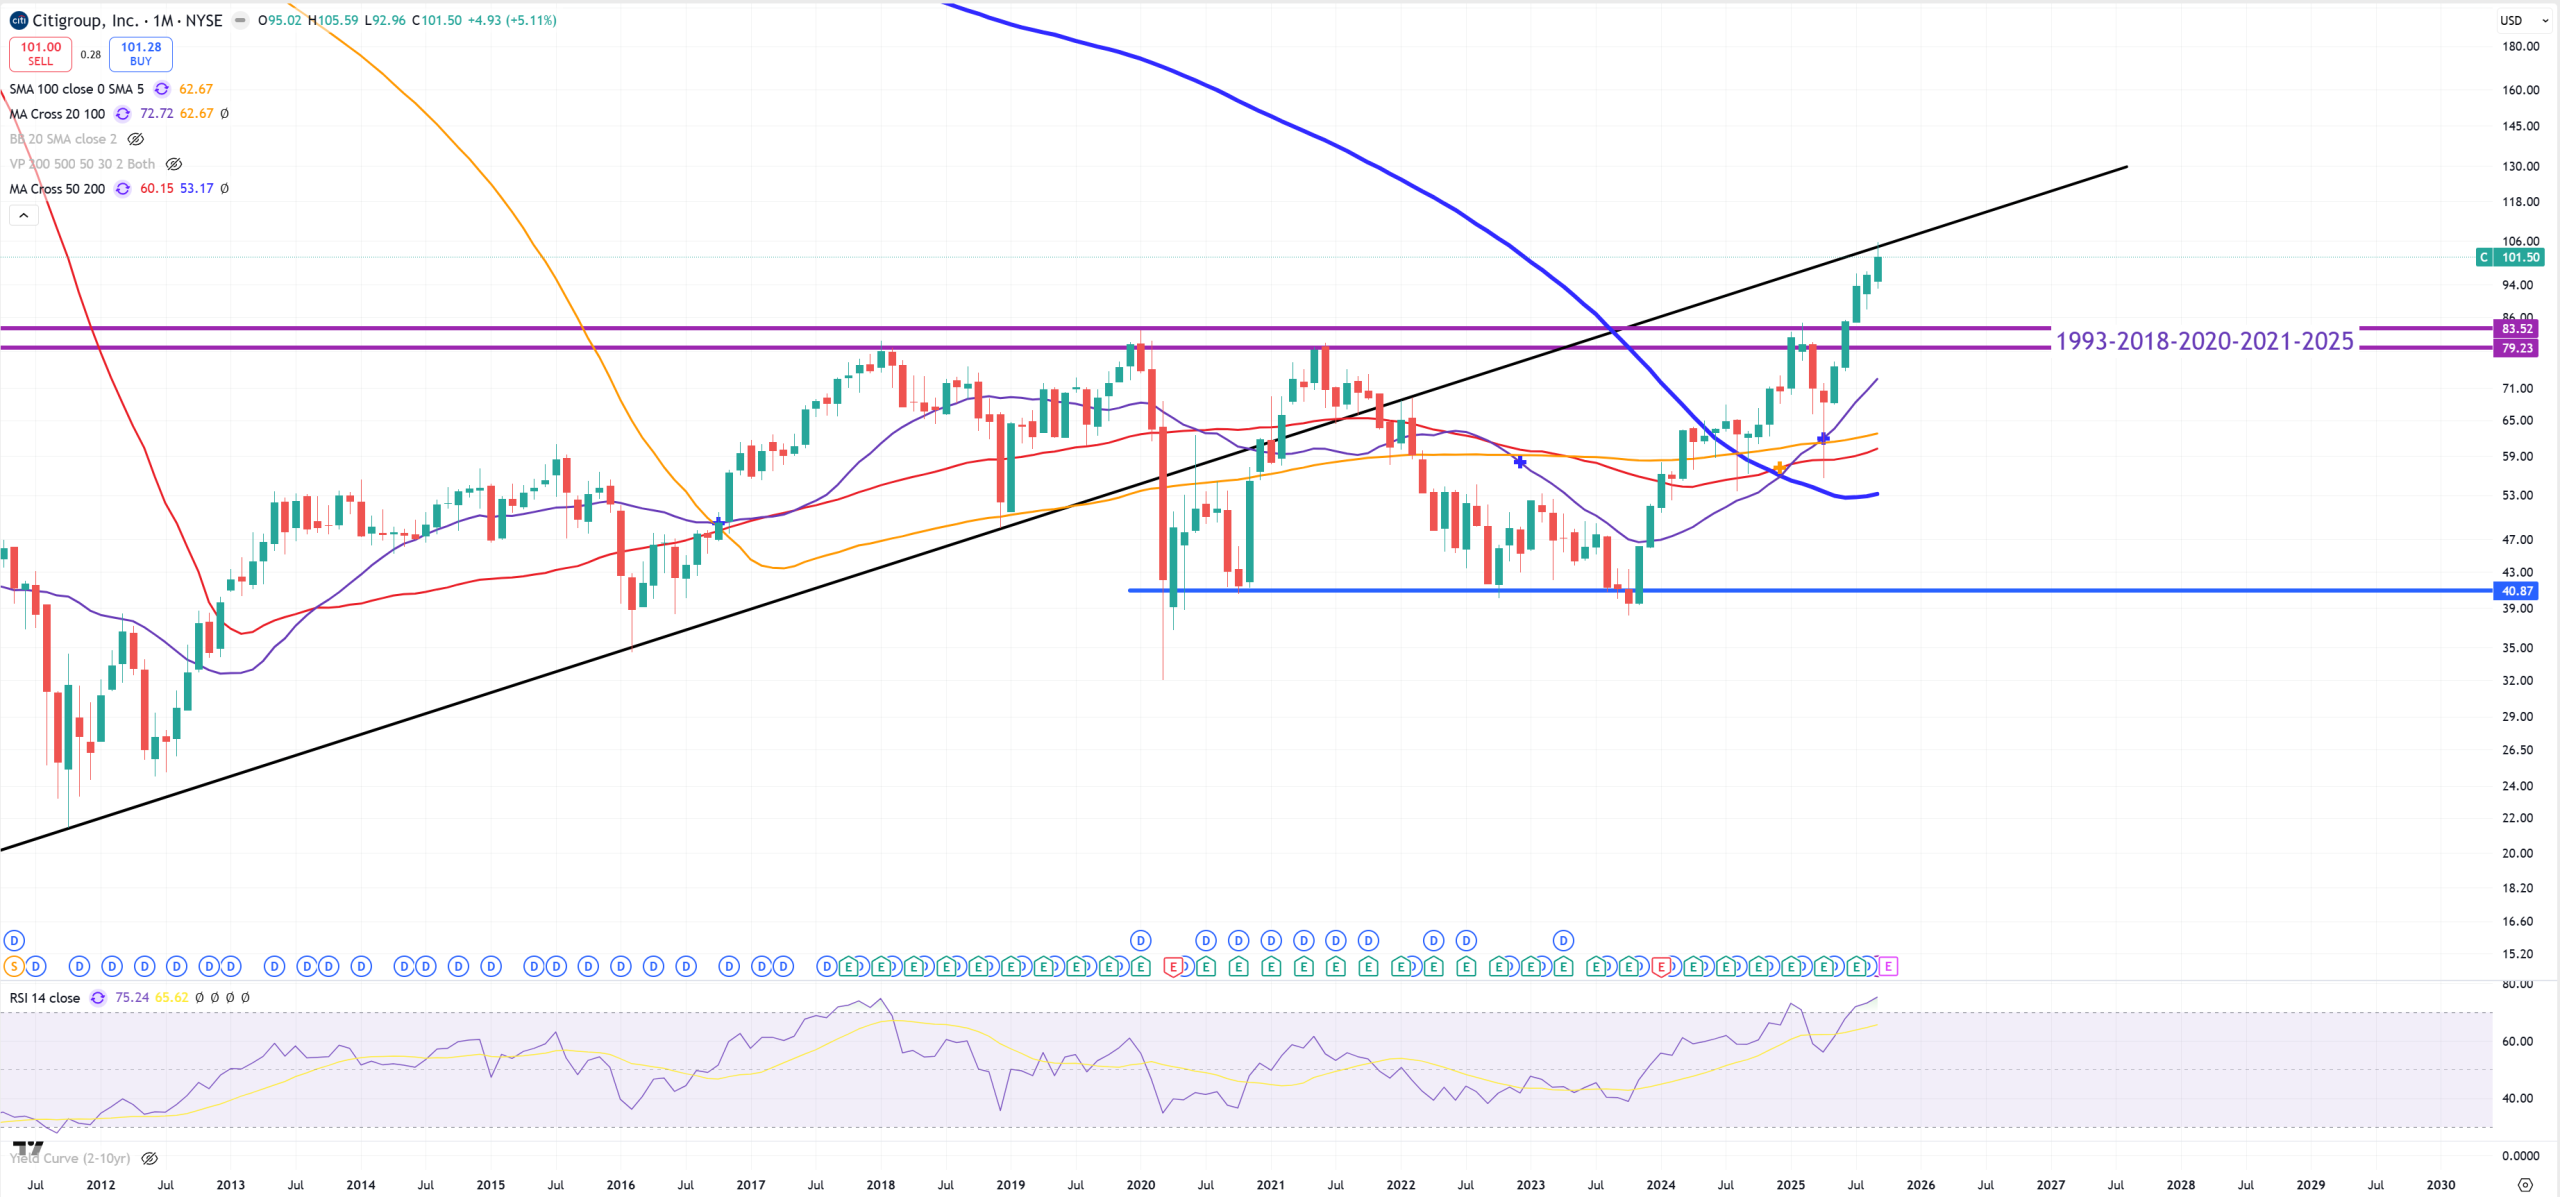
C – CitiBank and its retest
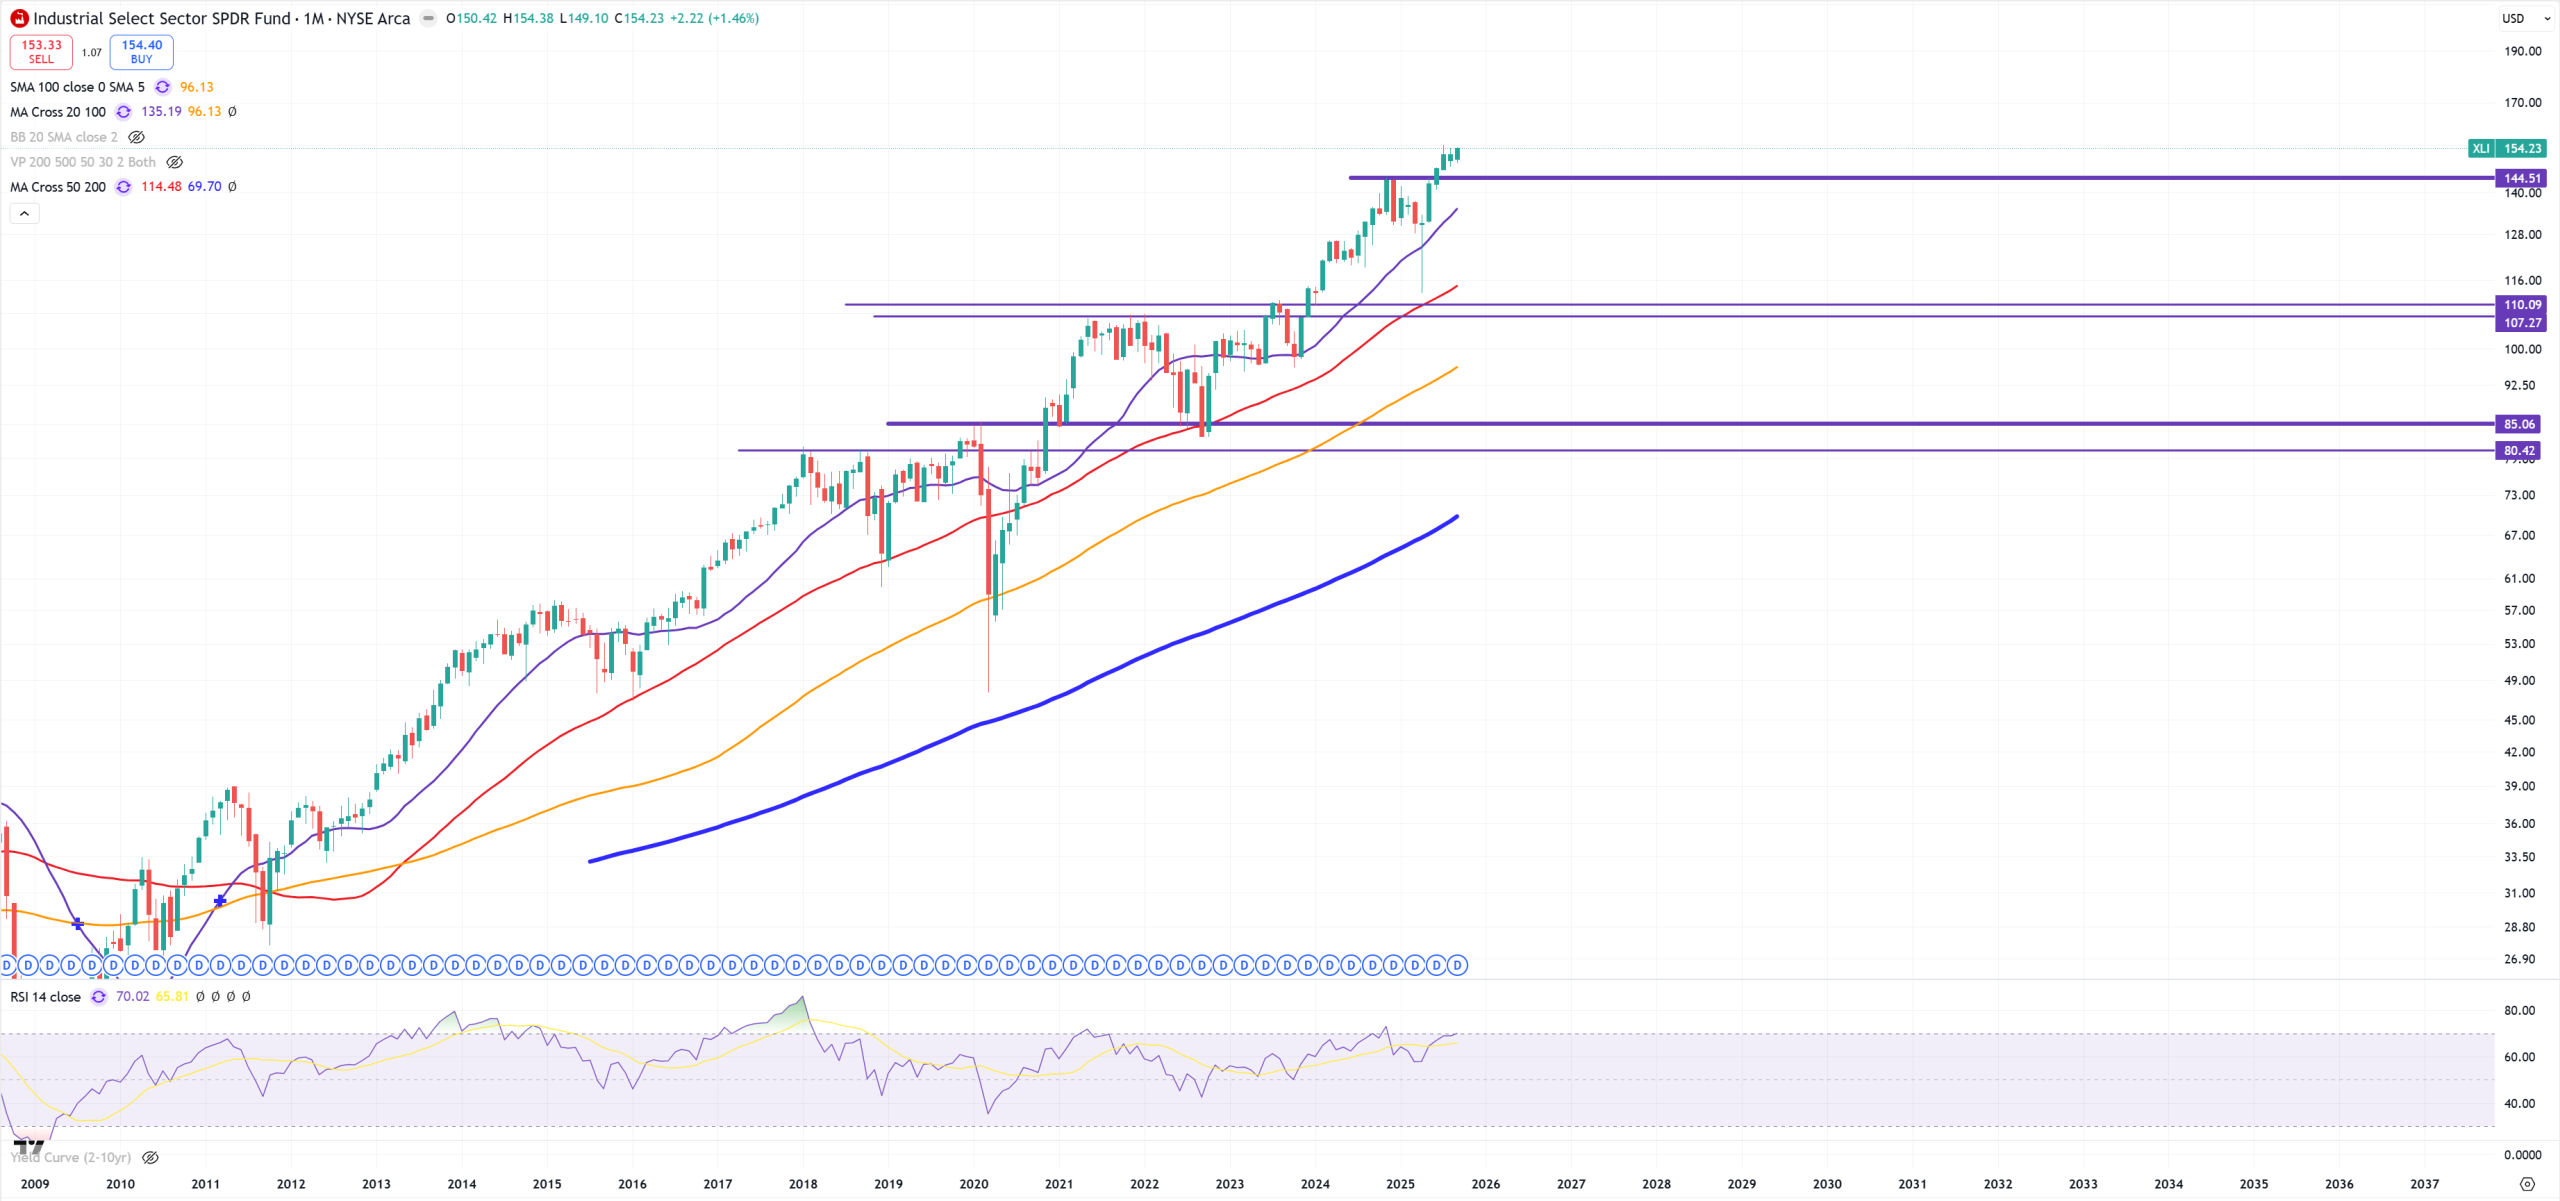
XLI – Industrials
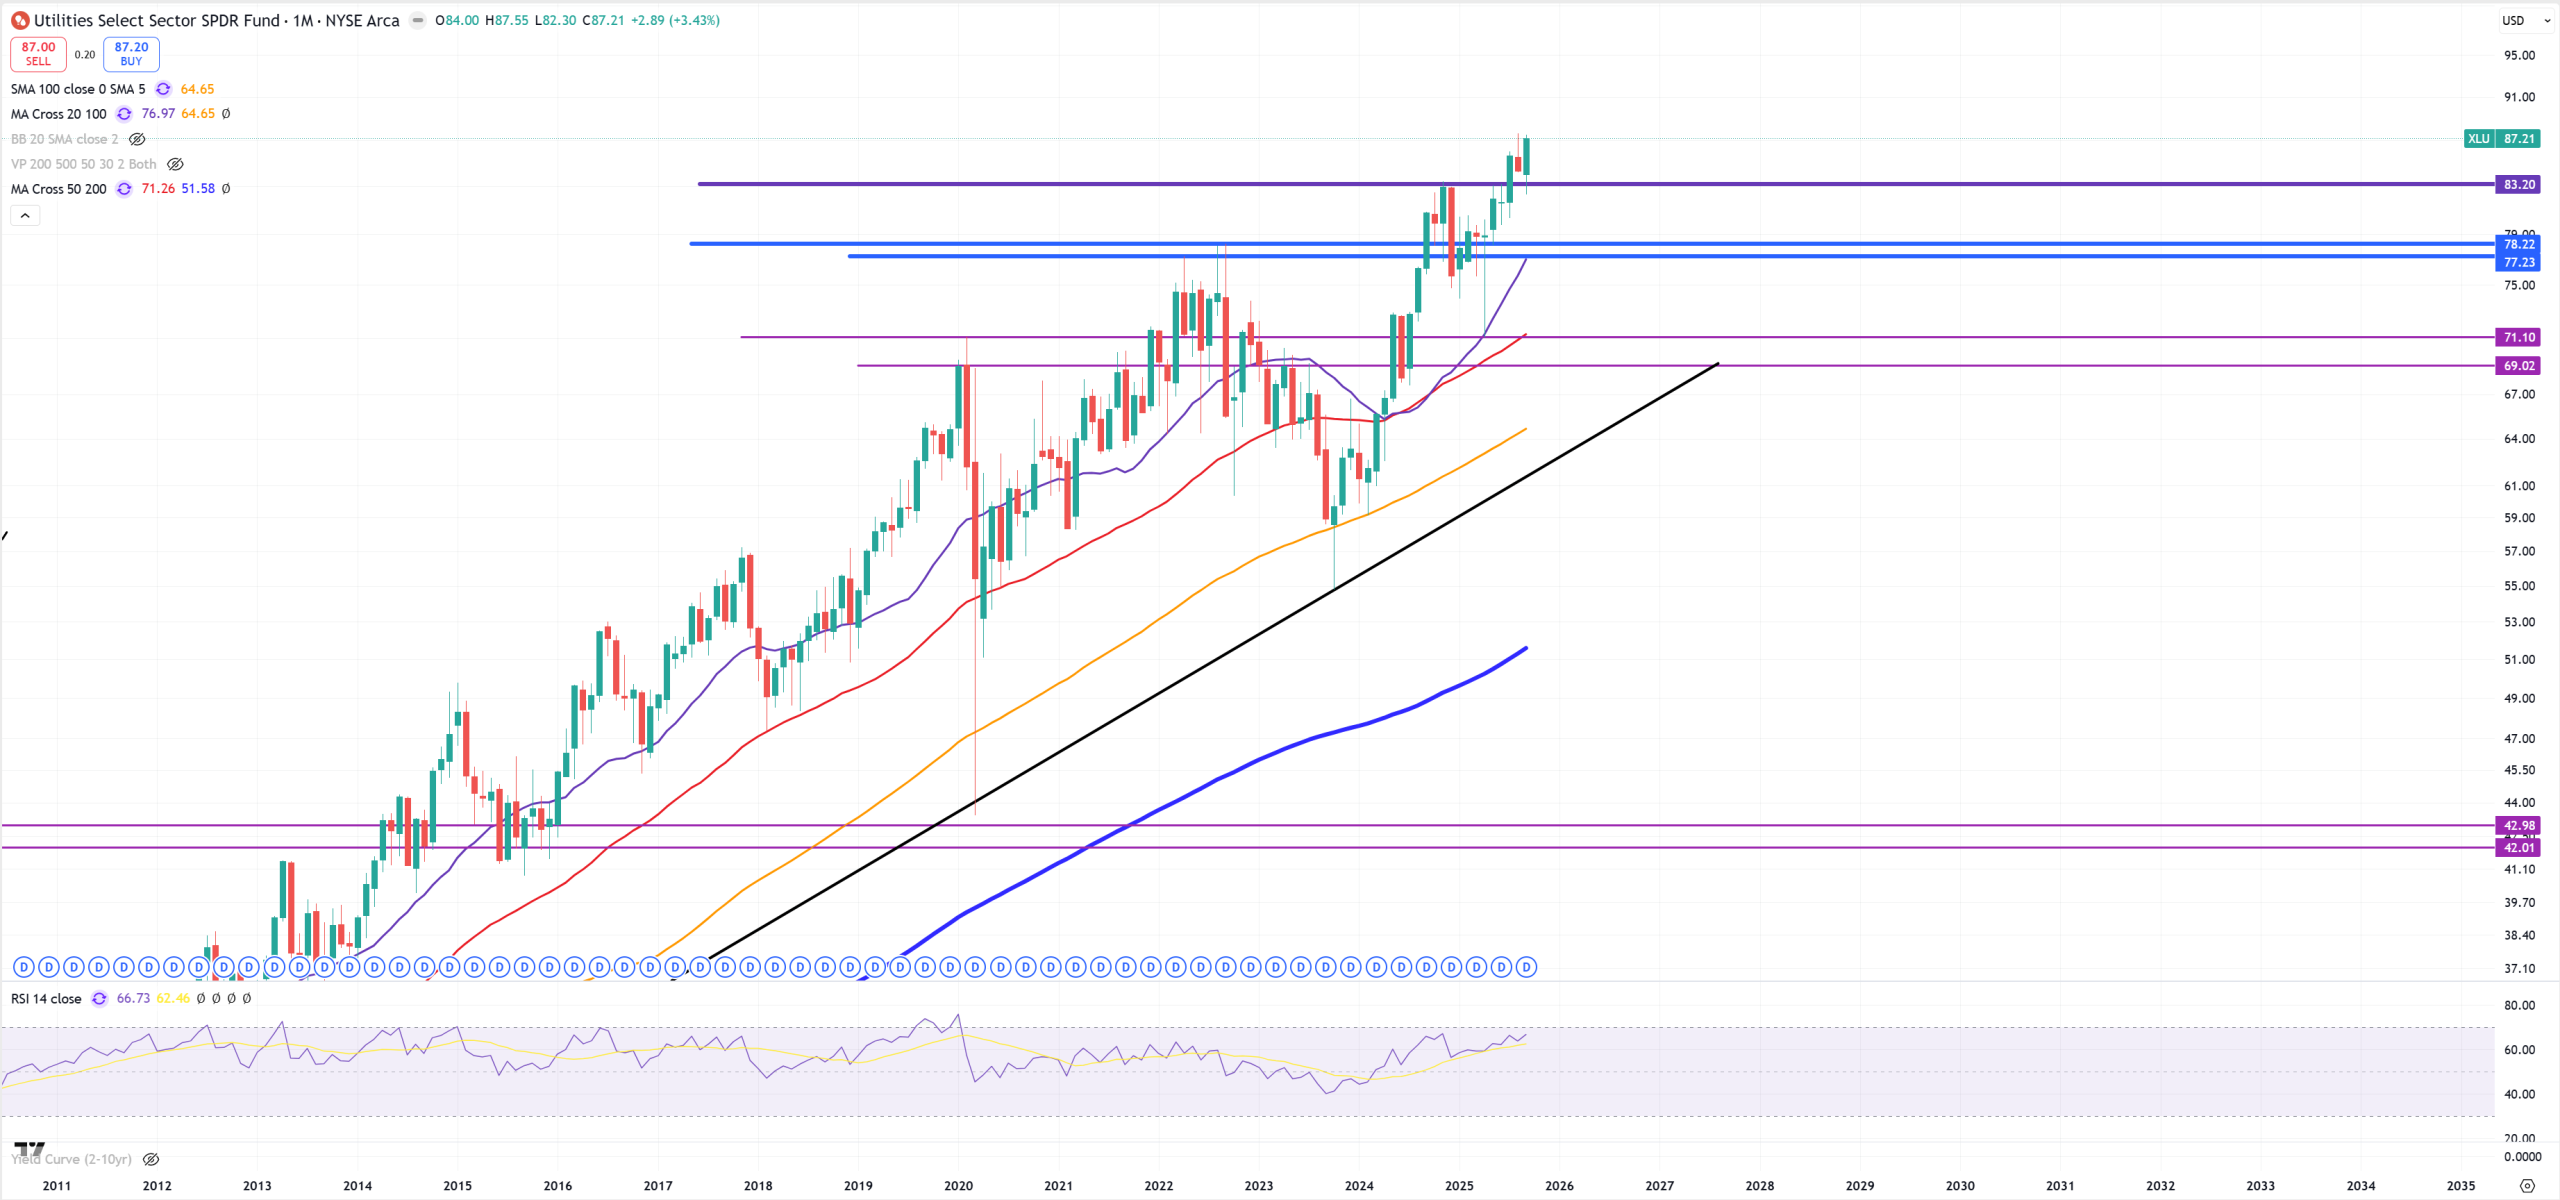
XLU – Utilities
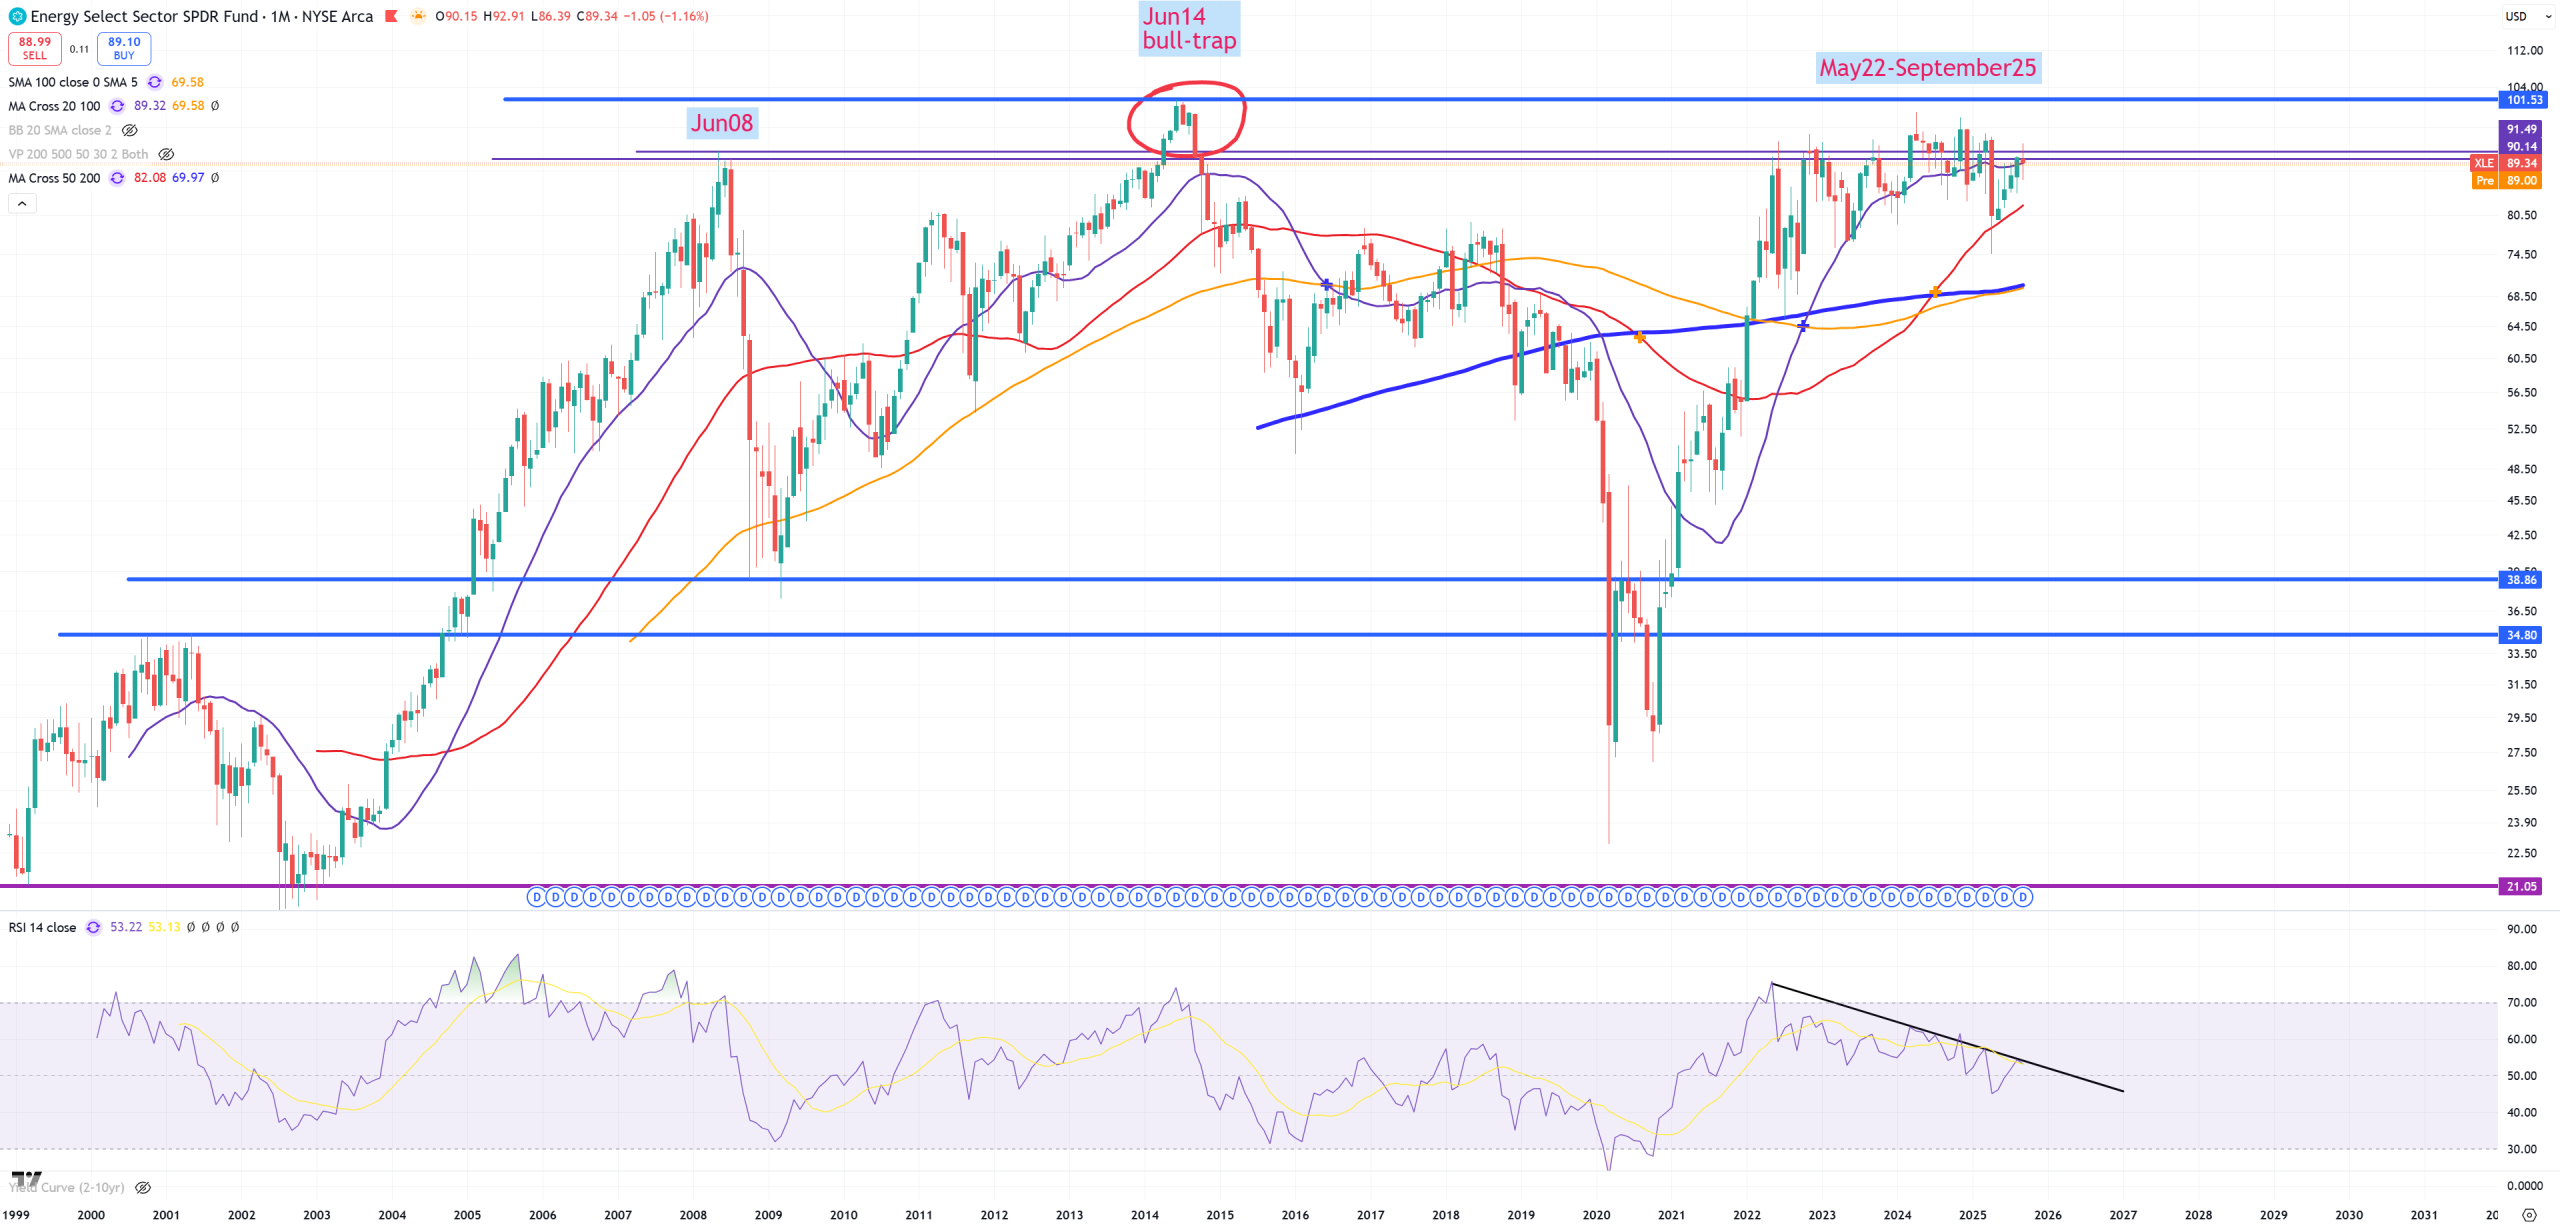
XLE – Energy and 3.5Y of knocking to 2008 resistance
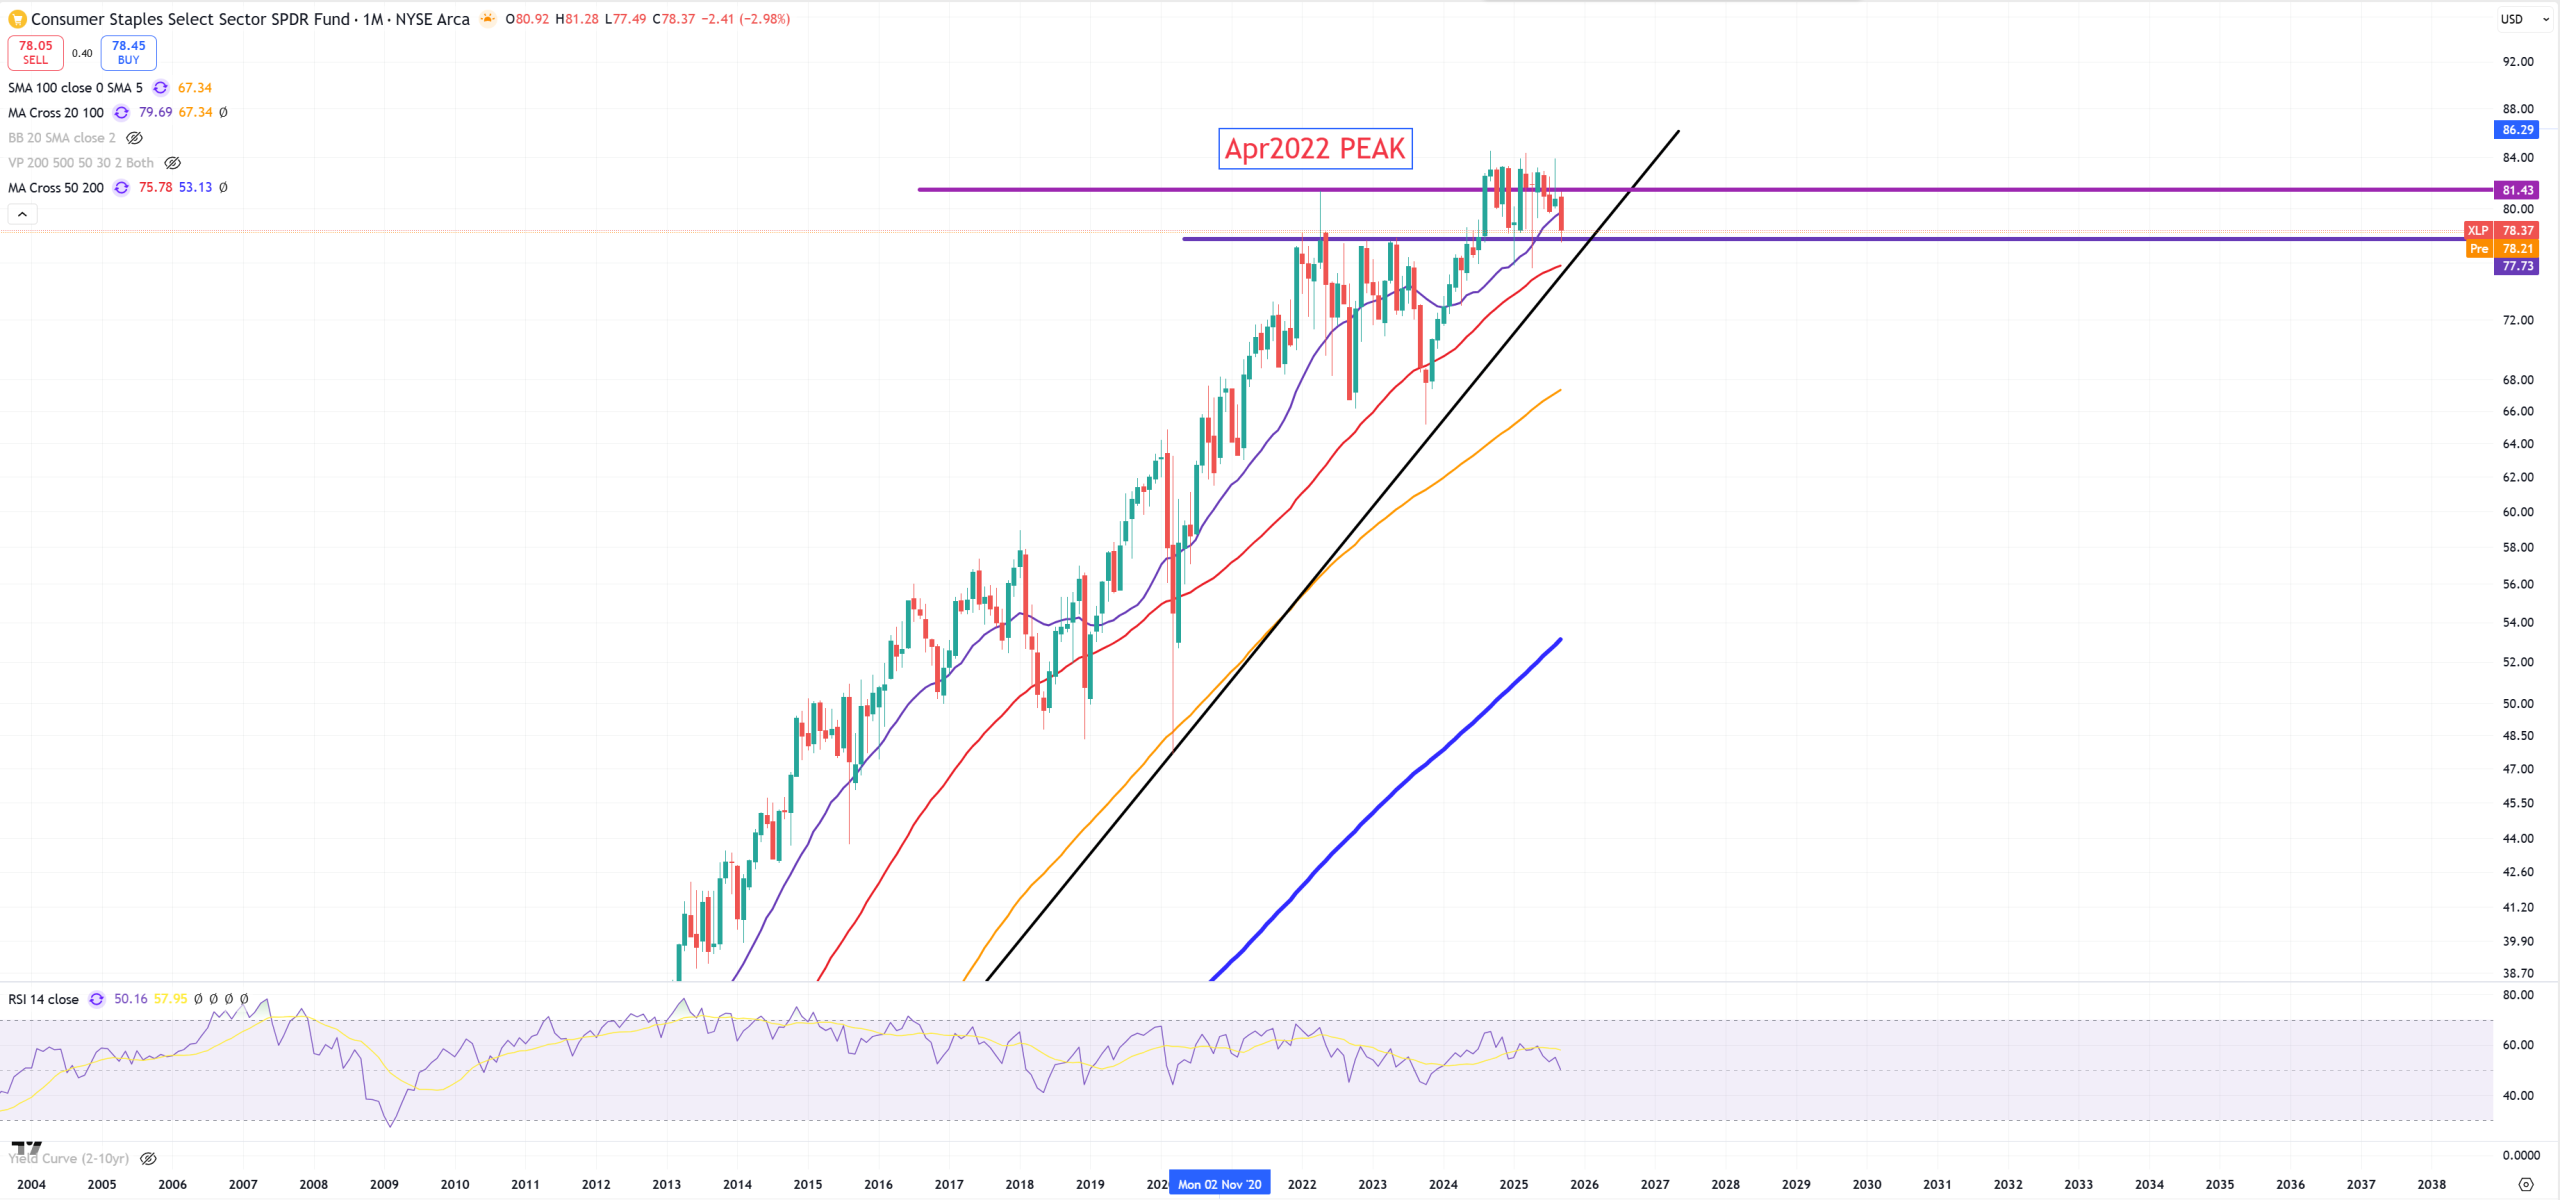
XLP – Consumer Staples
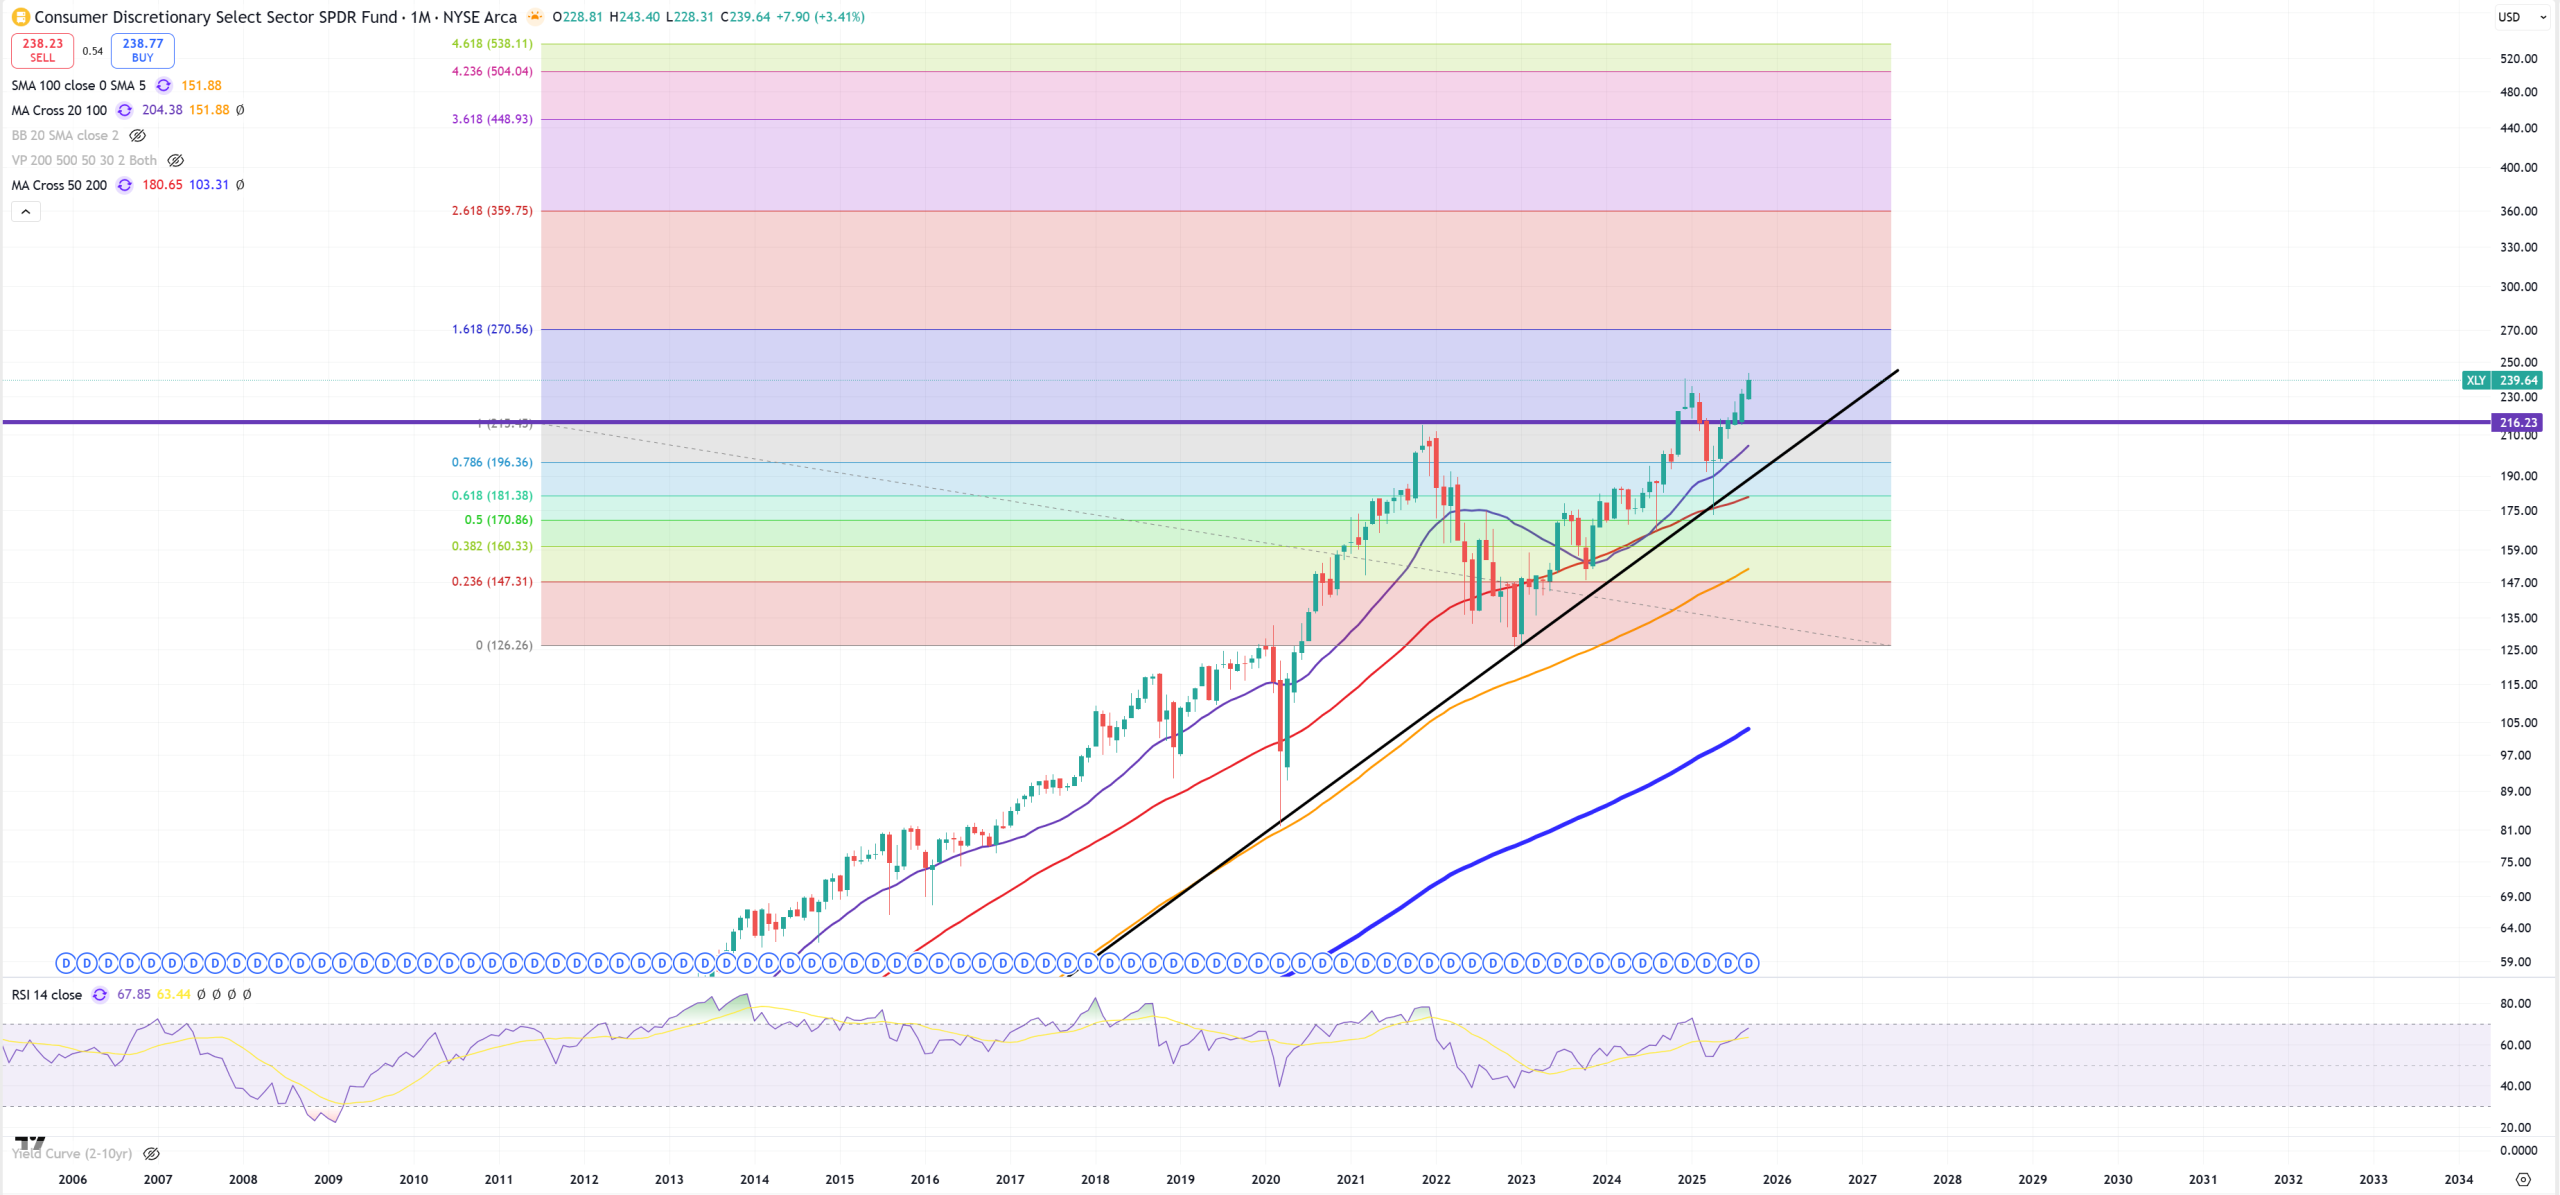
XLY – Consumer Discretionary
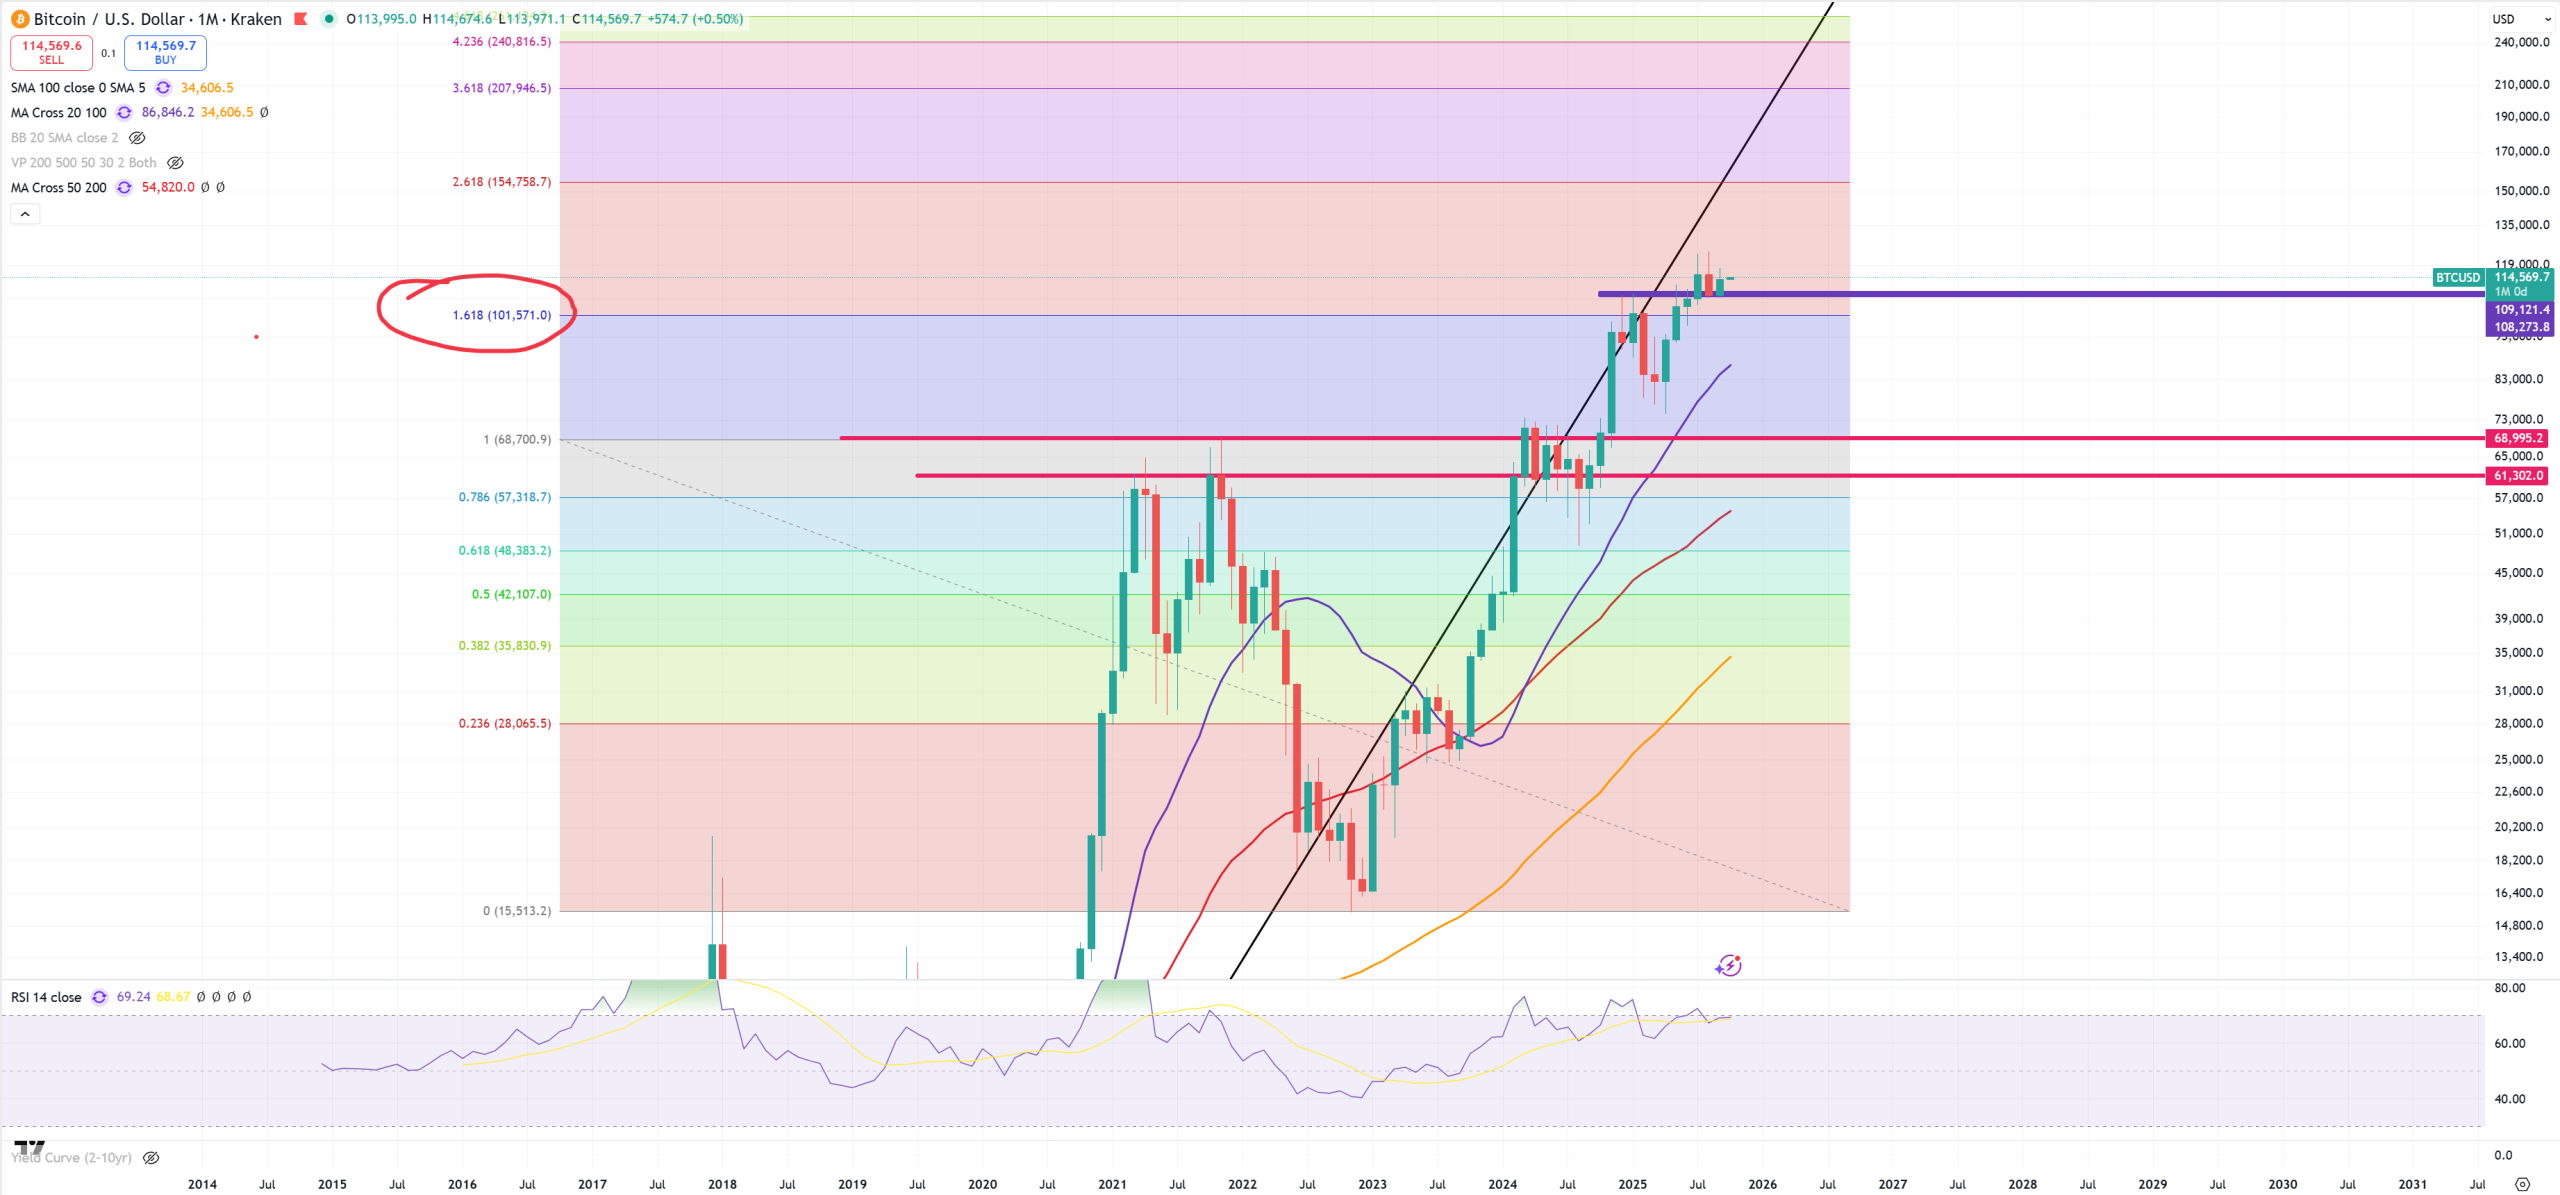
BTC – Bitcoin
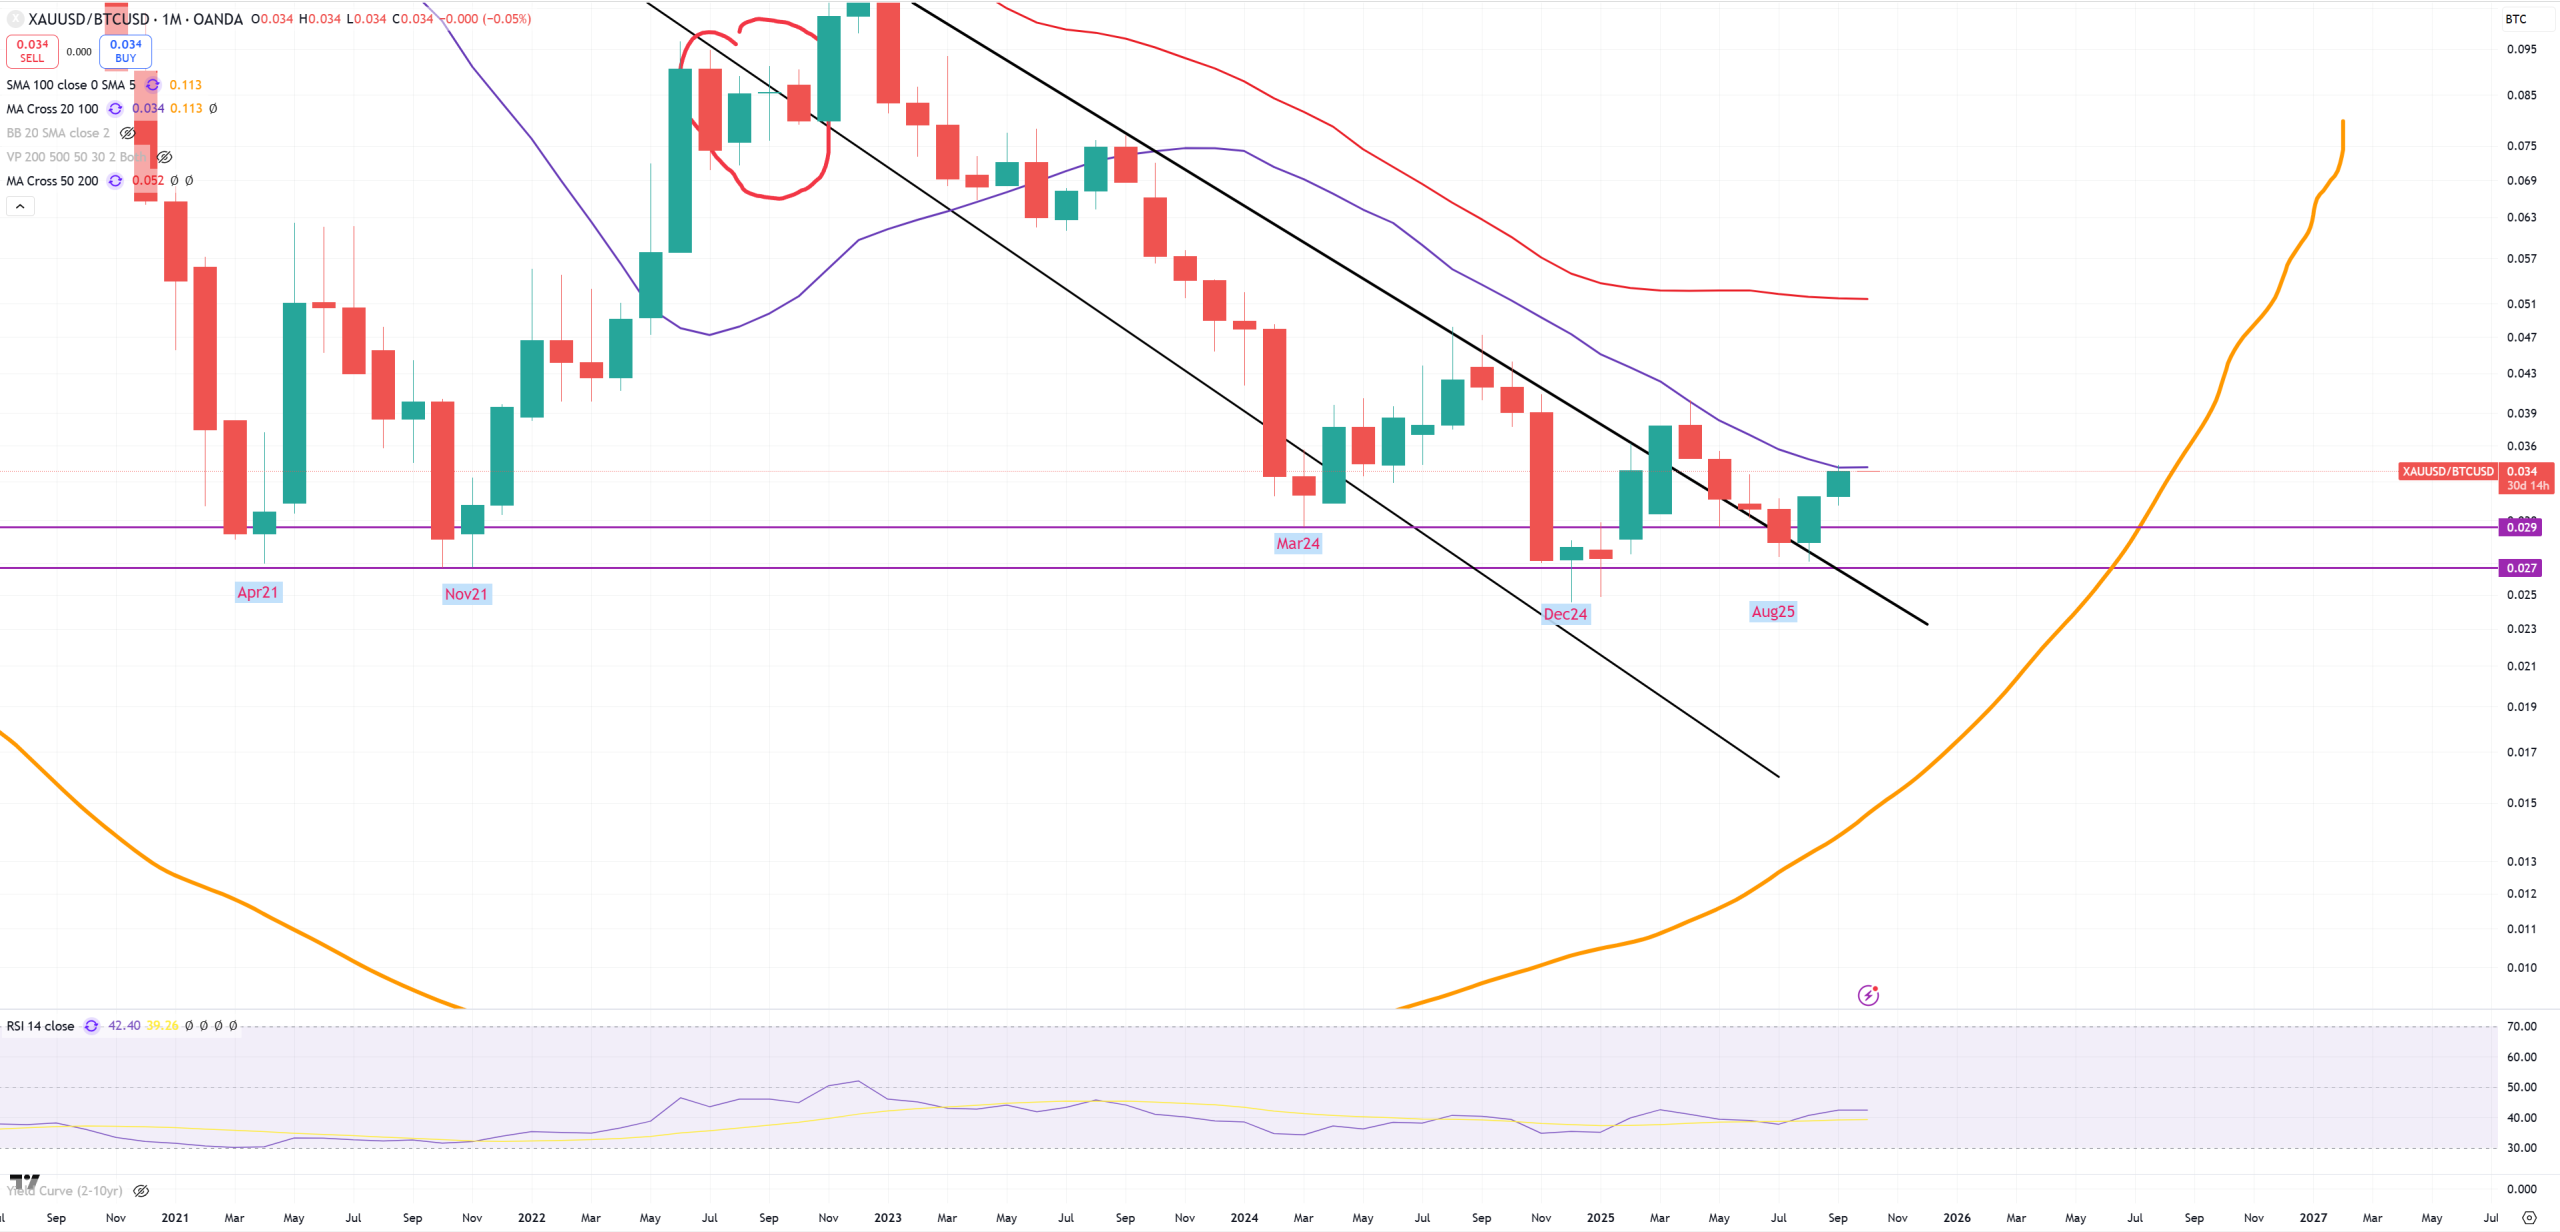
GOLD/BTC – (M)MA20 was not broken and any move lower is bullish BTC
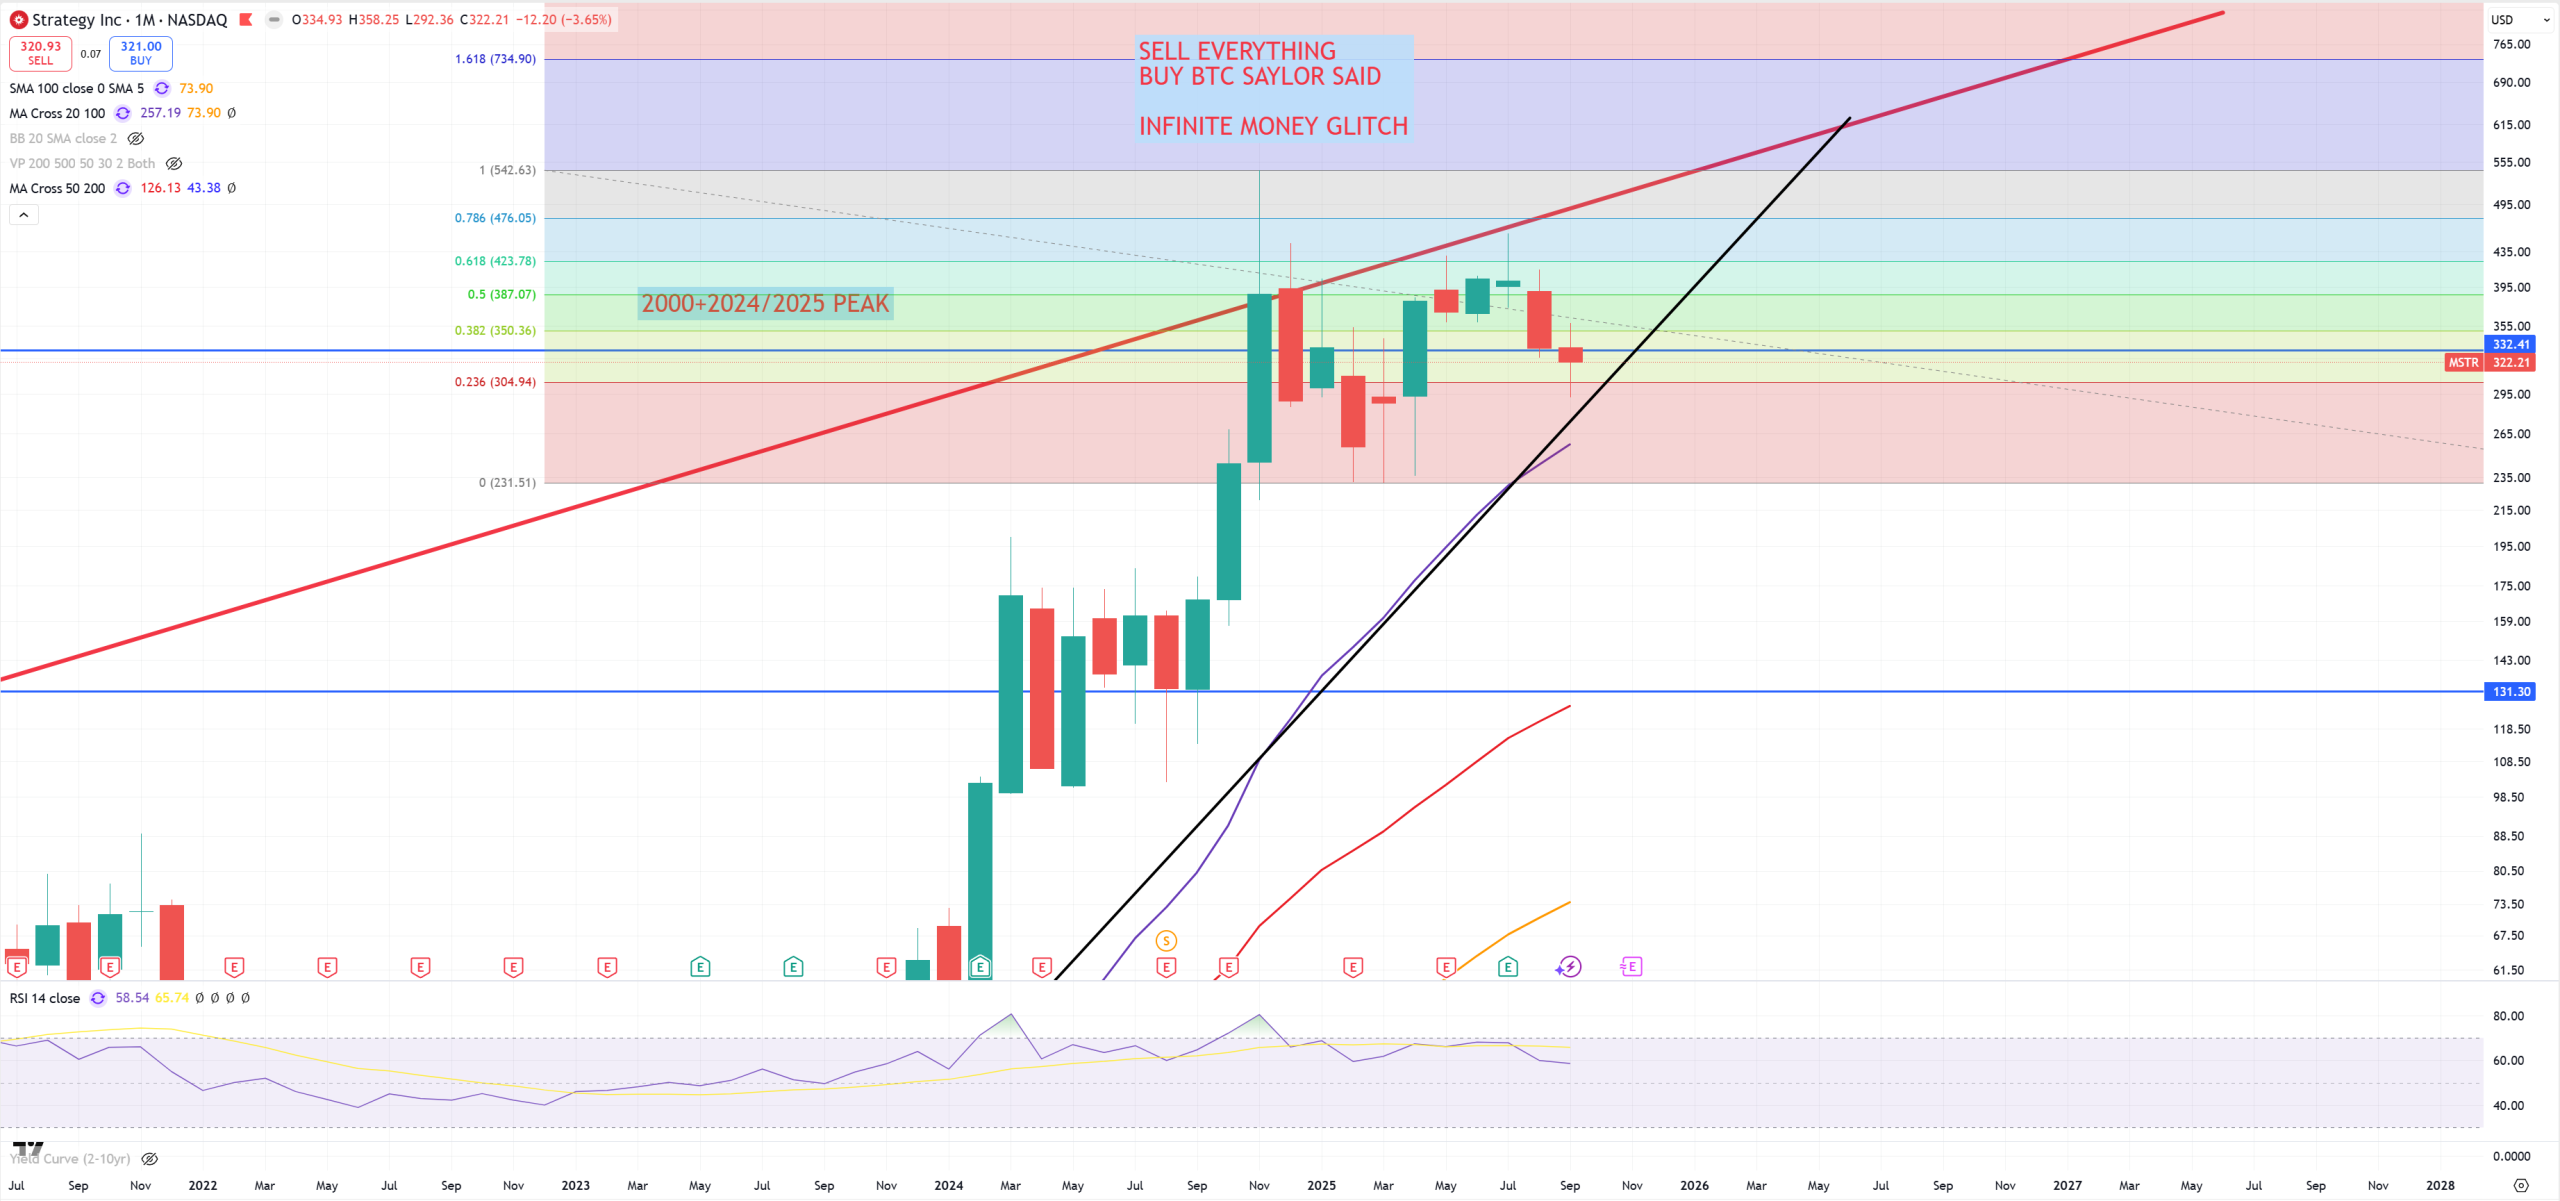
MSTR – from the other hand MSTR ends below its 2000 peak level
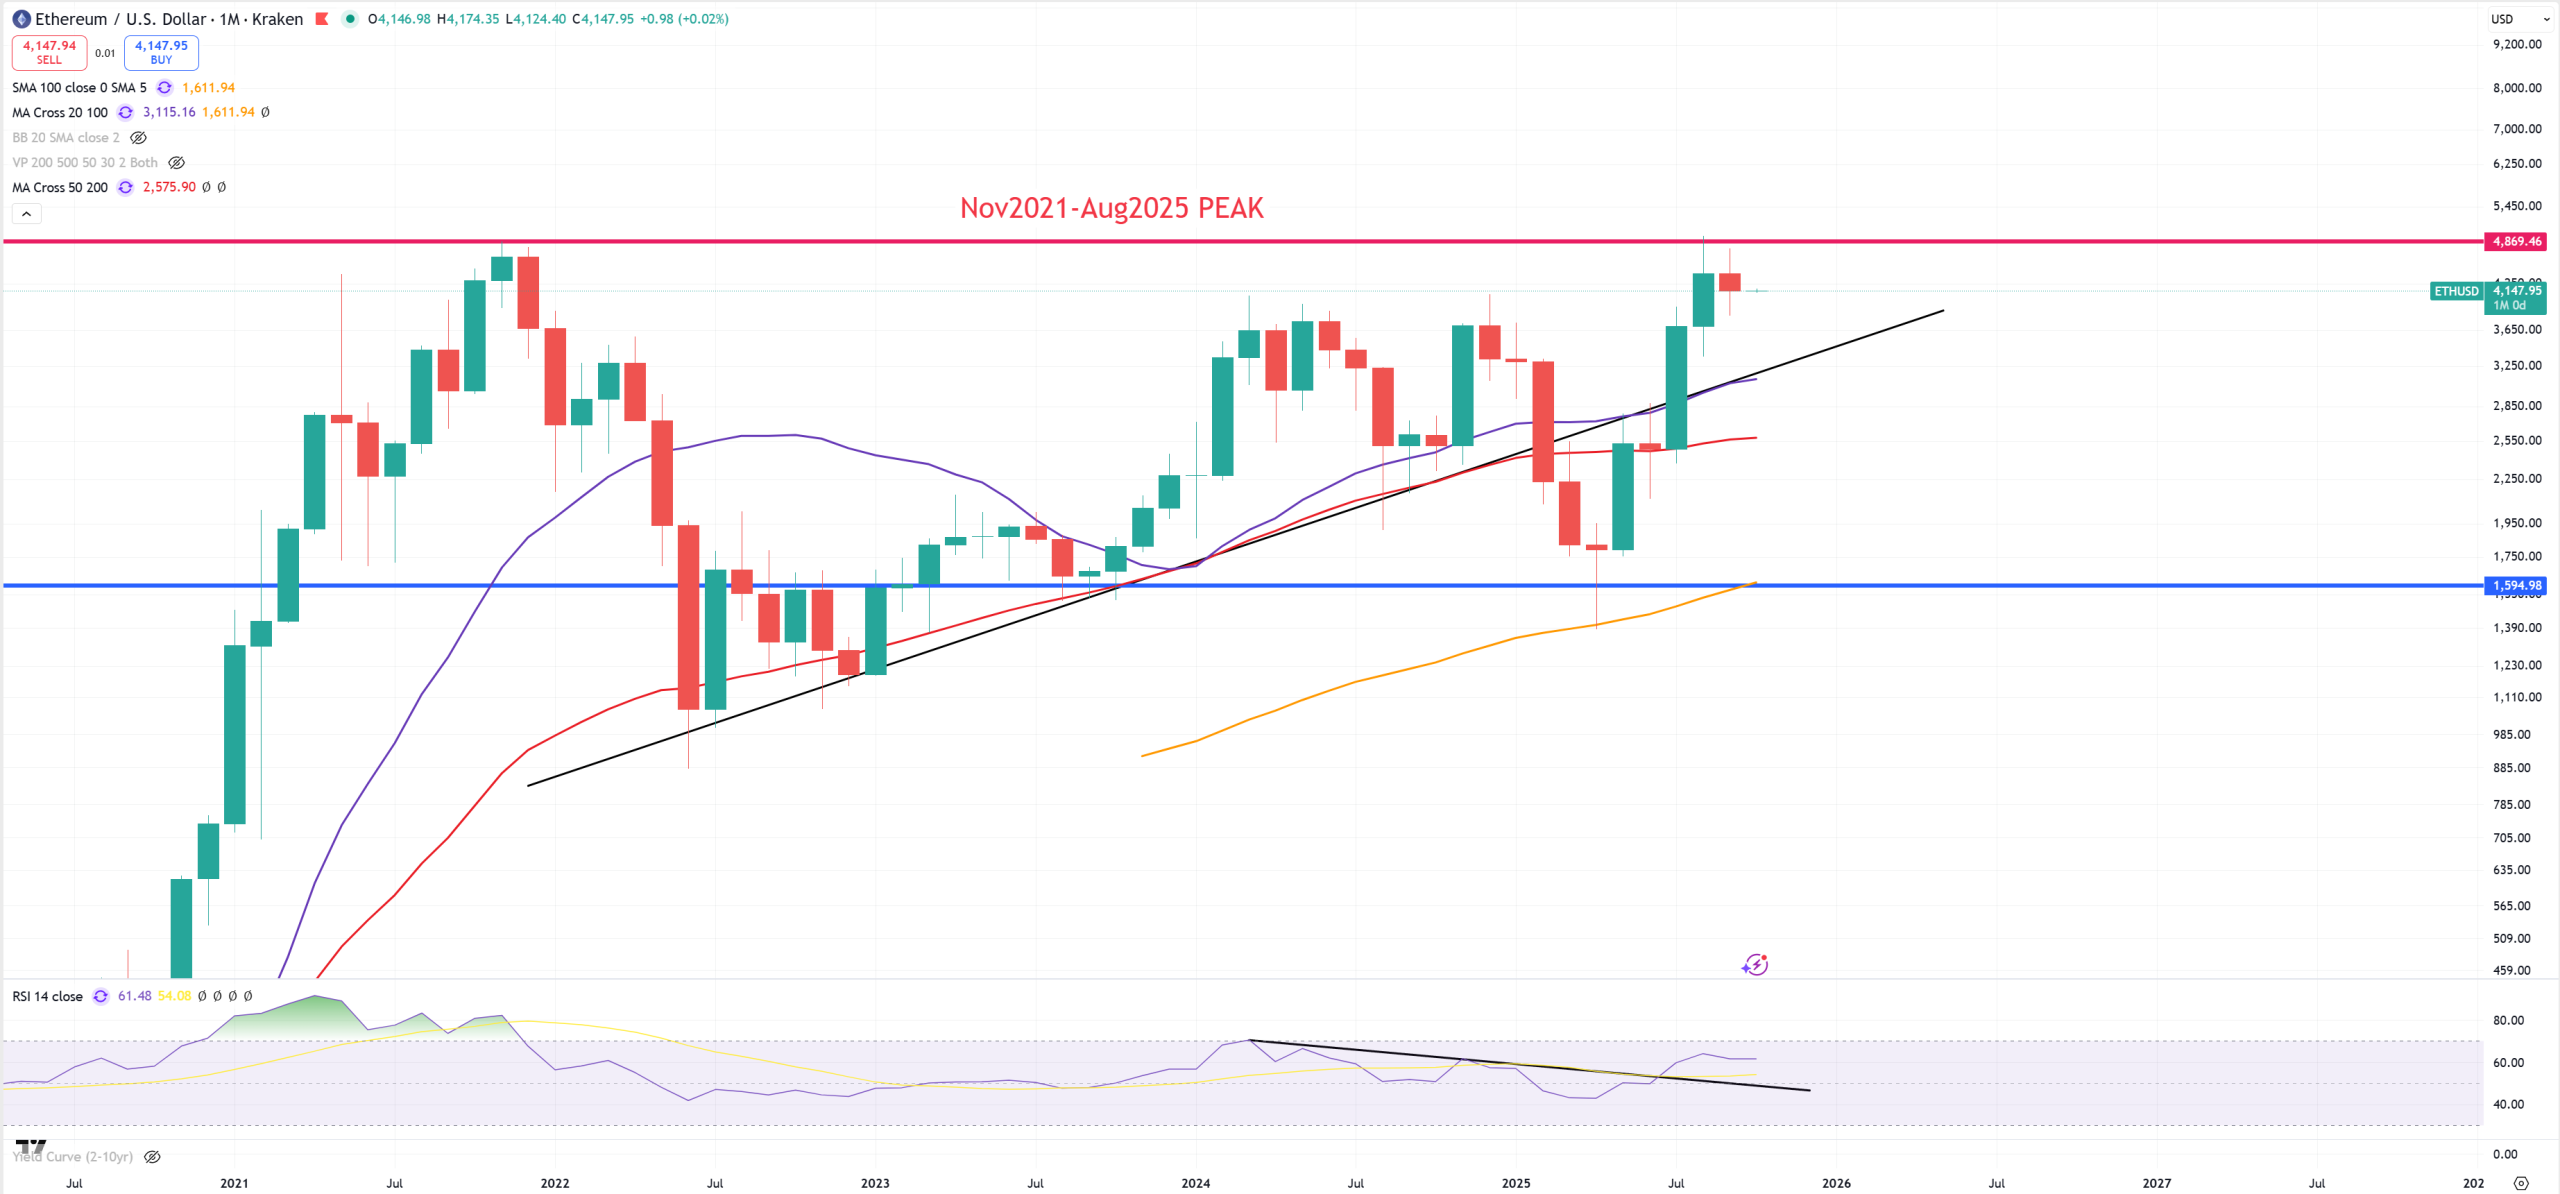
ETH – Ethereum
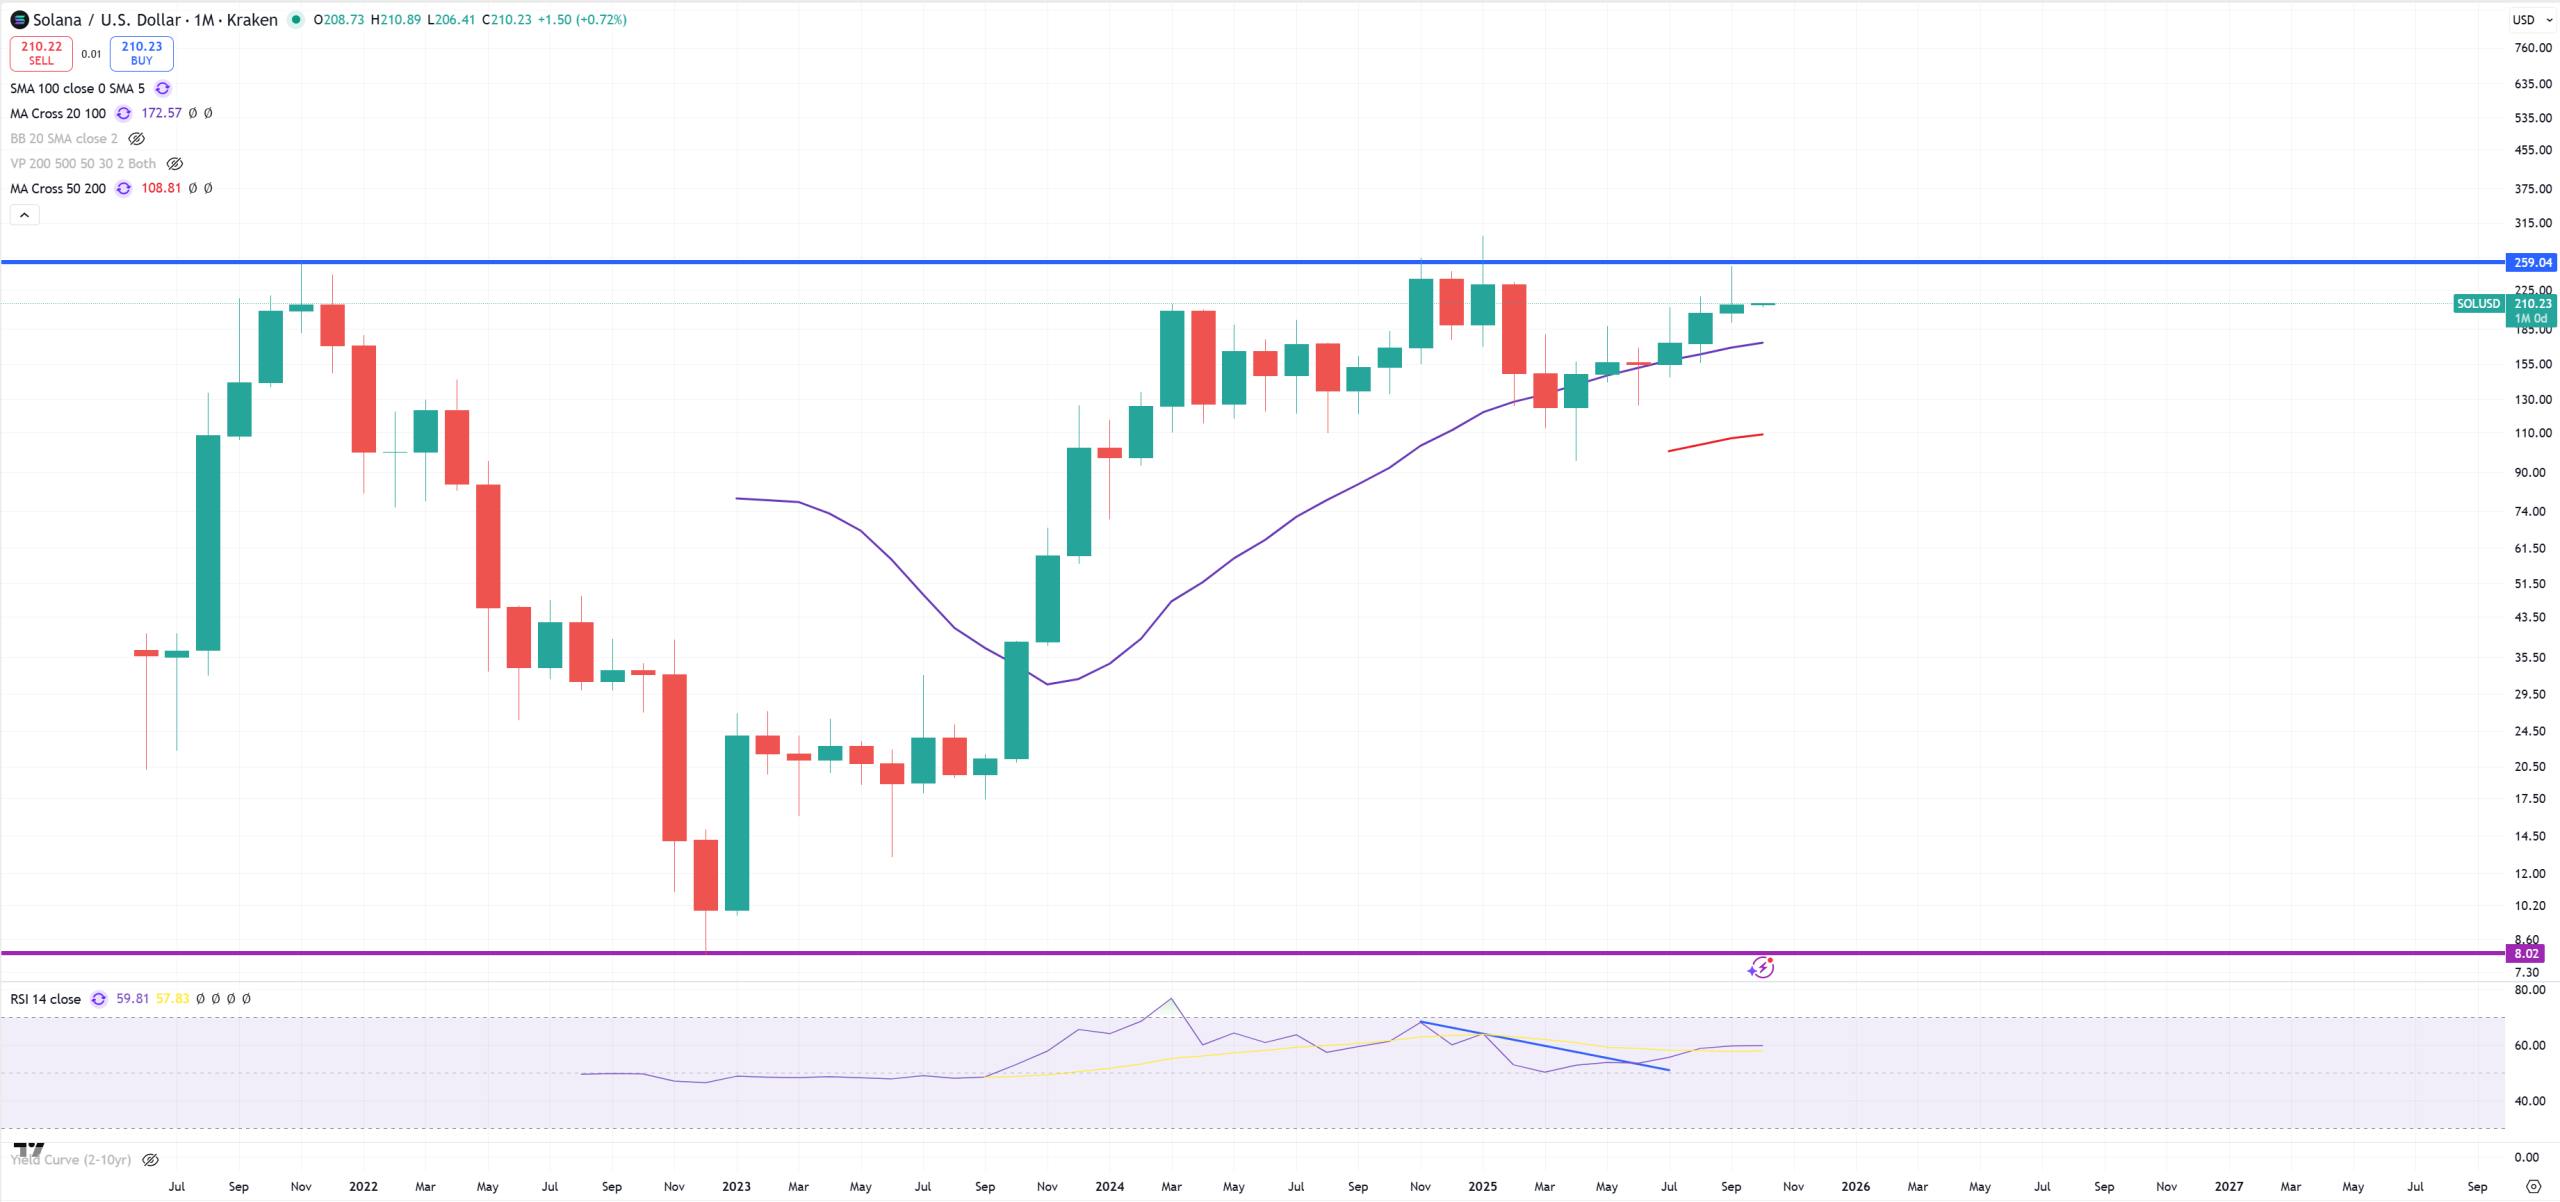
SOL – Solana
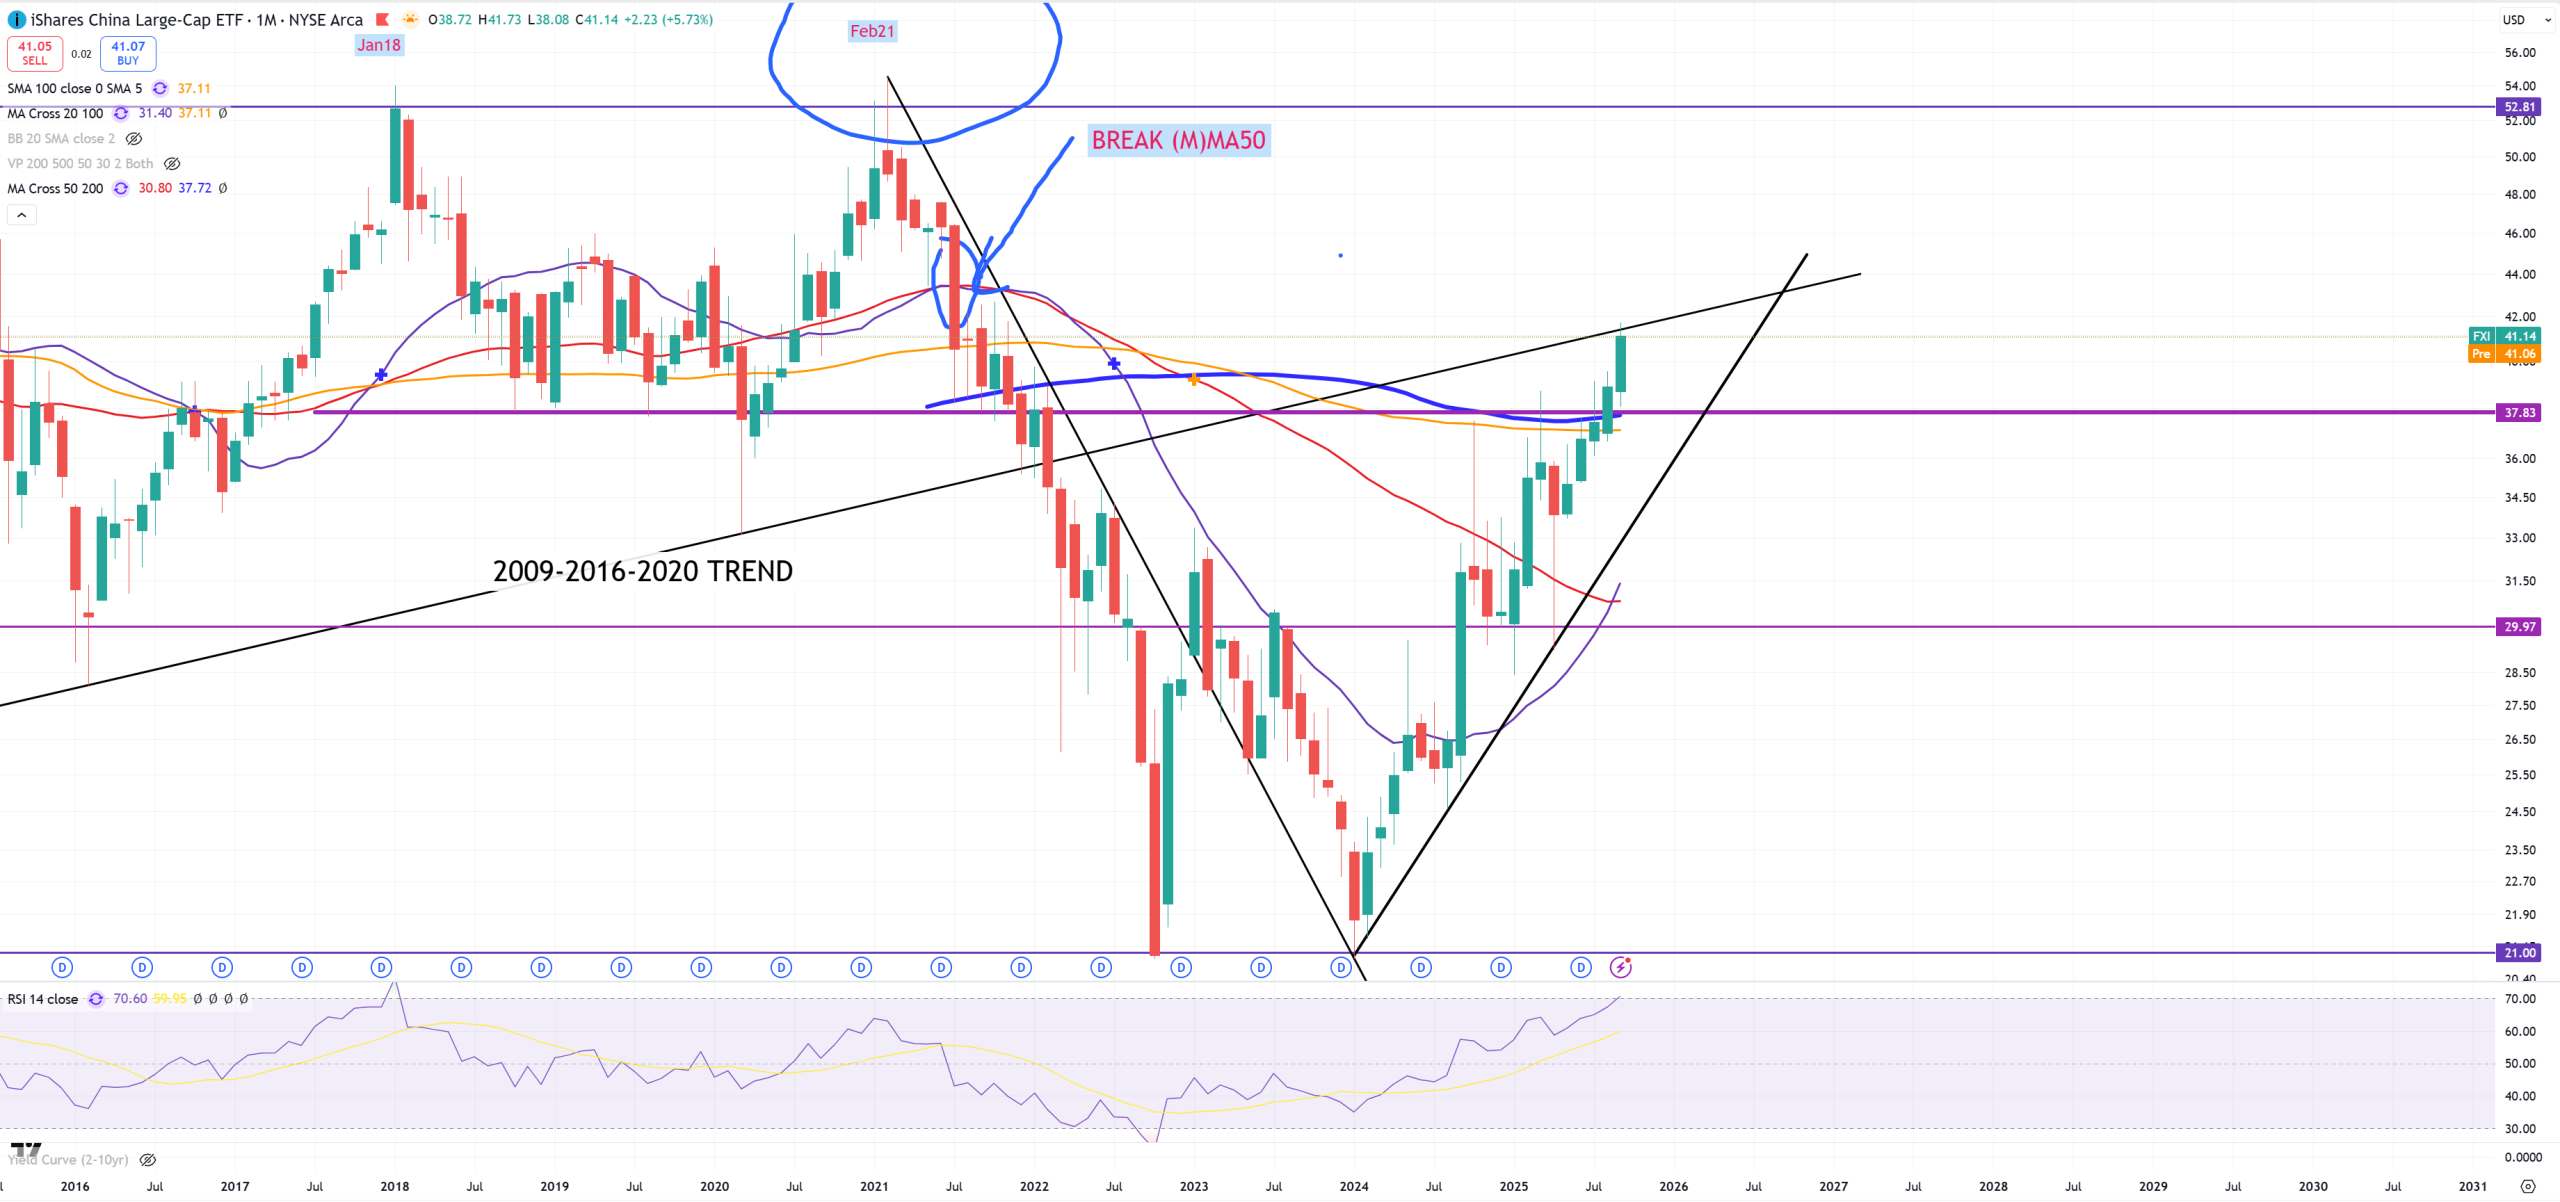
FXI – China – it’s very similar chart to C – after a bounce it broken everything and jumped to the highest possible level
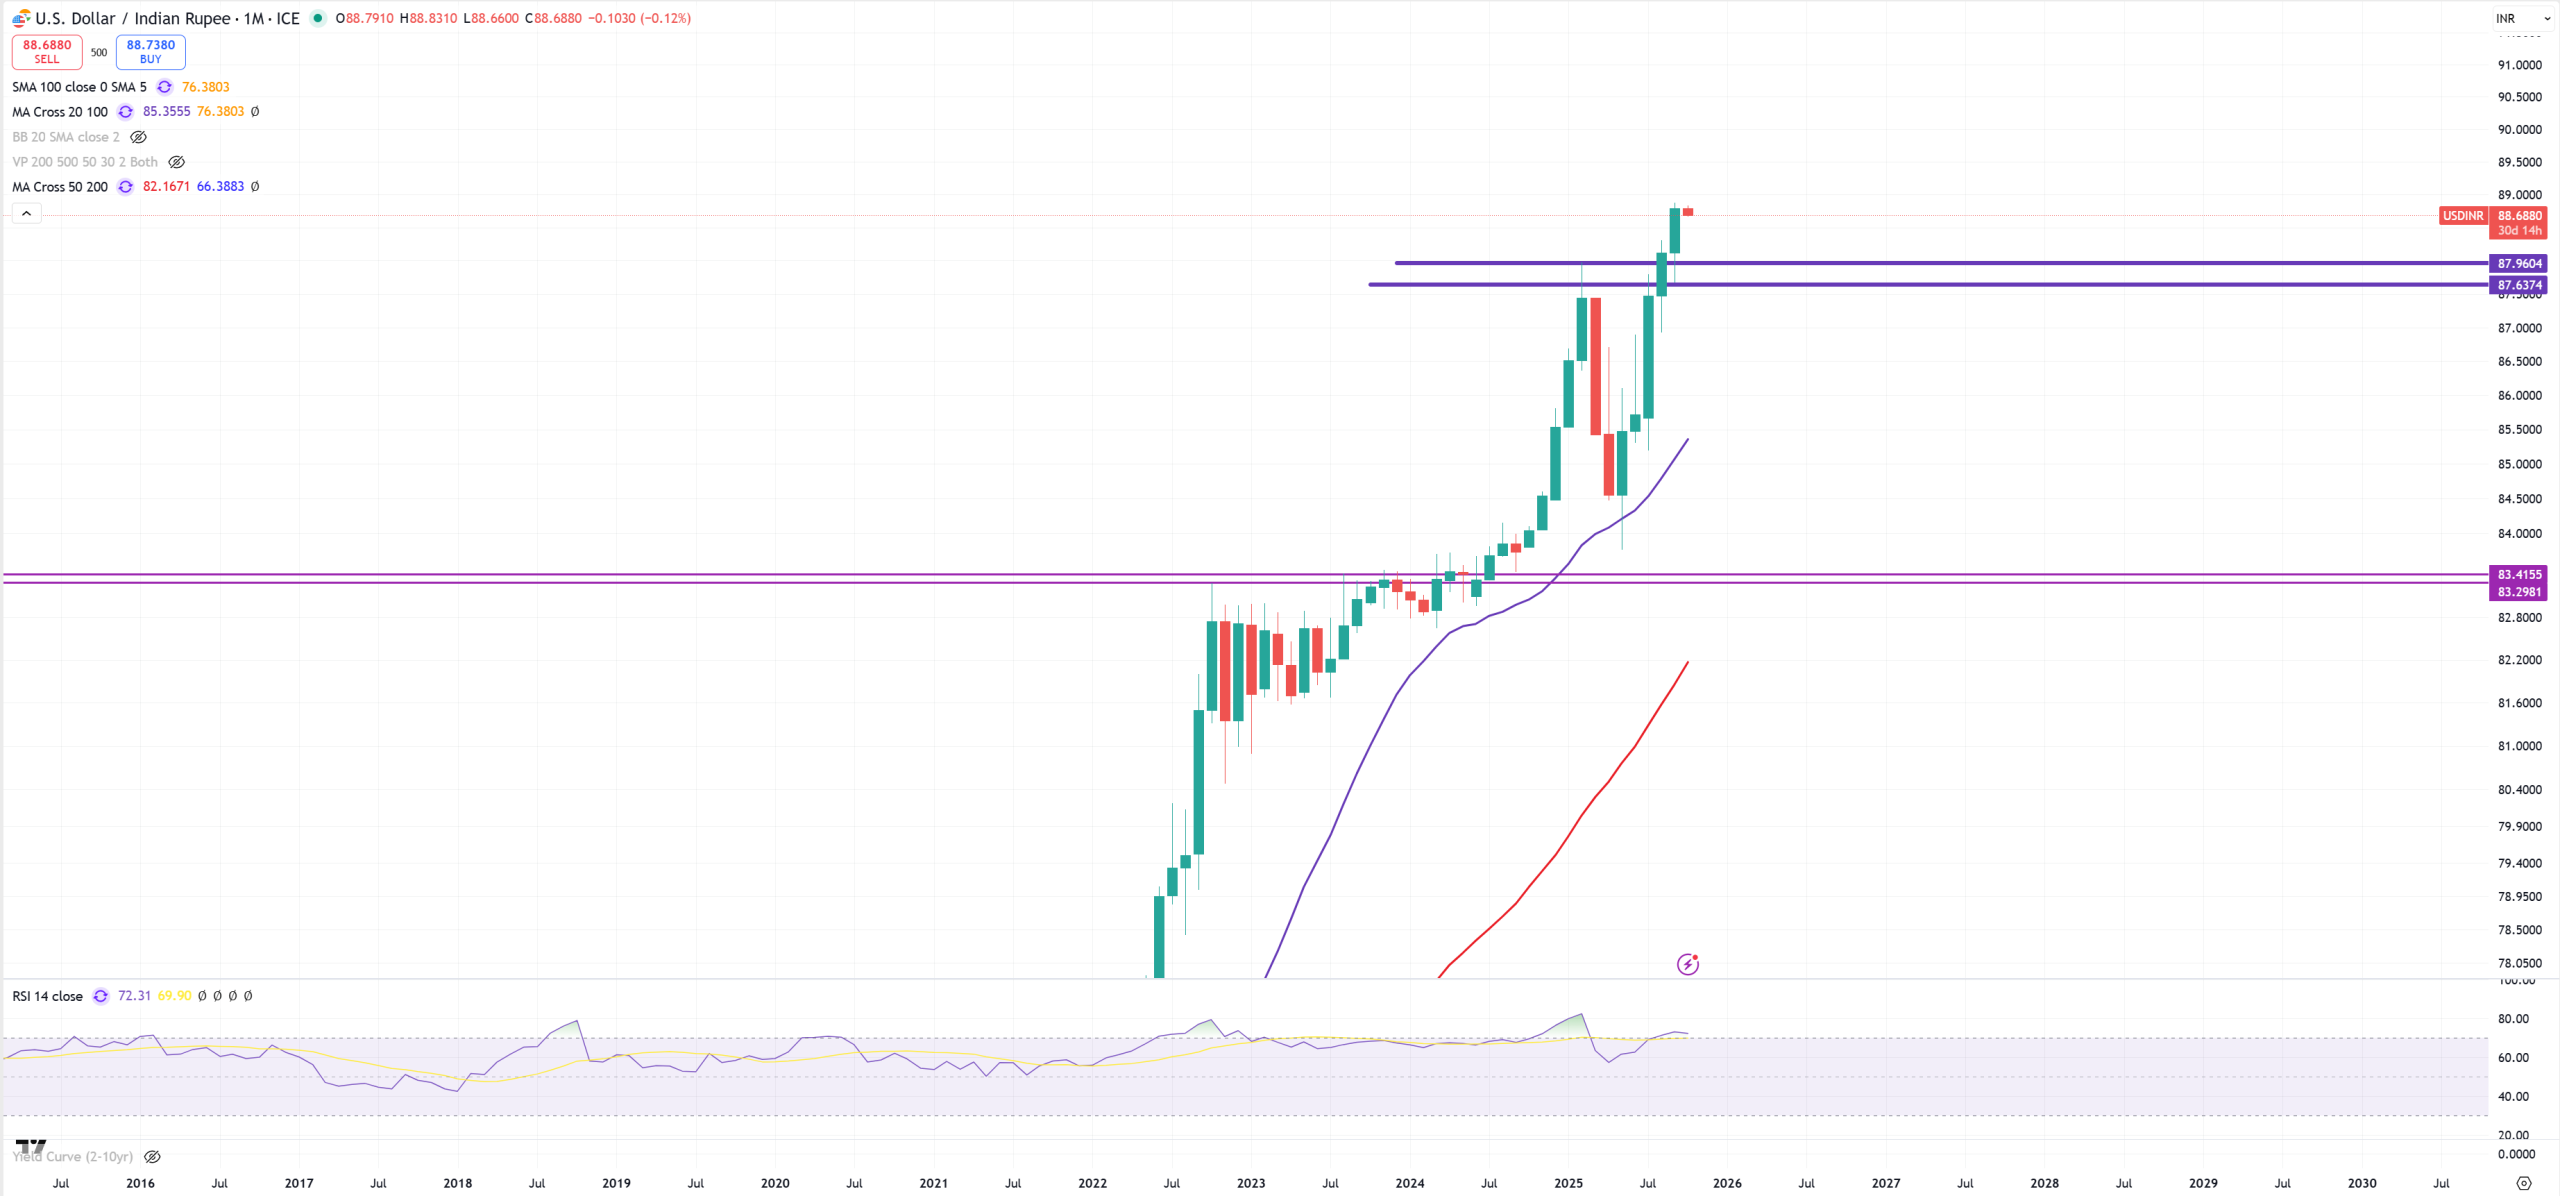
USDINR – this looks like next Turkish Lira.
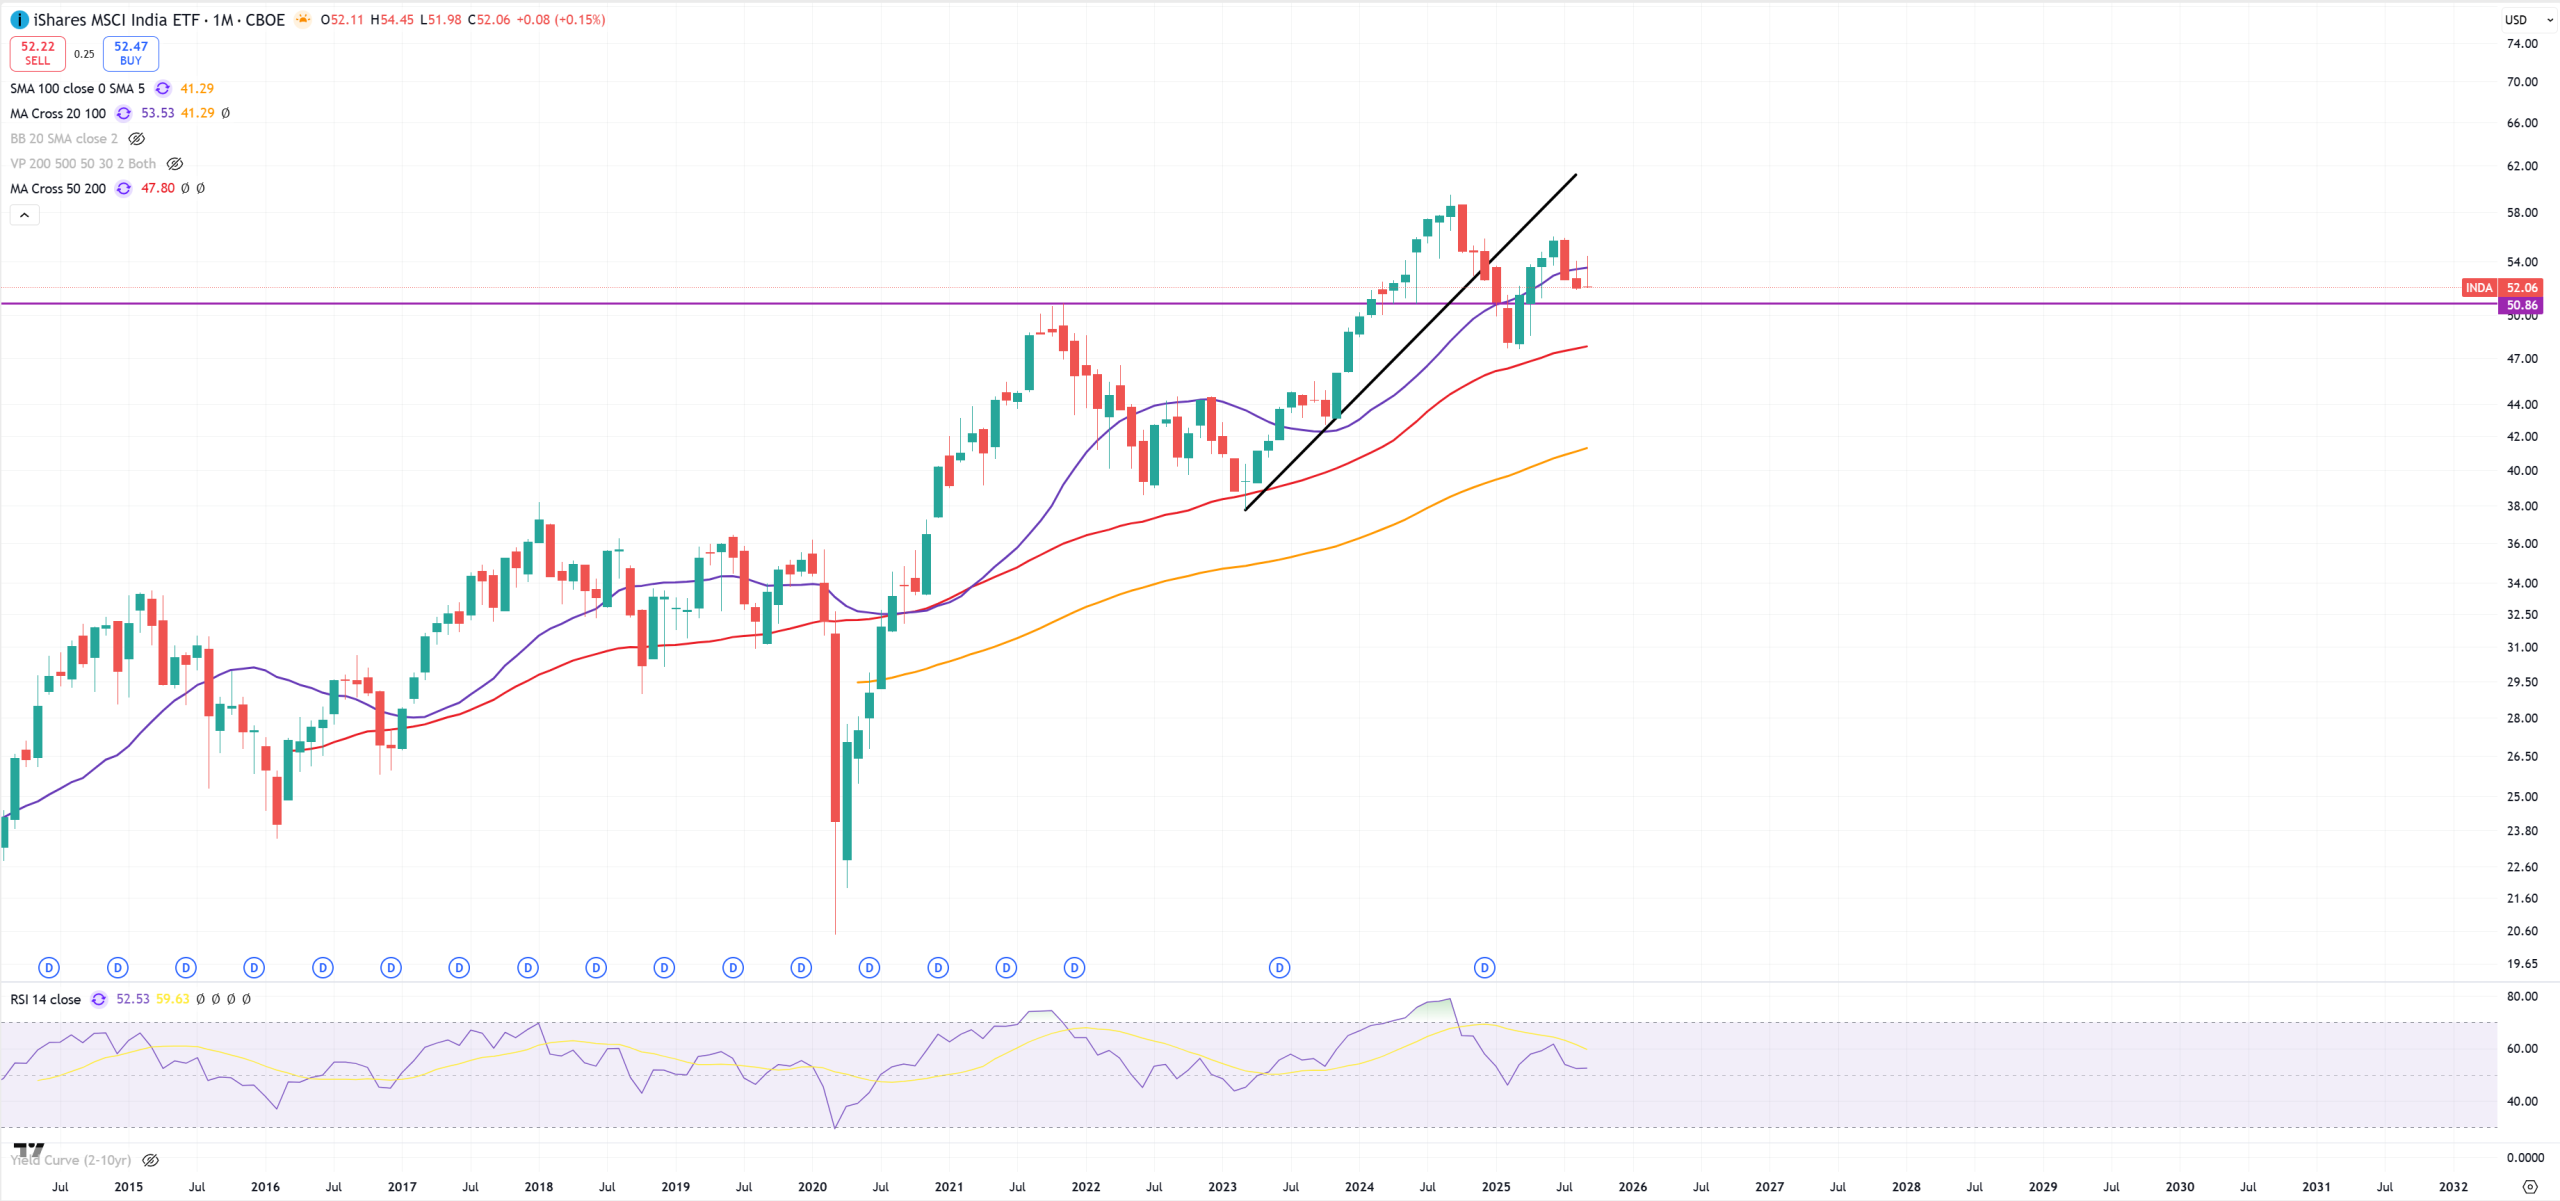
INDA – Awaits for coming back below 2021 peak
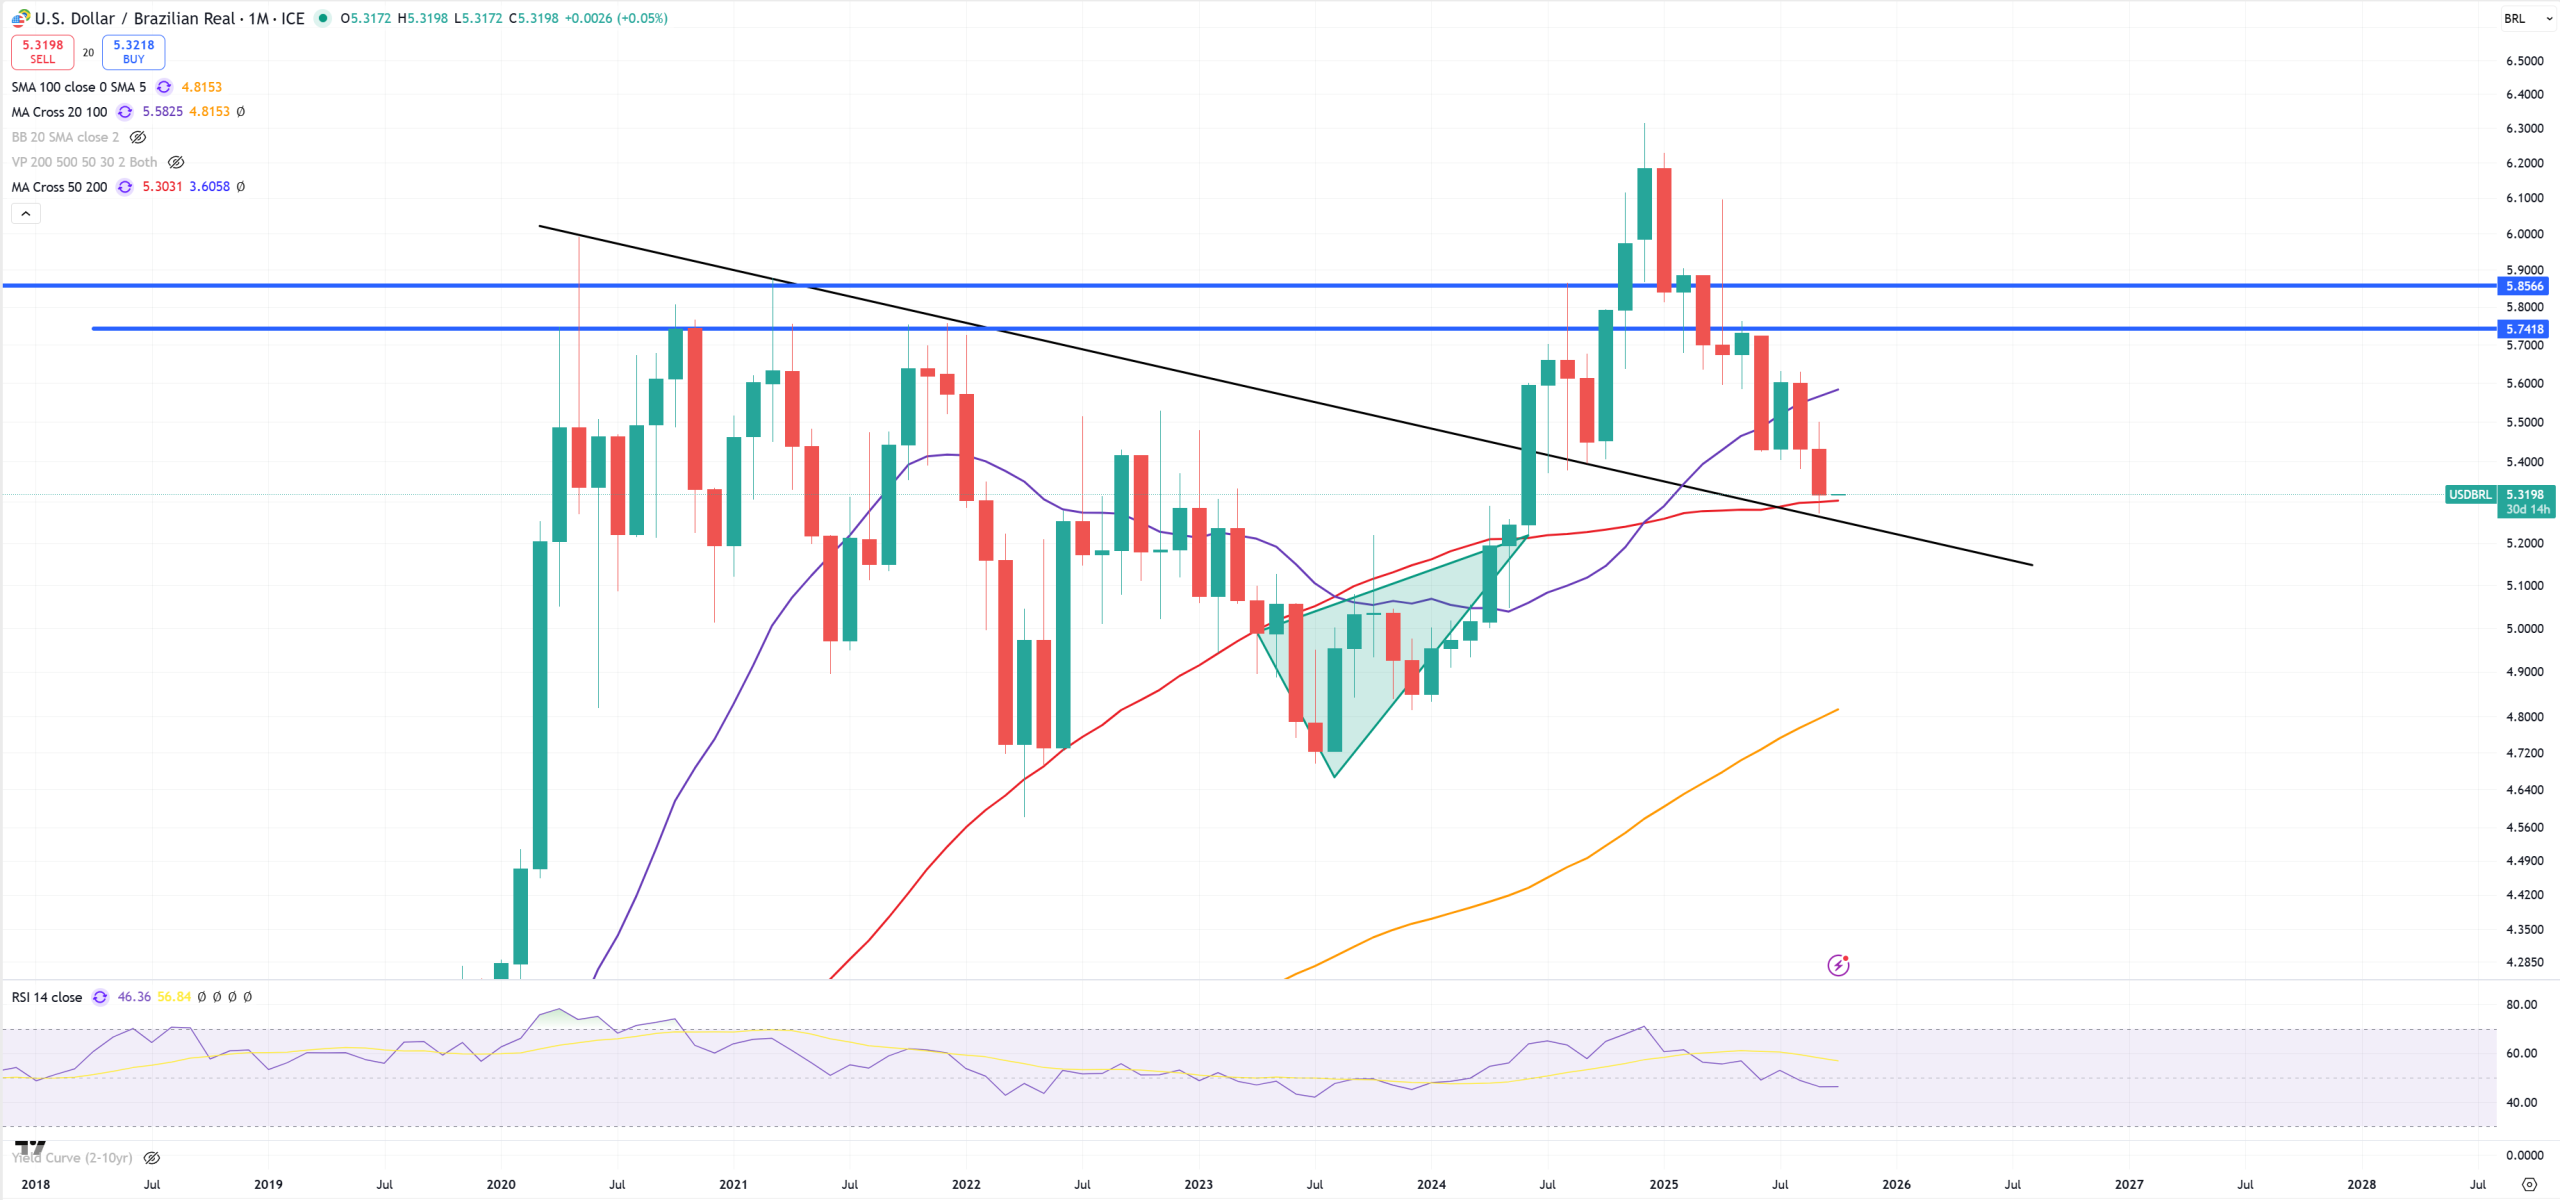
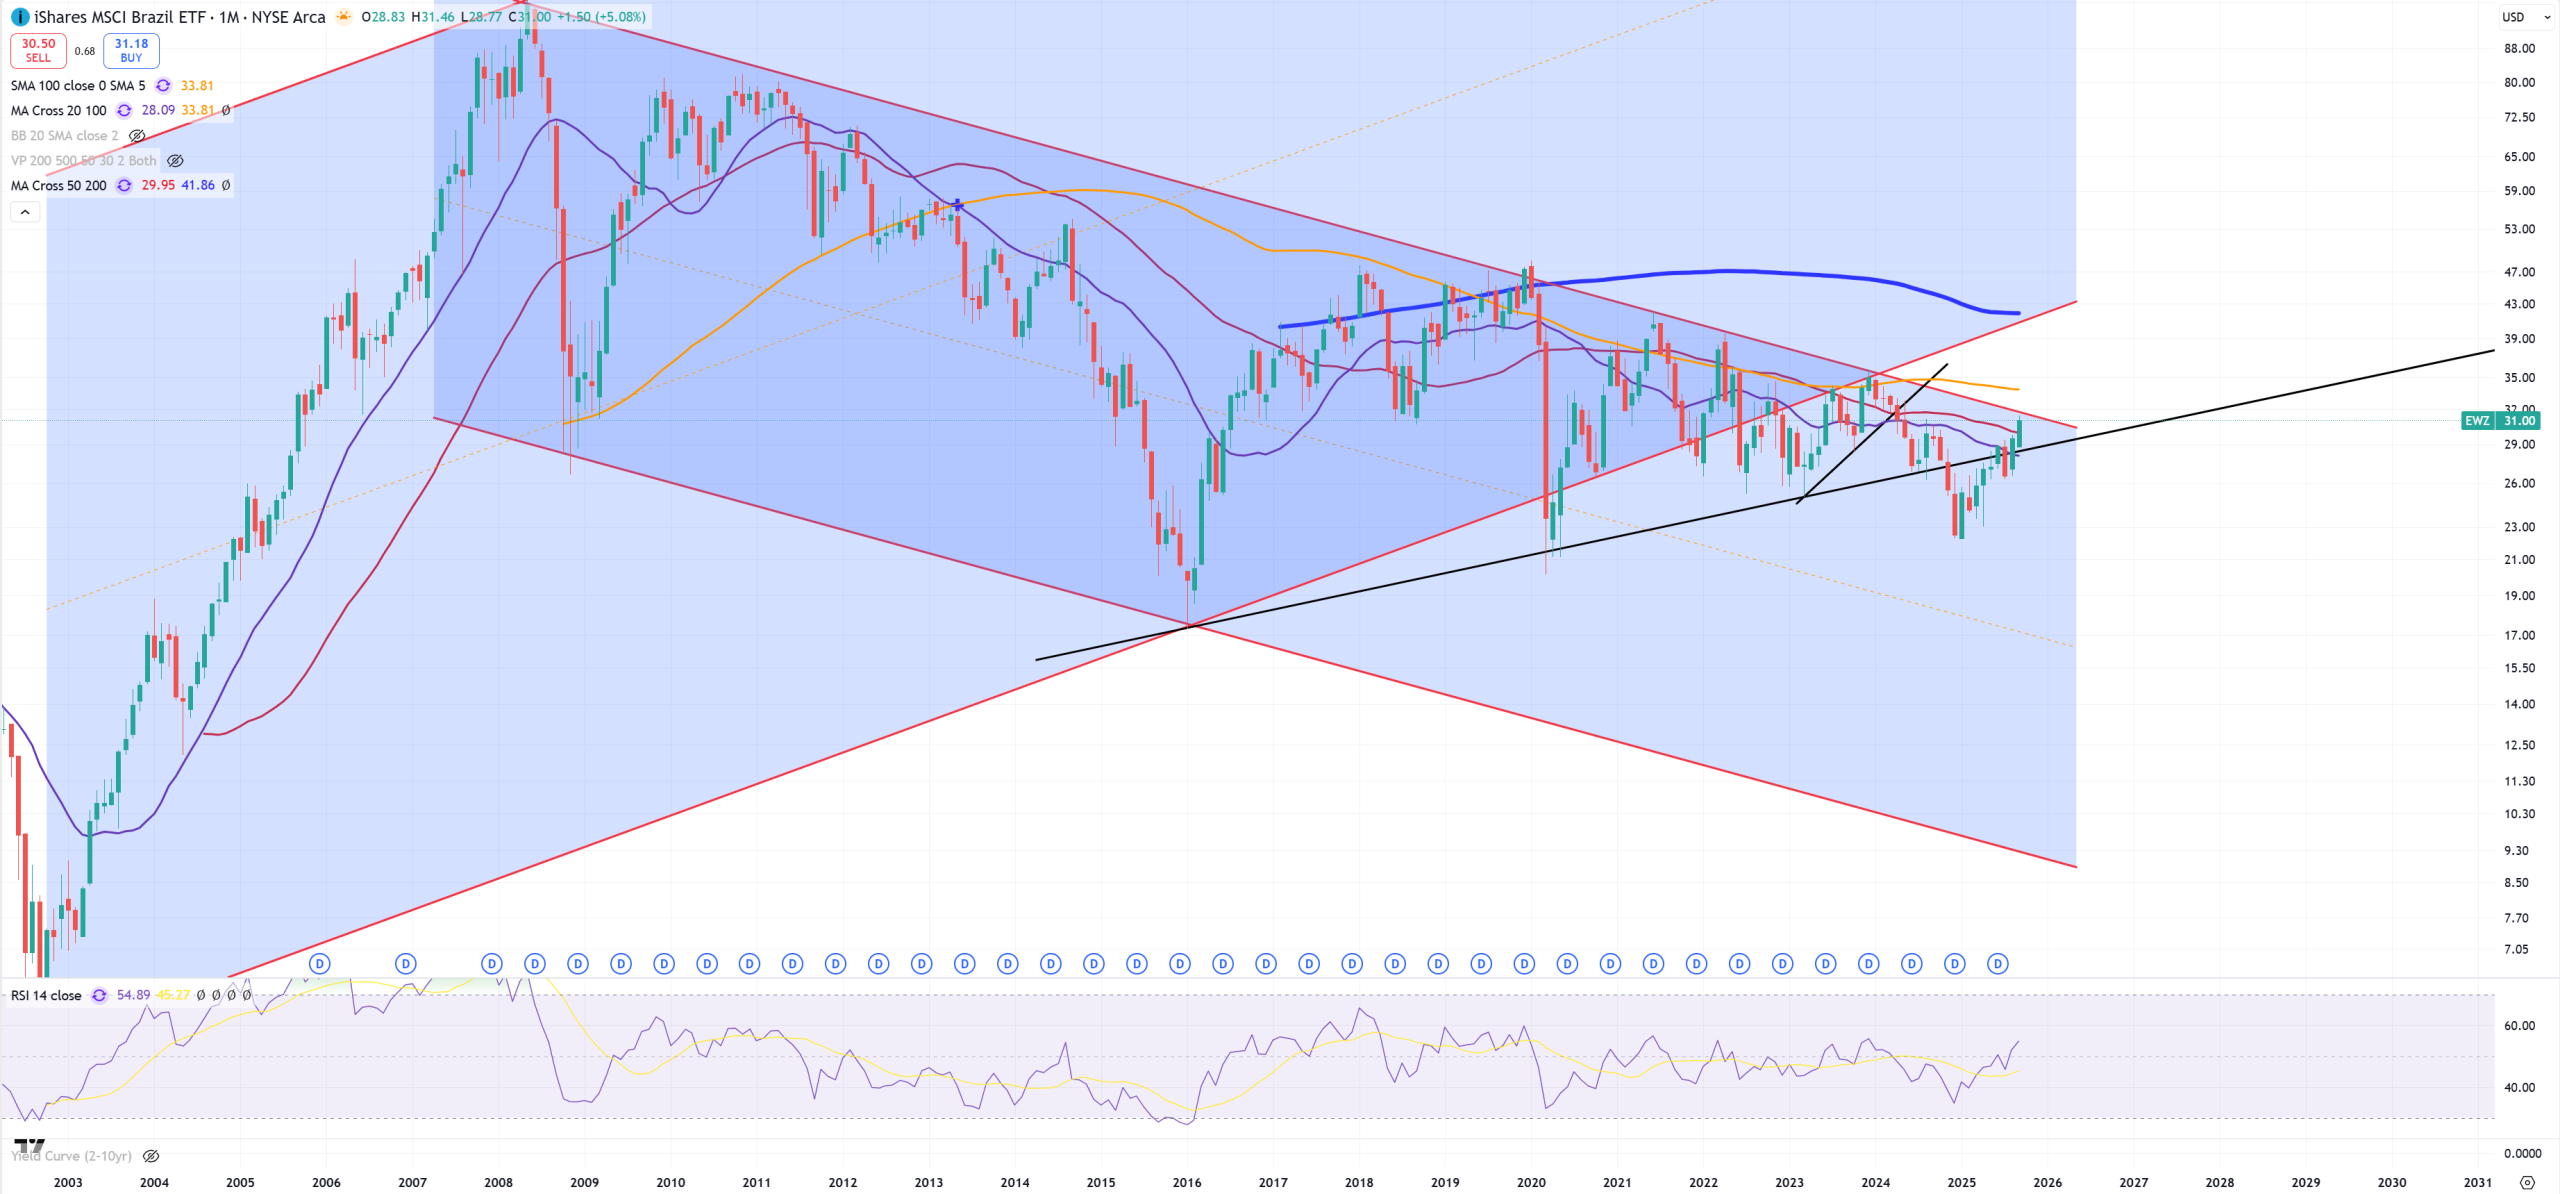
USDBRL, so far (M)MA50 acts as a support
EWZ – the fight continue
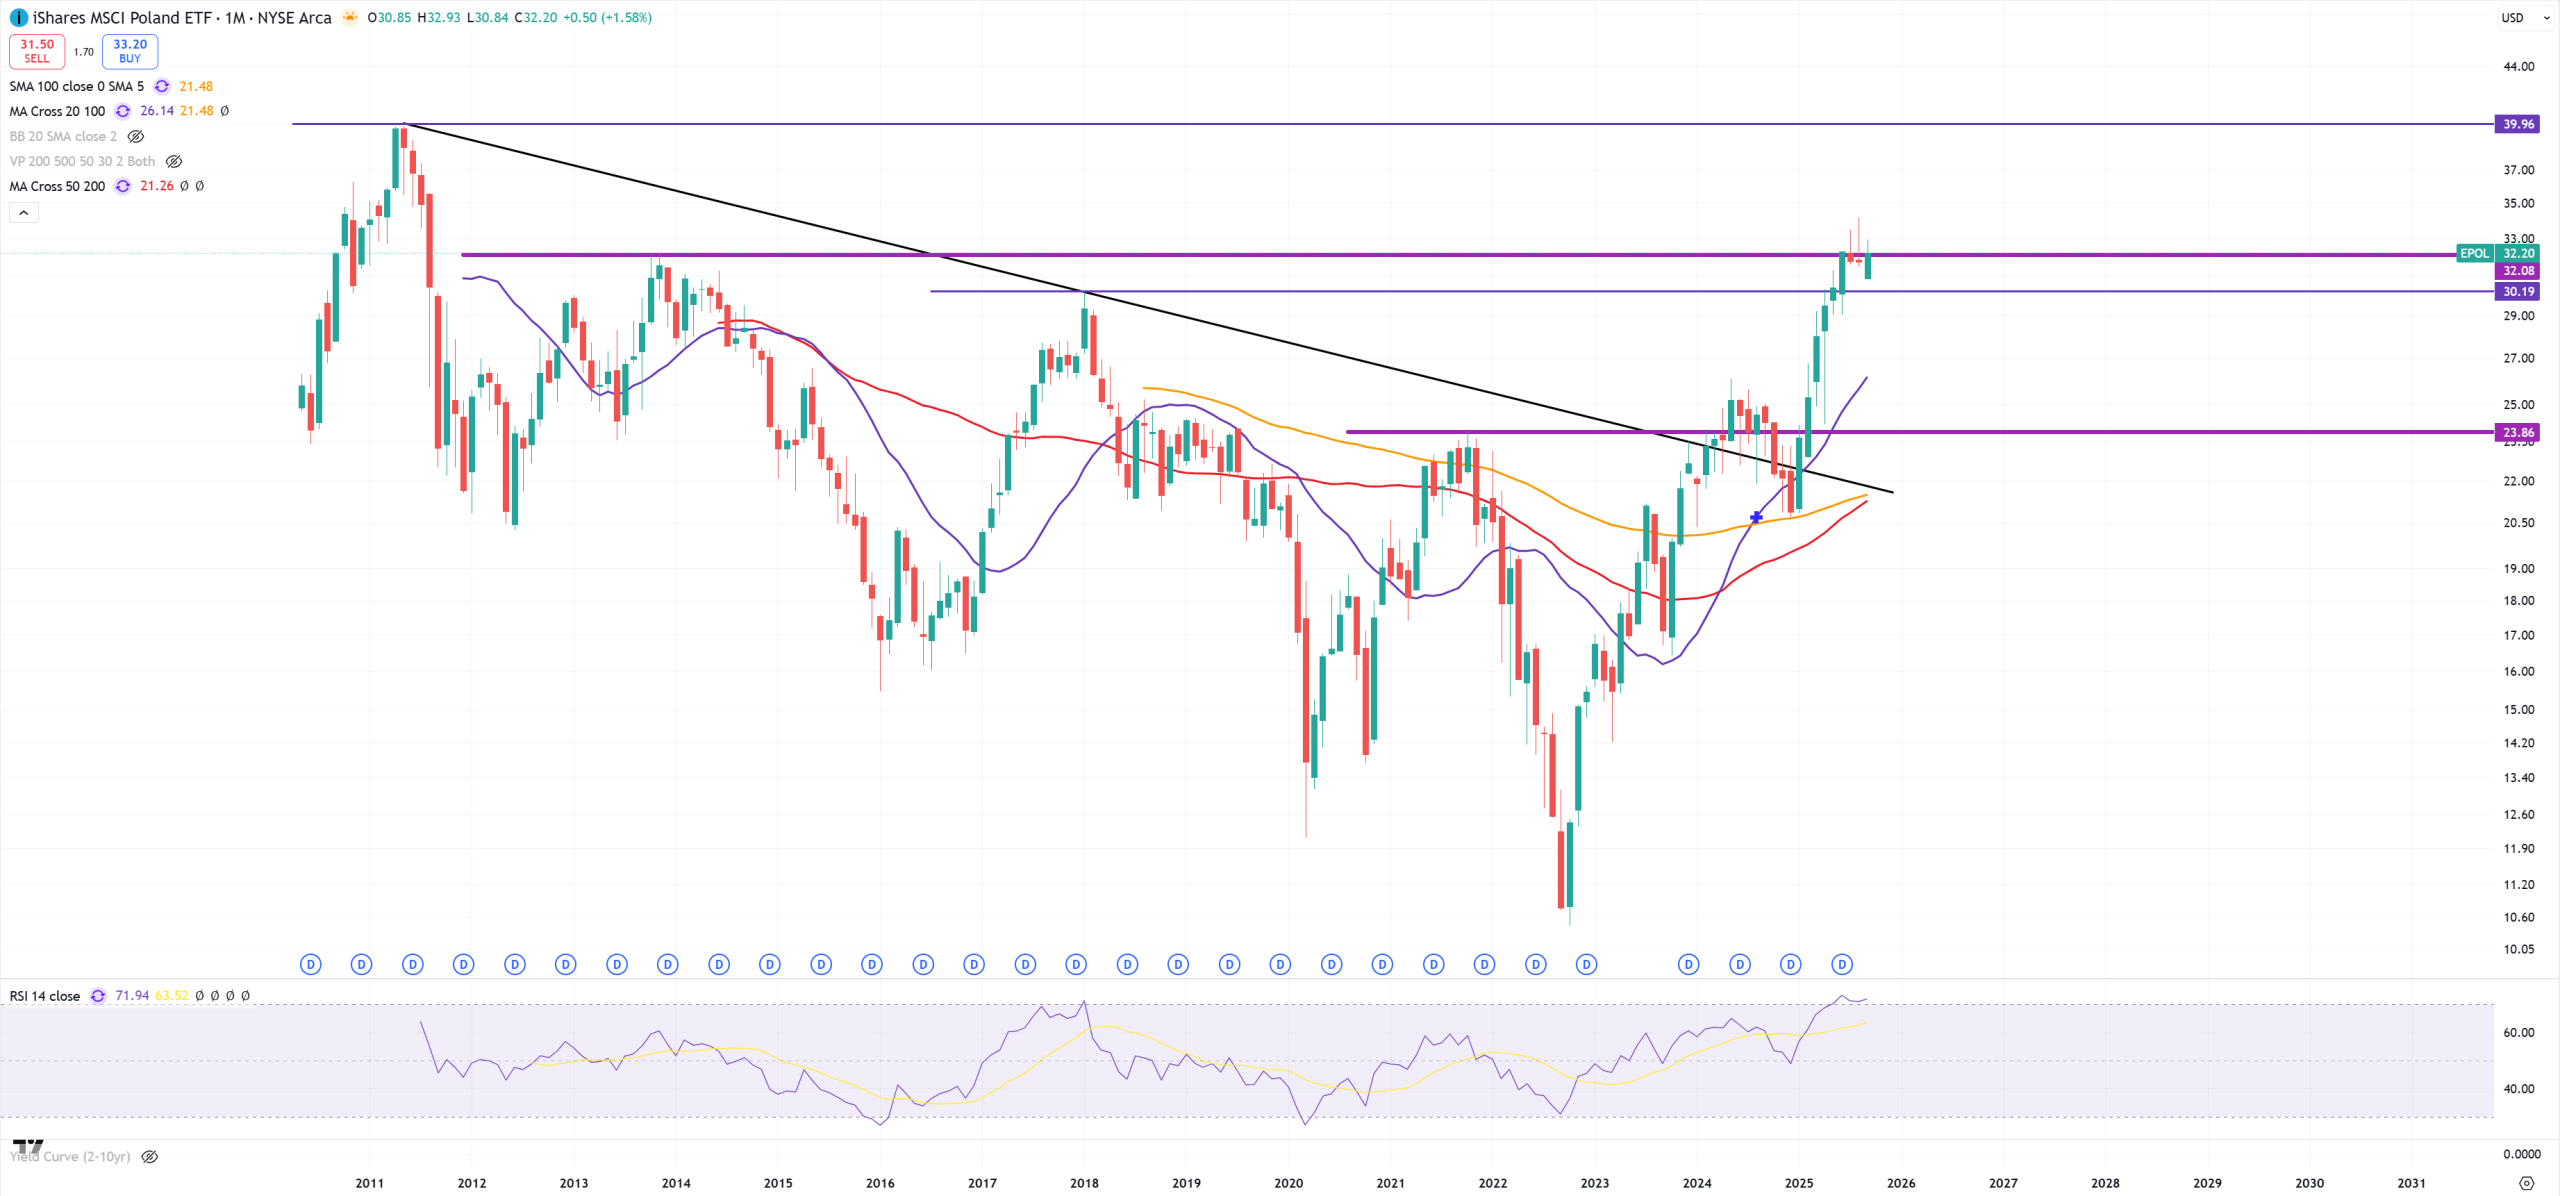
EPOL – hitting 2013 level
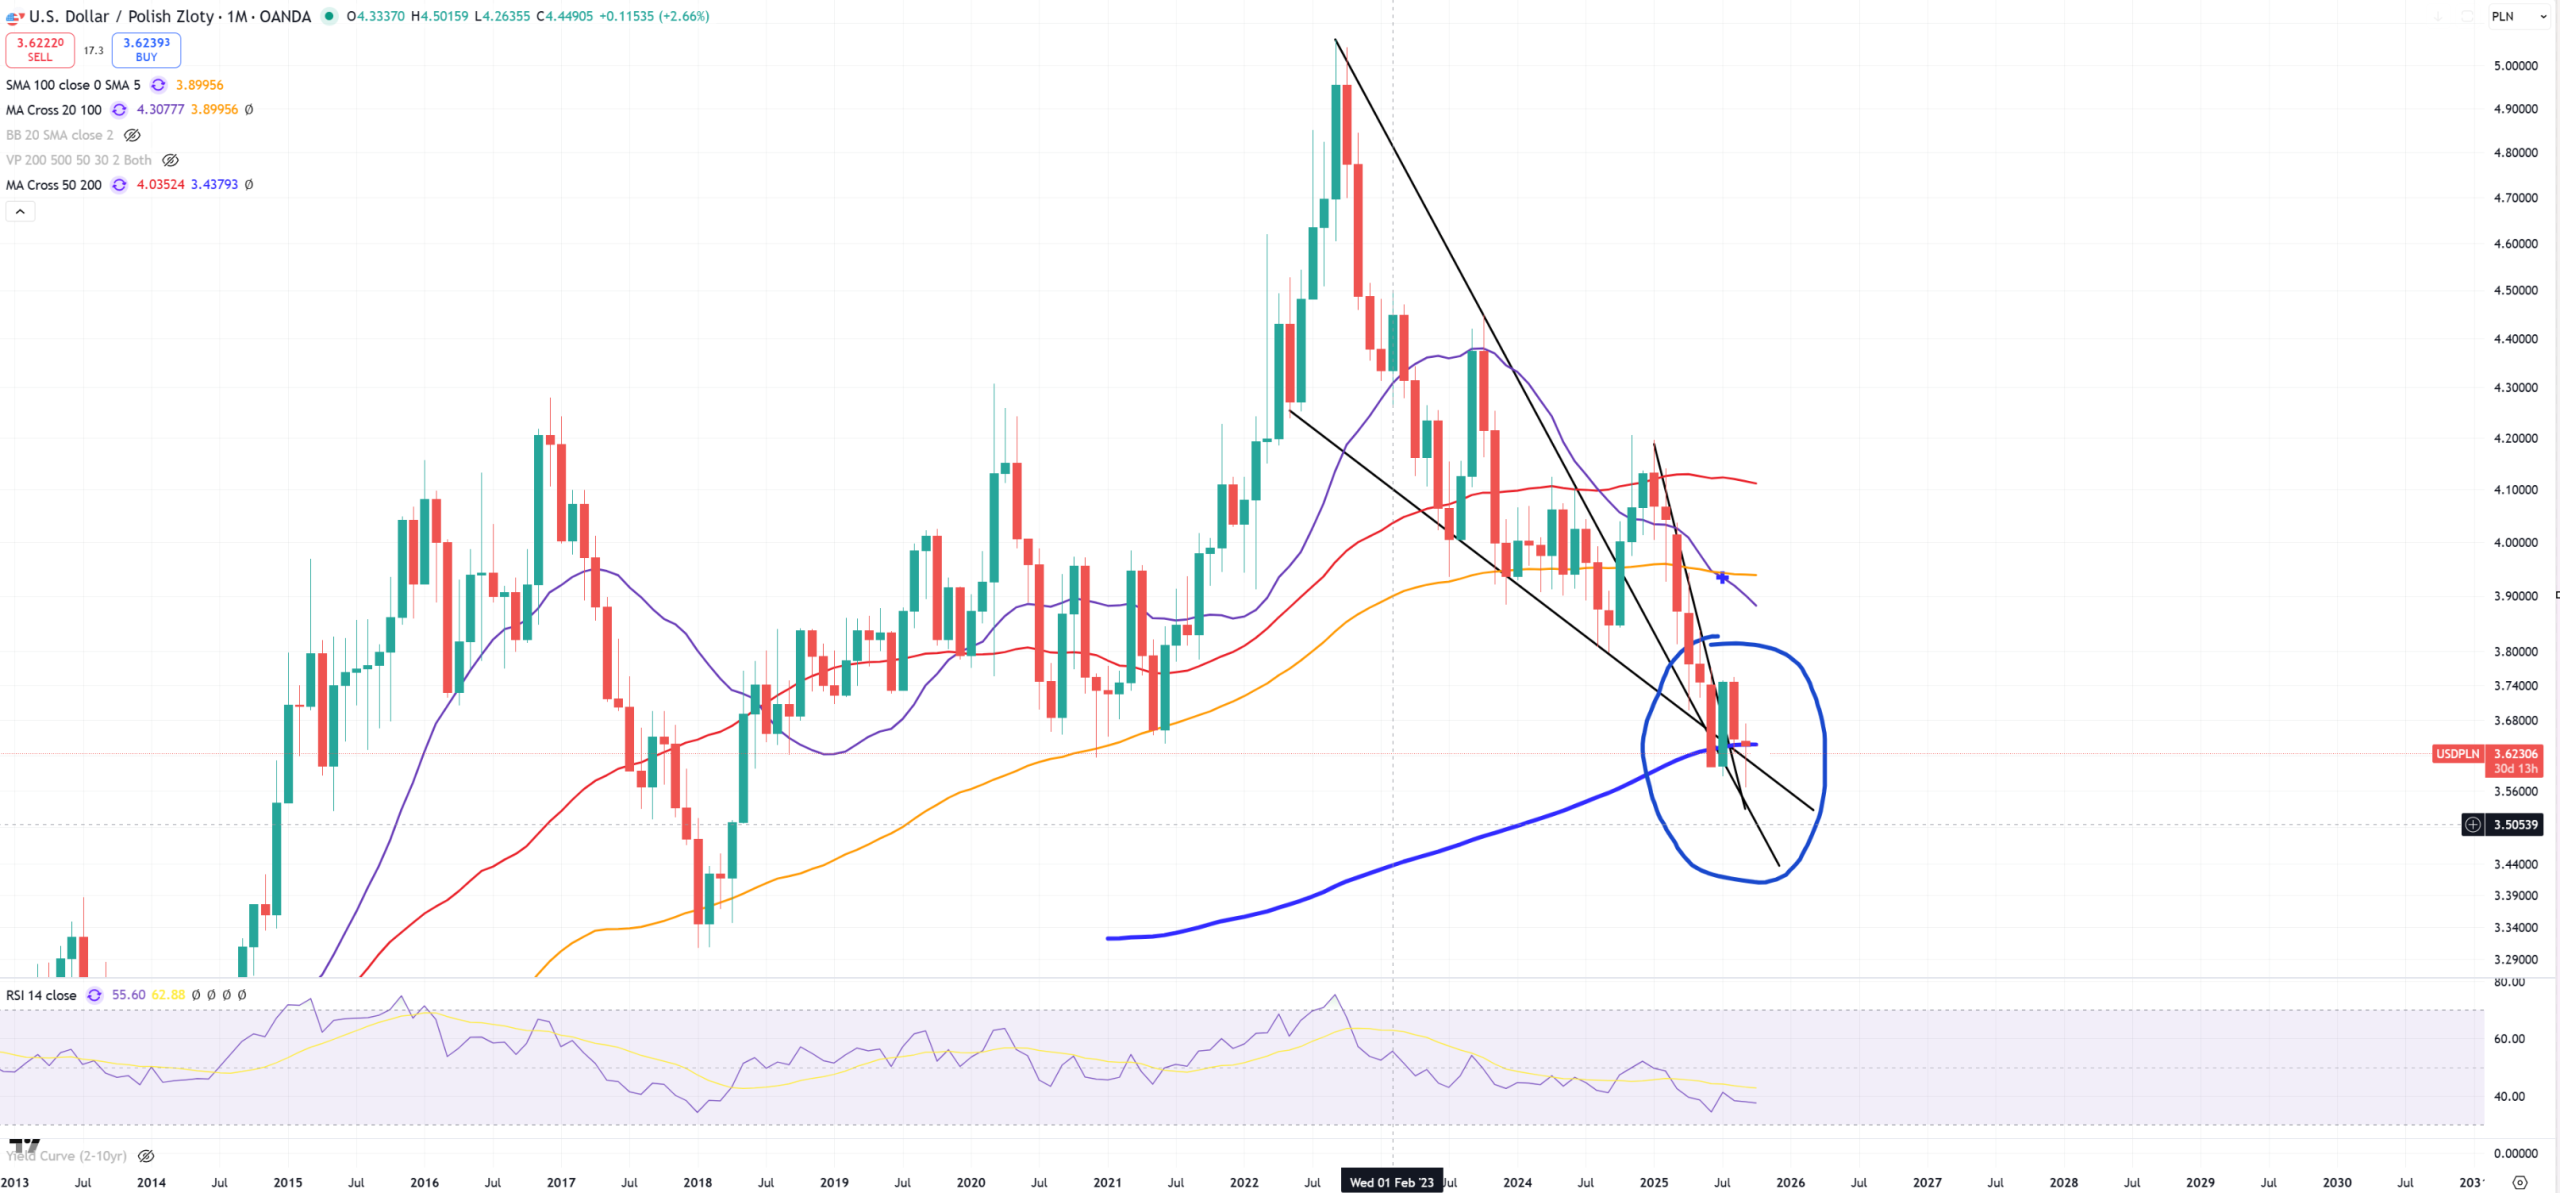
USDPLN – (M) finished on (M)MA200
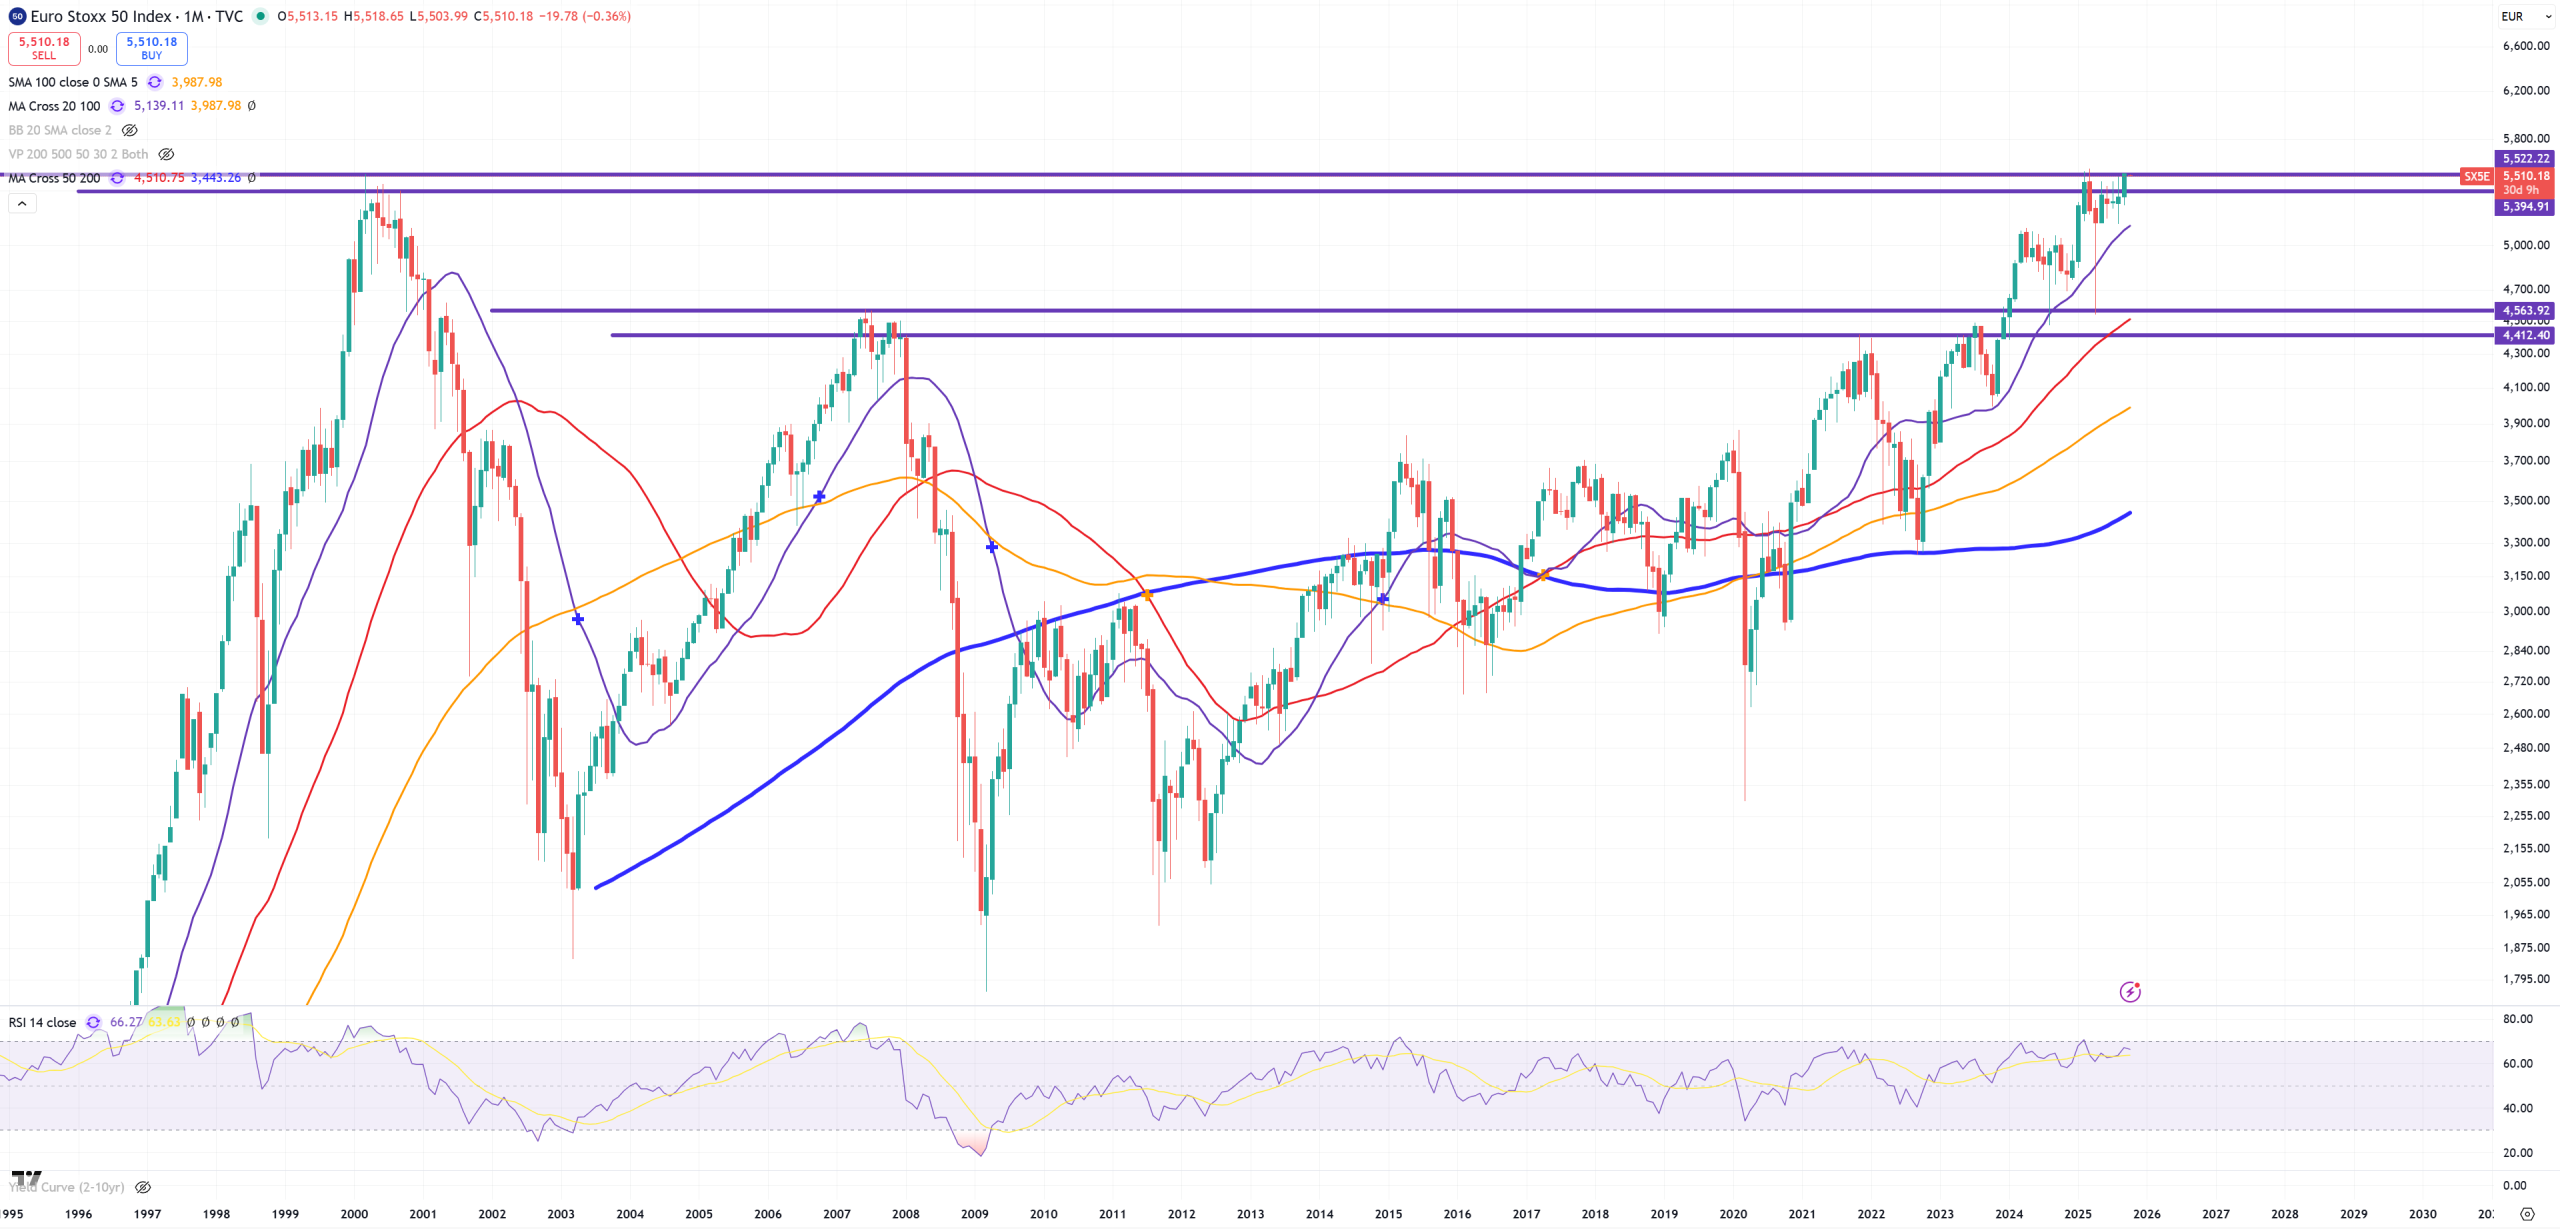
EUROSTOXX50 – ends knocking to 2000 peak resistance.
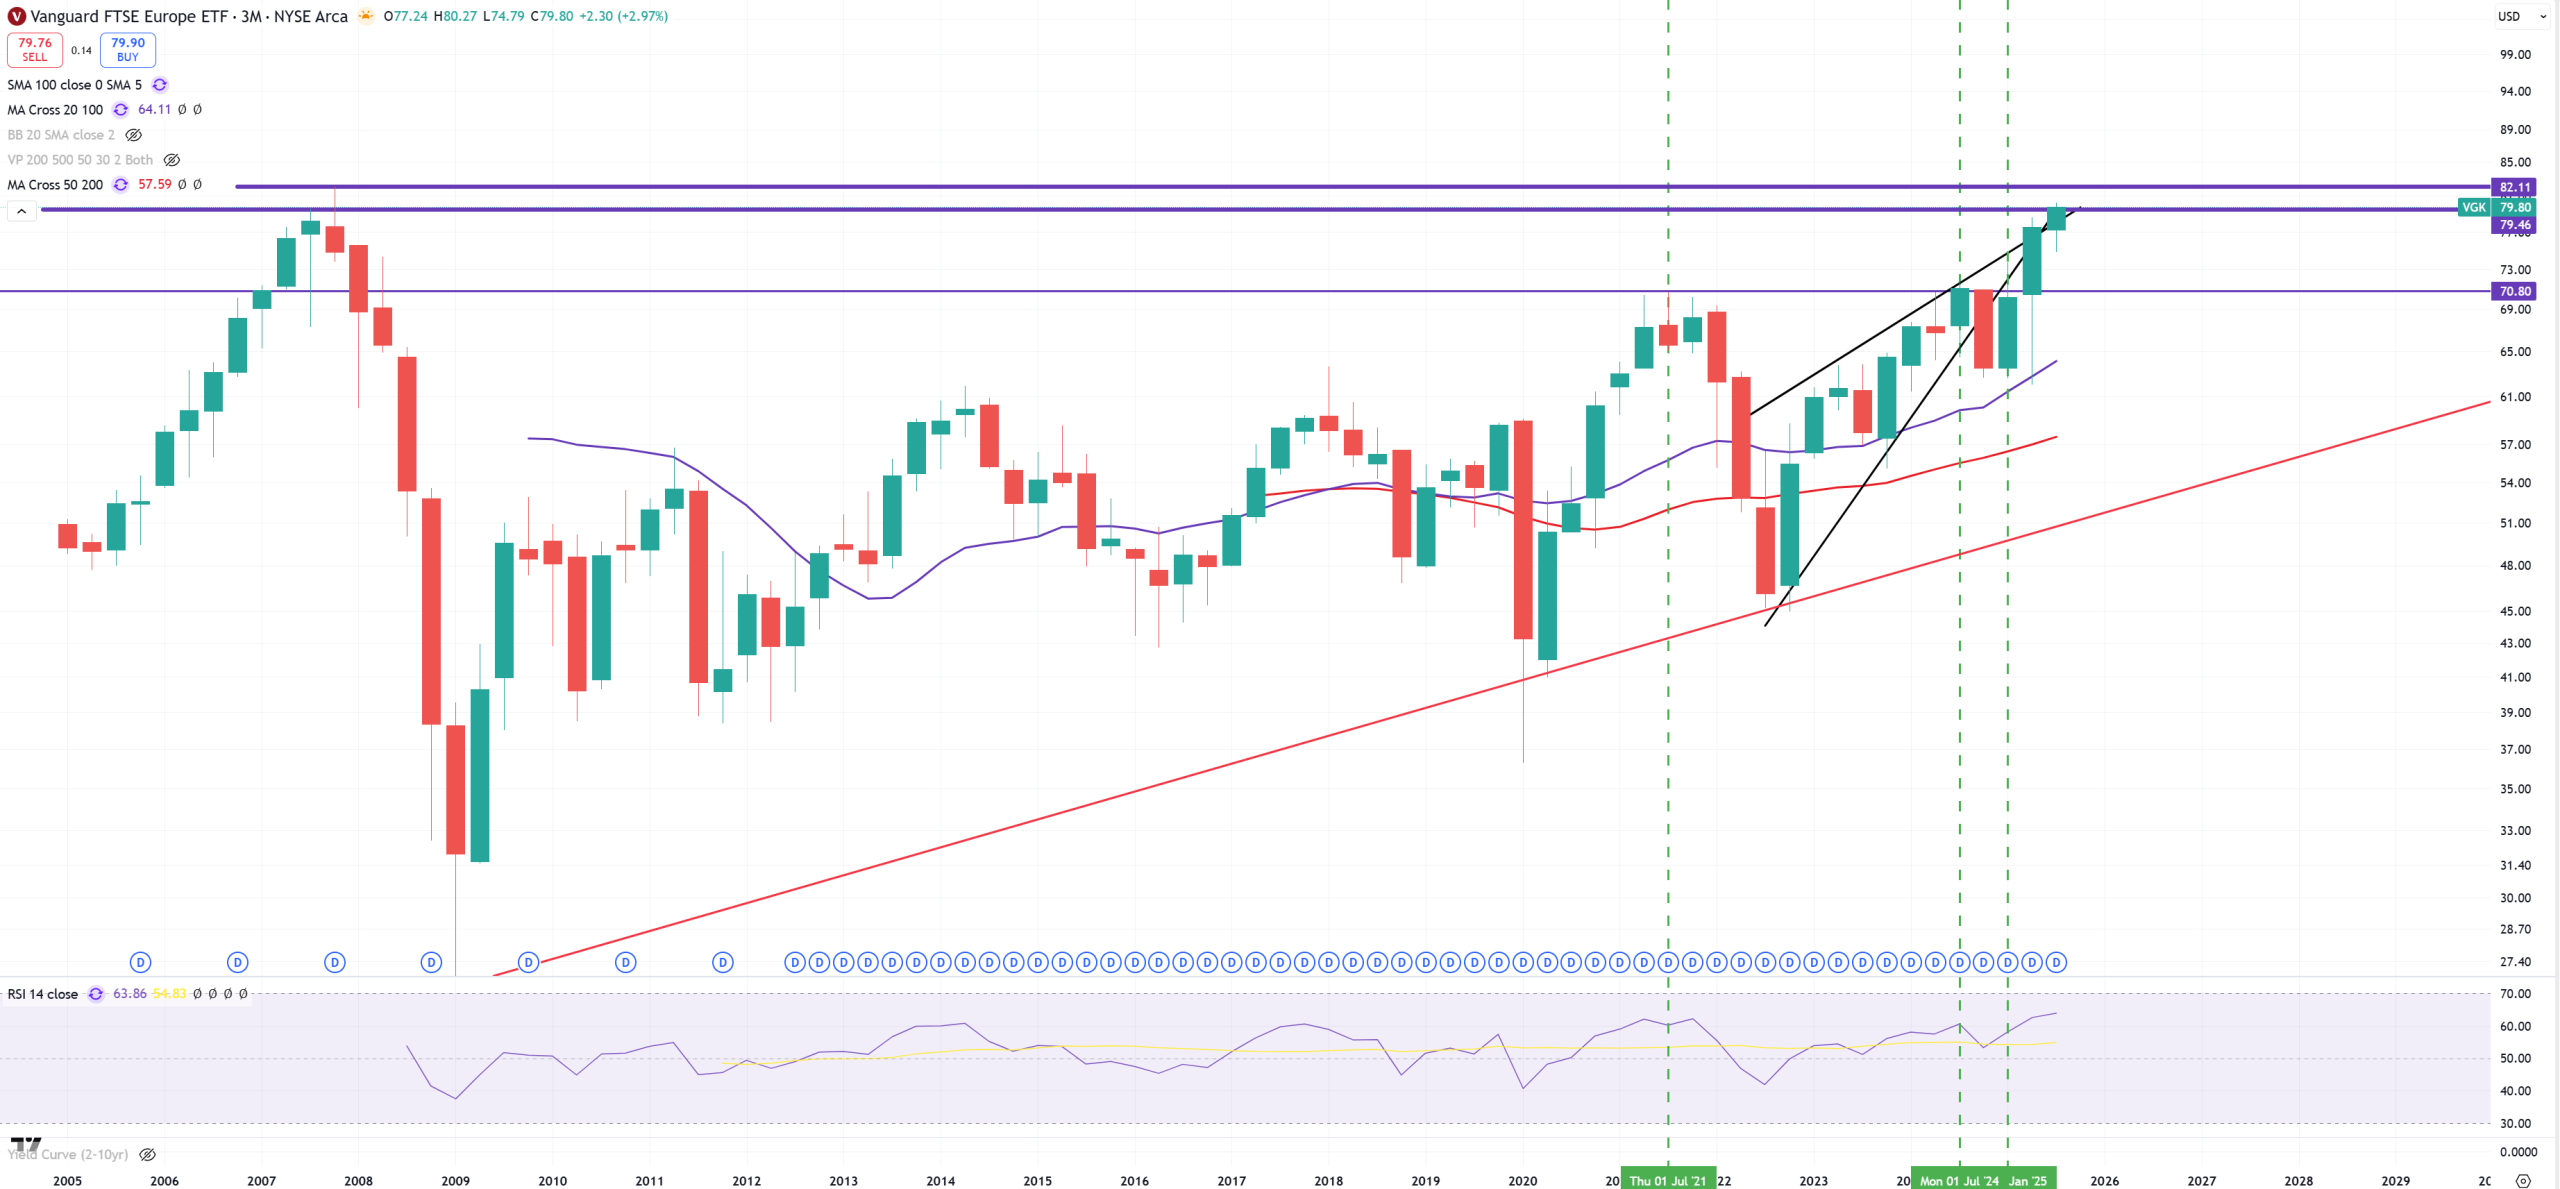
VGK – Europe and 2007 level
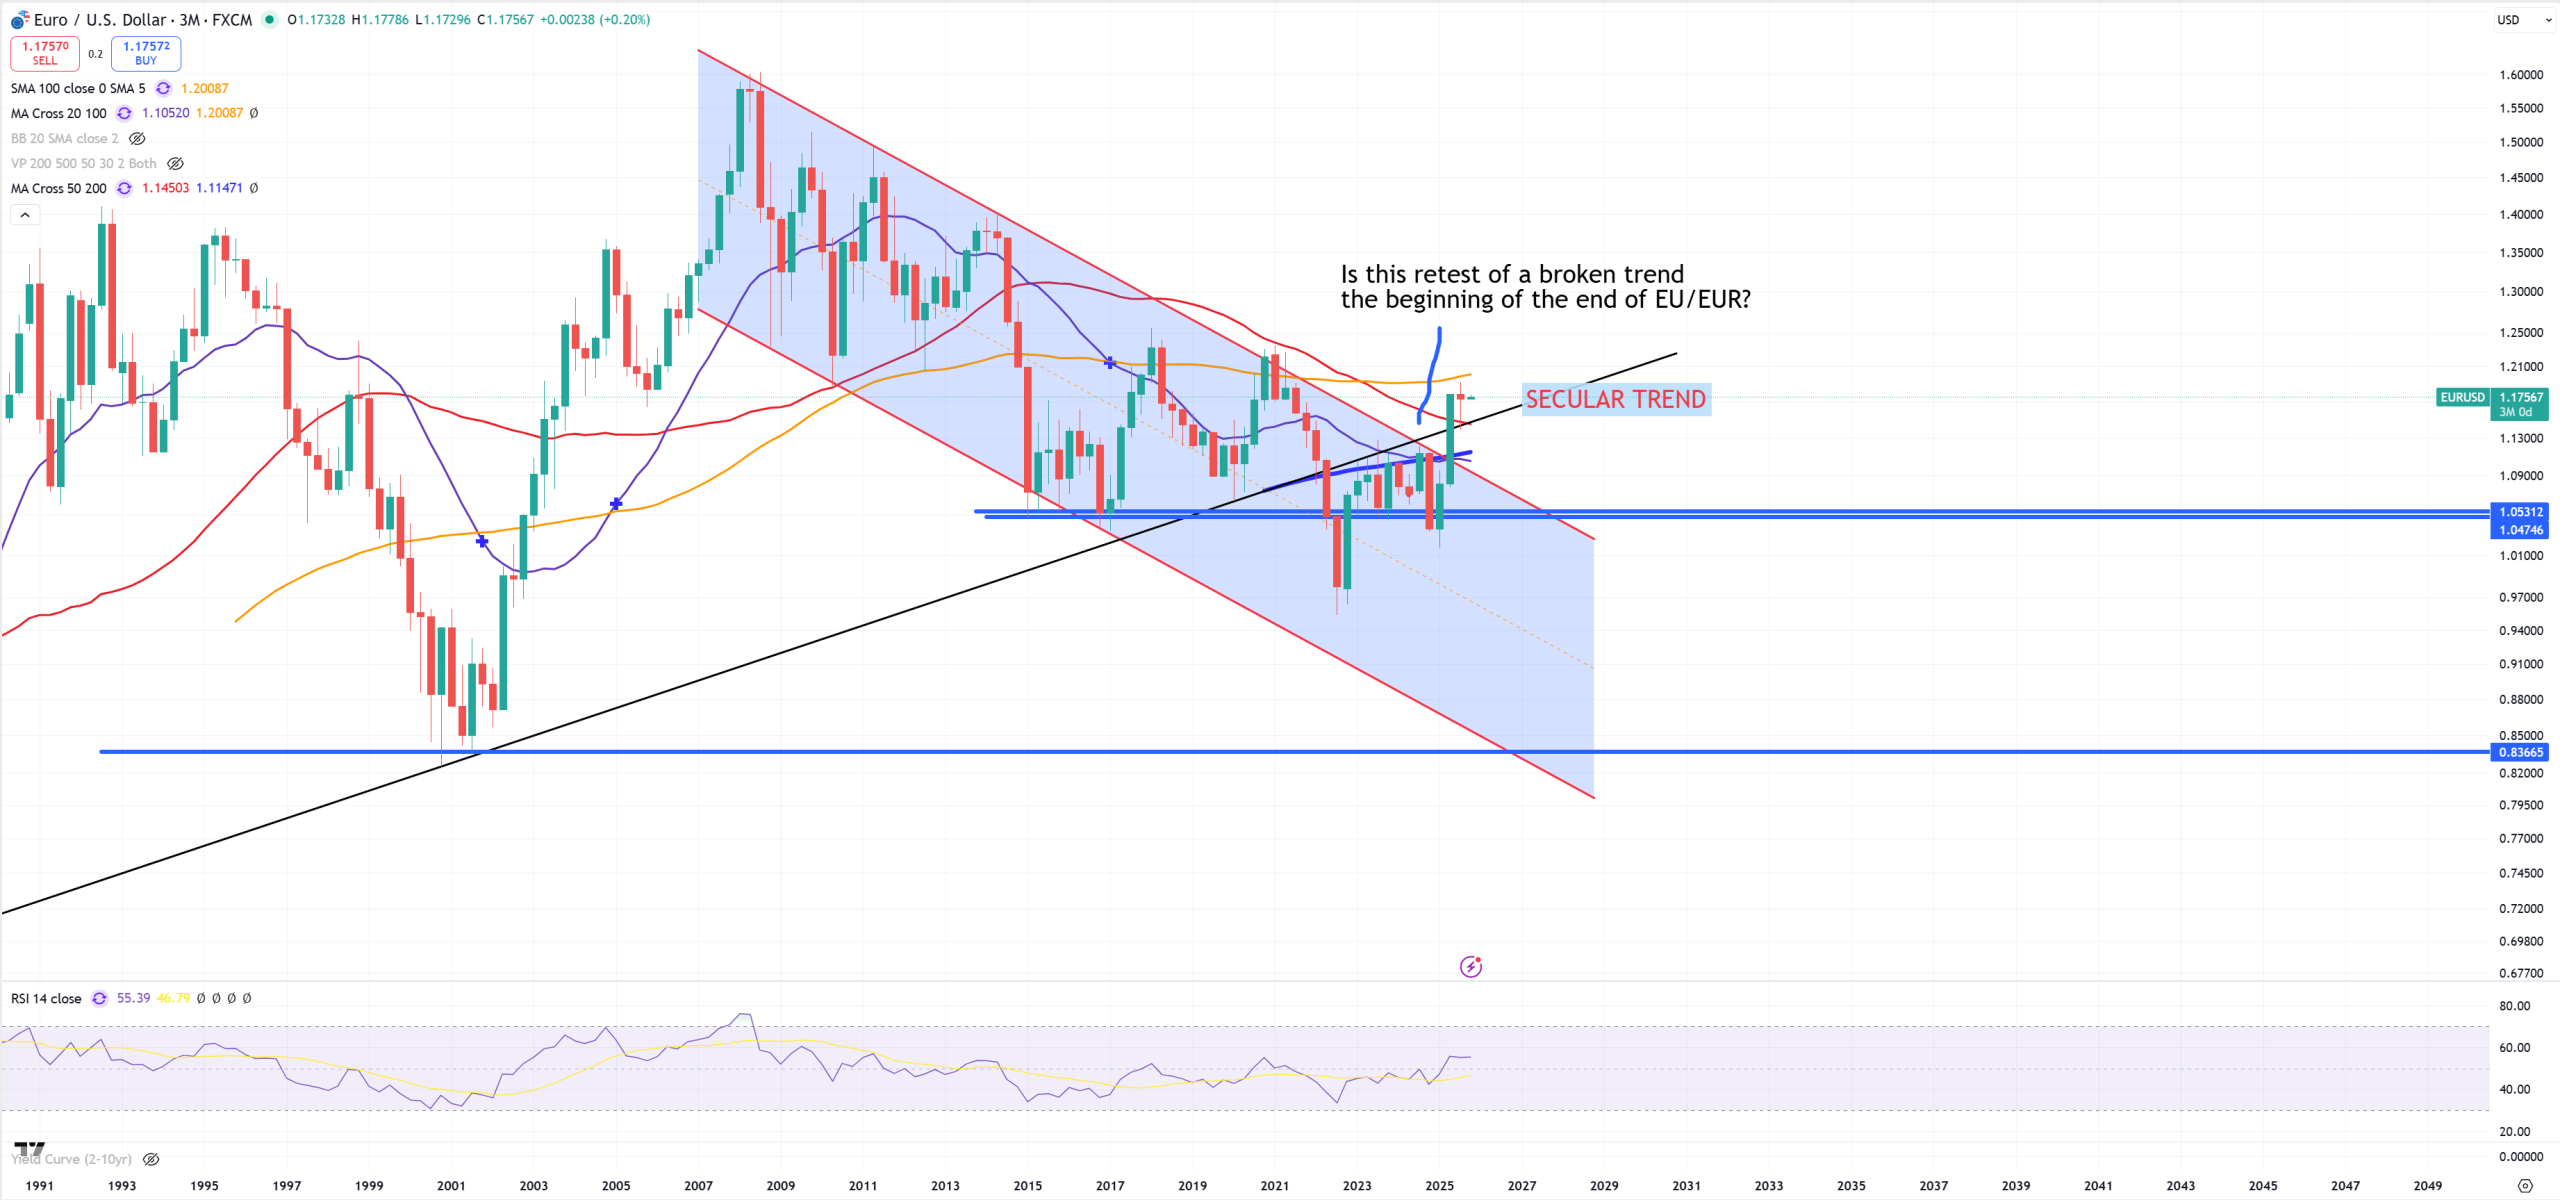
EURUSD – we see (3M) view. 1.15 is now the trend + (3M)MA50. Yellow (3M)MA100 is more or less in the same position as (M)MA200 = 1.20. This move is one of those big suprises for me, as I was expecting retest won’t take secular trend so now it’s 1.15. From the other hand DXY pointed for the lowest retest level = 96.
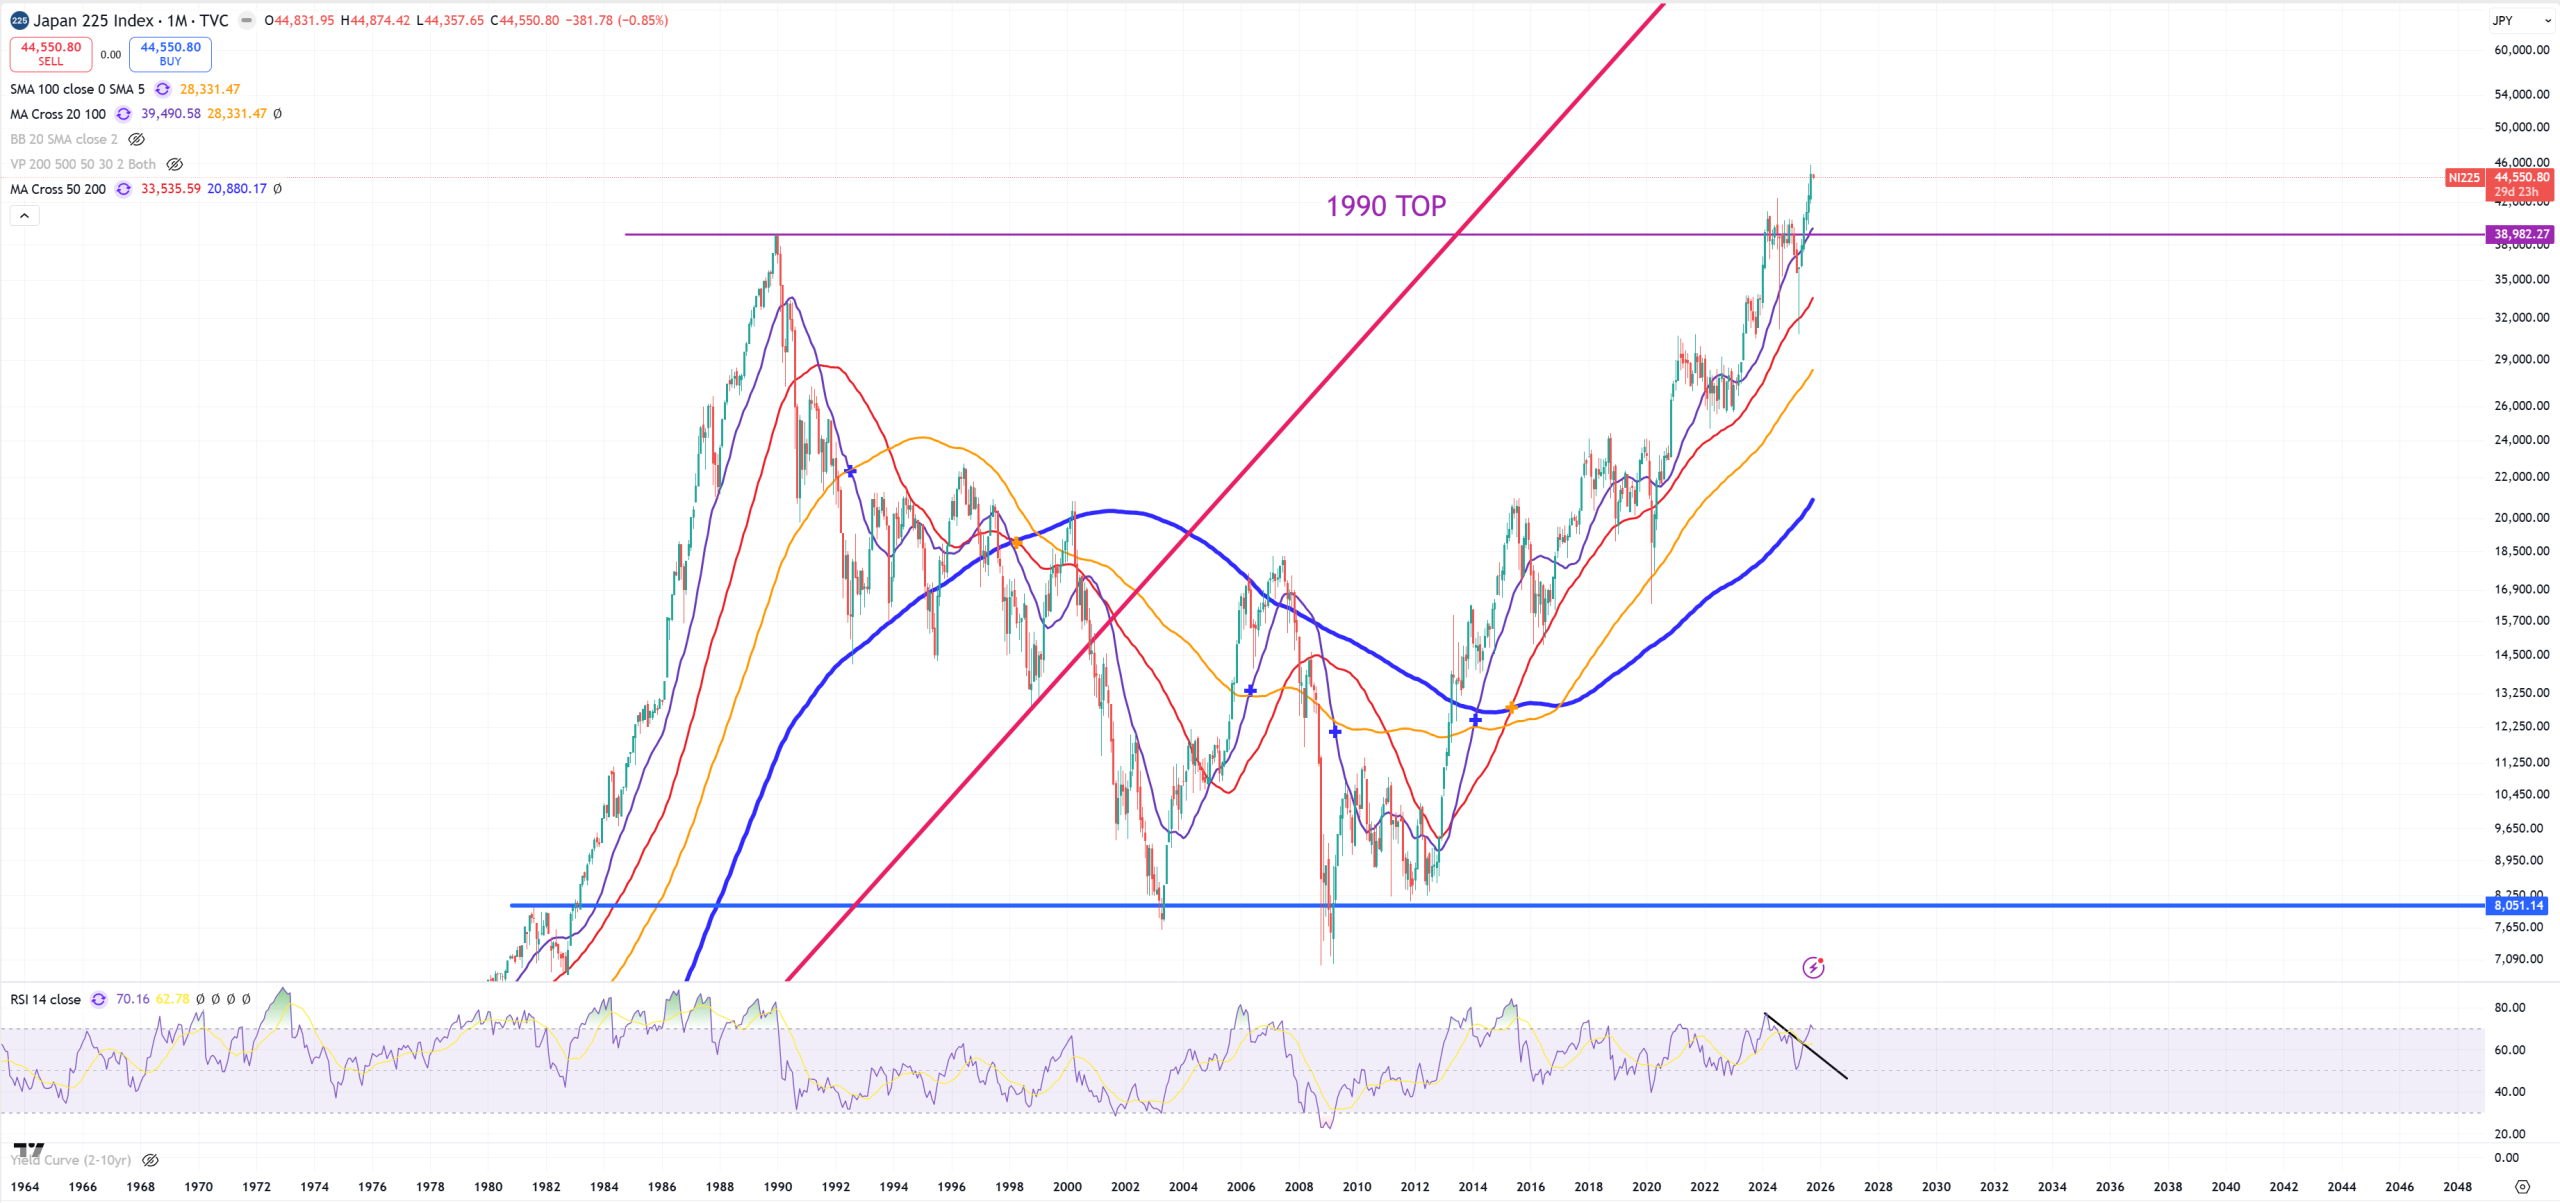
NIKKEI225 – this 1990 TOP is a big fight, so far Japan is breaking it.
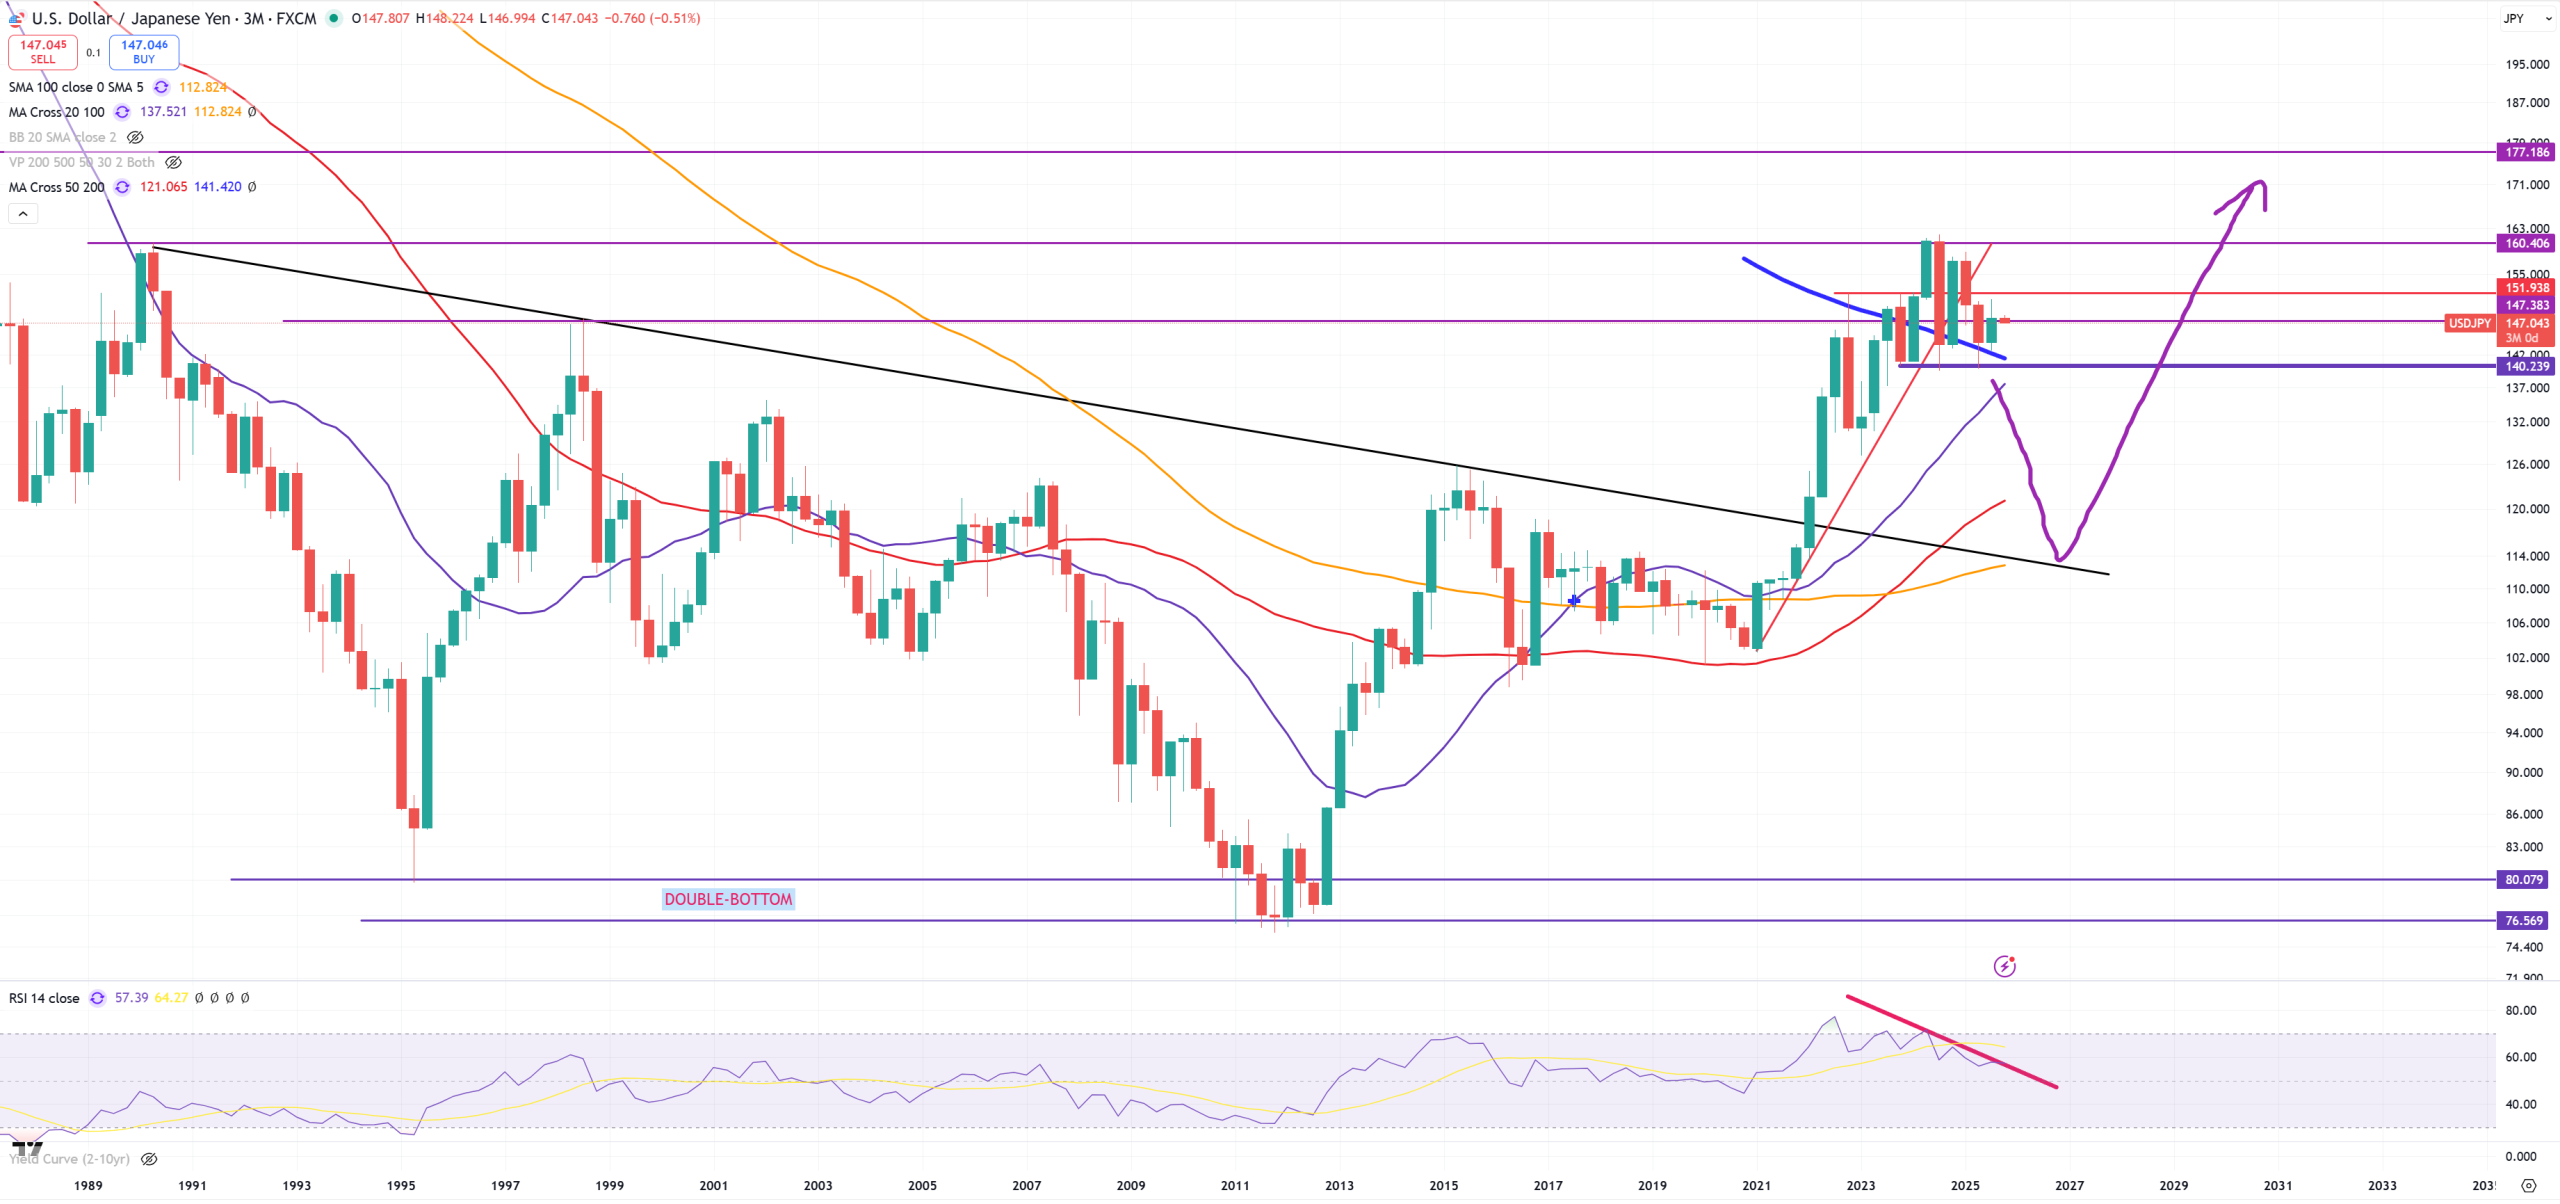
USDJPY – (3M) view is better because we see this 140 level, we also must watch JP bond market
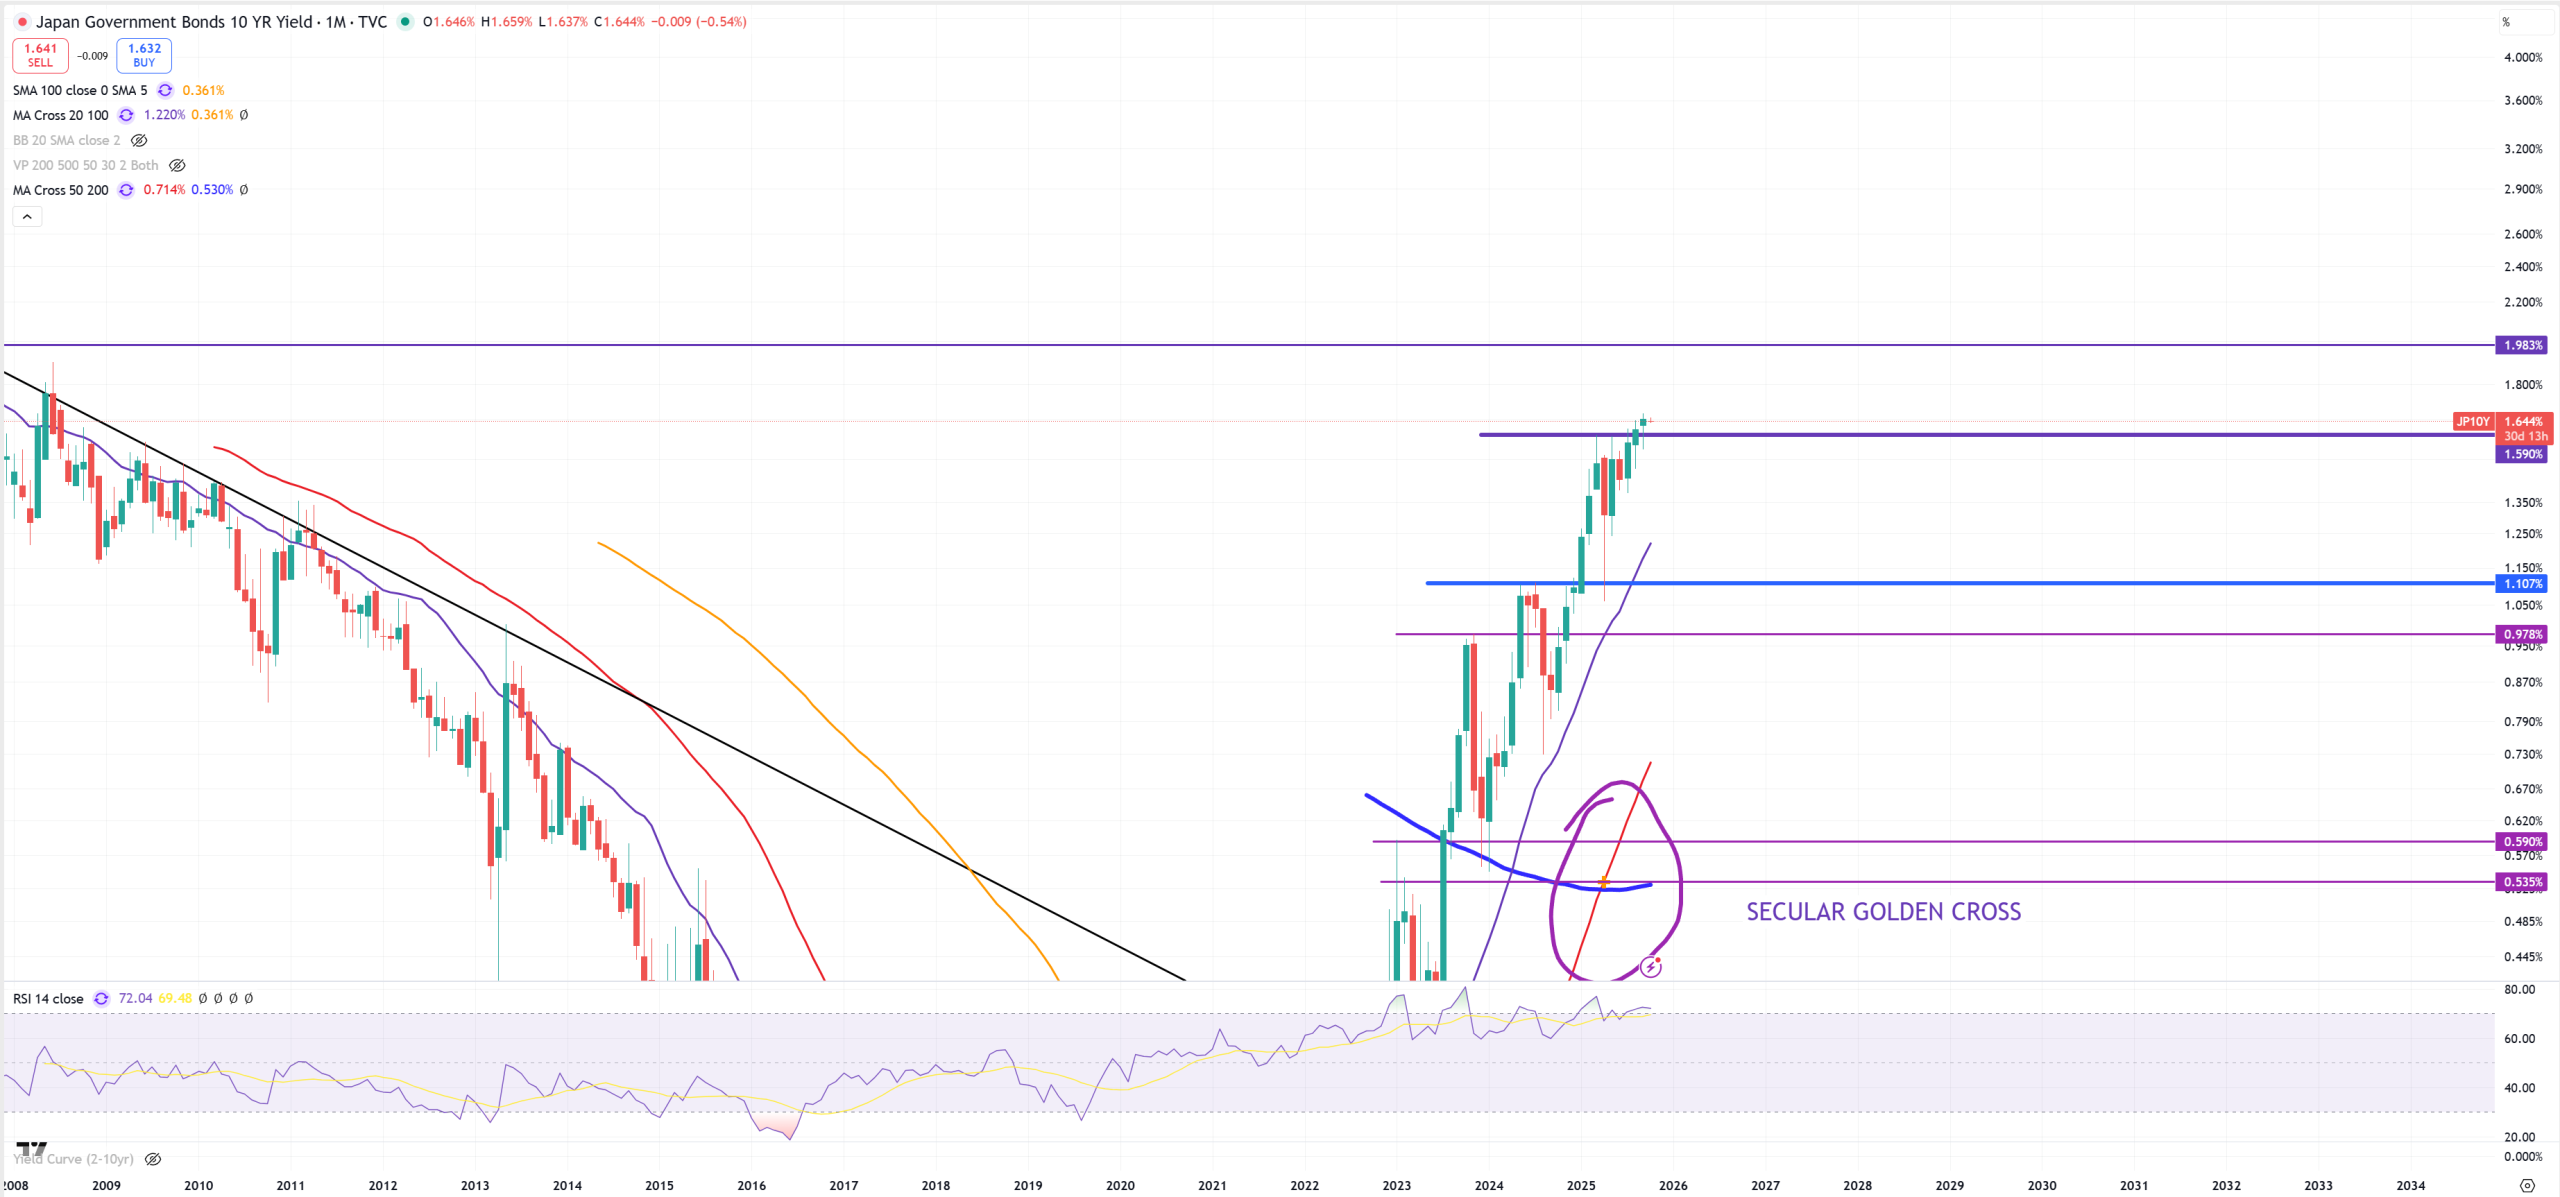
JP10Y – this looks like next wave towards 2.0% has started
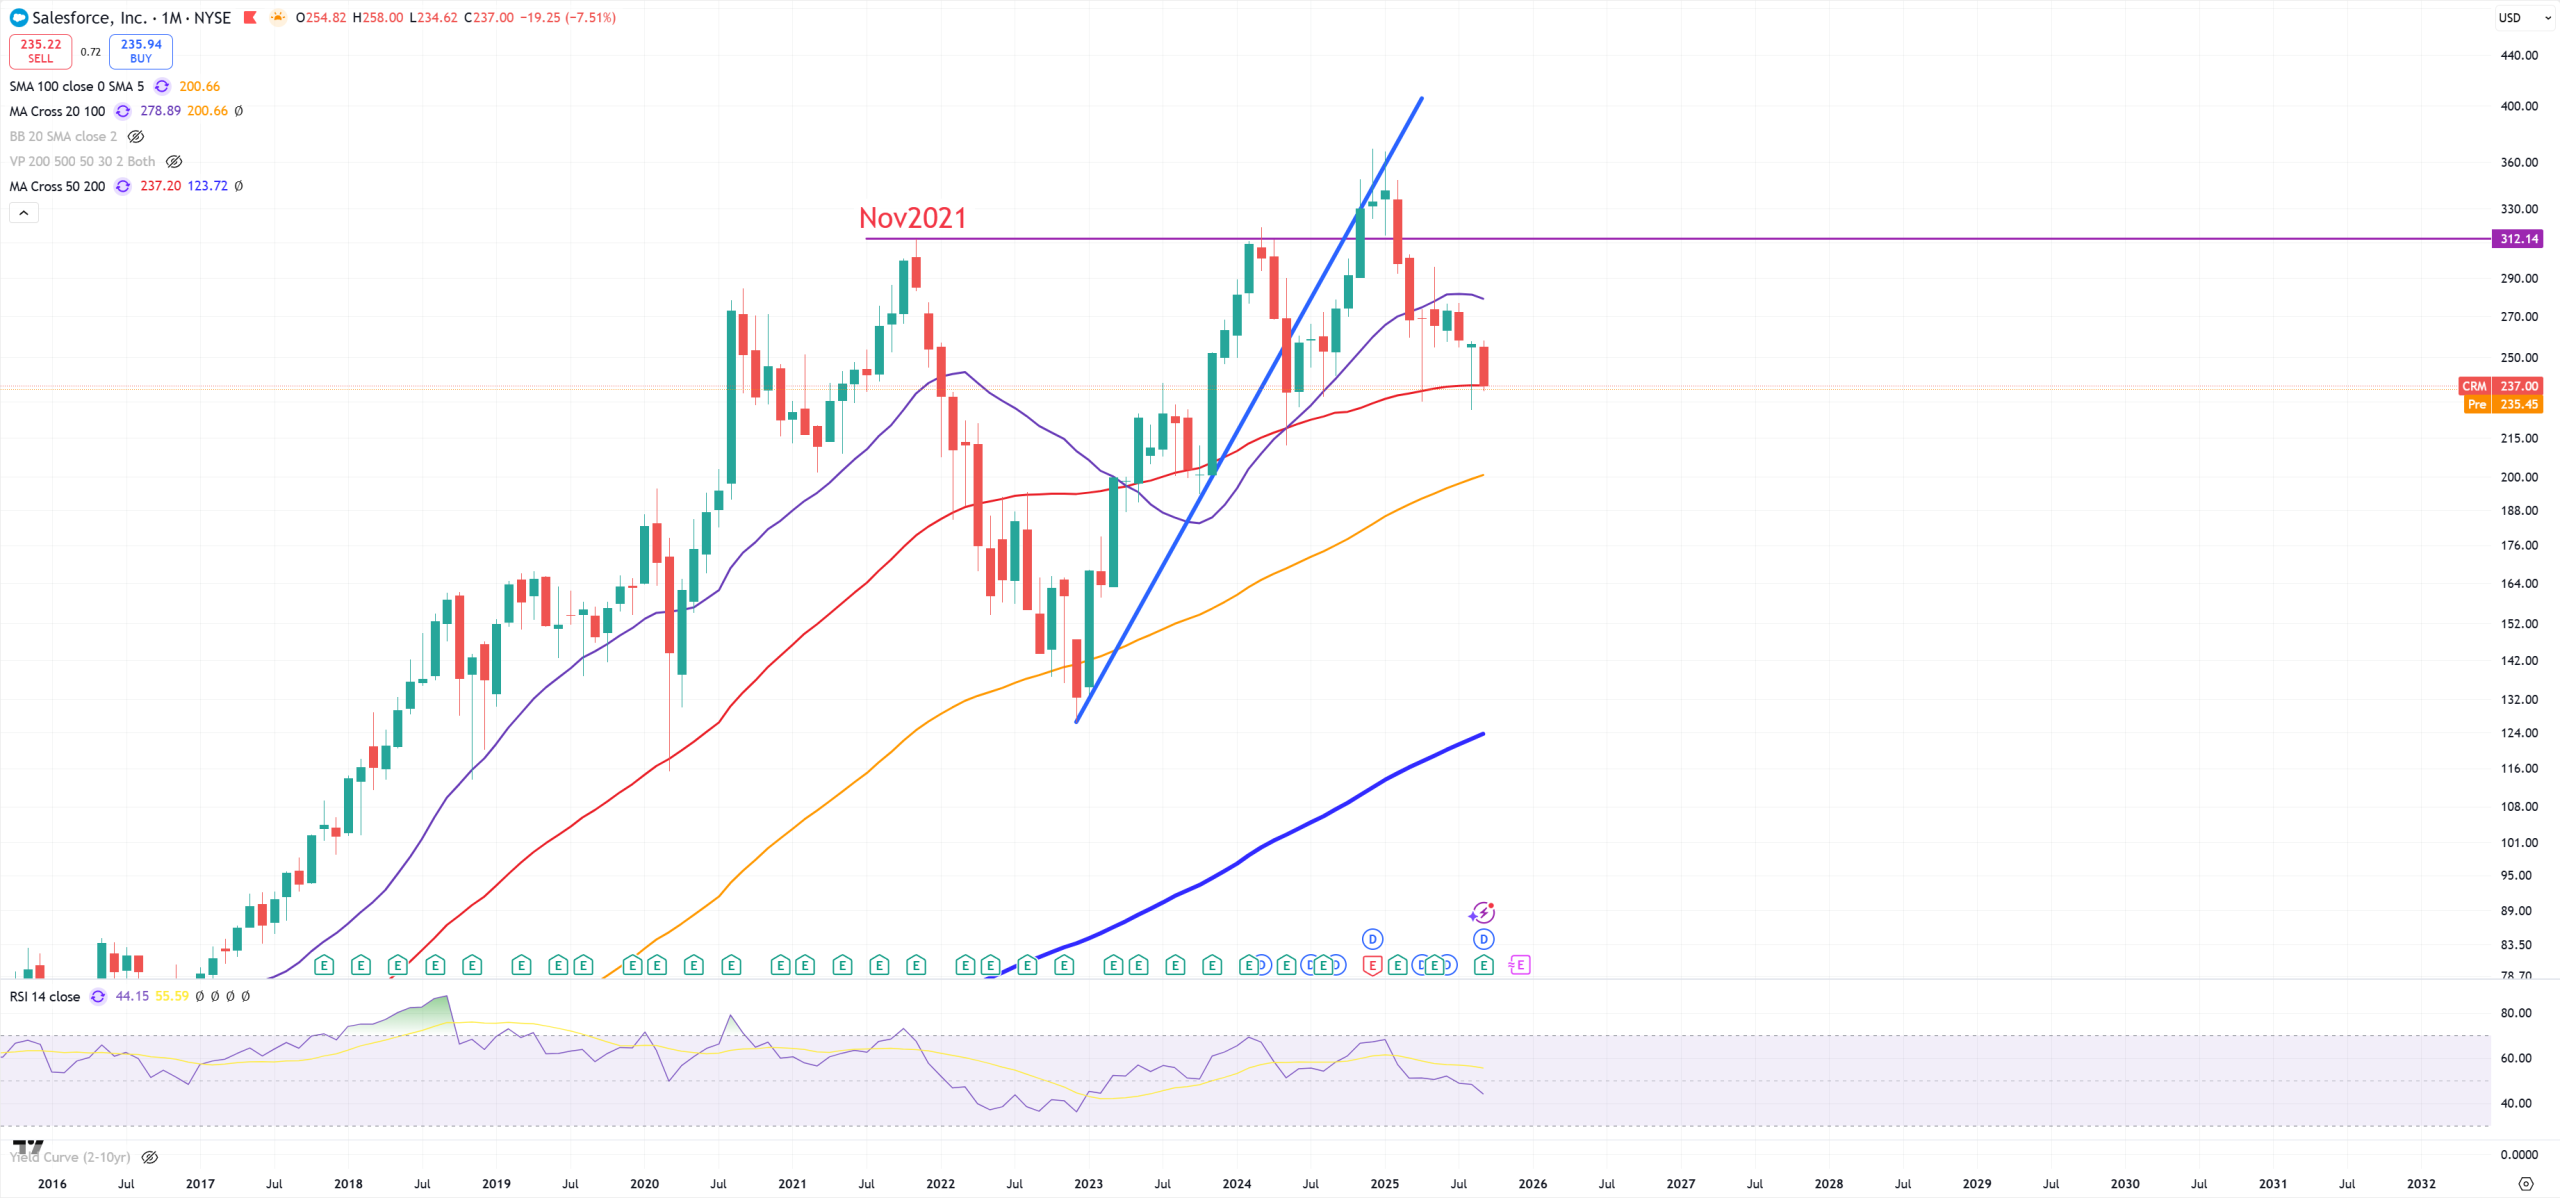
CRM – ends below (M)MA50
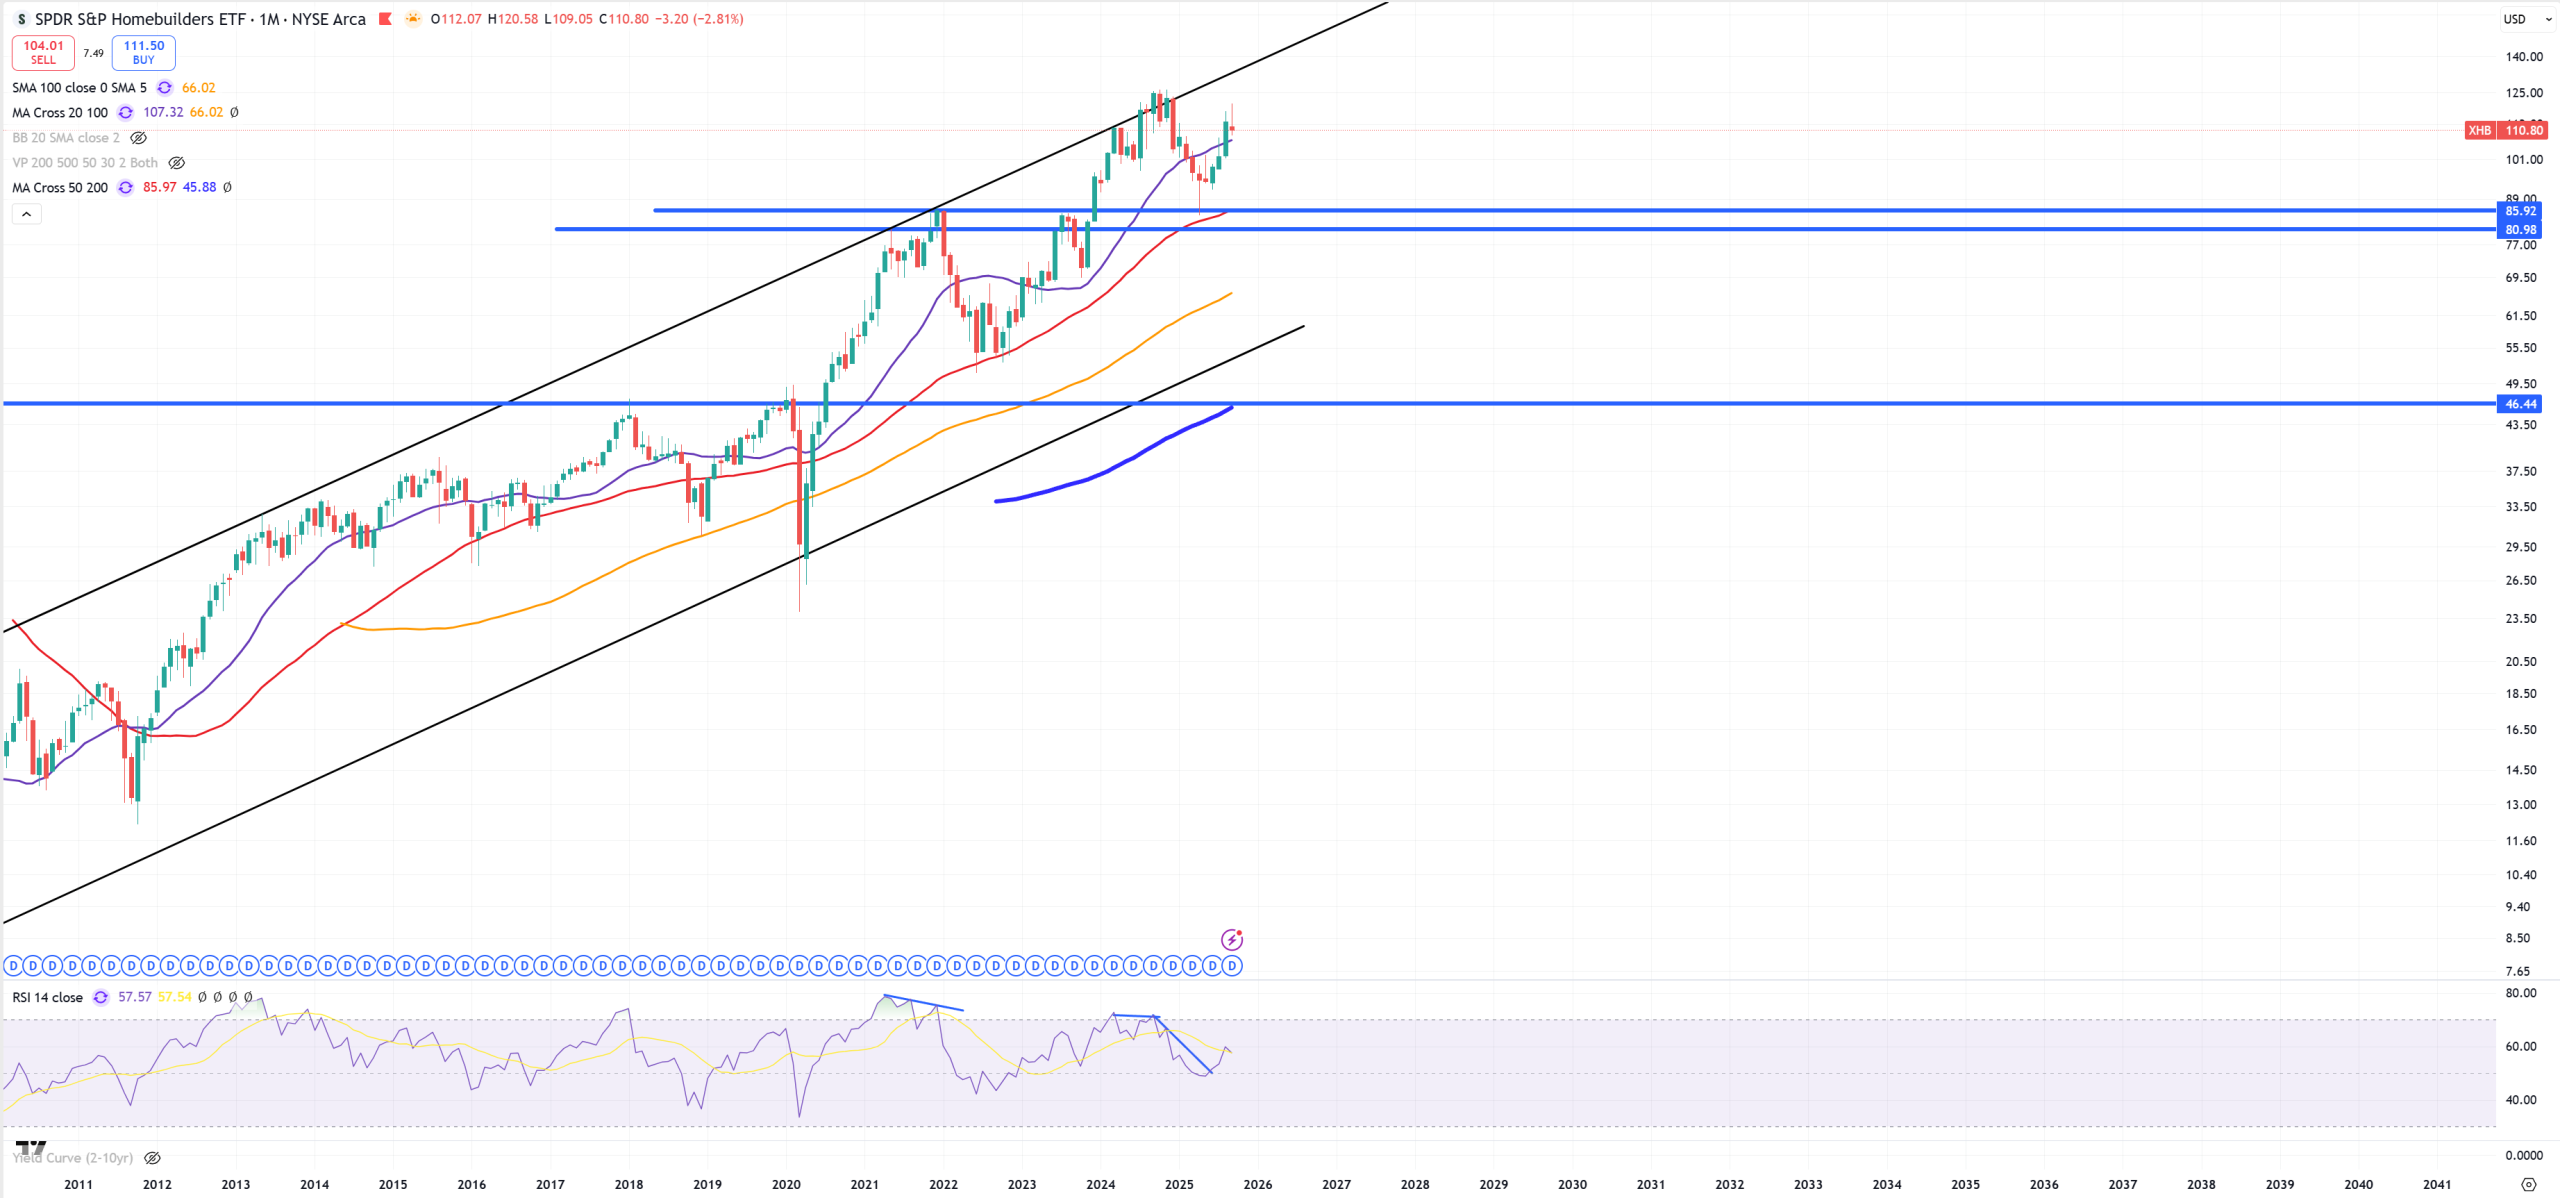
XHB
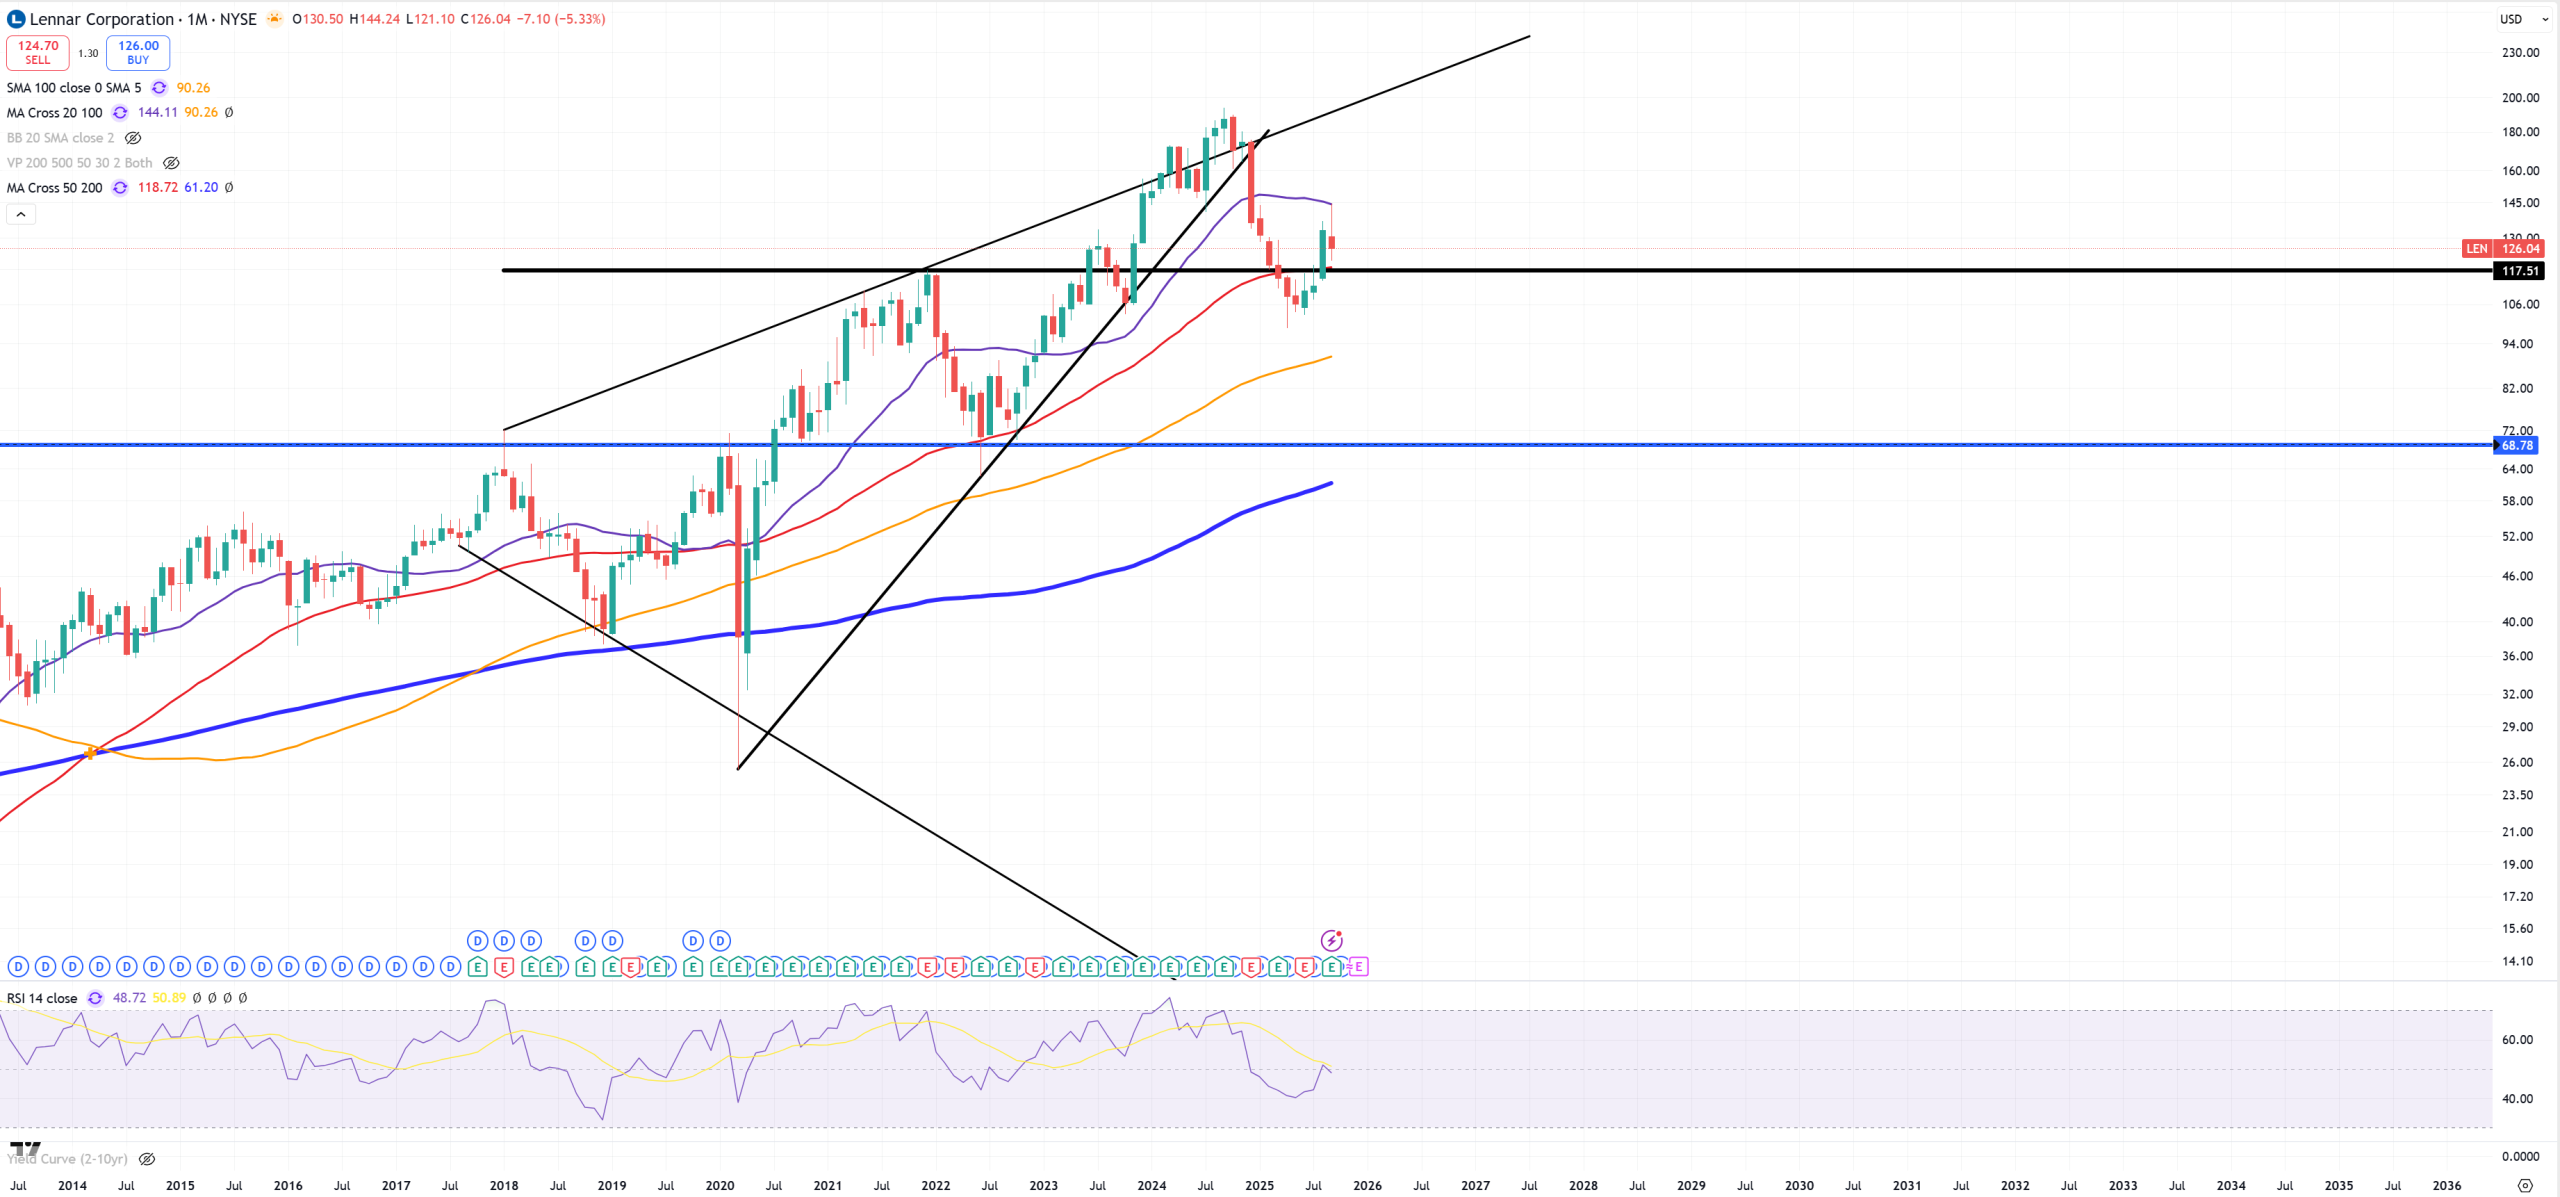
LEN
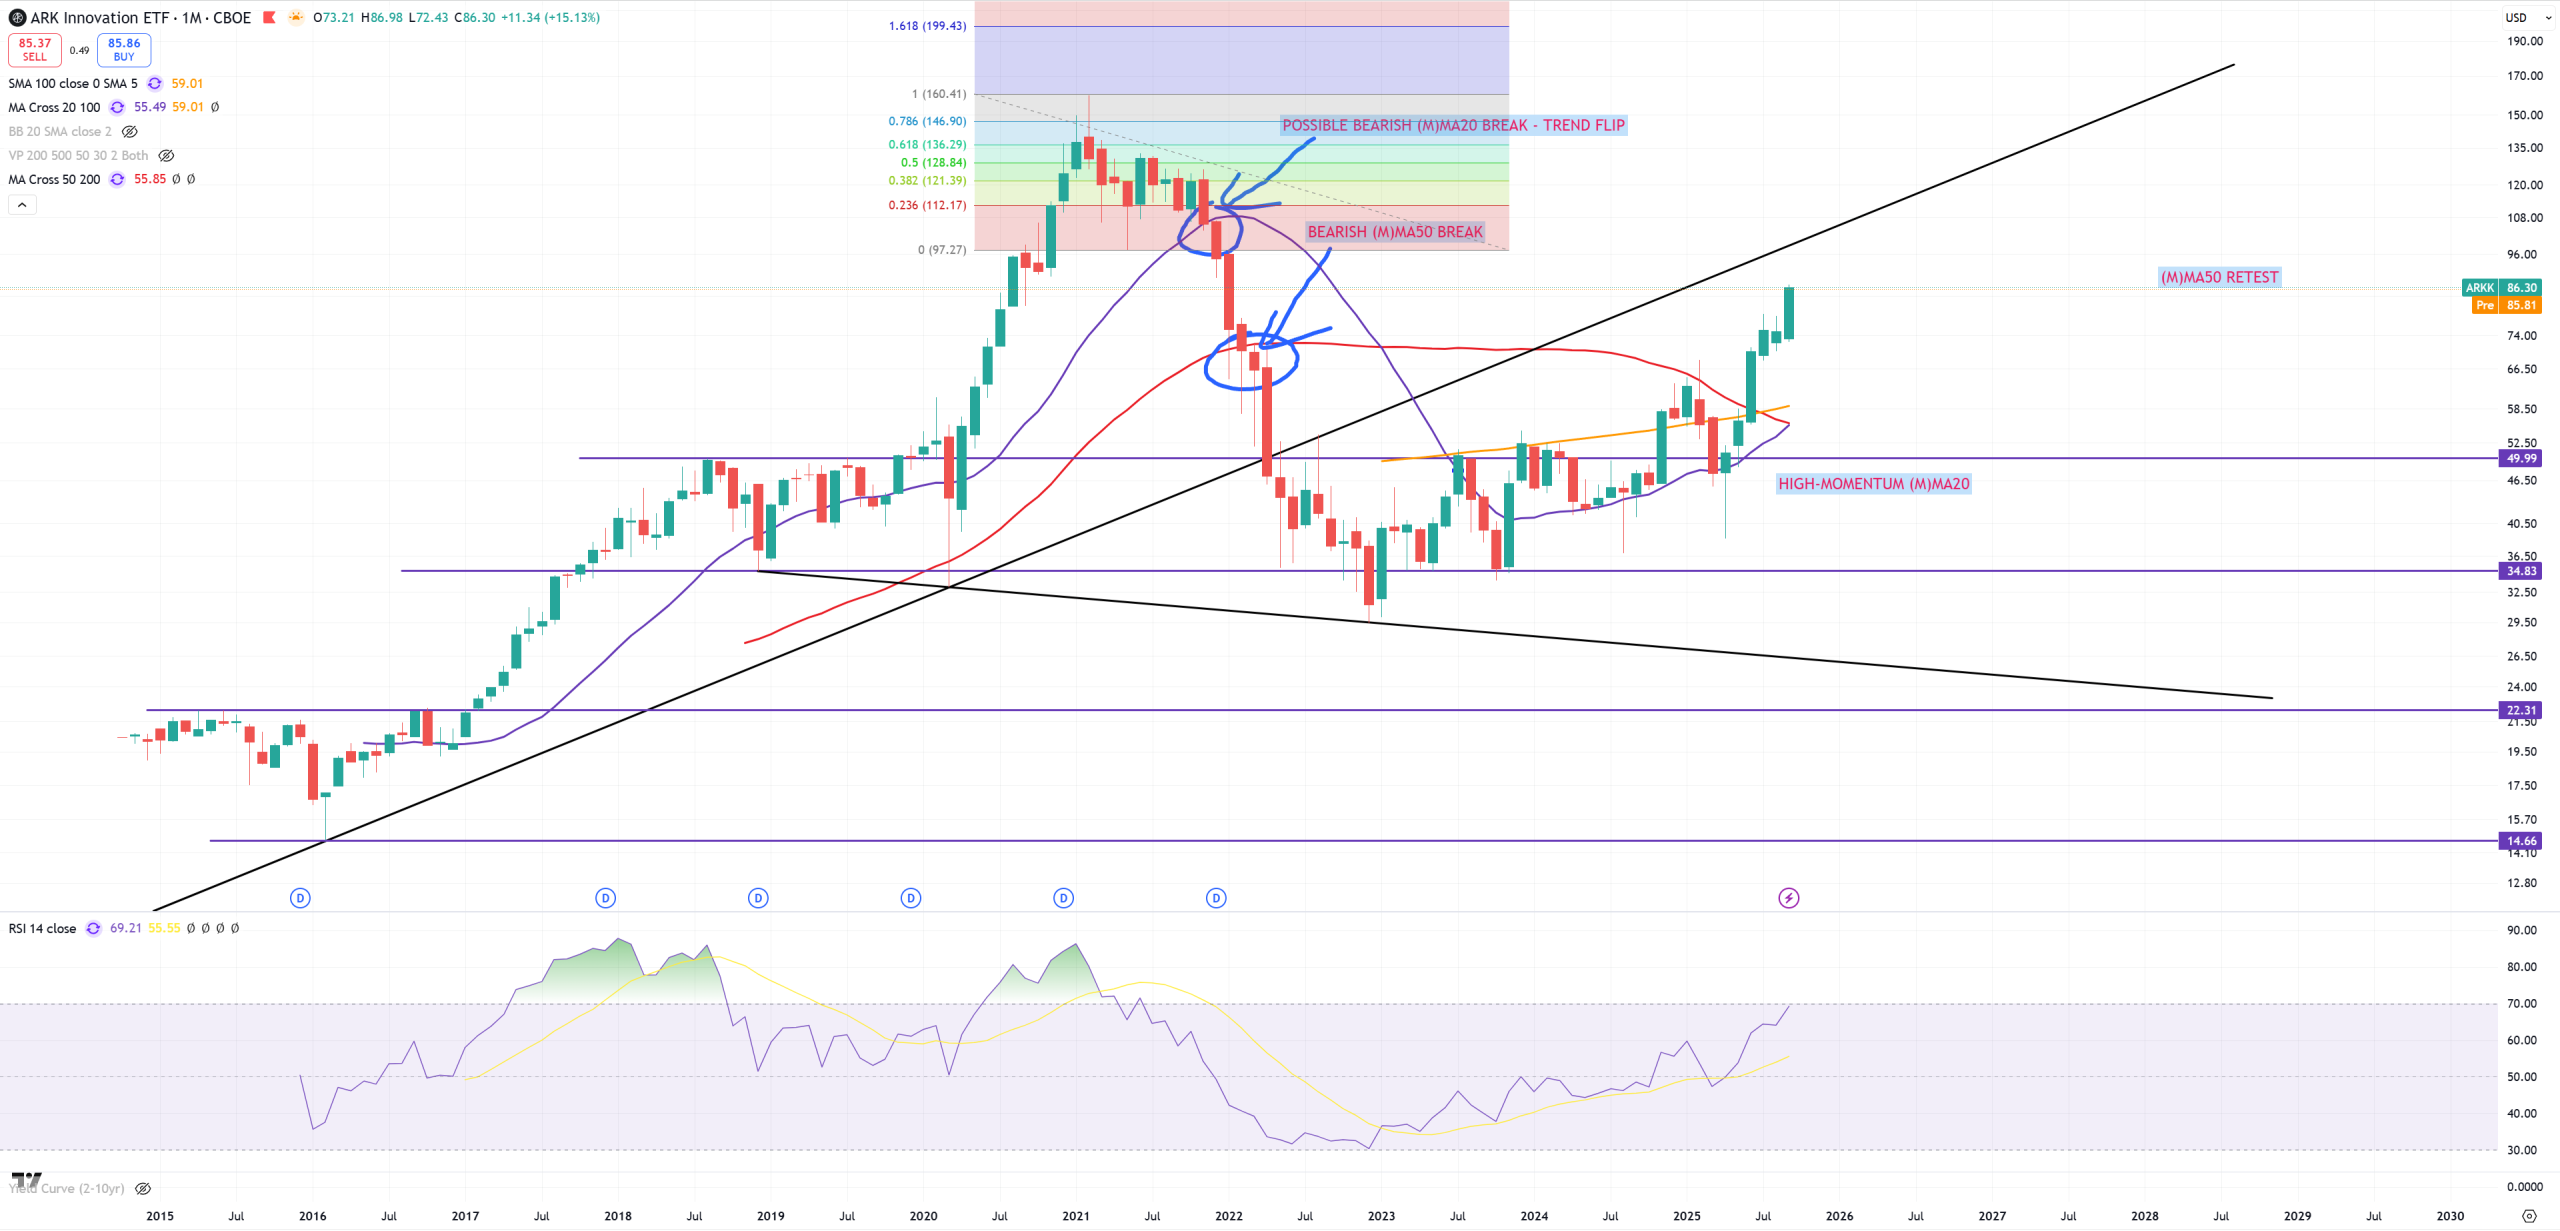
ARKK
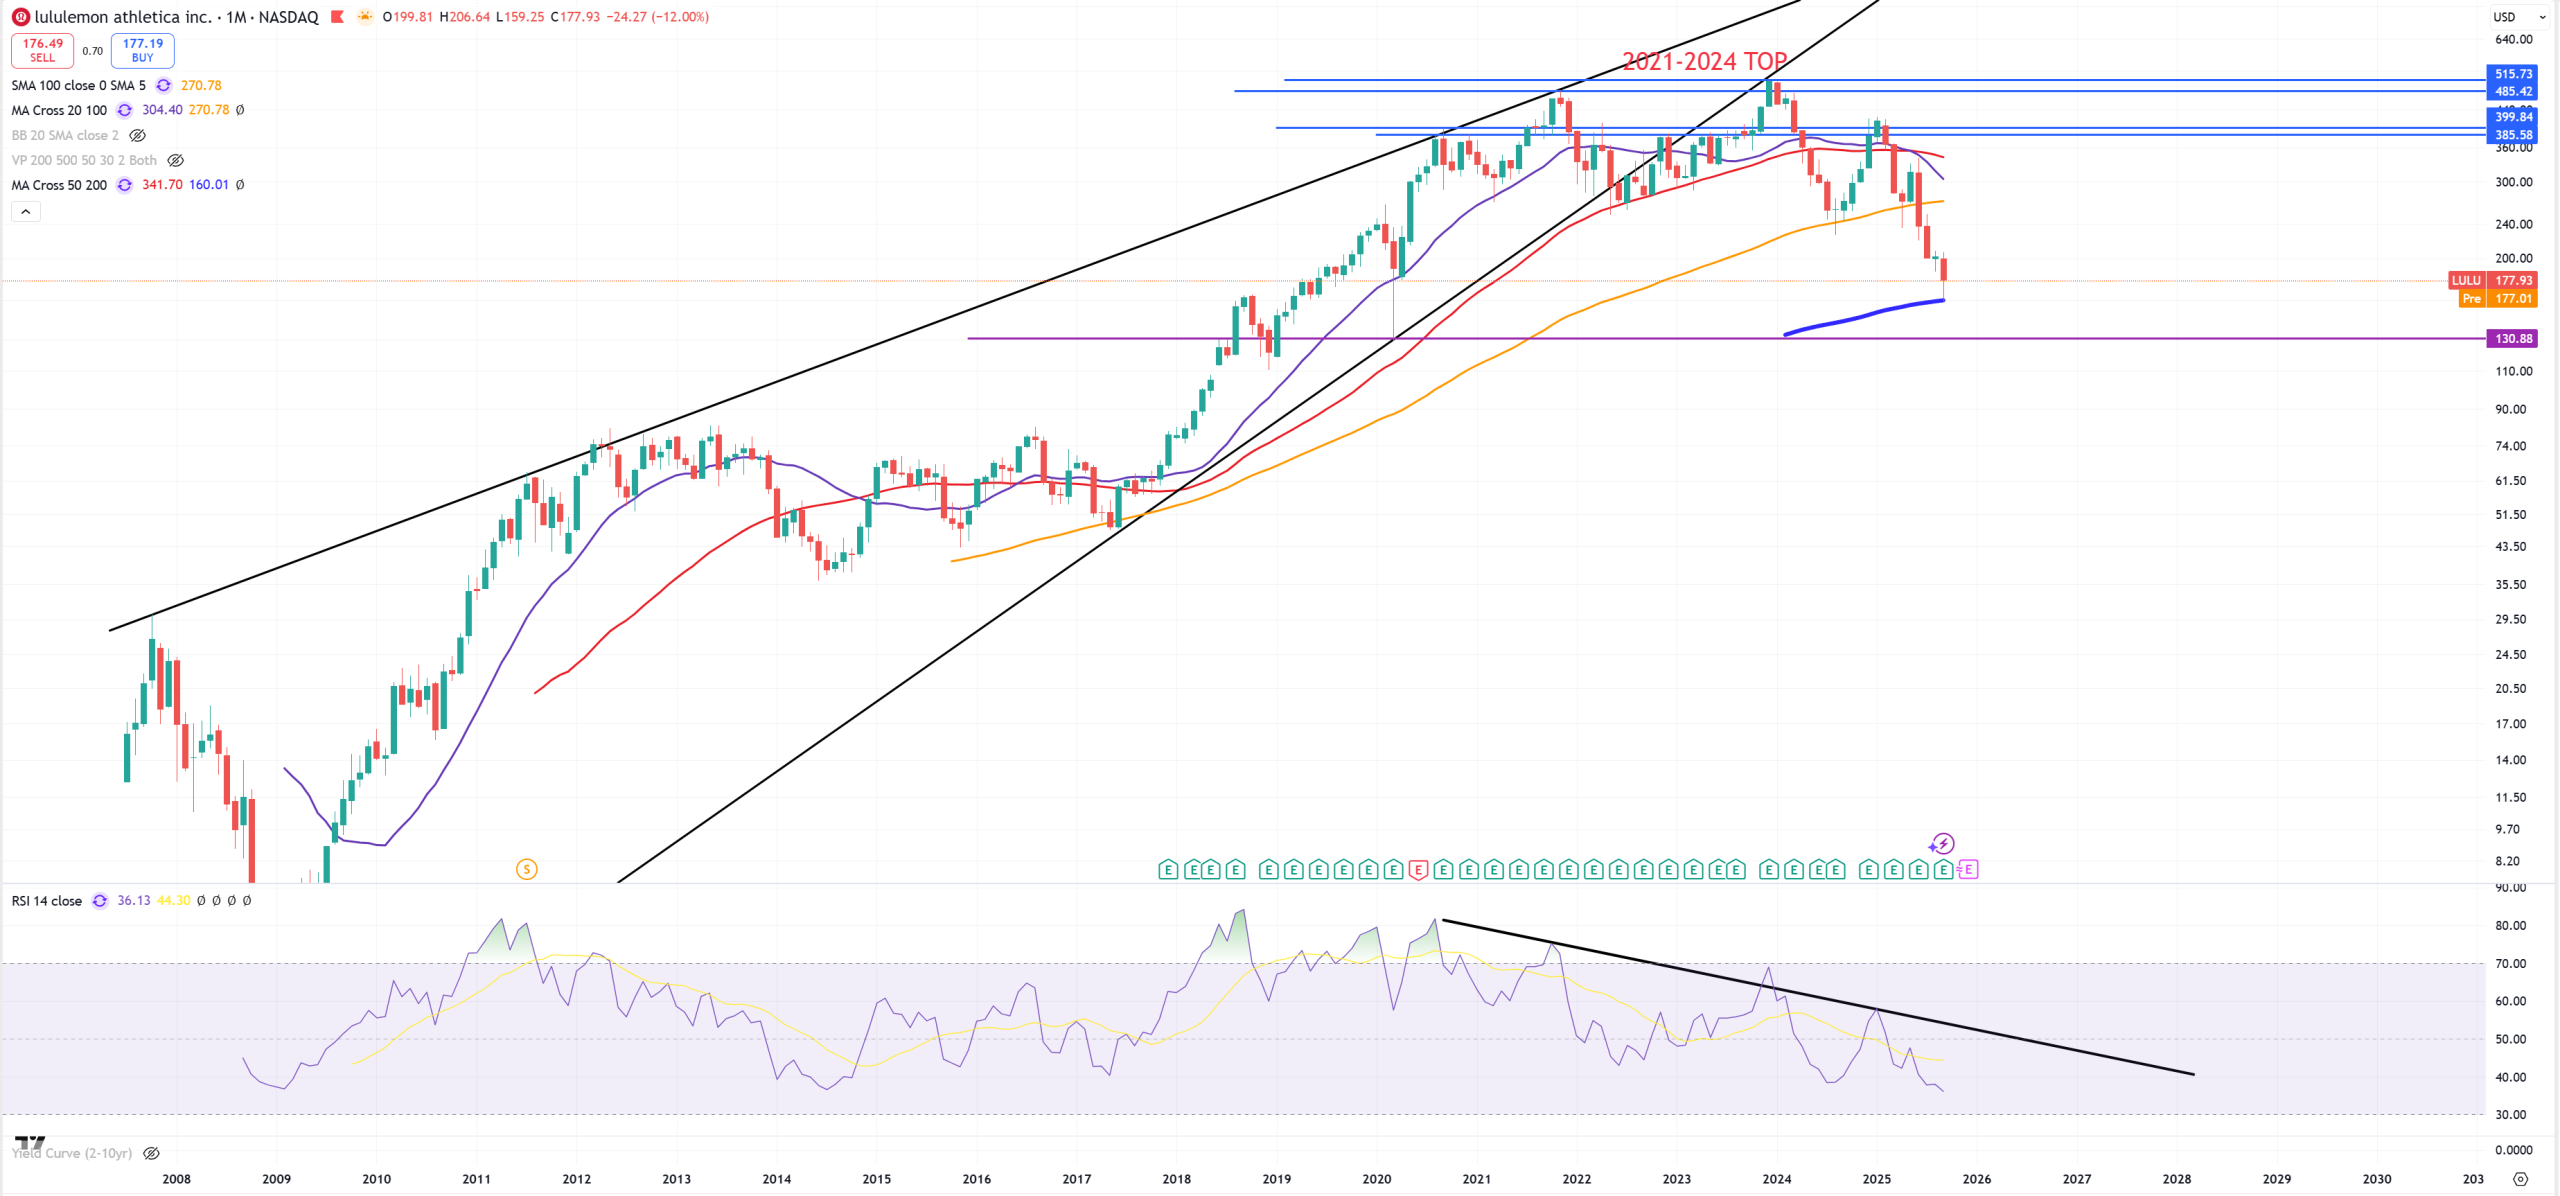
LULU
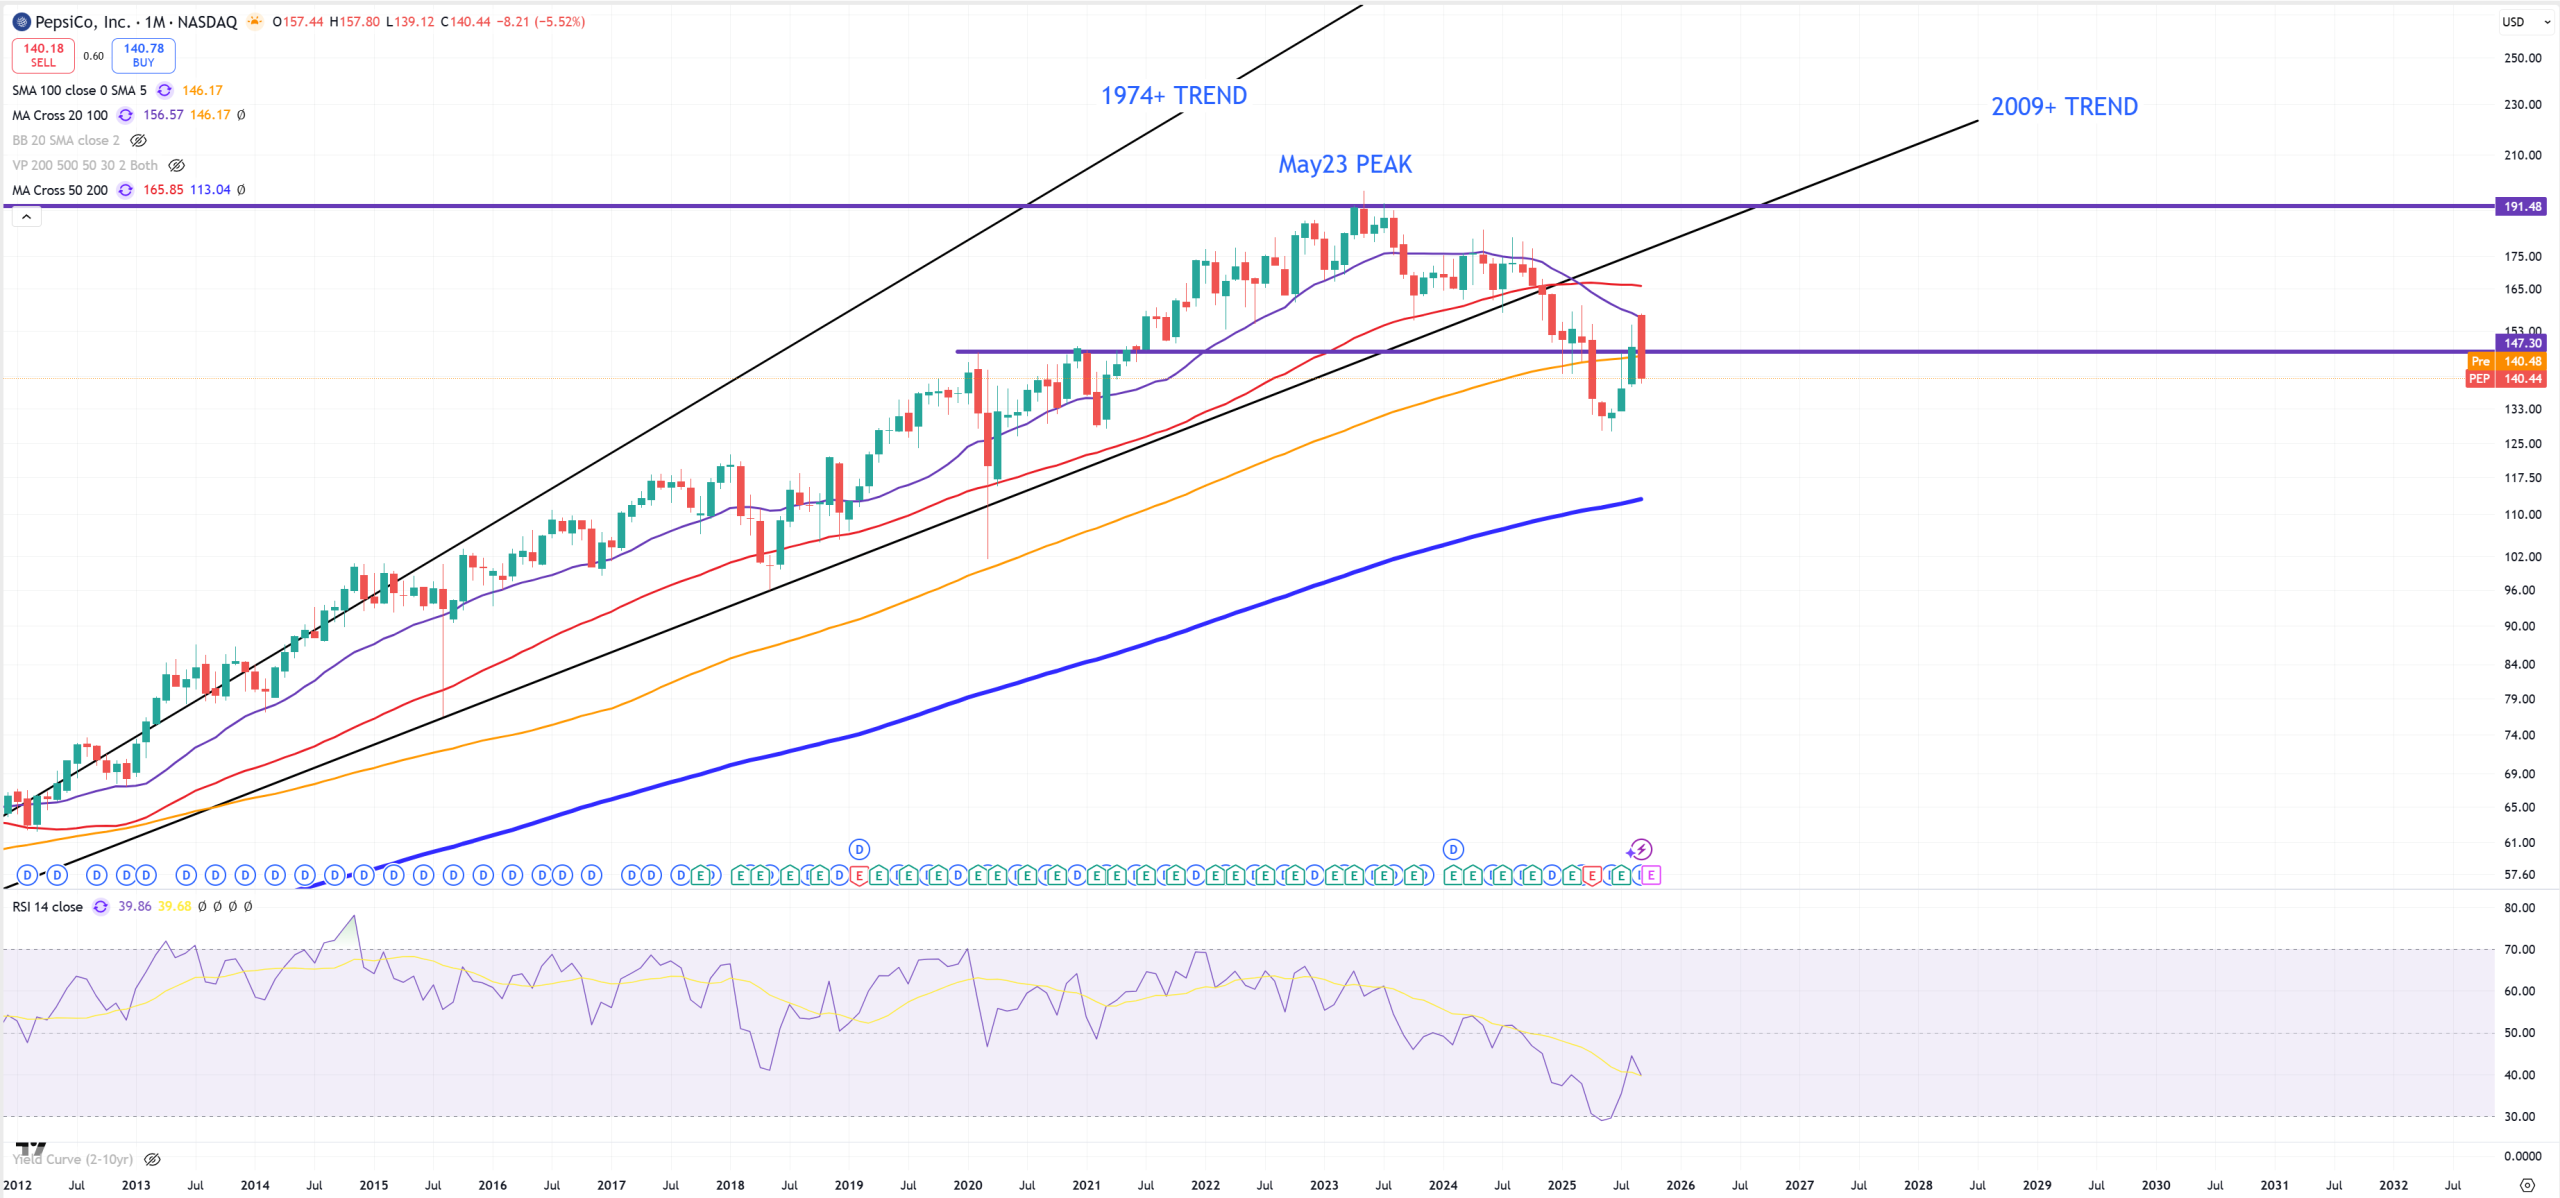
PEP – Pepsico and this reversal
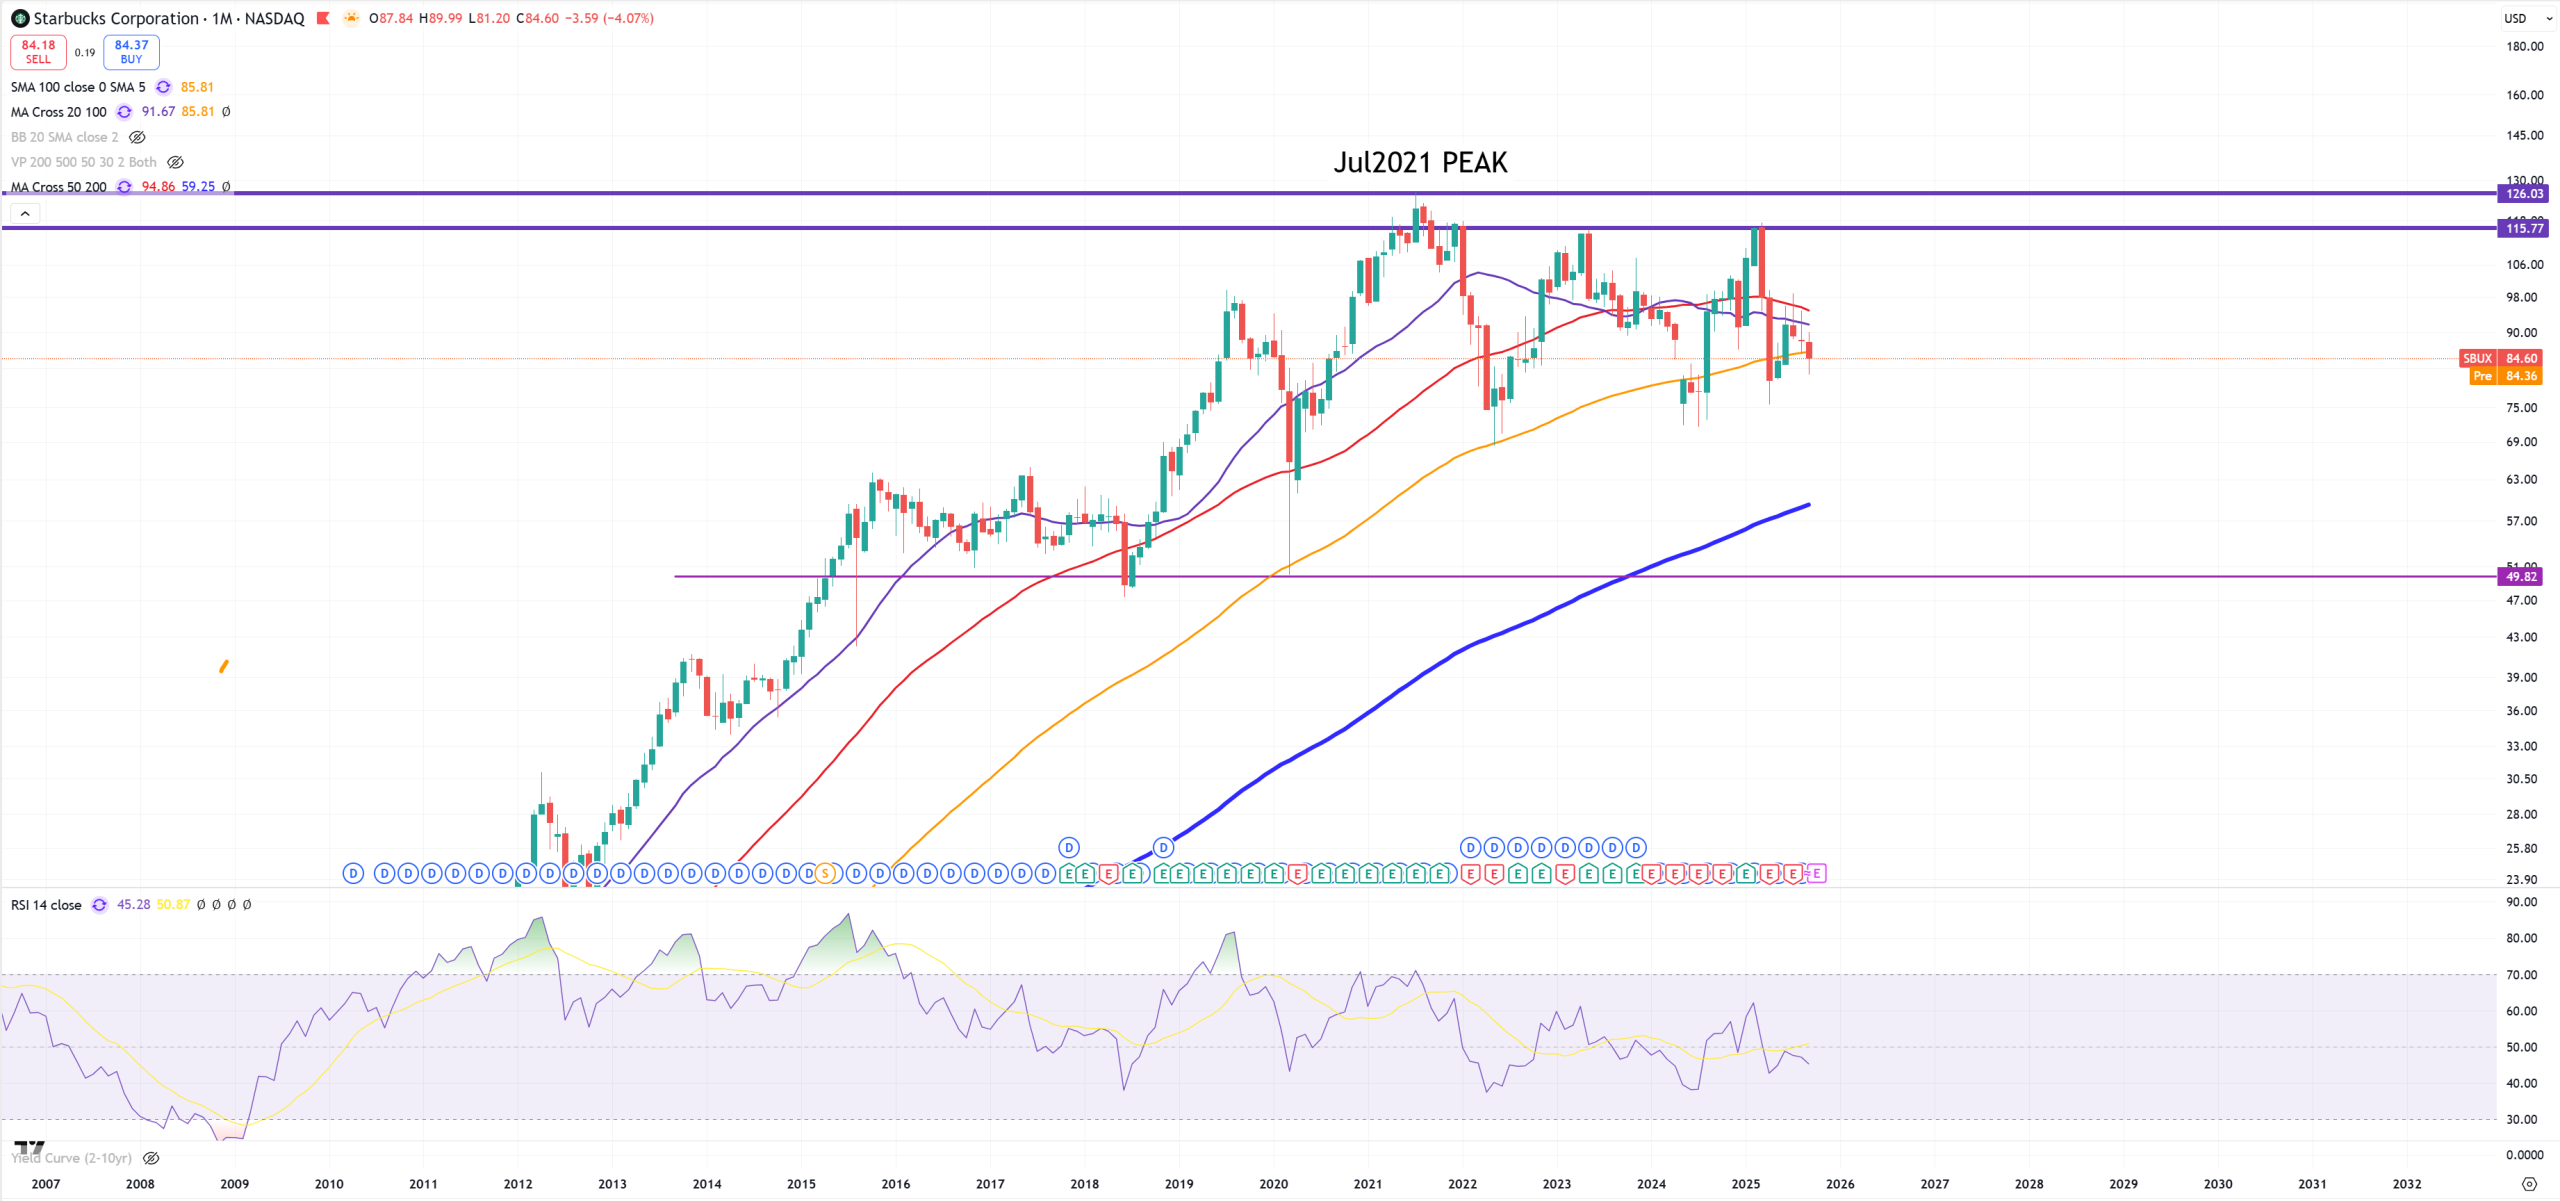
SBUX – Starbucks and have problems
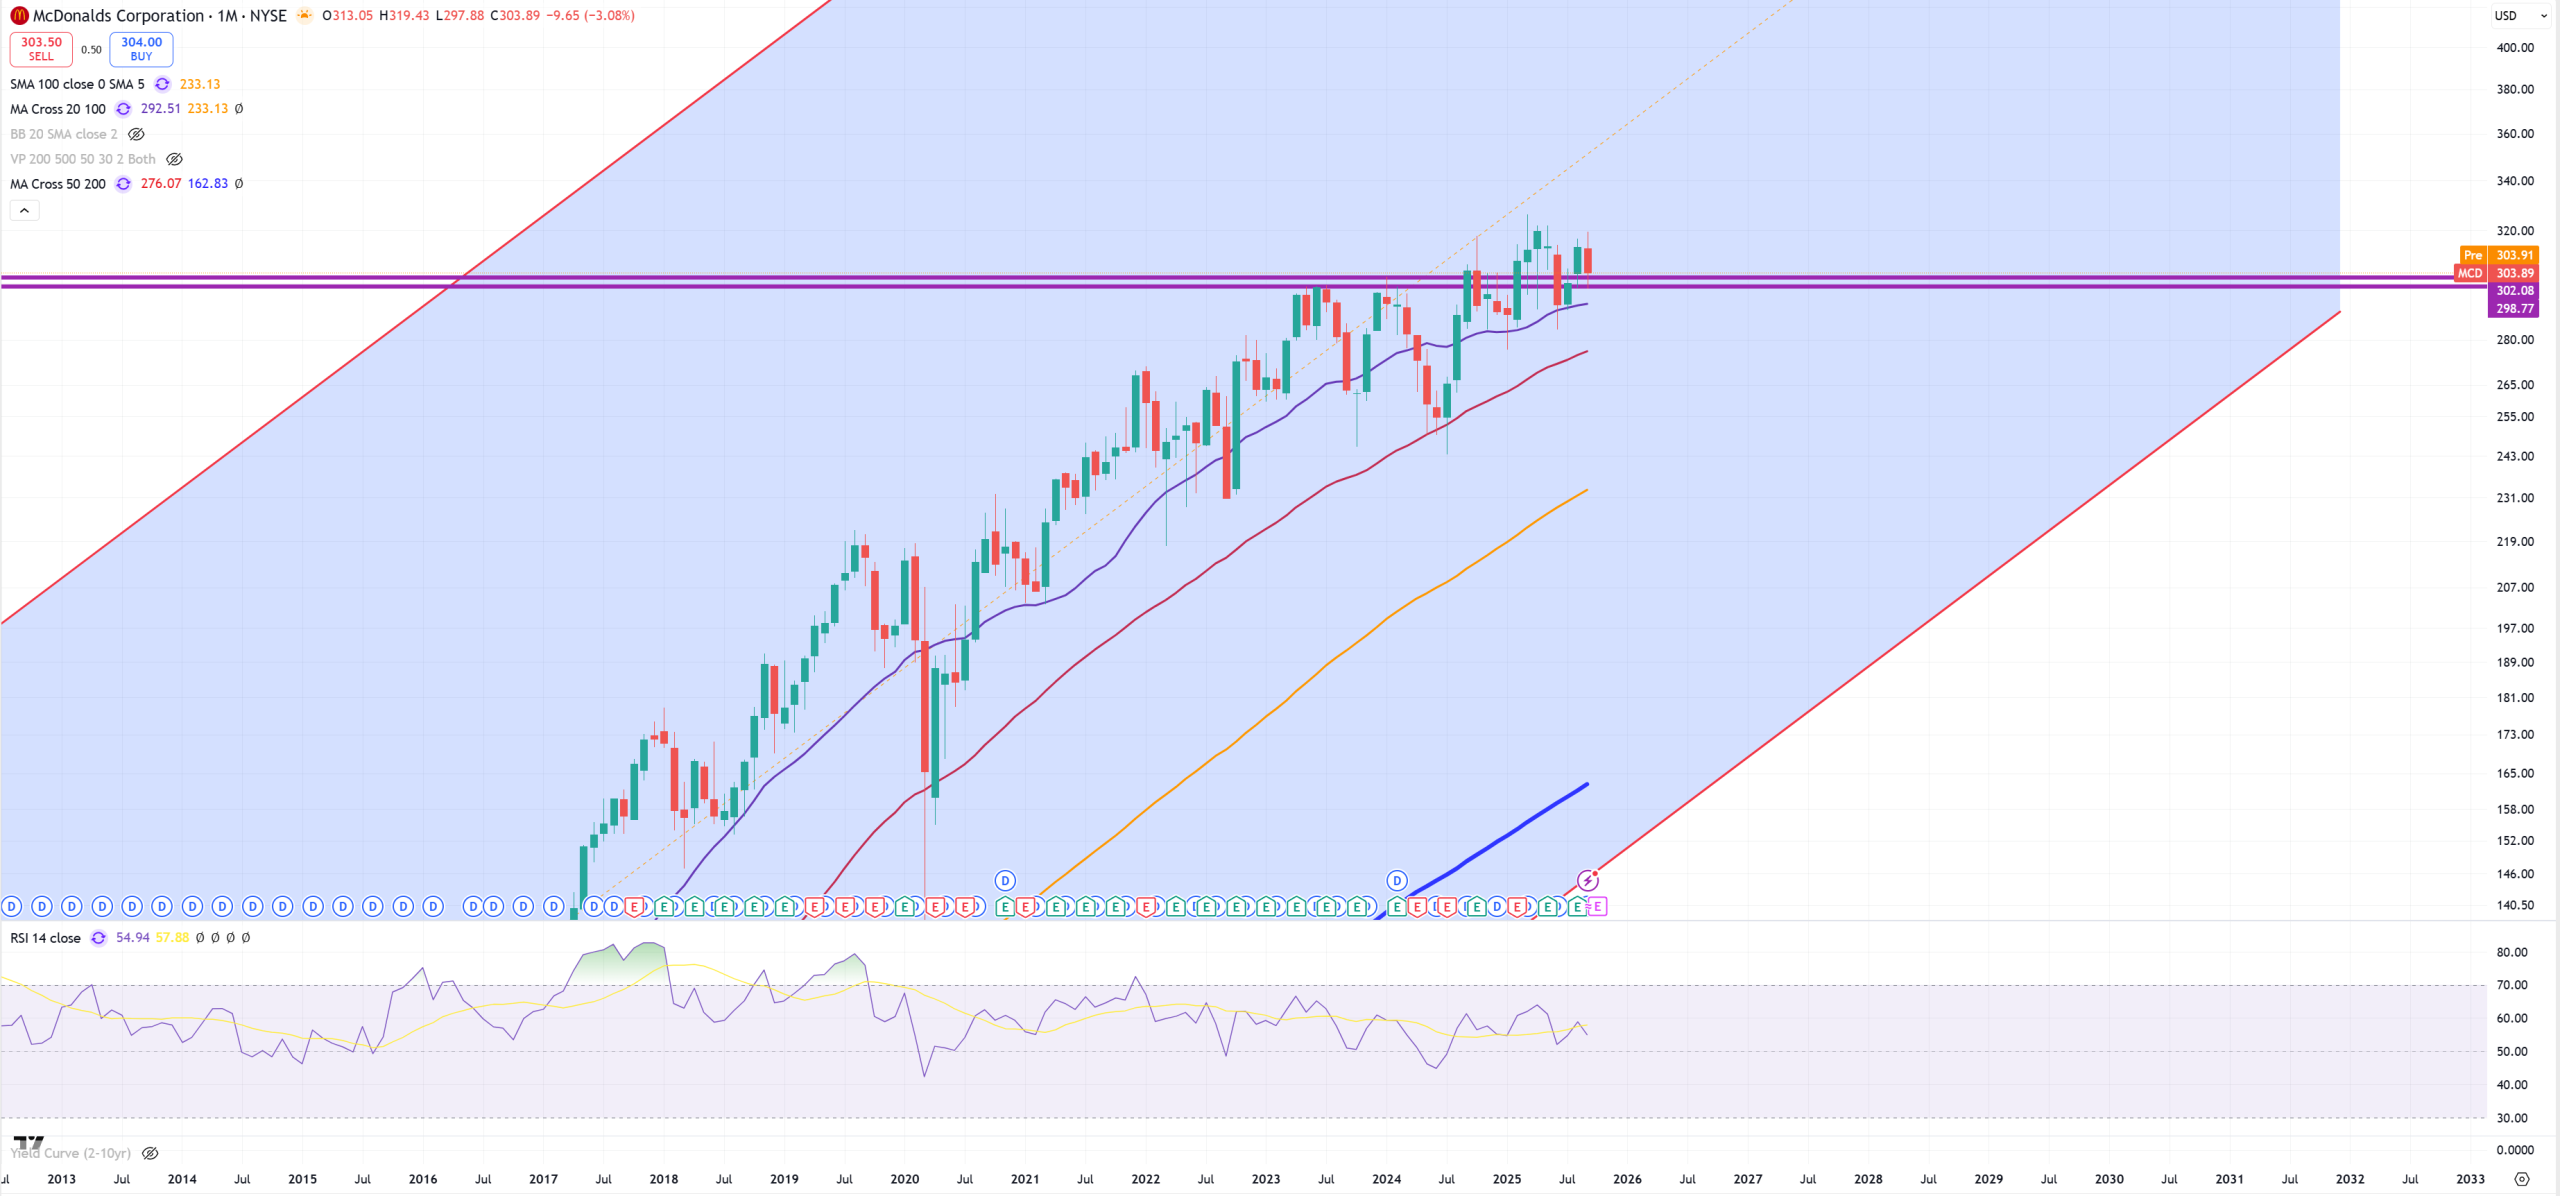
MCD – McDonalds and this 300$ level
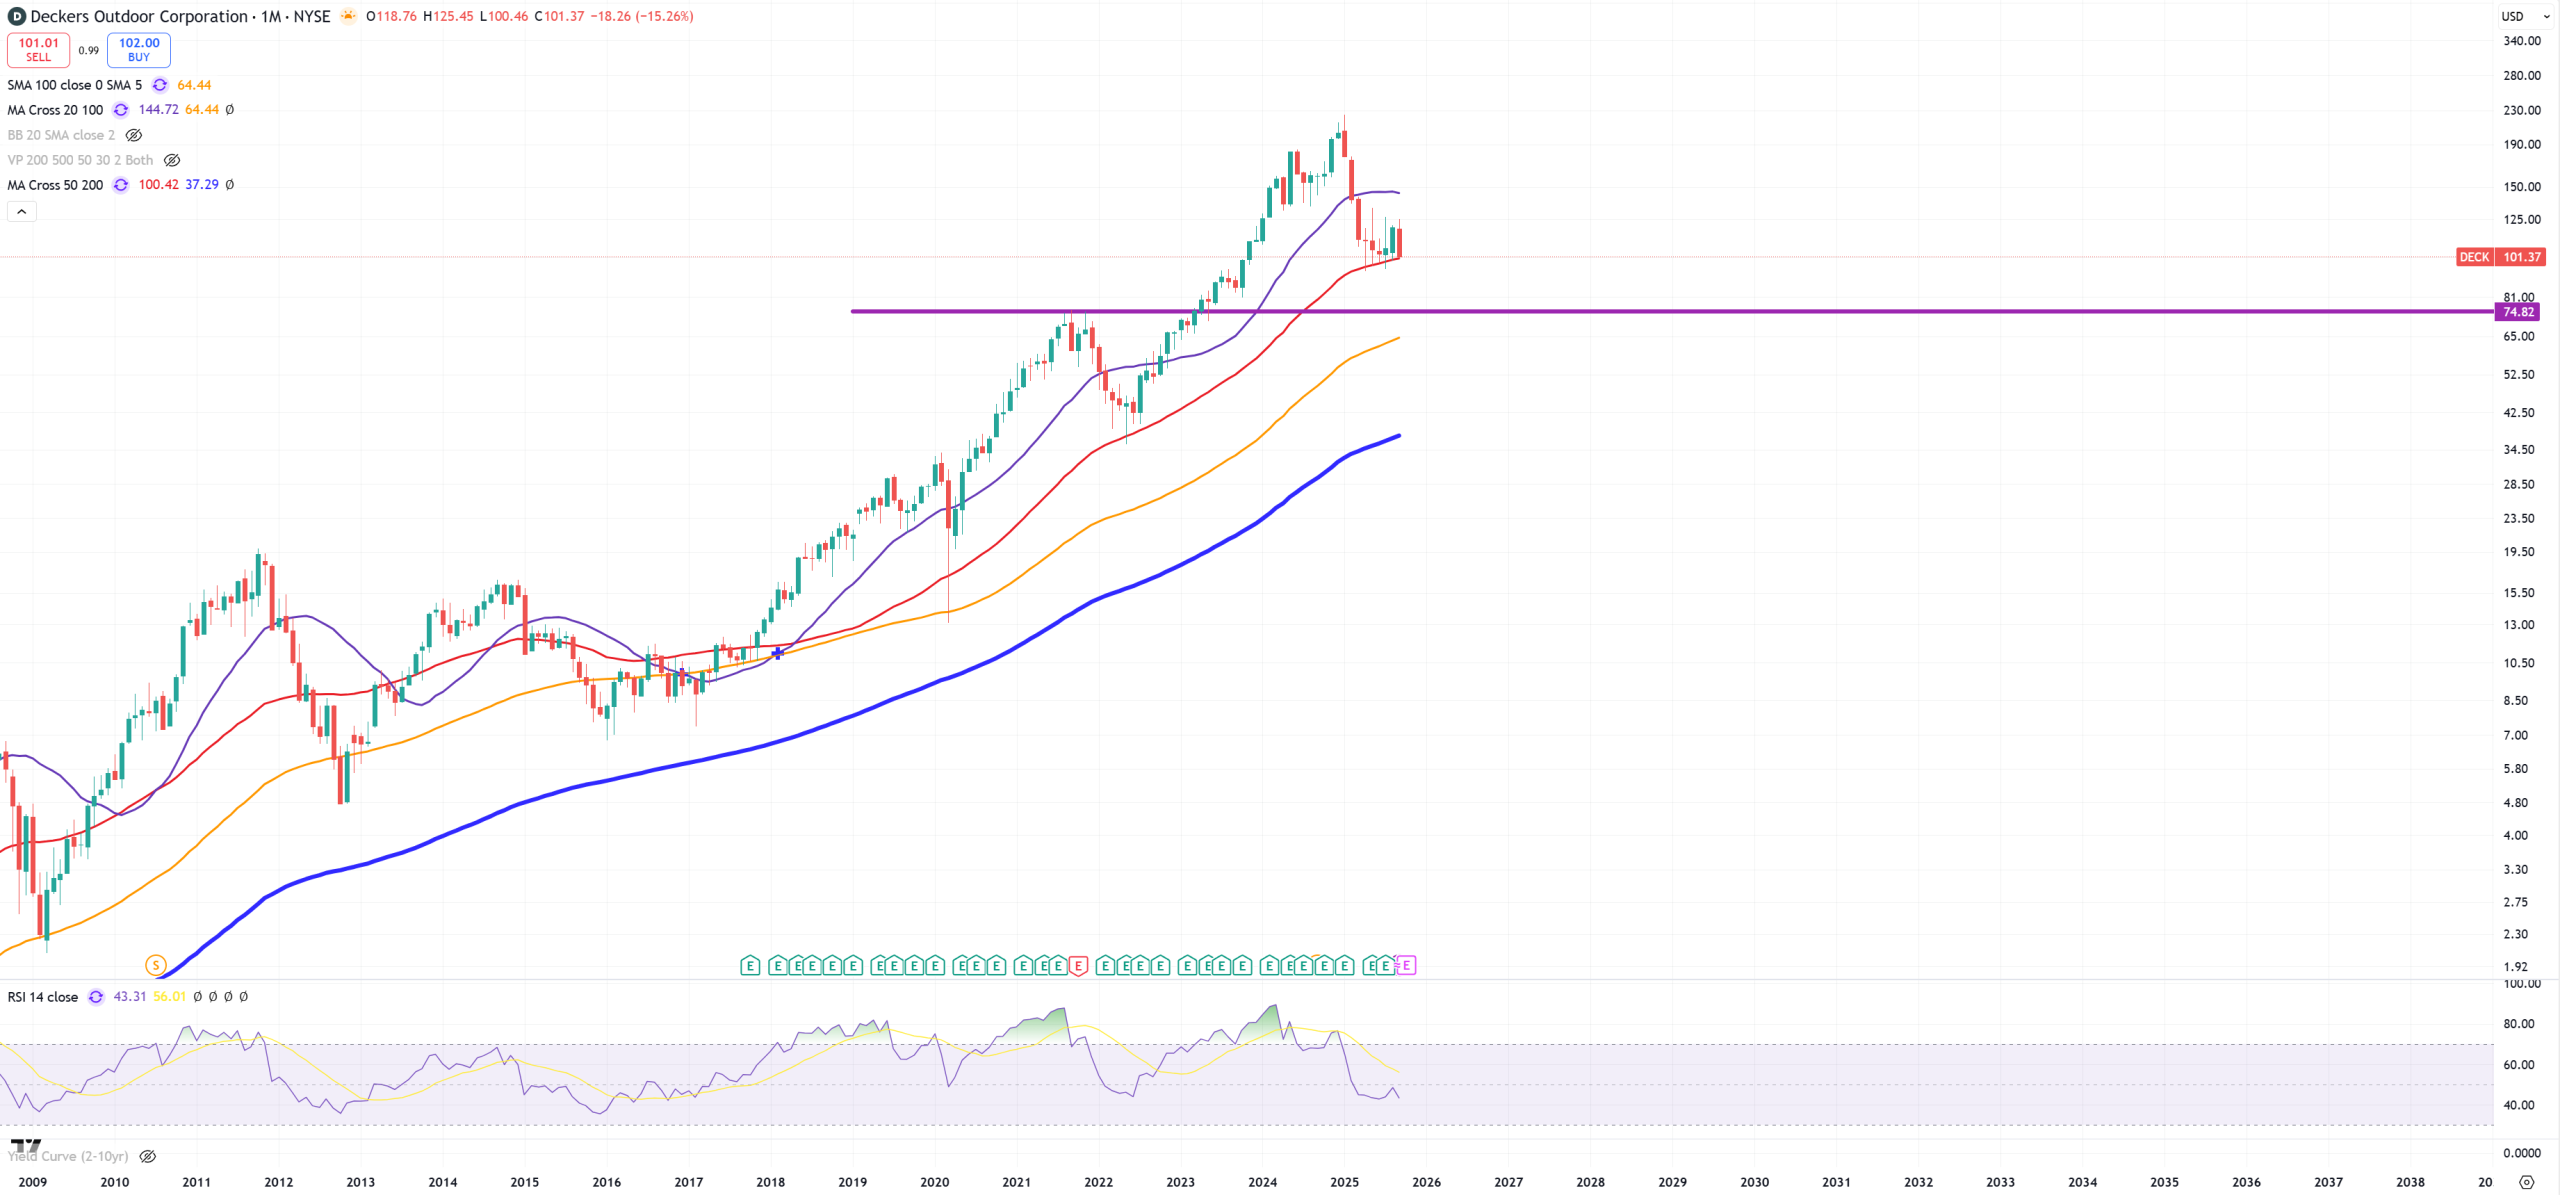
DECK – let’s call it more exclusive boots producer and red (M)MA50.
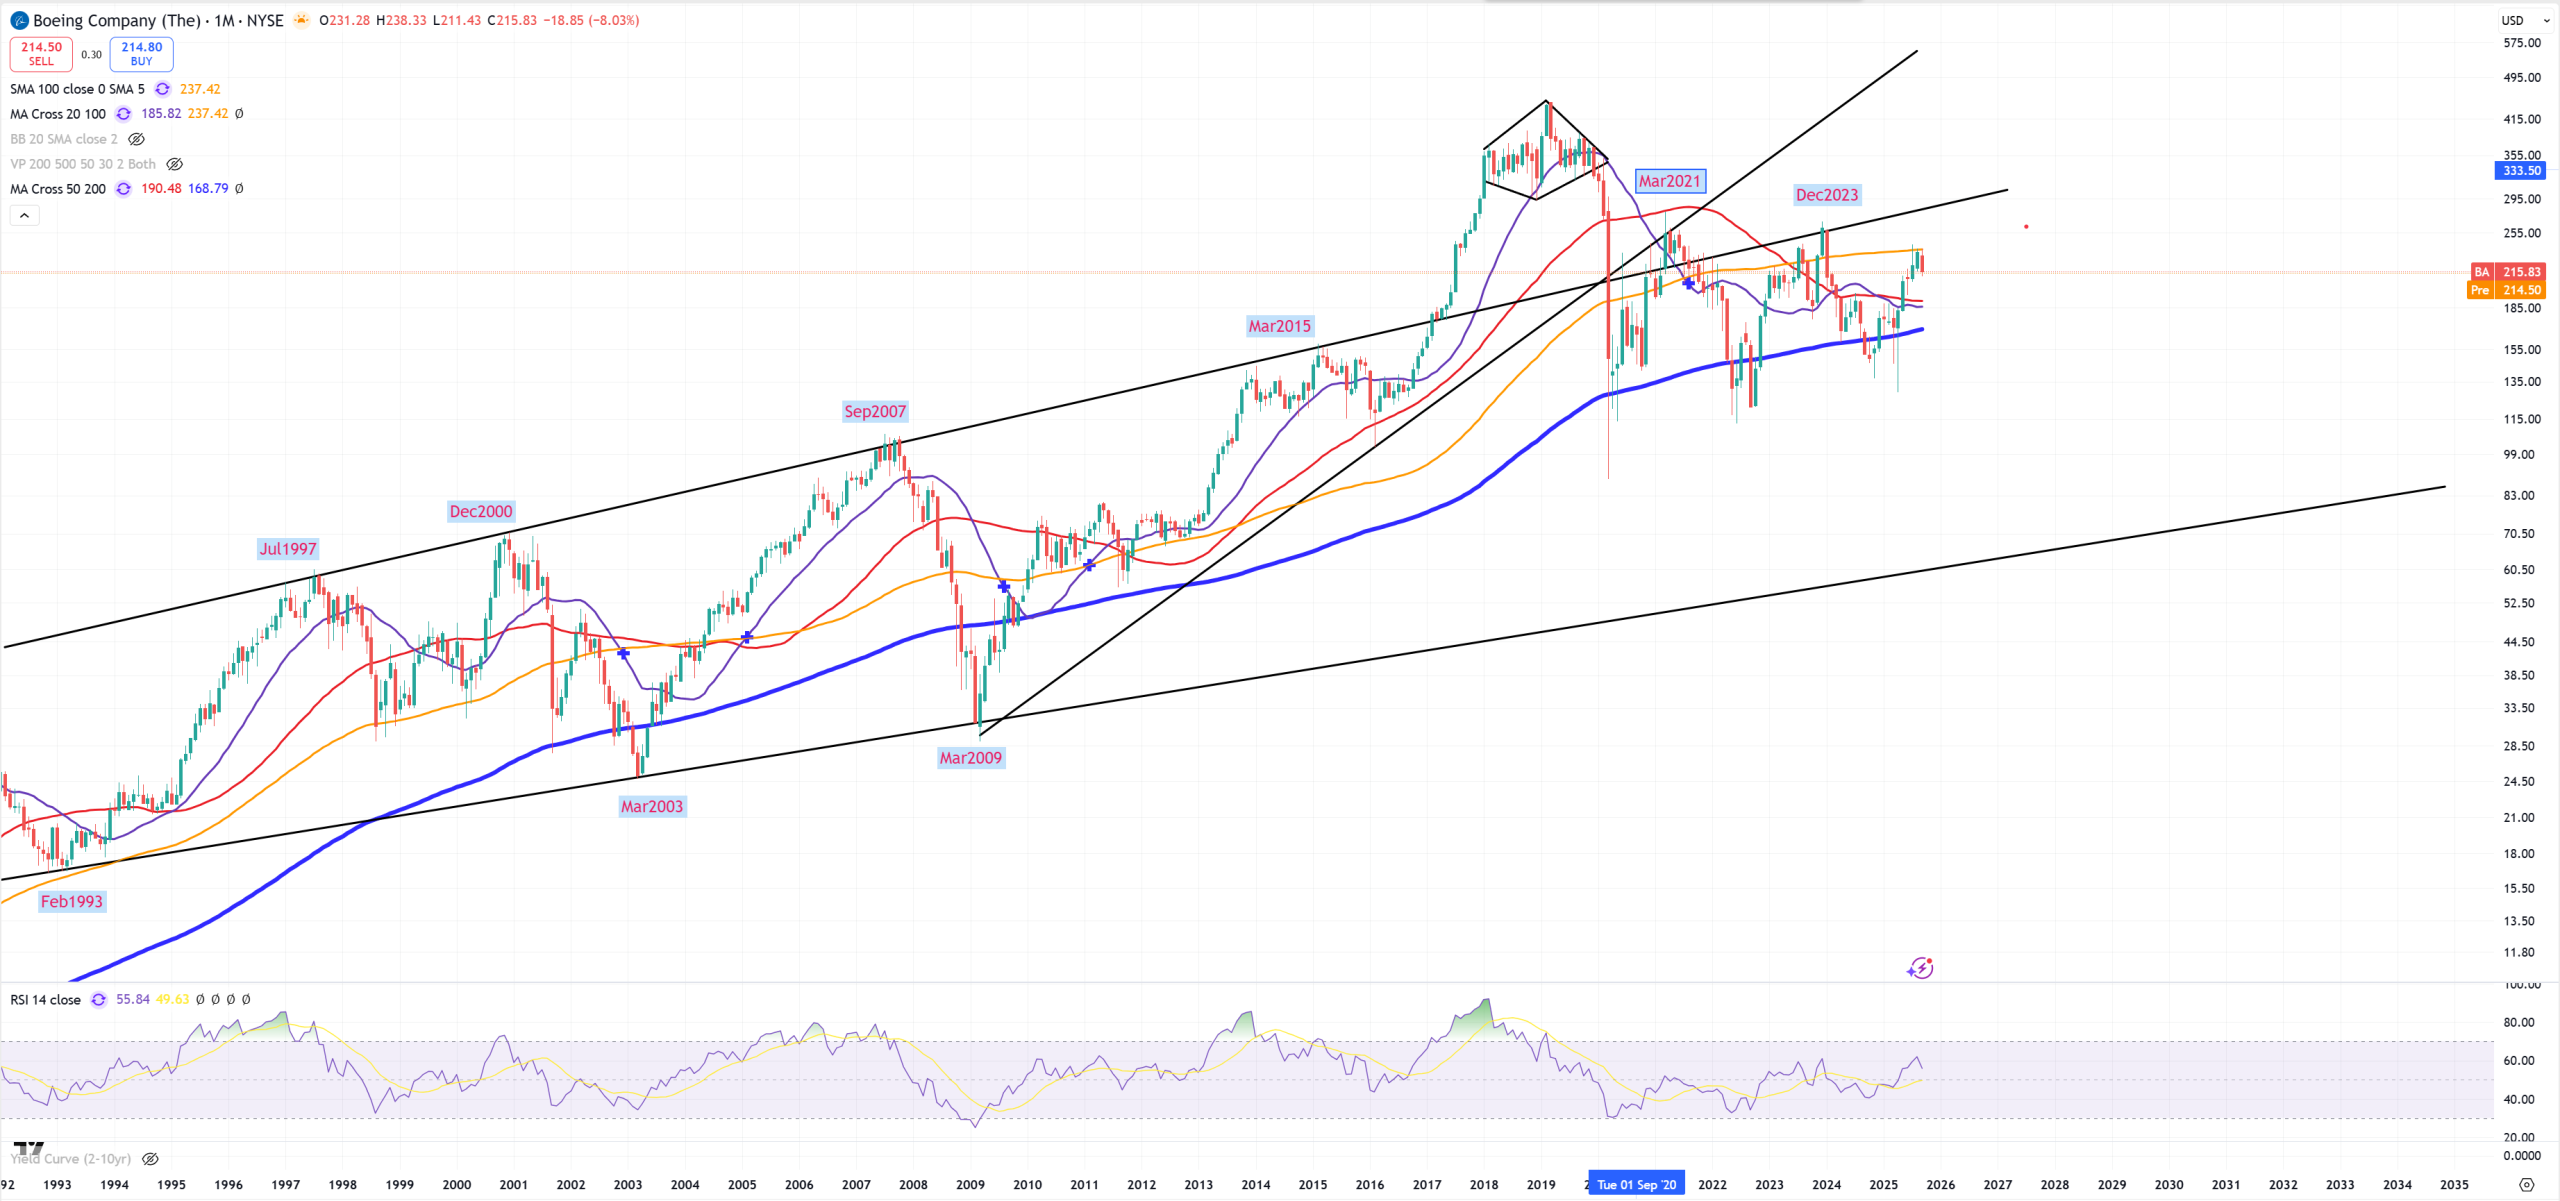
BA – I love Boeing chart because (M)MA200 break was so far always a confirmation of entering into a bear market of the whole economy. It was rescued 3 times so far from blue (M)MA200 : 2020, 2022, 2024/2025. Now (M)MA100 so testing natural bull-trap as yellow (M)MA100 is above red (M)MA50. Lower trend is still 60$. Also no 10Y/3M uninversion no drop.
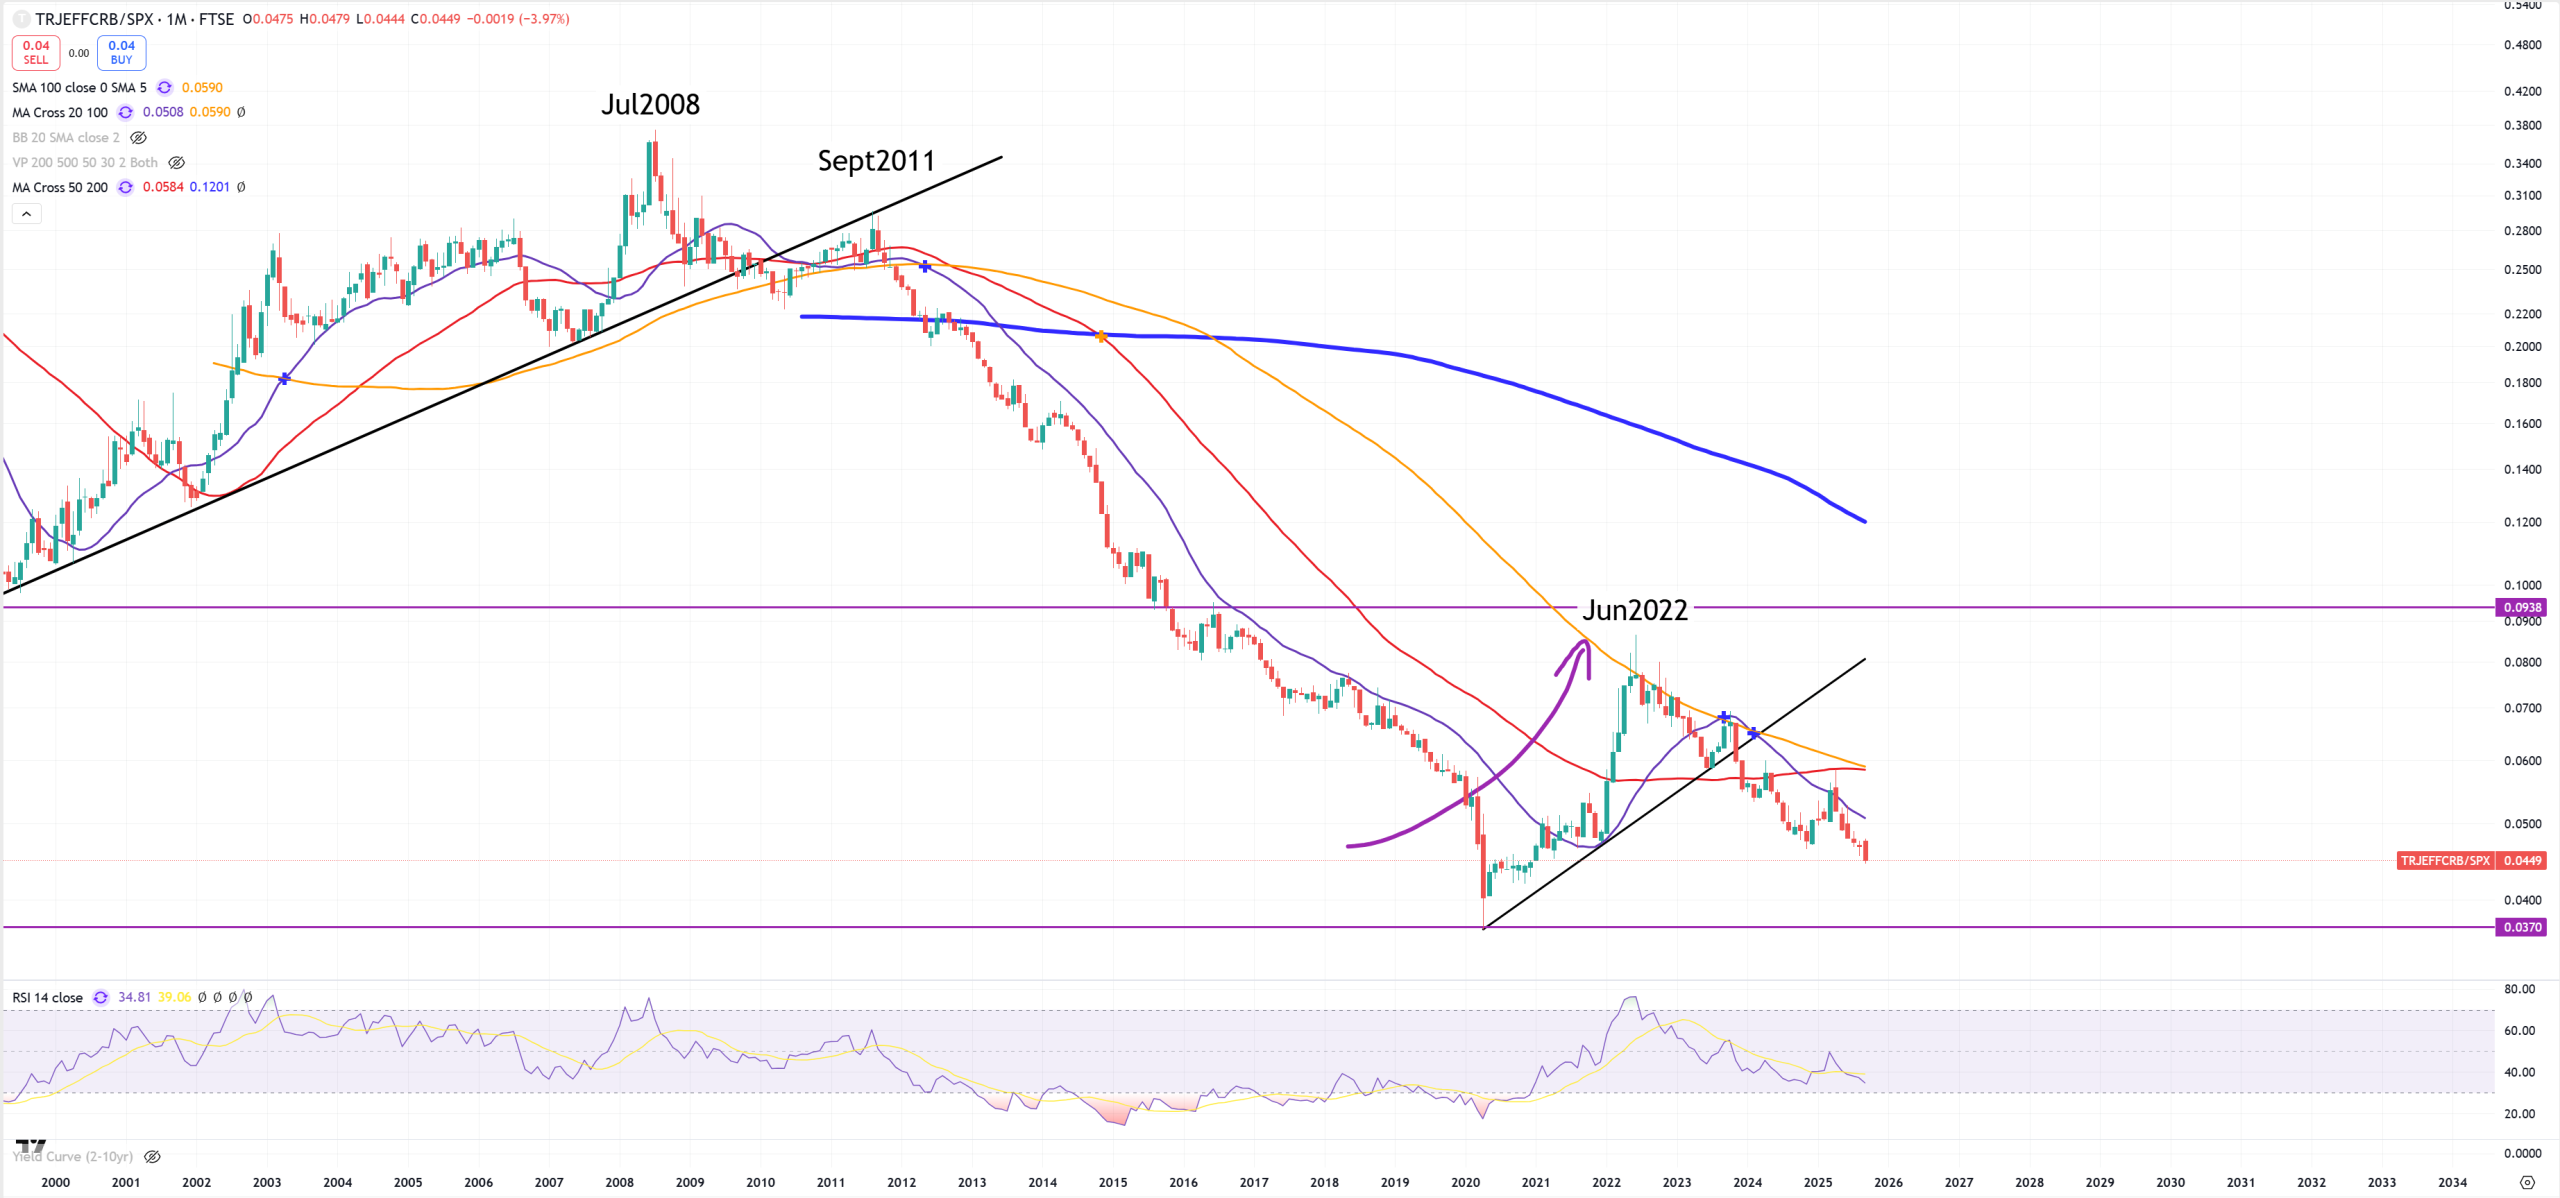
CRB/SPX – it tells us peak of inflation was around Jul2008 later bounce till September 2011 and downturn. Big inflationary spike from 2020 till Jun2022 and downturn, soon retest of 2020 lows.
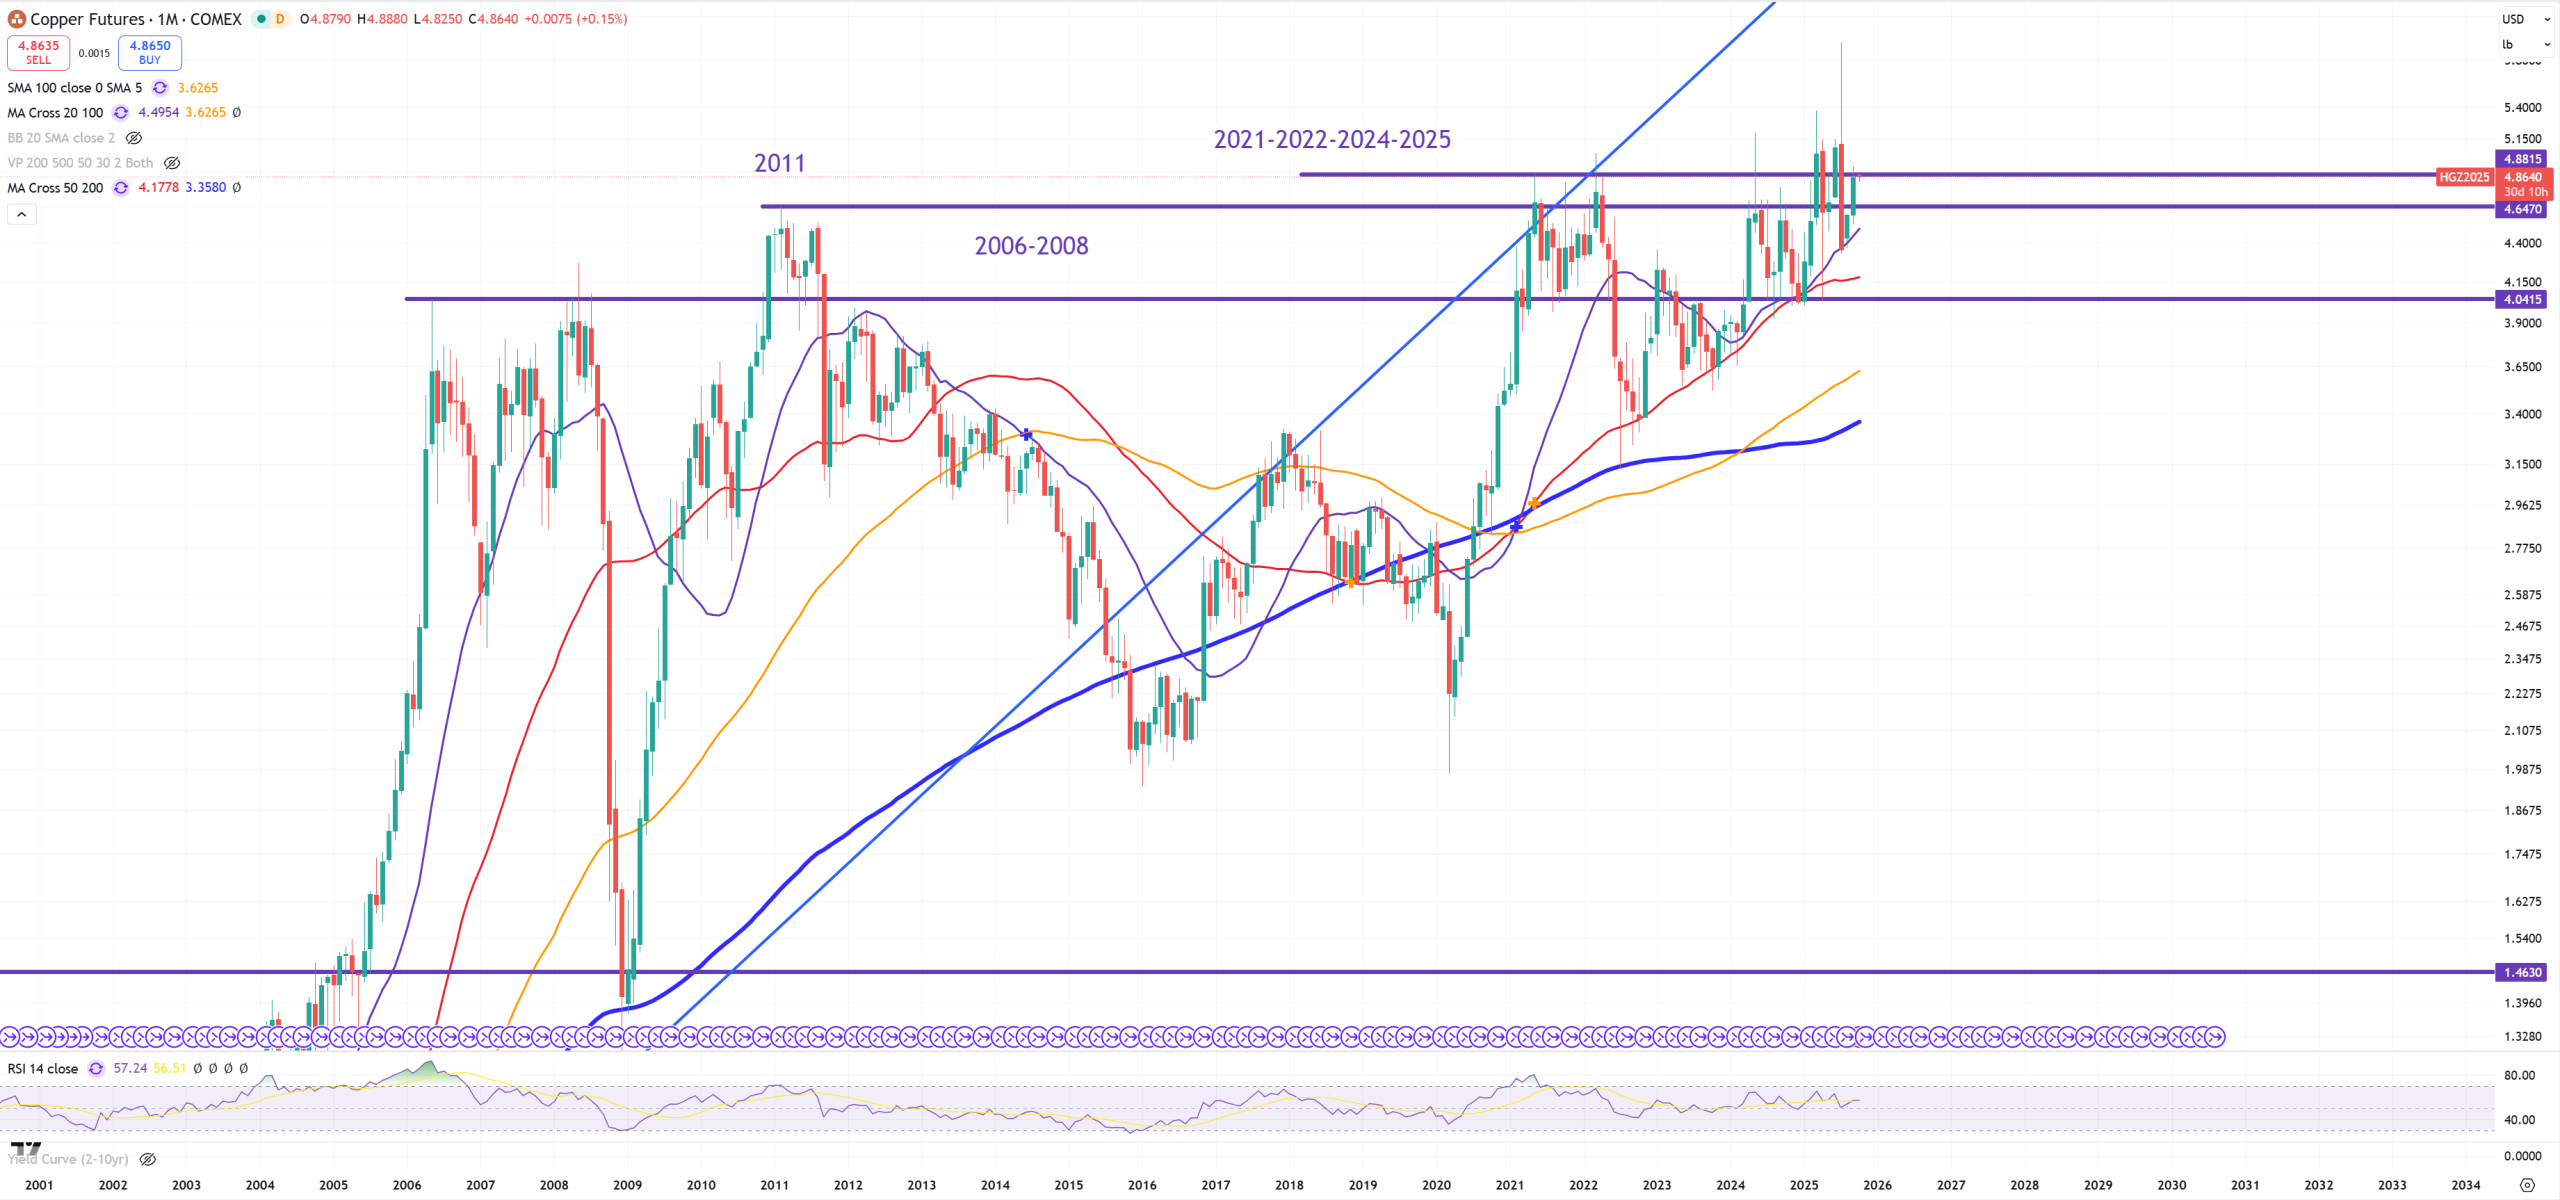
COPPER – key resistance
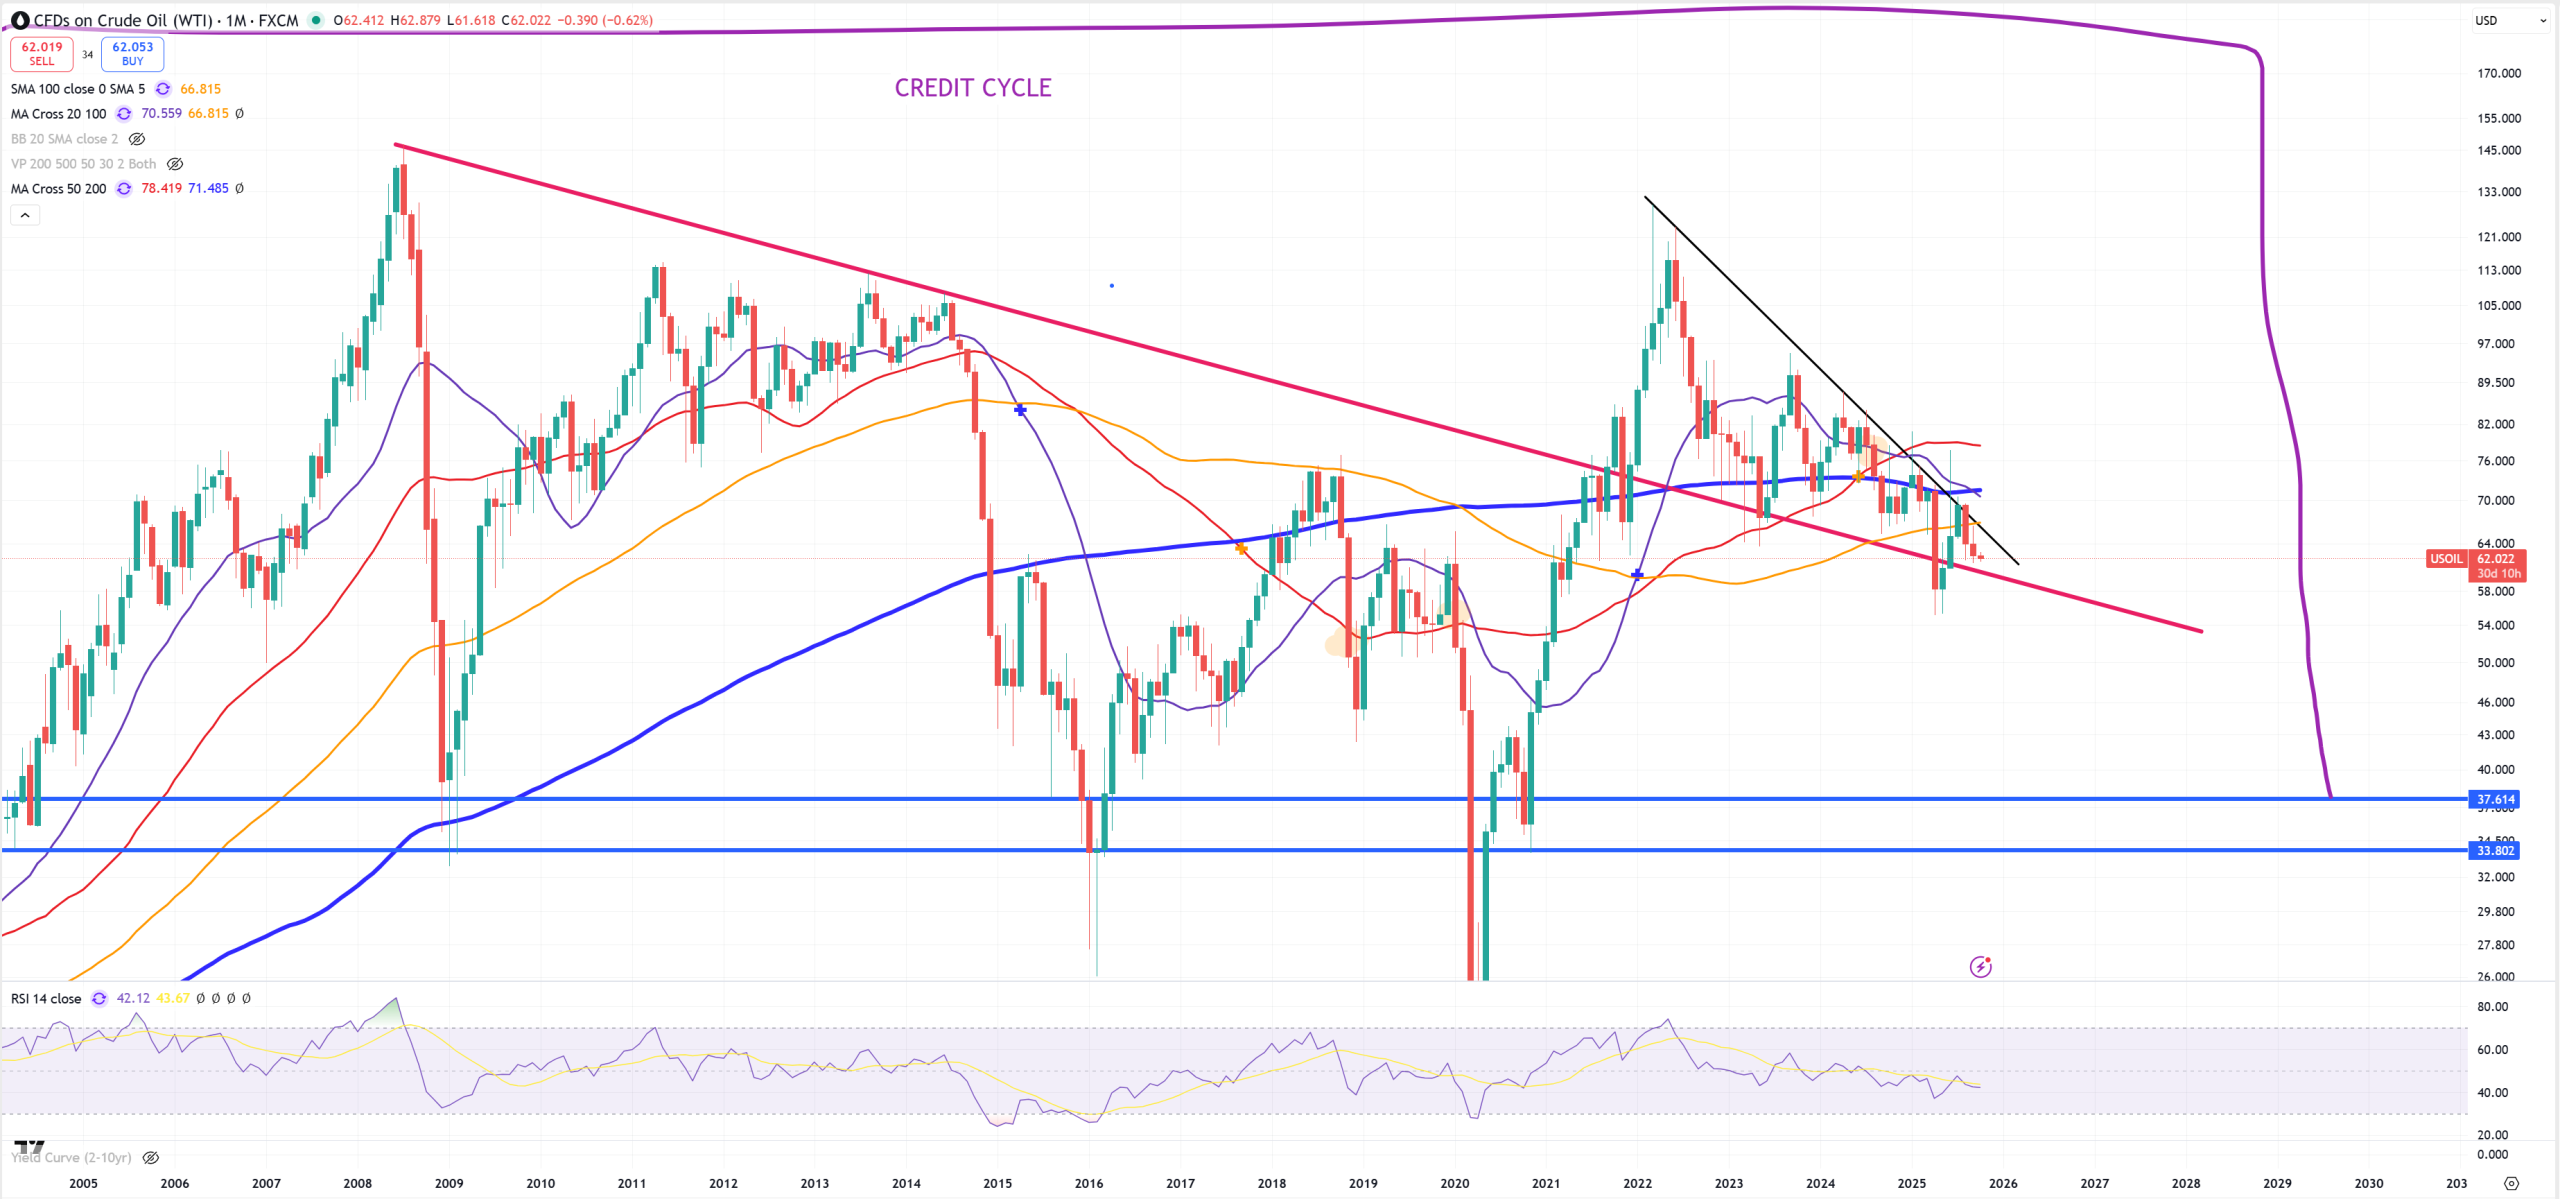
OIL – breaking RED trend line will make 30$ magnet, so far market avoided that.
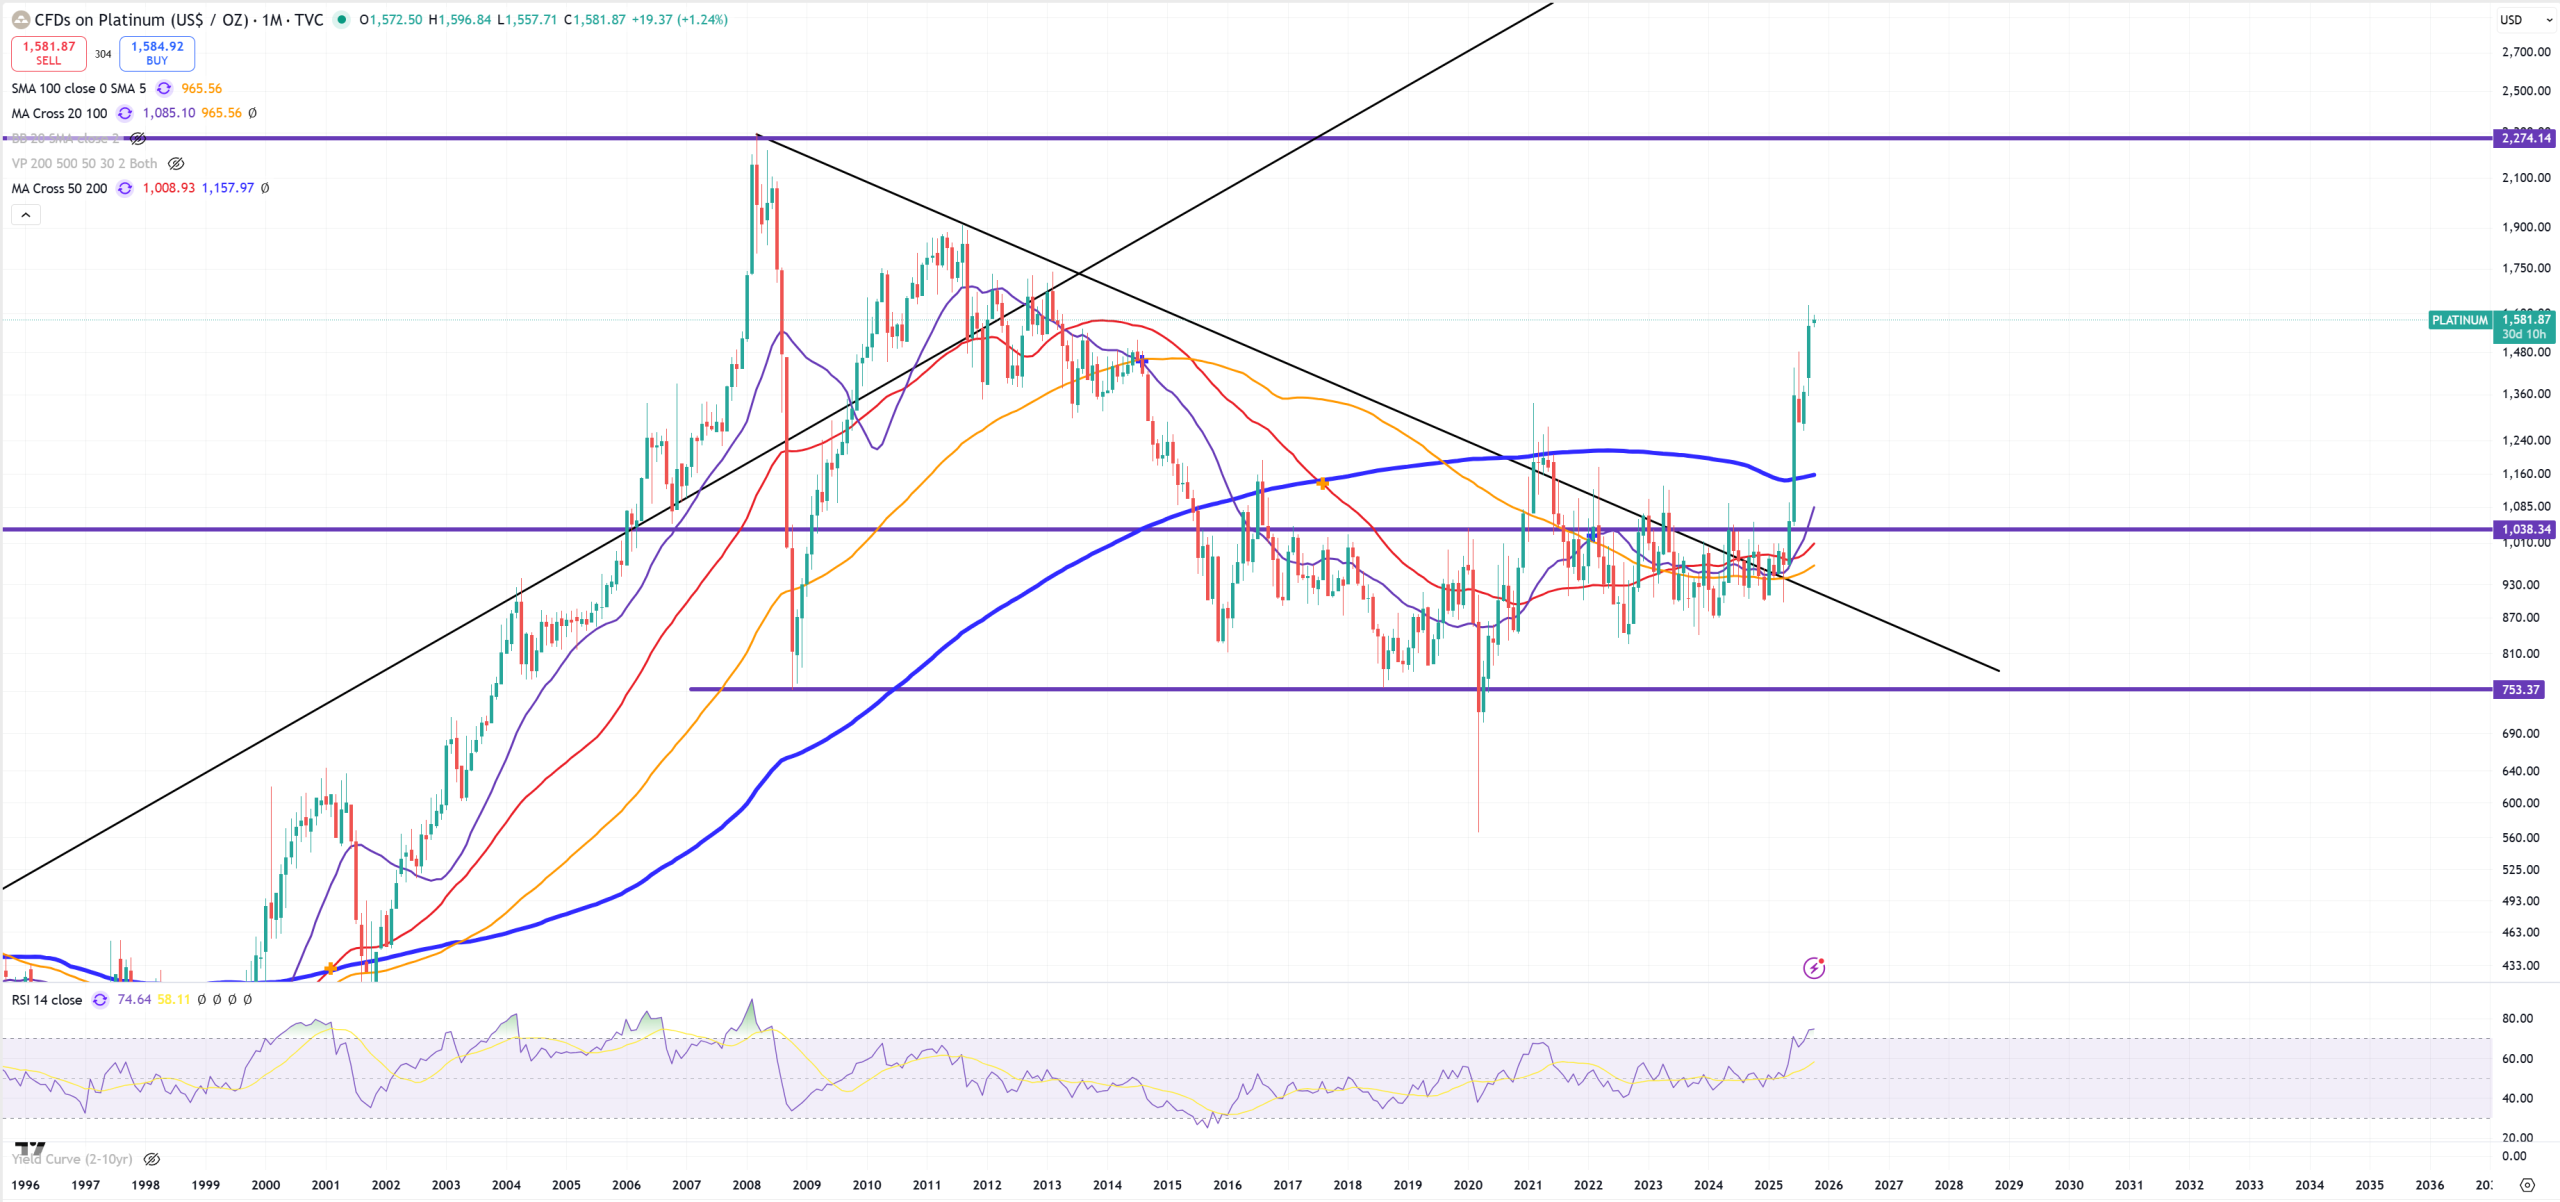
PLAT – Platinum
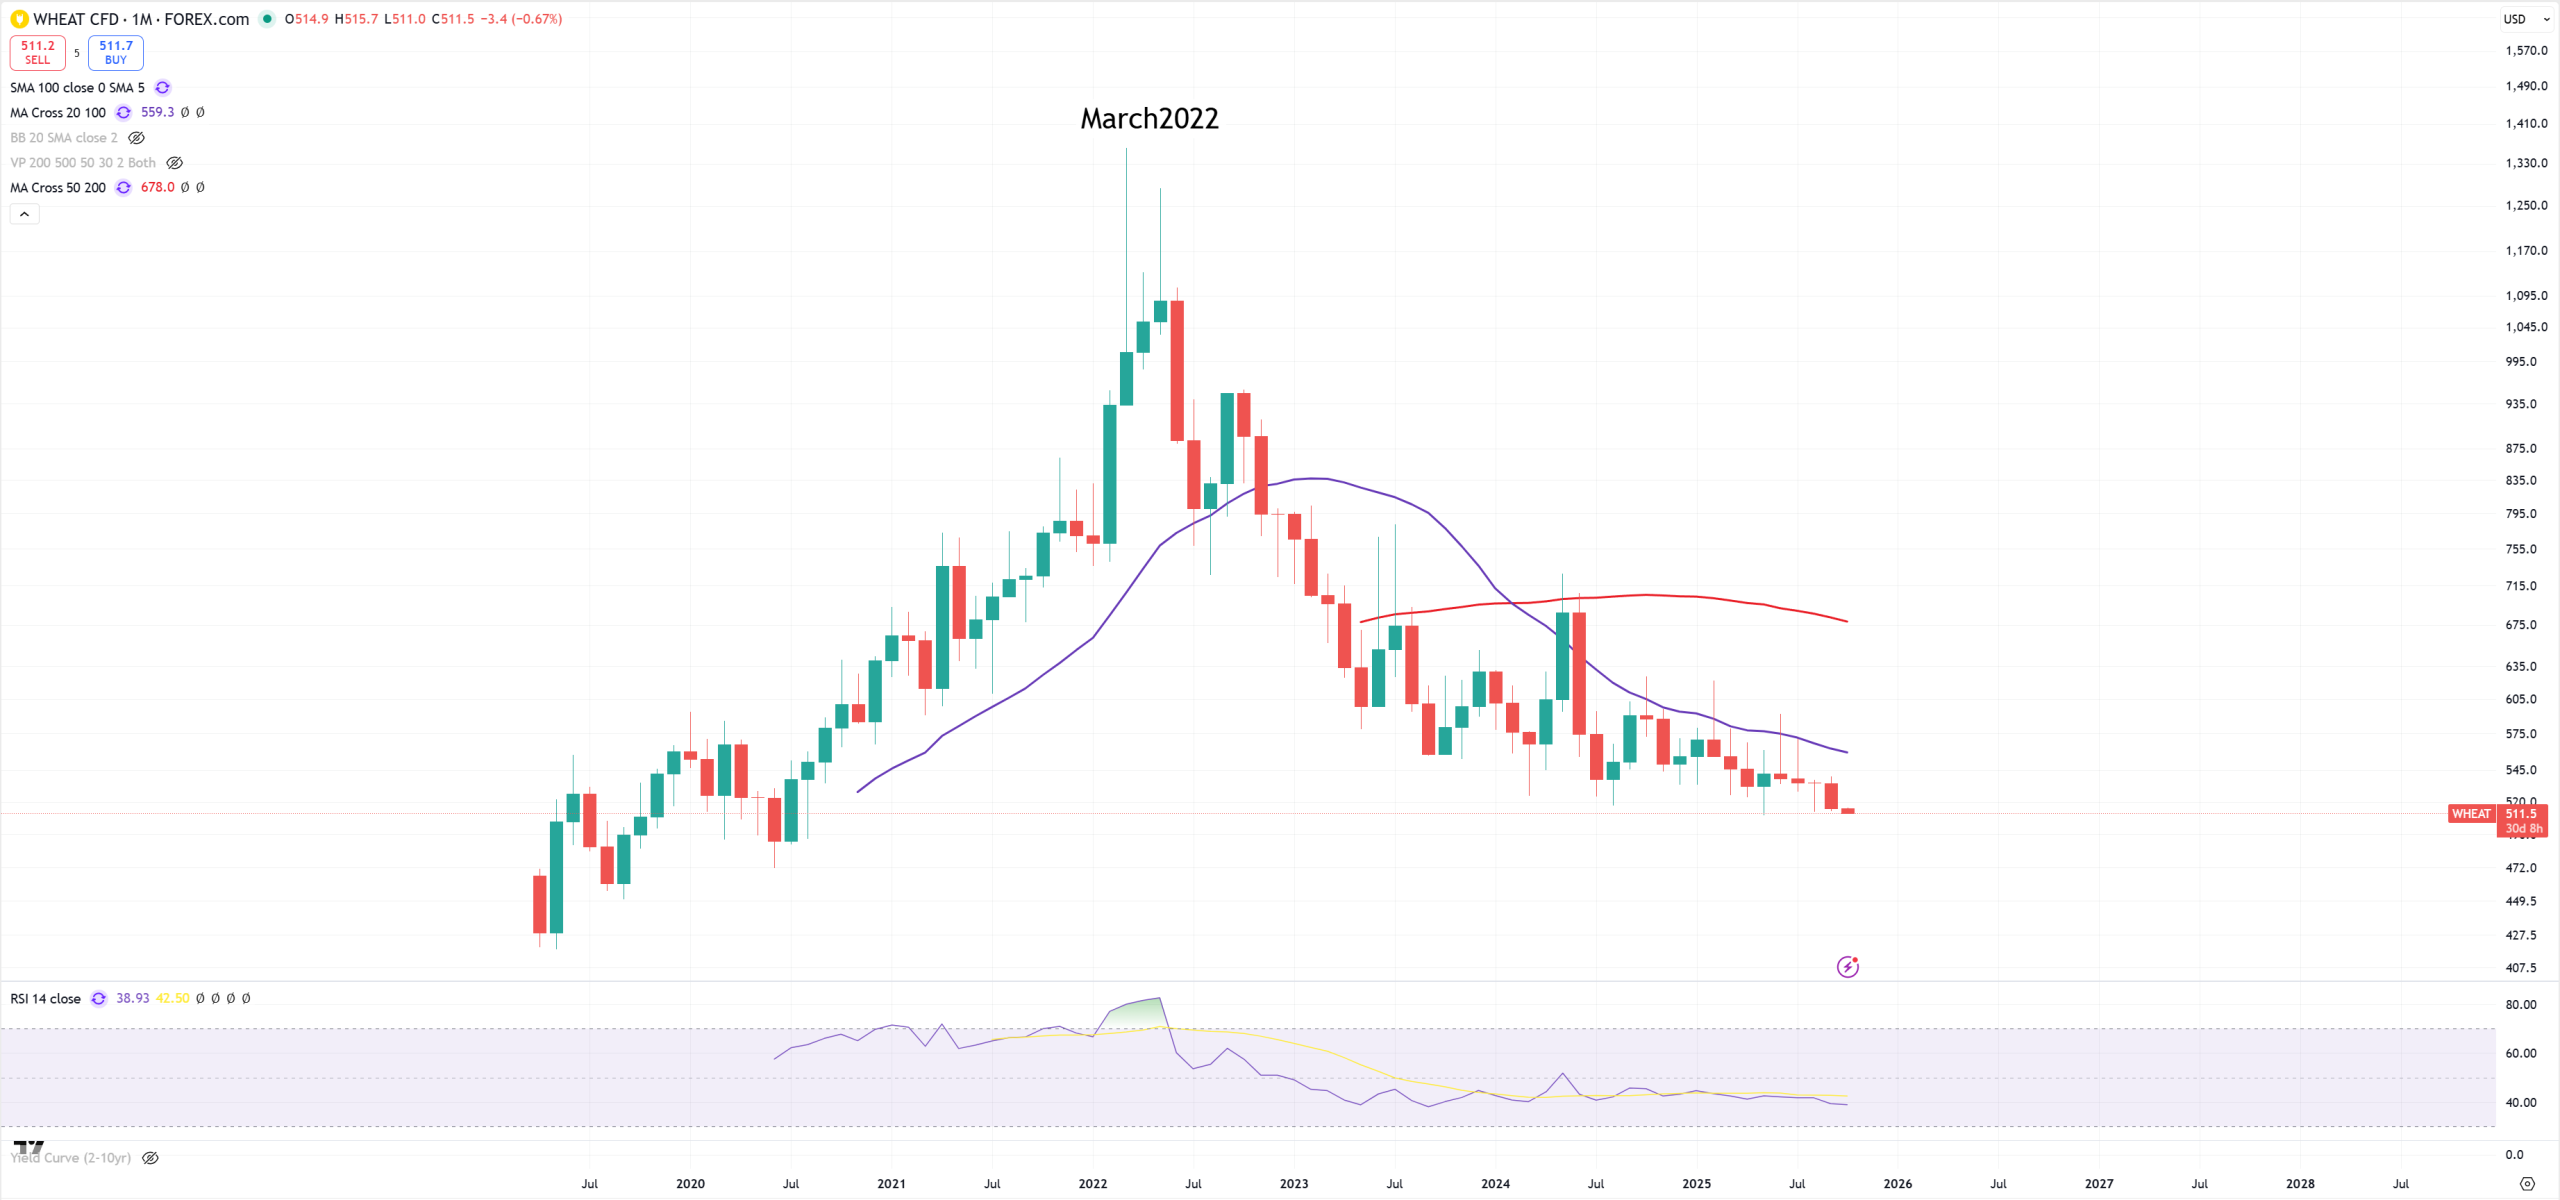
WHEAT – and peak in march 2022
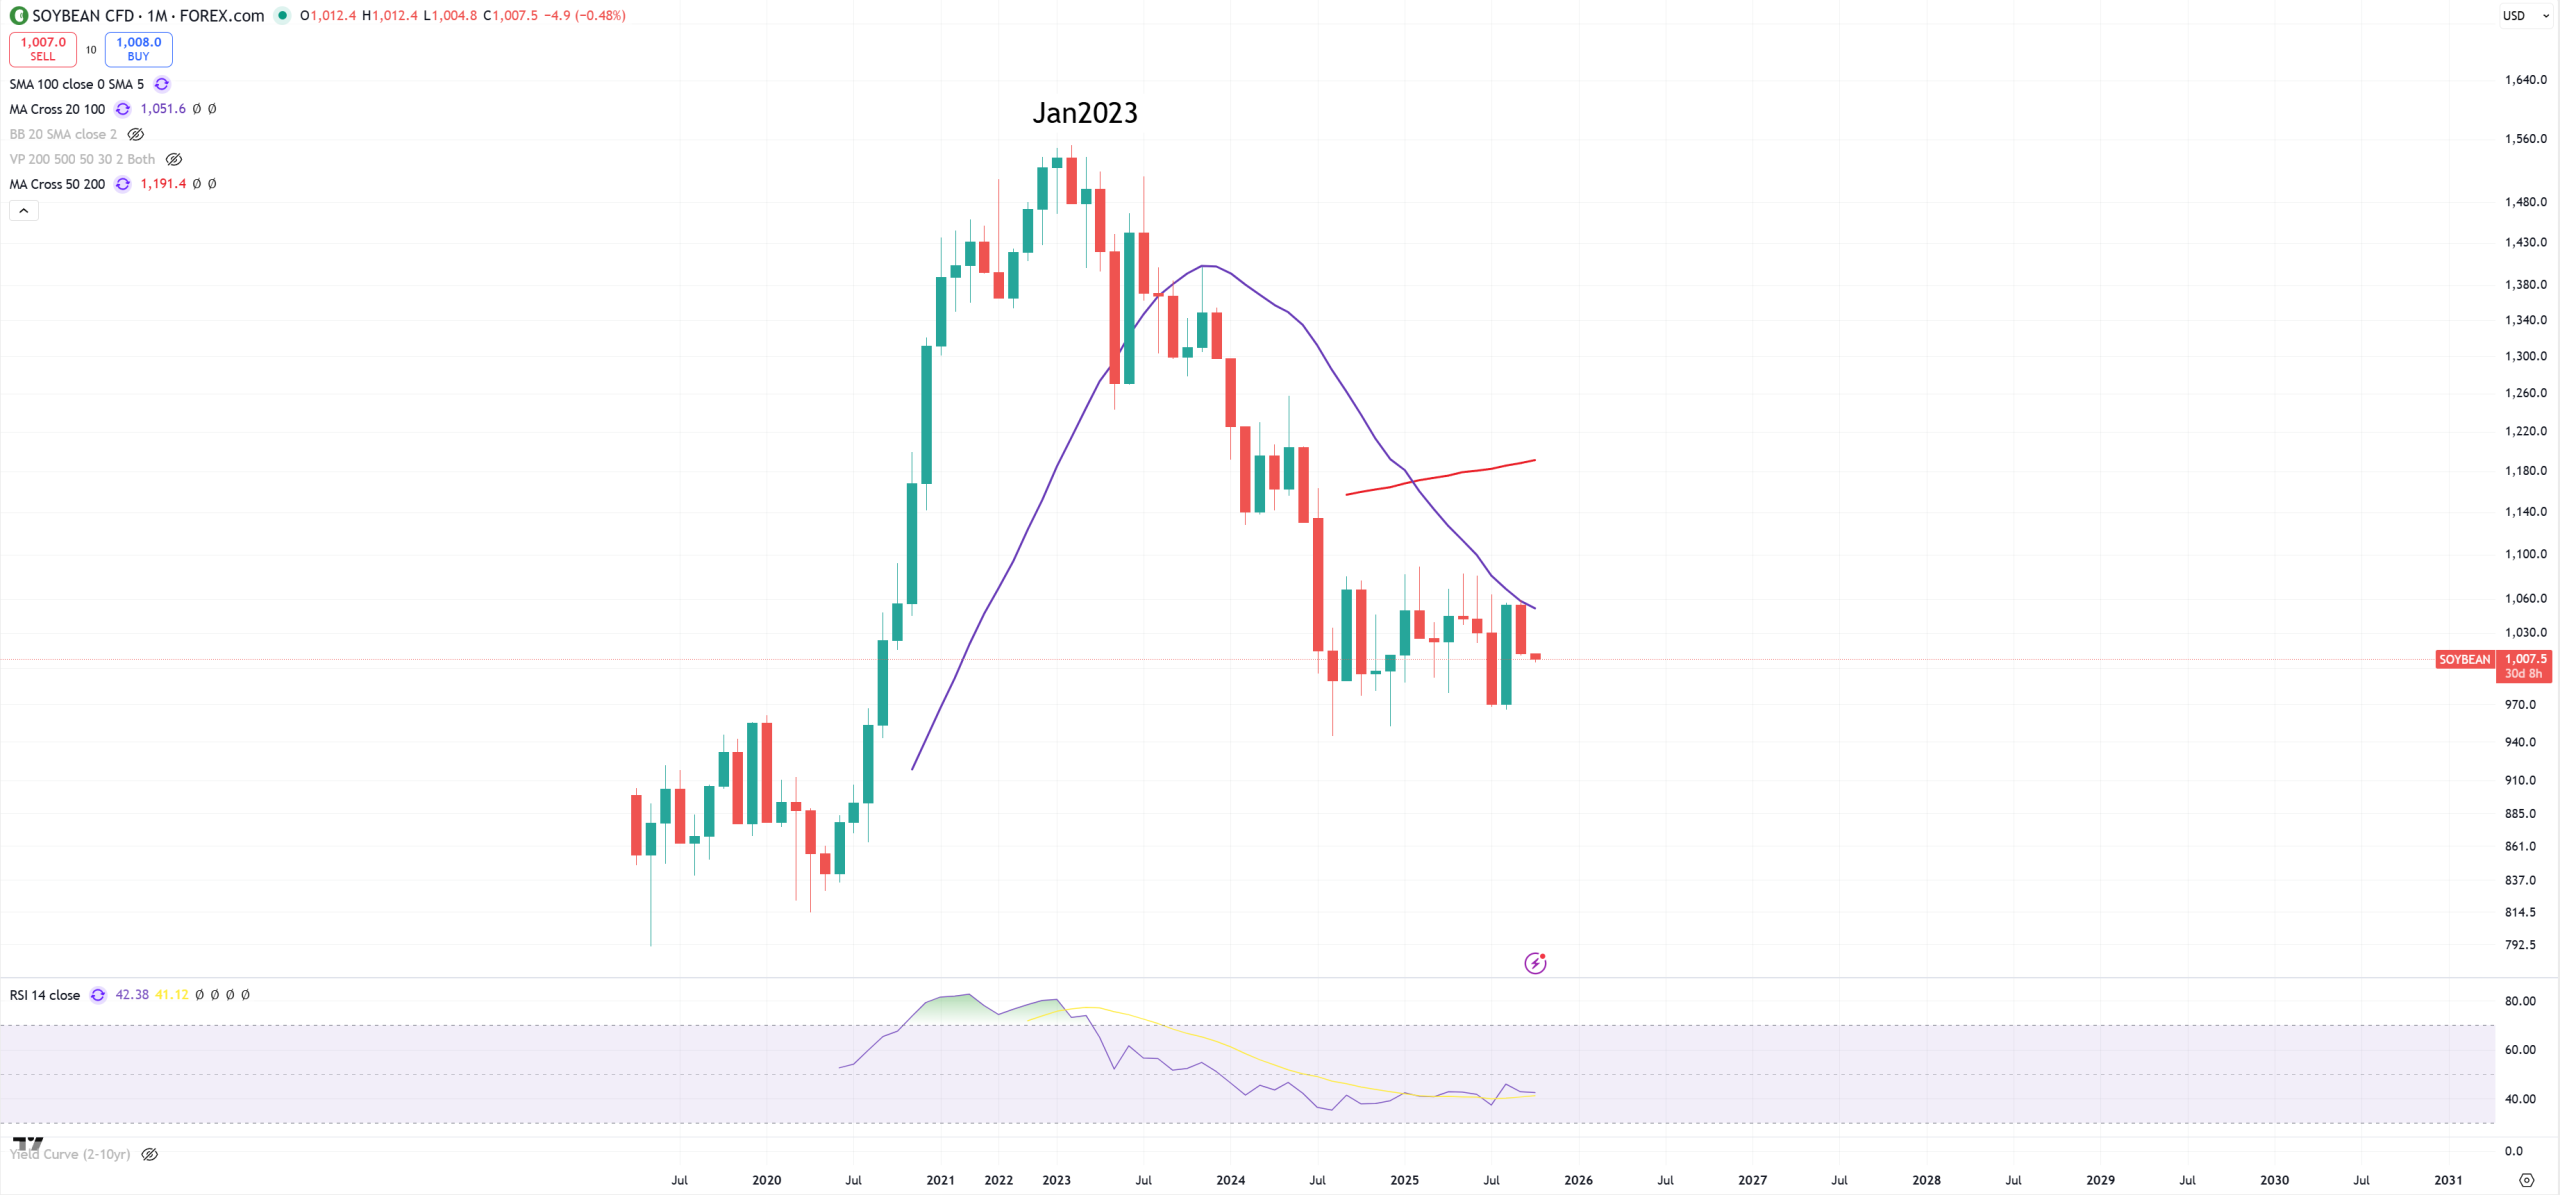
SOYBEAN – peak in Jan 2023 – in general farmers are in troubles.
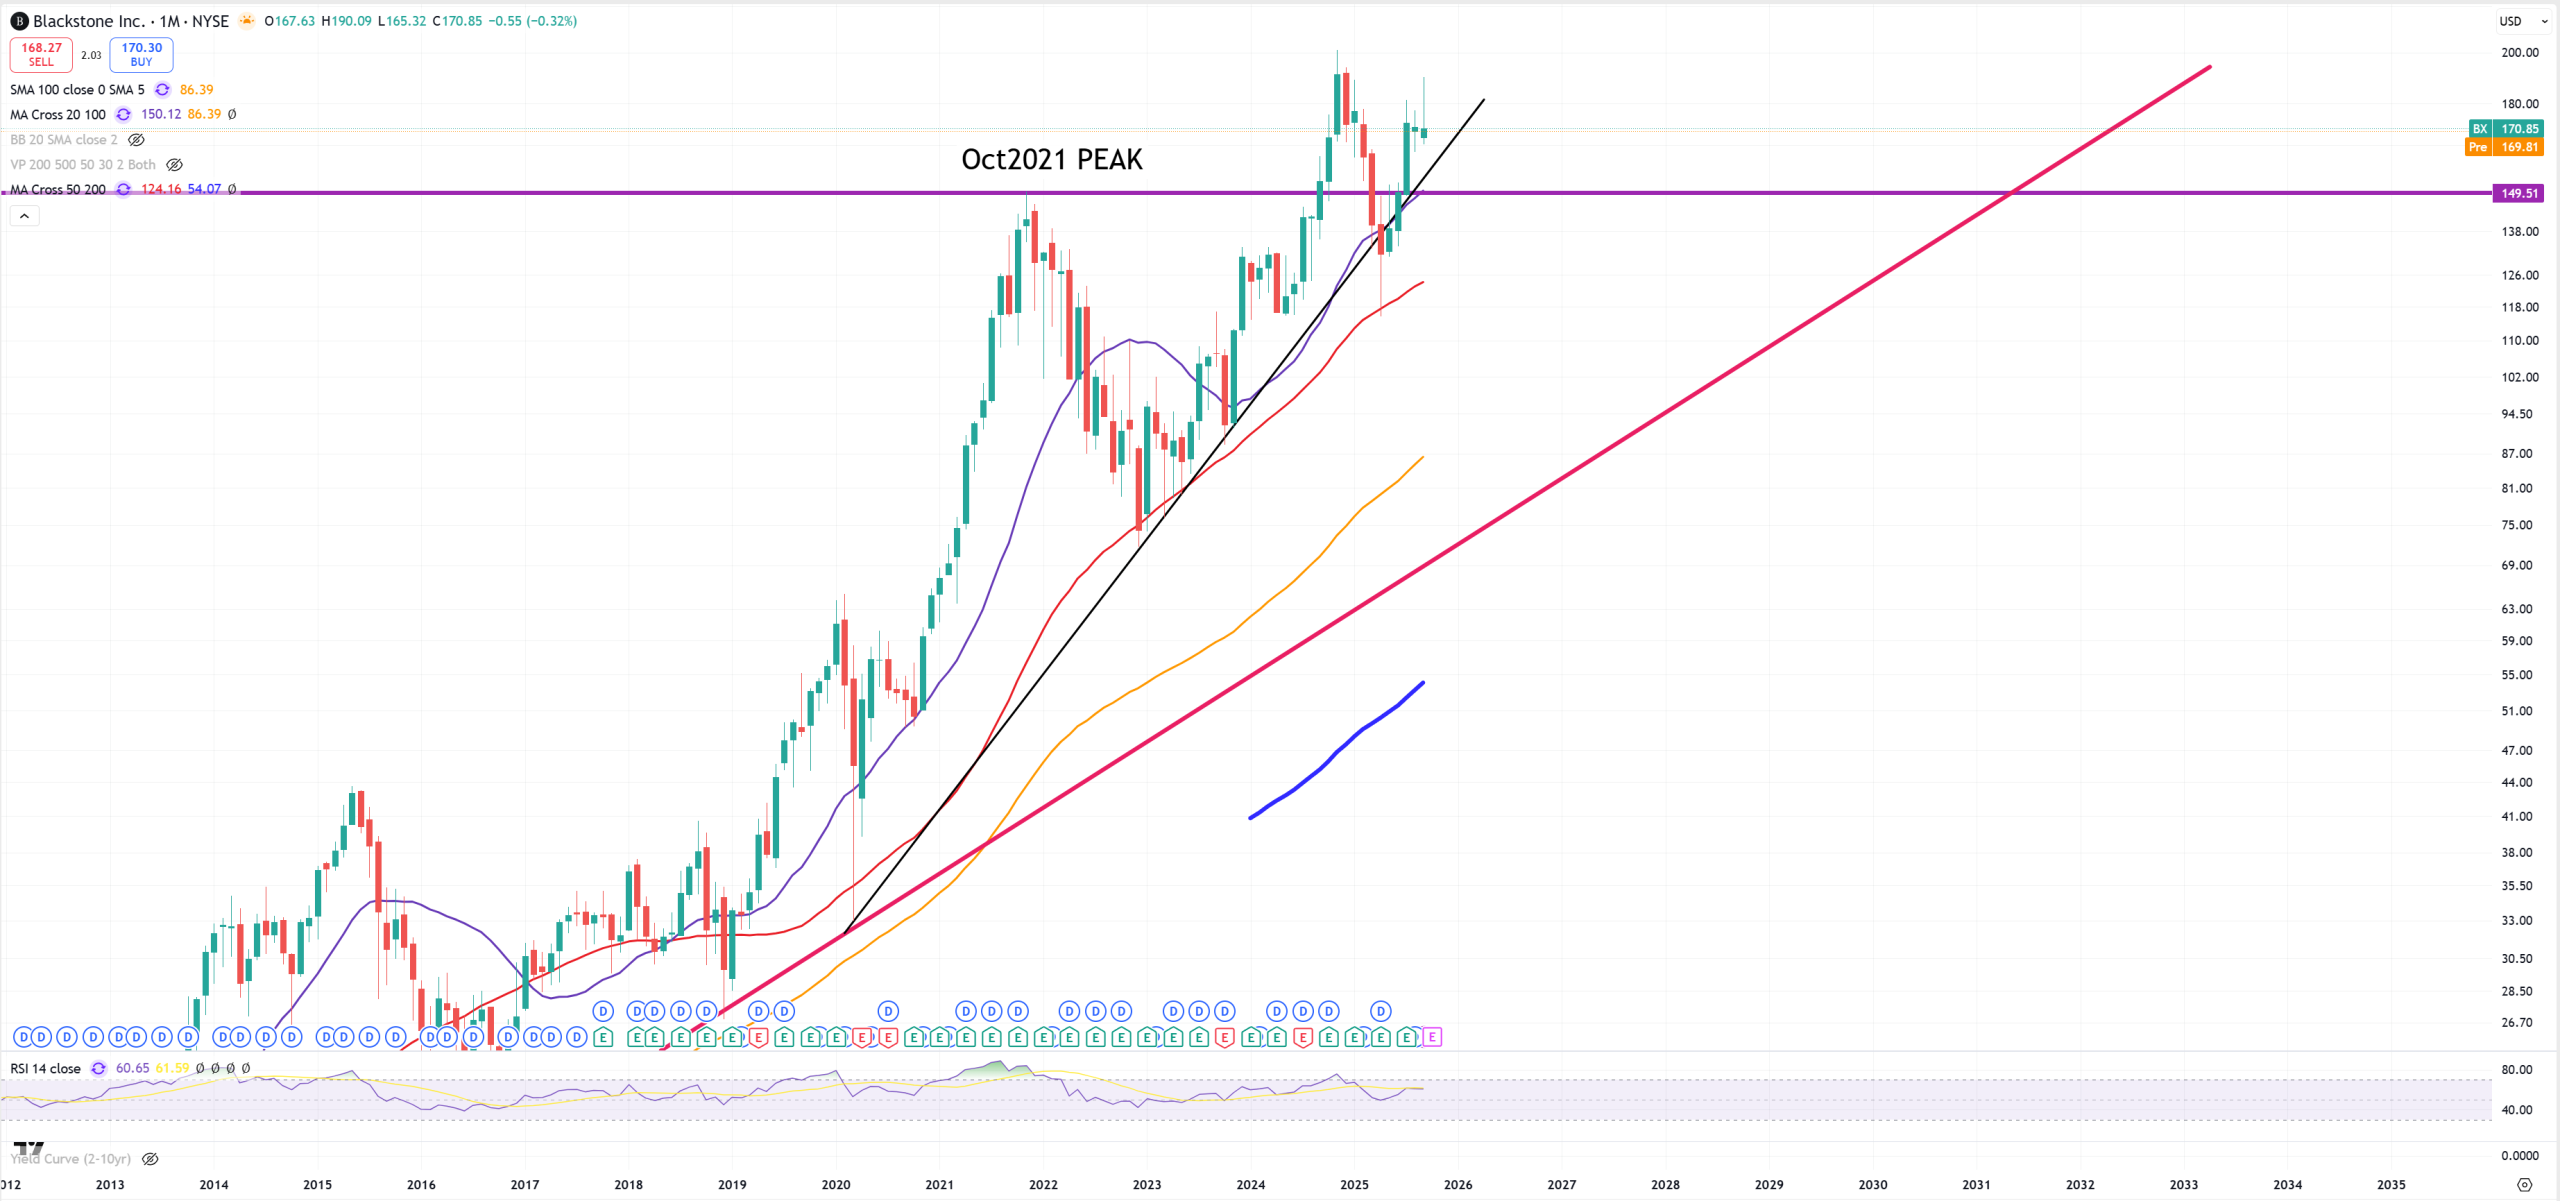
BX – BlackStone – so private credit
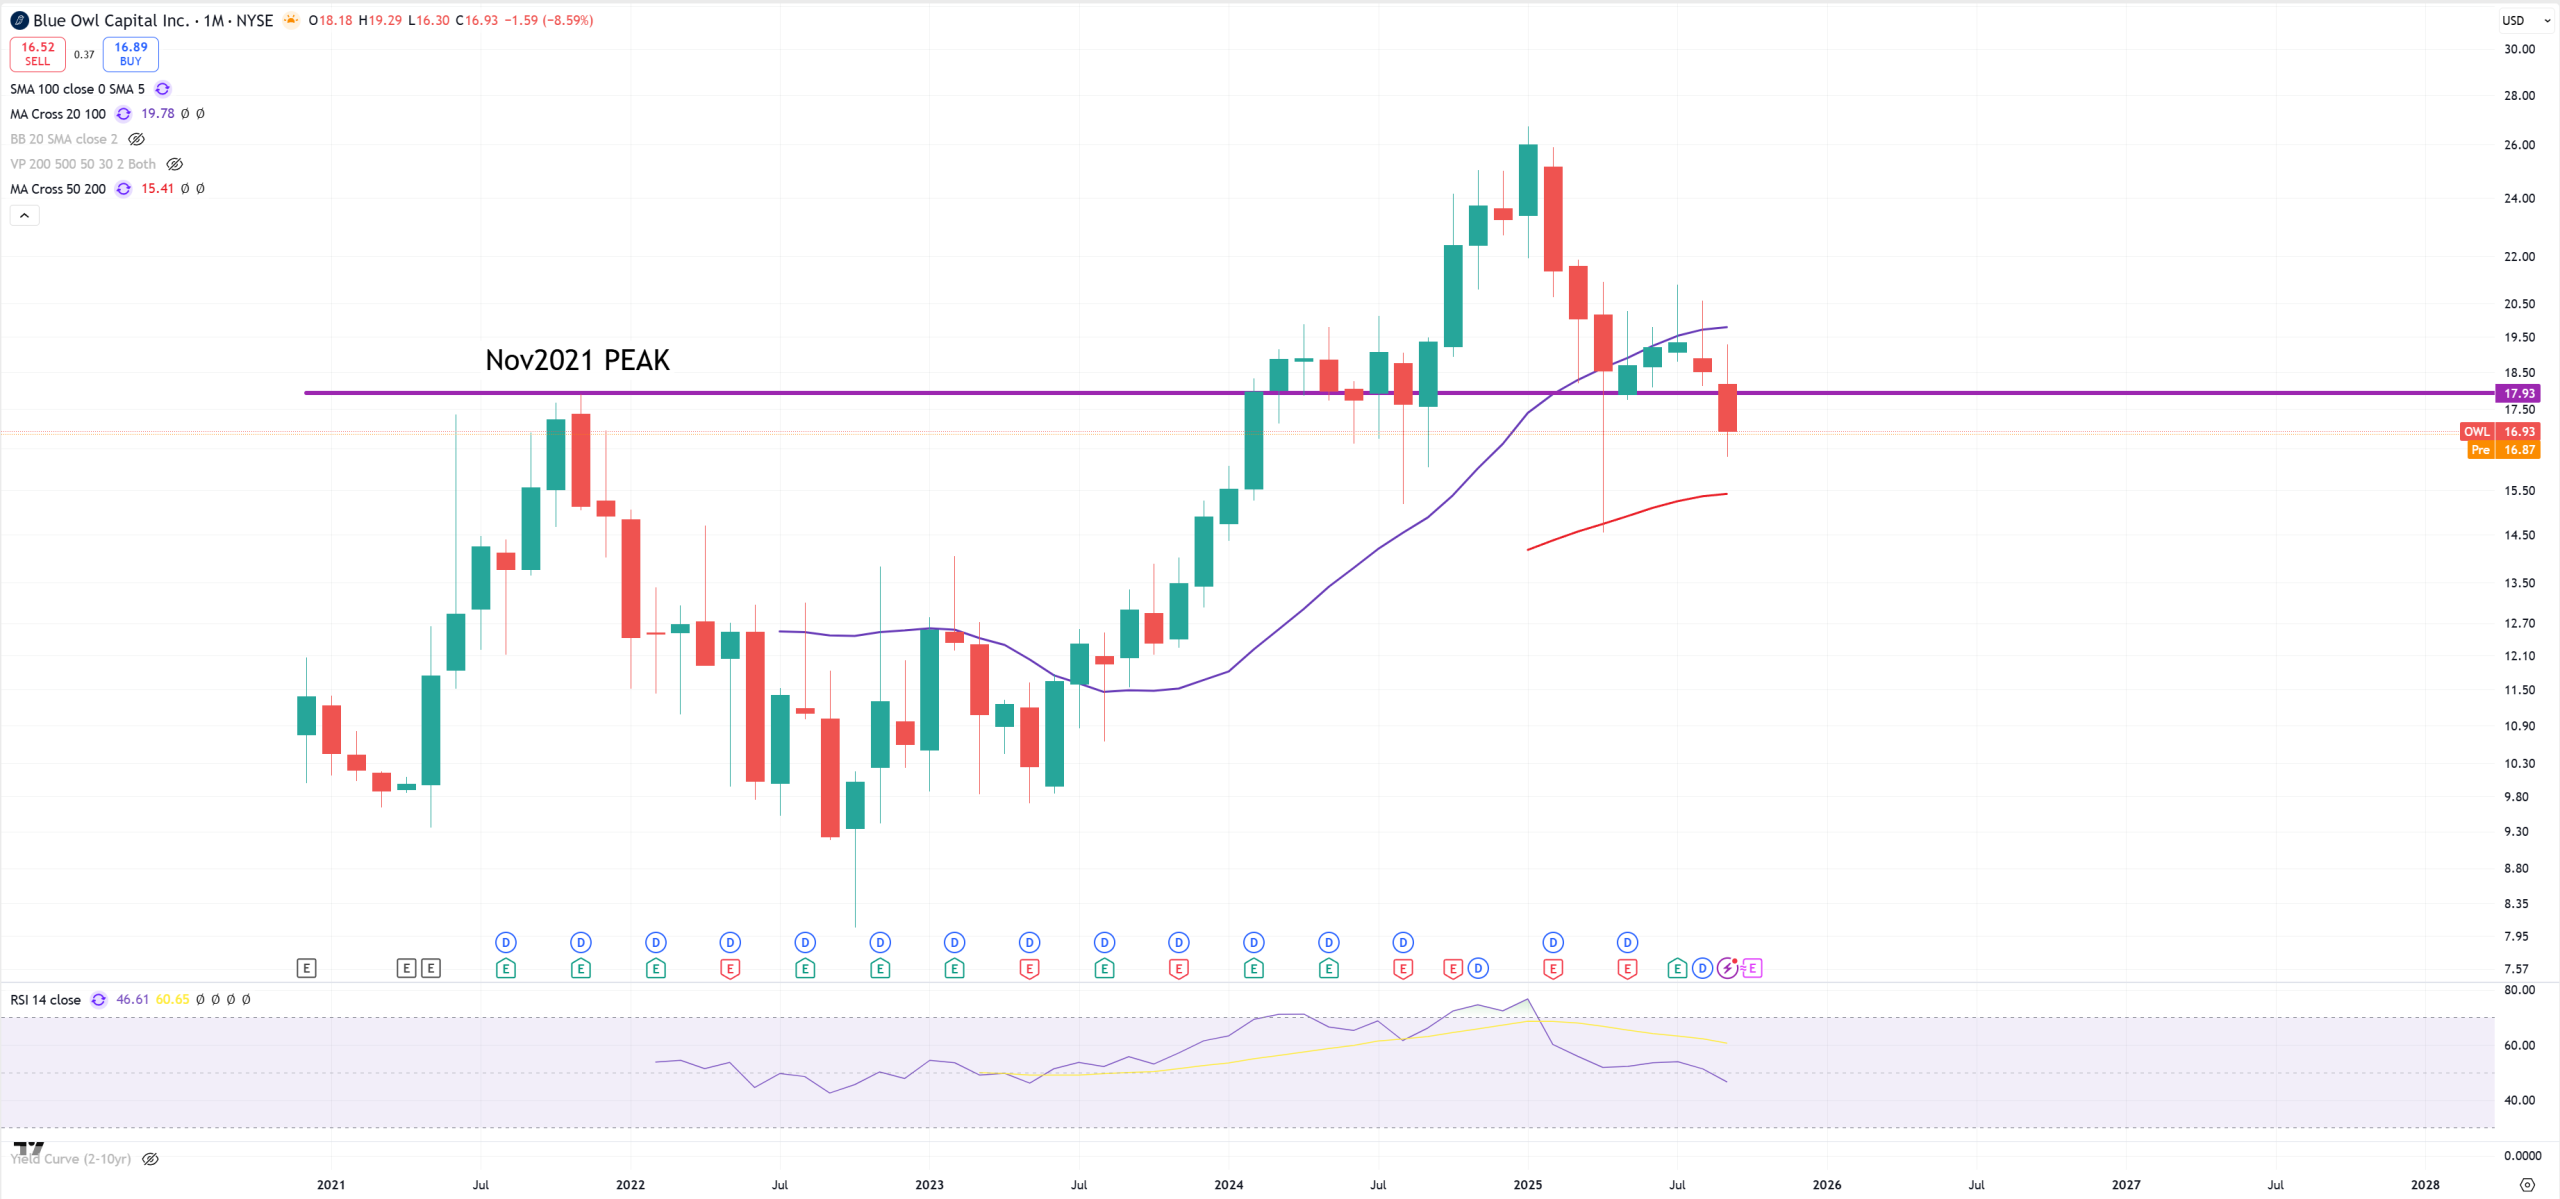
OWL – Blue Owl – so another private credit
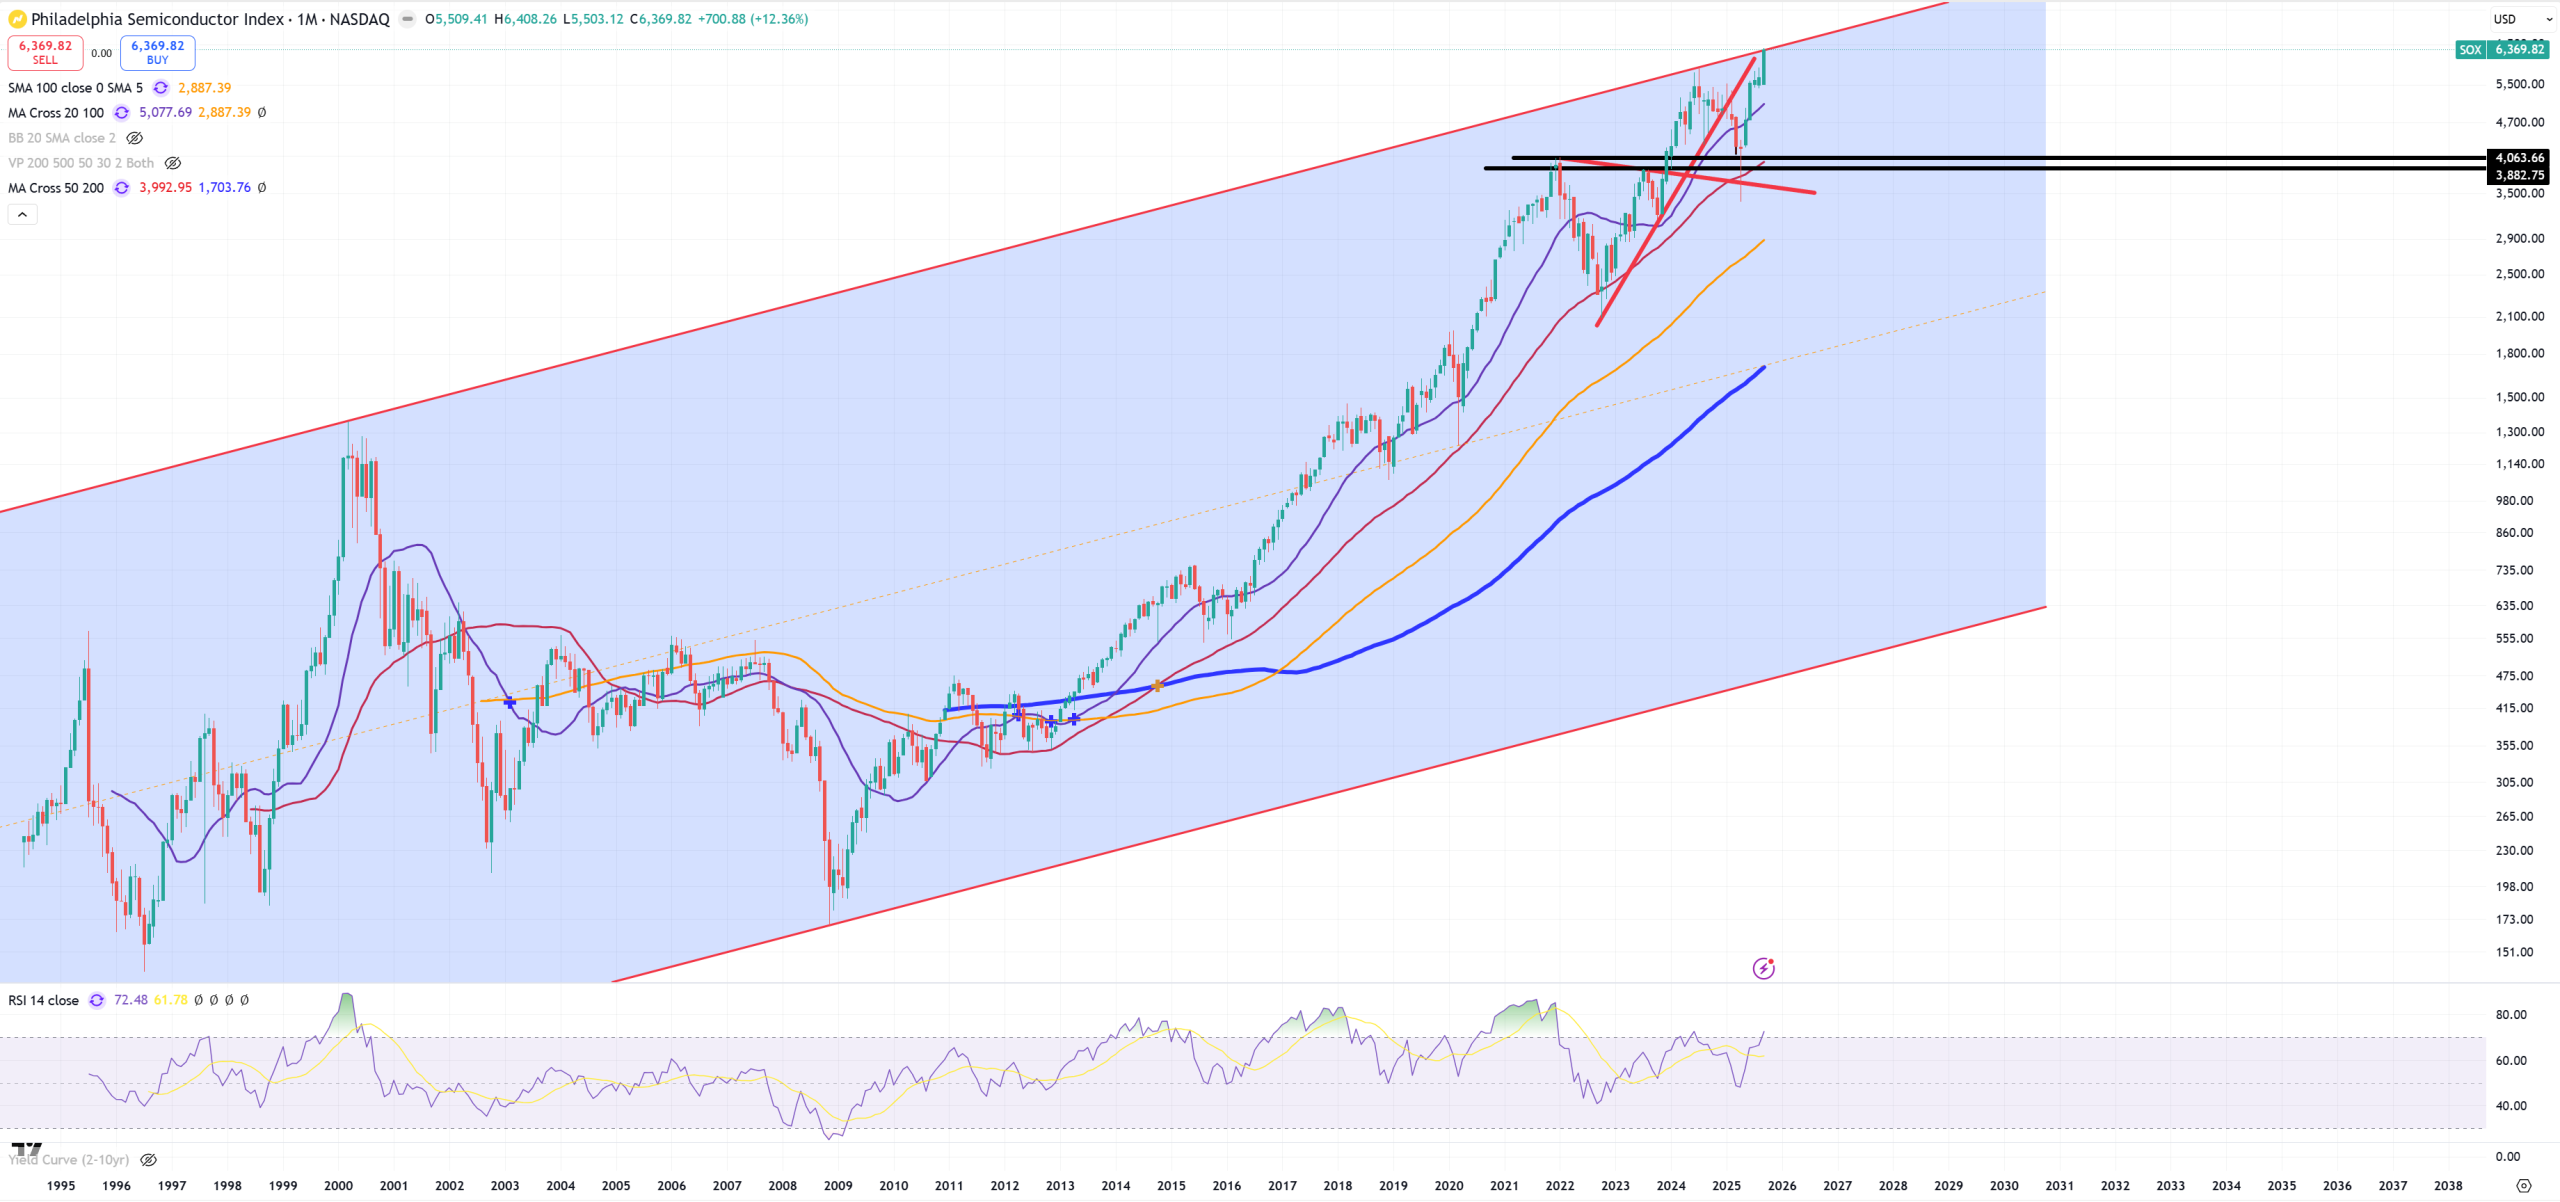
SOX – SOX in general is now a mix of super bullish stocks and bearish stocks.
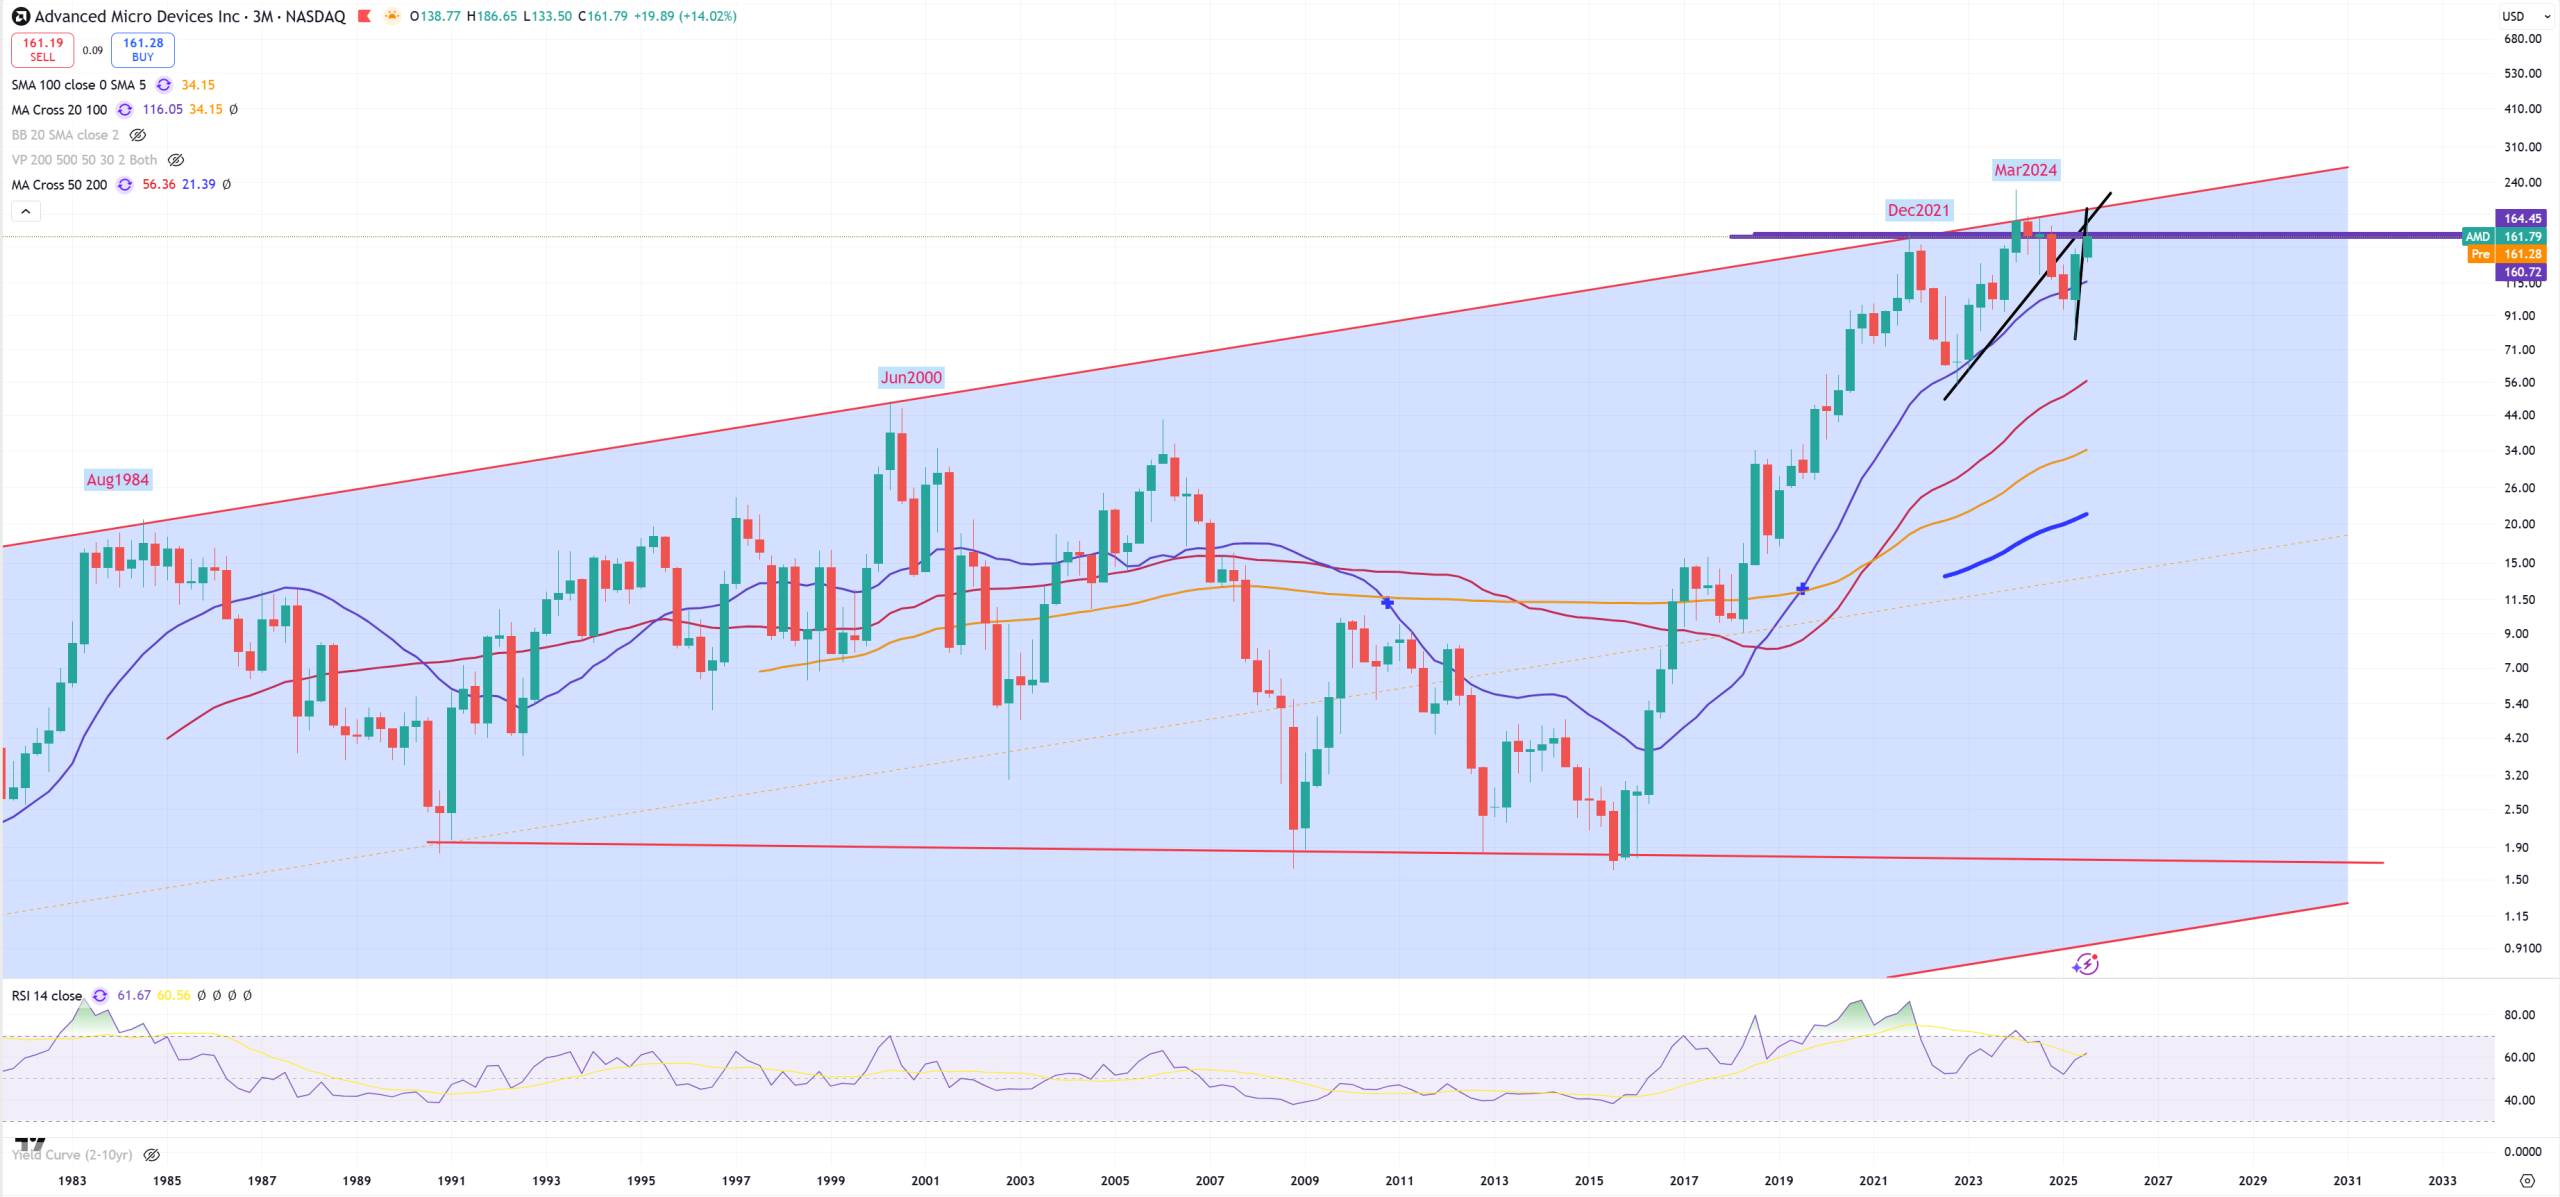
AMD – (3M) view and key trend 1984-2000-2021 and now December 2021 resistance so far holds – without a break this view is bearish
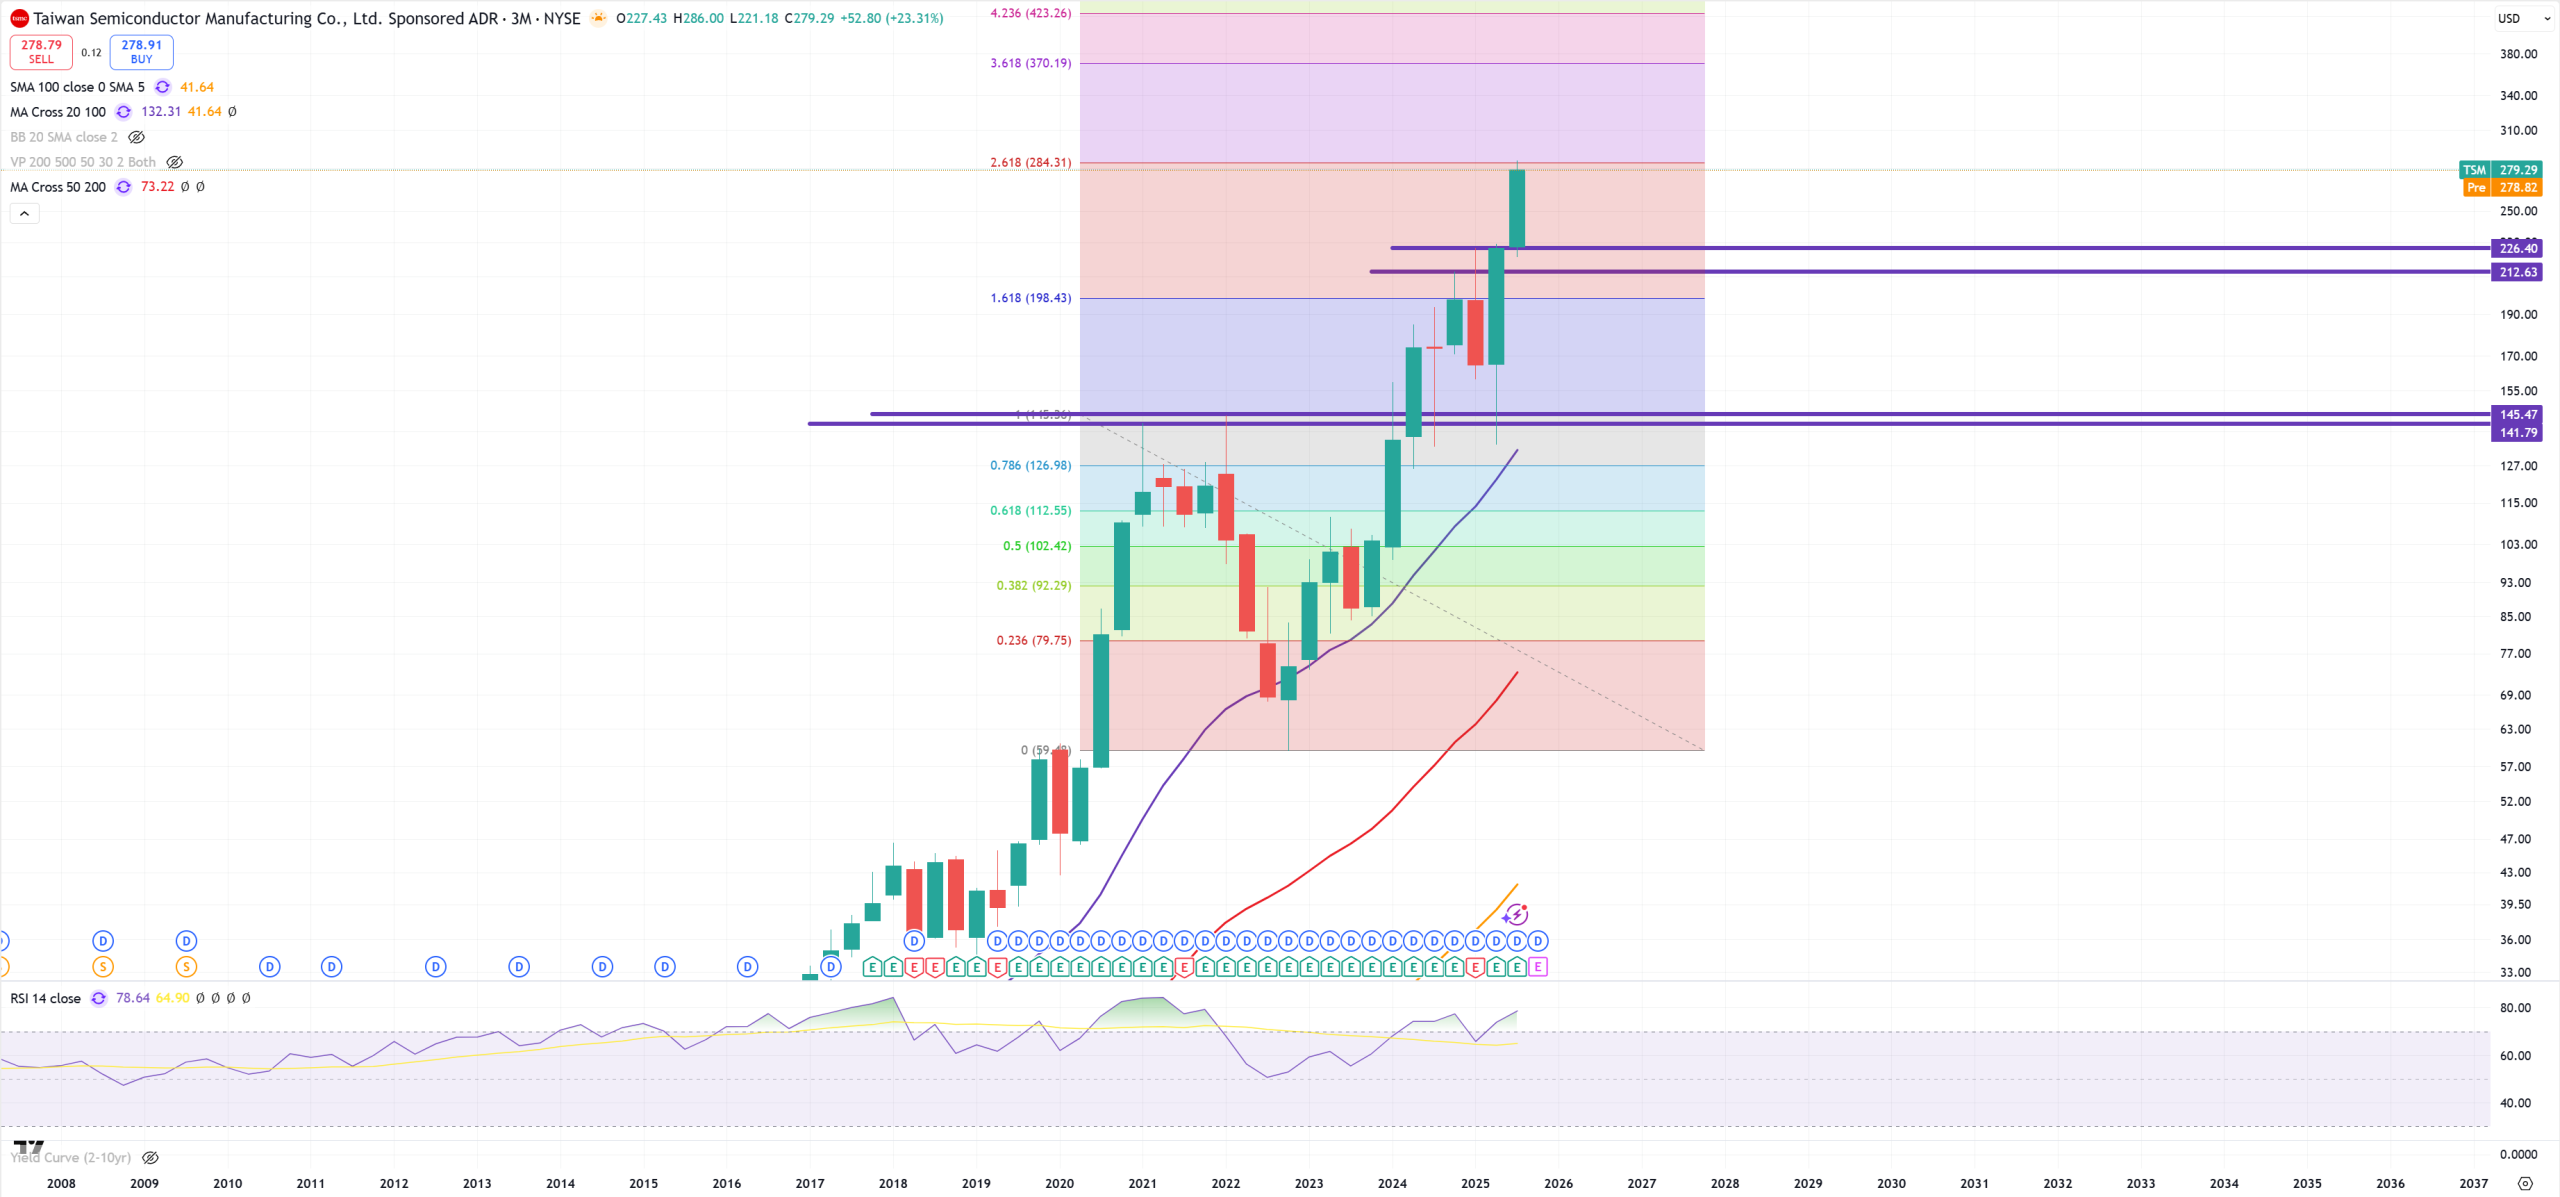
TSM – reaching 2.618 level and it’s still being considered as bullish
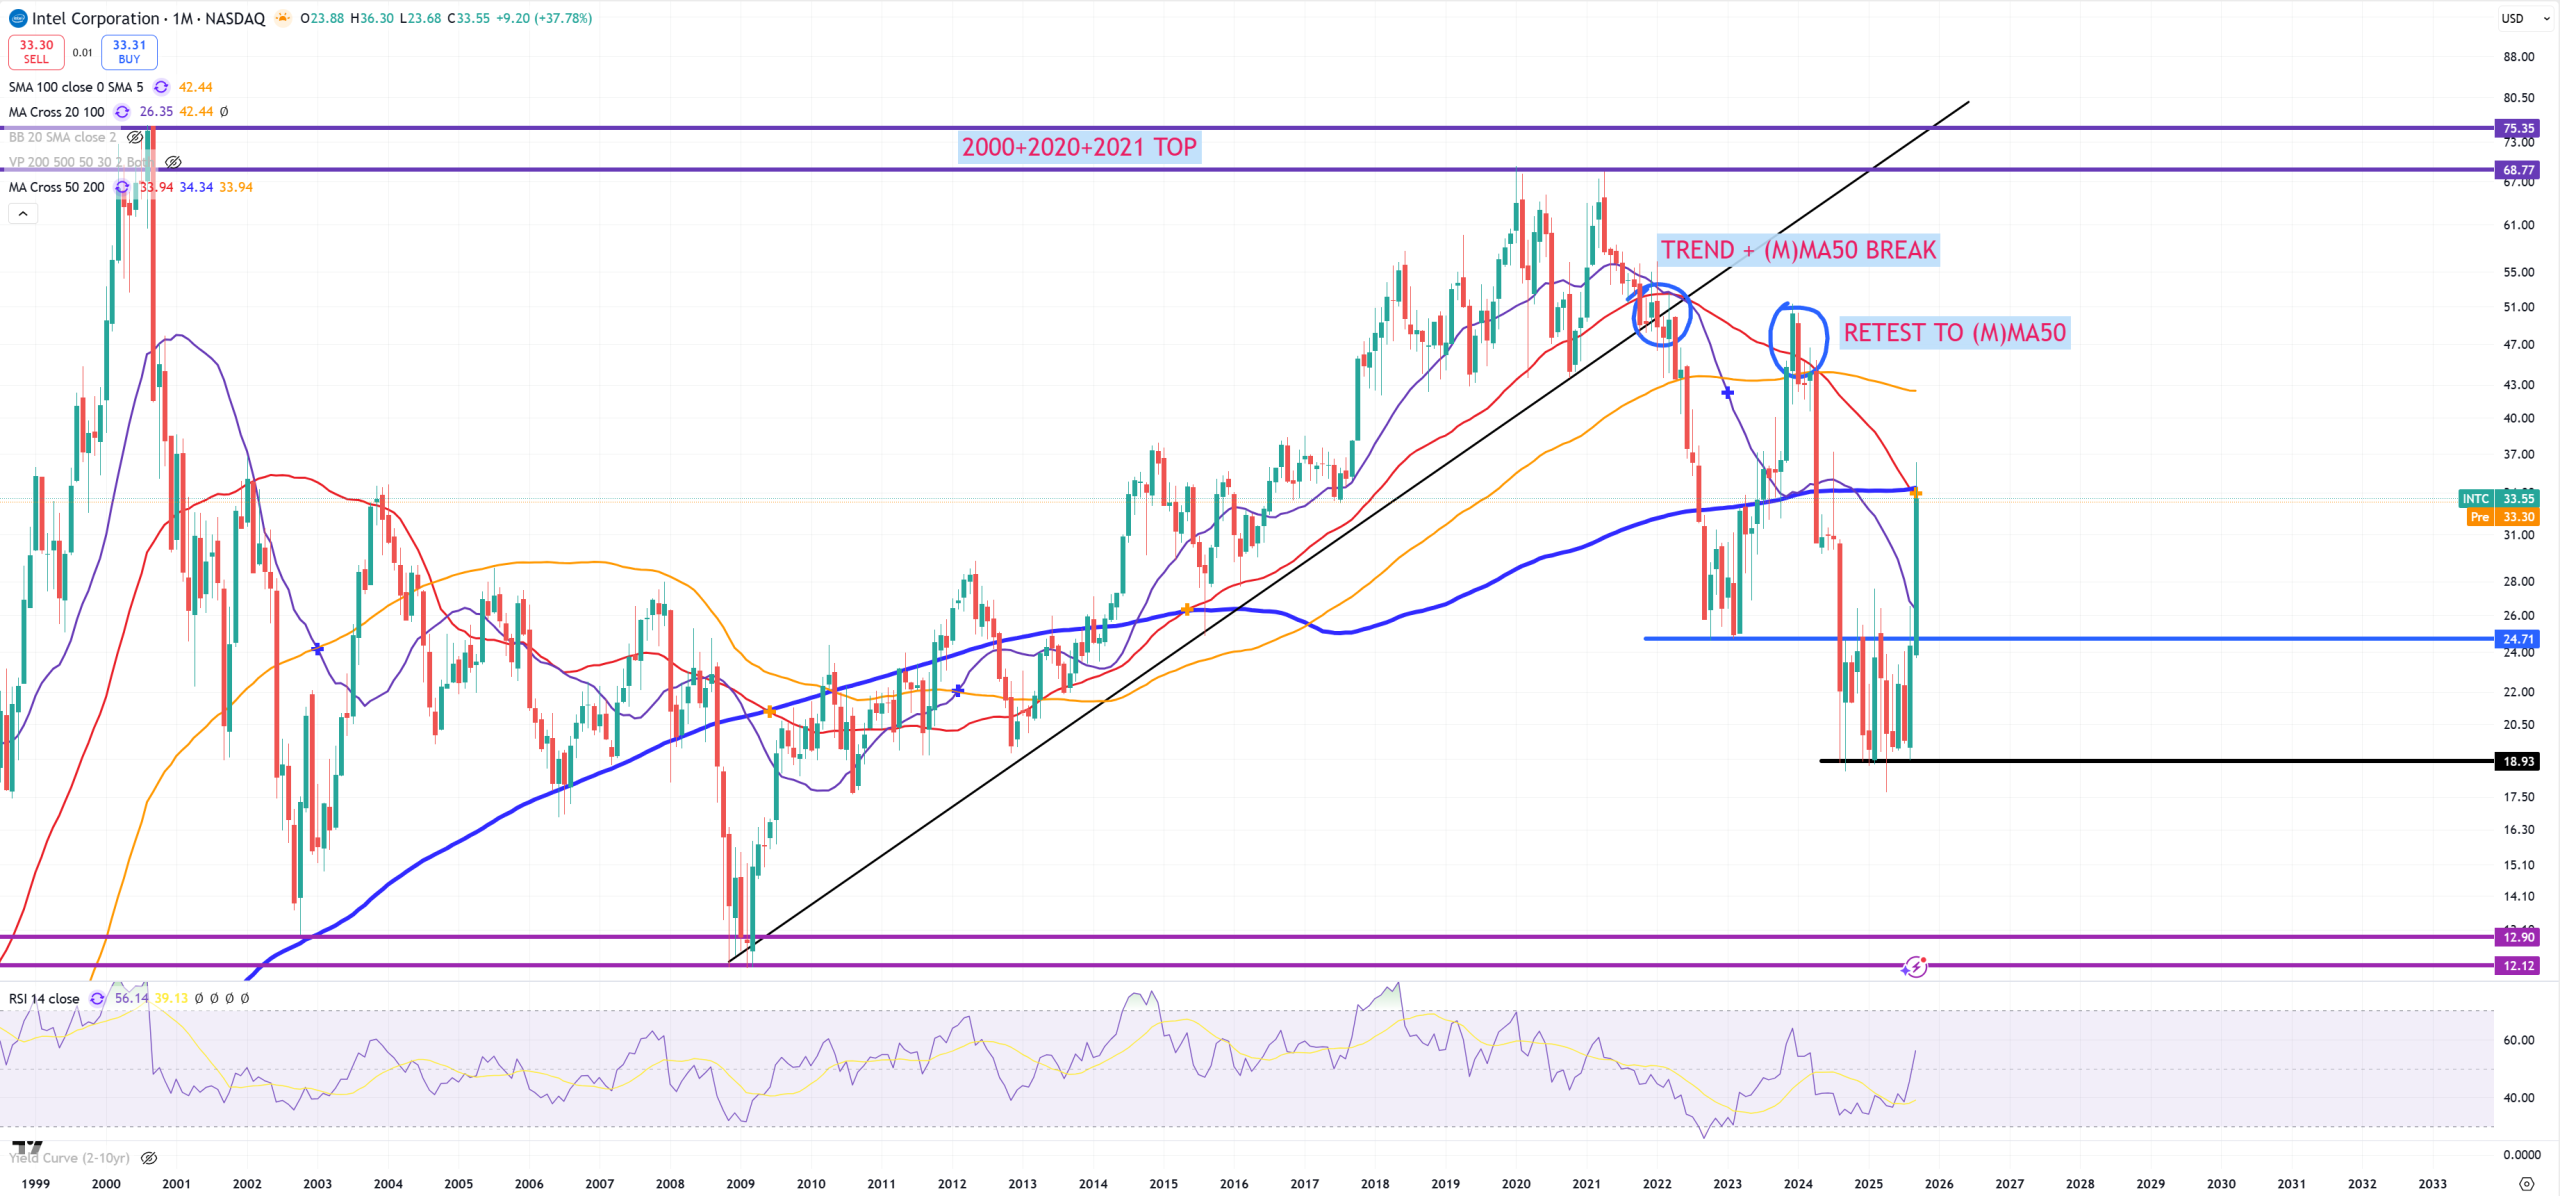
INTC – Intel – managed to get out from 19-25$ consolidation to the upside and now hitting into secular death-cross moment (M)MA50 & (M)MA200 resistance
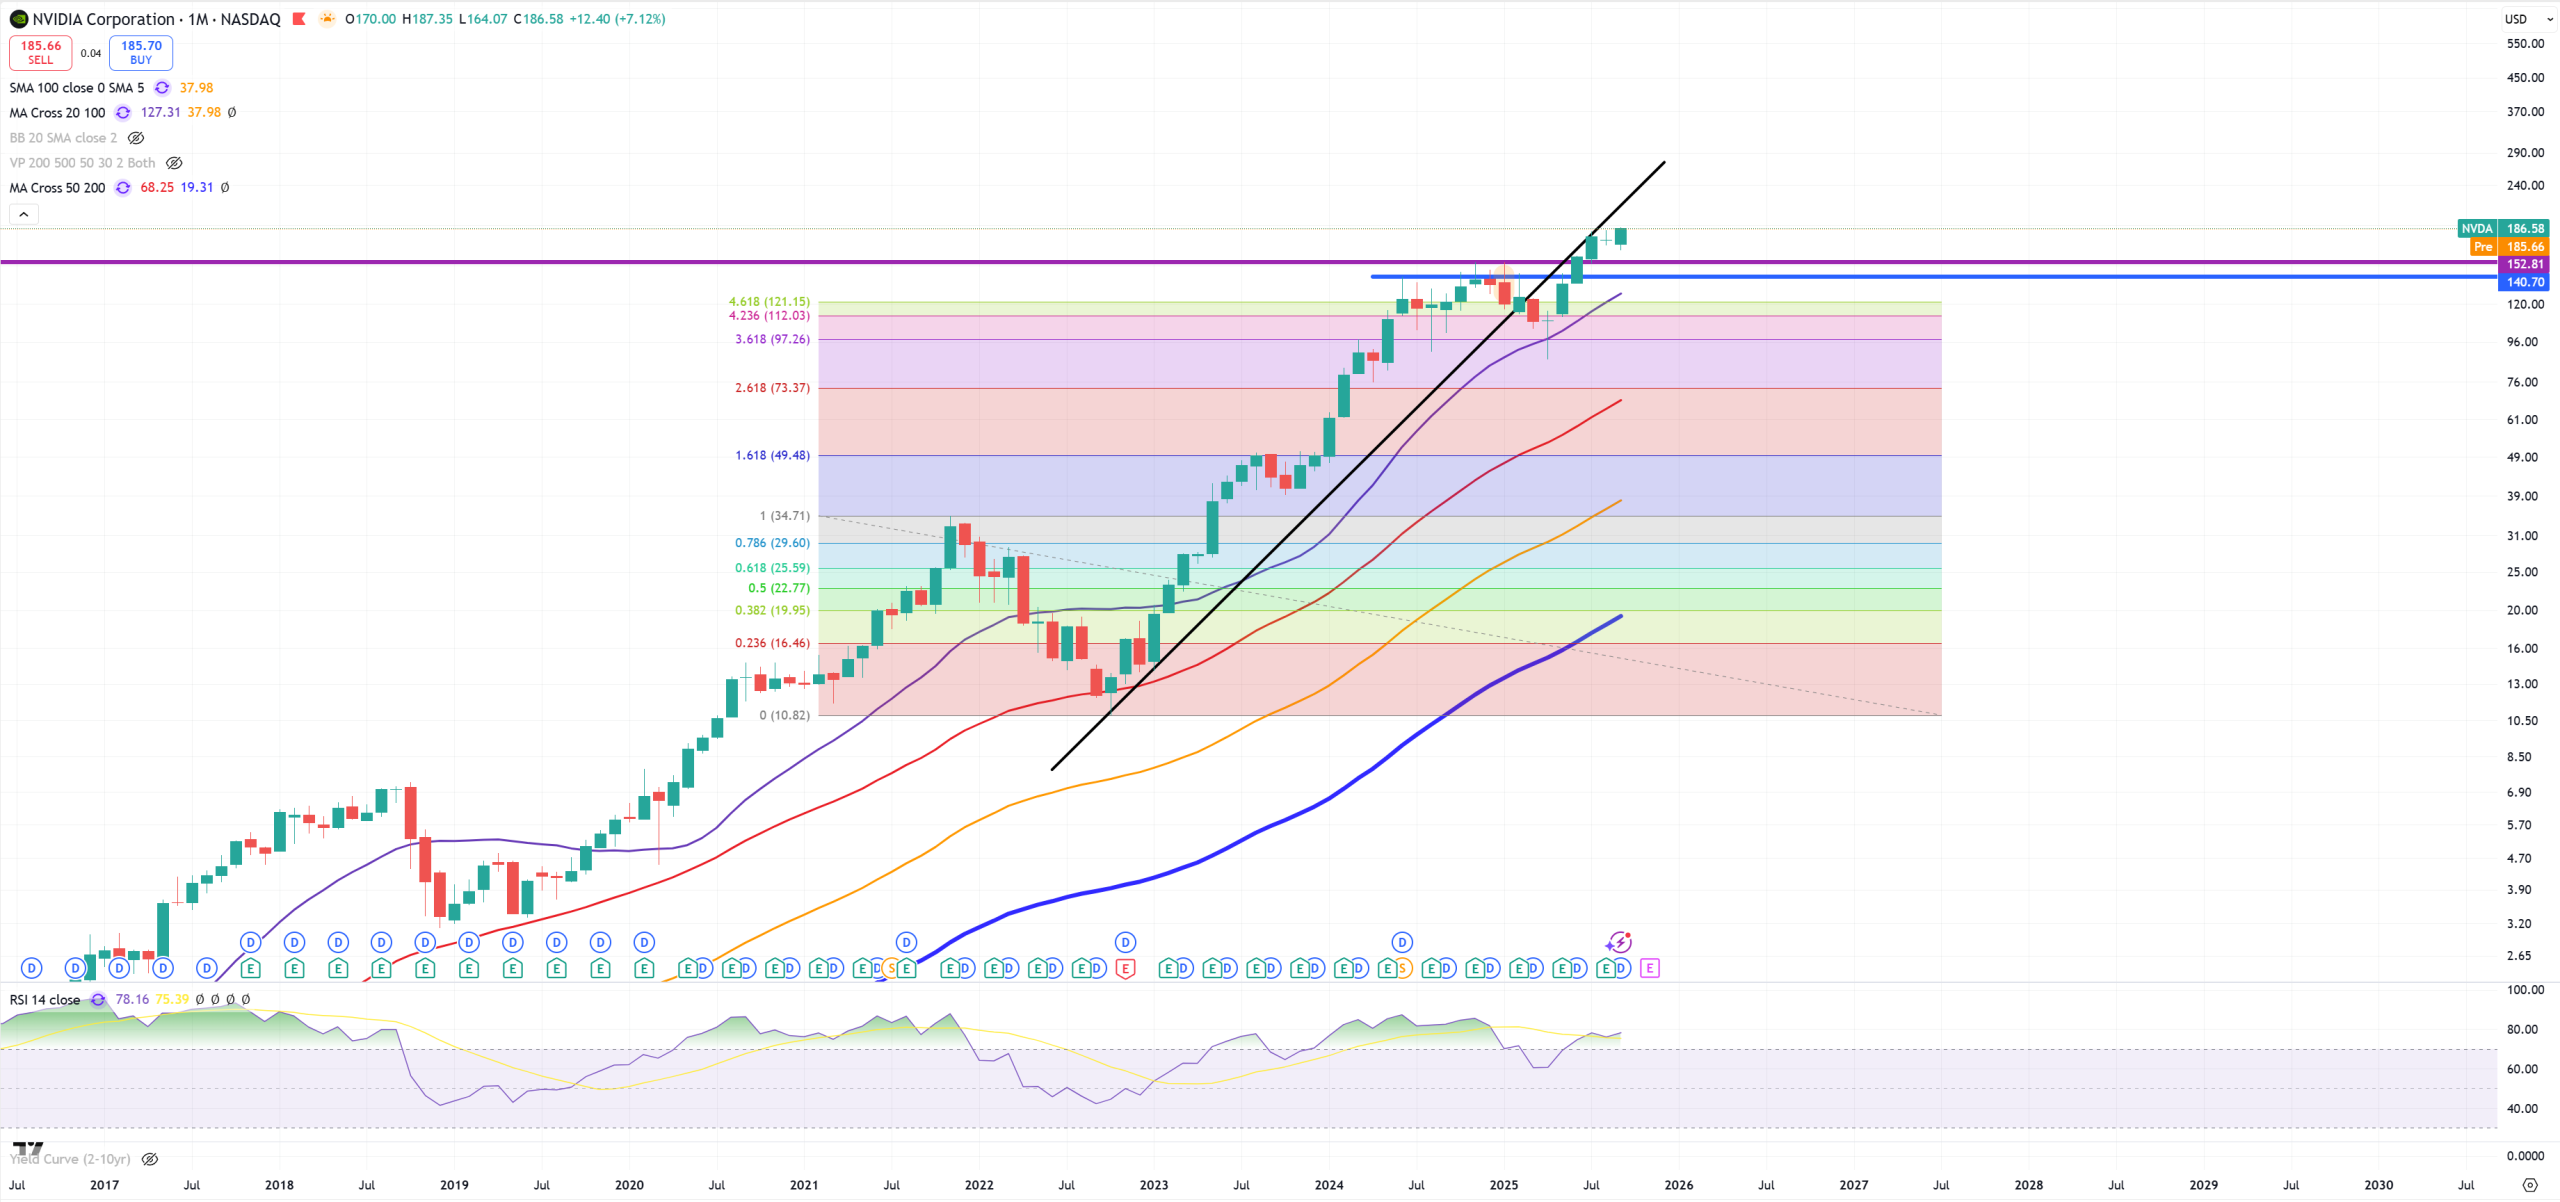
NVDA – company worth 4.5T$, breaking everything, but its distance to (M)MA50 is now -65%
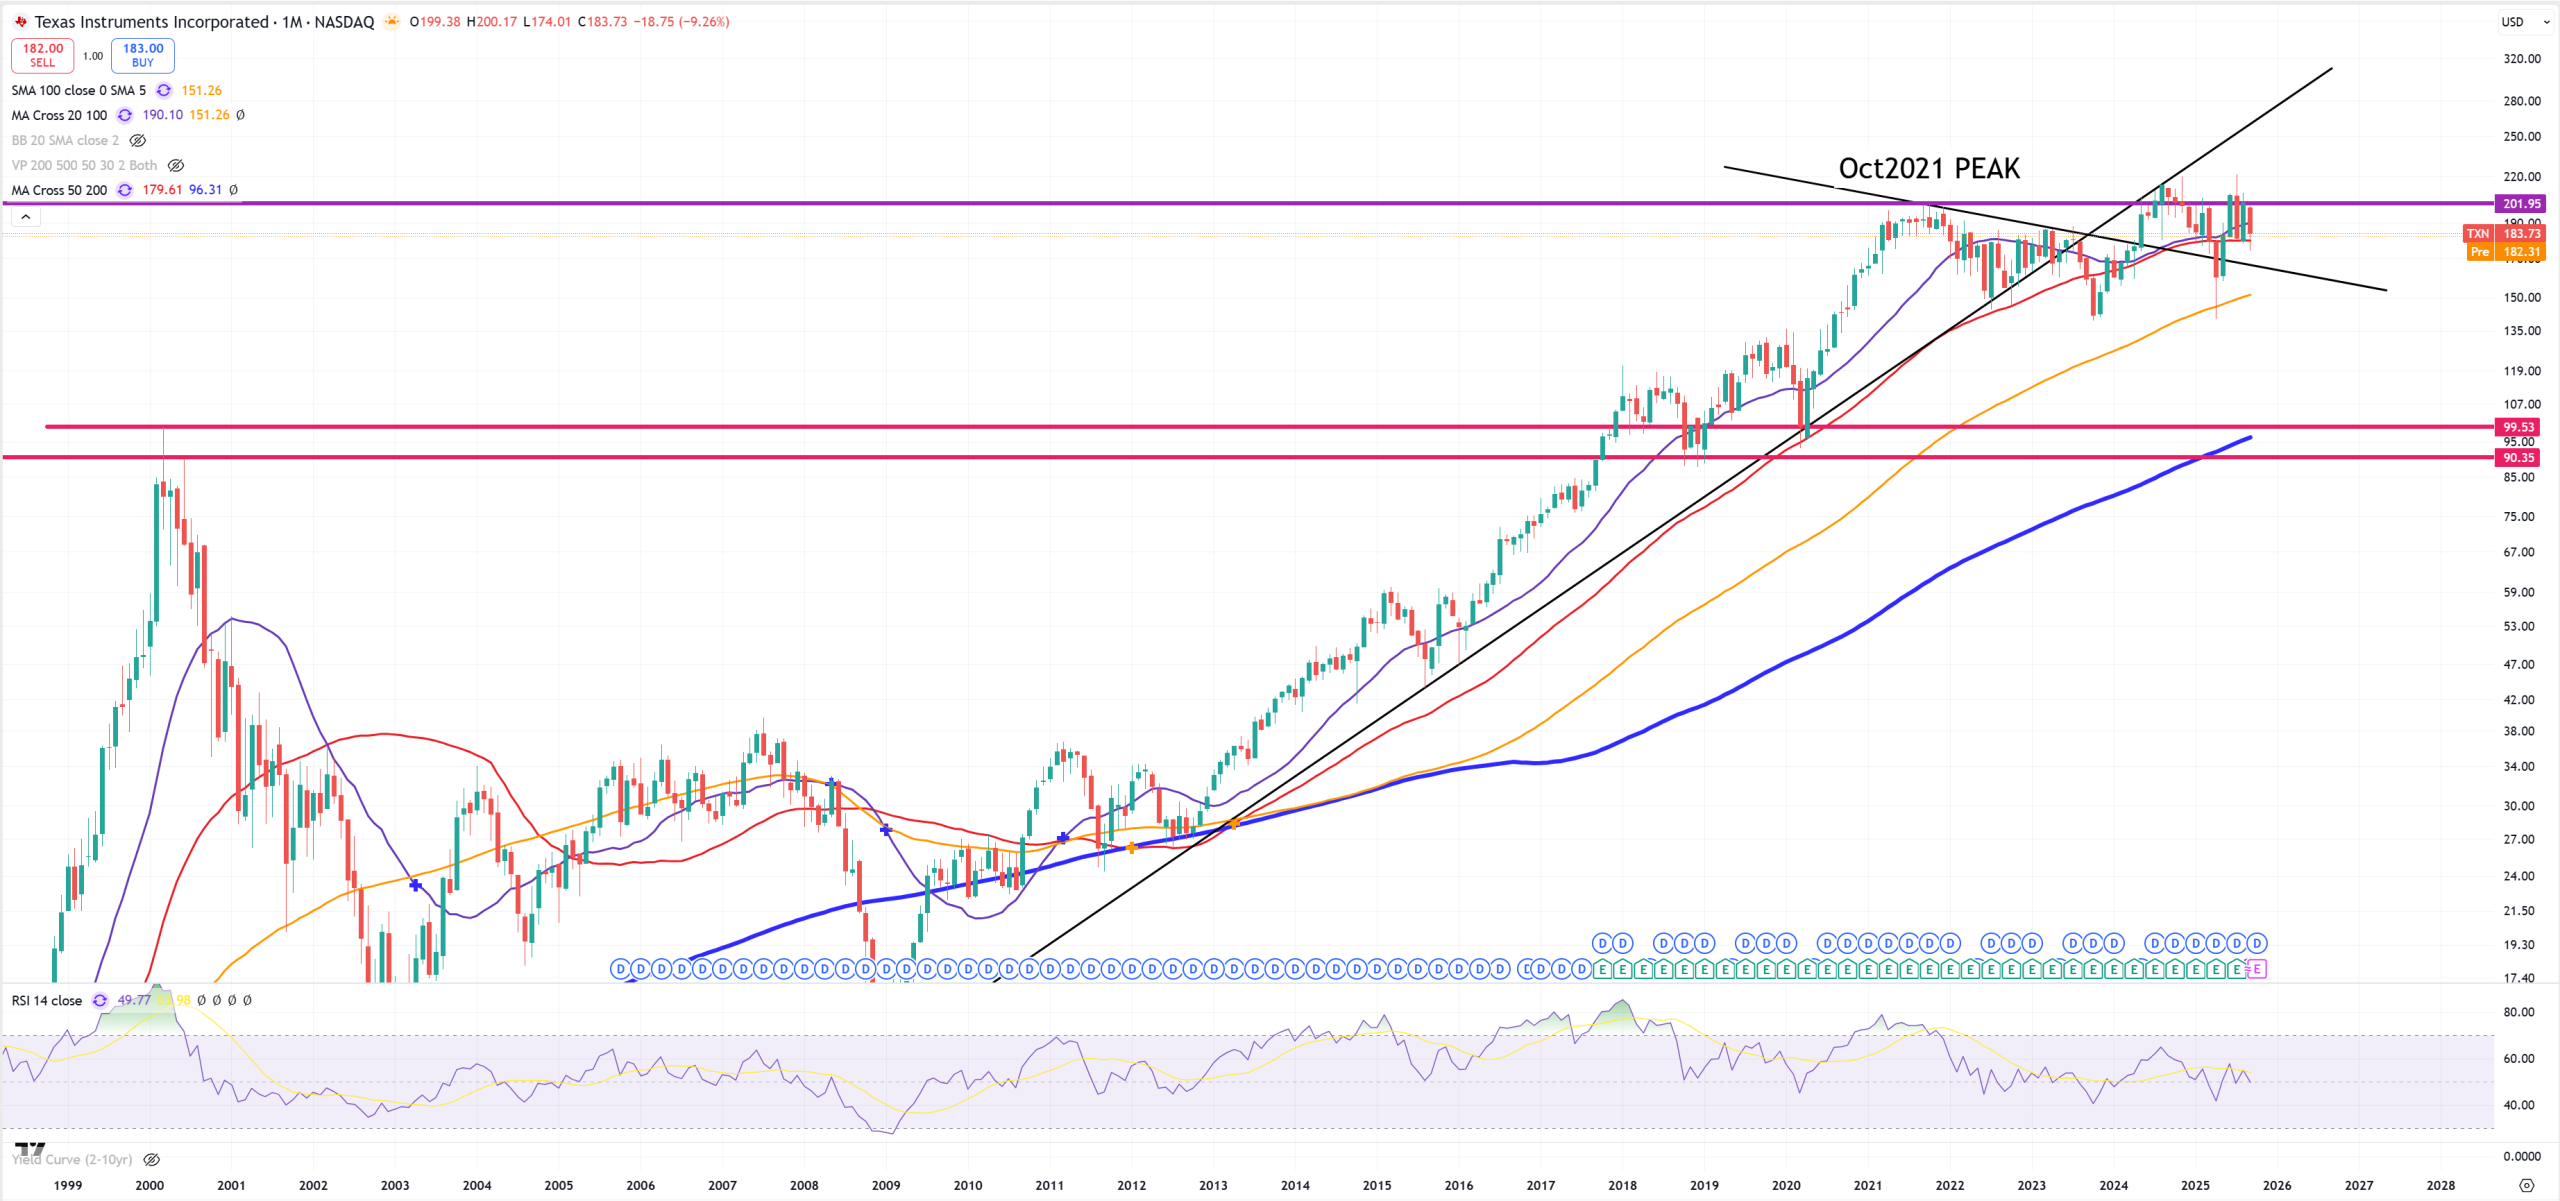
TXN – Texas Instuments and 2021 PEAK locked
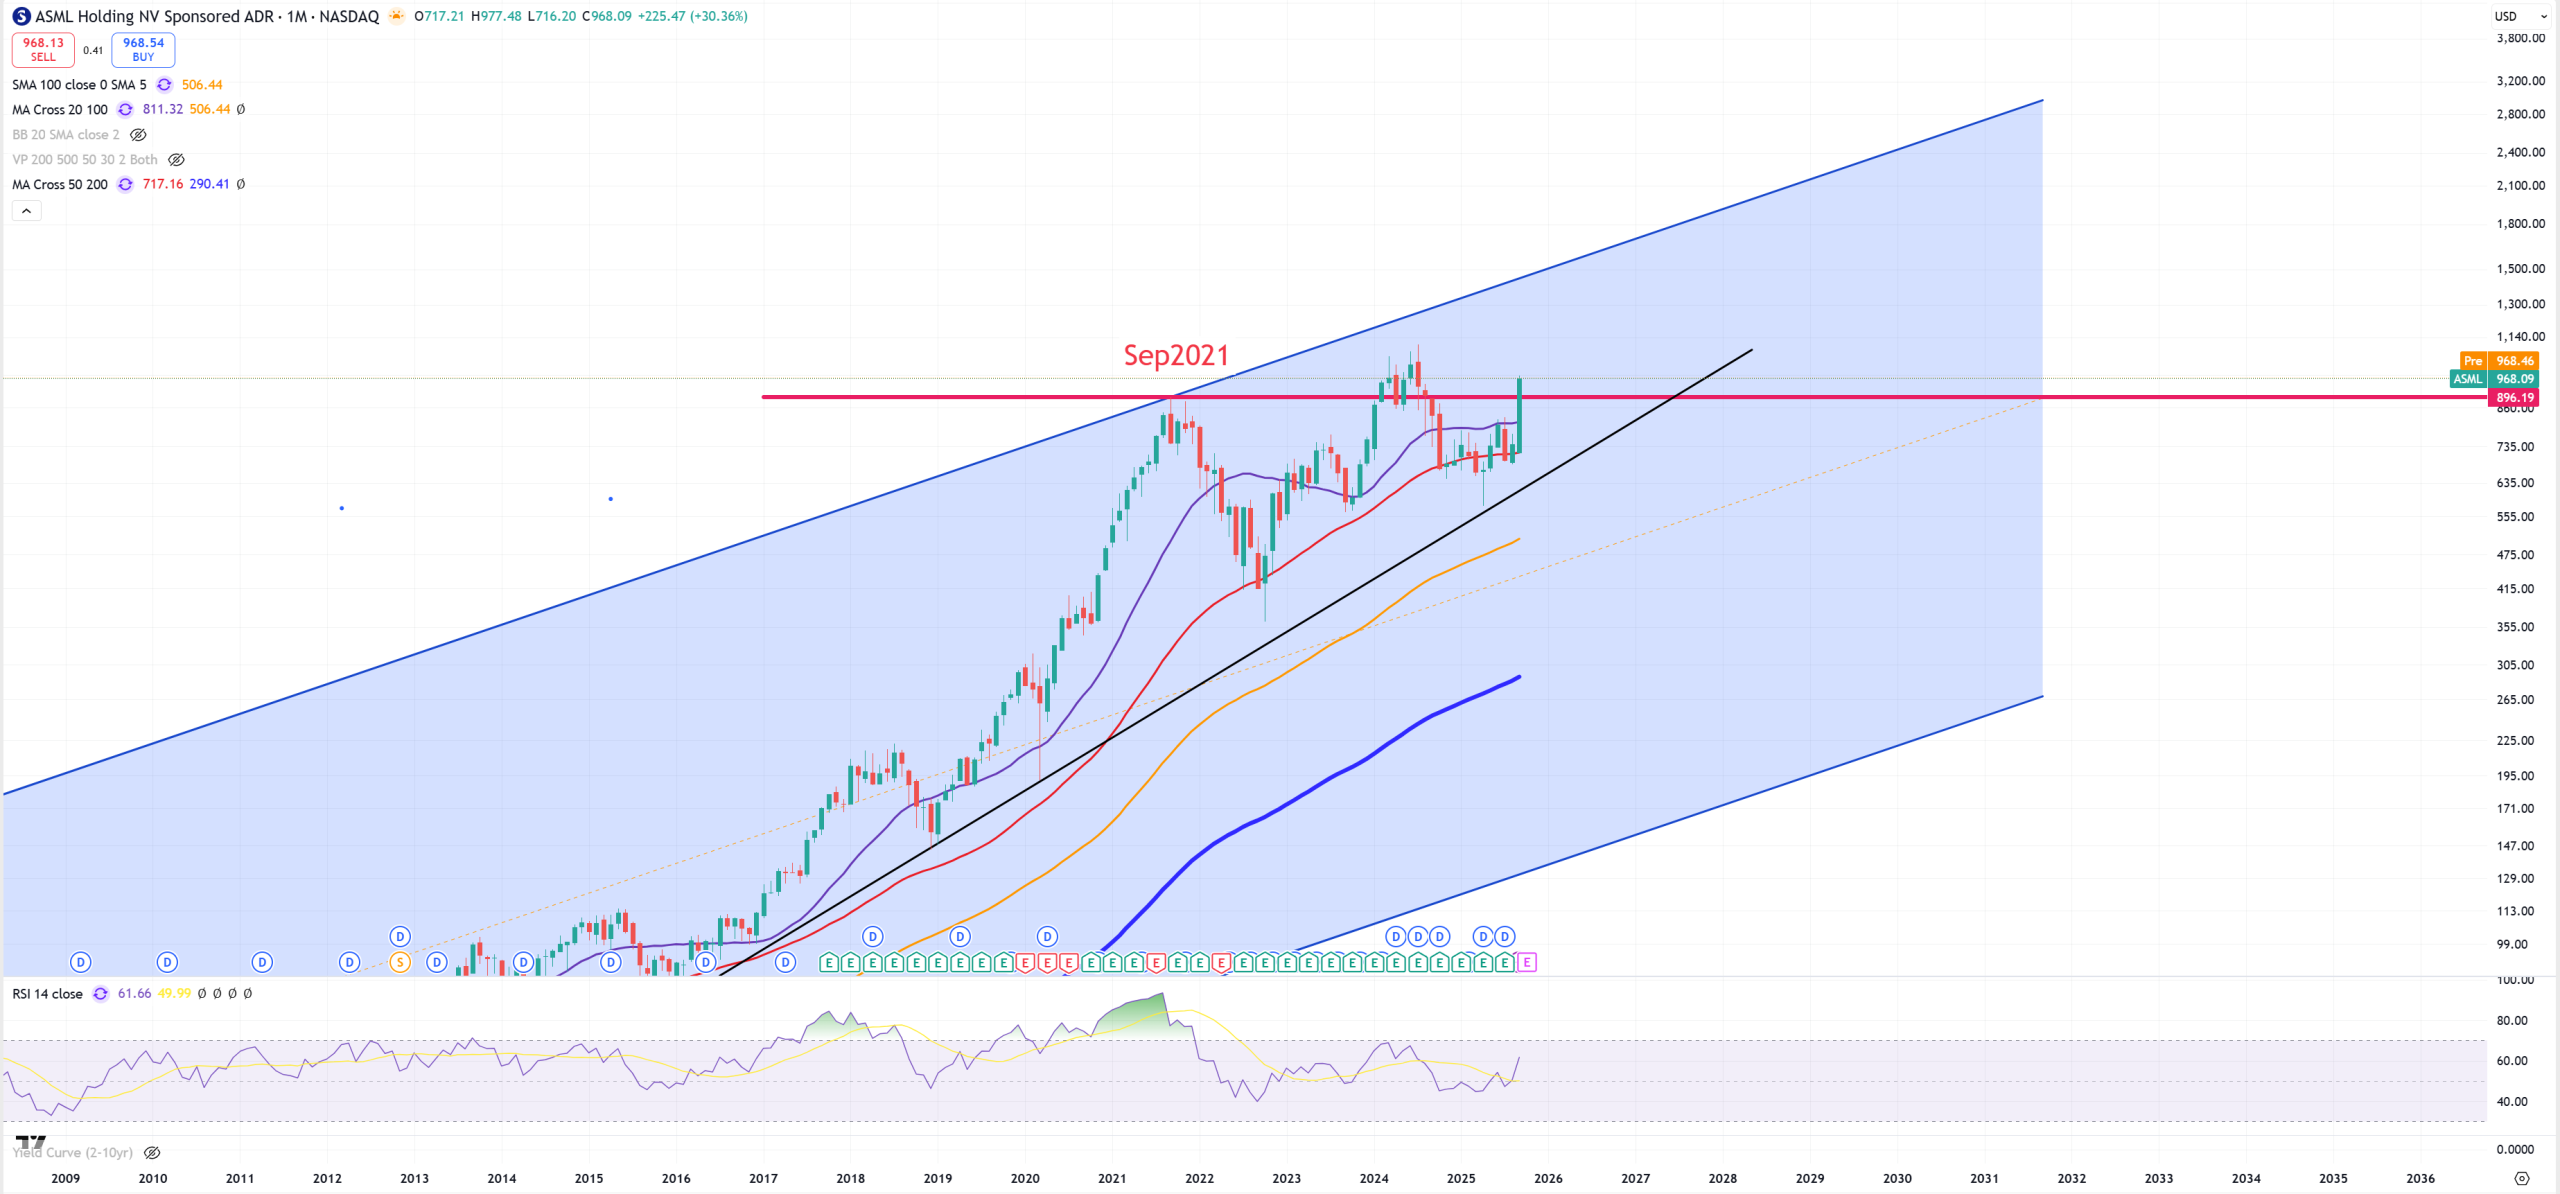
ASML – market was floating around (M)MA50 break, but bulls stepped in
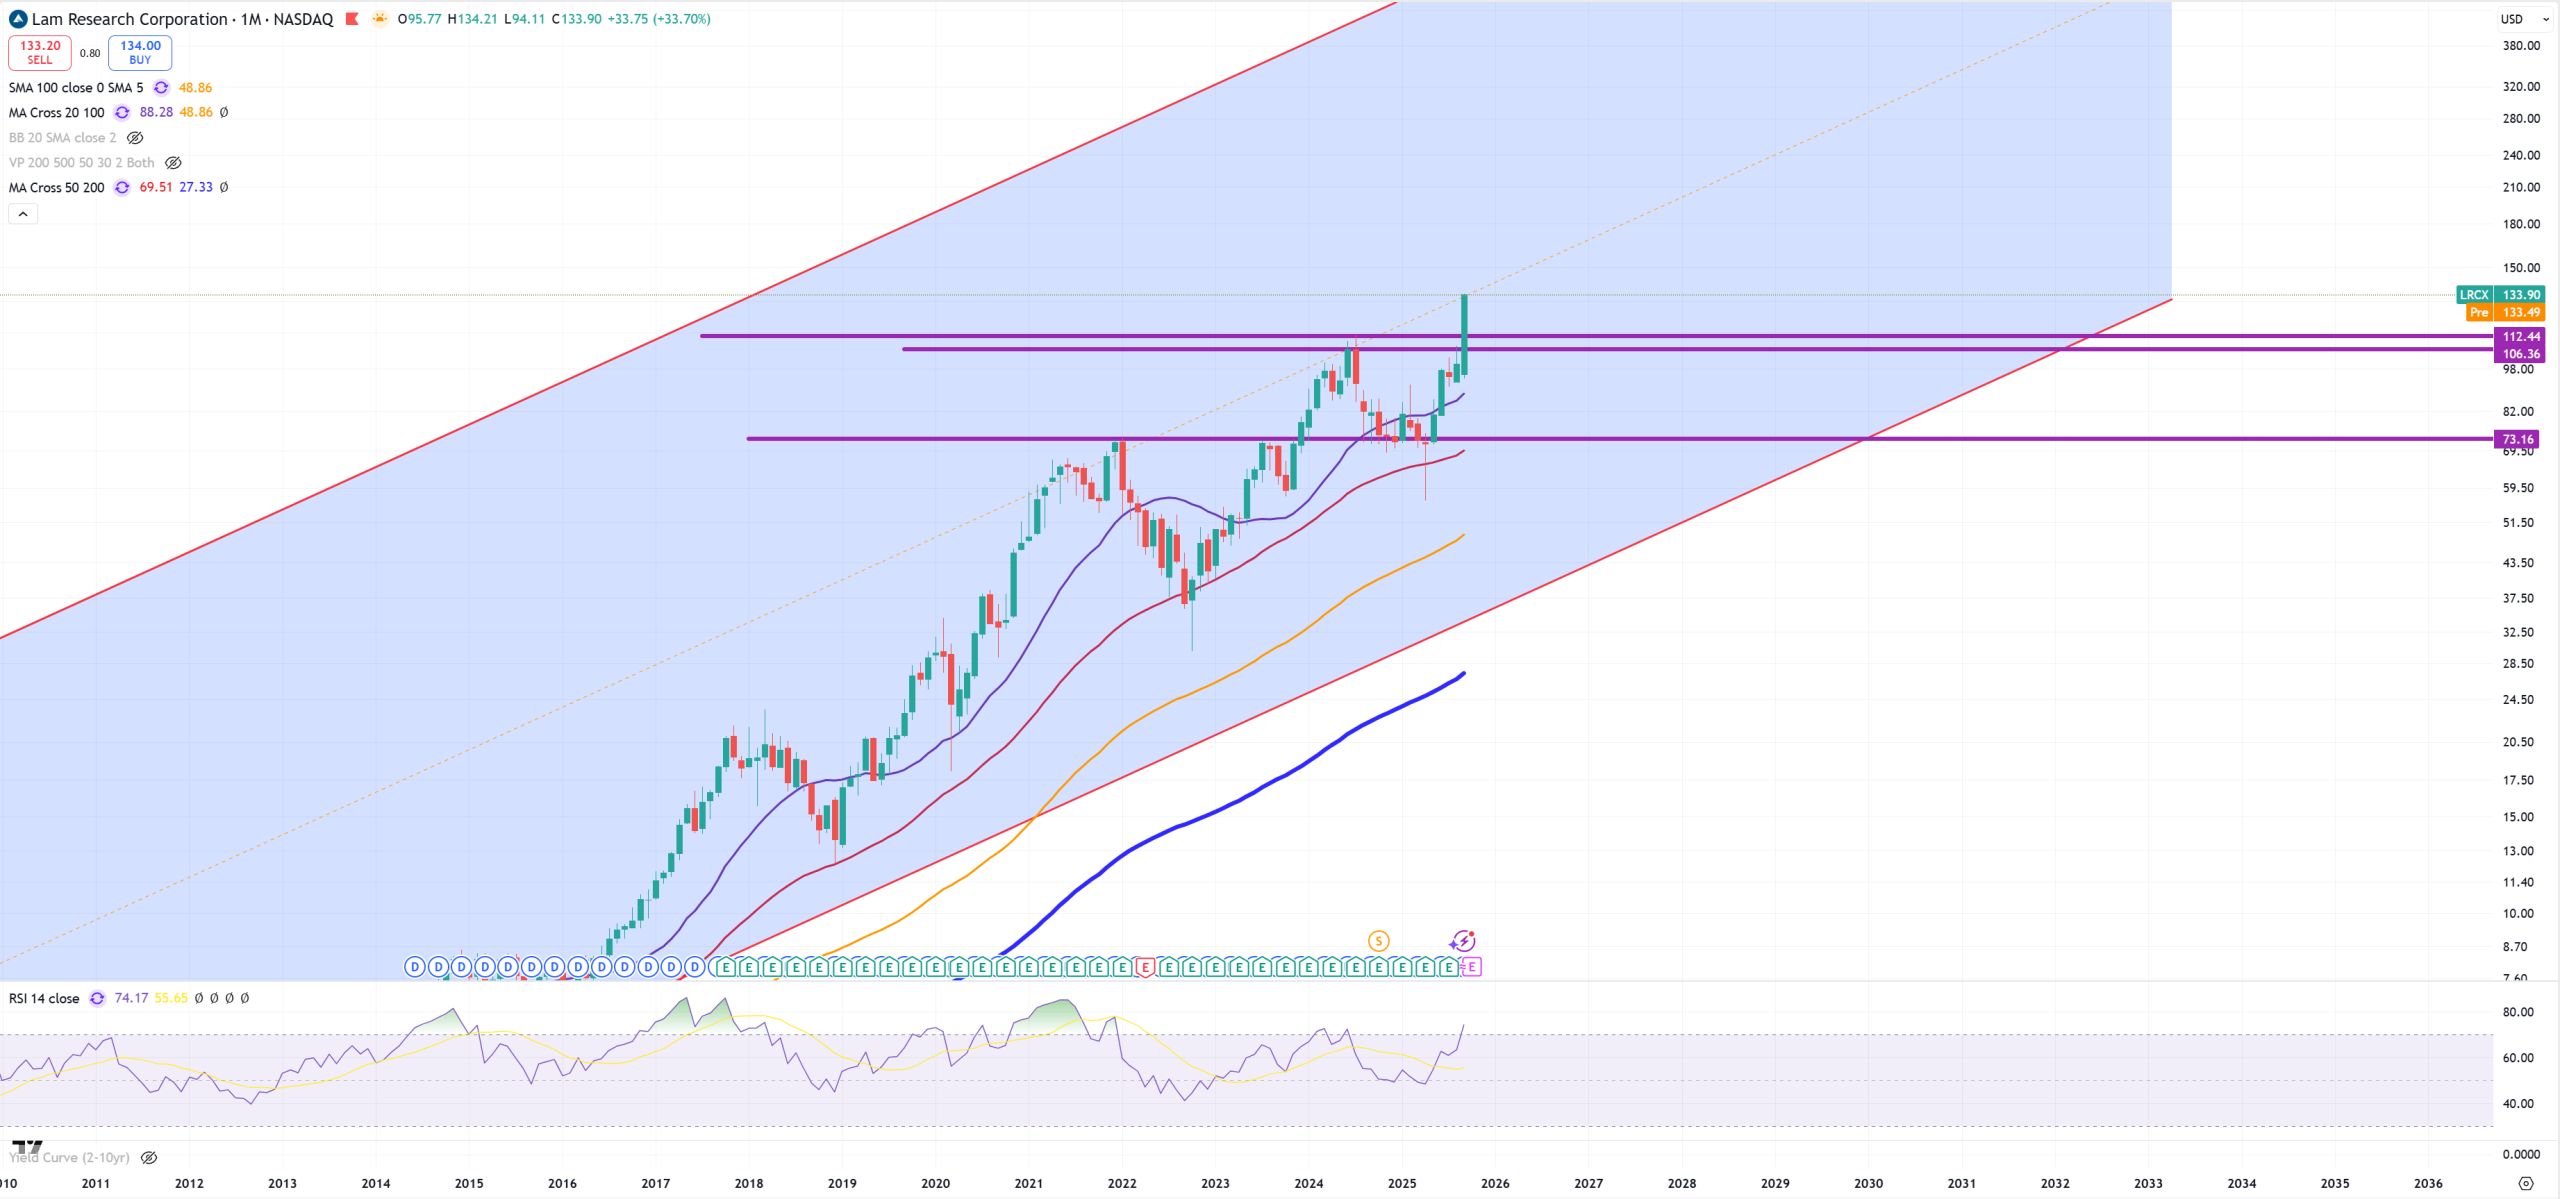
LRCX – no need to comment
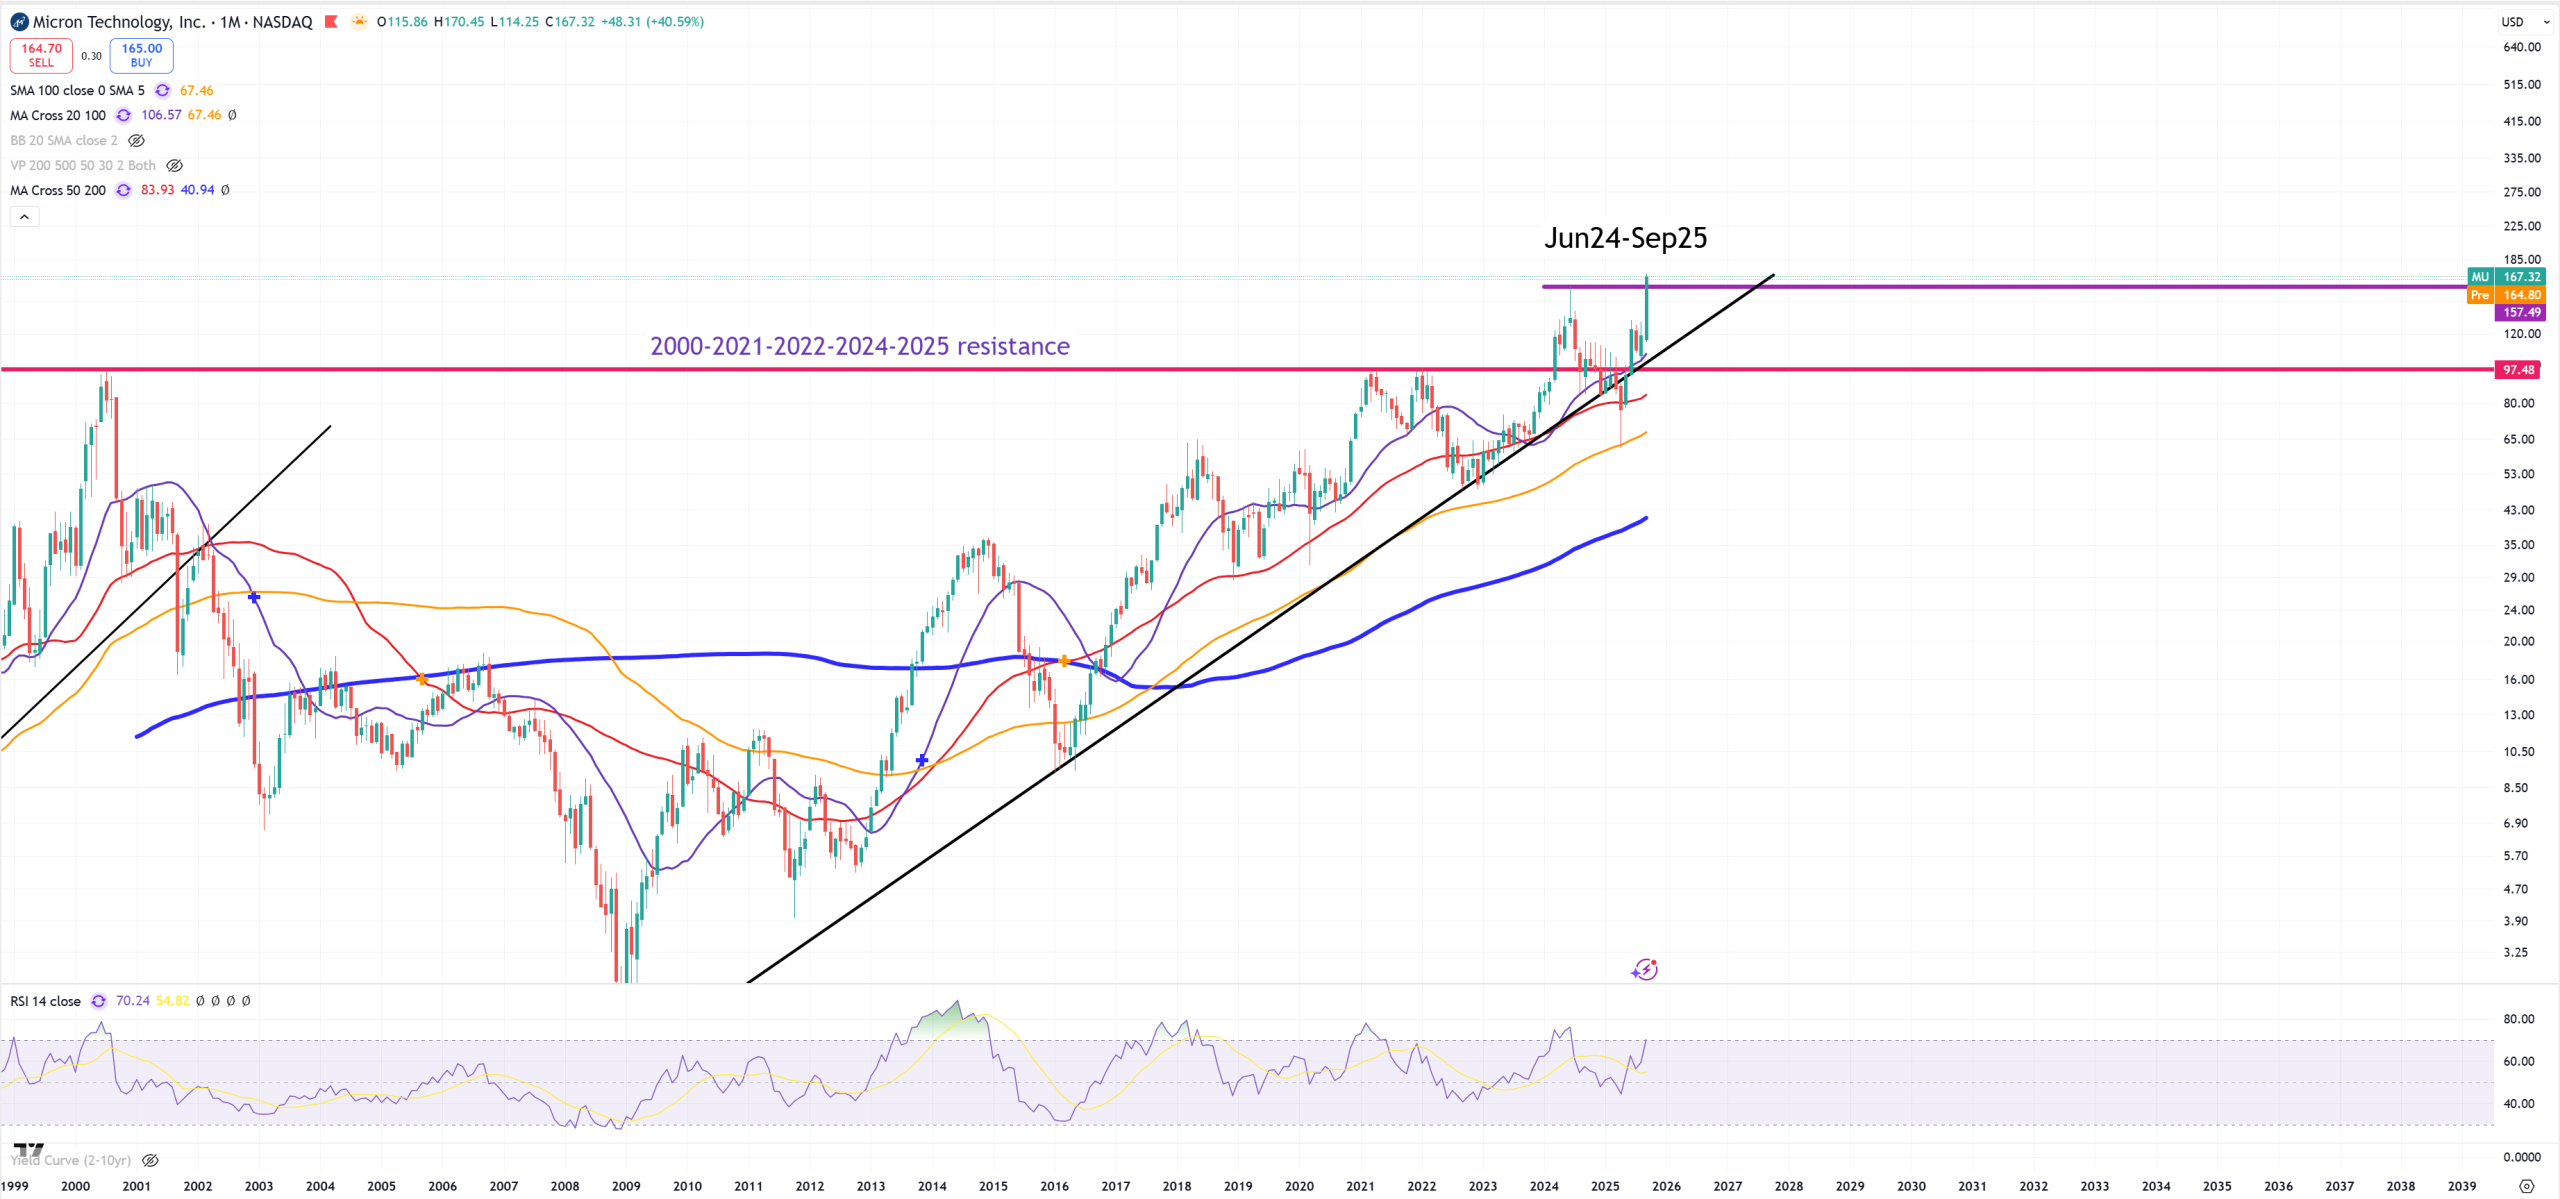
MU – Micron
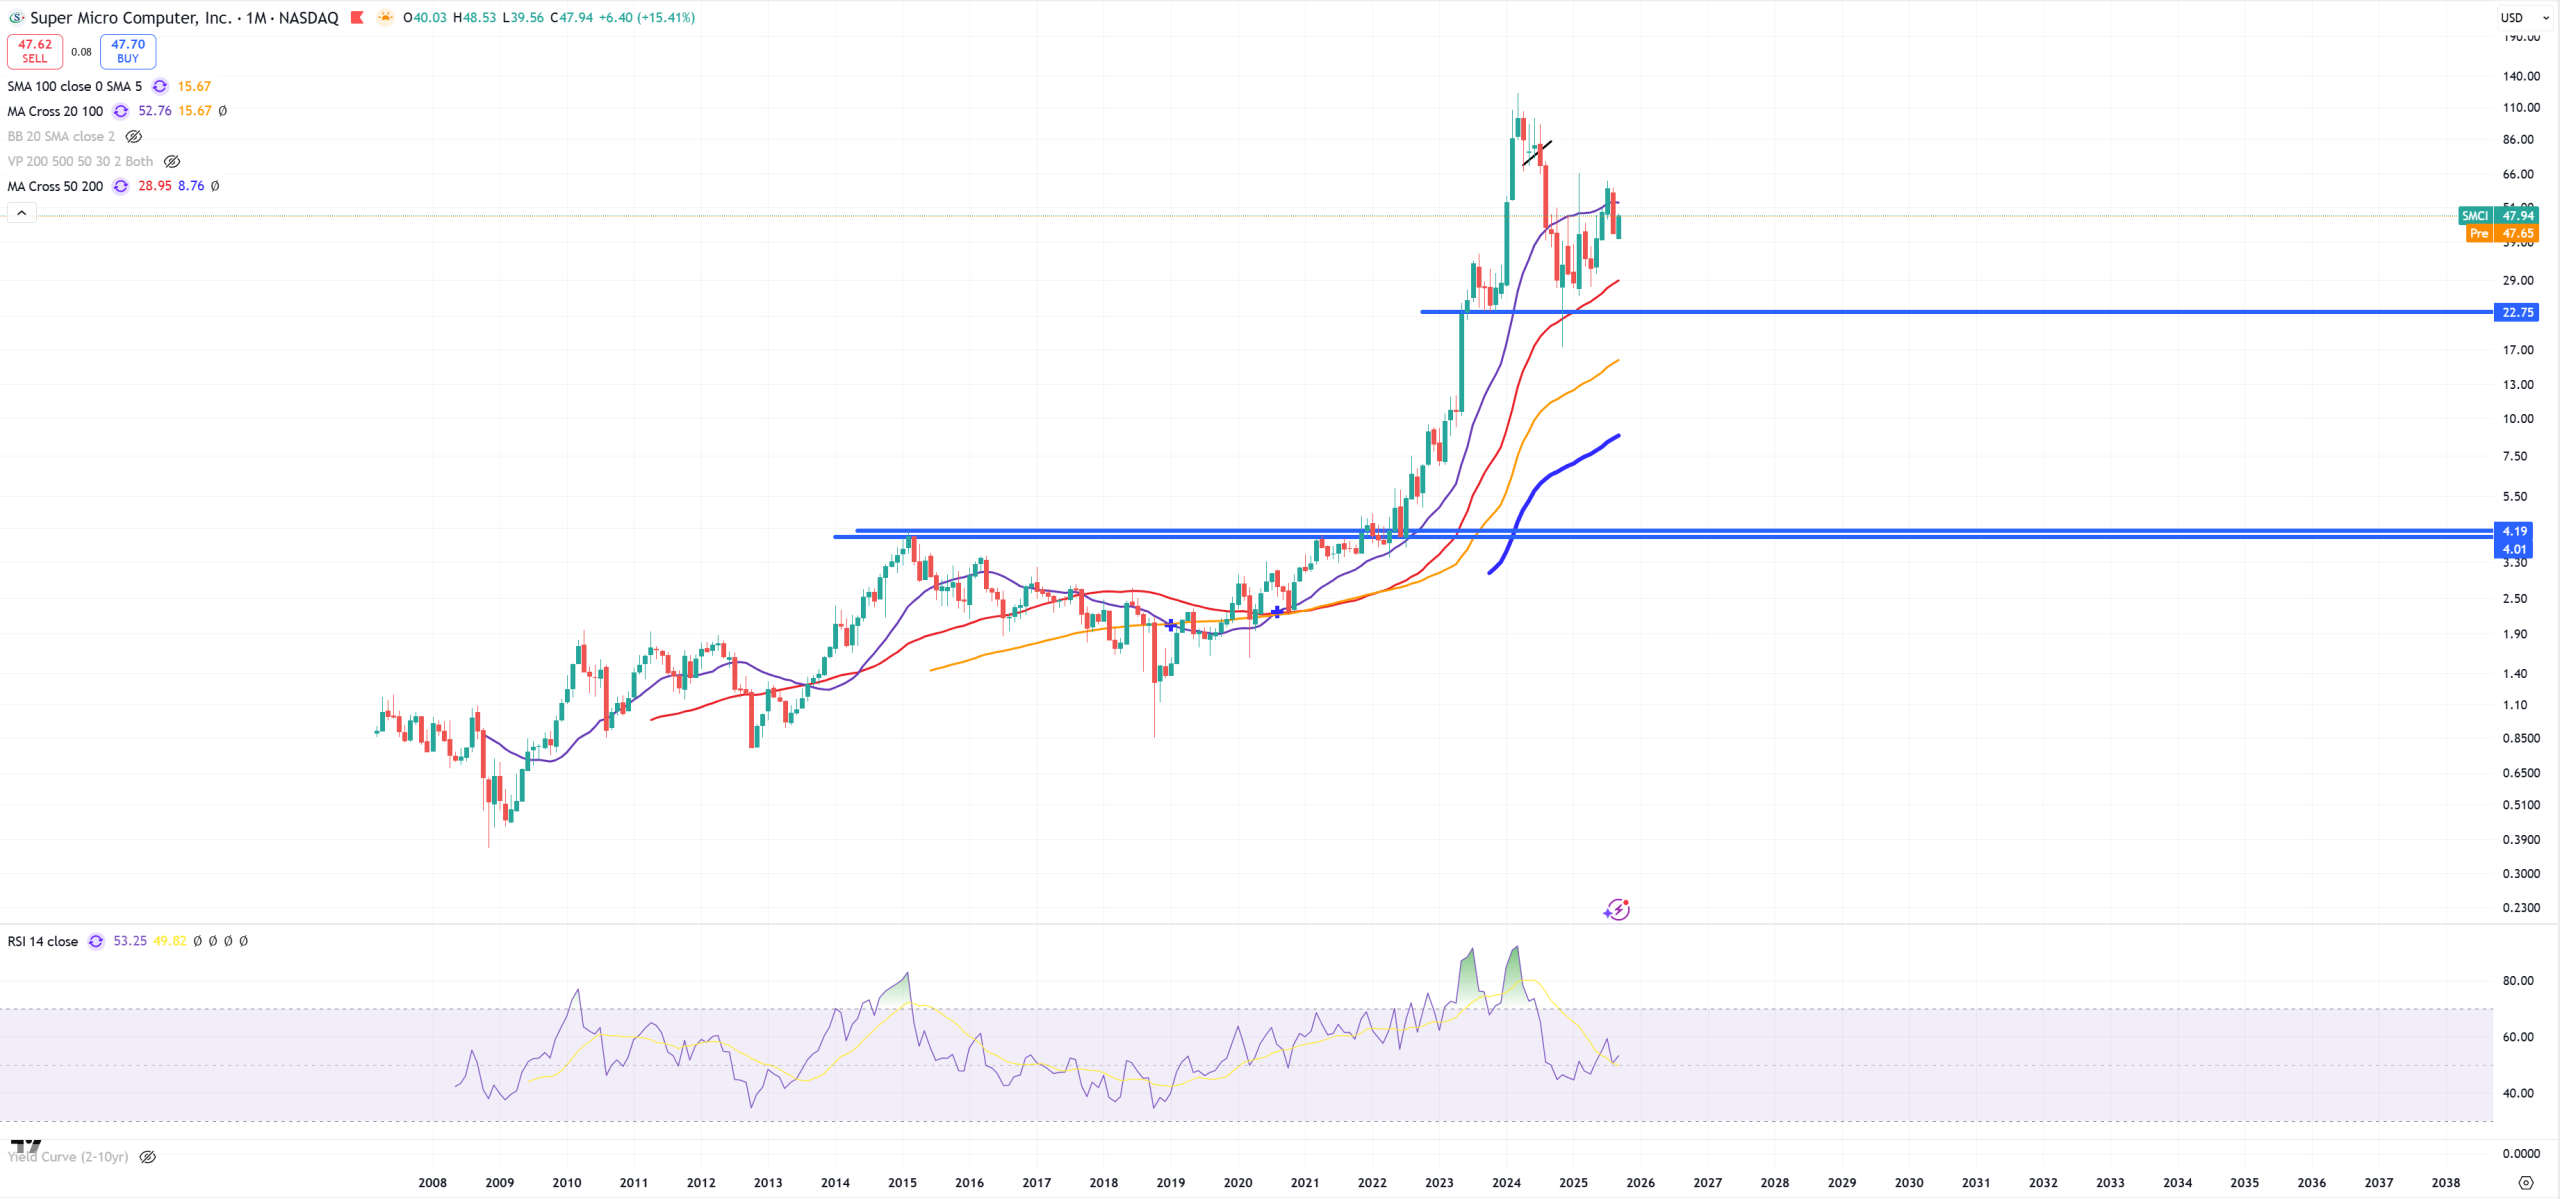
SMCI – this needs to resolve.
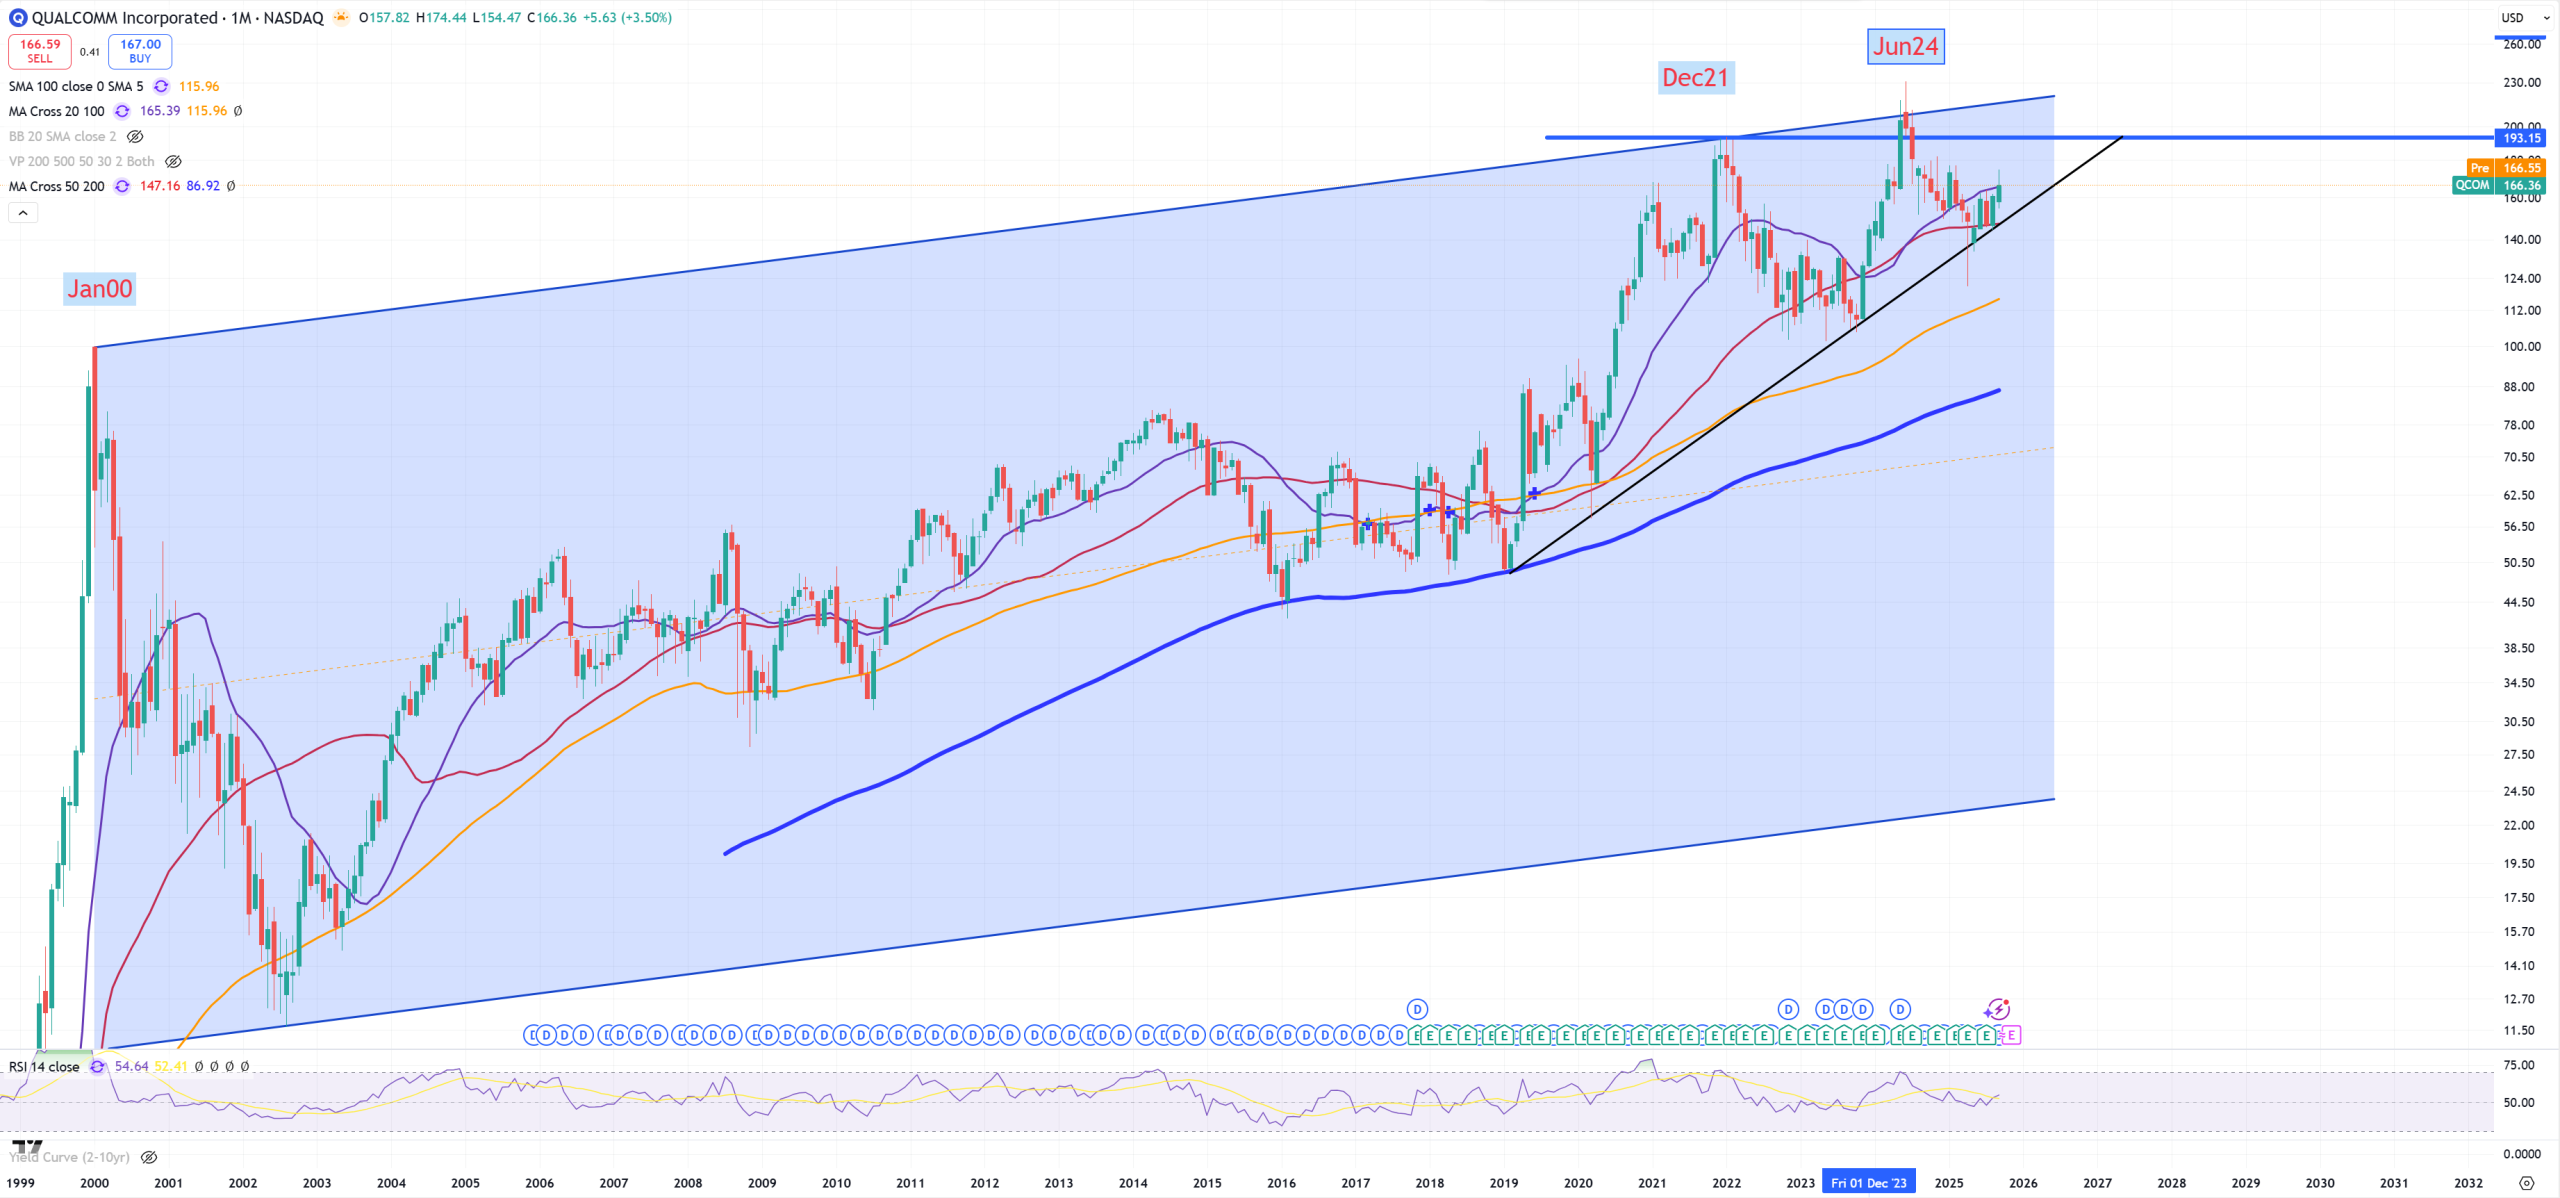
QCOM – that’s bearish chart
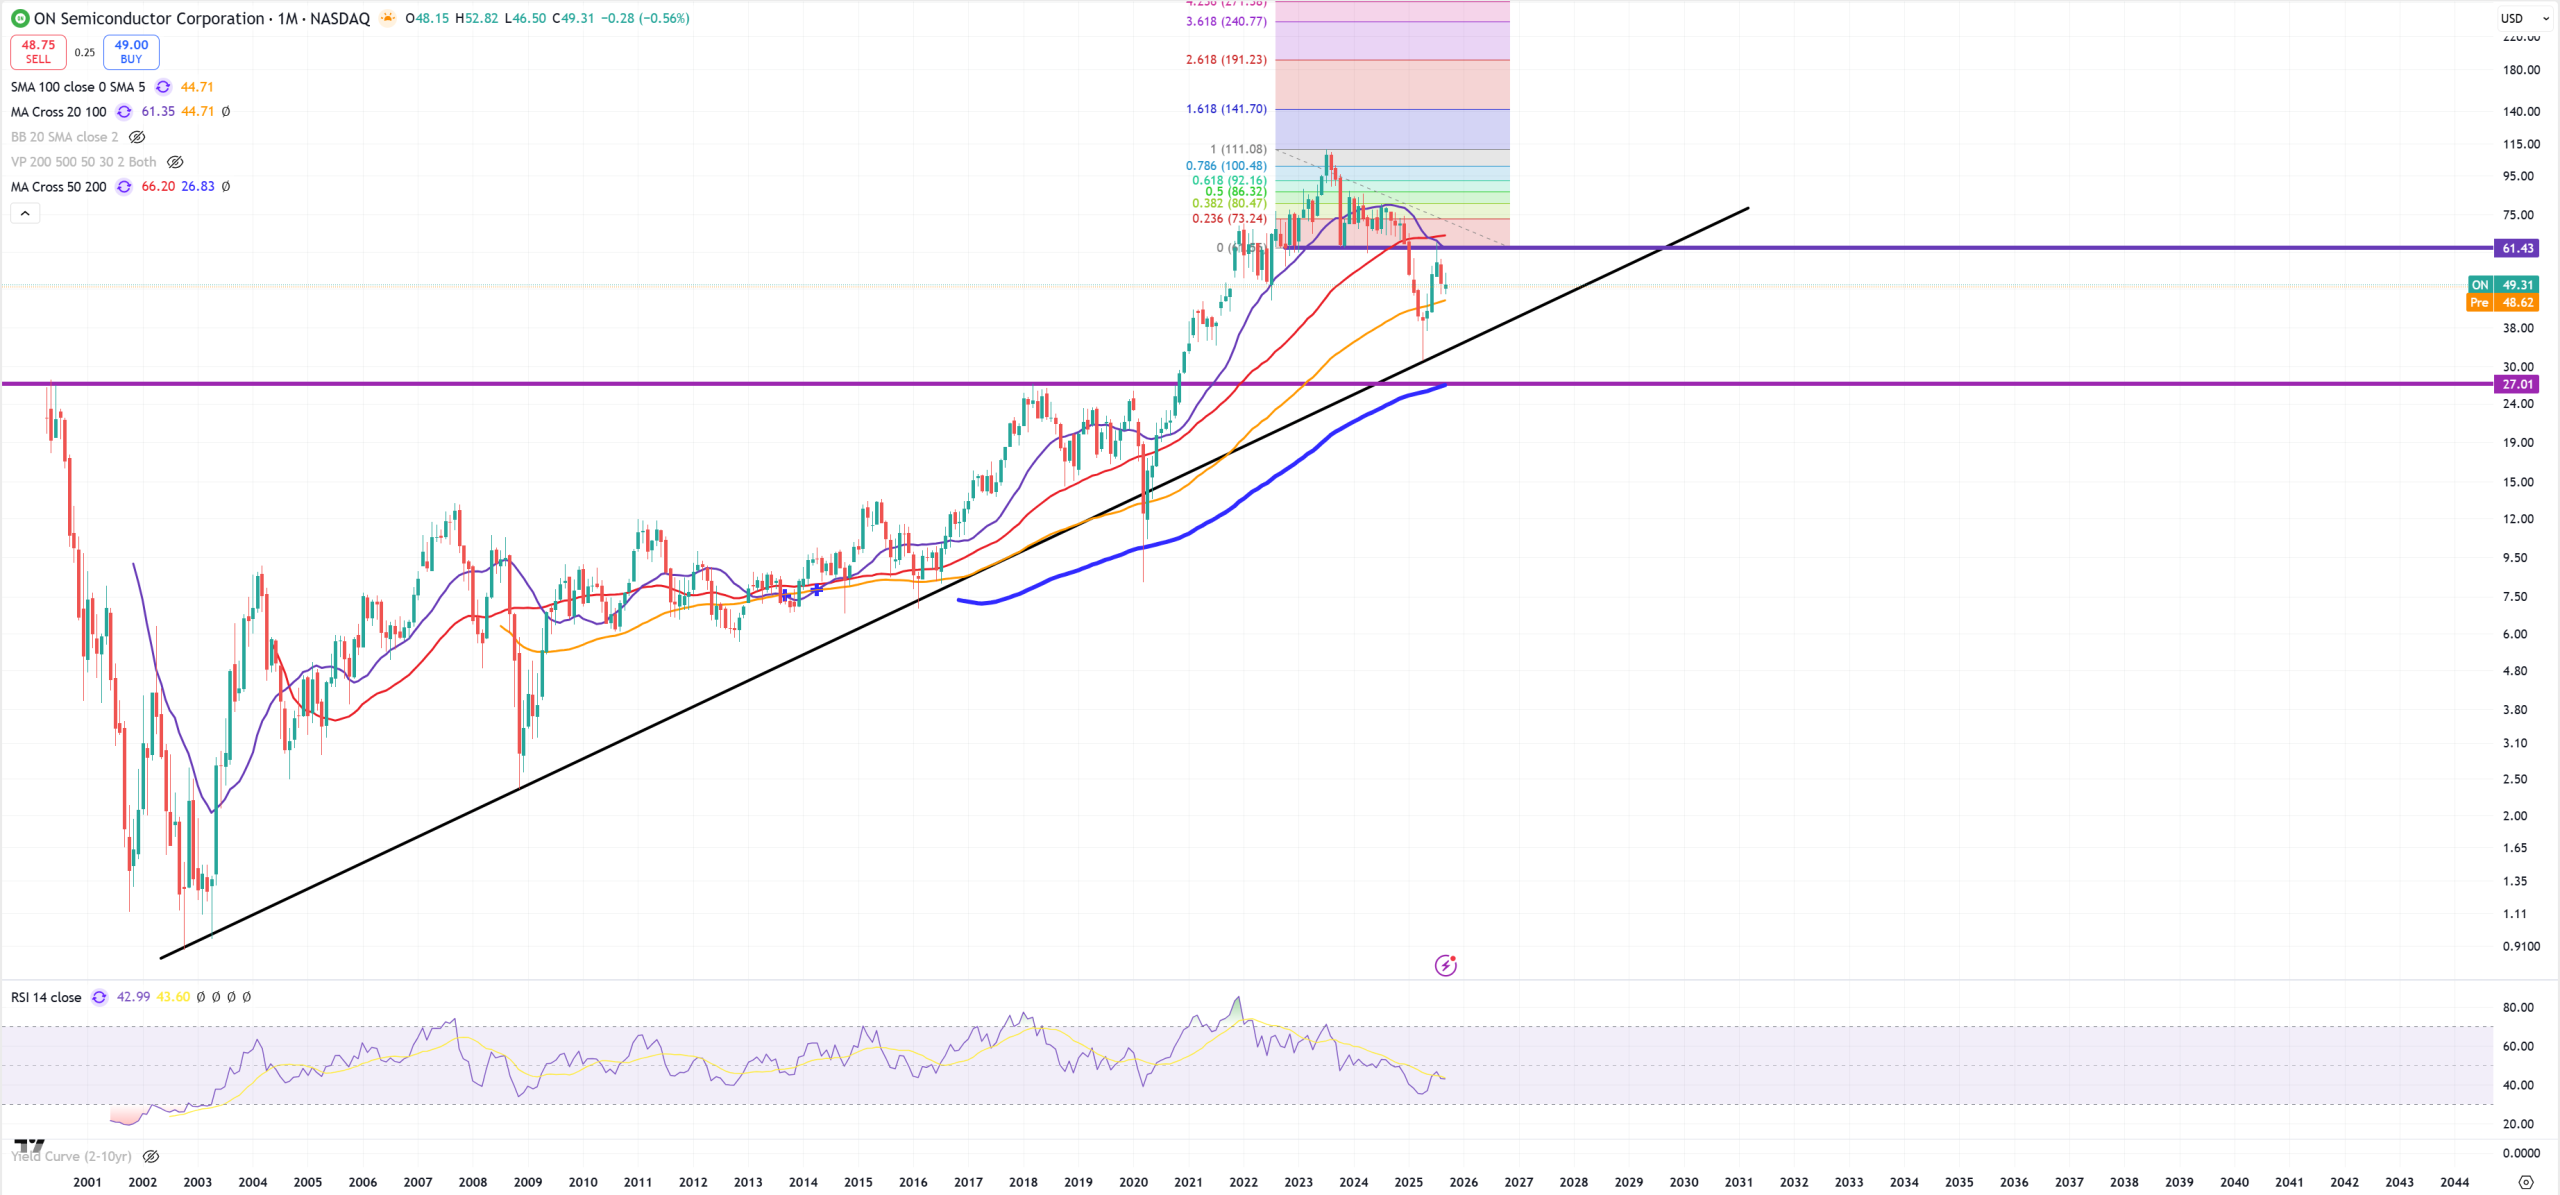
ON – On Semicondutor
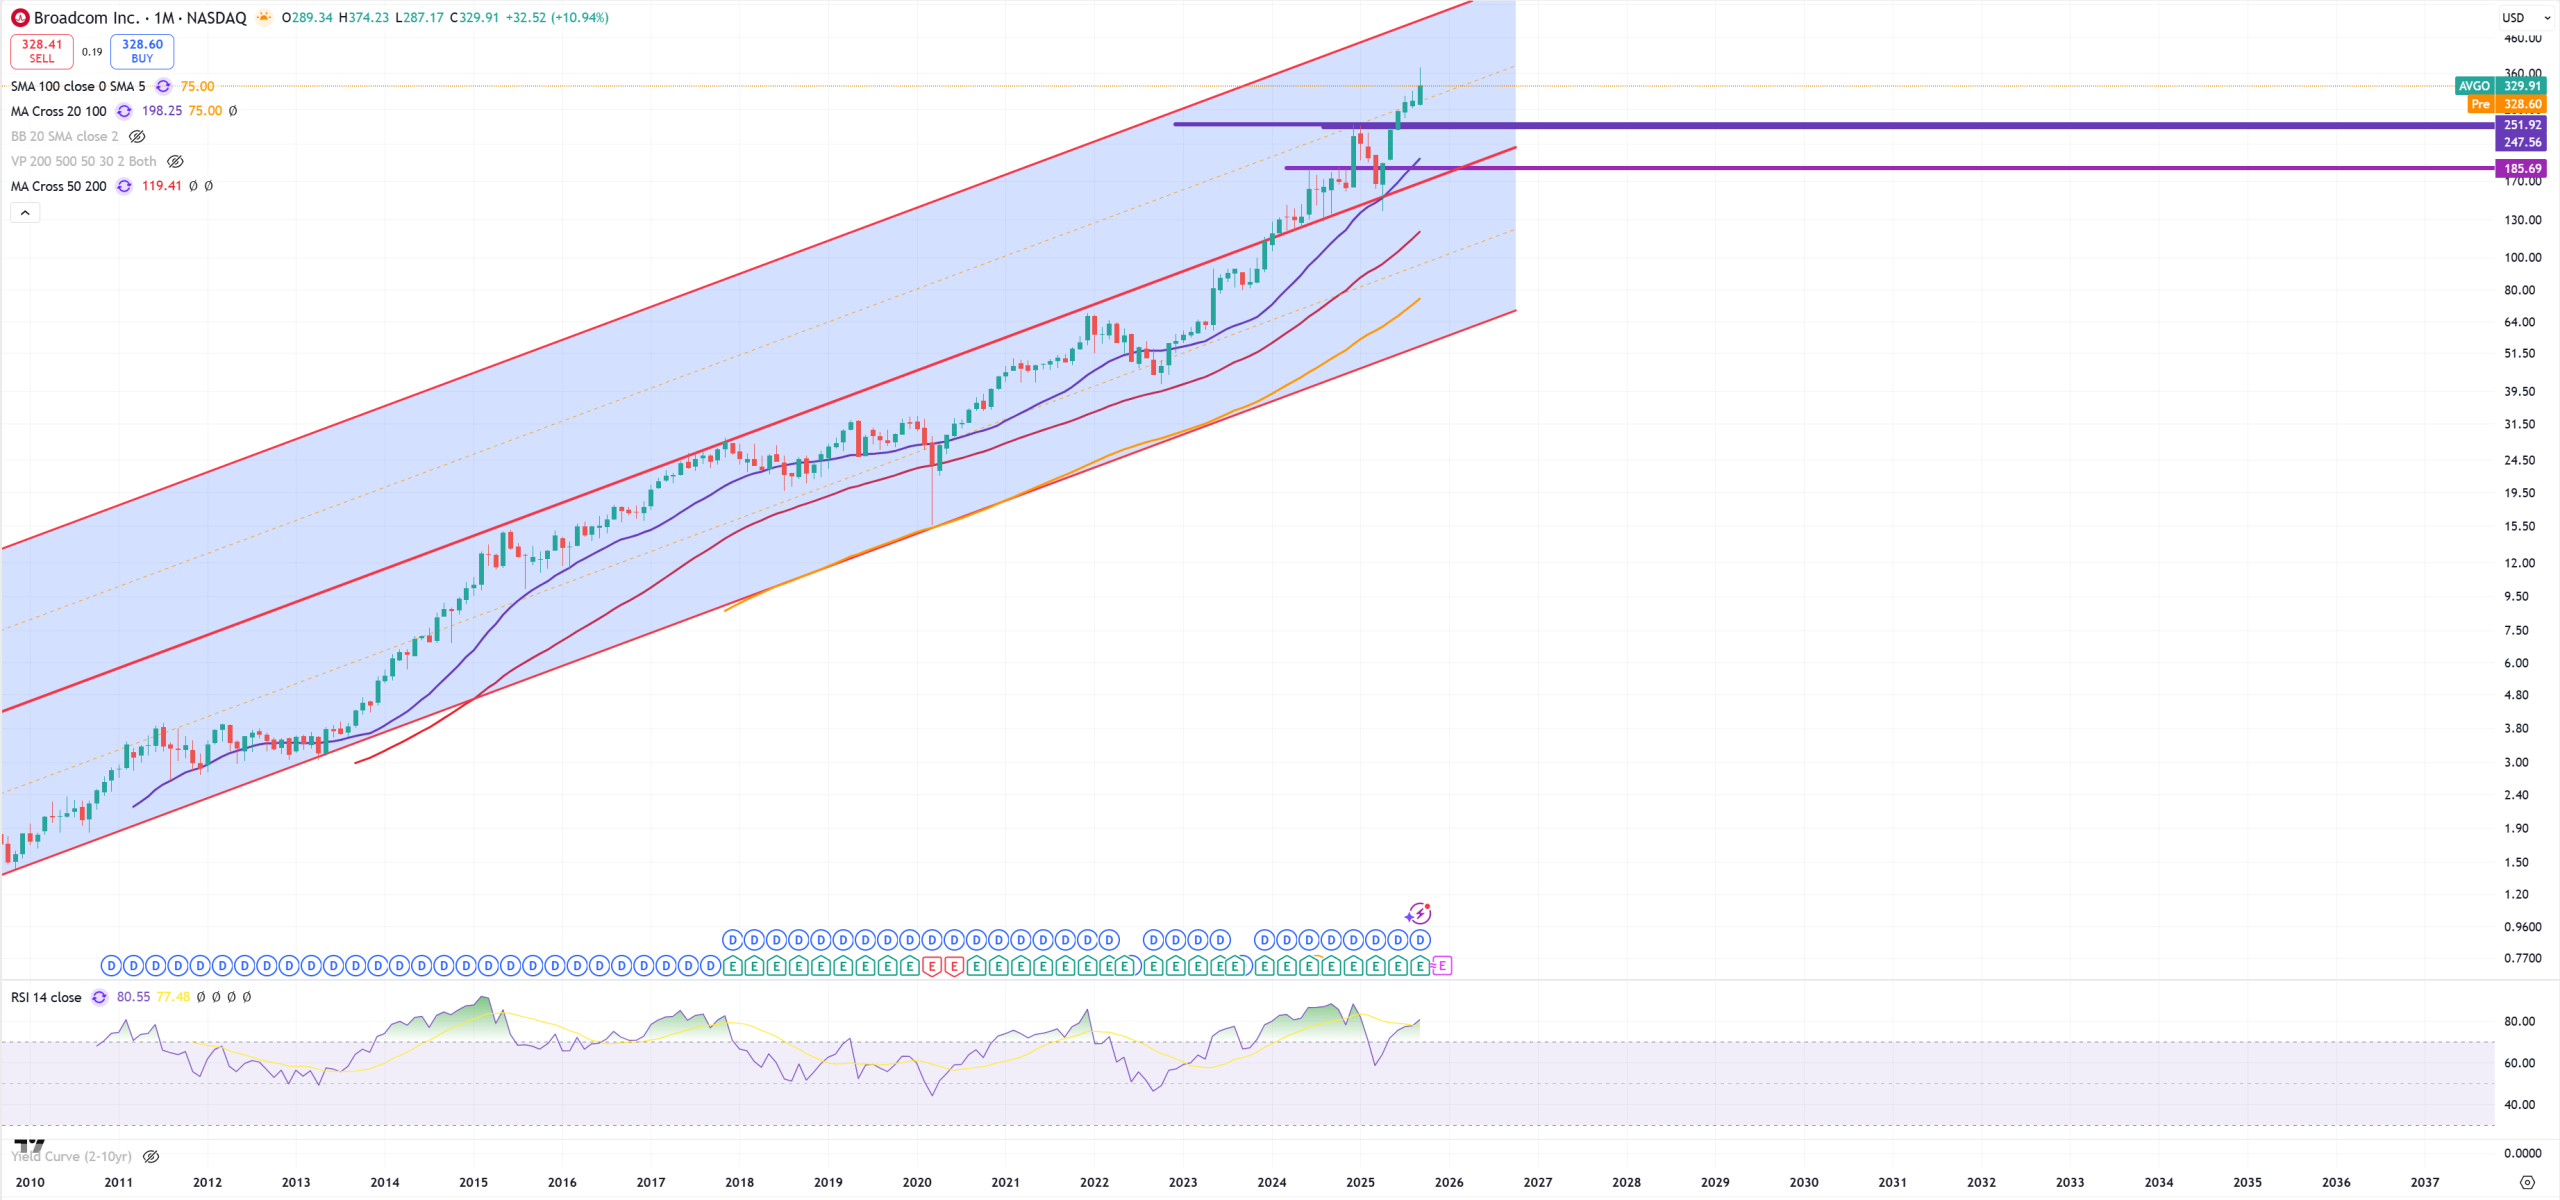
AVGO – Broadcom
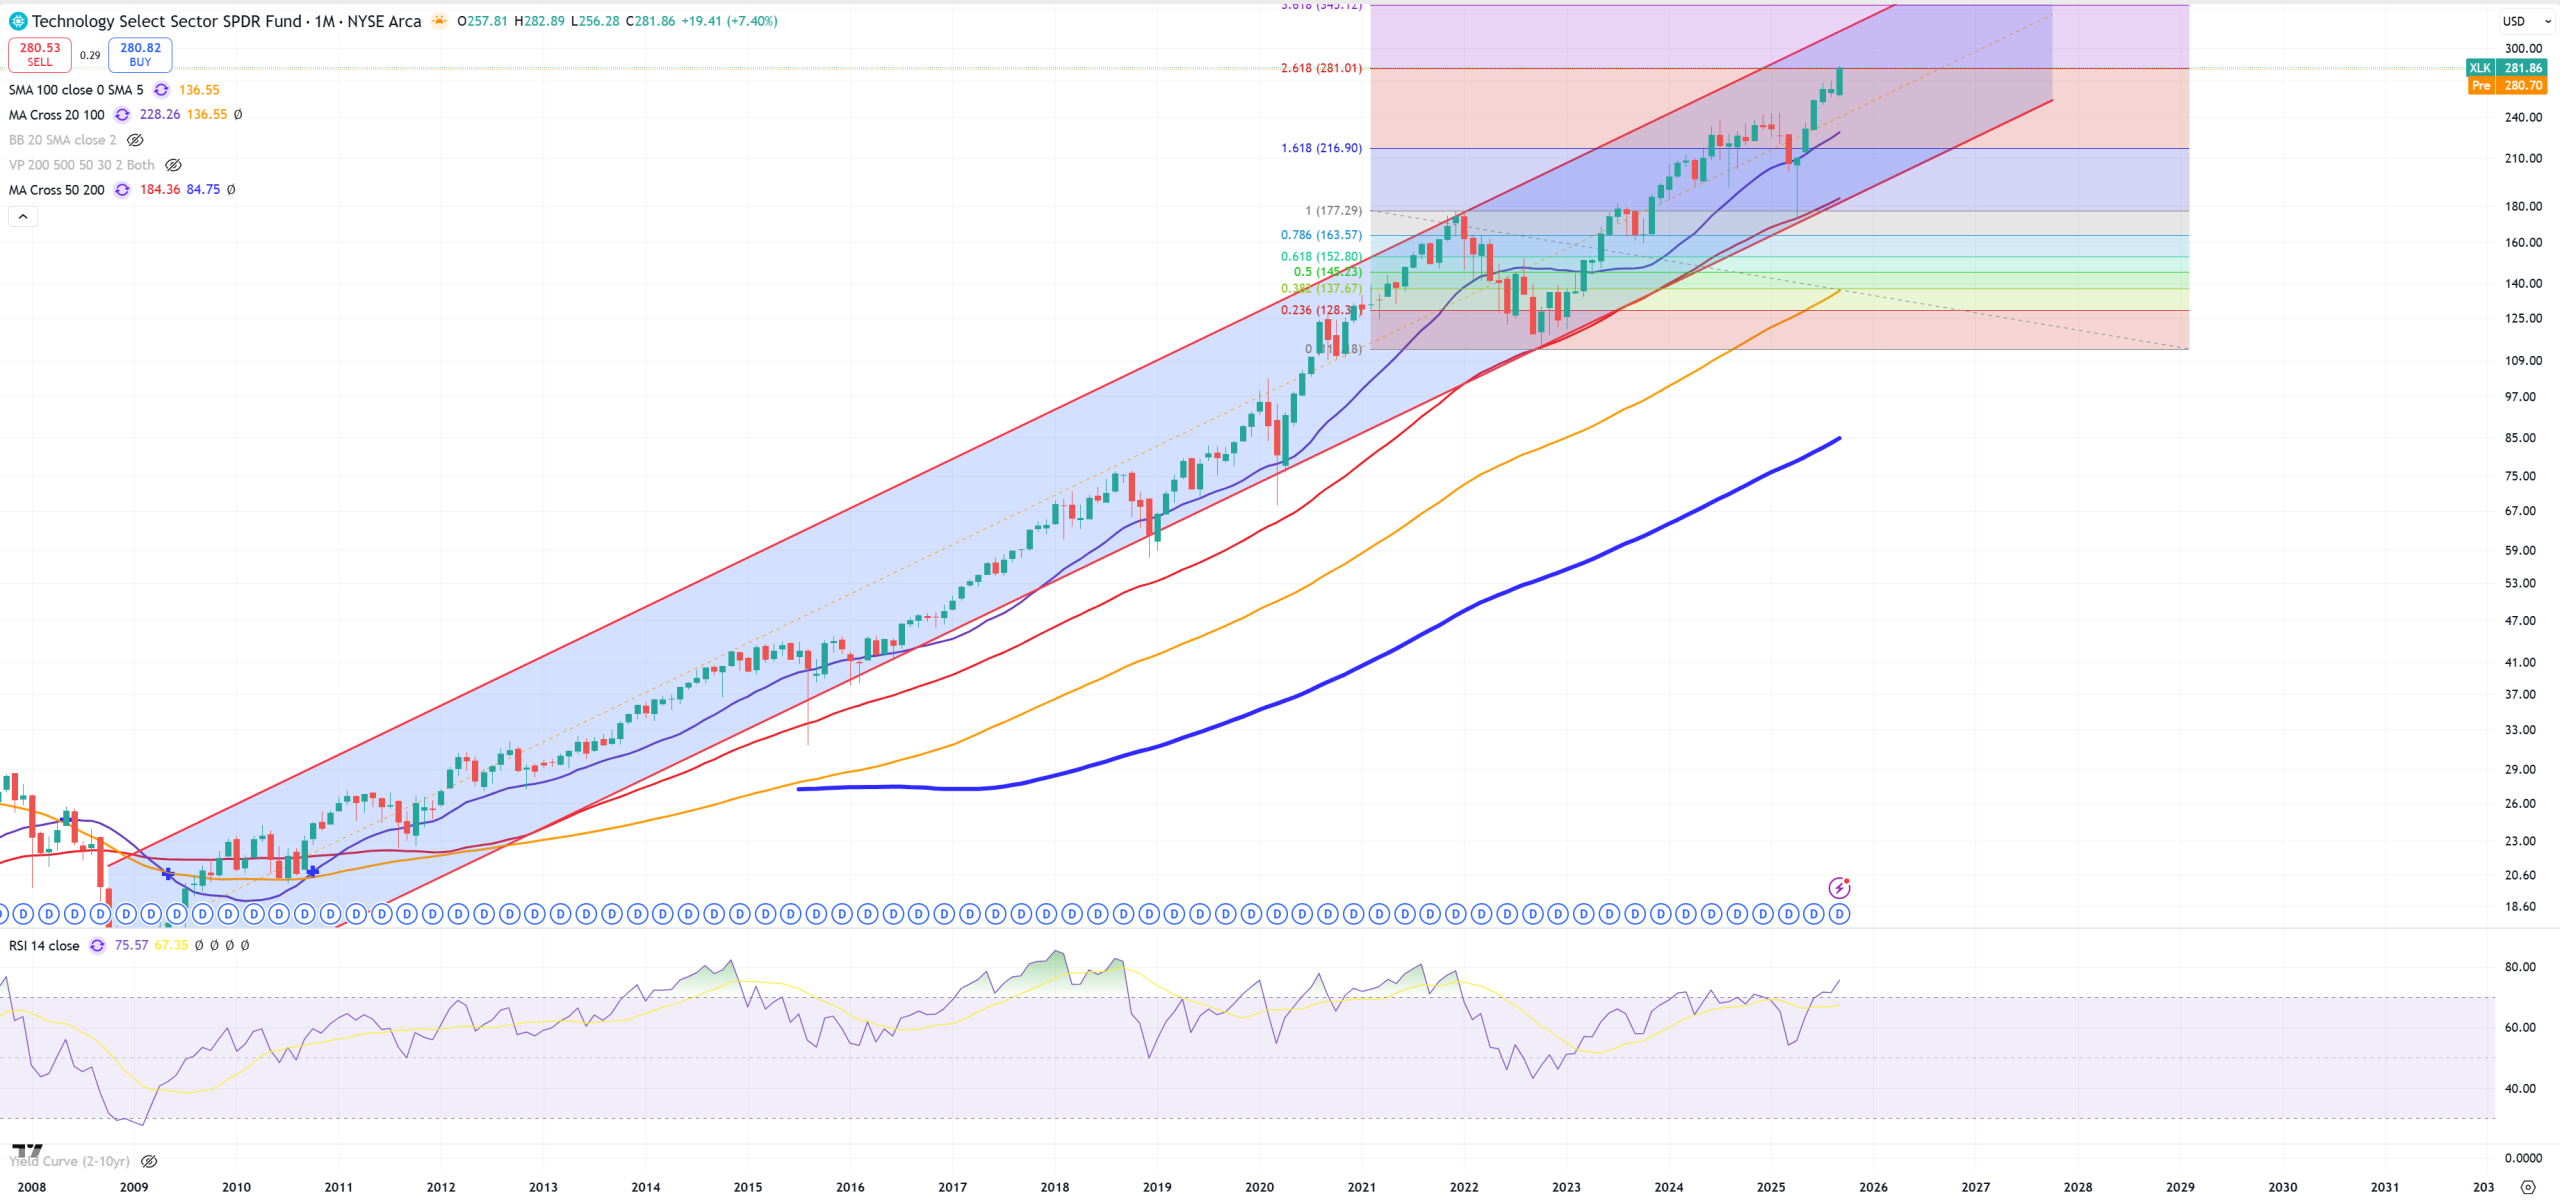
XLK – Tech – is taken for the end
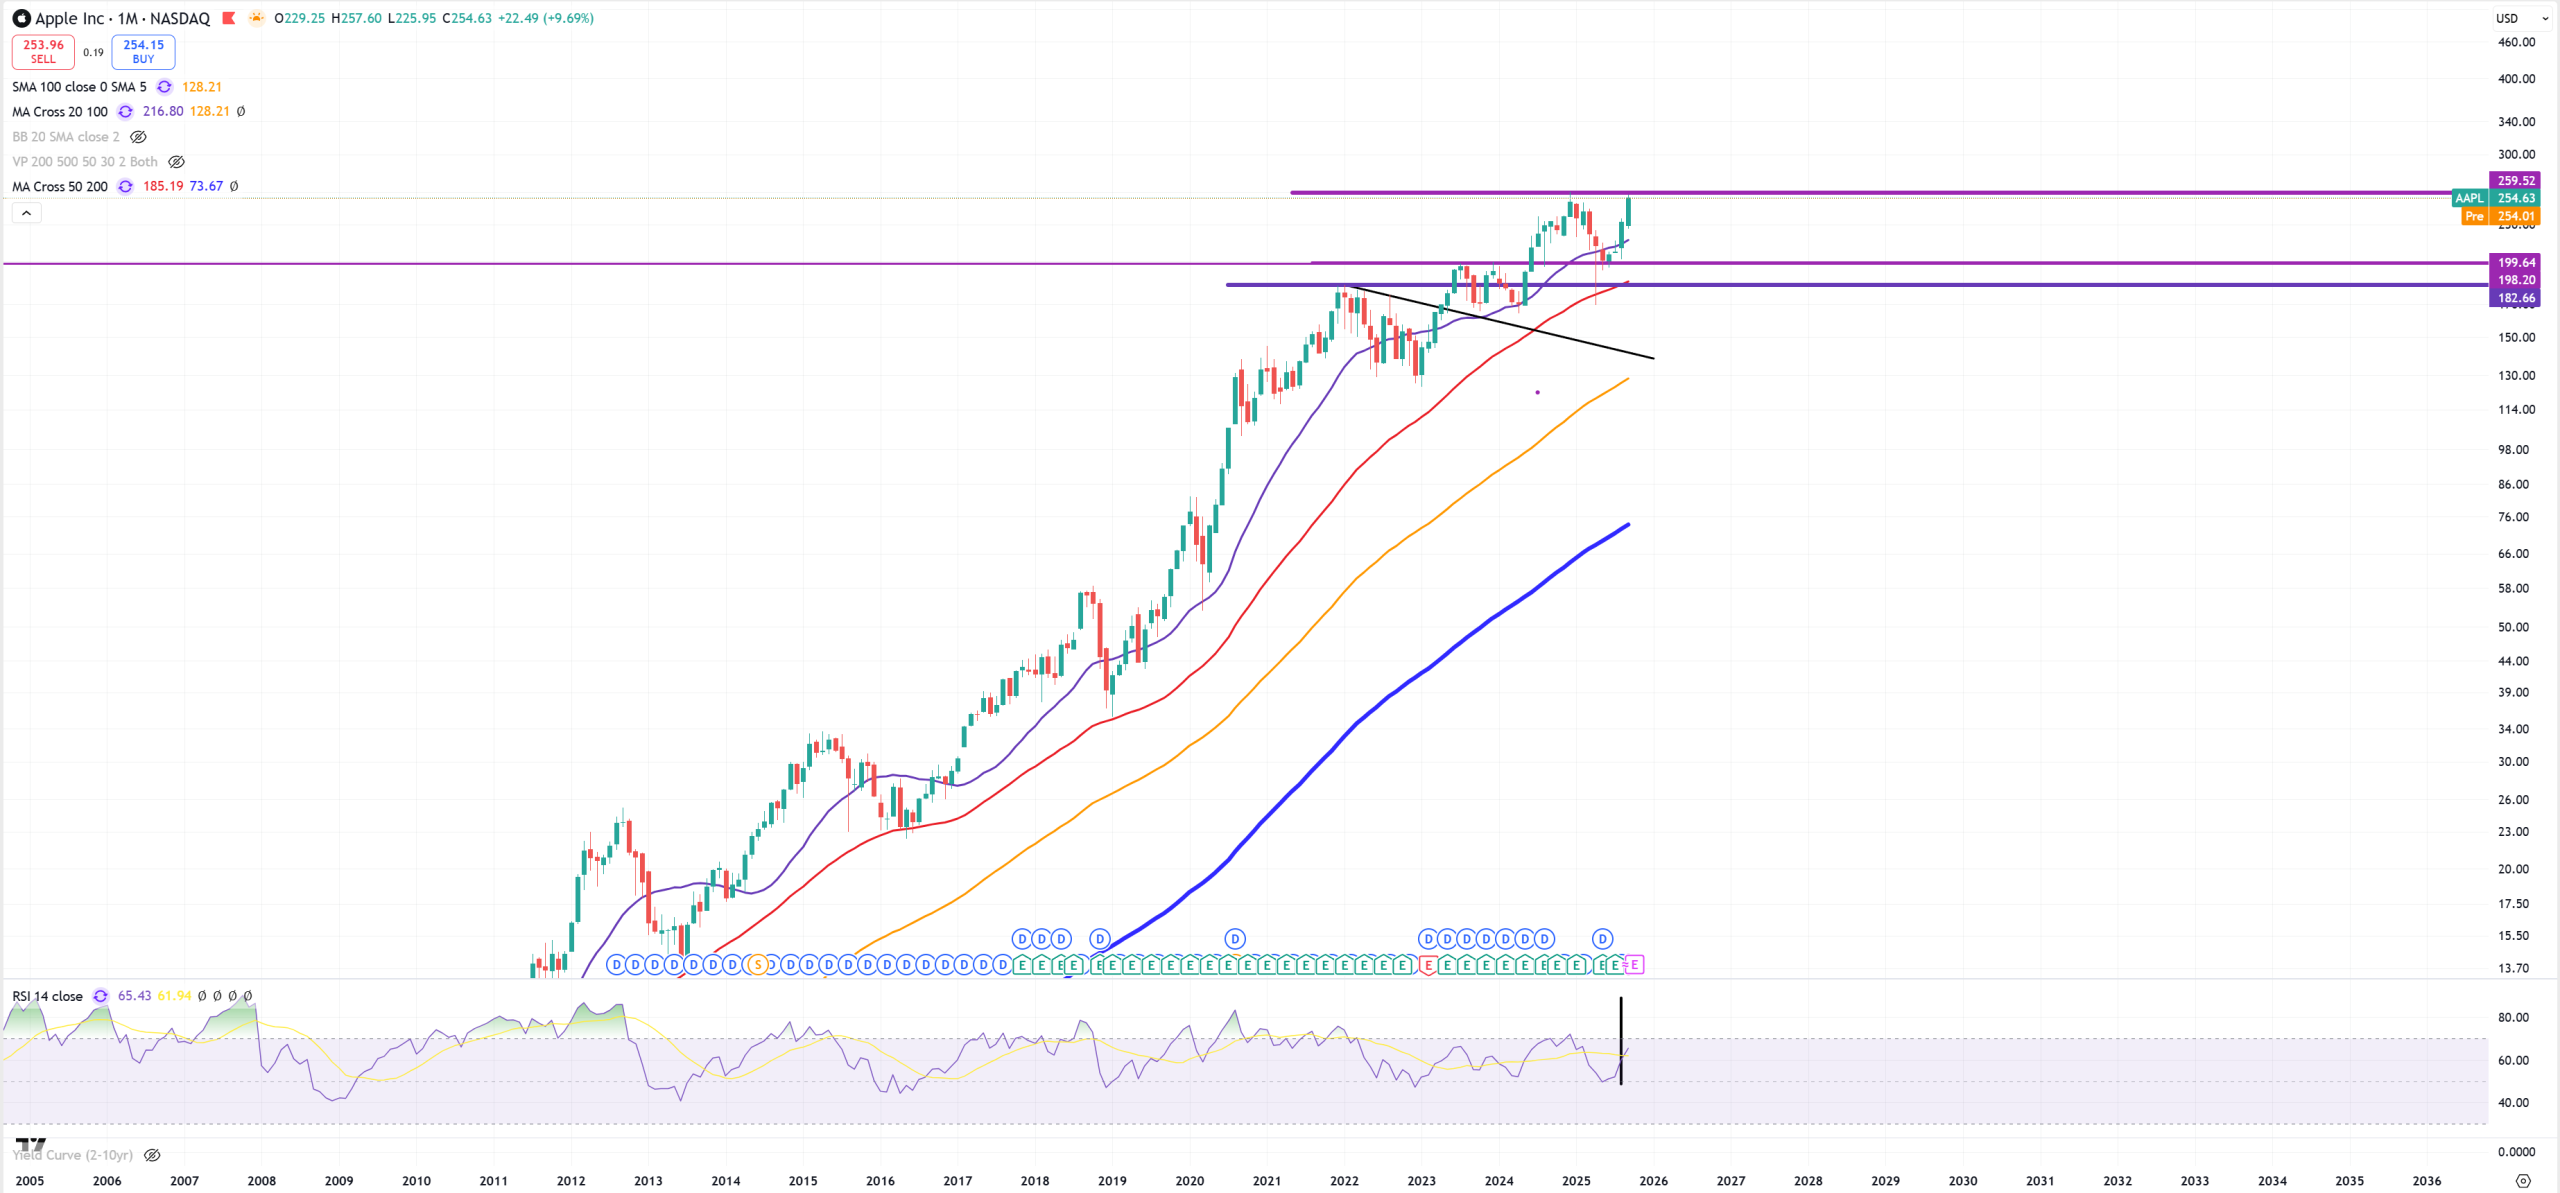
AAPL – Apple defending (M)MA50 and 200$ level.
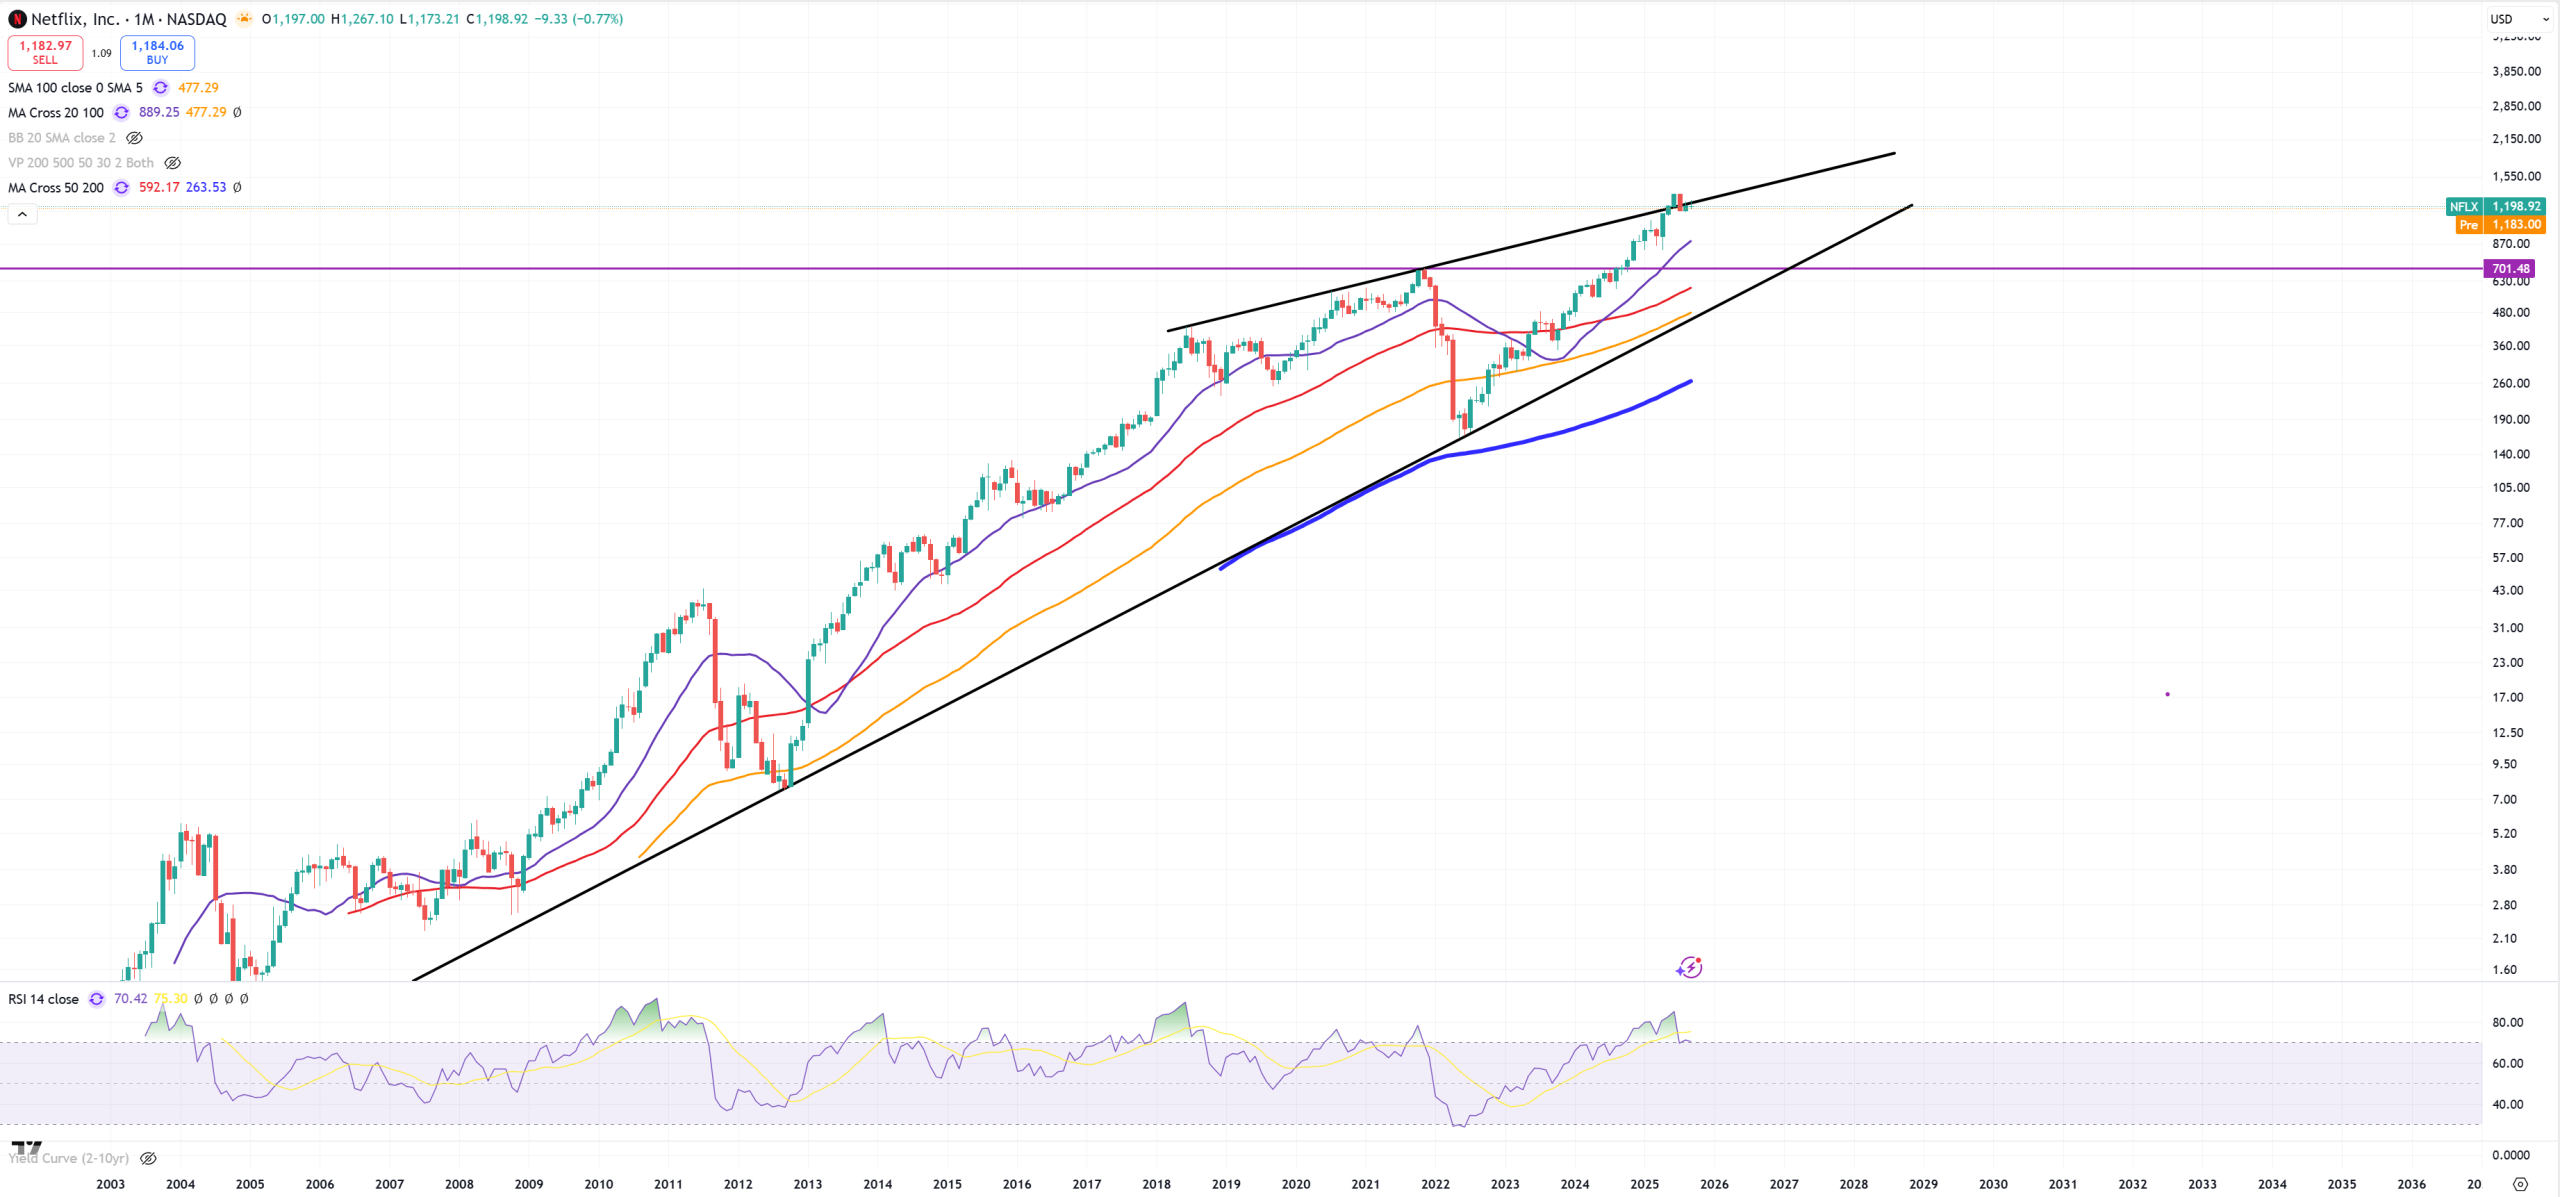
NFLX – Netflix is really interesting
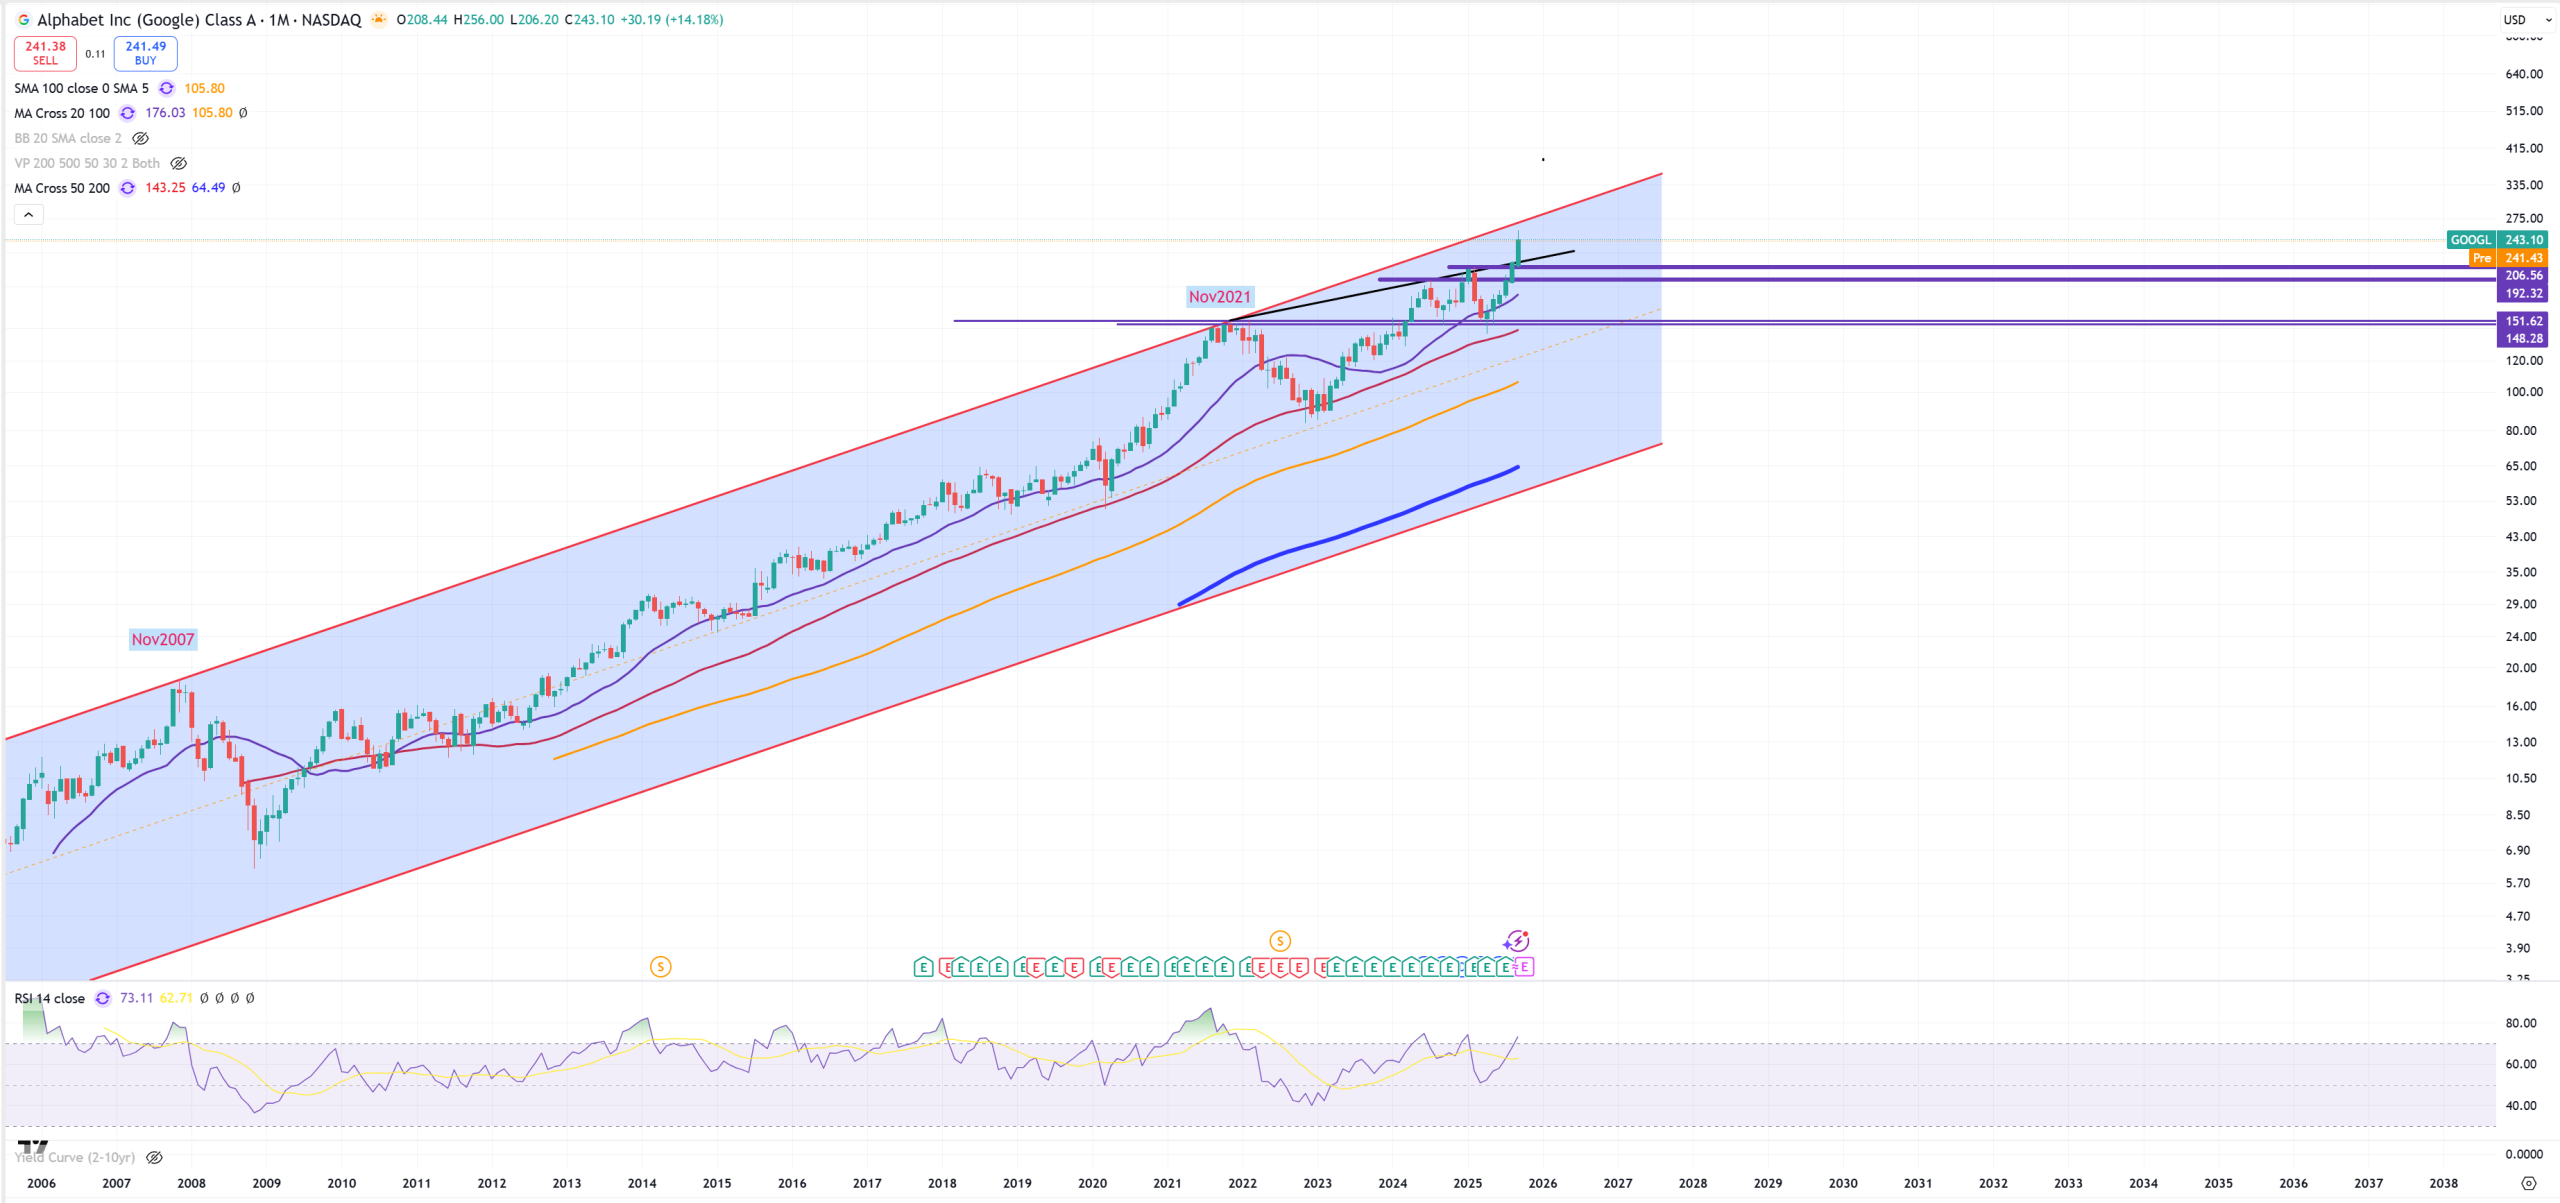
GOOGL – still some room.
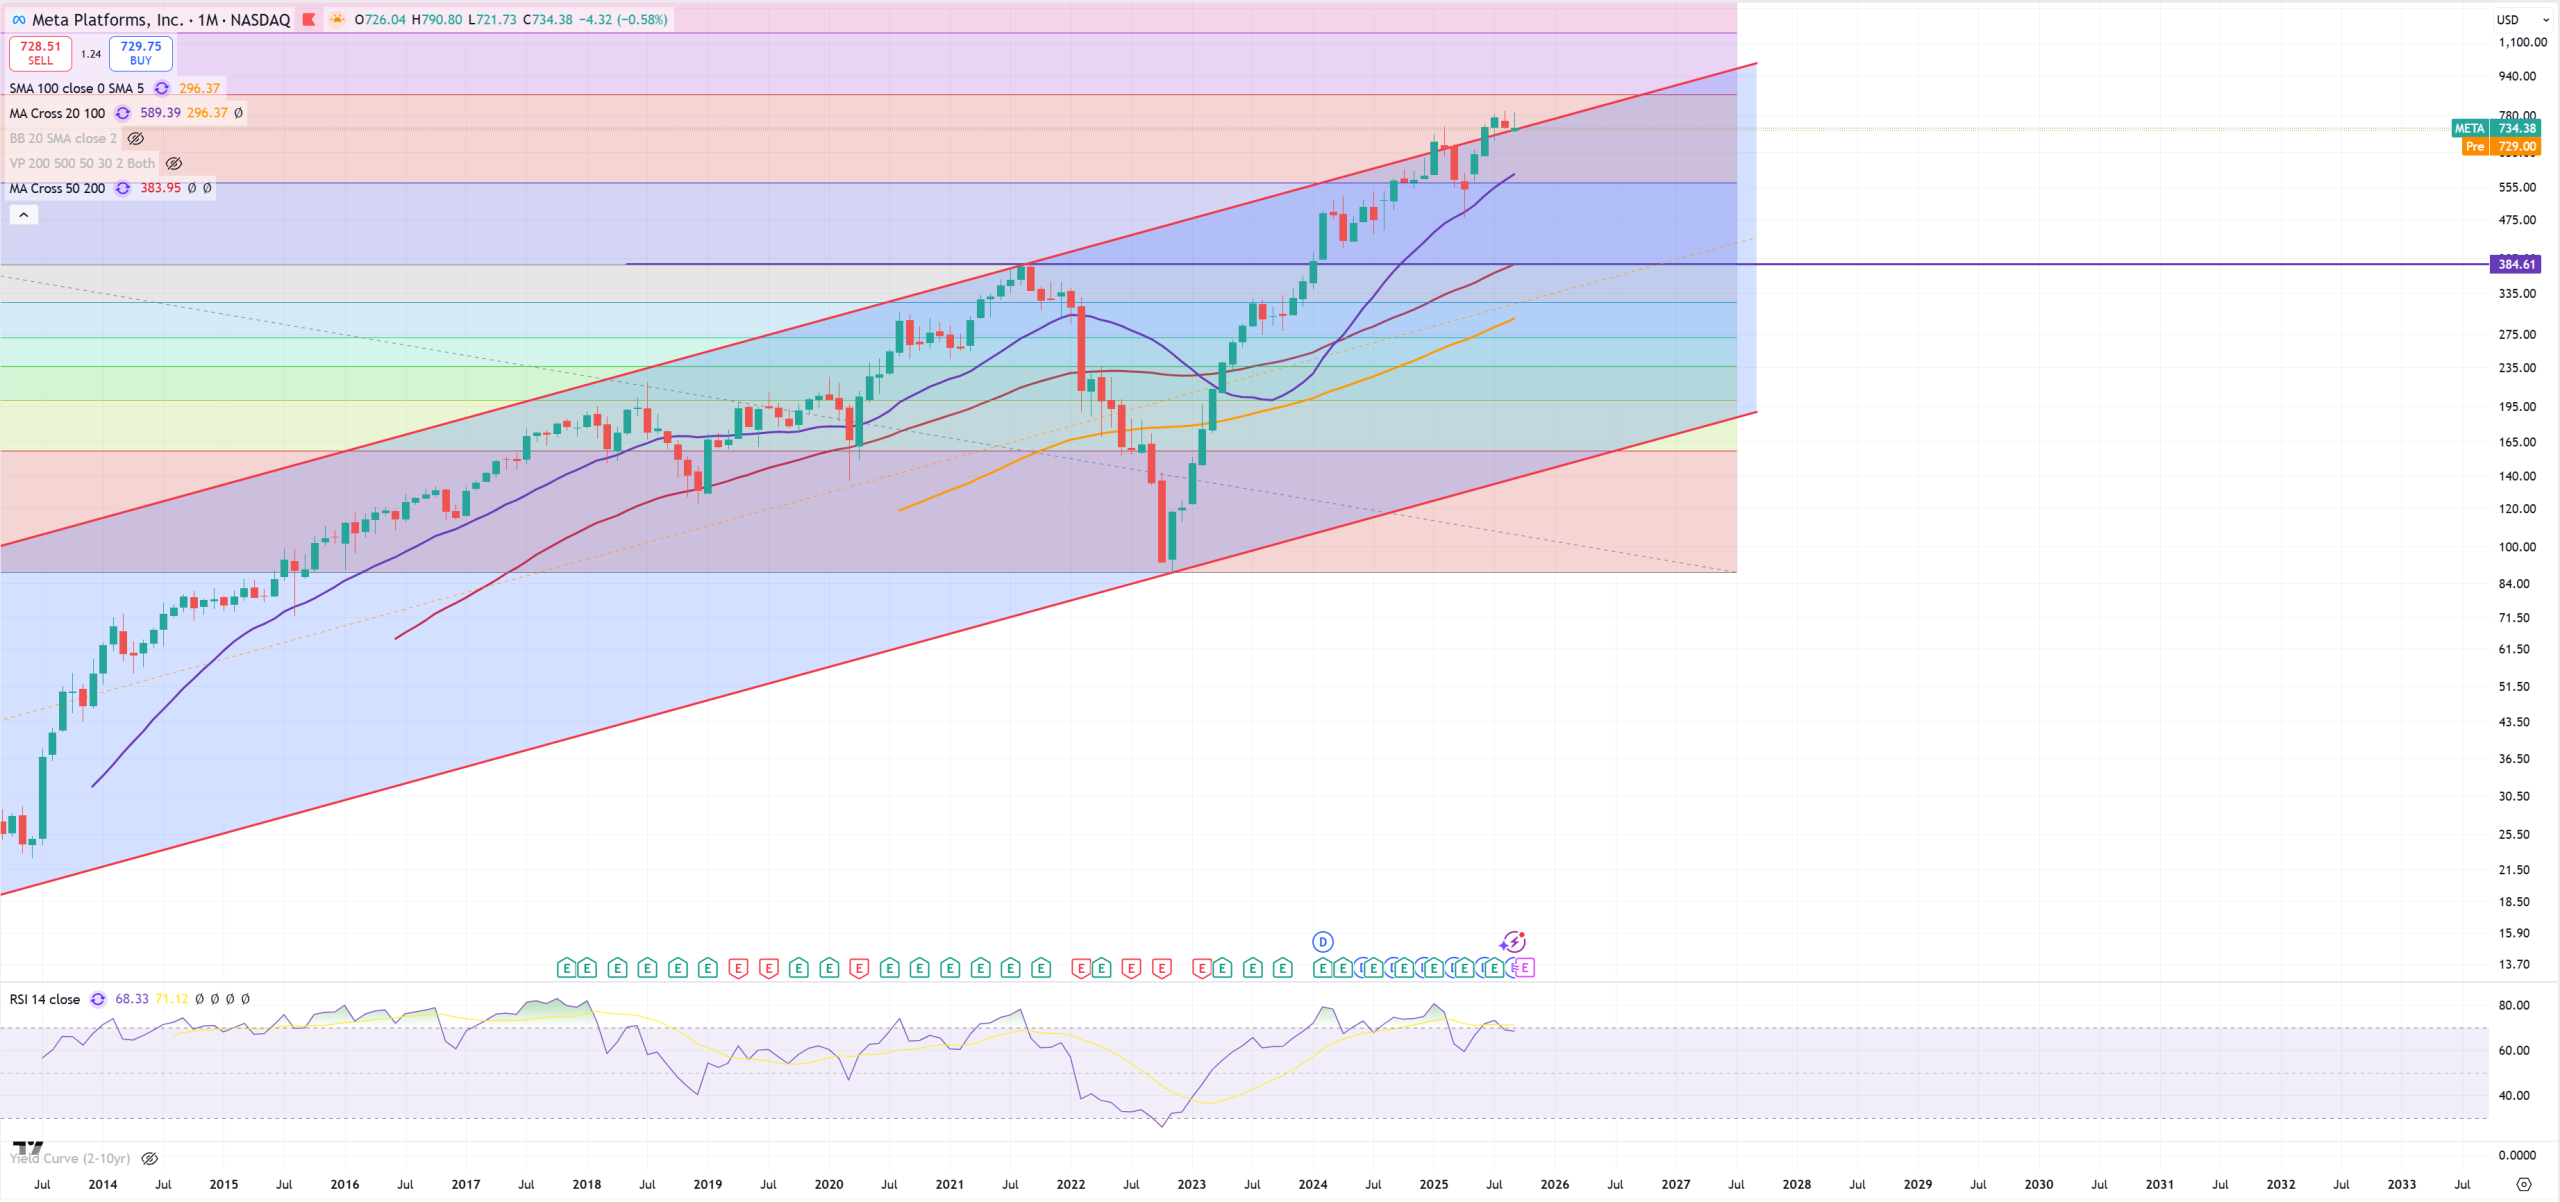
META
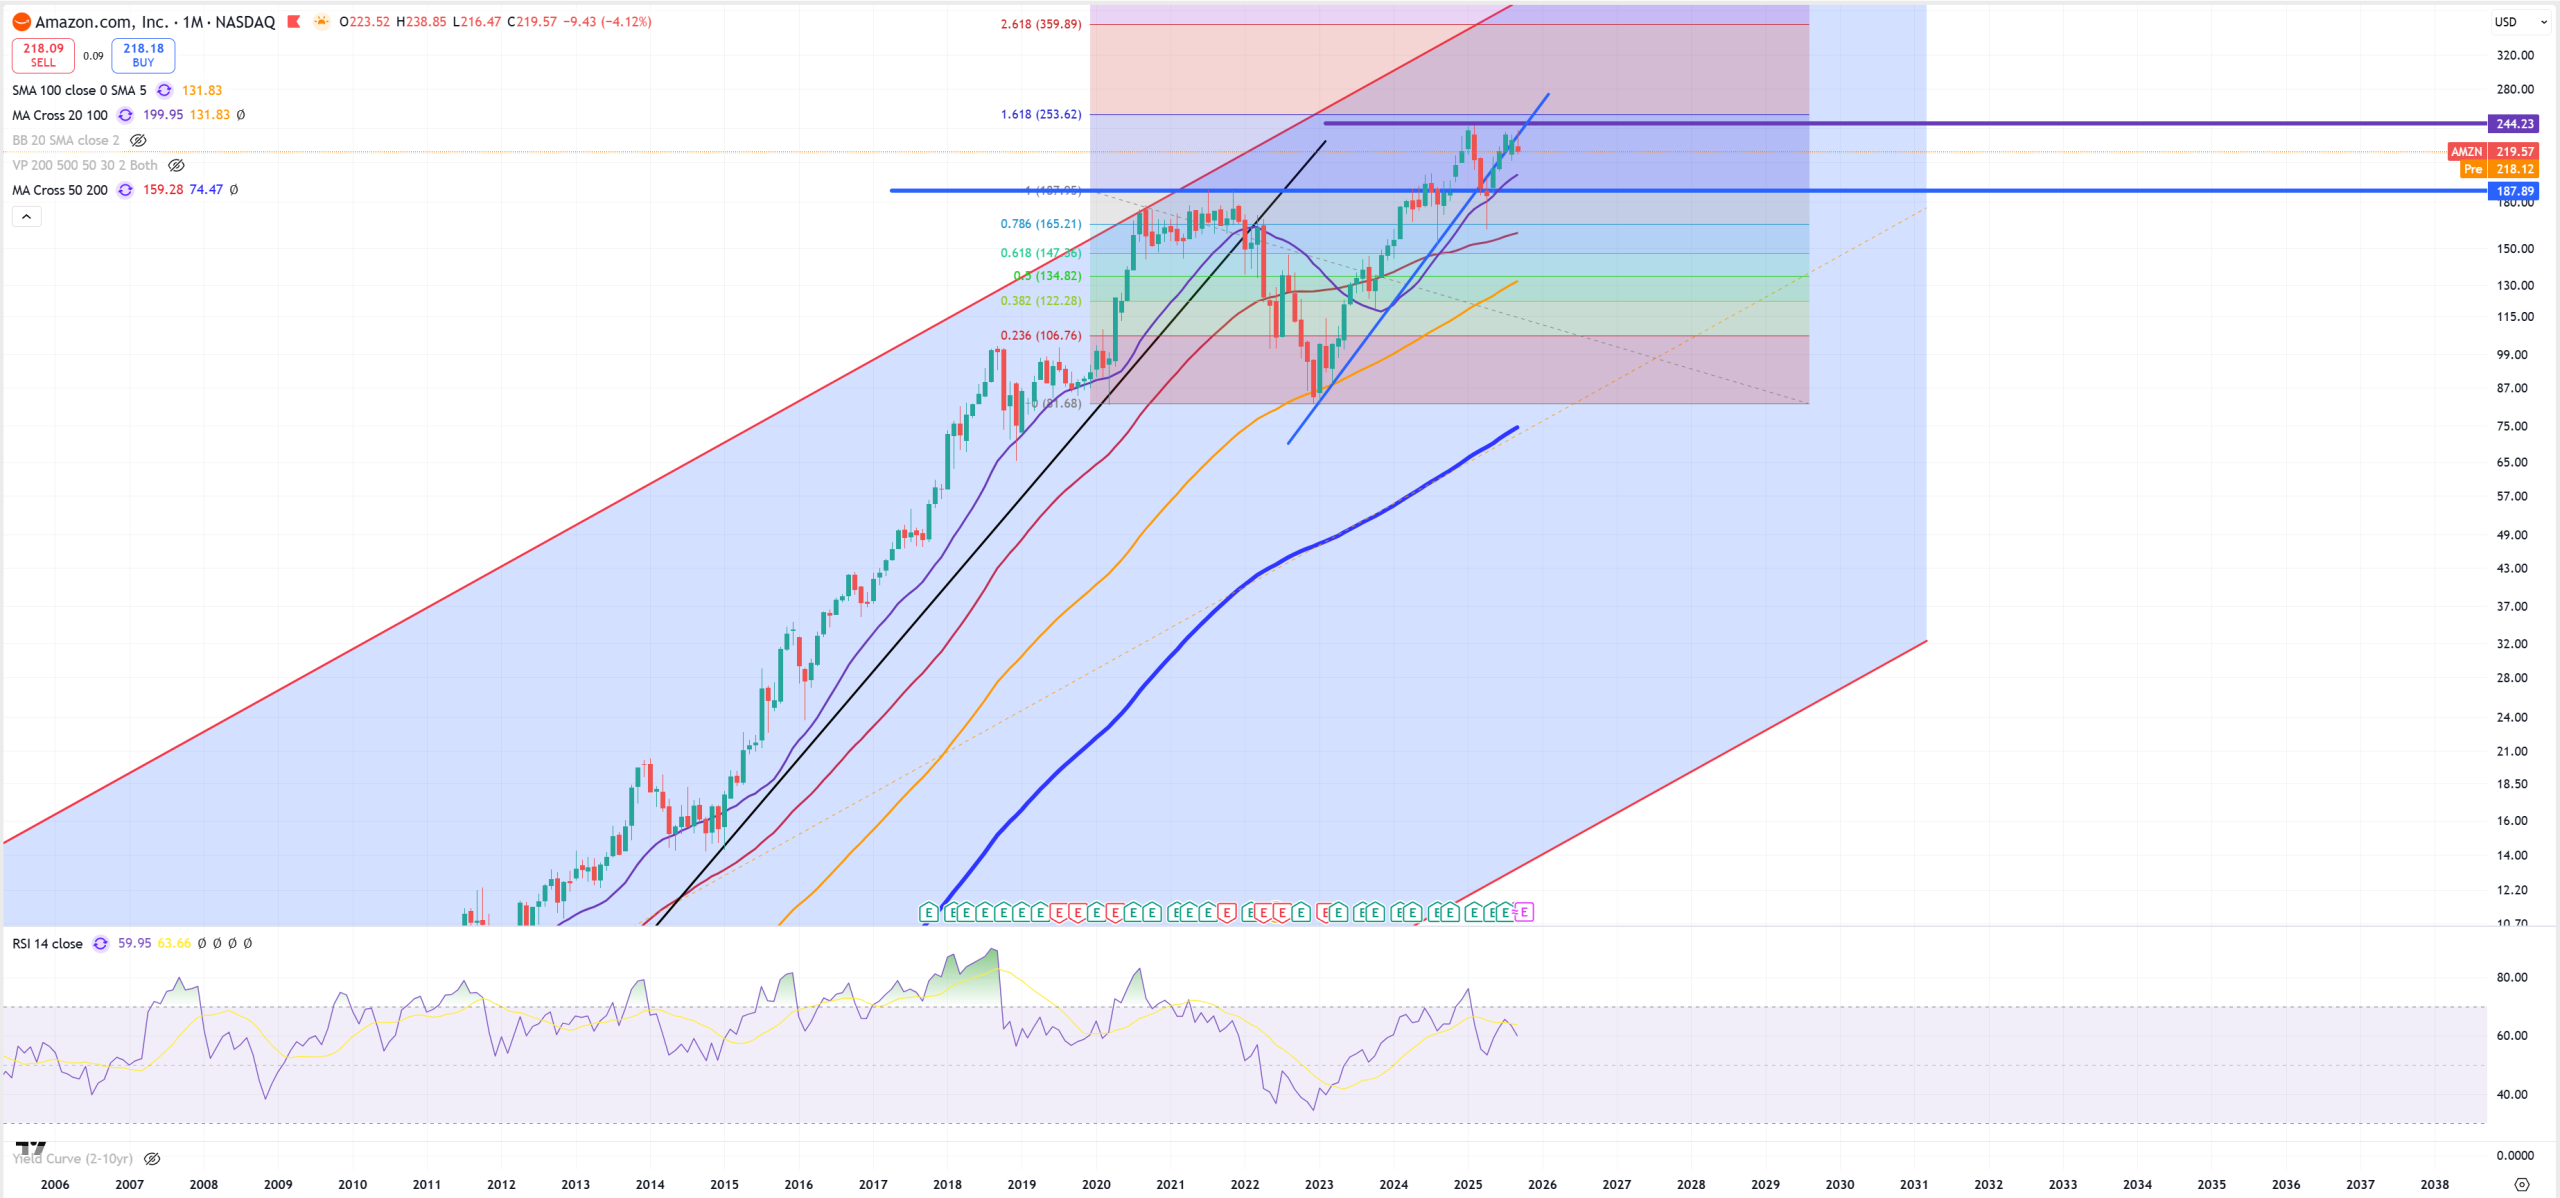
AMZN
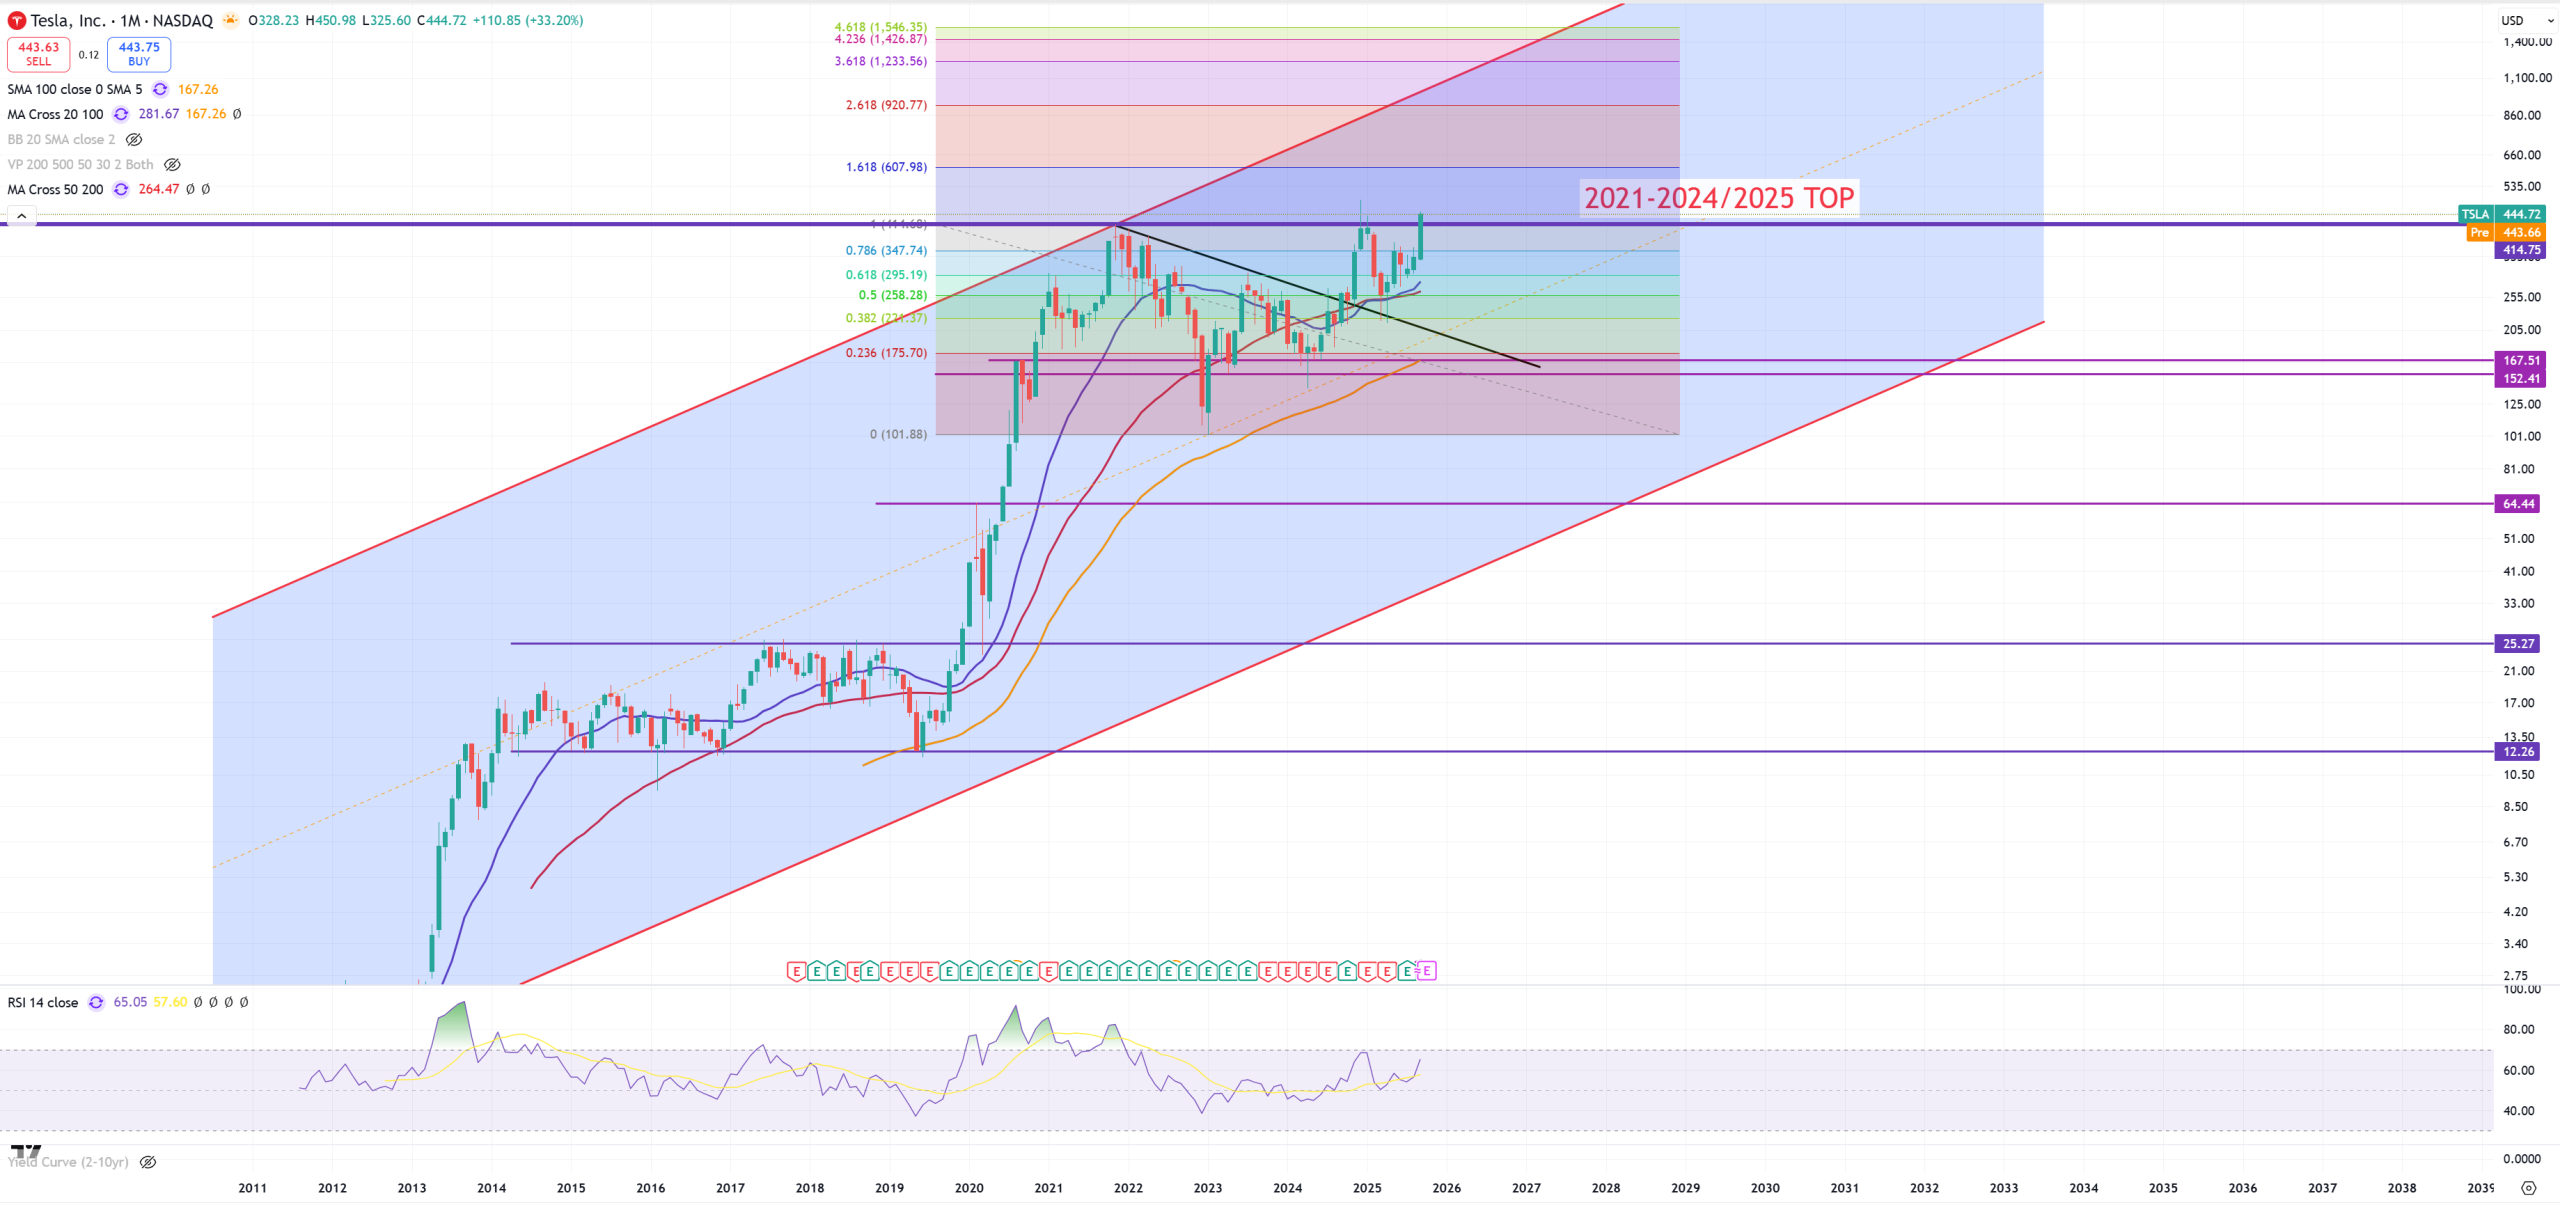
TSLA – despite epic crash in their reports, hype stays. I think personally Elon squeezes it but gamma squeeze without real demand always end in tears. So far we’re holding around 2021 level.