08/2025
August 1, 2025

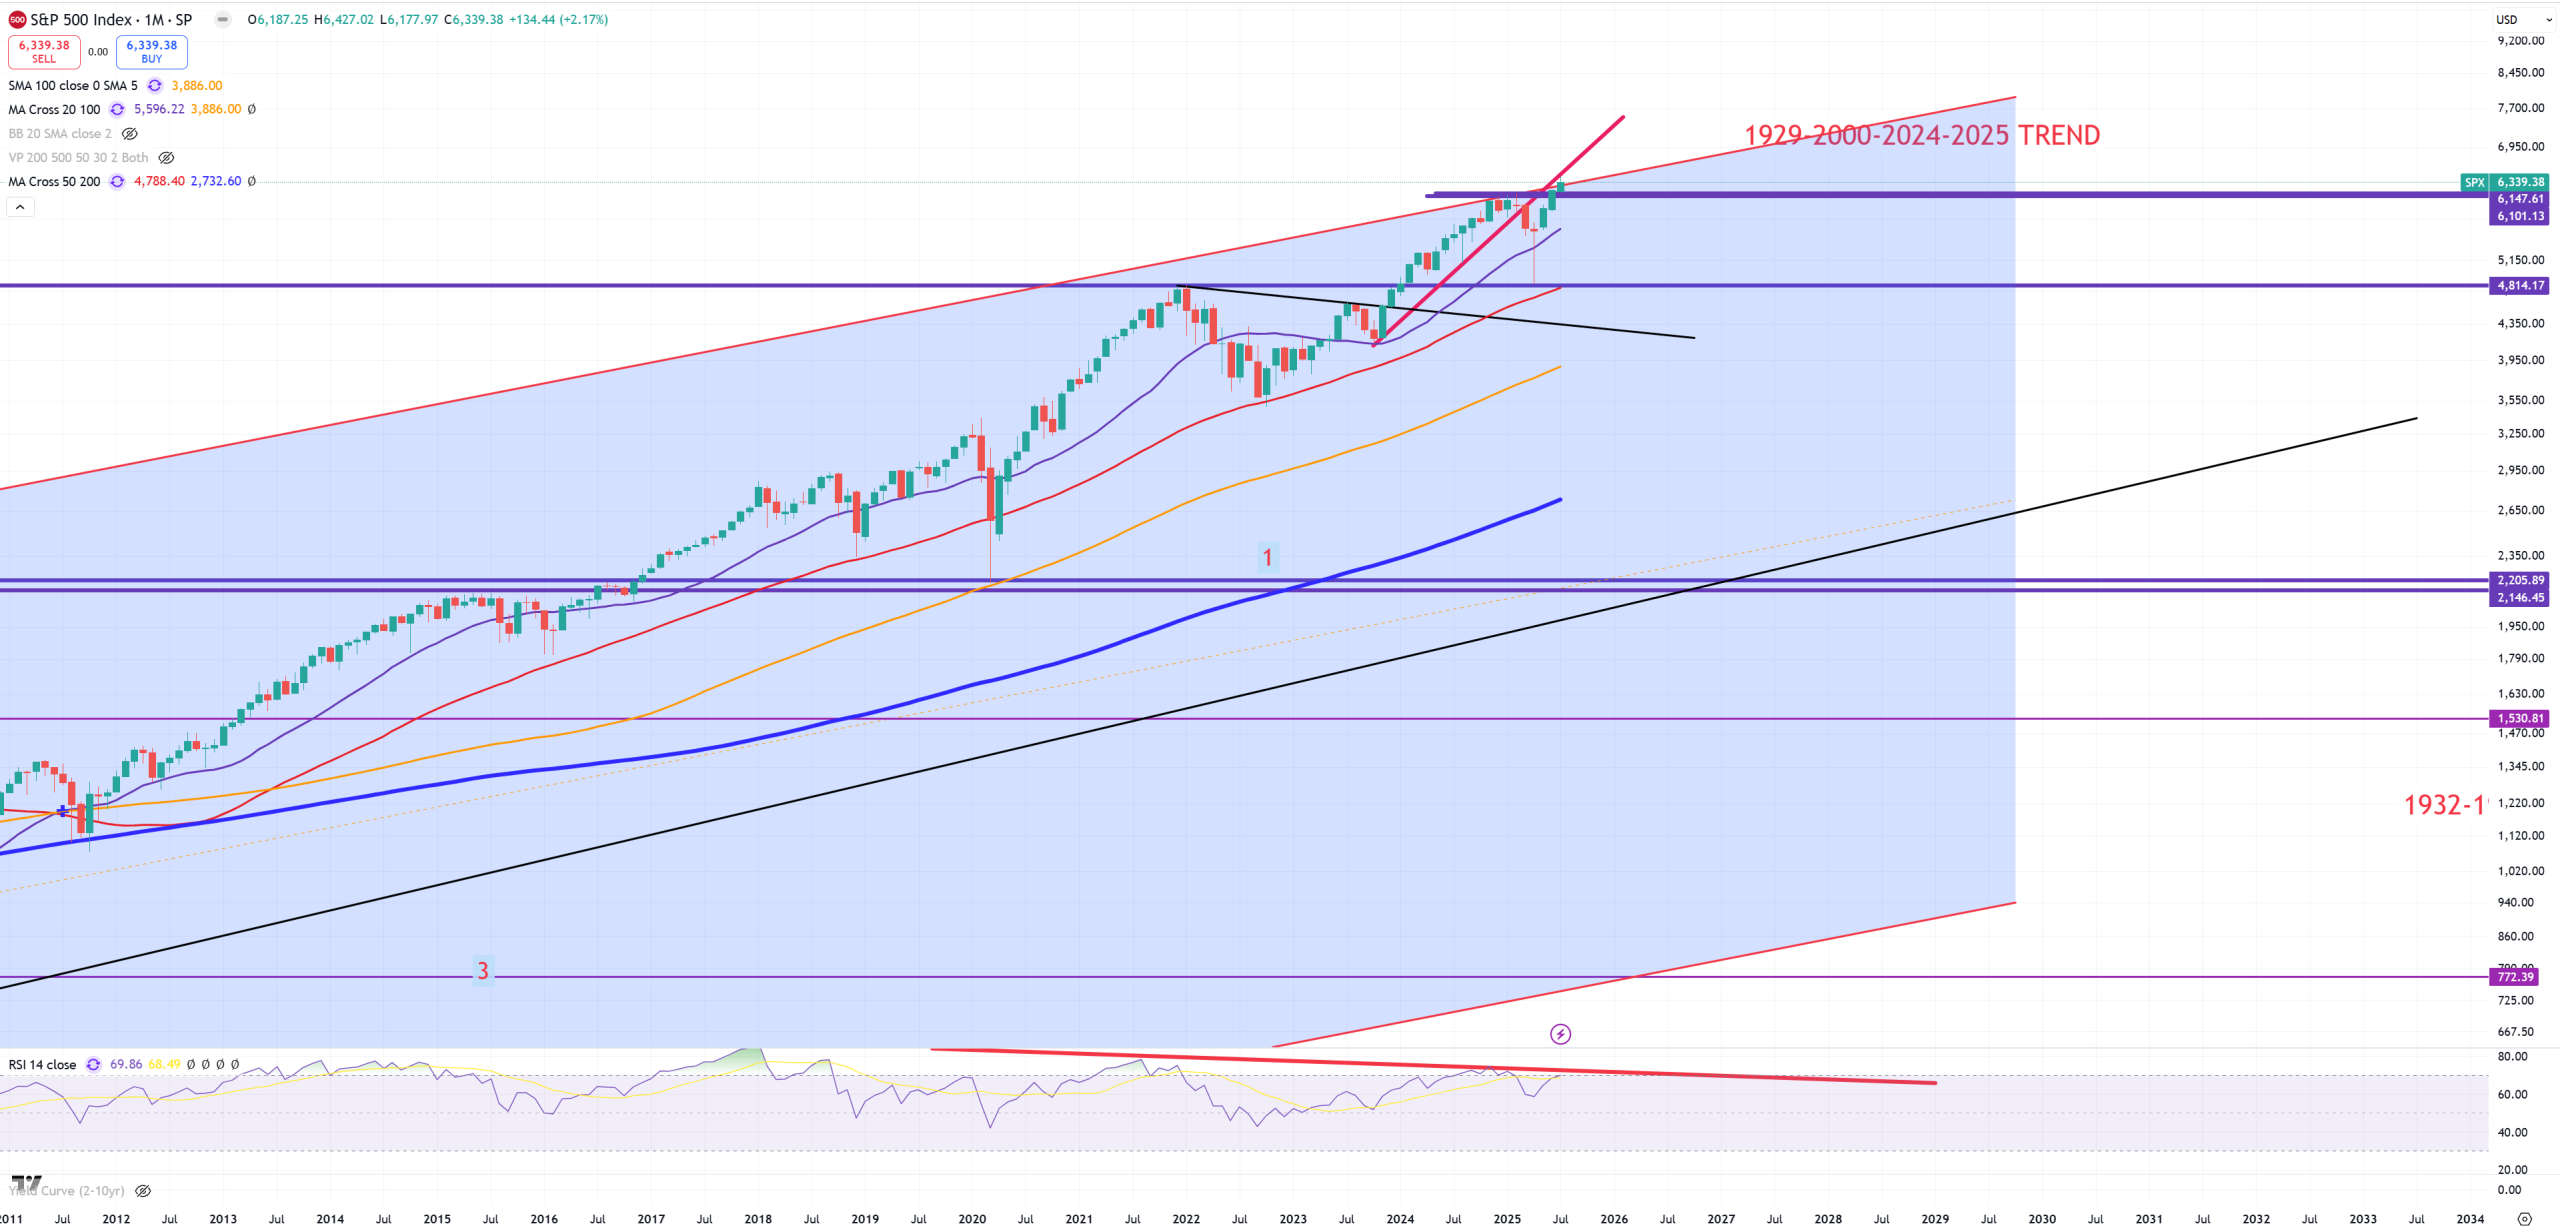
So as a reminder nr 1 chart I watch is still SPX 1929-2000 trend and it’s still below its trend starting August 2025, rest charts when you’ll be analyzing consider through a possible rejection of this 1929-2000 trend and watch in what technical situation those charts are. I can also say that post 2020 economic bounce has ended around 2021/2022 – that’s confirmed by so many macro charts including peak of inflation. Stocks are not the economy but they lag the economy, some does not lag, some lags a lot.
SPX – so the market still floats around its 1929-2000 trend and jumping even above. Level for August 2025 is 6315, while level for July 2025 is 6280. So I assume we open back below 6315 now pushing back below the main 1929-2000 trend.
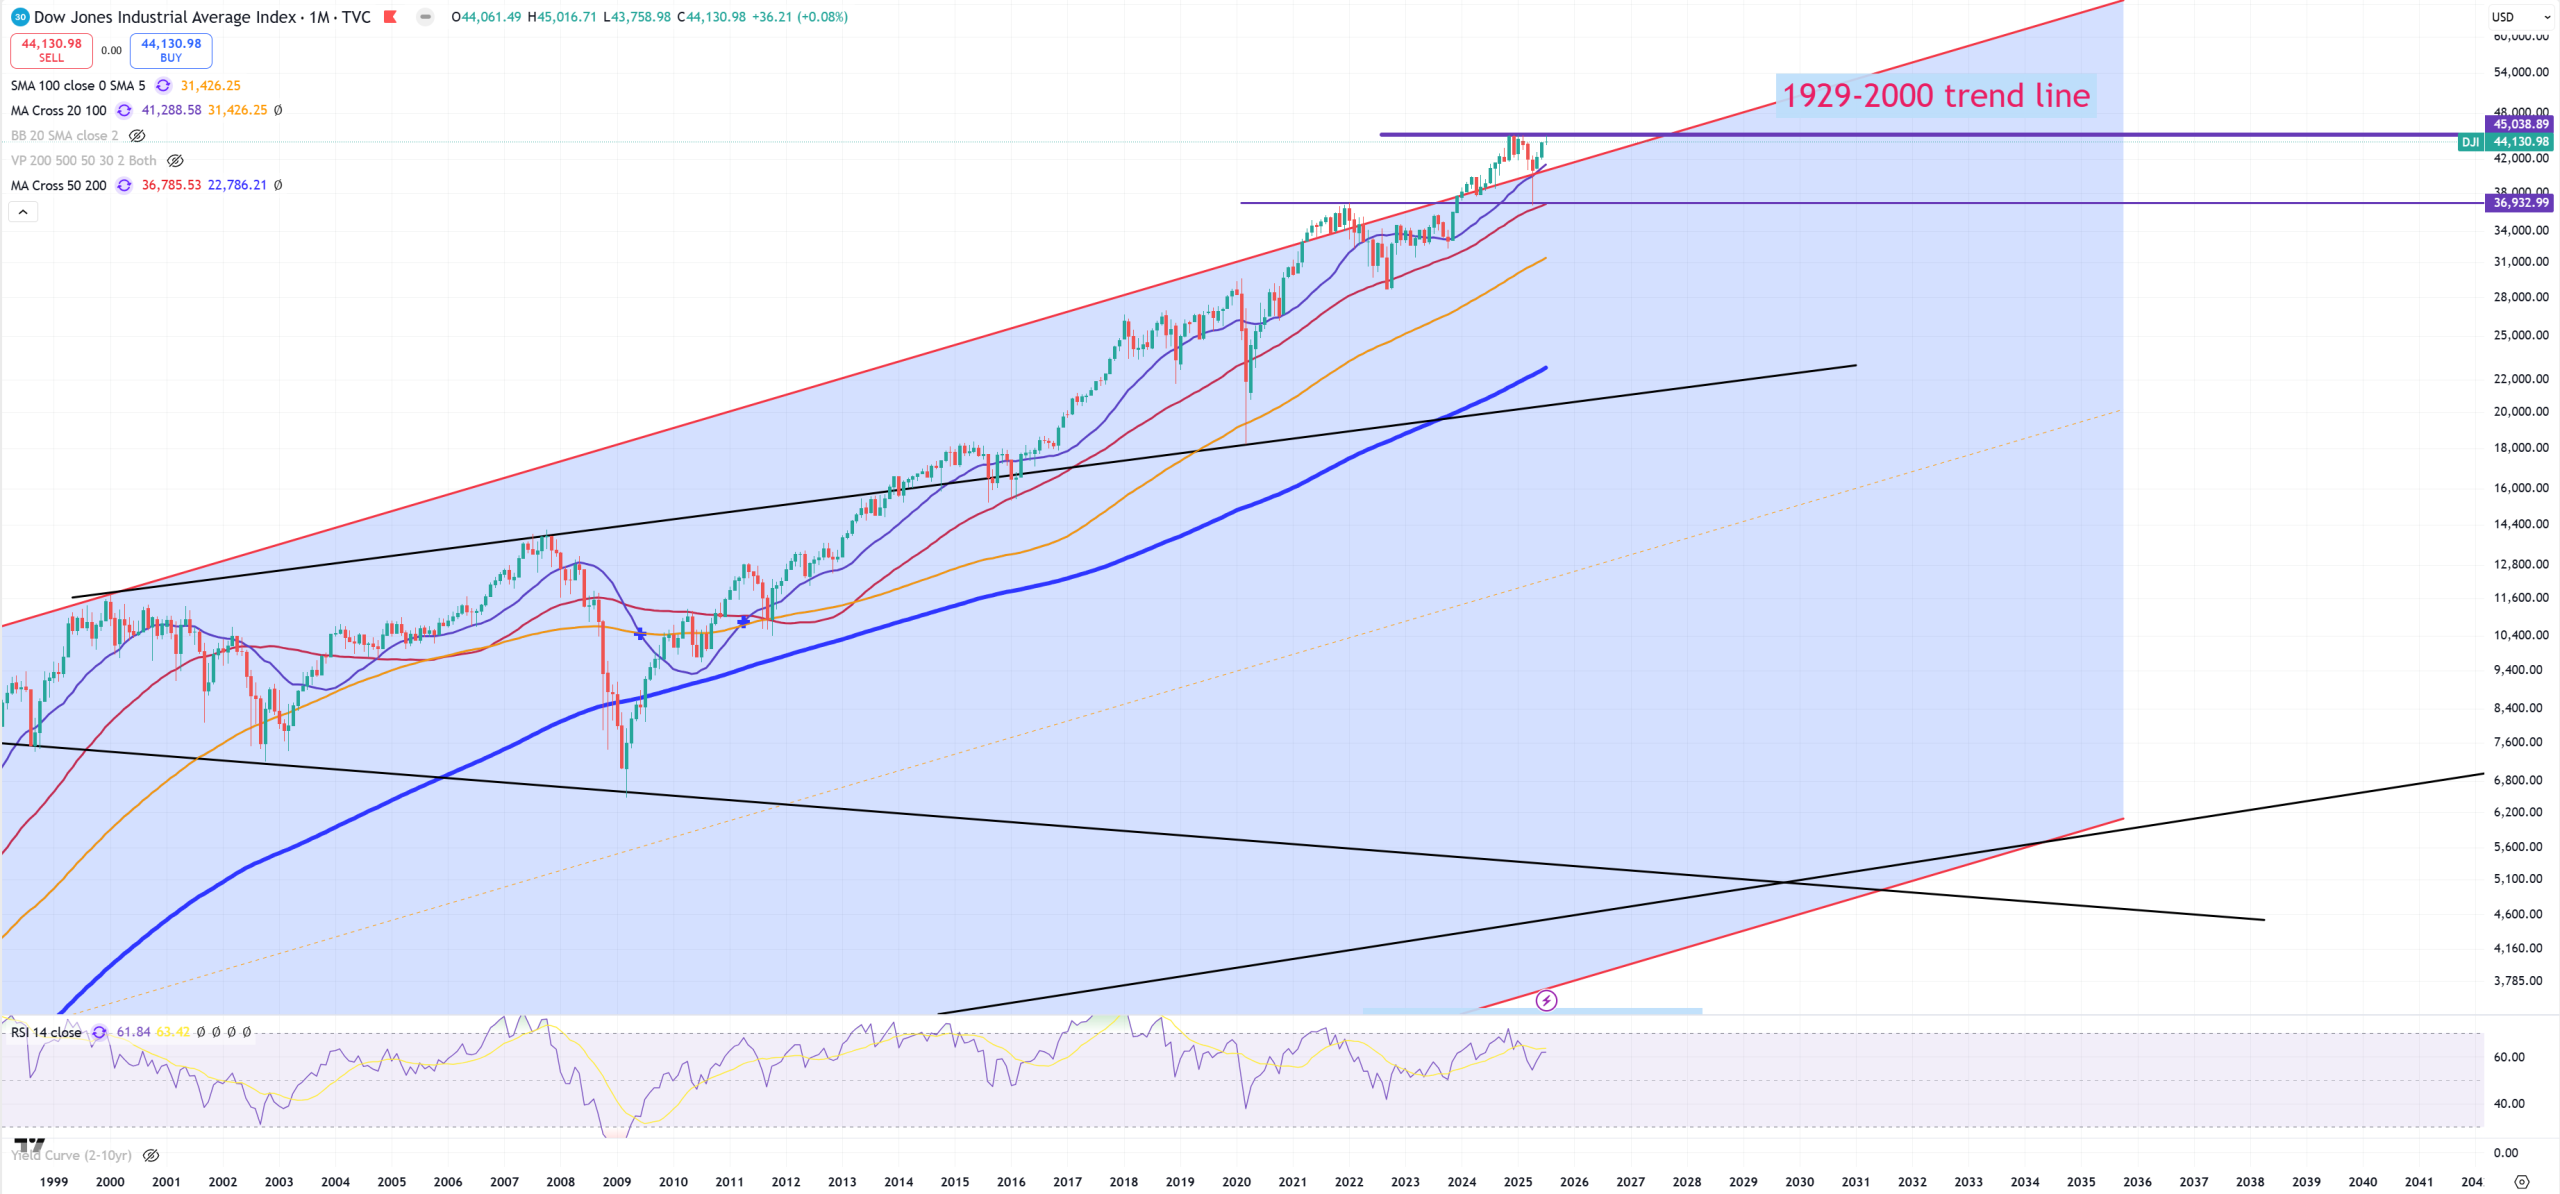
DJI – here’s still a bit different story, as if we put 1929-2000 trend (while 2000 wasn’t really a bubble for DJI, but let’s keep the same main trend like SPX) we see (M)MA20 holds the same level as the trend. 2021 is still the key, and now DJI hits multiple top resistance around 45050 level.
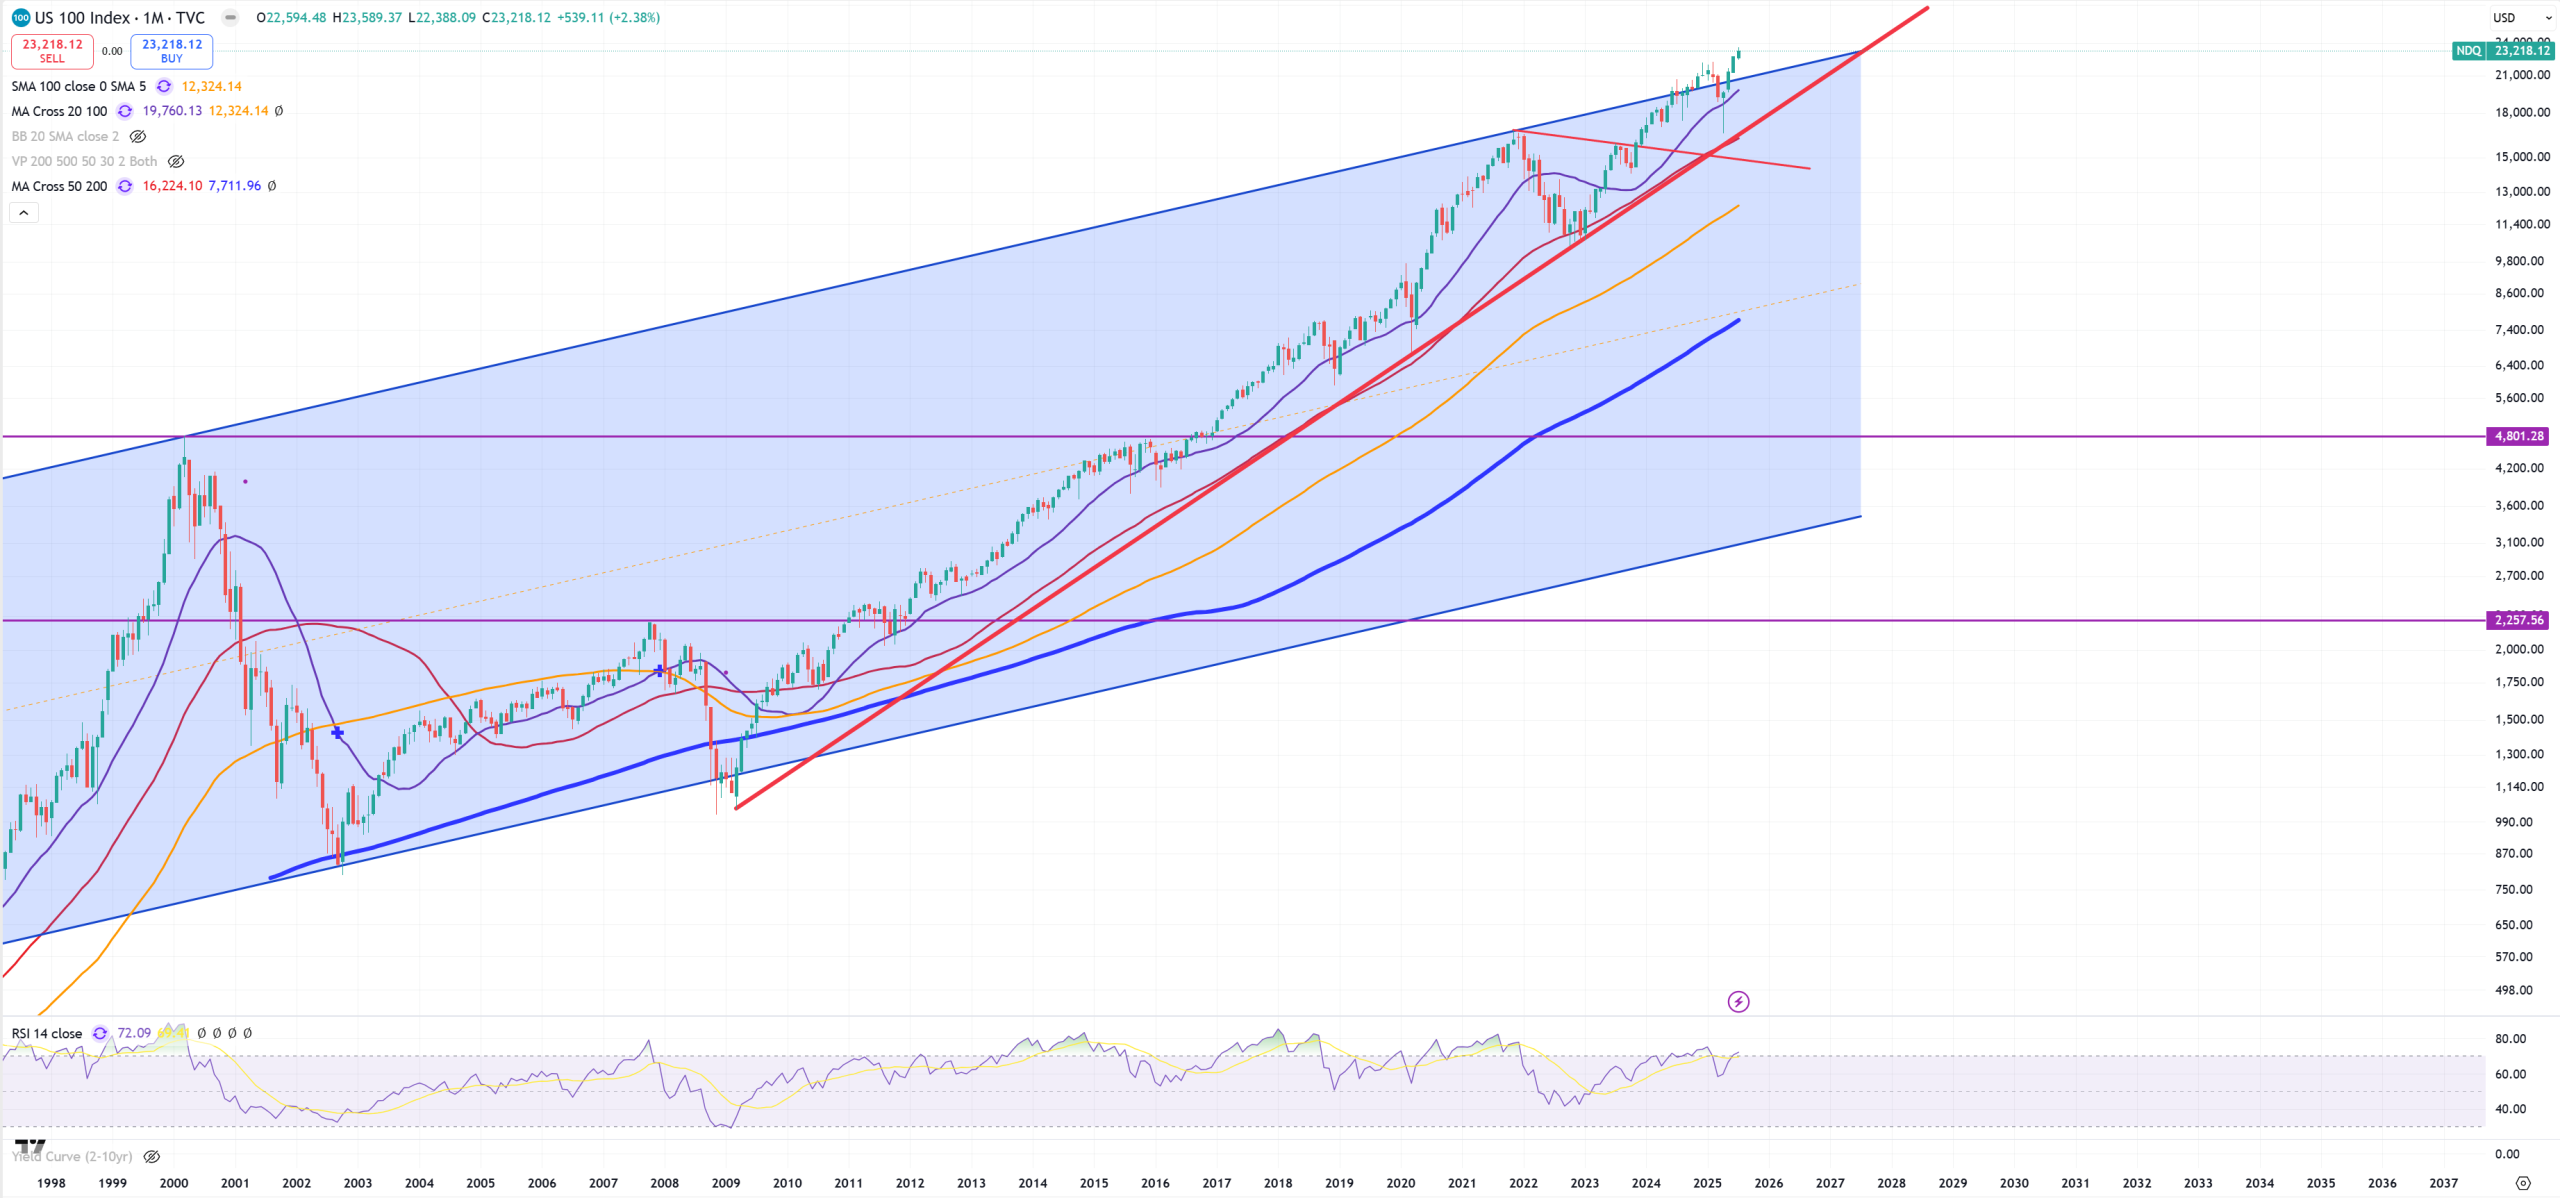
NDQ – Nasdaq has too short history, so we put only 2000 peak and 2021 peak + red trend, and it’s broken
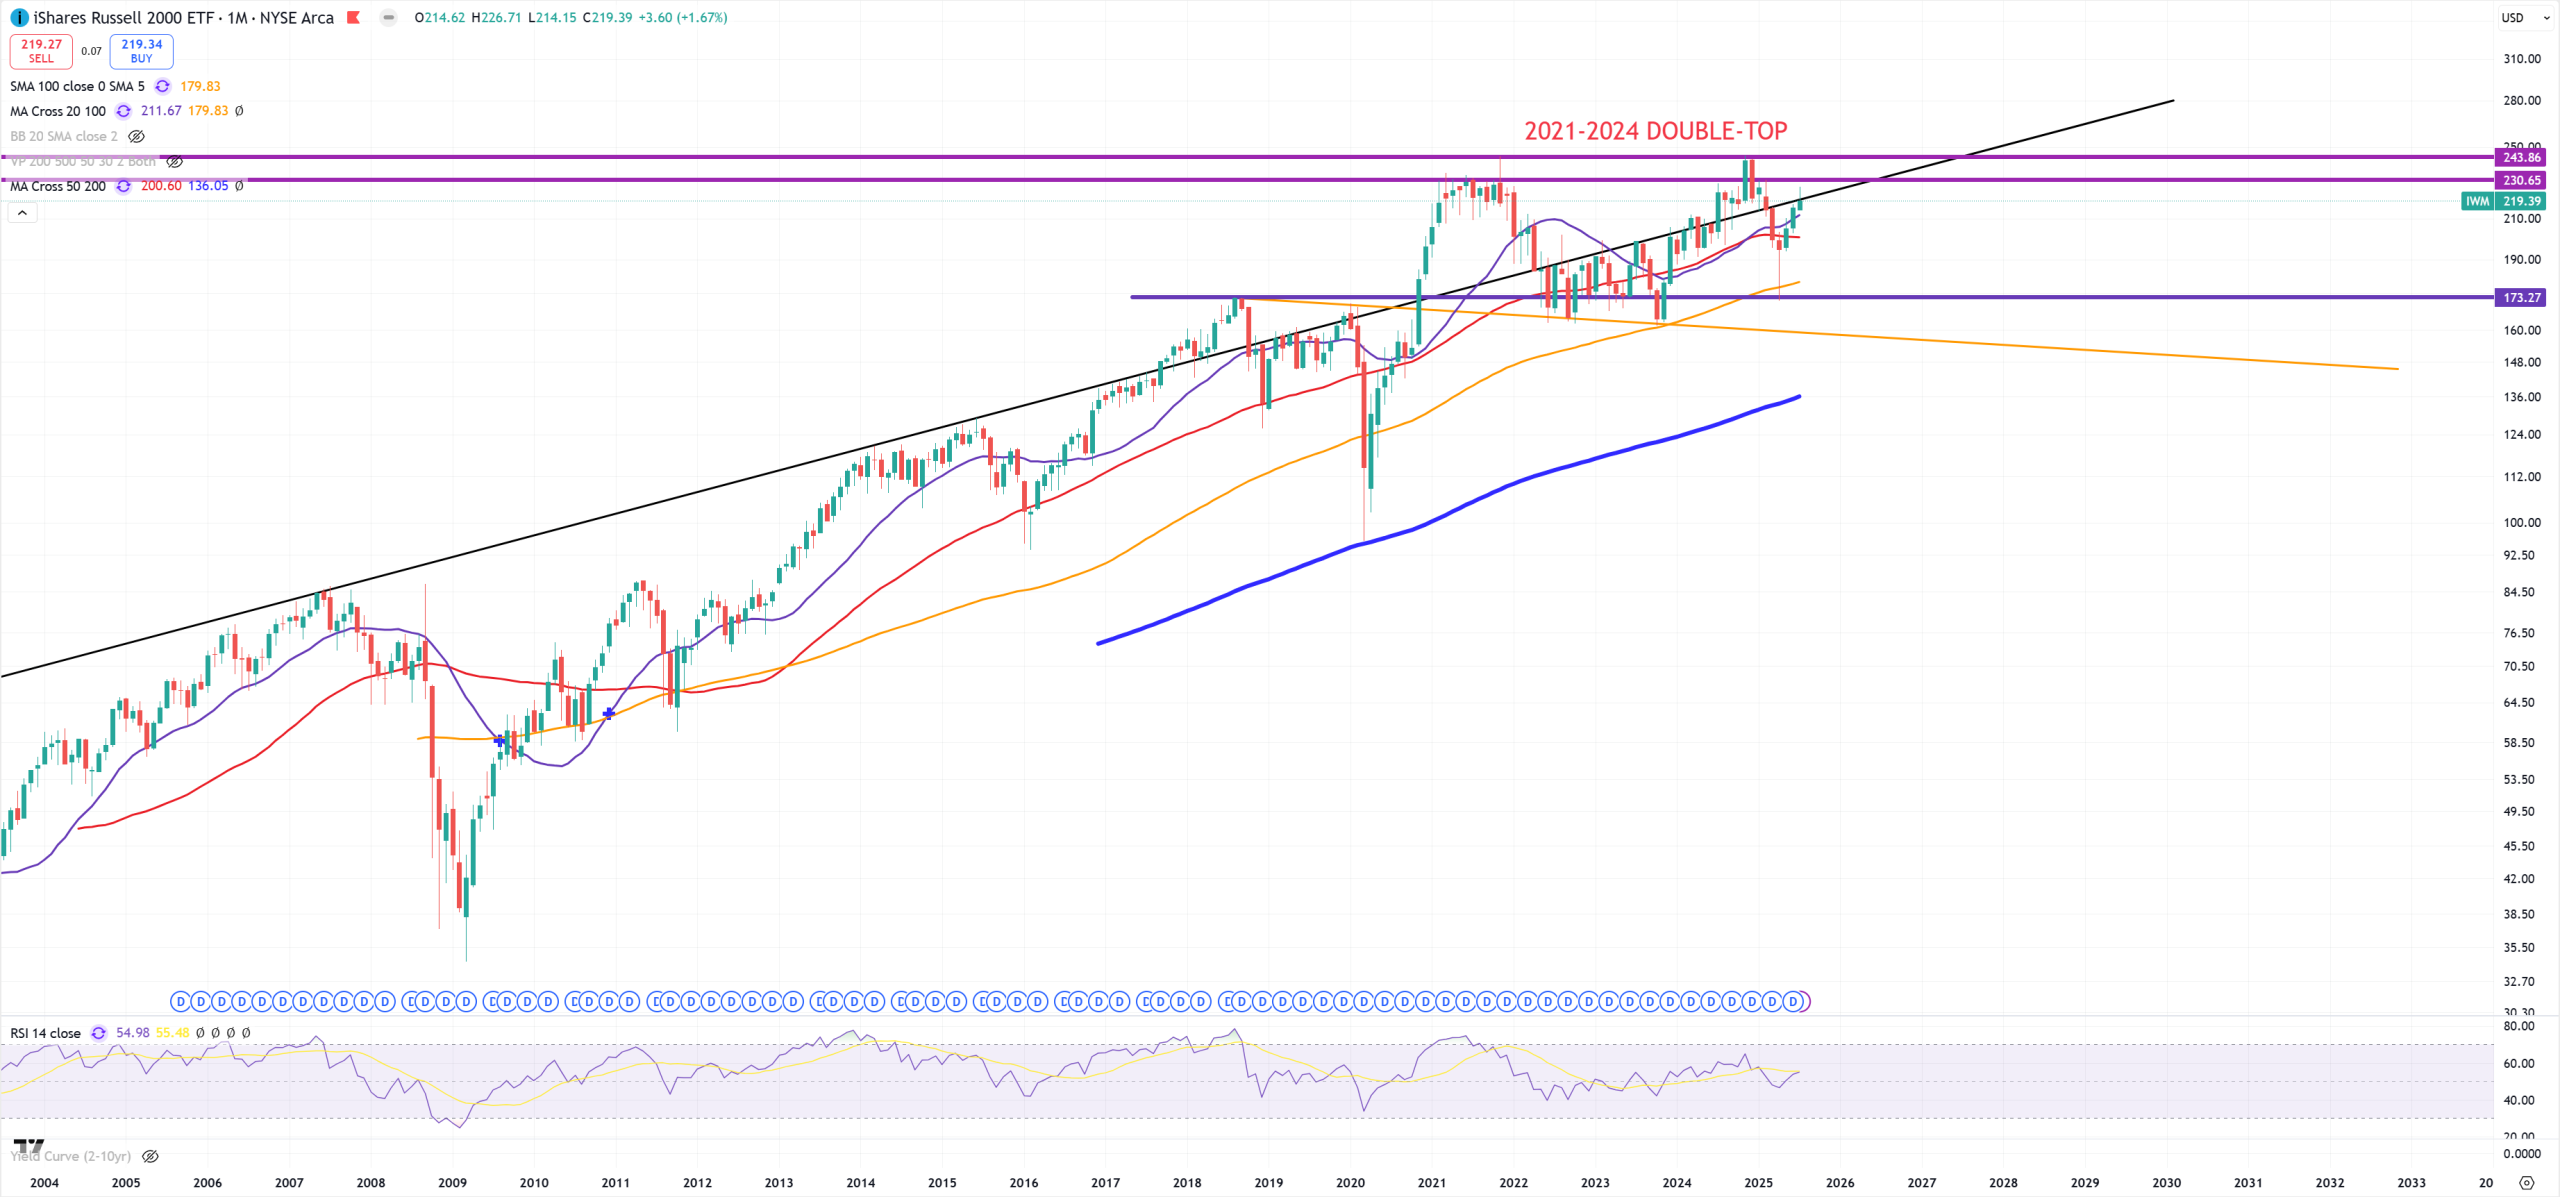
IWM – holds the trend, double top on 2021/2024 peaks :
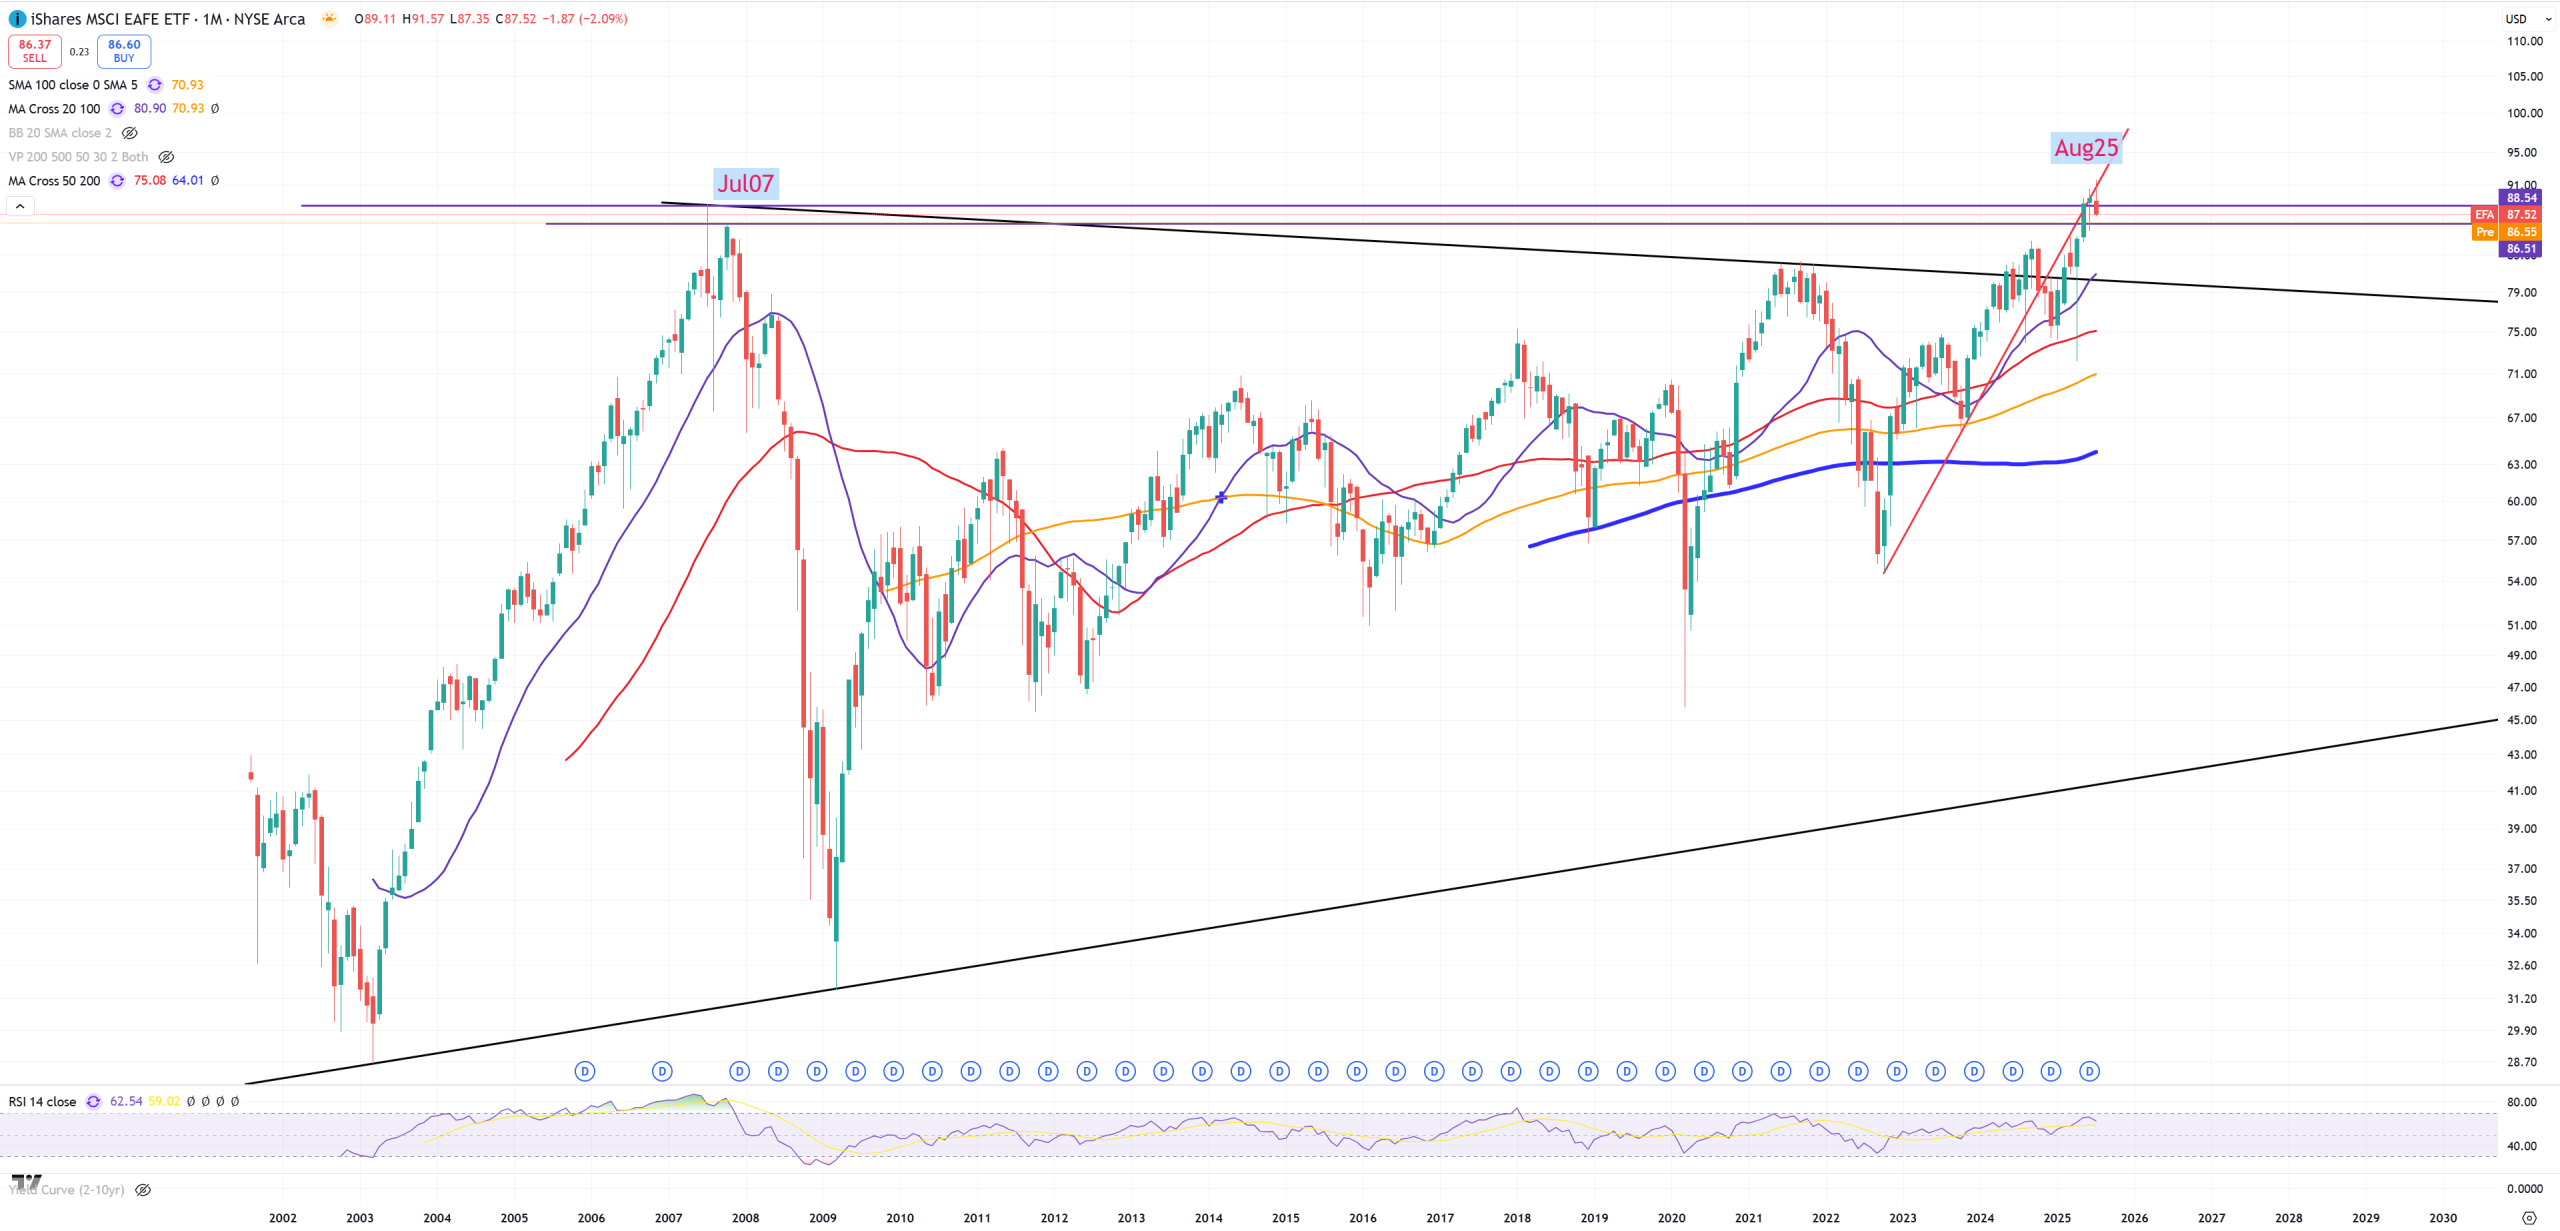
EFA – So developed markets excluding USA reached July 2007 peak
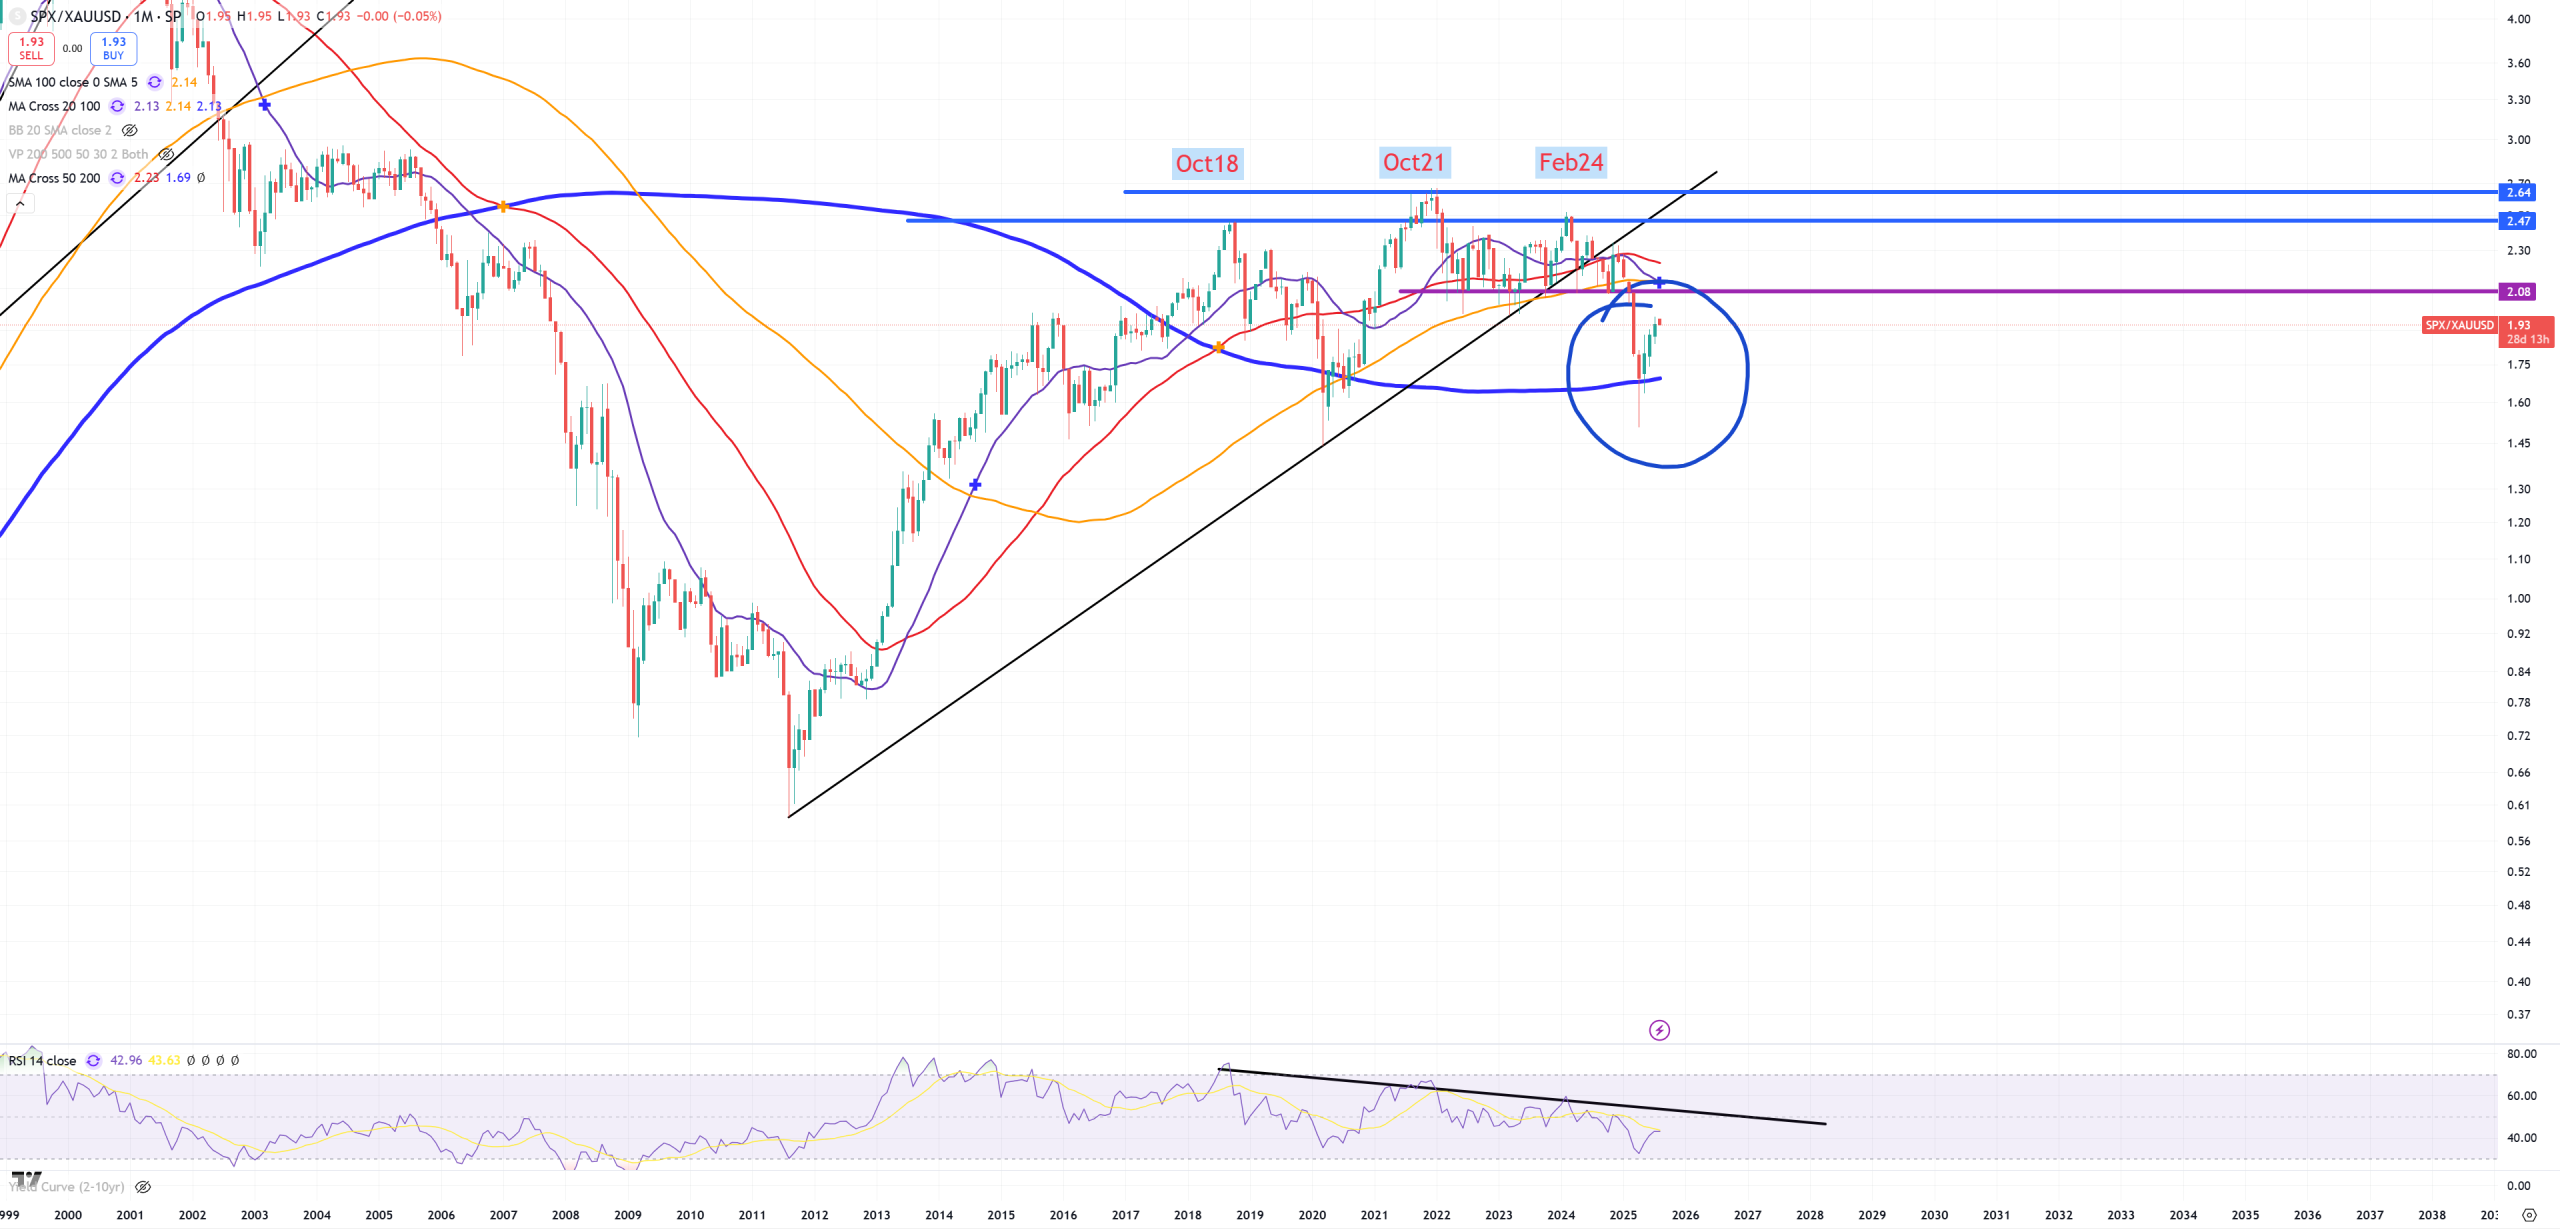
SPX/GOLD – main economic indicator, holds (M)MA200, RIP when it blows up this blue (M)MA200
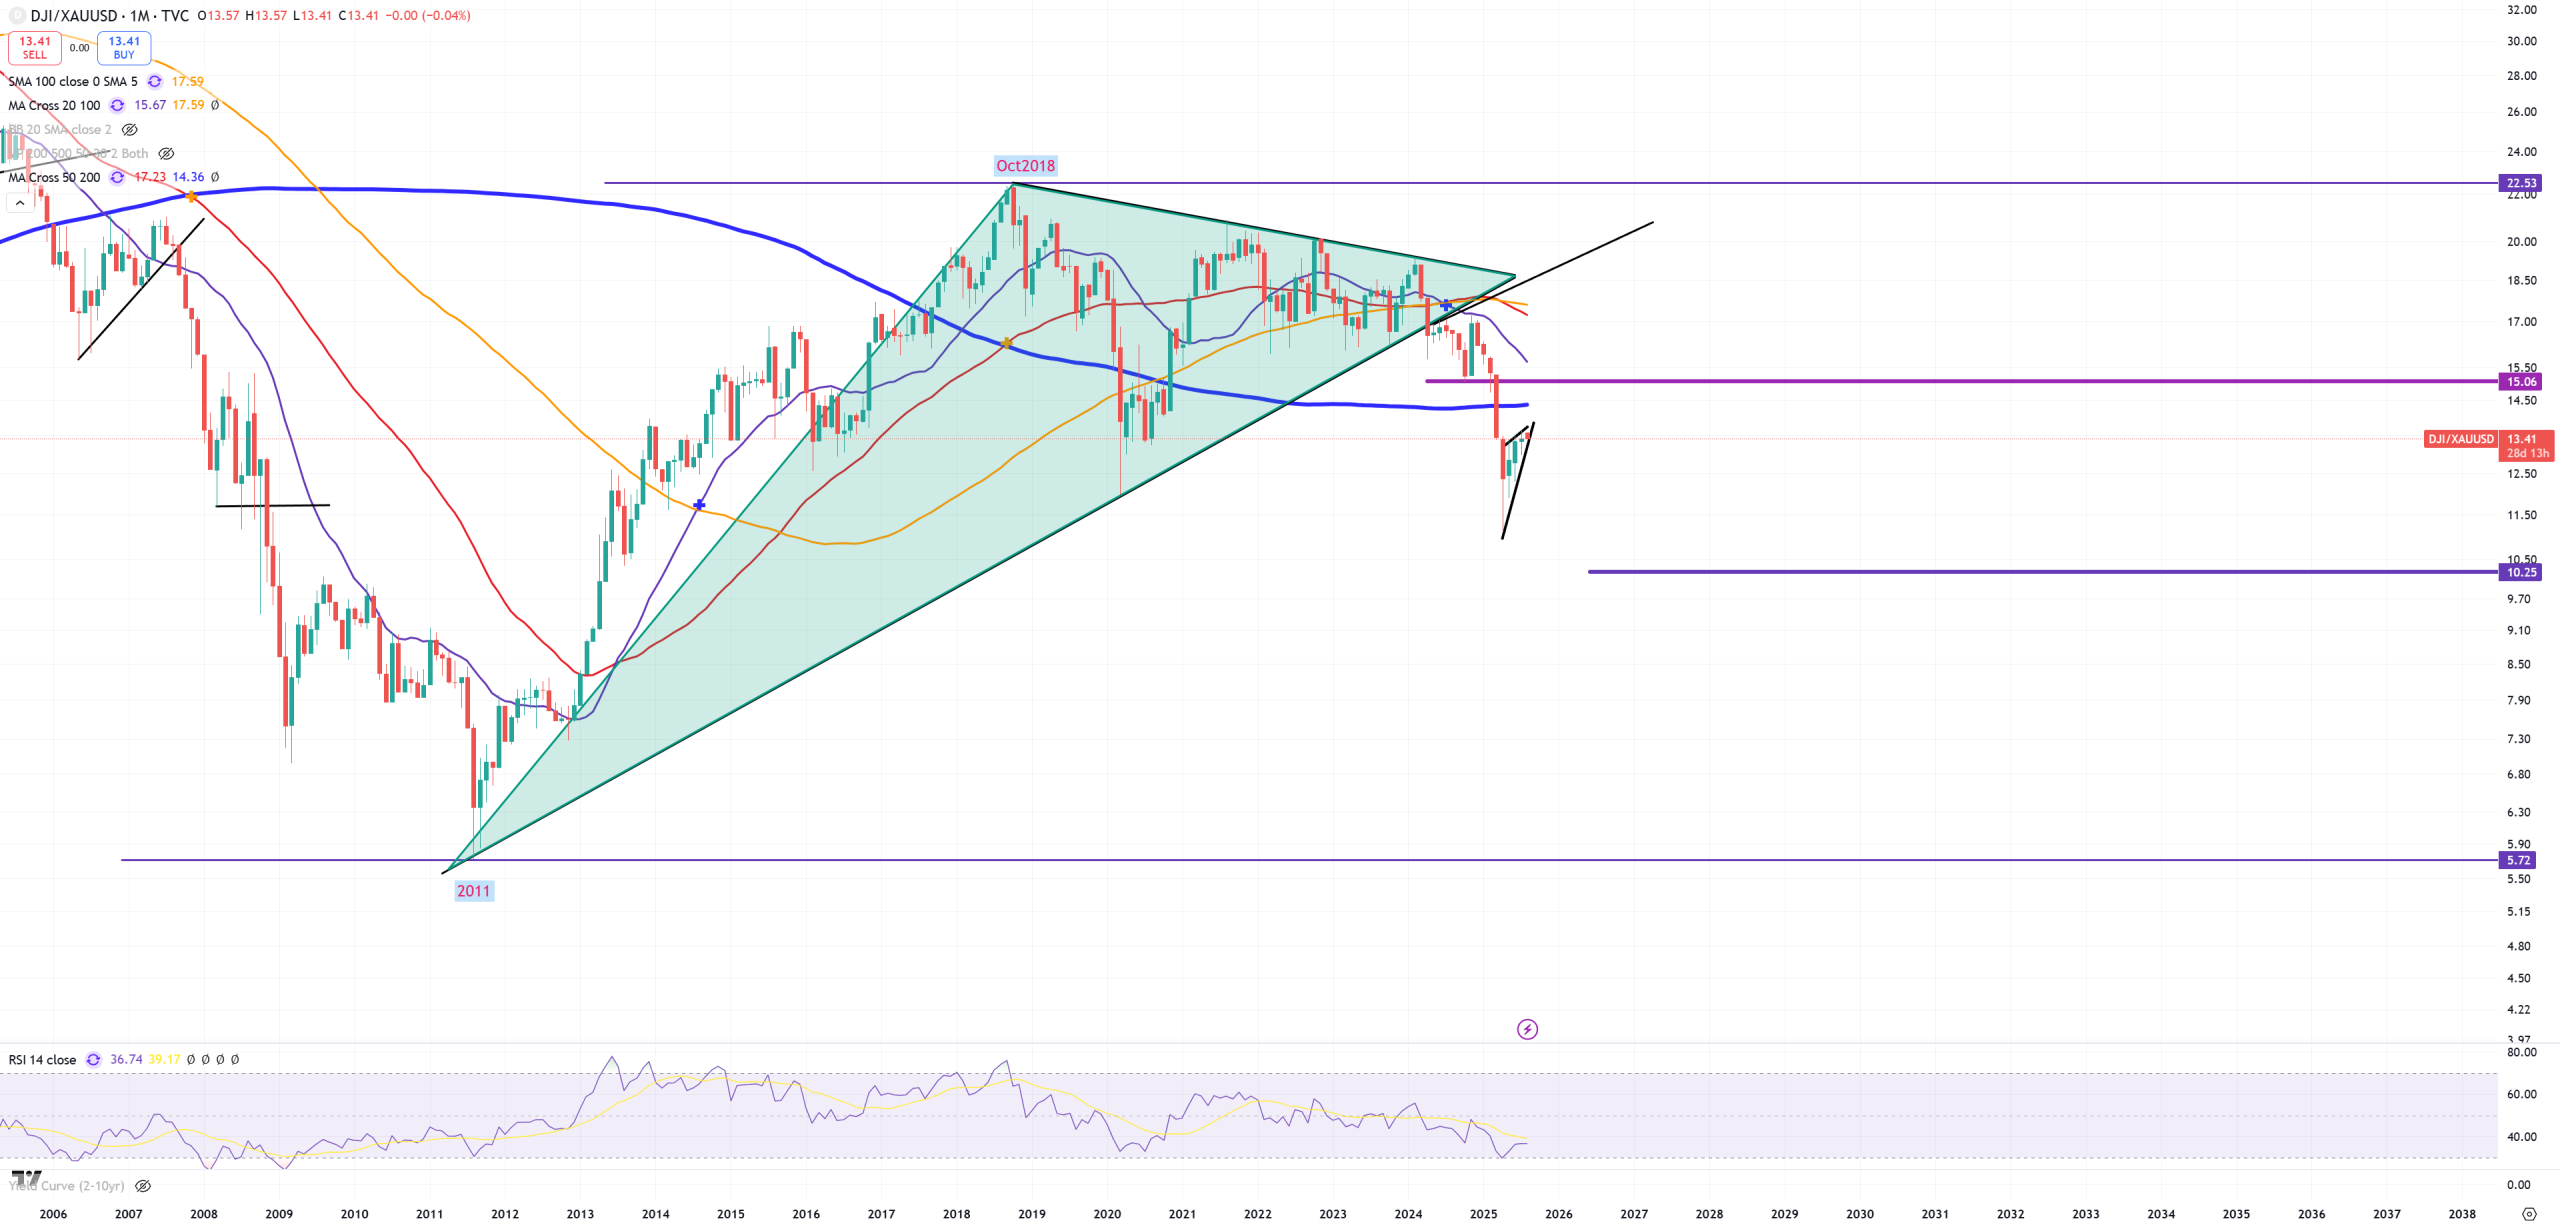
DJI/GOLD – another main economic indicator, but this one is broken, and not only below its 2011 trend but also below blue (M)MA200 and now it needs to resolve :
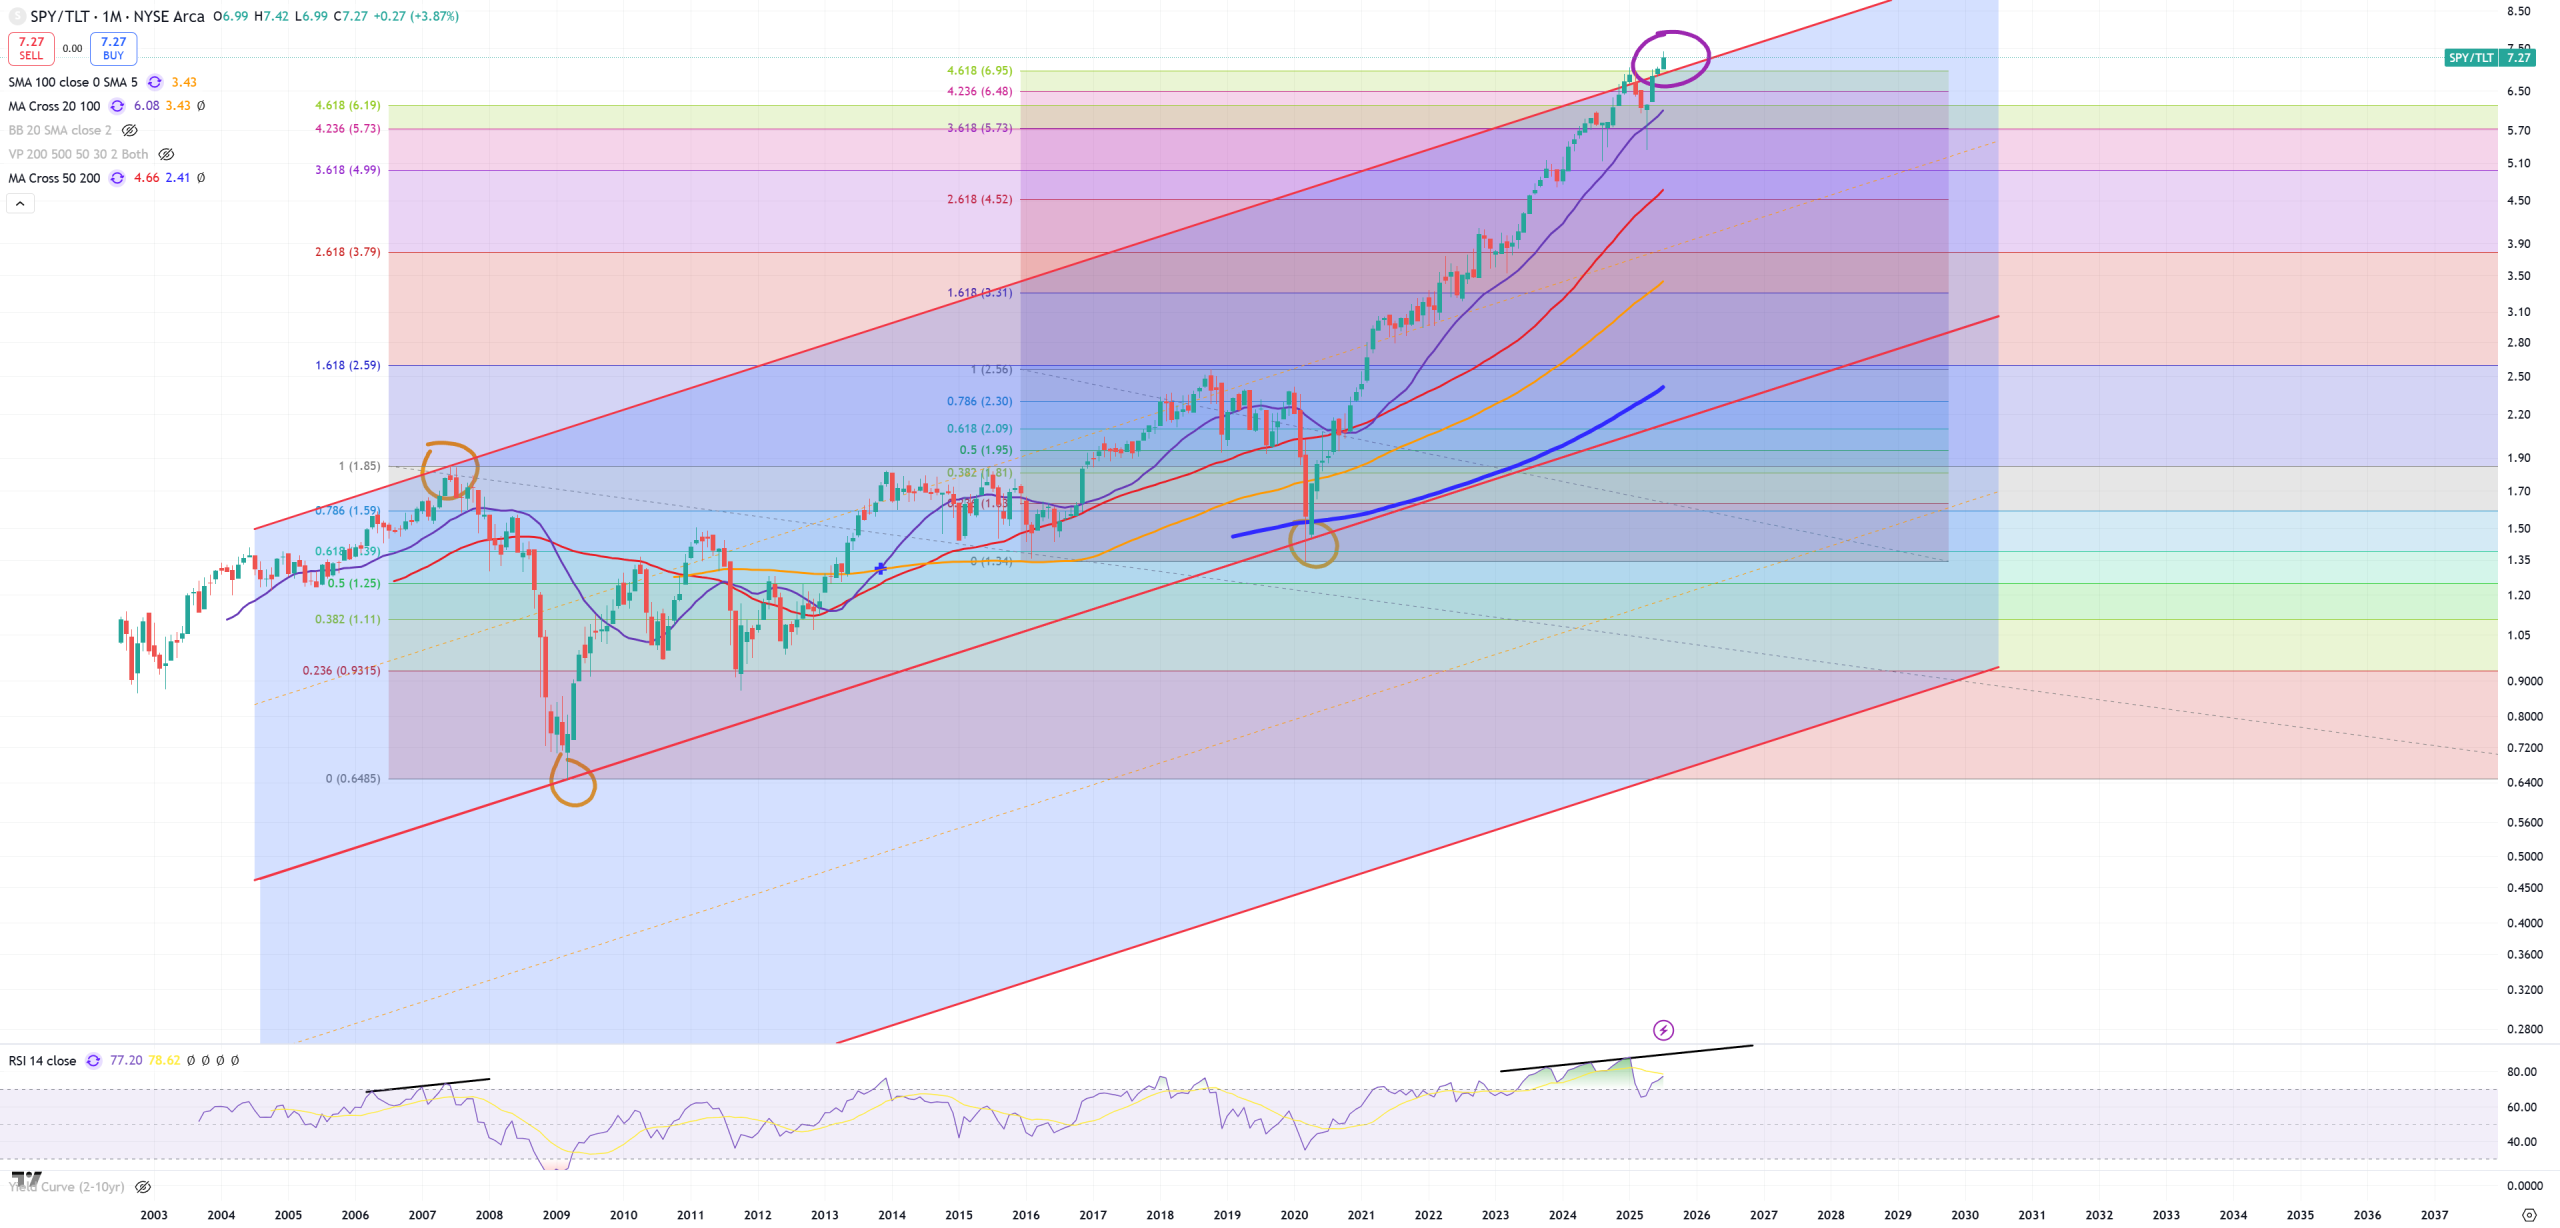
SPY/TLT – this ratio has too short history, but maybe at some point of time it’ll need a chart correction, but not now, overextension so far.
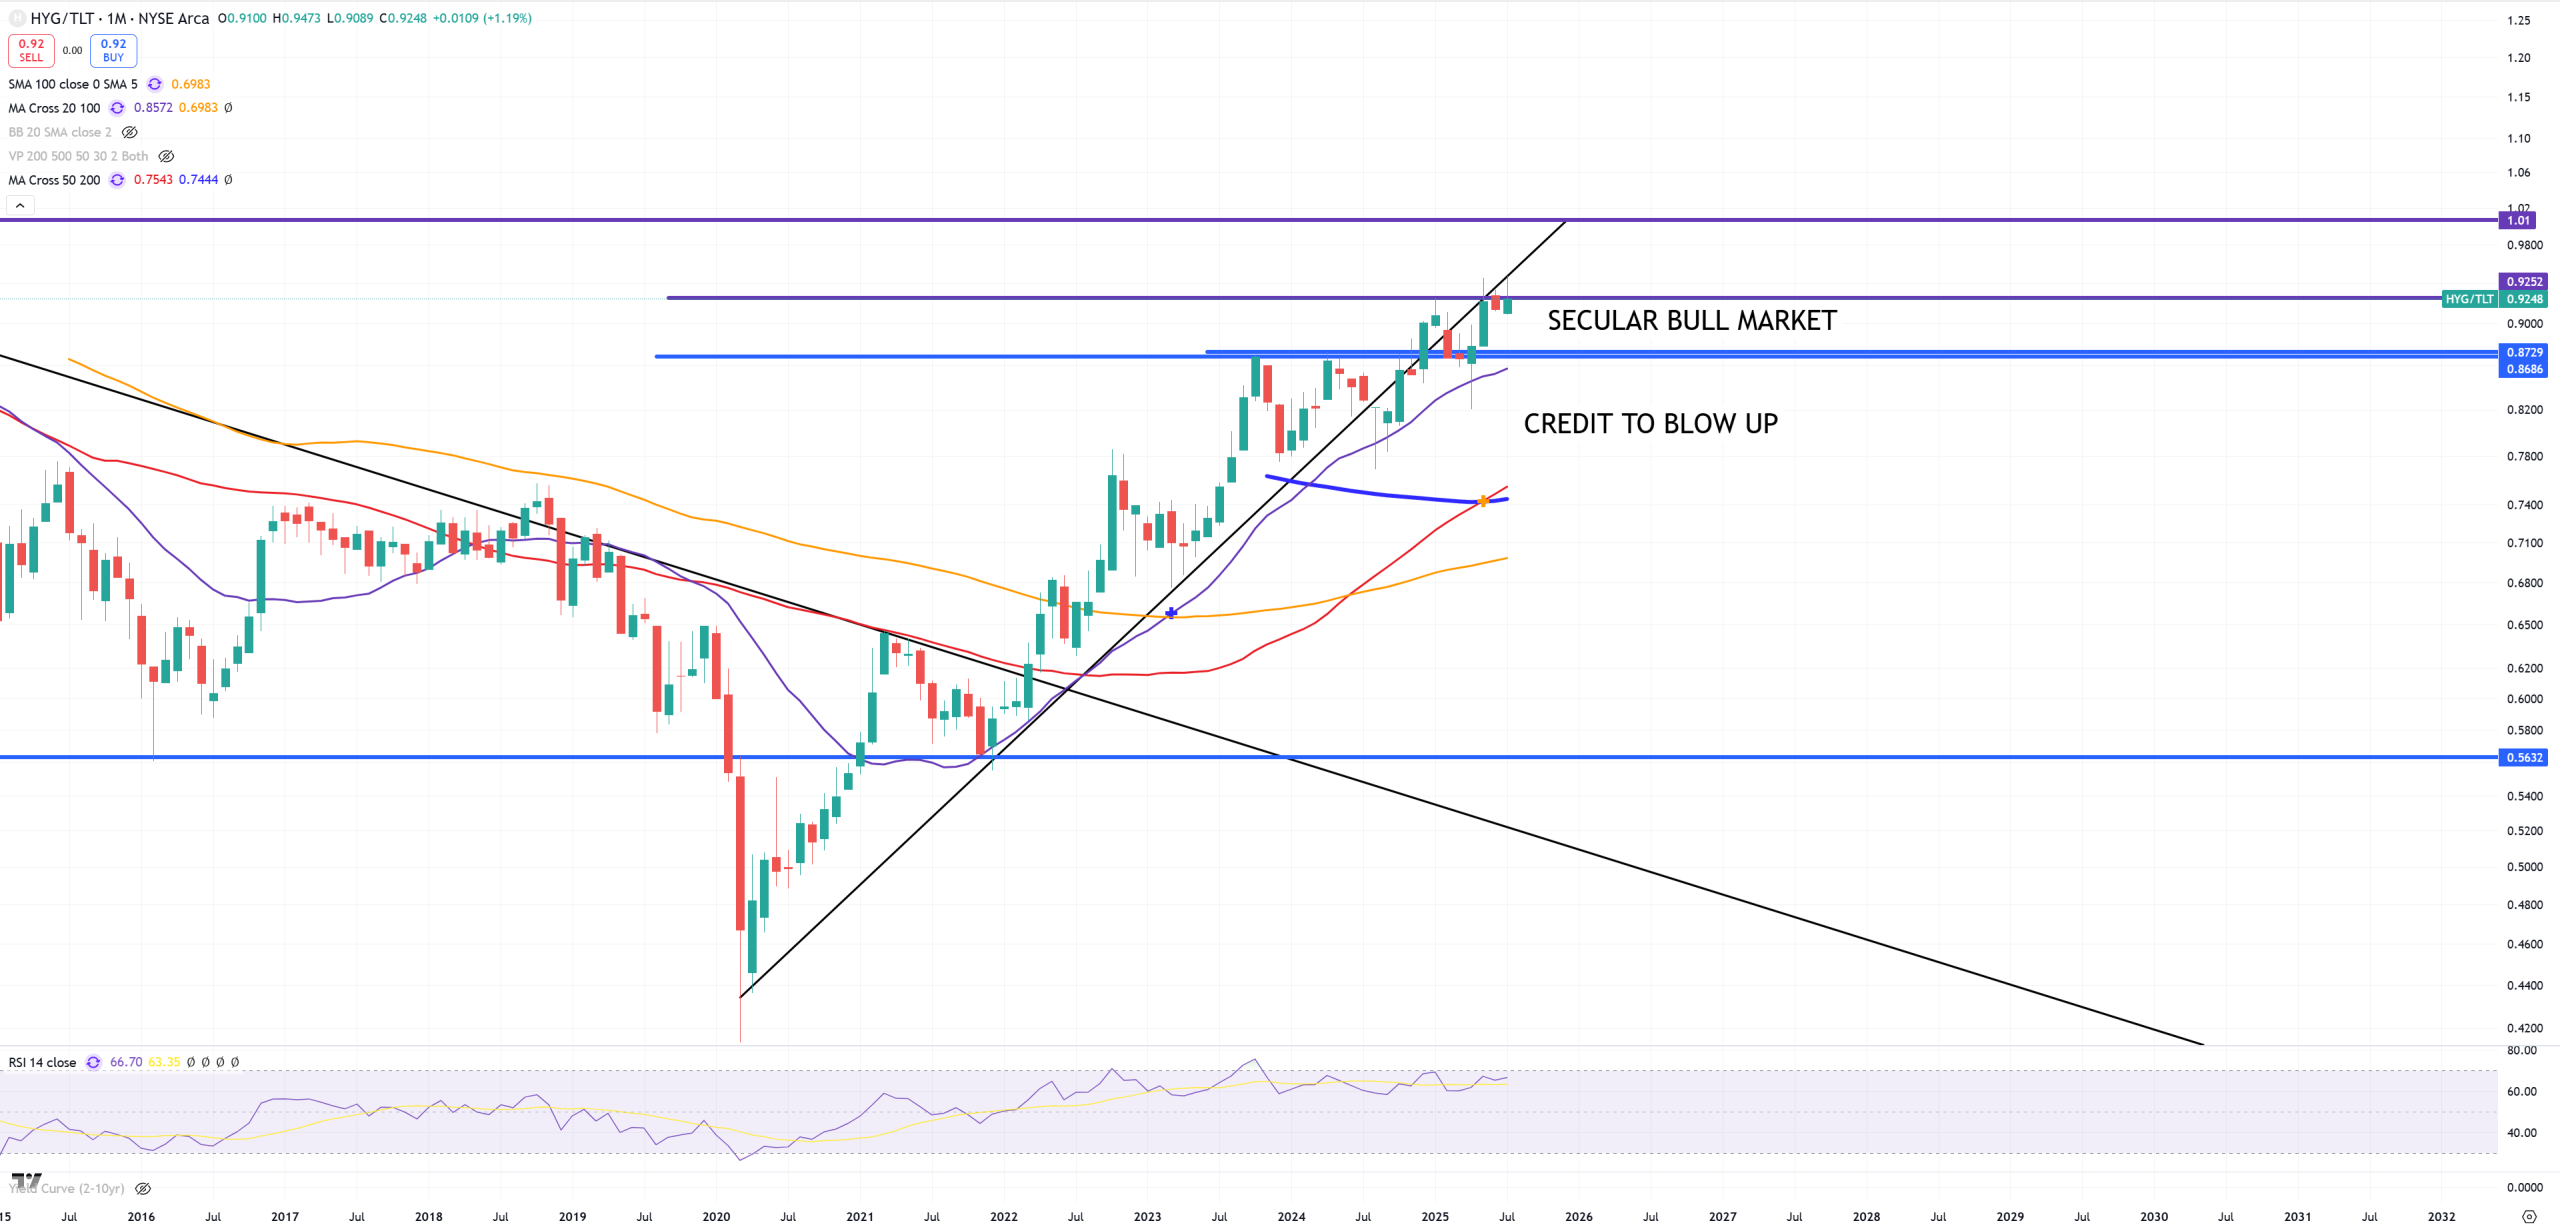
HYG/TLT – some kind of credit problem indicator. There’re multiple levels and it hits another one.
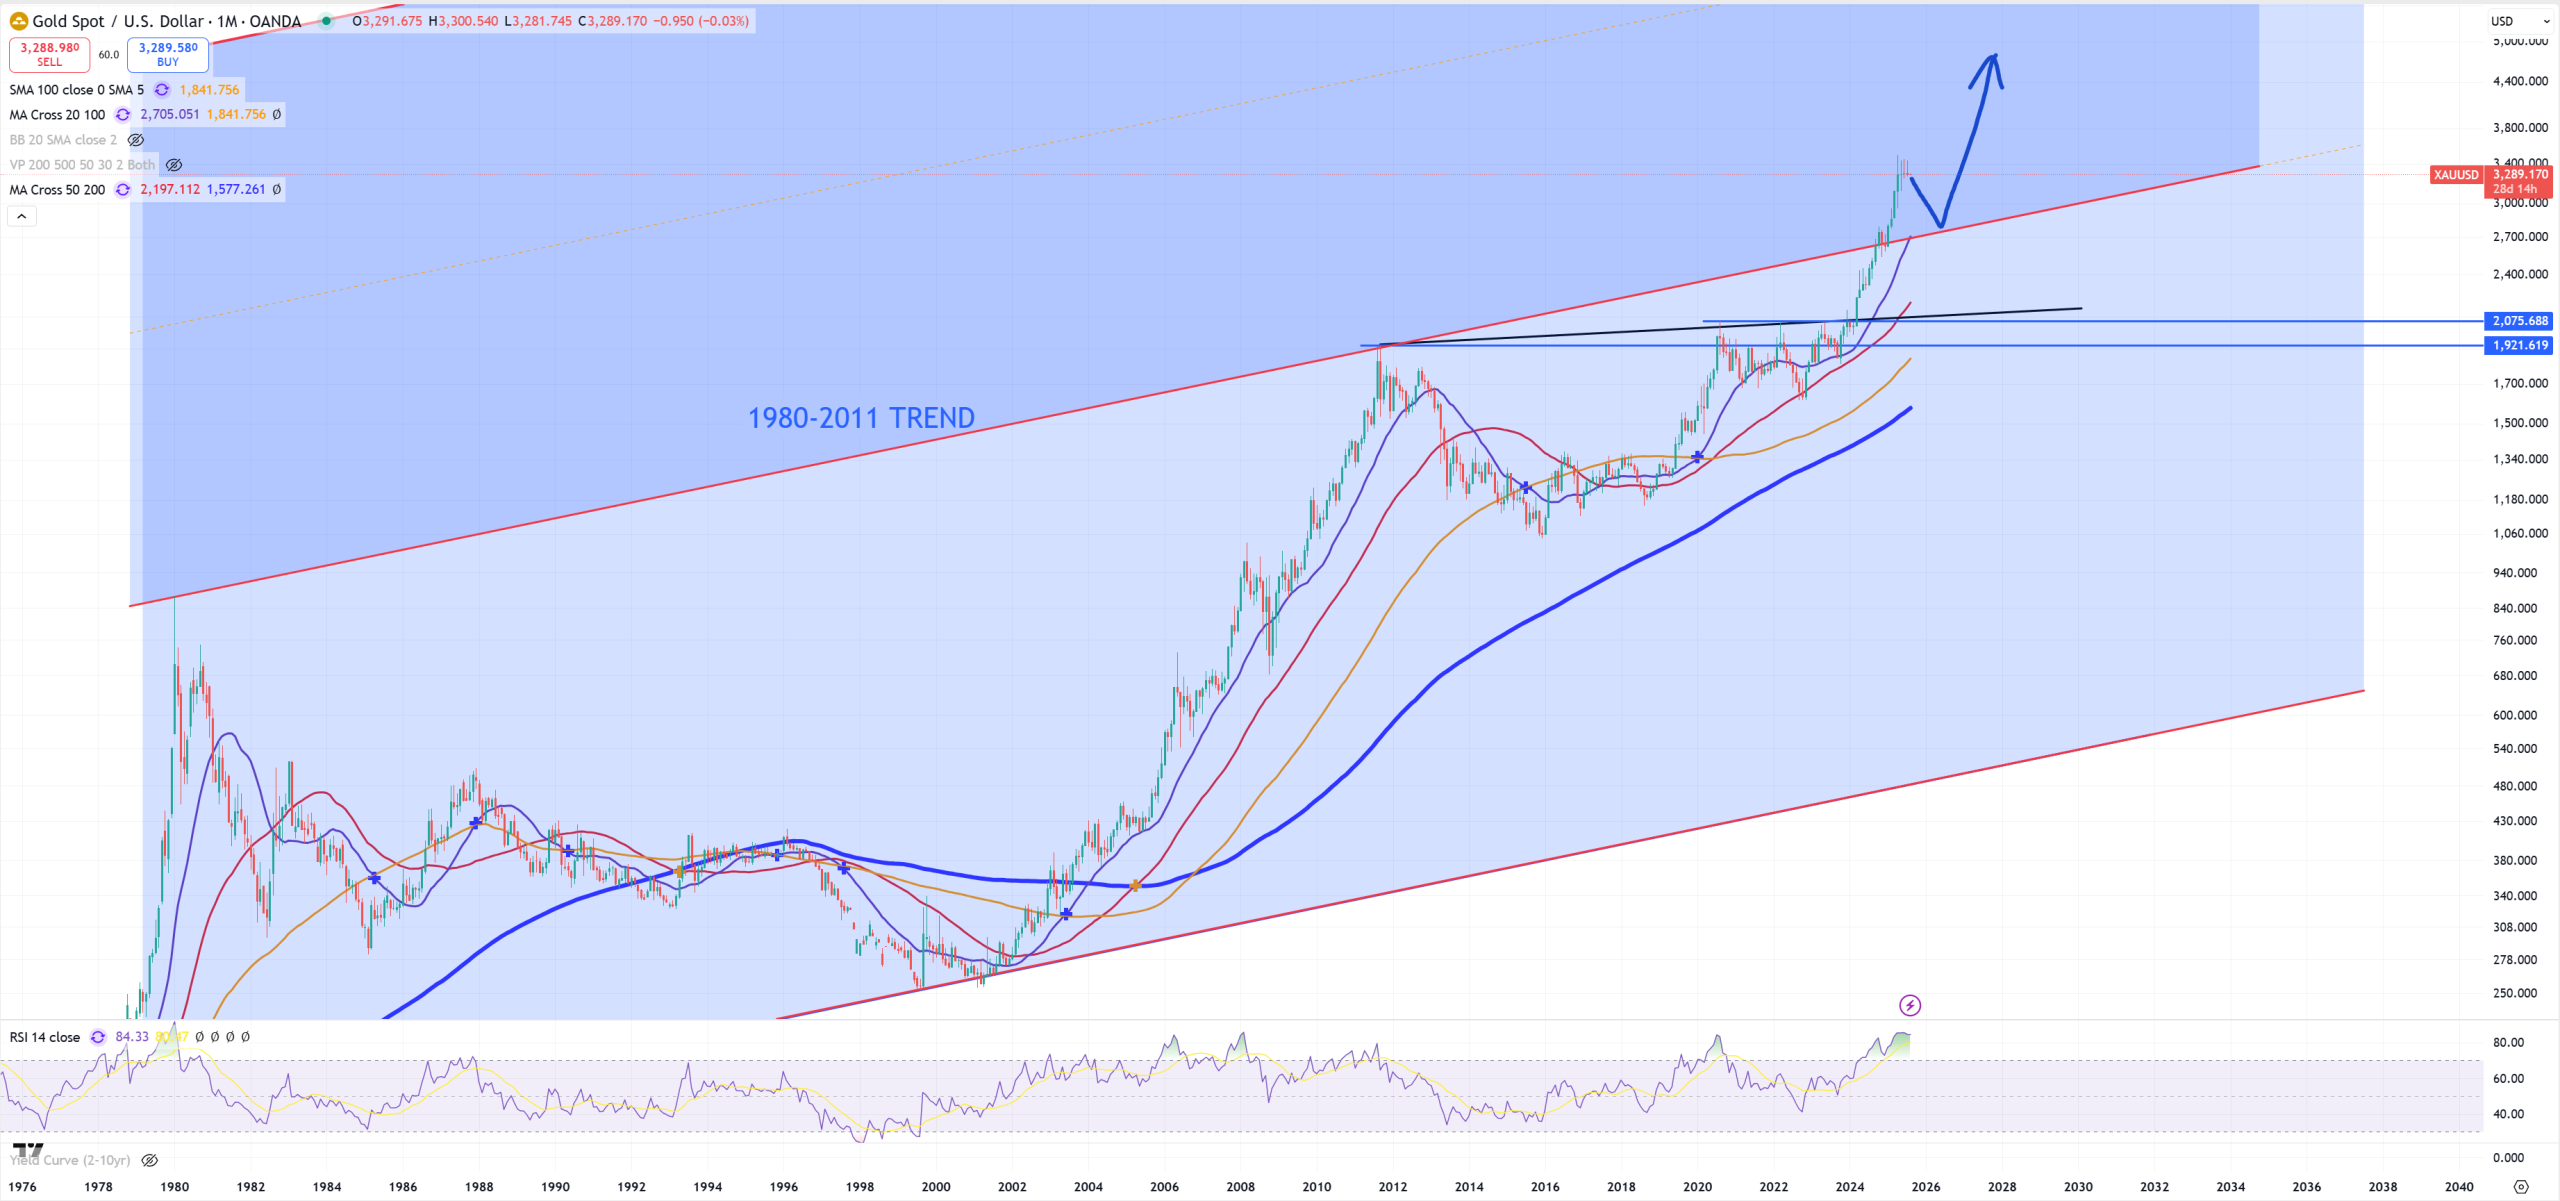
XAUUSD – Gold looks like a correction is coming(?) if DXY is going to spike, (M)MA20 + trend are on the same level 2700$. Overbought once of the biggest in a history. Bigger was only in 70s.
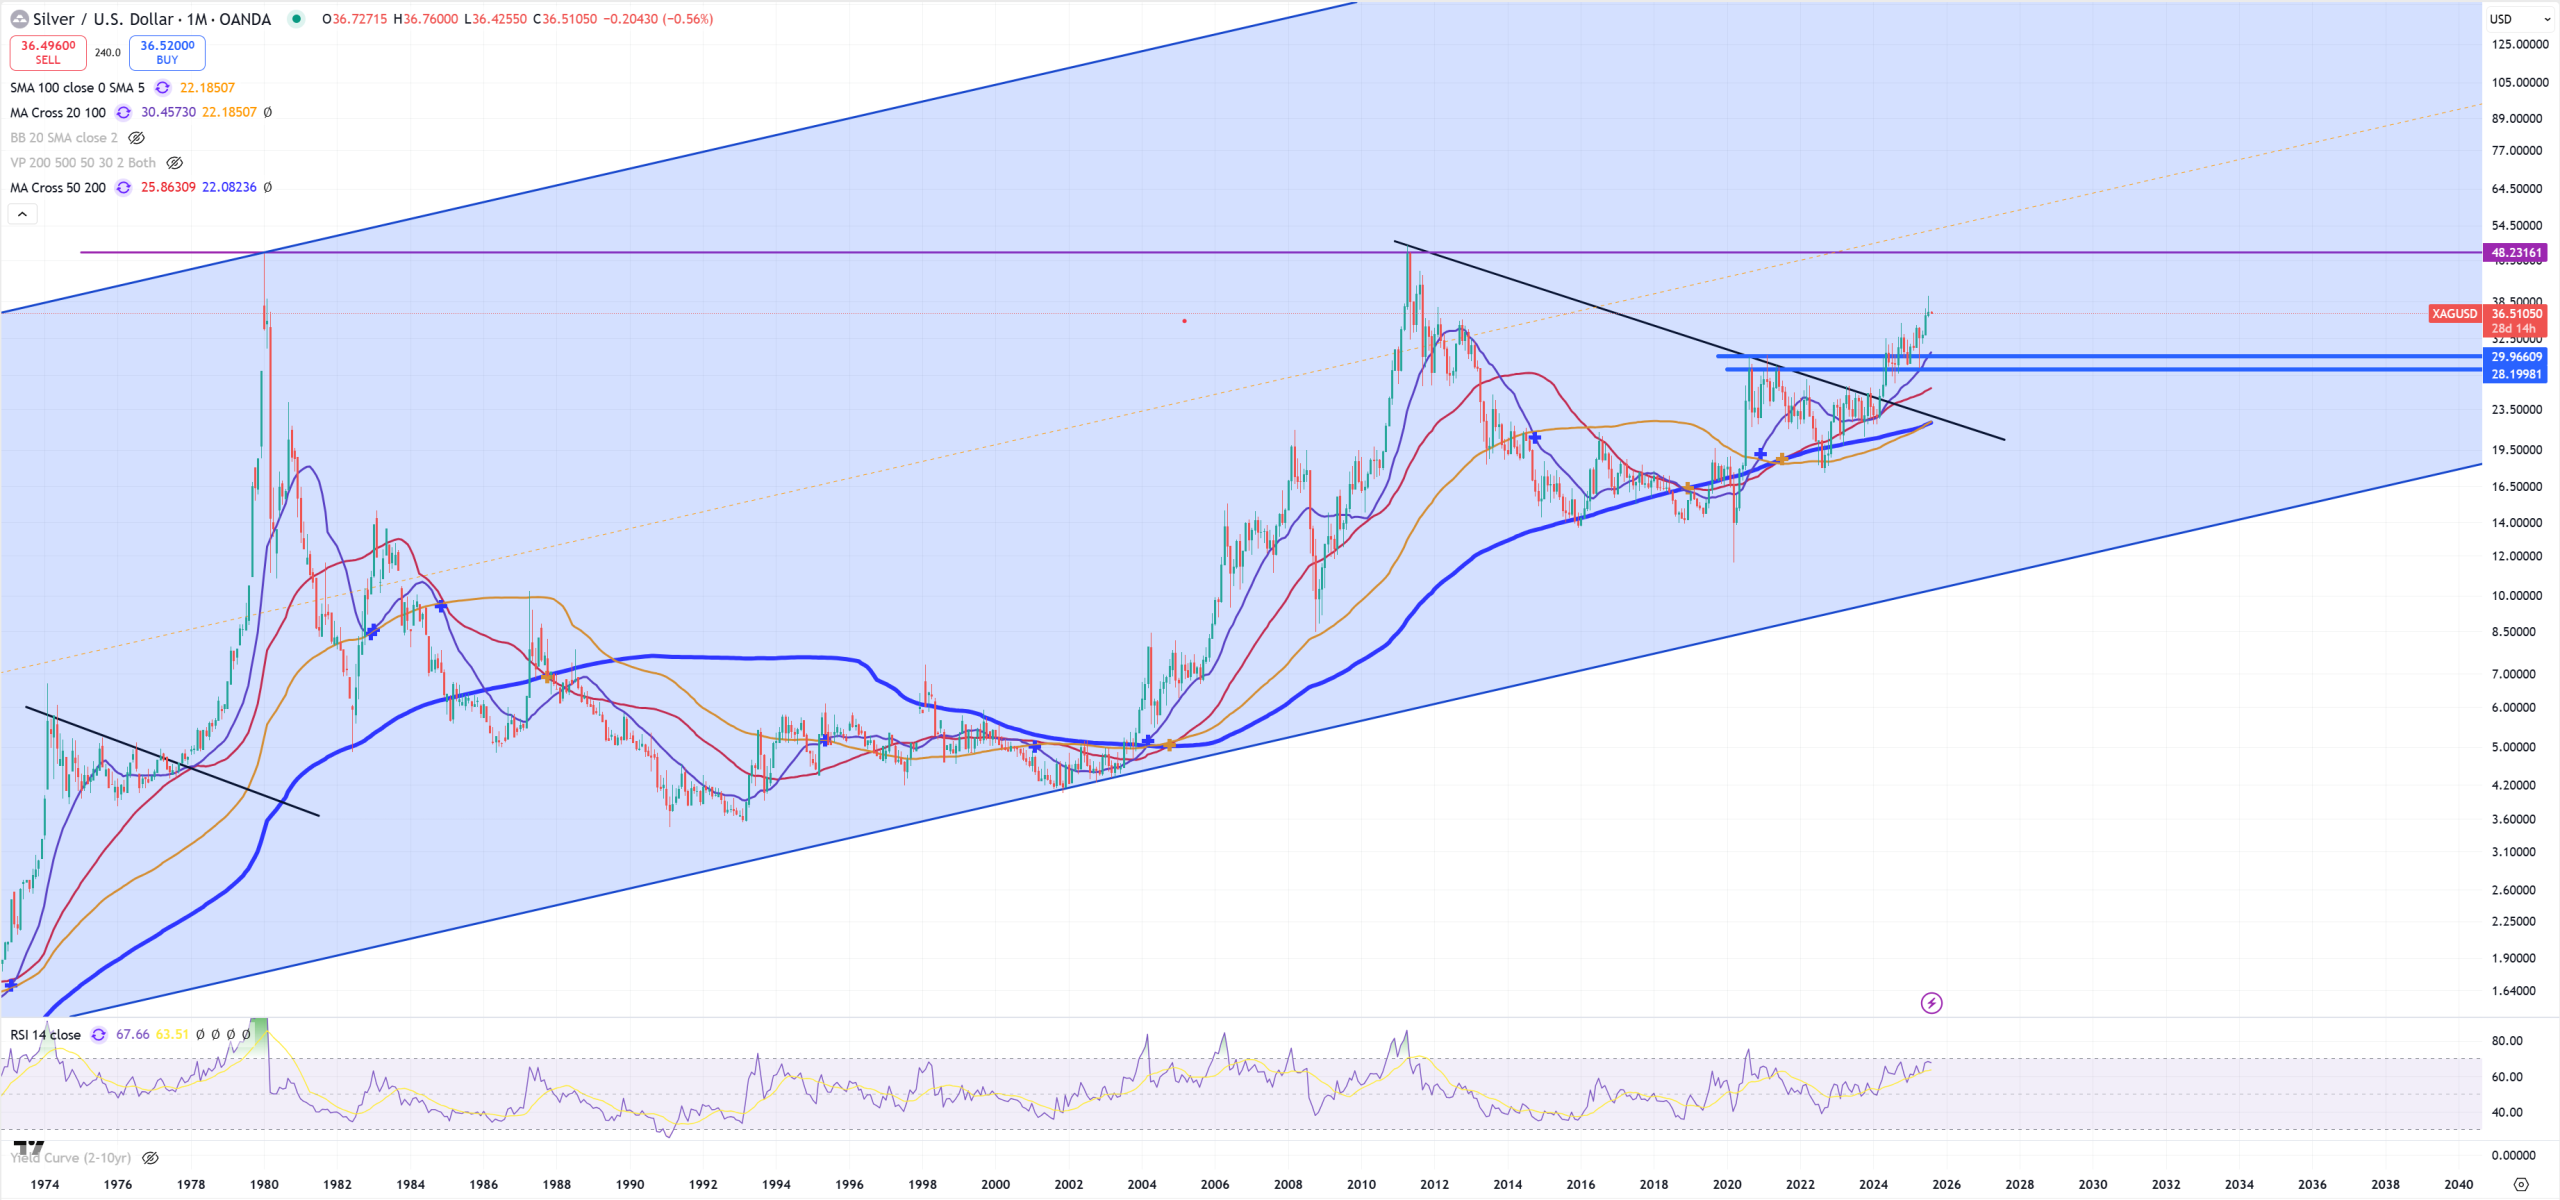
XAGUSD – Silver in reality should follow Gold, but it doesn’t look like that. Overbought does not exist here, but it doesn’t mean anything, it can squeeze higher here, or again drop to 30$.
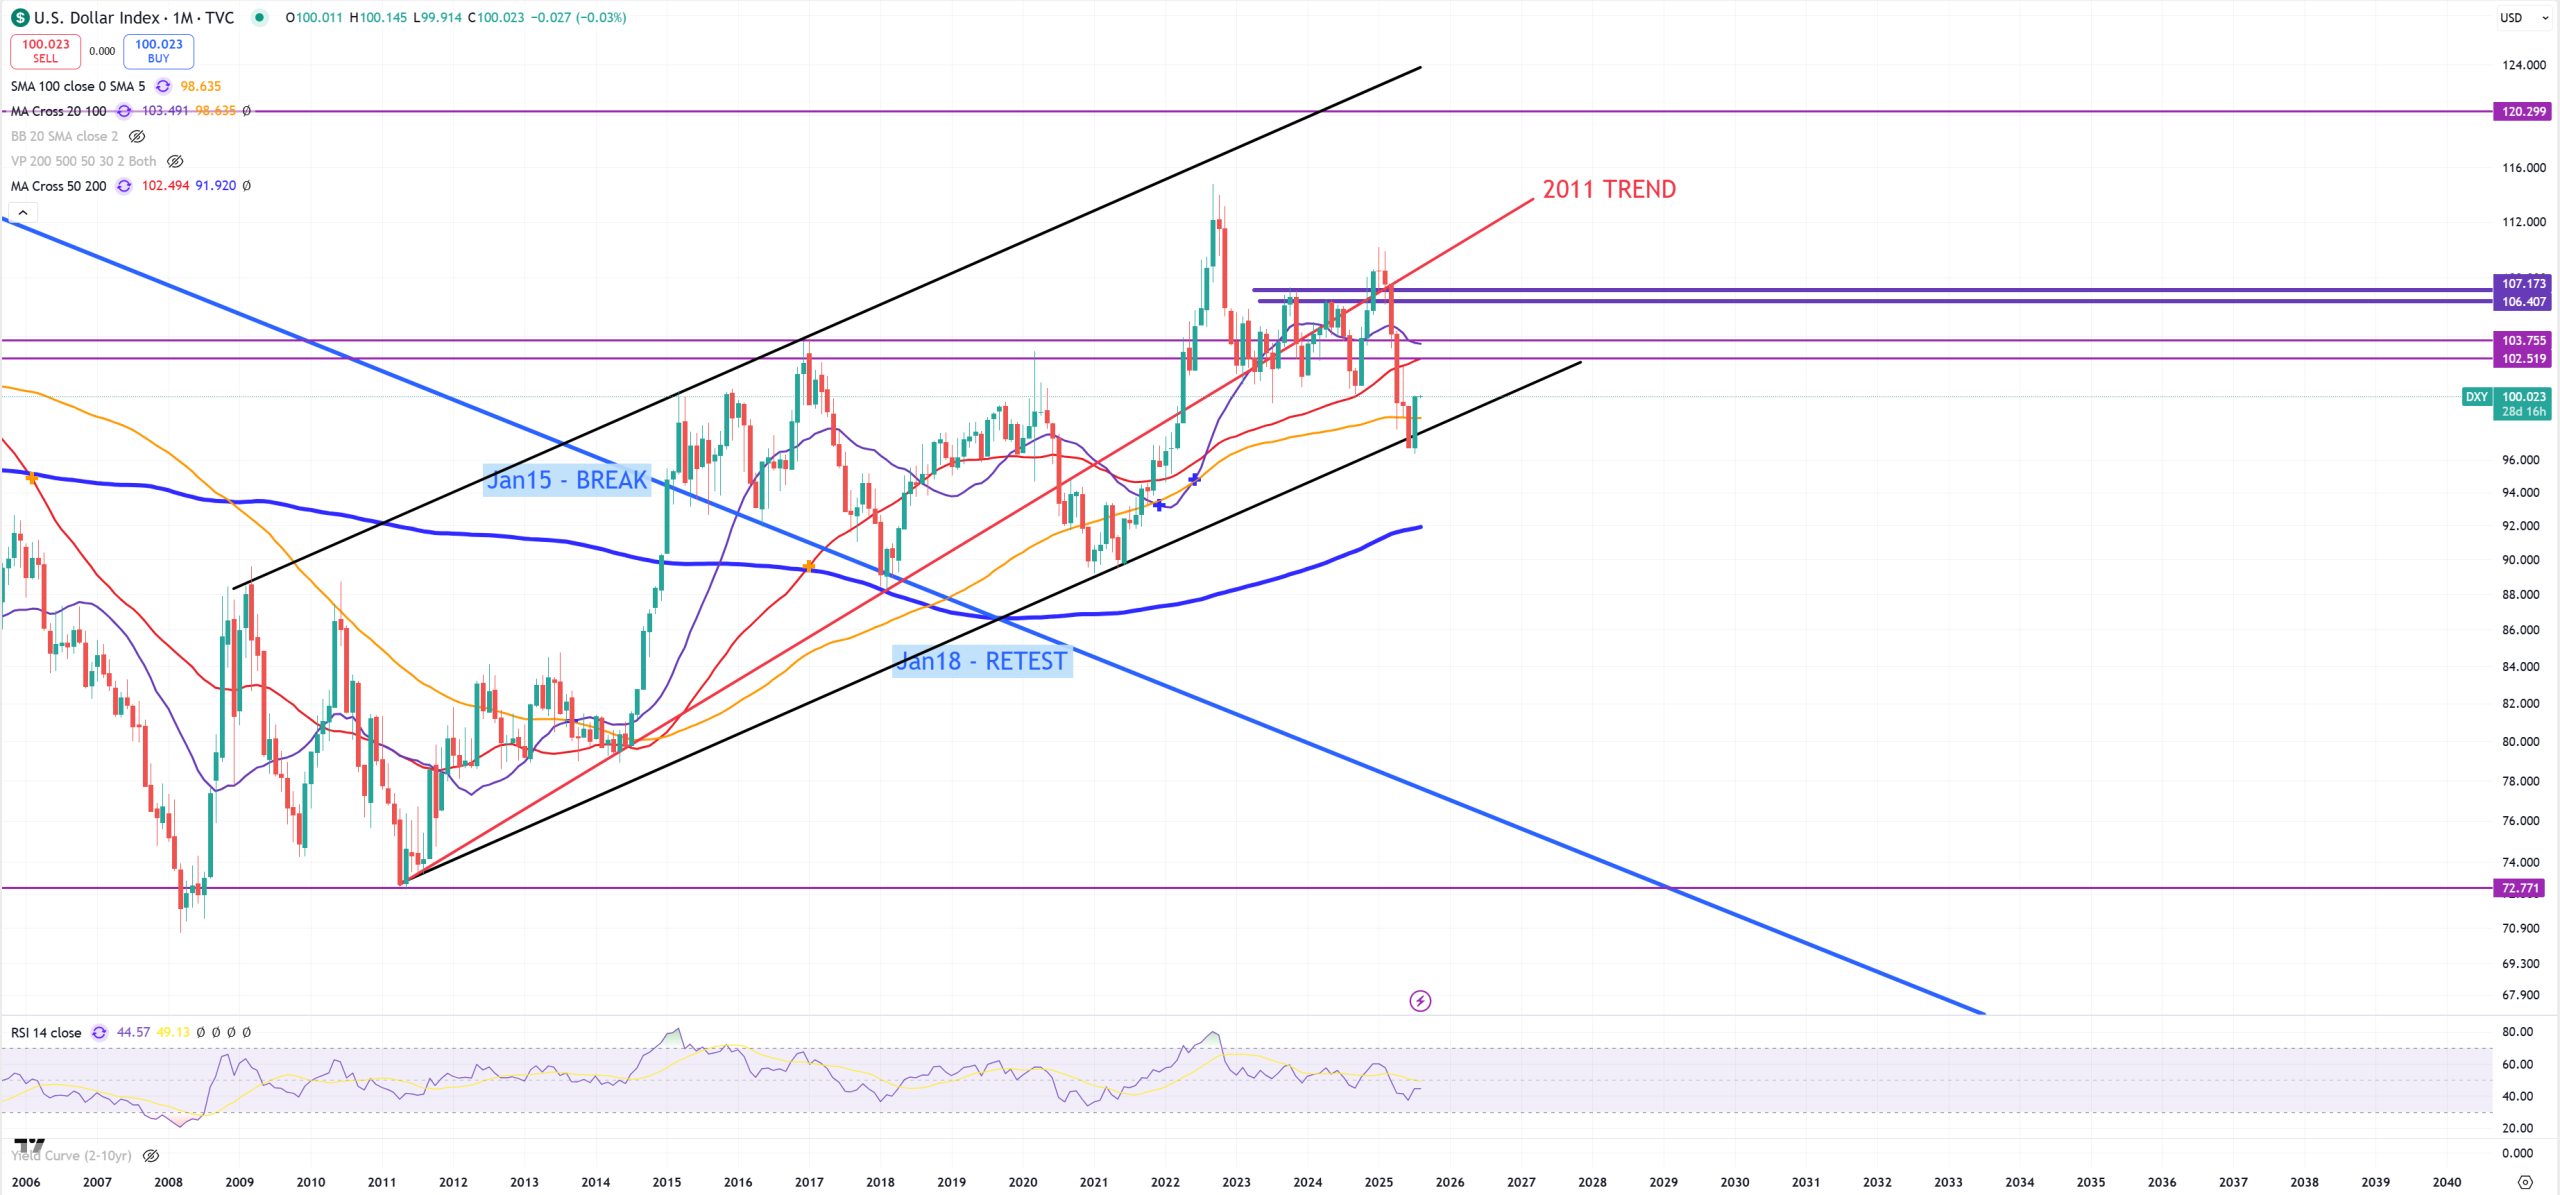
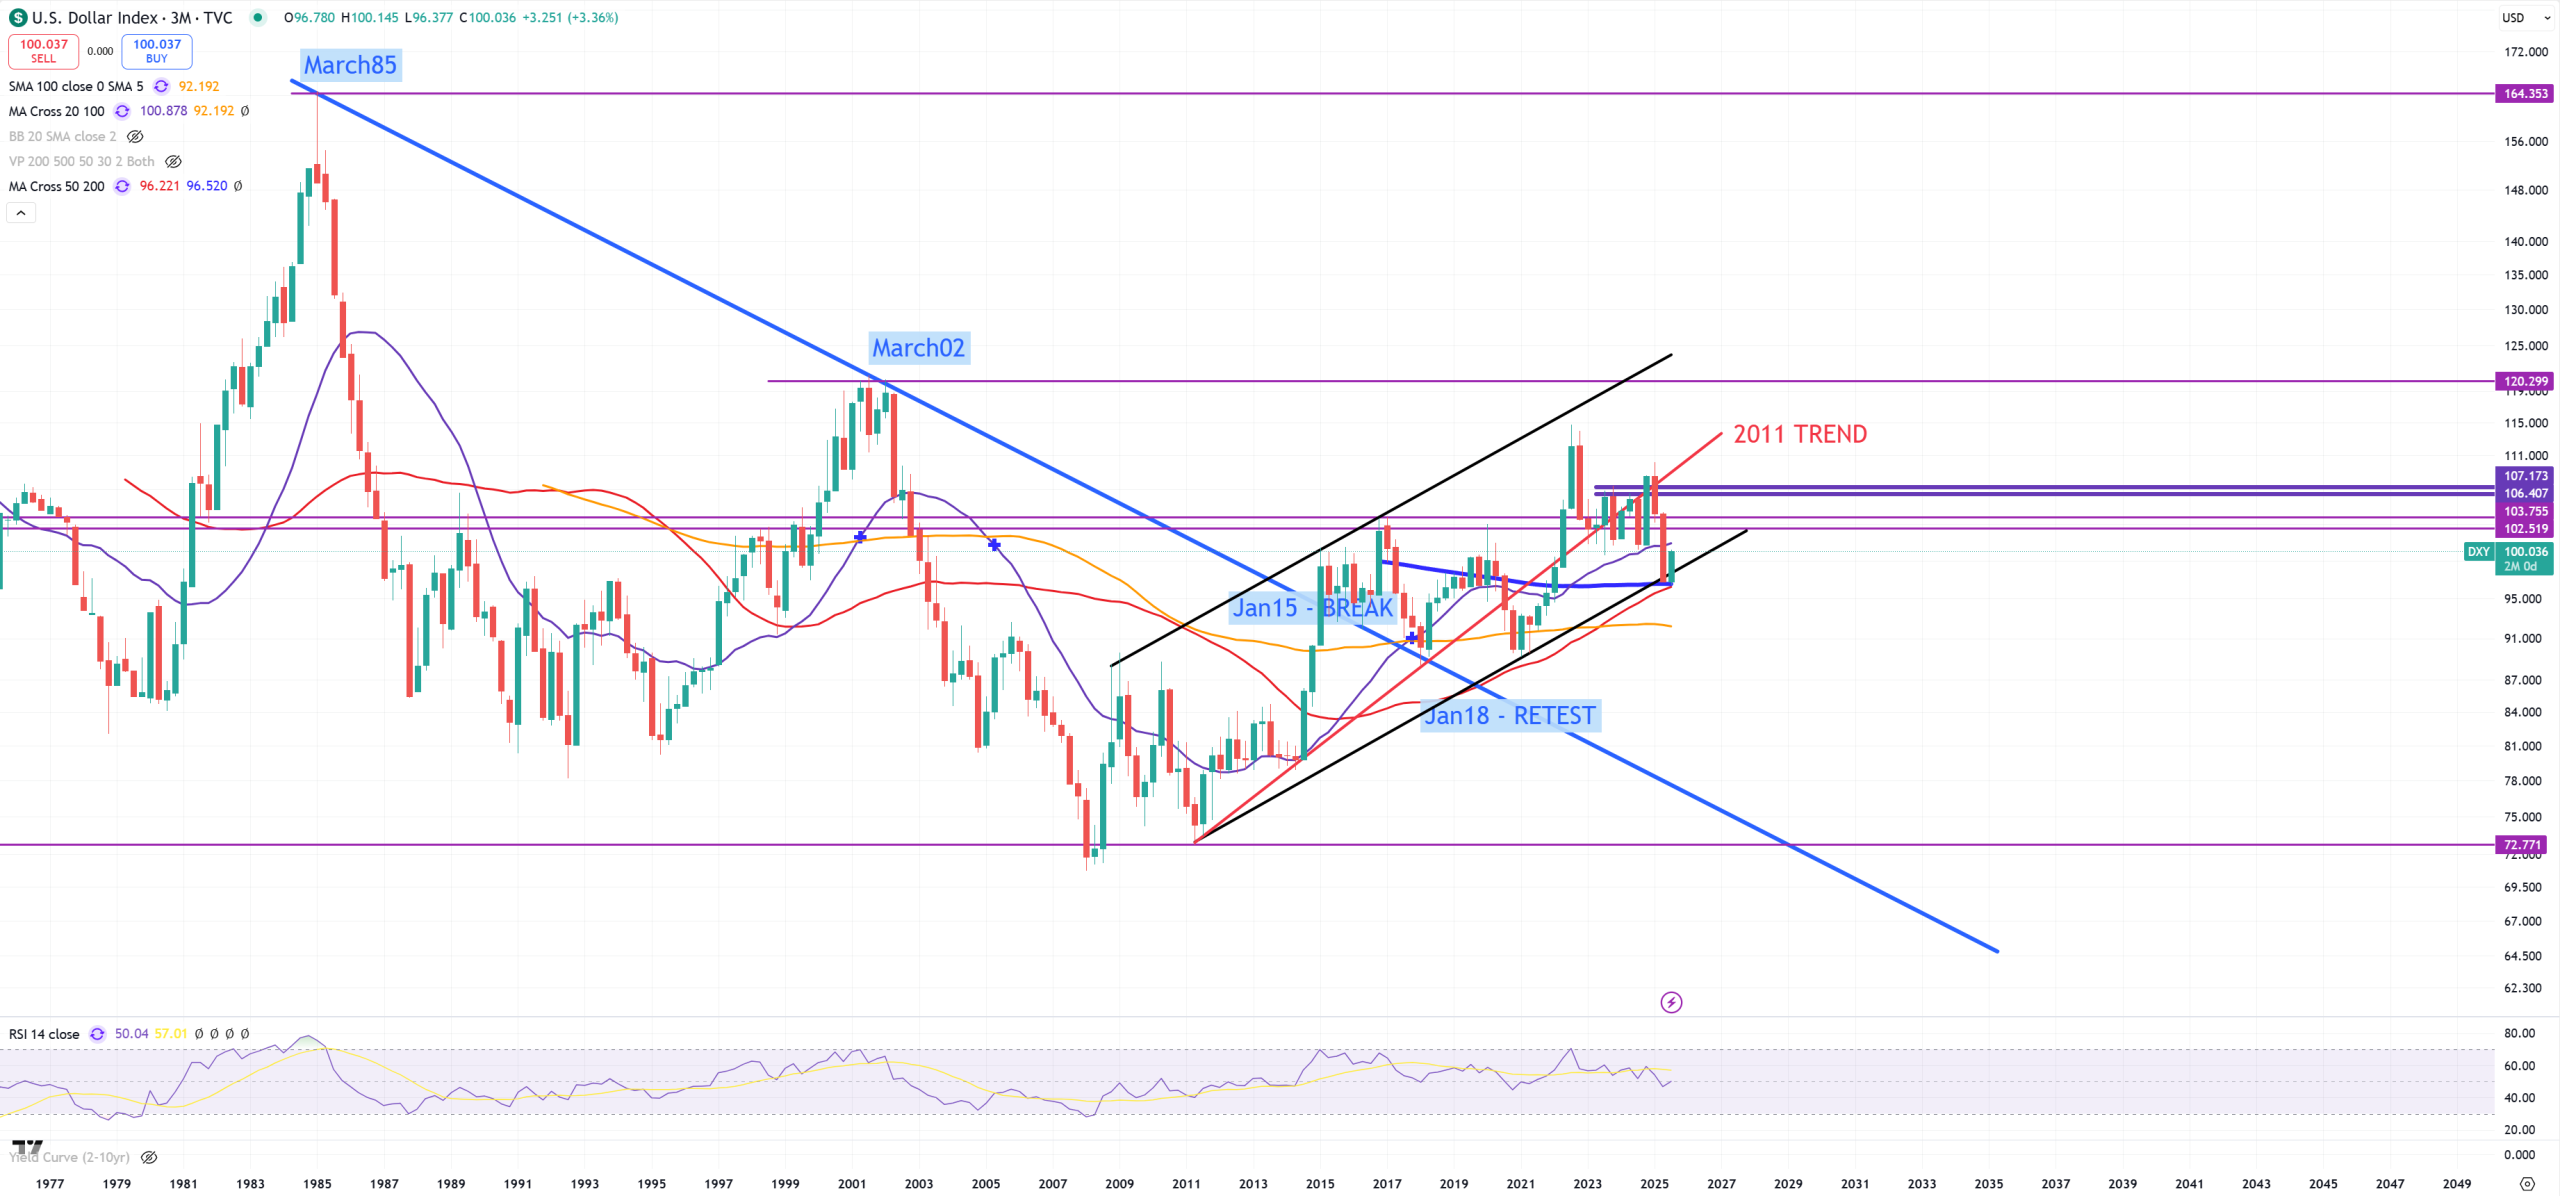
DXY – $$$ is the hero of this month because my last possible target which will force me to flip into bearish thesis was hold, yellow (M)MA100 which so ofter acts as a level of bull/bear trap just holds, probably the same moment SPX 1929-2000 level to hold at 6315 now. From the other hand I need to show (3M) view on DXY too and this building big cross (3M)MA50 / (3M)MA200 and support on those 2 MAs + trend.
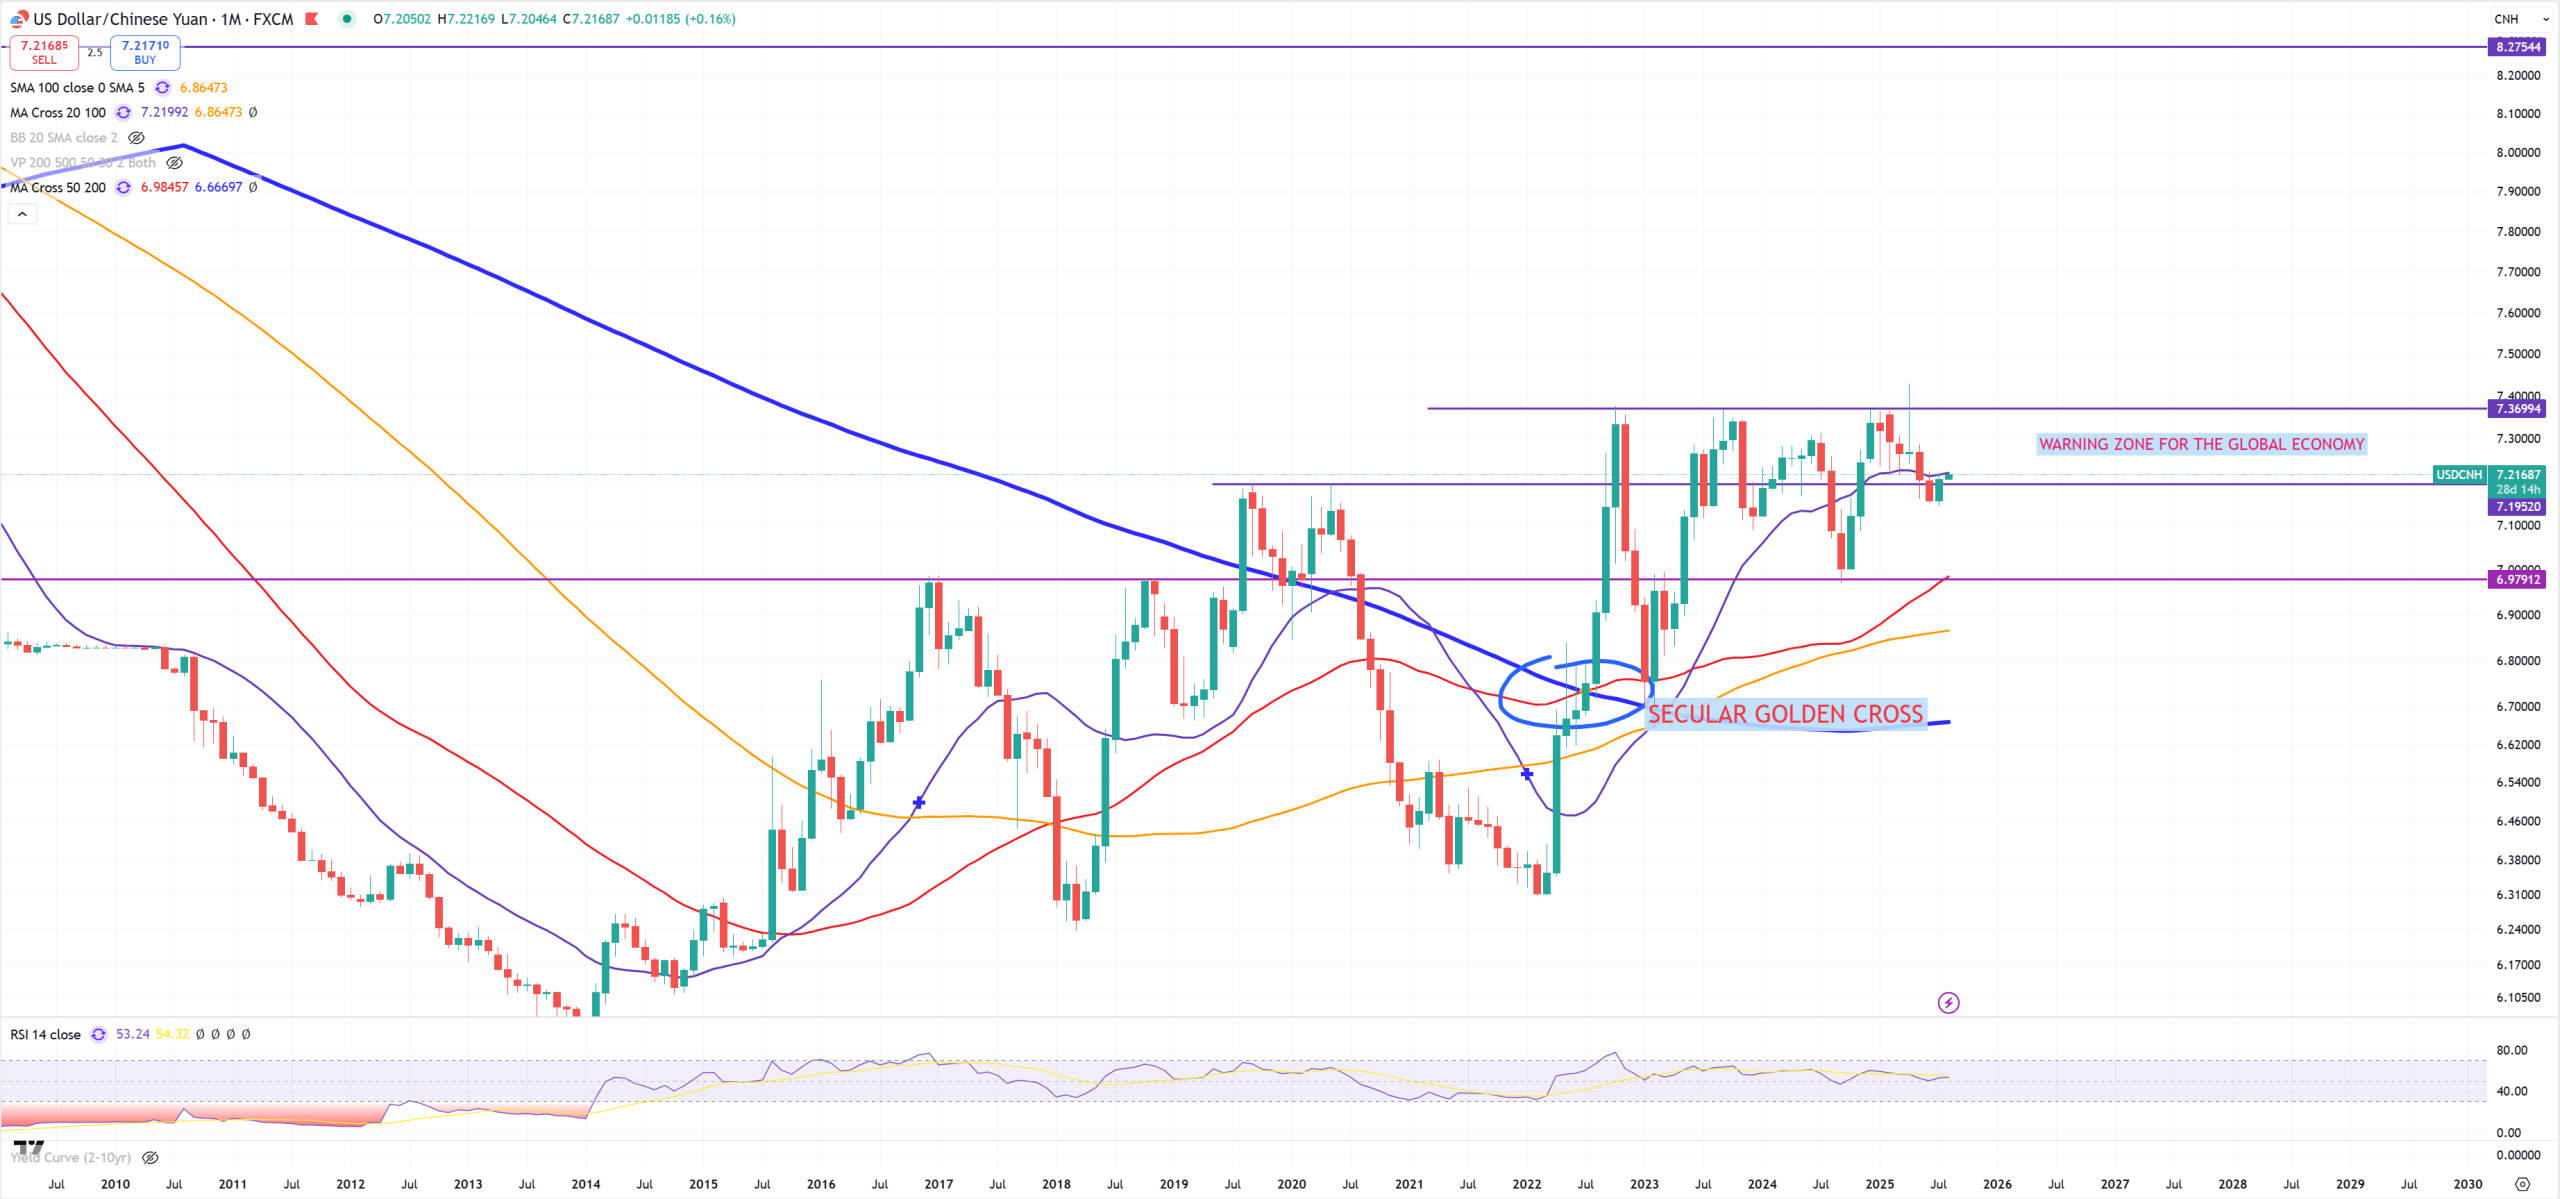
USDCNH – the power of the $$$ is a weakness of the Yuan. Yuan dropped from 7.45 to 7.14 and that forced DXY to drop from 105 to 96, but now Yuan jumped to 7.21 and DXY jumped to 100, that’s the most obvious logic. It’s still below (M)MA20, but it’s above key support 7.20.
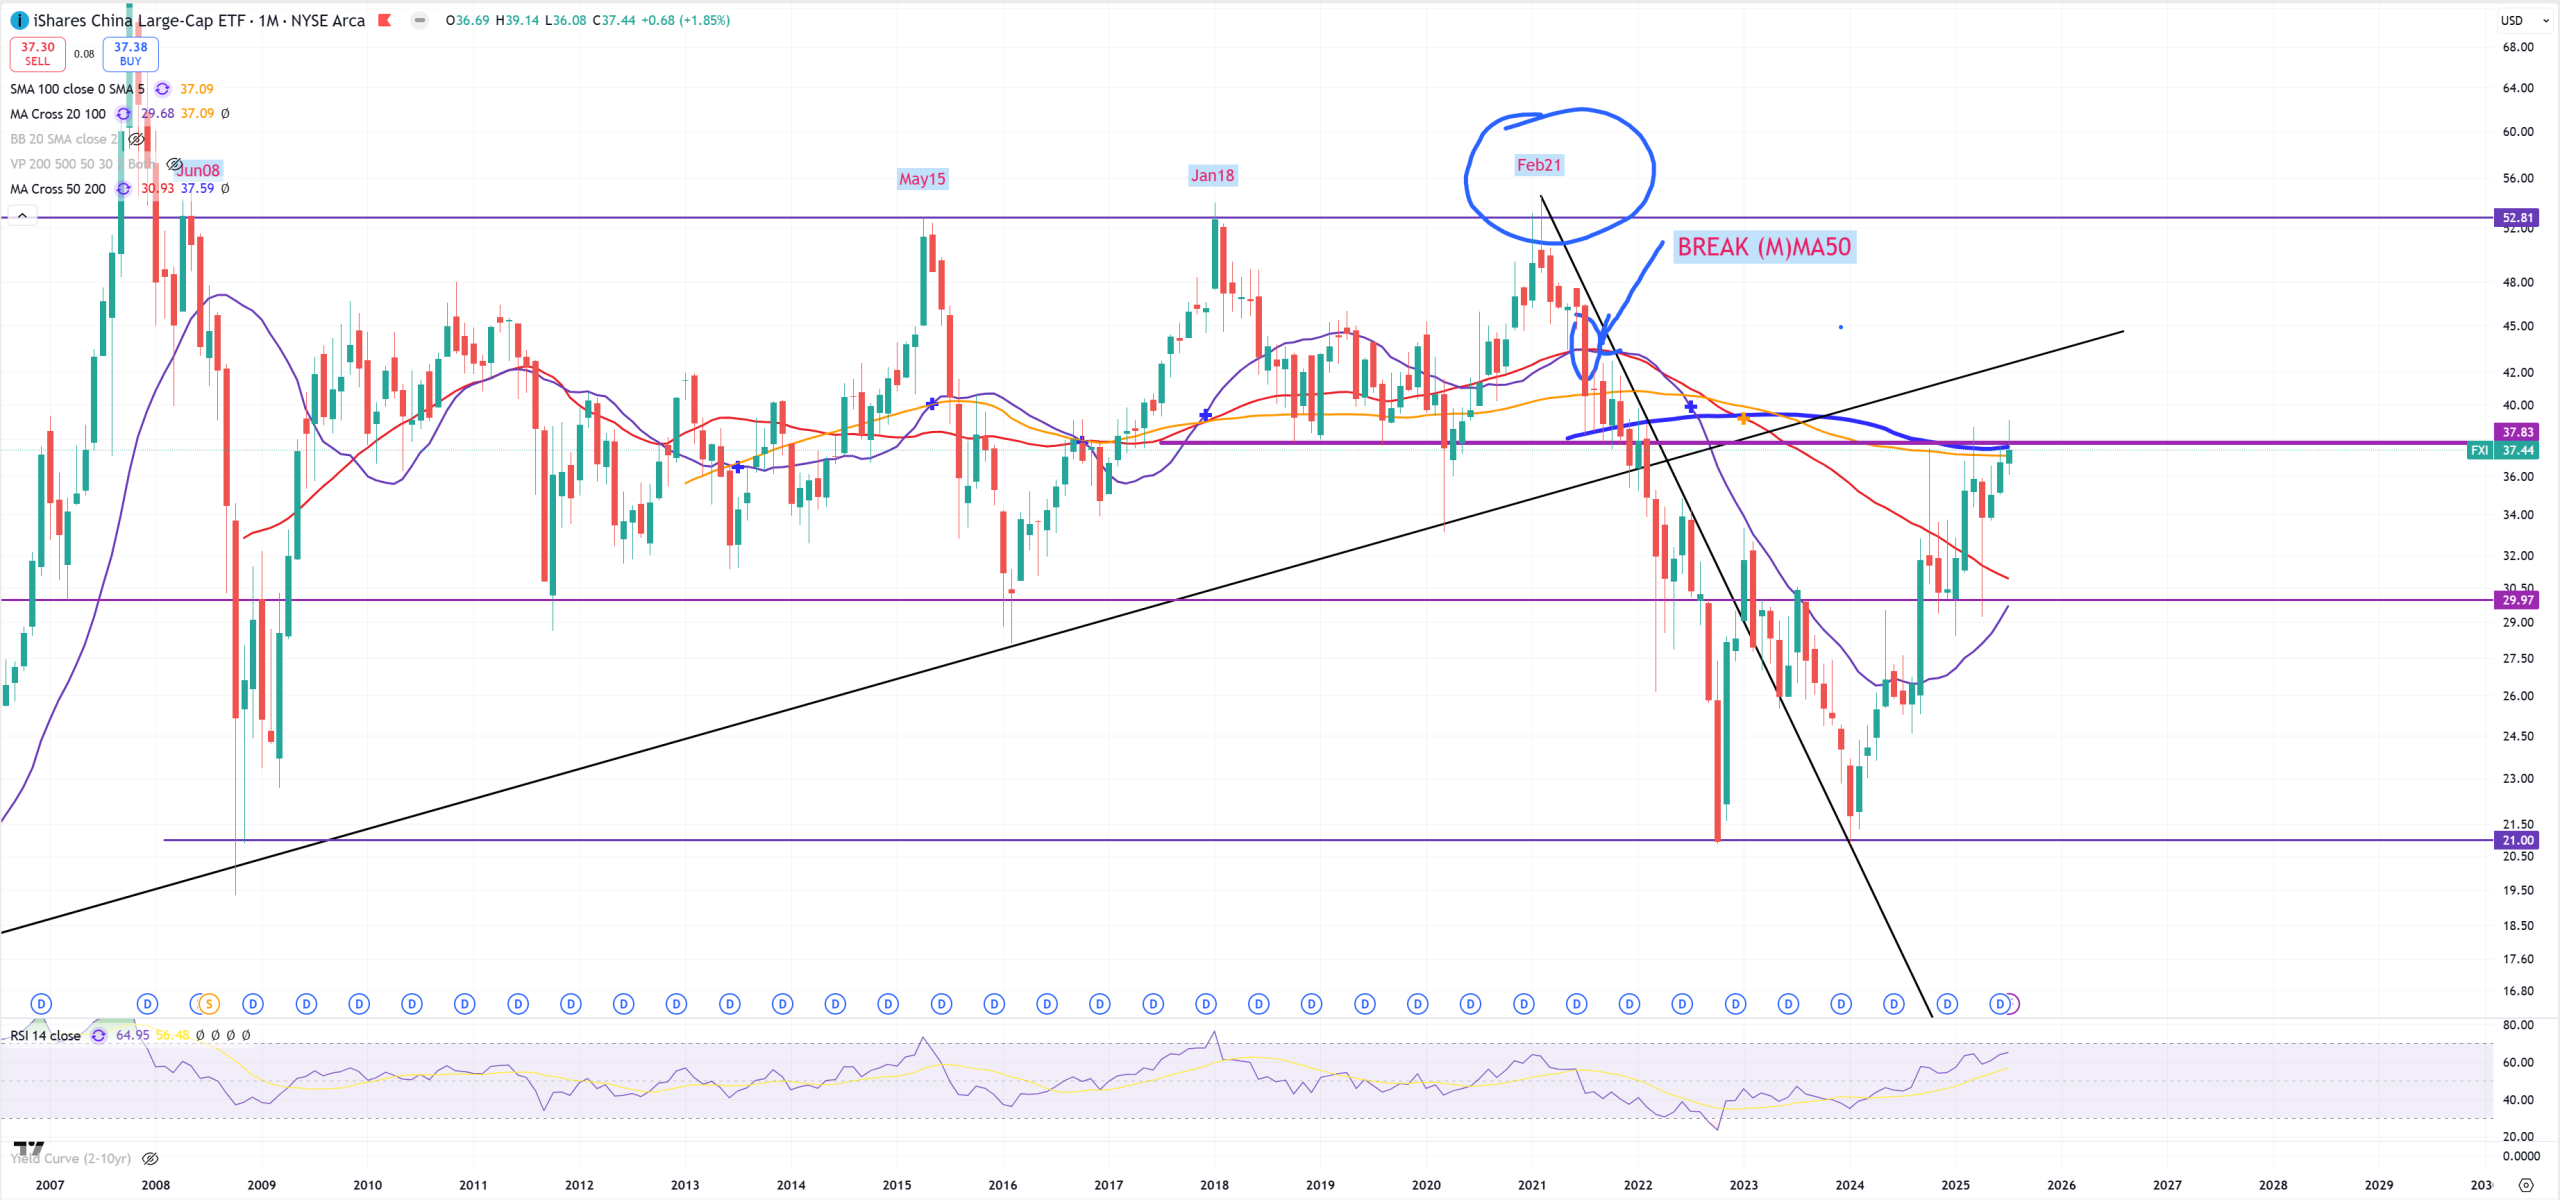
FXI – China – so if USDCNH finds its bottom, automatically FXI finds its peak. As you see blue secular (M)MA200 holds the resistance, so if SPX holds its 1929-2000 that’s the moment where the biggest drop should occur after successful retest. There’s still a possibility it’ll go higher to retest the trend, but if the main chart SPX will hold its secular trend line it shouldn’t happen
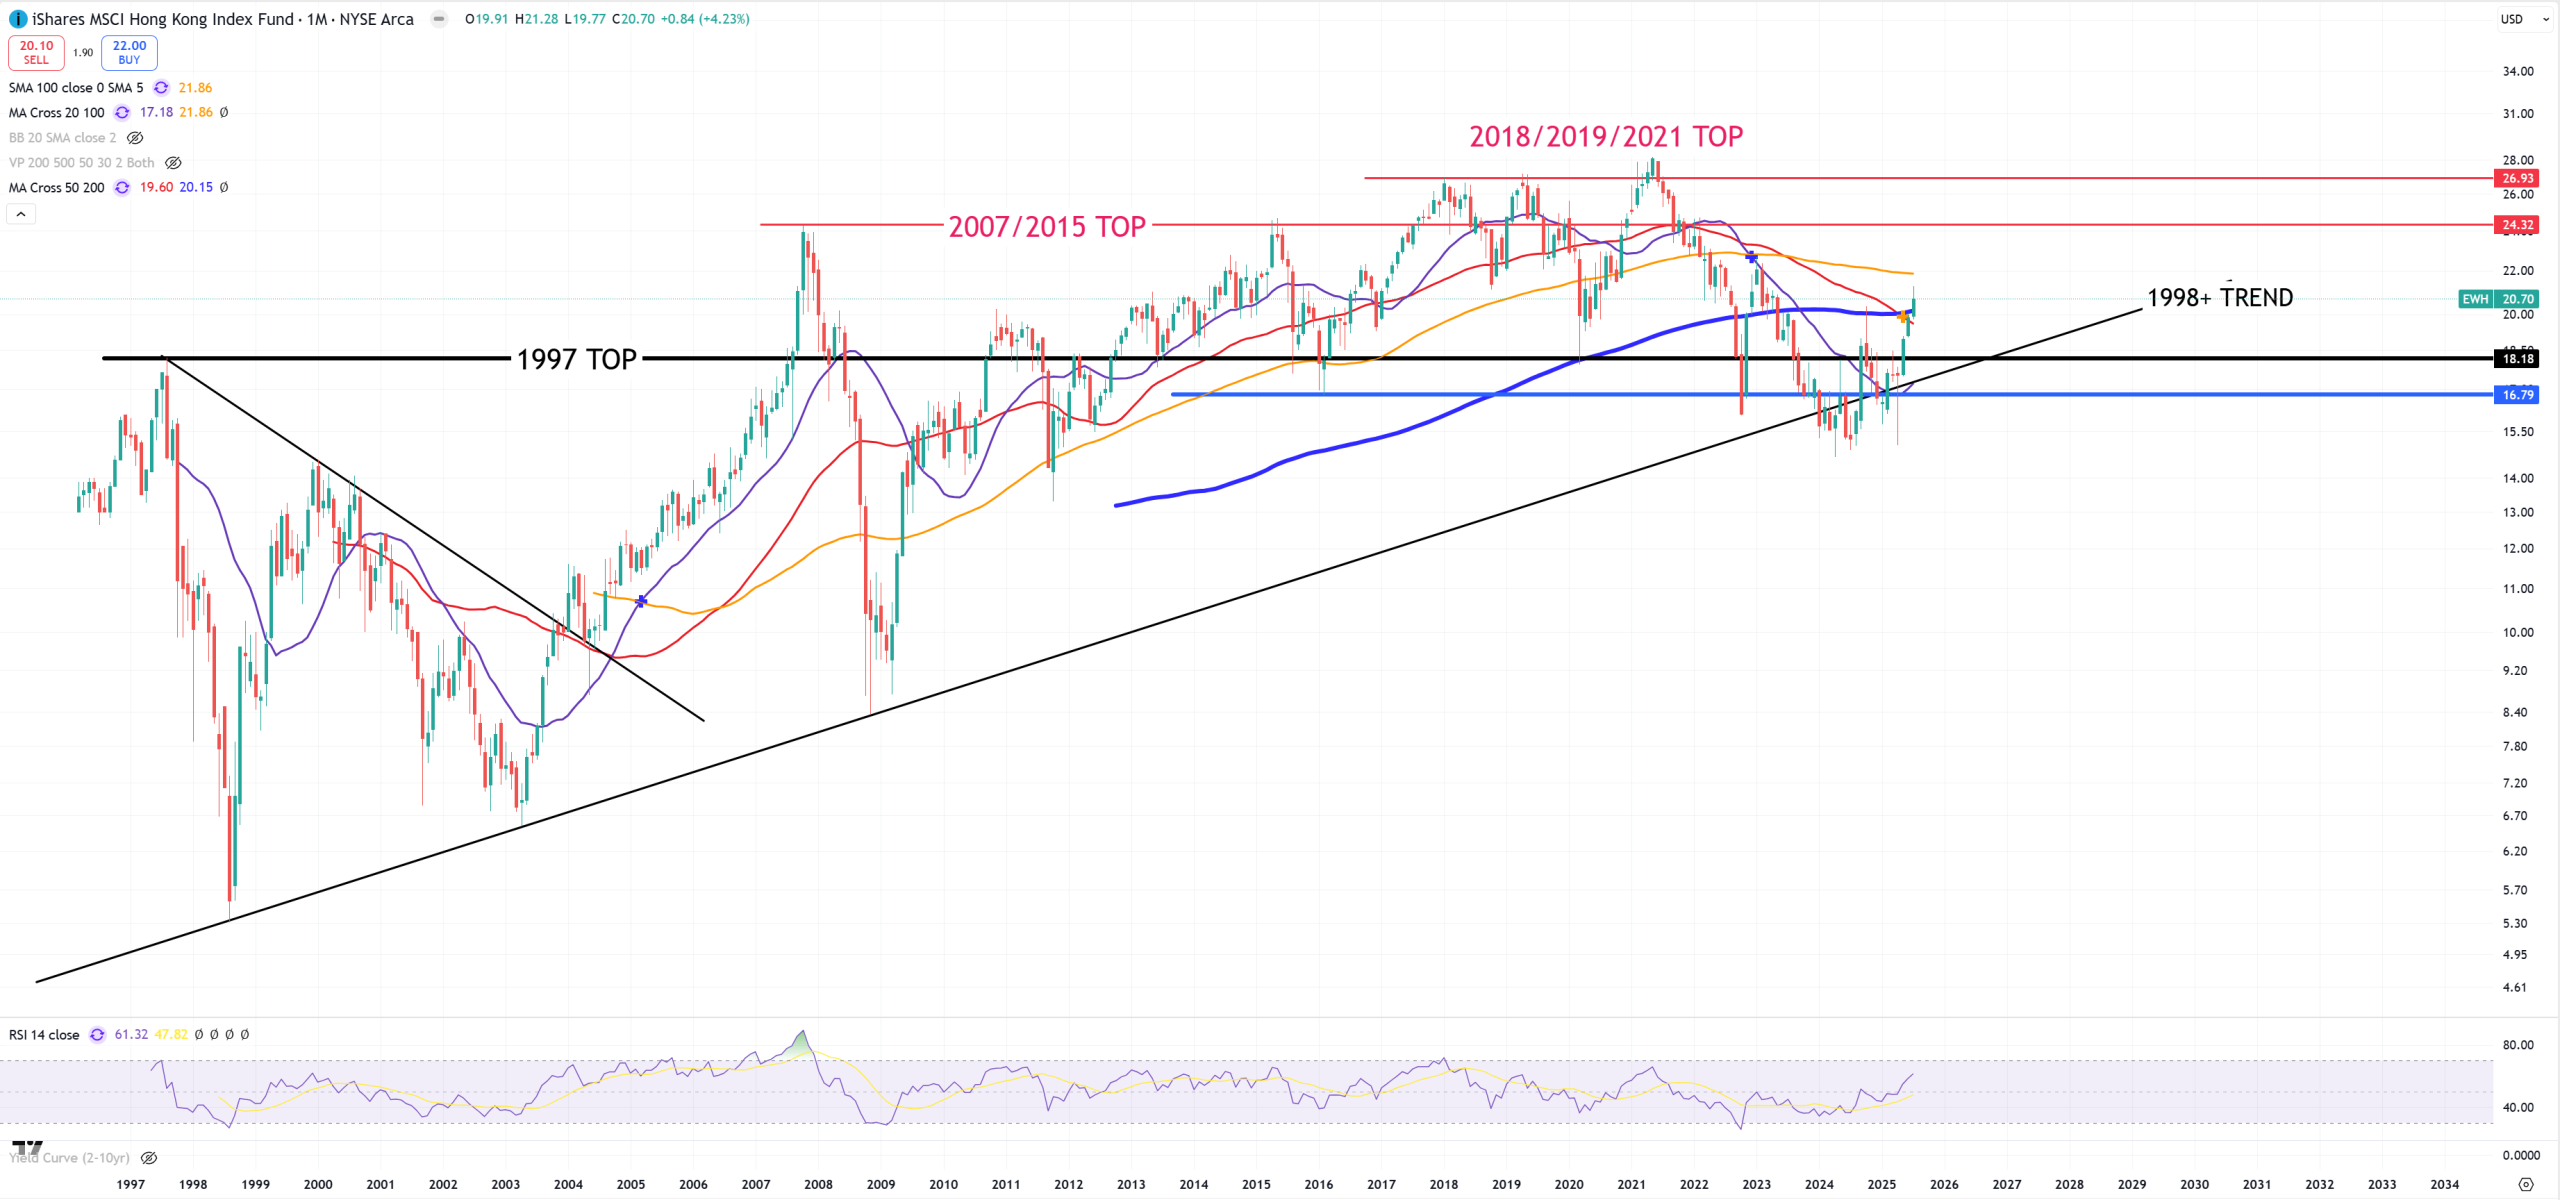
EWH – Hong-Kong – is a bit different story, after initial break of its 1998+ trend market managed to defend it, but it’s all about DXY drop in reality. Let’s call it it’s on the edge of (M)MA200 – I must admit I thought it’ll end the same as FXI, but not.
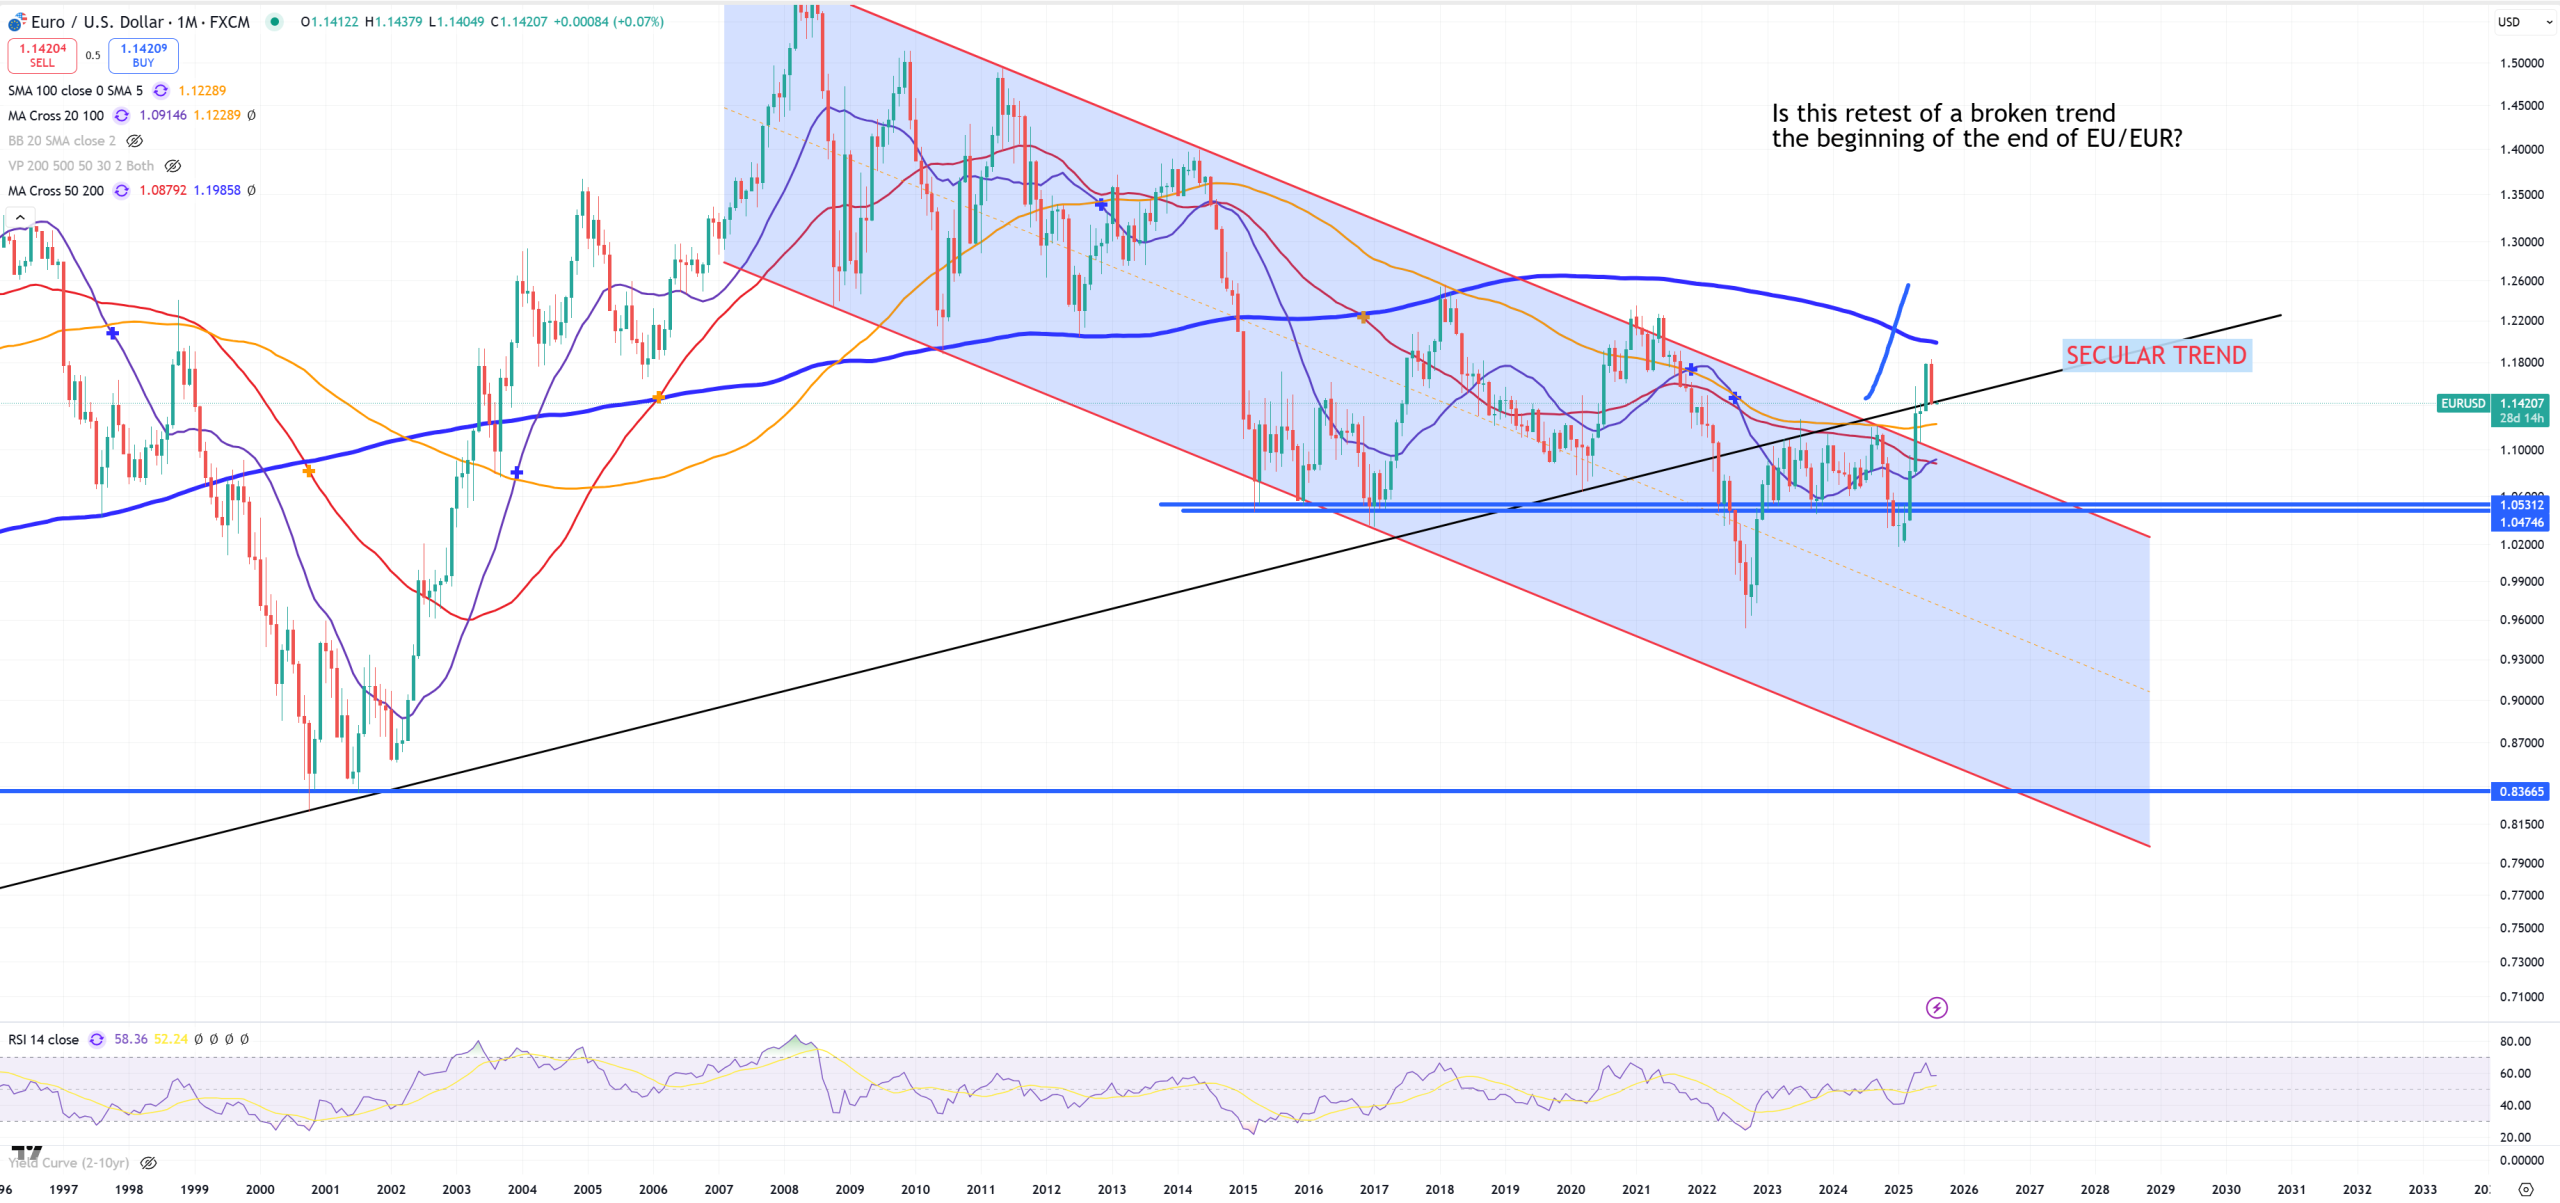
EURUSD – as you see after a massive spike above its secular trend line, shocking everyone including me, it’s now below it. 1.145 is the trend and 1.10 is the moment to push it back to channel. So full month to resolve.
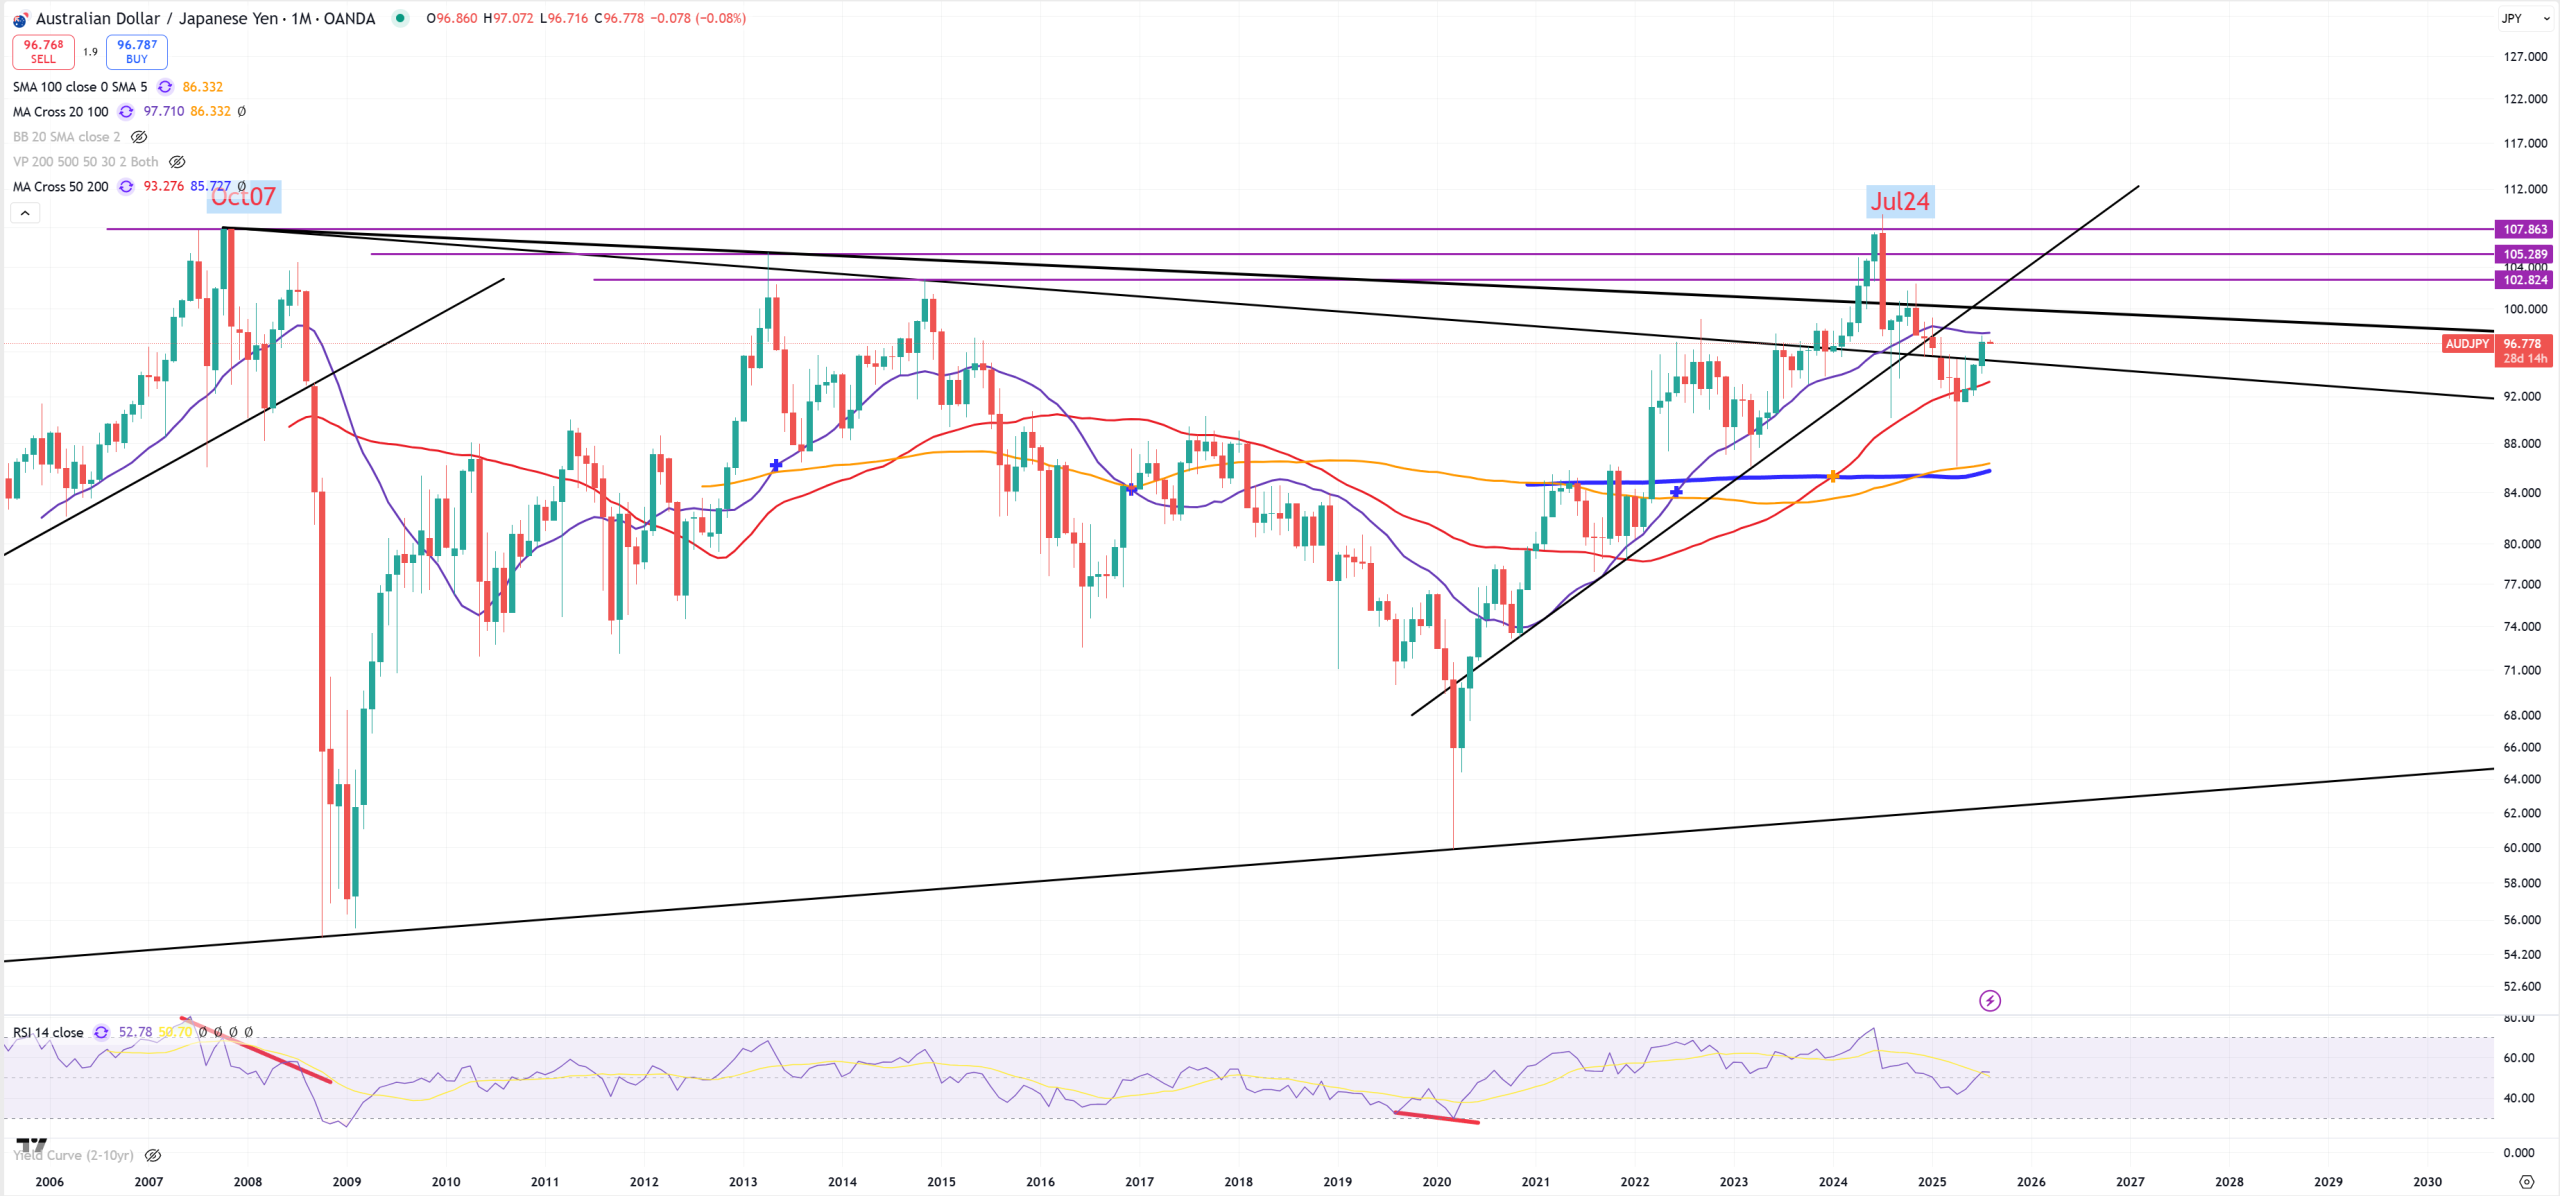
AUDJPY – stocks indicator pair and it’s here in the middle. Just like EWH I was expecting it to close somewhere below the trend which is around 95, but it did not.
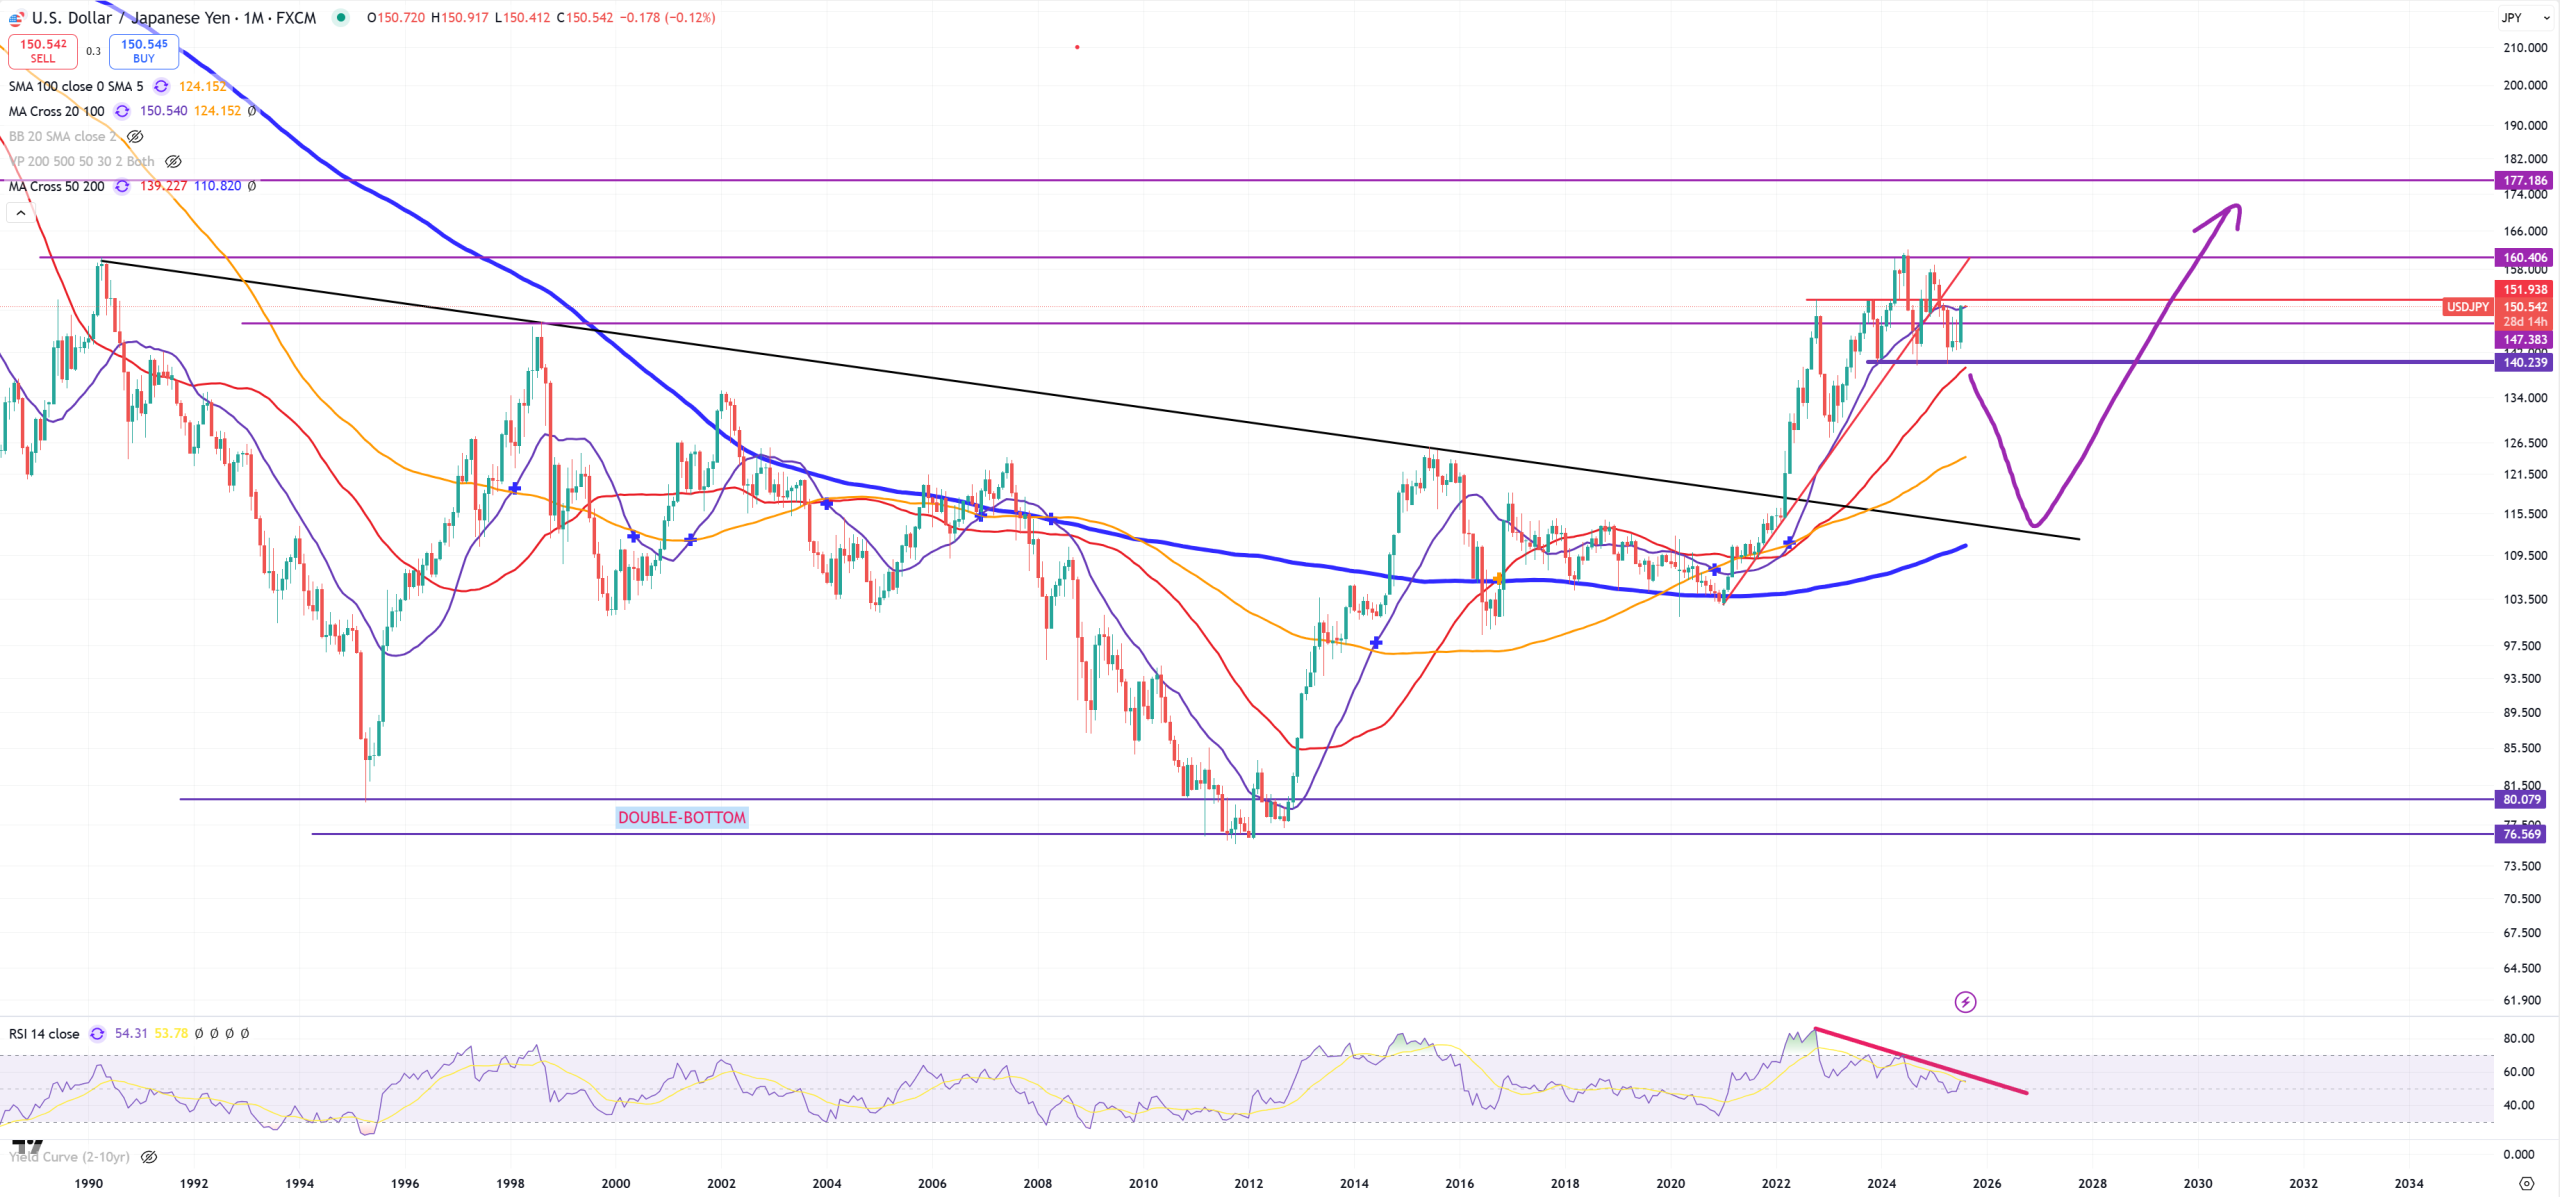
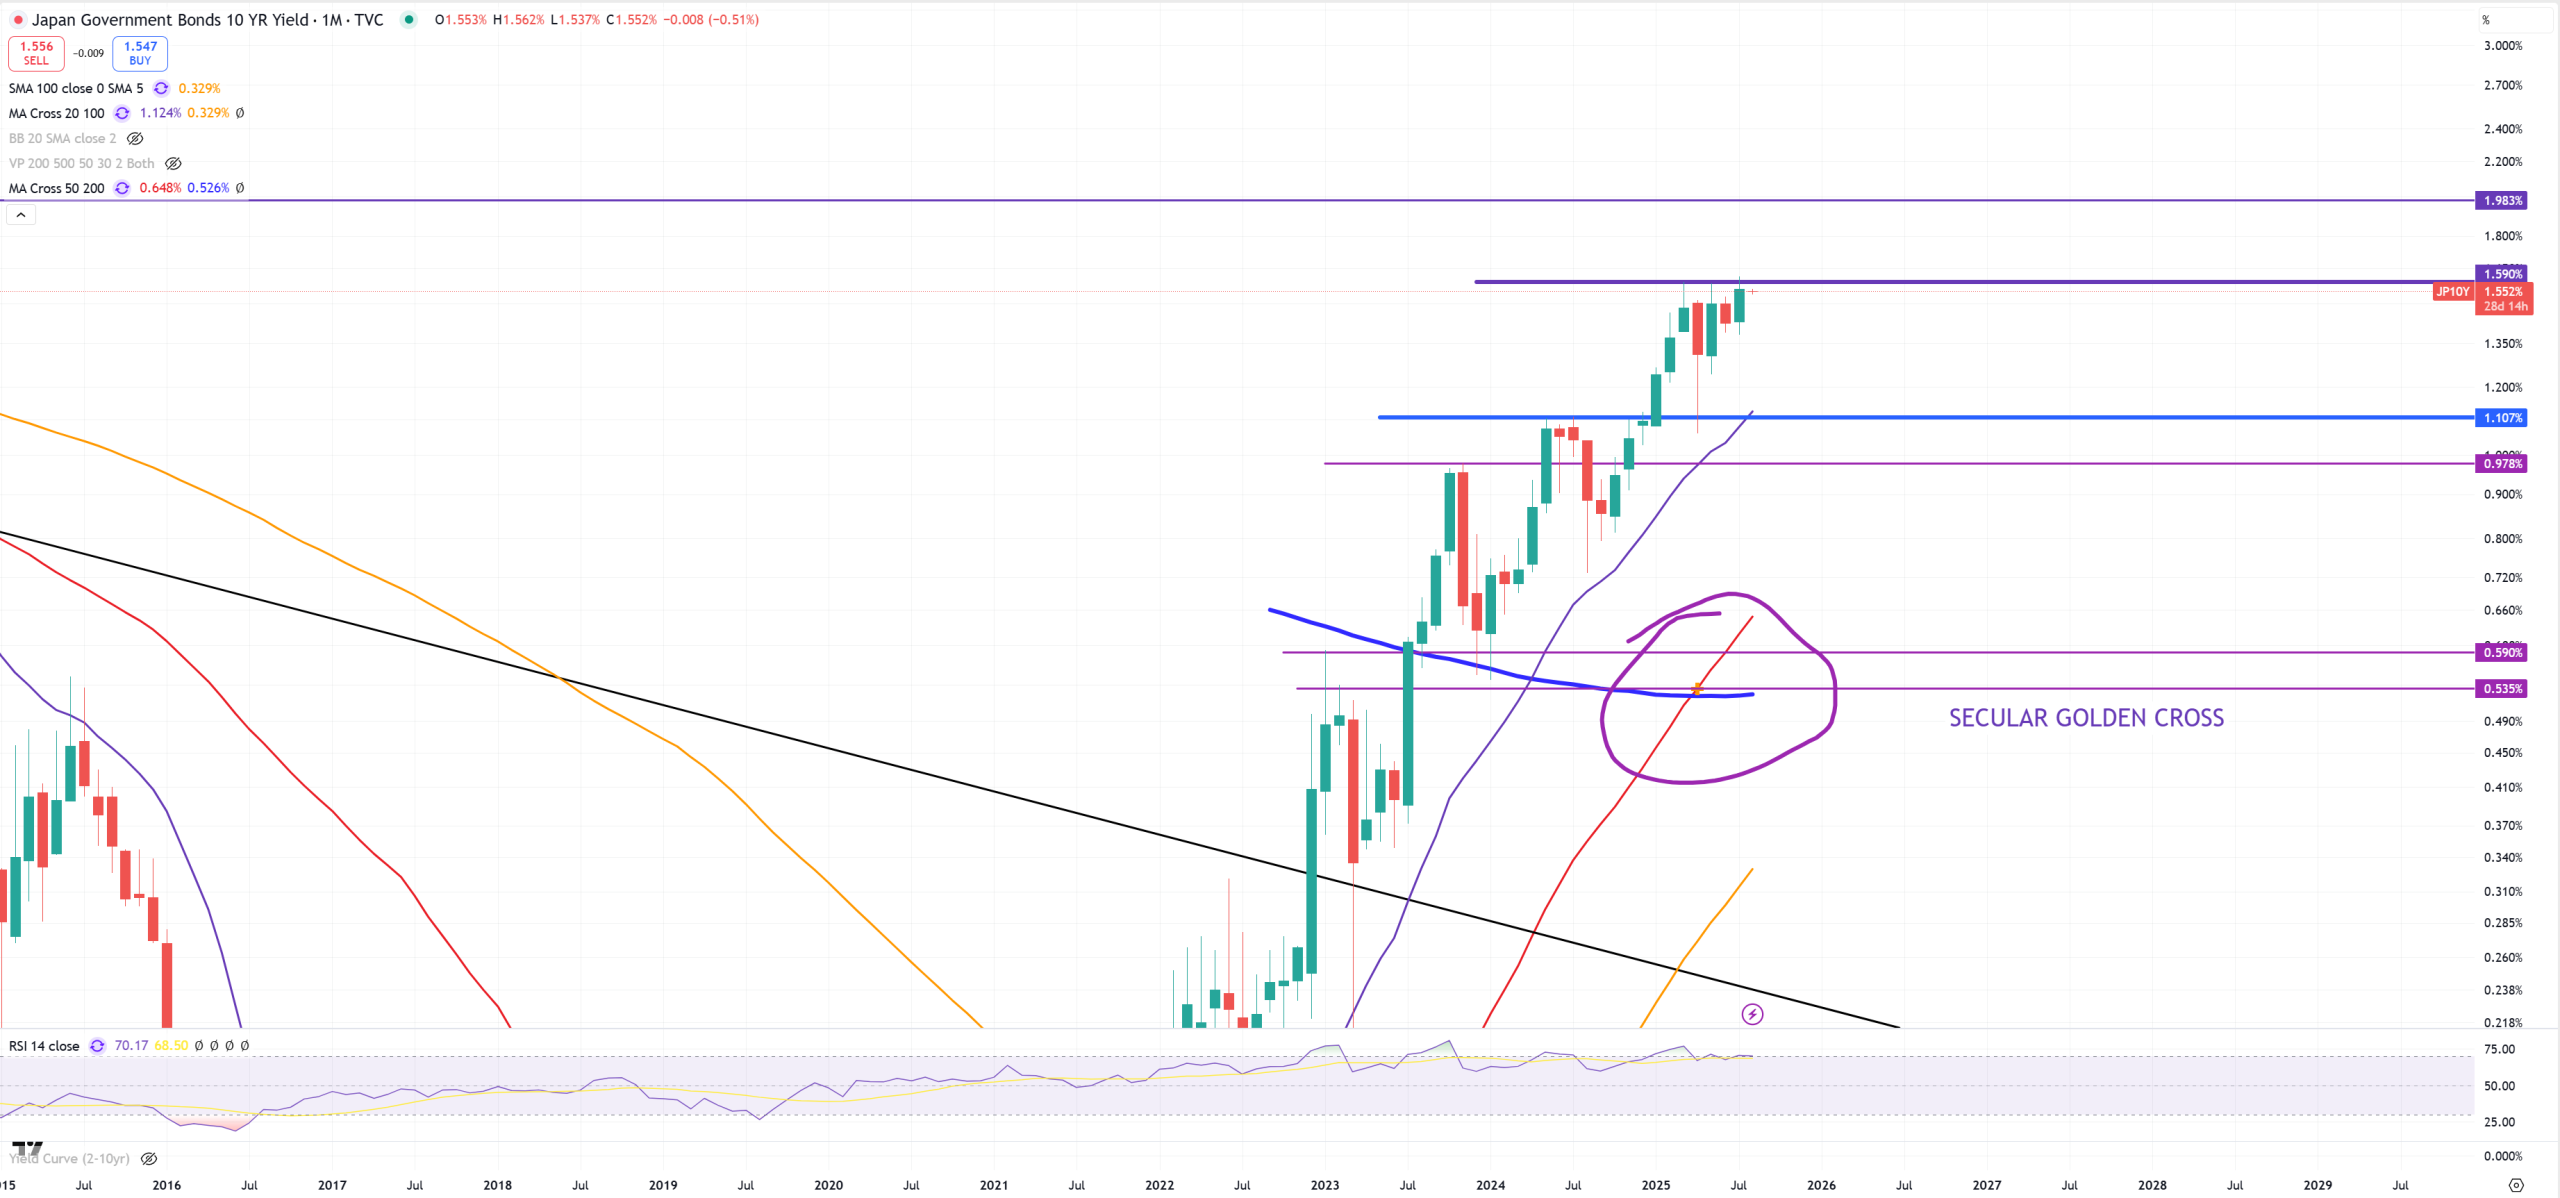
USDJPY – Yen still fights and BoJ needs to answer what they’d like to blow up first, their bond market of currency. It’s now 150 just because JP10Y holds 1.60%. I personally believe BoJ will lose control again on bond market and spike in yields will be way higher.
JP10Y – this 1.60% resistance. I can’t believe in any circumstances why those yields should go lower.
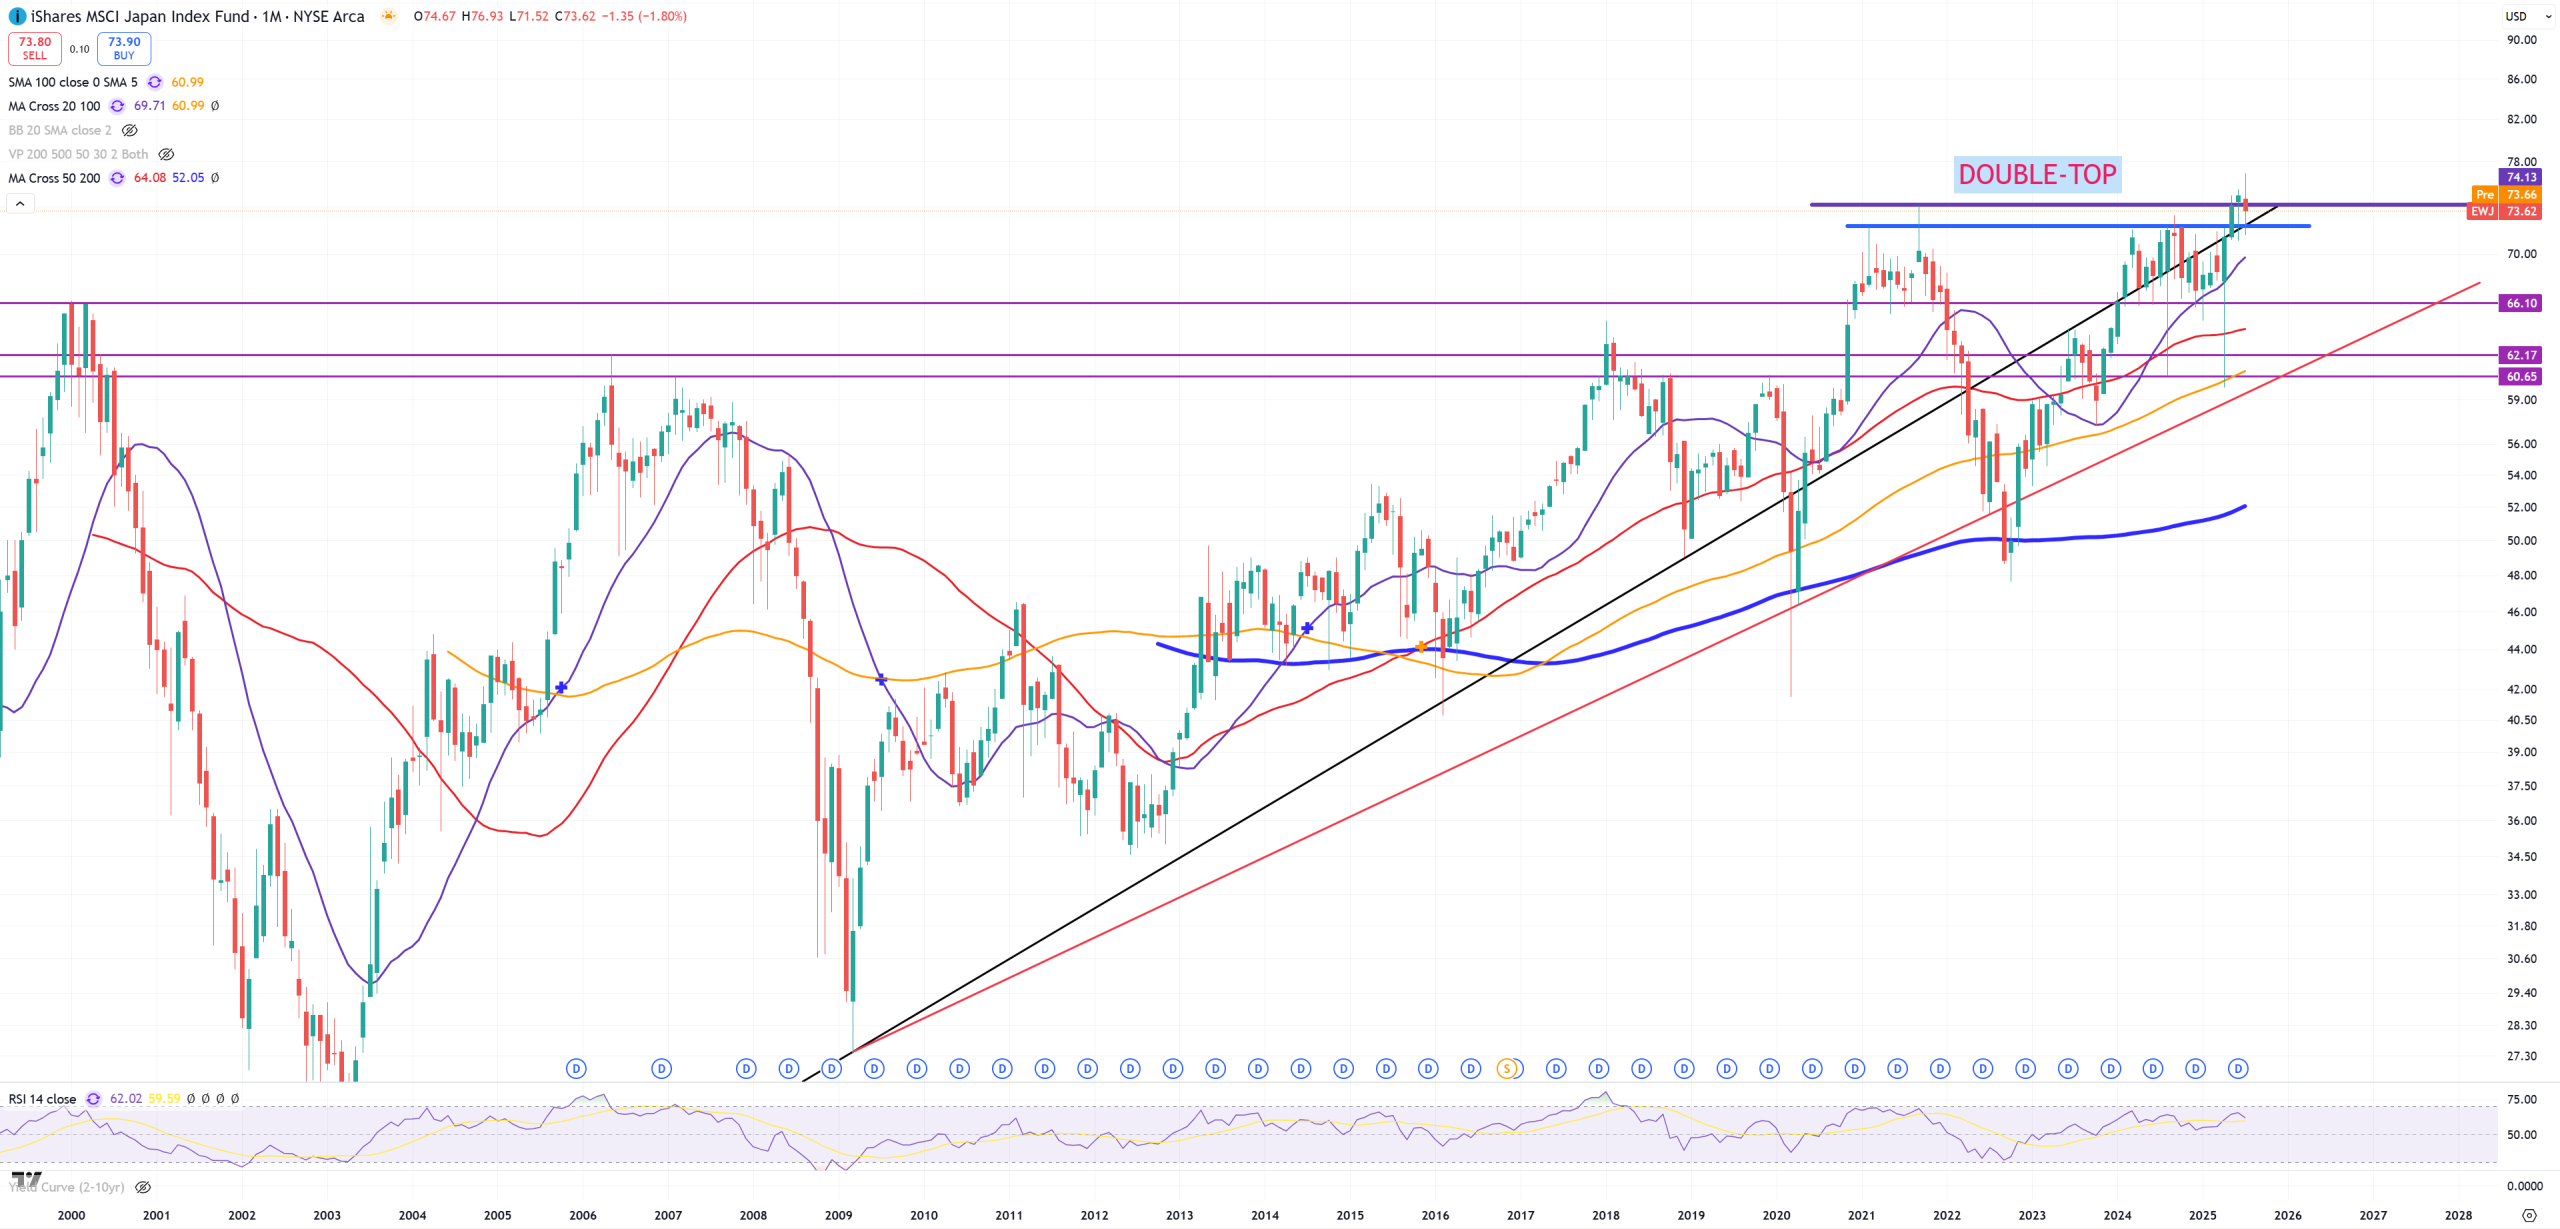
EWJ – Japan in $$$
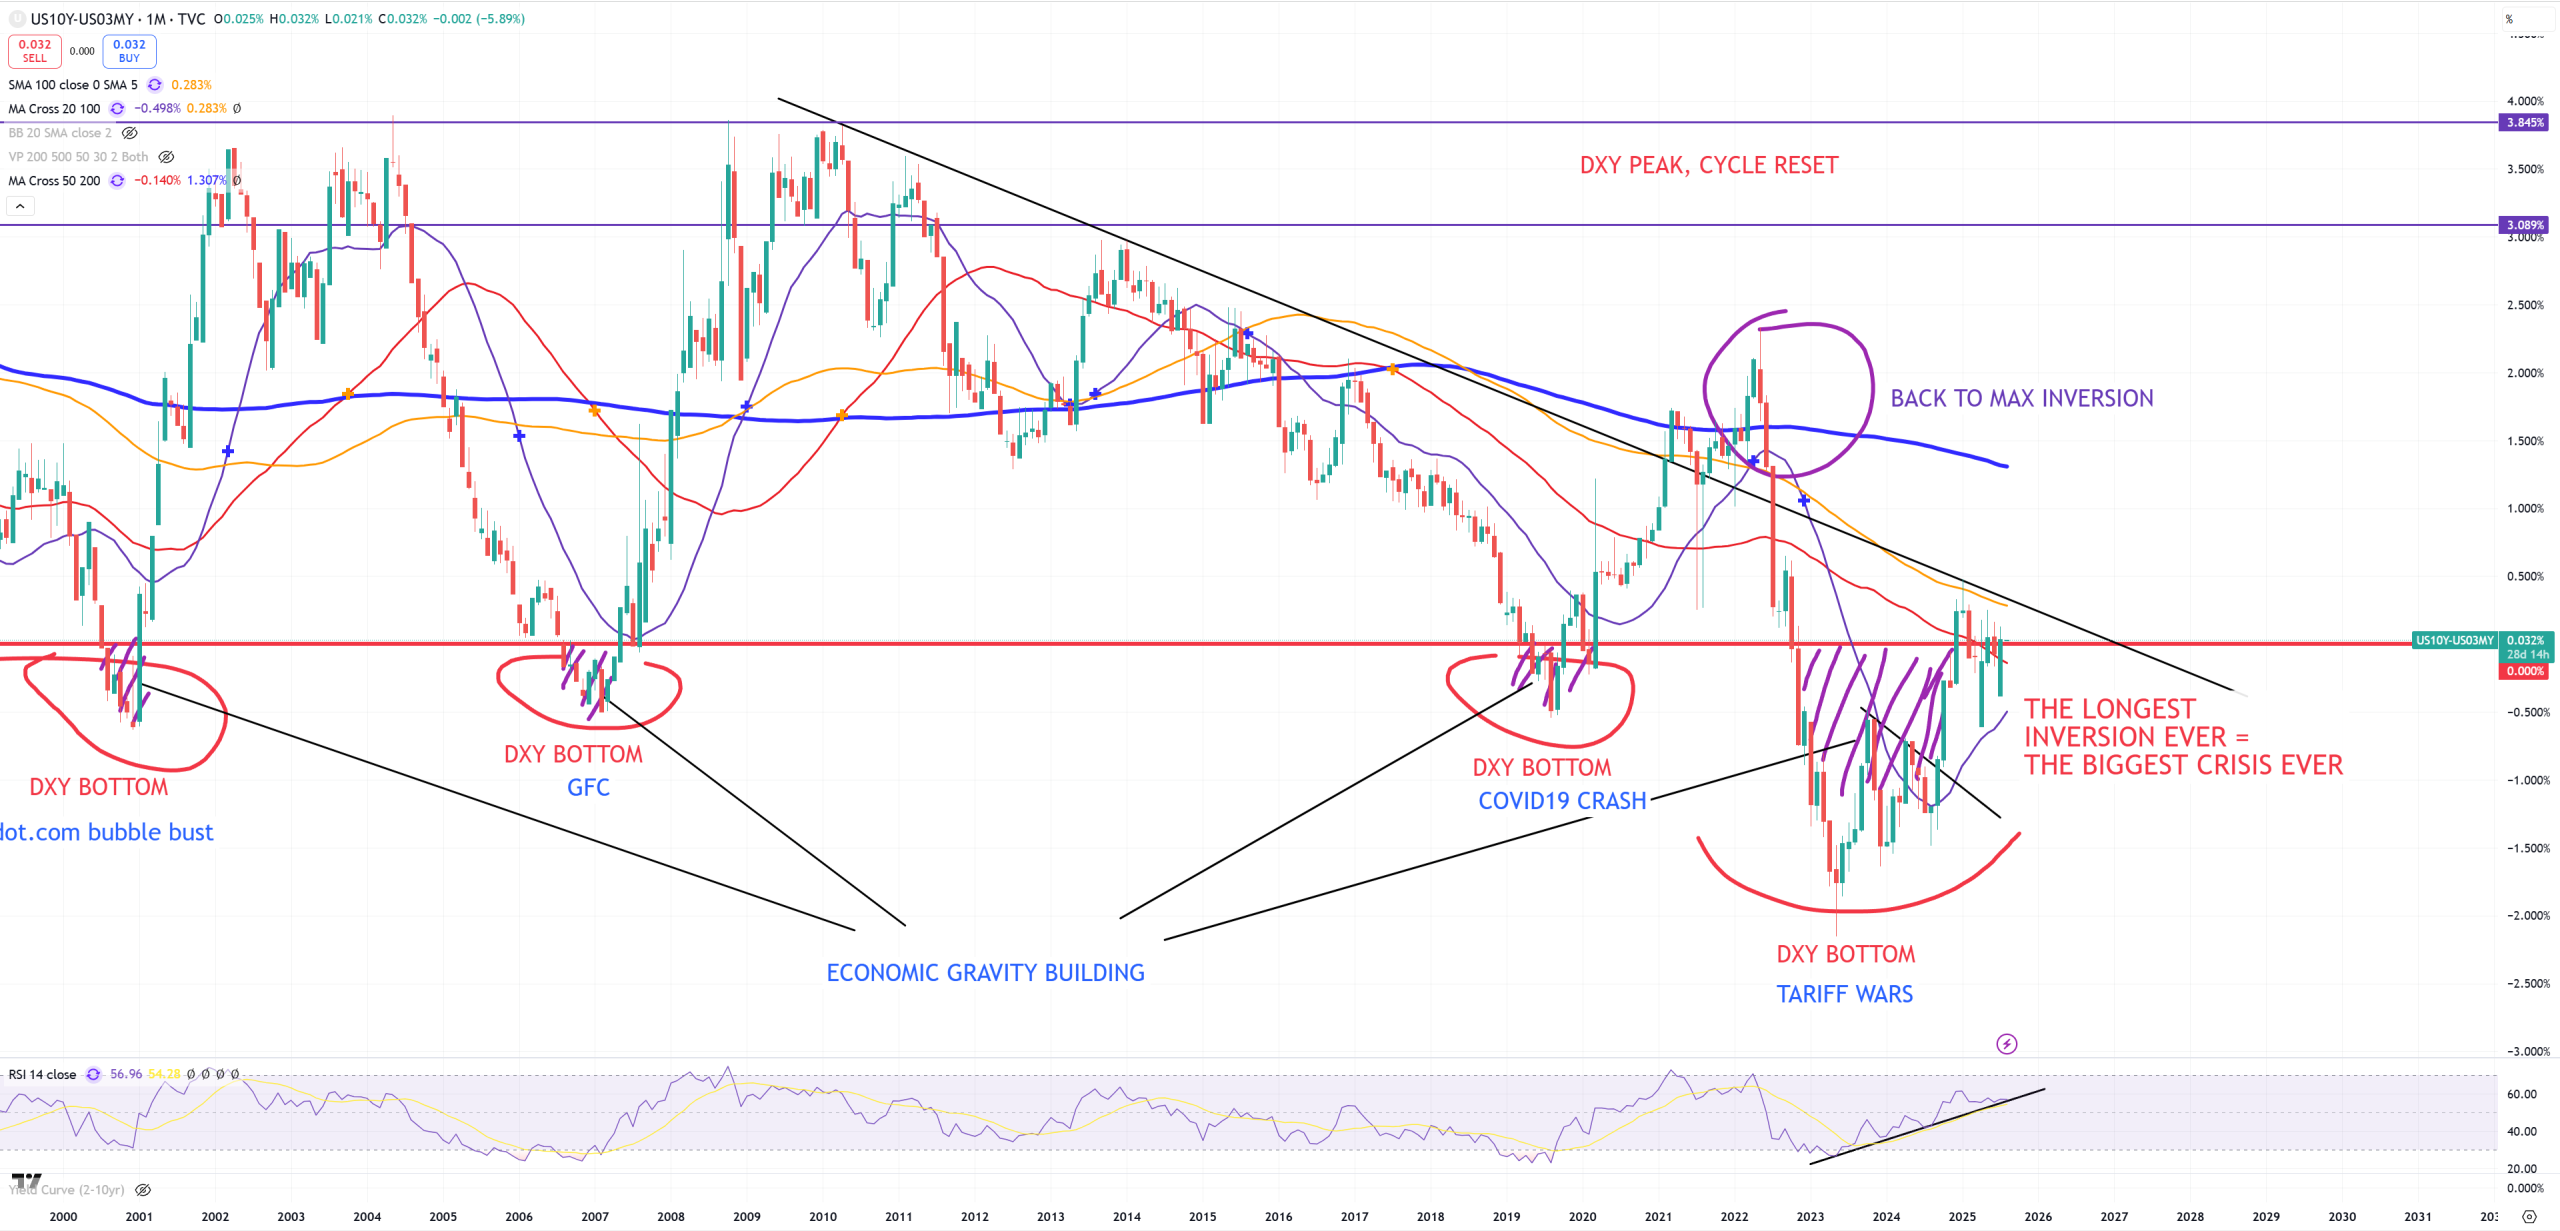
10Y/3M – holds above (M)MA50. So somebody was trying to make sure this kind of YCC (Yield Curve Control) will hold, but IMO it won’t be easy or even possible. We clearly see how the whole energy of putting this 10Y/3M down requires const DXY drop, but that means after 1000 days of inversion, just small moves up push DXY move really fast up. That’s my observation from previous month : the $$$ crush no longer works, but it adds a massive rubber power for it to jump. Action = Reaction, especially if 1929-2000 trend on SPX + DXY trend will hold.
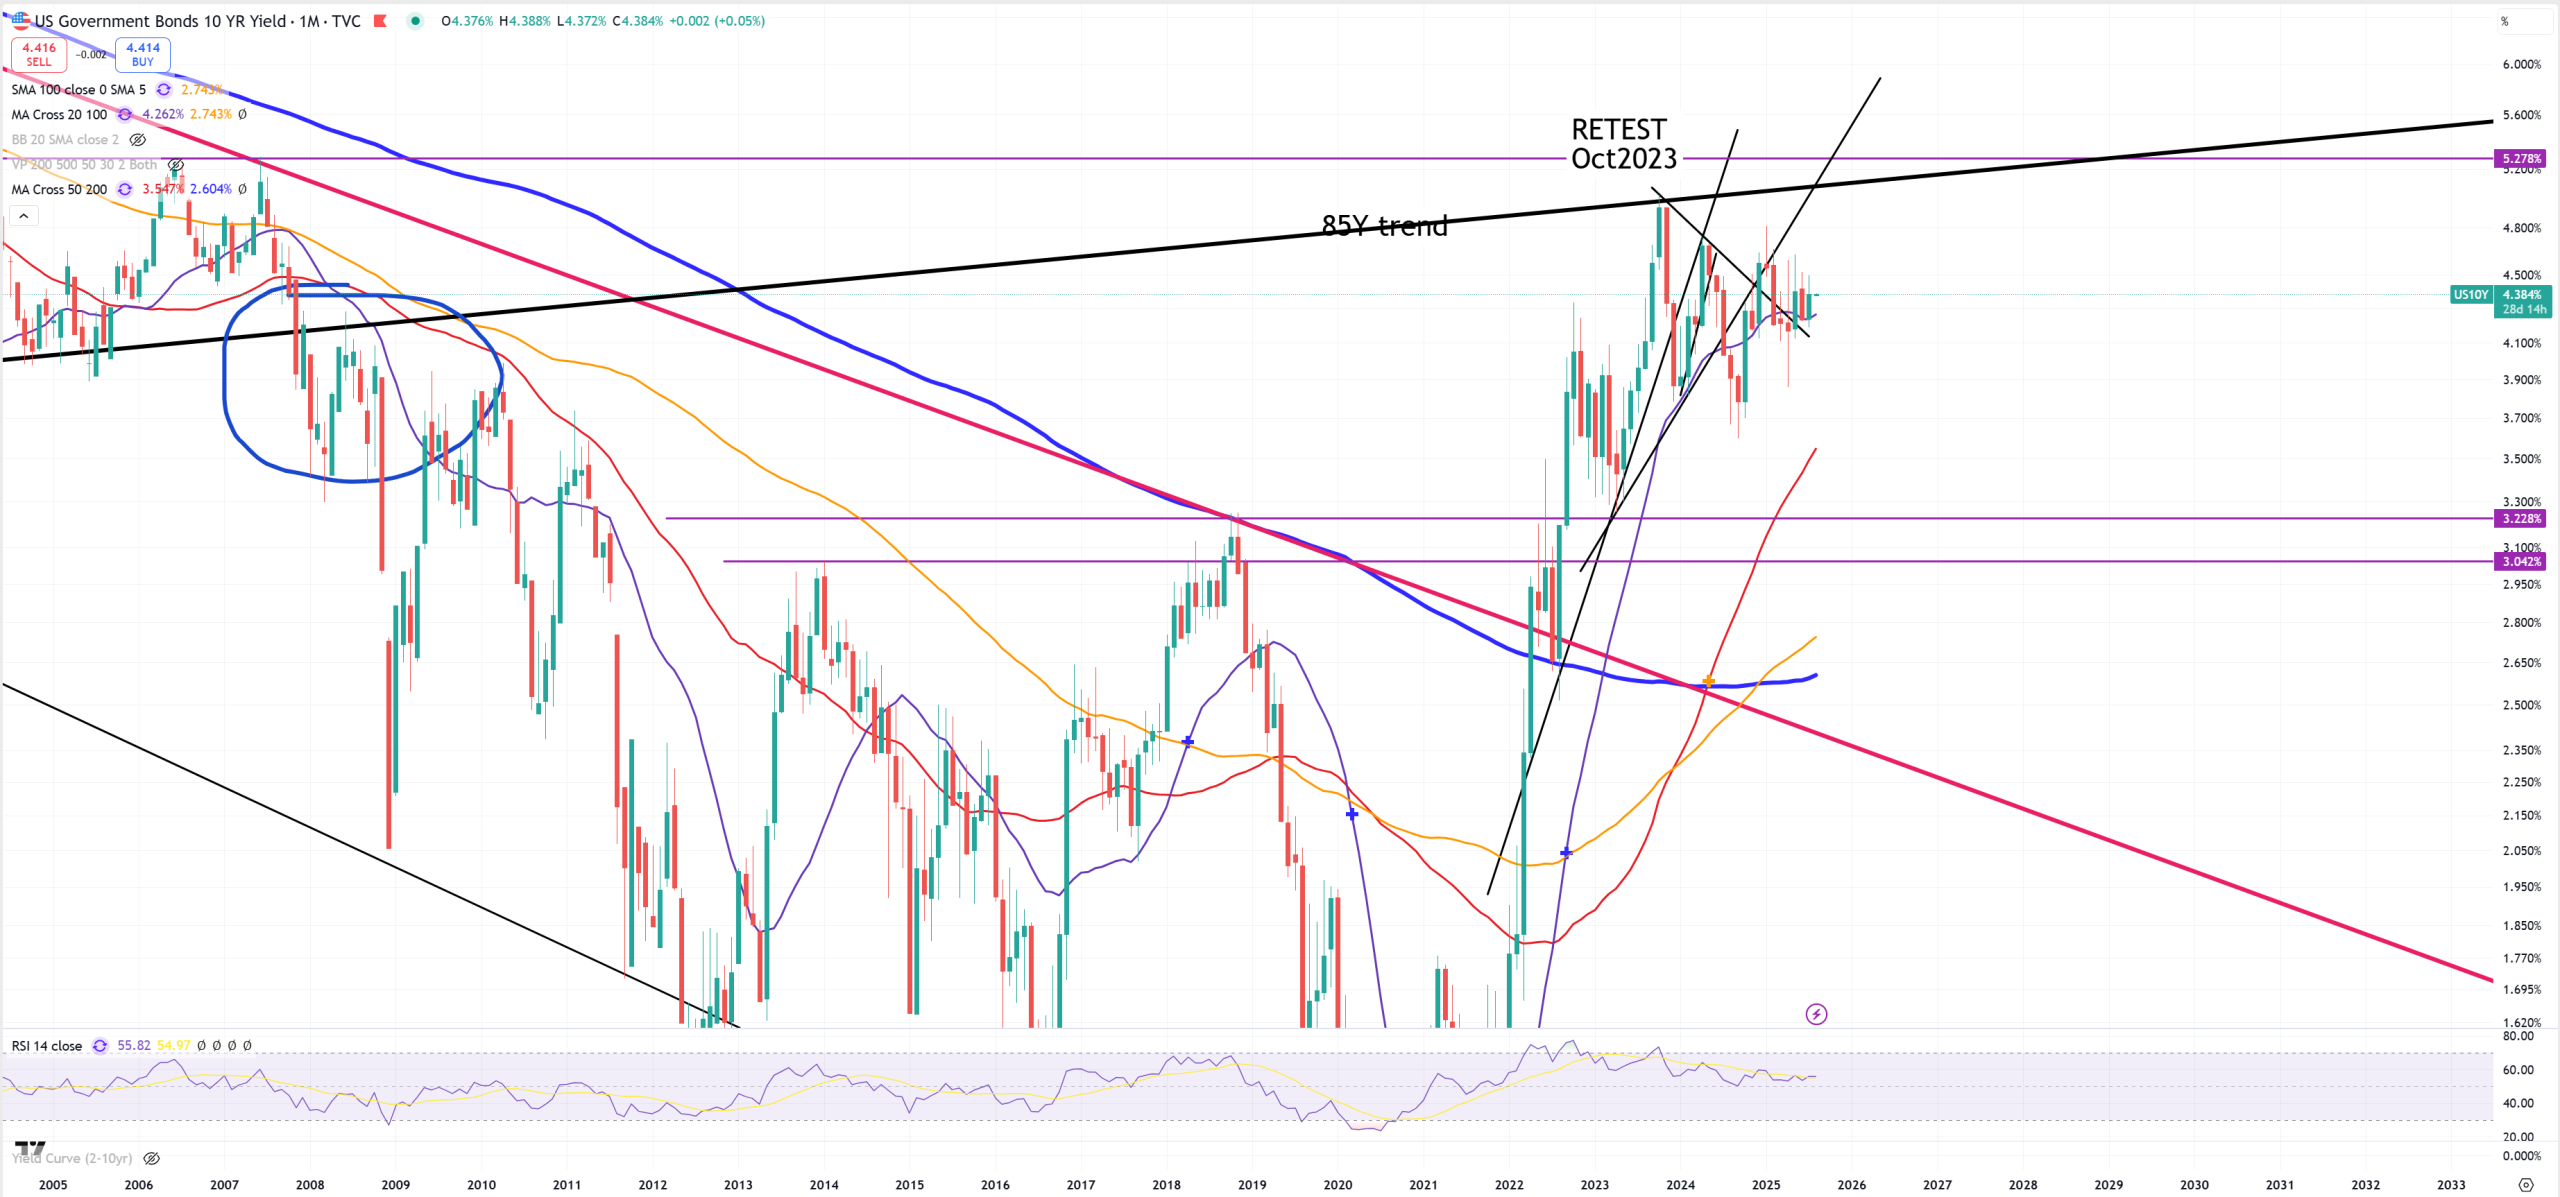
US10Y – nothing to say here expect on fact that in October 2023 it retested its 85Y trend. Consolidation takes ages.
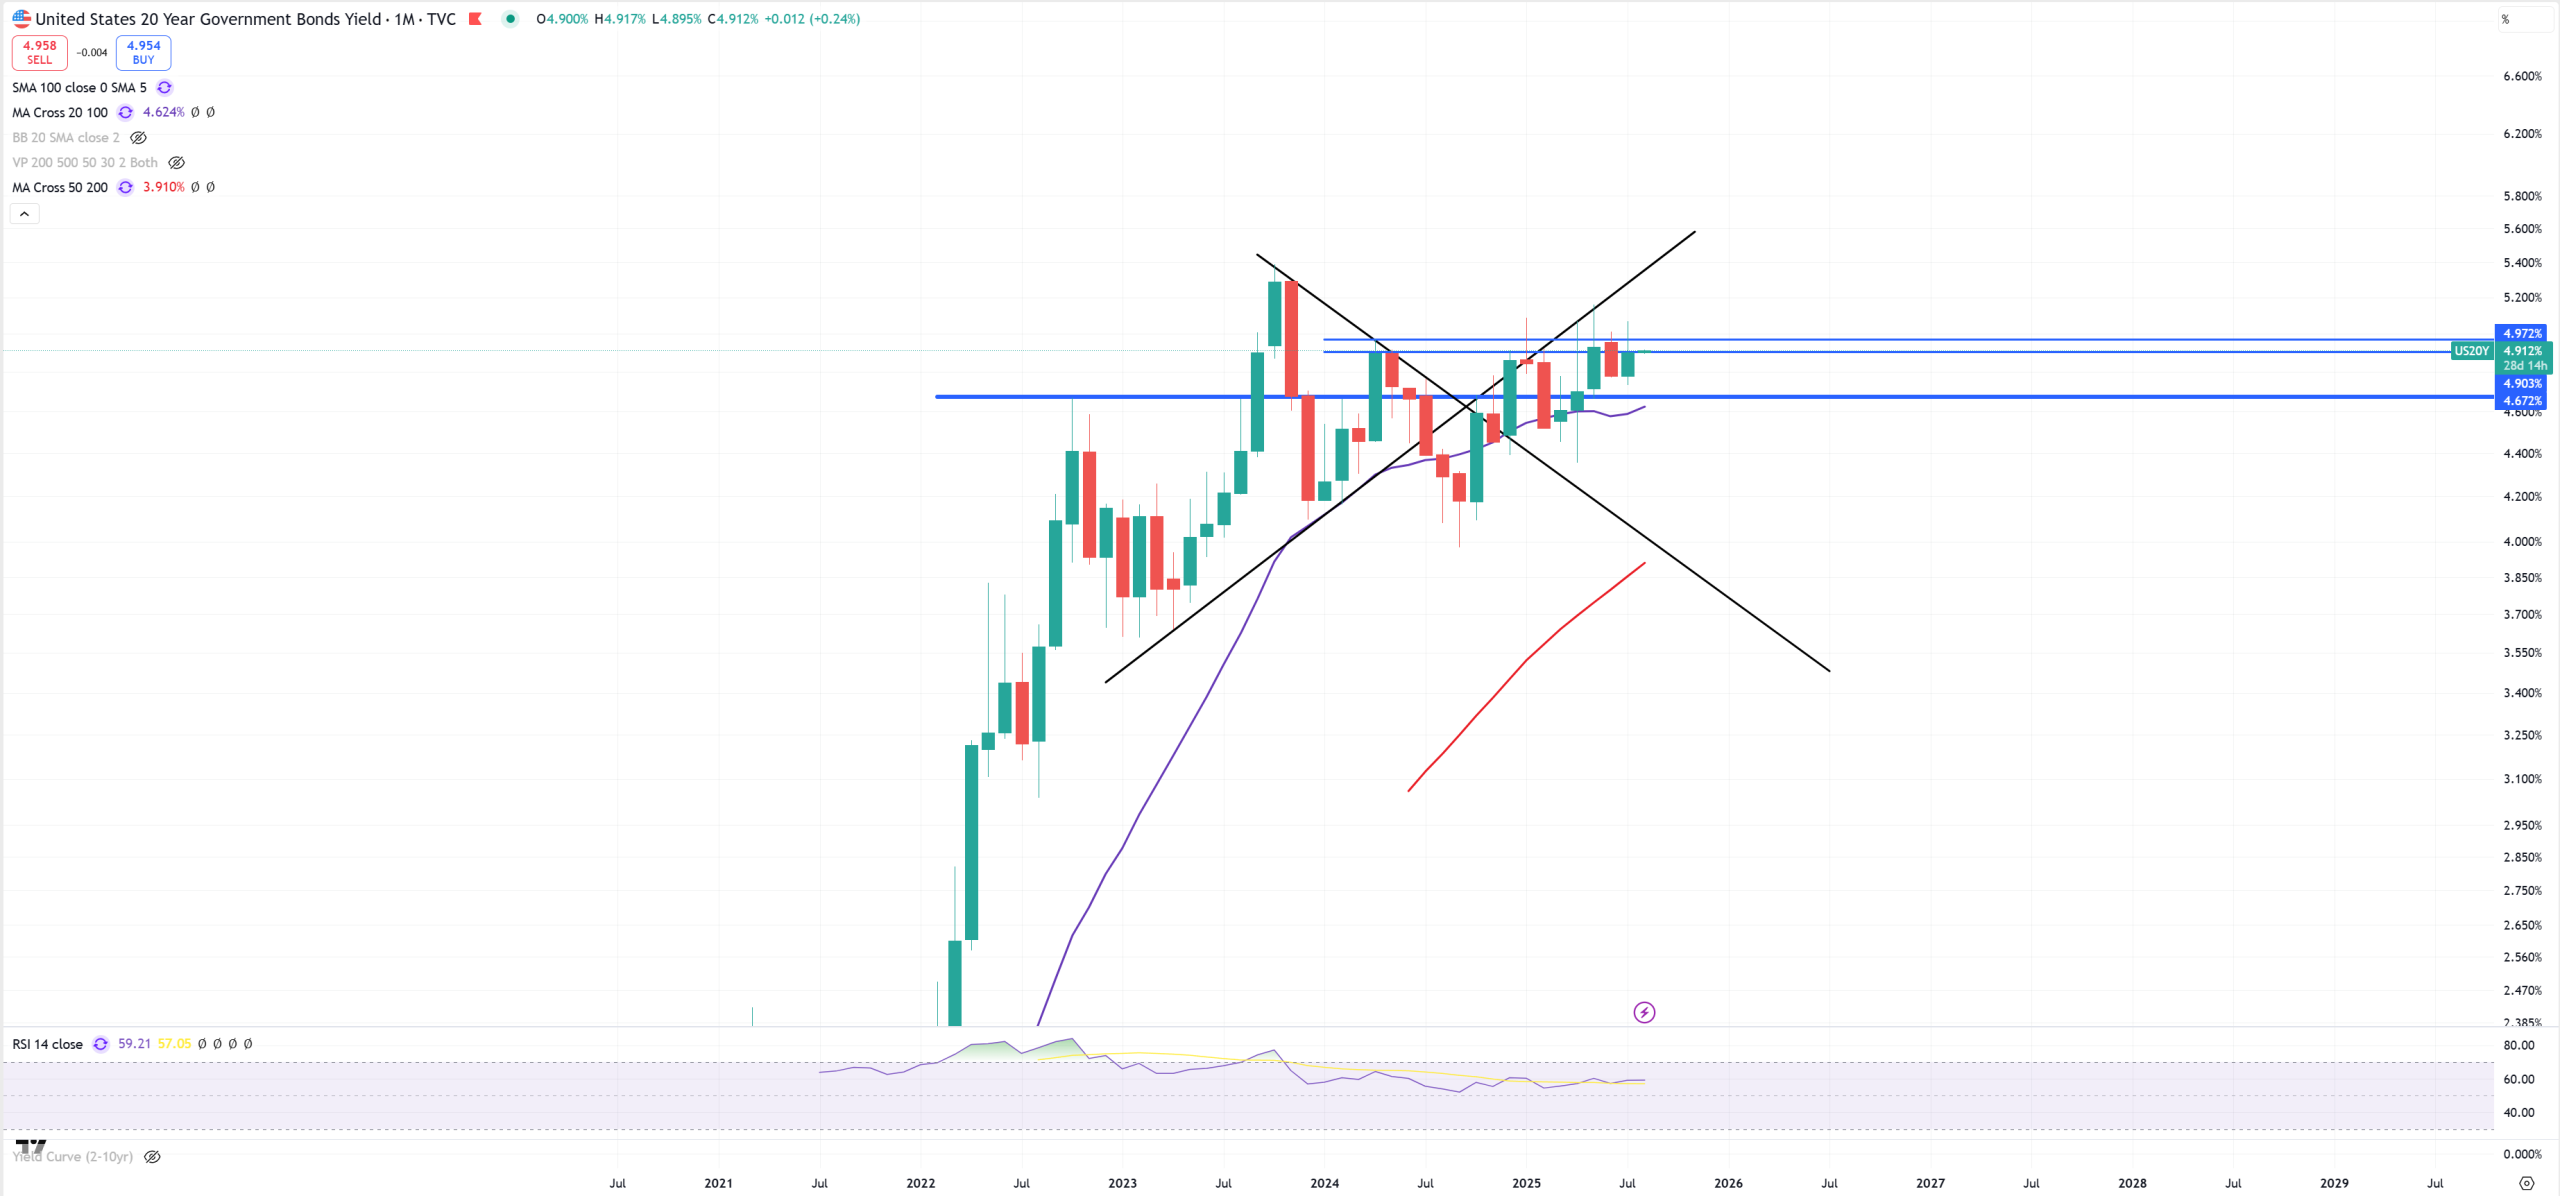
US20Y – this 5.0% resistance holds
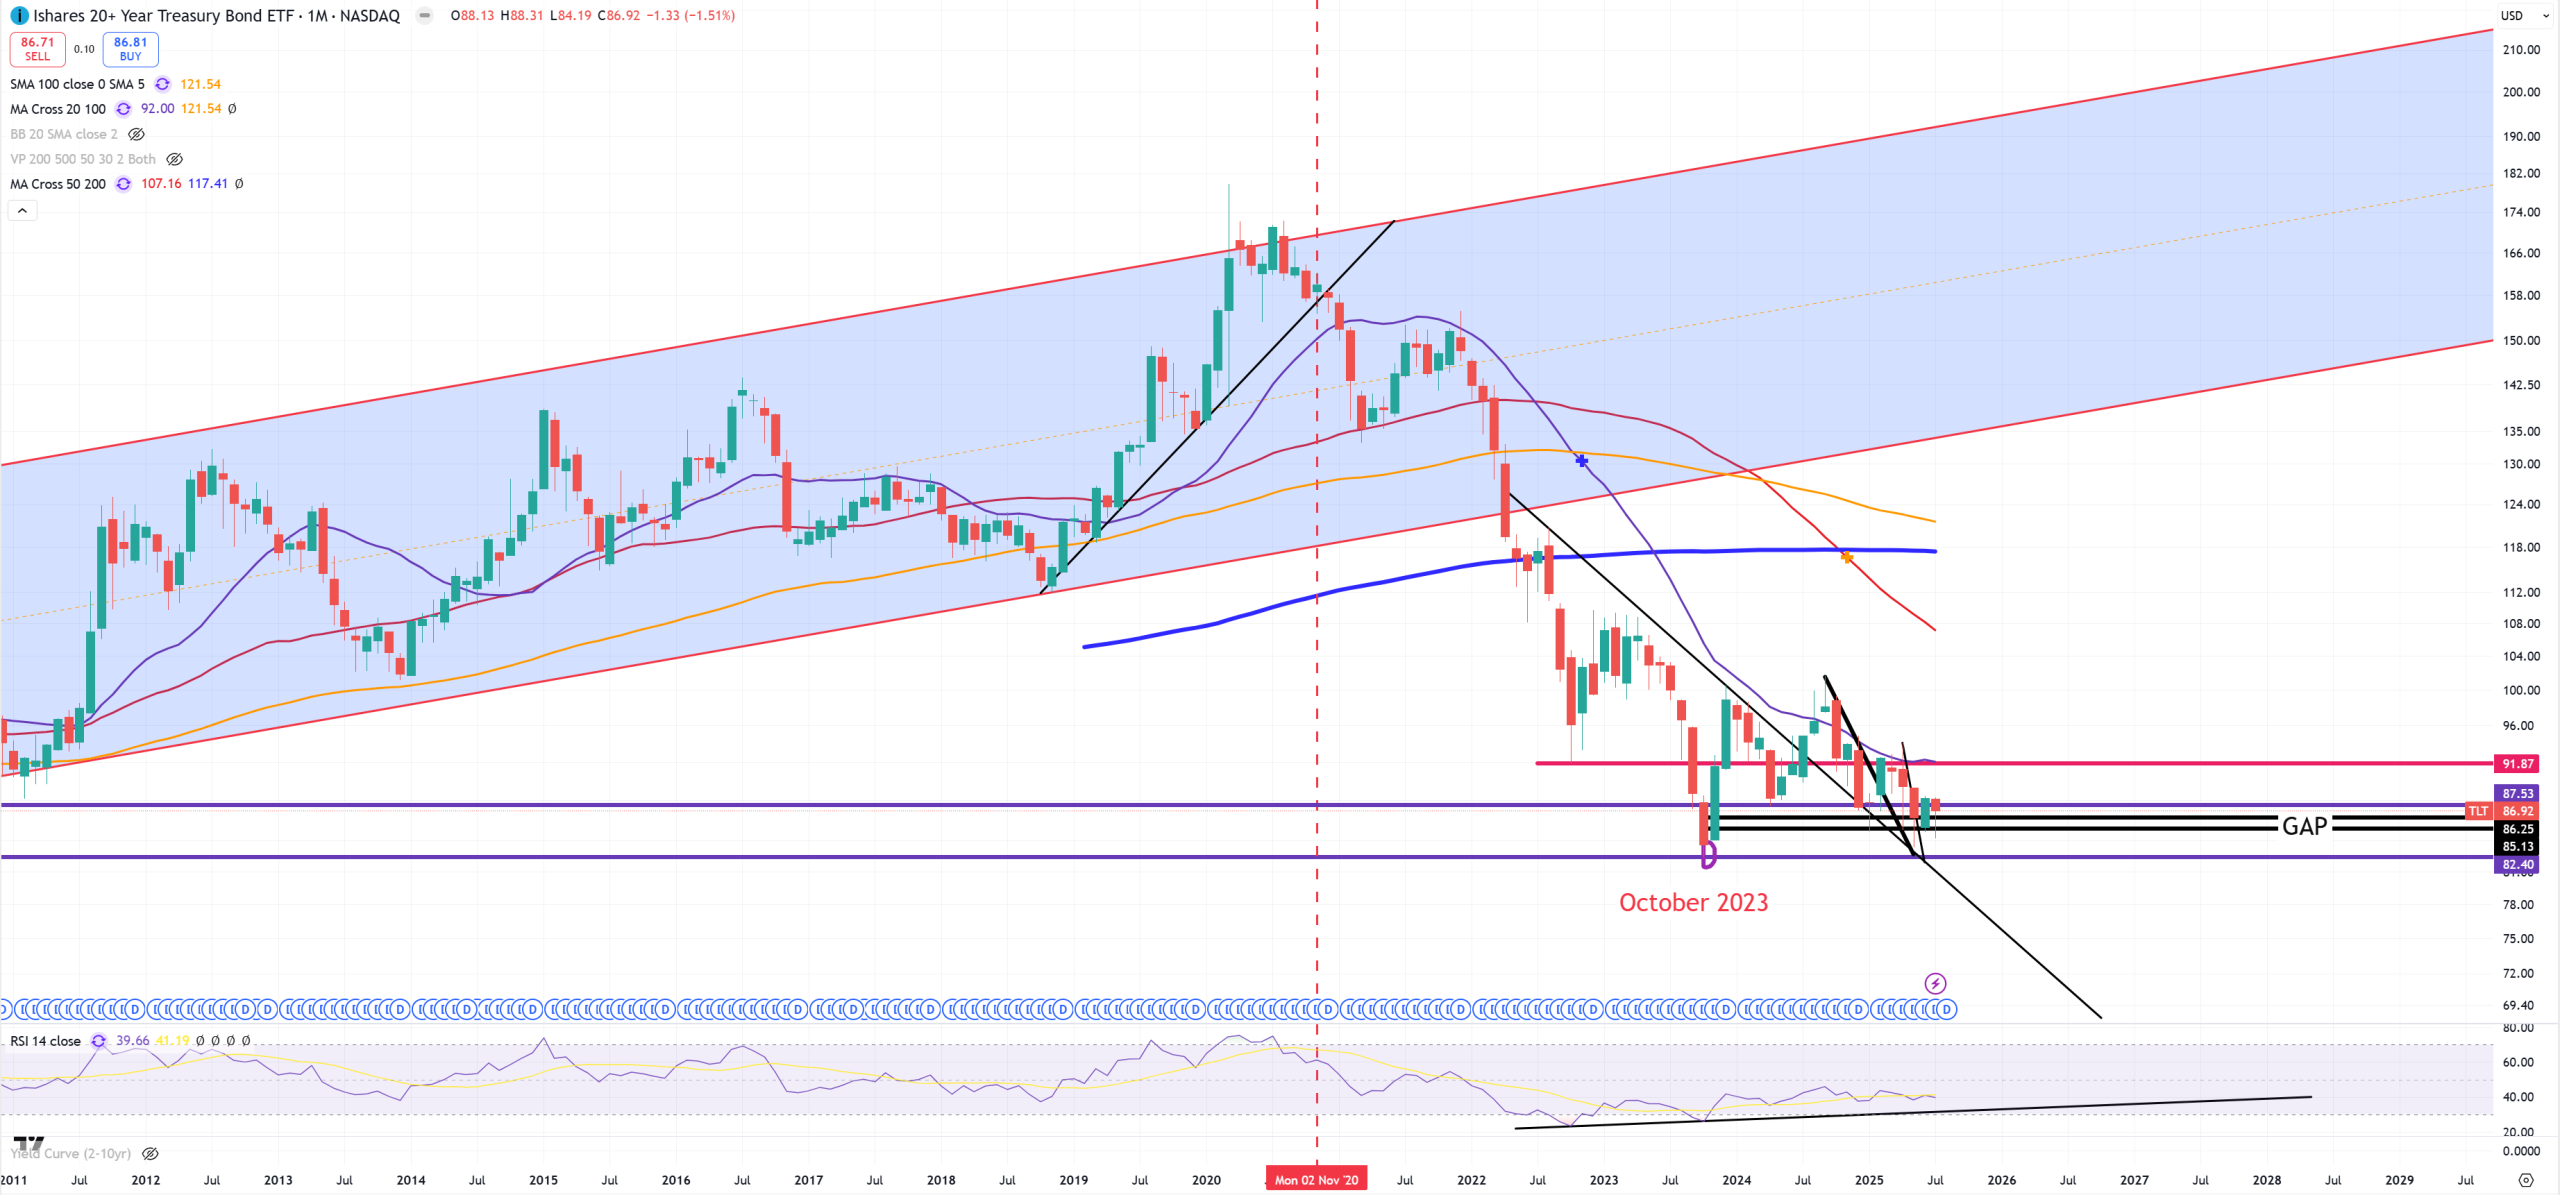
TLT – so it’s inverted US20Y, and TLT in October 2023 was 82$
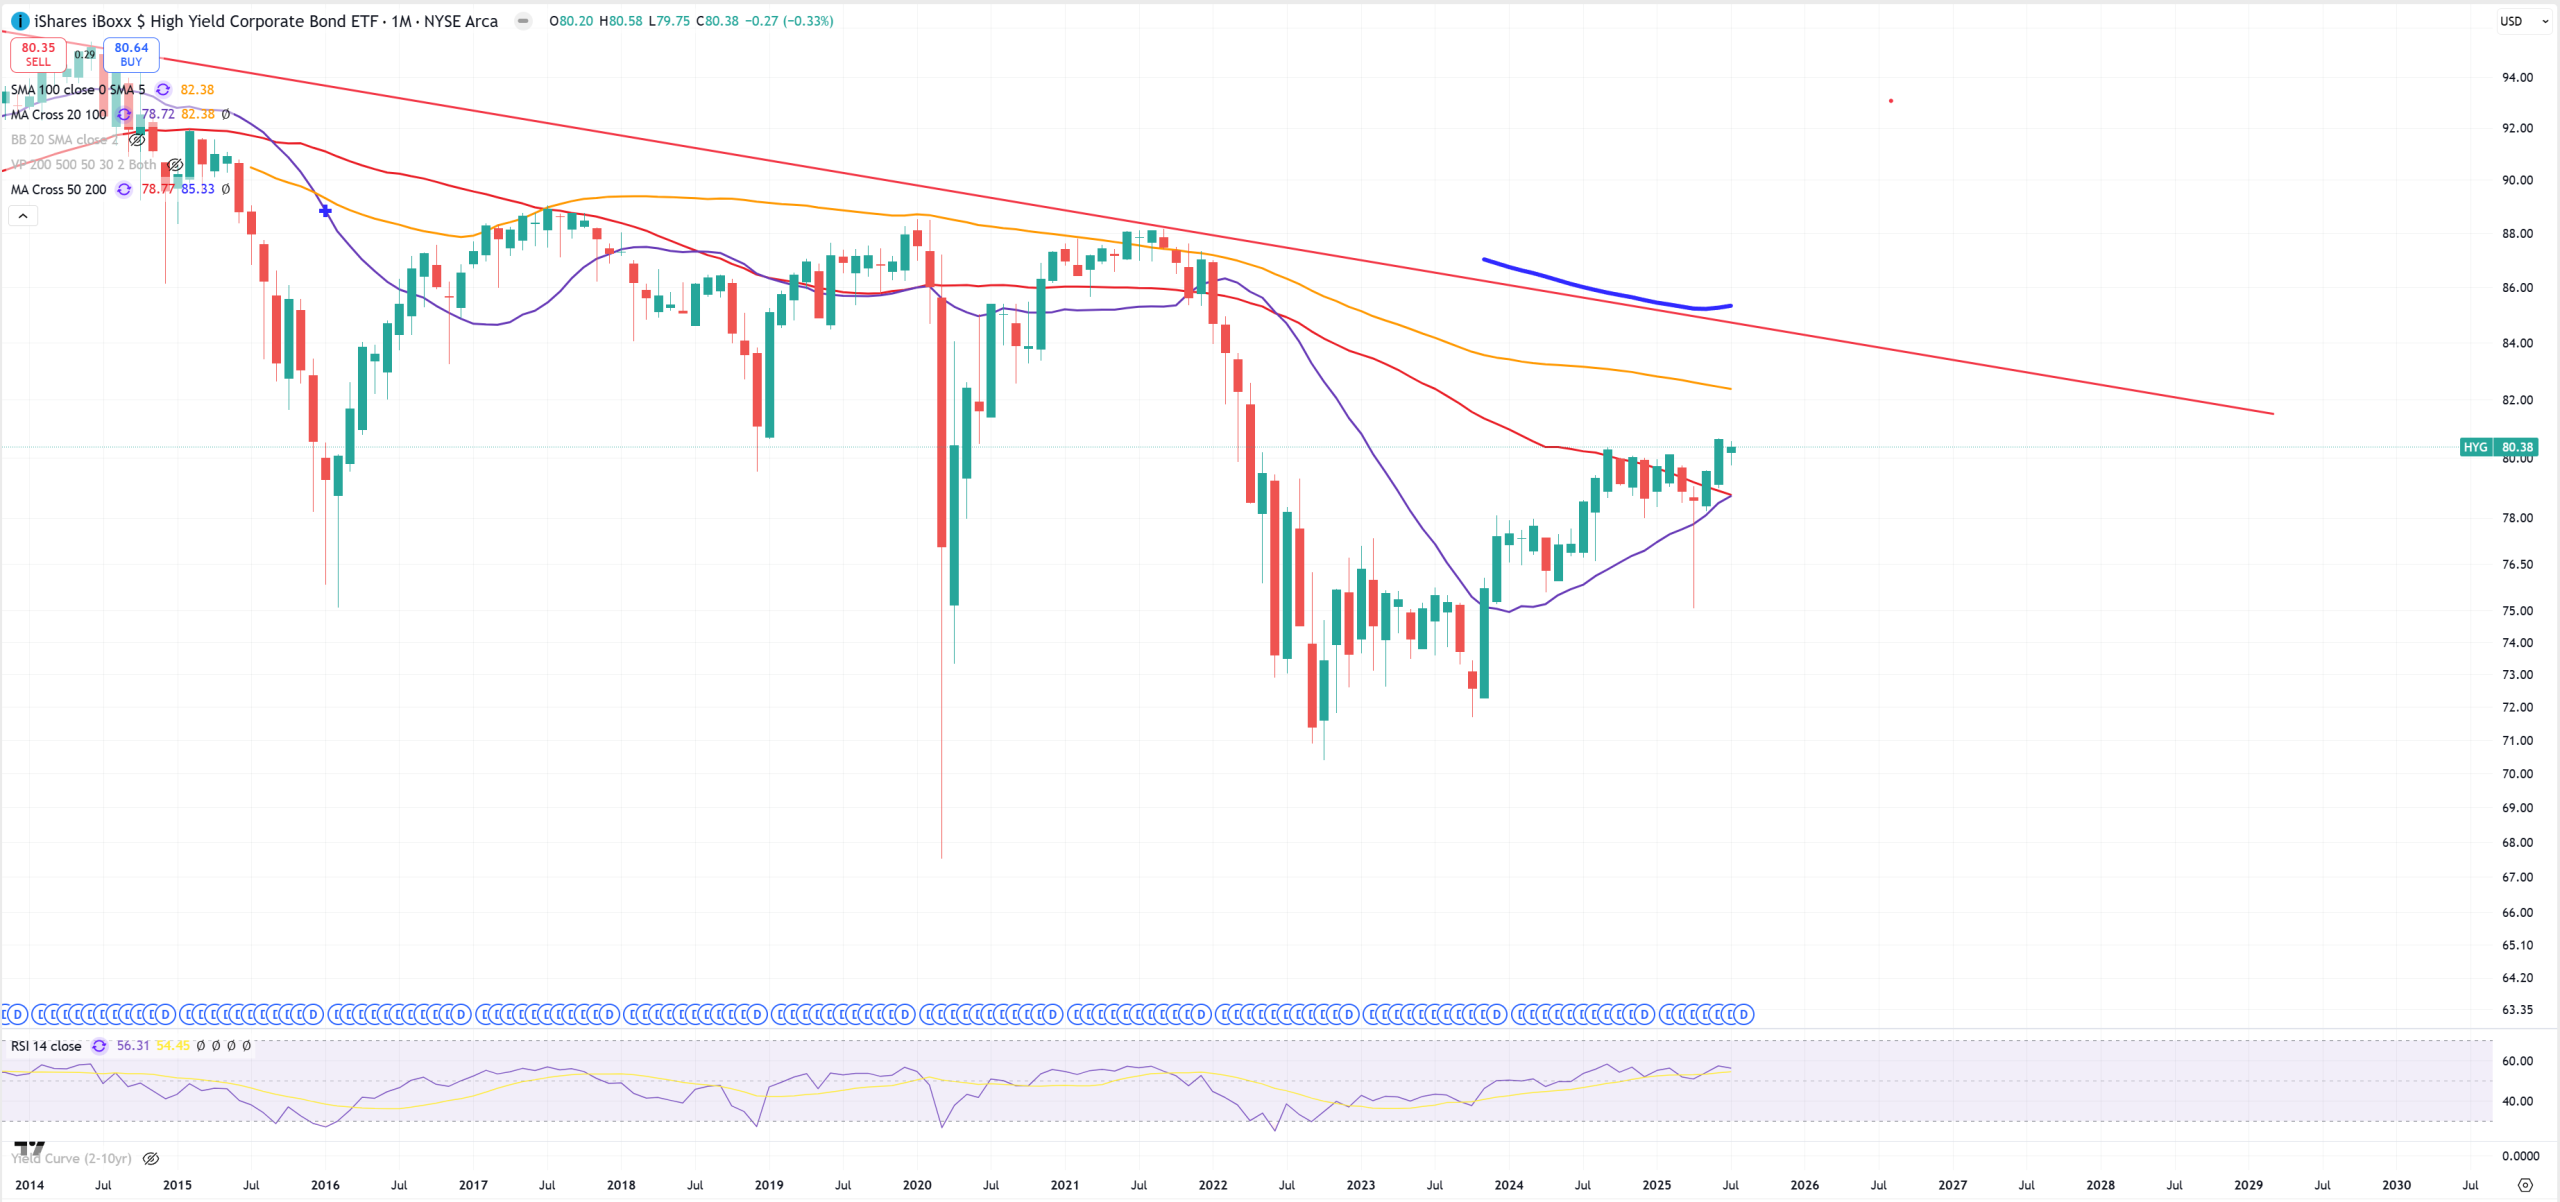
HYG – after couple months HYG jumps > (M)MA50, what is bullish for credit. This chart should be below (M)MA50 to confirm general bearish thesis considering SPX 1929-2000 trend rejection, so mixed.
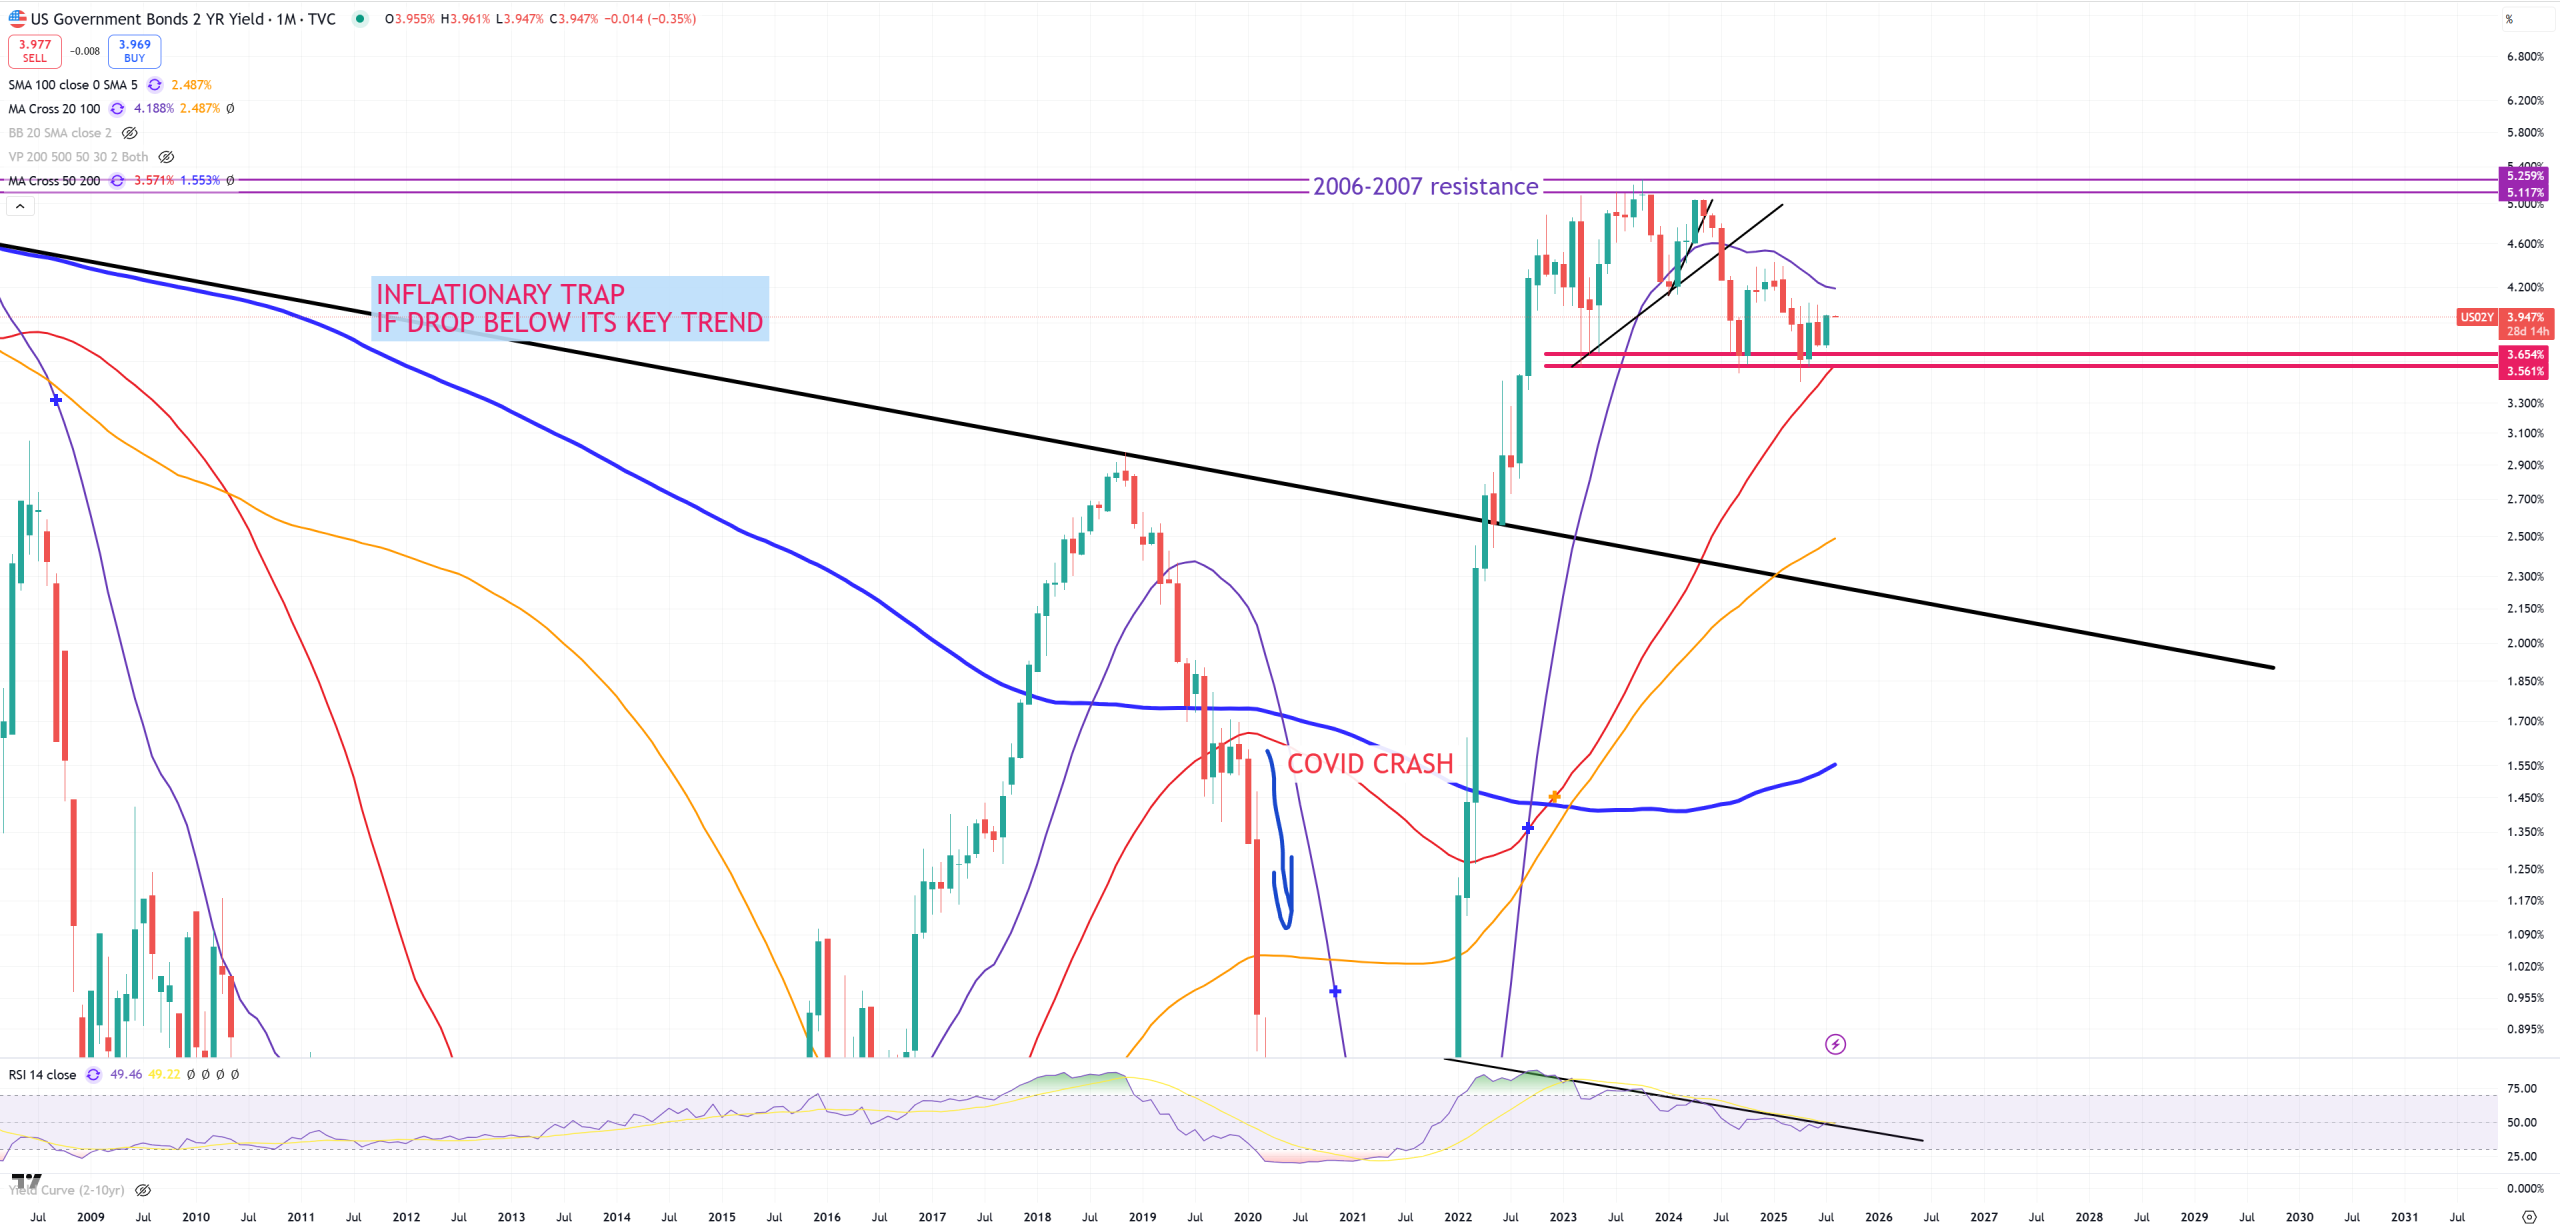
US02Y – problems to start once this support and (M)MA50 will be broken = 3.60%
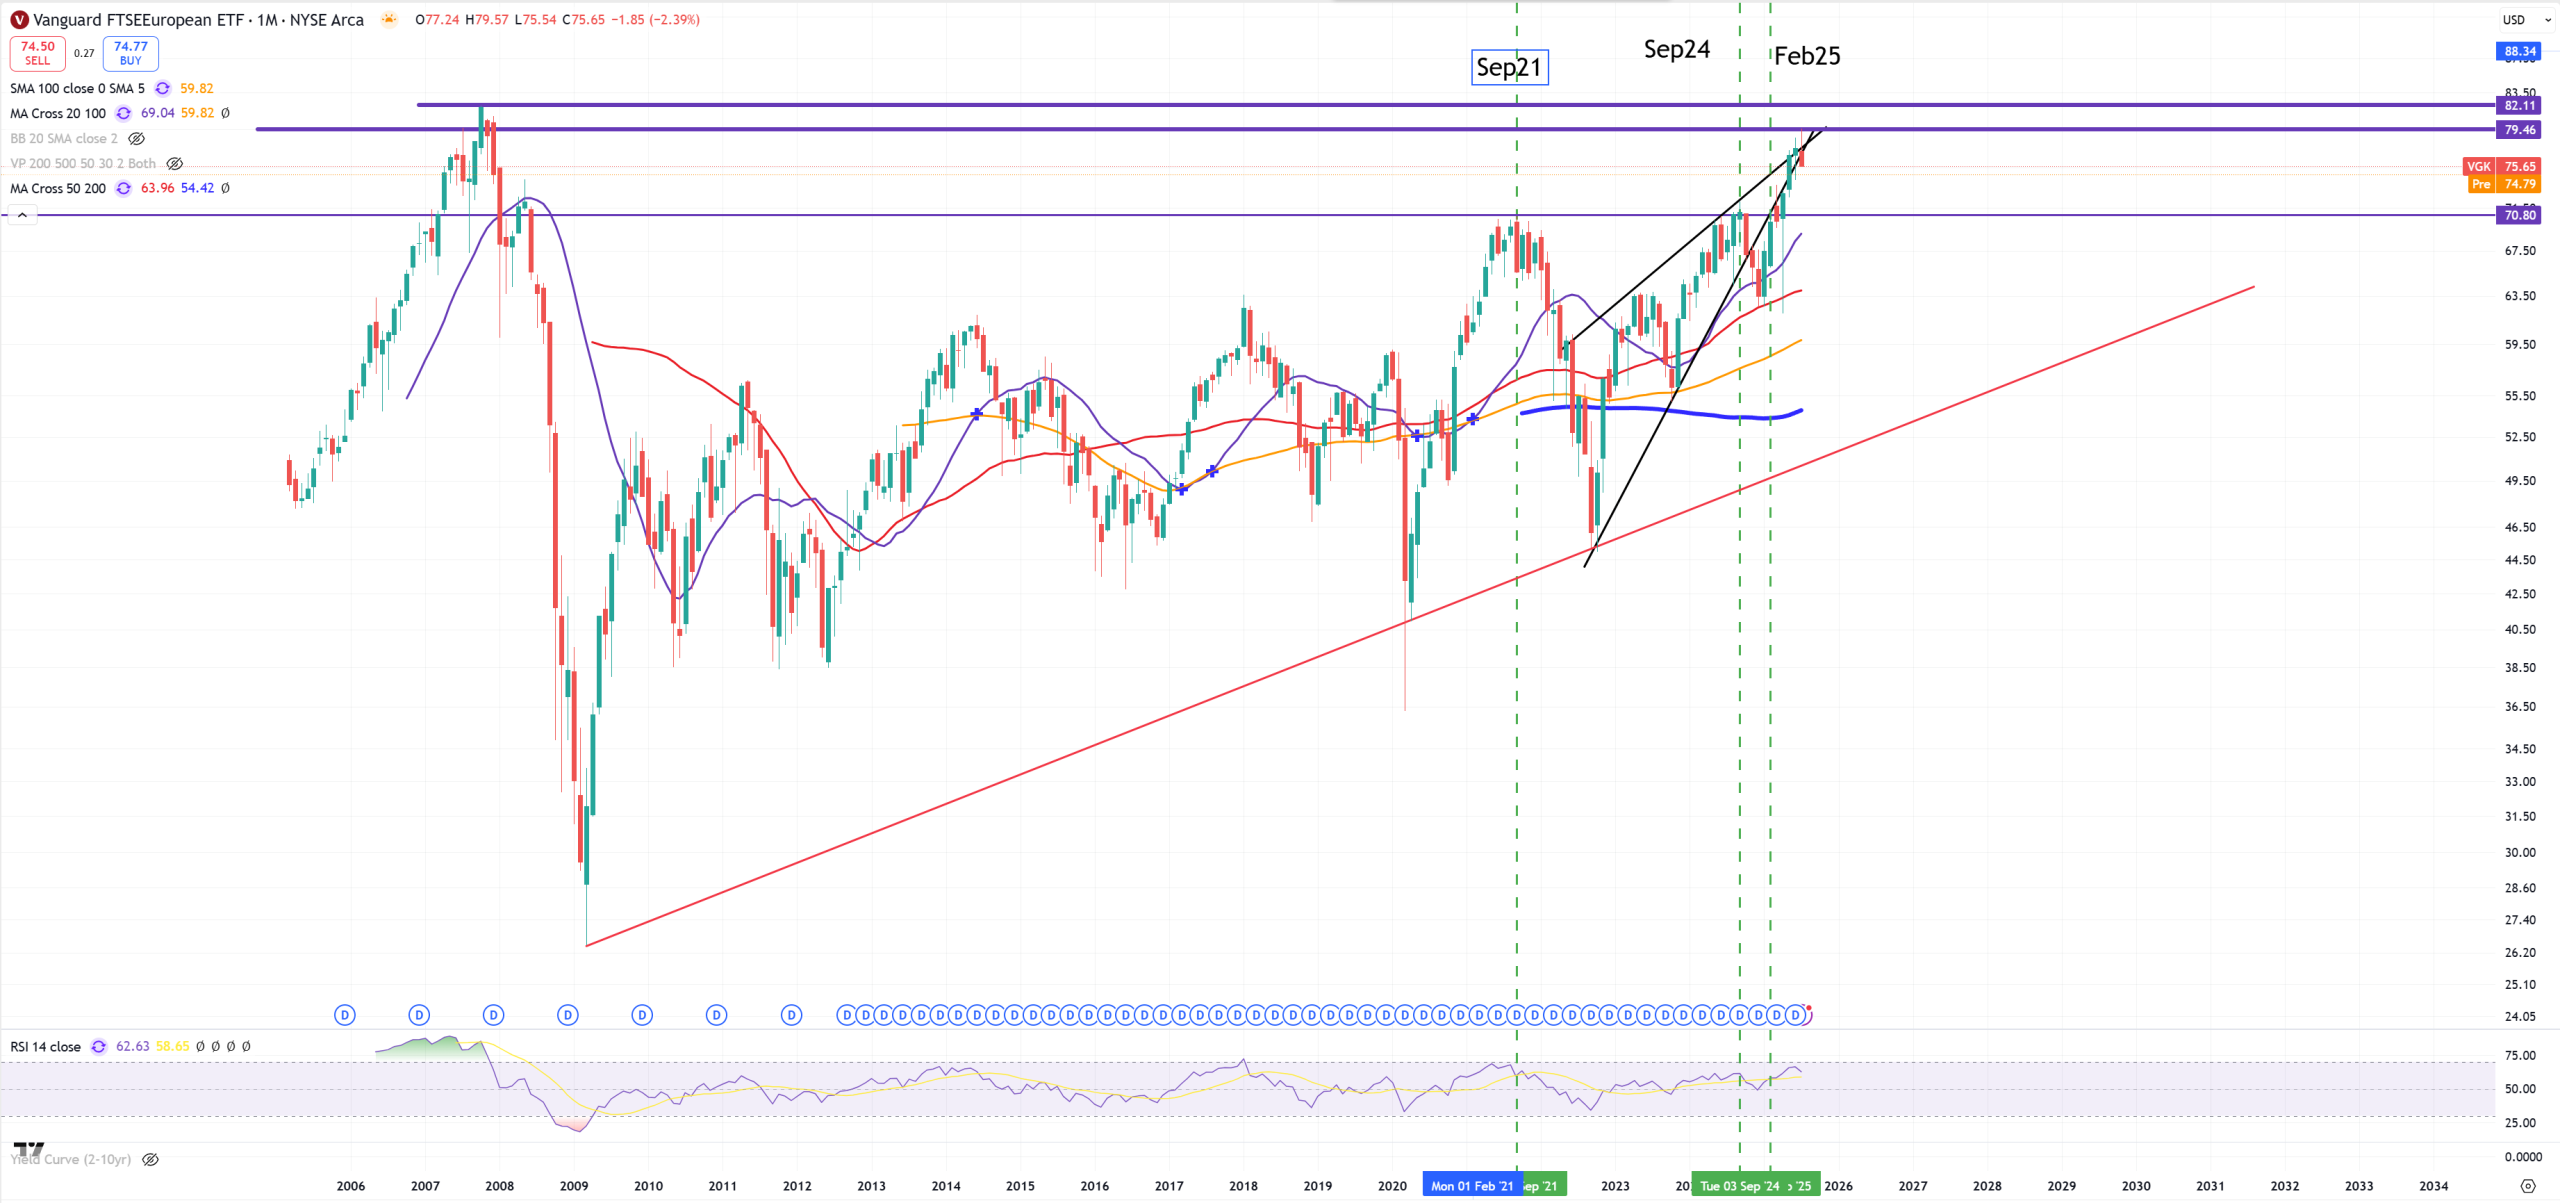
VGK – Europe – we clearly see another spike above 2021 peak but till 2007 resistance level, also we have a raising wedge, which comes to an end
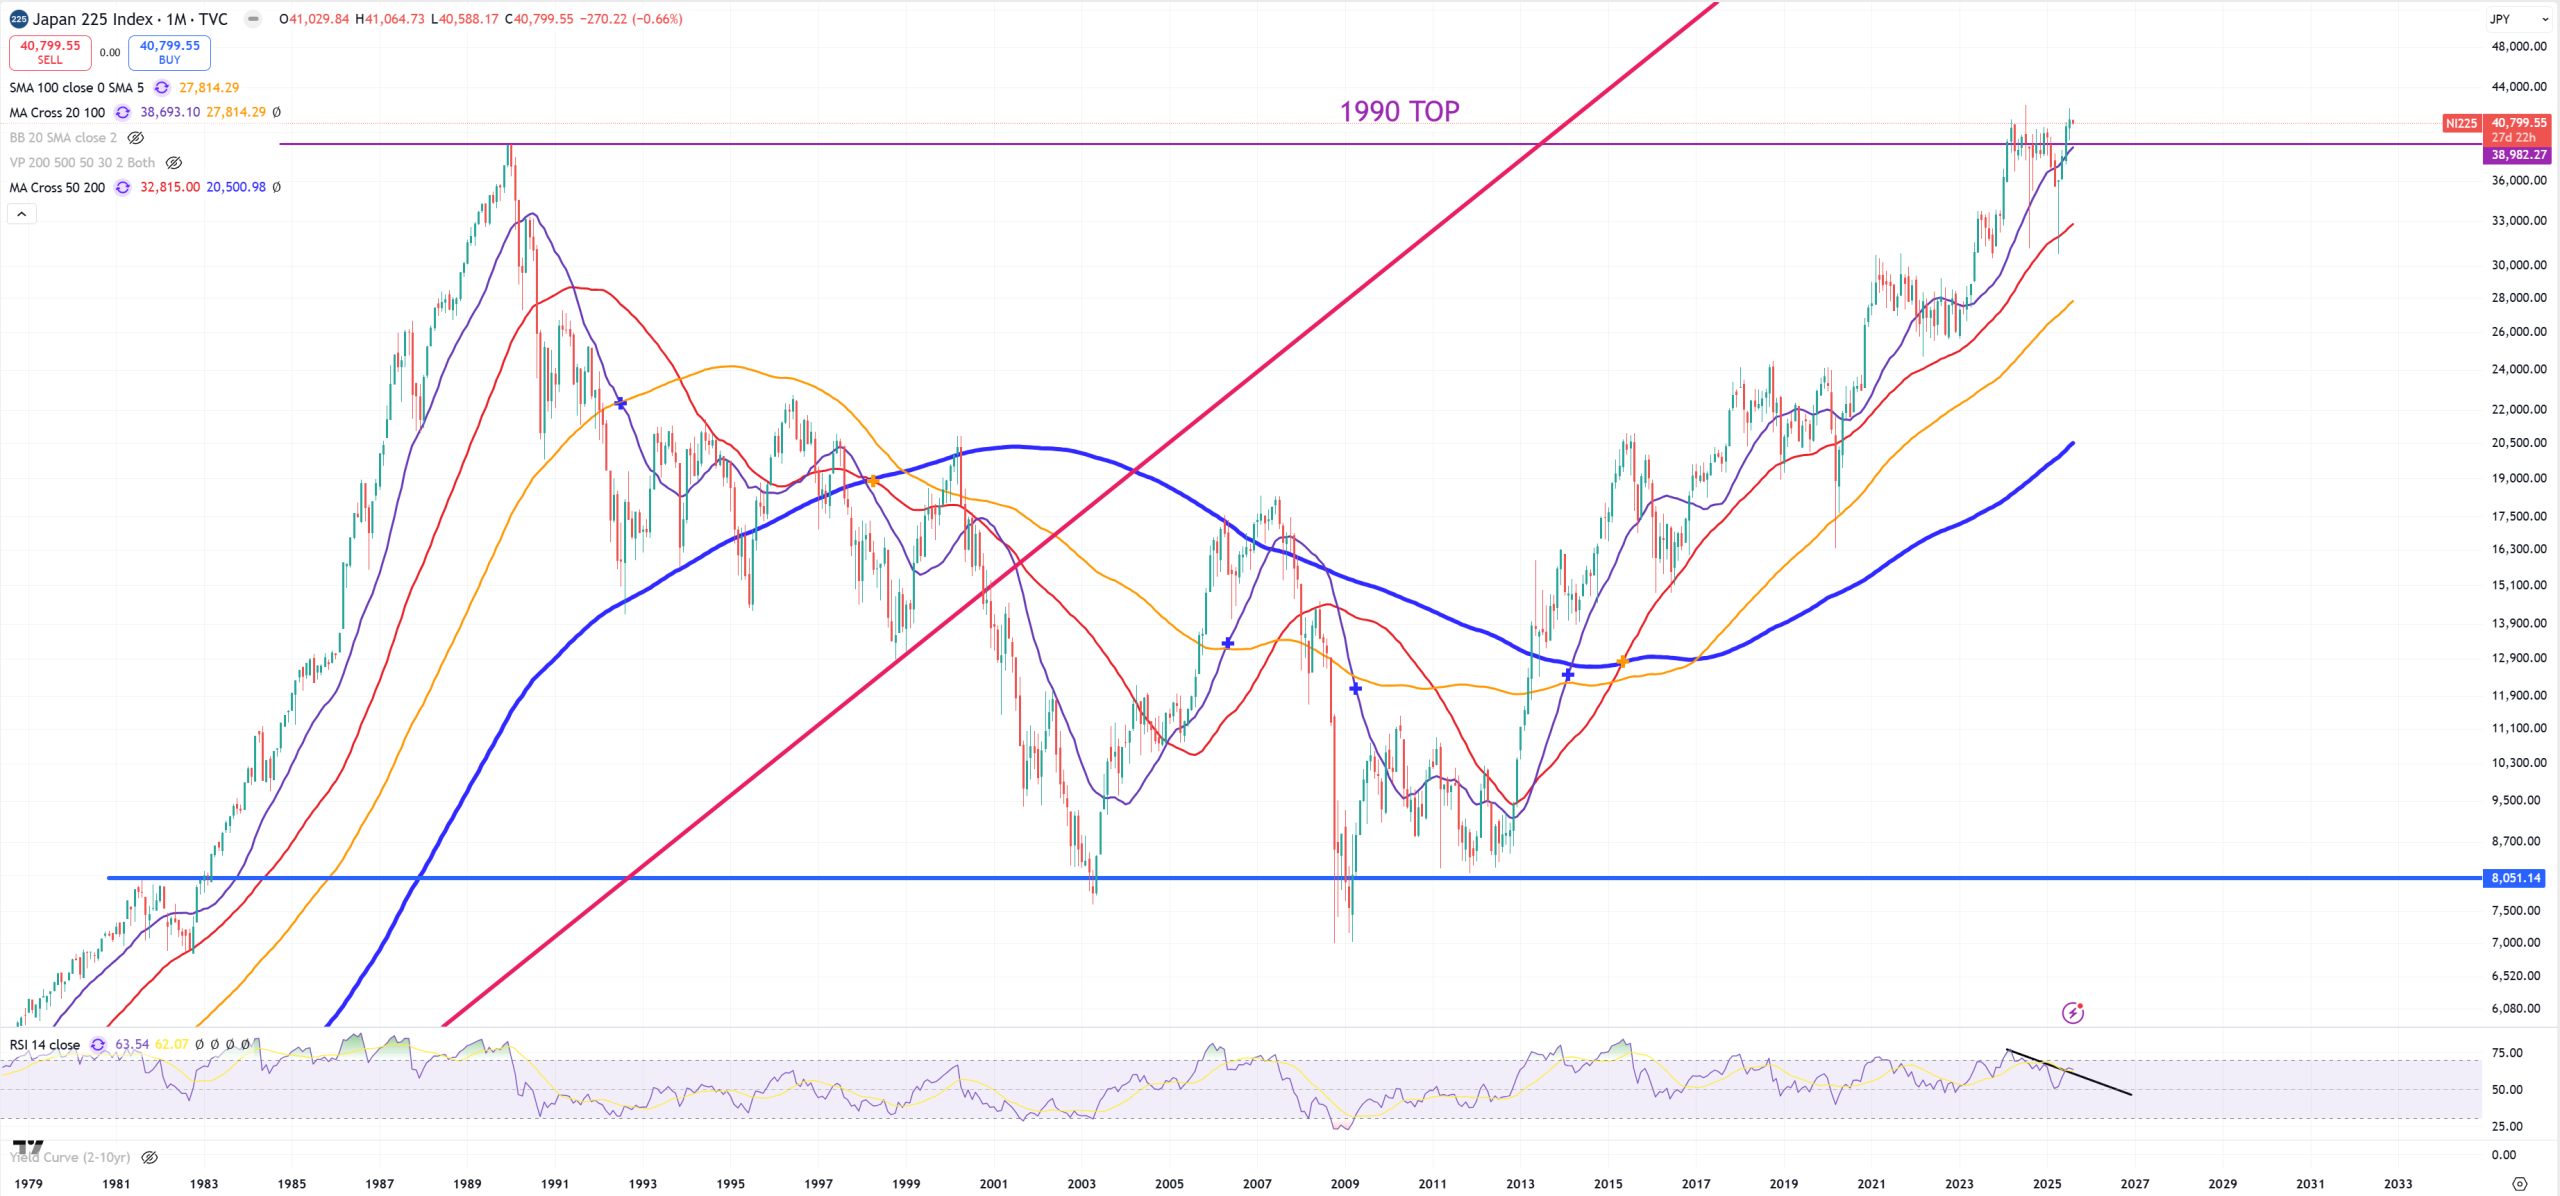
NIKKEI225 – BoJ doesn’t want to give up
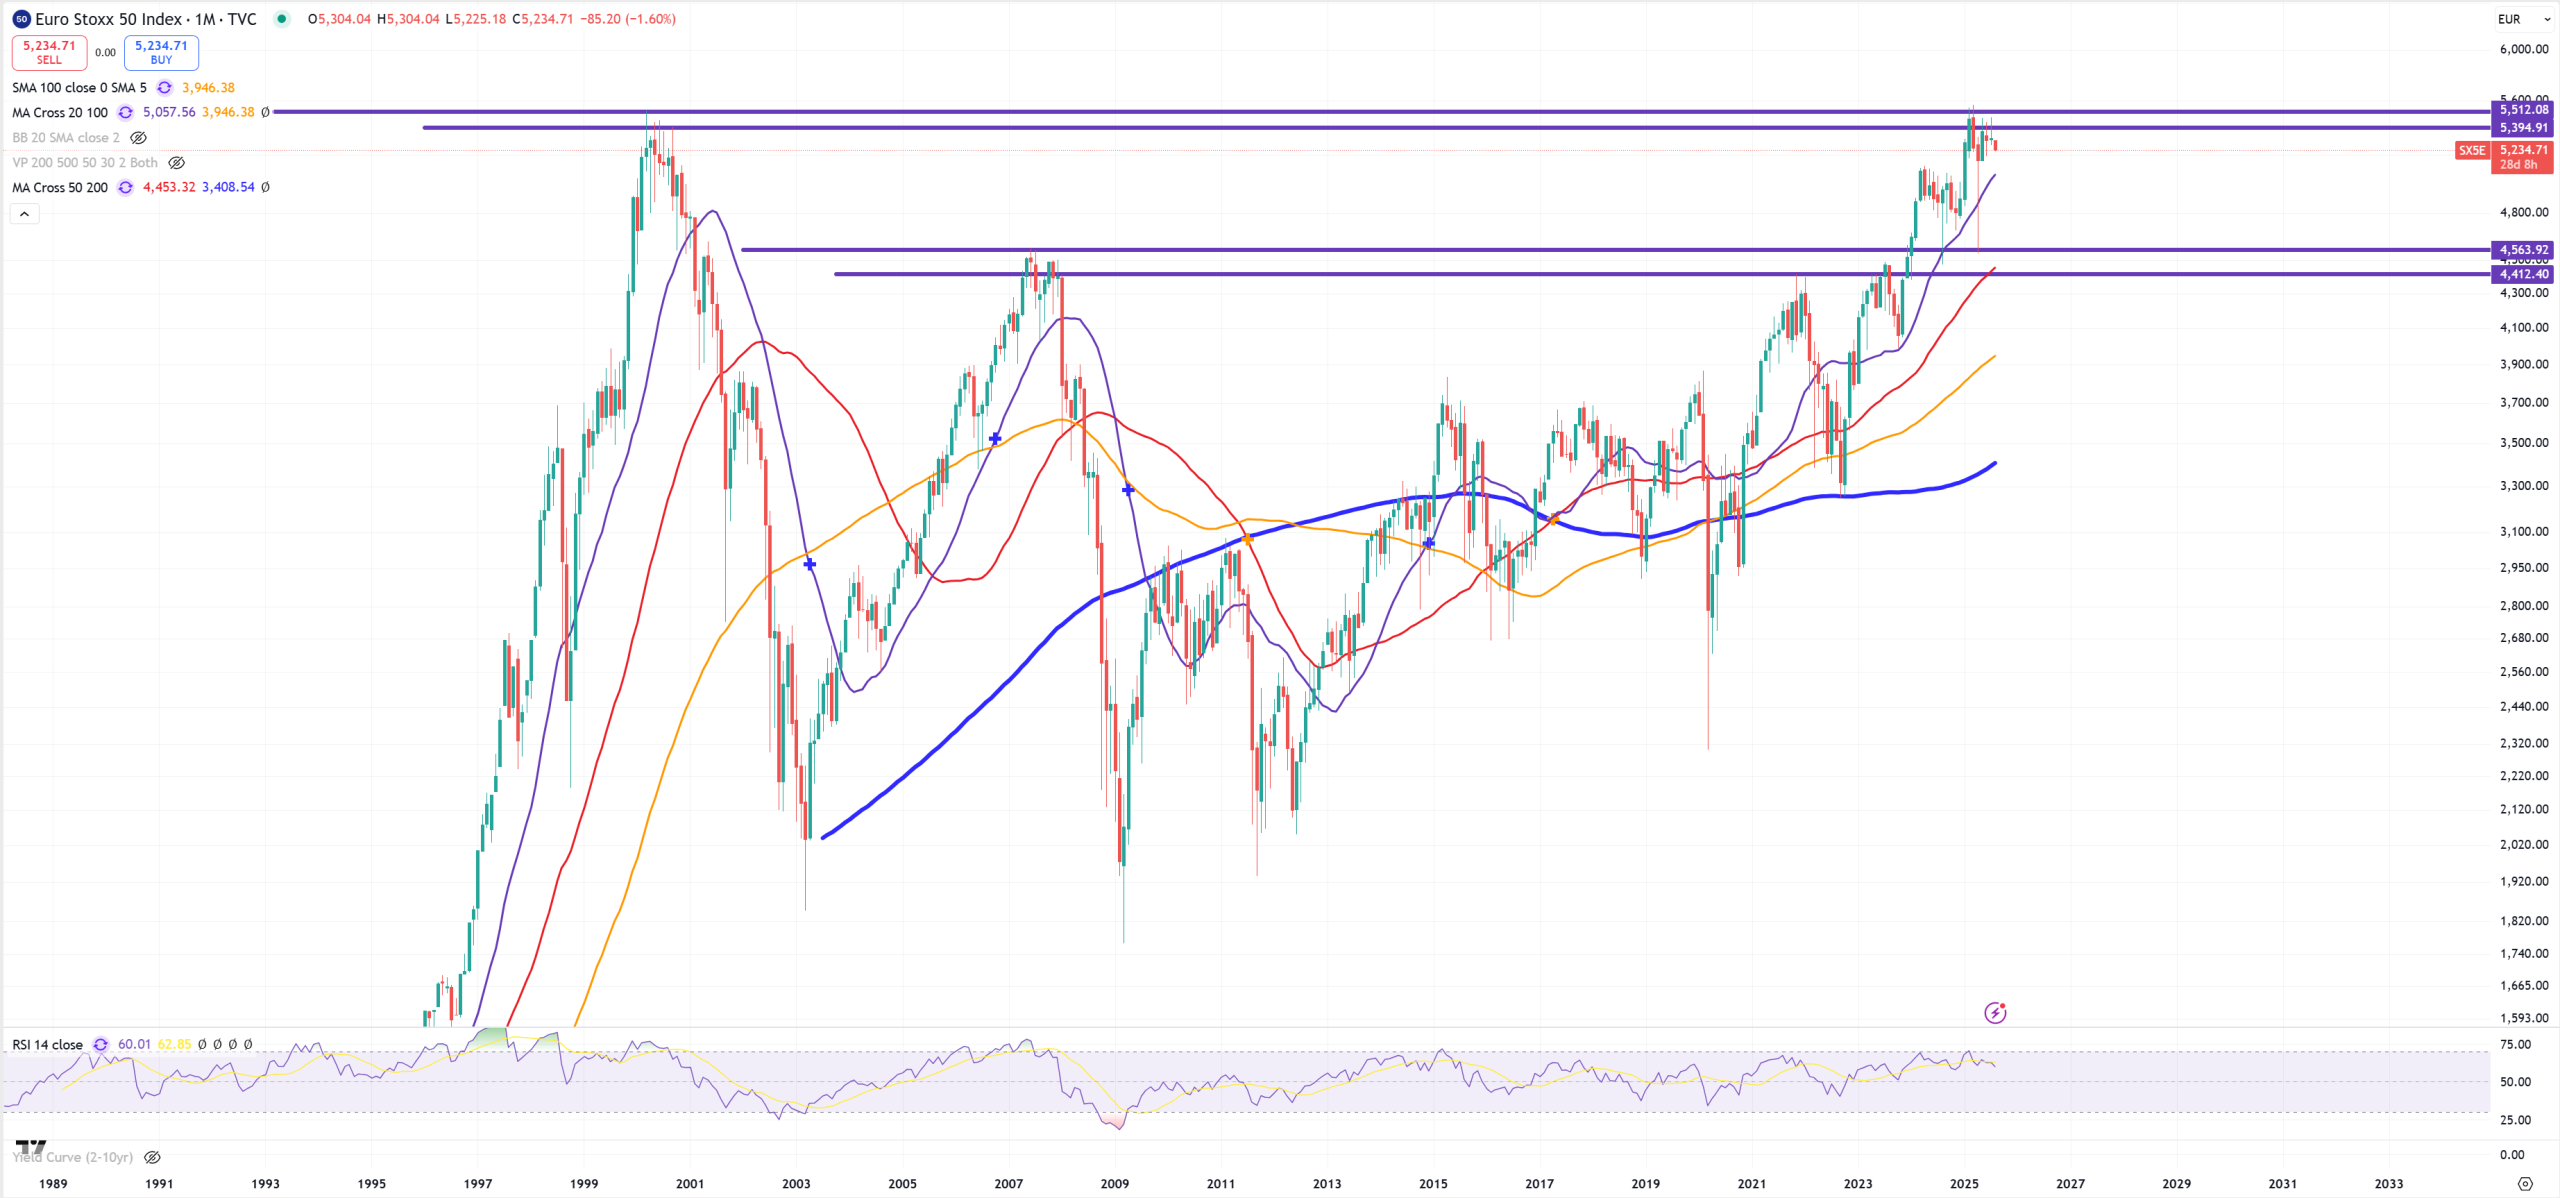
EUROSTOXX50 and its 2000 resistance
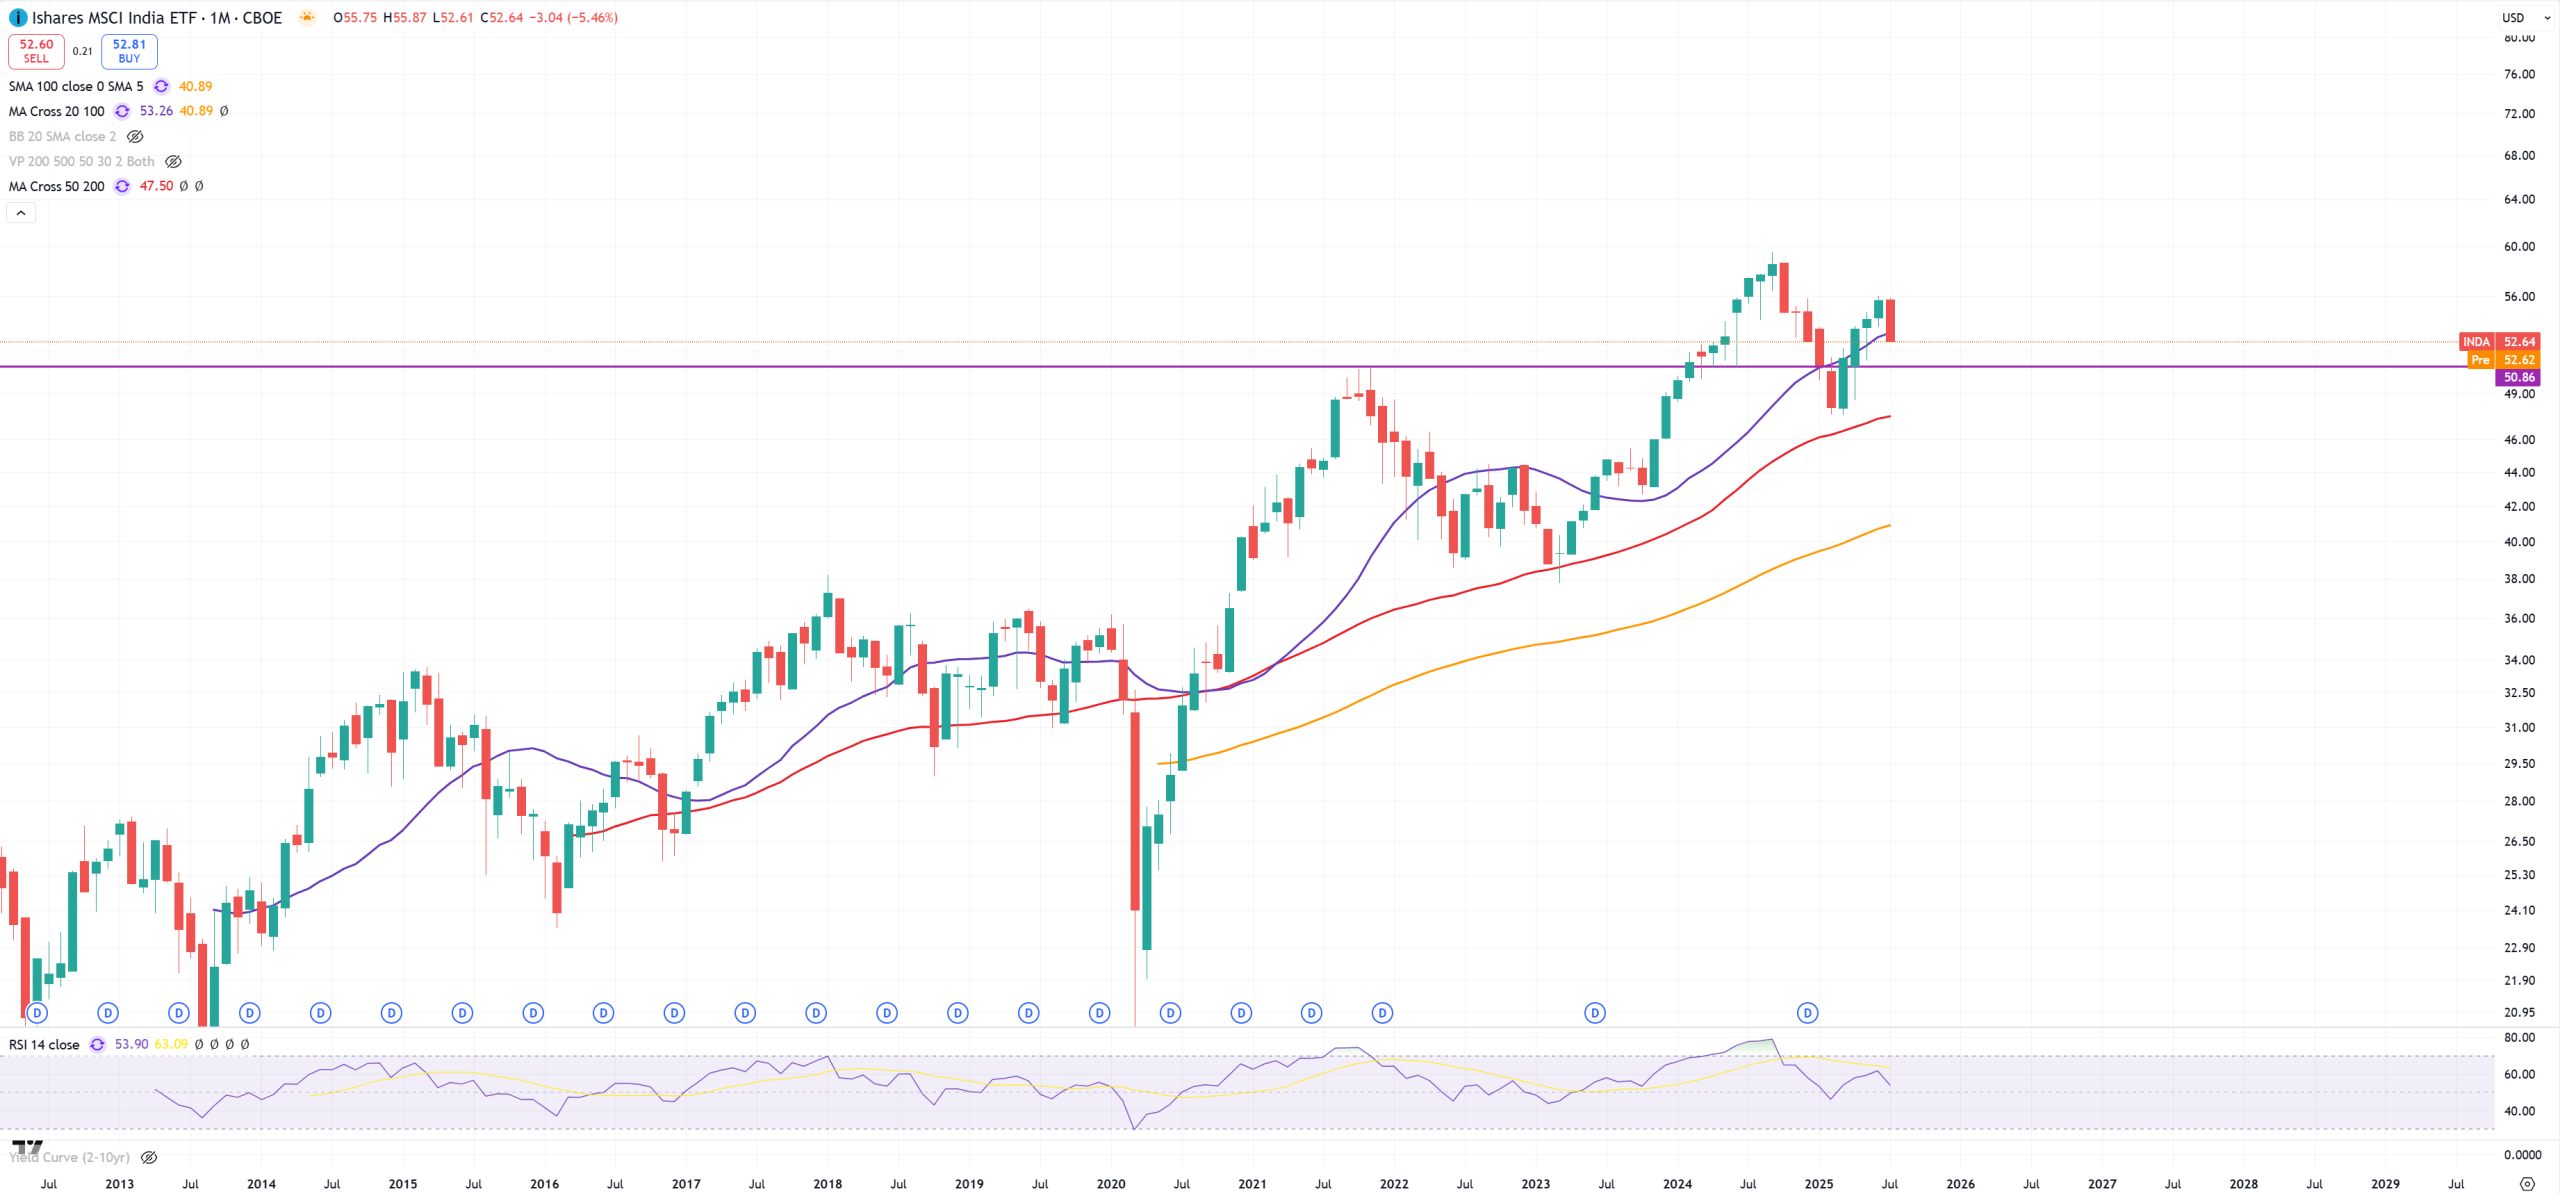
INDA – India – let’s see how tariffs will act here around its 2021 peak
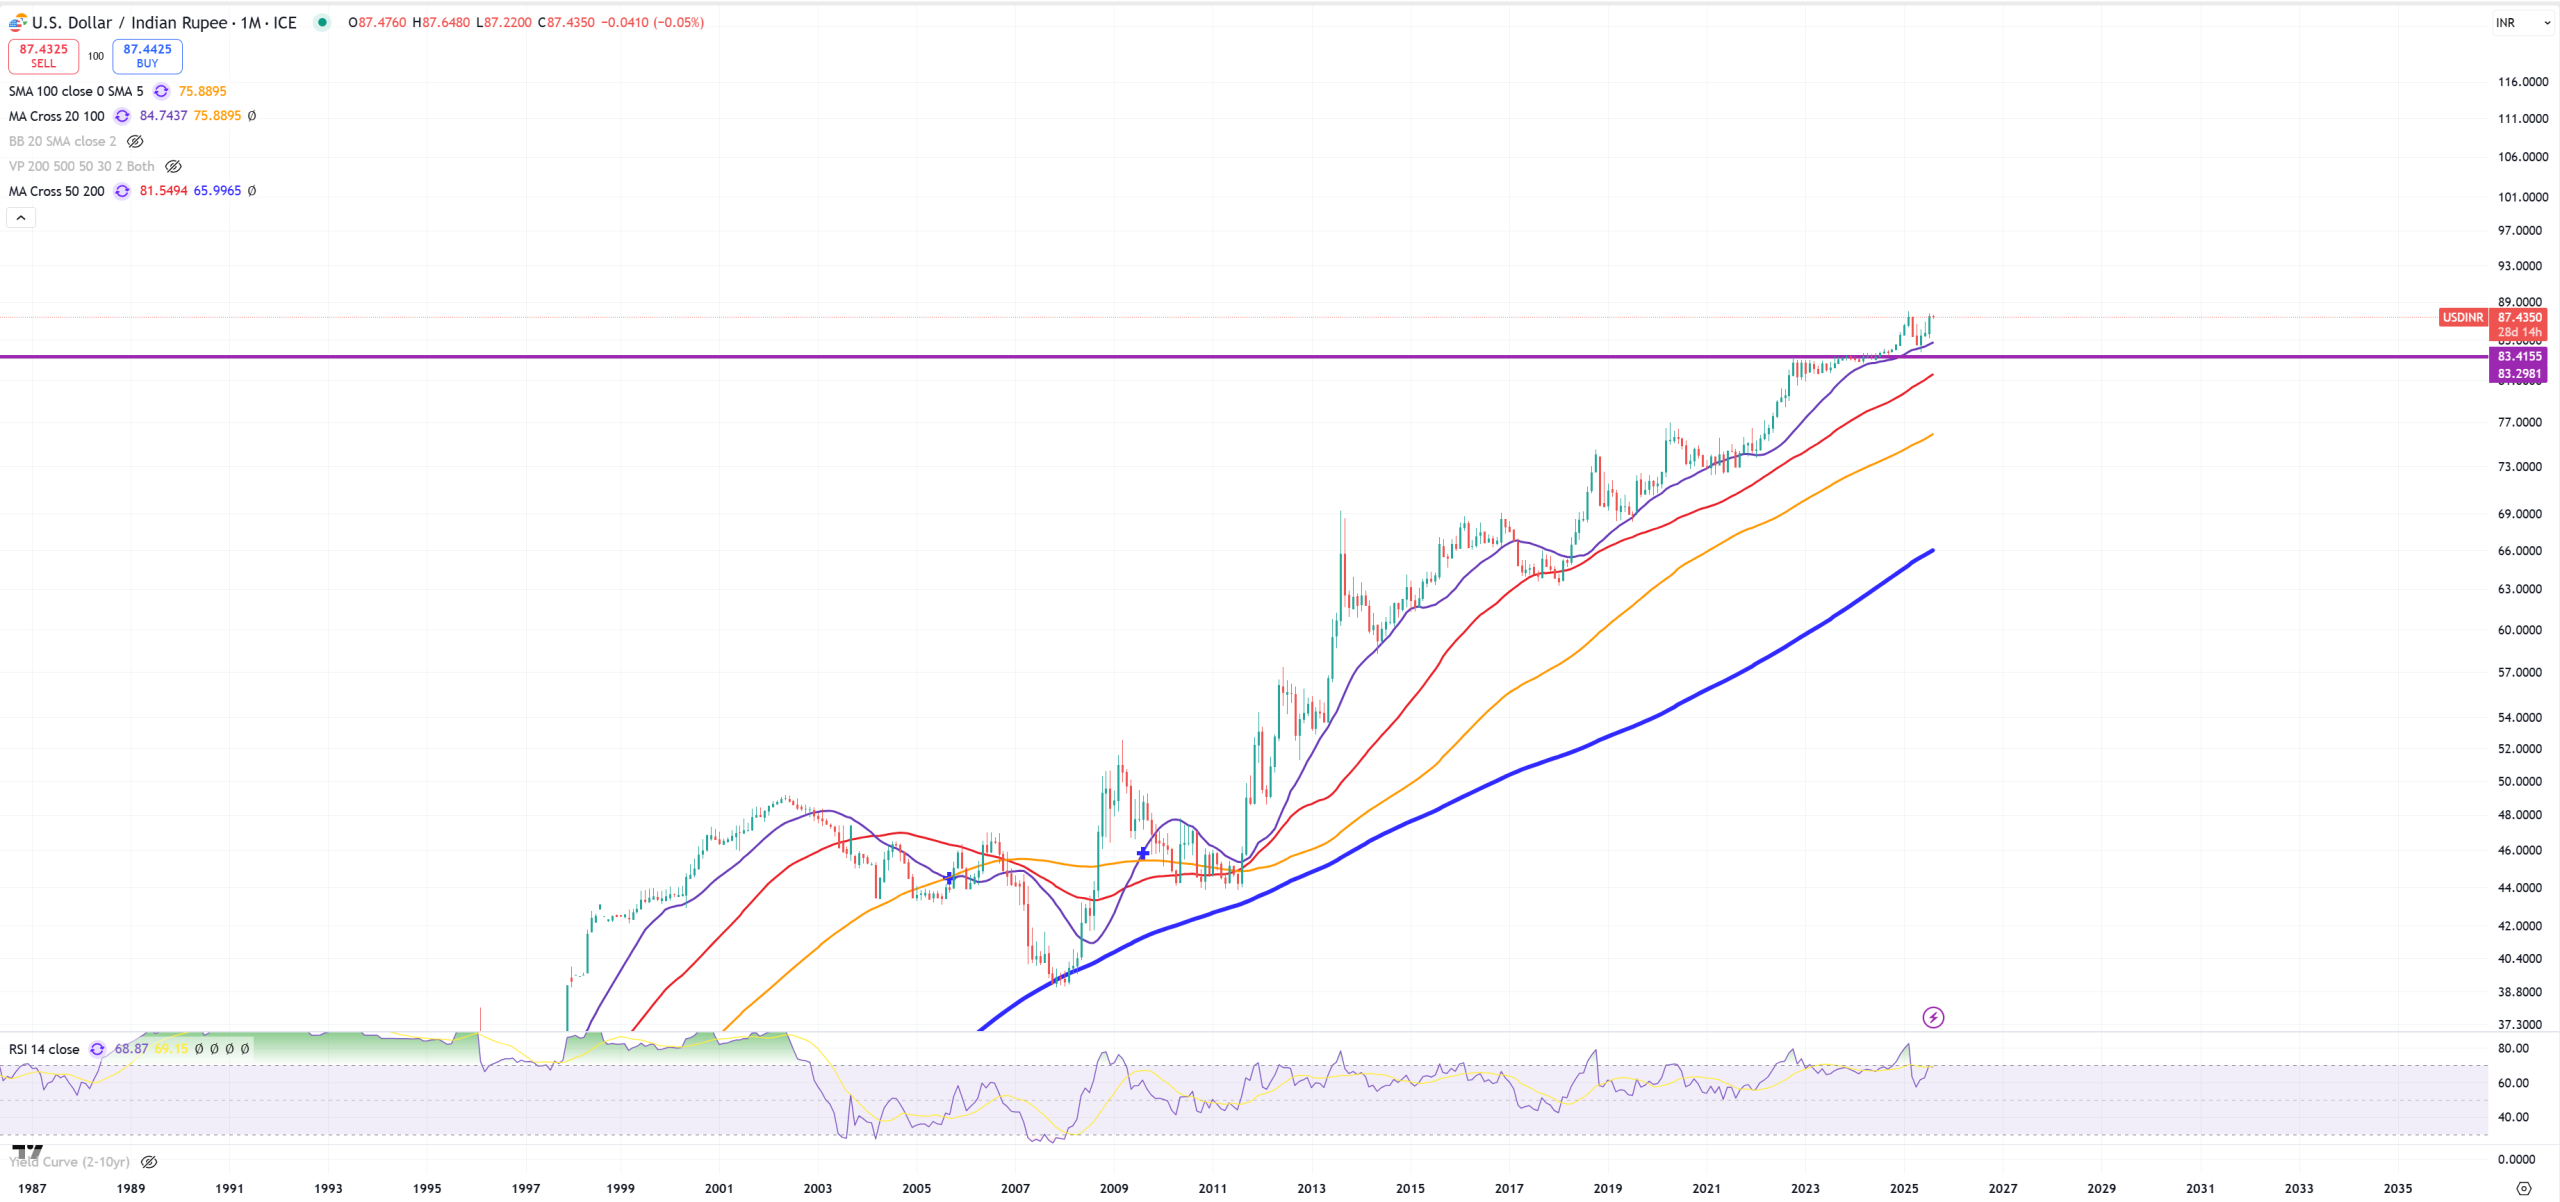
USDINR – even if DXY was dropping, Rupee didn’t get this memo, now it’s ready to go again way higher
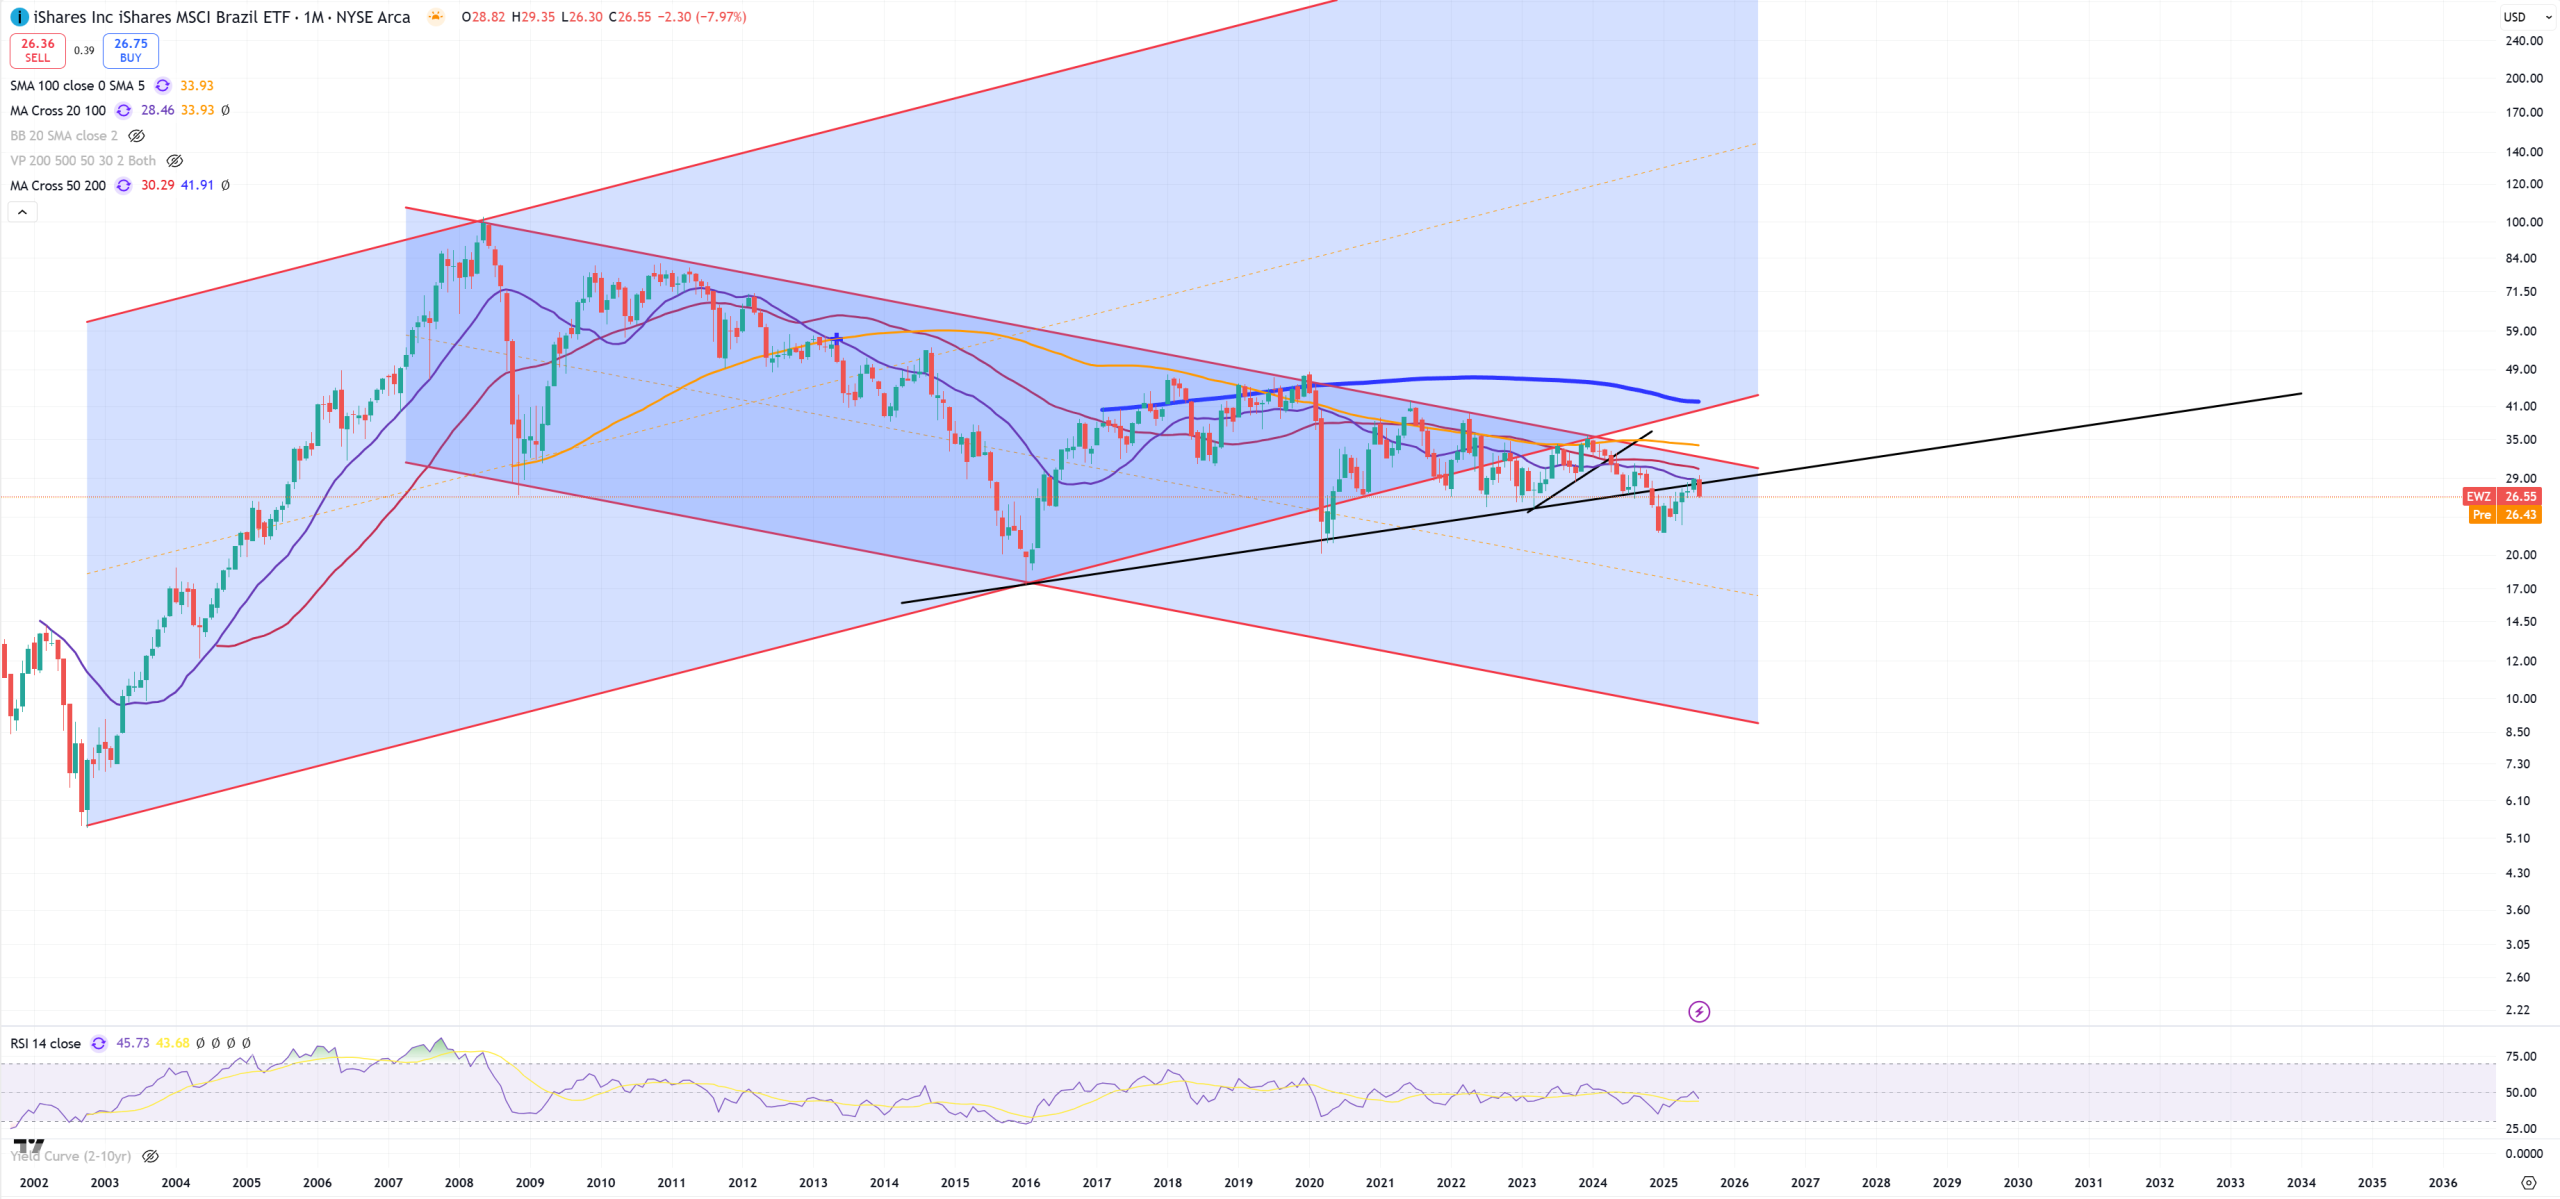
EWZ – Brazil and it’s GRANDE retest
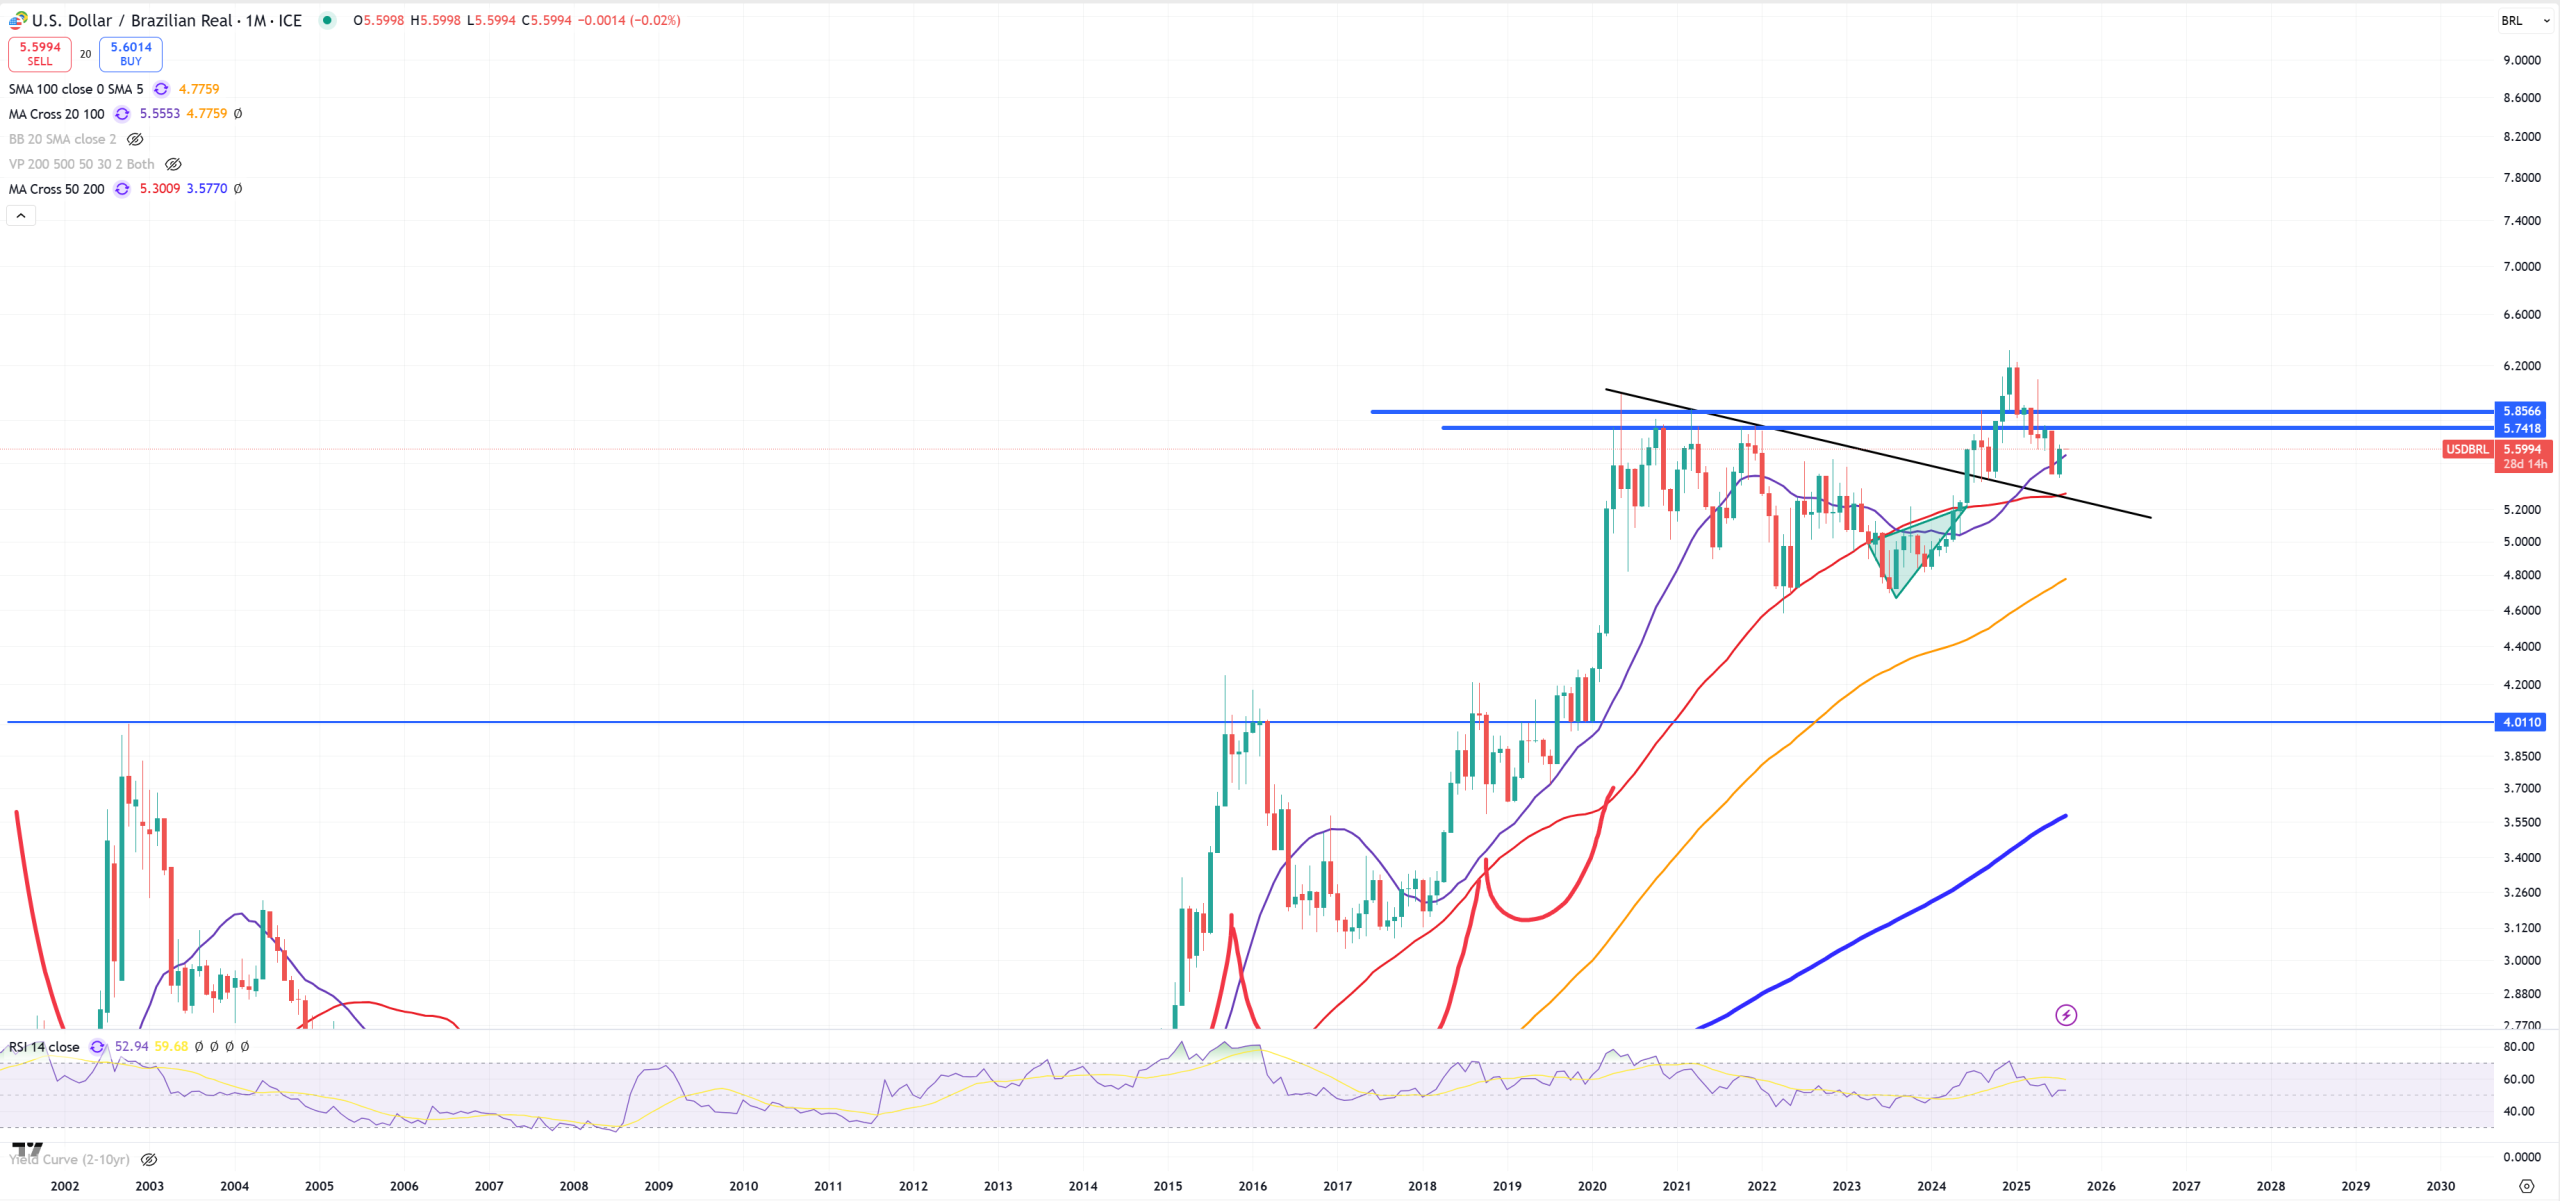
USDBRL – initial break was a bull trap here. That was a moment where DXY was breaking 105 and everything started to fail, but they managed to lower it to 96, but as I wrote earlier without a meaningful pullback on 10Y/3M, so this fuel came to an end. Now > (M)MA20 and reversal might be really fast here. Also 40-50% tariffs on Brazil.
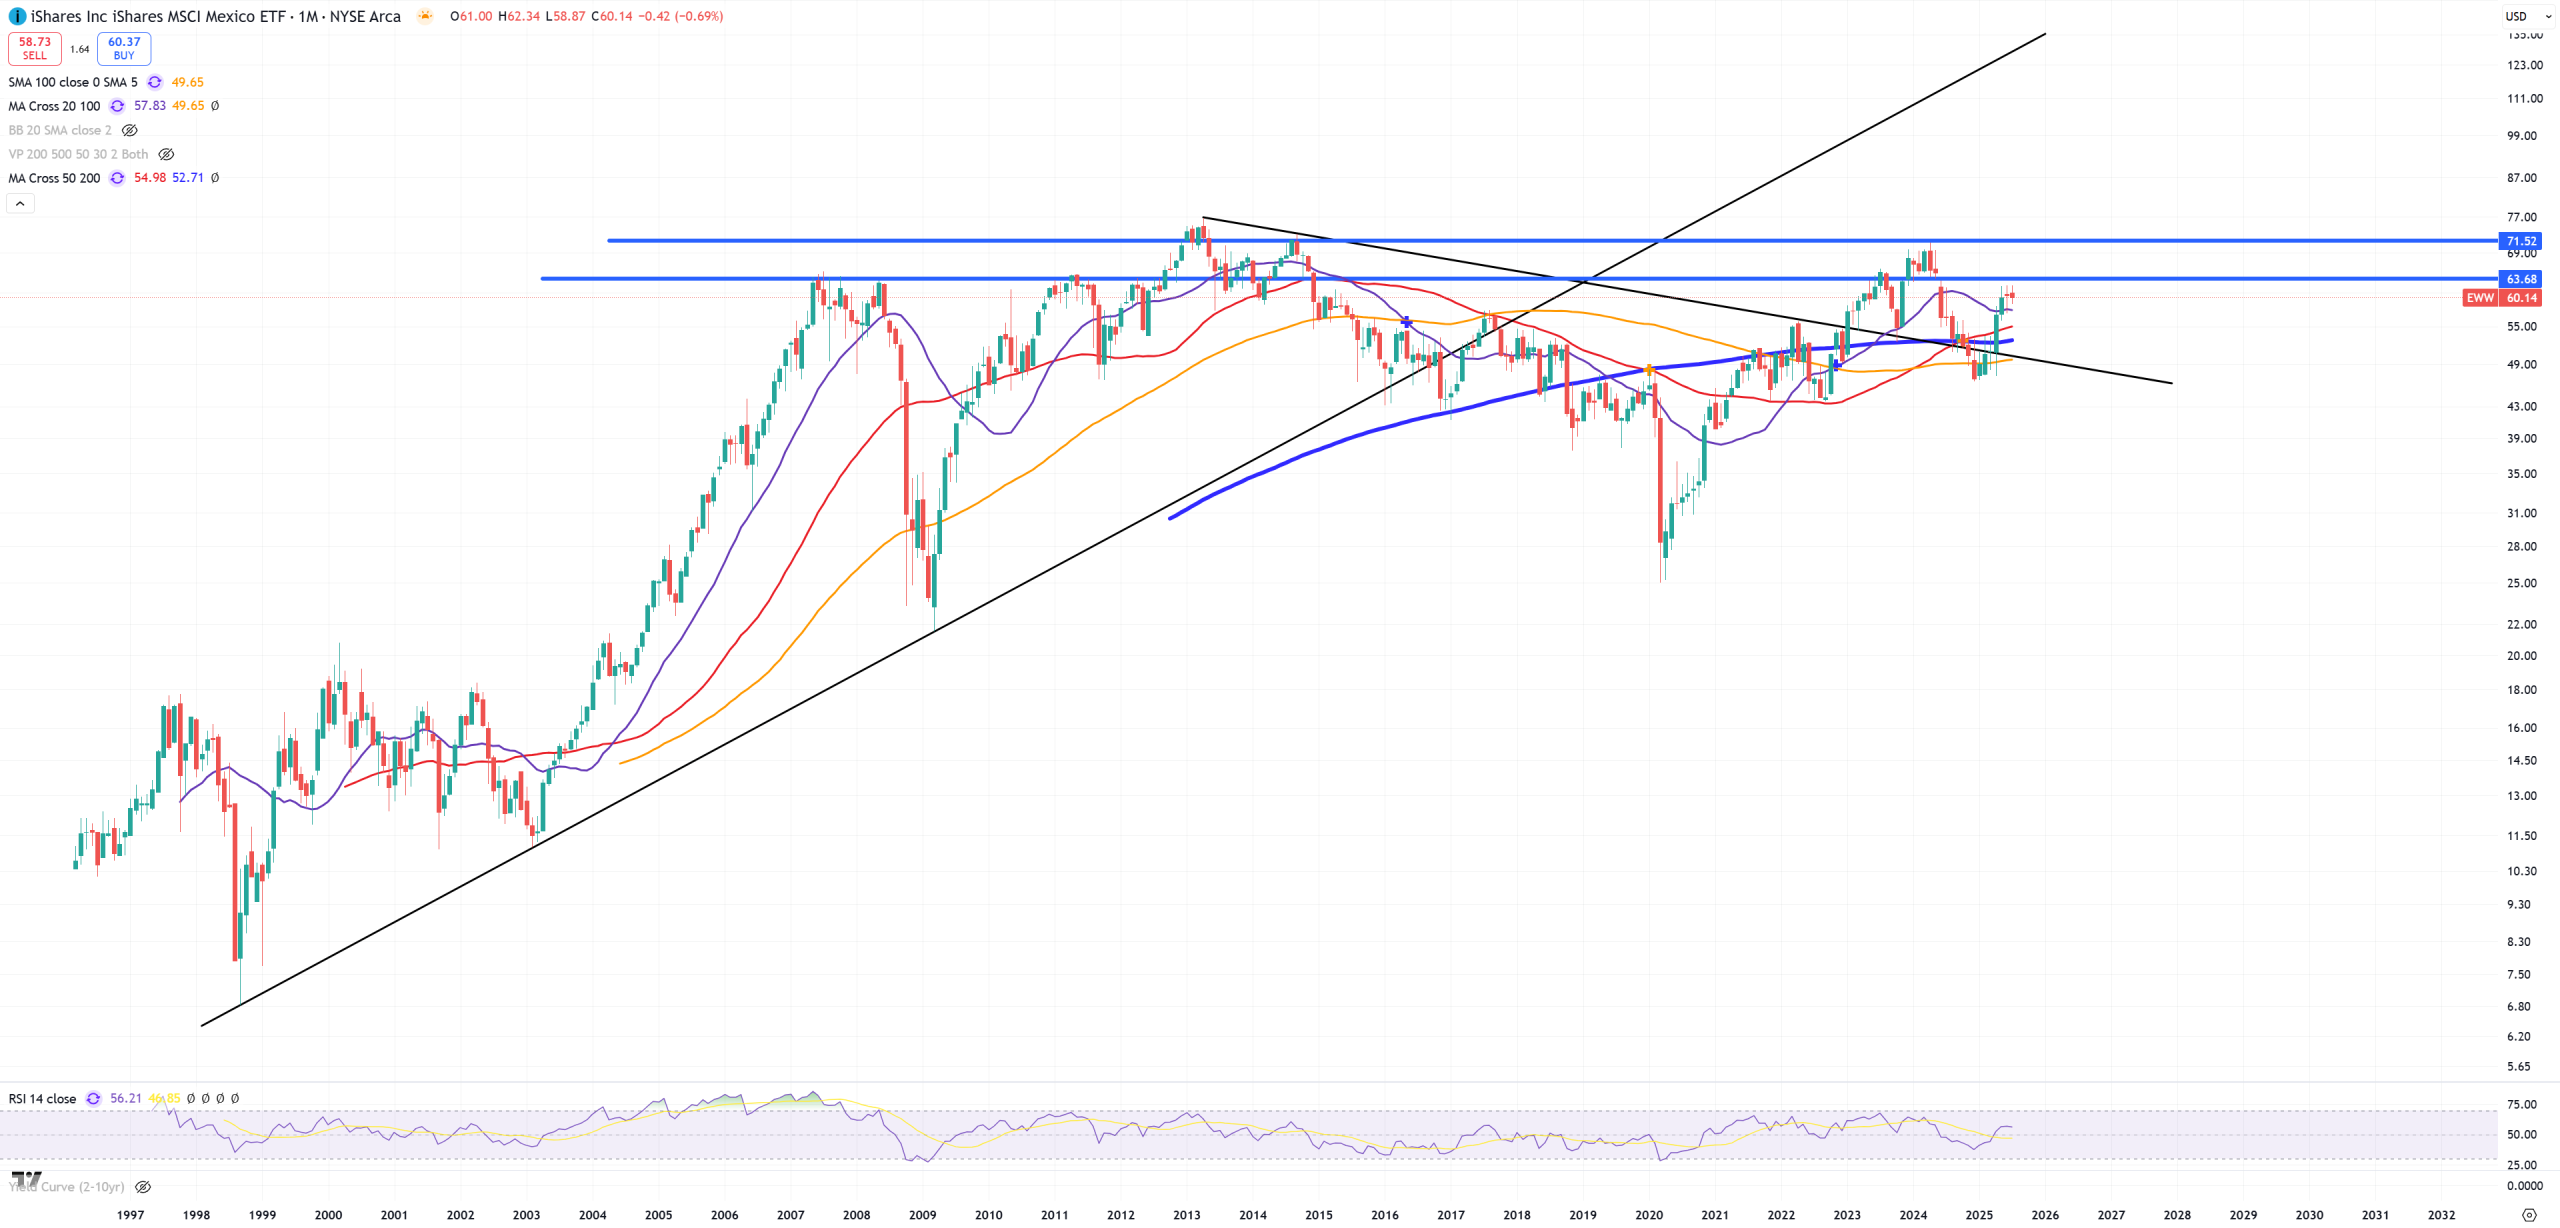
EWW – Mexico – it’s below 2008 peak
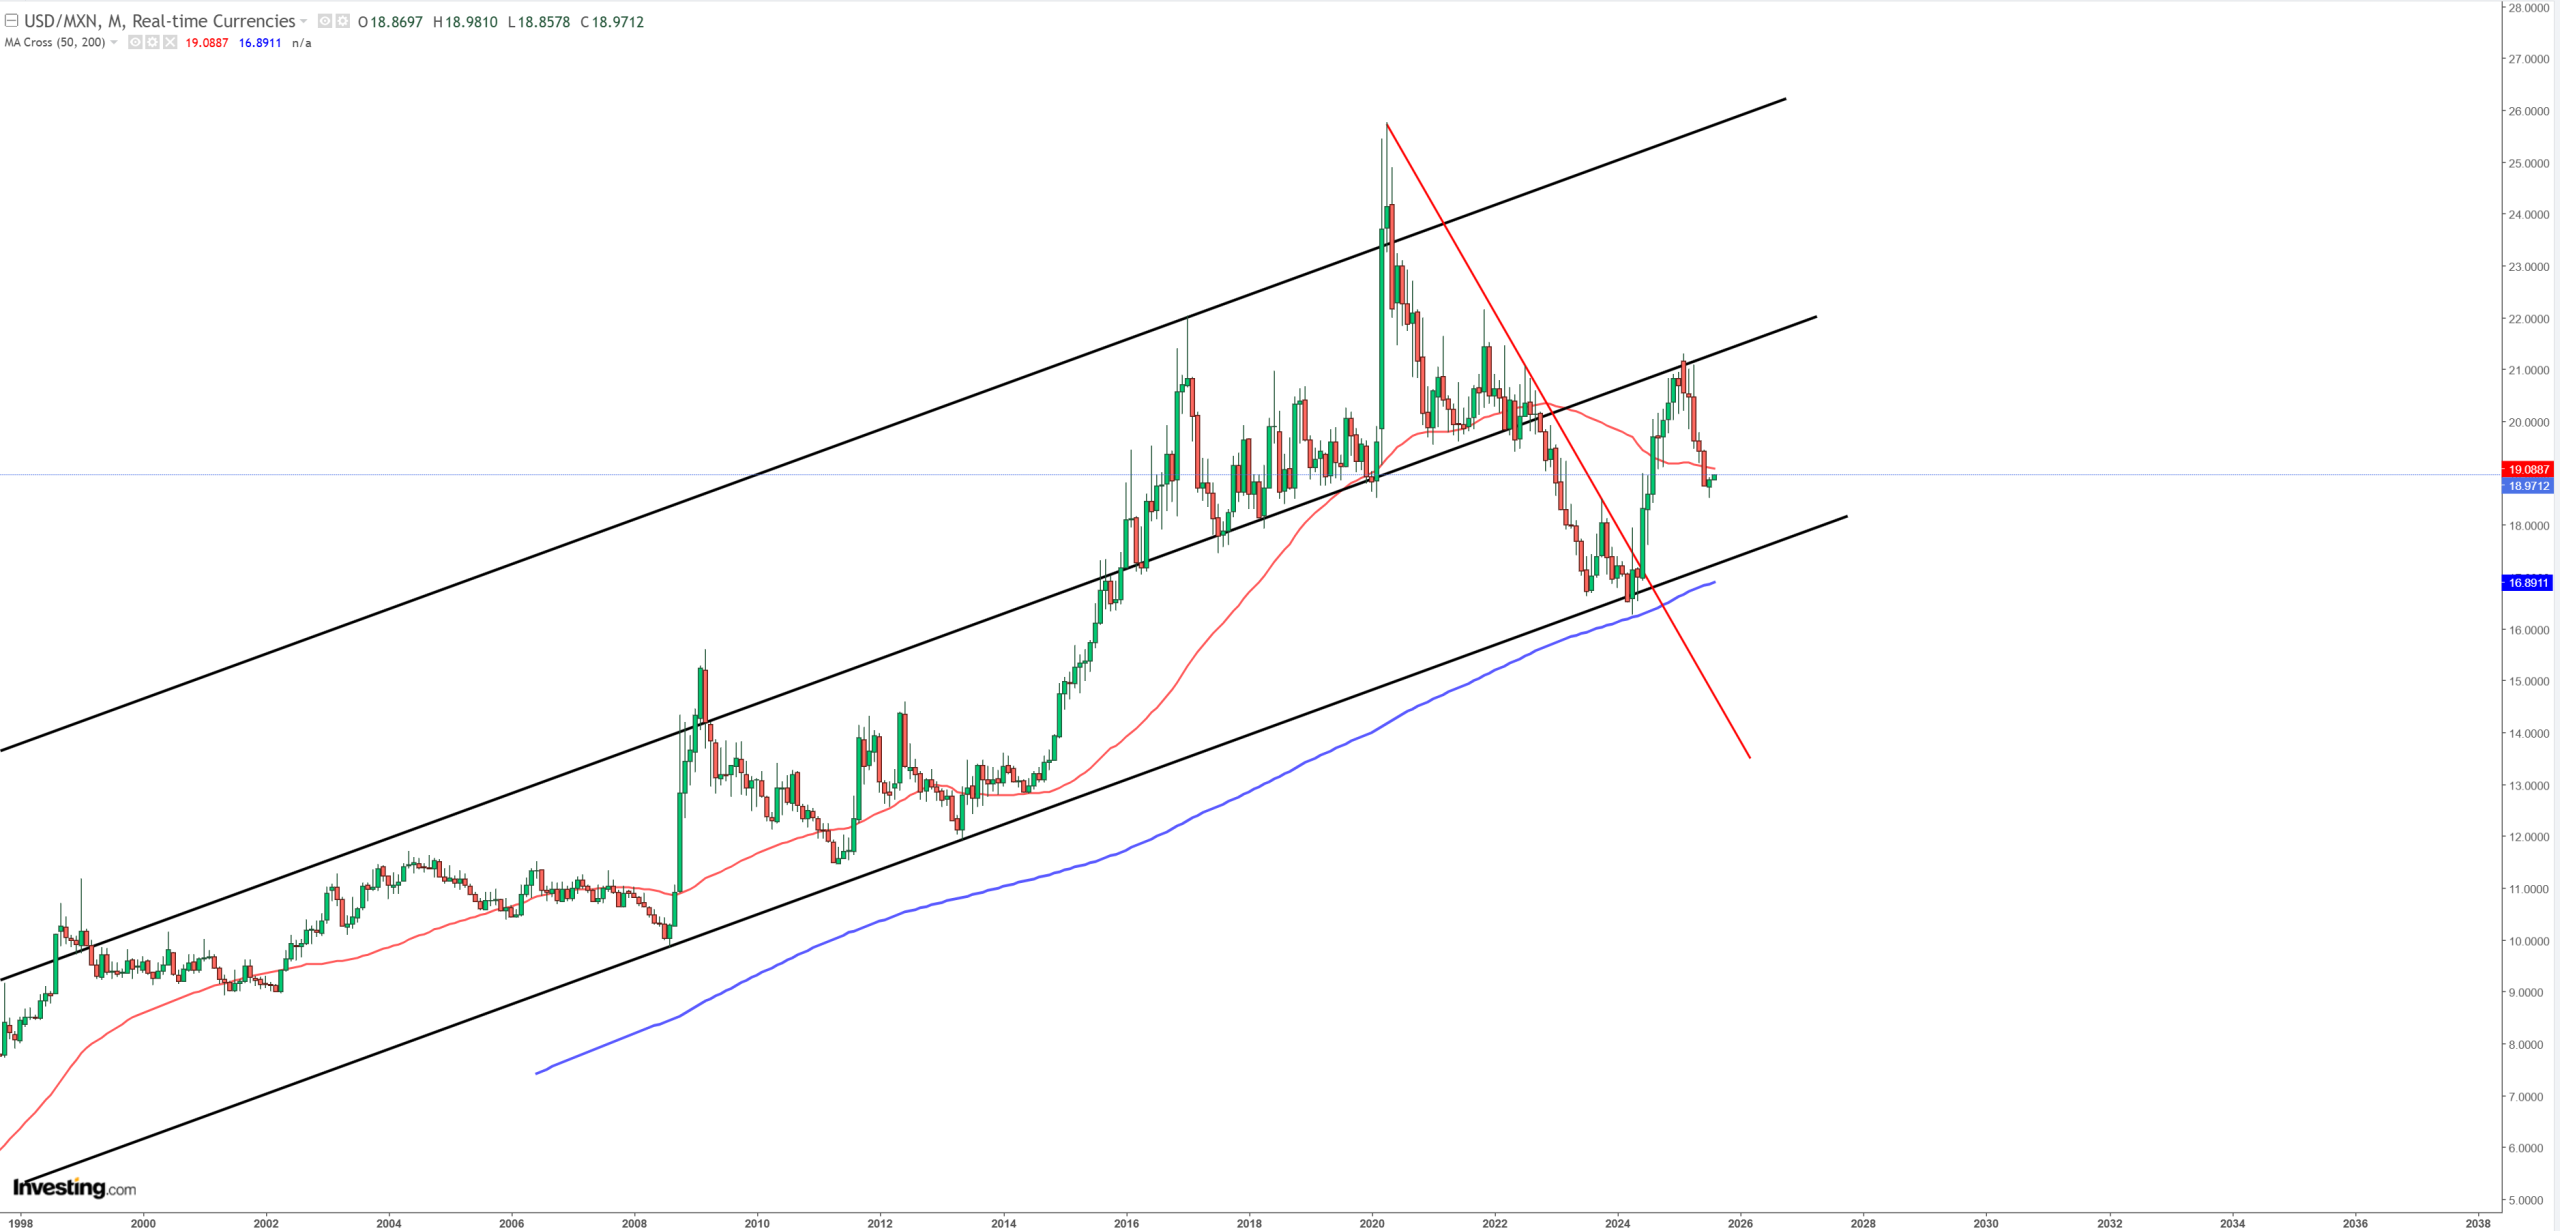
USDMXN – Mexican Peso – it bounced perfectly from the middle of the channel so far.
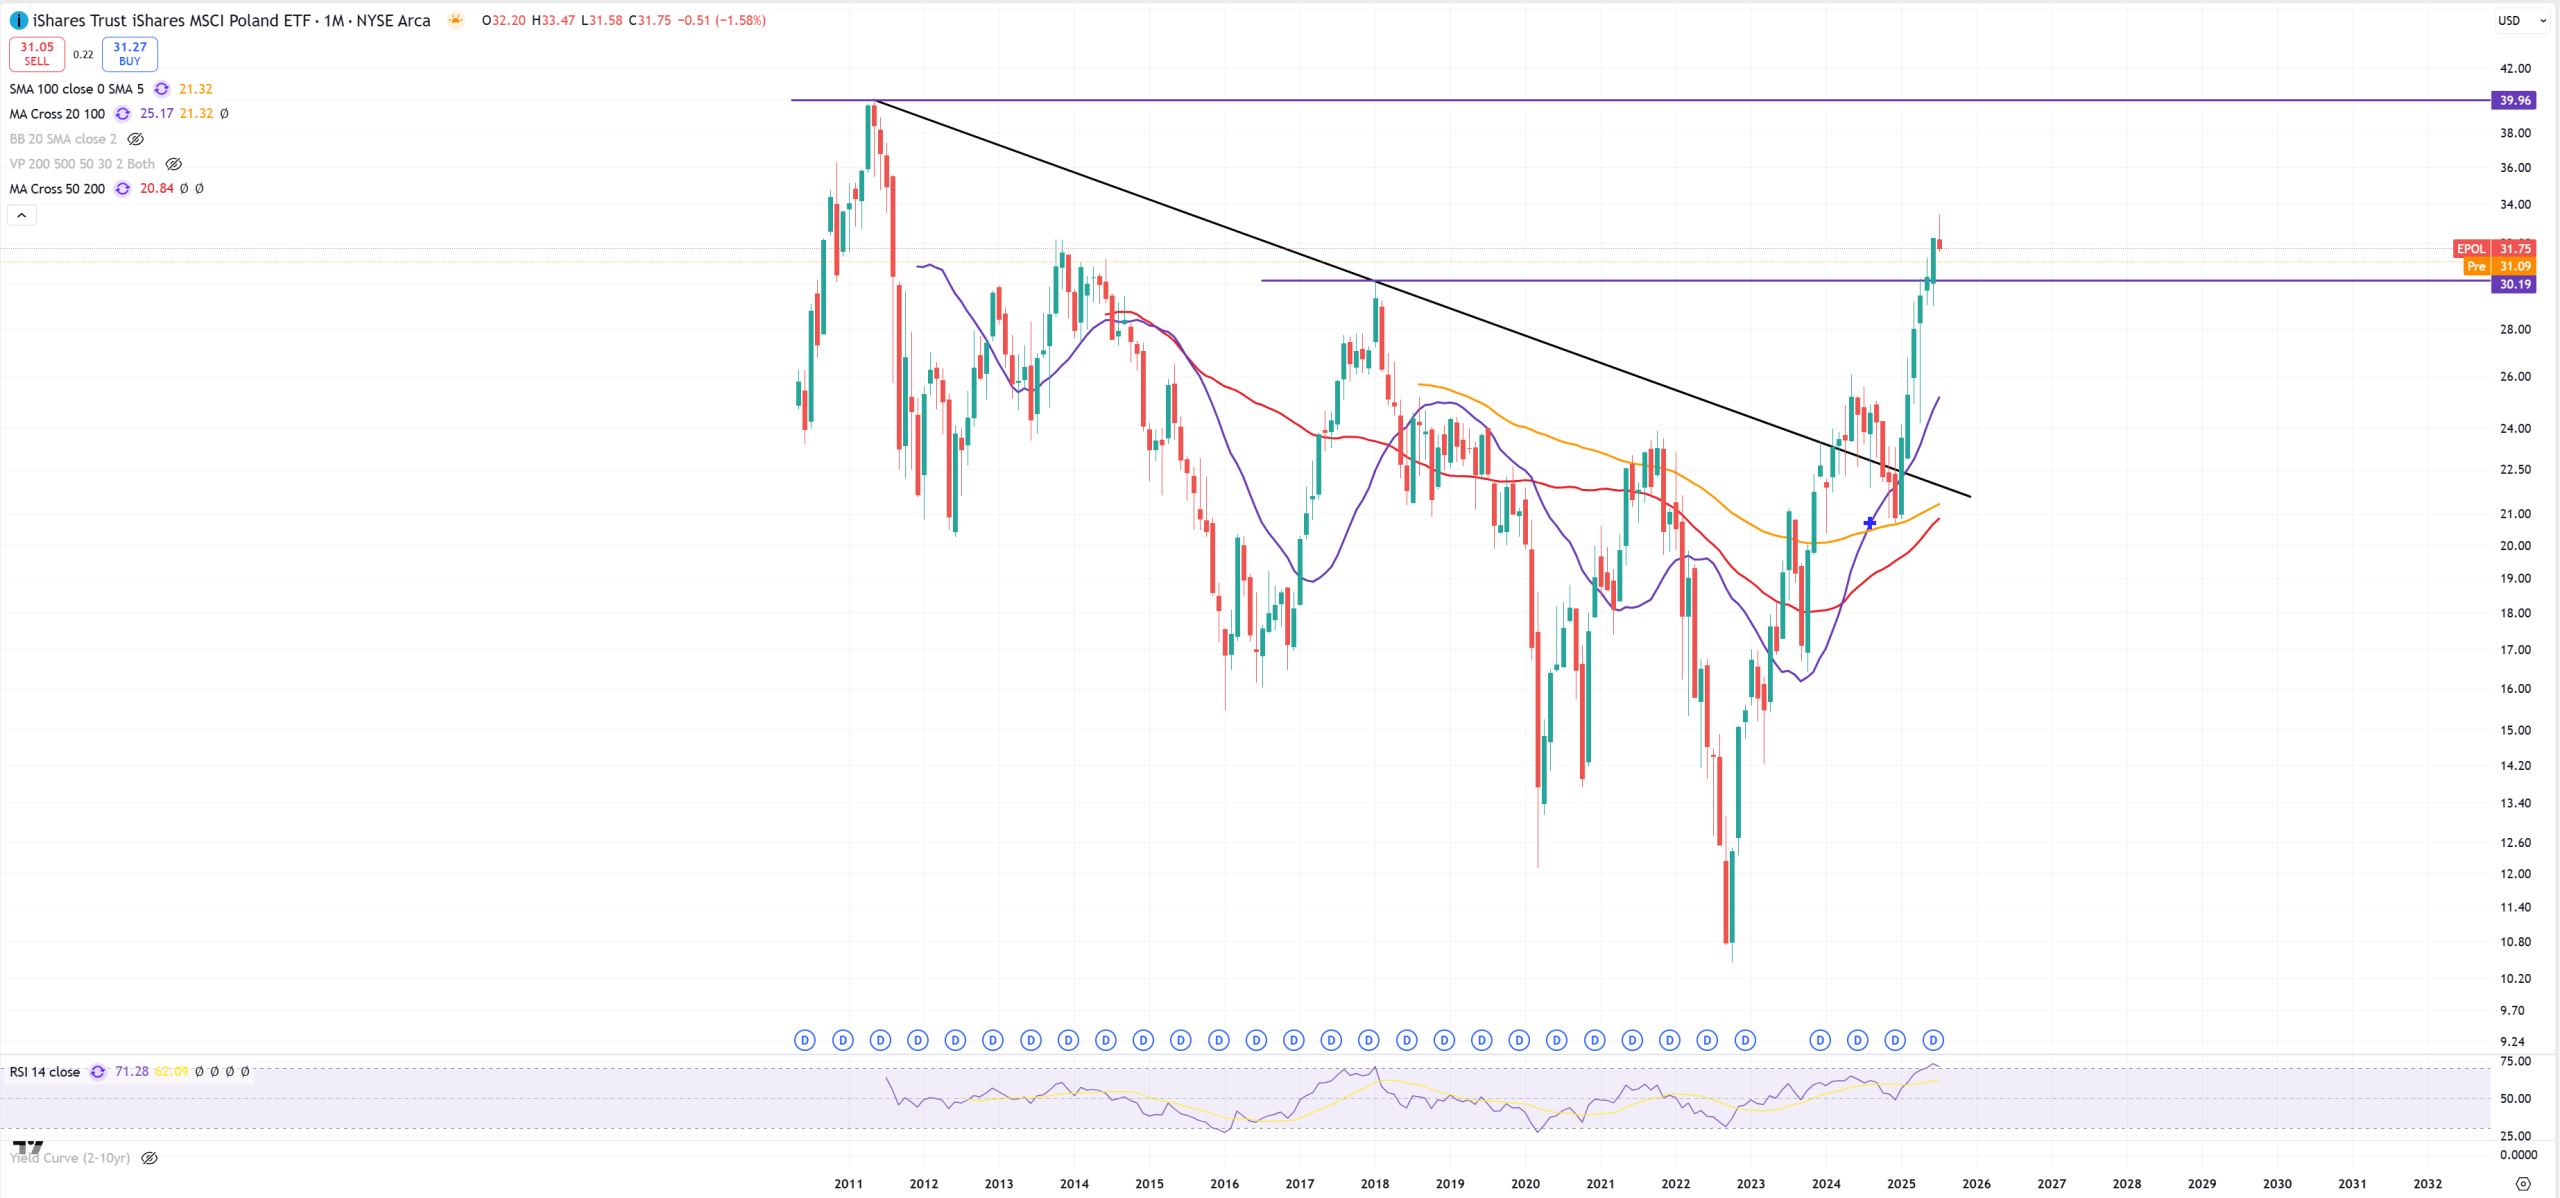
EPOL – Poland is #1 in gains for 2025, not much I can say here unless it’ll jump below 2018 peak
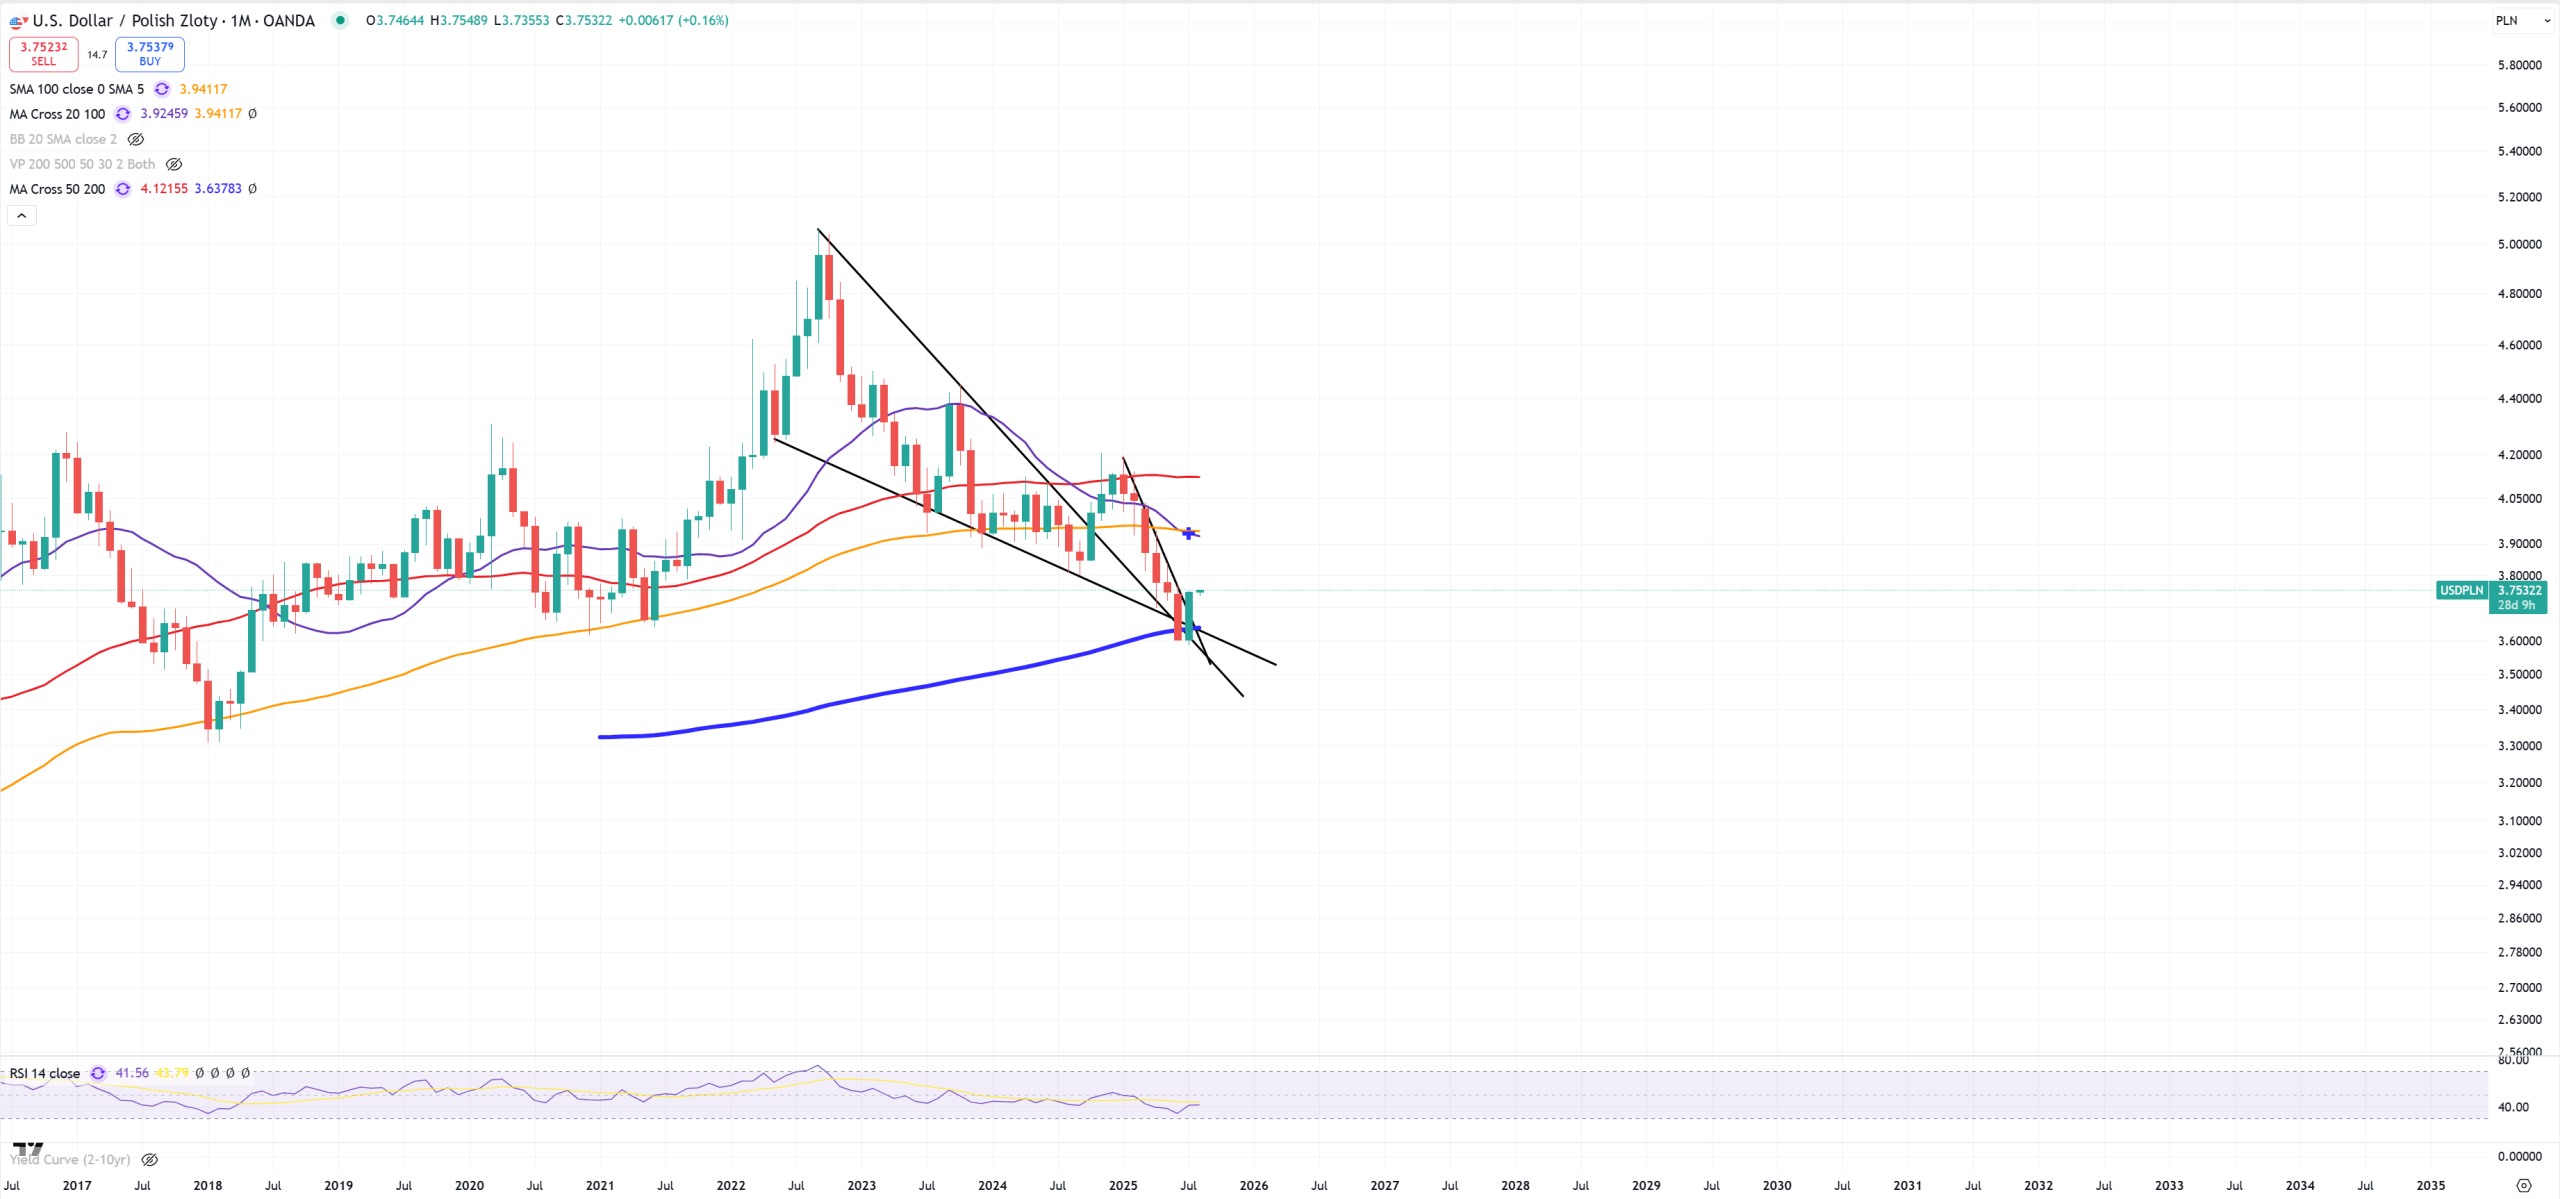
USDPLN – it’s a currency very much related to EURUSD, as on last DXY move down EUR gained the most so does USDPLN, it hit the last possible junction so (M)MA200 + couple technical wedges
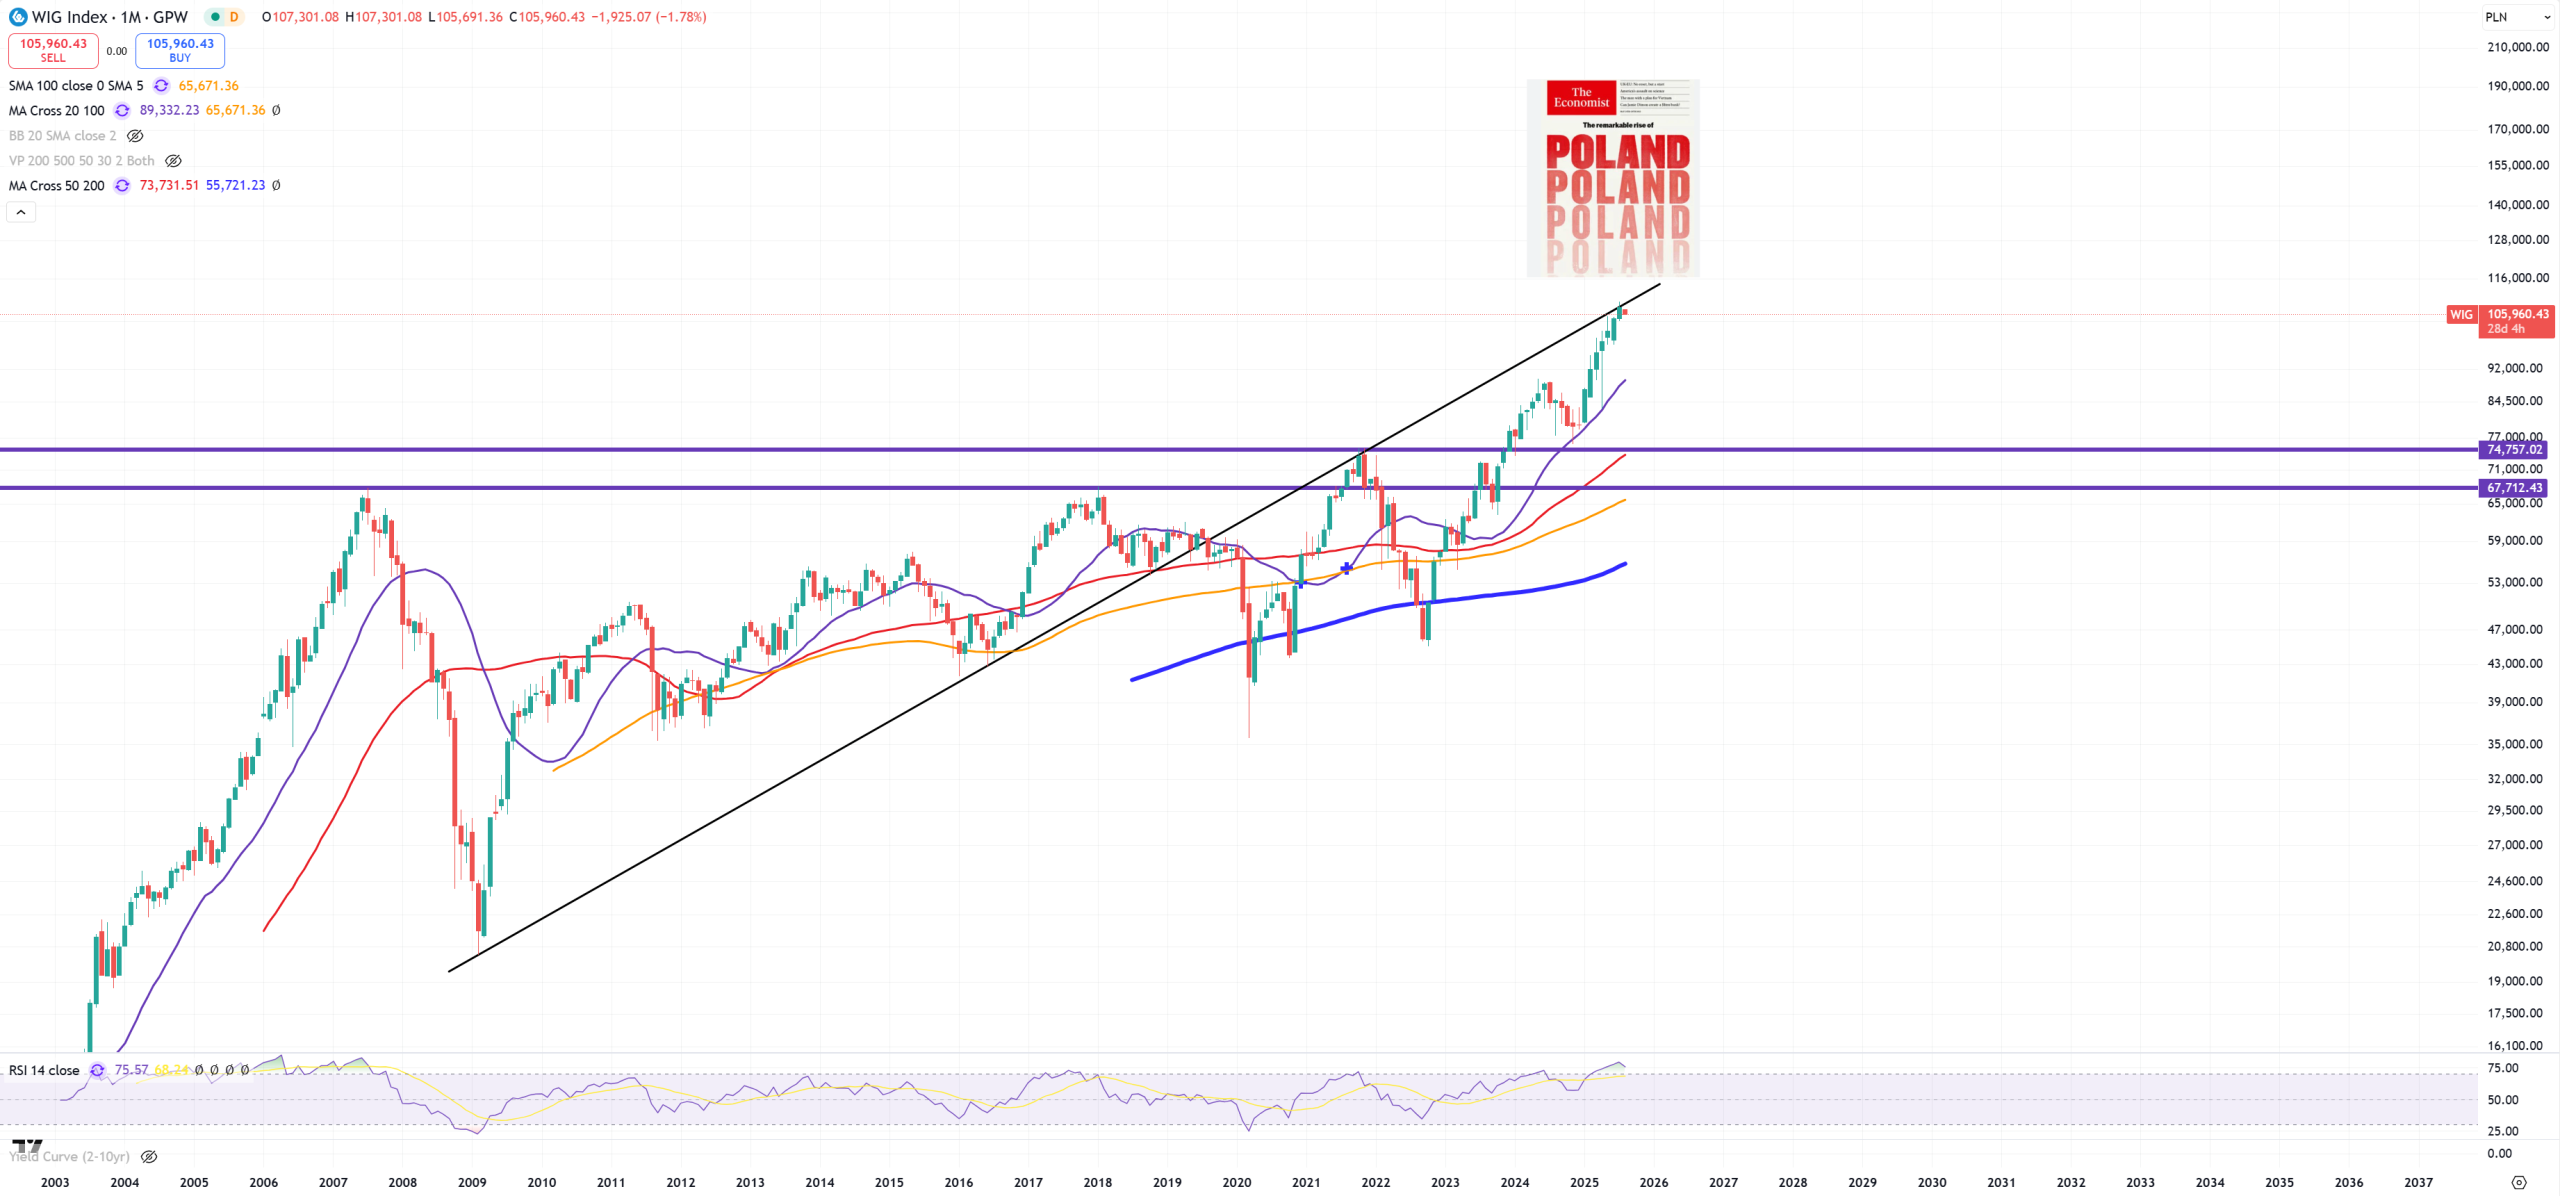
WIG – from the other hand if we take a look at its nominal stock market, but very far to 2007-2021 support level.
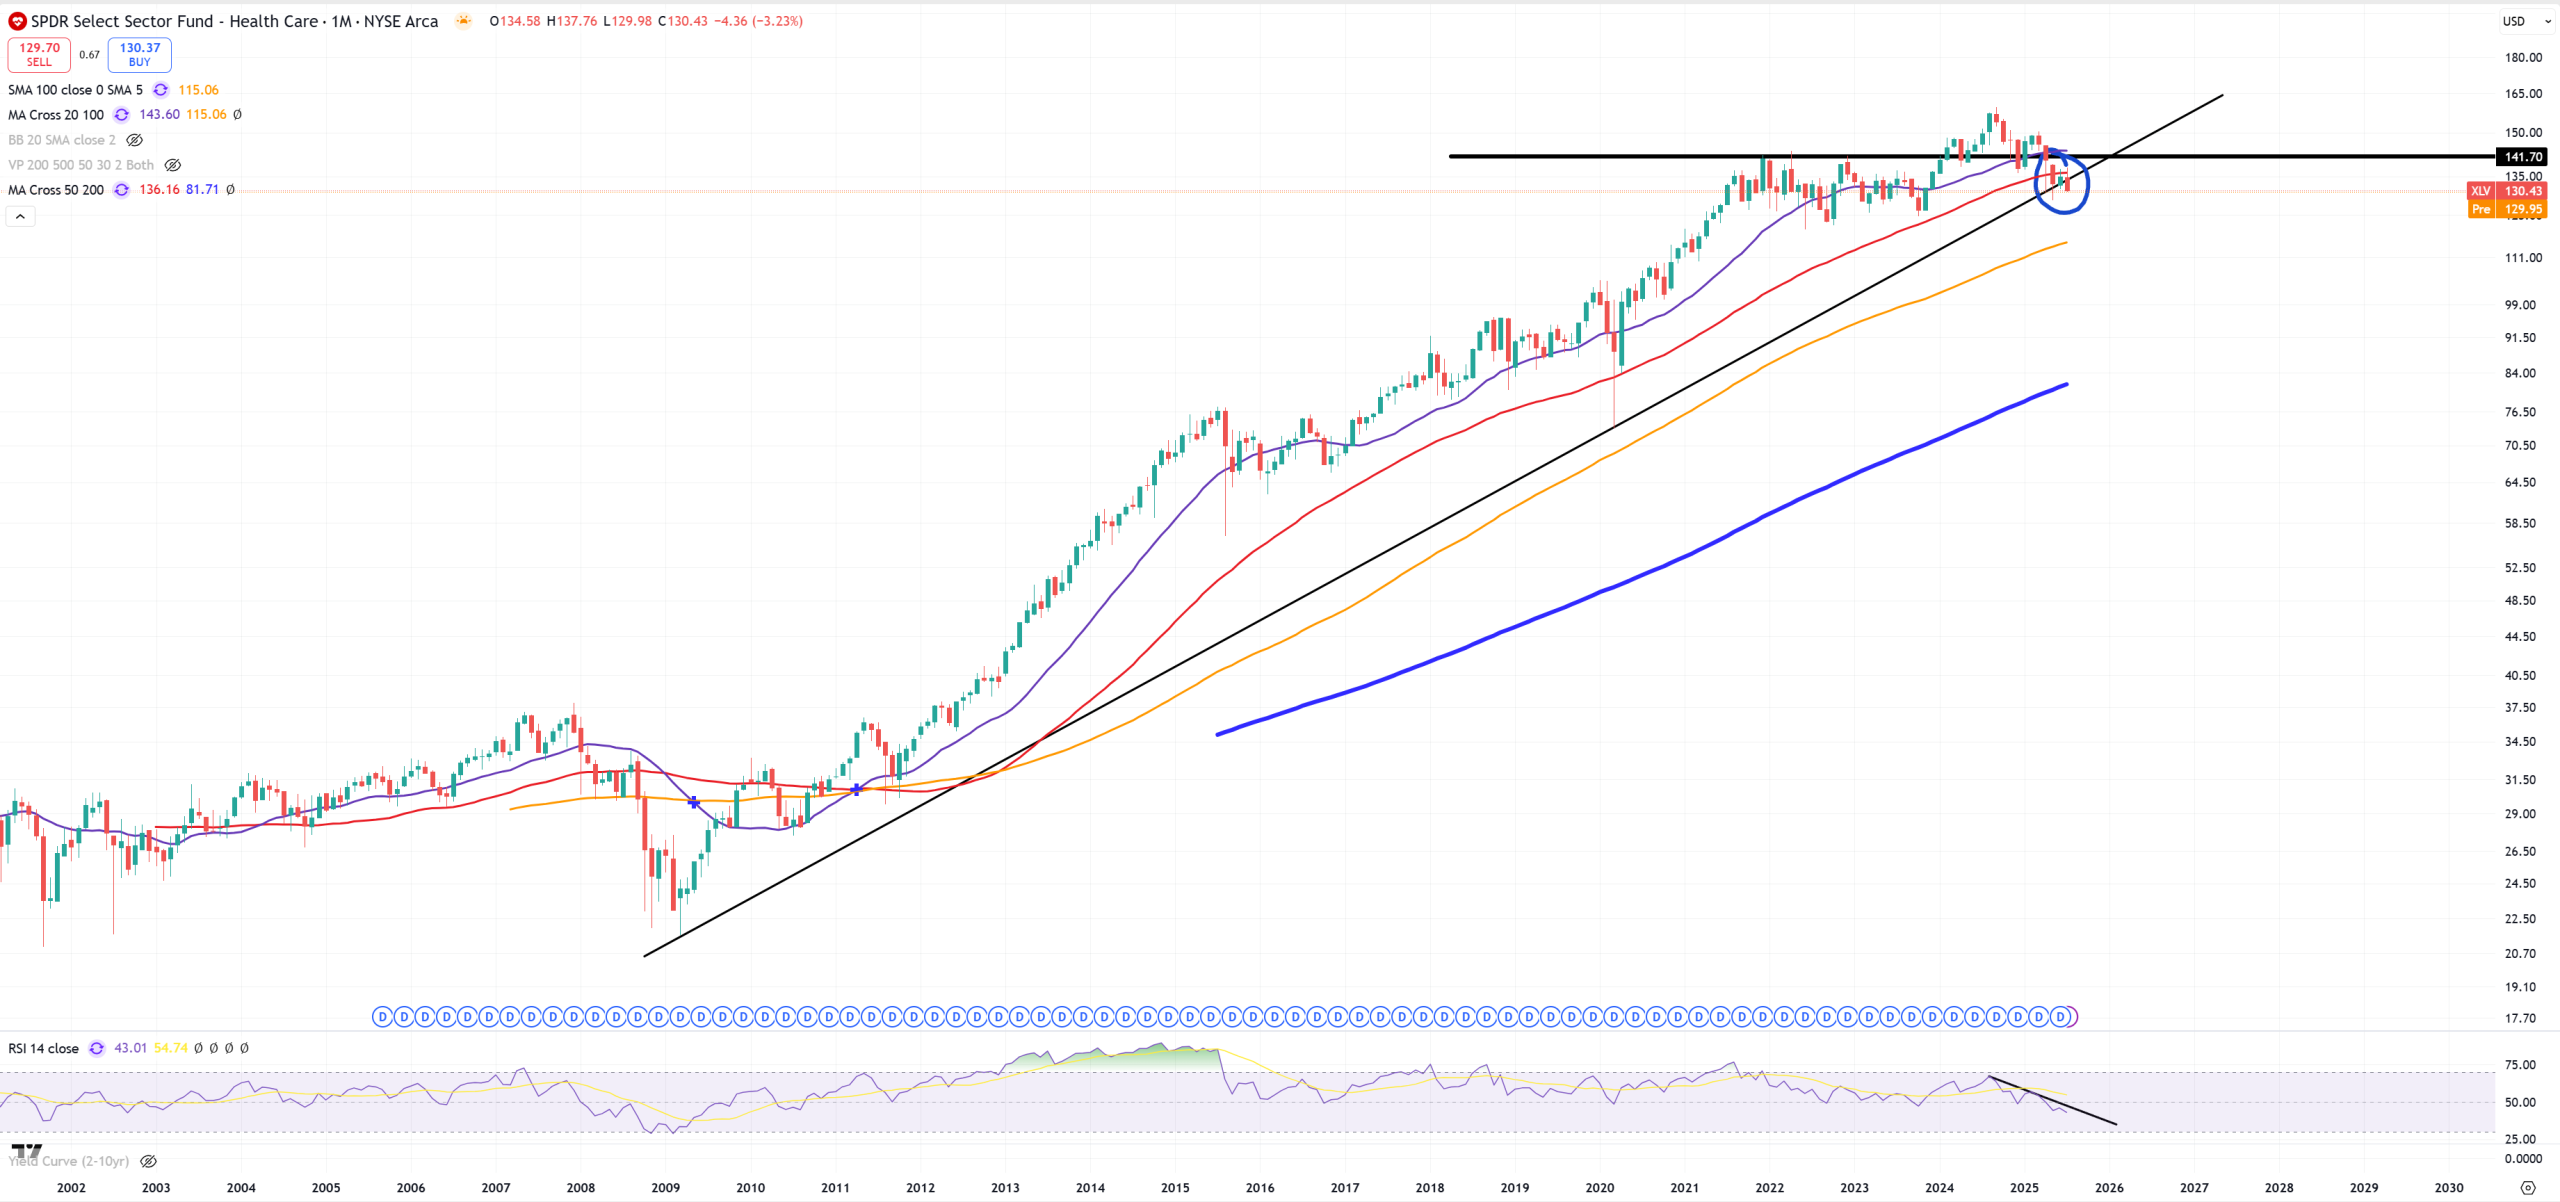
XLV – Healthcare – we can say welcome to the first technical bear market since 2008, especially when 10Y/3M is still around inversion. Trend broken, (M)MA50 broken, bull trap around 2024 to jump above key 2021 level and failure.
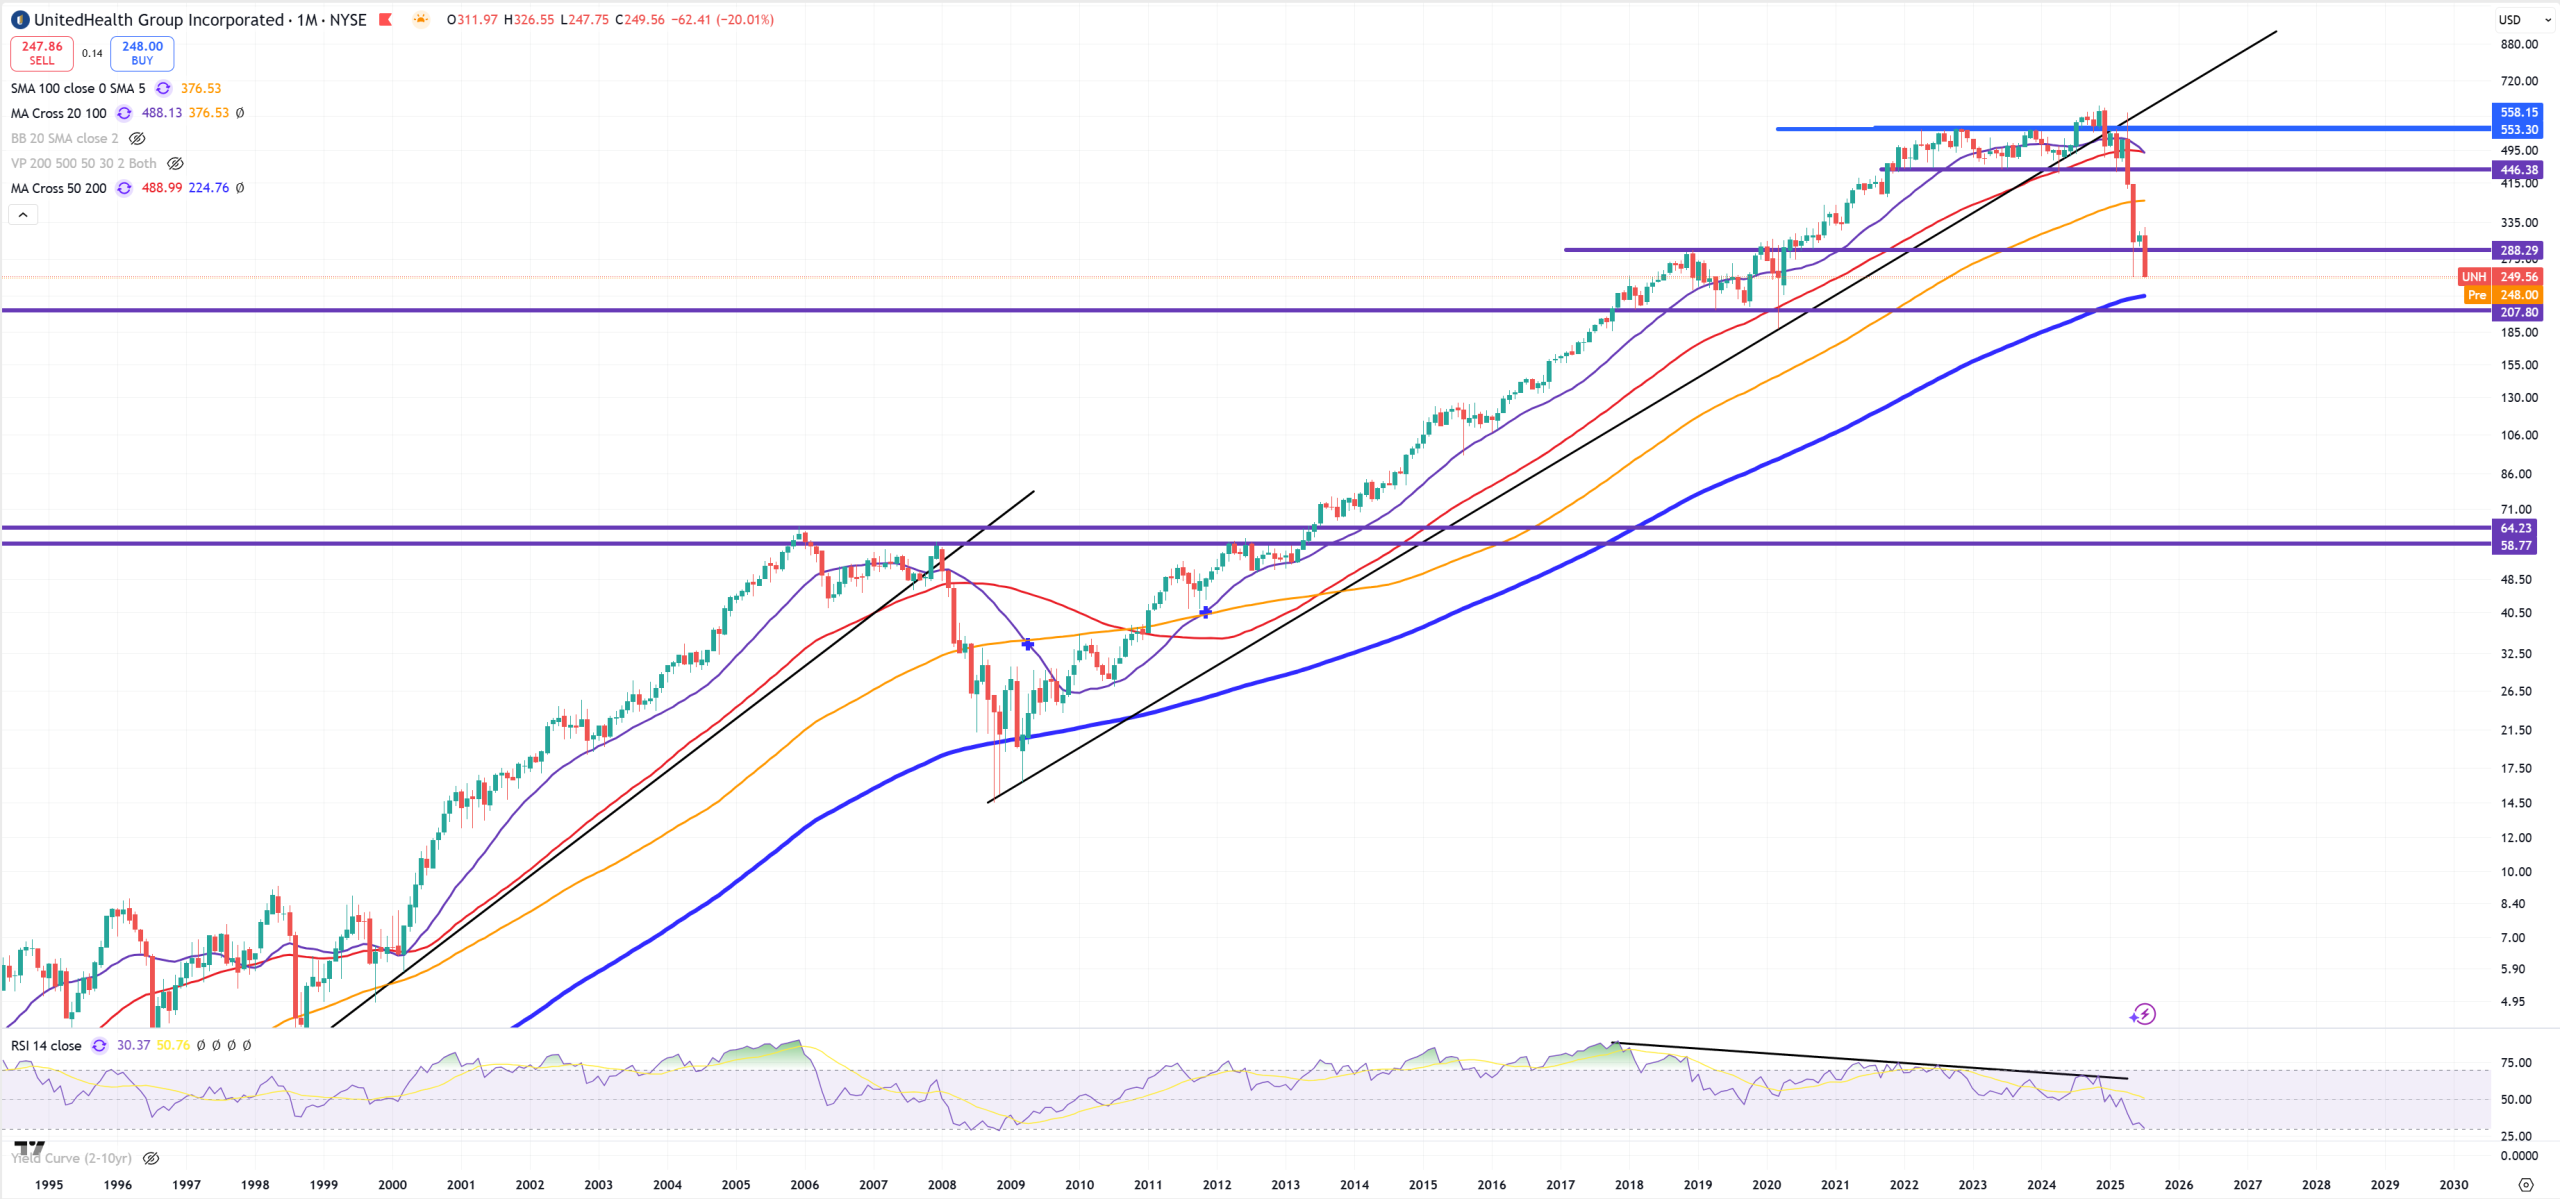
UNH – If you see how bad XLV looks like and you accept the fact it’s just on the beginning of its downturn, it’s hard to believe on UNH bottom, and so far it’s still going lower. (M)MA200 ahead, but also remember in 2009 10Y/3M was 350bps on this level, now it’s 0bps, so probablility this time this (M)MA200 will be broken is … like … 100%.
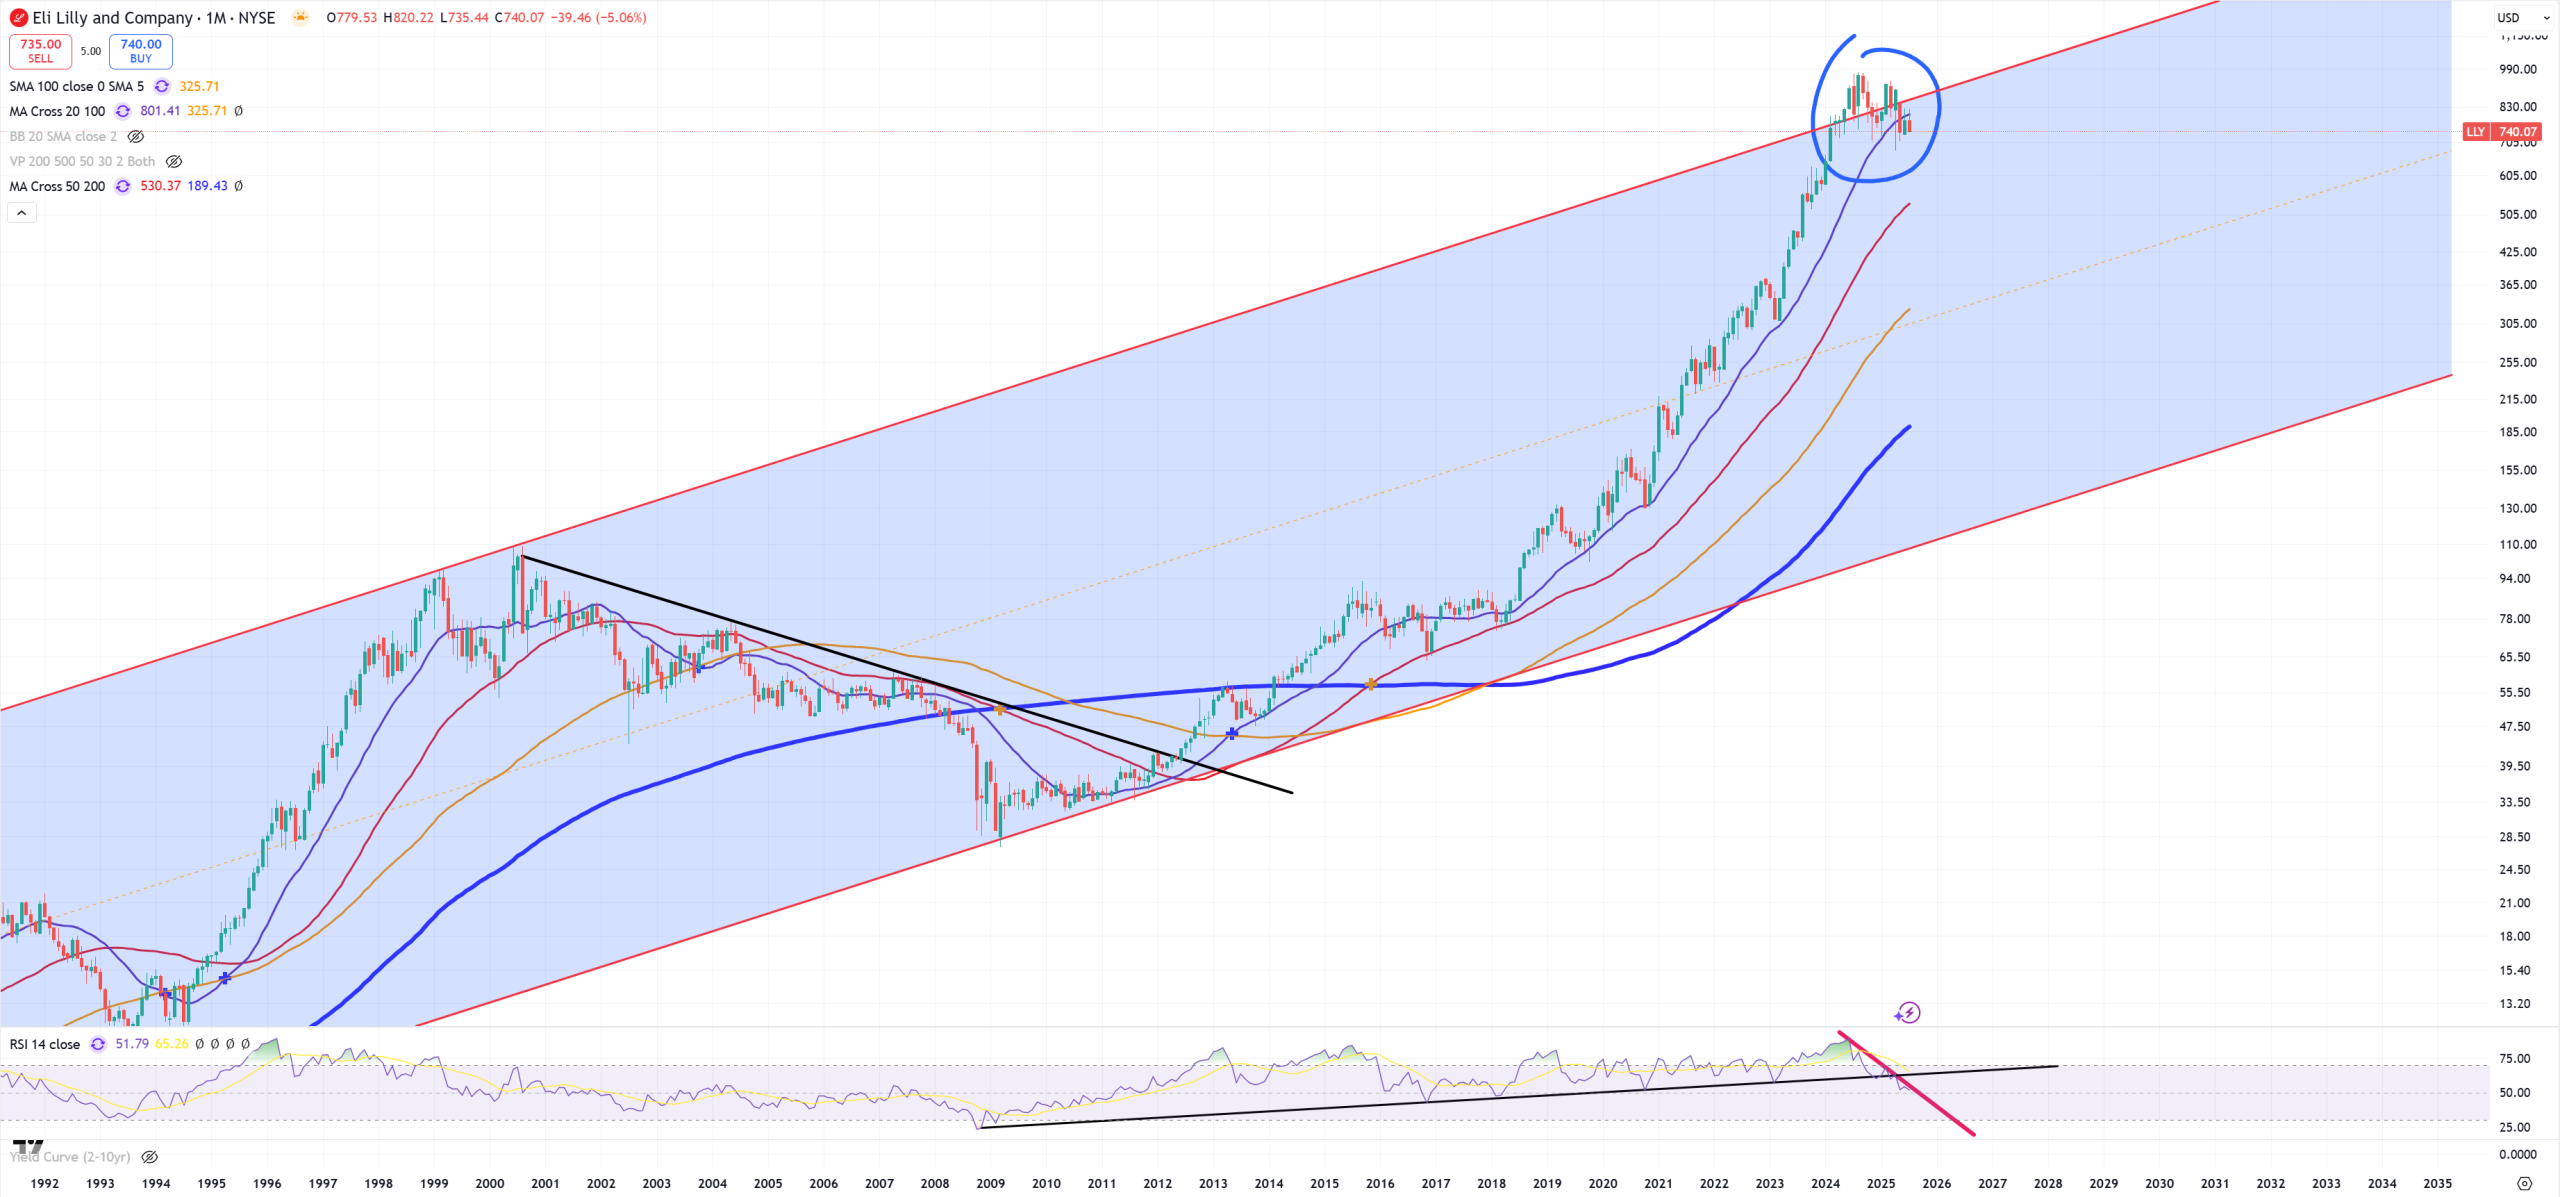
LLY – after multiple spikes above its key channel it failed and now (M)MA20 acts as a resistance, (M)RSI trend broken, negative divergence, it might be fast after such parabolic move higher
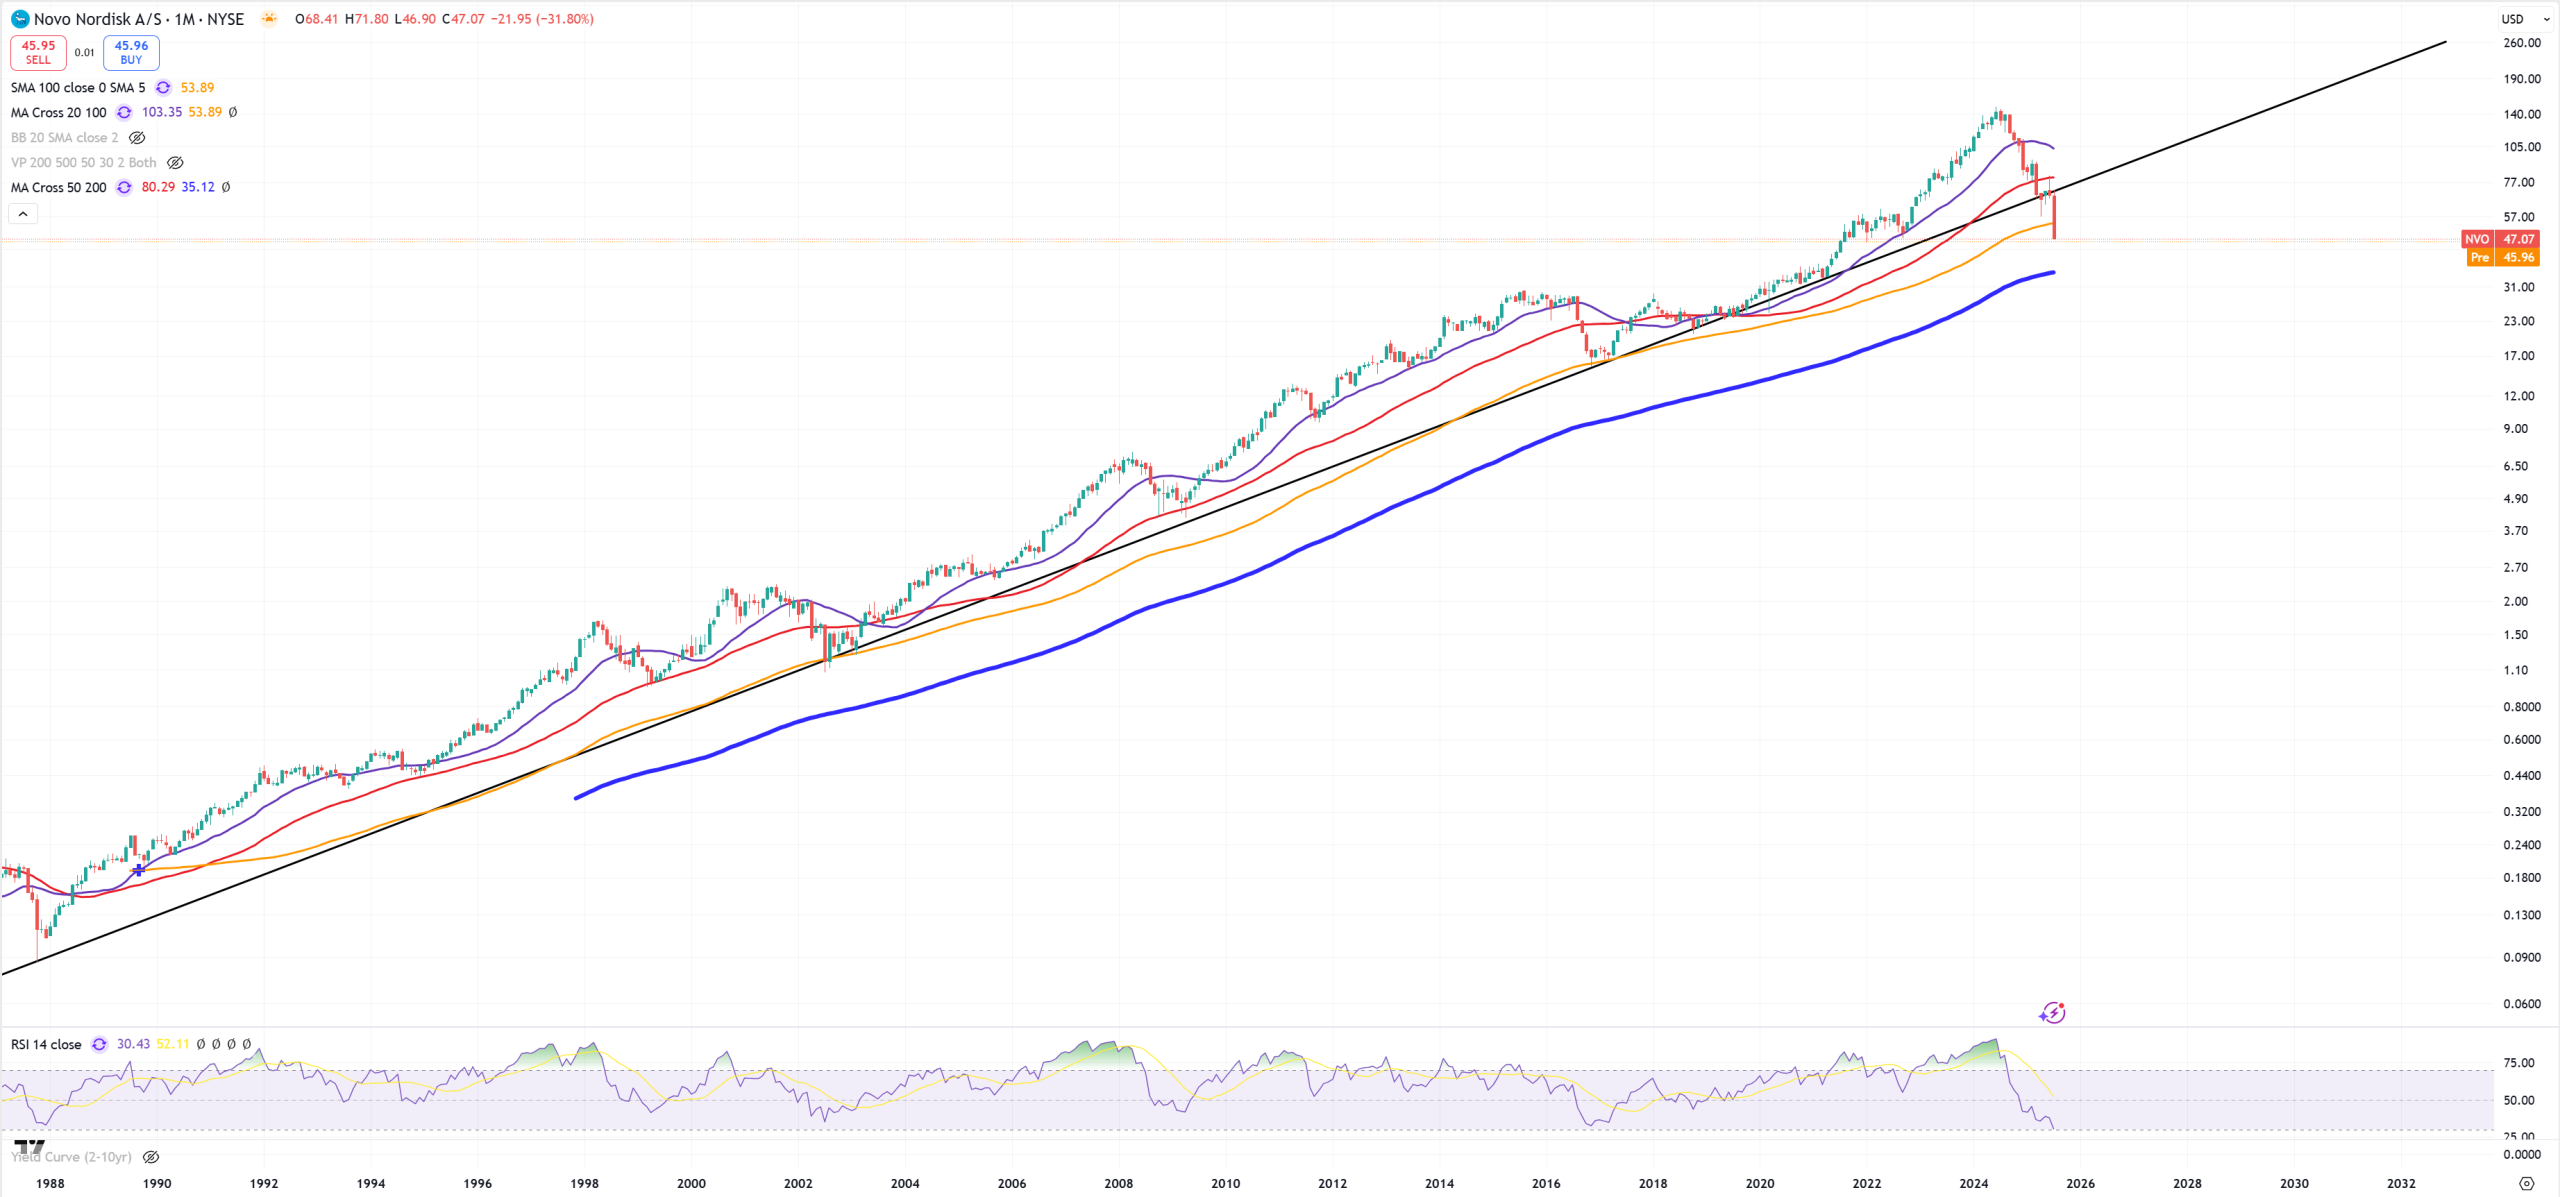
NVO – End of dreams
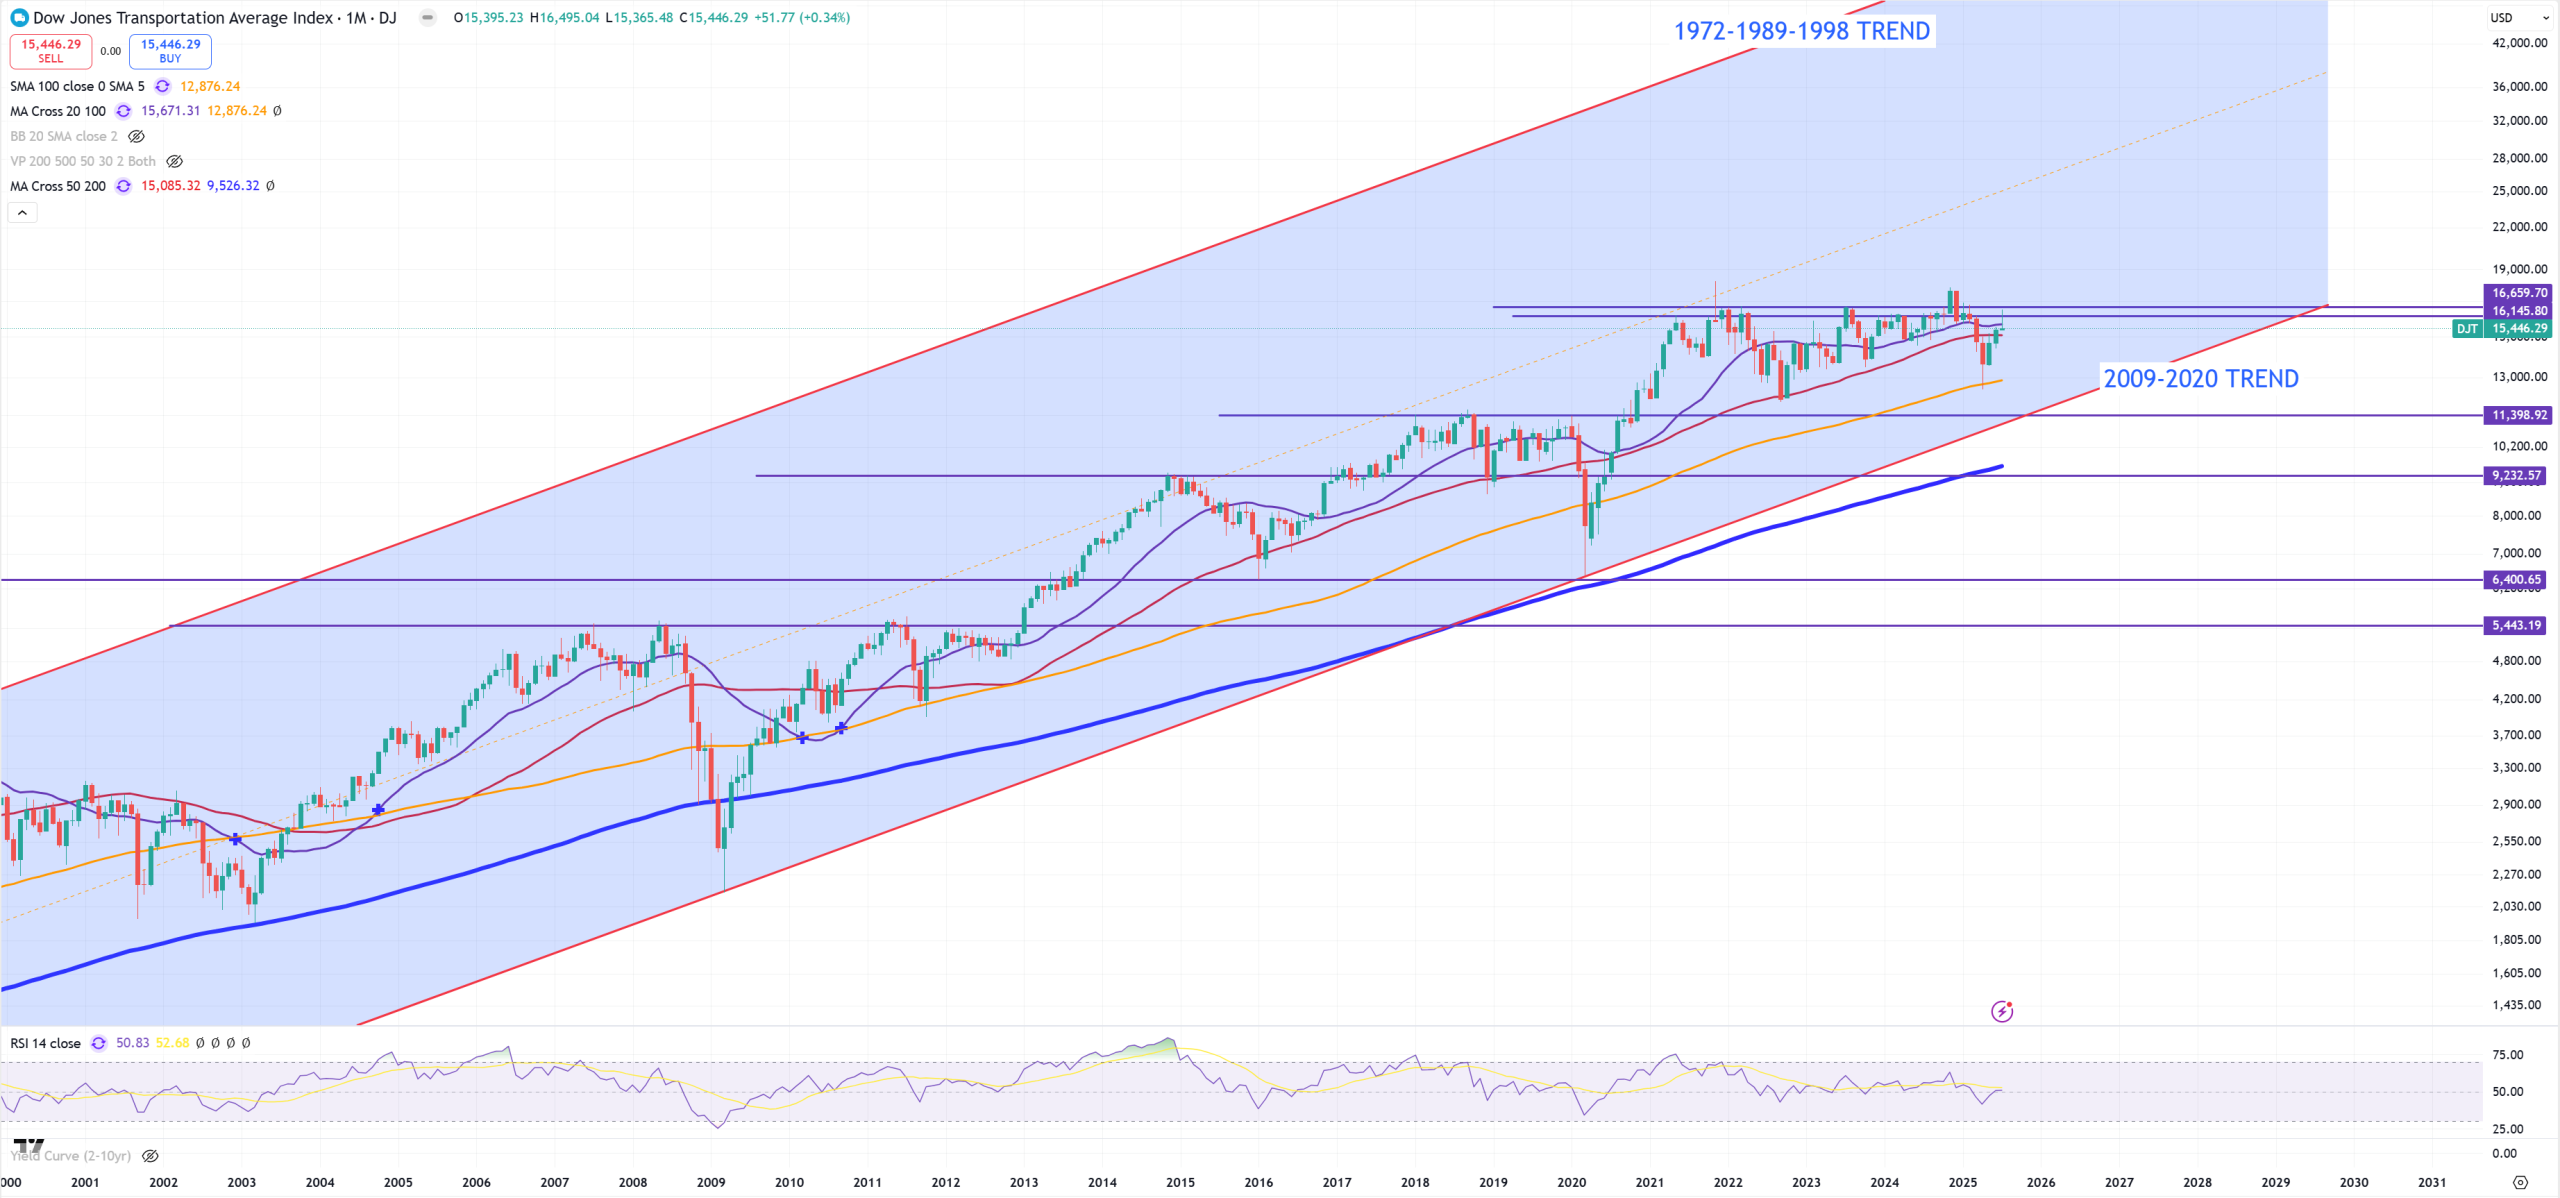
DJT – Dow Jones Transportation – it has a massive resistance on 2021 level, it needs to resolve
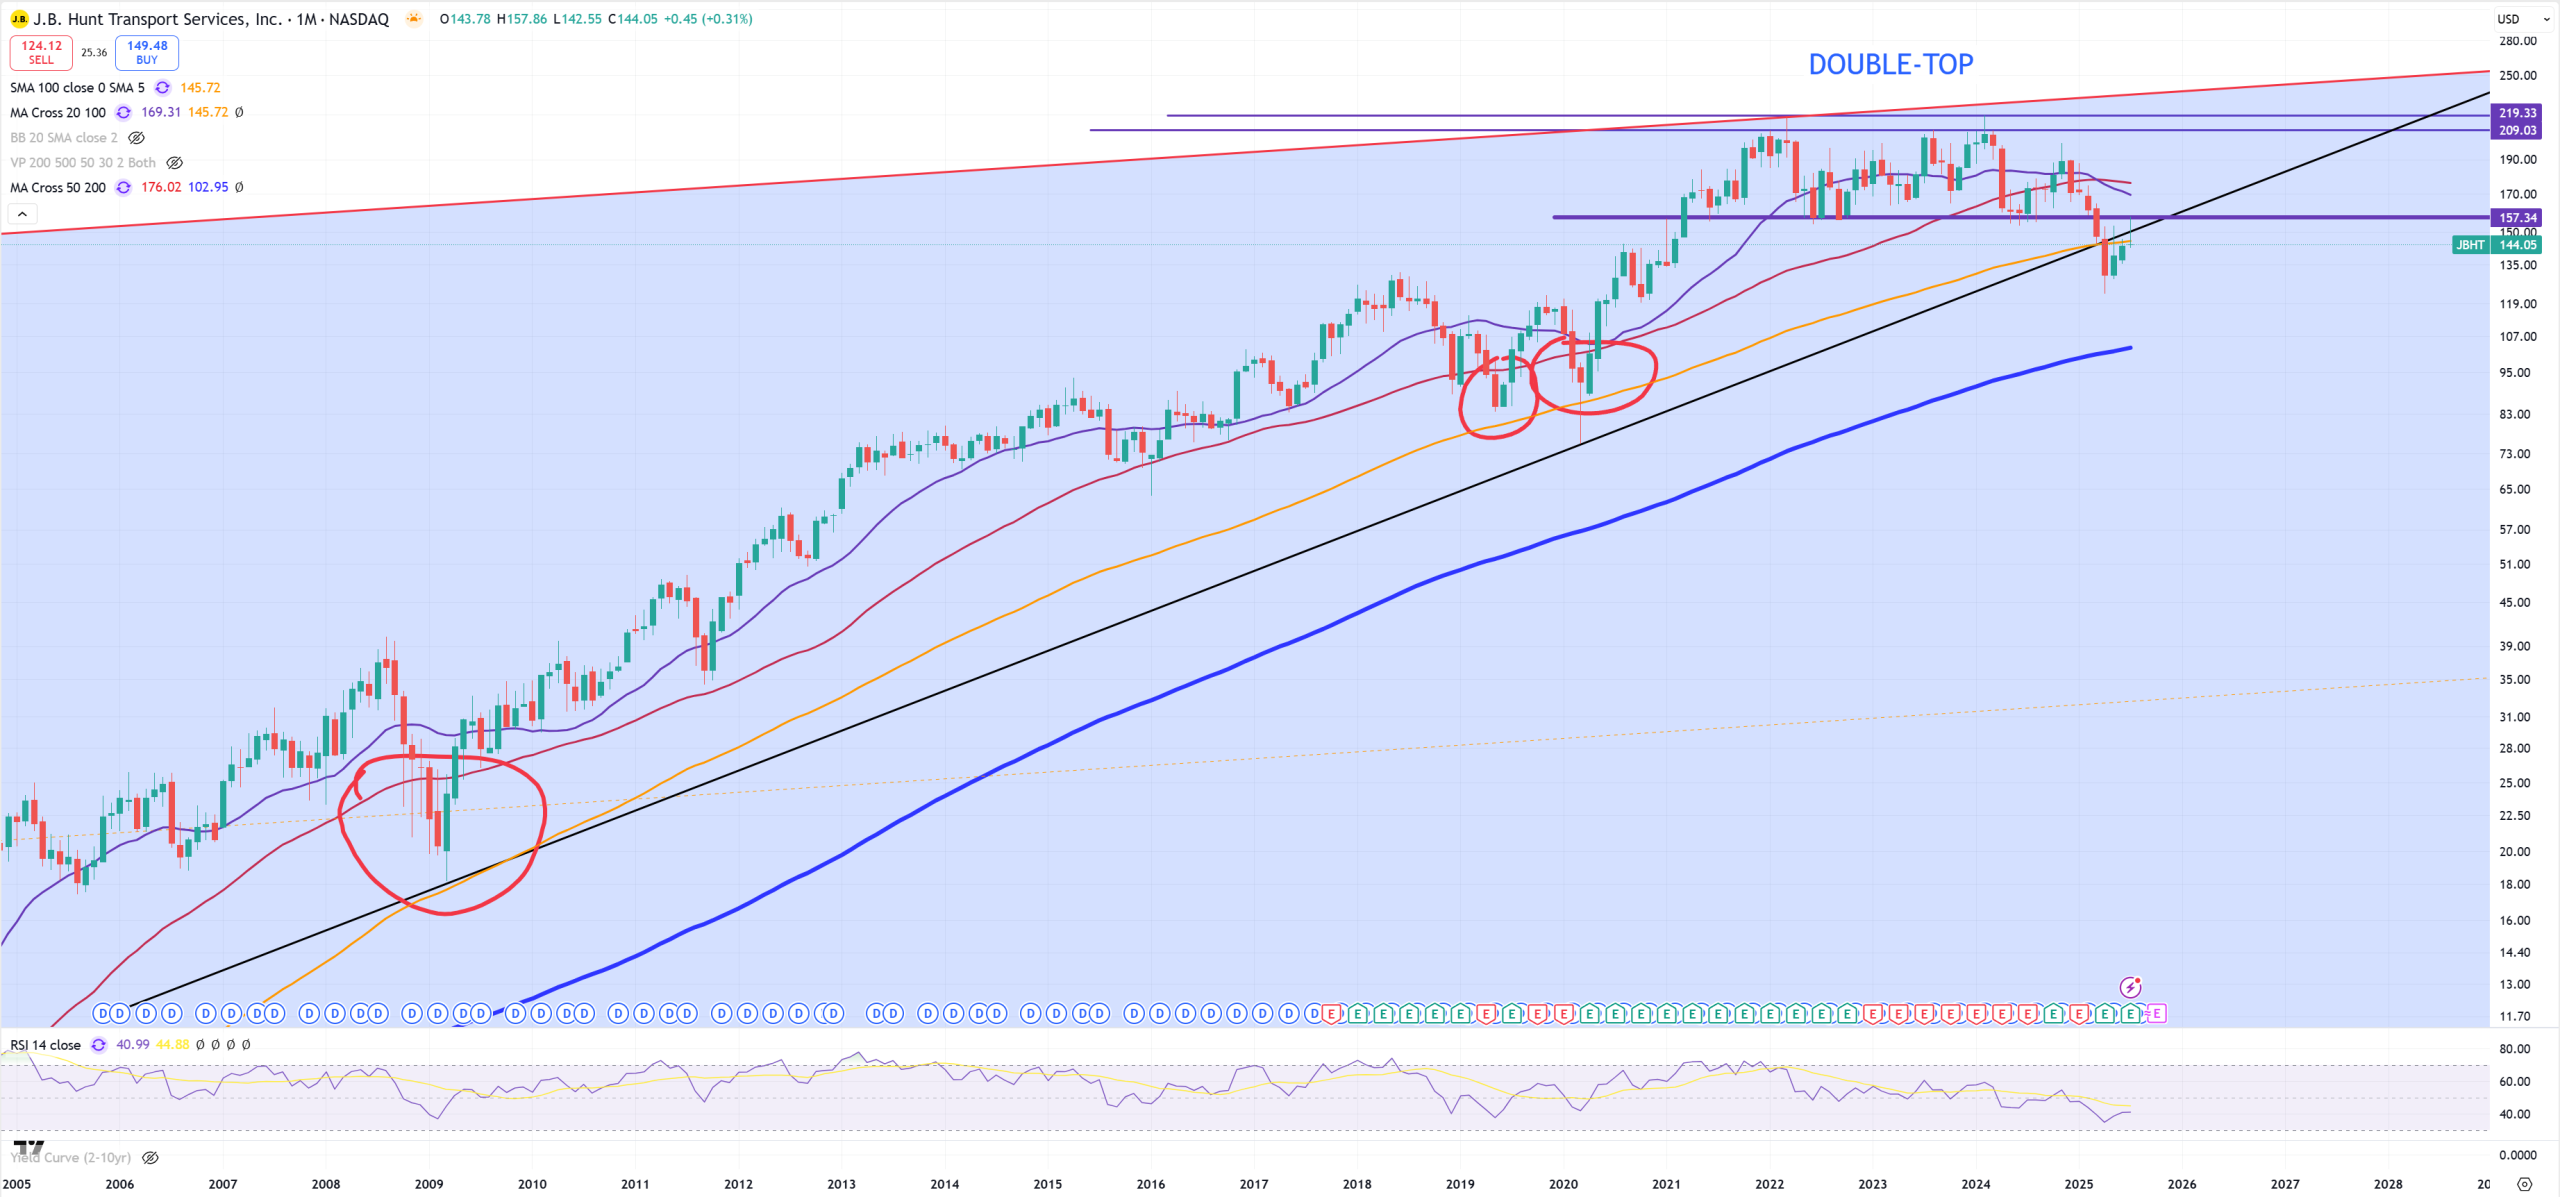
JBHT – technicals saying a huge dump ahead. Trend broken, (M)MA50 broken and (M)MA100 is not resistance. Massive setup.
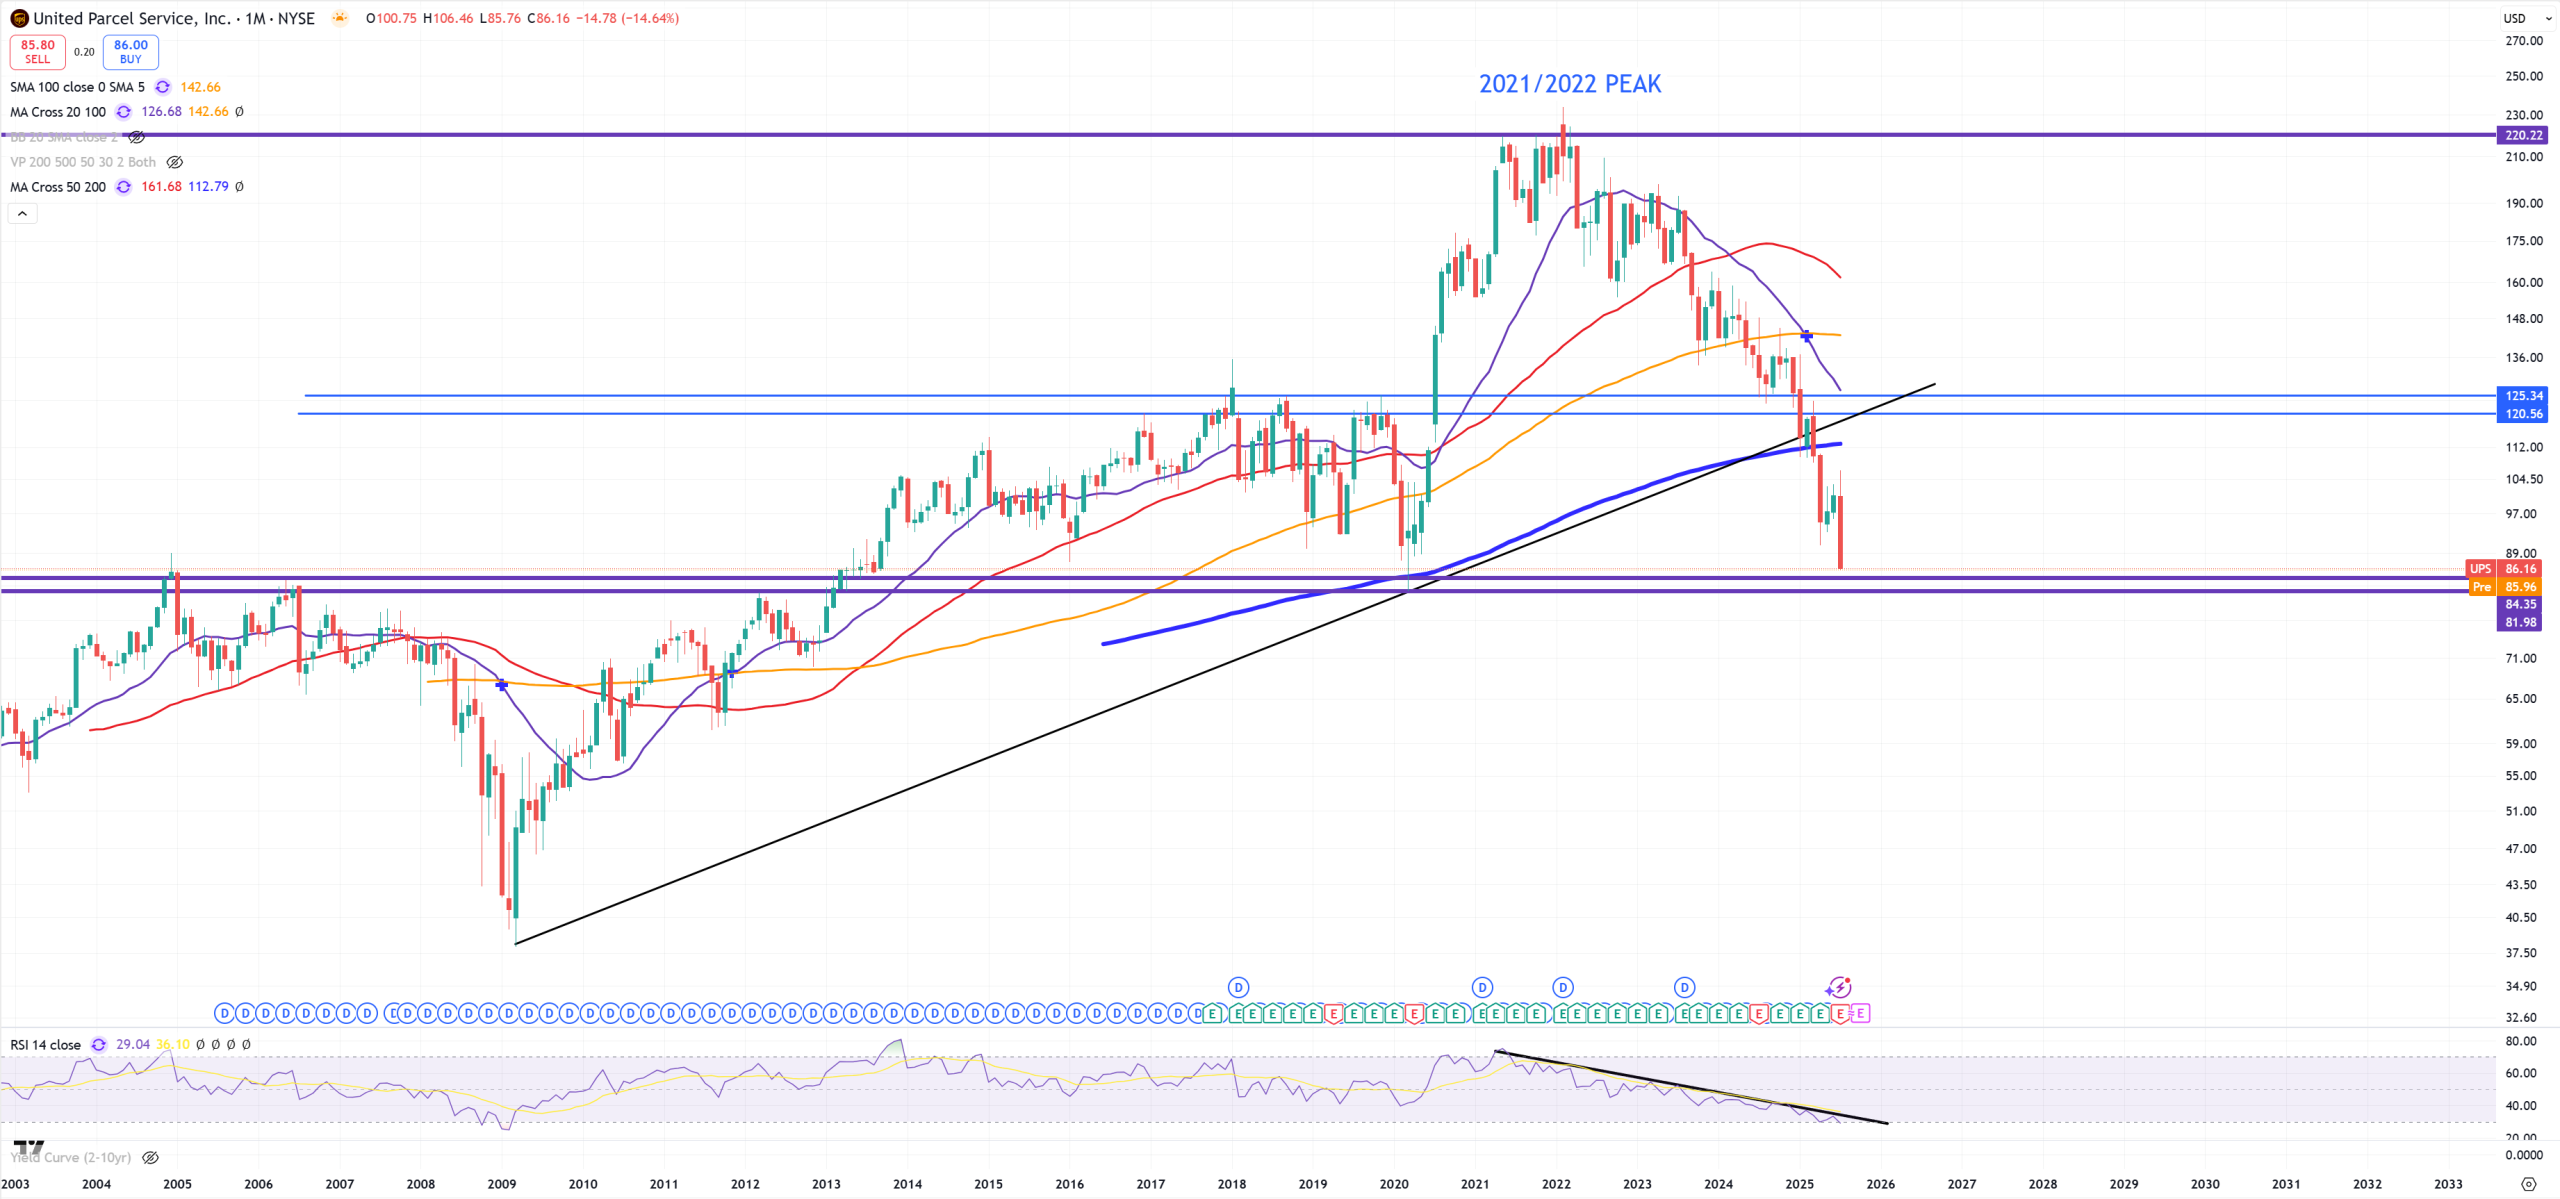
UPS – 2020 levels here we come, if we break it we can say we can see we’ll be operating below 2004-2005 level. No comment is needed how bad the situation here really is.
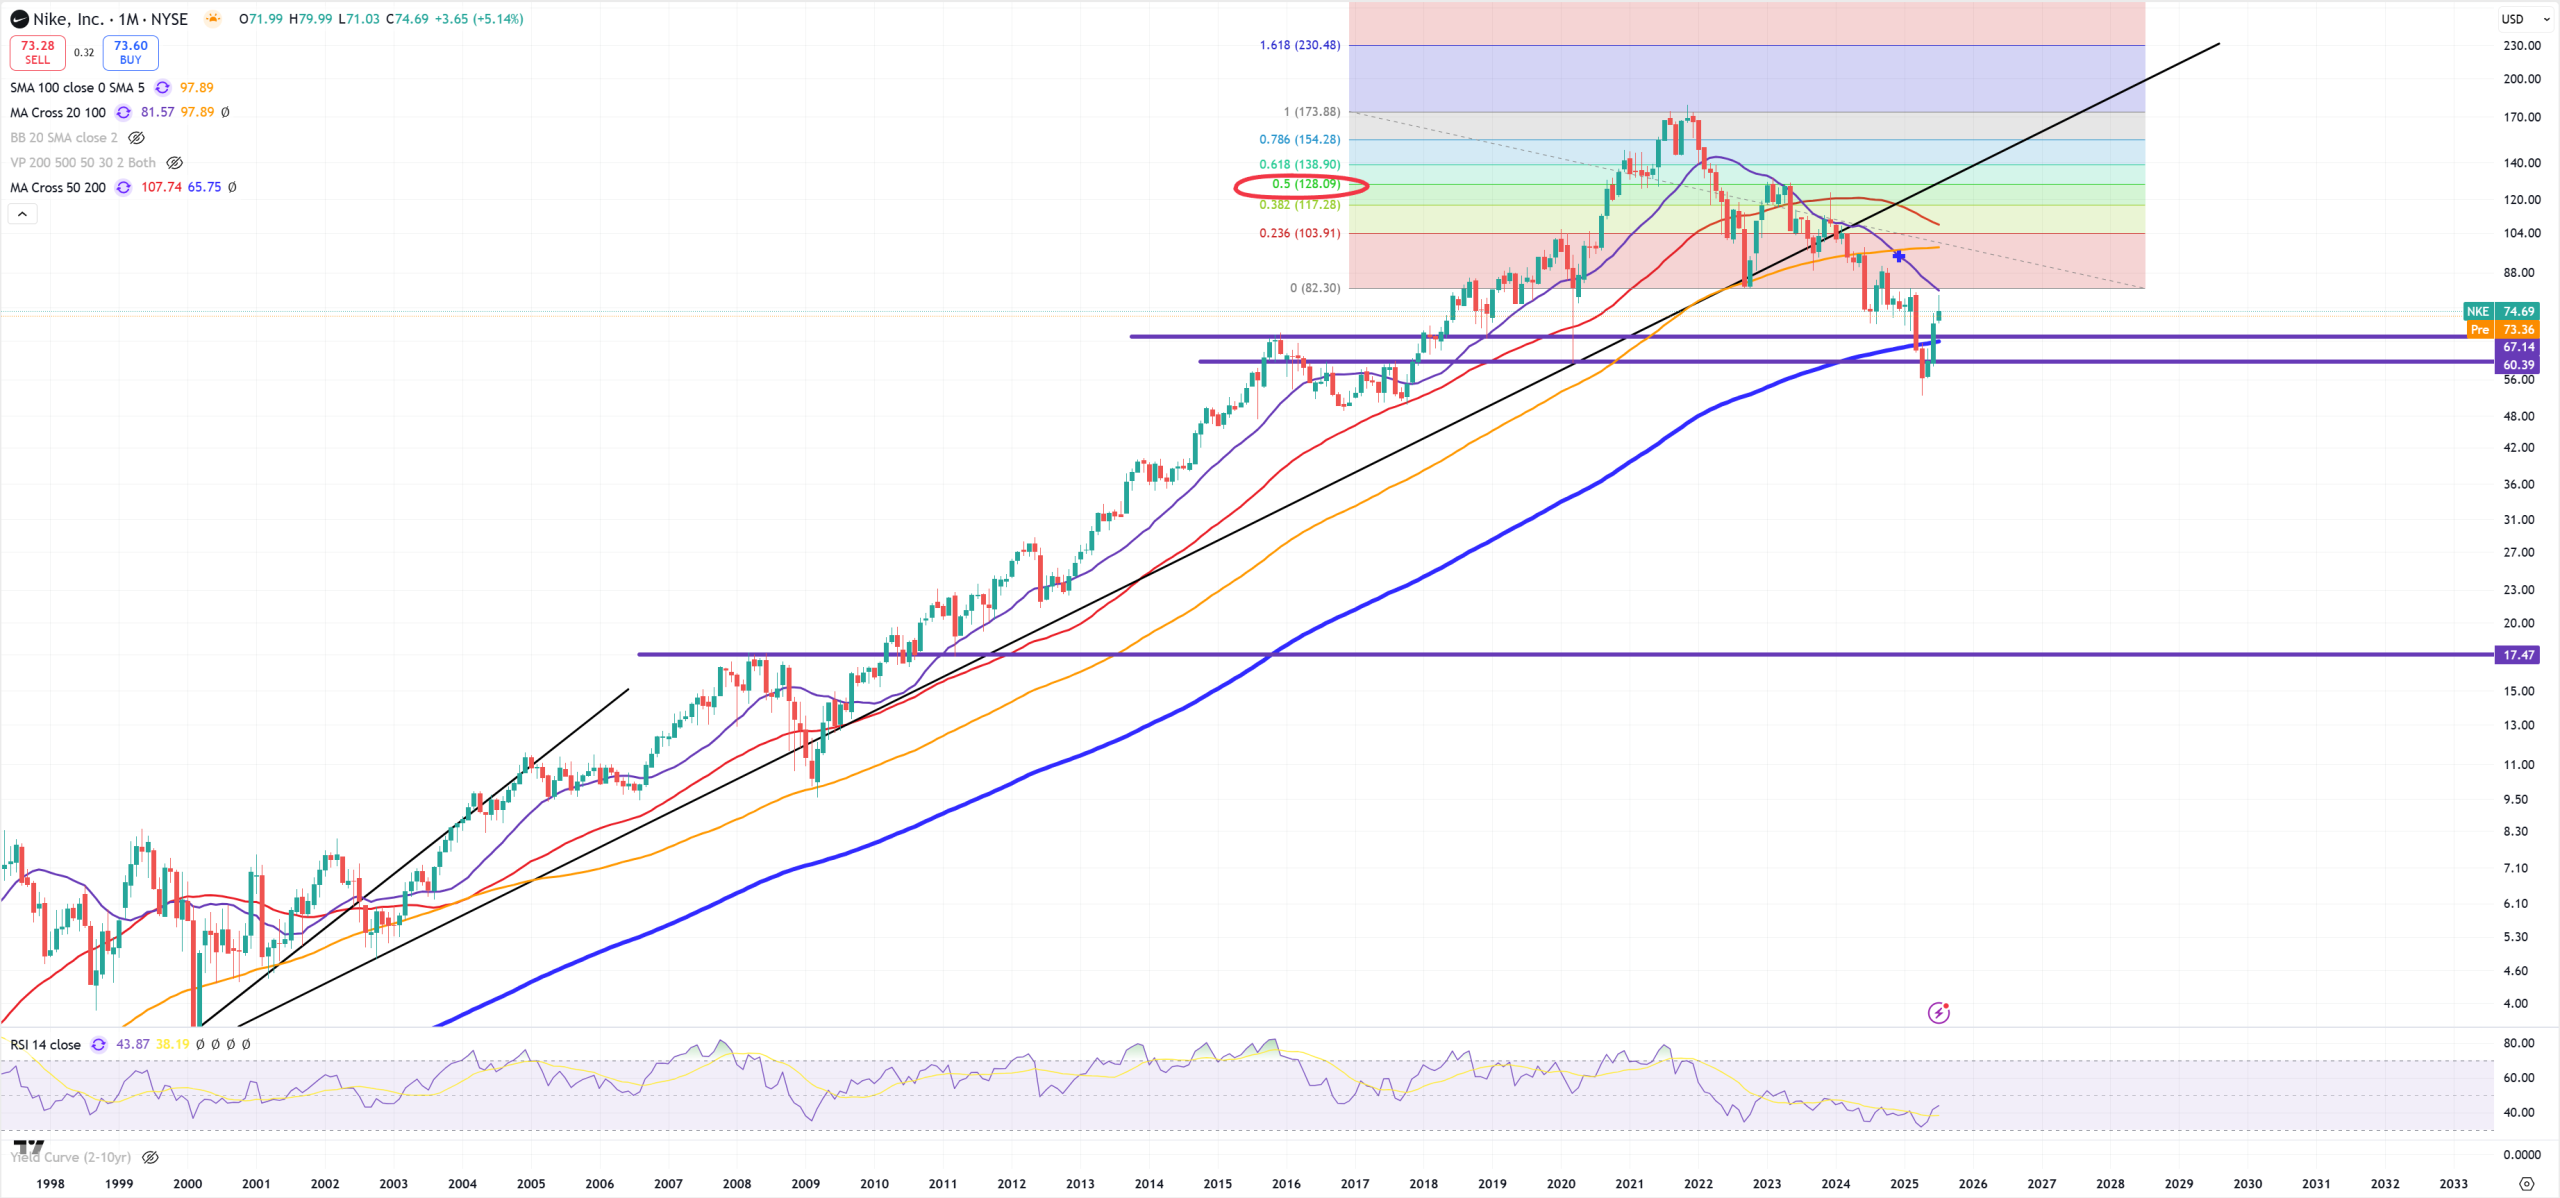
NKE – Nike so far trying to do everything to stay not below (M)MA200 and 2015 resistance. I doubt really in NKE it’ll stay above this 2015 support, but let’s find out. Peak in 2021
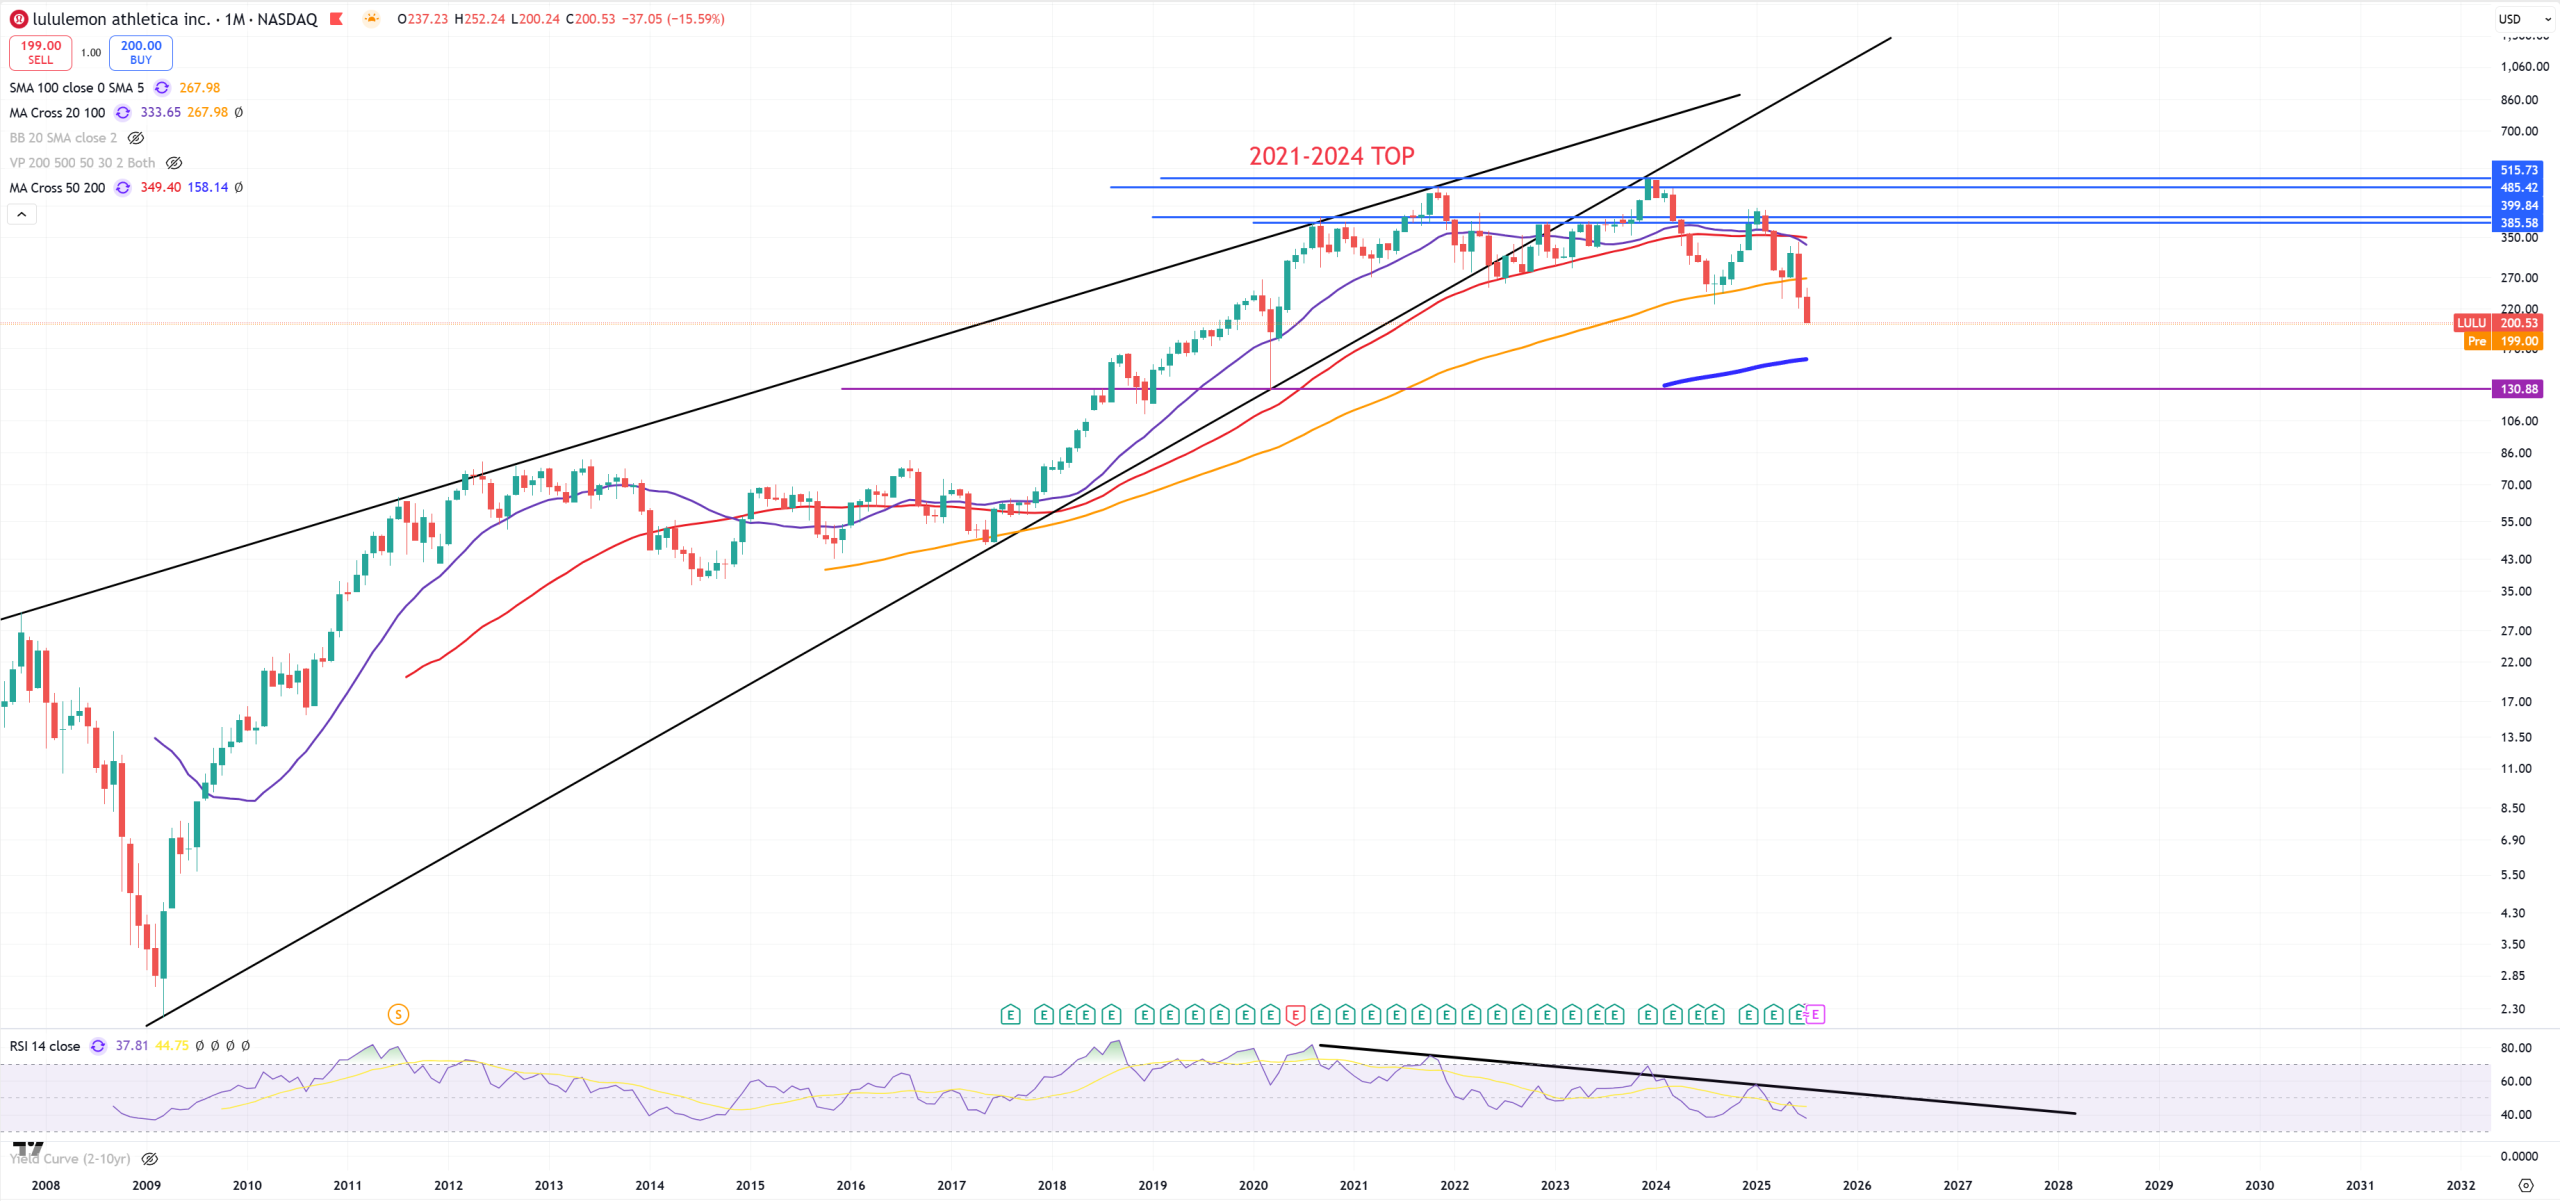
LULU – had a bigger hype than NKE, but they’re doing the same. 2021 and 2024 double top and LULU approaches towards its (M)MA200
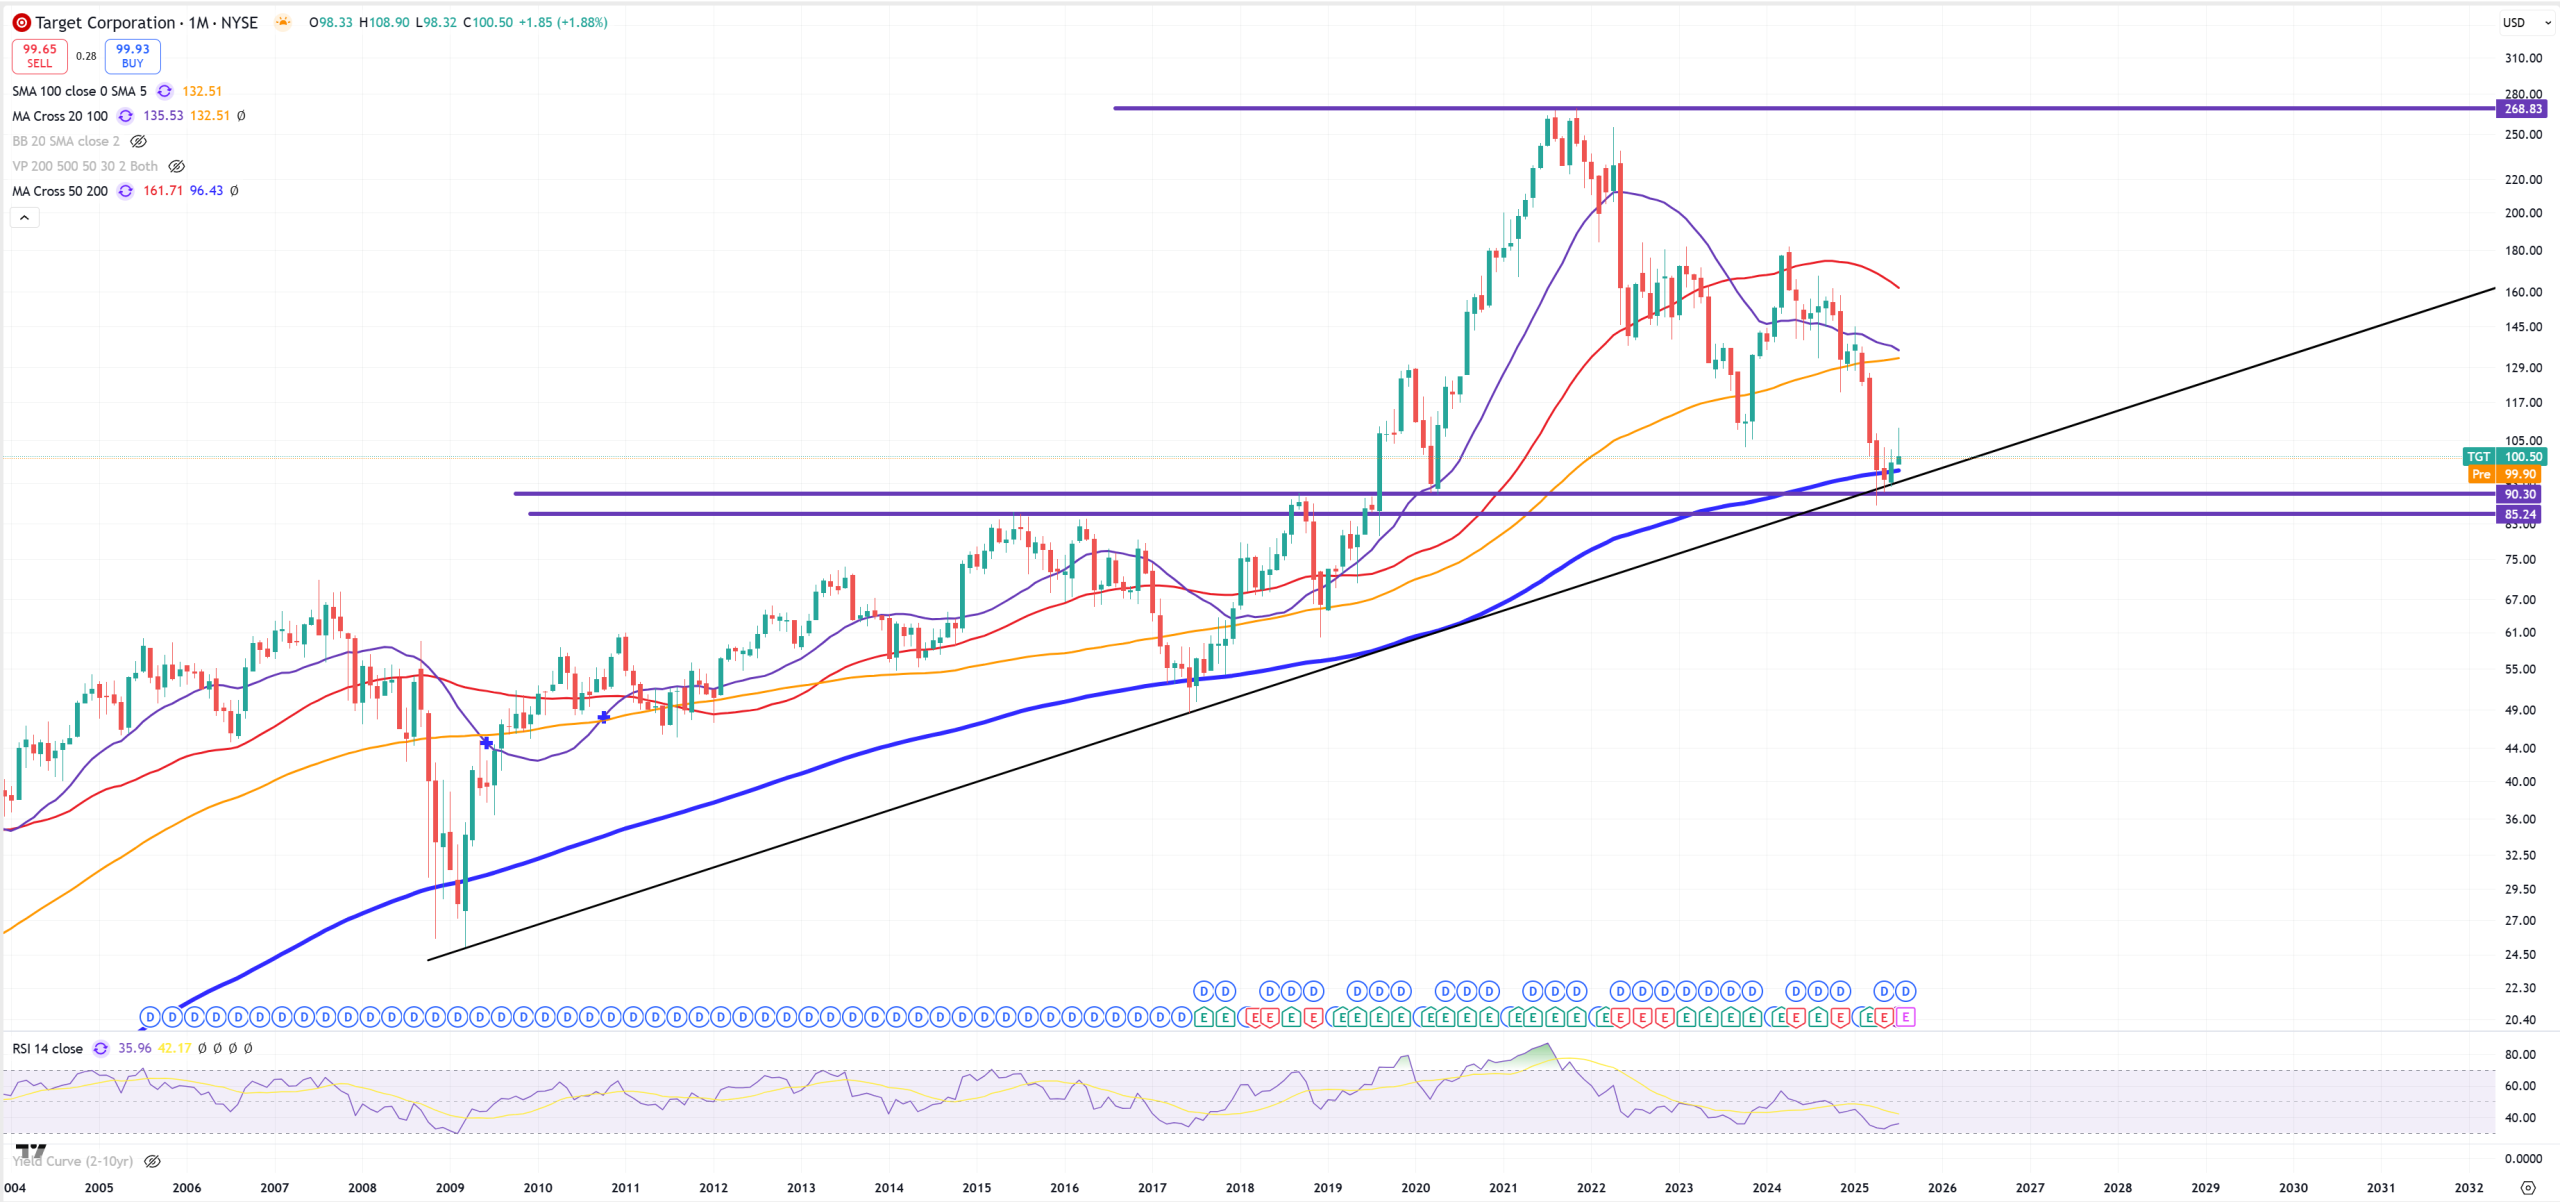
TGT – peak in 2021 now the same situation as NKE
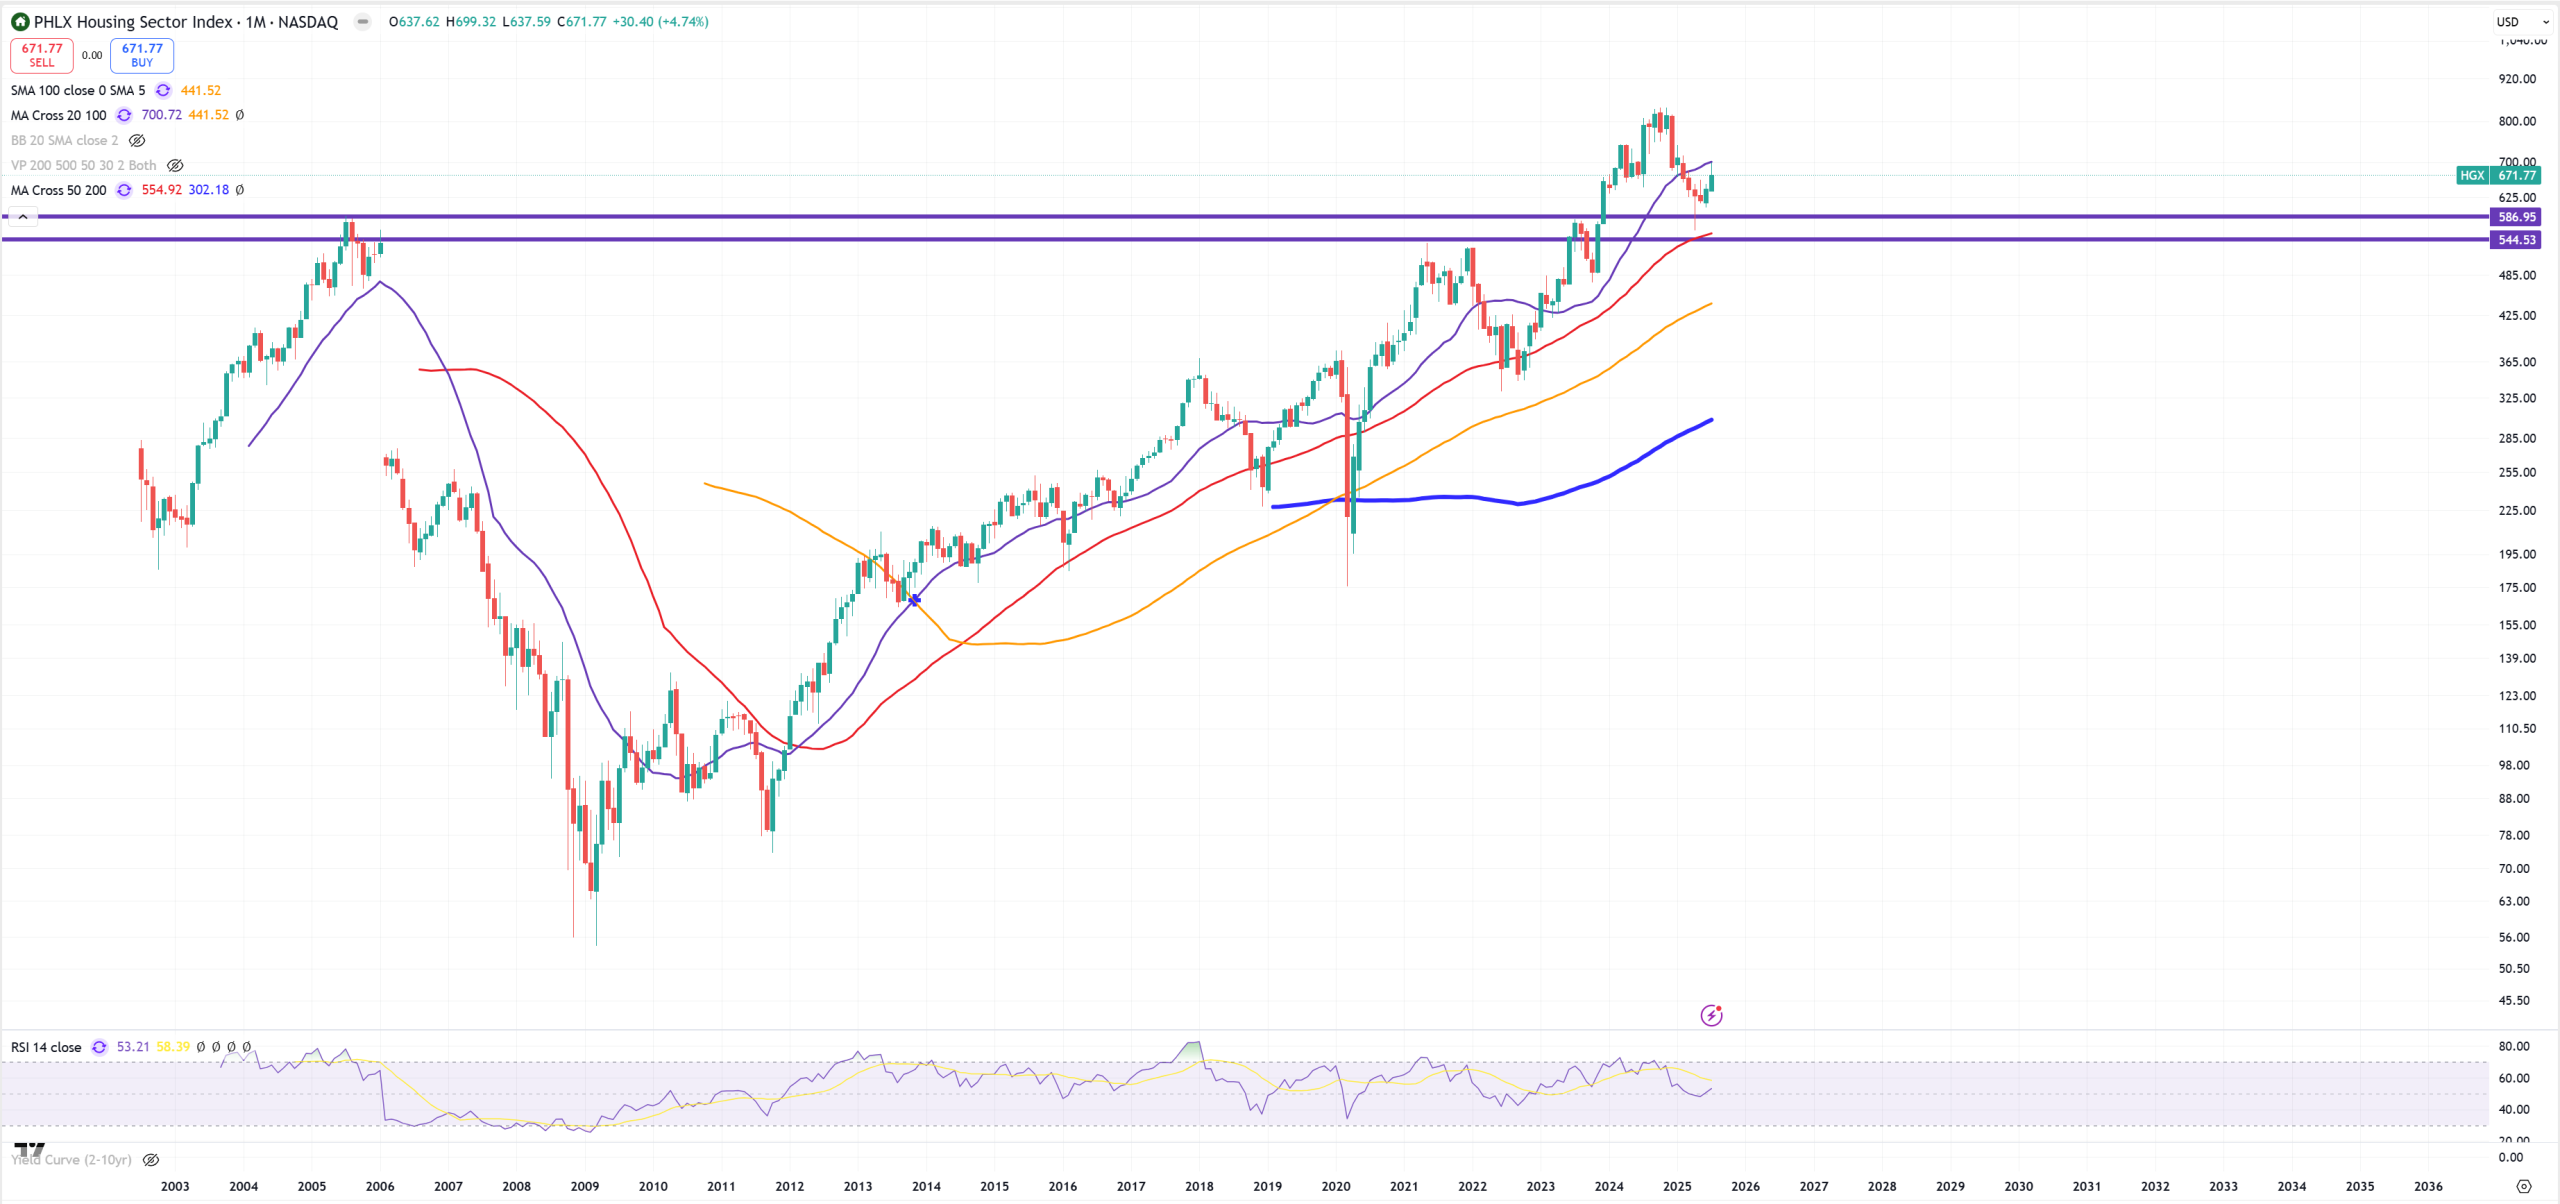
HGX – Housing sector – nothing extraordinary here, you just don’t want to see this spike above 2007 peak as a bull-trap
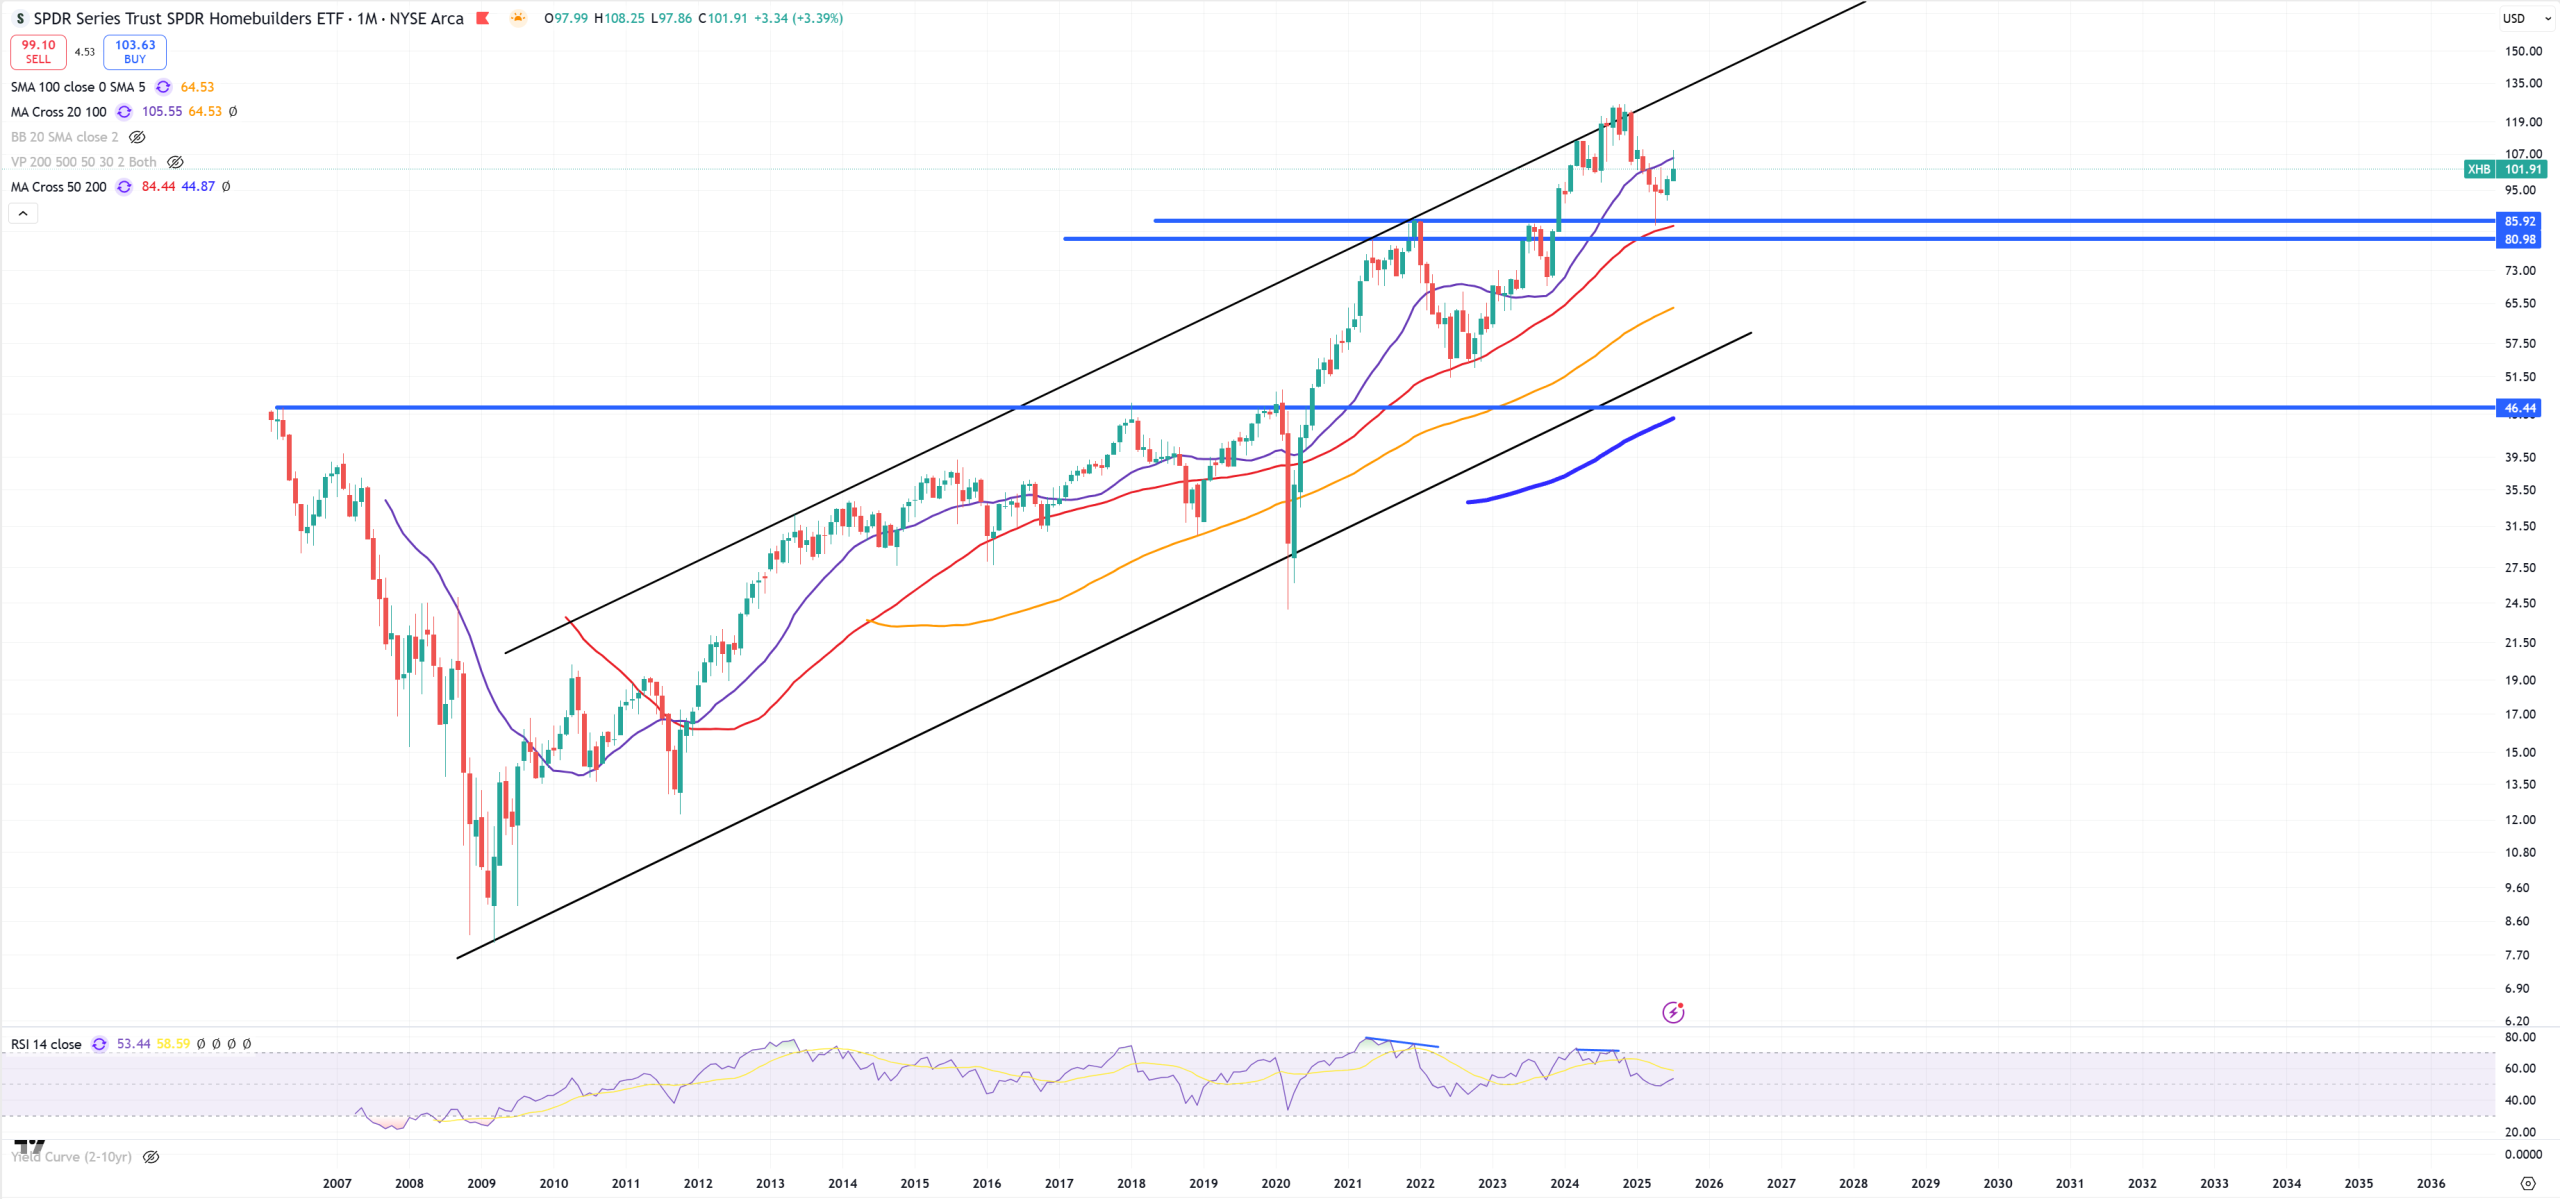
XHB – Homebuilders also doesn’t look so bad unless we’ll close below 2021 peak.
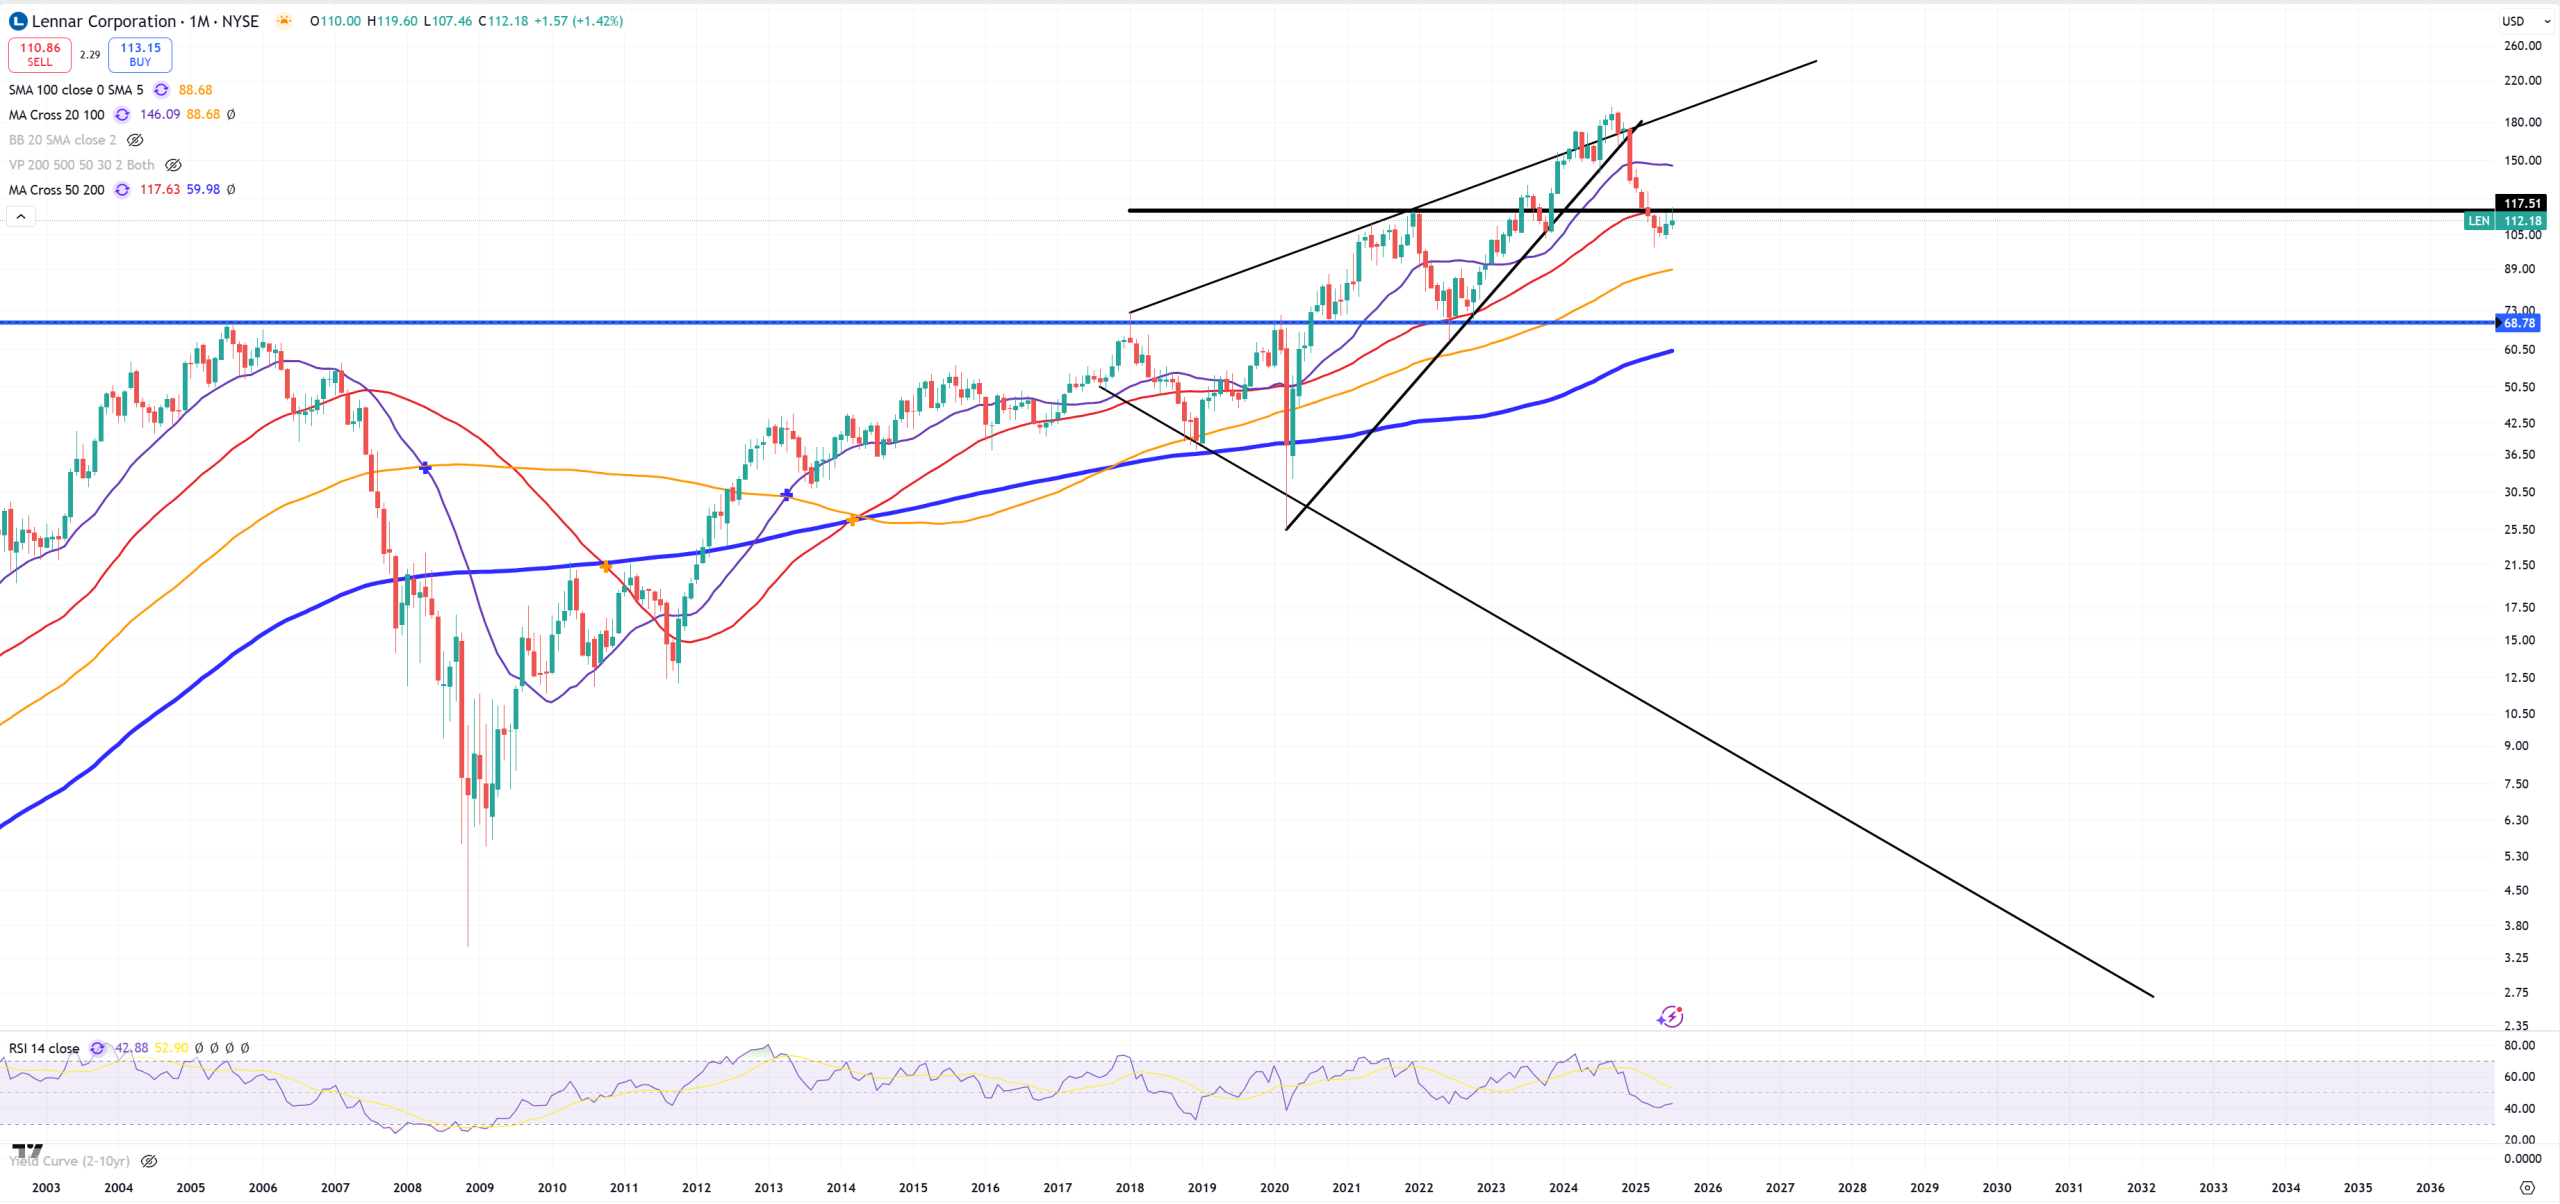
LEN – Lennar looks terrible from the other hand
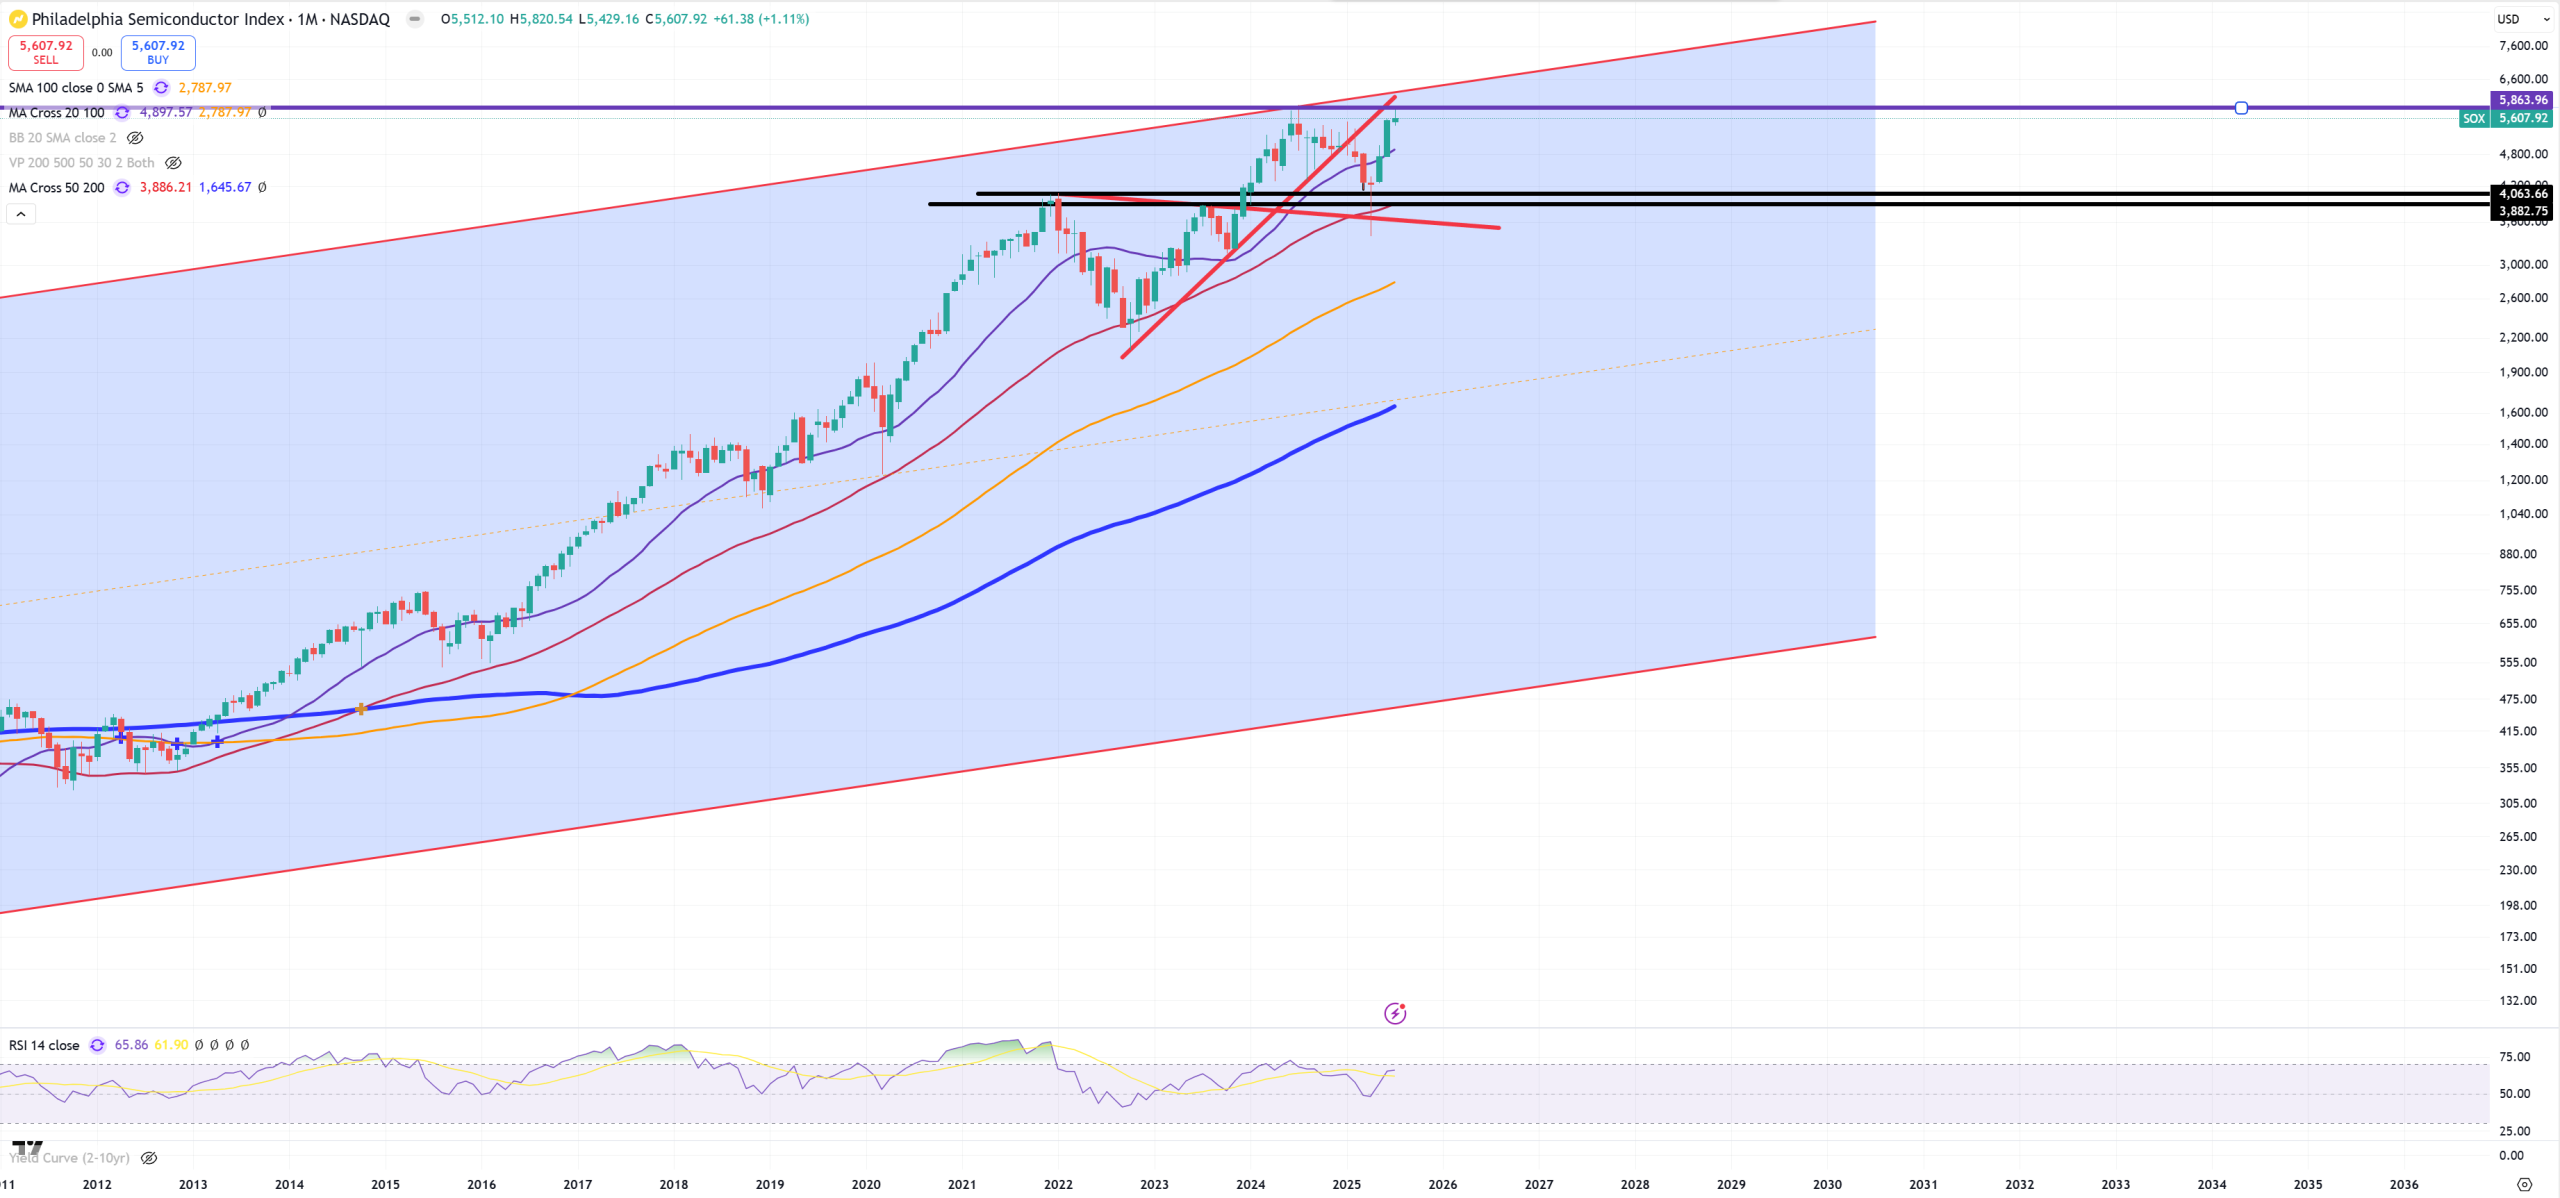
SOX – the main engine so it won’t release the support at the first time. It needs to resolve
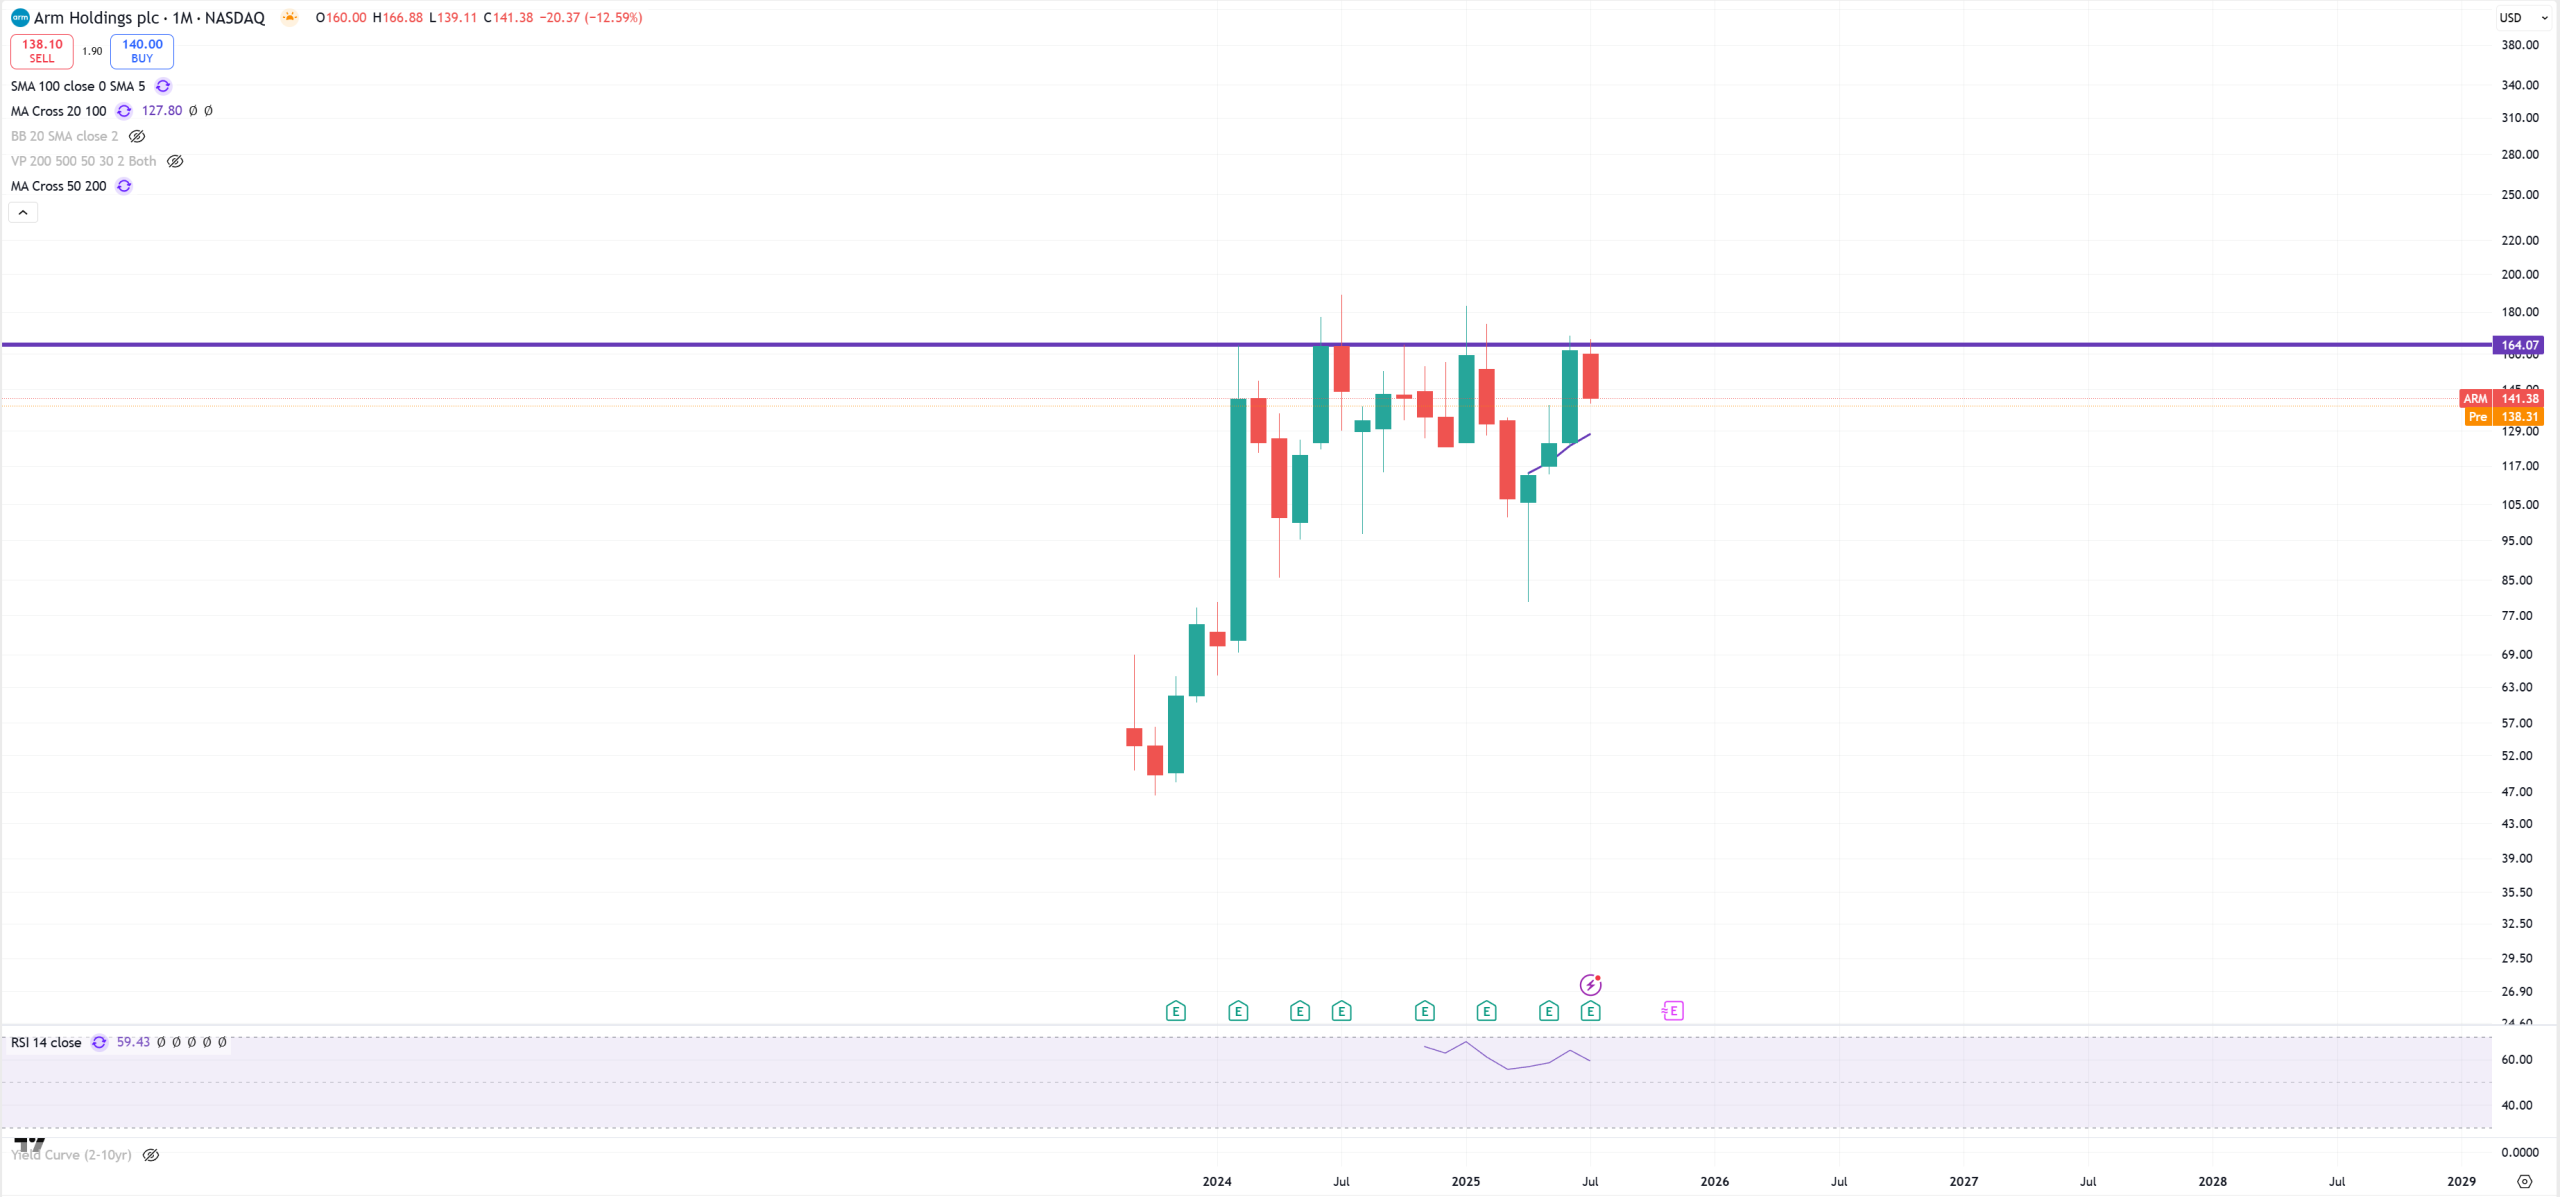
ARM – since 2024 this level acts as a resistance
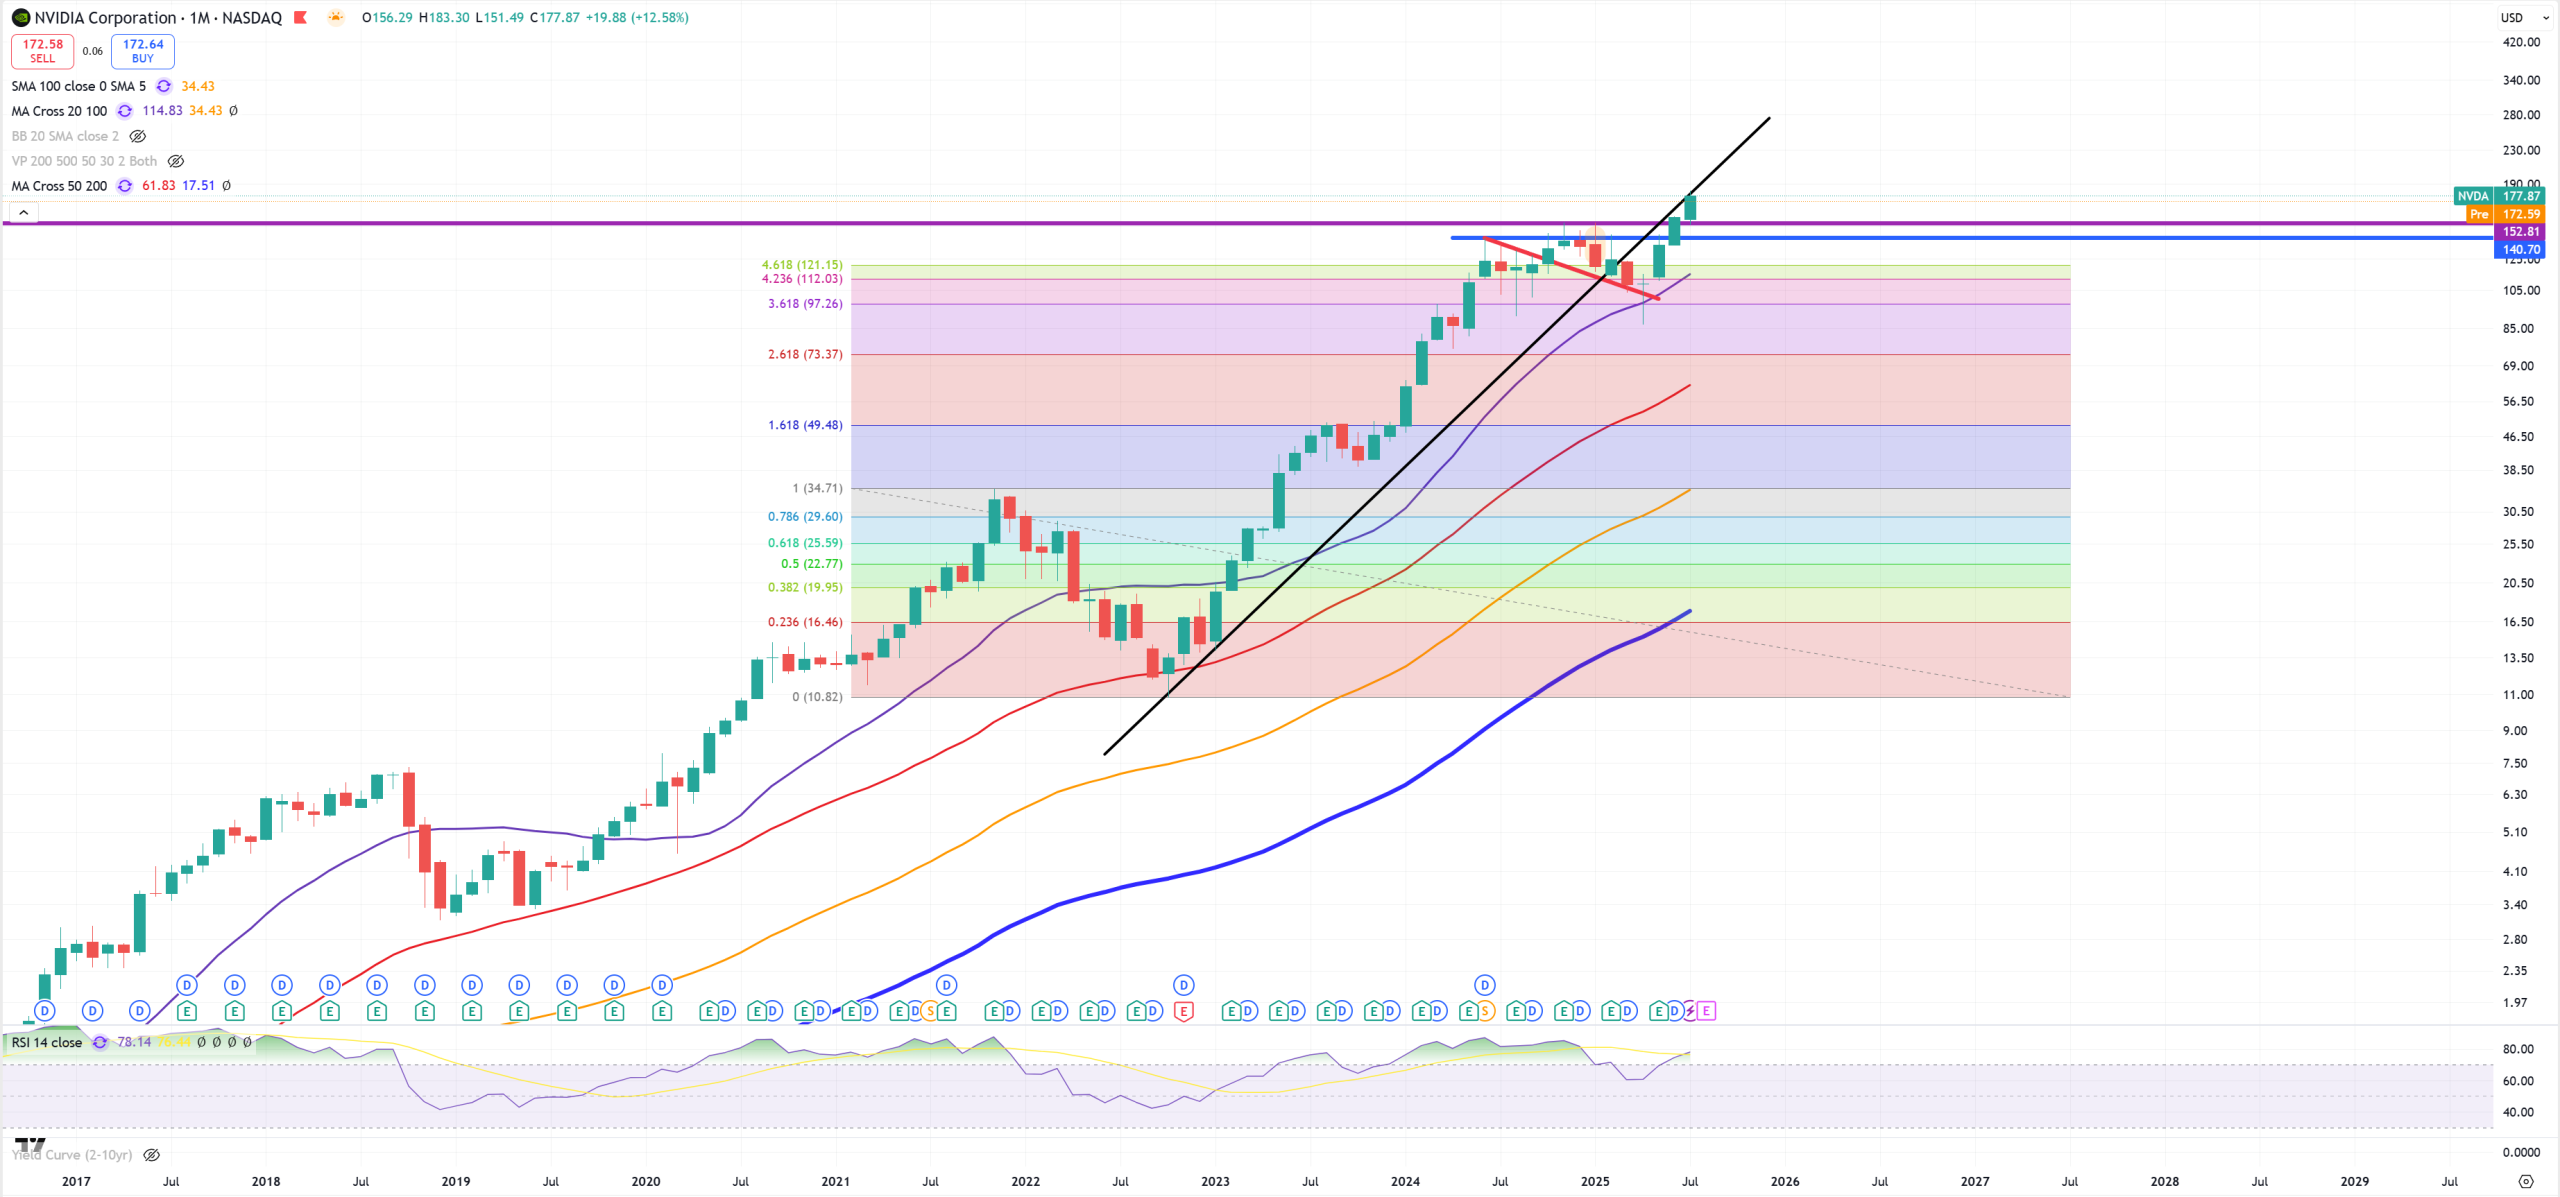
NVDA – Nvidia blew up all resistance levels, still not ending AI mania. 140, 152, but there’s also a trend from 2022. Now we have a very clear view that going back below 152 last support might be considered as an AI bubble explosion. Also distance to (M)MA50 is like -65% and NVDA still holds “tulip bubble” category.
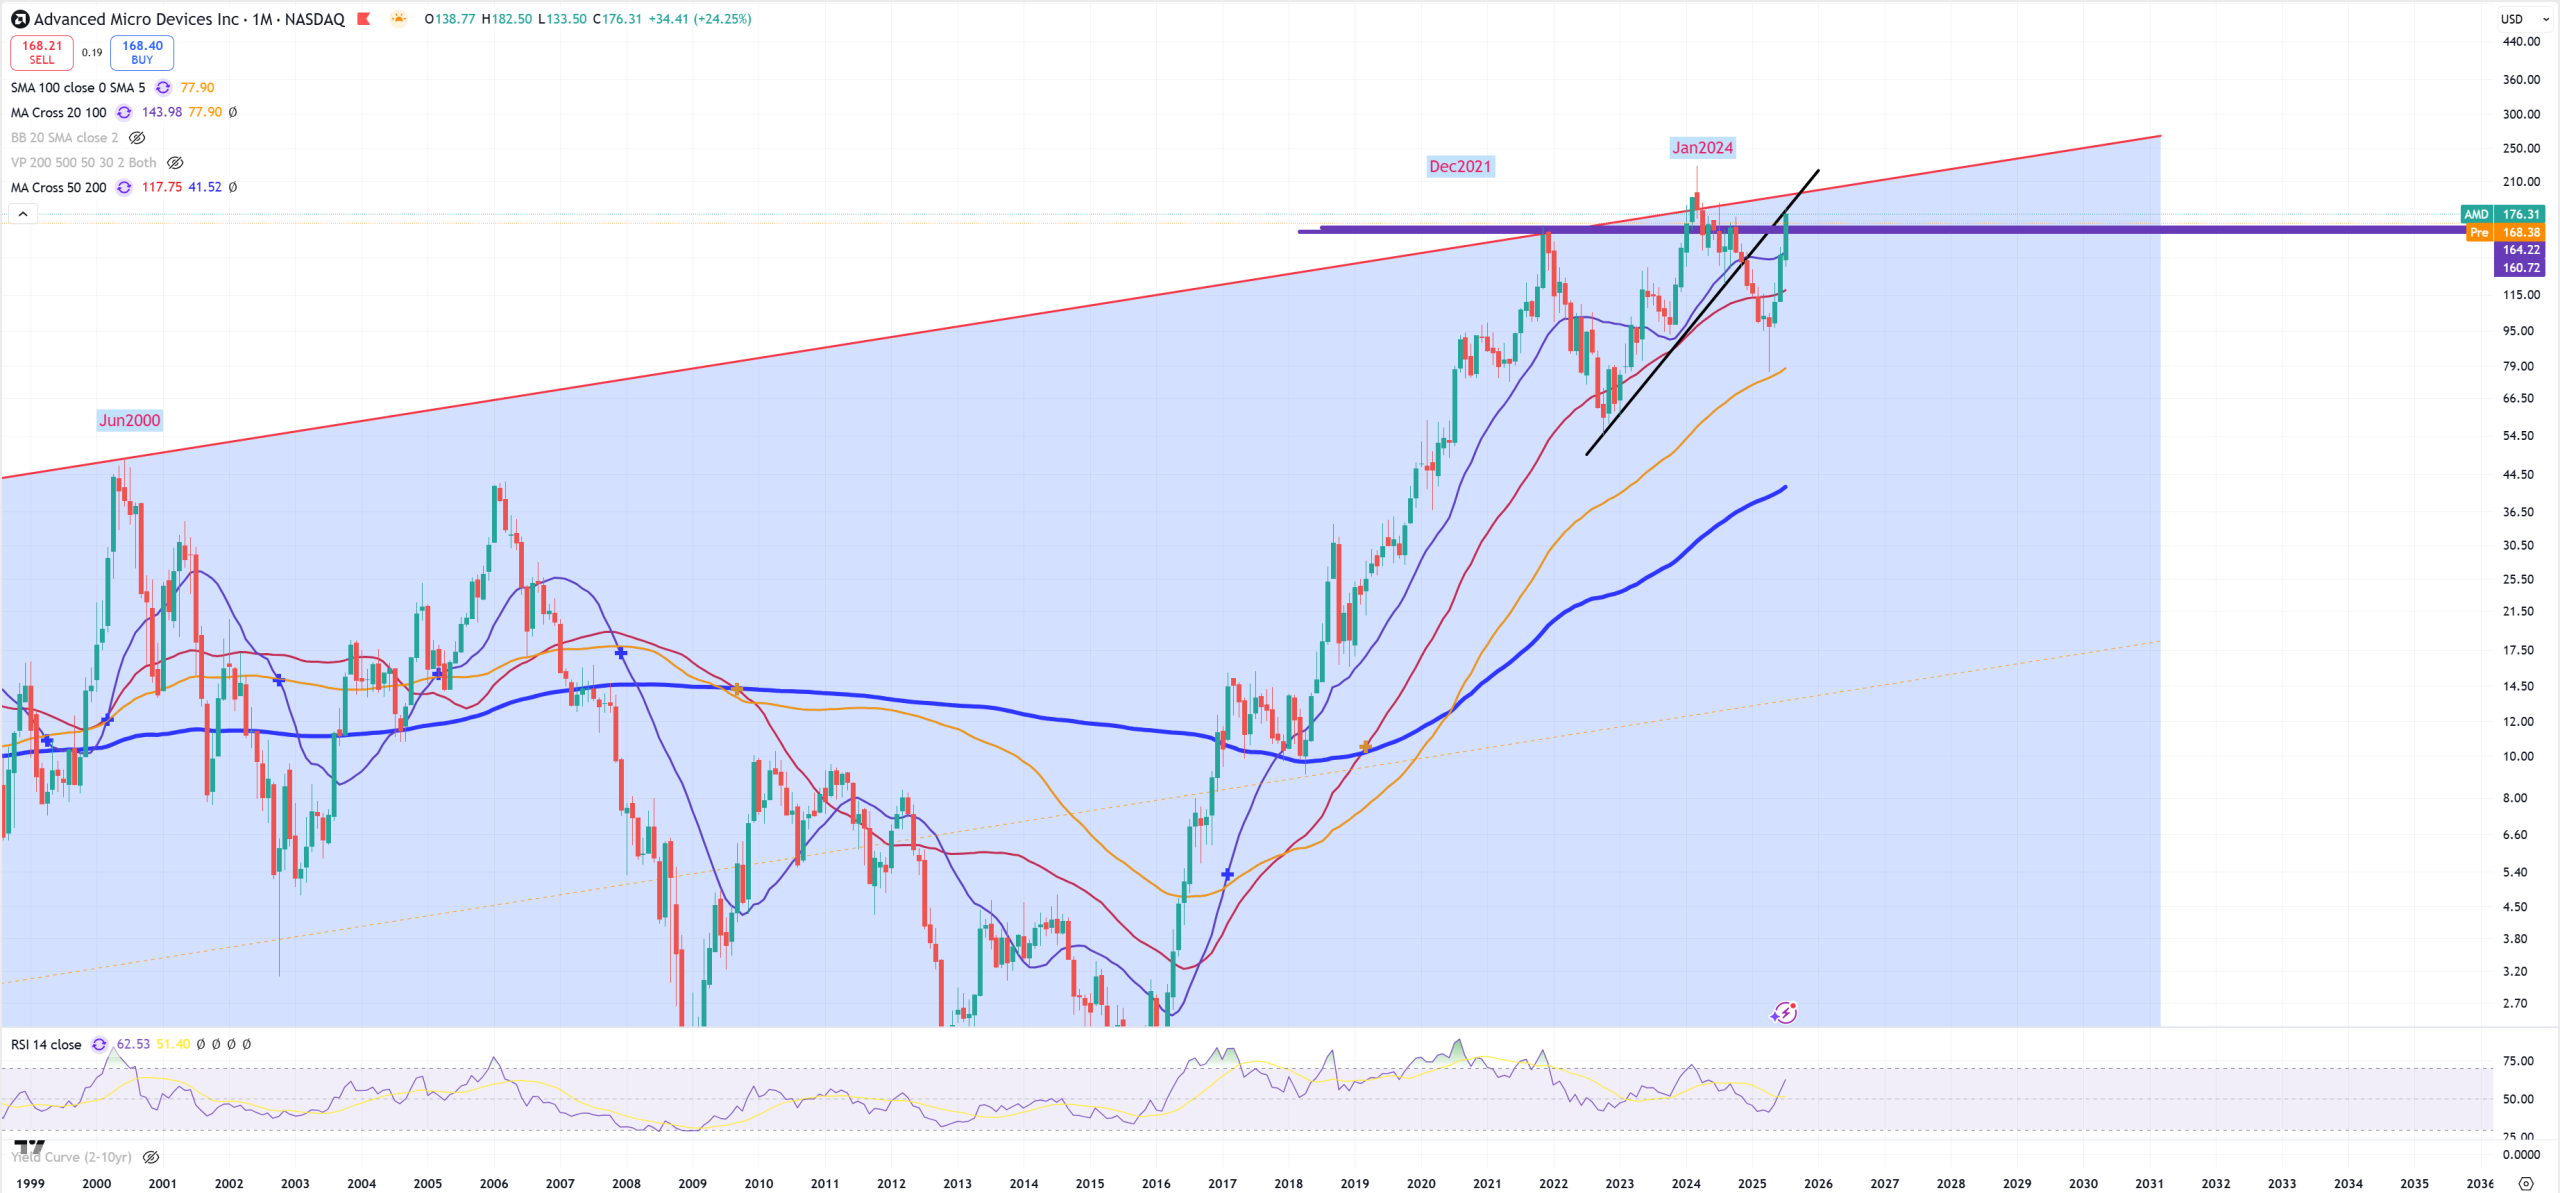
AMD – clear old chart, unchanged for ages. As you see yellow (M)MA100 was not broken, so this move below red (M)MA50 was a bear trap. From the technical point of view it doesn’t have much room to go.
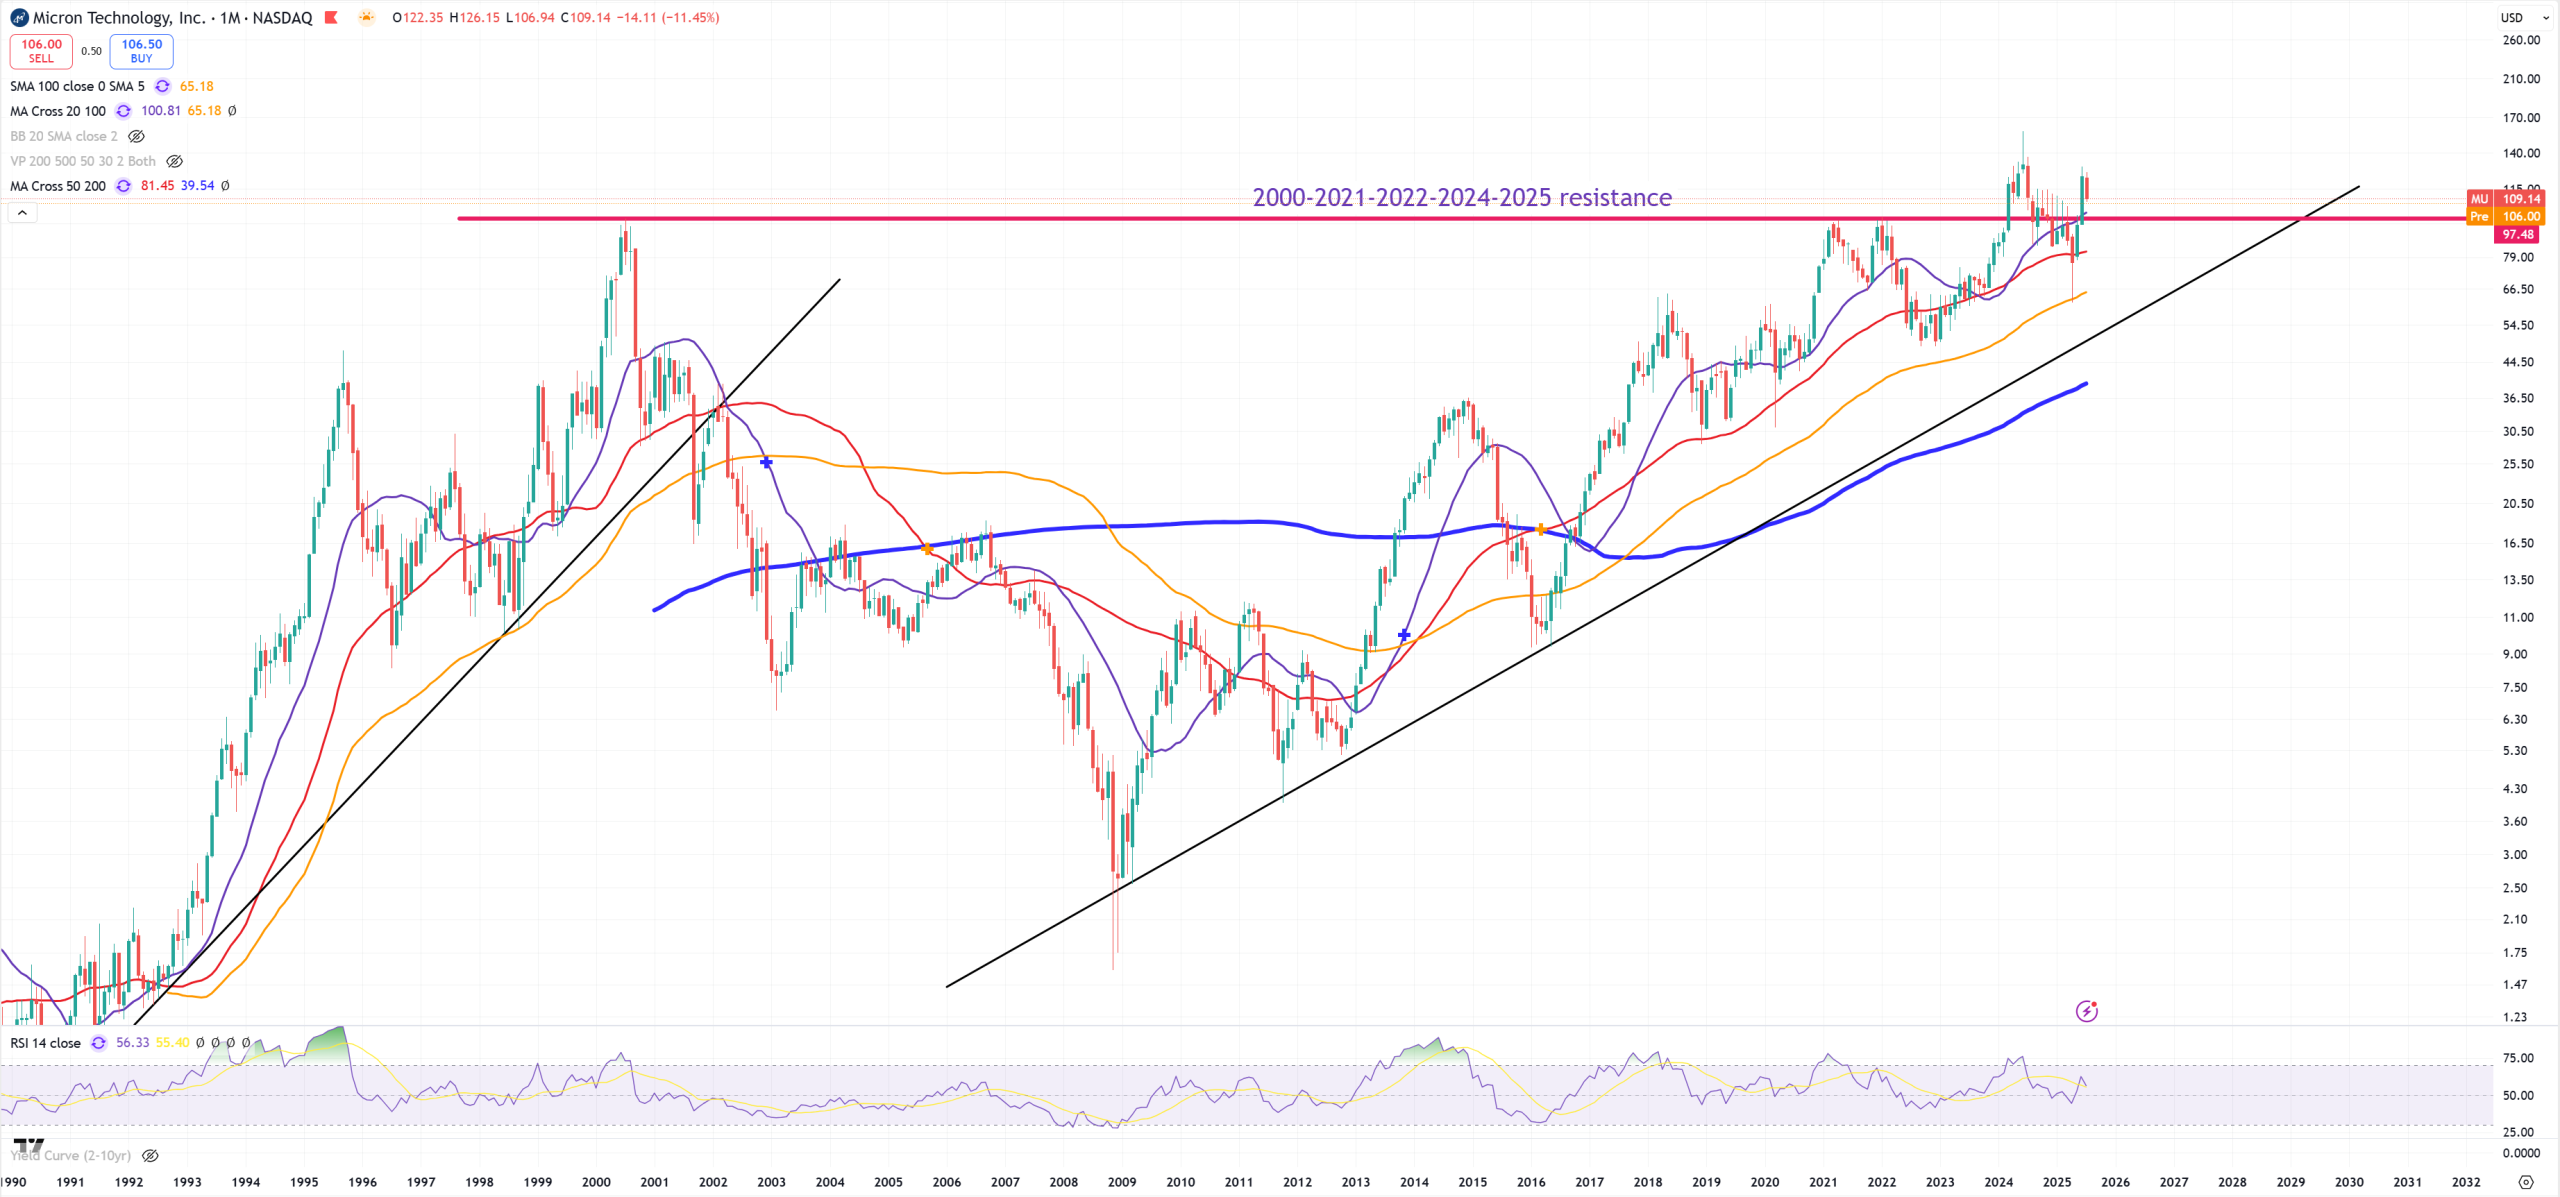
MU – fight continue around it super big resistance level
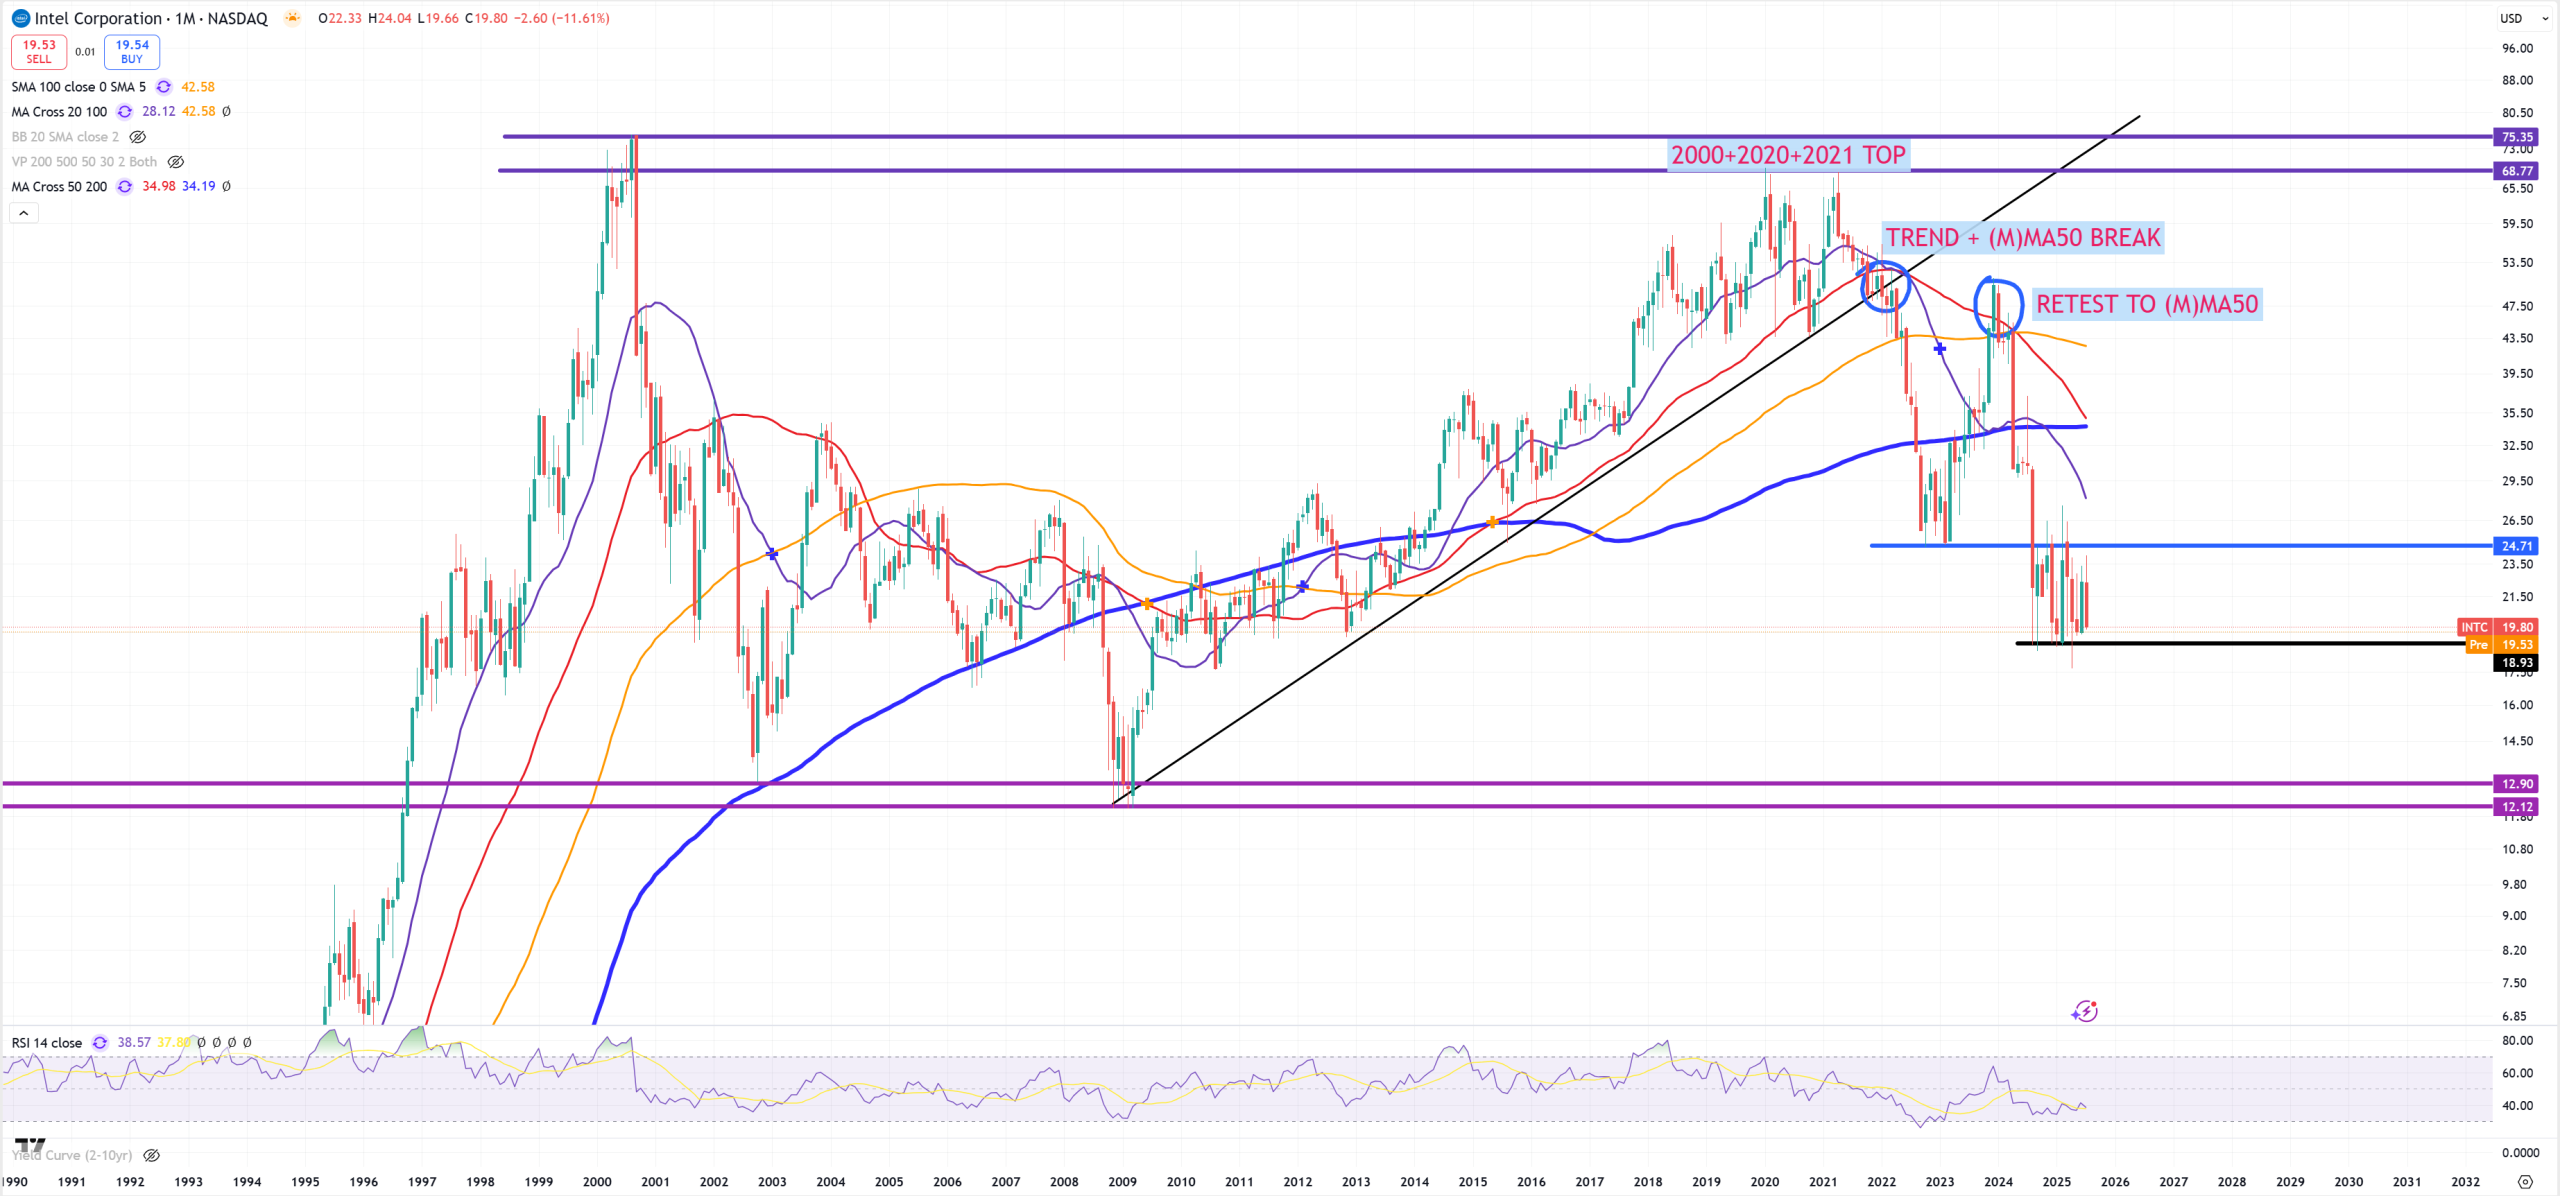
INTC – Intel is a company which might be forgotten, bad management, buybacks, financial engineering – that’s how it ends, 12$ coming = 2009 lows. Peak 2020 & 2021 level.
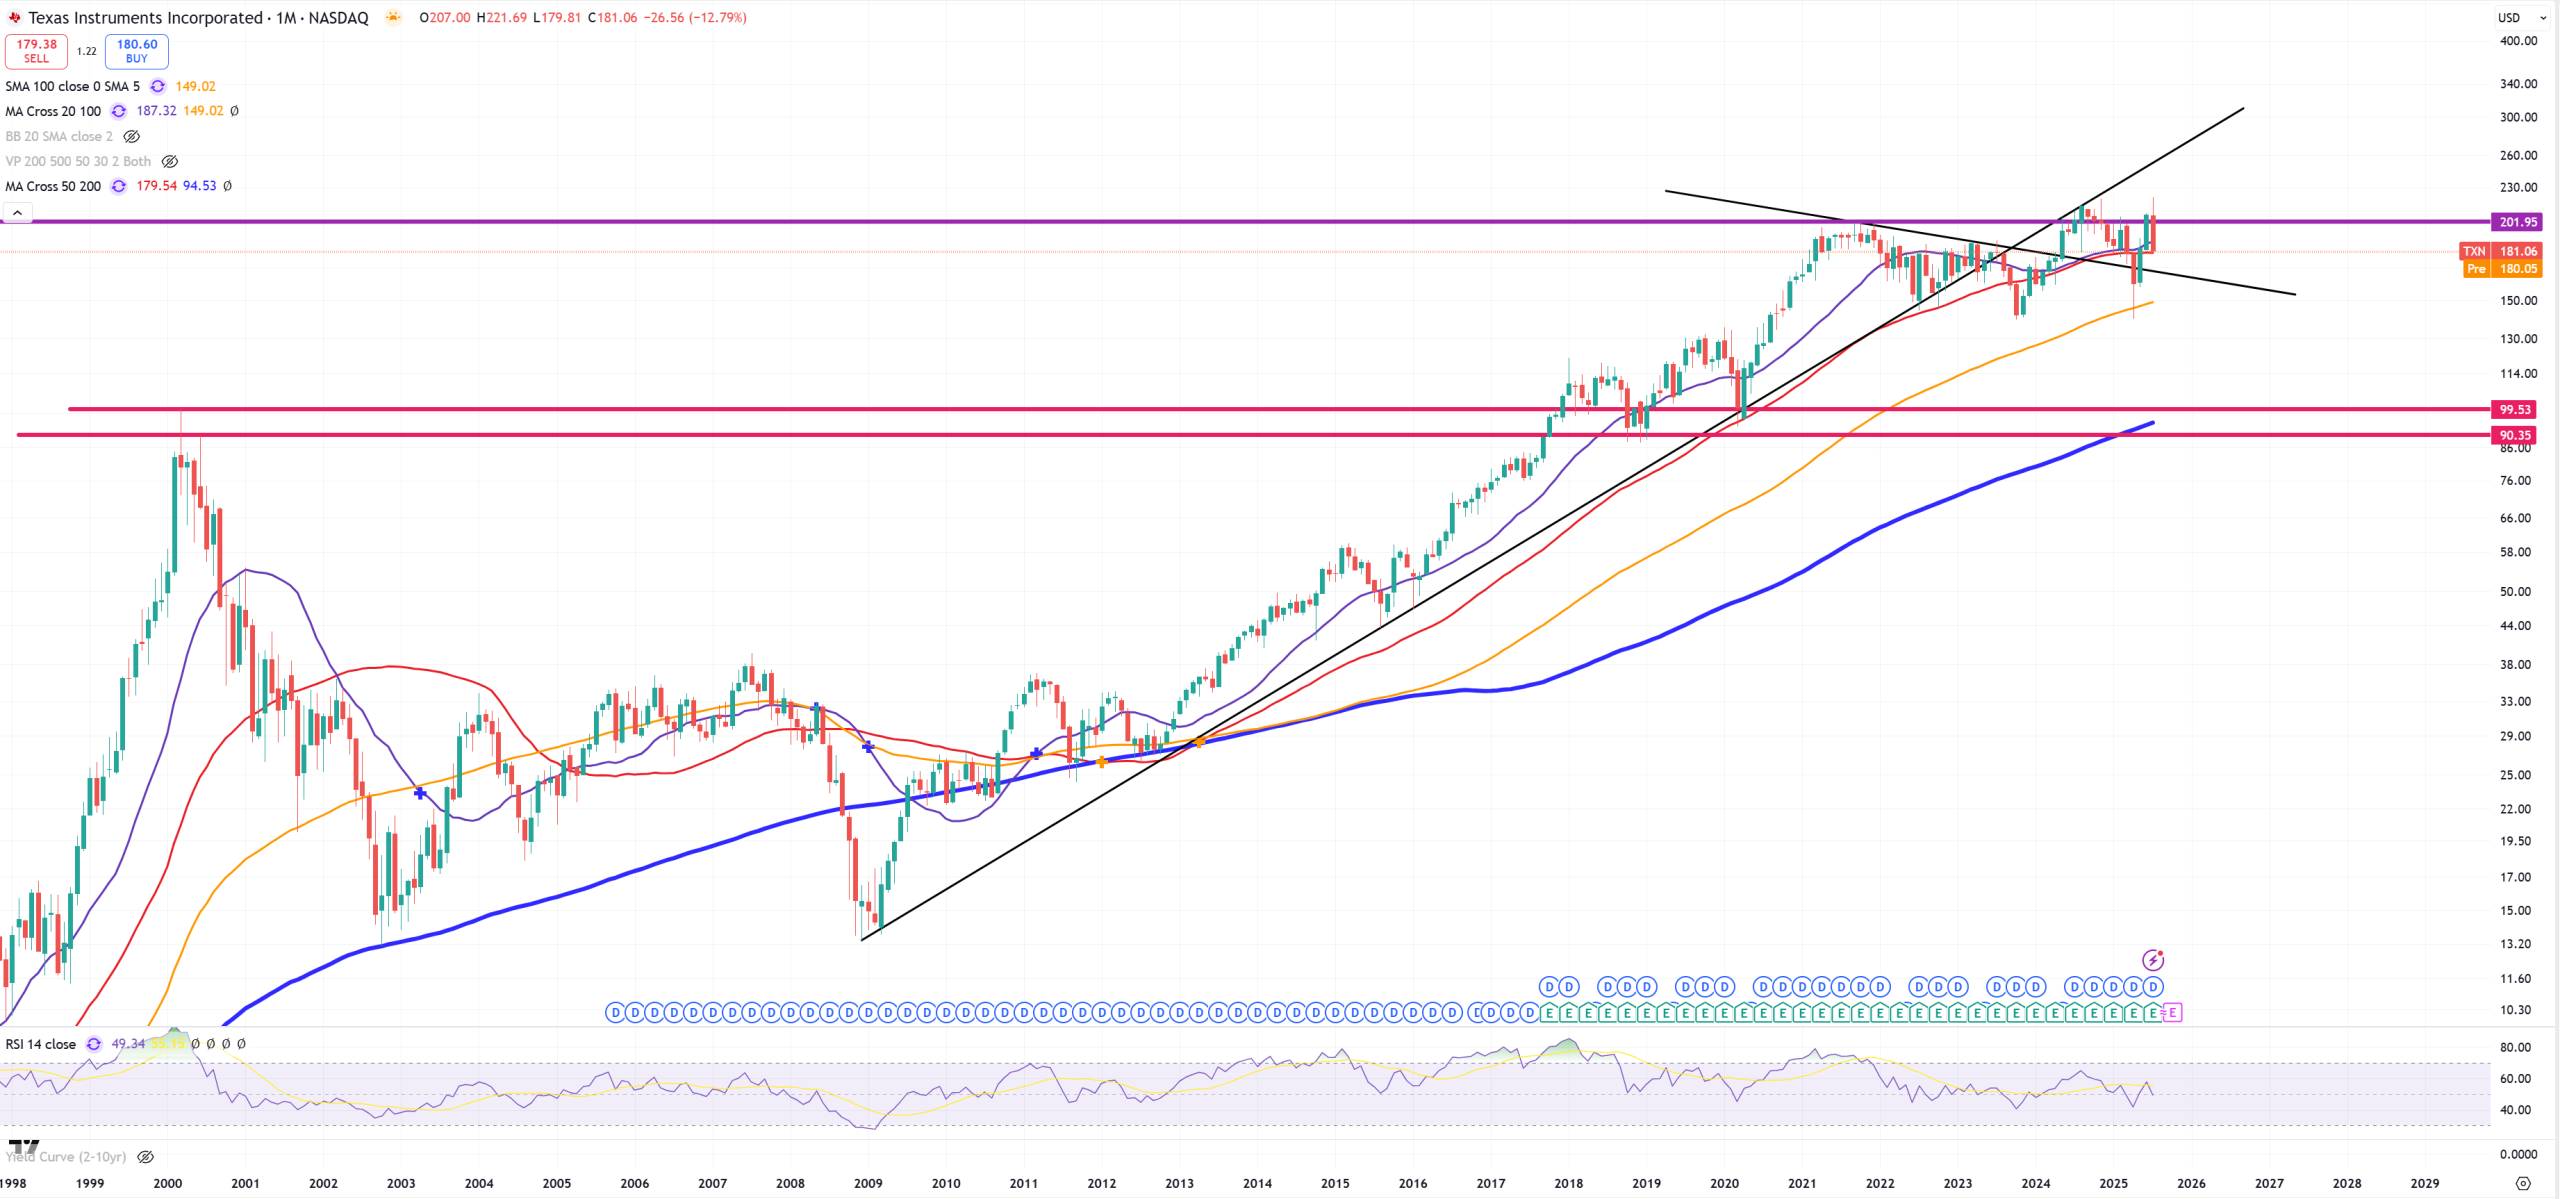
TXN – this resistance holds.
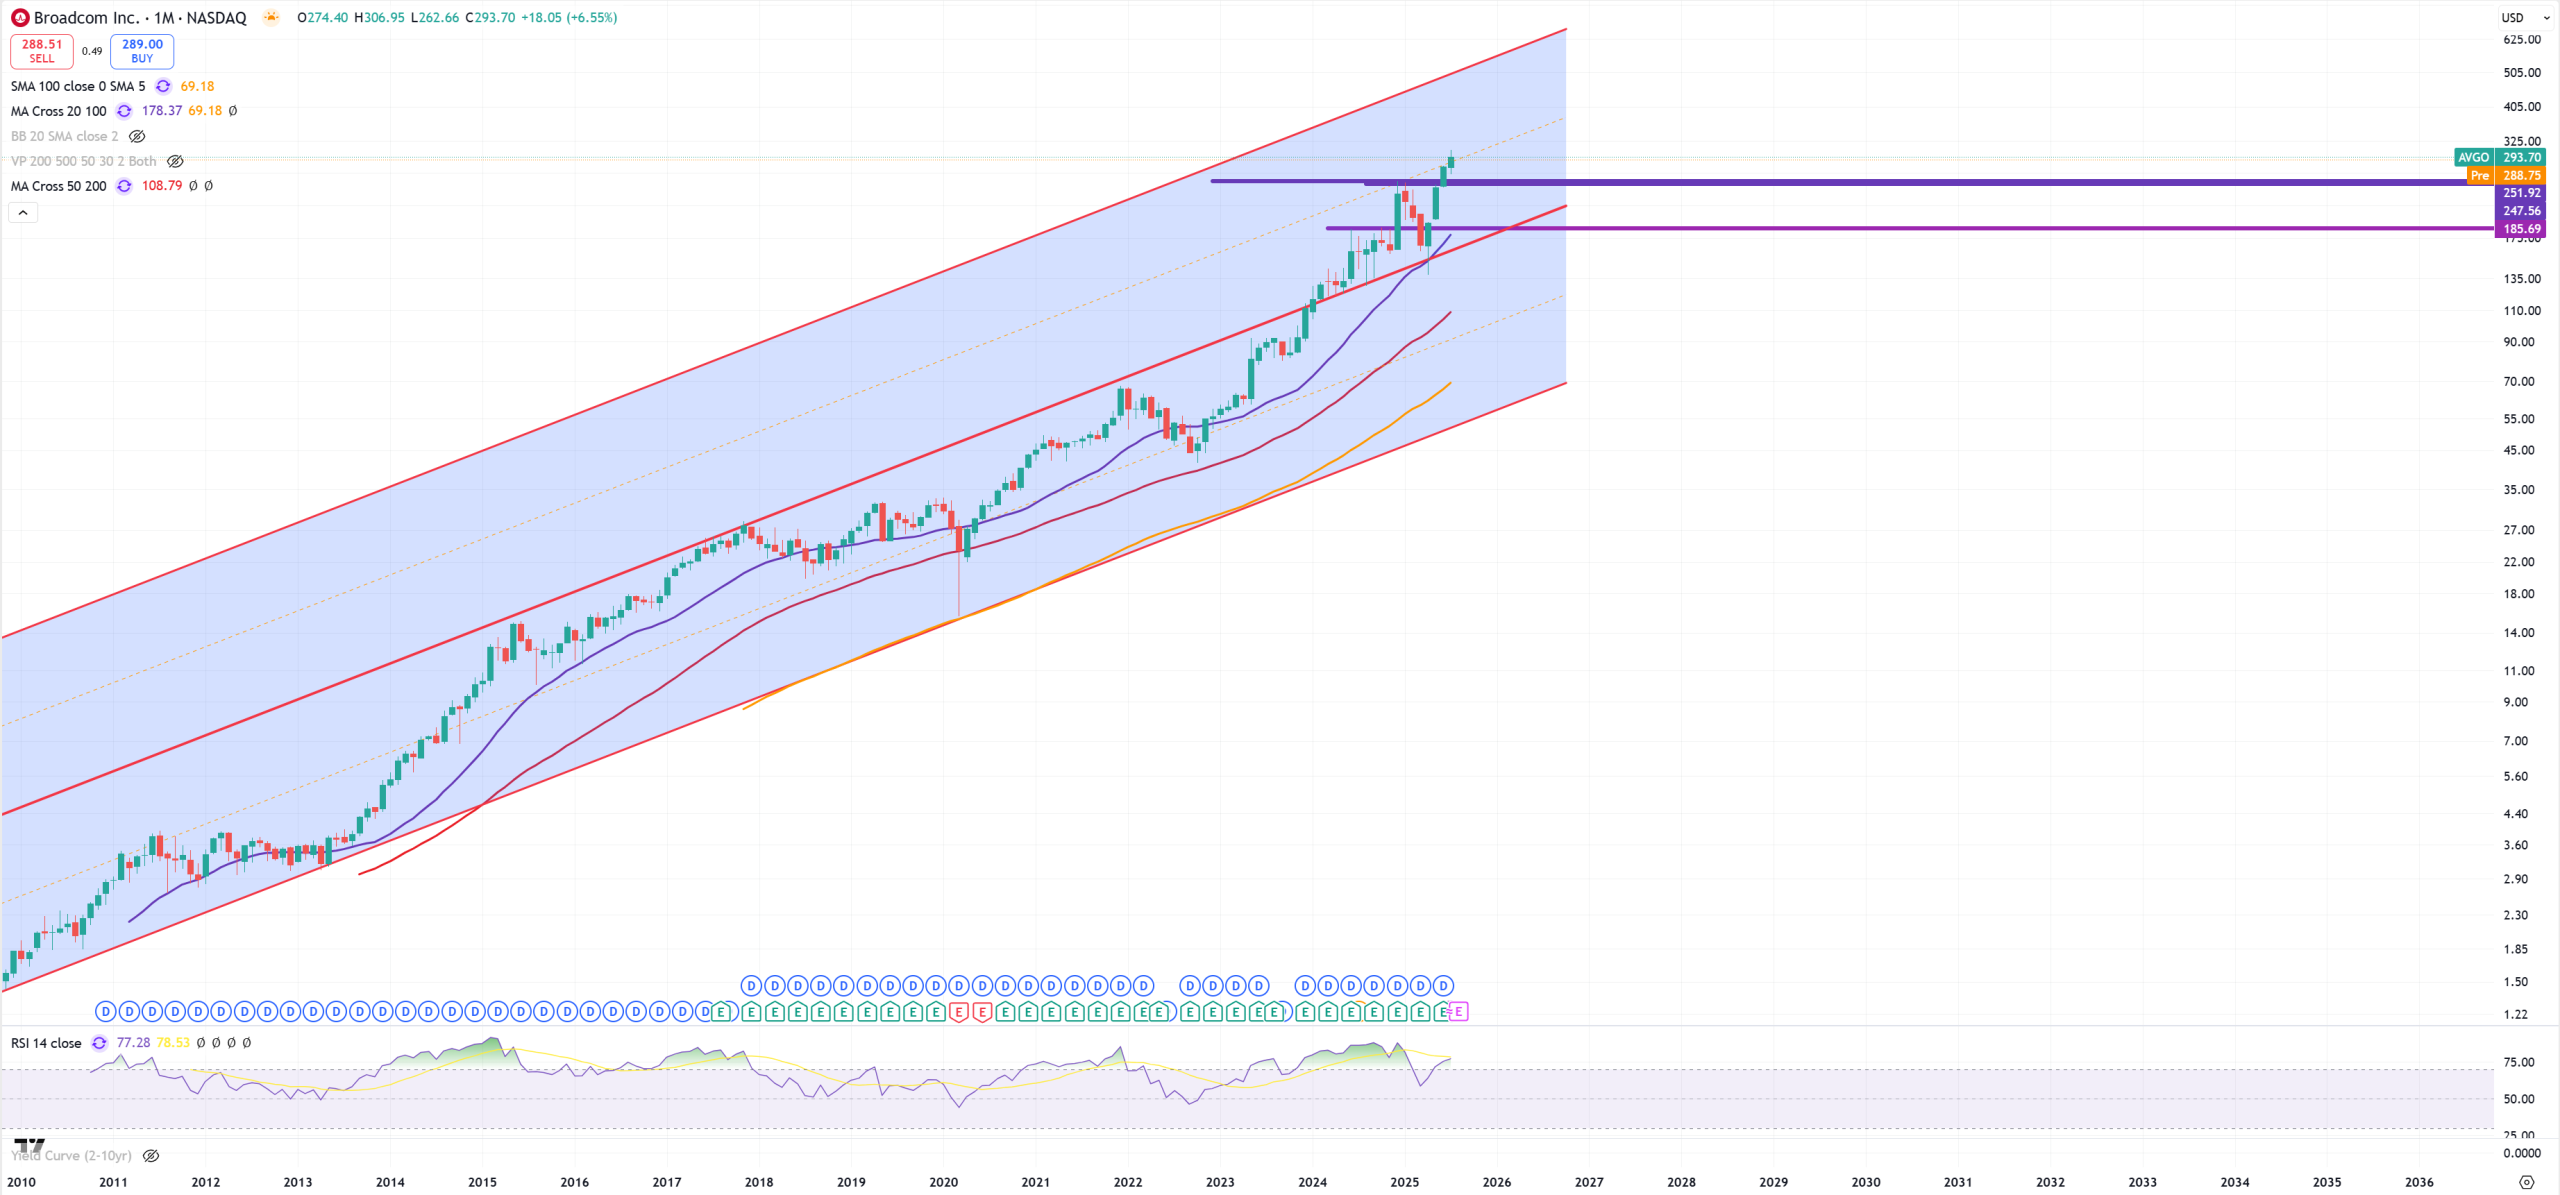
AVGO – just like Nvidia it’s broken
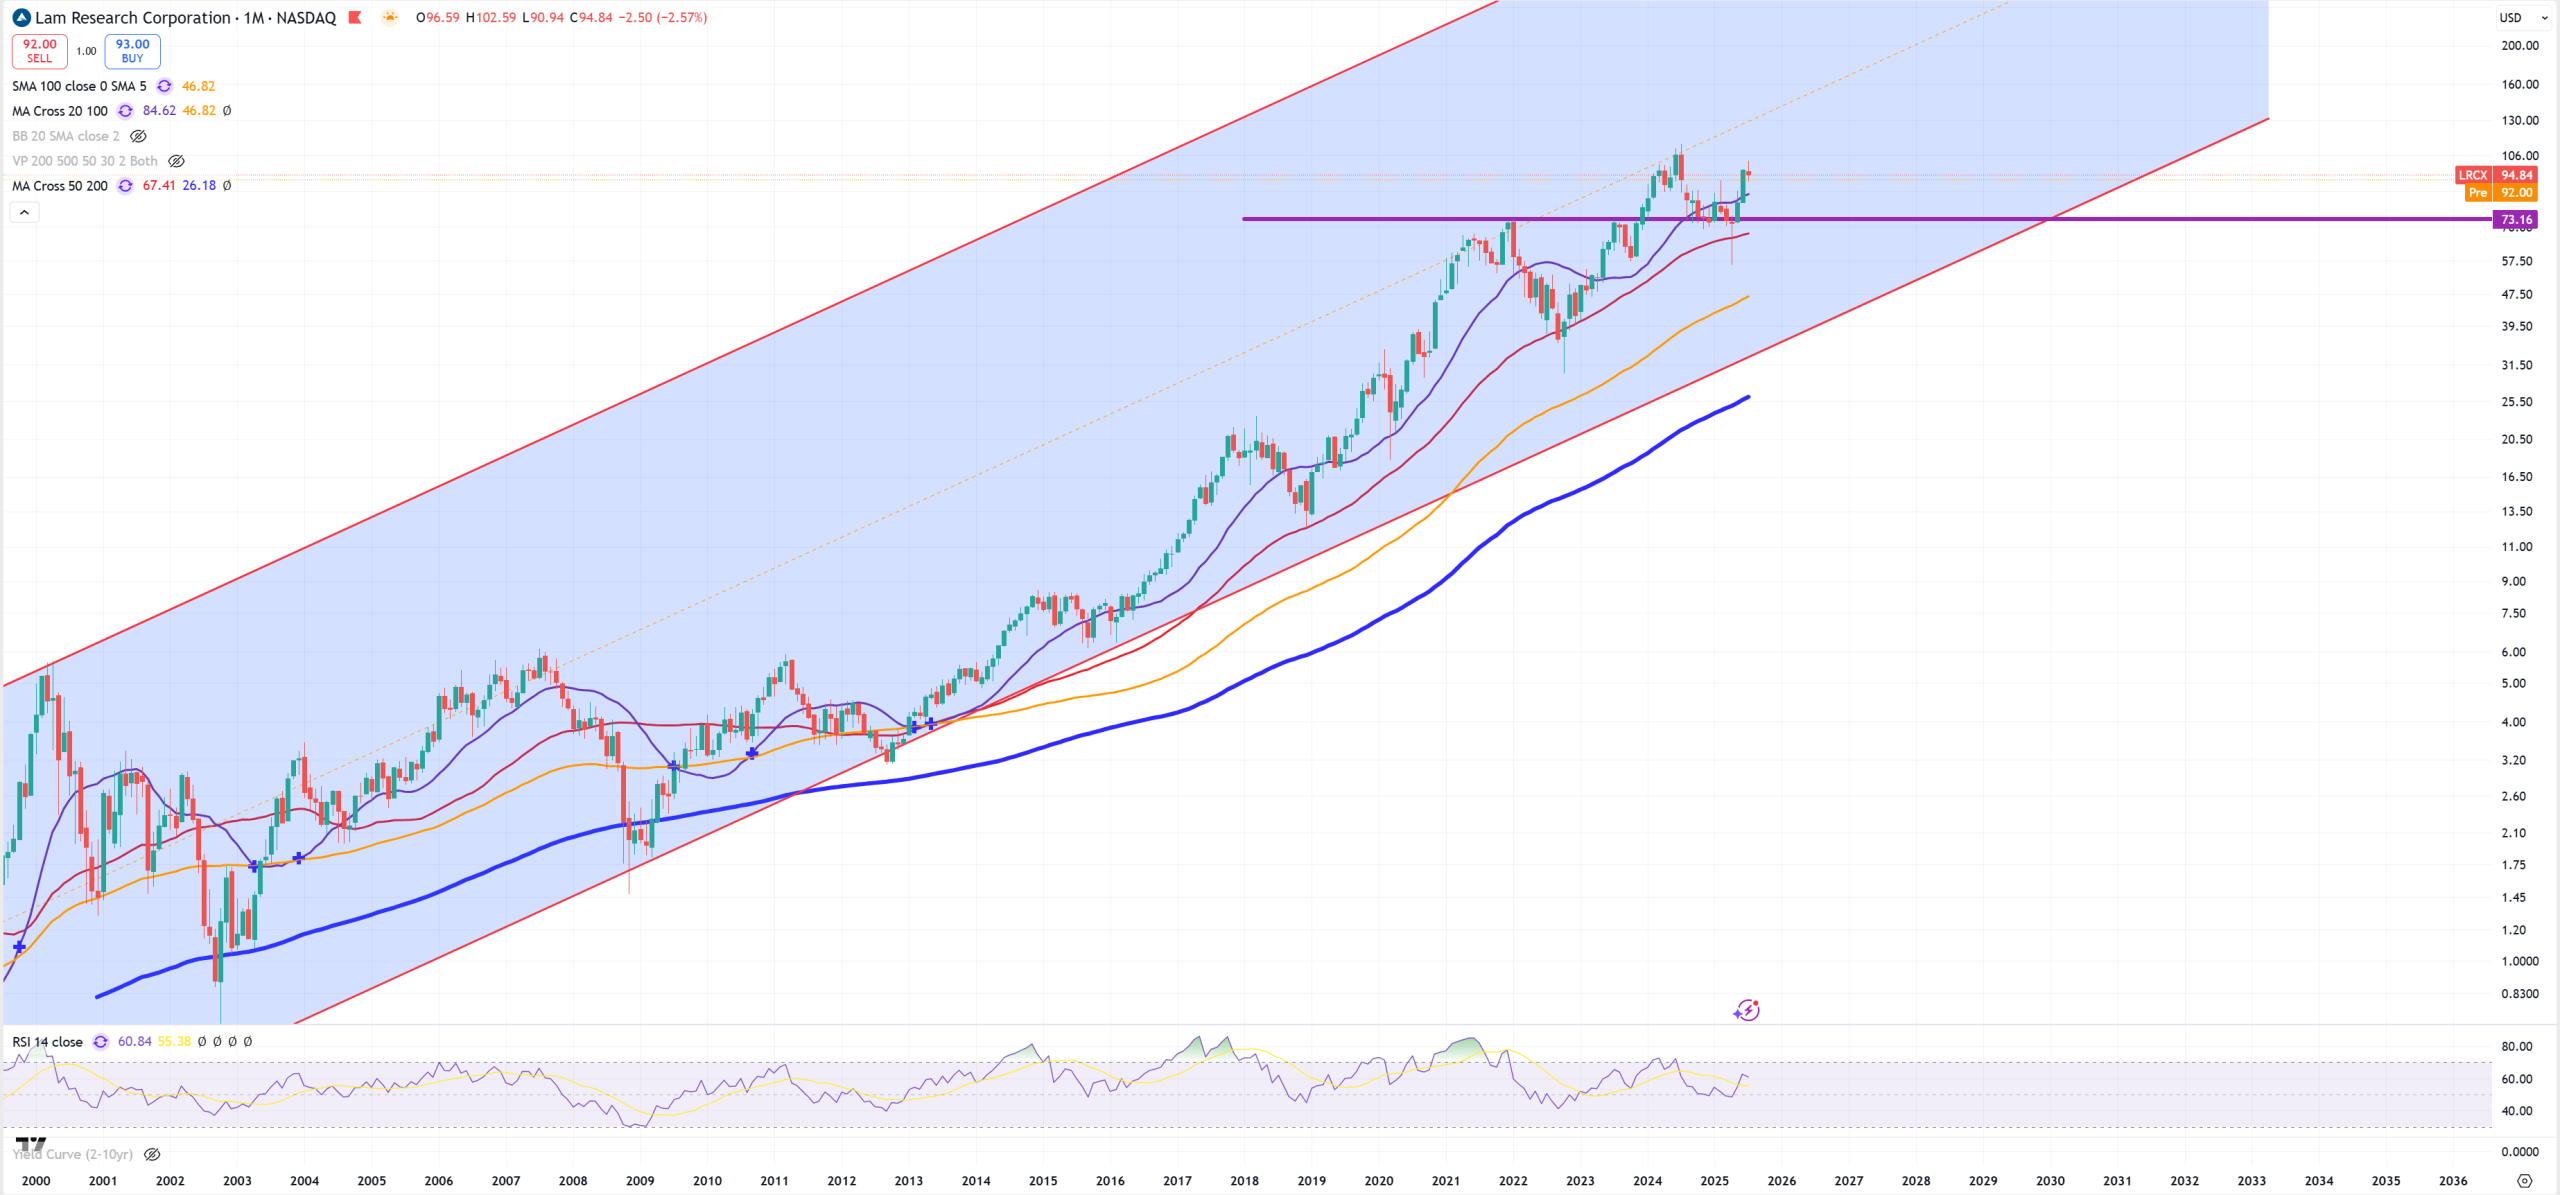
LRCX – 2021 support holds.
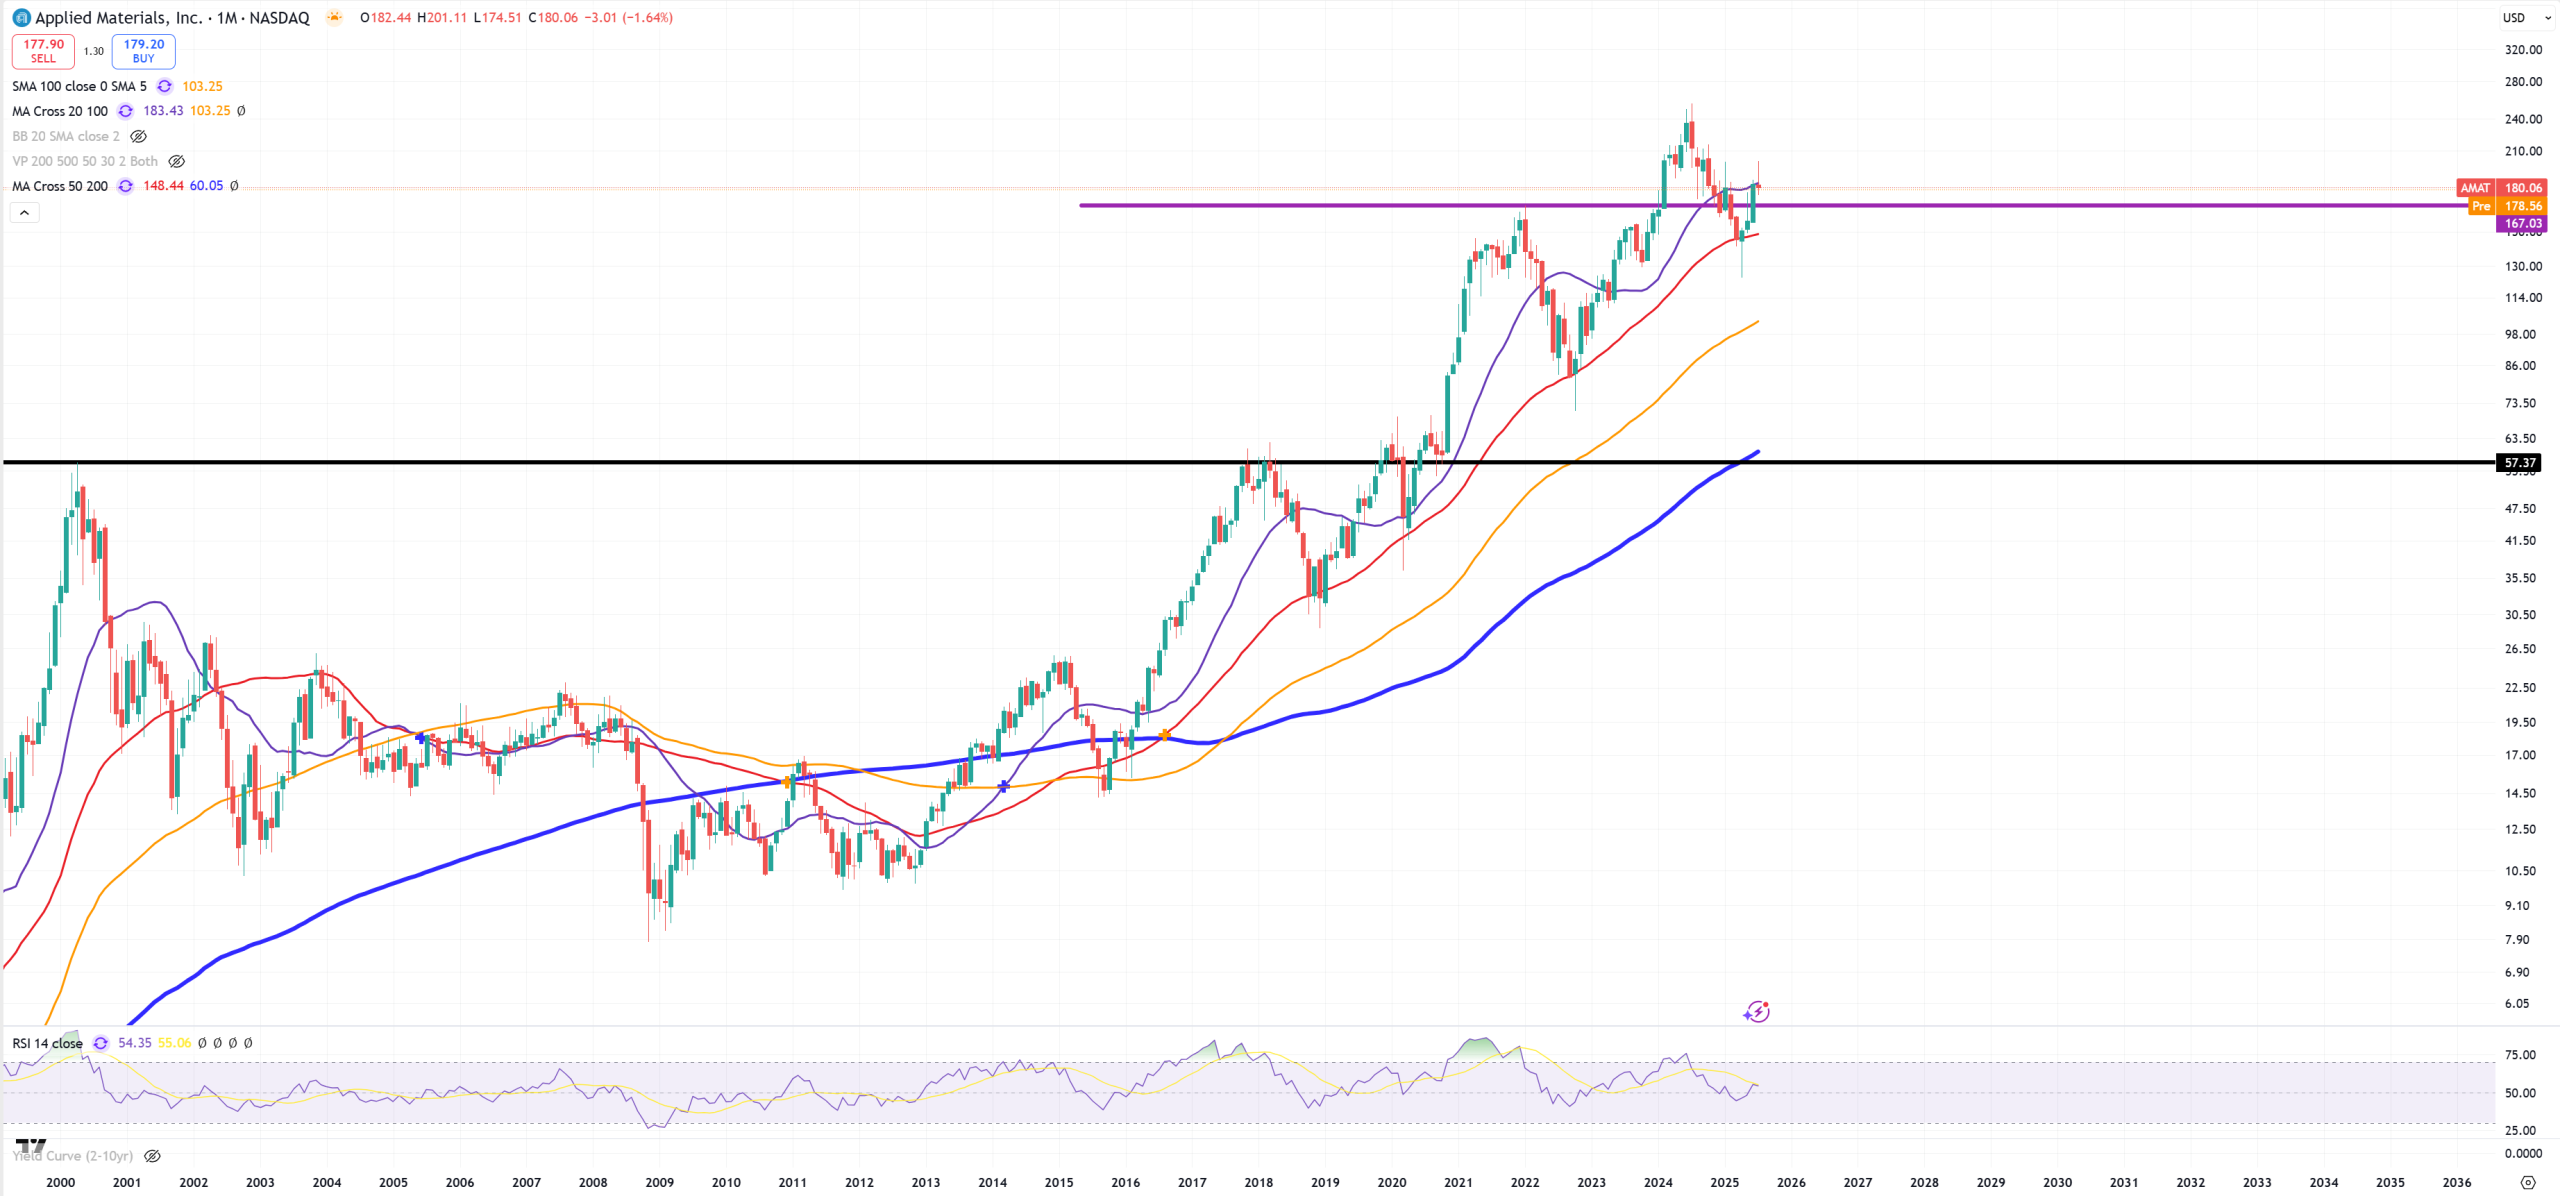
AMAT – also 2021 support holds
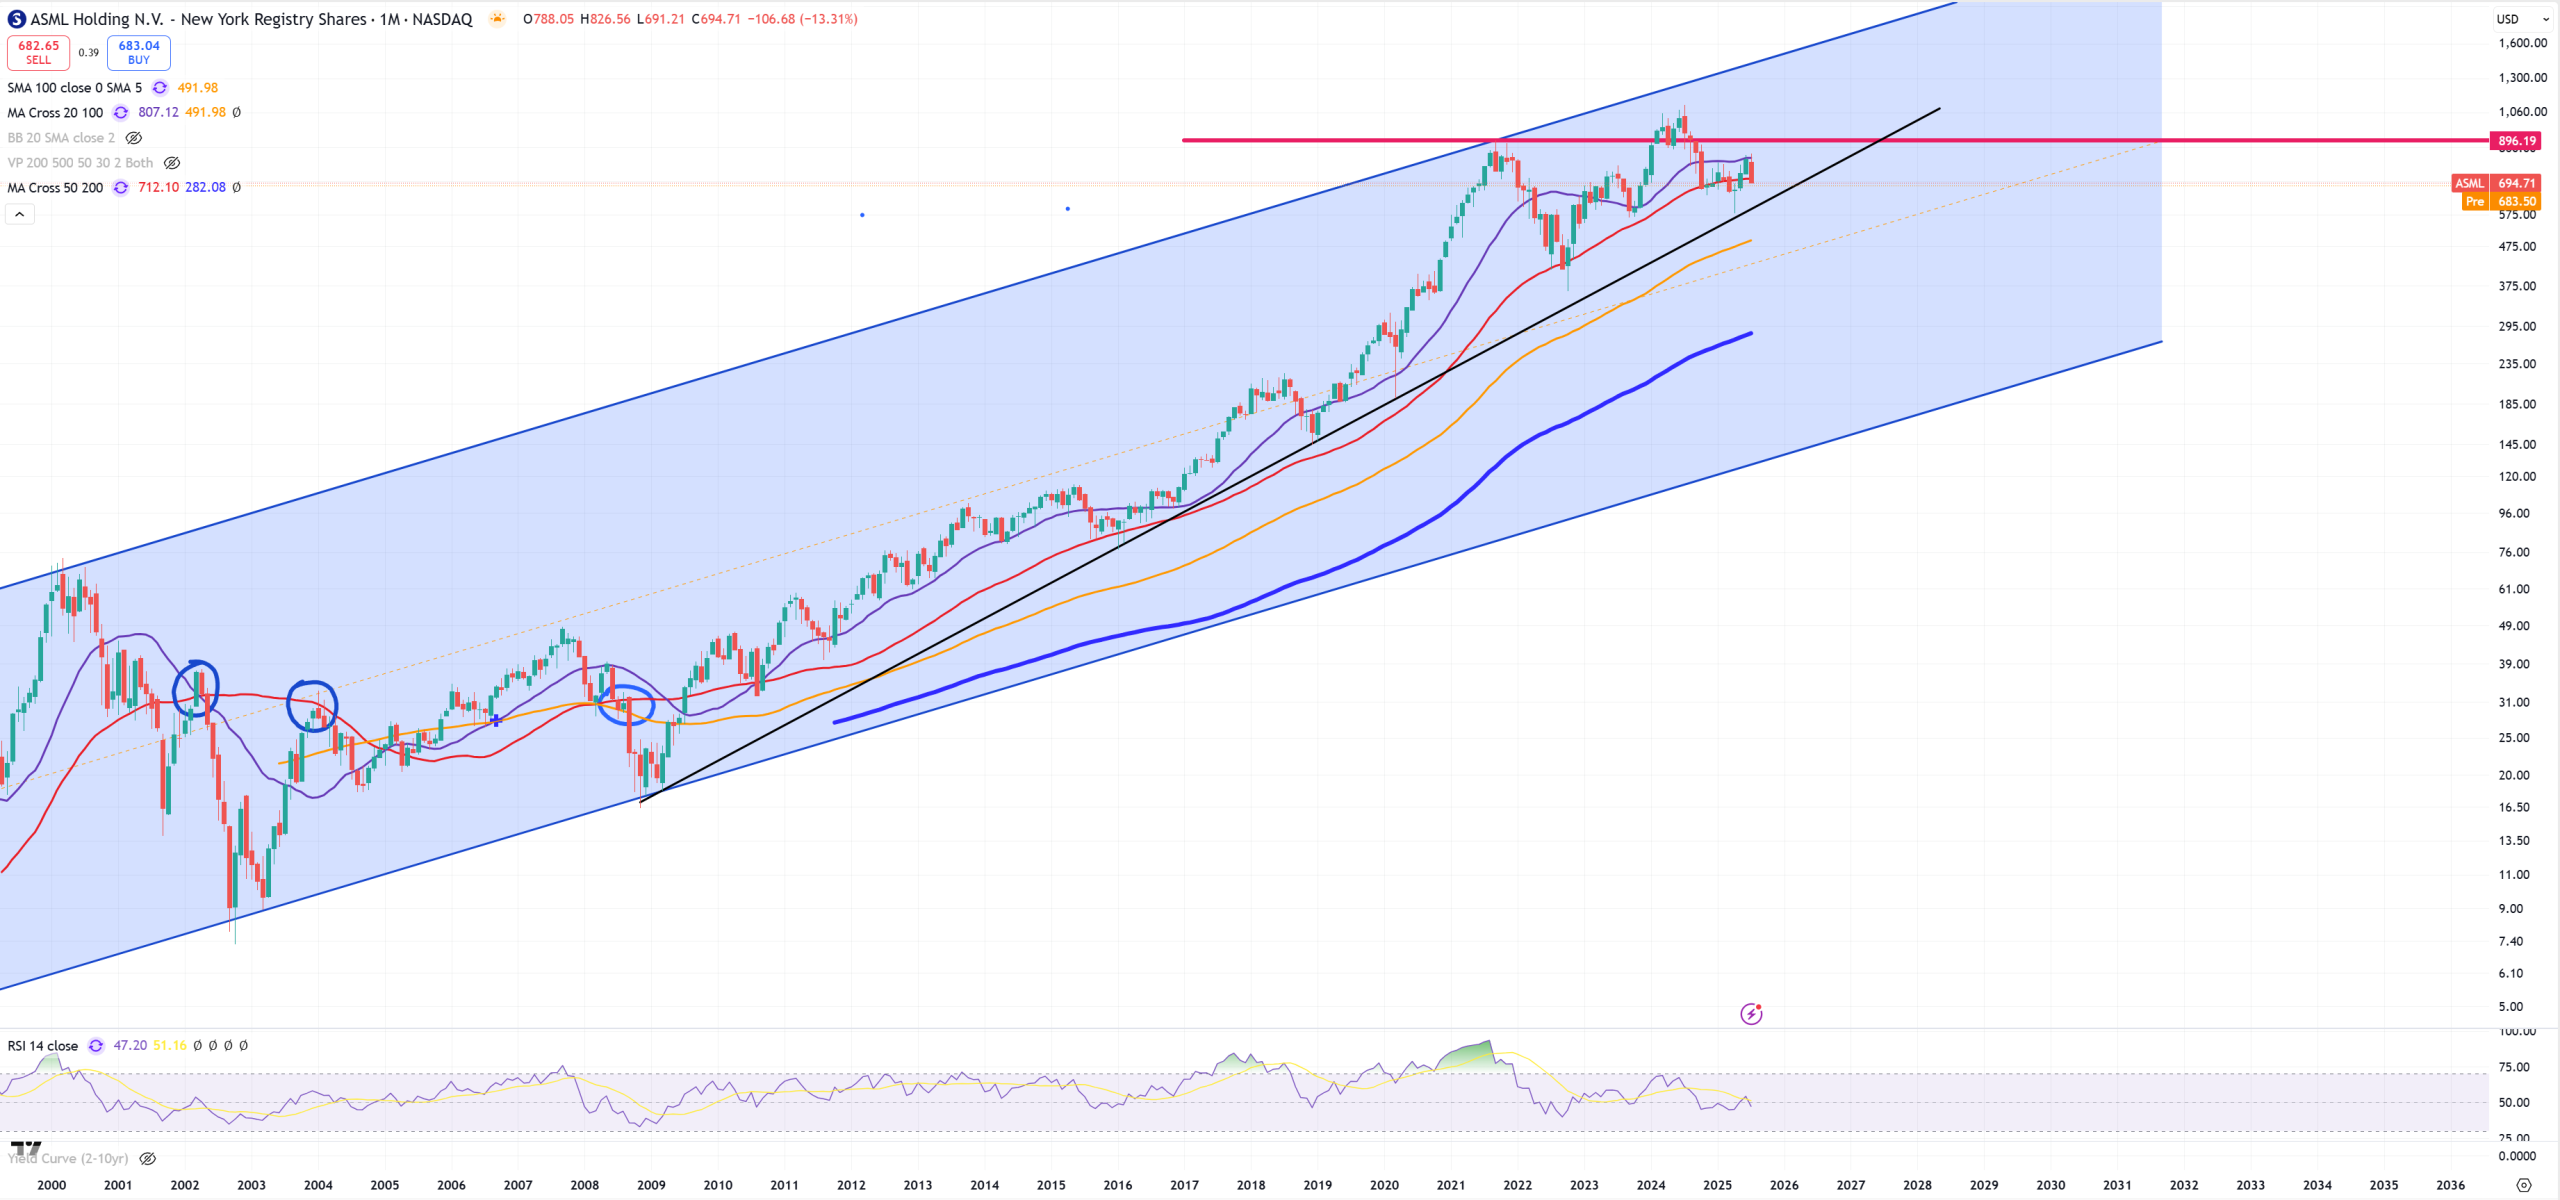
ASML – bulls lost ASML after huge fight we close below (M)MA50. 2021 peak holds, with a small bull trap peaked in Jun2024. There’ll be an attack on (M)MA100 now = 490$. The most obvious pattern here is to jump from yellow (M)MA100 to retest the broken 2009 trend if bears won.
MAR – Hotels start to get into troubles

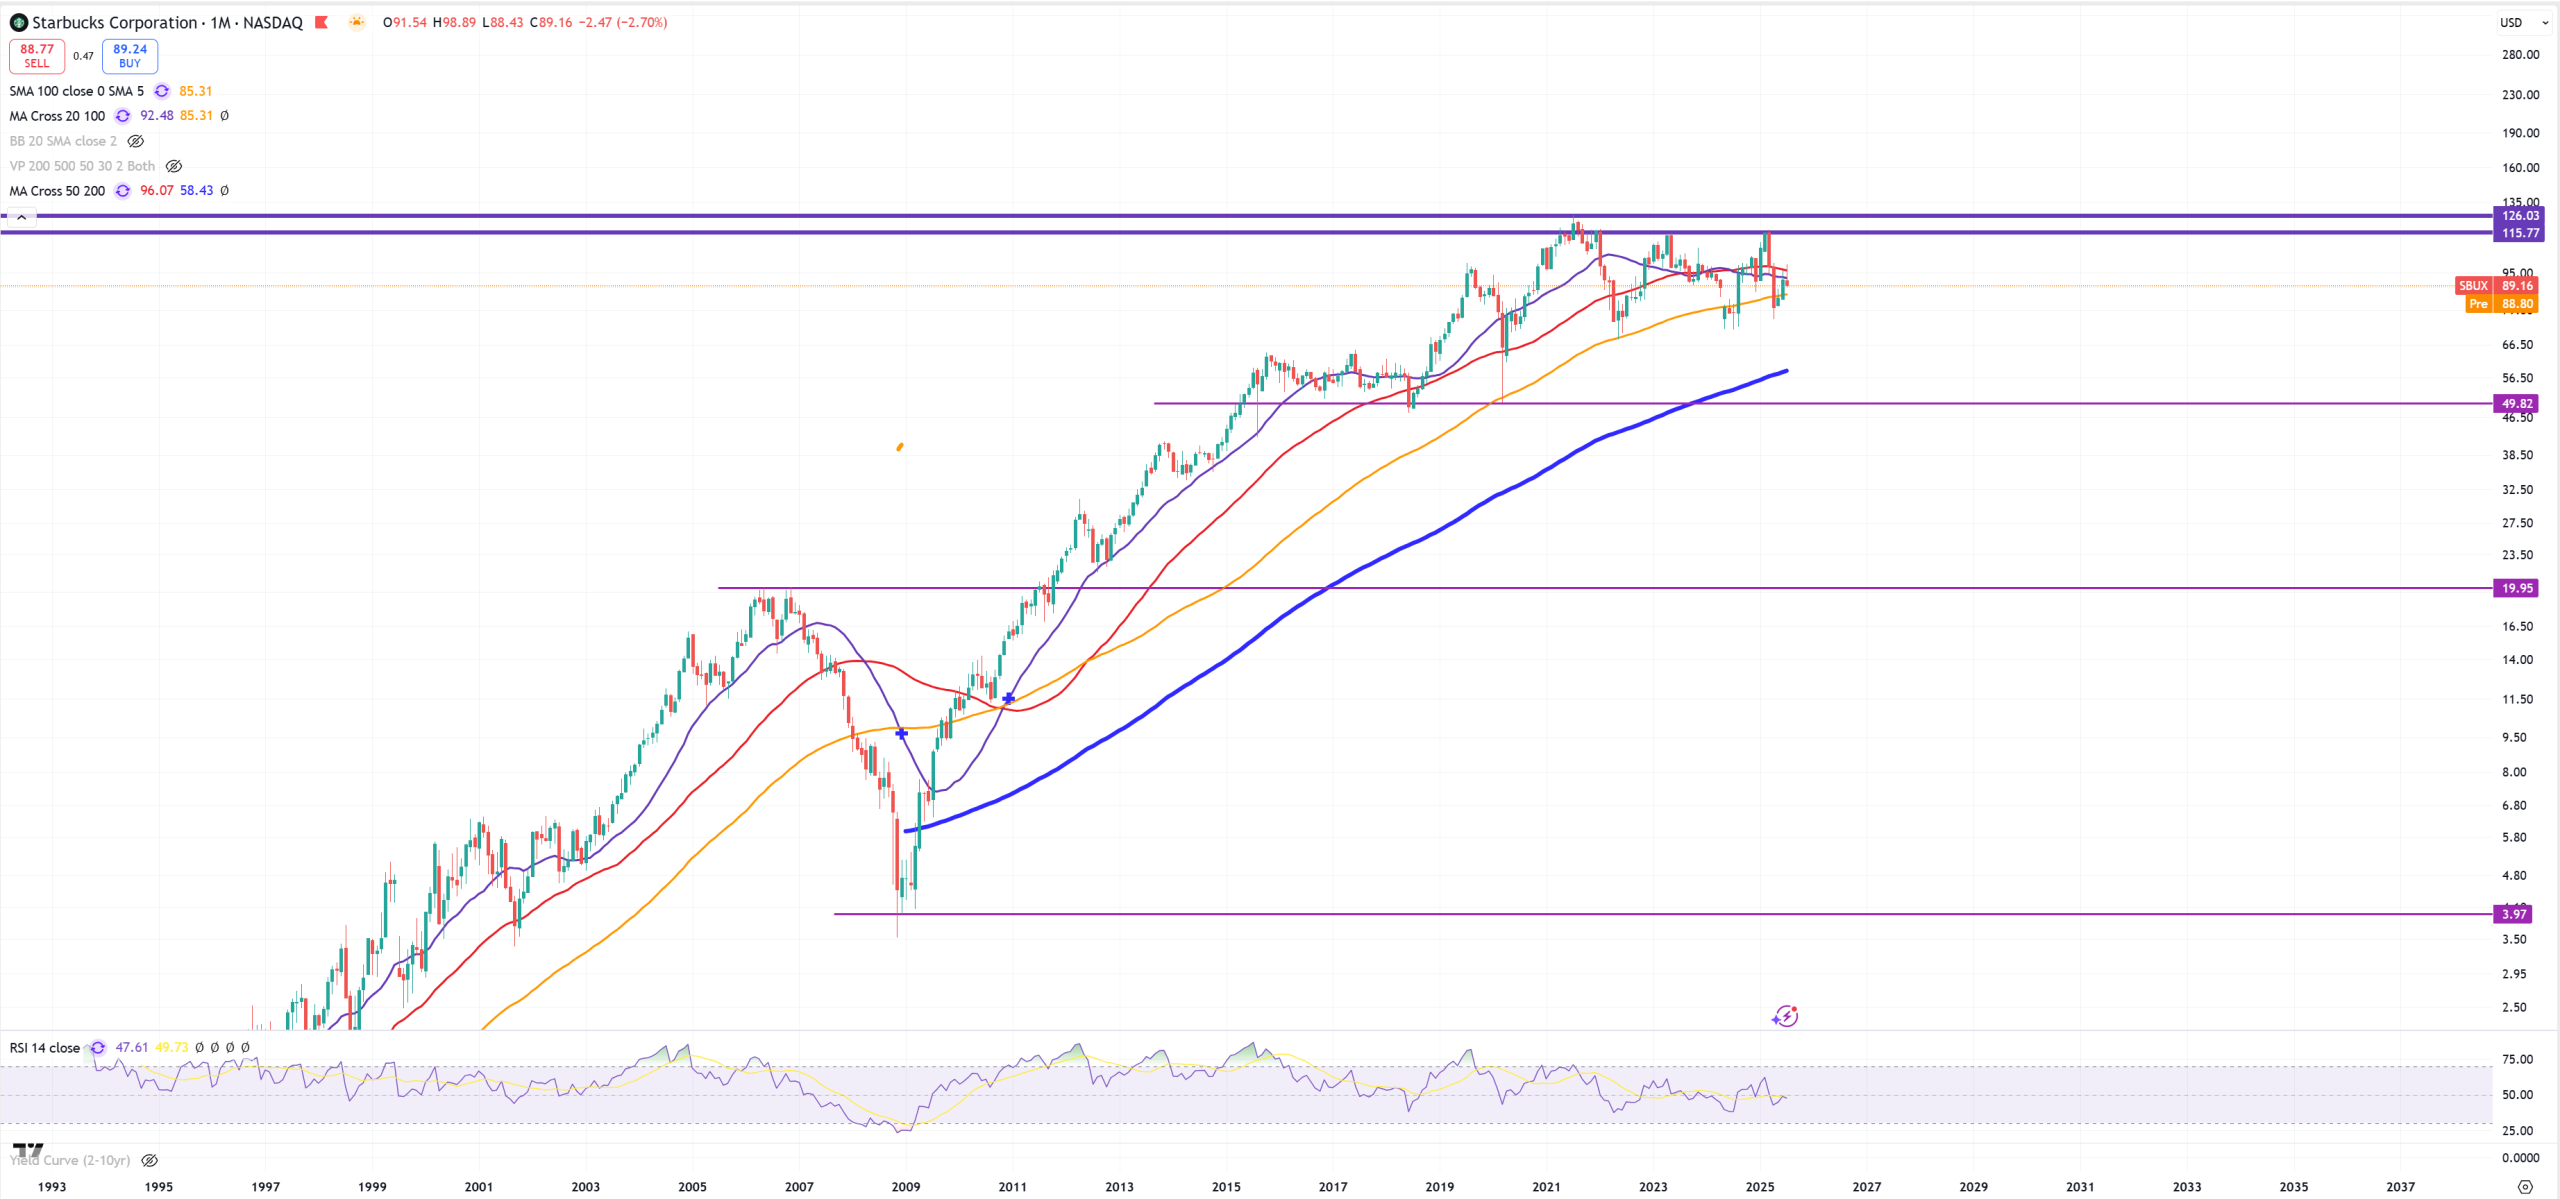
SBUX – Starbucks – buying 20$ coffee in current environment is not a good idea, so SBUX peaked in 2021 so far. It looks like it waits for ignition.
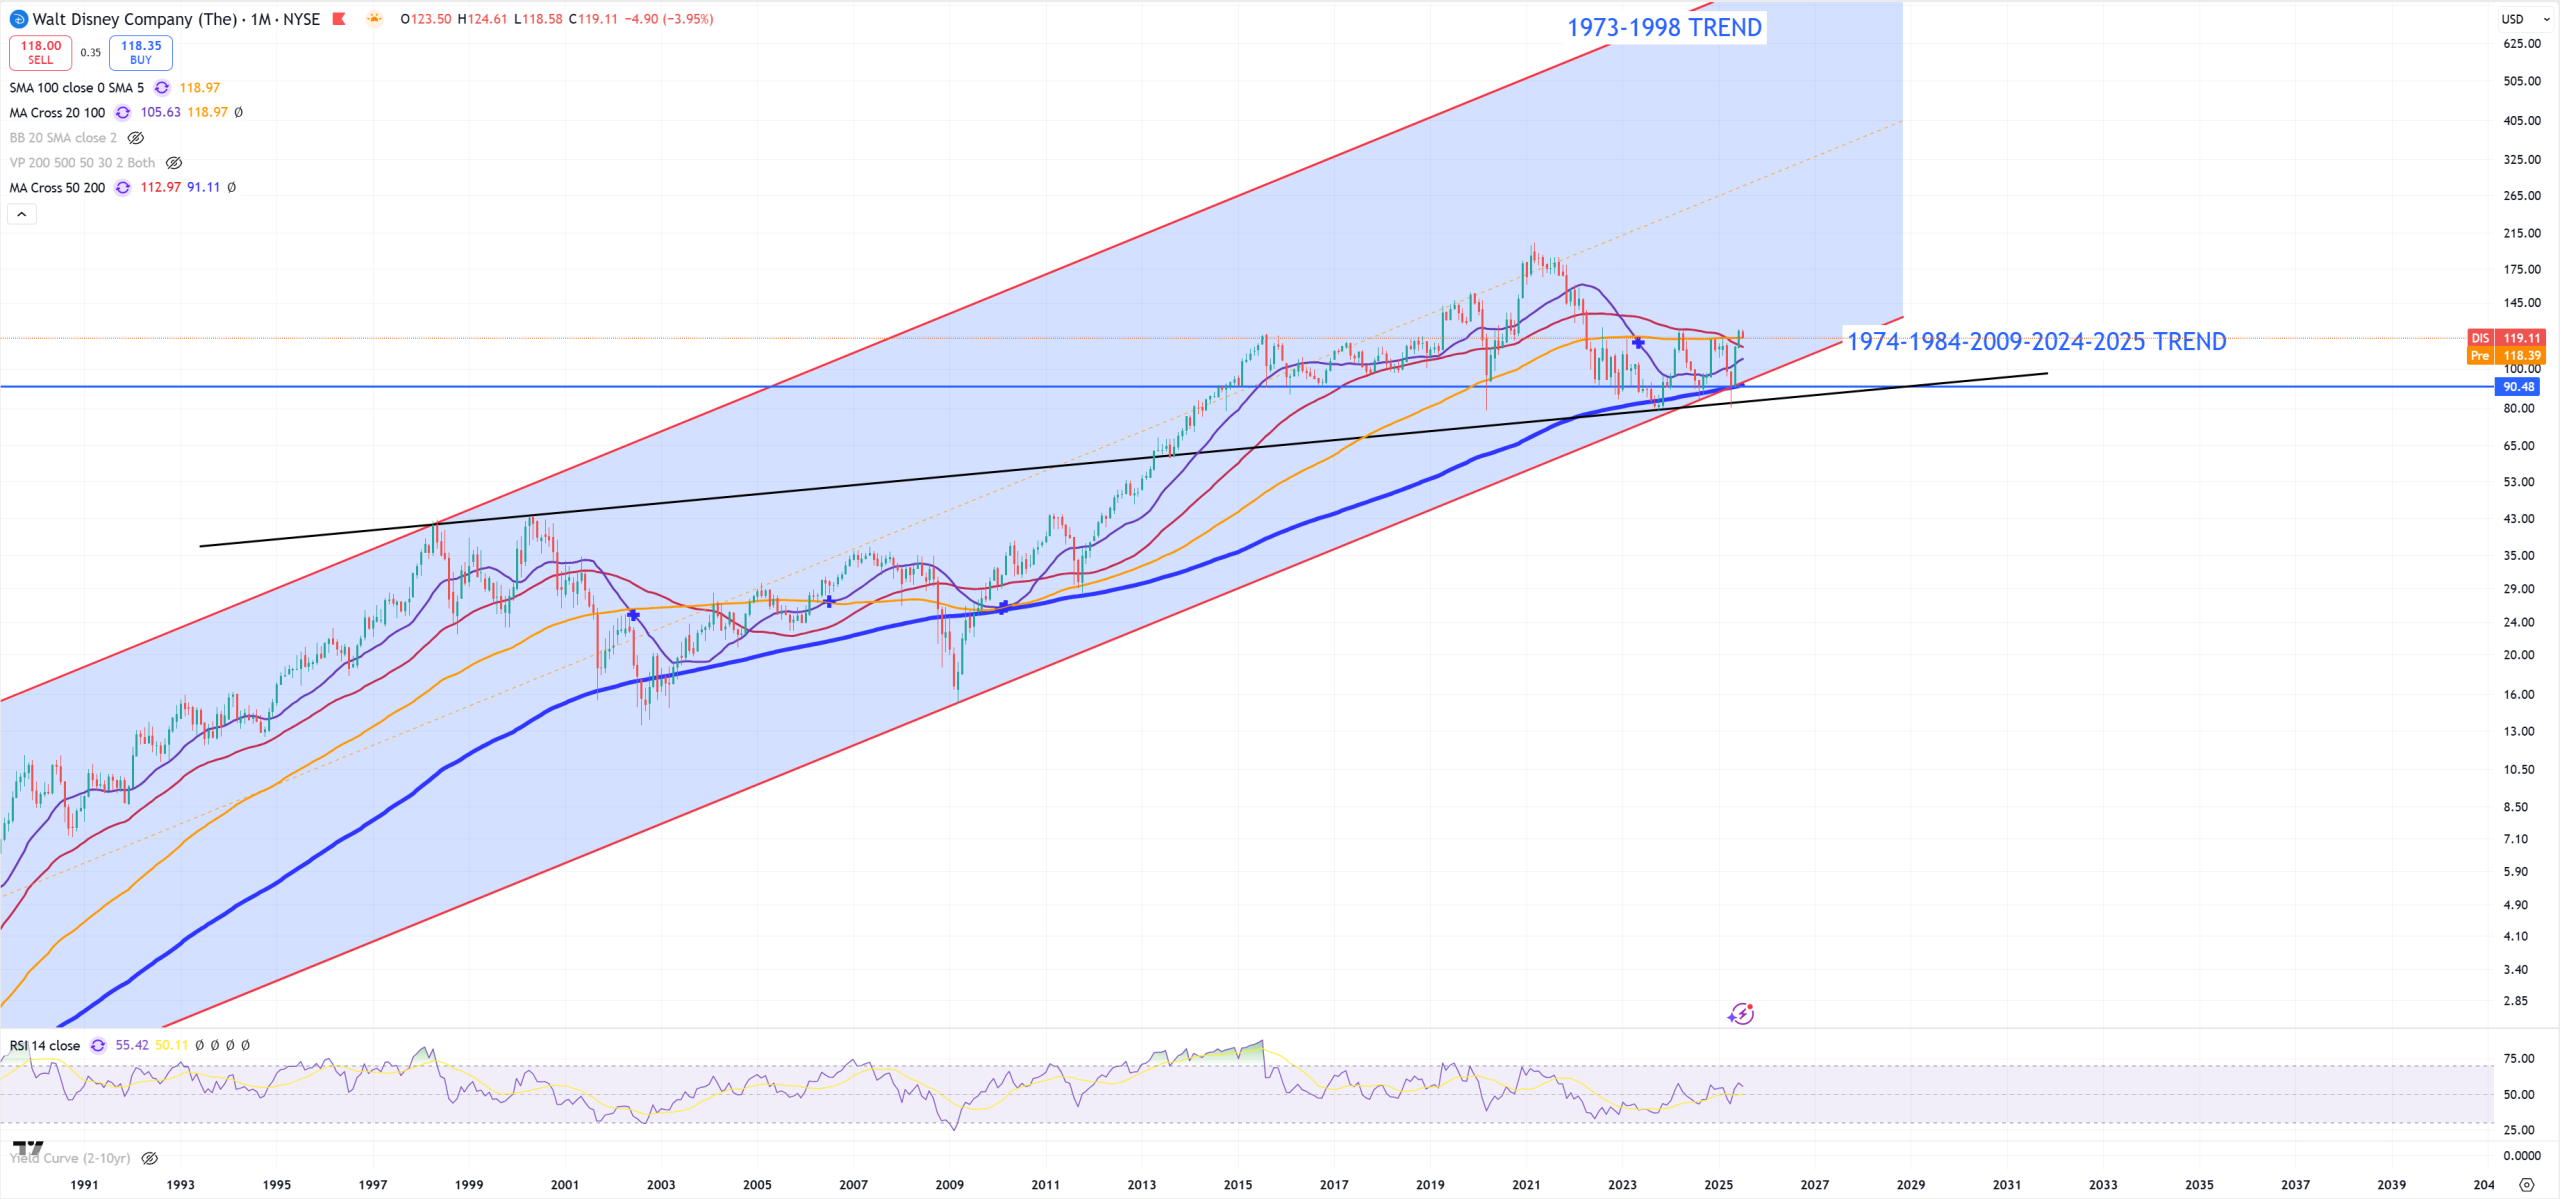
DIS – Disney – technicals are very supportive as it’s a mix of channel, (M)MA200, trend it’ll be hard to blow up, but once it’ll happen, because it’s hard to imagine people in current environment will be spending 1000$ in parks it’ll be brutal. Peak yes you guessed in 2021
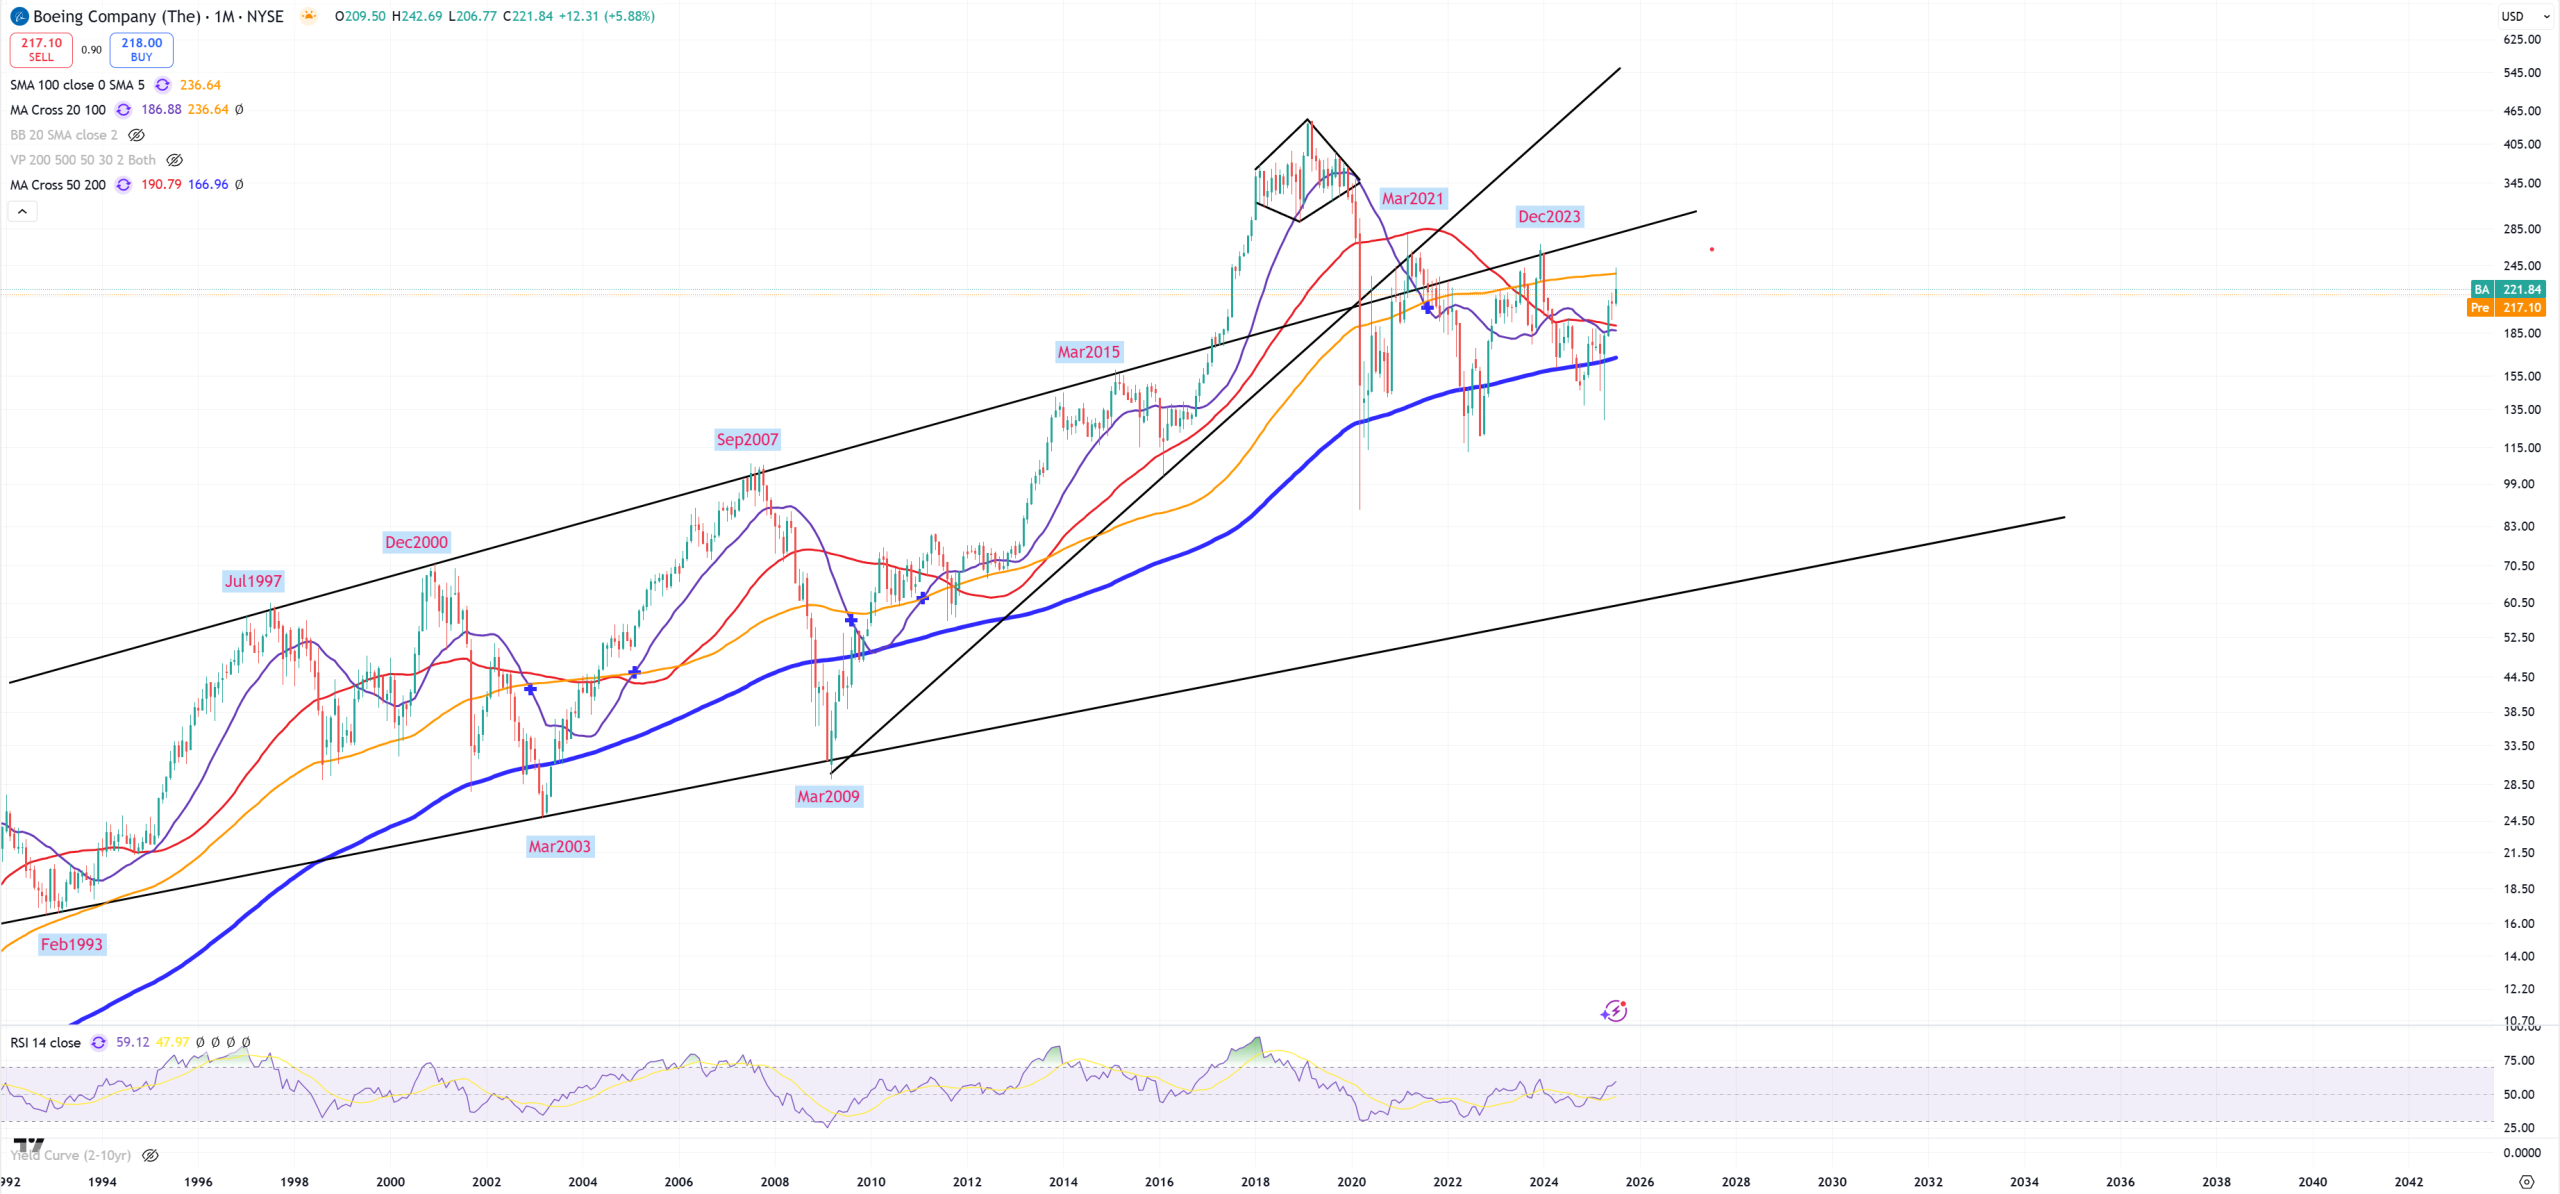
BA – Boeing is one of those companies that mostly concentrating on buybacks ignoring everything else, but so far they have 3 lifes. BA is very accurate so far telling us when market is in reality blows up. That’s always when BA goes down. In 2020, 2023 and 2024 blue (M)MA200 was hold, but once it’ll be taken down 60-70$ awaits for BA. Previous sustained cross down of (M)MA200 was October 2008. Now (M)MA100 moment so typical bull/bear trap level.
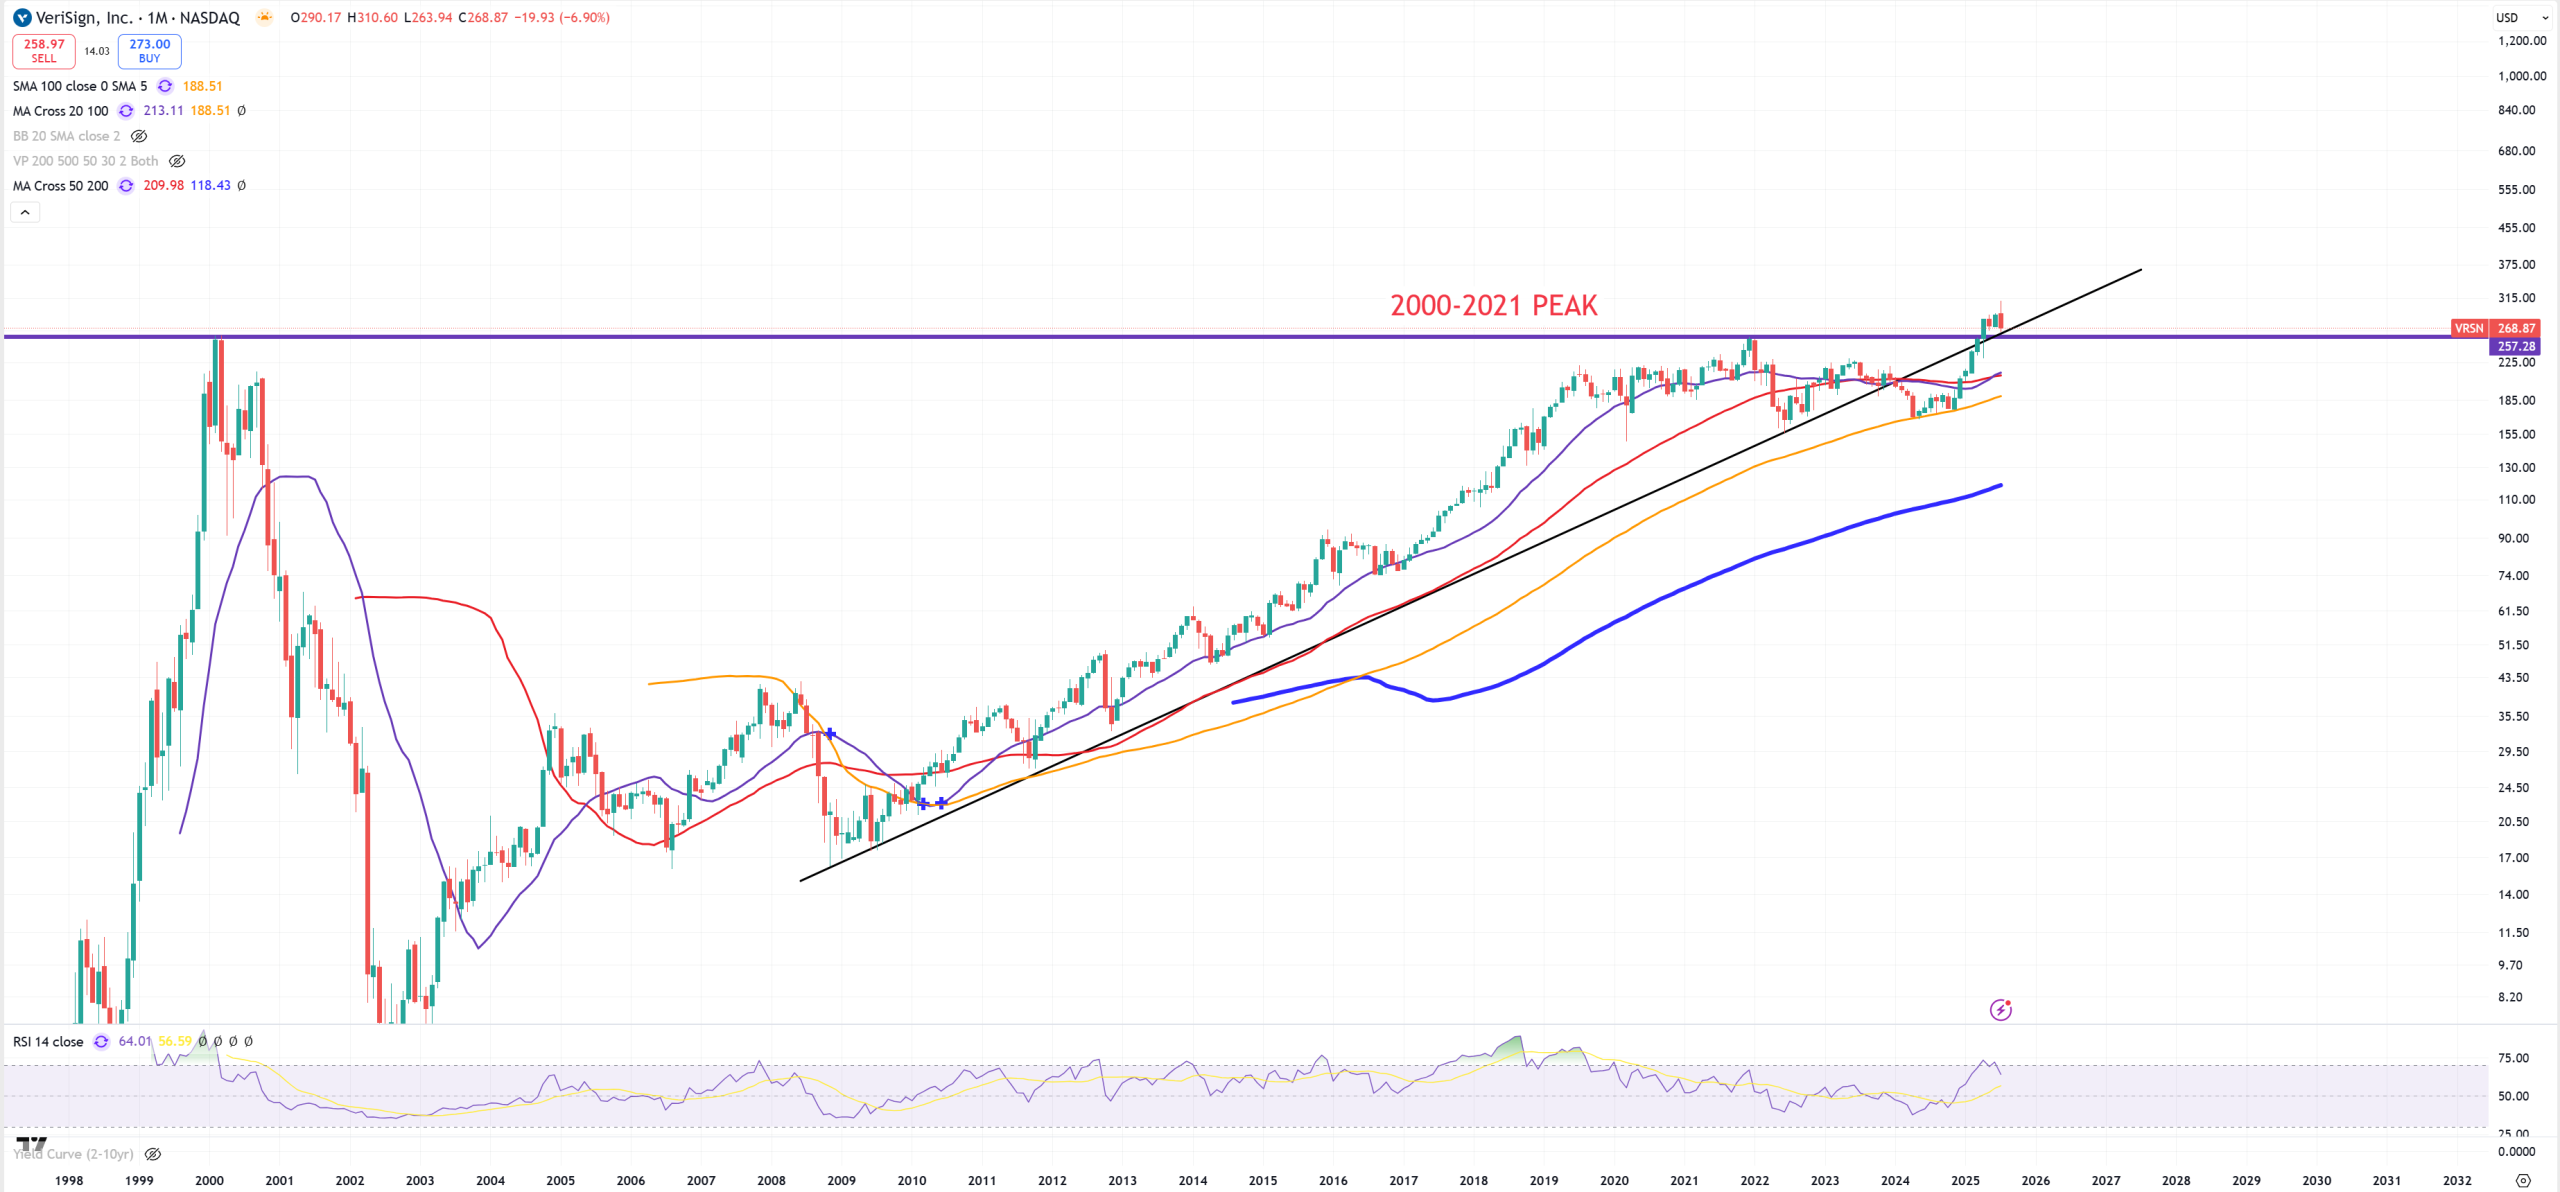
VRSN – Verisign, I must admit, don’t know even why I’m watching this company but I’m really interested in this break if it’ll be supported
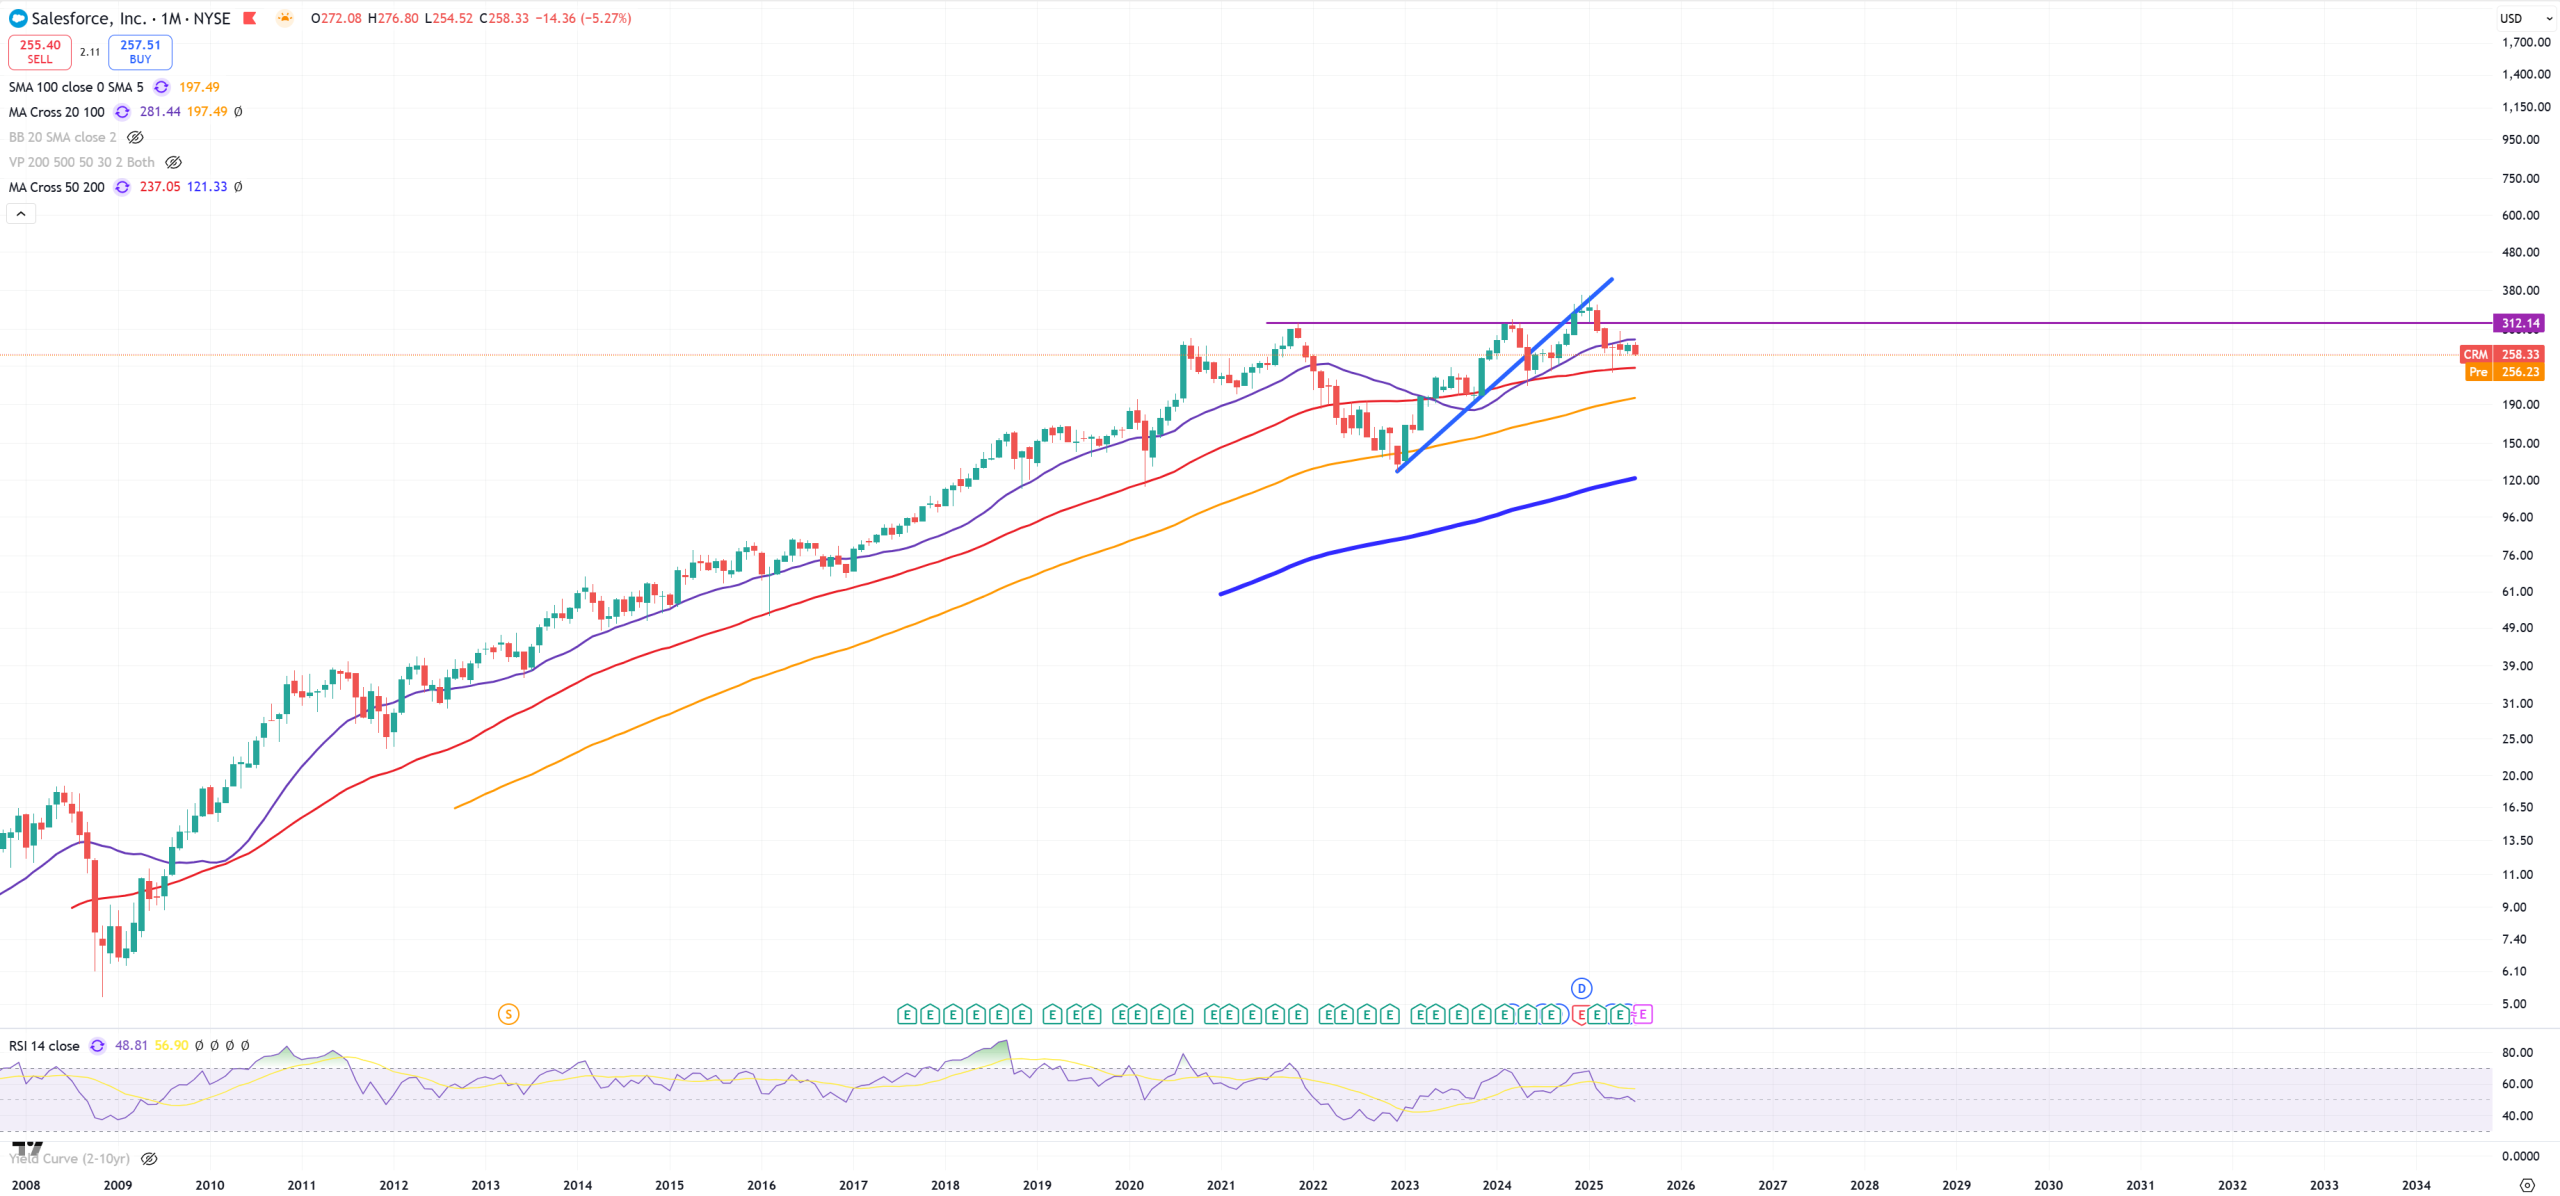
CRM – Salesforce is like ready to be blown apart
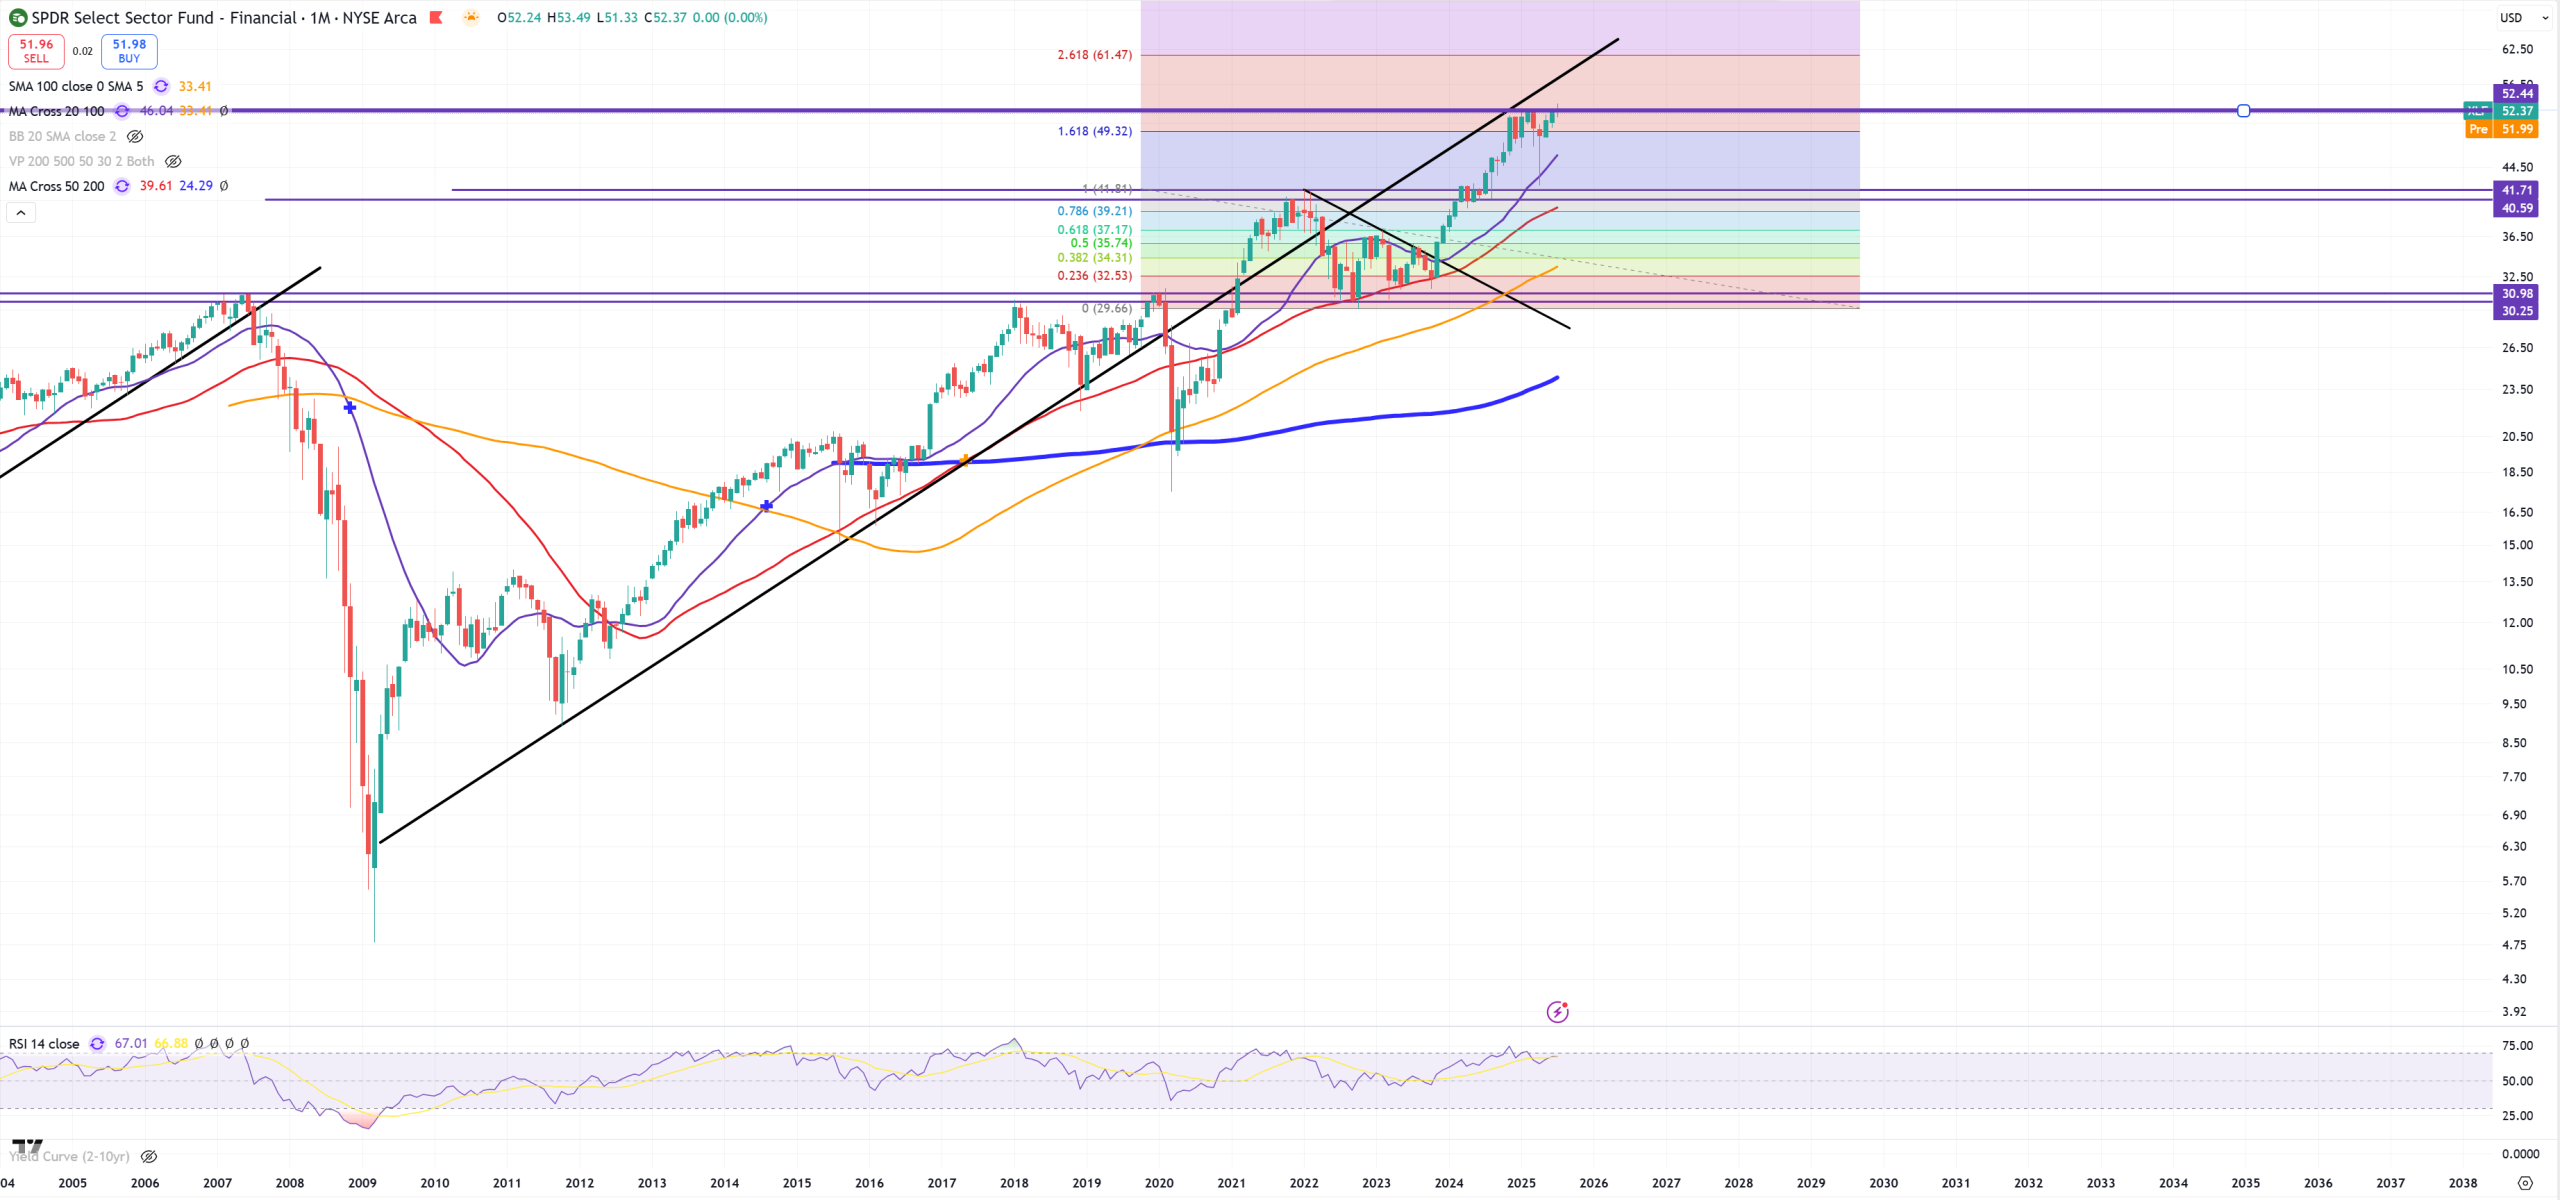
XLF – that’s still bullish, but it looks like a resistance is building around 52$ level
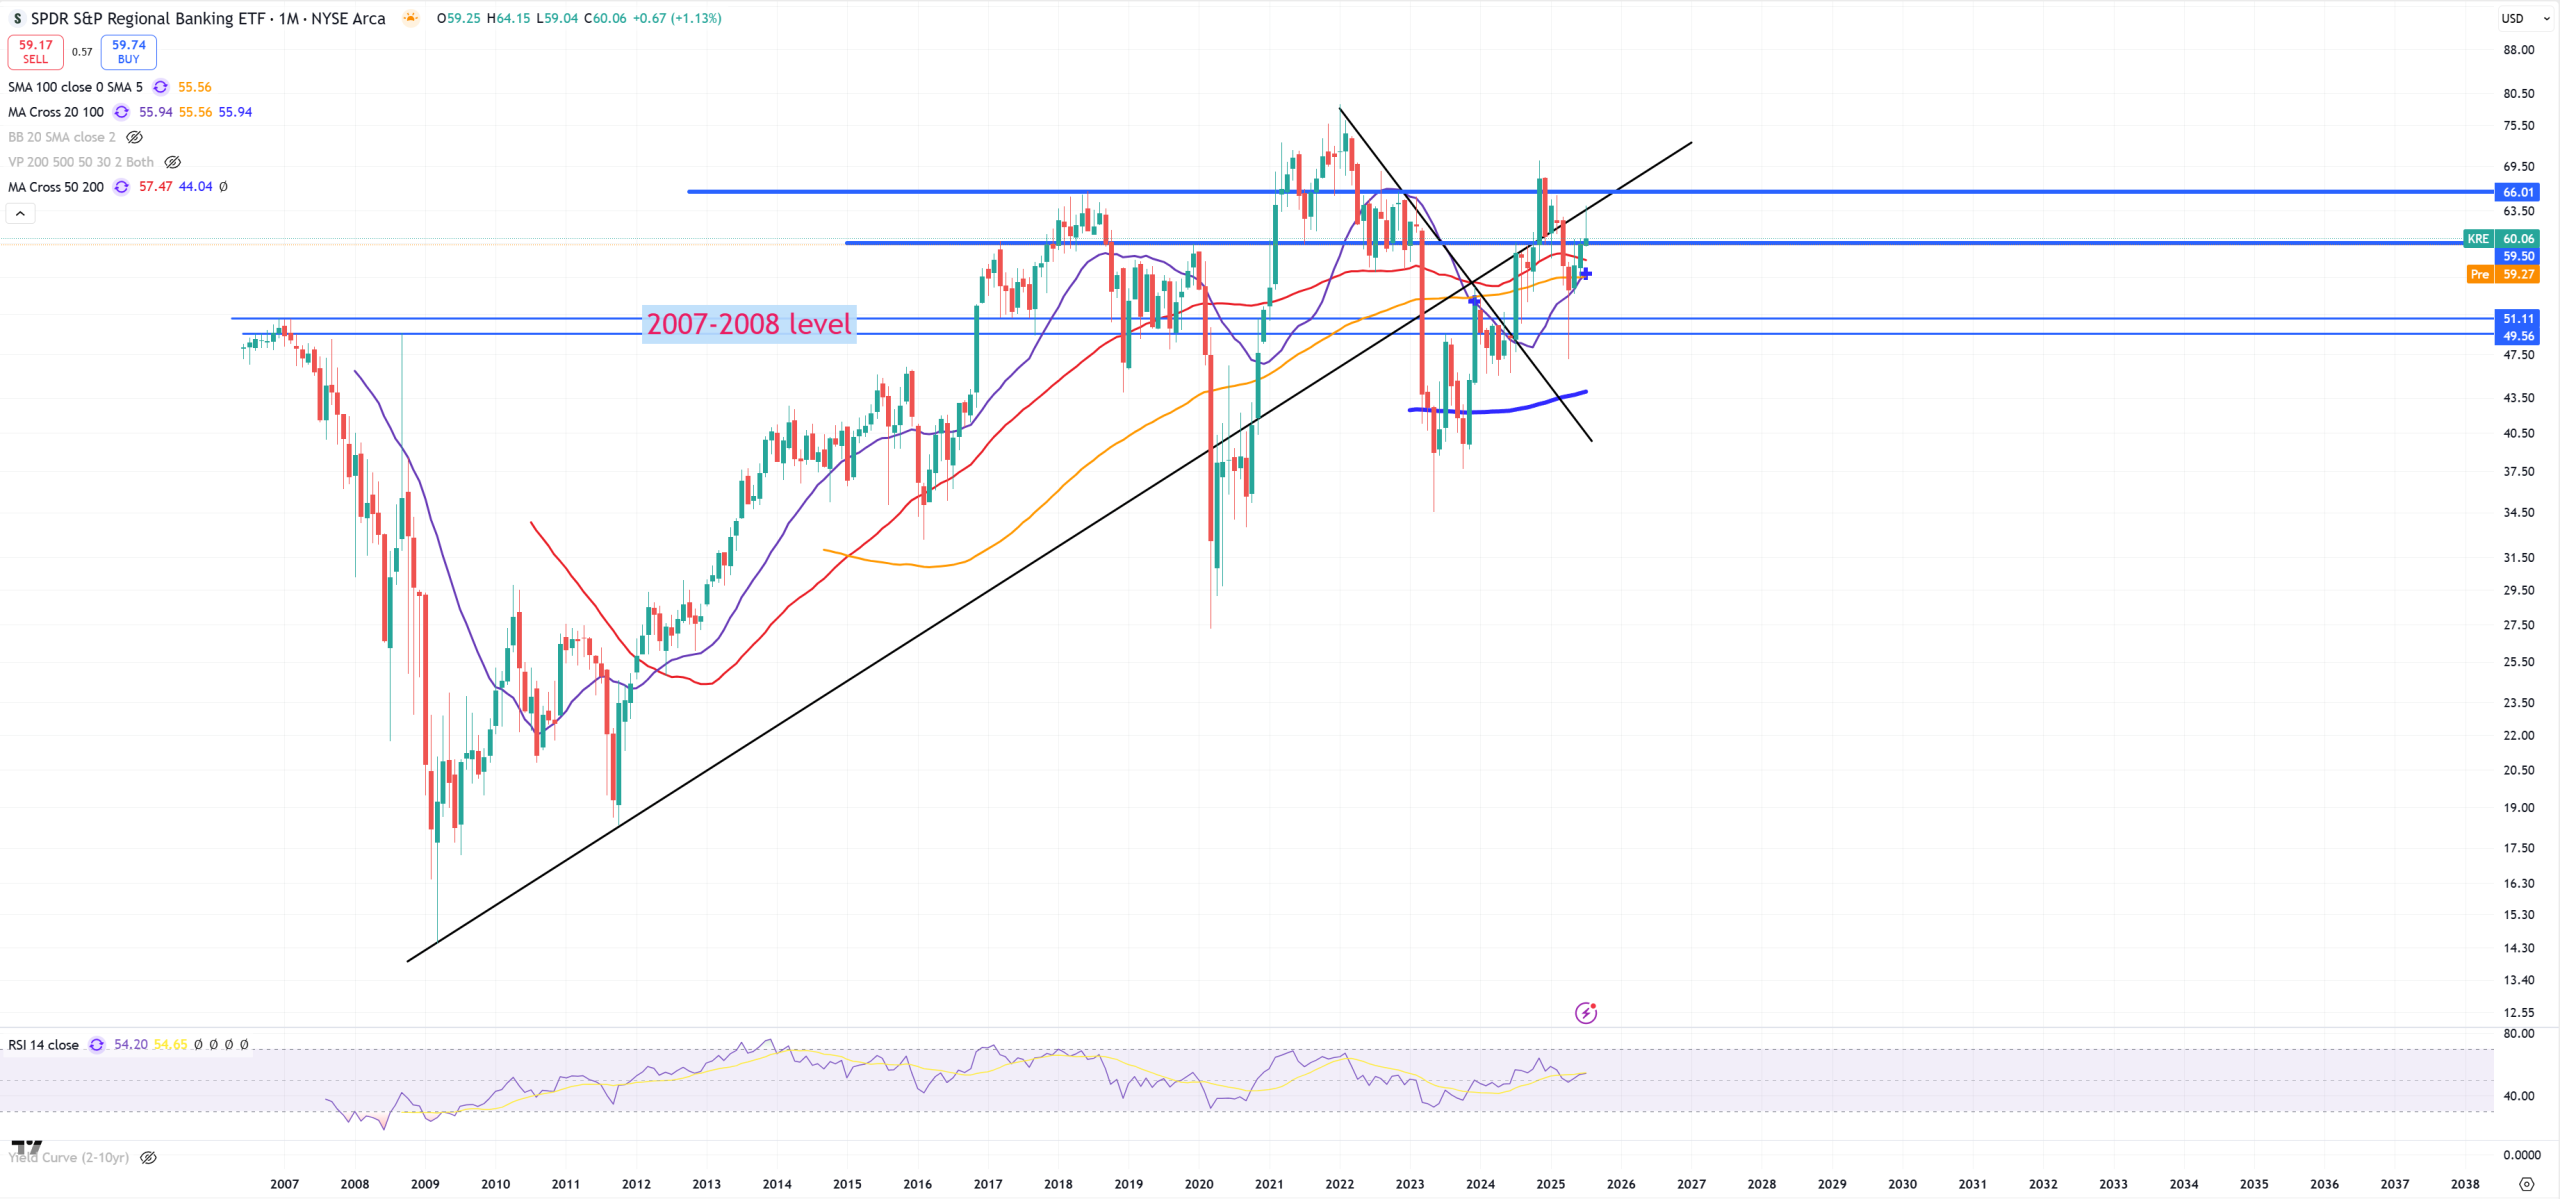
KRE – Regional Banking looks like to open below January 2020 peak
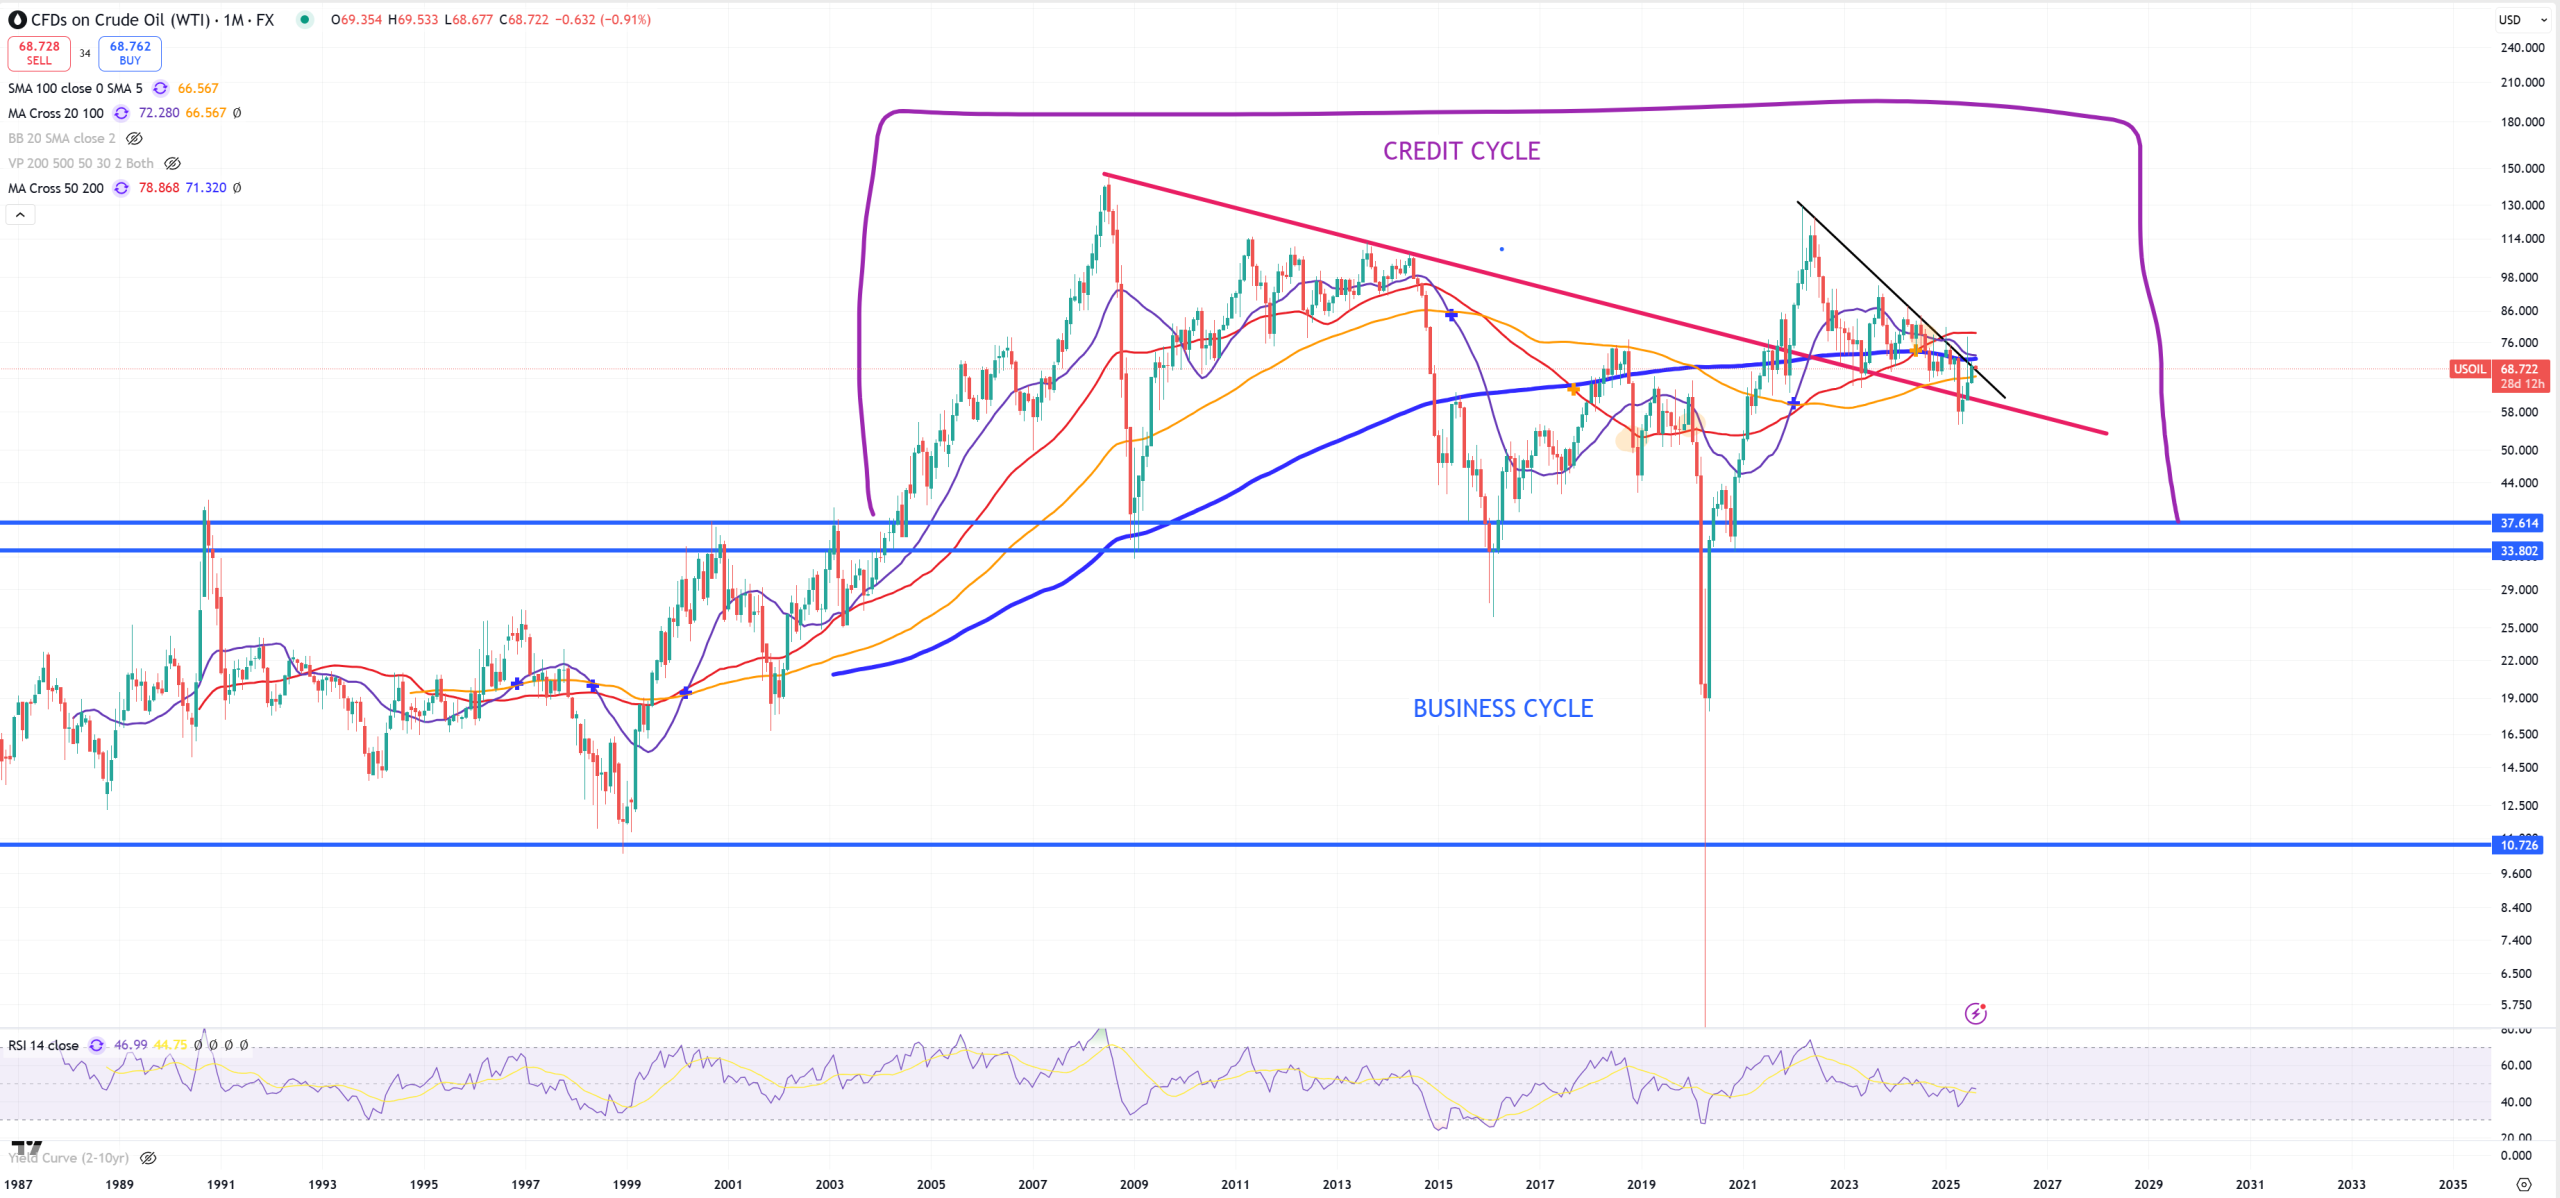
OIL – oil is still trying to play the game, until red trend line will be broken. Below all key (M)MAs except yellow (M)MA100
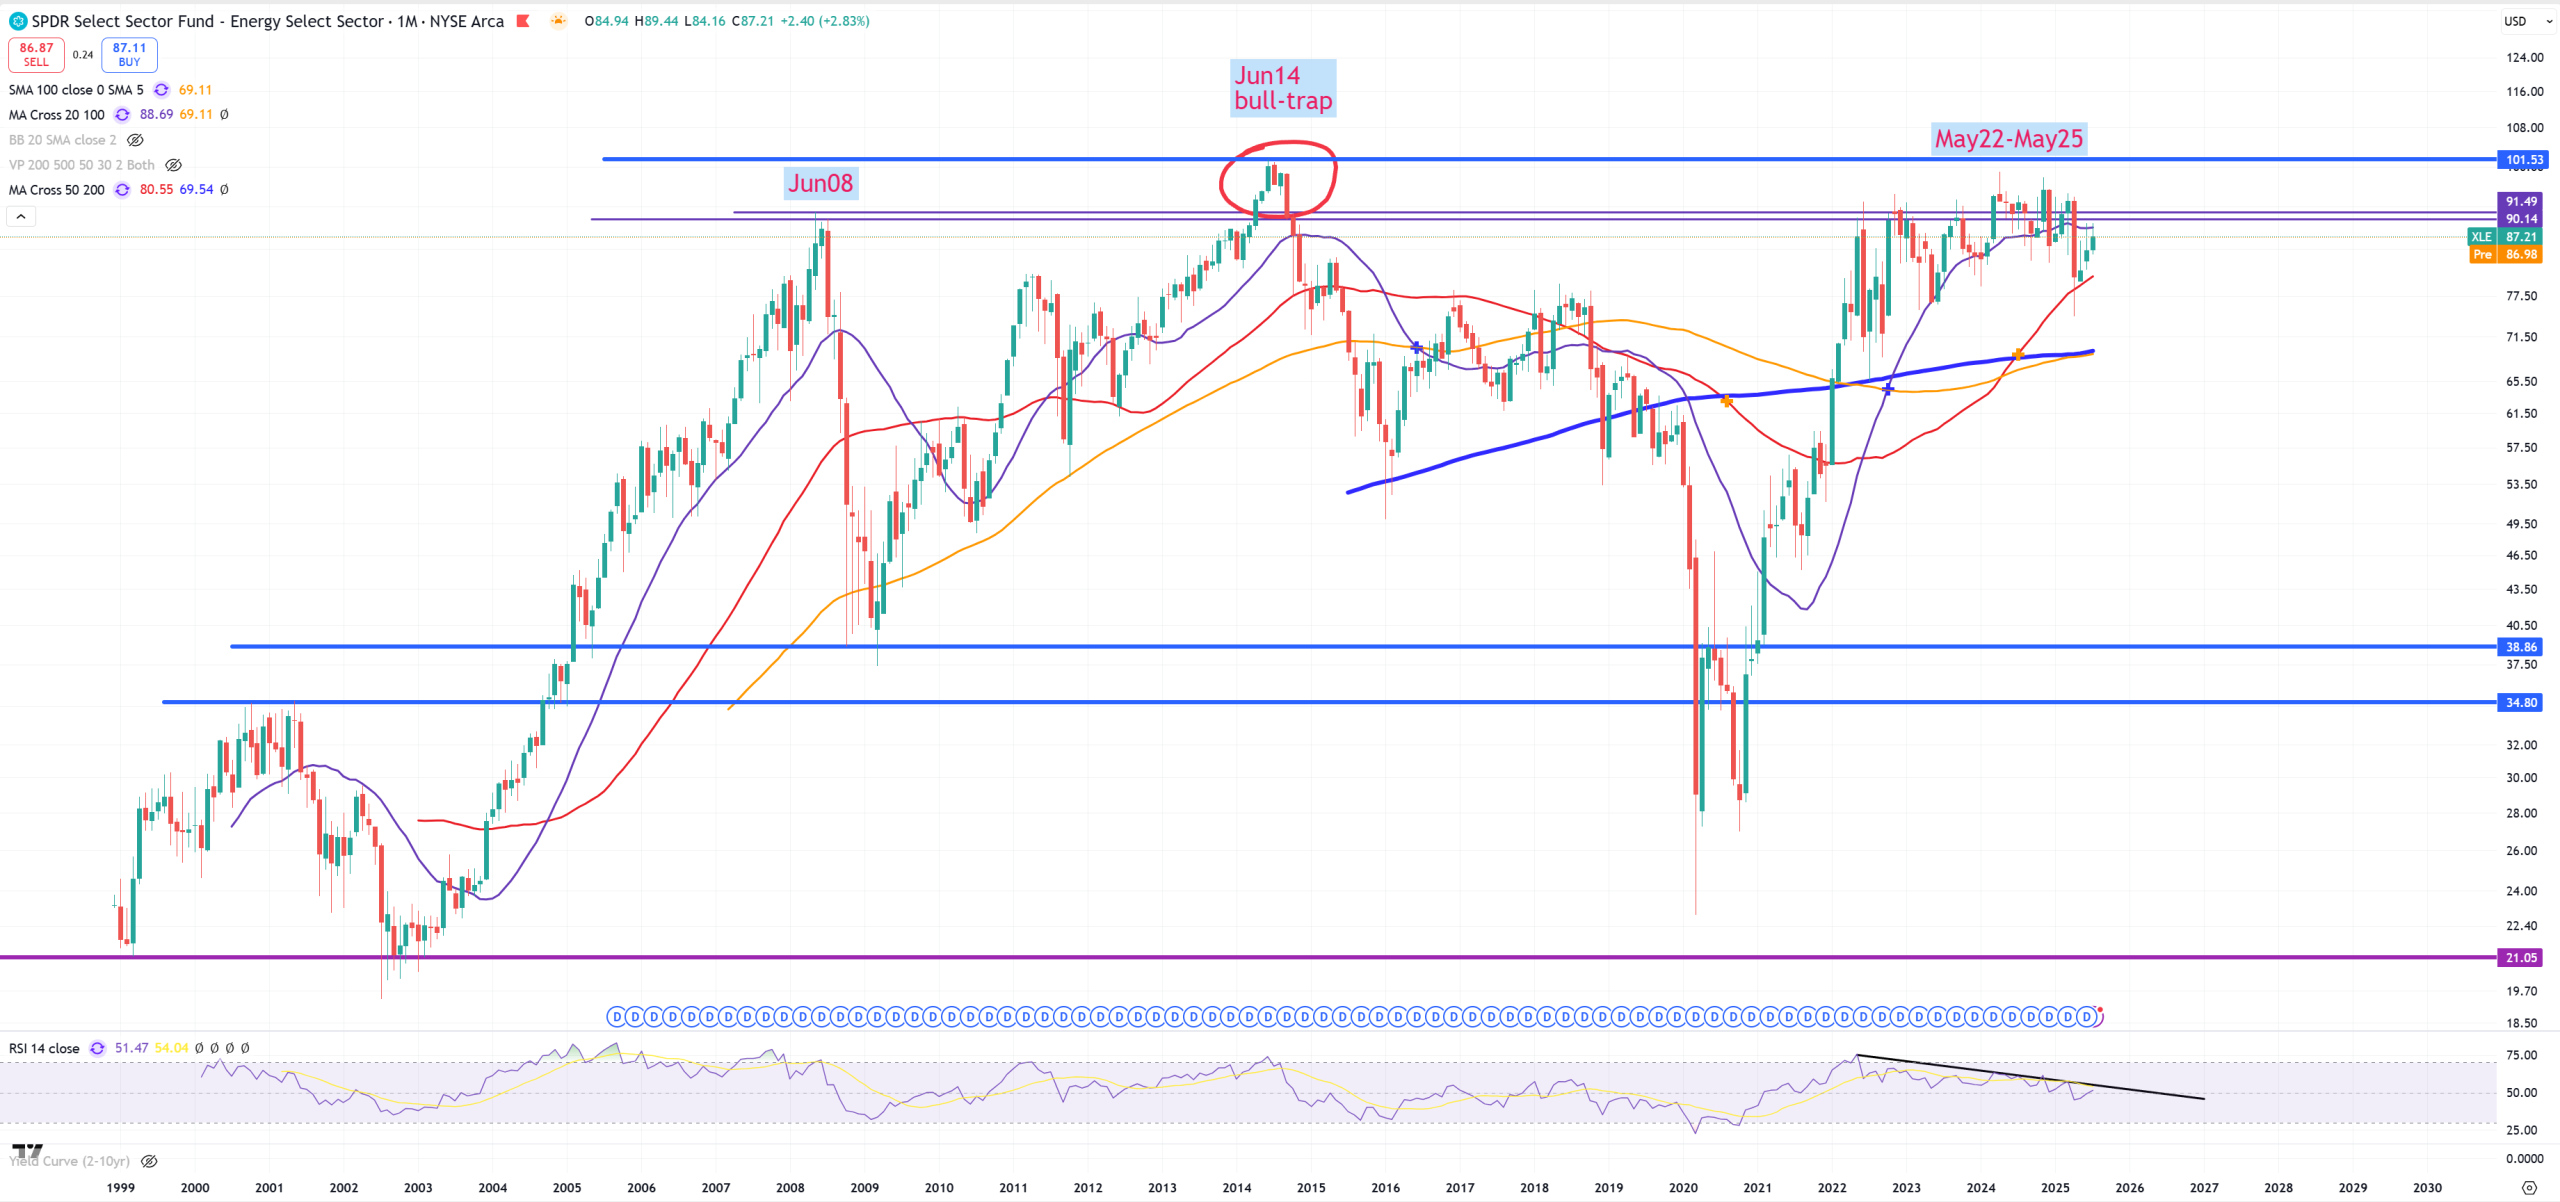
XLE – 3 years banking towards its June 2008 resistance
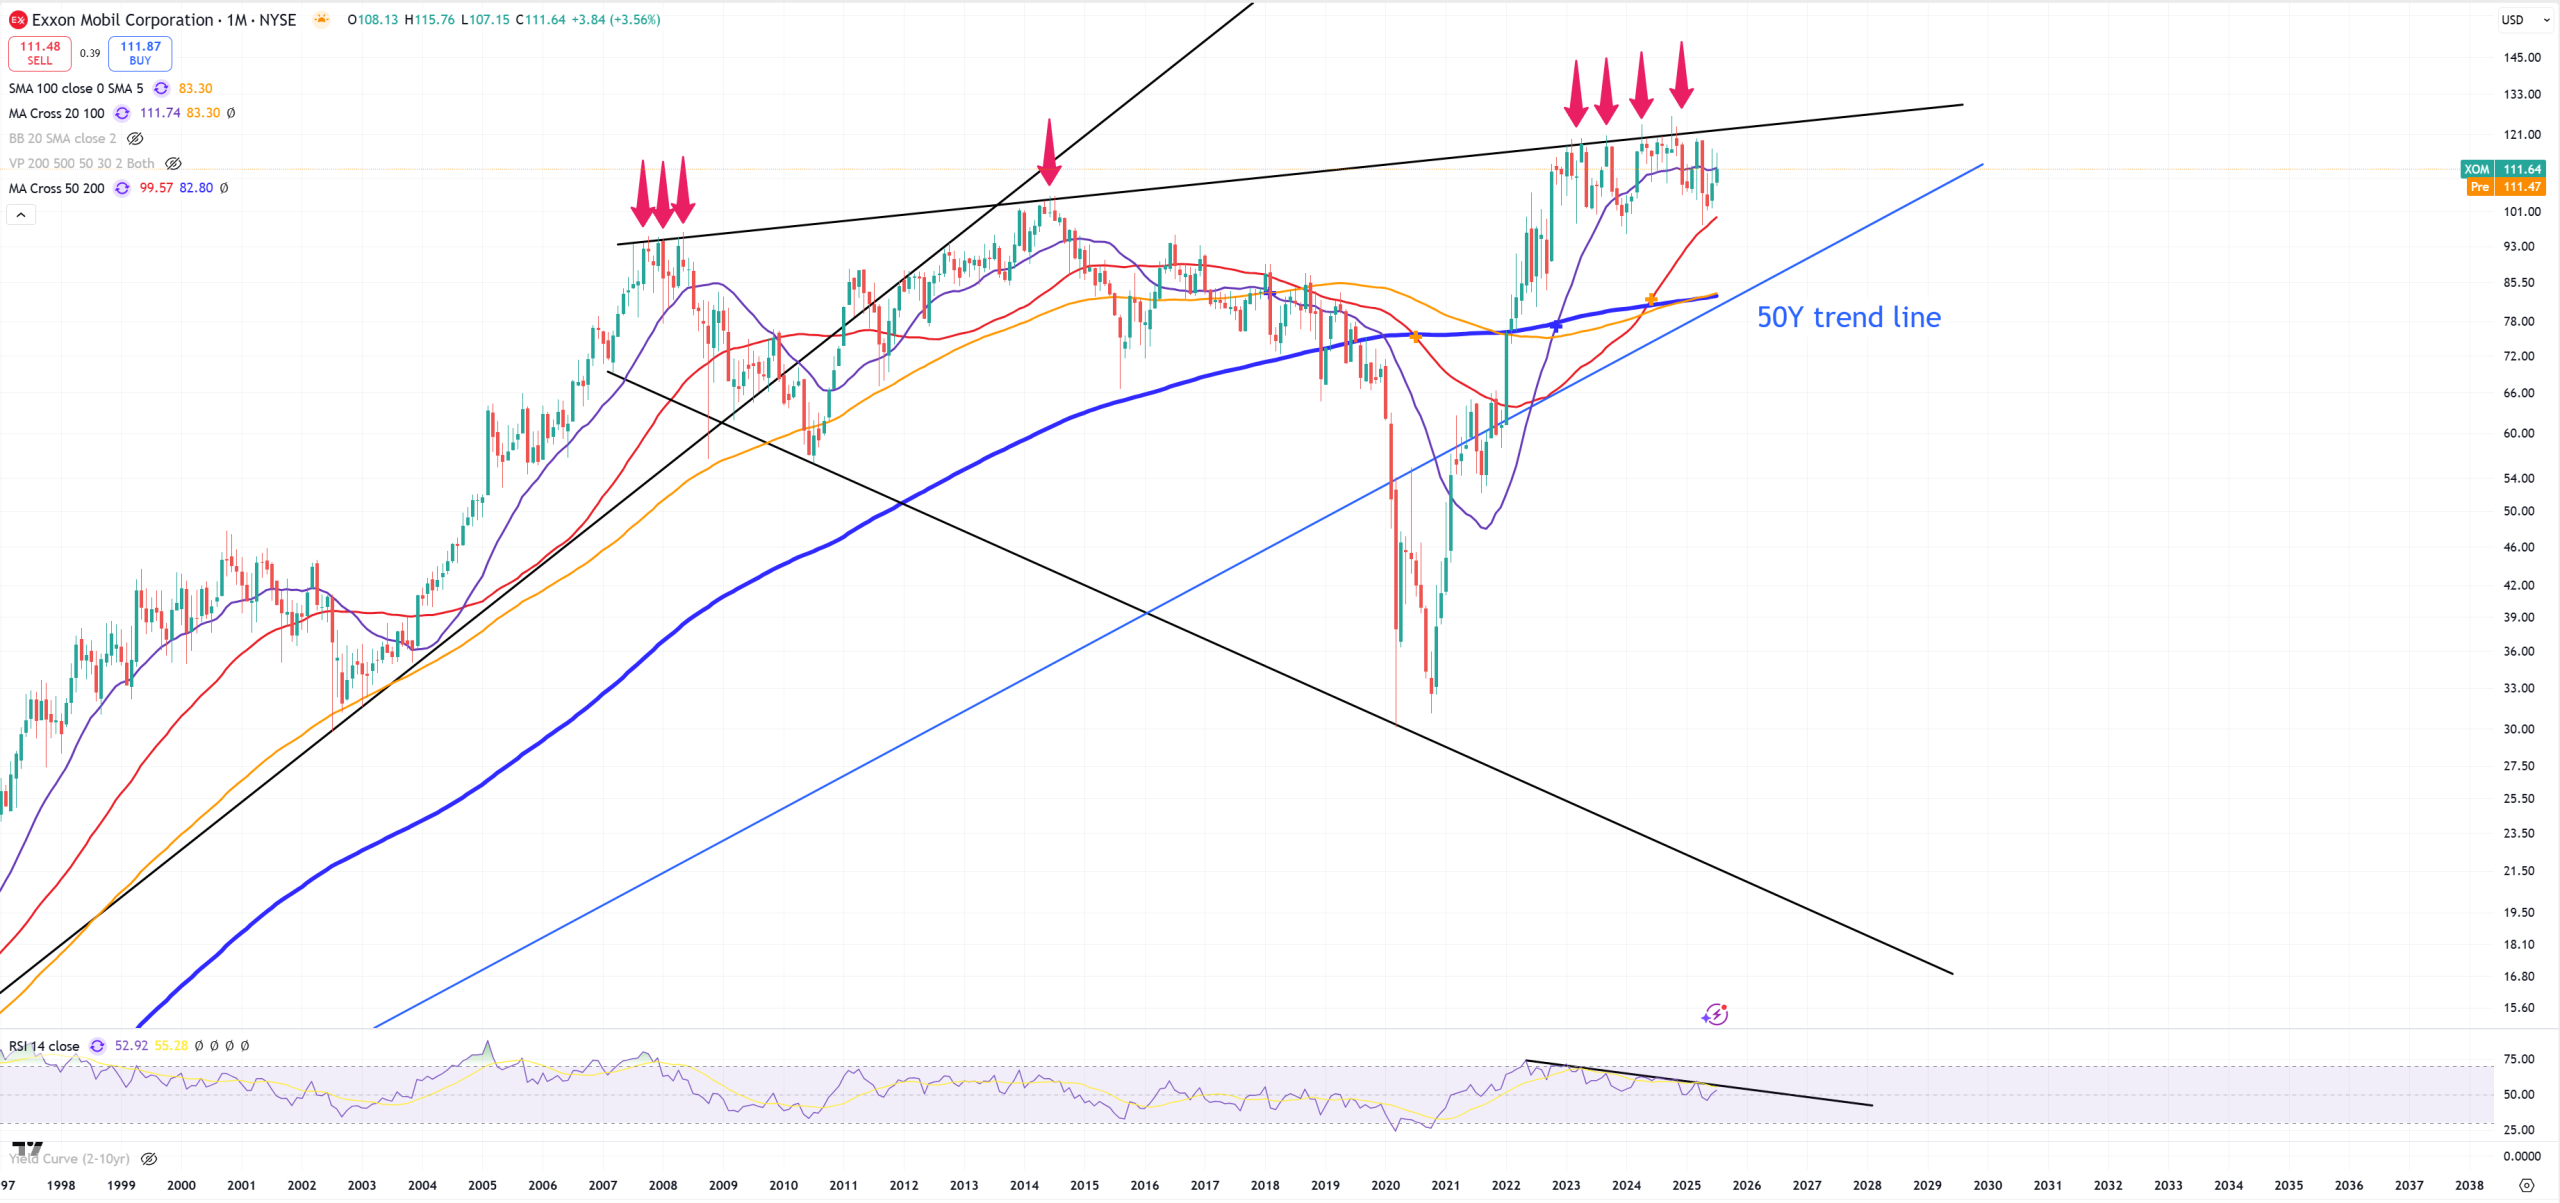
XOM – same story, megaphone pattern which can’t be broken – takes ages.
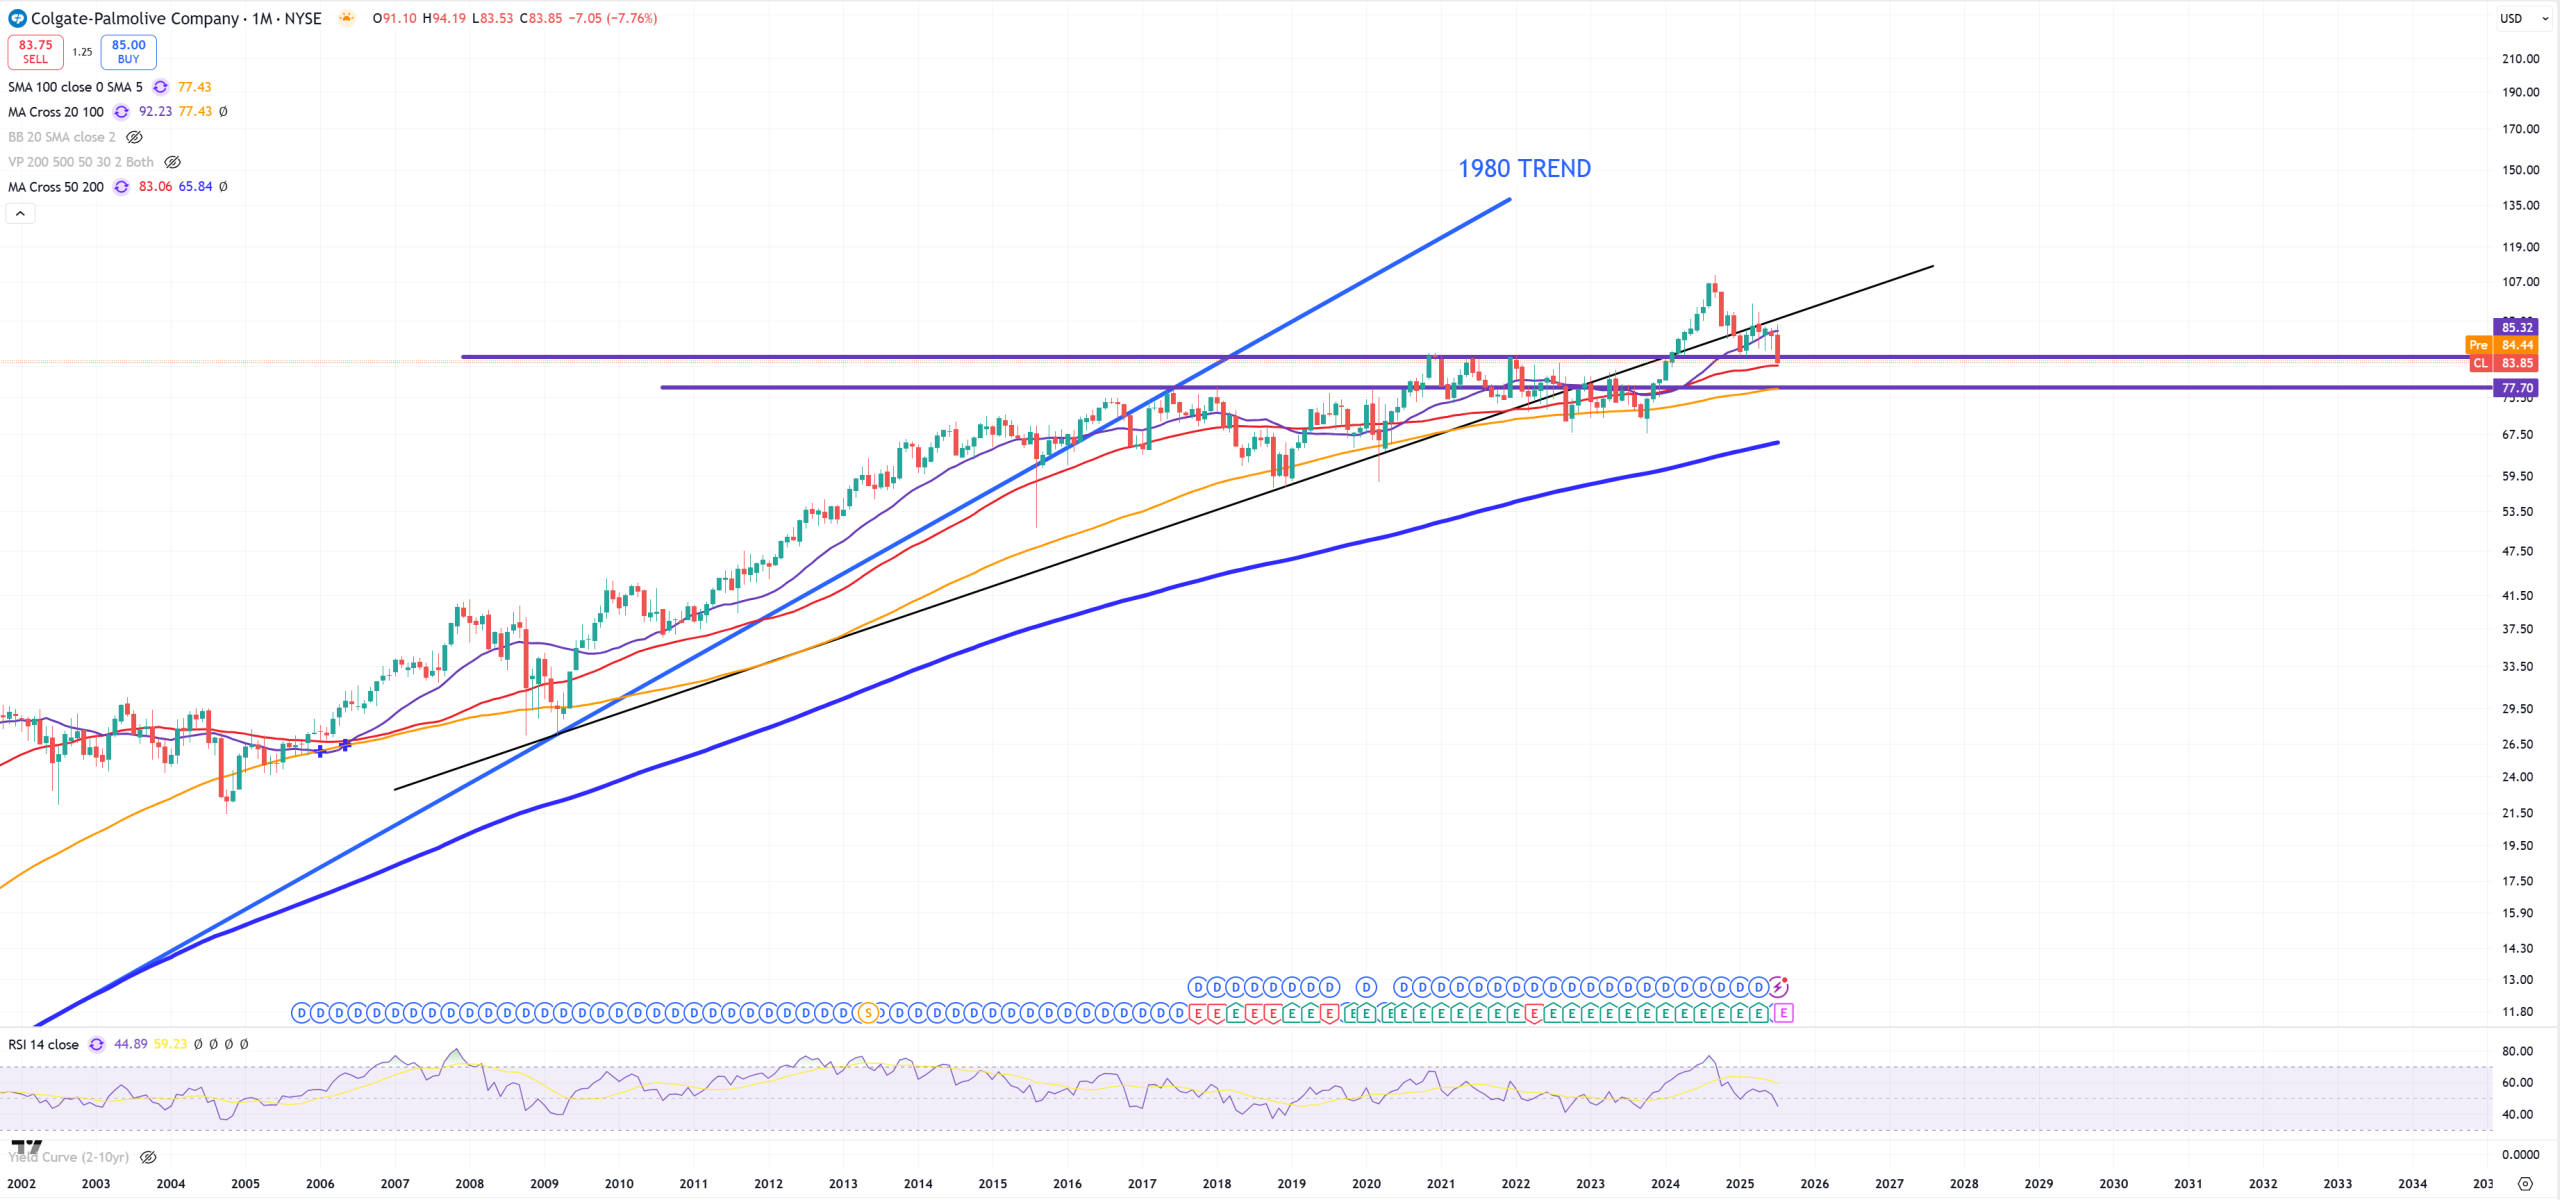
CL – Colgate – massive spike above 2020-2021-2022 resistance level, but now it failed and reversed as a massive bull-trap.
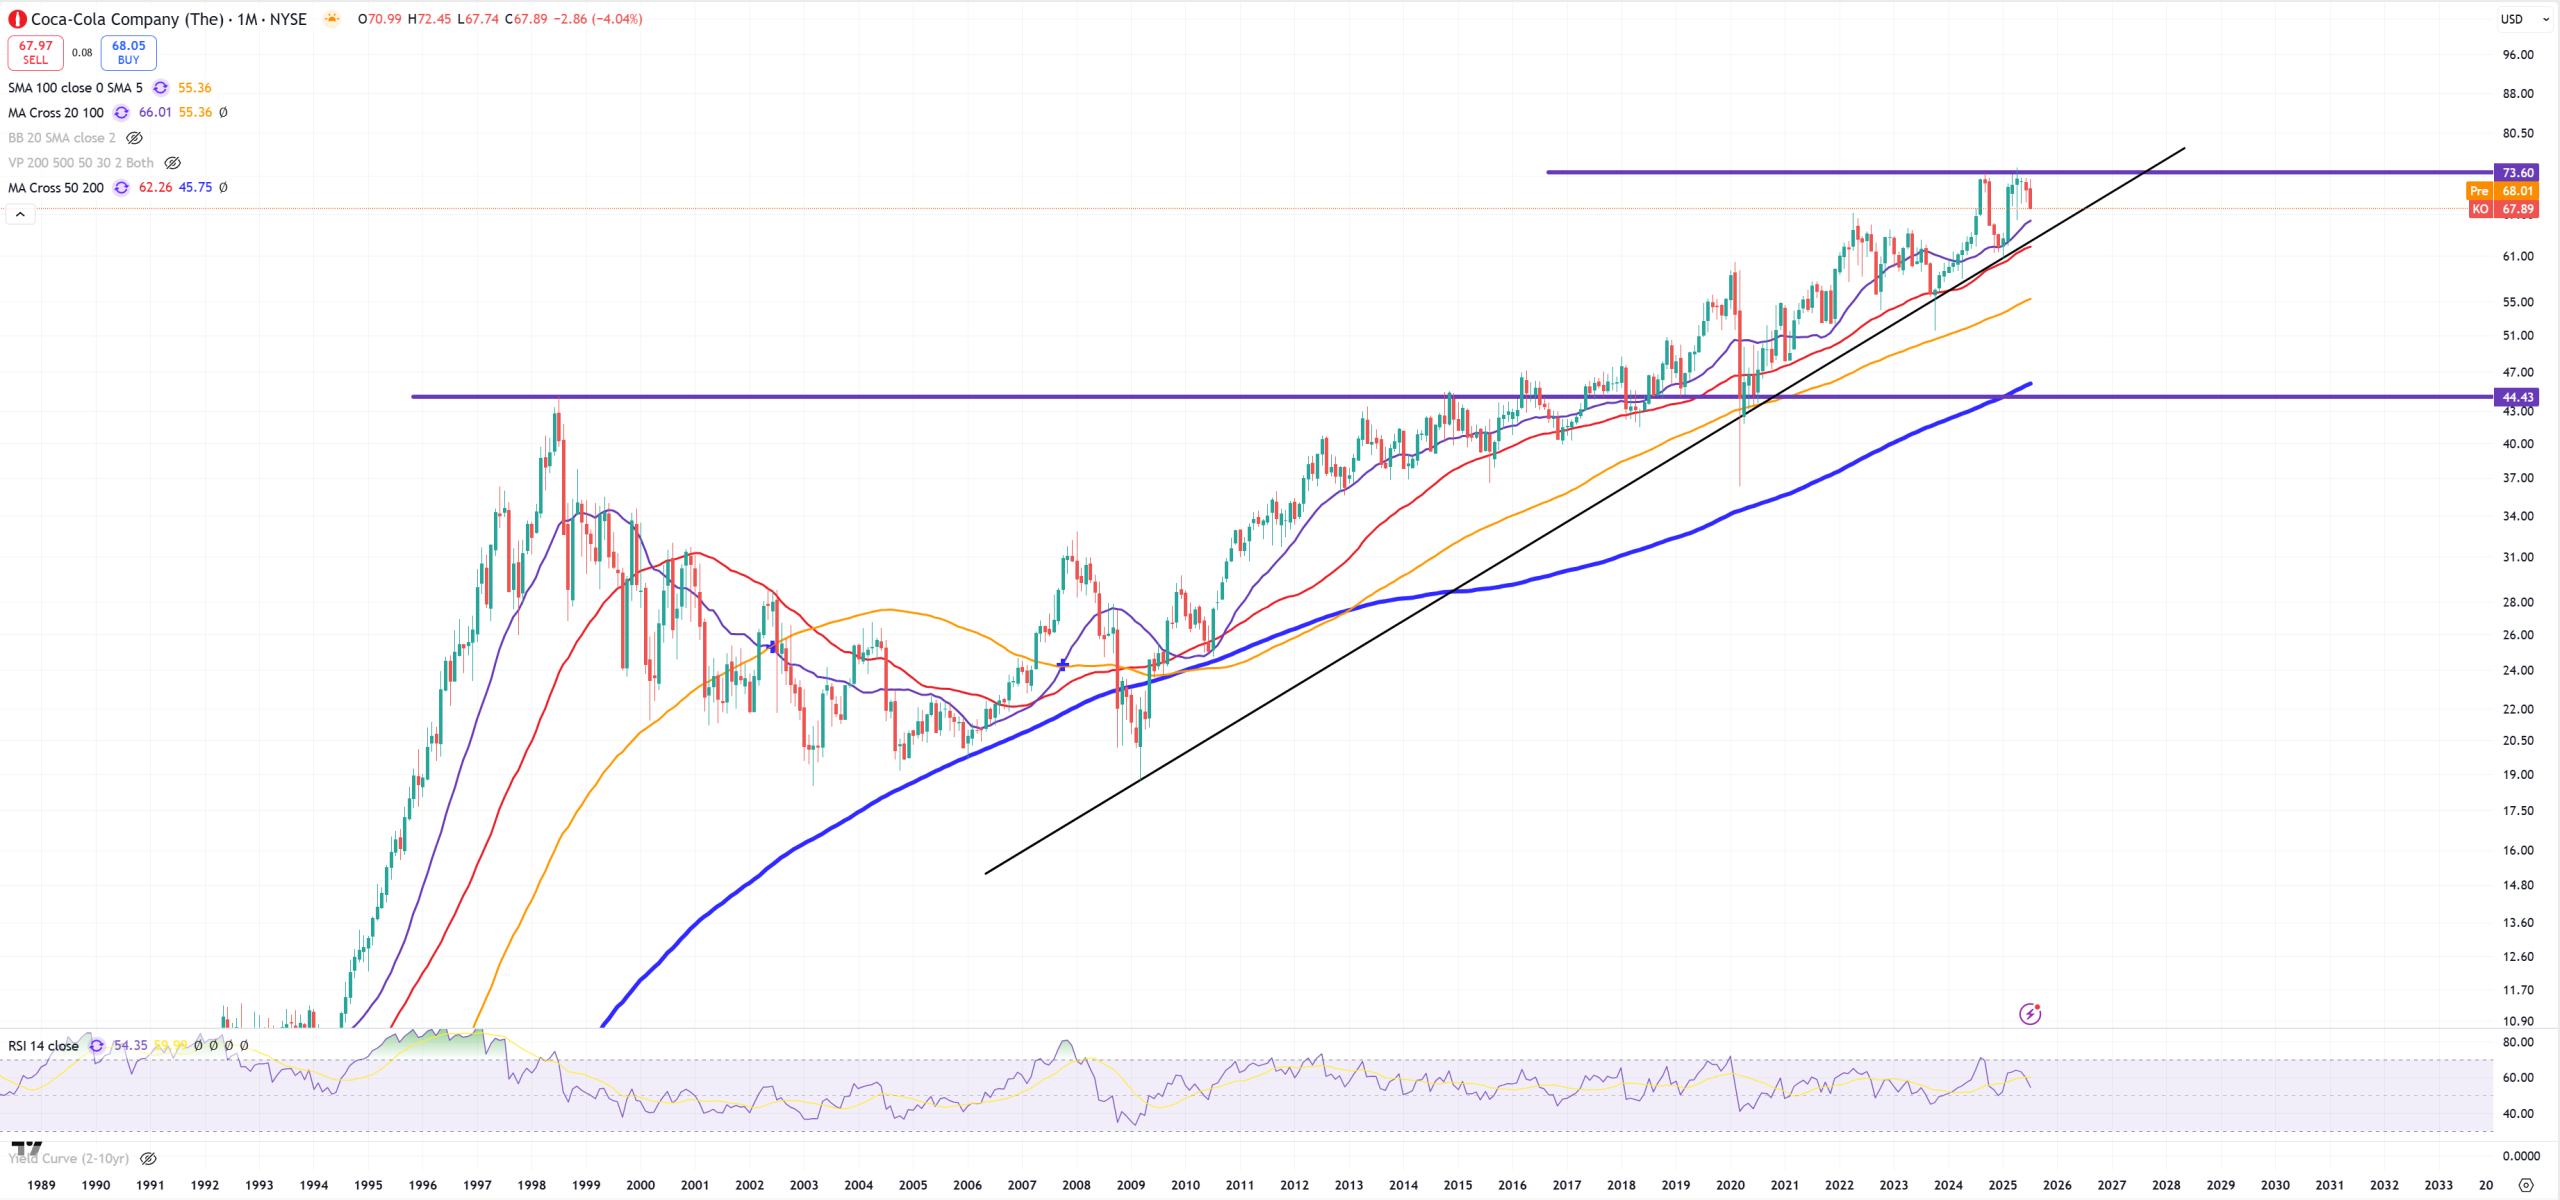
KO – Coca-Cola – massive double-top here
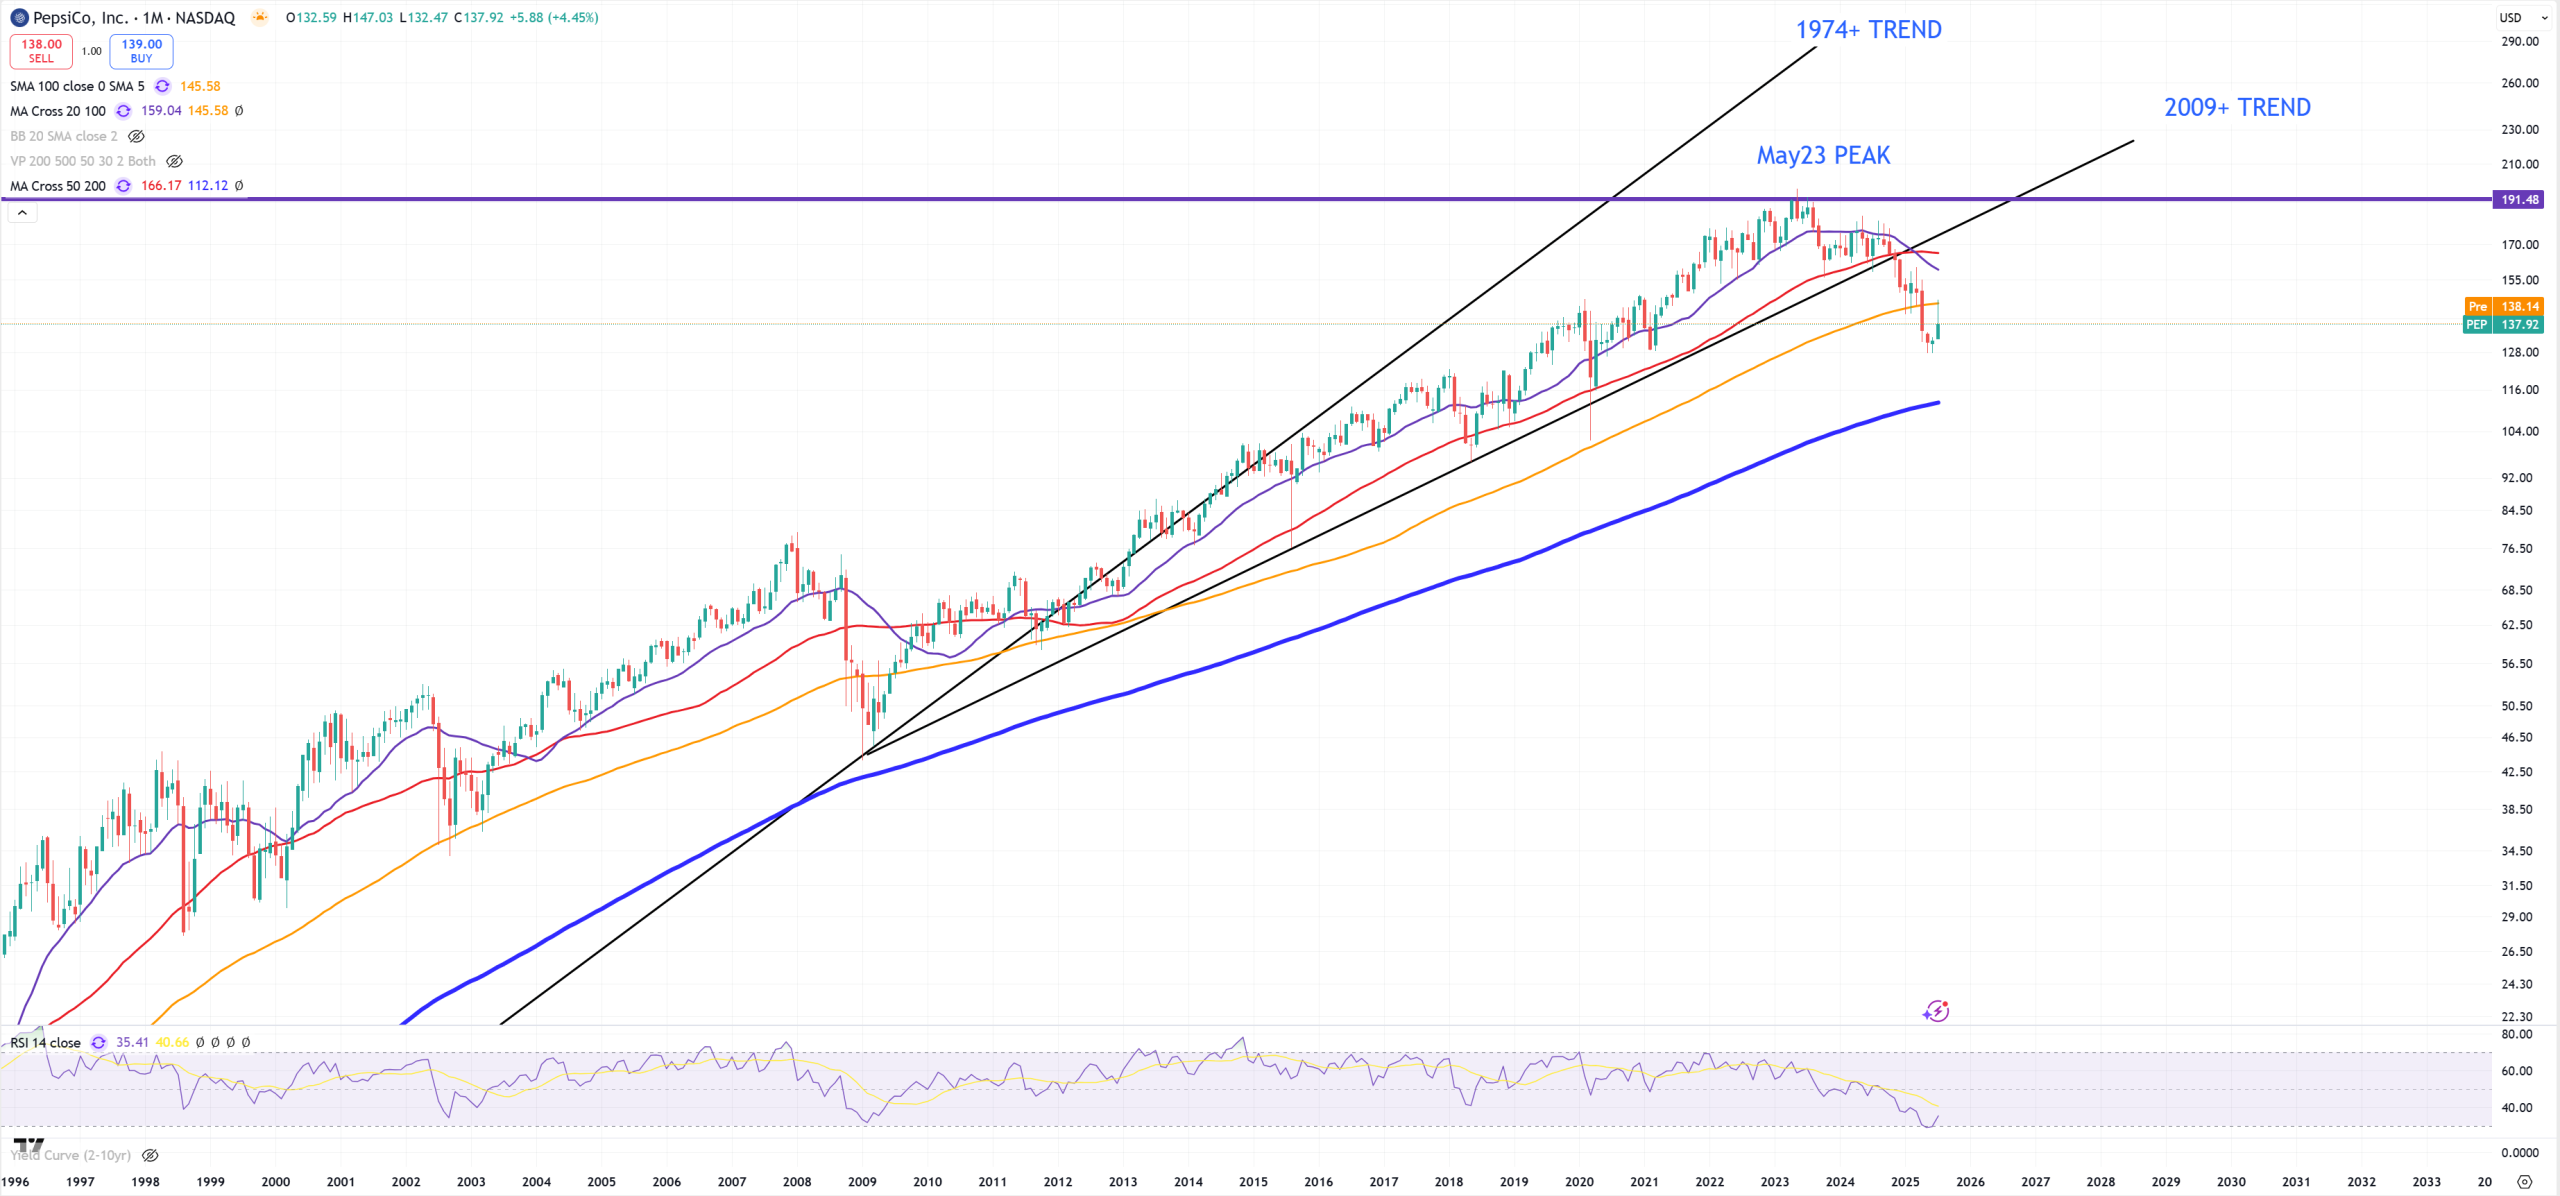
PEP – Pepsico plays totally different way than KO, you clearly see massive 2009+ trend break, peak in May 2023 and now retesting yellow (M)MA100 and rejection = bad things are going to happen. Somebody is lying KO or PEP, I think KO is way way way too high.
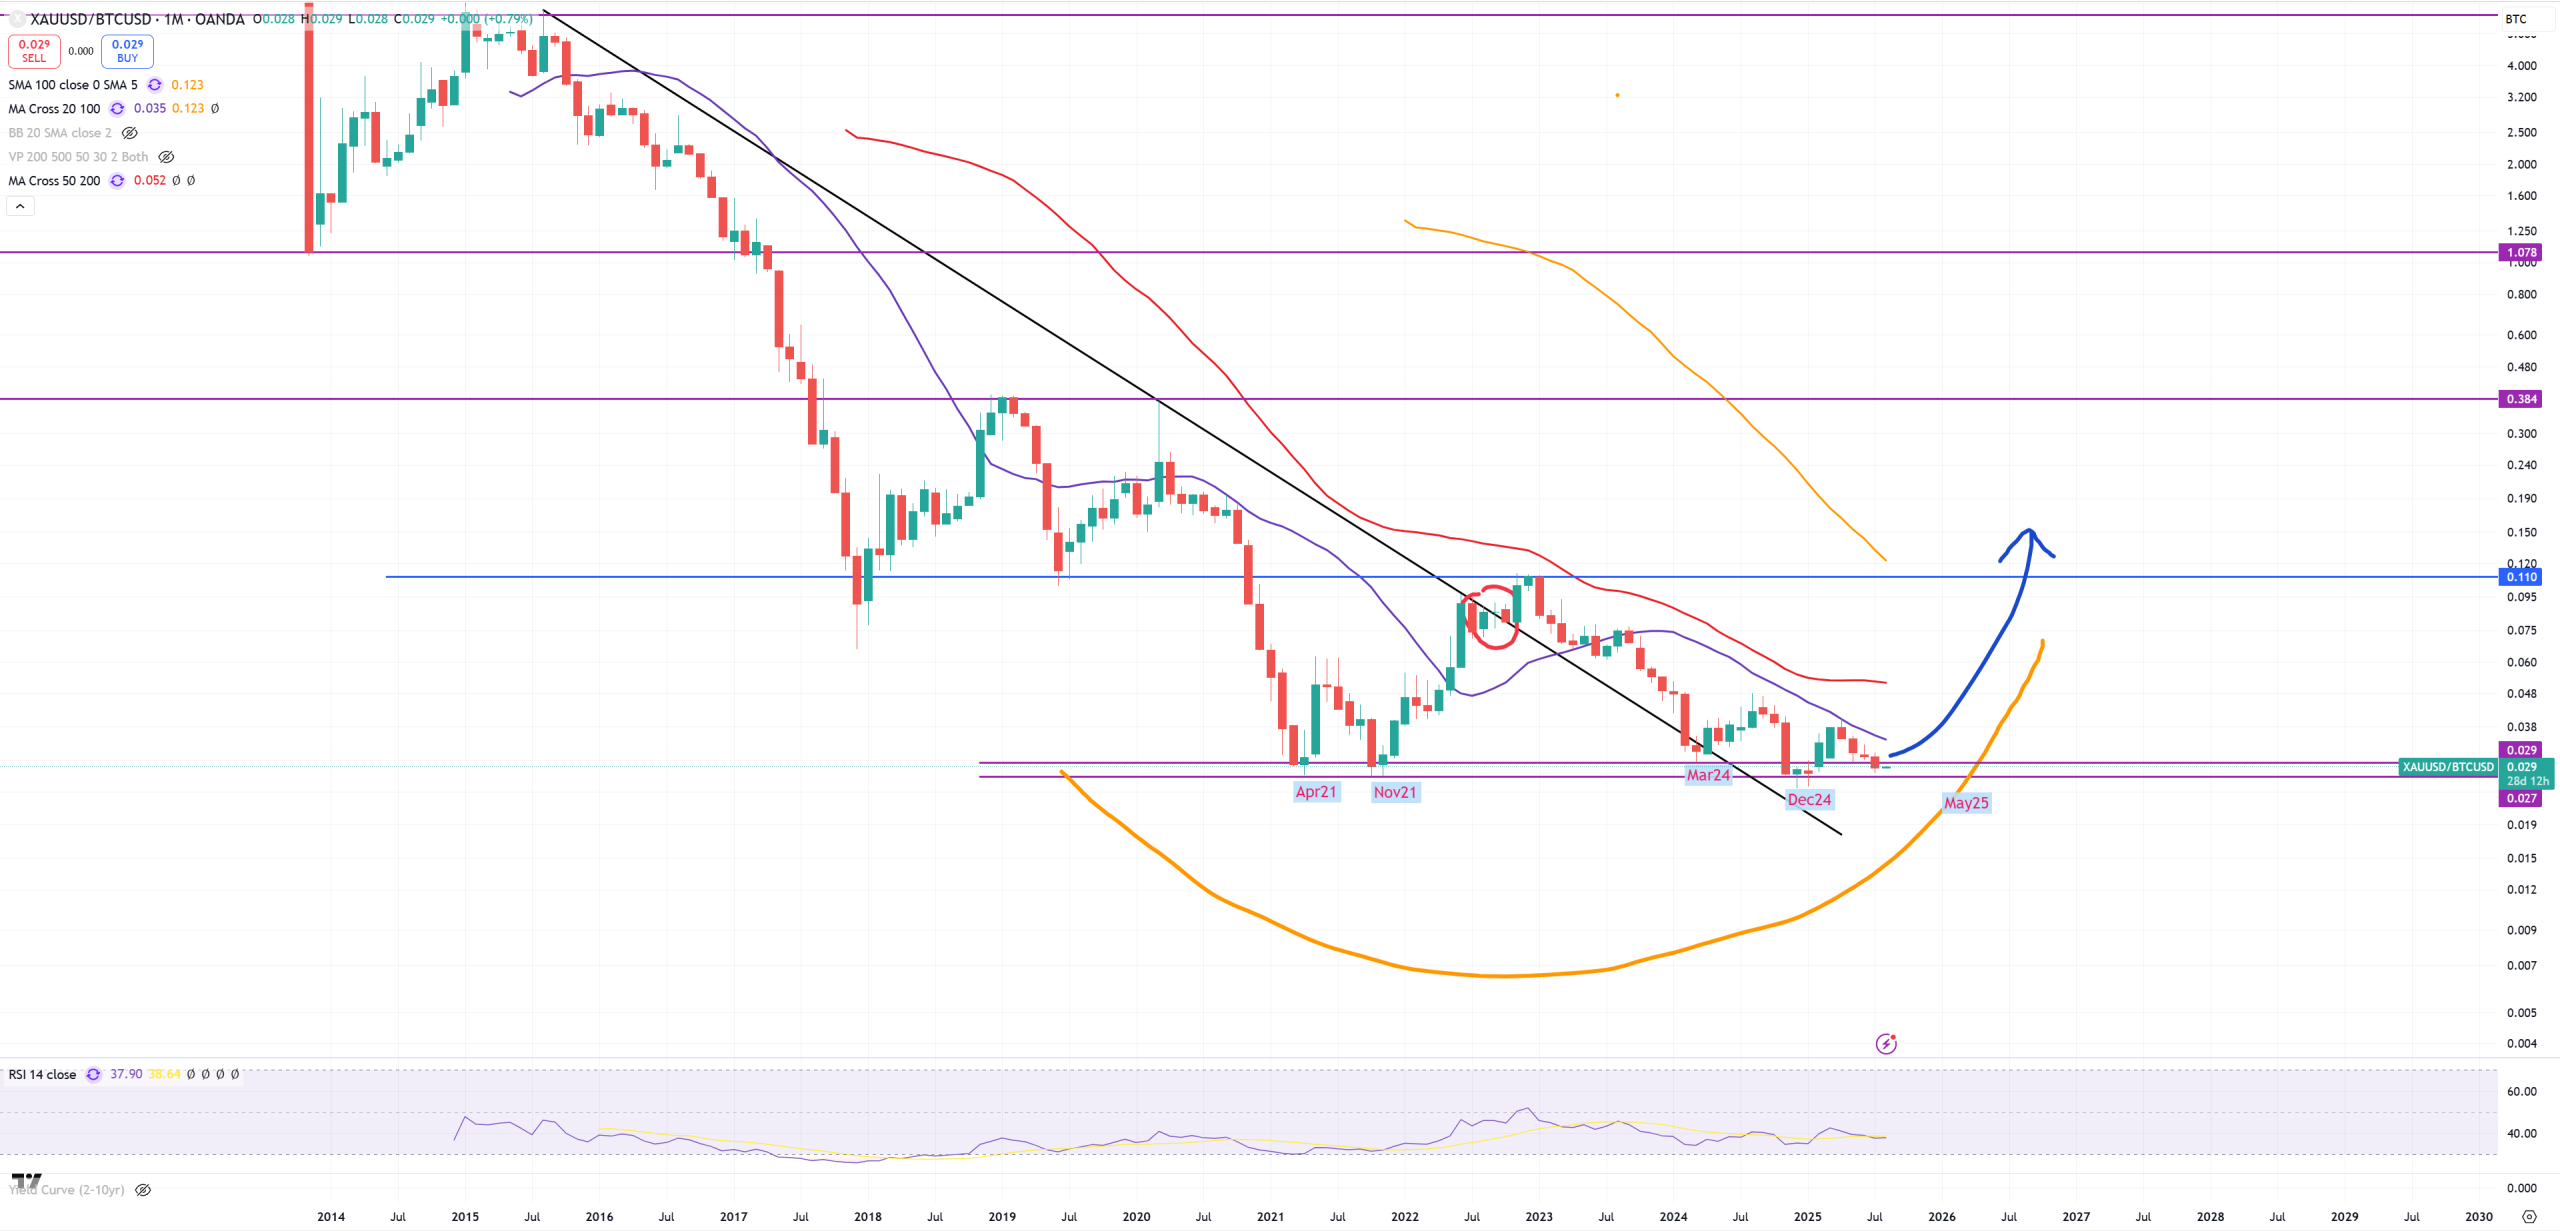
BTC/GOLD – so let’s start with crypto part, but as you know #1 chart I’m watching is BTC/GOLD, if this support holds = BTC or crypto in general peaks
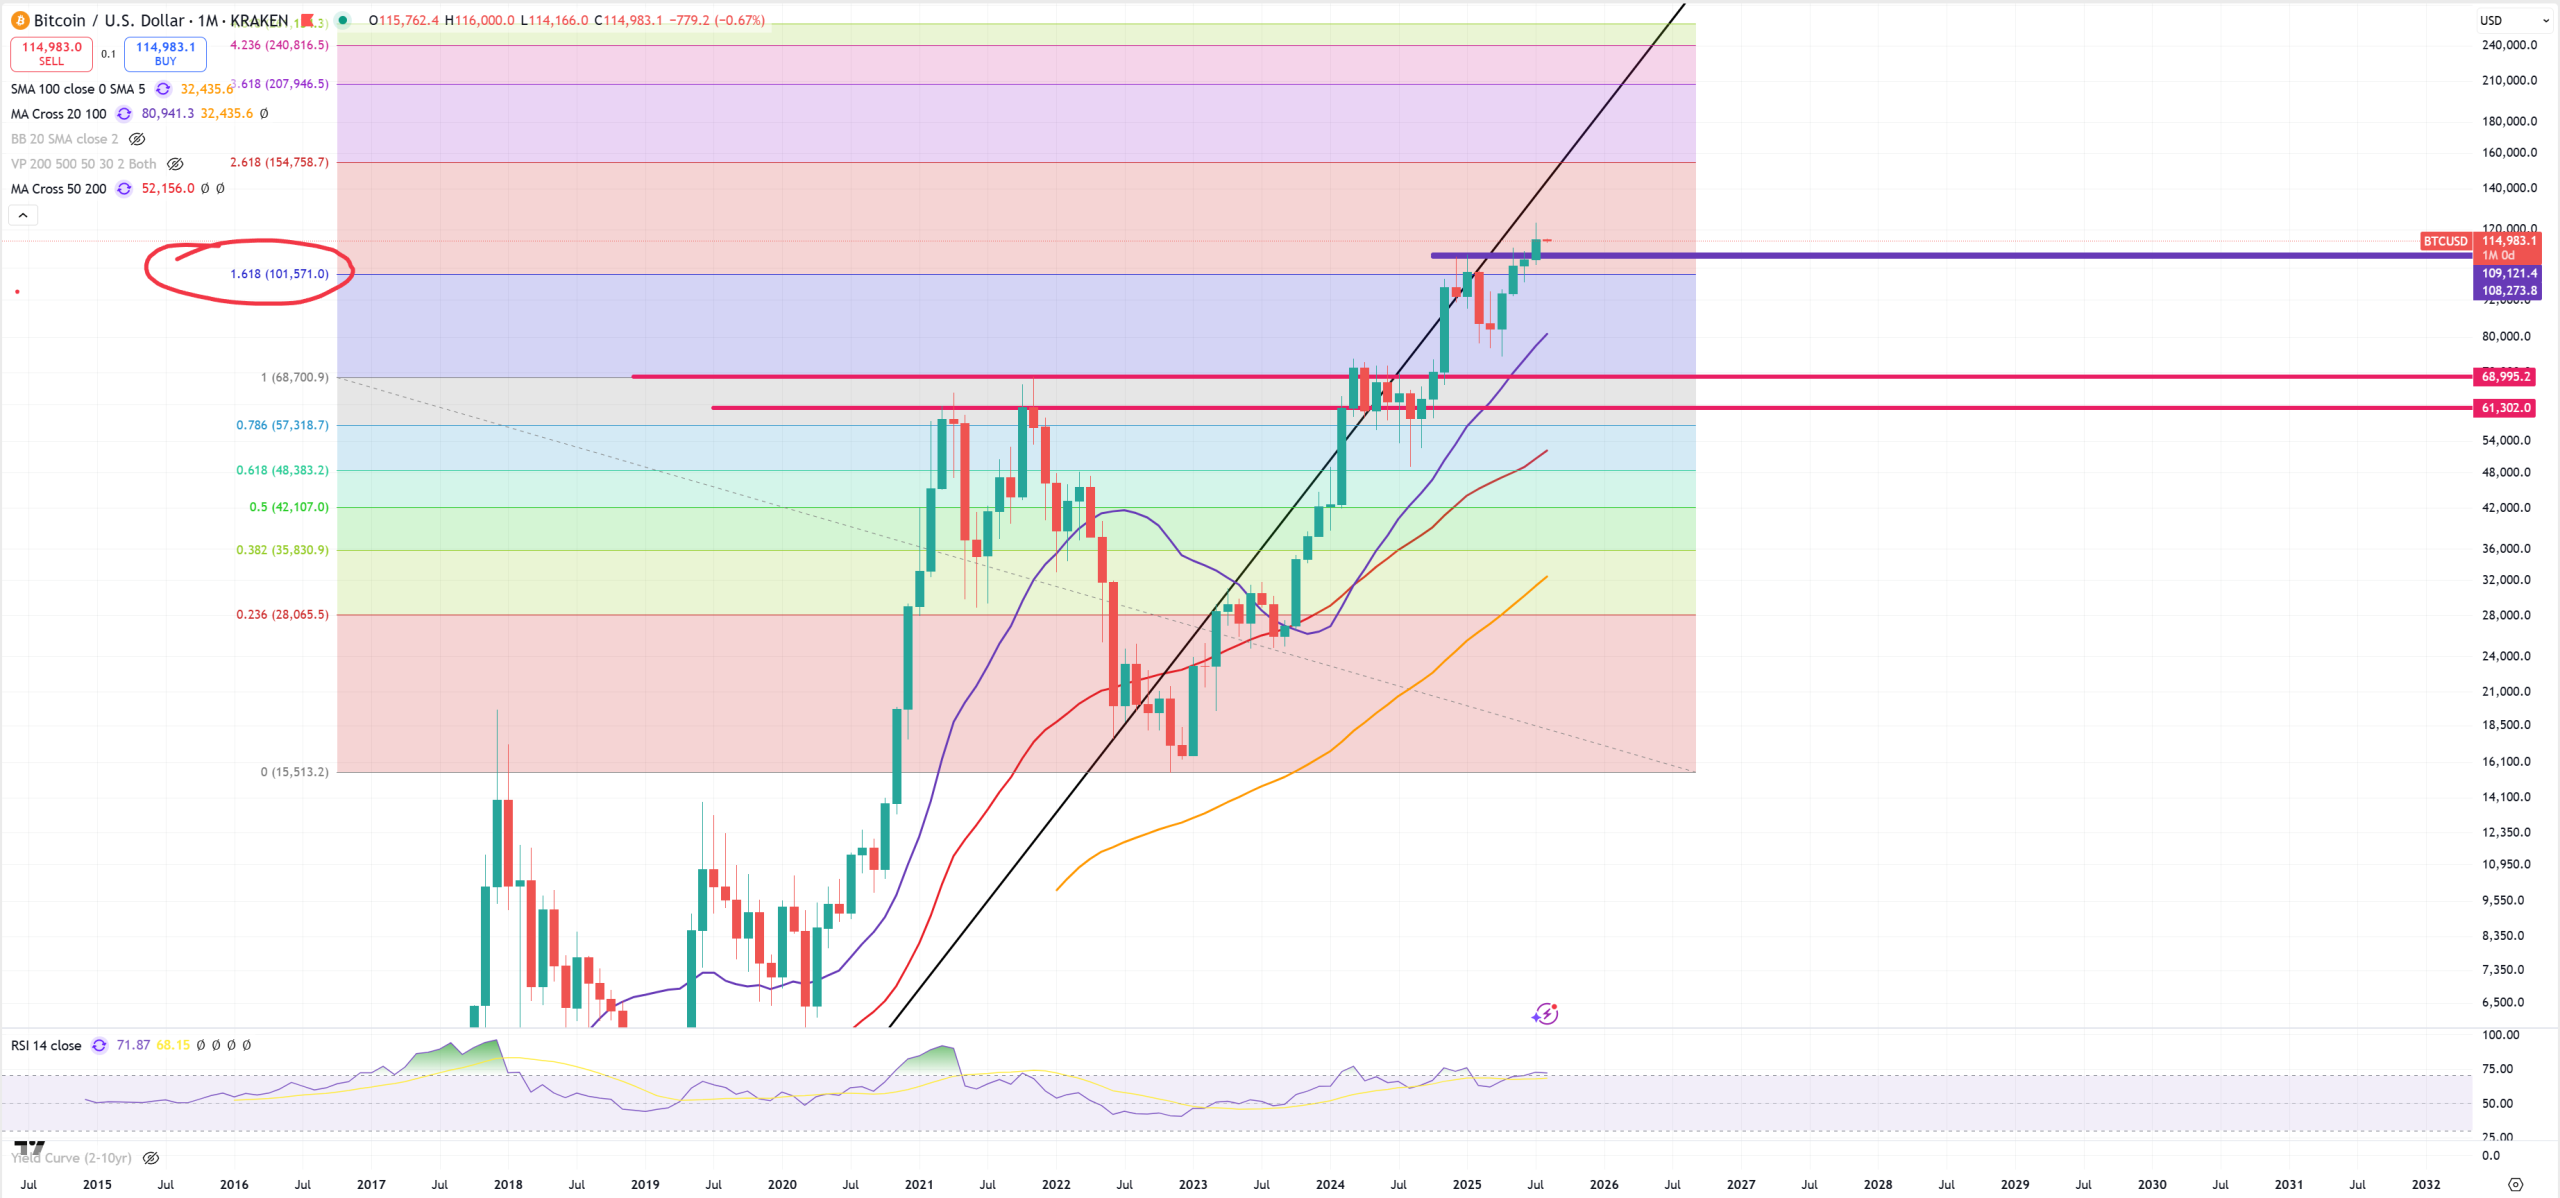
BTC – Bitcoin – so far 109k$ is a massive resistance, and BTC is broken above this level, but if BTC/GOLD will hold this support I expect this move above this level as a massive bull-trap. Consider also a fact that if SPX rejects finally its 1929-2000 trend you can clearly see if BTC is a safe-heaven or a liqudity bullshit which will go lower faster than stocks as old equation tells : BTC = TQQQ (3x leverated Nasdaq).
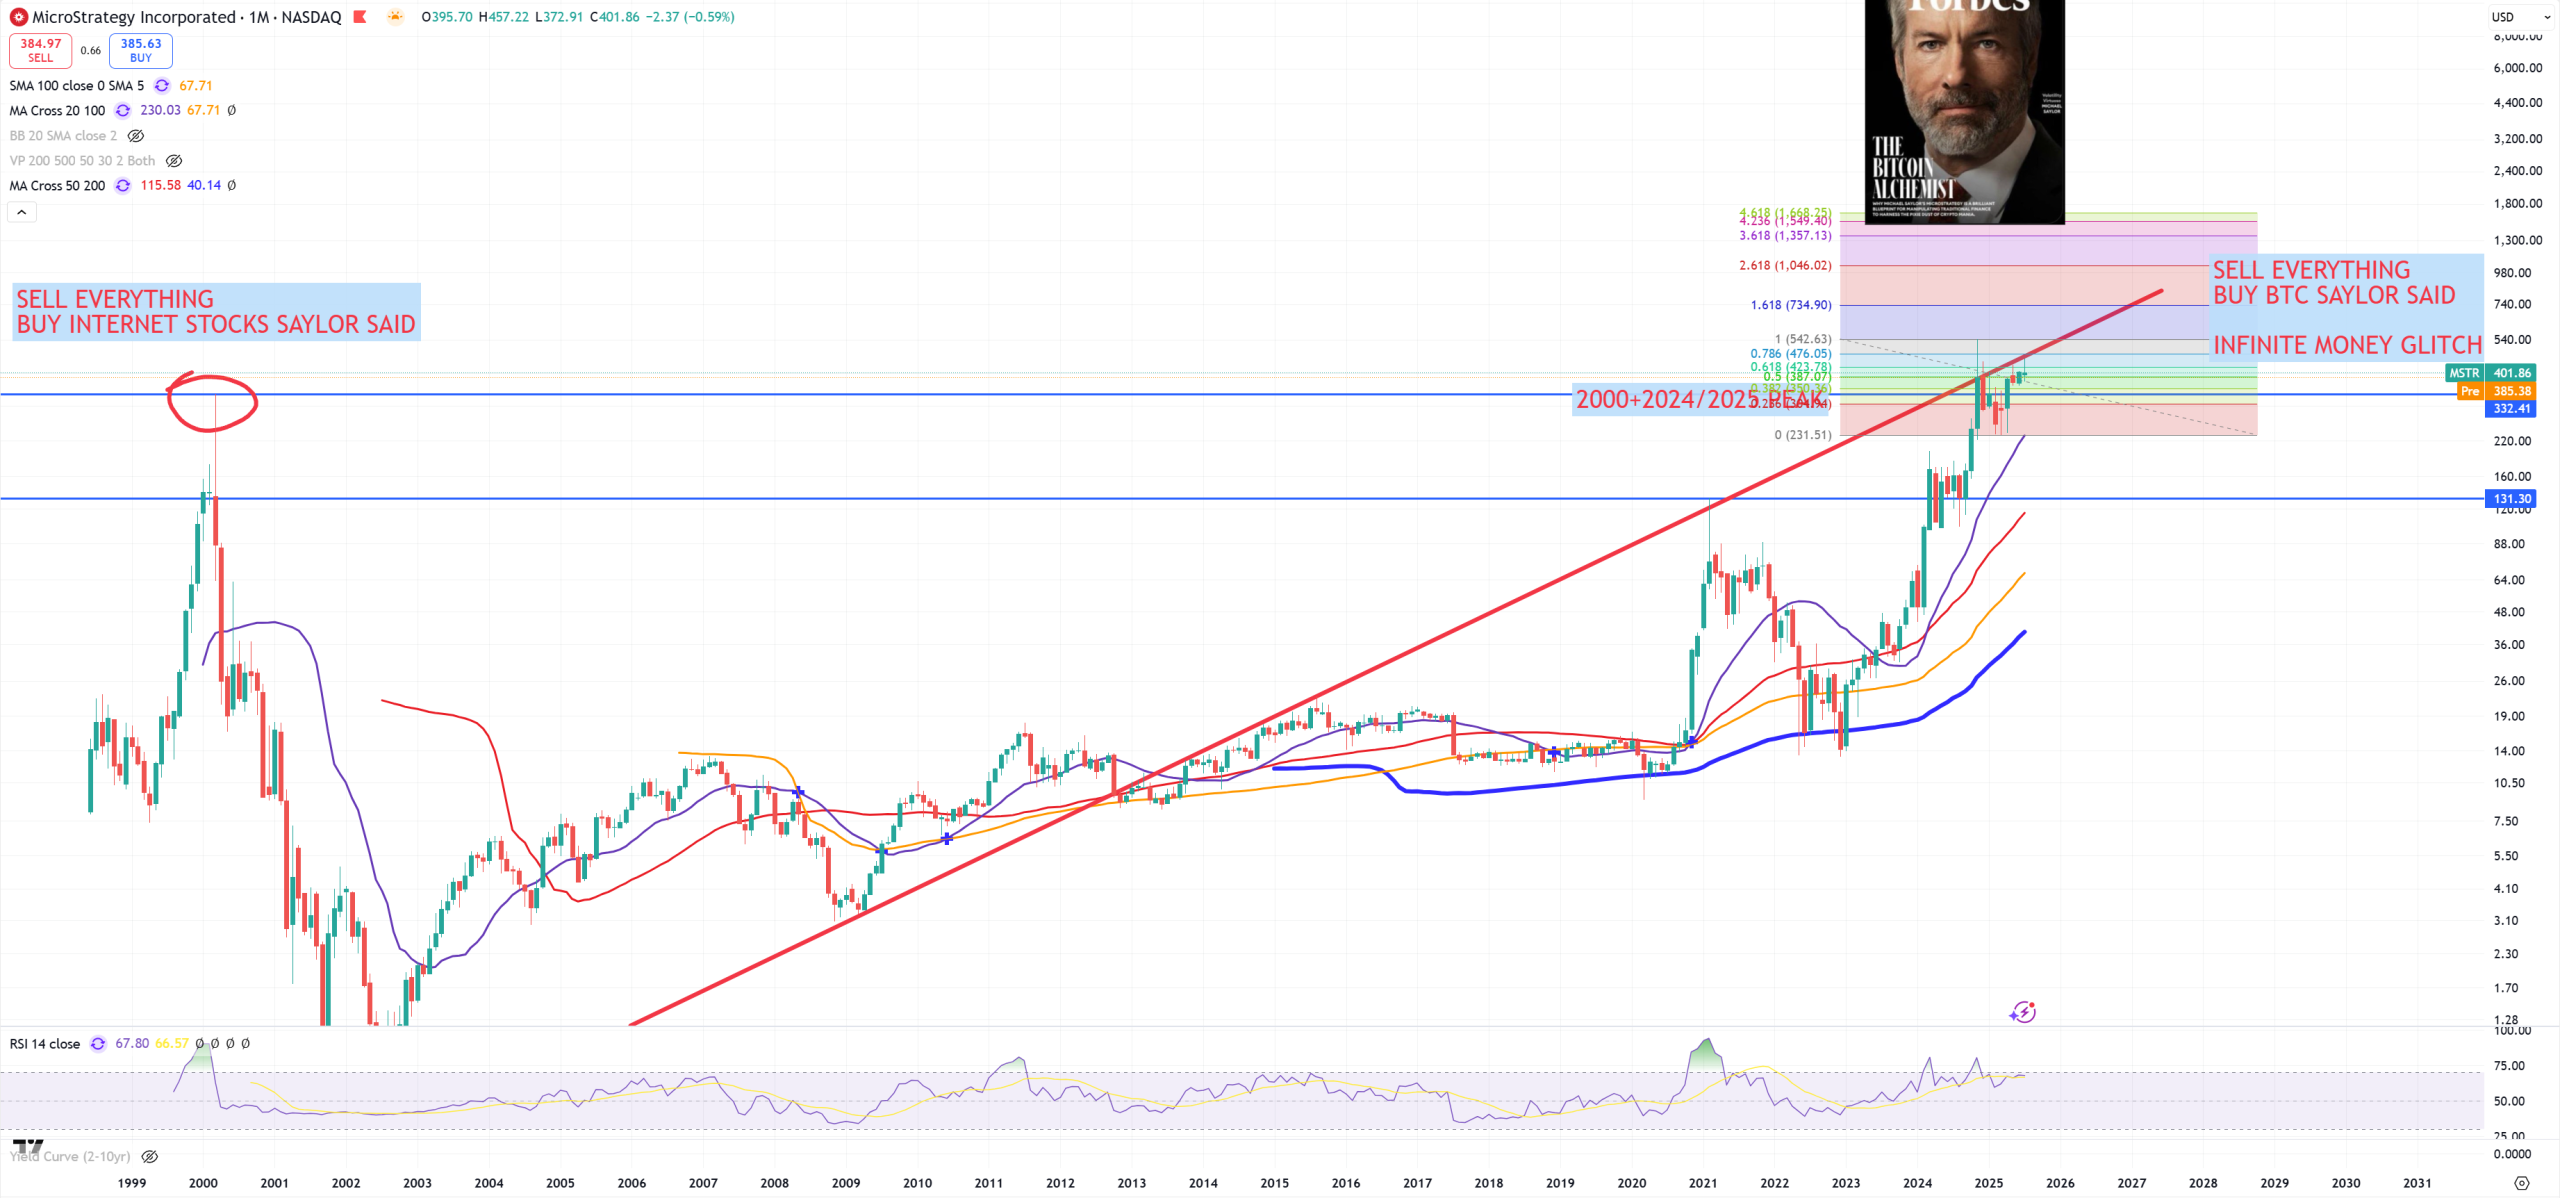
MSTR – can’t consider crypto without the most obvious company which started a scam called “Bitcoin Treasury Strategy”. OK still floating above its 2000 peak, where it lost 96% in 70 days, and I hope Saylor will manage to do the same, for the time I’m writing MSTR is going to open -4%, but we can still test this move above 2000 peak as a last technical level to retest red trend line.
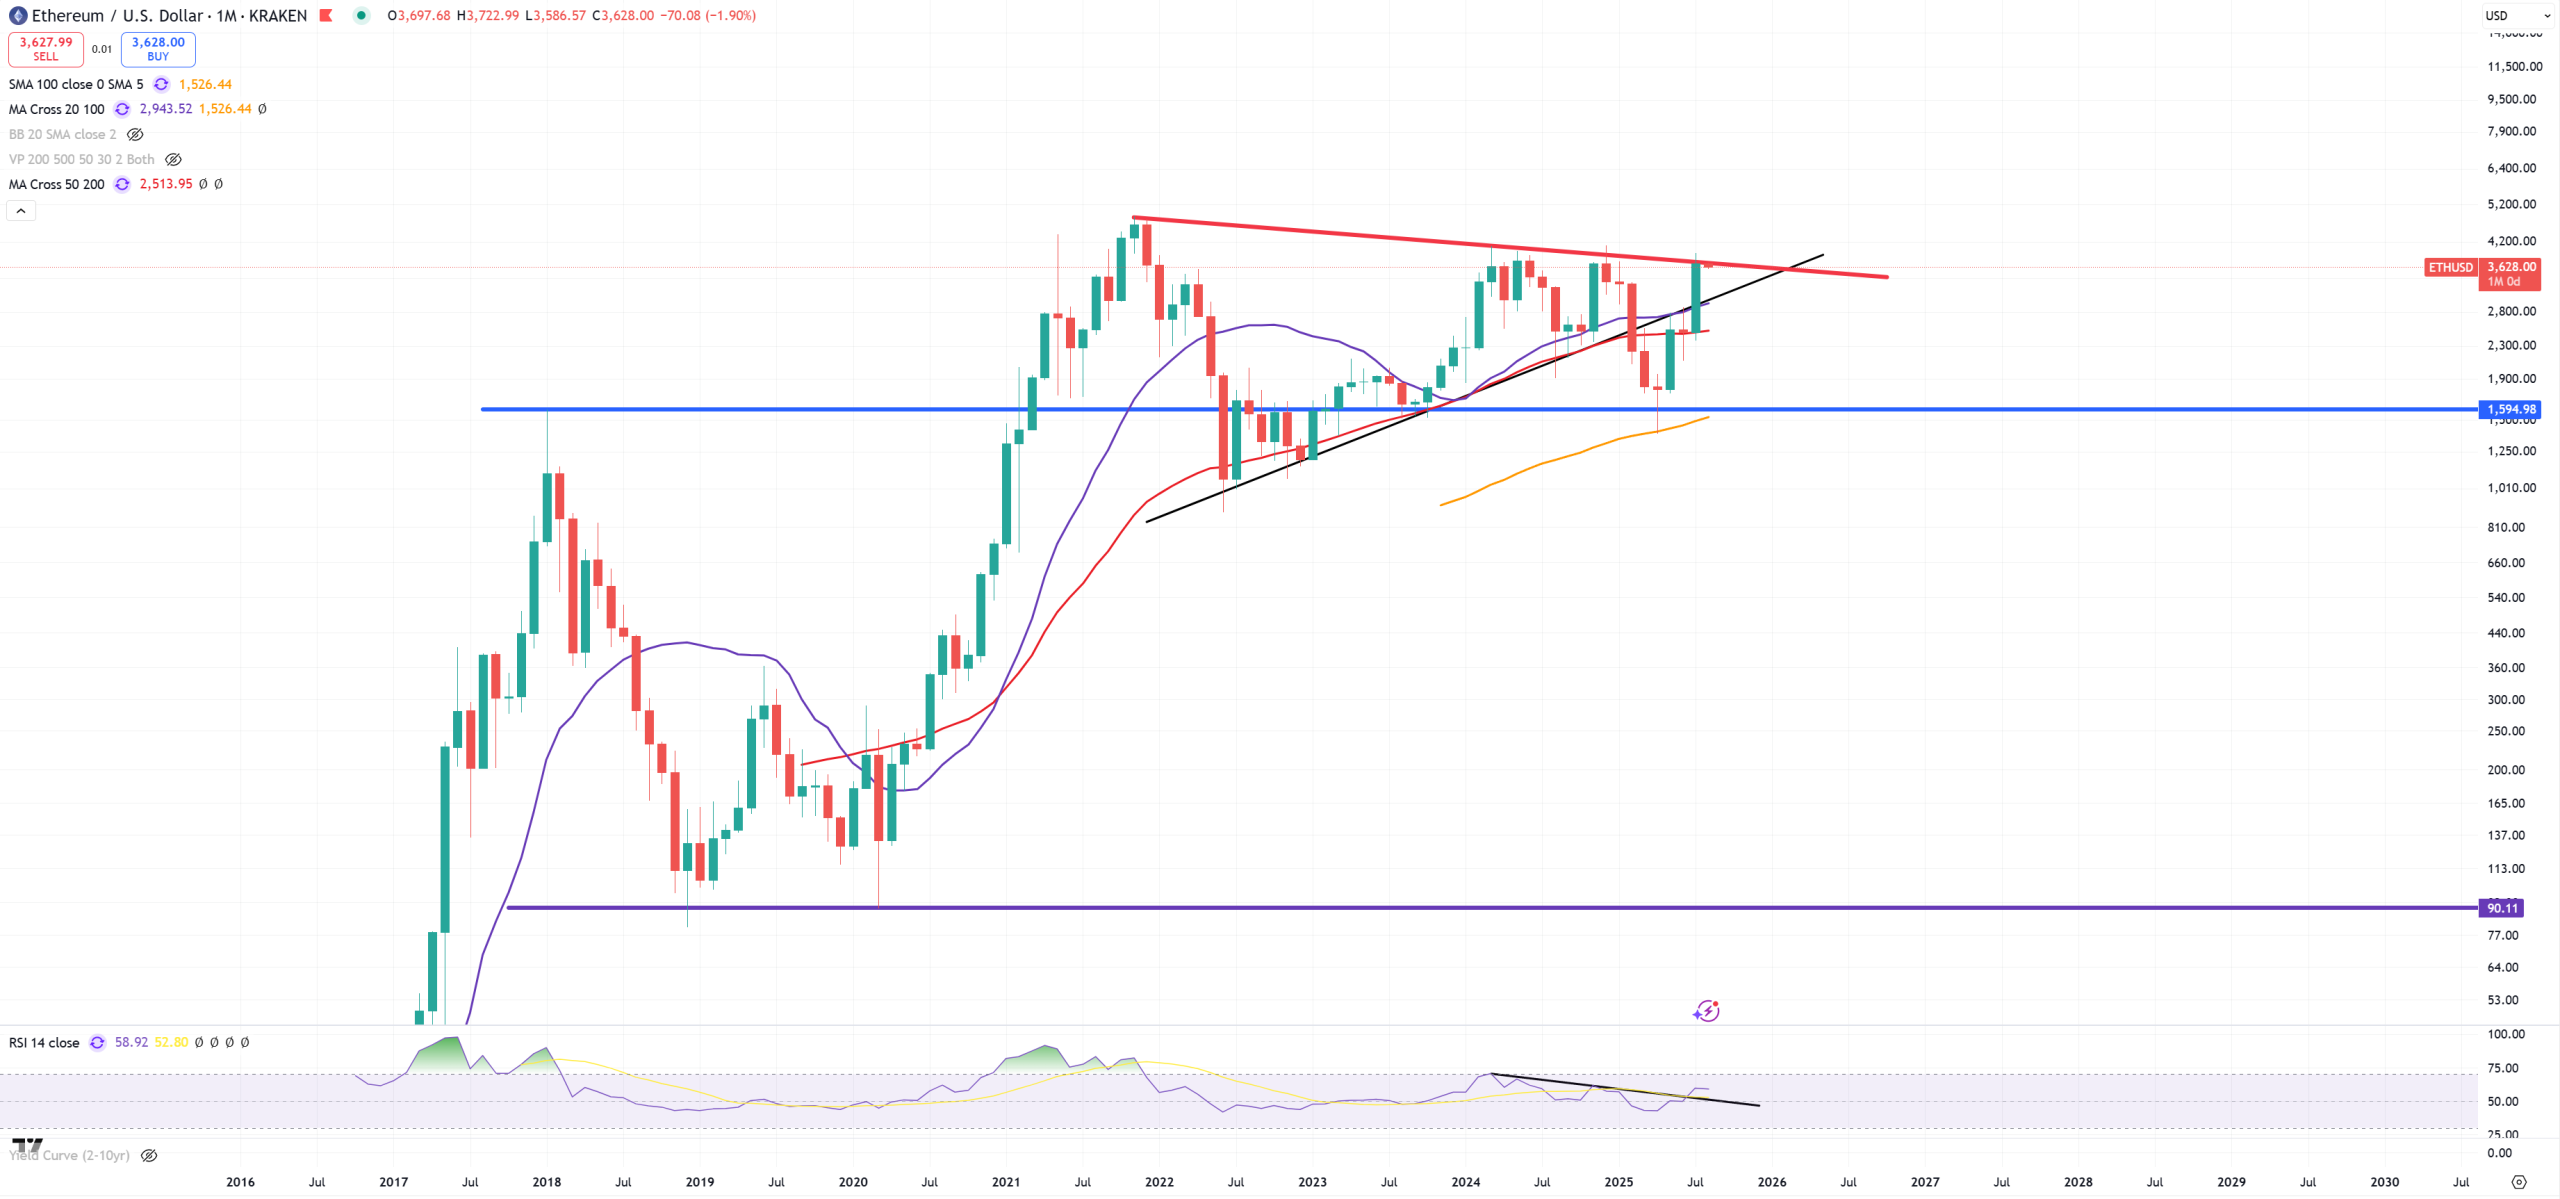
ETH – red trend line acts again as a resistance?
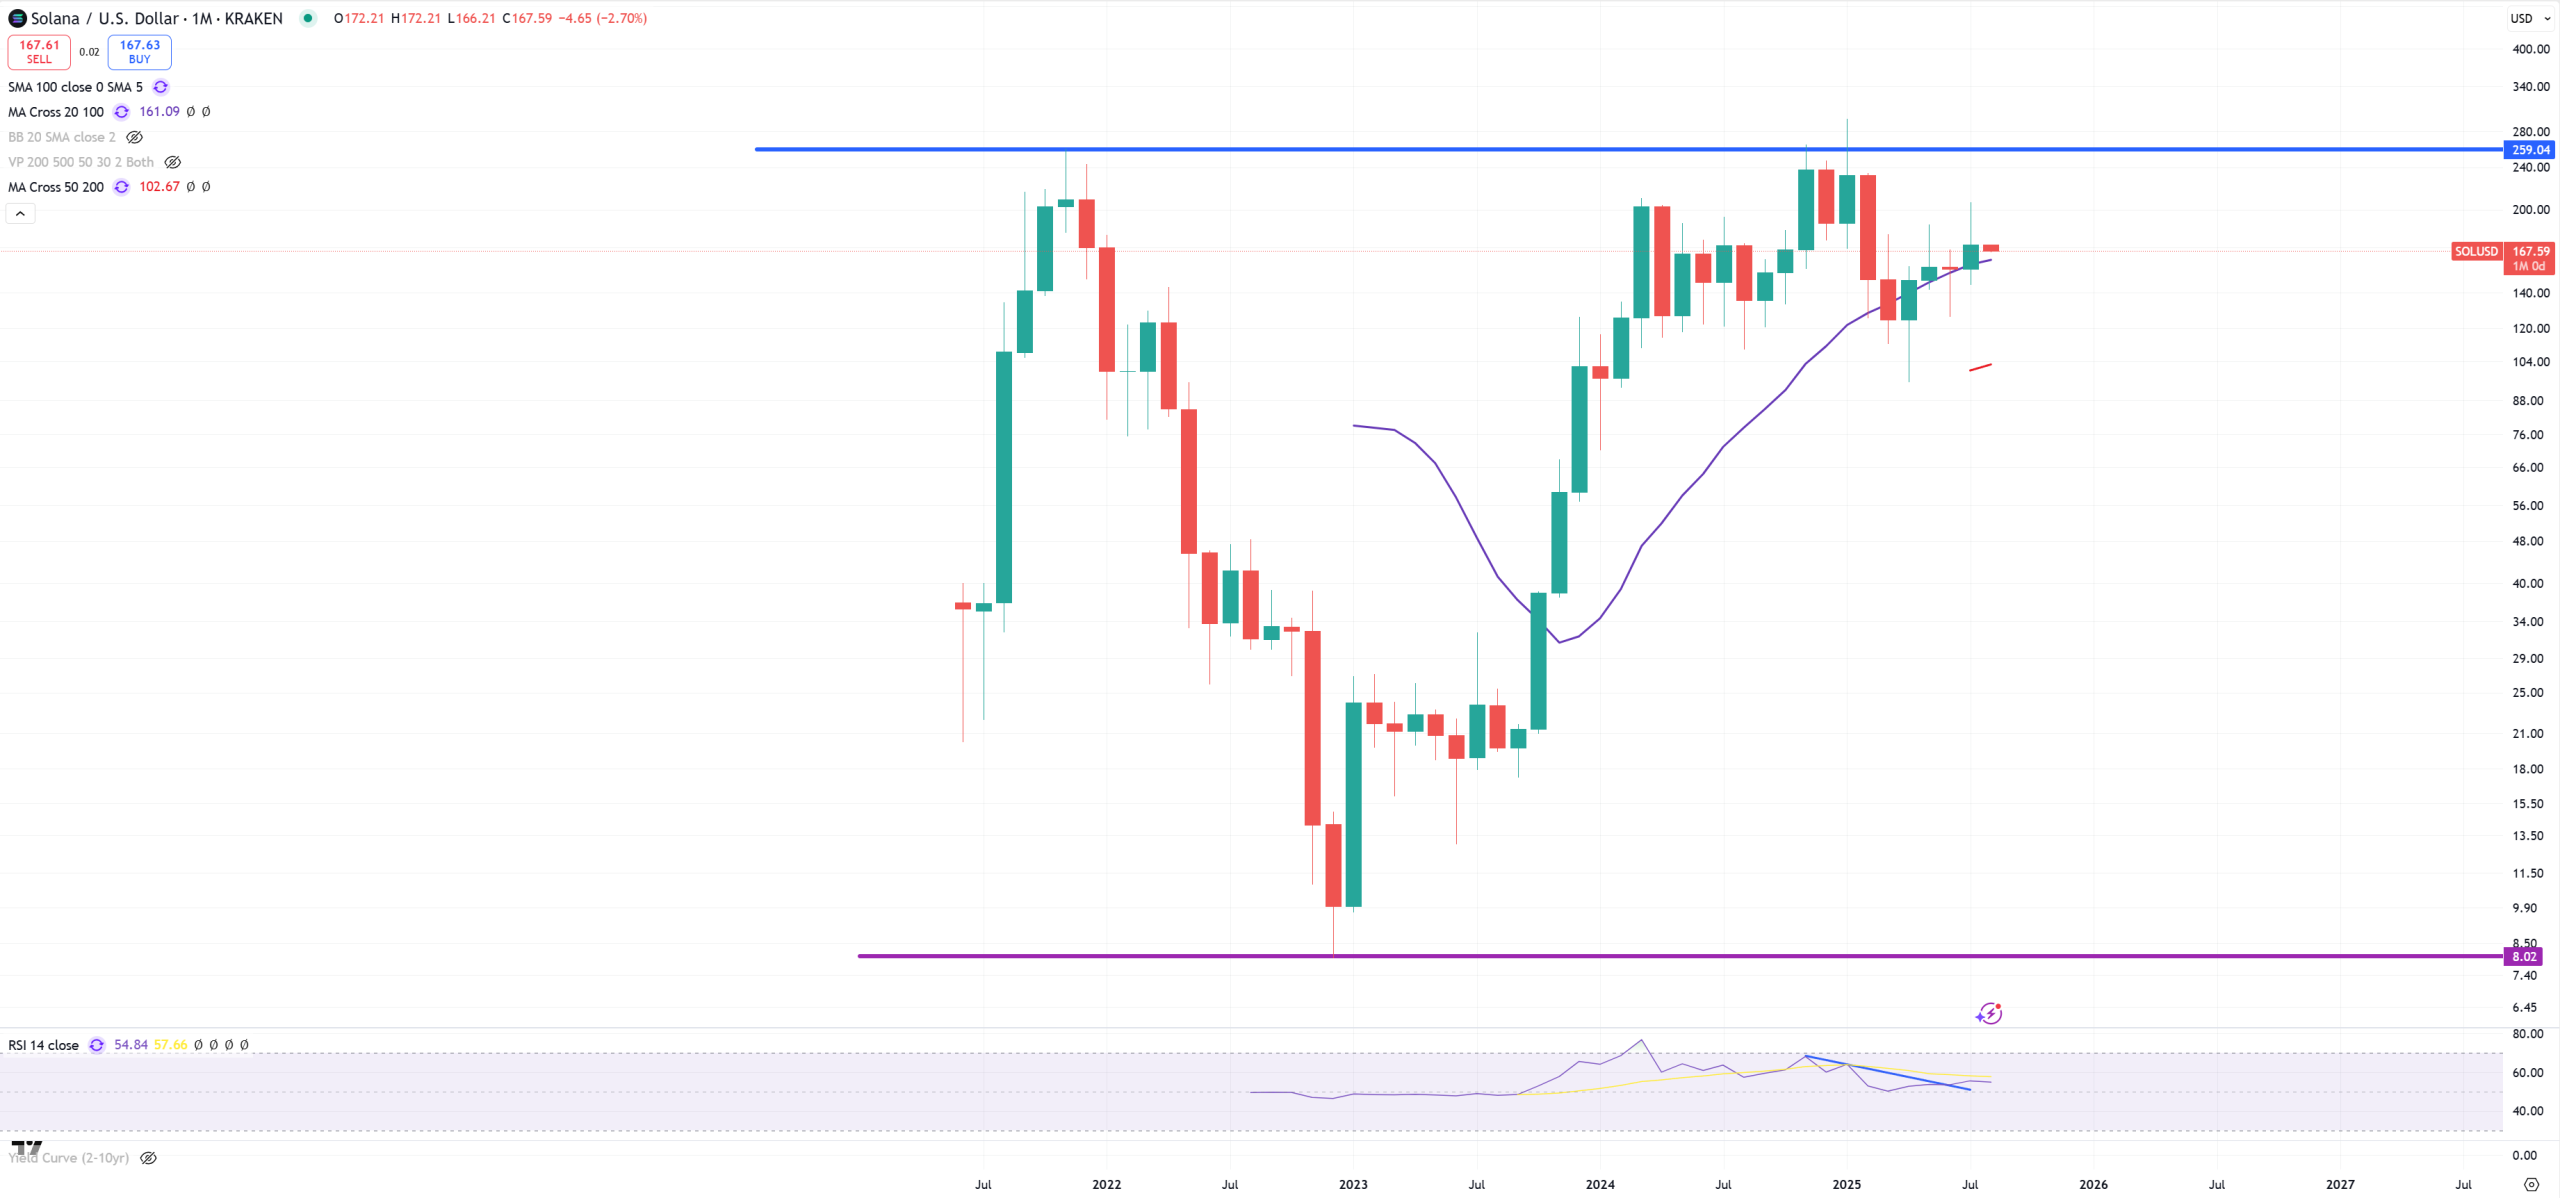
SOL – and the last crypto sliding on (M)MA20 but with a massive double-top here
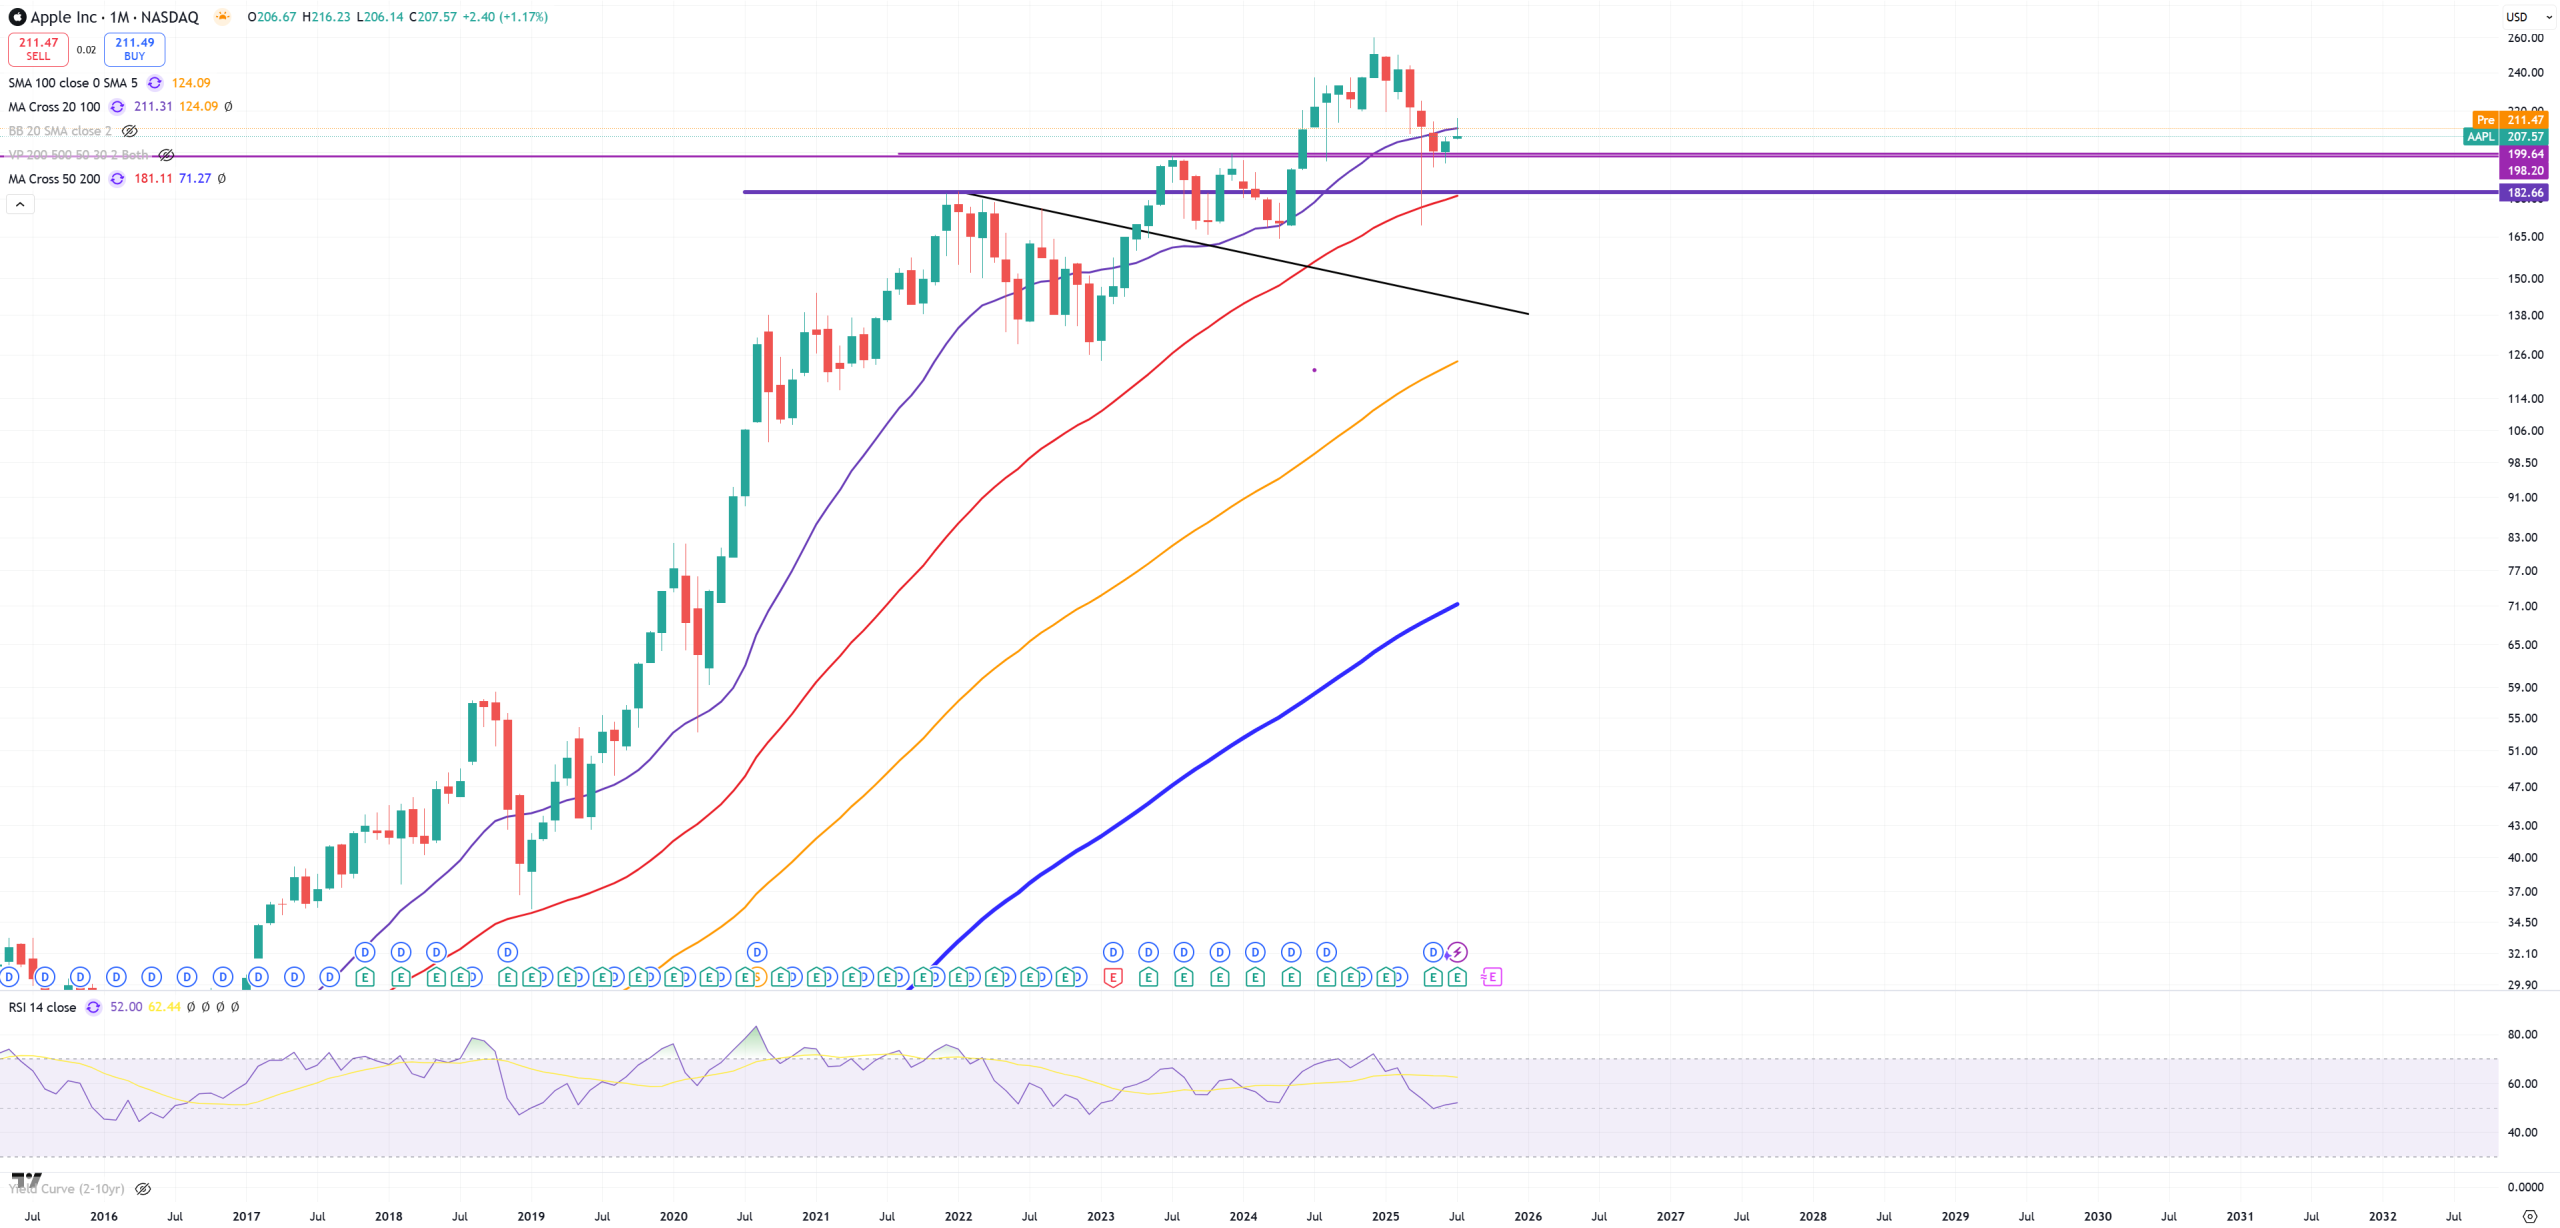
AAPL – so finally tech stocks, Apple presented really good earnings, as I’m trying to find a reason why stocks should retrace from SPX 1929-2000 trend, I bet Apple failed, but they did not, anyway Apple starts the month with just +1.8% not a big move. Level 200$ is really important. Let’s see if violet (M)MA20 will hold
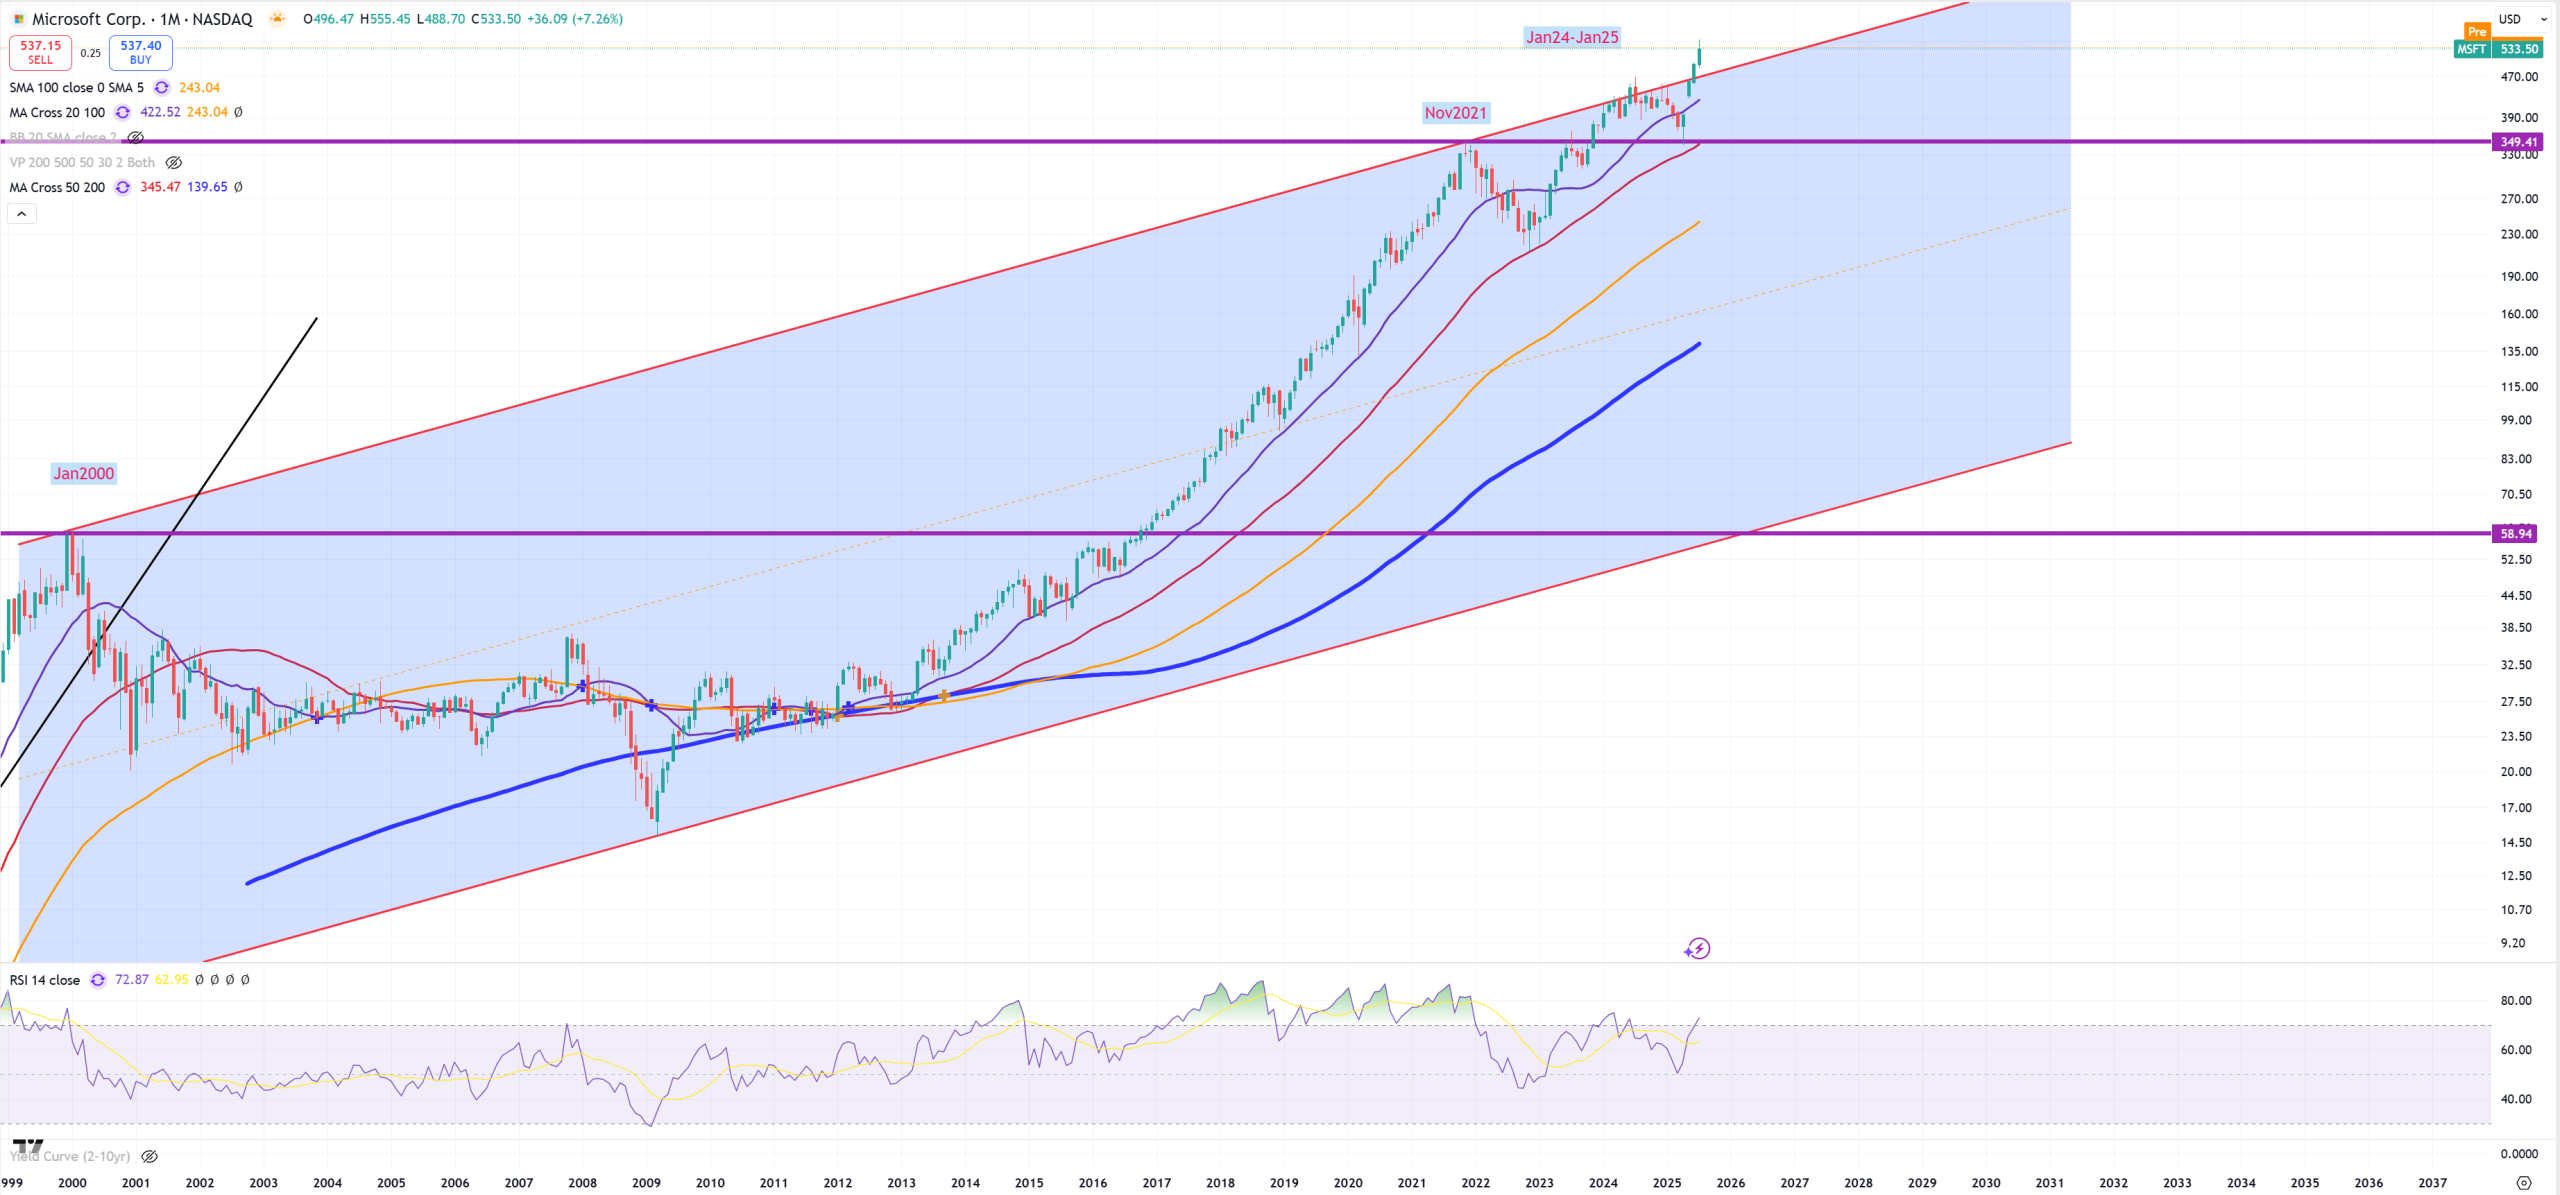
MSFT – Microsoft is flying above its channel, and there’s a big gap around 395$. Until candles are above the channel it’s not considered as “topping” pattern.
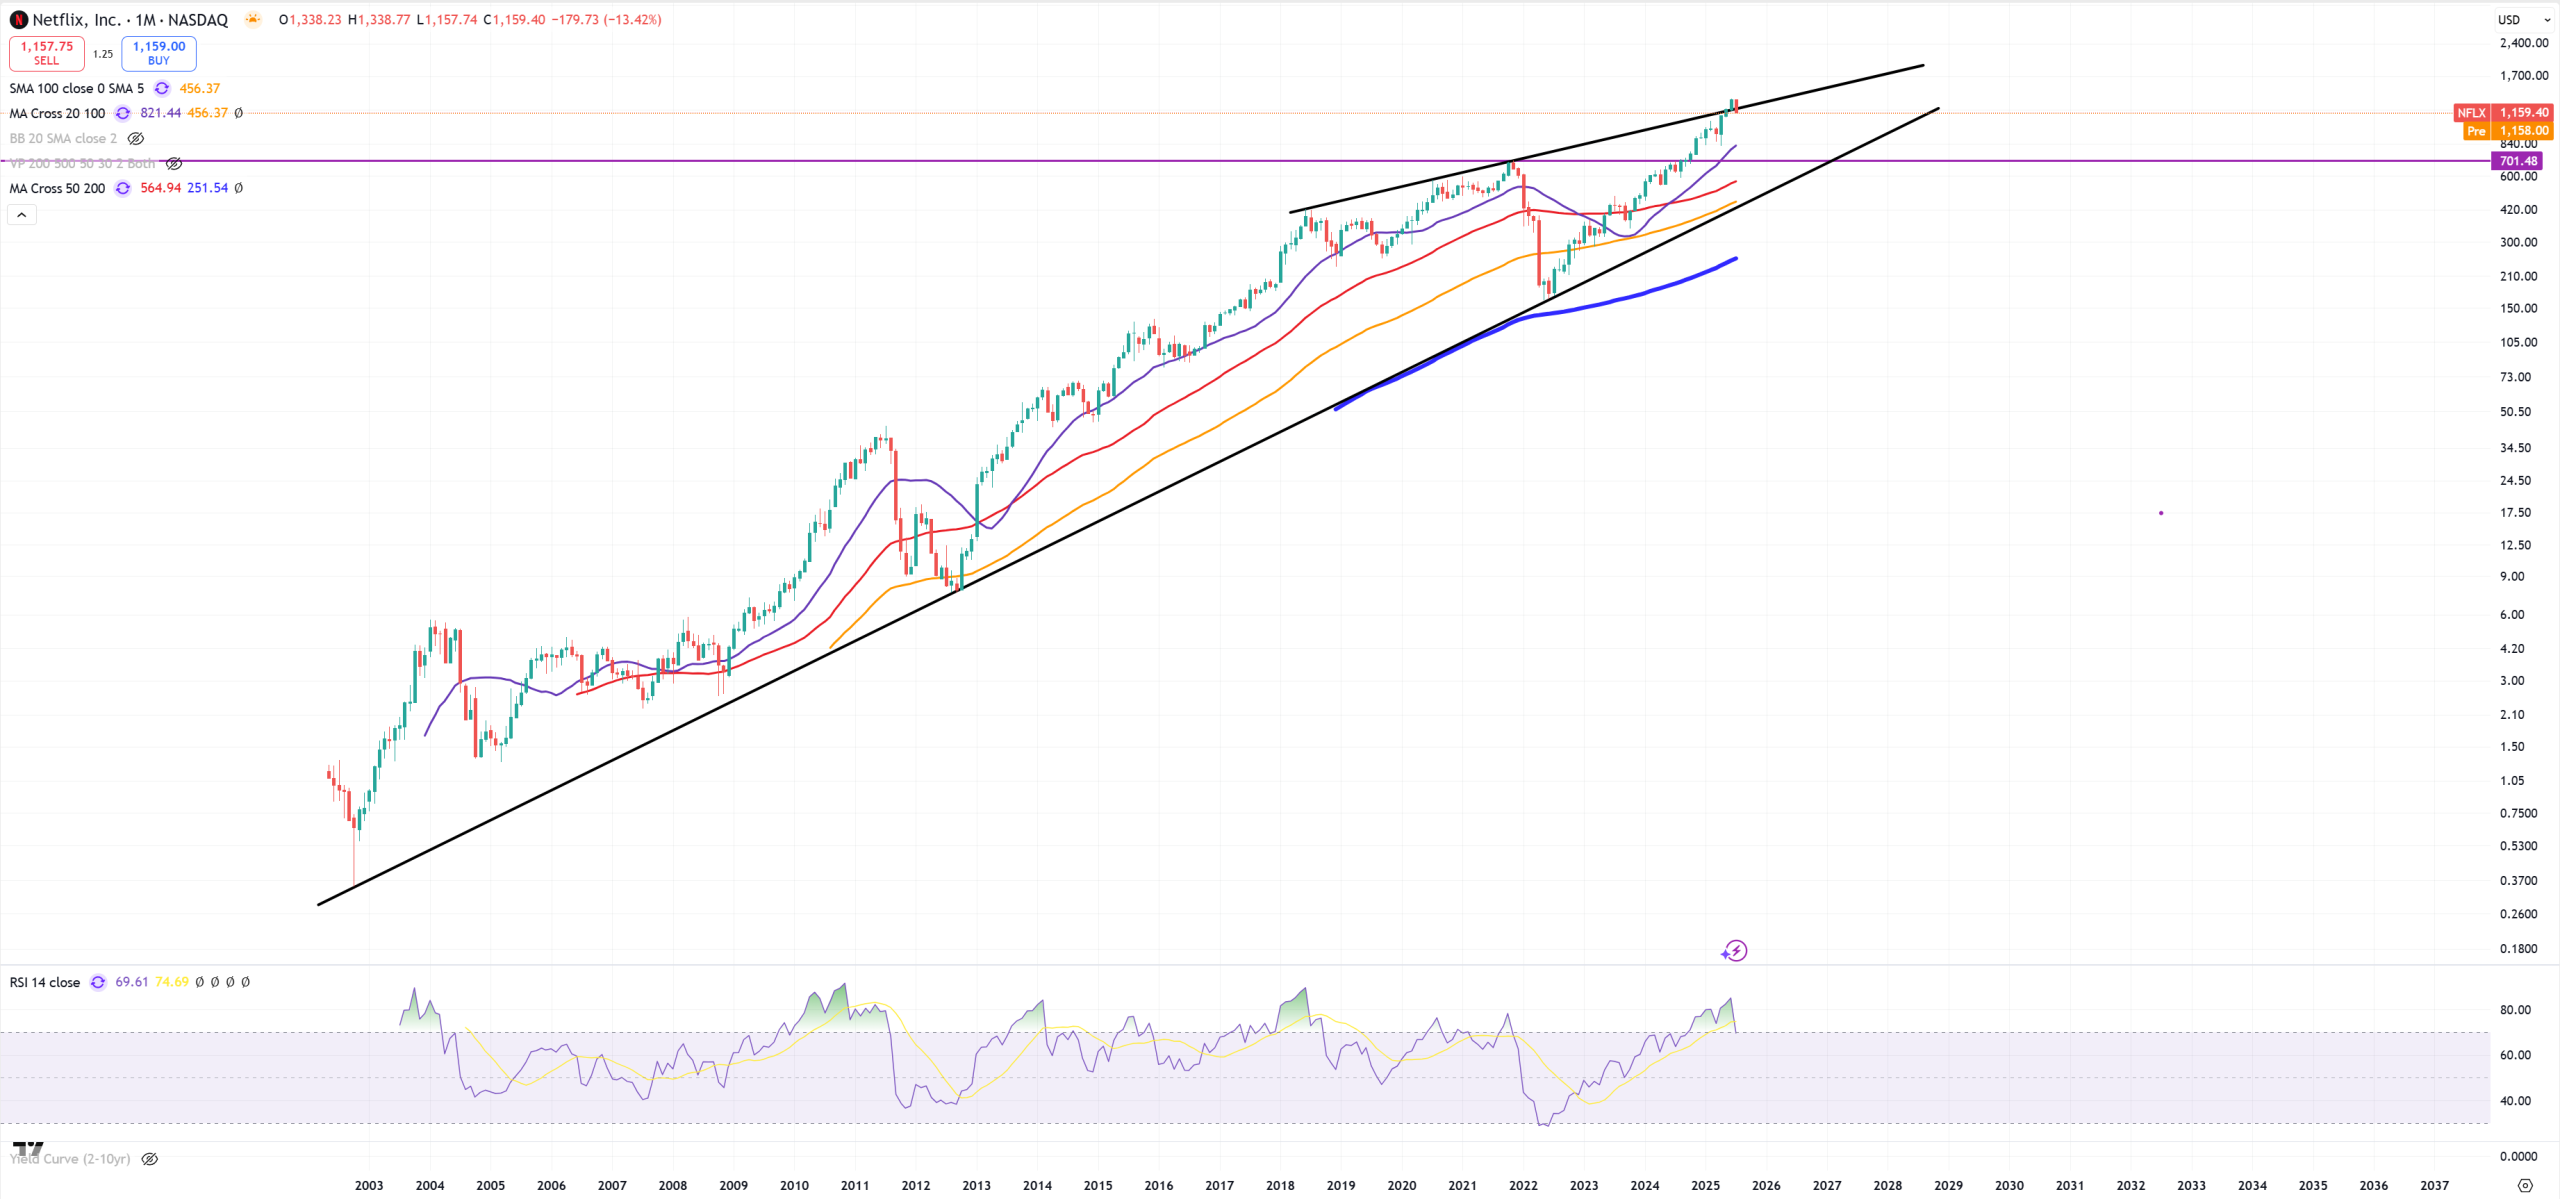
NFLX – and its megaphone channel – it holds
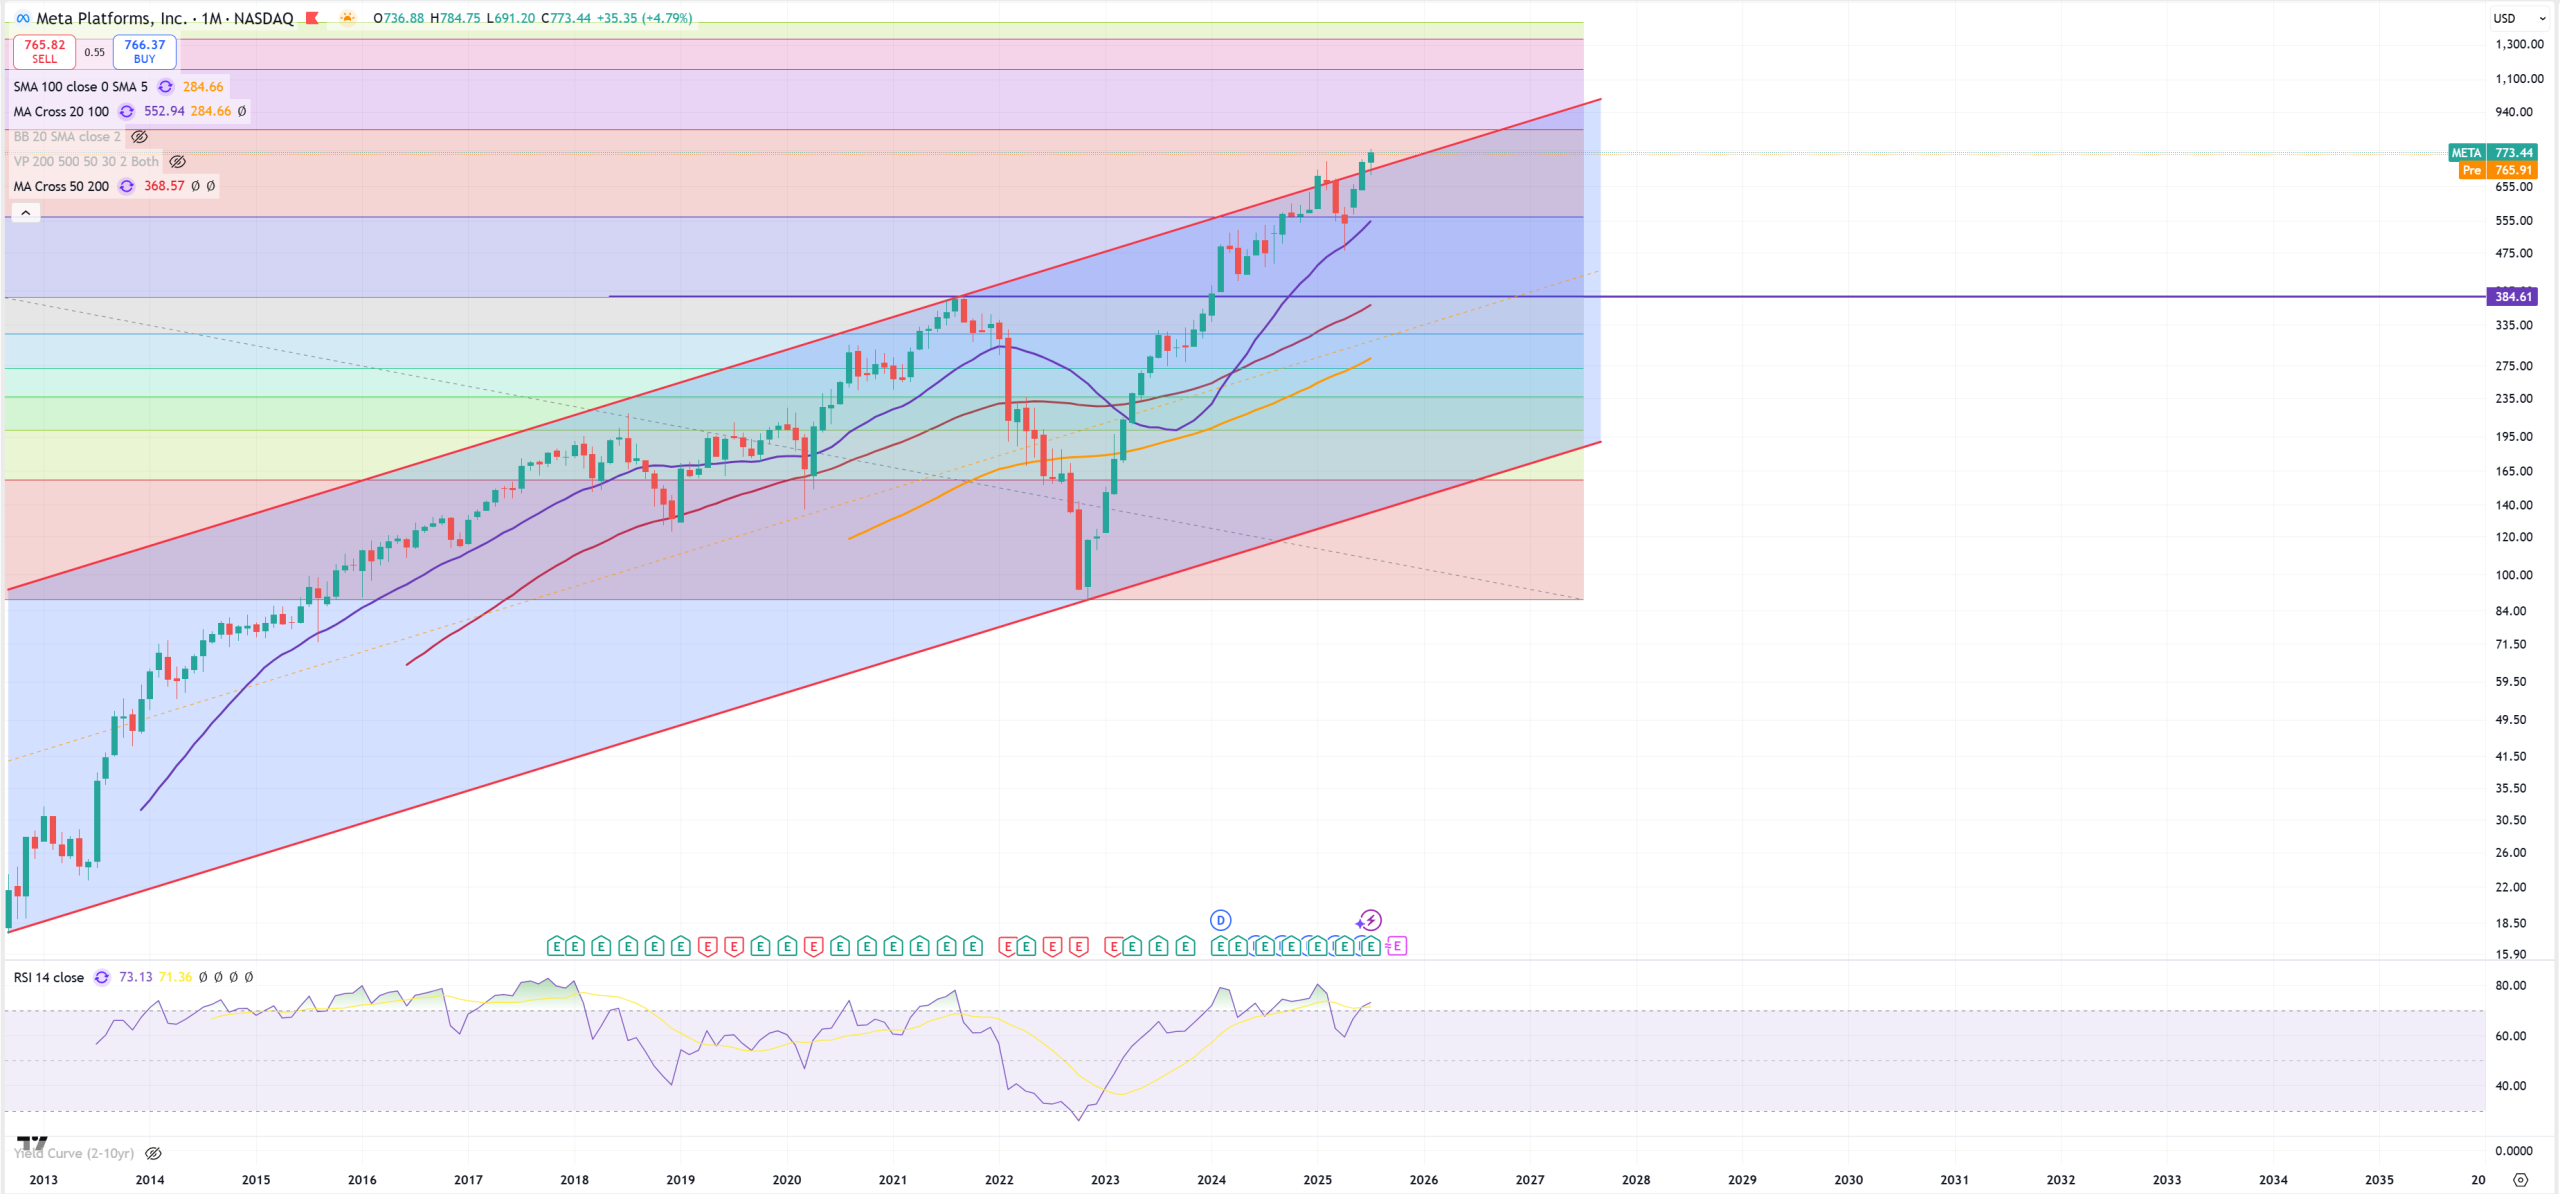
META – it’s the same issue as Microsoft – support on the channel line or false spike?
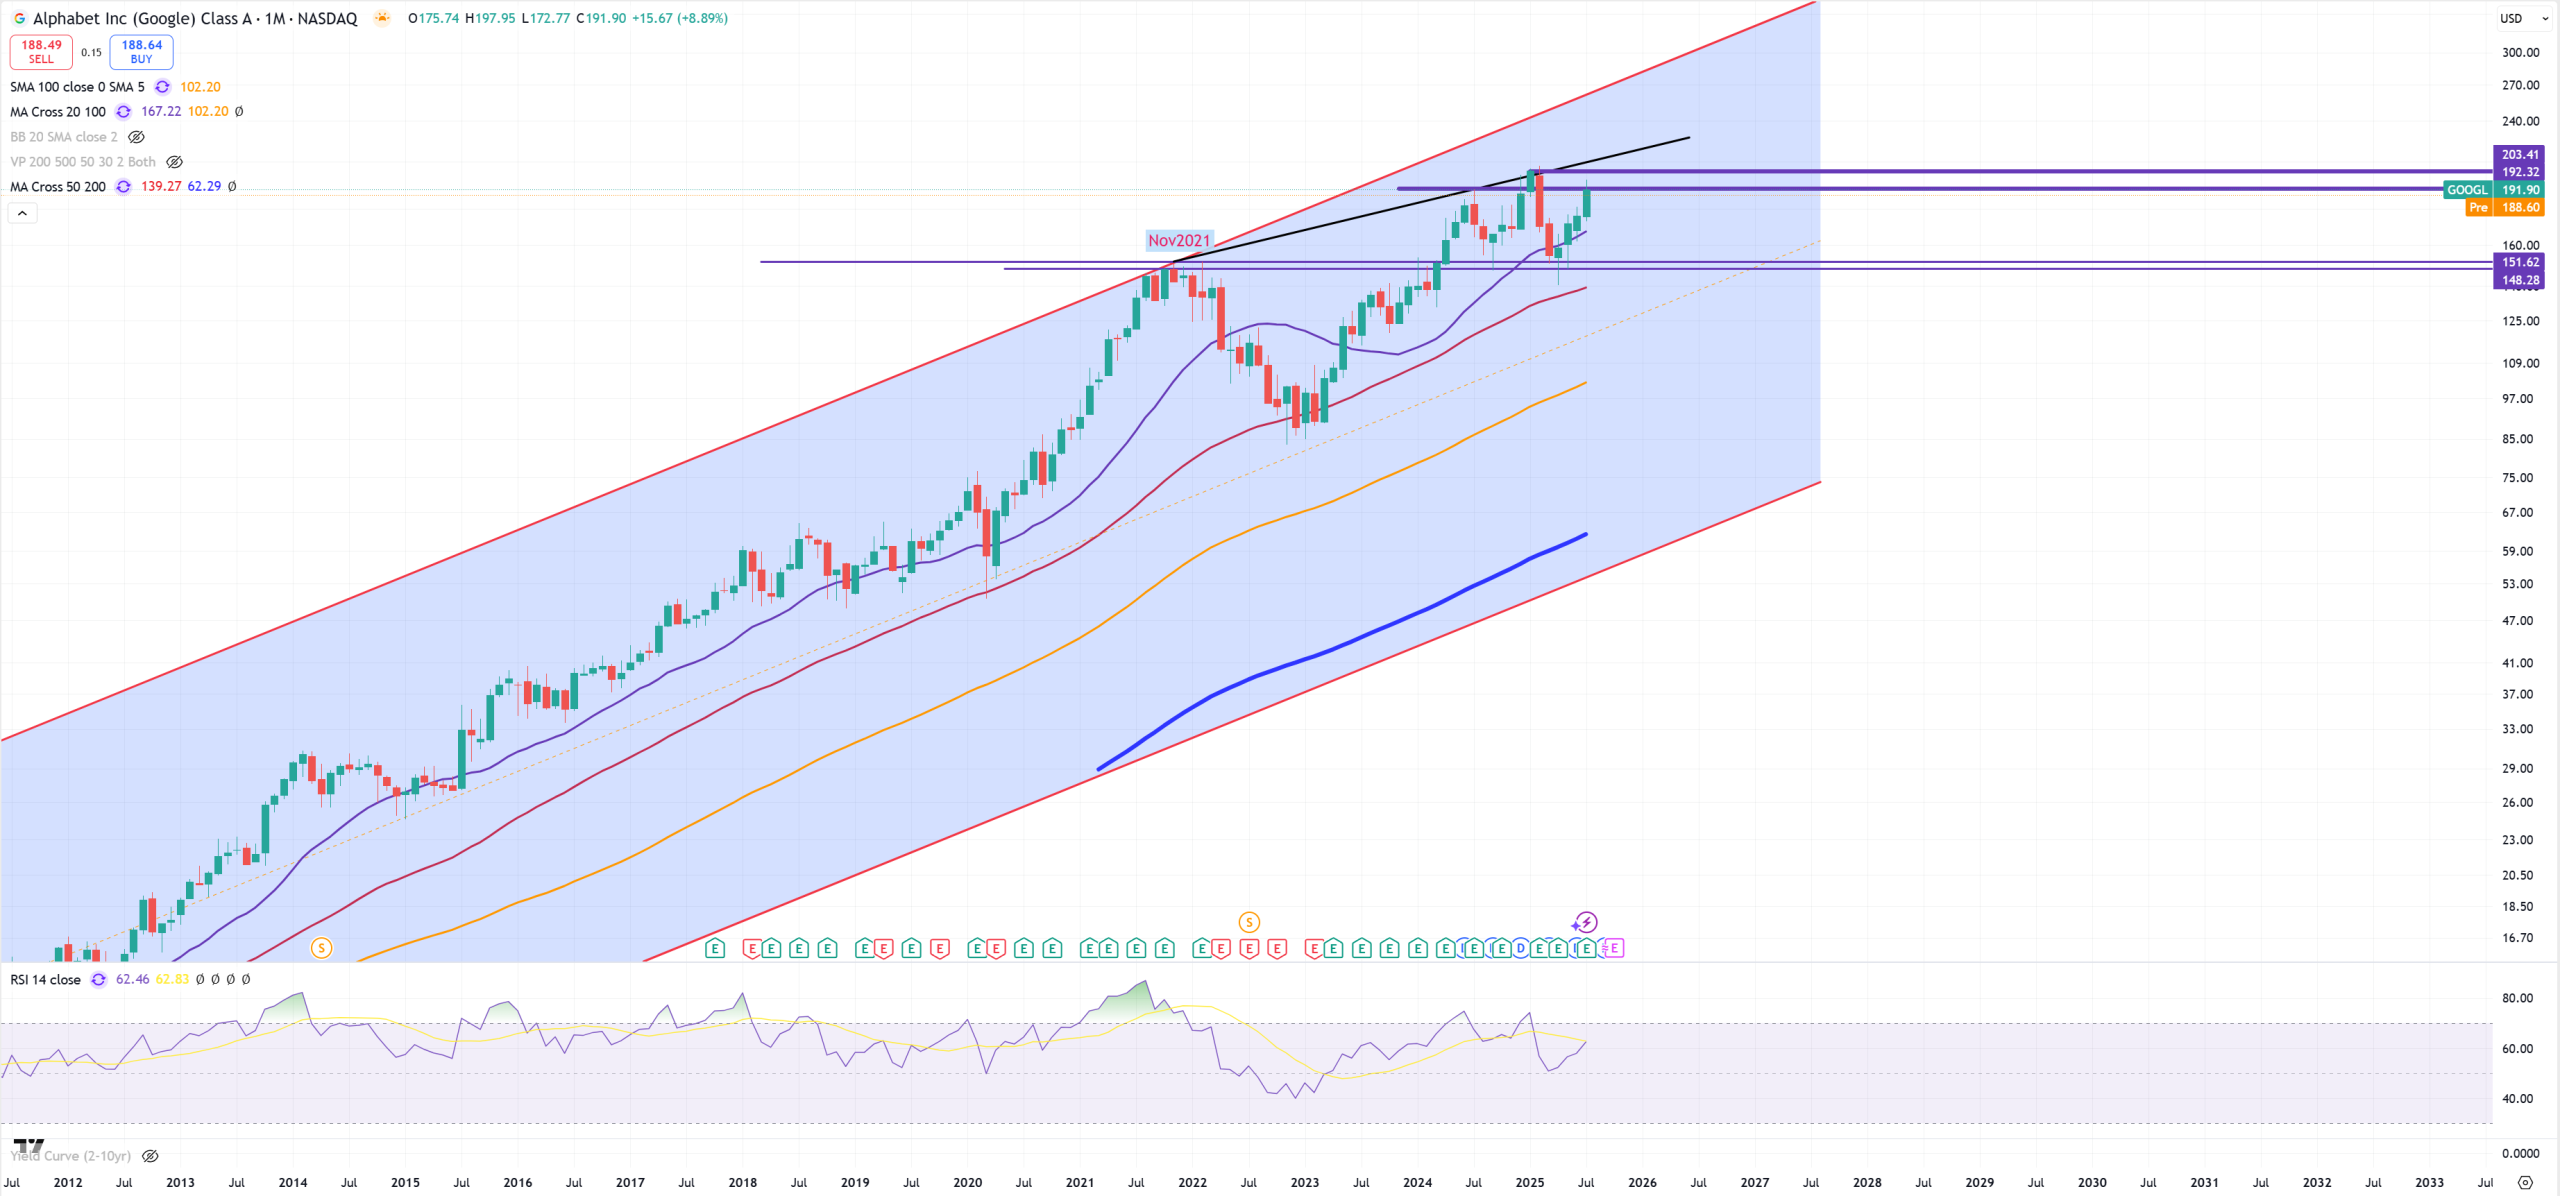
GOOGL – Google is now facing massive resistance, but there’s a possible megaphone trend even around 210$
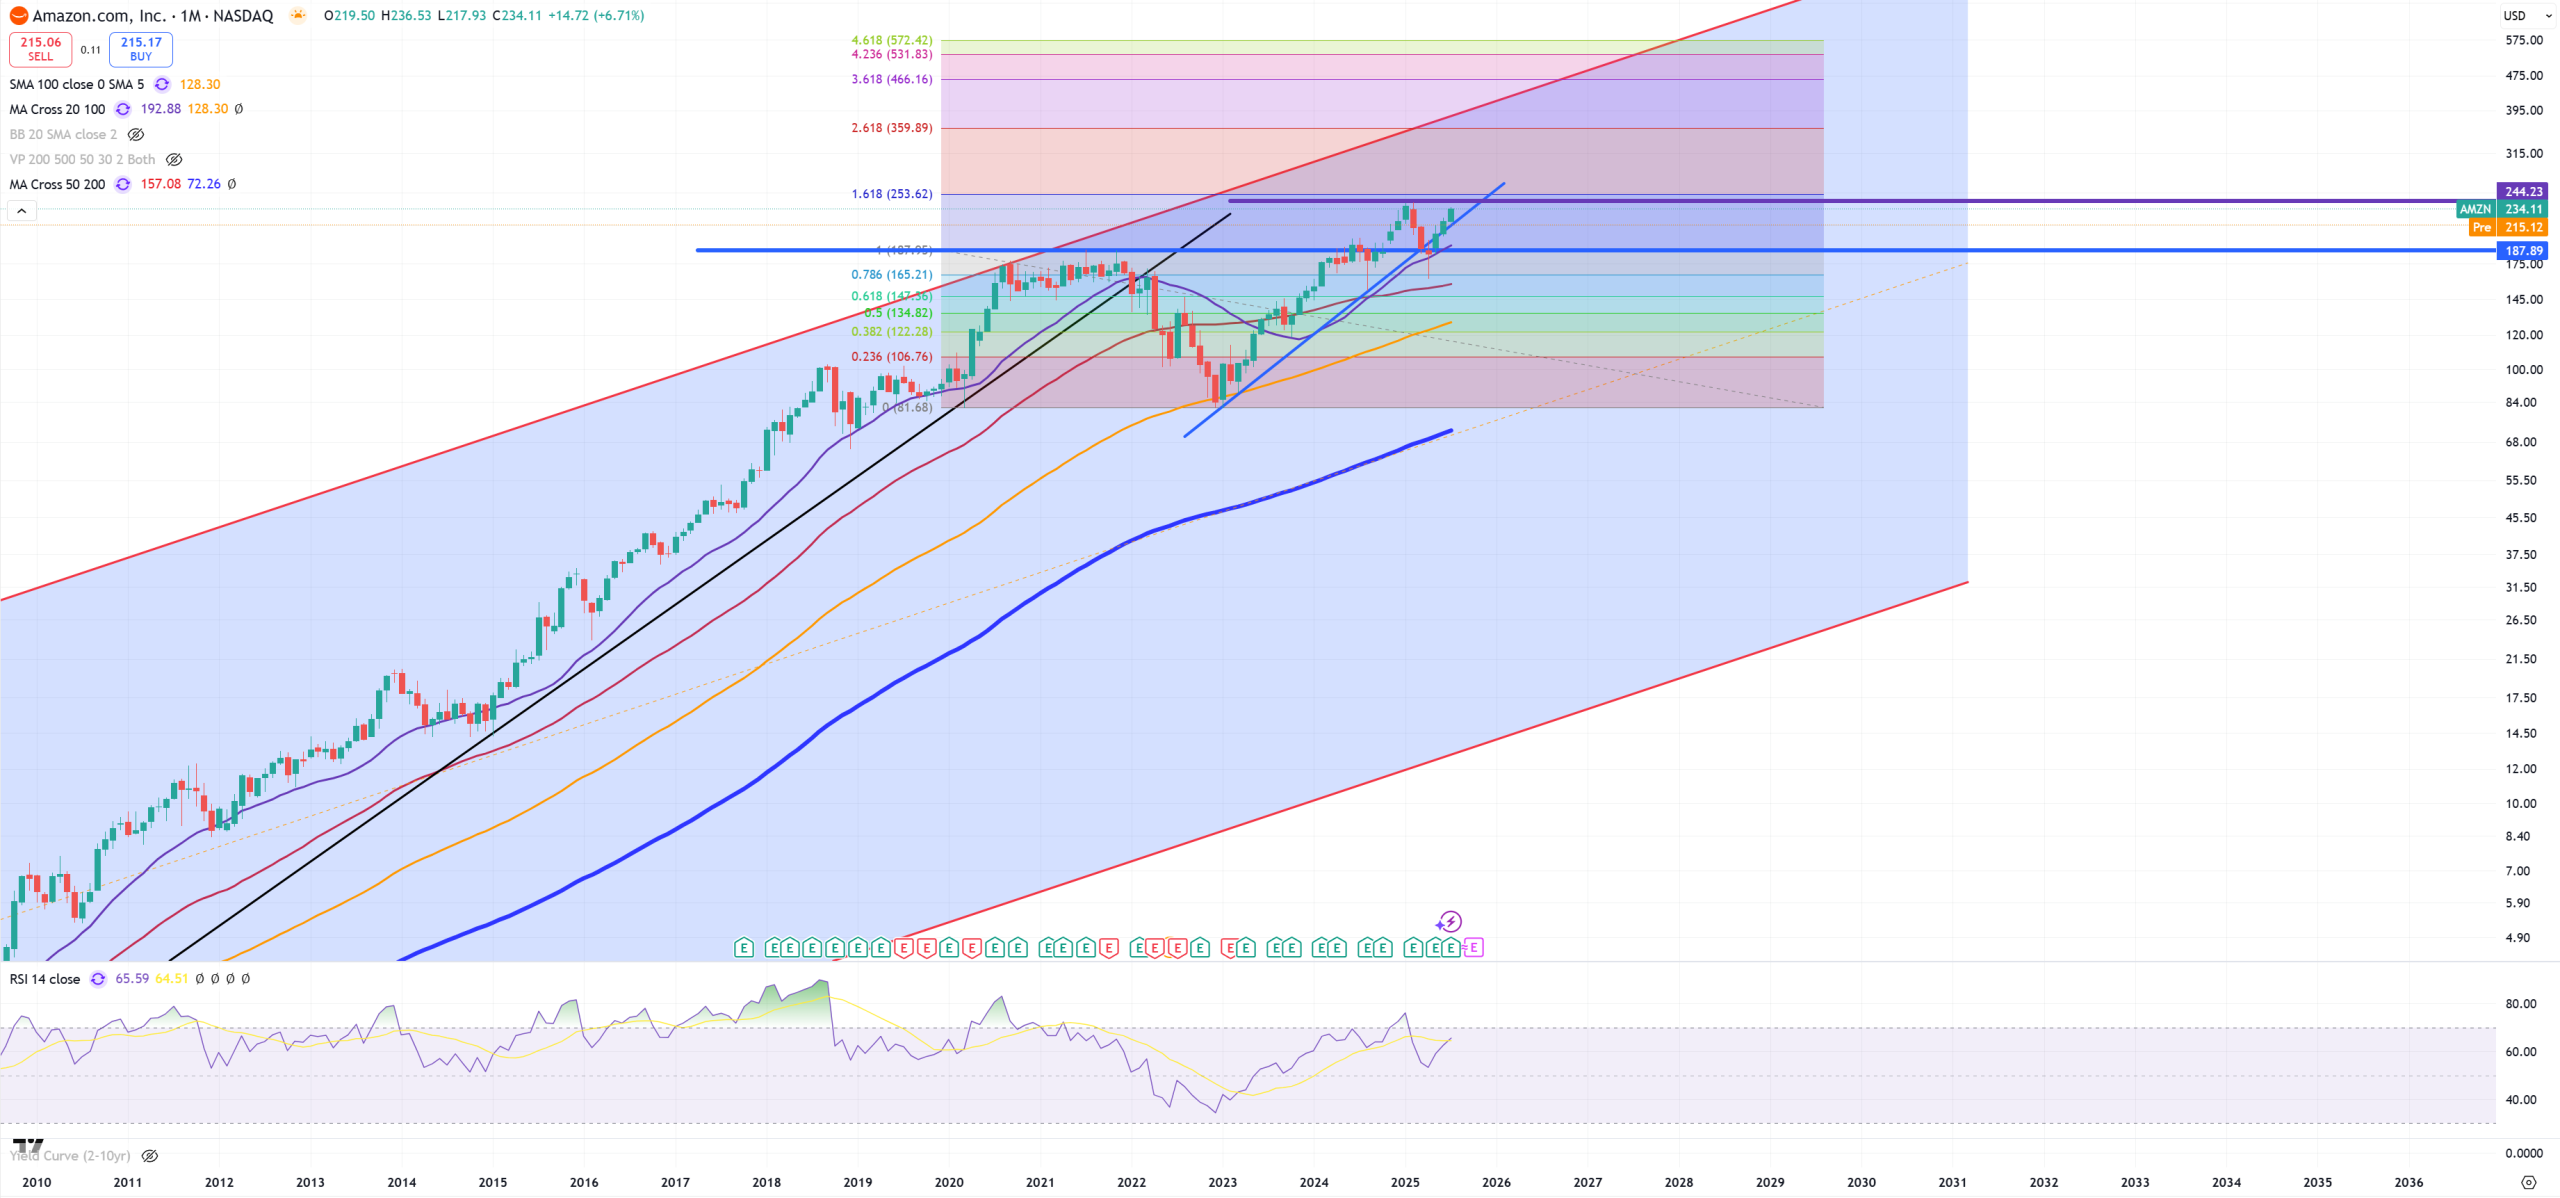
AMZN – Amazon – very close to Google, but earnings failed an it’s opening -8%
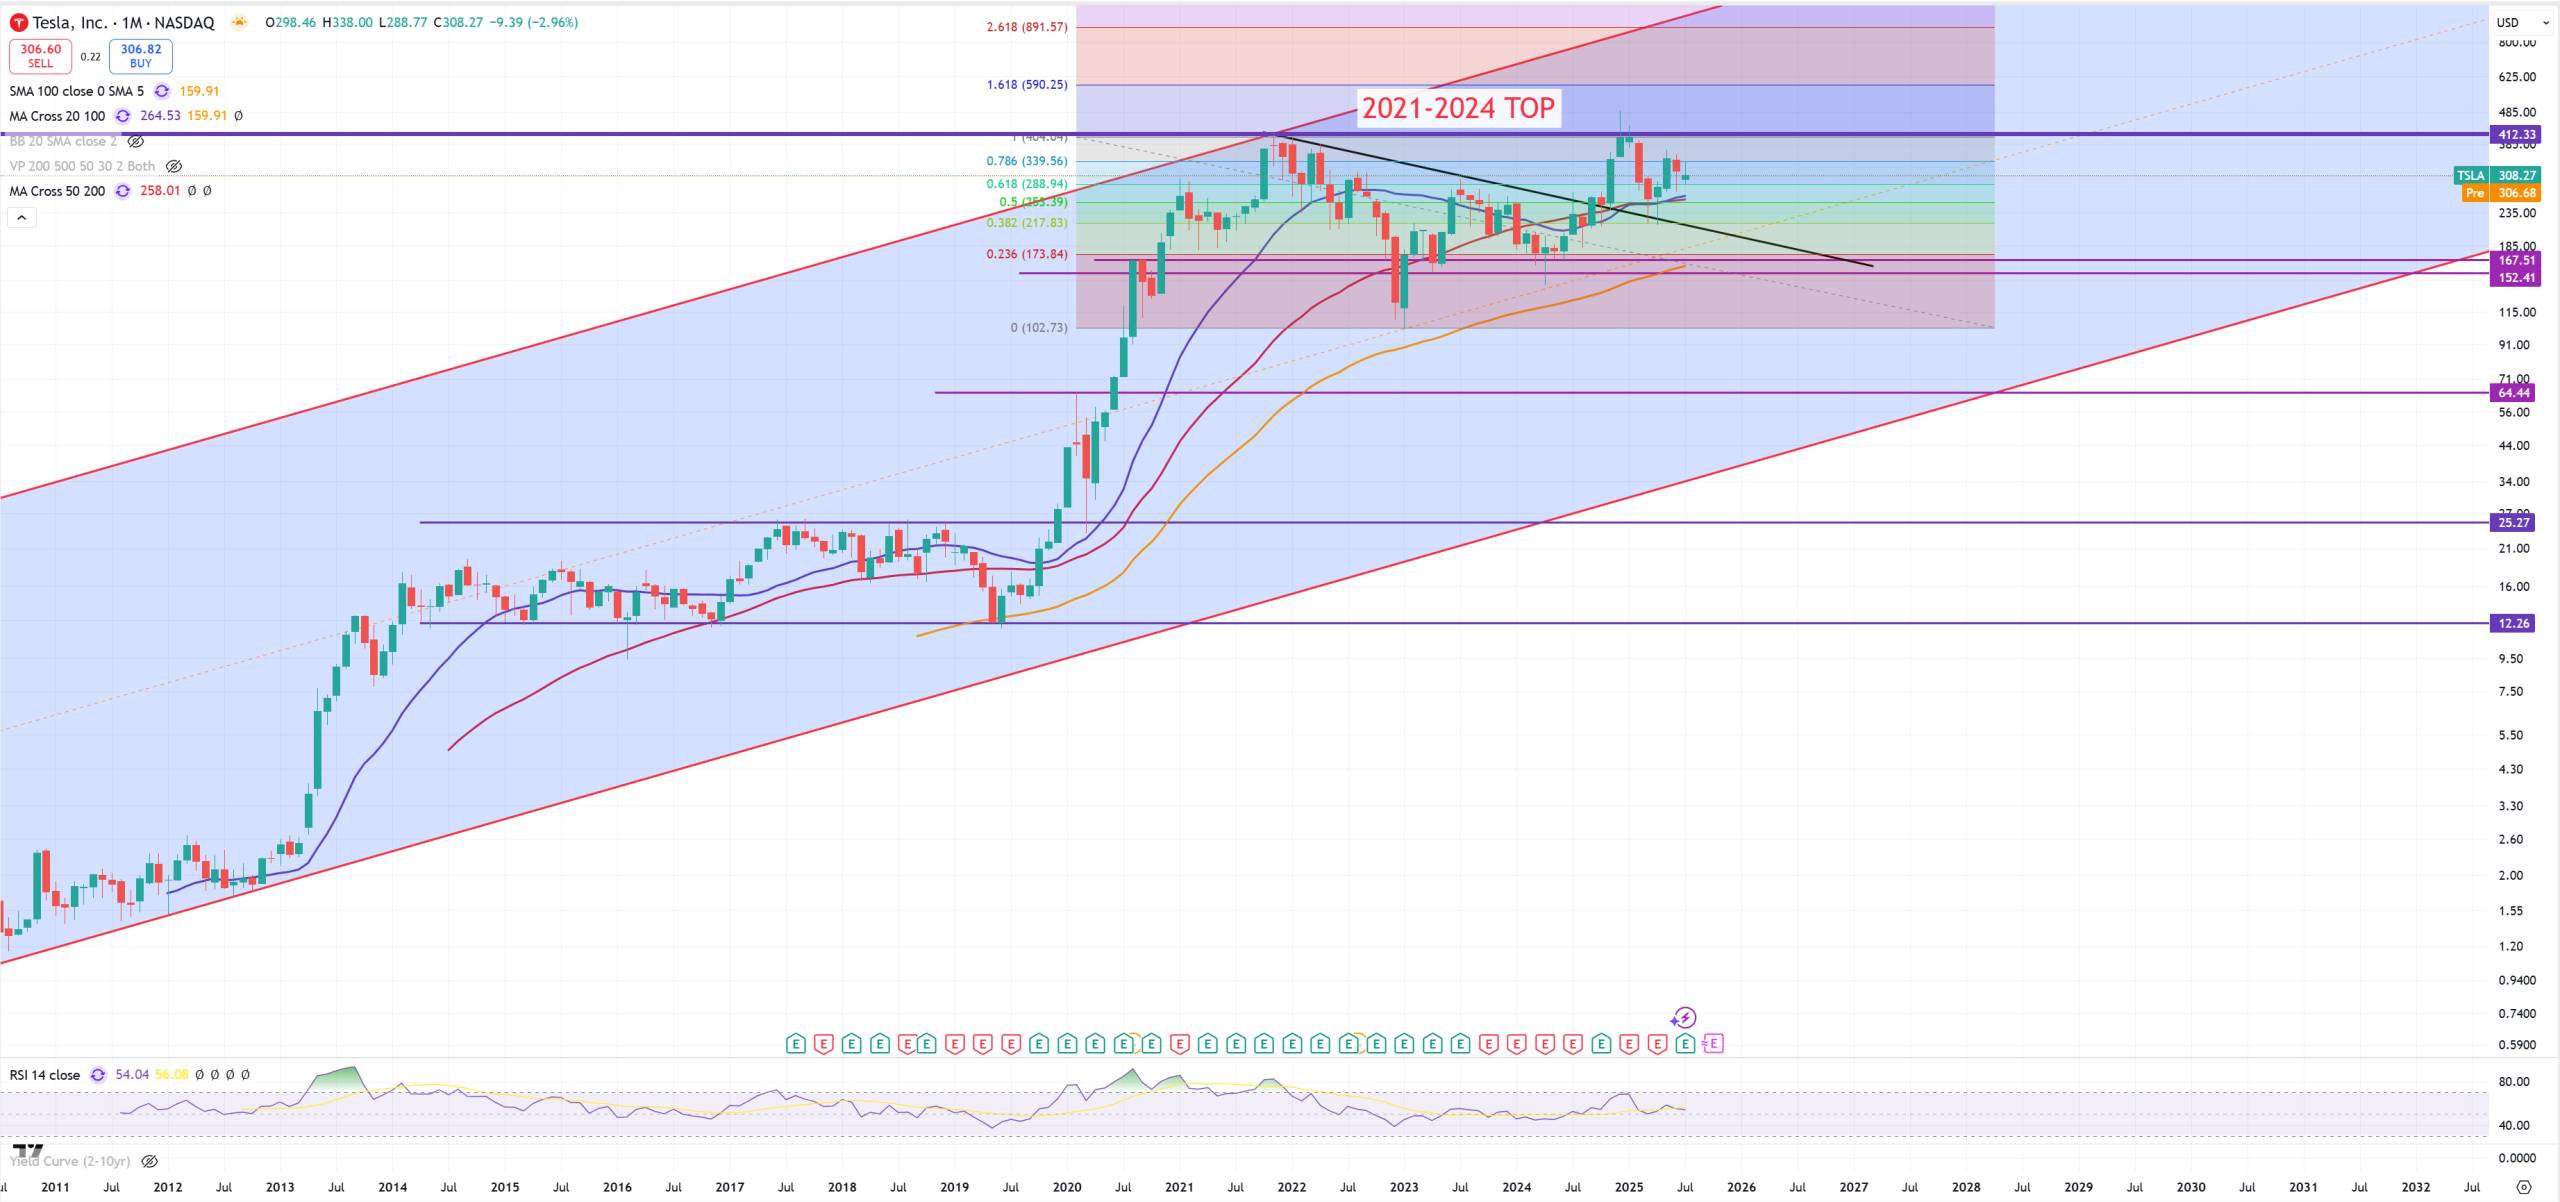
TSLA – Tesla can’t jump above 2021 level, placed double-top and get couple lifes just like Boeing. Big support around 150 and yellow (M)MA100. Breaking this level will lead to double digit stock price.
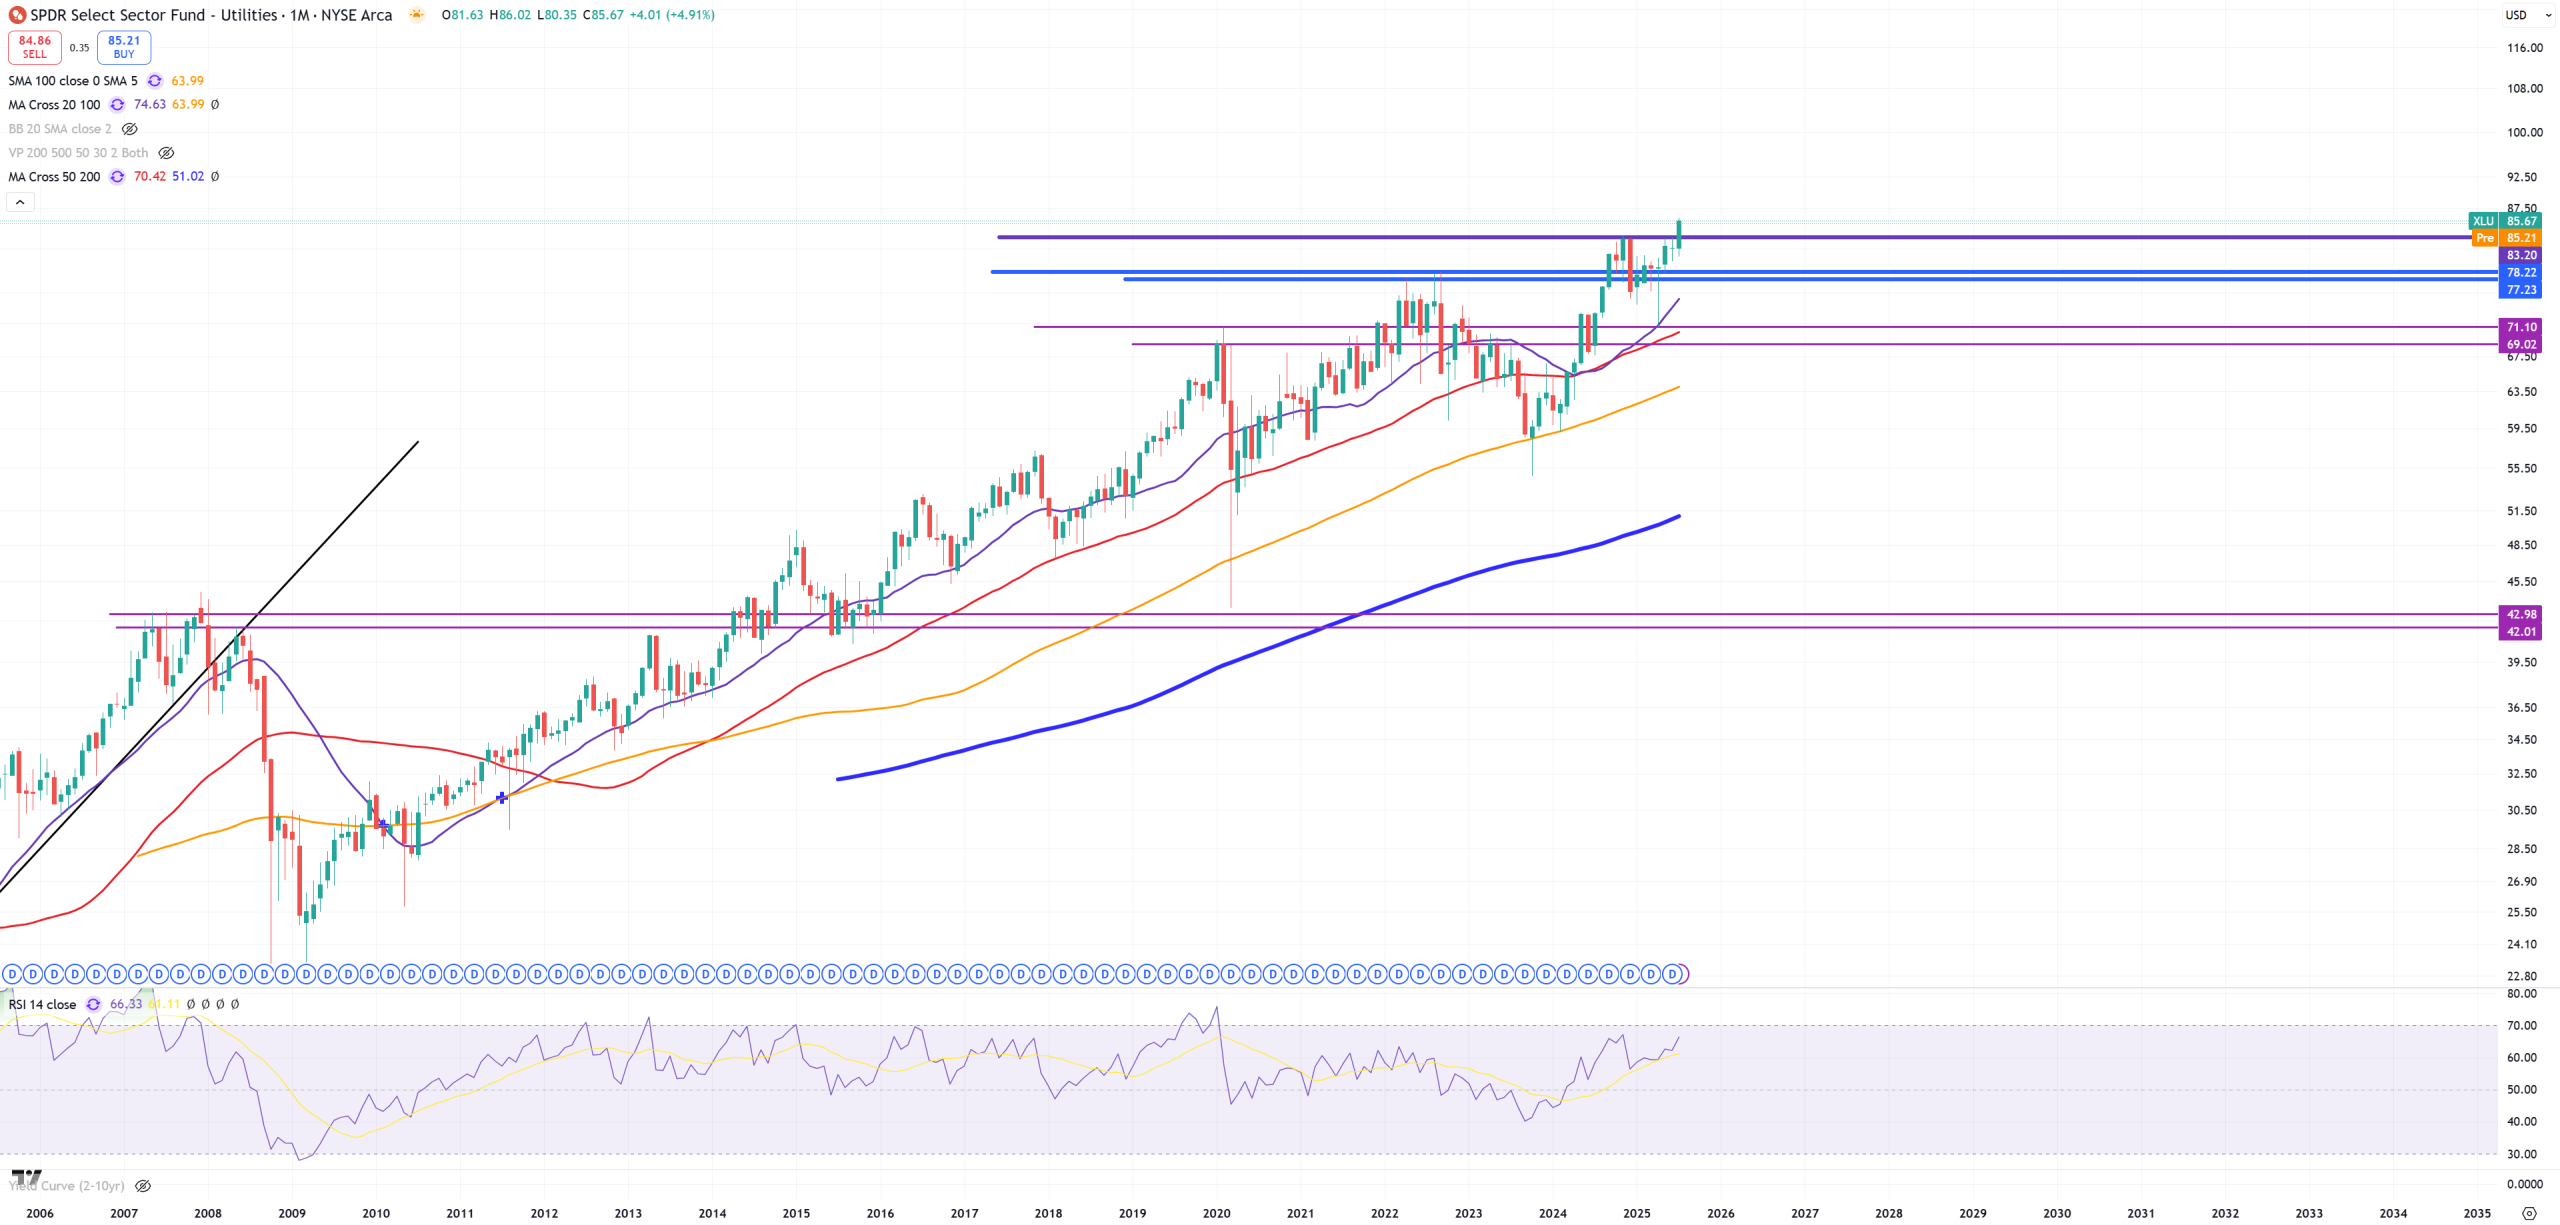
XLU – Utilities in general holds as a last man standing, but it’s jumping above previous resistance.
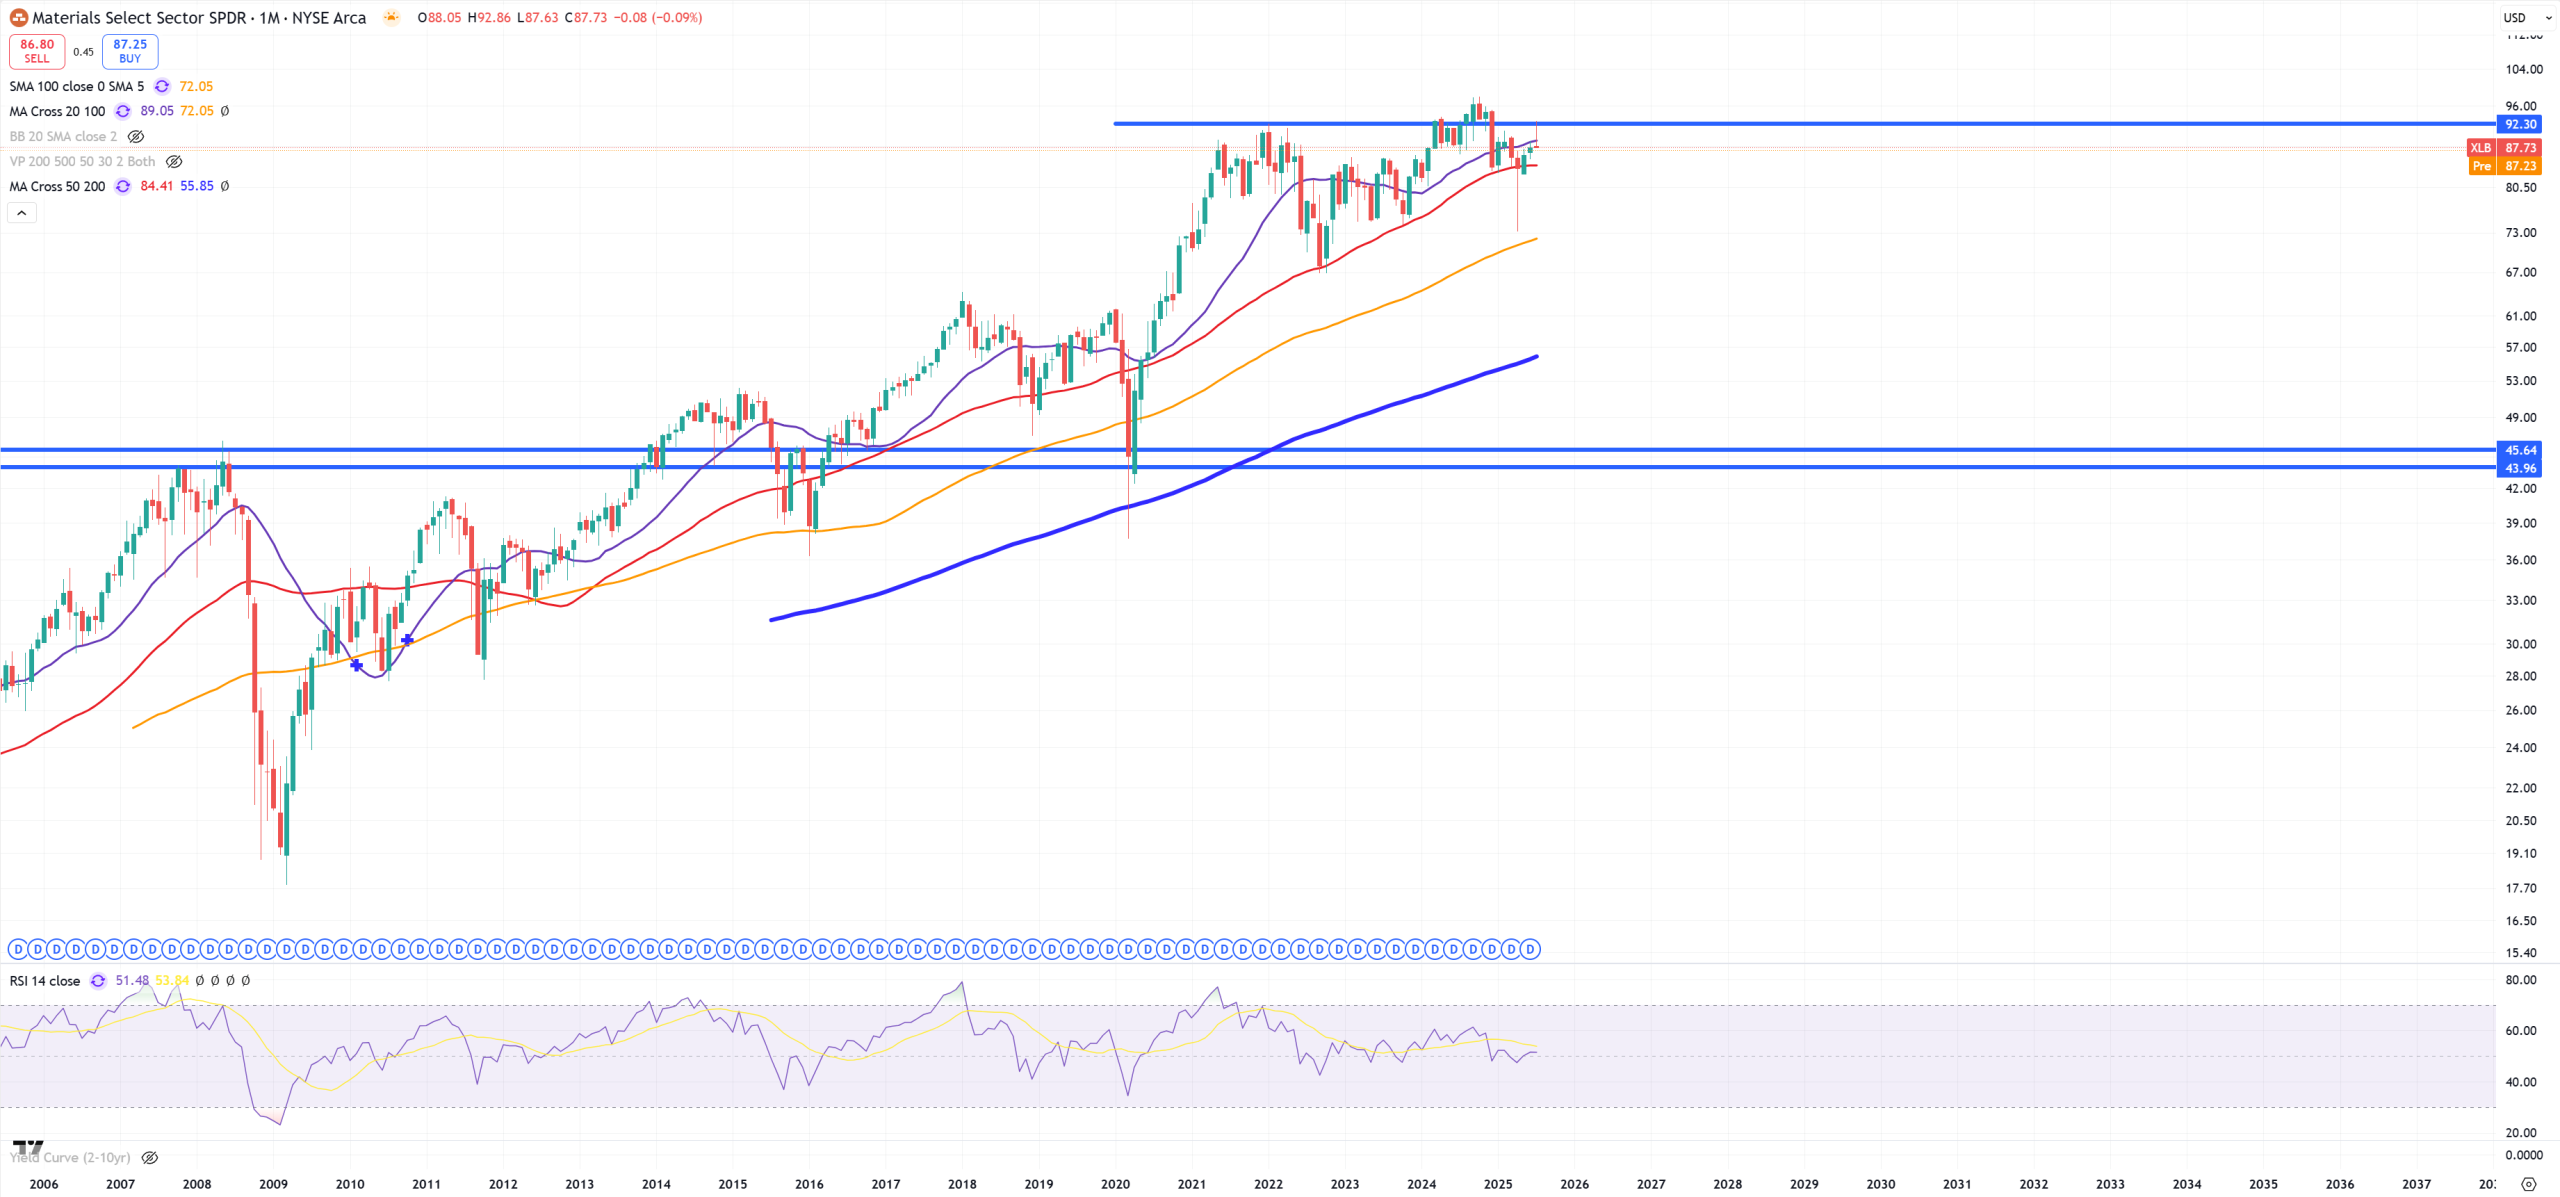
XLB – Materials – 2021 peak holds
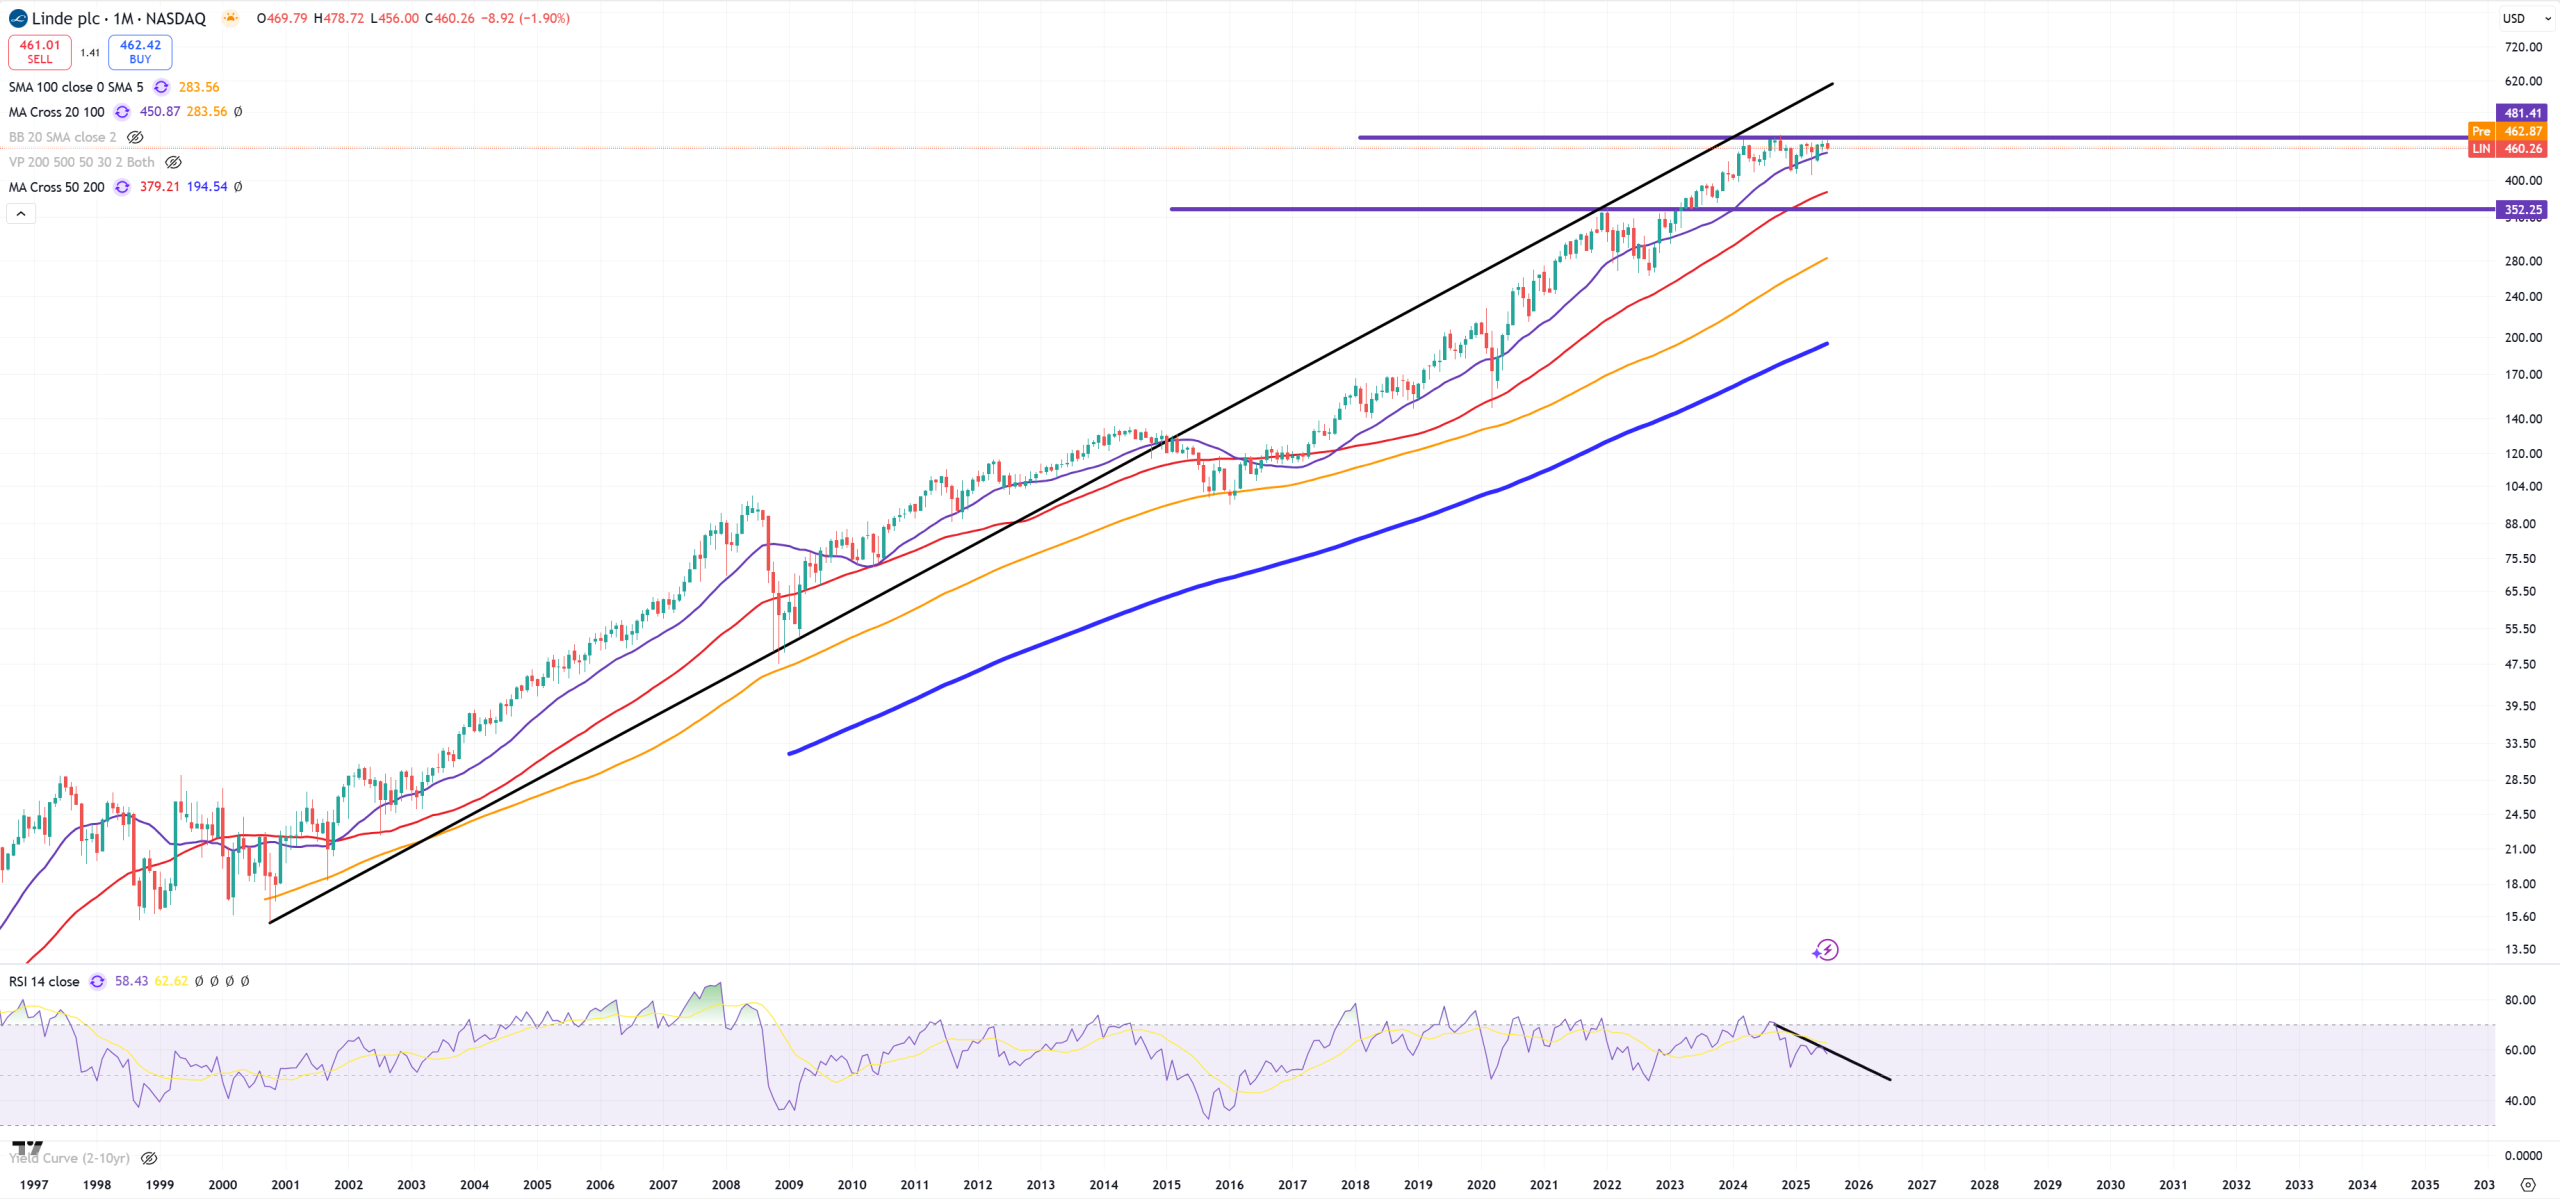
LIN – Linde is the biggest contributor to XLB it consolidates since March 2024
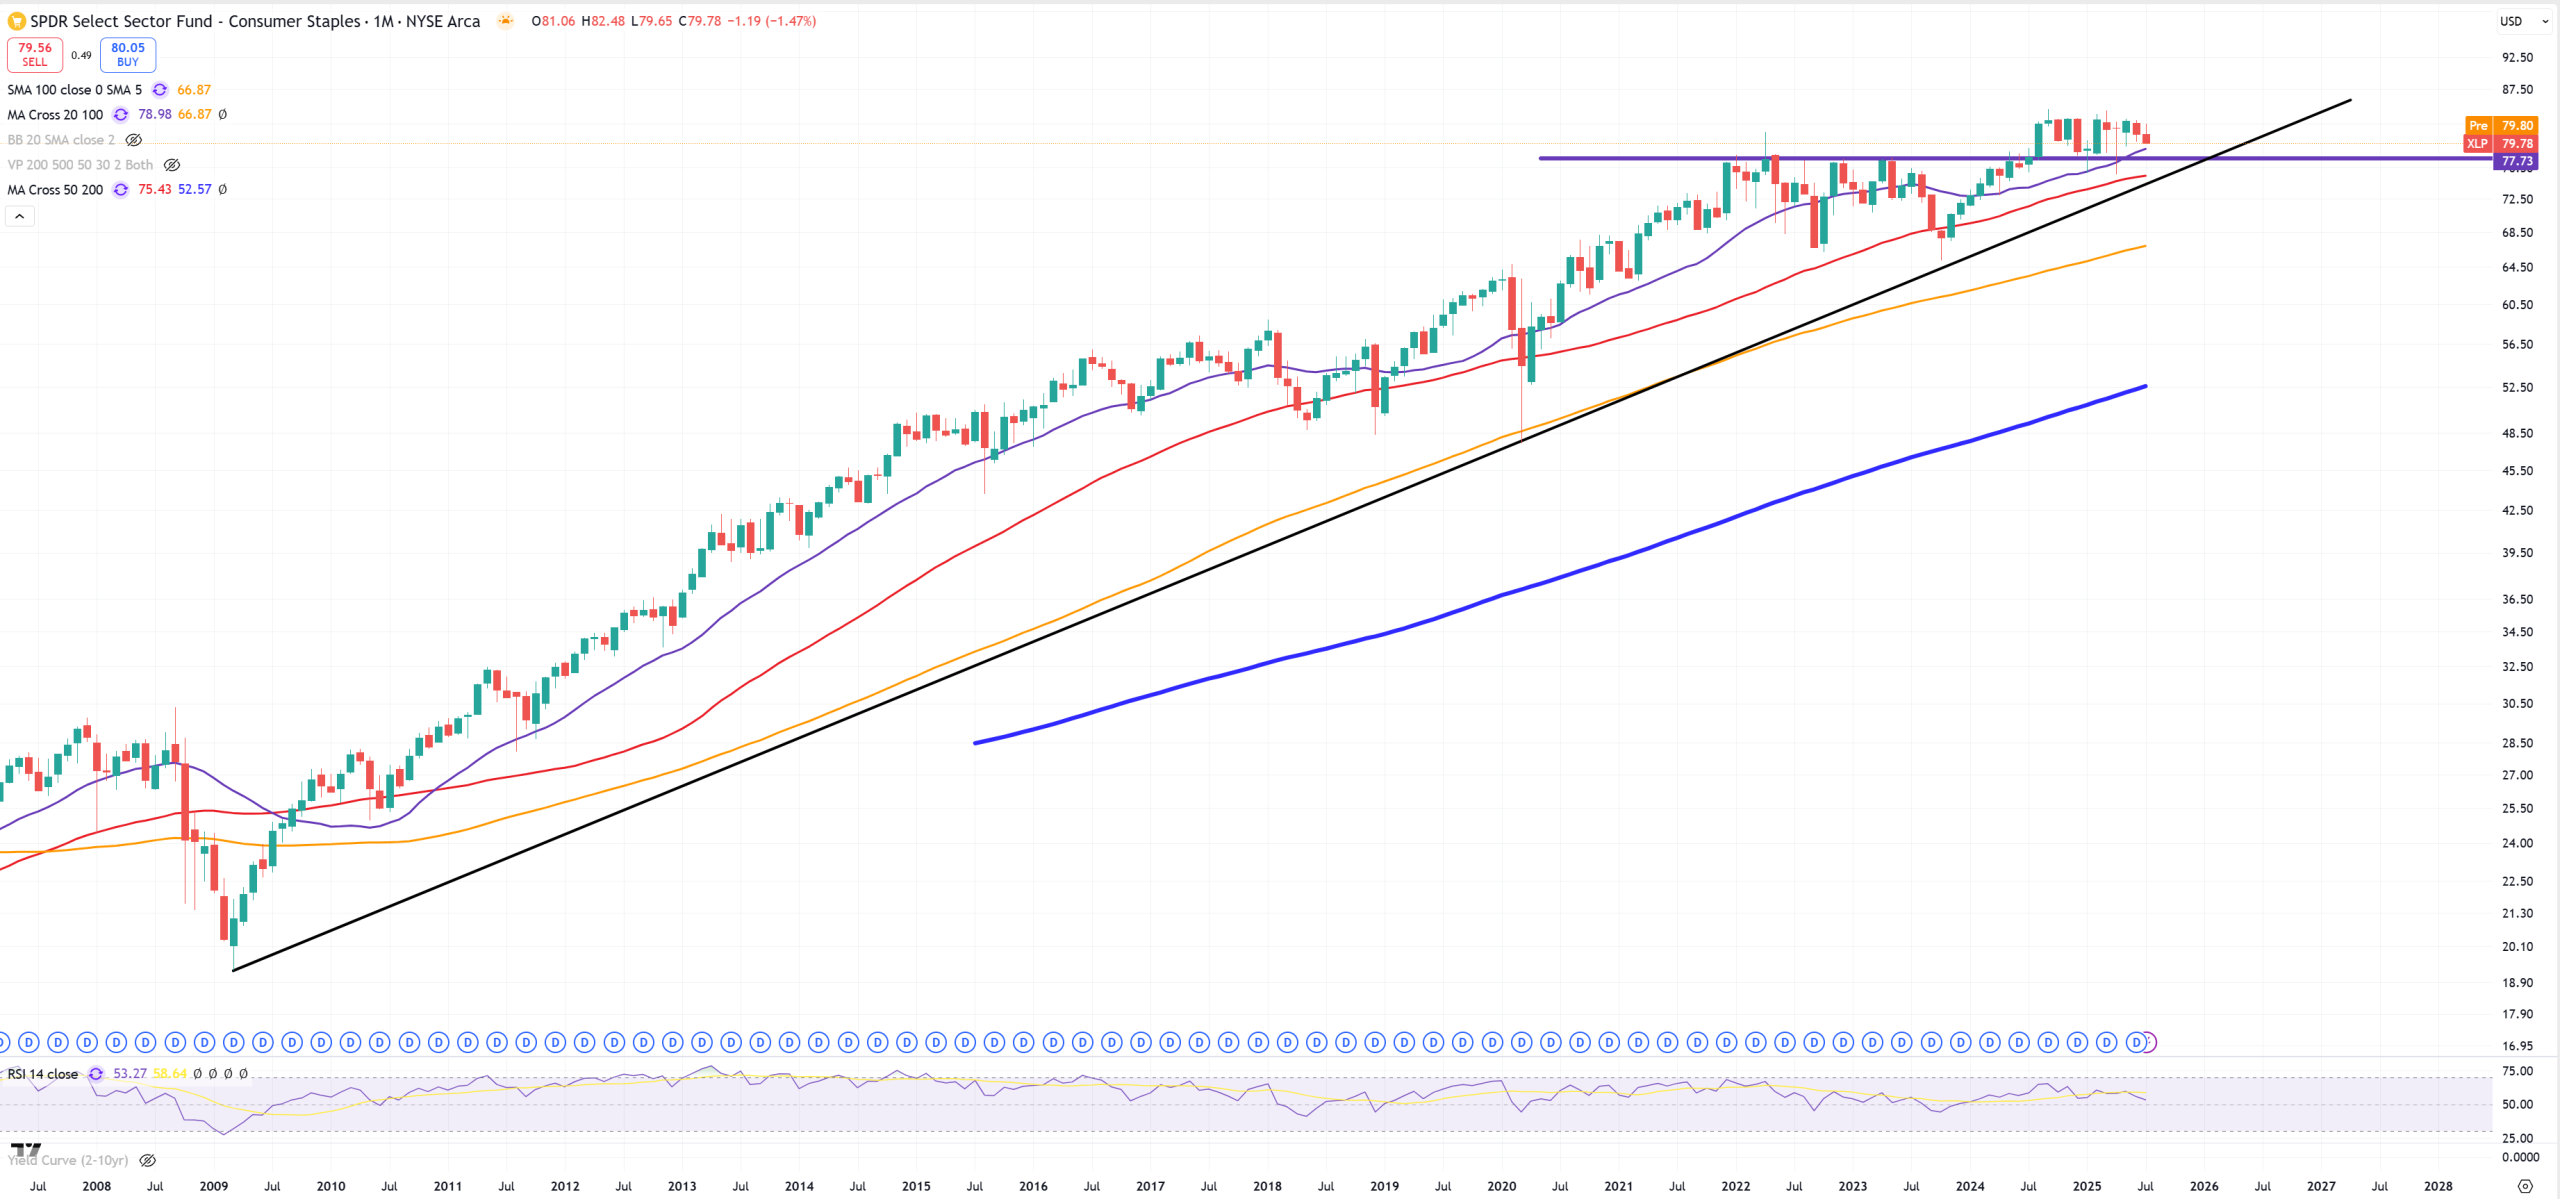
XLP – Consumer Staples – yes it’s above 2021 peak but very close to come back
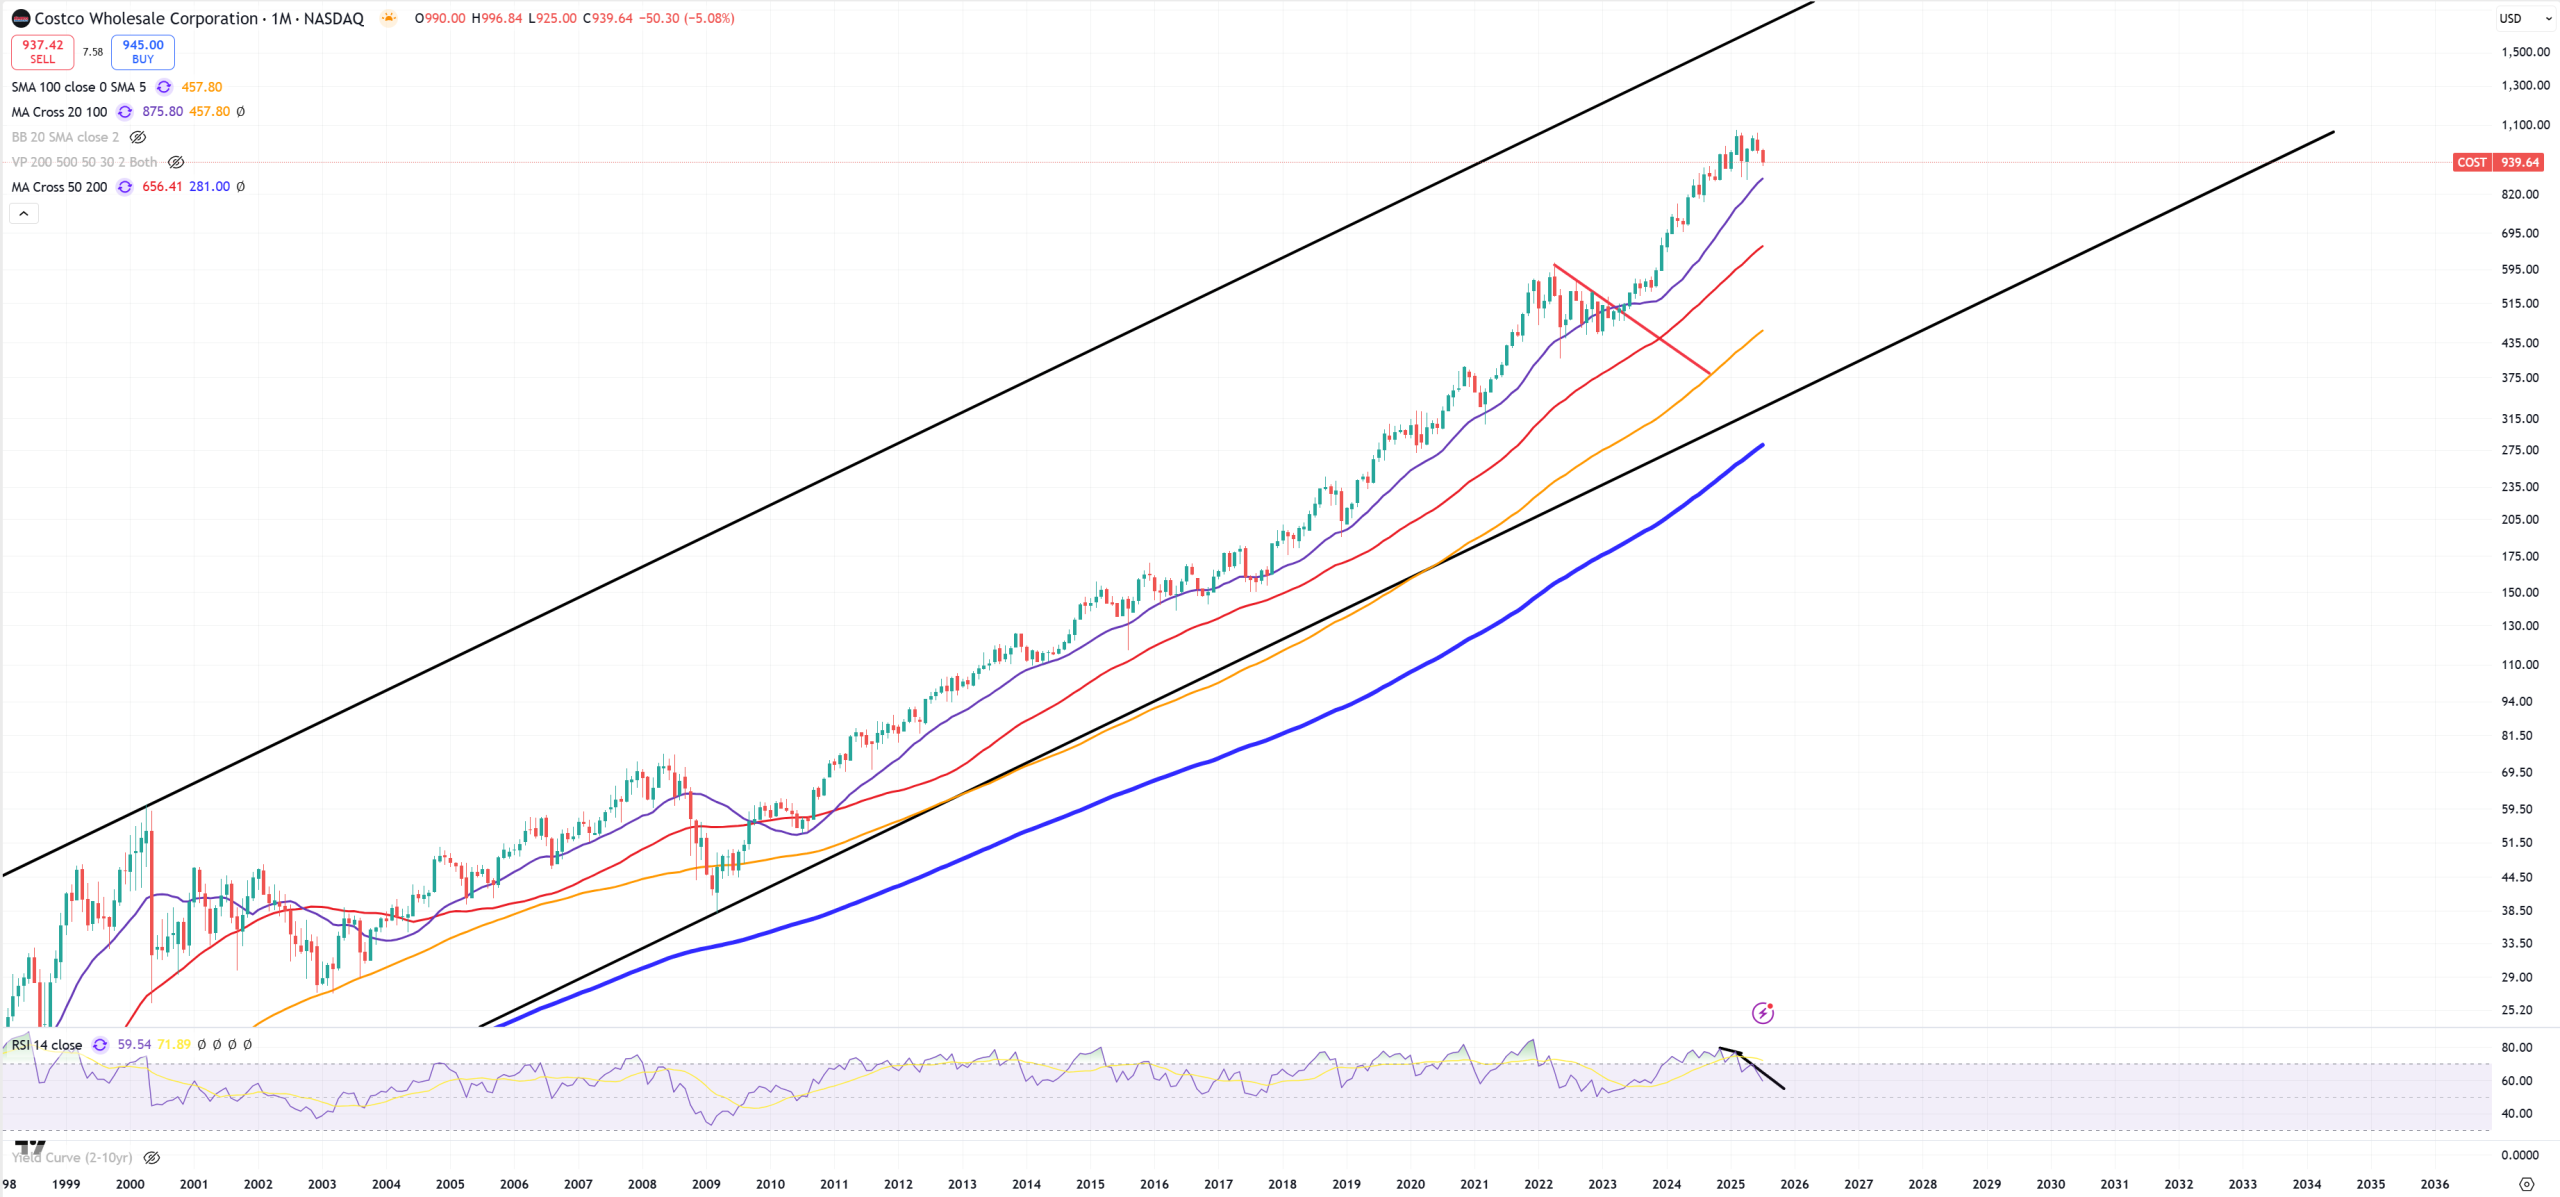
COST – if COST breaks -> market breaks, economy breaks heavily. COST and WMT are 2 biggest holdings in XLP
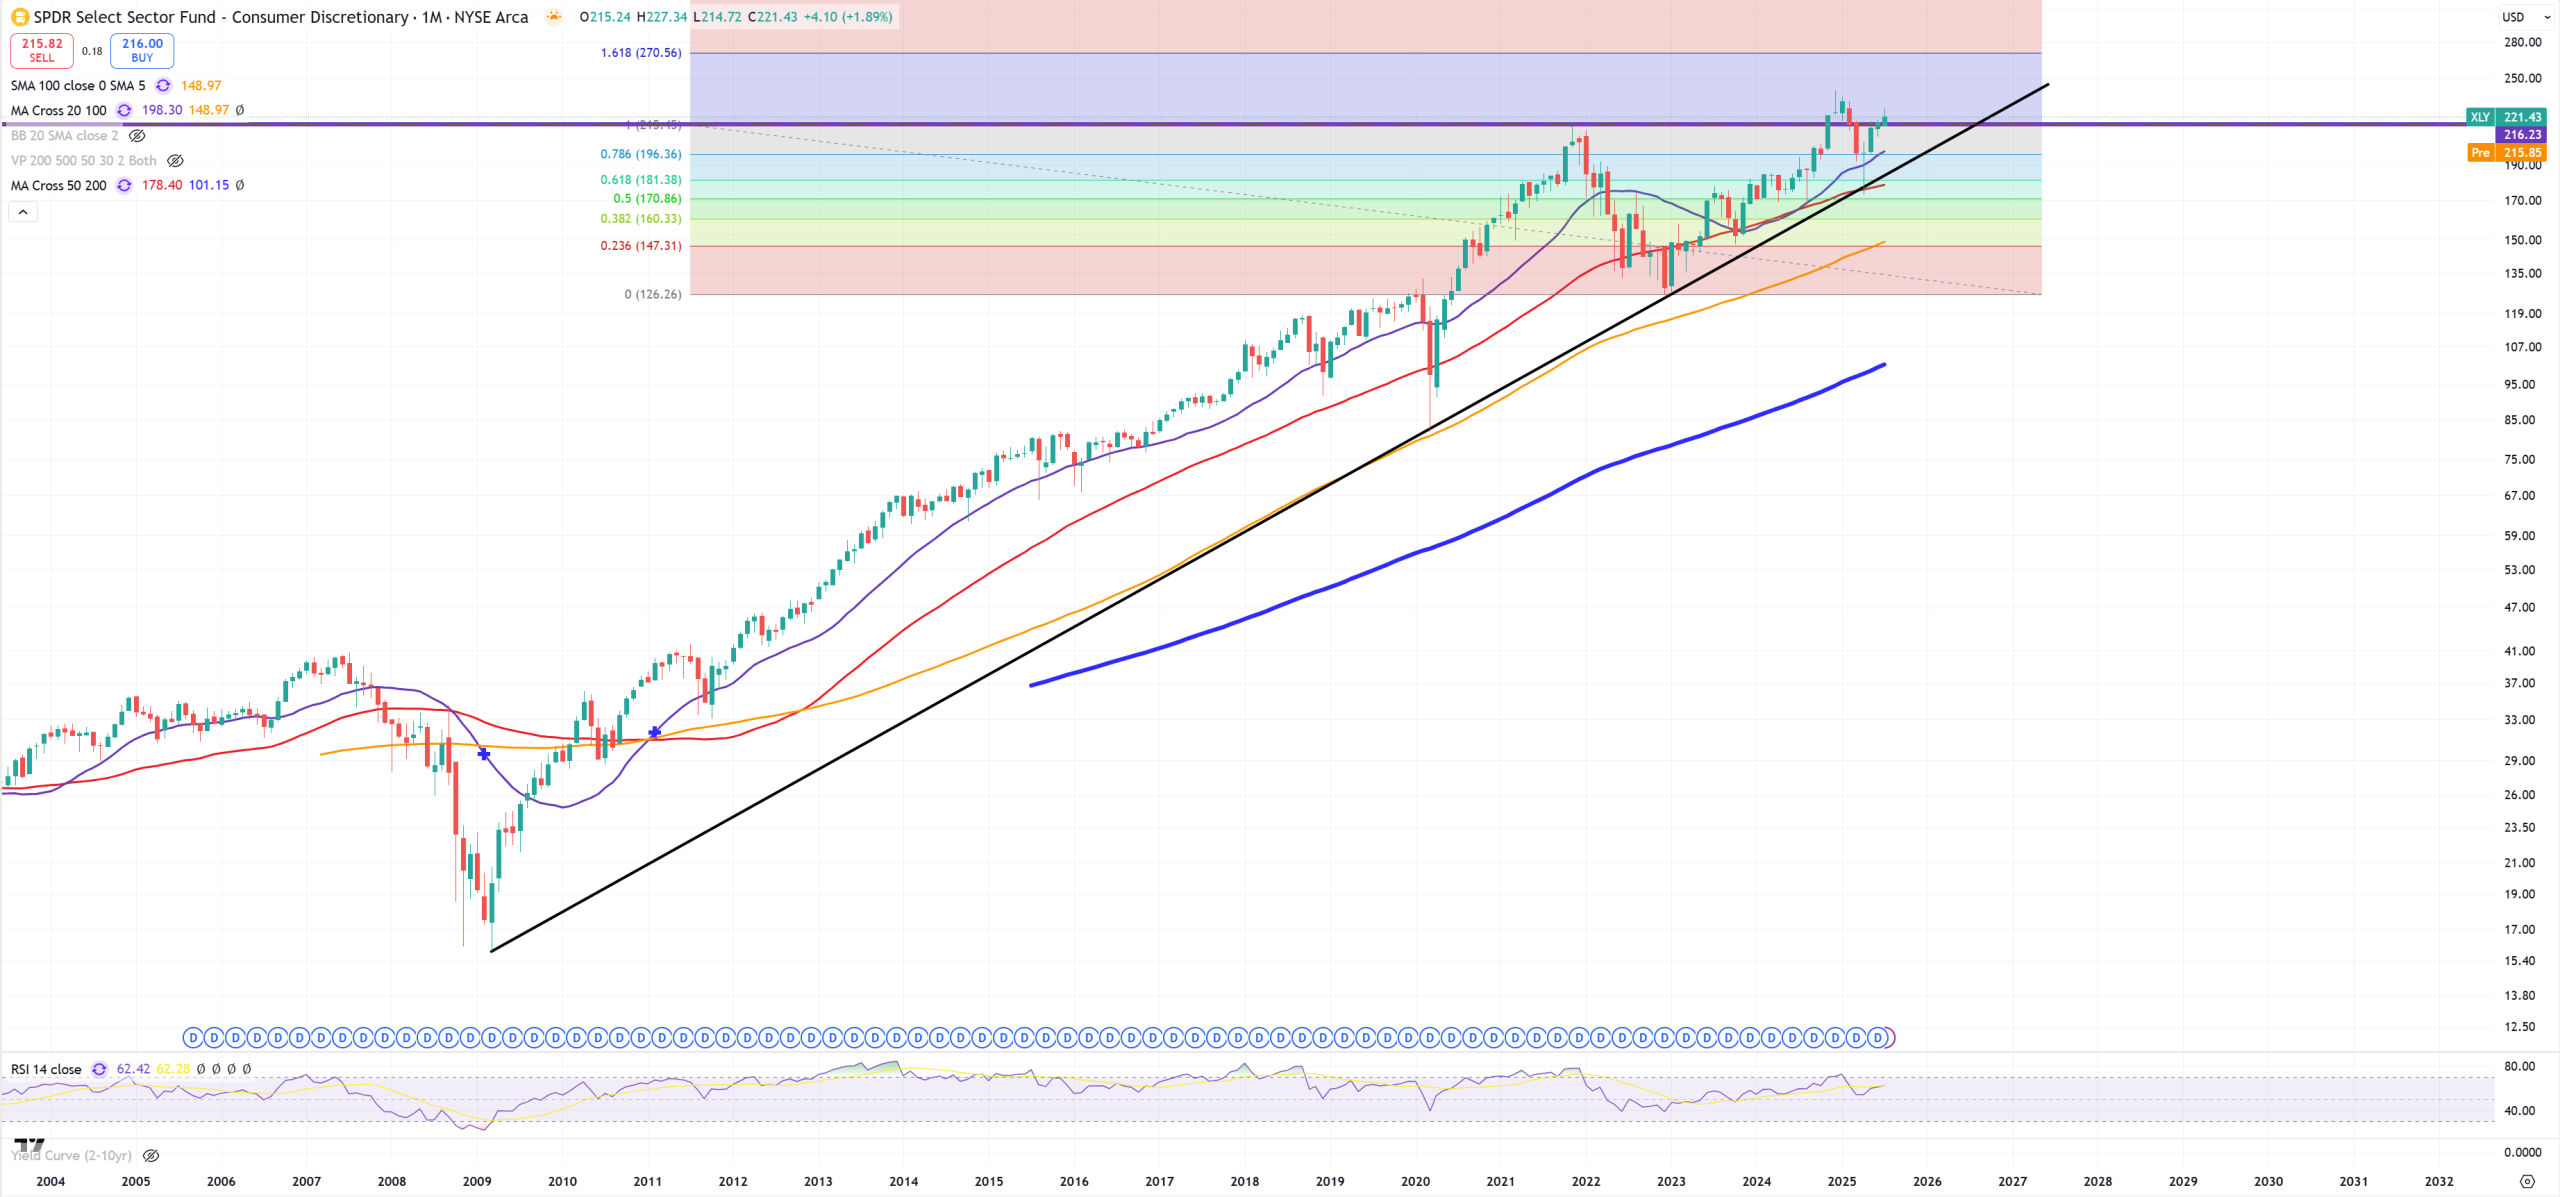
XLY – Consumer Discretionary – opens below 2021 peak. Here you can find AMZN, TSLA as biggest holdings, but also NKE, SBUX or HD, we’ll take HD as an example as rest were already in charts
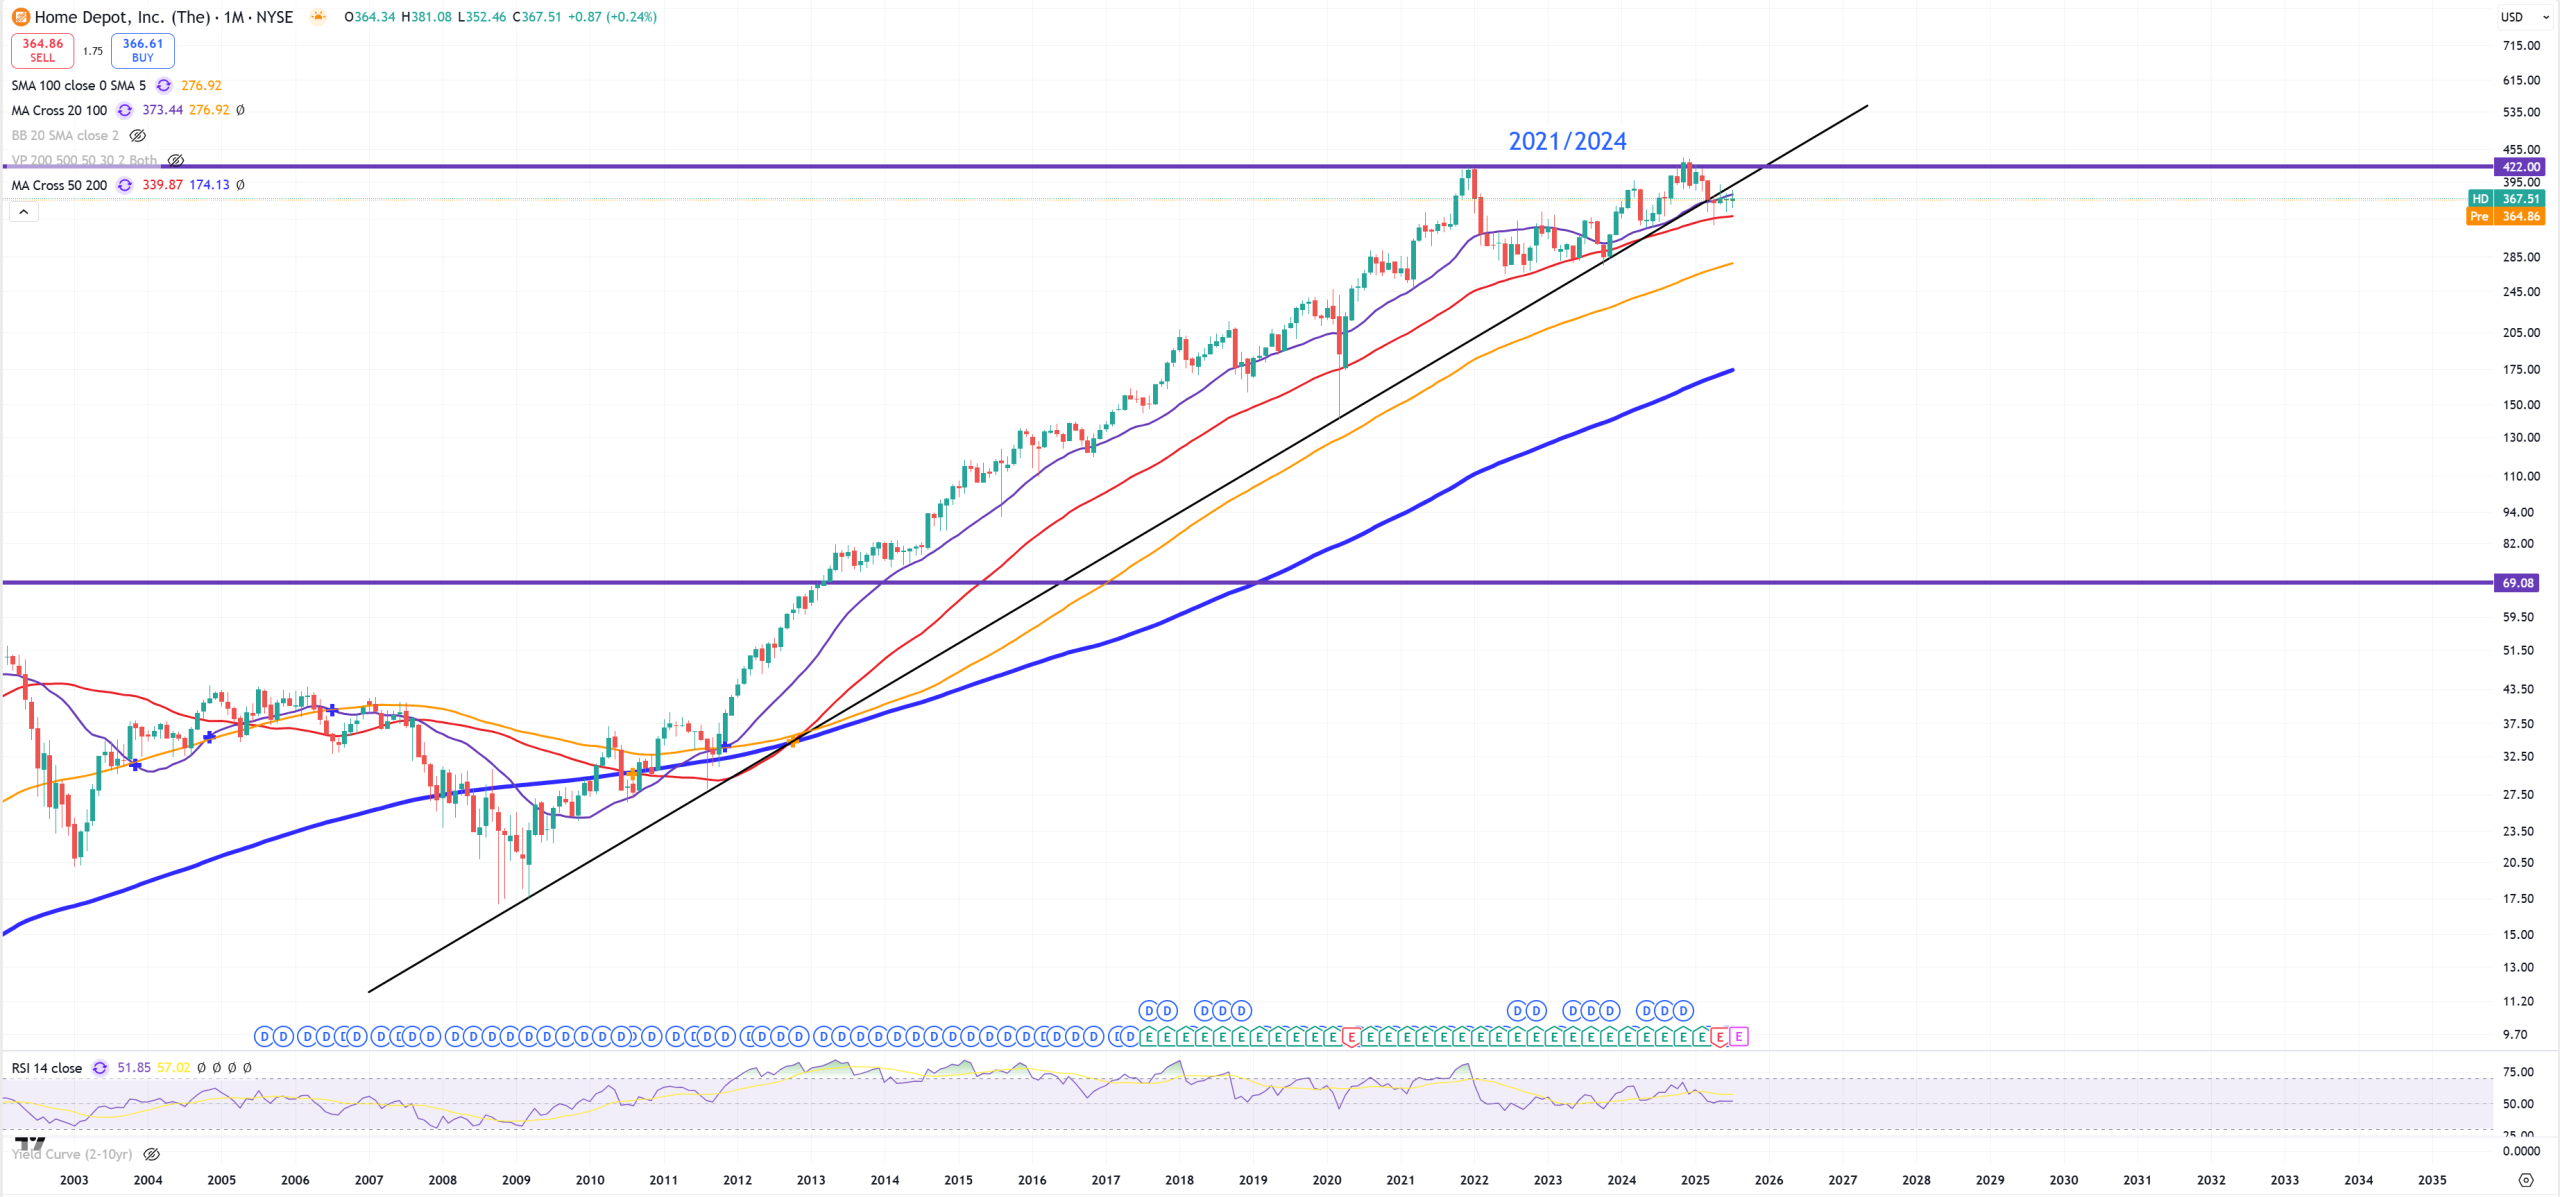
HD – Home Depot, trend is broken but not (M)MA50
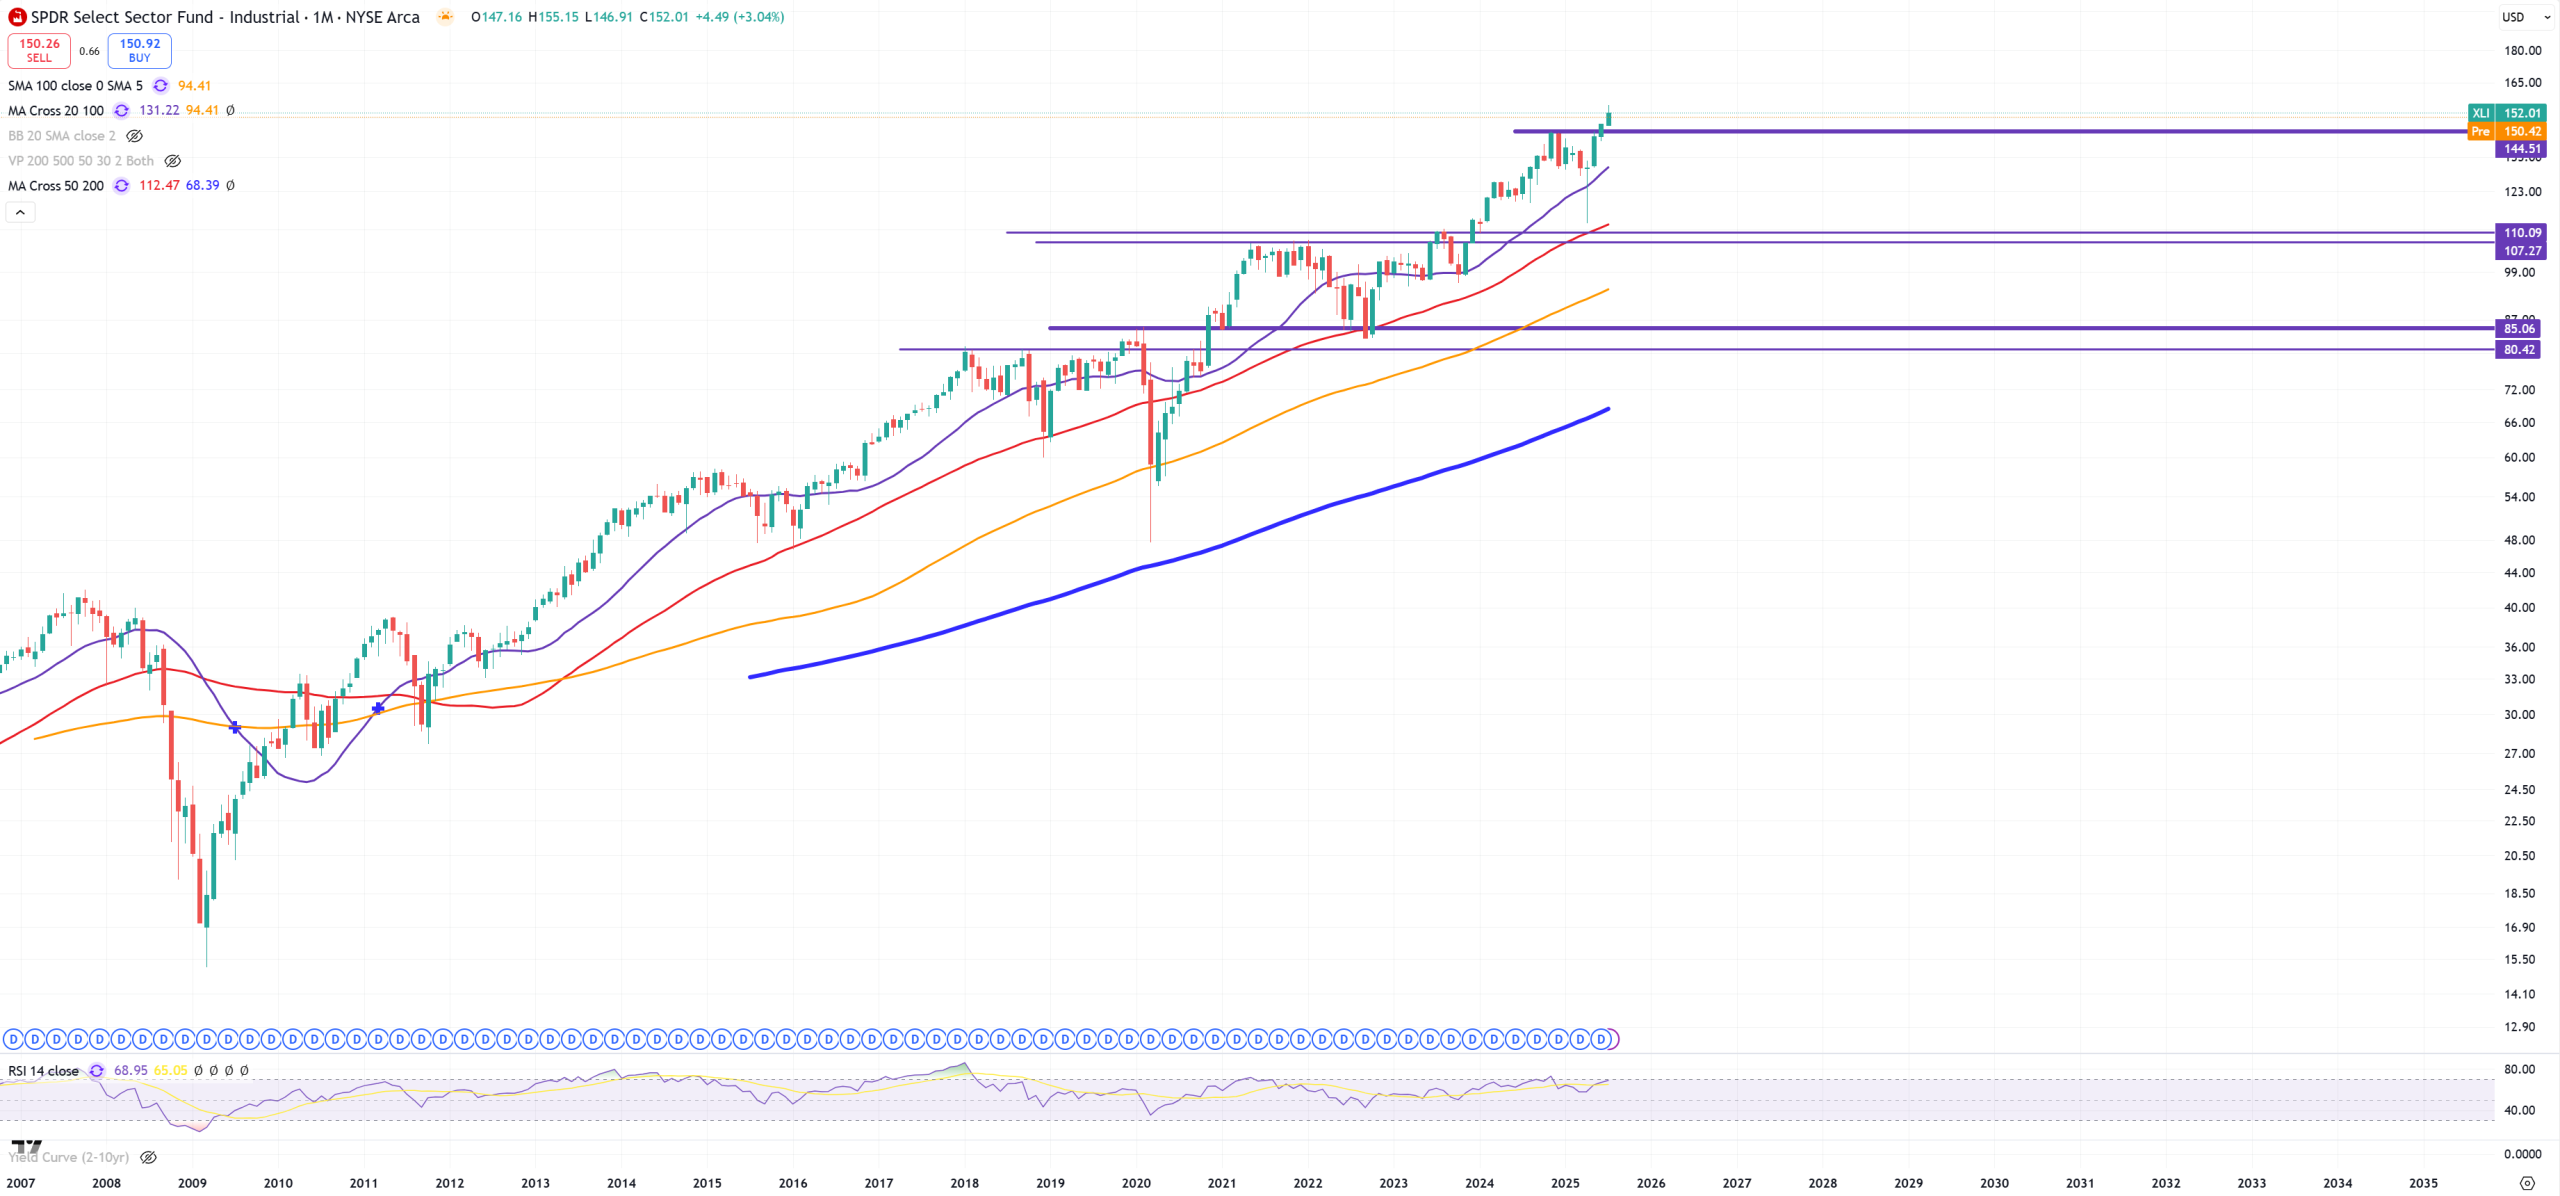
XLI – Industrial is a massive break, GE, CAT, DE, UBER, HON is here
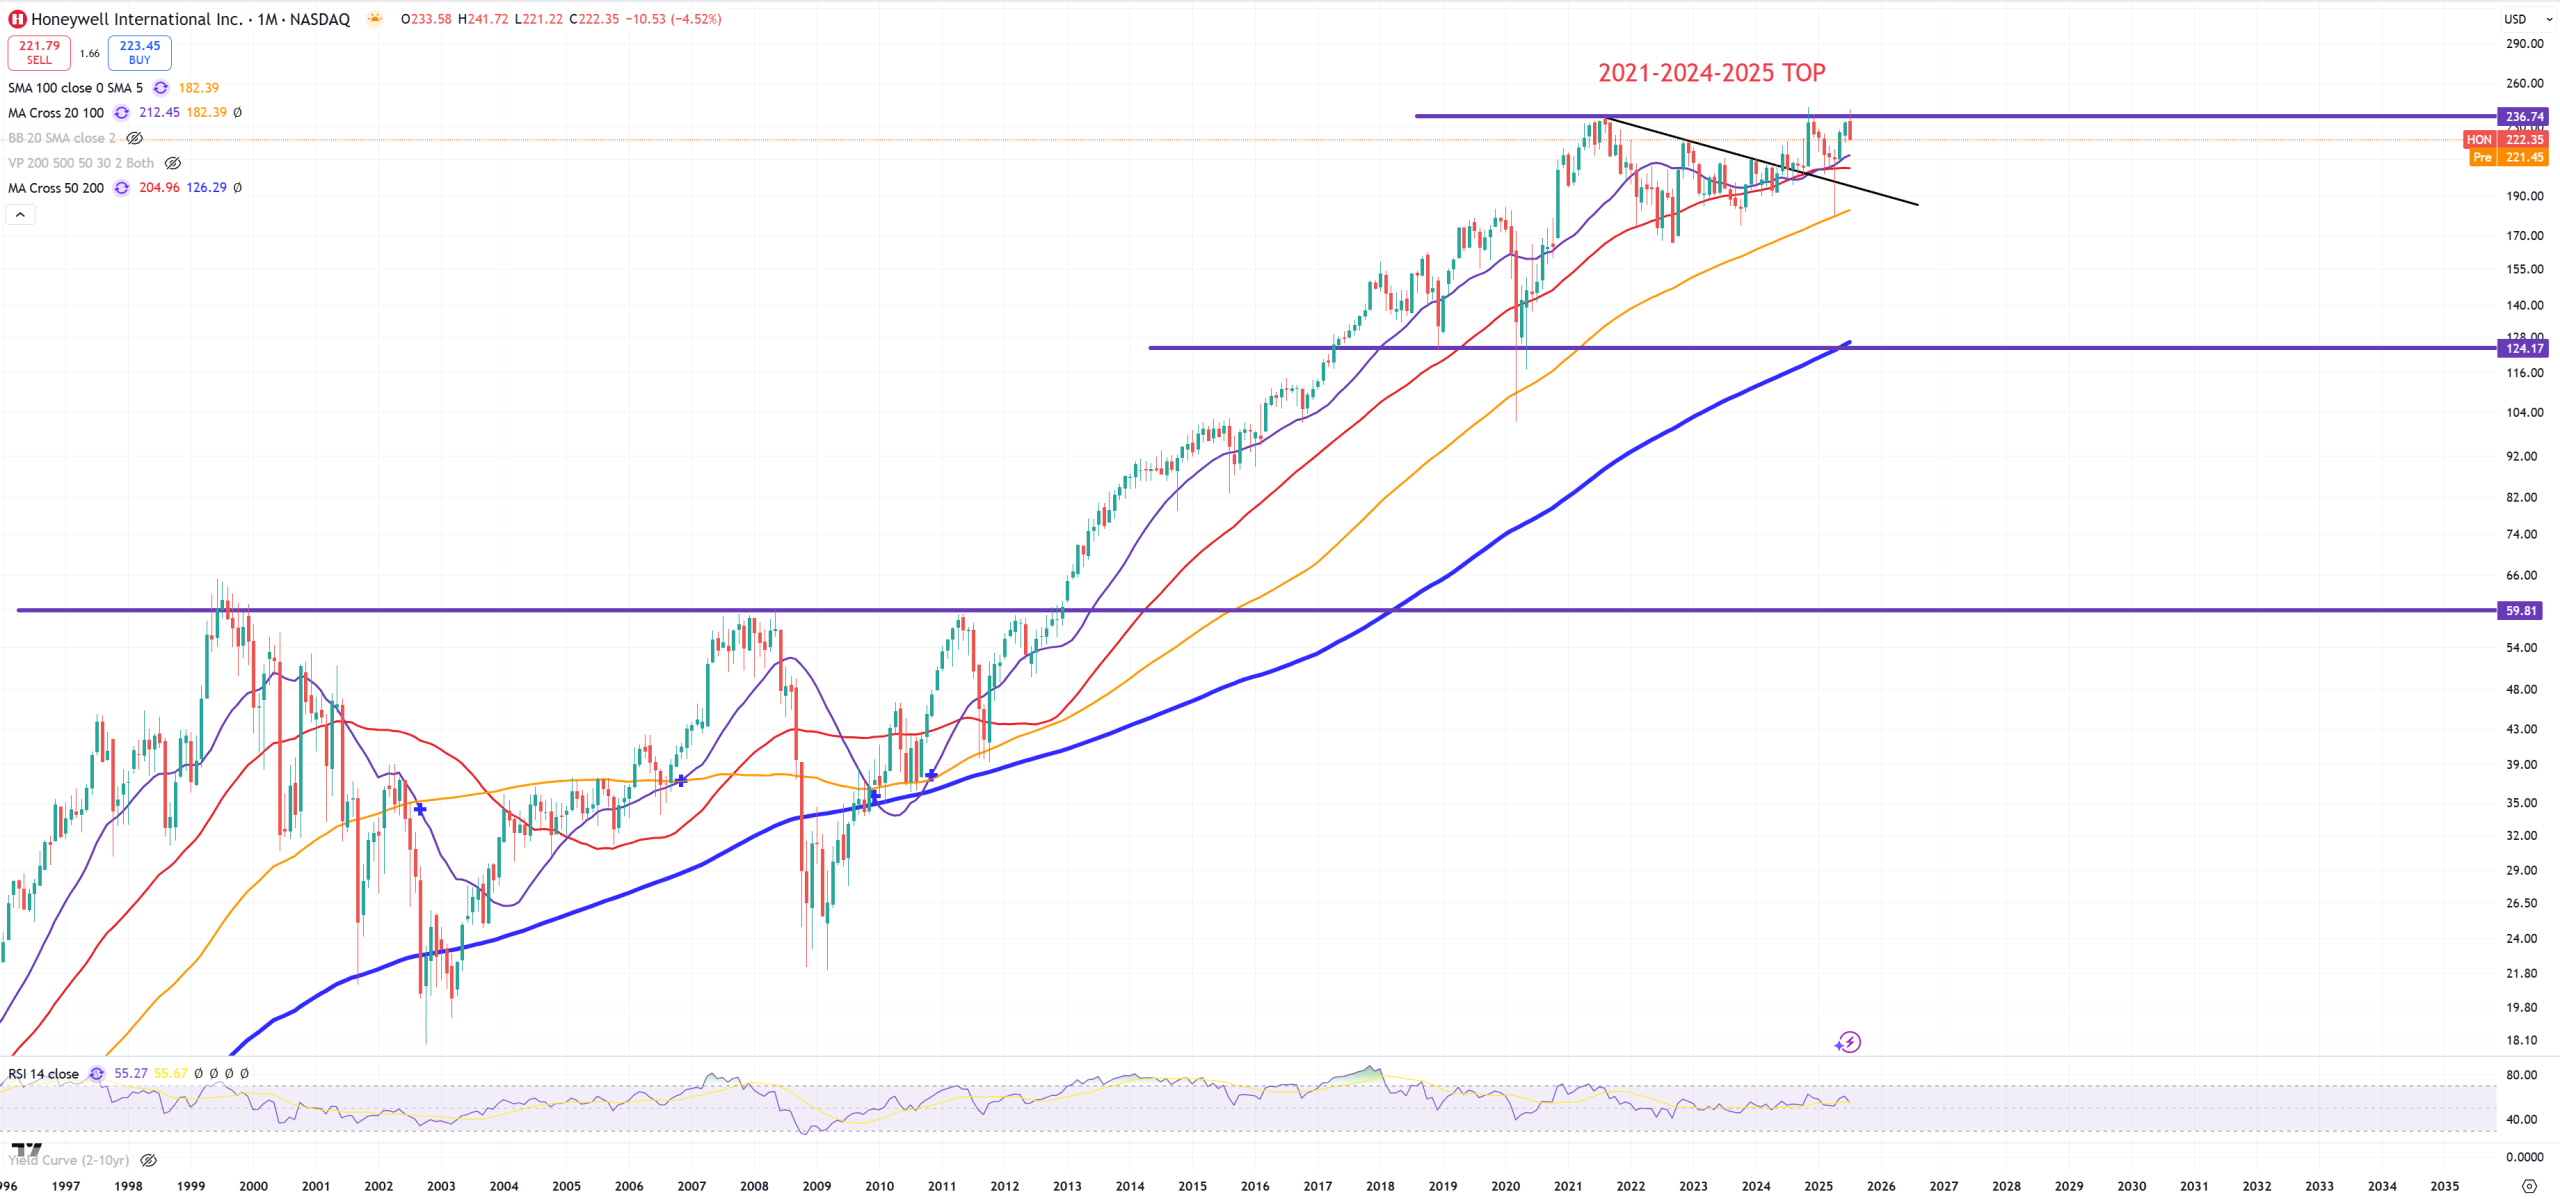
HON – Honeywell as problems with 2021 peak
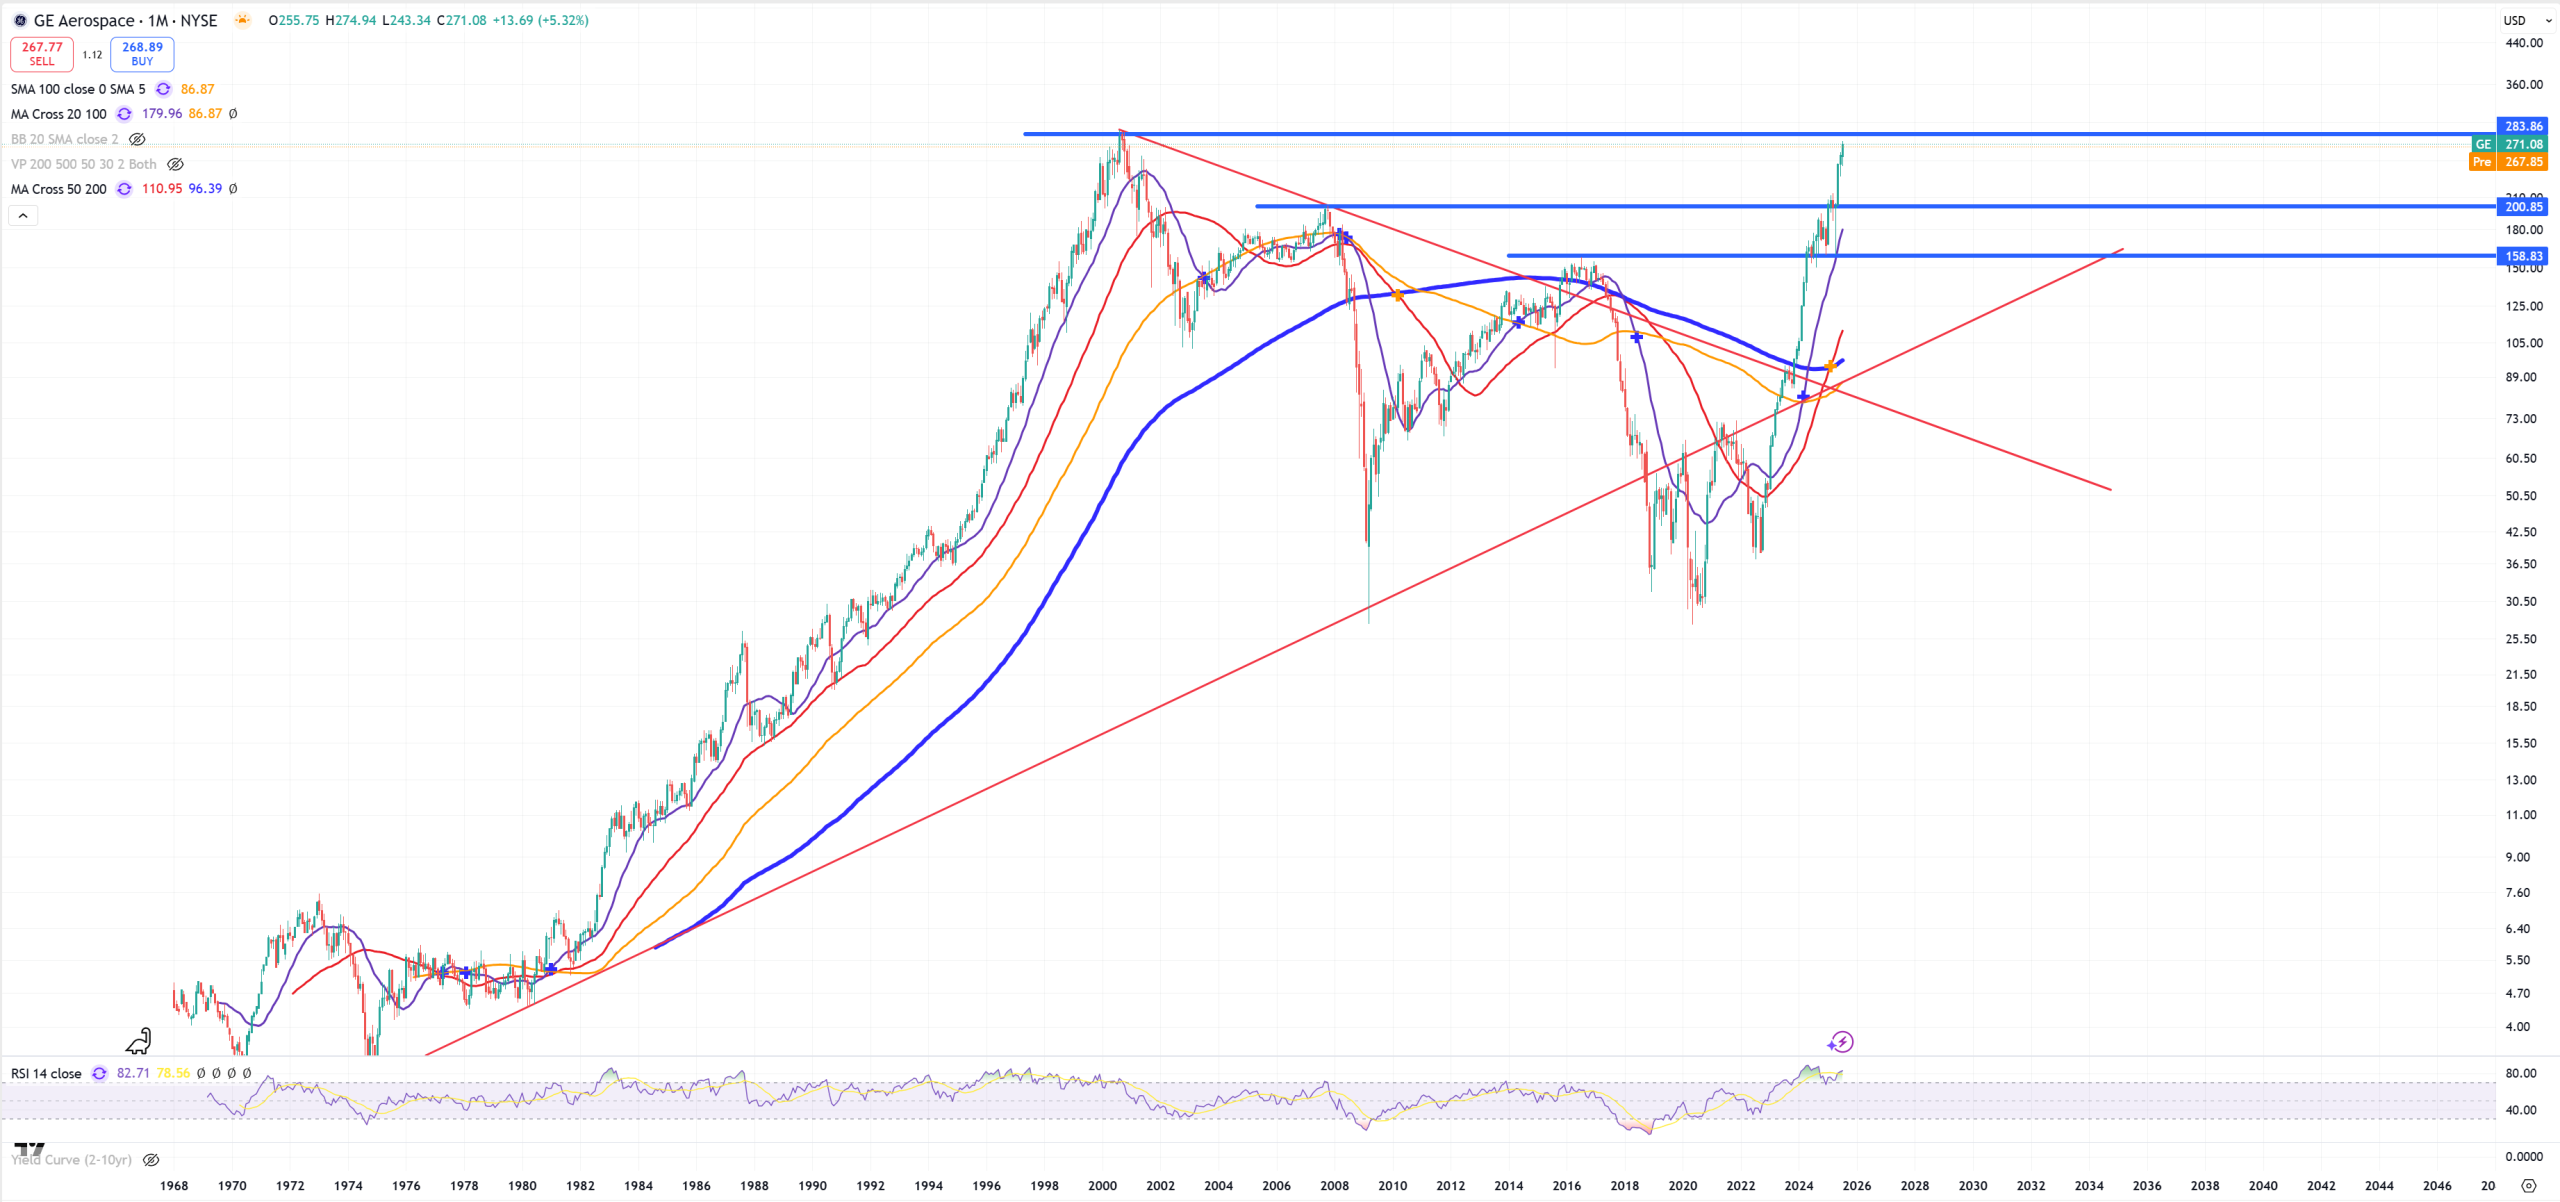
GE – approaching to 2000 peak – amazing come back.