Economy cycle sit-rep 1Q20 – dead cat bounce trigger seems to be released
March 11, 2020

I think it’s time to move back again to 26thJan18 … And analyse the cycle peak, let’s see how it looks from the past time.
I’ve been using my observation that in the full cycle you’ll receive just 2 significant corrections. If you missed that entry, I strongly encourage you to read it before you read this article.
So below that’s our economy what I think. All so far works perfectly. All parts of it and allocated assets made the best returns in those periods same as earnings.
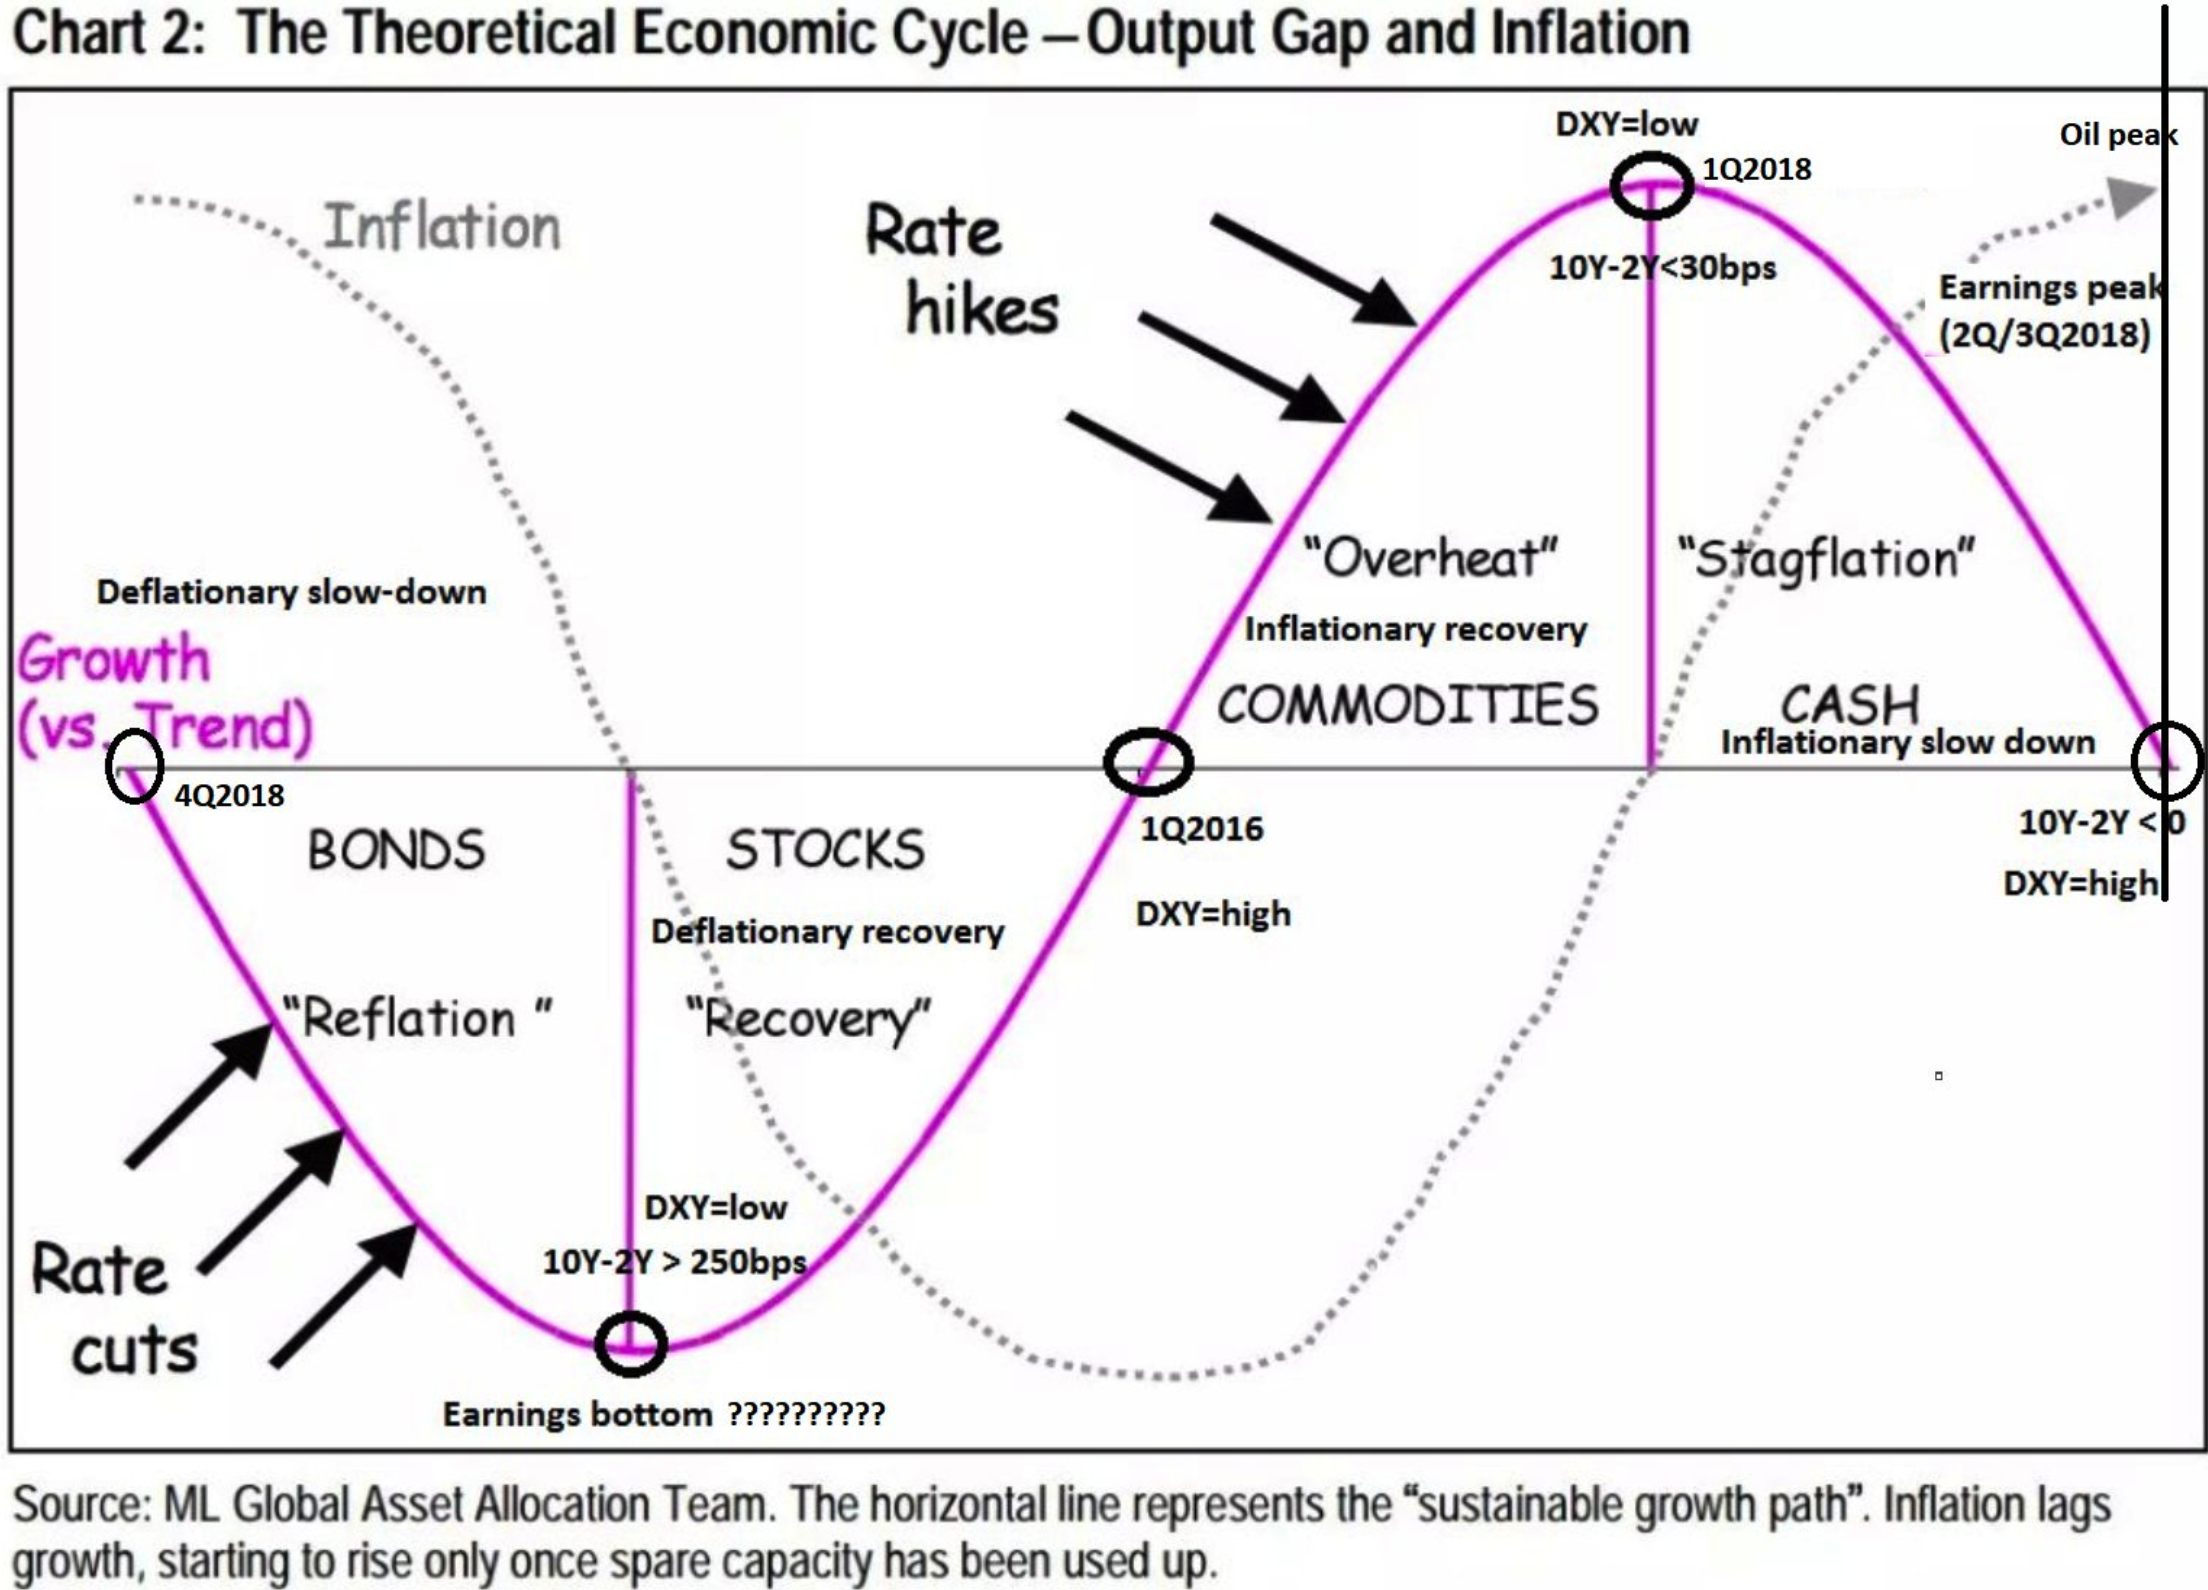
Below we’re looking at some key points of the economy cycle, most of them were explained in the article liked on the beginning of this article. We’ll need it anyway.
Commodities, Emerging Markets were strongly bid since 1Q2016 till 1Q2018 (26thJan18)(“Overheat” inflationary recovery phase), bonds ($TLT) same time were heavily sold, same as the $ and we had rate hikes. Situation changed after 26thJan18 – global cycle peak. From now on the best return should arrive from longing the $ (“Stagflation” – inflationary slowdown phase). This period also gave the $$$ the best return, until a second top was created and big shock down arrived with the worst December since 1931. It arrived in 4Q18 (considered top of the US cycle – leading economy) and same time we marked “Reflation” aka Deflationary slowdown on our cycle economy map. Market in 4Q18 tumbled and bounced from (W)MA200 for the dead-cat bounce run switching its best performing asset to Bonds ($TLT, $ZROZ) from that moment. So far in 4Q18-1Q20 the return :
$TLT made 40% gains during this time, $SPX only 10%
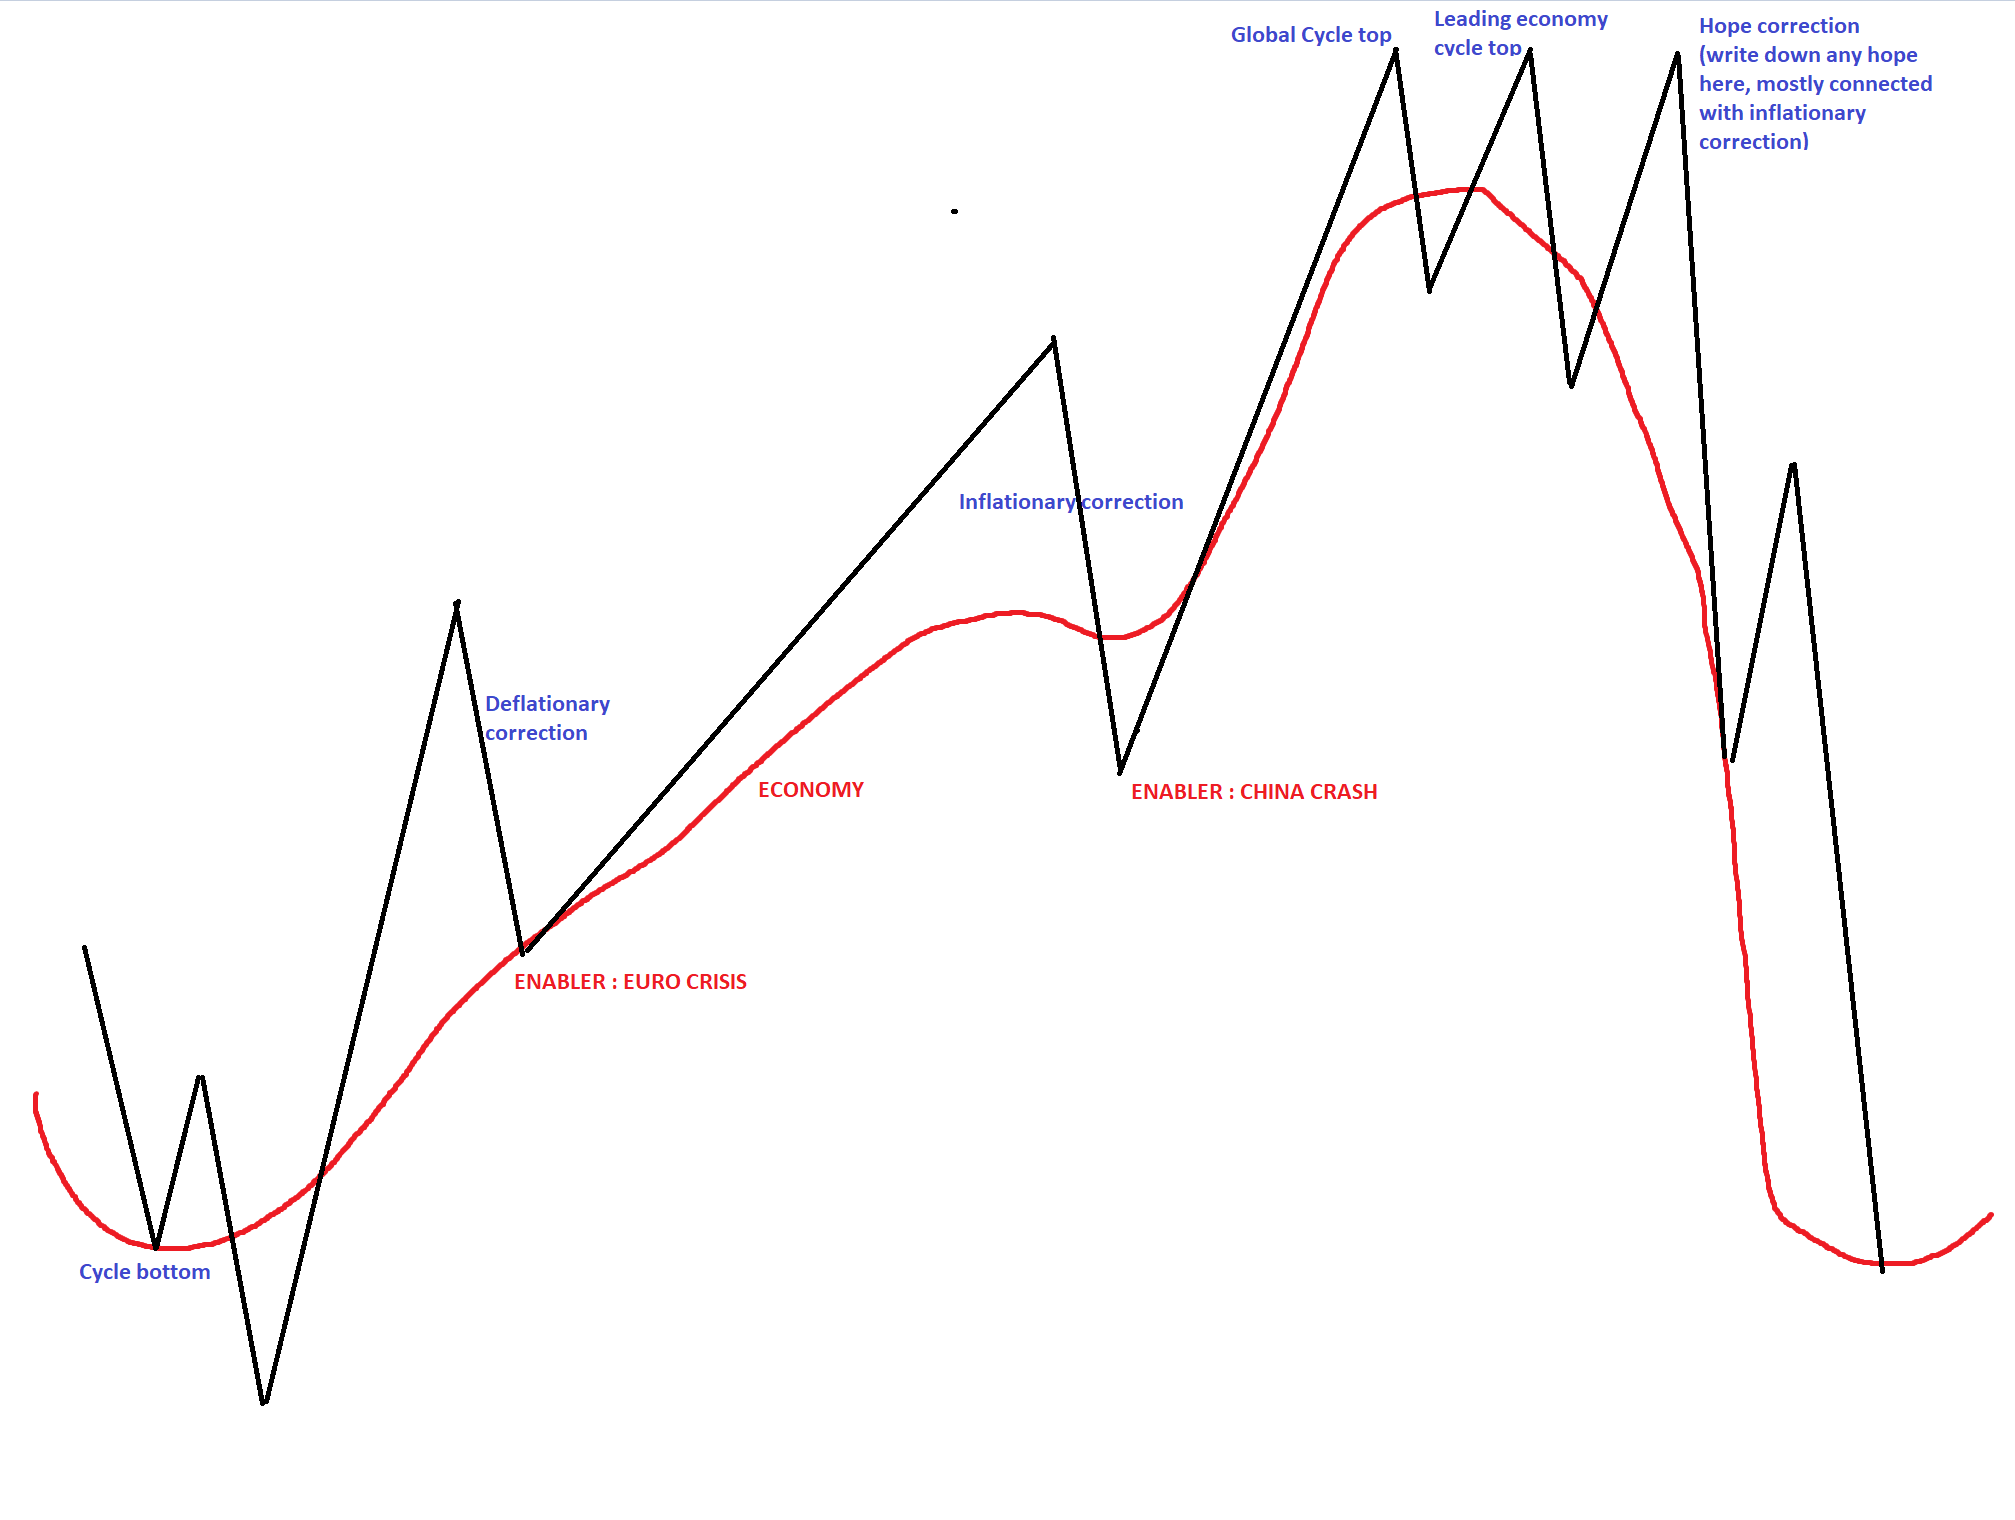
So far so good looks it all works and confirms the deflationary phase of the cycle. Bonds outperform stocks by miles during this phase. Rate cuts arrived, repo going to infinity, but the market made it clear. Needs some kind of 3 tops as market on the above chart. Global top, Leading economy top, Dead-cat bounce top.
The golden rule is the yield curve inverts between 2nd and 3rd top and as I’ve been saying :
Give me the dead-cat bounce hope correction 3rd top, I’ll give you a hammer to slam the economy down and spread the panic.
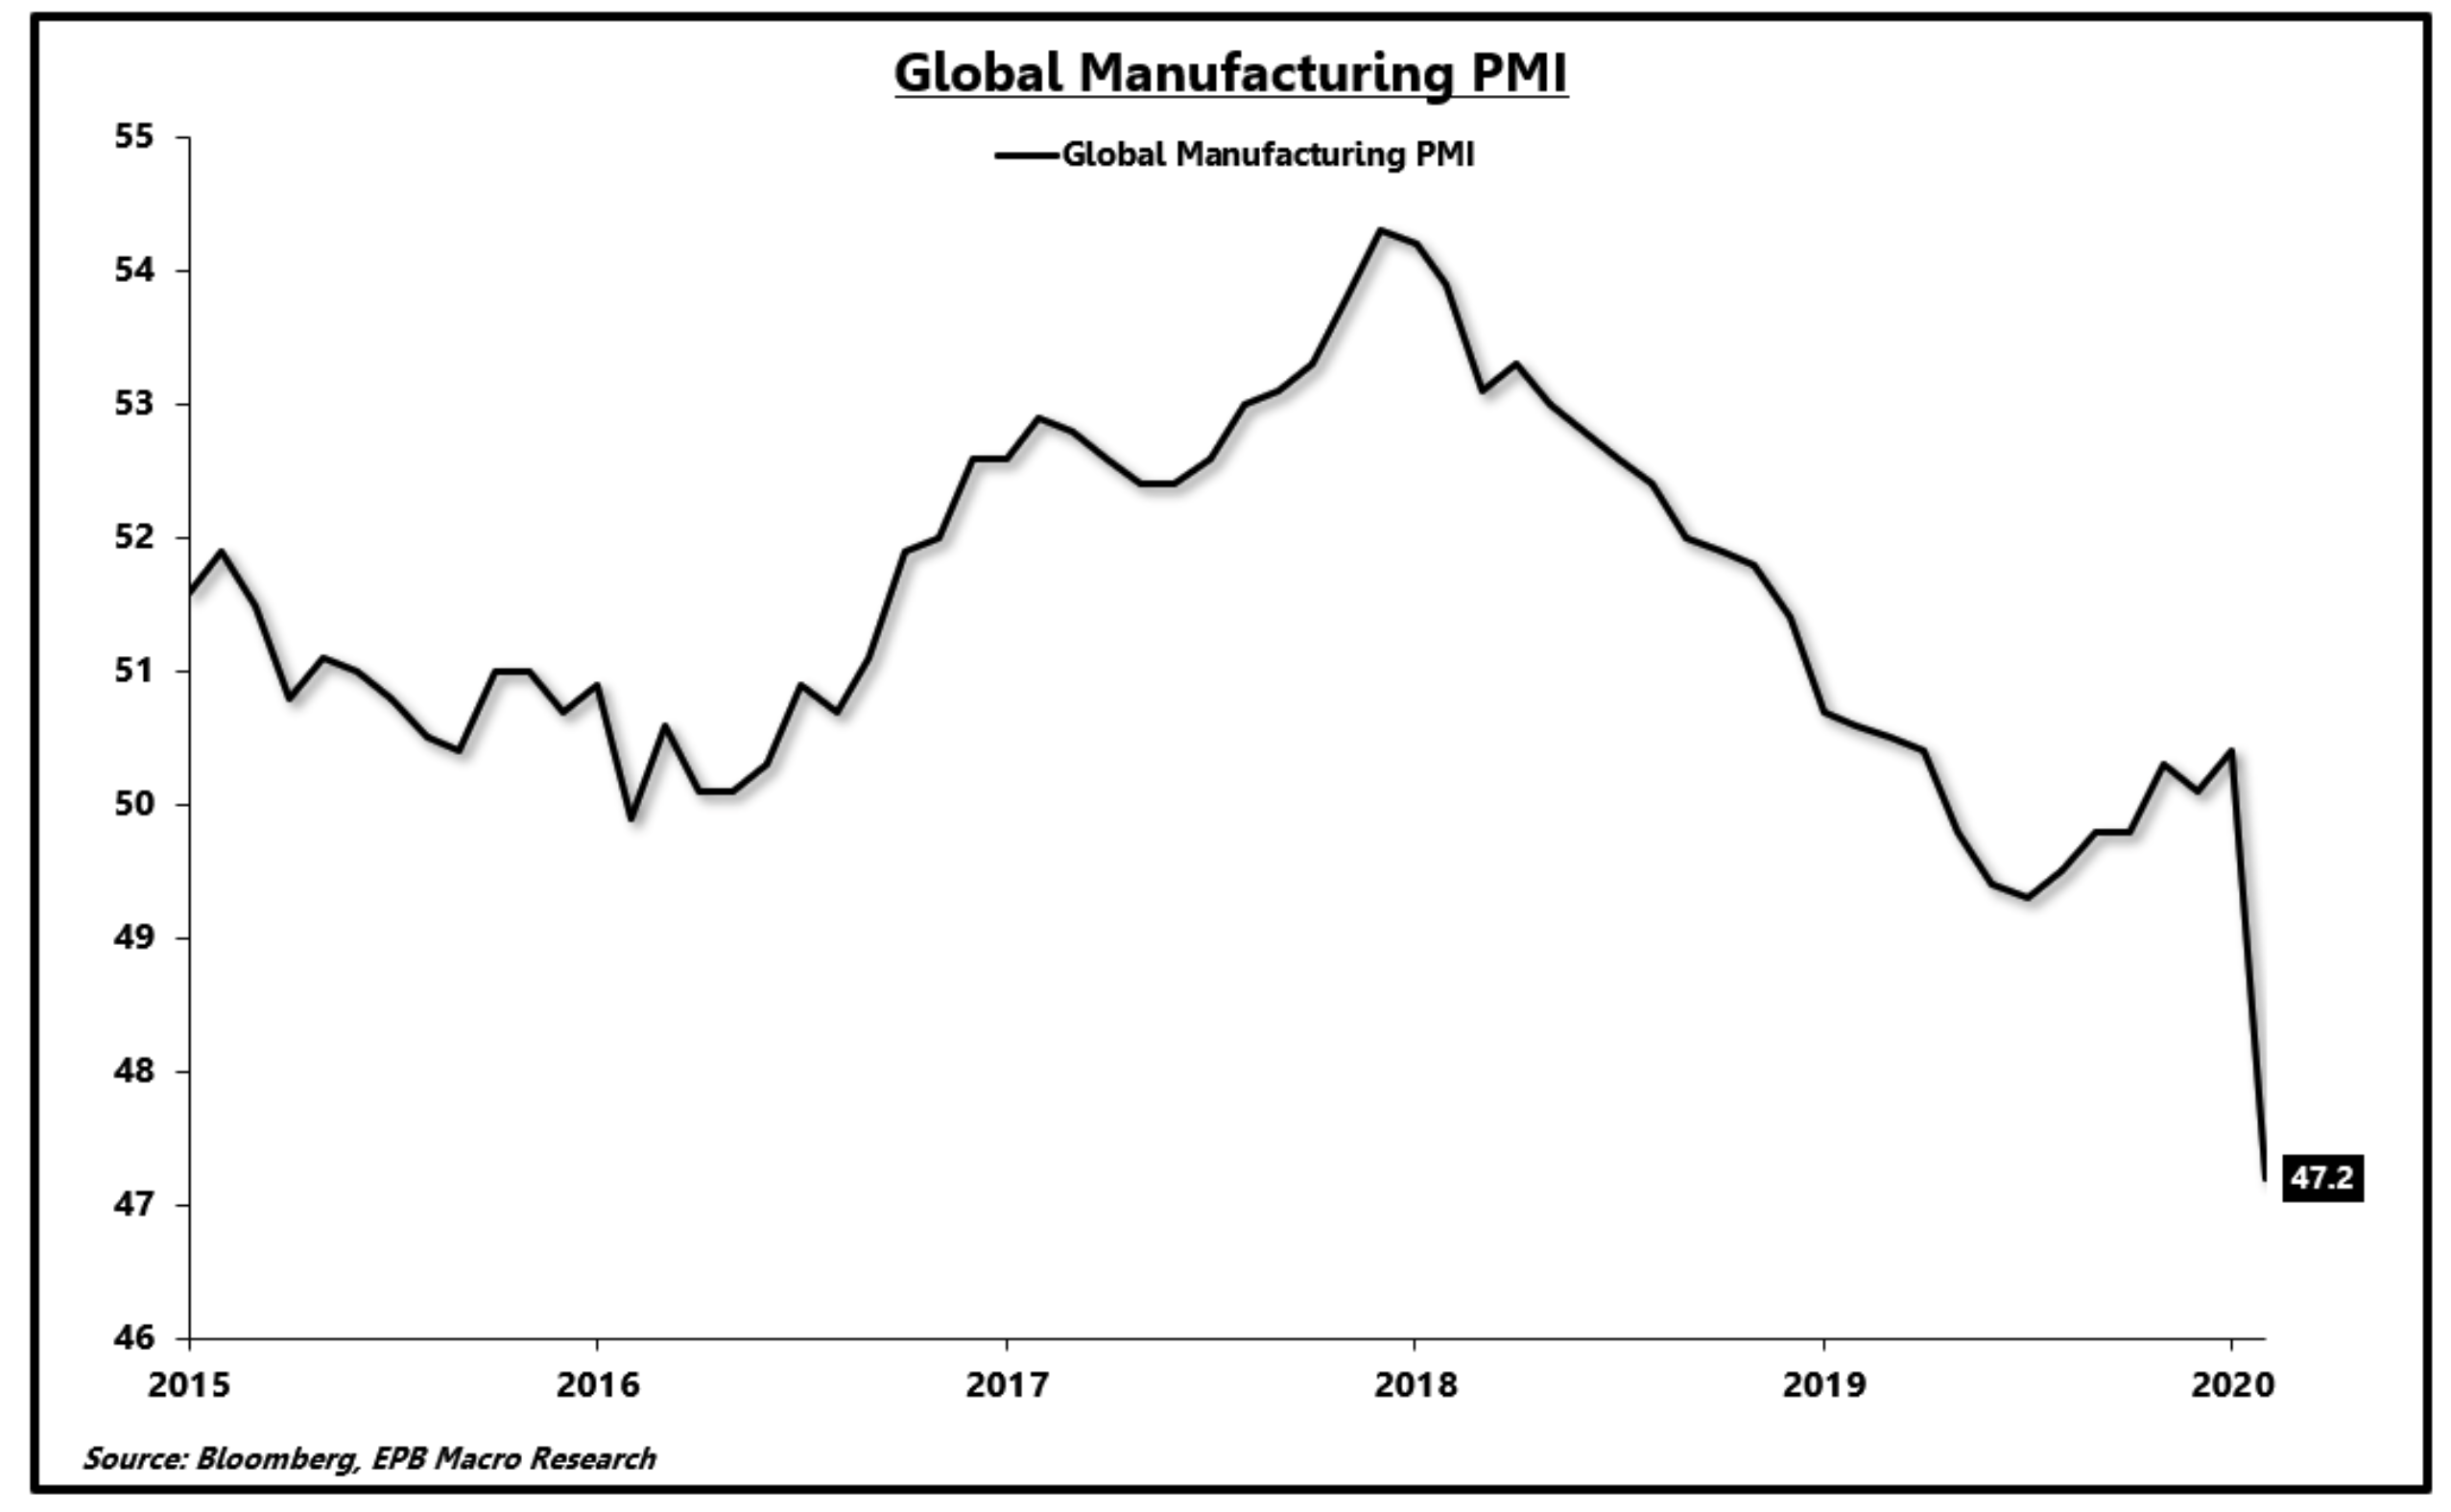
Was trying to figure out what the scary event will be long time ago. My imagination was going nuts, but have never ever thought we’ll get a COVID-19 which will lock down the economy, but again – something has arrived and don’t forget the cycle was peaking well before the 3rd top. 2 years before the first top. The leader – manufacturing PMI peaked exactly on 26thJan18 – XIV event VIXplosion.
Because cycles are replacing we should more look towards 2000 pattern, where Emerging Markets topped first, or replacing 2008 where US topped first and Emerging Markets was still going up. For most of the Emerging Markets in $$$ top occured on 26thJan18 :
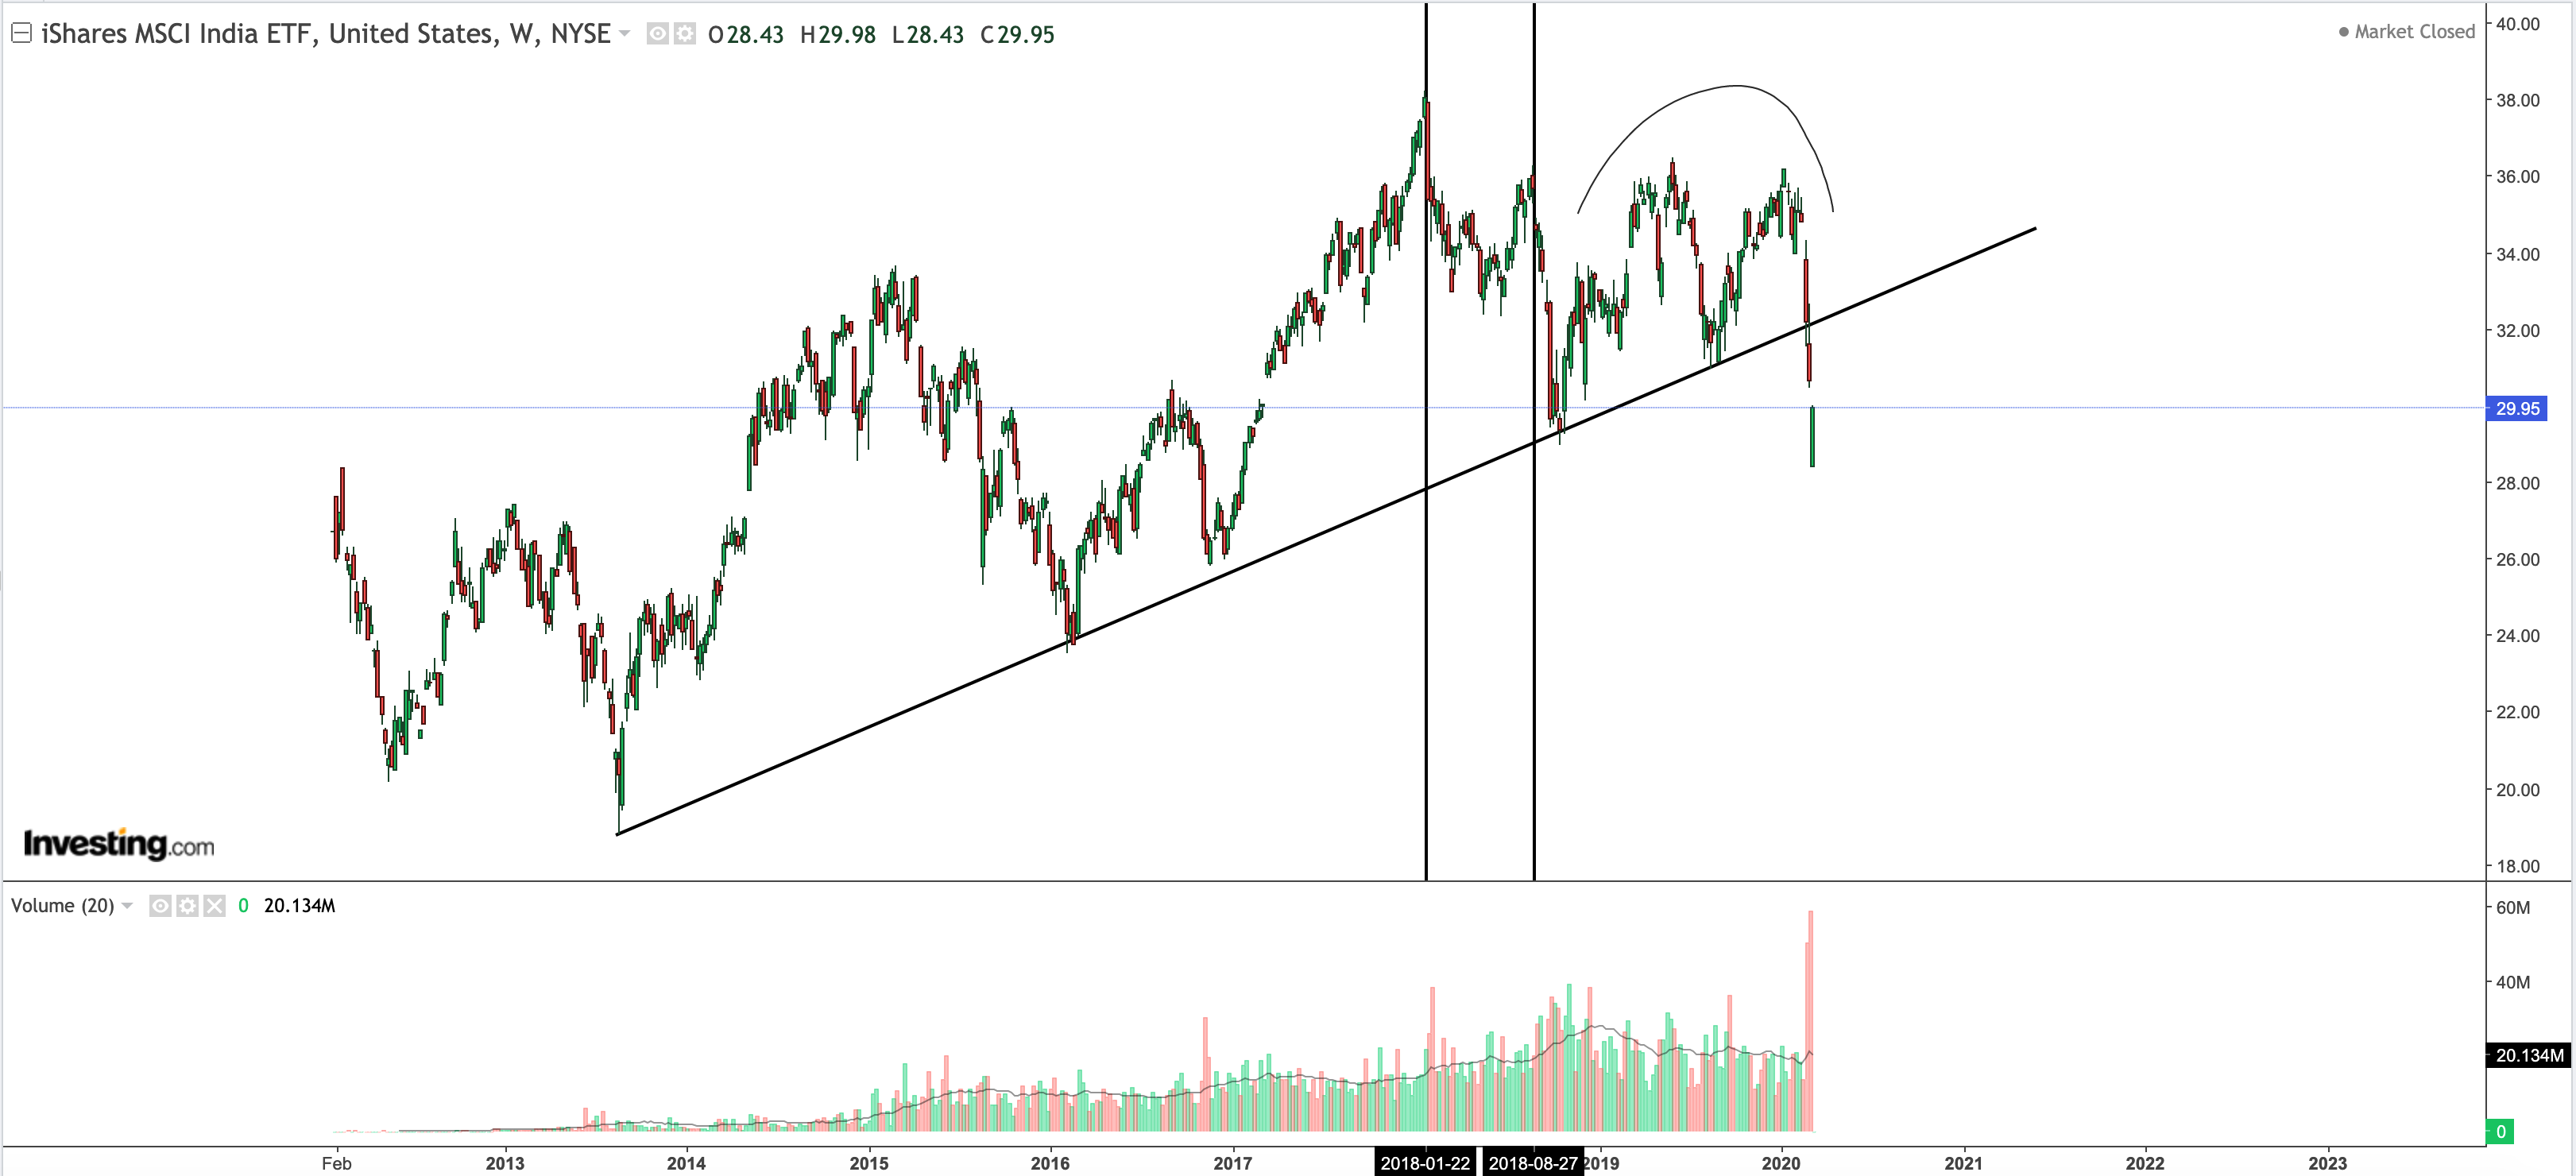
This is $INDA – so India, peak, 2nd top, dead-cat bounce and burst. Most of Emerging Markets looks this way. They peaked in 1Q18 with the bottom of the $$$.
The US is a leader in this cycle what means US is bursting last, not like in 2008 first. The delay is the difference between 2nd (4Q18) and 1st top (1Q18), so that’s 3 quarters. Leading economy is US – not Emerging Markets this time. So let’s imagine 3rd top in Emerging Markets was around 2Q19 looking at $INDA so if we add 3 quarters that’s giving us 1Q20 and that means burst of the dead cat bounce on the US markets. The hardest part of this calculation is the move between 2nd and 3rd top. Will it be like Russell 2000, or like Nasdaq.
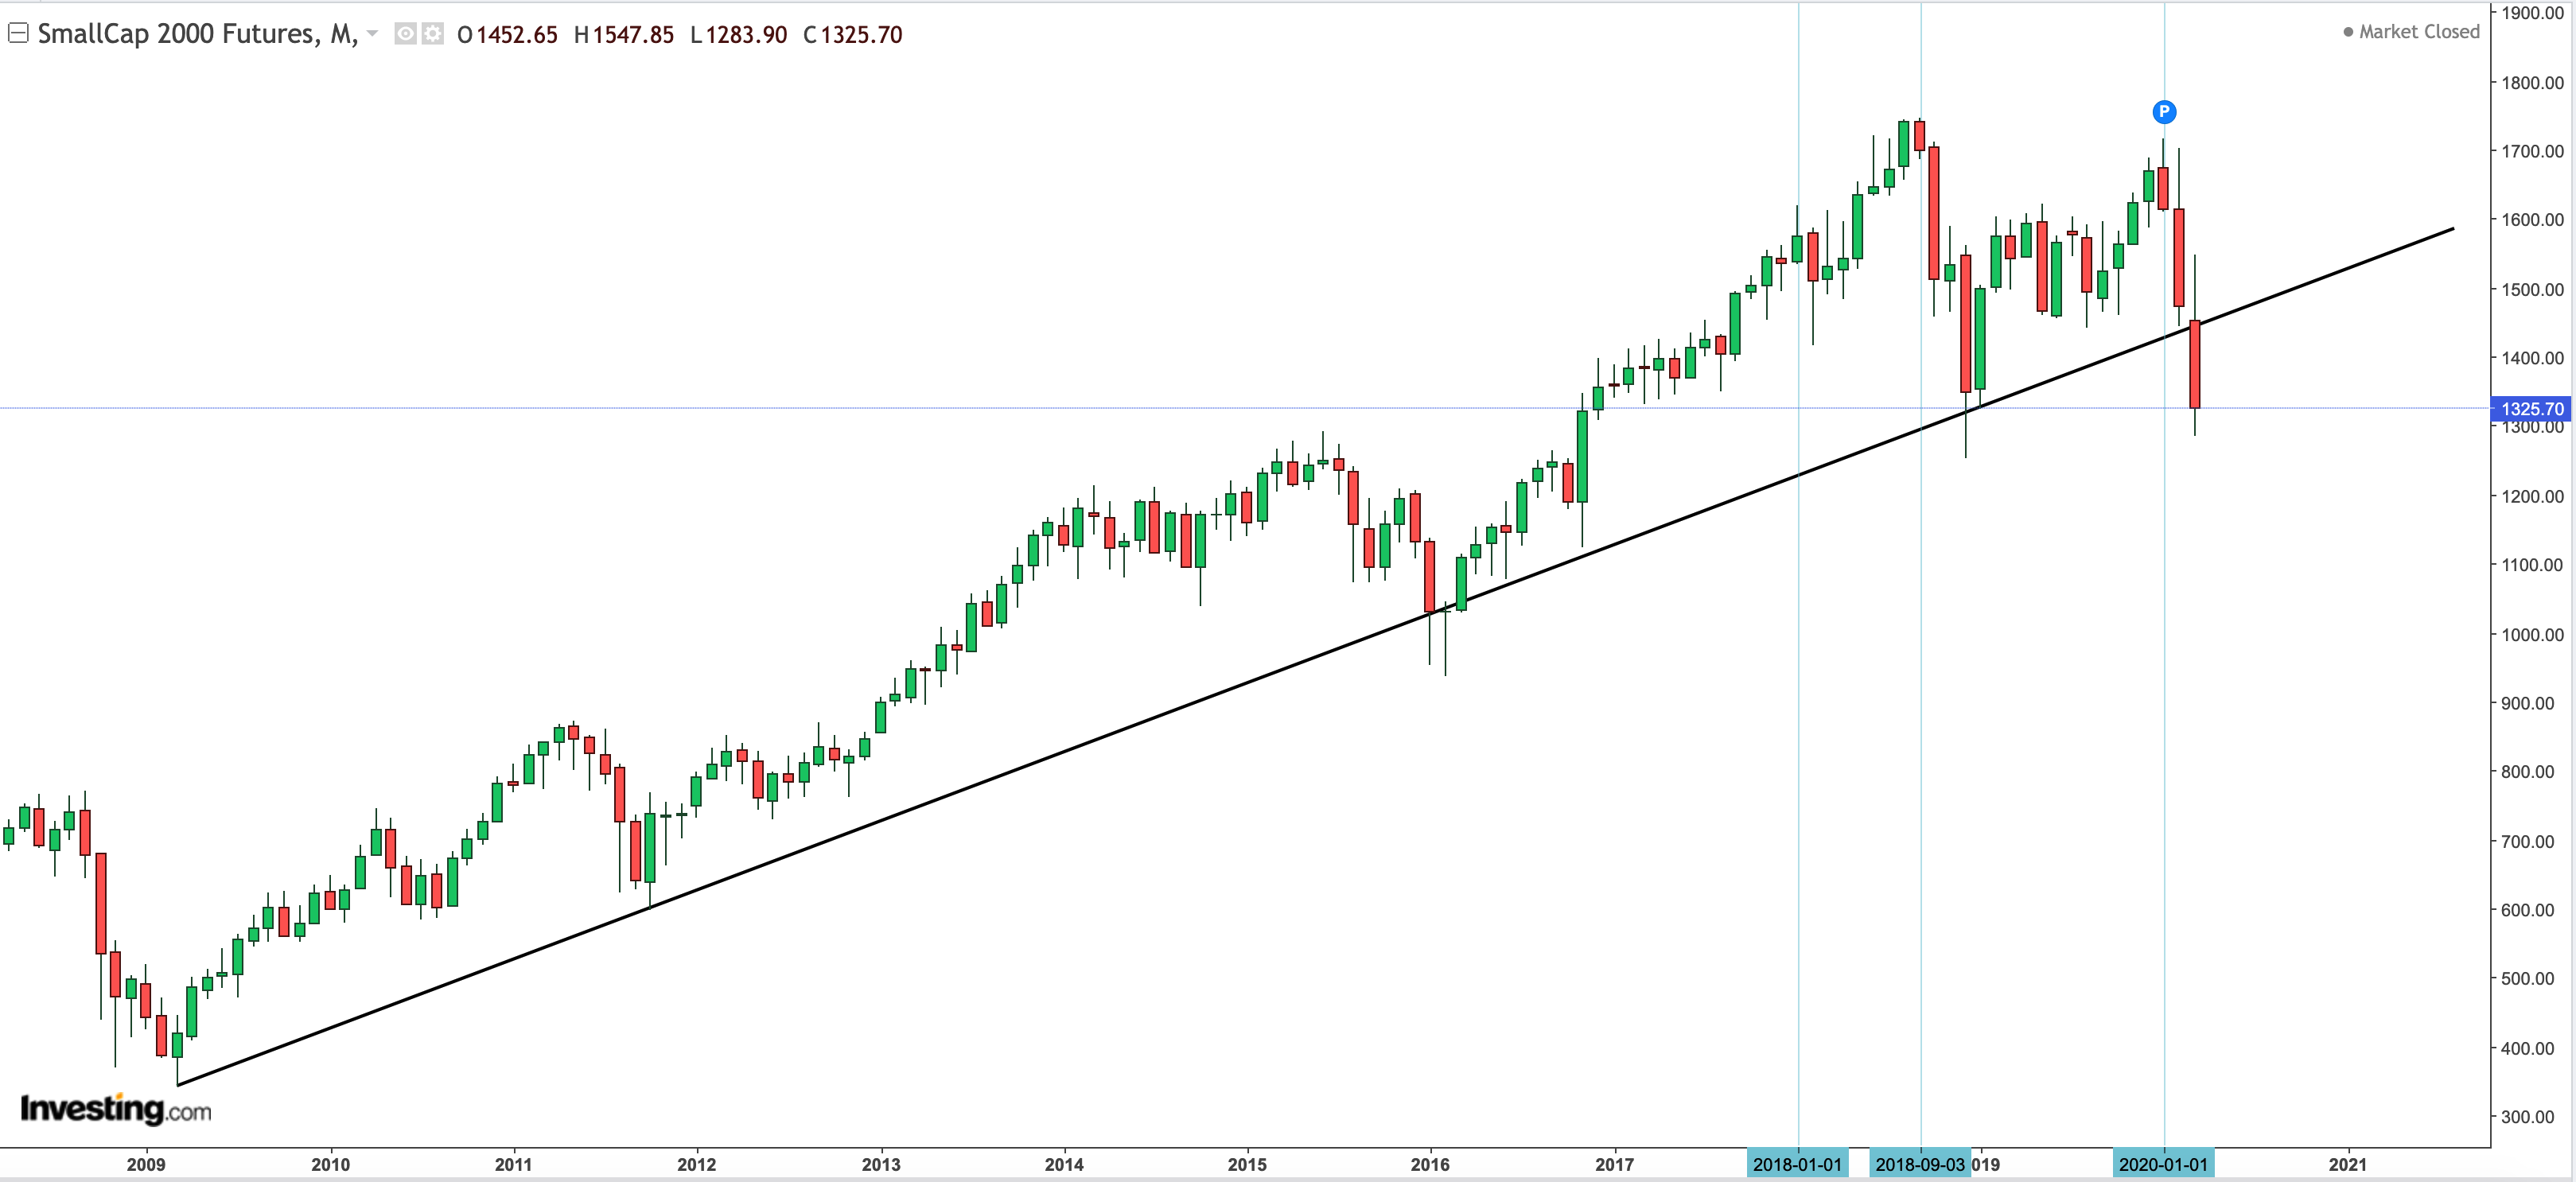
So Russell 2000 – typical lower dead-cat bounce. Russell 2000 is always a good choice to track because those companies there are utter “shit”. They don’t benefit from easing, repo, buybacks so much like SPX, Dow or NASDAQ. I marked with vertical lines 1st top 1Q18, second 4Q18 and 2Q19 (not marked) – fake dead-cat bounce, revived with repo madness, extended to 1Q20 and looks busted :
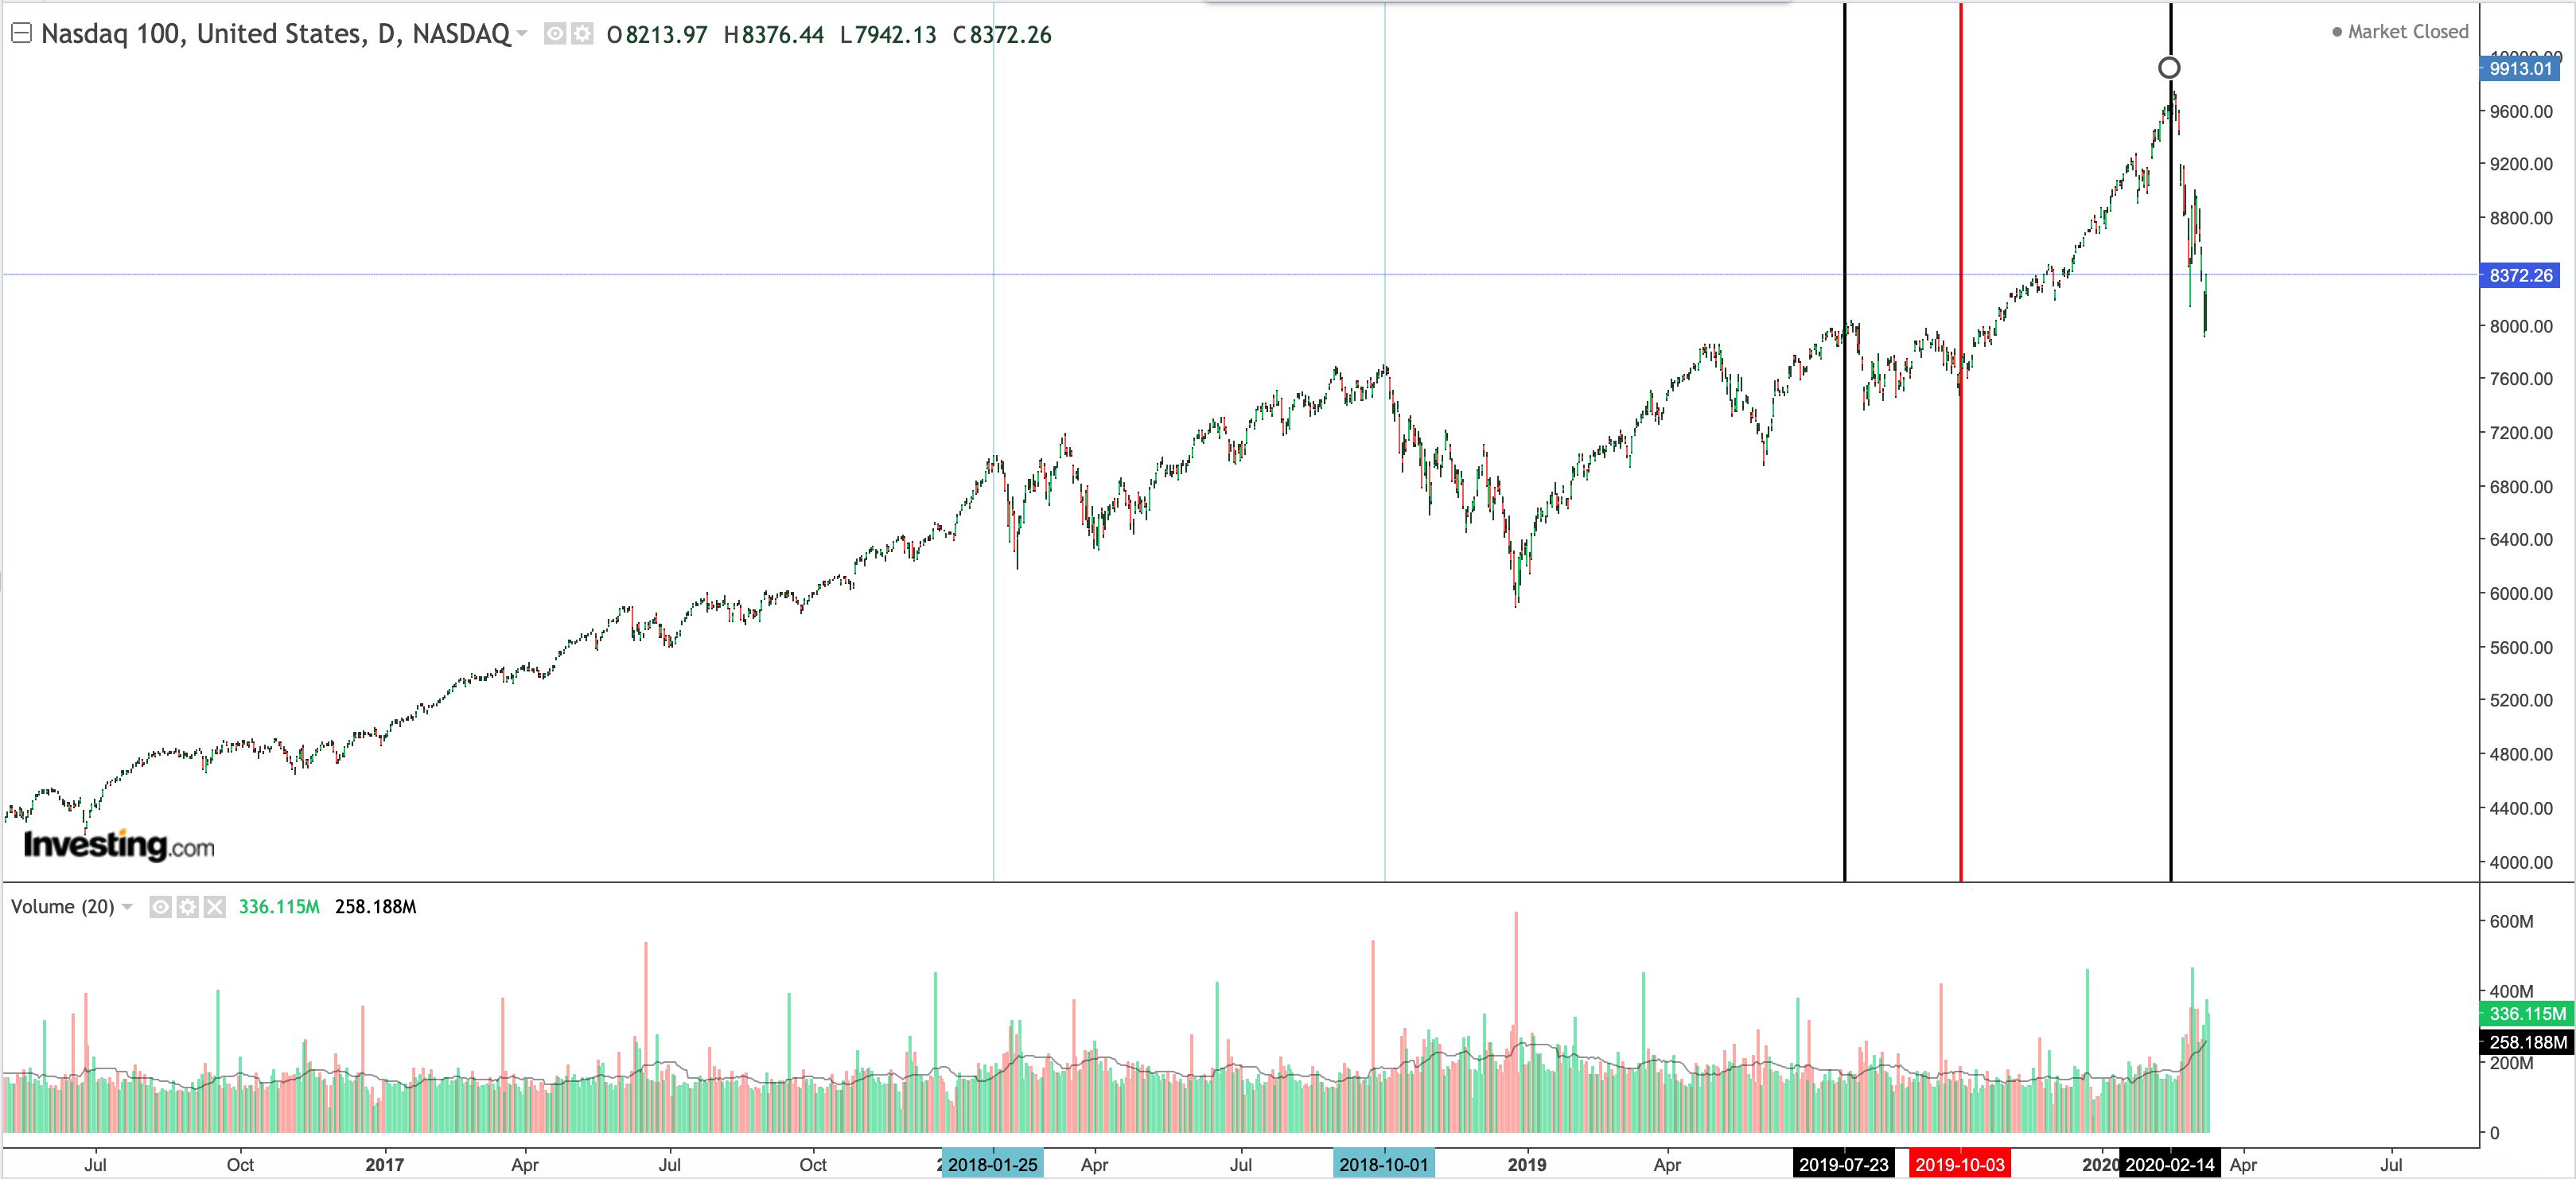
Let’s take NASDAQ. This is something really nice to interpret and I’ll stop here for a bit little longer. I marked 4 points. 1Q18, 4Q18, 2Q19 and 1Q20 :
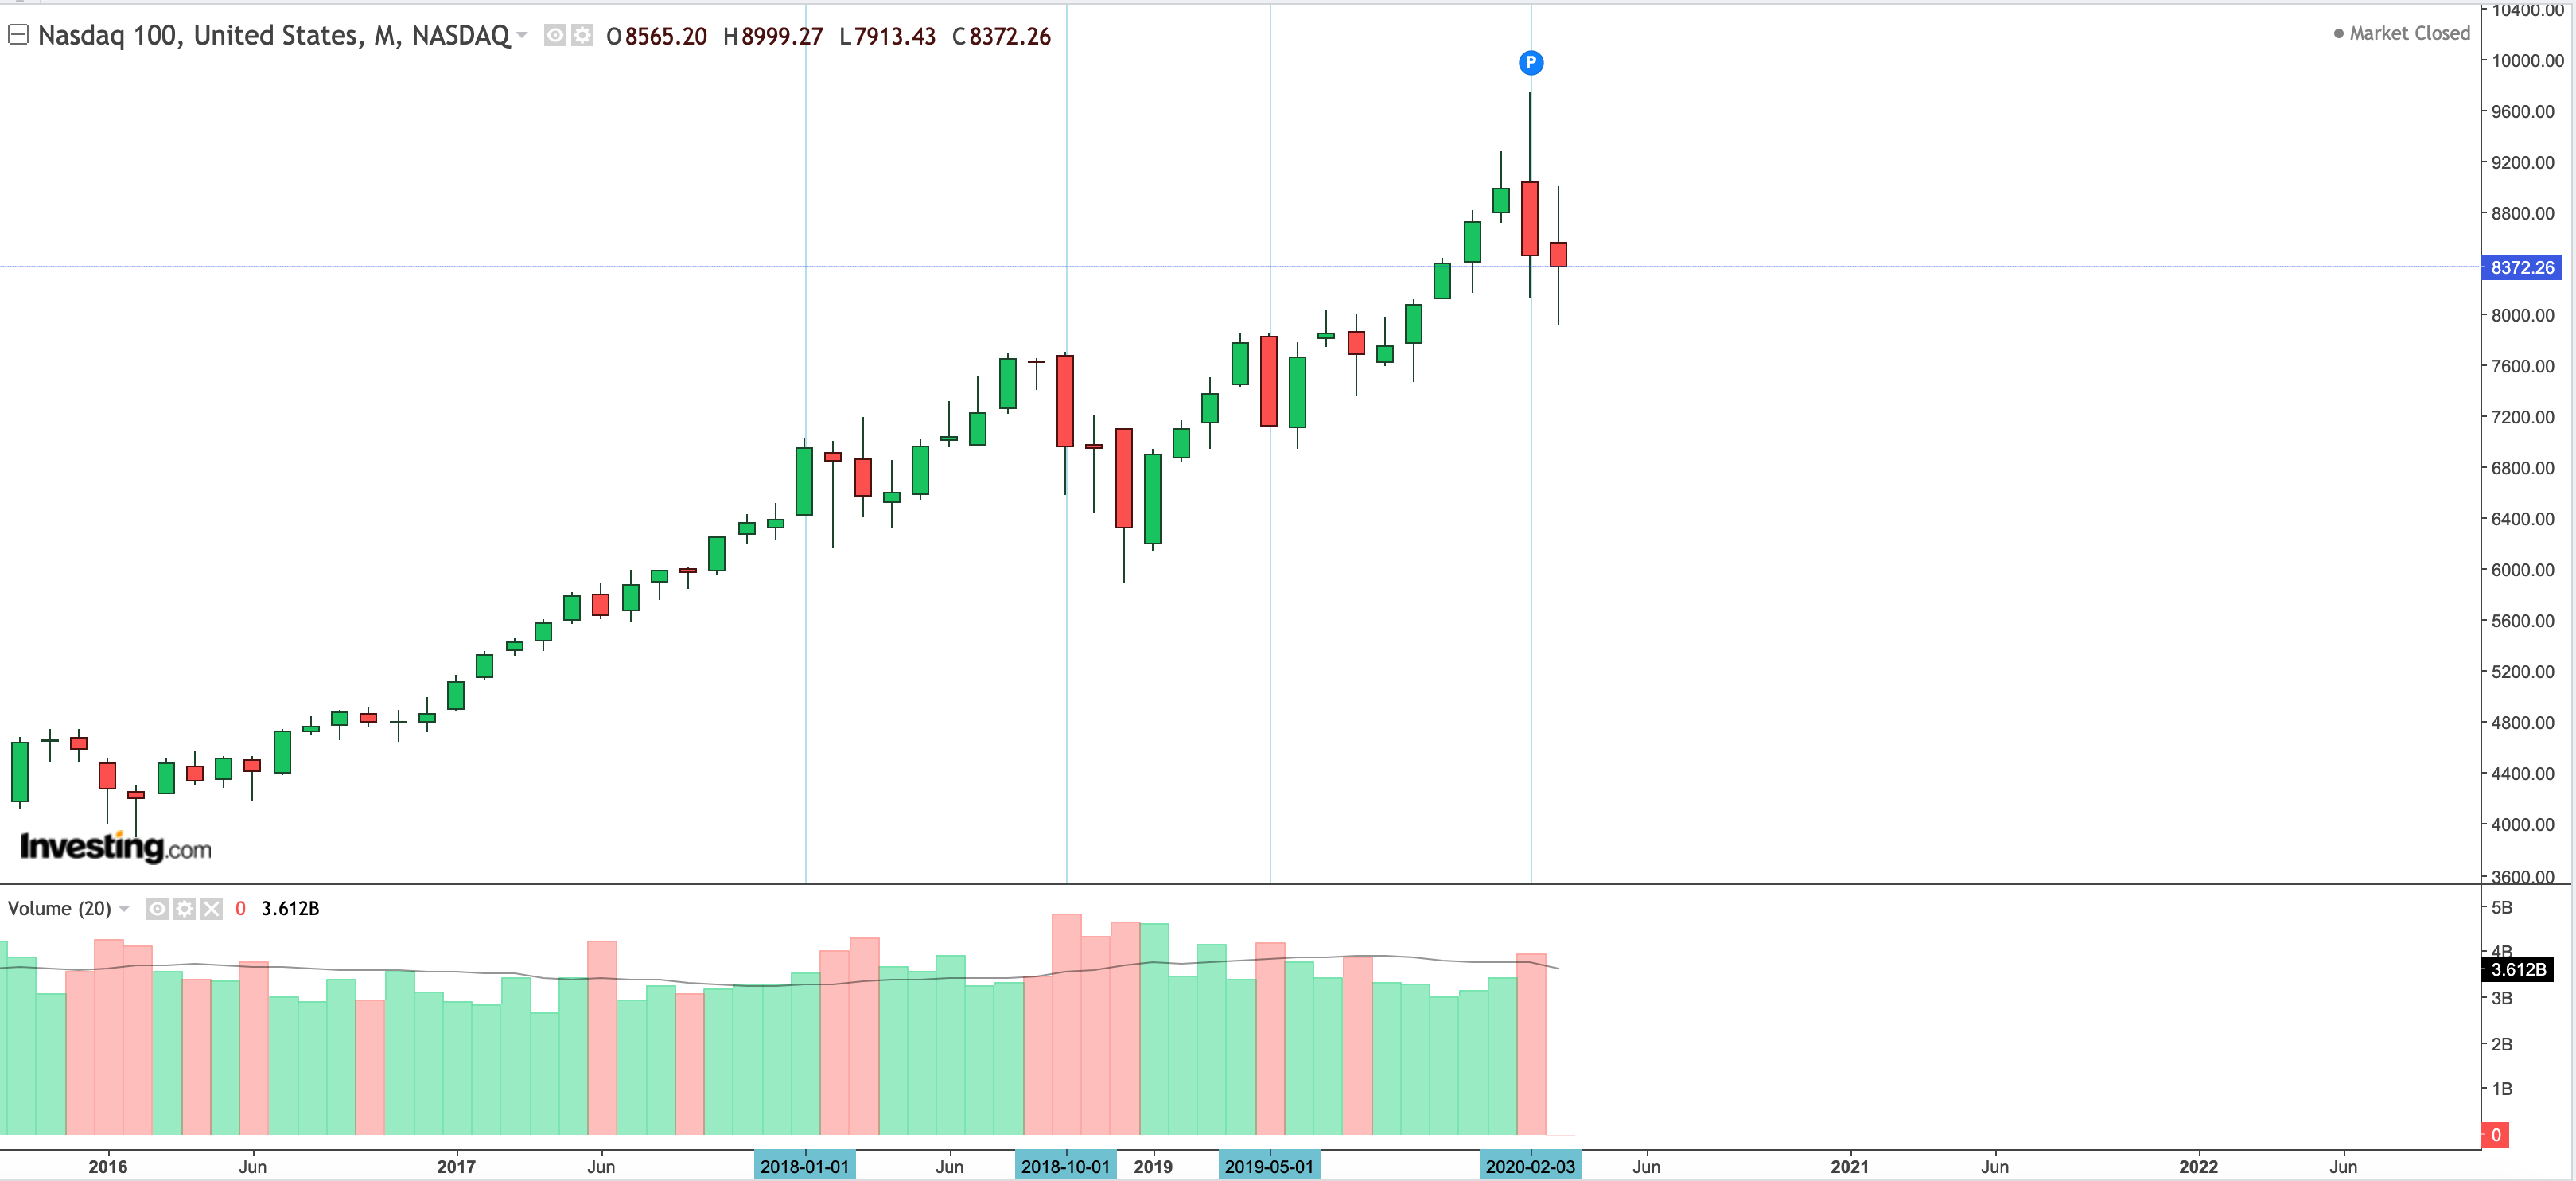
So this is a clearly like in 2000 growth bubble.
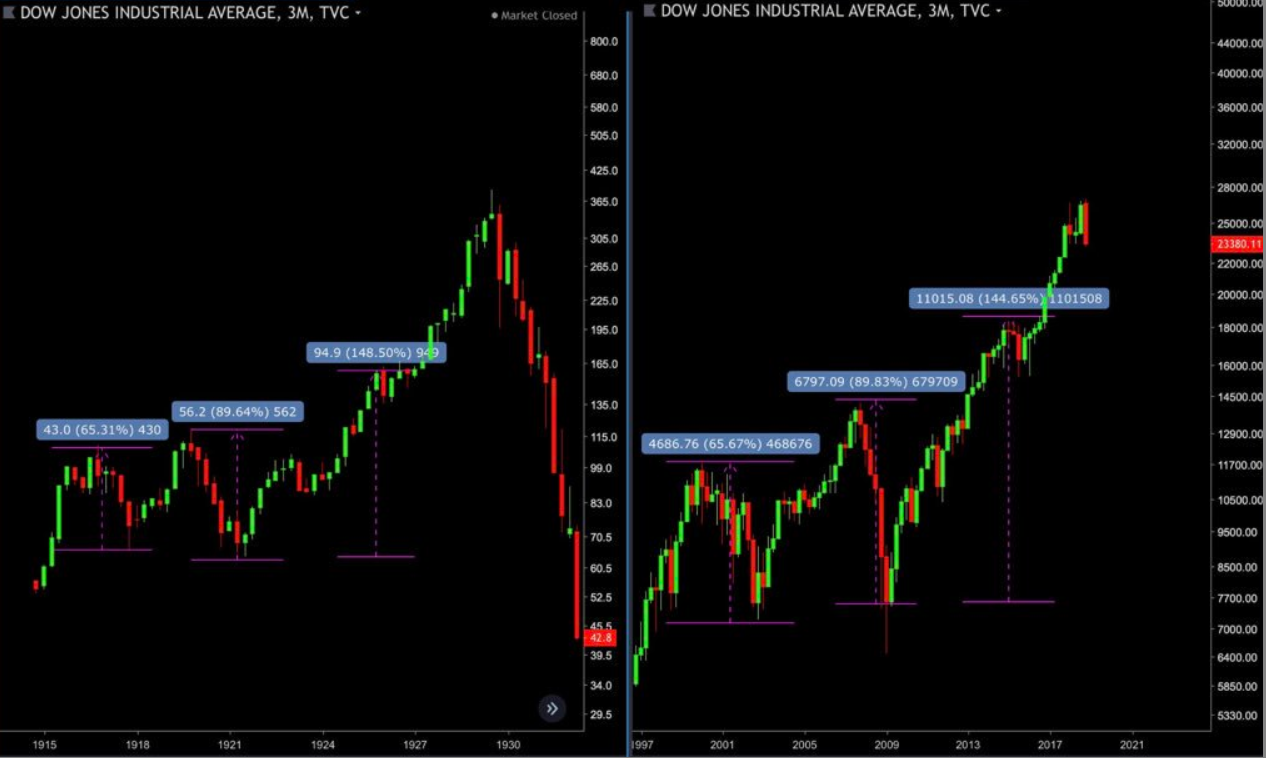
 Cycles are replacing. Like in 1929 when they went full credit cycle they peaked like this. Technological bubble, Financial Crisis, and Great Depression run on (almost) ZIRP and balance sheet expansion between 1924-1929 like on the left chart. Now again we’re facing Technological Bubble, Financial Crisis, and question what’s next.
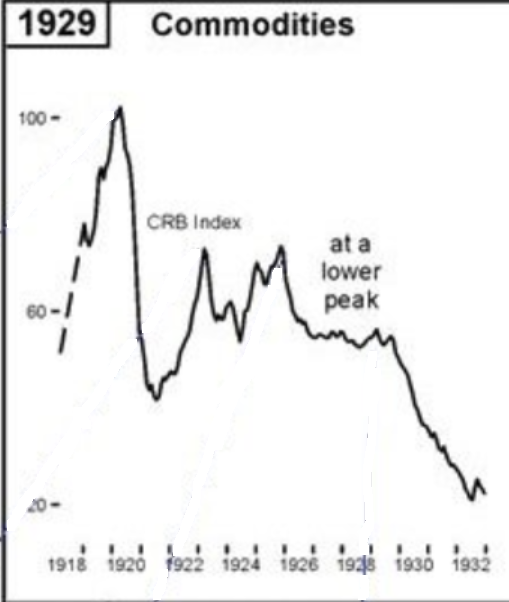
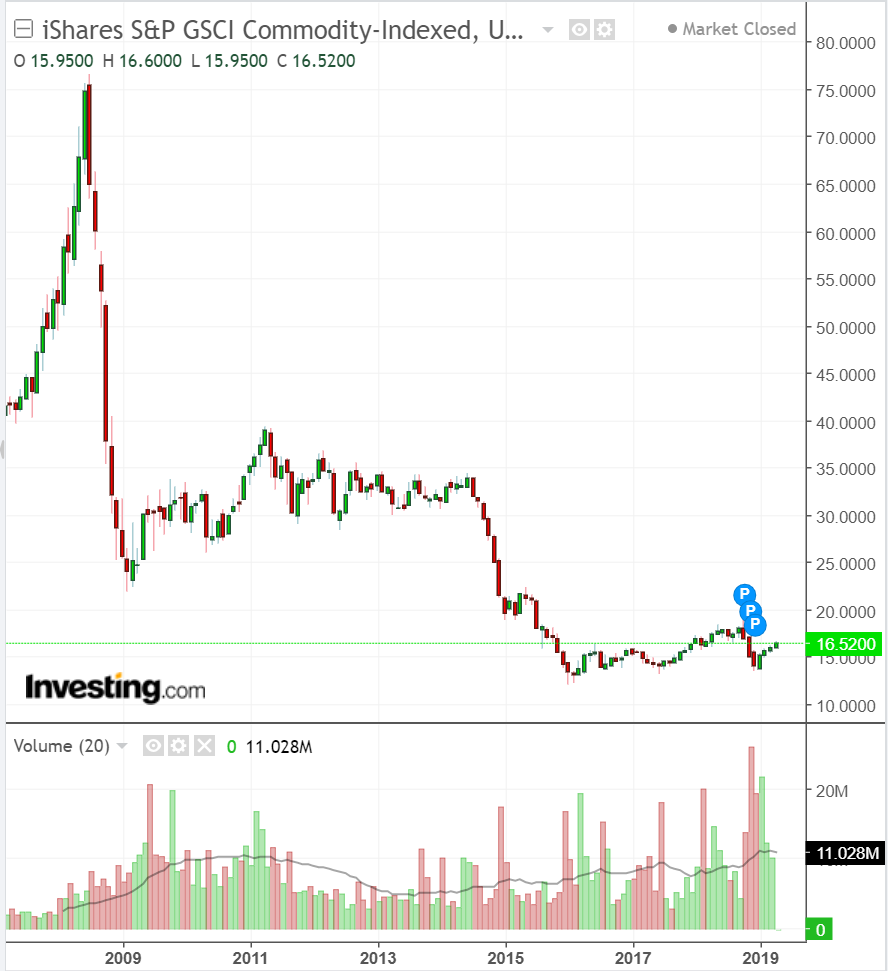
Commodities also has peaked during 1921 financial crisis like on the left chart. Right one is current commodity index. Quite similar isn’t it?
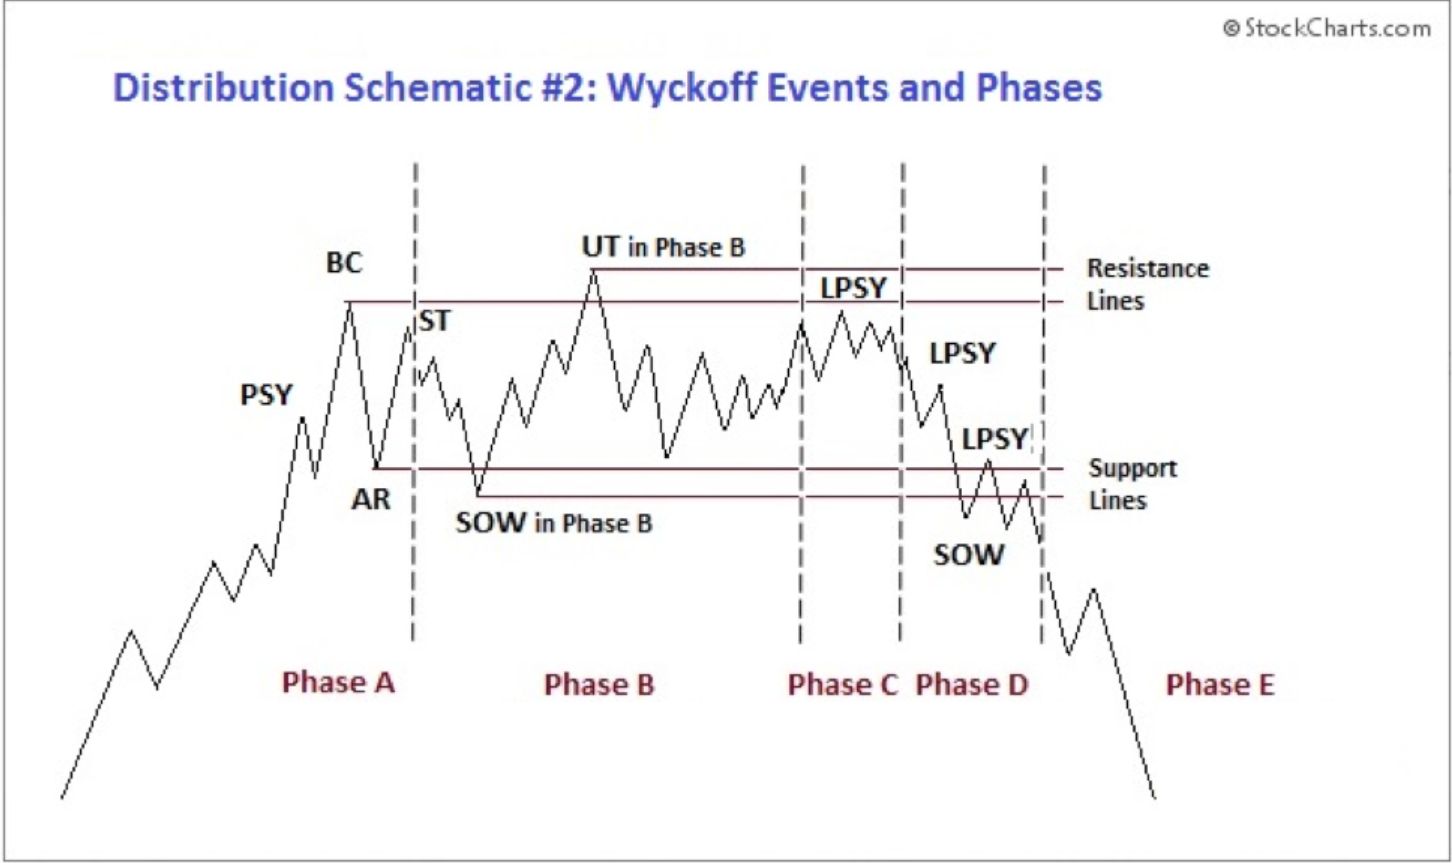
I am a big fan of Wyckoff Logic, many people know those patterns, you can find them in my previous articles, but there are actually 2 toppings. If you look at Russell 2000 it’s a beautiful 1:1 lower dead-cat bounce pattern, not much you can discuss here. Looks like we are in the bottom SOW LPSY and ready to make another 20-30% drop.
But Nasdaq went nuts here.
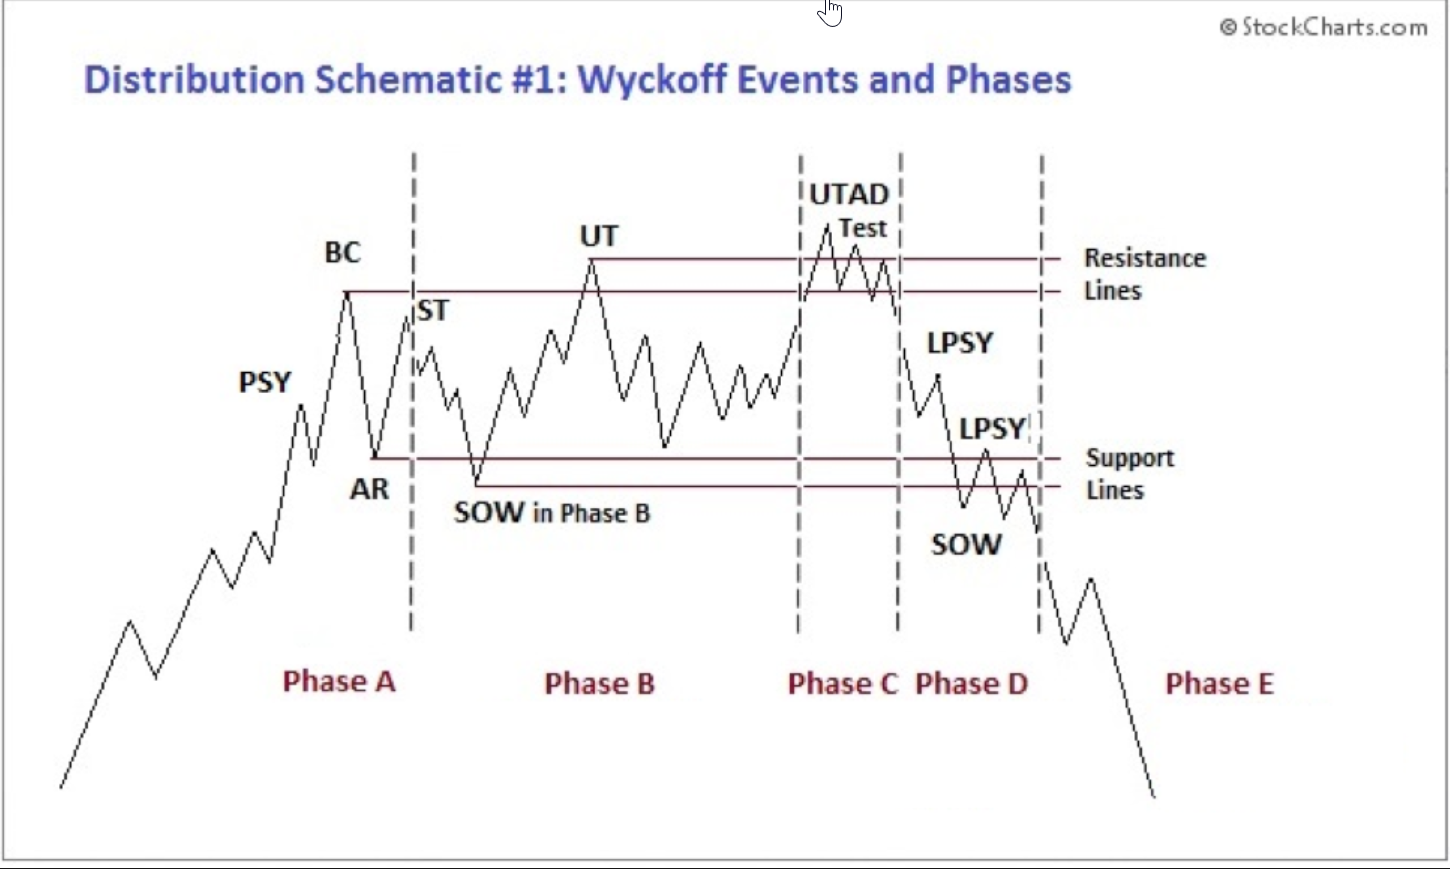
This UTAD pattern is also shown in a different way, so 4Q18 (UT) is Insiders go short phase, worse December since 1931, easing, new highs, bears on double top and “drop suprises everyone” in 1Q20 With some LPSY called “Buy-the-dip and emergency rate cutting.
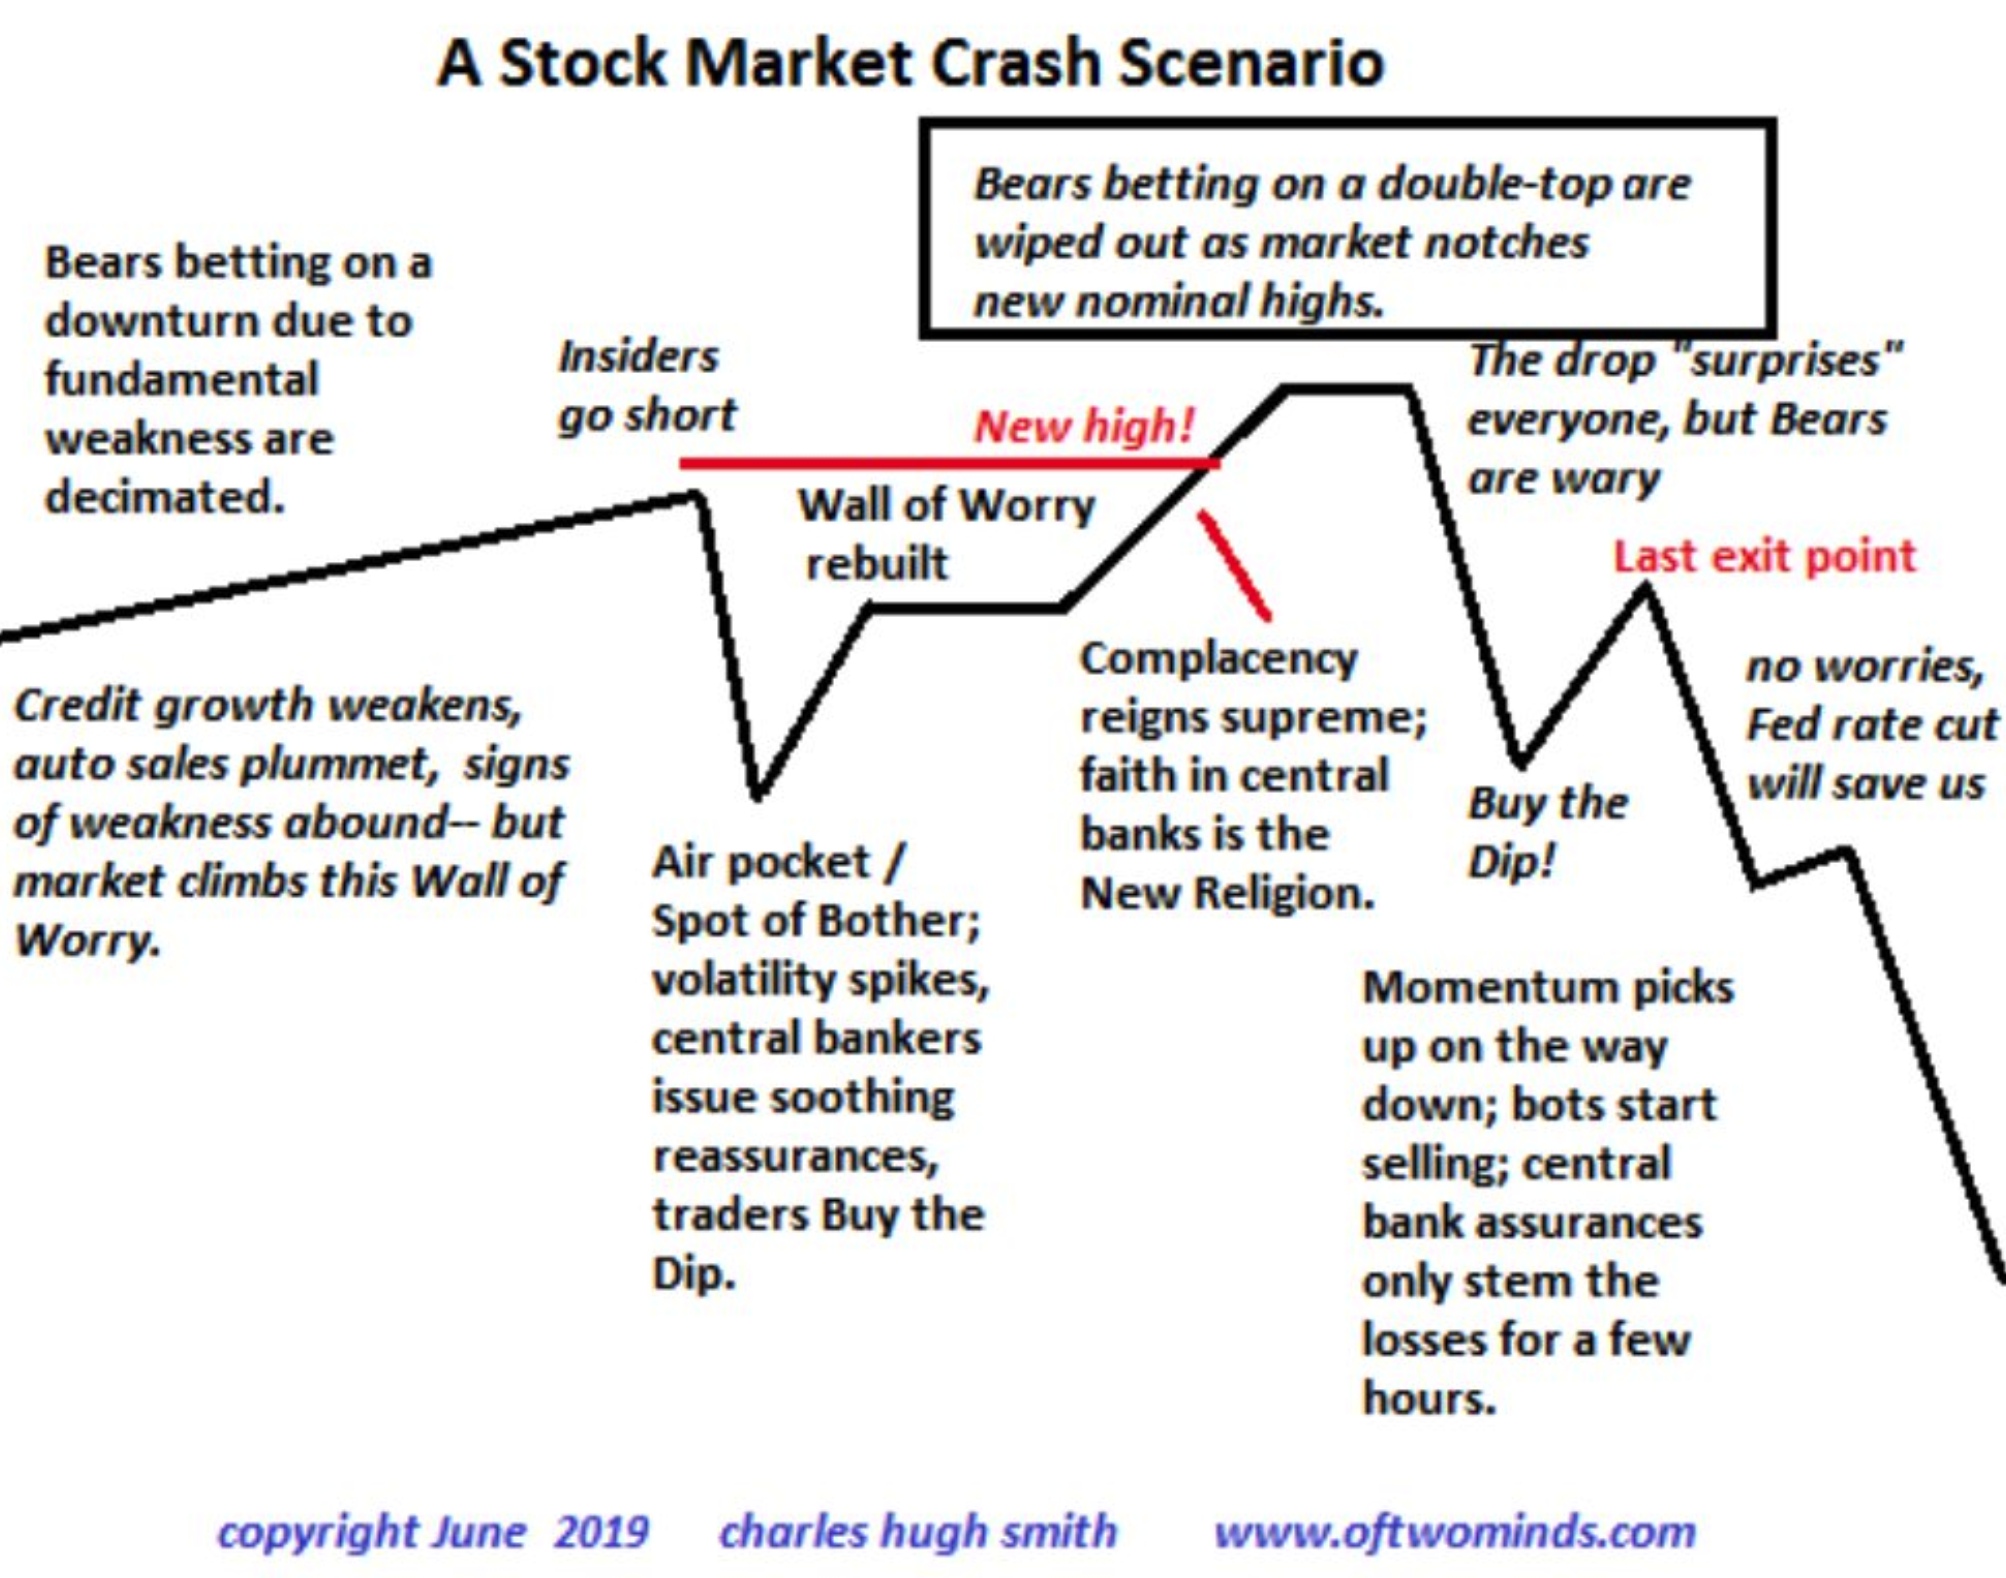
Let’s see when the LPSY repo-madness event kicked in in NASDAQ. Chart shows vertical lines : 1Q18, 4Q18, 2Q19, 1Q20 and red line repo madness which is 4Q19. Take a look again on UTAD Wyckoff pattern and notice first LPSY move after UTAD drop.
My thought here is that FED took first LPSY bounce and used it to fuel the dead-cat bounce to the extremes. It means the LPSY between UTAD and SOW is no existing right now, it means NASDAQ should drop to SOW levels (4Q18) in just one line without significant stop.
Of course we’ll all look for it if that’s right or wrong and time will tell, but that’s some kind of a difference vs full UTAD topping pattern. FED has utilized lower LPSY to push market to higher dead-cat bounce risking no support in lower level. I’m not sure if that’s right or wrong, but again we’ll find out.
Some discovery :
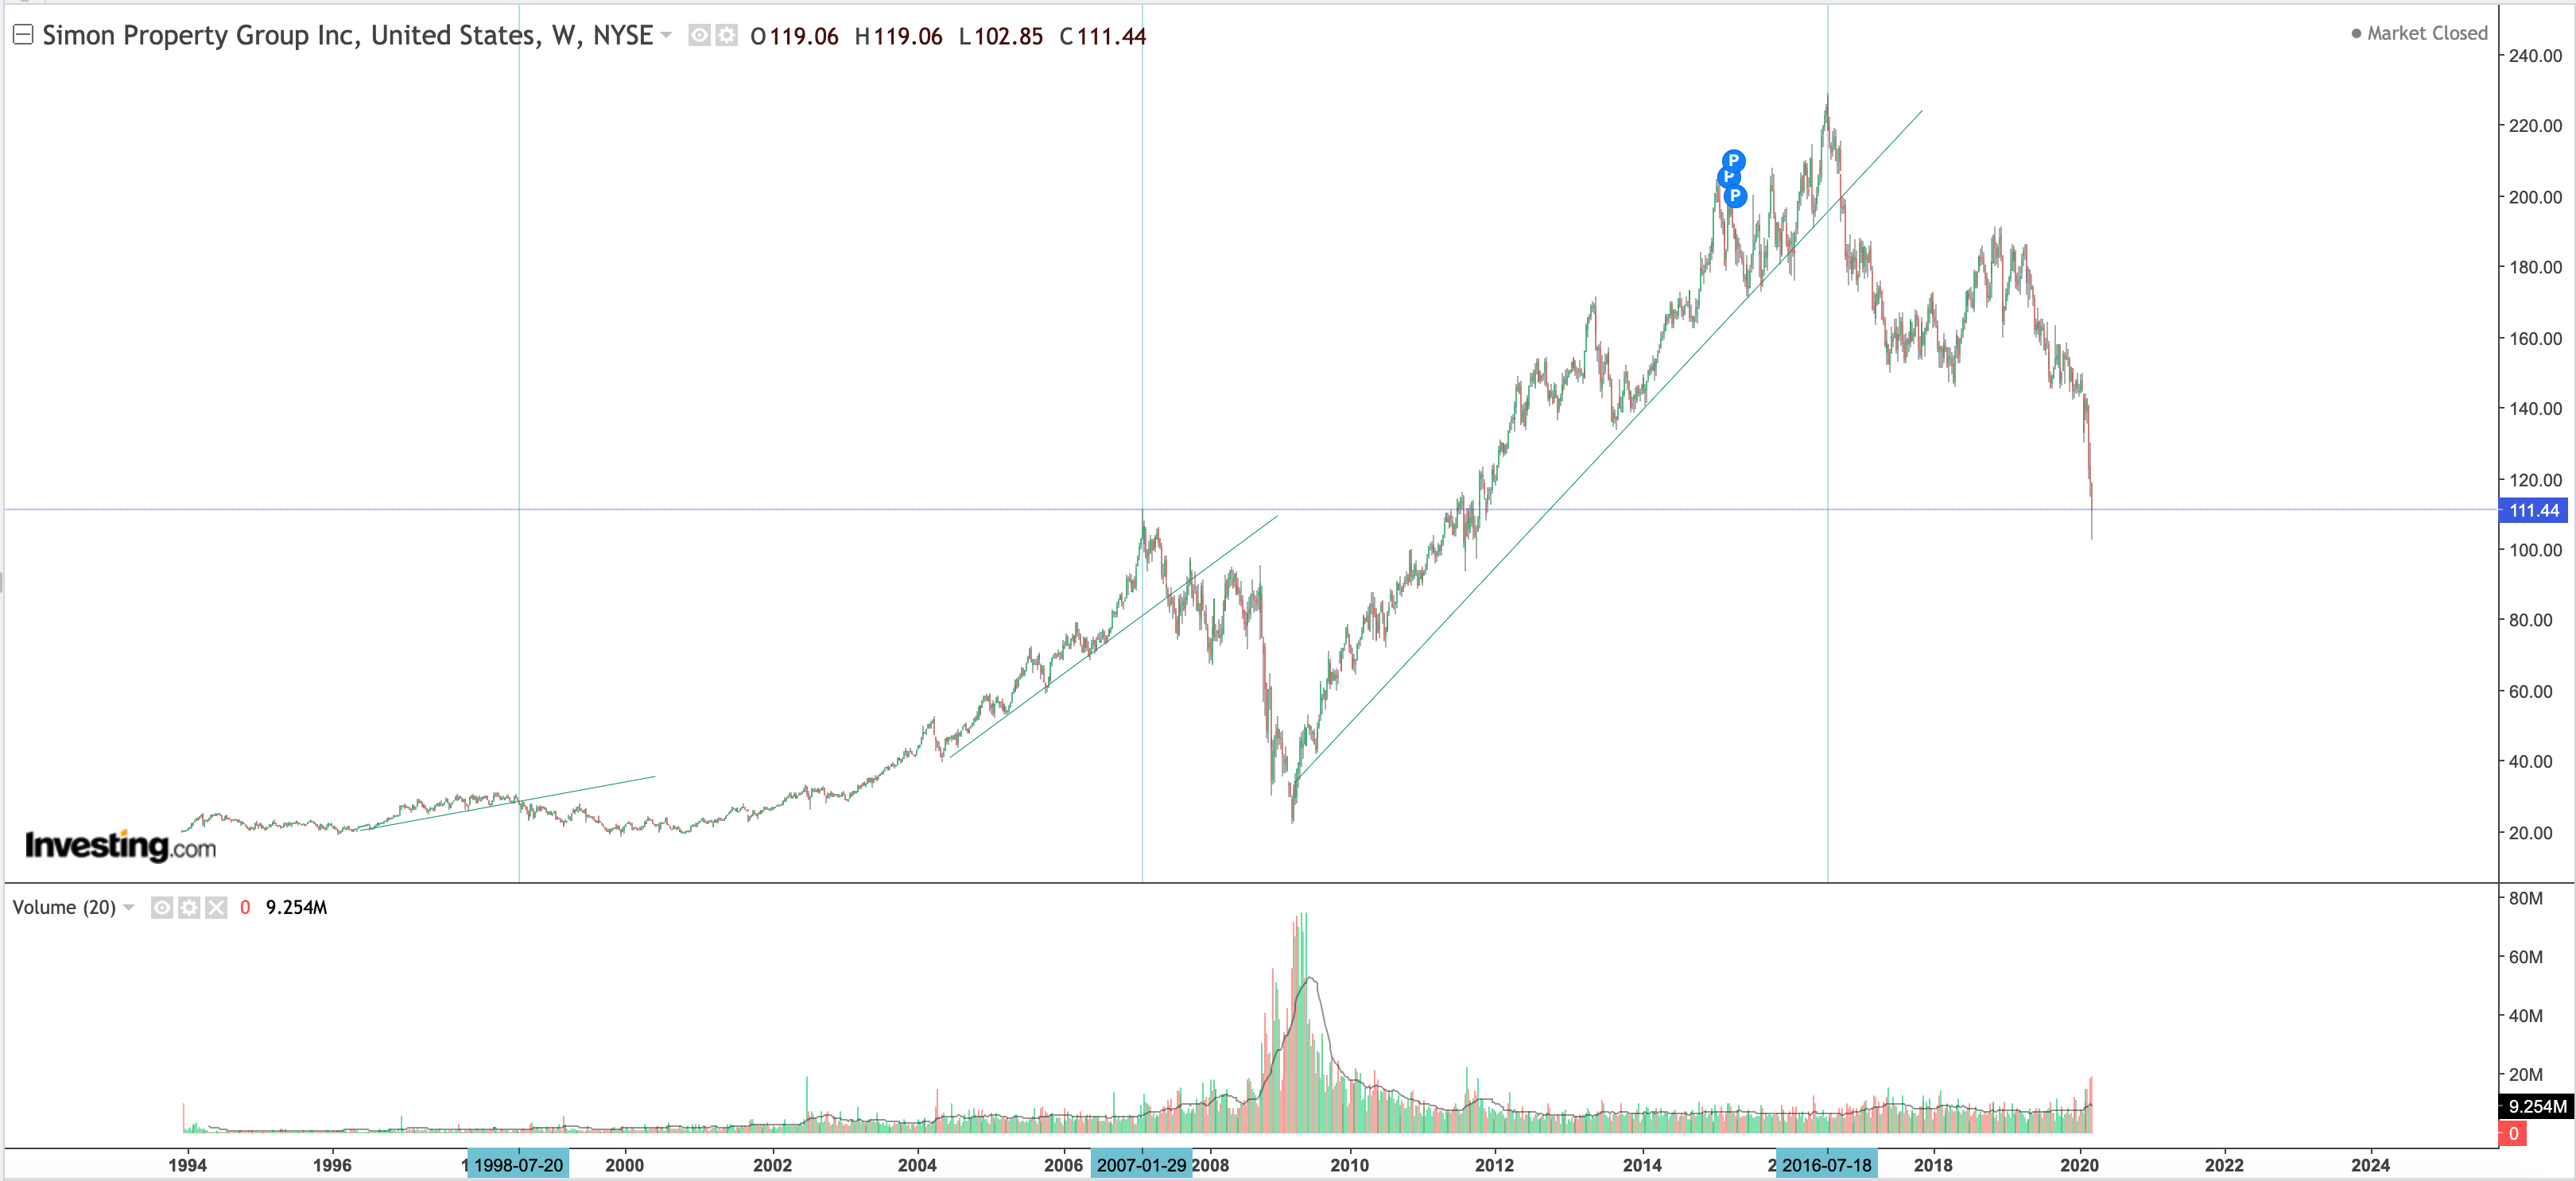
I also recognized that inflationary phase (“Overheating”) is signalled for example by $SPG. Remember since 2000 we don’t have business cycles anymore these are just pure credit cycles with parabolic moves in stock market. So $SPG was peaking around 1998, 2006/2007, 2016, so the moment when stock market received last inflationary boost till its peak and finally crash. Looks like SPG in current cycle bursted it’s dead-cat bounce in January 2020 moving its price from 140$ to 110$ fast. Does it mean the market will crash, well it always does, so let’s find out.
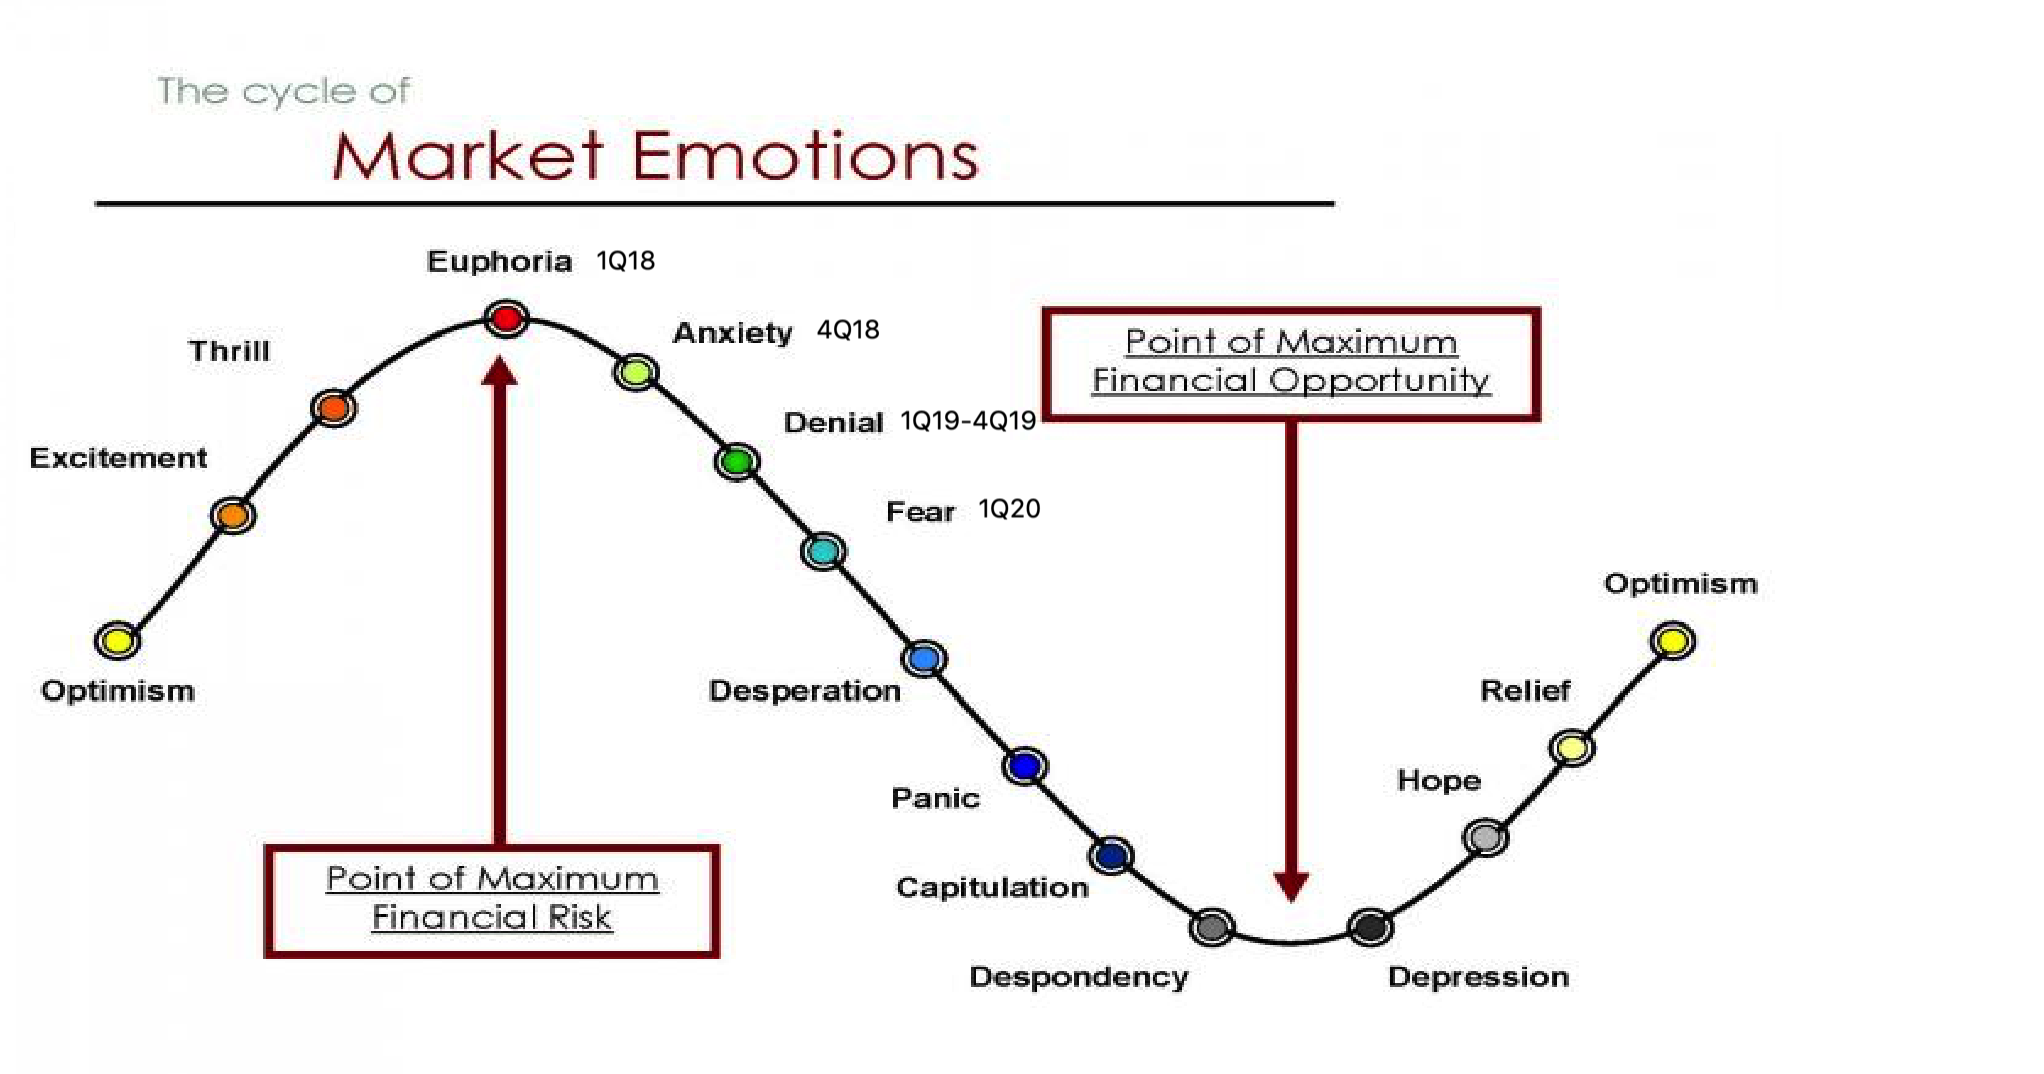
So how it looks on the market emotions map? I think something like that :