02/2025
January 31, 2025

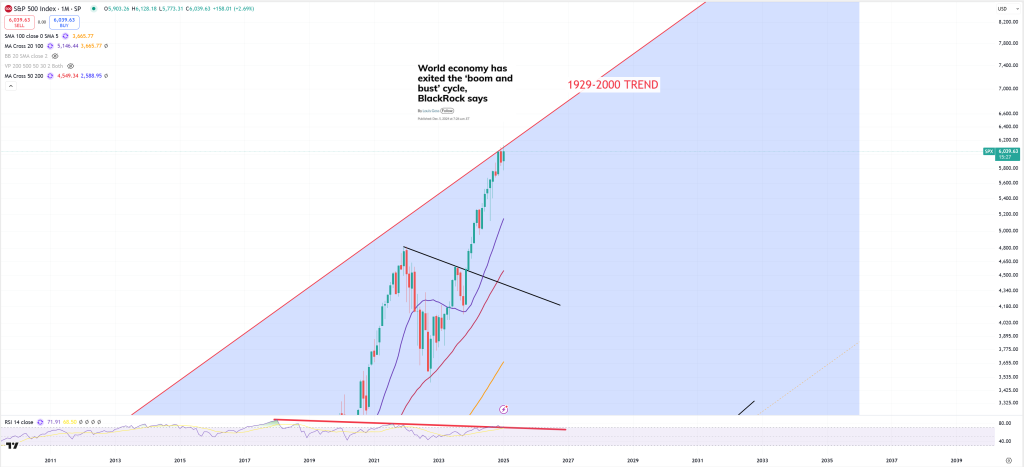
SPX – keeps dancing on 1929-2000 trend looks like 2024/2025 will be 3rd point on this trend line. Once it was retesting upper trend Trump created 25% tariffs on Mexico & Canada and 10% on China. It failed on this trend line for 3rd month.
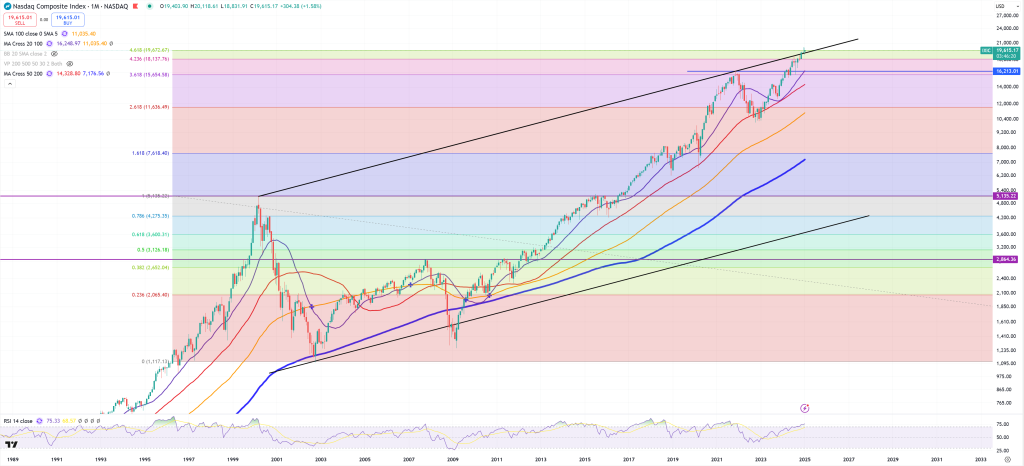
IXIC – Nasdaq Composite – is floating above the channel on 2000-2021 peaks hitting 4.618 FIBO
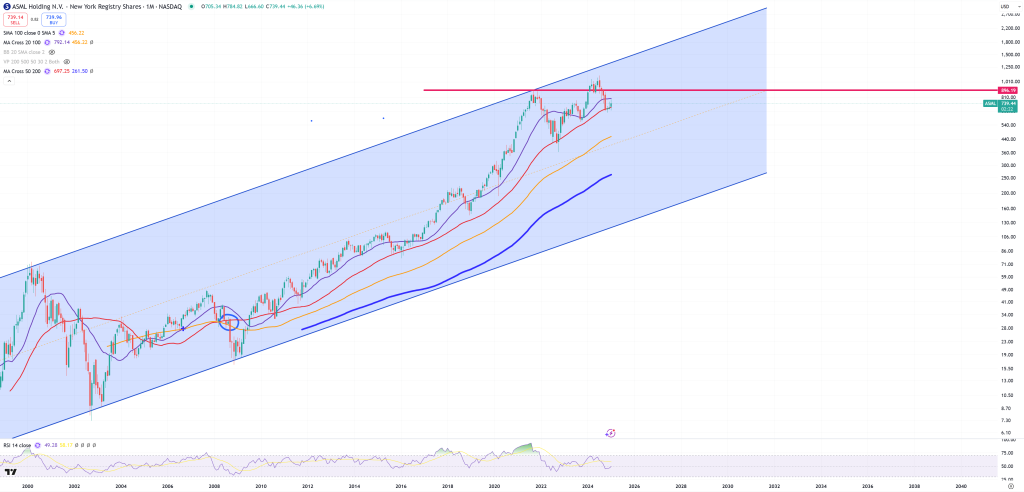
ASML – defends (M)MA50
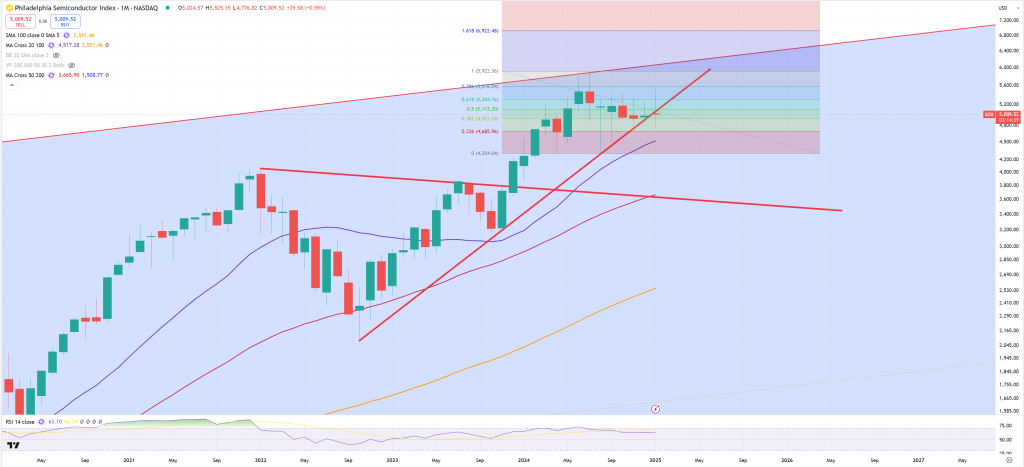
SOX and 0.618 typical dead-cat bounce level
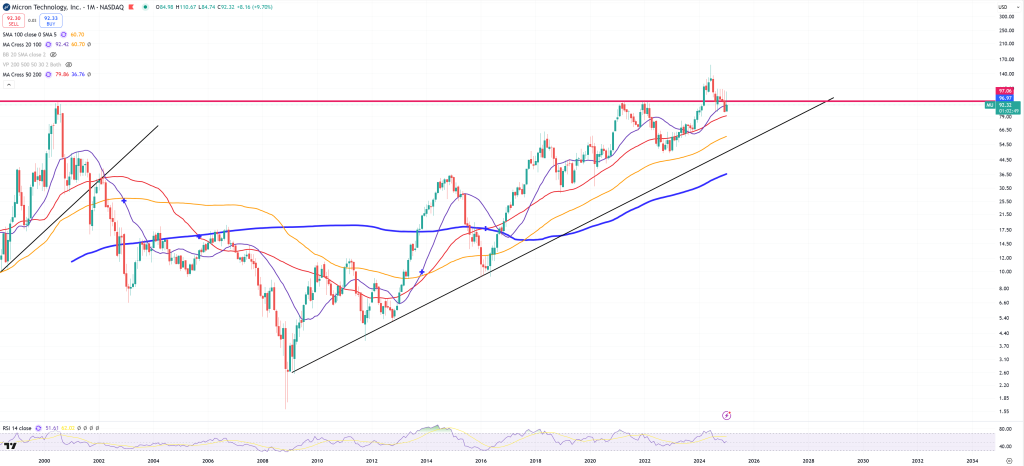
MU and its 2000 dot.com bubble peak resistance level with one bull trap so far
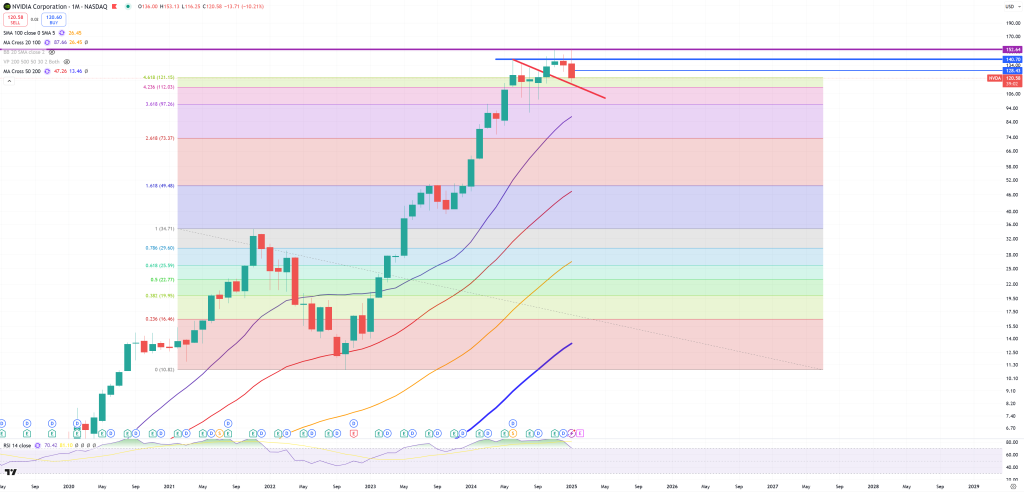
NVDA and its key levels – 140 with 2 wicks on 152 on (M) candles
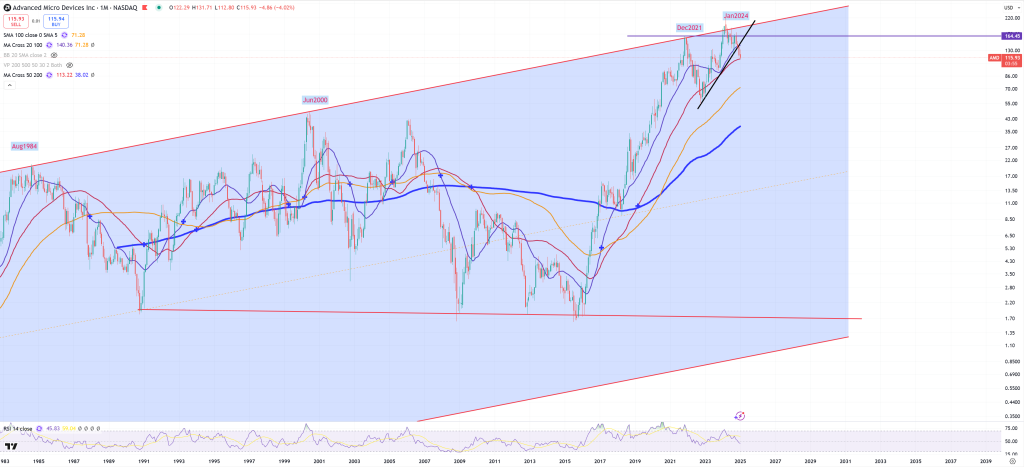
AMD – approaching to (M)MA50 after hitting its secular trend line with a bit of bull trap in Jan 2024
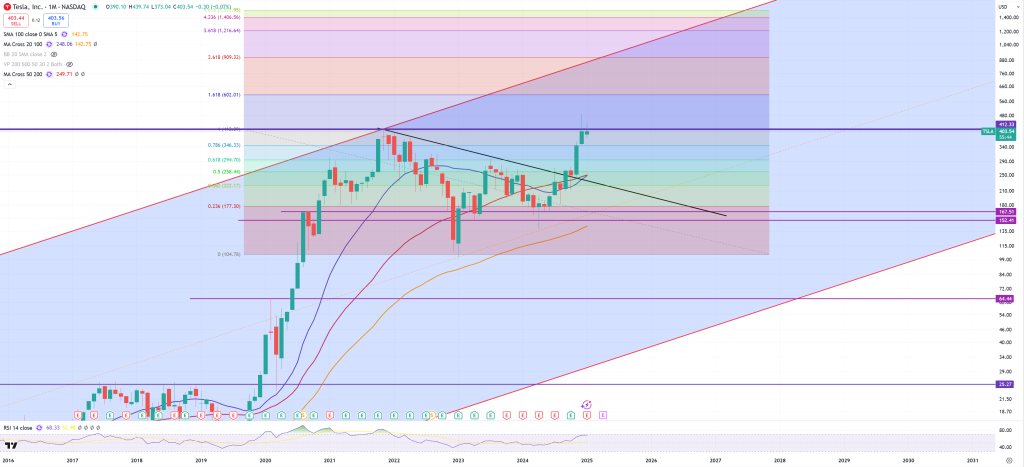
TSLA – and its possible DOUBLE-TOP
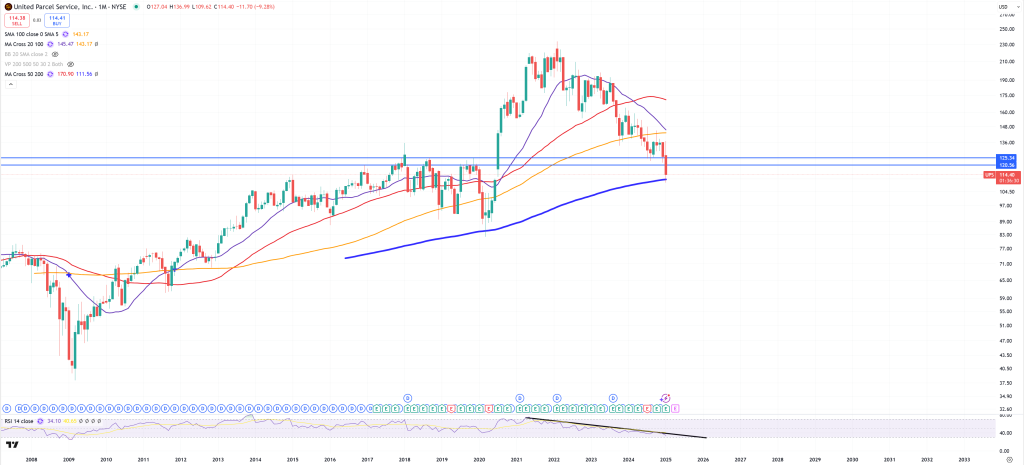
UPS approaching to 2020 lows, last level of defence (M)MA200 – last time it was 2020 bottom, will this time (M)MA200 holds?
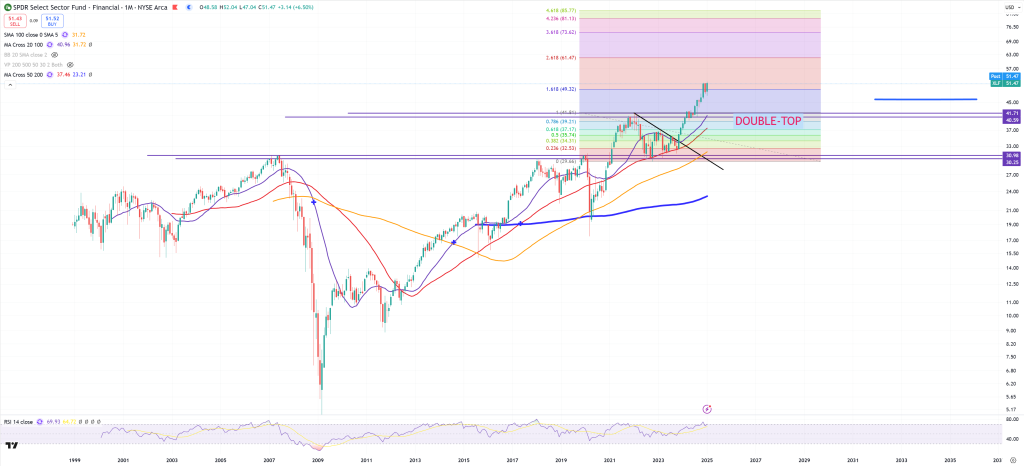
XLF breaking key trend approached around 1.618 FIBO level
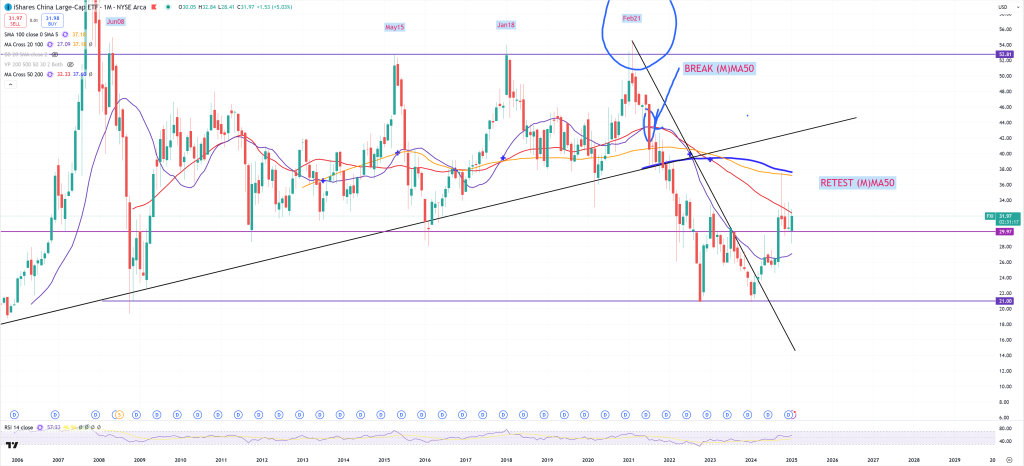
FXI – China and another month of (M)MA50 rejection
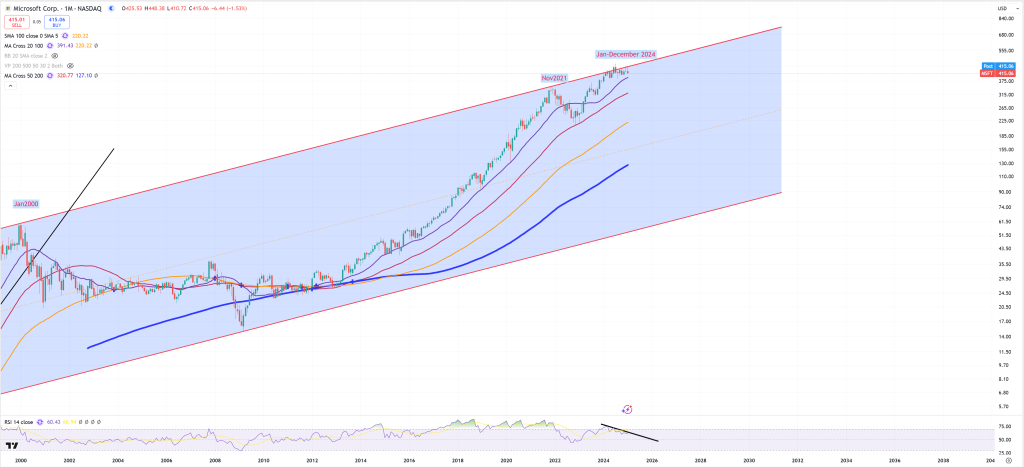
MSFT and its channel
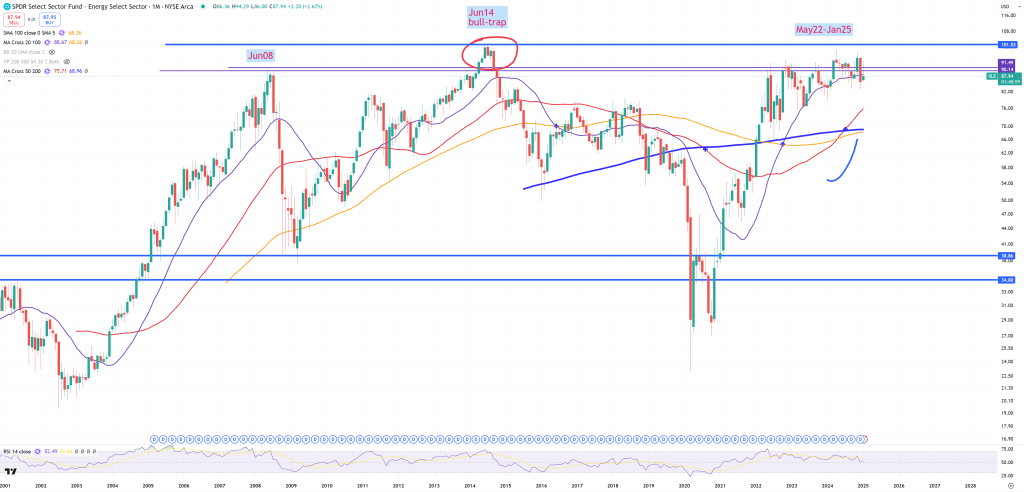
XLE – and its 2008 resistance crossing (M)MA20
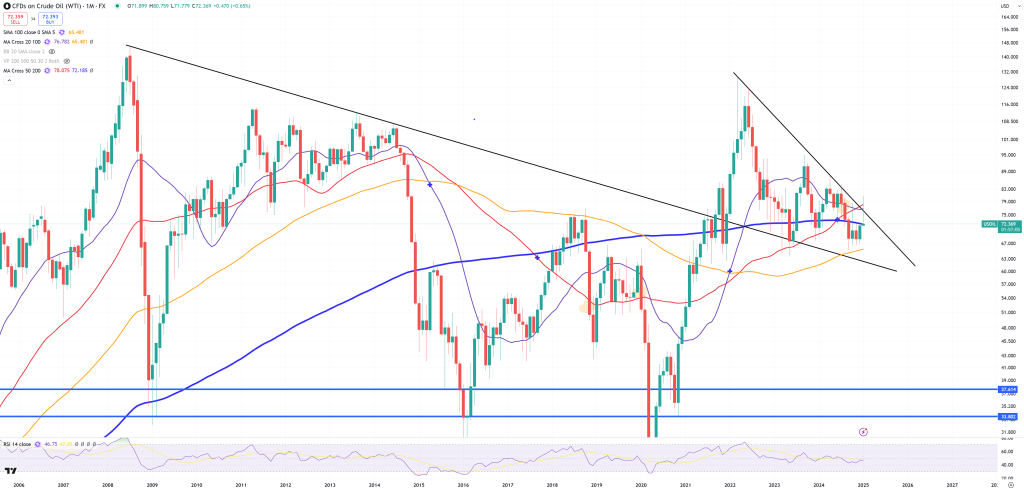
OIL – look at this false spike now back below (M)MA200
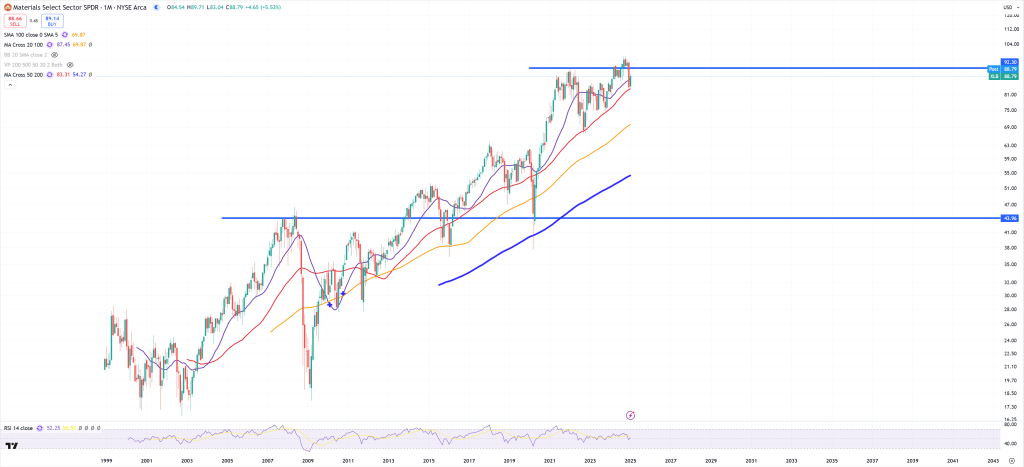
XLB – and key resistance
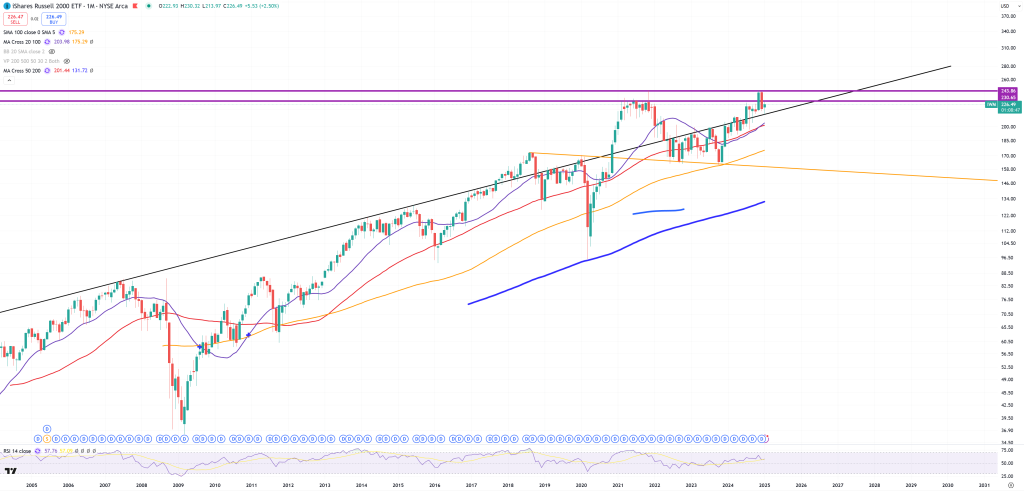
IWM and DOUBLE-TOP
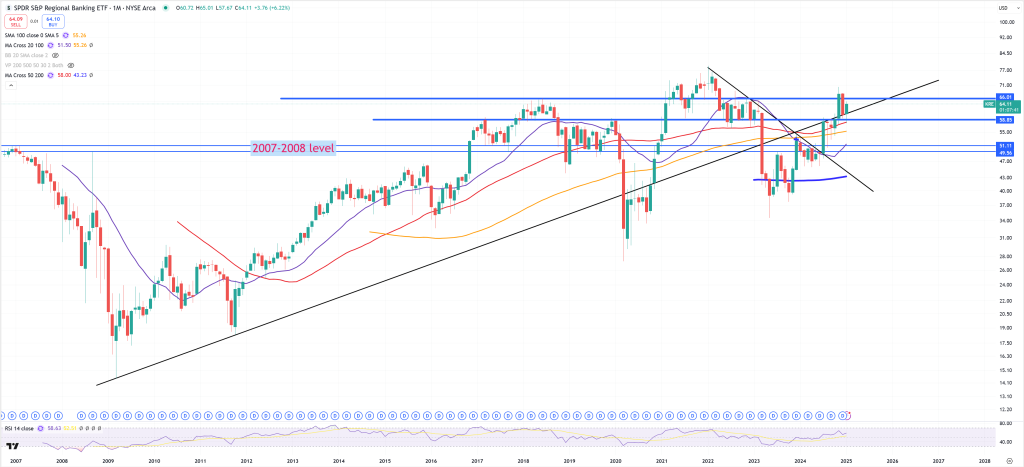
KRE – doesn’t want to give up again below key trend
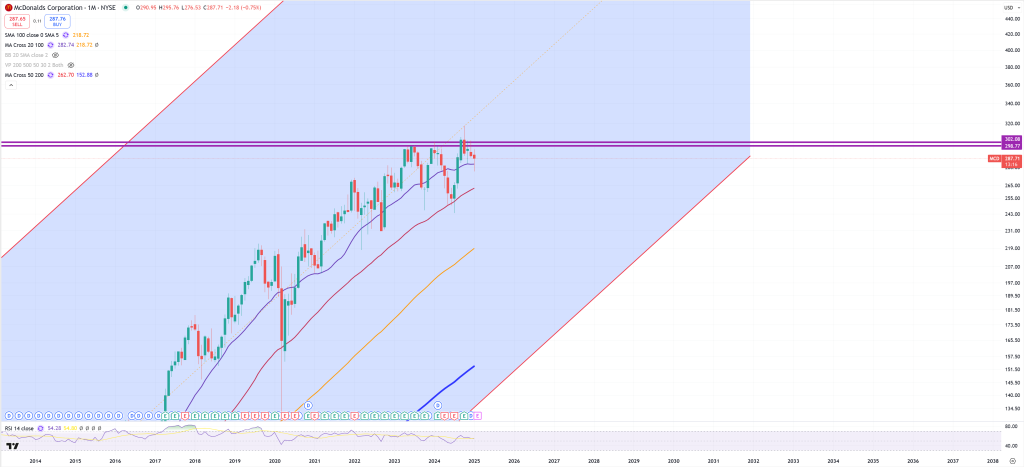
MCD – and its key resistance
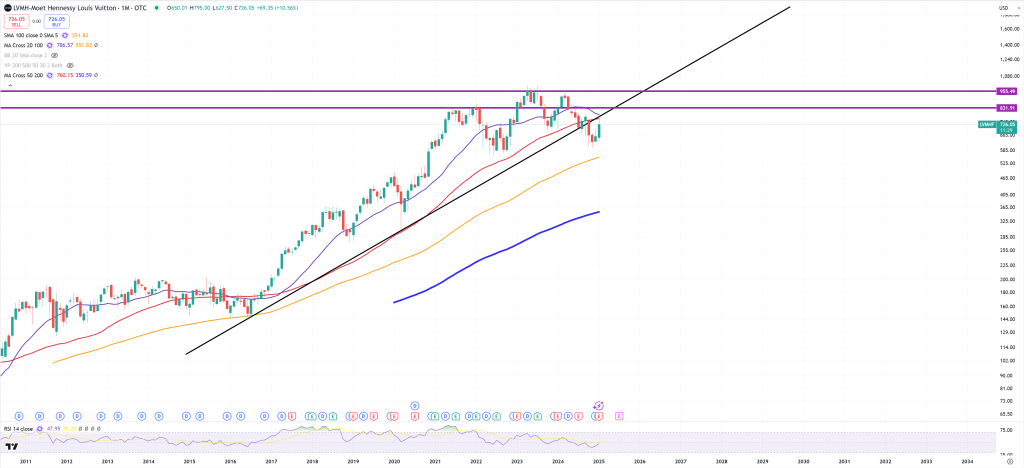
LVMH – Louis Vuitton and (M)MA50 retest and rejection
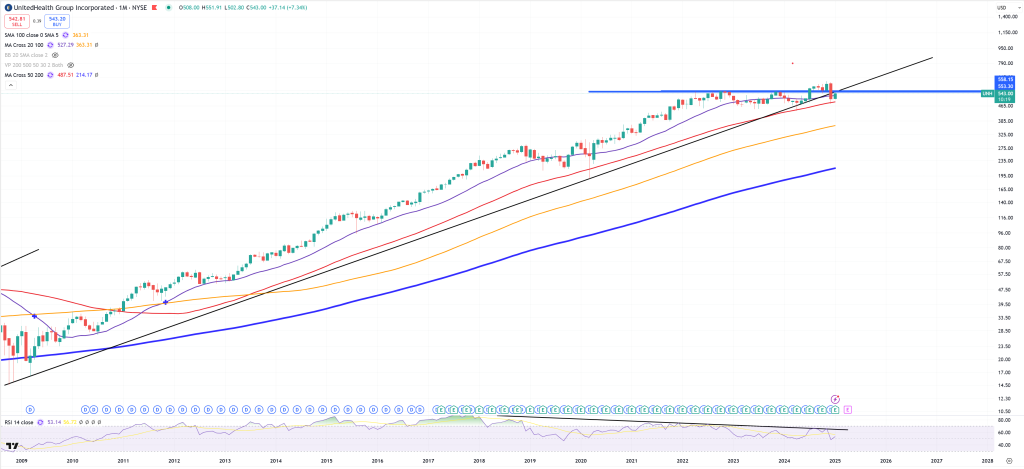
UNH – and retesting broken trend
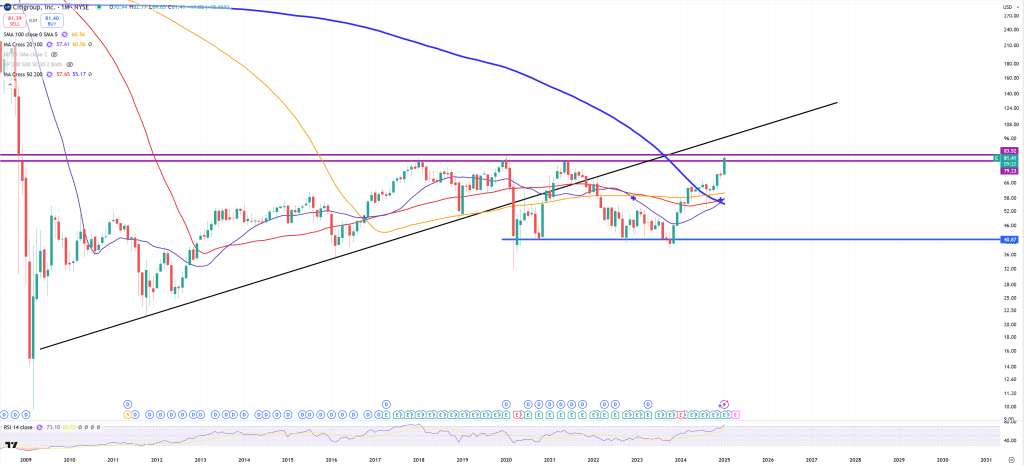
C – CitiBank and multiple resistance
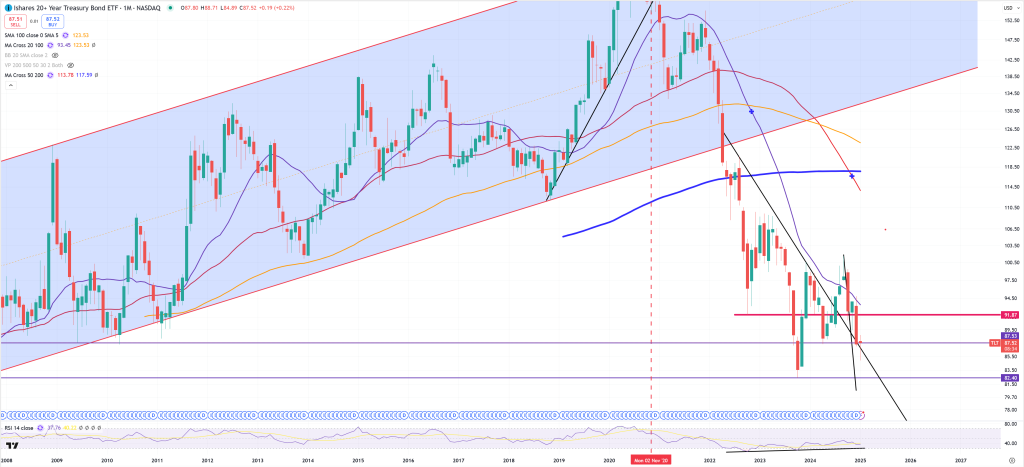
TLT and key support level
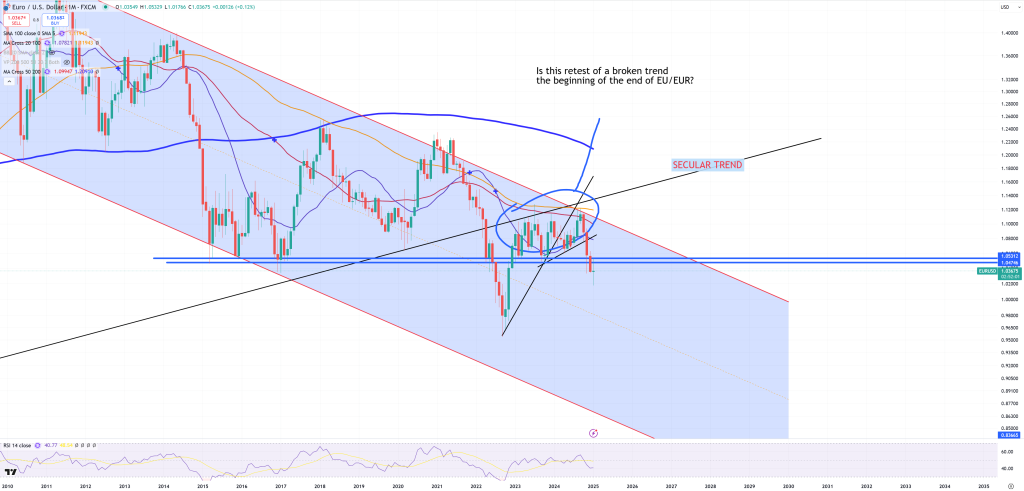
EURUSD – can’t pass 1.05
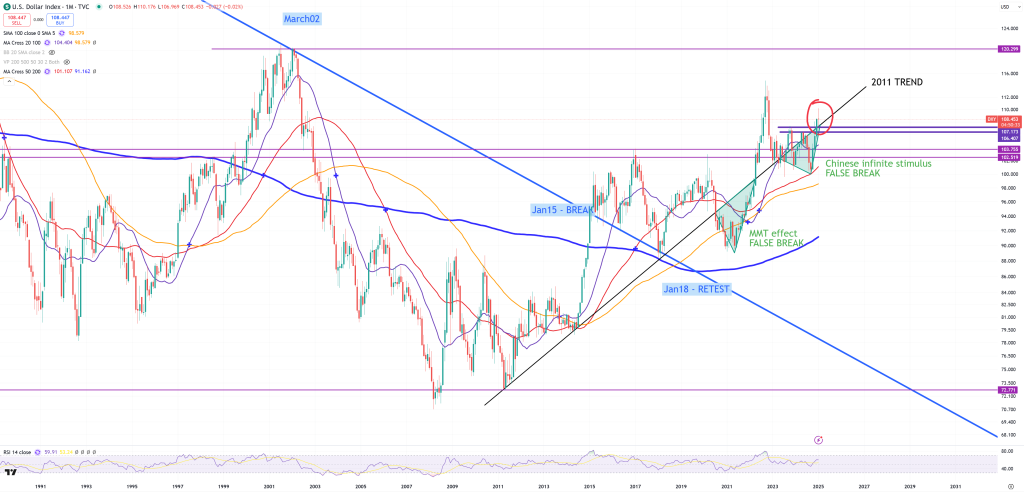
DXY – 107 should be a good support, race to 120
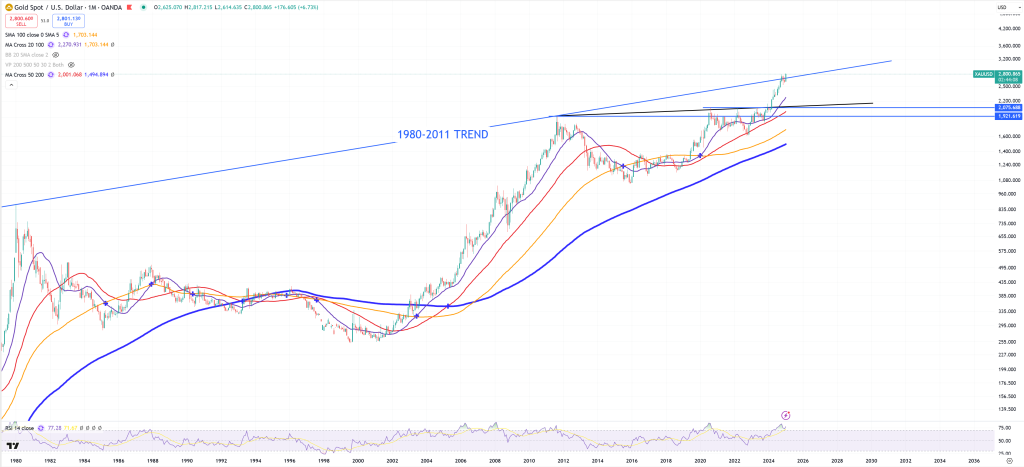
XAUUSD – breaking 1980-2011 trend
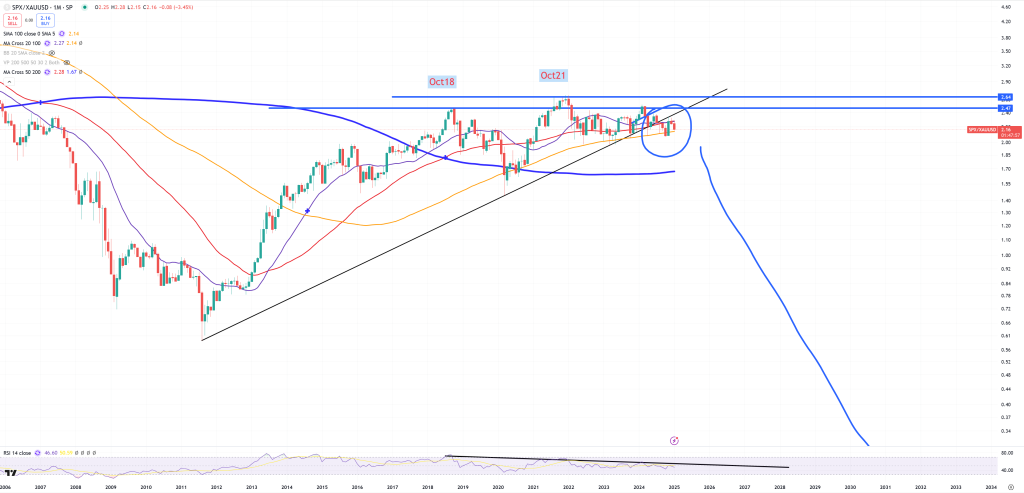
SPX/GOLD – still broken, look at this dependency. If XAUUSD breaking the trend, SPX rejects 1929-2000 trend and SPX/GOLD is broken = GOLD up, SPX=down.
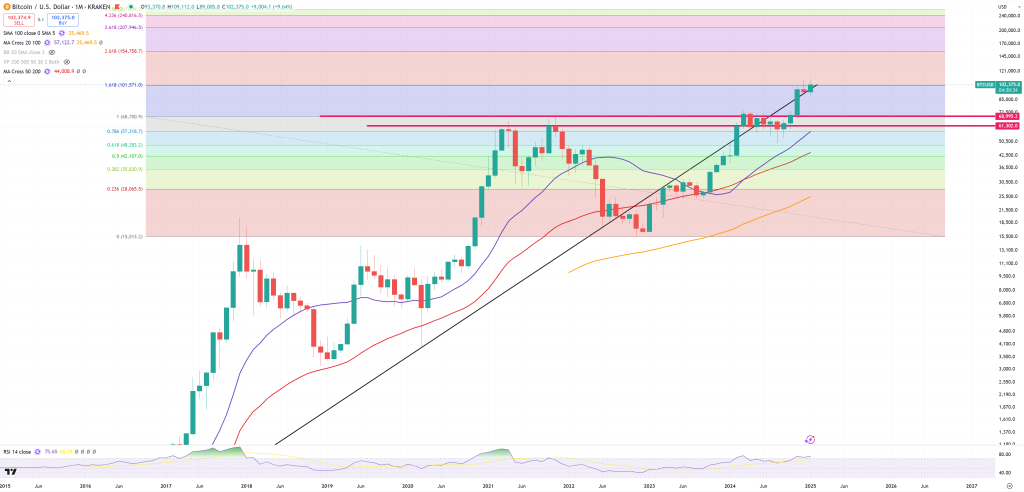
GOLD/BTC on support still indicates peak on BTC
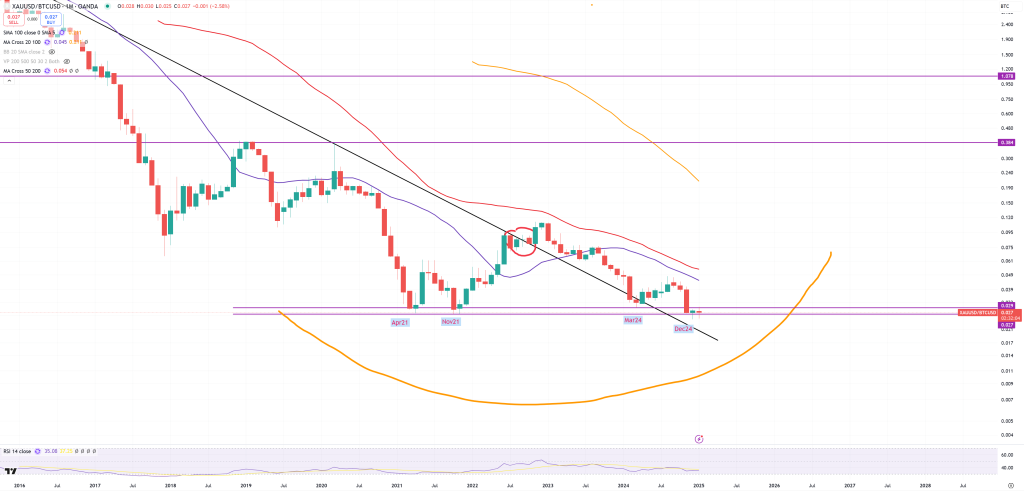
BTC and 1.618 FIBO = GOLD/BTC support level
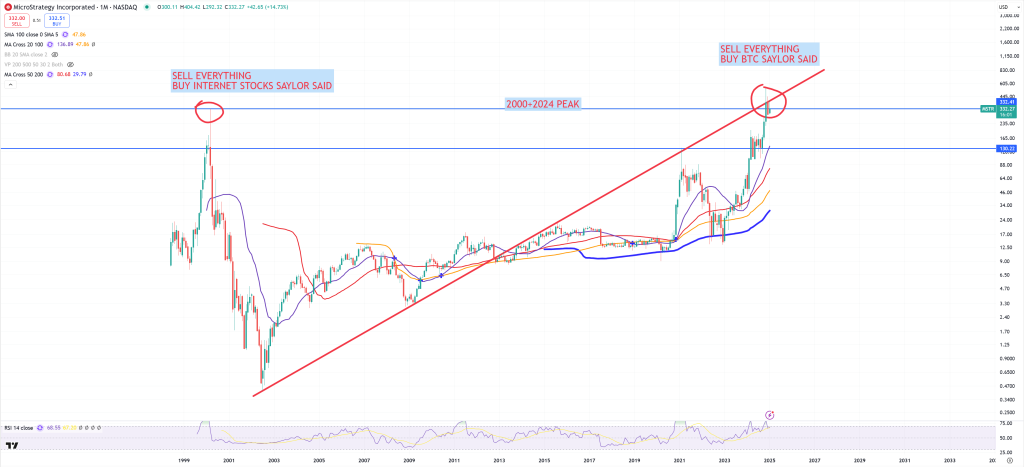
MSTR and its 2000 dot.com bubble resistance
10Y-2Y holds (M)MA100 – look how this (M)MA100 on this yield-curve = SPX 1929-2000 trend line or (M)MA50 on FXI.
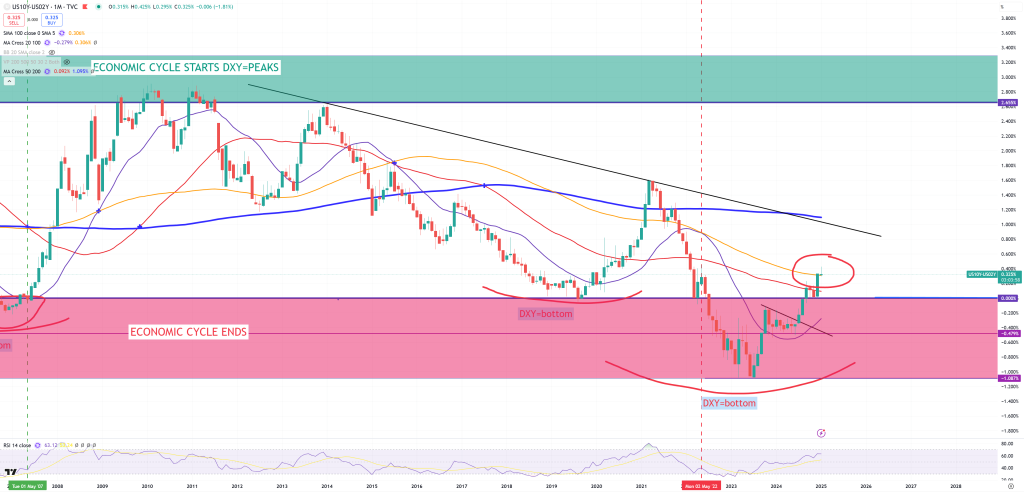
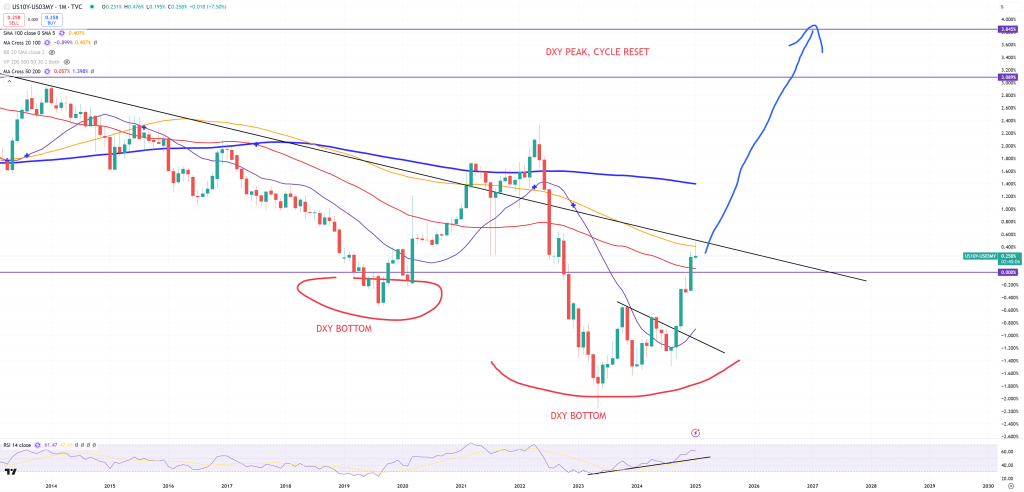
10Y-3M got rejected (M)MA100, but 10Y-2Y is above (M)MA100, looks like 10Y-2Y leads 10Y-3M, and that’s how it should be done
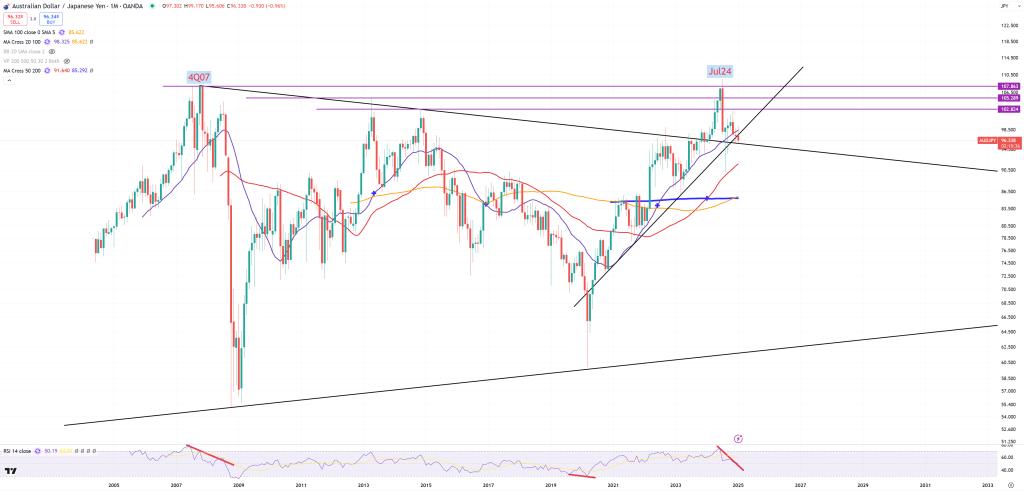
AUDJPY and also a big moment here – main risk on (AUDJPY up) /risk off (AUDJPY down) and inflation/deflation pair
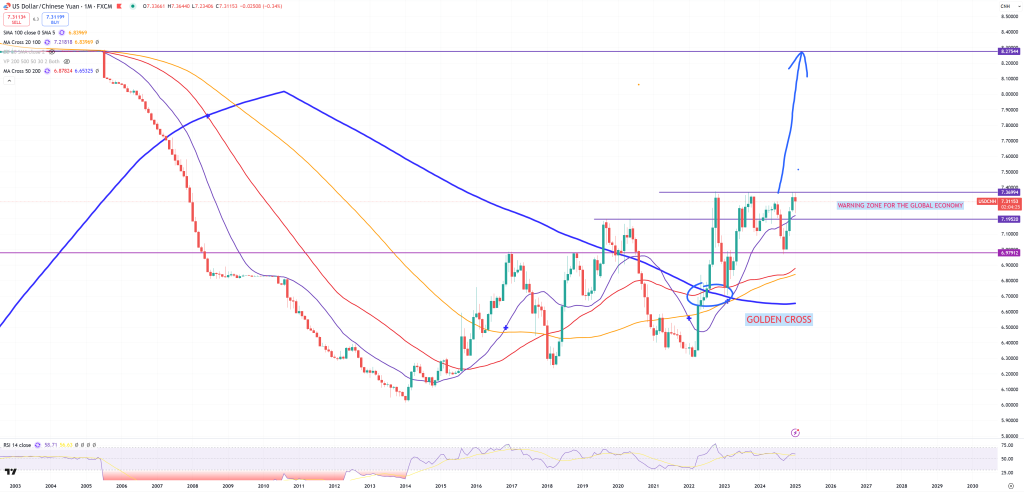
USDCNH – Yuan still fights not to break its “big moment” = 7.36-7.37
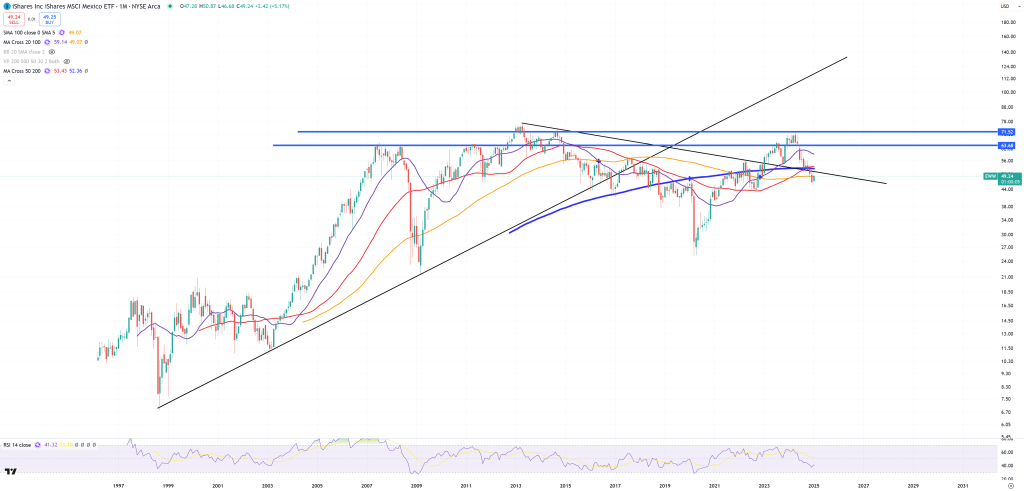
EWW – Mexico and its chart, new 25% tariffs kicked in in a moment where EWW was fighting for its trend
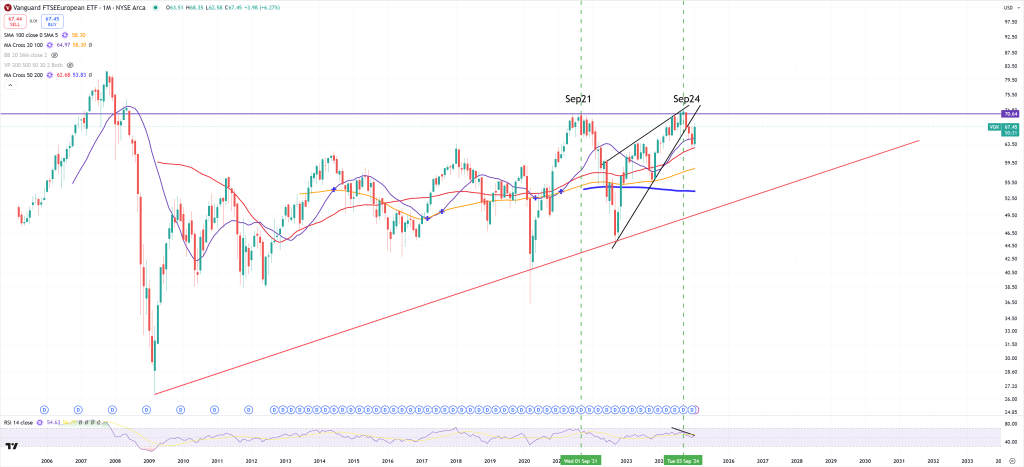
VGK – Europe
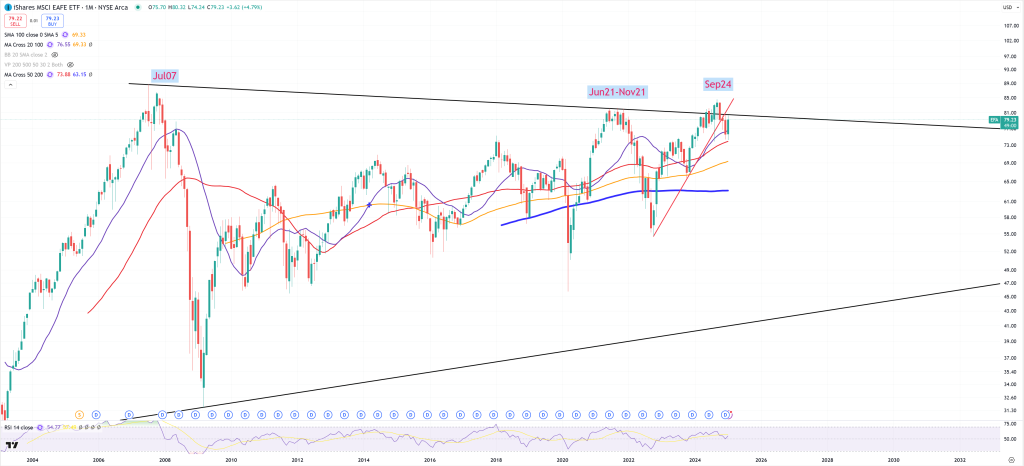
EFA – Developed Markets excluding USA