Cycle ending when SPX/GOLD starts consolidation process
February 8, 2025

If you follow me long enough, you probably got my idea that 2018 is when cycle came to an end. Cycle end of course doesn’t mean stock market going bustsm but stock market going bust once SPX/GOLD formation got broken.
We’re going to take a look SPX/GOLD + technical charts started to align with each other
Events on key technical junctions especially post uninverting yield-curve are brutal, you won’t predict them, but you don’t have to because it doesn’t matter.
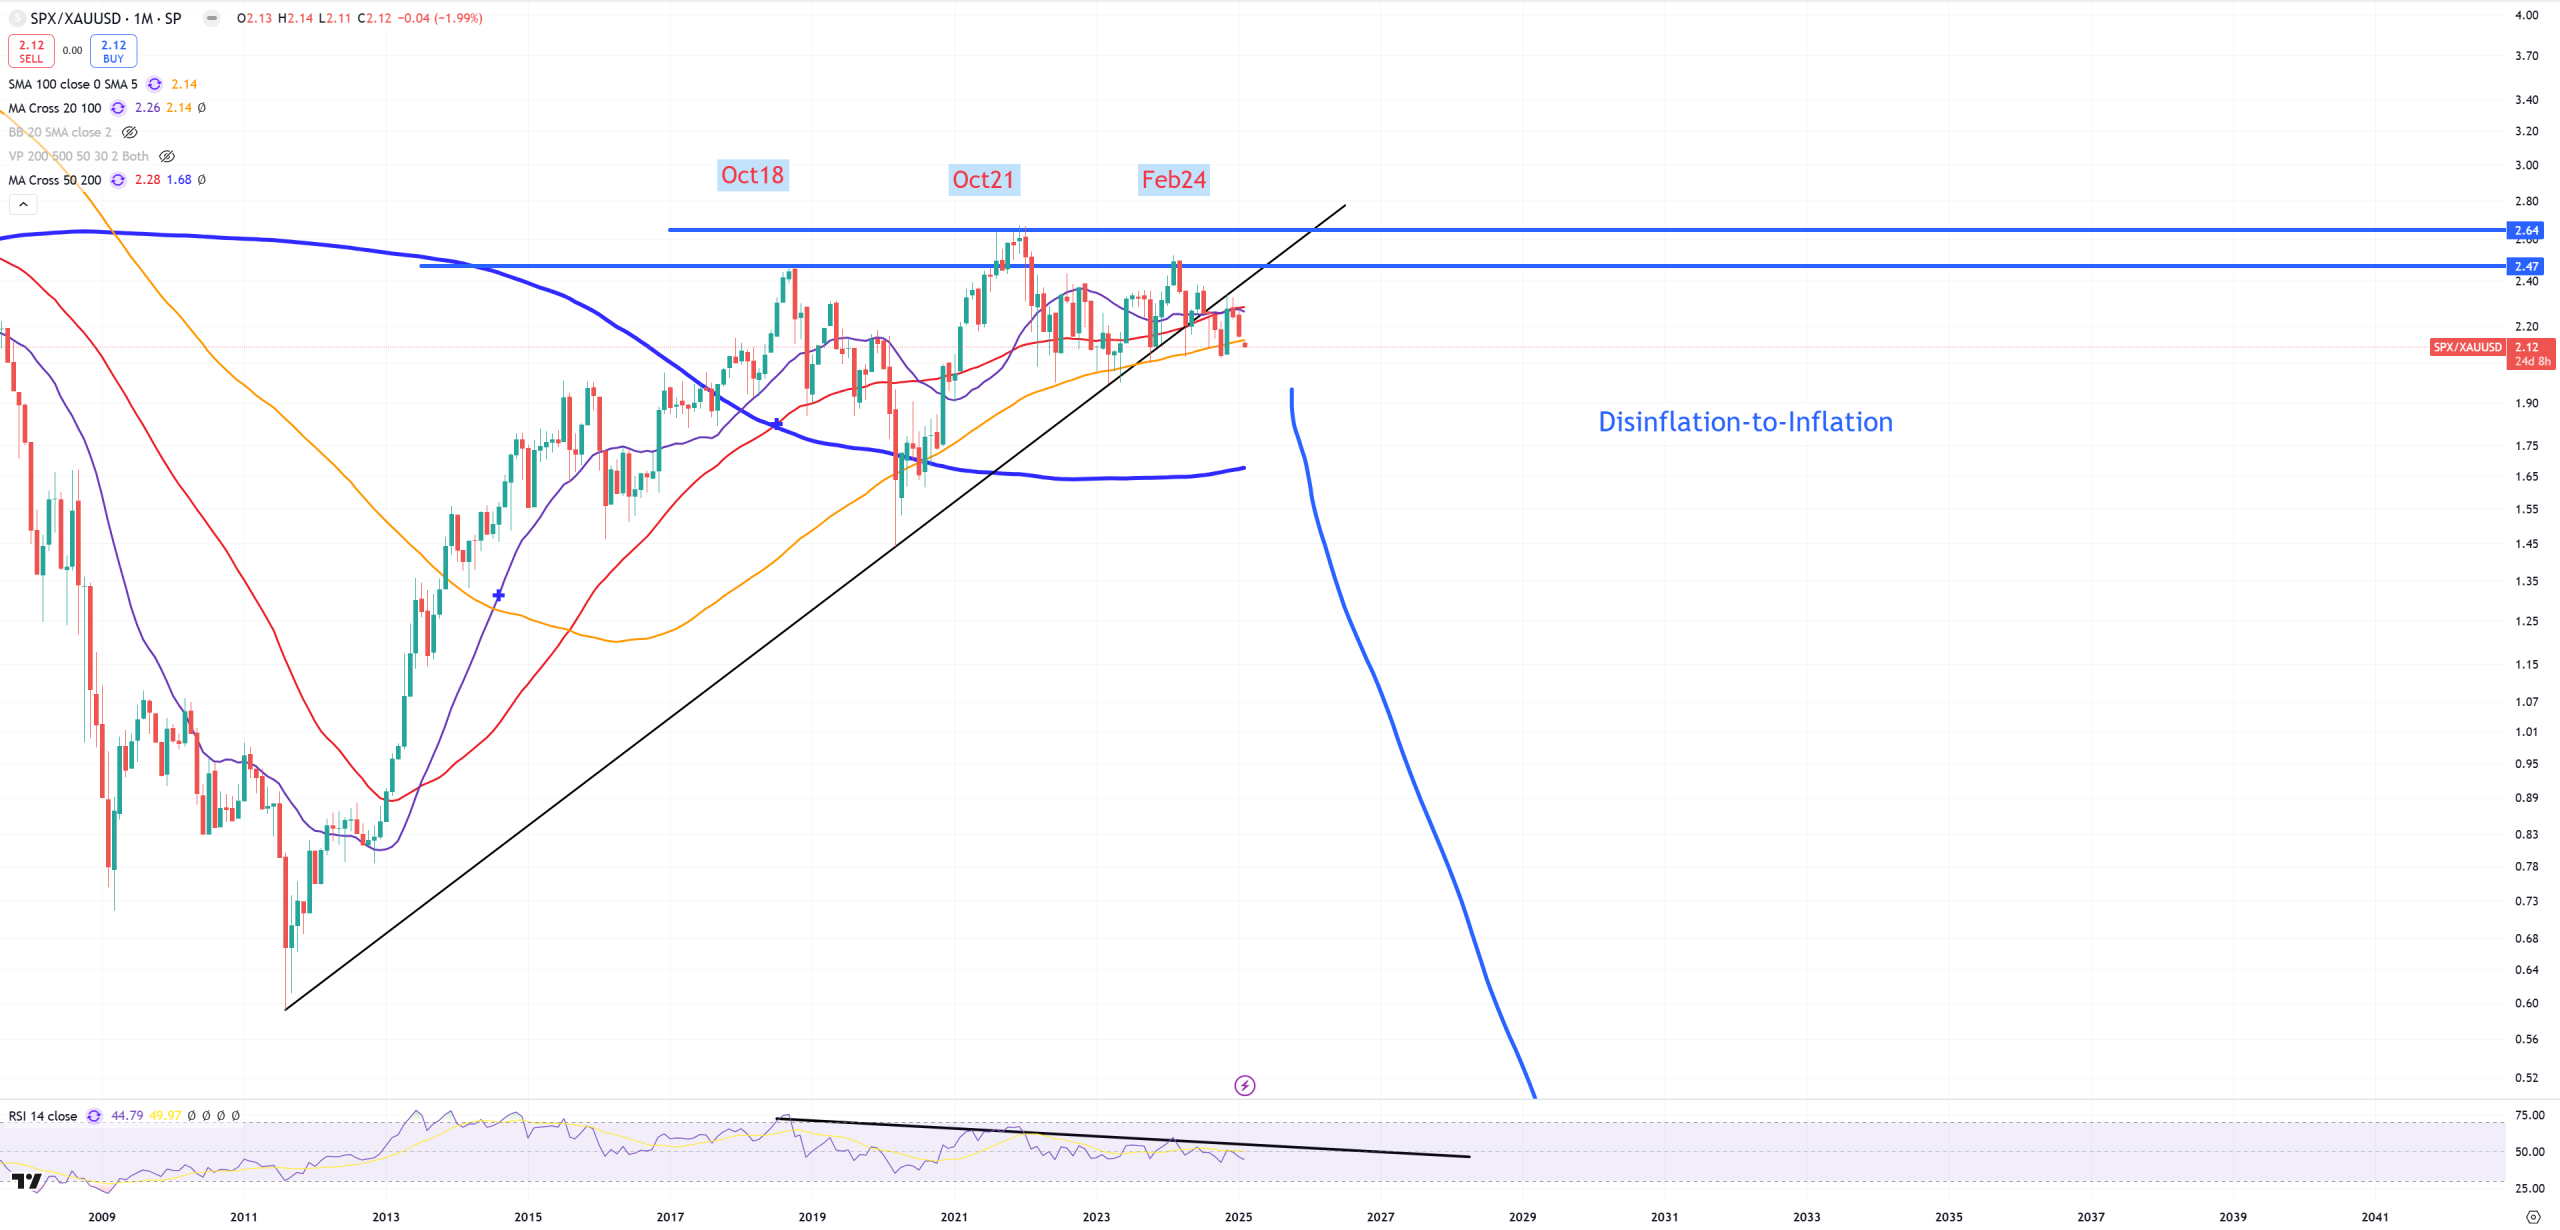
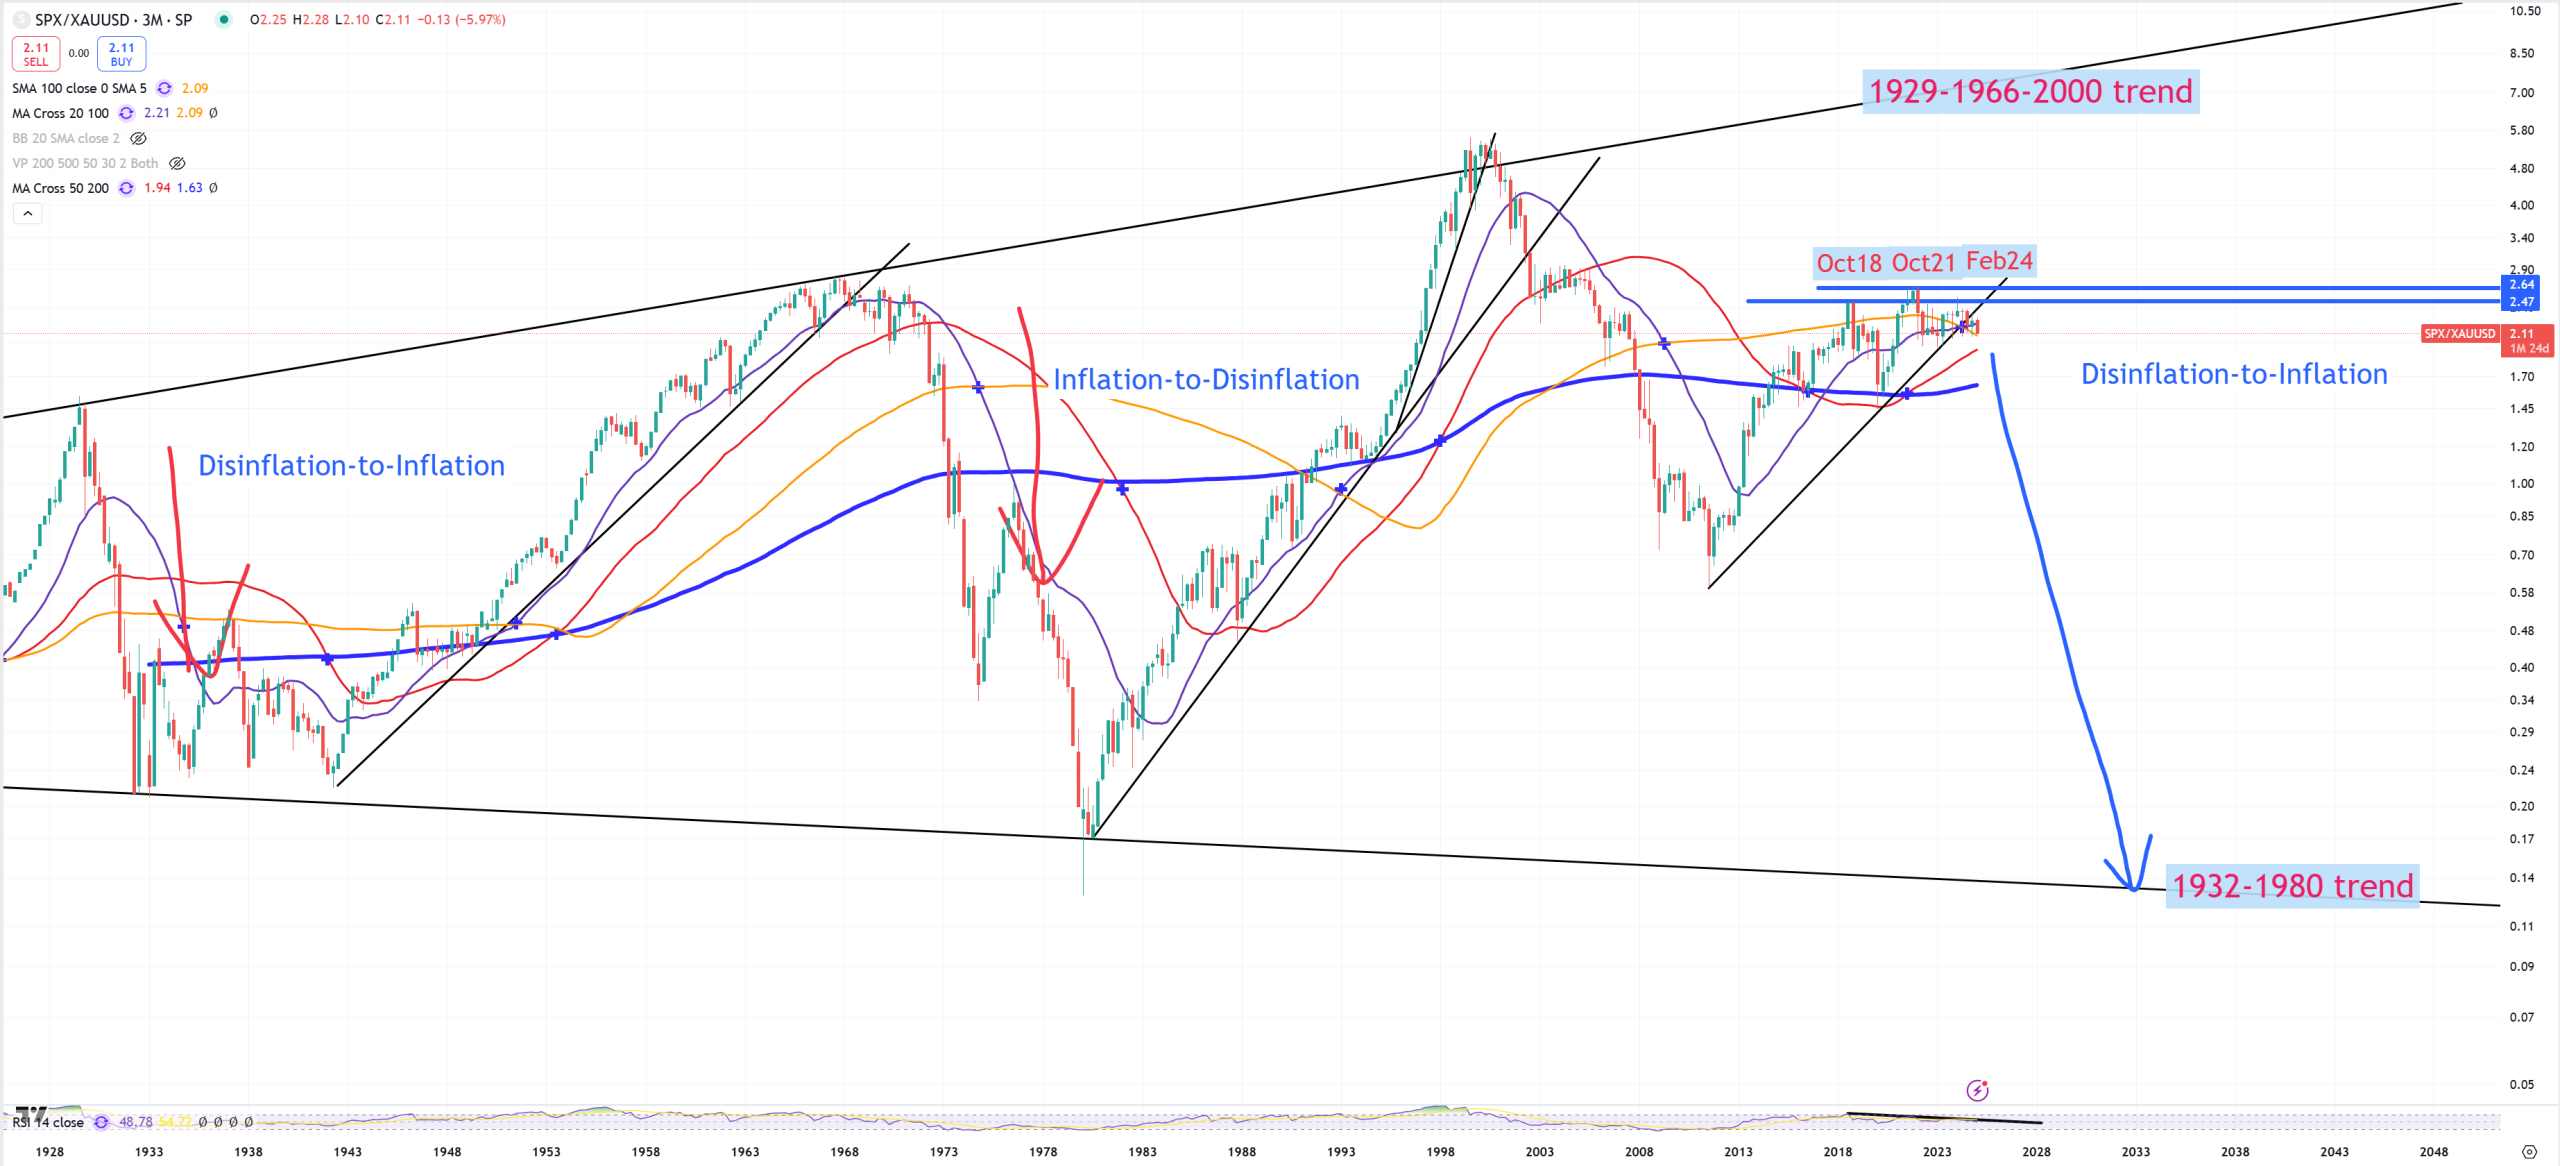
We clearly see there is a big resistance in SPX/GOLD starting from October 2018, post covid crash SPX/GOLD managed to get support around blue (M)MA200 with another October 2021 peak and another one around February 2024, when finally in May 2024 structure has been broken + retested and red (M)MA50 should be now resistance, while yellow (M)MA100 market is slowly losing.
A bit different looks DJI/GOLD. This one points for October 2018 as its peak. It’s not really easy to say WHEN cycle peaks. Nasdaq is too young index and too often going parabolic, so it’s not even worth to be concidered in cycle analysis.
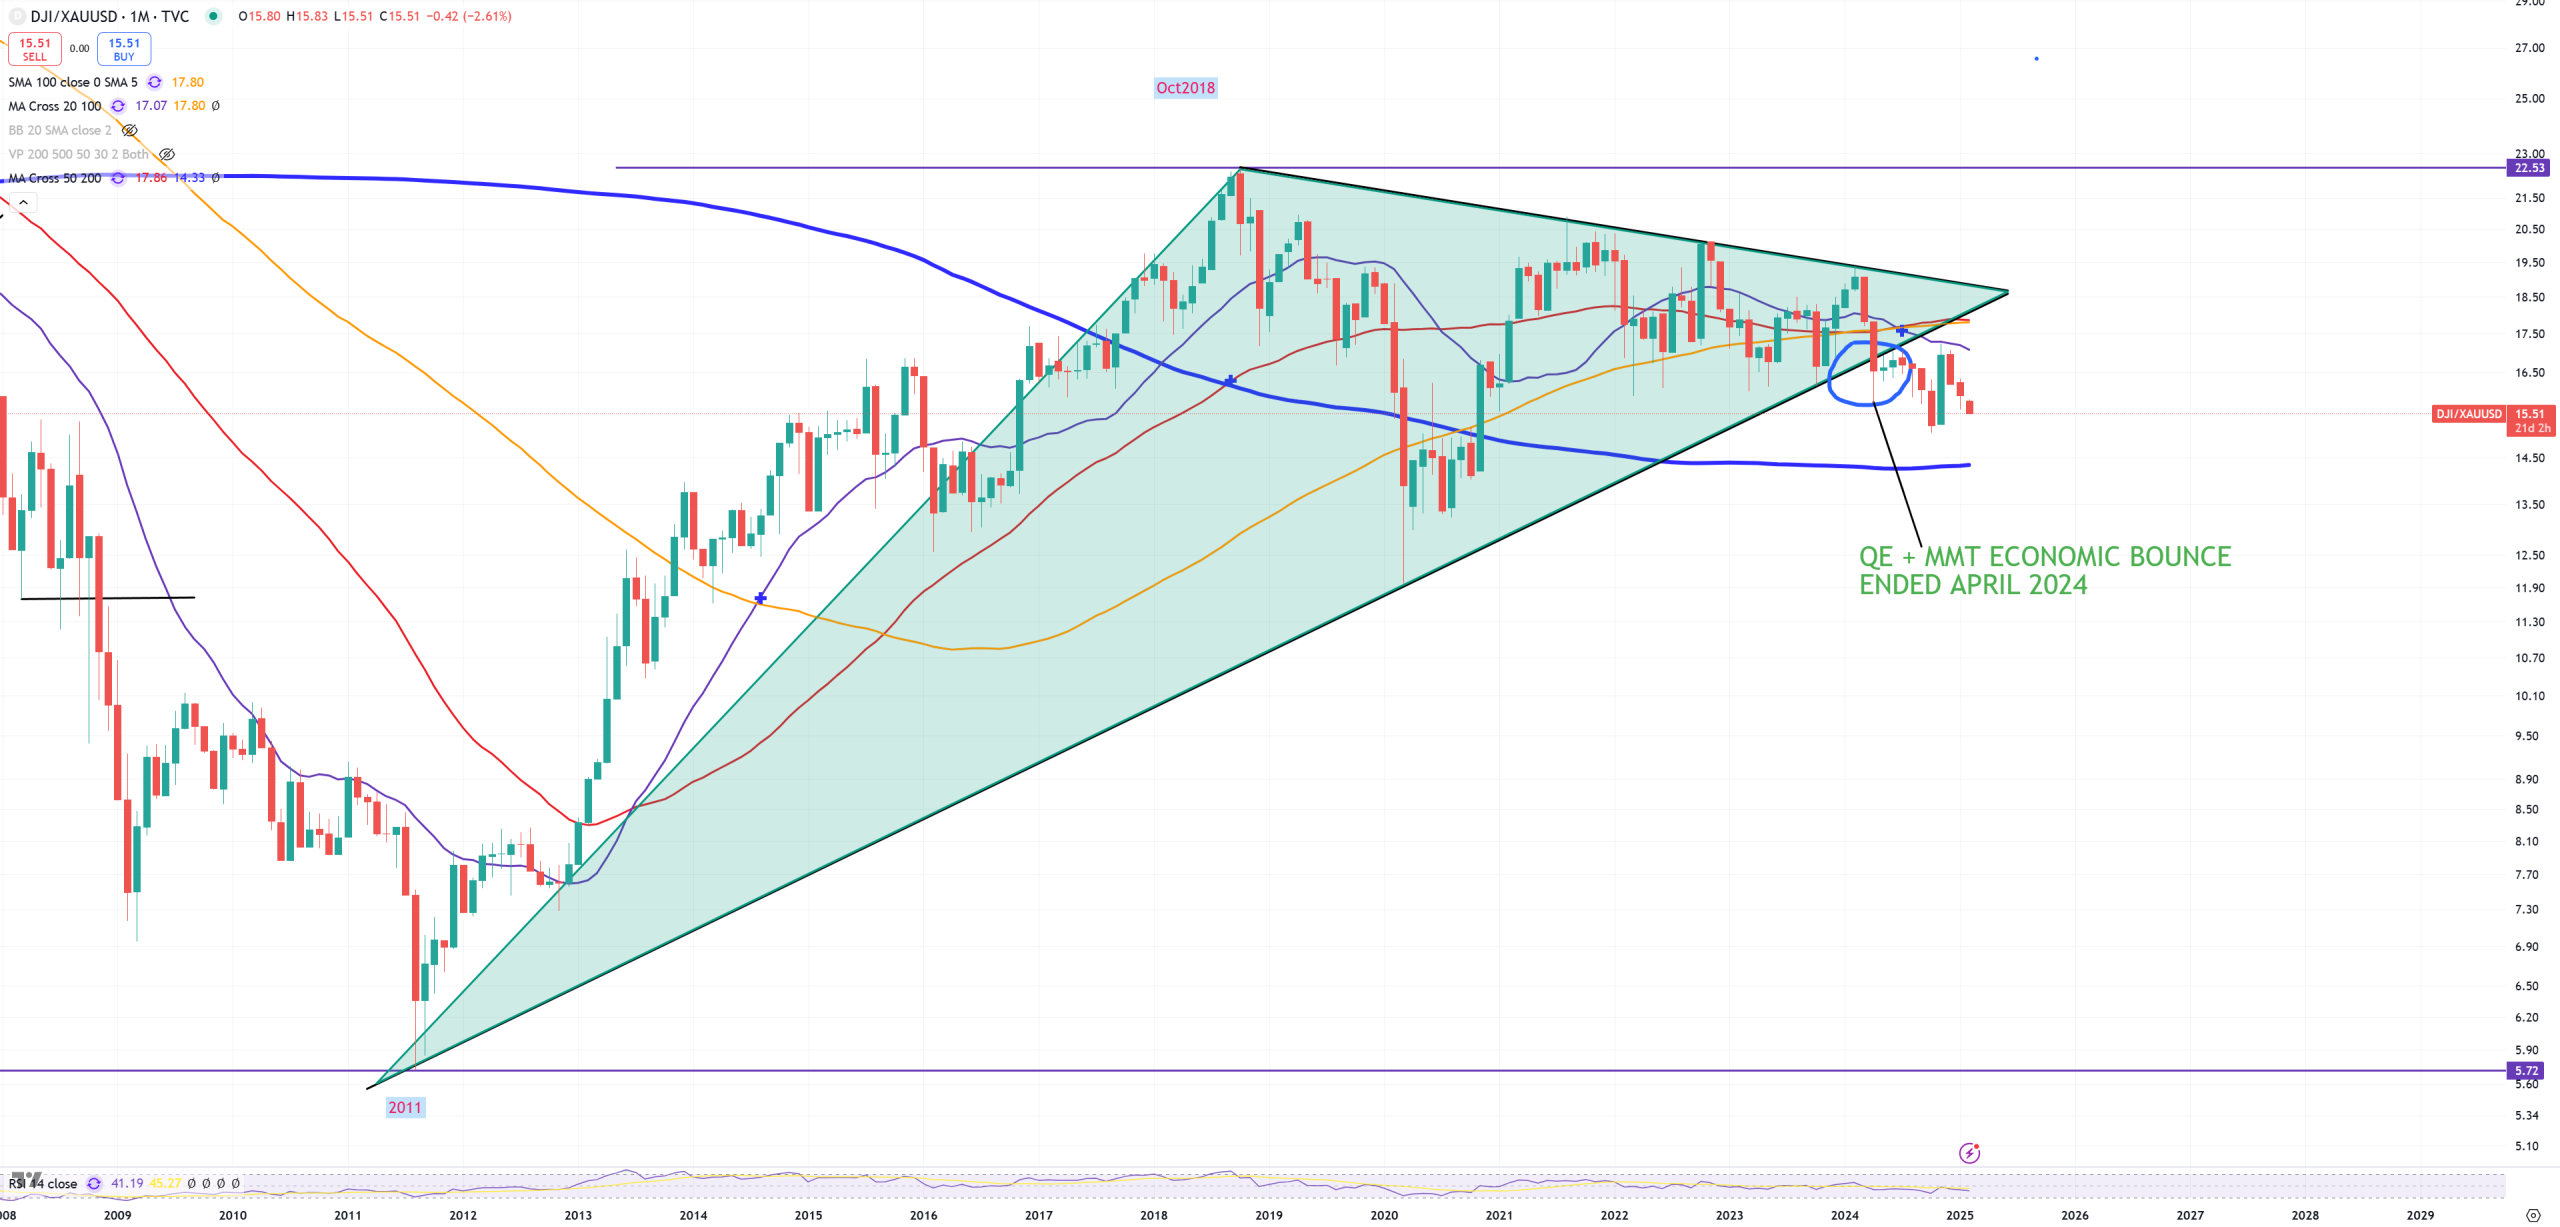
That’s why based on DJI/GOLD SPX/GOLD year 2018 is always provided as a beginning of transition on Kondratiev cycle, post huge bounce from 2011.
You can easily see coupe things
1/ Gold made some kind of a bottom in 2018, as DJI/GOLD peaked in Oct18 that was a moment where stocks in a longer term should be replaced by GOLD.
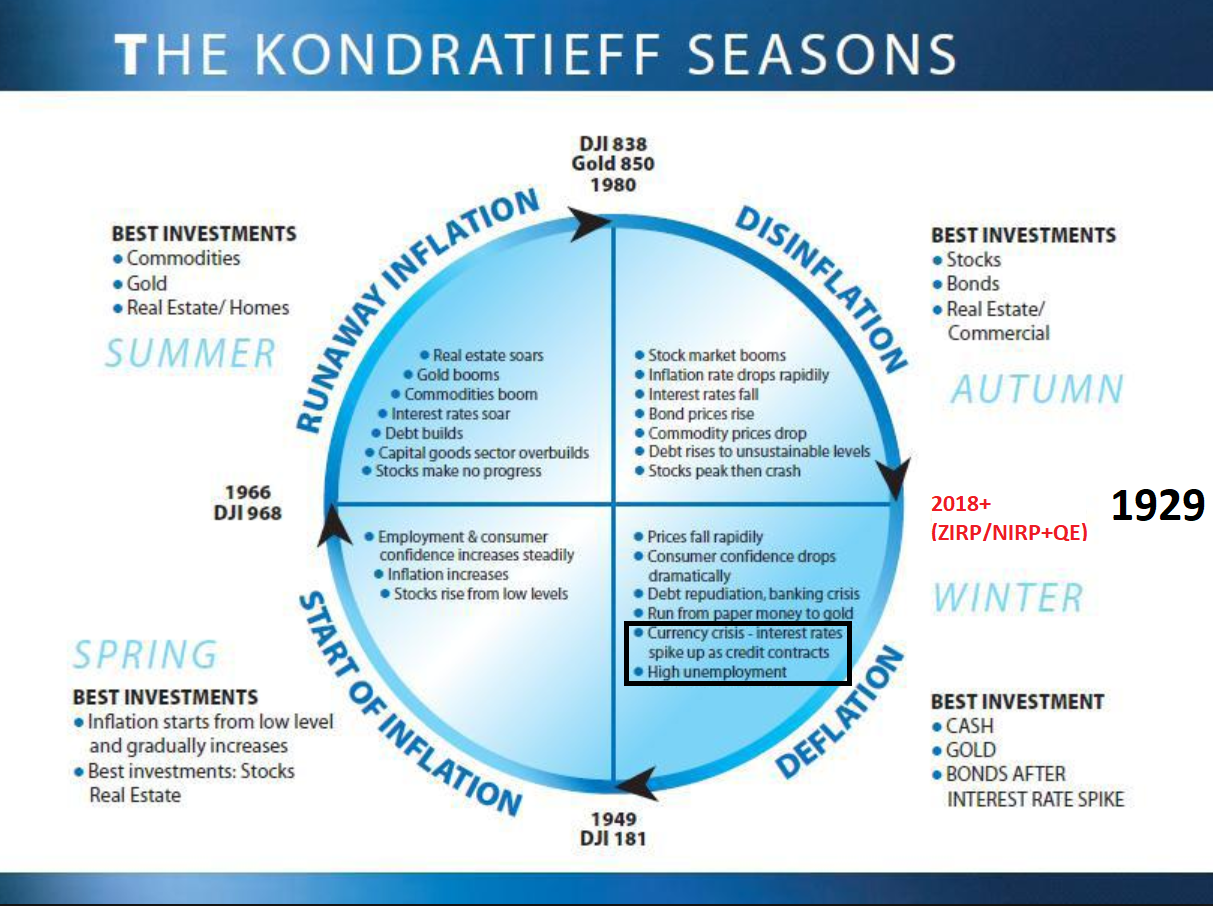
2/ CASH – DXY was in Oct 2018 around 94
3/ Currency Crisis ongoing from 2018 (amount of currencies breaking to new ATHs vs USD)
4/ Run from paper money to gold – ongoing
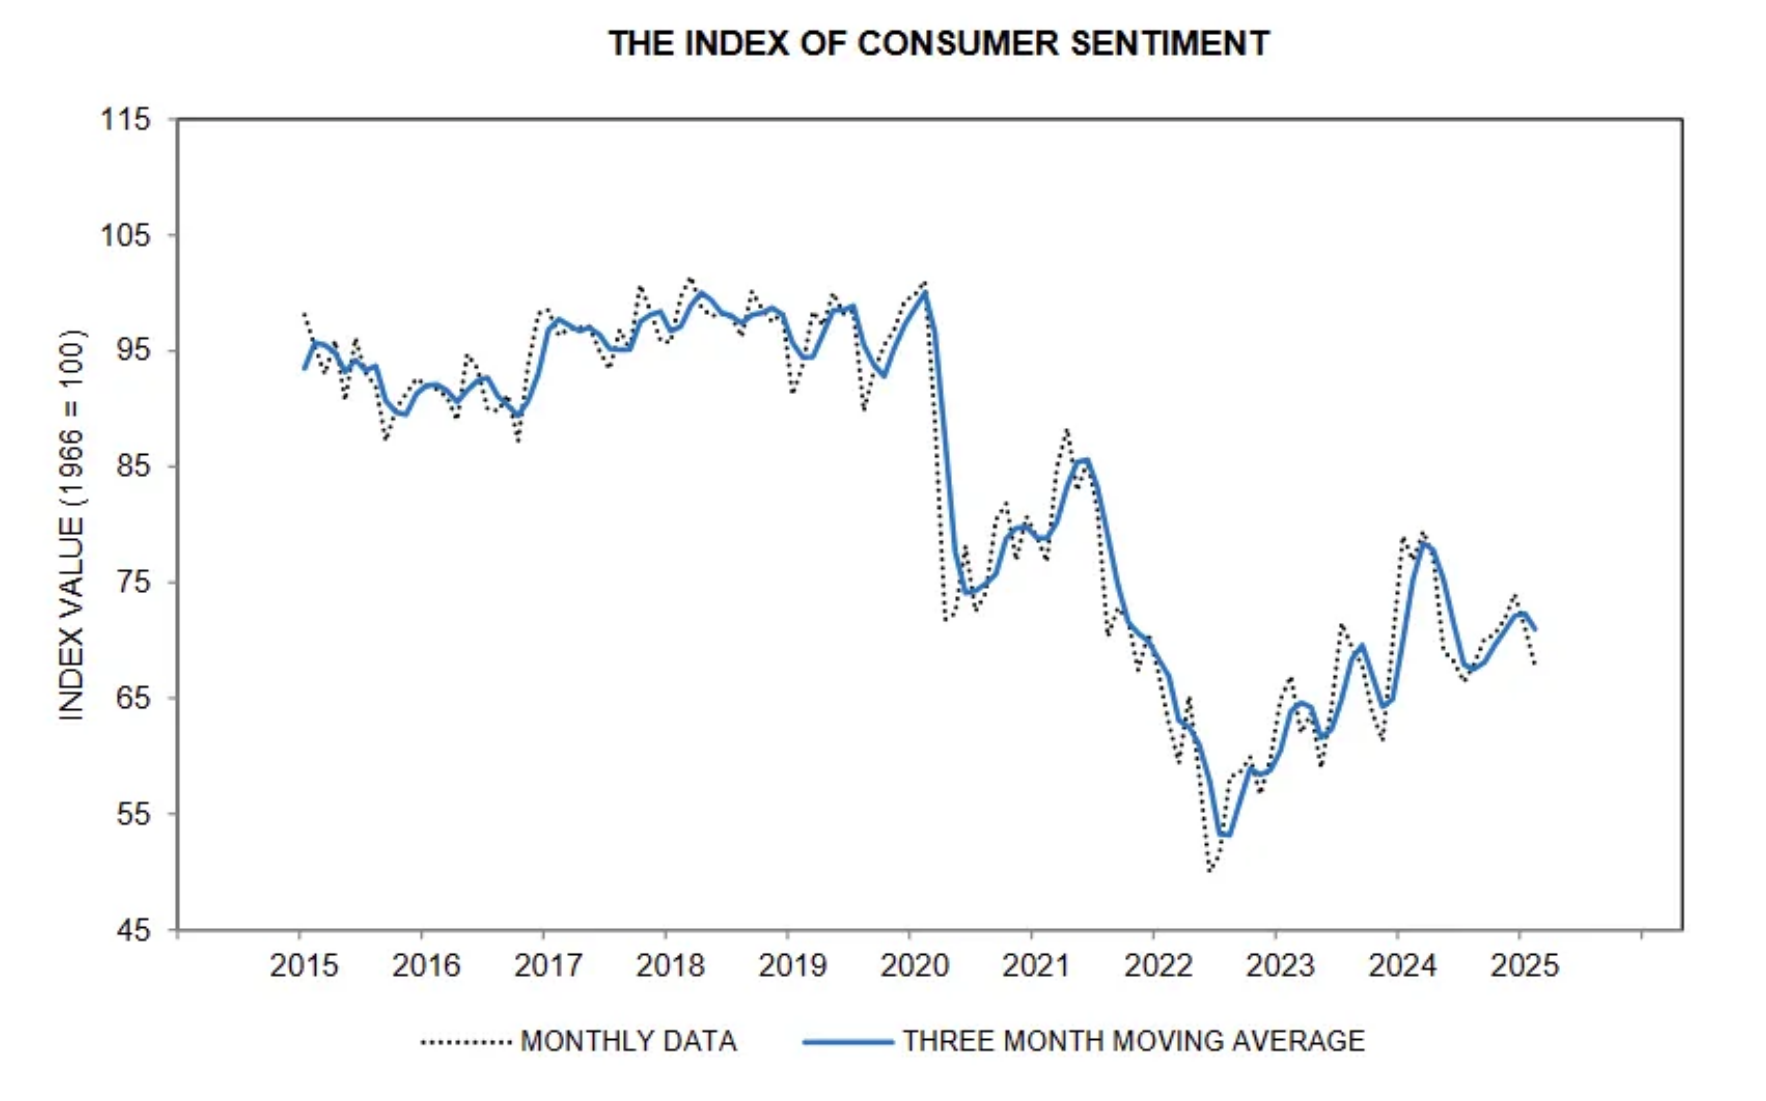
5/ Consumer confidence drops dramatically, and we really see here peak of sentiment between 2018 and 2020, post COVID sentiment never went up, and my idea is it won’t as SPX/GOLD will be going down. We see a move from 2022 till mid 2024 in Sentiment, but you see that move also on SPX/GOLD with 3rd peak in Feb2024.
The beginning of a cycle transformation is only valid if market really has started its path on SPX/GOLD towards its lower 1932-1980 trend lines, which are points of big cycle changes. It’s not a rocket science when we take a look at this chart that cycle is changing since 2000, but the move from 2011 (QE+MMT) took way way too long IMO to treat this 2000 as a valid transformation date, but at some point it is.
Gold should be outperformer once SPX/GOLD (DJI/GOLD) starts consolidating. If we add yield-curve inversion process we can be ahead of everyone. You see here that cycle end means some gains in stock market, but cycle <> stock market. SPX/GOLD is more like an equivalent of “The Economy”, it starts saying we’re about to end the good times, without really telling any timeframe. If you sit and think when the last good times in the economy were you should point to times just before pandemic.
So since Oct2018 we had almost 5.5Y of SPX/GOLD consolidation. Once this consolidation started we see a bottom in GOLD.
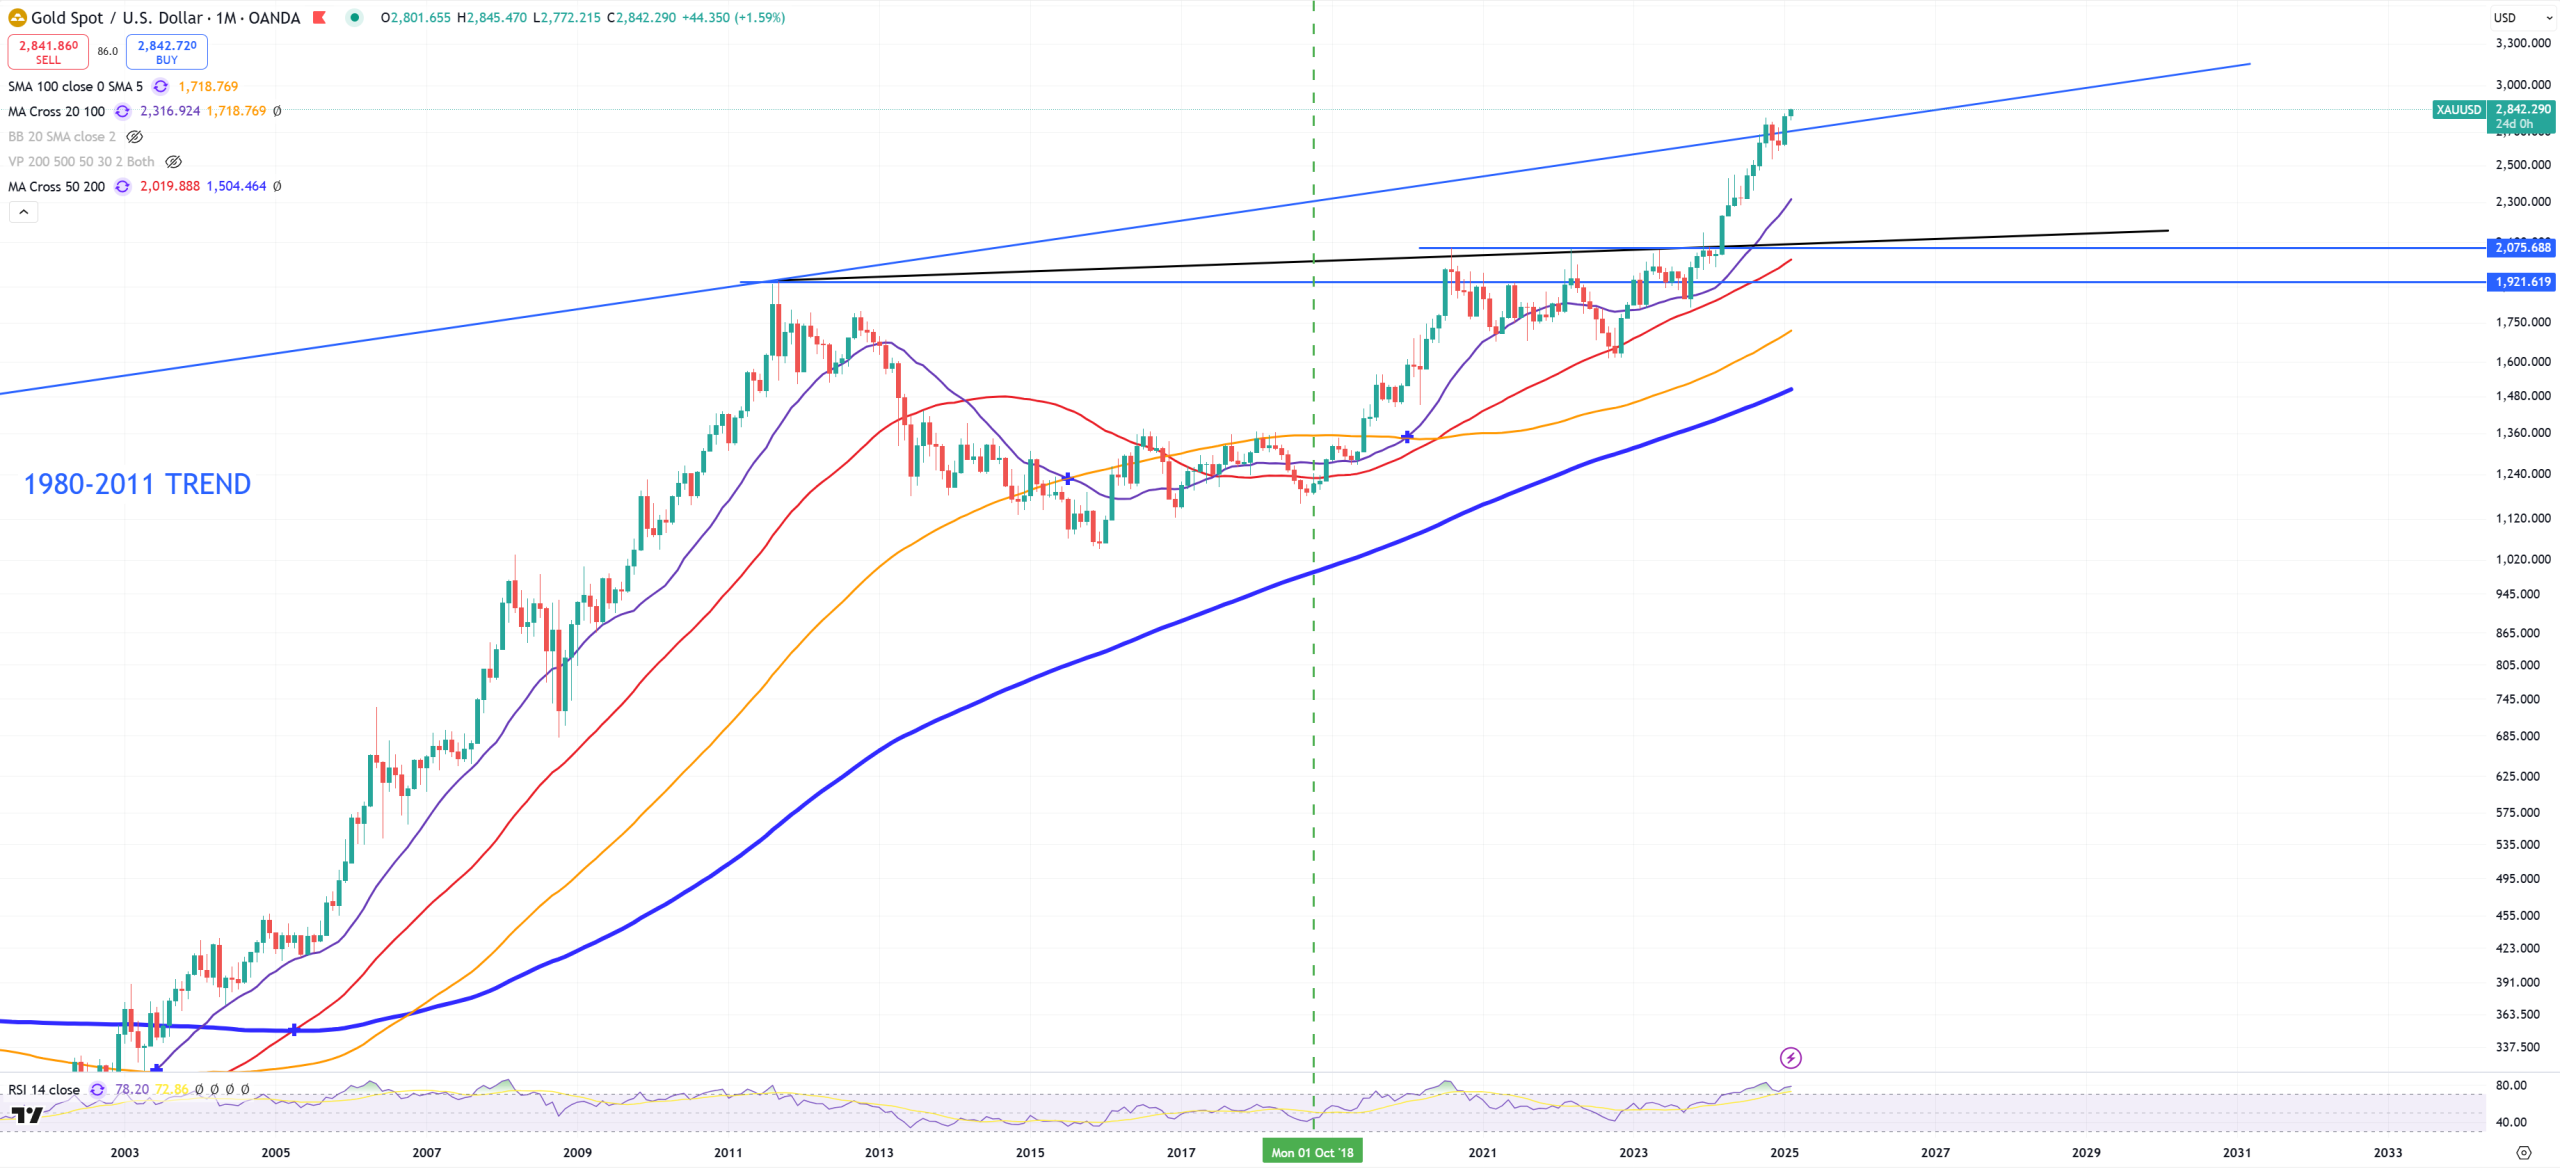
Since Oct18 – GOLD so far raised 138% while SPX 122%, but the fun starts when SPX/GOLD broke down in May 2024 officially flipping the trend.
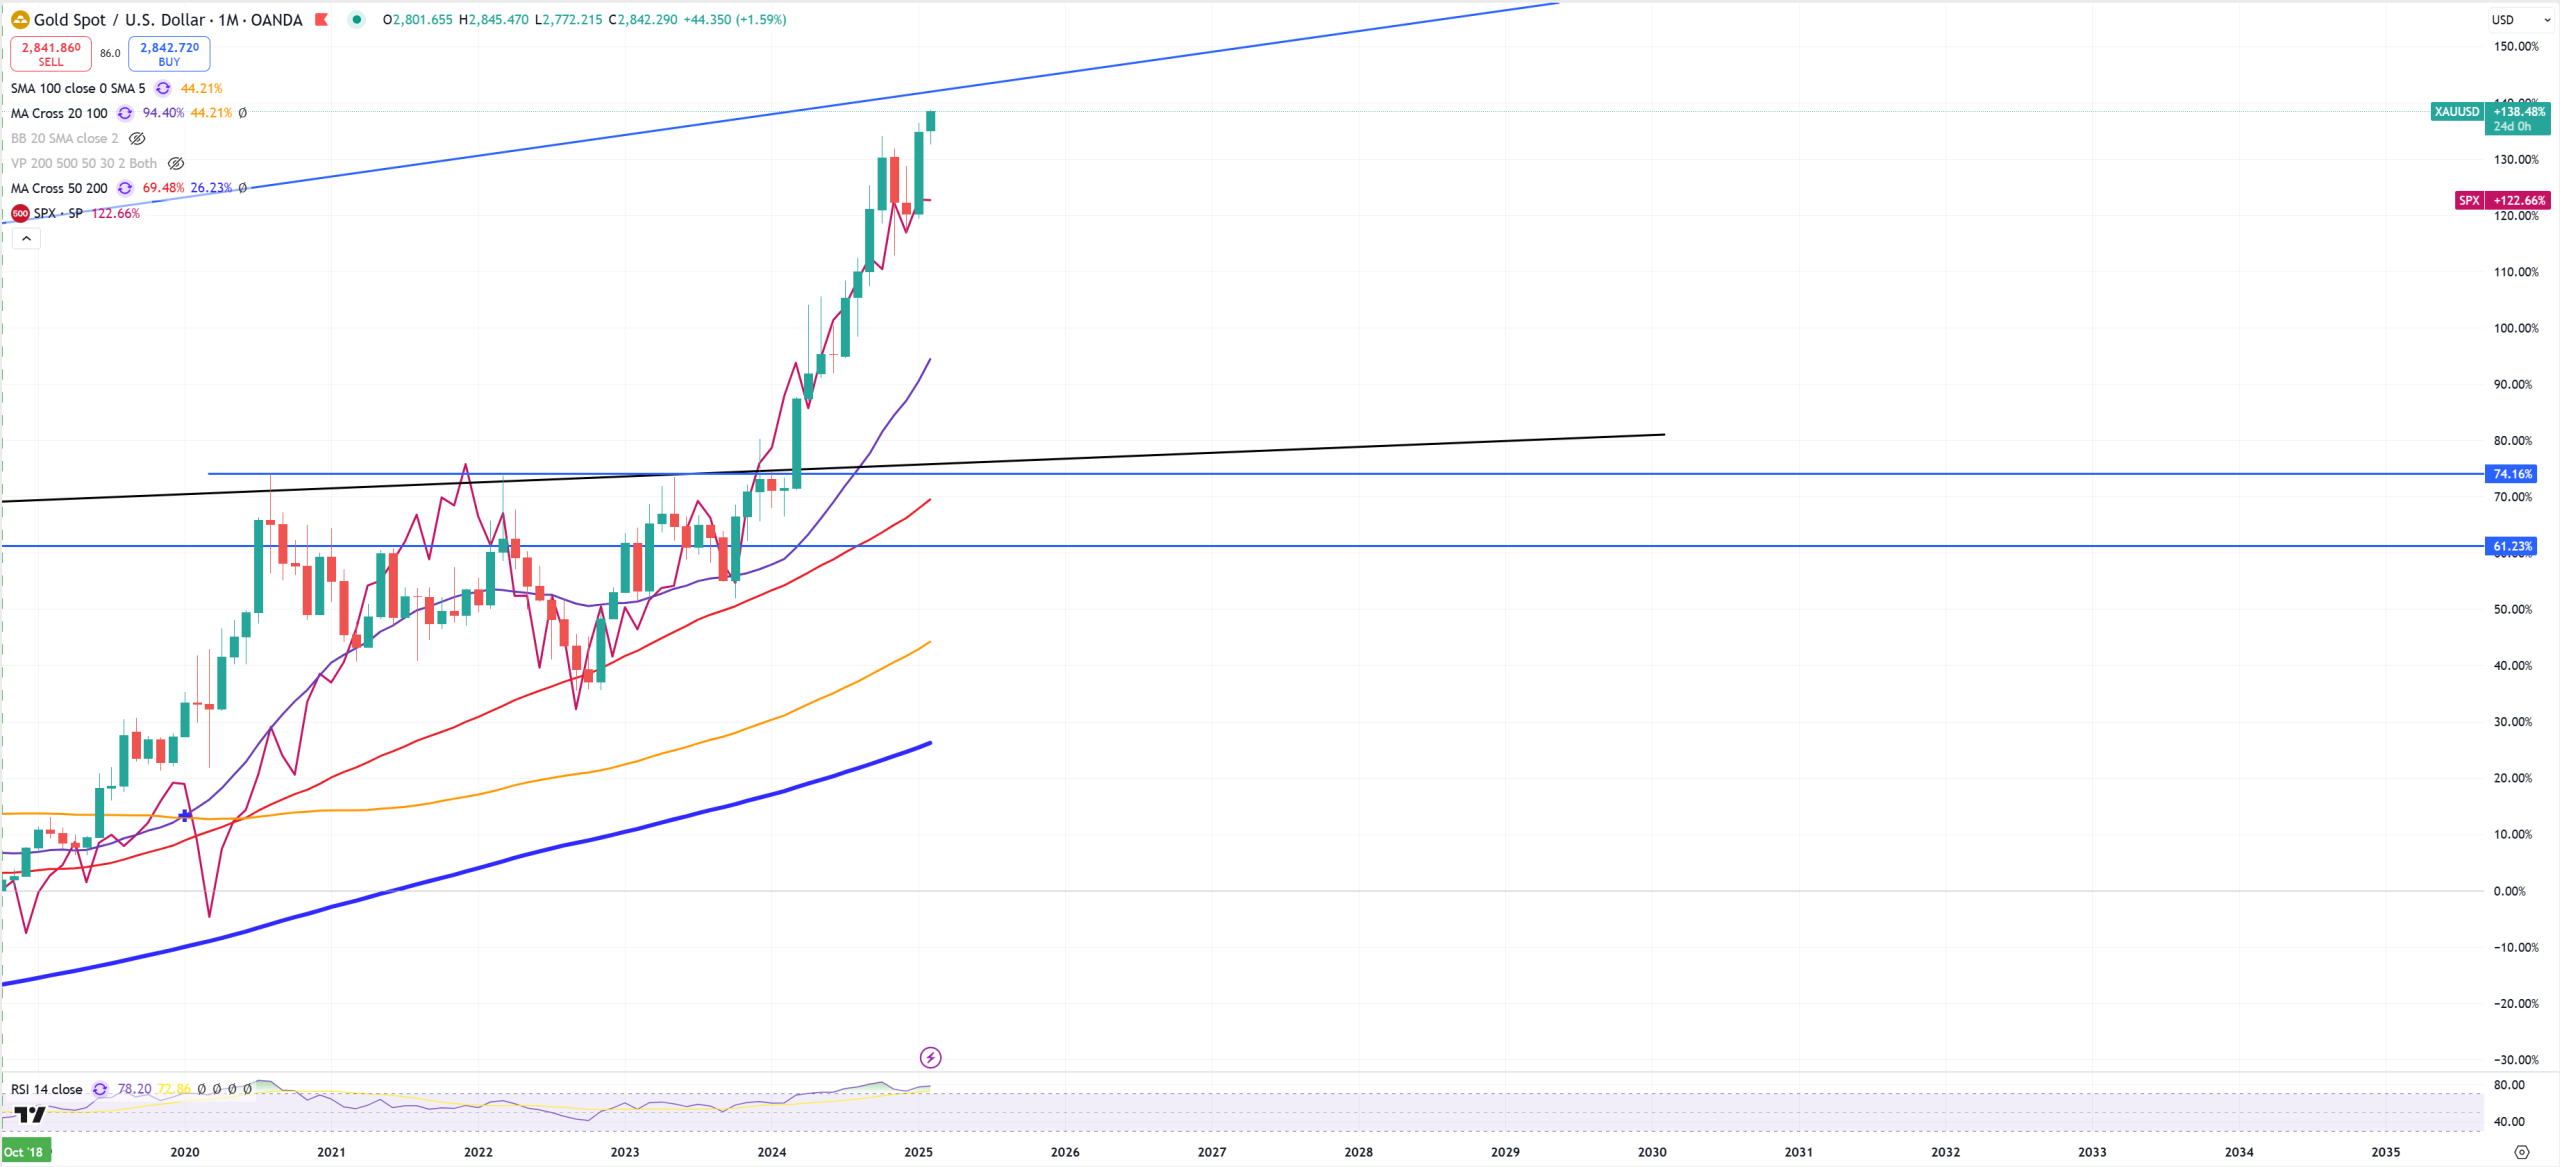
Since May 2024 we see Gold up 24%, SPX up 15%. As May 2024 is a break point on 2011 SPX/GOLD trend I think we’re going to see massive outperformance of GOLD vs SPX in the upcoming years.
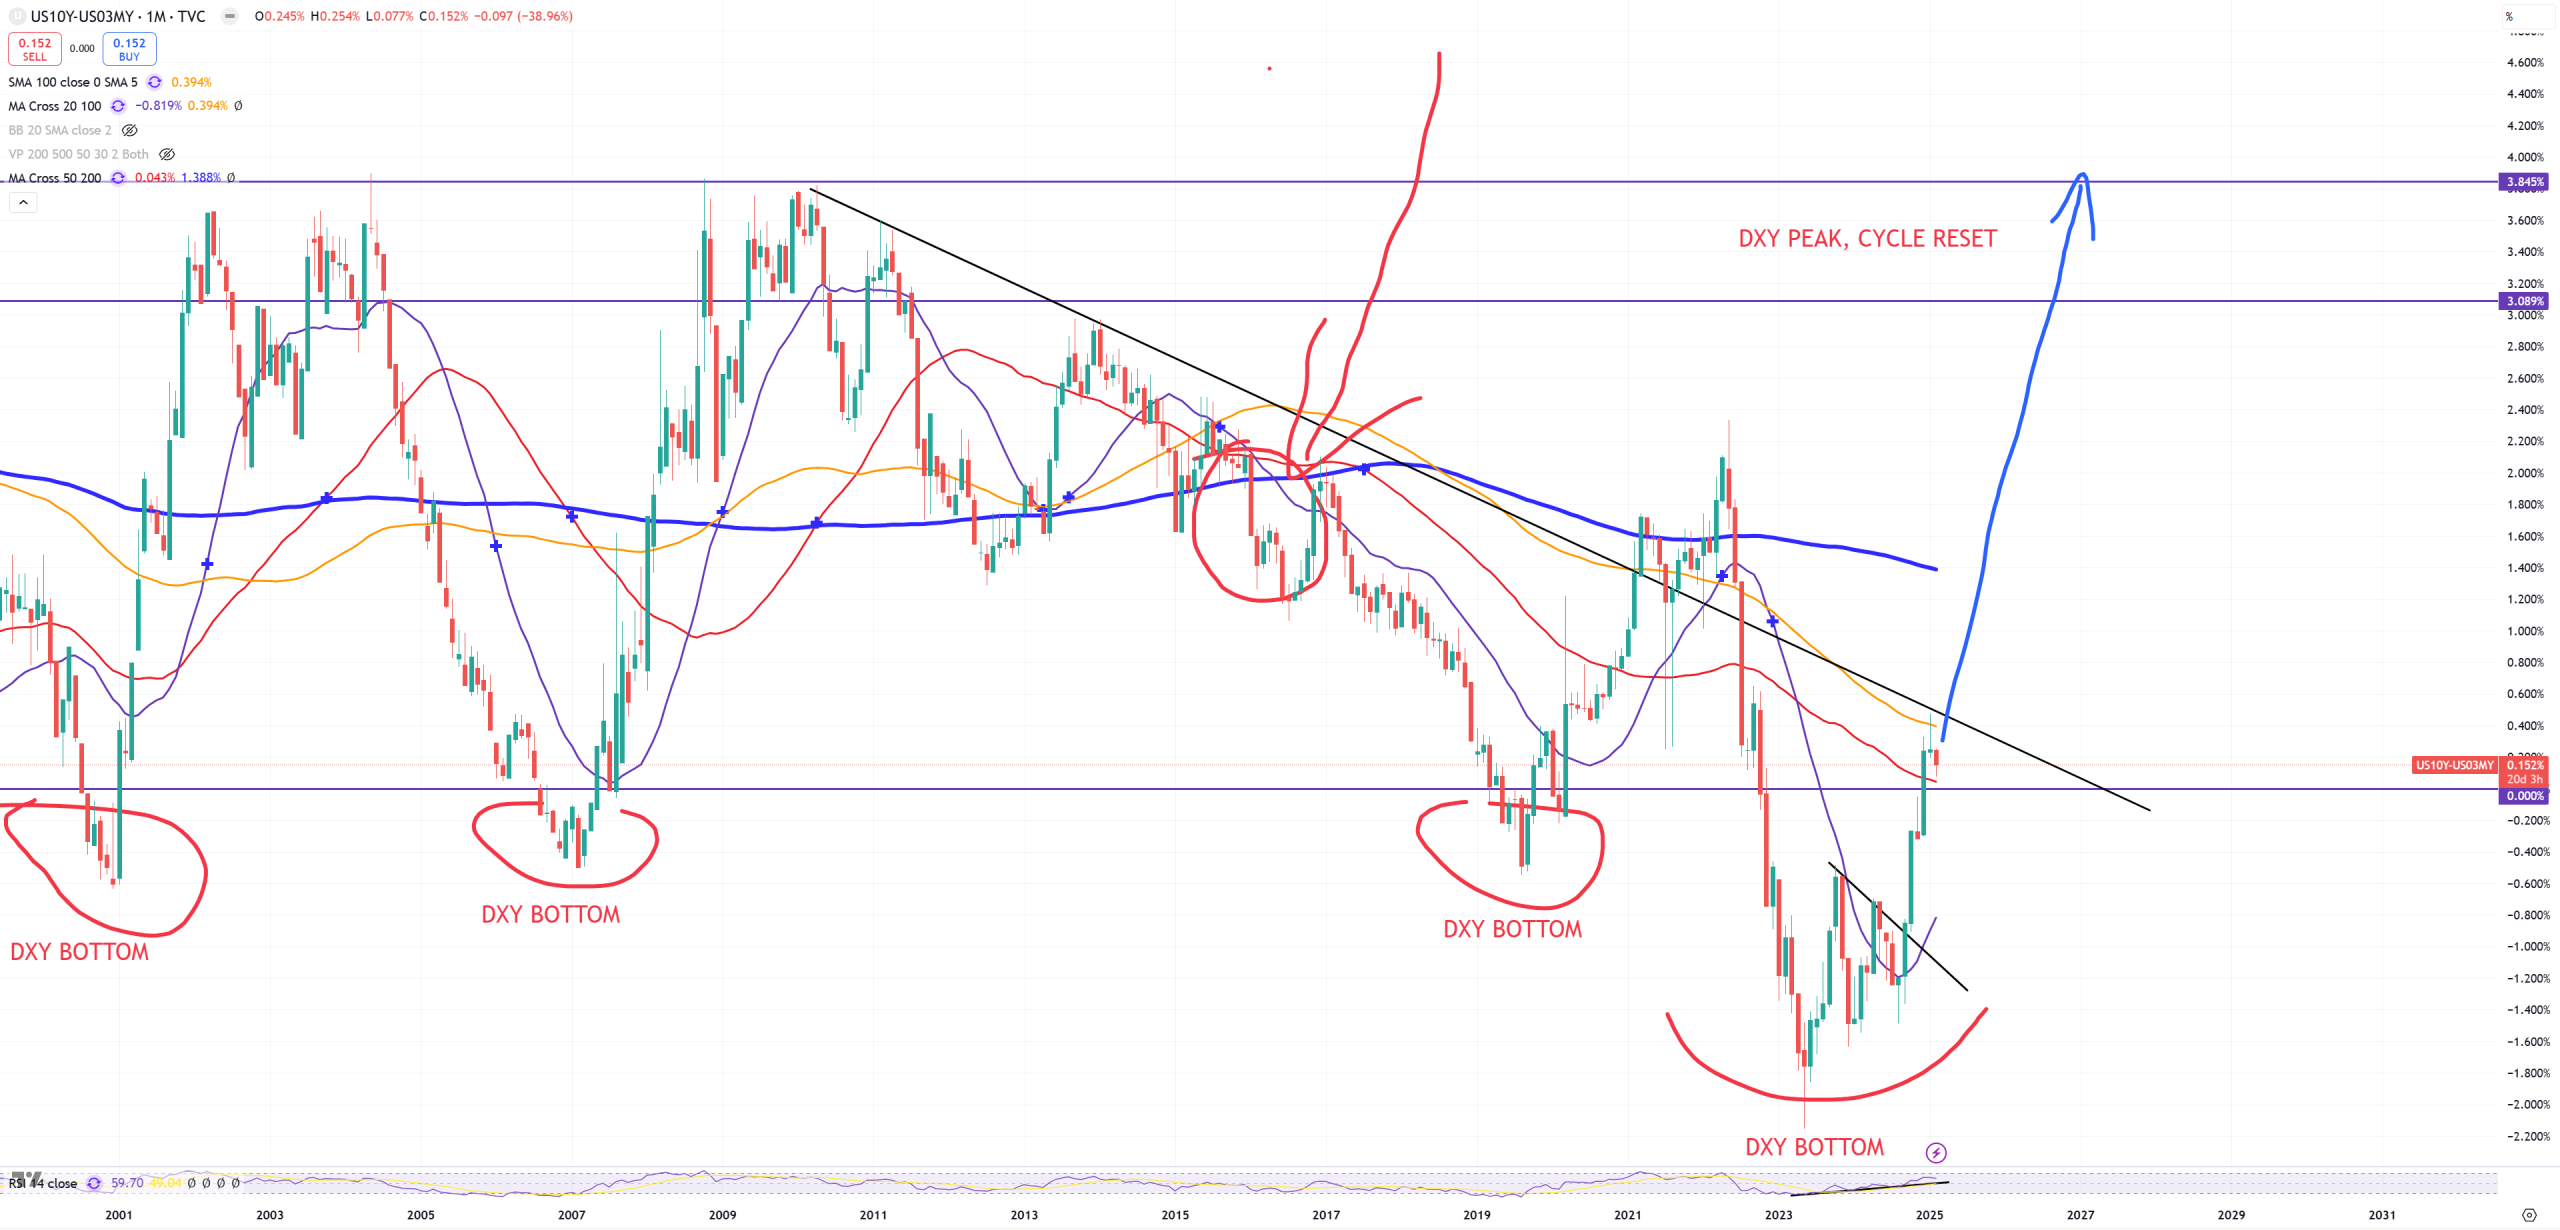
Just remember how far 1932-1980 trend of SPX/GOLD or DJI/GOLD really is. Quick look on 10y/3m and we see just +15bps. It needs to jump towards +350bps. 1M$ question if those 2 levels will match, so once 10y/3m will jump to +350bps, SPX/GOLD will revisit 1932-1980 trend.