03/2025
March 1, 2025

If you want to see charts larger scale, just click right mouse button on it and “open image in new tab” (chrome).
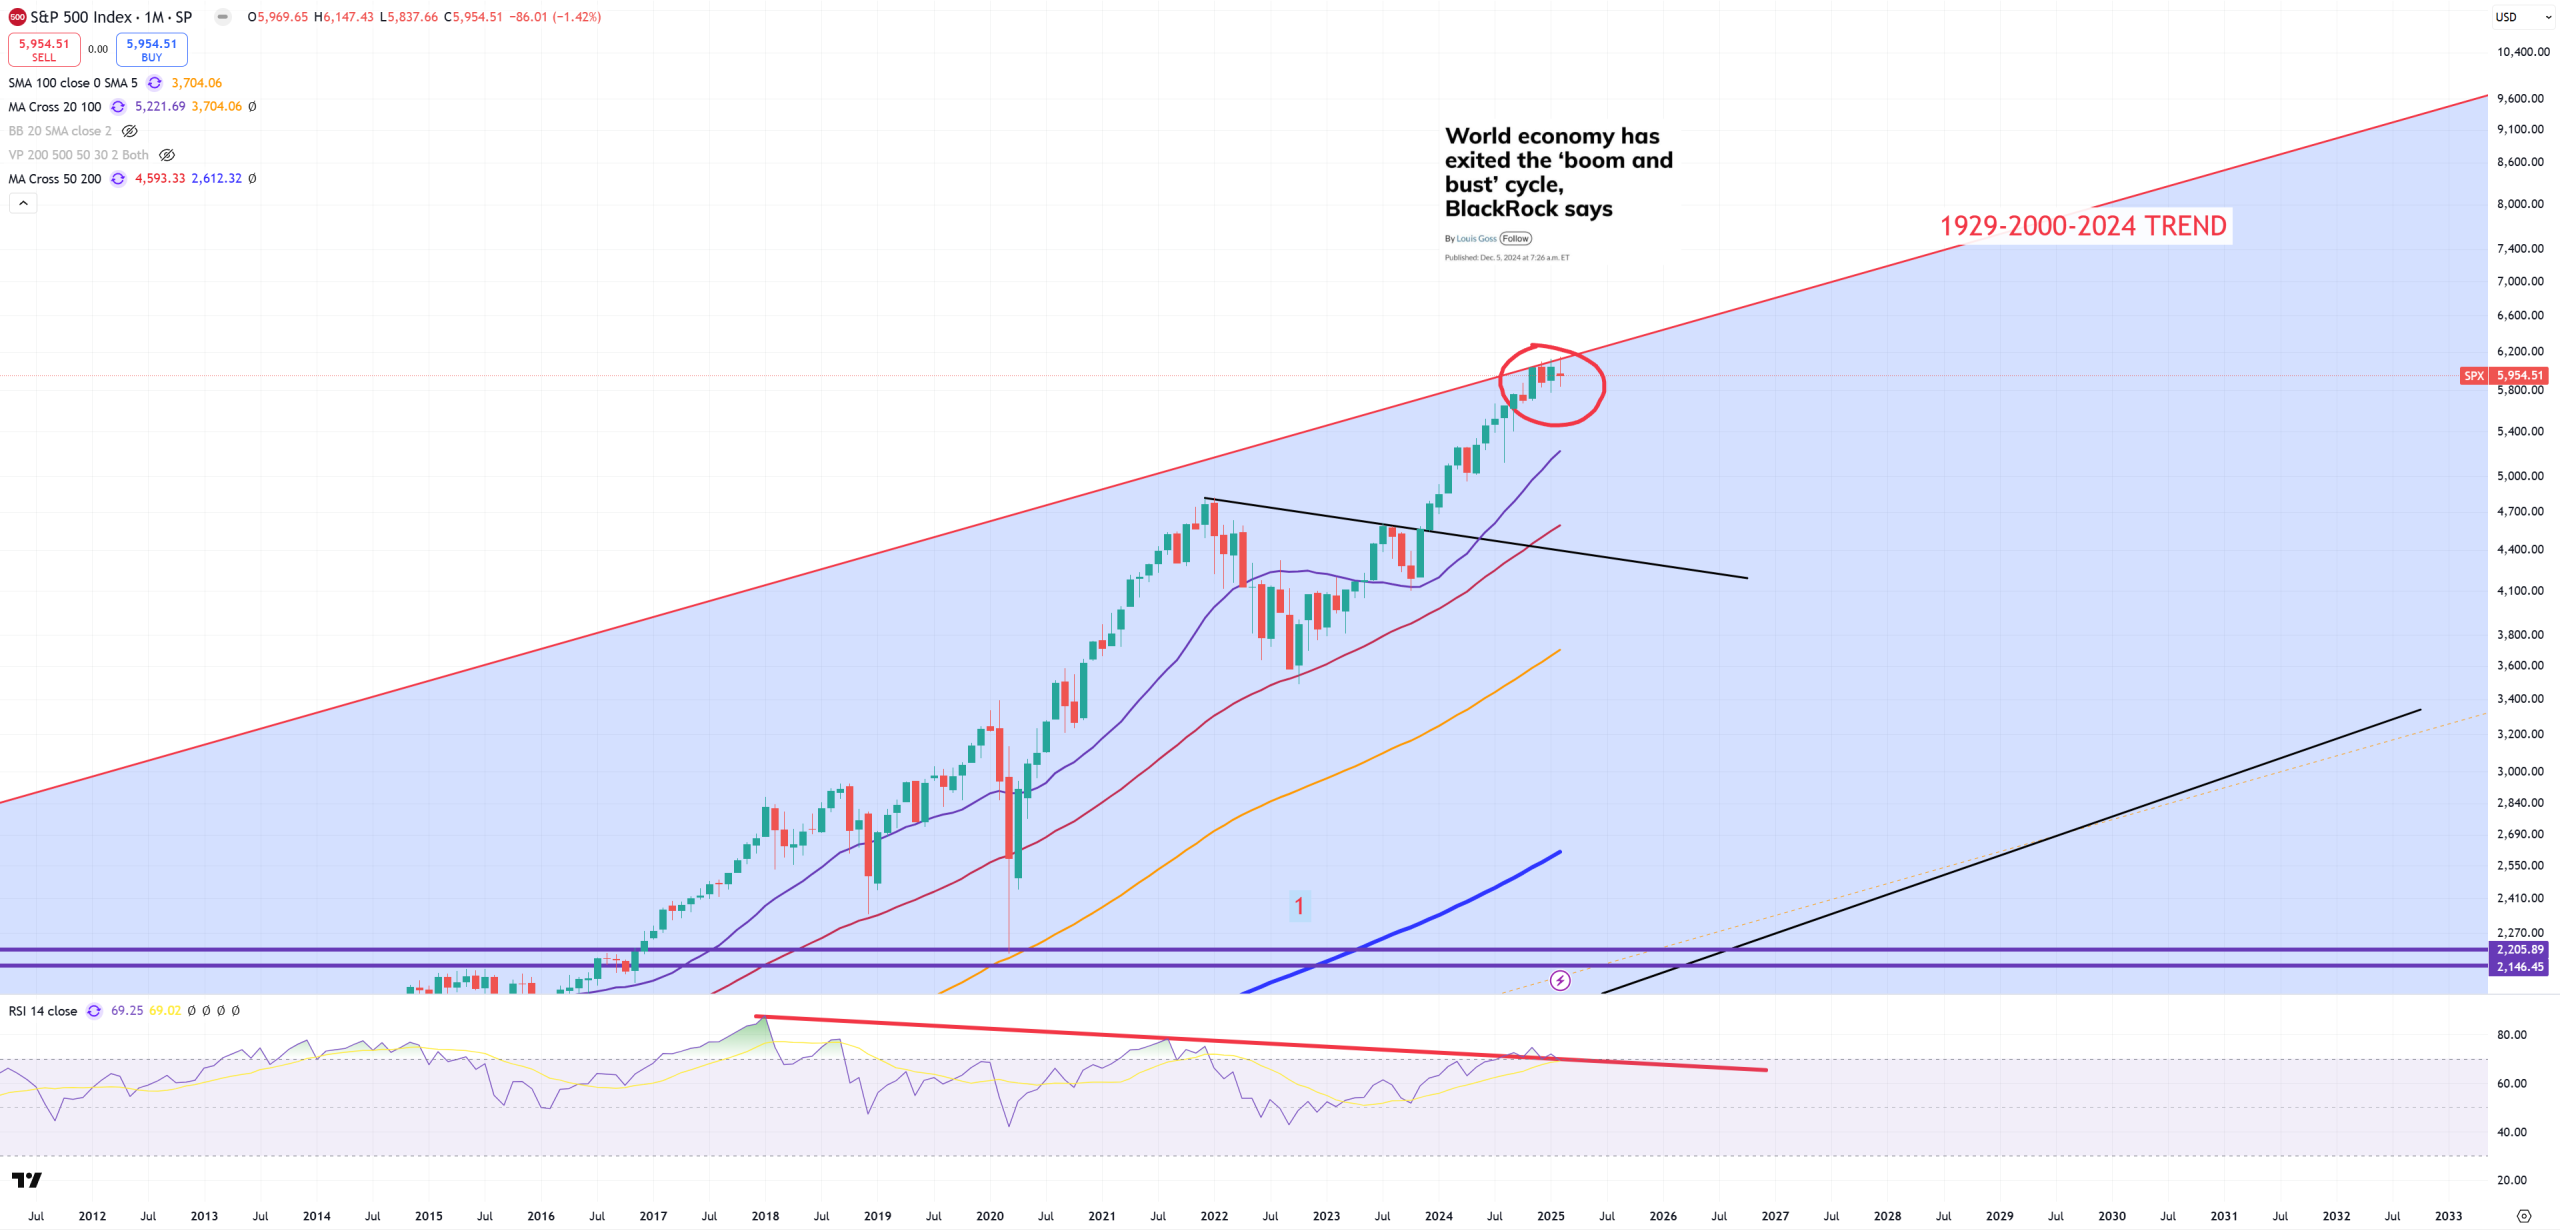
SPX and its 1929-2000 trend holds for 4th month setting up 3rd point 2024/2025
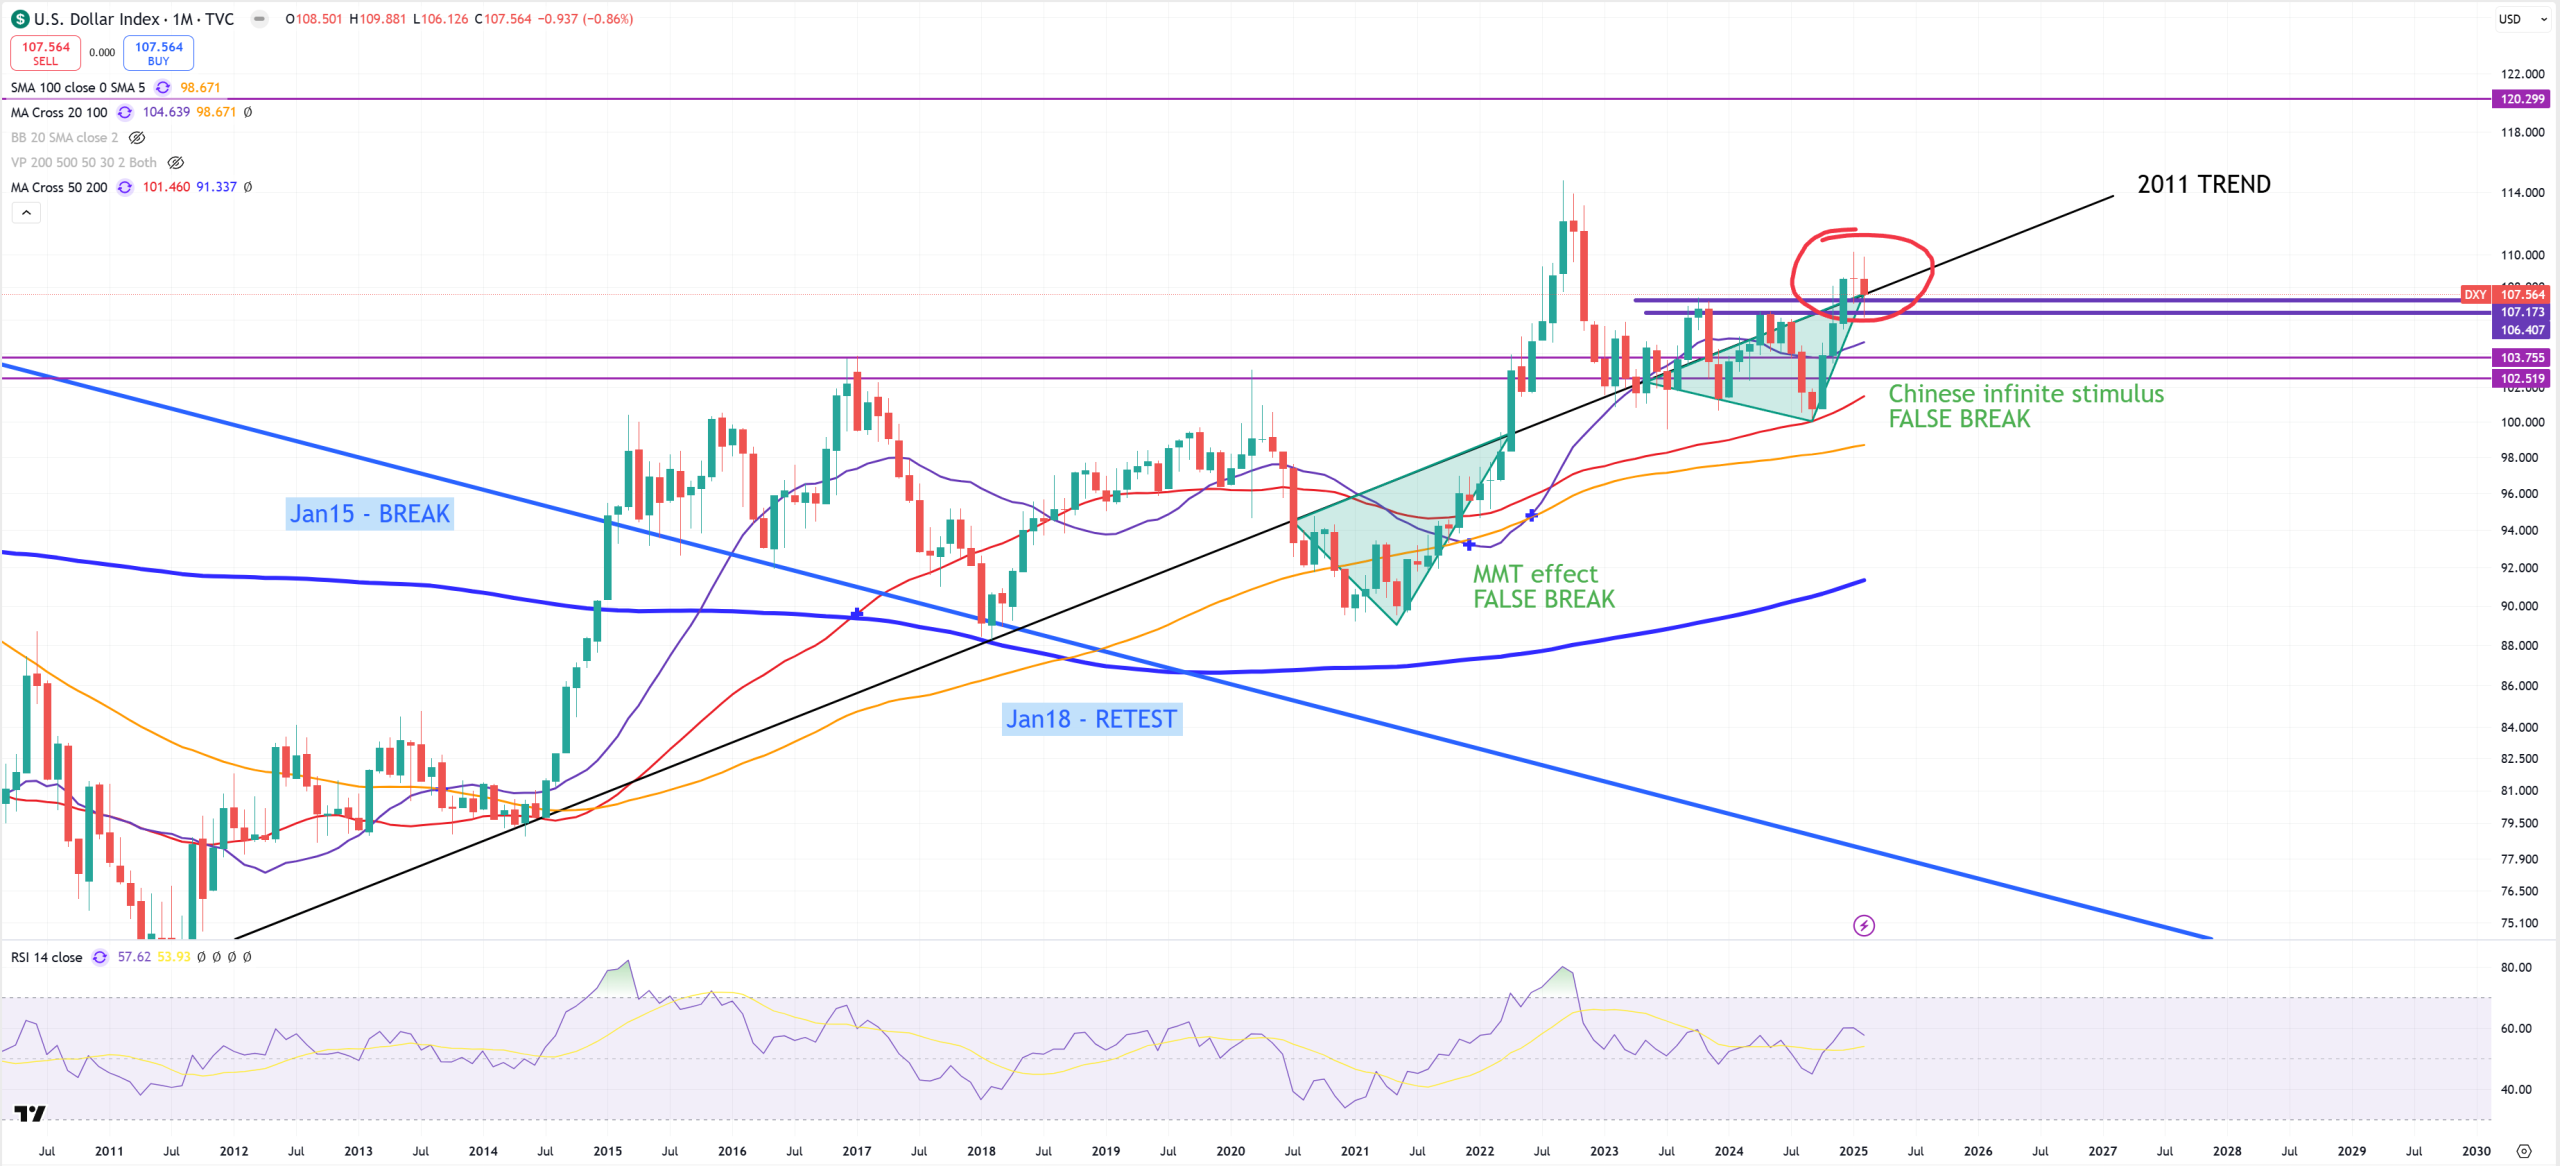
DXY – and its 107 support holds, what is not surprising if SPX holds 1929-2000 trend. Based on this chart we can say market received 2 additional “mini” bull-markets once 2011 DXY trend was broken down (2021 and 2024).
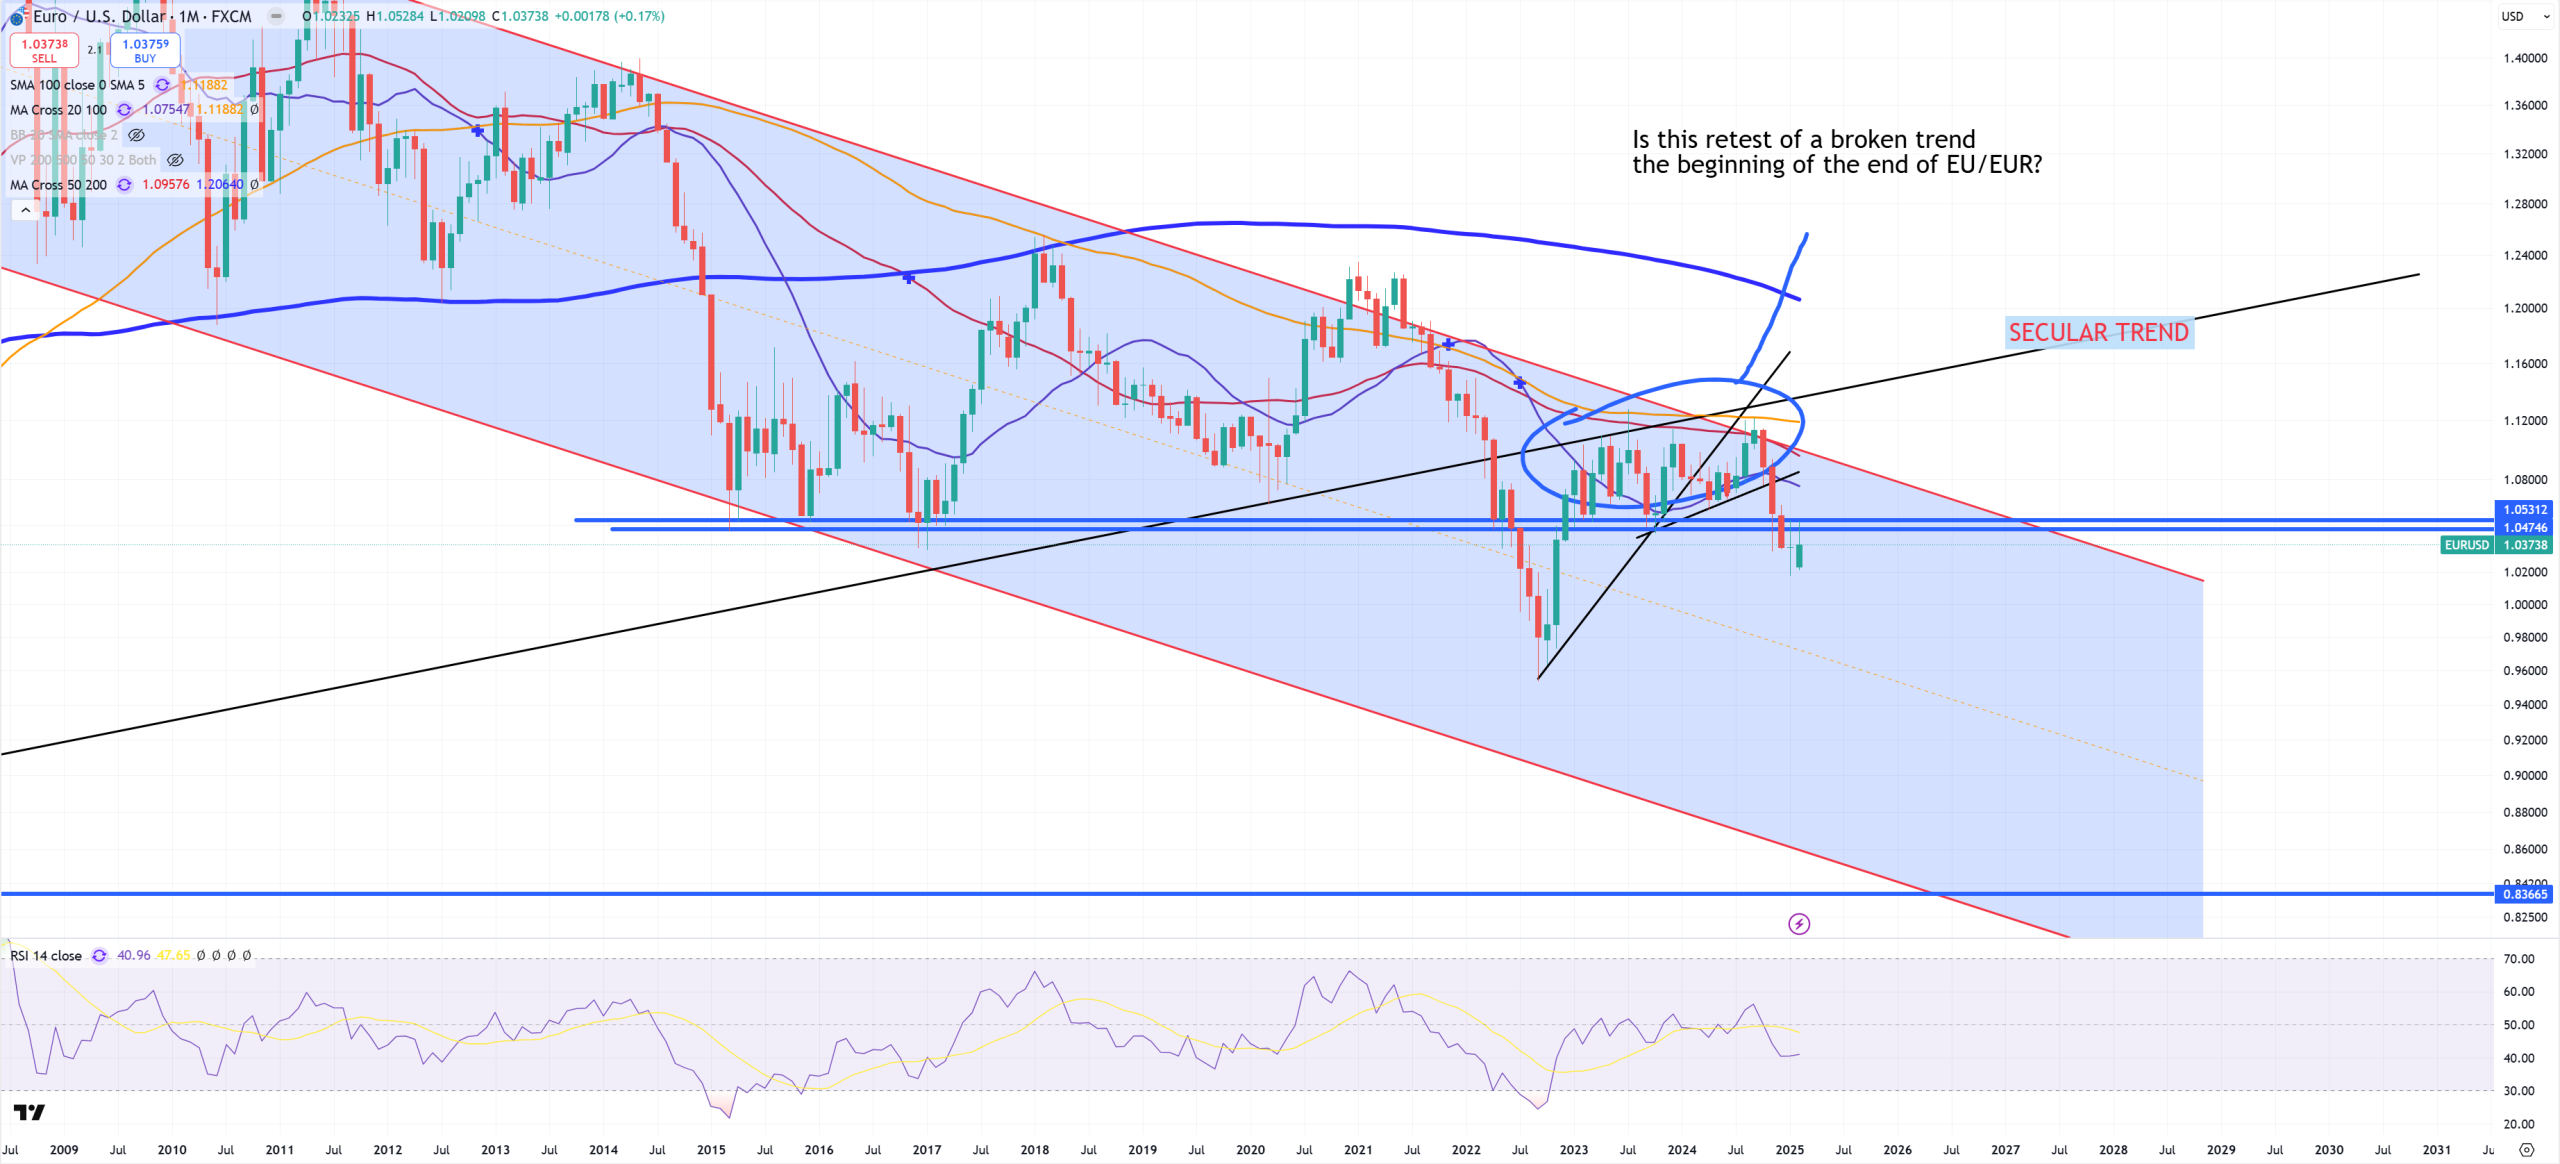
EURUSD – rejects 1.05 as DXY holds 107
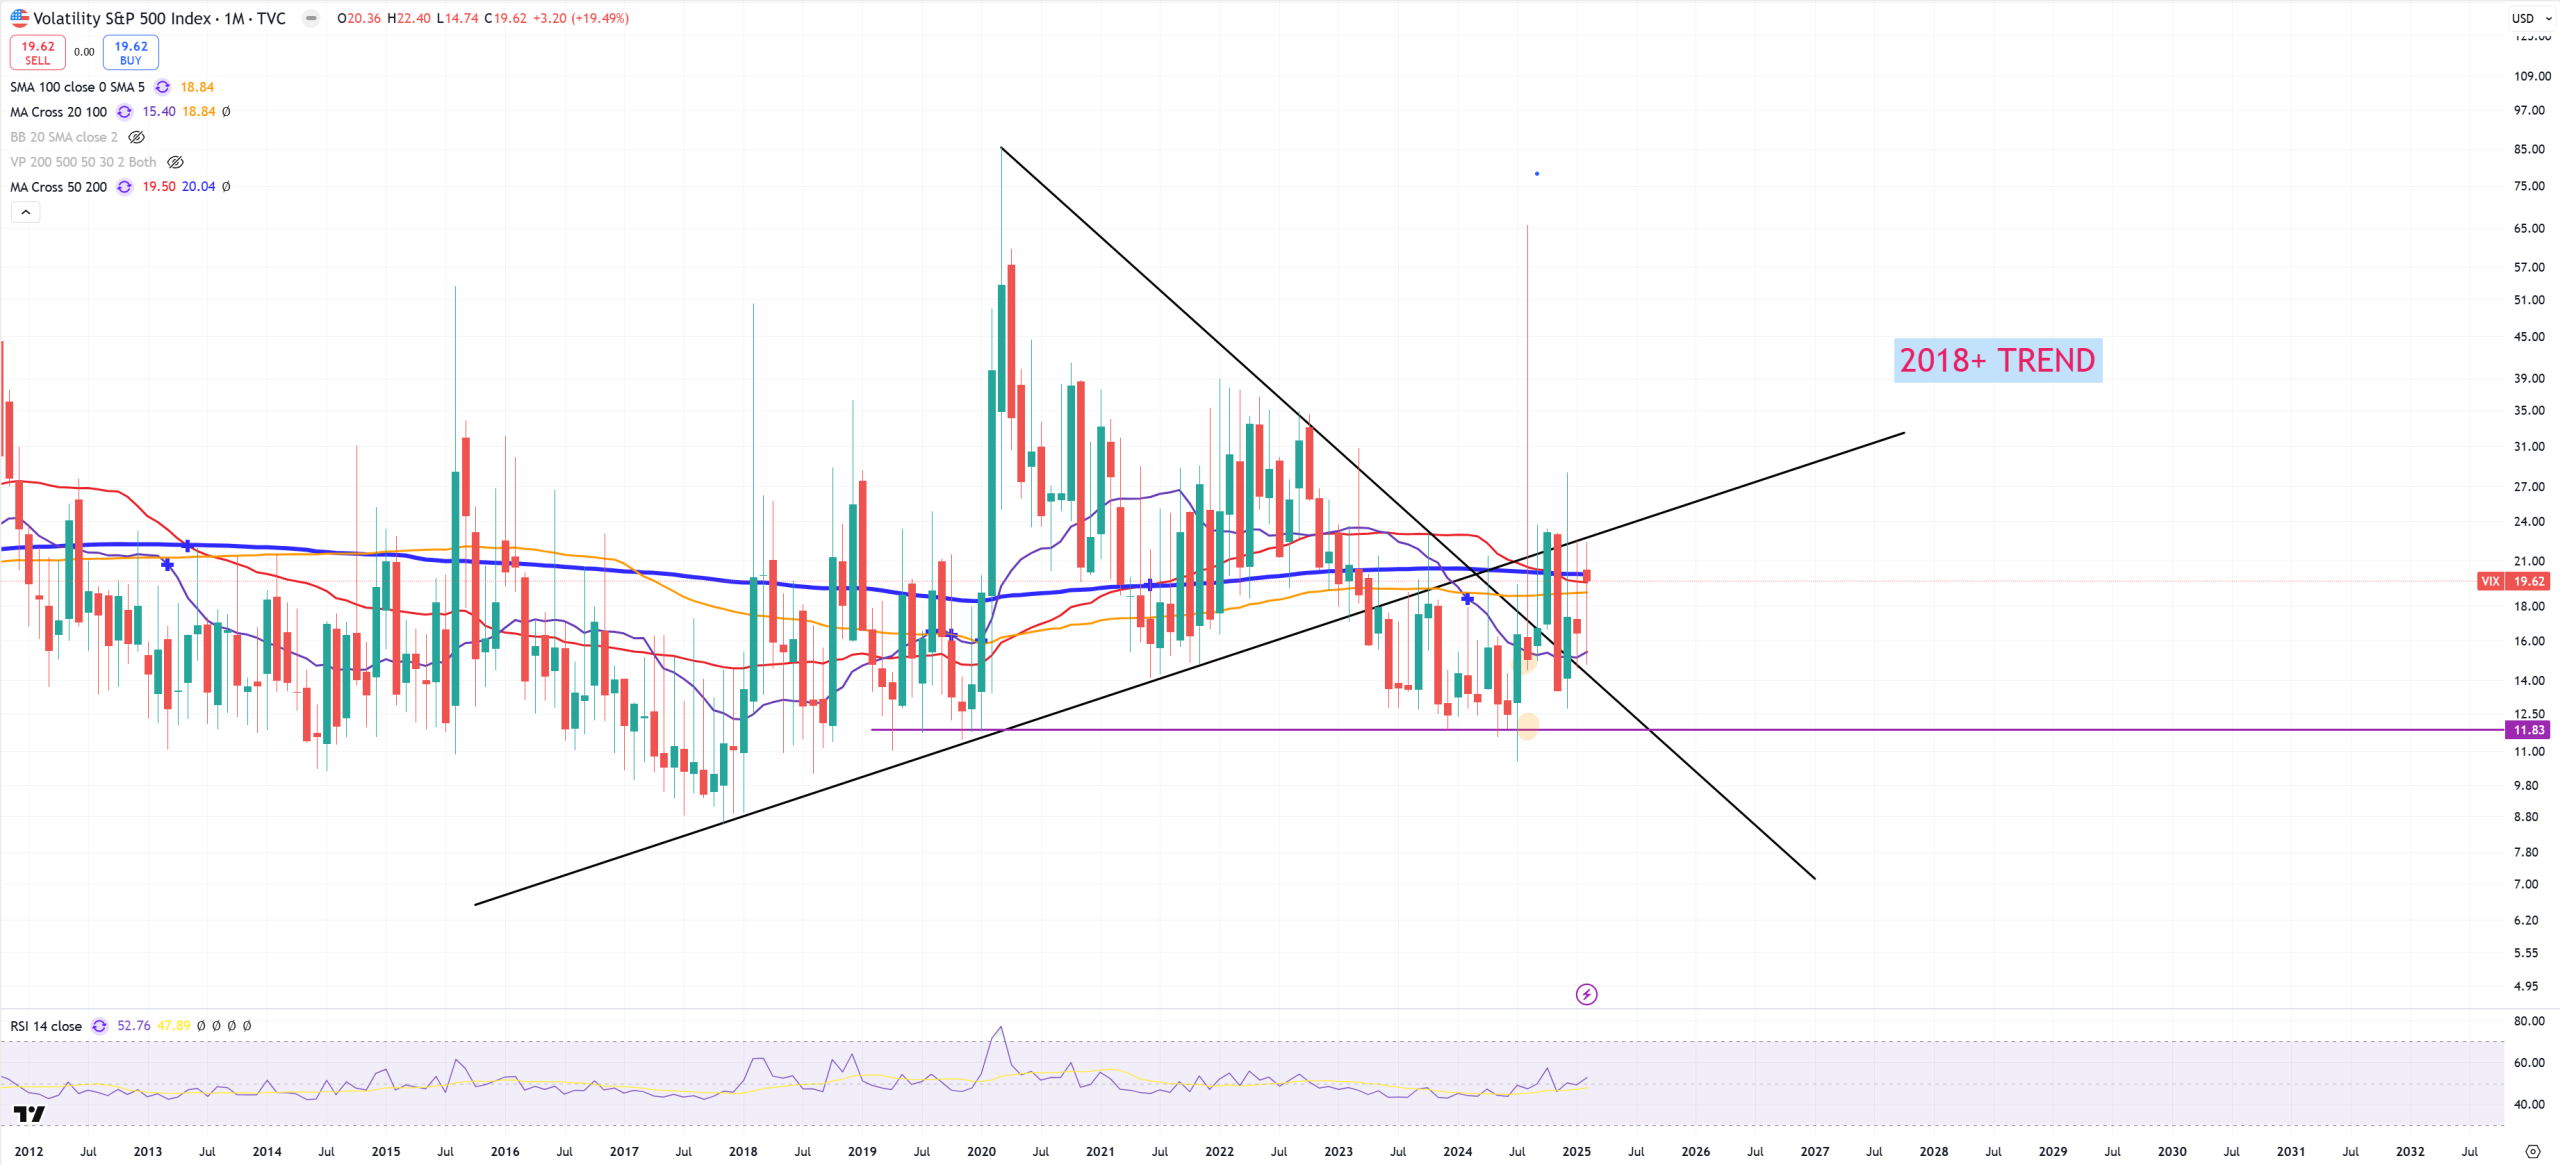
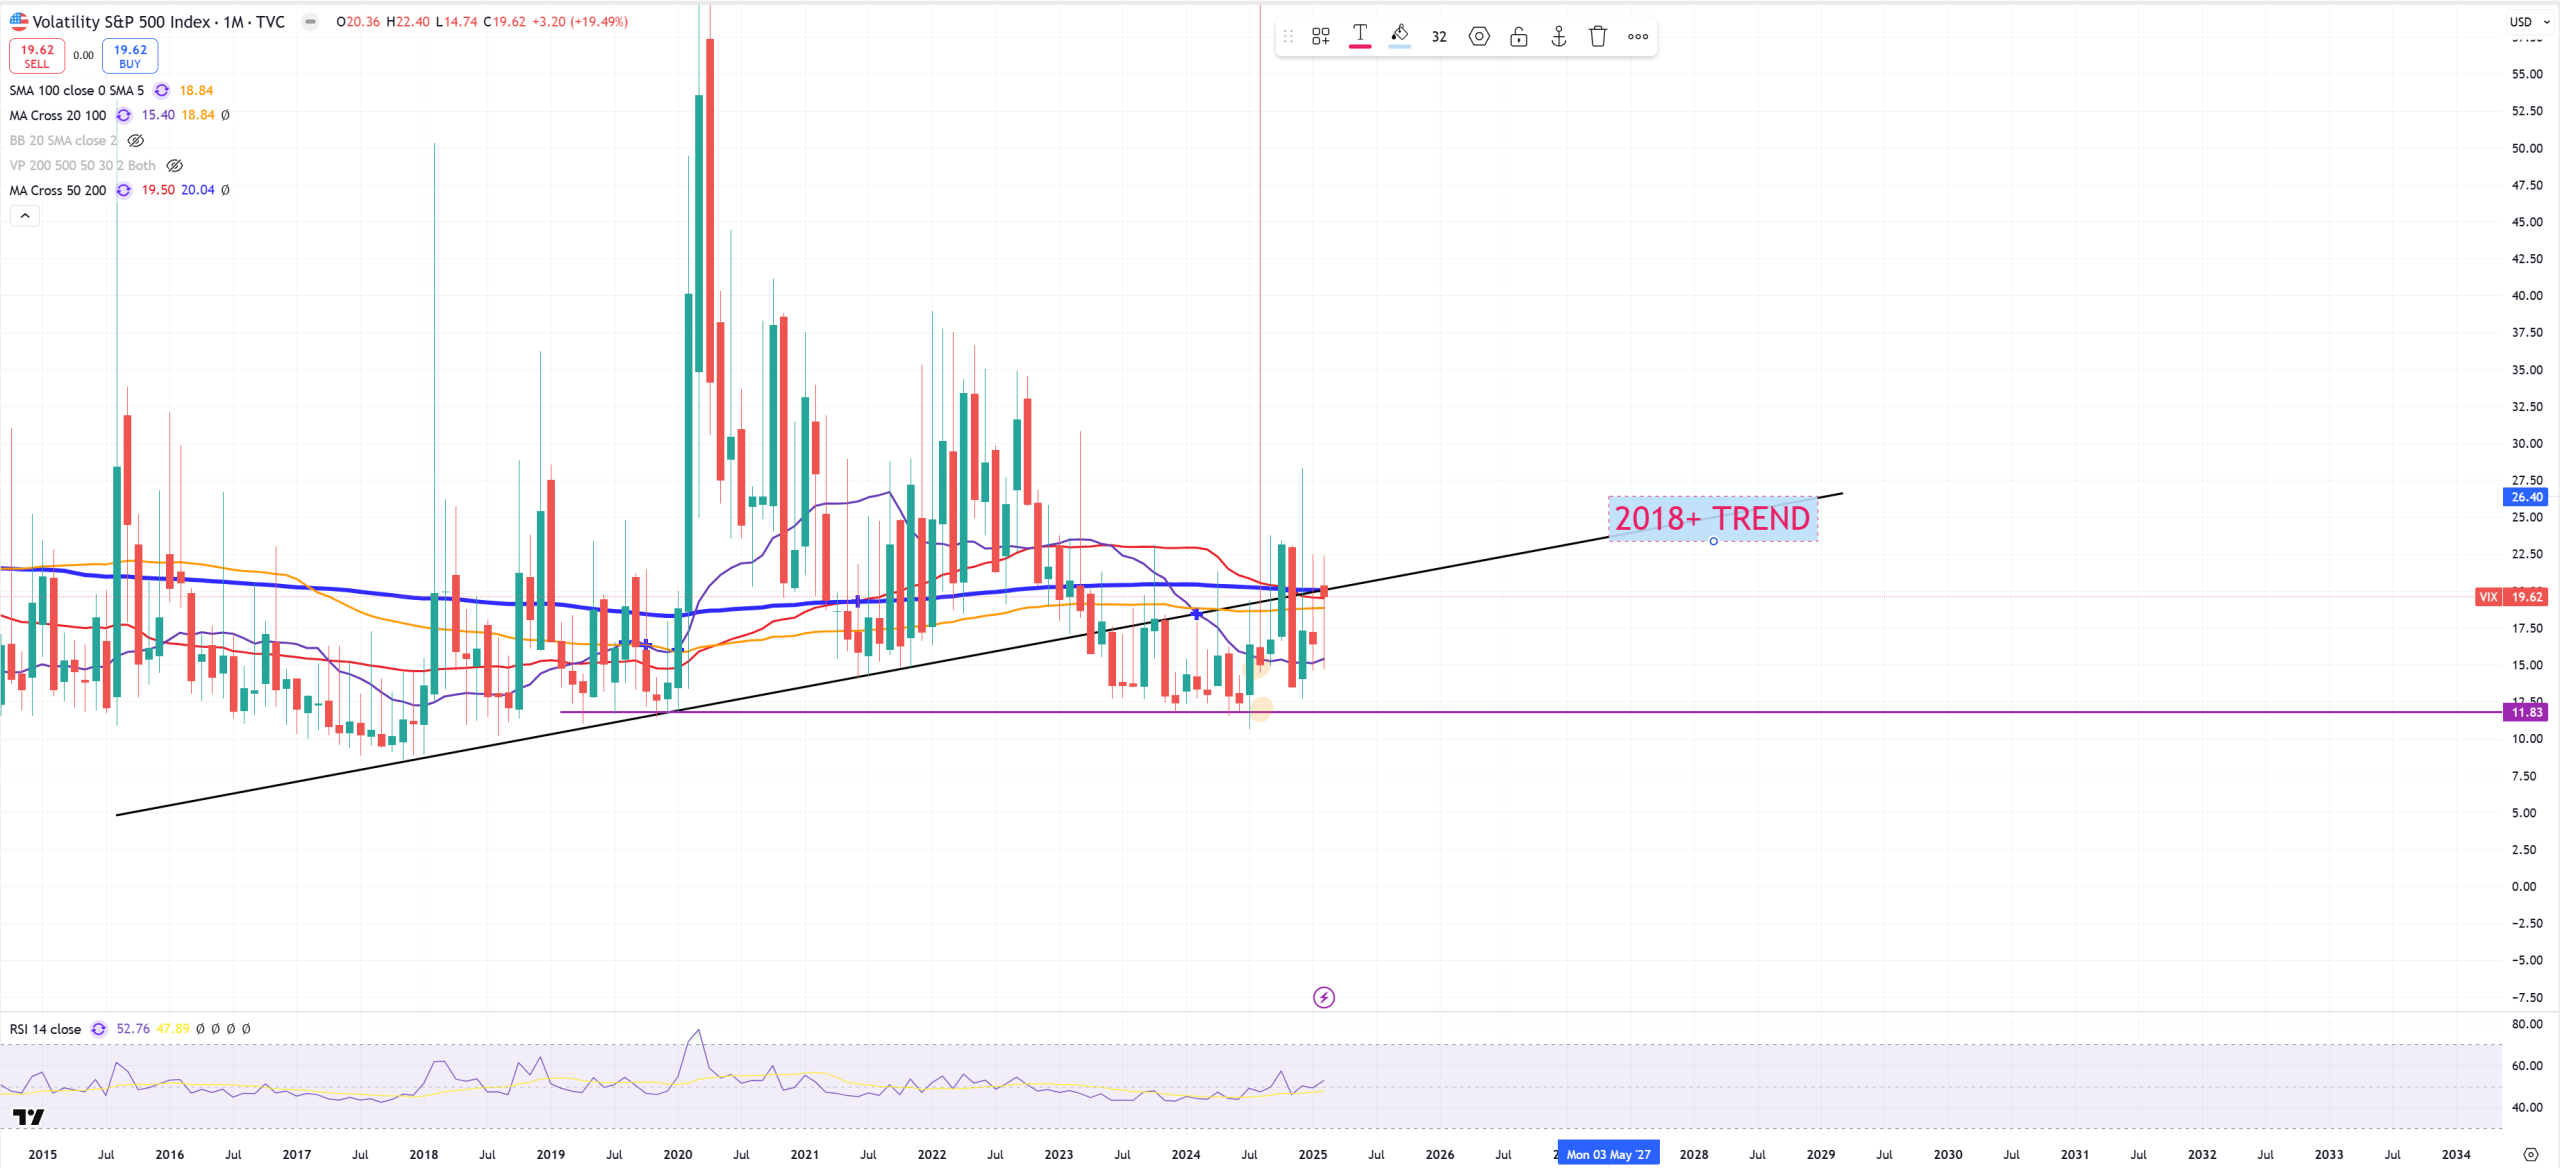
VIX and its trend I don’t like posting short term trend with log scale, but to make it more reliable we’re going to see VIX in log and non-log. One thing is sure, we’re in a middle of all (M)MAs
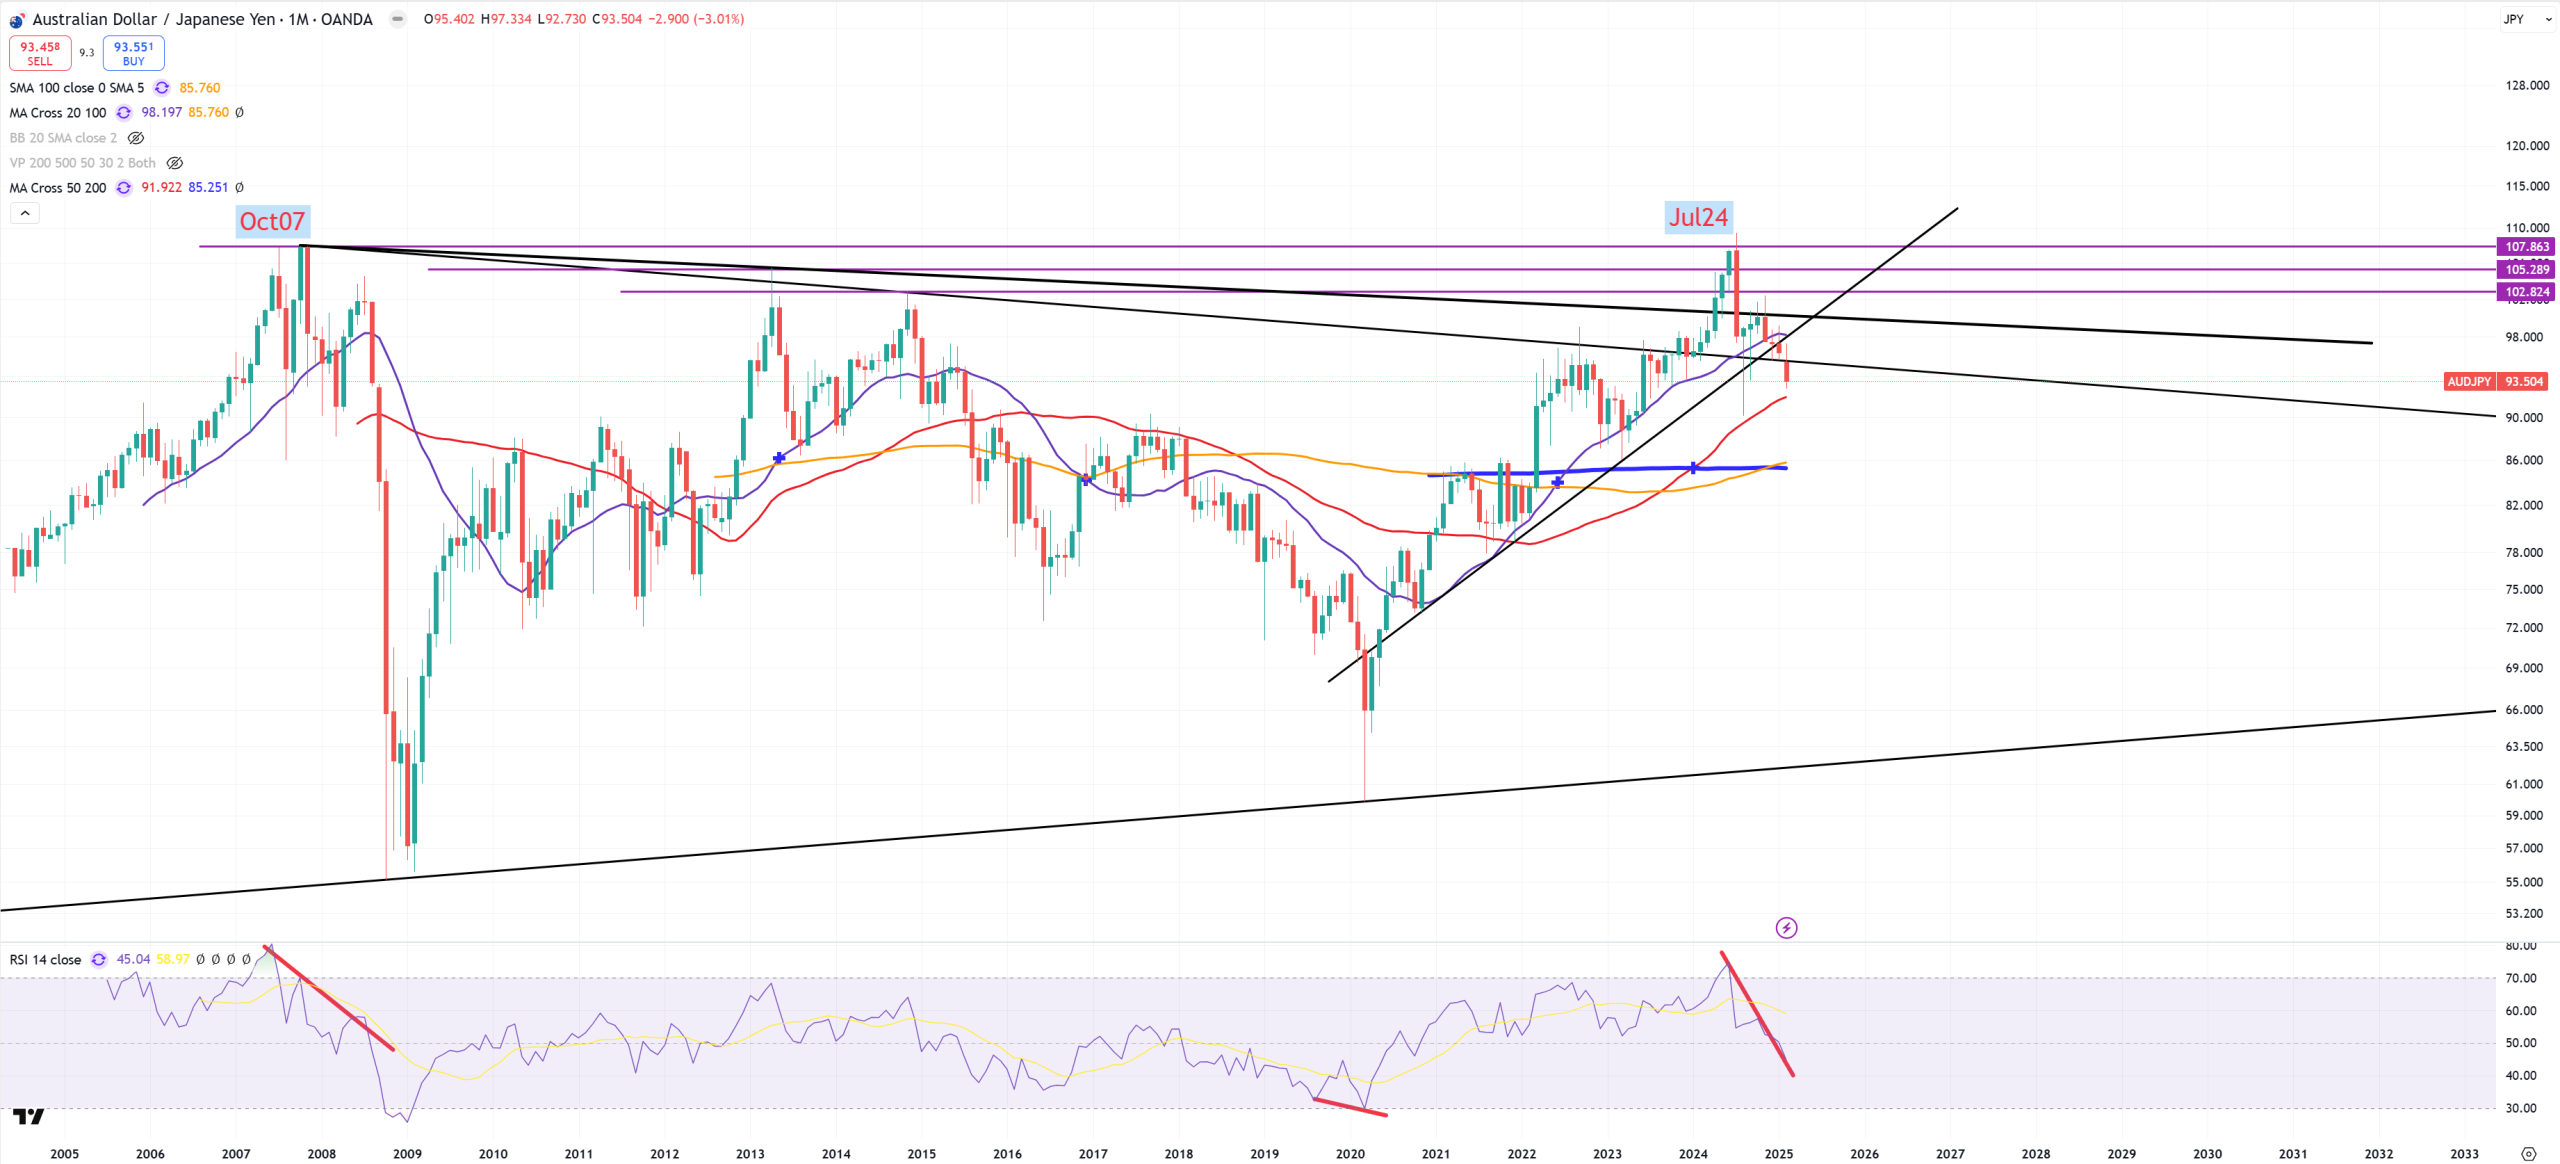
AUDJPY is the main risk on/off currency indicator, many people saying yields on bonds are a derivative of USDJPY, it might be right, but I doubt it saying US yields are now more correlated to AUDJPY than USDJPY, time’ll tell.
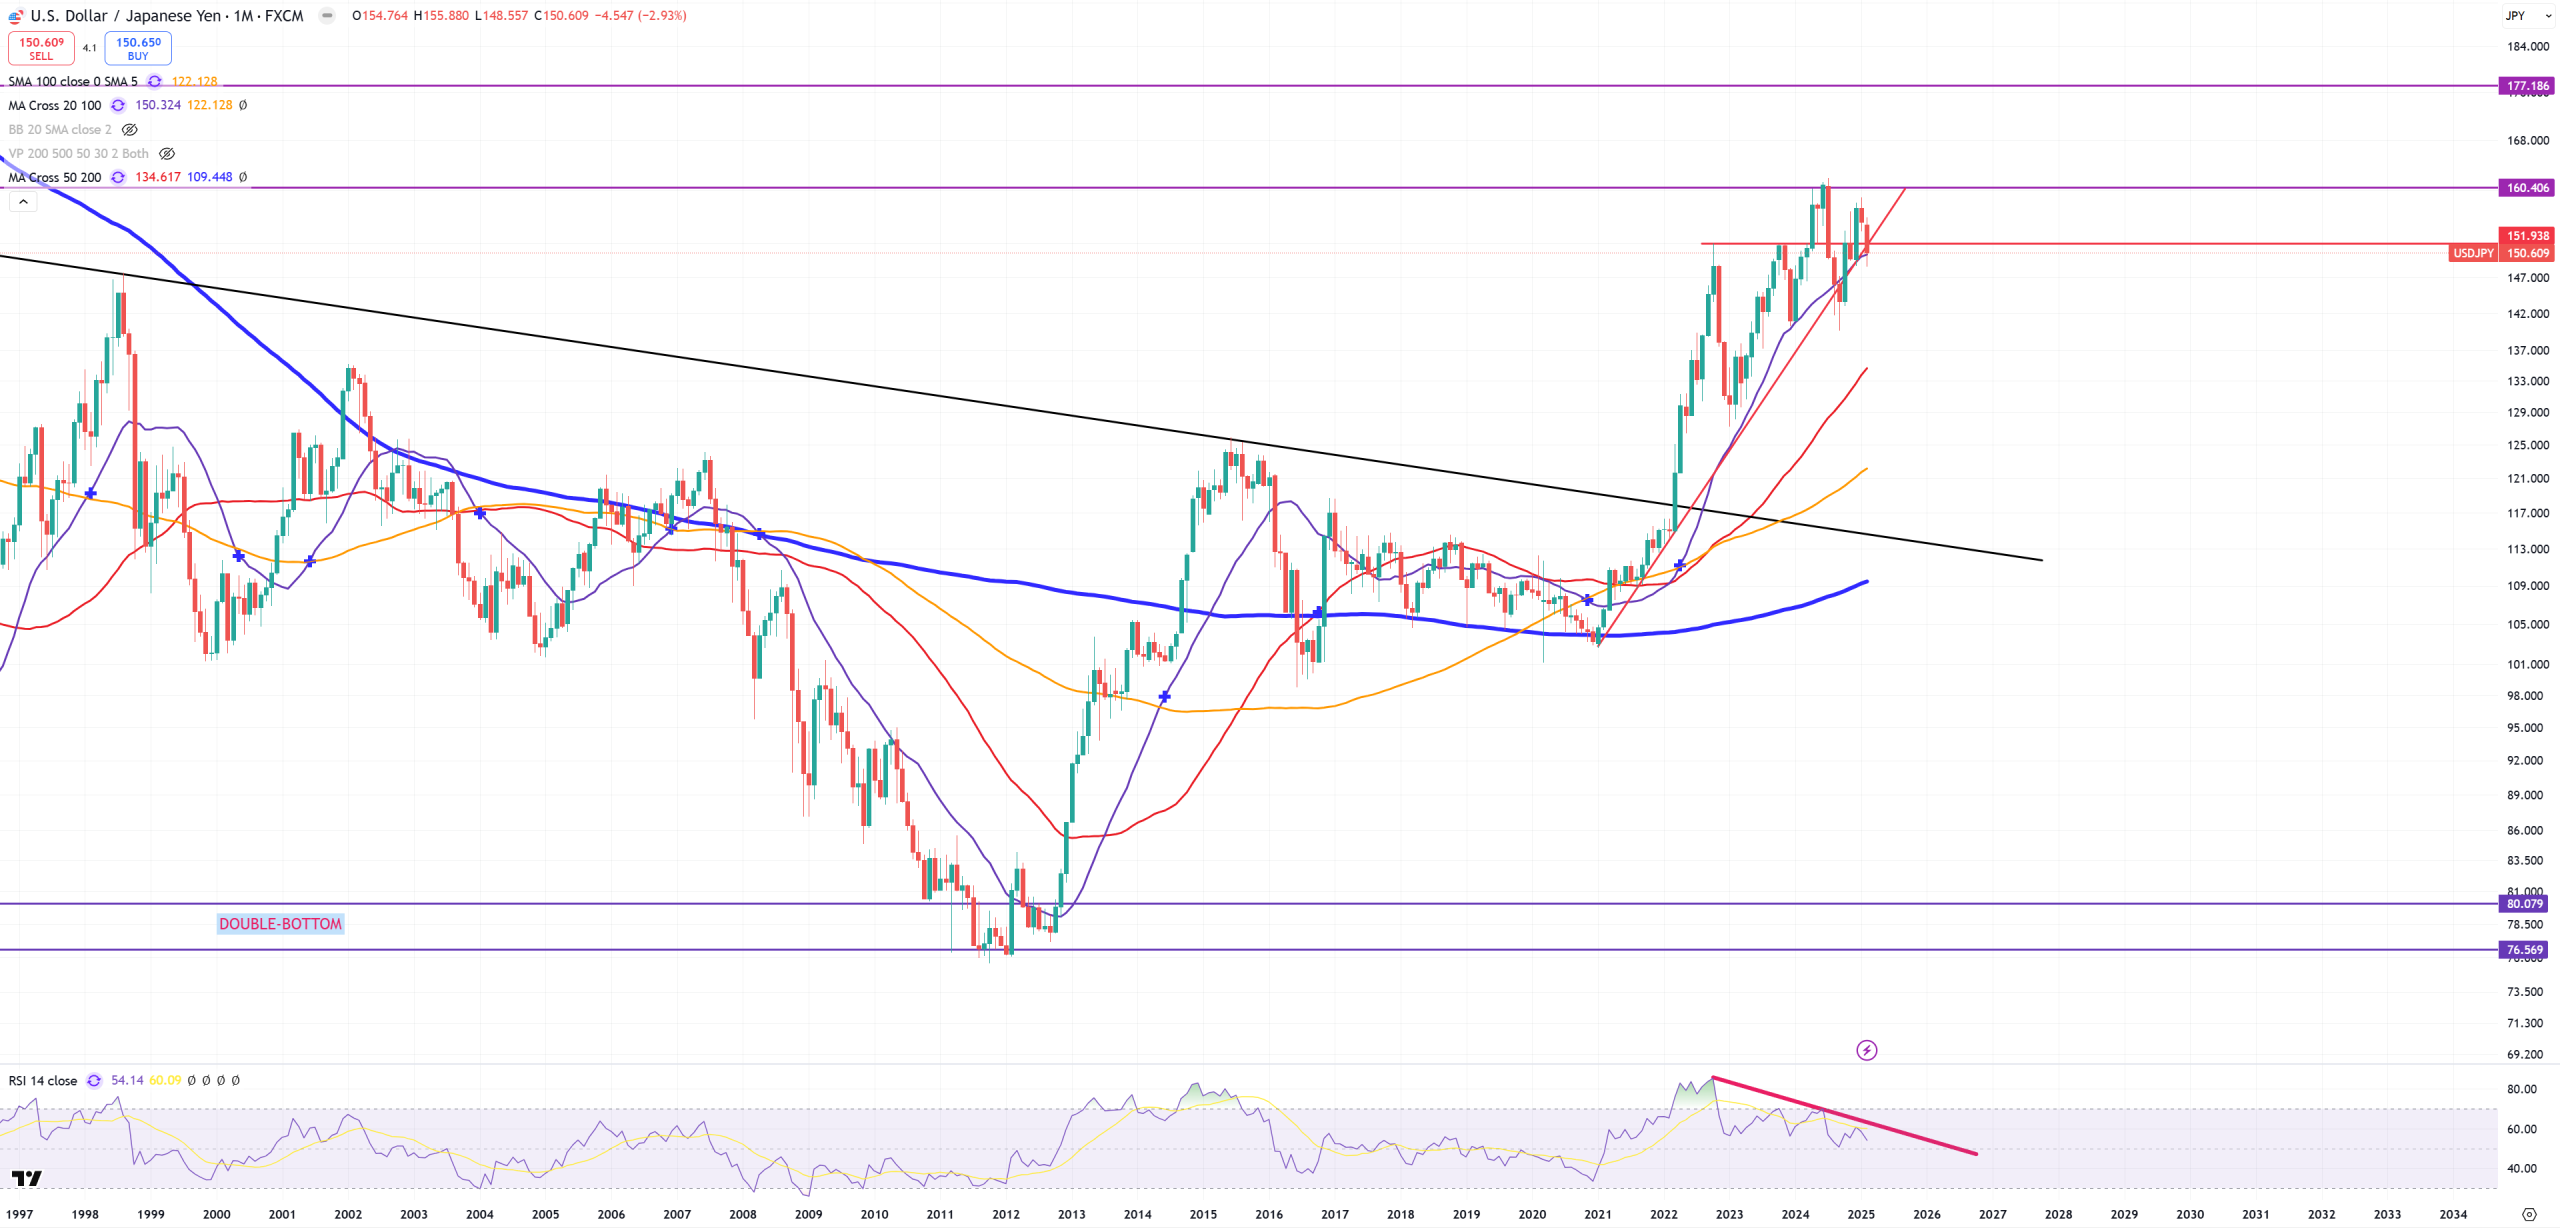
USDJPY – (M)MA20 holds, but trend is broken
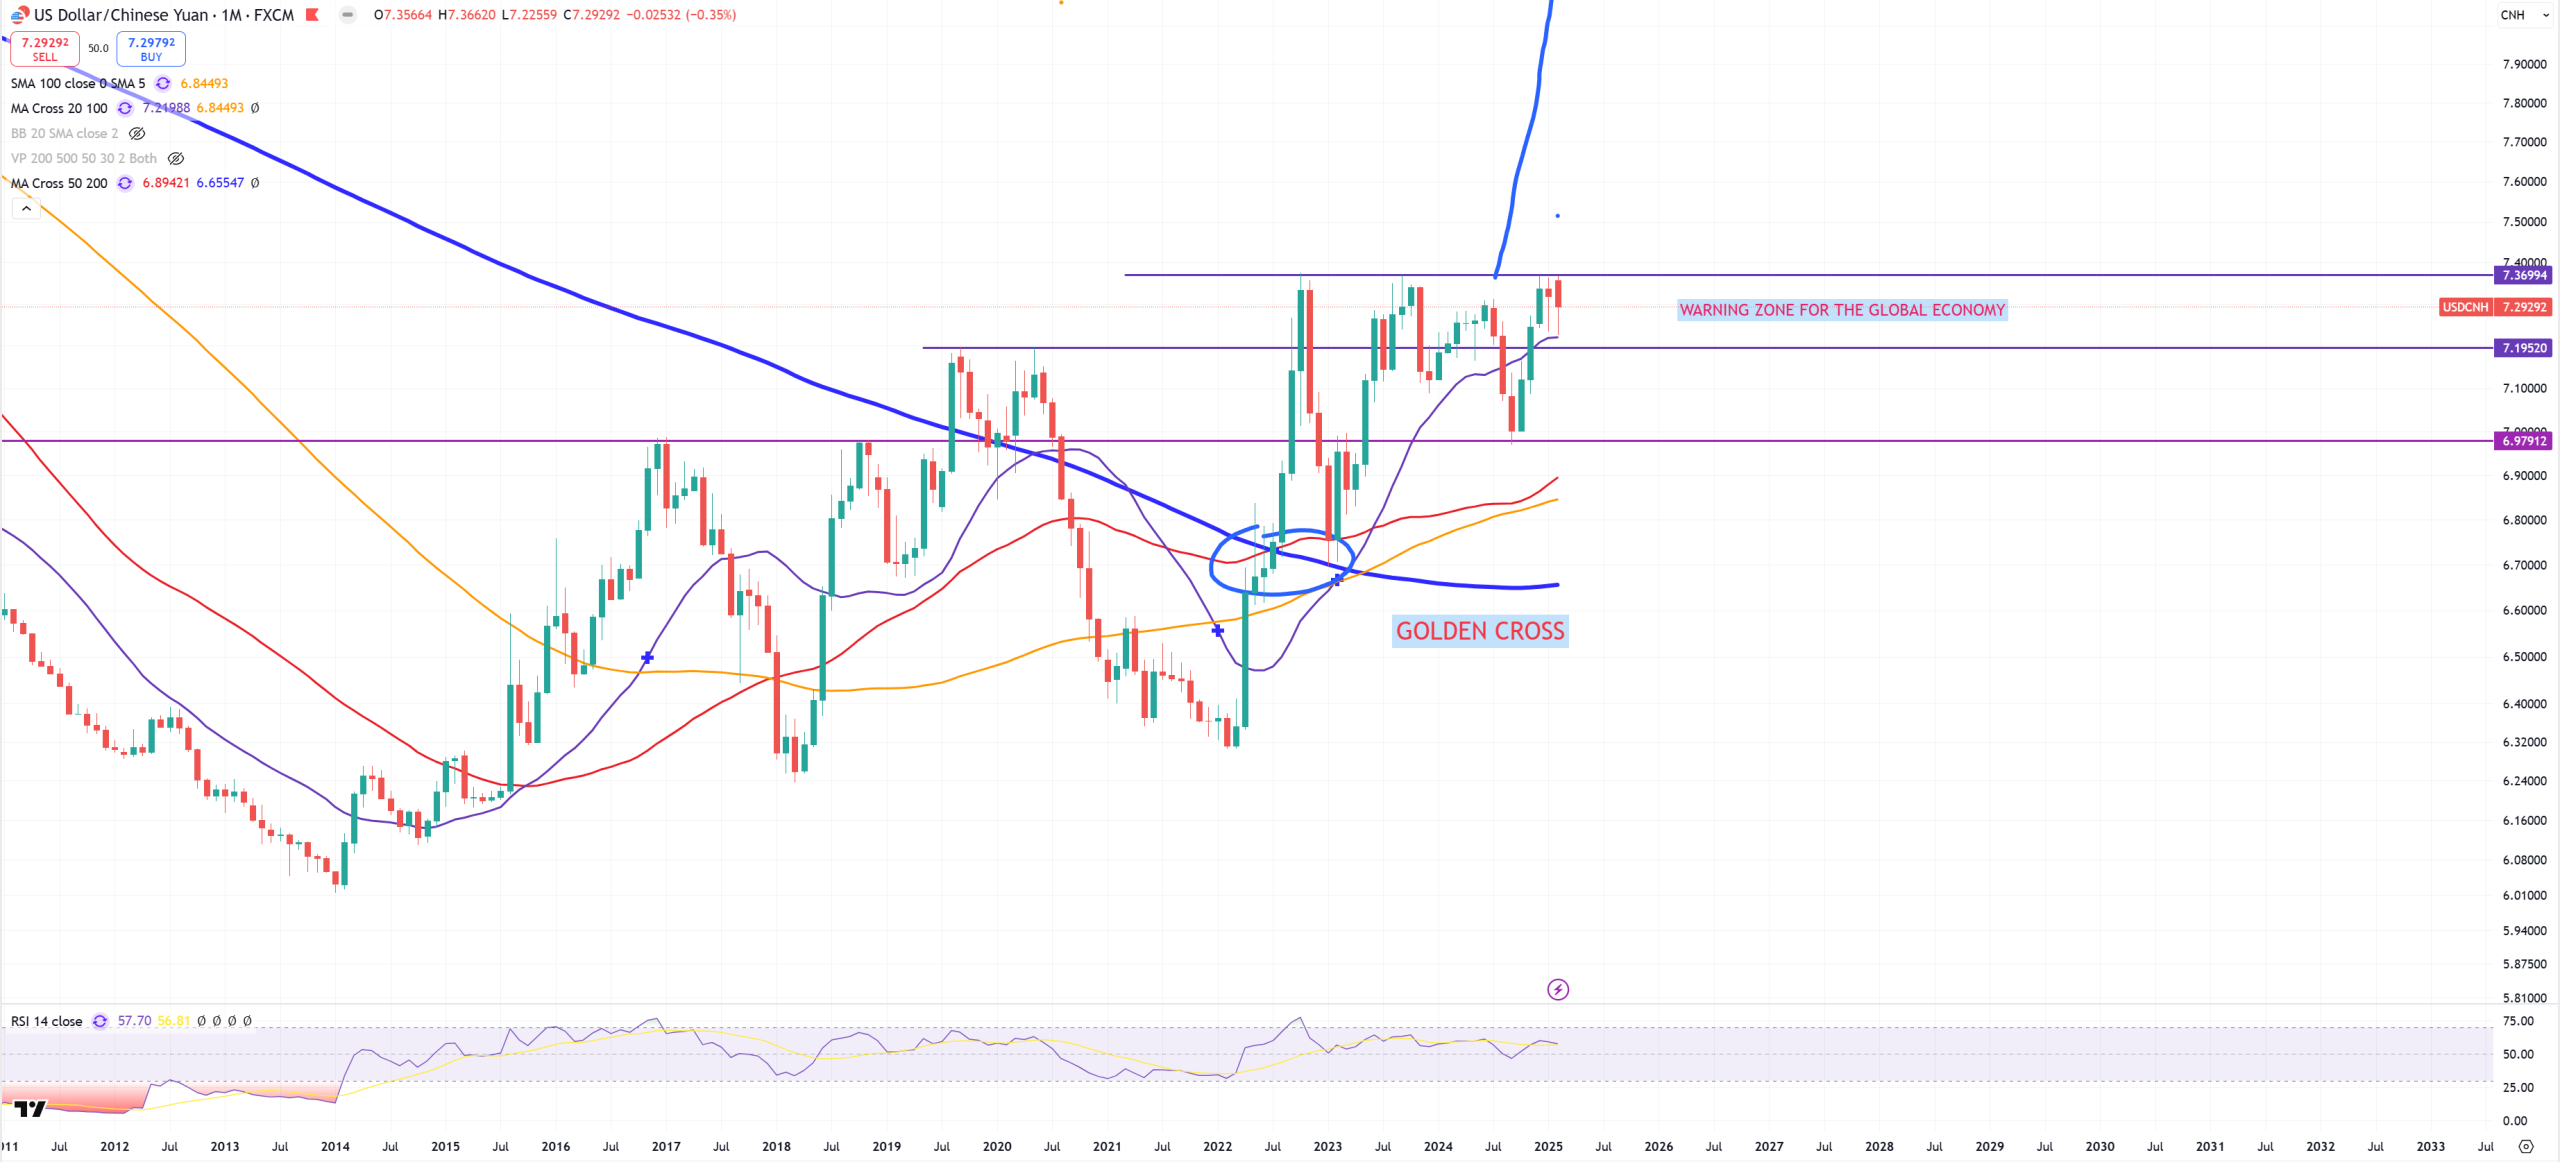
USDCNH – main currency to be watched needs 7.37 to blow up as it’s strong resistance
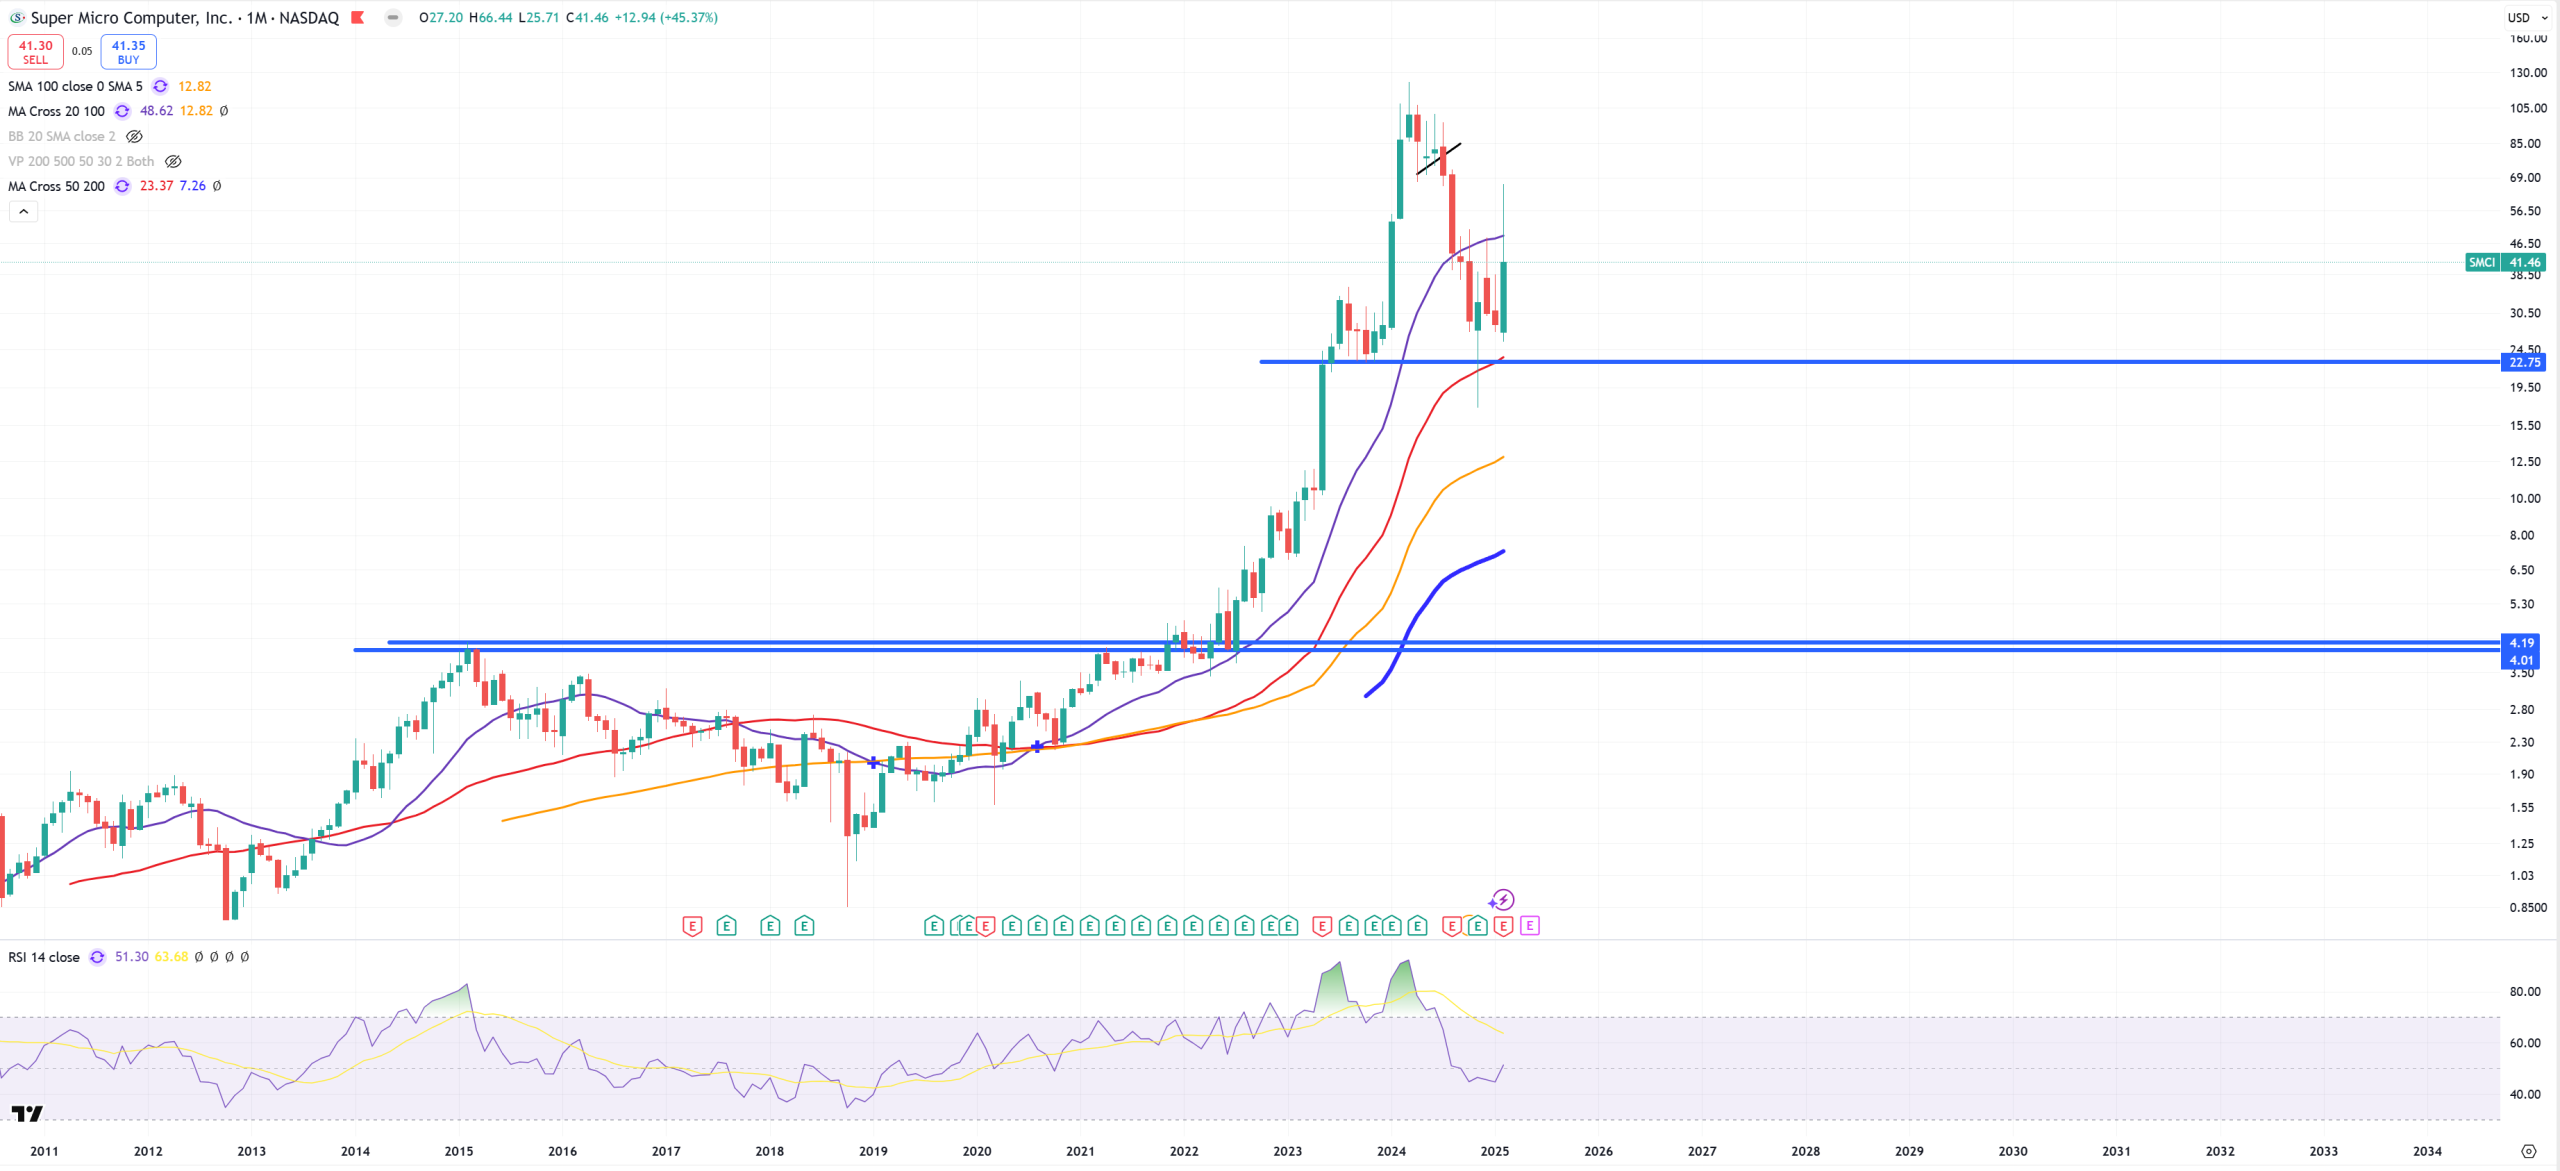
SMCI – rejects (M)MA20, boucing between (M)MA20 and (M)MA50, still 4$ possible, but need to break (M)MA50 and leave this area between those two (M)MAs.
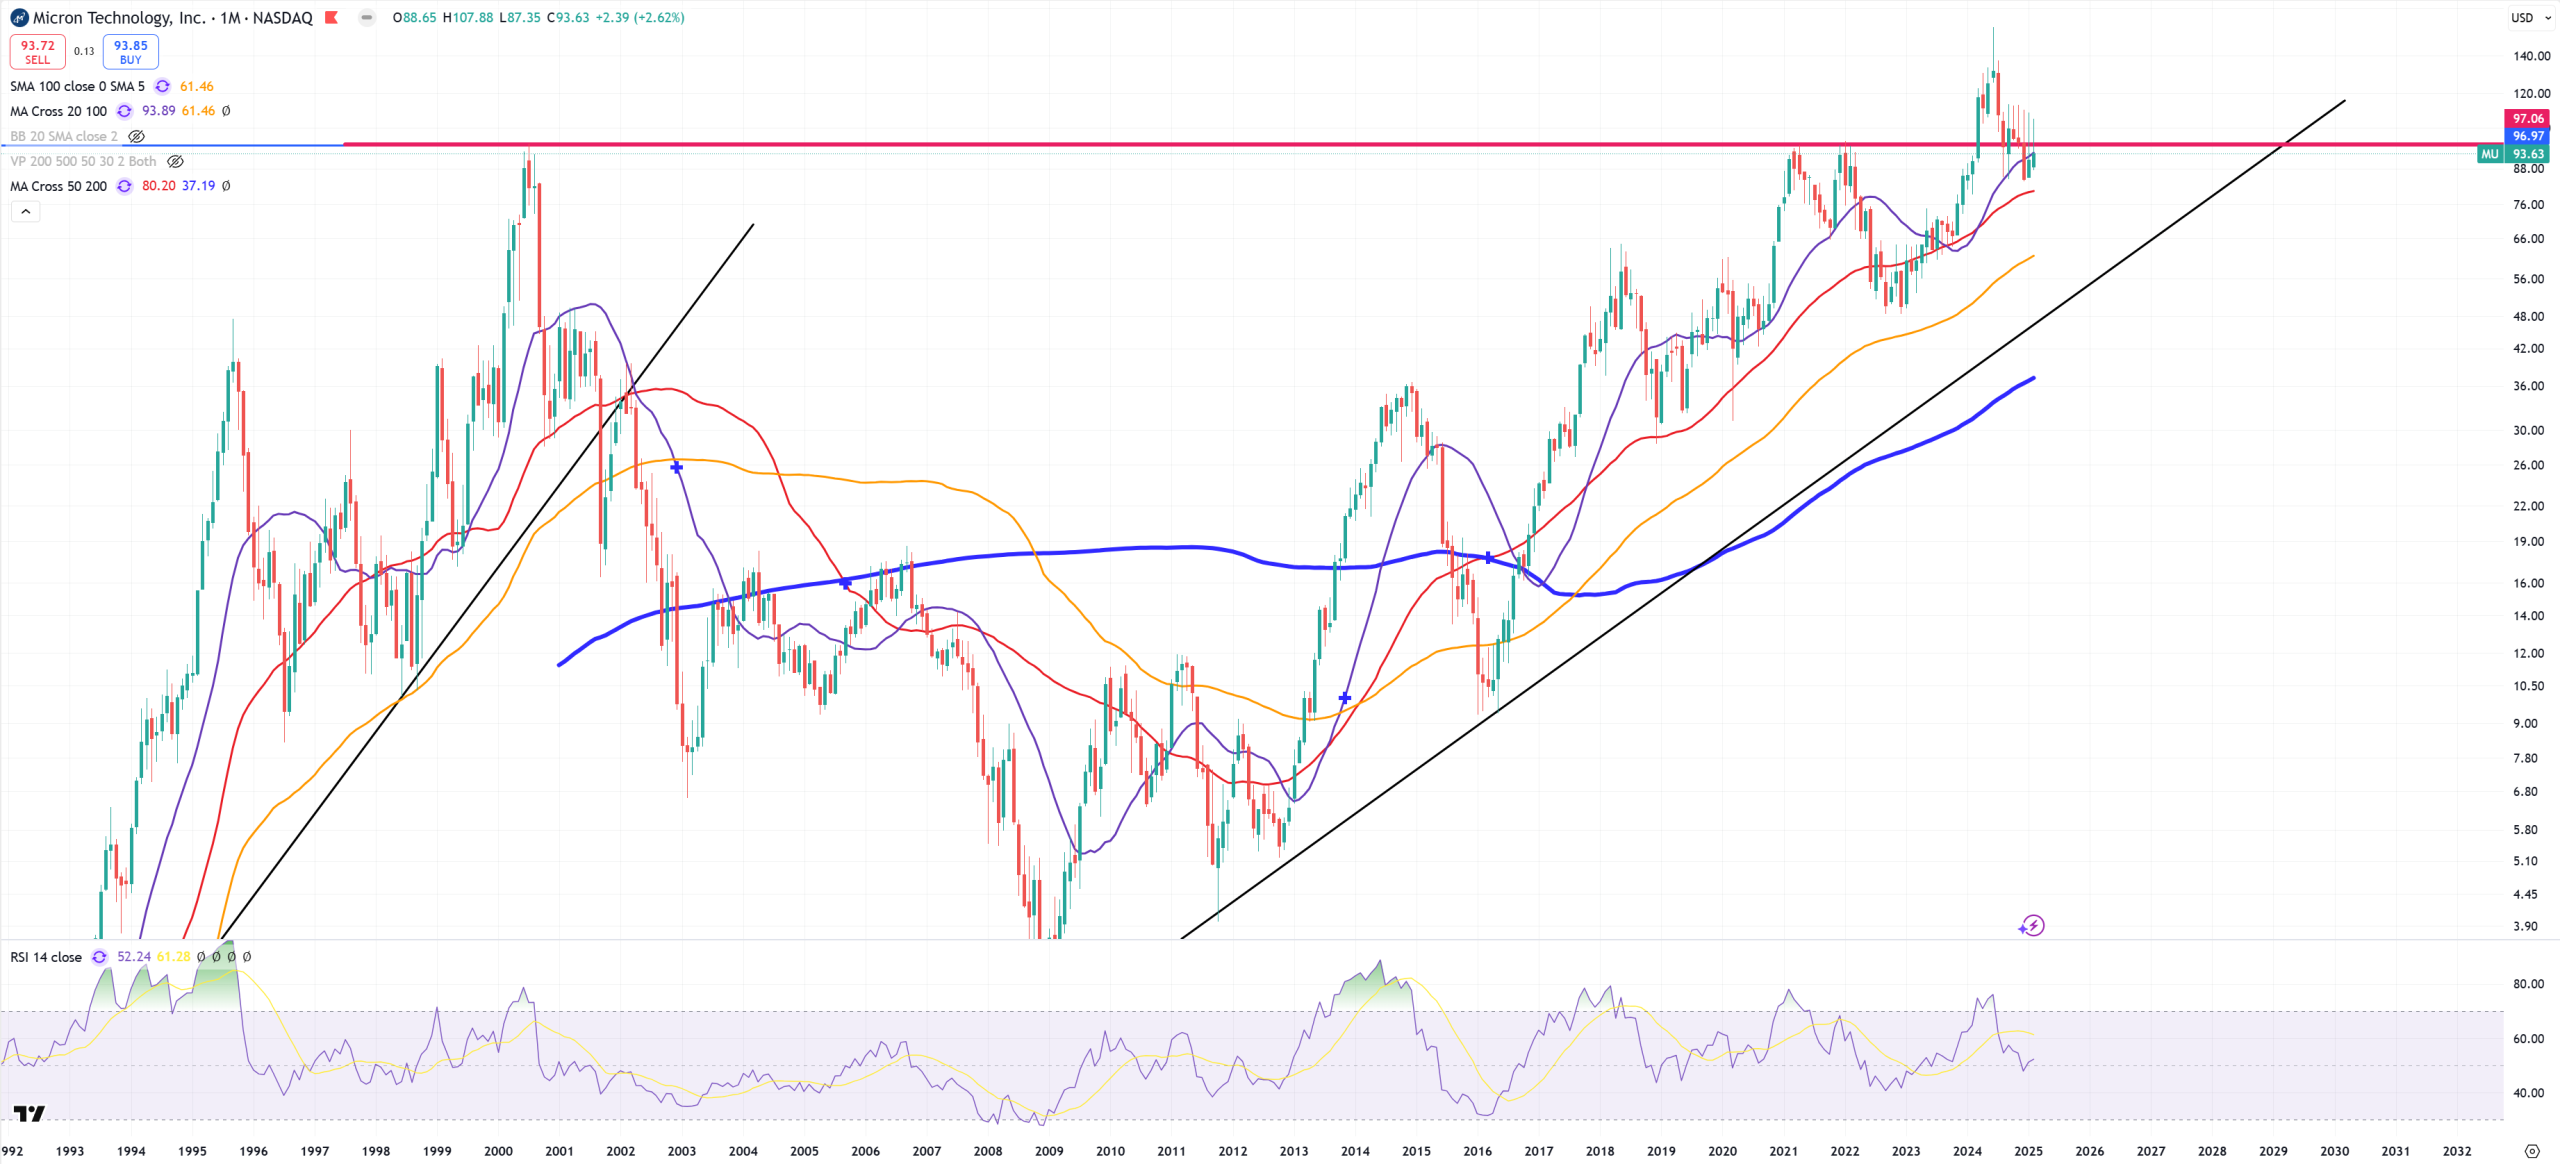
MU – rejects 2000 peak
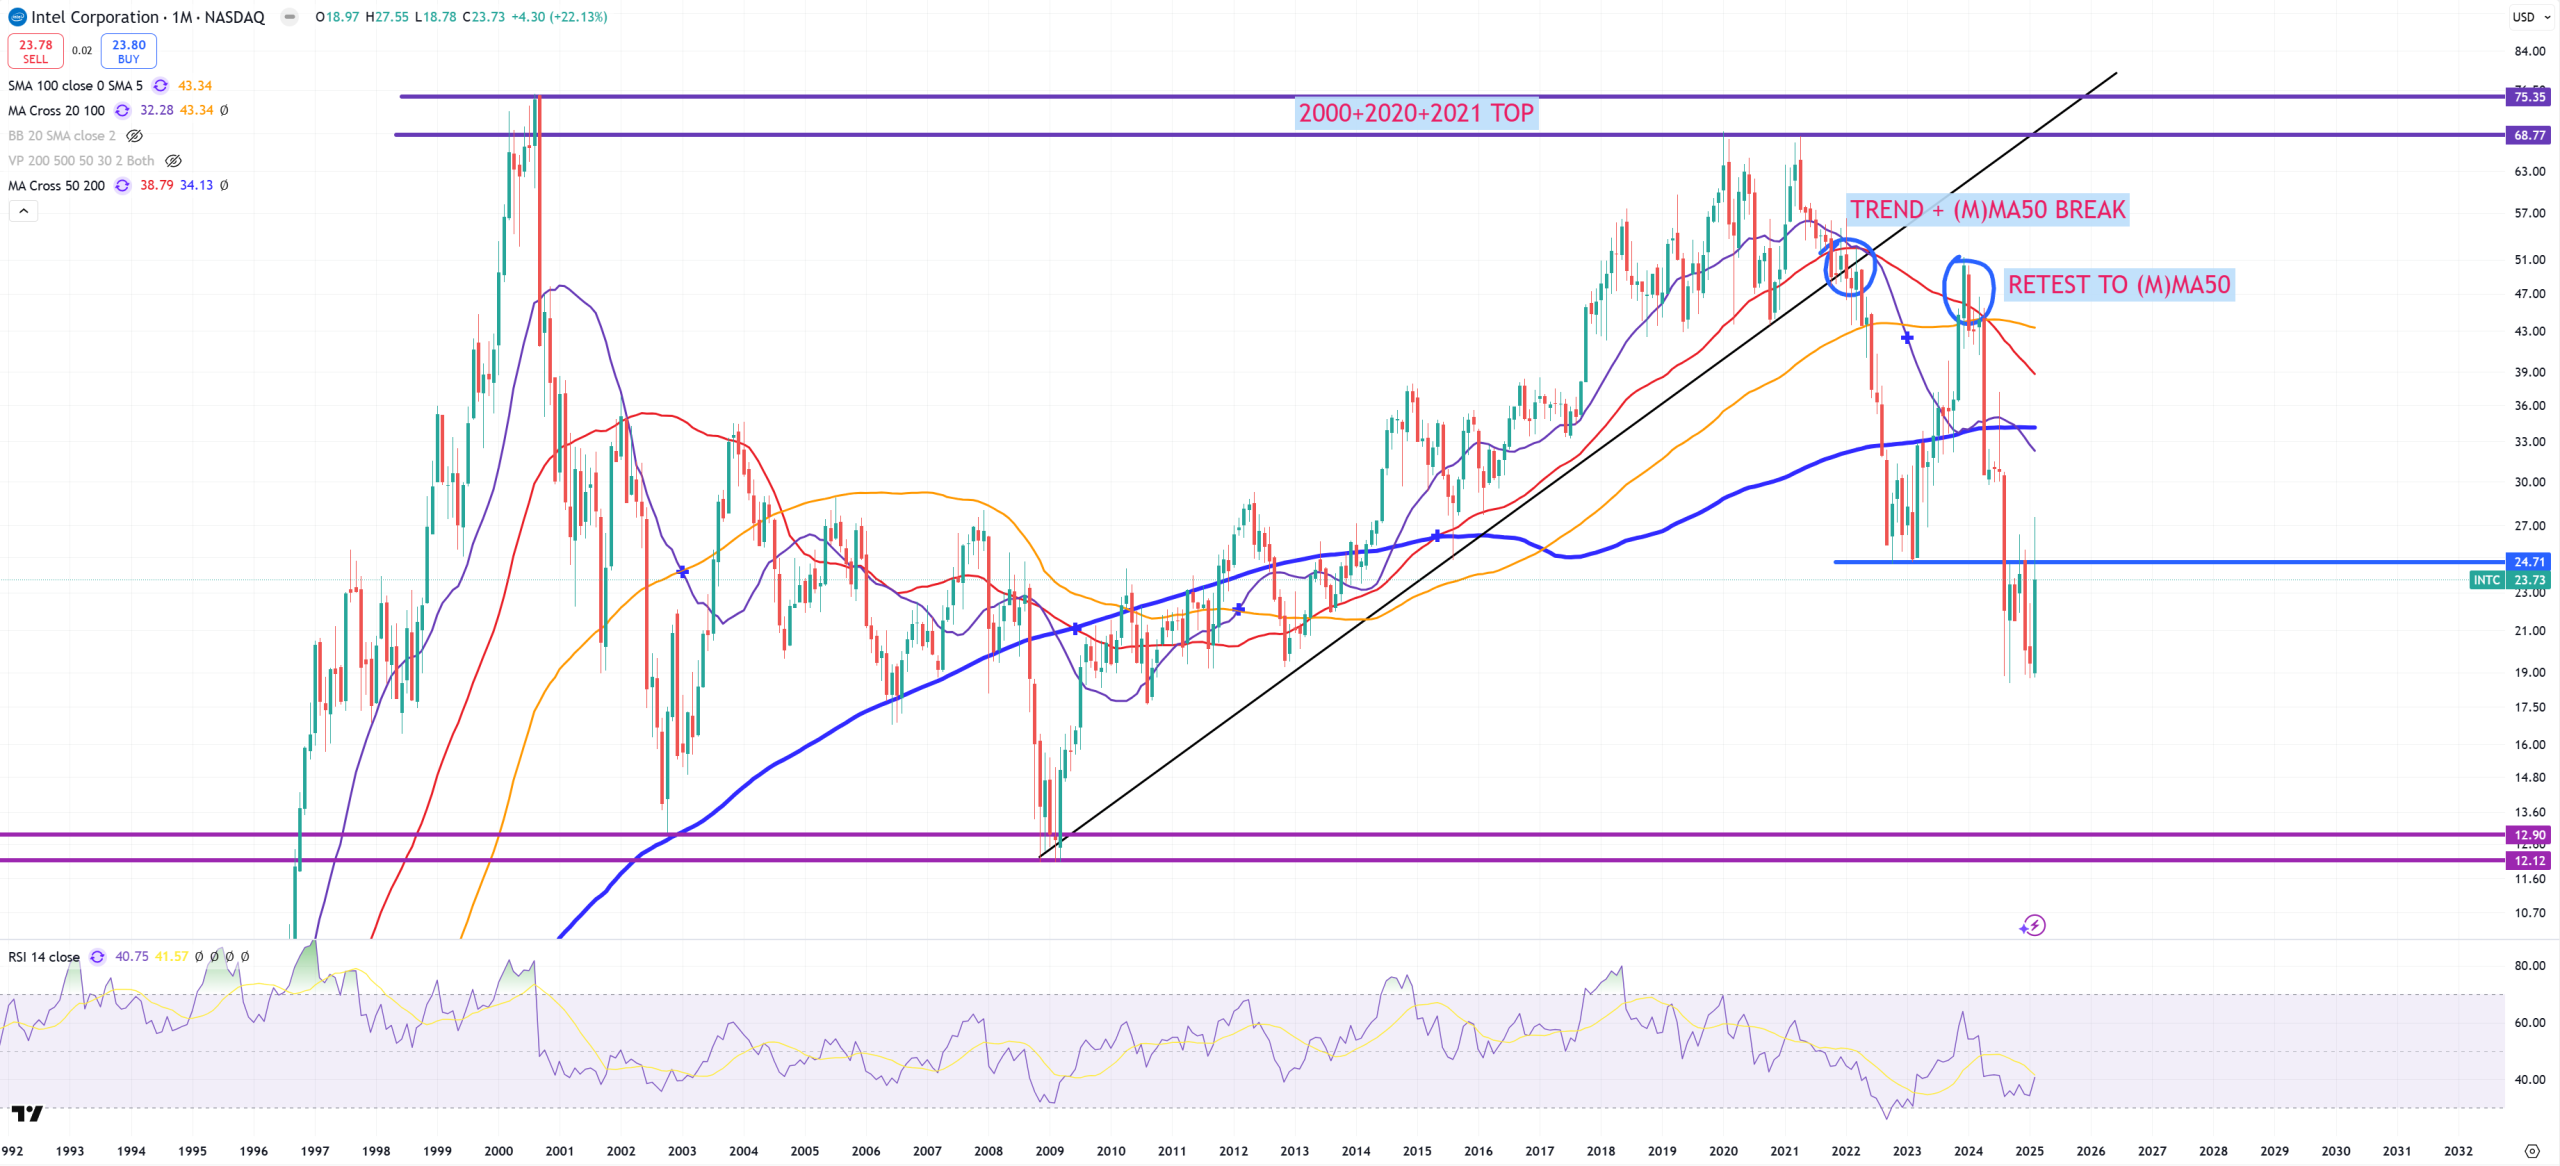
INTC – rejects key resistance
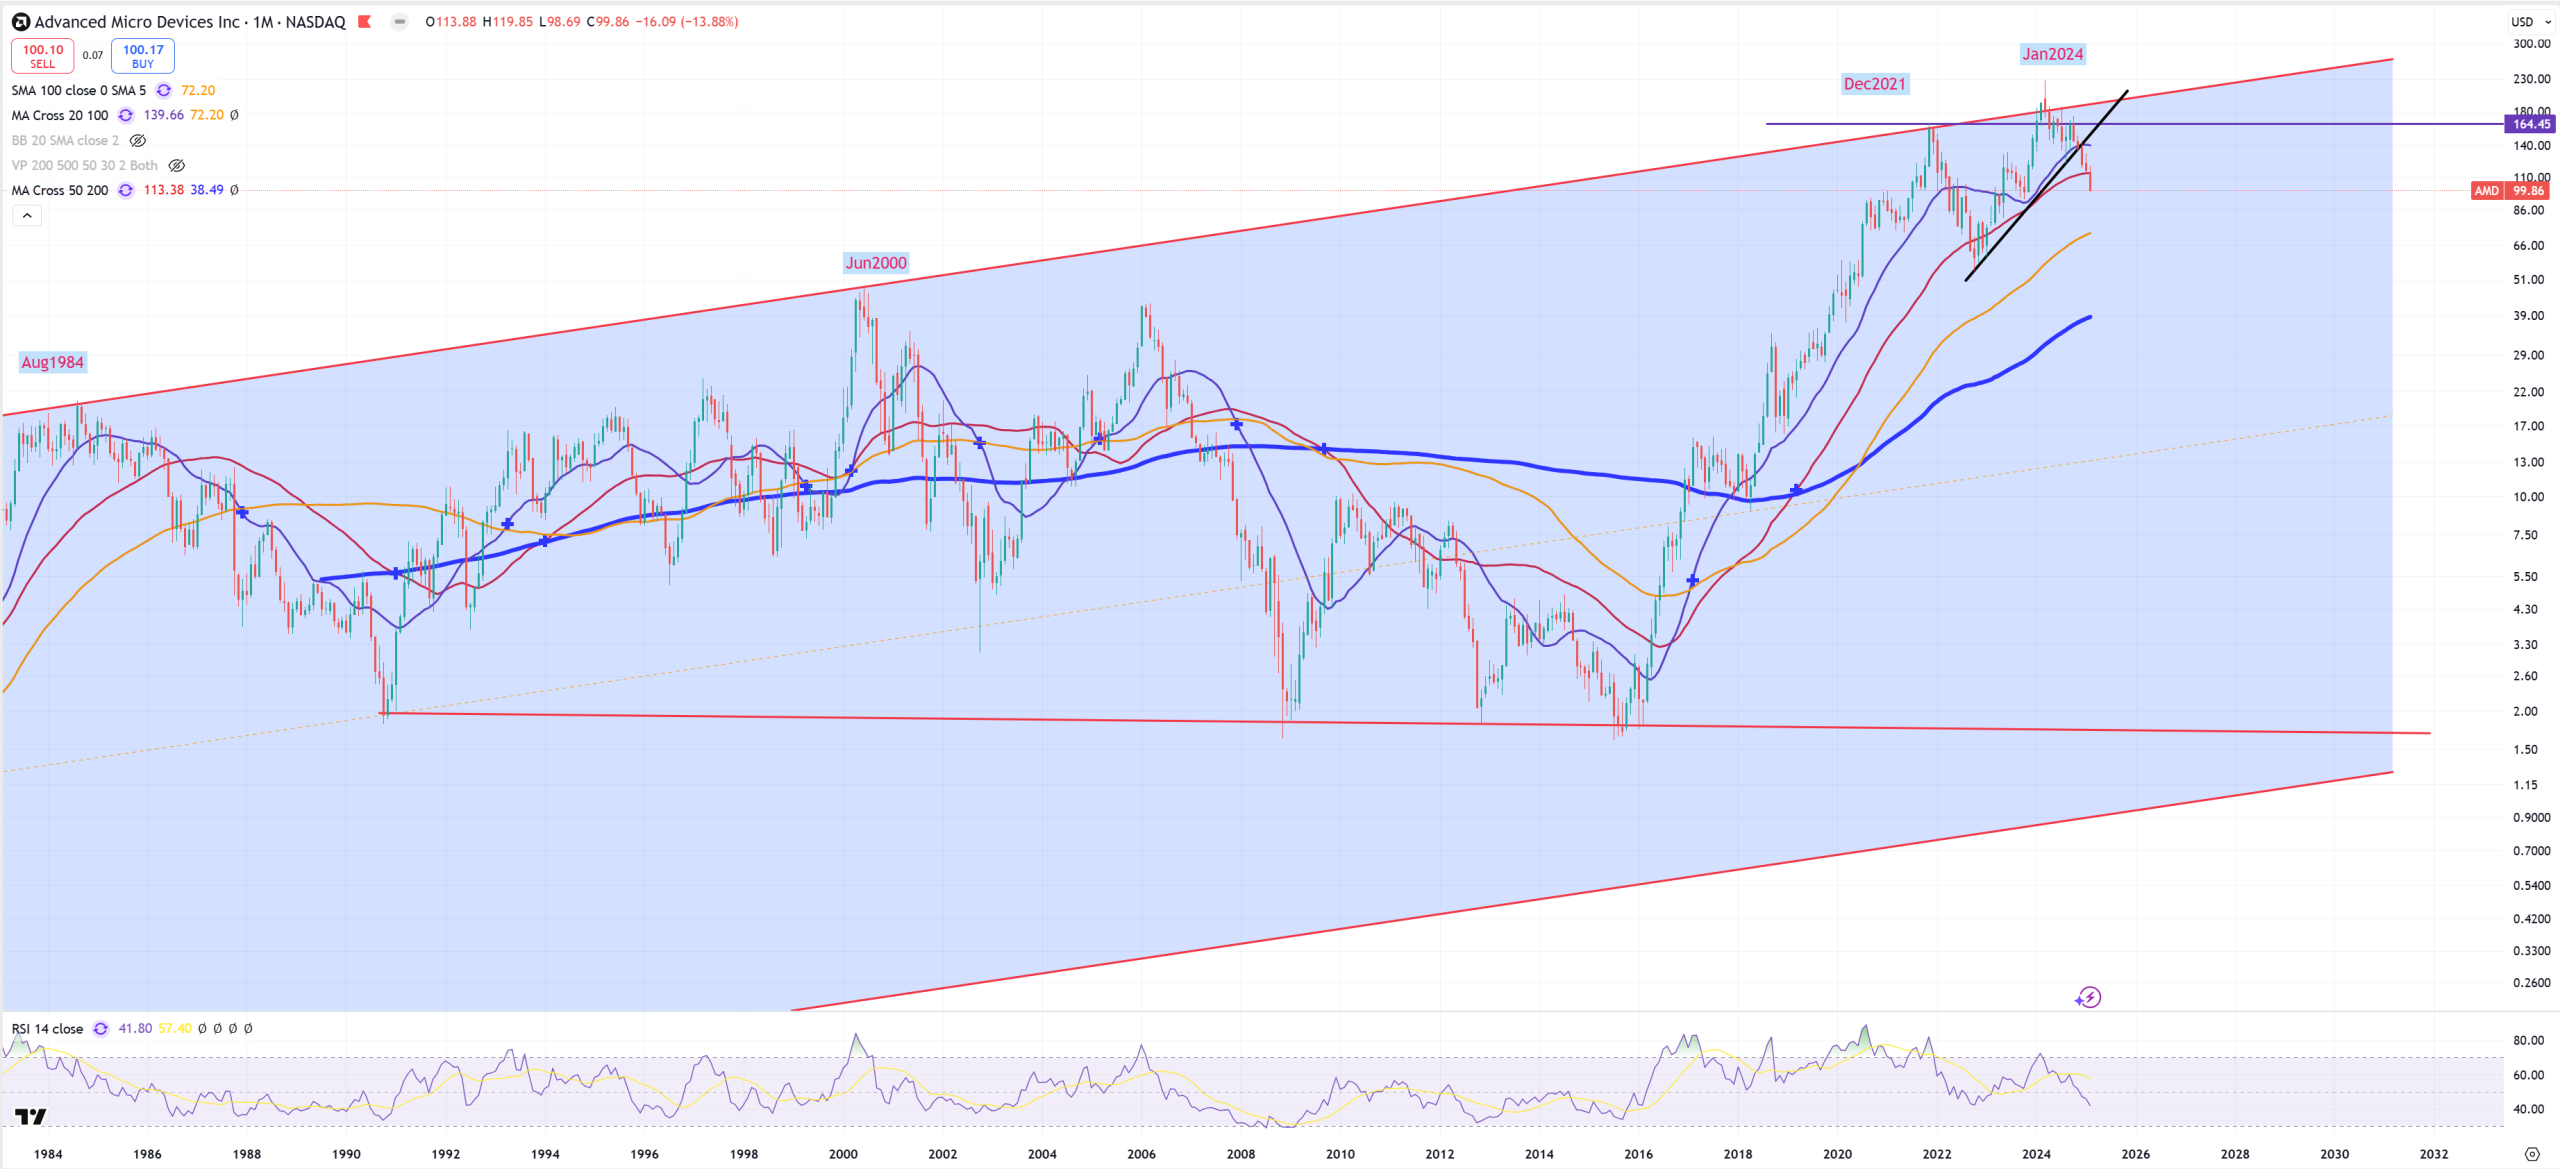
AMD – looks really bad as secular channel holds
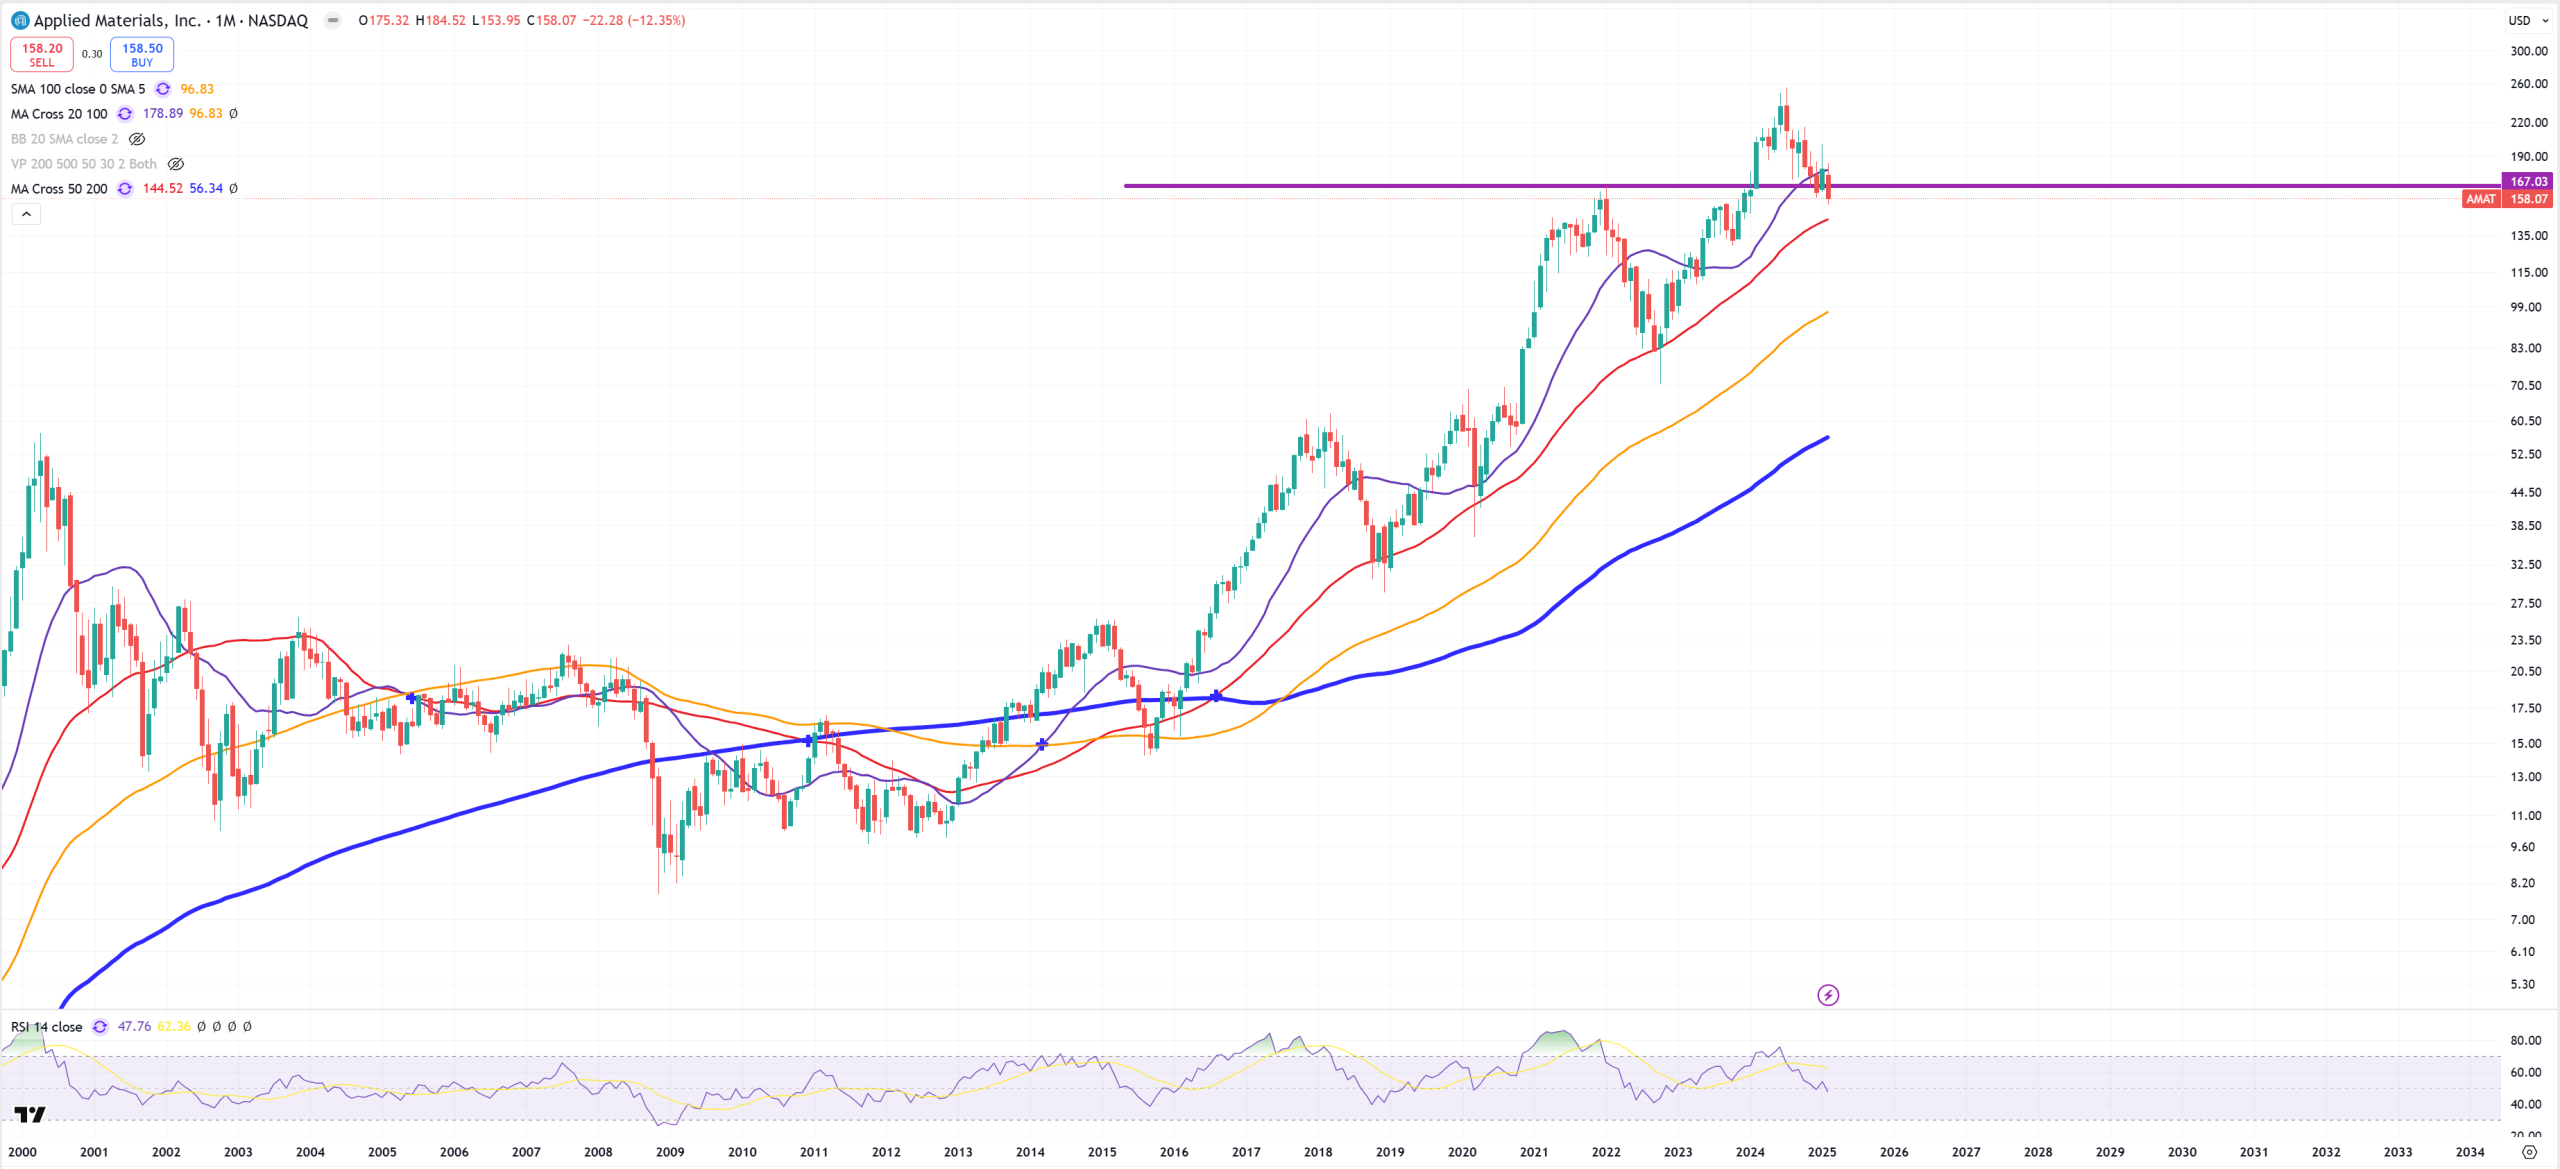
AMAT – another big flip below key support
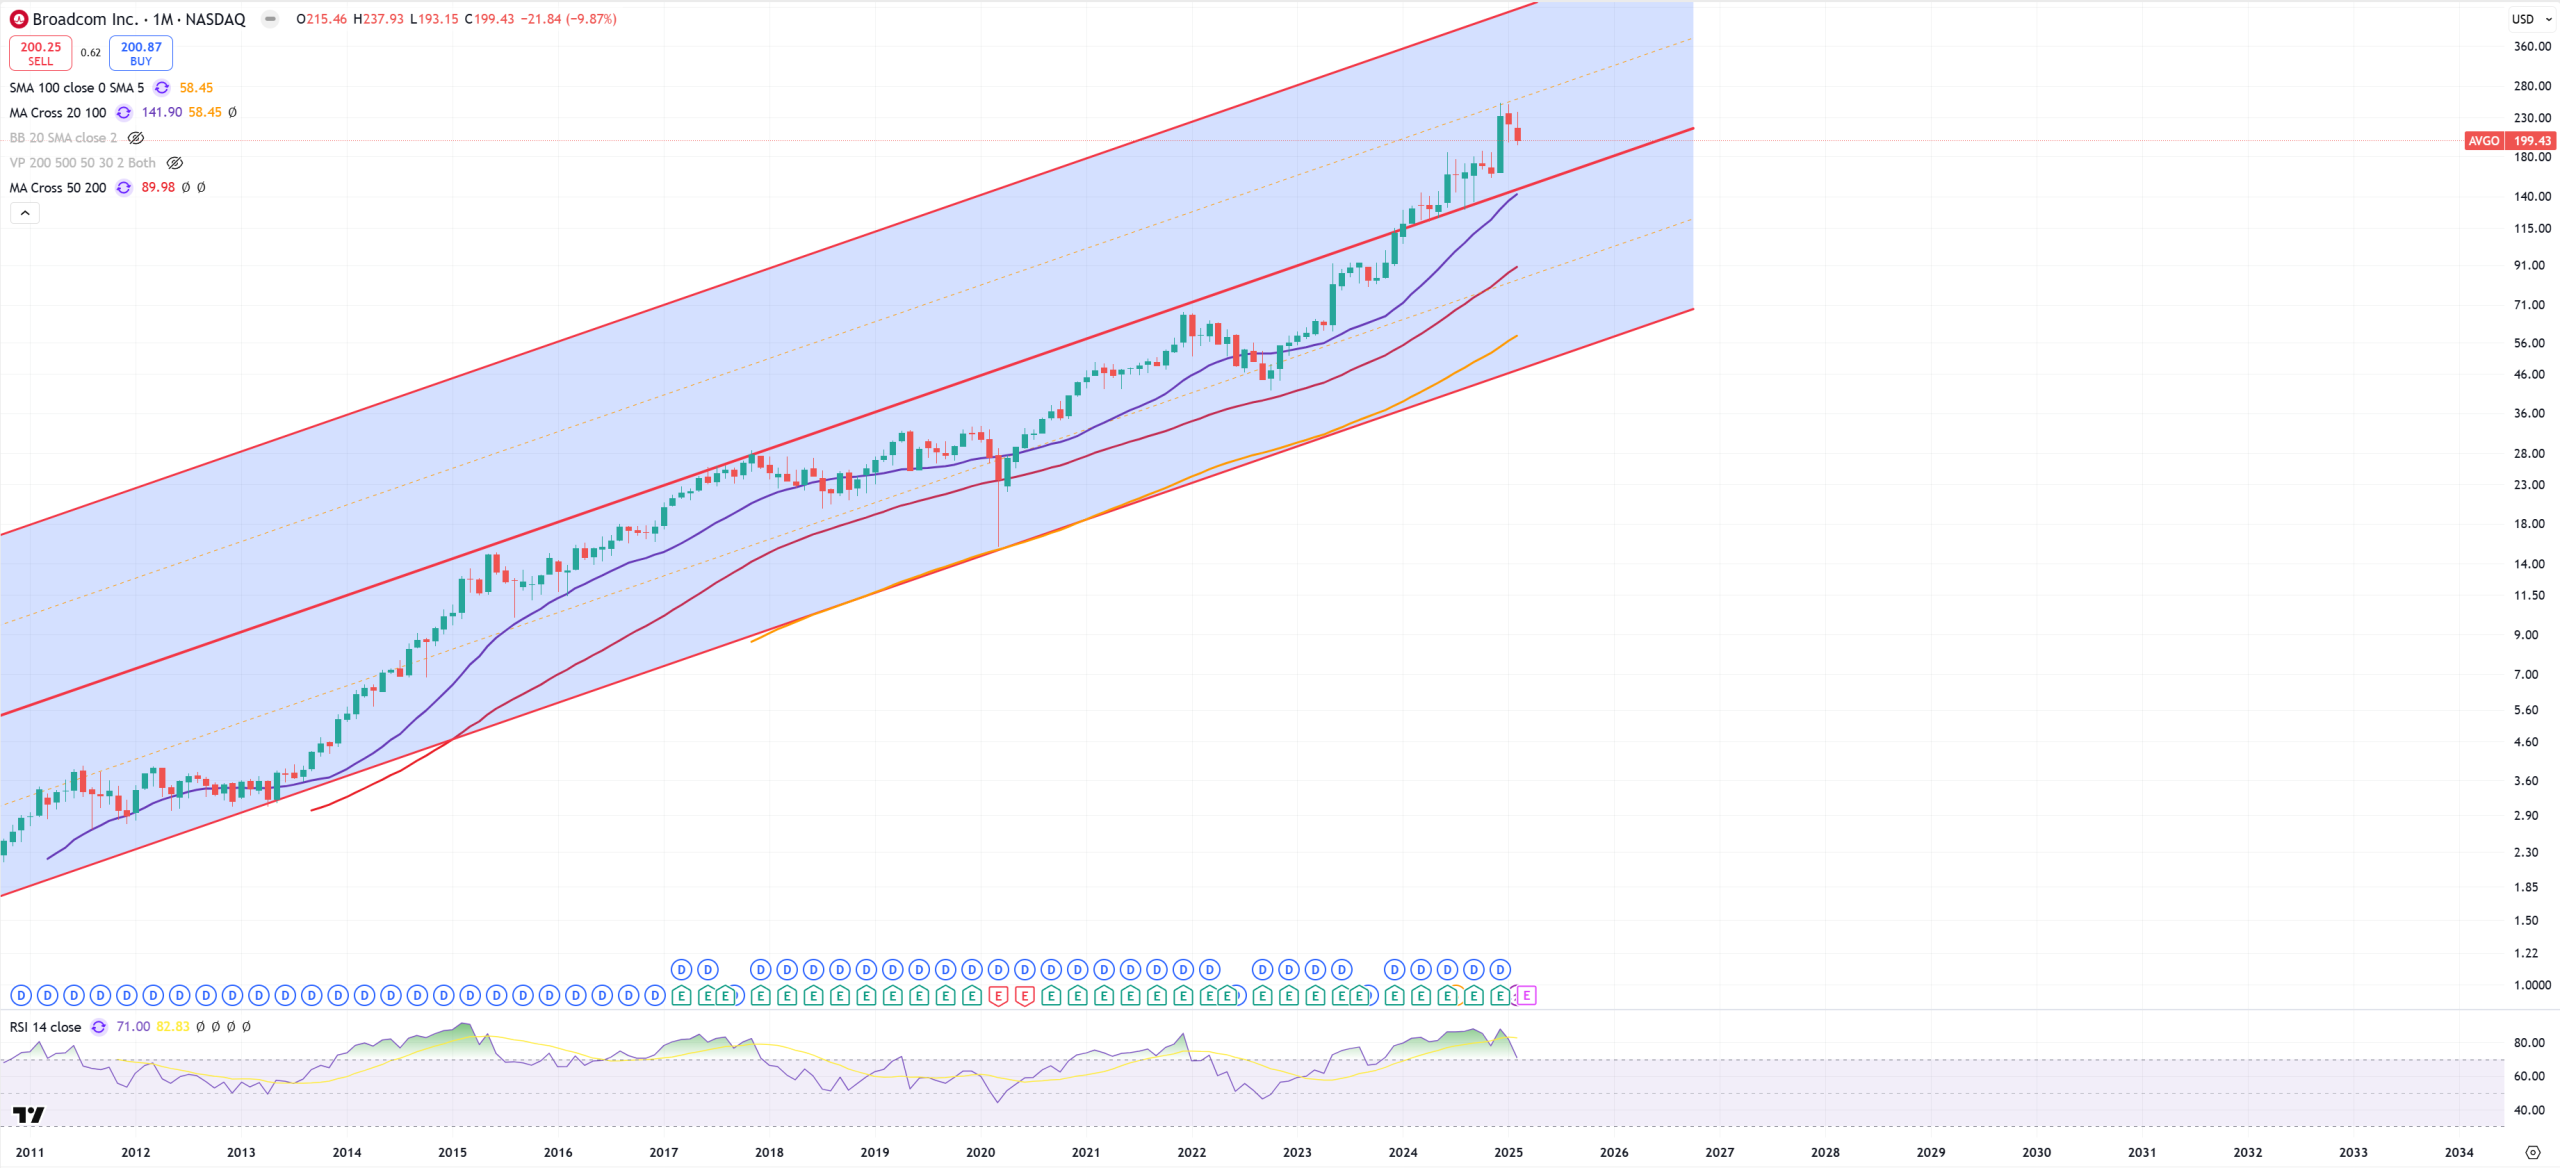
AVGO – had a channel, but once it was broken I decided to add same channel above the previous one and here comes the result
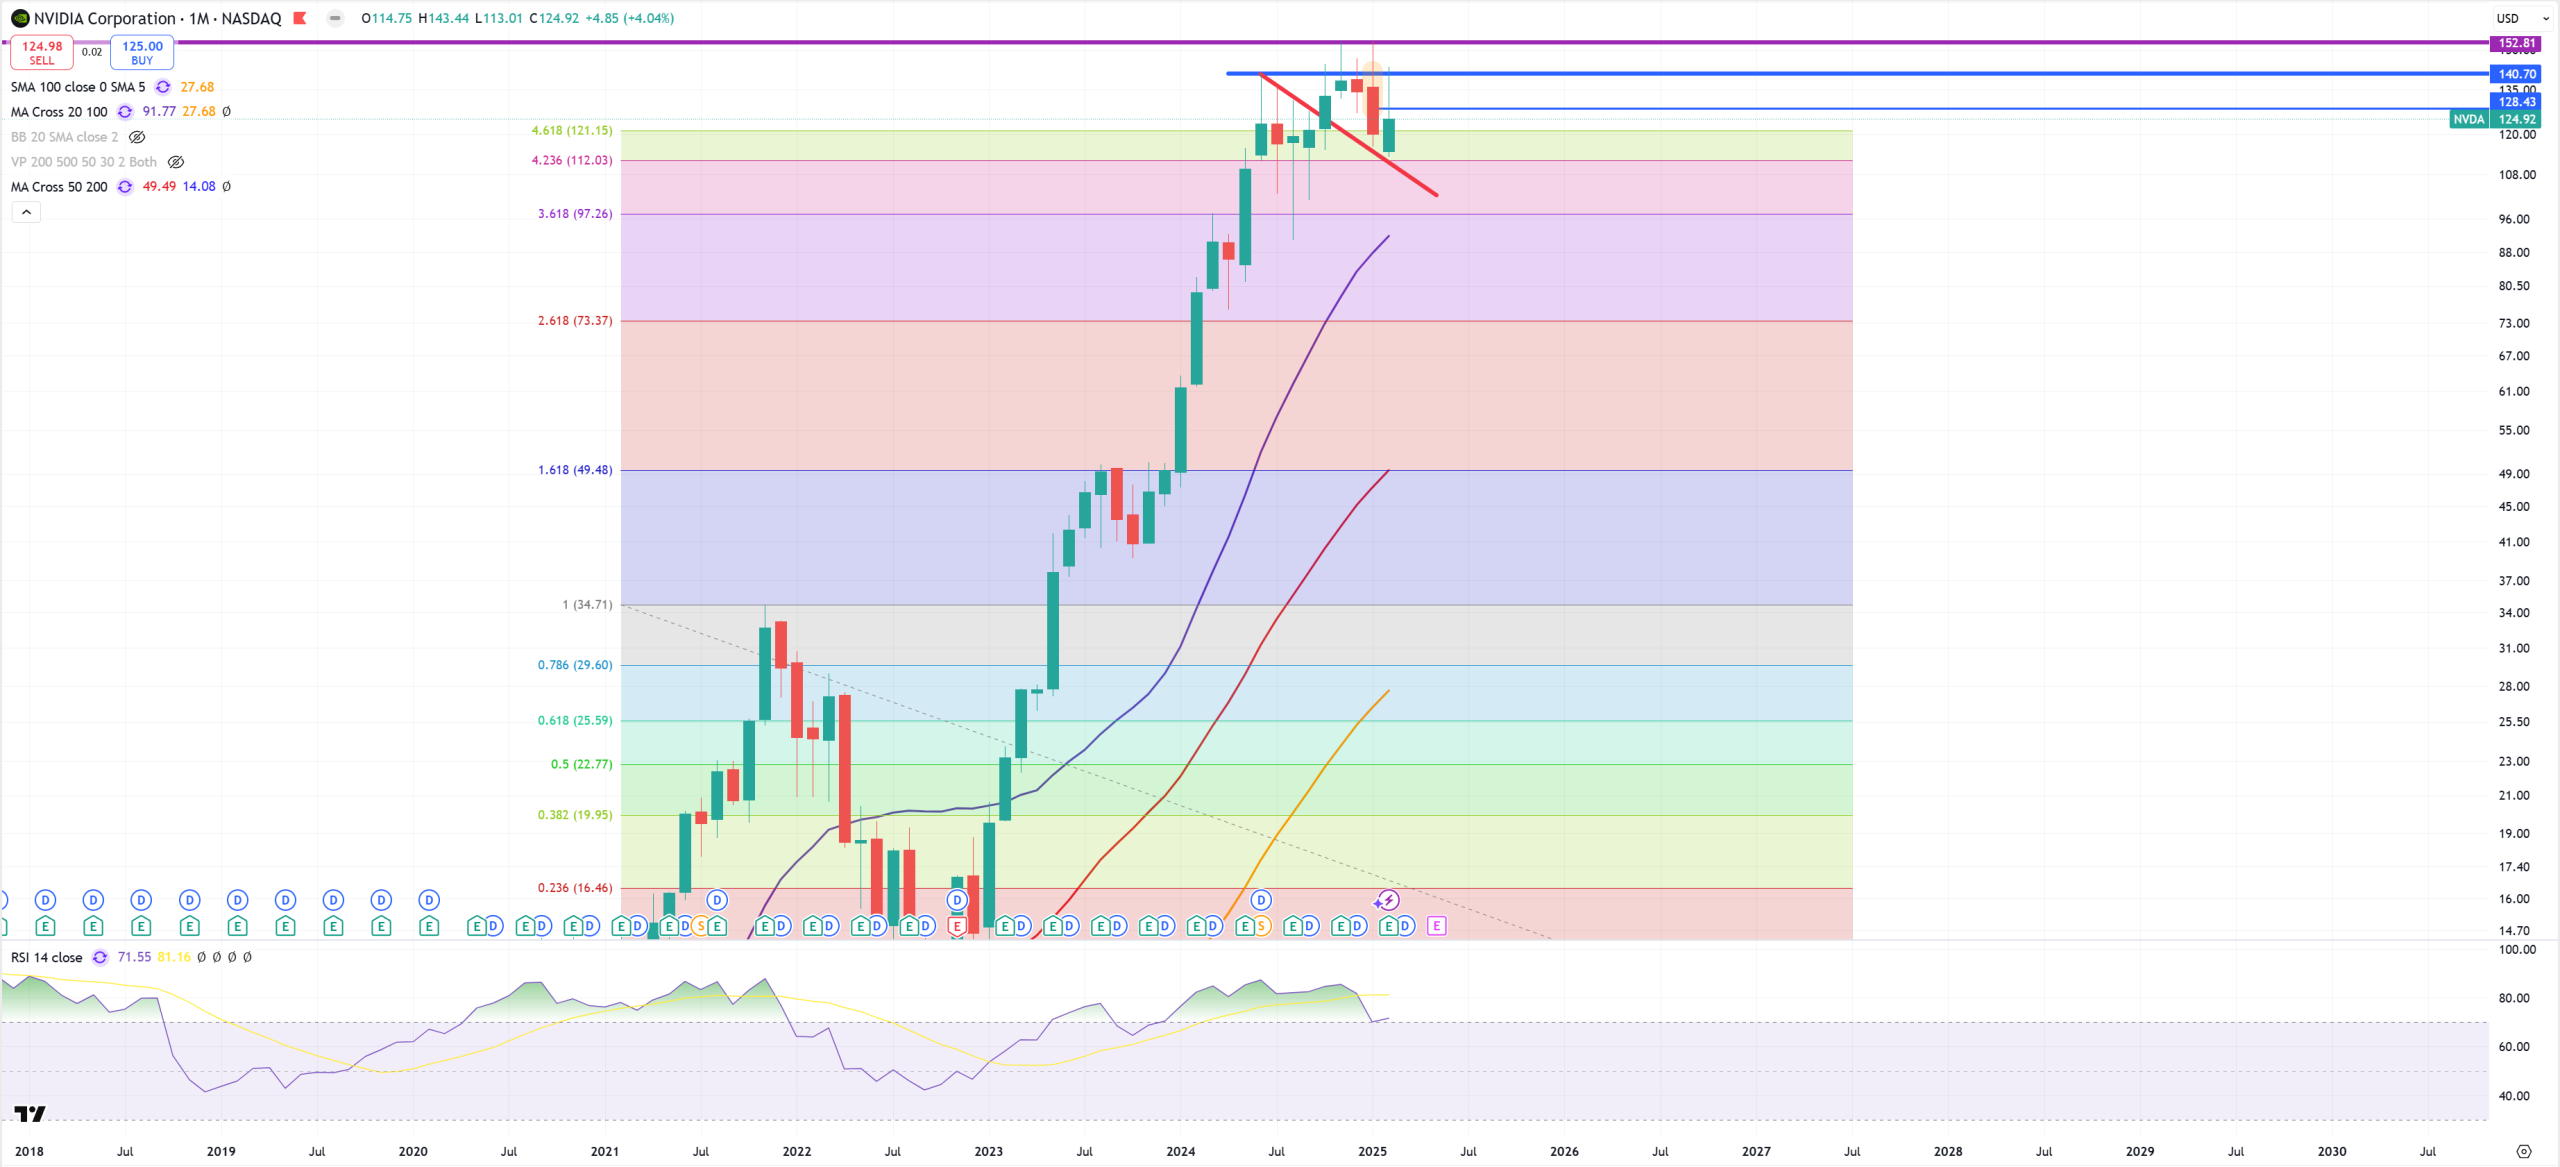
NVDA – and its 140$ key resistance. Double-top on 152$, looking on (M) candles we can see that this 152$ move was just overshooting 140$.
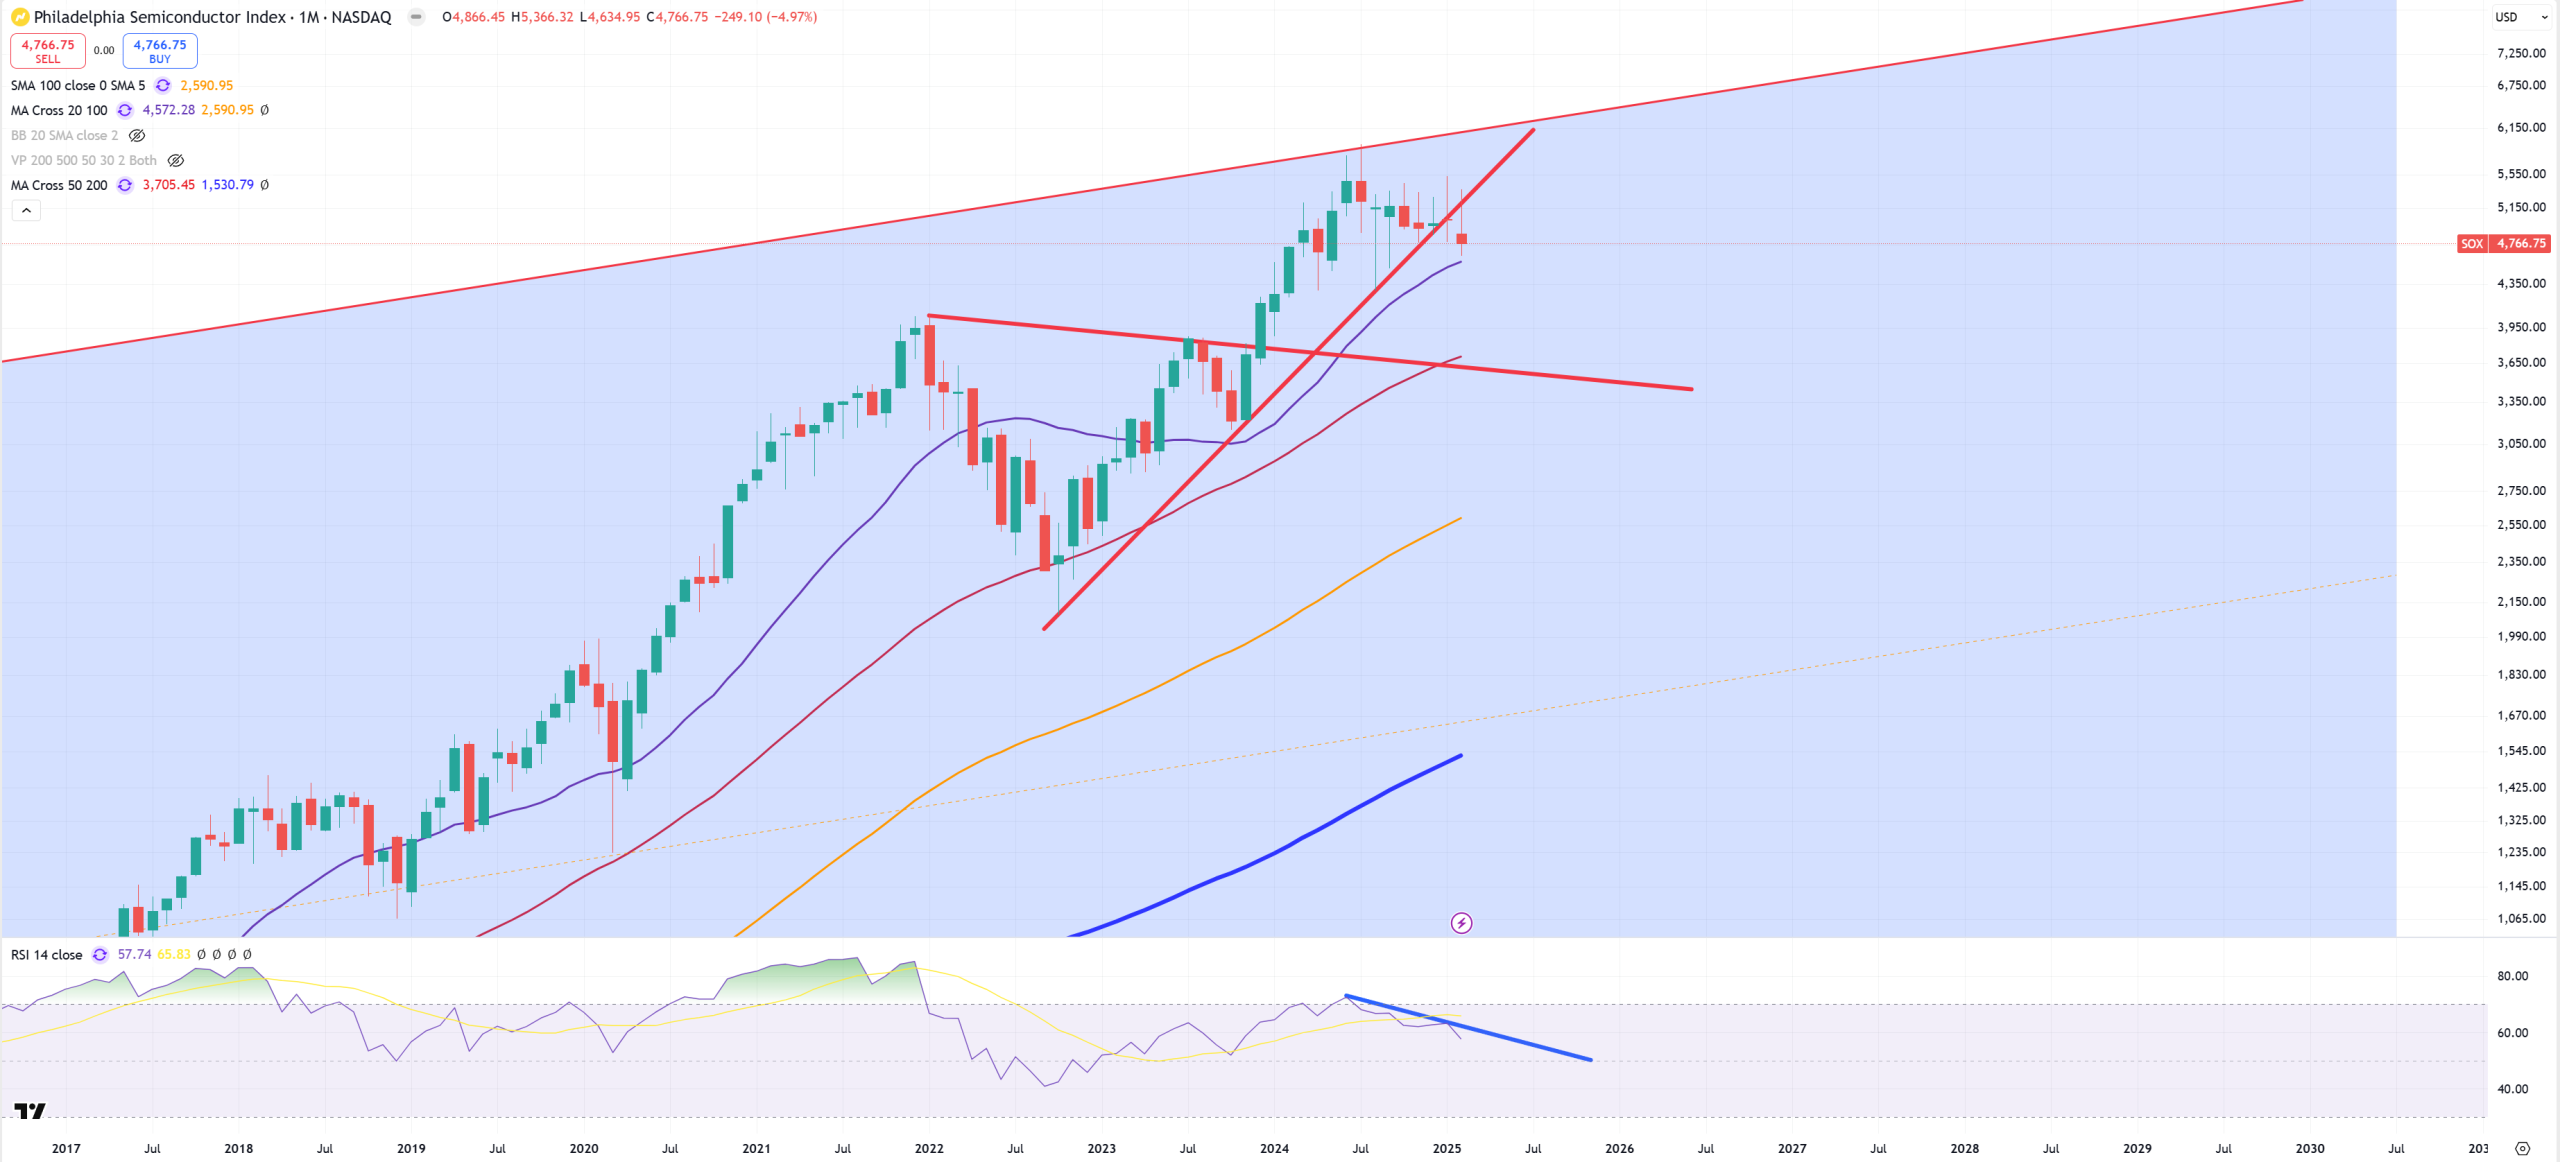
SOX – Semiconductors trend from October 2022 has been broken and retested
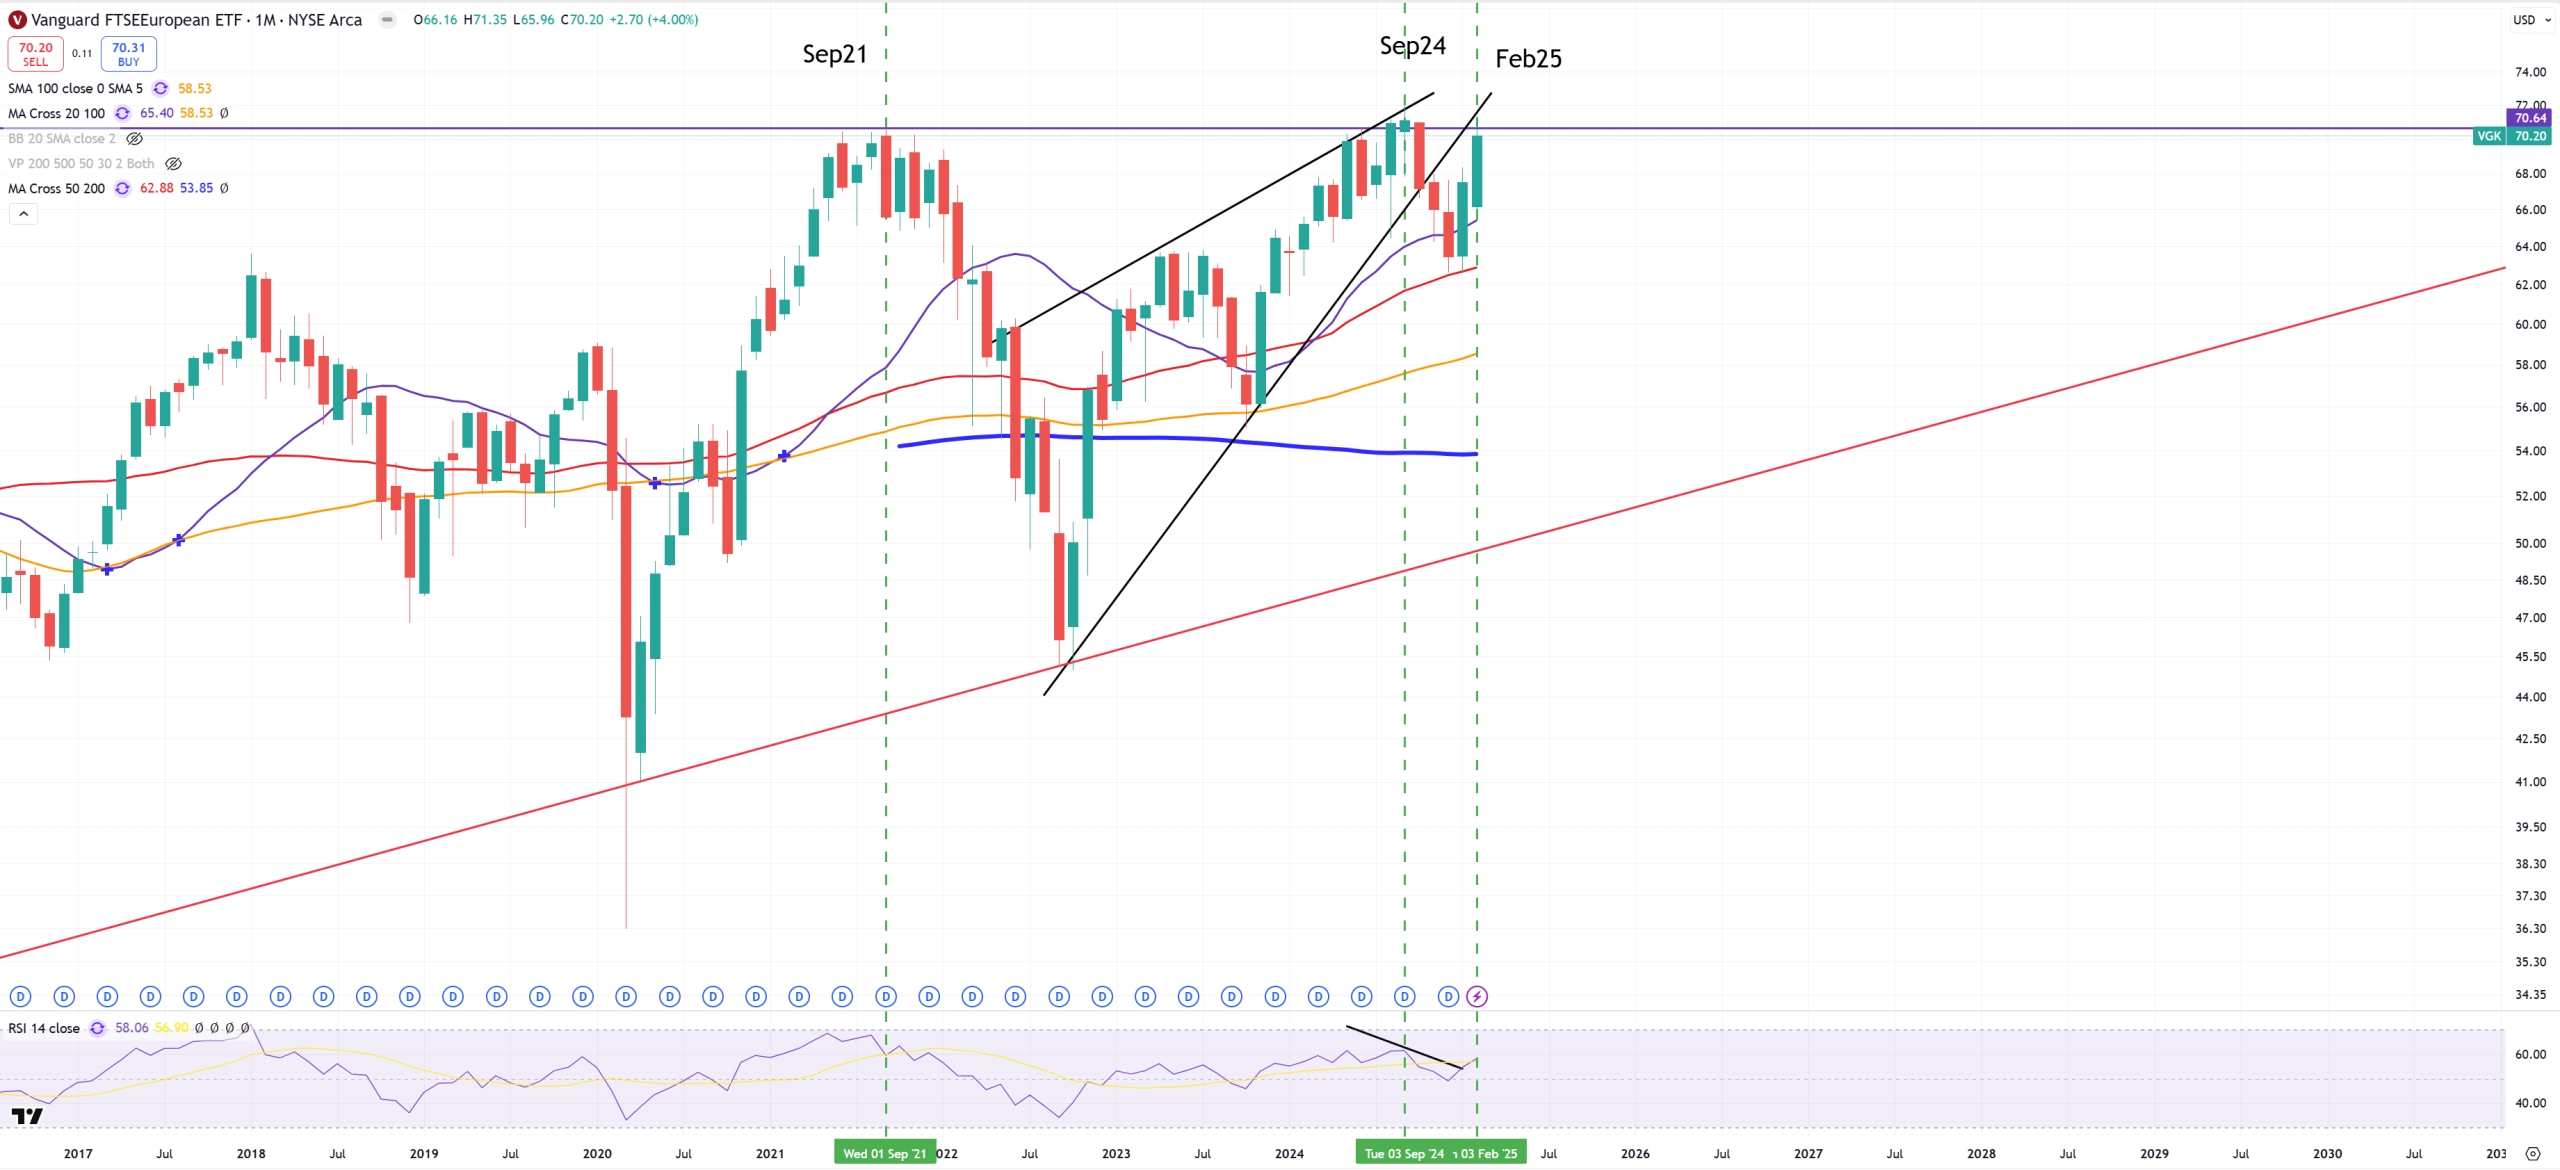
VGK – Europe – rejects key resistance
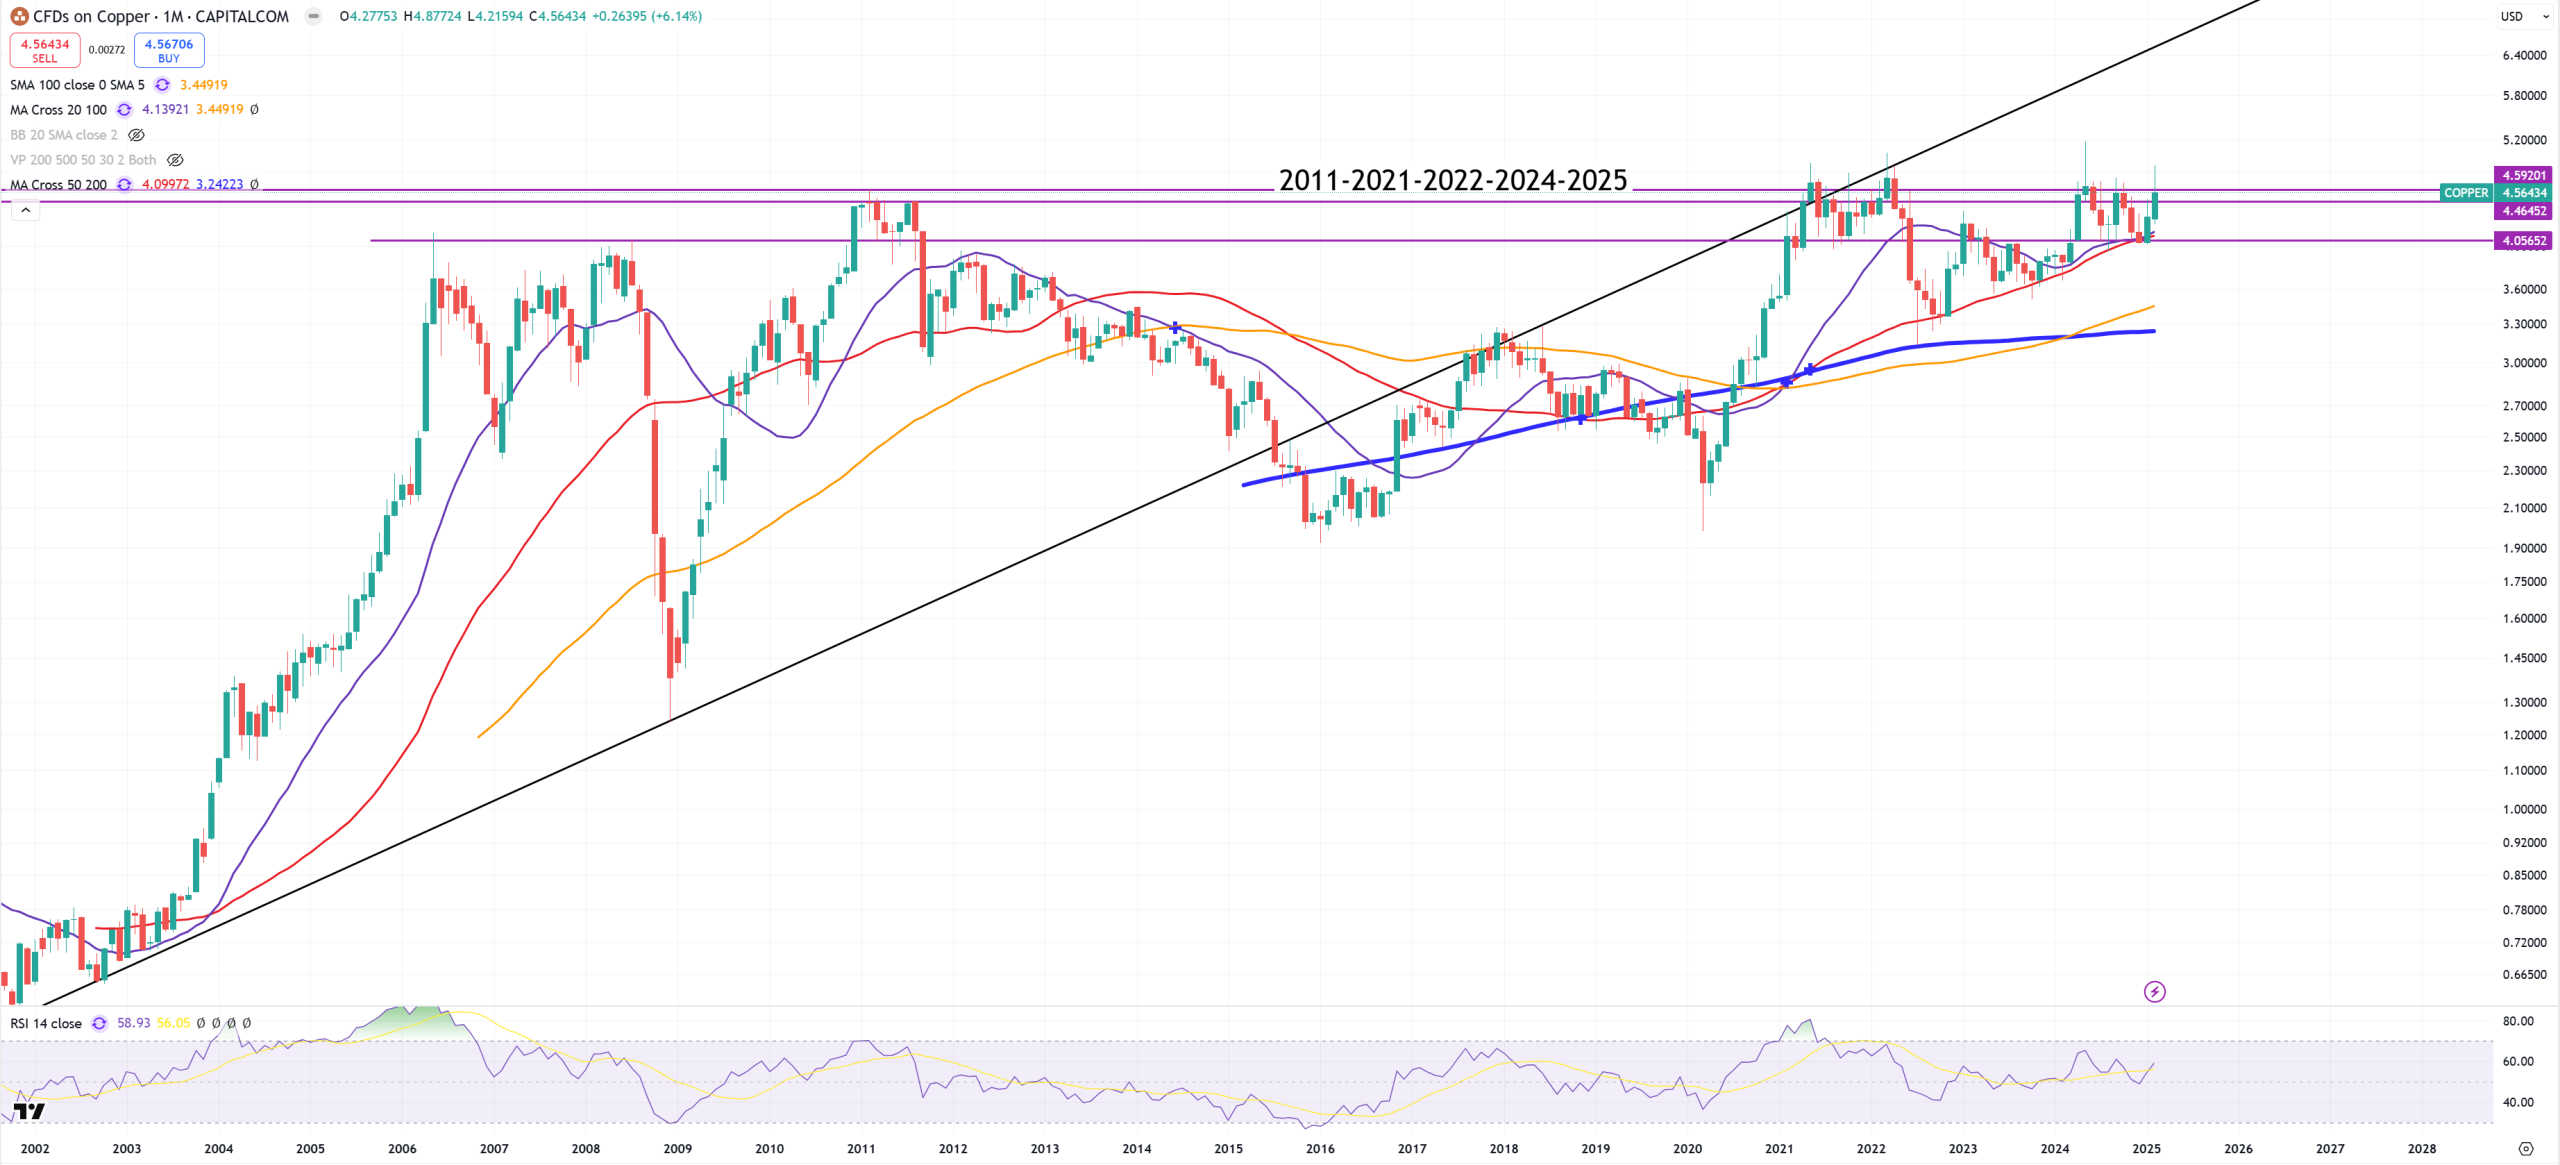
COPPER – rejects key resistance
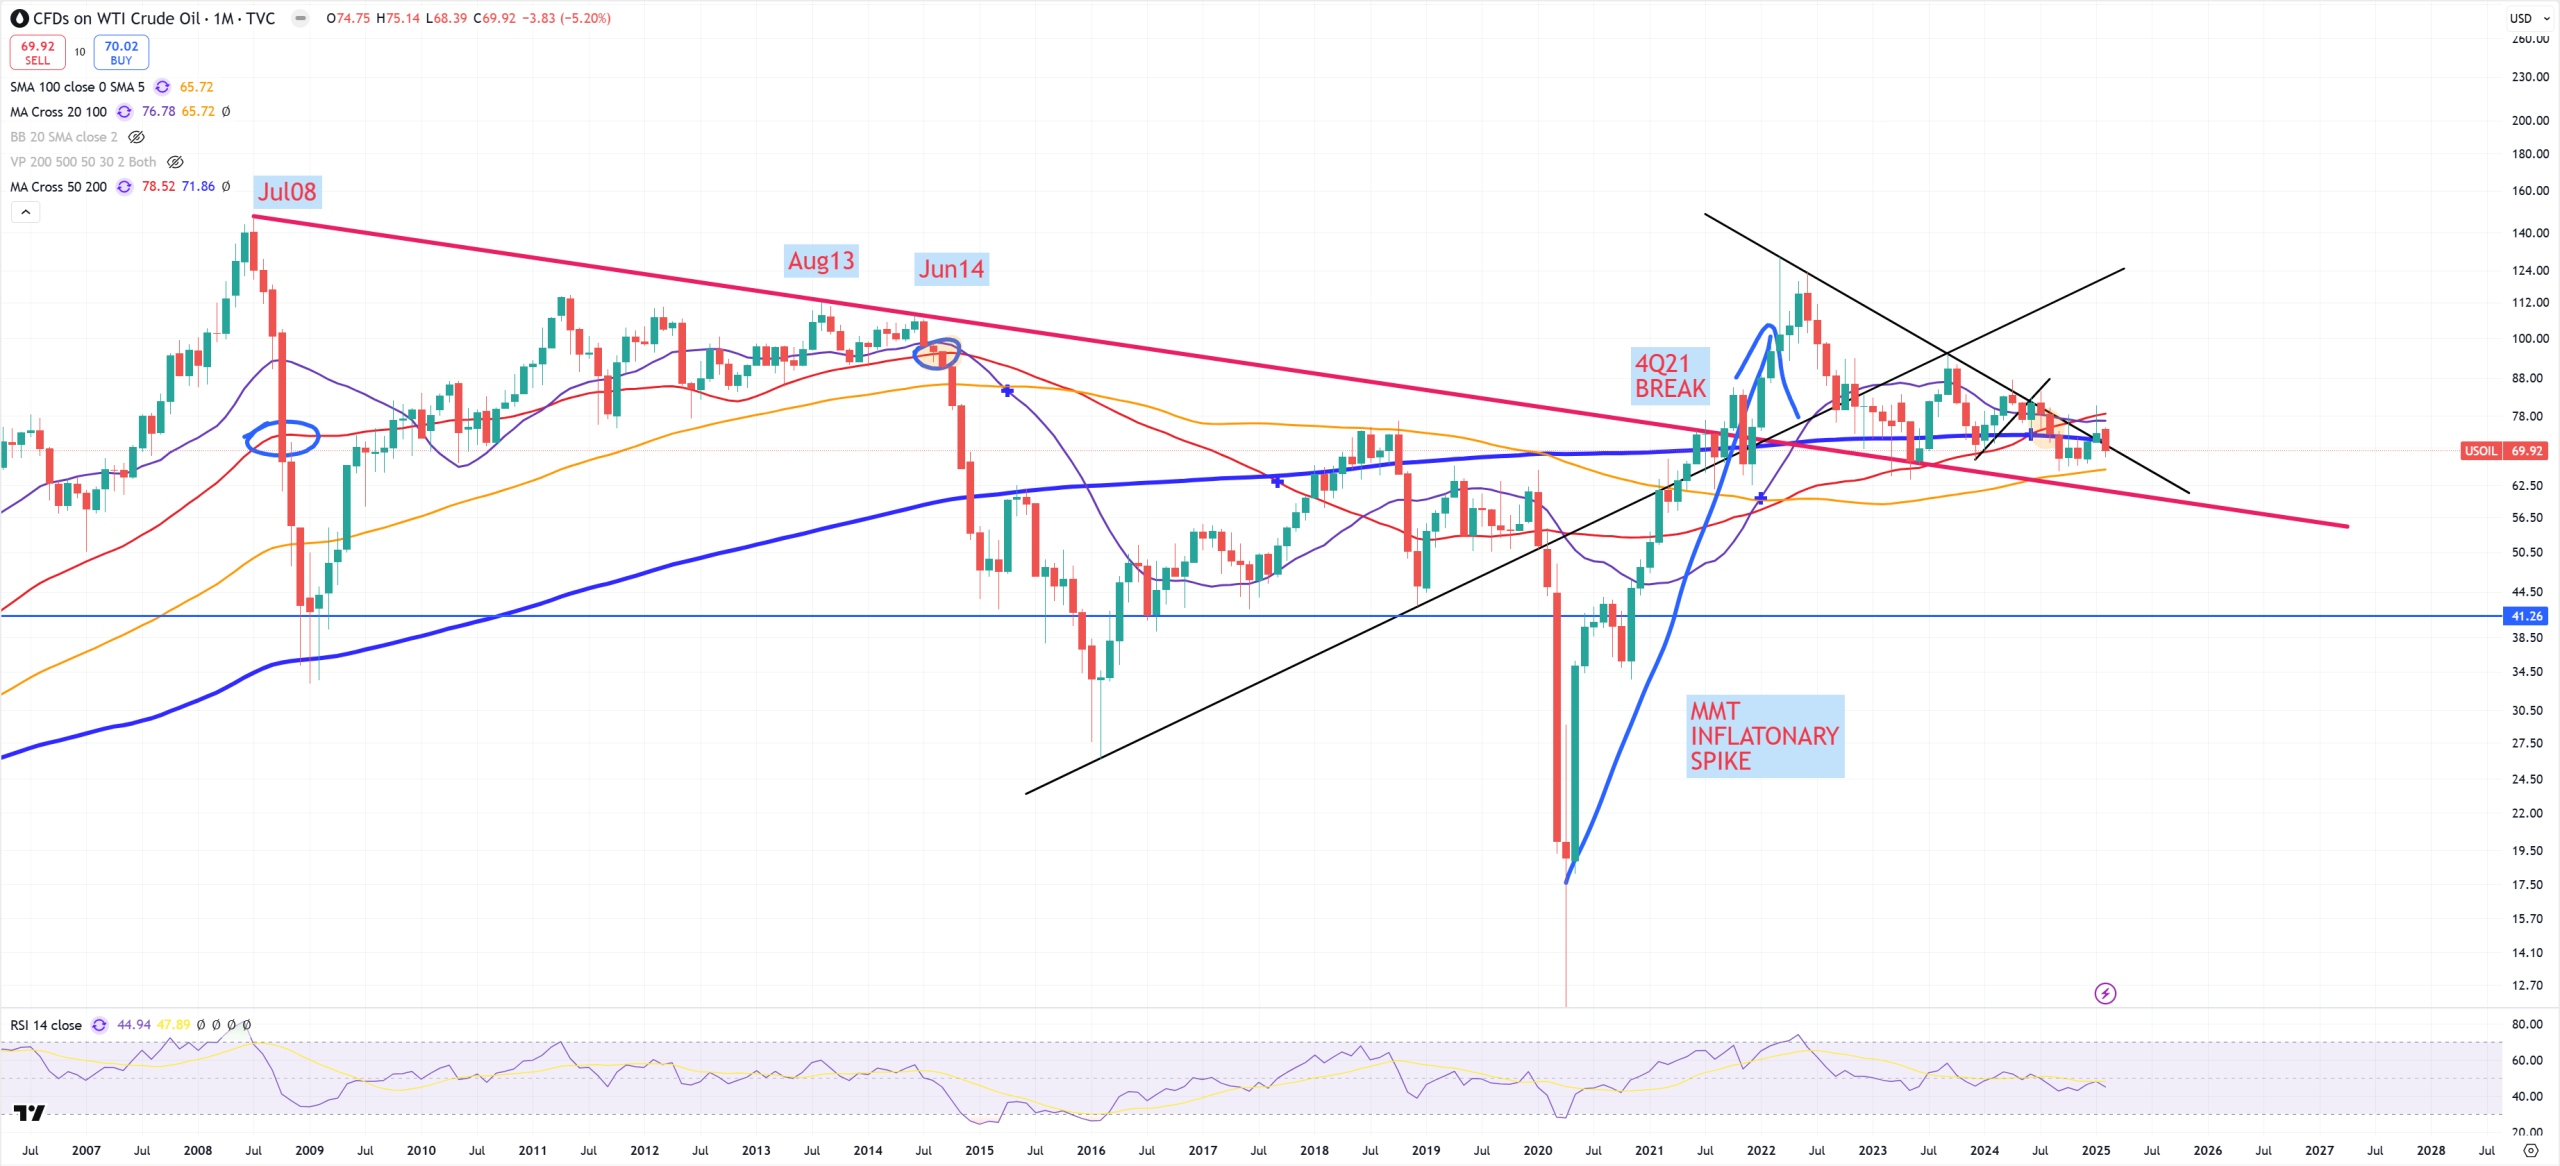
OIL – until red trend line won’t be broken we can have hopes about inflation, once it’ll be broken – the whole MMT bounce about inflation crashed and exacerbated deflation, that’s what last time caused 2008 crash. Oil spiked, inflation slowed the economy, demand evaporated and gone. So far (M)MA50 is rejected, level 62$ is “the red trend”.
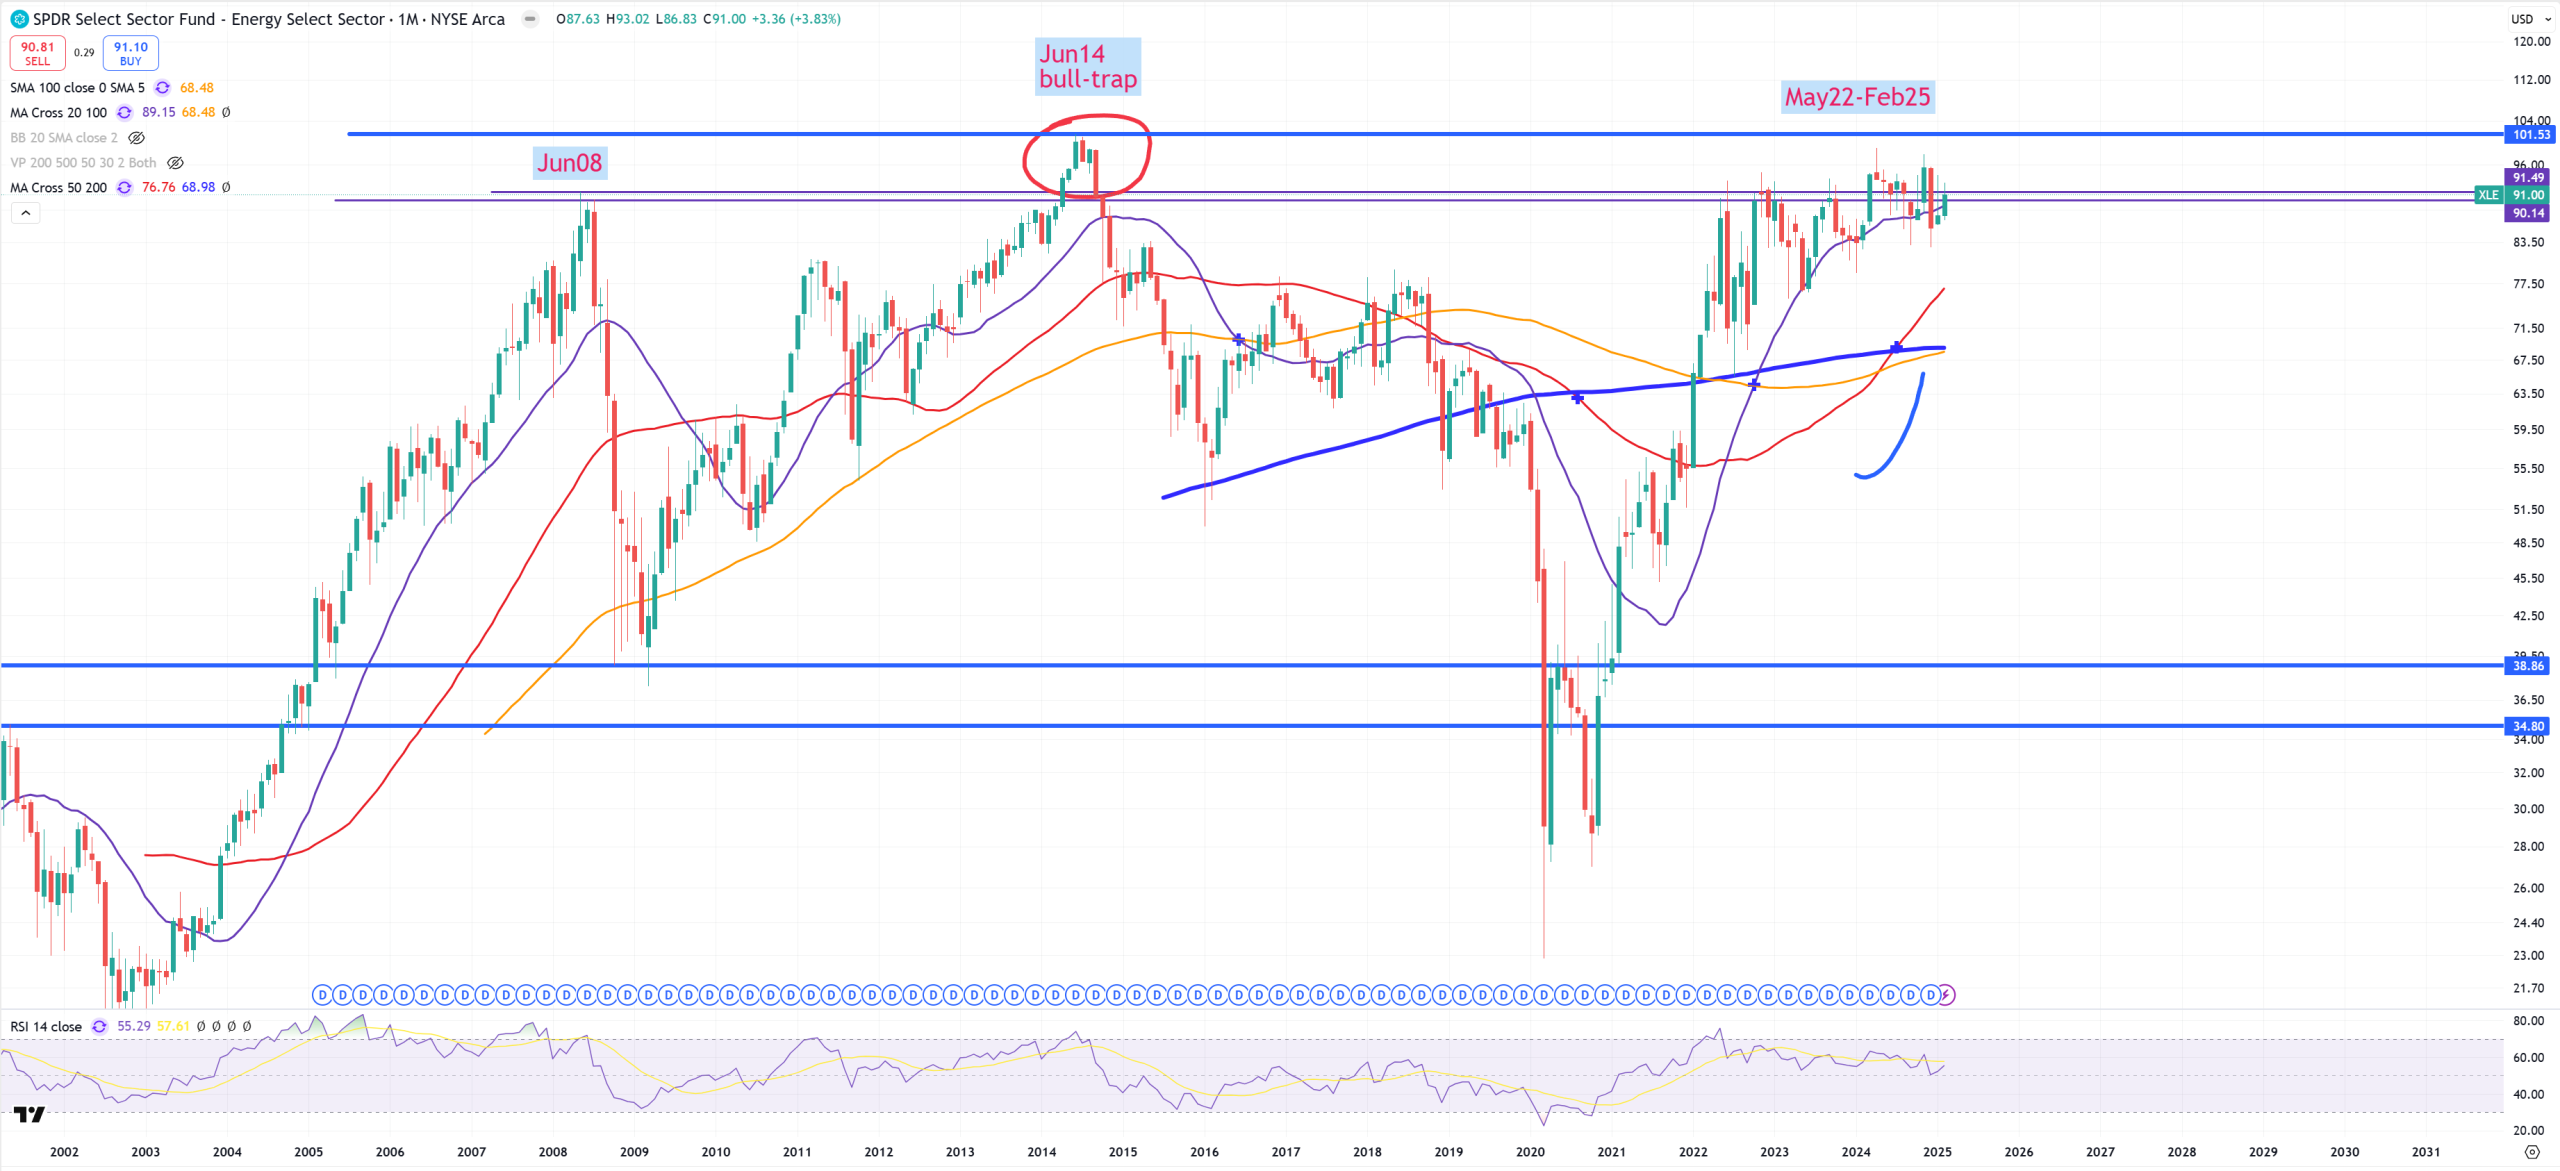
XLE – fights for its key resistance for soon 3 years
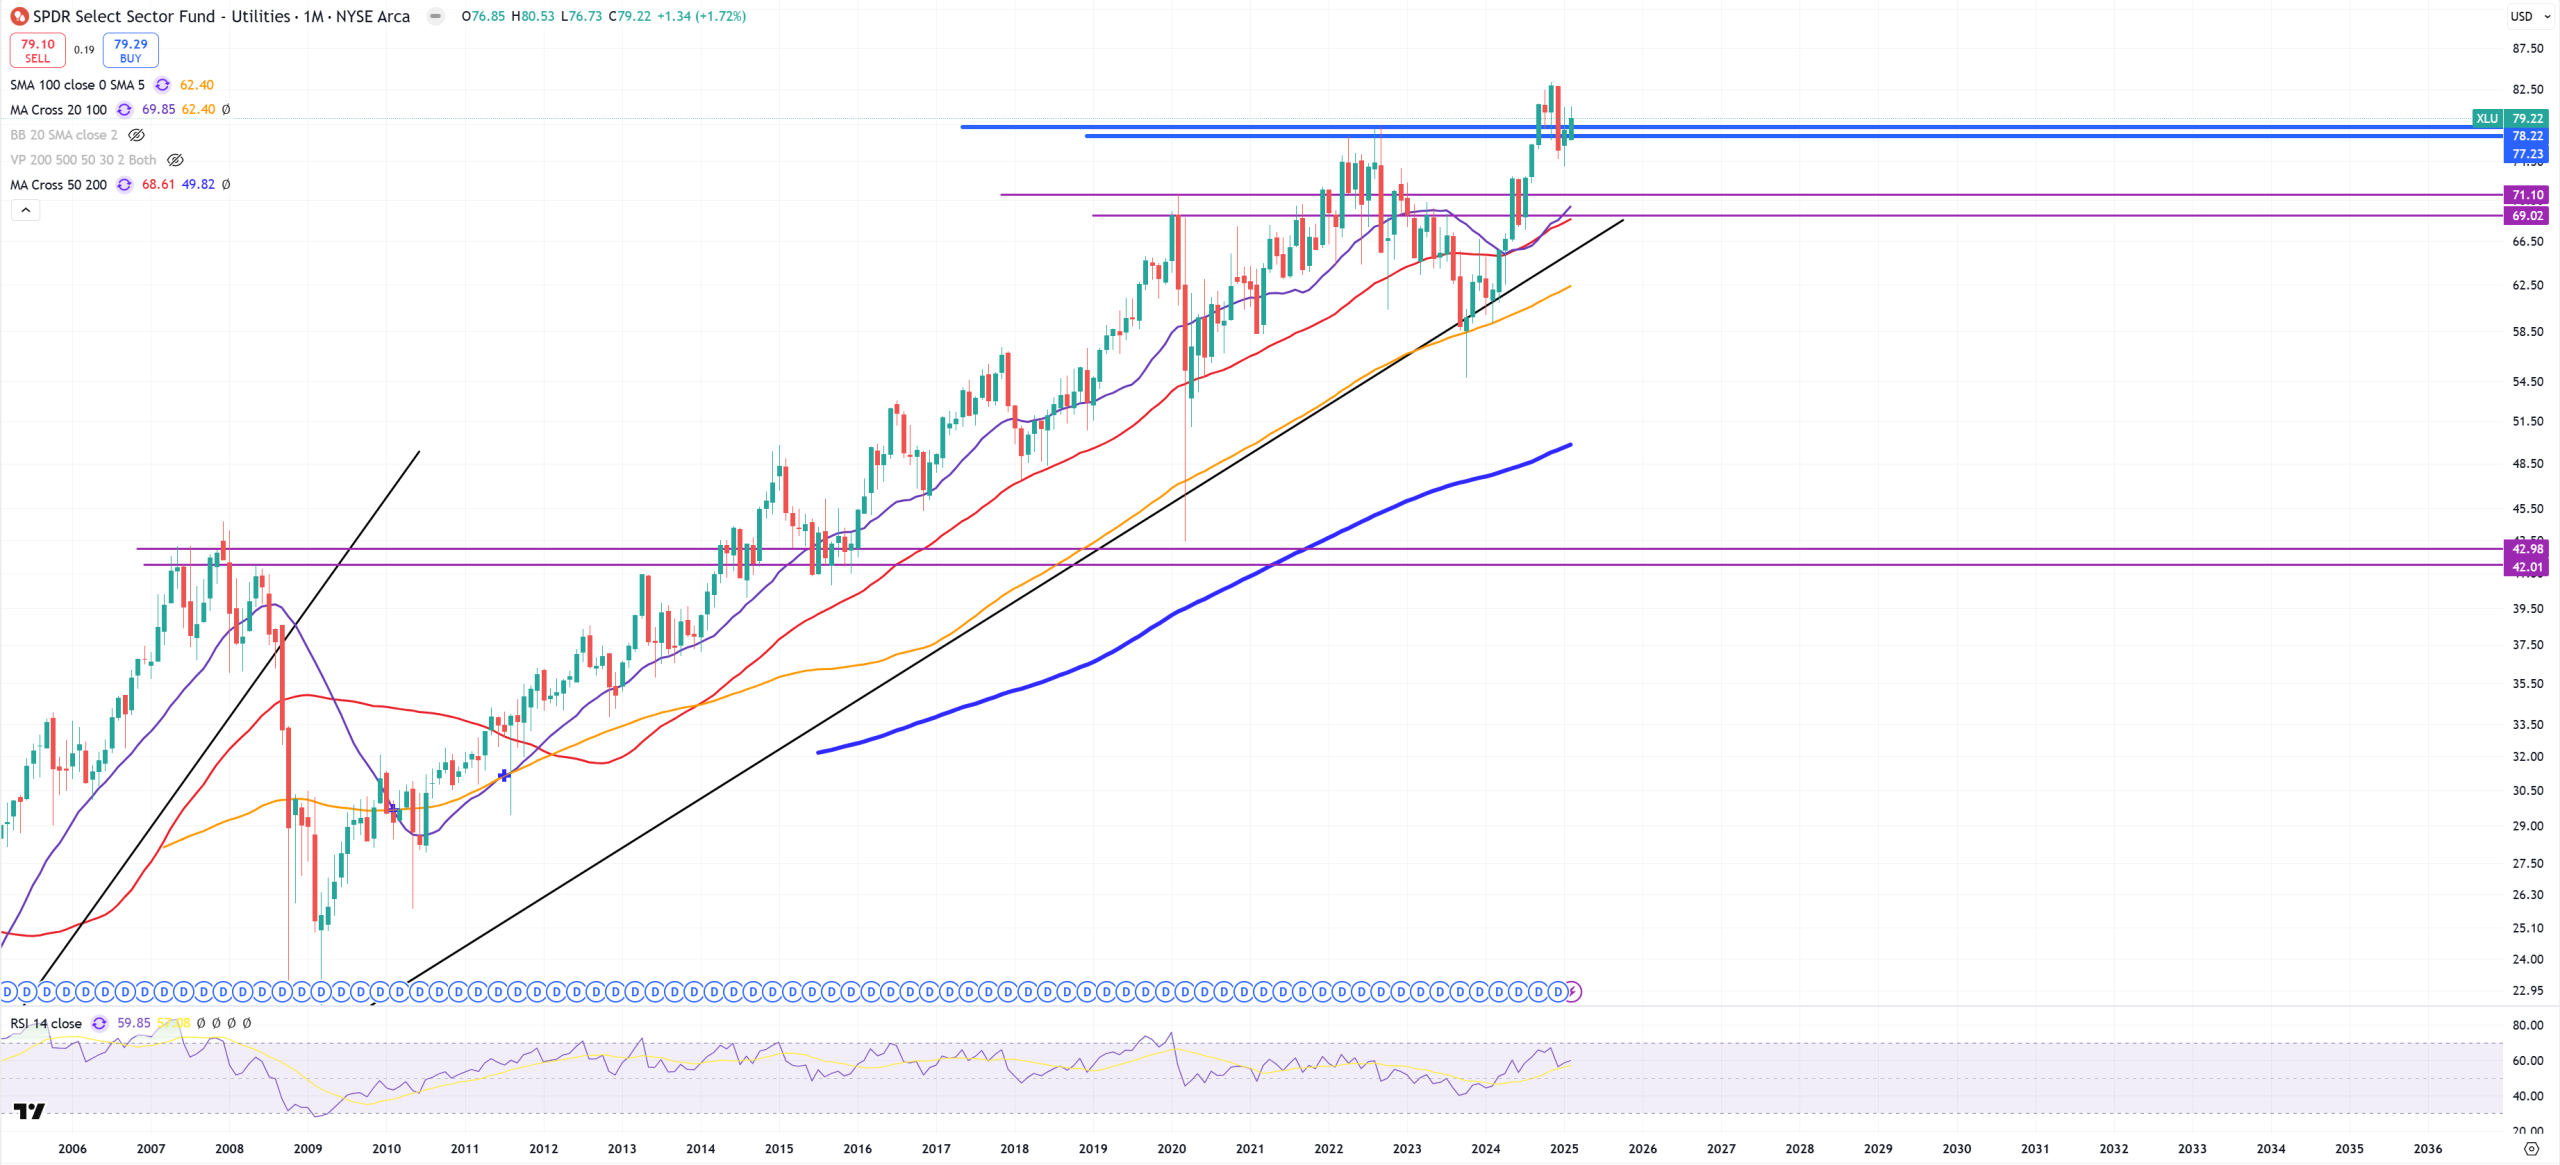
XLU – main safe-heaven stocks fights with support
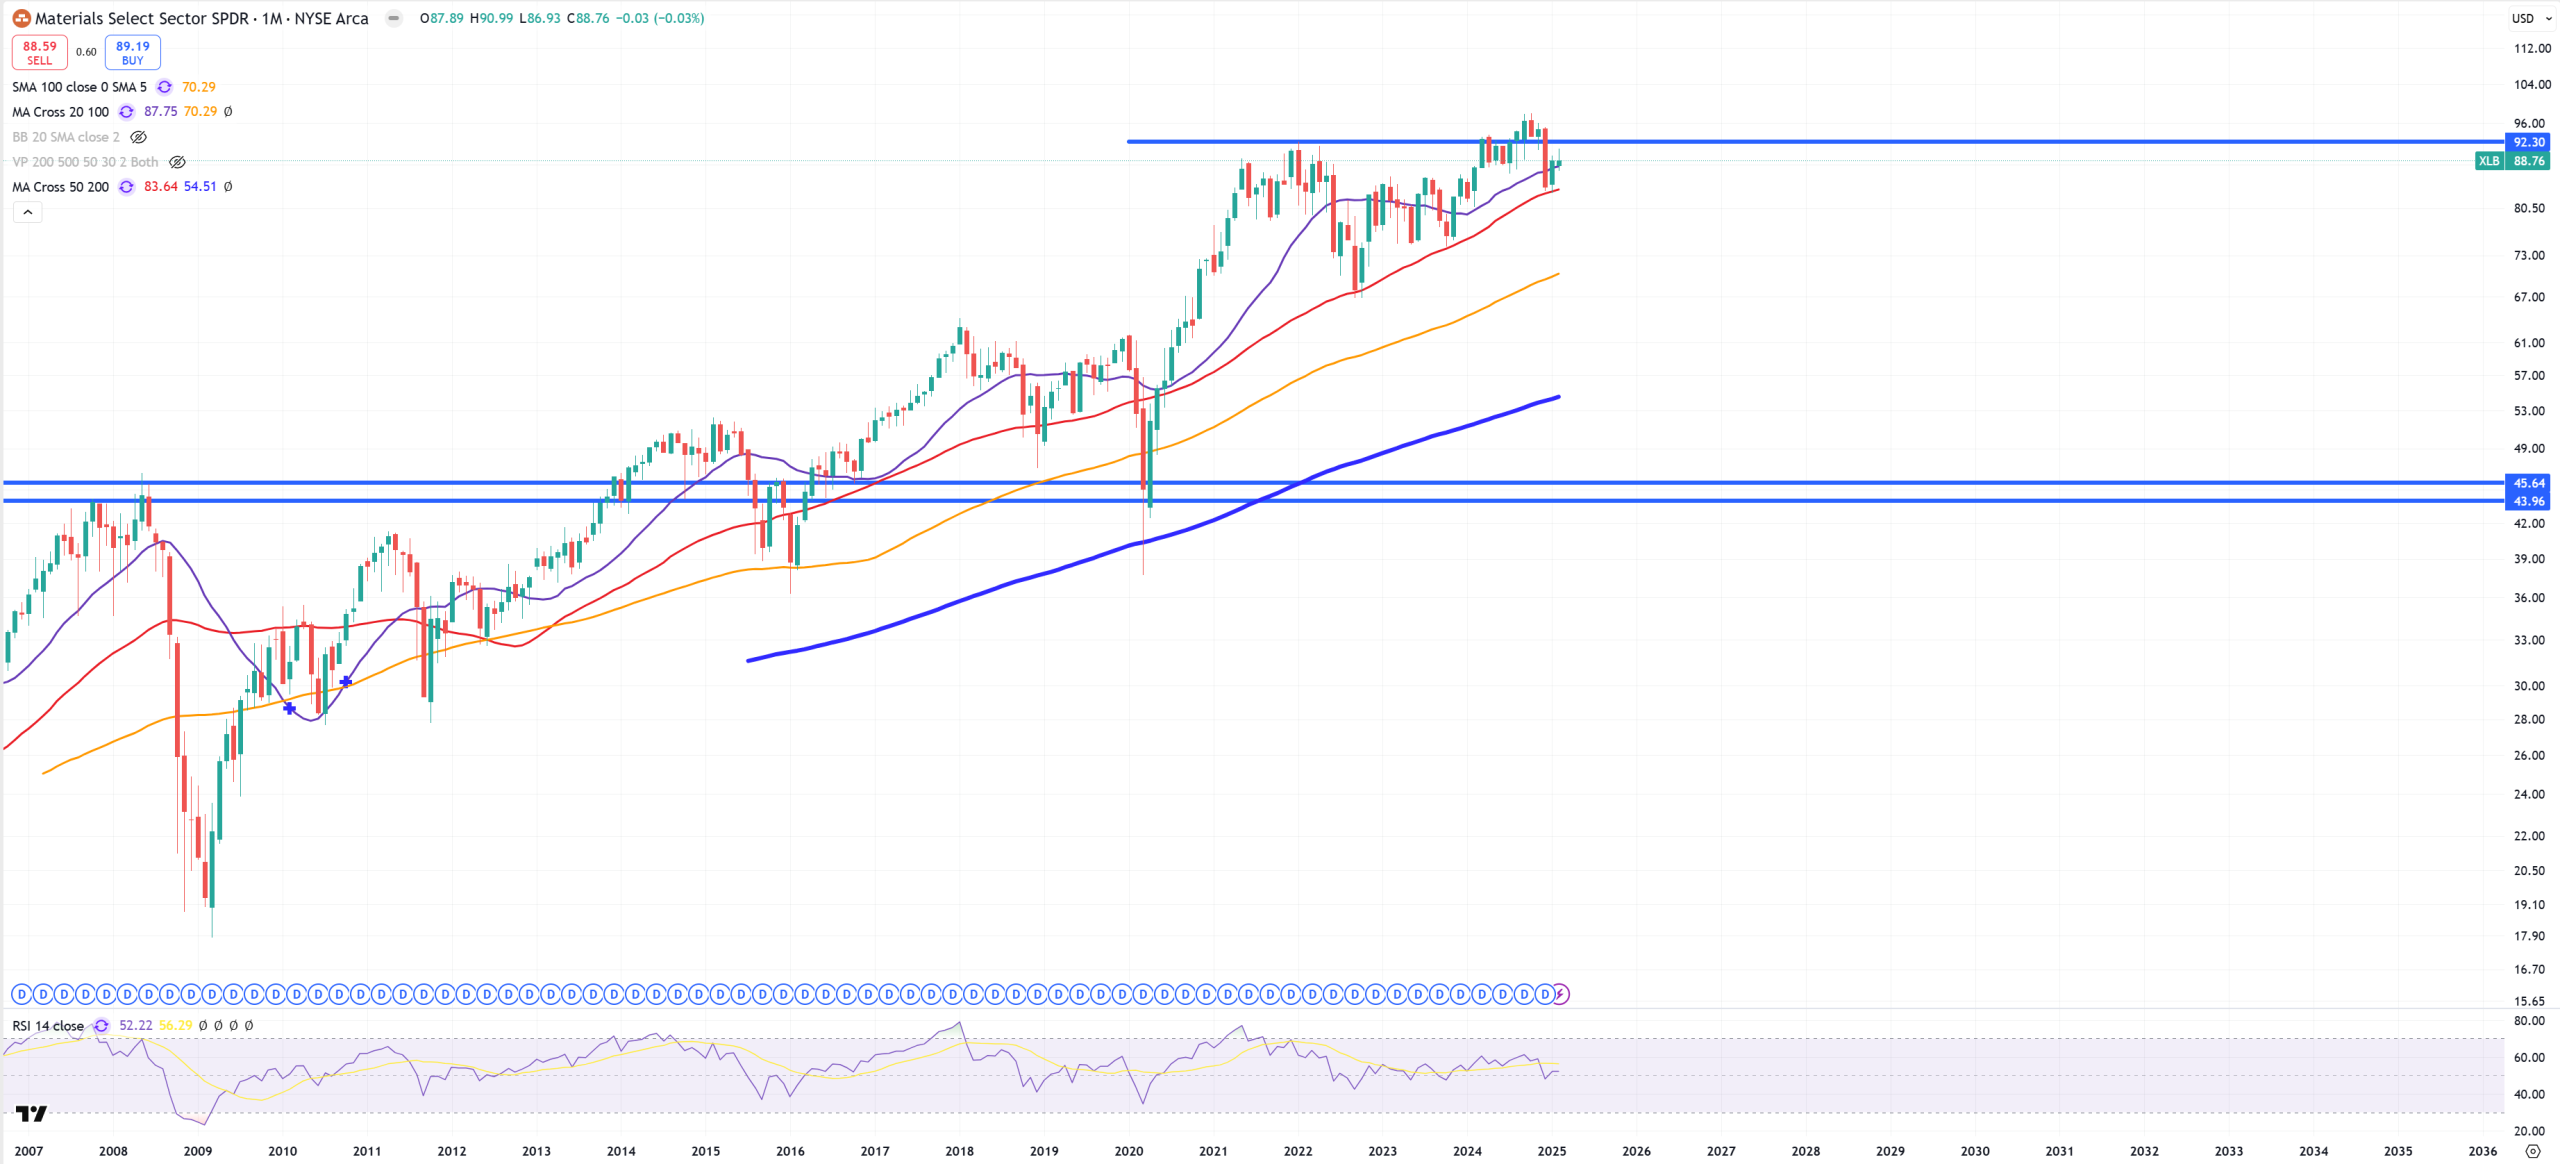
XLB – Materials – below key support now resistance
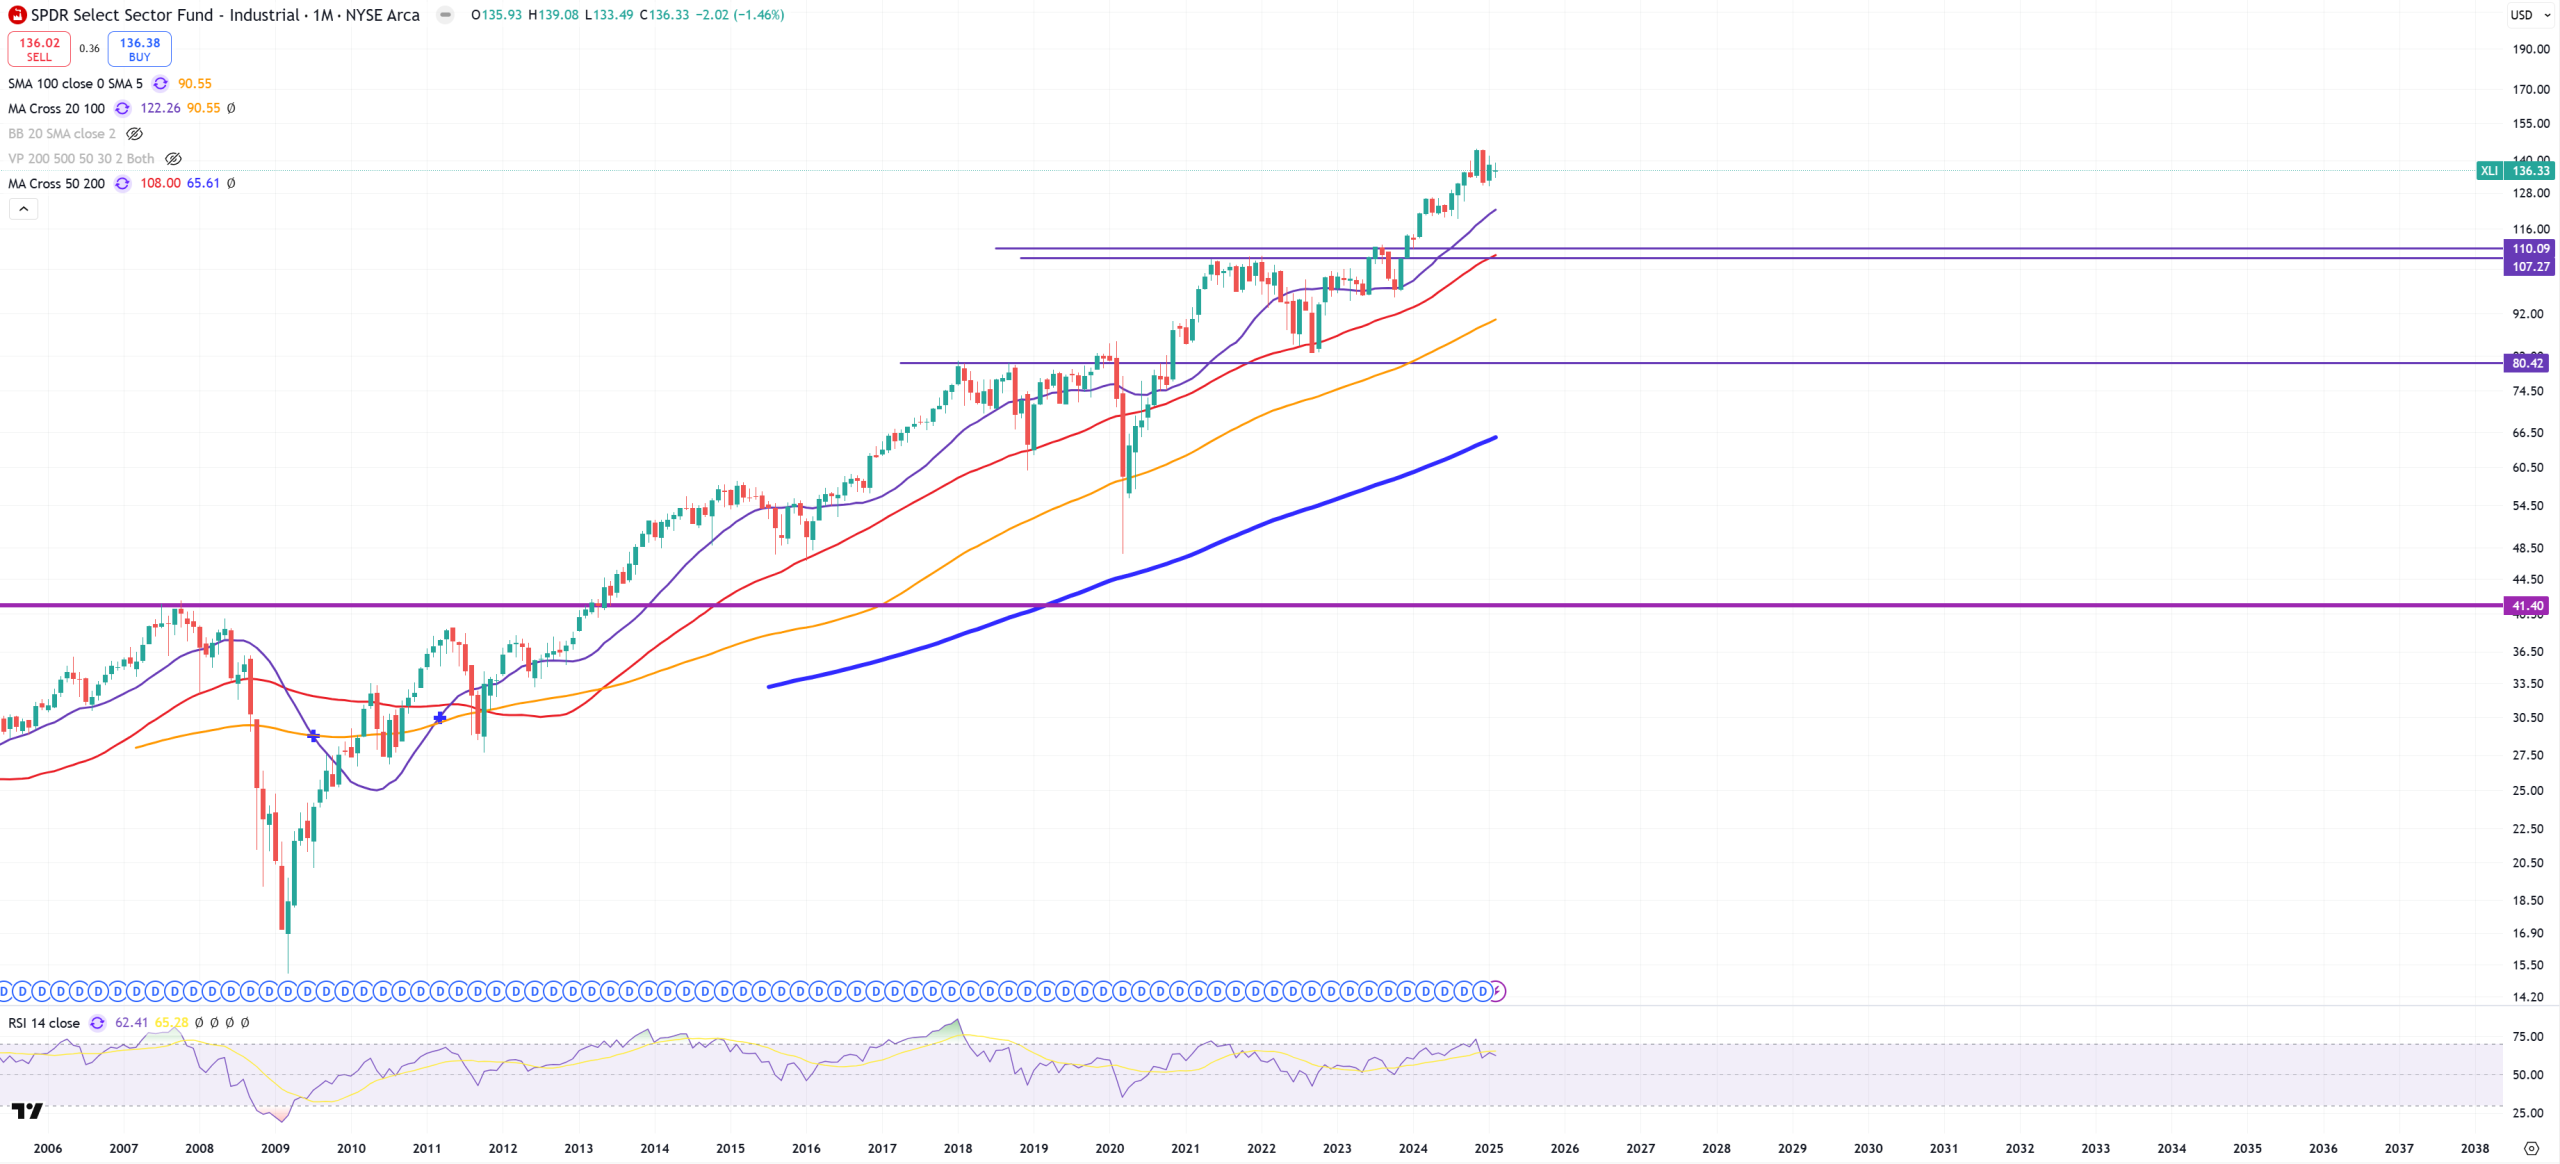
XLI – best sector so far
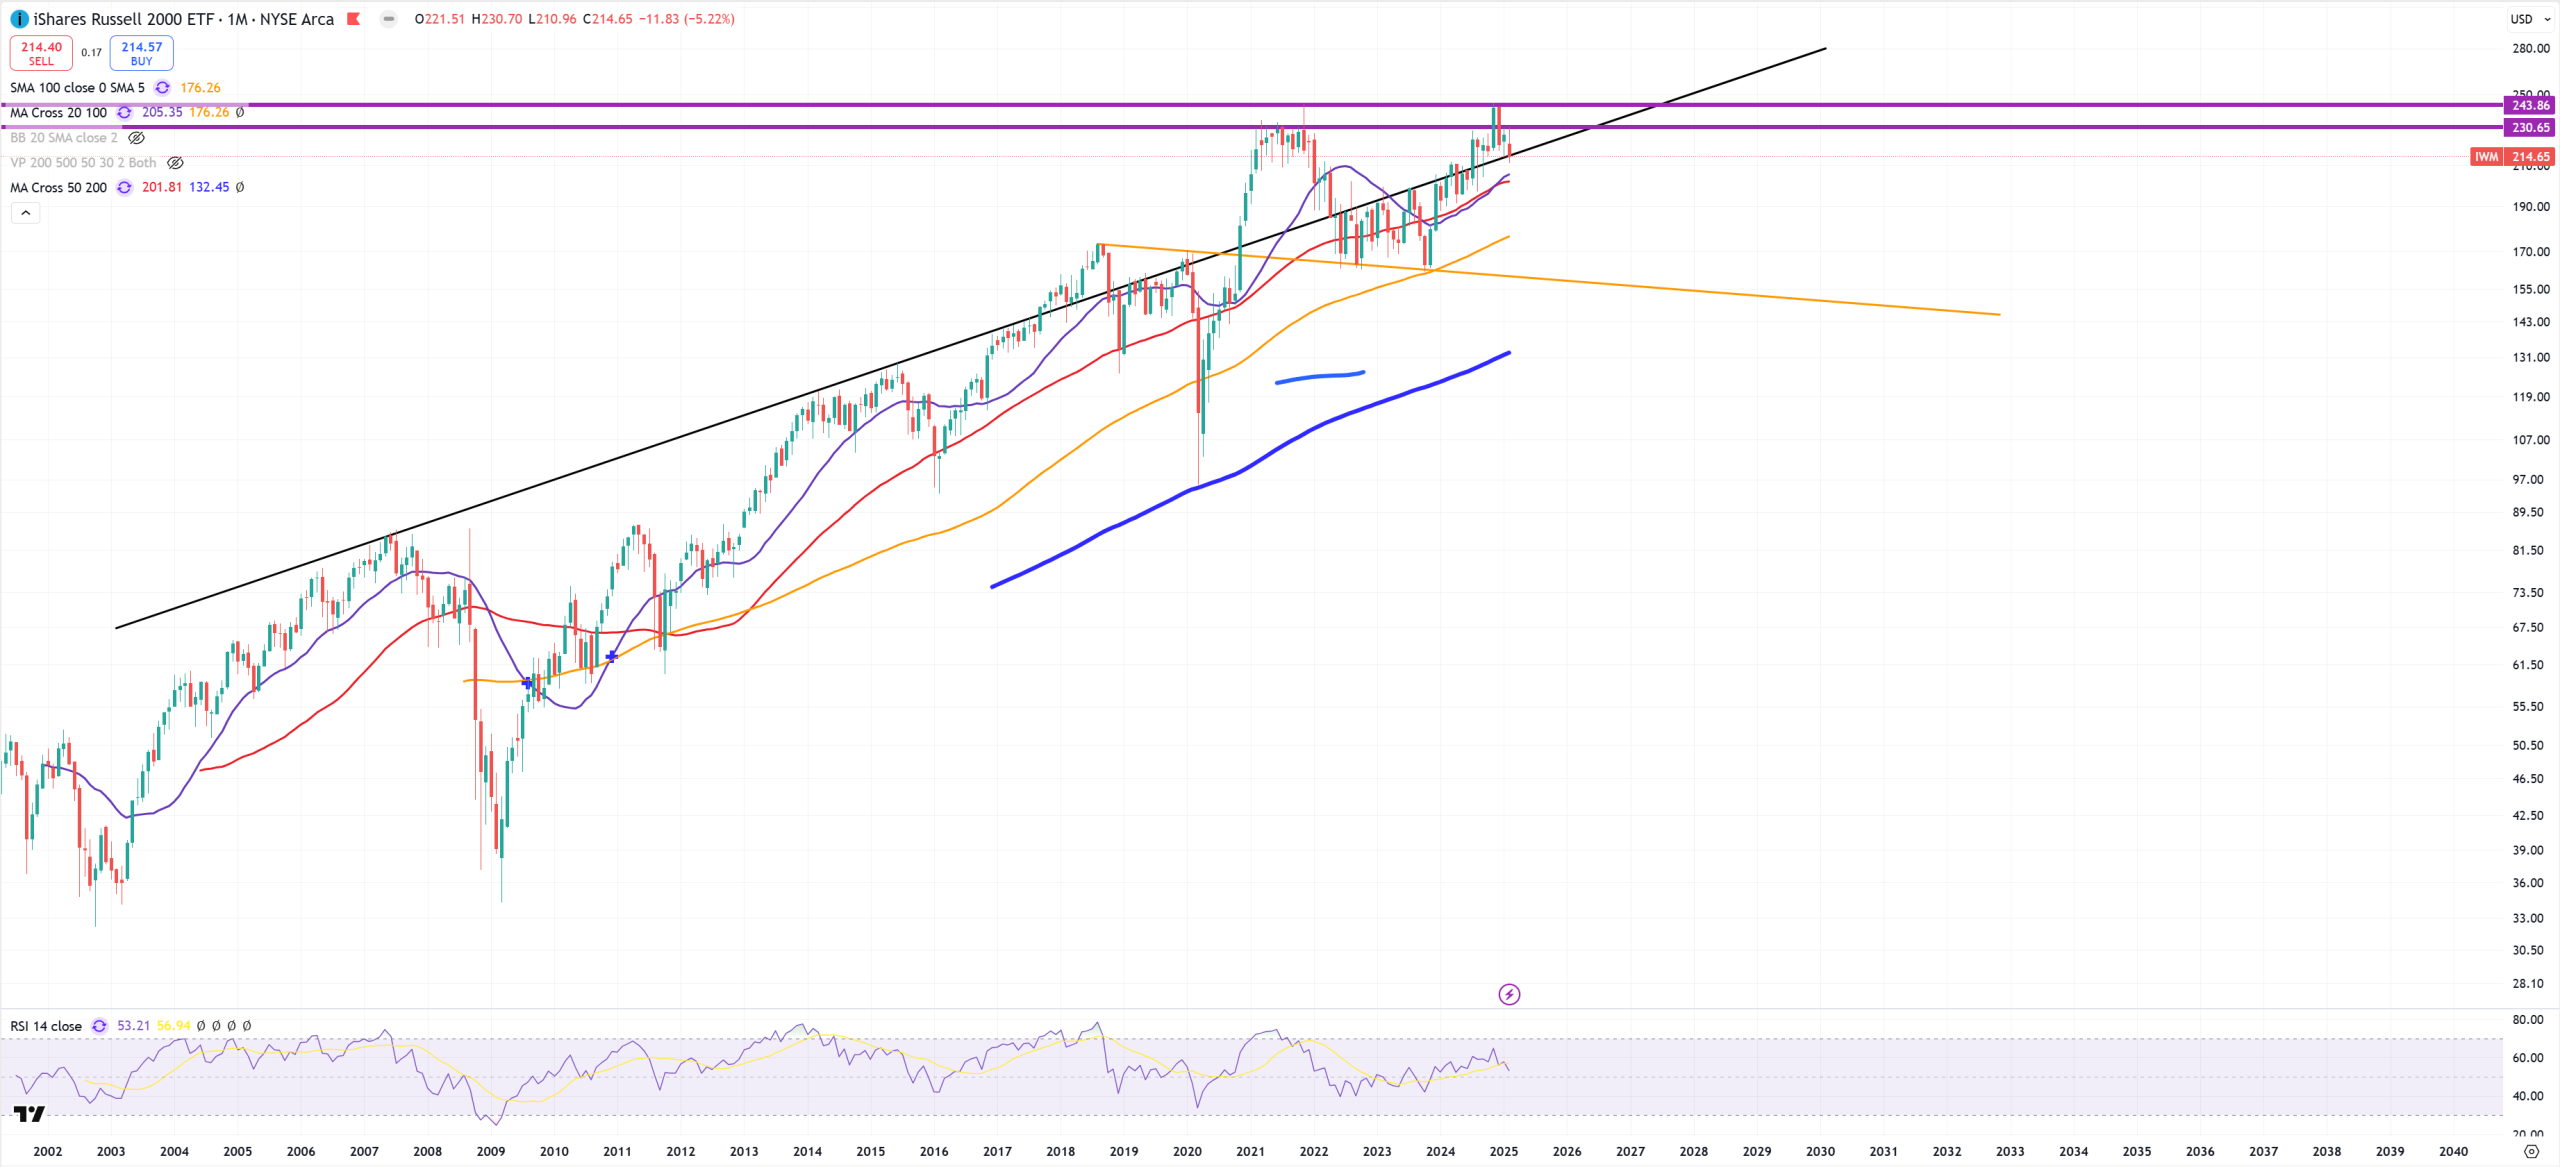
IWM – Small Caps – placed double-top and now on a key trend line, bears need to open March below the trend, bulls must keep it.
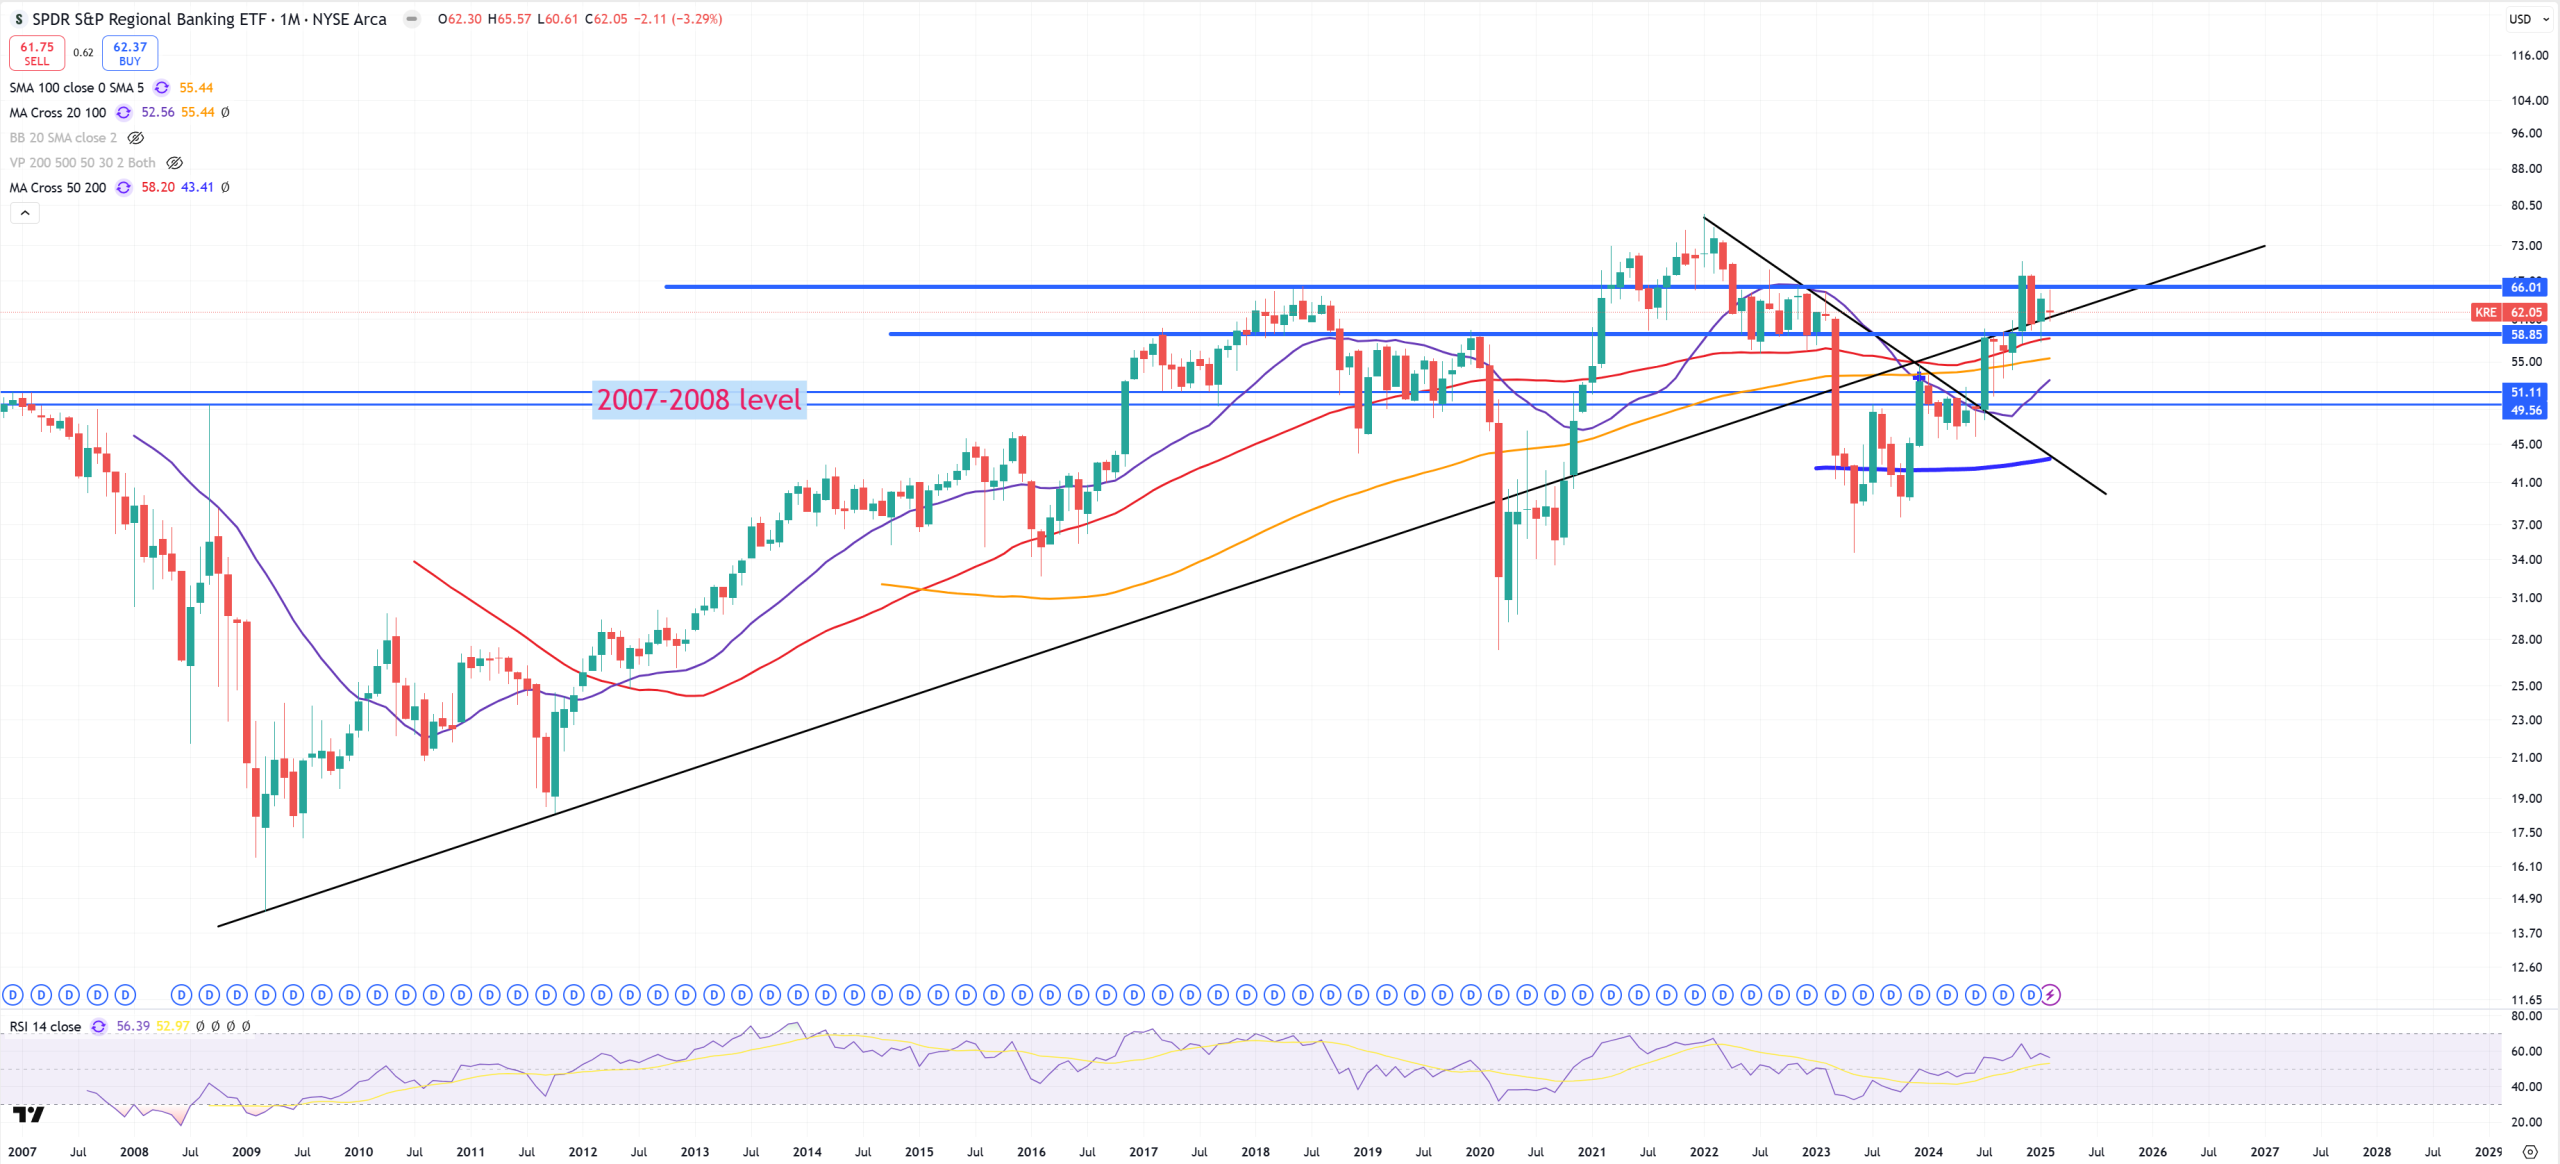
KRE – Regional Banking is following IWM it’s more or less the same chart, it was hold for couple months below black trend line, but just like IWM it decided to go above it.
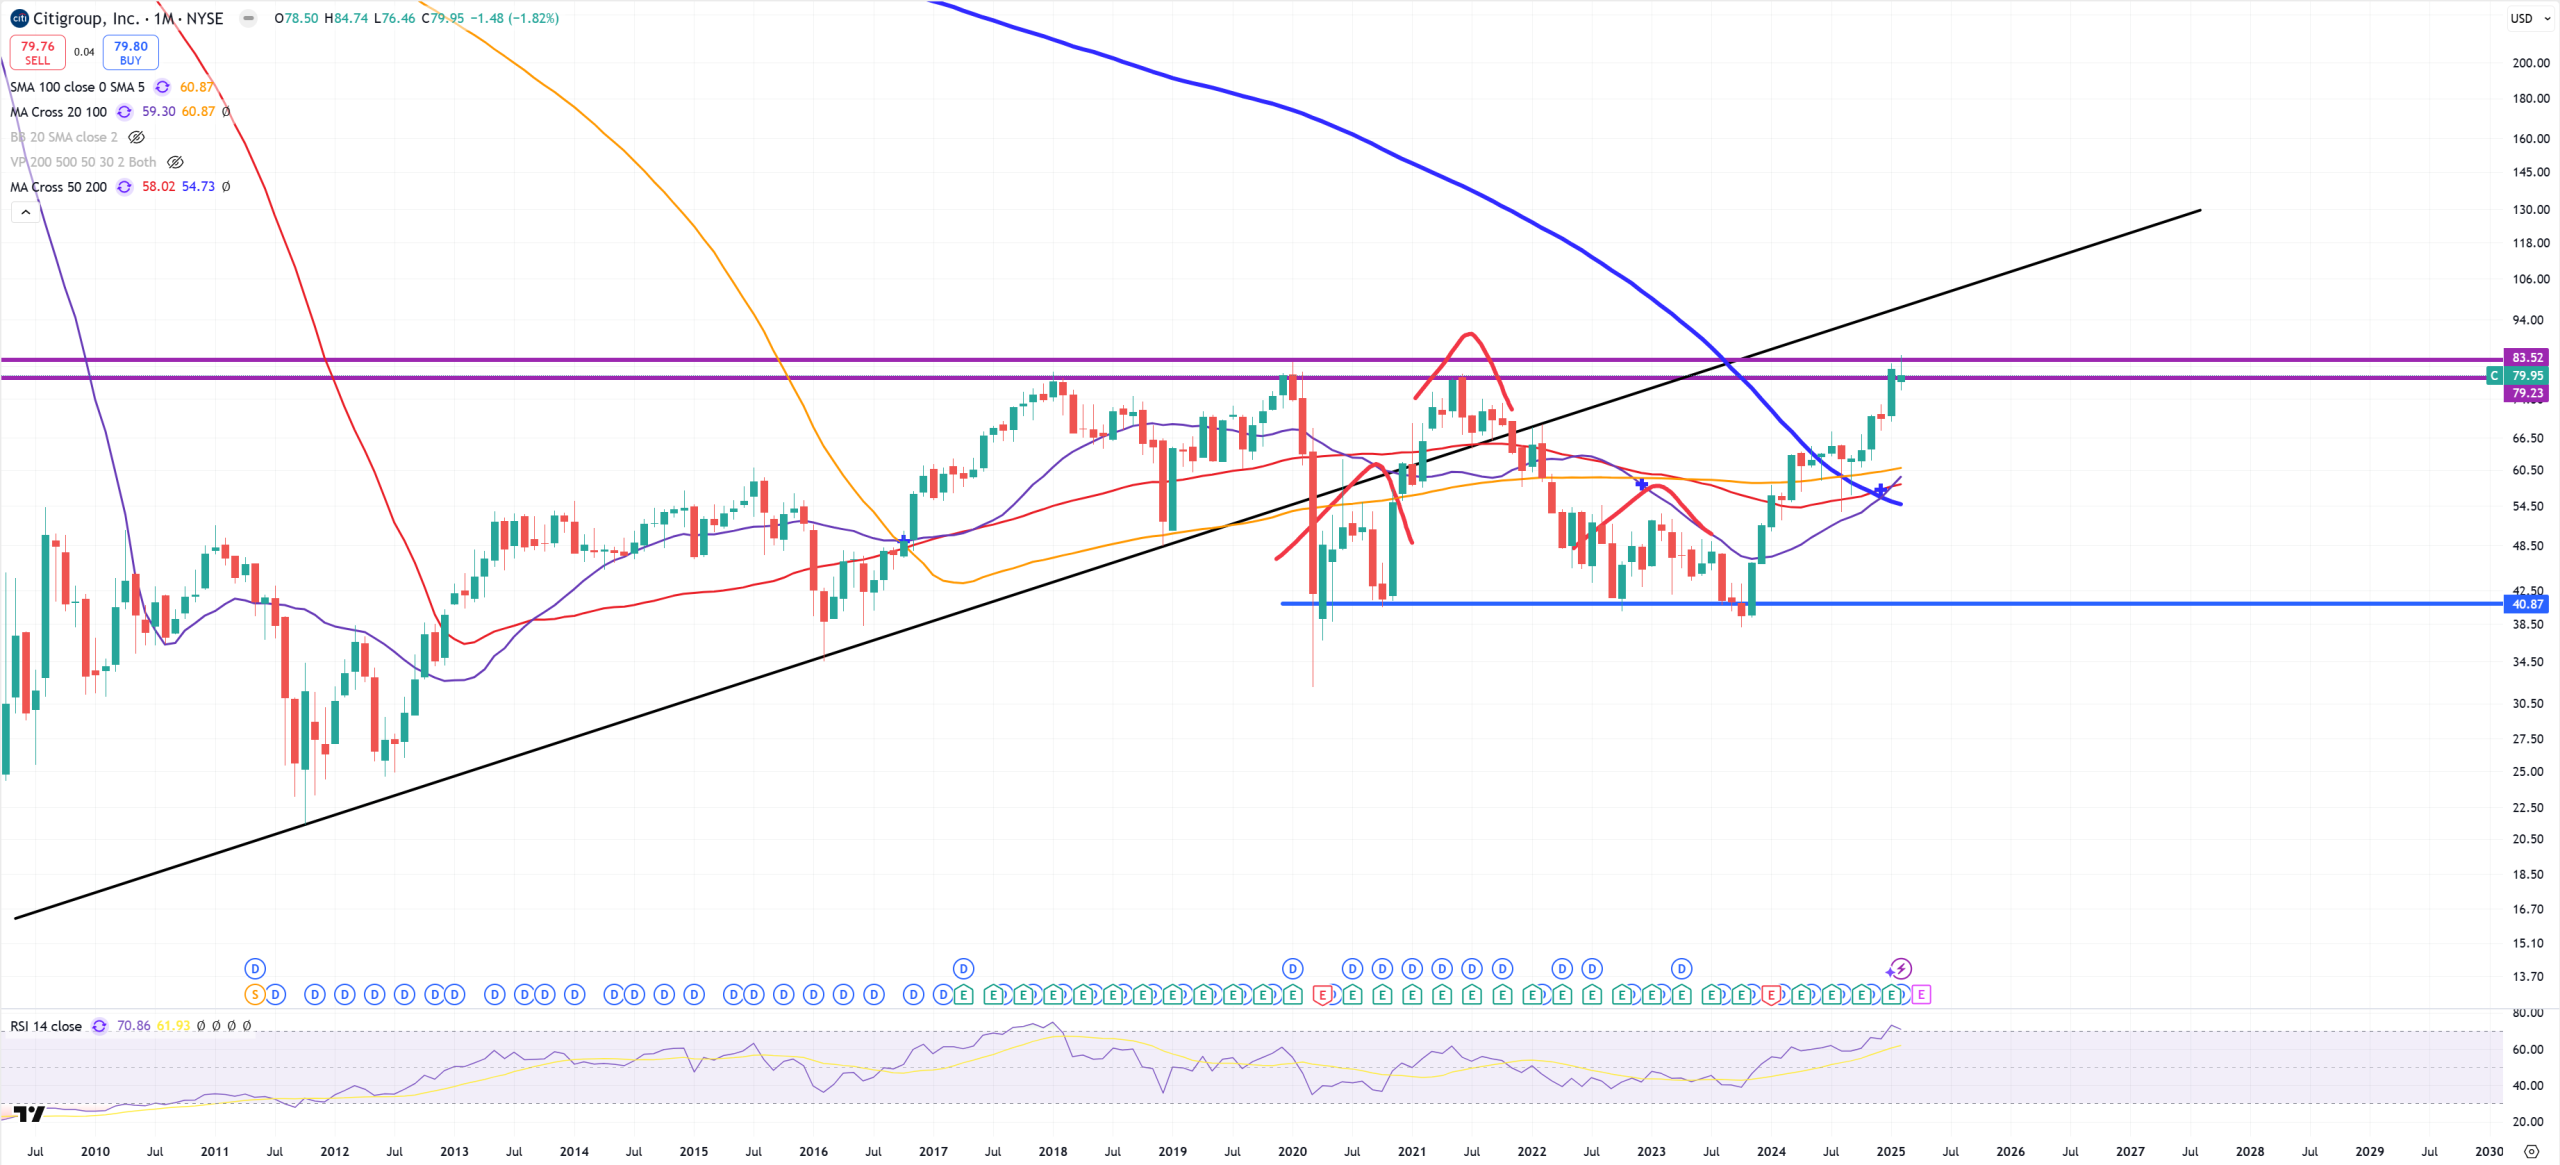
C – CitiBank and its multiple resistance
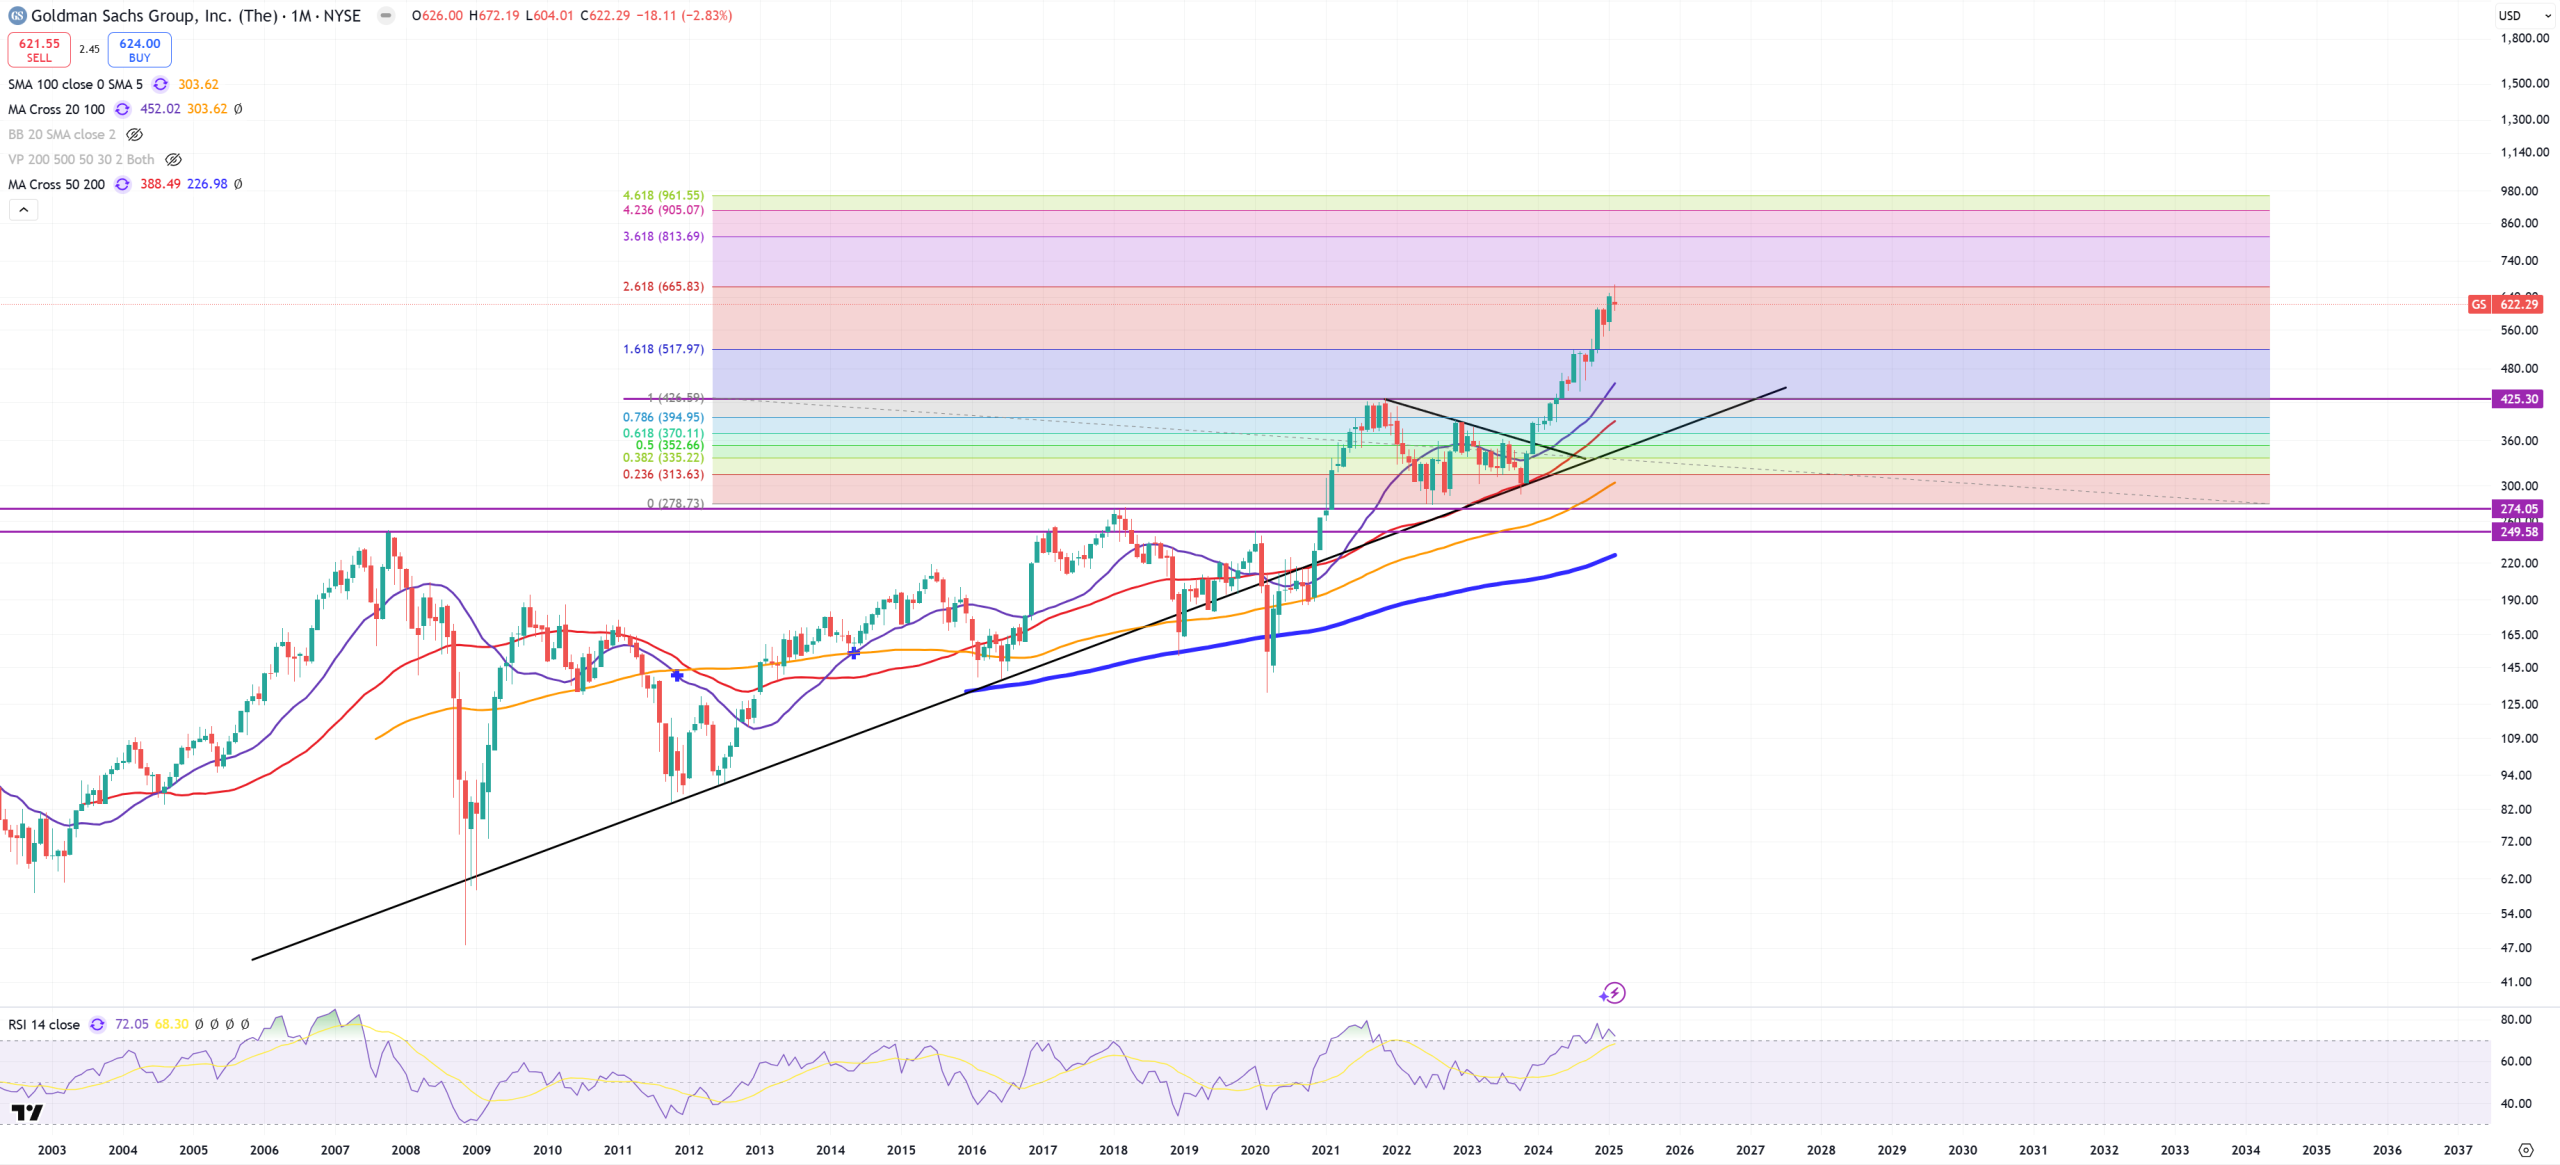
GS – Goldman Sachs trend is kept but 2.618 extension level has been hit
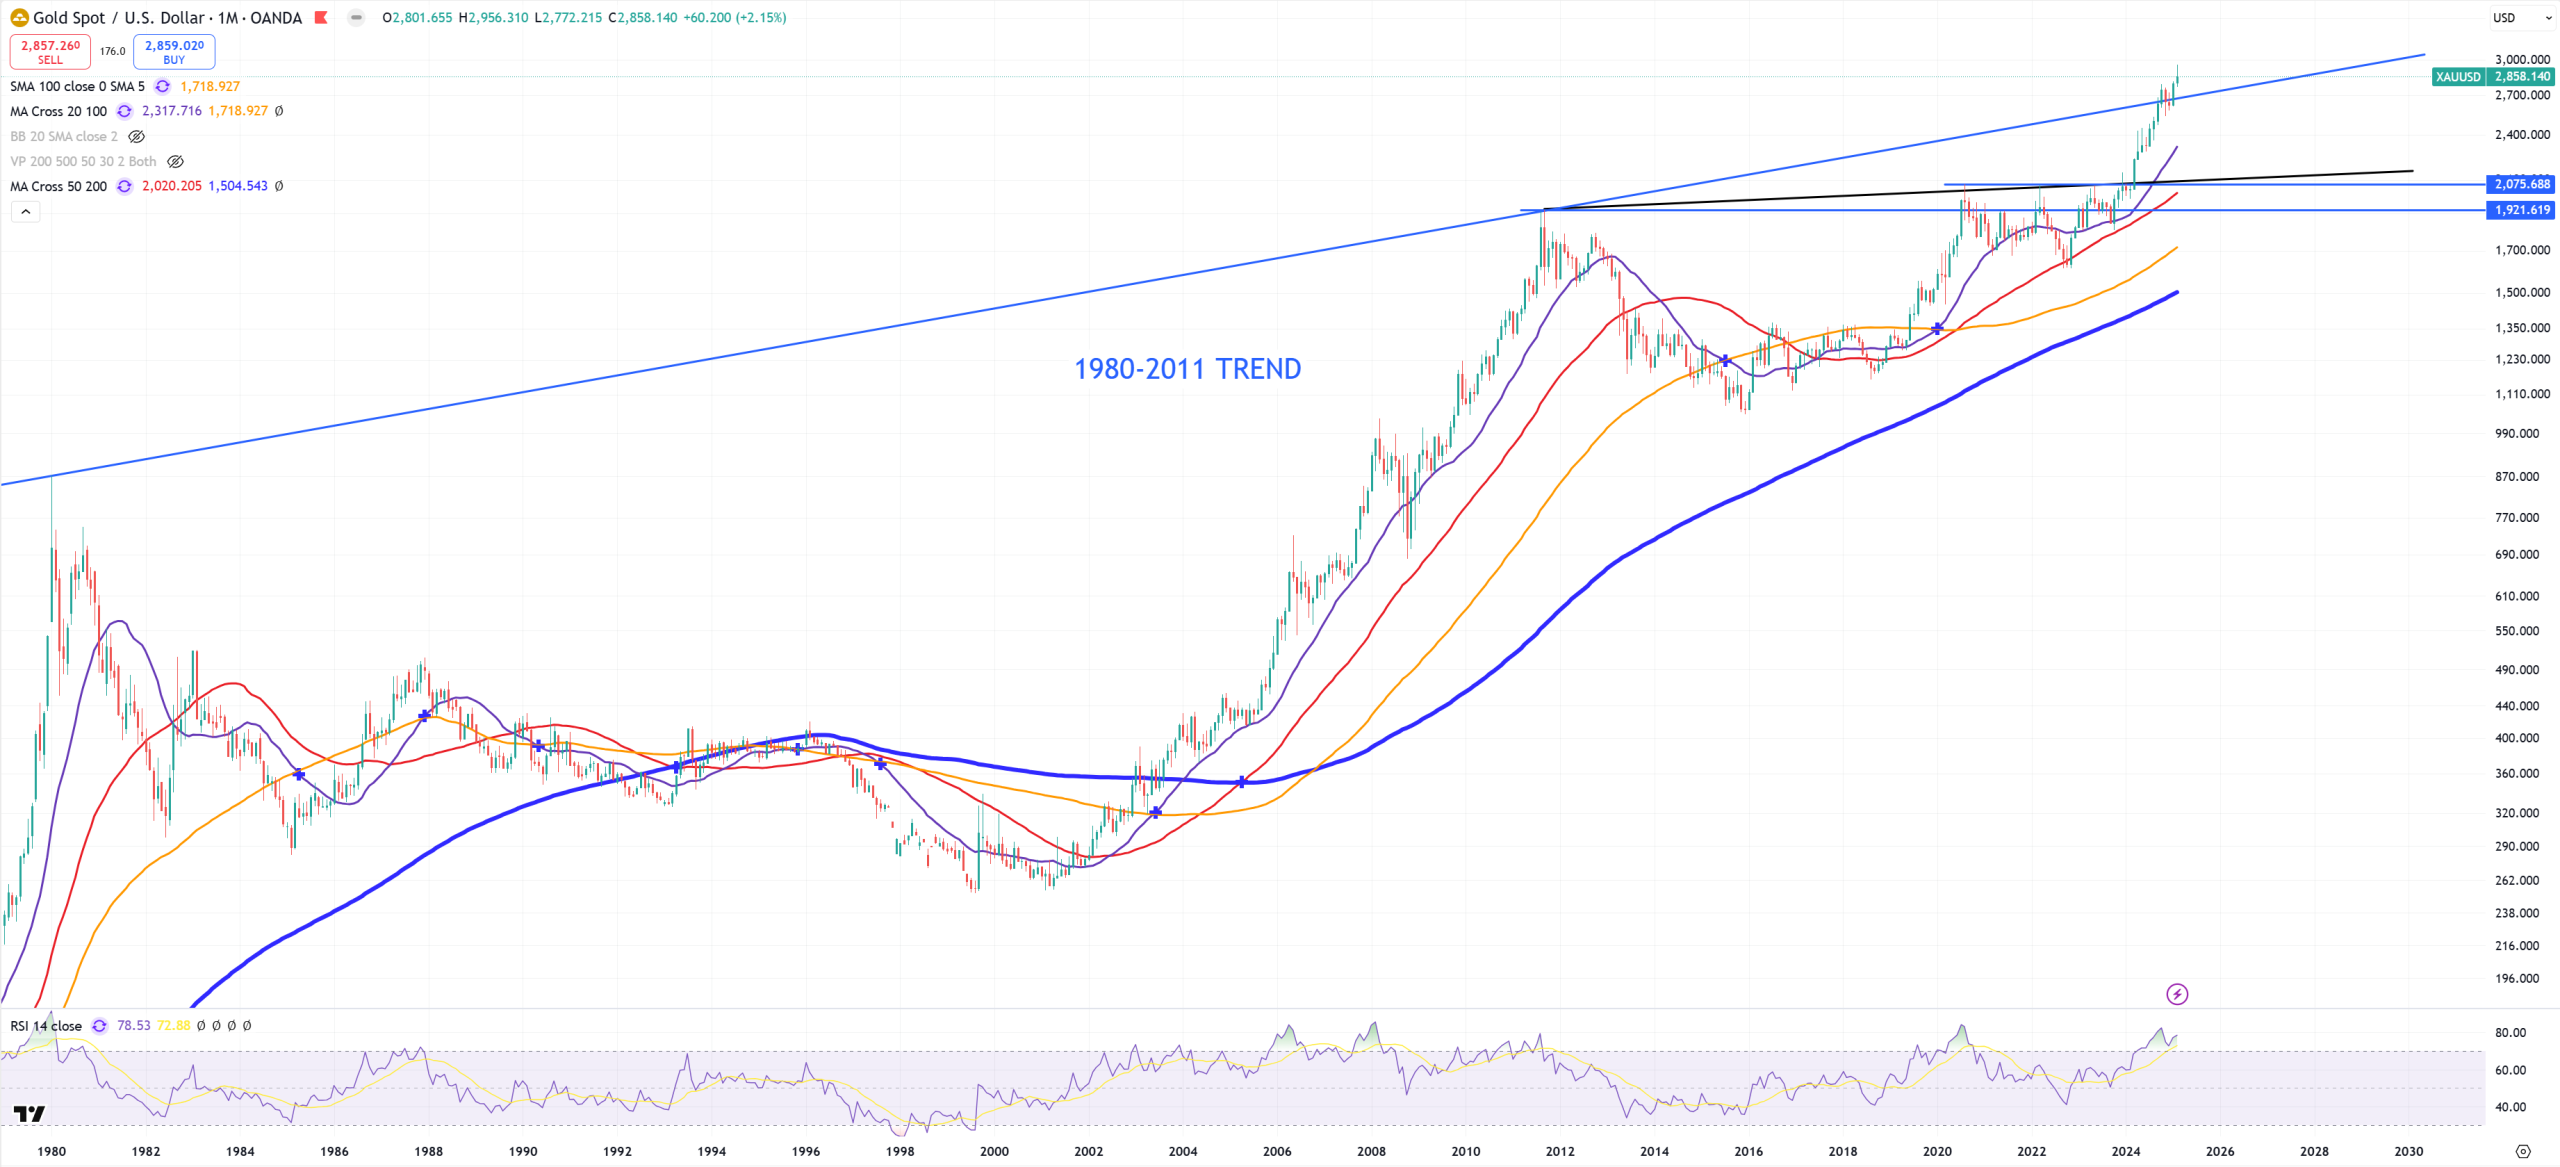
GOLD – long term 1980-2011 trend was broken, but GOLD is heavily overbought, 2700$ is a natural retest of a broken trend
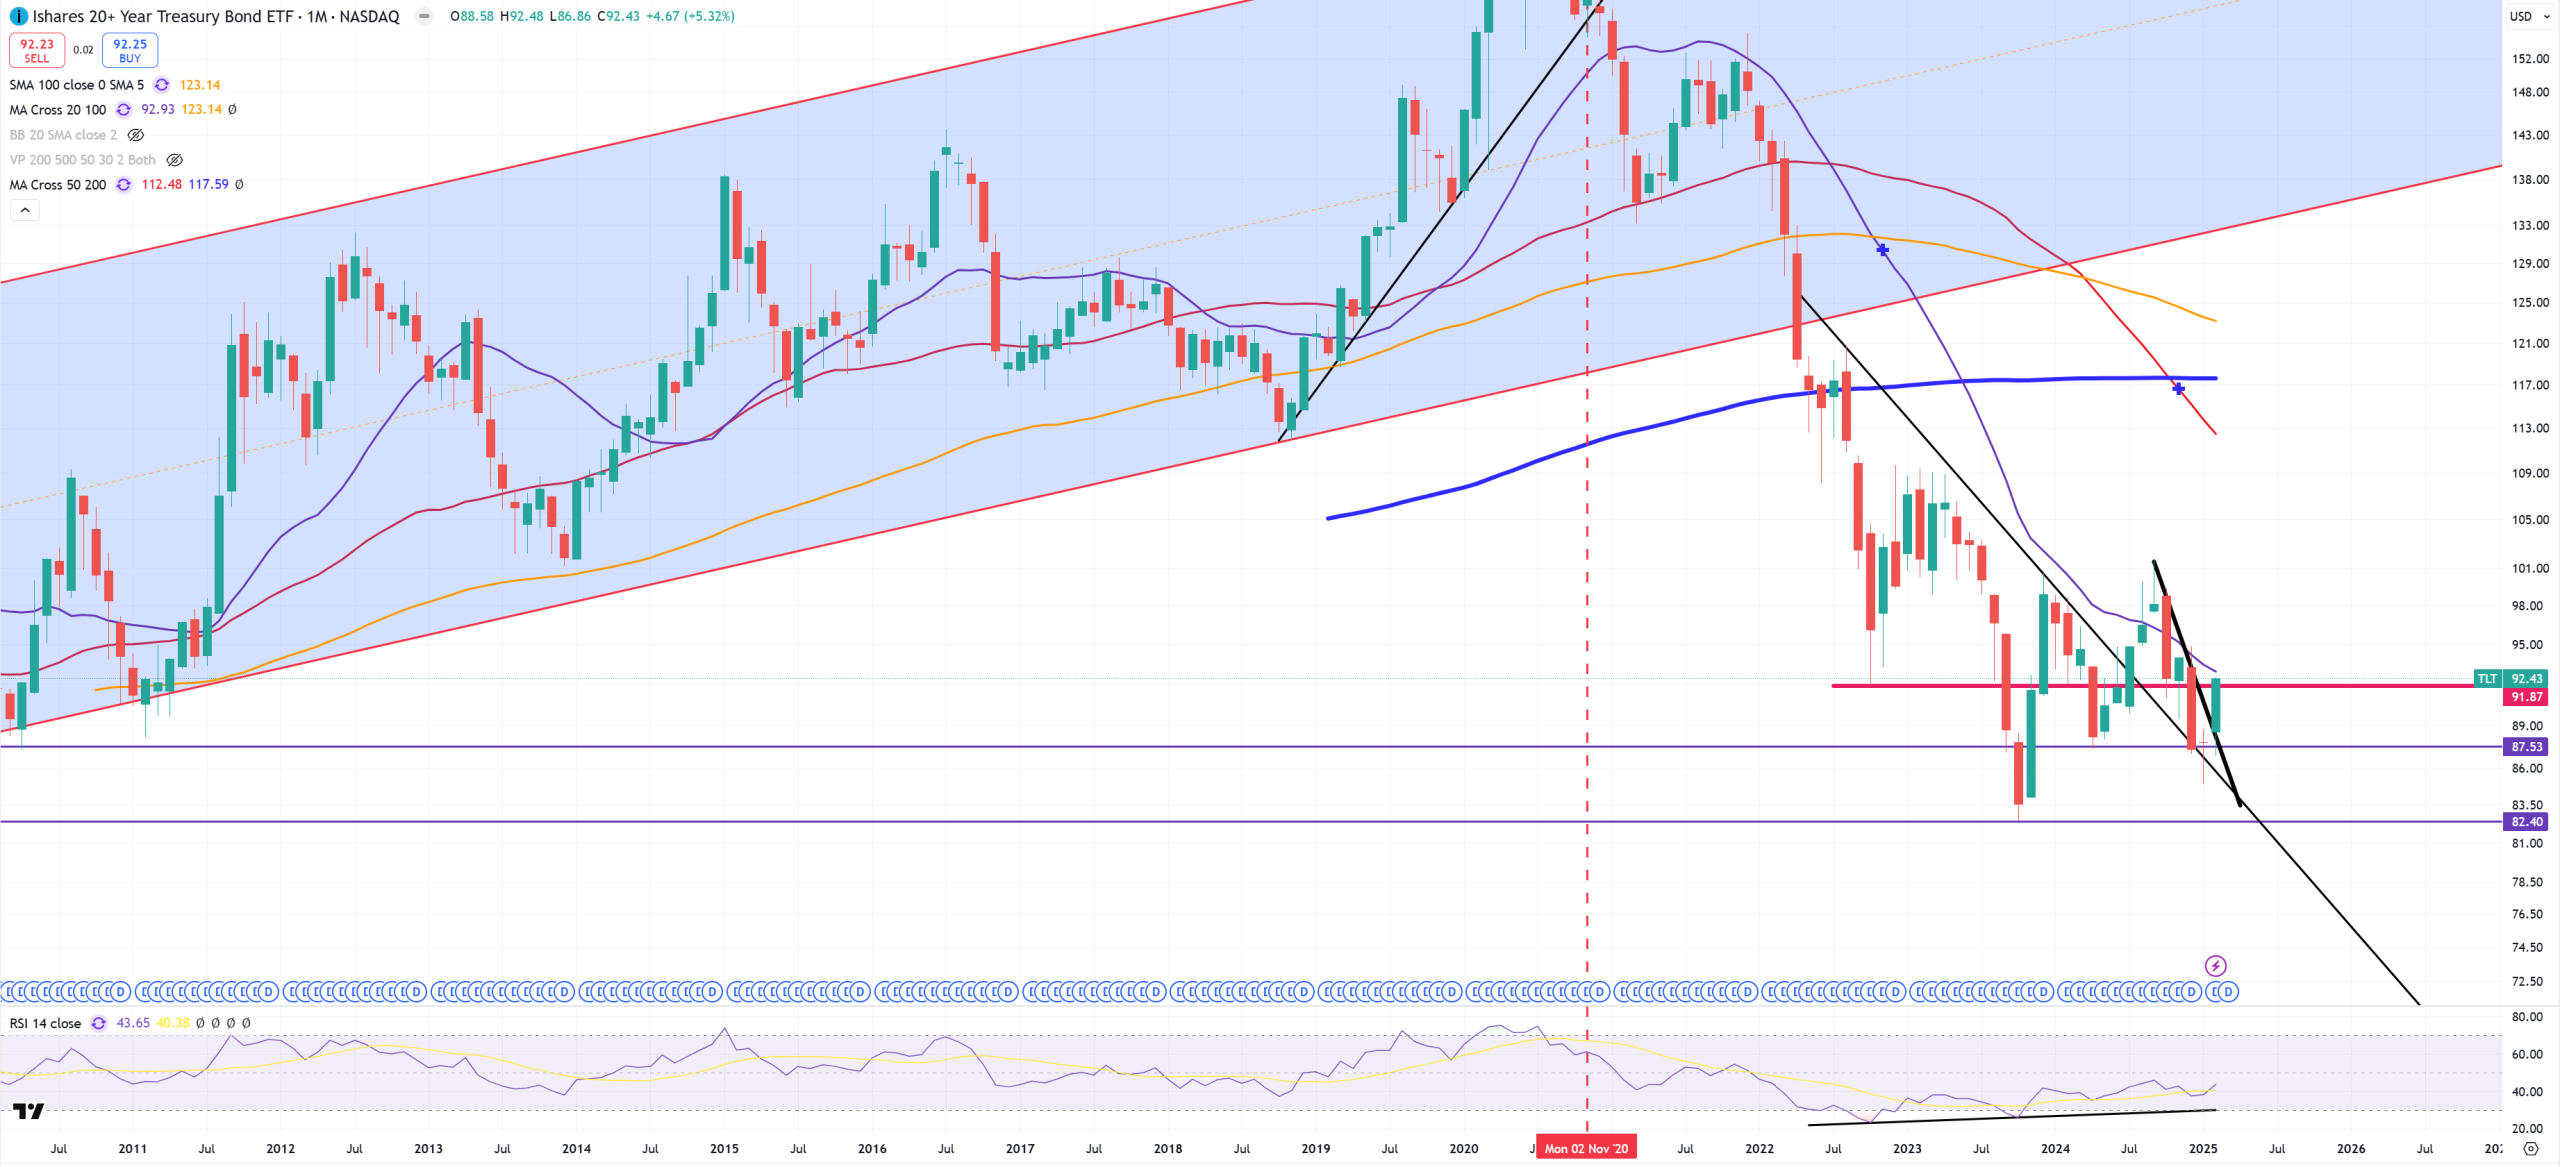
TLT – let’s see if 82$ was the ultimate low in October 2023, but this month it closed above key resistance (which is now support) = ~92$
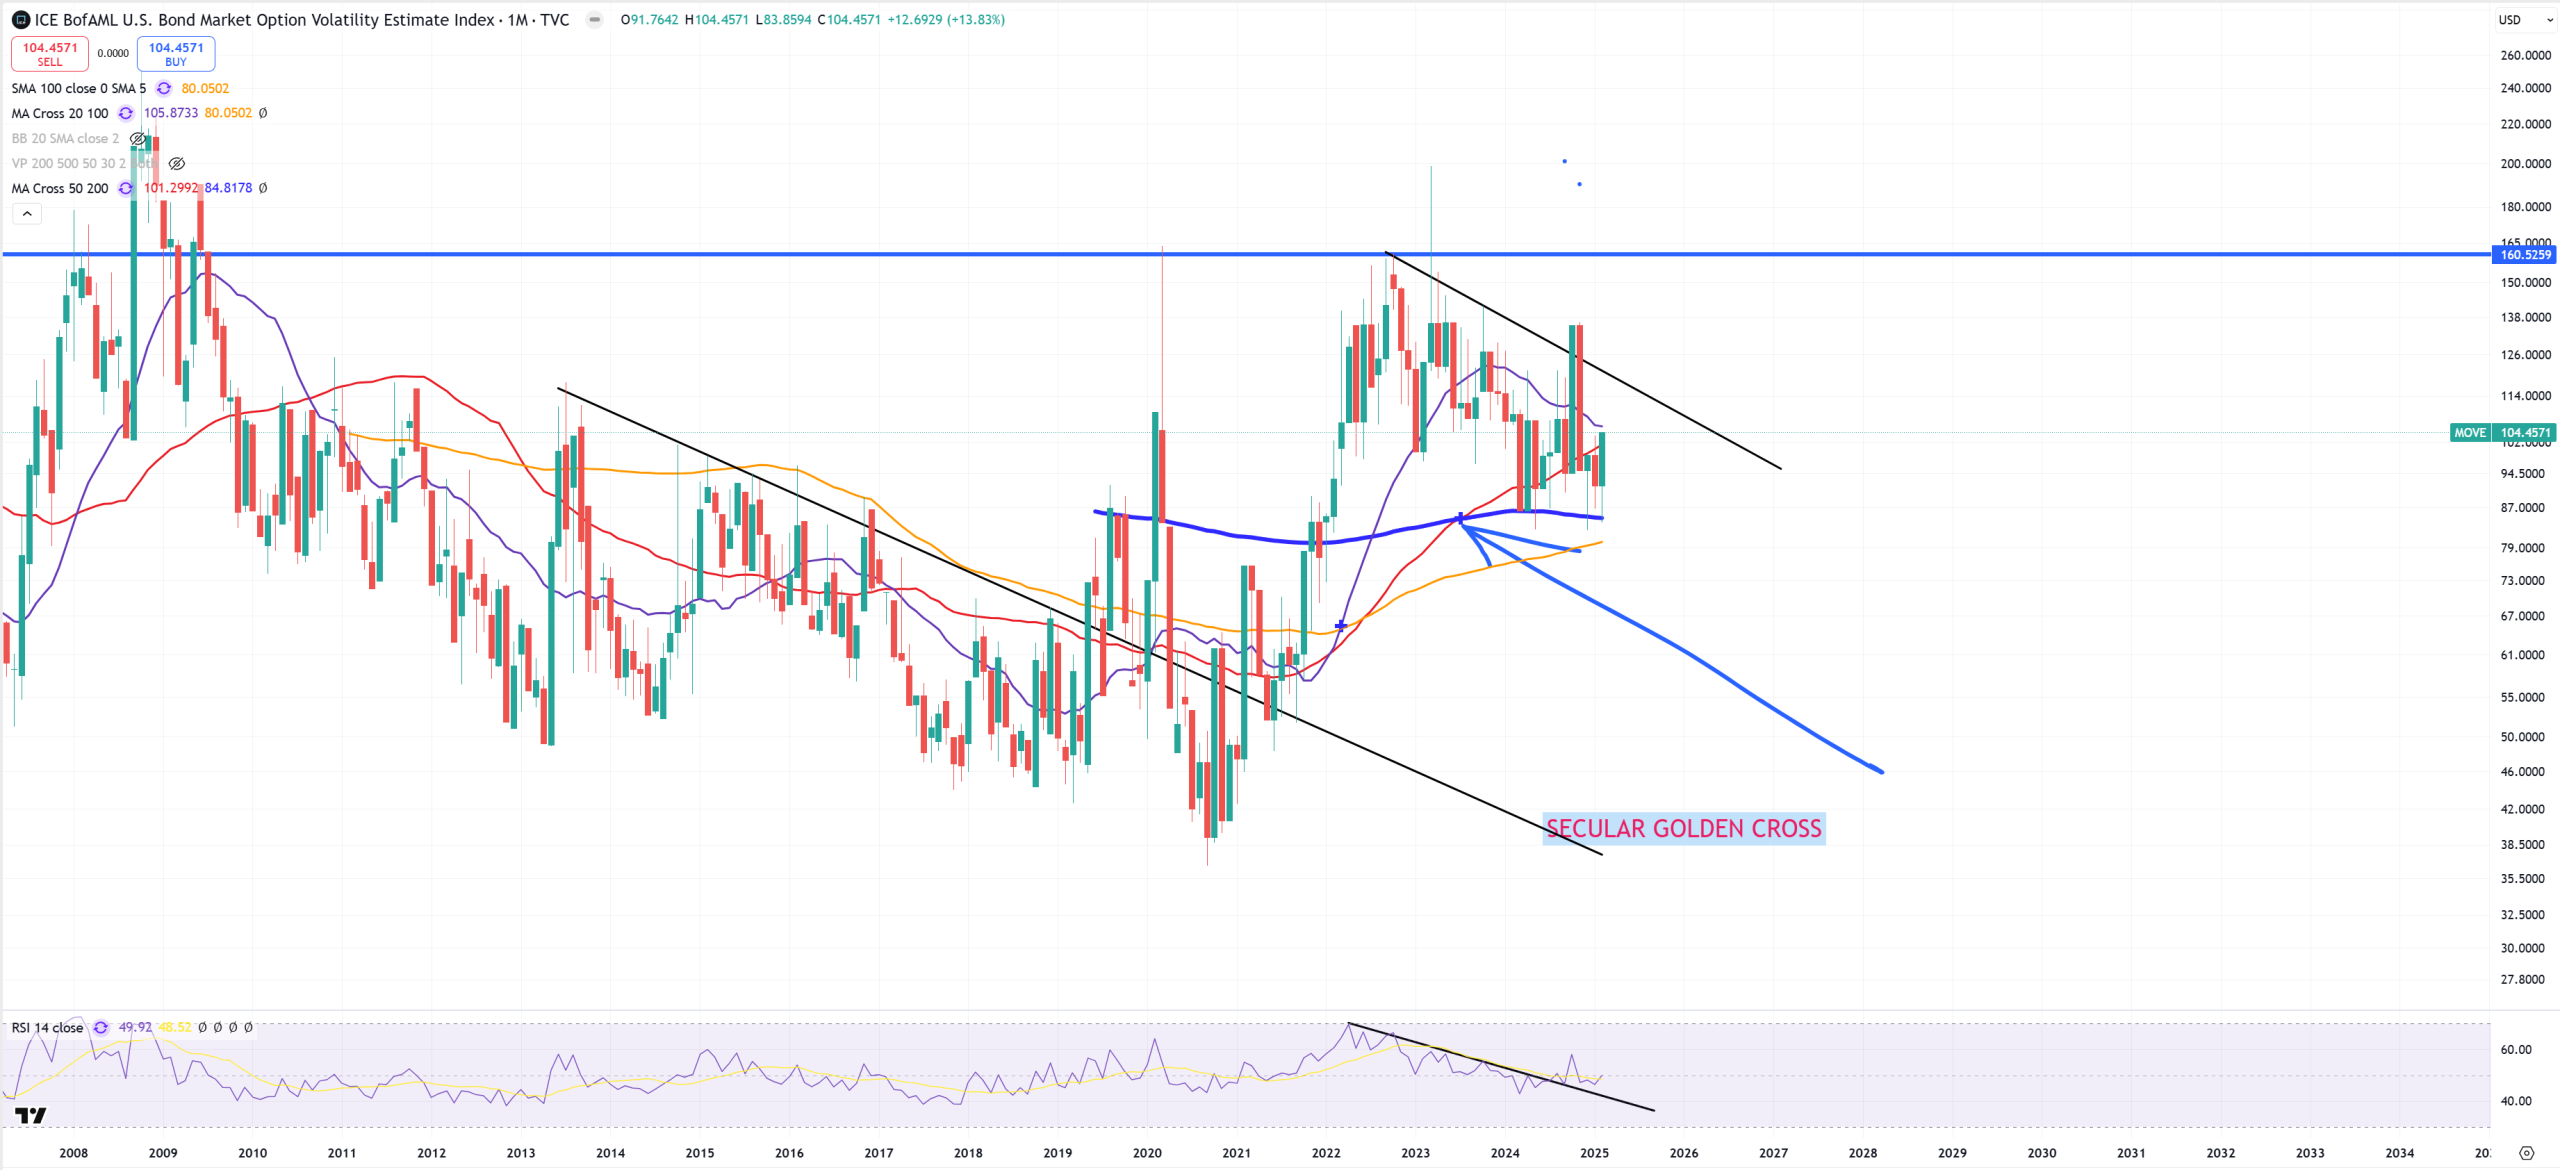
MOVE ends in 104 what was expected as I don’t expect it to break (M)MA200 and (M)MA50
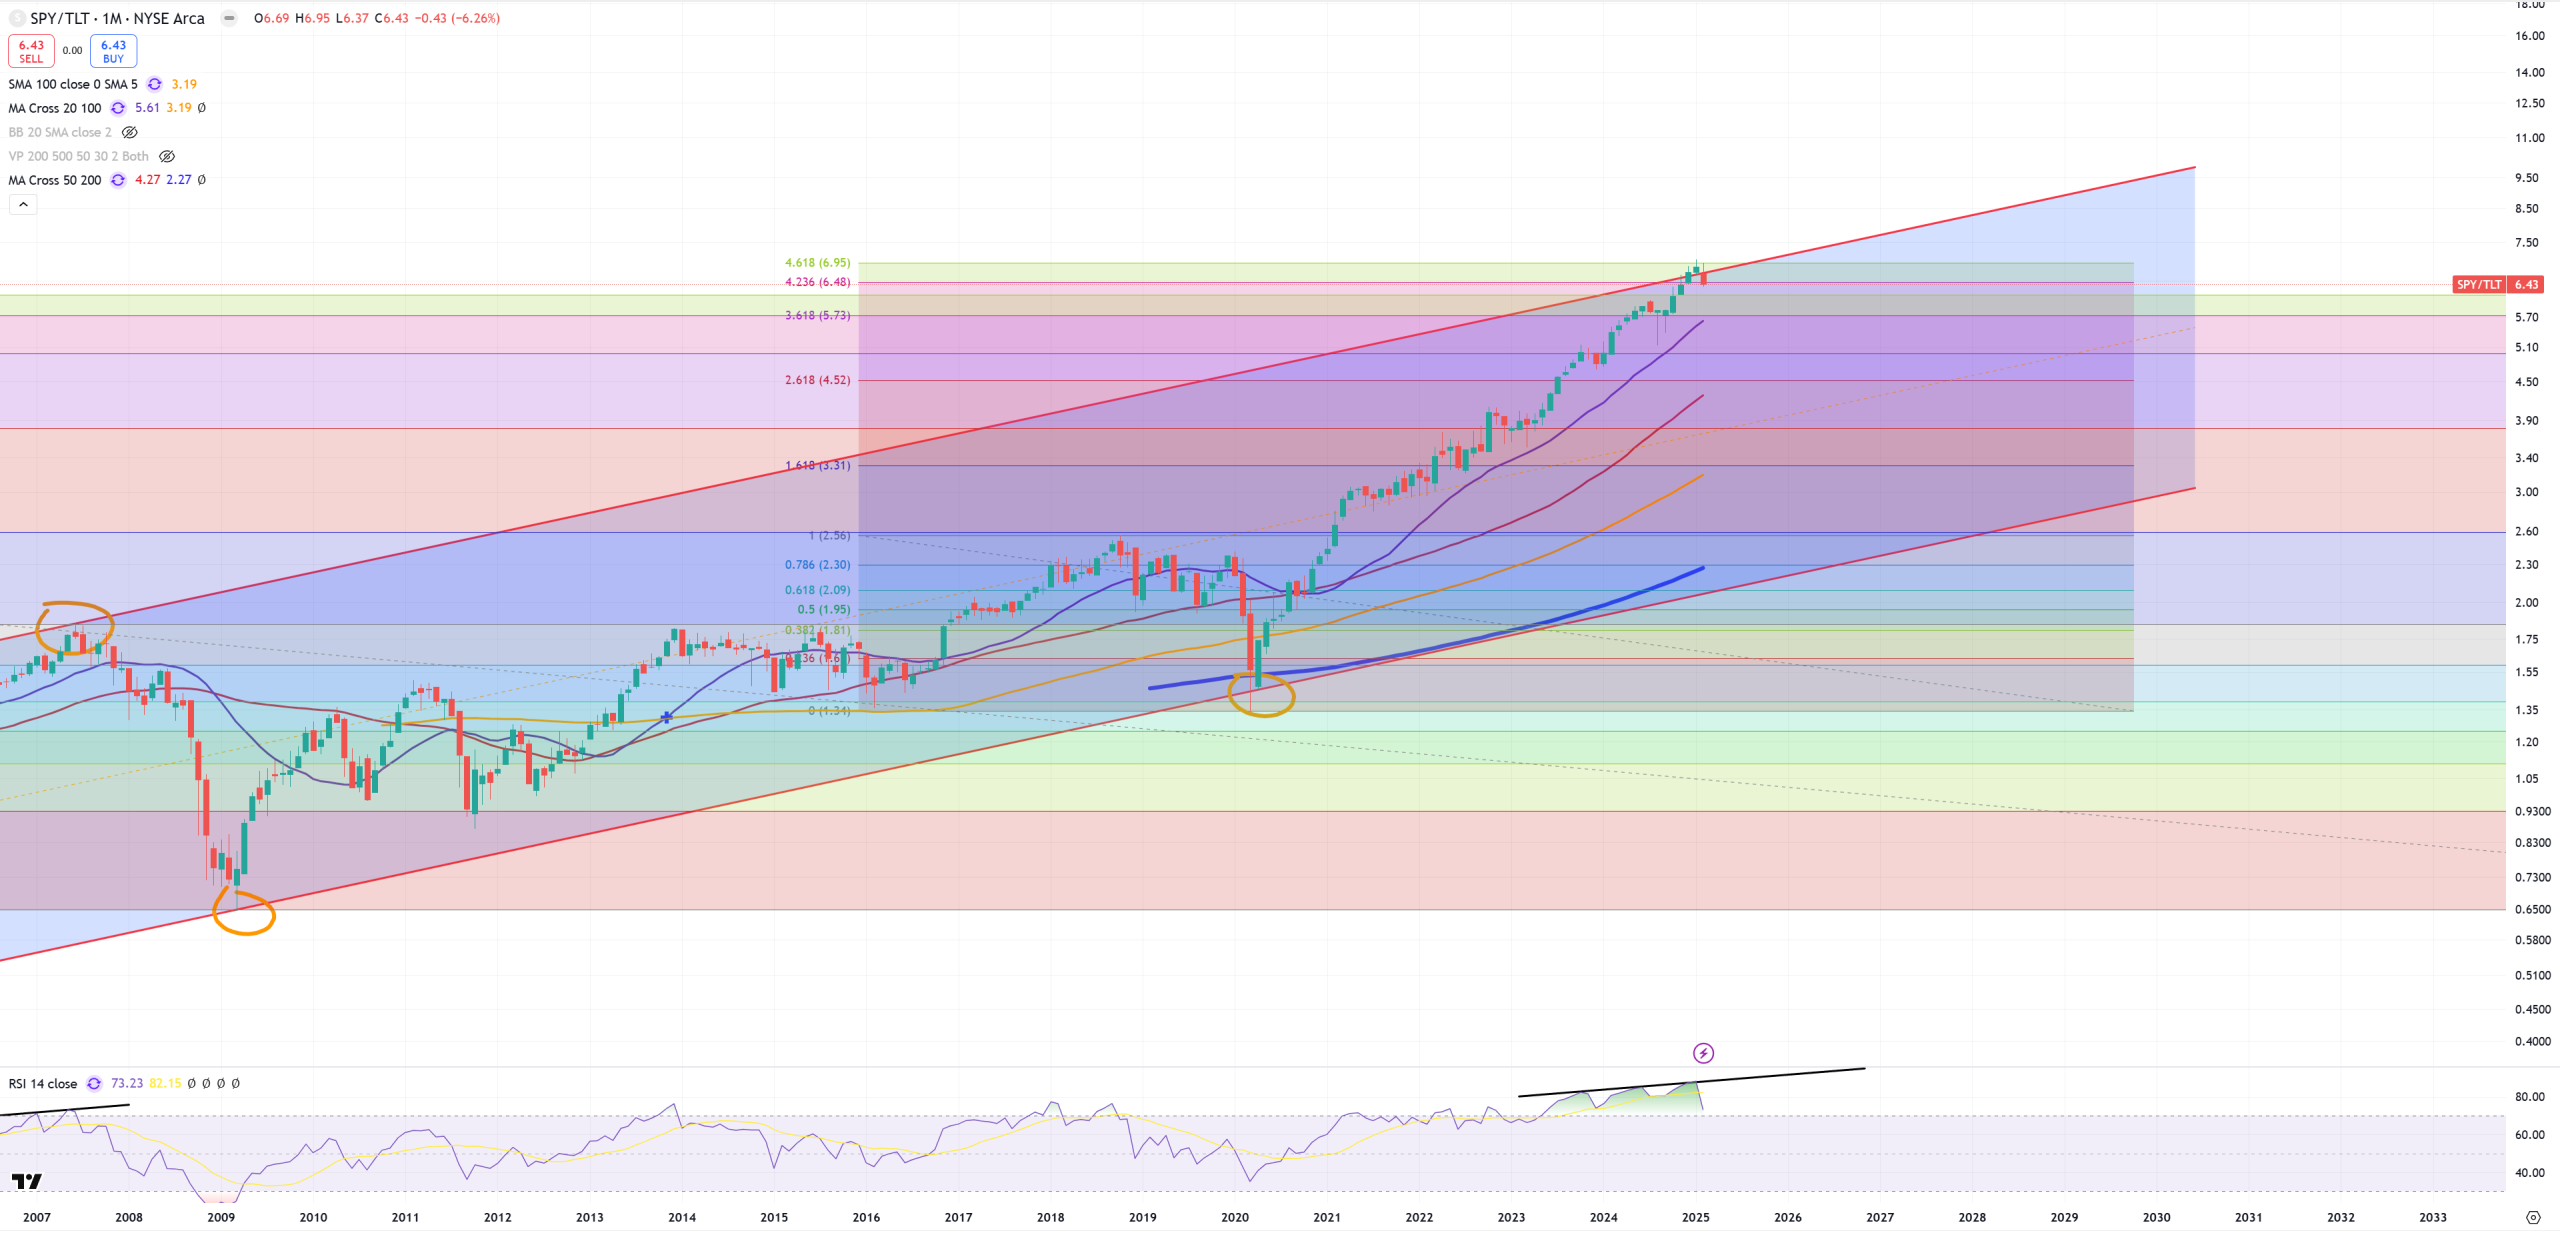
SPY/TLT after huge (M)RSI divergence reaching even 90 is reversing signalling problems
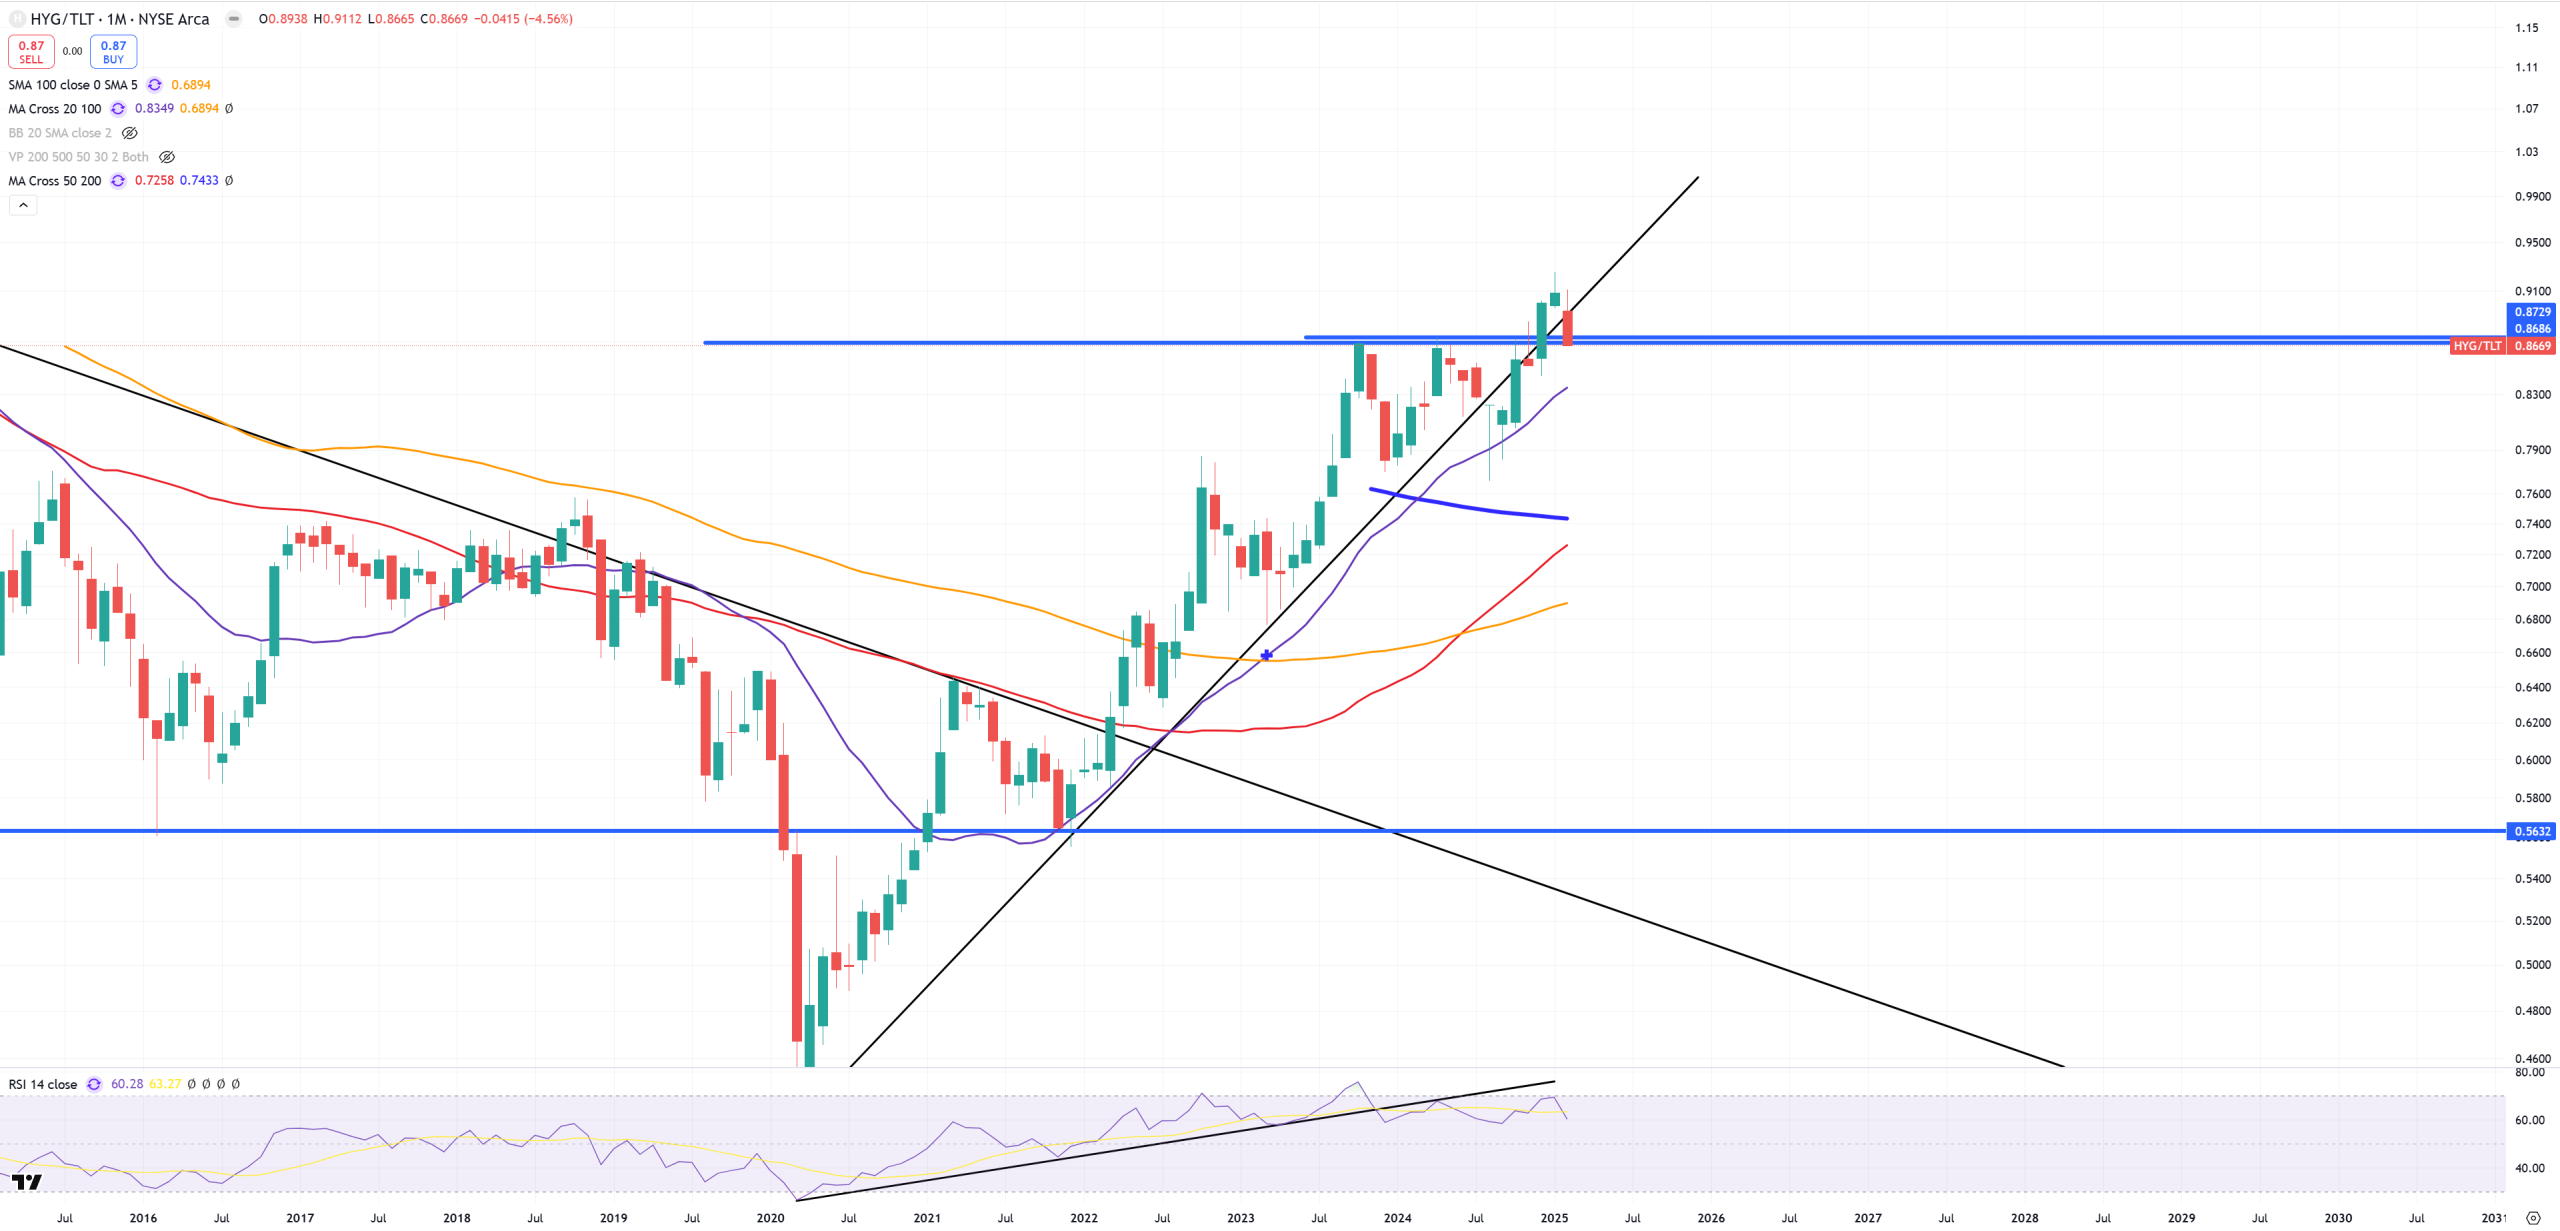
HYG/TLT – I was a bit shocked it was breaking higher, but it seems it was short lived
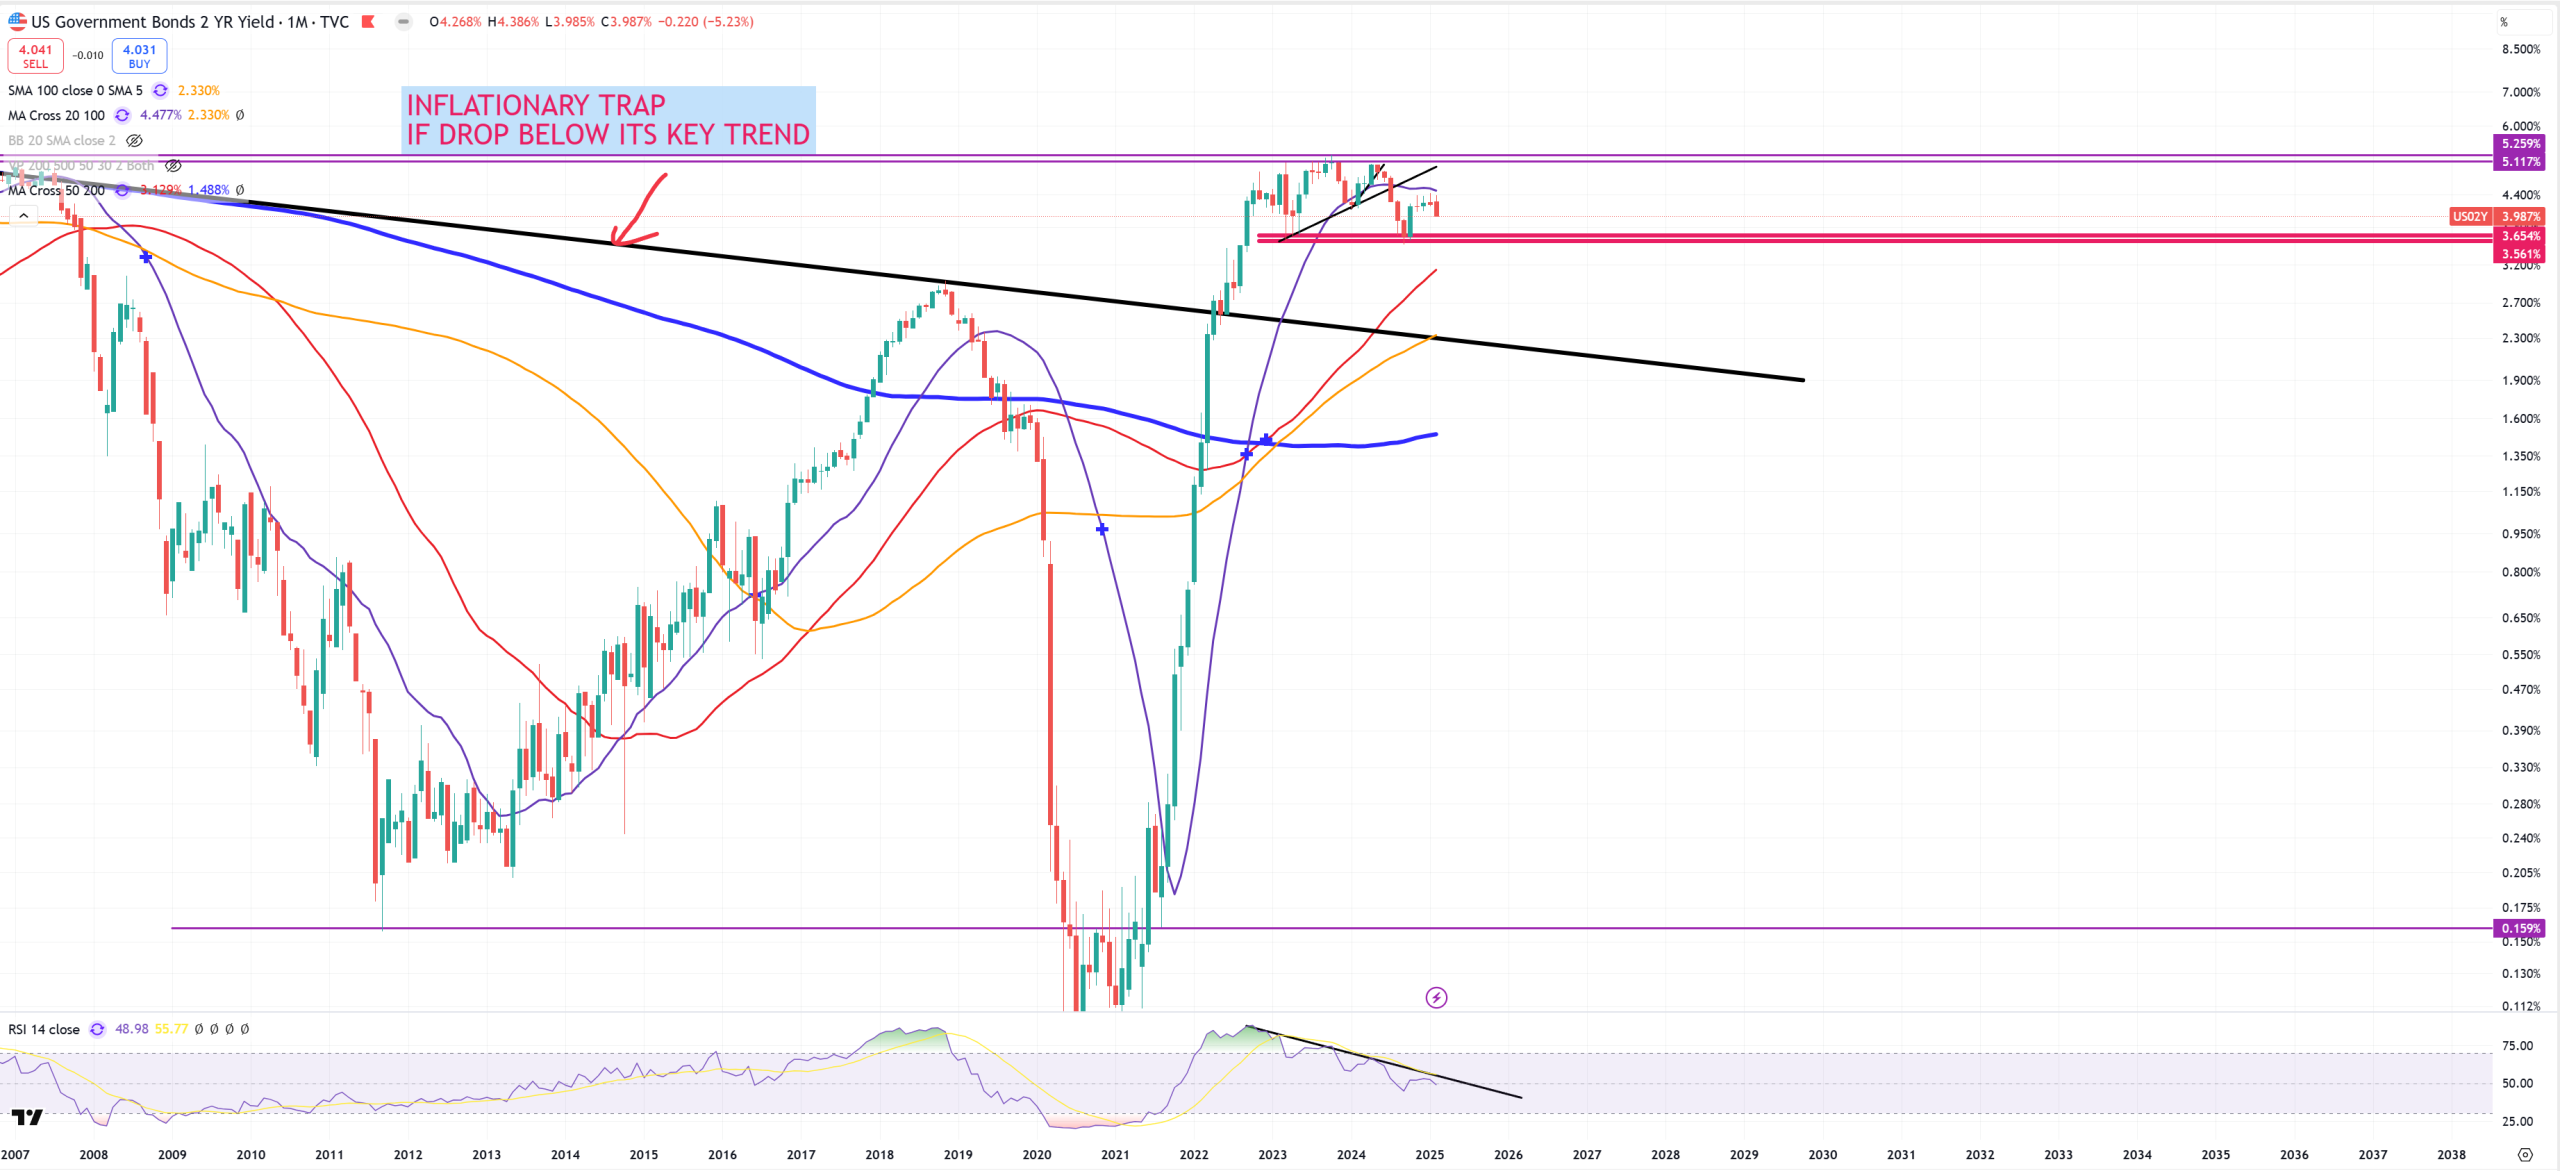
US02Y – I bet this bounce is done
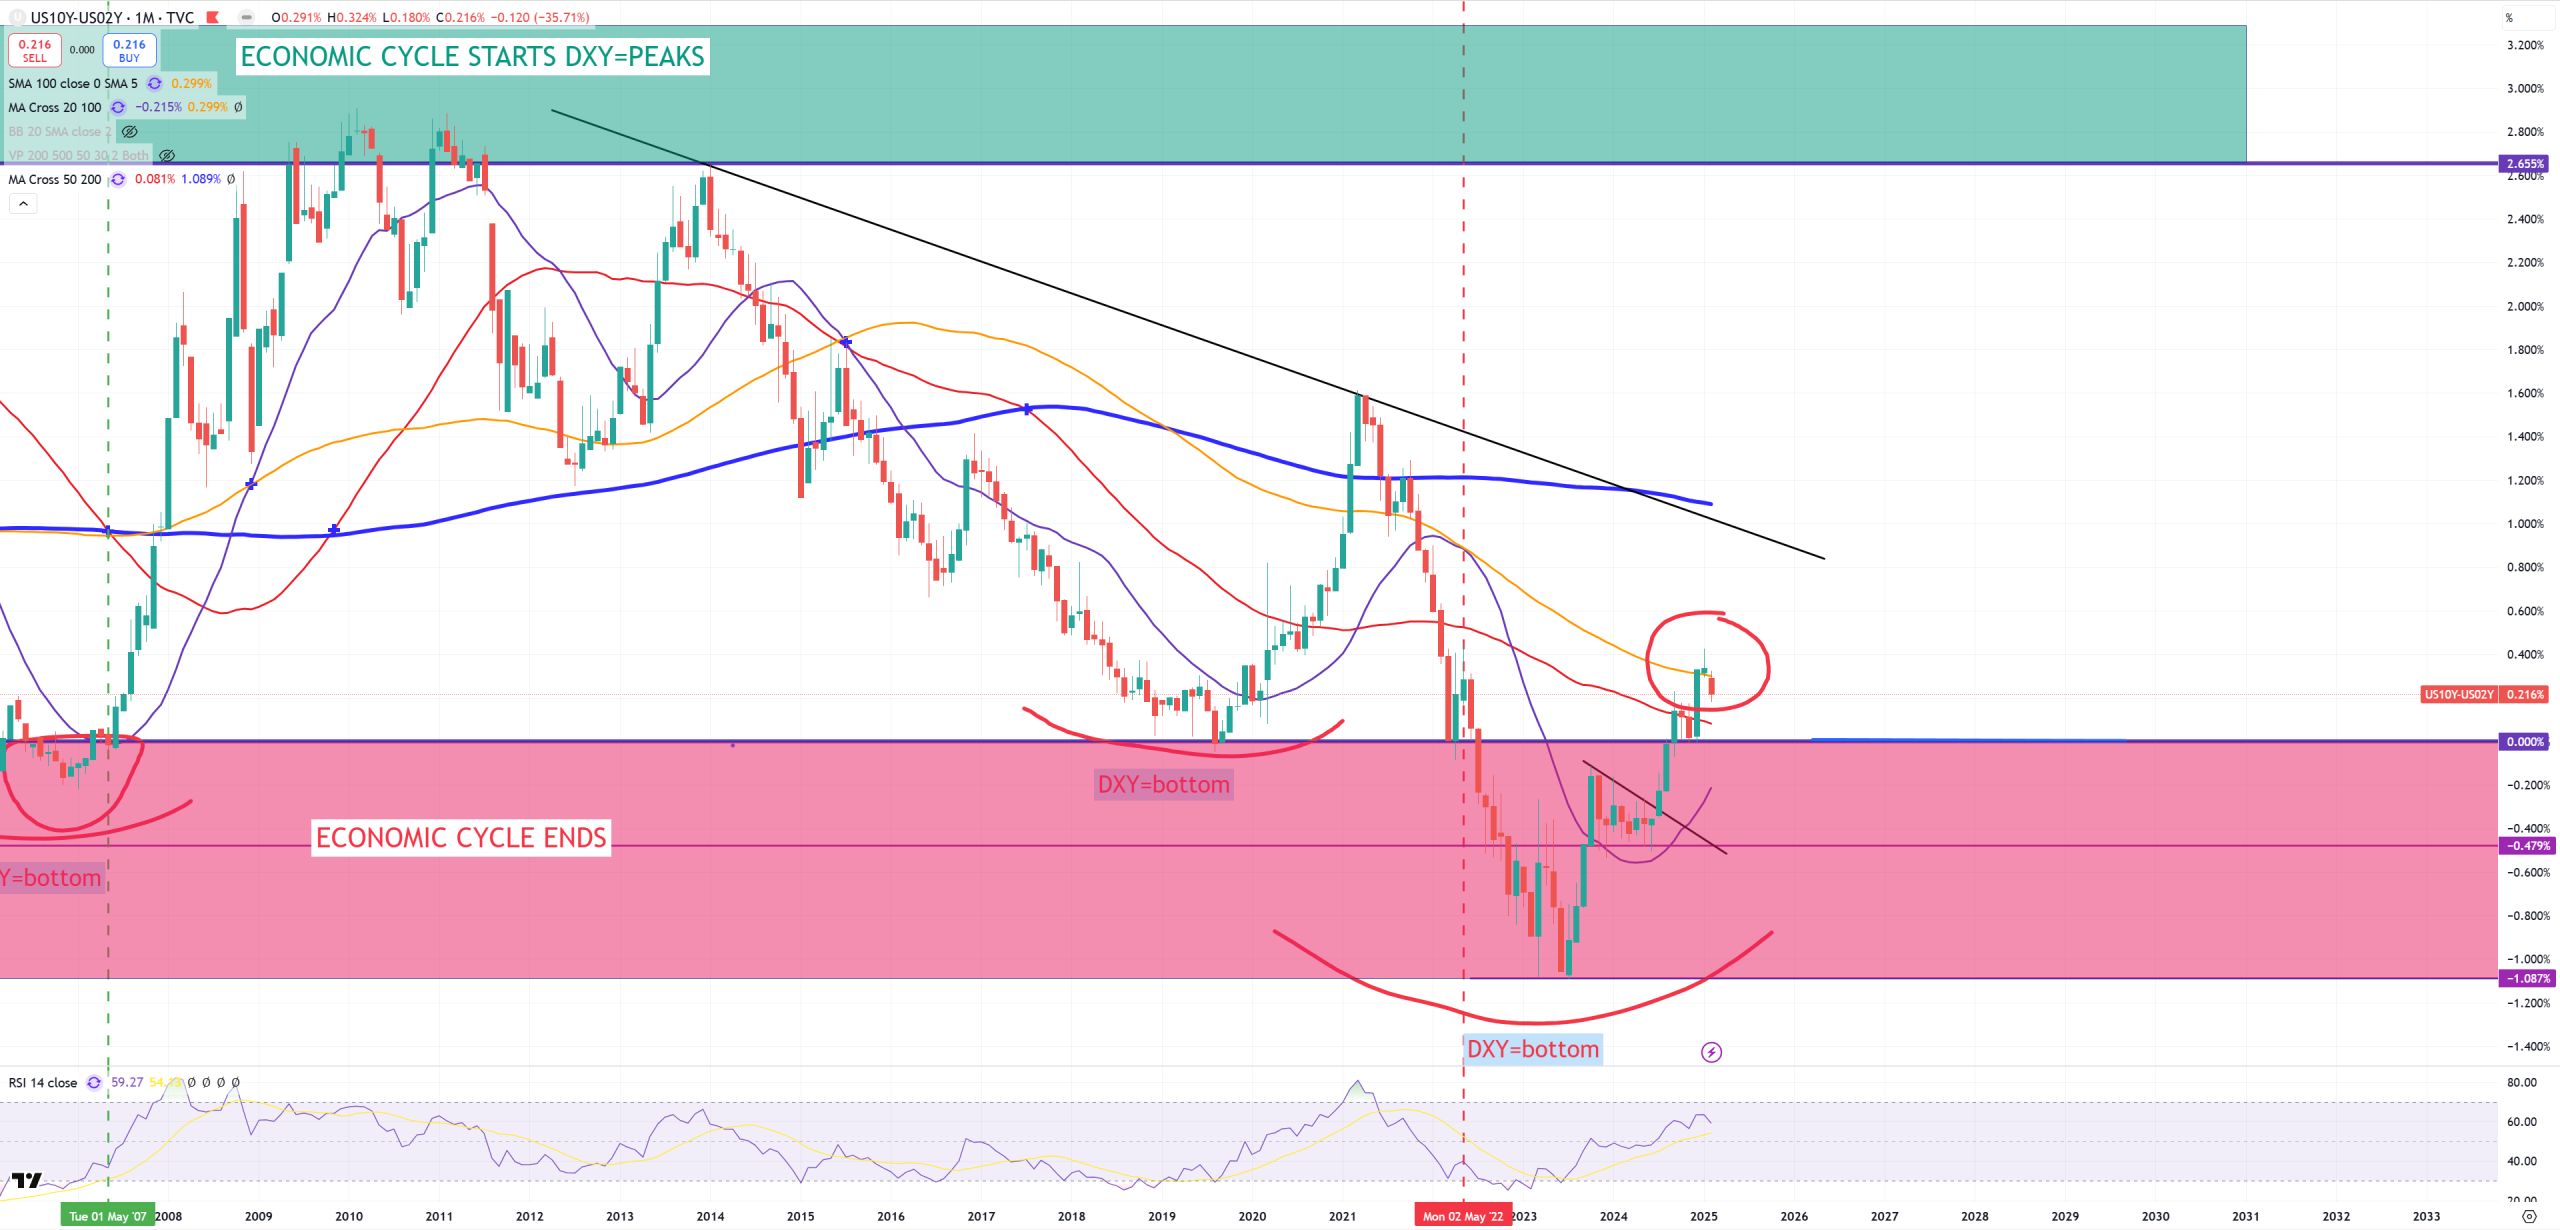
10Y/2Y is just still +20bps, but probably once DXY holds 107 support, SPY/TLT going back in the channel, we’re going to see bull steepening and big gains for DXY
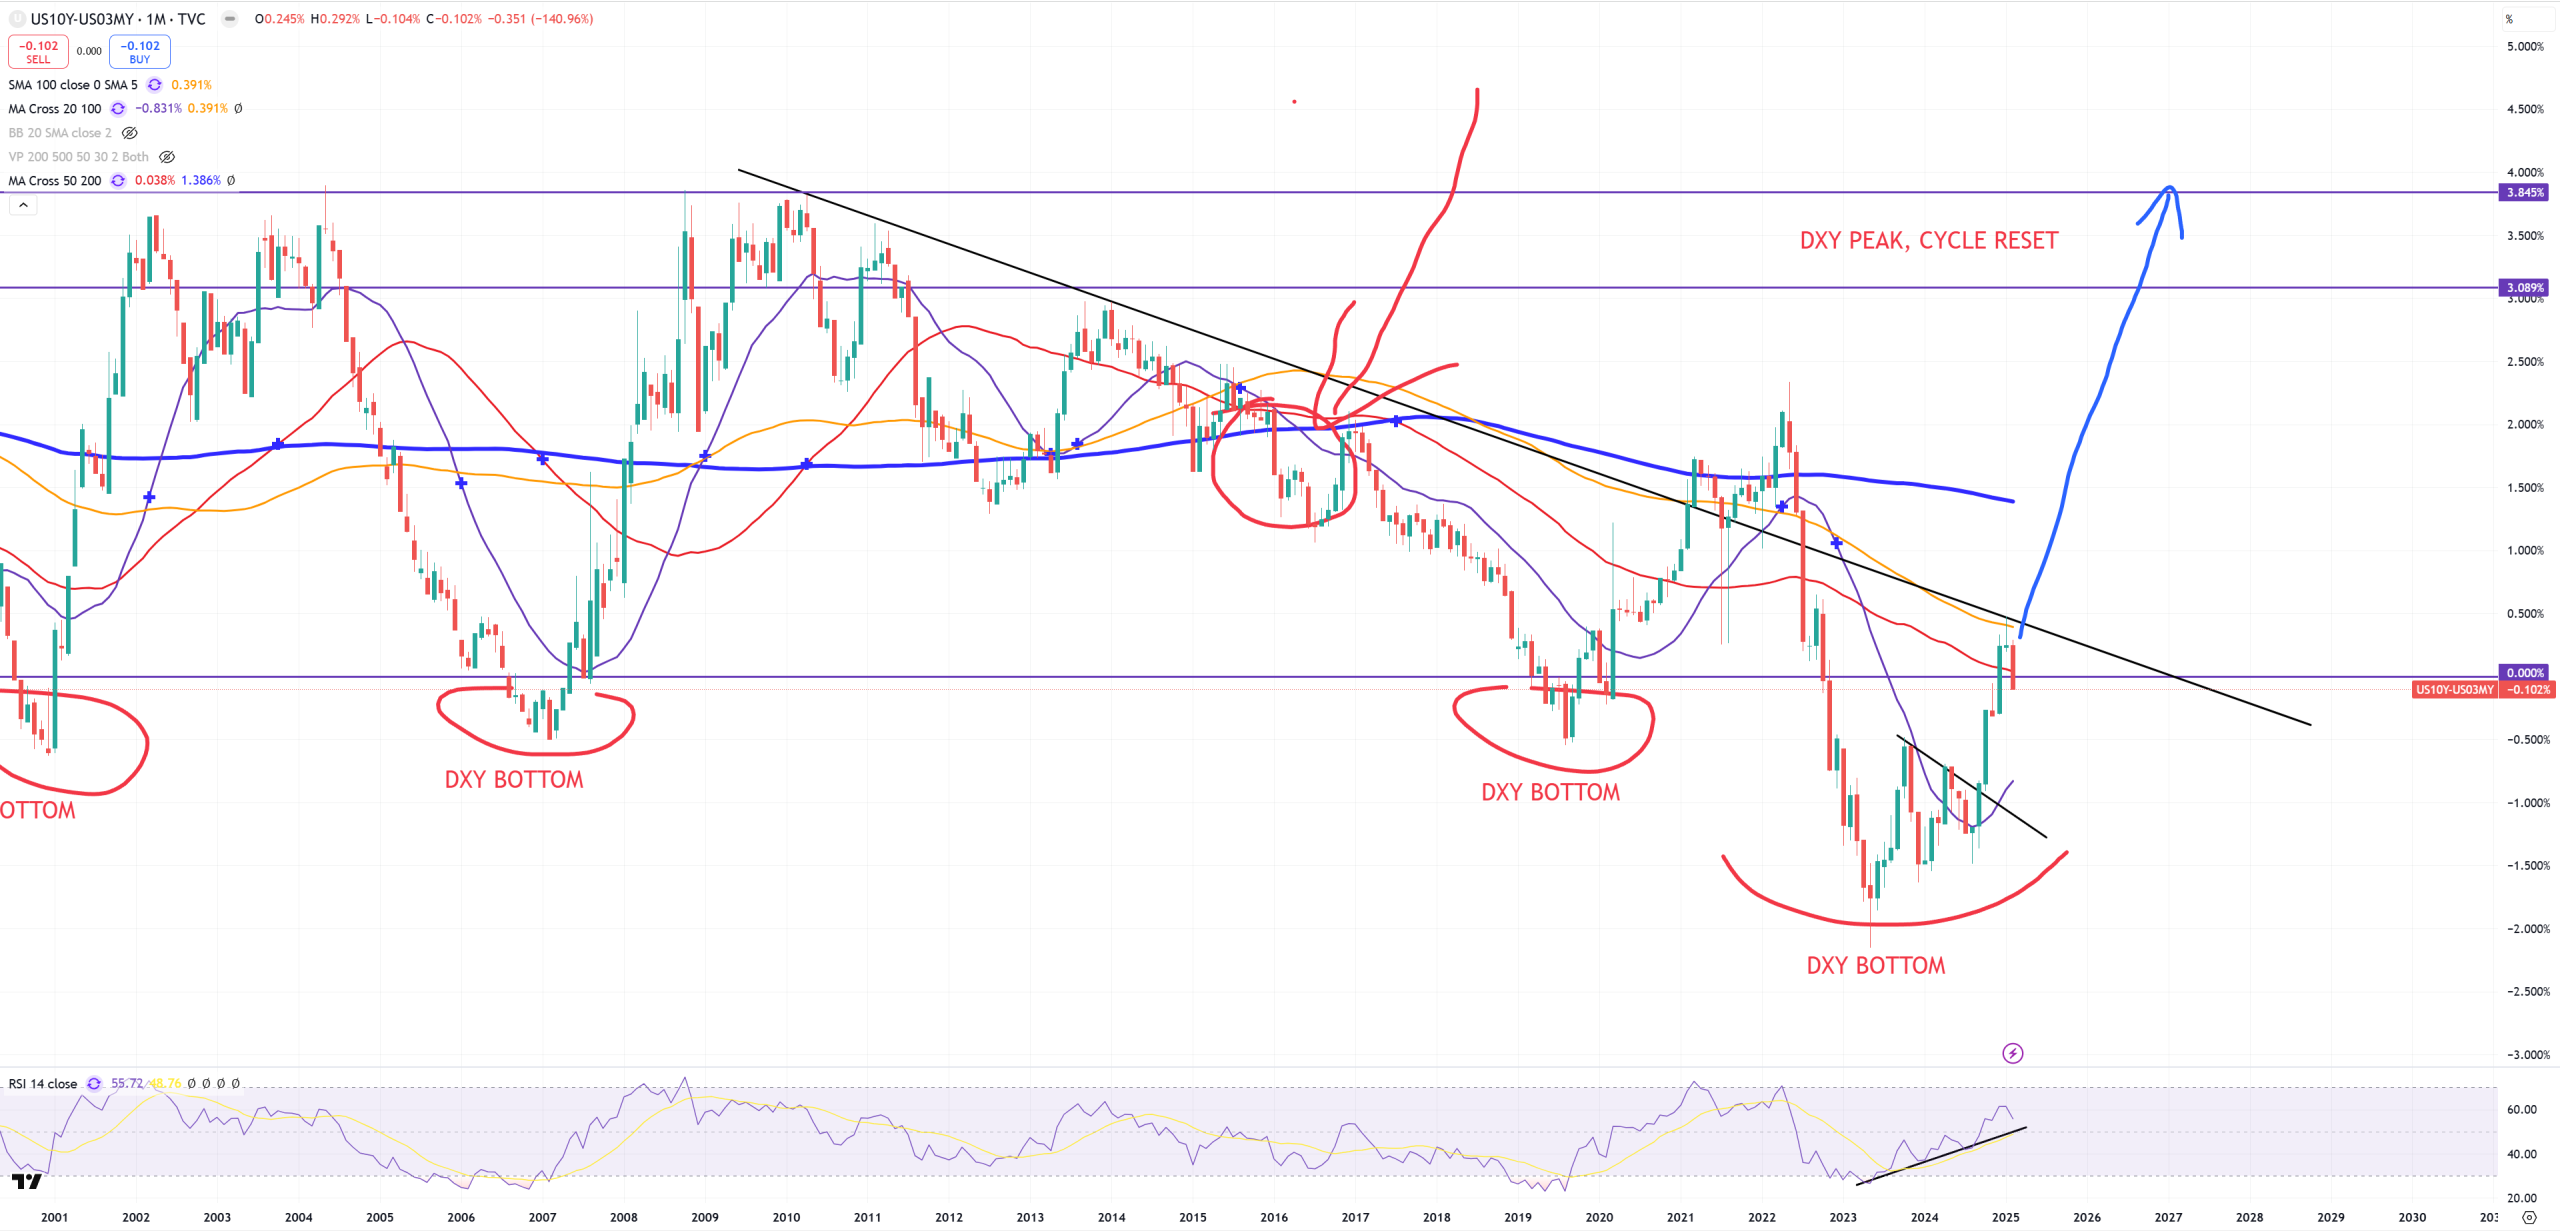
10Y/3M is down to -10bps, I expect 10Y/2Y to lead the future of 10Y/3M
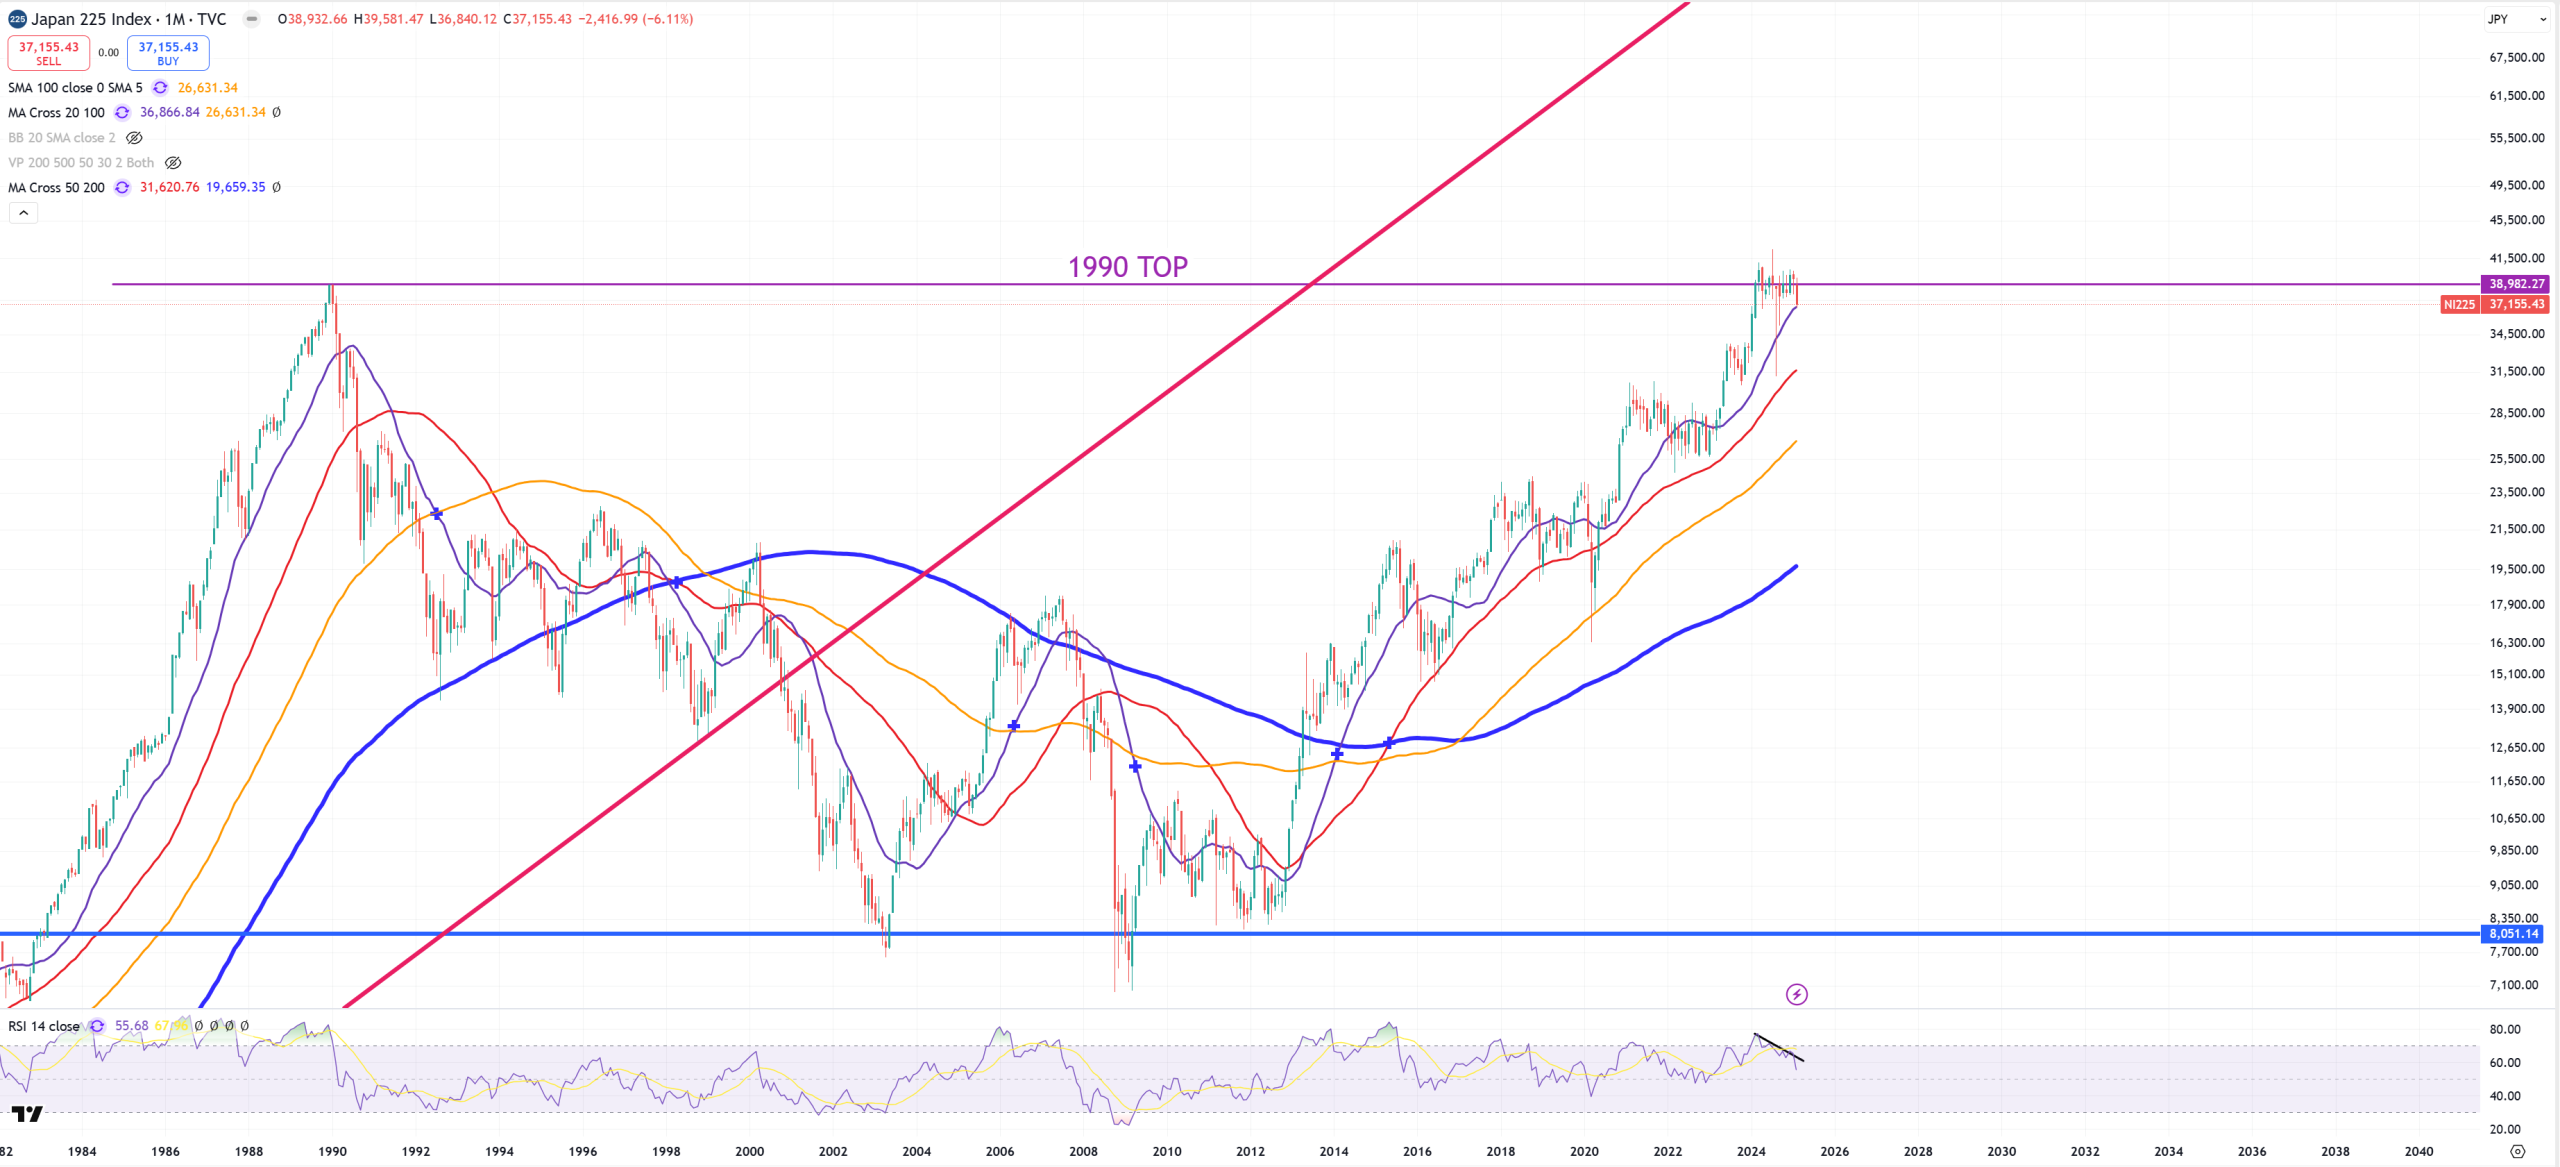
NIKKEI225 – and 1990 top
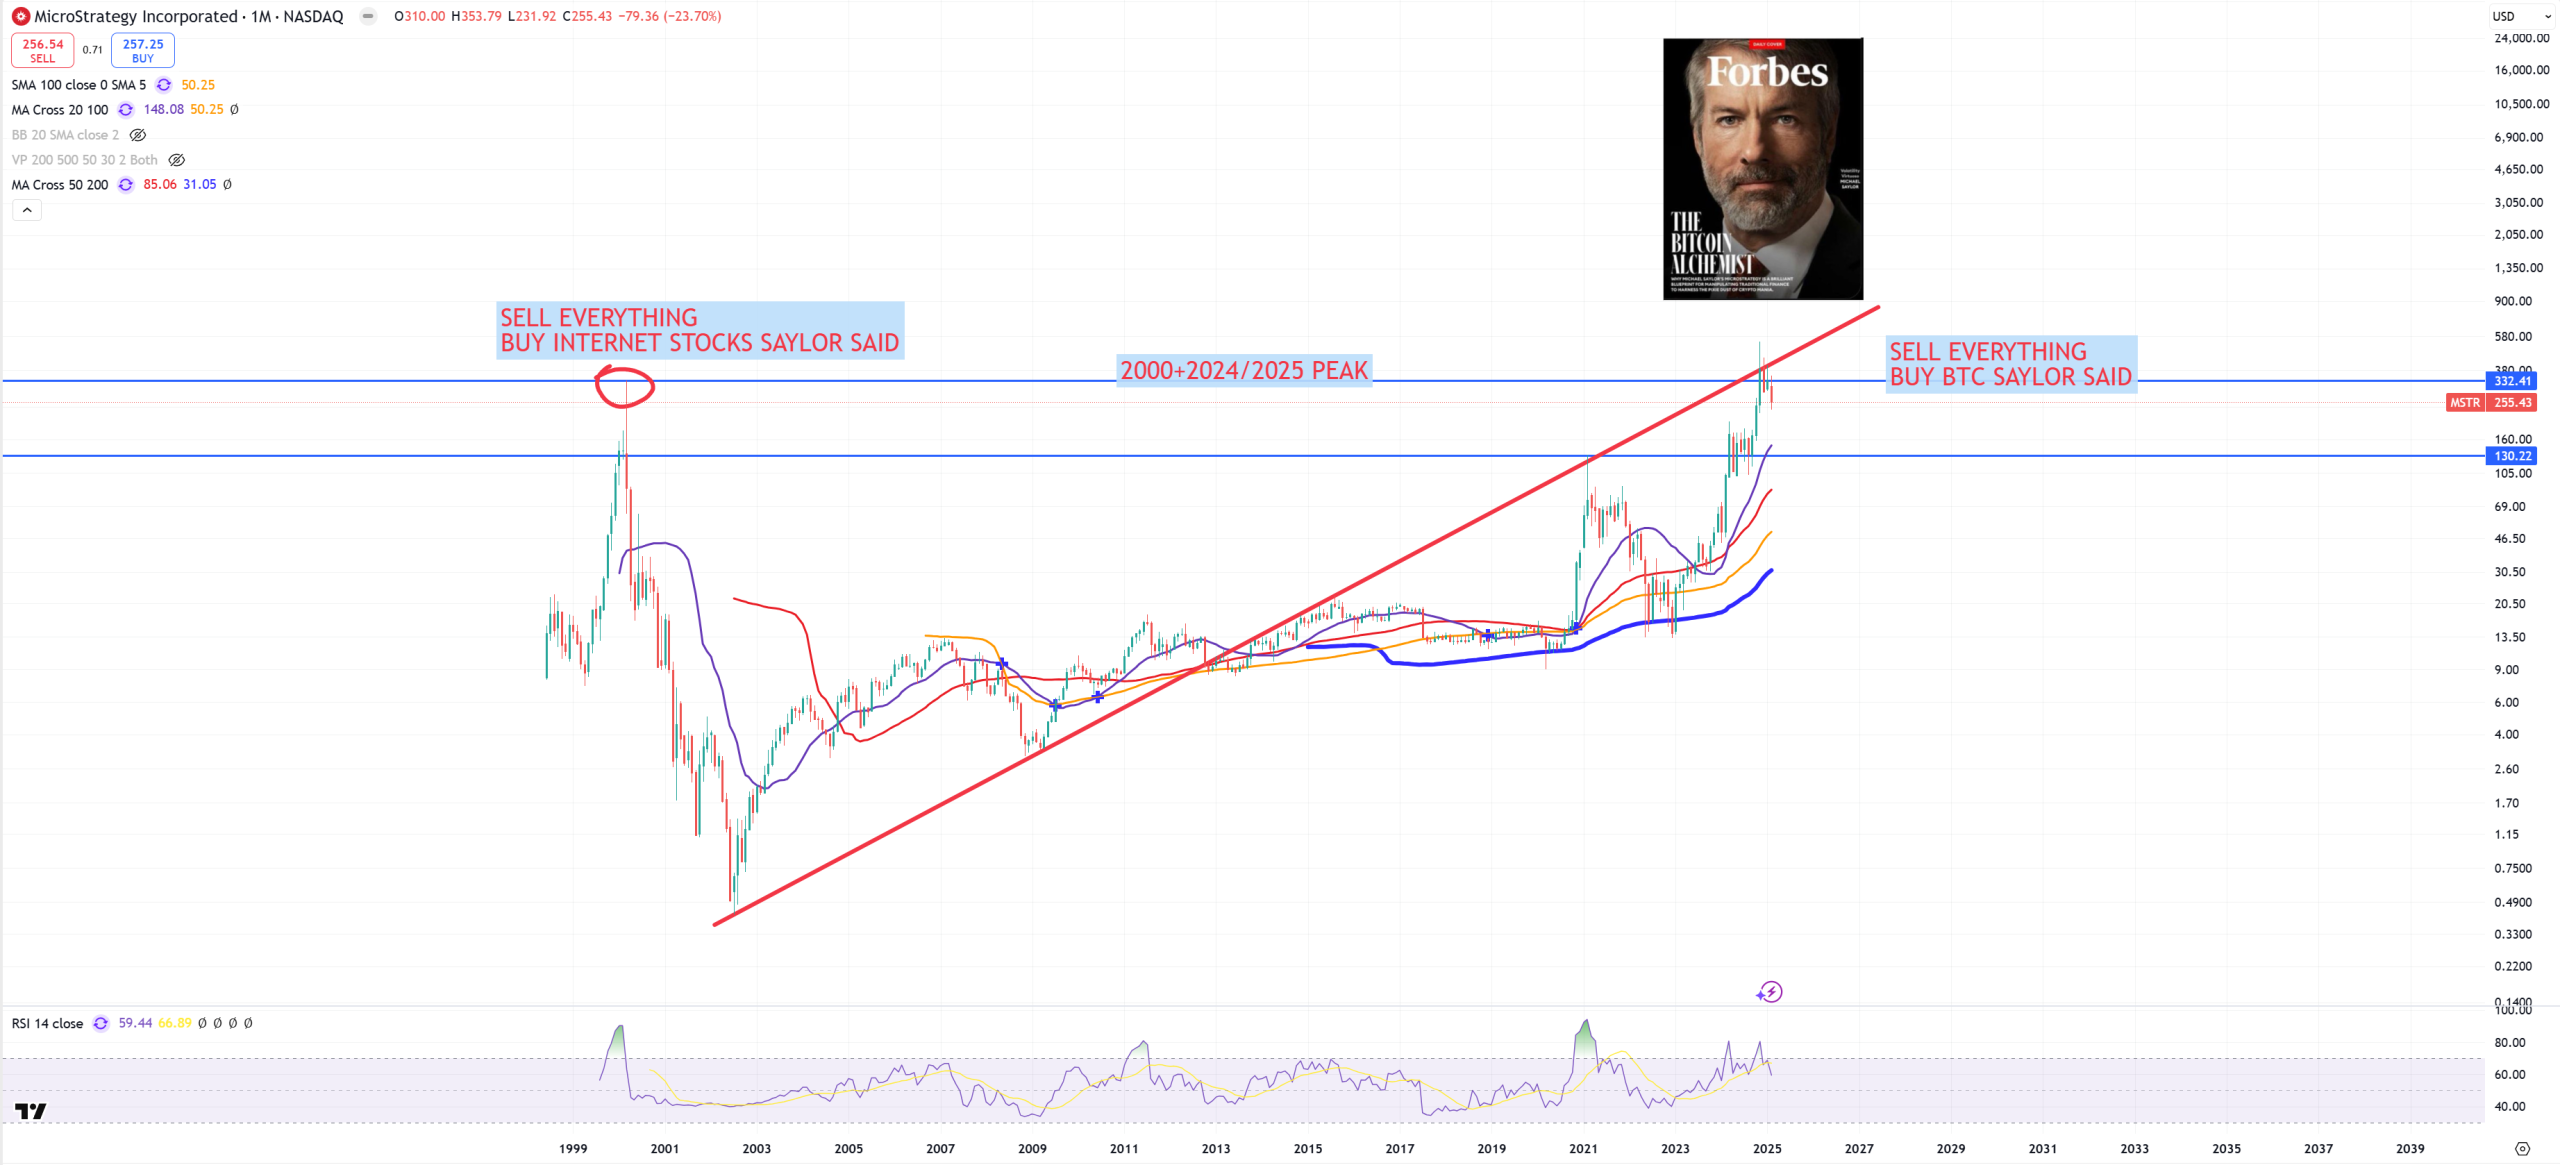
MSTR – and its 2000 top
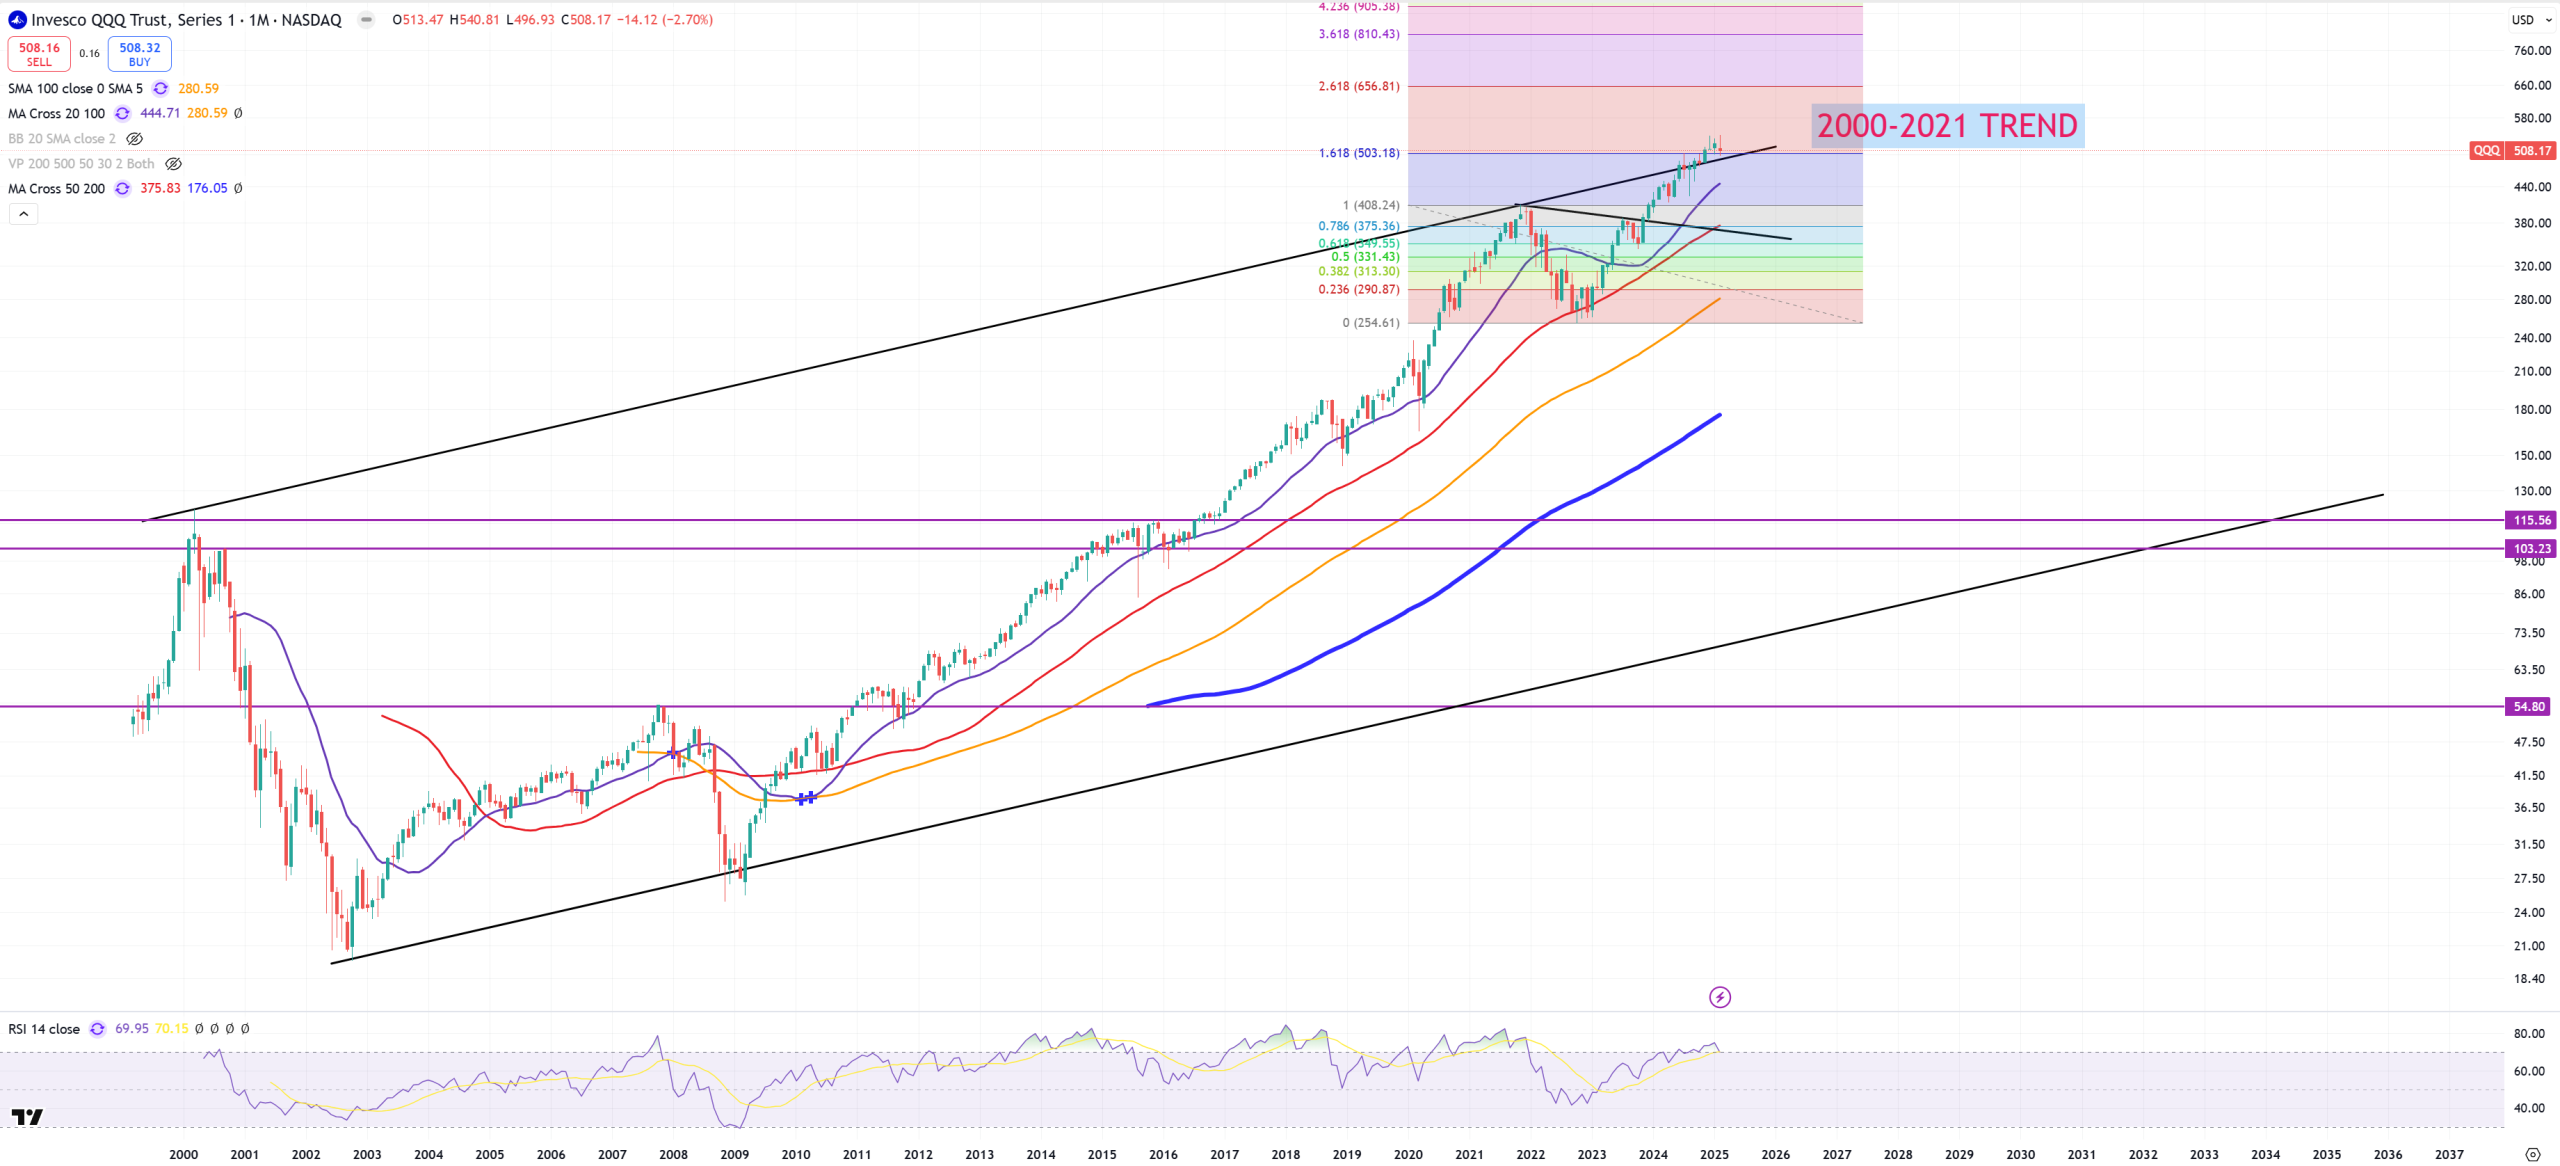
QQQ – Nasdaq is not having a long-term trend which we can rely on, but so far we connect points 2000-2021 and it’s floating still above
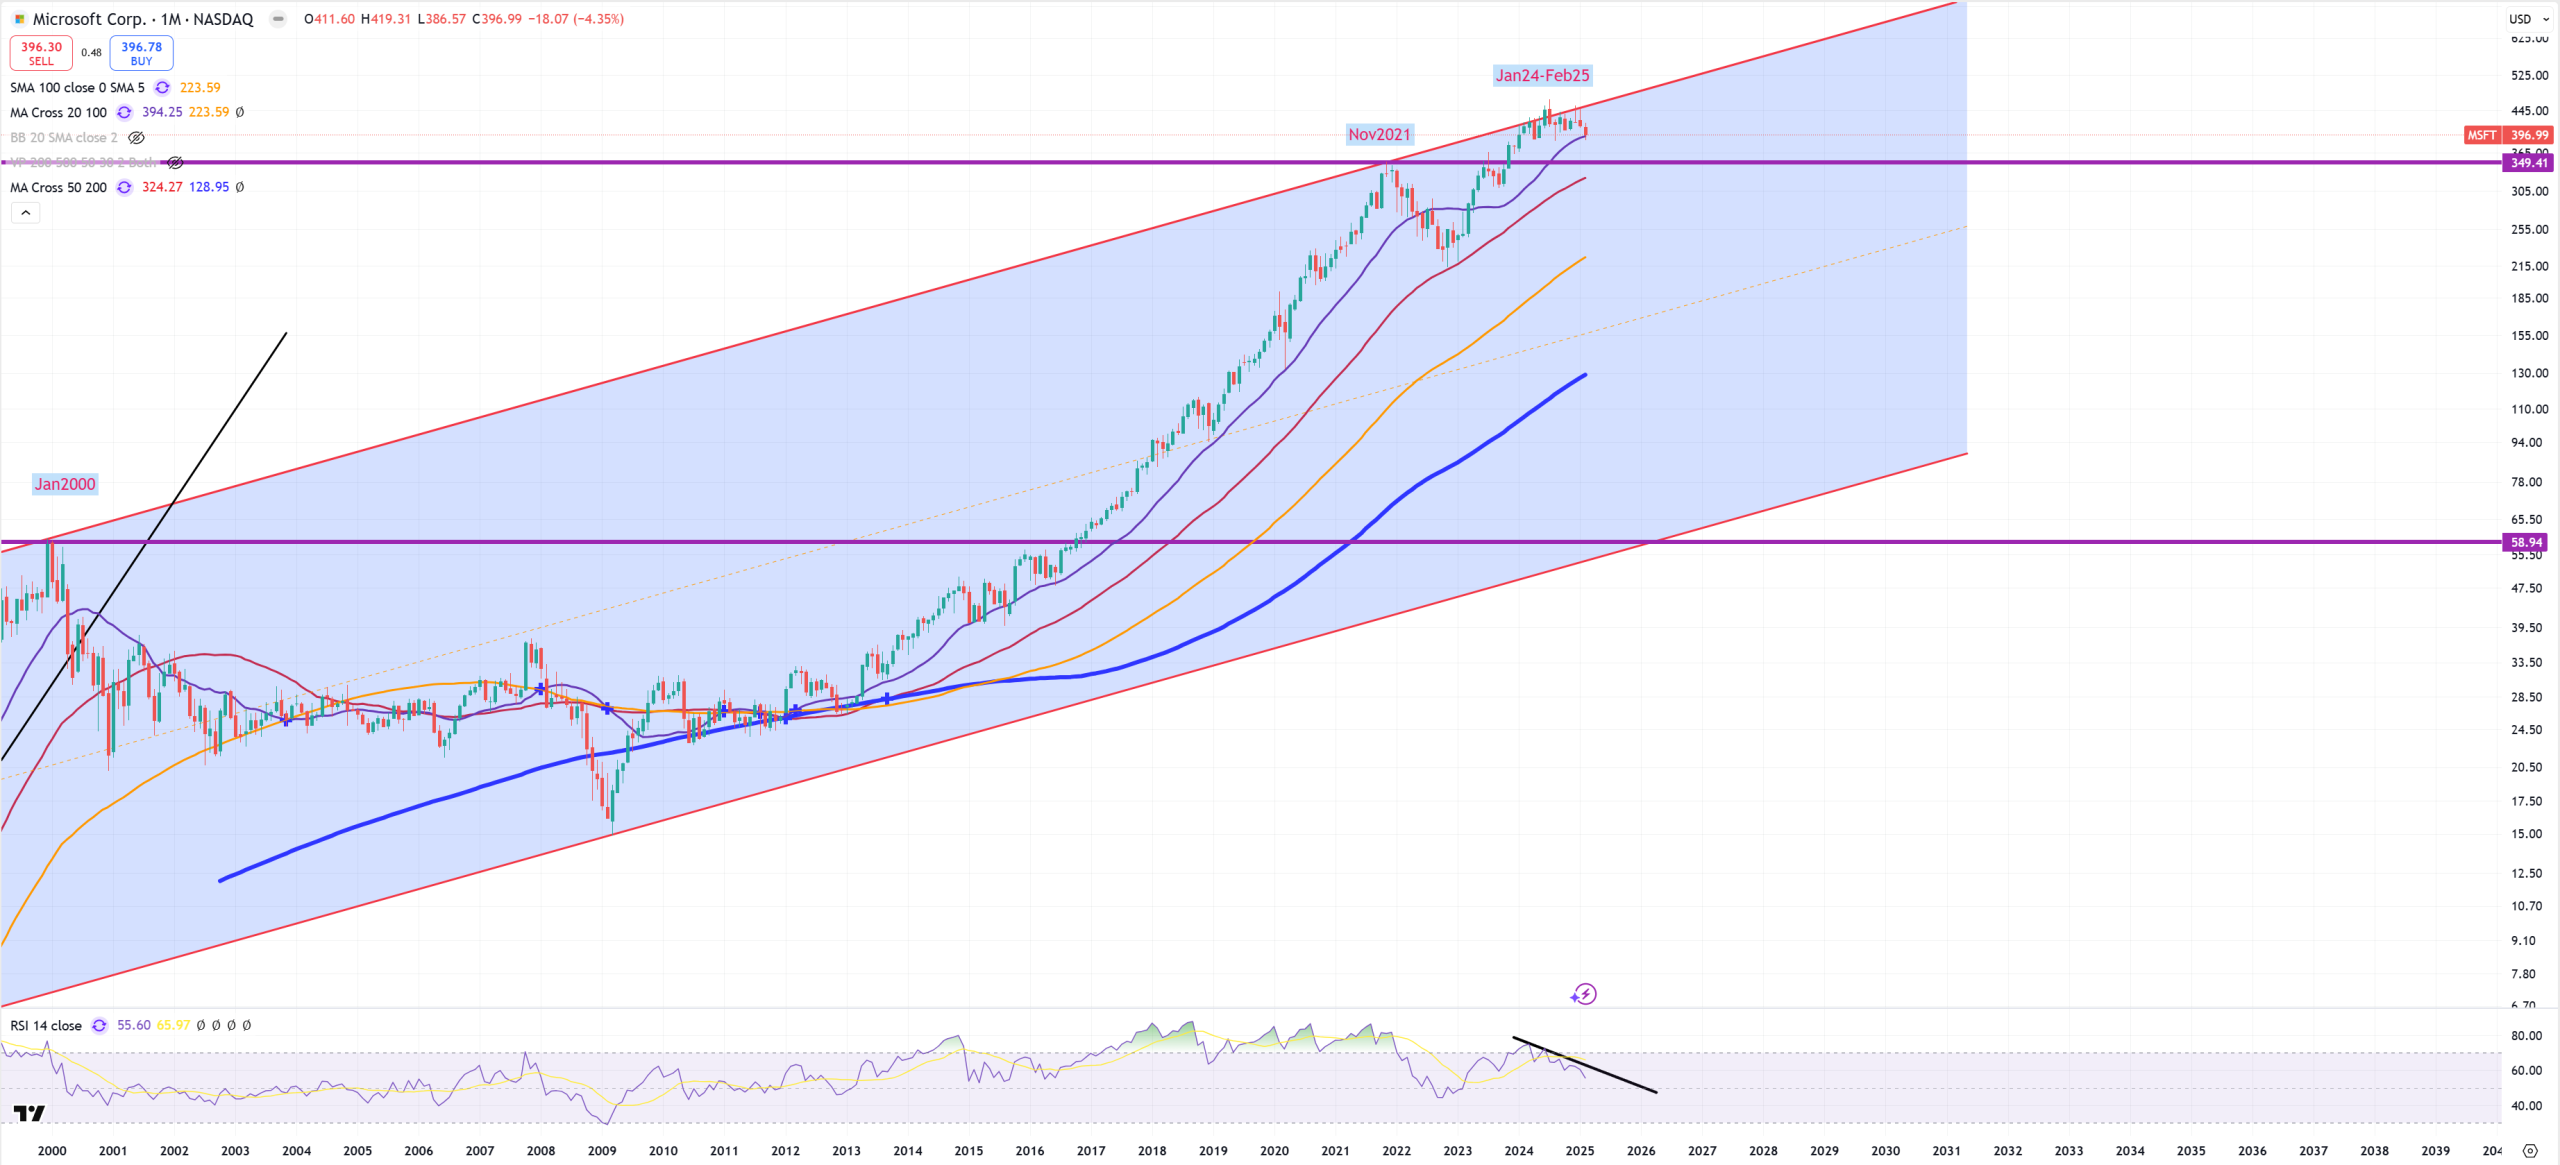
MSFT – Microsoft plays really good in its channel
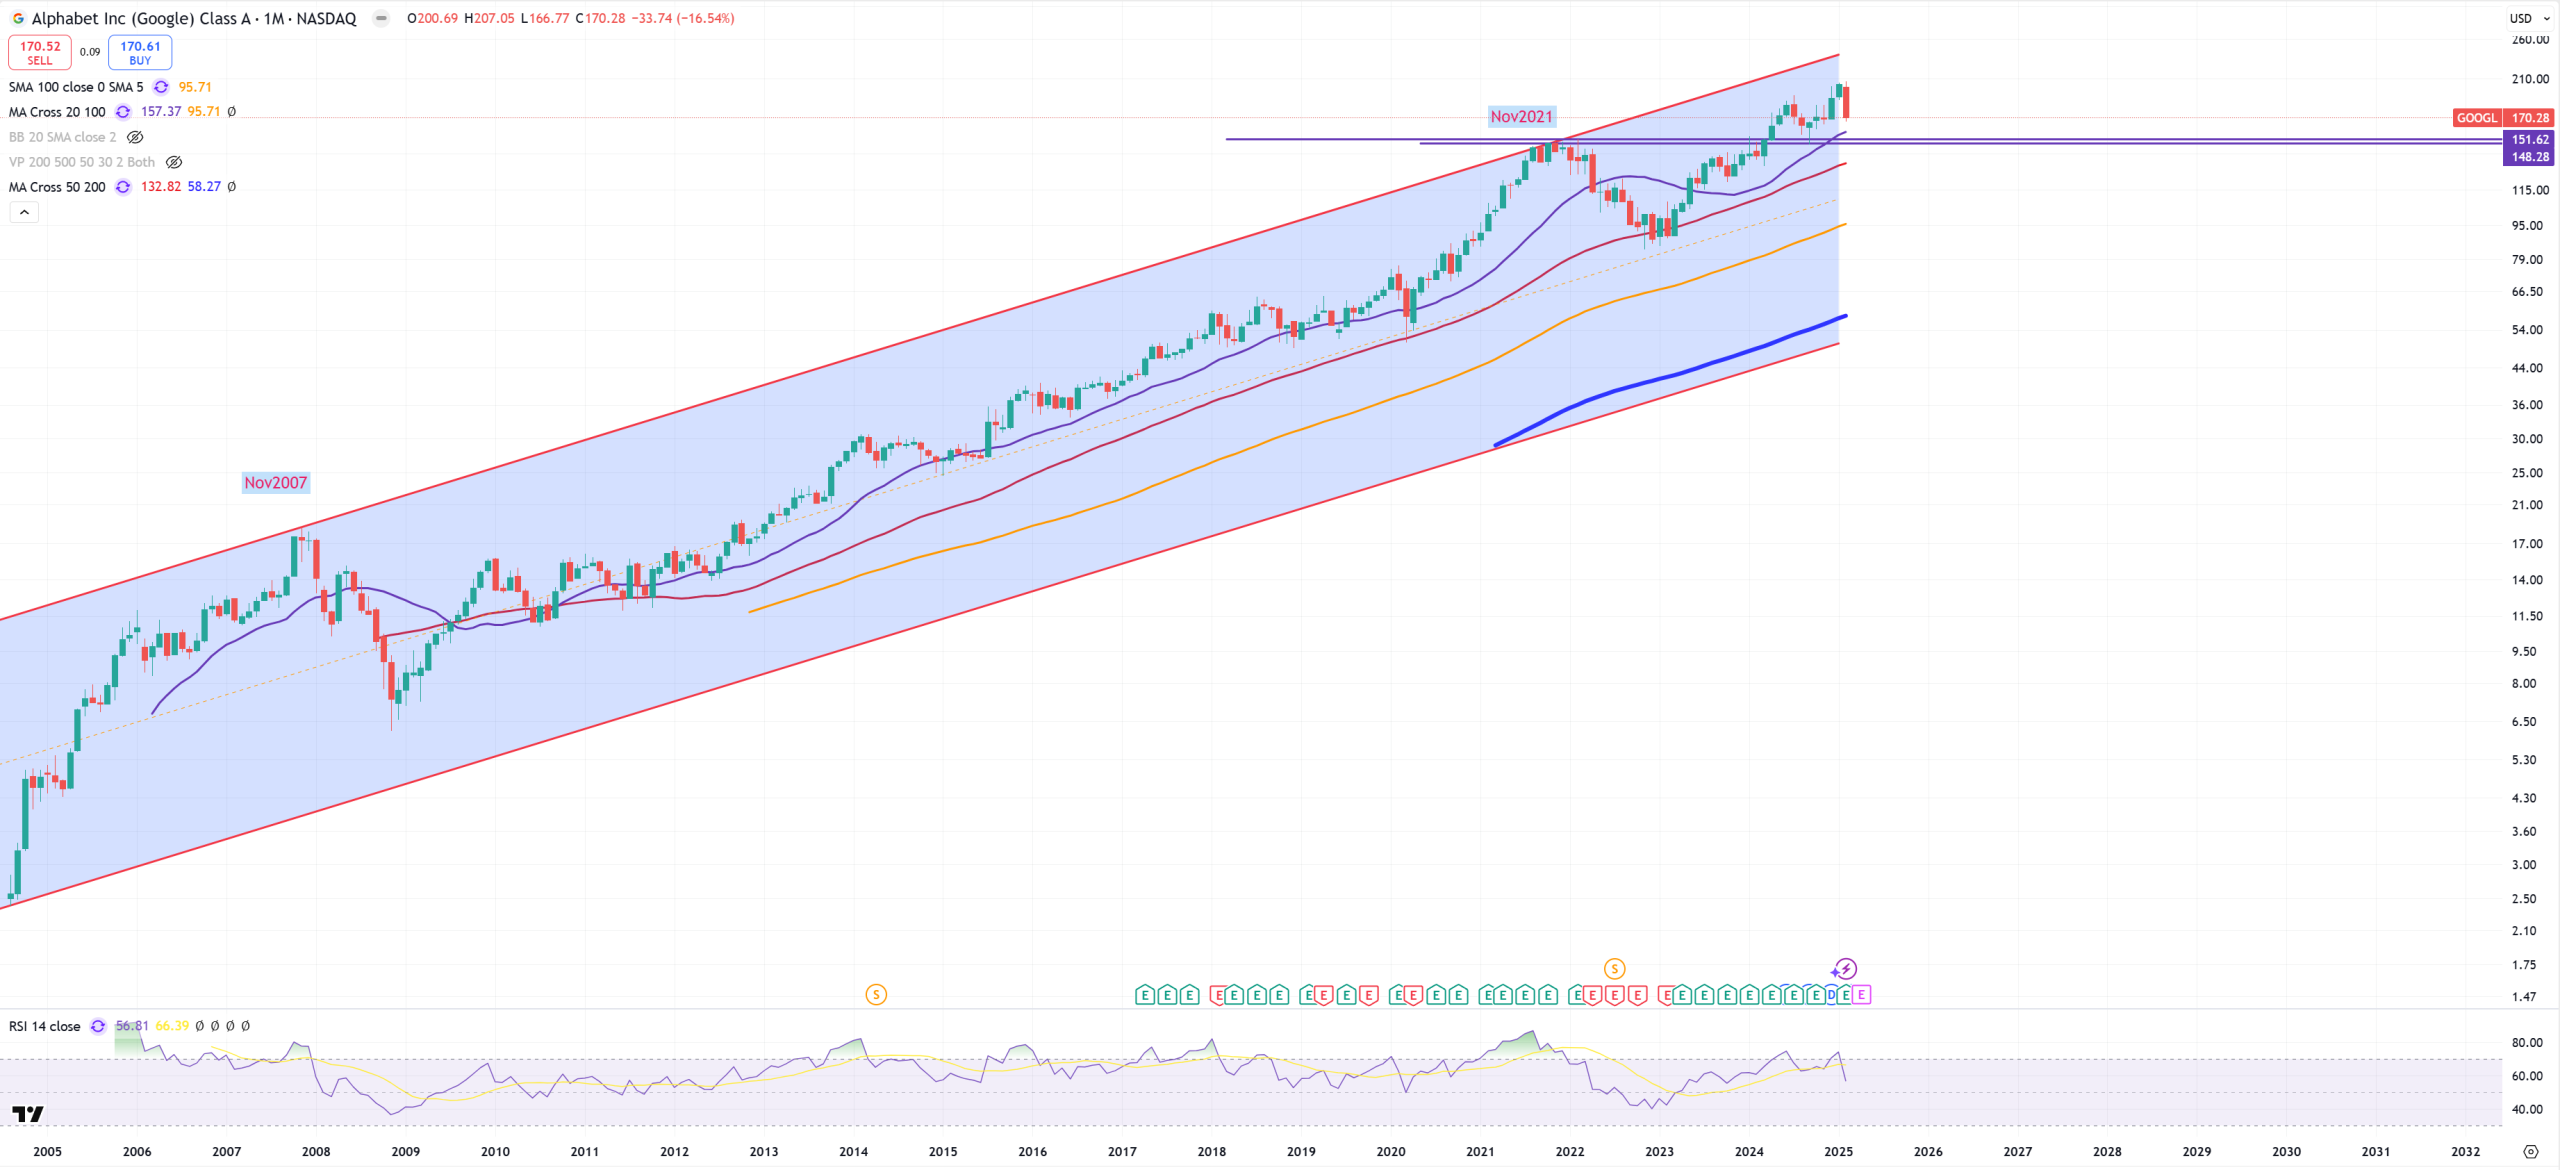
GOOGL – still above first top
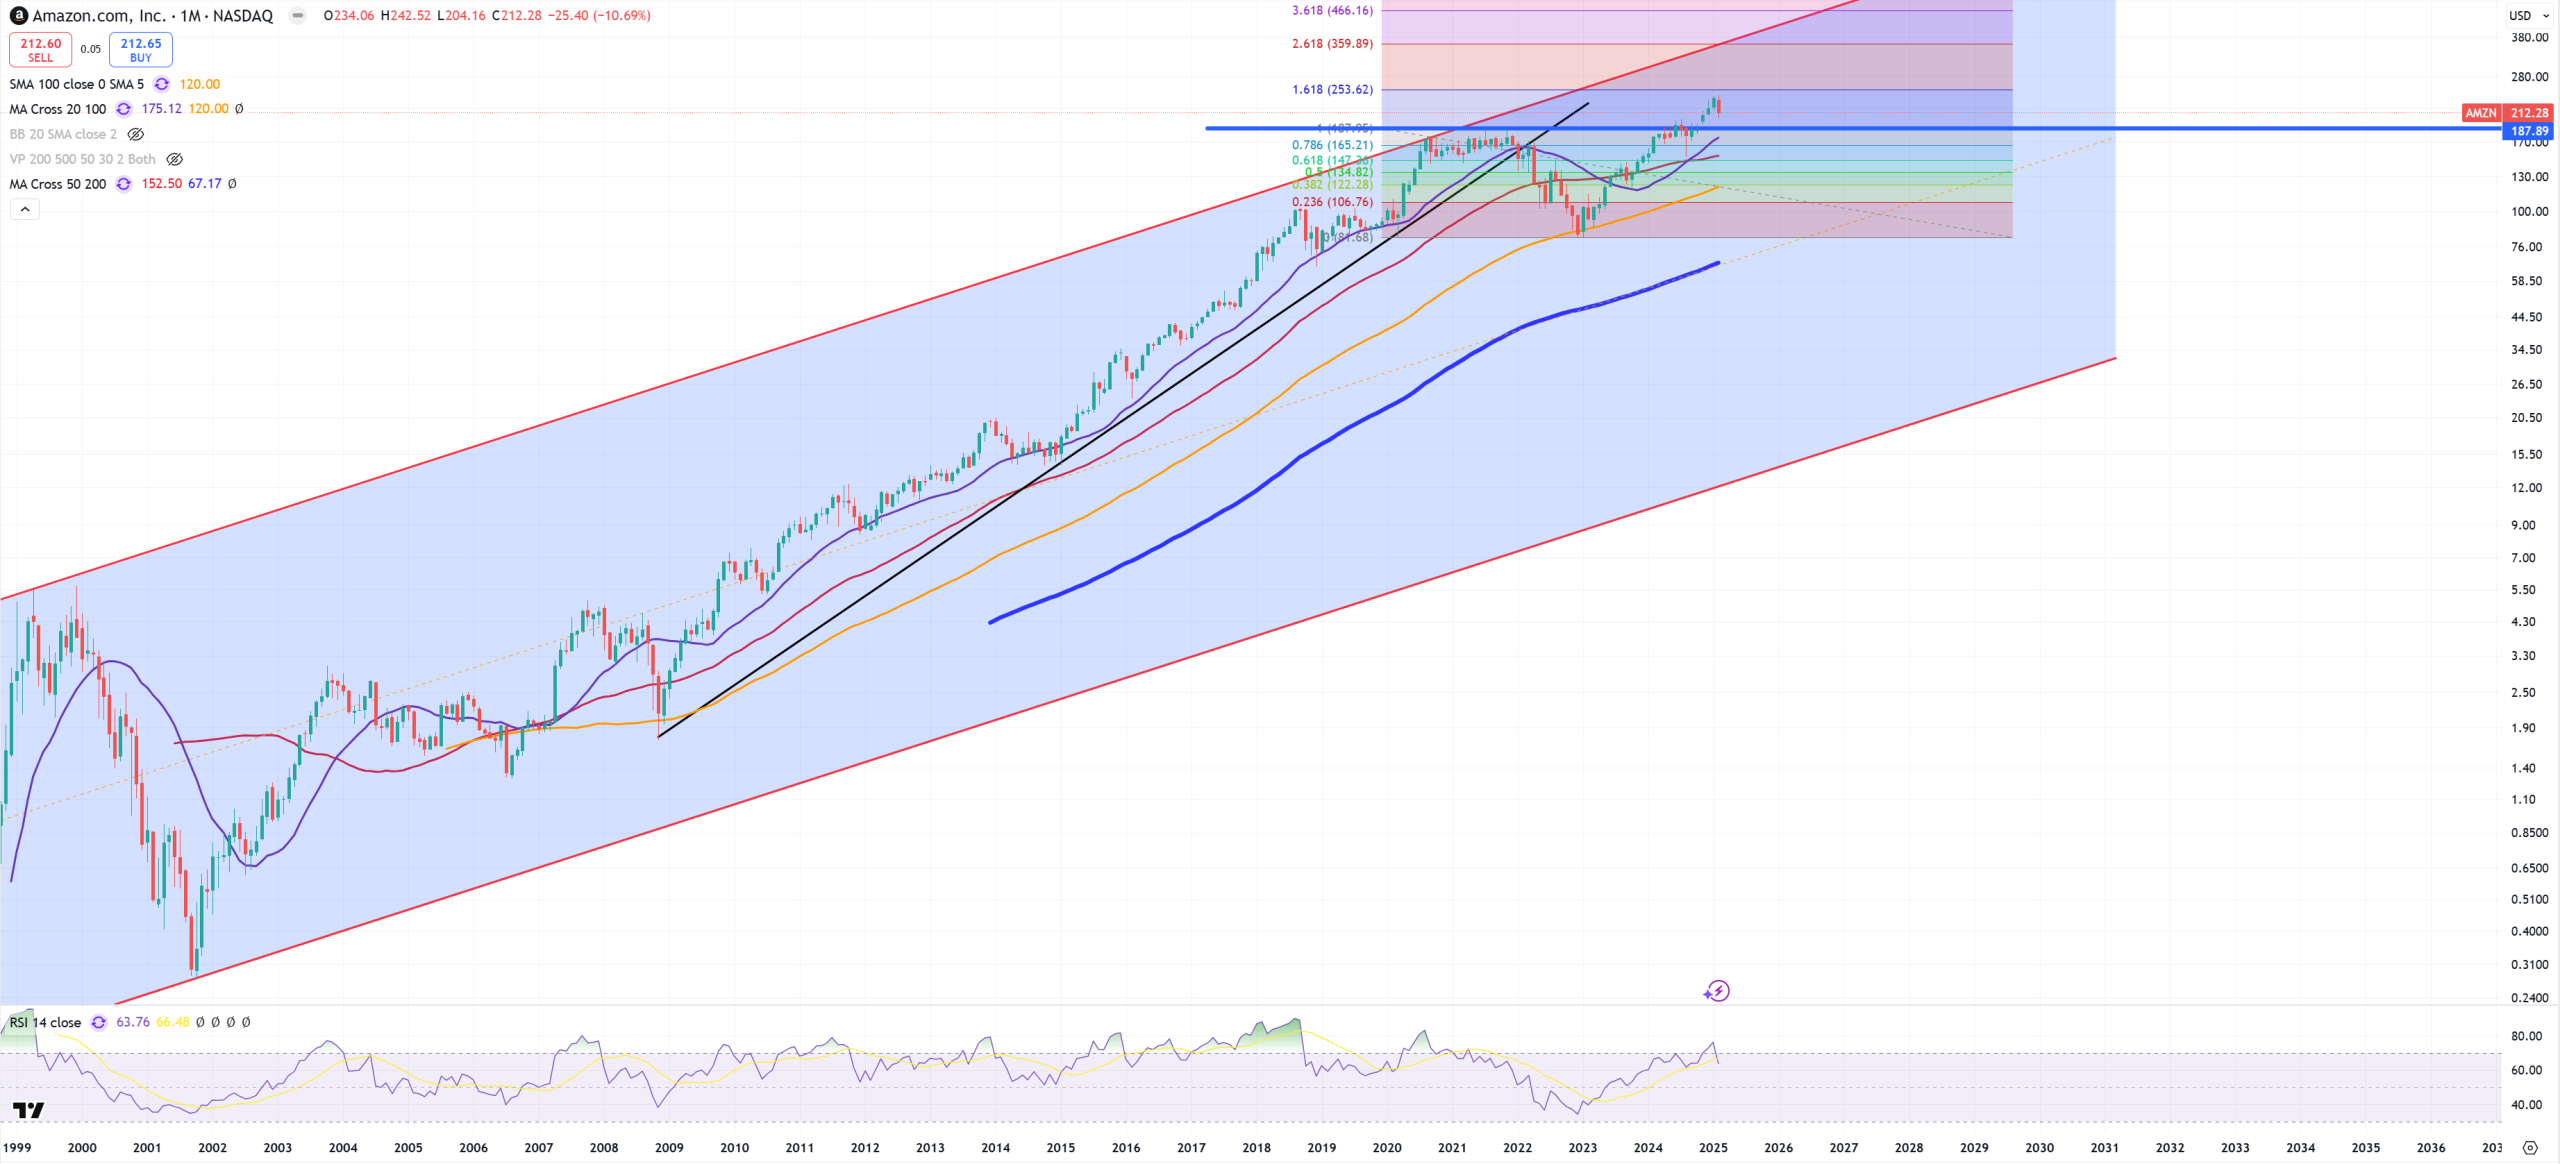
AMZN – same situation as GOOGL
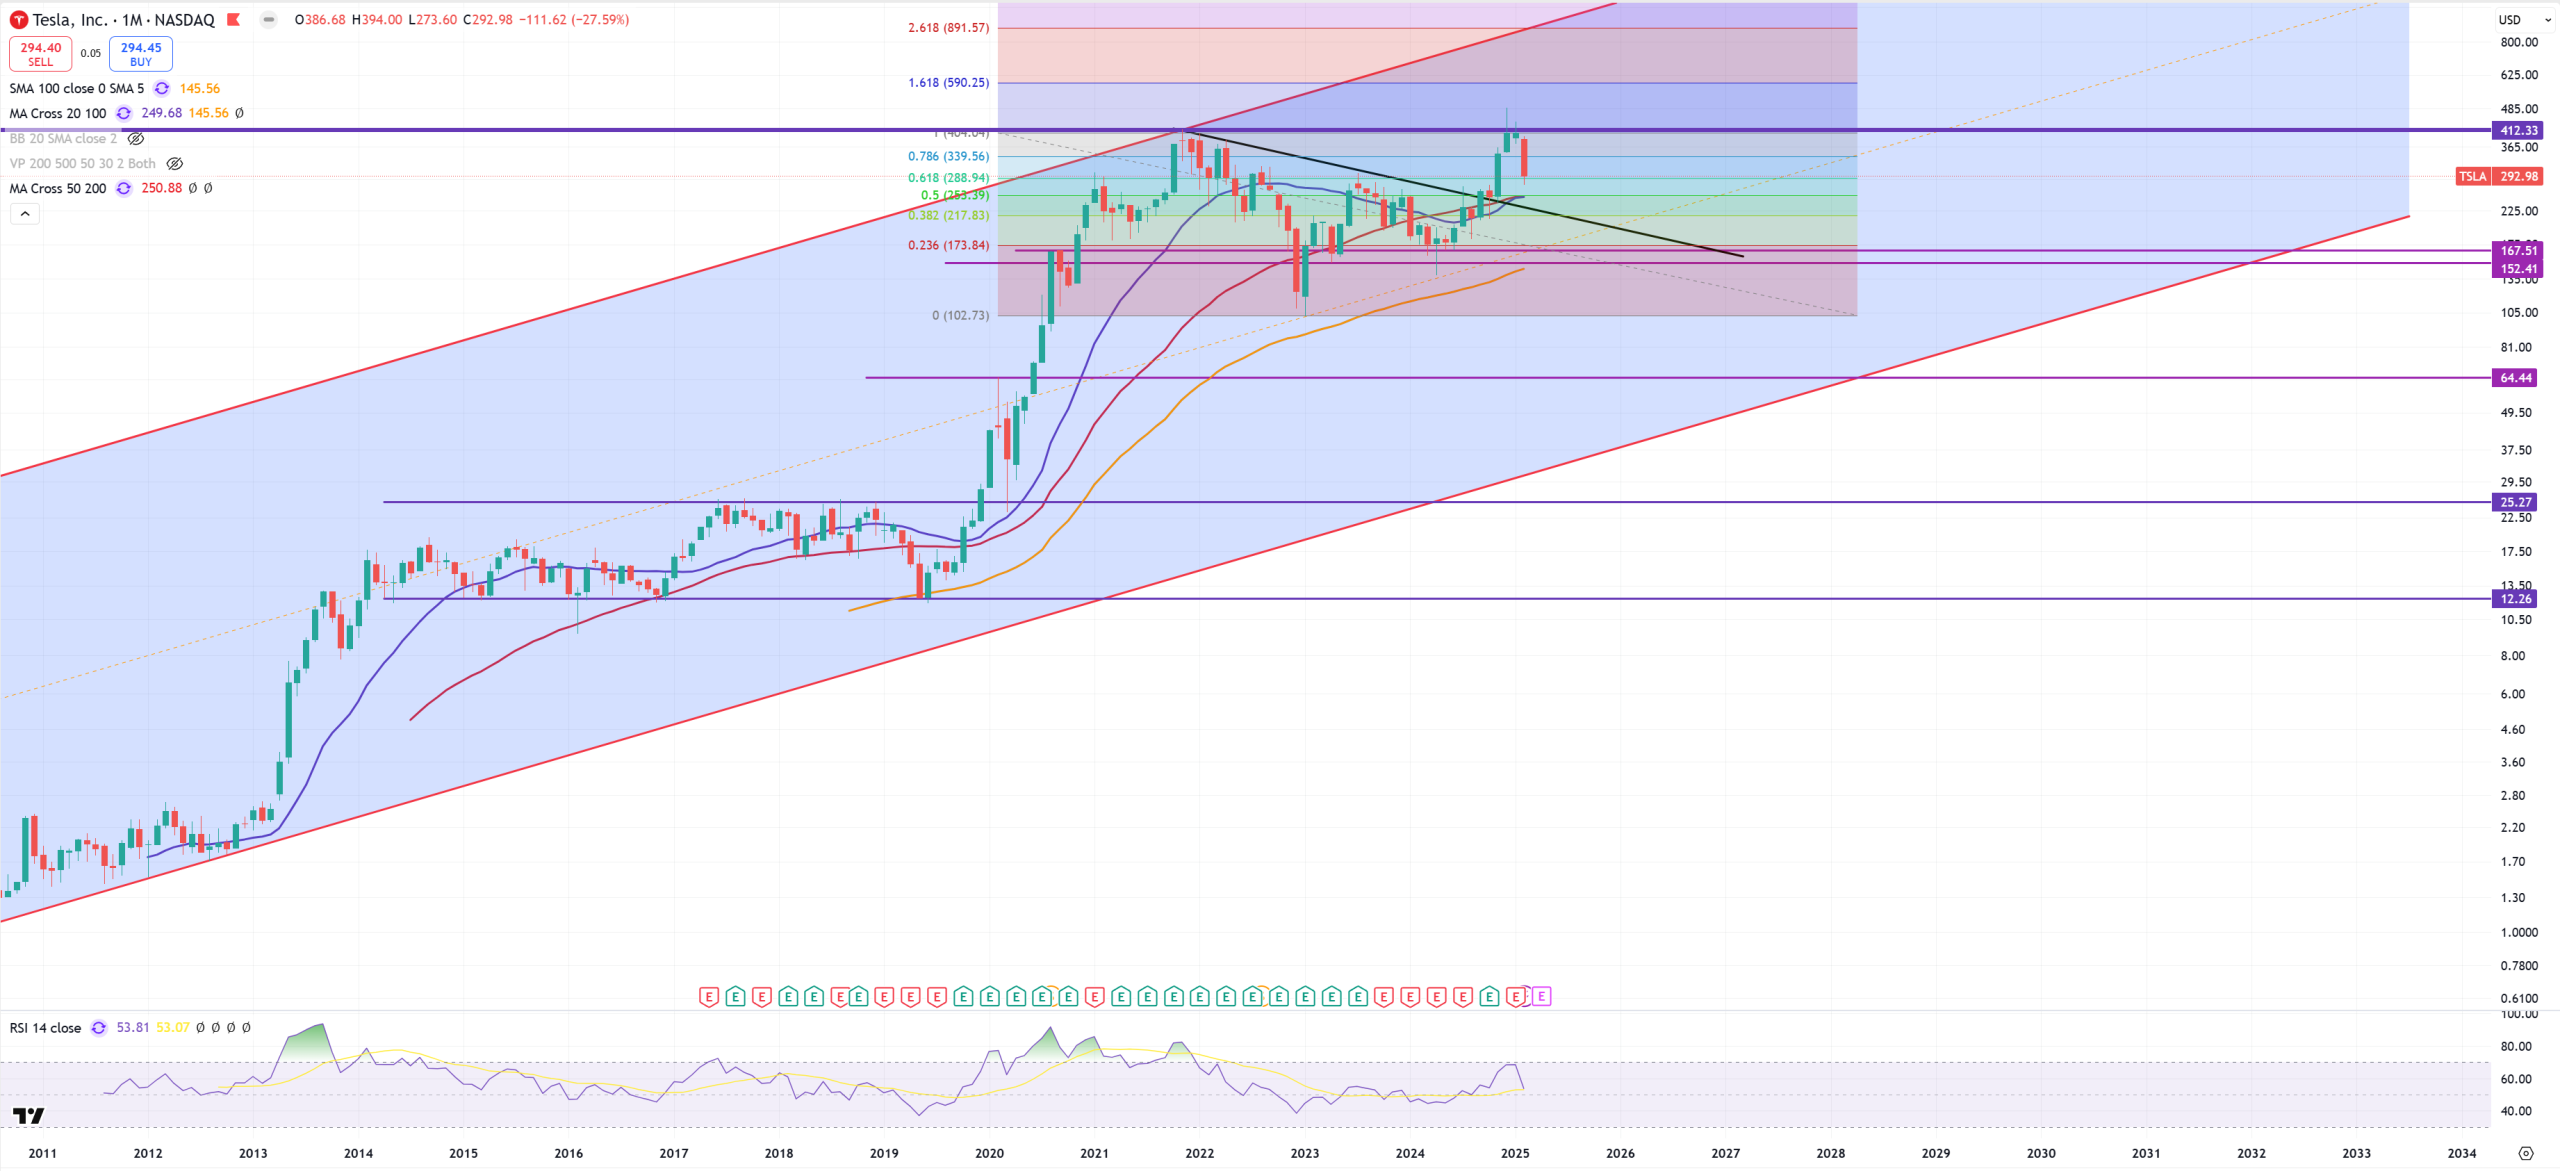
TSLA fights with double-top
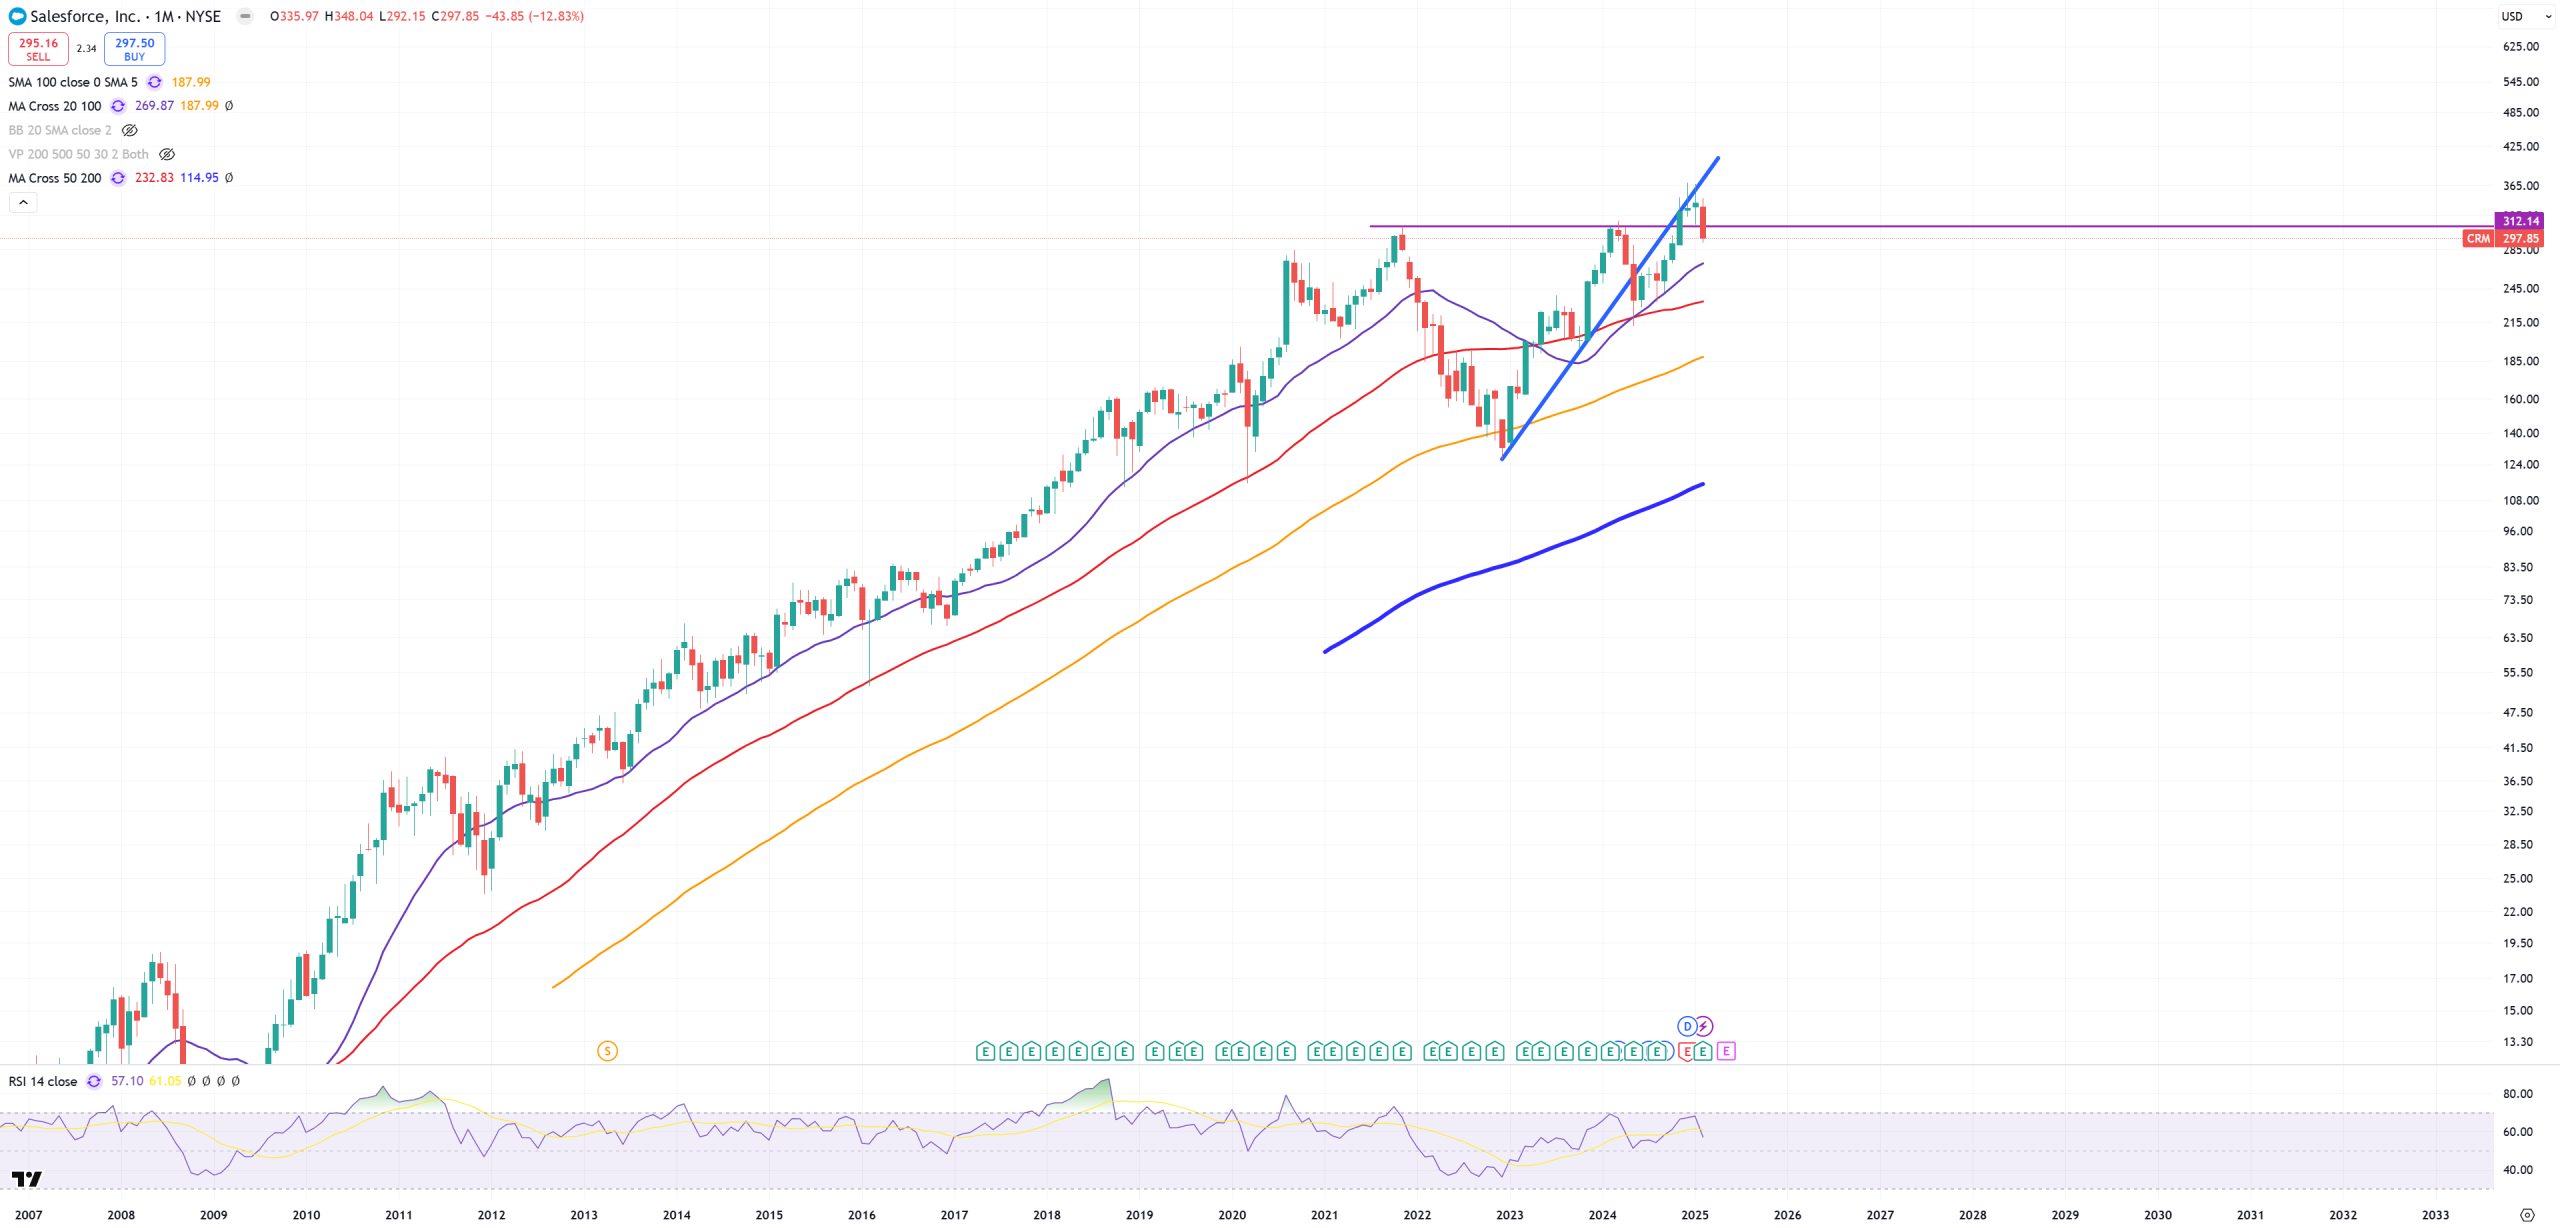
CRM – Salesforce below key support now flips to resistance
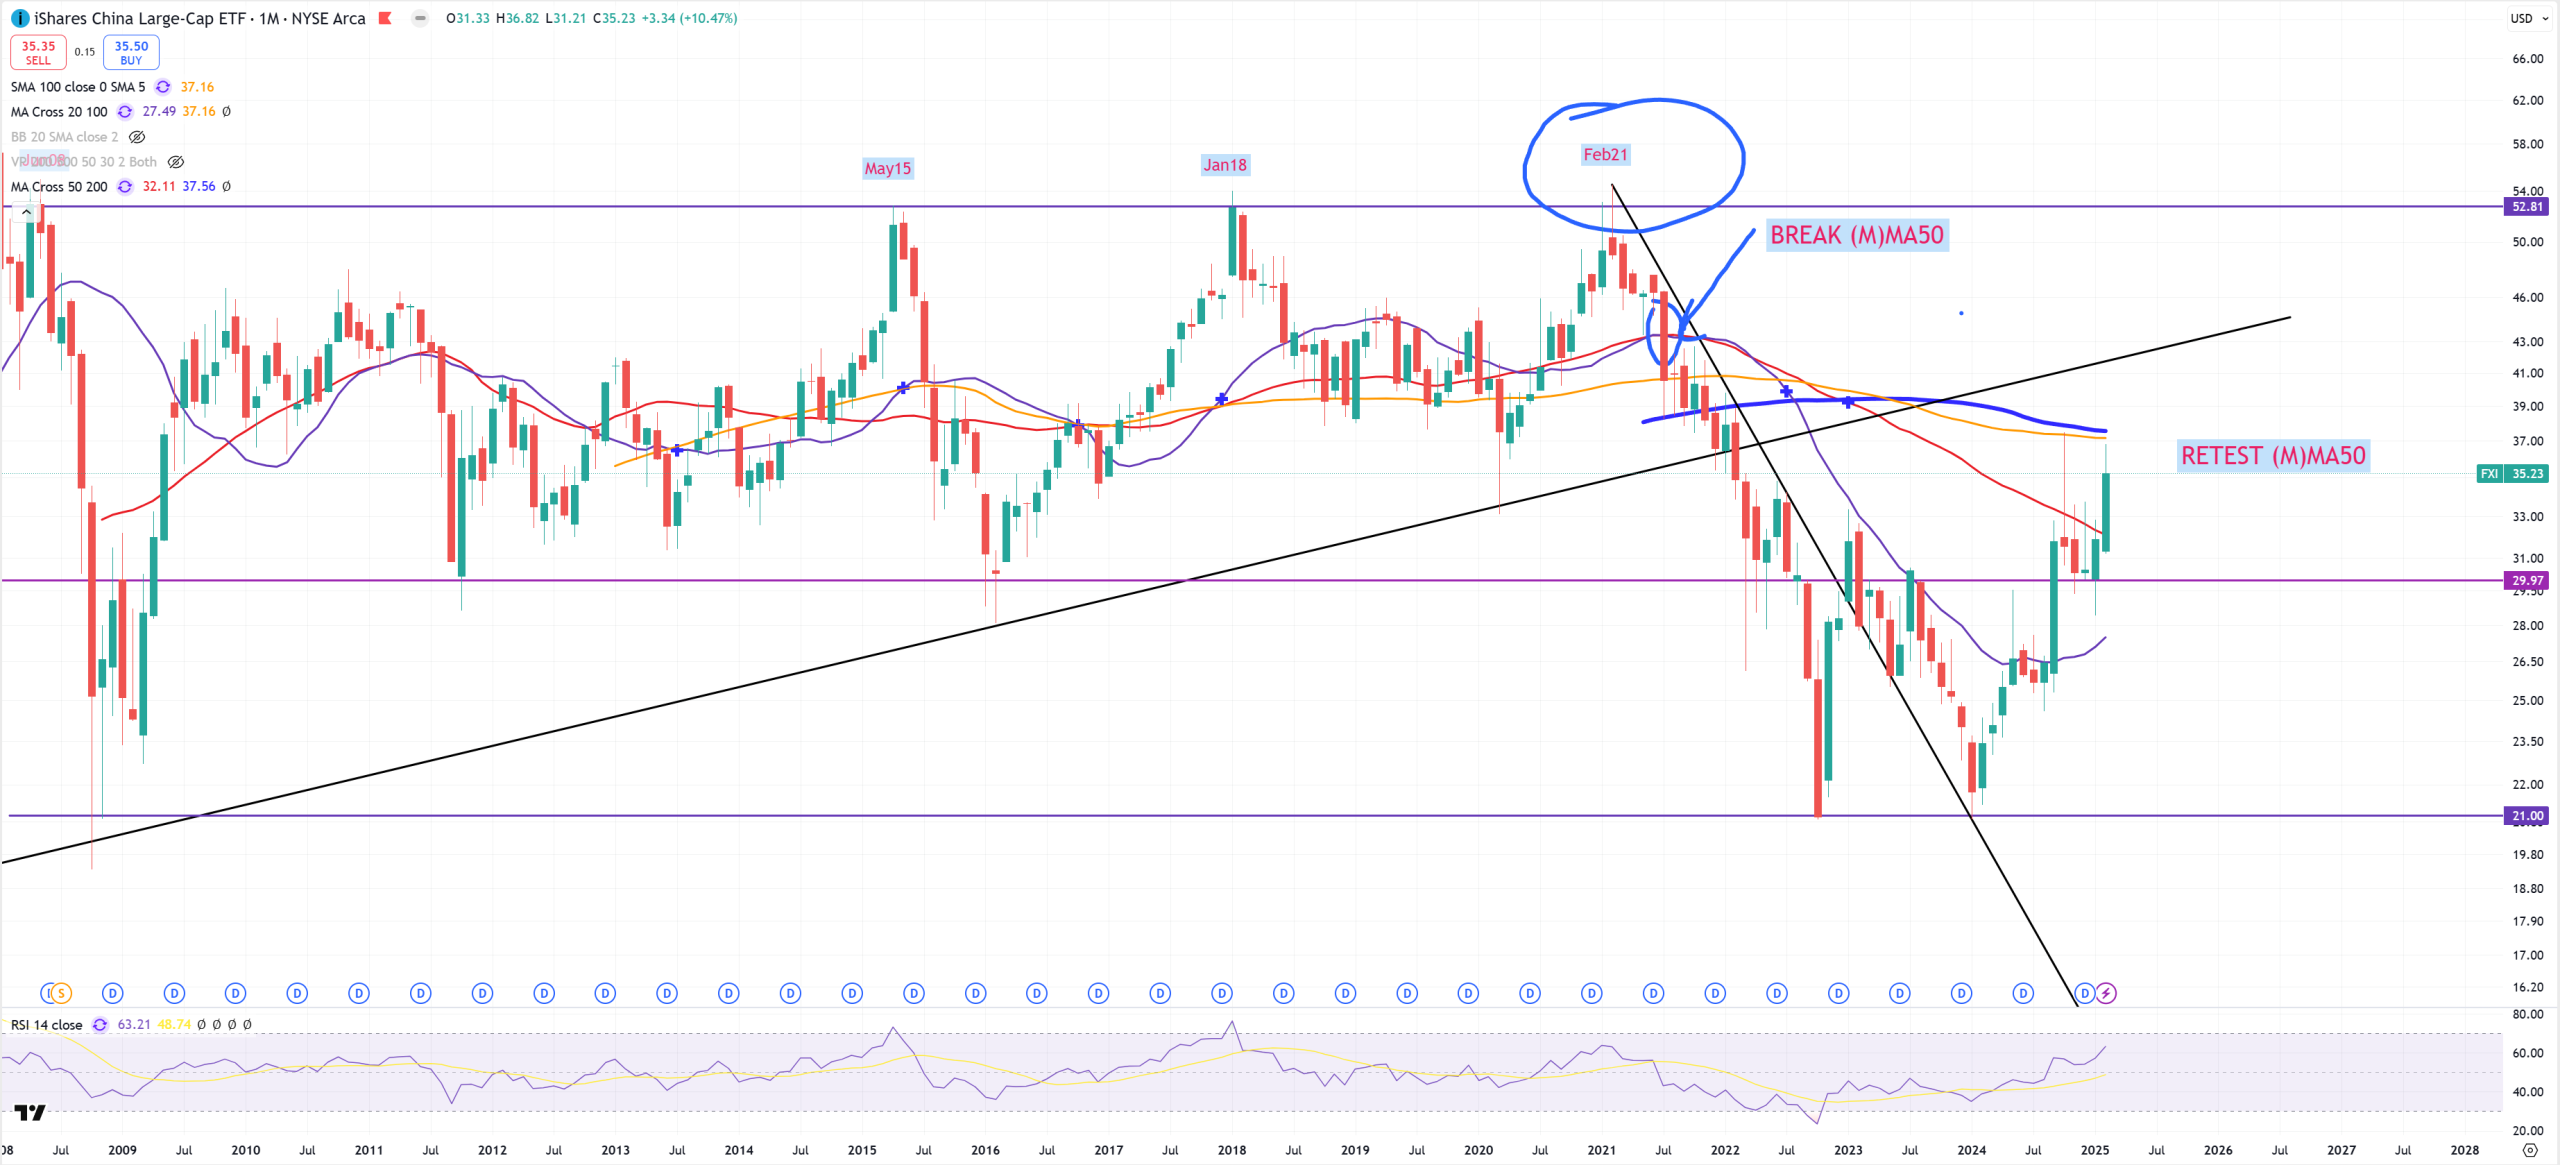
FXI – China tries to break (M)MA50, permanent or false, time will tell
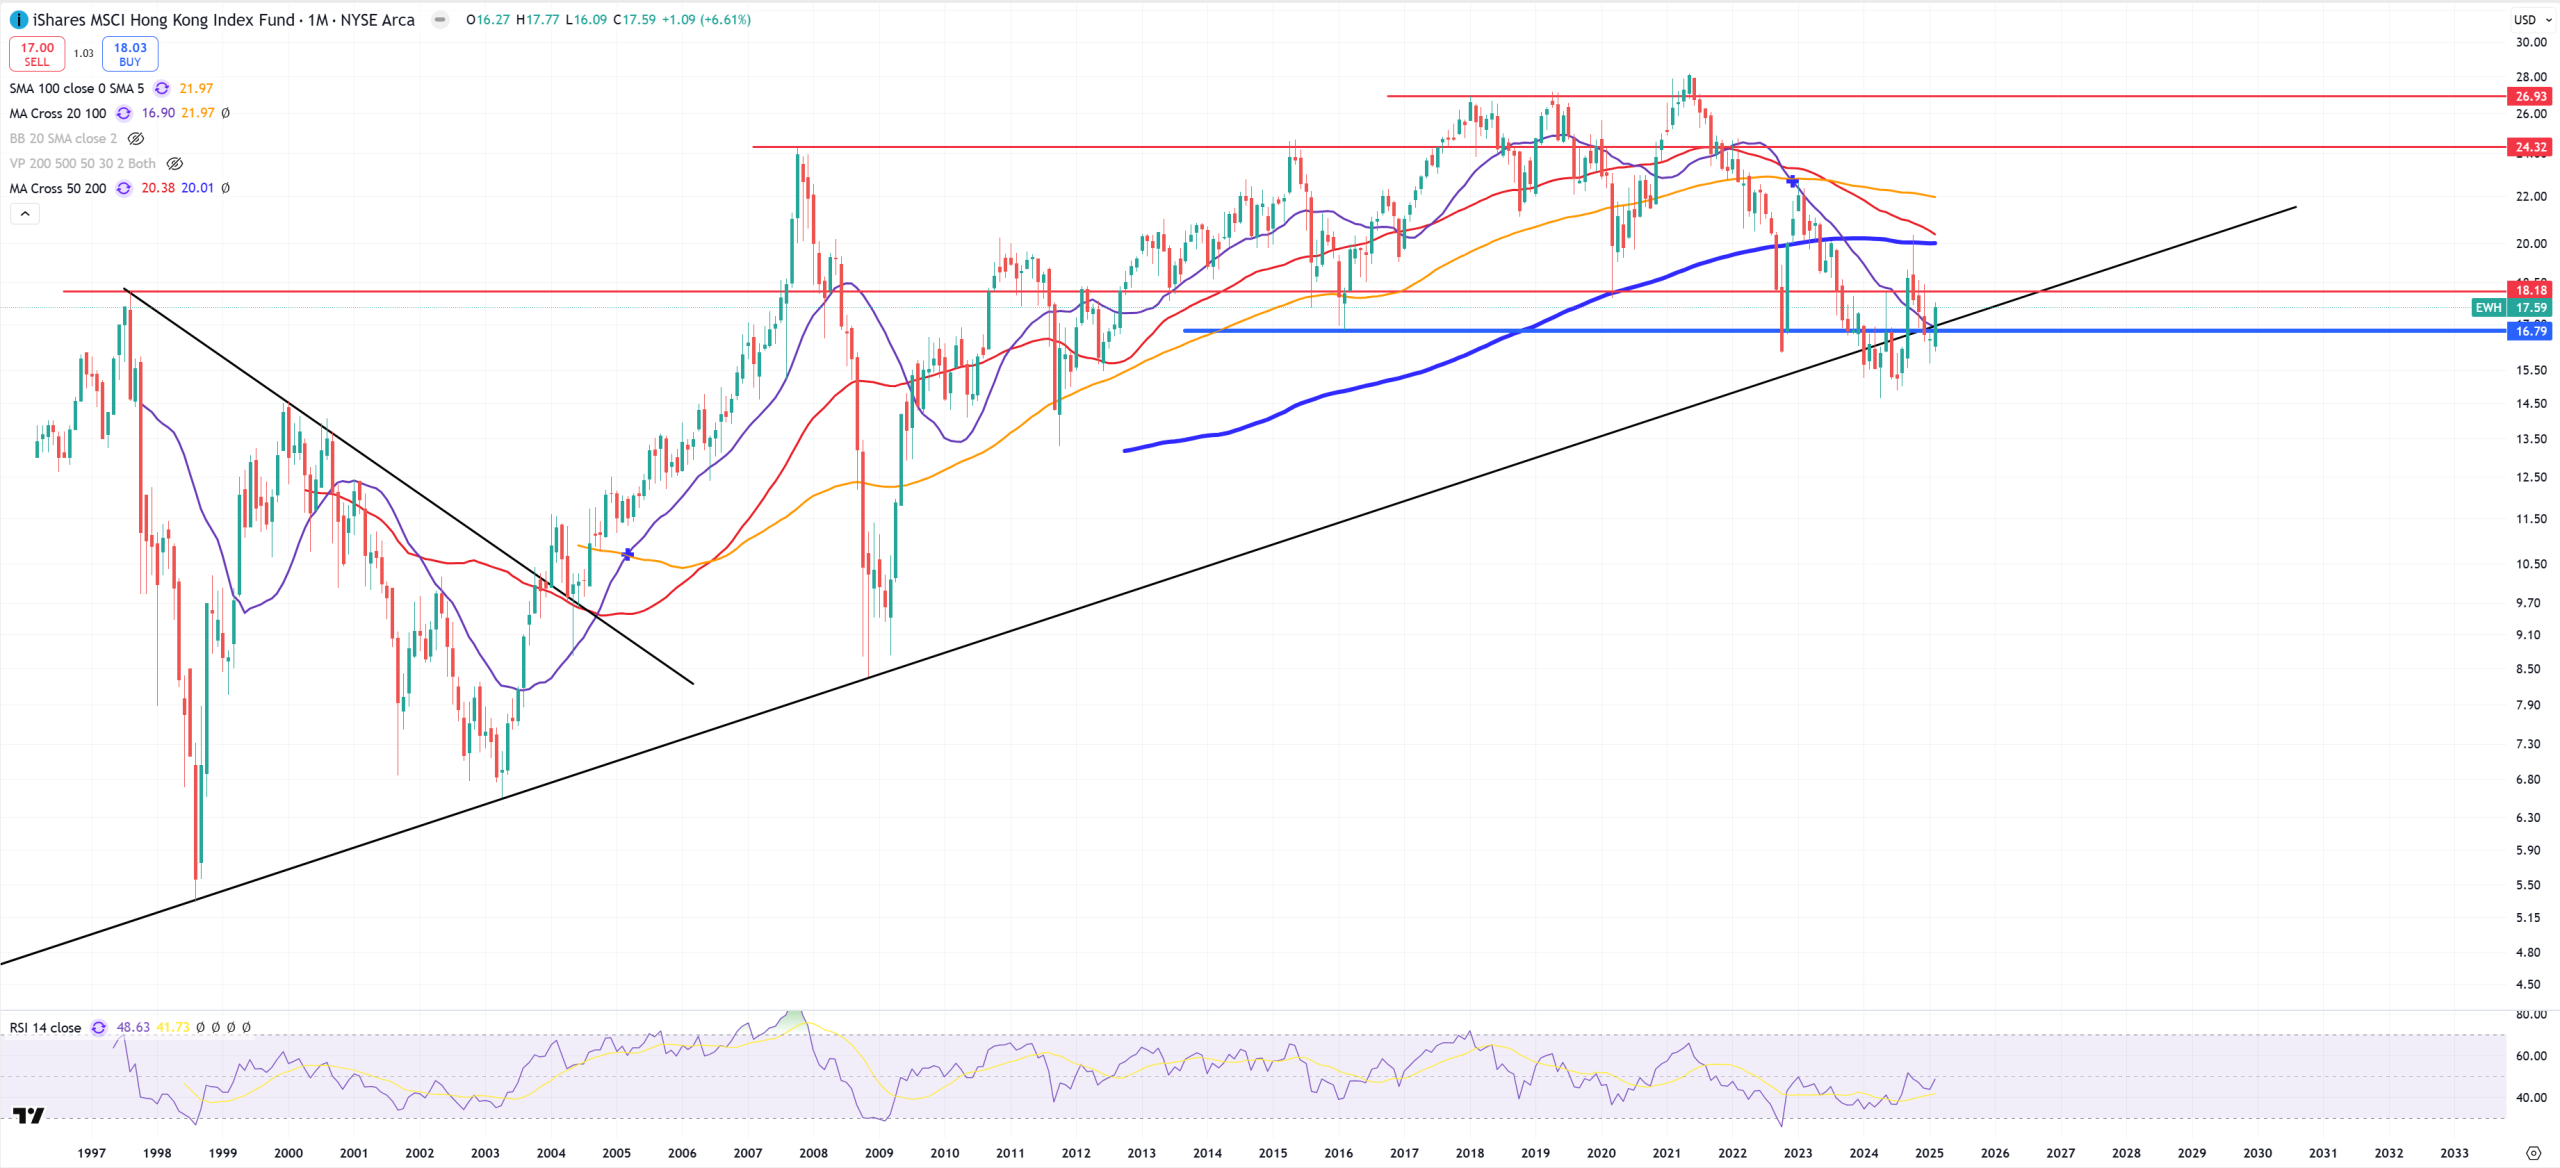
EWH – Hong-Kong – very similar setup to FXI – it tries not to reject its secular trend, last time it failed, will it be different this time?
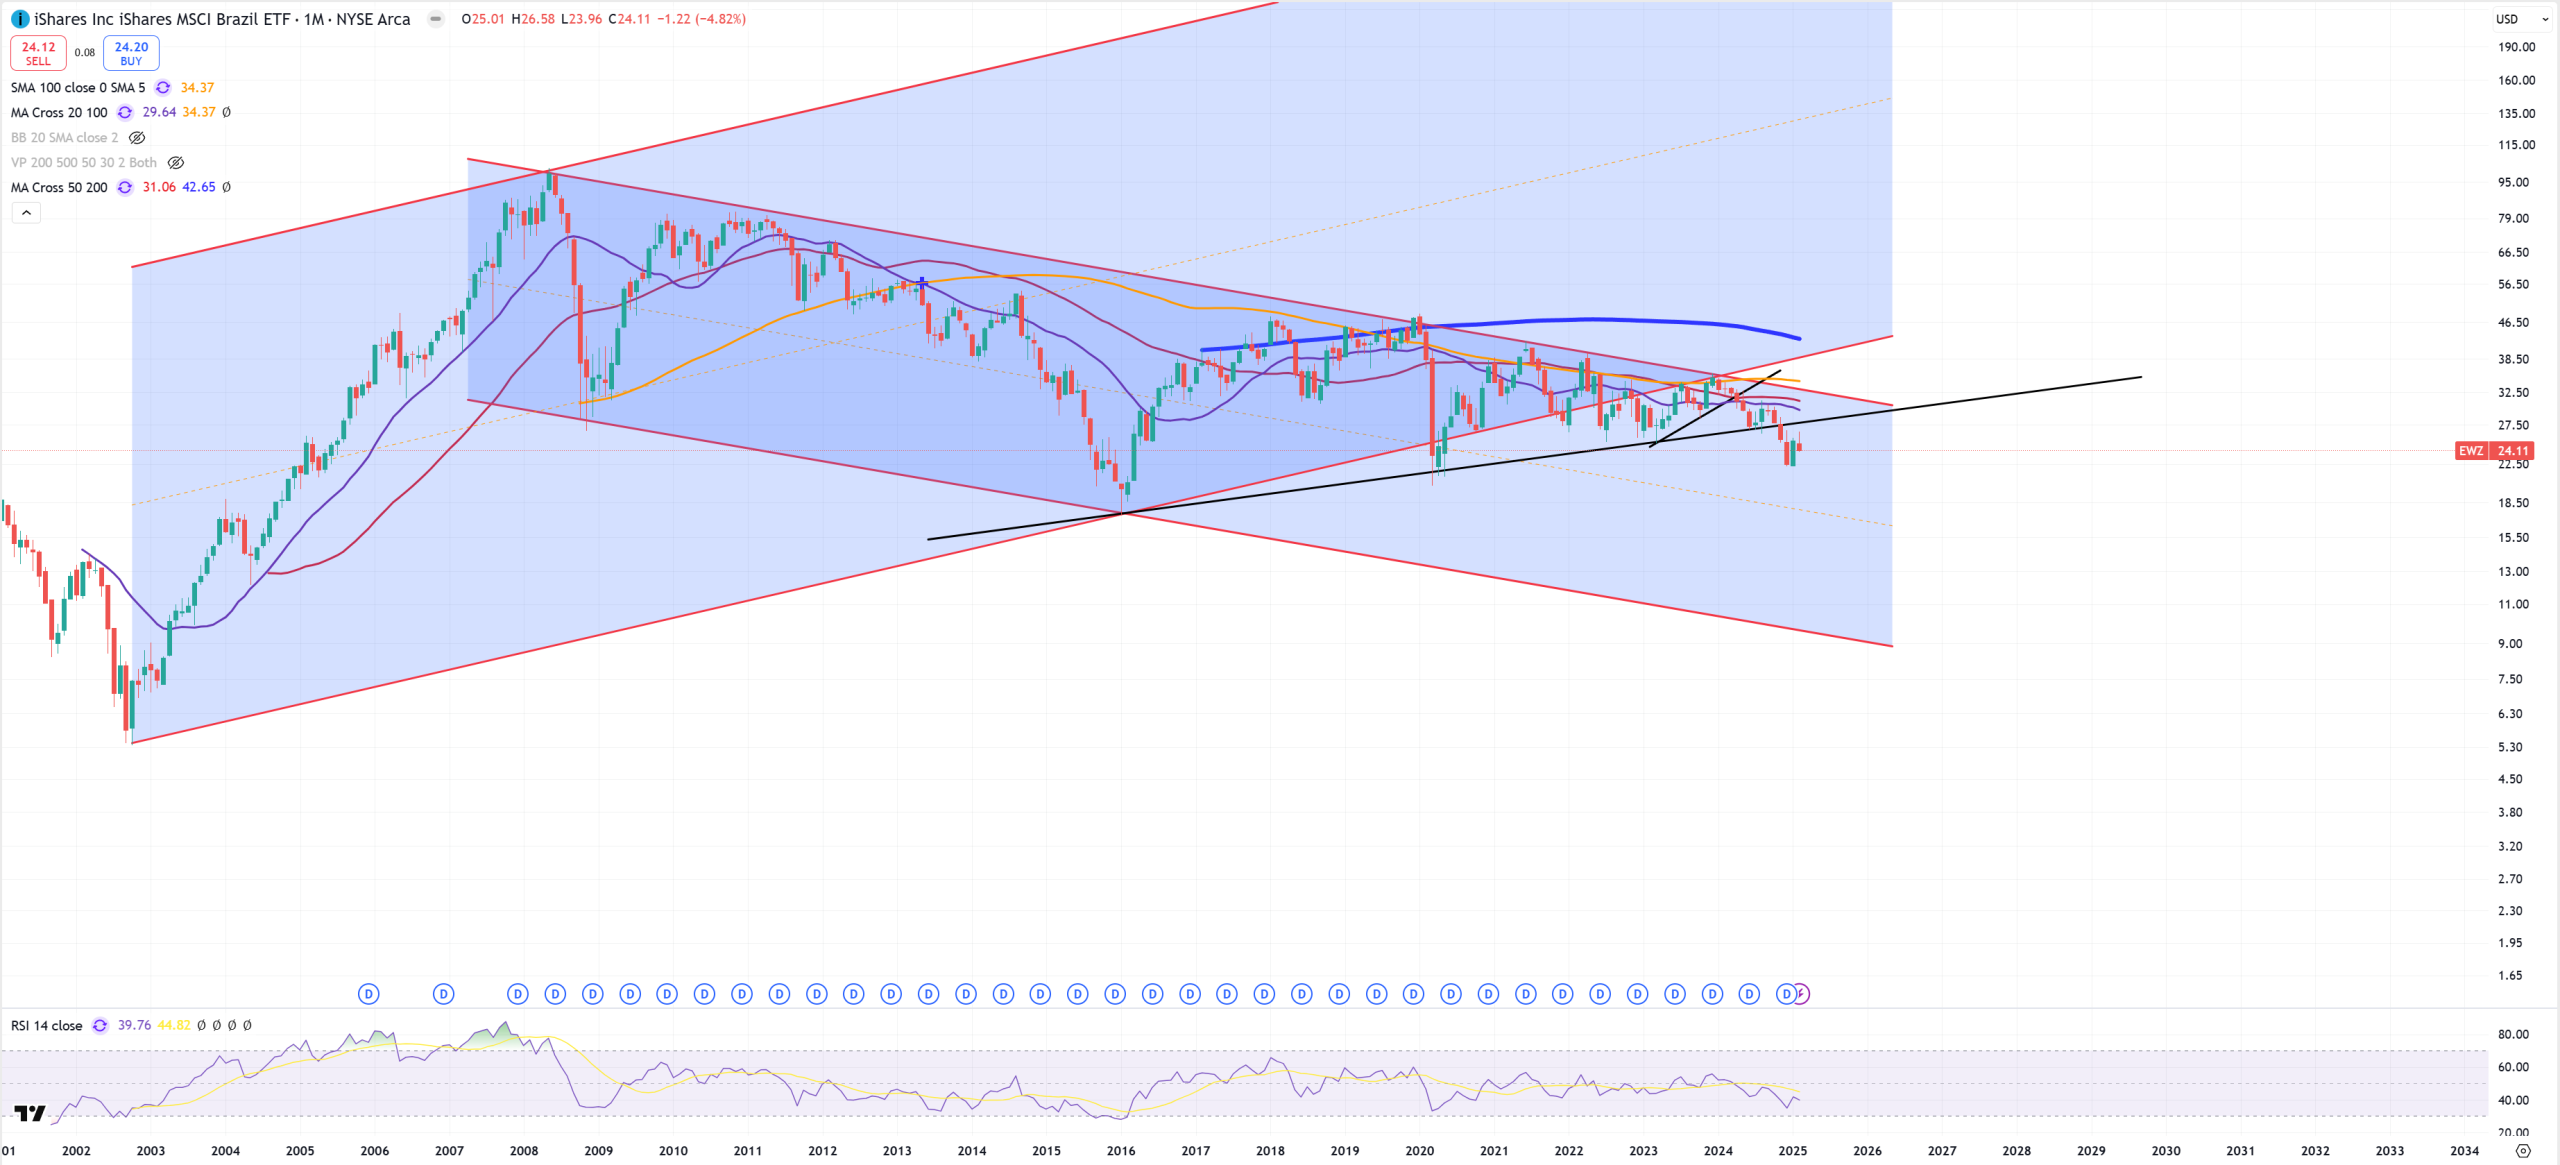
EWZ – Brazil and some kind of retest of a broken trend
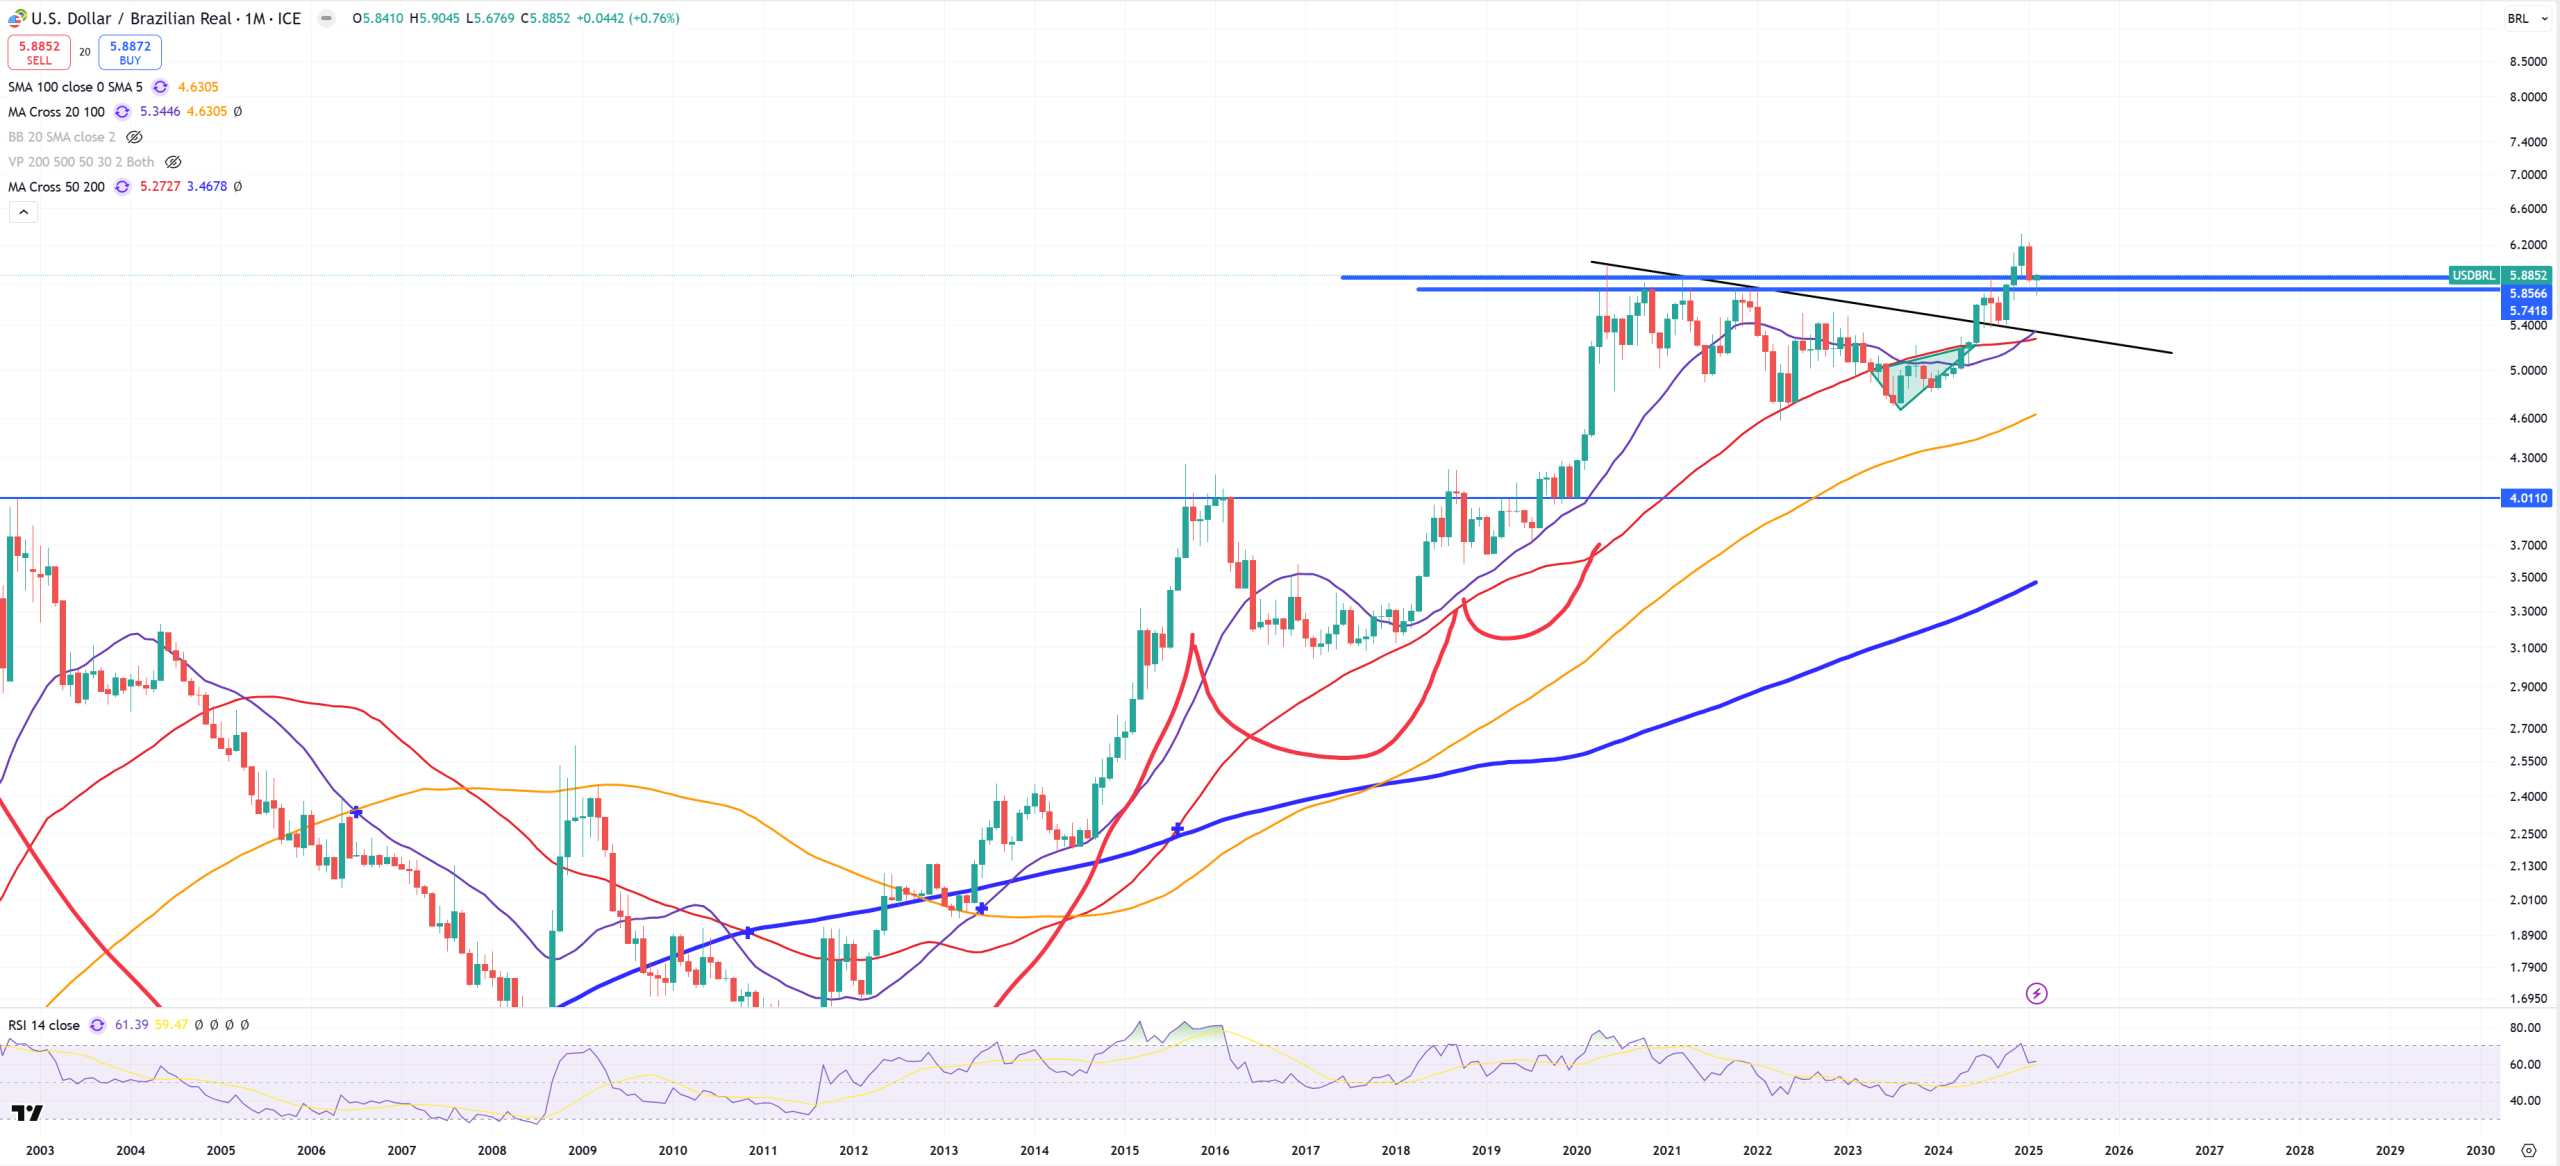
USDBRL – this is support = EWZ going down
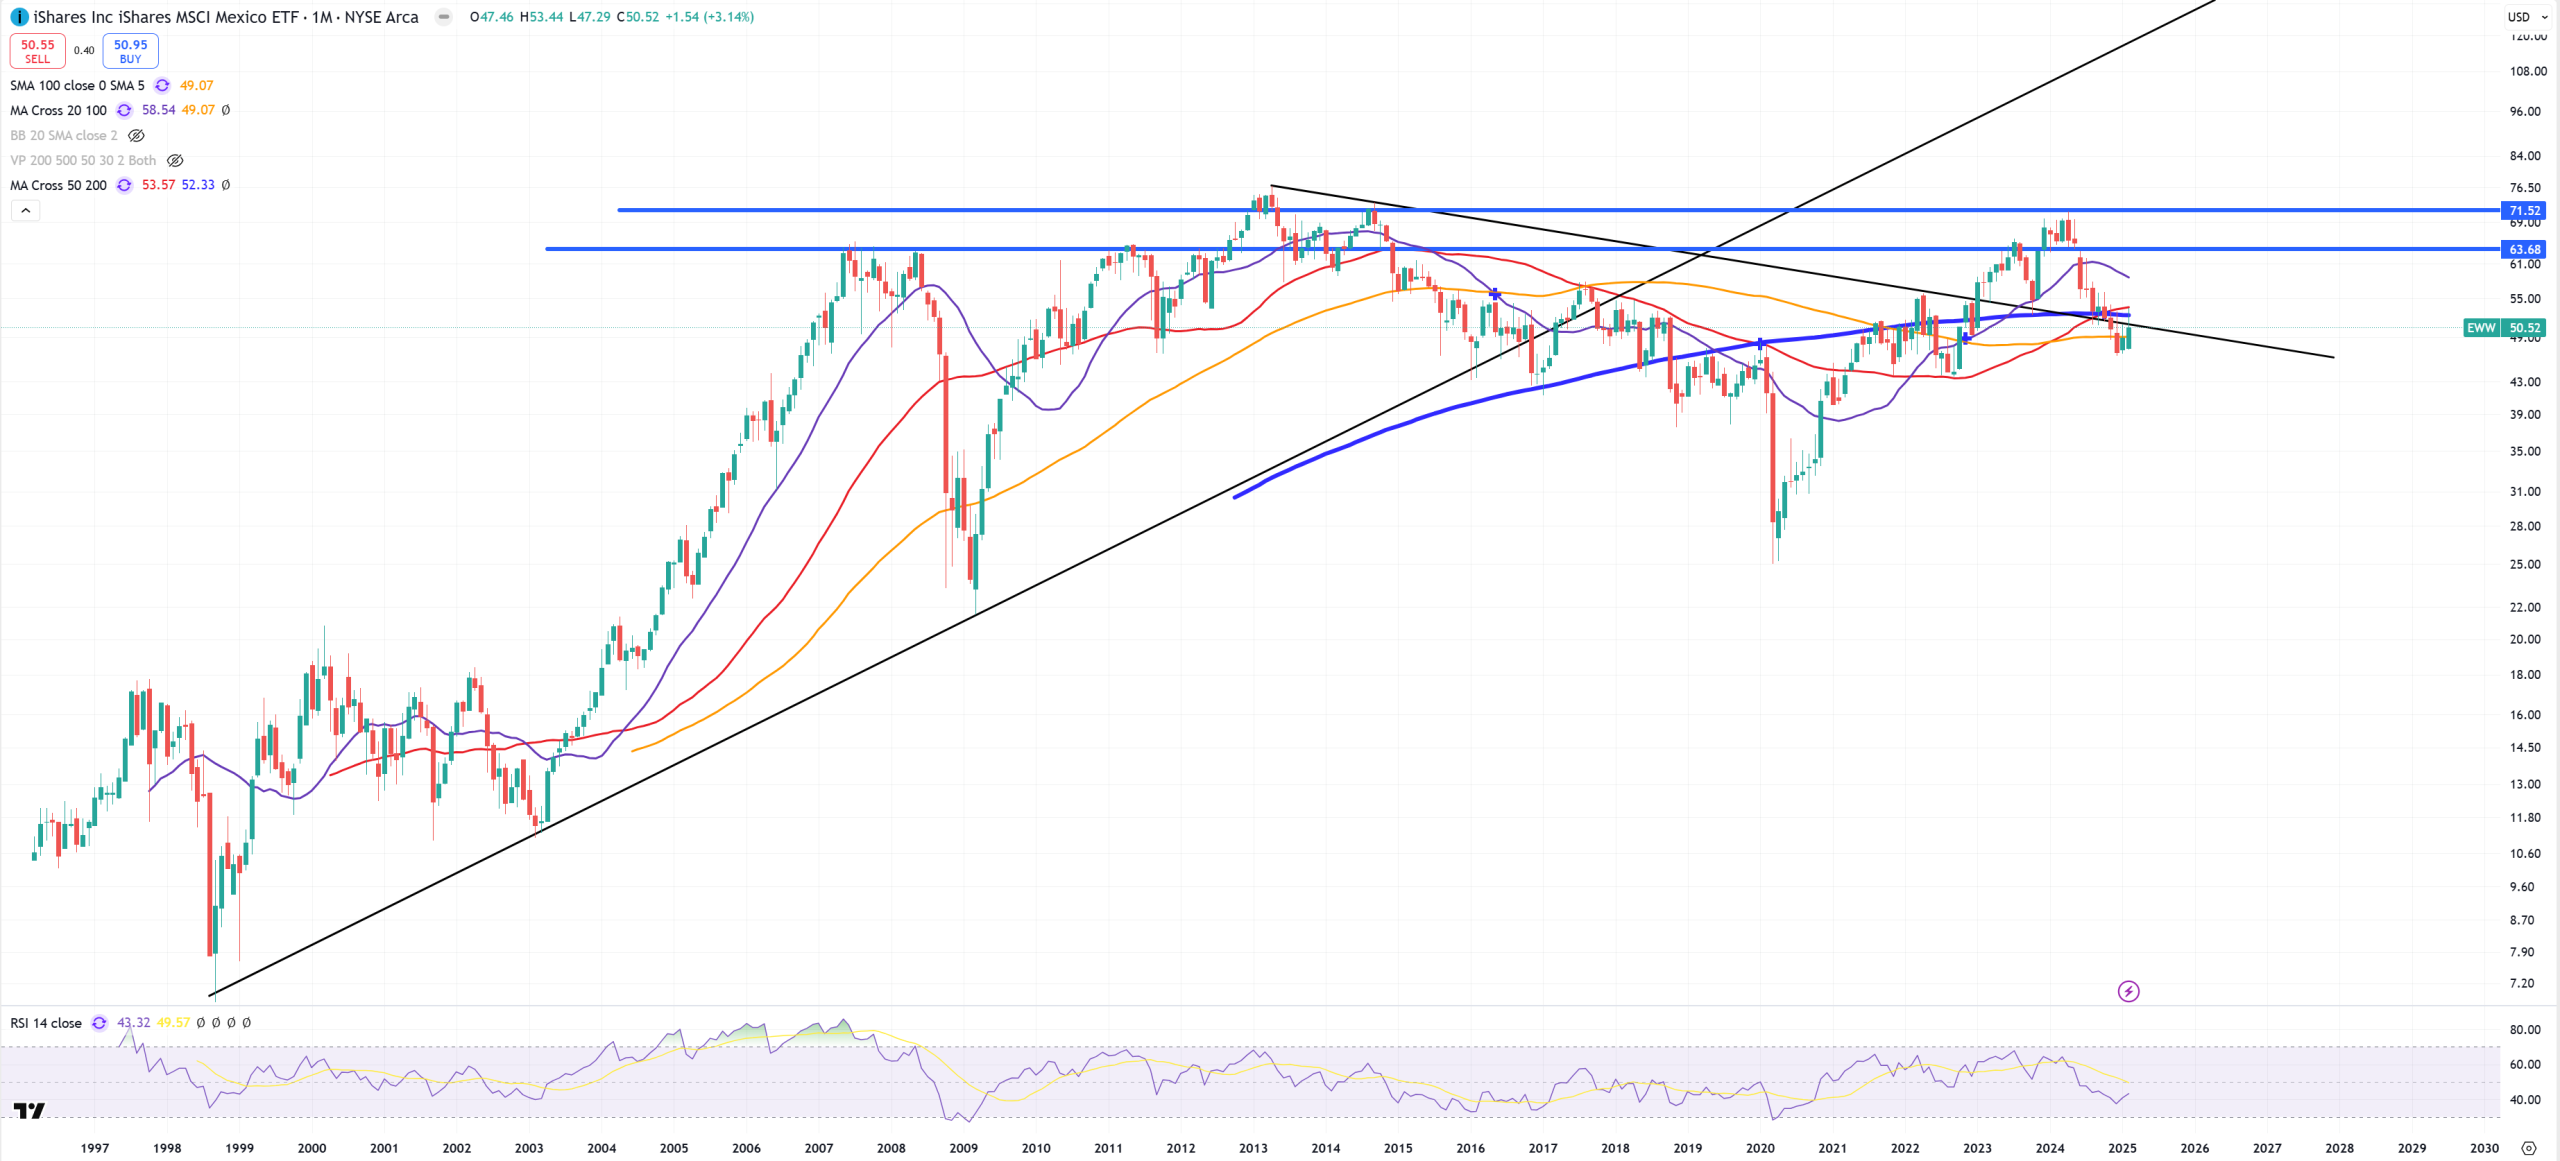
EWW – Mexico – very beautiful chart, back below key trend + almost all (M)MAs :
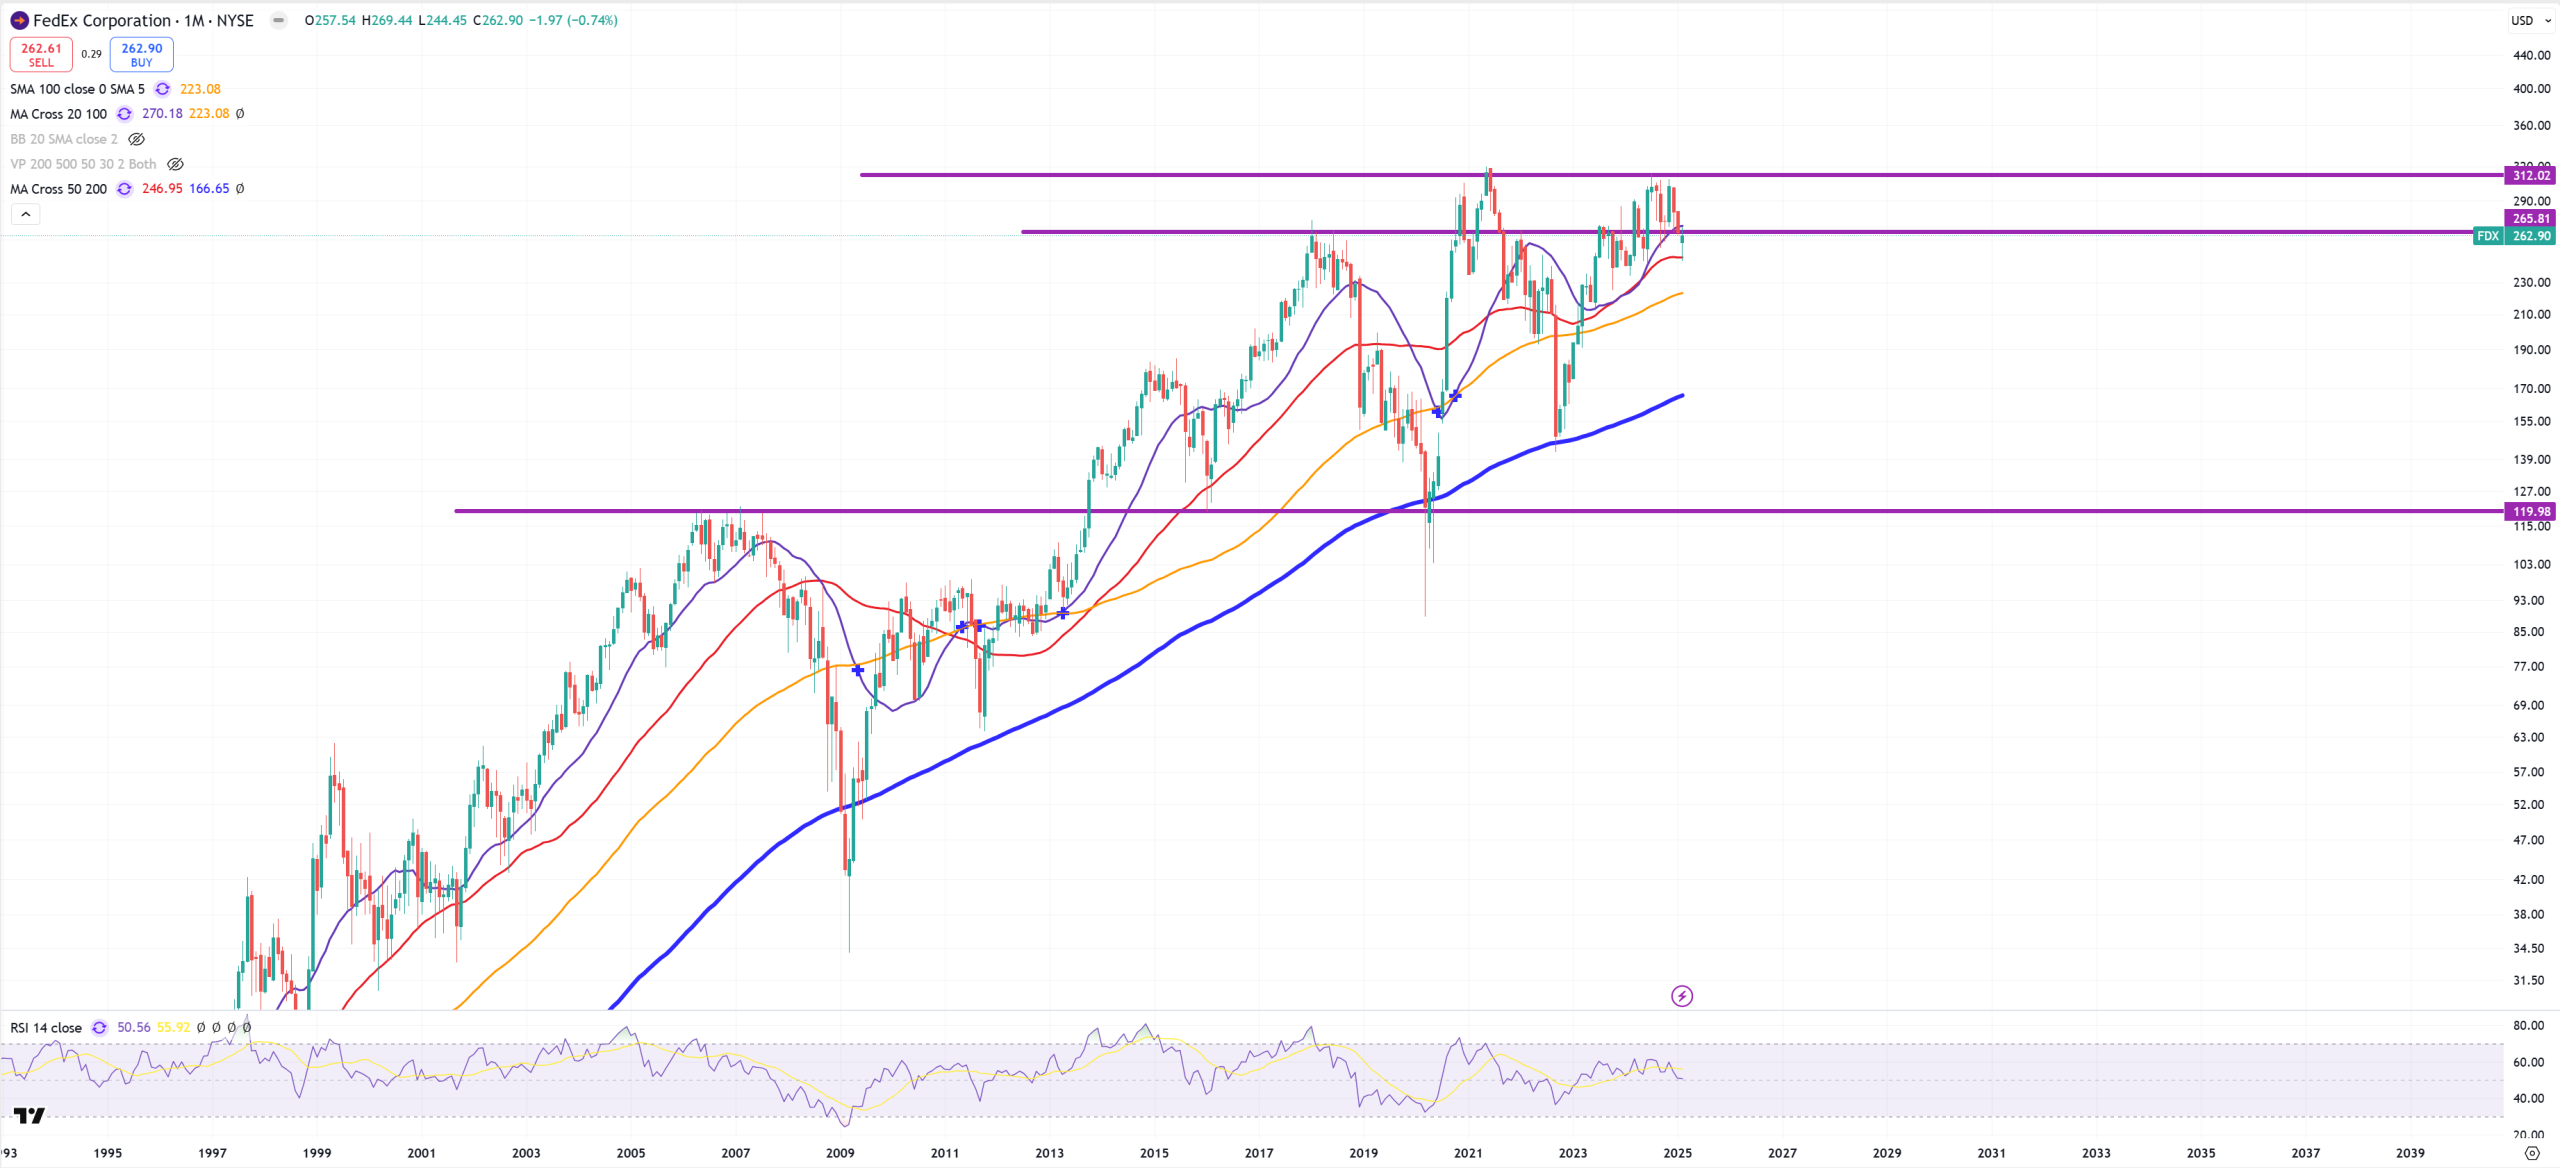
FDX – and double-top
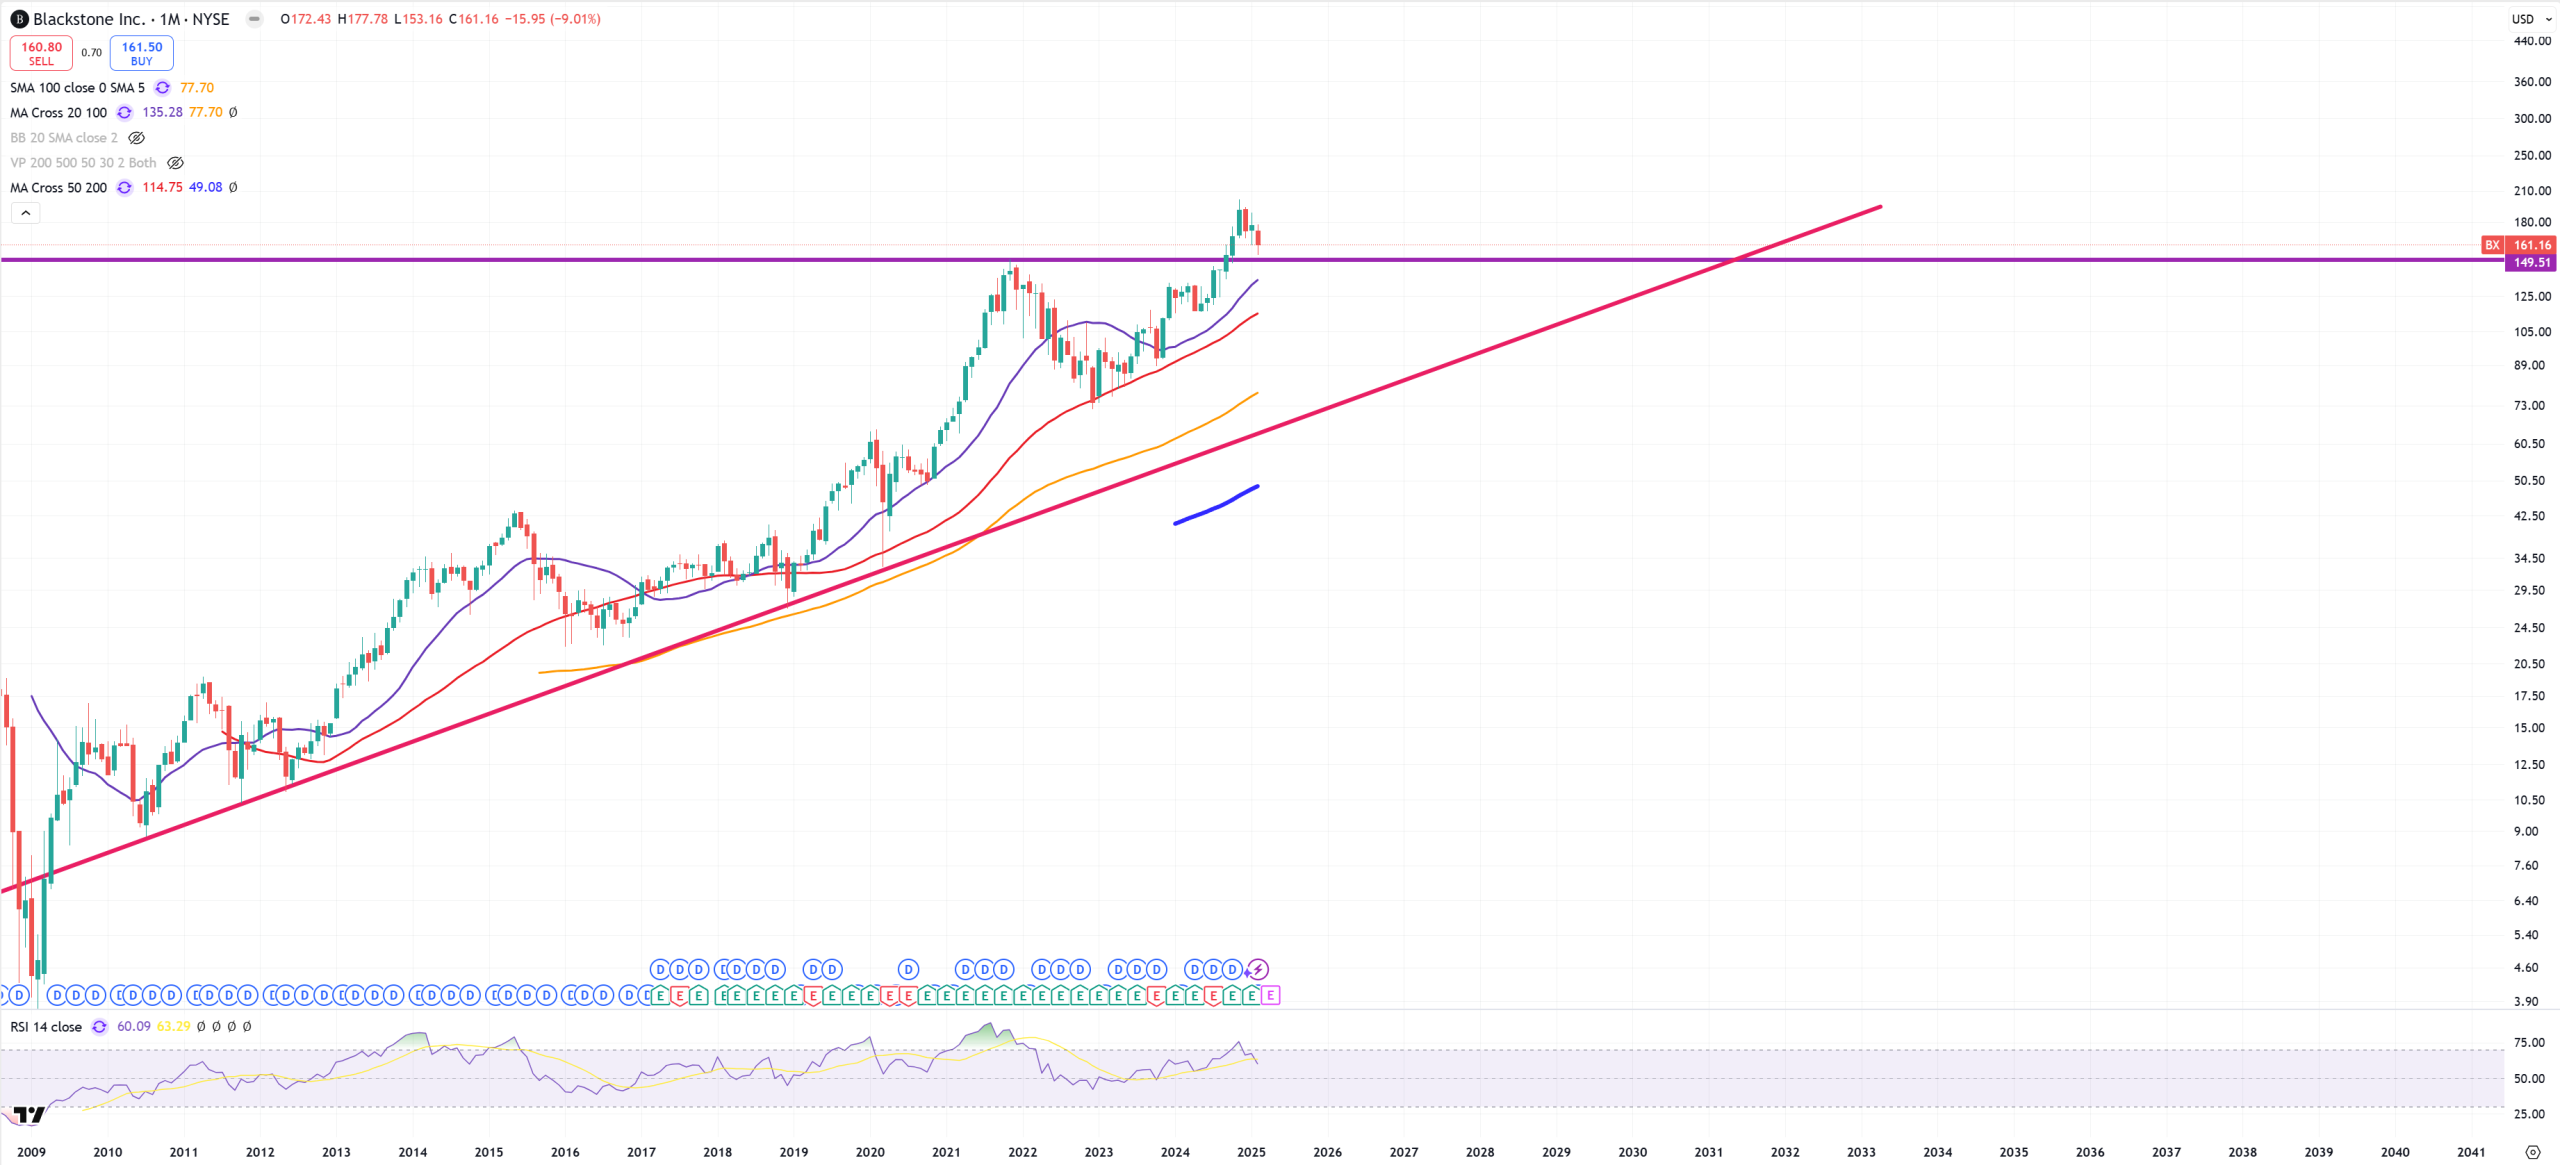
BX – Blackstone and commercial real estate – still above key level
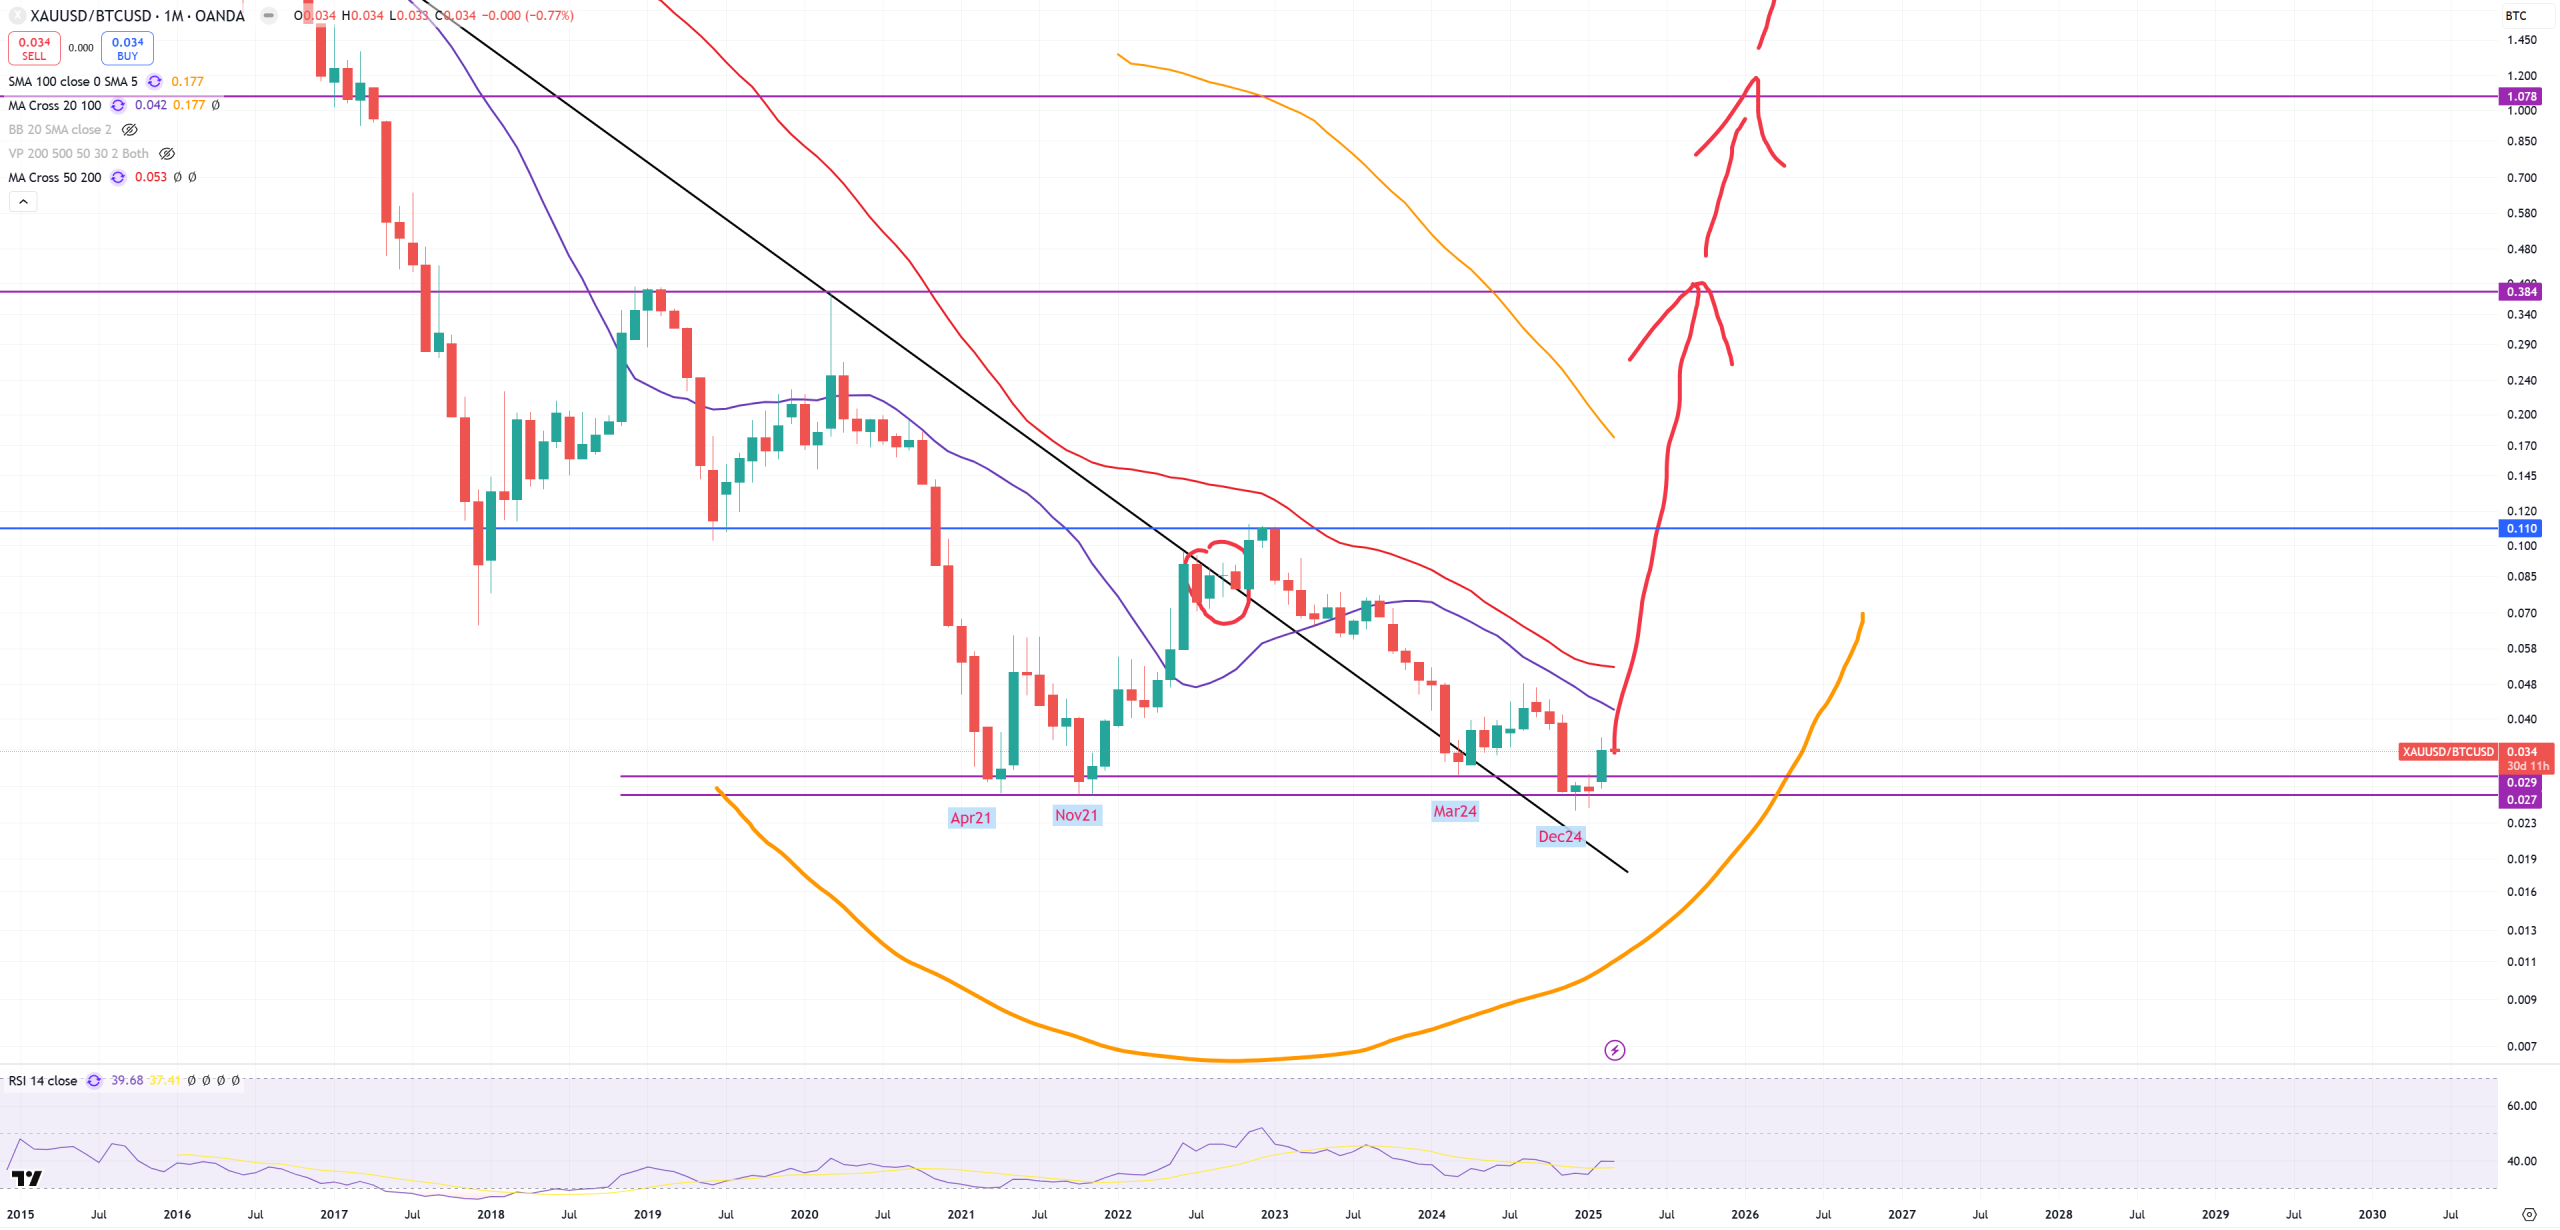
GOLD/BTC – main indicator of BTC peak once support hits
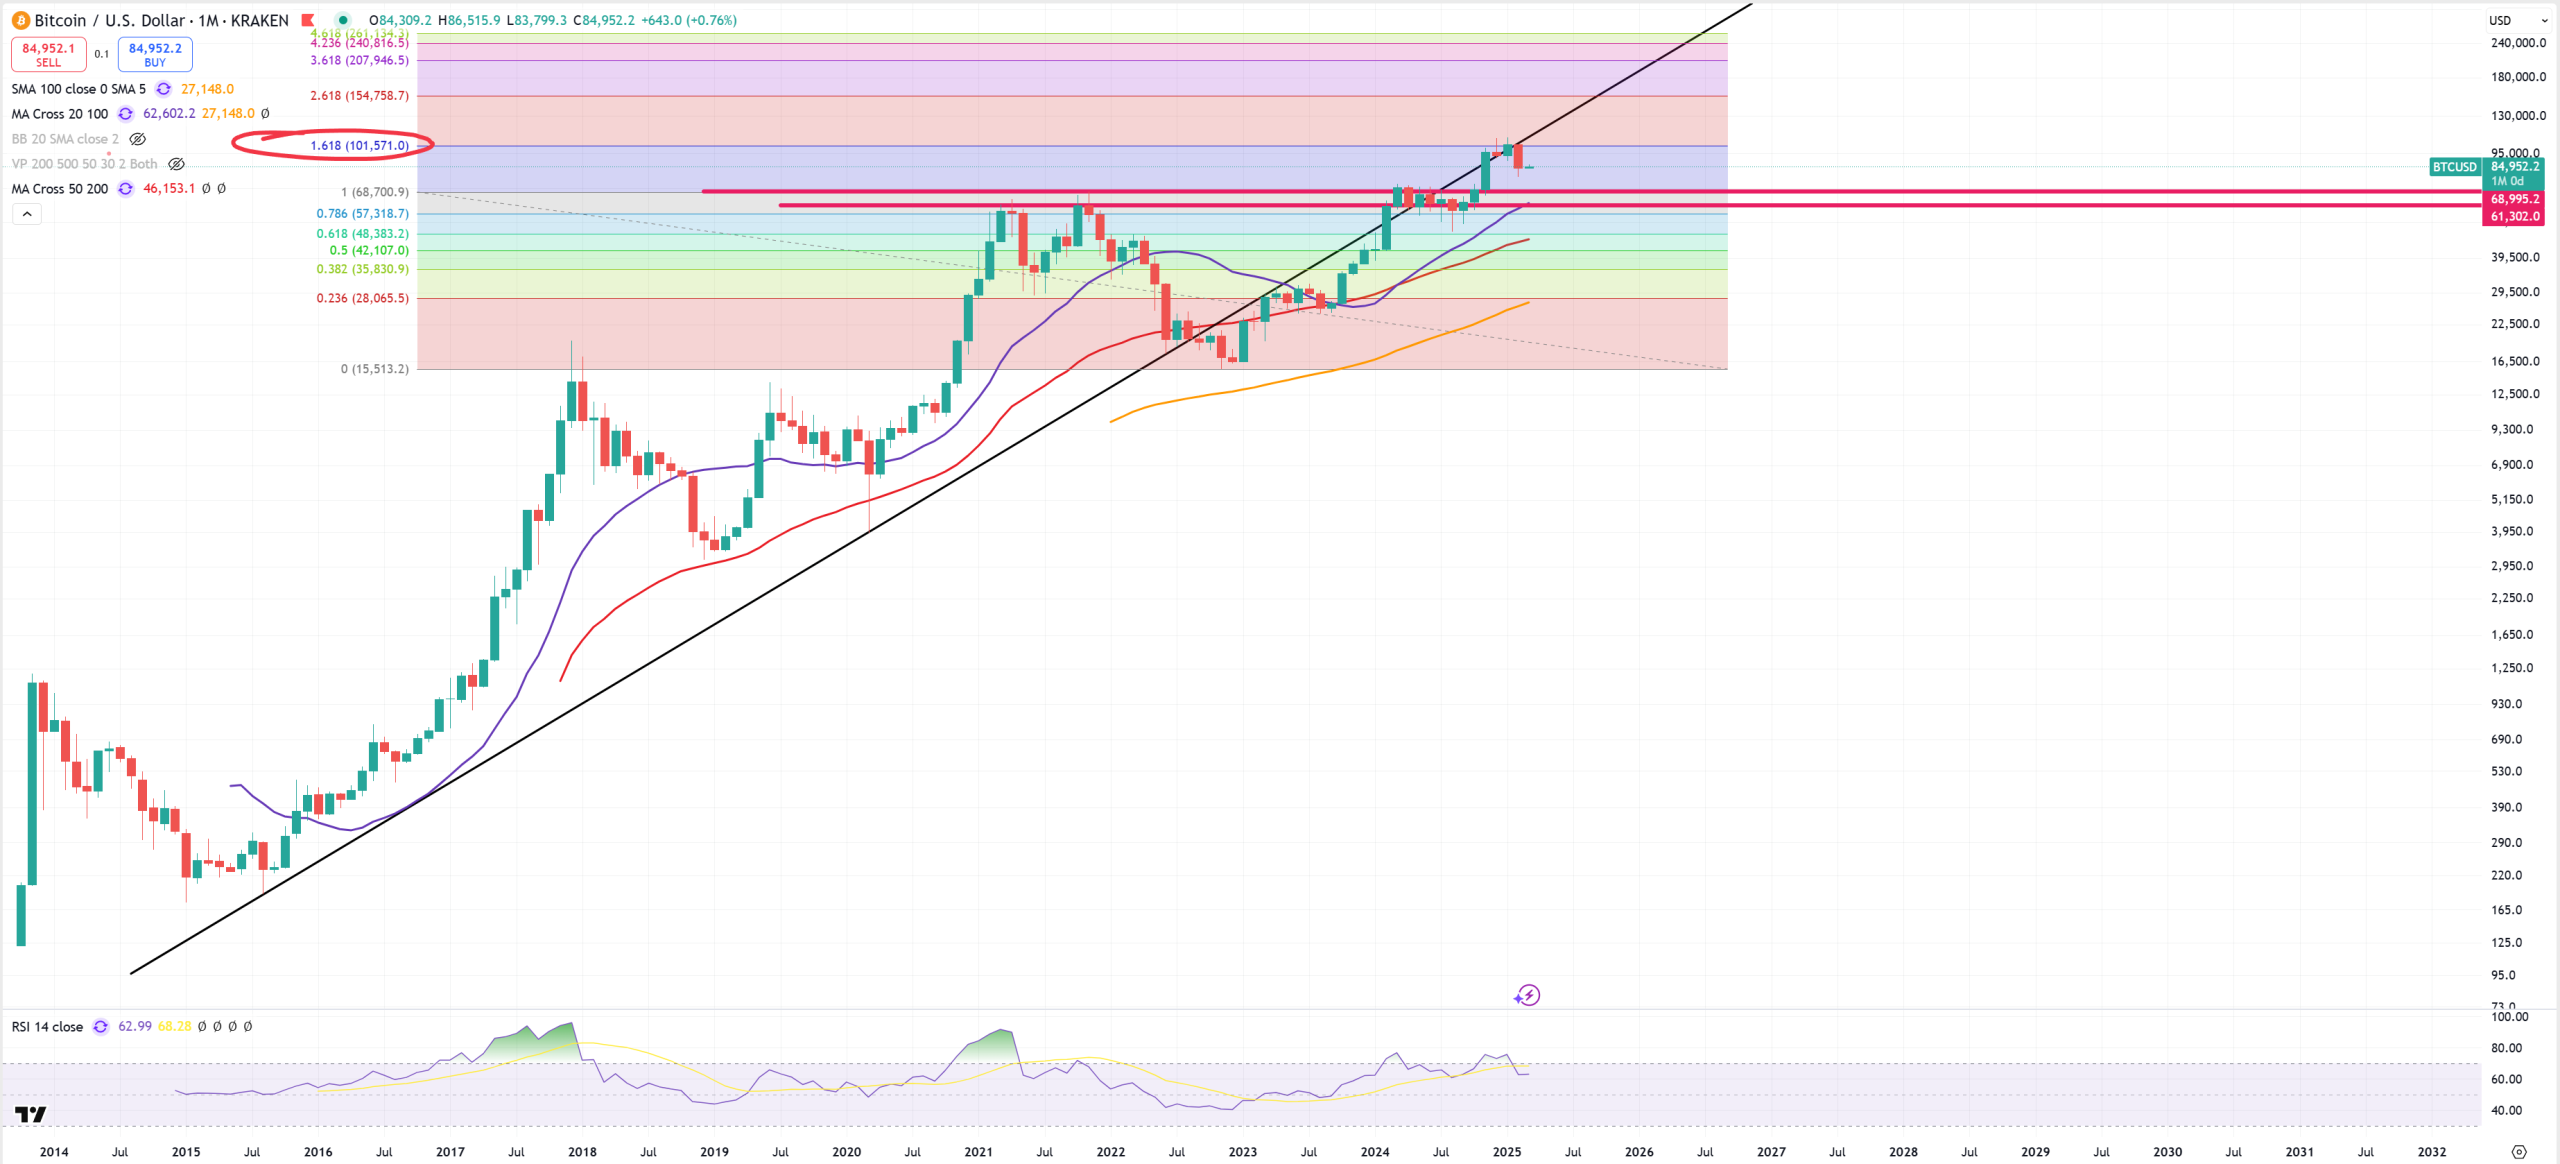
BTC and key support 70k$
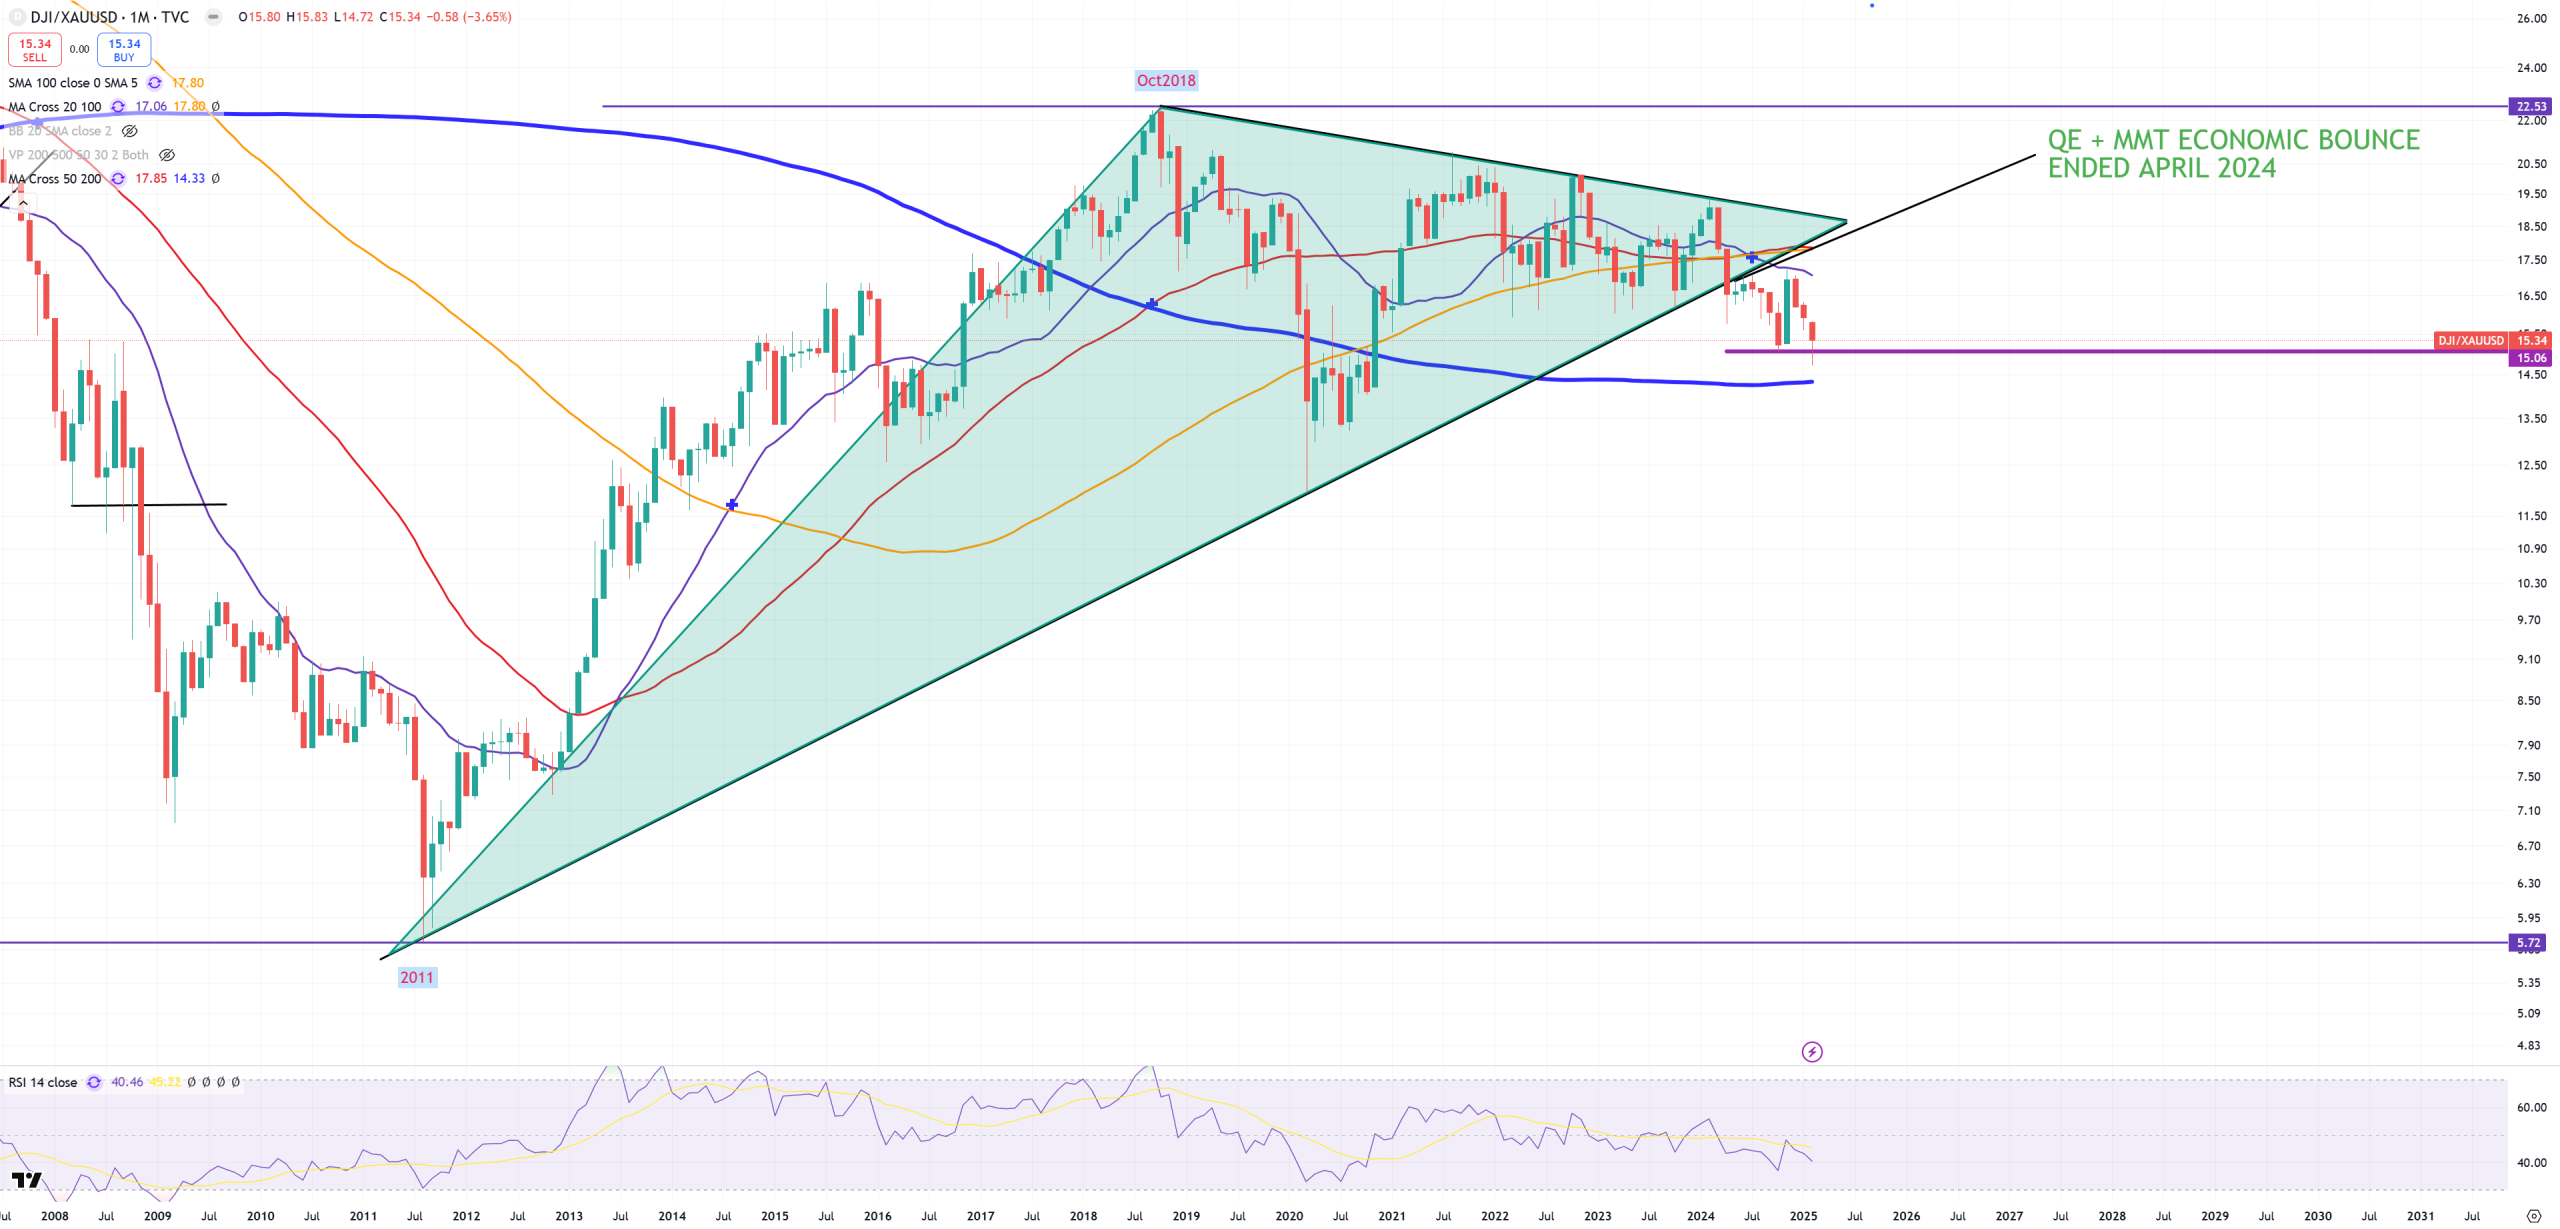
DJI/GOLD – main cycle indicator and 2018 peak, support holds but main 2011 trend is broken and already retested