We are entering in the third junction – 1Q21 – sitrep report
January 16, 2021

This market had already one possibility for a total reversal, that was about June 2020. I was writing about that in the previous report, but intervention has arrived, Central Banks scared of problems started buying everything and things above everything promoting scary inflation around the world. Market reacted and parabolic melt up occured. It took another months and quarters to get same situation and possible warning. One looked to be a false alarm, now all my indicators and triggers started to yell the same time they were yelling in 2Q20. Inflation is bullish for the stock market, but again FED keeps mixing their definition of healthy inflation connected with reflation and raising velocity of money and deadly inflation connected with stagflation and lowering velocity of money. For the market inflation is inflation and it’s always being considered as reflation, never as stagflation until some limits will hit.
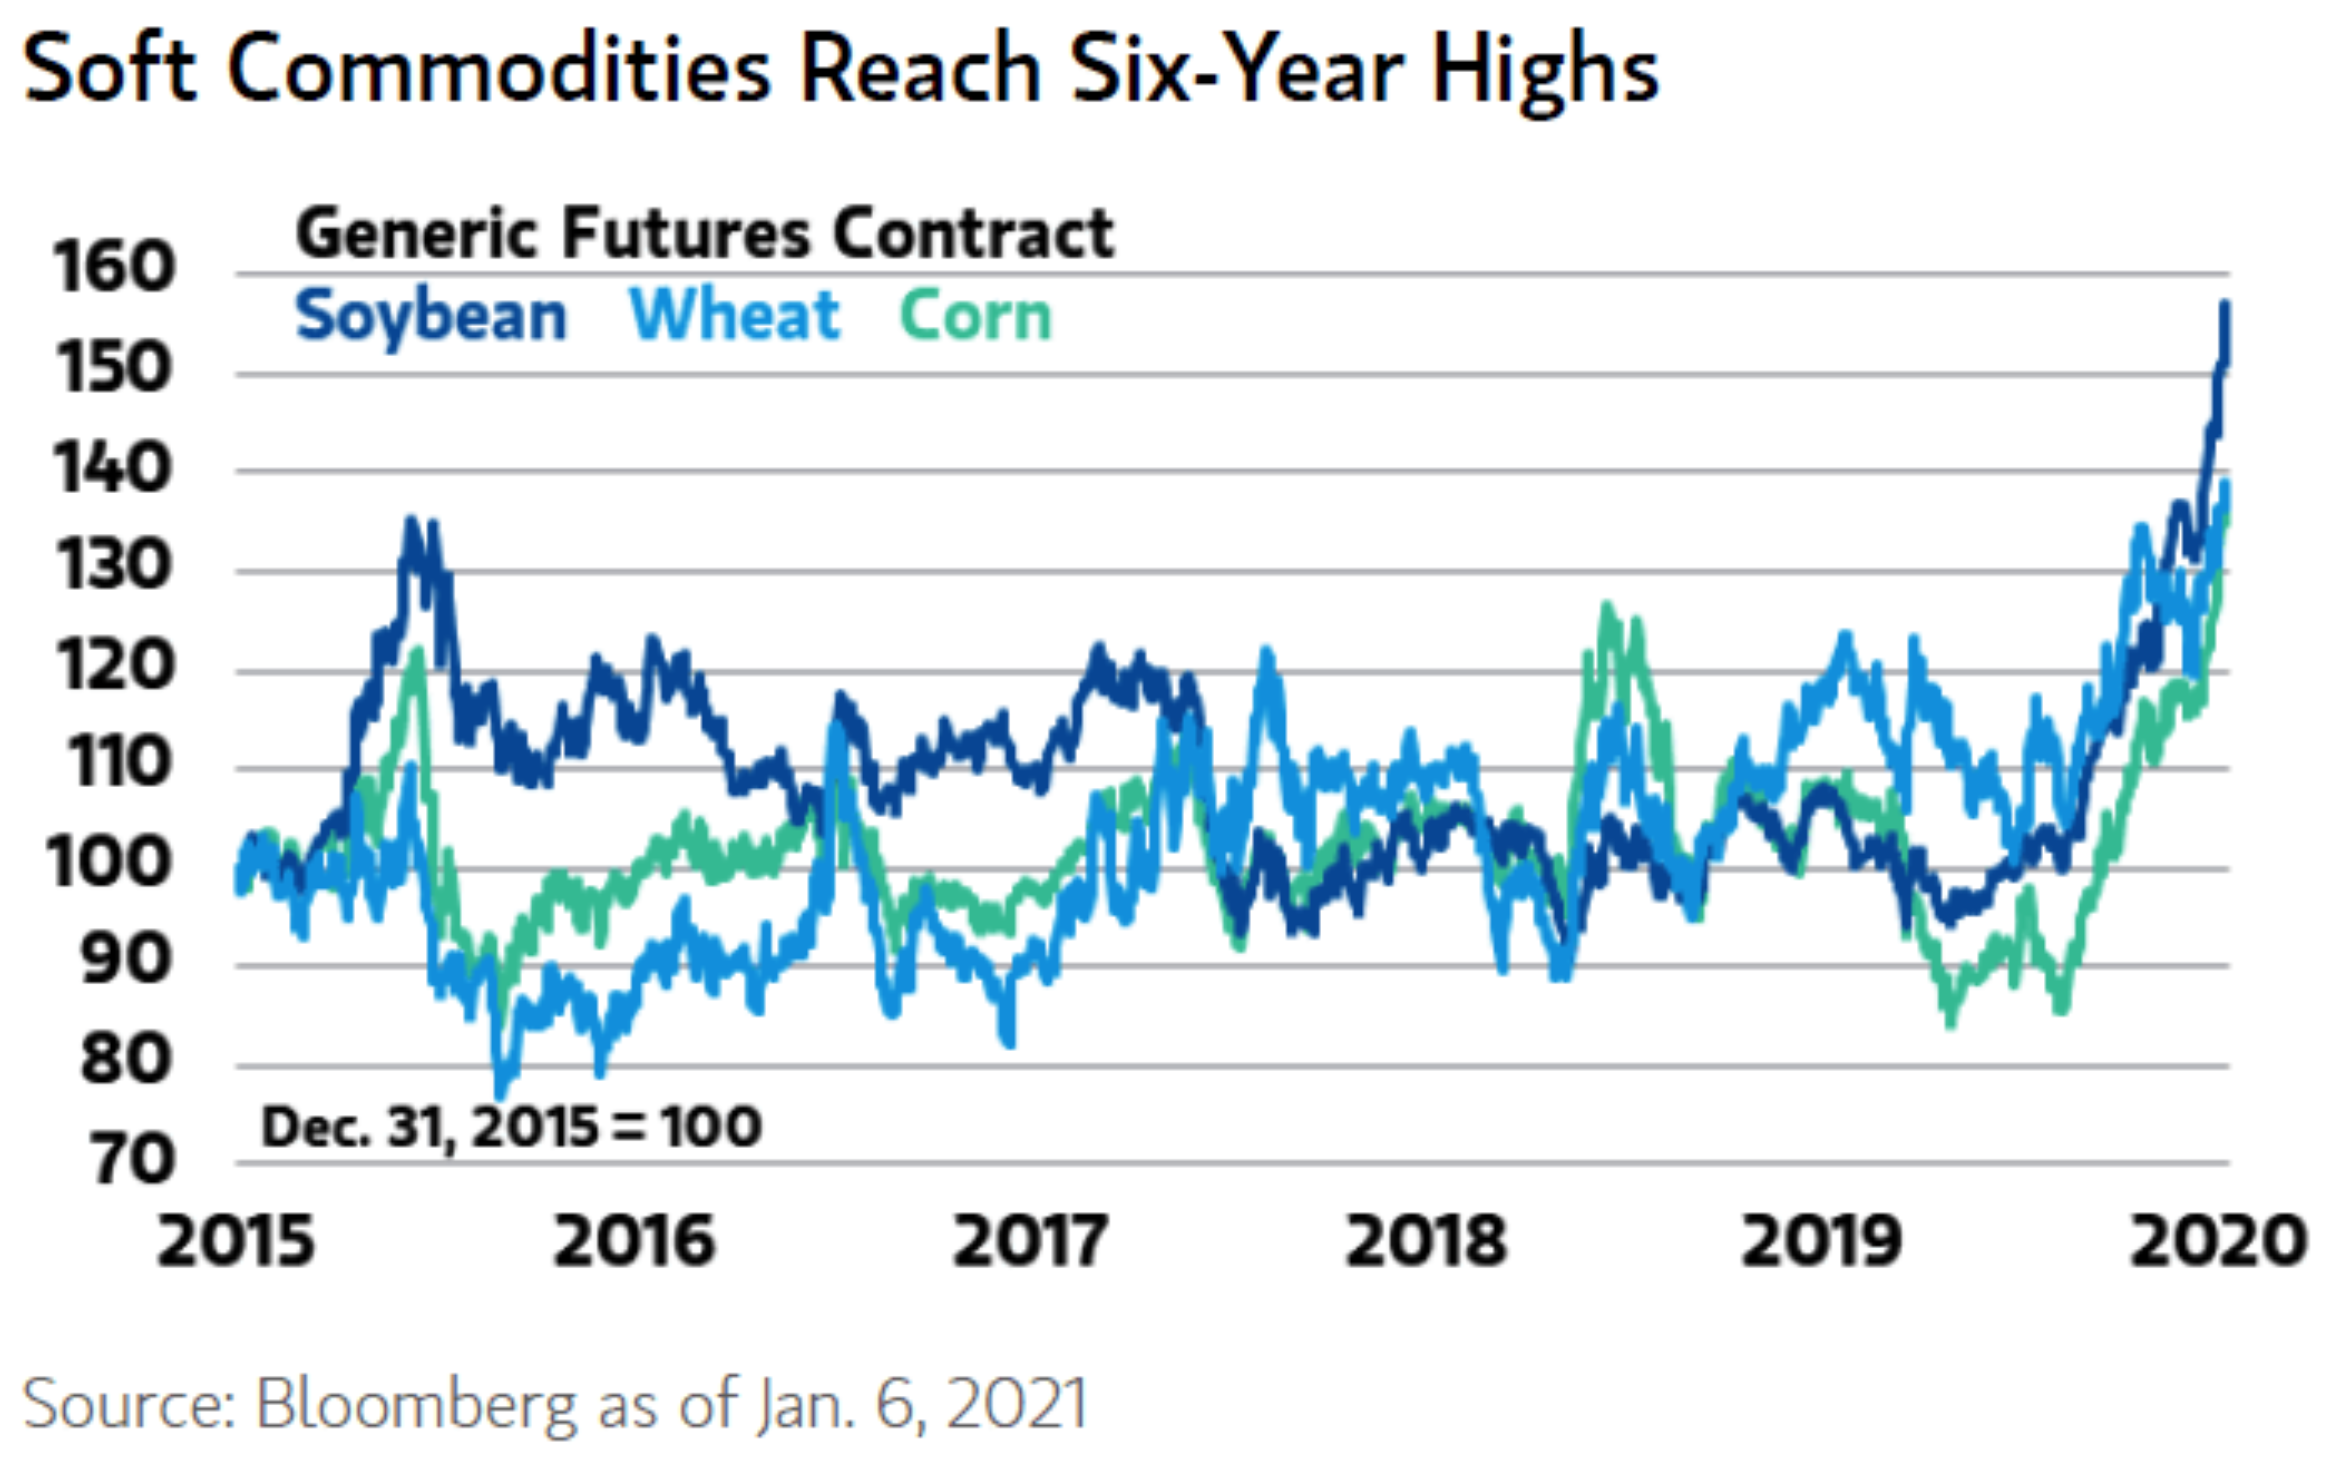
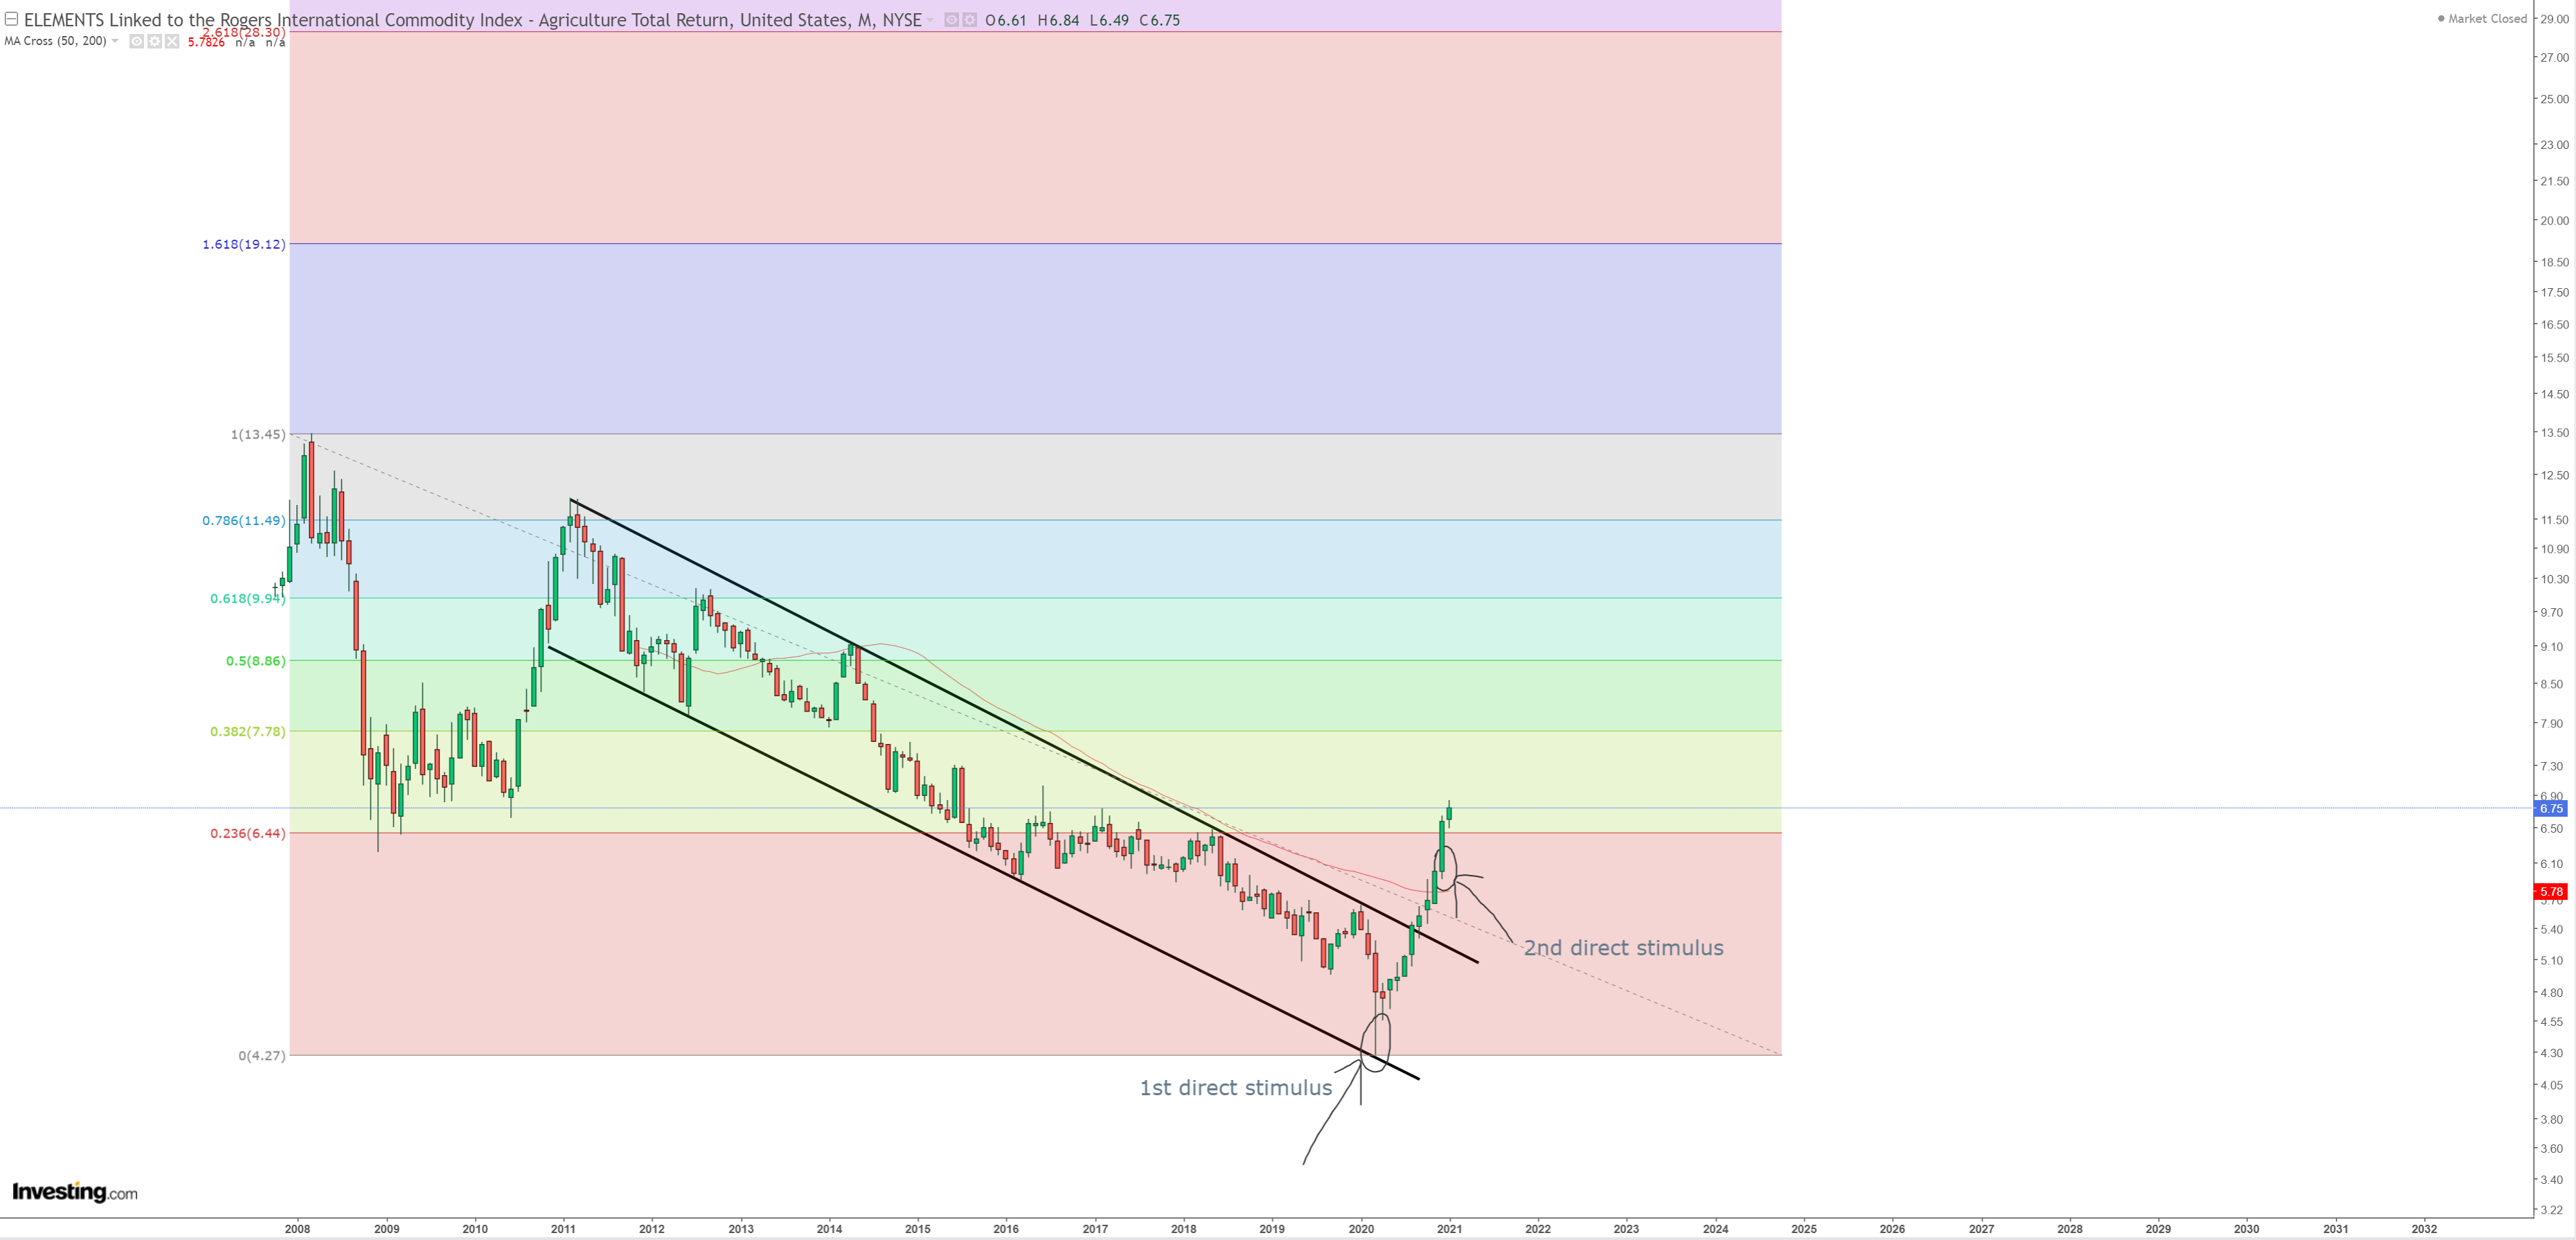
So first limit has arrived. If you are my twitter follower, I was yelling like an idiot from 1Q20 that agriculture is the next bitcoin as any idiotic moves by Central Banks will be offset by food inflation – it’s a natural economical move :
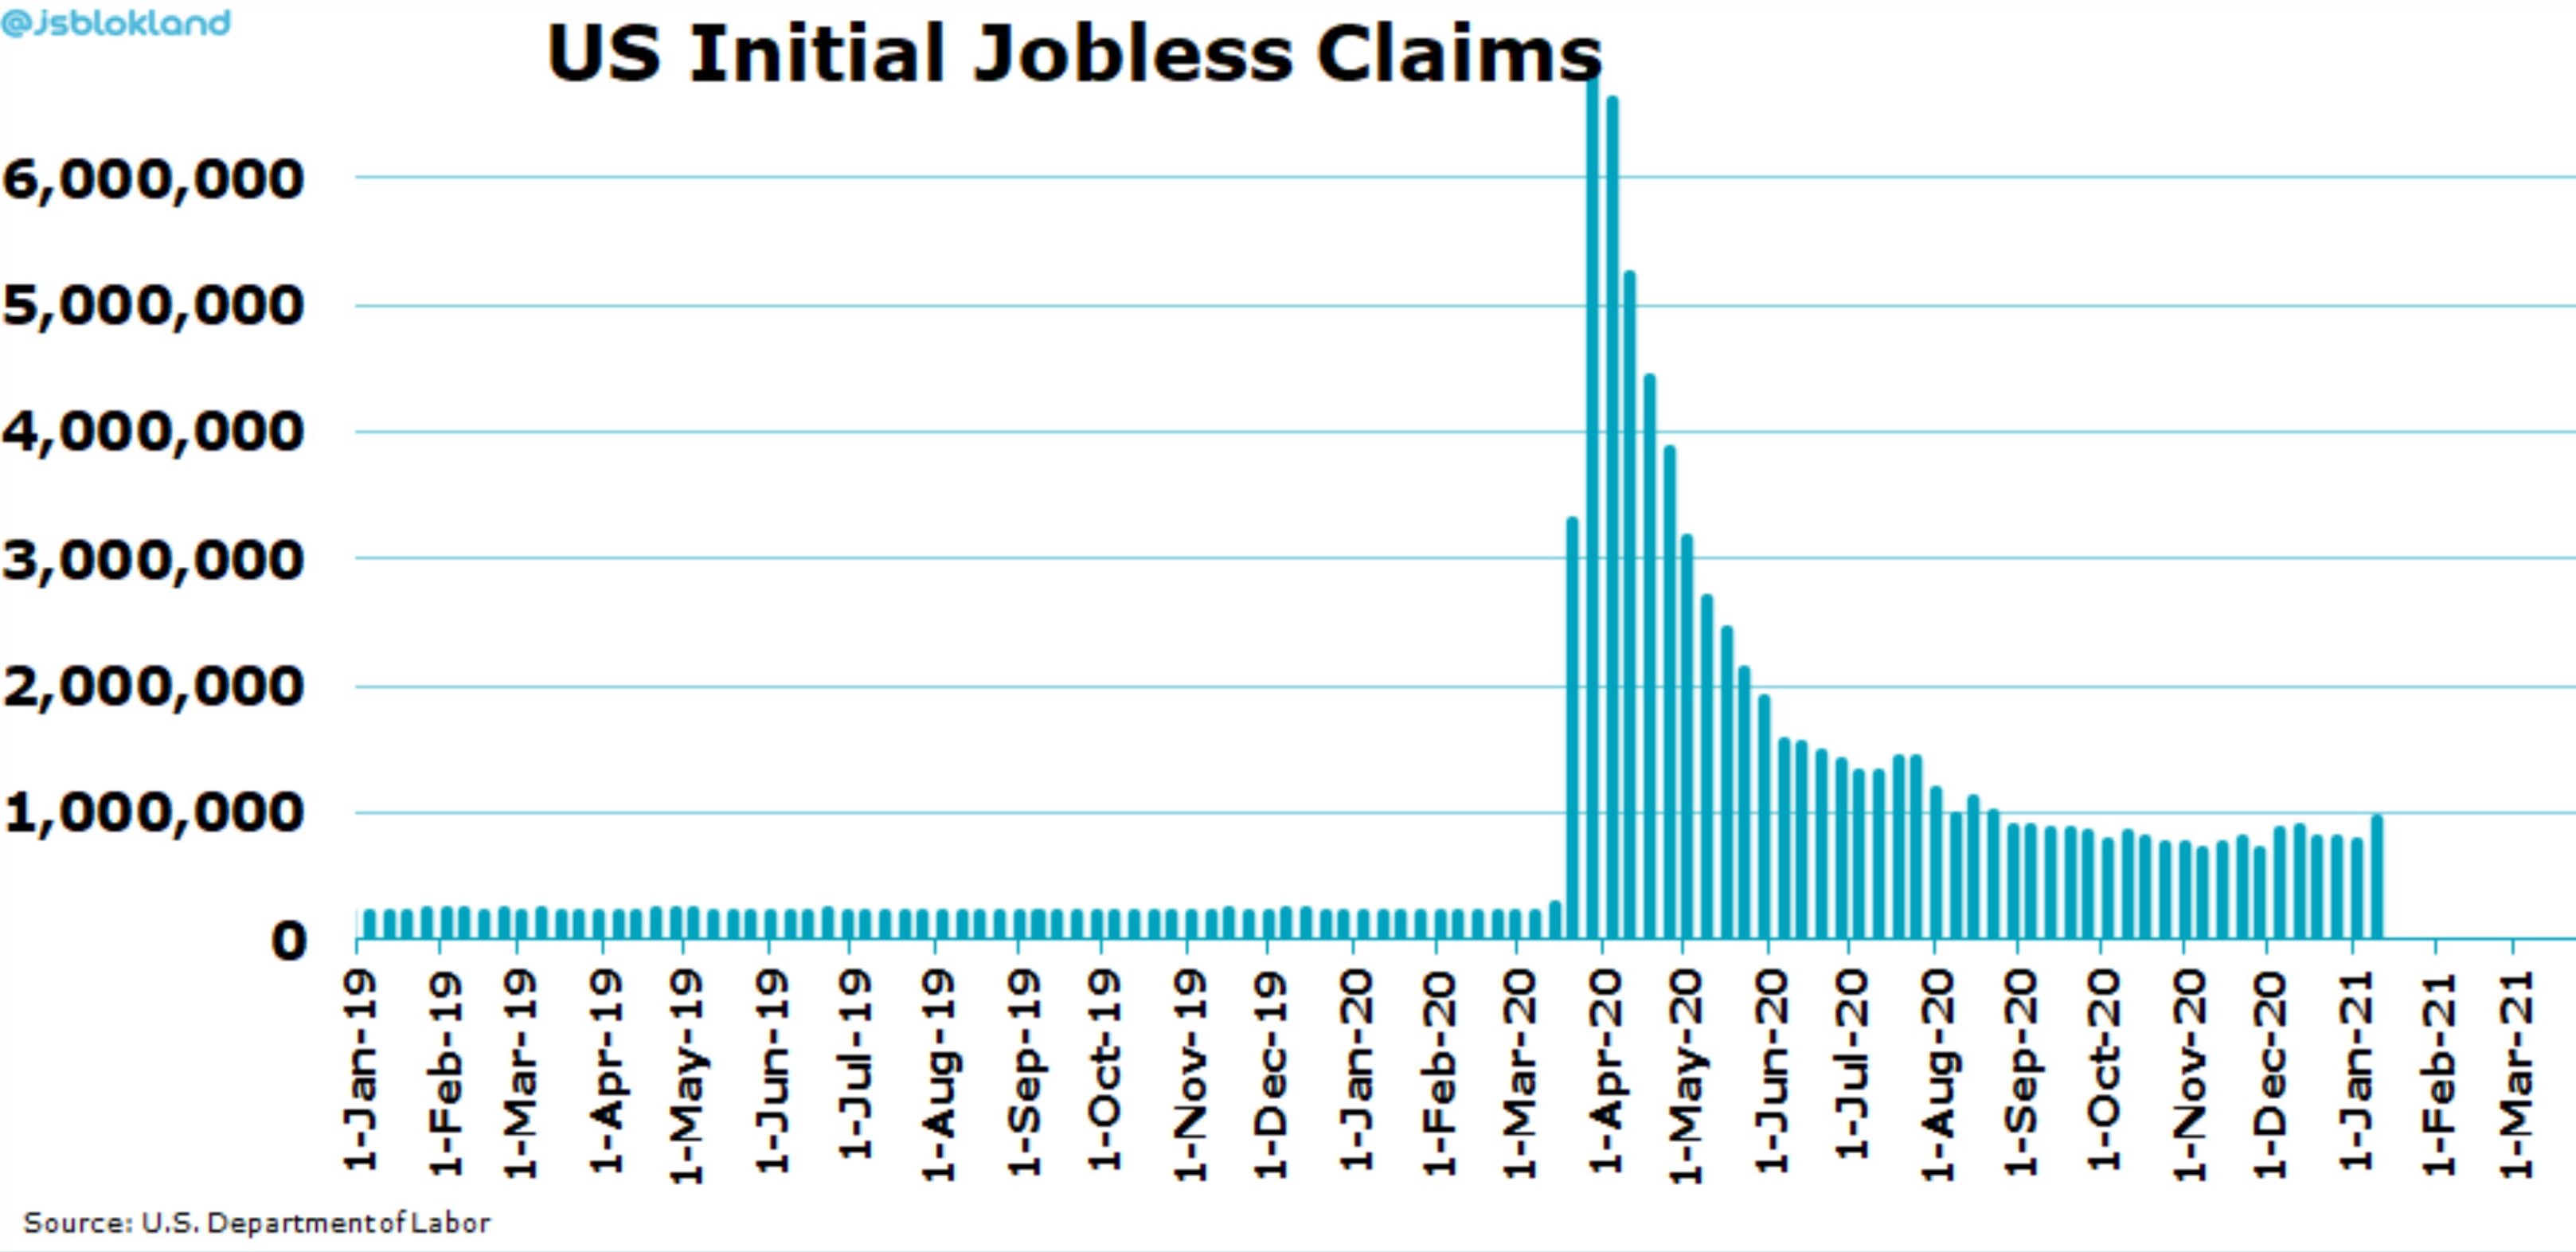
So it has arrived. All because FED trying to rescue asset prices killed another side of the economy :
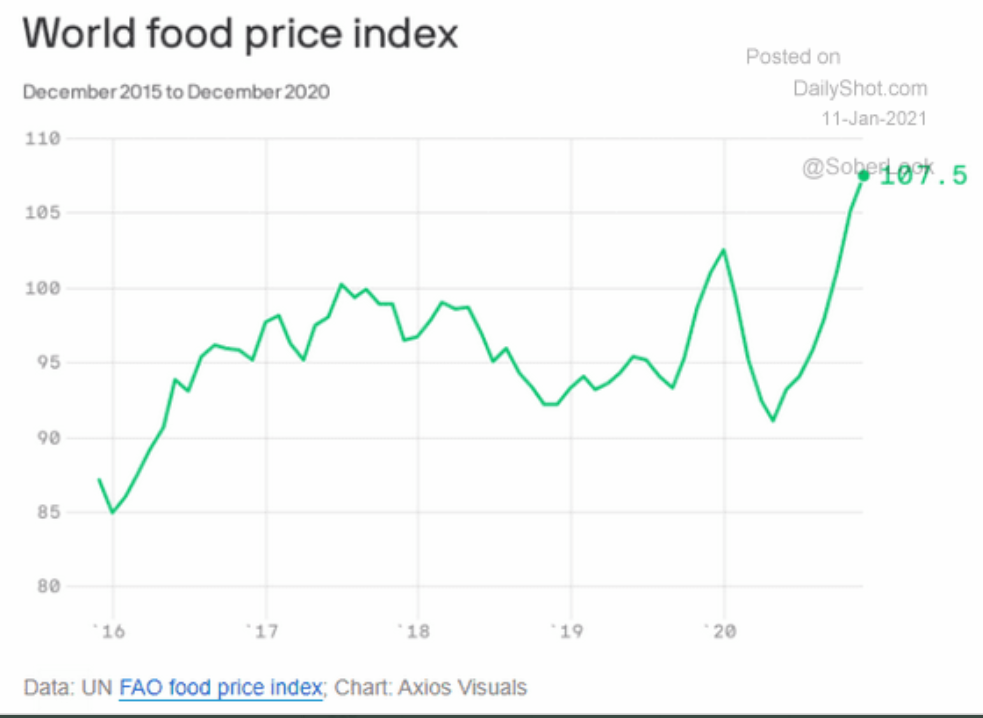
In sitrep I’m not going to share the “knowledge” why the reaction in food inflation happened, but if next time FED will be trying to buy another TIPS market in another 20% portion just go 3x long food inflation trade and might get better moves than BTC+Tesla measured as all together.
We should start our analysis with jaws in bond market. Remember FED (for some time) can convince the market that “inflation” is coming. We all know inflation happens in both – stagflation and reflation, but inflation for the market is only reflation. Reflation happens in economical uptrend, stagflation in economical downtrend. All is being managed by $ cycle. Nothing goes straight up and straight down. So considering economical cycle it looks this way :
disinflation/reflation/disinflation/reflation=>stagflation/deflation/stagflation/deflation=>disinflation/
disinflation and deflation = $ up, stagflation and reflation = $ down
Let’s look at the bond market. I’m a big lover of yield-curve. It’s in 95% not making any mistake. It was sending warnings in 2019 that soon a trigger will kick in when it was going negative below zero and it was inverted by a famous COVID19 aka economical trigger which of course by no mistake arrived, just nobody knew what it will be as everybody was saying “FED has eliminated recessions forever”. As you see they haven’t. Another paradigm which needs to be deleted will be : “More money supply will make infinite growth”. Once this one economy will delete we’ll get the meltdown to clean reckless Central Banking activities which were cheating the economy for some time.
So in 2Q19 yield-curve went on negative values -> signalling any “larger trigger” which will arrive “soon” will meltdown the economy. That was 1Q01, 1Q07 moment. From the other hand we all know once the curve will go up above the red line, the problem that was created below the blue line will be fixed, removed or controlled.
Yield curve : 10Y-3M :
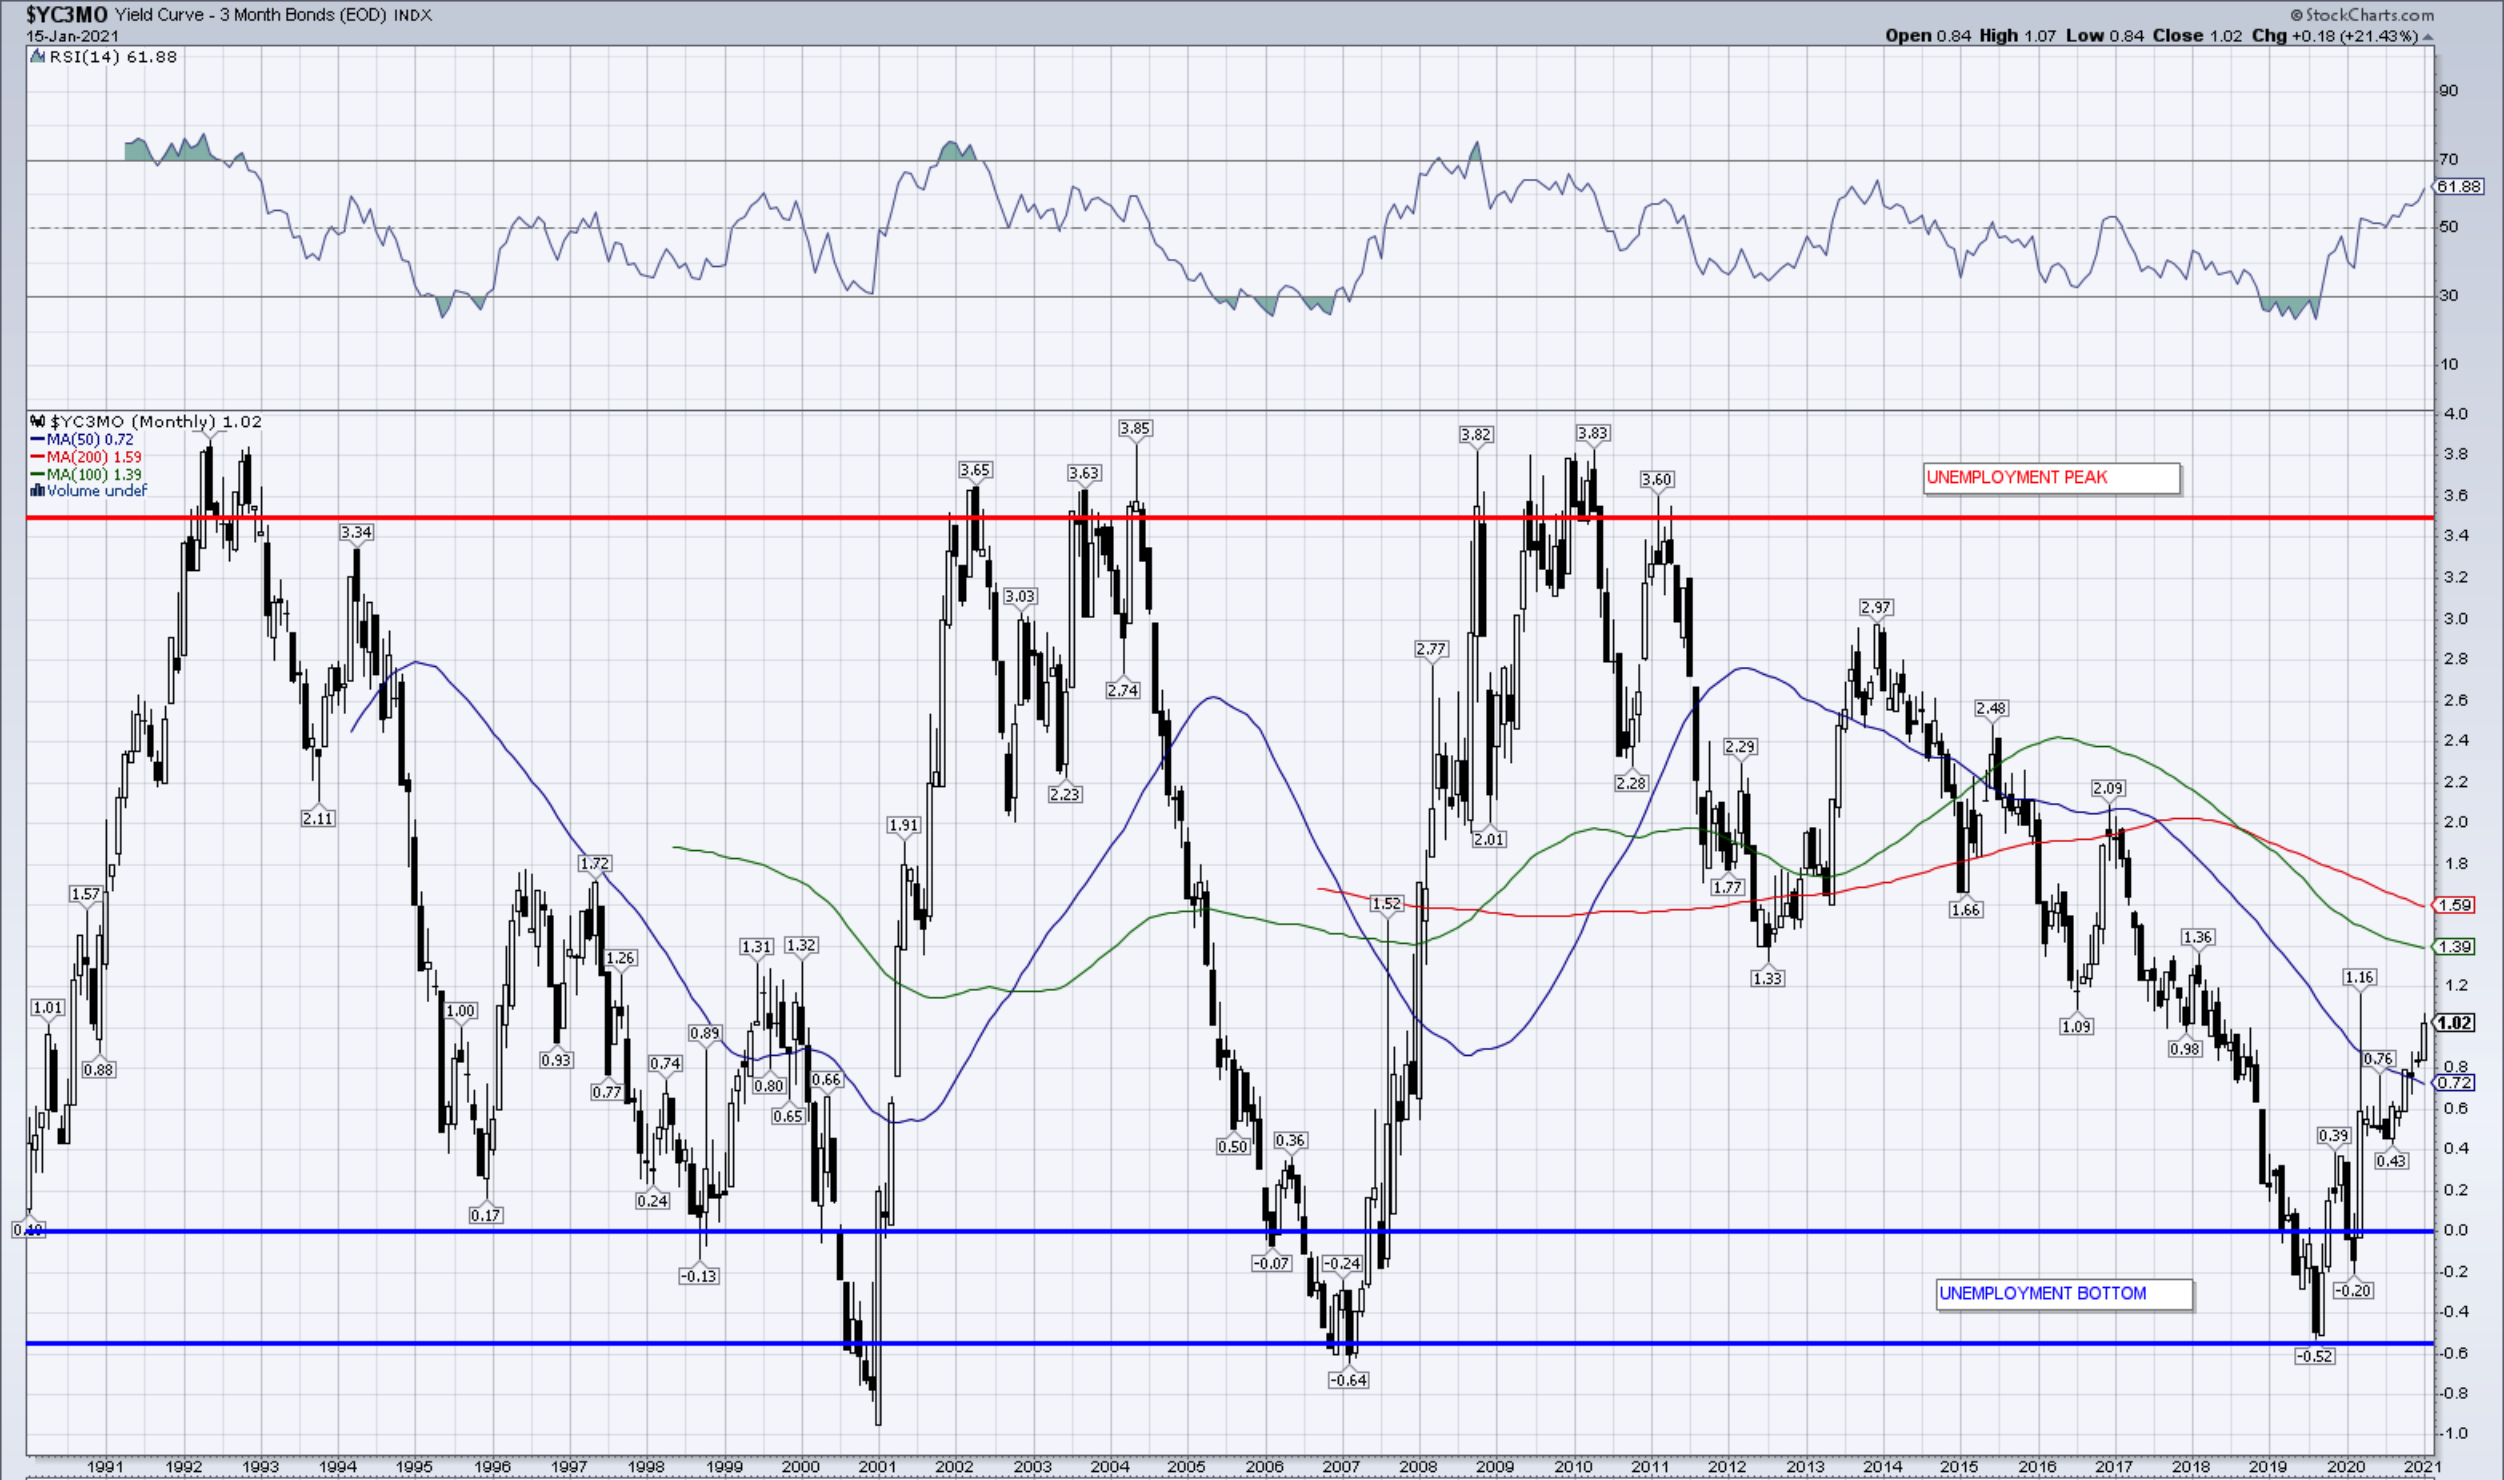
So my theory is simple, once yield-curve is going down from high levels (from above 350bp to below 0), each time it’s steepening/flattening in its “downturn” to below zero value, it’s going using reflation/disinflation narration moments, each time yield-curve inverts it’s going using stagflationary (weak $) /deflationary (strong $) moments. Nothing goes straight up and nothing straight down. In reality in previous cycle, economy was “bottoming” 2002-2004 and 2009-2012 looking on the yield-curve, so stagflation was transitioning to reflation and deflation was changing to disinflation using some triggers. During those years bears still had a chance to say economy will tank as last trigger arrived in 2012 – EURO Crisis (Greece etc), but yield-curve was saying that’s just the beginning of a recovery and after 2012 bears were shut down forever and ever.
So one more time bond market … There is always last deflationary spike when cycle ends (4Q08 meltdown) which is caused by big spike in nominal yields and big spike in $. This spike is killing counter-productivity creating new economical hole for new businesses. If we consider 10Y-3M 350bps steepening from inversion as an end of crisis, having in mind we have 102bps on the chart, we can say around 30% (102/350) of the crisis has passed . Yield-curve-control by the way is like moving us into permanent 30% crisis end. Still a crisis and still not ended.
I drew some “basic bond knowledge charts”
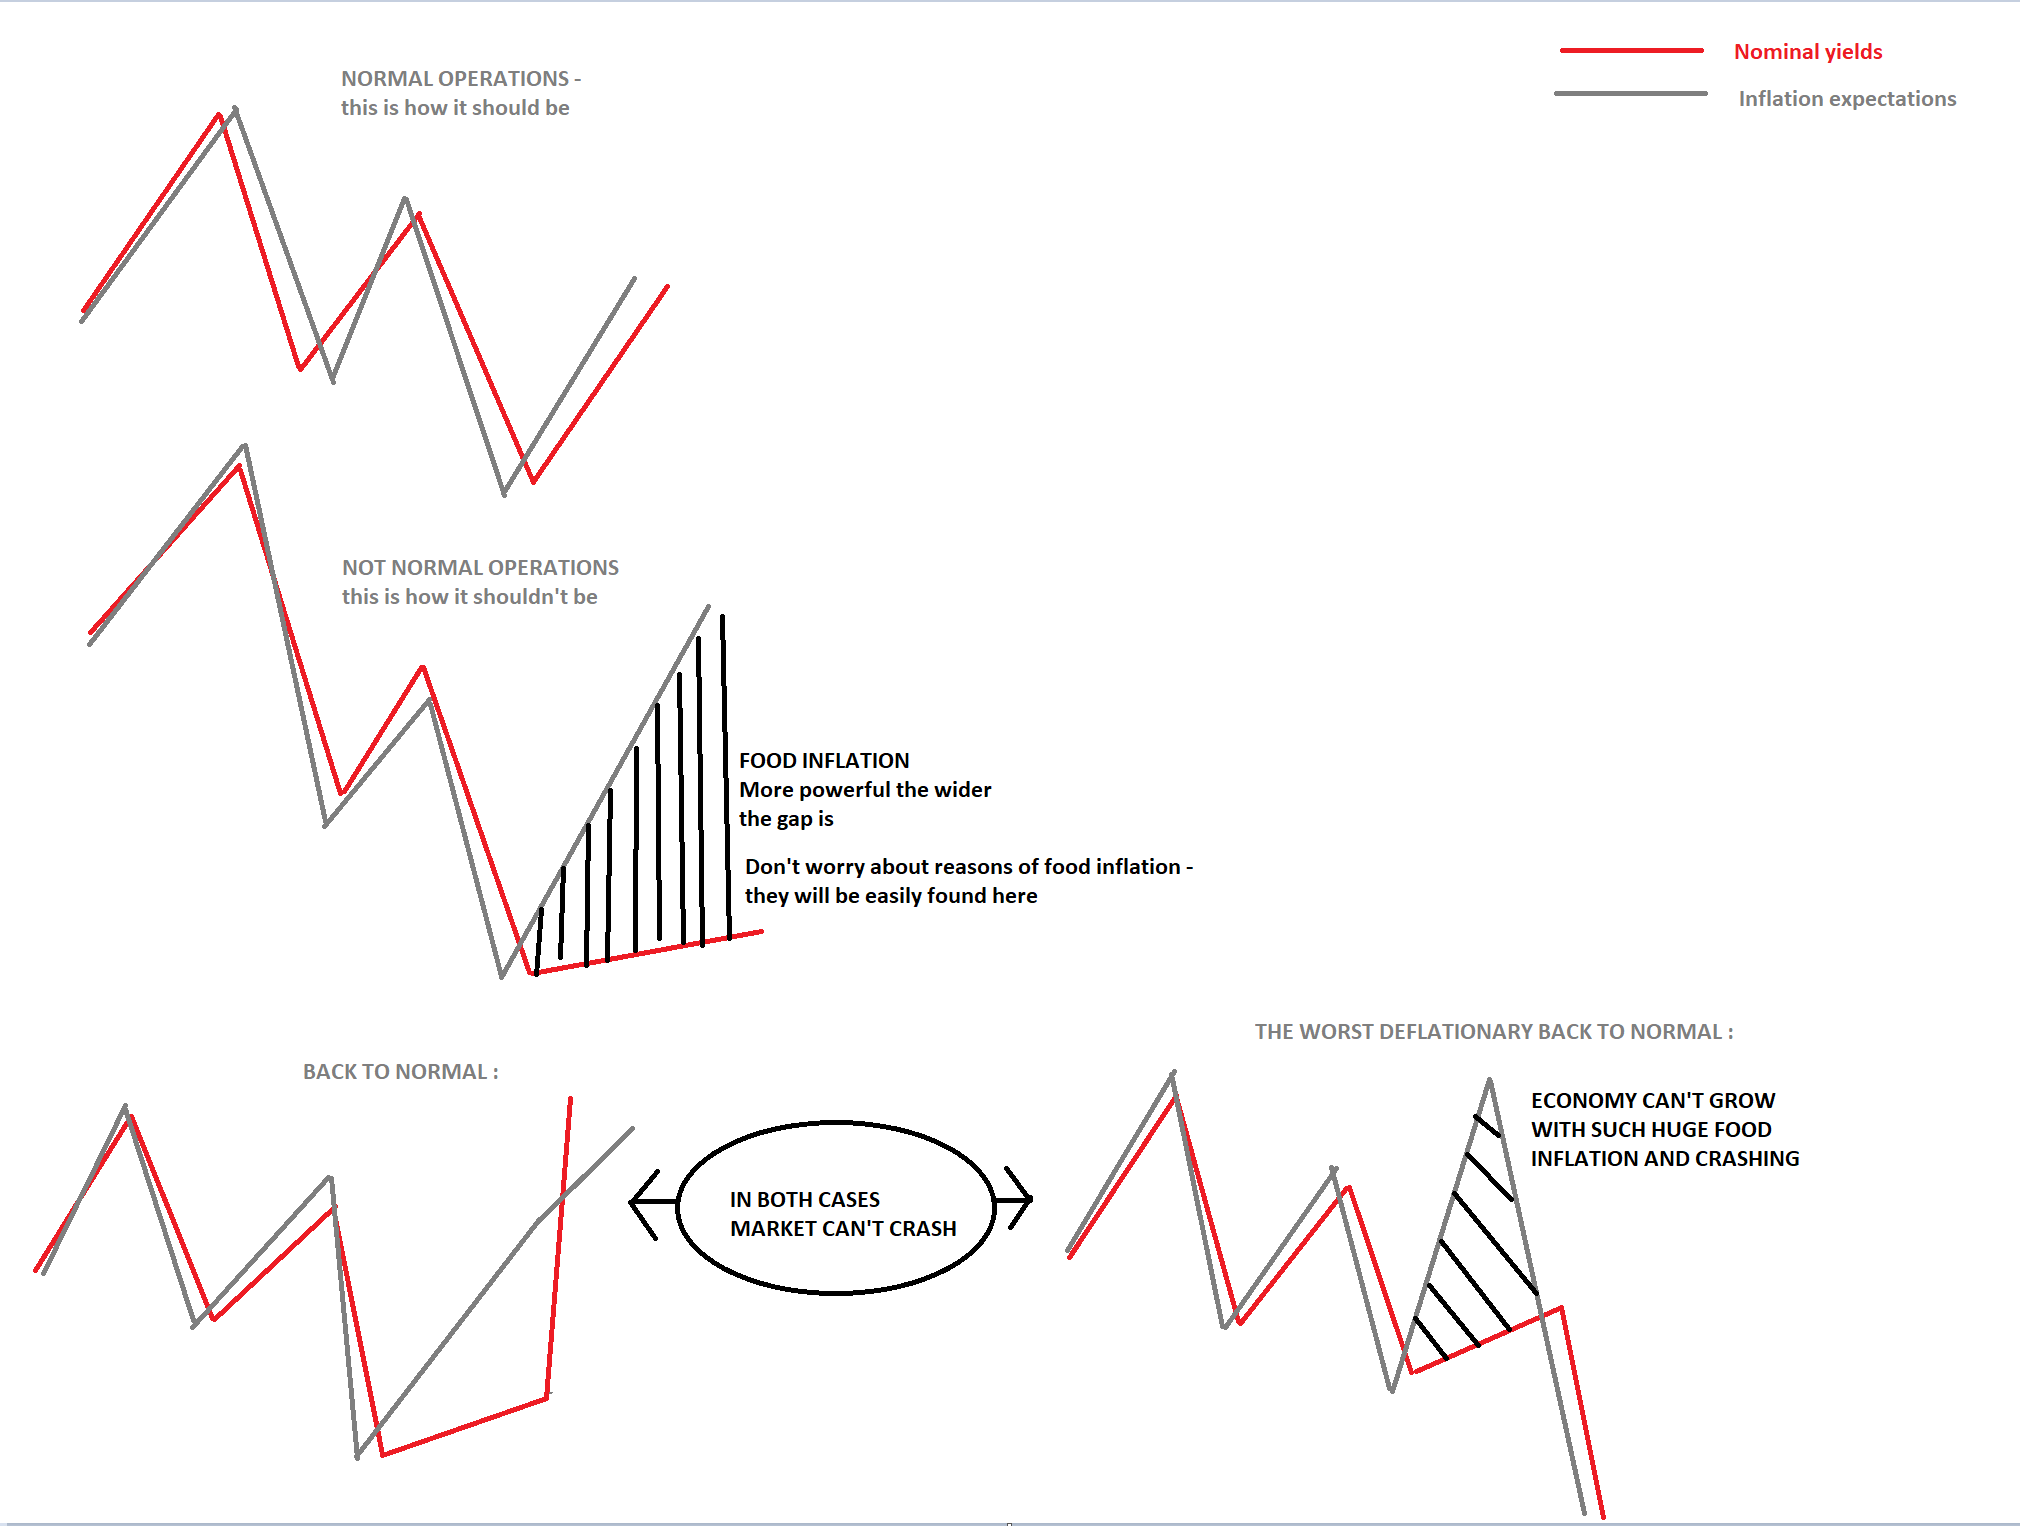
So nominal yields must go in tandem with inflation expectations aka “break-evens”, “inflation swaps” whatever you call them. In economical uptrend nominal yields are always higher than break-even yields (velocity of money in this tandem going UP and inflation is caused by economical boom and wages are growing), in economical downtrends signaled with inverted yield-curve opposite. Now we know the larger the gap between them is the higher and more nasty food inflation is going to arrive, so you are not able to deal with such a case forever. There are 2 possibilities as I drew on my “basic bond knowledge charts”. They are on the bottom of it.
- Nominal yields will spike above inflation swaps
- Nominal yields will crash and inflation swaps will crash 2-3x more powerful
In both cases jaws will be closed and probably $ will make a switch and will start raising (if it’s an uptrend economical move – jaws closing won’t crash the market). The first one is mild (bottom left one) and signalling cycle end is close, but 10Y-3M must jump above 320-350bps, second one is bad (right bottom one), signalling cycle end if far and 10Y-3M will jump to let’s say 200bps. In first case long term rates will spike (10Y yields will spike, $TLT will crash), in second short term rates will crash faster than long one and we’ll welcome NIRP in the USA (10Y yields below 0.5, 2Y – negative, $TLT – meltup).
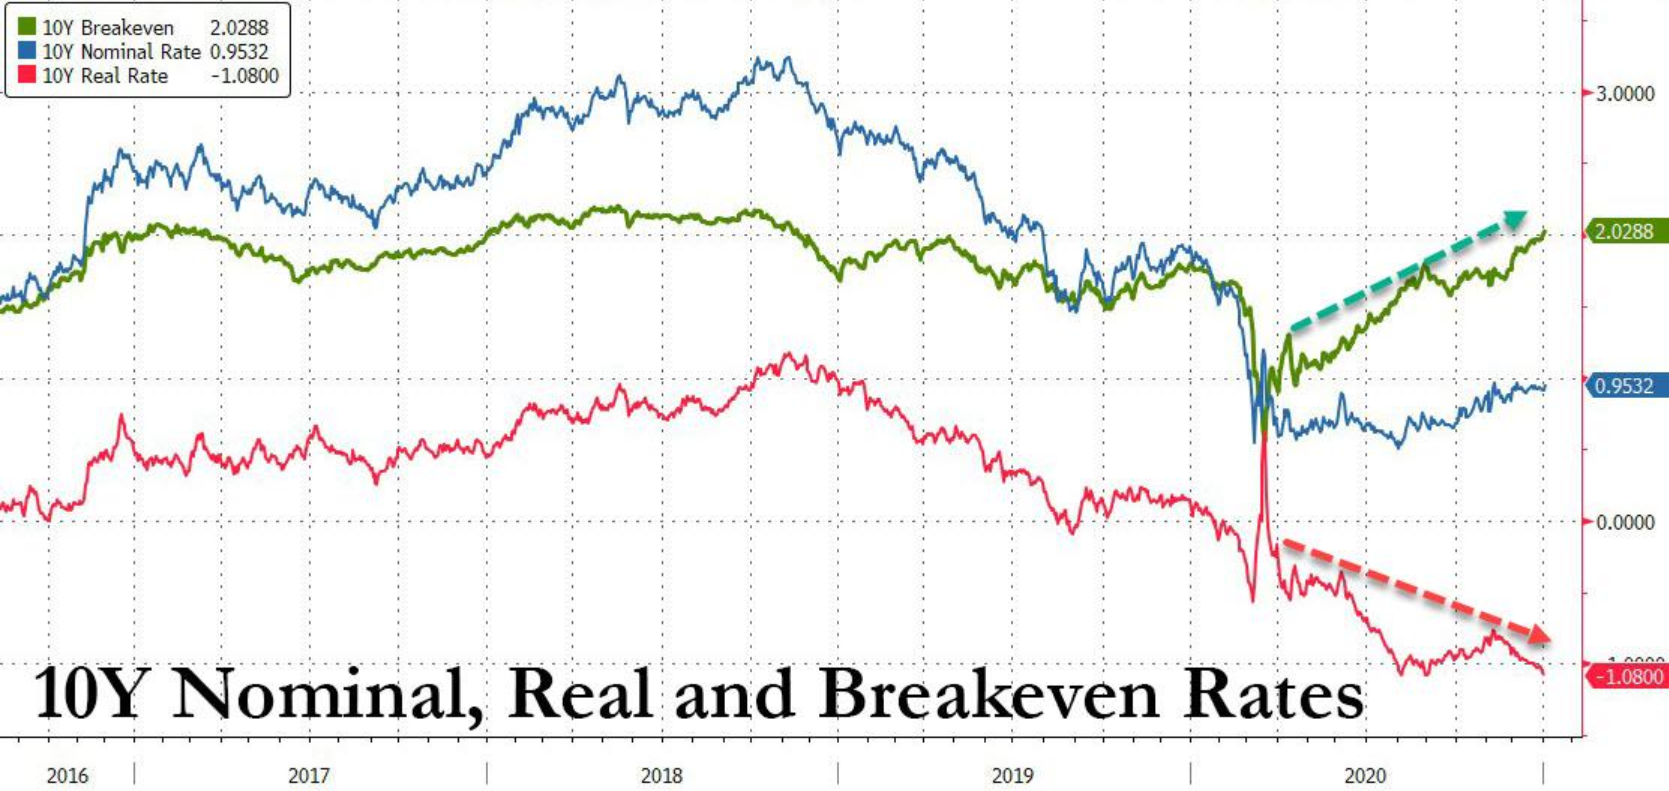
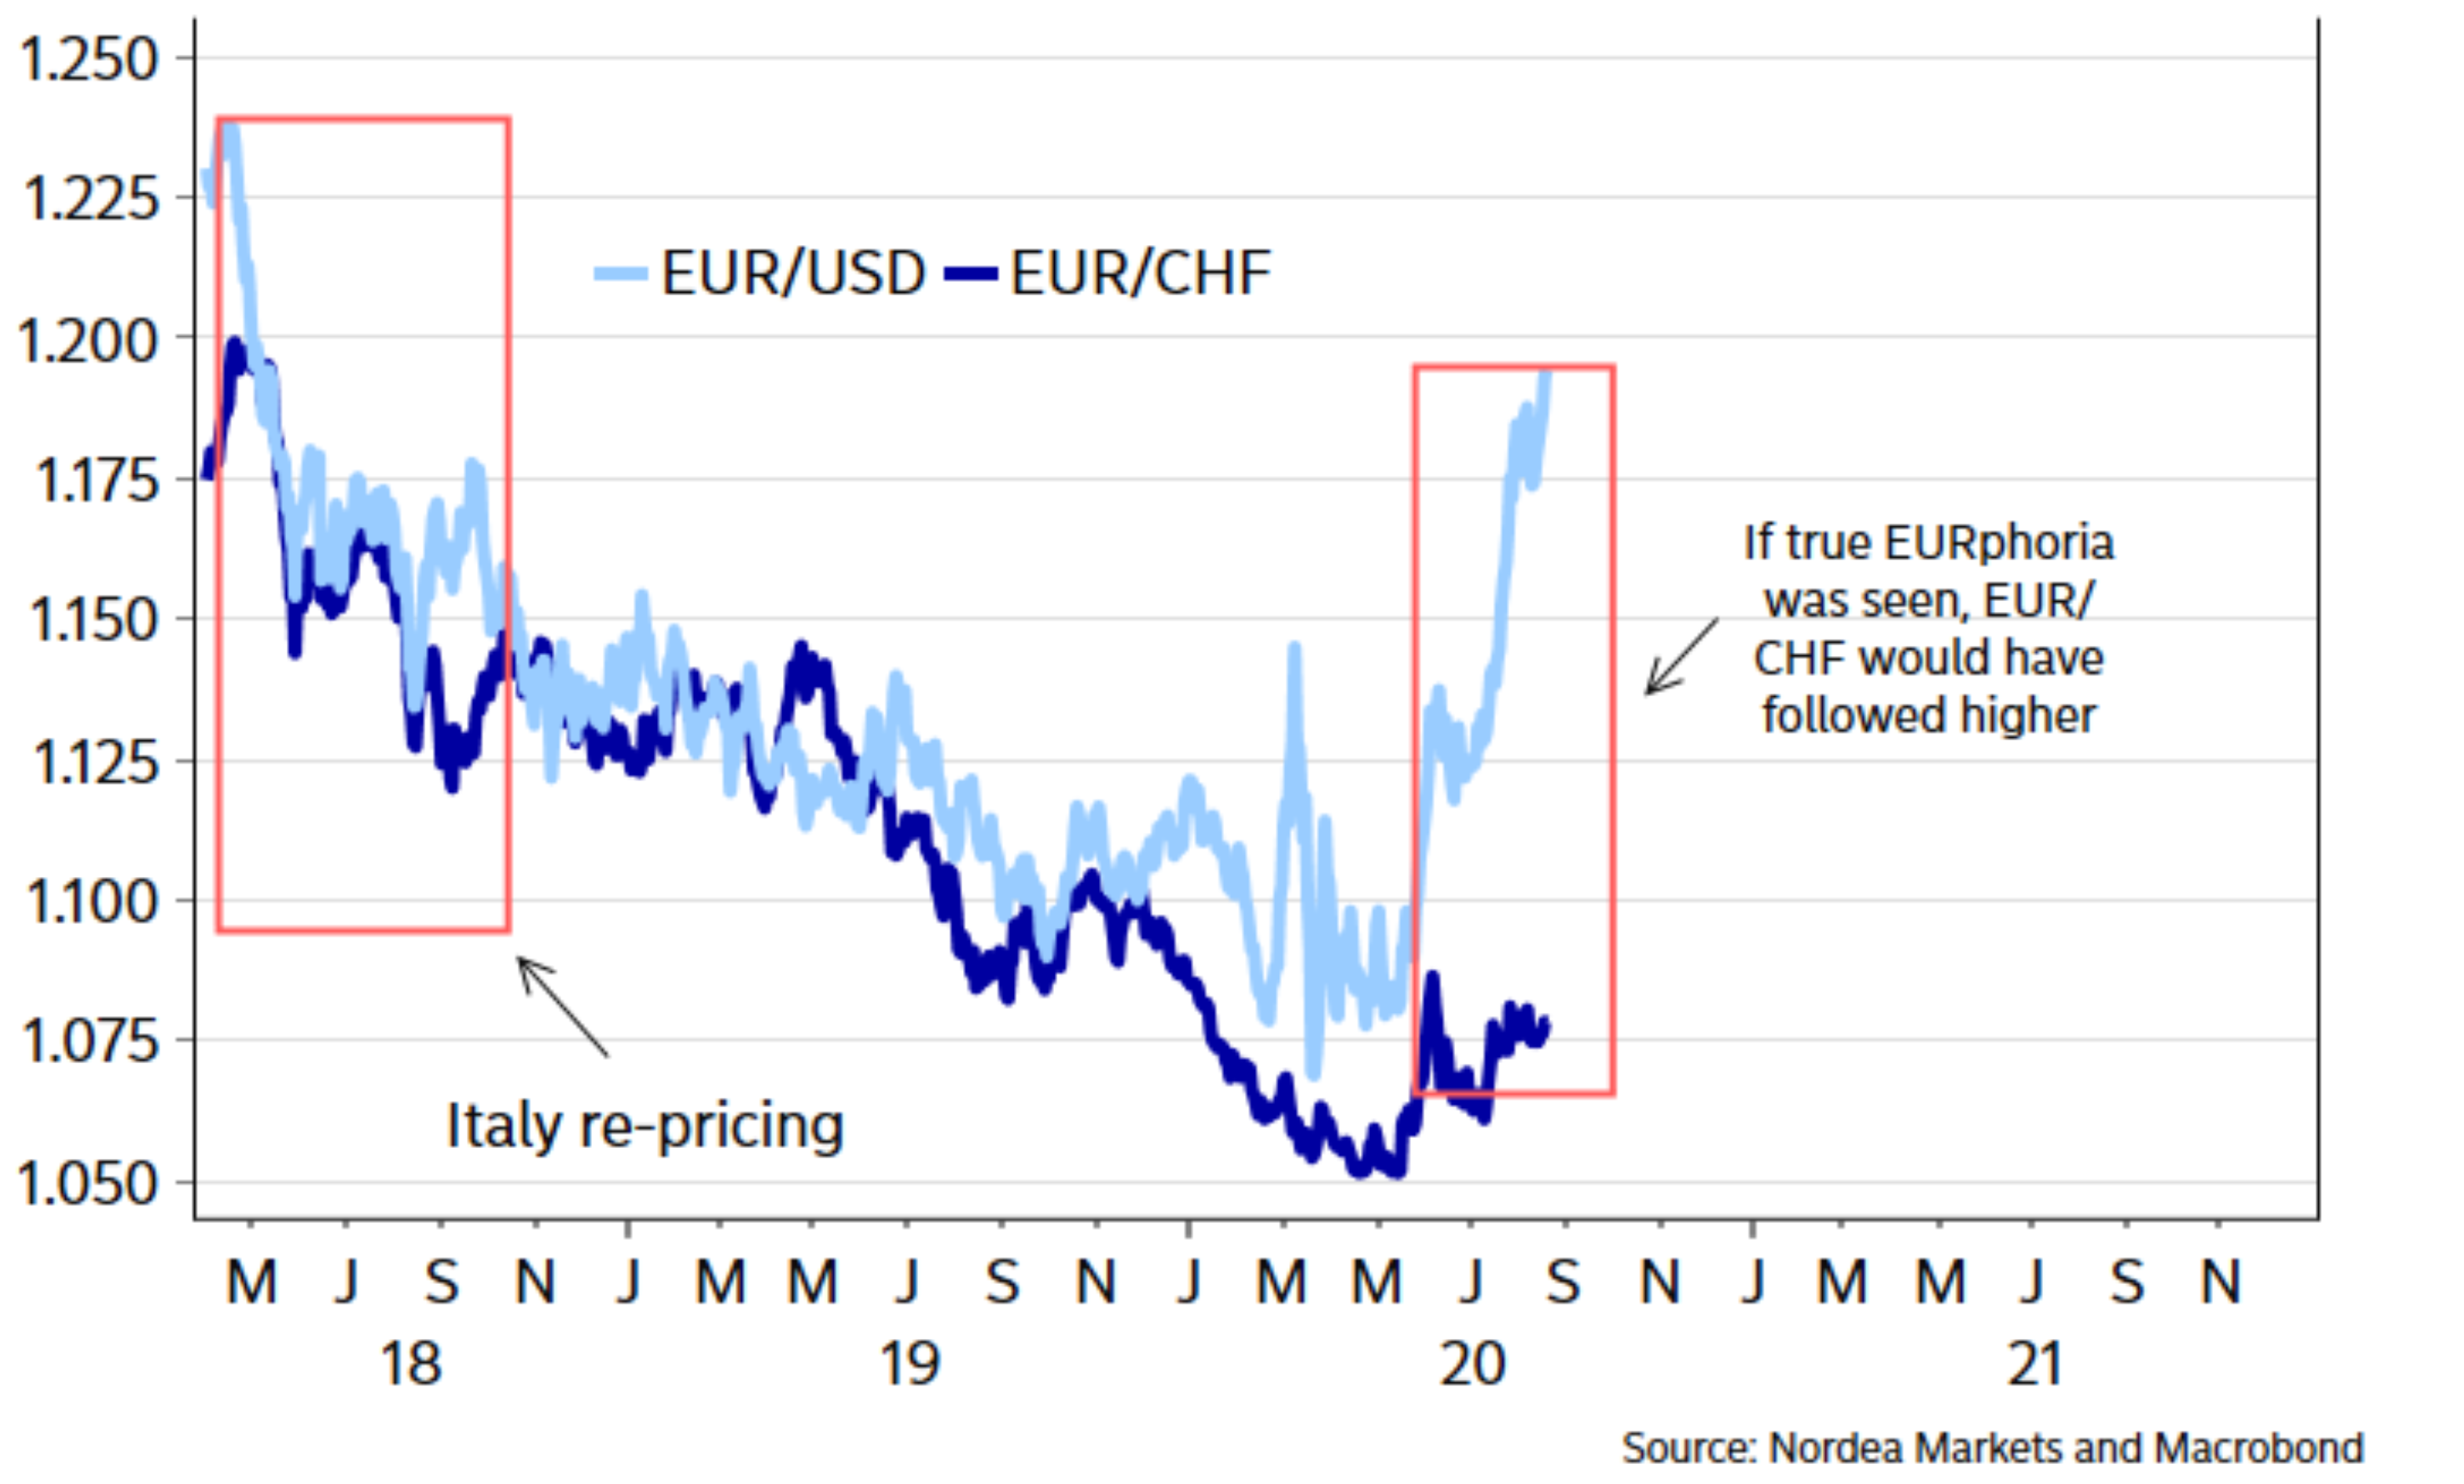
If I could describe what happened on the bond market chart above. FED has convinced the market “reflation” is coming, but economy using nominal yields is laughing asking traders to fuel food inflation to check how economical rebound is “valid” giving free triggers like export tax increases on wheat and probably much more. Suddenly economy rebound starts stalling. Food prices raising, wages declining and flat velocity of money doing its job and starts declining again. All stimulus checks are going to widen the gap between nominal yields and inflation breakevens bringing deadly basic cost of living inflation to our life. If FED can cheat the market, economy will offset it by raising very rapidly food prices to remove the economical bounce forcing bond jaws to close. Nothing is for free. Economy is juicing central banks like a lemon seeking their last ammo bullet. Jaws on bond market can be seen everywhere. Another example is F/X market. So EUR/CHF is our nominal yield but EUR/USD is our breakeven rate. I can that all night long, but that’s not a topic about that.
After we had some introduction time for charts.
What I’ve learned so far is to ignore everything except trend-lines, any moving averages etc. it’s just a piece of shit in 90%. So as 2Q20 possible bear turned to bull (weakening $), here comes another 1Q21 same possible change. The market requires to weaken $ further, but the same time to move food inflation more parabolic or lift up yields beyond inflation expectations so now 10Y needs to be > ~2.5%. Nothing is for free – once again. $ collapse means food inflation to infinity, but again nothing goes straight down and up.
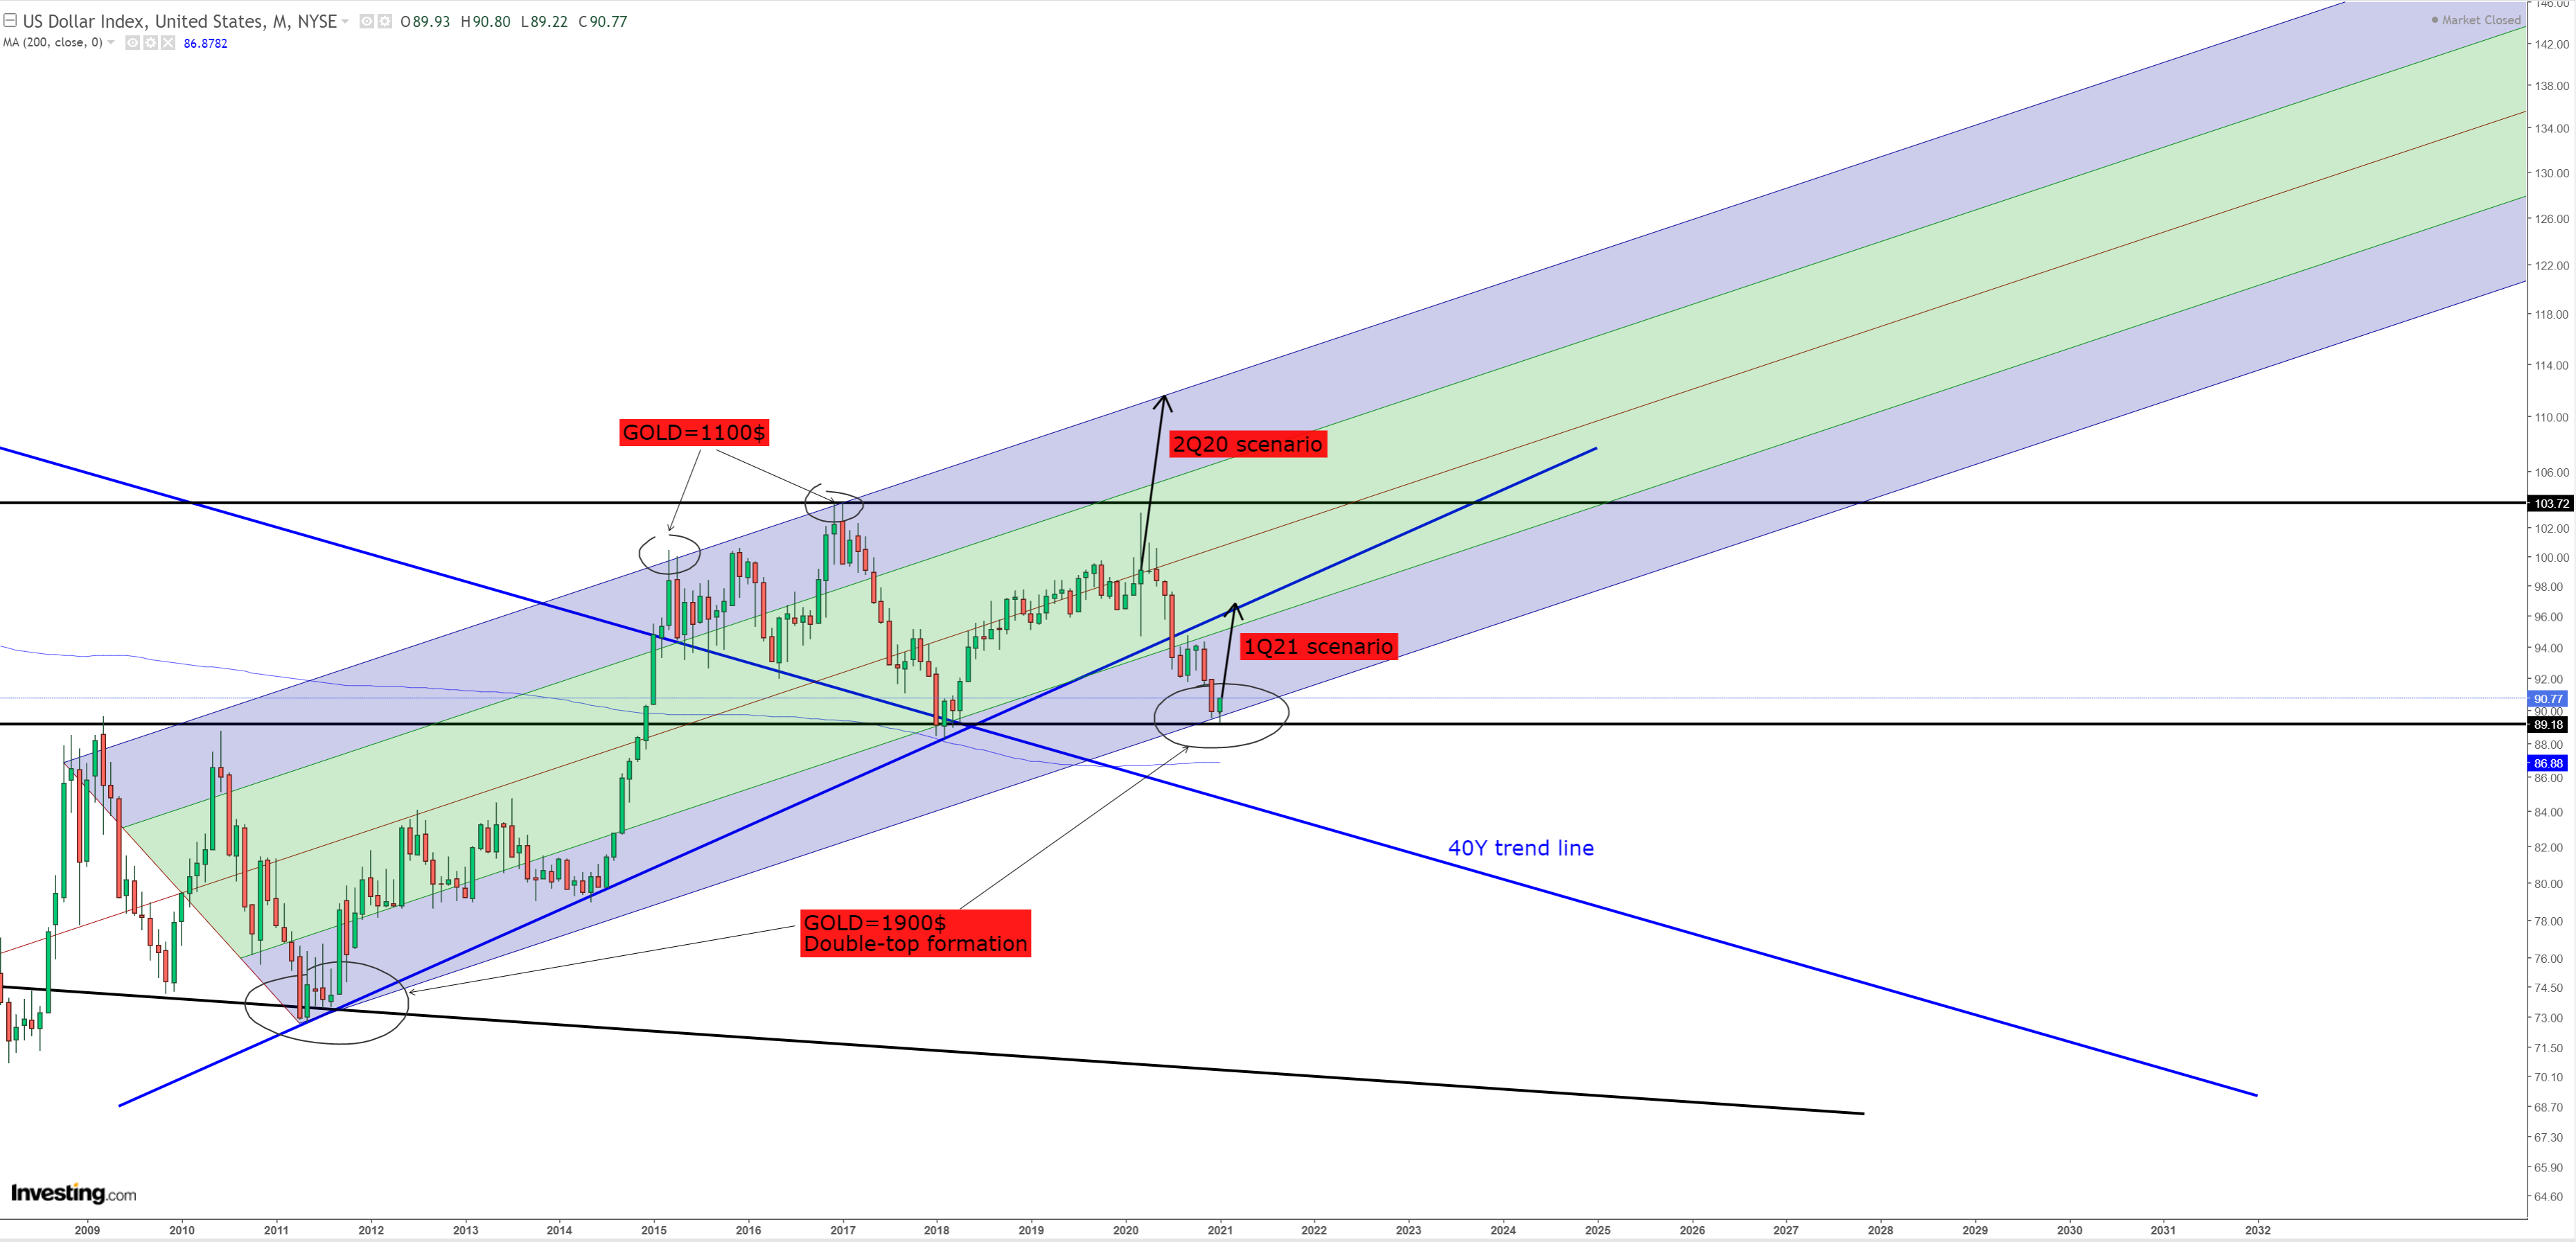
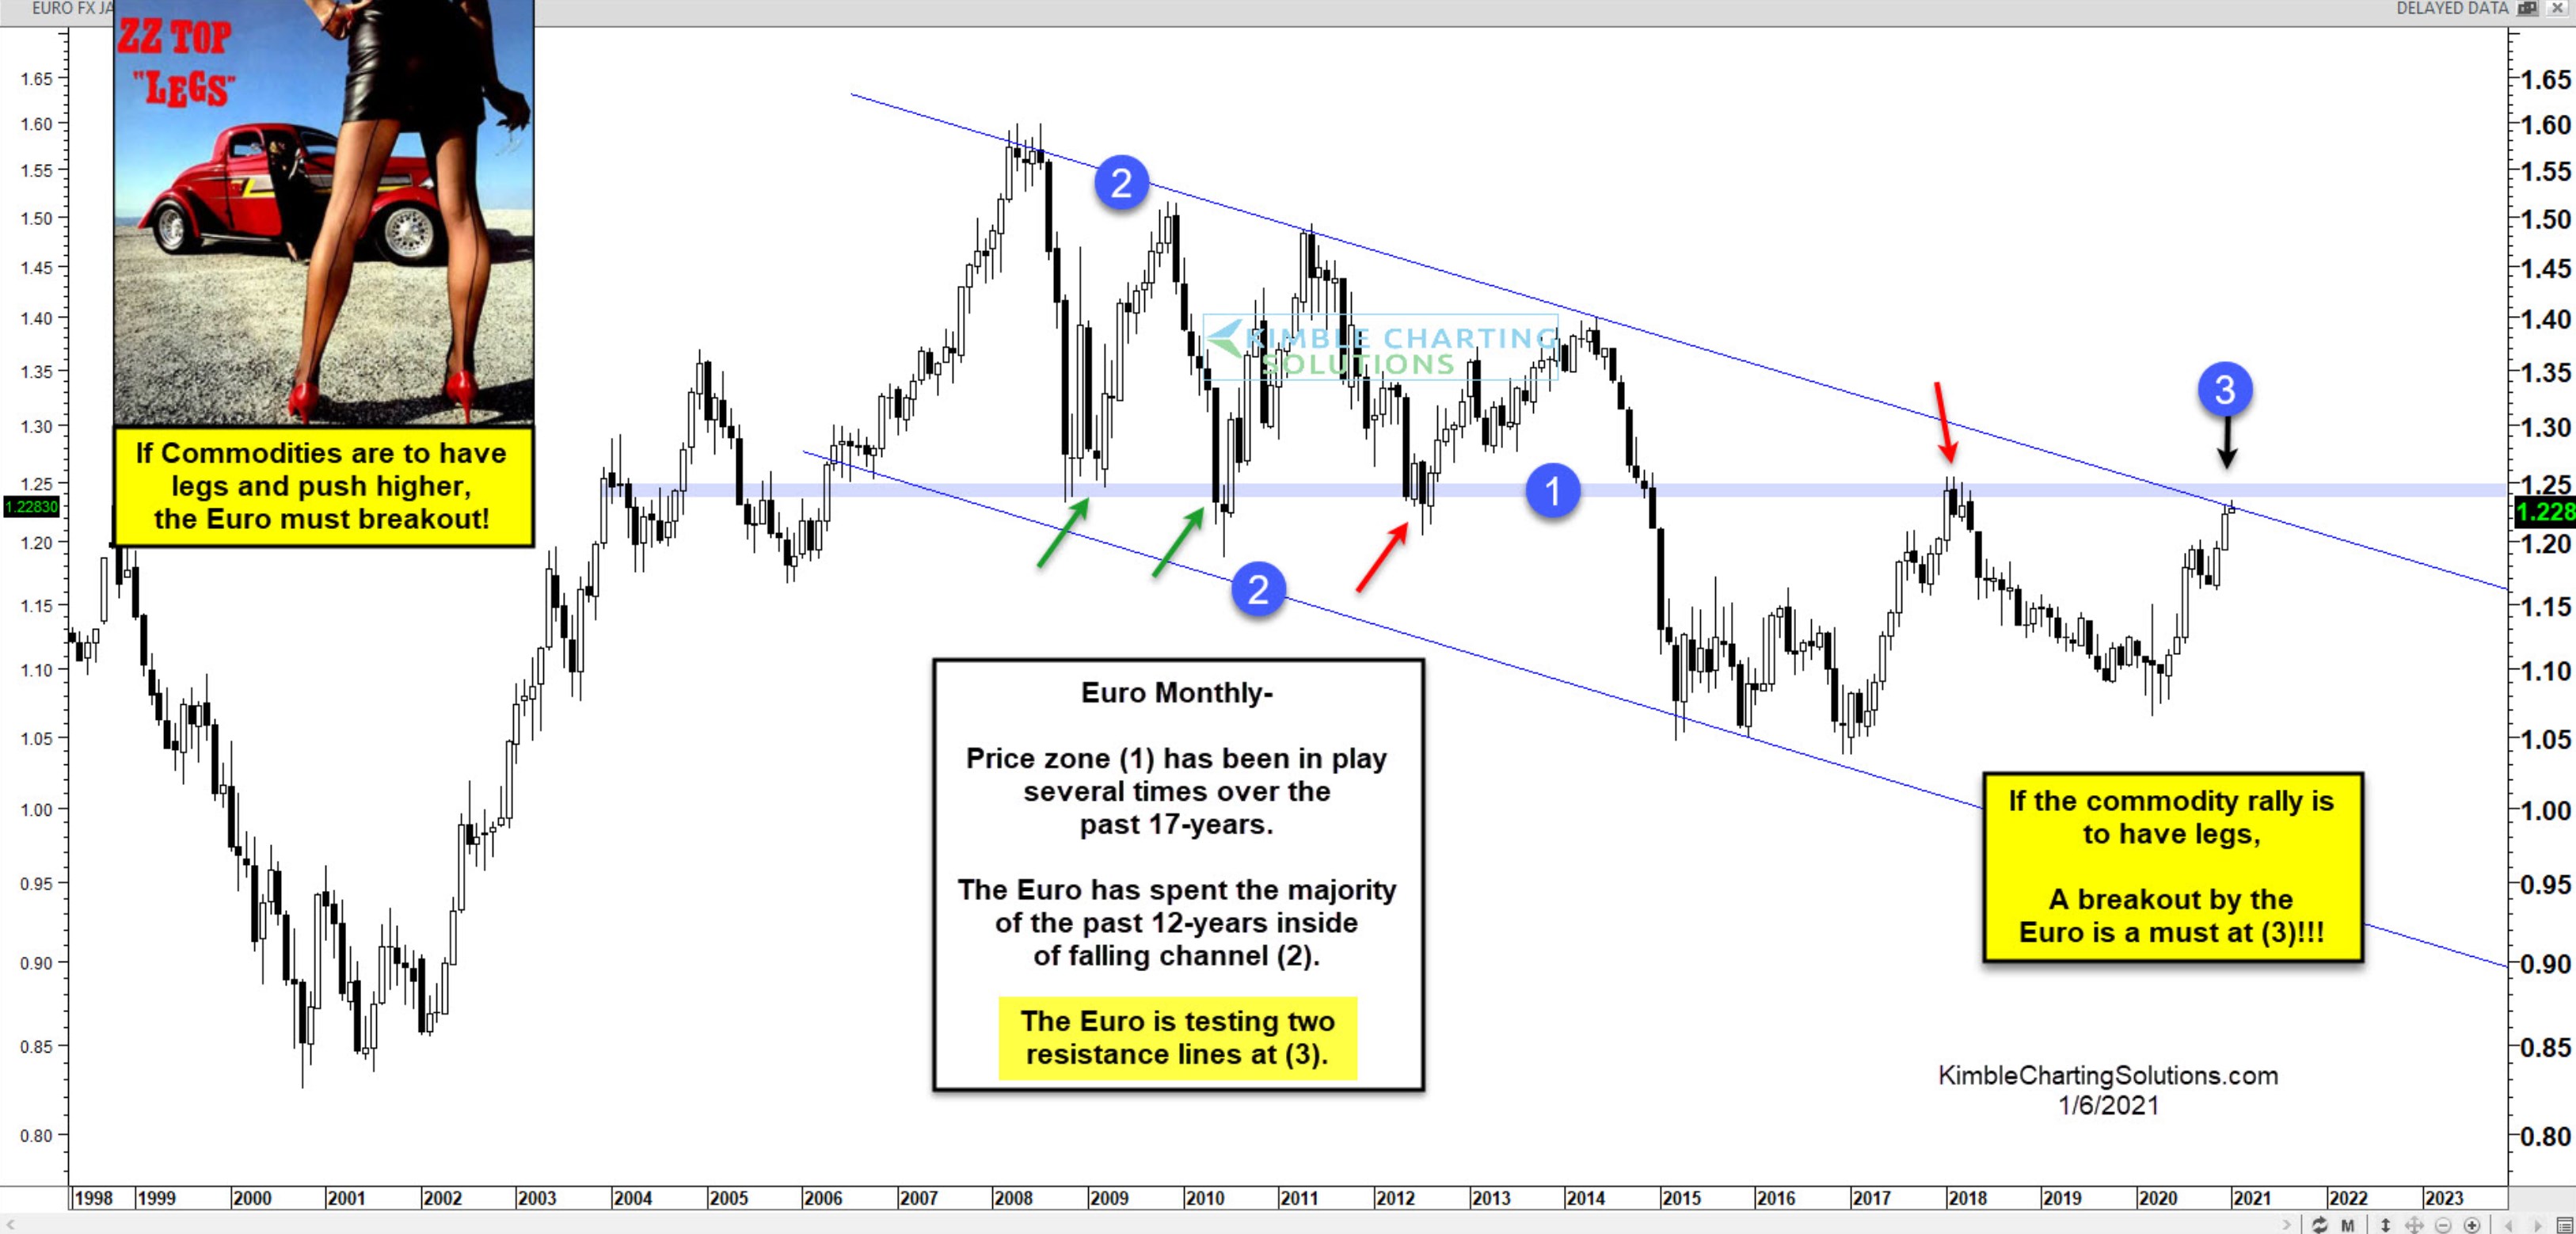
We’re going to start with long term $DXY and $EURUSD chart :
The first 2Q20 moment of possible turn was based on the fact that $ will spike higher, 1Q21 scenario is set that this moment is a key one as well. It’s just a simple weak $, strong $ move – don’t even try to find reasons about it. Bear in mind if $ will go lower, food inflation will start going up 2-5x faster than weakening $ until economy will flip or yields will spike.
The same time it’s $EURUSD path, will use Chris Kimble’s chart as this one has just on my second screen
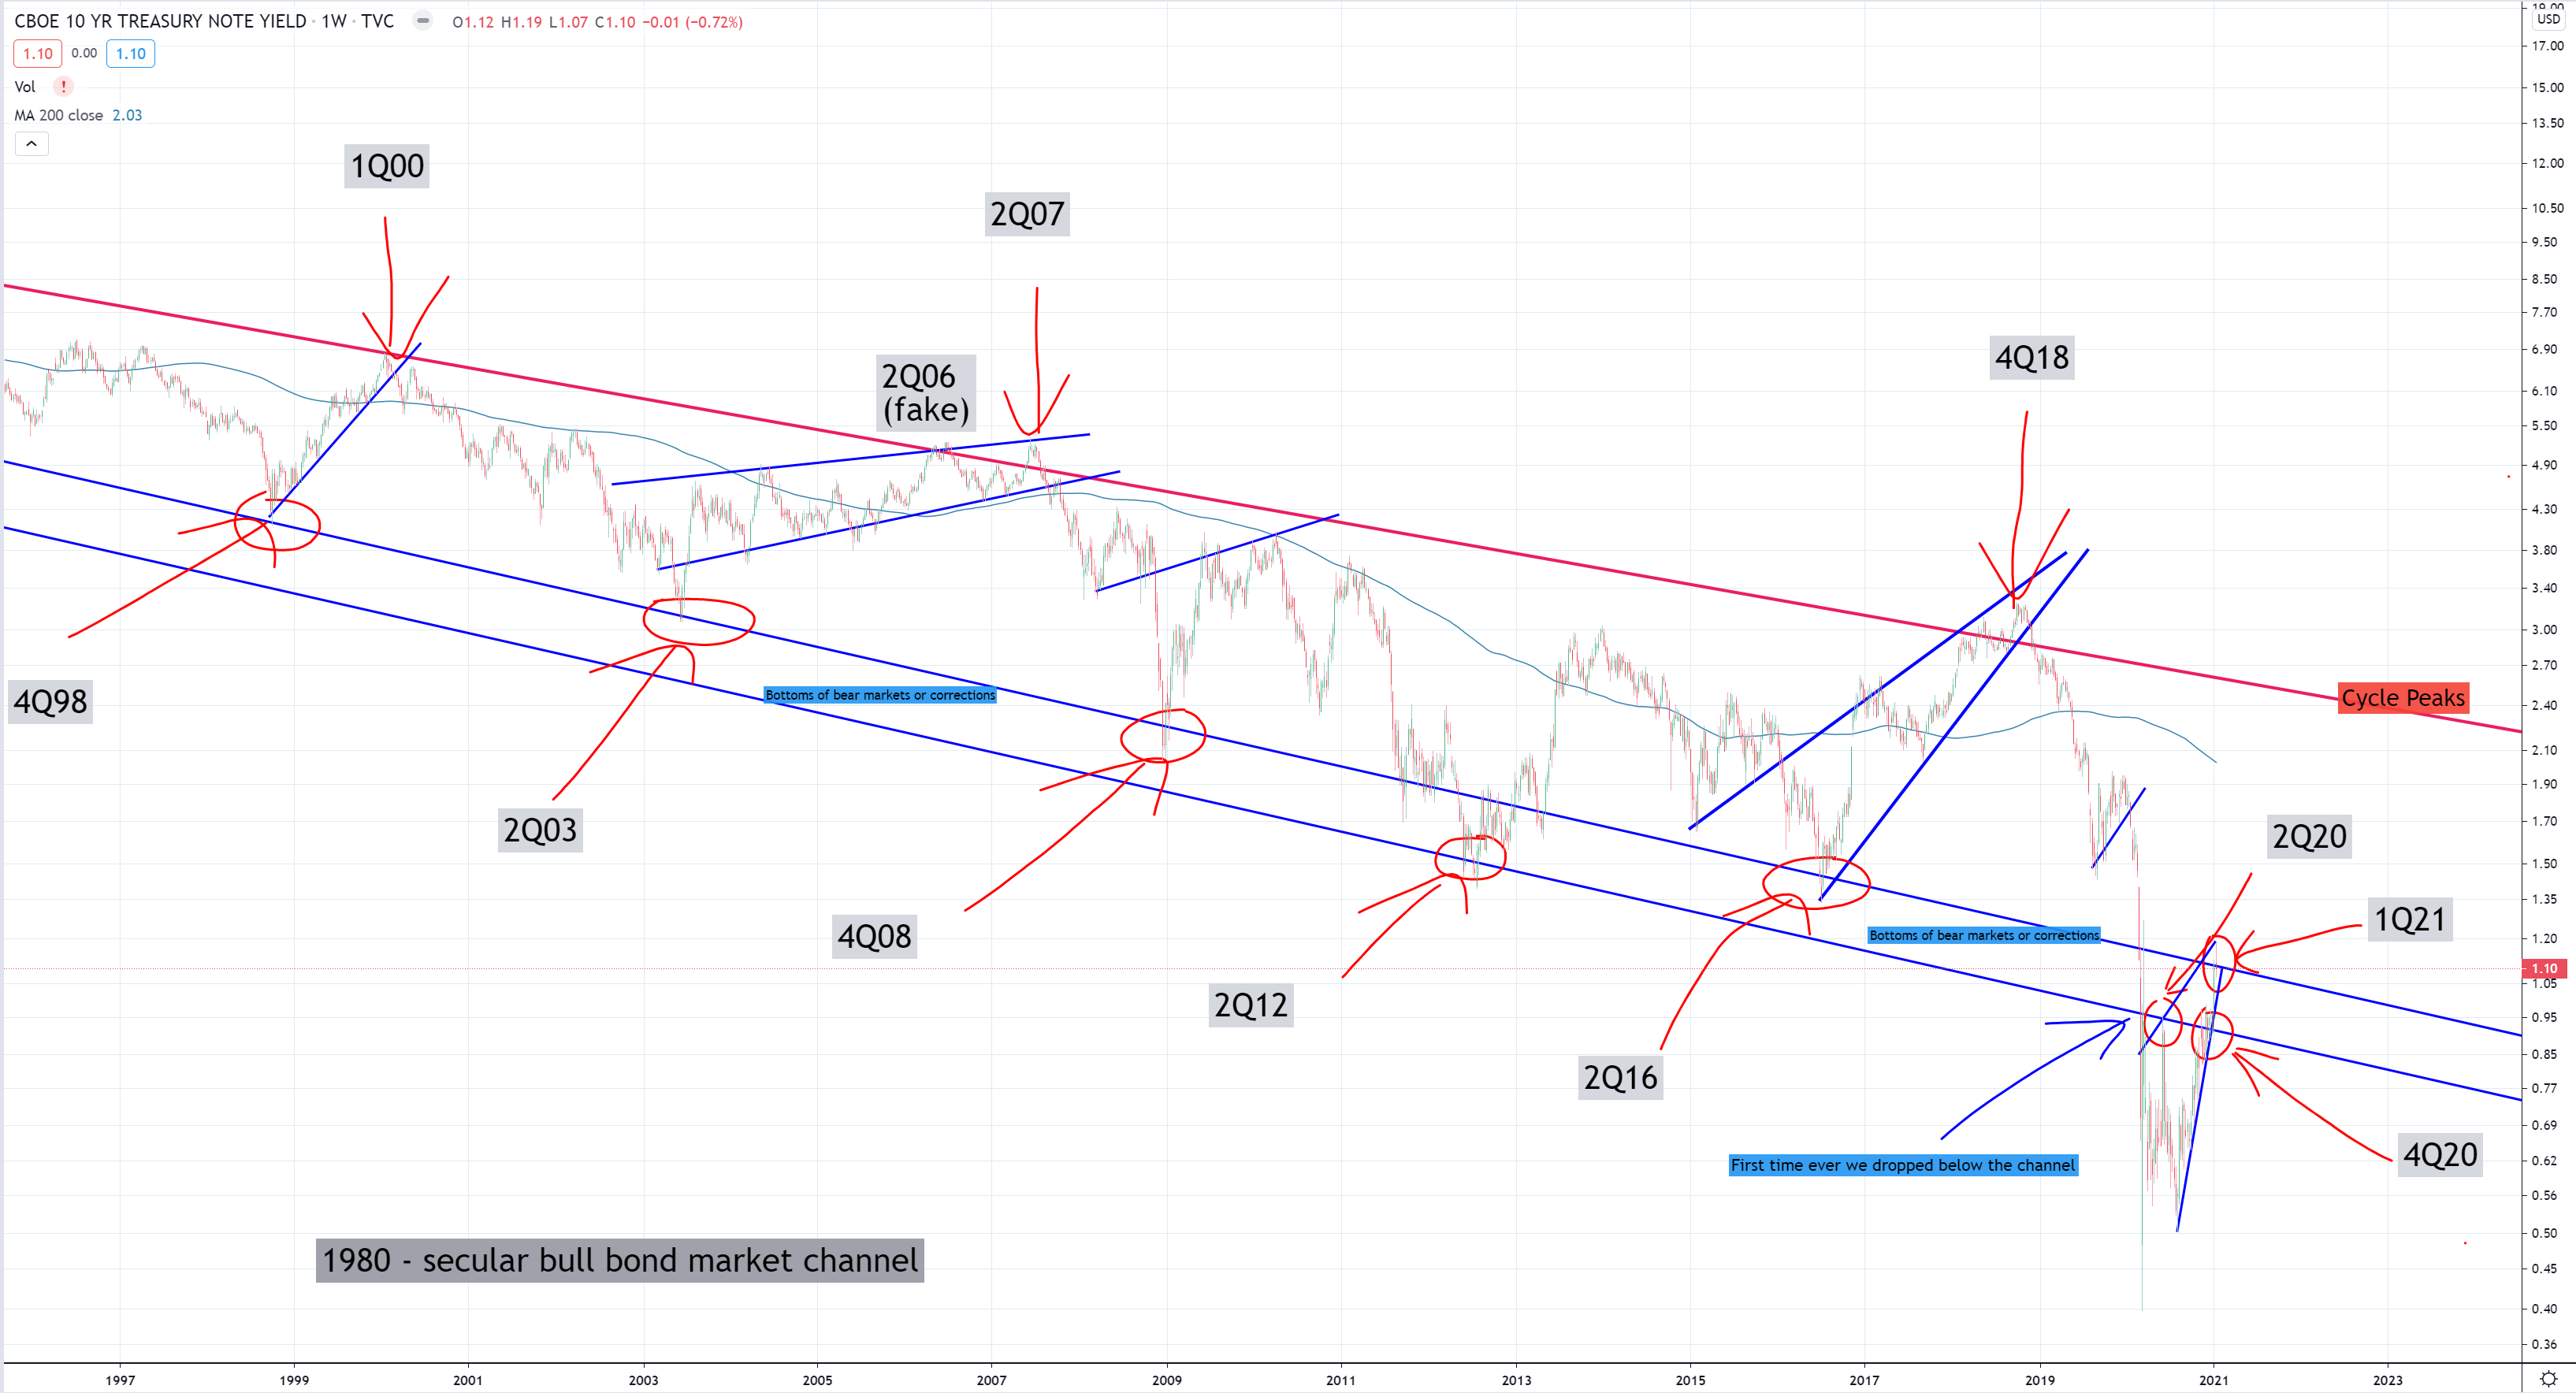
So we have basics. Now time for the bond market. Long term secular bond bull market :
Very long view (look where 2Q20 was – previous possible “bear” junction, I bet it was – but FED scared the shit out. That’s ok their moves are being way way much offset these days by simple food prices.
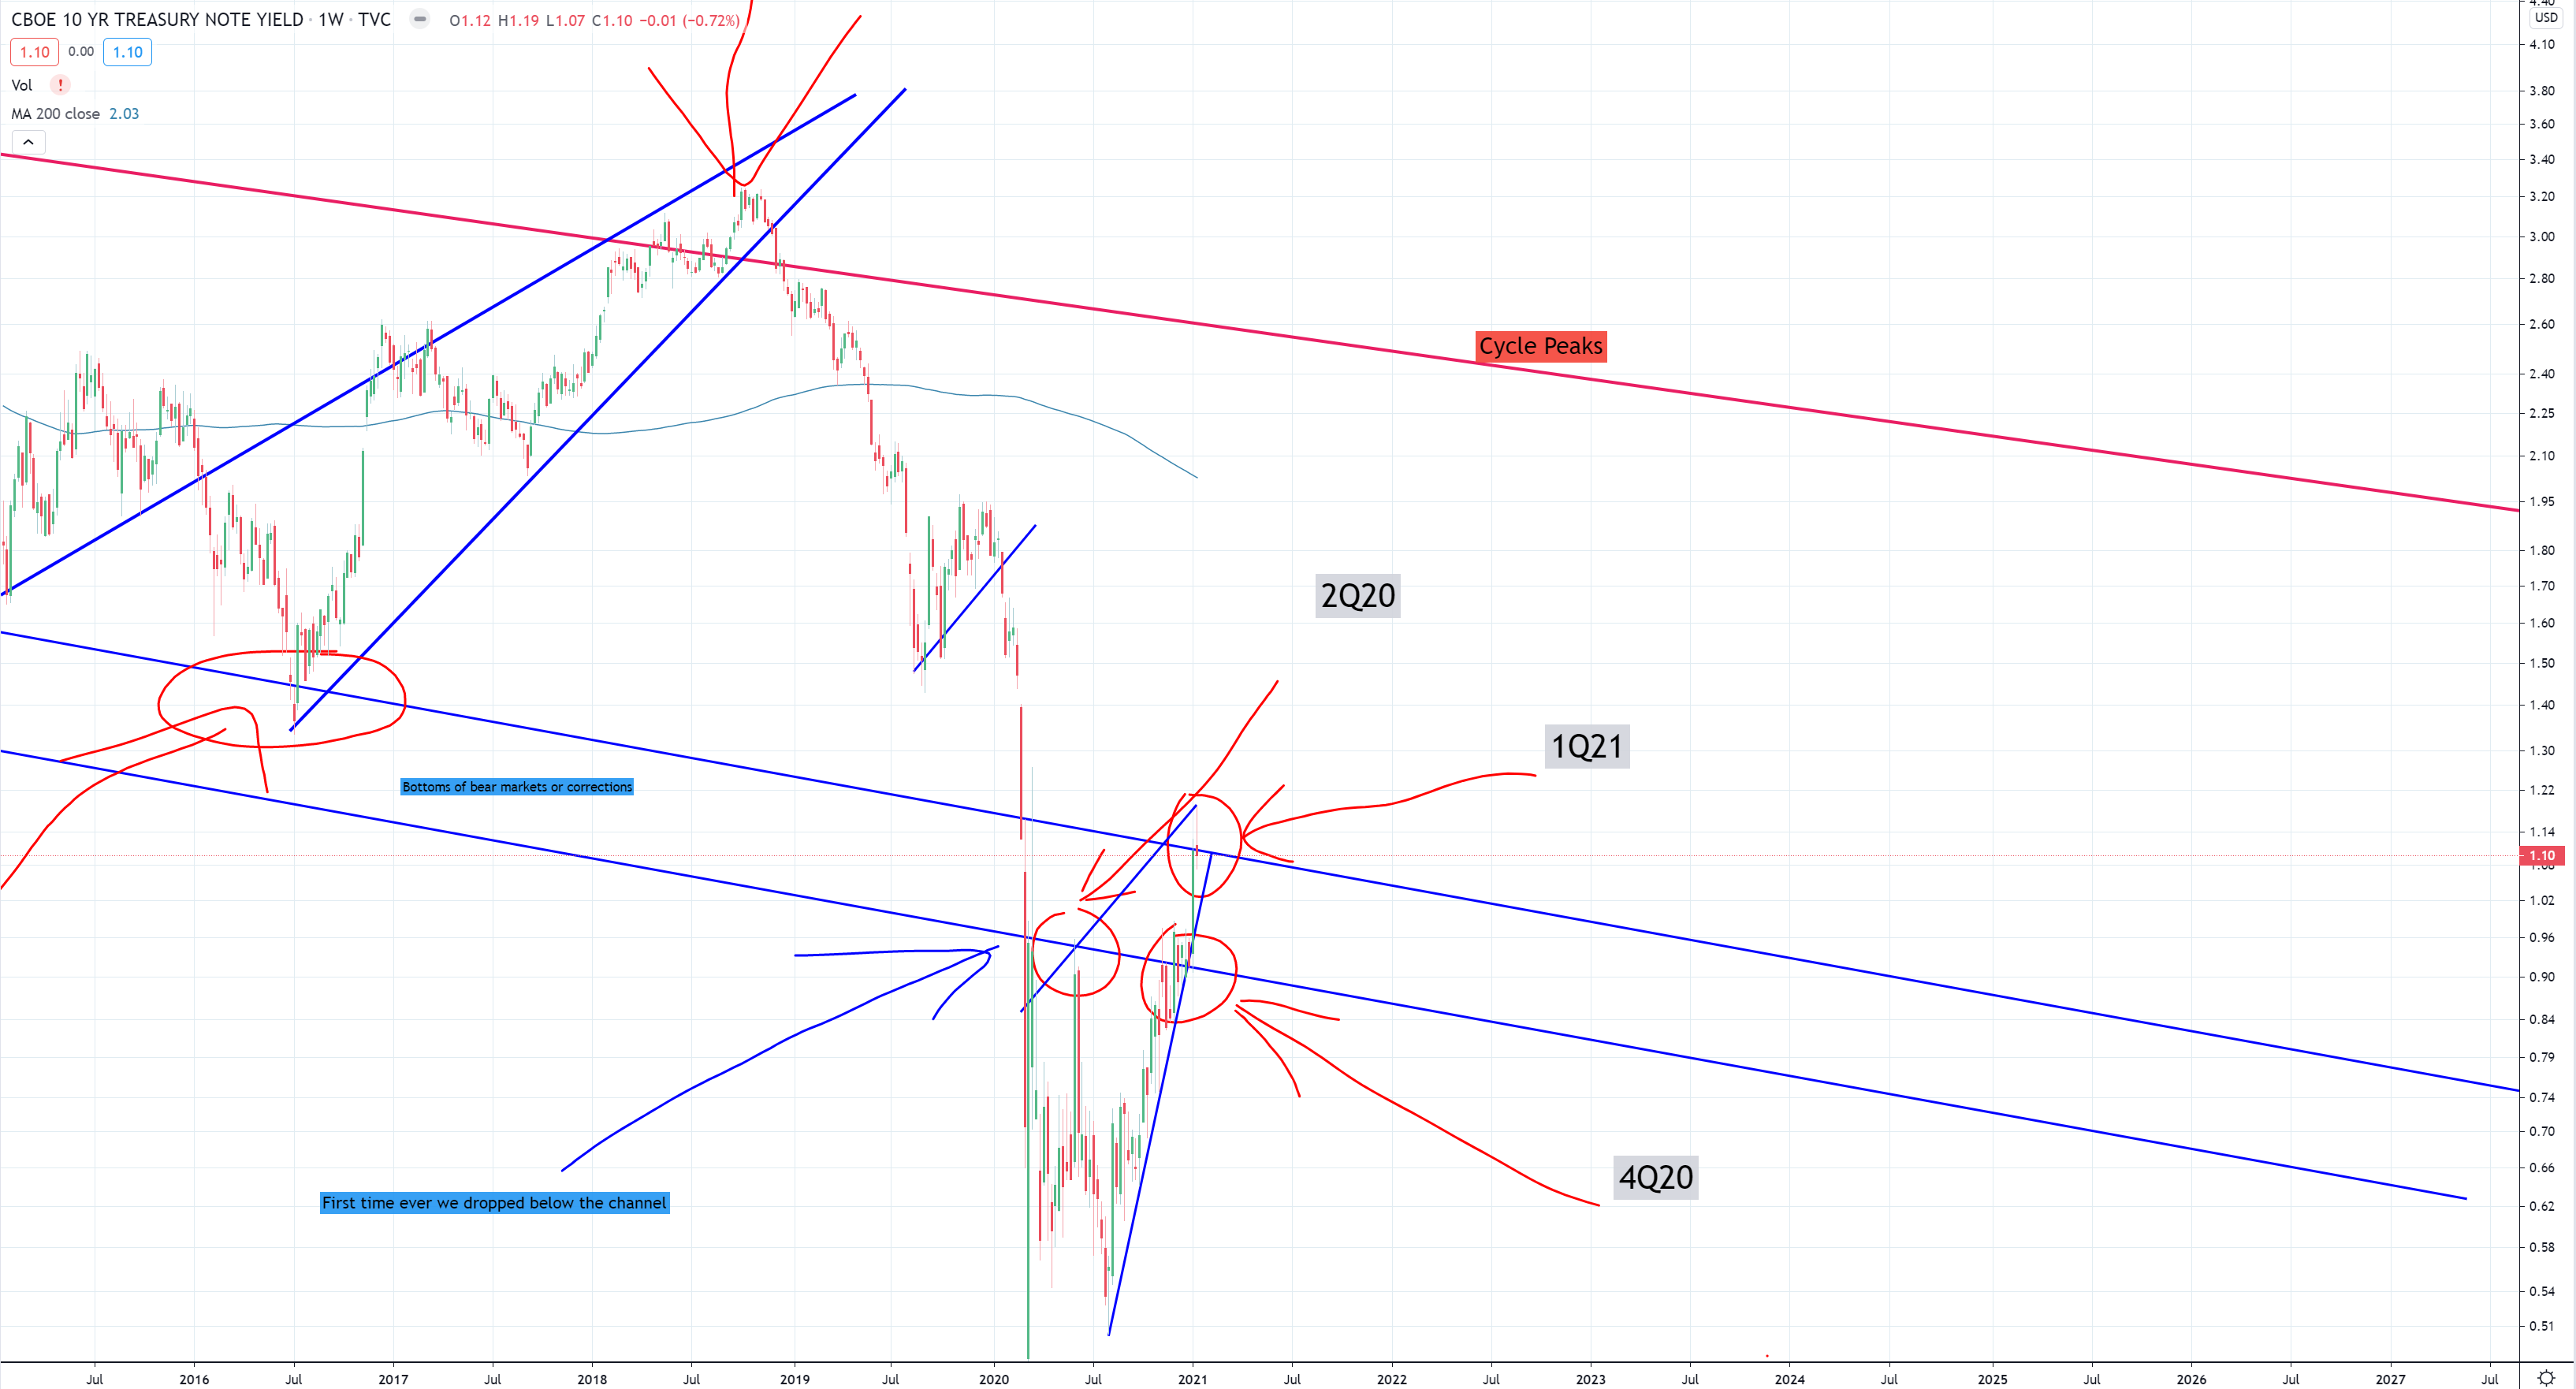
And deeper look on the same bond bull market :
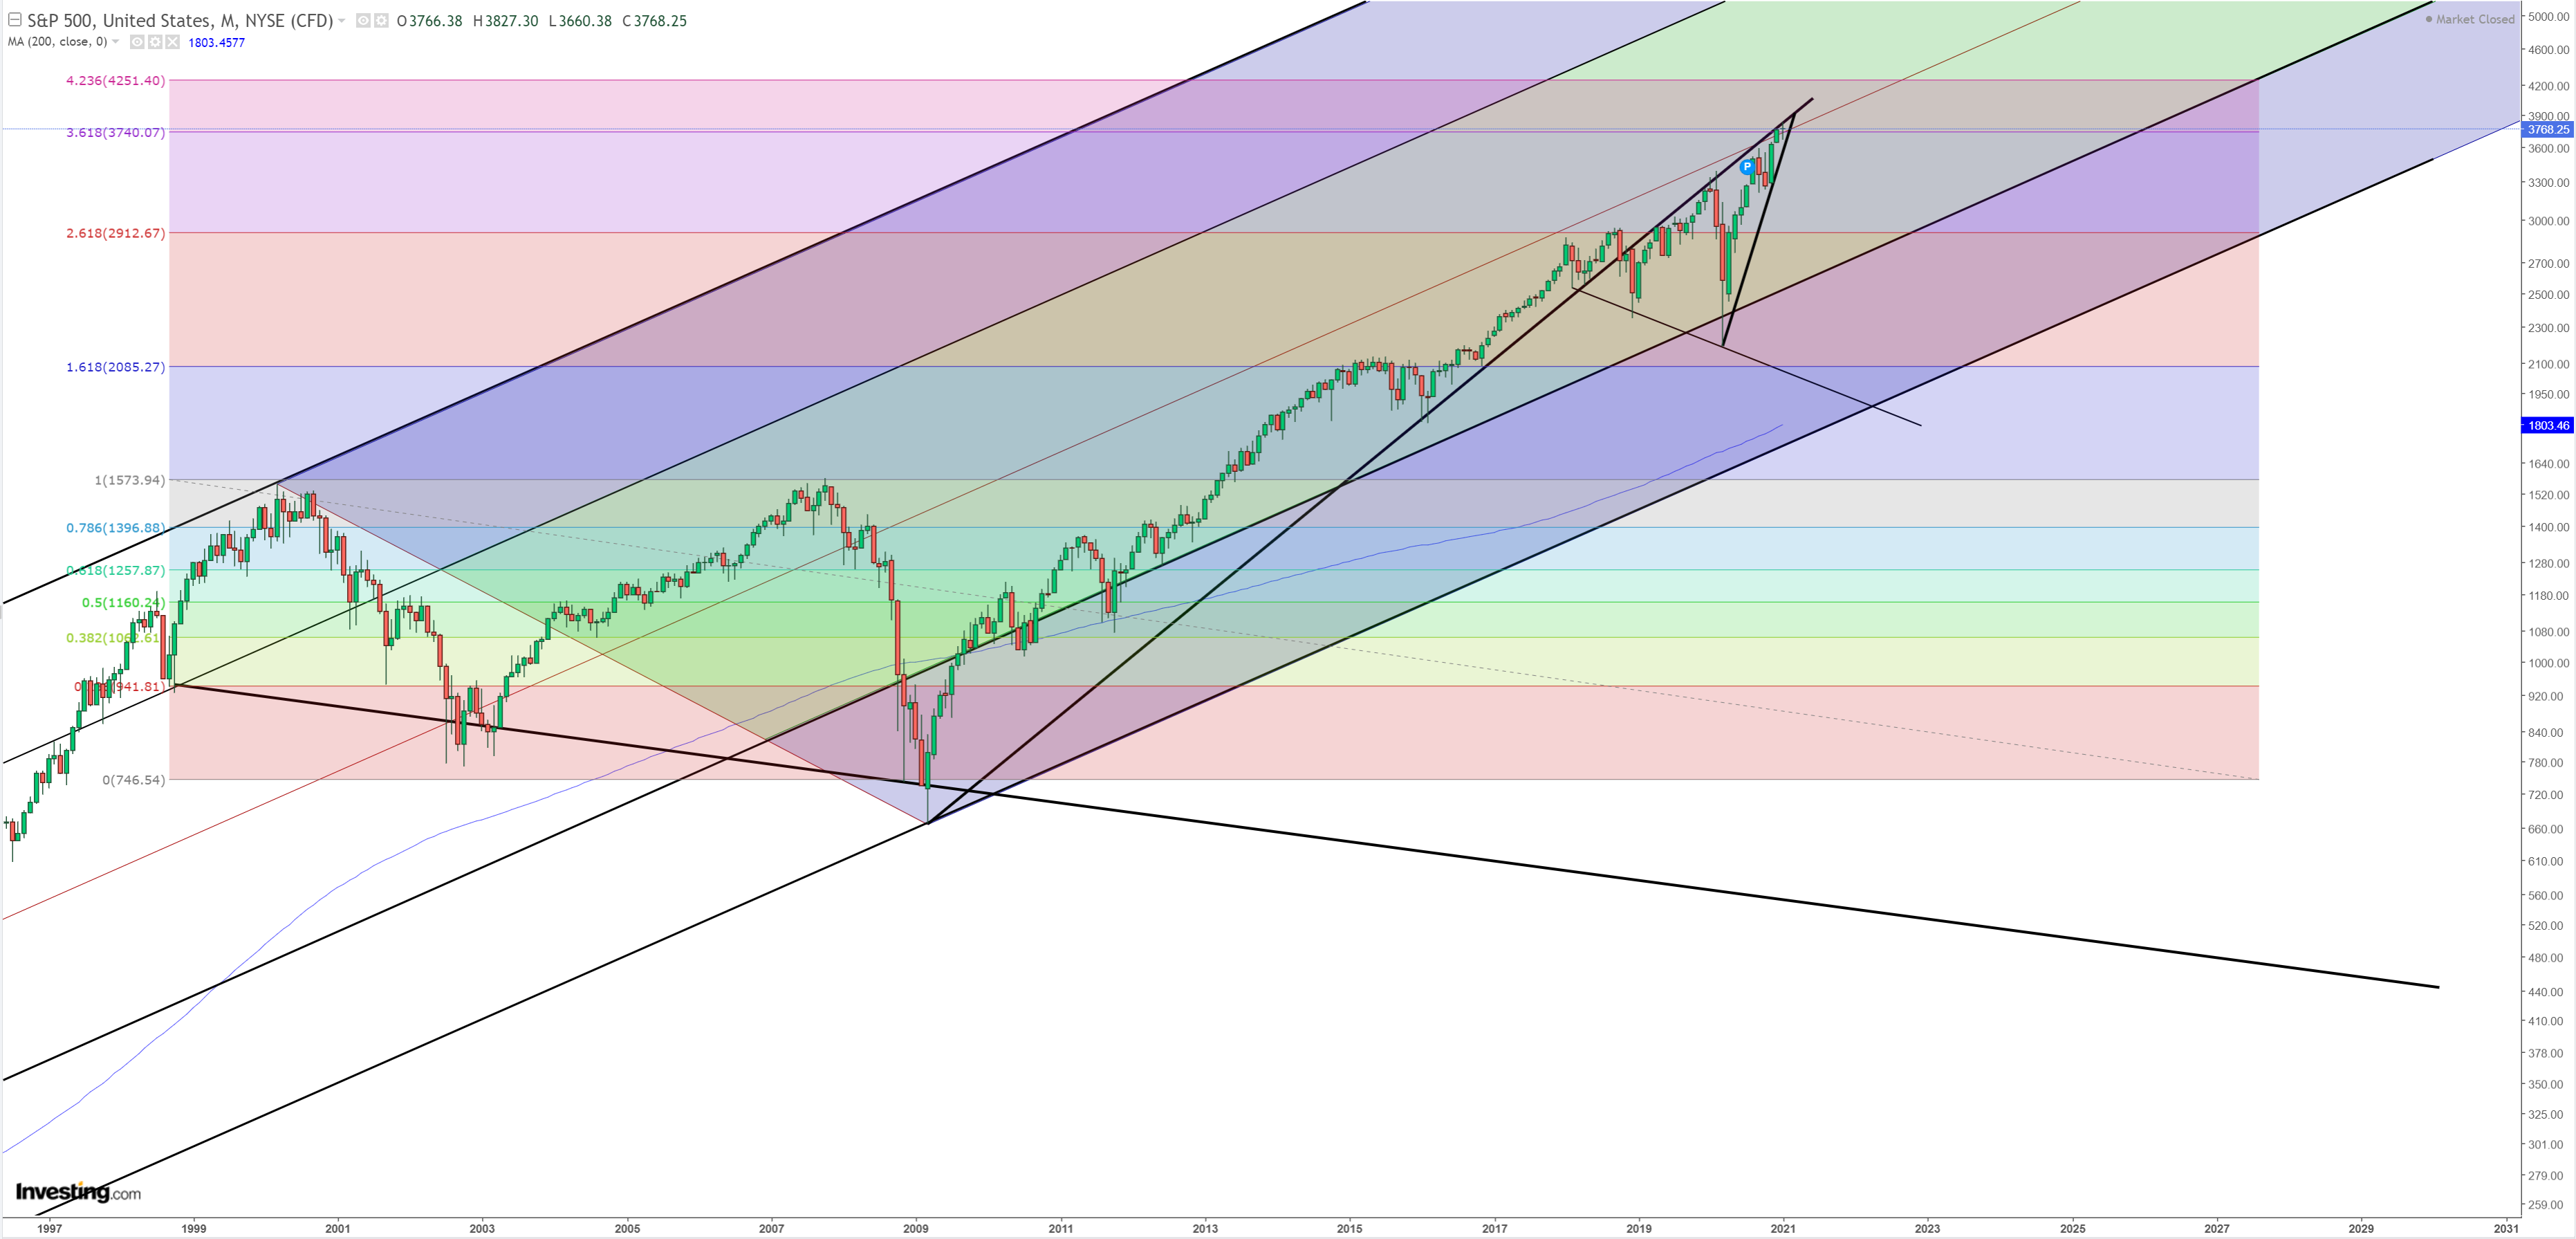
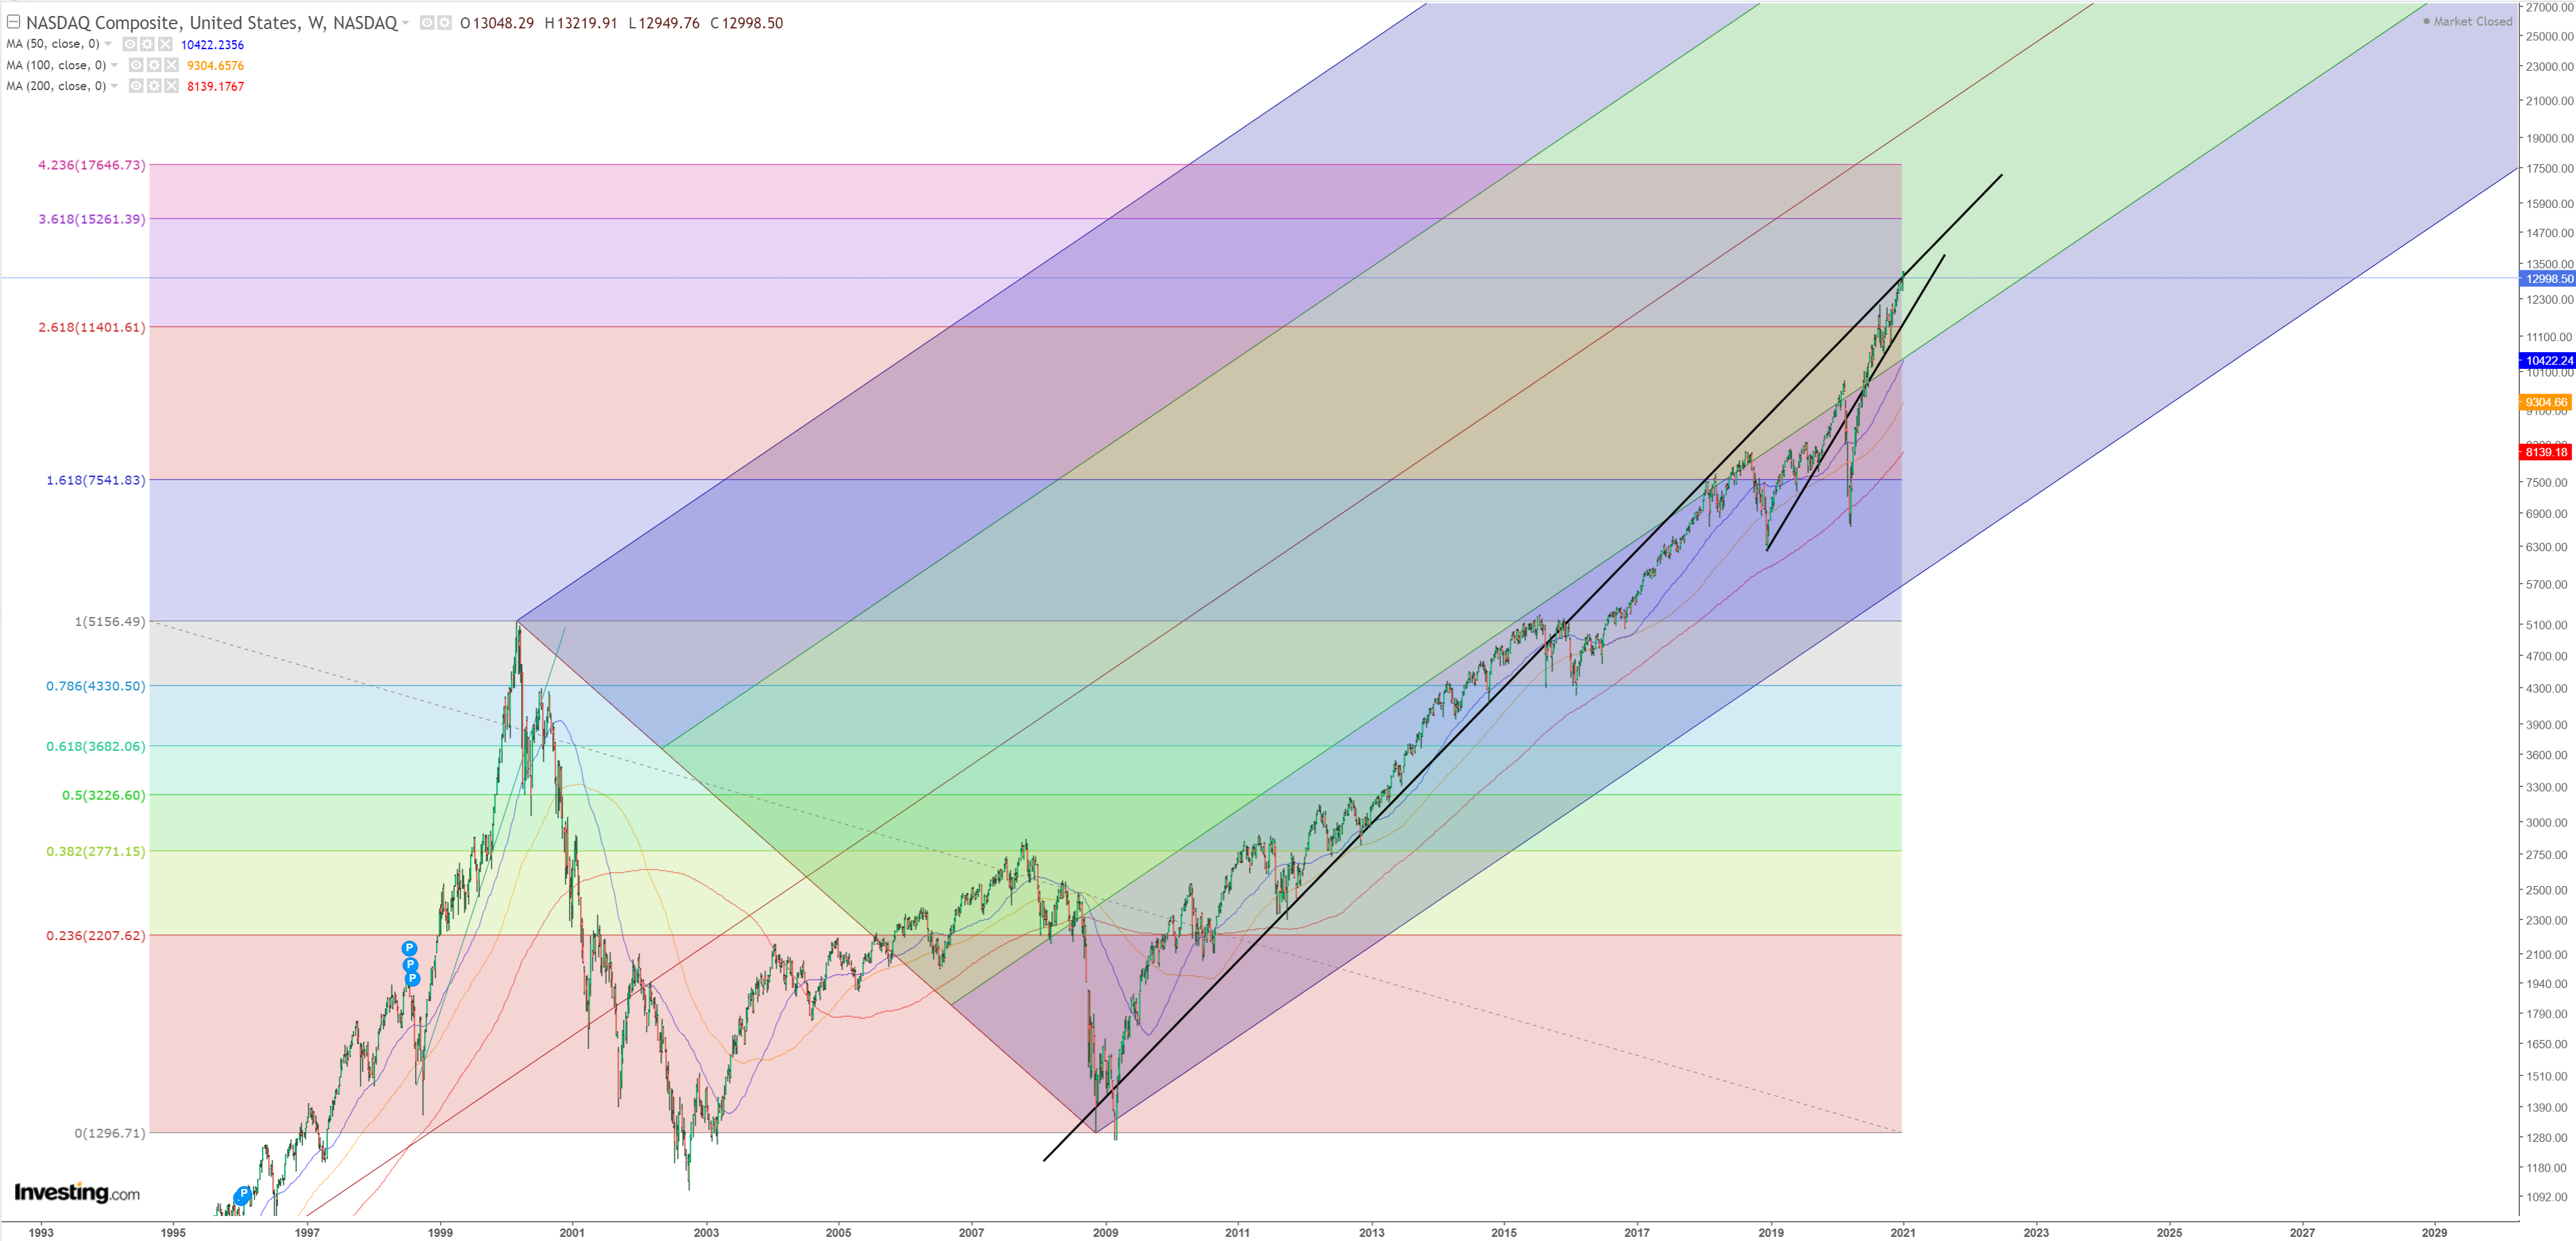
Long term $SPX chart – watch for 3840+ level
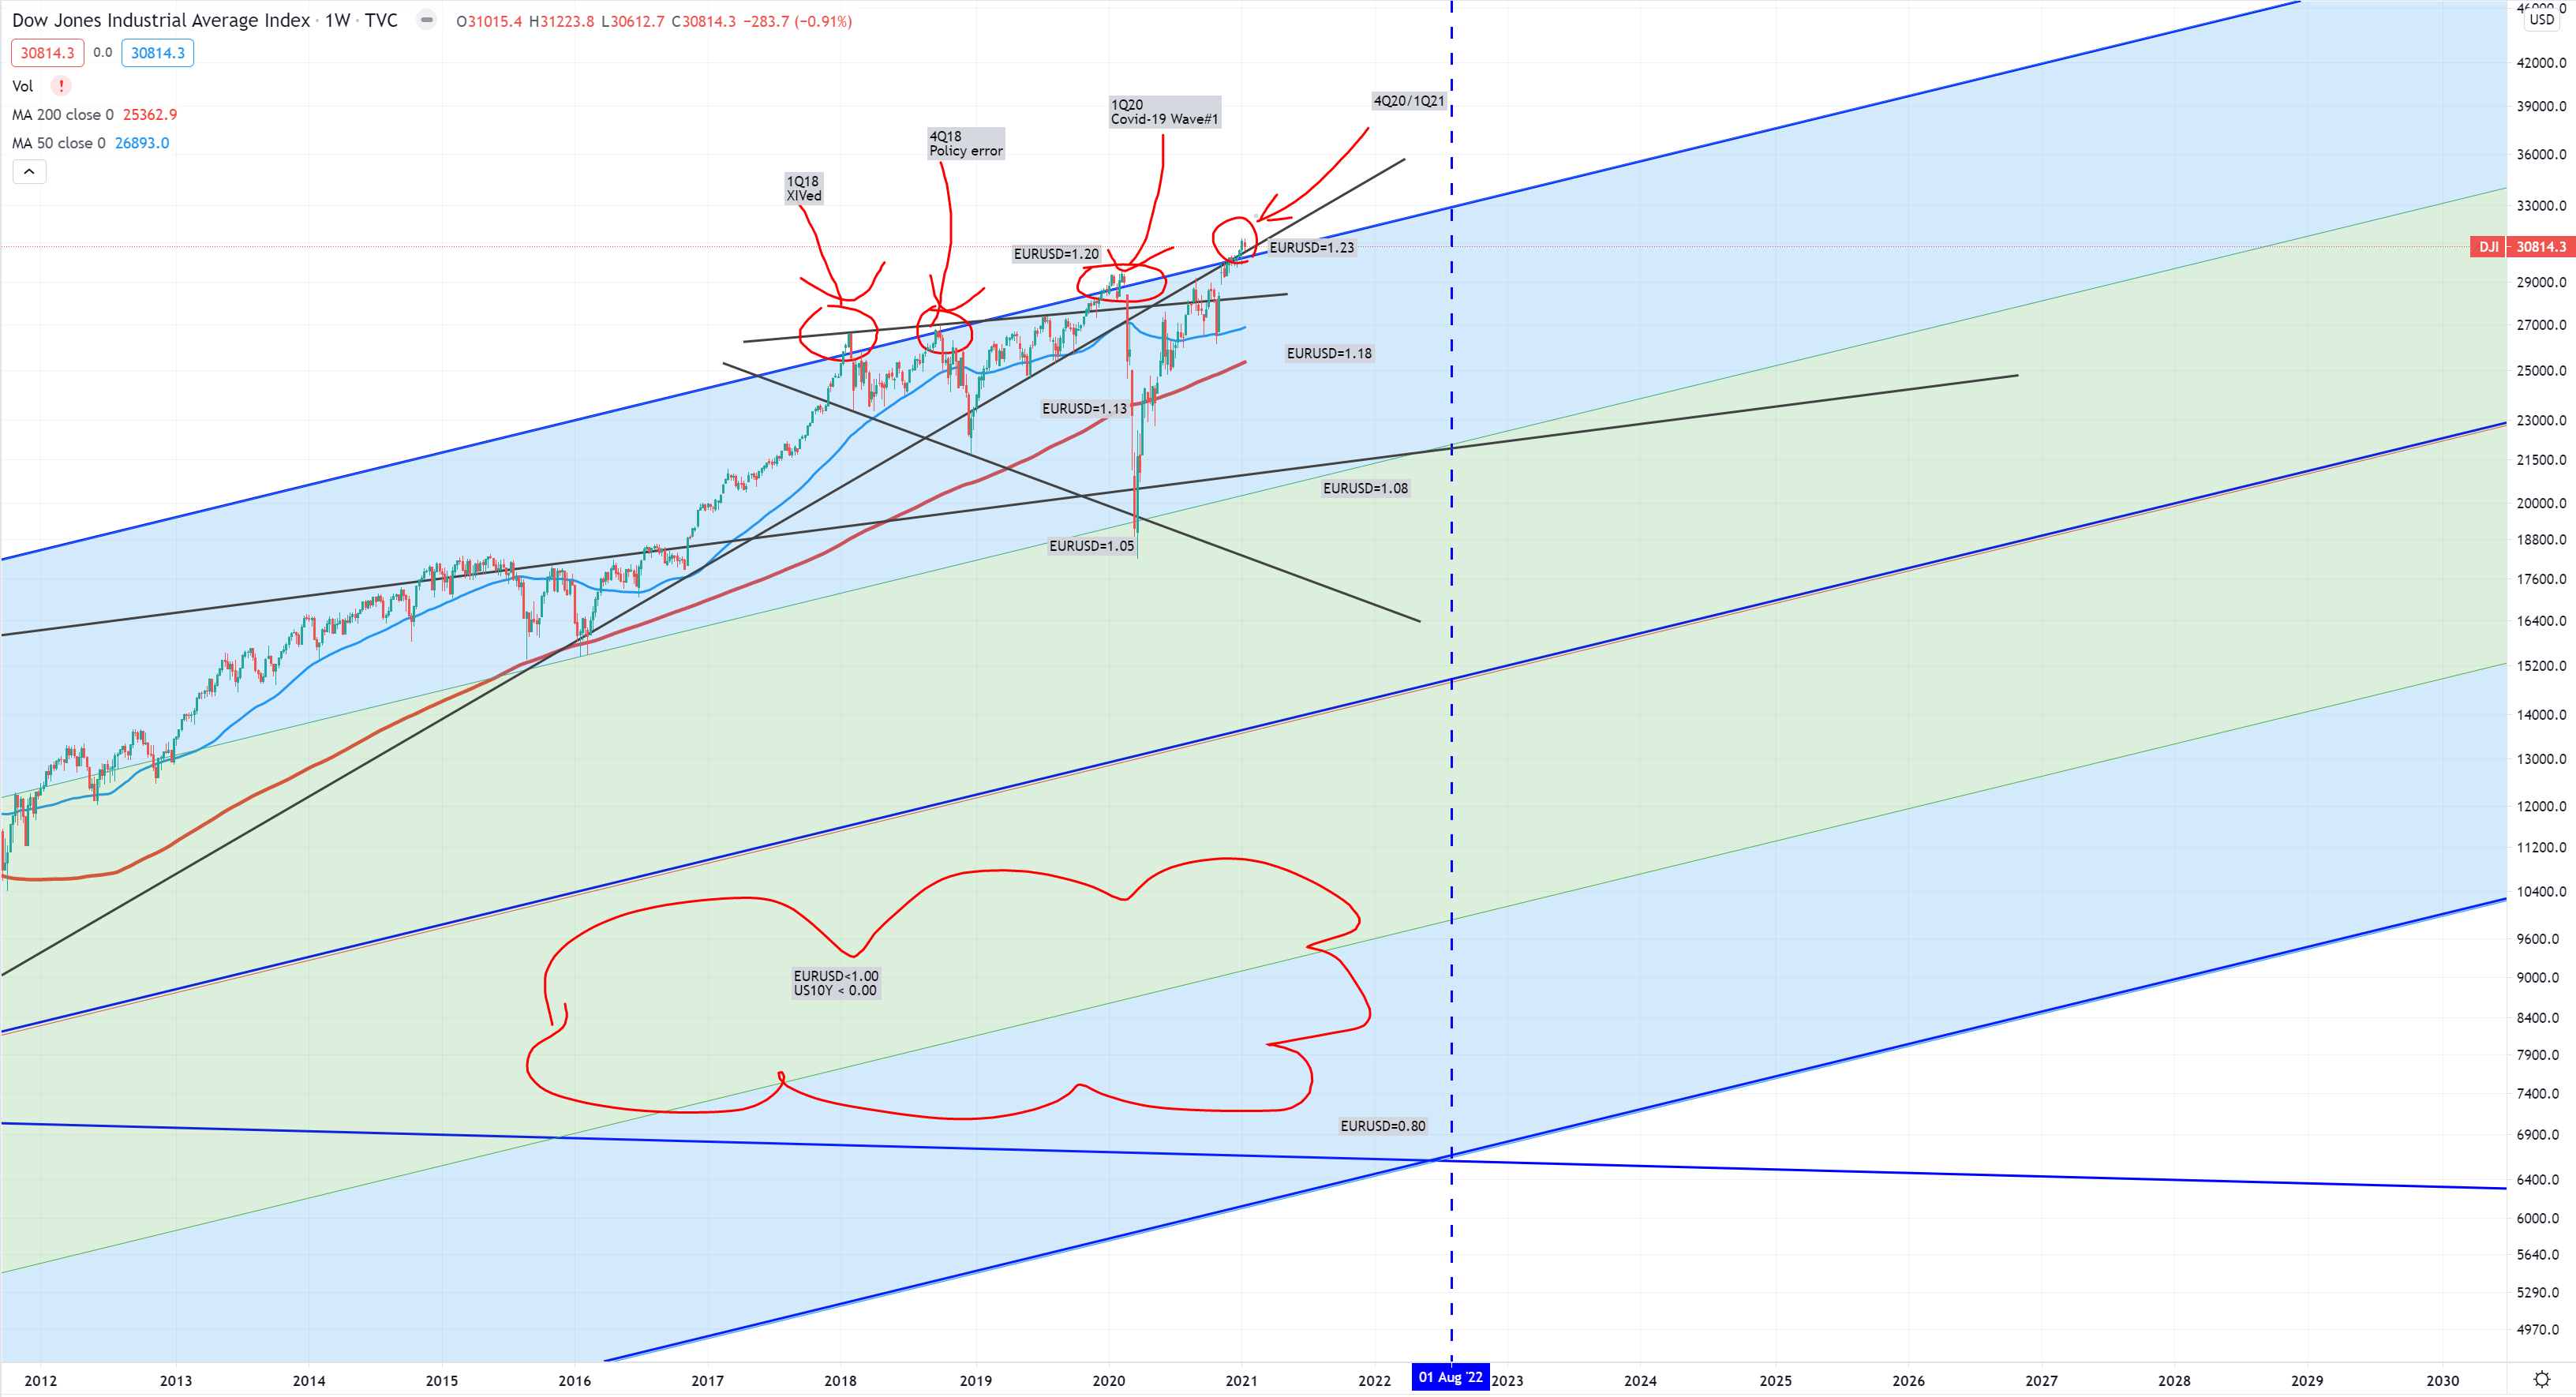
And long term Dow Jones Industrial with some EURUSD levels. Again 2Q20 happened when market was retracing around (W)MA200 – a very typical retrace on each bear market, but FED was scared and pumped the market again. That’s OK now governments will have to fight not only with COVID19, but evictions, wages, more initial claims (higher min wage) and trying to get food prices under control (ain’t happen without asset deflation) as asset inflation exceeding 2000, 1929 and in some cases 2000+1929 all together. Those numbers below are just pure guess, I’m guessing if EURUSD < 1.00 and US10Y < 0.00% market will tank below middle blue line that is below 14000 points. Again it’s just a pure guess. Around 31000 upper blue line trend line is (my 100Y channel). Bottom blue line channel was tested twice. Once in 1932 and once in 1982 and almost in 1942.
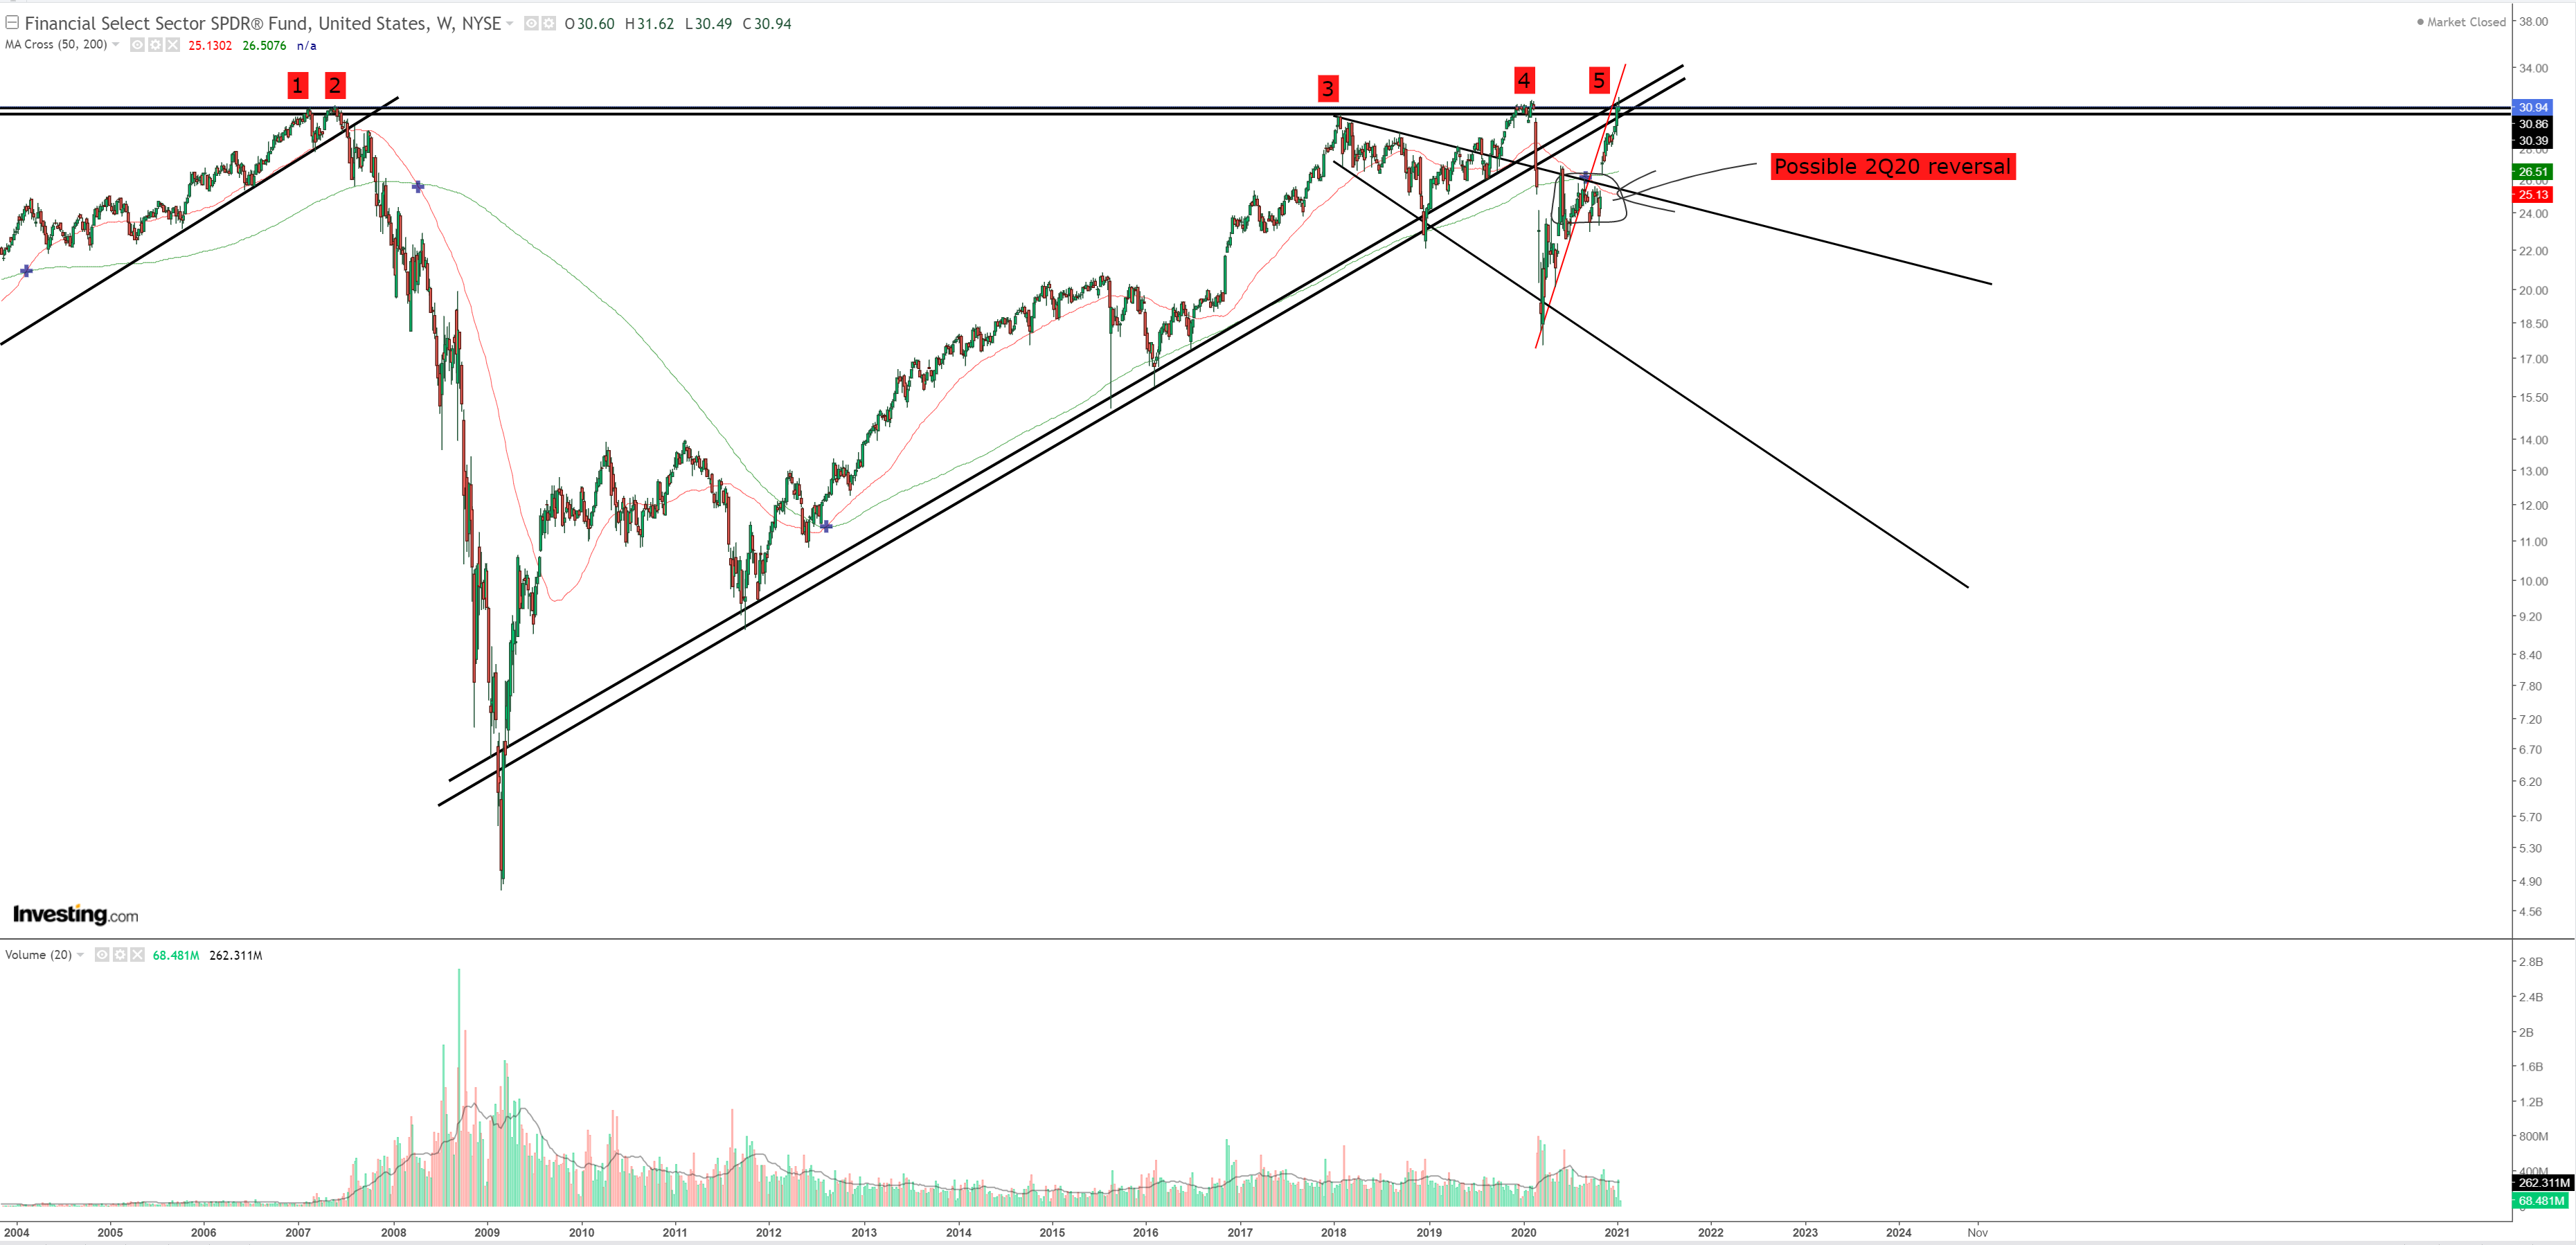
$XLF – so financials … I know words : single, double, triple, quadruple … but don’t know the word fifthaple, but that’s this example. Watch for 32$ level
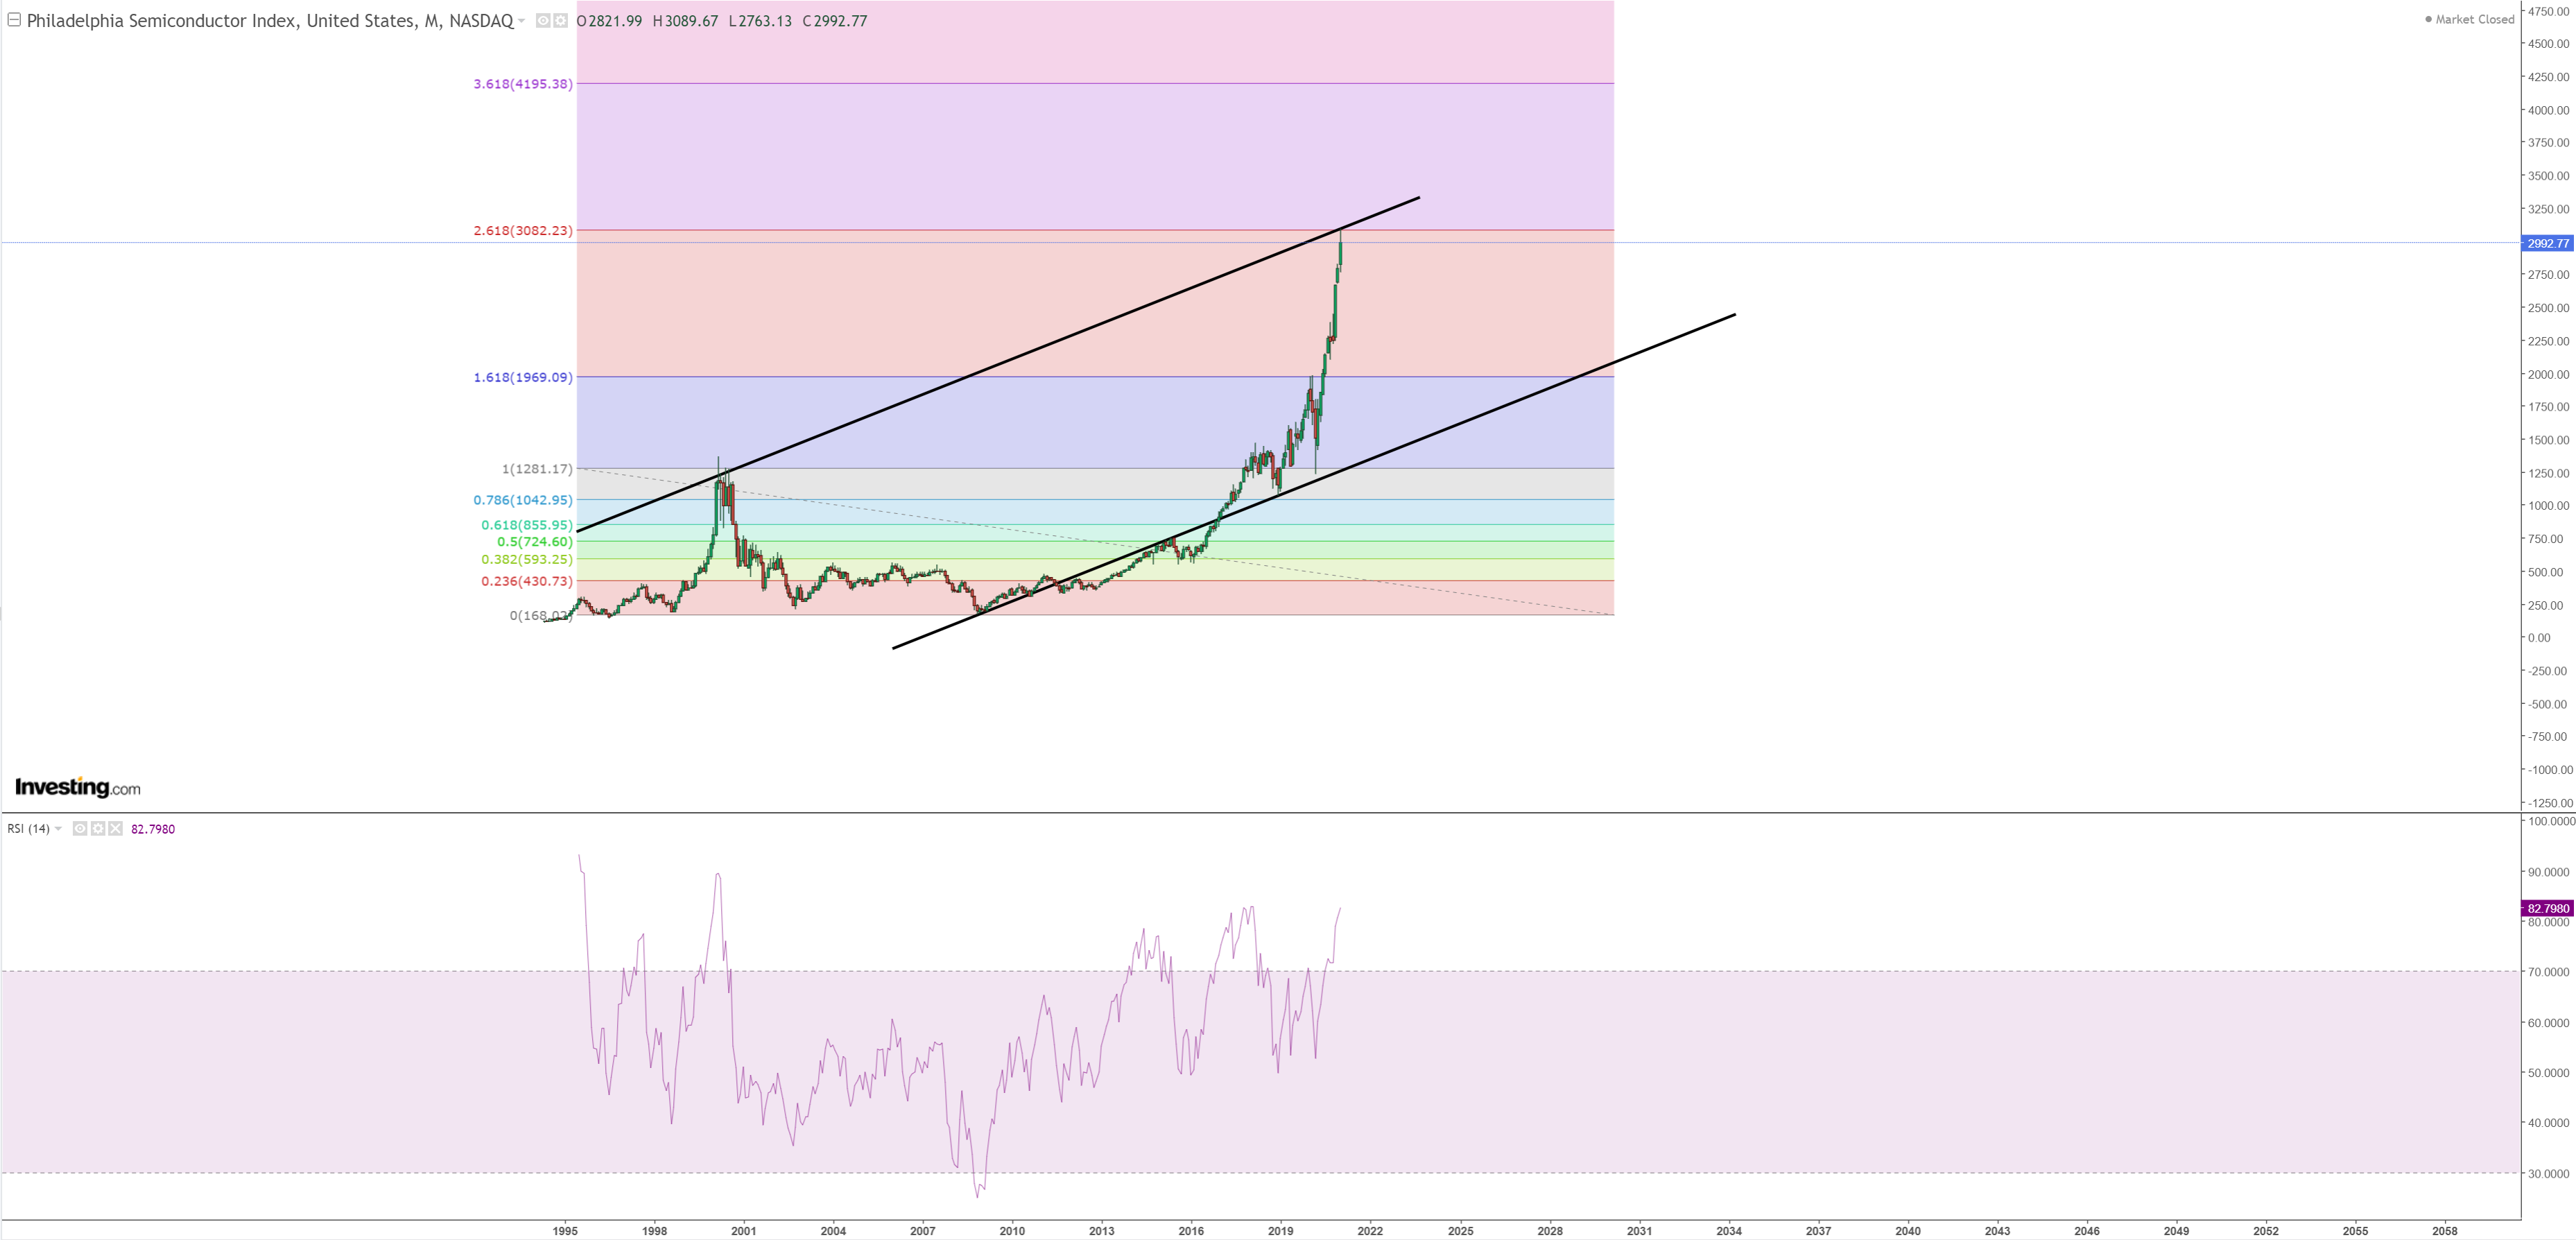
$SOX – semiconductors – the beast – had the biggest problem because all charts I was doing something always wasn’t right with this one. Until I saw another fibo levels. If you are long this beast to. Watch for 3080-3100 level.
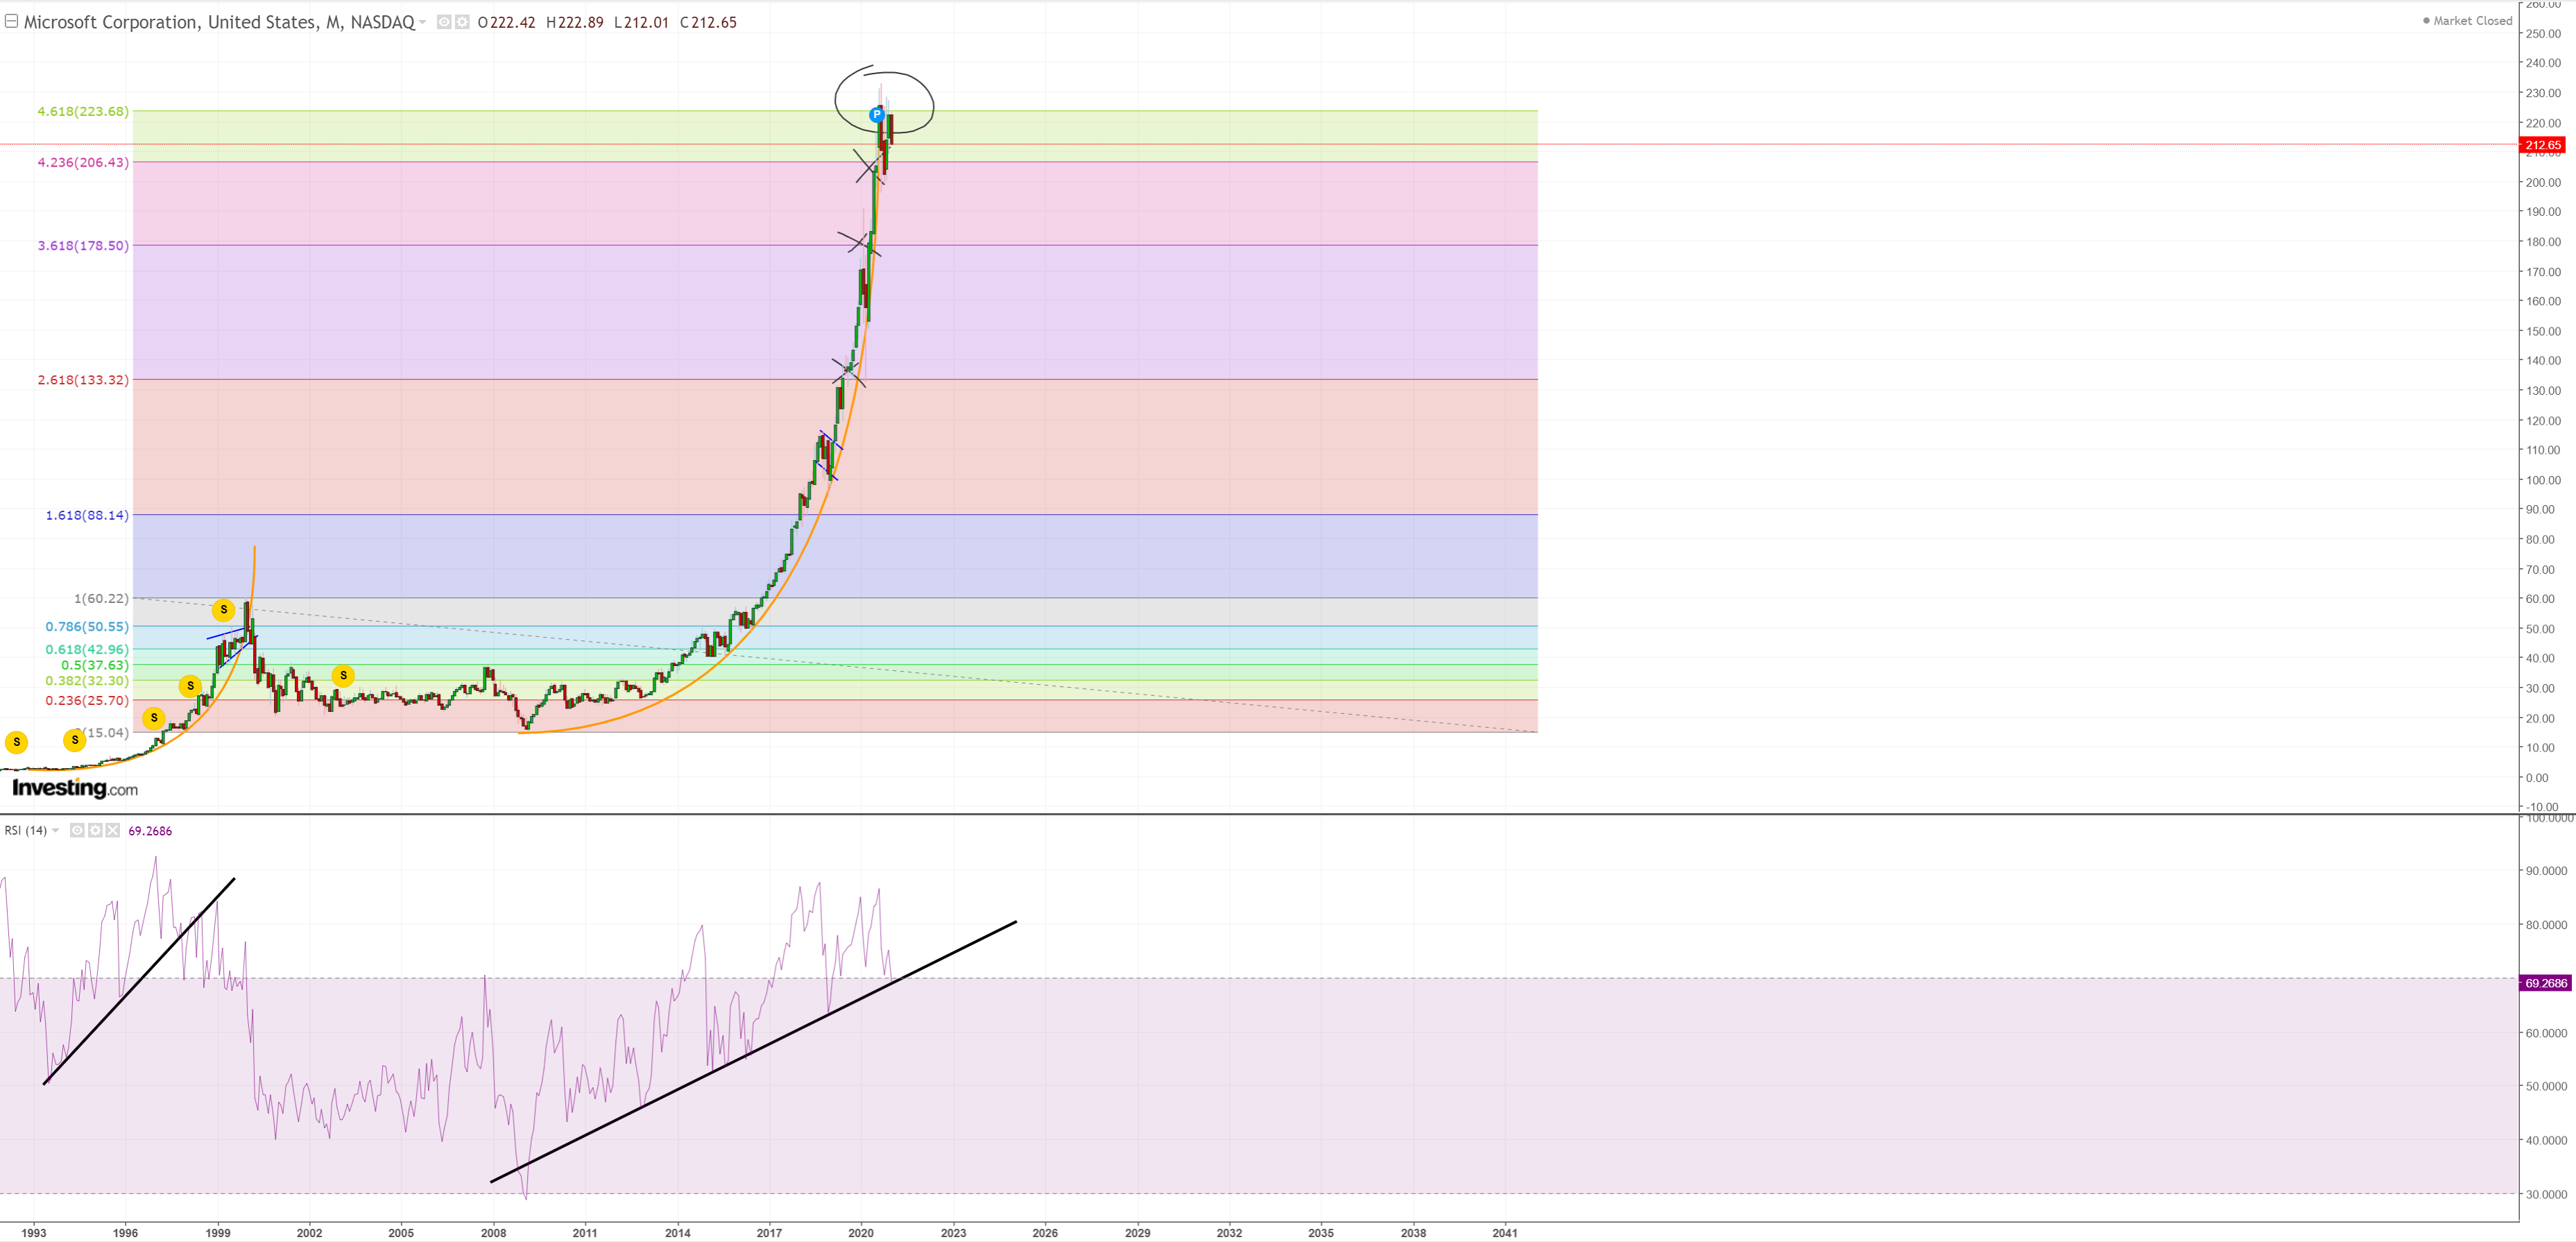
Can’t miss NDX – will be in a moment but first Microsoft $MSFT – I don’t have anything above ~225$ level – sky is the limit. The higher the parabolic approach the faster the melt up must be to sustain it. There’s no possibility we can change this bubble into simple linear move.
$NDX – very similar to $SPX and $DJI – breached FIBO, going towards trend line – I have zero comments about that – nothing I can say. Rounded Fibo around 12000, trendline touch around 13200. Totally unknown uncharted waters.
But $AAPL … – not chart needed – double top at 136$
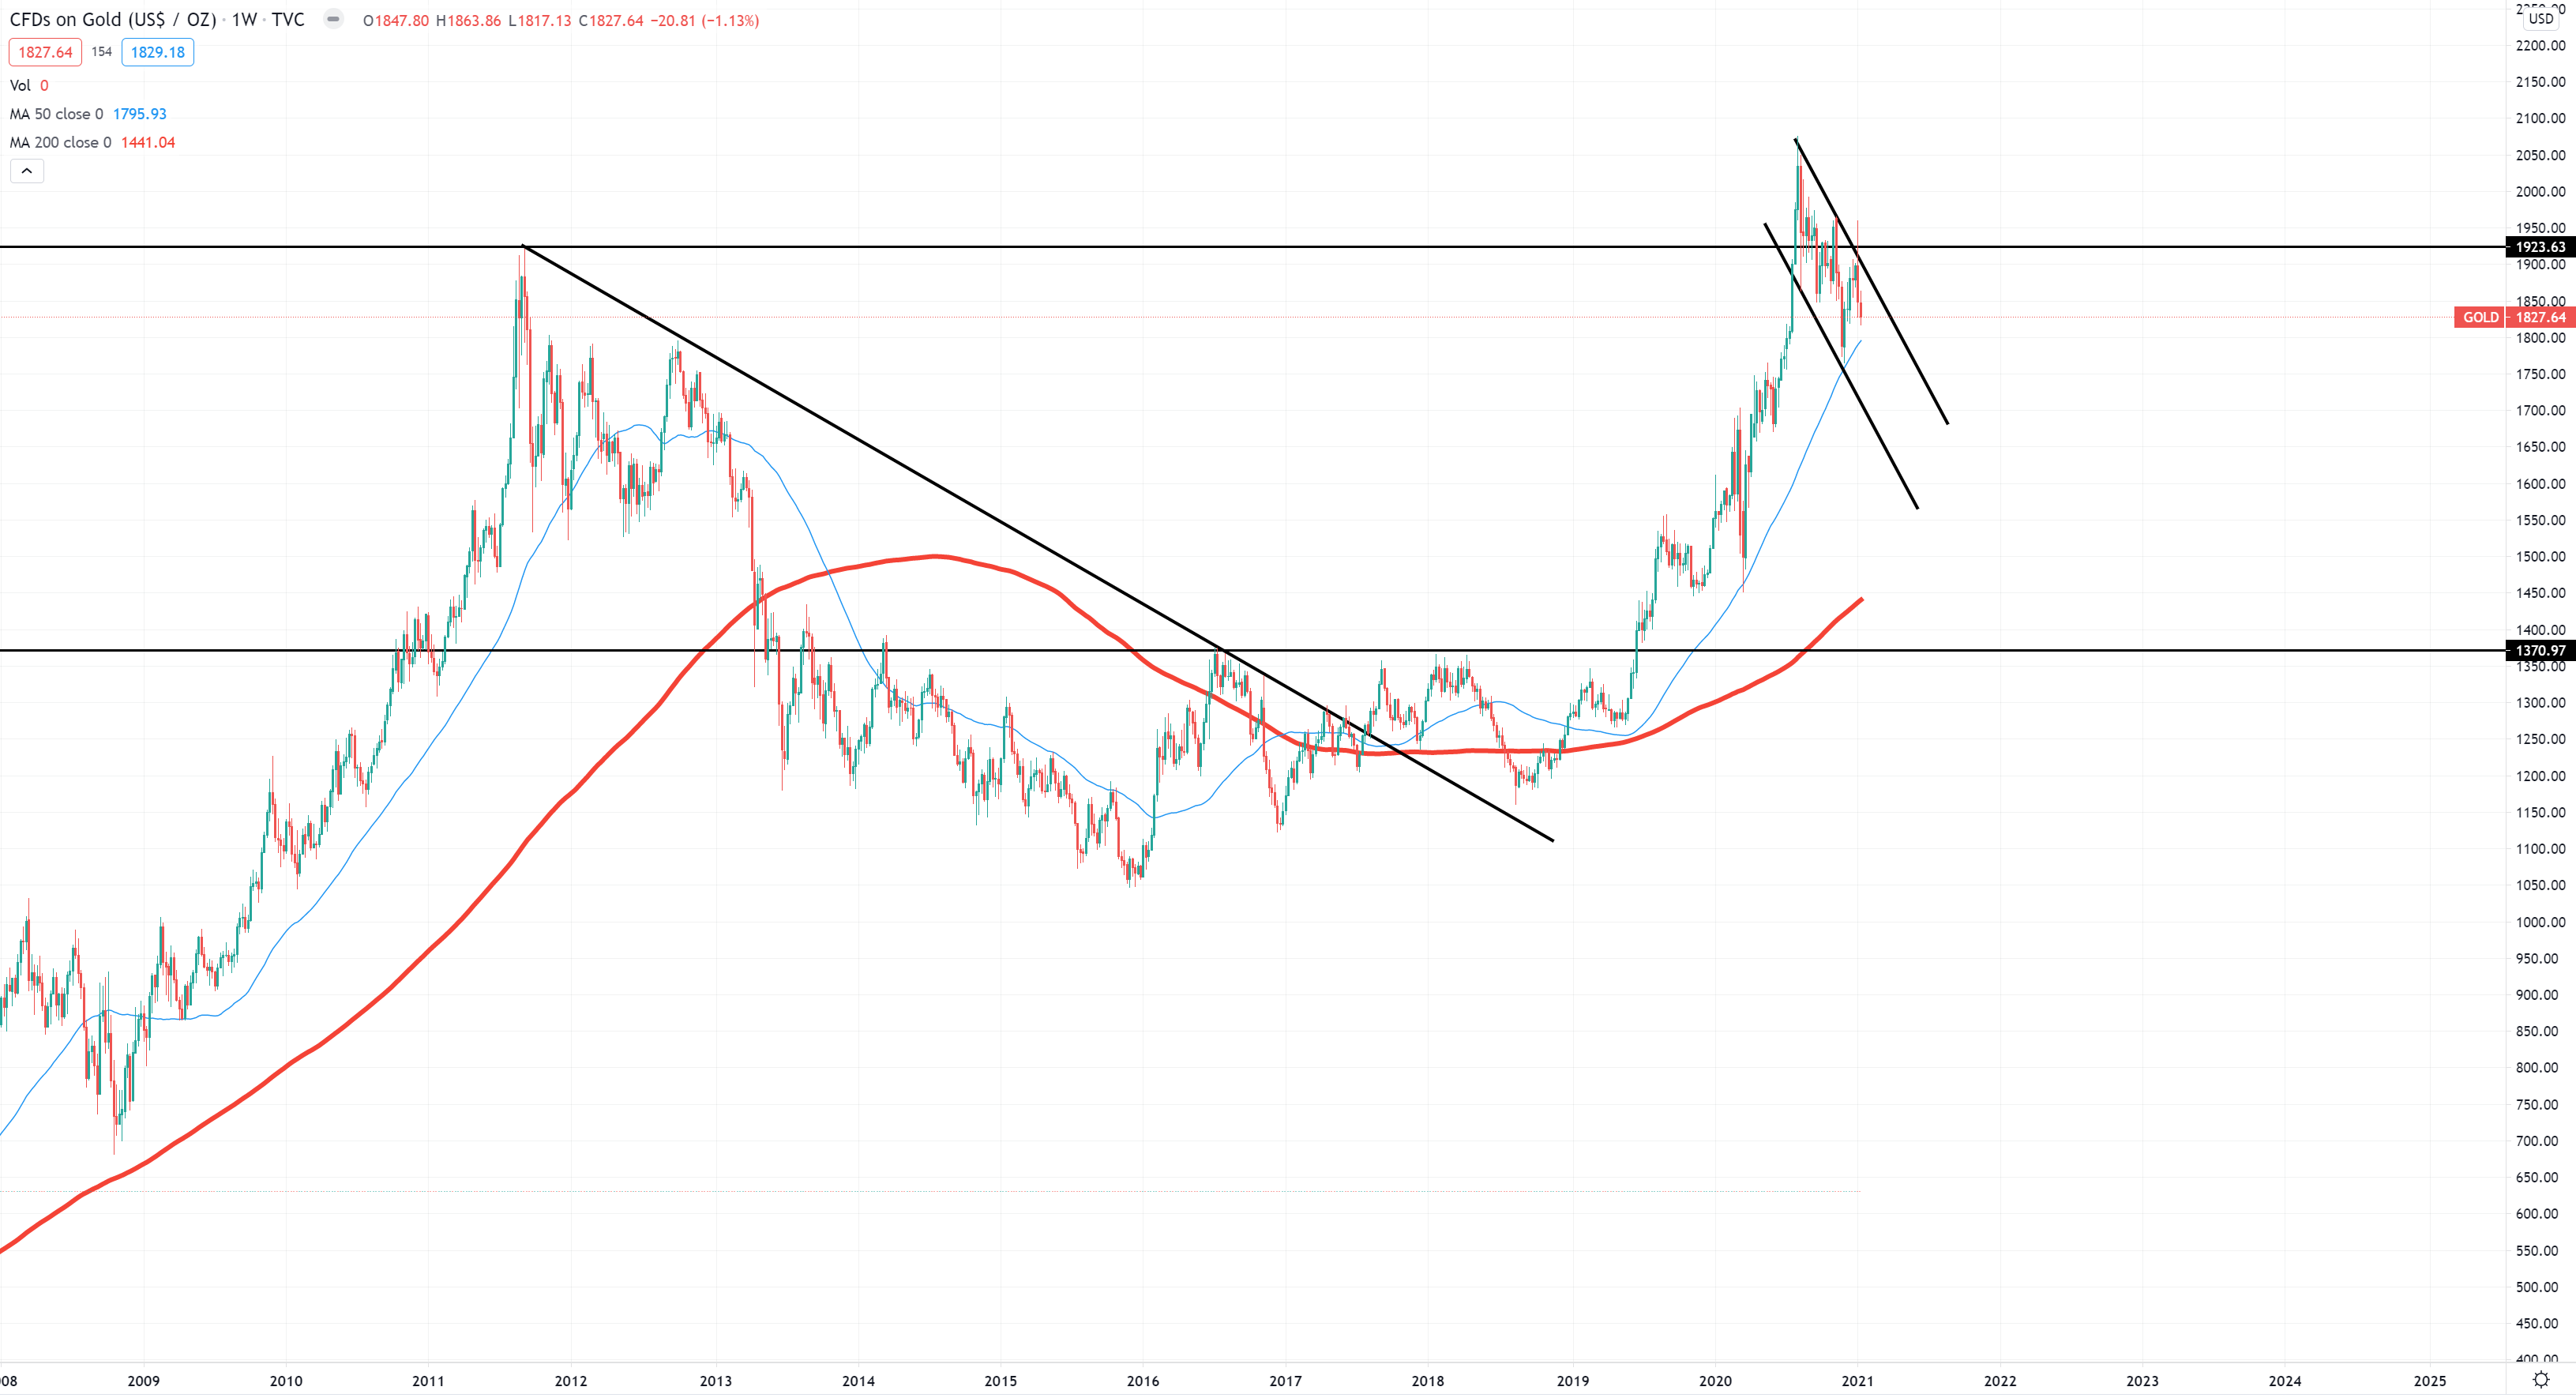
$GOLD – yeah I know – I am a gold bull too (longer term), but shorter/medium term $ bull. Double top at 1900$ with some 150$ (possible) fake break-out to 2050$ exacerbated by food inflation (yeah higher the gold more powerful food inflation). Telling 3000-5000$ on gold with $ collapse, probably means we would hunger the whole world and deflate it like never before. I can understand 3000-5000$ gold prices only after big deflation where there’ll be plenty of new opportunities and new economical branches opened to absorb people working to kill inflation with productivity.
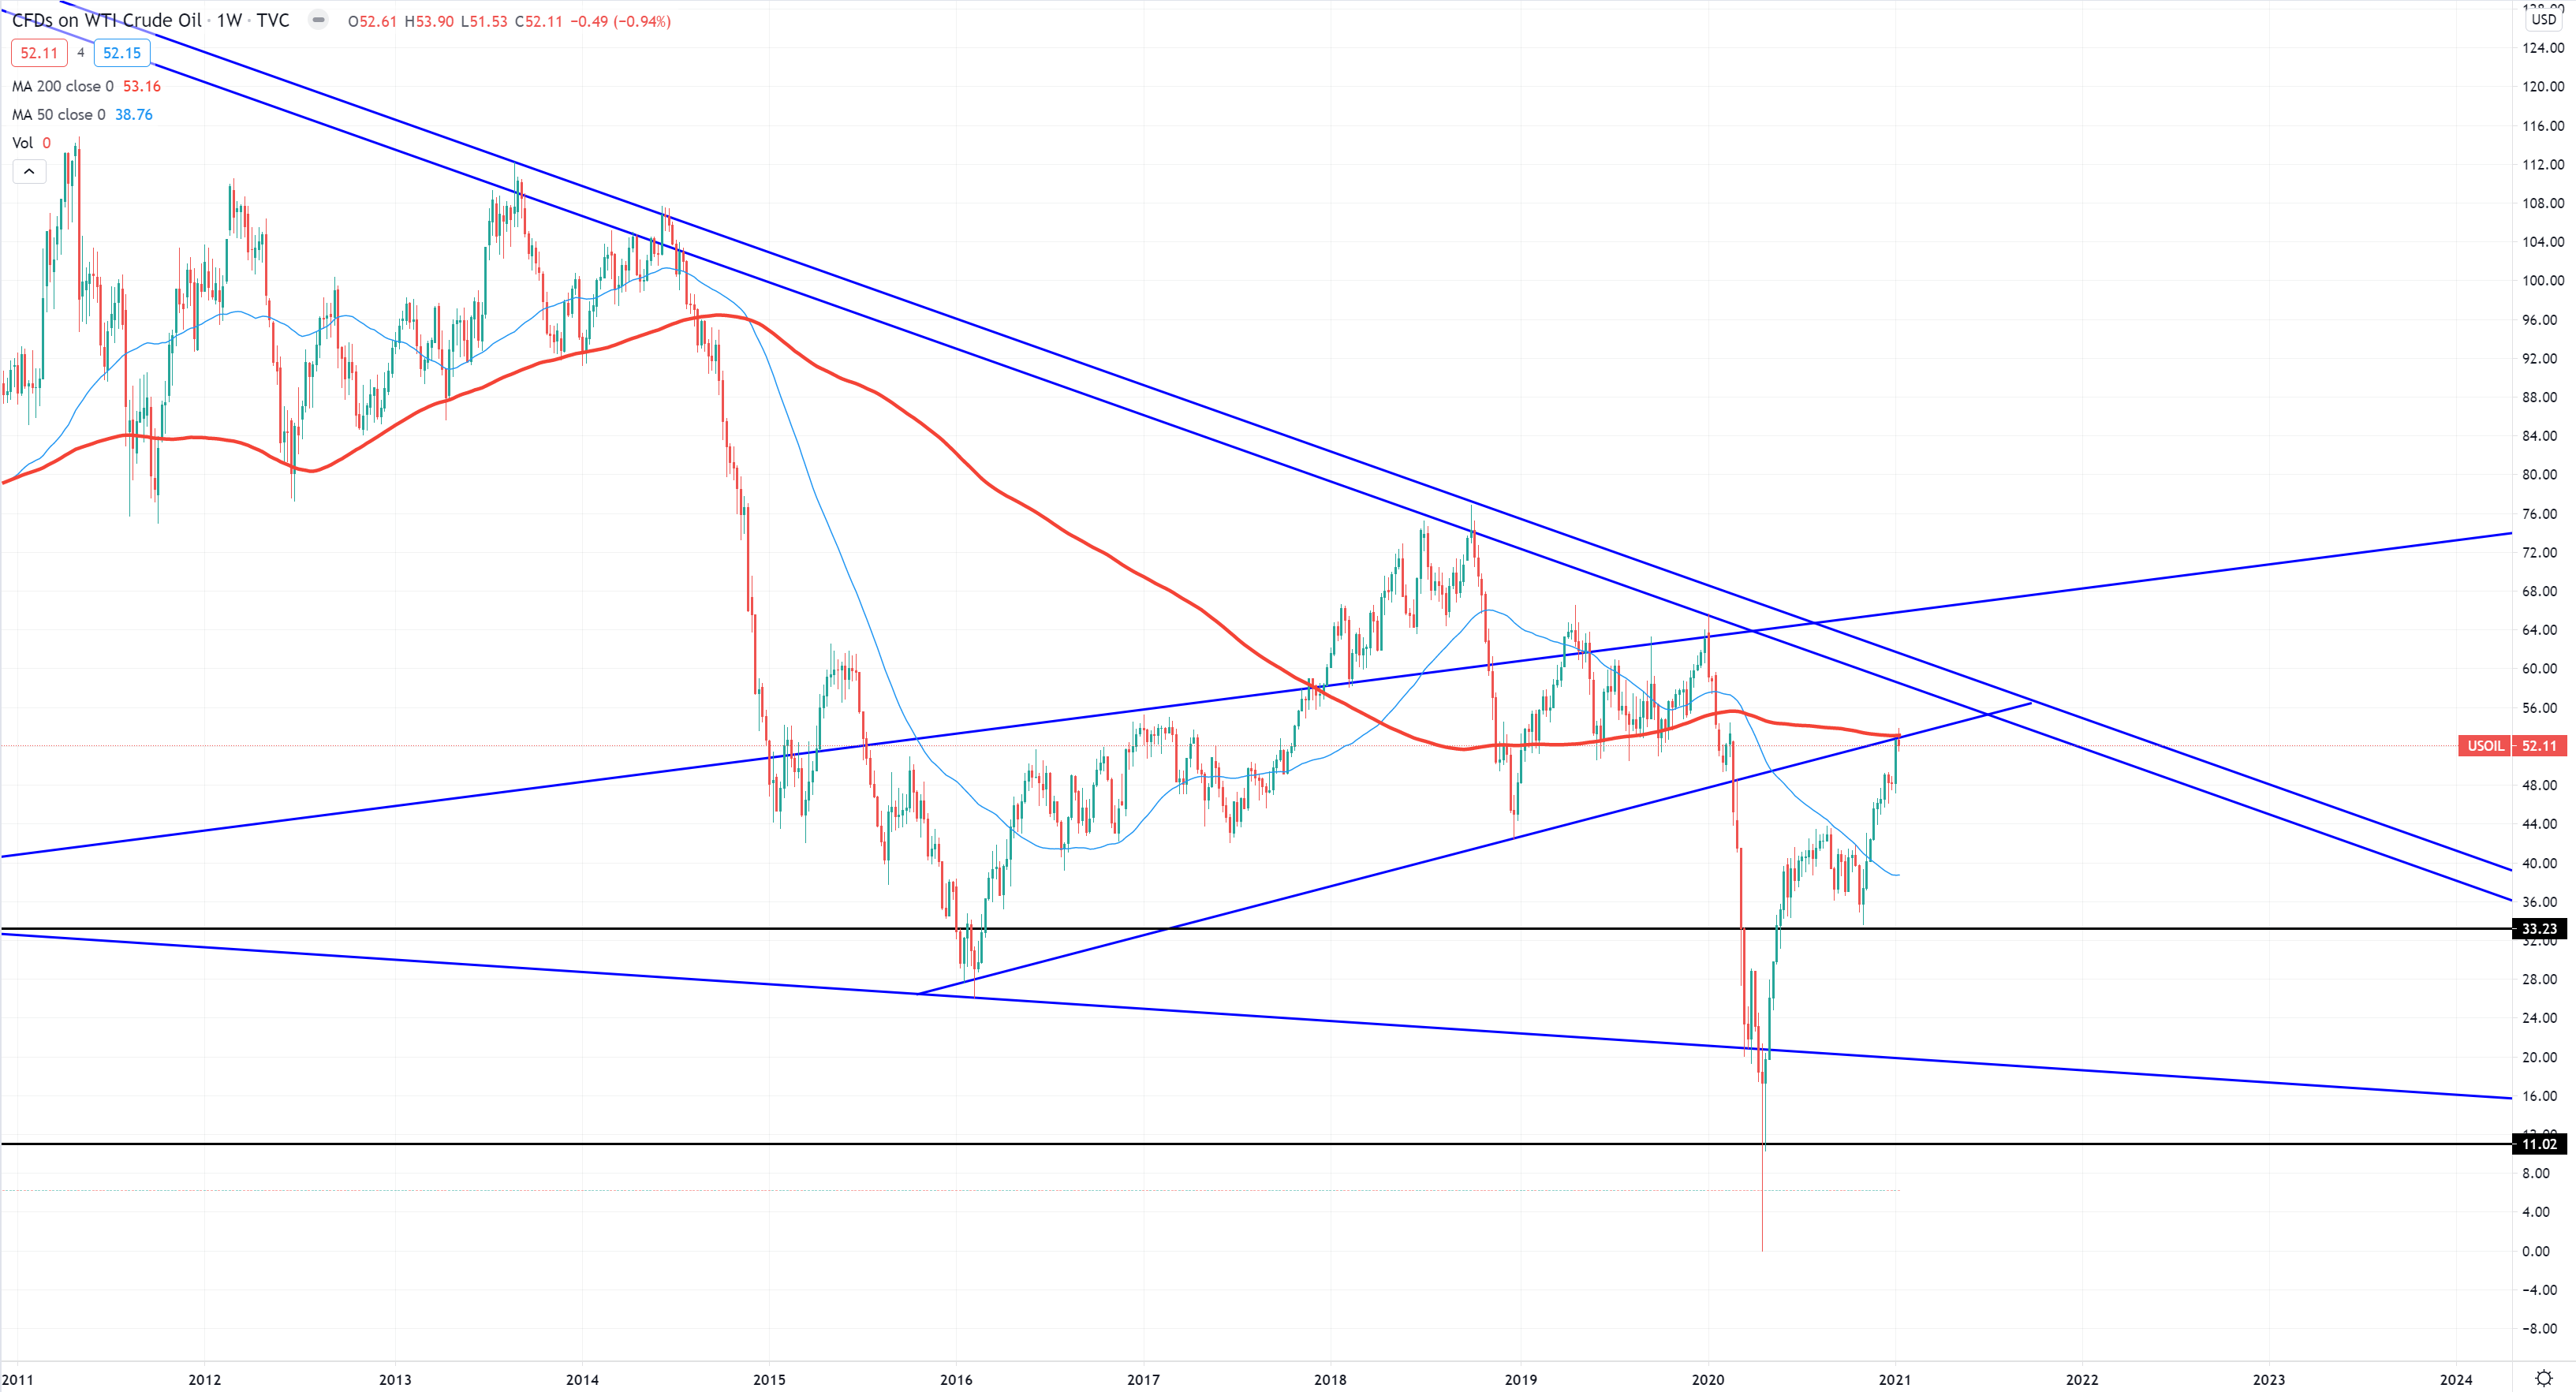
$WTI – crude oil market. This is almost 1:1 $AUDUSD chart which I’ll bypass. You see this 2Q20 bounce rescue. Easy
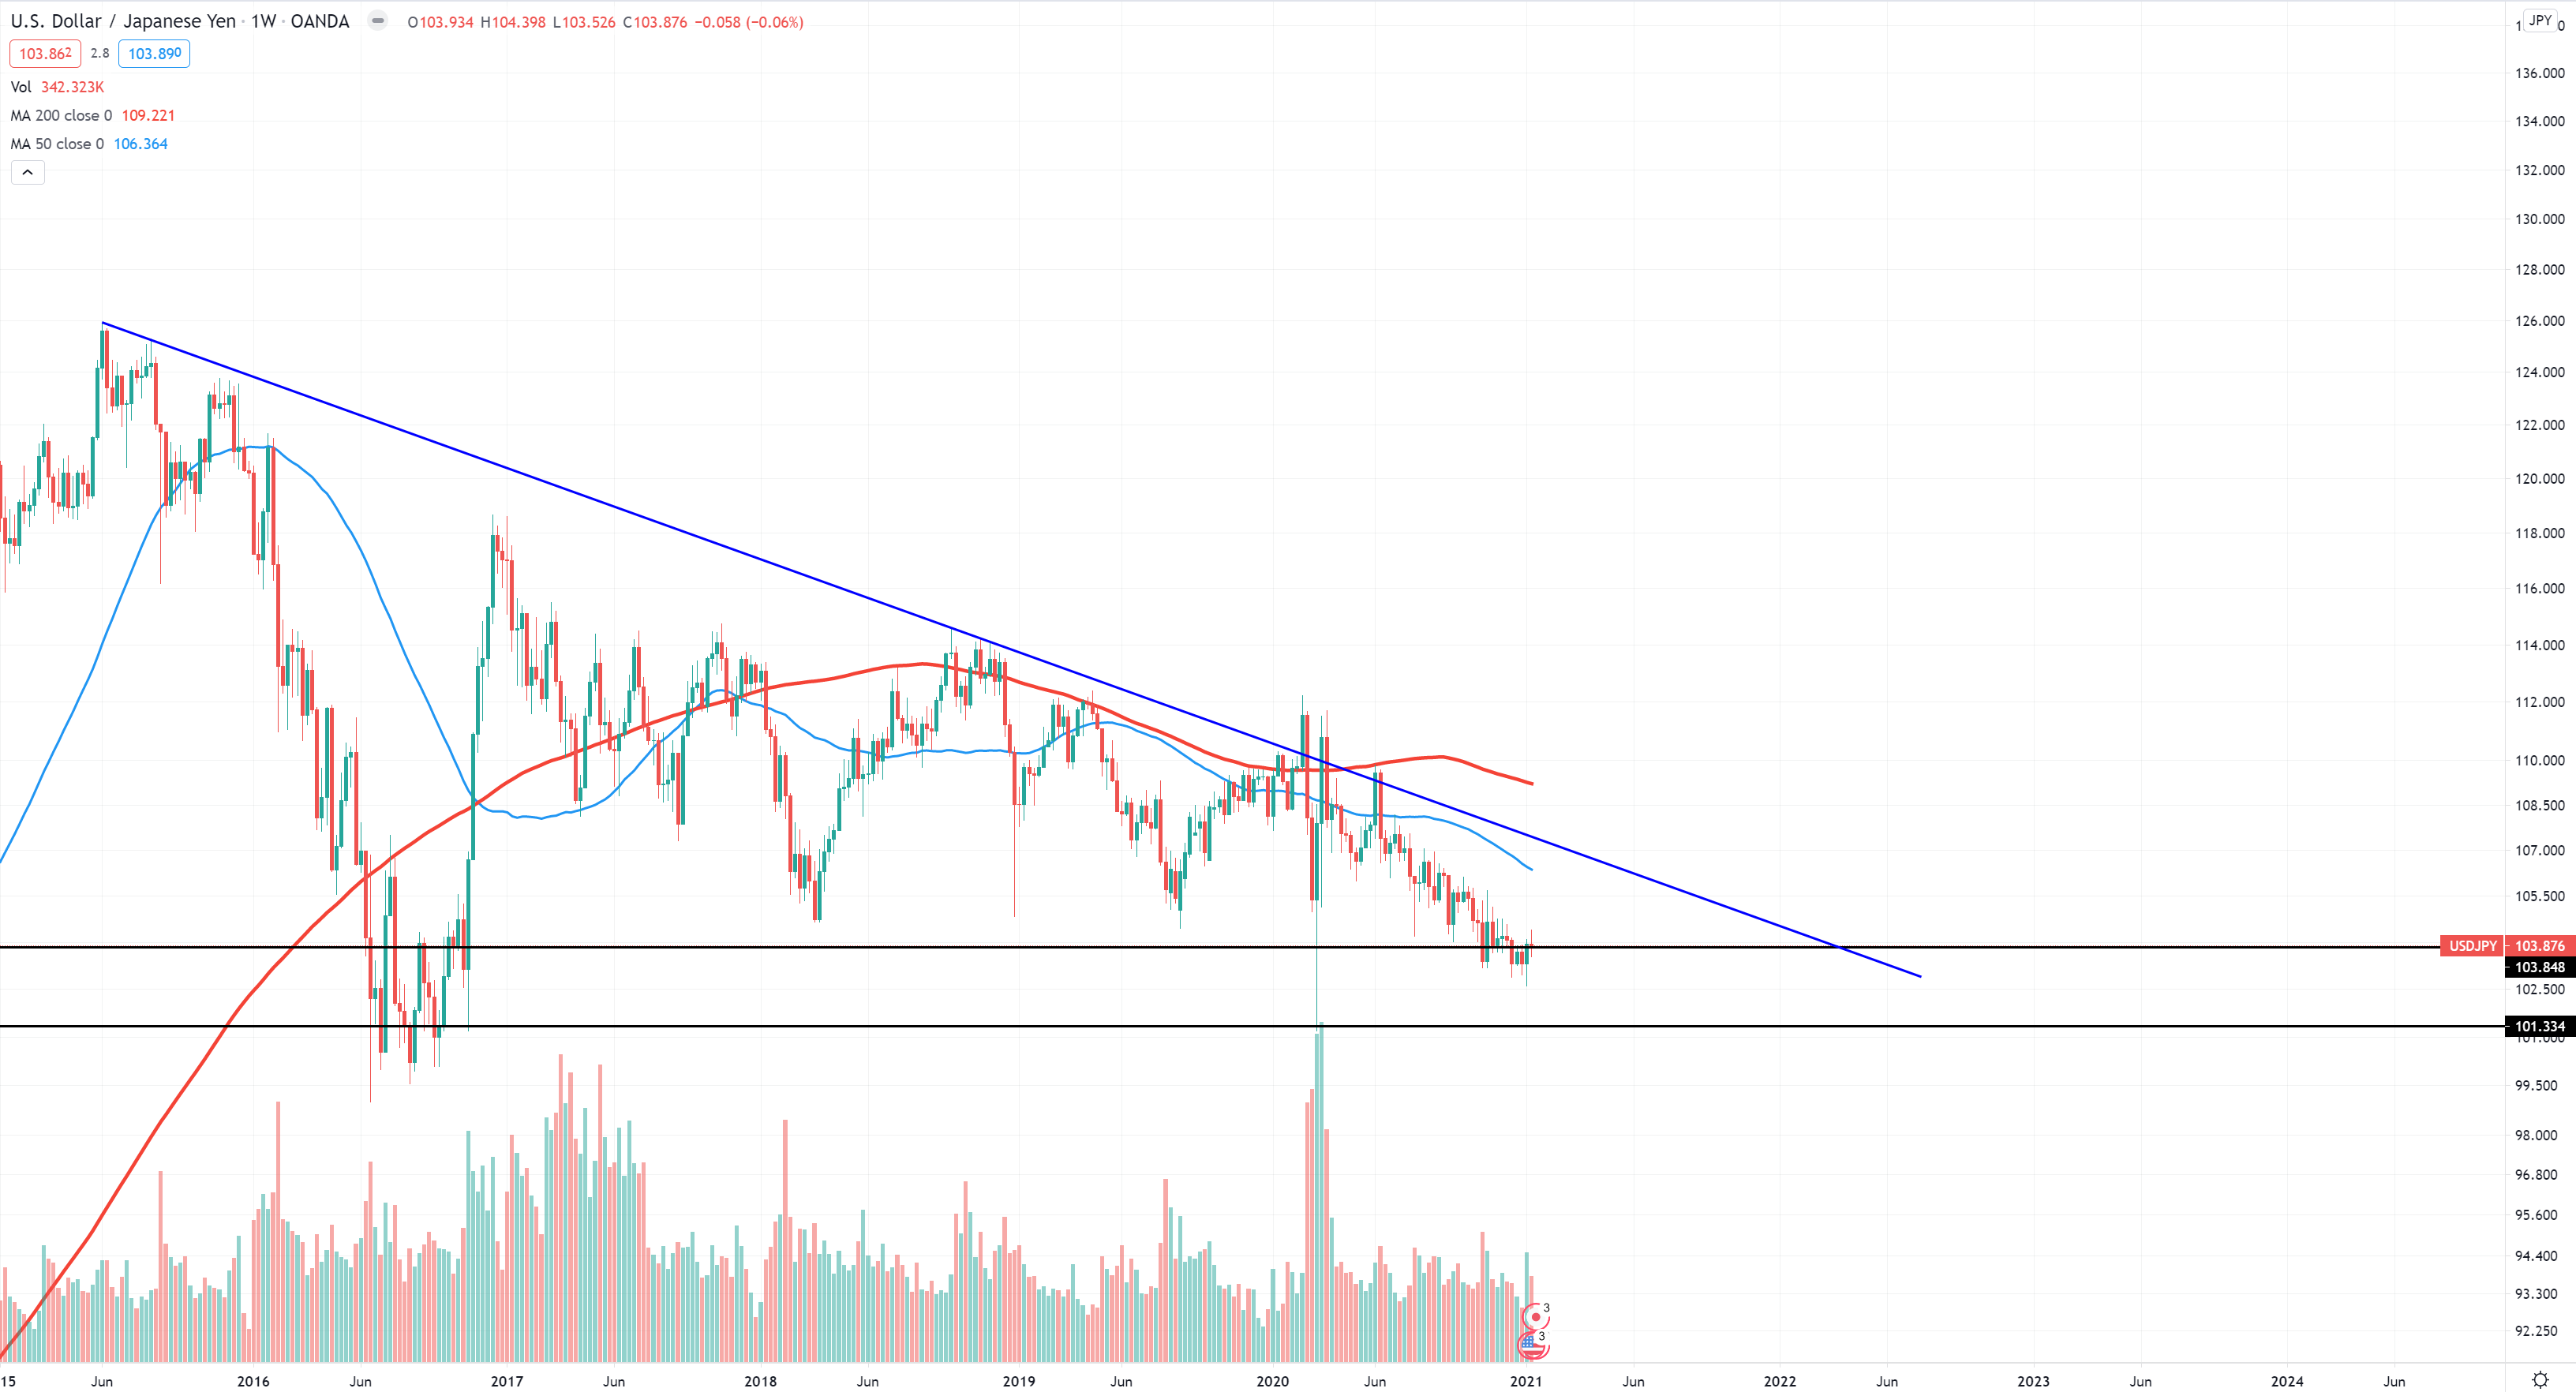
$USDJPY – double bottom. I’d like to stop here for a moment. If you take a look at 2016 (2016-2018 – reflation). USDJPY was going up, but the same time $EURUSD was also going up ($ was weakening). We don’t want to see $EURUSD going down and $USDJPY going up. In 2020 we had $EURUSD going up and $USDJPY down ($ was weakening).
Worst nightmare is $EURUSD down and $USDJPY breaking this value and $EURUSD will be dropping fast … (probably not much will be left with Japanese “fiscal” economical success story this time if that thing happen).
OK, so these are the charts. As I’ve been saying I’m keeping my liquidity portfolio all the time, but as another moment has initiated some triggers I went short with of course some stops. I am still a :
- Gold bull longer term (keeping 1300-1350$ real metal)
- $$$ bull mid term DXY=90
- A big agriculture bull from 1Q20, I think it’s a new secular bull market $RJA example :
- Still bond bull – economy without significant deleverage even with fiscal stimulus will be tanking on velocity of money – Japan example – just awaiting for $TLT to recapture 156$ value
- I am totally neutral to stocks with bearish attitude from 1Q21 – to be verified – TBD
- I am awaiting for the yield-curve 10Y-3M to go above 320-350bps to release the liquidity portfolio
- I am in general crypto bull – but neutral – as want to check how it’ll behave with stronger $ but BTFD Friday night, STFR Sunday before market open.
So in general to keep market running up we require negative real yields – but as we are all aware, keeping negative real yields (inflation swaps above nominal yields) will make food prices jumping to “infinity” when gold prices will be raising. $ can’t go down all the time as we live in $ world. In uptrend weakening $ helps boosting Emerging Market currencies with raising export, in downtrend weakening $ only brings deadly inflation which kills any lift up in economical bounces, but for market it is still reflationary inflation forever and ever.
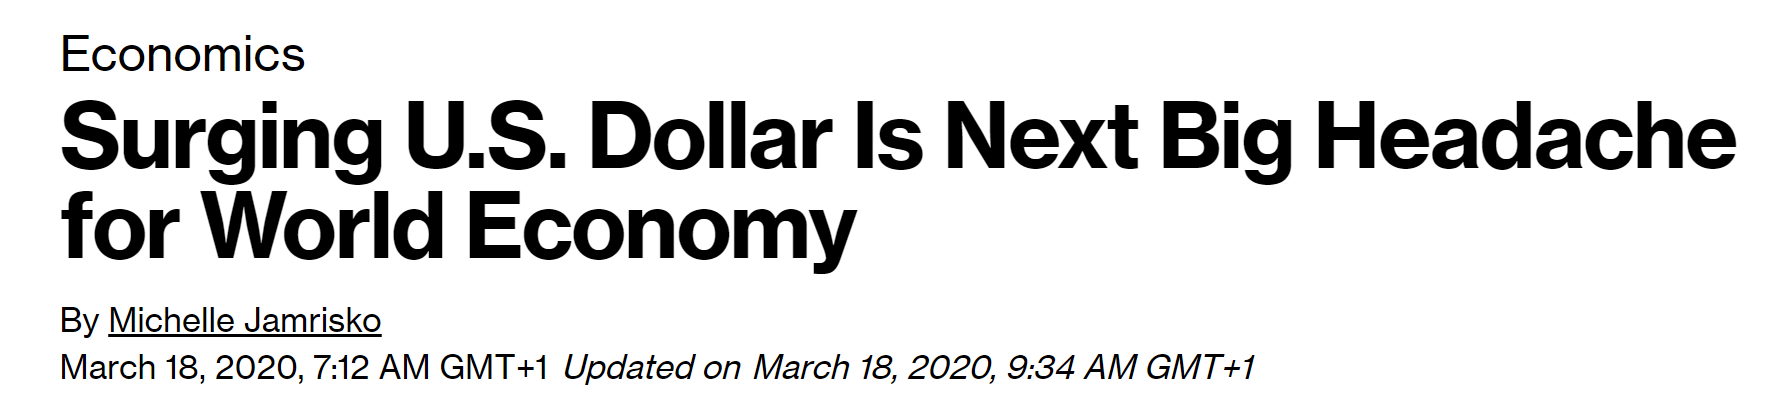
Everybody keeps calling for weaker $, while the same time in 1Q20, strong $ was our biggest trouble
1 year later weak $ is our biggest trouble (because export is still weak, basic cost of living inflation is really high, wages don’t grow and export still can’t stand up despite weak $, velocity of money crashed below Great Depression levels = wealth inequality has exploded same as savings in the banks of 1% society who has no idea what to do with them)

So I’ve been saying … as long as 10Y-3M > 320bps, initial claims won’t drop below “safe” levels 750k-1M people. Don’t even get excited by official unemployment numbers. One round of stimulus checks and unemployment will drop below 4% but initial claims can easily go above 2Ms . Still we have more initial claims than during Great Recession. Once $ starts its move up, you don’t want to see initial claims raising – that’ll mean stagflation has been transferring to DEFLATION, not positive disinflation in economical uptrend.