Did we overextend the economical bounce? Technicalities of March 2020 bottom and what does it mean?
August 27, 2021
Before we’ll start to get some analysis we definitely need to setup some key points which I’m sticking for years to understand later charts and discussions :
- China leads everything at least from 2009+
- US has an economical lag of around 2Qs to China
- US economy boom is in 100% dependent on Chinese ability to inject credit and “strengthening” the Yuan
- US Bond market and yields are global bond market. So even if US is booming declining yields might signal global economy is in problem, but as point #2 says there is a lag
- Technical charts create events on key junctions, trend lines etc
First of all I don’t want to say the same things I told in my previous topics, but one thing is sure. You can’t have permanent “reflation” in a world steered by people who abuse the monetary madness. As I’ve been saying in economical uptrend we’re interlaced of “reflationary” periods and “disinflationary periods”. In economical downtrends we’re interlaced of “stagflationary” periods and “deflationary” periods. Reflation and stagflation behaves somehow the same – it’s just an inflation. In reflation it’s being caused by rapidly raising wages so break-evens are going the same with nominal yields and nominal yields are even higher then break-evens so real rates keep raising. In stagflationary environment break-evens are always way higher than nominal yields so real rates keep tanking until there is a switch to the next wave of “disinflation” or “deflation” depends if we’re in the uptrend or downtrend. So basics and let’s take a look. First we need to take a look at US bond market. We’re going to look at $TLT – basic ETF and US 10Y yields and of course US Yield-Curve :
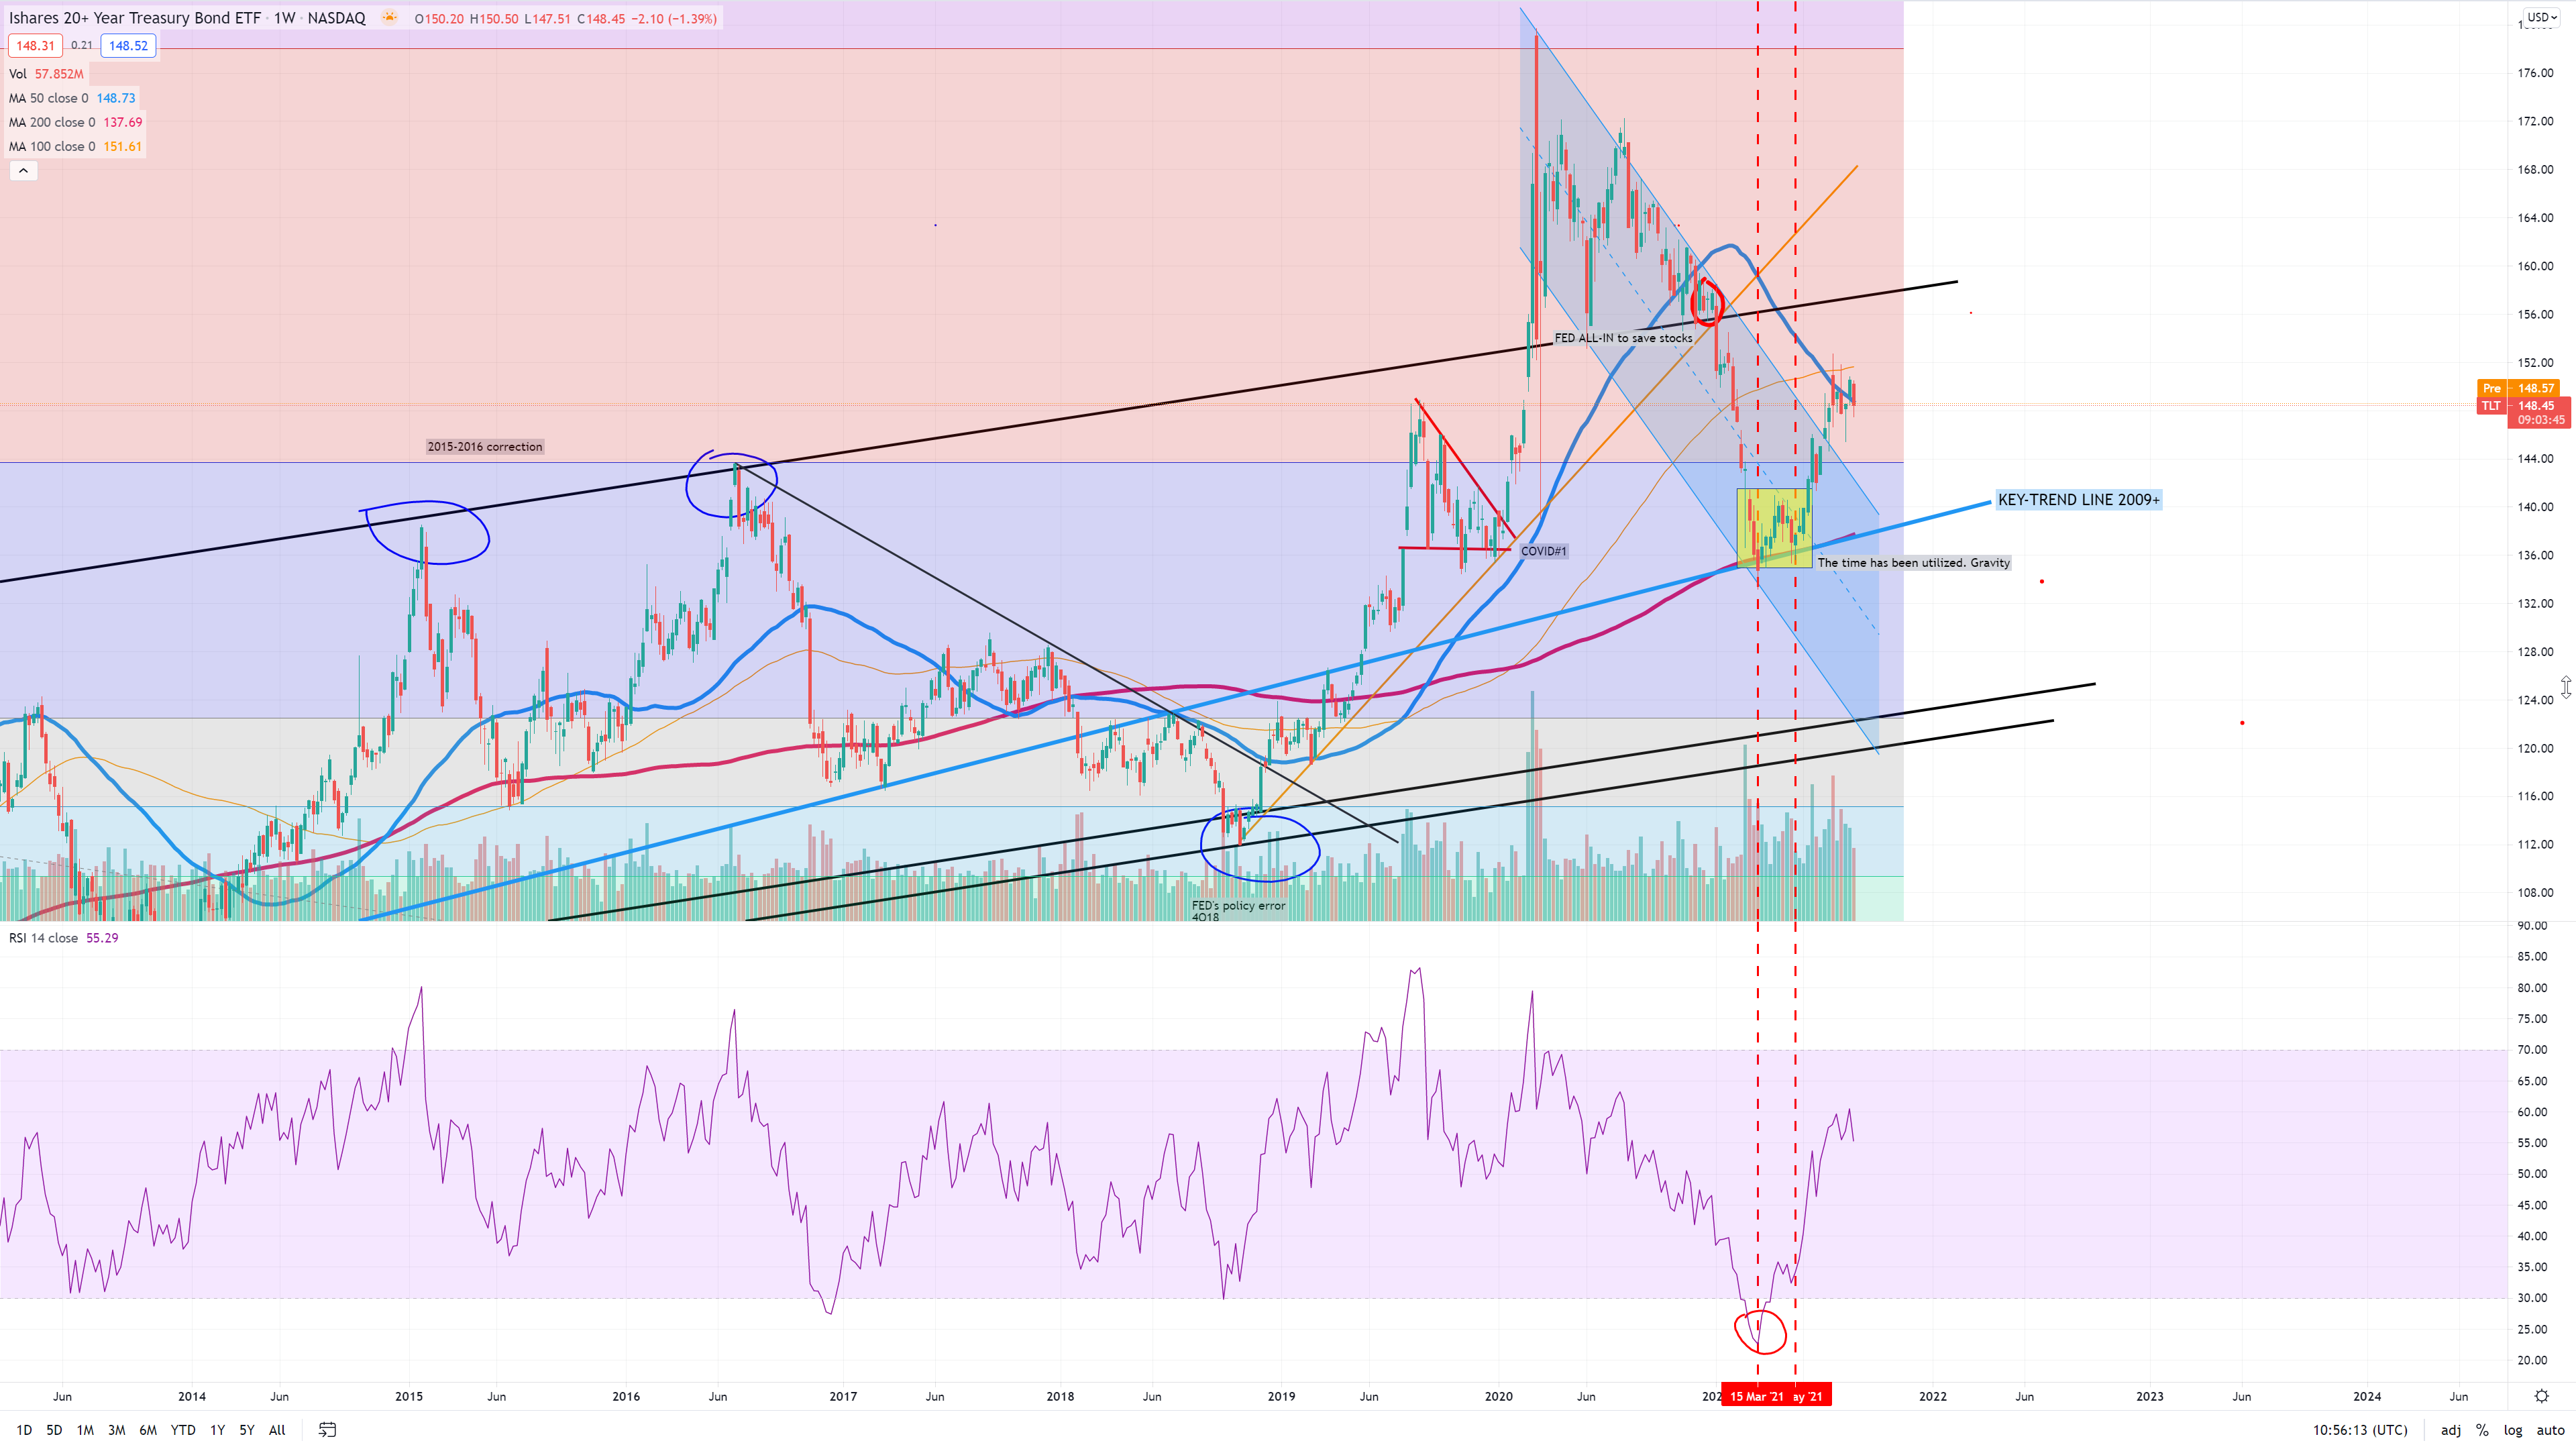
$TLT + US10Y Yields :
Technically $TLT was about to move way way to the upside around Jan2021 (red circle), where a tag is “FED All-IN to save the stocks”. It’s really important to remember the dates here. We won’t be discussing events, PMIs, TGA, QE, RRP > 1T$ because it doesn’t really make any sense here is we stick to a sentence : “Technicalities build events”.
So $TLT got big support over the (W)MA200 and “KEY TREND LINE 2009+” (if you can’t see the chart open it using right mouse button and open in new window)
To complete the bond market let’s take a look at just US Yields. $TLT is 20Y bonds so longer maturity – that’s not exactly the same as US10Y so I expect $TLT is a bit later in the phase what we can see below. It went back below 2 blue horizontal lines (2016 bottom) so far :
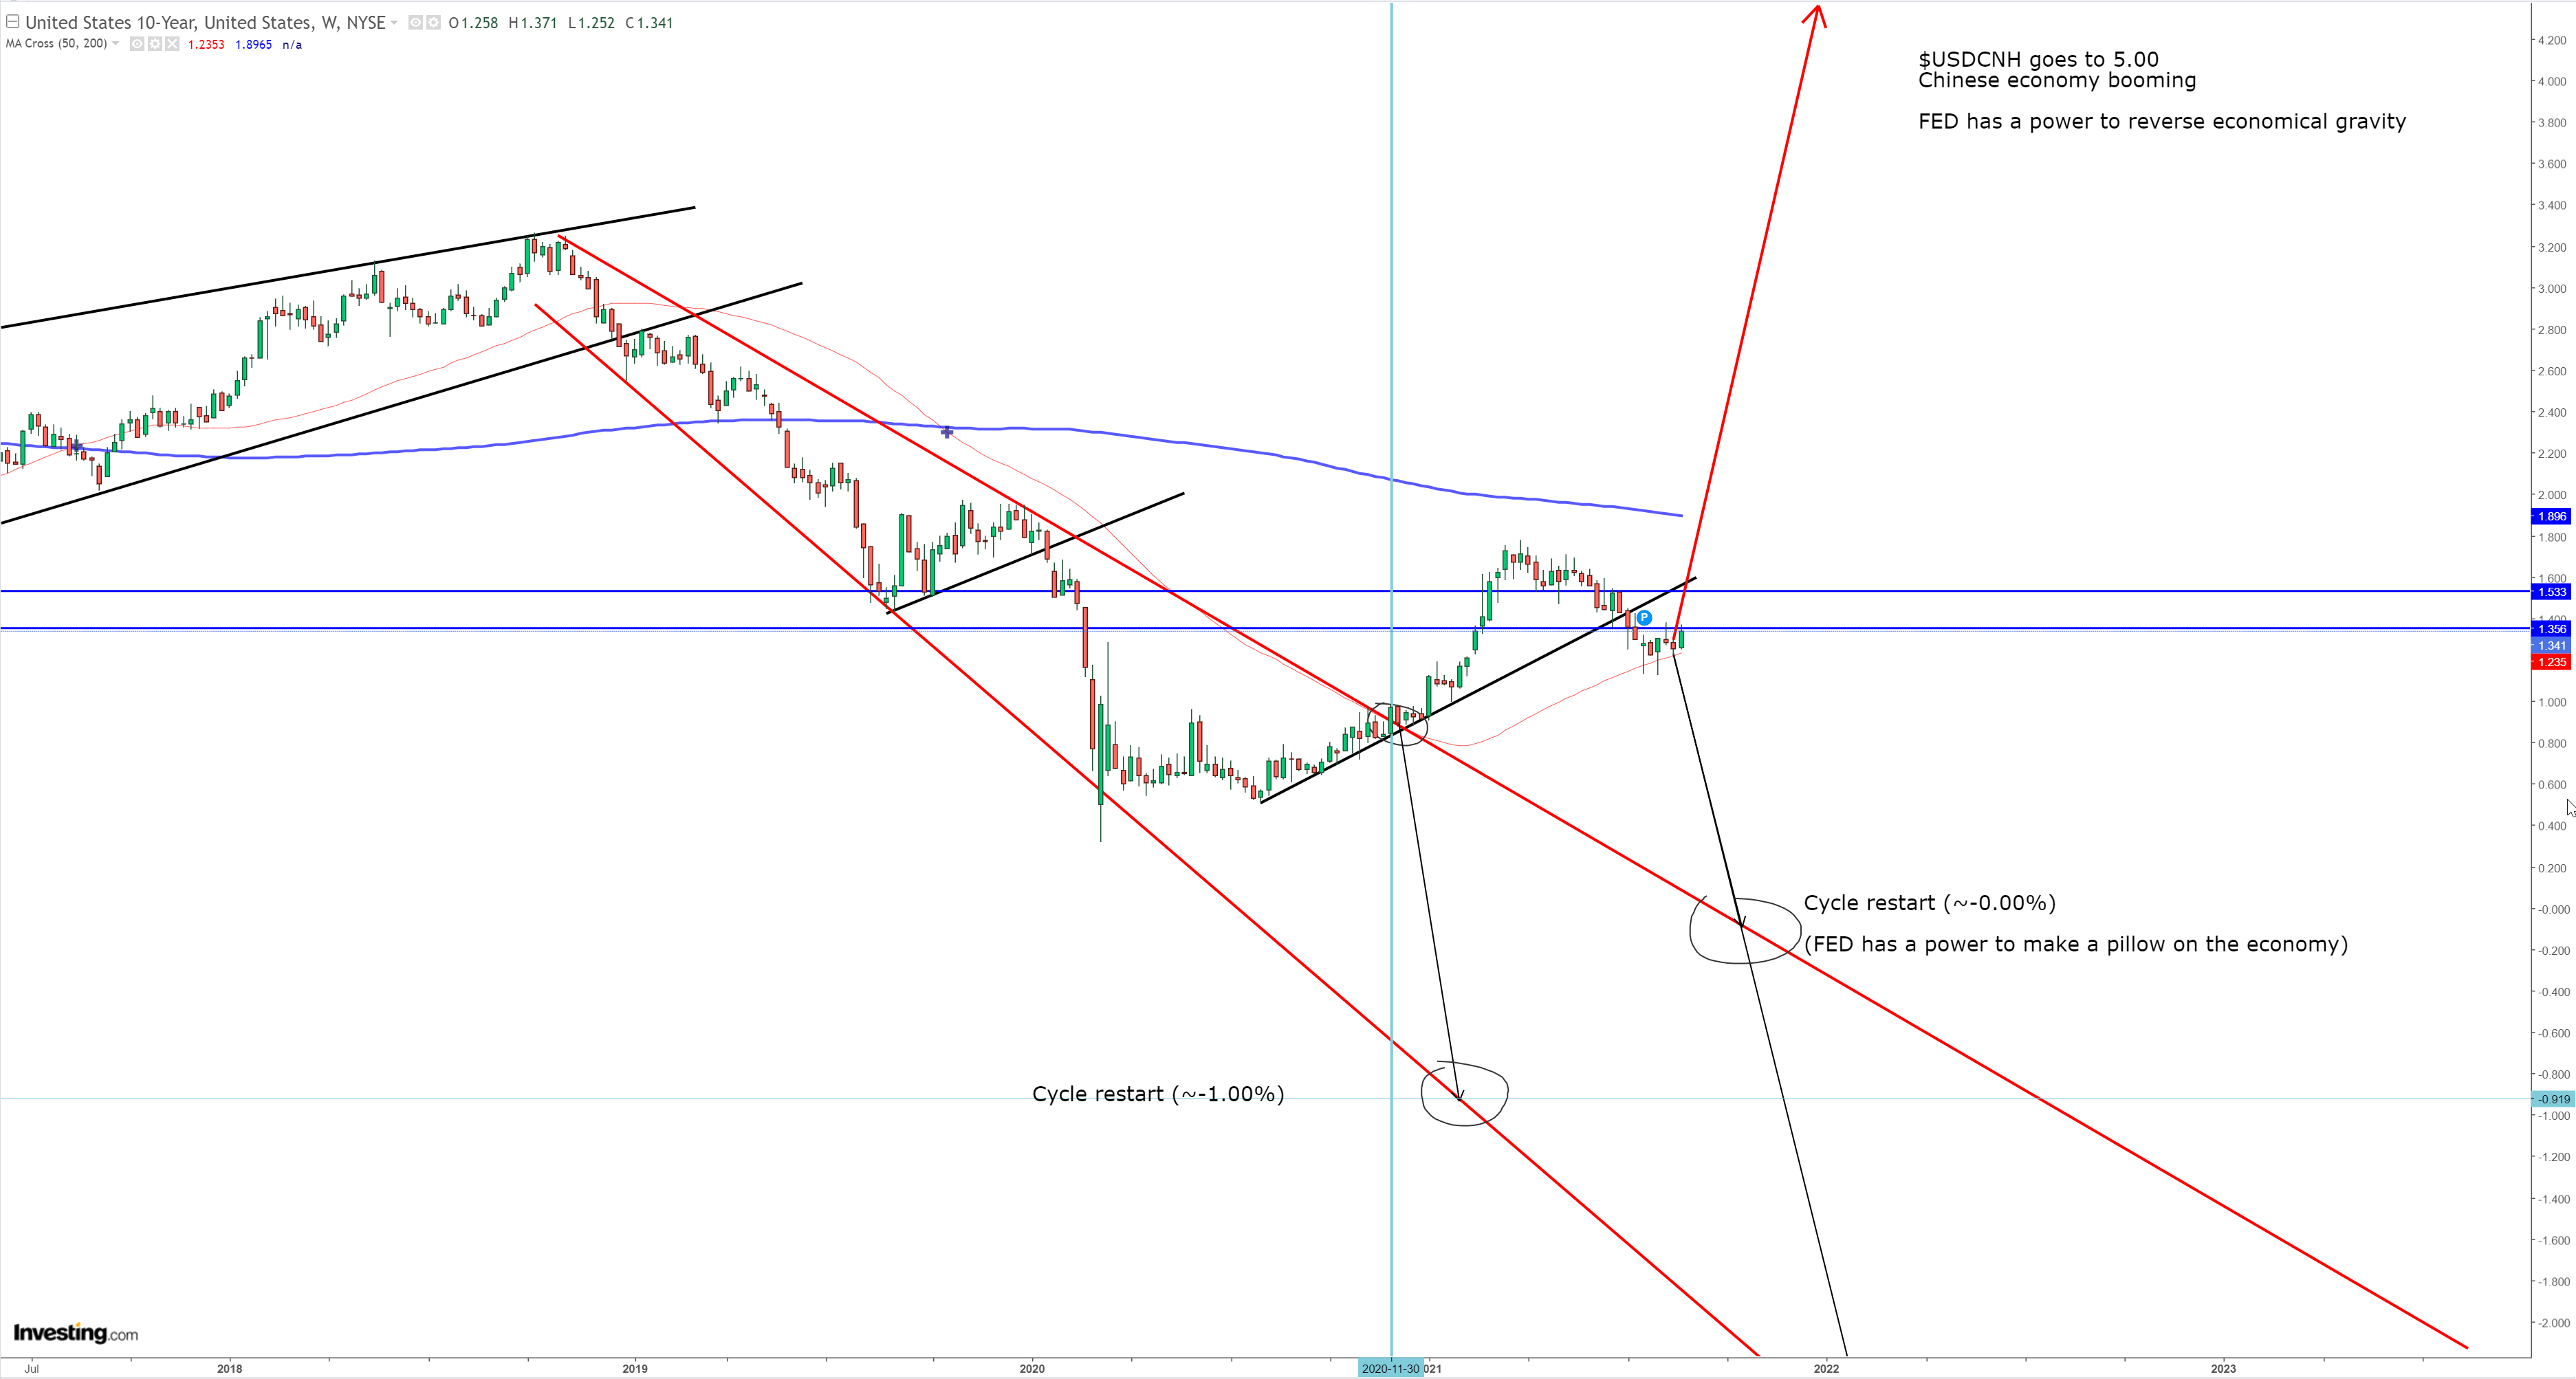
There is a light-blue VERTICAL line at around Nov2020. That is the equivalent of $TLT breaking down with a tag : “FED All-IN to save the stocks”. I bet somebody put lots and lots of efforts to break it opposite to the trend, but we have to accept that and follow that. I personally think that’s an effect of FED’s intervention to get more TIPS bonds on their books. That’s why we have so big inflation because market went nuts on this 1st ever intervention of quite illiquid TIPS market which can so easily boost inflation to the upside. But remember it’s something different when inflation arrives because of wages are growing and different where there is a problem with supply and demand side. Market really believed in that epic mirracle growth, but to confirm that nominal yields (what we can call an “economical gravity” indicator”) need urgently jump above break-evens so these days let’s say 10Y should be around 3.00% (without crashing stock market). 3.00% that’s like these days … 8 rate hikes. Can you believe in that? I don’t.
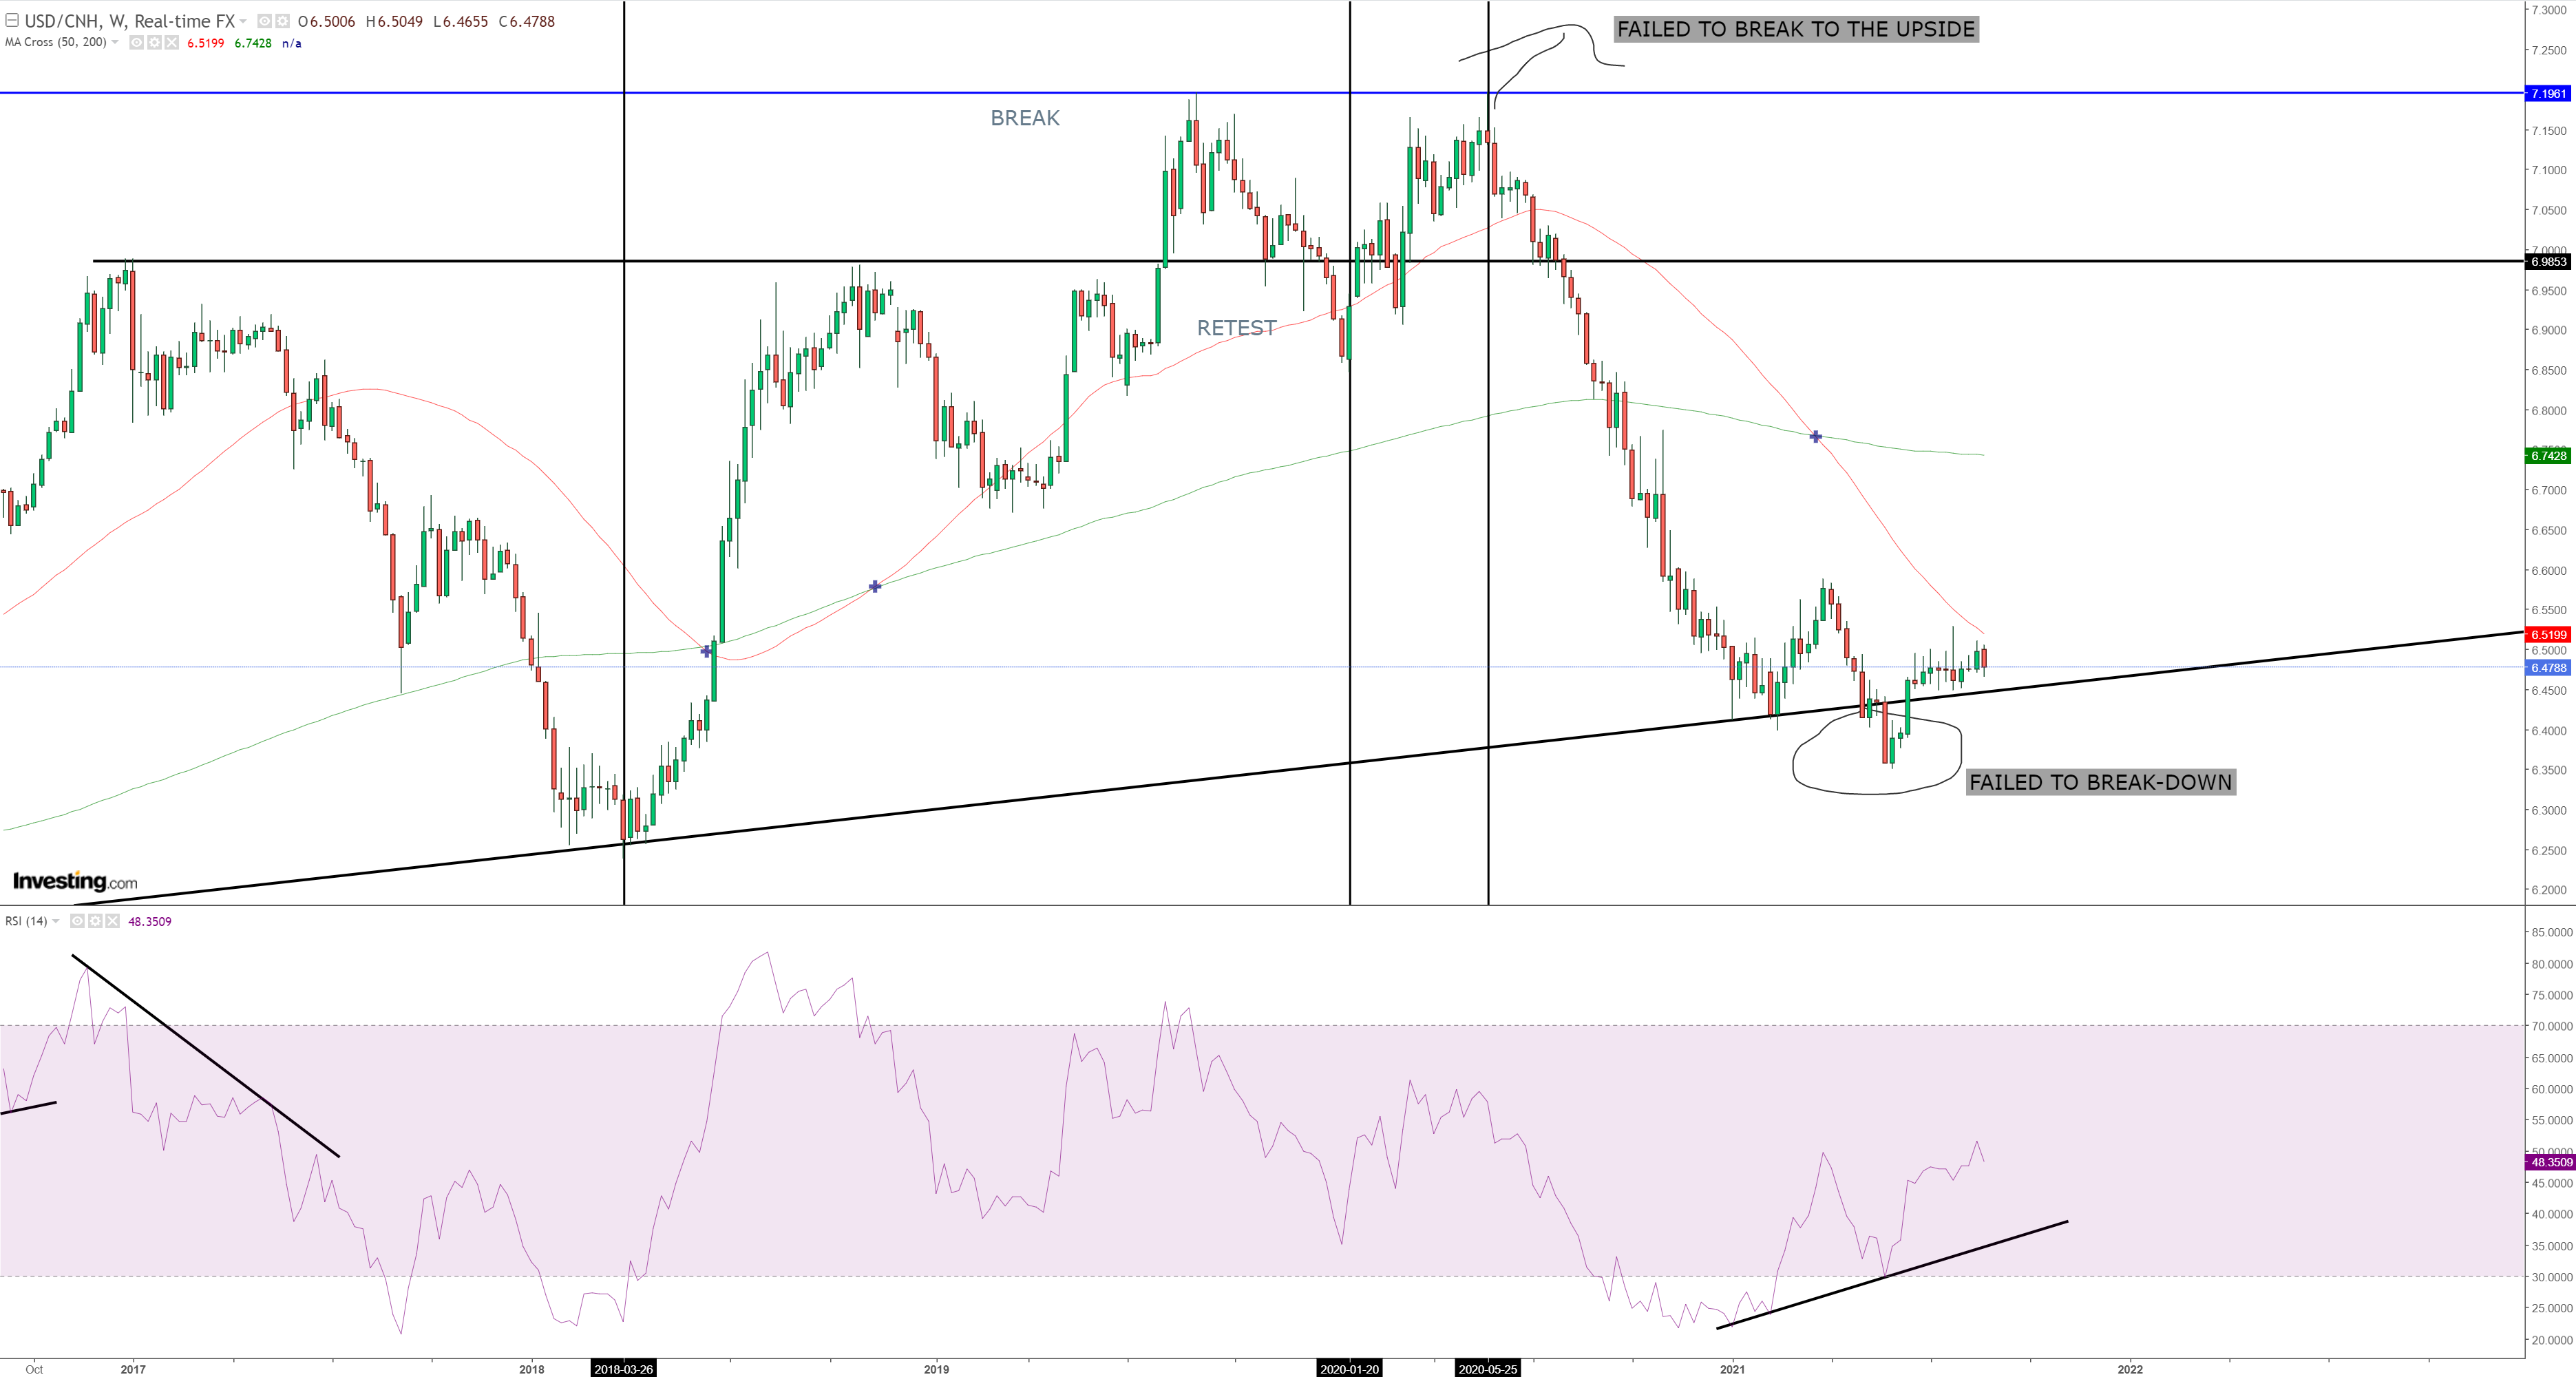
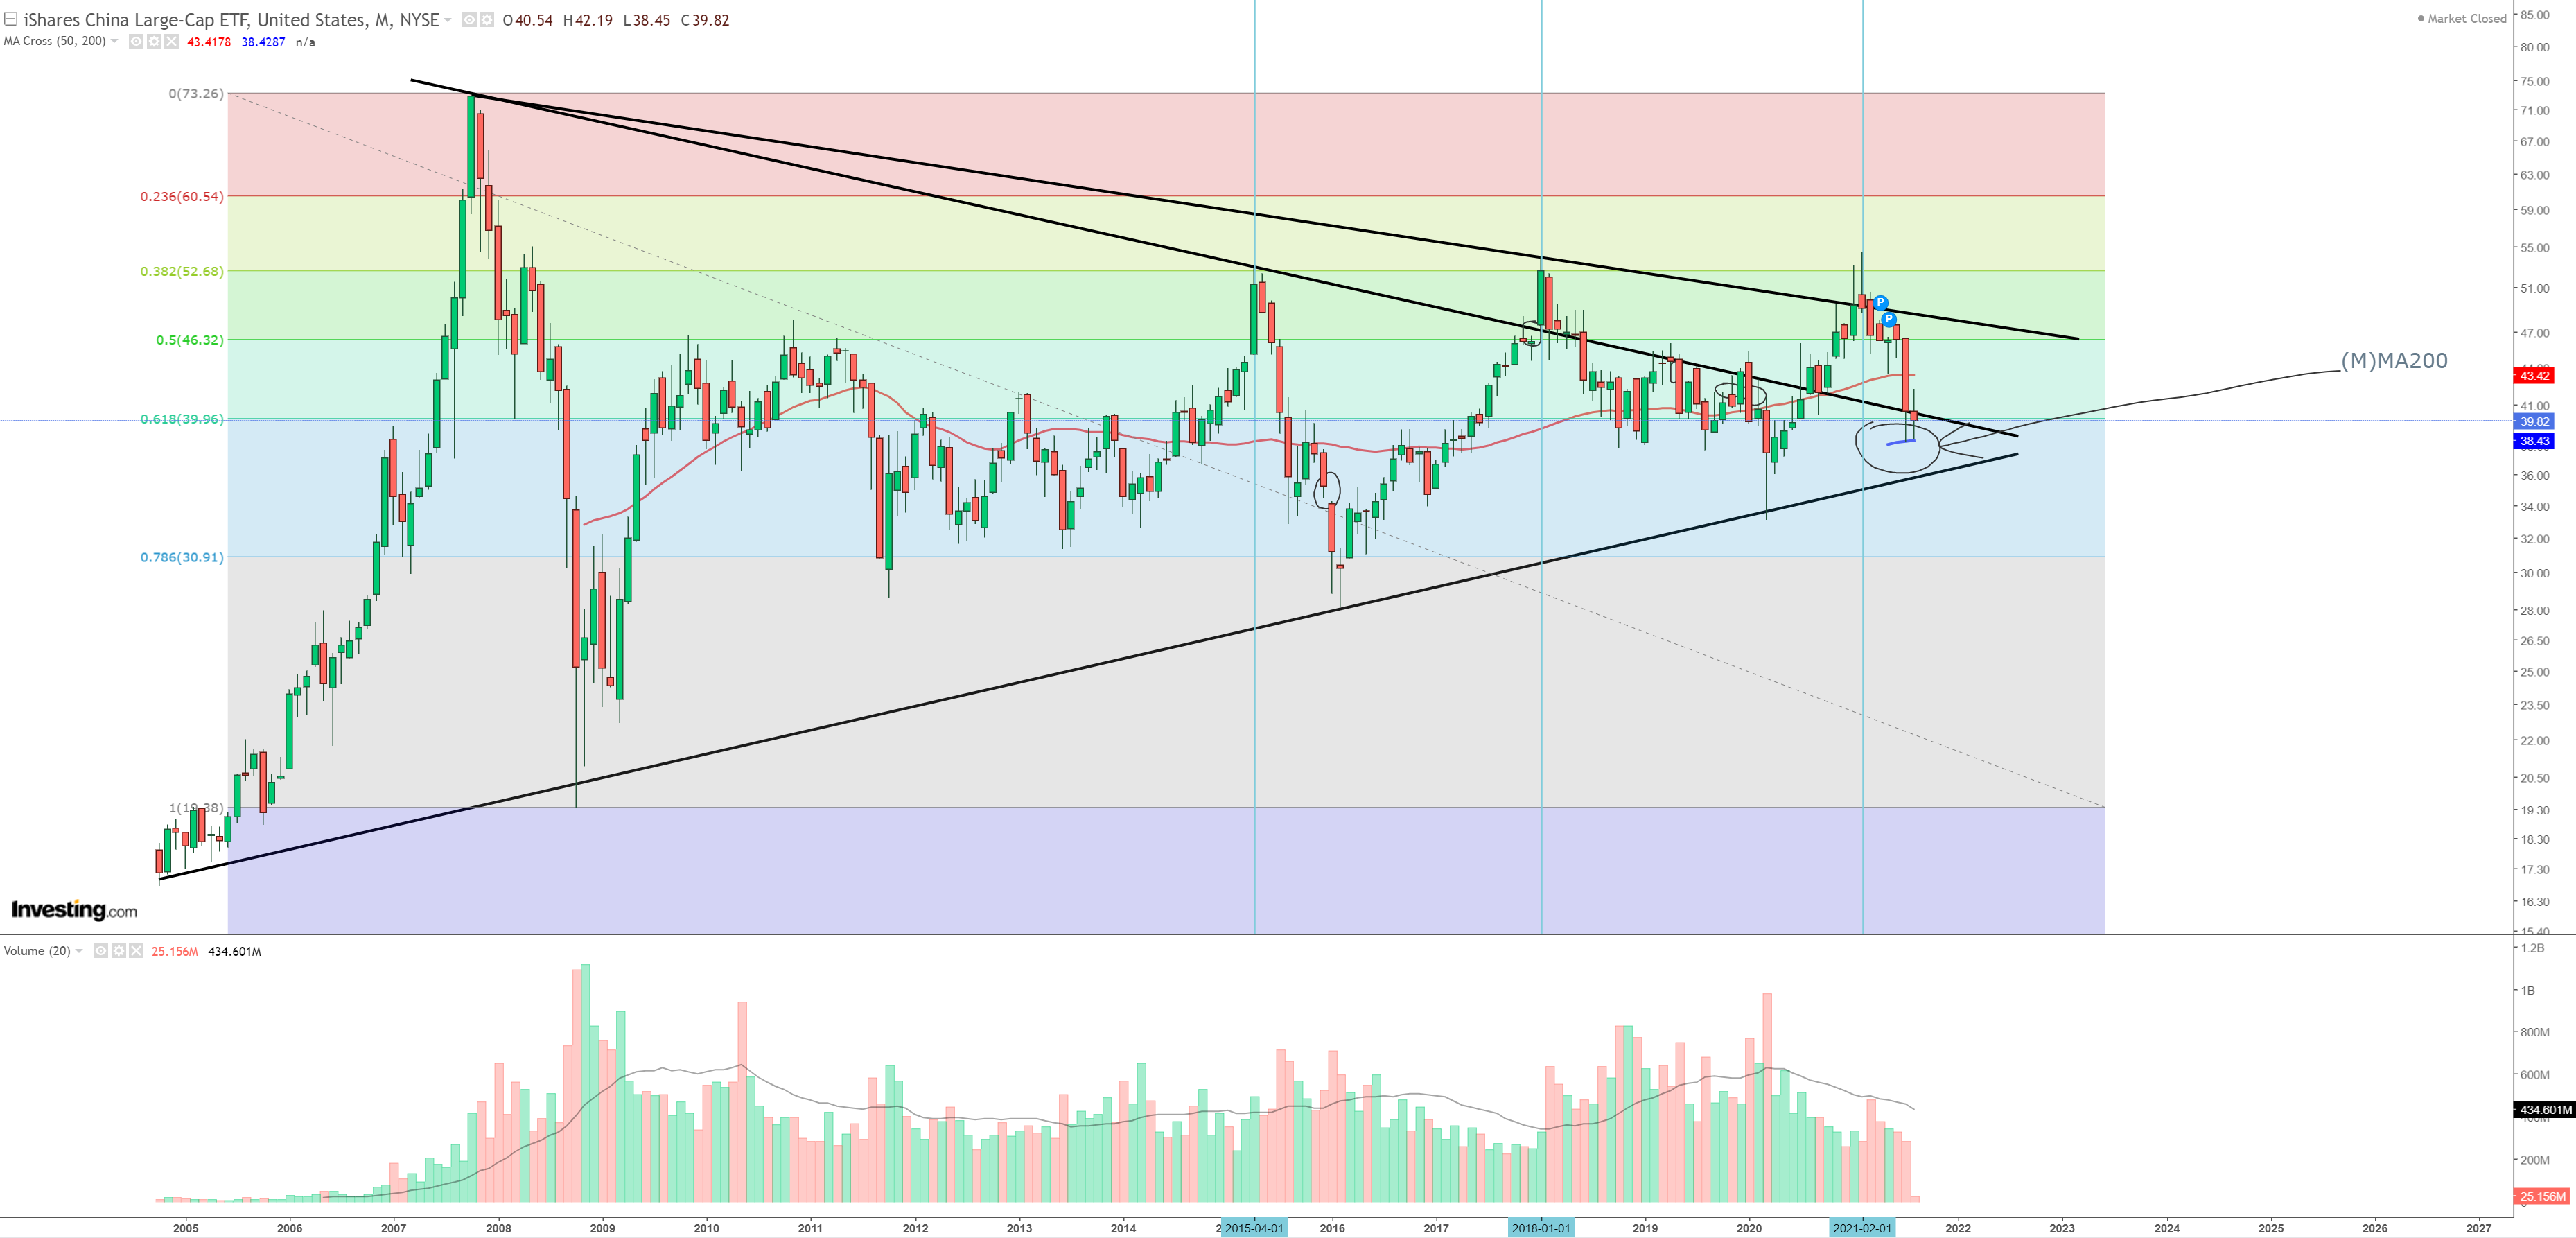
So what can we track for another economical gravity indicator? Of course let’s take a look at Yuan so $USDCNH – as I’ve been saying all problem in this cycle are only related to China and Asia. It’s quite simple to understand that the stronger the Yuan (lower $USDCNH) the more powerful inflation (reflation or stagflation) narration to keep going and the opposite. The weaker the Yuan (higher $USDCNH) the more powerful deflationary (disinflationary) narration to keep going. Let’s take a look at Yuan chart and $FXI (Chinese stock market in $$$ terms) and talk only about 2020+ moments :
$USDCNH :
$FXI :
So RETEST of the Yuan with some move below the trend line – occured in Jan2020. When we remember all What happened in 1Q20 where US still got 350k initial claims even after 1,5Y later we still got problems in the economy. So peak in Yuan was around May2020 (“FAILED TO BREAK TO THE UPSIDE”) and Yuan started an epic run. $USDCNH started to move down, Yuan was getting stronger the inflation was moving to the upside.
Chinese stock market also got troubles 3 peaks : May 2015, January 2018 and February 2021 got stuck on (M)MA200, but if something will break below (M)MA200 it’s usually change of the “secularity”. $FXI hangs like crazy and to move up requires Yuan go get stronger. Is it possible based on the charts? You have to answer by yourself.
Now as from first bullet points we know US is lagged around ~6Ms, so if Yuan peak was 7.15 in May2020 and we add 6Ms to that we get November 2020. So based on the Yuan slide we could have predicted there will a bounce which will start around November 2020. Of course there are big big consequences to that move if economy is in reality in a big downtrend – what I bet it is. Why? I measure it by just yield-curve inversion. Usually when yield-curve inverts first steepening is considered as reflation. Remember 2008? So let’s take a look where we are based on 10Y-3M :
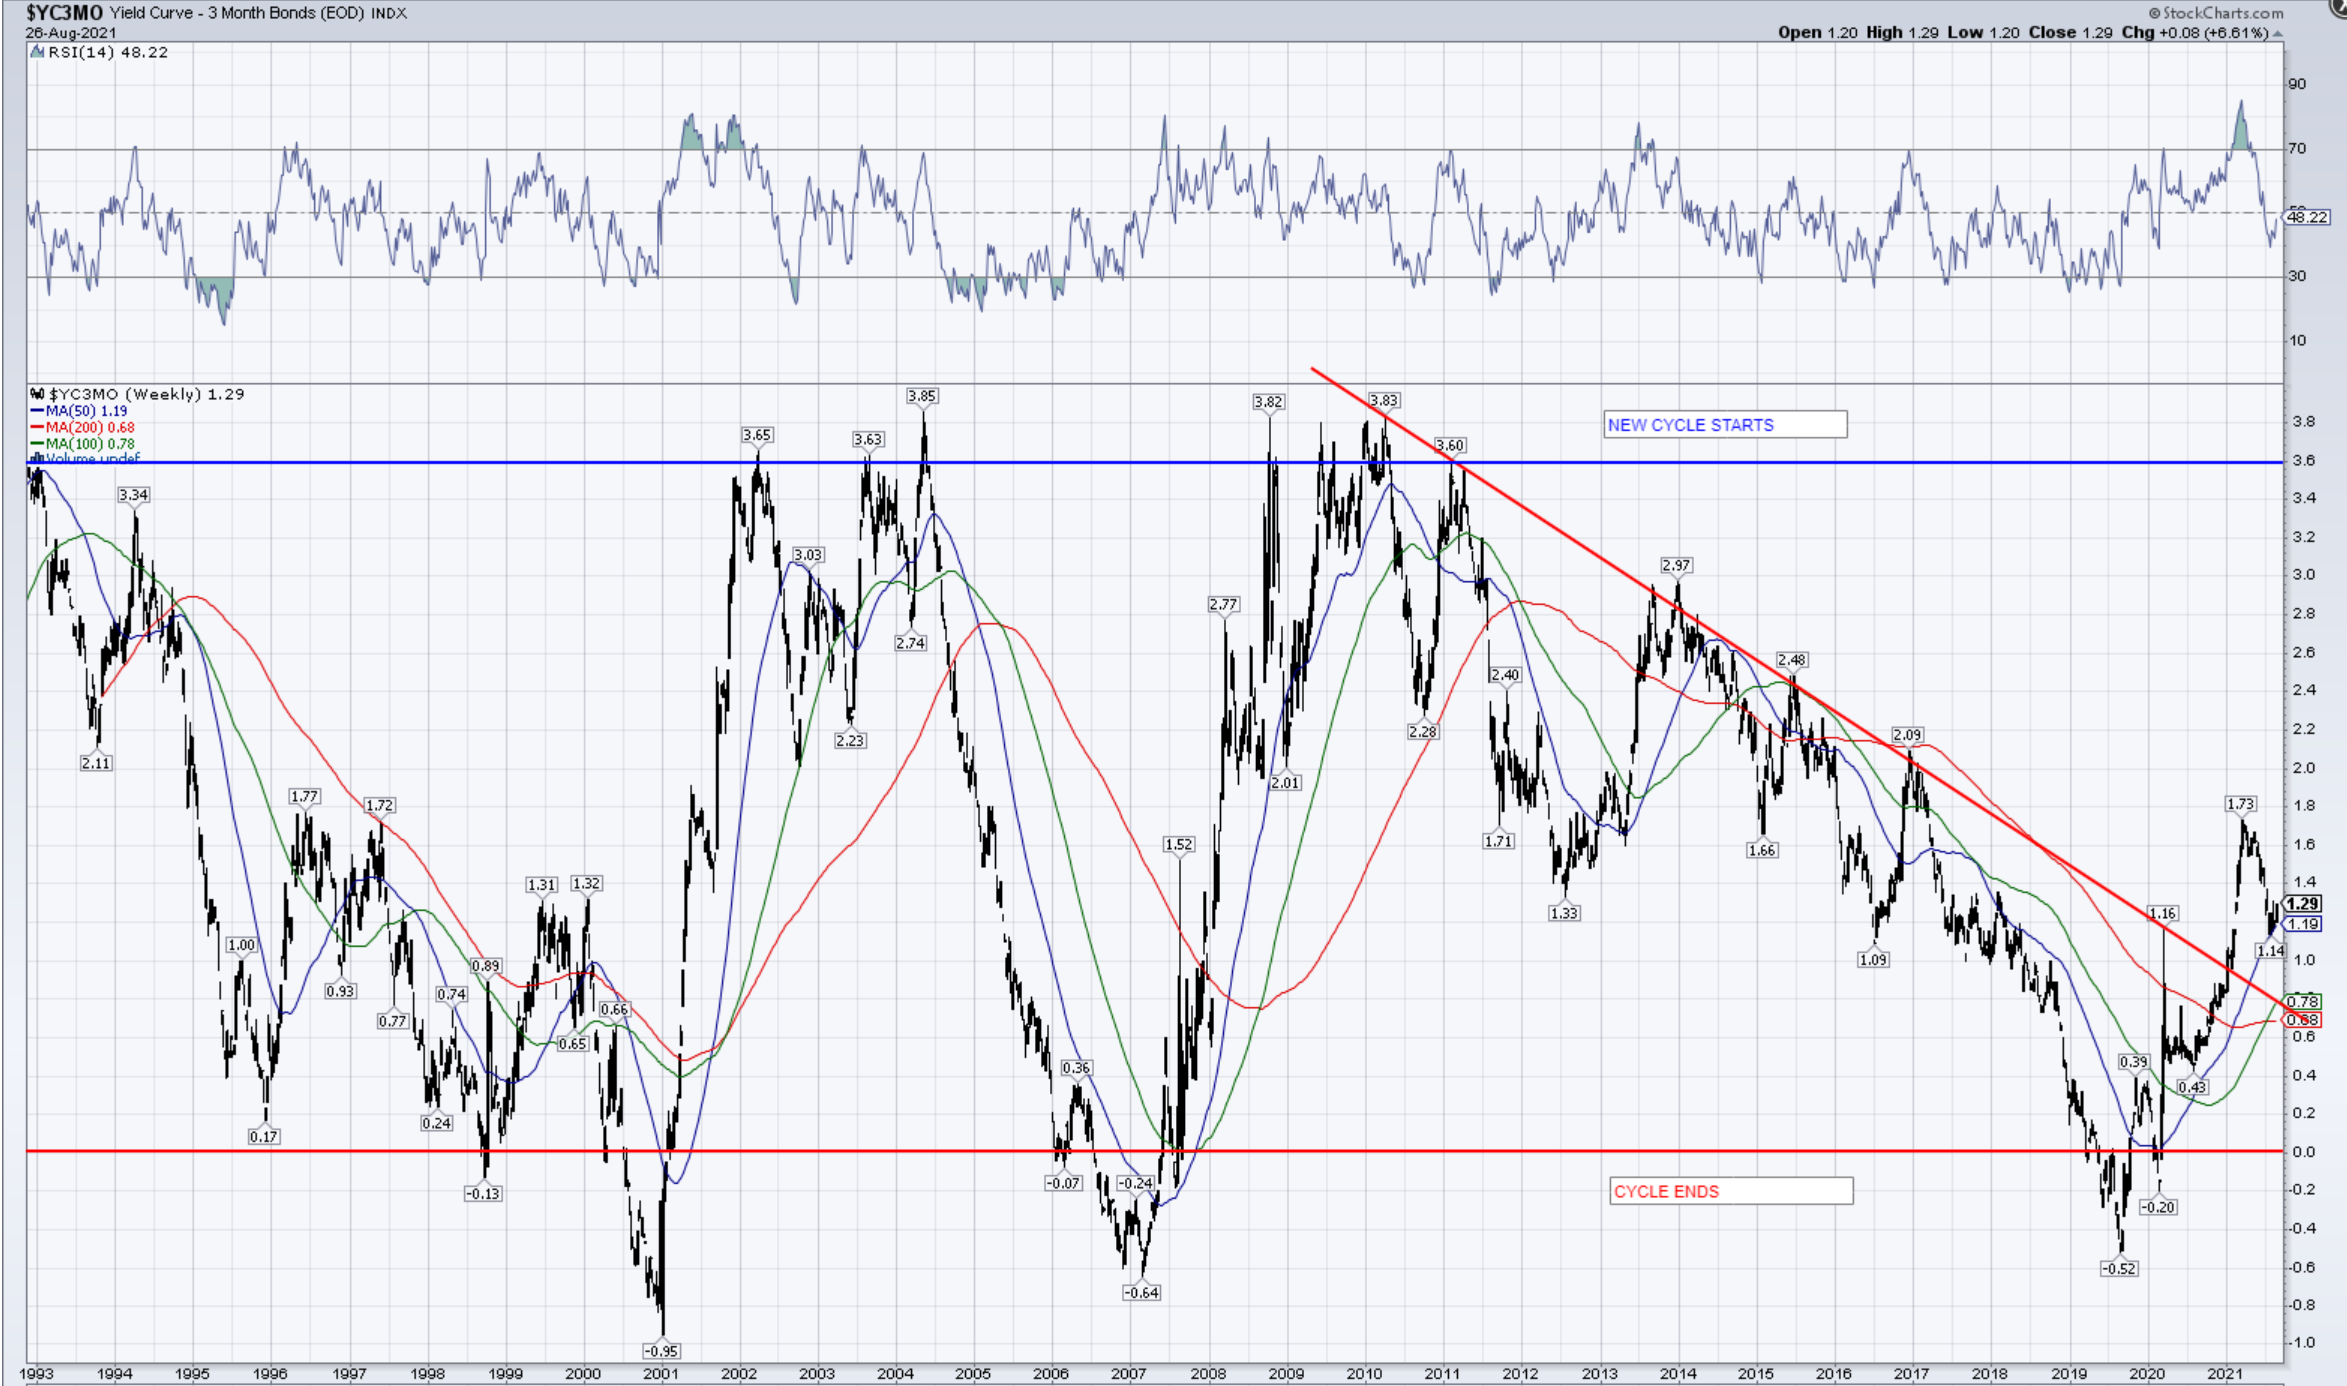
In our last credit cycle yield-curve inverted 3 times. In 2001, 2007 and 2019. We should all start asking. Did yield-curve predict COVID19? The answer is … NO. I won’t give you technical shitty explanation what it means, I’ll give you more pragmatic interpretation of this chart. If yield-curve is inverted it means “any” economical trigger will put us into recession. In 2020 we were hit accidentally by COVID and that was a “shock”. Many people are saying it’s a new cycle. No it’s not. Even if you take a look at Nasdaq you’re going to see – it did not break any crucial (M)Moving Average.
Considering $IXIC – Nasdaq Composite it didn’t break any of (M)MA50, (M)MA100 and (M)MA200, so we’re operating STILL on the same cycle (2009+) what yield-curve is still confirming (long journey till > 360bps). I’ll give you my thesis. When yield-curve starts steepening from inversion initially till half of it’s move people see reflation (long term rates raising faster than short term one). After the half steepening occurs because long term rates are falling much slower than … short term one). We won’t be discussing here YCC (Yield-Curve control), because I think it’s impossible in the USA (you would have blew up China in an epic deflation IMO).
Let’s take a look based on our assumptions what really has happened technically in November 2020 :
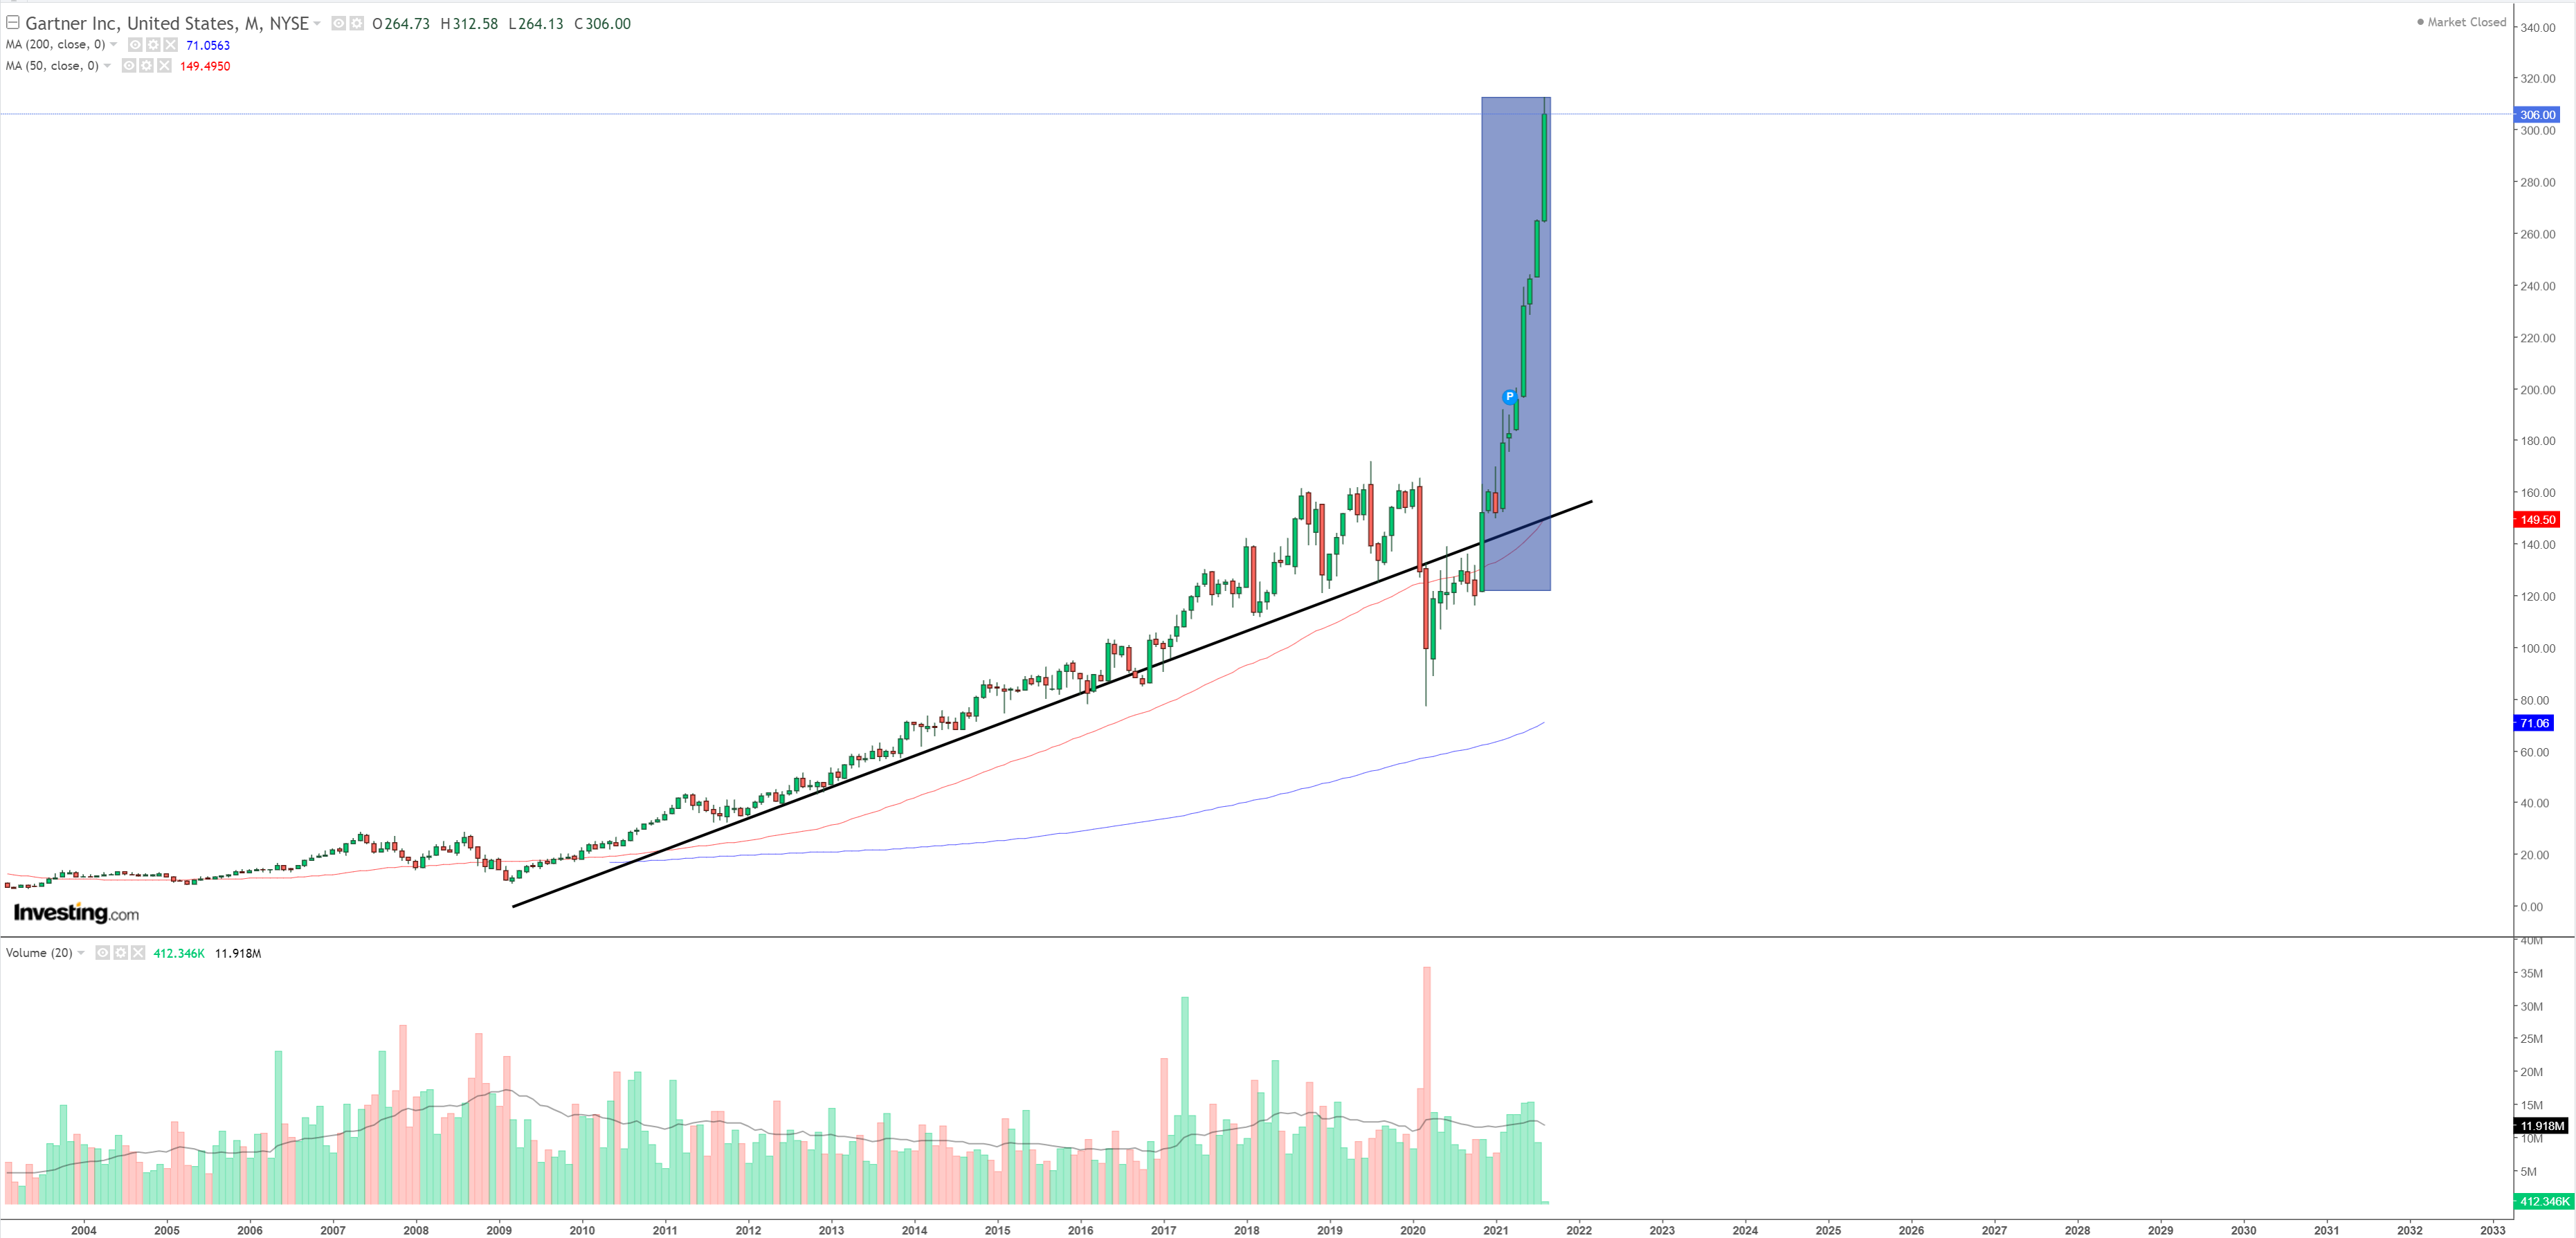
I won’t give you many examples but just 1 rest try to do your homework (check June-November 2020 period) :
$IT – Gartner – I put a rectangle on the November 2020 start. Technically it was break retest to (W)MA50 and parabolic move without any control.
Summarizing … Yuan managed to defend the US stock market, but there is a huge cost for that if economy is still in a downtrend. We can say so far we bought ~3Qs at the expense of possible bigger troubles, but we bought : bigger parabolic run, wider inequality, way way lower real wages, much much higher basic inflation (food + energy + shelter) what forces more and more governments to give free money for additional spending forcing more and more small & medium enterprises (SMEs) deeper into troubles because of lack of employees, higher prices, weaker demand for products dedicated to bottom 90% of society. So when the FED says this :
They are totally right. But the problem is that they are saying “Demand” for top 1-10% of society – so luxury goods. Remember US Yields and Yuan are the global economy for 100% of the society, so I bet FED is totally unglued from the economy these days and IMO people declaring 3-5% on US yields too… Remember economy is always way way smarter than money printers. True economical boom comes from hard work, savings and productivity, not from MMT which lifts up inflation on food mostly and removing jobs and putting SMEs (90% of job market) into bigger troubles (funny – US has 10M jobs opened and 5,4% unemployment and nobody can find any employee)
Does it mean it’s is permanent short? Of course it’s not. I don’t encourage anybody to short this market, especially the US one, and I never did from March 2020!, but I think August 2021 is a good time to short some Emerging Markets in $$$ terms if we talk about stocks only of course as Yuan seems to be bottomed. We need some good moves in Yuan and US Bond yields to confirm where we are.